Fryer, P., Wheat, C.G., Williams, T., and the Expedition 366 Scientists
Proceedings of the International Ocean Discovery Program Volume 366
publications.iodp.org
https://doi.org/10.14379/iodp.proc.366.108.2018

Site U14971
P. Fryer, C.G. Wheat, T. Williams, E. Albers, B. Bekins, B.P.R. Debret, J. Deng, Y. Dong, P. Eickenbusch, E.A. Frery, Y. Ichiyama, K. Johnson, R.M. Johnston, R.T. Kevorkian, W. Kurz, V. Magalhaes, S.S. Mantovanelli, W. Menapace, C.D. Menzies, K. Michibayashi, C.L. Moyer, K.K. Mullane, J.-W. Park, R.E. Price, J.G. Ryan, J.W. Shervais, O.J. Sissmann, S. Suzuki, K. Takai, B. Walter, and R. Zhang2
Keywords: International Ocean Discovery Program, IODP, JOIDES Resolution, Expedition 366, Site 1200, Site U1491, Site U1492, Site U1493, Site U1494, Site U1495, Site U1496, Site U1497, Site U1498, Mariana, Asùt Tesoru Seamount, Conical Seamount, Fantangisña Seamount, South Chamorro Seamount, Yinazao Seamount, Cretaceous seamount, subduction, subduction channel, forearc, seismogenic zone, mud volcano, fluid discharge, serpentinite, carbonate, harzburgite, clasts, ultramafic rock, breccia, gypsum, mudstone, chert, reef limestone, volcanic ash, guyot, CORK, CORK-Lite, screened casing
MS 366-108: Published 7 February 2018
Site summary
Site U1497 is located in the center of a depression at the summit of Fantangisña Seamount (informally known as Celestial Seamount). This serpentinite mud volcano is about 62 km from the trench and about 14 km above the subducting Pacific plate (Oakley, 2008; Oakley et al., 2008). No active seeps or chimneys were observed during the one remotely operated vehicle (ROV) Jason II dive on this seamount; however, a piston core in the center of the caldera recovered serpentinite material with altered interstitial waters (Hulme, 2005). Systematic variations in interstitial water chemistry are consistent with a deep-sourced input close to the seafloor with slow, centimeters per year or less, discharge of interstitial waters. Site U1497 is located near the site of this piston core and the headwall of a slump feature because a headwall slump feature on South Chamorro Seamount was identified as a permeable fluid discharge zone (Wheat et al., 2008). The primary objective at this site was to define the composition of the source fluid and intersect a subsurface permeable zone that transported deep-sourced fluid from depth within the cased/screened borehole structure for future experiments, sampling, and monitoring efforts.
Before spudding the first hole, we conducted a short camera survey to locate sites devoid of rocks. Hole U1497A was spudded and drilled to 34.2 meters below seafloor (mbsf). The ship was moved about 6 m for Hole U1497B, where the recovered sequence is similar but not identical to that from Hole U1497A. Hole U1497C was intended to be a deep hole to support the casing; however, difficult drilling required us to move back to within 5 m of Holes U1497A and U1497B. A casing/screened borehole was successfully deployed, and a cement plug was deposited at the bottom of the casing. A little over 3 days after deploying the cement, we returned to verify the depth of the cement plug, collect a water sample using the water-sampling temperature probe (WSTP), and measure temperature at several depths within the cased borehole.
Serpentinite mud deposits at the summit of Fantangisña Seamount appear to be more consolidated and viscous than those at the summit of Asùt Tesoru Seamount. This difference likely reflects less present-day fluid upwelling at the Fantangisña summit. Moreover, zones of reddish oxidized serpentinite muds in both cored holes underlie the uppermost intervals of dark bluish gray muds, suggesting significant episodes when such zones were exposed at the seafloor, oxidizing the serpentinite muds. Ultramafic lithic clasts in the serpentinite muds were generally highly serpentinized, consistent with a long residence time in high-pH fluids. The occurrence of numerous crustal clasts including greenstones, carbonates, cherts, and shales of probable Pacific plate provenance indicates significant input of material from the subduction channel.
Mantle-derived harzburgites are completely serpentinized but despite their alteration retain evidence of primary textures. These harzburgites are characterized by pseudomorphs after orthopyroxene porphyroclasts that are highly elongated (in one case 4 mm × 0.4 mm), with kink folds and undulatory extinction. Spinel occurs in association with pyroxene and also with subhedral to holly leaf shapes 1–2 mm in size. These results are consistent with initial porphyroclastic textures, indicating deformation at relatively low temperatures and moderate to high strain rates.
The metasedimentary rocks are characterized by incipient recrystallization of calcareous and siliceous microfossils. The degree of recrystallization indicates low-grade metamorphic conditions. Both the metasedimentary and volcanic rocks are brecciated to varying degrees. Brecciation resulted in the development of fine-grained cataclasite to ultracataclasite domains. The very fine grained metasedimentary rocks (shales and sandstones) were partly transformed into ultracataclastic shear zones with rounded clasts. The very small grain size (<2 µm) within these shear zones indicates that the general deformation mechanism was ductile flow. In general, brecciation (fracture) implies cataclastic deformation flow mechanisms (fracture and friction) at low-grade conditions and/or comparably high strain rates.
The occurrence of deformed metasedimentary rocks and volcanic rocks suggests that a significant fraction of the material entrained by this mud volcano was derived from the subducting Pacific plate. In particular, the titanaugite indicates an ocean island basalt alkalic provenance. In addition, the deformed metasedimentary rocks appear to contain microfossils such as radiolarians that are common in older sediments of the Pacific plate. Furthermore, the presence of ultracataclasite requires severe brittle deformation that is not likely to occur in sedimentary rock formations lying on top of the upper plate but can begin as the Pacific plate deforms on approach to the trench and is typical within the subduction channel.
Interstitial water CH4 and other hydrocarbon concentrations were not detected in samples from Holes U1497A and U1497B. Interestingly, methane contamination in background atmospheric samples was not observed, suggesting that the source of atmosphere contamination detected while analyzing samples from Yinazao and Asùt Tesoru Seamounts resulted from degassing of unconsolidated core materials that were exposed in the laboratory.
Fourteen whole-round samples were collected from Holes U1497A and U1497B for interstitial water extraction, and one sample was collected with the WSTP in Hole U1497D. Holes U1497A and U1497B show distinct trends of major and trace element abundances with depth. Concentrations of potassium, sodium, boron, lithium, and magnesium in interstitial waters decrease downhole from seawater concentrations. By contrast, concentrations of calcium, strontium, and pH increase from seawater values. Systematic variations in interstitial water profiles are consistent with the upwelling of deep-sourced fluid. Imprinted on this fluid composition are limited diagenetic changes that result from reaction with distinctive red layers composed of quartz sand and clay and carbonates. Fluid from the WSTP sampler, collected 3.25 days after previous operations ceased, is a mixture of this deep-sourced fluid and bottom seawater. This composition indicates active fluid discharge into and out of the borehole, making this cased-screened borehole an ideal foundation for future experiments, sampling efforts, and observations with a CORK-Lite structure.
Samples were collected for shore-based microbiological studies. To assess possible artifacts from drilling operations, tracers were pumped into the drill string prior to and during core recovery. Tracer analyses indicate that most of the whole-round samples for microbiology are suitable for shore-based analyses.
At Site U1497, physical property measurements of the serpentinite mud retrieved from the upper halves of both holes differ from those obtained at the summits of Yinazao (Site U1492) and Asùt Tesoru (Site U1496) Seamounts. Site U1497 has higher average values of bulk density (2.0–2.3 g/cm3), higher P-wave velocities (1750–1900 m/s), higher thermal conductivities (1.3–1.8 W/[m·K]), and lower porosities (38%–44%). These values are similar to those obtained on the flanks of Asùt Tesoru Seamount (Sites U1493–U1495) and reflect a more consolidated state of the material compared to the other summit sites. No clear trend with depth was identified within these serpentinite mud units, which could be related to the relatively shallow depth that was reached during coring operations or reflect properties intermediate between summit and flank behavior, consistent with a period of minimal activity at this summit.
The lower halves of Holes U1497A and U1497B comprise different lithostratigraphic units of sedimentary, mafic, and ultramafic polymict matrix materials with variable clast contents. These units have notably heterogeneous physical properties values (e.g., natural gamma radiation [NGR]). The prevalence of sedimentary clasts in Unit III can be correlated with overall high NGR values in both holes.
Downhole measurements include a single advanced piston corer temperature tool (APCT-3) measurement in Hole U1497B and a WSTP measurement in Hole U1497D, the cased borehole. Data for the single downhole temperature estimate and minimum seafloor temperature yielded a gradient of 11.7°C/km. Multiplying the gradient by the average measured thermal conductivity of 1.43 W/(m·K) results in an estimated heat flow of 16.8 mW/m2. Calculation of formation temperatures from WSTP fluid temperature data from Hole U1497D requires additional modeling to elucidate potential discharge rates. The heave experienced during deployment may have affected the thermal measurement. This potential source of mixing borehole and bottom seawater would have been diminished with the use of an advanced piston corer (APC) coring shoe (Hole U1496C), which allows the WSTP to extend further into the borehole casing. In the case of the rotary core barrel (RCB) coring shoe, the tip of the WSTP was the only portion that was allowed to penetrate into the borehole casing. Given that the WSTP was deployed with two distinctly different coring shoes and warming was observed in both deployments, fluid discharge is the likely cause for the rise in temperature. The chemical data require fluid discharge into the borehole.
Background and objectives
Site U1497 (proposed Site MAF-9B) is located in the center of a depression within the summit region of Fantangisña Seamount (Figure F1), which is located at 16°32.25′N, 147°13.25′E, about 62 km from the trench (see Figure F1 in the Expedition 366 summary chapter [Fryer et al., 2018b]). The base of the seamount is about 14 km above the subducting Pacific plate (Oakley, 2008). The summit region was mapped with DSL-120 in 2003 (3 km × 4 km survey) and surveyed with the ROV Jason II.
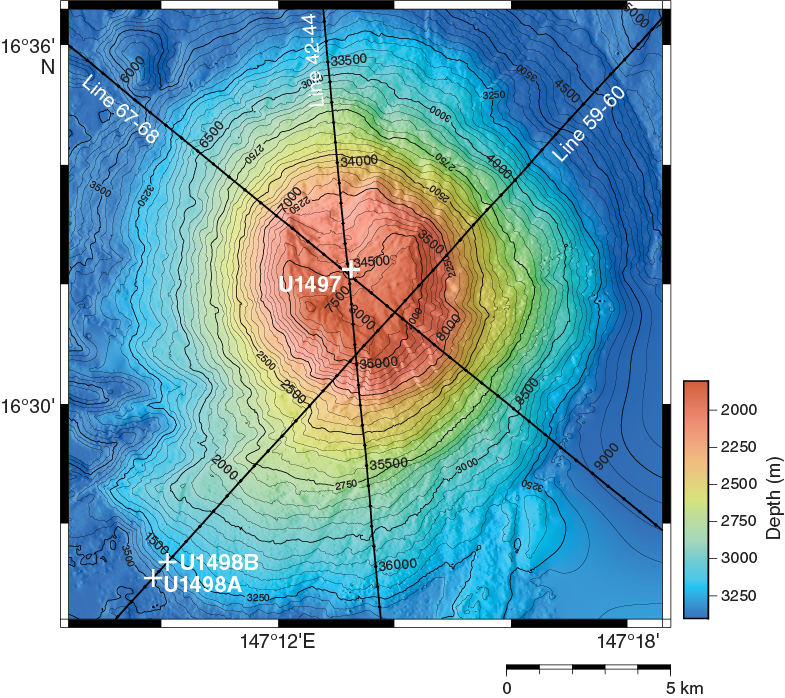
Figure F1. Bathymetric map.
The edifice lies on the north edge of a prominent forearc block that trends northwest. The overall morphology of the seamount summit is derived from bathymetry data collected with the Hawaii Mapping Research Group’s shallow-towed bathymetry and side-scan vehicle, MR1 (Rognstadt, 1992), the DSL-120 deep-towed vehicle, and a multichannel seismic (MCS) system (Oakley et al., 2007) (Figure F2). The main feature of the summit is a slump down the northern flank (Figure F1). Several stages of slumps exist, based on nested headwall scarps with sharply defined features at 2000 and 1840 m water depth; the latter depth is the summit (Figure F3). The side-scan backscatter of the seamount summit from the MR1 and DSL-120 surveys shows high intensity over most of the depression. It was expected, therefore, that a conduit region just north of the 2000 m depth contour might tap a deep source of fluids that is thought to have instigated the most recent slump, similar to the situation at South Chamorro Seamount (Wheat et al., 2008).
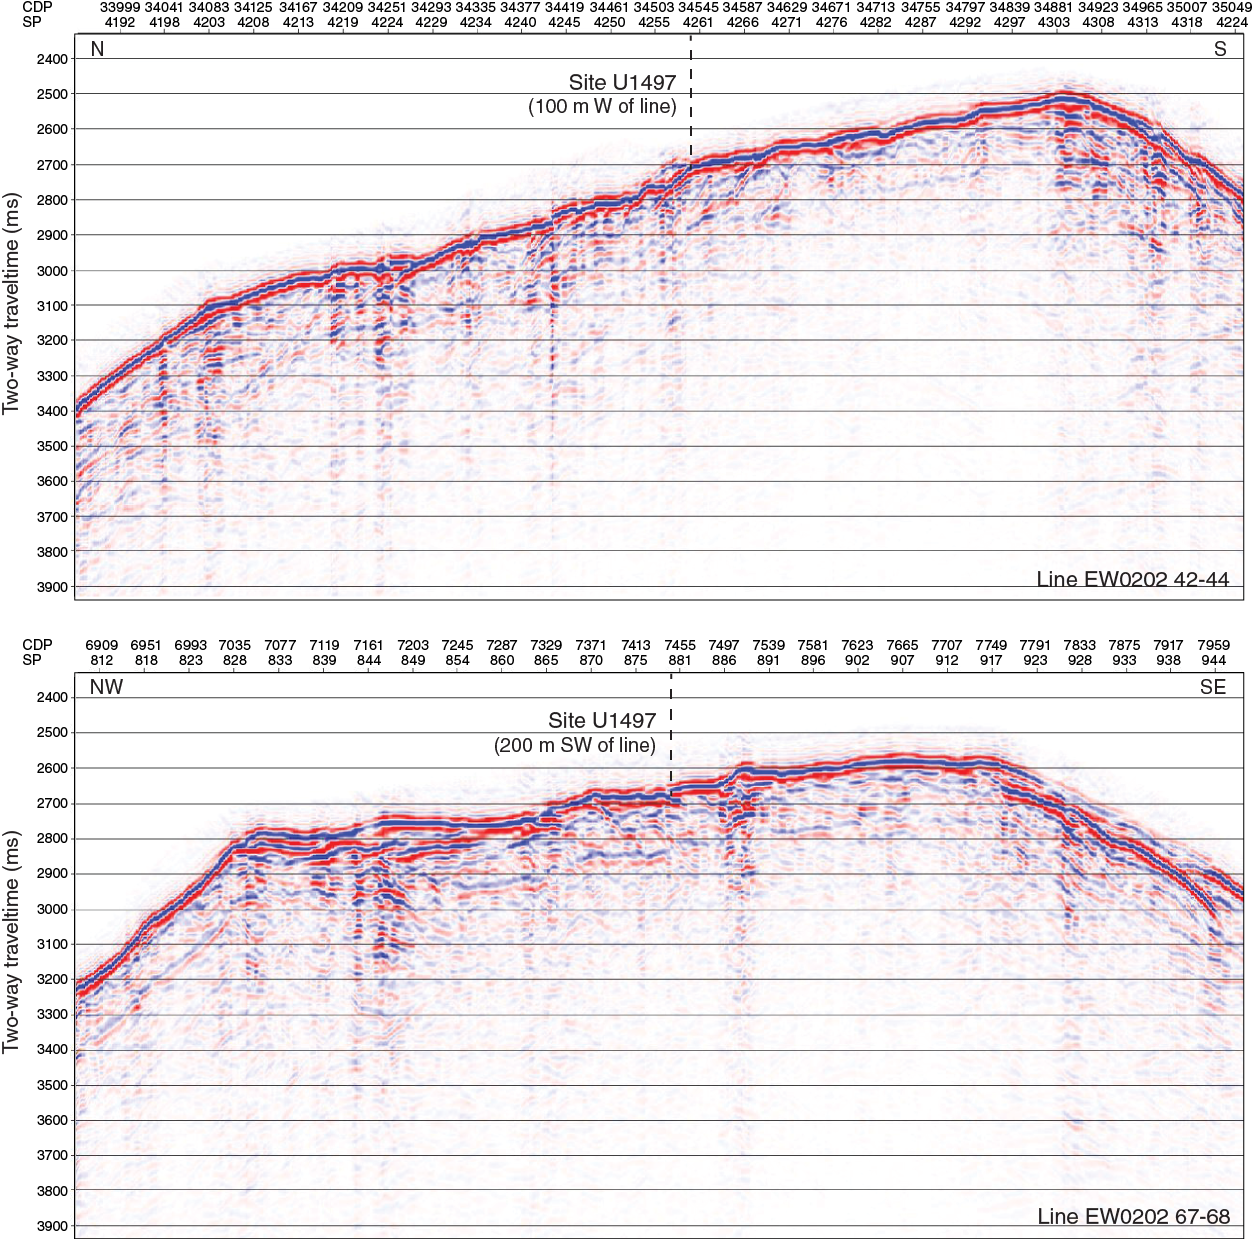
Figure F2. MCS Lines EW0202-42-44 and EW0202-67-68 and Site U1497.
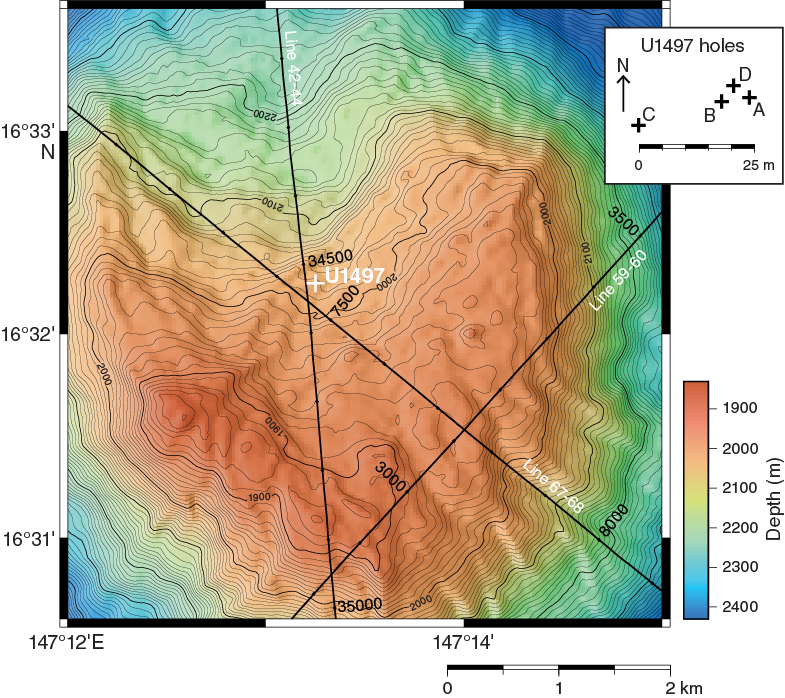
Figure F3. Bathymetric map of the summit.
No active seeps or chimneys were observed during the one ROV Jason II dive on this seamount (J2-038). This dive started within the summit caldera at the headwall of the 2000 m slump and headed up the southeastern slope to the summit of the caldera, which forms the headwall of a larger slump that shapes the caldera. Much of the caldera floor consists of pelagic sediment, smooth serpentinite muds, serpentinite muds dotted with dark clasts/rocks, white layers, a few manganese crusted rocks, sponges, and small serpentinite mud/rock mounds. The dive continued along the headwall of the seamount to the southwestern portion, revealing more rock exposures and rugged terrain.
The only indication of active serpentinite processes on the seamount is based on one piston core from the center of the caldera. This core recovered ~40 cm of serpentinite material; however, at the base of the core, Mg and alkalinity concentrations (49.6 and 0.89 mmol/kg, respectively) were lower than bottom seawater values (53 and 2.4 mmol/kg, respectively). These data indicate a deep-sourced input close to the seafloor, consistent with slow (centimeters per year or less) discharge of pore waters.
The operational plan was to target the more recent slump at the 2000 m deep headwall scarp and drill into the deep-sourced fluid pathway that instigated this slump. First, we would conduct a survey with the vibration isolated television (VIT) camera to assess regions void of surface exposures of rocks. Following the survey, the plan was to drill one or two shallow holes (nominal depth of 50 m) before drilling a deeper hole (~120 m) that would eventually be cased with several screened sections for a future observatory/experimental platform.
The primary objective was to define the source fluid composition and intersect a permeable zone that transported deep-sourced fluid from depth within the cased/screened borehole structure. Additional objectives included (1) determining the variability of mudflow and rock clast compositions and thicknesses of discrete units within the summit area, (2) investigating potential systematic variability in the degree of serpentinization with depth in the conduit region, (3) examining transport characteristics of the serpentinite mud/clast material, and (4) collecting samples for microbiological analysis. Upon completion of this site, the cased/screened borehole would be readied for a future expedition with an ROV to deploy a CORK-Lite and a variety of sensors and experiments.
Operations
Hole U1497A
The 94 nmi transit from Site U1496 to Site U1497 ended at 1000 h on 13 January 2017 (all dates and times are ship local times). Operations included two half-length advanced piston corer (HLAPC)/ extended core barrel (XCB) holes to ~50 mbsf followed by a reentry cone casing installation to ~100 mbsf. This site was expected to have rubble exposed at the surface, so a seafloor survey was conducted with the VIT/subsea camera to locate potential coring locations. An APC/XCB bottom-hole assembly (BHA) was assembled, and the VIT/subsea camera was deployed before the seafloor survey began at 1615 h on 13 January. The survey consisted of 25 m wide swaths to the east and west every 5 m north of the site location in the Expedition 366 Scientific Prospectus. Several acceptable spud locations were identified, and the seafloor was tagged at these locations. At 1915 h on 13 January, Hole U1497A was spudded with a calculated seafloor depth of 2030.4 mbsf (Table T1). Coring continued through Core 13G to 34.2 mbsf (2064.6 meters below rig floor [mbrf]) before the decision was made to abandon the hole. The bit was pulled clear of the seafloor at 1414 h on 14 January, ending Hole U1497A and beginning Hole U1497B.
Table T1. Site U1497 core summary. Download table in CSV format. View PDF table.
Hole U1497B
The ship was offset 5 m north and 20 m east of the primary site coordinates. Recovery from the first core established a calculated seafloor depth of 2029.4 mbrf (Table T1). Coring continued through Core 366-U1497B-7F to 23.8 mbsf (2053.2 mbrf). Hole U1497B was terminated at 0005 h on 15 January 2017 when the bit was pulled clear of the seafloor.
Hole U1497C
A standard reentry cone was positioned on the moonpool doors, and a 14¾ inch tricone drilling BHA was assembled. Hole U1497C was spudded at 1145 h on 15 January 2017 (Table T1). After a few hours and total penetration of 12.0 m, drilling ceased, ending Hole U1497C and beginning Hole U1497D.
Hole U1497D
The ship was offset 5 m north of Hole U1497B. The seafloor was tagged at 2030 mbrf. Drilling the 14¾ inch hole continued to the desired depth of 120.0 mbsf at 2300 h on 16 January 2017 (Table T1). The hole was swept with 50 barrels of high-viscosity drilling mud, and the bit was recovered to 52.0 mbsf (2082.0 mbrf). A standard reentry cone was deployed (released at the moonpool) at 0115 h on 17 January. The VIT/subsea camera was deployed to determine the orientation of the cone and observe the drill bit during pullout. The drill string cleared the seafloor/reentry cone at 0230 h.
Next, the bit, underreamer, and mud motor assembly were prepared and tested, and the 10¾ inch casing string was configured. The casing string included the casing shoe joint, two additional casing joints, three screened casing joints, and three more 10¾ inch casing joints (Figures F4, F5). At 1800 h on 17 January, the assembly was deployed and reentered Hole U1497D. The casing was washed/reamed to approximately 33 mbsf before a hard zone restricted progress for several hours. Eventually, that depth was penetrated, and washing/reaming continued to 70.0 mbsf. There, at 0915 h on 17 January, the Dril-Quip running tool once again prereleased from the casing hanger, allowing the casing string to drop approximately 15 m, similar to the Site U1492 deployment. In the process, formation material was forced into the casing. This material was drilled out. Washing/reaming the casing string continued to 110.4 mbsf (2140.4 mbrf). While making a drill string connection, the driller noticed that rather than picking up inside the casing, the casing string was being lifted as well. In addition, any rotation of the top drive caused the casing to rotate with the stinger assembly. It was surmised that the underreamer arms likely had the full weight of the casing string. This was also enough to stall out the mud motor. Thus, a small amount of top drive rotation was applied with low circulation rates in an attempt to drill ahead, hoping that the casing would at some point hang up and the weight would be removed from the underreamer arms. Eventually this did happen, and by 1230 h on 18 January, the casing string was successfully landed in the reentry cone. A 40 barrel high-viscosity mud sweep was pumped, and the VIT/subsea camera was recovered. A depth check verified that there was no fill in the rathole, and the drill string was pulled clear of the seafloor at 1500 h on 18 January and recovered.
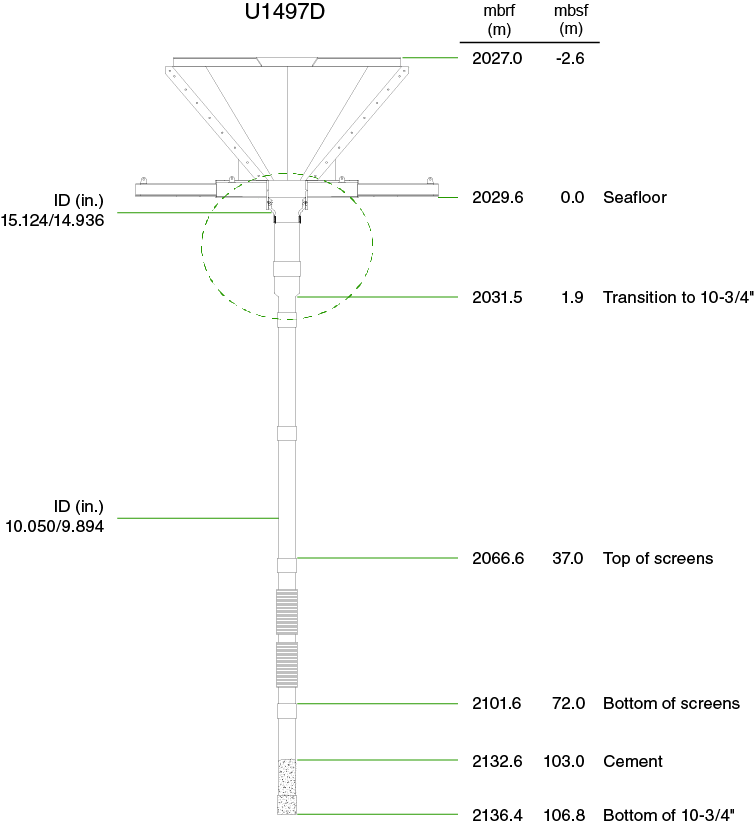
Figure F4. Observatory construction, Hole U1497D.
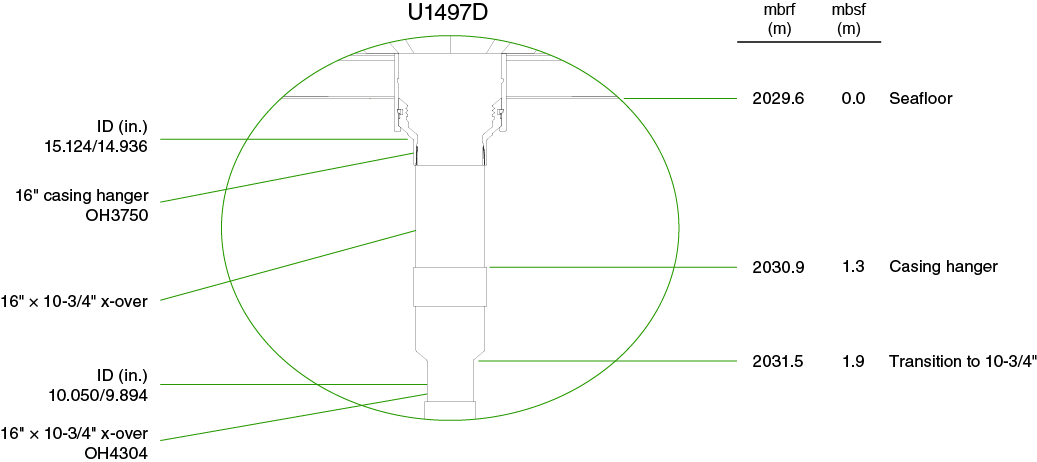
Figure F5. 16 inch casing hanger and swage.
The drill string was constructed for cementing operations and entered Hole U1497D at 0610 h on 19 January. The drill string continued to the bottom of the hole at 105.0 mbsf. The initial attempt at pumping a cement plug was delayed 1 h to troubleshoot and subsequently change out one of the cementing hoses that was clogged with old cement. By 1045 h, the 5 barrel cement plug had been mixed and displaced to the casing shoe with enough cement to fill 1.5 joints of casing. Because the cement was displaced at the casing shoe, we hoped that some of the cement would remain in the rathole. The bit cleared the seafloor at 1115 h and the rotary table at 1540 h. During the pipe trip, several unsuccessful attempts were made to release and recover the positioning beacon. Ultimately, the beacon was left behind because the ship would return to the site to check the results of the cementing operations. The ship was under way to Site U1492 at 1636 h on 19 January.
Return to Hole U1497D
After completing work at Sites U1492 and U1496, we returned to Hole U1497D at 2042 h on 22 January 2017. By 2122 h, a RCB BHA was assembled and the RCB core barrel was spaced out even though no RCB coring was planned at this site. The plan was to use this RCB BHA to tag the top of the cement in Hole U1497D, collect a water sample with the WSTP, and core the next site (U1498). The move between the two sites (U1497 and U1498) would be made in dynamic positioning (DP) mode, saving a pipe trip. Hole U1497D was reentered at 0325 h on 23 January. The bit was lowered to the upper screened joint, where a water sample was collected using the WSTP. This was the second WSTP water sample of the expedition inside casing. This sample was loaded with fine particles, unlike the fluid from the WSTP sample from Hole U1496C. In addition, temperature measurements were recorded continuously. The WSTP was stopped for 5–10 min at six discrete depths within the casing to establish a thermal gradient within the borehole. The WSTP was recovered before the drill string was lowered. The drill string tagged the cement plug at 103.0 mbsf (2132.6 mbrf). Because the casing shoe was located at 106.8 mbsf, most of the cement is likely to be in the rathole or just outside the lower casing joint. At 0815 h, the ROV platform was prepared and released from the moonpool 1 h later. The VIT/subsea camera confirmed that the ROV platform was centered, and the bit was removed from the hole (Figure F6).
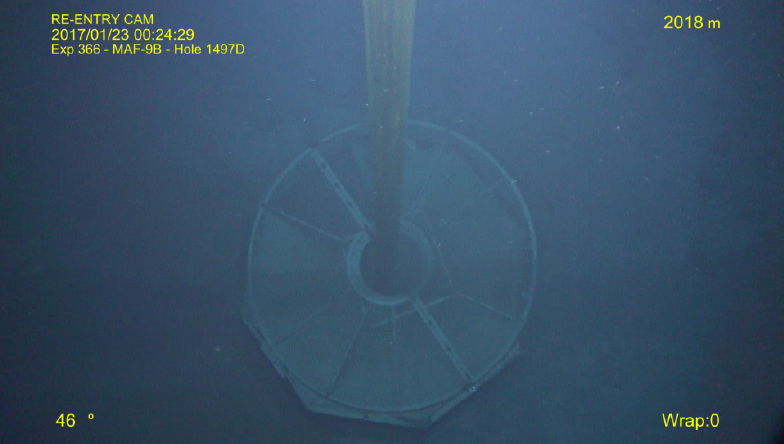
Figure F6. Reentry cone and ROV platform on the seafloor.
The VIT sleeve was equipped with a grapple that hung 6 m below to recover Beacon 1021, which provided an acoustic positioning signal but would not release. It took 1 h, 25 min to hook the beacon, and at 1215 h, both were recovered. The drill string was pulled back to 1977.0 mbrf and secured. The DP move to Site U1498 was initiated at 1348 h on 23 January, ending operations in Hole U1497D.
Lithostratigraphy
Site U1497 is at a water depth of 2019 m on the summit of Fantangisña Seamount (Figure F1). Lithologies recovered at Site U1497 include fine sand, oxidized serpentinite mud, blue and green serpentinite mudflows, and oxidized (red-brown) intervals containing polymict subangular sand to gravel fragments of sedimentary rock (siltstone, fine sandstone, and carbonate), metavolcanic rock, and serpentinized ultramafic rock.
A consistent lithostratigraphy between Holes U1497A and U1497B can be correlated fairly closely; this consistency is not unexpected because these holes are only 7 m apart. Units I–IV are present in both holes; Unit V is present only in Hole U1497A, which is 15 m deeper than Hole U1497B (Figure F7).
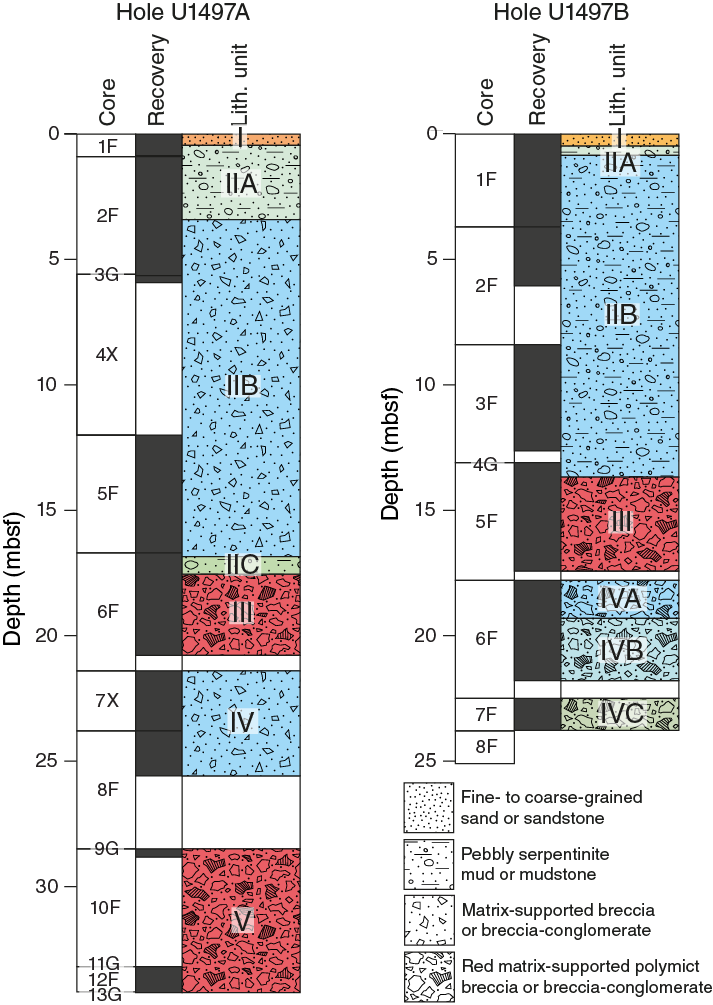
Figure F7. Lithostratigraphy, Holes U1497A and U1497B.
Hole U1497A
Hole U1497A was cored to 34.2 mbsf and recovered 22.47 m of core (65.7% recovery). Hole U1497A cores comprise five units (Figure F7; Table T2) with a total thickness of 34.2 m. Unit I is fine- to medium-grained brown sand, and Unit II is light green to blue-gray serpentinite mud with 15% lithic clasts. Unit III consists of red-brown matrix-supported polymict sand- to pebble-sized subangular to subrounded fragments of rock clasts. Unit IV is a similar clast-supported polymict sand- to gravel-sized interval with a matrix that varies from soupy at the top of the unit to stiffer with depth but is disturbed by fall-in and coring flow-in features, and Unit V includes serpentinite mud and clasts in clast-supported sand and gravel. Coring disturbance is moderate to severe with flow-in features throughout, consisting of vertical streaks, sinuous contortion of layers, and vertical smear trails of granule- to sand-sized fragments.
Table T2. Lithostratigraphic units, Hole U1497A. Download table in CSV format.
Unit I
Unit I is 0.45 m thick and consists of silt and fine sand with a muddy matrix. It is light brown and massive, with no bedding or other structures. It may be disturbed by drilling.
Unit II
Subunit IIA
Subunit IIA is 2.66 m thick and consists of light greenish gray serpentinite mud mottled with reddish brown and light brown (Section 1F-CC) with 4% lithic clasts. Clasts are small, typically coarse sand to granule sized, with few centimeter-scale pebbles consisting of altered ultramafic rock fragments.
Whole rounds were removed at the bottom of Sections 2F-1, 55 cm, and 2F-2, 31 cm.
Subunit IIB
Subunit IIB is 13.97 m thick and consists of blue-gray serpentinite pebbly mud to matrix-supported coarse sand–sized to 5 cm cobble-sized lithic clasts (20% of interval), including 18% ultramafic rock and 2% lithified siltstone and sandstone clasts. Clasts are subangular to subrounded, quite variable in size, and randomly distributed and apparently fractured by coring disturbance. Zones with abundant distorted white layers and interclast accumulations were observed throughout the unit (pure aragonite in some places; see Hole U1497A in Sediment and mudflow matrix) (Figure F8). The matrix is variably soft and soupy to more coherent with depth, but disturbance by coring is present throughout.
Whole rounds were removed at the bottom of several sections: 2F-3, 70 cm, 2F-4, 15 cm, 5F-2, 100 cm, 5F-3, 15 cm, and 6F-1, 61 cm.
Subunit IIC
Subunit IIC is 0.17 m thick and consists of light greenish gray to blue-gray serpentinite mud with ~7% lithic clasts (Figure F8). All of the clasts are serpentinized ultramafic rock. The clasts are angular to subangular and range in size from coarse sand to pebbles. Authigenic carbonate is found near the base.
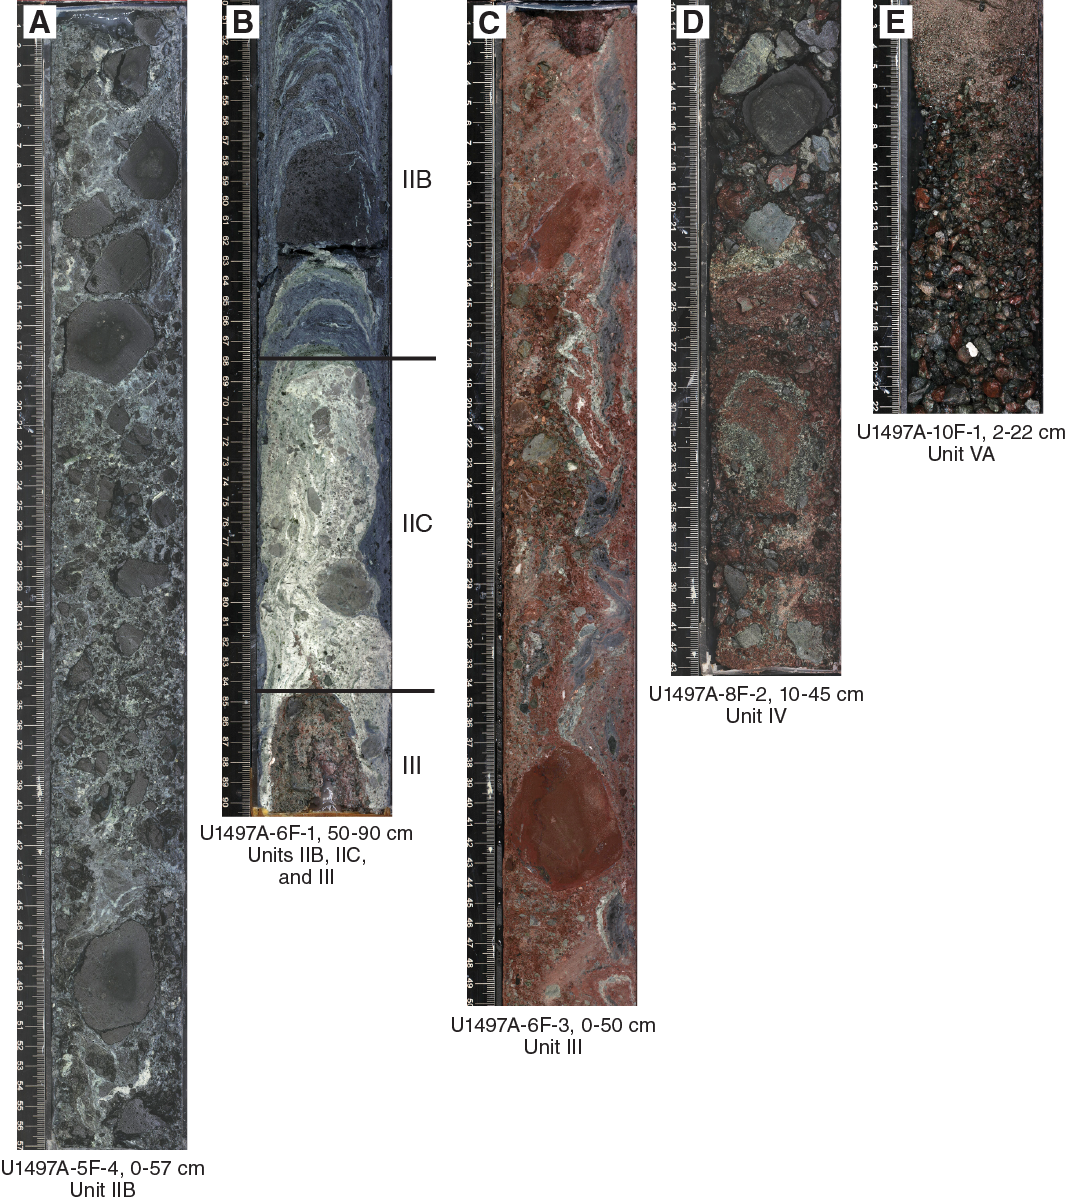
Figure F8. Major lithologies, Hole U1497A.
Whole rounds were removed at the bottom of Section 6F-1, 61 cm.
Unit III
Unit III is 3.22 m thick and consists of dusky red polymict pebbly mud with ~23% lithic clasts (Figure F8). The dominant clasts (18% coarse sand to cobbles) are dark gray-black ultramafic rock. The subdominant clasts (5% coarse sand to cobbles) are carbonate, sandstone, siltstone, and claystone and possibly some chert. The matrix is red serpentinite mud and silt.
Whole rounds were removed at the bottom of Section 6F-2, 58 cm. Unit III is followed by a gap in recovery of 0.63 m.
Unit IV
Unit IV is 4.18 m thick and consists of clast-supported polymict sand and gravel with 43% ultramafic and 15% sedimentary rock clasts including sandstone, siltstone, claystone, and carbonate (Figure F8). It is moderately well sorted, with a hint of normal grading, and contains individual clasts in Section 7X-CC. These clasts include serpentinite, greenschist, carbonate, and carbonate breccia. This unit is probably fall-in.
Unit IV is followed by a gap in section of 2.92 m.
Unit V
Unit V is 5.73 m thick and consists of polymict, subrounded to subangular lithic clasts in a dark gray-green mud matrix (Figure F8). Recovery includes ultramafic rock and strongly deformed red-brown siltstone clasts of varying size, as well as reddish brown mud interlayered with white intervals (brucite?) containing clasts. Clasts from ghost Cores 9G and 13G include (1) serpentinized harzburgite, (2) reddish brown clasts with intraclasts of rounded ultramafic rock fragments in a siliceous matrix, and (3) fine-grained siltstone, some with graded bedding in the interval (from drilling disturbance) and others with thin carbonate veins. Section 12F-1, 46–103 cm, has a reddish to dark gray to white matrix that supports polymict clasts but is drilling disturbed by flow-in.
Hole U1497B
Hole U1497B was cored to 23.8 mbsf and recovered 19.91 m of core (79.3% recovery). Hole U1497B cores comprise four units (Figure F7; Table T3) with a total thickness of 23.77 m. Units I–IV are nearly identical to those units in Hole U1497A but vary in detail; Unit V from Hole U1497A is absent because Hole U1497B was not deep enough to penetrate it.
Table T3. Lithostratigraphic units, Hole U1497B. Download table in CSV format.
Unit I
Unit I is 0.48 m thick and consists of serpentinite silt and sand with a muddy matrix. It is light reddish greenish brown and massive, with no bedding or other structures.
Unit II
Subunit IIA
Subunit IIA is 0.32 m thick and consists of light greenish gray transitioning into bluish gray serpentinite mud with ~2% lithic clasts. There are two clasts, 3–4 cm across, in Section 1F-1, 75–85 cm, and others are coarse sand to pebble sized, consisting of altered ultramafic rock fragments.
Whole rounds were removed at the bottom of Section 1F-1, 68 cm.
Subunit IIB
Subunit IIB is 12.18 m thick and consists of blue-gray serpentinite pebbly mud (which first appears at the bottom of Subunit IIA) with 19% lithic clasts, including 15% ultramafic rock and 4% serpentine chips (pale green). Former ultramafic clasts are extremely serpentinized and occasionally show ductile deformation (e.g., Section 3F-1, 25 cm). Zones of high clast concentration occur in Sections 3F-1, 20–70 cm, 3F-2, 40–80 cm, 3F-CC, and 5F-1, 33–58 cm. In Sections 2F-1, 27 cm, to 2F-CC, the matrix is a lighter gray, contains very few clasts, and is much less dense than the rest of the unit (see Physical properties). The core began degassing after being split. Core 4G is a ghost core consisting of fall-in material.
Whole rounds were removed at the bottom of several sections: 1F-2, 15 cm, 1F-3, 56 cm, 2F-1, 74 cm, 3F-2, 70 cm, and 3F-3, 16 cm.
Unit III
Unit III is 3.75 m thick and consists of dark gray serpentinite pebbly (mainly angular pebbles to cobbles with some breccias) mud with ~22% lithic clasts (Figure F9) and some dusky red matrix material in the upper 10 cm of the unit that becomes the dominant matrix component by Section 5F-2. The dominant clasts (15%) are dark gray-black ultramafic rock. The subdominant clasts (7%) are gray claystone, claystone breccia, carbonate, and red cherty siltstone. The matrix is red siliceous mud and silt mixed with dark gray and minor greenish serpentinite mud in Sections 5F-2 and 5F-3 grading to primarily greenish gray in the core catcher.
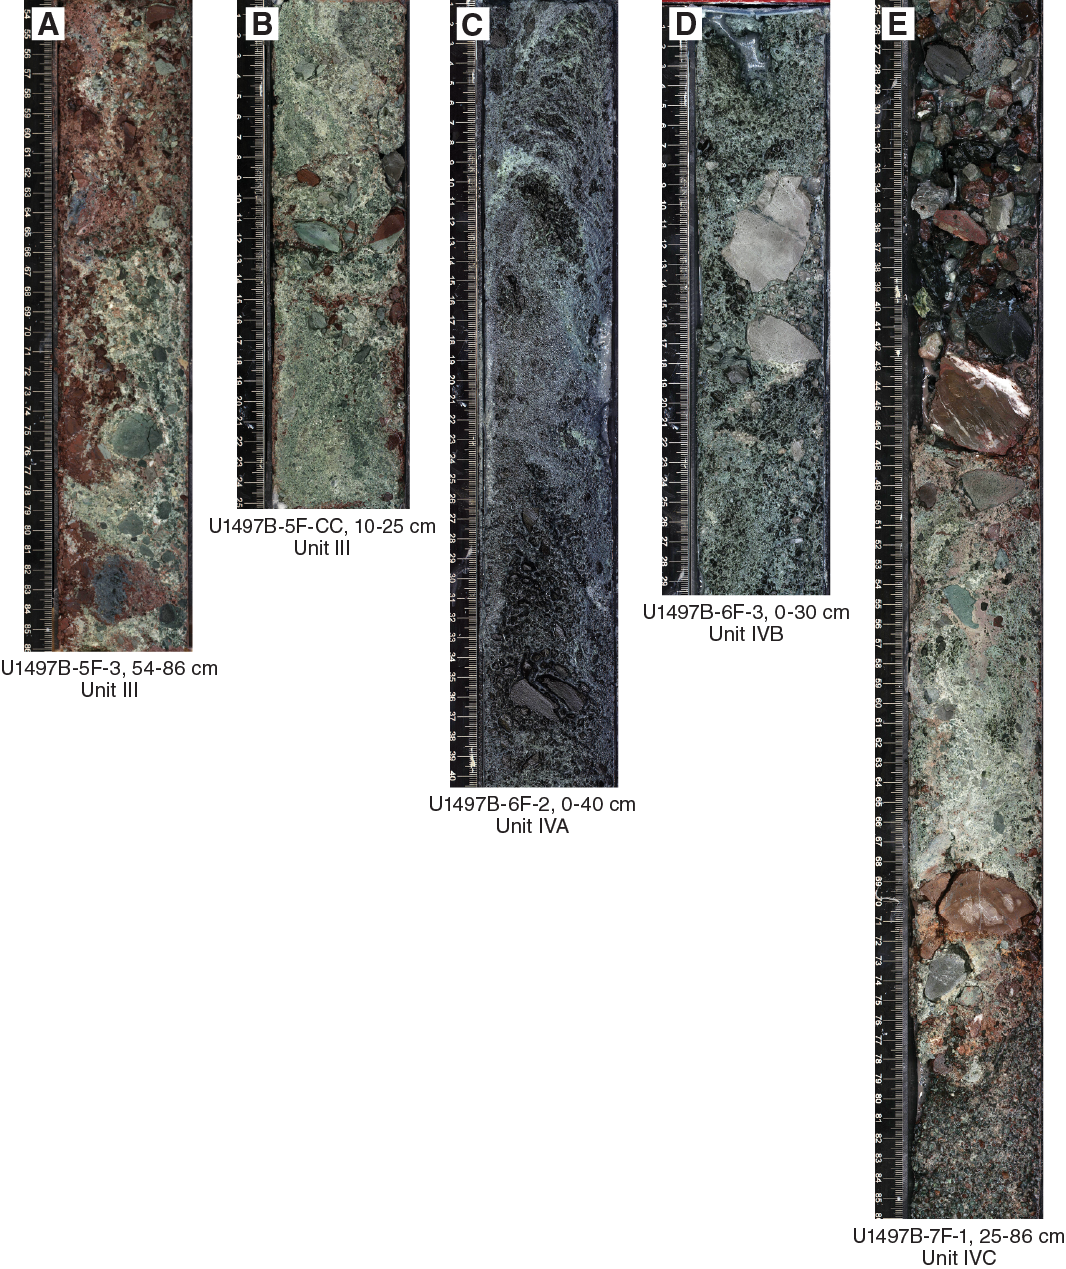
Figure F9. Major lithologies, Hole U1497B.
Whole rounds were removed at the bottom of several sections: 5F-1, 51 cm, 5F-2, 55 cm, 5F-3, 31 cm, 6F-1, 15 cm, and 6F-2, 60 cm. Unit III is followed by a gap in section of 0.37 m.
Unit IV
Unit IV is 5.97 m thick and consists of matrix-supported polymict subangular sand- to granule- to pebble-sized clasts with 14% ultramafic rock and 8% other rock lithologies. Other lithologies include mafic metavolcanic rock (greenstone and gray fine-grained basalt and basalt breccia), red-green siltstone, cherty shale, and red-brown mudstone fragments. The entire unit was disturbed by drilling and is made up of soupy to semisoupy fall-in deposits and up-arched flow-in layers of pebbly serpentinite mud (e.g., Section 6F-3).
Subunit IVA
Subunit IVA is 1.51 m thick and consists of bluish gray matrix-supported polymict subangular clasts of ultramafic rock (10%–18%, sand to pebble sized) and red-green mudstone/siltstone or gray basalt and basalt breccia (5%–10%, sand to pebble sized), some of the latter having carbonate in the matrix or carbonate veins (Figure F9). This subunit is extremely soupy and is likely a result of drilling fall-in.
Subunit IVB
Subunit IVB is 2.5 m thick and consists of loose, bluish to greenish gray serpentinite pebbly mud with clasts of ultramafic rock (10%–20%, sand to pebble sized) and gray basalt and basalt breccia (3%–10%, sand to pebble sized) (Figure F9). This subunit is also highly disturbed by drilling, with fall-in above up-arching and soupy flow-in deposits throughout. Whole rounds were removed from the bottom of Section 6F-2, 60 cm.
The interval from 21.81 to 22.50 mbsf was not recovered.
Subunit IVC
Subunit IVC is 1.27 m thick and consists of greenish to reddish gray matrix-supported polymict clasts, normally graded in places, with clasts of ultramafic rock (5%–20%, sand to pebble sized) and red shale, mud- and siltstone, gray basalt, basalt-breccia, and greenish metabasite rock (7%–20%, sand to cobble sized). In about Section 7F-1, 47–69 cm, more coherently matrix-supported serpentinite pebbly mud overlies a weakly matrix-supported red cobble of mudstone/siltstone (Figure F9). Drilling disturbance affected this entire subunit.
Petrology
Hard rock clasts recovered from Site U1497 are dominantly dark gray serpentinized ultramafic rock throughout all of the cores, although sedimentary and metavolcanic rock occurs as dominant or subdominant clasts within polymict lithologic units that are composed of red to greenish gray, matrix-supported, and clast-supported sand and gravel intervals (Units III–V in Hole U1497A and Units III and IV in Hole U1497B). The dominant ultramafic rock is serpentinized harzburgite, which shows shiny bastite pseudomorphs after pyroxene and dark gray serpentinized olivine. A deformed dunite clast was recovered from a ghost core in Section 366-U1497A-13G-CC, 61–63 cm. Some ultramafic clasts experienced such severe serpentinization that their primary texture is difficult to identify. Basaltic metavolcanic rock and sedimentary rock, including limestone, cherty limestone, sandstone, mudstone, and shale, is particularly common in the polymict matrix-supported and clast-supported sand and gravel intervals.
There are three types of sediment with various colors in Holes U1497A and U1497B. Generally, pelagic sediment (Unit I in both holes) overlies serpentinite mud (Unit II in Hole U1497A and Units II and IV in Hole U1497B), which is interbedded with dark red clay- to sand-sized matrix (Units III and V in Hole U1497A and Unit III in Hole U1497B) in the deeper parts of the cores. Pelagic sediment is calcareous ooze composed of dominant microfossils with minor volcanic fragments and aragonite needles and traces of serpentine and Mn oxide and/or Fe oxide. Serpentinite mud generally consists of dominant serpentine, minor brucite, trace carbonate, Fe oxides, chlorite, spinel, and garnet. However, some white layers in the serpentinite mud have distinct mineral compositions (e.g., clay-sized colorless isotropic mineral that is too fine to be identified). In the dark red layers, abundant sand-sized opaque lithic grains may be finely disseminated Mn oxide. Pyroxene is common in these layers, and some chlorite grains are occasionally observed.
Sediment and mudflow matrix
Based on lithologic changes, 18 samples from Hole U1497A and 10 samples from Hole U1497B were selected for smear slide study. The results are summarized in Figure F10.
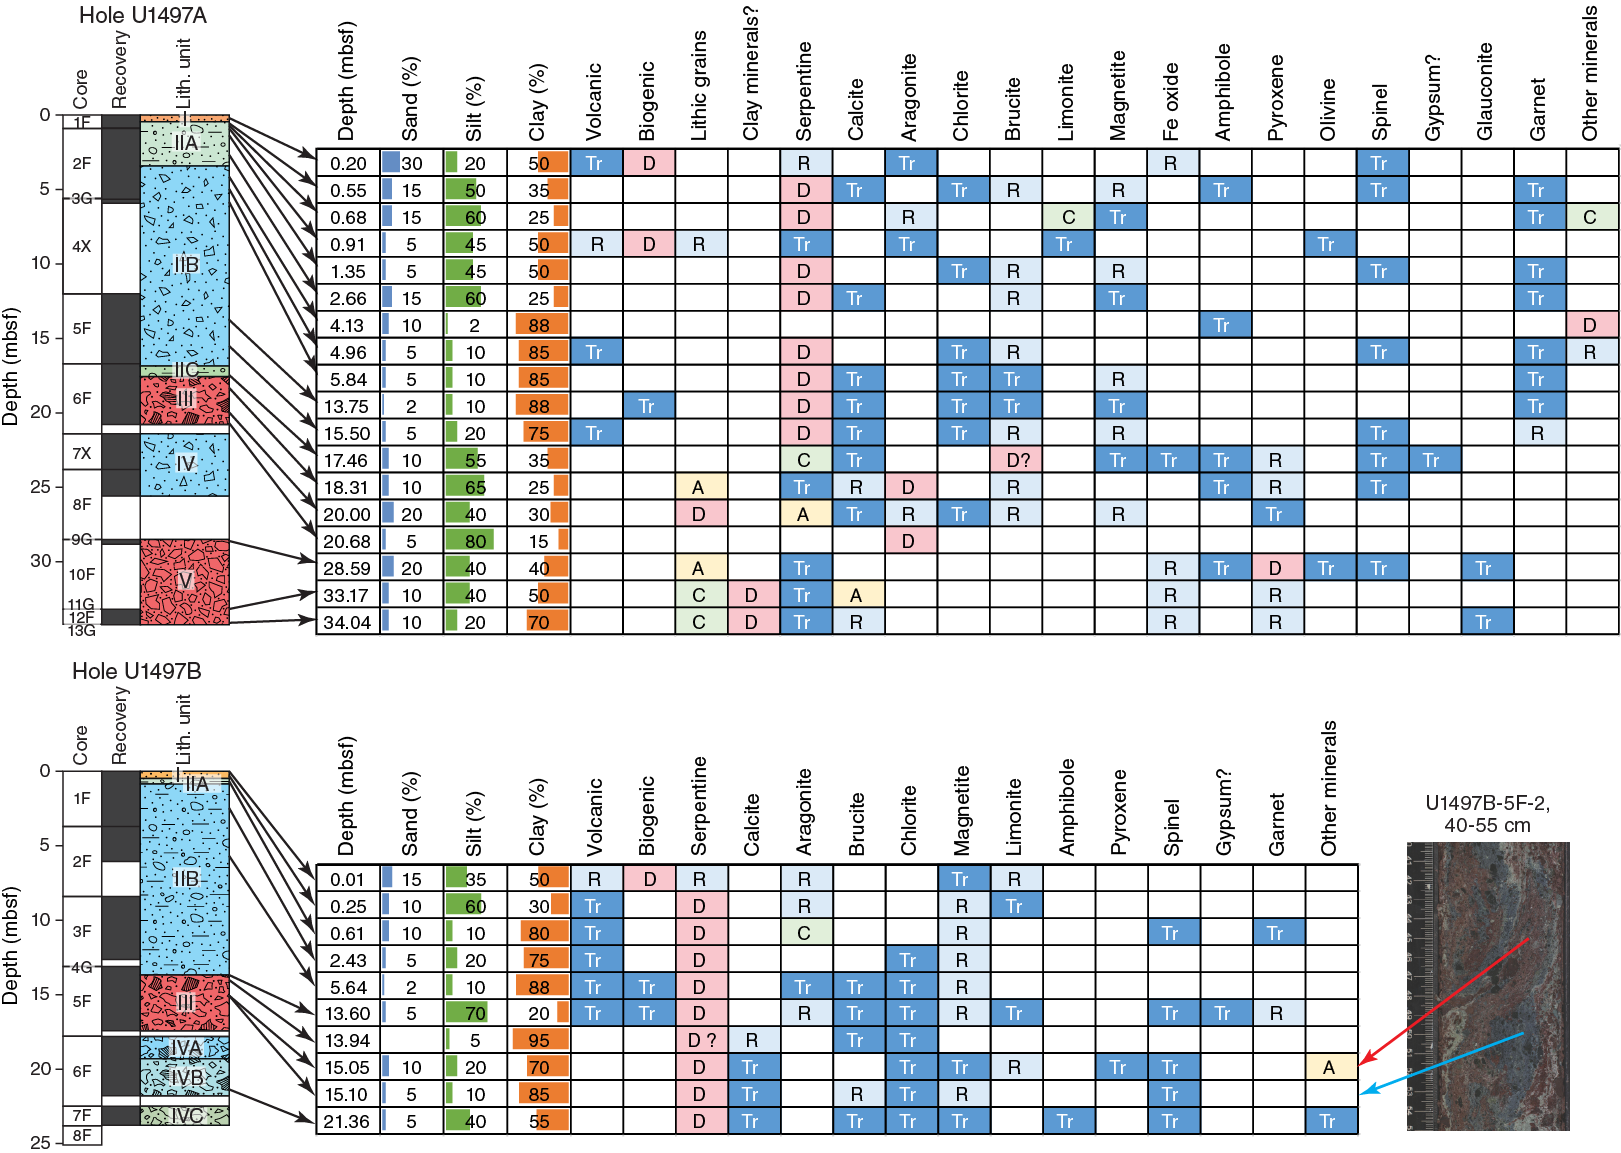
Figure F10. Downhole changes in mud composition.
Hole U1497A
The pelagic sediment in Sample 366-U1497A-1F-1, 20 cm, from Unit I is calcareous ooze mainly composed of sand- to silt-sized microfossils (45%), Fe oxide (2%), volcaniclastic material (1%), and clayey calcareous matrix (50%) (Figure F11). Microfossils include abundant very fine sand–sized foraminifers, minor silt- to clay-sized calcispheres, trace siliceous sponge spicules, and radiolarian fragments. Volcanic clasts include pyroxene, plagioclase, and pumice. Calcareous nannofossils, mainly coccoliths, compose the calcareous matrix. Trace amounts of serpentine, spinel, and aragonite were also found. The composition of fall-in pelagic sediment in Subunit IIA (Sample 2F-1, 1 cm) is similar to Sample 1F-1, 20 cm, although it contains more siliceous microfossils, including radiolarians (18%) and volcanic clasts (8%).
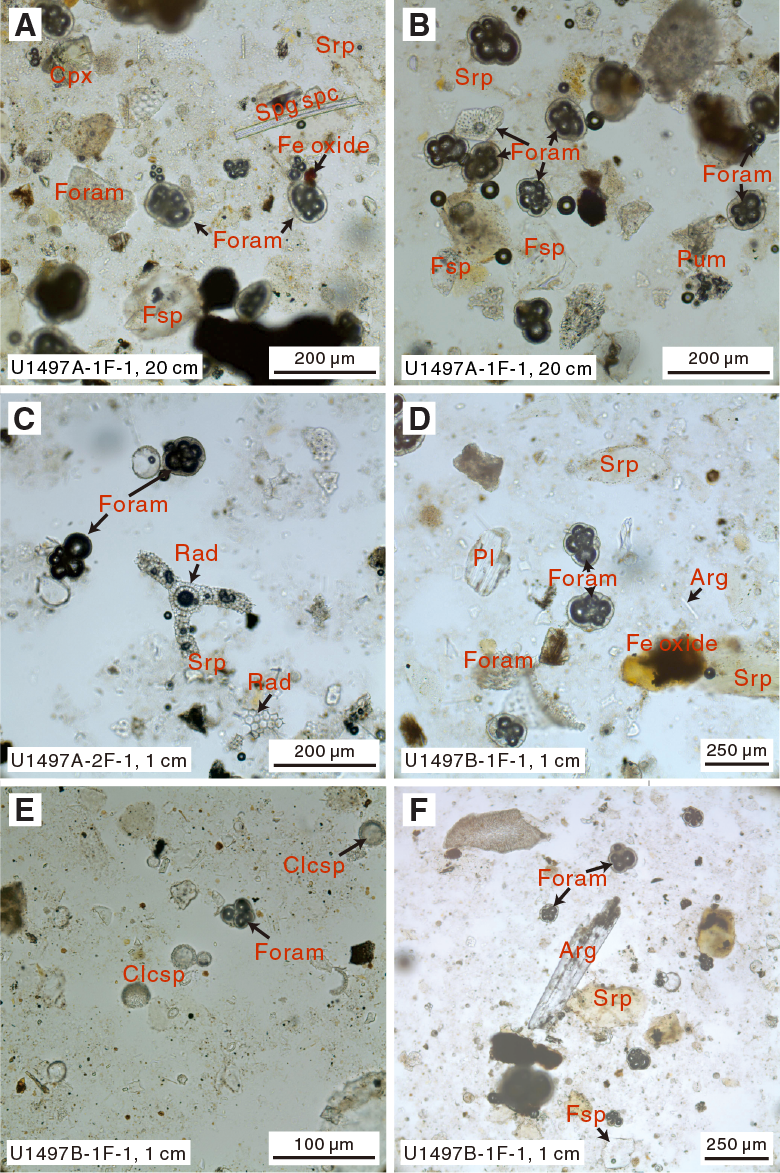
Figure F11. Pelagic sediment.
The oxidized serpentinite mud in Sample 1F-CC, 6 cm, in the upper part of Subunit IIA is primarily composed of silty to clayey yellowish brown to colorless serpentine (95%) with minor euhedral acicular aragonite (5%) (Figure F12). The yellowish brown serpentine appears to be partly or completely converted to brown alteration minerals. Trace amounts of magnetite and garnet were also observed. The bluish gray serpentinite mud in Subunit IIB is mainly composed of serpentine (96%–99%) with minor euhedral to anhedral, clay-sized magnetite (<2%). Trace amounts of chlorite, brucite, garnet, and carbonate grains were also observed, and volcanic glass and siliceous pipe-shaped microfossils were occasionally observed. In Subunit IIB, white mud (Sample 2F-3, 71 cm) is intercalated in the bluish serpentinite mud. The white mud consists of a clay-sized, isotropic mineral (99%) with high relief that is too fine-grained to identify.
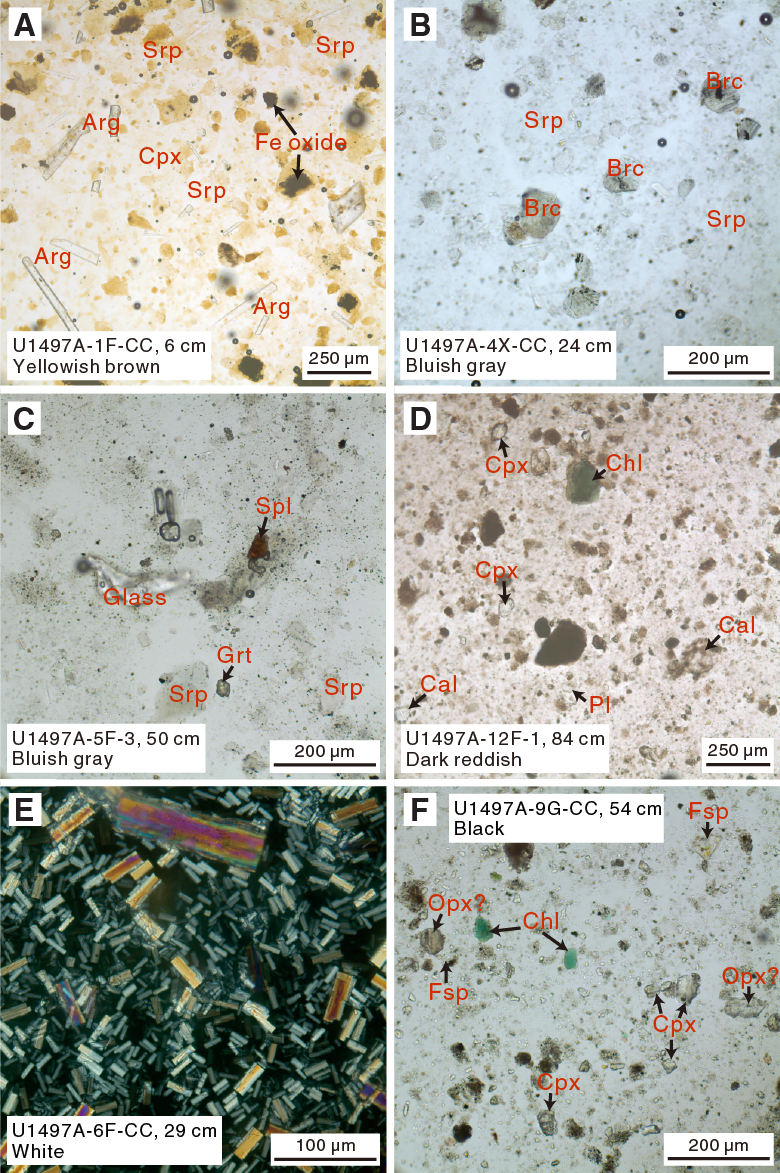
Figure F12. Serpentinite mud and other materials, Hole U1497A.
The dark reddish mud in Unit III is composed of dominant sand- to silt-sized reddish brown lithic grains (74%), minor silty to clayey serpentine (20%), brucite (3%), aragonite (1%), trace clinopyroxene, calcite, chlorite, and spinel. It is difficult to identify the lithic grains. However, some small lithic grains contain pyroxene, indicating they are lithic fragments of mafic rock. The dark reddish mud in Unit V is composed of sand- to silt-sized unidentified dusty minerals (15%) filled with Fe oxide (5%), silty to clayey calcite (5%–28%), clinopyroxene (2%–5%), and unidentified clay matrix (50%–73%). Trace serpentine and dark green chlorite are also present. A white vein (Sample 6F-CC, 29 cm) intercalated in the dark reddish mud (Unit III) is composed of pure sandy to silty euhedral lath-like aragonite. The black mud (Sample 9G-CC, 54 cm), probably from a brecciated clast surrounded by the reddish mud in the ghost core, is composed of dominant sandy to silty pyroxene (~50% clinopyroxene and orthopyroxene) and another unidentified dusty mineral (40%) filled with Mn oxide and/or Fe oxide (3%). Trace serpentine, spinel, and greenish blue chlorite are present. The similarity in mineralogical compositions between the dark reddish mud and the black mud suggest they may have some genetic connection.
Hole U1497B
One smear slide (Sample 366-U1497B-1F-1, 1 cm) of pelagic sediment from the uppermost part (less than 1 cm thick) of Unit I is calcareous ooze mainly composed of microfossils and minor volcaniclastic materials in the calcareous nannofossil matrix (Figure F11), most of which is composed of coccoliths. The microfossils include abundant foraminifers (25%), calcispheres (10%), and trace siliceous microfossils. The volcanic clasts (7%) include fragments of glass, pumice, microlites, clinopyroxene, orthopyroxene, and plagioclase. Sand-sized serpentine, lath-like aragonite, and Fe oxide (mainly limonite with trace magnetite) also occur.
Sample 1F-1, 25 cm, collected from Unit I, is oxidized serpentinite mud composed of silt-sized yellowish brown to colorless serpentine (98%) with minor sand-size lath-like aragonite (1%) and trace colorless volcanic glass (Figure F13).
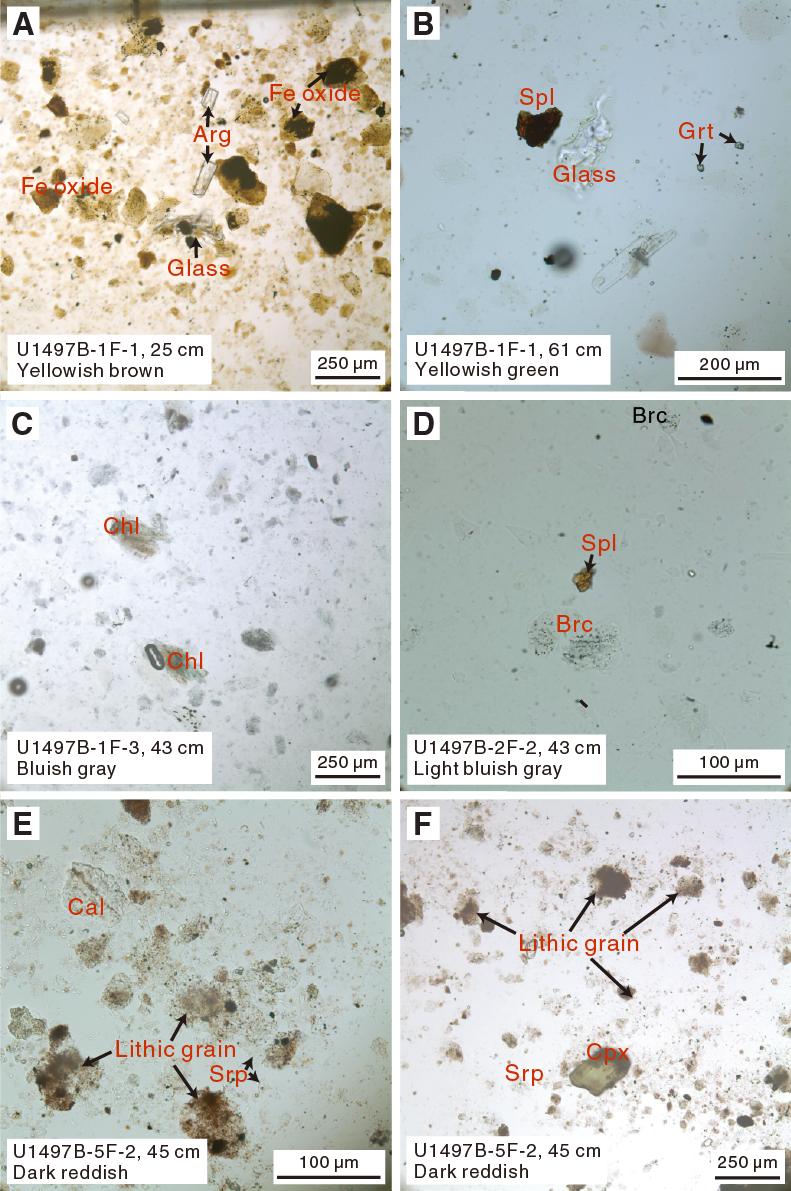
Figure F13. Serpentinite mud and other materials, Hole U1497B.
The other six smear slides of serpentinite mud, including four from Unit II, one from Unit IV (6F-3, 55 cm), and one from the blue serpentinite mud layer in Unit III (5F-2, 50 cm), are similar in mineralogical composition except for Sample 1F-1, 61 cm, collected from the uppermost layer of Unit II, which is enriched in aragonite (up to 10%). Serpentine is dominant for the serpentinite mud, and magnetite, brucite, chlorite, spinel, and carbonate are the common accessory minerals. Trace volcanic glass and siliceous pipe-like microfossils occur occasionally in samples from Unit II. Although garnet is not as common in Hole U1497B as in Hole U1497A, the garnet abundance is ~2% in Sample 5F-1, 50 cm, taken from the bottom of Unit II.
The other two samples from Unit III have different mineralogical compositions than the serpentinite mud. The light-colored sample (5F-1, 84 cm) taken from the uppermost layer of this unit consists of a dominant colorless scaly mineral that has a low refractive index (<1.56), low birefringence (maybe serpentine or other minerals), and ~1% acicular or anhedral carbonate, trace brucite, and chlorite. In the reddish sample (5F-2, 45 cm), the abundant dusty lithic grains (Mn oxide?) are hard to identify due to microinclusions of reddish brown opaque to translucent minerals (probably limonite or hematite). There are some serpentine grains in the matrix, probably caused by the mixing of serpentinite mud with the reddish mud due to drilling disturbance. Trace clinopyroxene, calcite, chlorite, magnetite, and spinel are present.
Ultramafic rocks
Ultramafic rocks include harzburgite and dunite. All are serpentinized to some degree, and many are totally serpentinized. Most serpentinization is pseudomorphic, which allows the primary modal mineralogy to be estimated and primary textures to be inferred, even when serpentinization is complete.
Harzburgites
Harzburgites vary from relatively unaltered to totally serpentinized. Some completely serpentinized harzburgites still preserve their primary textures, especially in pyroxene and spinel, allowing inferences about their original modal compositions.
Sample 366-U1497A-3G-CC, 4–5 cm (TS 90), is a weakly serpentinized clinopyroxene-bearing harzburgite with porphyroclastic texture (Figure F14). It is cut by serpentine mesh veins, but olivines in the mesh centers retain optical continuity over the original grain dimensions, allowing recognition of strained olivine porphyroclasts as long as 3 mm. Orthopyroxene porphyroclasts are 2–4 mm in size and partially to completely replaced by bastite pseudomorphs. They are commonly deformed, with undulatory extinction and kink folds, and contain thin exsolution lamellae. Clinopyroxene, sometimes twinned, occurs as small grains (0.2–0.4 mm) in scattered locations, most commonly along orthopyroxene grain margins, suggesting possible granule exsolution. Large spinels (1–2 mm), occasionally displaying holly leaf morphology, are rimmed by serpentine and penetrate into the grain boundaries of surrounding olivine and orthopyroxene. The texture appears to be transitional from protogranular to porphyroclastic.

Figure F14. Harzburgite.
Samples 2F-1, 80–82 cm (TS 89), and 4X-CC, 14–17 cm (TS 91), are totally serpentinized harzburgites (100% serpentinization). The serpentine displays pseudomorphic mesh and bastite textures replacing olivine and orthopyroxene, respectively. The mesh is slightly elongated and crossed by late opaque veins. The bastites are as large as 4 mm × 0.4 mm and can display kink folds and undulatory extinction. In Sample 2F-1, 80–82 cm, bastites are partly recrystallized to serpentine with orange or green colors and interpenetrating textures. Spinel occurs in association with bastite and with subhedral to holly leaf shapes 1–2 mm in size.
Dunite
One dunite with mild serpentinization (25%) was recovered. Sample 366-U1497A-13G-CC, 61–63 cm (TS 99), has three domains (Figure F15). Domain 1 is porphyroclastic with elongated olivine porphyroclasts as large as 7 mm long by 1 mm wide. Kink banding and undulatory extinction are common in the porphyroclasts. Rare spinels as long as 0.4 mm are commonly flattened in the foliation plane. Domain 2 is an equigranular mosaic with equigranular olivine and chromian spinel (about 0.4 mm). Olivine exhibits minor undulatory extinction, with smooth straight or curved grain boundaries and common 120° triple grain boundaries. Domain 3 is serpentine veins that crosscut foliation at oblique angles. The veins consist of interpenetrating serpentine, talc, and magnetite. In Domains 1 and 2, olivine is partly altered to mesh-textured serpentine.
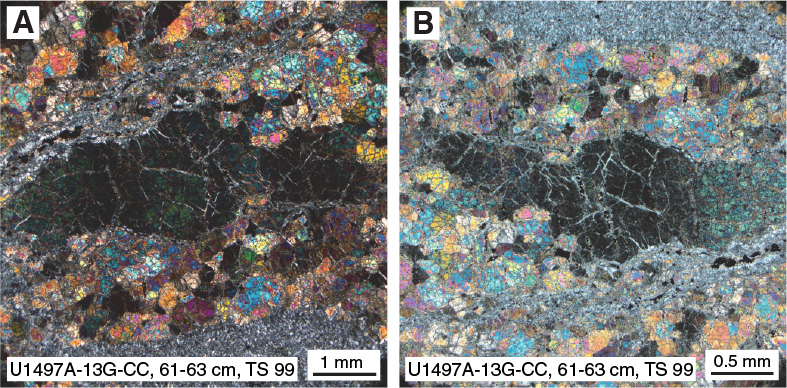
Figure F15. Dunite.
Mafic igneous rocks
Sample 366-U1497B-6F-3, 64–66 cm (TS 105), is sparsely augite microphyric basalt with rare plagioclase microphenocrysts (Figure F16). The groundmass is augite (unaltered), plagioclase laths (altered), and glassy mesostasis (altered). The texture is intergranular to intersertal.
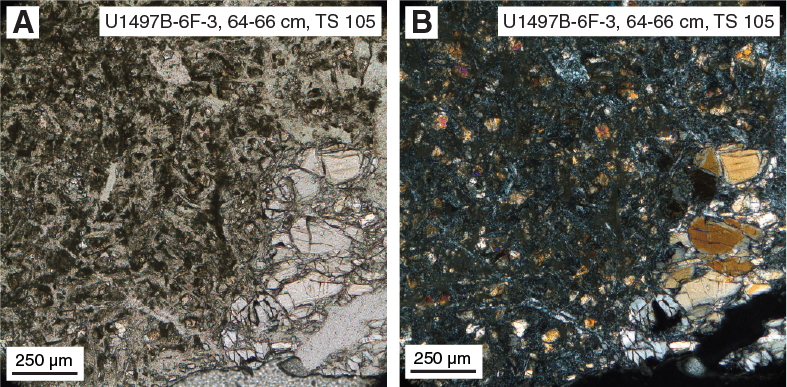
Figure F16. Fine-grained augite microphyric basalt.
(Meta-) sedimentary rocks
Samples 366-U1497A-7X-CC, 26–28 cm (TS 93), and 11G-CC, 17–19 cm (TS 98), represent siliceous carbonate breccia consisting of micritic clayey to silty matrix with angular fragments of cemented calcareous chert (Figure F17). The clasts contain carbonate microfossils (foraminifers and spherical recrystallized siliceous microfossils, possibly radiolarians); spherical parts are filled with microcrystalline chalcedony or calcite. The recrystallization fabric indicates low-grade metamorphic conditions. The clasts are internally brecciated and cemented with sparitic calcite. The breccia was therefore formed by multiple fragmentation and carbonate cementation. Carbonate veins are irregular and filled with coarse blocky calcite, or filling is replaced by radially fibrous serpentine, often surrounded by thin carbonate rims.
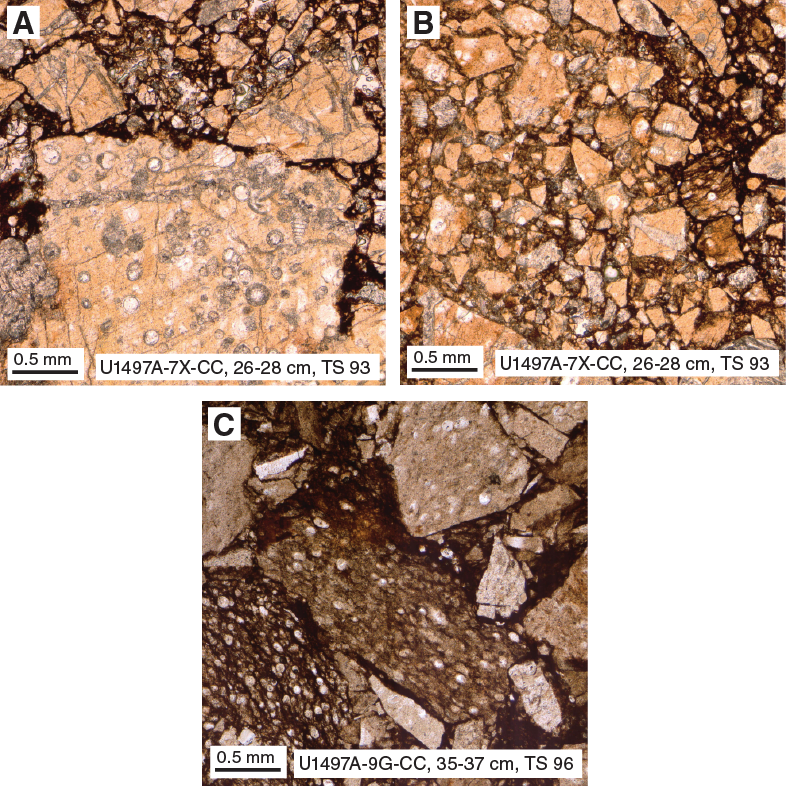
Figure F17. Brecciated (meta-) sediments.
In addition to the chert and carbonate clasts described above, Sample 9G-CC, 35–37 cm (TS 96), contains clasts of fossiliferous shale and mud-siltstone. Fragments of cemented chert, fossiliferous limestone, siltstone, and foliated clay-siltstone (shale) are embedded within a micritic clayey to silty matrix. Limestone clasts contain recrystallized relict carbonate microfossils; cherts are also recrystallized. Clasts are angular to subangular and cemented with sparitic calcite; multiple brecciation with carbonate cementation is evident. Shale clasts are layered at the microscale with layer-parallel stylolithic seams. Some calcareous chert also shows pressure solution seams. Chert contains spherical relics of recrystallized siliceous microfossils (radiolarians?); the spherical parts are filled with microcrystalline chalcedony or calcite. Carbonate veins are irregular and filled with coarse blocky calcite, or the filling is replaced by radially fibrous serpentine, often surrounded by thin carbonate rims. The recrystallization textures indicate very low grade metamorphic conditions.
Tectonite lithic clasts (fault rocks)
Sample 366-U1497A-9G-CC, 31–33 cm (TS 95), contains brecciated volcanic rocks. The microbreccia is mainly matrix supported and is composed of microcrystalline amorphous matrix with angular dolerite clasts formed by plagioclase and pink titanaugite crystals (Figure F18). The clasts are poorly sorted, highly variable in grain size, and composed mainly of pink titanaugite and plagioclase, ~300 µm in size. Euhedral to subhedral, elongate plagioclase is partly altered to clay minerals. Titanaugite is partly altered to chlorite. A distinct ultracataclastic shear zone domain (1–2 cm thick) with rounded clasts of dolerite and pyroxene accompanied by shear bands and single millimeter-thick veins with blocky calcite and irregular vein orientation is separated from the brecciated domain by a sharp, planar shear zone boundary. Distinct splays cut into the microbreccia domain. The general fabric is representative of cataclastic deformation resulting in formation of cohesive cataclasite to ultracataclasite.
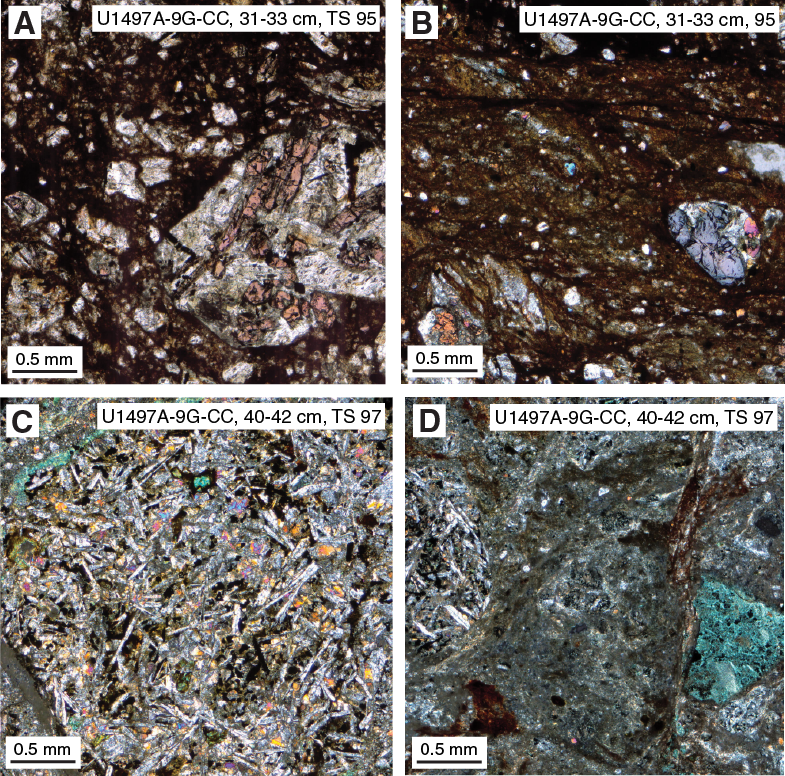
Figure F18. Brecciated volcanic rocks.
Sample 9G-CC, 40–42 cm (TS 97), is also characterized by cataclastic fabric. The microbrecciated basalt forms cohesive cataclasites composed of ultrafine-grained amorphous matrix with angular, poorly sorted basalt clasts and highly variable grain size. The internal texture is formed by acicular plagioclase and subhedral to anhedral pyroxene crystals, less olivine (ophitic or intersertal intergranular), and opaque interstitial phases (pyrite). Euhedral to subhedral, acicular plagioclase is partly altered to clay minerals. Ultracataclastic shear zones (1–2 cm thick, with rounded clasts of basalt and pyroxene) are additionally characterized by strong green alteration colors (chlorite). The cataclastic fabric is truncated by conjugate carbonate veins with antitaxial carbonate fibers oblique to wall rock and partly blocky calcite vein mineralization.
Sample 366-U1497B-5F-CC, 11–13 cm (TS 100), is cohesive ultracataclasite to ultramylonite, derived from reddish to green ultrafine-grained shale (Figure F19). The matrix appears amorphous, with reddish brown and bright green domains. Single, isolated clasts are serpentinite, fine-grained mafic rock (basalt), (devitrified) volcanic glass with vesicles, calcareous chert containing recrystallized relics of microfossils, and smeared clasts of shale. The shale fragment clasts are subrounded to rounded, with asymmetric strain shadows of sigma-type and delta-type (kinematic indicators). Single sets of subparallel shear bands with a C’- orientation transect the penetrative fabric. The sample might be derived from a wider shear zone. The sample is transected by an irregular vein network with fibrous syntaxial calcite. The overall fabric is characteristic for ductile flow, attributed to the very fine grained shale matrix facilitating ductile flow at rather low-grade conditions.

Figure F19. Ultracataclasite.
Structure
Drilling-induced structures
Most common drilling-induced deformation consists of up-arching structures that are due to upward vertical flow-in of the recovered sediments resulting in smearing toward the core liner flank. This type of deformation affects both clasts and mud (Figure F20) and is well developed in Sections 366-U1497A-2F-3, 6F-1 through 6F-CC and 12F-1 and 366-U1497B-1F-3, 1F-CC, 3F-1, and 5F-1.
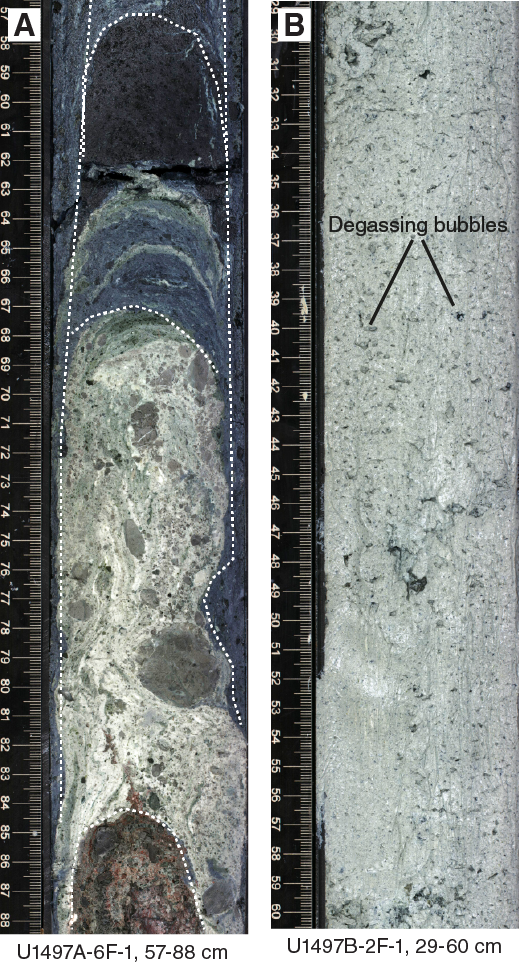
Figure F20. Drilling-induced structures.
Sections 366-U1497B-2F-1 through 2F-CC consist of soupy light blue mud, a consistency also induced by drilling disturbance. However, as indicated by degassing bubbles, these sections are full of gas. Such a high gas concentration can also partially explain the disturbance of the serpentinite mud.
Veins and breccia
Veins were observed in serpentinized ultramafic rock clasts and sedimentary rock clasts from Holes U1497A and U1497B (Figure F21). The two types of veined clasts are equally represented along the cores. The veined serpentinized ultramafic rock clasts are dominant in Sections 366-U1497A-2F-2 through 6F-1 and 366-U1497B-1F-2 through 5F-1. The veins are single to multiple, from 0.1 mm to 0.3 mm wide.
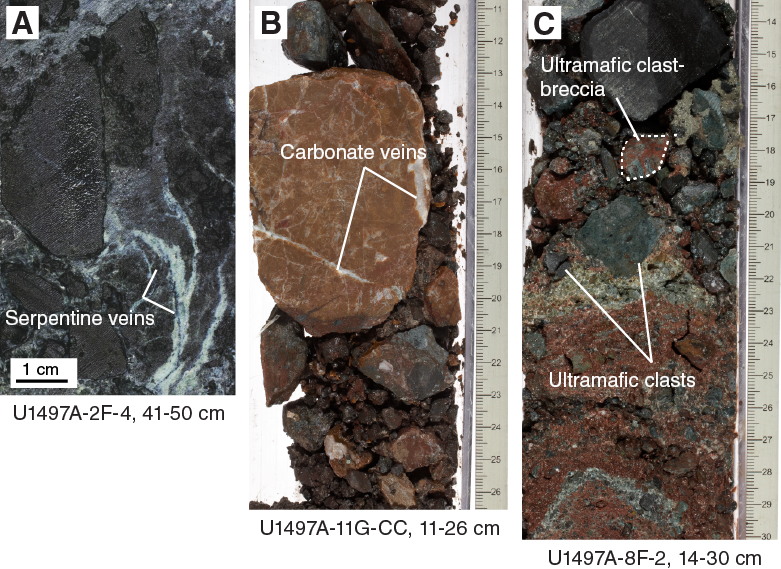
Figure F21. Veined clasts and breccia fragments.
The veined sedimentary clasts (red cherty-limestone breccia, red shale, and mud-siltstone) are dominant in Sections 366-U1497A-6F-2 through 13G-CC and 366-U1497B-5F-2 through 7F-CC. The veins are mainly carbonated and range from a network of very thin veins (<0.05 mm) to well-developed single veins as thick as 1 cm.
A reddish sedimentary matrix with subrounded ultramafic rock clasts was also recovered in the same intervals as the veined sedimentary clasts.
Lithostratigraphy, petrology, and structure summary
The serpentinite mud deposits at the summit of Fantangisña Seamount sampled in Holes U1497A and U1497B appear to be more consolidated and viscous than those at the summit of Asùt Tesoru Seamount. This may reflect less present-day fluid upwelling at the Fantangisña summit. Moreover, zones of reddish oxidized mud in both holes under the uppermost intervals of dark bluish gray mud suggest significant periods of time in the past during which the surface was exposed at the seafloor and not resurfaced. Ultramafic lithic clasts in the serpentinite mud were generally highly serpentinized, indicating long residence times in fluids. The occurrence of numerous crustal rock clasts, including greenstone, carbonate, chert, and shale of probable subduction-channel derivation, seems to signal significant input of material from the downgoing Pacific plate.
Mantle-derived harzburgite from Site U1497 (e.g., Sections 366-U1497A-2F-1, 80–82 cm, and 4X-CC, 14–17 cm) (Figure F14) is variably serpentinized but retains evidence of its primary texture despite its alteration. It is characterized by pseudomorphs of orthopyroxene porphyroclasts that are highly elongated (in one case 4 mm × 0.4 mm), with kink folds and undulatory extinction. Spinel occurs in association with pyroxene and also with subhedral to holly leaf shapes, 1–2 mm in size. We infer that their primary textures were porphyroclastic, indicating deformation at relatively low temperatures and moderate to high strain rates.
The (meta-)sediments are characterized by recrystallization of calcareous and siliceous microfossils. The degree of recrystallization indicates low-grade metamorphic conditions. Both the metasedimentary and volcanic rocks are brecciated to varying degrees. Brecciation resulted in the development of fine-grained cataclasite to ultracataclasite domains. The very fine grained sediment (shale and sandstone) was partly transformed into ultracataclastic shear zones with rounded clasts. Because of the very small grain size (<2 µm) within these shear zones, the general deformation mechanism was ductile flow. In general, brecciation (fracture) implies cataclastic deformation flow mechanisms (fracture and friction) at low-grade conditions and/or comparably high strain rates.
The occurrence of deformed sediment and volcanic rock at Site U1497 suggests that a significant fraction of the material entrained by this mud volcano was derived from the subducting Pacific plate. In particular, the pink titanaugite–bearing volcanic rock implies alkaline volcanic series in an off-axis seamount. In addition, the deformed sediment appears to contain microfossils such as radiolarians that are common in older sediments of the Pacific plate, and the presence of ultracataclasite requires severe brittle deformation that is not likely to occur in sediment lying on top of the upper plate.
Rock and sediment geochemistry
Elemental abundances for Site U1497 samples selected by the shipboard scientific party were determined using inductively coupled plasma–atomic emission spectroscopy (ICP-AES) and portable X-ray fluorescence spectrometer (pXRF) analysis (Table T4). pXRF calibration curves are provided in Figure F2 in Johnston et. al (2018). The examined samples include serpentinite muds and serpentinized ultramafic rocks (harzburgites and/or dunites), along with a single sample of serpentinized cumulate rock. A full discussion of Expedition 366 rock and sediment data is found in Sediment and rock chemistry in the Expedition 366 summary chapter (Fryer et al., 2018b).
Table T4. ICP and pXRF data, Site U1497. Download table in CSV format.
Fluid geochemistry
Headspace analysis of CH4 and other hydrocarbons
Interstitial water CH4 and other ethane concentrations were measured but not detected by gas chromatograph (GC)–flame ionization detector (FID) in Hole U1497A and U1497B samples (summit site of Fantangisña Seamount) (Table T5). In contrast to measurements made on samples from the summits of Yinazao and Asùt Tesoru Seamounts, we did not observe methane contamination in background atmospheric samples. This result is significant because it suggests that degassing of the sediments collected from the previously cored seamounts affected background atmospheric samples.
Table T5. Interstitial water methane and ethane concentrations determined by GC-FID, Site U1497. Download table in CSV format.
Electrochemical sensor measurements of H2 and H2S
In contrast to interstitial water CH4, significant concentrations of H2 were detected in most samples using an H2 electrochemical sensor (Table T6). The highest H2 concentration was obtained from the deepest sample in Hole U1497B (Section 6F-2), where red sediment was obtained (Figure F22). In a similar lithologic unit in Hole U1497A (Section 6F-3), no detectable H2 (>5 µM) was measured. A relatively high acid volatile sulfide (AVS) concentration was measured in the deepest sample from Hole U1497B (Section 6F-2), which corresponds to the depth with the highest H2 concentration. However, these high H2 and sulfide concentrations do not correlate to anomalous values in interstitial water pH, chloride, and sulfate concentrations.
Table T6. Interstitial water H2 and AVS concentrations determined by electrochemical sensors, Site U1497. Download table in CSV format.
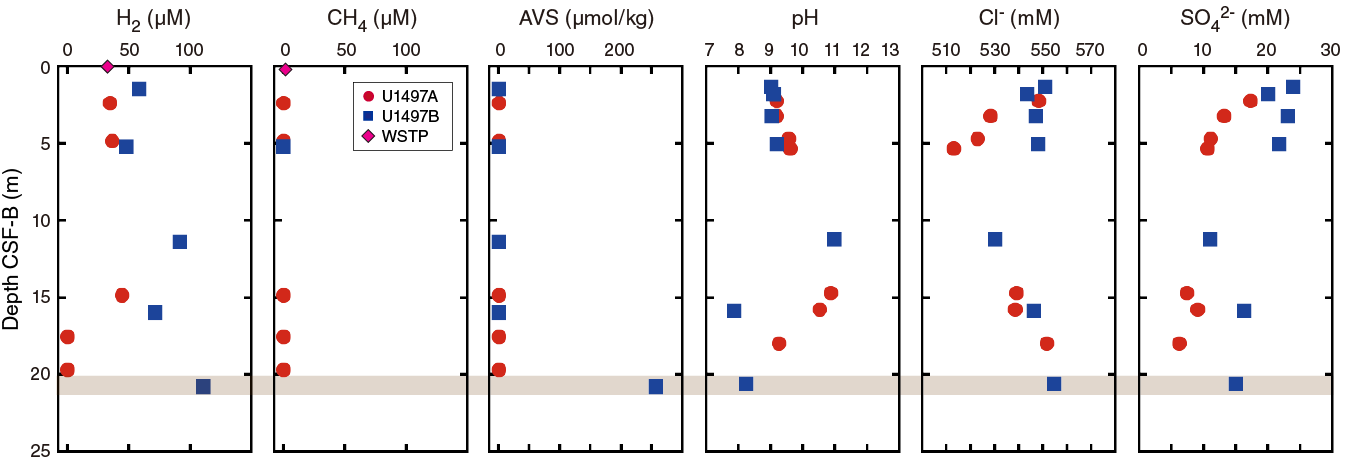
Figure F22. H2, CH4, and AVS.
Water-sampling temperature probe sampling
After the completion of sampling and casing installation in Hole U1492C, Expedition 366 returned to Site U1497 to check the cement plug that was placed in the bottom of the cased borehole. A WSTP sample was taken at the depth of the first screened interval in Hole U1497D with the tip of the probe at 44.2 mbsf. Dissolved gas and fluid data (Tables T5, T6, T7) were obtained from fluids collected by the WSTP titanium coil. The H2 and CH4 concentrations in the WSTP sample (U1497D-WSTP) are 43.1 and 0.864 µM, respectively (Table T5; Figure F23). These gas concentrations represent a similar range of values to many of the gas concentrations from Holes U1497A and U1497B. These data are plotted for comparison with the other data at 0 mbsf to minimize the spread of depth values. Fluid chemistry data for WSTP samples are described at the end of each section below.
Table T7. Interstitial water analyses, Site U1497. Download table in CSV format.
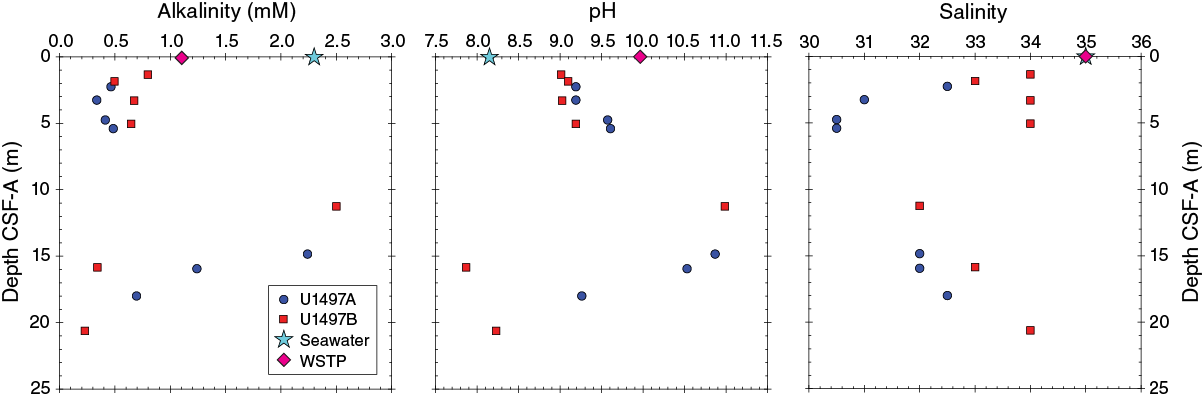
Figure F23. Alkalinity, pH, and salinity.
Interstitial water
The salinity, pH, alkalinity, and chlorinity of the 14 whole-round interstitial water samples and the WSTP sample collected from Holes U1497A and U1497B were measured within a few hours after sampling. Fluid samples were analyzed for NH4, PO4, and H2S by UV-vis spectrophotometry; Ca, Mg, K, Na, Br, and SO42– concentrations were measured by ion chromatography; and trace (Si, Li, B, Mn, Fe, Sr, and Ba) cation concentrations were measured using the shipboard Teledyne Leeman Labs Prodigy ICP-AES instrument. The wavelengths examined for these elements are in Table T1 in the Expedition 366 methods chapter (Fryer et al., 2018a).
Alkalinity, pH, and salinity
Holes U1497A and U1497B show similar patterns of alkalinity variation (Figure F23). Alkalinity concentrations in the uppermost ~6 m of both holes are lower than seawater values (2.3 mM), between 0.3 and 0.80 mM (Table T7). Maximum alkalinities of 2.24 and 2.50 mM occur at 14.85 and 11.25 mbsf in Holes U1497A and U1497B, respectively. Below these depths, alkalinity decreases to near-surface values.
pH and salinity have broadly similar patterns (Figure F23). pH is higher than seawater (8.15), ranging between 9 and 9.6 in the upper 6 m of both holes, and increases to >10 at 14.85 mbsf in Hole U1497A and 11.25 mbsf in Hole U1497B. Salinity is consistently below seawater value (35), ranging as low as 31 at ~5 mbsf and as high as 34. Alkalinity is consistently lower than seawater in most of the samples with concentrations <1 mM, with the exception of three samples: at 14.85 and 15.8 mbsf in Hole U1497A and 11.3 mbsf in Hole U1497B. Below 17 mbsf in Hole U1497A and 14 mbsf in Hole U1497B, a distinct change in lithology occurs. Blue-gray, often gas-rich serpentinite muds transition into a red sedimentary sequence comprising carbonates, quartz sand, and clay along with some ultramafic rocks (see Lithostratigraphy). The larger grain size at the top of this red layer may have been “flushed” with seawater/drilling fluid, which could explain the jump in alkalinity immediately above this transition. The reappearance of very low alkalinity values below this layer may reflect a return to uncontaminated interstitial fluids, although pH declines in both holes upon entering the red sedimentary sequence. Silicate weathering lowers pH, which may play a role in this change.
Alkalinity, pH, and salinity values in the WSTP sample are 1.1 mM, 9.96, and 35, respectively (Table T7). Other than salinity, these values are between those of seawater and fluids from depth, suggesting some mixing between seawater and interstitial fluids occurred in the 3.25 days between the cessation of circulation and our return to collect the sample.
Phosphate, ammonium, sulfate, sulfide, chloride, and bromide
Phosphate concentrations in Hole U1497A and U1497B interstitial waters are below the limit of detection (~0.5 µM). By comparison, concentrations of phosphate in the WSTP sample are 0.73 and 14.8 µM, respectively (Table T7); Figure F24). Sulfate contents are consistently lower than seawater values (28 mM) at the tops of Holes U1497A and U1497B and decrease to values of 6.2 mM at 18 mbsf in Hole U1497A and 11.1 mM at 11.25 mbsf in Hole U1497B. Sulfate concentrations in the two samples from deeper than 15 mbsf in Hole U1497B are consistent with seawater contamination. The sulfate concentration of the WSTP sample is near the seawater value. Measured ammonium contents are higher than seawater (estimated at ~0 µM) in interstitial waters and generally increase with depth in both holes. Ammonium concentrations remain relatively uniform in the upper 12 m of the sediment column (between 1.70 and 4.54 µM in Hole U1497A and between 1.58 and 2.41 µM in Hole U1497B) before increasing to maximum values of 15.4 and 12.0 µM at 18 and 20.6 mbsf in Holes U1497A and U1497B, respectively. The ammonium concentration in the WSTP sample is 14.8 µM. Sulfide concentrations in all interstitial water samples are below the detection limit of 0.1 µM.
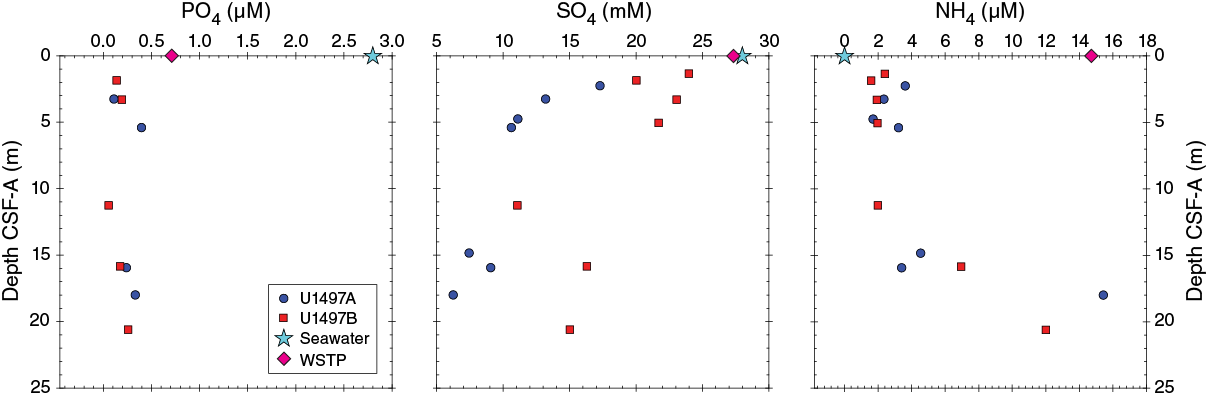
Figure F24. Phosphate, sulfate, and ammonium.
Chloride concentrations in Holes U1497A and U1497B are variable; initial values in the uppermost ~2 m of each hole are slightly higher than seawater values (542 mM) (Figure F25). Below this depth, chloride concentrations range from 513 and 552 mM in Hole U1497A and between 530 and 555 mM in Hole U1497B. The initial drop in salinity for Hole U1497B, followed by an increase back to near-seawater values, may result from the change in lithology to the red quartz-calcite-clay layer or contamination. In contrast, bromide concentrations are higher than seawater in the uppermost ~5 m of both holes and decrease to minimum values of 0.77 and 0.77 mM at 18 and 15.9 mbsf in Holes U1497A and U1497B, respectively.
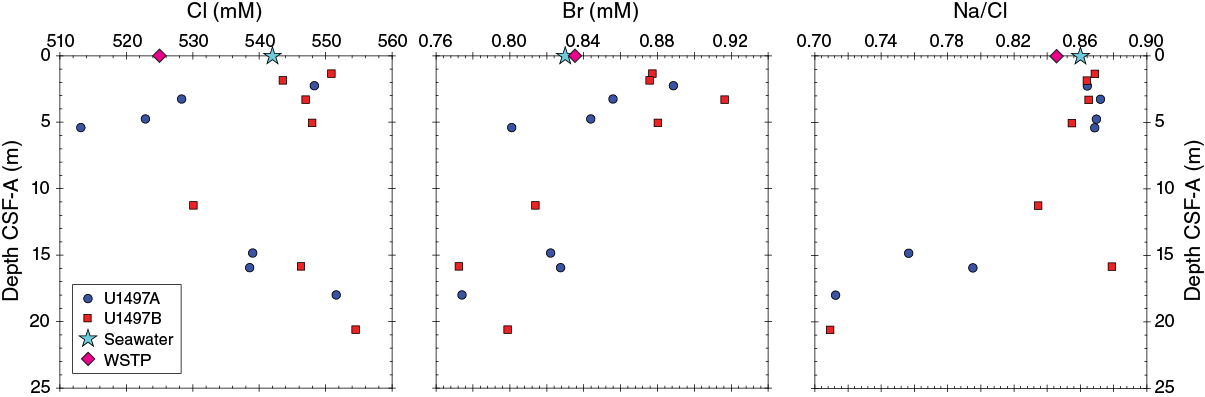
Figure F25. Cl, Br, and Na.
Chloride and bromide concentrations in the WSTP sample are slightly lower than seawater values (525 and 0.84 mM, respectively) (Figure F25). These values indicate the mixing of a deep-sourced fluids and seawater.
Major and trace cations
Holes U1497A and U1497B show distinct trends of major and trace element abundances with depth. K, Na, B, Li, and Mg generally decrease downhole from seawater concentrations to minimums of 4.3 mM, 393 mM, 21 µM, 7.9 µM, and <0.002 mM, respectively (Figure F26). In contrast, Ca and Sr concentrations increase from seawater values to 90 mM (20.6 mbsf in Hole U1497B) and 629 µM (18 mbsf in Hole U1497A). These trends do not return to near seawater values, except in two samples (Sections 366-U1497A-5F-3 and 366-U1497B-5F-2) where seawater/drilling mud contamination occurred. We therefore interpret the trends, including the interstitial fluids from the red layers, as actual intrinsic compositions associated with these layers. SiO2 contents are significantly lower than seawater (190 µM), ranging from 4.4 to 18 µM in the upper 12 m of the sediment column in both holes and reaching maximum values of 152 µM in Hole U1497A (at 18 mbsf) and 60.3 µM in Hole U1497B (at 20.6 mbsf). Fe concentrations are above the analytical detection limit (<0.47 µM) in two samples. Mn concentrations in Hole U1497A range from below the ICP-AES detection limit (<0.073 µM) to 0.99 µM at 3.26 mbsf. In contrast, concentrations in Hole U1497B are as high as 15.9 µM (3.3 mbsf). Ba concentrations in Hole U1497A increase downhole from below seawater values (0.14 µM) to a maximum of 0.58 µM at 14.85 mbsf. In contrast, Ba concentrations in Hole U1497B are lower than seawater values throughout the cored interval, with a maximum of 0.07 µM at 20.6 mbsf.

Figure F26. K, Na, Sr, Ca, B, Li, Mg, and SiO2.
The Na/Cl ratio is a characteristic feature of upwelling fluids, with a ratio below seawater (0.86) in seamounts closer to the trench and a ratio above seawater in seamounts farther away from the trench (Mottl et al., 2004). The Na/Cl ratios in Holes U1497A and U1497B are similar to seawater ratios in the upper ~6 m of both holes and then decrease to a minimum of 0.71 at the bottom of each hole (Figure F25).
The chemical composition of the fluid from the WSTP sample is distinctly different from seawater (Table T7). For example, the fluid has concentrations of K (10.71 mM), Na (443 mM), Ca (59.9 mM), Sr (<0.043 µM), and Mg (4.09 mM) that are consistent with a mixture of interstitial water from the screened section and bottom seawater.
Dissolved inorganic carbon/dissolved organic carbon
Dissolved inorganic carbon (DIC) concentrations in Holes U1497A and U1497B are significantly lower than the value estimated for bottom seawater (24 ppm), ranging from 1.5 to 8.3 ppm (Figure F27). Dissolved organic carbon (DOC) concentrations in Holes U1497A and U1497B range between 1 and 5 ppm. Insufficient sample volume was available from the WSTP sample for DIC/DOC analyses.
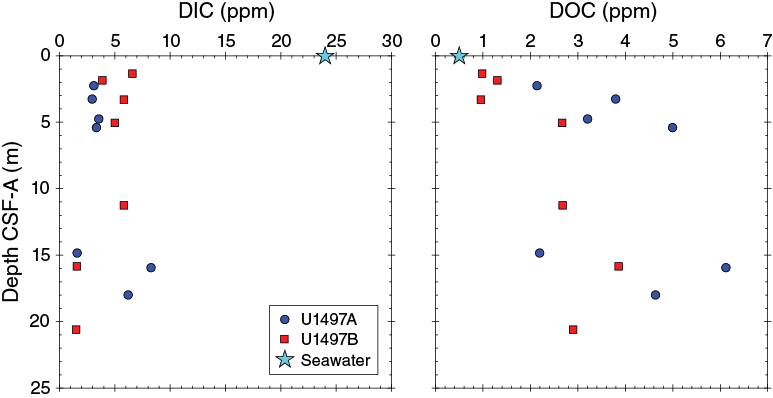
Figure F27. DIC and DOC.
Summary
Site U1497 interstitial waters are depleted in hydrocarbons but contain H2 and have a moderately high pH (mostly between 9 and 9.6, with a spike to >10), low alkalinity, and low DIC/DOC values. The low alkalinity contrasts with the very high values measured at the summit of Asùt Tesoru Seamount but is similar to those observed at Yinazao Seamount. Many of the major element interstitial water concentrations are consistent with upwelling of a deep-sourced interstitial fluid. Imprinted on this fluid composition are limited diagenetic changes that result from distinctive red layers composed of quartz sand and clay and carbonates. The fluid from the WSTP sampler, collected 3.25 days after circulation while drilling ceased, is a mixture of a deep-sourced fluid and bottom seawater, indicating fluid discharge into and out of the borehole.
Microbiology
Sample recovery
Microbiology sampling during Expedition 366 focused on exploring the limits of microbial life in serpentinite mud habitats across multiple depths using cultivation-based and cultivation-independent molecular biological approaches, microscopy, and assays for the detection of viruses. Sampling efforts targeted both near-surface and deeper whole-round cores, especially if there was evidence of transitions across gradients of microbiologically affecting compounds and gases (e.g., hydrogen, methane, hydrogen sulfide, and sulfate). Two 20 m long whole-round samples were collected at each sampled depth for general microbial analyses. Additional whole-round samples were collected for individual investigations. A total of 10 whole-round samples were collected for general microbial sampling from the summit of Fantangisña Seamount at Site U1497. These samples were preserved and will be analyzed postexpedition as described in Microbiology in the Expedition 366 methods chapter (Fryer et al., 2018a).
Contamination testing
Contamination testing at Site U1497 was conducted using perfluoromethyldecalin (PFMD). Tracer delivery was demonstrated by routine detection at the tops of Hole U1497A cores and in the drilling fluids in Hole U1497B, where contamination was expected to be high. Only qualitative contamination control was assessed because of limitations with the PFMD analytical method; thus, a conservative estimation of contamination was performed.
Sections 366-U1497A-2F-3 (4.5 mbsf) and 6F-2 (19.5 mbsf) have relatively low PFMD concentrations. In contrast, Section 5F-2 (14.6 mbsf) has a slightly higher concentration (Figure F28; Table T8). Sections 366-U1497B-3F-2 (11.0 mbsf), 5F-2 (15.6 mbsf), and 6F-2 (20.4 mbsf) have similar tracer concentrations at the exterior and halfway in the cores; however, the vast difference between these concentrations and those found in the drilling fluid (at least three orders of magnitude difference) suggest that these sections are viable for microbiological analyses. In contrast, Sections 1F-1 (1.1 mbsf) and 2F-1 (4.8 mbsf) have higher concentrations of the tracer PFMD and these concentrations are also more similar to those found in the drilling fluid, suggesting increased probability of contamination. Definite conclusions cannot be made concerning the viability of these samples for microbiological analyses; however, sections with lower concentrations of the tracer PFMD are less likely to be contaminated with drilling fluid (seawater).

Figure F28. PFMD concentrations.
Table T8. Summary of PFMD contamination assessment data, Site U1497. Download table in CSV format.
Physical properties
Physical property data were acquired for Site U1497, located at the summit of Fantangisña Seamount. Two holes, U1497A and U1497B, were cored 6 m apart at this site, penetrating to 34.2 and 23.8 mbsf, respectively.
The Whole-Round Multisensor Logger (WRMSL) was used to measure wet bulk density using gamma ray attenuation (GRA), magnetic susceptibility, and P-wave velocity on the P-wave logger (PWL). The whole rounds were then logged for NGR. Discrete thermal conductivity measurements were performed on one or two whole rounds per core depending on recovery. Color reflectance and point magnetic susceptibility (MSP) were measured on archive section halves. In addition, shear strength (automated vane shear) was measured on working halves, and discrete samples were collected for moisture and density (MAD) measurements of wet and dry bulk densities (see Physical properties in the Expedition 366 methods chapter [Fryer et al., 2018a]).
Core sections were frequently subject to incomplete filling of hard rock fragments and gravels or poor sediment-to-liner coupling of the unconsolidated deposits. This resulted in high P-wave velocity signal attenuation, and data acquisition on both the WRMSL and Section Half Measurement Gantry (SHMG) was compromised on such core sections. Although PWL measurements were often problematic, this incomplete data set is nevertheless presented here to be consistent with the other site chapters. Other data sets are mostly of good quality, except for some cores where the first section was highly disturbed.
Core 366-U1497A-7X recovered gravelly material, 185% of the cored interval, and is likely to be fall-in material from XCB cuttings that were too heavy to be flushed from the hole. This abnormally high recovery rate resulted in an overlap of this core data set with the subsequent Core 8F data set, which also contains mostly gravel that is probably out of place. Given this phenomenon and the poor filling of this gravely material in the core liners, we decided to remove the Core 7X physical property data from this chapter’s figures. These data are available in the IODP database.
Physical property measurements were performed to help characterize the lithostratigraphic units and to describe the mechanical and thermal states of the serpentinite mud seamounts. Precise intervals of lithostratigraphic units and subunits from core description (see Lithostratigraphy) are used to describe physical property trends and calculate average values. Data in the figures were filtered to remove spurious points that correspond to empty intervals in the liner or broken pieces. All of the onboard results and data interpretation are presented below.
GRA bulk density
Hole U1497A bulk GRA density values (Figure F29) show large variability, partly due to the lithology and partly due to drilling disturbance effects. Bulk density increases from ~1.5 g/cm3 at the top of the hole to ~2.1 g/cm3 at ~2.4 mbsf. From ~2.4 to 26 mbsf, GRA density is almost constant, ranging between 2.0 and 2.3 g/cm3, typical values of the serpentinite mud at flank sites (see Physical properties in the Sites U1493, U1494, and U1495 chapter [Fryer et al., 2018d]). From 26 mbsf downhole, GRA density values are very sparse and scattered, and no clear trend in the signal is apparent.

Figure F29. Color reflectance, GRA density and discrete bulk density, P-wave velocity, magnetic susceptibility, and NGR data, Hole U1497A.
Hole U1497B bulk GRA density values (Figure F30) increase from ~1.7 g/cm3 at the top of the hole to ~2.1 g/cm3 at 1.4 mbsf. From this depth to the base of the hole, bulk GRA density is fairly constant, with average values ranging between 2.0 and 2.3 g/cm3. Some core sections show deviations from this trend and large scattering of the data, in most cases associated with the presence of large voids and core disturbance or large clasts.
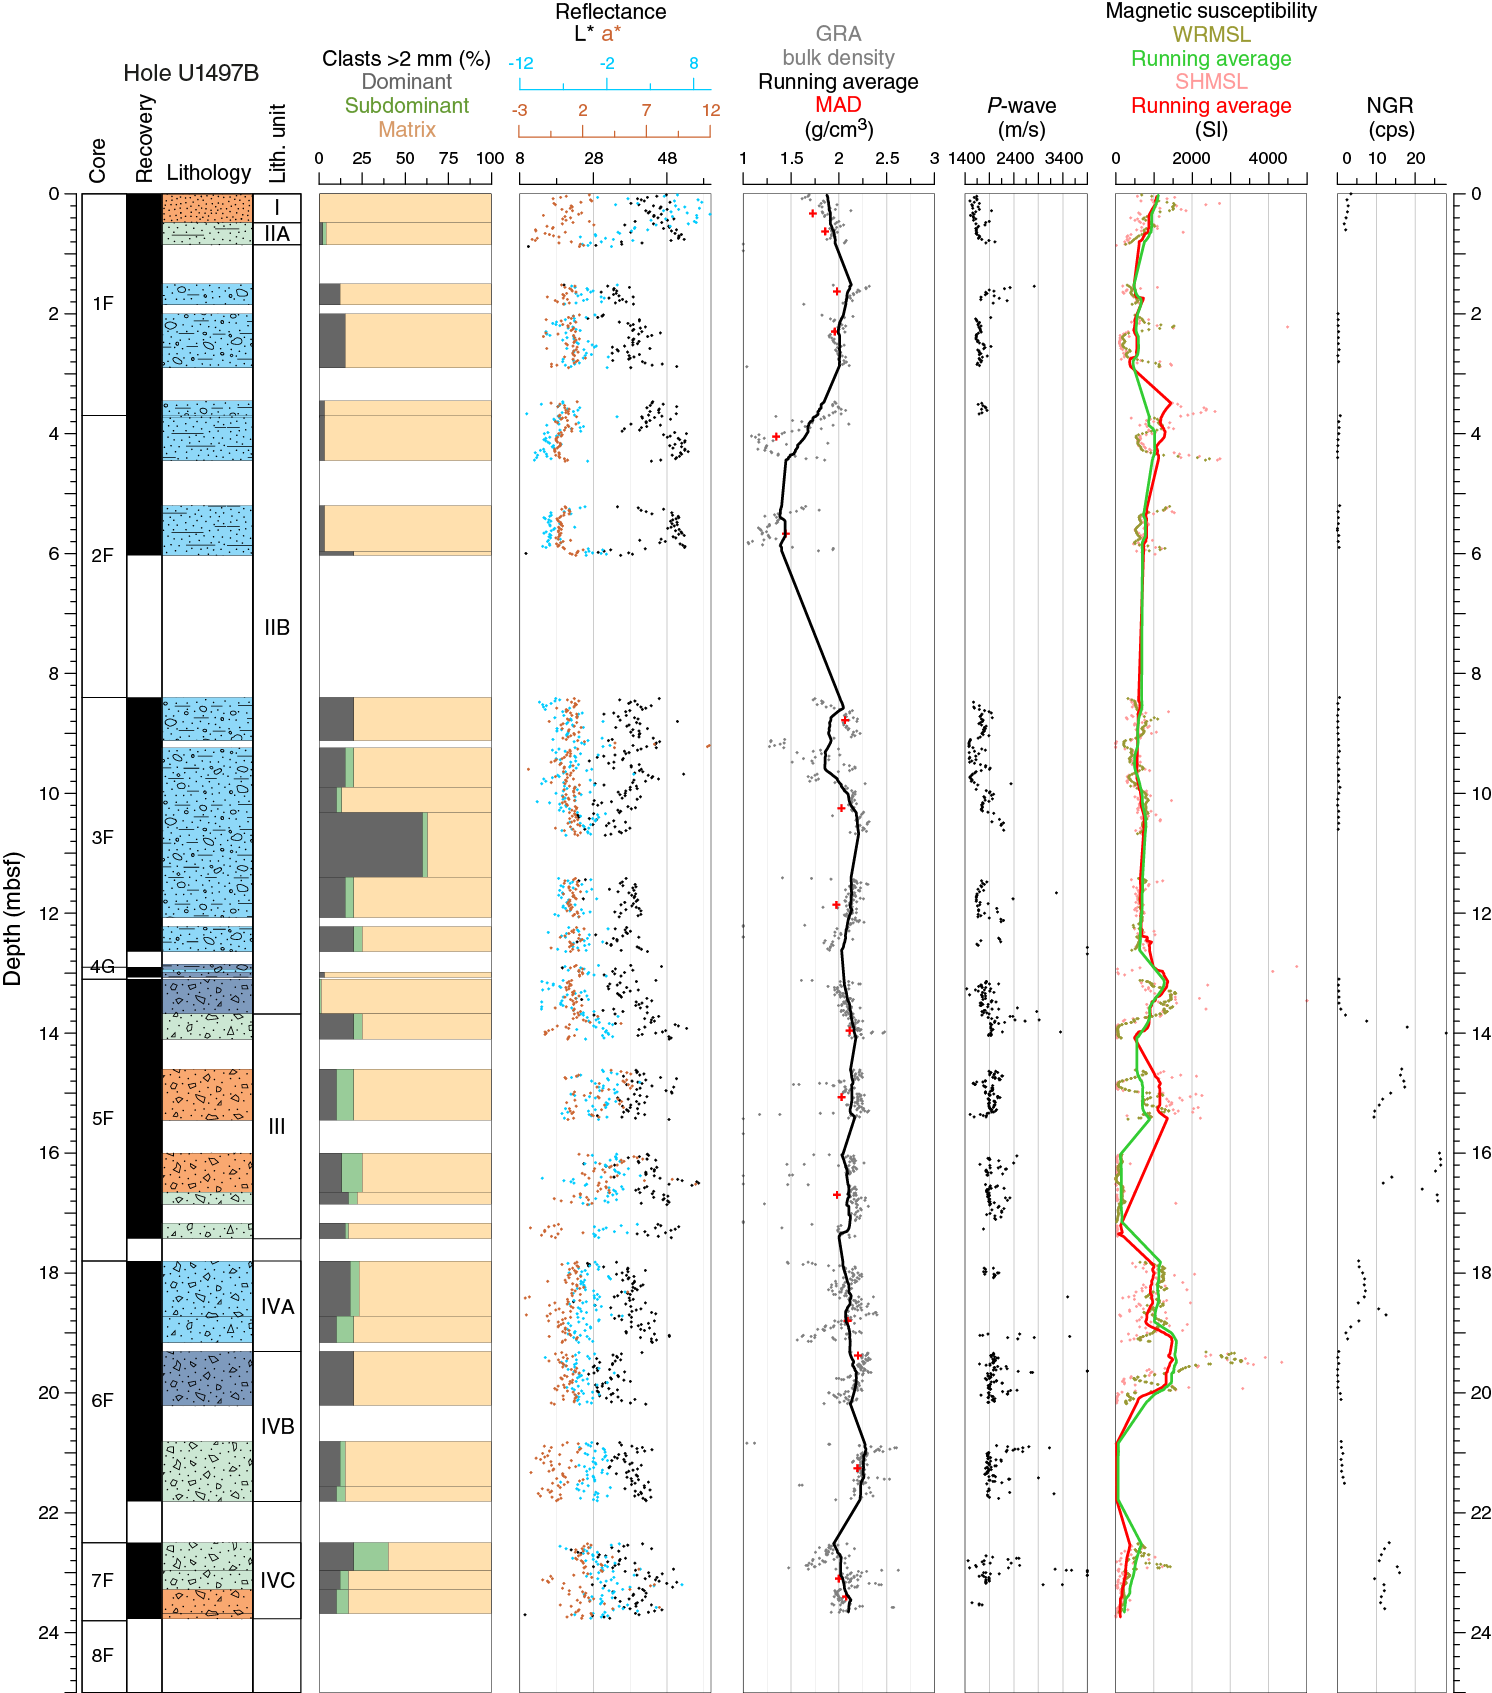
Figure F30. Color reflectance, GRA density and discrete bulk density, P-wave velocity, magnetic susceptibility, and NGR data, Hole U1497B.
For Holes U1497A and U1497B, GRA bulk density values are in good agreement with MAD measurements. The data variations for the two methods track each other in general.
P-wave velocity
Whole-round and discrete P-wave measurements were performed using the WRMSL. Therefore, only WRMSL data are used to describe Site U1497 P-wave velocity. Due to difficulties in recovering sediment cores in their pristine in situ conditions, P-wave velocity measurements in most Site U1497 cores were not always possible within the required quality standards defined by the acquisition software. Consequently, the P-wave velocity records show several depth intervals with no velocity data. The P-wave velocity data are generally characterized by large scattering of the values. However, a clear clustering of most of the values usually defines a minimum velocity threshold that is interpreted as the typical velocity of a particular lithology (e.g., pelagic sediment or serpentinite mud). In these holes, the P-wave velocity data frequently exhibit dispersion above this threshold, indicating higher velocities that are interpreted as reflecting the presence of large individual clasts or higher numbers of rock clasts that have P-wave velocities higher than the mud matrix.
P-wave velocities in Holes U1497A and U1497B (Figure F29) increase from ~1460 to ~1650 m/s in the uppermost 1 m. Below this depth, the data are more scattered, but the characteristic serpentinite mud P-wave velocity ranging between ~1750 and 1900 m/s (see Physical properties in the Sites U1493, U1494, and U1495 chapter [Fryer et al., 2018d]) was observed to 26 mbsf and is consistent with the characteristic values observed in the serpentinite mud in sites on the mud volcano flanks. Higher P-wave velocity values, which can reach as high as 3900 m/s, are interpreted as reflecting point measurements that included larger individual lithic clasts or higher amounts of rock clasts with high P-wave velocities.
Reflectance spectroscopy and colorimetry
Hole U1497A color reflectance parameters (Figure F29) show in general a good positive correlation between parameters a* and b*: muds that are more green and less red (negative a*) are also more blue (negative b*), but no clear correlation between L* and a* or between L* and b* was observed. Lightness is highly variable throughout the hole, with a slight increase to higher (i.e., lighter) values at the top. Reflectance parameters correlate well with the lithostratigraphic units. Units I and III and some layers of Unit V are characterized by higher a* (red) and b* (yellow) values, whereas the serpentinite mud in Unit II is characterized by lower a* (green) and b* (blue) values.
In Hole U1497B, a* and b* have generally low variability and no clear correlation with each other (Figure F30). At the top of the hole, higher b* values (yellowish color) were observed. Higher a* values (reddish color) were observed between 13.7 and 17.4 mbsf and then between 22.2 mbsf and the bottom of the hole. These higher a* values correspond to the reddish gray serpentinite breccia of Unit III and the polymict breccia of Subunit IVC. Lightness is highly variable throughout the hole, with no clear trends.
Magnetic susceptibility
In Holes U1497A and U1497B, magnetic susceptibility measurements with the WRMSL and MSP produced similar results. There is a general offset between the two magnetic susceptibility data sets, but they show similar trends and local variations. Of all the physical properties, the magnetic susceptibility profiles show the largest fluctuations at the meter and submeter scales. Submeter-scale fluctuations are especially evident in the lower units composed of highly heterogeneous material (polymict breccia, mud, ultramafic and sediment rock clasts, etc.), which were often recovered in incompletely filled core liners.
In Hole U1497A (Figure F29), the uppermost thin clayey mud unit with pelagic components (Unit I) is characterized by a magnetic susceptibility average value of 329 × 10–5 SI. Magnetic susceptibility values in the serpentinite mud deposits of both holes generally range between 200 × 10–5 and 1000 × 10–5 SI, with important variations observed at the extremities of some core sections (e.g., ~12 mbsf, Hole U1497A). Such variations can generally be correlated to GRA density variations and reflect coring disturbances. However, significant magnetic susceptibility increases up to 4000 × 10–5 SI were observed without any associated GRA change (e.g., ~2.5 and ~17 mbsf in Hole U1497A and ~13.5 mbsf in Hole U1497B). No significant changes in mud composition or clast content from the core descriptions can be related to these magnetic susceptibility increases (see Lithostratigraphy). The lower lithostratigraphic units (Units III–V in Hole U1497A; Units III–IV in Hole U1497B), composed of heterogeneous polymict breccia and sand with variable ultramafic, mafic, and sedimentary contents, show high magnetic susceptibility variability with high or low average values between different sections in the same core (e.g., 1053 × 10–5 SI in Section 366-U1497B-6F-1 and 37 × 10–5 SI in Section 6F-3). Again, no significant changes in mud composition or in clast content can clearly be identified from the core descriptions to interpret these magnetic susceptibility variations.
Natural gamma radiation
In Holes U1497A and U1497B, NGR profiles show similar variations between the different lithostratigraphic units. Although values may differ slightly, NGR measurements suggest good correlation between the units in both holes. The uppermost ~0.45 m thick pelagic clayey mud units (Unit I) are characterized by NGR values ranging from 5 to 17 counts/s and 2 to 4 counts/s in Holes U1497A and U1497B, respectively. Subsequently, serpentinite mud units (Unit II, 0.45–16.85 mbsf, Hole U1497A; Subunits IIA–IIB, 0.48–12.83 mbsf, Hole U1497B) are characterized by extremely low NGR values of generally less than 0.5 counts/s. The serpentinite mud Subunit IIC in Hole U1497A is, however, partly characterized by NGR values of 3–6 counts/s. This NGR increase relative to the average NGR of the other overlying serpentinite mud subunits (IIA–IIB) may be induced by the authigenic carbonate found near the base of this layer (see Lithostratigraphy). In both holes, a significant NGR increase occurs below the serpentinite mud in Unit III, which consists of reddish gray polymict breccia with significant amounts of sedimentary rock clasts (5%–7%). NGR values in Unit III range from 6.8 to 15.9 counts/s with an average of 12.6 counts/s in Hole U1497A and from 7.5 to 30.0 counts/s with an average of 18.1 counts/s in Hole U1497B.
In the lower lithostratigraphic units, correlation in the NGR measurements between the two holes is less apparent. In Hole U1497A, Unit IV, which consists of polymict sand and gravel with ultramafic and sedimentary rock clasts, is characterized by NGR values ranging from 11.2 to 17.1 counts/s, with 13.7 counts/s on average. The underlying Unit V, composed mostly of individual fragments of highly heterogeneous material similar to that observed in Unit IV (breccia, mud, ultramafic and sediment rock clasts, etc.), is characterized by slightly lower NGR values of 1.2 to 12.0 counts/s. These values may, however, be biased and underestimated because core liners were not entirely filled by the different rock fragments. In Hole U1497B, the polymict breccia NGR values of Subunits IVA and IVC differ from those of Subunit IVB. In Subunit IVA, NGR values range between 2.2 and 12.5 counts/s, with 6.3 counts/s on average, and values in Subunit IVC range from 10 to 20 counts/s, whereas in Subunit IVB, NGR values are mostly less than 1 count/s. This difference may be correlated to the presence of carbonate material in Subunit IVA and sedimentary-derived clasts in Subunit IVC (see Lithostratigraphy).
Moisture and density
Determination of MAD on discrete sediment samples was generally performed on every section of Holes U1497A and U1497B. Sampling targeted the most undisturbed part of a section, sometimes avoiding first sections of every core. As previously noted, MAD bulk density results are lower than the GRA values.
Average bulk densities over the two holes are 1.6–1.7 g/cm3 for pelagic sediment, whereas values for serpentinite mud are 2.0–2.3 g/cm3 and values for red polymict matrix intervals are 1.9–2.1 g/cm3. The two sites present different trends in MAD parameters with depth; Hole U1497A is subject to a decrease in bulk density and an increase in porosity with depth, whereas in Hole U1497B, all the MAD parameters are rather constant.
Hole U1497A has higher porosity values of 68%, corresponding to the pelagic sediments of Unit I, whereas Units II–IV exhibit a gradual increase in porosity from 38% at the top of the hole to 44% at the bottom (Figure F31). Low porosity values at 28 and 33 mbsf relate to clasts of red-brown siltstone microbreccia and carbonate breccia, respectively. At the bottom of Unit V (34 mbsf), a porosity value of 38% marks the occurrence of dark gray-green polymict matrix intervals. Bulk density reflects the same behavior exhibited in the porosity data. Grain density is erratic throughout the hole between 2.58 and 2.85 g/cm3, with higher values in Units III and IV.
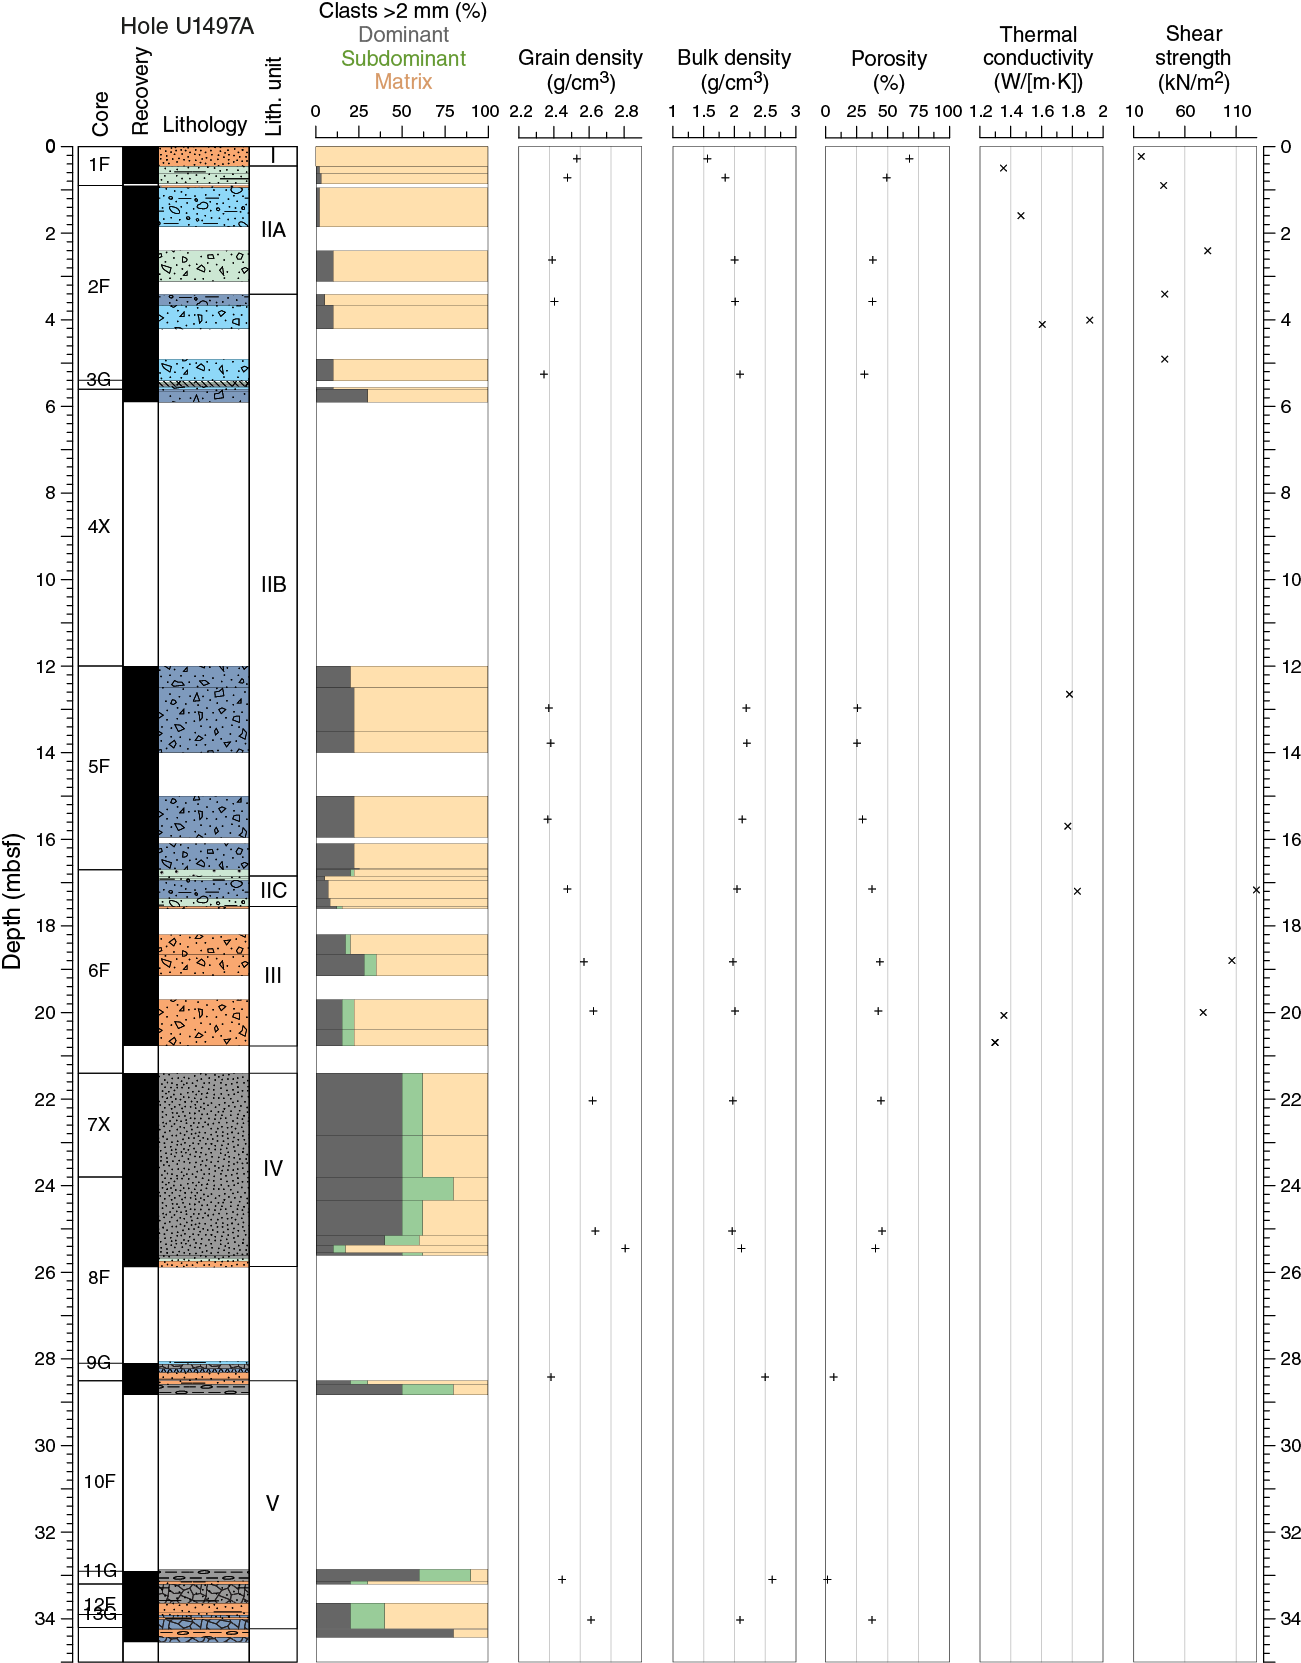
Figure F31. Index property data, thermal conductivity, and shear strength, Hole U1497A.
In Hole U1497B, as in Hole U1497A, porosity is 68% in Unit I and increases through Units II and III from 38% to 44%. Subunits IVA and IVB have lower values of 27%–29%, and values rise again to 42%–43% in Subunit IVC (Figure F32). Two high porosity values (75%–79%) in Unit II are linked with drilling disturbance identified by scattering of the WRMSL data. Bulk density reflects the same behavior exhibited in the porosity data. Grain density has mean values of 2.6 g/cm3 but is quite scattered downhole with a higher value at the top of Unit III of 2.91 g/cm3.
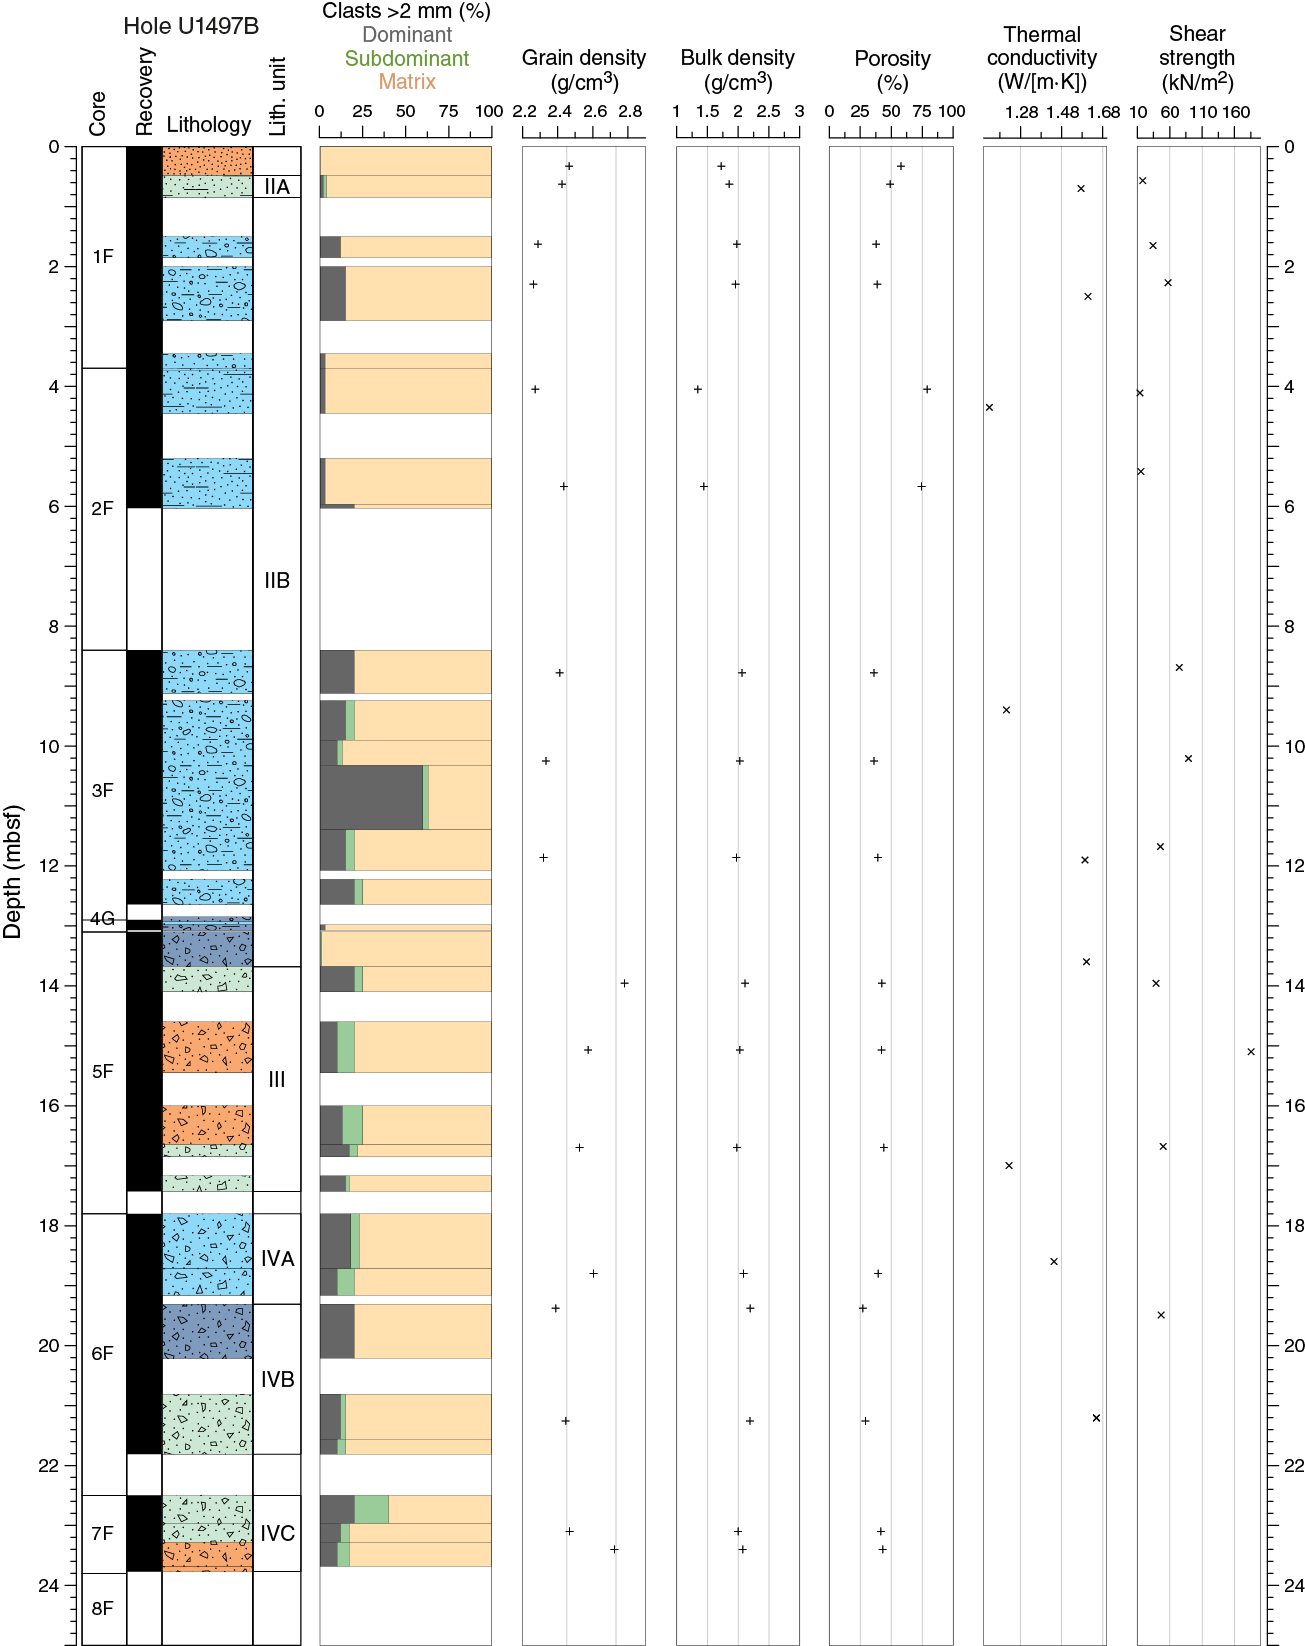
Figure F32. Index property data, thermal conductivity, and shear strength, Hole U1497B.
Thermal conductivity
Thermal conductivity measurements were made in Holes U1497A and U1497B at a rate of at least one and sometimes two per core, depending on recovery. Values for the two holes average 1.50 W/(m·K). Results differ slightly between the two holes.
Hole U1497A values range from 1.3 to 1.9 W/(m·K) (Figure F31). Units I and II show an increasing trend with depth corresponding to a porosity decrease of 20%. Unit III values are lower than those in Unit II by almost 30%. The decrease is apparently not due to drilling disturbance because shear strength is high in this unit. No measurements were possible in Units IV and V in Hole U1497A. In Hole U1497B, values range from 1.1 to 1.7 W/(m·K) (Figure F32). Unlike Hole U1497A, there is no increasing trend with depth in Units I and II. Instead, values are high throughout, except for two unusually low values (4.4 and 9.4 mbsf) that may be due to drilling disturbance, based on the GRA data. The single Unit III value matches those in Hole U1497A for this unit. The value in Subunit IVB (~1.7 W/[m·K]) is the highest measured in this hole.
Automated vane shear
The undrained shear strength was measured with the automated vane shear in cohesive sediments, but no measurements were done in the rock-filled cores or in the gravel recovered at the bottom of both holes. Automated vane shear measurements did not show remarkable trends, due to the scarcity of measurements, but they agree well with thermal conductivity trends in Hole U1497A.
In Hole U1497A, shear strength increases in Subunit IIA from 18 kN/m2 at the top to 82 kN/m2 at the bottom (Figure F31). Values decrease to 41 kN/m2 in Subunit IIB, and in Unit III values decrease with depth from 130 to 78 kN/m2.
In contrast, Hole U1497B shows erratic values with depth, which vary between 19 and 186 kN/m2 without discernable trends (Figure F32). The lowest values (14–15 kN/m2) between 4 and 5 mbsf are probably a drilling disturbance effect.
Discussion
Of the three seamounts cored, Fantangisña Seamount is at an intermediate distance from the trench (62 km), and its summit is located in 1900 m water depth (Oakley et al., 2007). At this summit site, the serpentinite mud data sets retrieved in the upper halves of both holes differ from those obtained at the summits of Yinazao and Asùt Tesoru Seamounts during this expedition (see Physical properties in the Site U1492 chapter and Physical properties in the Site U1496 chapter [Fryer et al., 2018c, 2018e]). This site has higher average values of bulk density of about 2.0–2.3 g/cm3, higher P-wave velocities of 1750–1900 m/s, higher thermal conductivities of 1.3–1.8 W/(m·K), and lower porosities of 38%–44%. These values are similar to those obtained on the flanks of Asùt Tesoru Seamount (see Physical properties in the Sites U1493, U1494, and U1495 chapter [Fryer et al., 2018d]) and could reflect a more consolidated state of the material. However, no clear trend with depth can be identified within these serpentinite mud units. The lack of a depth trend could be related to the relatively shallow depth or alternatively reflects properties intermediate between summit and flank behavior, consistent with a period of inactivity at this summit.
The lower parts of both holes are composed of different lithostratigraphic units of sedimentary, mafic, and ultramafic polymict mud matrix intervals with variable clast contents. These units are highlighted by heterogeneous physical properties values (e.g., NGR). The prevalence of sedimentary clasts in Unit III can be correlated with overall high NGR values in both holes.
Downhole measurements
The APCT-3 and the WSTP were used to estimate formation temperatures at Site U1497. The WSTP also obtained a water sample inside the casing of Hole U1497D at 44.2 mbsf. WSTP temperature data are described here; the results of the water sample are described in Fluid geochemistry.
Advanced piston corer temperature tool
A single APCT-3 temperature equilibration record of medium quality was obtained at 21.4 mbsf while taking Core 366-U1497B-6F (Figure F33). Data have a good frictional peak with two small offsets of 0.2°C each during the decay period. TP-Fit software was used to extrapolate to the formation temperature. The temperature analysis window was chosen to start shortly after the second small offset and extend as late as possible during the thermal decay, providing 9 min of decay for the fit. The estimated temperature is 2.54°C, using both the full window and the final third of the data window (Table T9). Seafloor temperature was recorded for 70 min, yielding a value of 2.51° ± 0.007°C. The minimum value recorded at the seafloor before entering the hole was 2.29°C, and this value is used for the thermal gradient.
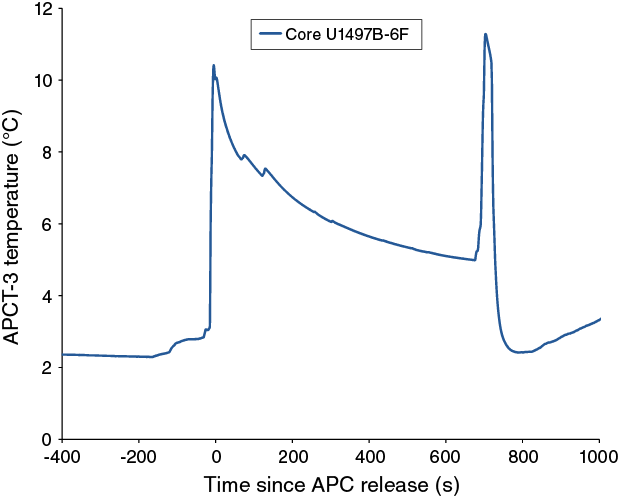
Figure F33. APCT-3 temperature measurements, Hole U1497B.
Table T9. APCT-3 temperature data, Site U1497. Download table in CSV format.
Data for the single downhole temperature estimate and minimum seafloor temperature are plotted in Figure F34. Using these two values yields a gradient of 11.7°C/km. Multiplying the gradient by the average measured thermal conductivity of 1.43 W/(m·K) results in an estimated heat flow of 16.8 mW/m2.
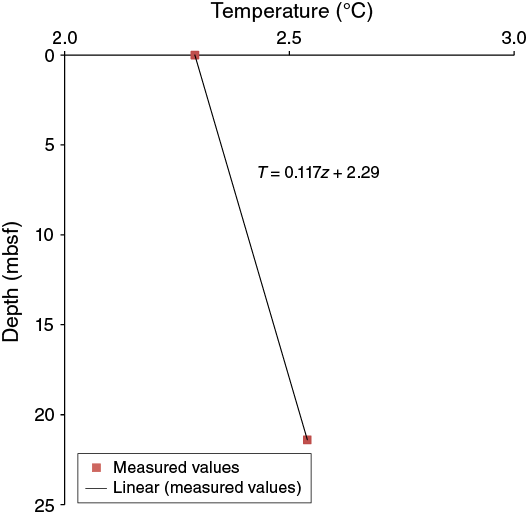
Figure F34. Calculated APCT-3 temperatures, Hole U1497B.
Water-sampling temperature probe
A ~90 min record of borehole fluid temperature was acquired in Hole U1497D with a 33.5 min stop at 44.2 mbsf and shorter stops at depths listed in Table T10). Acquired temperature data and coreline depth are shown in Figure F35. Temperatures increased with time when the probe was held at a constant depth, suggesting that warmer water is either being pumped up the borehole by the drill string heave or there is inflow of warmer water through the screen from deep-sourced fluids. The latter is consistent with the chemical data. The estimated thermal gradient using the data from the start of each constant depth position is 35.6°C/km (Figure F36).
Table T10. Estimated time required for formation temperature to recover after pumping. Download table in CSV format.
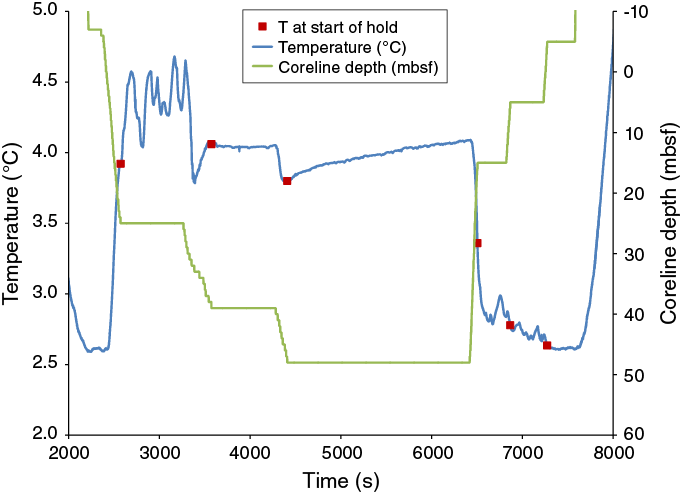
Figure F35. Measured WSTP temperatures.
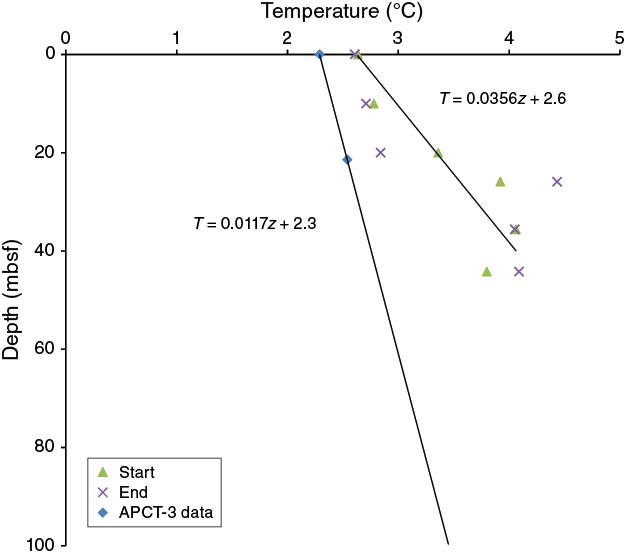
Figure F36. Estimated WSTP and APCT-3 temperatures.
Discussion
Because of the difficult drilling and coring conditions encountered at Site U1497, only one APCT-3 temperature measurement was obtained, but the temperature equilibration is relatively smooth, so we have confidence in the estimate for the formation temperature. The temperature gradient of 11.7°C/km is consistent with thermal gradients obtained at the other summit sites: 14.3°C/km in Hole U1496A and 11.8°C/km in Hole U1492C.
The recovery of the hole from drilling and casing operations was modeled to better understand the thermal conditions at the start of the WSTP run. The equation used is described in the Downhole measurements in the Site U1496 chapter (Fryer et al., 2018e). Table T11) shows the values used in the calculation. When the WSTP was deployed, the estimated perturbation should have decreased to 20% of the original perturbation. Using the more precise solution shown in figure 3 of Jaeger (1961) with αt1/a2 = 2.6 and t2 = 5.0 days yields a similar value. Combining these results with the observed perturbation in Hole U1498B indicates the WSTP values should be less than 0.1°C from formation values at 50 mbsf and 0.2°C at 100 mbsf at the time of the measurement.
Table T11. Borehole temperature, Site U1497. Download table in CSV format.
Temperatures measured with the WSTP are considerably warmer than those measured with the APCT-3. Two factors may contribute to the warmer temperatures. There was considerable heave of the drill string during the WSTP deployment, which may have moved water from lower in the hole. Assuming the base of the hole at ~103 mbsf had equilibrated with a temperature gradient of 11.7°C/km, the calculated temperature at the base of the borehole is 3.5°C. This value is considerably lower than the peak value of 4.4°C recorded by the WSTP at 25.9 mbsf. The reason for the high value is unknown; however, heat also may have been carried into the borehole by fluid flow from the screened interval at 37–72 mbsf, consistent with results from chemical analysis of the water sample. Similar to Hole U1496C, the WSTP recovered borehole fluids from Hole U1497D that are a mixture of seawater and a deep-sourced fluid, and both holes likely have fluid discharge from the borehole (see Fluid geochemistry).
Calculation of formation temperatures from WSTP temperature data in Holes U1496C and U1497D requires additional modeling to elucidate potential discharge rates. The heave experienced during the deployment may have affected the thermal measurement. This potential source of mixing would have been diminished with the use of an APC coring shoe as was used in Hole U1496C. The APC BHA allows the WSTP to extend completely outside the drill pipe. In contrast, the RCB coring shoe, which was used during the WSTP deployment in Hole U1497D, allows only 1.2 m of the WSTP to stick out beyond the drill bit. Given that the WSTP was deployed with two distinctly different coring shoes but warming was observed in each deployment, fluid discharge is the likely cause for the rise in temperature, consistent with the chemical data, which requires fluid discharge into the borehole. If the WSTP is to be used for borehole temperature logging in the future, it would be best to lower the tool below the shoe and into the open hole continuously with no stops. The data on the downhole log should be used rather than the uphole log.
Paleomagnetism
Paleomagnetic analyses were conducted on archive halves and discrete samples from Hole U1497A and U1497B cores using the shipboard superconducting rock magnetometer (SRM). The natural remanent magnetization (NRM) of both holes was measured at 5 cm intervals after 5–20 mT alternating field (AF) demagnetization. A total of 20 representative discrete samples were collected, and their NRMs were measured after 0–20 mT AF demagnetization. The calibrated bulk magnetic susceptibility (χ), normalized by volume, of 22 discrete samples from Holes U1497A and U1497B was measured with an AGICO KLY 4S Kappabridge instrument using the Sufar (AGICO) software.
Results
We analyzed NRM inclinations and declinations on discrete samples and section halves from Holes U1497A and U1497B. The vertical overprint is less pronounced at this site compared to the sites drilled earlier in the expedition; the NRM in most samples tends to show relatively low inclination values, averaging ~30° but with a large amount of scatter. The axial dipole field inclination at this site, latitude 16.5°N, is 30.6° (Figure F37).

Figure F37. NRM decay and AF demagnetization vectors.
Paleomagnetic directions of some samples show an overprint that remains after the 20 mT demagnetization step, leading to relatively high inclinations (e.g., Hole U1497B at 13.64 mbsf). Principal component analysis of demagnetization data and the results at the 5 mT demagnetization step from the section halves of both holes are generally consistent with one another (Figures F38, F39).
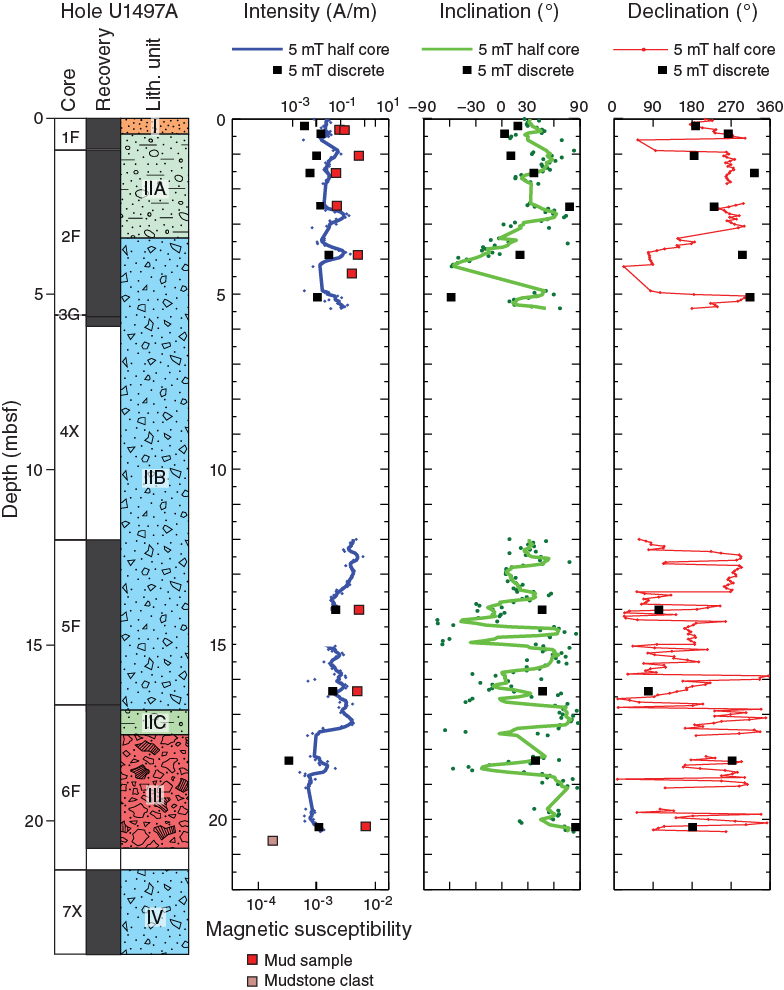
Figure F38. Paleomagnetic intensity, inclination, declination and magnetic susceptibility, Hole U1497A.
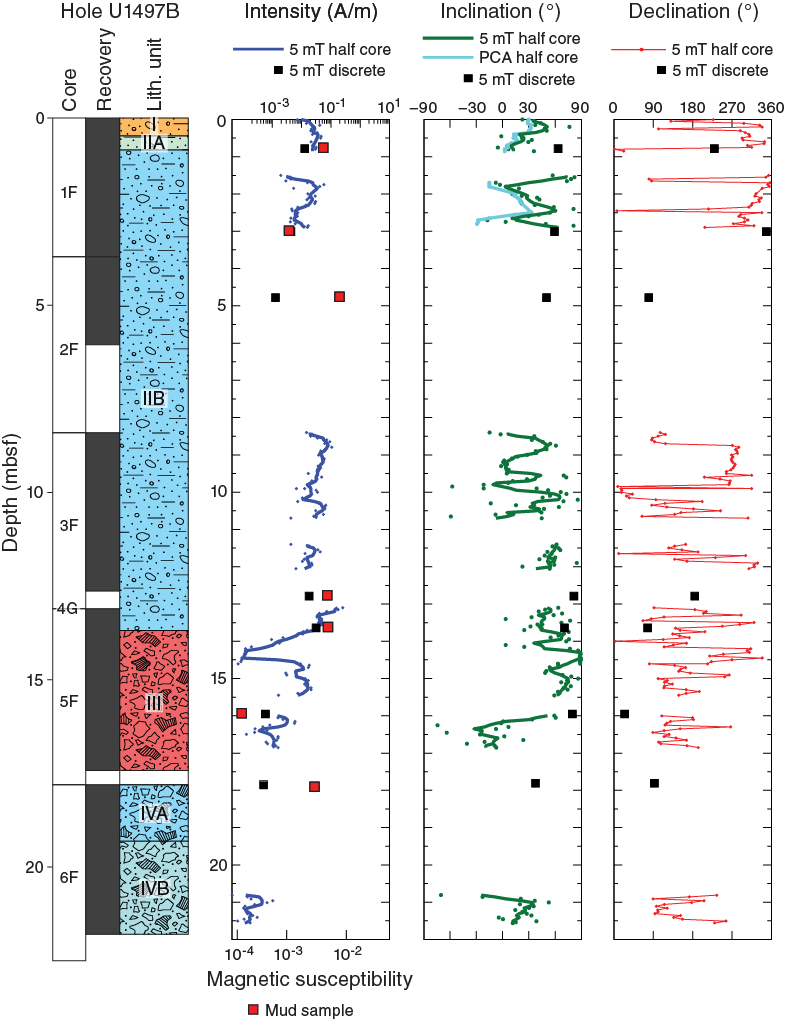
Figure F39. Paleomagnetic intensity, inclination, declination and magnetic susceptibility, Hole U1497B.
NRM intensities generally vary with lithostratigraphic units. The intensity values of discrete samples generally corroborate those from section halves at the 5 mT demagnetization step, varying with lithostratigraphic unit. Relatively high NRM intensity values of ~2.5 × 10⁻¹ A/m at the 5 mT demagnetization step occur at ~13 mbsf in Subunit IIB, which consists of bluish-gray serpentinite volcanic sediments, in both holes. An abrupt decrease in NRM intensity values to less than ~5.0 × 10⁻⁴ A/m was registered in Unit III, Hole U1497B, which consists of reddish gray matrix-supported polymict gravel to cobbles.
In Hole U1497A, discrete sample bulk magnetic susceptibility ranges from ~1.9 × 10⁻⁴ to 2.2 × 10⁻² and averages ~5.0 × 10⁻³. An abrupt decrease in magnetic susceptibility to less than 1.9 × 10⁻⁴ was registered in a mudstone clast in Unit III, Hole U1497A. Magnetic susceptibility values in Hole U1497B range from ~1.8 × 10⁻⁴ to 1 × 10⁻² with an average of ~4.0 × 10⁻³. The lowest magnetic susceptibility values occur in Unit III in Holes U1497A and U1497B, where low magnetic susceptibility values are registered in both mud and clasts.
References
Eglinton, T.I., and Repeta, D.J., 2014. Organic matter in the contemporary ocean. In Mottl, M.J., and Elderfield, H. (Eds.), Treatise on Geochemistry (2nd Edition) (Volume 8): The Oceans and Marine Geochemistry. Holland, H.D., and Turekian, K.K. (Series Eds.): Oxford, United Kingdom (Elsevier), 151–189. https://doi.org/10.1016/B978-0-08-095975-7.00606-9
Fryer, P., Wheat, C.G., Williams, T., Albers, E., Bekins, B., Debret, B.P.R., Deng, J., Dong, Y., Eickenbusch, P., Frery, E.A., Ichiyama, Y., Johnson, K., Johnston, R.M., Kevorkian, R.T., Kurz, W., Magalhaes, V., Mantovanelli, S.S., Menapace, W., Menzies, C.D., Michibayashi, K., Moyer, C.L., Mullane, K.K., Park, J.-W., Price, R.E., Ryan, J.G., Shervais, J.W., Sissmann, O.J., Suzuki, S., Takai, K., Walter, B., and Zhang, R., 2018a. Expedition 366 methods. In Fryer, P., Wheat, C.G., Williams, T., and the Expedition 366 Scientists, Mariana Convergent Margin and South Chamorro Seamount. Proceedings of the International Ocean Discovery Program, 366: College Station, TX (International Ocean Discovery Program). https://doi.org/10.14379/iodp.proc.366.102.2018
Fryer, P., Wheat, C.G., Williams, T., Albers, E., Bekins, B., Debret, B.P.R., Deng, J., Dong, Y., Eickenbusch, P., Frery, E.A., Ichiyama, Y., Johnson, K., Johnston, R.M., Kevorkian, R.T., Kurz, W., Magalhaes, V., Mantovanelli, S.S., Menapace, W., Menzies, C.D., Michibayashi, K., Moyer, C.L., Mullane, K.K., Park, J.-W., Price, R.E., Ryan, J.G., Shervais, J.W., Sissmann, O.J., Suzuki, S., Takai, K., Walter, B., and Zhang, R., 2018b. Expedition 366 summary. In Fryer, P., Wheat, C.G., Williams, T., and the Expedition 366 Scientists, Mariana Convergent Margin and South Chamorro Seamount. Proceedings of the International Ocean Discovery Program, 366: College Station, TX (International Ocean Discovery Program). https://doi.org/10.14379/iodp.proc.366.101.2018
Fryer, P., Wheat, C.G., Williams, T., Albers, E., Bekins, B., Debret, B.P.R., Deng, J., Dong, Y., Eickenbusch, P., Frery, E.A., Ichiyama, Y., Johnson, K., Johnston, R.M., Kevorkian, R.T., Kurz, W., Magalhaes, V., Mantovanelli, S.S., Menapace, W., Menzies, C.D., Michibayashi, K., Moyer, C.L., Mullane, K.K., Park, J.-W., Price, R.E., Ryan, J.G., Shervais, J.W., Sissmann, O.J., Suzuki, S., Takai, K., Walter, B., and Zhang, R., 2018c. Site U1492. In Fryer, P., Wheat, C.G., Williams, T., and the Expedition 366 Scientists, Mariana Convergent Margin and South Chamorro Seamount. Proceedings of the International Ocean Discovery Program, 366: College Station, TX (International Ocean Discovery Program). https://doi.org/10.14379/iodp.proc.366.105.2018
Fryer, P., Wheat, C.G., Williams, T., Albers, E., Bekins, B., Debret, B.P.R., Deng, J., Dong, Y., Eickenbusch, P., Frery, E.A., Ichiyama, Y., Johnson, K., Johnston, R.M., Kevorkian, R.T., Kurz, W., Magalhaes, V., Mantovanelli, S.S., Menapace, W., Menzies, C.D., Michibayashi, K., Moyer, C.L., Mullane, K.K., Park, J.-W., Price, R.E., Ryan, J.G., Shervais, J.W., Sissmann, O.J., Suzuki, S., Takai, K., Walter, B., and Zhang, R., 2018d. Sites U1493, U1494, and U1495. In Fryer, P., Wheat, C.G., Williams, T., and the Expedition 366 Scientists, Mariana Convergent Margin and South Chamorro Seamount. Proceedings of the International Ocean Discovery Program, 366: College Station, TX (International Ocean Discovery Program). https://doi.org/10.14379/iodp.proc.366.106.2018
Fryer, P., Wheat, C.G., Williams, T., Albers, E., Bekins, B., Debret, B.P.R., Deng, J., Dong, Y., Eickenbusch, P., Frery, E.A., Ichiyama, Y., Johnson, K., Johnston, R.M., Kevorkian, R.T., Kurz, W., Magalhaes, V., Mantovanelli, S.S., Menapace, W., Menzies, C.D., Michibayashi, K., Moyer, C.L., Mullane, K.K., Park, J.-W., Price, R.E., Ryan, J.G., Shervais, J.W., Sissmann, O.J., Suzuki, S., Takai, K., Walter, B., and Zhang, R., 2018e. Site U1496. In Fryer, P., Wheat, C.G., Williams, T., and the Expedition 366 Scientists, Mariana Convergent Margin and South Chamorro Seamount. Proceedings of the International Ocean Discovery Program, 366: College Station, TX (International Ocean Discovery Program). https://doi.org/10.14379/iodp.proc.366.107.2018
Hulme, S.M., 2005. Sources and magnitude of fluid venting from the Mariana forearc serpentine mud volcanoes [M.S. thesis]. San Jose State Univ., California.
Johnston, R.M., Ryan, J.G., and the Expedition 366 Scientists, 2018. pXRF and ICP-AES characterization of shipboard rocks and sediments: protocols and strategies. In Fryer, P., Wheat, C.G., Williams, T., and the Expedition 366 Scientists, Mariana Convergent Margin and South Chamorro Seamount. Proceedings of the International Ocean Discovery Program, 366: College Station, TX (International Ocean Discovery Program). https://doi.org/10.14379/iodp.proc.366.110.2018
Mottl, M.J., Wheat, C.G., Fryer, P., Gharib, J., and Martin, J.B., 2004. Chemistry of springs across the Mariana forearc shows progressive devolatilization of the subducting plate. Geochimica et Cosmochimica Acta, 68(23):4915–4933. https://doi.org/10.1016/j.gca.2004.05.037
Oakley, A., 2008. A multi-channel seismic and bathymeric investigation of the central Mariana convergent margin [Ph.D. dissertation]. University of Hawaii. http://www.soest.hawaii.edu/GG/resources/theses/Oakley Dissertation 2008.pdf
Oakley, A.J., Taylor, B., Fryer, P., Moore, G.F., Goodliffe, A.M., and Morgan, J.K., 2007. Emplacement, growth, and gravitational deformation of serpentinite seamounts on the Mariana forearc. Geophysical Journal International, 170(2):615–634. https://doi.org/10.1111/j.1365-246X.2007.03451.x
Oakley, A.J., Taylor, B., and Moore, G.F., 2008. Pacific plate subduction beneath the central Mariana and Izu-Bonin fore arcs: new insights from an old margin. Geochemistry, Geophysics, Geosystems, 9(6):Q06003. https://doi.org/10.1029/2007GC001820
Rognstad, M., 1992. HAWAII MR1: a new underwater mapping tool [paper presented at the International Conference on Signal Processing and Technology, Cambridge, Massachusetts, 2–5 November 1992]. http://www.soest.hawaii.edu/hmrg/facstaff/mark/MR1Paper.pdf
Wheat, C.G., Fryer, P., Fisher, A.T., Hulme, S., Jannasch, H., Mottl, M.J., and Becker, K., 2008. Borehole observations of fluid flow from South Chamorro Seamount, an active serpentinite mud volcano in the Mariana forearc. Earth and Planetary Science Letters, 267(3–4):401–409. https://doi.org/10.1016/j.epsl.2007.11.057
1 Fryer, P., Wheat, C.G., Williams, T., Albers, E., Bekins, B., Debret, B.P.R., Deng, J., Dong, Y., Eickenbusch, P., Frery, E.A., Ichiyama, Y., Johnson, K., Johnston, R.M., Kevorkian, R.T., Kurz, W., Magalhaes, V., Mantovanelli, S.S., Menapace, W., Menzies, C.D., Michibayashi, K., Moyer, C.L., Mullane, K.K., Park, J.-W., Price, R.E., Ryan, J.G., Shervais, J.W., Sissmann, O.J., Suzuki, S., Takai, K., Walter, B., and Zhang, R., 2018. Site U1497. In Fryer, P., Wheat, C.G., Williams, T., and the Expedition 366 Scientists, Mariana Convergent Margin and South Chamorro Seamount. Proceedings of the International Ocean Discovery Program, 366: College Station, TX (International Ocean Discovery Program). https://doi.org/10.14379/iodp.proc.366.108.2018
2 Expedition 366 Scientists’ addresses.
This work is distributed under the Creative Commons Attribution 4.0 International (CC BY 4.0) license. 