Fryer, P., Wheat, C.G., Williams, T., and the Expedition 366 Scientists
Proceedings of the International Ocean Discovery Program Volume 366
publications.iodp.org
https://doi.org/10.14379/iodp.proc.366.107.2018

Site U14961
P. Fryer, C.G. Wheat, T. Williams, E. Albers, B. Bekins, B.P.R. Debret, J. Deng, Y. Dong, P. Eickenbusch, E.A. Frery, Y. Ichiyama, K. Johnson, R.M. Johnston, R.T. Kevorkian, W. Kurz, V. Magalhaes, S.S. Mantovanelli, W. Menapace, C.D. Menzies, K. Michibayashi, C.L. Moyer, K.K. Mullane, J.-W. Park, R.E. Price, J.G. Ryan, J.W. Shervais, O.J. Sissmann, S. Suzuki, K. Takai, B. Walter, and R. Zhang2
Keywords: International Ocean Discovery Program, IODP, JOIDES Resolution, Expedition 366, Site 1200, Site U1491, Site U1492, Site U1493, Site U1494, Site U1495, Site U1496, Site U1497, Site U1498, Mariana, Asùt Tesoru Seamount, Conical Seamount, Fantangisña Seamount, South Chamorro Seamount, Yinazao Seamount, Cretaceous seamount, subduction, subduction channel, forearc, seismogenic zone, mud volcano, fluid discharge, serpentinite, carbonate, harzburgite, clasts, ultramafic rock, breccia, gypsum, mudstone, chert, reef limestone, volcanic ash, guyot, CORK, CORK-Lite, screened casing
MS 366-107: Published 7 February 2018
Site summary
Site U1496 is located at the summit of Asùt Tesoru Seamount (informally known as Big Blue Seamount), a serpentinite mud volcano about 72 km from the trench axis and 18 km above the downgoing plate (Oakley, 2008; Oakley et al., 2008). The major fault trend that controlled the growth of the edifice has a north-northeast trend and a crosscutting fault with a north-northwest trend. The seamount is topped by a roughly circular summit mound, approximately 3 km wide and 200 m high, which itself has three smaller circular mounds. The largest of these, about 350 m in diameter and 40 m high, was the focus of Site U1496 operations. This location was chosen because gravity, piston, and remotely operated vehicle (ROV) Jason II push coring operations revealed fluid discharge in the center of the largest of the three mounds (Hulme et al., 2010). The primary goals were to recover material from an active conduit for deep-sourced fluids and to deploy a casing-screened borehole that intersects the hydrologic conduit, providing the foundation for future experiments, sampling opportunities, and monitoring of physical conditions of volcanism with the aid of a CORK-Lite structure.
Holes U1496A and U1496B were cored with the half-length advanced piston corer (HLAPC) and extended core barrel (XCB) systems, reaching 44.8 and 36.0 meters below seafloor (mbsf), respectively. Because of the desire to quickly drill a deep hole for casing operations, Hole U1496C was cored with the rotary core barrel (RCB) system to 105 mbsf with minimal recovery. At the end of the casing deployment, serpentinite mud had risen into the casing and was tagged 7 m shallower than the bottom of the casing shoe. Later in the expedition, we returned to this borehole and collected a water sample and two HLAPC cores of the mud within the casing prior to washing the casing and plugging the bottom of the hole with cement.
Holes U1496A and U1496B are characterized by a dominant pale green serpentinite mud with a low proportion of lithic clasts compared to the flanks and other sites. The pale green serpentinite mud is typically soupy or very soft due to its high water and gas content, and it often continued to outgas long after the cores were split. Zones of dark blue serpentinite mud are uncommon and characterized by higher clast counts. These characteristics are consistent with an active summit site that is currently producing high-pH interstitial water and abiotic hydrogen and methane.
Although less common than at other sites, hard rock clasts recovered from all three holes provide insights into the plumbing system. The most common clasts are ultramafic, typically highly serpentinized harzburgites with less common dunite and orthopyroxenite. These clasts derive from the underlying forearc mantle lithosphere at the root of the serpentinite mud volcano system. Also recovered were mafic metavolcanic and sedimentary clasts. The sedimentary clasts include a fossiliferous cherty limestone that may be pre-Eocene in age (based on identification fossil identification). The mafic metavolcanic clasts include dolerites with pink titanaugite and augite-phyric vitrophyres. The presence of titanaugite in these rocks, as identified by postexpedition microprobe analysis (see Petrology), indicates that their protoliths are alkali basalts. The possible presence of Na-amphibole in the metadolerite implies that the mafic clasts experienced high pressure/temperature (P/T) metamorphism. These clasts may be recycled material from the subducted Pacific plate, the confirmation of which requires further studies on mineral and whole-rock geochemistry.
Interstitial waters and gas samples were extracted from each of the three boreholes, two ghost cores within the cased borehole, and one water-sampling temperature probe (WSTP) deployment. Dissolved gas data indicate high concentrations of methane, hydrogen, and C1/C2 ratios consistent with a deep-sourced origin. The methane to hydrogen ratio did not change with depth, indicating that microbial processes, although present and possibly active, are not sufficiently active to alter the deep-sourced fluid composition as it upwells from depth. Based on the almost asymptotic changes observed in many of the measured ions, (i.e., a rapid increase or decrease of concentration within uppermost 1 m below the seafloor followed by a quick leveling off at a consistent concentration level), there is significant upflow of deep-sourced fluids that discharge from Asùt Tesoru summit (on the order of tens of centimeters per year). Enrichment/depletion patterns in general are consistent with observations from shallow sediment coring (e.g., Mottl et al., 2004; Hulme et al., 2010). The pattern of cation and anion enrichments and depletions in interstitial waters at Asùt Tesoru Seamount are markedly different from those observed at Yinazao Seamount. Here, alkalinity and concentrations of K, Na, and B are elevated significantly above seawater levels, and Ca and Sr are depleted relative to seawater; the opposite of what was measured at Yinazao and Fantangisña Seamounts. The patterns of enrichment are similar to South Chamorro and Conical Seamounts (Mottl et al., 2003; Mottl, 1992), although to different degrees for these elements.
Samples were collected for shore-based microbiological studies. To assess possible artifacts from drilling operations, tracers were pumped into the drill string prior to and during core recovery. Tracer analyses indicate that most of the whole-round samples for microbiology are suitable for shore-based analyses.
Despite some core disturbance, the physical property data are of sufficient quality to characterize the summit deposits of the Asùt Tesoru Seamount. Data from measurements of serpentinite muds are consistent with those from other summit sites, either during this expedition (Yinazao Seamount, Site U1492; see Physical properties in the Site U1492 chapter [Fryer et al., 2018c]) or during previous expeditions (Conical Seamount, Ocean Drilling Program [ODP] Leg 125 [Fryer, Pearce, Stokking, et al., 1992]; South Chamorro Seamount, ODP Leg 195 [Salisbury, Shinohara, Richter, et al., 2002]). Bulk density and porosity range from 1.6 to 2.0 g/cm3 and 60% to 30%, respectively. Consolidation and compaction with depth in Hole U1496A is suggested by slight increases in bulk density, thermal conductivity, and vane shear, associated with decreasing porosity. In contrast, no such trends were observed in Hole U1496B. These results suggest that Hole U1496B is closer to the main upwelling zone than Hole U1496A.
Average physical property values in Holes U1496A and U1496B differ significantly from those obtained along the three-site transect on the southern flank of Asùt Tesoru Seamount (Sites U1493–U1495). The lower bulk density of the summit compared to the flank, along with the other physical property data, suggest relatively recent eruption/deposition of the summit serpentinite muds. This conclusion is supported by the absence of surface pelagic deposits postdating the serpentinite muds, more homogeneous lithostratigraphic composition, and lower clast contents (<5%) at the summit. These observations reflect the lack of material mixing by gravitational sliding and flow down the edifice. Both processes are evident in samples from flank sites. Other evidence for activity at the seafloor includes ROV observations of fluid discharge in the area targeted by Hole U1496B (see Background and objectives) and high dissolved gas content in the mud (hydrogen concentrations = ~1 mM).
Downhole measurements include three deployments of the advanced piston corer temperature tool (APCT-3) and the WSTP in Hole U1496C. Two of the APCT-3 deployments were of sufficient quality, resulting in a calculated thermal gradient of 14.3°C/km. Using the average thermal conductivity of 1.26 W/(m·K) from measurements of material from Holes U1496A and U1496B yields an estimated heat flow of 17.8 mW/m2. The WSTP temperature data were collected 9.5 days after circulation of drilling fluids ceased. This amount of time is sufficient for the temperature in the borehole to nearly (~90%) rebound to predrilling temperatures. Fluid compositional data also indicate discharge of a deep-sourced fluid into the borehole during this period, likely warming the formation. Further analysis may resolve the rate of discharge from the open borehole.
Paleomagnetic analyses were conducted on archive section halves and 44 discrete samples from Holes U1496A and U1496B using the shipboard superconducting rock magnetometer (SRM). The unconsolidated material contains randomly oriented pebble-sized clasts, which added scatter to the pattern of remanent directions. Magnetic susceptibility values from Site U1496 are high compared to those from Site U1492.
Background and objectives
Site U1496 is located at the summit of Asùt Tesoru Seamount (informally called Big Blue Seamount) (Figure F1), a serpentinite mud volcano that lies about 72 km from the trench axis (see Figure F1 in the Expedition 366 summary chapter [Fryer et al., 2018b). Asùt Tesoru Seamount is the farthest from the trench of the three seamounts targeted for coring during this expedition. The subducting slab lies approximately 18 km below its base, according to interpretation of multichannel seismic (MCS) data (Oakley et al., 2007). This mud volcano is the largest discovered so far on the Mariana forearc. It is about 50 km in diameter and over 2 km high. It may have been active since the Eocene because Deep Sea Drilling Project (DSDP) Site 459, only 35 km southeast of Site U1496, recovered two intervals of sediment composed of about 50% serpentinite muds immediately above Eocene basement (Desprairies et al., 1982).
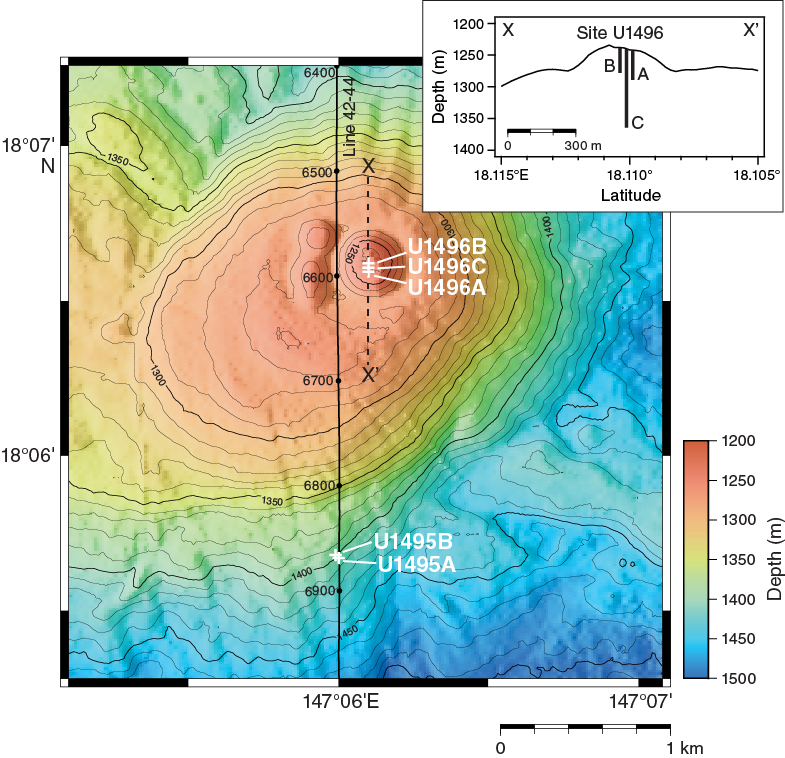
Figure F1. Bathymetric map of Asùt Tesoru Seamount summit area.
Like the many other serpentinite mud volcanoes that populate the southern half of the Mariana forearc (area between the trench and the volcanic arc), Asùt Tesoru Seamount is situated along a zone of weakness in the overriding plate’s lithosphere. The major fault that controlled the growth of the edifice has a north-northeast trend, and a crosscutting fault has a north-northwest trend (Figure F1). The north-northeast fault trend has a prominent scarp that curves around concave to the southeast at its eastern end. The summit region of the seamount has a prominent mound that lies at the intersection of these two fault trends. The summit mound is roughly circular and about 3 km in diameter and 200 m high. At its apex, it has three smaller circular mounds. One is centered at the middle of the 2 km mound and is about 150 m in diameter and 40 m high. Two others are about 75 m in diameter and 20 m high. These two smaller mounds lie side by side west of the larger 40 m high mound and are both overlapped by it. These three mounds compose a feature that resembles the head of a famous cartoon mouse.
A MCS line (EW0202 42-44) collected in 2001 with the research vessel (R/V) Ewing across Asùt Tesoru Seamount traversed the 3 km high mound (Fryer et al., 2016) (Figure F2) and shows a low acoustic impedance contrast subsurface, indicating that the muds in the mound likely contain gas. Gravity and piston cores taken at the largest summit mound in 2003 with the R/V Thomas G. Thompson recovered serpentinite muds that oozed out of the core catcher. MCS Line EW0202 42-44 shows reflectors below the surface that may represent a previous surface of the summit area that deflated since eruption and formed a depression that was subsequently refilled.
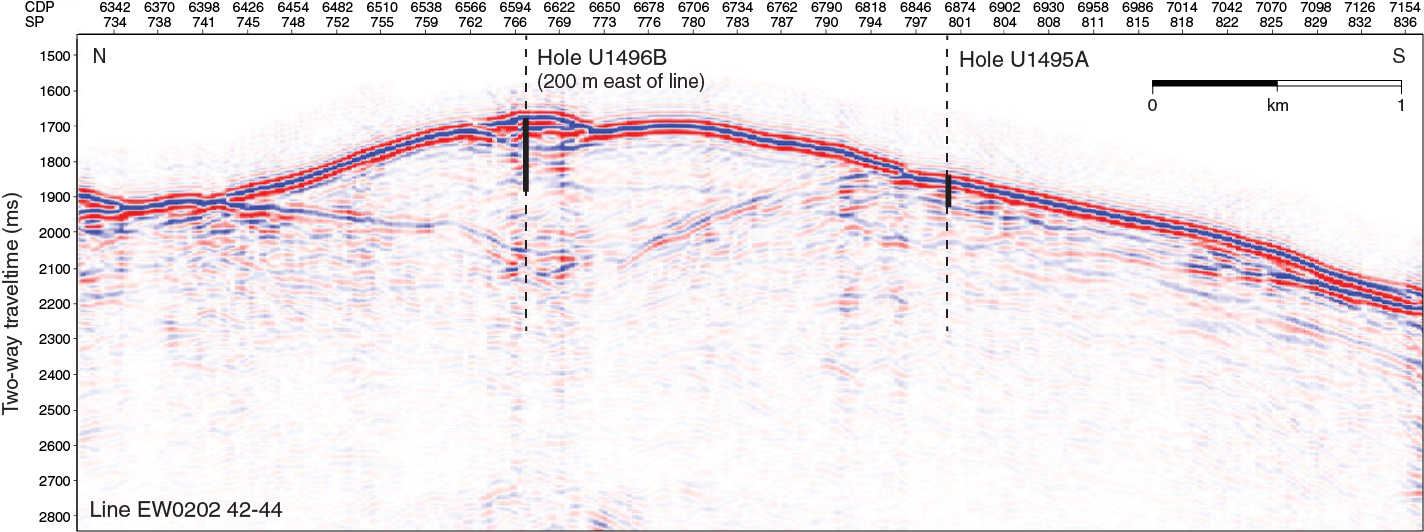
Figure F2. MCS Line EW0202 42-44.
The summit region was surveyed with a DLS-120 side-scan sonar system in 1997 to locate potential sites of fluid discharge from the seamount (Fryer et al., 2016). The ROV Jason II surveyed the summit of the larger mound in an area of low backscatter intensity (smooth surface), revealing unsedimented serpentinite mud. A transect of the larger mound was conducted with the ROV Jason II from west to east. The highest rate of fluid discharge occurred in the middle of the feature, which was the target for a gravity and a piston core, both of which indicated fluid discharge.
Three holes were planned for this site. Two would be located 50 and 100 m, respectively, south of the position of the push core that indicated the highest rate of fluid discharge. With these two 50 m deep boreholes, we expected to recover recently erupted serpentinite muds along with serpentinized peridotite clasts and perhaps other lithologies from the conduit system. We also expected to recover pore fluids with the most pristine signal from slab-derived sources, like those reported by Hulme et al. (2010). The third hole was located at the site of the ROV Jason II push core with the greatest discharge rate. Here, we planned to drill a 120 m deep hole that would be cased. The casing would include screens to serve as a future borehole observatory.
The primary purpose of the initial two boreholes was to locate a suitable place to deploy the deep borehole/casing structure and to bisect the conduit that brings deep-sourced fluids to the surface. In addition, objectives for coring the two shorter boreholes were to (1) intersect mudflows emanating from the spring to determine variability of mudflow composition and thickness, (2) investigate potential systematic variability in degree of serpentinization with young flows, (3) examine transport conditions, (4) provide a measure for the scale of potential fluid and dissolved gas fluxes and composition characteristics (e.g., diffuse vs. channelized), and (5) collect samples for microbiological studies. The objective for the deeper cased borehole was to tap into the deep-sourced conduit and serve as a later observatory/experimental site.
Operations
Hole U1496A
The 0.95 nmi dynamic positioning (DP) move to Site U1496 (proposed Site MAF-11A) was completed at 2224 h on 7 January 2017 at an average speed of 0.60 kt (all dates and times are ship local times). The positioning beacon was deployed at 2225 h. The drill string was lowered, establishing a tag depth of 1256.0 meters below rig floor (mbrf). The HLAPC was deployed, and Hole U1496A was spudded at 0045 h on 8 January. Recovery from the mudline core established a calculated seafloor depth of 1254.5 mbrf (Table T1). HLAPC/XCB coring continued through Core 366-U1496A-9F to 40.8 mbsf (1298.9 mbrf). An additional ~4 m thick hard (rock) interval was drilled at the base of the hole but not recovered. Because the rate of penetration remained slow, the decision was made to abandon the hole and try to go deeper in Hole U1496B. The drill string was pulled clear of the seafloor at 1700 h on 8 January, ending Hole U1496A and beginning Hole U1496B.
Table T1. Core summary. Download table in CSV format. View PDF table.
Hole U1496B
The ship was moved 50 m north in DP mode to the primary site coordinates. The seafloor was tagged at 1251.3 mbrf. Hole U1496B was spudded at 1915 h on 8 January 2017. Recovery from Core 366-U1496B-1F established a calculated seafloor depth of 1251.3 mbrf (Table T1). HLAPC/XCB coring continued through Core 8X to 28.4 mbsf (1279.7 mbrf), where once again a hard layer (rock) was encountered. An XCB center bit was deployed, and 6.0 m were drilled to 34.4 mbsf in an attempt to get through this interval. The HLAPC was deployed once more (Core 10F) and advanced 1.6 m to 36.0 mbsf (1285.7 mbrf), recovering 1.68 m of core. Again, the hole was abandoned in favor of trying the RCB coring system. It was recognized that recovery would likely suffer, but the RCB system is more robust and had the best chance of reaching the depth objective, which was set to the likely depth of the casing. The bit cleared the rotary table at 1540 h, ending Hole U1496B and beginning Hole U1496C.
Hole U1496C
The ship was offset 25 m south. After making up an RCB bottom-hole assembly (BHA), the drill string was tripped to 1233.0 mbrf and the top drive was picked up. The pipe was then lowered, establishing a seafloor depth of 1254.3 mbrf (Table T1). Hole U1496C was spudded at 2318 h on 9 January 2017, and RCB coring continued through Core 366-U1496C-9R to 84.4 mbsf (1338.7 mbrf). High torque and overpull led to a wiper trip to 35.7 mbsf (1290.0 mbrf) and back to total depth. RCB coring resumed, and Cores 10R and 11R were cut and recovered to 105.0 mbsf (1359.3 mbrf). The hole was swept with 20 barrels of high-viscosity drilling mud, and the pipe was pulled back to 45.7 mbsf (1300.0 mbrf). The reentry cone was released, allowing it to fall to the seafloor guided by the drill string. The reentry cone was observed on the seafloor. The drill string was subsequently pulled clear of the seafloor/reentry cone at 1555 h on 10 January. The bit cleared the rig floor at 1925 h on 10 January.
A BHA for the 14¾ inch tricone drilling assembly was assembled, and Hole U1496C was reentered at 2340 h on 10 January. The drilling/reaming process went well and continued for 8.5 h. At 0845 h on 11 January, the total desired depth of 106.5 mbsf (1360.8 mbrf) was achieved. The drill string was tripped out of the hole, and the bit cleared the rotary table at 1250 h.
Preparations then began for making up the 10¾ inch casing string. The 10¾ inch casing assembly consisted of (from bottom to top) a casing shoe joint, two additional joints of buttress casing, three screened casing joints, another three standard buttress casing joints, and a 16 inch Dril-Quip (DQ) casing hanger swaged down to 10¾ inches (Figures F3, F4). This casing string is different than the one used at Site U1492 in length and number of screened sections and lacks the pup joint between the 16 inch casing hanger and the swaged unit that necks down to 10¾ inch casing (Figure F5). The casing string was hung off in the moonpool, and the stinger BHA with mud motor and underreamer was assembled and tested. The DQ running tool was made up to the 16 inch casing hanger, which prior to deployment underwent adjustment to fit in the DQ running tool, and the entire assembly was tripped to bottom.
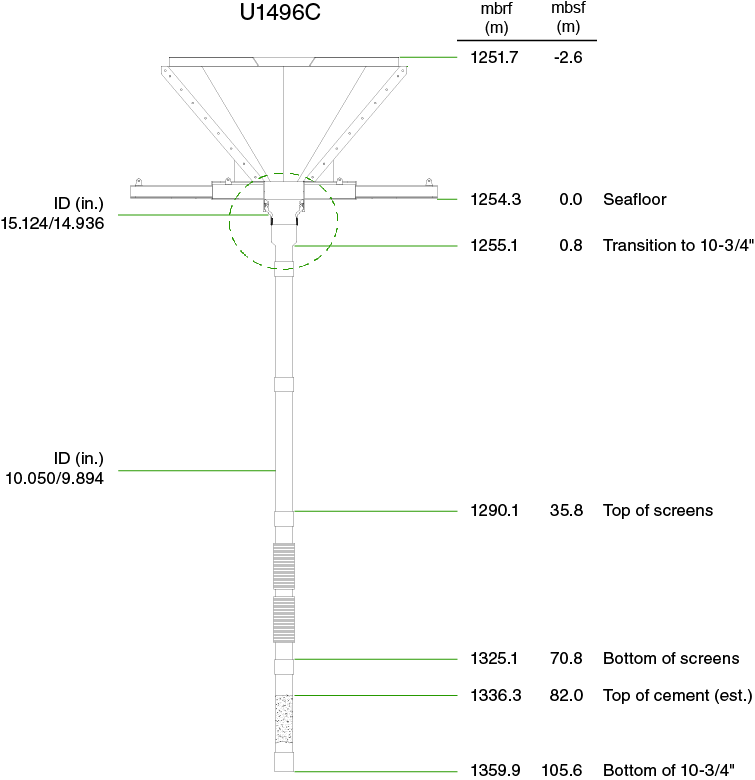
Figure F3. Schematic of observatory construction in Hole U1496.
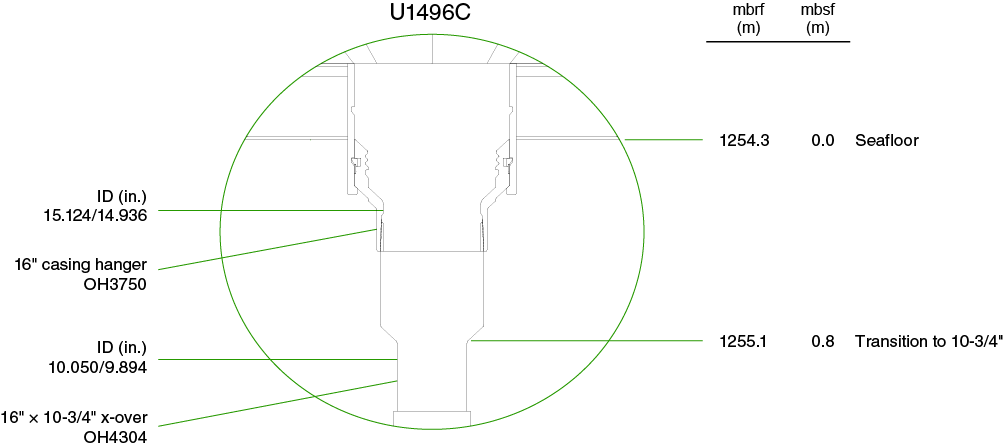
Figure F4. 16 inch casing hanger and swage.
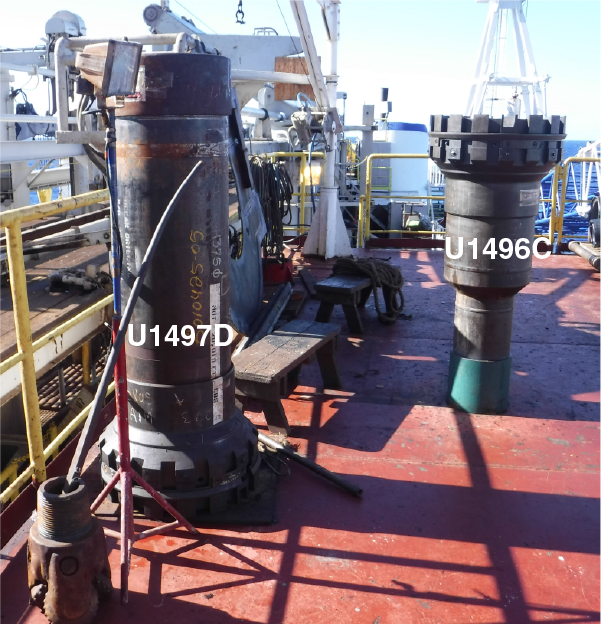
Figure F5. 16 inch casing hanger.
At 0130 h on 12 January, Hole U1496C was reentered. The casing string was washed/reamed into the hole without incident other than one tight spot at ~40 mbsf. The casing hanger landed in the reentry cone, and indications were that it latched into the cone. The DQ running tool was released without incident at 1100 h with the bit positioned inside the casing shoe at ~98 mbsf. The ROV platform was prepared for deployment. (The ROV platform was built using International Ocean Discovery Program (IODP) designs OJ4031-Platform, OJ4066-Gussets, and OJ4068 Struts. It weighs 1400 lb dry and 1220 lb in seawater.) Prior to deployment of the BHA, the ROV platform was placed in the moonpool and the drill string was deployed through the center (Figure F6). Two panels were removed to allow space for the mouse hole. Thus, the mouse hole was removed and the two panels were welded back in place before deployment. Slings were rigged to lower the ROV platform through the splash zone; however, one of the deployment slings hung up on an upper guide horn finger, slacking one of the other cables. The platform tilted dramatically as the moonpool doors were closed to allow the vibration isolated television (VIT) sleeve to be installed on the drill string. The platform metal mesh was partially damaged, and the platform prereleased from the lunar lander and free-fell to the reentry cone (Figure F7). During the platform deployment operation, the driller noted that the drill string was taking weight, indicating that the formation was encroaching into the casing beneath the drill bit. As soon as the ROV platform was released, the driller laid out some drill pipe, raising the bit from an initial position of just a few meters up inside the casing shoe to 53.7 mbsf. The VIT/subsea camera was deployed, and at 1745 h the platform was observed resting on top of the reentry cone slightly (~25 cm) off center. Several damaged areas were observed in the steel mesh surface (Figure F8). Comfortable with the position and orientation of the platform/reentry cone, the pipe was lowered back into the hole to see whether the hard fill had migrated any further into the casing or had stabilized. The drill string tagged at the same depth of ~98.7 mbsf. The bit was pulling clear of the reentry cone at 1750 h on 12 January, and another hour was spent observing the installation before the drill string was tripped back. The rig floor was secured for transit, all thrusters were raised, and at 0030 h on 13 January the ship began sea passage to Site U1497.
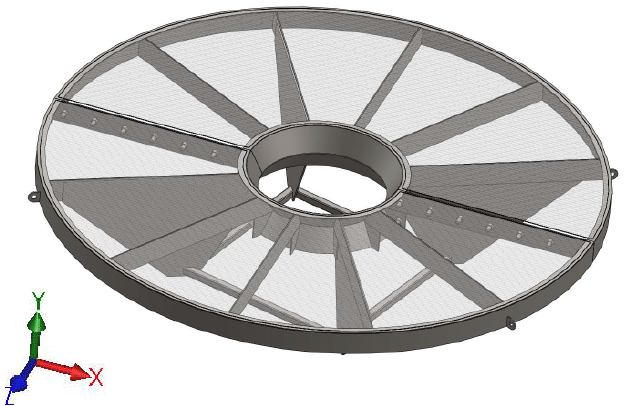
Figure F6. ROV platform.
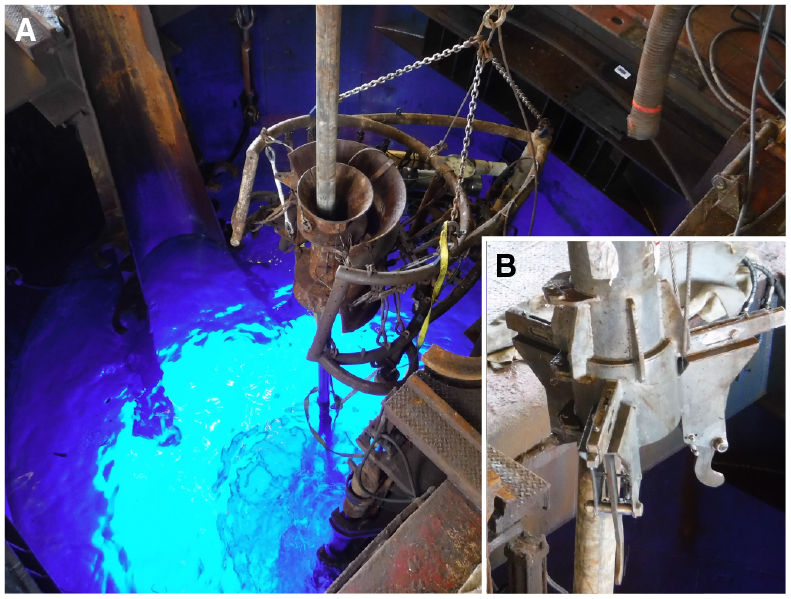
Figure F7. VIT camera system.
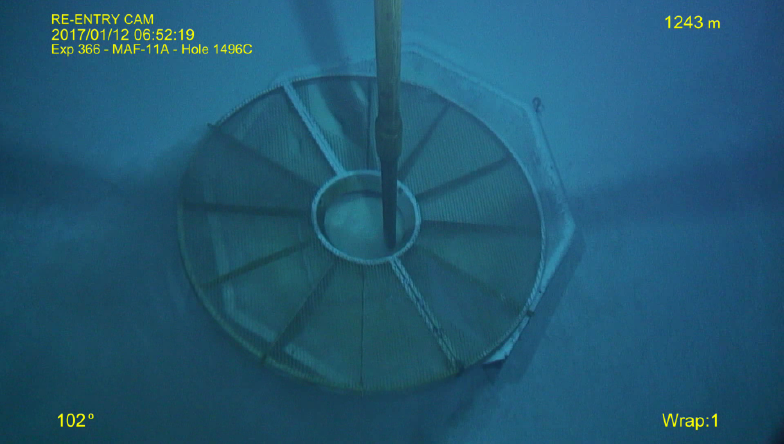
Figure F8. Reentry cone and ROV platform.
Return to Hole U1496C
After operations at Sites U1497 and U1492, we returned to Hole U1496C by 1545 h on 21 January 2017. An advanced piston corer (APC)/XCB BHA was assembled using a 9⅞ inch polycrystalline diamond (PCD) XCB bit, which allows reentry and passage through the 10¾ inch casing string. The drill string was tripped to 1217.0 mbrf, the VIT/subsea camera was deployed, and Hole U1496C was reentered at 2050 h. The VIT/subsea camera was recovered. The pipe was lowered to 42.0 mbsf (1296.3 mbrf) to the top of the uppermost screened casing joint for a successful recovery of a WSTP water sample; the tubing was flushed with 18.2 MΩ water before deployment (Figure F9). Fluids from this sample were clear (no drilling muds) and chemically altered, indicating that formation fluids entered the borehole and were likely discharging to the seafloor.
Figure F9. Final preparations for the WSTP.
After the recovery of the WSTP water sample, the drill string was lowered, tagging the top of the fill at 98.7 mbsf (1353.0 mbrf). This was the same depth, 7 m inside the casing, that was measured when we left the hole 9 days previously. Two HLAPC cores were taken inside the casing, with the second core extending beyond the casing shoe. Attempts were made to clean out the borehole to the depth of the casing shoe. We were unable to clean the hole completely. There was still 3 m of fill in the hole when a decision was made to cement the bottom portion of the hole. The VIT/subsea camera was deployed to observe the bit pulling clear of the seafloor/reentry cone. A 5 barrel 14.0 parts/gal cement plug was mixed and displaced 3 m from the bottom of the casing shoe. Given hole conditions and the amount of cement that was deployed, the top of the cement plug is estimated to be at 82 mbsf. The pipe was immediately pulled clear of the seafloor/reentry cone at 0725 h on 22 January and flushed with seawater. The bit cleared the rotary table at 1055 h on 22 January, and the ship was ready for sea passage to Site U1497 by 1200 h on 22 January, ending Hole U1496C operations.
Lithostratigraphy
Site U1496 is at a water depth of 1400 m on the summit of Asùt Tesoru Seamount (Figure F10). Materials recovered at Site U1496 comprise very minor pelagic sediment overlying serpentinite muds that are underlain by moderately to highly consolidated serpentinite sequences within the active eruptive region of this serpentinite mud volcano.
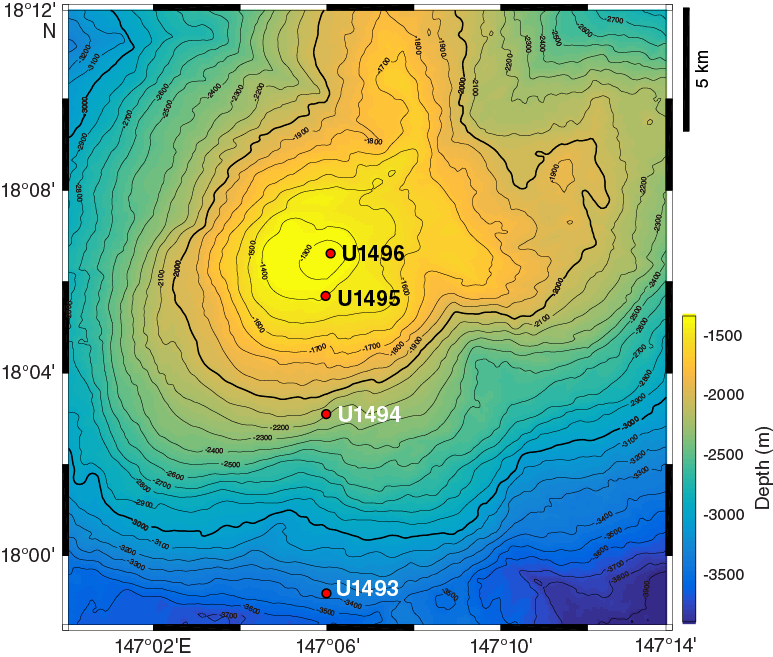
Figure F10. Bathymetric map of Asùt Tesoru Seamount.
Hole U1496A
Hole U1496A cores are divided into four units (Figure F11; Table T2) with a total thickness of 40.07 m. Unit I is grayish brown serpentinite mud, Unit II is dark blue-gray serpentinite mud with ≤1% lithic clasts, and Unit III is pale gray-green serpentinite mud with ~1% lithic clasts. Unit IV contains three subunits: Subunit IVA consists of light greenish gray serpentinite mud with 4%–5% harzburgite clasts, Subunit IVB consists of dark blue-gray serpentinite pebbly mud with 30%–35% harzburgite clasts, and Subunit IVC consists of pale gray-green serpentinite mud with 3%–4% harzburgite clasts.
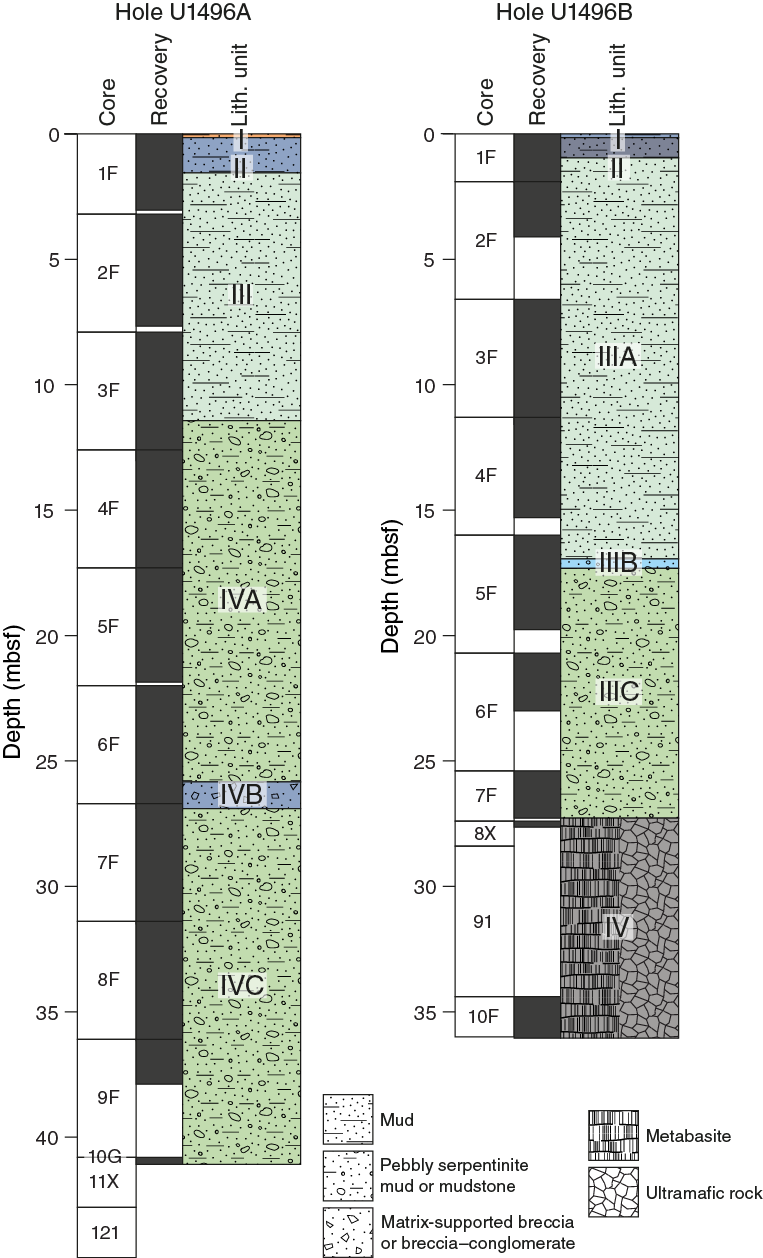
Figure F11. Lithostratigraphy.
Table T2. Lithostratigraphic units, Hole U1496A. Download table in CSV format.
Unit I
Unit I is 0.15 m thick and consists of oxidized serpentinite mud with lithic clasts. The mud is somewhat soupy and partially disturbed by coring, but the material is representative of similar serpentinite mud recovered from ODP Sites 780 and 1200 at the summits of two other previously drilled active serpentinite mud volcanoes. There is one 6 cm long by 4 cm wide clast of serpentinized ultramafic rock in the middle of the core liner in about Section 1F-1, 4–10 cm.
Unit II
Unit II is 1.40 m thick and consists of dark bluish gray serpentinite mud in Section 1F-1, 15–52 cm, with one clast of serpentinized ultramafic rock about 2.5 cm in diameter (Section 1F-1, 28–31.5 cm) that is cut by two veins. Aside from that clast, the unit contains ≤1% lithic clasts. Most clasts are small, typically coarse sand to granule sized, with few centimeter-scale pebbles. In Section 1F-1, 52–90 cm, the unit is medium bluish gray, and it grades to lighter bluish gray at the top of Section 2F (material below Section 1F-1, 52 cm, was removed for whole-round samples).
Unit III
Unit III is 9.72 m thick and consists of light greenish gray serpentinite mud with ≤1% lithic clasts. The clasts are serpentinized ultramafic rock that is too altered to infer their primary lithology. The clasts are angular to subangular and range in size from coarse sand to granules or small pebbles. Large (>2 cm) clasts are rare. A gradational transition from Unit II to Unit III occurs in Section 1F-2, 11–33 cm. Beginning at about Section 1F-2, 15 cm, the serpentinite mud changes color to greenish gray. There is a serpentinized ultramafic rock clast about 1.5 cm in diameter in Section 1F-2, 72.5–74 cm, in the center of the core liner, and another one in about Section 1F-2, 86–88 cm, is nearly 2 cm long and 1.5 cm wide. Deeper in the section, material was sampled for whole rounds. This entire unit shows fill-in features from APC coring disturbance, such as strongly up-arched surfaces. Smears of Unit II coat the sides of the core liner all the way to Section 1F-2, 90 cm. Internal details of the unit are not complete because several sections were sampled for whole rounds.
Unit IV
Subunit IVA
Subunit IVA is 14.25 m thick and consists of light greenish gray serpentinite pebbly mud similar to Unit II but containing 4%–5% lithic clasts. The dominant clasts are dark gray to black harzburgites as much as 4–5 cm in diameter but typically 1–2 cm in diameter, which stand out within the pale gray-green serpentinite matrix. Bastite pseudomorphs are common in the clast centers, but the clasts have black rims 5–6 mm thick with no visible relics, suggesting that the rims formed by alteration after the clast was incorporated into the mudflow. The upper half of one of the clasts (about Section 3F-5, 32–40 cm) appears to have been fractured and intruded by the serpentinite mud during coring.
The subdominant clasts (≤1%) are mostly small pale green serpentine chips or black chips from serpentinized ultramafic rocks. The serpentine chips are generally small, but several serpentine pebbles are as long as 2 cm. Layering in the larger serpentine chips indicate their formation as vein fill.
There are also two large, whitish clasts of metasedimentary rock (Sections 3F-5, 89–96 cm, and 3F-CC, 4–7 cm). These pebble- to cobble-sized clasts are matrix-supported siliceous microbreccias containing millimeter- to centimeter-sized lithic clasts. The lithic clasts include spherical fossiliferous clasts embedded within an ultrafine-grained micritic clay matrix. The general texture is characteristic of packstone (see Petrology).
Much of the recovery of this unit is soft and slightly soupy. Noteworthy is the smear of dark gray serpentinite mud at the top of Section 6F-1, suggestive of a flow-in or fall-in remnant from shallower levels in the stratigraphy.
Subunit IVB
Subunit IVB is 1.07 m thick and consists of dark bluish gray monomict, matrix-supported serpentinite breccia with 30%–35% lithic clasts. This unit stands out starkly from the units above and below it, but details of the contacts were lost to whole-round sampling. The dominant clasts are harzburgites with large bastite pseudomorphs. The harzburgite clasts have black rims as thick as 8 mm with no visible pseudomorphs; these rims appear to have formed after incorporation of the clasts into the mudflow. The subdominant clasts are serpentine chips that appear bleached to a white-green color. These chips occur as tiny flecks throughout the core and as larger granule size pieces that exhibit layered structure. Some of the white serpentine forms selvages on harzburgite and likely represents former veins.
Subunit IVC
Subunit IVC is 14.37 m thick and consists of light greenish gray serpentinite pebbly mud with 3%–4% lithic clasts. The dominant clasts are dark olive-gray harzburgites with bastite visible in the clast centers, but the rims are dark gray to black with no visible relics. Most harzburgite clasts are relatively fresh, but some are greener, cut by wider serpentine veins, and appear more serpentinized. This subunit is very similar to Subunit IVA.
In Section 7F-2, 0–50 cm, there are two large harzburgite clasts, one 4 cm × 6 cm, the other 3 cm × 4 cm. The larger clast has clear fresh pyroxene in its center; the smaller clast may also have pyroxene. Both clasts are dark olive-green with brick-red oxidation; the smaller clast is more oxidized than the larger one. The larger clast abuts the core liner and shows evidence of comminution on that side. Fragments broken off of the larger clast were drawn about 3 cm upsection. A dark gray halo in the mud around the smaller clast appears to have been drawn upsection a little over 2.5 cm. These two observations suggest flow-in occurred in this section. The subdominant clasts are small chips and granules of pale green serpentine. The larger serpentine chips are layered, suggesting that they were derived from vein fill.
Deeper in the hole (Section 7F-4 and below), the dominant clasts are harzburgites with 4–5 mm porphyroclasts of either pyroxene or bastite pseudomorphs of pyroxene. Here, there are no black rims on clasts. Two clasts have greenish gray rims, one in Section 7F-4, 16.5–19.5 cm, and another in Section 7F-4, 131–132.5 cm; however, most clasts make a sharp contact with the matrix mud. The subdominant clasts include serpentine chips and small white clasts (possibly silica–carbonate rock or rodingite). One 3 cm × 3 cm clast is breccia with two off-white rounded pieces cemented by pale green serpentine. Each clast in this breccia contains small green serpentine inclusions. The off-white material may be silica–carbonate or metamafic rock (rodingite). One clast in Section 7F-CC, 15–17 cm, has a light greenish gray halo (almost the same color as the mud matrix) that is about 4 mm thick around a dark gray core. Another clast in Section 8F-1, 22.5–26 cm, has a similar rim, though only 2 to 3 mm wide.
Variations in color of the matrix muds follow faint sinuous and up-arching paths through the unit, suggesting flow-in deformation from coring. The bottom of Section 8F-2 is soft and soupy and highly up-arching. Sections 8F-3, 8F-4, and 8F-CC are very soft and soupy and are likely entirely flow-in. There are no rock clasts in these three sections, just small dark gray granules, but there is a dark gray stain in Section 8F-4, 13 cm.
The abundance of clasts gradually decreases with depth below 31 mbsf. The dominant clasts are strongly serpentinized, dark gray to black ultramafic rocks containing few bastite pseudomorphs after pyroxene, and the clast size is generally small (≤1 cm). The matrix contains trace amounts of coarse sand–sized calcite crystals, with a few euhedral calcite crystals as long as 8 mm in Sections 7F-3, 7F-4, 7F-CC, and 8F-1.
In about Section 9F-1, 6 cm, the matrix becomes more solid and changes color to greenish gray. In the next section, there is clear evidence of flow-in along one-half of the section where a strip of darker olive-green serpentinite mud runs from Section 9F-2, 0–40 cm, bottoming out on a rock clast. The ghost core (10G-CC) is entirely clasts of variable lithology from serpentinized ultramafic rocks to breccia (see Petrology). In the bottommost core of this hole, in Section 11X-CC, 0–8 cm, rock clasts are enclosed in a medium-gray, serpentinite pebbly mud, but in Section 11X-CC, 8–14 cm, the mud is lighter bluish gray and encloses clasts of a variety of lithologies. In about Section 11X-CC, 14–20 cm, an interval that may comprise a single clast of light bluish to greenish gray with veins of white is transitional to breccia. Below this interval is a 1 cm thick, up-arched layer containing a white and greenish gray mottled mud with white clasts. In Section 11X-CC, 22–25 cm, another up-arched layer comprises angular clasts of dark gray and white rock. In Section 11X-CC, 25–27 cm, the bottom of the section, the core contains dark greenish gray, semiphacoidal, serpentinized mud mixed with serpentinized ultramafic phacoids.
Hole U1496B
Hole U1496B cores comprise four units (Figure F11; Table T3) with a total thickness of 35.27 m. Unit I is bluish gray serpentinite mud with foraminifers, and Unit II is dark bluish gray serpentinite mud with no lithic clasts. Unit III is divided into three subunits. Subunit IIIA is light greenish gray serpentinite mud with sparse (average = 2%) lithic clasts, Subunit IIIB is blue-gray serpentinite pebbly mud with ~8% lithic clasts, and Subunit IIIC is light greenish gray serpentinite pebbly mud with sparse (average = 3%) lithic clasts. Unit IV does not include complete cores, only lithic clasts and fragments created by rotary drilling. These clasts include ultramafic rocks, metabasalts (greenstones), and possibly rodingites.
Table T3. Lithostratigraphic units, Hole U1496B. Download table in CSV format.
Unit I
Unit I is 0.12 m thick and consists of very dark bluish gray serpentinite mud with foraminifers. The unit shows strong flow-in features, is very soupy, and exhibits pronounced up-arching and smearing of dark serpentinite mud down the core liner over the entire length of the interval. The darkness of the unit may also indicate the presence of manganese oxide coating on the seafloor or on some of the ultramafic rock clasts that have been smeared out or disaggregated in the coring process.
Unit II
Unit II is 0.84 m thick and consists of medium to dark bluish gray serpentinite mud with no lithic clasts. The transition to Unit III was lost to whole-round sampling at the base of this section.
Unit III
Subunit IIIA
Subunit IIIA is 15.98 m thick and consists of light greenish gray serpentinite mud with about 2% lithic clasts on average. Some sections contain many more clasts than others. The mud is soft and slightly soupy. The clasts are serpentinized ultramafic rock; they are subangular and range in size from coarse sand to granules or small pebbles. Large (>2 cm) clasts occur in Section 1F-CC, 1–7 and 12–15 cm, but elsewhere in the unit they are rare. The matrix mud shows very subtle vertical streaking and up-arching of the matrix where color changes occur, as was observed in Subunit IVA in Hole U1496A. The fill-in features are very evident in Section 3F-5. In Section 5F-1, 0–78 cm, the matrix mud is very soft and shows necking in several places.
Subunit IIIB
Subunit IIIB is about 0.38 m thick and consists of dark bluish gray serpentinite pebbly mud with ~8% lithic clasts. This subunit stands out from the subunits above and below it based on its darker color and higher clast content; it is similar to Subunit IVB in Hole U1496A but with significantly fewer clasts. The dominant clasts are harzburgites, as long as 8 cm on their long axis, with dark alteration rims where they contact the matrix.
Subunit IIIC
Subunit IIIC is 9.96 m thick and consists of light greenish gray serpentinite pebbly mud with ~3% lithic clasts. The dominant clasts are harzburgites. The dark bluish gray serpentinite pebbly mud in Subunit IIIB occurs as a smear down the sides of the core liner into Subunit IIIC to at least Section 5F-2, 37 cm, suggesting in-flow disturbance during coring. In Section 5F-3, 24–39 cm, a trail of granule-sized dark serpentinized ultramafic clasts is encased in a thin (2 mm wide) band of greenish gray mud that loops upcore and folds down upon itself, also indicating flow-in deformation. The bottom of Section 6F-CC, 7–11 cm, is soupy. This soupy matrix continues throughout Core 7F.
Unit IV
Unit IV is 7.87 m thick and does not include complete sections, only lithic clasts and fragments created by rotary drilling, except for Section 10F-1, 0–27 cm, which recovered very soupy light bluish gray serpentinite mud with granules of serpentinized ultramafic rocks. These clasts include ultramafic rocks, metabasalts (greenstones), and possibly rodingites. The ultramafic rocks include relatively fresh harzburgites and dunites. The metabasalts are dark greenish gray, medium-grained greenstones. Some pieces are crosscut by thin light green veinlets and carbonate veins (as large as 1 mm). Other pieces appear to be rodingites(?) composed of a reddish brown mineral and a dark grayish green mineral, possibly chlorite or amphibole. These pieces also contain carbonate and are typically crosscut by carbonate veins. One small clast comprises pink and white vein fill; it may be a rodingite or related to rodingite mineralization.
A few clasts are coarse-grained metamorphosed mafic rocks. These clasts have a white powdery coating on several sides that does not react to hydrochloric acid; similar thin, white veins occur within the clasts.
Petrology
Site U1496 cores are composed of serpentinite mud with hard rock clasts. Dominant clasts are dark gray serpentinized ultramafic rocks, and subdominant clasts are metadolerite and sedimentary lithic clasts. Ultramafic rocks are mostly serpentinized harzburgite displaying patches of bastite after orthopyroxene and dark gray serpentinized olivine. Dunites and orthopyroxenites occur in Sections 366-U1496A-10G-CC, 27–49.5 cm, and 2F-4, 10–13 cm, respectively. Various types of altered mafic rocks were recovered. Greenish gray fine- to medium-grained metadolerites, which are characterized by pink, mildly altered titanaugite, occur in the lowermost parts of Hole U1496B (Sections 8X-CC, 0–41 cm, and 10F-2, 0–38 cm. They are crosscut by reddish brown to light green veinlets and carbonate veins as thick as 1 mm. Some altered mafic rocks occur as volcaniclastic breccia–conglomerate. The detailed petrography of these samples is reported in the following sections.
Serpentinite mud
The mineralogy of the serpentinite mud from the summit of Asùt Tesoru Seamount is relatively homogeneous, although its color varies from light green to dark greenish gray. Serpentinite is dominant throughout the cores. Compared with the Site U1492 serpentinite mud (Unit II) from the summit of Yinazao Seamount, contents of brucite (as much as 5%) and garnet (as much as 2%) are remarkably higher, whereas magnetite (~0.6% = average of 24 samples) and carbonate contents are significantly lower. Pelagic and volcanic compositions including microfossil and glass are occasionally observed even in bottom layers.
Serpentinite mud from Sections 366-U1496A-7F-CC, 0–11 cm, 7F-3, 120–140 cm (MBIO2), and 7F-2, 30–49 cm, was wet sieved with opening sizes of 125 and 250 μm and dried in an oven for several hours at 80°C. The >250 μm fraction of the mud is composed of 55% green serpentine fragments, 45% serpentinized ultramafic rock fragments, and accessory calcite, magnetite, chromite, and hydrogarnet(?) (Figure F12).
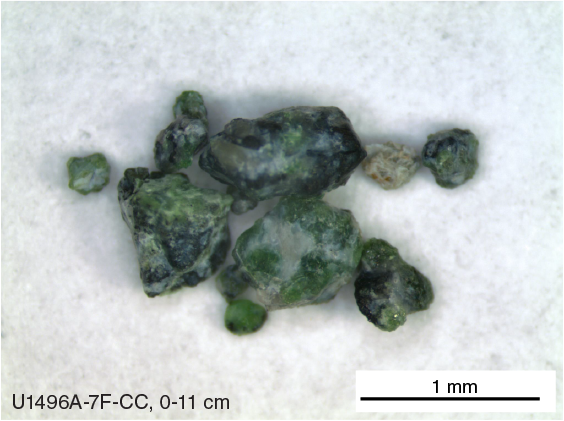
Figure F12. Green garnet associated with Cr spinel.
Hole U1496A
Fourteen, eleven, and six smear slides of serpentinite mud were prepared for Holes U1496A, U1496B, and U1496C, respectively. In Hole U1496A, the serpentinite mud changes from light brown to dark bluish gray and light greenish gray. The light brownish oxidized serpentinite mud (Unit I) in Hole U1496A consists of dominant sandy to silty serpentine (95%) with acicular-radial aragonite (~3%) (Figure F13). Anhedral to euhedral magnetite is the dominant Fe oxide, whereas some reddish brown grains of limonite also exist. A few grains of brownish glass and euhedral light green garnet (probably grossularite) were also observed.
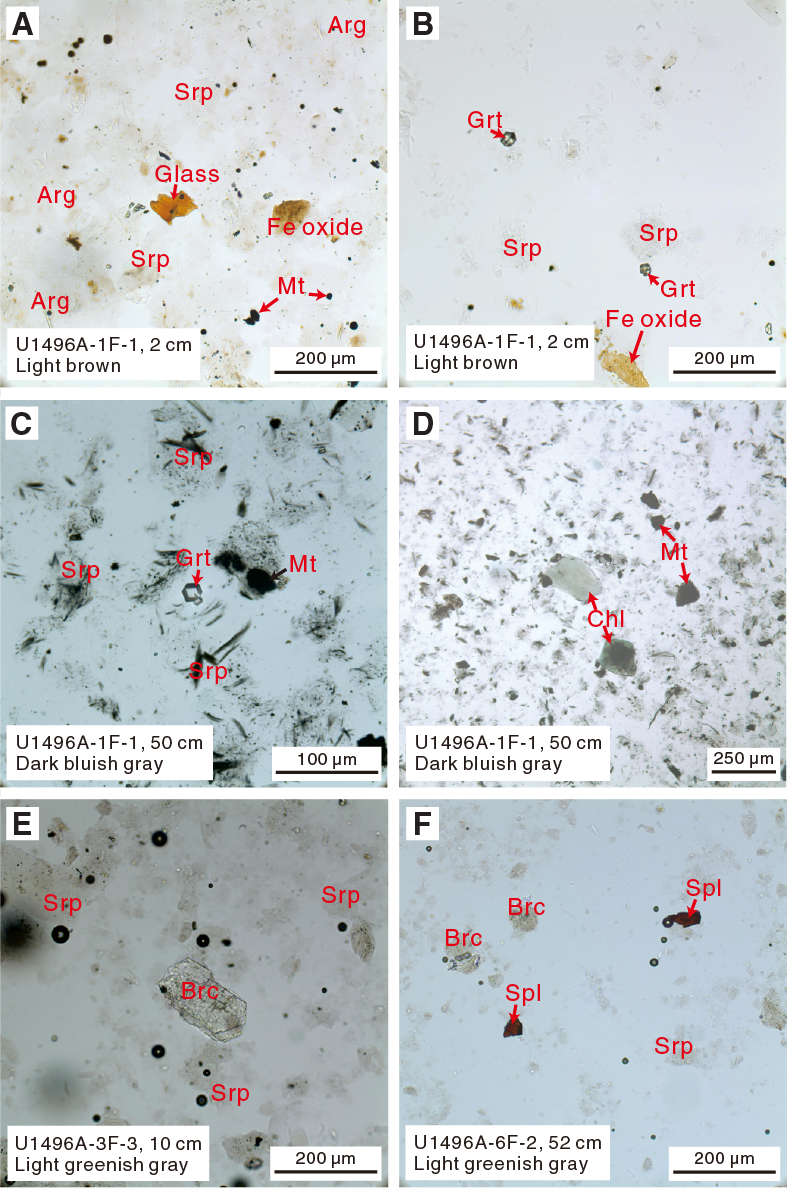
Figure F13. Serpentinite mud, Hole U1496A.
The dark bluish gray serpentinite mud (Unit II) is composed of sandy to silty, dusty-fibrous to granular serpentine (90%) filled with minute magnetite grains. Subhedral magnetite grains were also observed. The total magnetite abundance reaches ~10%. Trace garnet, chlorite, brucite, spinel, and sand- to clay-sized carbonate are also found.
The light greenish gray serpentinite mud (Units III and IV) is dominantly composed of silty to clayey serpentine (93%–99%) and subdominant brucite (1%–3%), minor sand-sized chlorite (trace to 1%), small grains of magnetite (trace to 1%), and trace garnet, calcite, and spinel. Downhole variations in smear slide components of Hole U1496A are shown in Figure F14.

Figure F14. Downhole changes in mud composition.
Scanning electron photomicrographs of dark bluish black serpentinite mud from Section 366-U1496A-1F-1, 48–49 cm, show the main mineral components of the mud (Figure F15). Prisms of aragonite are embedded in and draped by matted asbestiform serpentine (probably chrysotile) with microcrystalline magnetite (≤2 µm) scattered in the serpentine fibers. When the muds are disaggregated in water and allowed to settle, the accumulated constituent minerals are dominantly asbestiform serpentine with scattered aragonite and magnetite.

Figure F15. Dark bluish black serpentinite mud.
Hole U1496B
In Hole U1496B, the serpentinite mud changes from dark bluish gray to light greenish gray, and the brownish oxidized layer is absent. The dark bluish gray serpentinite mud at the top of this hole (Unit I) is composed of dominant silty to clayey dusty (from dark gray to colorless) serpentine (90%) with minor radial-acicular aragonite (as much as 4%) and magnetite (as much as 4%) and trace garnet (Figure F16), spinel, limonite, and chlorite. Magnetite is partly hosted in fibrous serpentine and partly as euhedral grains in the serpentine matrix. It seems that magnetite grew inside of the fibrous serpentine first, then grew on the surface of the serpentine as tiny grains, and finally formed an opaque aggregation. Volcaniclastic fragments, including glass and feldspar, and microfossils such as foraminiferal fragments, calcisphere, and nannofossils, were also observed.
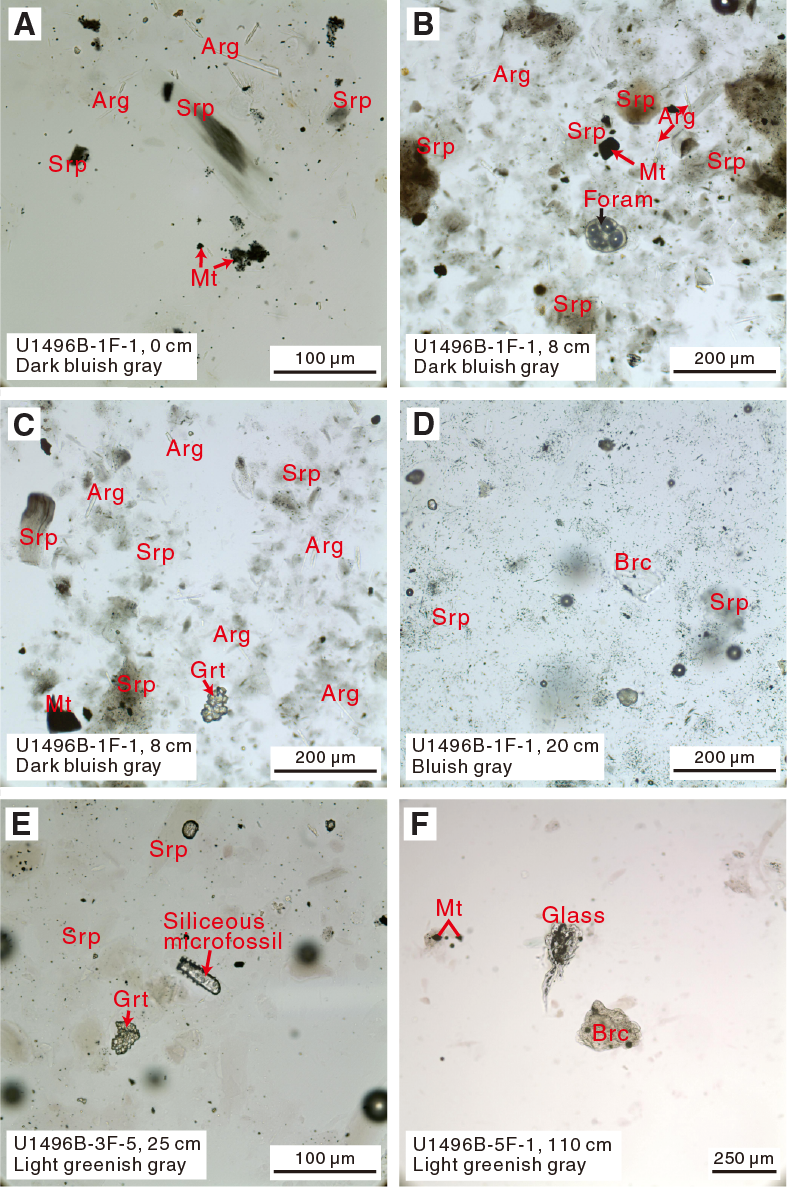
Figure F16. Serpentinite mud, Hole U1496B.
The bluish gray serpentinite mud (Unit II) below the dark bluish gray serpentinite mud is composed of dusty sand- to clay-sized serpentine (92%) filled with ubiquitous small magnetite (3%), minor brucite (3%), and trace garnet, chlorite, and spinel.
The light greenish gray mud (Unit III) is mainly composed of dominant silty to clayey serpentine (93%–97%), minor sand-sized brucite (2%–5%), and silt-sized euhedral to subhedral magnetite (trace to 1%), trace chlorite, tremolite (only in Sample 366-U1496B-5F-1, 110 cm), garnet, and spinel. Trace clay-sized calcite is sometimes scattered in the serpentine matrix. Pelagic and volcanic grains, as well as coccolithophorids, siliceous microfossils, and sand-sized glass, were occasionally observed. Downhole variations in smear slide components in Hole U1496B are shown in Figure F17.

Figure F17. Downhole changes in mud compositions, Hole U1496B.
Hole U1496C
In Hole U1496C, due to low recovery with the RCB system, only six smear slides, five from Section 1R-1 and one from Section 11R-3, were made. Summarized results are shown in Figure F18.
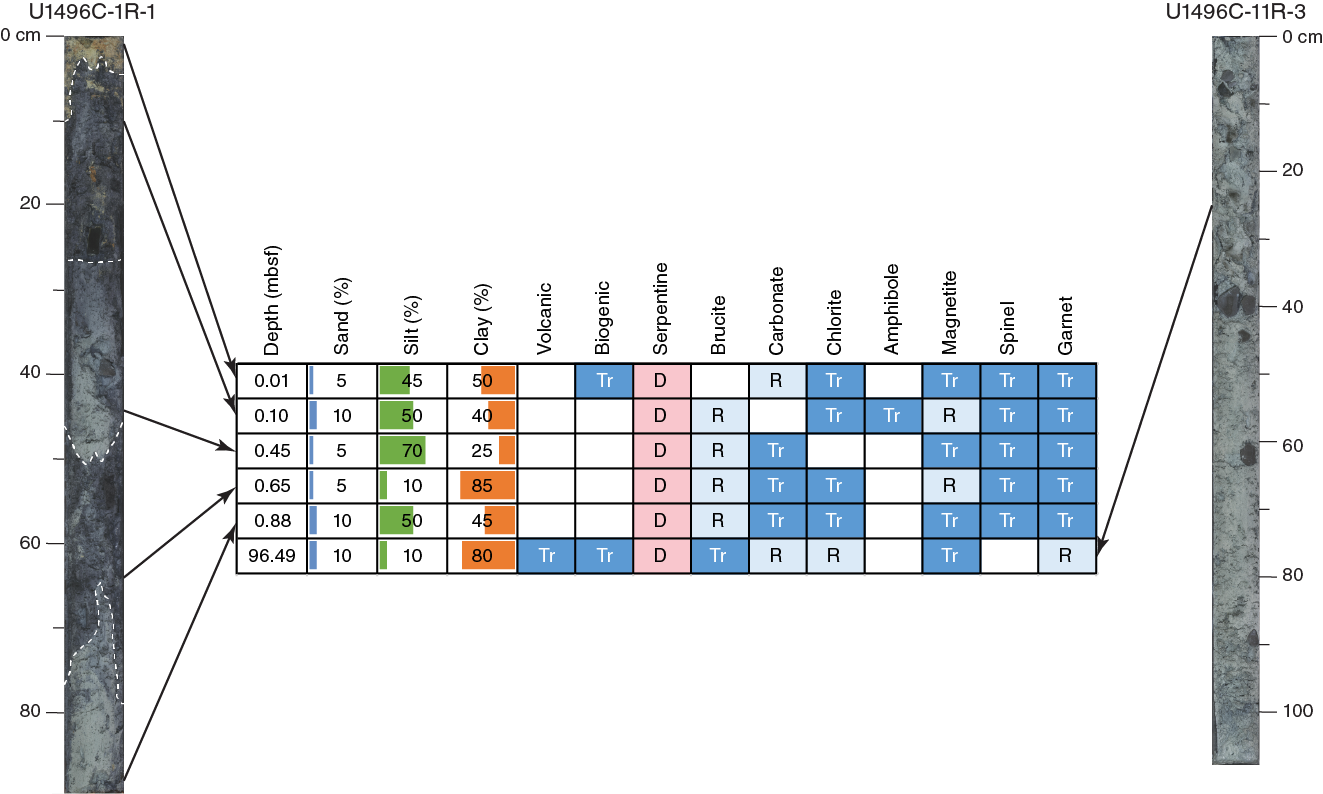
Figure F18. Downhole changes in mud compositions, Hole U1496C.
Sample 366-U1496C-1R-1, 1 cm, is a light greenish color and is dominated by clay- to silt-sized serpentine with trace foraminiferal fragments and a coccolith grain (Figure F19). Acicular aragonite crystals (~3%) suggest a mixture of seawater and upwelling fluid. Magnetite, hematite, garnet, and chlorite were also found.
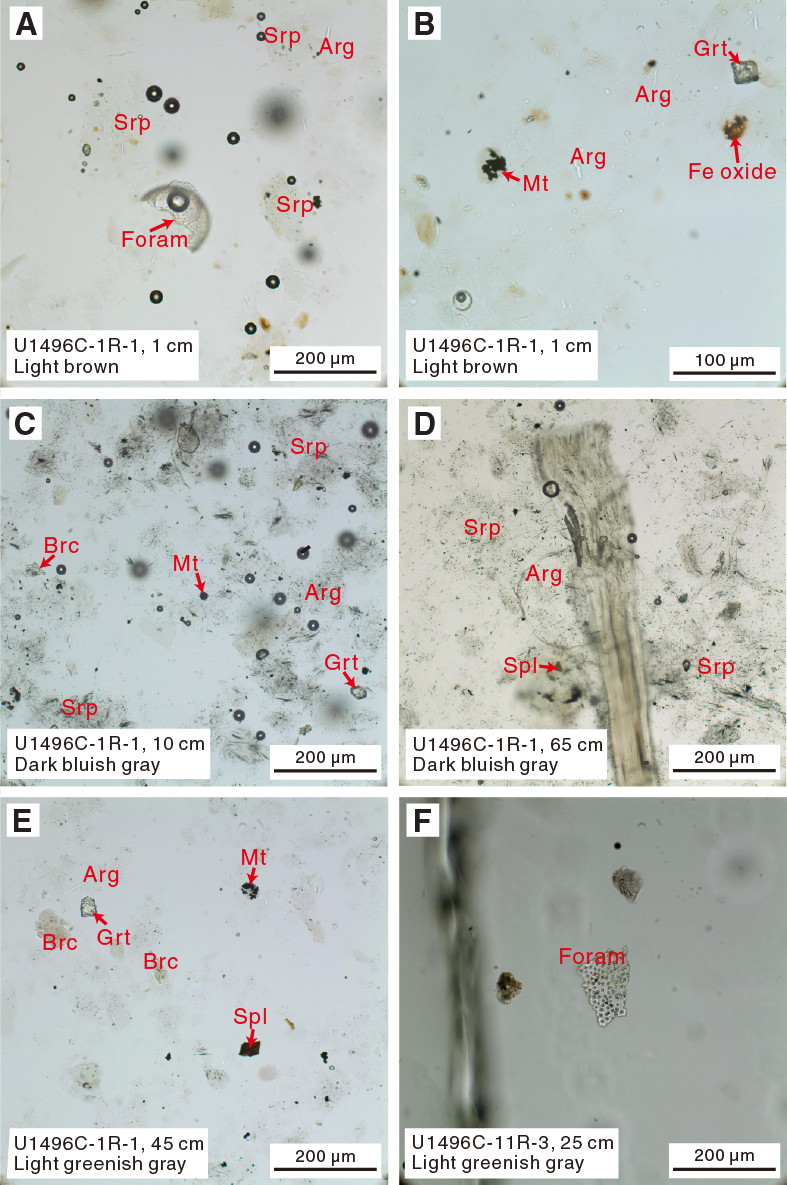
Figure F19. Serpentinite mud, Hole U1496C.
The mineral compositions of the other samples from the light greenish layer or dark blue layers are similar. Serpentine is dominant, and brucite, magnetite, chlorite, carbonate, spinel, and garnet are accessory. However, dusty serpentine fibers filled with minute grains of magnetite are abundant in Samples 1R-1, 10 and 65 cm, forming dark bluish layers in both intervals. Trace fragments of glass and foraminifers found in Sample 11R-3, 25 cm, indicate pelagic input even in deeper layers. With episodicity of eruptive phases, this is not unlikely.
Serpentinized ultramafic rocks
Ultramafic clasts recovered from Site U1496 are dominantly dark gray harzburgite with 50% to 100% serpentinization. Some are severely altered to serpentinite with non-pseudomorphic interpenetrating texture. Orthopyroxenite (Section 366-U1496A-2F-4, 10–13 cm) and dunite (10G-CC, 0–30 cm) also occur. Four representative serpentinized harzburgites, one orthopyroxenite, and one dunite were selected for petrographic description.
Harzburgites
Sample 366-U1496C-5R-1, 5–7 cm (TS 87), is partly serpentinized harzburgite (60% serpentinization) (Figure F20). The estimated protolith consists of about 75% olivine and 25% orthopyroxene with trace amounts of chromian spinel. Olivines range from 0.8 to 2.5 mm in size (average = 1.2 mm) and display evident kink banding and undulatory extinction. Orthopyroxenes average 1.4 mm in size (as long as 3 mm). Some have relatively round shapes, consistent with sheared deformation. Spinels occur as interstitial phases with holly leaf texture (average size = 0.8 mm) and do not show association with pyroxene (Figure F21). The elongate habit of pyroxene and olivine, holly leaf interstitial spinel, and the lack of association of spinel with pyroxene all suggest a moderately deformed porphyroclastic texture.

Figure F20. Location of thin section billet and serpentinized harzburgite clast.

Figure F21. Porphyroclastic texture.
Sample 366-U1496A-8F-1, 23–26 cm (TS 80), is a massive serpentinized harzburgite (about 90% serpentinization) displaying pseudomorphic mesh and bastite textures that partly recrystallized into interpenetrated lamellae of serpentine. Bastite pseudomorphs after pyroxene commonly contain associated amphibole. Primary olivine grains are inferred to be equant with 1–2 mm size (some up to 3 mm long and 0.8 mm across) and smooth curvilinear grain boundaries. They do not show kink bands or undulatory extinction. Altered orthopyroxenes (bastite) are about 2–3 mm long. Large red-brown picotite spinels up to 1.2 mm across were observed.
Samples 366-U1496A-6F-2, 57–60 cm (TS 77), and 6F-5, 64–66 cm (TS 78), are 100% serpentinized harzburgite containing about 75% hourglass-textured serpentine after olivine and 25% bastite after orthopyroxene. In these samples, very large orthopyroxene pseudomorphs (as large as 5 mm) have smooth curvilinear grain boundaries with undeformed olivine. Smaller interstitial clinopyroxene pseudomorphs fill space between olivine grains. Large 0.4 mm red-brown spinels are typically associated with, or inside, large bastites.
Dunite
Sample 366-U1496A-1F-1, 4–6 cm (TS 70), represents a massive dunite with a coarse, foliated texture. The sample contains 40%–50% pseudomorphic mesh texture serpentine. Well-preserved olivine occurs within the mesh, along with subhedral Cr spinel. Primary grain size can be estimated from contacts between areas with different optical orientations (Figure F22). Olivine forms giant elongate grains as large as 12 mm × 4 mm, with some small 1–2 mm subequant grains. Undulatory extinction is evident in large grains. Distinct domains are sheared, and aligned olivine clasts have a shape-preferred orientation. Sheared domains show more intense serpentinization (80%–90%). A conjugate to irregular vein network is formed by chlorite, serpentine, and fine-grained carbonate(?) and clay minerals(?) with fibrous spherical growth textures. Veins have alteration seams composed of opaque (sulfate) minerals within a serpentine mesh; almost no olivine is preserved within the alteration seams.
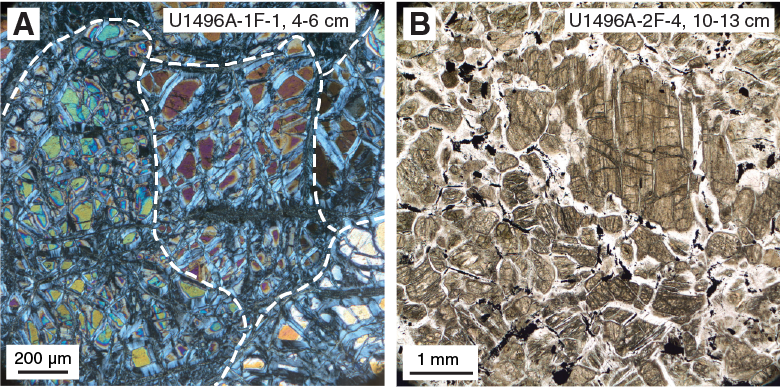
Figure F22. Dunite and pyroxenite.
Orthopyroxenite
Sample 366-U1496A-2F-4, 10–13 cm (TS 71), is a massive serpentinized orthopyroxenite (95% serpentine and possibly 5% orthoamphibole) crosscut by fibrous serpentine veins (Figure F22). Modal abundances of primary olivine and orthopyroxene appear to be about 5% and 95%, respectively. Blocky euhedral grains of spinel occur as a minor accessory phase. The primary rock texture is granoblastic (decussate). Orthopyroxenes are severely altered to pseudomorphic bastite serpentine and a higher birefringence mineral, probably orthoamphibole (anthophyllite?). Olivine is altered to non-pseudomorphic interpenetrating serpentine and brucite. Brucite, magnetite, and talc or anthophyllite (colorless mineral with high birefringence color and positive elongation sign that is probably talc) occur in the serpentine veins.
Mafic igneous rocks
Mafic igneous rocks comprise a diverse suite at Site U1496 (Table T4). All such rocks were highly altered under subgreenschist facies conditions such that primary plagioclase is replaced entirely by low-temperature assemblages, but Ca-rich clinopyroxene is only partly altered to amphibole and relict primary pyroxene is commonly preserved. Three suites of igneous rock were found: (1) fine- to medium-grained gray-green metadolerites, (2) volcanic breccias containing basalt vitrophyre clasts, and (3) metabasalt. These suites preserve a range of primary igneous textures, including subophitic, intergranular, and vitrophyric.
Table T4. Igneous lithologies. Download table in CSV format.
Dolerite
Greenish gray fine- to medium-grained metadolerites crosscut by light green very thin veinlets and carbonate veins (as large as 1 mm) occur at the bottom of Hole U1496B in Sections 8X-CC, 0 cm, to 10F-2, 38 cm (Figure F23). They contain a reddish brown carbonate domain in Section 8X-CC, 21–41 cm.
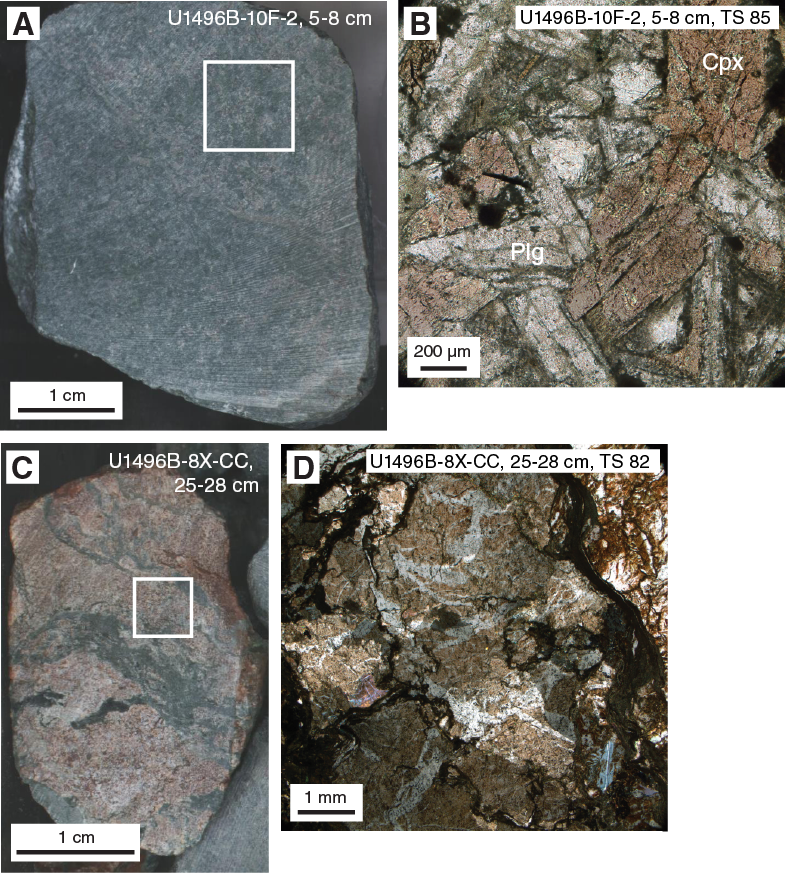
Figure F23. Metadolerite and carbonate veins.
Samples 8X-CC, 33–36 cm (TS 83), and 10F-2, 5–8 cm (TS 85), are fine-grained equigranular metadolerites. They consist mainly of ~500 µm sized pink, moderately fresh titanaugite and plagioclase. Some plagioclase laths are embedded in titanaugite crystals. Primary plagioclase is completely altered to clay minerals but still preserves relict albite twinning. Some pink titanaugites are partly altered to aegirine–augite at rims and along fractures. Disseminated acicular titanite occurs. Reddish clay-mineral or carbonate veins crosscut these rocks.
Sample 10F-2, 0–5 cm (TS 84), consists of two domains: metadolerite and breccia. The metadolerite domain shows medium-grained equigranular texture. Euhedral to subhedral pink clinopyroxenes are partly altered to chlorite, and plagioclases are completely replaced by fine-grained alteration minerals. Some clinopyroxene is partly replaced by chlorite, epidote, and a bluish and low birefringence mineral, possibly Na-rich amphibole, which should be confirmed by microprobe analysis. The breccia domain is composed of metadolerite clasts and a clay mineral matrix. Secondary magnetite and sulfide are scattered throughout the entire section. On the whole, this sample exhibits weak foliation. Ductile deformation is seen in elongated, boudinaged altered mineral grains surrounded by shear bands in one corner of the thin section.
The reddish brown carbonate that occurs in association with greenish metadolerite (Section 8X-CC, 25–28 cm; TS 82) is composed of red and green domains. The red domain contains carbonate minerals overprinted by reddish, secondary alteration clay minerals. The green domain consists of chlorite, epidote, and clay minerals.
Volcaniclastic breccia
Clasts of volcaniclastic breccia and metabasalts were observed at different depths in Hole U1496A (Sections 3F-CC, 19–21 cm, 7F-4, 124–126 cm, 10G-CC, 27–29 cm, and 10G-CC, 27–28 cm).
Sample 3F-CC, 19–21 cm (TS 72), is altered volcaniclastic breccia with an irregular serpentine vein network. Clasts range from ~50 µm to 5 mm in size and are composed of two types of volcanic rock fragments: moderately clinopyroxene–plagioclase-phyric basalt (Figure F24) and sparsely clinopyroxene-phyric basalt. Both are vitrophyres with a devitrified, glassy black matrix. Plagioclase laths in each clast are completely altered to low birefringence minerals. The breccia matrix consists of altered microcrystalline minerals. Shear bands defined by ultrafine-grained, dark brown symplectite preferentially formed within the fine-grained matrix.
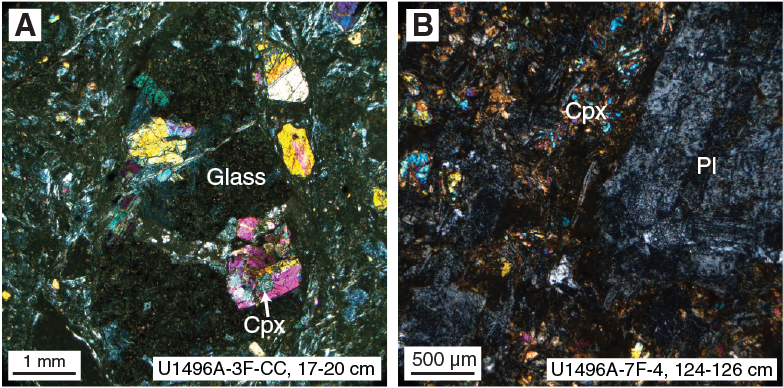
Figure F24. Volcaniclastic breccias.
The volcaniclastic breccia from Section 7F-4, 124–126 cm (TS 79), consists of fine-grained, plagioclase-phyric (>2 mm) metabasalt clasts and microcrystalline breccia matrix. The clasts are ~0.5 mm sized equigranular plagioclase and greenish clinopyroxene. Plagioclase is altered to a fine-grained clay mineral but still preserves relict albite twinning and zoning. The breccia matrix consists of a brown clay mineral, chlorite, and fragments of metabasalts. A thin chlorite vein crosscuts the sample.
Basalt
Metabasalt from Section 366-U1496A-10G-CC, 27–28 cm (TS 76), shows white and green layering. The white layers are made of acicular chlorite and amphibole crystals, and the green layers are mainly composed of thinly recrystallized greenish mineral (epidote?). Sample 366-U1496B-10F-2, 13–21 cm (TS 111) is deformed basalt with intersertal texture containing pink-bronze titanaugite. Plagioclase and mesostasis are all replaced by secondary minerals. Titanite occurs as long, acicular needles. The general microstructure is cataclastic, mainly matrix-supported volcanic/volcaniclastic breccia with poorly sorted clasts and highly variable grain size. Clasts are composed mainly of pink titanaugite and plagioclase ~300 µm in size. Euhedral to subhedral, elongate plagioclase is partly altered to clay minerals. Titanaugite is partly altered to aegirine–augite along cracks and edges.
Sample 366-U1496B-10F-2, 17–20 cm (TS 112) is augite microphyric basalt containing pink-bronze titanaugite microphenocrysts and groundmass. Plagioclase microphenocrysts and mesostasis are completely replaced, in part by sprays of bright green pleochroic chlorite. There are abundant interstitial microcrystalline elongated prisms of a highly birefringent, colorless, nonpleochroic mineral with parallel extinction, possibly phengite or anthophyllite. The sample contains abundant acicular needles of titanite and an ultracataclastic, millimeter-thick shear band with lens-shaped dolerite clasts.
(Meta-)sedimentary lithic clasts
Pebble-sized clasts of whitish metasedimentary rock were retrieved from Sections 366-U1496A-3F-5 and 3F-CC. Macroscopically, these clasts are matrix-supported microbreccias with millimeter- to centimeter-sized lithic clasts. The microbreccias are generally siliceous, although some are slightly carbonaceous.
At microscale, fossiliferous clasts are mostly spherical, some with falcate shape, and minor lithic clasts are embedded within an ultrafine-grained micritic clay matrix (Sample 366-U1496A-3F-5, 96–98 cm; TS 73). Both the fossiliferous and lithic components are highly altered and do not display an internal structure or texture. Lithic clasts are subangular to subrounded. Single spherical clasts are surrounded by thin rims of fibrous carbonate. The general texture is characteristic for packstone with lithic fragments. Distinct brownish bands with serpentine and acicular pigmented minerals crosscut the sedimentary fabric. Irregular veins, often with splays, show a zoned mineralization with chlorite in the central part and serpentine along the vein-wall contact with the rock. Single irregular, tiny microveins and gashes are filled with chlorite and epidote.
Structure
Brittle deformation structures were observed in a few clasts from Hole U1496A, particularly in Cores 6F, 10G, and 11X (Figure F25). Serpentine veins of various morphologies, geometries, and structures crosscut large serpentinite clasts.
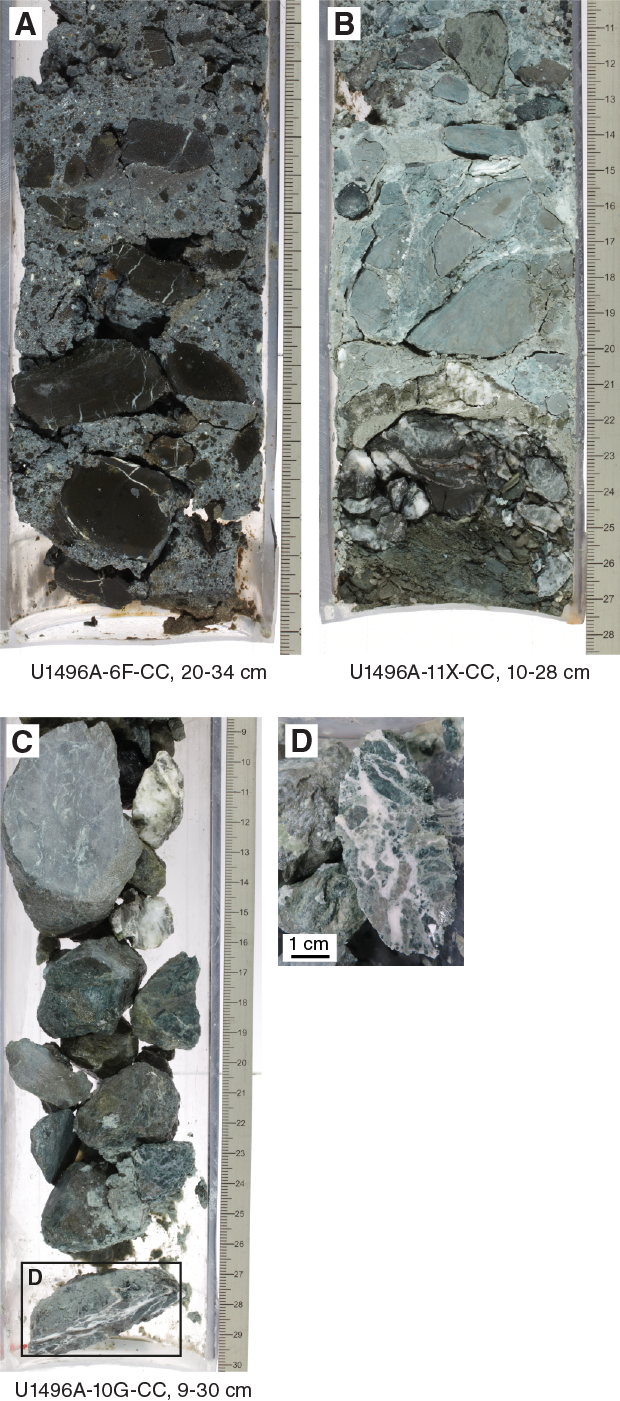
Figure F25. Brittle deformation structures.
Conjugate fracturing to minor fracturing is present. Vein networks are composed of narrow (<1 mm thick) fractures that seem to be filled with black serpentine (chrysotile?). This network is composed of subvertical and subhorizontal fractures. Serpentine veins with 1–2 mm thick halos are crosscut by pale green to white serpentine veins. These veins are 0.4 to 2 cm long and 0.05 to 1 mm thick, mostly conjugate and branched with a straight to kinked morphology. They form along the previous serpentine veins and their associated halos and typically crosscut them at high angles.
Lithostratigraphy, petrology, and structure summary
Both of the holes cored at the summit of Asùt Tesoru Seamount are characterized by a dominance of pale green serpentinite mud with a low proportion of lithic clasts compared to the flanks and other sites. The pale green serpentinite mud is typically soupy or very soft due to its high gas content, and it often continued to outgas long after curation. Zones of dark blue serpentinite mud are uncommon and characterized by higher clast counts. These characteristics are consistent with an active summit site that is currently producing high-pH water and abiotic hydrogen and methane.
Although less common than at other sites, hard rock clasts derived from beneath the seamount provide important insights into the mud volcano plumbing system and the variety of course regions for rock clasts. Ultramafic clasts are the most common, typically highly serpentinized harzburgites with less common dunite and orthopyroxenite. These clasts represent samples of the underlying forearc mantle lithosphere at the root of the serpentinite mud volcano system.
Of significance are the mafic metavolcanic and sedimentary clasts. The sedimentary clasts include fossiliferous limestone that may be pre-Eocene in age. The mafic metavolcanic clasts include dolerites with pink titanaugite and augite-phyric vitrophyres. The pink clinopyroxene in these rocks was confirmed by electron microprobe analysis at University of Hawaii to be titanaugite, supporting the hypothesis that their protoliths may be alkali basalts. These samples also contain zones of aegirine–augite with titanaugite, possibly indicating that the mafic clasts experienced moderate P/T metamorphism. Titanaugites are commonly present in alkali basalts typical of seamounts but not mid-ocean-ridge basalt. Therefore, the titanaugites in metabasalts from Hole U1496B cores are likely to be recycled material from subducted seamounts on the Pacific plate.
Rock and sediment geochemistry
Elemental abundances for Site U1496 samples selected by the shipboard scientific party were determined using inductively coupled plasma–atomic emission spectroscopy (ICP-AES) and portable X-ray fluorescence spectrometer (pXRF) analysis (Table T5). pXRF calibration curves are provided in Figure F2 in Johnston et al. (2018). The examined samples included serpentinite muds and serpentinized ultramafic rocks (harzburgites and/or dunites), along with metamorphosed mafic rocks. A full discussion of Expedition 366 rock and sediment data is found in Sediment and rock chemistry in the Expedition 366 summary chapter (Fryer et al., 2018b).
Table T5. ICP and pXRF data. Download table in CSV format.
Fluid geochemistry
Headspace analysis of CH4 and H2
Interstitial water methane and ethane concentrations in samples from Holes U1496A–U1496C (summit of Asùt Tesoru Seamount) were measured by gas chromatograph (GC)–flame ionization detector (FID) because the GC–helium ionization detector (HID) used at Sites U1491 and U1492 was out of order. Interstitial water H2 concentrations were measured using an electrochemical sensor as described below. Interstitial water CO measurement capabilities were unavailable.
Dissolved methane and ethane are reported in Table T6. High concentrations of CH4 (>200 µM in most samples) were detected in each sample. The highest concentration of dissolved CH4 is in the shallowest sample from Hole U1496C (1047 µM). The deepest recovery from Hole U1496C (approximately 98.5 mbsf) retains a consistently high concentration (771 µM). Dissolved ethane concentrations were the highest measured to date during this expedition, varying from 0.422 to 3.6 µM. Depth profiles of dissolved CH4 and ethane concentrations are similar (Figure F26). The C1/C2 ratio is uniform (between 266 and 481) with depth from the top section (0.7 mbsf) to the deepest samples in each hole (102.5 mbsf for Hole U1496C). The range of C1/C2 ratios found at the summit site of Asùt Tesoru Seamount are comparable to the ranges of C1/C2 ratios reported from the summit sites of South Chamorro Seamount (245–796; ODP Leg 195 [Shipboard Scientific Party, 2002]) and Conical Seamount (149–794; ODP Leg 125 [Shipboard Scientific Party, 1990]). Because all three of these subseafloor serpentinite mud environments display hyperalkaline conditions of pH = ~12.5, which is equal to or exceeds the presently known upper pH value (pH = 12.4) for microbial growth, most of these hydrocarbons are likely to be associated with abiogenic processes such as hydrocarbon synthesis through Fischer-Tropsch Type reactions rather than production from microbial activity.
Table T6. Interstitial water methane and ethane concentrations. Download table in CSV format.
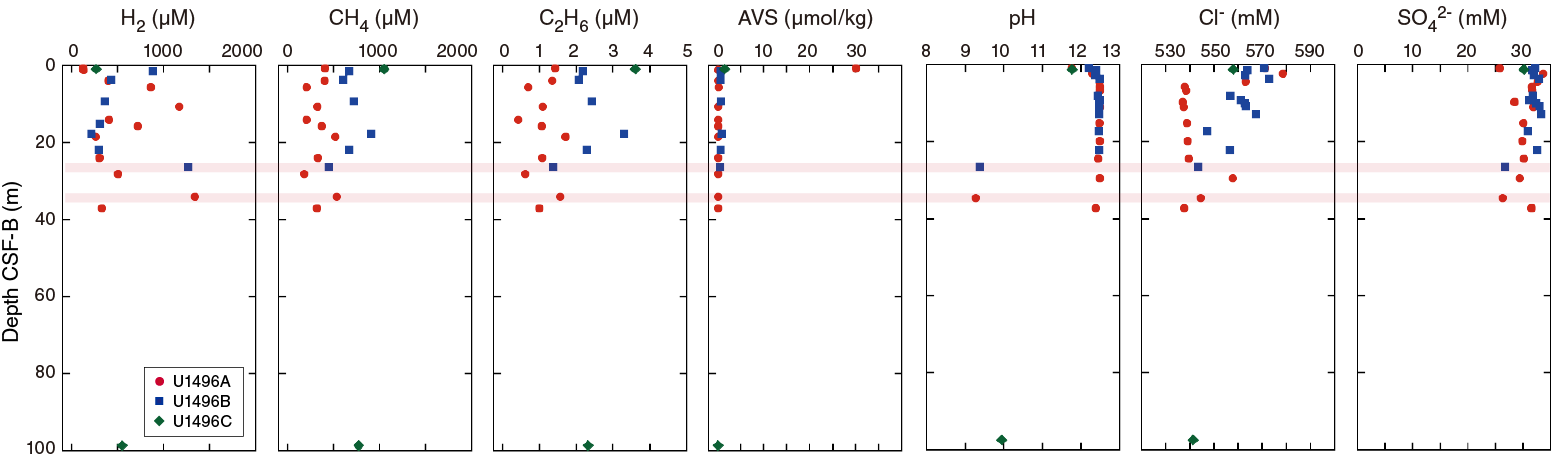
Figure F26. Head space and interstitial water concentration-depth profiles.
Electrochemical sensing of H2 and H2S
Similar to CH4 concentrations, high concentrations of H2 were detected in samples from all depths at Site U1496 (Table T7; Figure F26). The highest H2 concentration was obtained from the “moussey” zones of Holes U1496A and U1496B. In contrast, high acid volatile sulfide (AVS) concentrations were found only in the relatively shallow zones (Sections 366-U1496A-1F-2, 2.3 cm, and 366-U1496C-1R-2, 1.3 cm). These sulfidic samples were associated with depths that are relatively depleted in dissolved H2. Thus, the relatively abundant AVS concentrations in the shallower zones may be associated with microbial sulfate-reducing activity using H2 as the electron donor, consistent with a slightly lower sulfate concentration in this zone compared with data from greater depths (Section 366-U1496A-1F-2).
Table T7. Interstitial water H2 and AVS concentrations. Download table in CSV format.
The relationship between H2 and CH4 concentrations was examined by comparing the CH4/H2 ratio and H2 or CH4 concentration, including data obtained from all core samples collected to date during Expedition 366 (Figure F27). Three groups were evident: fluids from the serpentinite conduit of Asùt Tesoru Seamount, fluids from the flank regions of Asùt Tesoru Seamount, and fluids from Yinazao Seamount. Trends were observed in both diagrams, likely interpreted by the combined function of methanogenesis (probably microbial), possible methane-hydrate dissolution, serpentinization, and diffusion/mixing.
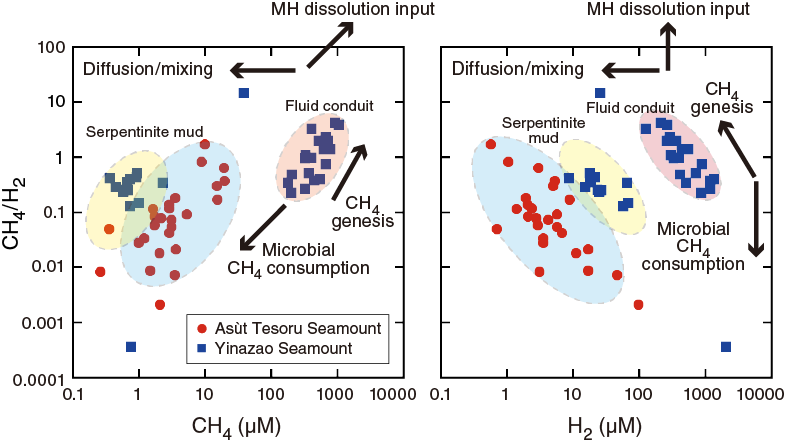
Figure F27. Headspace H2 and CH4 concentrations vs. CH4/H2.
Water-sampling temperature probe and ghost core sampling
Eight days following the completion of sampling and installing casing for a future CORK-Lite installment in Hole U1496C, Expedition 366 returned to Asùt Tesoru Seamount to clean out the hole and seal the bottom with a cement plug. Approximately 7 m of serpentinite mud had risen into the borehole, which was cored (two ghost cores: 12G and 13G) and cleaned out, leaving 3 m of fill in the bottom of the borehole before a cement plug was deployed. One WSTP sample was also taken in the middle of the shallowest screen; the probe tip extended beyond the BHA to 43.5 mbsf. Both gas and fluid data were obtained from these samples. H2 concentrations in the WSTP water sample (U1496C-WSTP) and the ghost core samples (Cores 12G and 13G) are 840, 495, and 852 µM, respectively (Table T7). CH4 (and C2H6) concentrations in the ghost core interstitial water samples (Cores 12G and 13G) are 179 (0.589) and 231 (0.867) µM, respectively (Table T6). These gas concentrations are similar to those in Holes U1496A and U1496B. These results indicate that the fluid and serpentinite mud that infiltrated into the cased hole were in part derived from the indigenous subseafloor fluid and serpentinite mud materials at the bottom and screened portion of the casing. Fluid chemistry data for WSTP and interstitial water samples are described at the end of each section below but indicate substantial dilution with bottom seawater. No CH4, C2H6, or C1/C2 data were collected from Sample U1496C-WSTP (Table T6).
Interstitial water
The salinity, pH, alkalinity, and chlorinity of the WSTP and interstitial water samples collected in Holes U1496A–U1496C were measured within a few hours after sampling (Table T8). Samples were analyzed for NH4, PO4, and H2S by UV-vis spectrophotometry; concentrations for Ca, Mg, K, Na, Br, and sulfate were measured by ion chromatography (IC); and trace (Si, Li, B, Mn, Fe, Sr, and Ba) cation concentrations were measured using the shipboard Teledyne Leeman Labs Prodigy ICP-AES instrument. The wavelengths examined for these elements are listed in Table T1 in the Expedition 366 methods chapter (Fryer et al., 2018a).
Table T8. Interstitial water analyses. Download table in CSV format.
Salinity, pH, and alkalinity
Holes U1496A and U1496B show similar patterns of salinity variation (Figure F28) to ~20 mbsf, where both holes exhibit consistently high values relative to seawater. Hole U1496A salinities are above seawater values of 35 to 37 mbsf, except at 29 and 35 mbsf, where they decrease to ~34. Hole U1496B salinities are 37.5 at 2 mbsf and then increase to a constant 38.5 before decreasing to 34.5, close to seawater values, at 22.5 mbsf in the deepest sample. Hole U1496C salinities are generally slightly lower than seawater. These lower salinity values, along with deviations in pH and alkalinity, confirmed seawater entrainment/contamination at those depths (see Physical properties).
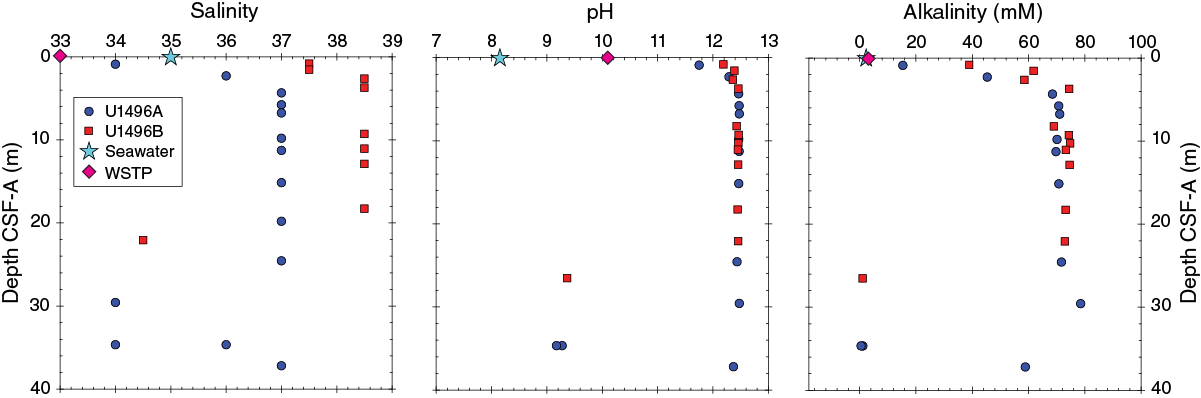
Figure F28. Interstitial water alkalinity, pH, and salinity.
All three holes exhibit similar pH values (12.3–12.5) at depth, with the exception of a few samples affected by seawater entrainment. Such high pH is consistent with active serpentinization within the seamount (Mottl et al., 2004; Hulme et al., 2010).
Alkalinity concentrations for Holes U1496A and U1496B display similar patterns and include the highest values measured during Expedition 366. Values increase from seawater (~2.3 mM) to 68 mM at 4 mbsf and remain consistently near this value to the deepest sample collected. Values below 10 mbsf vary between 59 and 79 mM for both holes. Similar to pH, alkalinity concentrations drop to near 0 mM at 34 mbsf in Hole U1496A and 26 mbsf in Hole U1496B, consistent with seawater contamination and reaction with the seawater contaminant. Hole U1496C alkalinity values are 15.4 and 1.6 mM for samples from Sections 1R-1 and 11R-5, respectively.
The salinity, pH, and alkalinity of the ghost core samples (Sections 366-U1496C-12G-3 and 13G-3) are listed in Table T8. Salinity values (34–35) are similar to seawater, like those measured in other Site U1496 samples. pH values are consistent with the highest values measured on Site U1496 cores, indicating little mixing with seawater. Alkalinity values are significantly higher than seawater values, similar to those measured elsewhere at Site U1496. Salinity, pH, and alkalinity in the WSTP sample are significantly lower than both the ghost core samples and other Site U1496 samples, suggesting that mixing with seawater occurred. This fluid was visually clear, unlike the WSTP sample collected at Site U1497.
Ammonium, phosphate, sulfate and sulfide, chloride, and bromide
Measured ammonium concentrations are higher than seawater (estimated at 0 µM) and range between 96 and 258 µM in Hole U1496A and between 118 and 216 µM in Hole U1496B. Values are between 35 and 135 µM in Hole U1496C. Minimum concentrations measured outside this range are 11.7 and 43.4 µM at 34.7 mbsf in Hole U1496A and 26.5 mbsf in Hole U1496B, respectively, at which depths pH and alkalinity are significantly lower than other values from these holes, indicating contamination with seawater.
Phosphate concentrations in Hole U1496A are below seawater values (estimated at 2.8 µM; Mottl et al., 2004) in the upper 4.35 m and then rise to a maximum of 6.28 µM at 6.76 mbsf and range between 0.34 and 5.55 µM below this depth (Figure F29). A minimum phosphate concentration below the detection limit (<0.5 µM) at 34.7 mbsf is attributed to seawater contamination, consistent with the lower pH and alkalinity for these samples. Phosphate concentrations in Hole U1496B are slightly lower than those in Hole U1496A, with values lower than seawater in the top 12.9 m. Below this depth, phosphate concentration increases to 3.7 µM. The lowest phosphate concentration, which is below the detection limit (<0.5 µM), occurs at 26.5 mbsf, corresponding to lower pH and alkalinity consistent with seawater/drill fluid contamination, as above. Phosphate concentrations in Hole U1496C are between 0.53 and 1.06 µM.
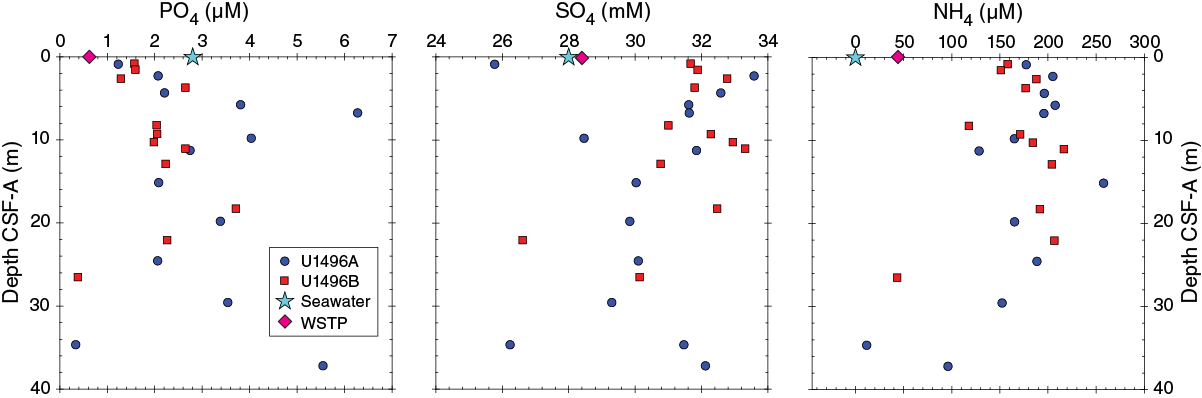
Figure F29. Interstitial water phosphate, sulfate, and ammonium.
Sulfate concentrations are greater than seawater (28 mM) at most depths in Holes U1496A and U1496B. The lowest sulfate concentration recorded in these holes is 25.8 mM at 0.9 mbsf in Hole U1496A and corresponds to the depth where the highest concentration of hydrogen sulfide was measured (2550 µM). Sulfate concentrations in the two samples from Hole U1496C are similar to that measured in seawater. Hydrogen sulfide concentrations (Table T8) are mostly below detection, with only three measurable values in Hole U1496A. Hydrogen sulfide concentrations are highest in the uppermost 1 m of Holes U1496A and U1496B. Likewise, most of the samples from Hole U1496B are below detection. Hole U1496C also has elevated hydrogen sulfide concentrations (52.8 µM) at ~99 mbsf, but it is below detection in the other samples from this hole.
Chloride concentrations are generally higher than seawater values (542 mM) in Hole U1496A, consistent with reported values (546 mM; Hulme et al., 2010); thus, concentrations lower than bottom seawater values are unexpected. These lower chloride concentrations may, however, be the result of drilling contamination. Chloride concentrations in Hole U1496B are consistently higher than seawater values, with a maximum concentration of 573 mM at 3.7 mbsf. Hole U1496C chloride values are slightly higher than seawater. Bromide concentrations are lower than seawater values (0.83 mM), with generally decreasing values from near the top of the hole to concentrations as low as 0.695 mM (~37.2 mbsf). Bromide concentrations generally increase below ~20 mbsf (excluding contamination) but do not reach seawater concentrations (Figure F30).
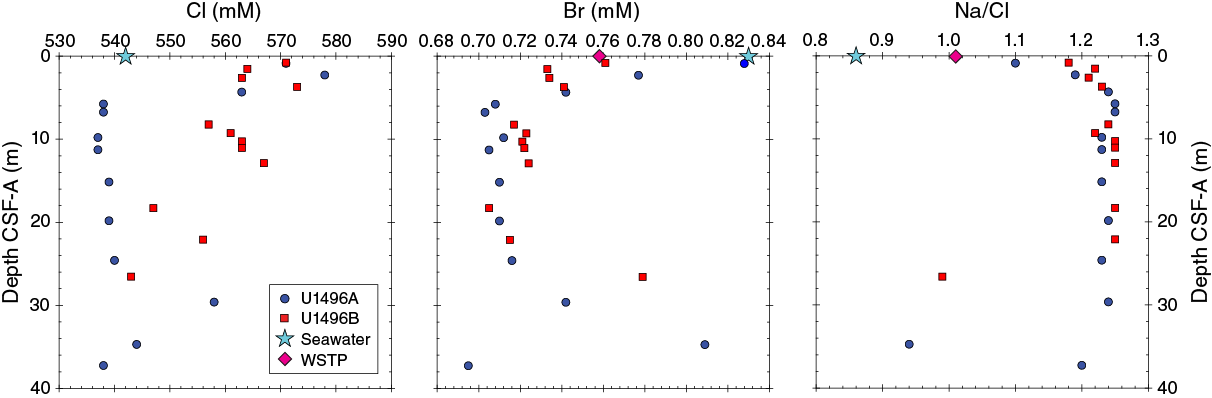
Figure F30. Interstitial water Cl, Br, and Na.
As noted in Fluid geochemistry in the Site U1492 chapter (Fryer et al., 2018c), the Na/Cl ratio is a characteristic feature of deep-sourced fluid, with a ratio below seawater (0.86) in seamounts closer to the trench and a ratio above seawater in seamounts farther away from the trench (Mottl et al., 2004). The Na/Cl ratios in Holes U1496A and U1496B are consistently higher than seawater Na/Cl ratios. The Na/Cl ratios are consistent below ~2 mbsf in each hole, ranging between 1.22 and 1.25 apart from significant deviations to lower ratios that correspond to seawater contamination during drilling. A ratio of 1.26 was reported by Hulme et al. (2010) for interstitial waters collected from this seamount. The asymptotic character of our data below ~2 mbsf suggests a similar deep-sourced fluid.
Ammonium and phosphate concentrations for the two Hole U1496C ghost core samples are 59 and 46 µM for Core 12G and 1.06 and 0.83 µM for Core 13G, much lower than those measured in other Site U1496 samples. Sulfide is below detection, but sulfate concentrations are slightly higher than seawater (~29 mM) in the two samples from the ghost cores. Similar to samples from the regular cores, chloride and bromide concentrations from the two ghost cores are slightly lower than seawater. These patterns are similar for the WSTP sample.
Major and trace cations
Major and trace element abundances show several distinct trends in Holes U1496A and U1496B. K, Na, and B concentrations in interstitial waters are significantly higher than seawater throughout the depth range that was drilled. K concentrations are between 11 and 14.6 mM in Hole U1496A, 11.5 and 14.1 mM in Hole U1496B, and 12.1 and 12.4 mM in Hole U1496C. These concentrations are elevated compared to bottom seawater values (10.1 mM). Below ~34.7 mbsf in Hole U1496A and ~26.5 mbsf in Hole U1496B, K concentrations are less, with some values near seawater values (Figure F31). This decrease coincides with contamination with seawater, as noted above (Figure F28). Na concentrations mimic this pattern with concentrations higher than seawater and generally above 650 mM. Once again, two samples had much lower concentrations, consistent with dilution of higher concentration deep fluids by seawater during drilling. B concentrations are generally two to three times that of seawater (410 µM) (Figure F31). At depths where reductions in K and Na are reported due to seawater contamination, B concentrations drop to values significantly lower than seawater, 182 and 212 µm, which indicates reaction with seawater, interstitial fluids, and the serpentinite matrix.

Figure F31. Interstitial water K, Na, Sr, Ca, B, Li, Mg, and SiO2.
In contrast to the summit site of Yinazao Seamount (U1492), Ca and Sr concentrations at the summit of Asùt Tesoru Seamount are significantly lower than that of seawater (10.2 mM and 90 µM, respectively). Within 1 mbsf, the Ca concentration is 1.1 and 2.1 mM and the Sr concentration is 17.9 and 4.3 µM in Holes U1496A and U1496B, respectively. The Ca concentration in the shallower sample from Hole U1496C is only 4.19 mM, but the deeper sample is near seawater values at 11.33 mM. Concentrations of these elements remain consistently low with depth with the exception of the two samples affected by dilution with drilling fluids (seawater). Like Ca and Sr, concentrations of Li, Mg, and SiO2 are significantly lower than seawater (26 µM, 52.4 mM, and 190 µM, respectively) at all sampled depths, with the exception the two samples affected by contamination. Mg is below the limit of detection by IC (<0.002 mM) at many depths in these holes. Mn and Fe contents are below ICP-AES detection limits (<0.073 and <0.47 µM, respectively) in most of the samples from Holes U1496A and U1496B. The highest Mn and Fe concentrations occur at ~34.6 mbsf in Hole U1496A and ~26.5 mbsf in Hole U1496B, corresponding to contamination with seawater. Ba concentrations are consistently below detection limits by ICP-AES (<0.015 µM), except for samples from 22.05 and 26.52 mbsf in Hole U1496B where they are 0.09 and 0.25 µM, respectively. SiO2 concentrations increase from approximately 15–20 µM near the tops of the holes to around 35 µM at 7 mbsf and remain at this concentration to about 25 mbsf, where the concentration increases (to 302 µM in Hole U1496A and 112 µM in Hole U1496B). However, these increases are likely the result of drilling contamination.
Major and trace cation abundances in the ghost core and WSTP samples are similar to, but not as extreme as, those observed in the regular cores. K, Na, and B concentrations are higher than seawater, whereas Ca and Sr concentrations are lower. Mn, Ba, Si, Mg, and Fe concentrations are either below detection limits or very low, similar to values observed for all interstitial water samples to date.
Dissolved inorganic carbon/dissolved organic carbon
Dissolved inorganic carbon (DIC) concentrations in Hole U1496A increase from seawater-like values (24 ppm) to as high as 36.8 ppm before dropping to concentrations less than seawater below ~25 mbsf (Figure F32). A similar trend was observed in Hole U1496B but with a higher maximum concentration at ~8 m of 53.6 ppm. DIC values in Hole U1496C are 8.69 and 3.18 ppm. In general, DIC concentrations are much higher than those observed on the flanks of Asùt Tesoru Seamount or at the summit of Yinazao Seamount and are more than twice as high as the bottom seawater value. The origin of this CO2 could be the oxidation of methane through microbial processes or the devolatilization of carbonates from the subducting slab at depth.
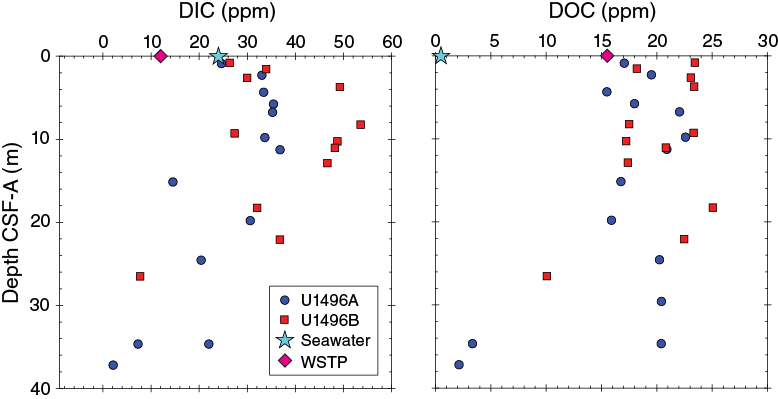
Figure F32. Interstitial water DIC and DOC.
Dissolved organic carbon (DOC) concentrations are significantly higher than the bottom seawater value (~0.5 ppm) in Holes U1496A–U1496C, ranging generally between 15 and 25 ppm. These high values could reflect microbial activity or indicate high concentrations of short-chain carbon molecules, such as formate/acetate, which are known to form as intermediate products of Fischer-Tropsch Type reactions.
DIC and DOC concentrations in the ghost core and WSTP samples are similar to those observed in other interstitial water samples from this site. DIC concentrations are 37.8 and 42.2 ppm, whereas DOC concentrations are 13.1 and 16.8 ppm for the ghost core interstitial water samples. The WSTP sample has 11.97 ppm DIC and 6.0 ppm DOC.
Summary
Concentrations of H2, CH4, and C2H6 at Site U1496 exceed all measured values at the other Expedition 366 sites. These concentrations, coupled with a low C1/C2 ratio, are consistent with an abiogenic source, such as hydrocarbon synthesis through Fischer-Tropsch Type reactions rather than microbial processes. The correlation of AVS and SO4 at depths where H2 is relatively depleted may be associated with microbial sulfate-reducing activity using H2 as the electron donor. The CH4/H2 ratio and H2 or CH4 concentrations from the summits of Yinazao and Asùt Tesoru Seamounts point to distinct differences between the potential Asùt Tesoru serpentinite fluid conduit and the flank regions of Asùt Tesoru Seamount, as well as marked differences in fluid sources compared to Yinazao Seamount.
Based on the almost asymptotic changes with depth observed in many of the measured ions, (i.e., a rapid increase or decrease of concentration within the uppermost meter followed by a quick leveling off at a consistent concentration level with depth), there is significant upflow of deep-sourced fluids that discharge from Asùt Tesoru summit on the order of tens of centimeters per year. Enrichment/depletion patterns in general are consistent with observations from shallow sediment coring (e.g., Mottl et al., 2004; Hulme et al., 2010).
The pattern of cation and anion enrichments and depletions in interstitial waters at Asùt Tesoru Seamount are markedly different from those observed at Yinazao Seamount and are also different from those measured at South Chamorro and Conical Seamounts (Mottl et al., 2003; Mottl, 1992). Perhaps the species showing the most dramatic differences is B, which is ~30 times higher at the Asùt Tesoru summit than at the Yinazao summit but only ~30% as high as interstitial waters from South Chamorro Seamount and only ~25% as high as fluids from Conical Seamount. K is higher at Asùt Tesoru Seamount than at Yinazao Seamount but is lower than those observed at South Chamorro (19 mM) and Conical Seamounts (15 mM) (Mottl et al., 2003); Na shows a generally similar seamount-to-seamount pattern, with much higher concentrations at Asùt Tesoru Seamount than at Yinazao Seamount. Interestingly, Na is somewhat lower at South Chamorro Seamount (mean = 610 mM) and markedly lower at Conical Seamount (mean = 390 mM) (Mottl et al., 2003).
The marked differences between the deep-sourced fluids from Yinazao (~13 km) and Asùt Tesoru (~18 km) Seamounts most likely point to the onset of prograde metamorphic reactions in the slab that liberate fluids and some bound trace species. The differences between Asùt Tesoru Seamount and the deeper sited South Chamorro (~19 km) and Conical (~18 km) Seamounts could either reflect the onset of additional mineral breakdown/re-equilibration reactions or be evidence for optimal fluid/solid partitioning conditions (e.g., the Na maximum at Asùt Tesoru Seamount could mean that DNafluid/solid is highest under the pressure-temperature conditions in the subduction channel beneath it). The inferred temperature at the slab/mantle interface beneath Asùt Tesoru Seamount is low (<250°C) (Hulme et al., 2010; est. 200°C; see Physical properties), likely reflecting lower greenschist or prehnite-pumpellyite conditions.
The dramatically lower Ca and Sr concentrations in interstitial waters from Asùt Tesoru Seamount and fluids from South Chamorro and Conical Seamounts relative to Yinazao Seamount may indicate sequestration in CaCO3 (Mottl et al., 2003, 2004; Hulme et al., 2010). This idea is consistent with the observed higher DIC concentrations of the discharging fluid at Site U1496, suggesting that reactive carbon is present in this system.
Ghost core interstitial water and WSTP fluid compositions are similar to those observed for regular interstitial water samples, although not as extreme. This suggests a portion of these samples was the deep-sourced fluid, but mixed with seawater.
Microbiology
Sample recovery
Microbiology sampling during Expedition 366 focused on exploring the limits of microbial life in serpentinite mud habitats across multiple depths using cultivation-based and cultivation-independent molecular biological approaches, microscopy, and assays for the detection of viruses. Sampling efforts targeted both near-surface and deeper whole-round cores, especially if there was evidence of transitions across gradients of microbiologically affecting compounds and gases (e.g., hydrogen, methane, hydrogen sulfide, and sulfate). Two 20 cm long whole-round samples were collected at each sampled depth for general microbial analyses. Additional whole-round samples were collected for individual investigations. A total of 22 whole-round samples were collected for general microbial sampling from the summit of Asùt Tesoru Seamount at Site U1496. These samples were preserved and will be analyzed postexpedition as described in Microbiology in the Expedition 366 methods chapter (Fryer et al., 2018a).
Contamination testing
Contamination testing at Site U1496 was conducted using perfluoromethyldecalin (PFMD). Tracer delivery was demonstrated by routine detection at the top of the cores and in the drilling fluid, where contamination is expected to be high. Only qualitative contamination control was carried out due to limitations with the PFMD analytical method; thus, a conservative estimation of contamination was performed.
Contamination results from Holes U1496A and U1496B are variable, ranging across as many as three orders of magnitude among samples from the same section. Some sections, such as 366-U1496A-3F-2 (9.4 mbsf), 5F-2 (19.4 mbsf), 366-U1496B-2F-1 (2.4 mbsf), 4F-2 (12.6 mbsf), and 6F-1 (21.8 mbsf), show relatively low concentrations of PFMD and are therefore less likely contaminated with drilling fluid (Figure F33; Table T9). In contrast, contamination results from Sections 366-U1496A-8F-3 (34.5 mbsf) and 9F-1 (37.0 mbsf), when combined with the drop in interstitial fluid pH and alkalinity, indicate a high level of seawater contamination. Definite conclusions cannot be made for the viability of these samples for microbiological analyses; however, sections with lower concentrations of the tracer PFMD are less likely to be contaminated with drilling fluid.

Figure F33. PFMD concentrations.
Table T9. PMCH sampling. Download table in CSV format.
Physical properties
Physical property data were acquired for Site U1496, located at the summit of Asùt Tesoru Seamount. Two holes, U1496A and U1496B, were cored 100 m apart and penetrated to 44.8 and 36.0 mbsf, respectively. The third hole, U1496C, was drilled with the RCB system, but material was recovered only in the first and last cores of the hole.
The Whole-Round Multisensor Logger (WRMSL) was used to measure wet bulk density using gamma ray attenuation (GRA), magnetic susceptibility, and P-wave velocity on the P-wave logger (PWL). Whole rounds were then logged for natural gamma radiation (NGR). Discrete thermal conductivity measurements were performed on one or two whole rounds per core, depending on recovery. Color reflectance and point magnetic susceptibility (MSP) were measured on the archive section halves. In addition, shear strength (automated vane shear) was measured on the working section halves, and discrete samples were collected for moisture and density (MAD) measurements of wet and dry bulk densities (see Physical properties in the Expedition 366 methods chapter [Fryer et al., 2018a]).
Local but frequent core disturbance of the poorly consolidated mud deposits compromised the collection of P-wave velocity data on both the WRMSL and in discrete measurements on the working section halves. Poor sediment-to-liner coupling, incompletely filled core liners, and core liner fracturing and double thickness often occurred, resulting in high signal attenuation. Although most PWL measurements were not retrieved, this incomplete data set is nevertheless presented here to be consistent with the other site chapters. Other data sets are mostly of good quality, except for some cores where the first section was highly disturbed.
Physical property measurements were performed to help characterize the lithostratigraphic units and to describe the mechanical and thermal states of the serpentinite mud seamounts. Precise intervals of lithostratigraphic units and subunits from core description (see Lithostratigraphy) are used to describe physical property trends and calculate average values. Data in the figures are filtered to remove spurious points that correspond to empty intervals in the liner or broken pieces. All of the shipboard results and data interpretation are presented below.
GRA bulk density
Bulk GRA density values in Hole U1496A (Figure F34) show large variability, partly due to lithology and partly due to drilling disturbance effects. These values reflect the physical properties of the serpentinite mud, the main lithology at this site. Lithostratigraphic Units II–IV have densities ranging from ~1.6 to ~1.8 g/cm3, with outliers attributed to local disturbance effects or the presence of large lithic clasts or higher percentage of these clasts in the mud matrix. Lithostratigraphic Unit I (the uppermost 15 cm of the hole) shows a large scattering of density values.

Figure F34. Physical property data, Hole U1496A.
Bulk GRA density values in Hole U1496B (Figure F35) also show large variability, due in some cases to lithology and in other cases to drilling effects. Average GRA density values (with the exception of some sections with high disturbance) range between ~1.5 and ~1.7 g/cm3. These values are lower than those observed for serpentinite mud at the flank sites (2.0–2.2 g/cm3). This contrast could be because the mud at the summit was erupted more recently than the mudflows on the flank and contains actively flowing fluid (see Discussion).
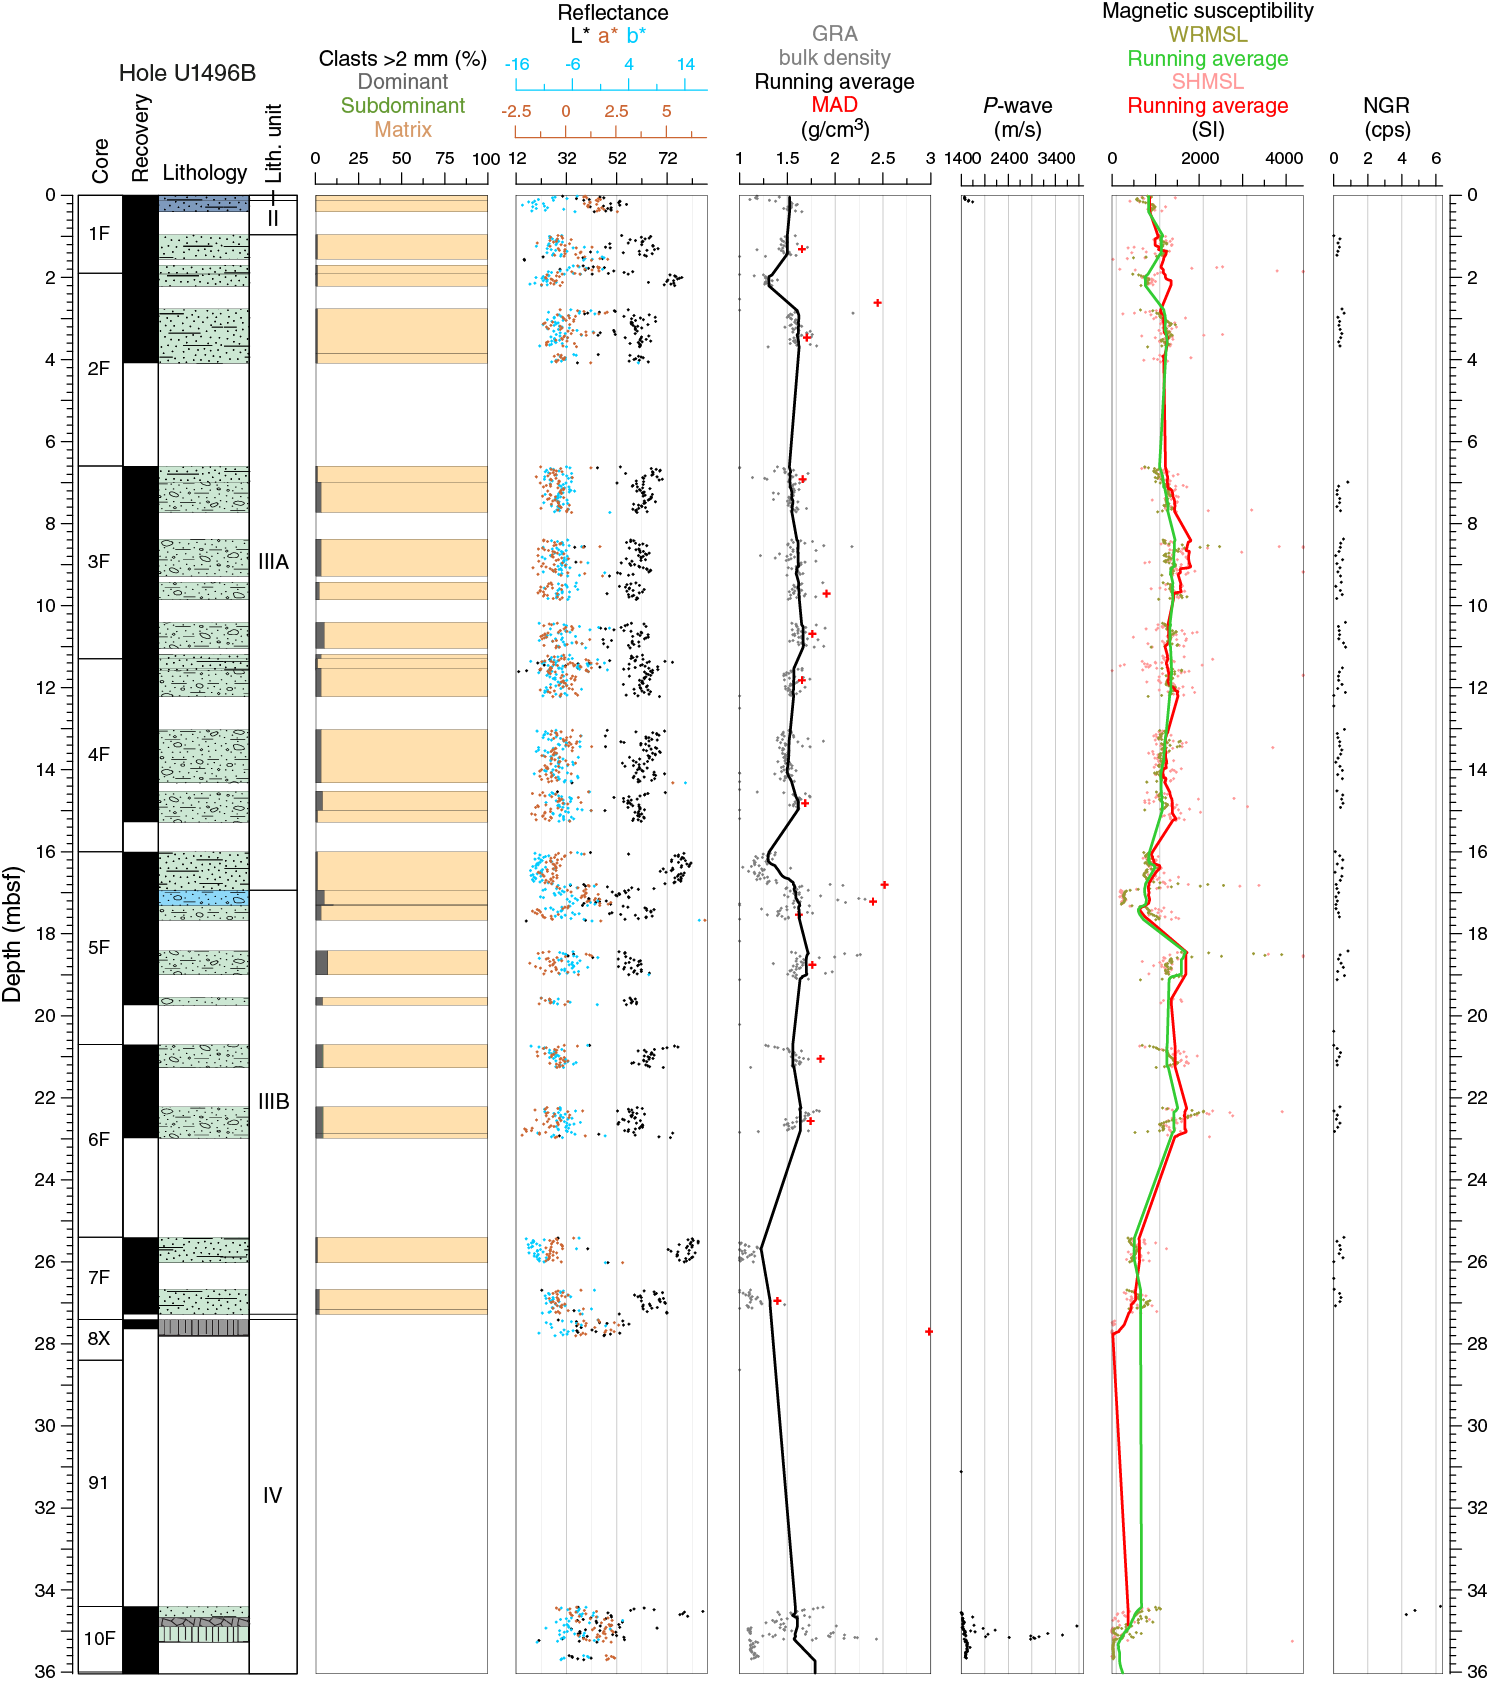
Figure F35. Physical property data, Hole U1496B.
In Hole U1496C, bulk GRA density values were only measured in the uppermost 2.3 mbsf and at the base of the hole between 93.9 and 99.5 mbsf. These data are plotted (Figure F36) but not discussed here due to the small quantity and low quality.
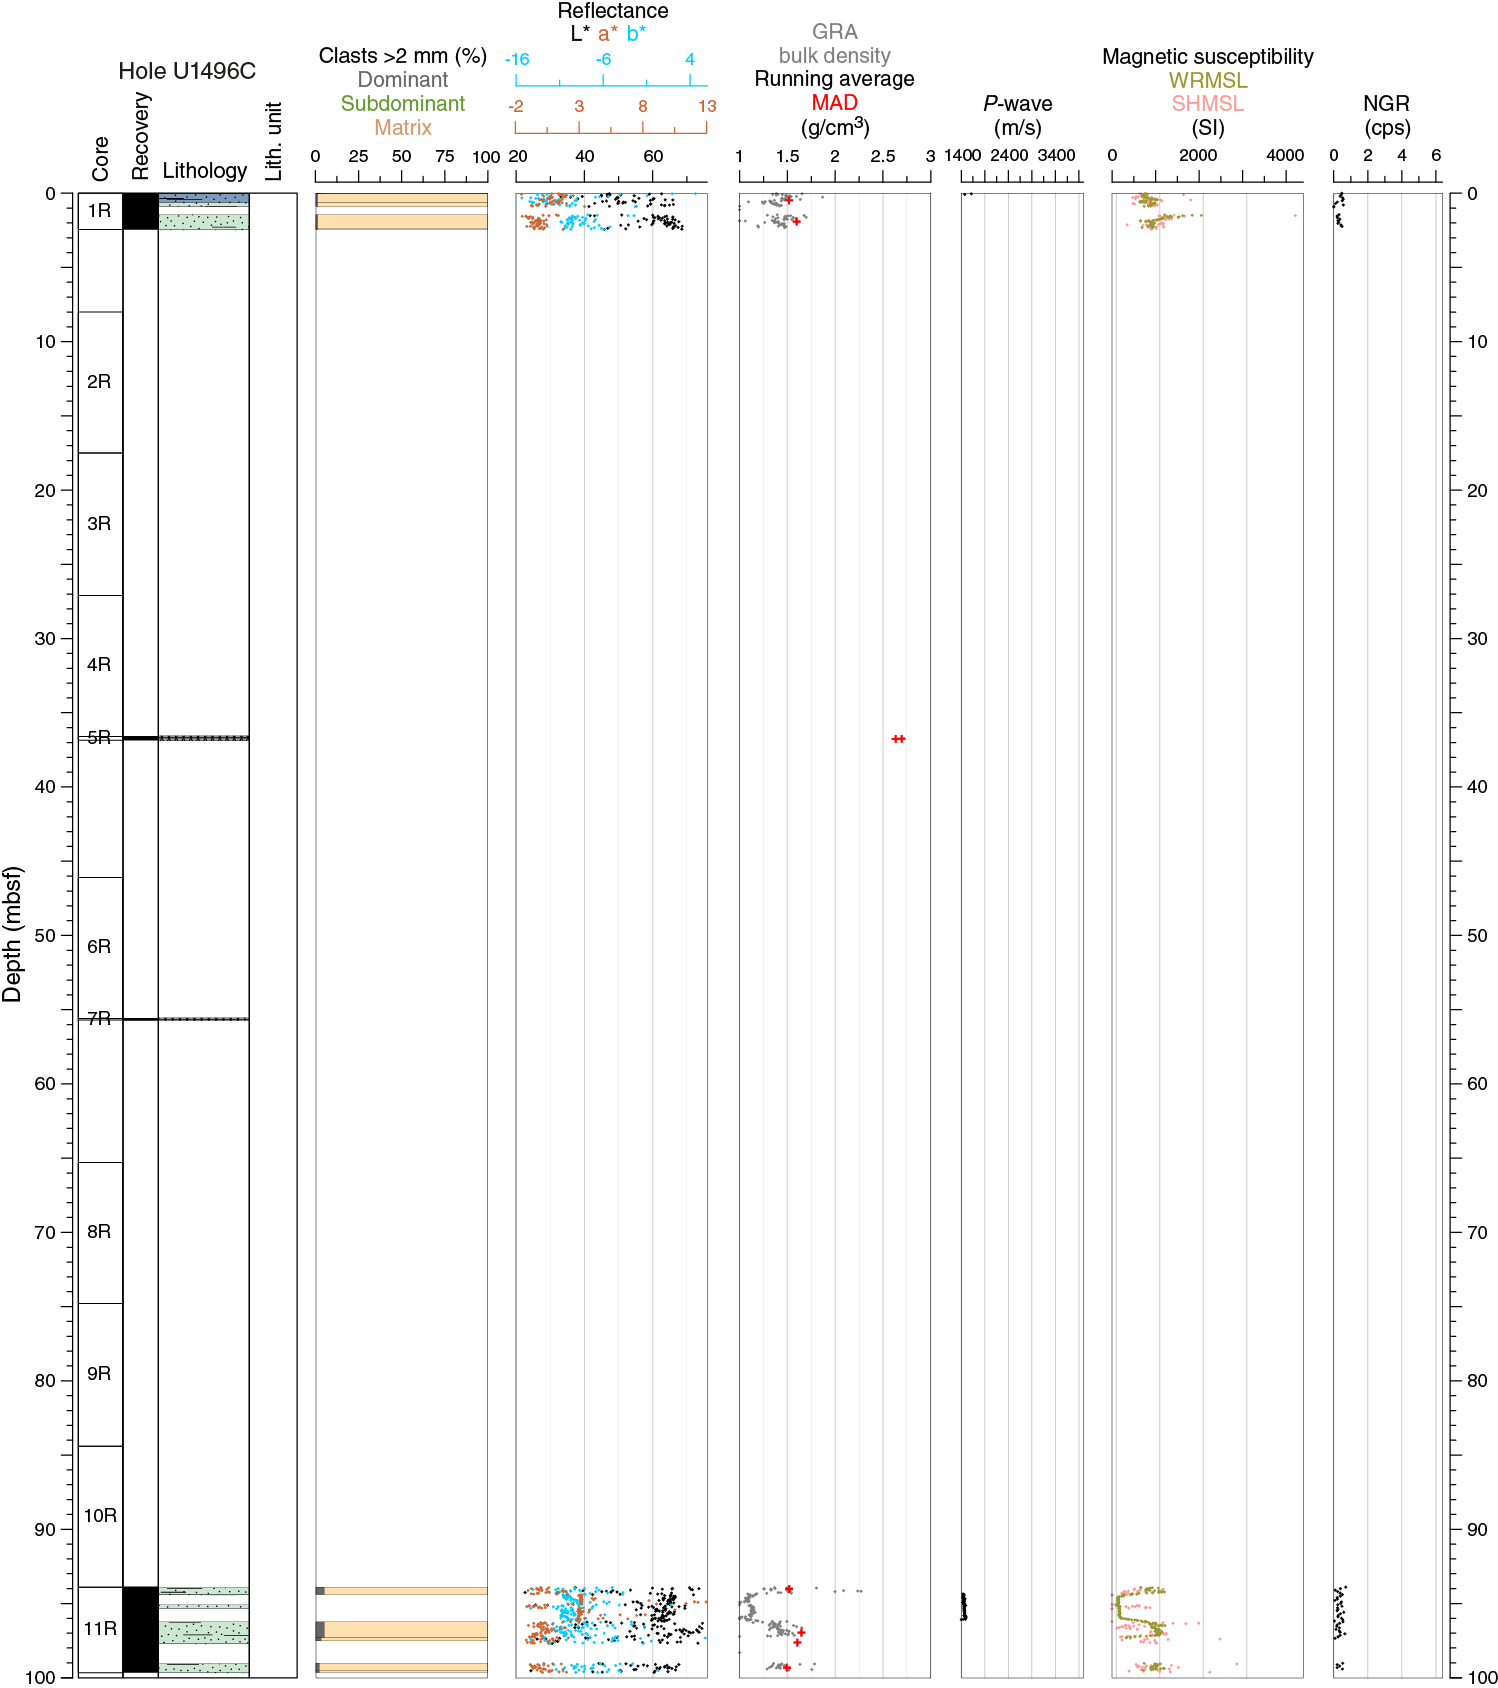
Figure F36. Physical property data, Hole U1496C.
For Holes U1496A and U1496B, GRA bulk density values are in good agreement with MAD measurements. The data variations for the two methods track each other; however, the MAD data show slightly but systematically higher average values than those measured with the WRMSL. This difference may be due to the fact that the MAD measurements can target undisturbed, representative areas inside the liner. Some MAD measurements were done on samples composed of individual lithic clasts and samples of pebble-sized clasts with higher bulk densities than the serpentinite mud.
P-wave velocity
Whole-round and discrete P-wave velocity measurements were performed using the WRMSL and the velocity gantry on the working section half. However, because of the high signal attenuation from the unconsolidated state of the mud, the gantry failed to acquire data, so its use was quickly discontinued. Therefore, only WRMSL data are used to describe Site U1496 P-wave velocity. Difficulties recovering cores of unconsolidated material in their pristine in situ conditions meant P-wave velocity measurements on most Site U1496 cores were impossible within the required quality standards defined by the acquisition software. Most of the cores showed high core disturbance, exsolved gas bubbles inside the core liner, voids filled with seawater, and deformed core liners with double plastic layers. Consequently, the P-wave records show almost no velocity data.
P-wave velocity in Hole U1496A (Figure F34) was only acquired for the upper 48 cm of the hole, with highly scattered values ranging from seawater values (~1500 m/s) to ~3000 m/s. P-wave velocity in Hole U1496B (Figure F35) was only acquired for the upper 16 cm of the hole and for 70 cm at the base of the hole; both intervals have seawater values (~1500 m/s). P-wave velocity in Hole U1496C (Figure F36) was only acquired for the upper 8 cm of the hole and 2 m at the base of the hole; both intervals have seawater values (~1500 m/s).
Reflectance spectroscopy and colorimetry
Hole U1496A reflectance parameters (Figure F34) show in general a good positive correlation between a* and b* and a negative correlation between L* and a*: muds that are more green and less red (negative a*) are also more blue (negative b*), and lighter colored muds (positive L*) are greener (negative a*). The reflectance parameters also correlate very well with the dominant colors of the lithostratigraphic units. Unit III and Subunits IVA and IVC are characterized by low a* (green) and high L* (light) values, and Unit II and Subunit IVB show the inverse (high a* and low L*). Hole U1496B reflectance parameters (Figure F35) have a more discontinuous record due to lower core recovery, with higher scatter in the values than in Hole U1496A. The color reflectance patterns are otherwise similar with higher a* and lower L* intervals at 0–1 and 17–17.4 mbsf. Hole U1496C reflectance parameters (Figure F36) were only acquired for the upper 2 m of the hole and for 6 m at the base of the hole. Some gaps occur, resulting in large scattering of the values that do not permit any clear interpretation.
Magnetic susceptibility
In Holes U1496A and U1496B, magnetic susceptibility measurements with the WRMSL and MSP produced similar results (Figures F34, F35). A general offset between both magnetic susceptibility data sets occurs; however, both show similar trends and local variations. In both holes, the top thin clayey mud units with pelagic components (Unit I) are characterized by relatively low magnetic susceptibility (<1000 × 10−5 SI) in comparison with most of the serpentinite mud units downhole. Magnetic susceptibility of the serpentinite mud (Units II–IV in Hole U1496A; Units II and III in Hole U1496B) generally ranges between 1000 × 10−5 and 1800 × 10−5 SI. However, two thin layers located at ~26 and ~17 mbsf in Holes U1496A and U1496B, respectively, stand out with values of about 200 × 10−5 SI. These significant variations are correlated with a bulk density increase that is due to high clast content. These two layers correspond to similar serpentinite mud Subunit IVB in Hole U1496A and the top of Subunit IIIB in Hole U1496B, distinguished during core description by relatively higher ultramafic lithic clast content (30%–35% and 8%, respectively). The other meter-scale significant magnetic susceptibility variations observed in the serpentinite mud deposits are generally localized at the transitions between cores (e.g., 17.3 mbsf, between Cores 366-U1496A-4F and 5F) and are clearly correlated to GRA density variations. These variations, observed in the rather homogeneous serpentinite mud units, may result from variable coring disturbance degrees between the different cores according to the lithostratigraphic core descriptions. Below 33 and 25 mbsf in Holes U1496A and U1496B, respectively, the relatively low magnetic susceptibility data correlates with a bulk density decrease.
Natural gamma radiation
In both Holes U1496A and U1496B, NGR measurements on the whole rounds show extremely low values, generally less than 1 count/s (Figures F34, F35). Most of the recovered cores correspond to serpentinite mud and show no variations between the different lithostratigraphic units of these deposits described downhole (see Lithostratigraphy). Serpentinite mud units in Holes U1496A (Units II–IV) and U1496B (Units II and III) are characterized by NGR average values of 0.41 and 0.33 counts/s, respectively. In Hole U1496A, two measurement points stand out at 12.33 and 12.43 mbsf with NGR values of 1.8 and 4.7 counts/s, respectively. These two higher values are attributed to a 7 cm long white carbonate clast recovered in Section 3F-5. At the bottom of both holes, NGR values increase, correlated to a decrease in magnetic susceptibility. In Hole U1496B, the three last NGR data points of ~4–6 counts/s were measured in a short core section composed of metabasite and ultramafic rock pieces representing the base of lithostratigraphic Unit IV.
Moisture and density
Determination of MAD on discrete samples of unconsolidated material was generally performed on every section in Holes U1496A–U1496C. Sampling was preferentially carried out on the most undisturbed part of a section, sometimes avoiding first sections of every core. As previously noted under GRA bulk density, MAD methods gave slightly higher bulk density results than the GRA values.
The average bulk density for pelagic sediment is 1.7 g/cm3, whereas values for serpentinite mud are 1.7–2.0 g/cm3. The two holes present different trends in MAD parameters with depth; Hole U1496A is subject to an increase in bulk density and a decrease in porosity with depth, whereas in Hole U1496B, all the parameters are rather constant.
In Hole U1496A, Units I–IV exhibit a gradual decrease in porosity from 61% at the top to 31% at the bottom of the hole (Figure F37). High porosity values at 13, 18, and 23 mbsf relate to drilling disturbance effects in the mud matrix, in accordance with the other physical properties. In the center of Subunit IVC (34 mbsf), two outliers with porosity as high as 86% mark the occurrence of a moussey layer, whereas the two values at 36–38 mbsf with a porosity of 32% correspond to a highly serpentinized dark greenish gray layer. Bulk density reflects the same behavior exhibited in the porosity data. Grain density is constant throughout the hole, between 2.6 and 2.7 g/cm3, with the exception of a clast at 26 mbsf with a value of 2.57 g/cm3.
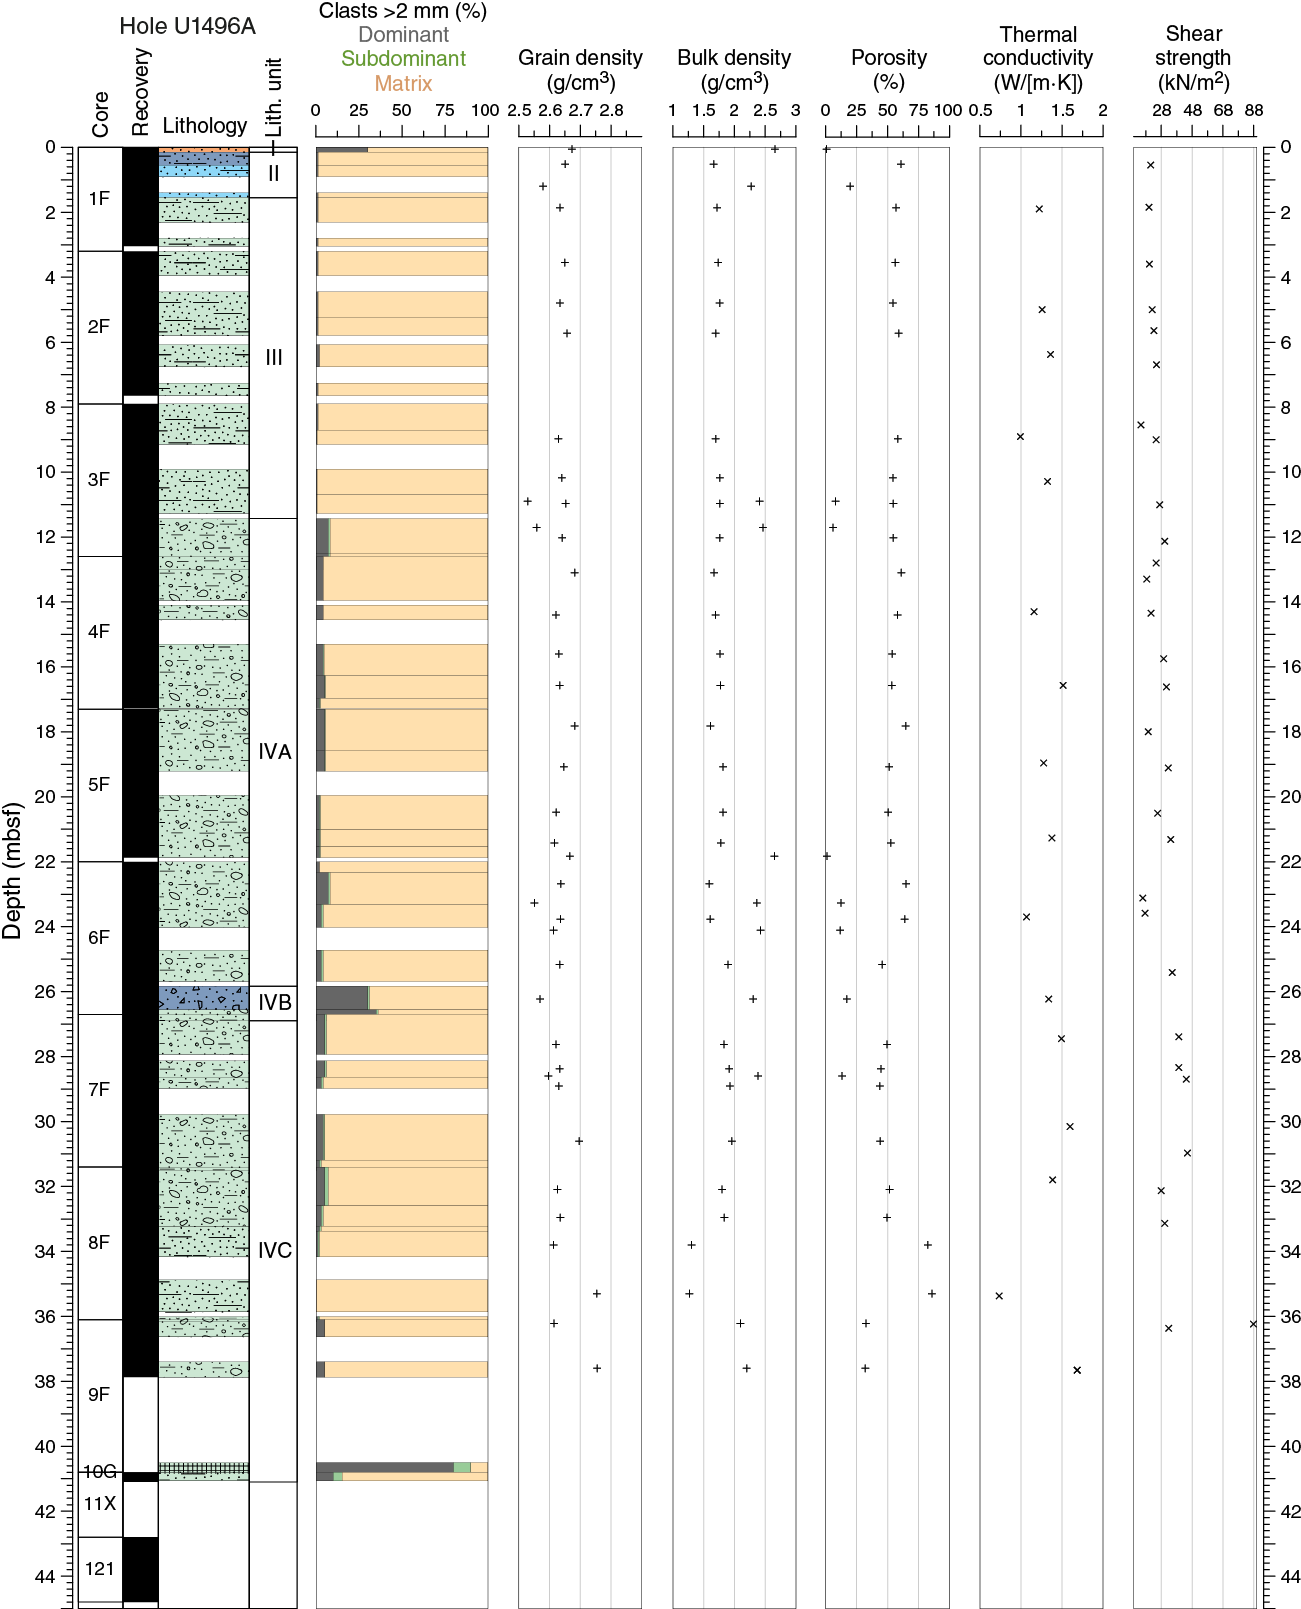
Figure F37. Index property data, Hole U1496A.
In Hole U1496B, porosity oscillates downhole between 62% and 45% without clear trends (Figure F38). One high porosity value (77%) near the base of the hole is linked with the occurrence of a moussey layer. Bulk density is also constant downhole, between 1.0 and 1.4 g/cm3. Grain density has a mean value of 2.6 g/cm3 and is rather constant downhole, with the exception of a clast of rodingite (metasomatized basalt) at 28 mbsf with a value of 3.1 g/cm3.
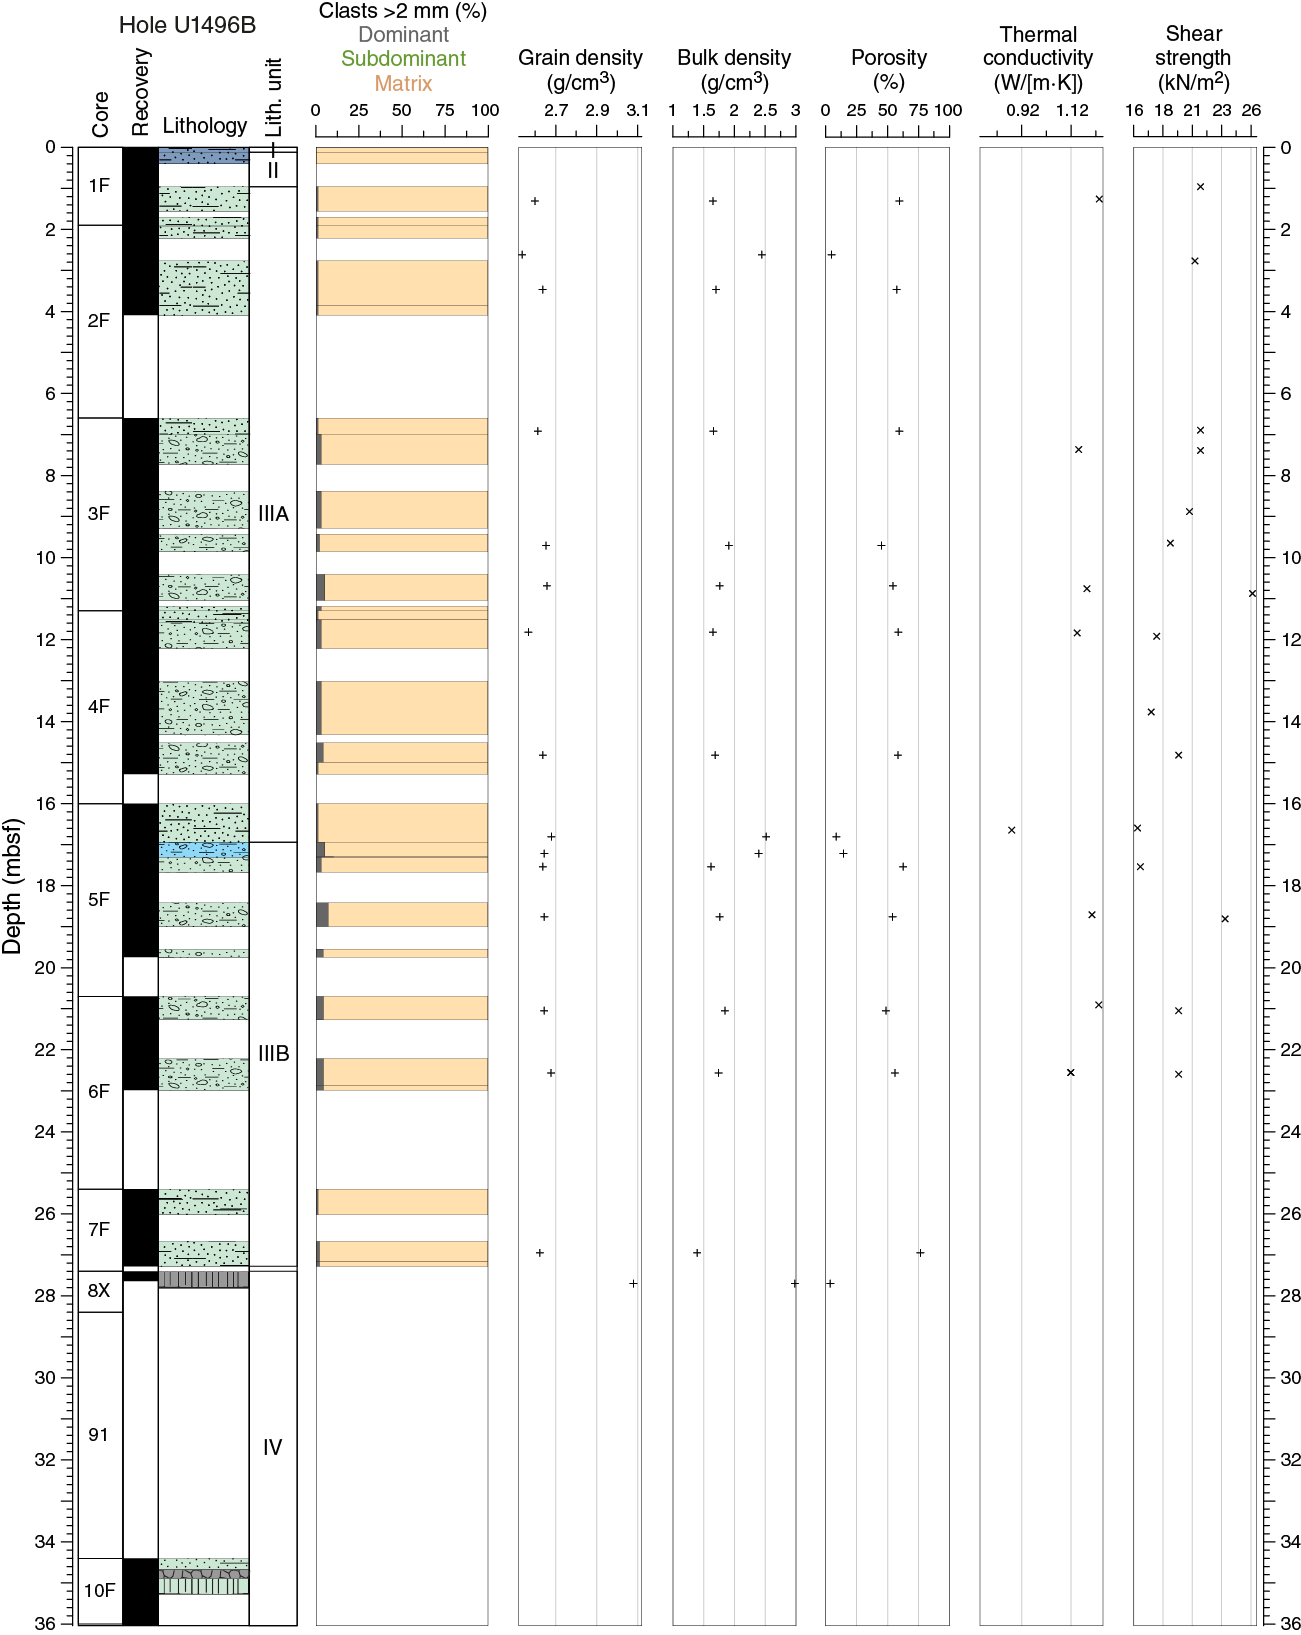
Figure F38. Index property data, Hole U1496B.
Thermal conductivity
Thermal conductivity measurements were made in Holes U1496A and U1496B at a rate of at least one and sometimes two per core, depending on recovery. No measurements were made in Hole U1496C due to the small recovery and disturbed nature of the cores. Values in both holes range between 0.74 and 1.69 W/(m·K) (average = 1.25 W/[m·K]). Results differ slightly between the two holes.
In Hole U1496A, thermal conductivity values increase by 15% from the top to the base of the hole, consistent with a corresponding porosity decrease of 15% (Figure F37). Adjacent values vary by ~50% over short distances. Most notably, a very low value of 0.74 W/(m·K) at 35.4 mbsf is only about half the adjacent values and does not appear to be caused by drilling disturbance.
Thermal conductivity values in Hole U1496B fall in the range of 1.1 to 1.3 W/(m·K), except for a single value at 16.5 mbsf, which is likely due to drilling disturbance (Figure F38). Unlike Hole U1496A, there is no clear increase in values with depth.
Thermal conductivity data for Hole U1496C are shown in Figure F39.
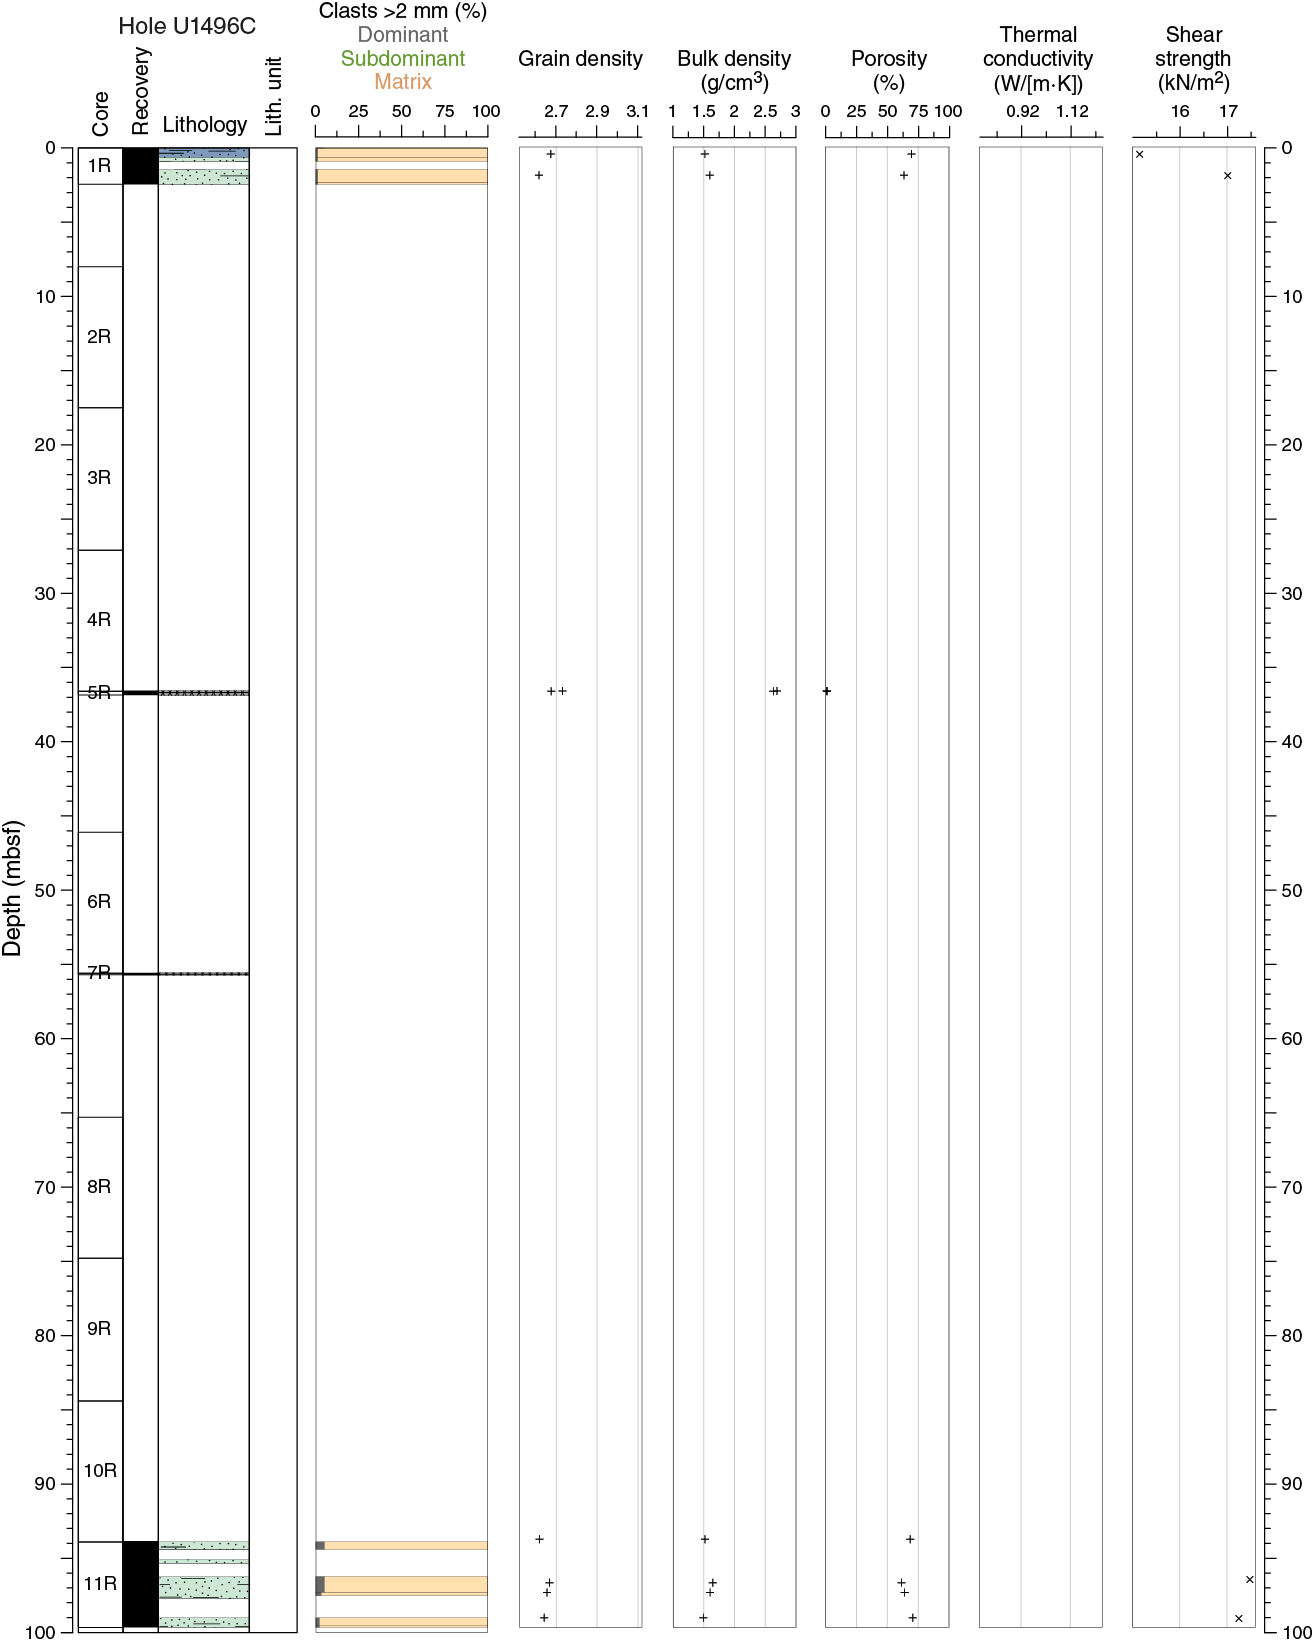
Figure F39. Index property data, Hole U1496C.
Automated vane shear
The undrained shear strength was measured with the automated vane shear in cohesive unconsolidated material, but no measurements were done on the rock-filled cores recovered at the bottom of all three holes. The automated vane shear has proven to be an excellent instrument to highlight consolidation trends in the pelagic sediments and serpentinite muds, as well as a good proxy, along with thermal conductivity, to identify core disturbances.
Hole U1496A exhibits a slight trend of increasing shear strength downhole from 20 kN/m2 at the top to 45 kN/m2 at about 31 mbsf (Figure F37). Values then decrease to 30 kN/m2 between 32 and 36 mbsf. Drilling disturbances are highlighted by a set of low values at 9, 13, 18, and 23 mbsf, all of which measure between 14 and 24 kN/m2, in broad agreement with lower thermal conductivity measurements at those depths.
Hole U1496B, in contrast, shows no trend with depth, in agreement with porosity and thermal conductivity (Figure F38). Low values between 16 and 26 kN/m2 characterize the entire hole to 23 mbsf, a probable sign of underconsolidated serpentinite mud.
Discussion
The physical property data collected at Site U1496, despite core disturbance identified in some core top sections, were of sufficient quality to characterize the summit deposits of the Asùt Tesoru mud volcano. The serpentinite mud data sets are consistent with those measured at the summits of other active seamounts of the Mariana forearc, either during this expedition (Yinazao mud volcano, Site U1492; see Physical properties in the Site U1492 chapter [Fryer et al., 2018c]) or during previous expeditions (Conical Seamount, Leg 125 [Fryer, Pearce, Stokking, et al., 1992]; South Chamorro Seamount, Leg 195 [Salisbury, Shinohara, Richter, et al., 2002]). Bulk density and porosity range from 1.6 to 2.0 g/cm3 and 30% to 60%, respectively. In Hole U1496A, consolidation and compaction with depth is suggested by slight increases in bulk density, thermal conductivity, and vane shear, associated with decreasing porosity, whereas no such trend is observed in Hole U1496B.
The average physical property values of both holes, as well as the downward variations in Hole U1496A, differ significantly from those obtained along the three-site transect of the southern flank of the Asùt Tesoru mud volcano. The lower bulk density of the summit compared to the flank (i.e., 2.2 vs. 2.3 g/cm3), along with the other property contrasts (see Physical properties in the Sites U1493, U1494, and U1495 chapter [Fryer et al., 2018d]), suggest relatively recent deposition of the summit serpentinite mud. This conclusion is supported by the absence of surface pelagic deposits postdating the serpentinite mud and the morphology of the summit mounds. More homogeneous lithostratigraphic composition and lower lithic clast contents (<5%) are also observed at the summit, reflecting the lack of material separation by gravitational sliding and descent along the mud volcano slopes observed at the flank sites. Other evidence for active flow includes previous observations of active flow seepages at the Hole U1496B location (see Background and objectives) and high gas content in the mud (e.g., hydrogen >1000 µM; see Fluid geochemistry). These observations may help explain the relatively low bulk density and high porosity observed at this mud volcano summit, with no significant variations in the several tens of meters recovered. Moreover, the data suggest that Hole U1496B is closer to the main upwelling zone than Hole U1496A.
Evidence for core disturbance was evaluated in all cores. This issue is important because in disturbed sections, some data may be unreliable due to poor quality core recovery. Data artifacts are induced by disturbed mud sucked up during coring or incompletely filled sections of ultramafic and/or mafic rock fragments (Cores 366-U1496B-8X and 10F). Two cores with unusually low bulk density and magnetic susceptibility contained soft moussey layers (Cores 366-U1496A-8F and 366-U1496B-7F), raising concerns that these were disturbed cores. On the other hand, several aspects of these cores suggest that the unusual properties may not be due to disturbance, including porosity values higher than usual for disturbed cores and the finding of associated gas (see Fluid geochemistry). In addition, the moussey sections are at the base of the core, whereas disturbed sections are usually at the top. Finally, the physical property data are consistent through the section, rather than noisy with layers above and below having radically different values. Together, these observations should be considered when evaluating the physical property data for this site.
Downhole measurements
The APCT-3 and WSTP were used to estimate formation temperatures at Site U1496. The WSTP also obtained a water sample inside the casing of Hole U1496C at 43.5 mbsf, 9.5 days after the casing was installed. WSTP temperature data are described here; results from the water sample are described in Fluid geochemistry.
Advanced piston corer temperature tool
Three APCT-3 measurements were attempted in Hole U1496C (Table T10). Of the three deployments, two yielded medium quality data. Data from the shallowest deployment were low quality and could not be used to obtain an estimate for the formation temperature. There were several problems with this deployment. The tool oscillated after emplacement and reached temperatures over 18°C. The peak value was followed by an extremely rapid decay, which stabilized with a temperature over 6°C, followed by a slow rise to the end of the deployment.
Table T10. APCT-3 temperature data. Download table in CSV format.
Data from the two medium quality measurements are plotted in Figure F40. The seafloor temperature was assumed to be the lowest measured value for a given deployment. The lowest bottom water temperature is 3.99°C, measured in Core 9R. Temperatures estimated with the TP-Fit software are plotted in Figure F41. A linear trend with a gradient of 14.3°C/km results from the two formation and bottom seawater measurements. Using the average thermal conductivity of 1.26 W/(m·K) obtained for Holes U1496A and U1496B and assuming only conductive heat flow yields an estimated heat flow of 17.8 mW/m2.
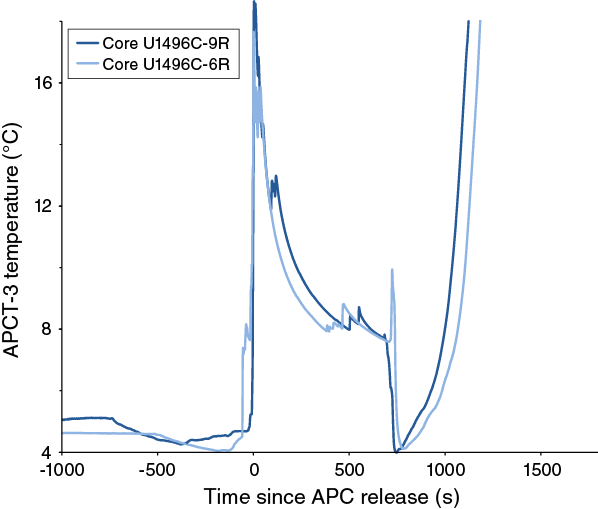
Figure F40. APCT-3 temperature measurements.

Figure F41. Calculated APCT-3 formation and bottom seawater temperatures.
Water-sampling temperature probe
Borehole fluid temperature logs can be used to assess formation temperature by comparing temperature logs measured in repeat deployments separated by a period of days (i.e., Site 459; Uyeda and Horai, 1982). Although time constraints prevented repeated runs of the WSTP in Hole U1496C, we assumed that temperatures recovered to near-equilibrium values in 9.5 days, which is the period of time between operations at this installation. A temperature record of ~50 min was acquired with a 30 min stop at 43.5 mbsf and a 10 min stop at 9.5 mbsf. The acquired temperature data, together with wireline depth, are displayed in Figure F42. Times were converted to depths using the RigWatch wireline data to create a plot of temperature versus depth (Figure F43). Temperatures increased with time when the probe was held at a constant depth, suggesting that water was either flowing into the screened borehole or being pumped in response to heave. The latter would bring warmer water from deeper in the hole into upper levels of the hole. The estimated thermal gradient using the WSTP data is 25.5°C/km, although a simple linear gradient would not be appropriate to describe the formation temperature in a borehole with active fluid flow (see below) (Figure F44).
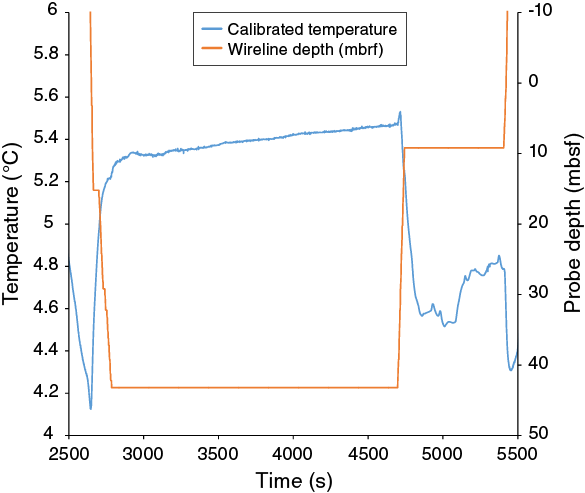
Figure F42. Measured WSTP temperatures and depths.
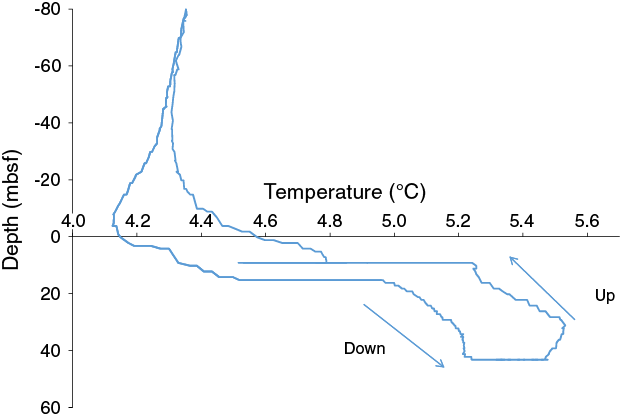
Figure F43. WSTP temperature in the borehole.
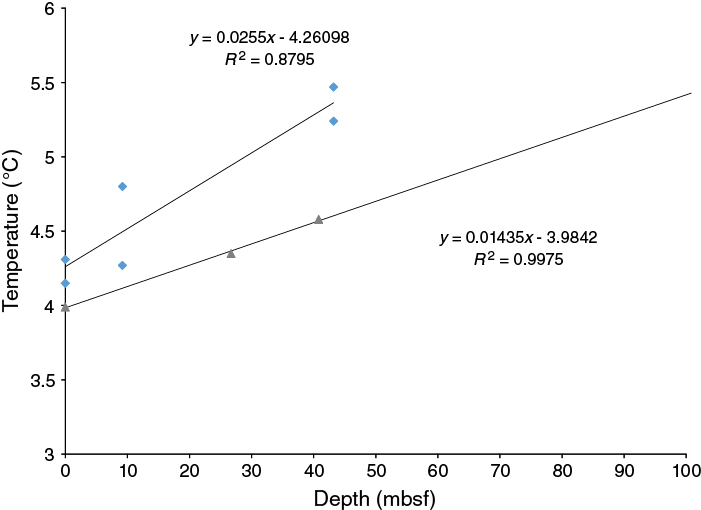
Figure F44. Estimated WSTP and APCT-3 temperatures.
Discussion
The low thermal gradient of 14.3°C/km obtained with the APCT-3 data is consistent with the low values obtained for Site U1492 and Chamorro Seamount (Shipboard Scientific Party, 2002). The thermal gradient value of 25.5°C/km obtained with the WSTP profile is significantly higher (Figure F41).
The thermal recovery of the fluid in the hole following drilling and casing operations was modeled to better understand the conditions when the WSTP was deployed. While drilling, seawater is continuously pumped into the borehole to clear cuttings, lowering the temperature within the borehole to the temperature of bottom seawater (3.99°C), which is significantly lower than the projected temperature of 5.4°C at the bottom of the hole. Once pumping ends, the formation begins to recover from the perturbation. Although the total heat exchanged with the borehole walls is unknown, we estimate the time required for the formation temperature to recover using the formula of Bullard (1947; see Jaeger [1956] for correction):
T/T0 = ln(1 + t1/t2)/[ln(4αt1/a2) − 0.577],
- T0 = temperature perturbation at the end of drilling,
- t1 = time spent circulating fluid in the hole,
- t2 = time since drilling ended,
- T = temperature perturbation after time t2, and
- a = radius of the borehole.
Thermal diffusivity (α) is given by
The values used in the calculation are provided in Table T11. Results show that by the time the WSTP was deployed, the temperature perturbation had decreased to 11% of the original value. Using the more precise solution of Jaeger (1961; figure 3) where αt1/a2 = 1.54 and t2 = 10.5 days yields a similar value. Without knowing the initial perturbation, the assessment of the formation temperature with the WSTP is problematic but reasonably estimated. The potential perturbation was assessed in Hole U1498B using a temperature wireline log run immediately after drilling operations ended (see Downhole measurements in the Site U1498 chapter [Fryer et al., 2018e]). Assuming the unperturbed thermal gradient in Hole U1498B as a model for values obtained at other flank sites (~30°C/km), the perturbation immediately after drilling was ~0.5°C at 50 mbsf and ~1.0°C at 100 mbsf. Drilling fluid was circulated in Hole U1498B for at least 3.4 days, or twice the time at Hole U1496C. In addition, the thermal gradient in Hole U1496C is just 14.3°C/km, so these perturbations are maximum values. Combining these results with the ~89% thermal recovery indicates that the WSTP values should be within 0.05°C of formation values at 50 mbsf and 0.1°C at 100 mbsf. Thus, we conclude that the perturbation from drilling was mostly dissipated by the time the WSTP profile was measured.
Table T11. Estimated time required for formation temperature to recover after pumping. Download table in CSV format.
Two factors may contribute to the warmer temperatures measured by the WSTP compared to the APCT-3. The heave of the drill string during the WSTP deployment may pull water up from the base of the hole. This could be the reason why temperatures increased when the tool was held at a constant depth. Assuming the base of the hole at ~98 mbsf equilibrated with a temperature gradient of 14.3°C/km, the estimated temperature is 5.4°C. This temperature is comparable to the peak value of 5.5°C recorded by the WSTP at 43.2 mbsf. Alternatively, heat may also have been transported into the borehole by fluid flow through the screened portion of the borehole at 35–70 mbsf. Flow up the borehole is supported by results from the WSTP water sampling, indicating that a portion of the seawater in the casing was replaced by formation water in 9.5 days between operations in this hole (see Fluid geochemistry).
Paleomagnetism
Paleomagnetic analyses were conducted on archive section halves and discrete samples from Hole U1496A and U1496B cores using the shipboard SRM. The natural remanent magnetization (NRM) of both holes was measured at 5 cm intervals after 5–20 mT alternating field (AF) demagnetization. A total of 44 representative discrete samples were collected, and their NRMs were measured after 0–20 mT AF demagnetization steps. Subvertical magnetic overprints are pervasive. The calibrated bulk magnetic susceptibility (χ), normalized by volume, of 31 discrete samples from Hole U1496A and 13 discrete samples from Hole U1496B was measured with an AGICO KLY 4S Kappabridge instrument using the Sufar (AGICO) software.
Results
We analyzed NRM inclinations and declinations in Holes U1496A and U1496B from discrete samples, which, similar to previous sites, show an overprint that remains after the 20 mT demagnetization step, leading to anomalously high inclinations (Figure F45). Principal component analyses (PCA) of demagnetization data and the results at the 5 mT demagnetization step from the section halves of both holes are also generally characterized by strong vertical overprint (Figures F46, F47). The serpentinite mud contains randomly oriented pebble-sized clasts, which add scatter to the pattern of remanent directions. Intensity values at this site are relatively constant, probably reflecting the relatively uniform lithology at this site.
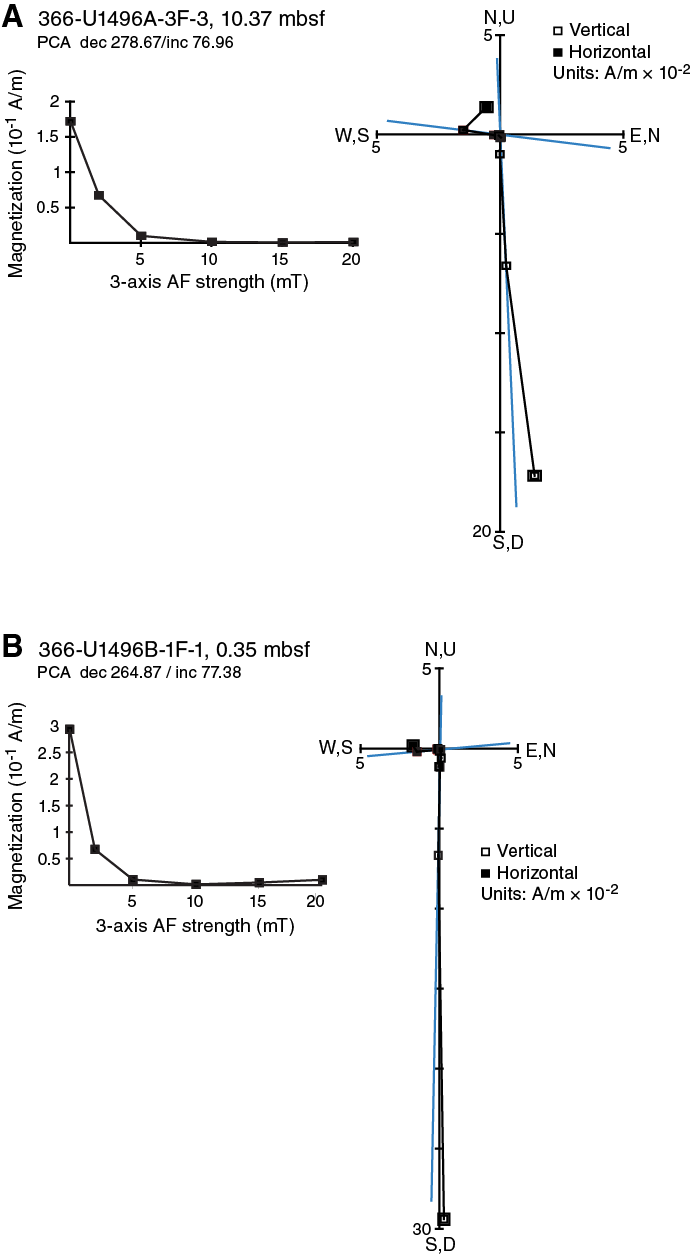
Figure F45. NRM decay and AF demagnetization vectors.

Figure F46. Paleomagnetic intensity, inclination, and declination, Hole U1496A.

Figure F47. Paleomagnetic intensity, inclination, and declination, Hole U1496B.
In Hole U1496A, NRM intensity after 20 mT AF demagnetization abruptly decreases to less than 3.0 × 10⁻³ A/m from 26 to 27 mbsf, corresponding to Subunit IVB, which consists of dark blue-gray momomict matrix-supported serpentinite breccia with lithic clasts. This interval of lower NRM intensities is consistent with the lower bulk magnetic susceptibility value of a mud discrete sample for the same interval (Figure F46). Both NRM intensity and magnetic susceptibility values drop by about an order of magnitude from 36.5 to 37.5 mbsf, corresponding to a moussey interval (see Physical properties). NRM intensities in Hole U1496B section halves are relatively constant at ~1.4 × 10⁻² A/m at the 5 mT demagnetization step.
In Hole U1496A, magnetic susceptibility ranges from ~1.0 to 12 × 10−3 with an average around 5.0 × 10⁻³. An abrupt decrease in magnetic susceptibility to less than 3.0 × 10⁻³ is registered in the mud samples from Subunit IVB. In Hole U1496B, magnetic susceptibility ranges from ~3 to 64 × 10−3 with an average of ~7.0 × 10⁻³. There is an increase in magnetic susceptibility to 6.5 × 10⁻² of a clast from Core 366-U1496B-5F at ~17 mbsf in Subunit IIIB, which mainly consists of bluish gray serpentinite pebbly mud with lithic clasts and is correlated with Subunit IVB, Hole U1496A.
References
Bullard, E.C., 1947. The time necessary for a borehole to attain temperature equilibrium. Monthly Notices of the Royal Astronomical Society, 5(S5):127–130. https://doi.org/10.1111/j.1365-246X.1947.tb00348.x
Desprairies, A., 1982. Authigenic minerals in volcanogenic sediments cored during Deep Sea Drilling Project Leg 60. In Hussong, D.M., Uyeda, S., et al., Initial Reports of the Deep Sea Drilling Project, 60: Washington, DC (U.S. Government Printing Office), 455–466. https://doi.org/10.2973/dsdp.proc.60.120.1982
Eglinton, T.I., and Repeta, D.J., 2014. Organic matter in the contemporary ocean. In Mottl, M.J., and Elderfield, H. (Eds.), Treatise on Geochemistry (2nd Edition) (Volume 8): The Oceans and Marine Geochemistry. Holland, H.D., and Turekian, K.K. (Series Eds.): Oxford, United Kingdom (Elsevier), 151–189. https://doi.org/10.1016/B978-0-08-095975-7.00606-9
Fryer, P., 2012. Serpentinite mud volcanism: observations, processes, and implications. Annual Review of Marine Science, 4(1):345–373. http://dx.doi.org/10.1146/annurev-marine-120710-100922
Fryer, P., Pearce, J.A., Stokking, L.B., et al., 1992. Proceedings of the Ocean Drilling Program, Scientific Results, 125: College Station, TX (Ocean Drilling Program). https://doi.org/10.2973/odp.proc.sr.125.1992
Fryer, P., Wheat, C.G., and Williams, T., 2016. Expedition 366 Scientific Prospectus: Mariana Serpentine Mud Volcanism. International Ocean Discovery Program. http://dx.doi.org/10.14379/iodp.sp.366.2016
Fryer, P., Wheat, C.G., Williams, T., Albers, E., Bekins, B., Debret, B.P.R., Deng, J., Dong, Y., Eickenbusch, P., Frery, E.A., Ichiyama, Y., Johnson, K., Johnston, R.M., Kevorkian, R.T., Kurz, W., Magalhaes, V., Mantovanelli, S.S., Menapace, W., Menzies, C.D., Michibayashi, K., Moyer, C.L., Mullane, K.K., Park, J.-W., Price, R.E., Ryan, J.G., Shervais, J.W., Sissmann, O.J., Suzuki, S., Takai, K., Walter, B., and Zhang, R., 2018a. Expedition 366 methods. In Fryer, P., Wheat, C.G., Williams, T., and the Expedition 366 Scientists, Mariana Convergent Margin and South Chamorro Seamount. Proceedings of the International Ocean Discovery Program, 366: College Station, TX (International Ocean Discovery Program). https://doi.org/10.14379/iodp.proc.366.102.2018
Fryer, P., Wheat, C.G., Williams, T., Albers, E., Bekins, B., Debret, B.P.R., Deng, J., Dong, Y., Eickenbusch, P., Frery, E.A., Ichiyama, Y., Johnson, K., Johnston, R.M., Kevorkian, R.T., Kurz, W., Magalhaes, V., Mantovanelli, S.S., Menapace, W., Menzies, C.D., Michibayashi, K., Moyer, C.L., Mullane, K.K., Park, J.-W., Price, R.E., Ryan, J.G., Shervais, J.W., Sissmann, O.J., Suzuki, S., Takai, K., Walter, B., and Zhang, R., 2018b. Expedition 366 summary. In Fryer, P., Wheat, C.G., Williams, T., and the Expedition 366 Scientists, Mariana Convergent Margin and South Chamorro Seamount. Proceedings of the International Ocean Discovery Program, 366: College Station, TX (International Ocean Discovery Program). https://doi.org/10.14379/iodp.proc.366.101.2018
Fryer, P., Wheat, C.G., Williams, T., Albers, E., Bekins, B., Debret, B.P.R., Deng, J., Dong, Y., Eickenbusch, P., Frery, E.A., Ichiyama, Y., Johnson, K., Johnston, R.M., Kevorkian, R.T., Kurz, W., Magalhaes, V., Mantovanelli, S.S., Menapace, W., Menzies, C.D., Michibayashi, K., Moyer, C.L., Mullane, K.K., Park, J.-W., Price, R.E., Ryan, J.G., Shervais, J.W., Sissmann, O.J., Suzuki, S., Takai, K., Walter, B., and Zhang, R., 2018c. Site U1492. In Fryer, P., Wheat, C.G., Williams, T., and the Expedition 366 Scientists, Mariana Convergent Margin and South Chamorro Seamount. Proceedings of the International Ocean Discovery Program, 366: College Station, TX (International Ocean Discovery Program). https://doi.org/10.14379/iodp.proc.366.105.2018
Fryer, P., Wheat, C.G., Williams, T., Albers, E., Bekins, B., Debret, B.P.R., Deng, J., Dong, Y., Eickenbusch, P., Frery, E.A., Ichiyama, Y., Johnson, K., Johnston, R.M., Kevorkian, R.T., Kurz, W., Magalhaes, V., Mantovanelli, S.S., Menapace, W., Menzies, C.D., Michibayashi, K., Moyer, C.L., Mullane, K.K., Park, J.-W., Price, R.E., Ryan, J.G., Shervais, J.W., Sissmann, O.J., Suzuki, S., Takai, K., Walter, B., and Zhang, R., 2018d. Sites U1493, U1494, and U1495. In Fryer, P., Wheat, C.G., Williams, T., and the Expedition 366 Scientists, Mariana Convergent Margin and South Chamorro Seamount. Proceedings of the International Ocean Discovery Program, 366: College Station, TX (International Ocean Discovery Program). https://doi.org/10.14379/iodp.proc.366.106.2018
Fryer, P., Wheat, C.G., Williams, T., Albers, E., Bekins, B., Debret, B.P.R., Deng, J., Dong, Y., Eickenbusch, P., Frery, E.A., Ichiyama, Y., Johnson, K., Johnston, R.M., Kevorkian, R.T., Kurz, W., Magalhaes, V., Mantovanelli, S.S., Menapace, W., Menzies, C.D., Michibayashi, K., Moyer, C.L., Mullane, K.K., Park, J.-W., Price, R.E., Ryan, J.G., Shervais, J.W., Sissmann, O.J., Suzuki, S., Takai, K., Walter, B., and Zhang, R., 2018e. Site U1498. In Fryer, P., Wheat, C.G., Williams, T., and the Expedition 366 Scientists, Mariana Convergent Margin and South Chamorro Seamount. Proceedings of the International Ocean Discovery Program, 366: College Station, TX (International Ocean Discovery Program). https://doi.org/10.14379/iodp.proc.366.109.2018
Hulme, S.M., Wheat, C.G., Fryer, P., and Mottl, M.J., 2010. Pore water chemistry of the Mariana serpentinite mud volcanoes: a window to the seismogenic zone. Geochemistry, Geophysics, Geosystems, 11(1):Q01X09. http://dx.doi.org/10.1029/2009GC002674
Jaeger, J.C., 1956. Conduction of heat in an infinite region bounded internally by a circular cylinder of a perfect conductor. Australian Journal of Physics, 9(2):167–179. https://doi.org/10.1071/PH560167
Jaeger, J.C., 1961. The effect of the drilling fluid on temperatures measured in boreholes. Journal of Geophysical Research, 66(2):563–569. https://doi.org/10.1029/JZ066i002p00563
Johnston, R.M., Ryan, J.G., and the Expedition 366 Scientists, 2018. pXRF and ICP-AES characterization of shipboard rocks and sediments: protocols and strategies. In Fryer, P., Wheat, C.G., Williams, T., and the Expedition 366 Scientists, Mariana Convergent Margin and South Chamorro Seamount. Proceedings of the International Ocean Discovery Program, 366: College Station, TX (International Ocean Discovery Program). https://doi.org/10.14379/iodp.proc.366.110.2018
Mottl, M.J., 1992. Pore waters from serpentinite seamounts in the Mariana and Izu-Bonin forearcs, Leg 125: evidence for volatiles from the subducting slab. In Fryer, P., Pearce, J.A., Stokking, L.B., et al., Proceedings of the Ocean Drilling Program, Scientific Results, 125: College Station, TX (Ocean Drilling Program), 373–385. https://doi.org/10.2973/odp.proc.sr.125.121.1992
Mottl, M.J., Komor, S.C., Fryer, P., and Moyer, C.L., 2003. Deep-slab fluids fuel extremophilic Archaea on a Mariana forearc serpentinite mud volcano: Ocean Drilling Program Leg 195. Geochemistry, Geophysics, Geosystems, 4:9009. http://dx.doi.org/10.1029/2003GC000588
Mottl, M.J., Wheat, C.G., Fryer, P., Gharib, J., and Martin, J.B., 2004. Chemistry of springs across the Mariana forearc shows progressive devolatilization of the subducting plate. Geochimica et Cosmochimica Acta, 68(23):4915–4933. http://dx.doi.org/10.1016/j.gca.2004.05.037
Oakley, A., 2008. A multi-channel seismic and bathymeric investigation of the central Mariana convergent margin [Ph.D. dissertation]. University of Hawaii. http://www.soest.hawaii.edu/GG/resources/theses/Oakley Dissertation 2008.pdf
Oakley, A.J., Taylor, B., Fryer, P., Moore, G.F., Goodliffe, A.M., and Morgan, J.K., 2007. Emplacement, growth, and gravitational deformation of serpentinite seamounts on the Mariana forearc. Geophysical Journal International, 170(2):615–634. http://dx.doi.org/10.1111/j.1365-246X.2007.03451.x
Oakley, A.J., Taylor, B., and Moore, G.F., 2008. Pacific plate subduction beneath the central Mariana and Izu-Bonin fore arcs: new insights from an old margin. Geochemistry, Geophysics, Geosystems, 9(6):Q06003. https://doi.org/10.1029/2007GC001820
Salisbury, M.H., Shinohara, M., Richter, C., et al., 2002. Proceedings of the Ocean Drilling Program, Initial Reports, 195: College Station, TX (Ocean Drilling Program). https://doi.org/10.2973/odp.proc.ir.195.2002
Shipboard Scientific Party, 1990. Introduction. In Fryer, P., Pearce, J.A., Stokking, L.B., et al., Proceedings of the Ocean Drilling Program, Initial Reports, 125: College Station, TX (Ocean Drilling Program), 5–14. http://dx.doi.org/10.2973/odp.proc.ir.125.101.1990
Shipboard Scientific Party, 2002. Leg 195 summary. In Salisbury, M.H., Shinohara, M., Richter, C., et al., Proceedings of the Ocean Drilling Program, Initial Reports, 195: College Station, TX (Ocean Drilling Program), 1–63. http://dx.doi.org/10.2973/odp.proc.ir.195.101.2002
Uyeda, S., and Horai, K., 1982. Heat flow measurements on Deep Sea Drilling Project Leg 60. In Hussong, D.M., Uyeda, S., et al., Initial Reports of the Deep Sea Drilling Project, 60: Washington, DC (U.S. Government Printing Office), 789–800. https://doi.org/10.2973/dsdp.proc.60.146.1982
1 Fryer, P., Wheat, C.G., Williams, T., Albers, E., Bekins, B., Debret, B.P.R., Deng, J., Dong, Y., Eickenbusch, P., Frery, E.A., Ichiyama, Y., Johnson, K., Johnston, R.M., Kevorkian, R.T., Kurz, W., Magalhaes, V., Mantovanelli, S.S., Menapace, W., Menzies, C.D., Michibayashi, K., Moyer, C.L., Mullane, K.K., Park, J.-W., Price, R.E., Ryan, J.G., Shervais, J.W., Sissmann, O.J., Suzuki, S., Takai, K., Walter, B., and Zhang, R., 2018. Site U1496. In Fryer, P., Wheat, C.G., Williams, T., and the Expedition 366 Scientists, Mariana Convergent Margin and South Chamorro Seamount. Proceedings of the International Ocean Discovery Program, 366: College Station, TX (International Ocean Discovery Program). https://doi.org/10.14379/iodp.proc.366.107.2018
2 Expedition 366 Scientists’ addresses.
This work is distributed under the Creative Commons Attribution 4.0 International (CC BY 4.0) license. 