Sun, Z., Jian, Z., Stock, J.M., Larsen, H.C., Klaus, A., Alvarez Zarikian, C.A., and the Expedition 367/368 Scientists
Proceedings of the International Ocean Discovery Program Volume 367/368
publications.iodp.org
https://doi.org/10.14379/iodp.proc.367368.104.2018

Site U15001
Joann M. Stock, Zhen Sun, Adam Klaus, Hans Christian Larsen, Zhimin Jian, Carlos A. Alvarez Zarikian, Jacopo Boaga, Stephen A. Bowden, Anne Briais, Yifeng Chen, Deniz Cukur, Kelsie A. Dadd, Weiwei Ding, Michael J. Dorais, Eric C. Ferré, Fabricio Ferreira, Akira Furusawa, Aaron J. Gewecke, Jessica L. Hinojosa, Tobias W. Höfig, Kan-Hsi Hsiung, Baoqi Huang, Enqing Huang, Xiao-Long Huang, Shijun Jiang, Haiyan Jin, Benjamin G. Johnson, Robert M. Kurzawski, Chao Lei, Baohua Li, Li Li, Yanping Li, Jian Lin, Chang Liu, Chuanlian Liu, Zhifei Liu, Antonio Luna, Claudia Lupi, Anders J. McCarthy, Geoffroy Mohn, Lachit Singh Ningthoujam, Michael Nirrengarten, Nobuaki Osono, David W. Peate, Patricia Persaud, Ning Qiu, Caroline M. Robinson, Sara Satolli, Isabel Sauermilch, Julie C. Schindlbeck, Steven M. Skinner, Susanne M. Straub, Xiang Su, Liyan Tian, Froukje M. van der Zwan, Shiming Wan, Huaichun Wu, Rong Xiang, Rajeev Yadav, Liang Yi, Cuimei Zhang, Jinchang Zhang, Yang Zhang, Ning Zhao, Guangfa Zhong, and Lifeng Zhong2
Keywords: International Ocean Discovery Program, IODP, JOIDES Resolution, Expedition 367, Expedition 368, Site U1500, northern South China Sea, continent–ocean transition zone, Ridge B, hyperextension, continental breakup, thinning, rifting, basalt, Cenozoic, red clay, turbidite, reworked microfossils
MS 367368-104: Published 28 September 2018
Site summary
International Ocean Discovery Program (IODP) Expedition 367 Site U1500 is located on basement Ridge B and is the most seaward site that Expedition 367 drilled within the South China Sea (SCS) continent–ocean transition (COT) zone. Ridge B is located ~80 km seaward of the outer margin high and ~20 km seaward of Ridge A, where Site U1499 was drilled. The goal of drilling here was to sample and log the lowermost sediment and underlying basement rocks to determine basement age and lithology of the COT or embryonic oceanic crust, thus providing a test of different possible models for the processes and rheology controlling the breakup of the continent. Ridge B was expected to have basement of either upper continental crust, lower continental crust, mantle rocks, or oceanic crust. The coring and logging would also constrain the history of the region after rifting by determining the age, water depth, and subsidence rates of the overlying sedimentary packages.
We conducted operations in two holes at Site U1500 (proposed Site SCSII-8B; Sun et al., 2016) (Table T1). Hole U1500A is located at 18°18.2762′N, 116°13.1916′E in a water depth of 3801.7 m. In Hole U1500A, we drilled without coring from the seafloor to 378.2 m and then cored with the rotary core barrel (RCB) system from 378.2 to 494.6 m and recovered 26.5 m (23%). Thereafter, we drilled without coring from 494.6 to 641.2 m and cored with the RCB system from 641.2 to 854.6 m and recovered 67.2 m (31%).
Table T1. Site U1500 core summary. View table in PDF format. Download table in CSV format.
Hole U1500B is located at 18°18.2707′N, 116°13.1951′E in a water depth of 3801.7 m. After installing casing, we continuously cored the sediment sequence from 846.0 to 1379.1 m (533.1 m cored; 164.7 m recovered; 31%) and then continuously cored 149.9 m into the underlying basalt from 1379.1 to 1529.0 m (114.92 m recovered; 77%). This made Hole U1500B the eighth deepest hole that the R/V JOIDES Resolution has drilled in Ocean Drilling Program (ODP)/Integrated Ocean Drilling Program/IODP history. Three downhole logging strings were run in Hole U1500B from 842 to 1133 m.
Lithostratigraphy
The cored sediment at Site U1500 is divided into eight lithostratigraphic units (Figure F11). The uppermost 378.2 m of sediment was drilled without coring. Lithostratigraphic Unit I (378.2–410.0 m) is a 31.8 m thick upper Miocene sequence of greenish gray heavily bioturbated clay with silt and sandy silt interbeds. Some of the clay intervals are nannofossil rich. Structure in the clay is mostly massive, but parallel laminations occur in the silt and sandy silt interbeds. Unit II (410.0–494.6 m) is an upper Miocene sequence of interbedded dark greenish gray clay and silt. Recovery was very low for this unit (~8%), which may indicate a change in lithology (e.g., increased abundance of nonlithified sands). This unit is underlain by another interval drilled without coring (494.6–641.2 m).
Unit III (641.2–892.4 m) is defined by upper Miocene interbedded claystone, siltstone, and sandstone. Many of the siltstone and sandstone intervals are organized into a variety of massive and stratified beds that include sedimentary structures such as parallel laminations, cross-stratification, and contorted strata. There are also several massive beds of sandstone that contain pebble-sized mud clasts. The well-organized coarser intervals fine upward into more massive claystone intervals and are interpreted as turbidite sequences. Several of the stratified beds are composed of foraminifer tests.
Unit IV (892.4–1233.3 m) also had very low recovery (15%). This unit is composed of lower upper Miocene very dark greenish gray to dark gray sandstone with dark brown to very dark gray claystone and siltstone intervals. Many of the intervals described in this unit contain interlaminations of silt or sand within a prevailing claystone lithology. Similar to Unit III, sedimentary structures in many of the sandstone and siltstone intervals are interpreted as turbidites. The claystone in some of the cores shows a distinctive color banding, which was observed as a pattern of alternating reddish brown, dark greenish gray, and brownish gray. The color banding appears to be associated with fining-upward grain sizes and varying levels of bioturbation. Sandstone intervals within this unit contain high percentages of K-feldspar, quartz, plagioclase, and mica minerals that may have been sourced from granitic rocks exposed along the southern margin of China.
Unit V (lower middle Miocene) is divided into Subunits VA (1233.30−1272.10 m) and VB (1272.10−1310.98 m) based on the abundance of calcareous material. Subunit VA consists of dark reddish brown, dark greenish gray, and dusky red homogeneous massive claystone with few sandstone and siltstone interbeds (3–12 cm thick). Subunit VB consists of dark reddish brown, reddish brown, and greenish gray intervals of claystone, nannofossil-rich claystone, claystone with biogenic carbonate, and clay-rich chalk. The greenish gray color banding within Subunits VA and VB is interpreted as diagenetic alteration.
Unit VI (1310.98−1370.33 m) is composed of Oligocene dark greenish gray massive silty claystone with biogenic carbonate and dark gray sandstone. Unit VII (1370.33−1379.10 m) comprises a thin (30 cm thick) Oligocene dusky red claystone. The lowermost 2 cm of this unit has a greenish gray color that marks a sharp horizontal contact with the igneous rocks below in Unit VIII. The basalt in Unit VIII (1379.10−1529.0 m), which is Oligocene or pre-Oligocene in age, contains some fractures that are filled with well-lithified claystone. The claystone contains authigenic carbonate, siliciclastic components, and rare nannofossils. The basalt intervals are sparsely intercalated with dusky red claystone, with the basalt/sediment contacts often associated with chilled glassy margins. Some claystone intervals within the basalt unit show evidence of dolomitization in thin section.
Igneous petrology
In Hole U1500B, we cored 149.9 m of igneous rocks below the sedimentary section and recovered a total of 114.92 m of basalt. The aphanitic to porphyritic basalts are nonvesicular to moderately vesicular and glassy to hypocrystalline, with the latter ranging from cryptocrystalline to fine grained, making up an aphyric to highly olivine-plagioclase phyric texture (microstructure). These basalts contain numerous 2–5 cm thick baked/chilled contacts and chilled margins, many of the latter with preserved fresh glass, as well as occasional hyaloclastites showing brecciated glass fragments mixed with sediment. The basalts comprise Unit VIII and are divided into igneous lithologic Subunits 1a and 1b according to flow boundaries to distinguish an upper massive lava flow sequence (27.28 m thick) from a lower, predominantly pillow lava flow succession (122.62 m thick) with subordinate thin (<6 m) interbedded lobate, sheet, and massive lava flows. The pillow lobes are well preserved and are separated by chilled, glassy margins (identifying upper and lower chilled margins of individual pillows where possible) and also claystone. Plagioclase phenocrysts are found throughout these basalts, with olivine being an occasional phenocryst. Modal abundances of olivine and plagioclase phenocrysts increase downhole, reaching a peak between 1420 and 1470 mbsf. Veins occur throughout Unit VIII and are predominantly filled with carbonates and Fe (hydr)oxides, chlorites, zeolites, and silica, as well as sediment. Veins usually show a sharp contact with the host basalt and are either polycrystalline or massive. Claystone is a ubiquitous phase in many carbonate-rich veins, especially in pillow lava flows, and is usually found as very fine aggregates within carbonate veins or as centimeter-thick veins with no preserved textures or structures. Red to green-red halos usually surround the carbonate veins, which are related to the background alteration of interstitial glass, olivine, and occasionally plagioclase and clinopyroxene. Alteration of these basalts remains slight overall, as evidenced by the minimal alteration of interstitial glass as well as the good preservation of plagioclase. Alteration intensity, however, does increase downhole.
Structural geology
Tilted sedimentary bedding and deformation structures were observed in all lithostratigraphic units. Faults, tilted beds, folds, and mud clasts observed in Units I, II, and III are likely related to gravity-controlled deposition (e.g., debris flows, slumps, slides, etc.). Unit IV has low recovery and exhibits only a few tilted beds and compaction faults. A total of 47 centimeter-scale faults were measured in the claystone of Units V, VI, and VII. Many of these faults have slickensides and are likely related to clay compaction during lithification. Open fractures and veins are identified in the sparsely to highly plagioclase phyric basalts of Unit VIII. There are no preferred orientations of these structures. Most of the veins are filled by carbonate minerals, Fe oxides, sediment, and secondary minerals. Veins are often haloed by Fe oxide alteration. Vein connectivity is variable; single veins, branched veins, and vein networks were observed. There is no mineral-preferred orientation. Although the seismic profile across Site U1500 shows dipping reflectors in the basalt, we did not observe any clear paleohorizontal or dipping features within these lavas.
Biostratigraphy
All core catcher samples were analyzed for calcareous nannofossil and foraminifer contents. Additional samples were taken from the split-core sections when necessary to refine the ages between core catcher samples. Preservation of microfossils varies from poor to good. Overgrown and abundant broken fragments are common in the sediment sequences. The total abundance varies from barren to abundant, and most samples exhibit some degree of reworking.
Although recovery is low and ~50% of the samples are barren, the succession is apparently continuous and is tentatively assigned a late Oligocene–Miocene age. The late/middle Miocene boundary (11.6 Ma) can be placed between Samples 367-U1500B-37R-1, 40–41 cm, and 44R-CC. Both calcareous nannofossils and planktonic foraminifers indicate an early Miocene to late Oligocene succession in Cores 46R through 56R.
In the calcareous sandstone (Section 56R-1), just above the basalt, some younger species, such as Praeorbulina circularis (middle Miocene), Globigerinoides subquadratus, and Orbulina suturalis, are found together with the typical late Oligocene–early Miocene planktonic foraminiferal species (Catapsydrax dissimilis). In the same sample, the nannofossil content is represented by long-range species and cannot give a precise age. However, two samples from the veins and intrapillow fill of the basalts in Unit VIII contain poorly preserved calcareous nannofossils that indicate an Oligocene age. The resolution of the age discrepancy in Core 56R requires further postcruise studies.
Geochemistry
At Site U1500, measurements of organic and inorganic carbon and nitrogen were conducted on one sample per sedimentary core that had relative high recovery, and headspace gas measurements were taken for all sediment cores. In addition, four basalt samples were analyzed for concentrations of major elements and several trace elements using inductively coupled plasma–atomic emission spectroscopy (ICP-AES). Headspace gas values do not exceed 15 ppmv and are mostly below the quantification limit. Carbonate contents are dominated by biogenic carbonate and vary between <1 and 40 wt%, with higher values corresponding to the calcareous-rich lithostratigraphic units. Total organic carbon (TOC) and TOC/total nitrogen (TN) are low, averaging 0.14 wt% and 4.6, respectively. ICP-AES analyses of basalts from Site U1500 indicate subalkaline mid-ocean-ridge basalt (MORB)-like compositions.
Paleomagnetism
We conducted alternating field (AF) demagnetization of archive-half sections and AF and thermal demagnetization of representative discrete samples from both sedimentary successions and the igneous rocks. For the sedimentary samples, AF demagnetization effectively removed the drilling-induced overprint. The polarity interpretation results based on inclination data from the sedimentary long core and discrete samples are in agreement, which supports our current preliminary polarity pattern, but because of discontinuous coring and poor recovery in many cored intervals, we are not able to correlate these results to the standard geomagnetic polarity timescale. The pass-through measurements of the basalts from the archive halves using the SRM effectively removed a low-coercivity component; however, it is not clear if the characteristic remanent magnetization (ChRM) or primary magnetization has been reached, partly due to the unavoidable magnetic contamination and partly due to the destructive feature and thus limited AF treatment levels (up to 25 mT). Within a single igneous subunit, basalts sometimes show both positive and negative inclinations upon stepwise AF treatments, which makes it hard to assign reliable polarities. The demagnetization behaviors of the discrete basalt samples are of high noise at higher temperatures, which is probably due to the onset of thermo-viscous remanent magnetization especially in a magnetically nonshielded environment. The close association of negative inclinations, changes in magnetic susceptibility, and demagnetization behavior with fractures in the cores points to the possibility of a secondary chemical remanent magnetization (CRM) as the source of the reversed intervals in the basalt.
Petrophysics
We conducted measurements of gamma ray attenuation (GRA) bulk density, magnetic susceptibility, and natural gamma radiation (NGR) on whole-round cores and additional measurements on split cores and discrete samples, including thermal conductivity, P-wave velocity on the P-wave caliper (PWC), porosity, and bulk, dry, and grain density. In general, bulk densities, P-wave velocities, and thermal conductivities increase with depth, whereas porosities decrease with depth as a result of compaction and lithification. However, some properties, such as NGR or magnetic susceptibility, show local variations related to the specific lithology. A significant increase in carbonate content in Subunit VB (1272–1311 m) causes a general decrease in NGR counts and only a slight decrease in magnetic susceptibility. Physical properties change significantly in the basalts of Unit VIII (1379–1529 m). Magnetic susceptibility values are two orders of magnitude higher than in the sediment above and vary depending on the degree of alteration. P-wave velocity values are also much higher, ranging between 4430 and 5710 m/s, whereas porosity and NGR values are very low compared to the sediment above.
Correlation to seismic data
We used physical property measurements on cores and samples to correlate Site U1500 data with the available seismic reflection profile. We also used the Site U1500 density and PWC velocity data to create synthetic seismograms that provided additional constraints on the correlation. The time-depth relationship (TDR) obtained for Site U1500 shows substantial agreement with that for Site U1499 and Sites U1431 and U1433; in contrast, the ODP Site 1148 TDR exhibits higher velocities in the deeper layers. The comparison between the seismic reflectors and the variations in physical properties and lithology characteristics using the computed Site U1500 TDR shows good correlation between the high-amplitude seismic reflector at ~6.4 s two-way traveltime (TWT) and the top of the basalts of Unit VIII.
Downhole measurements
Three downhole logging tool strings were run in Hole U1500B: a modified triple combo (sonic velocity, NGR, bulk density, resistivity, and caliper), the Formation MicroScanner (FMS)-sonic (FMS resistivity images and calipers, as well as NGR), and the Versatile Seismic Imager (VSI; check shot and NGR). During the first run, the tool string encountered an obstruction at 4946 m wireline log depth below rig floor (WRF; ~1133 m), and we were unsuccessful in getting the tool string to pass below this depth. We collected FMS data from ~1044 m uphole to the bottom of the casing (842 m). Although the hole had many zones that were significantly enlarged, initial observations of the real-time FMS data indicate that some intervals exhibit relatively good caliper contact and should provide useful resistivity images. A seismic check shot survey with the VSI successfully collected data at one depth in the open hole and at the base of the casing. Because this was the last operation conducted during Expedition 367 and we only had a 1 day transit to Hong Kong, data processing and full evaluation of the log data will be conducted after Expedition 367.
Background and objectives
Site U1500 (Figures F1, F2) is located on a basement high (Ridge B) clearly visible in the map of TWT to basement (Figure F3) and is well imaged on seismic Lines 08ec1555 and 15ecLW4 (Figure F4). The primary objectives at this site were to document the nature of the basement and relative timing of processes of basement formation in this part of the COT (see Objectives 1 and 2 in Preliminary scientific assessment in the Expedition 367/368 summary chapter [Larsen et al., 2018]).
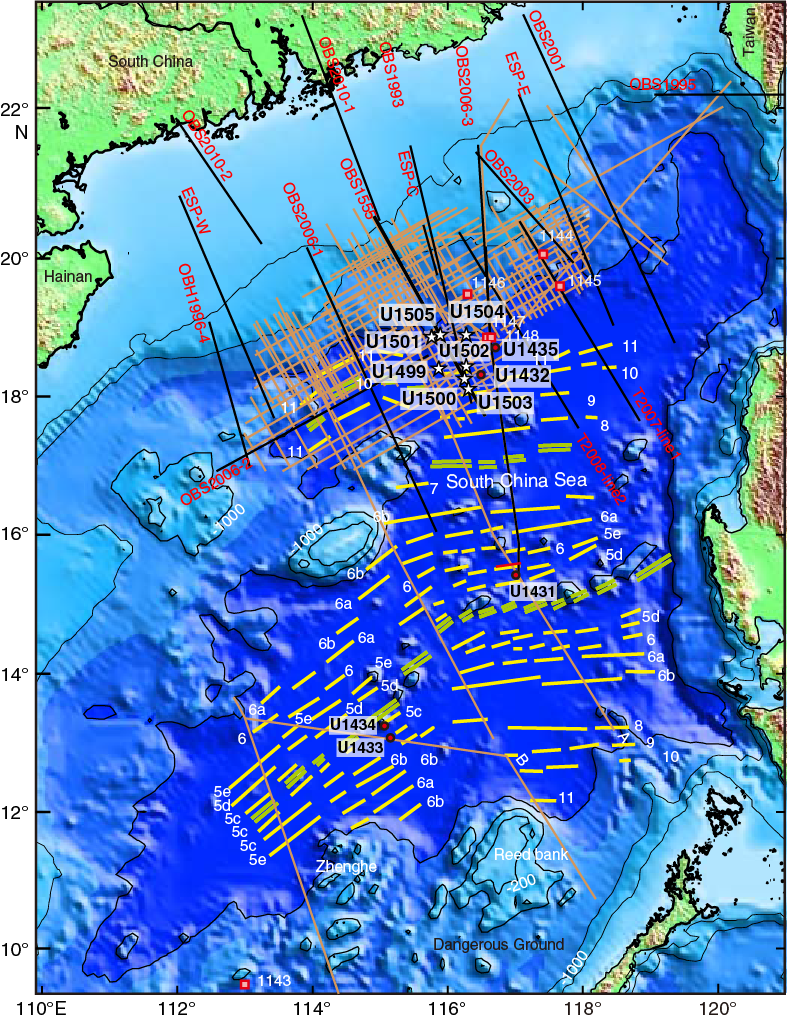
Figure F1. Seismic data coverage and magnetic anomalies.
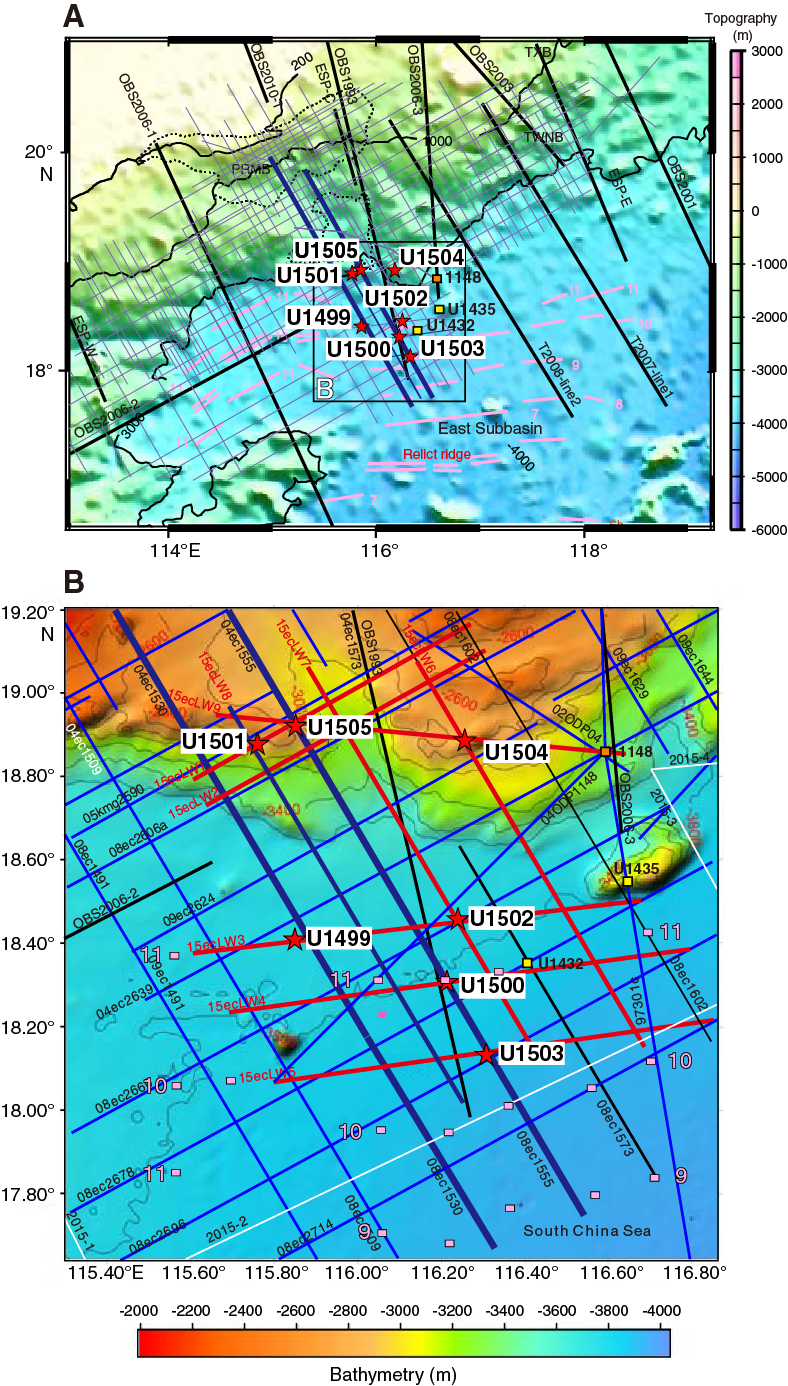
Figure F2. North SCS margin with seismic coverage.
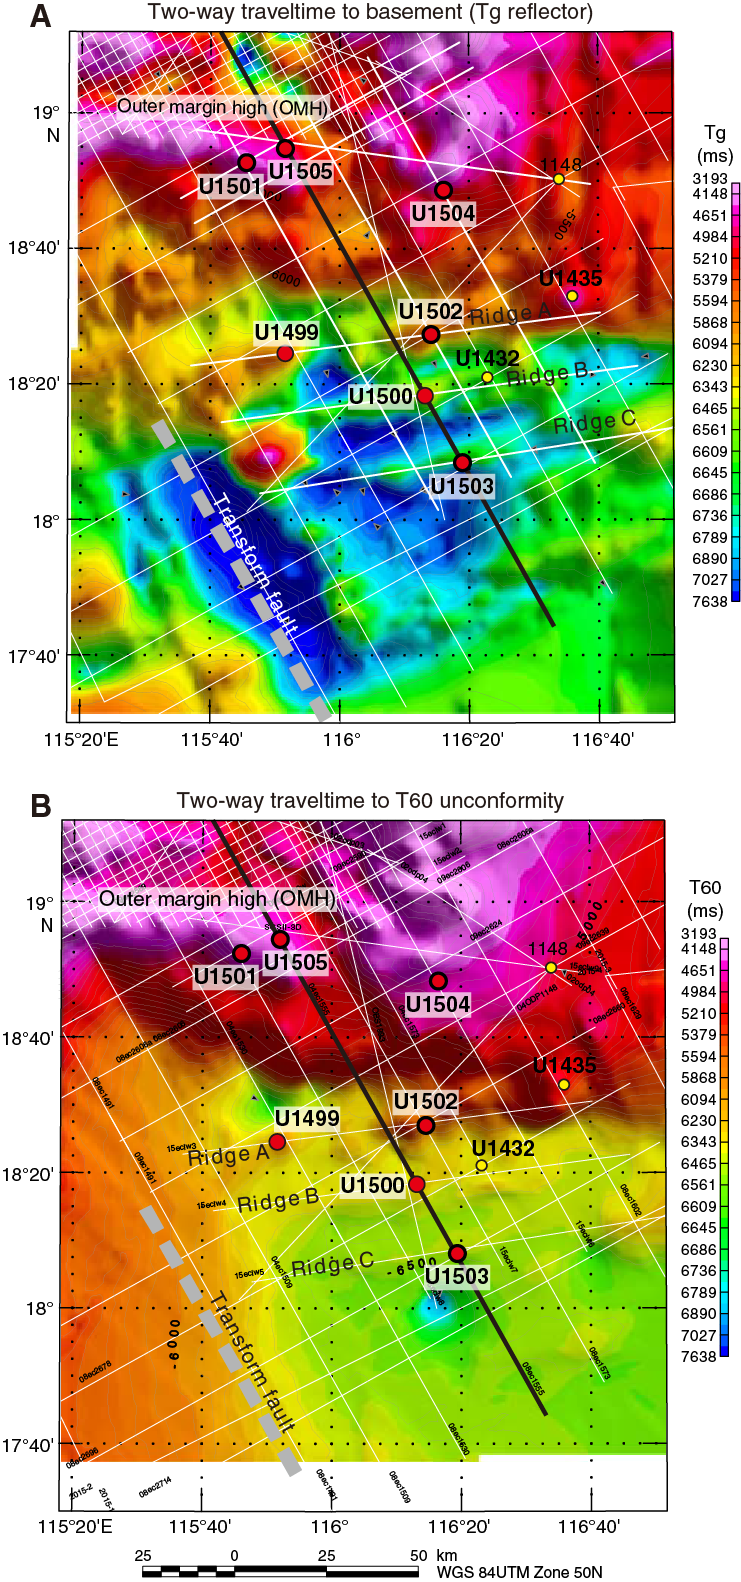
Figure F3. Two-way traveltime to Tg unconformity and Reflector T60.
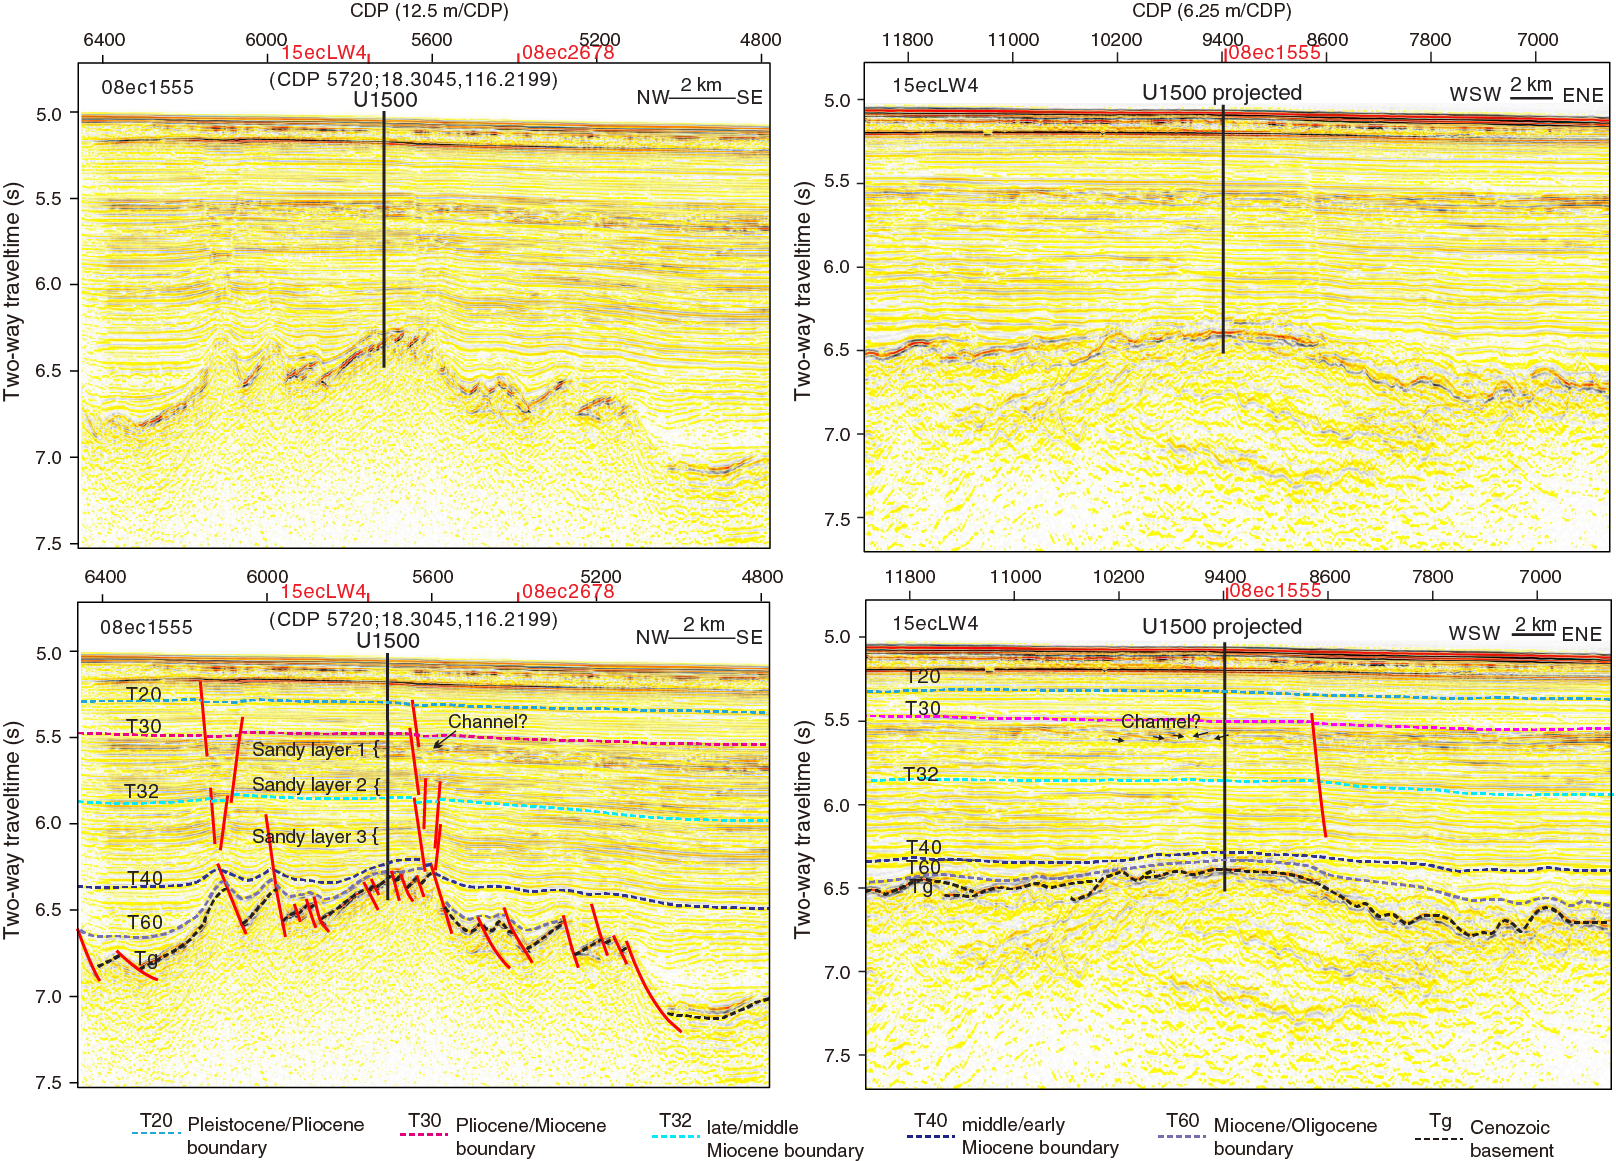
Figure F4. Original and interpreted seismic profiles.
The Ridge B basement high is seaward of Ridge A, where Site U1499 was cored and logged. The sedimentary section at Ridge B is similar to that seen covering and pinching out against Ridge A (Figure F5) and is interpreted to be sand/sandstone, clay/claystone, and silt/siltstone containing major seismic reflectors in the postrift sequence (seismic stratigraphic Unconformities T32–T60), with a variable thickness of sedimentary rock below Unconformity T60 and above acoustic basement Reflector Tg (see Correlation to seismic data in the Expedition 367/368 summary chapter [Larsen et al., 2018]). The site is located along the part of Ridge B where the basement is shallowest and the sedimentary rocks older than Unconformity T60 are relatively thin, so basement can be reached most easily.

Figure F5. Uninterpreted and interpreted seismic profiles.
This basement high is cut by a series of generally southeast-dipping faults. As seen clearly on seismic Line 08ec1555 (Figure F4), the surface interpreted as acoustic basement (Reflector Tg) is tilted northwest in a series of fault blocks. Some of the bounding faults only affect older strata (deeper than Unconformity T60), whereas other faults can be seen to cut Unconformities T60, T40, and T32; a few faults also cut Unconformity T30 (inferred to correlate with the Miocene/Pliocene boundary [Reflector Tmp]; Li et al., 2015a) and extend nearly to the seafloor before terminating at a shallow, strong reflector at ~0.1 ms TWT below the seafloor. The faults show minor offset after Unconformity T60 suggesting that they might be caused mainly by differential compaction. The spacing of these faults varies from 200 to 600 m. Because the basement surface is dipping, the drill hole was in an optimal position to avoid the nearby faults while reaching the basement at the shallowest feasible location.
This site will help to distinguish among various models for the nature of the basement at this part of the COT. The basement might be serpentinized subcontinental or asthenospheric mantle, as shown in the evolutionary model in Figure F6. However, it could also be upper or lower continental crust or oceanic igneous rock such as basalt and/or gabbro (Figure F7). Because the Mohorovicic seismic discontinuity is not clearly imaged here on the seismic profile (Figure F8) and crustal reflectors suggestive of detachment faults are not seen in this area (Figure F9), several possible models are left open, including diverse combinations of continental or oceanic lithosphere with or without magmatic intrusions or serpentinization.
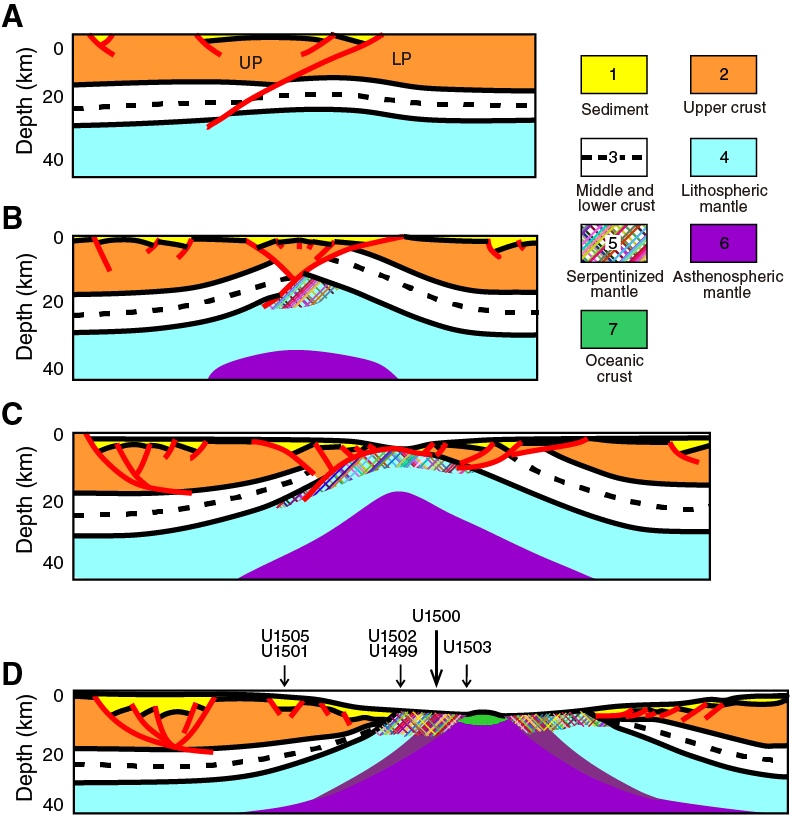
Figure F6. Schematic development of continental breakup.
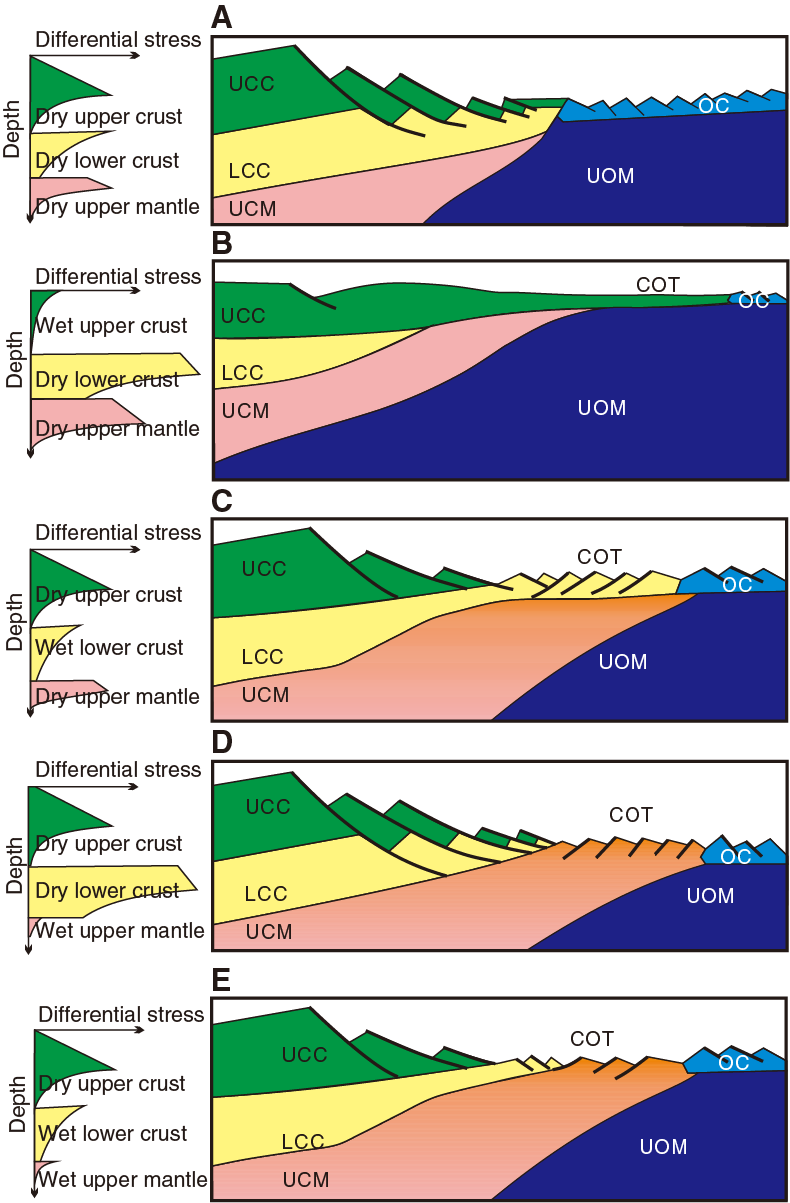
Figure F7. Spectrum of possible magma-poor rifted margin models.
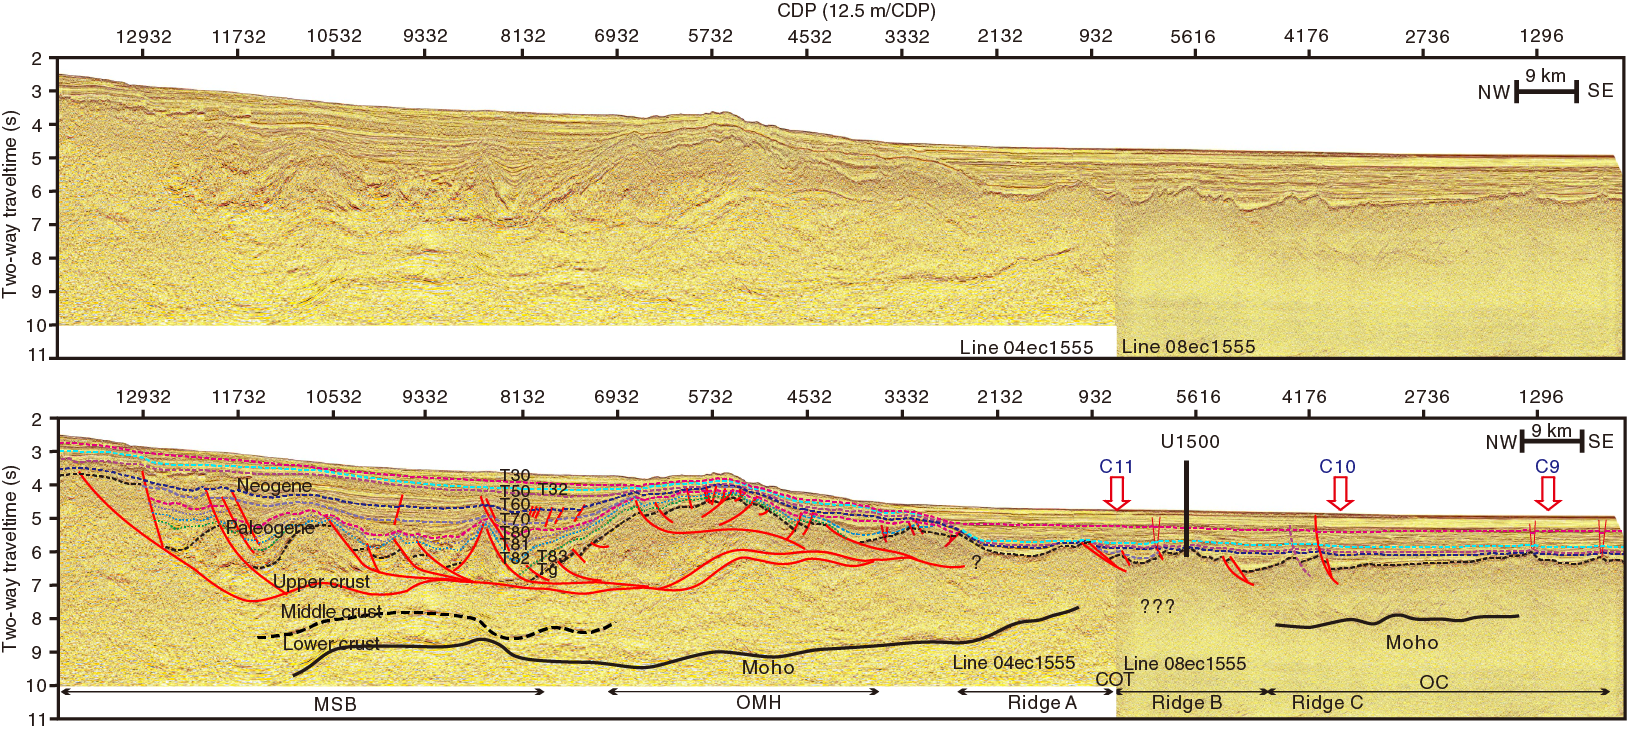
Figure F8. Uninterpreted and simplified interpretation, seismic Profile 1555.
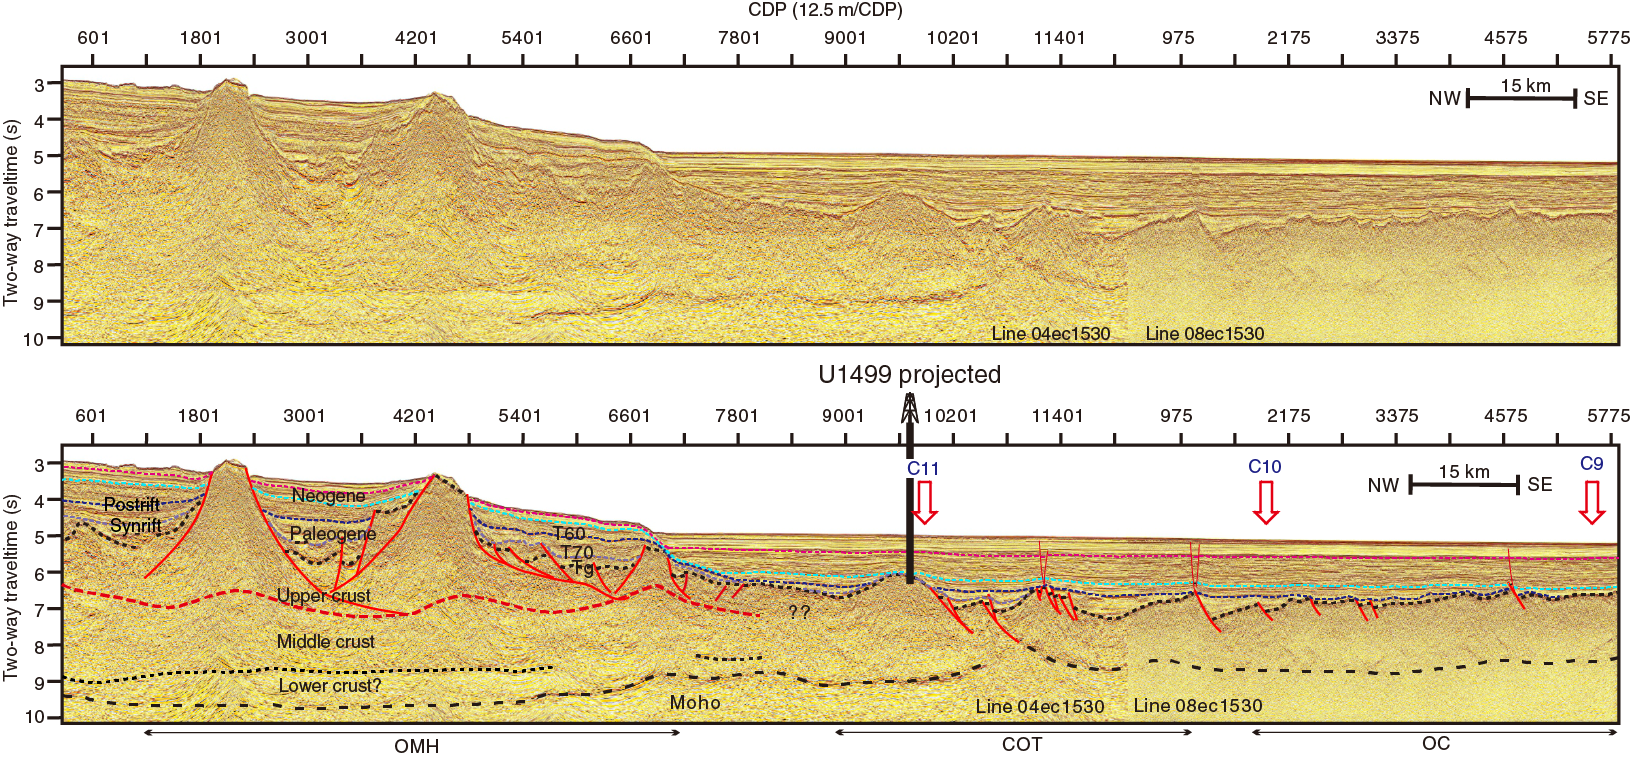
Figure F9. Uninterpreted and simplified interpretation, seismic Profile 1530.
Operations
We conducted operations in two holes at Site U1500 with the primary objective of sampling and logging the lowermost sediments and underlying basalt. We successfully penetrated from the seafloor to the sediment/basalt contact at 1379 m and 150 m into the underlying basalt. The sedimentary section was not continuously cored, and recovery in the cored intervals was highly variable and rather poor (30%). In contrast, core recovery in the basalt was excellent (77%).
Hole U1500A is located at 18°18.2762′N, 116°13.1916′E in a water depth of 3801.7 m. We knew we would have to install casing to achieve our deep objectives at this site, so our operations in Hole U1500A were designed to provide information on the formation characteristics and drilling conditions so that we could decide the length of casing to drill into the seafloor at deep-penetration Hole U1500B. Given this purpose and the amount of time to drill the second, deep hole, we did not core continuously in Hole U1500A. In Hole U1500A, we
- Drilled without coring from the seafloor to 378.2 m,
- RCB cored from 378.2 to 494.6 m and recovered 26.5 m (23%),
- Drilled without coring from 494.6 to 641.2 m, and
- RCB cored from 641.2 to 854.6 m and recovered 67.2 m (31%).
Hole U1500B is located at 18°18.2707′N, 116°13.1951′E in a water depth of 3801.7 m. In Hole U1500B, we
- Drilled a reentry funnel and 842 m of 10¾ inch casing into the seafloor,
- Continuously RCB-cored the sediment sequence from 846.0 to 1379.1 m (533.1 m cored; 164.7 m recovered; 31%),
- Continuously RCB-cored 150 m into the underlying basalt from 1379.1 to 1529.0 m (114.92 m recovered; 77%), and
- Collected downhole log data with three tool strings from 842 m (base of casing) to a total depth of 1133 m (~400 m above the base of the hole).
Core summaries for Holes U1500A and U1500B are presented in Table T1, and a summary of the casing installation and operations in Hole U1500B is shown in Figure F10.
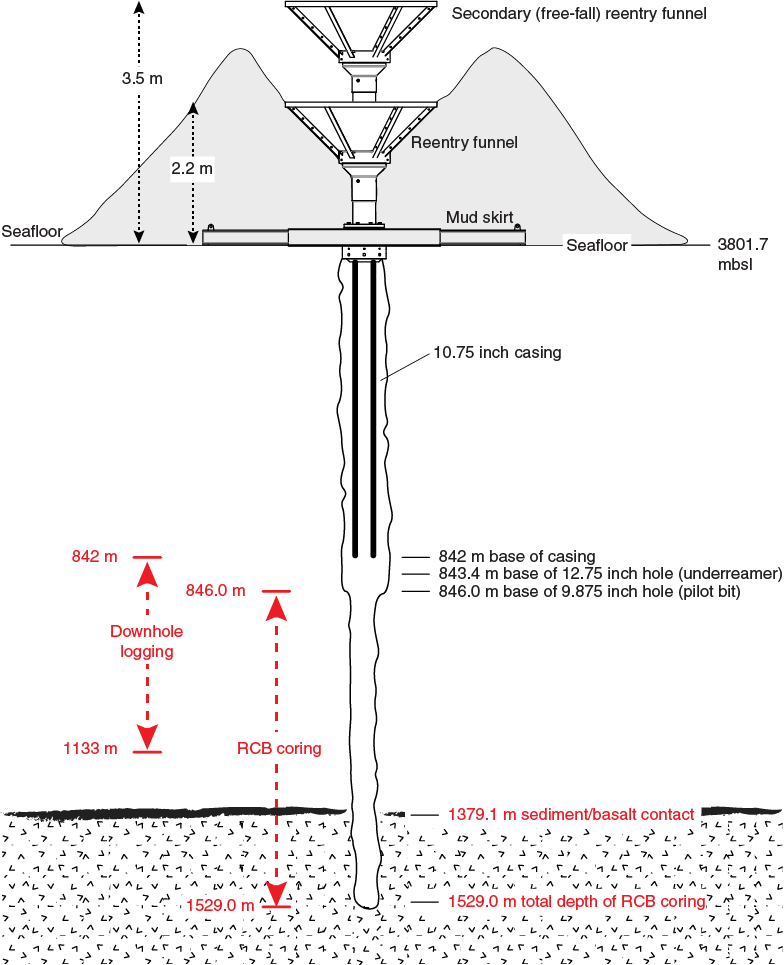
Figure F10. Reentry system and casing.
Hole U1500A
After pulling the drill string out of Hole U1499B at 1120 h on 8 March 2017, we recovered the seafloor positioning beacon and started the transit to Site U1500 in dynamic positioning mode just before 1300 h. While in transit, we continued to recover the drill string (which was completed at 1830 h) and then assembled a new RCB bit and started lowering it to the seafloor.
At 0415 h on 9 March, we deployed the subsea camera system and observed the bit tag the seafloor to establish the water depth (3801.7 meters below sea level [mbsl]). After recovering the camera system, we started drilling without coring in Hole U1500A at 0935 h. Unfortunately, at 1930 h with the bit at 340.5 m, the drawworks clutch diaphragm that was replaced earlier in the expedition failed. The clutch diaphragm was repaired with one of the new diaphragms that had been delivered to the ship by boat on 27 February. As soon as it was fixed (0930 h on 10 March), we resumed drilling without coring from 340.5 to 378.2 m. While drilling down, we pumped 30 bbl mud sweeps at 350.2 and 378.2 m. We recovered the center bit and started RCB coring at 1245 h on 10 March. Cores 2R through 13R penetrated from 378.2 to 494.6 m and recovered 26.5 m (23%). We drilled without coring from 494.6 to 641.2 m and then resumed RCB coring to the total depth of 854.6 m.
Except for a few short intervals (Cores 2R through 4R from 378.2 to 407.3 m, Cores 24R through 27R from 728.5 to 767.3 m, and Cores 35R through 36R from 835.2 to 844.9 m), core recovery was quite poor. In contrast, the cores that took 15 min or more to cut had better recovery (from 0.88 to 8.93 m; average recovery = 59%). We pumped frequent mud sweeps through the entire cored interval.
A formation change occurred at 728.5 m with Cores 24R through 27R (728.5–767.3 m), taking 30–50 min to cut with substantially improved recovery (32.1 m; 83%) of clay/claystone. We thought this would be a good formation for the base of our planned Hole U1500B casing until Core 28R once again reentered a fast-penetrating, low-recovery interval inferred to be sand. Following this, Cores 29R through 36R penetrated from 770.0 to 854.6 m and recovered 27.6 m (36%). The majority of the core recovered was in Cores 30R, 33R, 35R, and 36R (25.29 m). For the other cores, penetration rates were, once again, very fast and recovery was very low (2%–9%; inferred to be less consolidated silt/sand). When the last two cores (35R and 36R) encountered stable, well-consolidated formation, we decided we had met our primary objective of determining formation conditions at Site U1500 and an appropriate casing set point for our next hole at this site. We pulled the bit out of the hole, and it cleared the seafloor at 2330 h on 13 March. Based on the Hole U1500A information (cores, drilling, and borehole conditions), we decided that to achieve our deep-coring and logging objectives at this site, we would drill 842 m of casing into the seafloor at Hole U1500B. This placed the base of the casing in the relatively fine grained stable formation recovered in the last two cores and would isolate the multiple intervals of unstable formation above (inferred sand/silt). After the bit arrived back on the rig floor at 0640 h on 14 March, we disassembled the bit, cleared the rig floor, and conducted required routine rig servicing (drill line slip and cut).
Hole U1500B
From 0900 on 14 March 2017 to 0400 h on 15 March we prepared the casing running tool (HRT), assembled 842 m of 10.5 inch casing, and latched it into the mud skirt sitting on the moonpool doors. We then assembled and tested a 846 m long drilling assembly composed of a 9.875 inch tricone bit, underreamer (set to 12.75 inches), and mud motor. This drilling assembly was lowered through the casing, the HRT was attached to the top of it, and then it was secured to the mud skirt/casing. At 1130 h on 15 March, the entire system was lowered through the moonpool and to the seafloor. We deployed the subsea camera system at 2015 h on 15 March and installed the top drive shortly thereafter (2315 h).
At 0035 h on 16 March, we started drilling the casing into the seafloor at Hole U1500B. Along the way, we circulated 30 bbl of mud at multiple depths (335.6, 374.6, 394.0, 423.1, 452.2, 481.4, 510.6, 539.6, 568.8, 597, 627, 656, 685, 714, 744, 774, 802, and 832 m). Drilling the casing into the seafloor proceeded smoothly until ~779 m (0800 h on 17 March) when we observed the mud skirt and reentry funnel rotate very quickly, indicating that torque had built up in the drill string and then suddenly released. At the same time, we also observed that the penetration rate slowed down substantially. We suspected that one or more of the underreamer arms had lost its cutting structure (roller cone). Our options at this point were limited. We could continue to drill the bit in to the full depth or pull it back to the ship, shorten the casing string, and try to drill that in. We had only ~63 m more of penetration until the casing was fully installed. Based on the coring information from Hole U1500A, much of this interval was expected to be loosely consolidated fast-penetration formation with only a couple of short intervals of firm formation, so we continued to drill in. Although penetration rates slowed quite a bit, we were able to continue advancing the entire system until a reduction in drill string weight indicated that the mud skirt had landed on the seafloor at 1740 h on 17 March (Figure F10). This fact led us to suspect that if the underreamer cutters had come off, they likely had been pushed off into the borehole wall behind the casing. We dropped the go-devil to activate the HRT, and the drilling assembly released from the casing at ~1833 h on 17 March. We raised the bit and underreamer back up to 841.4 m, inside the casing, and filled the annulus between the casing and the drill pipe with 100 bbl of mud to inhibit sand from being sucked back up into the casing as we pulled the drilling assembly out of the hole (as previously happened at Hole U1499B). We then pulled the drill string out of the hole. After the bit cleared the seafloor (2220 h on 17 March), we conducted a short survey of the reentry system, which was barely visible in the cutting mound.
Once we finished recovering the drilling assembly and the underreamer arrived back on the rig floor (0730 h on 18 March), we observed that all of its cutting structures were still attached. However, one of them was clearly damaged (failed bearing assembly) and likely the cause of the torque event and subsequent reduction in penetration rate. We started assembling the RCB bottom-hole assembly (BHA) at 0915 h on 18 March and lowered it to the seafloor. We deployed the subsea camera system at 1615 h, started searching for the Hole U1500B reentry funnel, and after only 6 min of maneuvering, we reentered Hole U1500B at 1845 h on 18 March. We recovered the camera system, lowered the bit through the casing, and installed the top drive in preparation for RCB coring. We lowered the bit into the open hole below the end of the casing (842 m), found only 1 m of fill, circulated 25 bbl of mud and displaced the heavy mud out of the hole, and started RCB coring at 0115 h on 19 March. The uppermost 5.3 m of the first core taken after installing the casing (Core 2R) was composed primarily of heavy mud mixed with some cuttings.
Overall core recovery in Hole U1500B was very poor over a significant interval of the sedimentary section, particularly from 893.8 to 1233.3 m (lithostratigraphic Unit IV). Cores from this interval (Cores 7R through 41R) penetrated 339.5 m and recovered only 51.3 m (15%). For cores in this interval that cut quickly (≤15 min), core recovery was only 7%, and we inferred the formation is likely dominated by unconsolidated sand/silt. In contrast, recovery in cores that took longer to penetrate (20–55 min) was higher (41%) and recovered sandstone with claystone and siltstone interbeds.
While cutting Core 42R, we encountered a substantial formation change at 1235 m, and core recovery increased to 66% for Cores 42R through 45R. The time to cut Cores 43R through 45R also increased to 40–80 min. The formation change is also reflected in the recovered cores, which are dusky red claystones with greenish alteration zones and a few interbedded sandstone layers. Cores 46R through 50R penetrated from 1272.1 to 1320.6 m and recovered 30.2 m (62%). Although it took quite a long time to cut each of these cores (1.8–3.8 h), the penetration rate was very smooth and hole conditions were quite good. Cores 51R through 57R then penetrated from 1320.6 to 1388.5 m and recovered 32.4 m (48%). After Core 51R took 100 min to cut, the next five cores (52R through 56R) penetrated quite quickly; all but one took only 5–25 min and had relatively lower recovery (31%). Core 57R cut slowly (3.6 h) but smoothly and consistently and recovered 8.34 m that is almost entirely basalt. Cores 58R through 60R continued in basalt, penetrating from 1388.5 to 1415.9 m and recovering 19.9 m (73%). These cores also cut slowly (4.3–5.4 h) but mostly smoothly and consistently. Because we had 52 rotating hours on the bit and we wanted to core and log deeper in Hole U1500B, we decided to retrieve the drill string to change the RCB bit. We circulated cuttings out of the hole, raised the bit up to 1242 m, and pumped 235 bbl of weighted (11.0 lb/gal) mud into the hole to stabilize it while we changed the bit. We then pulled the drill string out of the hole (removing the top drive at 1066.0 m), and the bit cleared the seafloor at 2340 h on 25 March.
Before we recovered the drill string, we paused operations for 2 h to conduct routine rig servicing (drill line slip and cut). The bit arrived on the rig floor in good shape at 0845 h on 26 March. We attached a new RCB bit for basement coring (C-7) and lowered it toward the seafloor. Once the bit was at the seafloor along with the camera system, we started searching for the reentry funnel at 1730 h on 26 March. After a short search, we saw streaks of cuttings on the outside of the mound of drill cuttings around the hole. We moved the bit over the clearly visible reentry funnel and reentered Hole U1500B at 1755 h. We lowered the bit through the casing and into the open hole below. As we were doing this, we had the float valve shifted into the open position, which allows water to easily pass through the bit. If it’s in the closed position we have to stop periodically to fill the drill string with water as we lower it. As we lowered the bit, it encountered a bridge at ~1067 m, and sediment appeared to block flow through the bit. We then pulled up a little bit and deployed a core barrel to try to clear the obstruction in the bit and to close the float valve so we could wash/drill back down the hole to resume RCB coring.
The core barrel that we dropped to clear the obstruction in the bit did not land properly at the bottom of the drill string. We deployed the core line to retrieve the core barrel and found that it had landed ~42 m above the bottom of the drill string. We made three unsuccessful attempts to pull the core barrel back out. We then raised the bit from 1018 to 454 m inside the casing (above the top of the weighted mud) and still could not free the core barrel and reestablish circulation. We made two more unsuccessful attempts with the bit at 249 m and then above the seafloor. At 1530 h on 27 March, we decided the only way to fix this problem was to retrieve the entire drill string. At 0000 on 28 March, the bit had reached 58 m below the rig floor, and we spent most of the early morning of 28 March recovering the final parts of the BHA on the rig floor and cleaning out sediment (cuttings, sand, etc.) that filled the lowermost ~40 m of it. The sediment had worked its way above the core barrel. At 0700 h on 28 March, we started reassembling the RCB BHA and lowering it to the seafloor. We deployed the camera system, dropped a core barrel to close the float valve, and started to position the bit over the reentry funnel at 1830 h on 28 March. We reentered Hole U1500B at 1930 h, recovered the camera system, and lowered the bit down to 804.3 m in the casing. At 2315 h on 28 March, we started to install the top drive in preparation for lowering the bit through the base of the casing (842 m) and into the open hole below. At 0045 h on 29 March, however, we discovered a problem with the top drive (one of the counter-balance cylinders). After fixing it, we resumed lowering the bit at 0400 h on 29 March. After exiting the base of the casing and moving down into the open hole, the bit started encountering some resistance at ~1066 m. We washed from there back down to the bottom of the hole at 1415.9 m, pumping 30 bbl of mud at 1008, 1115, 1203, 1232.4, and 1300.52 m. At the bottom of the hole, we pumped 35 bbl of weighted (11.0 lb/gal) mud to clean the cuttings out of this deep hole. We planned to continue using weighted mud in Hole U1500B as we penetrated deeper. We recovered the core barrel that was in place while getting the bit back to bottom (ghost Core 61G; 2.36 m recovered), deployed a fresh core barrel at 1745 h on 29 March, and resumed RCB coring. Core 62R arrived on the rig floor at 2230 h on 29 March after penetrating 2.5 m (1415.9–1418.4 m) and recovering 2.36 m (94%). This shorter penetration was necessary to adjust pipe connections at the rig floor.
Although Core 63R recovered 3.6 m of very nice basalt, it took much longer to cut (8 h) and the core pieces became stuck inside the plastic core liner and in the core catcher sub. It is likely that the recovered material came from the upper part of the cored interval, then jammed, and the rest of the core got ground up, washed away, and never entered the core barrel. These conditions may have also contributed to the slow penetration rate (at least after the core jammed off), so we decided to cut only half-length cores. Cores 64R through 73R then penetrated from 1428.0 to 1475.9 m and recovered 40.0 m (84%). Although the cores took from 2.3 to 4.7 h to cut, the recovery and core quality of the basalts was excellent.
Because the bit had accumulated 44 h of rotating time, hole conditions remained good, and we planned to continue to core deeper into basement and collect downhole logs, we decided to stop coring to change the bit. After cutting Core 73R, we circulated cuttings out of the hole with two 35 bbl weighted mud sweeps and raised the bit to 1387.8 m where we removed the top drive. We then raised the bit to 1242.1 m and filled the hole with 235 bbl of weighted mud to stabilize it while we changed the bit. Once the mud was in place, we raised the bit to just below the seafloor (45.7 m) and deployed a secondary reentry (free-fall) funnel on top of the first one that we previously drilled into the seafloor with the casing (Figure F10). This secondary reentry funnel was intended to block the large pile of cuttings around the hole from falling back in while we continued our Hole U1500B operations. After the funnel was dropped at 2208 h on 1 April, we continued to circulate to minimize the amount of cuttings in the seafloor structure while the secondary funnel landed. We deployed the subsea camera system at 2330 h on 1 April so that we could observe the bit being withdrawn from Hole U1500B.
At 0100 h on 2 April, we observed the bit being pulled out of the hole with the subsea camera system and then recovered the drill string with the bit arriving back on the rig floor at 0840 h. We installed a new bit more appropriate for hard formations (C-9), lowered it to the seafloor, and started positioning the ship to reenter Hole U1500B at 2000 h on 2 April. We reentered the hole at 2100 h, recovered the camera system, and lowered the bit down through the casing.
Before lowering the new RCB bit into the open hole below the casing, we paused for 2 h to conduct routine rig servicing (drill line slip and cut; lubricate the rig). Once in the open hole, the bit encountered some resistance (bridge/ledge) at ~947 m and we reamed from there to ~950 m. The bit passed quite easily from there to the bottom of the hole, where ~0.5 m of hard fill was drilled out. After circulating two 35 bbl mud sweeps, we recovered the core barrel that was in place while getting back to the bottom of the hole. We resumed RCB coring from 1475.9 m at 1730 h on 3 April. Cores 74R through 83R penetrated from 1475.9 to 1529.0 m and recovered 39.8 m (75%).
The last core of Expedition 367 (Core 83R) arrived on the rig floor at 1530 h on 5 April. We stopped coring so that we would have time to collect downhole log data with three different tool strings (triple combo, FMS-sonic, and VSI). In preparation for logging, we circulated cuttings out of the hole (two 35 bbl mud sweeps) and raised the bit to 1416 m, where we removed the top drive. We then continued to raise the bit to 1242 m and spent 1 h (1730–1830 h on 5 April) filling the borehole (and well up into the casing) with 300 bbl of weighted (11.0 lb/gal) mud to improve our chances that the hole would stay open for collecting the log data. When this was finished, the drill string had become stuck and we were unable to raise it. We spent the next 2.75 h trying to free the drill string (installed the top drive, pumped, and applied overpull). Finally, at 2115 h on 5 April, we were able to resume raising the bit up the hole with the top drive.
We deployed the subsea camera system as we finished pulling the drill string out of Hole U1500B; the bit cleared the seafloor at 0430 h on 6 April. We offset the ship 20 m to the west, released the bit on the seafloor at 0600 h, reentered Hole U1500B at 0840 h, and set the end of the pipe at a logging depth of 35.4 m (inside casing). After the camera system was recovered at 1100 h on 6 April, we prepared the rig floor for logging. We assembled a modified triple combo tool string that contained the following tools:
- Dipole Sonic Imager (DSI) for acoustic velocity,
- High-Resolution Laterolog Array (HRLA)/Phasor Dual Induction-Spherically Focused Resistivity Tool (DIT) for electrical resistivity,
- Hostile Environment Litho-Density Sonde (HLDS) without the source for caliper data, and
- Hostile Environment Natural Gamma Ray Sonde (HNGS)/Enhanced Digital Telemetry Cartridge (EDTC-B) for NGR.
At 1345 h on 6 April, we started lowering to the seafloor. The tool passed through the base of the casing at 842 m and into the open hole. It was unable to pass an obstruction at 1133 m, and log data were collected from there up to the base of the casing. The modified triple combo tool string arrived back on the rig floor at 2145 h on 6 April.
We assembled an FMS tool string consisting of the FMS to collect borehole resistivity images and the HNGS and EDTC-B to collect NGR data and for correlating with the previous logging runs. This second tool string was only able to reach 1044 m, 89 m shallower than the first logging string. We opened the FMS arms and collected data from that depth up to the bottom of the casing at 842 m. Our last operation for Expedition 367 was to conduct a check shot experiment with the VSI (geophone). We started assembling the VSI tool string at 0700 on 7 April. It consisted of the VSI sonde and ETDC-B. Routine IODP protected-species procedures were implemented leading up to and throughout use of the seismic source. The VSI tool string reached a total depth of 1031 m, and data were collected at that depth as well as at one station in the bottom of the casing at 783 m. The VSI tool string arrived back on the rig floor at 1430 h on 7 April. After the rig floor was cleared of logging equipment at 1530 h on 7 April, we pulled the end of the pipe out of the hole (1523 h on 7 April) and recovered the drill string. We conducted operations at Site U1500 for a total of 30.3 days (5.5 days in Hole U1500A; 24.8 days in Hole U1500B).
At 0100 h on 8 April, we started our transit to Hong Kong. Expedition 367 ended with the first line ashore at 0800 h on 9 April.
Lithostratigraphy
Two holes were drilled at Site U1500, reaching a total depth of 1529.0 m below seafloor. Both Holes U1500A and U1500B were cored using the RCB drilling assembly. We penetrated from the seafloor through 1379.1 m of unconsolidated to lithified sediment and sedimentary rock and into the underlying basalt (see Igneous petrology). However, we only cored 862.9 m of the sedimentary section, from which we recovered 258.22 m of core. The overall sedimentary penetration included two intervals that we drilled without coring (0–378.2 and 494.6–641.2 m) (Table T1).
From the recovered intervals at Site U1500, we organized the lithostratigraphy into eight units (Figure F11) grouped into three main lithologic sections. The uppermost four units (I–IV) comprise interbedded greenish gray clay(stone), silt(stone), and sand(stone), with some intervals containing increased biogenic carbonate. Units V–VII comprise the second main lithologic section composed of reddish brown and greenish gray claystone. More specifically, Unit V is dark reddish brown claystone that transitions into a clay-rich chalk. Unit VI contains massive greenish gray silty claystone and dark gray sandstone. Unit VII is a short interval of very dusky red and greenish gray claystone. Unit VIII is the third main lithologic section recovered at this site and is composed of basalt with occasional gray and reddish brown sandy claystone inclusions (see Igneous and metamorphic petrology).
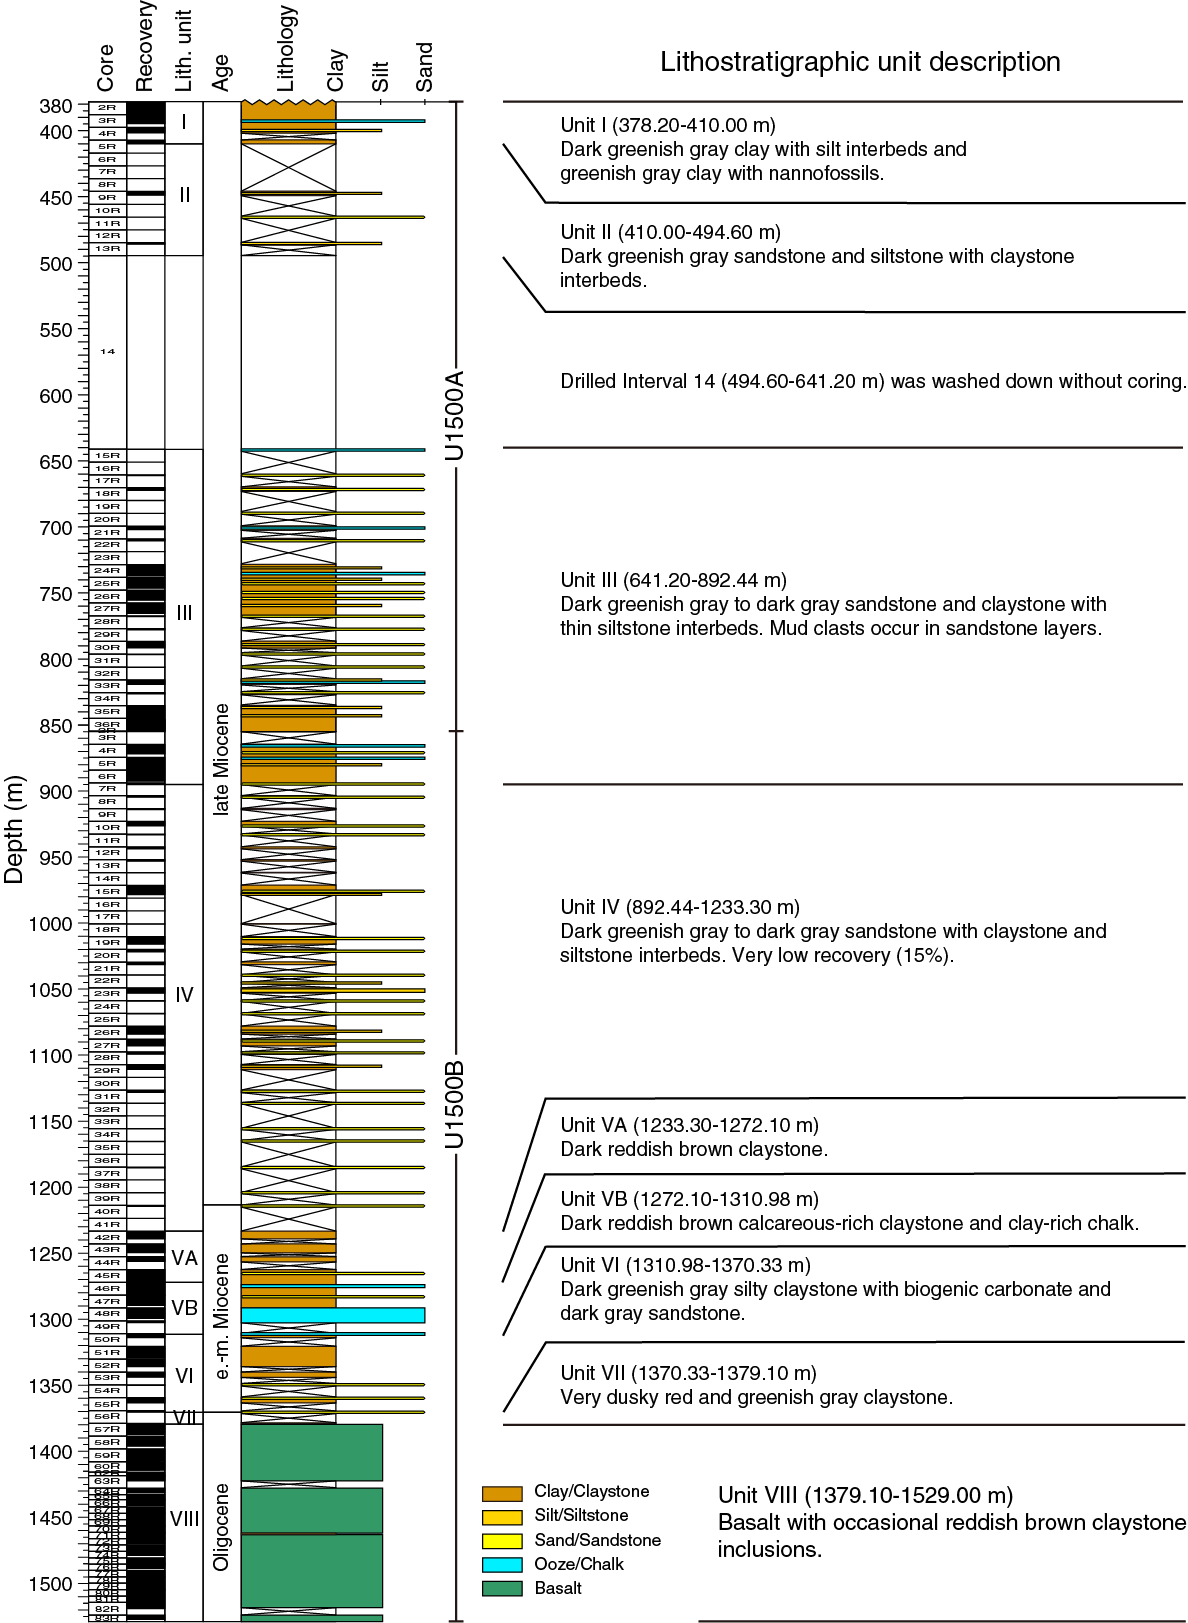
Figure F11. Lithostratigraphic summary.
Lithostratigraphic units and subunits were primarily defined by principal lithology and by the repetitive assemblages of facies that occur in each unit (see Lithostratigraphy in the Expedition 367/368 methods chapter [Sun et al., 2018a]). The boundaries between units and subunits were initially chosen based on these criteria and then corroborated using physical property measurements (Figure F12), mineralogical data by X-ray diffraction (XRD) (Figure F13), and calcium carbonate concentrations. Because core recovery was poor across most of the boundaries that separate individual lithostratigraphic units, their precise depth can only be inferred. Like many of the lithostratigraphic units defined at Site U1499, the units at Site U1500 exhibit gradual changes downhole, further complicating the definition of unit boundaries.
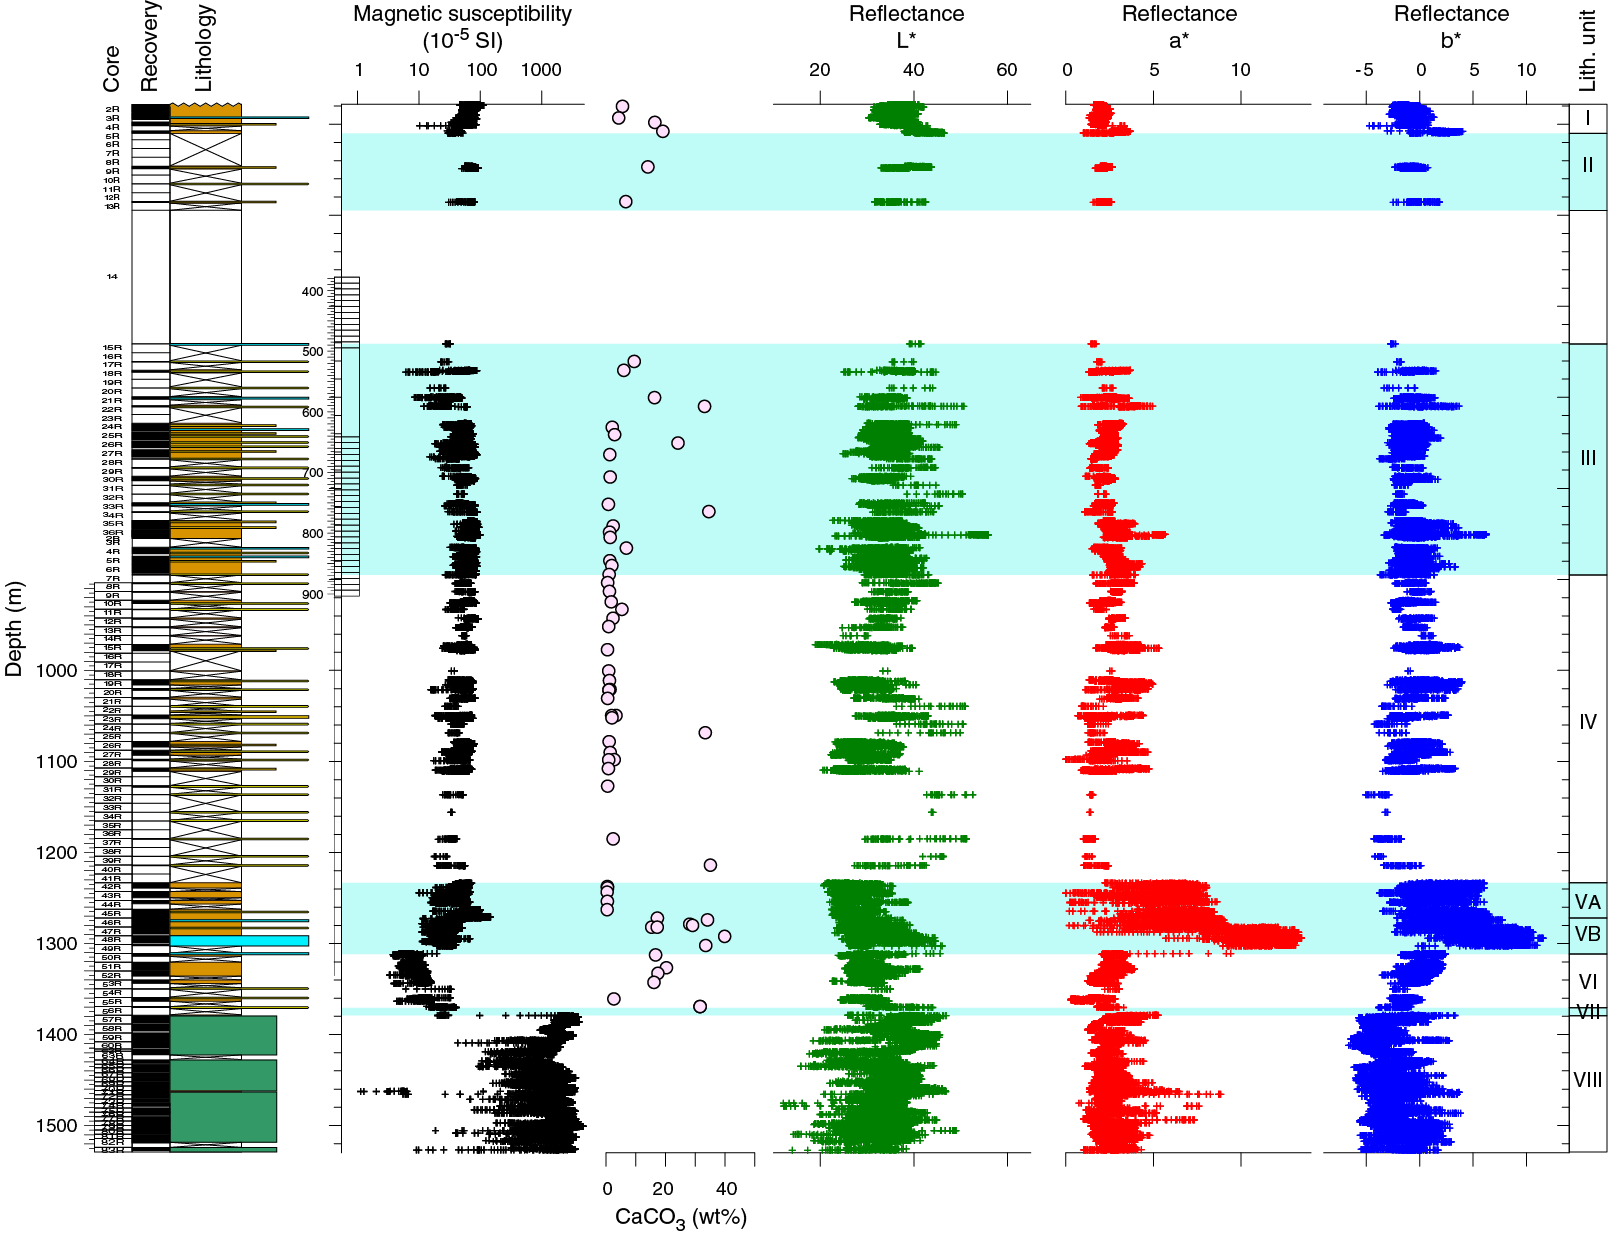
Figure F12. Correlation of lithostratigraphic units.
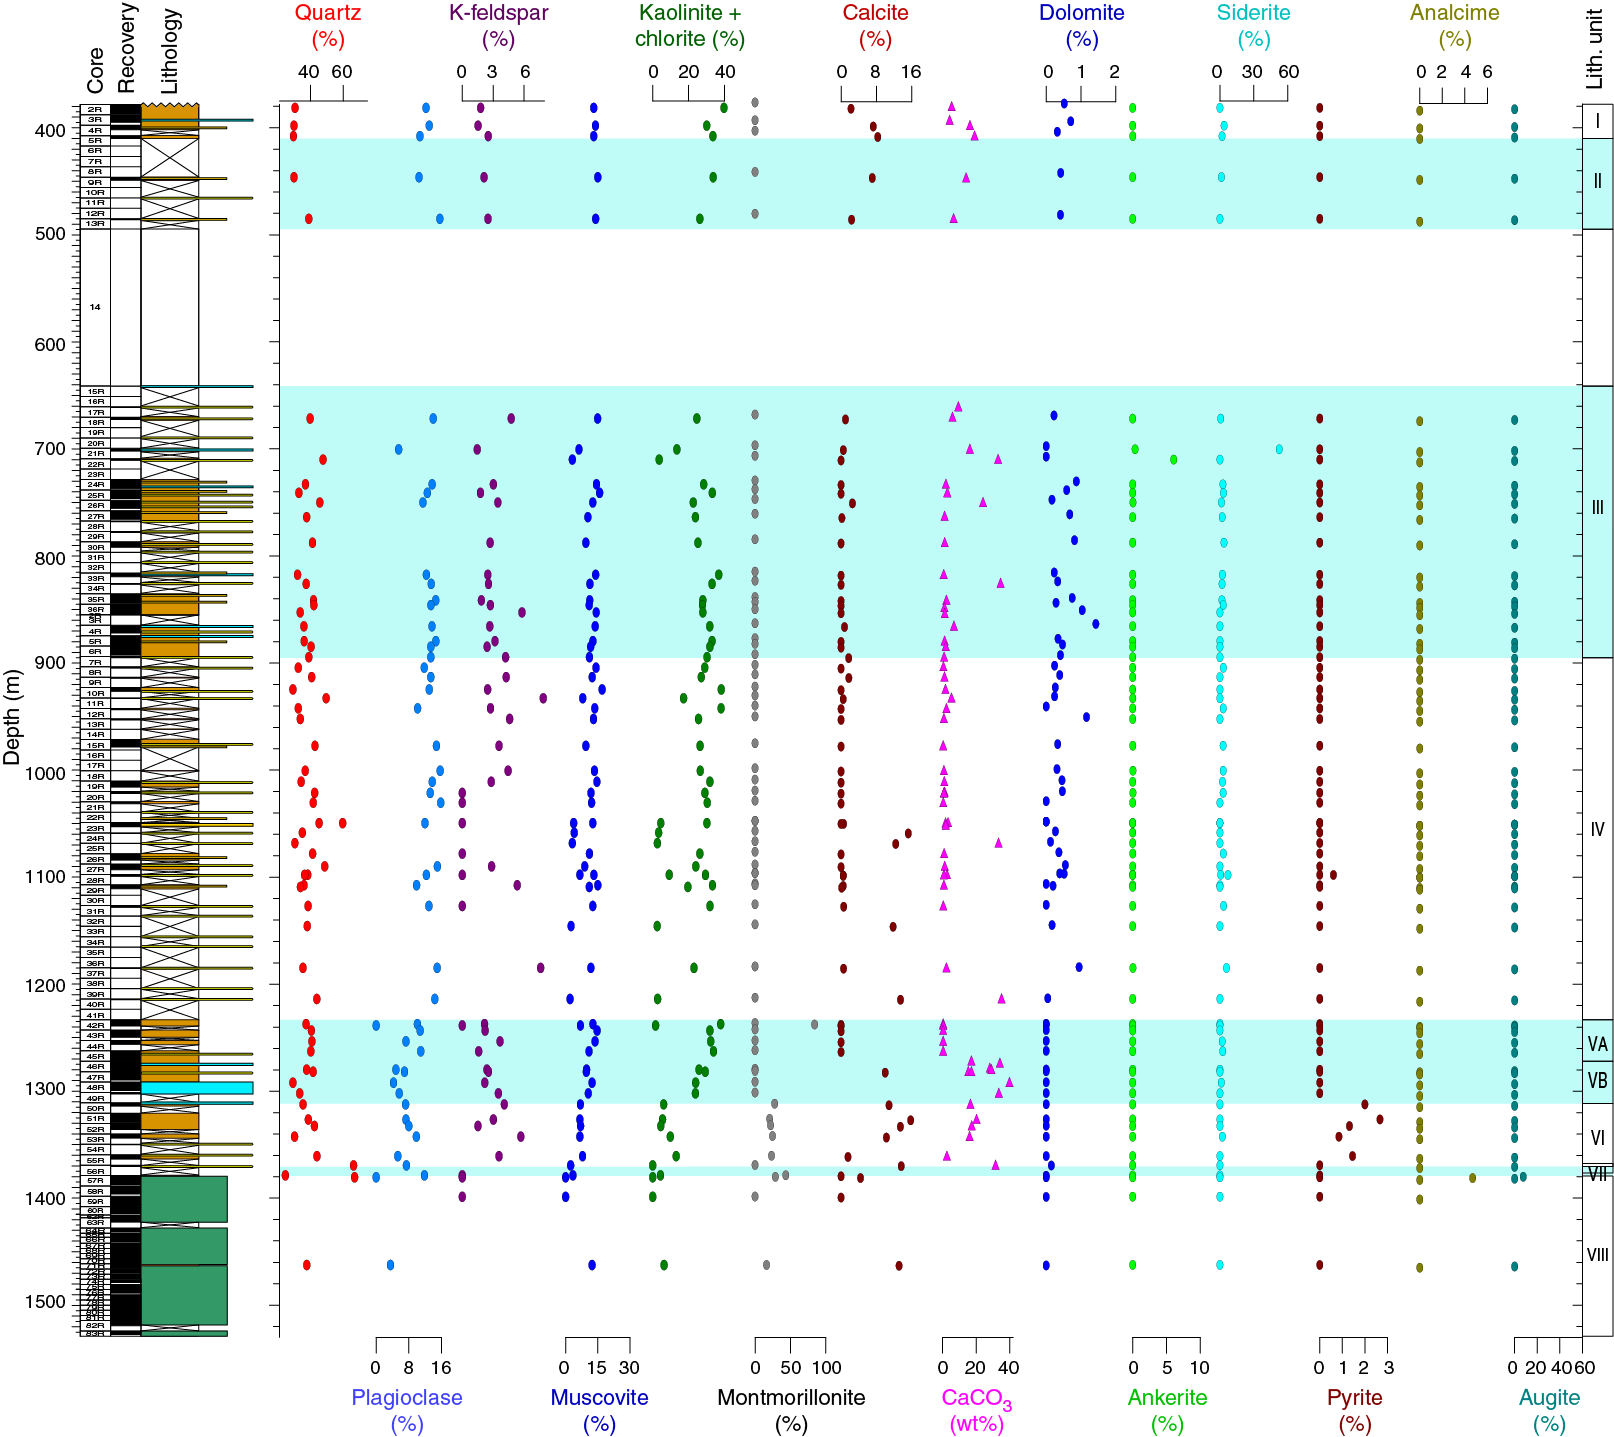
Figure F13. Bulk mineralogy.
Unit descriptions
Unit I
- Interval: 367-U1500A-2R-1, 0 cm, to 5R-CC, 17 cm
- Depth: 378.20−410.00 m (0–378.20 m drilled without coring)
- Age: late Miocene
Unit I consists of greenish gray clay with silt and sandy silt interbeds. Some of the clay intervals are nannofossil rich (Figure F14). The clays are well consolidated and exhibit heavy bioturbation. Based on visual and smear slide analysis, we observed subrounded grains that are well sorted. Structure in the clay is mostly massive, but parallel laminations occur in the silt and sandy silt interbeds. Contacts between lithologic intervals are bioturbated higher in the unit (Core 2R), whereas in Cores 4R and 5R the contacts are erosive and planar.
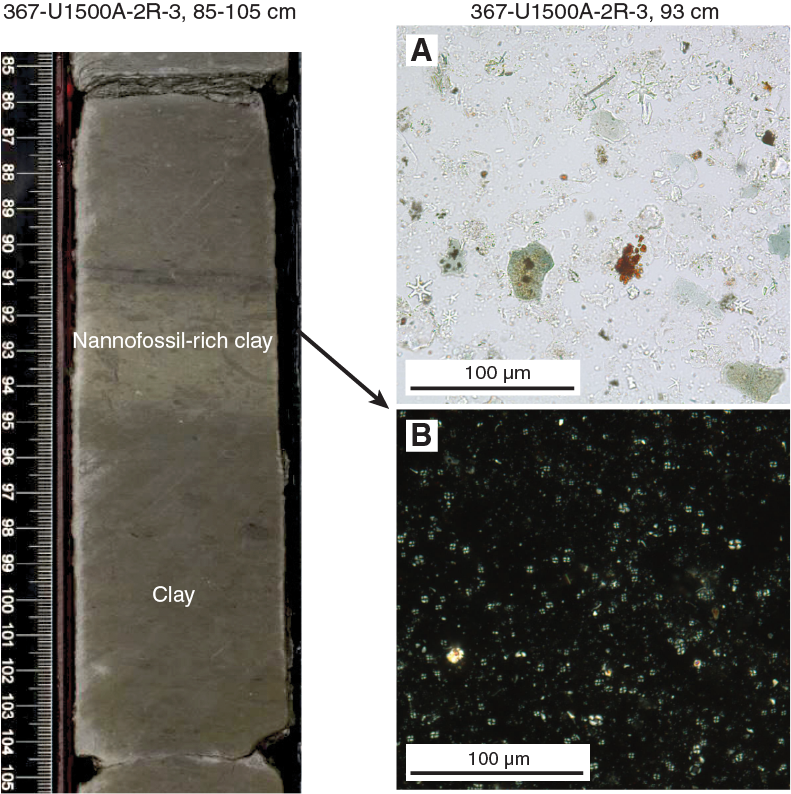
Figure F14. Heavily bioturbated nannofossil-rich clay.
Calcium carbonate concentrations range from 4 to 19 wt% (Figure F12), with nannofossil-rich clay intervals containing higher amounts of carbonate. L* values measured on the Section Half Multisensor Logger (SHMSL), which are positively correlated to carbonate concentrations, increase from Cores 2R through 4R (L* = 30–40) to Core 5R (L* = 40–50), indicating increasing carbonate concentrations toward the bottom of the unit. Magnetic susceptibility decreases from a peak of 167 × 10−5 SI at the top of Unit I to values between 30 × 10−5 and 40 × 10−5 SI at the bottom of the unit (Figure F12). Three XRD samples from Unit I provide preliminary mineralogical information. The dominant components are quartz (27%–31%) and kaolinite + chlorite (25%–34%) (Figure F13).
Unit II
In Unit II, recovery was very low (~8%). The recovered sediment contains interbedded dark greenish gray clay and silt. The clay and silt intervals are well consolidated and heavily bioturbated. Classifying Unit II was difficult due to low recovery. For example, Core 11R only contains 3 cm of lithified sandstone (Figure F15A) that could have been fall-in from higher in the hole. However, the intervals of no recovery may indicate a change in lithology (e.g., increased abundance of nonlithified sands). Based on this inference, we separated this interval (Cores 9R through 13R) into a distinct unit.
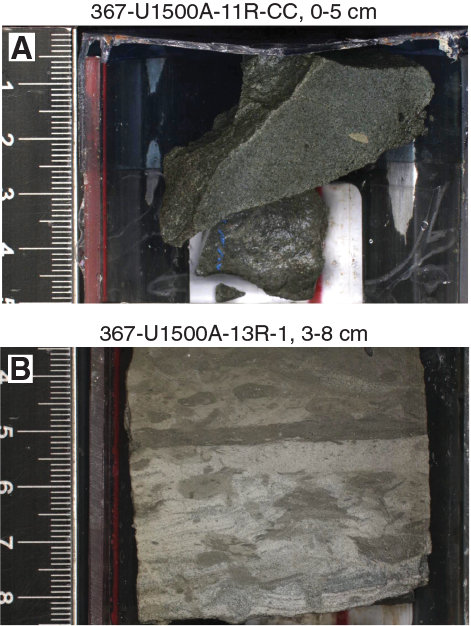
Figure F15. Recovered interval from Core U1500A-11R.
Some clay intervals contain >10% biogenic carbonate, based on carbonate concentrations (Figure F12), smear slide analysis, and visual analysis of color change. These intervals are classified as clay with nannofossils and range from 4 to 65 cm thick. There is one interval of foraminiferal silt in Section 13R-1 (Figure F15B). Contacts between the silt and underlying clay are generally erosive, and silt intervals often exhibit parallel laminations.
Two XRD samples from Unit II clay intervals contain dominant quartz (26%–42%) and kaolinite + chlorite (24%–31%) (Figure F13). Magnetic susceptibility exhibits relatively high variance between 45 × 10−5 and 100 × 10−5 SI, but there is no significant trend throughout the unit. Similarly, color reflectance data (L*, a*, b*) lack trends downunit (Figure F12).
The drilled interval from 494.60 to 641.20 m was washed down without coring.
Unit III
- Intervals: 367-U1500A-15R-1, 0 cm, to 36R-CC, 17 cm; 367-U1500B-2R-1, 0 cm, to 6R-CC, 17 cm
- Depths: Hole U1500A = 641.20−854.60 m; Hole U1500B = 846.00−892.44 m
- Age: late Miocene
Unit III spans the bottom of Hole U1500A and the top of Hole U1500B and is composed of interbedded claystone, siltstone, and sandstone. Many of the contacts between siltstone or sandstone and underlying claystone are erosive, and some are slightly inclined. Color transitions from dark greenish gray into dark gray and grayish brown. Bioturbation increases downhole from slight to heavy.
The siltstone and sandstone intervals include both massive and stratified beds with parallel lamination, cross-stratification, contorted strata, and mud clasts (Figure F16).
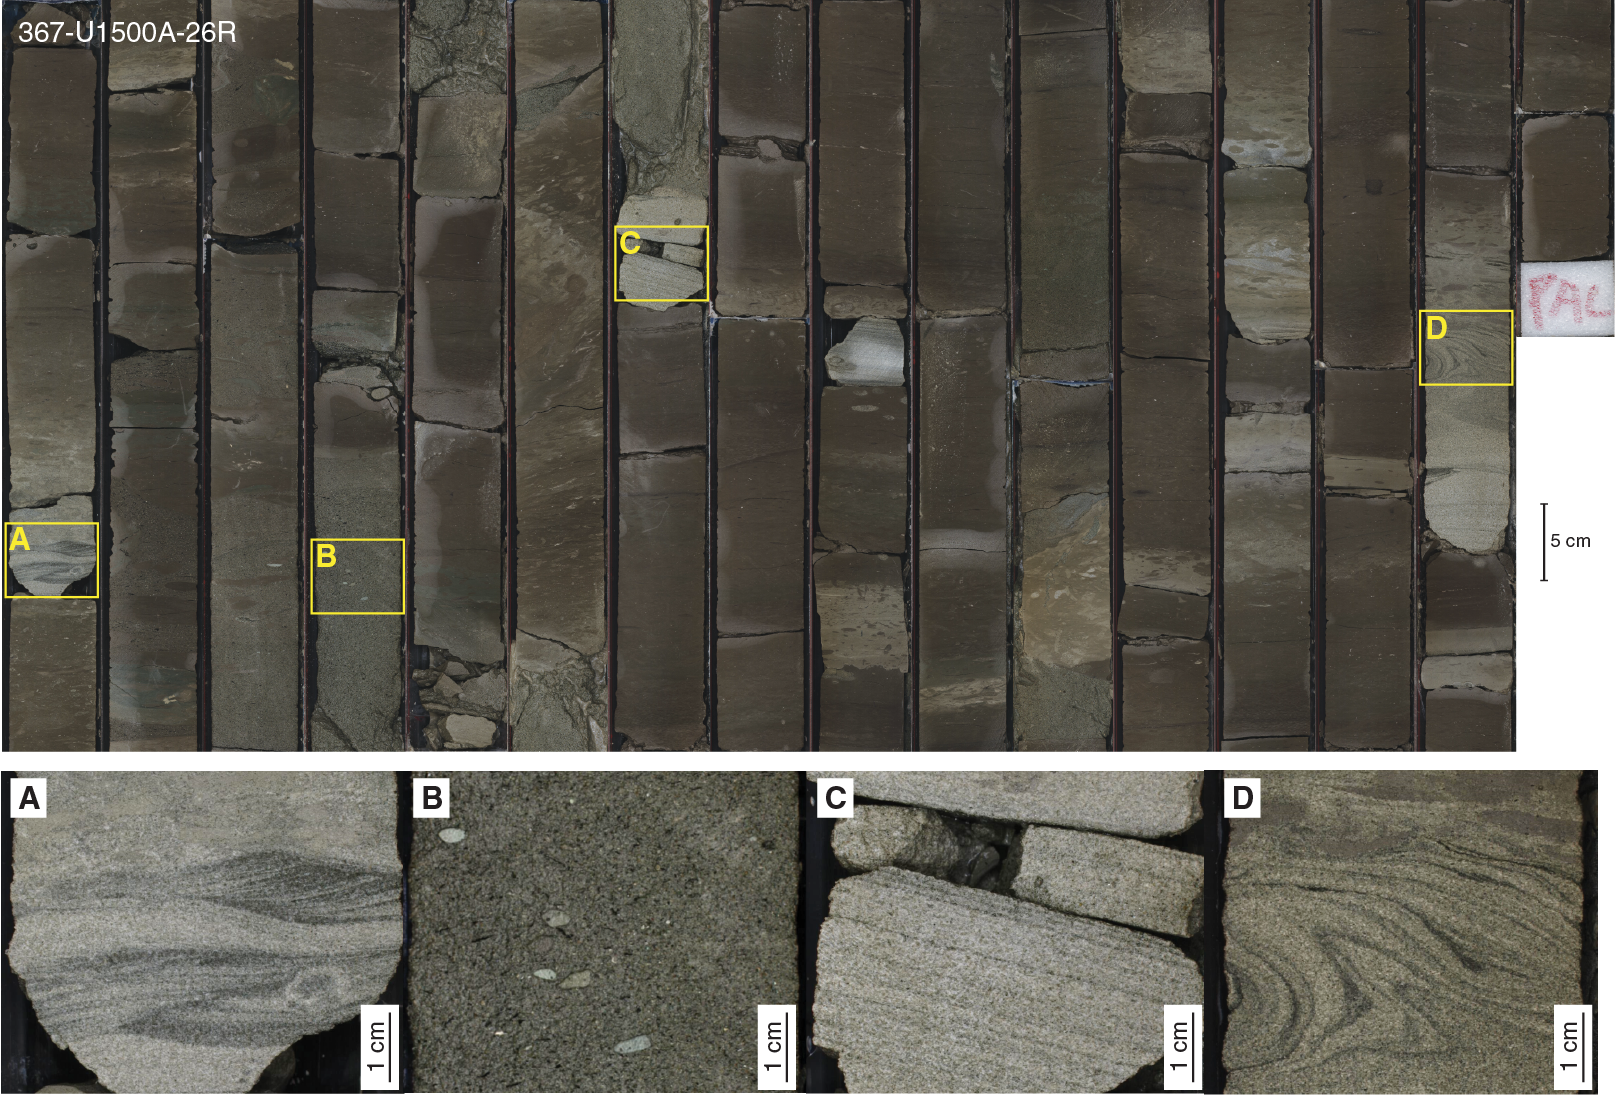
Figure F16. Turbidite sequences and sedimentary structures.
Similar to Units I and II, the dominant mineralogical components of Unit III are quartz (33%–62%) and kaolinite + chlorite (17%–31%) (Figure F13). However, two samples contain minerals that may be diagenetic. Interval 367-U1500A-21R-1, 105–106 cm, contains 29% siderite, which is an order of magnitude higher than any other sample measured at Site U1500. Interval 22R-1, 106–108 cm, contains 9% ankerite, which is again an order of magnitude greater than all other samples at Site U1500. This interval also has the lowest measured concentrations of muscovite (5%; unit average = 16%) and kaolinite + chlorite (4%; unit average = 25%).
Magnetic susceptibility increases from between 25 × 10−5 and 30 × 10−5 SI to a midunit peak between 100 × 10−5 and 110 × 10−5 SI and then decreases toward the bottom of the unit to between 40 × 10−5 and 50 × 10−5 SI. Color reflectance data vary within a small range throughout the unit. Carbonate contents in the claystone intervals range from <1 to 16 wt%, whereas siltstone and sandstone intervals contain up to 35 wt% carbonate (Figure F12).
Unit IV
Recovery in Unit IV was very low with an average of 15%. The dominant lithology is very dark greenish gray to dark gray sandstone with dark brown to very dark gray claystone and siltstone intervals. Many of the intervals described in this unit contain interlaminations of silt or sand within a prevailing claystone lithology. Some of the sandstone and siltstone intervals contain interlaminations of clay and are typically organized into a variety of stratified and massive beds (Figure F17). We observed parallel lamination, cross-stratification, fining-upward sequences, interlamination, contorted strata, and mud clasts. Mud clasts, similar to those observed in Unit III, were observed within massive sandstone intervals in Cores 10R, 11R, and 23R. Parallel laminations are present in siltstone and claystone intervals in sections where color banding is also abundant.
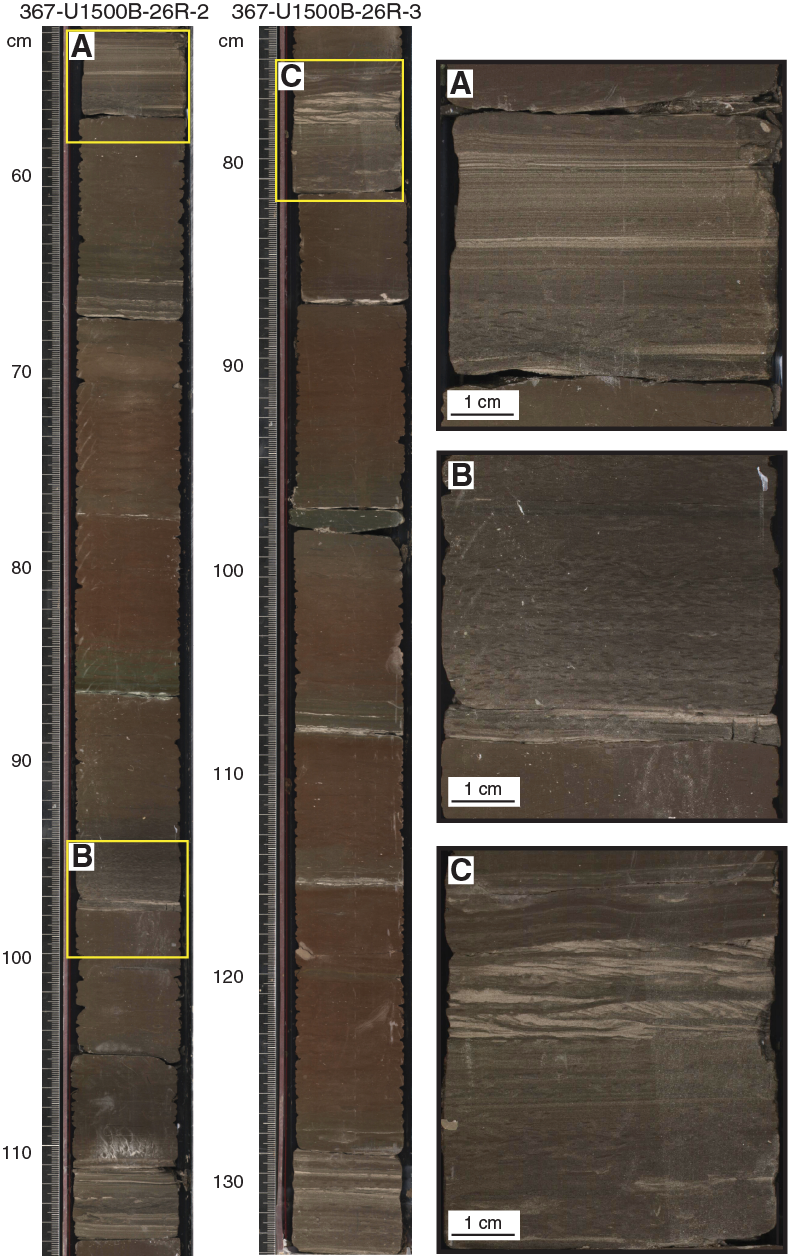
Figure F17. Patterns of color banding and sedimentary structures.
The claystone in some cores shows distinctive color banding, which was observed as a pattern of alternating reddish brown, dark greenish gray, and brownish gray (Figure F17). The color banding appears to be associated with varying levels of bioturbation and fining-upward intervals. Contacts between different lithologies are more varied than in previous units, including planar, gradational, erosive, and bioturbated geometries. Bioturbation is also highly variable from none to heavy throughout the unit. Bioturbation cannot be easily observed within sandstone intervals but is very abundant within claystone intervals.
The dominant mineralogical components from Cores 7R through 21R are quartz (29%–50%) and kaolinite + chlorite (17%–38%) with lesser plagioclase (10%–22%) and muscovite (8%–17%) (Figure F13). The top of the unit has slightly higher amounts (0%–3%) of calcite and siderite. Samples from sandstone intervals generally contain higher amounts of K-feldspar and calcite and lower amounts of muscovite and kaolinite + chlorite. Thin sections cut from well-lithified sandstone intervals show that many of the framework grains coincide with the results from the XRD analysis (Figure F18). Samples that have high amounts of muscovite and kaolinite + chlorite and low amounts of K-feldspar and calcite are from claystone intervals.

Figure F18. Sandstone intervals in Unit IV.
Carbonate contents for Unit IV are typically very low and range from <1 to 5 wt%, with two samples containing very high abundances of calcium carbonate (>30 wt%) (Figure F12). Both samples are from sandstone intervals; one is from Section 25R-CC (33 wt% calcium carbonate), and one is from Section 40R-1 (35 wt% calcium carbonate). The high carbonate contents in the sandstone intervals are likely due to the pervasive carbonate cement that occupies the interstitial spaces between grains (Figure F18). Magnetic susceptibility exhibits relatively high variance between 5 × 10⁻⁵ and 99 × 10−5 SI, but there are no significant peaks within the unit (Figure F12). Values appear to slightly decrease from a maximum value of 99 × 10−5 SI at the top of the unit to a maximum value of 67 × 10−5 SI at the bottom of the unit. Color reflectance data show an increase in L* around Cores 24R and 25R (L* = 52) and then a short decrease. The L* data also have a positive peak around Cores 39R and 40R (L* = 58). These two peaks in L* occur in the same core sections as the two high values of calcium carbonate, showing a positive correlation of L* values and calcium carbonate abundance. Overall, L* varies throughout the unit from 10 to 58.
Unit V
Unit V contains dark reddish brown claystone and reddish brown clay-rich chalk. The unit is divided into two subunits based on carbonate contents (Figure F12). Subunit VA consists of dark reddish brown claystone with few sandstone and siltstone intervals, whereas Subunit VB consists of dark reddish brown to reddish brown calcareous-rich claystone and clay-rich chalk. In Core 48R, the calcareous-rich claystone transitions into a clay-rich chalk. There are also thin (<5 cm) sandstone intervals in Subunit VB.
Subunit VA
A gradational contact (Sections 34R-1 through 42R-1) marks the boundary between the very dark gray to dark brown claystone with sandstone and siltstone interbeds in Unit IV and the more homogeneous red claystone of Unit V (Figure F19). Subunit VA consists of dark reddish brown, dark greenish gray, and dusky red homogeneous claystone with few sandstone and siltstone interbeds (3–12 cm thick). Bioturbation throughout these cores is mostly moderate. Although the overall structure is massive, we observed parallel laminations in some of the claystone and sandstone intervals. Bottom contacts between intervals are mostly gradational, with some planar and bioturbated contacts. One interval in Section 42R-1 (72–78 cm) contains contorted strata within an altered section of yellow to greenish gray claystone (see leftmost core image in Figure F19). Intervals of greenish gray color within the unit are interpreted as diagenetic because they were observed surrounding fractures in the core and as halos surrounding foraminifer tests and other fossil fragments.
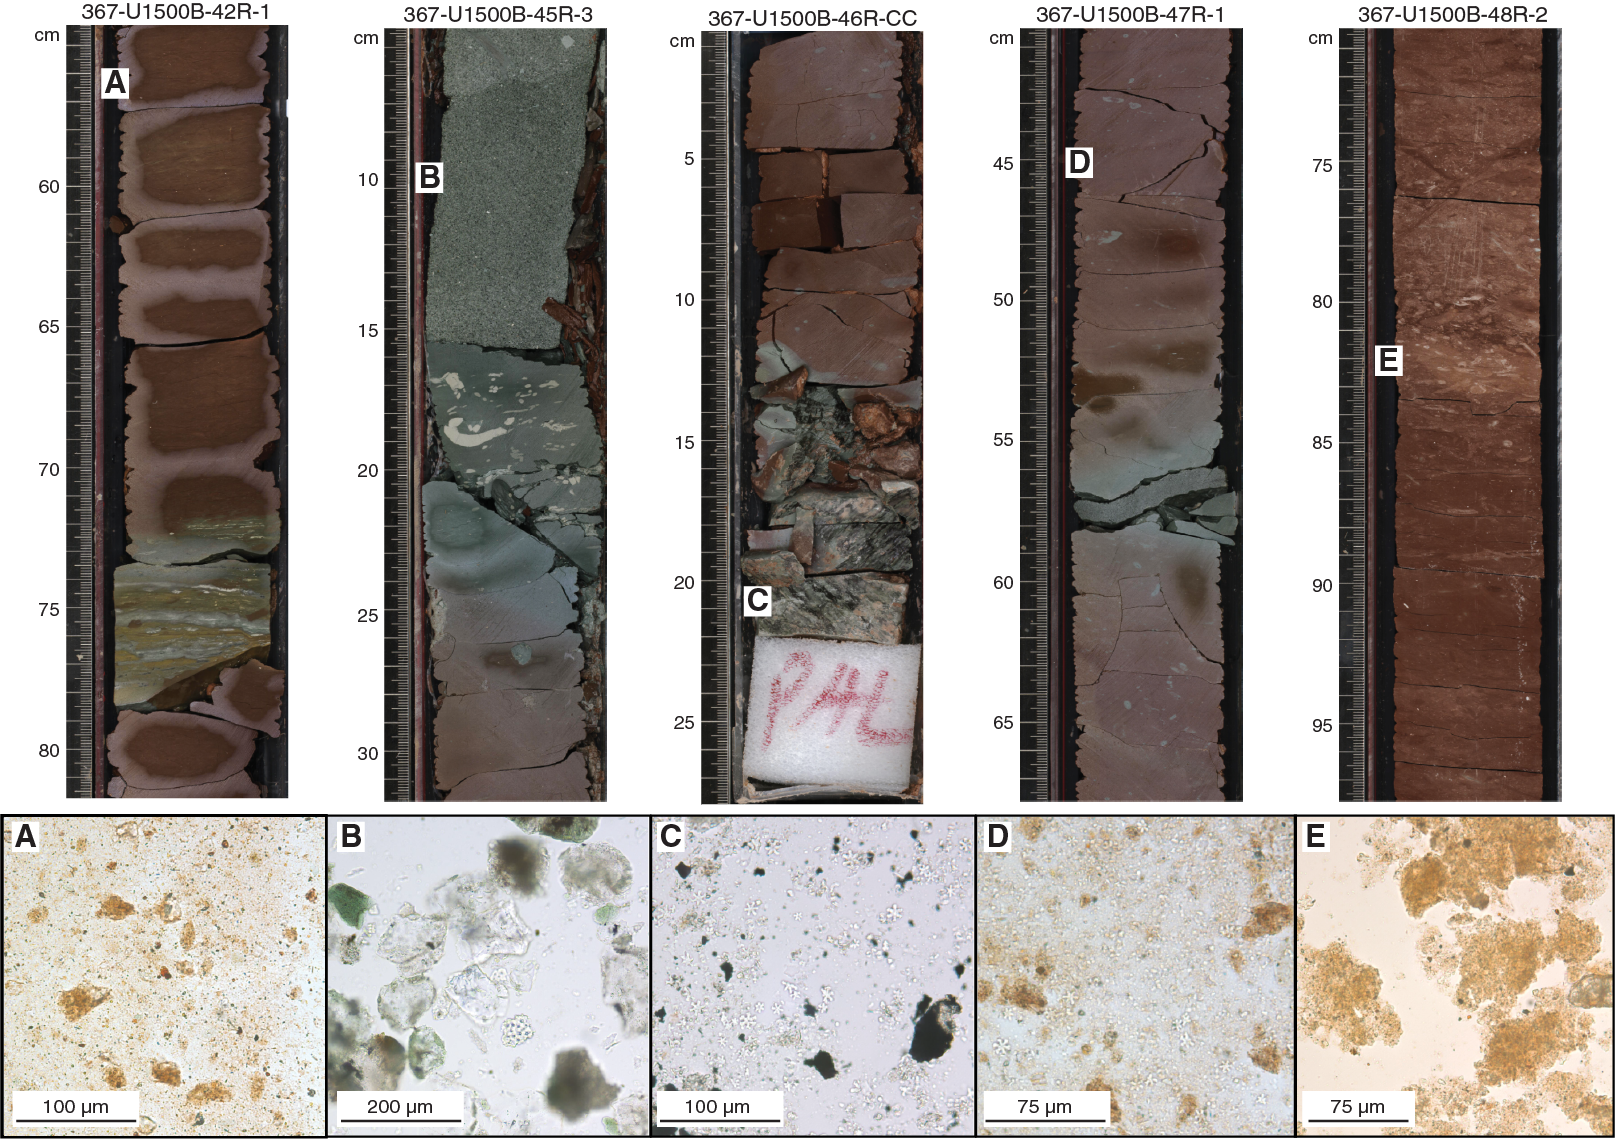
Figure F19. Transitions between subunits.
Similar to the first four units, the dominant mineralogical components for most of Subunit VA are quartz (40%–41%) and kaolinite + chlorite (32%–34%) (Figure F13). However, one sample contains a completely different mineral assemblage. The sample taken from Section 42R-5 (67–68 cm) contains 84% montmorillonite, 7% quartz, and 7% muscovite. This is the only sample measured for XRD analysis in this subunit that contains montmorillonite. This is also the largest percentage of montmorillonite observed in any XRD sample at Site U1500. Samples measured at the base of the subunit contain small amounts of siderite (2%–3%), and samples at the top do not contain any siderite.
Carbonate contents for the claystone in this subunit are very low, all <0.5 wt% (Figure F12). Although the laboratory-measured carbonate values for this unit are low overall, a smear slide taken of a foraminifer-rich sandstone interval in Section 45R-3 was observed to have >20% biogenic carbonate. This variability in carbonate contents is the result of sampling from different lithology intervals within a core. Thus, a smear slide may indicate high carbonate contents from one interval and geochemical analysis from another interval may show low carbonate contents. Magnetic susceptibility is variable throughout the unit, with lower values at the top of the unit (0 × 10−5 to 87 × 10−5 SI) increasing in range lower in the unit (0 × 10−5 to 154 × 10−5 SI) (Figure F12). A large peak within the massive claystone at Section 45R-6 could be caused by the diagenesis and alteration of red clay to green clay. L* reflectance data range from 10 to 47 throughout the subunit. The top of Core 43R (Sections 1–3) shows a slight increase in L* and a decrease in a* and b*, possibly suggesting an increase of calcium carbonate in those sections.
Subunit VB
Subunit VB consists of dark reddish brown, reddish brown, and greenish gray intervals of claystone, nannofossil-rich claystone, claystone with biogenic carbonate, and clay-rich chalk. Bottom contacts between these claystone and clay-rich chalk intervals are mostly gradational, with few planar and irregular contacts. There are two 3–4 cm thick intervals of greenish gray clayey sandstone within Core 47R, one of which contains mud clasts. Bioturbation throughout these cores is mostly heavy. Similar to Subunit VA, diagenetic greenish gray intervals were observed within the core in the form of halos around foraminifer tests and surrounding fractures. We analyzed smear slides from three intervals within the subunit. All three have abundant to dominant calcareous nannofossils, making two of the samples chalk and one a nannofossil-rich claystone (Figure F19). This analysis correlates well with the macroscopic description.
Subunit VB is constrained by a significant change in carbonate concentration from <1 wt% in Section 45R-1 of Subunit VA to 17 wt% in Section 46R-1 of Subunit VB. Carbonate contents ranged from 15 to 40 wt% in Subunit VB, which is higher than in Subunit VA. The dominant mineralogical components for most of Subunit VB are quartz (29%–42%), kaolinite + chlorite (24%–29%), and calcite (10%–27%) (Figure F13). This subunit has the largest percentage of calcite observed at Site U1500; other samples outside of this subunit that were measured for XRD contain 0%–16% calcite.
Magnetic susceptibility decreases with depth to Section 47R-1, where there is a small increase to ~55 × 10−5 SI (Figure F12). Magnetic susceptibility data also show a large peak in Section 48R-3, with a maximum of 131 × 10−5 SI compared to a subunit average of 29 × 10−5 SI. L* reflectance shows a small range of values; however, it does increase slightly downhole (Figure F12).
Unit VI
Unit VI contains dark greenish gray silty claystone with biogenic carbonate and dark gray sandstone (Figure F20). Recovery rate varies significantly from sandstone-dominated (e.g., Core 54R; 5% recovery) to claystone-dominated (e.g., Core 51R; 92% recovery) cores. Bioturbation is heavy within the claystone intervals, whereas sandstone intervals show almost no bioturbation.
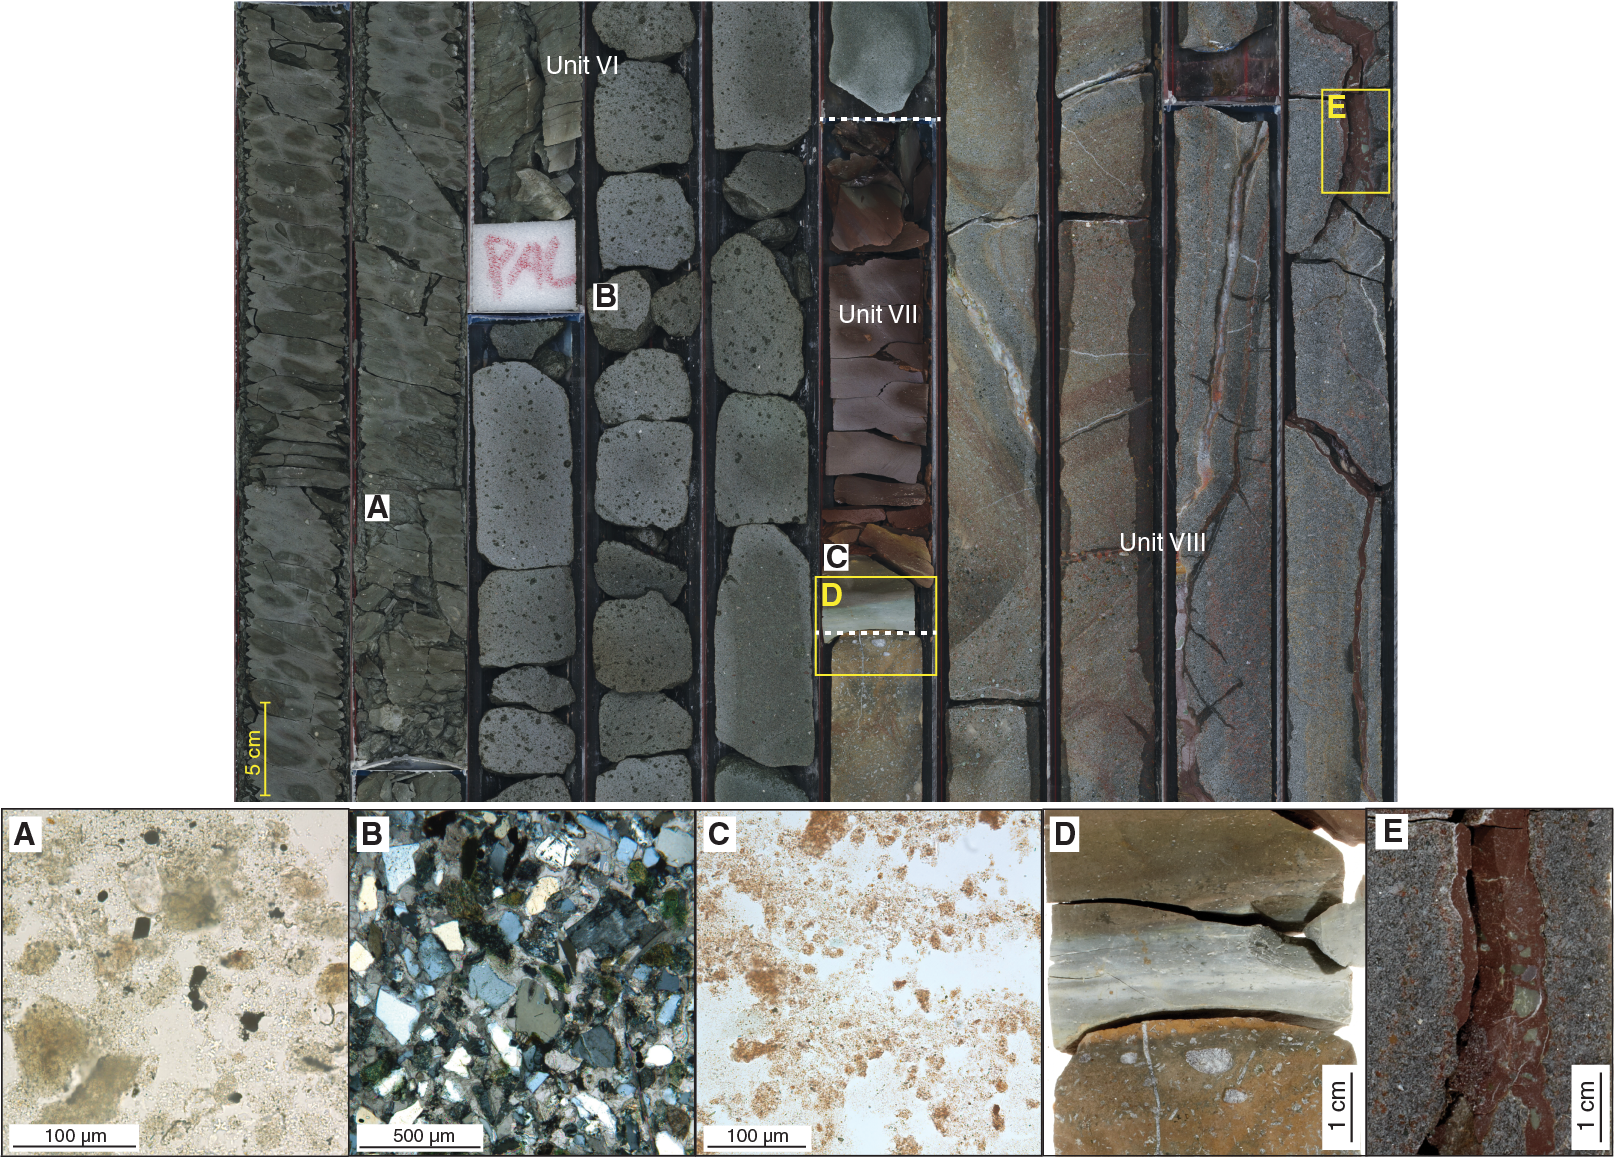
Figure F20. Contacts between Units VI, VII, and VIII.
Magnetic susceptibility drops significantly from Unit V to <10 × 10−5 SI in the upper part of Unit VI (Figure F12). Color reflectance a* decreases significantly from Subunit VB, and b* shifts to ~0, which corresponds to the color change from dark brownish gray to dark greenish gray. The changes in magnetic susceptibility and color reflectance data are consistent with a decrease of magnetic minerals from Unit V to VI. Generally, magnetic susceptibility migrates to higher values within Unit VI, shifting to an average value of 25 × 10−5 SI in Core 56R.
Calcium carbonate contents in the upper part of Unit VI (in and above Sample 53R-3, 18–19 cm) are ~20 wt%, dropping significantly in a claystone interval downcore (3 wt% in Sample 55R-2, 13–14 cm) and increasing again in a deeper sandstone interval (32 wt% in Sample 56R-1, 46–47 cm). The trend is corroborated by XRD data (Figure F13). The most significant mineralogical changes are the increase of montmorillonite (from 0% in Subunit VB to >20% in the claystone intervals of Unit VI) and the decrease of kaolinite + chlorite (from >20% in Subunit VB to mostly <10% in Unit VI).
Unit VII
Unit VII comprises a short (30 cm thick) dusky red claystone interval (Figure F20). Because the recovery of the sandstone layer above this unit is low (13%), the upper boundary of Unit VII is uncertain. However, the dusky red claystone was observed in the core catcher of Core 56R, indicating a change in lithology unrelated to fall-in. The lower boundary of Unit VII is in horizontal contact with igneous rocks (Unit VIII). The lowermost 2 cm of this unit has a greenish gray color. Bioturbation is slight throughout the unit.
The average magnetic susceptibility of Unit VII is similar to the lowermost section (Core 56R) of Unit VI (Figure F12). Carbonate contents were not measured within Unit VII due to the limited material. One XRD sample from this unit shows that the montmorillonite content is 43%, even higher than in Unit VI, and the calcite content is almost zero (Figure F13).
Unit VIII
Unit VIII comprises basalt (see Igneous and metamorphic petrology for description of principal composition); however, some fractures within the basalt are filled with very well lithified claystone. Based on smear slide analysis, the claystone contains authigenic carbonate, siliciclastic components, and rare nannofossils (Figure F21). The basalt intervals contain rare dusky red claystone inclusions where the basalt is typically bound with chilled, glassy margins (Figure F24). Section 71R-1 contains 31 cm of gray to reddish brown claystone, silty claystone, and calcareous-rich sandy claystone. Parts of the sedimentary intervals have undergone extensive dolomitization, possibly by the recrystallization of calcium carbonate microfossil fragments (e.g., foraminifer tests). Additionally, Section 71R-3 contains 15 cm of calcareous-rich sandy claystone with a 1.8 cm long angular clast of altered basalt.
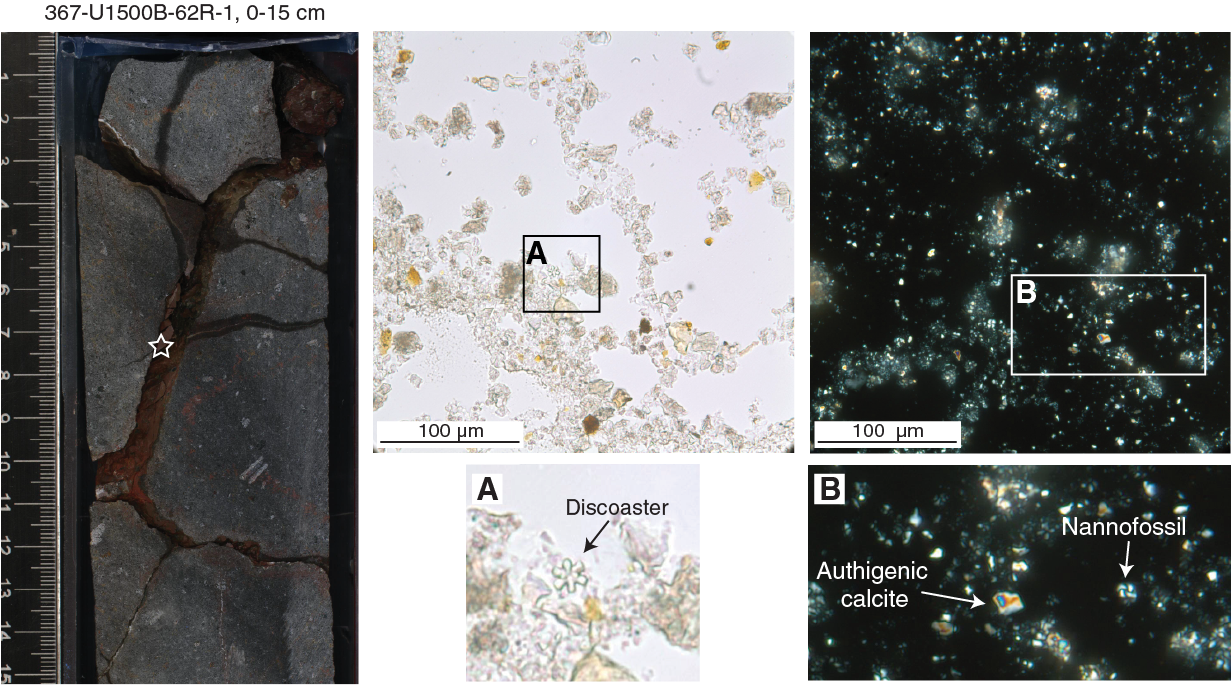
Figure F21. Claystone-filled fracture/vein within basalt.
Discussion
Sandstone deposition
Sandstone intervals are common in almost all of the lithostratigraphic units cored at Site U1500. However, they are most prevalent in Units III and IV. In addition to the recovered sedimentary intervals, most of the unrecovered intervals are inferred to represent weakly consolidated sand because of fast drilling penetration rates and high amplitudes in the seismic reflection data. A similar interpretation was drawn at Site U1499. The amount of sandstone recovered from each core likely depends on the degree of lithification and the presence of interbedded clay.
The depositional setting of the sand intervals from Site U1500 is uncertain, but the sand intervals all share similar characteristics. The sand intervals are organized into both massive and stratified beds, which likely suggests that a variety of transport processes were responsible for sediment delivery to Site U1500. The stratified beds include a range of parallel, cross, and convolute laminations, together with fining-upward sequences (Figures F16, F17), which implies that deposition occurred through suspension-load transport, potentially by turbidity currents (e.g., Pickering et al., 1989). The massive beds at Site U1500 typically contain pebble-sized mud clasts, which are particularly common in Unit III. Unlike stratified beds, massive beds are most commonly deposited in sediment-laden gravity flows where intergranular friction is high (e.g., Pickering et al., 1989). Massive beds can form in high-concentration turbidity currents or in sand–clay debris flows (e.g., Lowe, 1982; Stow and Shanmugam, 1980).
Grain size in the sand intervals ranges from fine- to coarse-grained sand, with the maximum grain size rarely exceeding 1 mm (Figure F18). The grains have subangular and subrounded shapes and are either surrounded by a clay matrix or cemented with calcium carbonate. The size and shape of the grains implies that the sand was not transported over long distances or significantly reworked by bottom currents. The composition of the sand grains from each lithostratigraphic unit is similar. The siliciclastic component includes quartz, plagioclase, K-feldspar, mica, chert, and other sedimentary rock fragments. Fragmented bioclasts of benthic and planktonic foraminifers (see Biostratigraphy) also make up significant proportions of the sand, and in some cases their proportions exceed 50% of all grains found within a single interval (e.g., foraminiferal sandstone intervals from Unit III) (Figure F16).
Petrographic observations from thin sections and smear slides corroborate the results from XRD analysis (Figure F13). The combination of K-feldspar, quartz, plagioclase, and mica indicates a plutonic source of felsic composition (e.g., granite). Abundant Jurassic and Cretaceous granitic rocks are exposed along the margin of southern China (e.g., Zhou and Li, 2000). Additionally, the majority of these sediments were deposited prior to the uplift of Taiwan, eliminating that as a potential source region. It is therefore likely that the large rivers of southern China, namely the Pearl River and its analogous rivers, delivered sediments from the plutonic rocks of the southern margin of China to the SCS.
Diagenesis
Sediments recovered from Site U1500 are mainly composed of quartz, carbonate minerals (including calcite, dolomite, ankerite, and siderite), clay minerals (including illite-muscovite, kaolinite, and chlorite), plagioclase, and K-feldspar. Minor minerals include montmorillonite-beidellite and pyrite (Table T2; Figure F13). The variation of mineral compositions with depth is well correlated to the lithology. For example, most of the samples collected from chalk and nannofossil-rich claystone intervals are accompanied by higher calcite abundance. On the contrary, the sandstone samples usually contain less clay minerals and more K-feldspar. Besides the trend between lithology and mineral composition of sediments, some subtle changes between different species of carbonate minerals and secondary minerals reveal that the sediments have undergone different diagenetic processes.
Table T2. Mineral percentages. View table in PDF format. Download table in CSV format.
Comparing analytical results between carbonate species (measured by XRD analysis) and total calcium carbonate concentration, the XRD data are systematically lower than the measured total calcium carbonate. In some cases, samples with lower calcium carbonate abundances (measured by geochemical analysis) show elevated values of other carbonate species such as dolomite, siderite, and ankerite (measured by XRD analysis), which all have possible diagenetic origin. In carbonates at surface temperatures, dominant cations (Ca2+) are strongly hydrated, preventing Mg2+ and Fe2+ cations in interstitial water of marine sediments from entering the mineral lattice. Ca ions will be less hydrated with increasing temperature (60°–100°C), allowing Mg and Fe to replace Ca in the lattice. When this occurs, dolomite, ankerite, or siderite may form (Bjørlykke, 1983; Larsen and Chilingar, 1979). In addition to thermal regulation, mechanical compaction may also influence the solubility of minerals and precipitation in open pores (De Boer, 1977; De Boer et al., 1977; Hendry et al., 2000; Weyl, 1959). Although we did not use the advanced piston corer temperature tool (APCT-3) for geothermal gradient measurements at Site U1500, the general heat flow of the area (see Figure F57 in the Site U1499 chapter [Sun et al., 2018b]) and the thermal gradient at Site U1499 (93°C/km; Figure F56 in the Site U1499 chapter [Sun et al., 2018b]) suggest conditions favorable to the formation of ankerite and siderite. At Site U1500, we also identified Mg-calcite as cement in multiple sandstone intervals from Sections 367-U1500B-24R-1, 25R-CC, 33R-1, 40R-1, and 56R-1 (Figure F13). This cementation process may be linked to the high P-wave velocities observed in Sections 24R-1 and 25R-CC (4468 and 4550 m/s, respectively).
In Unit V, which is composed of dark reddish brown claystone and clay-rich chalk, some greenish gray intervals were observed. One sample taken from the greenish gray interval (Sample 42R-5, 67–68 cm) for XRD analysis contains >80% montmorillonite-beidellite (Figure F13), which is of diagenetic origin (Larsen and Chilingar, 1979; Sato et al., 1996). The existence of beidellite also implies the sample may have undergone hydrothermal alteration (Guisseau et al., 2007).
Pyrite was identified by XRD in Sections 28R-1, 50R-2, 51R-5, 52R-2, 53R-3, and 55R-2. Especially for samples from Sections 50R-2 through 55R-2, pyritization of foraminifers, radiolarians, diatoms, and sea urchin spines were observed in addition to authigenic pyrite grains (Figure F13). However, because these pyritized biogenic grains occurred alongside pristine biogenic material, it is possible they were pyritized elsewhere before being transported to this site.
In summary, the variation of mineral composition in Site U1500 can be divided into three zones. In the first zone, encompassing lithostratigraphic Units I and II, little evidence of diagenetic activity was observed, and the carbonates are dominated by calcite. In the second zone, which includes lithostratigraphic Units III and IV, most of the carbonate in sediments with low fossil abundance is composed of dolomite, ankerite, and siderite. In calcareous-rich clay and chalk intervals, the dominant carbonate species is calcite. In sandstone intervals, the cementation by Mg-calcite increases the lithification of Sections 367-U1500B-24R-1 and 25R-CC and leads to high P-wave velocity. We interpreted the no recovery zones in Units III and IV to contain nonlithified sands. These intervals could provide a pathway for basin-scale transport of fluid or hydrothermal flow, which could drive diagenesis in adjacent lithologies. The third zone includes lithostratigraphic Units V–VII. Close to the contact with underlying basalt, the most characteristic features include the appearance of montmorillonite-beidellite in greenish gray silty sandstone and the pyritization of foraminifers, radiolarians, diatoms, and sea urchin spines in Sections 50R-2 through 55R-2. Both diagenetic minerals suggest potential hydrothermal alteration related to the emplacement or alteration of basalt below the sediments.
Trace fossils
Recovered sediments and sedimentary rocks at Site U1500 are heavily bioturbated, especially in intervals of both dark greenish gray and brownish gray claystone and dark reddish brown clay-rich chalk. Trace fossils preserved in deep-sea sediments represent the burrows that are imposed on sediment beneath the mixed surface layer, which spans the uppermost 5–7 cm of the seafloor (Ekdale et al., 1984). The occurrence of trace fossil assemblages or even a single ichnogenus in deep-sea sediments can provide information about the depositional environment. They have been increasingly used as paleoceanographic tools to infer the sedimentary and ecological setting (e.g., Knaust and Bromley, 2012; Dorador et al., 2016).
Investigations of modern seafloor sediments of the SCS reveal that postdepositional trace fossils are extensively distributed in brown, oxidized, soft to soupy, and uniformly fine grained deep-sea sediments (Wetzel, 2002; 2009). These trace fossils were also observed in the long sedimentary sequences dating back to the middle Miocene in the central SCS during IODP Expedition 349 (Li et al., 2015b). Similarly, trace fossils identified in our cores are typical of very deep water sedimentary environments in distal clastic settings. They mainly include Nereites, Planolites, Thalassinoides, Scolicia, Chondrites, and Zoophycos (Figure F22). Modern observation shows that Nereites exclusively occurs above the redox boundary, with water depths mostly exceeding 4000 m (Wetzel, 2002). Although relatively less frequent at Site U1500, Nereites was observed at the base of Unit III (Core 367-U1500B-5R), which could reflect the limit of oxygenation depth during the deposition period. Zoophycos occurs in environments experiencing high but seasonal organic matter deposition on the seafloor. In Cenozoic hemipelagic sediments, the presence of Zoophycos is used to interpret deep-sea environmental conditions related to energy variation, sedimentation rate change, and food availability (e.g., Löwemark, 2015). A study from Site U1385 on the West Iberian margin shows that Zoophycos is most common in sediments deposited during glacial times, when the sedimentation rate was intermediate and primary production was high and seasonal, suggesting a relationship with seasonal organic matter deposition (Dorador et al., 2016). Zoophycos was frequently observed in dark reddish gray calcareous-rich claystone in Subunit VB (Figure F22D).
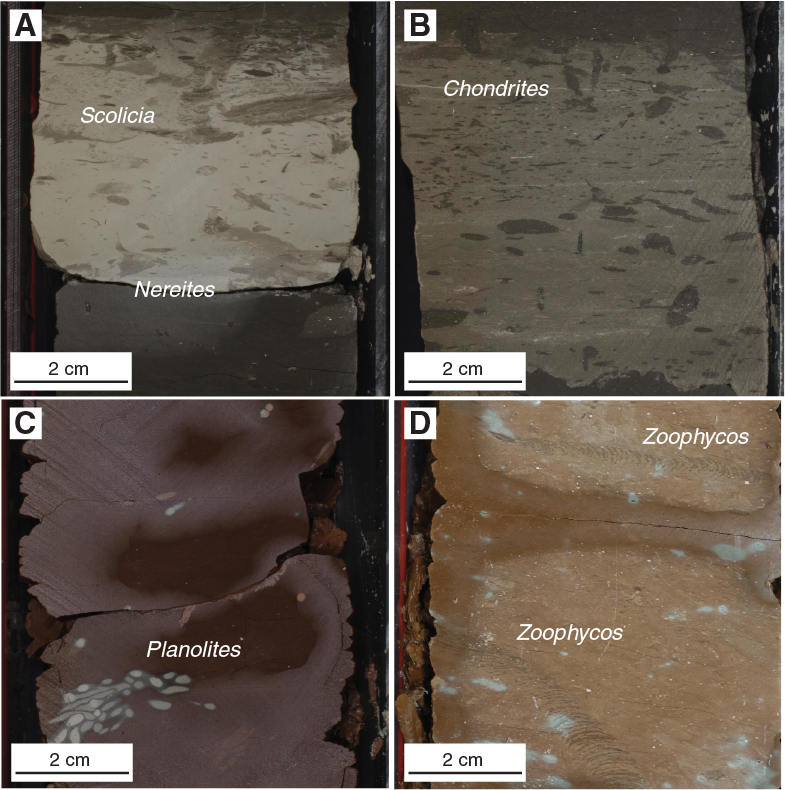
Figure F22. Trace fossils in claystone and chalk intervals.
Igneous and metamorphic petrology
In Hole U1500B, basalt was drilled from 1379.1 to 1529.0 m with a total recovered core length of 114.92 m. The aphanitic to porphyritic basalts are nonvesicular to moderately vesicular and glassy to hypocrystalline, with the latter ranging from cryptocrystalline to fine grained in grain size, making up an aphyric to highly (olivine-) plagioclase phyric texture (microstructure). The basalt comprises lithostratigraphic Unit VIII, which corresponds to igneous lithologic Unit 1. Unit 1 is further divided into two subunits (1a and 1b) to separate an upper sequence of massive flows (Subunit 1a) and a lower sequence dominated by pillow lava flows and occasionally interbedded massive, sheet, and lobate flows (Subunit 1b). Pillow lobes are well preserved with chilled and/or glassy margins, occasionally associated with claystone. Plagioclase phenocrysts are present throughout the basalts, with occasional olivine phenocrysts. Modal abundances of olivine and plagioclase phenocrysts increase downhole, reaching a peak between 1420 and 1470 m.
Veins found throughout the lava flows usually show a sharp contact with the host basalt. The veins are either polycrystalline or massive and predominantly filled with carbonates and Fe (hydr)oxides, as well as subordinate chlorites, zeolites, silica, and clay sediment. Very fine claystone aggregates are ubiquitous in several carbonate-rich veins, particularly in those hosted by pillow lava flows. Alteration of the basaltic flows is slight overall; however, the alteration intensity increases to a moderate level downhole.
Igneous lithologic Unit 1 (lithostratigraphic Unit VIII)
- Interval: 367-U1500B-57R-1, 30 cm, to 83R-3, 67 cm
- Depth: 1379.1–1529.0 m
- Thickness: 149.9 m
- Recovery: 76%
- Lithology: basalt with minor hyaloclastite and claystone
- Age: late Oligocene or older
The boundary between the pelagic sediment of Unit VII and the underlying basalt of Unit VIII was identified at 1379.1 m (Figure F23). Lithostratigraphic Unit VIII extends throughout the remainder of the hole to the bottom at 1529.0 m. The sediment/volcanic contact is sharp with a ~0.5 cm thick basaltic chilled margin and is overlain by claystone, gradually changing from greenish gray to dark reddish brown closer to the contact (Figure F20). Although this color change might suggest a baked contact, no other mineralogical or textural observations could be made to confirm this hypothesis. Throughout Unit VIII, the recovered basaltic rocks remain texturally and mineralogically similar, ranging from nonvesicular to moderately vesicular, cryptocrystalline to fine grained, and aphyric to highly (olivine-)plagioclase phyric with a hypocrystalline groundmass (Figure F24). The basaltic flows contain 2–5 cm thick hypohyaline to holohyaline chilled margins (Figures F24C, F25), with preserved fresh glass and occasional hyaloclastites with brecciated glass fragments mixed with clayey sediments. All basalts are grouped as lithostratigraphic Unit VIII (see Lithostratigraphy)/lithologic igneous Unit 1 due to the lack of significant change in mineralogy, texture, composition, or emplacement mechanism but are separated into two igneous lithologic subunits (1a and 1b) based on the change from massive (Subunit 1a; 27.28 m) to predominantly pillow lava flows (Subunit 1b; 122.62 m) (Figures F23, F25). Sparsely vesicular massive and sheet lava flows are texturally uniform and gradually increase in grain size toward the center of the flow. Pillow lobes are well preserved and separated by chilled, glassy margins (distinguishing upper from lower chilled margins of individual pillows where possible) and occasionally admixed claystone (Figures F24, F26). Core 71R contains two sequences of reddish gray to reddish calcareous claystone locally showing fining-upward sequences in direct contact with chilled margins of basalt pillows (Figure F24F). Plagioclase phenocrysts are found throughout the basalts, with olivine being usually a sparse phenocryst mineral. The modal abundance of olivine phenocrysts increases downhole, reaching a peak of 5%–10% between 1420 and 1470 m. The plagioclase phenocryst abundance also increases downhole, reaching a peak at 1440–1460 m (20%–35%; referring to highly plagioclase phyric basalts).
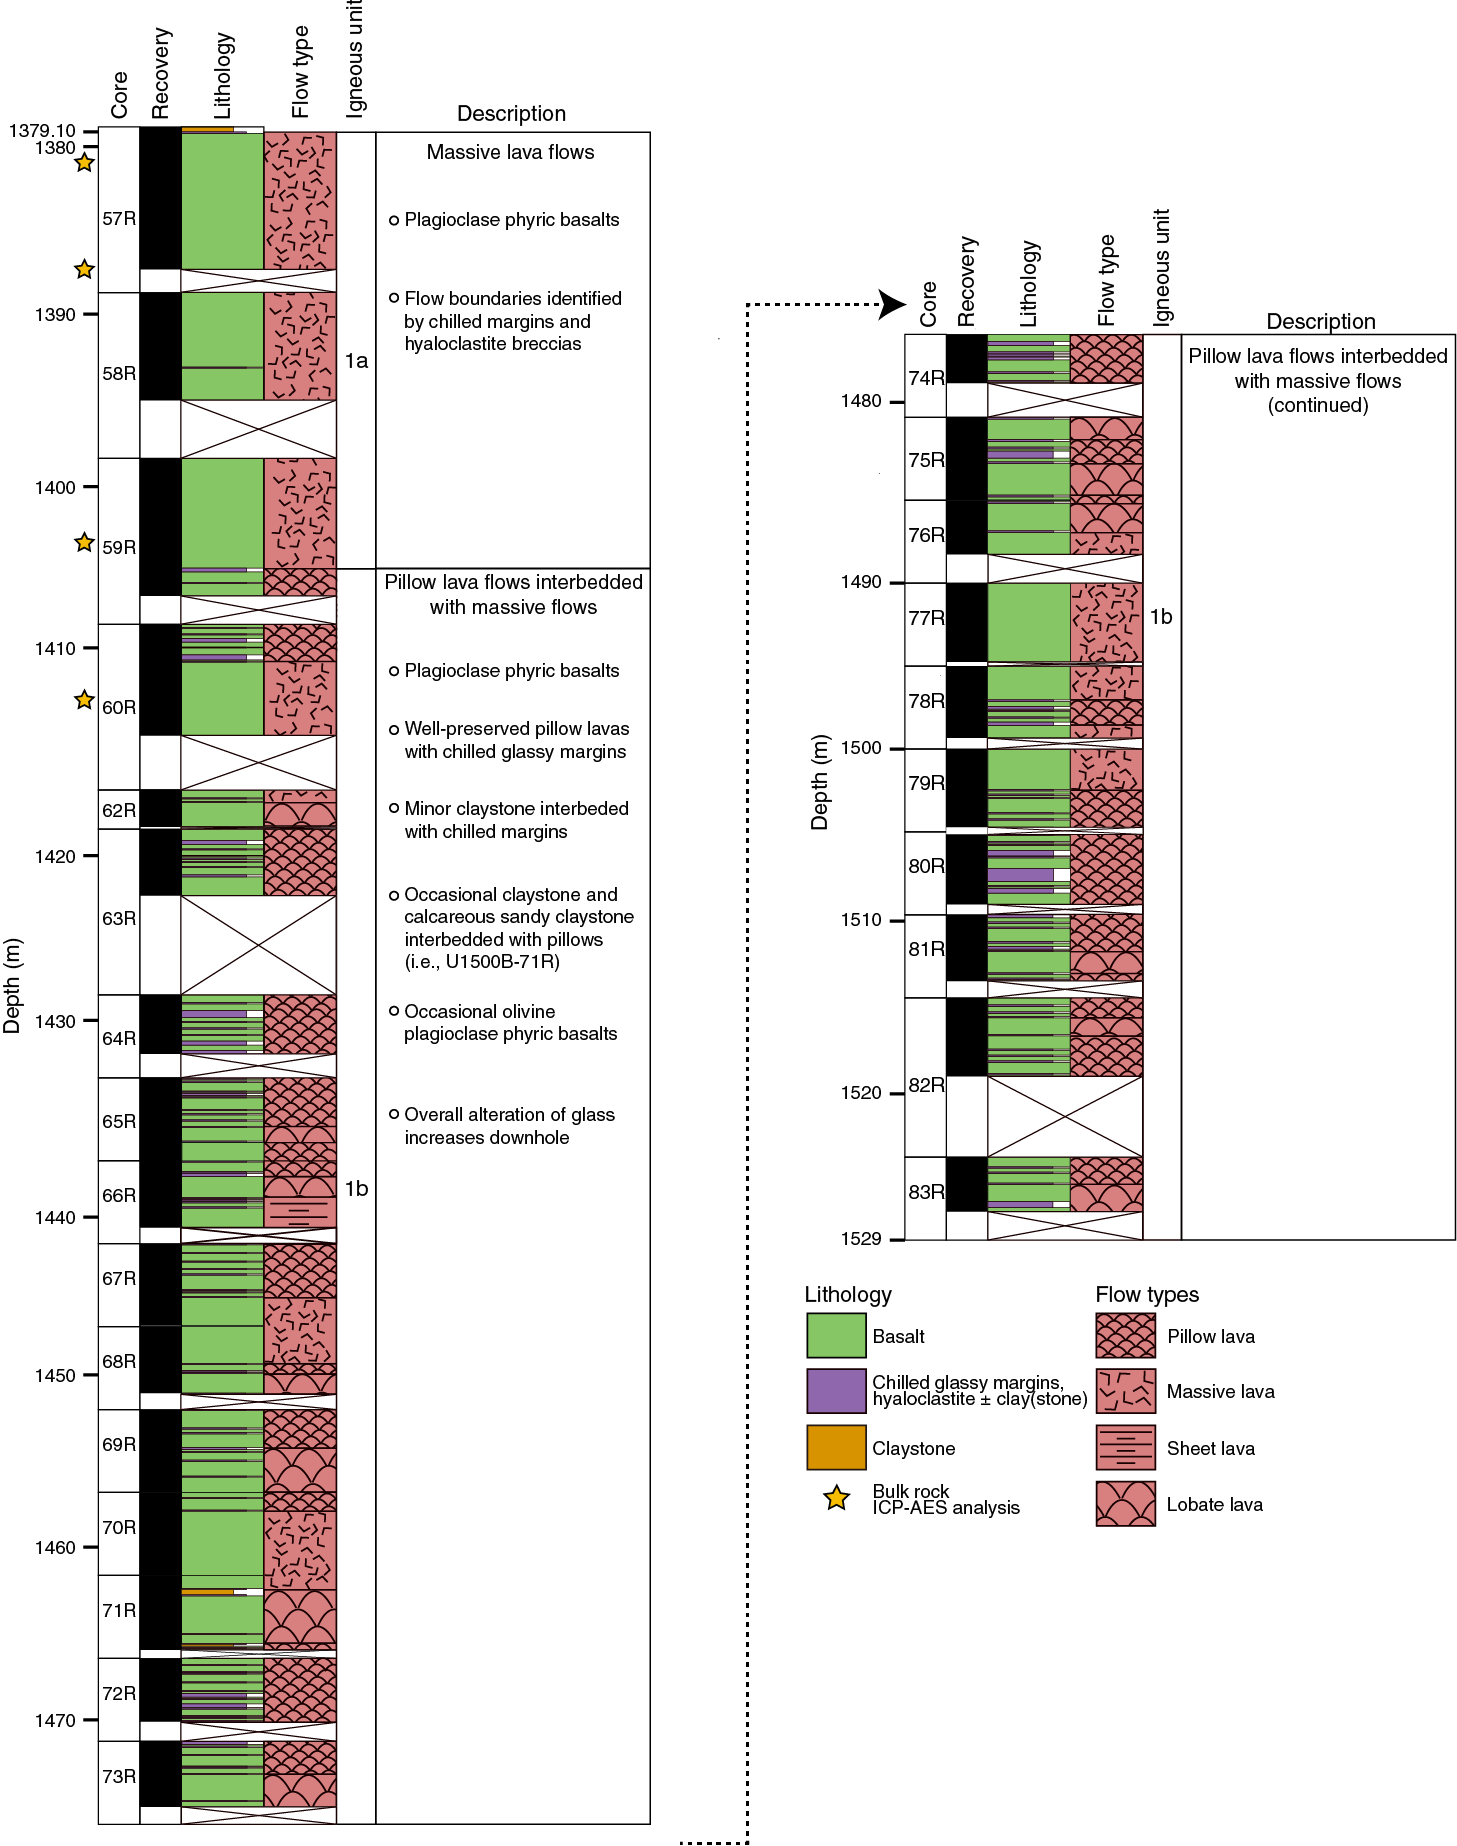
Figure F23. Lithostratigraphic summary.

Figure F24. Homogeneous sparsely vesicular phyric basalts.

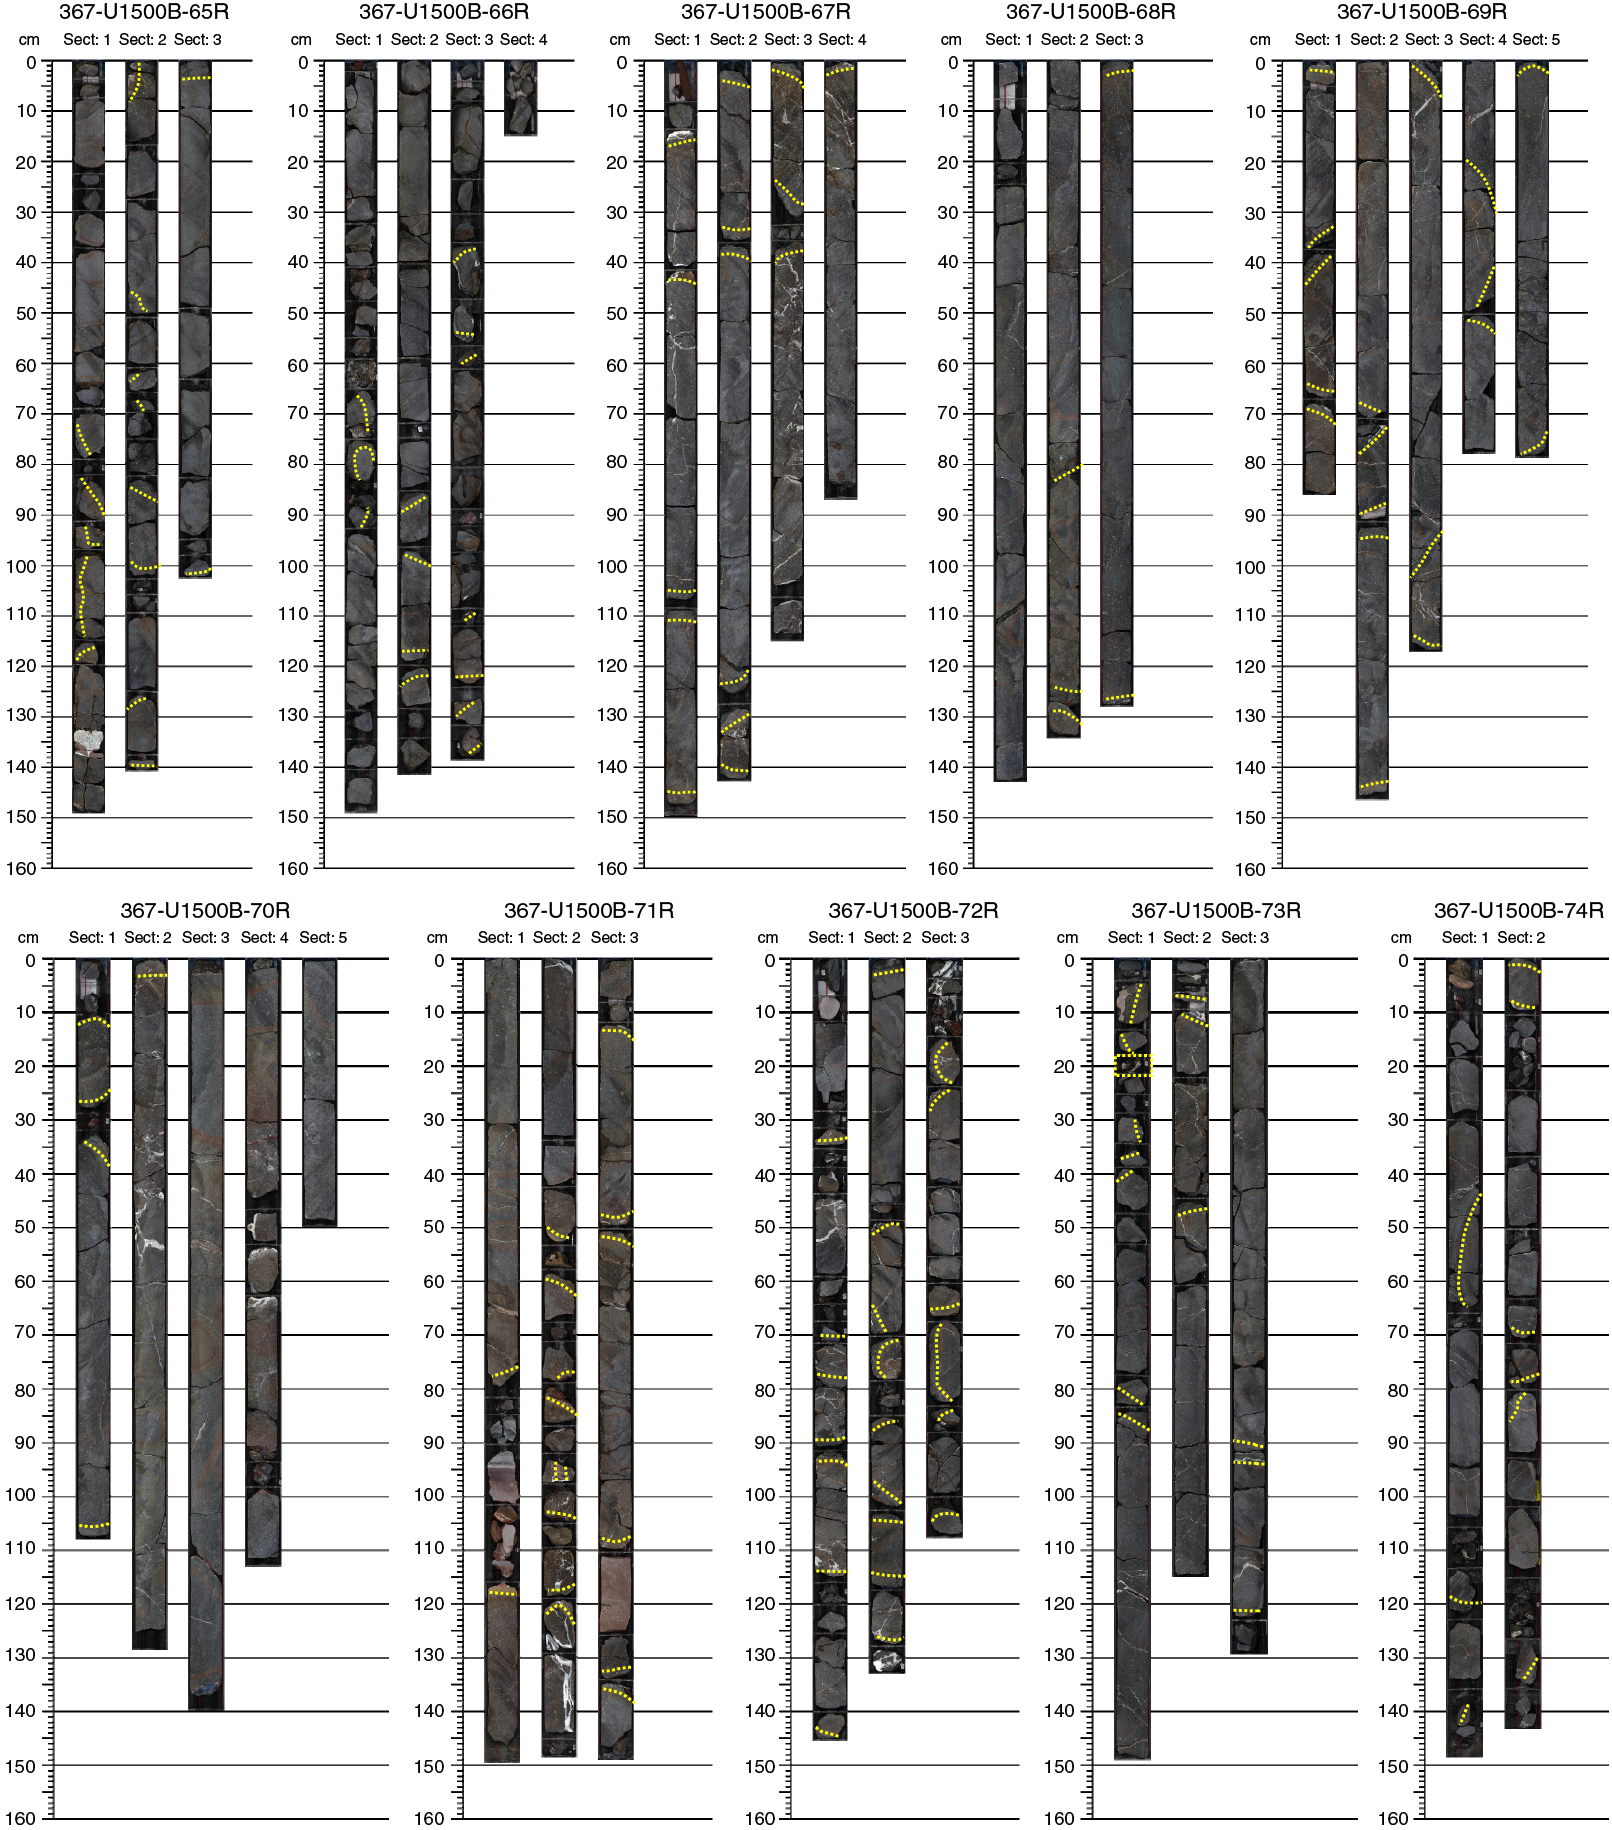
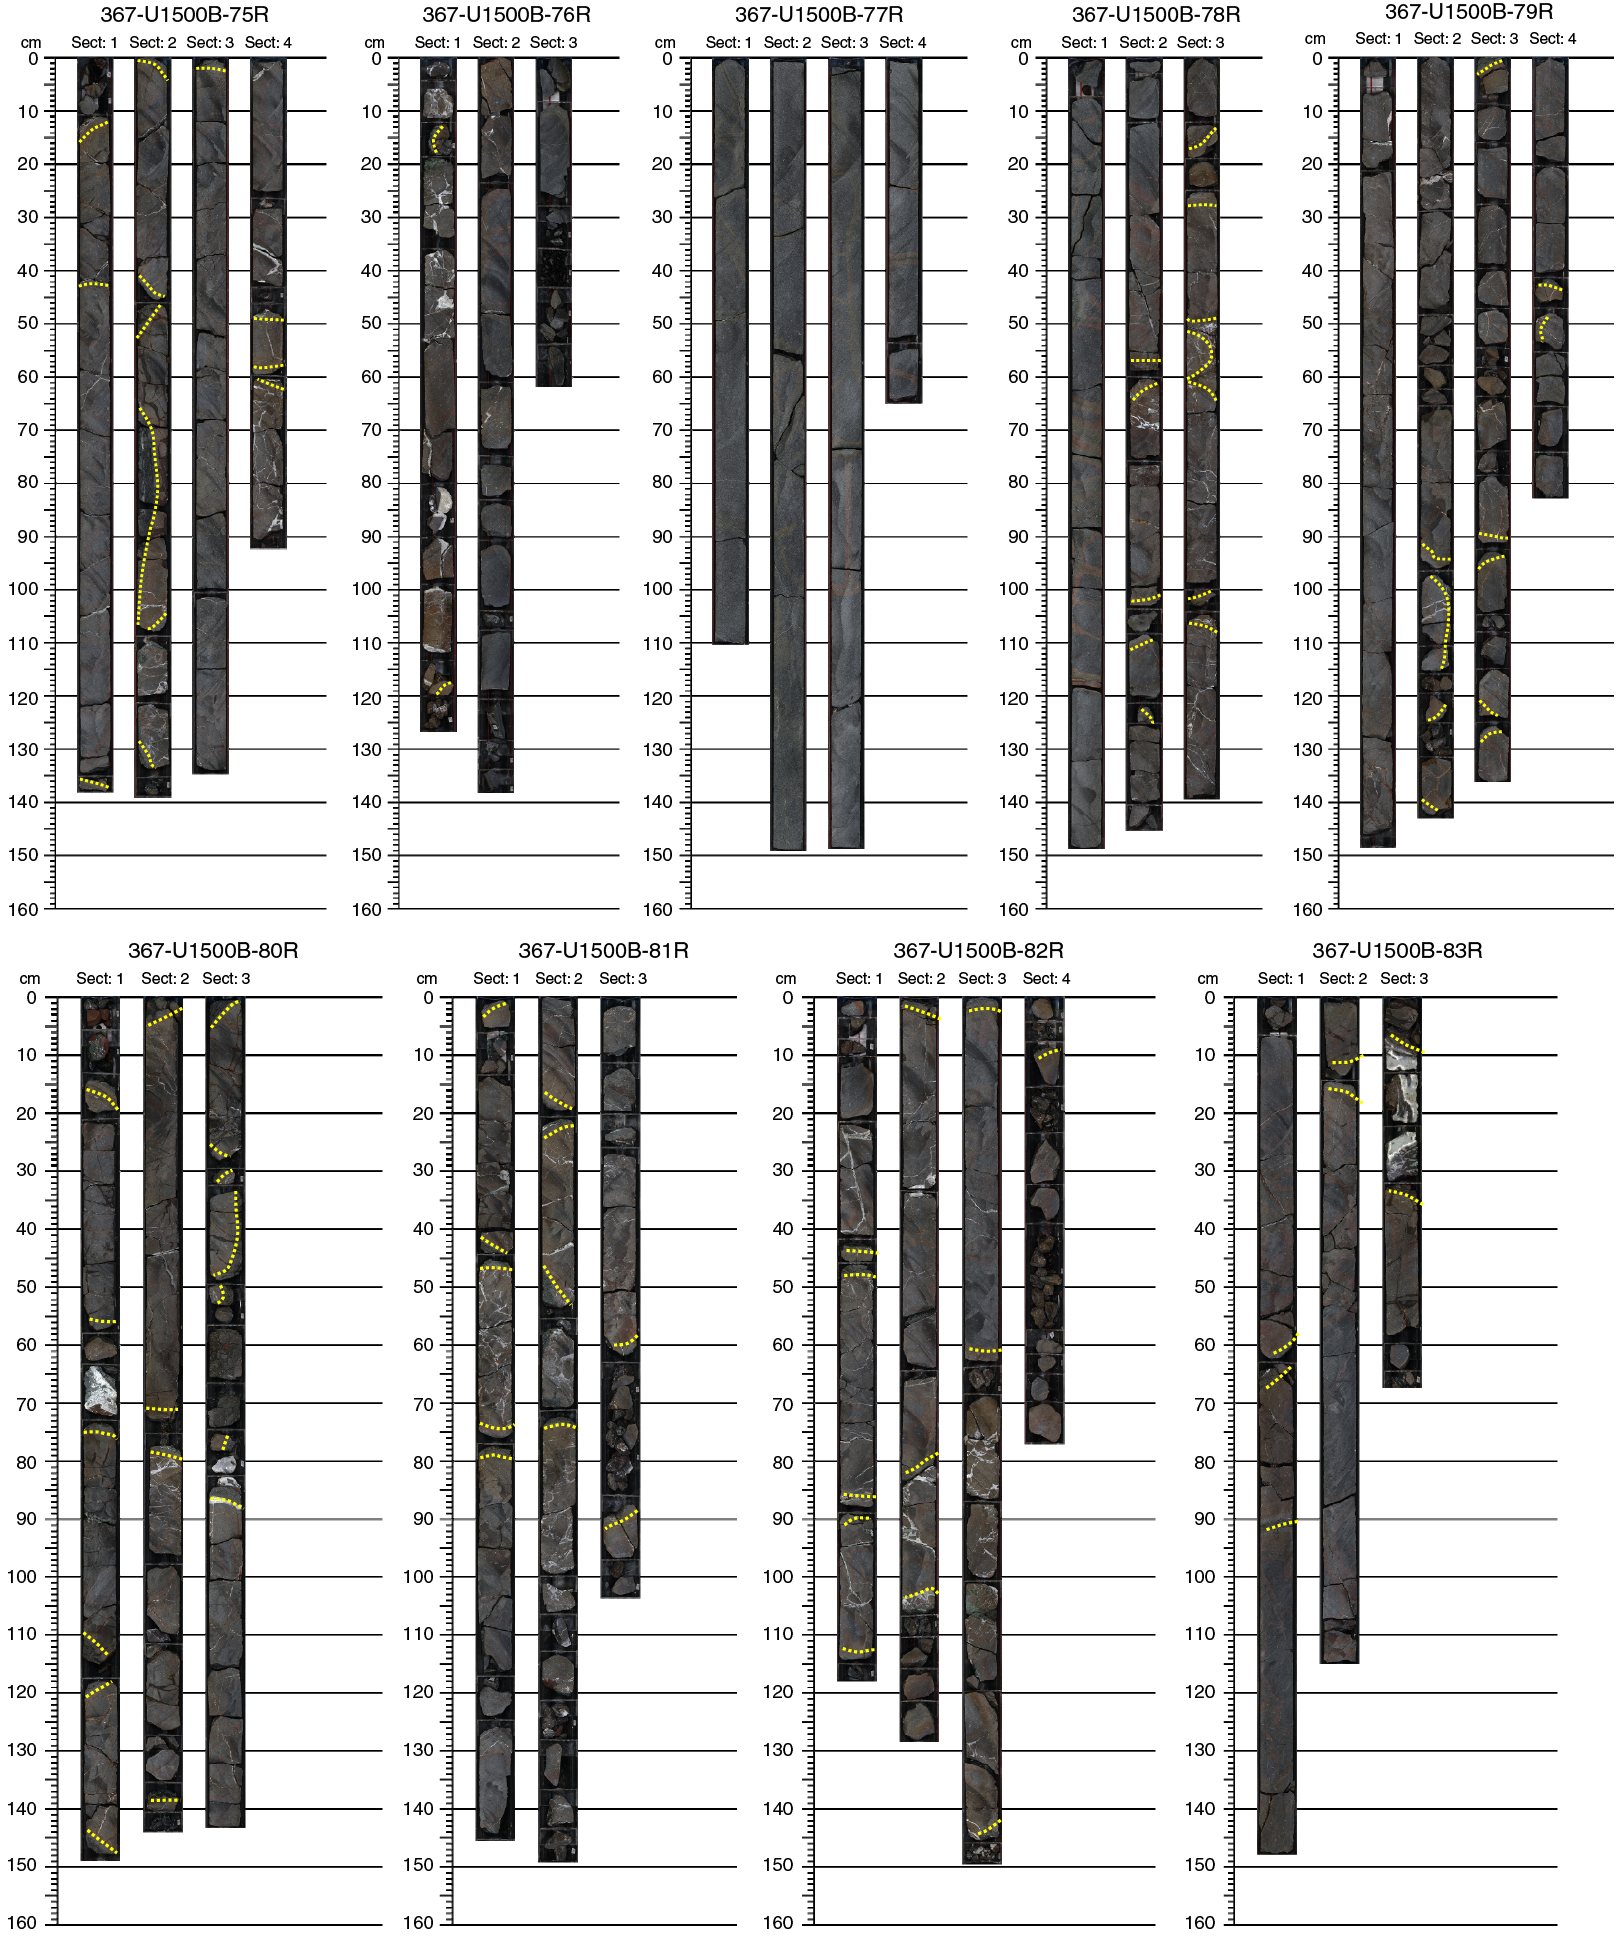
Figure F25. Basalts highlighting all observed chilled contacts and margins.
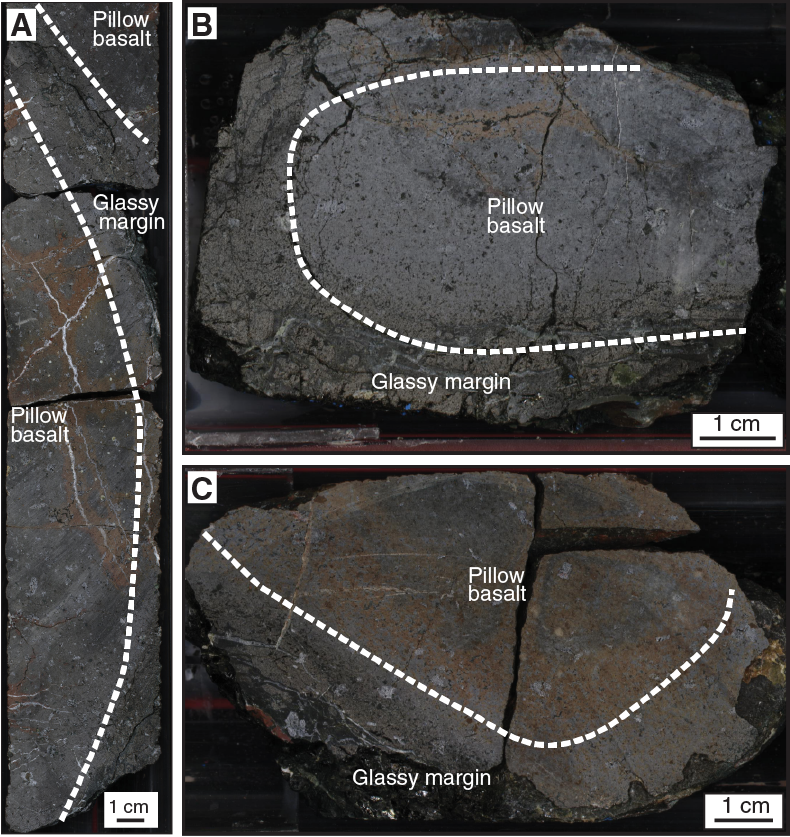
Figure F26. Basalts with glassy chilled rims and hypocrystalline interiors.
Petrographic description
At the microscopic scale, these hypohyaline to hypocrystalline, cryptocrystalline to fine-grained porphyritic basalts show a well-preserved primary igneous mineral assemblage (olivine, plagioclase, clinopyroxene, and Fe-Ti oxides) and microtextures (such as aphyric, [glomero]porphyritic, vitrophyric, dendritic, [sub]ophitic, and intersertal) (Figure F27). Stubby or elongated prismatic subhedral plagioclase is the dominant phenocryst mineral (1%–35%; 1–20 mm in size), showing well-defined oscillatory zoning and resorption textures (Figure F28). Plagioclase glomerocrysts are found throughout these flows. Olivine (≤10%; 0.5–2.5 mm in size) remains an occasional phenocryst mineral throughout Unit VIII and is either fresh (Figures F27, F28) or recognizable by olivine pseudomorphs composed of iddingsite, chlorite, and mesh textures of serpentine and fine-grained magnetite. Rare clinopyroxene phenocrysts were identified at the macroscopic scale.

Figure F27. Representative textures observed in hypocrystalline basalts.
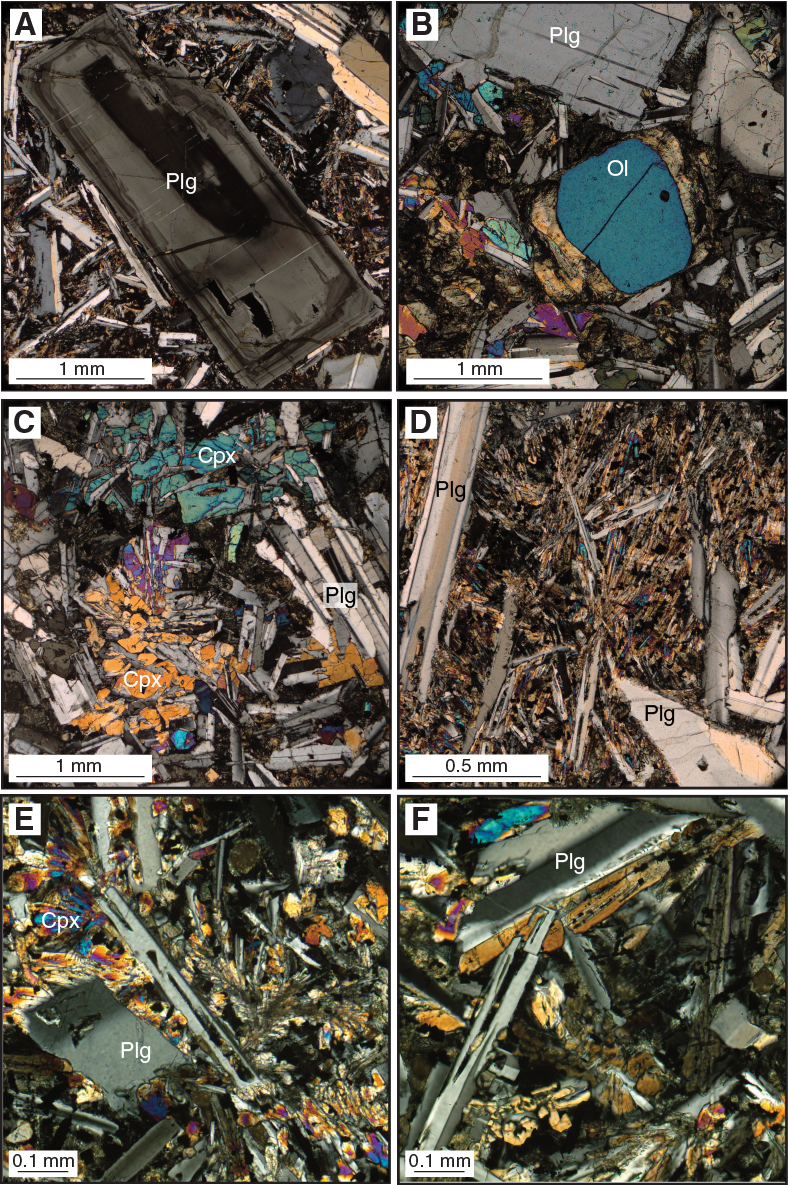
Figure F28. Primary rock-forming minerals and textures of basalts.
The hypocrystalline groundmass is composed primarily of glass, plagioclase, clinopyroxene, and Fe-Ti oxide, as well as rare pyrite. Plagioclase mostly occurs as narrow, elongated prismatic crystals in subophitic to ophitic relationships with clinopyroxene and occasionally in swallow-tail textures containing inclusions of Fe-Ti oxide, clinopyroxene, and altered glass. Clinopyroxene mostly occurs as narrow, elongated prismatic crystals within poikilitic textures or occasional comb textures (Figure F28). Clinopyroxene is partially slightly altered to chlorite. Fresh glass is only preserved in chilled margins and is altered to chlorite in the groundmass. Glass and groundmass alteration does increase downhole.
Veins and alteration
Veins are found throughout lithostratigraphic Unit VIII and are predominantly filled with carbonates and Fe (hydr)oxides, chlorite, zeolites, and silica, giving them a white, red, or greenish color. Veins usually have a sharp contact with the host basalt and are either polycrystalline or massive. Clay-rich margins in veins, as well as clay aggregates, are ubiquitous in many carbonate-rich veins, particularly in pillow lava flows, being usually found as very fine aggregates within carbonate veins or as centimeter-thick claystone layers with no preserved textures or structures. Red to green-red halos related to the background alteration of interstitial glass, olivine, and occasionally plagioclase (Figure F24) usually surround these veins. The halos consist of carbonates, Fe (hydr)oxides, zeolites, and chlorite. The remainder of the background alteration predominantly comprises iddingsite, partially to fully replacing olivine phenocrysts. Background alteration varies from a fresh to moderate intensity throughout Unit VIII and is mostly related to vein halos. Occasionally, opal- or hydrated quartz–bearing veins are found in carbonate-rich veins, whereas sulfides are commonly absent and only rarely preserved. Vesicles in these flows are overall moderately to highly spherical and rounded and are usually filled with zeolites, chlorite, and carbonates. Alteration of Unit VIII basalts is slight overall, consistent with the alteration of interstitial glass and with the good preservation of plagioclase. Average alteration intensity increases downhole (changing from slight to moderate), which is compatible with decreasing preservation of glass within the chilled margins and background color of Unit VIII grading from black (fresh glass) and very dark gray (fresh basalt) to greenish (altered glass) and reddish-grayish brown (moderately altered basalt), respectively.
Chemical composition (pXRF and XRF core scanning)
Four samples from Subunit 1a and the uppermost core of Subunit 1b were analyzed for major elements and selected trace elements by ICP-AES, and these data are discussed in Geochemistry. During Expedition 368, additional compositional analyses were made on the 14 thin section billets of the Site U1500 basalts using the handheld portable X-ray fluorescence spectrometer (pXRF; see Igneous and metamorphic petrology in the Expedition 367/368 methods chapter [Sun et al., 2018a]). The results of these reconnaissance pXRF analyses are given in Table T3, and they were made to see if there were any significant compositional changes with depth (the ICP-AES analyses cover Cores 367-U1500B-57R to 60R, and the pXRF analyses cover Cores 57R to 74R). The pXRF analyses show limited compositional variability (TiO2 = 1.5 ± 0.1 wt%; Zr = 97 ± 10 ppm; Sr = 161 ± 17 ppm), with concentrations similar to the ICP-AES analyses. Ratios of immobile incompatible elements, such as Ti and Zr, also show limited variability (Ti/Zr = 94 ± 8), which suggests that there were no significant changes in parental magma composition at Site U1500.
Table T3. Rock major element oxides and minor elements. View table in PDF format. Download table in CSV format.
A high-resolution XRF core scanning data set for the Site U1500 volcanic rock section was produced onshore (see Igneous and metamorphic petrology in the Expedition 367/368 methods chapter [Sun et al., 2018a]) and can be retrieved as shipboard data from the LORE database (http://web.iodp.tamu.edu/LORE). At the time of this publication, assessment and discussion of this data set have not been concluded yet.
Interpretation
Because of the lack of well-defined age constraints from the immediately overlying sediments (lithostratigraphic Unit VII) and interbedded calcareous claystone within the pillow lava flows, the age of Unit VIII can only be estimated as being Oligocene or older, based on the late Oligocene age of lithostratigraphic Unit VI. The presence of pillow structures, quenched mineral textures, hyaloclastites, and chilled margins mixed or associated with claystone containing deep-water agglutinated foraminifers (see Biostratigraphy) indicates subaqueous eruptions. The presence of zoned plagioclase phenocrysts and subordinate olivine phenocrysts suggests that these basalts had already fractionated at depth and are thus not “primitive,” which is consistent with a moderately low Mg# (see Geochemistry). Moreover, the lack of significant clinopyroxene phenocrysts, up to 35% plagioclase, and a crystallization sequence of olivine → plagioclase → clinopyroxene + Fe-Ti oxides indicates shallow-level crystallization of relatively dry melts, which is consistent with a general tholeiitic trend and MORB-like affinity shown by initial shipboard chemical bulk rock analysis (Figures F3, F44).
Structural geology
Site U1500 is located on Ridge B at the northern COT of the SCS margin and ~39 km southeast of Site U1499. Coring at Site U1500 did not start until 378 m below the seafloor. Tilted bedding (Figure F29) and deformation structures were observed in all lithostratigraphic units. Several units present similar deformation structures and are described together.

Figure F29. Lithostratigraphic summary with bedding dips, Site U1500.
Units I–III
Units I–III are mainly composed of dark greenish to dark gray clay, sandstone, and claystone. Only six faults (five normal and one indeterminate) were measured in these units, four of them in the unlithified Unit I (Figure F30) and two in Unit III (Figure F31). The centimeter-scale faults have 0–2 cm offsets and 35°–62° dips. A series of millimeter-scale faults appear to crosscut thin sand layers with an offset of less than 5 mm. In addition, the surrounding claystone contains contorted beds in interval 367-U1500A-21R-1, 94–108 cm (Figure F30). Four synsedimentary folds are identified in Units II and III. The variations of color and lithology highlight the fold morphologies. For instance, folds from Section 22R-1 occur with coarse sand within a grayish brown claystone. Tilted bedding in Units I–III has an average dip of 9° with a standard deviation of 5° (Figure F29). Tilted beds are more frequent in Cores 21R through 30R. Additionally, mud clasts occur in Sections 26R-1, 100 cm, to 33R-1, 87 cm. These clasts sometimes show preferred orientation (interval 27R-6, 8–15 cm) or subrounded shape (interval 33R-1, 79–86 cm; Figure F30).
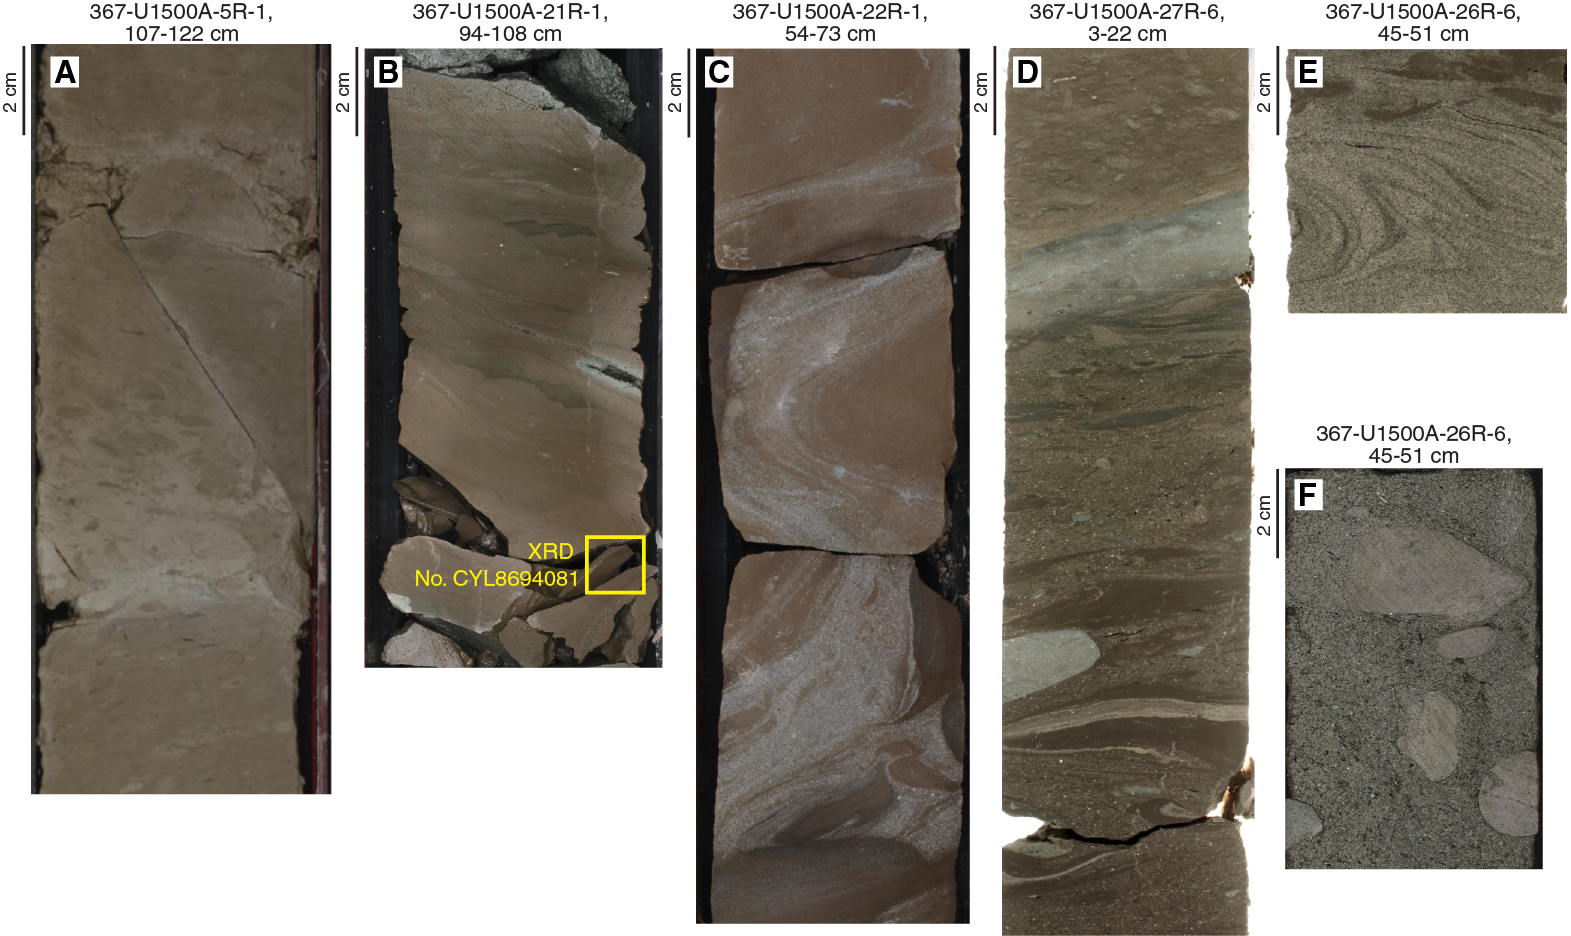
Figure F30. Sedimentary and deformation structures in Units I–III.
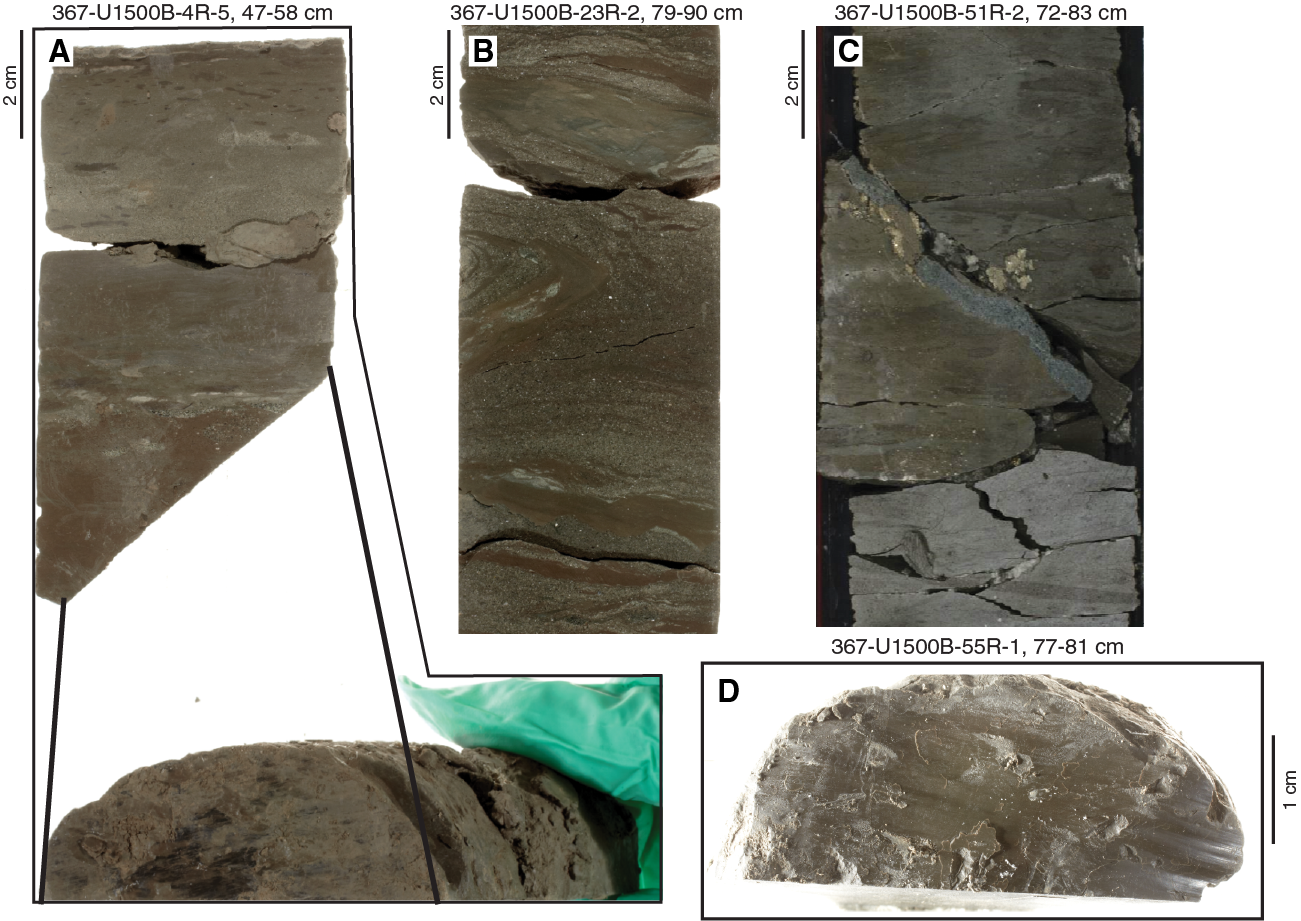
Figure F31. Sedimentary and deformation structures in Units IV–VII.
Interpretation
Synsedimentary folds are formed in poorly consolidated sediments before lithification. The millimeter-scale faults, together with the contorted beds in Section 364-U1500A-21R-1, indicate synsedimentary deformation. Interestingly, the XRD sample (CYL8694081) located at the bottom of the deformed zone presents anomalously high contents of siderite. We interpret this deformation zone as a potential pathway for hydrothermal fluid. Mud clasts present throughout Unit III (Cores 15R through 33R) suggest erosion and transport of these clasts before their sedimentation within coarser material, likely caused by gravity-controlled deposition (e.g., debris flows, slumps, etc).
Unit IV
Unit IV has low recovery and is composed of dark greenish to dark gray sandstone with claystone and siltstone interbeds. Fourteen tilted beds in localized sandstone intervals were measured. The average bedding dip is 11°, and the standard deviation is 6°. A single centimeter-scale synsedimentary fold was recorded in an interval of sandstone with foraminifers (interval 367-U1500B-23R-2, 83–86; Figure F31). Six centimeter-scale faults with indeterminate motion were measured in the different lithologies of Unit IV. These faults are likely related to differential compaction.
Units V–VII
Units V–VII are composed of claystone with variations of color, carbonate contents, and frequency of sandstone intervals. Only four tilted beds were measured in these three units. In all cases, tilted bedding occurs within bioturbated claystone. The average bedding dip is 16°, and the standard deviation is 11° (Figure F29). Forty-seven centimeter-scale faults were measured in Units V–VII. Most of these faults (92%) are in Unit V, and >80% have well-defined slickensides (Figure F31). Only five faults are defined as normal faults; no clear shearing direction can be determined on the others. All of the faults occur in claystone intervals, which suggests the faulting is linked to differential compaction during clay lithification. Three single, uniform veins appear in silty claystone or claystone in Unit VI and are filled with pyrite (Figure F31).
Unit VIII
Unit VIII is composed of sparsely to highly plagioclase phyric basalts. Petrologists defined two subunits composed of sheet flow, massive flow, and pillow lava/lobate flow. A total of 819 measurements were taken on structures, including open fractures and veins (some fractures present mineral infill and were counted in both categories). Half of the veins are haloed, but uniform and composite veins were also observed (Figure F32). Forty-nine percent of the veins are single; the other veins present branched or network connectivity. Vein dips range from 1° to 90°; the average dip is 41° with a standard deviation of 24°. Haloed-vein thicknesses vary from 0.2 to 11 cm and are composed of carbonate, Fe oxide, and other secondary minerals. From interval 367-U1500B-57R-2, 27–55 cm, neptunian dikes filled with dark red claystone were observed throughout Unit VIII.
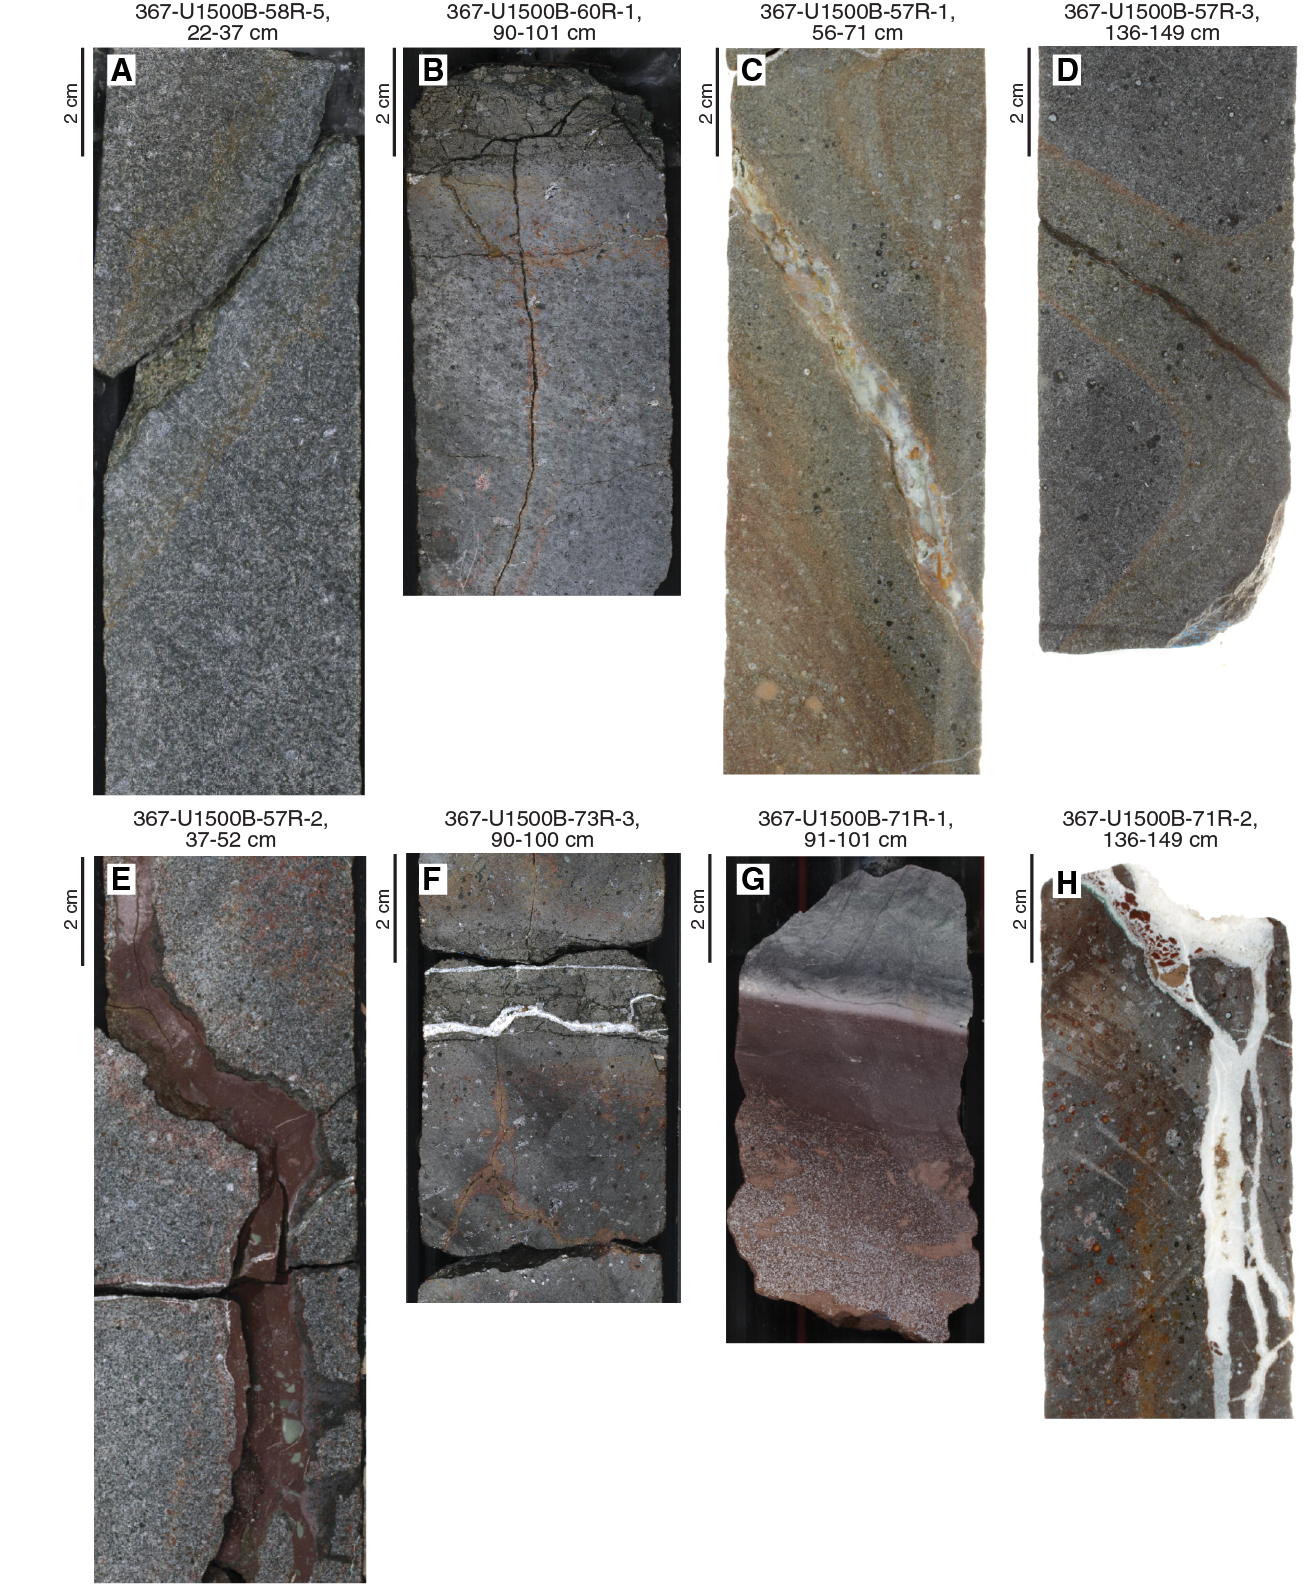
Figure F32. Igneous structures in Unit VIII.
Digital imaging of the whole-round external core surface was conducted for sufficiently intact/unbroken core pieces of basalt before splitting. The resulting images and structural analysis of these 360° images from Cores 59R through 83R are shown in Figure F33. These images are complementary and similar to the logging FMS resistivity data; therefore, the position and amplitude of a sinusoid can indicate the strike and dip angle of a plane. The stereographic projections in the core reference frame of veins and fractures (Figure F34) and the 360° images of these cores indicate that there is no preferred orientation of the structures (Figure F33). Some single veins are almost perpendicular to the chilled glassy margin, whereas a vein network filled by carbonate mineral is often observed parallel to the glassy margin (Figure F32). Carbonate vein networks were observed, sometimes containing individualized angular basalt or sediment clasts (Section 71R-2). These fractures and veins are likely generated by cracking and fluid circulation during or after cooling of the basalt. There are no macroscopic or microscopic mineral preferred orientations in the basalts, which could indicate a flow direction. The silty and sandy claystone interbedded with the basalt in interval 71R-1, 91–101 cm, has a dip of 20°; however, because it is the only tilted bed, we cannot assess the origin of the tilting.
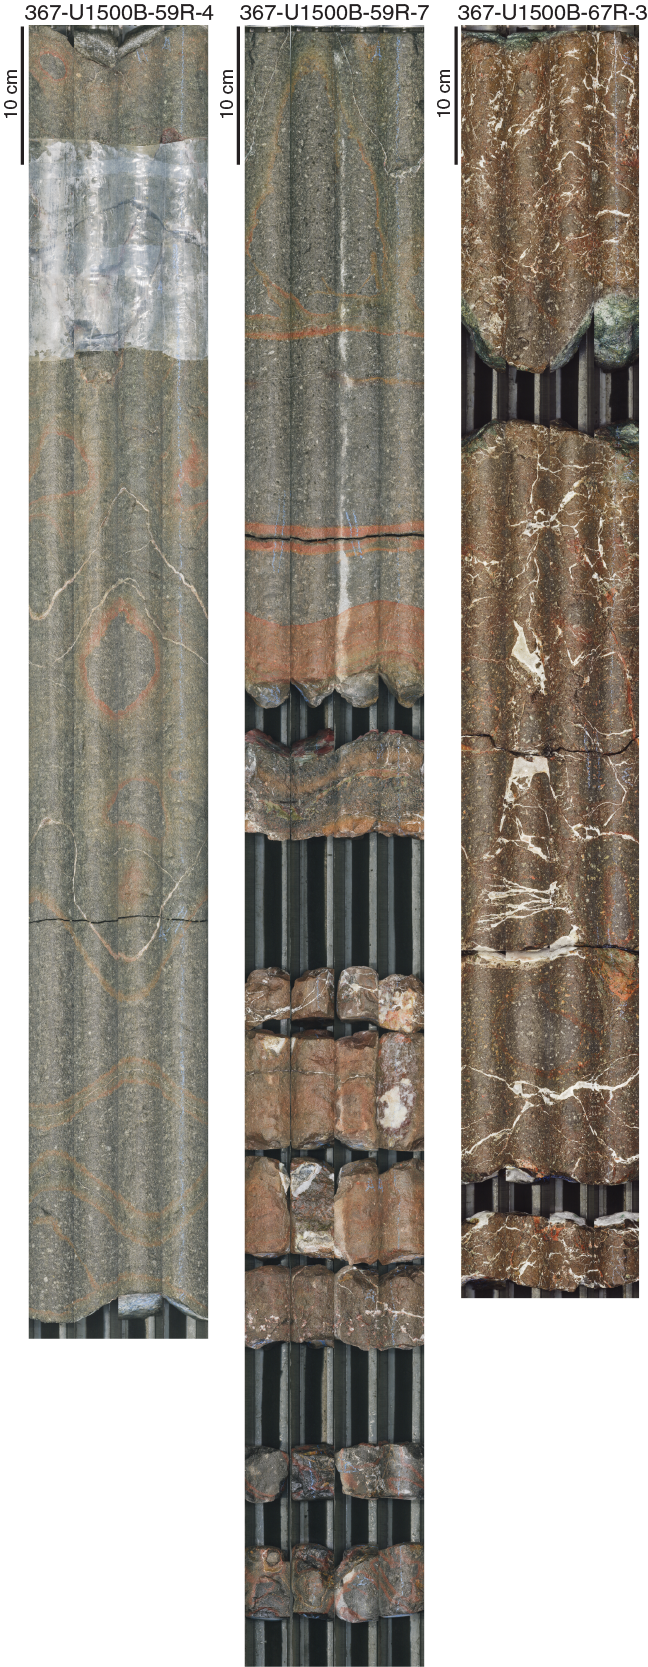
Figure F33. Whole-round images.
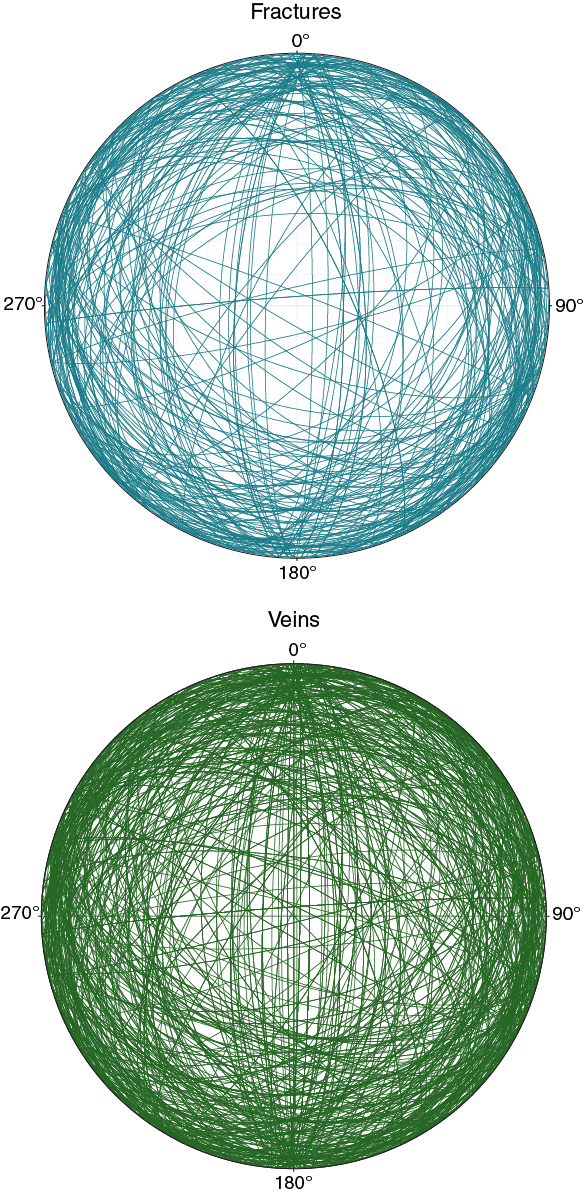
Figure F34. Stereographic projection fractures and veins.
Biostratigraphy
All core catcher samples in Holes U1500A and U1500B were analyzed for calcareous nannofossil and foraminiferal content. Additional samples were taken from the split-core sections when necessary to refine the ages between core catcher samples. Preservation of microfossils varies from poor to good. Overgrown or broken fragments are common for the calcareous fossils in the sediment sequences. Both calcareous nannofossils and foraminifers vary from barren to abundant and exhibit some degree of reworking in most samples.
Although core recovery is low or even barren for half of the cores, 12 biostratigraphic datums were recognized from Cores 367-U1500A-2R through 367-U1500B-56R, revealing that we recovered an apparently continuous succession from the late Oligocene to the late Miocene. The biostratigraphic events are listed in Table T4, and an age-depth plot using these events is shown in Figure F35.
Table T4. Biostratigraphic events. Download table in CSV format.
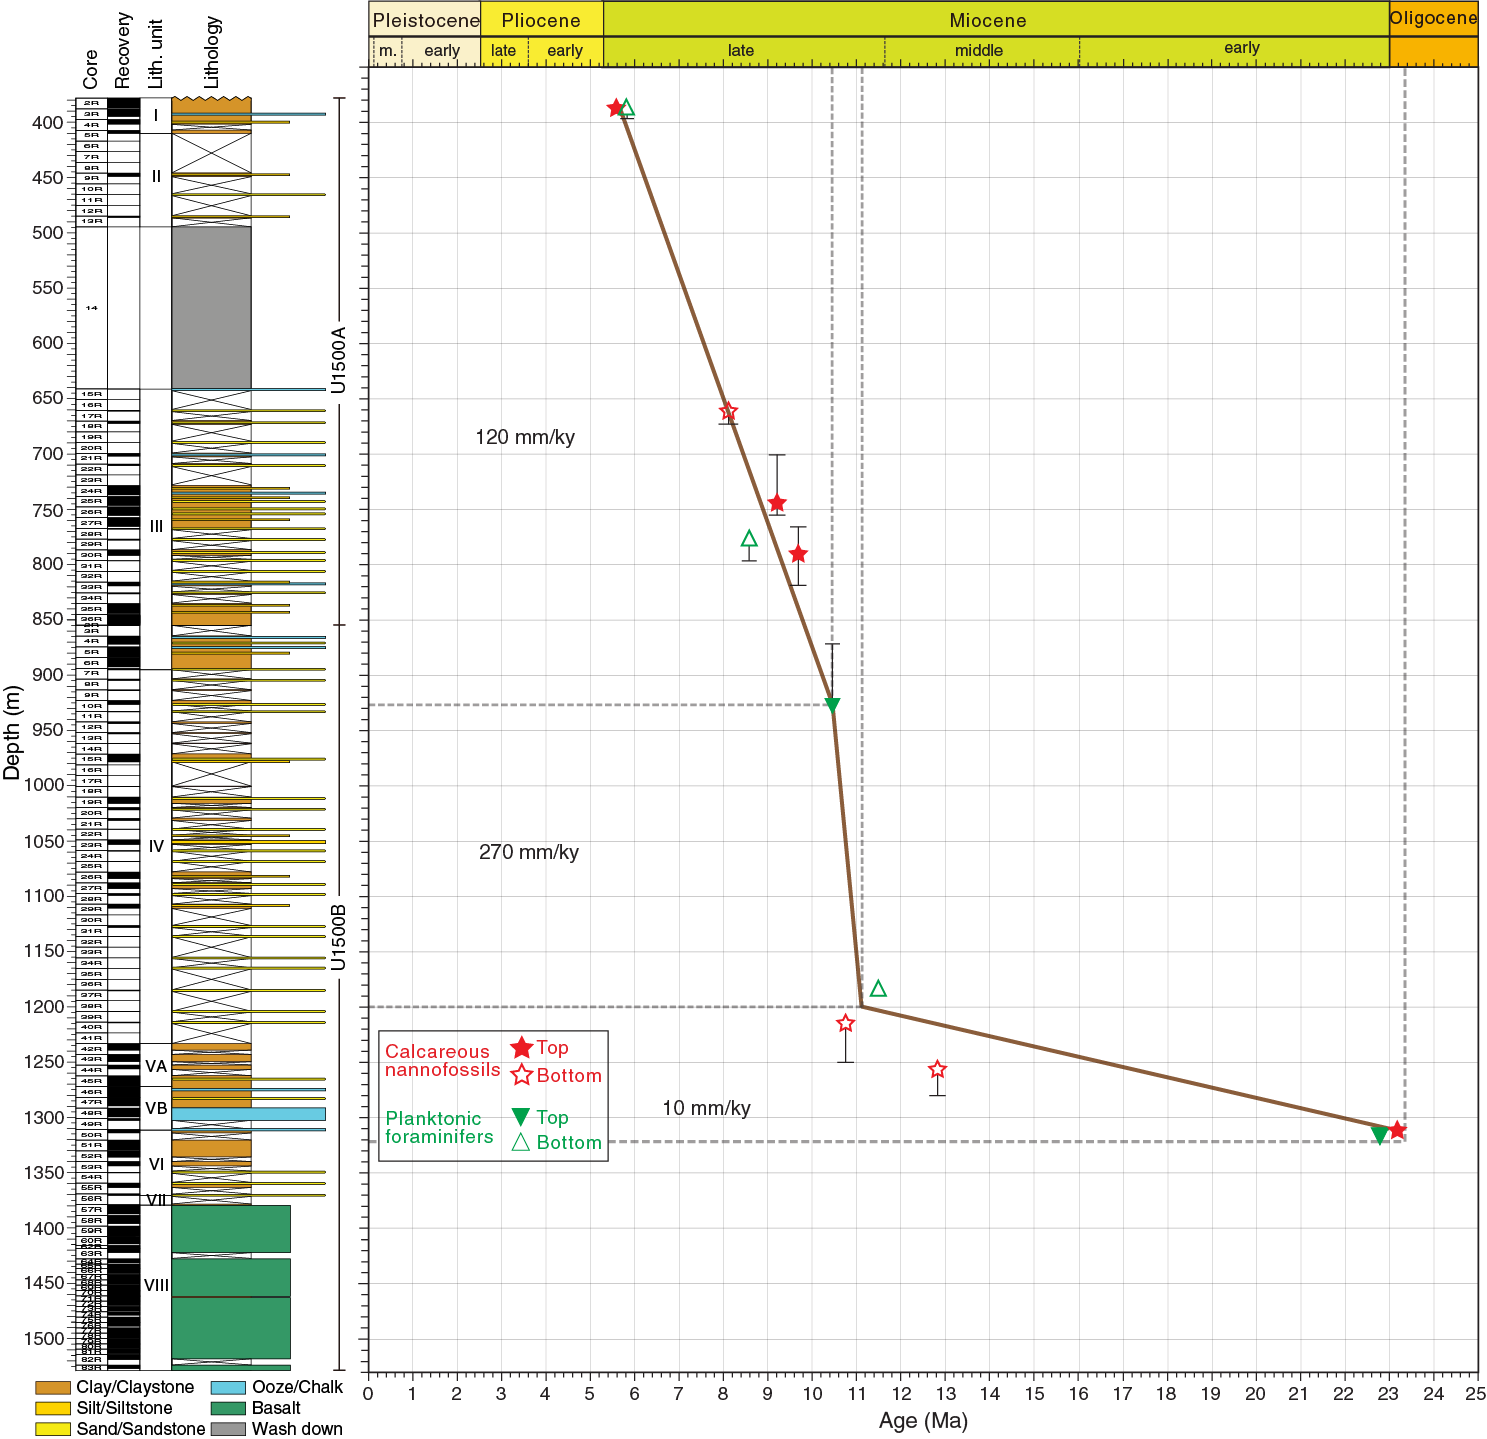
Figure F35. Age-depth model.
Cores 367-U1500A-2R through 367-U1500B-10R (380 to ~930 m) were assigned to the upper portion of the late Miocene. Preservation of the calcareous nannofossils is moderate, whereas the planktonic foraminifers are poorly preserved. The sedimentation rate is ~120 mm/ky for the late late Miocene at this site.
Cores 367-U1500B-10R through 37R (930 to ~1200 m) were assigned to the lower portion of the late Miocene. Both calcareous nannofossils and planktonic foraminifers are poorly preserved at this interval. The estimated sedimentation rate is ~270 mm/ky for the early late Miocene.
Cores 37R through 50R (1200 to ~1313.85 m) were assigned to the middle Miocene–late Oligocene with a sedimentation rate of ~10 mm/ky. Fossil preservation is moderate to poor. The first appearance datums (FADs) of Globoturborotalita decoraperta (11.46 Ma) and Reticulofenestra pseudoumbilicus (12.83 Ma) indicate the late/middle Miocene boundary (11.60 Ma) can be confidently placed between Samples 37R-1, 40–41 cm, and 44R-CC. The last appearance datums (LADs) of Globigerina ciperoensis (22.9 Ma) and Reticulofenestra bisecta (23.13 Ma) occur in Core 50R and possibly indicate the Miocene/Oligocene boundary. Both calcareous nannofossils and planktonic foraminifers indicate a late Oligocene succession from Cores 51R through 55R. Two samples from the veins and intrapillow fill of the basalts in Unit VIII contain poorly preserved calcareous nannofossils and indicate an Oligocene age. However, in the calcareous sandstone from Section 56R-1, P. circularis, G. subquadratus, and O. suturalis, which are commonly present in the middle Miocene, are found together with early Miocene to late Oligocene typical planktonic foraminiferal species (C. dissimilis). In the same sample, the nannofossil content is represented by long-range species and cannot give a precise age for Core 56R. The accurate age of Core 56R requires further studies.
Calcareous nannofossils
Calcareous nannofossil biostratigraphy at Site U1500 is based on analysis of all core catcher samples and additional split-core samples (Tables T5, T6). A total of 148 samples were analyzed, 71 of which were barren of calcareous nannofossils. Nannofossils are rare to common in most of the fossiliferous samples and abundant in samples from the dark brownish calcareous-rich claystone of lithostratigraphic Unit VB. Preservation of nannofossils is poor to moderate with varying degrees of overgrowth on nannofossils, as well as reworked specimens and abundant broken fragments, especially among discoasters.
Table T5. Calcareous nannofossils, Hole U1500A. View table in PDF format. Download table in CSV format.
Table T6. Calcareous nannofossils, Hole U1500B. View table in PDF format. Download table in CSV format.
Seven nannofossil biostratigraphic datums indicate an age of late Oligocene to late Miocene for the sediment sequence recovered at Site U1500 (Table T4). The LAD of Discoaster quinqueramus (5.59 Ma) marks the top of Zone NN11, which corresponds to the Pliocene/Miocene boundary. D. quinqueramus was found in Sample 367-U1500A-2R-CC (386.97 m), which suggests that the Pliocene/Miocene boundary is shallower than 386.97 m. The FAD of D. quinqueramus (8.12 Ma) in Sample 17R-1 (660.89 m) defines the bottom of Zone NN11. Zones NN11–NN9 could not be reliably identified due to poor preservation or the absence of nannofossils in several core catchers. The LAD of Discoaster bollii (9.21 Ma) within Zone NN10 occurs in Sample 25R-5, 54 cm (743.96 m). The LAD of Catinaster coalitus (9.69 Ma) within Zone NN9 occurs in Sample 30R-3, 86 cm (790.18 m). The occurrences of C. coalitus and D. bollii in Sample 367-U1500B-4R-3, 28 cm (867.80 m), allow reliable biostratigraphic correlation between the deep part of Hole U1500A and the uppermost section of Hole U1500B (Tables T5, T6). Low or barren nannofossil abundance between Cores 367-U1500B-4R and 40R prevent the identification of boundaries between Zones NN9 and NN6. The LAD of Discoaster brouweri (10.76 Ma) within Zone NN8 occurs in Sample 40R-CC (1214.5 m), and the FAD of R. pseudoumbilicus (12.83 Ma) within Zone NN6 occurs in Sample 44R-CC (1256.1 m). The Zone NN1/NP25 boundary occurs in Sample 50R-1, 8 cm (1310.98 m), based on the LAD of R. bisecta (23.13 Ma), which corresponds to the top of the late Oligocene. Samples from Core 51R through 55R present a typical late Oligocene association, such as Sphenolithus predistentus, Sphenolithus distentus, Sphenolithus ciperoensis, and R. bisecta. However, this portion of the succession is considered with caution because the nannofossils became surprisingly abundant and well preserved.
Eighteen sediment samples were analyzed from the veins and intrapillow fill of the basalts of lithostratigraphic Unit VIII. Only two samples contain poorly preserved calcareous nannofossils (Samples 62R-1, 7 cm, and 66R-3, 90–92 cm; Table T6). Sample 62R-1, 7 cm (1415.97 m), contains R. bisecta (LAD at 23.13 Ma), Cyclicargolithus floridanus, Cyclicargolithus abisectus (FAD at 32.02 Ma in Young et al., 2014), and S. predistentus (LAD at 26.93 Ma), which indicates an age range of ~27–32 Ma. In Sample 66R-3, 90–92 cm (1440.4 m), nannofossils are poorly preserved and strongly overgrown; only some specimens of R. bisecta, C. floridanus, and C. abisectus were recognized, indicating an Oligocene age.
Planktonic foraminifers
We analyzed all core catcher samples and several additional samples from selected split cores in Holes U1500A and U1500B (Table T7) for planktonic foraminifers. The preservation of planktonic foraminifers varies from good to poor. Recrystallization, dissolution, and deformation of planktonic foraminifers were often observed in most of the samples. The abundance of planktonic foraminifers is generally low. More samples in the upper part of Hole U1500B (880–1270 m) are barren of planktonic foraminifers, which makes the identification of foraminiferal bioevents difficult.
Table T7. Planktonic foraminifers. View table in PDF format. Download table in CSV format.
The Site U1500 planktonic foraminiferal biostratigraphy was established by planktonic foraminiferal evolution events and assemblages. Because many planktonic foraminifers are reworked, we distinguished bioevents from reworked occurrences by relying more heavily on FADs rather than LADs.
Our results indicate that the recovered sediment sequence spans the early Miocene/late Oligocene to the late Miocene (Zone M14) based on four bioevents and one assemblage of planktonic foraminifers. Samples from Core 367-U1500A-2R-CC (378.2 m) through Sample 367-U1500B-37R-1, 40–41 cm (1185.3 m), are assigned to the late Miocene. Sediments from Cores 367-U1500B-37R-CC (1184.8 mbsf) through 50R-CC (1313.85 m) are assigned to the middle Miocene to early Miocene/late Oligocene.
Within Zone M14, the FAD of Tuborotalita humilis (5.81 Ma) was found in Sample 367-U1500A-2R-CC (386.97 m). The FAD of Globorotalia plesiotumida (8.58 Ma) in Sample 29R-CC (777.79 m) and LAD of Paragloborotalia mayeri/siakensis (10.46 Ma) in Sample 367-U1500B-10R-CC (926.23 m) provide two biostratigraphic control points for the boundary of Subzones M13b/M13a and Zones M12/M11, respectively.
Several specimens of Fohsella robusta found in Sample 29R-CC (1110.75 m) suggest an age from 11.75 to 13.13 Ma. The LAD of G. decoraperta (11.49 Ma) was assigned in Sample 37R-1, 40–41 cm (1185.20 m).
In Sections 46R-2 (1274.2 m) through 55R-CC (1363.3 m), planktonic foraminifers are dominated by C. dissimilis and Catapsydrax unicavus and contain abundant deformed planktonic foraminifer shells. The LAD of G. ciperoensis (22.9 Ma) in Sample 50R-CC (1313.85 m) implies the Miocene/Oligocene boundary. In addition, the late Oligocene species Paragloborotalia nana was observed in Samples 48R-CC through 53R-CC, suggesting these planktonic foraminiferal assemblages belong to early Miocene to late Oligocene.
Sample 56R-CC (red claystone) is barren of planktonic foraminifers. However, the middle Miocene or younger components, such as Globigerinoides sacculifer, G. subquadratus, P. circularis, and Orbulina suturlaris, together with the early Miocene to late Oligocene species (C. dissimilis), were observed in two samples from Section 56R-1. Further studies are needed to clarify the stratigraphy of this section.
Benthic foraminifers
Shallow-water benthic foraminifers (e.g., Ammonia and Florius) were observed in some sandstone samples (e.g., interval 367-U1500B-56R-1, 72–74 cm), indicating downslope transport. Deepwater agglutinated benthic foraminifers (e.g., Glomospira, Trochamminopsis, and Recurvoides) are common in Samples 40R-CC through 56R-CC and in sediments interbedded within lithostratigraphic Unit VIII basalt (Section 71R-1), suggesting it was a deepwater environment at that time.
Paleomagnetism
Shipboard paleomagnetic studies consisted of two complementary approaches (see Paleomagnetism in the Expedition 367/368 methods chapter [Sun et al., 2018a]): (1) measurement and in-line AF demagnetization of archive-half sections on the pass-through 2G Enterprises superconducting rock magnetometer (SRM) and (2) measurement and AF and thermal demagnetization of discrete samples on the spinner magnetometer (Agico JR-6A). Representative discrete samples were collected from each sedimentary core section (1.5 m) except those that were severely disturbed or contained unique sediments or structures deemed important for other research. Three discrete samples were collected from the basalt in lithostratigraphic Unit VIII.
We use the remanent magnetization of archive-half sections, measured after the maximum AF treatment (25 mT), to determine the polarity along the core (Figure F36). Discrete samples were analyzed using Zijderveld diagrams (Zijderveld, 1967), and the ChRM direction was calculated by principal component analysis (PCA) (Kirschvink, 1980) using PuffinPlot (version 1.03, 23 April 2015) (Lurcock and Wilson, 2012).
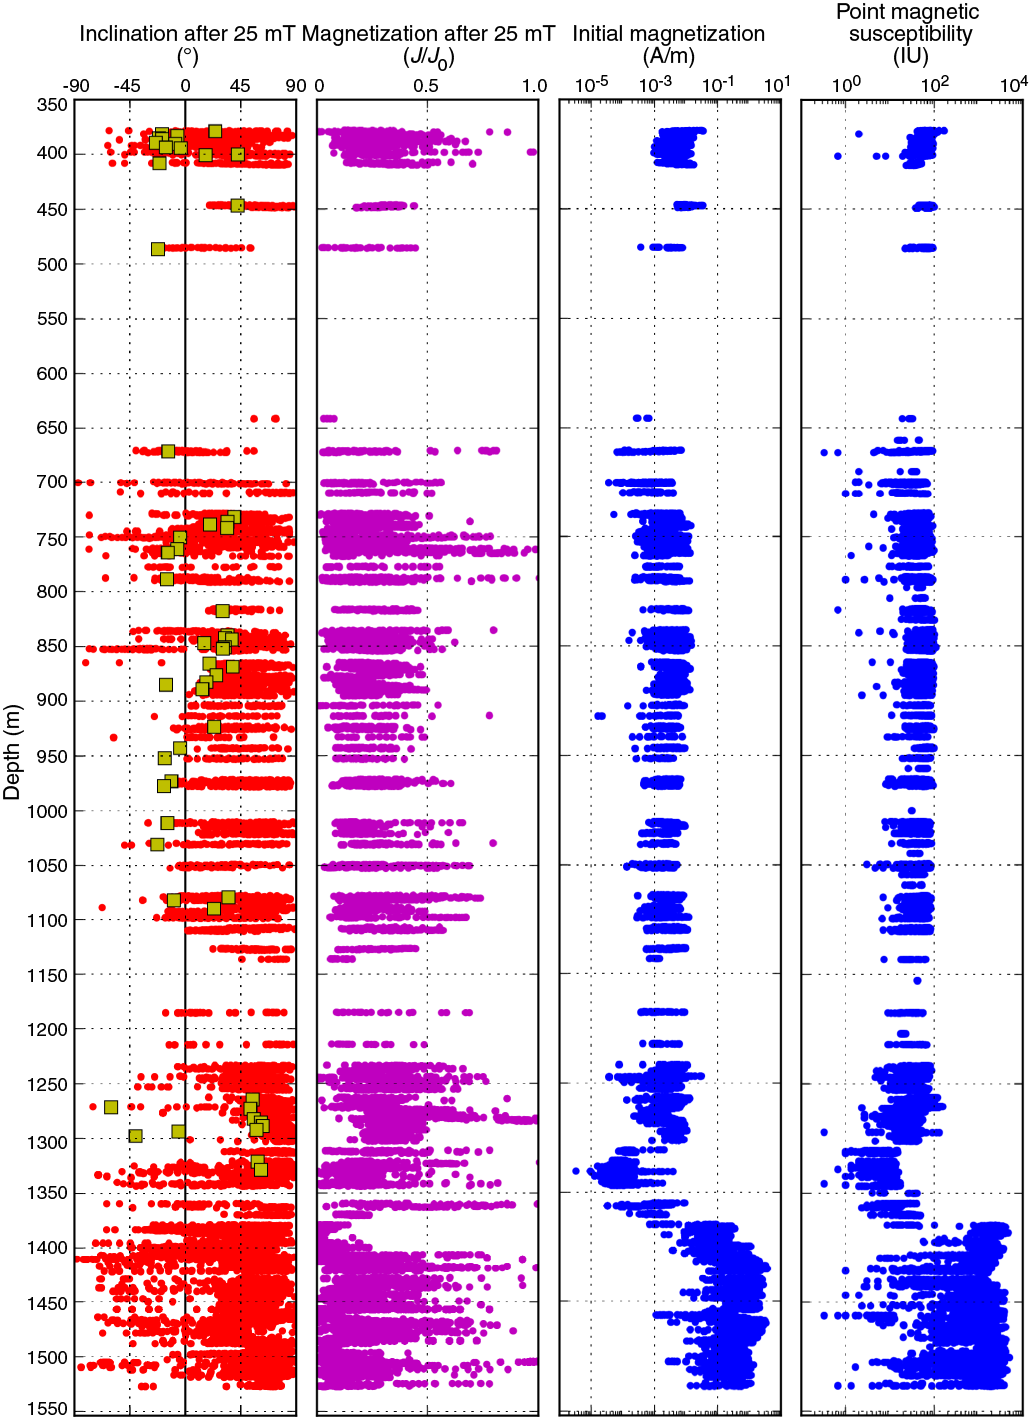
Figure F36. Remanent magnetization data.
Demagnetization behavior
The archive halves of sedimentary cores were measured at 2.5 cm intervals through in-line AF demagnetization steps of 0, 5, 15, and 25 mT. The sedimentary cores exhibited a steep drilling-induced overprint that was removed with a field of 15 mT. Discrete samples were measured on the SRM with 11 AF demagnetization steps from 0 to 45 mT. The sedimentary cores, including both archive halves and discrete samples, had an average initial intensity of magnetization on the order of 10−2 A/m. We were able to remove on average 70% of the initial intensity of magnetization (Figure F36). The sediments recovered in Cores 367-U1500B-50R through 53R had an initial intensity of magnetization that was an order of magnitude weaker than the sediments above. The average magnetization of these cores after demagnetization to 25 mT is on the order of 10−4 A/m, which is of same level as the background noise and thus beyond the shipboard SRM resolution. Typical examples of normal (and reversed) polarity interpretation are shown in Figure F37. In cases where the data are insufficient to quantitatively solve for the ChRM yet the demagnetization path suggests a trend toward normal or reversed polarity, we use the terms “potential normal” or “potential reversed” (Figure F37A, F37B).
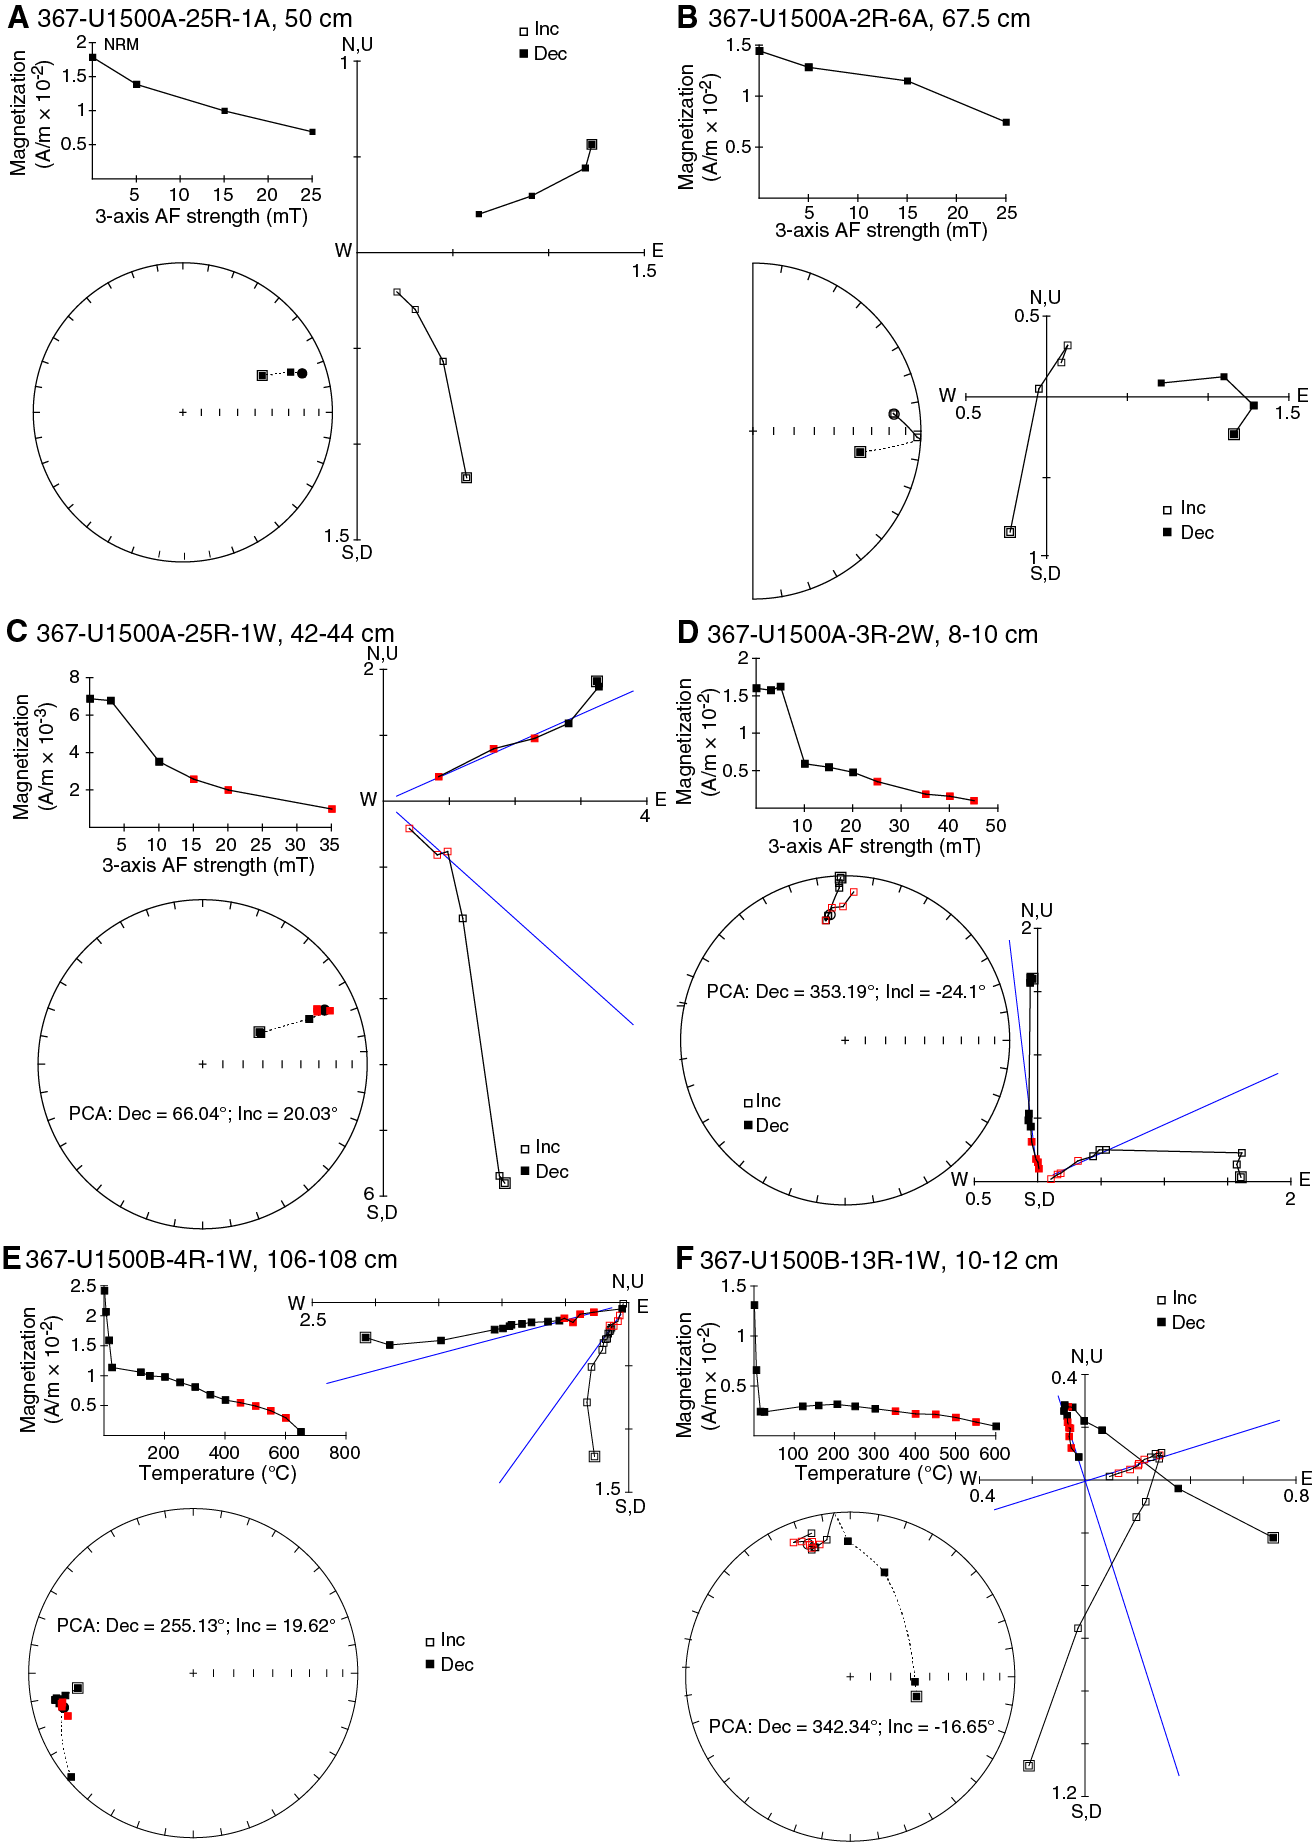
Figure F37. Demagnetization data.
The archive halves of basalt cores from Site U1500 were measured at 2 cm intervals after nine in-line AF demagnetization steps from 0 to 25 mT. The average initial intensity of magnetization of the basalts was on the order of 10 A/m. The stepwise AF demagnetization of the archive halves usually reveals two components: the first component is closely related to the drilling overprint, whereas the second is directed toward the origin but needs further demagnetization to determine the ChRM. To elucidate the demagnetization behavior, three representative discrete samples were taken from the basalts of Cores 57R, 59R, and 60R (Figure F38). Discrete samples have a 50%–90% loss of initial intensity of magnetization after an AF treatment of 10 mT. A combination of AF and thermal demagnetization of the discrete basalt samples reveals multiple components with overlapping coercivity. The first component (AF treatments < 5–7 mT) is related to the drilling overprint; the second component (AF treatments of 8–10 mT and low-temperature steps < 300°C) is marked by a “plateau” in demagnetization with a slight directional shift toward the origin; the third component (300°–450°C) is then interpreted as the ChRM; for higher steps, the samples often become noisy and exhibit a scattered distribution. AF demagnetization of the archive-half sections is insufficient to reveal the multiple components contributing to the remanent magnetization. Thermal demagnetization on shore is therefore required to fully characterize the magnetic remanence of the basalts and the magnetic minerals contributing to the various components.

Figure F38. Demagnetization data for Hole U1500B basalts.
Magnetostratigraphy
For the sedimentary cores shallower than Core 57R, we constructed the magnetostratigraphy (Figure F39) based on the demagnetization behavior of both the archive halves and discrete samples. However, robust correlation to the standard geomagnetic polarity timescale is not possible because of coring gaps, the very poor core recovery, and the noisy demagnetization behavior.
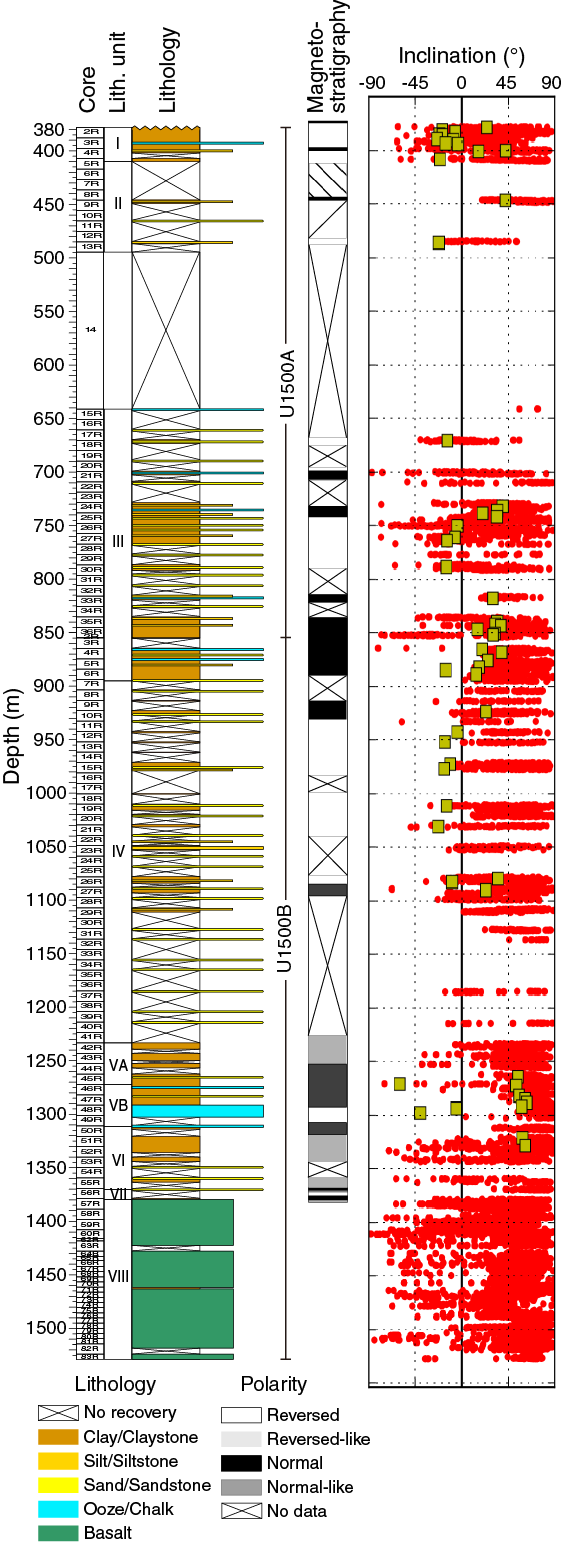
Figure F39. Magnetostratigraphy.
The basalts show predominately positive inclinations with sporadic negative inclinations upon stepwise AF treatments within a single cooling unit, such as in igneous lithologic Subunit 1a (1379.1–1395.52 m), described by shipboard petrologists (e.g., Figure F23). Therefore, we infer that these inclinations are likely CRM and not useful for determining magnetic polarity (e.g., Channell and Xuan, 2009; Doubrovine and Tarduno, 2004). Additionally, the negative inclinations in the basalt are sometimes closely associated with fractures and intervals of alteration, which also correlate with changes in the effectiveness of AF demagnetization and changes in magnetic susceptibility (Figure F40). All these might indicate the presence of magnetic mineralogical changes and a corresponding secondary CRM after the basalt cooled. To clarify this, postcruise analysis of rock magnetic properties should be conducted (Zhao et al., 2006).
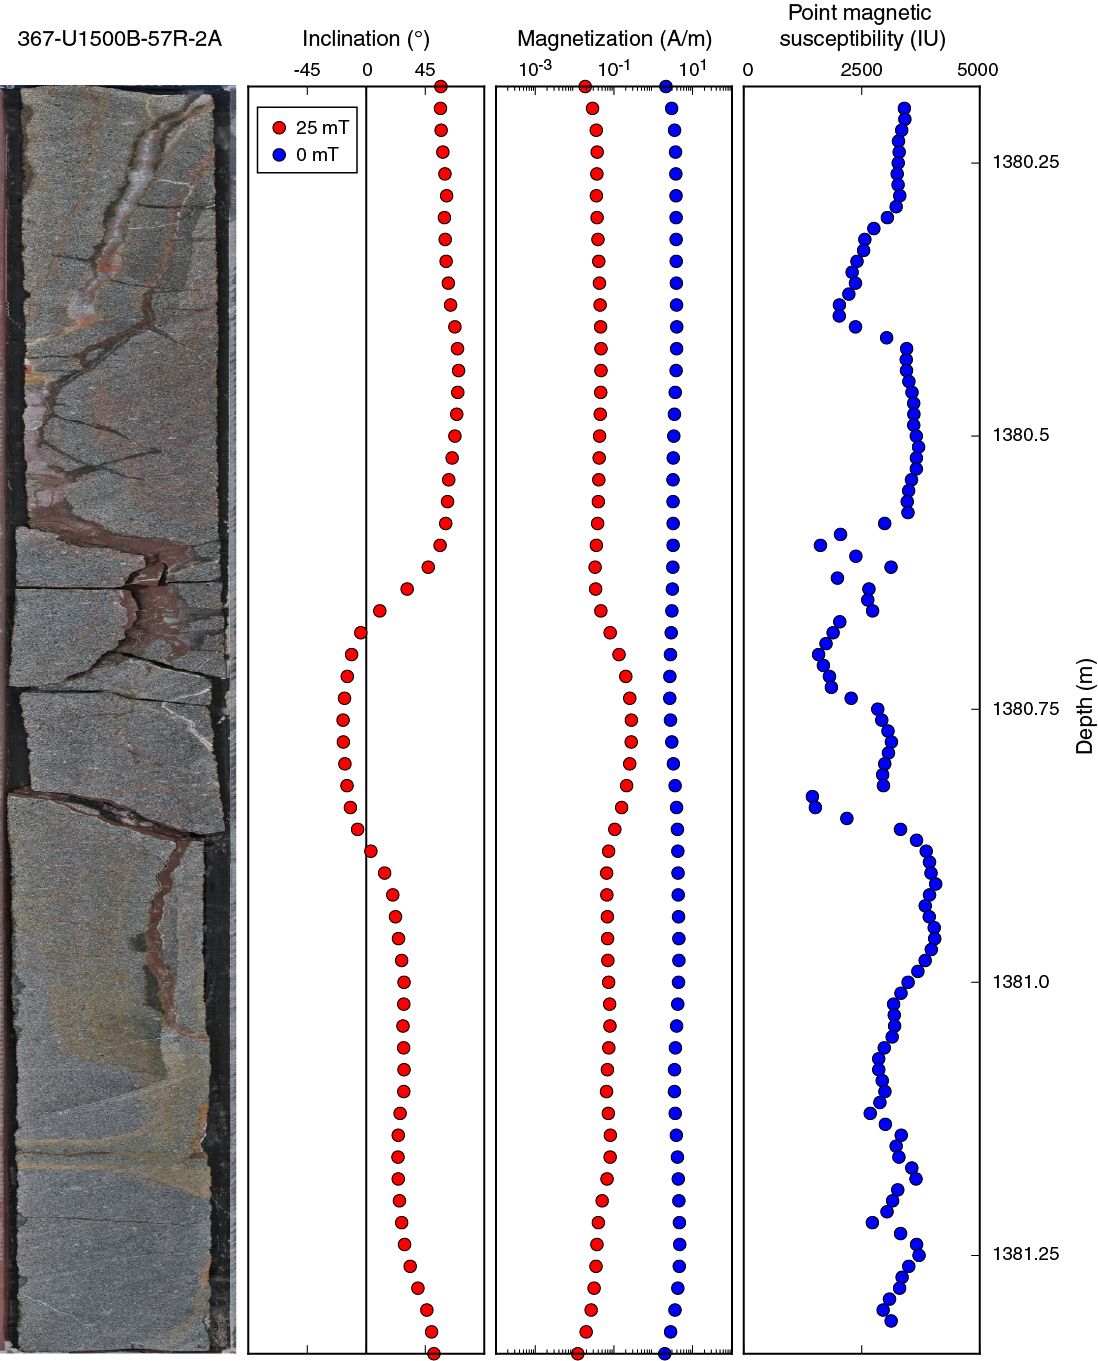
Figure F40. Magnetic property variation.
Geochemistry
At Site U1500, headspace gas measurements were taken for all cores, with values not exceeding 15 ppmv and mostly below the detection limit. Total organic and inorganic carbon and nitrogen were conducted on one sample per sedimentary core that had relative high recovery. Carbonate contents are dominated by biogenic carbonate and vary between <1 and 40 wt%, with higher values corresponding to the calcareous-rich lithostratigraphic units. TOC and TOC/TN ratios are low, averaging 0.14 wt% and 4.6, respectively. In addition, four basalt samples were analyzed for concentrations of major elements and several trace elements using ICP-AES. The ICP-AES analyses of basalts from Site U1500 indicate a subalkaline, MORB composition.
Headspace gas
Headspace gas analyses (78 samples) were performed on one sample per core throughout the sedimentary section (upper 1378 m) for routine safety monitoring. Methane and ethane concentrations are generally below detection limits except for 14 samples with low values (<15 ppmv) occurring from 1250 to 1378 m (Table T8). Ethene was detected only in one sample; its presence is probably the result of coring contamination.
Table T8. Headspace gas data. View table in PDF format. Download table in CSV format.
Bulk sediment geochemistry
Total carbon, total inorganic carbon (TIC), calcium carbonate, TOC, and TN were determined on 68 discrete sediment samples (Table T9; Figure F41). Bulk sediment total carbon and TN were determined by elemental analysis, and TIC was determined by coulometer (see Geochemistry in the Expedition 367/368 methods chapter [Sun et al., 2018a]).
Table T9. Carbon and nitrogen. View table in PDF format. Download table in CSV format.
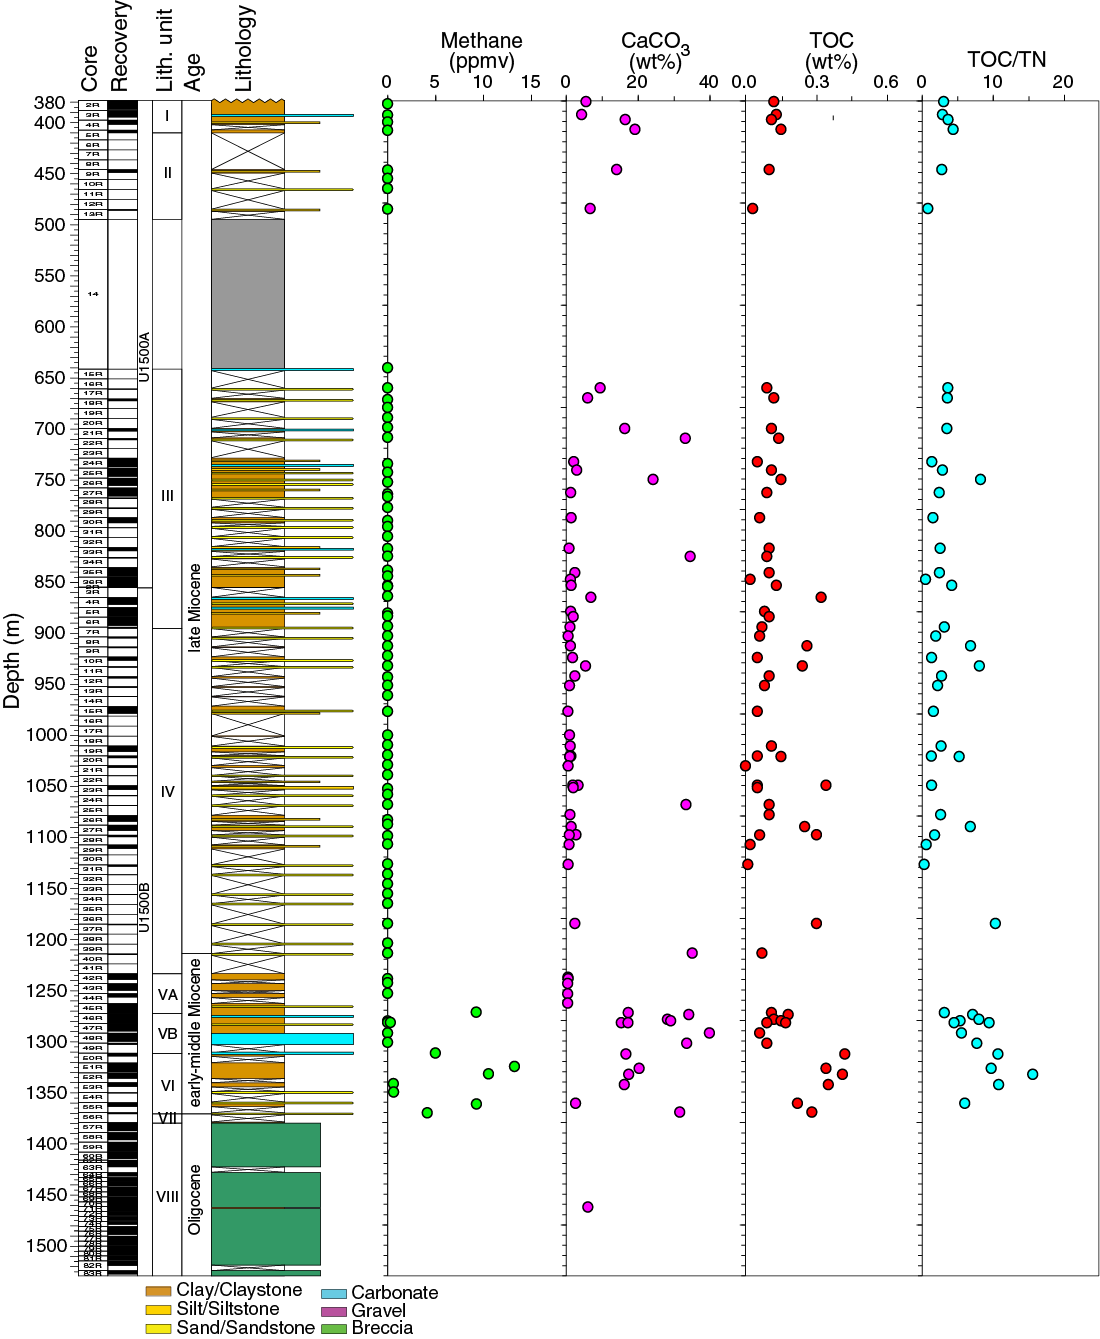
Figure F41. Lithology, carbon, and TOC/TN profiles.
TIC contents range from <0.1 to 4.79 wt% (average = 1.13 wt%). Weight percent calcium carbonate, assuming inorganic carbon is exclusively present as CaCO3, varies between 0.34 and 39.9 wt% (average = 9.4 wt%). From 380 to 485 m, carbonate contents vary from 4 to 19 wt%. Between 660 and 1263 m, carbonate contents fluctuate greatly from <1% to >30%; the higher values correspond to nannofossil- and/or foraminifer-rich intervals. High carbonate contents of up to ~40 wt% (average = 23 wt%; 1272–1370 m) occur in the calcareous-rich claystone and sandstone of lithostratigraphic Subunit VB and Unit VI.
Total carbon contents vary between <0.1 and 4.85 wt%. TOC is <0.2 wt% from 380 to 848 m (Table T9; Figure F41), varies between <0.1 and 0.34 wt% without a consistent pattern between 854 and 1312 m, and finally increases to relatively higher contents (up to 0.41 wt%) in the dark greenish claystone/sandstone of lithostratigraphic Unit VI. The relatively higher TOC in this deepest unit coincides with the presence of very small concentrations of hydrocarbon gases, suggesting that a slightly higher concentration of organic matter has facilitated methanogenesis.
The elemental TOC/TN ratio is generally used as a preliminary estimate for the source of organic material, with high values (TOC/TN > 12) typically attributed to a predominantly terrestrial source and lower values (TOC/TN < 8) being indicative of dominant marine contributions (Müller and Mathesius, 1999). TOC/TN values range from <1 to 15 (average = 4.6), with most values <8 at Site U1500 (Table T9; Figure F41), suggesting that the majority of the organic matter is likely from a marine source.
Igneous rock geochemistry
Four samples of igneous rocks from three different basaltic lava flows in lithostratigraphic Unit VIII in Hole U1500B (igneous lithologic Subunits 1a and 1b) were analyzed for concentrations of major elements and several trace elements (Table T10) by ICP-AES (see Geochemistry in the Expedition 367/368 methods chapter [Sun et al., 2018a] for information on analytical procedures, instrumentation, and data quality). Total contents for the major element oxides vary from 97.31 to 99.72 wt%. Possible reasons for such totals are discussed in Geochemistry in the Expedition 367/368 methods chapter (Sun et al., 2018a). To enable a better comparison of our results between each another and with data from the literature, we normalized raw major element values to 100 wt% totals.
Table T10. Basalt ICP-AES analyses. View table in PDF format. Download table in CSV format.
Weight loss on ignition (LOI) serves as a rough indicator of the overall level of alteration in these rocks. LOI values for unaltered basalt are typically <1 wt% (Rhodes, 1996). With the exception of Sample 367-U1500B-57R-2, 36–39 cm, which has an LOI of 2.55 wt%, the other three samples from Hole U1500B have LOI values of <1.6 wt%. The principal effects of alteration on the suite of elements measured appear to be strongest on the K2O contents. Potassium contents of Sample 57R-2, 36–39 cm, are the highest of the four samples from this site, reaching 0.49 wt%, whereas the other three samples with low LOI values have K2O contents of 0.23 wt% or less.
In a total alkalis (Na2O + K2O) versus SiO2 diagram (Le Maitre et al., 1989; Figure F42), the obtained data plot in the subalkaline basalt field shows normalized SiO2 concentrations ranging from 49 to 53 wt%. Hole U1500B samples overlap the compositional range of other SCS basalts recovered during Expedition 349 (Li et al., 2015b), especially rocks from Sites U1433 and U1434. Samples from Site U1431 are poorer in silica than other igneous rocks obtained during Expedition 349 and those from Hole U1500B. Mg# (Mg# = 100 × (MgO/[MgO + FeO*] calculated on a molar basis; FeO* = Fe2O3 × 0.8998) varies from moderately low values of 51.9 to 65.5 in the Site U1500 basalts, indicating some fractionation at depth.
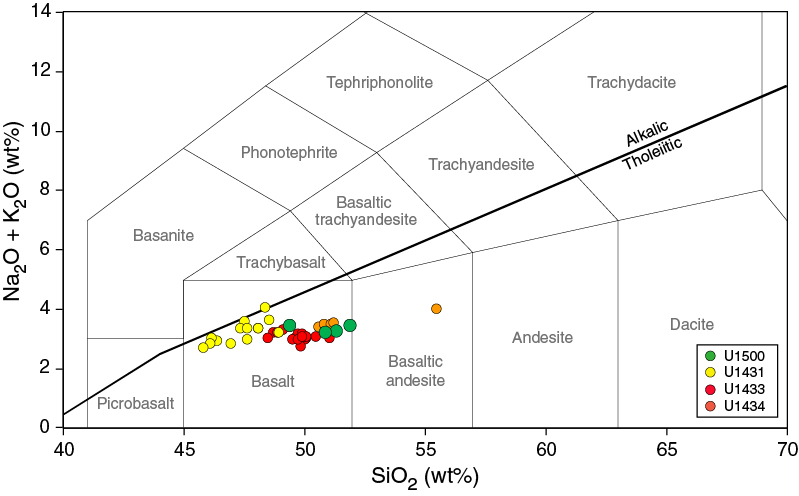
Figure F42. Total alkalis vs. SiO2.
On the V versus Ti diagram (Shervais, 1982) Figure F43), Hole U1500B samples plot in the MORB and back-arc basalt field and overlap the compositional range of Site U1433 and U1434 samples. Likewise, in the Ti versus Zr diagram (Pearce and Cann, 1973) of Figure F44, all samples from Expeditions 349 and 367 plot in the MORB field (with some samples from Site U1431 plotting in the overlap region of several basalt types), and Hole U1500B samples overlap the compositional range defined by samples from Sites U1433 and U1434. These relationships suggest that the basalts drilled at Site U1500 are very similar to MORB obtained from the previous SCS expedition.
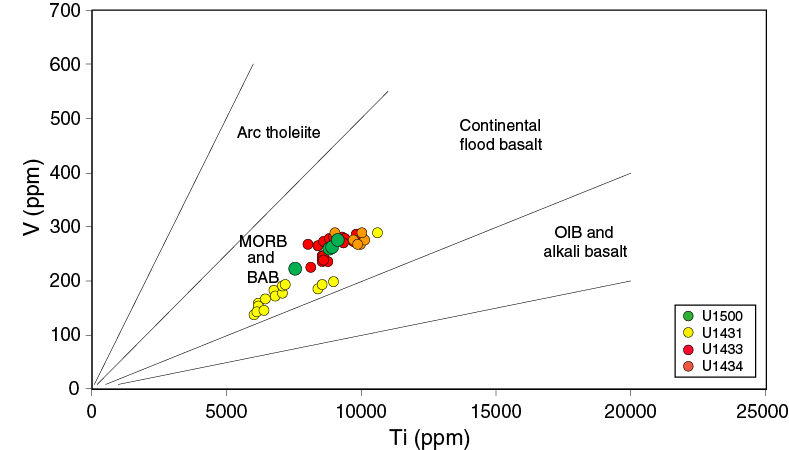
Figure F43. V vs. Ti.
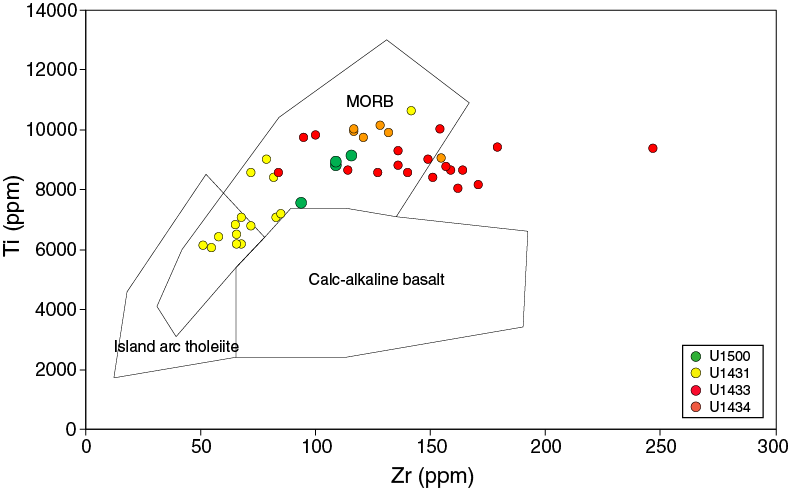
Figure F44. Zr vs. Ti.
Physical properties
We measured physical properties on whole-round cores and on working-half sections for lithostratigraphic characterization and correlation between core description, borehole data, and seismic profiles. These measurements included GRA bulk density, magnetic susceptibility, NGR, P-wave velocity, moisture and density (MAD; porosity), and thermal conductivity. We used the Whole-Round Multisensor Logger (WRMSL) to measure GRA bulk density and magnetic susceptibility. No P-wave velocity was measured using the WRMSL because of the large gap between sample and core liner produced during RCB coring. NGR was measured on whole-round cores with the Natural Gamma Radiation Logger (NGRL). After the cores were split into section halves, P-wave velocity was measured with the Section Half Measurement Gantry (SHMG) using the X-caliper for measurements through the split core, usually at least one measurement per section. No velocity measurements were performed with the Y- and Z-bayonet on the SHMG because the sample material was too hard for the bayonets to penetrate without disrupting and introducing cracks. Discrete samples were taken for MAD measurements, including mass measurement with dual balances and volume measurement with a pycnometer. For this, small pieces were cut from the working-half sections in the hard sediment or in the basalt. Resulting MAD values were used to calculate bulk properties (wet bulk density, dry bulk density, sediment grain density, porosity, and void ratio).
For Cores 367-U1500B-57R through 82R, P-wave measurements were made with the caliper on individual basalt core pieces without the core liner. For Cores 57R through 60R within the basalt, discrete samples were shared between paleomagnetism and physical property analyses. First, samples were measured for paleomagnetism using AF demagnetization but no heating. Afterwards, we soaked the same samples in salt water for 24 h under a vacuum and then performed P-wave and MAD measurements (see Physical properties in the Expedition 367/368 methods chapter [Sun et al., 2018a]). The samples were then returned for further paleomagnetic measurements that included thermal demagnetization.
Throughout all cores, thermal conductivity was measured on section halves with a puck probe. For each core, three measurements were conducted on the same piece, usually in the middle section. The small puck probe measurements showed unstable results and notable differences between the three measurements on samples with high amounts of fractures. Therefore, no measurement was implemented on some of the cores (e.g., Cores 49R through 53R). Hard rock pieces from Cores 57R through 73R were placed in a seawater bath for 4 h before thermal conductivity was measured with a large puck in the bath.
In addition, wireline log data were acquired below the bottom of the casing (846 m) in Hole U1500B (see Downhole measurements).
Data cleaning and depth correction
Data measured using automatic systems such as the WRSML, NGRL, and SHMSL (point magnetic susceptibility) can contain data outliers (e.g., data from voids in the core, unrealistic high values, etc.) that must be removed. This cleaning is required before the integration of these data into the models (e.g., synthetic seismograms).
We defined values exceeding μ ± Nσ (with N = 2), where μ is the mean and σ is the standard deviation of the data set, as outliers and removed them from the data set. Because the values in the basalt layer are very different from those in the sediment, we estimated the mean and standard deviation for the two data sets separately and cleaned the data accordingly (Table T11). The WRMSL measurements on the basalt cores (from Core 367-U1500B-57R to the bottom of the hole) show very scattered values due to voids in the liner between rock pieces. The corresponding standard deviation is very high. We also smoothed the data when it was used for modeling computation by applying a moving-average filter. SHMG data were usually considered to be reliable because the operator checks the result as it is acquired. For the MAD data, we observed very few outliers with values exceeding μ ± 2σ.
Table T11. Mean and SD for physical property measurements. Download table in CSV format.
To insure the homogeneity of the descriptions and the comparisons of our measurements to other core characteristics collected in other laboratories, we used sample depths below seafloor calculated by core depth below seafloor, Method A (CSF-A; see http://www.iodp.org/top-resources/program-documents/policies-and-guidelines/142-iodp-depth-scales-terminology-april-2011/file). It is important to note that depths calculated this way do not account for core expansion, including cores that have >100% recovery.
Density
GRA bulk density was measured automatically every 2 cm by the WRMSL. In addition, bulk density was measured on discrete core samples with the MAD system (~10 cm3 volume each, usually three samples per core according to recovery). Both types of density measurements show similar variations (Figure F45). It should be noted that the reduced diameter of the RCB cores does not completely fill the core liner and causes lower density values during WRMSL measurements. No data could be collected for intervals penetrated without coring (0–378 and 495–641 m) or for intervals of poor core recovery within lithostratigraphic Unit IV that are presumed to be sand/sandstone. A few MAD samples were collected in the basalt of Unit VIII. No MAD samples were collected from Core 367-U1500B-61R to the bottom of the hole because we did not expect much variability in the MAD values in the relatively uniform basalts recovered and because these cores should mostly be preserved for higher priority postcruise research.
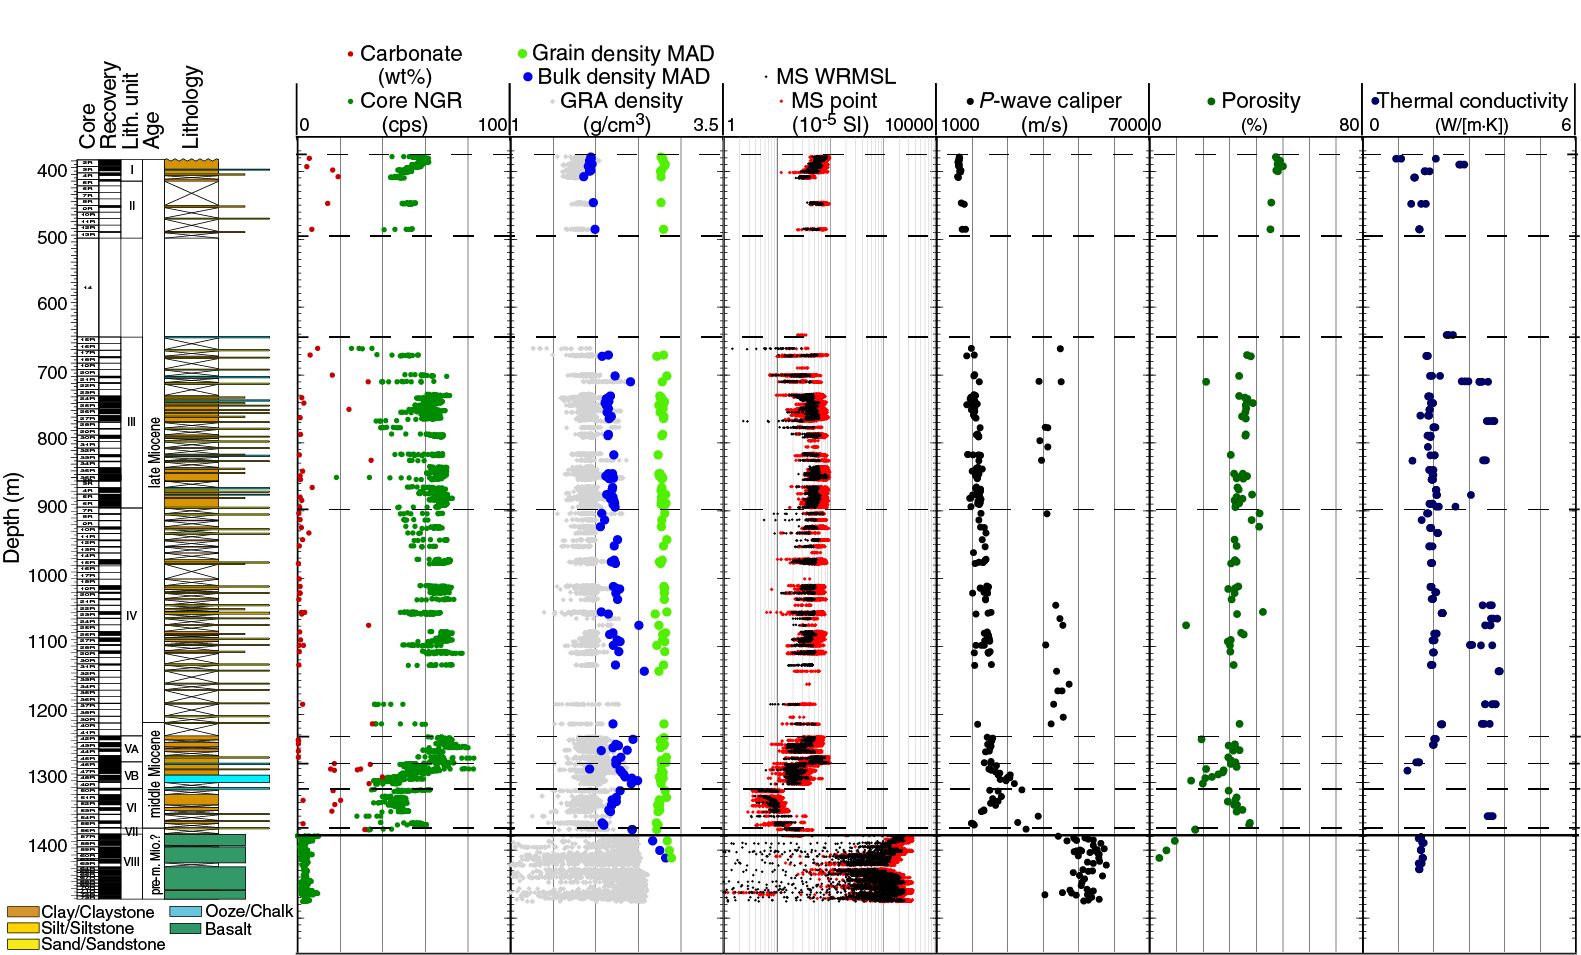
Figure F45. Sediment physical property measurements.
In Unit I (378–410 m), GRA bulk density decreases slightly with depth, ranging between 2.1 and 1.4 g/cm3 (Figure F45). Unit II has such low recovery that no trend can be observed. However, the shallowest part (446–449 m) has slightly higher density values (up to 2.04 g/cm3) than the deeper part (485–487 m), which has values only up to ~1.96 g/cm3. MAD bulk density in Units I and II shows similar trends and generally increases from 1.86 to 1.99 g/cm3. Below the second interval penetrated without coring, GRA bulk density data are highly scattered because of the presence of cracks and gaps in the more lithified core pieces, with values ranging between 1.5 and 2.5 g/cm3. Within Unit III through Subunit VA (641–1272 m), MAD bulk density increases slightly with depth from ~2.0 to 2.3 g/cm3, with some measurements as high as 2.9 g/cm3. In Subunit VB (1272–1311 m), MAD bulk density significantly increases with depth from ~2.3 to 2.5 g/cm3, whereas in lithostratigraphic Units VI and VII (1311–1379 m), it decreases with depth from 2.3 to 2.0 g/cm3. Grain densities of discrete samples from Units I–VII (378–1370 m) stay relatively constant, ranging between 2.7 and 2.85 g/cm3. The basalts in Unit VIII (1370 m to the bottom of the hole) have much higher GRA bulk density values, ranging mainly between 2.3 and 2.6 g/cm3. Three discrete samples were taken in Unit VIII, yielding MAD bulk density values between 2.67 and 2.75 g/cm3. Grain densities of these samples range between 2.84 and 2.86 g/cm3.
Porosity decreases with depth within the upper two lithostratigraphic units (378–495 m), ranging between 45% and 52%. From 641 to 1370 m, porosity shows a less steep decrease with depth from 42% to ~20%. In carbonate-rich Subunit VB (1272–1311 m), there is a significant drop in porosity data from 33% to 20%. Porosity data from the basalts show very low values between 2% and 9%.
Magnetic susceptibility
Magnetic susceptibility was measured on the WRMSL and the SHMSL (point). Magnetic susceptibility is sensitive to magnetic mineral content and mineralogy of the formation (e.g., Clark and Emerson, 1991). Magnetic susceptibility data were collected every 2 cm, and point magnetic susceptibility data were collected every 1 cm. Magnetic susceptibility and point magnetic susceptibility values are in very good agreement throughout the entire cored section (Figure F45).
Magnetic susceptibility values show a strong decrease with depth within Unit I (378–410 m) from 95 × 10−5 to 15 × 10−5 SI (Figure F45). Deeper values show much smaller variability from ~410 to ~1233 m, around 30 × 10−5 to 40 × 10−5 SI on average. The lowermost part of lithostratigraphic Subunit VA (~1260–1272 m) has magnetic susceptibility values of ~60 × 10−5 SI that are higher than in the sediment above and include a local high of up to 150 × 10−5 SI (Core 367-U1500B-45R; ~1270–1272 m). Within Subunit VB (1272–1311 m), magnetic susceptibility exhibits relatively lower values, ~20 × 10−5 SI on average. Still significantly lower magnetic susceptibility values were measured in Unit VI (1311–1370 m); they increased with depth between ~5 × 10⁻⁵ and 15 × 10−5 SI. In the basalt of Unit VIII, magnetic susceptibility values are two orders of magnitude higher than in the sediment units and increase to about 2390 × 10−5 to 2980 × 10−5 SI. The data are very scattered but appear to correlate with alteration reactions in new fractures and veins (Figure F46; see Paleomagnetism).
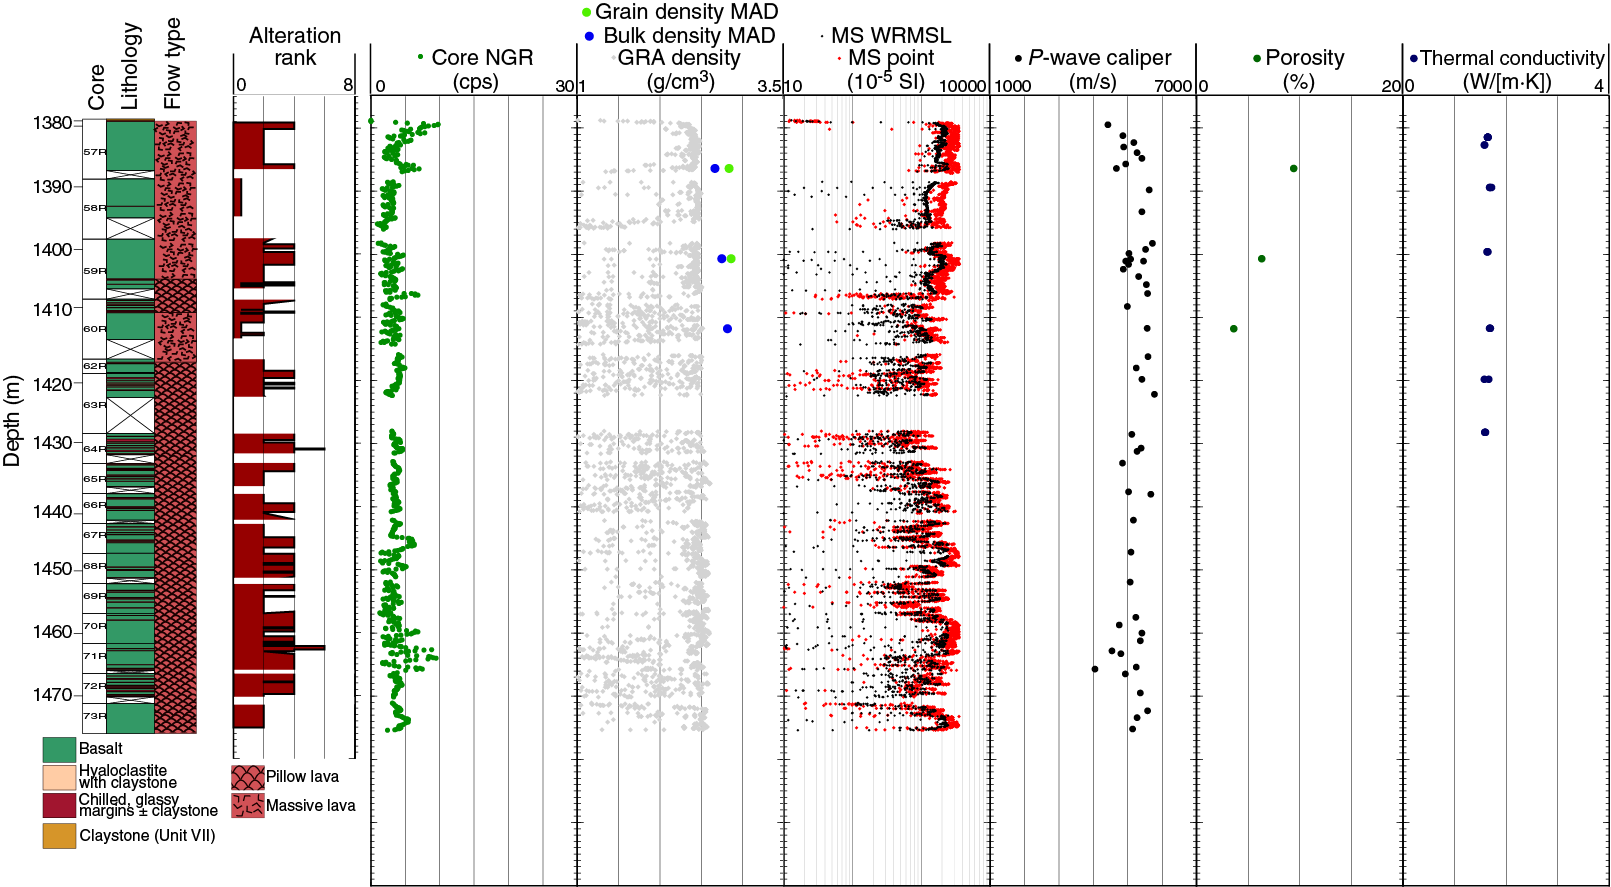
Figure F46. Basalt physical properties measurements.
P-wave velocity
P-wave velocity was not measured with the WRMSL on Site U1500 cores due to the gap between liner and sample but was measured directly on the split cores with the X-caliper. The values show a gradual increase with depth from 1630 m/s near 360 m to 2570 m/s at 1270 m (Figure F45). Some isolated measurements in lithostratigraphic Units III and IV show significantly higher values ranging between ~3880–4720 m/s, corresponding either to sandstone layers interbedded with claystone in Unit III or to single pieces in the low-recovery cores of Unit IV. In carbonate-rich Subunit VB (1270–1310 m), P-wave velocity increases with depth from 2380 to 3400 m/s, which is higher than the over and underlying sediment units. There is a steep increase in P-wave velocity values (4430–5710 m/s) in the basalt of Unit VIII.
Natural gamma radiation
In lithostratigraphic Unit I (378–410 m), NGR values decrease with depth from ~60 to ~40 counts/s, coinciding with a decrease in magnetic susceptibility within this unit (Figure F45). NGR values show very low variability, remaining around 60–70 counts/s between 410 and 1272 m. In Unit II, NGR values range between 45–60 counts/s with no clear trend due to the low recovery. NGR slightly increases with depth in Units III and IV (641–1233 m), ranging from ~20 to 80 counts/s. NGR significantly decreases from ~80 counts/s near 1270 m to 25 counts/s at 1310 m, coinciding with an increase in carbonate contents at the boundary between Subunits VA and VB. Basalts in Unit VIII have very low NGR values, almost entirely <10 counts/s, as expected for basalt.
We estimated concentrations of K, U, and Th using NGR and bulk density measurements (Figure F47), based on a study from De Vleeschouwer et al. (2017). The general trend of each element concentration is similar to the total NGR count values.
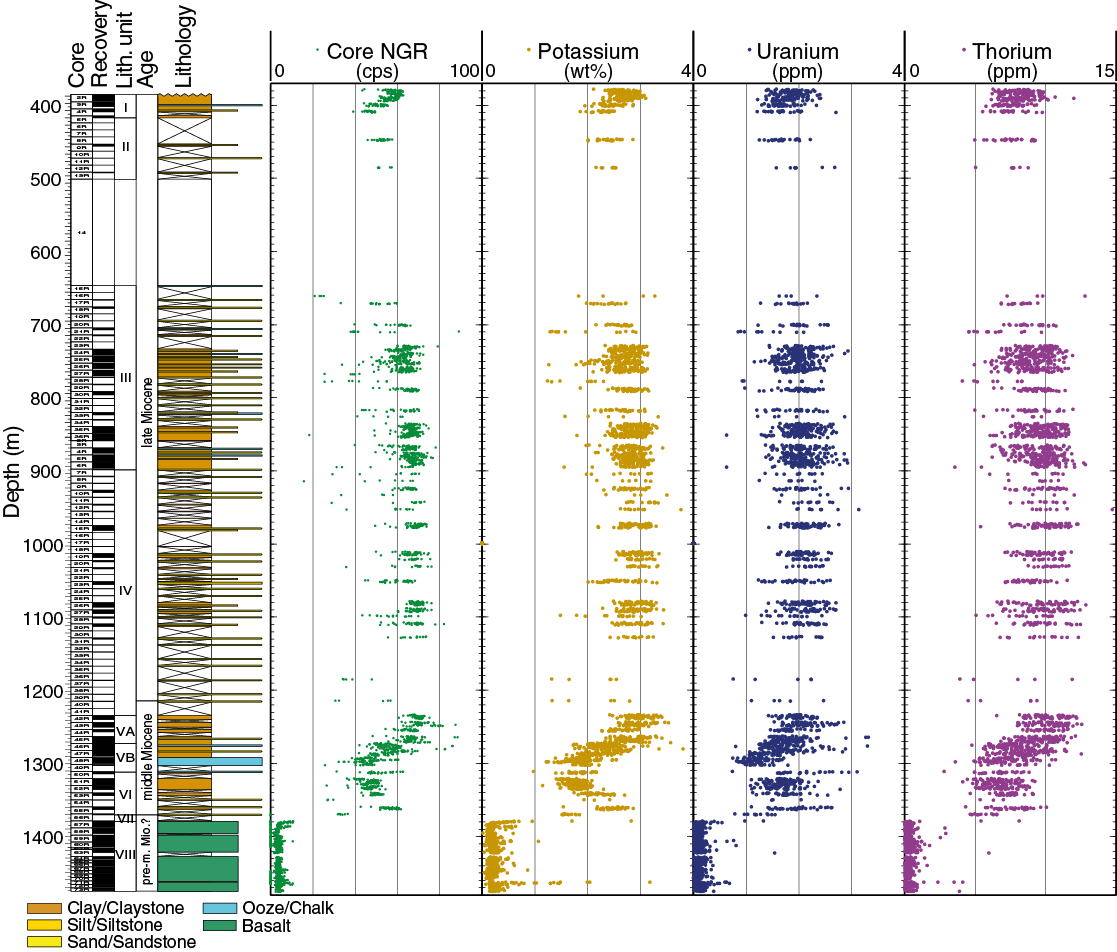
Figure F47. Core NGR measurements.
Thermal conductivity
Thermal conductivity increases slightly with depth from 1.1 W/(m·K) at 381 m to 2.2 W/(m·K) at 1214 m (Figure F45). Some measurements in lithified pieces from lithostratigraphic Units III and IV have significantly higher values between ~2.8 and 3.8 W/(m·K). These very high values could be spurious and related to measurement problems with the contact probe. Thermal conductivity decreases significantly to 1.5 W/(m·K) in the chalks of Subunit VB. Values measured in the basalt of Unit VIII are relatively uniform around 1.6 W/(m·K) (Figure F46).
Data interpretation and lithology correlation
Correlation with lithology
The claystones, siltstones, and sandstones of lithostratigraphic Units II–IV (410–1233 m) do not display large contrasts (Figure F45). However, some deeper layers exhibit variations that can be correlated to the lithology. For example, clear changes in NGR (low), density (high), velocity (as high as 3400 m/s), porosity (low), and thermal conductivity (low) are associated with the high carbonate contents (up to 40 wt%) in Subunit VB (1272–1311 m). However, no significant increase in magnetic susceptibility data could be observed, similar to the carbonate-rich layer at Site U1499 (Subunit VIIIB). The content in magnetic minerals and their mineralogy are reflected in magnetic susceptibility measurements in claystone, siltstone, or sandstone, which likely explains the variations in depth of magnetic susceptibility and NGR in Unit I and the relatively high magnetic susceptibility values in the lower part of the brownish claystone in Subunit VA. Meanwhile, NGR values vary not only with lithology but also within the same sediment type. Unit VIII, which consists mainly of basalt, causes a significant change in the physical property measurements.
Unit VIII basalt
Cores 367-U1500B-57R through 73R recovered basalt. Magnetic susceptibility values are very high in Unit VIII but vary depending on the alteration grade within the basalt (Figure F46). Zones where alteration is significant generally have lower magnetic susceptibility. However, some variations do not appear to be directly related to alteration and might correspond to changes in the nature of the magnetized minerals or the grain size (see Paleomagnetism). Compared to the sedimentary rocks above, the P-wave velocities of the basalts are quite high (~4430–5710 m/s.). NGR and porosity are quite low, whereas density is much higher.
Downhole measurements
Wireline downhole logging
Downhole logging measurements at Site U1500 were performed as the last operations of Expedition 367 and ended just before the 1 day transit to Hong Kong. The collected raw data were sent to Lamont-Doherty Earth Observatory for postprocessing and were not available before the end of the expedition. Therefore, the following chapter focuses mainly on logging operations and tool setups, as well as preliminary results based on real-time observations (e.g., caliper measurements for description of borehole conditions) that were not depth corrected. The processed data were made available online to the Expedition 367 scientists immediately following the expedition and were also sent back to the ship during the port call for the Expedition 368 scientists to use.
Logging operations and tools
Downhole logging operations started at 1400 h on 6 April 2017 after finishing RCB coring to 1529 m. Three logging string tools were run in Hole U1500B (Figure F48). The first tool string was a modified triple combo tool string that included the following tools:
- DSI for acoustic velocity,
- HRLA/DIT for electrical resistivity,
- HLDS for caliper data (no source was included to acquire density data due to unstable borehole conditions experienced when raising the drill string out of hole), and
- HNGS/EDTC-B for NGR.
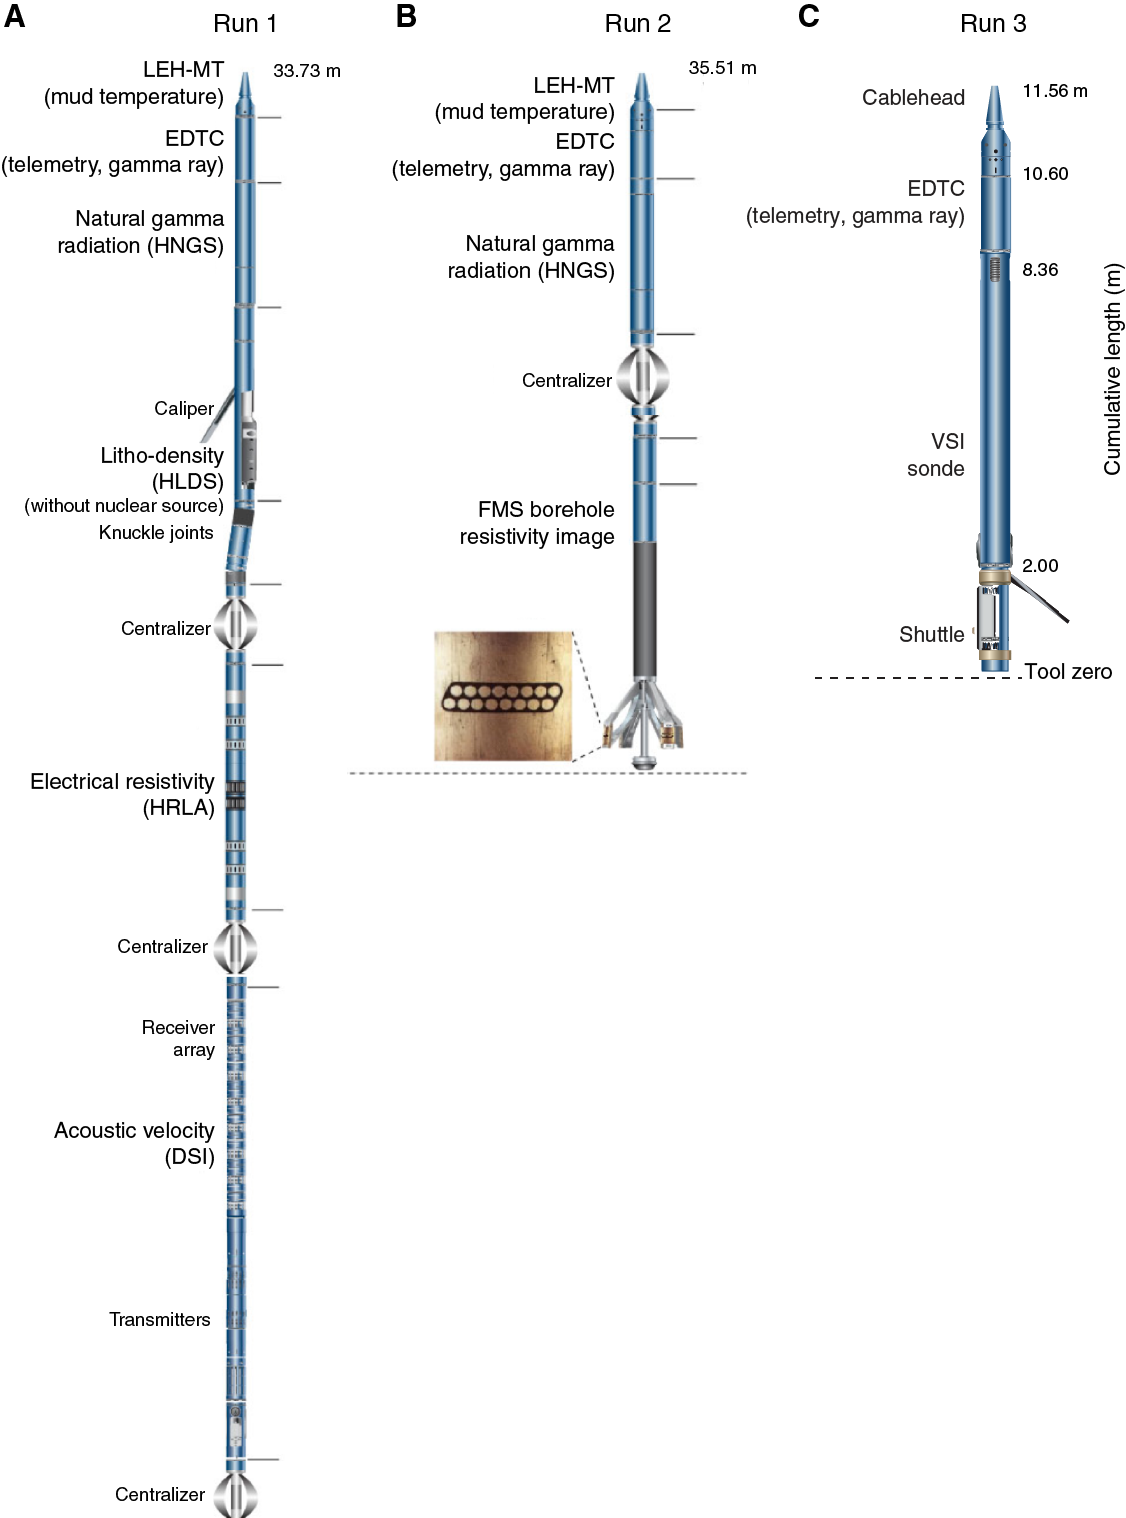
Figure F48. Downhole logging tool strings.
At 1630 h, the modified triple combo tool string reached the end of casing at 4655 m WRF at a speed of ~600 m/h (Figure F49). The end of casing is easily detected by a substantial change in resistivity and sonic velocity. The tool string was lowered out of the end of the casing at 842 m drilling depth below seafloor (DSF) and into the open hole (previously RCB cored to a total depth of 1529 m DSF). The tool string encountered an obstruction at 4946 m WRF (~1133 m). We were unsuccessful in getting the tool string to pass below this depth. We opened the caliper and collected data from 4946 m WRF (~1133 m) up to 4800 m WRF (~987 m). We then closed the caliper arm and lowered it back down, but it could not get back to the previous depth and this time reached 4925 m WRF (~1112 m), ~21 m shallower than the first run. We then opened the caliper arm and collected log data at a speed of ~600 m/h over the entire open hole from 4925 m WRF (~1112 m) up to the base of the casing (4655 m WRF; 842 m).

Figure F49. Logging operations summary.
The second tool string run started at ~0300 h 7 April. This tool string included the FMS to collect borehole resistivity images and the HNGS and EDTC-B for NGR and correlating with the previous logging runs.
HNGS data were collected while lowering the tools into the borehole (Figures F48, F49). The tool string could only reach a total depth of 4857 m WRF (~1044 m), and we opened the FMS arms and collected FMS and HNGS data from that depth up to the bottom of the casing at 4655 m WRF (842 m).
We started assembling our third logging string at 0700 on 7 April. The third tool string consisted of the EDTC-B and VSI. Routine IODP protected-species procedures were implemented leading up to and throughout use of the seismic source. The seismic source was deployed 38 m from the moon pool and 7 m below the sea surface using the aft port crane (Figure F50). No protected species were observed, and a soft ramp-up of the gun was performed to a maximum pressure of 2000 psi. The VSI tool string reached a total depth of 4843 m WRF (~1031 m). We set the VSI tool at that depth, activated the seismic source four times, and acquired two good data records for stacking. No other good location in the open hole was found in the restricted time left for the experiment. We set the VSI tool again at 4595 m WRF (~783 m; in the casing) and got two good data records. After the VSI station, the tool was brought back to the surface and rigged down. The rig floor was then cleared of logging equipment at 1430 h on 7 April for a total of ~24 h for logging operations.
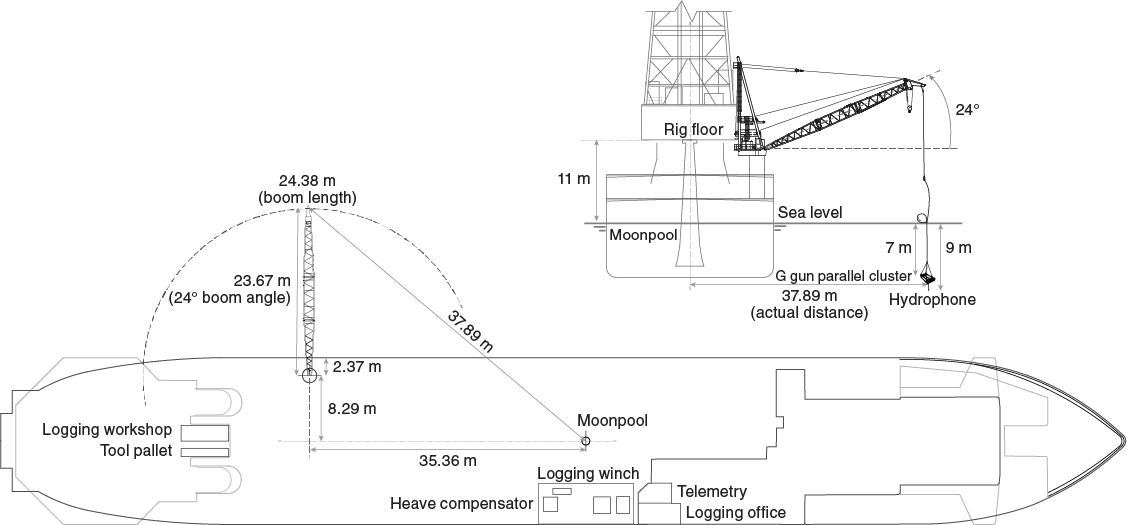
Figure F50. VSI seismic source deployment scheme.
Borehole conditions and expected data quality
Before starting the downhole measurements, conditions in the deeper part of the hole deteriorated significantly while pulling out of the hole to release the drill bit on the seafloor. For the details of hole preparation, see Operations. While pulling the bit out of the hole, the drill string became stuck at ~1240 m. Unfortunately, during these operations the weighted (11.0 lb/gal) mud that had been pumped into the hole to help stabilize it for downhole measurements was displaced out of the hole. There were no other problems pulling the bit out of the hole; however, we suspected that the borehole conditions were not ideal for logging. We released the bit on the seafloor, reentered Hole U1500B, set the end of the pipe at 30 m (inside the casing), and prepared the rig floor for logging.
During the first logging run, low tension was noticed at 4907 m WRF (1094 m), which most probably was caused by a ledge or bridge. Subsequently, caliper data in this region show that the hole is enlarged from 4892 to 4901 m WRF (1079–1088 m) and at 4902 m WRF (1089 m), the hole diameter narrows to ~6 inches, less than the bit size. We were able to get the tool string through this barrier after hitting it a second time. However, the tool string could not pass below 4946 m WRF (1133 m), and log data could only be collected to that depth. It appears that this depth correlates to the top of a low-recovery zone that only returned sandstones with a high P-wave velocity (~4.5 km/s). The total depth of the hole kept decreasing for each subsequent logging run.
The quality of the collected FMS images could be estimated only on the screen during their acquisition. The images are of variable quality due to large variations in borehole diameter, but there are at least three intervals that are several tens of meters thick where the FMS pads had good contact with the borehole walls and we obtained good quality images. The collected log data are in DOWNHOLE in Supplementary material.
Correlation to seismic data
We used physical property measurements on cores and samples and other available data to correlate Site U1500 data with the available seismic reflection profiles. We also used the Site U1500 density and velocity data to create synthetic seismograms that provided additional constraints on the correlation. All correlations of the seismic reflection data with the Site U1500 core data, as well as the synthetic seismogram tests, were performed onboard using the Petrel software.
Velocity and density data
Velocity data in Holes U1500A and U1500B were acquired in the laboratory from split-core sections (PWC), and density data were acquired both in whole-round core sections (GRA density) and split-core sections (MAD; see Physical properties). For seismic correlation, we used PWC velocity and MAD density values.
Time-depth relations from the velocity data
TDRs are generally assumed to be quadratic polynomial functions from the interpolation of depth-velocity data. From the depth-velocity data, we computed the incremental TWT (Tin) as
Tin = [(dn − dn − 1)/Vn] × 2 × 1000,
where dn is the depth of the nth layer and Vn is the relative velocity. The incremental Ti is multiplied by 2000 for conversion into TWT expressed in milliseconds.
From Tin we derived the cumulative TWT (Tcn) expressed as
and finally, the TWT adjusted from the seafloor (Ta) was calculated as
where Ta is the TWT of the seafloor expressed in milliseconds.
If the TDR is referred to the seafloor, the intercept of the interpolated quadratic polynomial functions is set to 0.
Figure F51 shows the Site U1500 velocity and density values collected with the PWC and MAD measurements and the TDR computed relative to the seafloor.
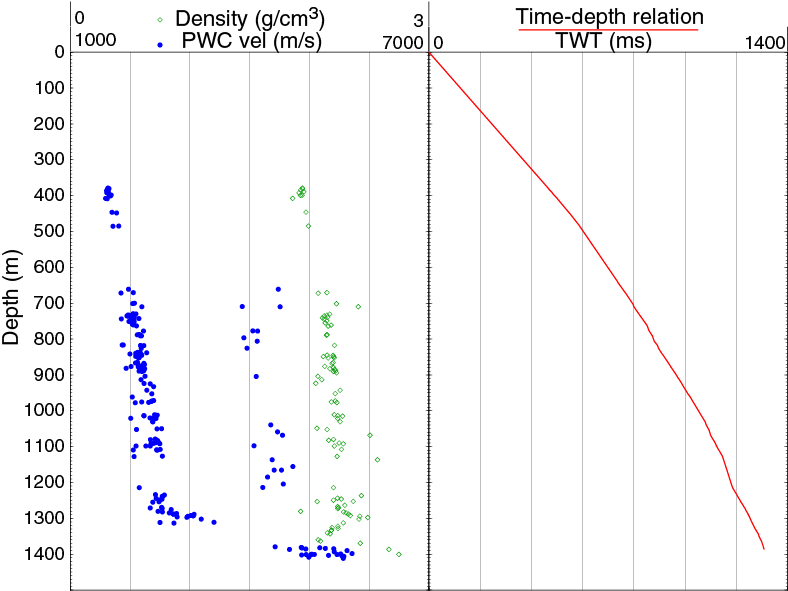
Figure F51. Density, velocity, and TDR adjusted to seafloor.
The resulting quadratic polynomial function is
where d is the depth in meters and t is the TWT in milliseconds.
Comparison of time-depth relations
We compared our Site U1500 TDR with the Site U1499 TDR and other relations collected in previous expeditions in the SCS (Shipboard Scientific Party, 2000; Li et al., 2008, 2015a). Figure F52 shows the comparison of Site U1500 TDR to those for IODP Sites U1499, U1431, and U1433 and Site 1148. Our Site U1500 and U1499 TDRs are in substantial agreement with each other. The analyzed TDRs collected during previous SCS expeditions are in general agreement for the upper sediments (0–400 m). However, the TDR from Site 1148 shows higher velocities in the deeper layers.
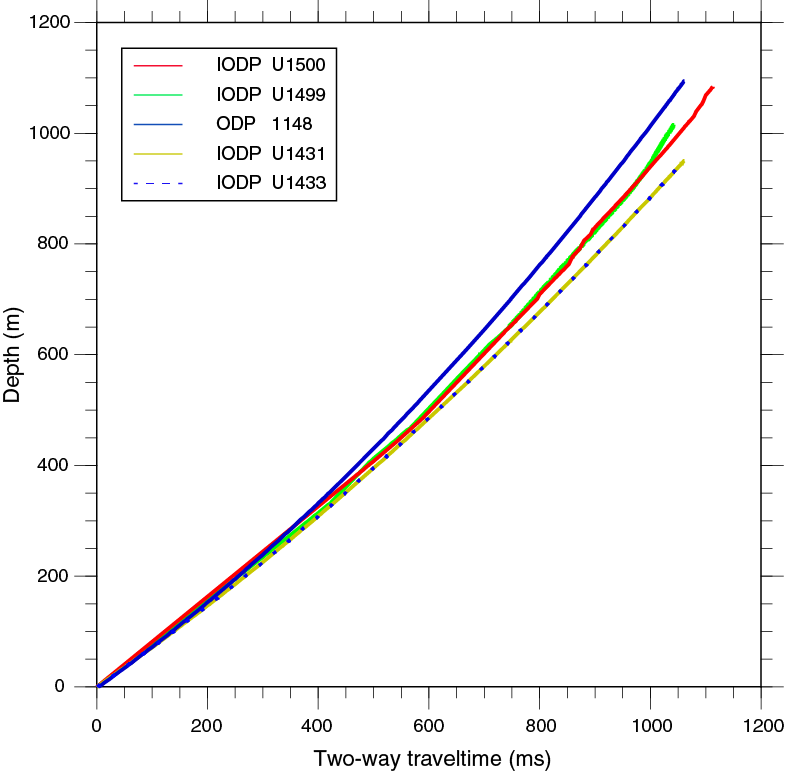
Figure F52. Site U1500 TDR compared to other sites.
Data correlations with Petrel
Using the TDR based on Site U1500 data, we correlated the site survey seismic reflection data with the data collected from the whole-round cores (GRA density, magnetic susceptibility, and NGR) and split cores (MAD and PWC). We also plotted other data collected on board, such as core recovery, lithostratigraphic unit description, and carbonate contents. All of these properties were plotted over the seismic section with Petrel (Figure F53).
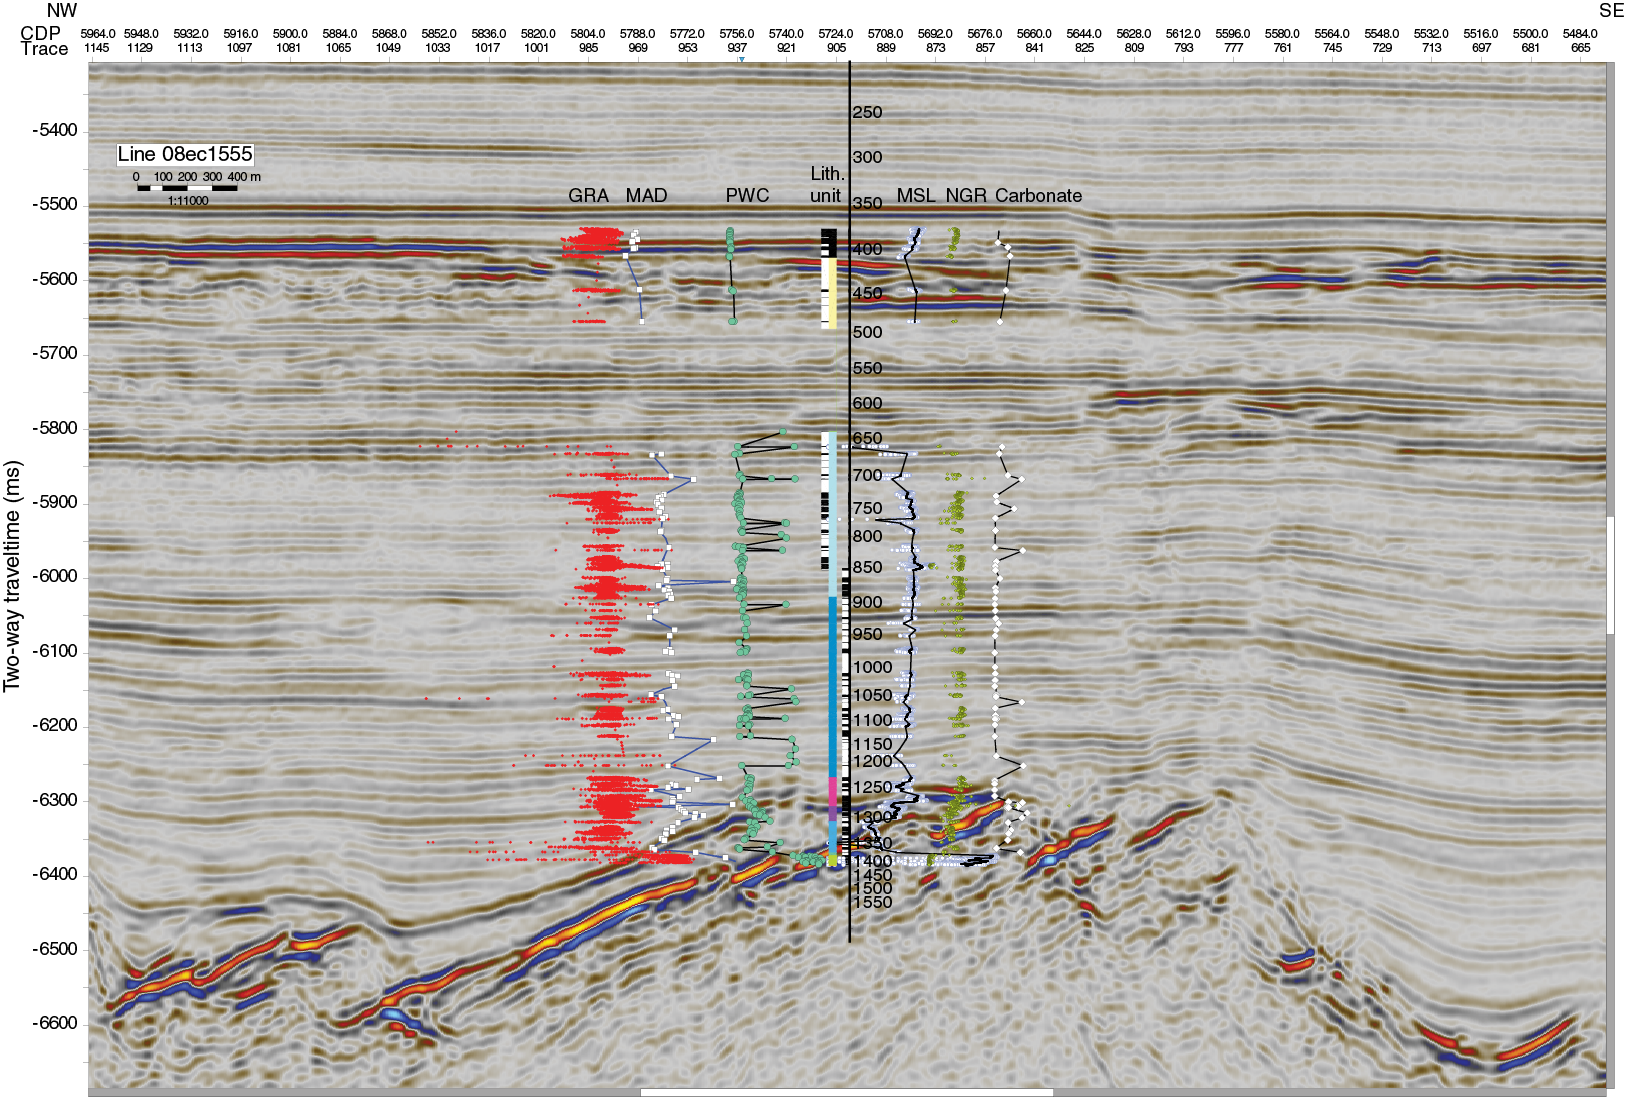
Figure F53. Seismic section.
The following import flow process was used:
- The coordinate system of the project was set (for Expedition 367: WGS1984_UTM50N),
- A new seismic folder and a new survey were created,
- SEGY data were imported with presettings (after the check of the Trace Header Information with the SeisSee software),
- The “Well” was created,
- The TDR file was imported (the file must have the depth-TWT adjusted with respect to the seafloor), and
- Well logs (ASCII files) for all the properties of interest were imported (the file must be tab delimited and can be directly imported from the Laboratory Information Management System database; we chose to import CSF-B depths and the values of interest).
We cleaned the data to remove the outliers before importing the values in Petrel (see Physical properties). An additional moving-average smoothing filter was also applied for GRA density. For the velocity data, more cleaning was applied. We manually checked the differences that might be created by manual or automatic picking of the first break for the caliper data and discarded the manually picked values that appeared doubtful because of a large difference from the surrounding values.
The physical properties are displayed over the seismic data to allow a direct comparison between the reflectors and the properties trends. Figure F53 shows the data using the computed Site U1500 TDR (Figure F51). The figure shows good correlation between the main reflectors and the measured physical properties. In particular, there is an abrupt decrease in magnetic susceptibility and NGR values and a corresponding increase in carbonate contents, density, and P-wave velocity at ~1280 m, in agreement with the high-amplitude reflector at ~6.3 s TWT. This reflector seems to be related to the carbonate-rich interval within lithostratigraphic Unit V; a similar correlation was observed between the core and seismic data at Site U1499. At ~1380 m, abrupt changes can be observed in all the physical properties, especially the steep increase in magnetic susceptibility, density, and P-wave velocity values (the boundary between the sediments of Unit VII and the basalt of Unit VIII; see Physical properties). This depth is well correlated with the main seismic reflector at ~6.4 s TWT.
Synthetic seismograms with Petrel
We used the seismic interpretation module in Petrel to compute synthetic seismograms to further constrain the TDR relation. The parameters that need to be defined to compute synthetic seismograms are the seismic source signature, density values, and velocity values. Petrel allows the choice of single frequency–centered sources. We chose Ricker wavelets centered at the mean values of the frequency content in our seismograms. For Site U1500, we used the density data derived from the MAD measurements and the PWC velocity. The resulting synthetic seismogram for the main deep reflectors (900–1400 m) is shown in Figure F54.
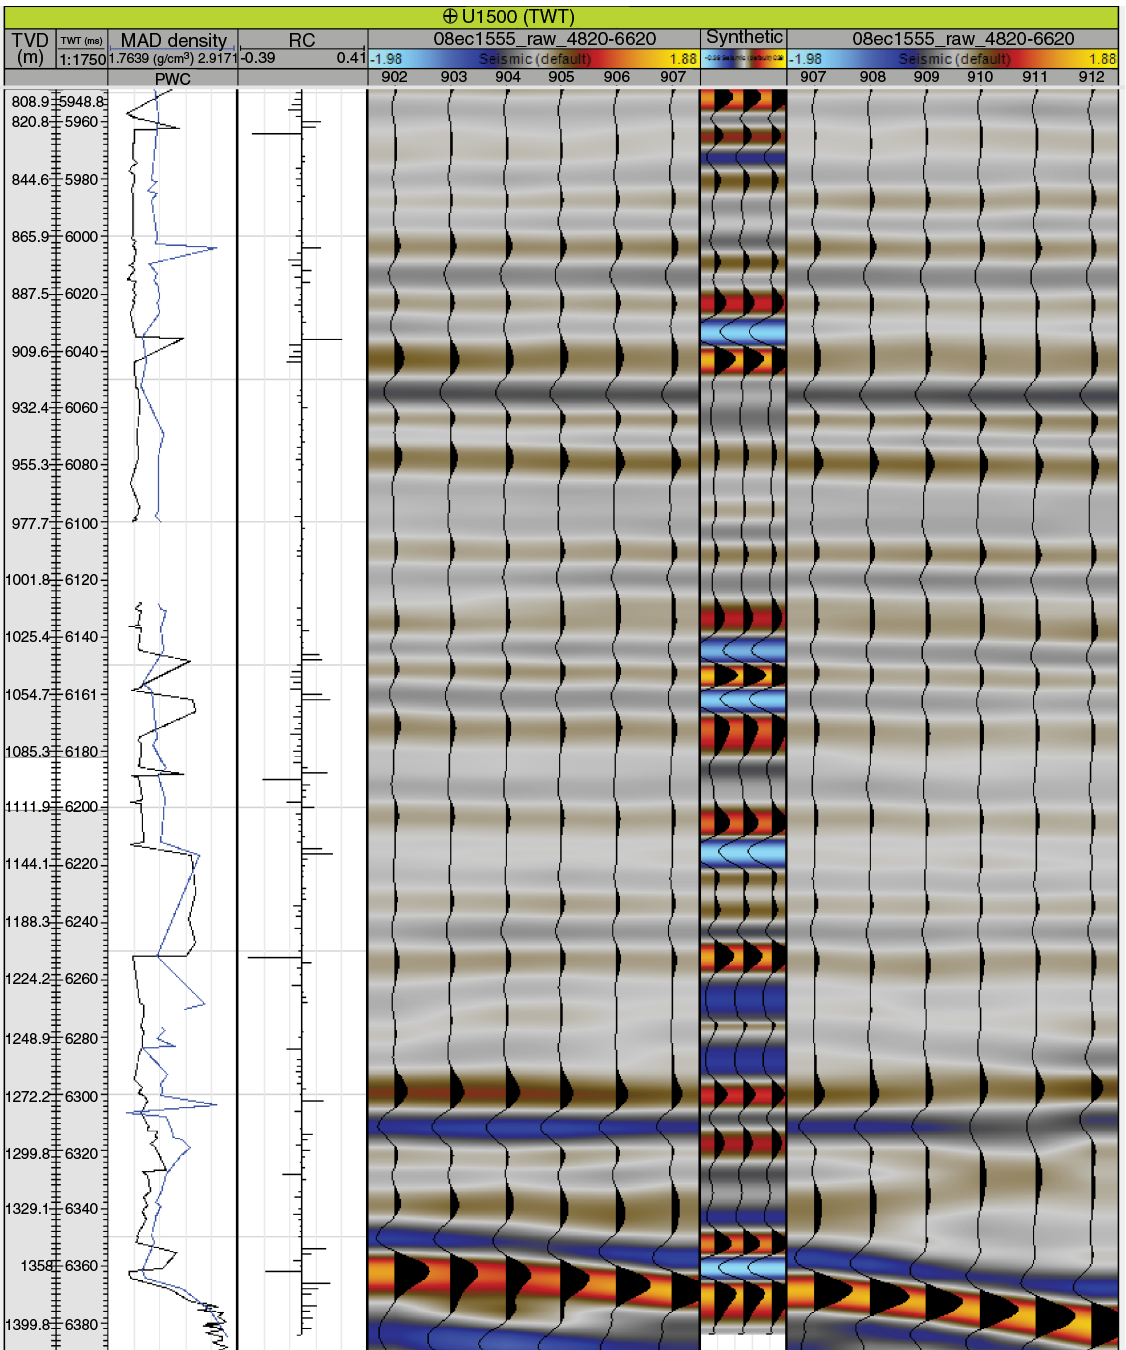
Figure F54. Synthetic seismogram.
References
Bjørlykke, K., 1983. Diagenetic reactions in sandstones. In Parker, A., and Sellwood, B.W. (Eds.), Sediment Diagenesis: Dordrecht, Netherlands (Springer), 169–213. https://doi.org/10.1007/978-94-009-7259-9_3
Briais, A., Patriat, P., and Tapponnier, P., 1993. Updated interpretation of magnetic anomalies and seafloor spreading stages in the South China Sea: implications for the Tertiary tectonics of Southeast Asia. Journal of Geophysical Research: Solid Earth, 98(B4):6299–6328. https://doi.org/10.1029/92JB02280
Channell, J.E.T., and Xuan, C., 2009. Self-reversal and apparent magnetic excursions in Arctic sediments. Earth and Planetary Science Letters, 284(1–2):124–131. https://doi.org/10.1016/j.epsl.2009.04.020
Clark, D.A., and Emerson, D.W., 1991. Notes on rock magnetization characteristics in applied geophysical studies. Exploration Geophysics, 22(3):547–555. https://doi.org/10.1071/EG991547
De Boer, R.B., 1977. On the thermodynamics of pressure solution—interaction between chemical and mechanical forces. Geochimica et Cosmochimica Acta, 41(2):249–256. https://doi.org/10.1016/0016-7037(77)90232-0
De Boer, R.B., Nagtegaal, P.J.C., and Duyvis, E.M., 1977. Pressure solution experiments on quartz sand. Geochimica et Cosmochimica Acta, 41(2):257–264. https://doi.org/10.1016/0016-7037(77)90233-2
De Vleeschouwer, D., Dunlea, A.G., Auer, G., Anderson, C.H., Brumsack, H., de Loach, A., Gurnis, M., et al., 2017. Quantifying K, U, and Th contents of marine sediments using shipboard natural gamma radiation spectra measured on DV JOIDES Resolution. Geochemistry, Geophysics, Geosystems, 18(3):1053–1064. https://doi.org/10.1002/2016GC006715
Dorador, J., Wetzel, A., and Rodríguez-Tovar, F.J., 2016. Zoophycos in deep-sea sediments indicates high and seasonal primary productivity: Ichnology as a proxy in palaeoceanography during glacial–interglacial variations. Terra Nova, 28(5):323–328. https://doi.org/10.1111/ter.12224
Doubrovine, P.V., and Tarduno, J.A., 2004. Self-reversed magnetization carried by titanomaghemite in oceanic basalts. Earth and Planetary Science Letters, 222(3–4):959–969. https://doi.org/10.1016/j.epsl.2004.04.009
Ekdale, A.A., Bromley, R.G., and Pemberton, S.G. (Eds.), 1984. Ichnology: The Use of Trace Fossils in Sedimentology and Stratigraphy. SEPM Short Course, 15.
Guisseau, D., Mas, P.P., Beaufort, D., Girard, J.-P., Inoue, A., Sanjuan, B., Petit, S., Lens, A., and Genter, A., 2007. Significance of the depth-related transition montmorillonite-beidellite in the geothermal field of Bouillante (Guadeloupe, Lesser Antilles). American Mineralogist, 92(11):1800–1813. https://doi.org/10.2138/am.2007.2398
Hendry, J.P., Wilkinson, M., Fallick, A.E., and Haszeldine, R.S., 2000. Ankerite cementation in deeply buried Jurassic sandstone reservoirs of the central North Sea. Journal of Sedimentary Research, 70(1):227–239. https://doi.org/10.1306/2DC4090D-0E47-11D7-8643000102C1865D
Huismans, R., and Beaumont, C., 2011. Depth-dependent extension, two-stage breakup and cratonic underplating at rifted margins. Nature, 473(7345):74–78. https://doi.org/10.1038/nature09988
Kirschvink, J.L., 1980. The least-squares line and plane and the analysis of palaeomagnetic data. Geophysical Journal of the Royal Astronomical Society, 62(3):699–718. https://doi.org/10.1111/j.1365-246X.1980.tb02601.x
Knaust, D., and Bromley, R.G. (Eds.), 2012. Developments in Sedimentology (Volume 64): Trace Fossils as Indicators of Sedimentary Environments. van Loon, A.J. (Series Ed.): Amsterdam (Elsevier).
Larsen, G., and Chilingar, G.V. (Eds.), 1979. Developments in Sedimentology (Volume 25A): Diagenesis in Sediments and Sedimentary Rocks: New York (Elsevier).
Larsen, H.C., Sun, Z., Stock, J.M., Jian, Z., Alvarez Zarikian, C.A., Klaus, A., Boaga, J., Bowden, S.A., Briais, A., Chen, Y., Cukur, D., Dadd, K.A., Ding, W., Dorais, M.J., Ferré, E.C., Ferreira, F., Furusawa, A., Gewecke, A.J., Hinojosa, J.L., Höfig, T.W., Hsiung, K.-H., Huang, B., Huang, E., Huang, X.-L., Jiang, S., Jin, H., Johnson, B.G., Kurzawski, R.M., Lei, C., Li, B., Li, L., Li, Y., Lin, J., Liu, C., Liu, C., Liu, Z., Luna, A., Lupi, C., McCarthy, A.J., Mohn, G., Ningthoujam, L.S., Nirrengarten, M., Osono, N., Peate, D.W., Persaud, P., Qui, N., Robinson, C.M., Satolli, S., Sauermilch, I., Schindlbeck, J.C., Skinner, S.M., Straub, S.M., Su, X., Tian, L., van der Zwan, F.M., Wan, S., Wu, H., Xiang, R., Yadav, R., Yi, L., Zhang, C., Zhang, J., Zhang, Y., Zhao, N., Zhong, G., and Zhong, L., 2018. Expedition 367/368 summary. In Sun, Z., Jian, Z., Stock, J.M., Larsen, H.C., Klaus, A., Alvarez Zarikian, C.A., and the Expedition 367/368 Scientists, South China Sea Rifted Margin. Proceedings of the International Ocean Discovery Program, 367/368: College Station, TX (International Ocean Discovery Program). https://doi.org/10.14379/iodp.proc.367368.101.2018
Le Maitre, R.W., Bateman, P., Dudek, A., Keller, J., Lameyre, J., Le Bas, M.J., Sabine, P.A., Schmid, R., Sorensen, H., Streckeisen, A., Woolley, A.R., and Zanettin, B., 1989. A Classification of Igneous Rocks and Glossary of Terms: Oxford, United Kingdom (Blackwell Science Publishing).
Li, C.-F., Li, J., Ding, W., Franke, D., Yao, Y., Shi, H., Pang, X., et al., 2015a. Seismic stratigraphy of the central South China Sea Basin and implications for neotectonics. Journal of Geophysical Research: Solid Earth, 120(3):1377–1399. https://doi.org/10.1002/2014JB011686
Li, C.-F., Lin, J., Kulhanek, D.K., Williams, T., Bao, R., Briais, A., Brown, E.A., Chen, Y., Clift, P.D., Colwell, F.S., Dadd, K.A., Ding, W., Hernández-Almeida, I., Huang, X.-L., Hyun, S., Jiang, T., Koppers, A.A.P., Li, Q., Liu, C., Liu, Q., Liu, Z., Nagai, R.H., Peleo-Alampay, A., Su, X., Sun, Z., Tejada, M.L.G., Trinh, H.S., Yeh, Y.-C., Zhang, C., Zhang, F., Zhang, G.-L., and Zhao, X., 2015b. Expedition 349 summary. In Li, C.-F., Lin, J., Kulhanek, D.K., and the Expedition 349 Scientists, South China Sea Tectonics. Proceedings of the International Ocean Discovery Program, 349: College Station, TX (International Ocean Discovery Program). https://doi.org/10.14379/iodp.proc.349.101.2015
Li, C.-F., Zhou, Z., Li, J., Chen, B., and Geng, J., 2008. Magnetic zoning and seismic structure of the South China Sea ocean basin. Marine Geophysical Researches, 29(4):223–238. https://doi.org/10.1007/s11001-008-9059-4
Lowe, D.R., 1982. Sediment gravity flows, II. Depositional models with special reference to the deposits of high-density turbidity currents. Journal of Sedimentary Petrology, 52(1):279–297. https://doi.org/10.1306/212F7F31-2B24-11D7-8648000102C1865D
Löwemark, L., 2015. Testing ethological hypotheses of the trace fossil Zoophycos based on Quaternary material from the Greenland and Norwegian Seas. Palaeogeography, Palaeoclimatology, Palaeoecology, 425:1–13. https://doi.org/10.1016/j.palaeo.2015.02.025
Lurcock, P.C., and Wilson, G.S., 2012. PuffinPlot: a versatile, user-friendly program for paleomagnetic analysis. Geochemistry, Geophysics, Geosystems, 13(6):Q06Z45. https://doi.org/10.1029/2012GC004098
Makris, J., Papoulia, J., McPherson, S., and Warner, L., 2012. Mapping of sediments and crust offshore Kenya, East Africa: a wide aperture refraction/reflection Survey. In SEG Technical Program Expanded Abstracts 2012: Tulsa, OK (Society of Exploration Geophysicists). https://doi.org/10.1190/segam2012-0426.1
Müller, A., and Mathesius, U., 1999. The palaeoenvironments of coastal lagoons in the southern Baltic Sea, I. The application of sedimentary Corg/N ratios as source indicators of organic matter. Palaeogeography, Palaeoclimatology, Palaeoecology, 145(1–3):1–16. https://doi.org/10.1016/S0031-0182(98)00094-7
Pearce, J.A., and Cann, J.R., 1973. Tectonic setting of basic volcanic rocks determined using trace element analyses. Earth and Planetary Science Letters, 19(2):290–300. https://doi.org/10.1016/0012-821X(73)90129-5
Pickering, K.T., Hiscott, R.N., and Hein, F.J., 1989. Facies, processes, sequences and controls. In Pickering, K.T., Hiscott, R.N., and Hein, F.J., (Eds.), Deep-Marine Environments: Clastic Sedimentation and Tectonics: London (Unwin Hyman), 13–40.
Rhodes, J.M., 1996. Geochemical stratigraphy of lava flows sampled by the Hawaii Scientific Drilling Project. Journal of Geophysical Research: Solid Earth, 101(B5):11729–11746. https://doi.org/10.1029/95JB03704
Sato, T., Murakami, T., and Watanabe, T., 1996. Change in layer charge of smectites and smectite layers in illite/smectite during diagenetic alteration. Clays and Clay Minerals, 44(4):460–469. https://doi.org/10.1346/CCMN.1996.0440403
Shervais, J.W., 1982. Ti-V plots and the petrogenesis of modern and ophiolitic lavas. Earth and Planetary Science Letters, 59(1):101–118. https://doi.org/10.1016/0012-821X(82)90120-0
Shipboard Scientific Party, 2000. Leg 184 summary: exploring the Asian monsoon through drilling in the South China Sea. In Wang, P., Prell, W.L., Blum, P., et al., Proceedings of the Ocean Drilling Program, Initial Reports, 184: College Station, TX (Ocean Drilling Program), 1–77. https://doi.org/10.2973/odp.proc.ir.184.101.2000
Sibuet, J.-C., and Tucholke, B.E., 2012. The geodynamic province of transitional lithosphere adjacent to magma-poor continental margins. Geological Society Special Publication, 369:429–452. https://doi.org/10.1144/SP369.15
Stow, D.A.V., and Shanmugam, G., 1980. Sequences of structures in fine-grained turbidites: comparison of recent deep-sea and ancient flysch sediments. Sedimentary Geology, 25(1–2):23–42. https://doi.org/10.1016/0037-0738(80)90052-4
Sun, Z., Jian, Z., Stock, J.M., Larsen, H.C., Klaus, A., Alvarez Zarikian, C.A., Boaga, J., Bowden, S.A., Briais, A., Chen, Y., Cukur, D., Dadd, K.A., Ding, W., Dorais, M.J., Ferré, E.C., Ferreira, F., Furusawa, A., Gewecke, A.J., Hinojosa, J.L., Höfig, T.W., Hsiung, K.-H., Huang, B., Huang, E., Huang, X.-L., Jiang, S., Jin, H., Johnson, B.G., Kurzawski, R.M., Lei, C., Li, B., Li, L., Li, Y., Lin, J., Liu, C., Liu, C., Liu, Z., Luna, A., Lupi, C., McCarthy, A.J., Mohn, G., Ningthoujam, L.S., Nirrengarten, M., Osono, N., Peate, D.W., Persaud, P., Qui, N., Robinson, C.M., Satolli, S., Sauermilch, I., Schindlbeck, J.C., Skinner, S.M., Straub, S.M., Su, X., Tian, L., van der Zwan, F.M., Wan, S., Wu, H., Xiang, R., Yadav, R., Yi, L., Zhang, C., Zhang, J., Zhang, Y., Zhao, N., Zhong, G., and Zhong, L., 2018a. Expedition 367/368 methods. In Sun, Z., Jian, Z., Stock, J.M., Larsen, H.C., Klaus, A., Alvarez Zarikian, C.A., and the Expedition 367/368 Scientists, South China Sea Rifted Margin. Proceedings of the International Ocean Discovery Program, 367/368: College Station, TX (International Ocean Discovery Program). https://doi.org/10.14379/iodp.proc.367368.102.2018
Sun, Z., Stock, J.M., Klaus, A., Larsen, H.C., Jian, Z., Alvarez Zarikian, C.A., Boaga, J., Bowden, S.A., Briais, A., Chen, Y., Cukur, D., Dadd, K.A., Ding, W., Dorais, M.J., Ferré, E.C., Ferreira, F., Furusawa, A., Gewecke, A.J., Hinojosa, J.L., Höfig, T.W., Hsiung, K.-H., Huang, B., Huang, E., Huang, X.-L., Jiang, S., Jin, H., Johnson, B.G., Kurzawski, R.M., Lei, C., Li, B., Li, L., Li, Y., Lin, J., Liu, C., Liu, C., Liu, Z., Luna, A., Lupi, C., McCarthy, A.J., Mohn, G., Ningthoujam, L.S., Nirrengarten, M., Osono, N., Peate, D.W., Persaud, P., Qui, N., Robinson, C.M., Satolli, S., Sauermilch, I., Schindlbeck, J.C., Skinner, S.M., Straub, S.M., Su, X., Tian, L., van der Zwan, F.M., Wan, S., Wu, H., Xiang, R., Yadav, R., Yi, L., Zhang, C., Zhang, J., Zhang, Y., Zhao, N., Zhong, G., and Zhong, L., 2018b. Site U1499. In Sun, Z., Jian, Z., Stock, J.M., Larsen, H.C., Klaus, A., Alvarez Zarikian, C.A., and the Expedition 367/368 Scientists, South China Sea Rifted Margin. Proceedings of the International Ocean Discovery Program, 367/368: College Station, TX (International Ocean Discovery Program). https://doi.org/10.14379/iodp.proc.367368.103.2018
Sun, Z., Stock, J., Jian, Z., McIntosh, K., Alvarez Zarikian, C.A., and Klaus, A., 2016. Expedition 367/368 Scientific Prospectus: South China Sea Rifted Margin. International Ocean Discovery Program. https://doi.org/10.14379/iodp.sp.367368.2016
Wetzel, A., 2002. Modern Nereites in the South China Sea—ecological association with redox conditions in the sediment. Palaios, 17(5):507–515. https://doi.org/10.1669/0883-1351(2002)017<0507:MNITSC>2.0.CO;2
Wetzel, A., 2009. The preservation potential of ash layers in the deep-sea: the example of the 1991-Pinatubo ash in the South China Sea. Sedimentology, 56(7):1992–2009. https://doi.org/10.1111/j.1365-3091.2009.01066.x
Weyl, P.K., 1959. Pressure solution and the force of crystallization—a phenomenological theory. Journal of Geophysical Research, 64(11):2001–2025. https://doi.org/10.1029/JZ064i011p02001
Young, J.R., Bown, P.R., and Lees, J.A. (Eds.). Nannotax3. http://ina.tmsoc.org/Nannotax3
Zhao, X., Riisager, P., Antretter, M., Carlut, J., Lippert, P., Liu, Q., Galbrun, B., Hall, S., Delius, H., and Kanamatsu, T., 2006. Unraveling the magnetic carriers of igneous cores from the Atlantic, Pacific, and the southern Indian oceans with rock magnetic characterization. In Sager, W.W., Acton, G.D., Clement, B.M., and Fuller, M. (Eds.), ODP Contributions to Paleomagnetism. Physics of The Earth and Planetary Interiors, 156(3–4):294–328. https://doi.org/10.1016/j.pepi.2005.08.005
Zhou, X.M., and Li, W.X., 2000. Origin of late Mesozoic igneous rocks in southeastern China: implications for lithosphere subduction and underplating of mafic magmas. Tectonophysics, 326(3–4):269–287. https://doi.org/10.1016/S0040-1951(00)00120-7
Zijderveld, J.D.A., 1967. AC demagnetization of rocks: analysis of results. In Collinson, D.W., Creer, K.M., and Runcorn, S.K. (Eds.), Developments in Solid Earth Geophysics (Volume 3): Methods in Palaeomagnetism: Amsterdam (Elsevier), 254–286. https://doi.org/10.1016/B978-1-4832-2894-5.50049-5
1 Stock, J.M., Sun, Z., Klaus, A., Larsen, H.C., Jian, Z., Alvarez Zarikian, C.A., Boaga, J., Bowden, S.A., Briais, A., Chen, Y., Cukur, D., Dadd, K.A., Ding, W., Dorais, M.J., Ferré, E.C., Ferreira, F., Furusawa, A., Gewecke, A.J., Hinojosa, J.L., Höfig, T.W., Hsiung, K.-H., Huang, B., Huang, E., Huang, X.-L., Jiang, S., Jin, H., Johnson, B.G., Kurzawski, R.M., Lei, C., Li, B., Li, L., Li, Y., Lin, J., Liu, C., Liu, C., Liu, Z., Luna, A., Lupi, C., McCarthy, A.J., Mohn, G., Ningthoujam, L.S., Nirrengarten, M., Osono, N., Peate, D.W., Persaud, P., Qui, N., Robinson, C.M., Satolli, S., Sauermilch, I., Schindlbeck, J.C., Skinner, S.M., Straub, S.M., Su, X., Tian, L., van der Zwan, F.M., Wan, S., Wu, H., Xiang, R., Yadav, R., Yi, L., Zhang, C., Zhang, J., Zhang, Y., Zhao, N., Zhong, G., and Zhong, L., 2018. Site U1500. In Sun, Z., Jian, Z., Stock, J.M., Larsen, H.C., Klaus, A., Alvarez Zarikian, C.A., and the Expedition 367/368 Scientists, 2018. South China Sea Rifted Margin. Proceedings of the International Ocean Discovery Program, 367/368: College Station, TX (International Ocean Discovery Program). https://doi.org/10.14379/iodp.proc.367368.104.2018
2 Expedition 367/368 Scientists’ addresses.
This work is distributed under the Creative Commons Attribution 4.0 International (CC BY 4.0) license. 
- F1. Seismic data coverage and magnetic anomalies.
- F2. North SCS margin with seismic coverage.
- F3. Two-way traveltime to Tg unconformity and Reflector T60.
- F4. Original and interpreted seismic profiles.
- F5. Uninterpreted and interpreted seismic profiles.
- F6. Schematic development of continental breakup.
- F7. Spectrum of possible magma-poor rifted margin models.
- F8. Uninterpreted and simplified interpretation, seismic Profile 1555.
- F9. Uninterpreted and simplified interpretation, seismic Profile 1530.
- F10. Reentry system and casing.
- F11. Lithostratigraphic summary.
- F12. Correlation of lithostratigraphic units.
- F13. Bulk mineralogy.
- F14. Heavily bioturbated nannofossil-rich clay.
- F15. Recovered interval from Core U1500A-11R.
- F16. Turbidite sequences and sedimentary structures.
- F17. Patterns of color banding and sedimentary structures.
- F18. Sandstone intervals in Unit IV.
- F19. Transitions between subunits.
- F20. Contacts between Units VI, VII, and VIII.
- F21. Claystone-filled fracture/vein within basalt.
- F22. Trace fossils in claystone and chalk intervals.
- F23. Lithostratigraphic summary.
- F24. Homogeneous sparsely vesicular phyric basalts.
- F25. Basalts highlighting all observed chilled contacts and margins.
- F26. Basalts with glassy chilled rims and hypocrystalline interiors.
- F27. Representative textures observed in hypocrystalline basalts.
- F28. Primary rock-forming minerals and textures of basalts.
- F29. Lithostratigraphic summary with bedding dips, Site U1500.
- F30. Sedimentary and deformation structures in Units I–III.
- F31. Sedimentary and deformation structures in Units IV–VII.
- F32. Igneous structures in Unit VIII.
- F33. Whole-round images
- F34. Stereographic projection fractures and veins.
- F35. Age-depth model.
- F36. Remanent magnetization data.
- F37. Demagnetization data.
- F38. Demagnetization data for Hole U1500B basalts.
- F39. Magnetostratigraphy.
- F40. Magnetic property variation.
- F41. Lithology, carbon, and TOC/TN profiles.
- F42. Total alkalis vs. SiO2.
- F43. V vs. Ti.
- F44. Zr vs. Ti.
- F45. Sediment physical property measurements.
- F46. Basalt physical properties measurements.
- F47. Core NGR measurements.
- F48. Downhole logging tool strings.
- F49. Logging operations summary.
- F50. VSI seismic source deployment scheme.
- F51. Density, velocity, and TDR adjusted to seafloor.
- F52. Site U1500 TDR compared to other sites.
- F53. Seismic section.
- F54. Synthetic seismogram.
- T1. Site U1500 core summary.
- T2. Mineral percentages.
- T3. Rock major element oxides and minor elements.
- T4. Biostratigraphic events.
- T5. Calcareous nannofossils, Hole U1500A.
- T6. Calcareous nannofossils, Hole U1500B.
- T7. Planktonic foraminifers.
- T8. Headspace gas data.
- T9. Carbon and nitrogen.
- T10. Basalt ICP-AES analyses.
- T11. Mean and SD for physical property measurements.