Sutherland, R., Dickens, G.R., Blum, P., and the Expedition 371 Scientists
Proceedings of the International Ocean Discovery Program Volume 371
publications.iodp.org
https://doi.org/10.14379/iodp.proc.371.107.2019

Site U15101
R. Sutherland, G.R. Dickens, P. Blum, C. Agnini, L. Alegret, J. Bhattacharya, A. Bordenave, L. Chang, J. Collot, M.J. Cramwinckel, E. Dallanave, M.K. Drake, S.J.G. Etienne, M. Giorgioni, M. Gurnis, D.T. Harper, H.-H.M. Huang, A.L. Keller, A.R. Lam, H. Li, H. Matsui, H.E.G. Morgans, C. Newsam, Y.-H. Park, K.M. Pascher, S.F. Pekar, D.E. Penman, S. Saito, W.R. Stratford, T. Westerhold, and X. Zhou2
Keywords: International Ocean Discovery Program, IODP, JOIDES Resolution, Expedition 371, Site U1510, Tasman Frontier, Zealandia, Reinga, Challenger, Eastern Australian Current, Lord Howe, Murihiku, New Caledonia, Norfolk, Northland, Pacific, Ring of Fire, Tasman, Taranaki, Tonga, Kermadec, Waka Nui, Wanganella, subduction, Early Eocene Climatic Optimum, EECO, Middle Eocene Climatic Optimum, MECO, biogenic bloom, stratigraphy, diagenesis, compaction, volcanism
MS 371-107: Published 2 February 2019
Background and objectives
International Ocean Discovery Program (IODP) Site U1510 (36°19.74ʹS, 164°33.52ʹE; 1238 m water depth) is on southern Lord Howe Rise, ~850 km west of northern New Zealand (Figure F1). Two Deep Sea Drilling Project (DSDP) sites are nearby: Site 592 is ~80 km east, and Site 207 is ~105 km southeast. Seismic reflection data can be used to tie stratigraphy between the three sites but with some uncertainty caused by unconformities and deformation. Site U1510 was chosen to determine the timing of Cenozoic folding on the southern Lord Howe Rise and to obtain stratigraphic information to constrain the timing of vertical tectonic movements and volcanism.
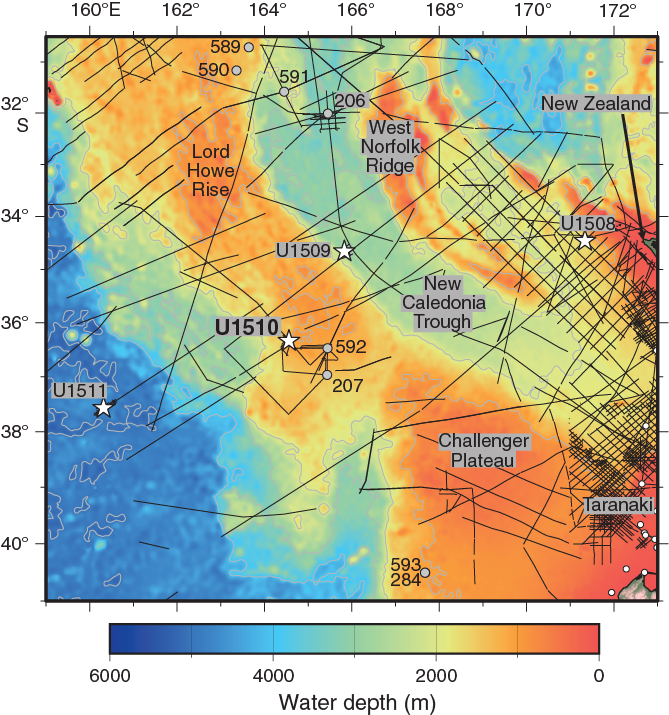
Figure F1. Regional bathymetry, seismic reflection lines, and boreholes.
At Site 592, a Quaternary to lower Miocene sequence of foraminifer-bearing nannofossil ooze and chalk overlies lower Oligocene to upper Eocene nannofossil ooze and chalk with volcanic ash (Shipboard Scientific Party, 1986). The boundary between the upper and lower units is a prominent unconformity clearly visible on seismic reflection data as a channeled erosion surface.
The Neogene unit and its basal unconformity can be mapped from Site 592 to Site 207. At Site 207, however, Quaternary to middle Miocene foraminifer-bearing nannofossil ooze overlies middle Eocene to Paleocene foraminifer-bearing nannofossil ooze and chalk containing siliceous microfossils with clay content that increases downward (The Shipboard Scientific Party, 1973). Cretaceous claystone overlies sandstone and Cretaceous rhyolite at the base of the sequence drilled at Site 207.
Seismic reflection data used to map units near Sites 207 and 592 image reverse faults and volcanic centers. The faulting represents the “Tectonic Event of the Cenozoic in the Tasman Area” (TECTA) (Sutherland et al., 2017). Site U1510 was chosen to sample strata adjacent to reverse faults, folds, and volcanic centers associated with this deformation. Three seismic stratigraphic units were identified (Figures F2, F3).
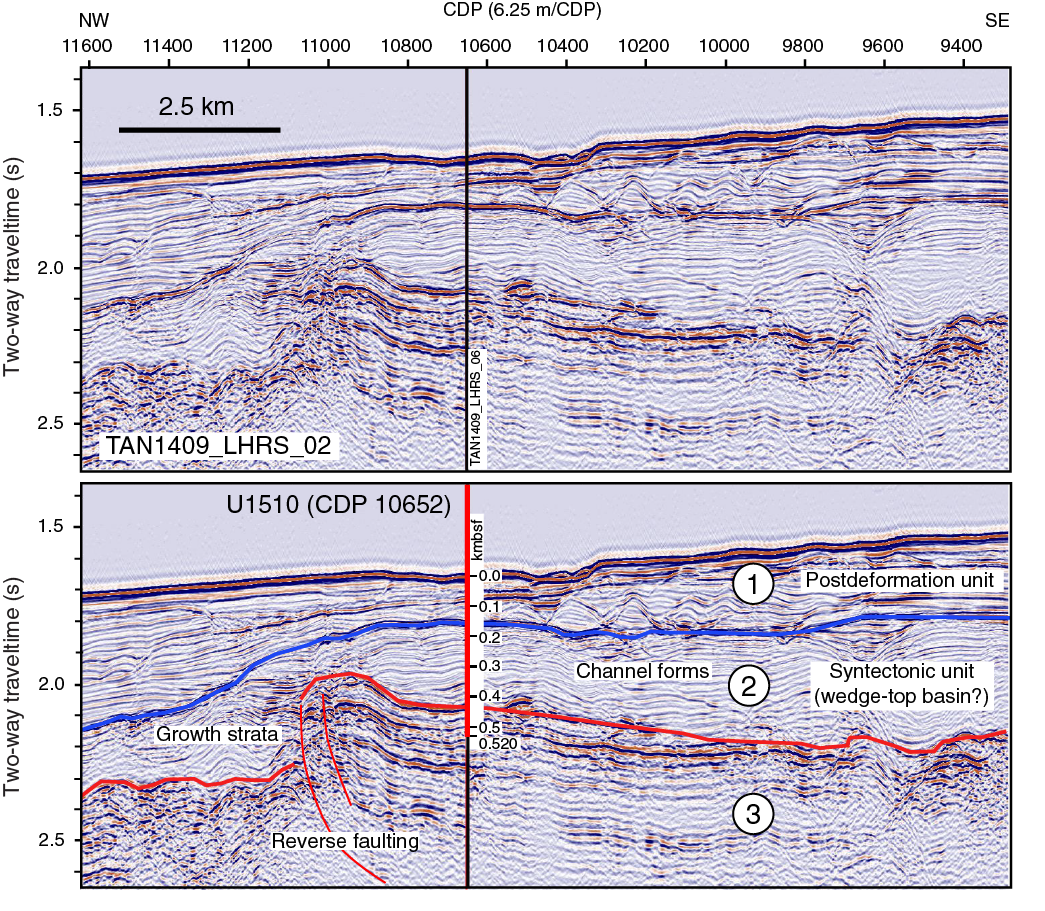
Figure F2. Seismic reflection Line TAN1409_LHRS_02.

Figure F3. Seismic reflection Line TAN1409_LHRS_06.
The upper seismic unit (1) has continuous moderate-amplitude reflectors with complex internal geometry. At Sites 207 and 592, the unit corresponds to Neogene and Quaternary strata.
The middle seismic unit (2) is channeled near its top surface and characterized throughout by fanning low- to moderate-amplitude, continuous undulating reflectors. This unit has large lateral variations in thickness associated with folds and reverse faults that lie beneath. It is interpreted to be a syntectonic unit. Seismic Unit 2 correlates with lower Oligocene to upper Eocene strata at Site 592 but is missing at Site 207. Volcanic cones are identified on seismic reflection data and are inferred to be contemporaneous with seismic Unit 2, which is confirmed by the significant volcanic component in the lower unit at Site 592.
The lower seismic unit (3) is characterized by moderate- or high-amplitude, continuous reflectors that are locally folded and reverse faulted. Seismic Unit 3 can be traced to Site 207, where it is sampled as the lowest sedimentary unit drilled. The unit is considerably thinner at Site 207 compared with at Site U1510.
The primary drilling objectives at Site U1510 were to (1) sample the top and base of the middle seismic unit to constrain the minimum and maximum ages of folding, (2) sample the lower seismic unit to determine the pre-TECTA state of the southern Lord Howe Rise, and (3) look for evidence of volcanism and vertical movements (e.g., evidence of nearby shallow water at any age).
Operations
Hole locations, water depths, and the number of cores recovered are listed in Table T1. All times are local ship time (UTC + 11 h).
After a 380 nmi transit in heavy winds and seas from a waiting on weather location, the ship arrived at Site U1510 at 0918 h on 12 September 2017. The thrusters were lowered, dynamic positioning was established, and the drill floor was cleared for operations at 0936 h. No seafloor positioning beacon was deployed at this site.
An advanced piston corer (APC)/extended core barrel (XCB) bottom-hole assembly (BHA) was assembled and deployed. After the first 7 stands of drill pipe were added, the iron roughneck clamping valve refused to unclamp from the drill pipe. While the repair was taking place, drill pipe assembly continued using the rig tongs instead of the iron roughneck for the next 23 stands. When the iron roughneck repair was complete, the remaining 8 stands of drill pipe were run. The top drive was picked up, the nonmagnetic core barrels were dressed with core liners, and the orientation tool was installed. Coring in Hole U1510A started at 1915 h on 12 September.
APC coring continued through Core 17H, which stroked out after only ~3 m because the cutting shoe impacted a chert layer. At 0645 h on 13 September, we decided to switch to XCB coring. We stopped deploying the orientation tool after Core 15H. Temperature measurements were taken on Cores 4H, 7H, 10H, 13H, and 17H. The APC cored interval penetrated from 0 to 150.5 m drilling depth below seafloor (DSF) and recovered 147.9 m (98%).
XCB coring continued until 1930 h on 14 September. Cores 18X through 52X penetrated from 150.5 to 483.4 m DSF and recovered 108.1 m (32%). Frequent chert layers seriously compromised recovery.
Coring in Hole U1510A concluded with a total penetration of 483.4 m DSF and total recovery of 260.0 m (53%). The drill pipe was retrieved from Hole U1510A, clearing the rig floor at 2135 h on 14 September and ending Hole U1510A. The time spent on Hole U1510A was 60 h or 2.5 days.
The ship was offset 20 m east and APC coring in Hole U1510B began at 2300 h on 14 September with Core 1H and ended at 0215 h on 15 September with Core 7H. Nonmagnetic core barrels were used for Cores 1H through 7H, and a single advanced piston corer temperature tool (APCT-3) temperature measurement was taken on Core 7H. Cores 1H through 7H penetrated from 0 to 66.3 m DSF and recovered 64.7 m (98%). The drill string was recovered and the rig floor was secured for transit at 0815 h, ending Hole U1510B and operations at Site U1510. The time spent on Hole U1510B was 10.75 h or 0.4 days.
The thrusters were raised, and the ship began transit to Site U1511 at 0842 h on 15 September.
Lithostratigraphy
The sedimentary sequence at Site U1510 (Table T2) is ~138 m of Pleistocene to middle Miocene calcareous ooze (lithostratigraphic Unit I; Figures F4, F5) overlying ~340 m of upper to lower Eocene calcareous ooze and chalk interbedded with cherty limestone, chert, and rare volcaniclastic layers (lithostratigraphic Unit II). Unit I is divided into two subunits on the basis of subtle color banding between light gray and white in the calcareous ooze of Subunit Ia, whereas Subunit Ib is mostly homogeneous, white calcareous ooze. Both subunits also contain discrete beds of foraminiferal ooze. The Unit I/II boundary (~138 m) is defined by the first occurrence of chert and corresponds to a hiatus spanning the middle Miocene to upper Eocene (see Biostratigraphy and paleoenvironment). Unit II is divided into three subunits: Subunit IIa is homogeneous nannofossil ooze with bioclasts; Subunit IIb is calcareous chalk with varying amounts of clay, shallow-water bioclasts, cherty limestone, and chert; and Subunit IIc is nannofossil chalk interbedded with chert horizons and sparse volcaniclastic layers in the lower part.
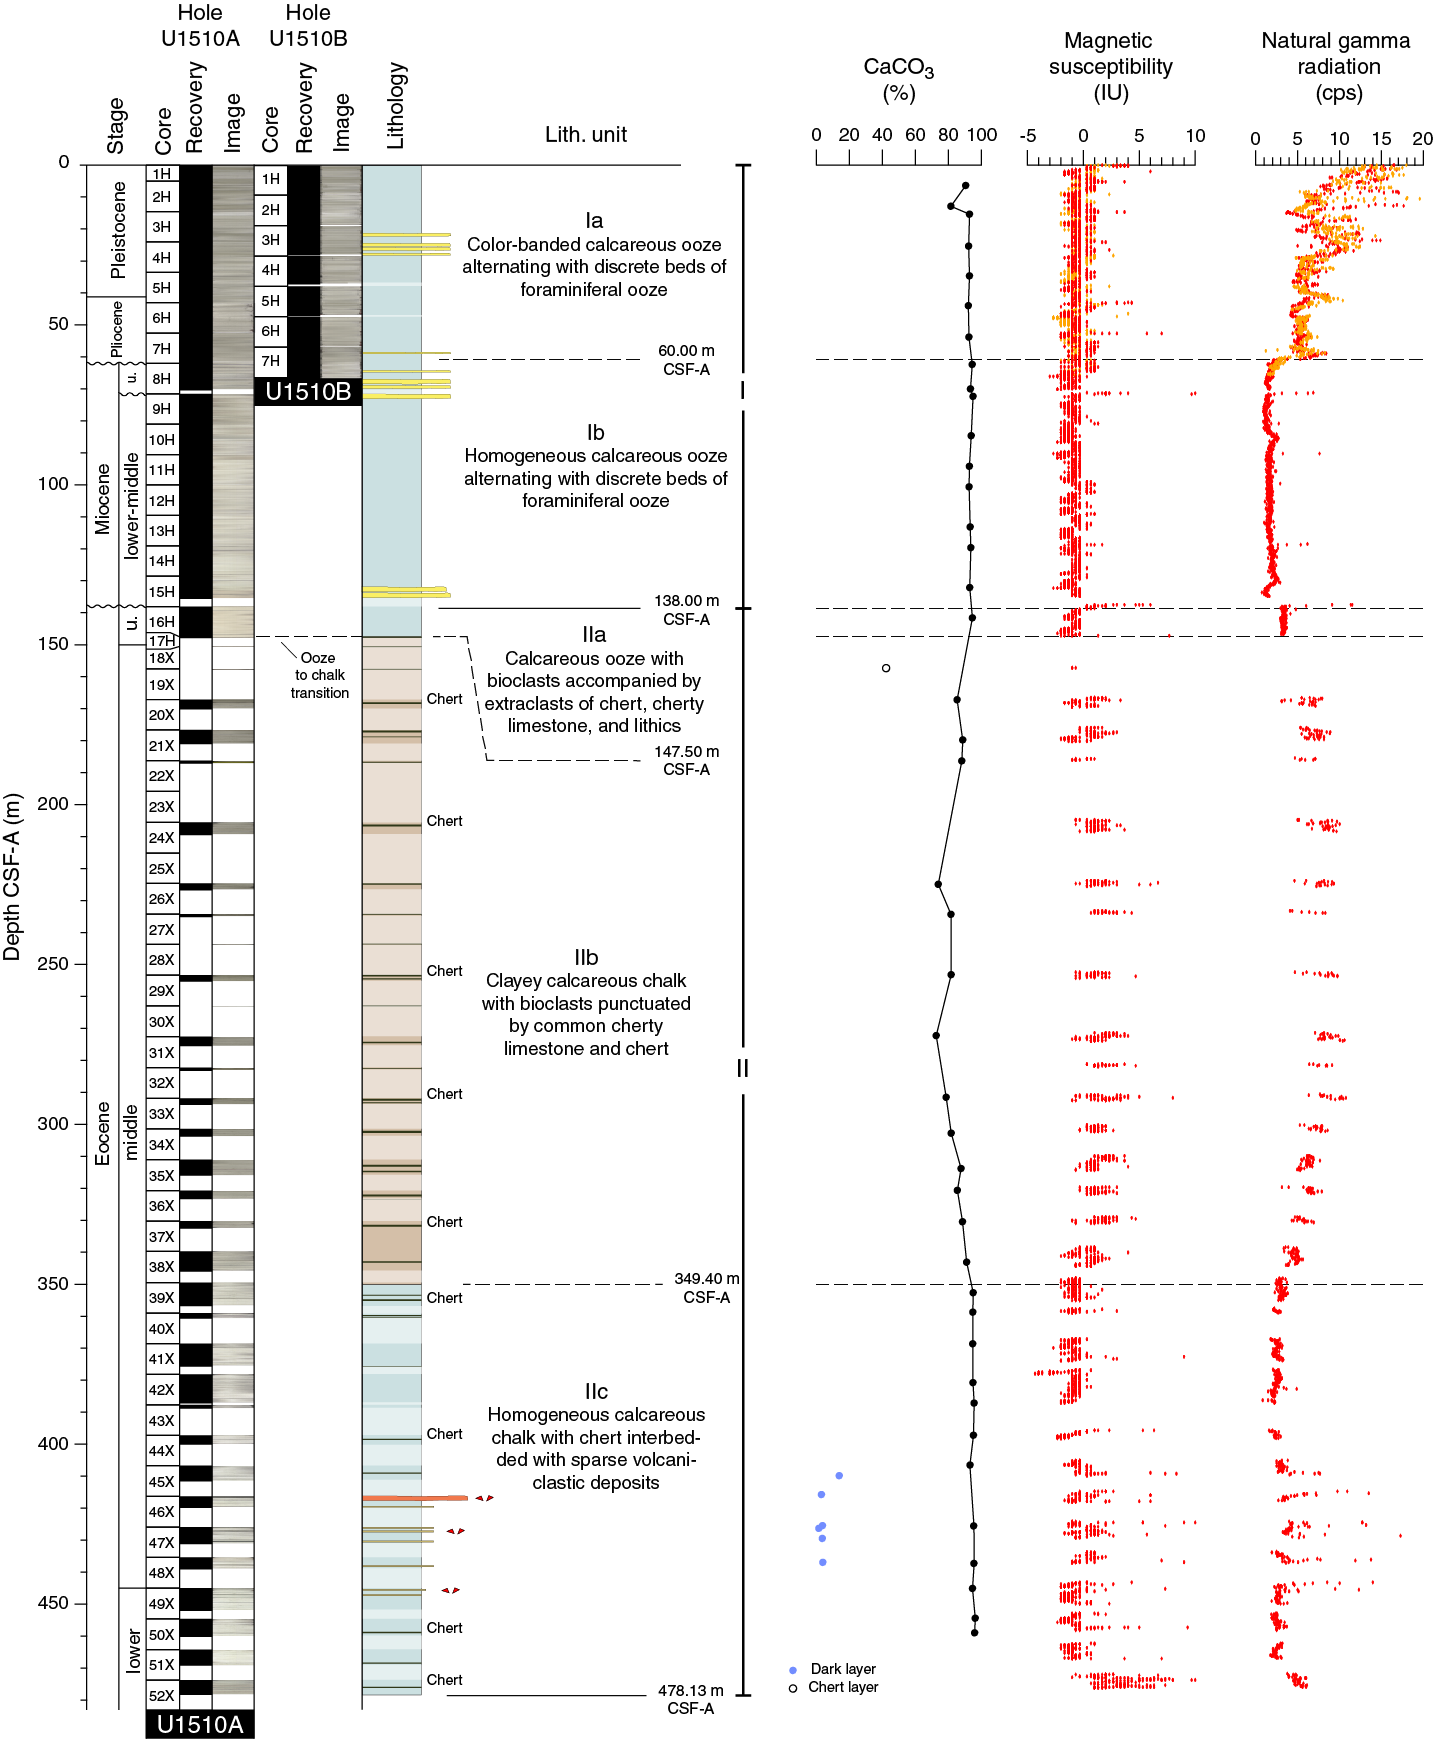
Figure F4. Lithostratigraphic summary of sedimentary section.
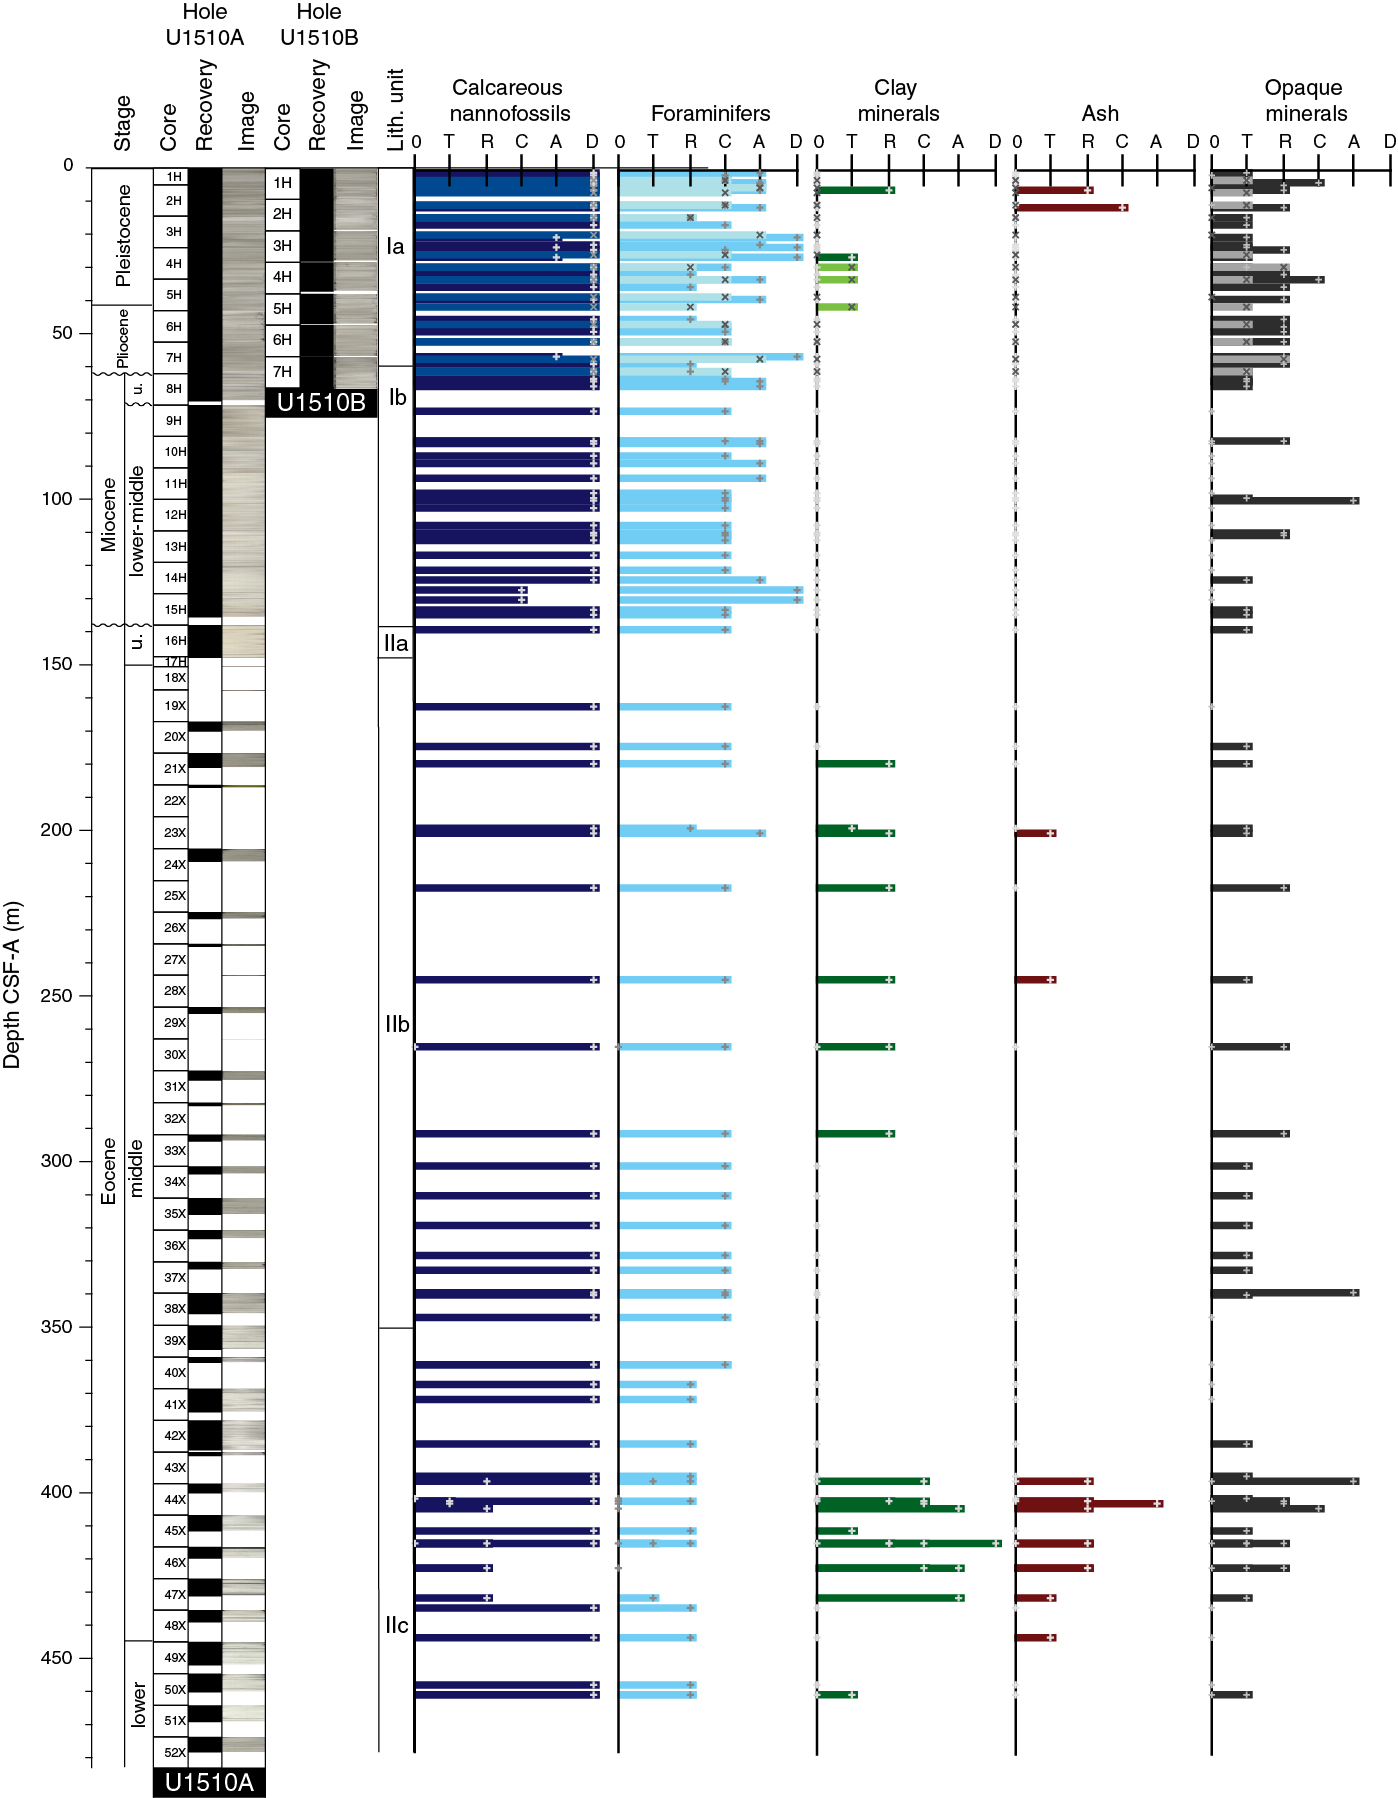
Figure F5. Major biogenic and lithologic constituent abundances.
Unit I
Subunit Ia
Subunit Ia encompasses the uppermost part of Hole U1510A and almost all of Hole U1510B (Table T2). The subunit consists of nannofossil ooze with foraminifers of varying abundance (rare to abundant), including discrete foraminiferal ooze beds throughout (Figures F6, F7). Subunit Ia is also characterized by decimeter- to meter-scale variations in sediment color. Alternations between light gray (2.5Y 7/2) and white (2.5Y 8/1) foraminiferal nannofossil ooze at ~1.5–2 m intervals occur from Core 371-U1510A-1H to Core 2H (0–14.6 m) and are expressed by higher and lower a*, respectively (Figure F8). The color banding is subtler in Cores 3H and 4H (14.6–33.4 m), in which intervals of white (N/8) sediment alternate with light gray (2.5Y 7/1) to light olive gray (5Y 6/2) sediment. The light intervals are several meters thick, whereas the darker intervals typically do not exceed 50 cm. Alternations in sediment color throughout this subunit are diffuse and bioturbated. Color bands in Subunit Ia do not correspond to obvious changes in major sediment composition (Figure F5), but they do coincide with variations in natural gamma radiation (NGR) (see Petrophysics).
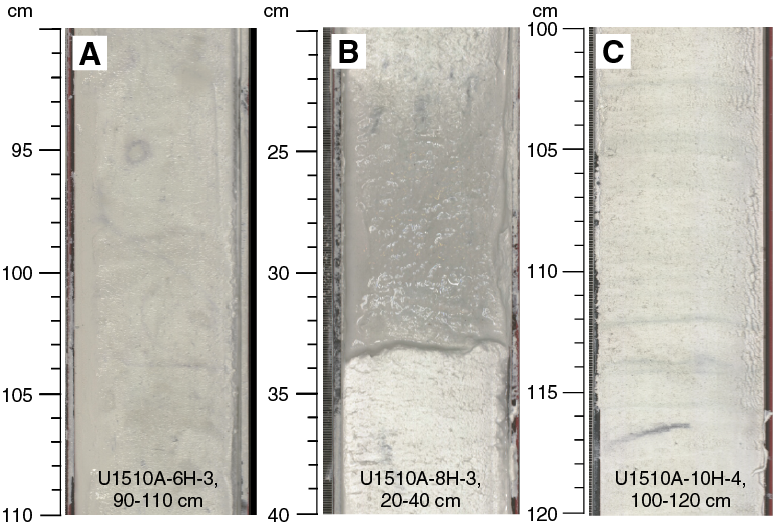
Figure F6. Representative Subunit Ia and Ib lithologies.
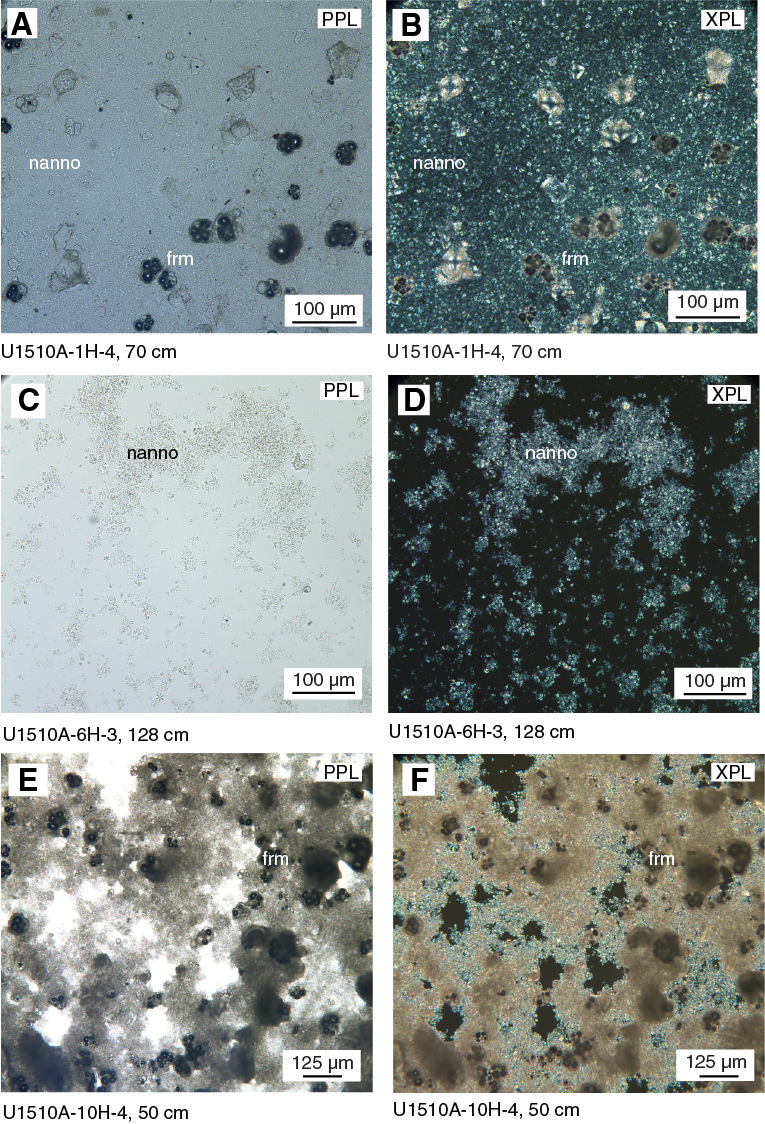
Figure F7. Representative Unit I lithologies.
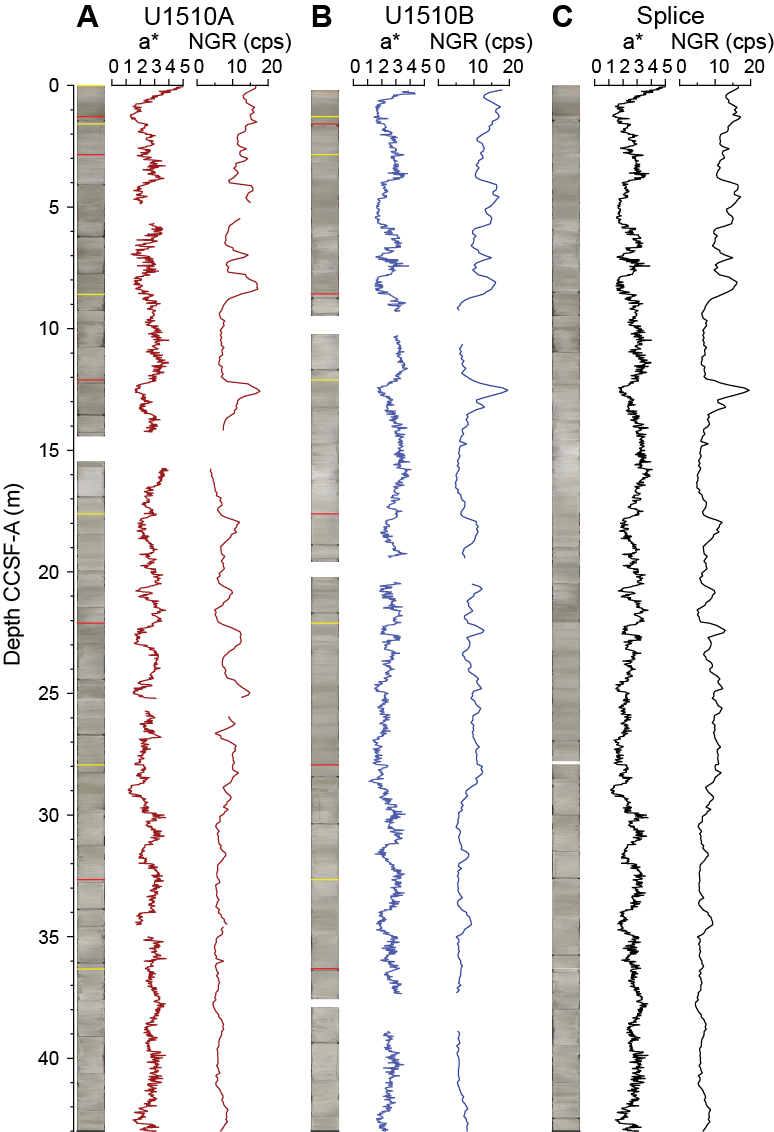
Figure F8. Color banding, Subunit Ia.
Medium to thick beds of foraminiferal ooze occur in Cores 371-U1510A-3H, 4H, and 7H (14.5–30.0 and 52.5–59.0 m; Figure F5). These beds have a fine sand grain size and either sharp or diffuse bases and tops.
APC coring provided nearly 100% core recovery in Unit I. However, significant drilling disturbance occurred throughout the upper portion of Subunit Ia. Moderate up-arching was observed in Cores 371-U1510A-2H through 6H (5.0–52.7 m), severe flowage was documented in Cores 3H and 4H (14.7–33.5 m), and soupy sediments resulting from drilling occurred locally in almost every core. Similar features are present in the equivalent intervals of Hole U1510B.
Subunit Ib
Subunit Ib is dominated by homogeneous, white (N/9) nannofossil ooze with abundant to common foraminifers (Table T2; Figures F6, F7). It differs from Subunit Ia by a lack of color banding and a decrease in NGR values (see Petrophysics). The upper ~5 m of Subunit Ib (Core 371-U1510A-8H at ~62–70 m and Sections 371-U1510B-7H-4 through 7H-7 from 61.3 m to the base of the hole) is nannofossil ooze with centimeter-thick beds of foraminiferal ooze (Figure F6B). Two hiatuses occur in the upper part of the subunit between Cores 7H and 9H. These hiatuses are likely represented by foraminiferal ooze beds and caused by erosion (see Biostratigraphy and paleoenvironment).
Of note is the first appearance of pale green and gray laminations in Core 371-U1510A-10H (Figure F6C). These laminations occur frequently from this core through Core 14H (81–128.6 m). No laminations occur in Core 15H. Sediments in Sections 15H-1 through 15H-3 (128.6–132 m) are white (N/9) and homogeneous foraminiferal nannofossil ooze. This lithology transitions to subtly darker (2.5Y 8.5/1) foraminiferal ooze with millimeter-sized grains of glauconite and dark minerals in Sections 15H-3 through 15H-CC (~132–135.3 m).
The Unit I/II boundary is placed at the first occurrence of chert. This occurrence is found in the top ~30 cm of Section 371-U1510A-16H-1, where hard heterogeneous fragments of gray chert and cherty limestone are present, along with glauconite, Mn oxides, and lithic clasts. The fragments are likely fall-in derived from unrecovered hard-mineralized layers in the 2.5 m between the base of Core 15H and the top of Core 16H (~135–138 m). The unit boundary coincides with a hiatus spanning the upper Eocene to lower Miocene (see Biostratigraphy and paleoenvironment) and a distinct increase in gamma ray attenuation (GRA) density (see Petrophysics).
Unit II
Lithostratigraphic Unit II is ~340 m of upper to lower Eocene calcareous ooze and chalk interbedded with cherty limestone, chert, and local volcaniclastic layers. Unit II is divided into three subunits (Figure F4; Table T2). The ooze–chalk transition occurs in a very poorly recovered interval between Subunits IIa and IIb (~147 m). Subunit IIb is also distinguished from Subunit IIa by the occurrence of thin to medium beds of cherty limestone, an increased abundance of clay, and an increase in bioturbation. The Subunit IIb/IIc boundary is marked by a distinct change in color from light gray (2.5Y 7/1) to white (N/9) and by an increase in the abundance and color variability of chert.
Subunit IIa
Subunit IIa is white (10YR 8.5/1), homogeneous nannofossil ooze with bioclasts, which include foraminifers, sponge spicules, and bryozoan and echinoderm fragments (Figure F9). Smear slide analysis suggests that these bioclasts are altered and intensely overgrown with calcite, which may be responsible for the higher density observed in the calcareous ooze in Subunit IIa, as compared with Unit I (see Petrophysics).
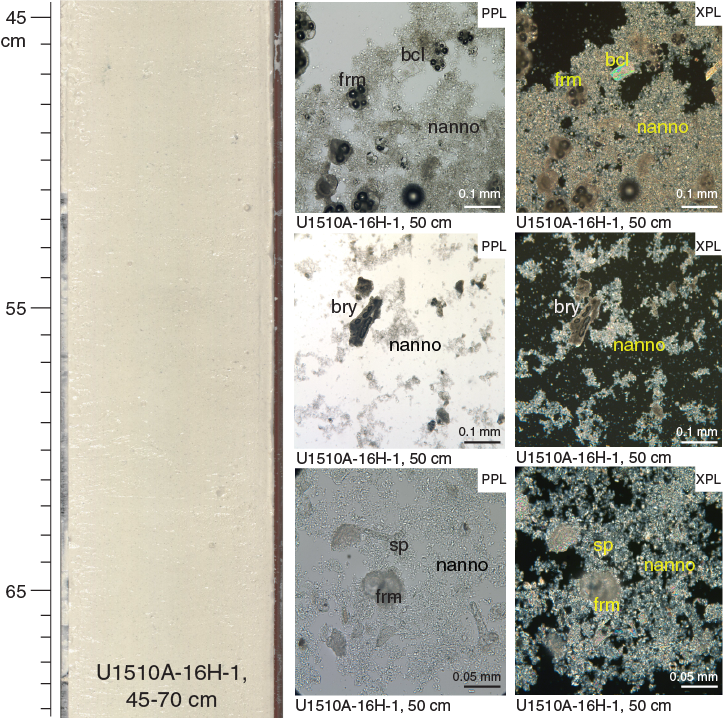
Figure F9. Nannofossil ooze with bioclasts in Subunit IIa.
Subunit IIb
Subunit IIb is light gray (5Y 7/1 and 2.5Y 7/1) clayey calcareous chalk interbedded with light gray (5Y 7/1) to light olive gray (5Y 6/2) cherty limestone (Figures F10, F11). The upper 19 m is poorly recovered (<5%) and contains chert, cherty limestone, and other lithic mineral fragments (Figure F10A).

Figure F10. Representative Subunit IIb lithologies.
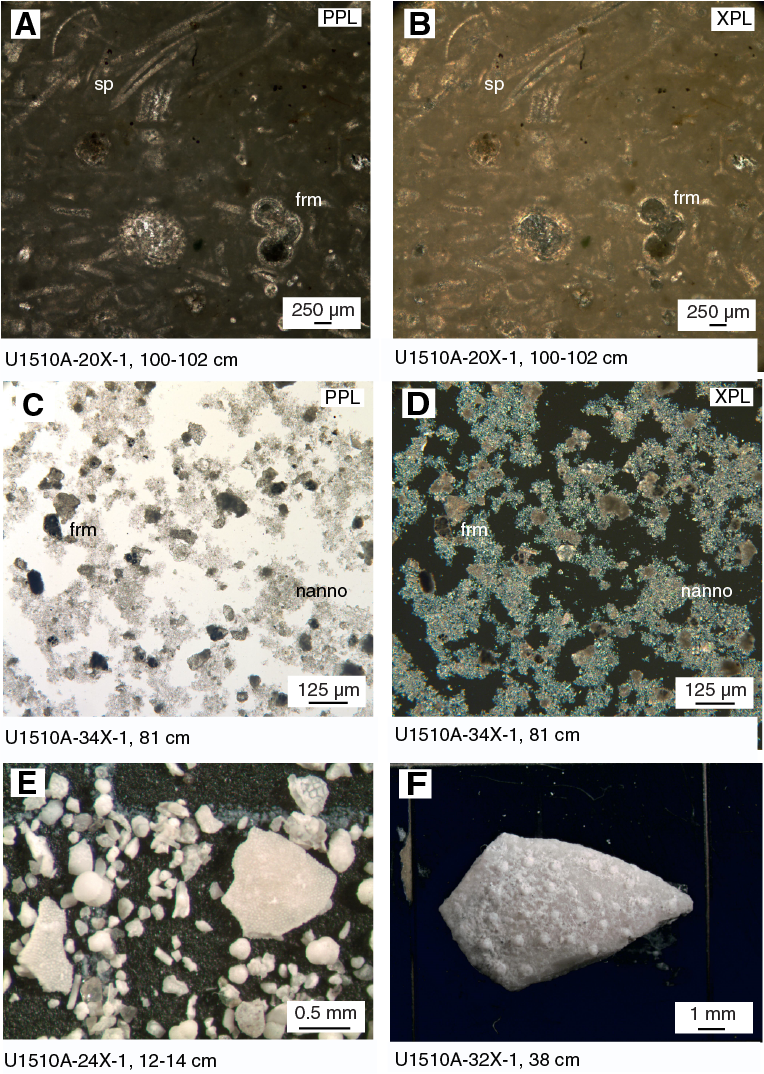
Figure F11. Representative Subunit IIb lithologies.
The calcareous chalk in Subunit IIb includes various amounts of clay, silicate minerals, and bioclasts. Overall, clay abundance is greater than that in Subunit IIa as observed in smear slides (Figure F5), carbonate contents (see Geochemistry), and NGR values (see Petrophysics). Bioturbation was not observed in the heavily biscuited sediment of Cores 371-U1510A-20X through 22X (167.1–186.9 m) but gradually increases from slight to moderate in Cores 24X through 38X (253.3–349.4 m). In Core 24X, bioturbation is slight with common bioclasts and rare silicate minerals and clay. Clusters of undifferentiated silt-sized bioclasts and silicate minerals were observed in Sections 24X-1 (Figure F11E) and 32X-1. Large shallow-water bioclasts were also found in samples from Subunit IIb, including a millimeter-sized fragment of an echinoderm (interval 32X-1, 36–38 cm; Figure F11F), a honeycomb-shaped bioclast 3 mm in diameter (Section 34X-2, 51 cm), and sponge fragments (Section 37X-2, 18 cm). Bioclast abundance decreases downhole to rare in the lower part of the subunit.
Core recovery in Subunit IIb is poor (averaging ~20%). Drilling disturbance includes moderate to severe biscuiting of the chalk and severe fragmentation of the cherty limestone. Fall-in often occurs at the tops of Cores 371-U1510A-20X through 38X.
Subunit IIc
Subunit IIc is homogeneous, white calcareous chalk interbedded with chert, with sparse intervals of volcaniclastic material in Cores 371-U1510A-45X through 49X (~410.5–430.4 m) (Figures F12, F13).
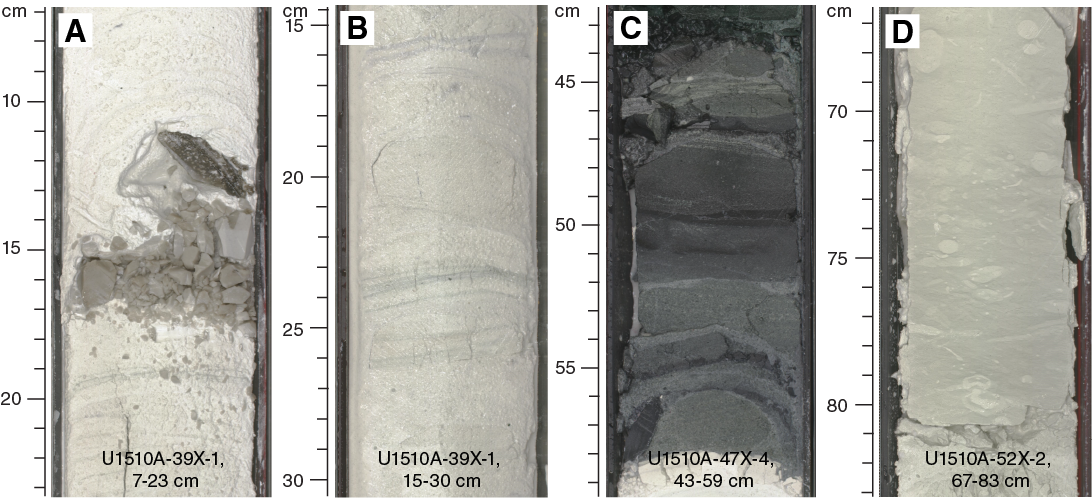
Figure F12. Representative Subunit IIc lithologies.
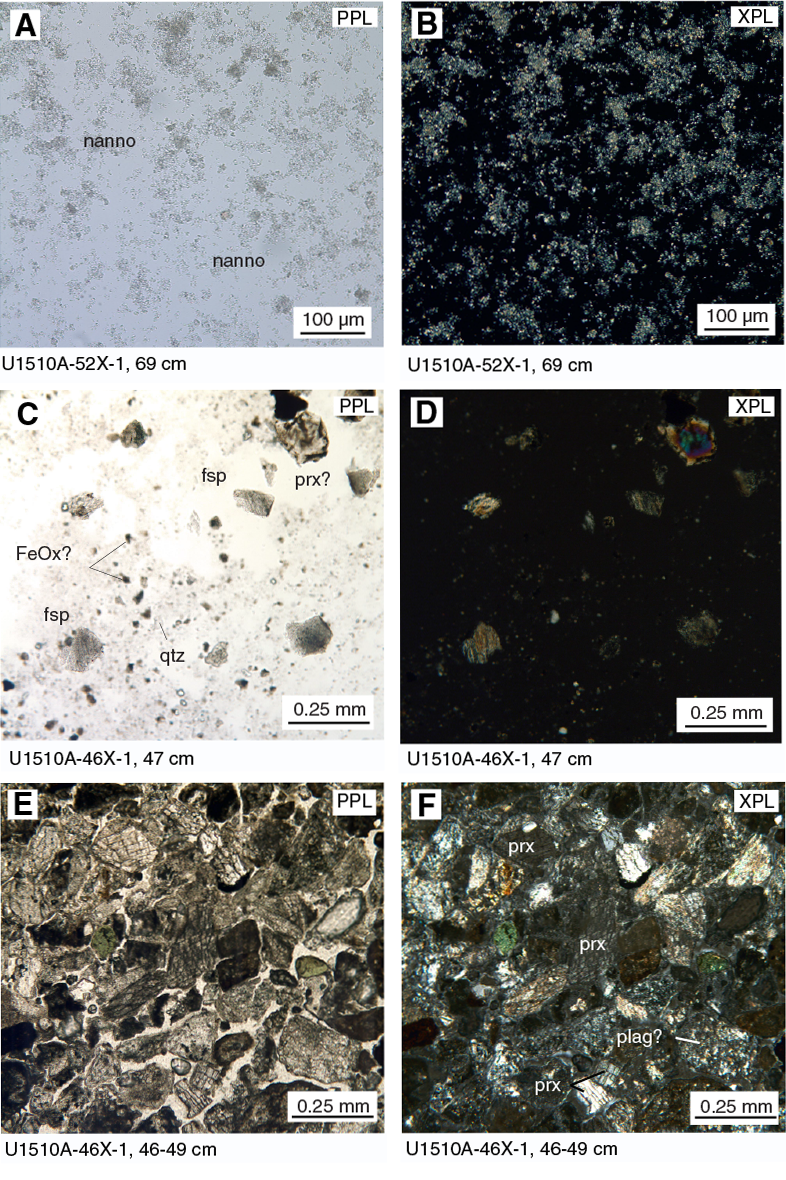
Figure F13. Representative Subunit IIc lithologies.
The chalk in Subunit IIc displays subtle variations in composition and bioturbation intensity. The sediment is dominated by nannofossils and common to rare foraminifers (Figure F5). Cores 371-U1510A-39X through 41X (349–375 m) contain rare silicate minerals. Bioturbation is generally absent in the upper portion of Subunit IIc and gradually increases to moderate from Core 52X downhole. Greenish gray (GLEY 1 6/10GY) wispy laminations are present throughout Subunit IIc. The chert in Subunit IIc has a pearly luster and a wide range of color, including black, very dark gray, light olive gray, light gray, brown, light yellow brown, and pink (Figure F14). A gradual lightening was observed downhole. In Cores 49X through 51X, chert fragments have a gray rim.
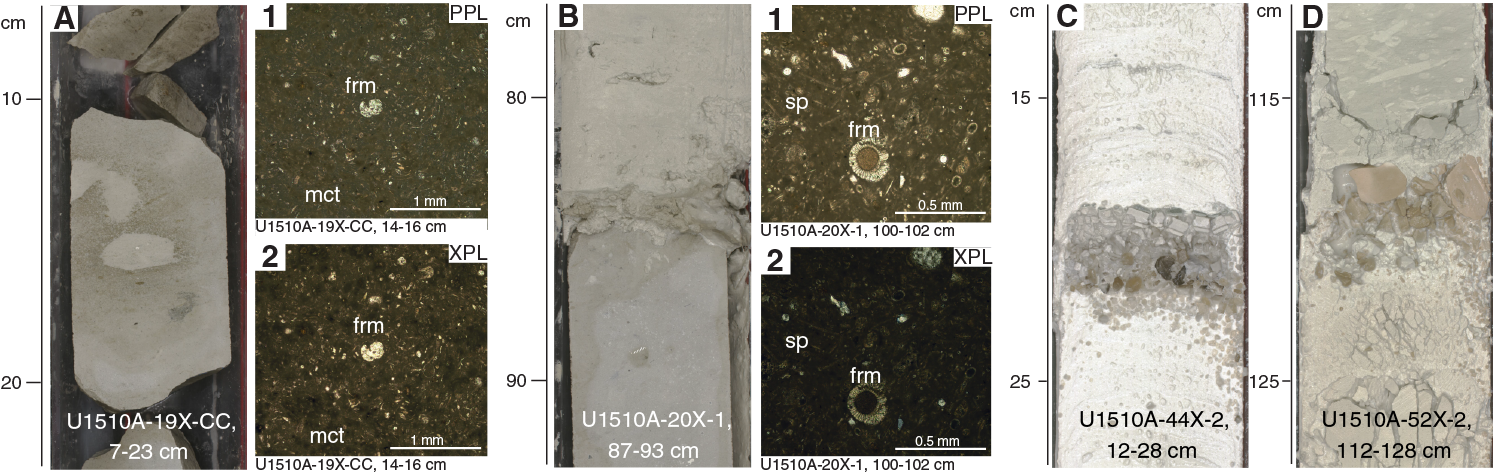
Figure F14. Chert and cherty limestone.
Sporadic centimeter-thick green to black tuff beds are present in Cores 371-U1510A-45X through 49X (~410.5–430.4 m). Two prominent intervals were observed in Section 46X-1 (416.3–416.8 m) and interval 47X-4, 43–59 cm (430.1–430.4 m). The former consists of a sharp-based, parallel laminated to massive, dark gray tuff gradually fining upward into a black tuffaceous claystone. The latter is a composite succession of medium- to thinly bedded, planar- to ripple-laminated beds stacked following an overall fining-upward succession, from greenish gray tuff to bioturbated green tuffaceous claystone (Figure F12C). Smear slide and thin section observations reveal highly altered minerals (dominantly pyroxene and plagioclase), rare glass shards, oxides, and possible metamorphic grains (Figure F13). Moreover, titanium oxides were possibly observed as a common pale green, high-relief mineral with rounded to subrounded shape and moderate birefringence. Altered planktic foraminifers, probably phosphatized, were observed in thin section (Sample 47X-4, 50–52 cm).
X-ray diffraction (XRD) analyses on the mineral components of the volcaniclastic layers in Subunit IIc reveal that black and green beds contain dominant quartz and clay and variable amounts of albite (Figure F15). Calcite is rare to absent, except in a thin green tuffaceous claystone (interval 371-U1510A-45X-3, 103–105 cm). In some samples, the possible presence of fluorapatite (Ca5[PO4]3F) and anatase (TiO2) was detected. Although difficult to explain in this context, the presence of these two minerals is supported by X-ray fluorescence (XRF) results that show higher P and Ti abundance in the respective samples (Figures F15, F16). XRD Samples 46X-1, 10–20 cm, and 46X-1, 24–25 cm, have mineralogical compositions different from the rest. The latter, especially, exhibits an enigmatic peak that does not occur in any other sample (Figure F15).

Figure F15. XRD analysis of volcaniclastic sediments from Subunit IIc.

Figure F16. XRF analysis of volcaniclastic sediments from Subunit IIc.
In Core 371-U1510A-52X (473.8 m), a slight change in sediment color from white to light greenish gray (GLEY 1 8/5GY) and pinkish white (7.5YR 8.5/2) coincides with a downhole decrease in the sedimentation rate and increase in magnetic susceptibility (see Biostratigraphy and paleoenvironment and Petrophysics, respectively). A harder chalk layer occurs at the bottom of the core catcher and corresponds to an increase in P-wave velocity (see Petrophysics). The average core recovery in Subunit IIc is ~50%. Drilling disturbance includes moderate to severe biscuiting of chalk and severe fragmentation of chert.
Comparison with DSDP Site 592 lithostratigraphy
Seismic profiles across the southern Lord Howe Rise show a series of reflectors that can be correlated with previously cored drill sites. The nearest site (592), which is ~80 km west of Site U1510, recovered a 388.5 m thick sediment section (Shipboard Scientific Party, 1986). It was anticipated that Site U1510 would have both similarities and differences in the sediment record.
The sedimentary sequence at Site 592 consists of a single lithostratigraphic unit divided into five subunits, four of which are primary and span from the upper Quaternary to the upper Eocene (Shipboard Scientific Party, 1986). Distinction between the units primarily reflects different amounts of foraminiferal nannofossil ooze and chalk and of nannofossil ooze and chalk. Of special interest to lithostratigraphic studies is that the sequence at Site 592 includes (1) an especially thick interval of lower Pliocene–upper Miocene nannofossil ooze, (2) a ~15 My hiatus separating lower Miocene and lower Oligocene strata, and (3) two ooze–chalk transitions (one each above and below the hiatus).
The sedimentary succession at Site 592 resembles the upper part of Site U1510. Lithostratigraphic Subunit Ia at Site 592 consists of 30 cm of pale orange to pinkish gray foraminifer-bearing nannofossil ooze that represents an oxic layer found in near-seafloor sediment at multiple locations across Lord Howe Rise (Shipboard Scientific Party, 1986). This layer was not clearly observed at Site U1510; however, Cores 371-U1510A-1H and 371-U1510B-1H display a slightly pinker color in their uppermost few tens of centimeters. Pale olive to white and very light gray banded calcareous ooze represents Subunit Ib at Site 592, reaching a depth of 33.3 meters below seafloor (mbsf). This subunit corresponds both in facies and in thickness to Subunits Ia and Ib at Site U1510. The Subunit Ib/Ic boundary at Site 592 was defined at an ooze–chalk transition that was not observed at Site U1510. On the other hand, a major hiatus marks the base of Subunit Ic at Site 592, spanning the lower Miocene to the lower Oligocene. A major hiatus was also identified at Site U1510, but it spans a longer time interval, from the lower Miocene to the upper Eocene. Another calcareous ooze interval occurs below the hiatus at Site 592 (Subunit Id) and transitions to chalk between 350 and 369 mbsf (Subunit Ie). These lithologies correspond in age to Subunit IIa at Site U1510, but this unit is only 9.5 m thick and bears evidence of at least one hardground, as recovered by the fragments at the top of Core 371-U1510A-16H. These differences indicate laterally variable sediment accumulation on the Lord Howe Rise between the upper Eocene and the Miocene.
Biostratigraphy and paleoenvironment
Site U1510, on the southern end of Lord Howe Rise, was targeted to recover an undeformed Neogene sequence and a deformed Paleogene sequence, presumably separated by a major unconformity. The timing of deformation and evidence for vertical motions in the southern Tasman Frontier were crucial to overall Expedition 371 objectives. Microfossil biostratigraphy was employed at this location to determine the age of the sediment sequences and to assess paleobathymetry using benthic foraminifer and ostracod assemblages.
Microfossil abundance is highly variable across all fossil groups at Site U1510 (Figure F17). Nannofossils and planktic foraminifers are abundant in the upper part of the site to ~120 m, where abundance begins to decrease downhole slightly. Benthic foraminifers and radiolarians have low abundances in all samples examined. Microfossil preservation is variable, with the best preservation for all groups in the upper ~40 m and an overall decrease in preservation below.
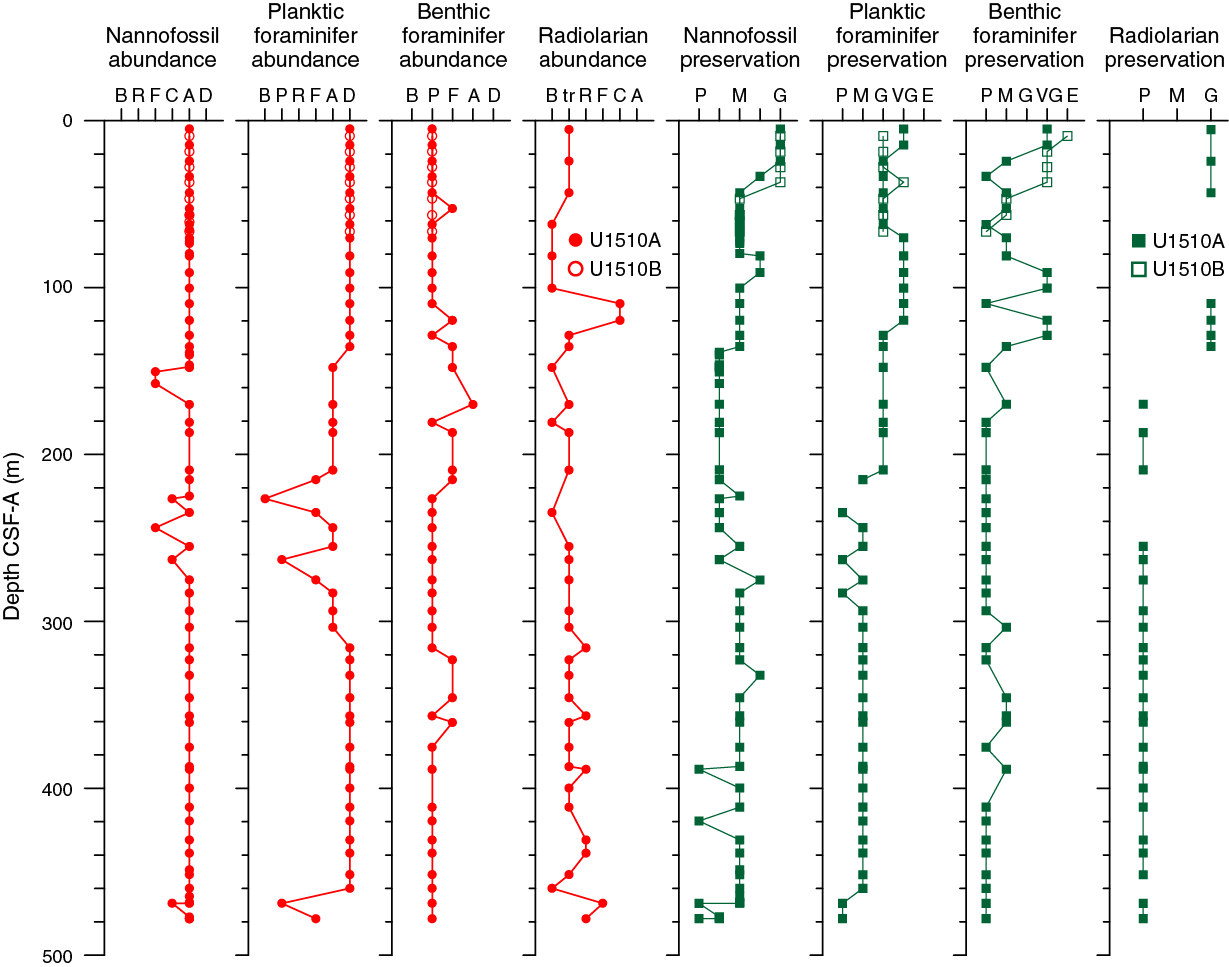
Figure F17. Microfossil preservation and abundance.
Sediments from Hole U1510A range from the Pleistocene to early Eocene based on calcareous nannofossil and planktic foraminifer biostratigraphy (Table T3; Figure F18). Two hiatuses punctuate the Neogene record: between the early Pliocene and late Miocene (~4.4 My duration) and between the late Miocene and middle Miocene (5.3 My duration). A third hiatus separates the early Miocene and late Eocene (~17.5 My duration), so the Oligocene has no sedimentary expression. Sediments from Hole U1510B are Pleistocene to late Miocene in age.
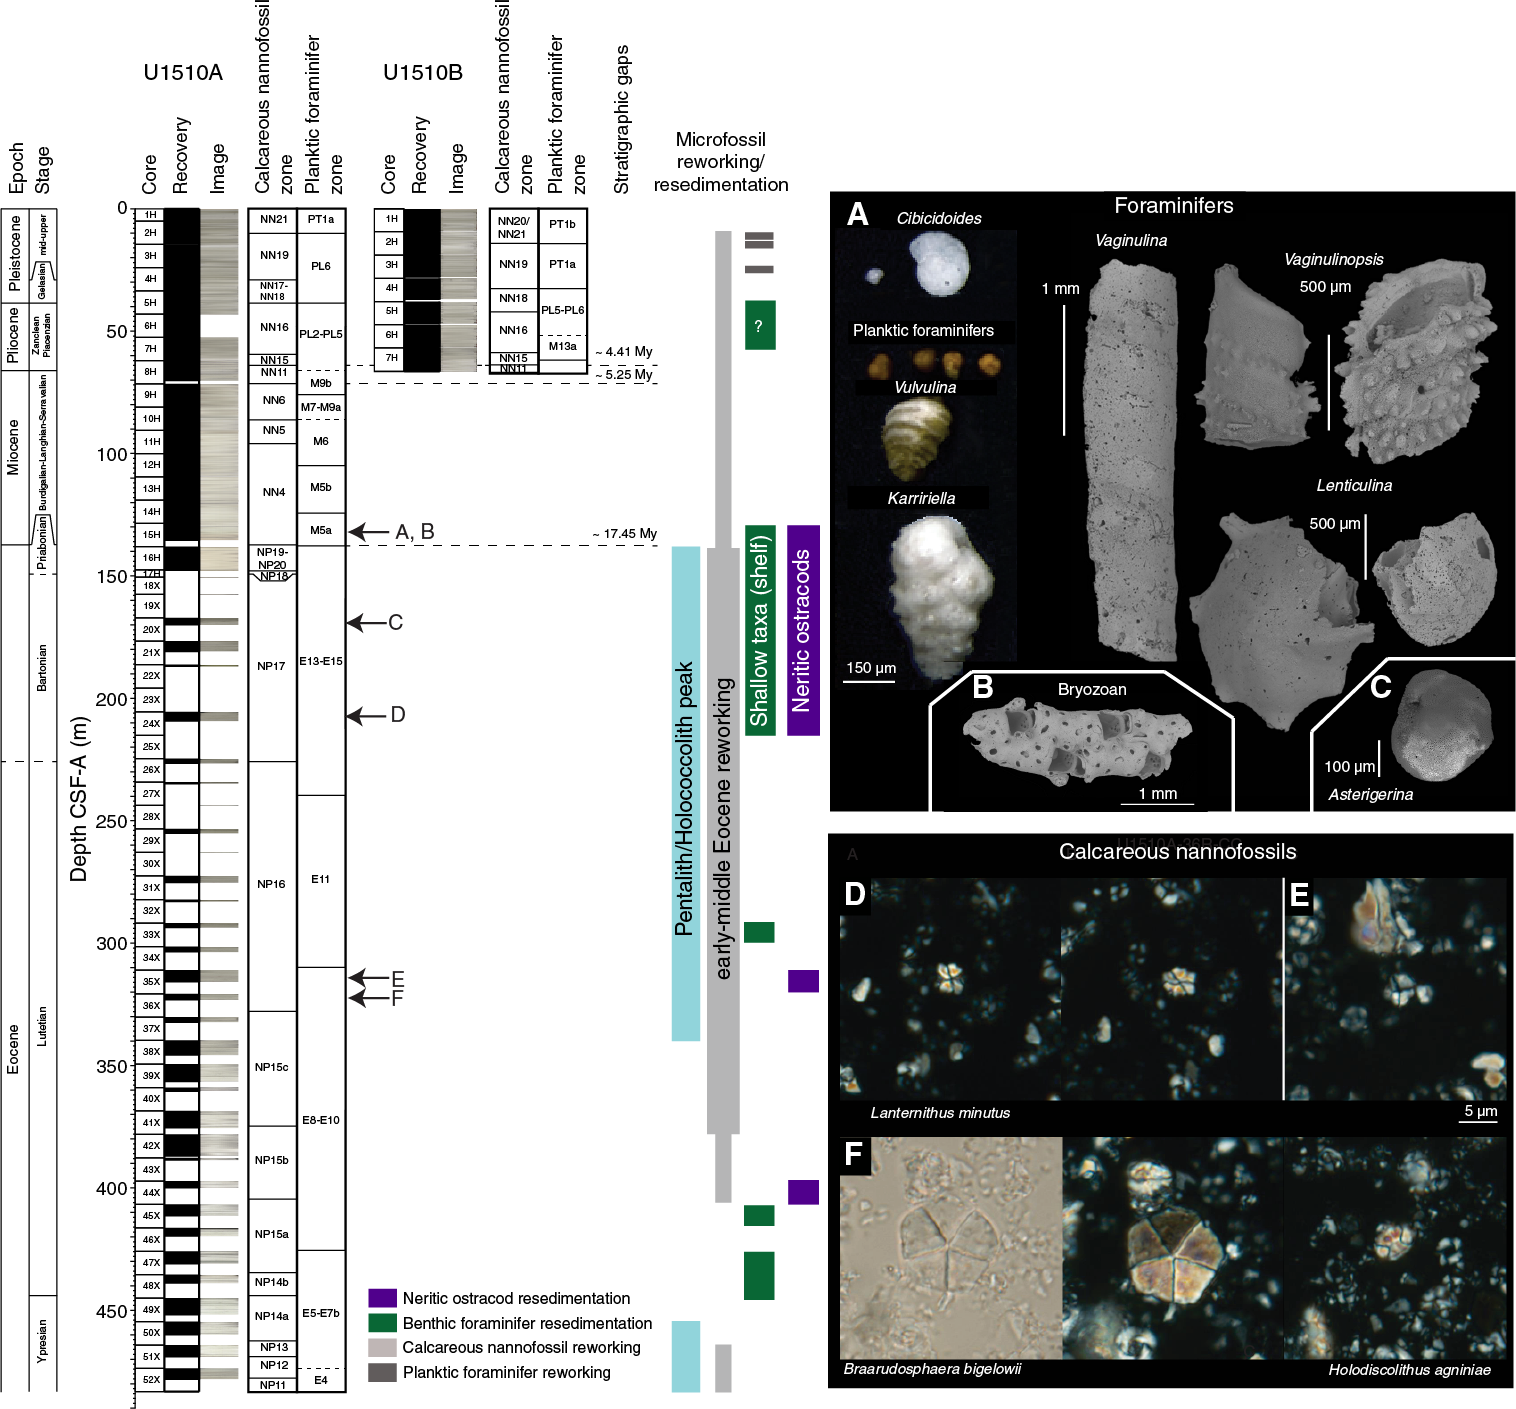
Figure F18. Biozonations and reworking/resedimentation of microfossil assemblages.
Reworking of microfossil species is prevalent throughout both holes at Site U1510 (Figure F18). Early Pliocene to late Miocene planktic foraminifers were found throughout the Pleistocene interval in Hole U1510B (Samples 2H-5, 74–75 cm; 2H-6, 49–51 cm; and 3H-6, 47–49 cm). Reworked calcareous nannofossils were found throughout, with a consistent presence of early to middle Eocene specimens in Samples 371-U1510A-15H-CC through 41X-CC (135.33–375.52 m). Importantly, such reworking includes the presence of resedimented neritic nannofossils, shelfal benthic foraminifers, and neritic ostracods from Sample 371-U1510A-15H-CC downhole (Figure F18) and suggests material sourced from a proximal shallow shelf environment.
Benthic foraminifer and ostracod assemblages indicate the depositional environment of Site U1510 has not changed significantly since the early Eocene. Both fossil groups indicate a lower bathyal paleodepth (excluding reworked microfossils).
Due to weather constraints that limited shipboard palynological processing, no samples from Site U1510 were analyzed for palynology.
Calcareous nannofossils
Calcareous nannofossil biozones were assigned to sediments from Cores 371-U1510A-1H through 52X and 371-U1510B-1H through 7H. Analyses are primarily based on core catcher samples (paleontology; PAL), with additional samples from working-half sections used to refine ages for select intervals, particularly those across major hiatuses. Calcareous nannofossil distribution data are based on shipboard observations that focused on age diagnostic species, so distribution data do not represent the full nannofossil assemblage (Table T4).
Calcareous nannofossils are abundant throughout most of Hole U1510A and all of shorter Hole U1510B. Exceptions include samples from Cores 371-U1510A-18X, 19X, 26X, 28X, 30X, and 51X, where abundance ranges from common to few. Preservation at Site U1510 varies from good to poor; however, most samples have assemblages with moderate preservation.
The parallel upper sequences drilled in Holes U1510A and U1510B represent the Pleistocene (Zones NN21 through NN18) and Pliocene (Zones NN16 through NN15). Deeper in Hole U1510A, sediments accumulated during the Miocene (Zones NN6 through NN4) and late, middle, and early Eocene (Zones NP19/NP20 through NP18, NP17 through NP14b, and NP14a through NP11, respectively).
The uppermost sections of Holes U1510A and U1510B record Pleistocene sediments between 4.98 and 33.51 m and between 9.20 and 36.99 m, respectively, based on the presence of Gephyrocapsa spp. (Samples 371-U1510A-1H-CC and 371-U1510B-1H-CC; Zone NN20/NN21), Pseudoemiliania lacunosa and Helicosphaera sellii (Samples 371-U1510A-2H-CC and 3H-CC, respectively, and Samples 371-U1510B-2H-CC and 3H-CC, respectively; Zone NN19), and Discoaster brouweri (Samples 371-U1510A-4H-CC and 371-U1510B-4H-CC; Zone NN18).
The Pliocene was recorded in Samples 371-U1510A-5H-CC through 7H-CC (43.14–62.28 m) and 371-U1510B-5H-CC through 6H-CC (46.76–56.64 m) (Zones NN16 through NN15). Upper Miocene sediments (Zone NN11) were recorded in Cores 371-U1510A-8H and 371-U1510B-7H based on the presence of Discoaster quinqueramus and Discoaster berggrenii. This gap indicates a hiatus of at most 4.41 My (3.70–8.11 Ma).
In Hole U1510A, a hiatus of at least 5.25 My (8.11–13.36 Ma) spans from the late to middle Miocene between Zones NN11 and NN6 identified in Samples 8H-CC and 9H-1, 75 cm (70.29–72.25 m). The presence of Coccolithus miopelagicus and Cyclicargolithus floridanus assigns Samples 9H-1, 75 cm, through 9H-CC (72.25–81.14 m) to Zone NN6. Zone NN5 was recognized in Sample 10H-CC. The presence of Sphenolithus heteromorphus and the top of Discoaster deflandrei at 95.67 m (±4.69 m) has been used to define the top of Zone NN4 because of the absence of Helicosphaera ampliaperta.
A major hiatus as long as 19.45 My (17.75–36.97 Ma) was identified between Samples 371-U1510A-15H-CC and 16H-1, 80 cm (135.43–138.80 m), and spans the early Miocene to late Eocene (Zones NN4 through NP19/NP20). Below this hiatus, calcareous nannofossils highlight a 340 m long succession through upper, middle, and lower Eocene sediments.
The base of Zone NP19/NP20, defined by the base of Isthmolithus recurvus, was recorded between Samples 371-U1510A-16H-CC and 17H-1, 1–19 cm, at 147.81 m (±0.12 m). Sample 17H-CC was assigned to Zone NP18, with the base of Chiasmolithus oamaruensis at 149.00 m (±1.50 m).
The top of Chiasmolithus grandis at 163.70 m (±6.20 m) marks the top of Zone NP17, which extends from Sample 371-U1510A-20X-CC to Sample 26X-1, 32 cm. The base of Zone NP17 was defined by the top of Chiasmolithus solitus, but because of reworking the presence of this taxon extends well above its stratigraphic range. We thus tentatively place the base of Zone NP17 at 225.71 m (±0.79 m), which is approximated by the base of Dictyococcites bisectus. However, similar forms, denoted as D. cf. bisectus, occur down to Core 30X. Zone NP16 spans Cores 26X through 36X, with the base of this zone defined by the top of Nannotetrina spp. at 327.72 m (±4.54 m), which also coincides with the base common of Reticulofenestra umbilicus. The total range of Chiasmolithus gigas marks the top and base of Subzone NP15b at 374.59 m (±0.83 m) and 404.43 m (±4.47 m), respectively, constraining this zone to Samples 41X-CC and 45X-CC. The base of Nannotetrina fulgens (the Nannotetrina alata group) marks the base of Zone NP15a at 438.22 m (±0.41 m).
The absence of Blackites inflatus inhibits the formal recognition of the base of Zone NP14b, but this datum can be approximated by the base of Nannotetrina cristata and the top of Discoaster lodoensis that occur between Samples 371-U1510A-48X-CC and 49X-3, 89 cm (443.91 ± 4.98 m). D. lodoensis and Discoaster sublodoensis are both present from Samples 49X-3, 89 cm, through 50X-CC (448.89–459.96 m) in Subzone NP14a, with the base of D. sublodoensis (462.42 ± 2.36 m) defining the base of this subzone. Zone NP13 spans Samples 51X-1, 58 cm, to 51X-4, 46 cm, with the base defined by the top of Tribrachiatus orthostylus (468.78 ± 0.11 m). The base of D. lodoensis marks the base of Zone NP12 at 477.57 m (±0.49 m). The lowermost Sample 52X-CC (478.06–478.23 m) was ascribed to the upper part of Zone NP11 based on the presence of Girgisia gammation.
In Hole U1510A, Braarudosphaeraceae are present in assemblages (Braarudosphaera spp., Micrantholithus spp., and Pemma spp.) from the early Miocene (Sample 15H-CC; 135.33–135.43 m) through the middle Eocene (Core 37X; 332.26 m) and in the early Eocene (Cores 50X through 52X) (Figure F18). High abundances of this group are often interpreted to be neritic environments because they can be observed in these environments in the present day (e.g., Black Sea; Bukry, 1974) and in ancient sequences located close to the shelf (e.g., Blake Nose; Erbacher, Mosher, Malone, et al., 2004). The presence of these pentaliths, including very large (>20 µm) forms of Braarudosphaera spp., suggests either resedimentation from a proximal neritic environment or that Site U1510 was neritic through this interval. Holococcoliths present in this interval might also suggest a shallower environment. However, other components of calcareous nannofossil assemblages are not typical of a neritic paleoenvironment. Including the presence of reworked specimens of other microfossil groups in the same interval, collectively the assemblages support transport from nearby shallow-water environments.
Planktic foraminifers
Planktic foraminifers are a dominant to abundant part of the >63 µm fraction in Samples 371-U1510A-1H-CC through 24X-CC (4.98–209.32 m) and 371-U1510B-1H-CC through 7H-CC (9.20–66.59 m) (Figure F17). Below 209.32 m, abundances generally decrease, with a few samples barren of planktic foraminifers. Preservation ranges from excellent to good in the upper part of the holes (Samples 371-U1510A-1H-CC through 21X-CC [4.98–180.87 m] and 371-U1510B-1H-CC through 7H-CC [9.20–66.59 m]); preservation decreases from Sample 371-U1510A-22X-CC through Sample 52X-CC (186.89–478.23 m) (Table T5).
Planktic foraminiferal zones and subzones were assigned to Samples 371-U1510A-1H-CC through 52X-CC and 371-U1510B-1H-CC through 7H-CC (Table T3; Figure F18).
The uppermost section of Hole U1510A (Samples 1H-CC through 2H-CC; 5.08–14.58 m) was assigned to the Pleistocene. Samples 3H-CC through 7H-CC (24.37–62.18 m) were assigned to the early late–late Pliocene. The base of Zone PL6 was defined by the top of Globorotalia tumida between Samples 5H-CC and 6H-CC (47.96 ± 4.72 m). From Sample 6H-CC through Sample 8H-CC (52.71–70.19 m), Zones PL5–PL2 were loosely defined based on planktic foraminifer assemblages. The early Pliocene to late Miocene interval in Hole U1510A was not recognized by planktic foraminifers.
Middle Miocene Subzone M9b was identified between Samples 371-U1510A-8H-CC and 9H-CC (75.67 ± 5.38 m) based on the base of Fohsella robusta. Zone M7 through Subzone M9a (undifferentiated) was tentatively placed between Samples 9H-CC and 10H-CC (86.06 ± 4.92 m). The expanded middle Miocene Zone M6 through Subzone M5a was recognized from Sample 10H-CC through Sample 15H-CC (91.08–135.33 m). A continuous Praeorbulina–Orbulina lineage that includes the biohorizons of Praeorbulina sicana, Praeorbulina glomerosa, Praeorbulina circularis, and Orbulina suturalis was recorded through this interval.
No Oligocene planktic foraminifer assemblage was recognized in Hole U1510A, which is consistent with calcareous nannofossil assemblages, indicating that this epoch is absent from the sedimentary record at Site U1510. However, in line with calcareous nannofossils, the site does contain a relatively thick late to early Eocene section. Samples 15H-CC through 16H-CC include Globigerinatheka index and Turborotalia increbescens, which indicate late to middle Eocene Zones E15–E14 (141.63 ± 6.20 m). Subsequent Samples 16H-CC through 24X-CC (147.83–209.32 m) were assigned to Zones E14–E13 based on the co-occurrences of Acarinina collactea and Subbotina linaperta. Although Zone E12 was not recognized because of the absence of Orbulinoides beckmanni, the boundary between Zones E13 and E11 was identified between Samples 27X-CC and 28X-CC based on the top of Acarinina bullbrooki (239.41 ± 4.45 m). In turn, the top of Guembelitrioides nuttalli, which defines the base of Zone E11, was found between Samples 34X-CC and 35X-CC (309.68 ± 6.06 m).
The base of G. index was identified between Samples 371-U1510A-40X-CC and 41X-CC (367.99 ± 7.43 m), indicating Zone E10. In addition, Sample 40X-CC yields common Hantkenina australis, a species that has been previously recorded to occur only in the New Zealand lower Kaiatan to upper Bortonian stages (Hornibrook et al., 1989), well above the last occurrence of G. index. Samples 41X-CC through 46X-CC (375.52–419.60 m) were assigned to Zones E10–E8 and contain abundant Acarinina species, including A. bullbrooki, A. collactea, and Acarinina primitiva. The top of Morozovella crater was recognized between Samples 46X-CC and 47X-CC (425.34 ± 5.63 m), which corresponds to the top of Subzone E7b in sequences of New Zealand (Raine et al., 2015). The base of M. crater was placed between Samples 51X-CC and 52X-CC (473.61 ± 4.52 m), which indicates Zone E5. Therefore, Subzone E7b through Zone E5 is undifferentiated (Figure F18). Between the same samples, the tops of Morozovella lensiformis and Morozovella aequa also occur, indicating Zone E4. The co-occurrence of M. crater, M. lensiformis, and M. aequa suggests a ~2.0 My hiatus near the base of Hole U1510A, but nannofossil biostratigraphy did not support this hiatus.
In Hole U1510B, Samples 1H-CC through 4H-CC (9.20–36.99 m) were assigned to Pleistocene Zone PT1 based on the occurrence of Globorotalia truncatulinoides. The evolutionary last appearance of Globigerinoides ruber (pink) occurs alongside the top of Globoconella puncticuloides at 1.03 Ma (Sample 2H-3, 74–75 cm), perhaps indicating this species has an earlier extinction in the Tasman Sea compared with much of the Indo-Pacific region (Wade et al., 2011; Crundwell et al., 2016). The top of G. tumida was recognized between Samples 5H-CC and 6H-CC (51.70 ± 4.84 m), indicating Zone PL5. The occurrence of Globorotalia crassaformis and the absence of Globoturborotalita nepenthes in Sample 6H-CC indicates Pliocene Zones PL5–PL2. Samples 6H-CC through 7H-CC (61.57 ± 4.93 m) were assigned to late Miocene Subzone M13a based on the co-occurrence of Globoquadrina dehiscens and Hirsutella cibaoensis.
Benthic foraminifers
Benthic foraminifers were examined qualitatively from 52 cores in Holes U1510A and U1510B (Table T6). The abundance of this group ranges from poor to few relative to total sediment particles in the >63 µm fraction of most studied samples (Figure F17). Only Sample 371-U1510A-20X-CC (178.55 m) from the upper Eocene contains abundant benthic foraminifers, where they comprise more than 10% of total sediment particles.
Benthic foraminifer preservation in Pleistocene sediments ranges from very good to poor in Cores 371-U1510A-1H through 4H and from excellent to very good in Cores 371-U1510B-1H through 4H (Figure F17). Preservation is mainly moderate in Pliocene sediments and ranges from poor to very good in Miocene sediments. Eocene benthic foraminifers are generally poorly preserved, with an interval of moderate preservation in the middle Eocene (Cores 371-U1510A-38X, 39X, 40X, and 43X). More than 1500 specimens were picked from Holes U1510A and U1510B, and 160 taxa were identified. Most samples are strongly dominated by calcareous taxa. Agglutinated taxa only become a common component of assemblages in Samples 371-U1510A-15H-CC and 16H-CC (135.33 and 147.83 m).
There is a slight change in the Miocene assemblages, which are more diverse than those found in the Pliocene and Pleistocene. These assemblages include common Anomalinoides spp. (e.g., Anomalinoides semicribratus), Bolivina spp. (including Bolivina byramensis), Cassidulina spp., Cibicidoides mundulus, Globocassidulina subglobosa, Gyroidinoides spp., Lenticulina spp., nodosariids, Oridorsalis umbonatus, and Stilostomella spp.
Eocene assemblages contain abundant Bolivina spp., Cibicides spp. (including Cibicides novozelandicus and Cibicides parki), Cibicidoides spp., G. subglobosa, Lenticulina spp., nodosariids, O. umbonatus, stilostomellids, and Spiroplectammina cubensis. The species Cibicidoides laurisae and Nuttallides truempyi become more common in the middle Eocene. Middle Eocene Sample 371-U1510A-40X-CC (360.46 m) is strongly dominated by infaunal taxa, including Trifarina bradyi, nodosariids, and stilostomellids.
Pleistocene sediments contain a lower bathyal assemblage consistent with the ~1200 m present-day water depth at Site U1510. The Pleistocene assemblage includes the primarily bathyal species Uvigerina hispida and Eggerella bradyi and species with wider depth ranges (bathyal to abyssal), such as Epistominella exigua, Cibicidoides bradyi, Cibicides robertsonianus, G. subglobosa, O. umbonatus, and Planulina wuellerstorfi (van Morkhoven et al., 1986; Holbourn et al., 2013). The frequent occurrence of P. wuellerstorfi and C. mundulus, whose upper depth limit is generally placed at 1000 m depth, supports deposition at lower bathyal depths.
The Pliocene interval also contains common lower bathyal species, including Hopkinsina mioindex, Cibicides ihungia, C. bradyi, or E. bradyi. The occurrence of frequent to abundant B. byramensis suggests deposition at paleodepths above lower bathyal (2000 m). The presence of specimens ascribable to Carpentaria sp. and some unidentified species of discorbids during the Pliocene (Samples 371-U1510A-6H-CC through 8H-CC; 52.61–70.29 m) may indicate episodes of resedimentation.
The Miocene interval accumulated at lower bathyal paleodepths, as inferred from the common occurrence of B. byramensis, G. subglobosa, O. umbonatus, and C. laurisae and the presence of A. semicribratus, C. mundulus, and P. wuellerstorfi. Reworking is pervasive in Miocene Sample 371-U1510A-15H-CC (135.33 m), where foraminifer tests display different colors (white, green, and orange) and preservation states. The assemblage includes broken tests of Vaginulinopsis hochstetteri and Lenticulina spp., possibly derived from shelfal environments, as well as Hanzawaia ammophila (neritic to upper bathyal), Gyroidinoides girardanus (whose top occurrence has been reported at the Paleocene/Eocene boundary), and agglutinated species that are most common at upper bathyal and shelf settings, such as Gaudryina reussi and Gaudryina proreussi.
The 330 m thick Eocene interval is also considered to be lower bathyal, as it contains a significant number of bathyal (Buliminella grata) and bathyal to abyssal (Anomalinoides capitatus, Bulimina trinitatensis, Bulimina tuxpamensis, Buliminella browni, Cibicides collinsi, Cibicides truncanus, G. subglobosa, and O. umbonatus) dwellers. Several species of Vulvulina were identified, although in very low numbers. In the New Zealand region, this genus has been commonly used as a deep mid-bathyal marker (Hayward, 1986). The scattered occurrence of Cibicidoides grimsdalei indicates a lower bathyal depth of deposition, as this species occurs in greatest abundance at abyssal depths (van Morkhoven et al., 1986).
Resedimentation of specimens from shallower water depth is inferred for many samples from the late to middle Eocene. In the late Eocene, the benthic assemblages in Cores 371-U1510A-16H, 20X, 21X, 22X, and 24X contain Flabellammina jacksoni, Wadella globiformis, Eponides lornensis, Bolivinitella olsoni, and Glabratella spp. These species are recorded from late Eocene bryozoan limestones associated with volcanic deposits in North Otago, New Zealand, and are thus considered shelf or upper bathyal dwelling taxa. Other shelf- or upper bathyal–restricted taxa recovered from the middle to late Eocene (Cores 33X and 45X through 47X) include Arenodosaria antipoda, large Vaginulinopsis spp. (including V. hochstetteri), G. proreussi, and large nodosariids. In the middle Eocene, sparse specimens of Asterigerina sp. were recovered from Cores 31X, 34X, and 36X. In New Zealand, Asterigerina is associated with late Eocene deposits and is considered to generally represent shallow-water conditions (shelf environments).
Ostracods
In total, 1665 specimens of ostracods were picked from Hole U1510A sediment. These specimens were identified to the family or genus level. Abundance data were normalized to the number of specimens per 45 cm2 tray and range from 0 to 130 (Figure F19). Four shifts in abundance were found: (1) an increase from ~10 to ~95 specimens/tray between Samples 371-U1510A-15H-CC and 16H-CC (135.33–147.93 m), which marks the Unit I/II boundary; (2) a decrease to ~5 specimens/tray between Samples 24X-CC and 25X-CC (209.22–215.20 m); (3) an increase to ~62 specimens/tray between Samples 33X-CC and 35X-CC (293.61–315.84 m); and (4) a decrease to ~8 specimens/tray between Samples 44X-CC and 45X-CC (399.86–411.42 m). The most abundant taxa include Argilloecia spp., Cytheropteron spp., Cytherella spp., Bradleya spp., Xestoleberis spp., Krithe spp., Bairdoppilata spp., Poseidonamicus spp., and trachyleberidids.
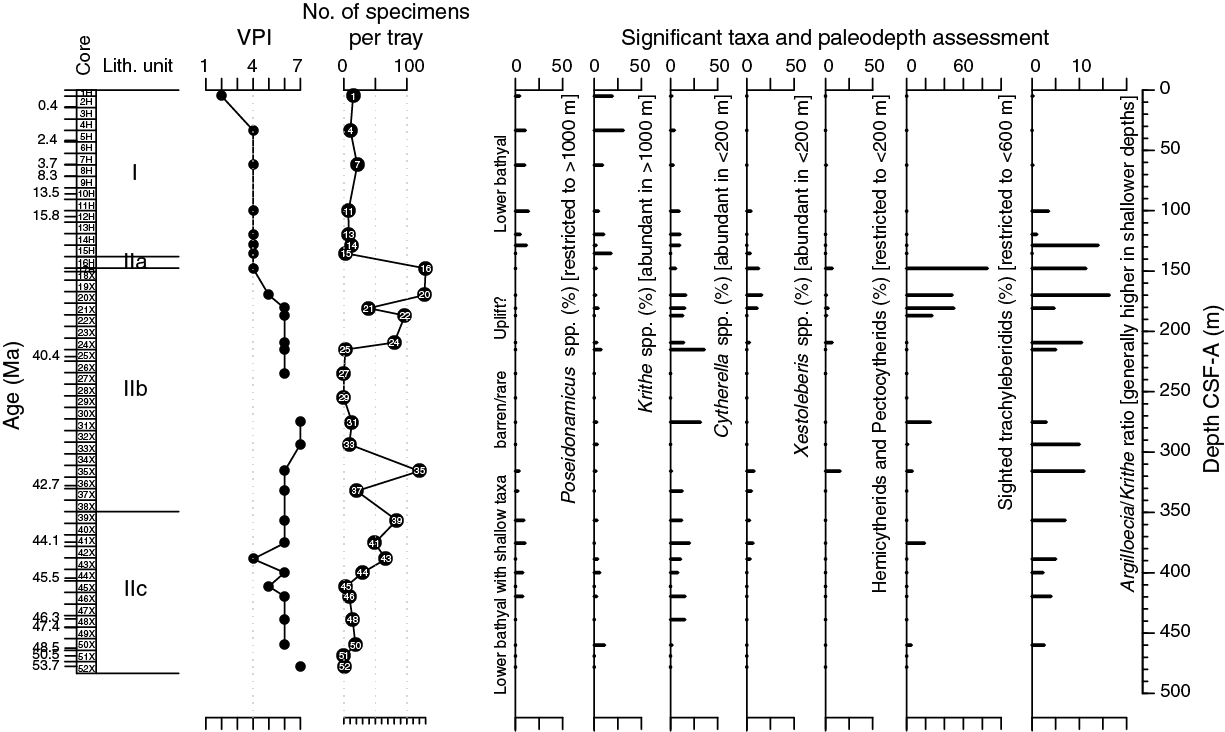
Figure F19. Ostracod preservation, abundance, and assemblage composition.
Ostracod preservation was assessed using the visual preservation index (VPI) (Dwyer et al., 1995). VPI ranges from 2 to 4 in Unit I and Subunit IIa and ranges from 4 to 7 in Subunits IIb and IIc (Figure F19).
Paleodepth estimates based on ostracods suggest lower bathyal settings for much of Hole U1510A, although with some complexity (Figure F19). From the Pleistocene to the middle Miocene (Samples 1H-CC through 14H-CC; 4.98–128.71 m), Poseidonamicus spp., which exclusively inhabits >1000 m water depths, is present. Late Eocene Samples 16H-CC through 24X-CC (147.83–209.32 m) include a predominantly neritic assemblage, including Argilloecia spp., Cytherella spp., Xestoleberis spp., and sighted trachyleberidids. This assemblage suggests a shallow-water depth or, alternatively, resedimentation. Below the lower late Eocene interval of low abundance (Samples 25X-CC through 33X-CC; 215.10–293.71 m), mixtures of Poseidonamicus spp. and neritic taxa were found in the middle Eocene (Samples 35X-CC through 44X-CC; 315.74–399.96 m).
Radiolarians
A total of 38 core catcher samples from Core 371-U1510A-1H through Core 52X (4.98–478.23 m) were processed and analyzed for radiolarian abundance and preservation. The middle Miocene interval between 109.55 and 119.67 m (Samples 12H-CC and 13H-CC), as determined by nannofossil and planktic foraminifer biostratigraphy, contains common radiolarians along with abundant sponge spicules. In all other cores, radiolarian abundance is generally very low. Most samples contain only trace or rare counts of radiolarians. The bottom of the hole shows slightly higher abundances, varying between rare and few (430.97–478.23 m).
Radiolarian preservation is good in the top part of Hole U1510A (4.98–135.43 m) and deteriorates to poor thereafter. The occurrence of chert from ~150 m downhole suggests diagenetic alteration of biogenic silica, which may account for the very low abundance and poor preservation of radiolarians.
Due to scarcity and poor preservation, no biostratigraphic radiolarian events were documented (Table T7). The two radiolarian-rich samples (109.55–119.67 m) of middle Miocene age contain a mixture of long-ranging species such as Lychnocanium elongata (Zones RP22a–RN3), Botryostrobus miralestensis (Zones RN2–RN8), Cyrtocapsella tetrapera (Zones RN1–RN6), and Cyrtocapsella japonica (Zones RN5–RN6).
Paleomagnetism
Pass-through paleomagnetic measurements were performed on all archive-half sections from Site U1510. A total of 33 discrete samples were also collected, either by pushing standard 7 cm3 cubes into sediment (28 samples from Unit I and Subunit IIb) or trimmed from cores as 2 cm × 2 cm × 2 cm cubes (5 samples from Subunit IIc). Discrete samples were subjected to remanence measurement after stepwise alternating field (AF) demagnetization of natural remanent magnetization (NRM), followed by anisotropy of magnetic susceptibility (AMS) measurement.
Paleomagnetic results
NRM intensity of most sediment cores from Unit I at Site U1510 is weak, around 10−4 to 10−3 A/m (Figures F20, F21). From 150 m downcore in Unit II, NRM intensity is on average higher, although core recovery dropped significantly. In addition, cores from Unit II have significant disturbance resulting from XCB coring. These factors result in a generally very noisy paleomagnetic signal from the pass-through magnetometer. This noisy signal can also be seen from the histogram of inclination values, which does not show a bimodal distribution (Figure F22A–F22B).
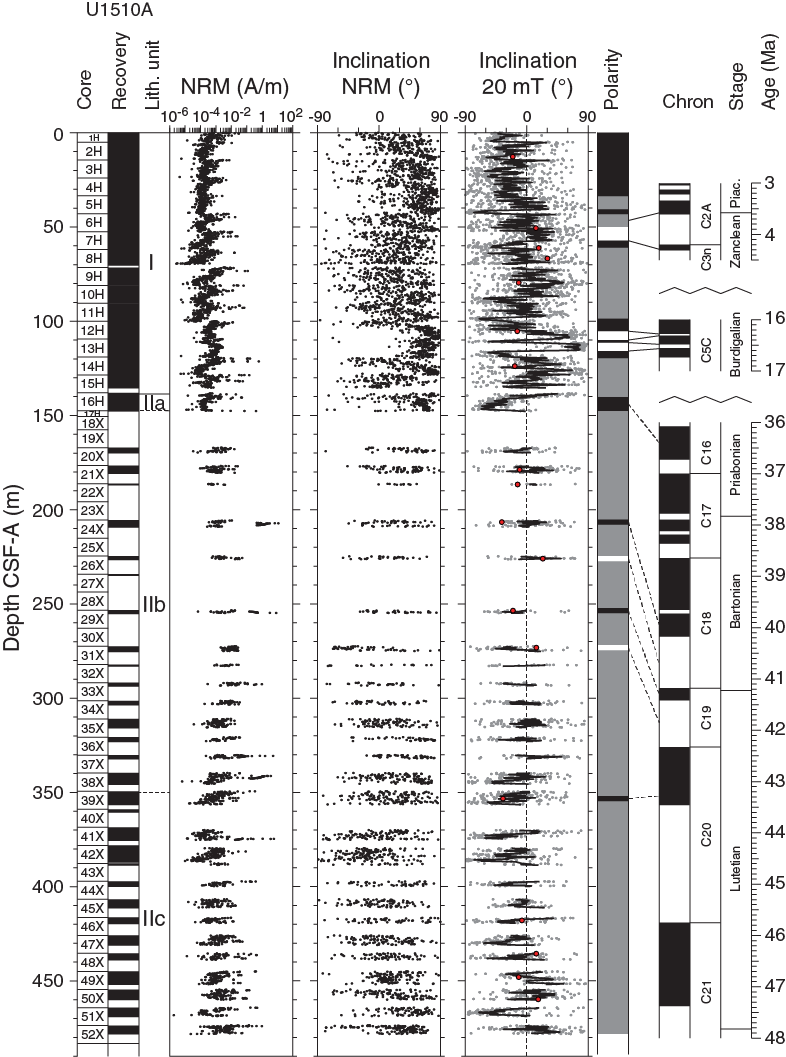
Figure F20. Pass-through paleomagnetic data, Hole U1510A.
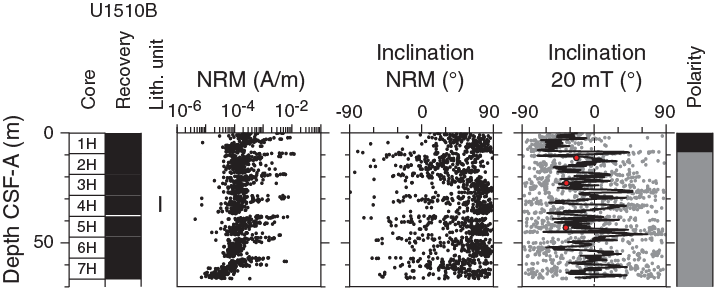
Figure F21. Pass-through paleomagnetic data, Hole U1510B.
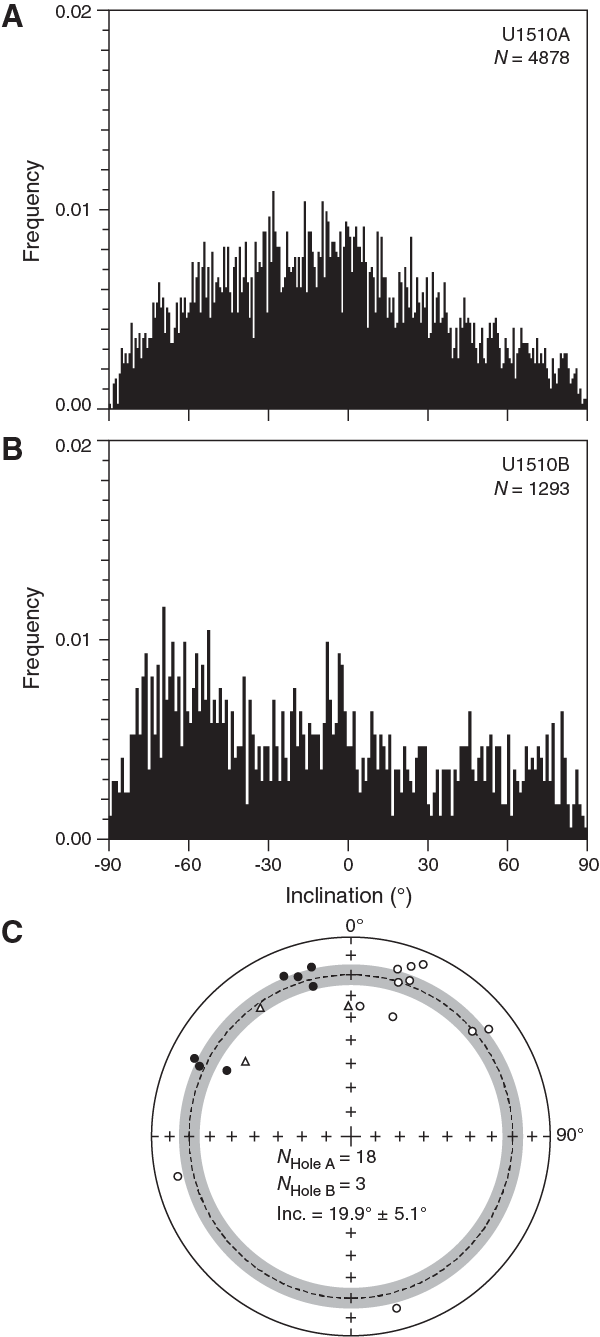
Figure F22. Inclination values.
Principal component analysis (PCA) of paleomagnetic data on discrete samples enables isolation of characteristic remanent magnetization (ChRM) components of the NRM in 21 of the discrete samples from Site U1510 (Figure F23). The average inclination for the combined upward- and downward-pointing vectors was estimated following the method of McFadden and Reid (1982; Figure F22C). Stereographic projection of all directions derived from discrete samples shows a clustered distribution of declination data toward the northern hemisphere of the projection. Such clustered distribution of declination values was not expected, considering the XCB coring, which should result in a random distribution of declination. The origin of such clustered declination could have derived from coring, splitting, or sampling operations.

Figure F23. Vector endpoint demagnetization diagrams.
Anisotropy of magnetic susceptibility
AMS was measured on all 33 discrete samples from Site U1510 (Figure F24). Most samples (N = 23) have negative susceptibility values (i.e., dominated by diamagnetic materials such as carbonate) and render AMS measurements with large errors. Therefore, AMS results from these magnetically weak samples were disregarded. The remaining 10 samples with positive susceptibility values show a poorly defined orientation of the AMS tensor with weakly developed fabric. Nevertheless, the κmin axis of the AMS ellipsoid is oriented roughly perpendicular to the horizontal plane although with a large dispersion around the vertical axis. The large deviation of the κmin axis from the vertical axis is probably due to coring and sampling-induced disturbance.
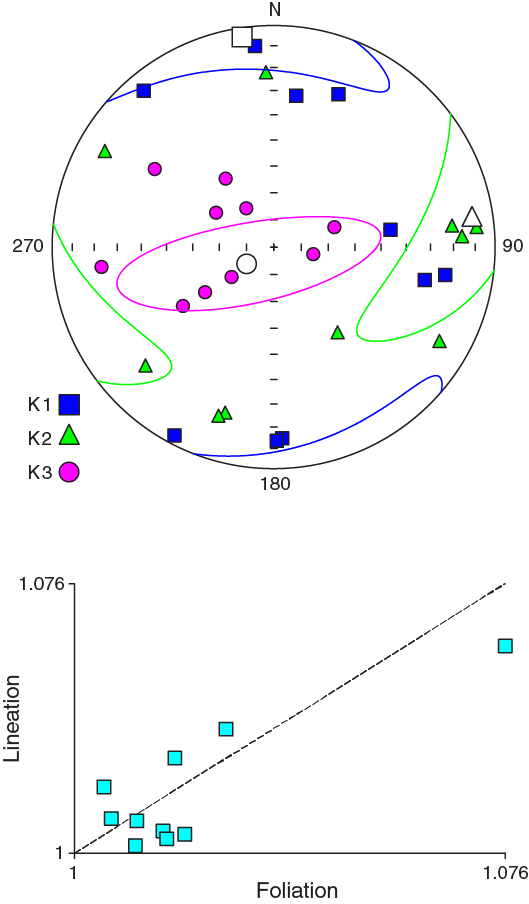
Figure F24. AMS data for 10 discrete samples.
Magnetostratigraphy
After integrating paleomagnetic data with biostratigraphy, a few paleomagnetic reversals and polarity zones may correlate with some of those in the geomagnetic polarity timescale (GPTS) (Figure F20). However, the generally low core recovery and significant core disturbance make the derived magnetic polarity correlation highly speculative. Hence, shipboard magnetostratigraphic data were not considered for the age model at Site U1510.
Petrophysics
Hole U1510A cores were analyzed with the full suite of physical properties measurements (see Petrophysics in the Expedition 371 methods chapter [Sutherland et al., 2019a]). Downhole temperature measurements were made at five depths in Hole U1510A and one depth in Hole U1510B. No wireline logging measurements were made. Physical properties measurements at Site U1510 are affected by low recovery and by the churned up nature of the core that was recovered by XCB drilling in ooze and chalk with chert layers.
In the calcareous ooze in Unit I, bulk density rapidly increases then decreases with depth, with opposite trends observed in porosity. NGR is highly variable in this unit, whereas P-wave velocity is low and approximately constant. The Unit I/Subunit IIa boundary marks the first occurrence of chert and cherty limestone and corresponds to significant changes in most physical properties. Bulk density, porosity, magnetic susceptibility, NGR, and color reflectance all have baseline shifts at this boundary.
In Subunit IIb, bulk density varies between ~1.8 and 2.1 g/cm3, grain density and porosity are approximately constant (with outliers), and P-wave velocity values increase to ~1750 m/s by 300 m and then decrease again to 1600 m/s by ~350 m, the base of Subunit IIb, where fewer chert layers were observed. Magnetic susceptibility and NGR both increase downhole toward the middle of the subunit and then decrease toward the base of Subunit IIb. Velocity increases locally in Subunit IIc, where NGR spikes occur and sand layers were observed. Near the base of Hole U1510A at 478 m, increased lithification is associated with the highest density and velocity values and lowest porosity values.
From the in situ temperatures, the heat flux is 62.8 ± 5.4 mW/m2, which is within expected values based on reliable heat flow values from the surrounding region.
Density and porosity
Bulk density was estimated using the GRA method on whole-round sections and the moisture and density (MAD) method on discrete samples from section halves (Figure F25). The decrease in porosity (φ) with depth (z) (i.e., φ = φoe−z/c), is best fit with φo = 63.4% ± 1.6% and c = 1221 ± 166 m, with substantial deviations as described below. The most substantial jump to higher bulk density and lower porosity is at ~138 m and is associated with the boundary between lithostratigraphic Unit I ooze and Subunit IIa ooze with chert. Another large change occurs at the base of Hole U1510A in the lowermost section of Core 52X (478 m) and is associated with increased lithification. These changes are not reflected in grain density, which is consistent with the overall calcareous material at the site (see Lithostratigraphy).
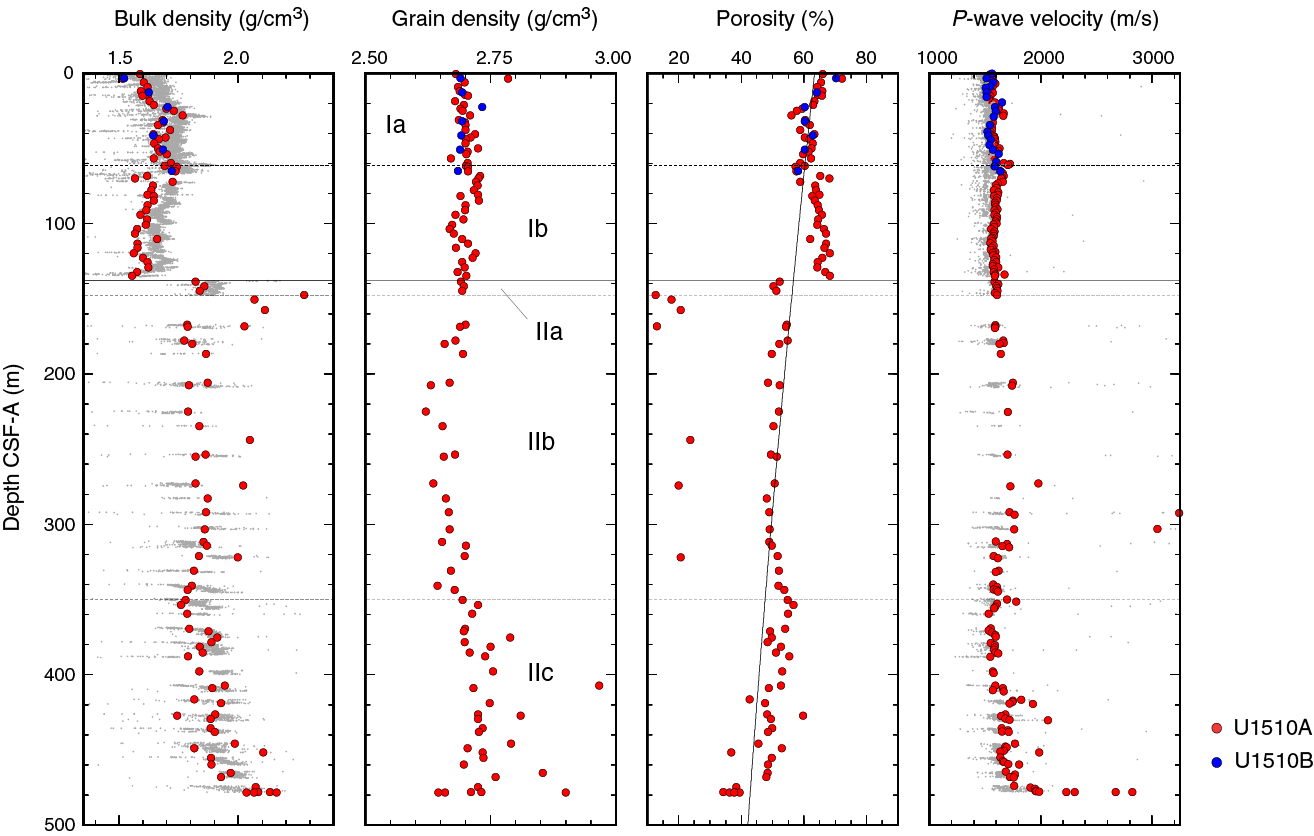
Figure F25. Bulk density, grain density, porosity, and P-wave velocity.
In the calcareous ooze in Unit I, bulk density rapidly increases with depth in the uppermost part of the unit (0–30 m) from 1.60 to 1.75 g/cm3. Bulk density is approximately constant at 1.70 g/cm3 at 30–65 m and then gradually decreases from 1.70 to 1.55 g/cm3 between 65 m and the bottom of Unit I at 138 m. MAD bulk density values are lower than GRA bulk density values in this unit, which is attributed to the GRA calibration (and computation) that does not take into account the carbonate nature of the sediment. Grain density remains constant around 2.70 g/cm3 in Unit I, whereas porosity decreases from 65% to 60% between 0 and 65 m and increases from 60% to 70% between 65 and 138 m. Porosity is higher than that predicted by the exponential fit in Subunit Ib (Figure F25).
At the Unit I/II boundary at 138 m, where bioclasts appear in the ooze, bulk density increases from 1.55 to 1.85 g/cm3 and porosity decreases from 70% to 50%. From 138 to 330 m in Unit II, bulk density varies between 1.75 and 1.85 g/cm3, with localized high values of 2.0–2.2 g/cm3 measured in layers of cherty limestone. In that same interval, grain density and porosity are approximately constant at around 2.67 g/cm3 and 50%, respectively, except for localized values <2.50 g/cm3 (not plotted) and <24%, respectively, measured in cherty limestone.
In Subunit IIc, below about 350 m, bulk density shows some variance but generally increases downhole from 1.8 to 2.2 g/cm3. In the interval 350–477 m, grain density also increases with depth from 2.7 to 2.8 g/cm3 and porosity decreases from ~60% to ~35% downhole. At 478 m (bottom of the hole; Sample 371-U1510A-52X-CC), bulk density reaches 2.16 g/cm3, grain density is 2.9 g/cm3, and porosity is 34% in an interval that is not associated with a significant change in composition (see Lithostratigraphy). Rather the sediments in Core 52X are more lithified and represent a condensed section of early Eocene carbonate (see Biostratigraphy and paleoenvironment).
P-wave velocity
P-wave velocity was measured on whole-round sections (P-wave logger [PWL]) and on working-half sections (P-wave caliper [PWC]) (Figure F25). Where possible, the PWC measurements were taken on core pieces with minimal drilling disturbance, such as coherent biscuits comprising the main lithology. However, for most cores between ~138 and 300 m (Subunit IIb), coherent biscuits were scarce and measurements were taken in fractured and remolded sediments. The resulting P-wave velocity values are likely lower than in situ values. PWC velocity values are higher than PWL values because more coherent core pieces were selected for measurement.
P-wave velocity (PWC) in Unit I increases from 1550 to ~1600 m/s between 0 and 138 m. Variance is low in this unit; however, P-wave velocity increases locally at 22 and 60 m to ~1650 m/s. Beds of foraminifer ooze noted in the calcareous ooze do not correlate with the change in physical properties.
In Subunits IIa and IIb, low recovery prevents a robust analysis of bulk physical properties. P-wave velocity increases from ~1600 to ~1800 m/s from 138 to ~320 m. Chert bands sampled in this unit have P-wave velocity values as high as 4000 m/s (extreme values are not plotted). Thickness ratios of cherty limestone to nannofossil chalk cannot be determined because of poor core recovery, and the average in situ P-wave velocity for this interval is higher than that calculated from recovered sediments. P-wave velocity decreases downhole to 1600 m/s at 330 m, just above the top of Subunit IIc, further decreases to 1550 m/s by ~360 m, and then increases again to 1700 m/s at ~417 m. This pattern likely reflects varying levels of drilling disturbance rather than in situ properties. The nannofossil chalk of Subunit IIc has fewer chert layers than Subunit IIb.
At ~420 m, P-wave velocity in Subunit IIc is 1820 and 1930 m/s in tuffaceous sandstone and claystone (Core 371-U1510A-46X; 416–420 m), respectively. Below 420 m, P-wave velocity in the major lithology of nannofossil chalk in Subunit IIc is ~1700 m/s. P-wave velocity increases throughout Core 52X to ~2000 m/s at 477 m, 2300 m/s at 478.1 m, and ~2600 m/s at the base of the PAL sample (52X-CC; 478.2 m). These velocity increases are not associated with a significant change in composition (see Lithostratigraphy); rather the sediments in Core 52X are more lithified and represent a condensed section of early Eocene carbonate (see Biostratigraphy and paleoenvironment).
Magnetic susceptibility
Magnetic susceptibility was measured with the pass-through system (loop magnetic susceptibility [MSL]) on all whole-round sections and the point measurement system (point magnetic susceptibility [MSP]) on all section halves (Figure F26). Values are mostly 0 to −3 instrument units (IU), characteristic of the diamagnetic nature of the Unit I foraminifer ooze (0–138 m). Lithostratigraphic Subunits IIa and IIb show slightly higher values, increasing from −1 IU at ~138 m to ~4 IU at 300 m in chalk and cherty limestone. From 330 to ~410 m, values decrease again and are mostly negative in Subunit IIc. From 400 m to the base of the section, values fluctuate between −3 and 10 IU.
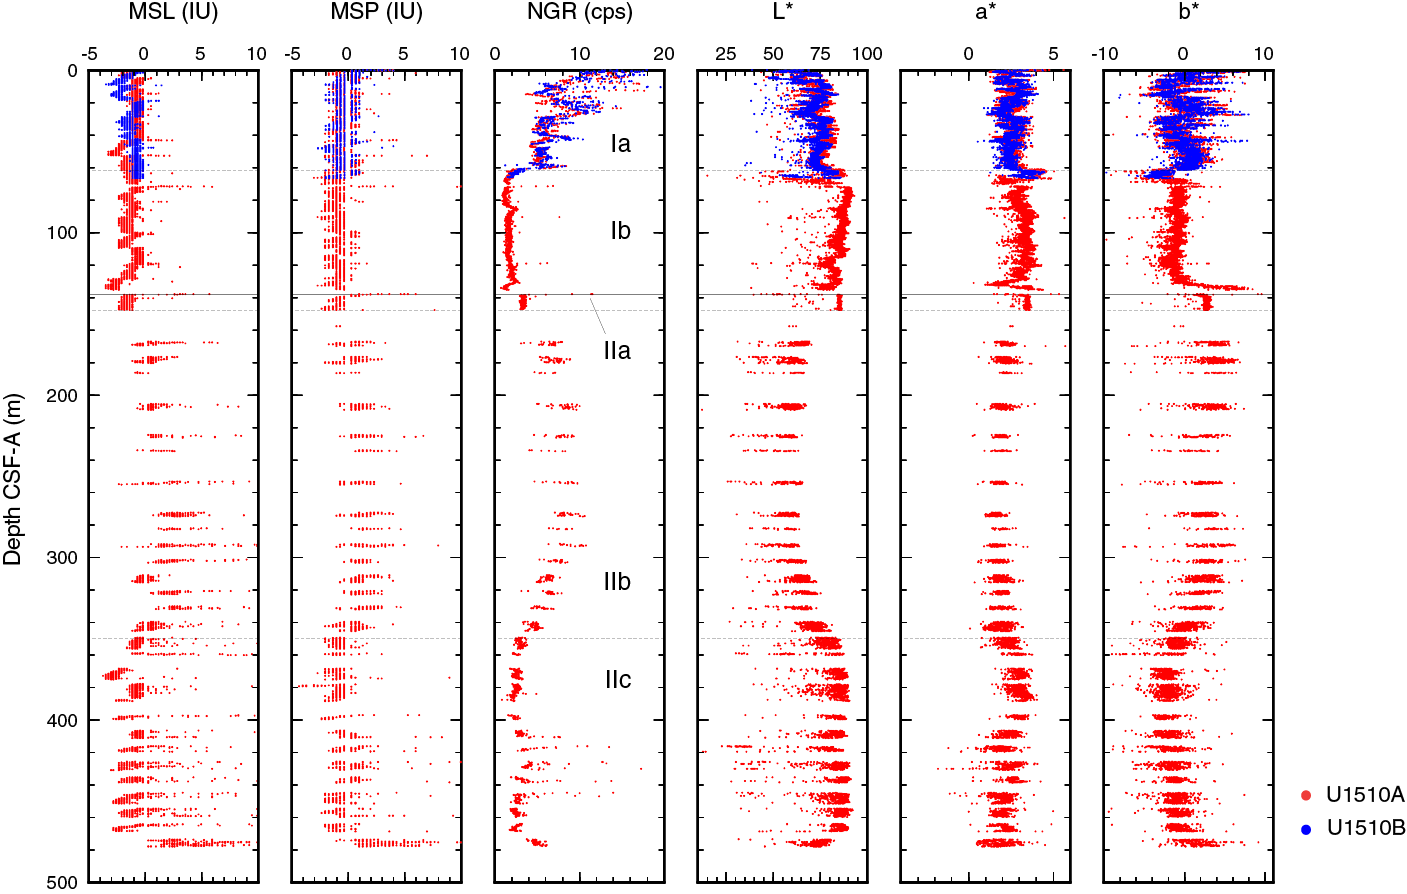
Figure F26. Magnetic susceptibility, NGR, and L*, a*, b*.
Natural gamma radiation
NGR was measured on all whole-round sections from Hole U1510A (Figure F26). NGR is variable in lithostratigraphic Unit I; values decrease downhole from ~18 to ~2 counts/s in Subunit Ia (0–60 m) and remain at ~2 counts/s through Subunit Ib (60–138 m). Holes U1510A and U1510B show the same trend with depth. Subunit IIa has slightly higher NGR values of ~3.5 counts/s. In Subunit IIb, NGR values follow the trend observed in magnetic susceptibility data; values increase downhole to 10 counts/s at 290 m and then decrease to 3 counts/s by ~350 m. NGR is ~2 counts/s in Subunit IIc but spikes to ~15 counts/s at 410–450 m. Similar to increases in other physical properties data at the base of the subunit (~475 m; Core 371-U1510A-52X), NGR shows a small increase to ~5 counts/s.
Thermal conductivity and temperature
Thermal conductivity measurements were made on the dominant lithology in each core of both Holes U1510A and U1510B in the upper 70 m and in Hole U1510A below 70 m. Thermal conductivity data show an increasing trend with depth from about 1.0 to 1.2 W/(m·K) from the seafloor to about ~60 m and from ~1.2 to ~1.6 W/(m·K) from 60 to 480 m (Figure F27D).
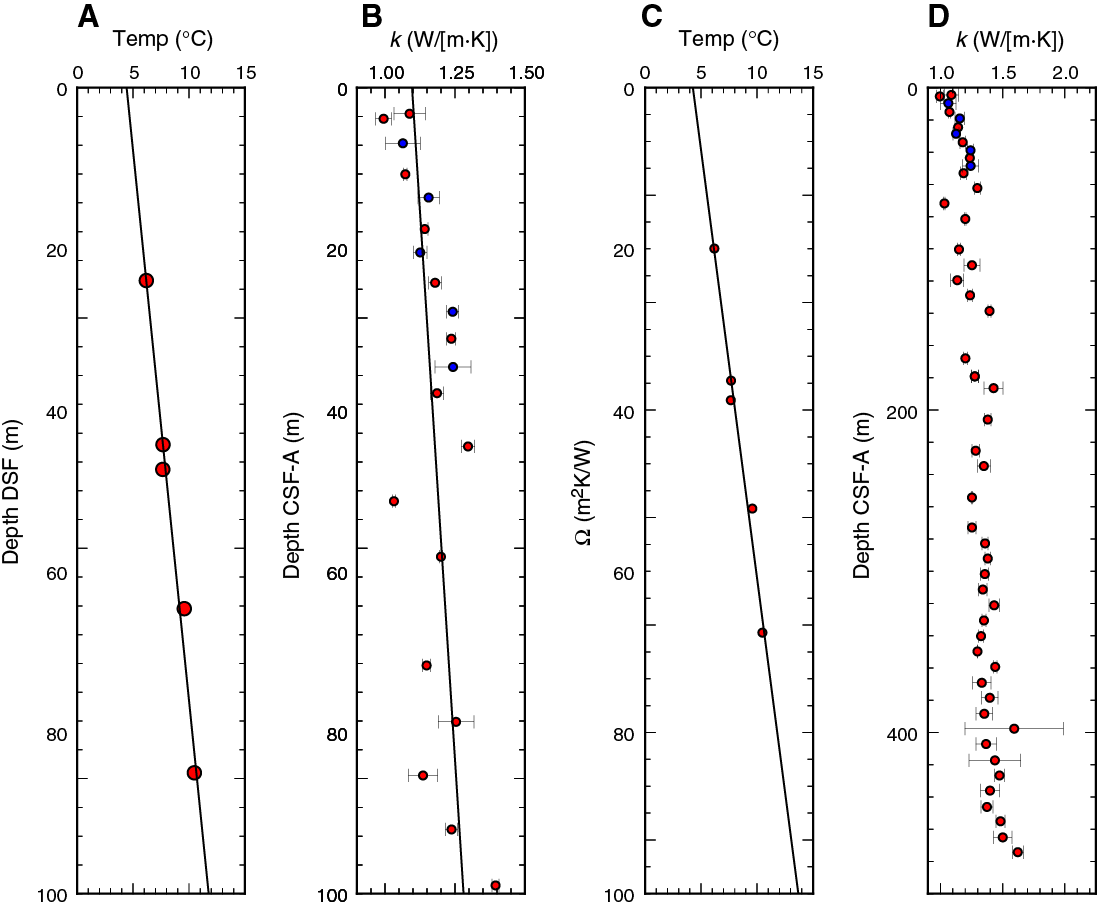
Figure F27. Heat flow.
In Hole U1510A, in situ temperature measurements with the APCT-3 were attempted at five depths just after cutting Cores 4H, 7H, 10H, 13H, 15H, and 17H (33.5–147.7 m DSF). The time-temperature record from Core 17H was not usable. Measurements with Cores 4H, 7H, and 13H were good quality with only small deviations from a single heat pulse. The measurement from Core 10H (91.1 m) was fair quality but still yields an ambient temperature with errors <1°C. In Hole U1510B, one measurement was made from Core 7H (66.3 m) and yields a fair quality temperature record with errors less than about 1°C. Temperature increases below the seafloor with a gradient of 52.4 ± 4.6°C/km (Figure F27A).
As thermal conductivity is not constant with depth, the Bullard method was used to estimate heat flux (see Petrophysics in the Expedition 371 methods chapter [Sutherland et al., 2019a]; Figure F27C). The constant slope of the plot between thermal resistance and temperature is consistent with a thermal regime that is close to a conductive state. From the plot of temperature and thermal resistance, we estimate the heat flux to be 62.8 ± 5.4 mW/m2 from the slope and the temperature at the seafloor to be 4.3° ± 0.4°C from the intercept. The heat flux was within expected values based on a summary of reliable heat flow values from the surrounding region (Hackney et al., 2012).
Sediment strength
Sediment strength was measured with the automated vane shear and penetrometer on Cores 371-U1510A-1H through 16H, 20X, and 41X (0–170 and 370 m; Figure F28). Vane shear strength values increase from 13–20 kPa near the seafloor to ~20 kPa at 65 m, with two strong peaks of >25 kPa at 8 and 28 m, then drops to ~13 kPa at 70 m in foraminifer ooze. The strength values increase downhole again to around 30 kPa at 80–85 m then abruptly decrease to ~15 kPa at 125–130 m in a foraminifer-rich interval at the base of Unit I (see Lithostratigraphy). Strength remains low (12 kPa) in nannofossil ooze with bioclasts in Subunit IIa despite a porosity reduction from >65% to 50% in this subunit.
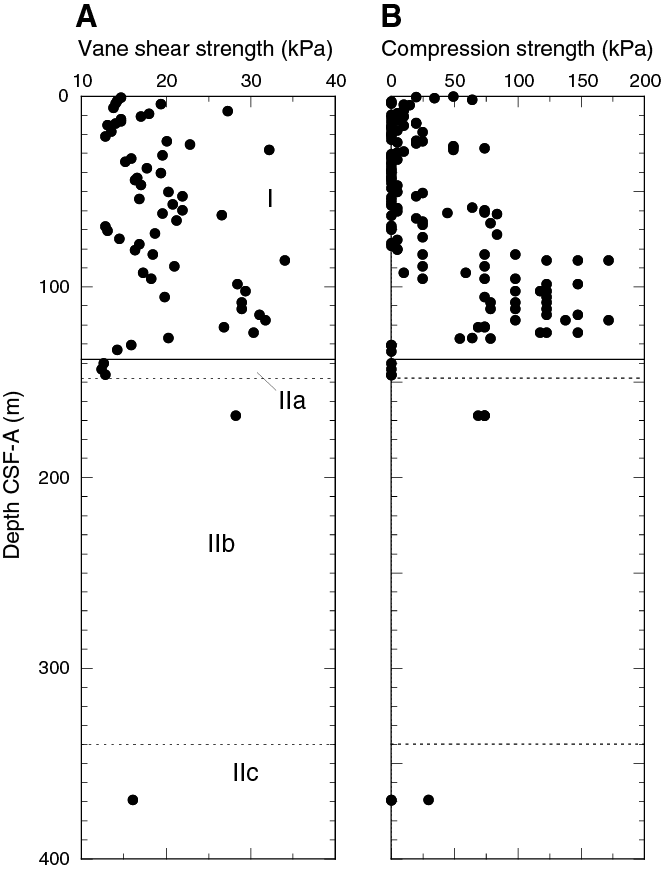
Figure F28. Shear and compressive strength.
Compressional strength is low (<5 kPa) from the seafloor to 80 m except for local spikes at 2 m (~60 kPa) and 28 m (~75 kPa) and a relatively strong (>80 kPa) interval at 60–75 m. Compressional strength abruptly increases downhole at 80–85 m, remains high with values >50 kPa and two local peaks of 175 kPa at 85 and 118 m, and then decreases to <5 kPa at 130 m. Vane shear and compressional strength at 370 m are 17 and <5–30 kPa, respectively, as weak as near the seafloor. These low strength values are most likely the result of severe drilling disturbance, including fracturing and remolding.
Color spectrophotometry
Color reflectance values show significant cyclic variability in Unit I. Between 0 and 60 m (Subunit Ia), L* varies from ~50 to 80. Below 60 m (Subunit Ib), L* is slightly higher, varying from 75 to 90. b* values decrease downhole (0–20 m) from 2 to −2 then increase to 0 by 60 m. Between 60 and 70 m, b* decreases markedly to −4, below which values are −3 to 1 in Subunit Ib to the base of the unit. a* values vary from 1 to 4 throughout Unit I. Spikes in color were observed at the bottom of Subunit Ib (~135 m) near the boundary with Subunit IIa.
In Subunit IIa (~138 m), a* and b* values increase to 5 and 10, respectively, and lightness (L*) increases to 85 at this boundary, which marks the first occurrence of chert at the site. In Subunit IIb (148–349 m), lightness (L*) decreases from ~60 to ~50 by ~220 m and increases again to ~80 at the base of the subunit. a* and b* values are approximately constant at ~2 in Subunit IIb. In Subunit IIc, lightness (L*) increases to ~85 and is approximately constant to 475 m, where it decreases to 75 at the base of the subunit in the high velocity layer. In Subunit IIc, a* values decrease downhole from 3 to 2 and b* increases from −2 to 2.
Two-way traveltime to depth conversion
Laboratory-measured P-wave velocity and density data were used to calculate acoustic impedance, and velocity and borehole depth data were used to calculate two-way traveltime (TWT) for the laboratory measurements on sediments from Site U1510 (see Petrophysics in the Expedition 371 methods chapter [Sutherland et al., 2019a]). Physical properties measured on cores may not be representative of in situ values because of three main effects: mechanical porosity rebound, drilling disturbance, and sample bias. Porosity rebound is inferred to exert the dominant effect on physical property change under laboratory conditions in ooze, whereas drilling disturbance and sample bias are dominant in the lower, more lithified, cored sections. Sample bias caused by low recovery is particularly prevalent between 150 and 330 m depth where chalk and chert were cored. Layer thickness ratios of the hard (chert) to soft (chalk) are poorly constrained. Chert has a laboratory-measured P-wave velocity of ~4000 m/s and is difficult to recover, so it is underrepresented in the laboratory measurements.
To put bounds on in situ velocity and TWTs for Site U1510, we applied a laboratory-to-in situ correction to the velocity data to address the three mechanisms affecting physical properties measurement results. First, we applied a standard porosity rebound correction for carbonate to the entire cored interval at Site U1510 (C = 0.66; see Petrophysics in the Expedition 371 methods chapter [Sutherland et al., 2019a]). This correction results in average velocity values of ~1670 m/s in Unit I and ~2000 m/s in Unit II. Next, to account for both drilling disturbance and sample bias we used a correction of C = 2 (see Petrophysics in the Expedition 371 methods chapter [Sutherland et al., 2019a]). This solution roughly equates to a standard carbonate rebound correction plus a ~30% abundance of chert in Unit II and results in average P-wave velocity values of 1850 m/s in Unit I and 2720 m/s in Unit II.
TWTs were calculated for each correction from borehole depths and corrected velocity values (see Petrophysics in the Expedition 371 methods chapter [Sutherland et al., 2019a]). Impedance and depth versus TWT are plotted for the two corrections (Figure F29). Estimated TWTs from these two solutions differ at the base of the hole by ~100 ms. The correction to higher velocity (C = 2) roughly aligns the strong reflector at ~2.080 ms TWT with the high impedance calculated from velocity and density measurements at 478 m. However, these high impedance values were only obtained from the bottom 10 cm of the borehole. Further analysis is required to refine velocity and TWT relationships for Site U1510.
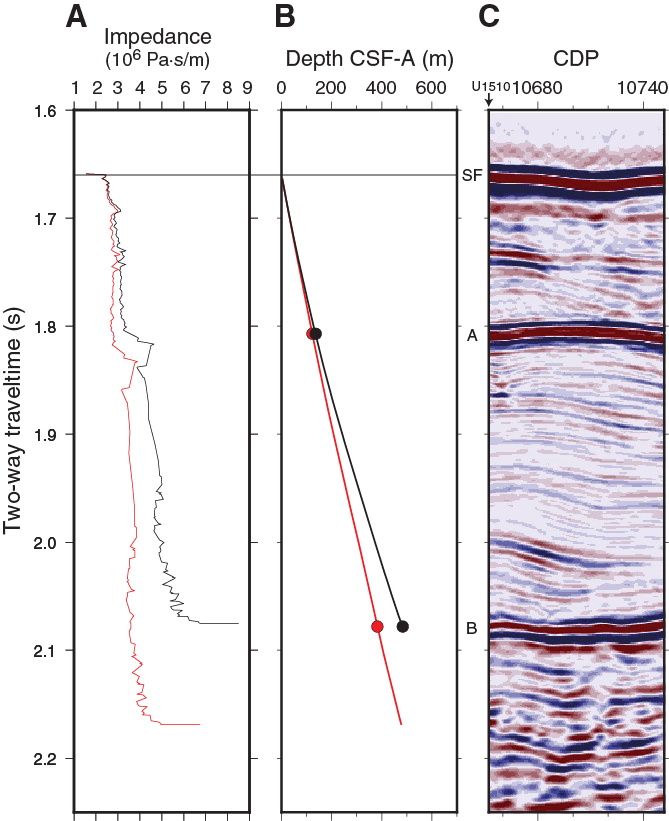
Figure F29. Core data compared with MCS reflection Line TAN1409_LHRS_02.
Geochemistry
The geochemistry program at Site U1510 on southern Lord Howe Rise had two primary goals: (1) to characterize the composition of pore water and solid sediment and (2) to refine techniques for collecting pore water in shallow sediment. The site is proximal to Sites 207 and 592 (see Background and objectives), which recovered several hundred meters of calcareous ooze and chalk with minor amounts of biogenic silica, clay, and volcanic ash (Burns and Andrews, 1973; The Leg 90 Staff, 1983). At Site 592, interstitial water (IW) samples were collected by conventional squeezing at one sample every two cores and analyzed on shore for a limited number of species (Baker, 1986). The ensuing pore water profiles were suggested to reflect several diagenetic processes, including alteration of silica-rich basement rock, recrystallization of biogenic carbonate, and dissolution of biogenic silica (Baker, 1986). Such reactions are important to understand because they can modify sediment properties, including sonic velocity used in seismic calculations, and sediment components, including biogenic carbonate employed for paleoceanographic reconstructions.
Headspace hydrocarbon gases
A total of 52 headspace (HS) gas samples were taken, typically one from every core in the top 5 cm of the last section or core catcher. Light hydrocarbon gas concentrations were consistently below the detection limit.
Interstitial water analyses
A total of 117 IW samples were collected at Site U1510 (Table T8). The suite included 50 samples by squeezing and 32 samples by Rhizons from Hole U1510A and 14 samples by squeezing and 22 samples by Rhizons from Hole U1510B. Additionally, a mudline sample was taken from the top of Section 371-U1510A-1H-1. The deepest IW sample collected for squeezing came from 477 m in Hole U1510A; Rhizon samples from both holes were restricted to the upper 20 m. To present and discuss overall downhole pore water chemistry, profiles obtained from squeezed samples from the two holes are displayed together on the core depth below seafloor (CSF-A) depth scale. The description of IW data refers to the squeezed samples unless mentioned specifically as Rhizon samples. Profiles generated for the uppermost 30 m of sediment, including results from Rhizons, are further discussed with respect to the core composite depth below seafloor (CCSF) depth scale.
Salinity, pH, and alkalinity
The three most basic water chemistry profiles exhibit different downhole trends (Table T8; Figure F30). Salinity remains within 0.5 unit offset from that of bottom water (34.5 in the mudline sample) across all samples analyzed. pH varies between 7.86 and 7.61 across all samples. Although the values show considerable scatter (as also observed at other Expedition 371 sites), pH generally decreases with depth to near the base of the hole. Alkalinity increases from 2.3 mM in the mudline sample to 5.7 mM at 80 m. Below this local maximum, alkalinity overall decreases to 4.2 mM at 314 m, increases to a maximum of 8.1 mM at 459 m, and decreases to 4.2 mM at 477 m.
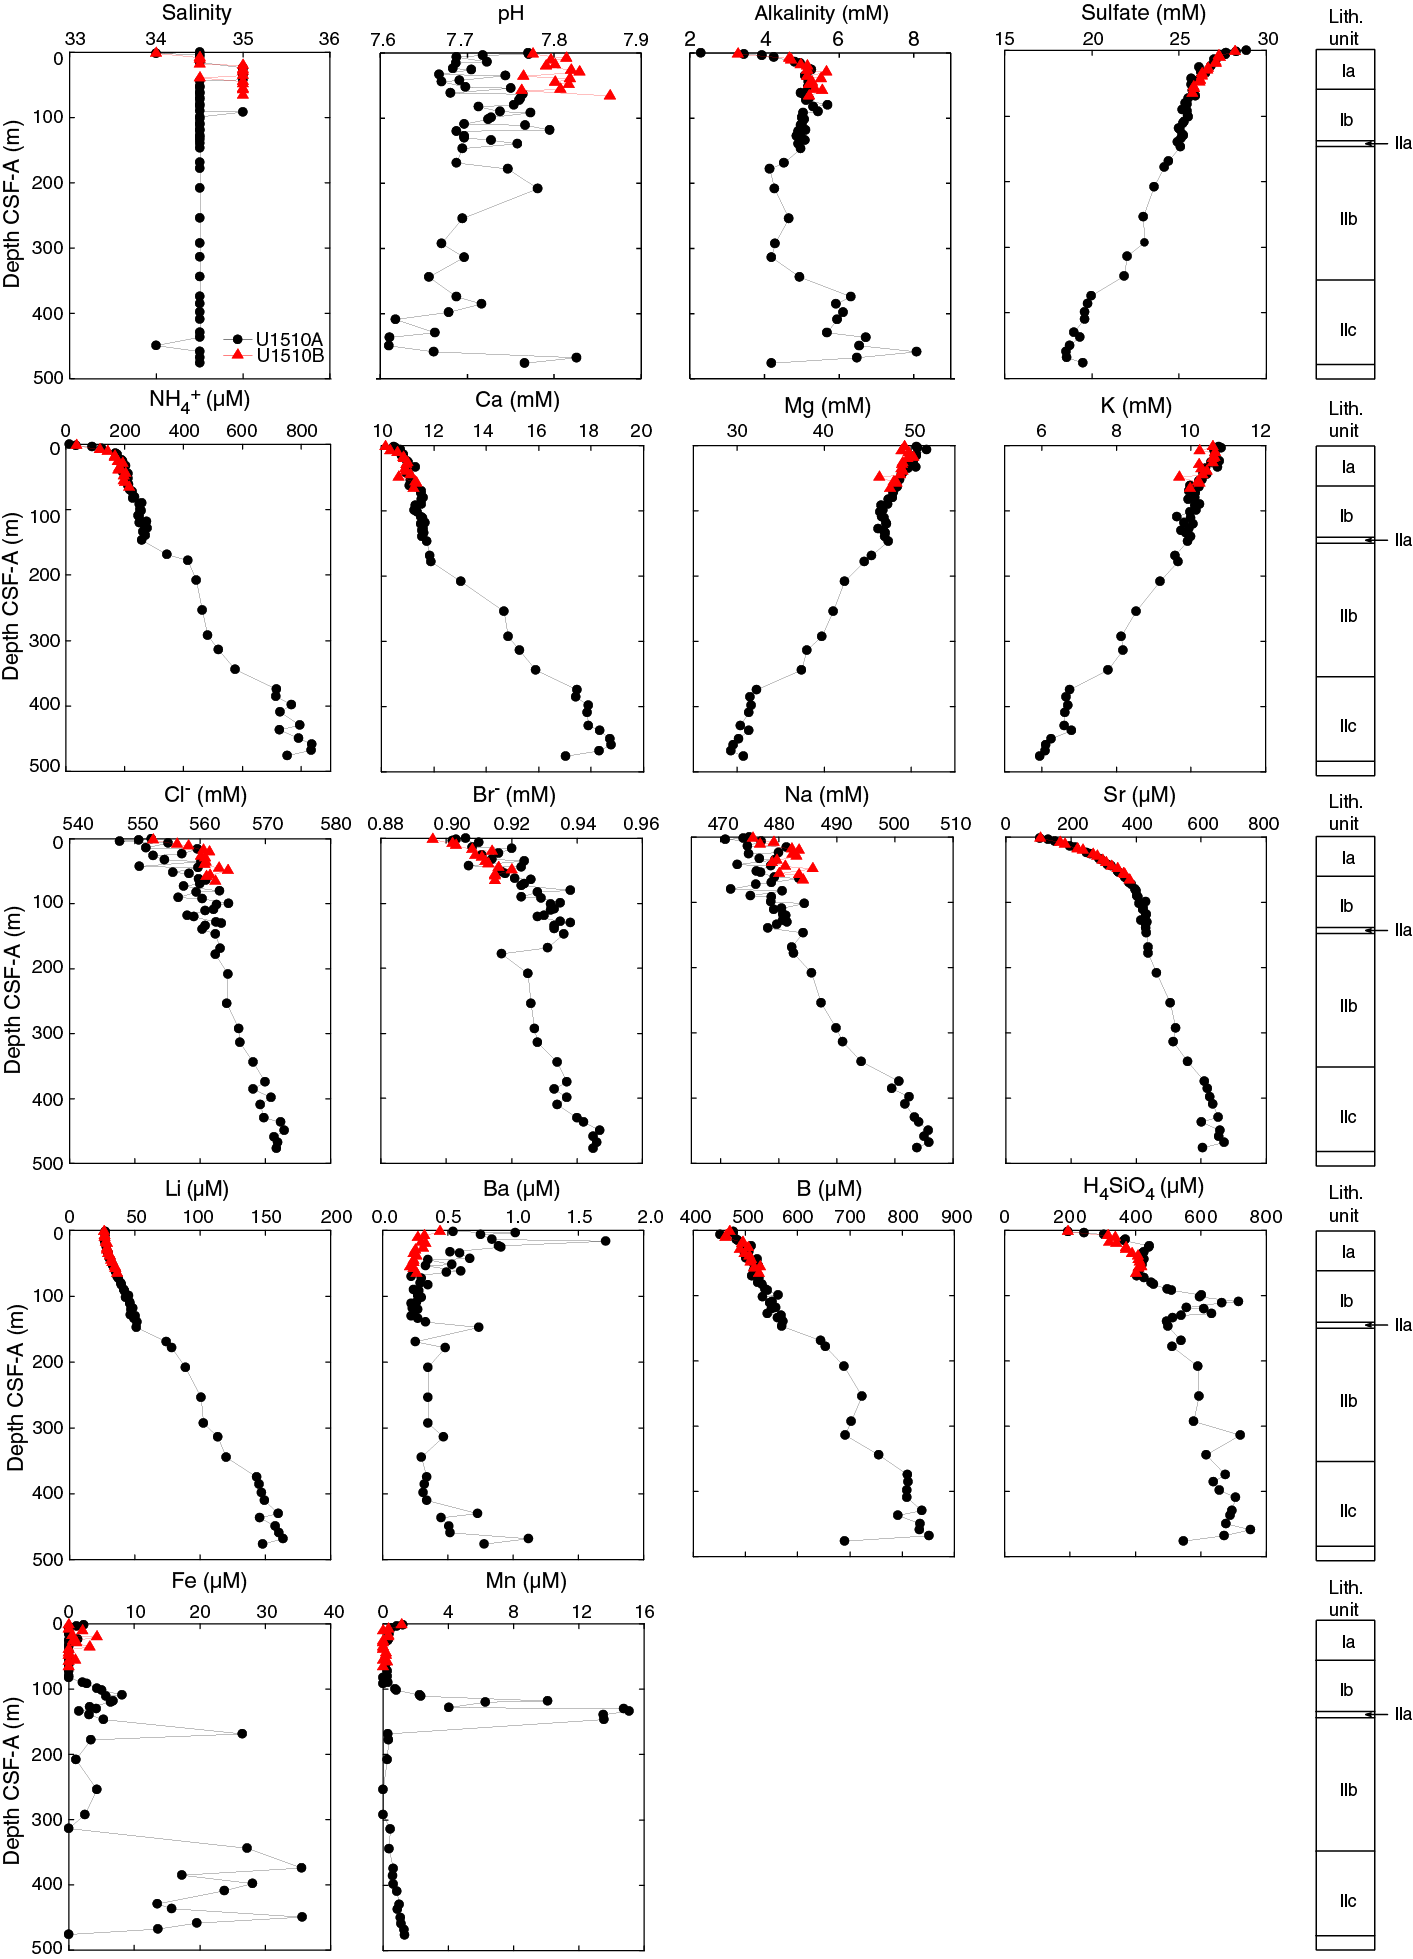
Figure F30. Squeeze IW chemistry for uppermost 477 m.
Sulfate and ammonium
In general, the SO42− and NH4+ concentration profiles mirror each other with SO42− decreasing and NH4+ increasing downhole (Table T8; Figure F30). Sulfate and NH4+ concentrations are 28.9 mM and 12.3 µM, respectively, in the mudline sample. From the seafloor to ~150 m (and the Subunit IIa/IIb boundary), SO42− exhibits a concave-down decrease to ~25 mM, whereas NH4+ exhibits a concave-down increase to ~260 µM. Importantly, therefore, the decrease in SO42− over this depth interval (4 mM) is about the same as the increase in alkalinity and about 16 times as great as the increase in NH4+. In the lower sediment sequence at Site U1510, SO42− decreases to a minimum of 18.6 mM at 468 m and increases slightly to 19.5 mM at 477 m, whereas NH4+ increases to a maximum of 836.7 µM at 459 m; both profiles show inflections at ~380 m.
Calcium, magnesium, and potassium
Major cation concentrations change moderately with depth (Table T8; Figure F30) from near the seafloor, where they are close to those of seawater with a salinity of 35.5 (see Geochemistry in the Expedition 371 methods chapter [Sutherland et al., 2019a]). Dissolved Ca increases gradually from 10.5 mM at 1 m to 11.9 mM at 178 m and then increases more rapidly downhole to a maximum of 18.8 mM at 460 m. By contrast, dissolved Mg decreases downhole from 50.6 mM at 1 m to a minimum of 29.3 mM at 468 m, and dissolved K decreases downhole from 10.8 mM at 1 m to a minimum of 6.0 mM at 477 m. Notably, the change in calcium relative to the change in magnesium (ΔCa/ΔMg) approximates −0.39 mol/mol.
Chloride, sodium, and bromide
The Cl−, Na, and Br− concentration profiles share similar increasing trends downhole (Table T8; Figure F30). Concentrations in the mudline sample are 553, 475, and 0.91 mM, respectively, for the three elements, which are essentially the values for standard seawater (see Geochemistry in the Expedition 371 methods chapter [Sutherland et al., 2019a]). Cl− and Na concentrations increase to highs near the base of the hole of 572 and 504 mM, respectively. As such, although concentrations of both elements increase modestly, that of Na is about 10 mM greater. This difference compensates well for the charge balance deficit induced by the low downhole ΔCa/ΔMg ratio. Br− concentration increases to 0.94 mM at 147 m, decreases sharply to 0.92 mM at 178 m, and increases to 0.95 mM at 477 m. The change in Br− concentration is intriguing, but the overall percentage increase is similar to that of Cl−.
Strontium, lithium, and barium
Dissolved Sr and Li concentrations generally increase downhole, whereas Ba concentration remains relatively constant except for elevated values from IW samples above 63 m and below 430 m (Table T8; Figure F30). The Sr profile shows a concave-down increase from 105 µM at 1 m to 430 µM at ~150 m. Below this Subunit IIa/IIb boundary, Sr concentration increases almost linearly to a maximum of 672 µM near the base of Hole U1510A. Although Li concentration also increases six-fold over the same depth interval, from 27.3 µM at 1 m to 163.8 µM at 468 m, the profile shows a major difference that hints at a potentially important process: a major inflection toward low values coincides with the Subunit IIa/IIb boundary. The variations in dissolved Ba to local maxima of 1.7 µM at 16 m and 1.1 µM at 468 m are trivial considering changes documented at other Expedition 371 sites (see Geochemistry in the Site U1508 chapter and Geochemistry in the Site U1509 chapter [Sutherland et al., 2019b, 2019c]).
Boron and silica
The B and H4SiO4 concentration profiles show broadly similar increases downhole with one notable exception (Table T8; Figure F30). Dissolved B increases almost linearly from 476 µM at 1 m to 570 µM at 150 m. Below this depth, B shows 100 m scale variations with a maximum of 851 µM at 468 m. Dissolved H4SiO4 also increases between 1 and 150 m from 194 to 499 µM. However, a superimposed depth interval of high H4SiO4 concentration (to 715 µM) is centered at 110 m, the lowermost part of Unit I. Below the Subunit IIa/IIb boundary, H4SiO4 concentration increases gradually downhole to a maximum of 753 µM at 459 m and decreases to 547 µM at 477 m.
Iron and manganese
Dissolved Fe and Mn each display peaks in concentration, although at different depths (Table T8; Figure F30). Fe concentration is mostly <5.0 µM in the uppermost 300 m, except for highs of 8.1 µM at 109 m and 26.5 µM at 169 m. Below 300 m, Fe concentration fluctuates between 13.5 and 35.7 µM except at 314 and 477 m, where Fe is below the detection limit. Mn concentration decreases gradually from 1.2 µM at 1 m to a minimum of 0.2 µM at 61 m and remains <1 µM to 101 m. From this depth downhole, Mn concentration increases to a maximum of 15.1 µM at 134 m and decreases sharply to 0.3 µM at 169 m. Dissolved Mn concentration again increases below 300 m, albeit gradually, reaching 1.3 µM at 477 m.
Squeeze and Rhizon samples from uppermost sediment
The 68 IW samples obtained from the upper 30 m of sediment represent four “batches” of pore water independently collected by two methods (squeeze and Rhizon) from the two holes and analyzed over several days. Ideally, measurements from each batch would render similar pore water chemistry profiles once sample depths were placed onto a common CCSF depth scale (see Stratigraphic correlation).
Comparisons of profiles from the two methods and the two holes (Figure F31) reveal commonalities and differences for the various analytes that are perhaps expressed best by reference to an average of all values and a deviation from this number. The following are revealed for some species:
- Similar concentrations (≤5% of the average) are found at approximately the same depth across all four batches (i.e., the smooth overlapping trends for salinity, alkalinity, SO42−, NH4+, Cl−, Na, Sr, H4SiO4, and Mn),
- Similar concentrations (≤5% of the average) are found at approximately the same depth for samples by the same sampling method, but the values differ in samples by a different sampling method (i.e., the obvious offset between methods for Ba), and
- Different concentrations (≥5% of the average) are found at approximately the same depth irrespective of batch (the high scatter for pH, Ca, Mg, K, Br−, Li, B, and Fe).
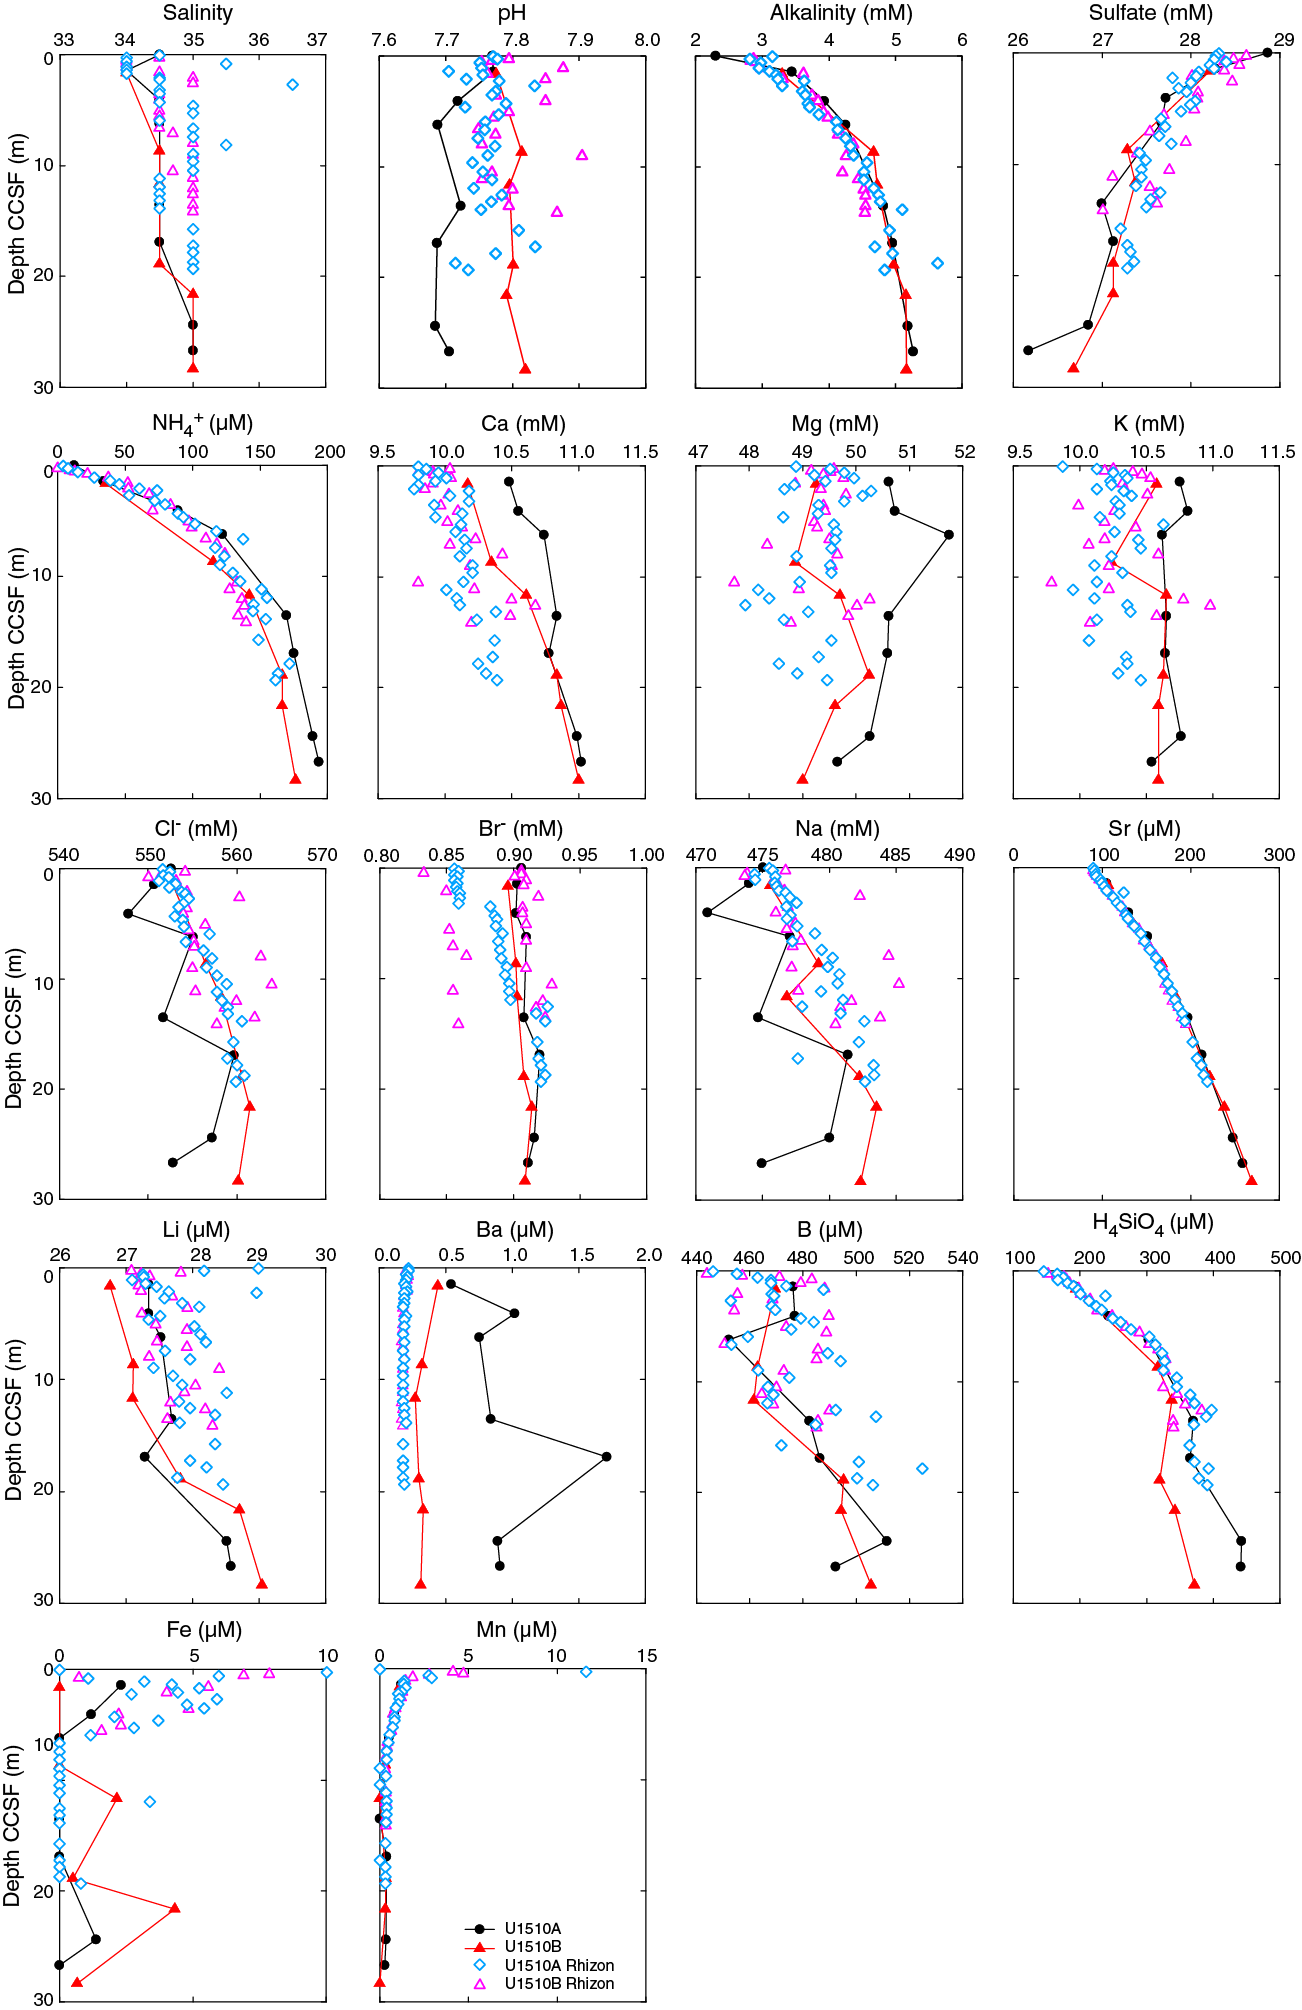
Figure F31. Squeeze and Rhizon IW chemistry for uppermost 30 m CCSF.
Beyond methodological comparisons, the “high-resolution” pore water profiles show features of interest to geochemical modeling studies. For example, Mn concentration is not zero in the shallowest samples from either hole, and Mn, Sr, and H4SiO4 profiles each exhibit concentration gradient changes in the upper 10 m below the seafloor. Notably, as revealed by odor, the closely spaced Rhizon sampling showed the presence of H2S between about 6 and 12 m CCSF.
Bulk sediment geochemistry
A wide range of carbonate content is found at Site U1510 (Table T9; Figure F32) depending on lithology and the depth interval examined. At the broad scale, carbonate content is >90 wt% in Unit I and in Subunits IIa and IIc, which correspond to calcareous ooze and chalk lithologies (see Lithostratigraphy). Across the clayey calcareous chalk in Subunit IIb, carbonate contents generally decrease toward a broad minimum in the middle, a feature also characterized by a low in L* and a high in NGR. Interbedded cherty and tuffaceous layers in Unit II, however, are distinguished by carbonate contents of <20 and <50 wt%, respectively. Total organic carbon (TOC) contents are mostly below the detection limit but are represented by somewhat higher values (averages 0.39 wt%) below 400 m. Nitrogen contents are low throughout the sedimentary column, averaging 0.005 wt%.
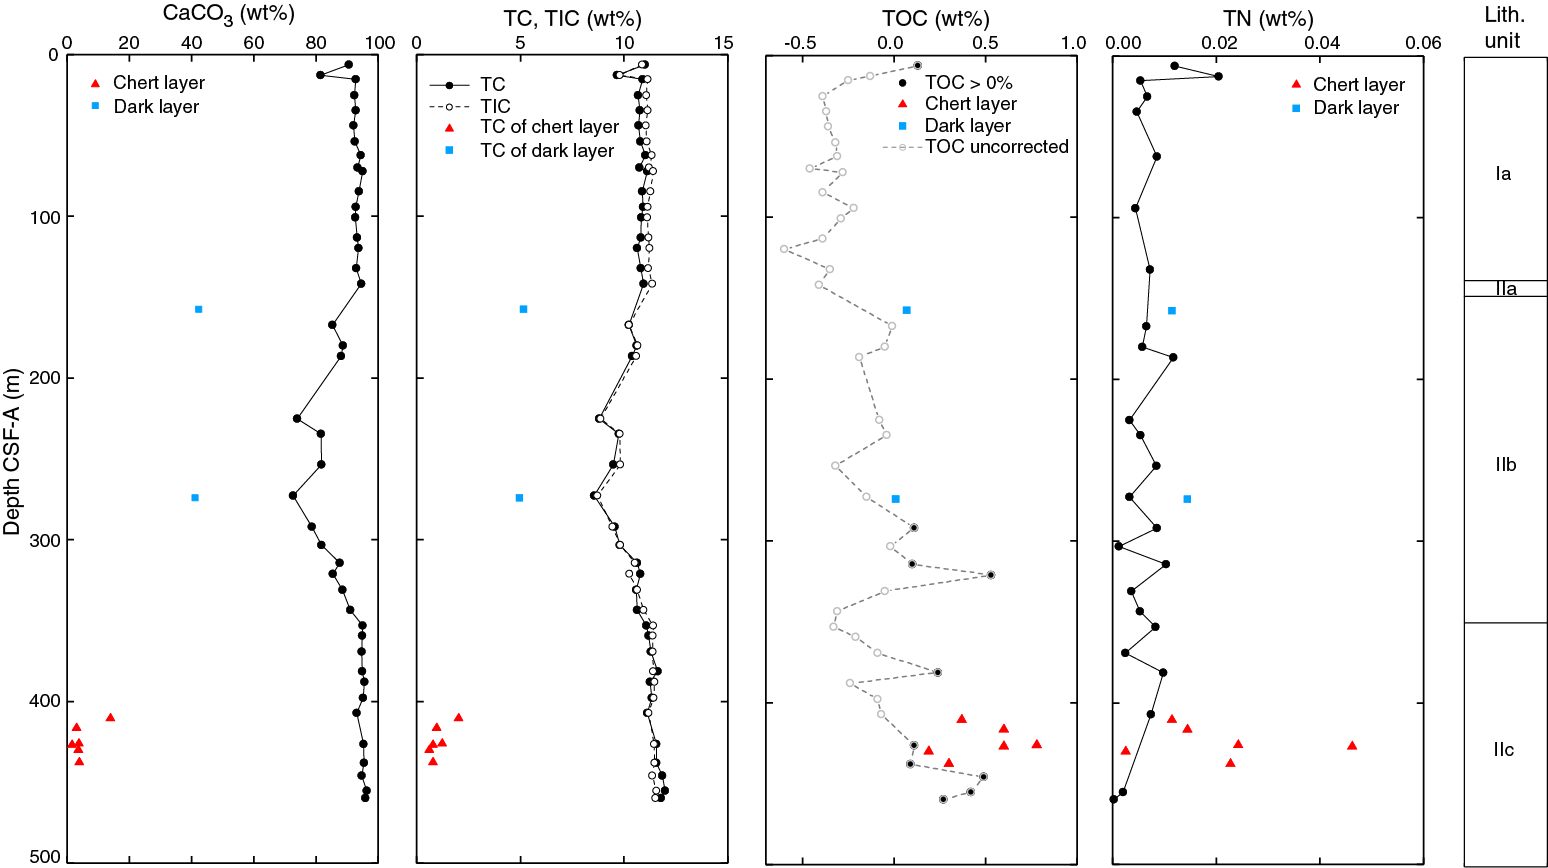
Figure F32. Bulk sediment profiles.
Discussion
A series of processes impact IW chemistry at Site U1510, and these processes and the ensuing pore water profiles strongly relate to lithology.
Organoclastic sulfate reduction in Unit I
Microbes can utilize SO42− to decompose particulate organic carbon (POC), as discussed for Site U1506. This reaction, commonly called organoclastic sulfate reduction (OSR), can be expressed in a simple form:
2CH2O + SO42− → 2CO2 + S2− + 2H2O. (E1)
OSR can also be expressed in an expanded form to include nutrients (Froelich et al., 1979):
(CH2O)106 (NH3)16 (H3PO4) + 53SO42− → 106CO2 + 16NH3 + 53S2− + H3PO4 + 106H2O. (E2)
At Site U1510, sediment accumulating on the seafloor at a modest rate (~20 m/My) contains sufficient POC to consume readily available electron acceptors (dissolved O2, NO3−, and metal oxides; Froelich et al., 1979). Microbes then use dissolved sulfate to slowly decompose POC, producing a concave-down decreasing SO42− profile (Figures F30, F31). Per molar loss of SO42−, this reaction (Equation E2) releases 2 mol of dissolved inorganic carbon and 0.3 mol of NH3. The concave-down increasing alkalinity and NH4+ profiles are somewhat predicted once charge has been apportioned between species and once different diffusion rates for species have been accounted for over time.
The production of reduced sulfur (Equation E2) also explains the slight smell of H2S and the low in dissolved Fe concentrations in shallow sediment at Site U1510. The solubilities of common Fe sulfide minerals are extremely low so that once sulfide is generated by OSR, it reacts with dissolved Fe.
Silica and manganese oxide dissolution near the Unit I/II boundary
The peaks in dissolved H4SiO4 and Mn near the Unit I/II boundary (Figure F30) strongly indicate dissolution of solids that release these species to surrounding pore water. Biogenic silica provides an obvious source candidate for generation of dissolved H4SiO4 (Baker, 1986). Although not noted in lithologic descriptions for the lower part of Unit I (see Lithostratigraphy), a transition in radiolarian abundance from barren to common occurs above the Subunit IIa/IIb boundary (see Biostratigraphy and paleoenvironment). Alternatively, H4SiO4 might derive from alteration of volcanic ash. Pale green and gray laminations that might represent altered volcanic ash (Gardner et al., 1986) frequently occur between 81 and 129 m at Site U1510. The high in dissolved Mn lies lower in the sediment column, spanning the Unit I/II boundary and Subunit Ib (60–138 m). In general, high contents of solid MnO2 can only accumulate near the seafloor during times of low sedimentation rate and low POC input. The simplest explanation for a peak in pore water Mn concentration is dissolution of a buried horizon of MnO2 that originally formed in a condensed interval. A hiatus and coincident MnO2 fragments were identified at ~135 m (see Lithostratigraphy).
Ooze–chalk transition and the Subunit IIa/IIb boundary
Many concentration profiles show a break at 147 m at the ooze–chalk transition (Figure F30). Chert layers and cherty limestone are also found around this horizon (see Lithostratigraphy). Formation of these hard layers may have changed the pore water profiles in two regards. First, given Fick’s law of diffusion, where the flux of a dissolved species depends on the porosity and the concentration gradient, chemical profiles should change with the decrease in porosity. Second, the precipitation of chalk and chert might remove elements from pore water. This would explain the inflections in alkalinity and dissolved Ca, H4SiO4, and perhaps Li.
A second, deeper break occurs in many chemistry profiles at 349 m, the Subunit IIb/IIc boundary. Another hard layer that changes porosity is inferred from the chemistry at this depth. However, such a layer was not recovered.
Major ion reactions below the drilled interval
The coupled changes in Ca, Mg, and K are similar to those at Sites U1506 and U1507, suggesting reaction of the pore water with volcanic matter (Gieskes and Lawrence, 1981). The ΔCa/ΔMg ratio of −0.39 mol/mol is similar to those observed at previous drilled sites with siliceous basement rock underneath (Baker, 1986). All the sites on Lord Howe Rise share a similar ΔCa/ΔMg ratio (Figure F33), suggesting somewhat similar basement rock in this region. The problem with this concept, though, is the basalt found at Site U1506.
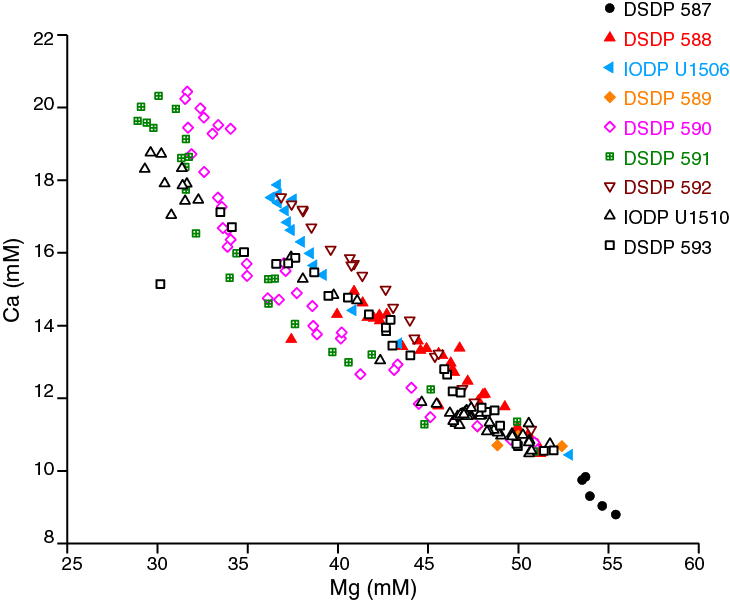
Figure F33. Dissolved Ca vs. Mg in IW.
Comments on high-resolution sampling
Although rarely conducted during scientific drilling operations, “high-resolution” IW sampling allows for comparisons between sampling methods and for assessments of accuracy and precision. Such issues are usually discussed with reference to repeated analyses of one or more standards in a single batch, omitting issues of variable sample collection and large chemical variance.
In general, the significant differences between analyses over the upper 30 m at Site U1510 (Figure F31) cannot be explained by evaporation or dilution (with seawater or pure water) because such changes should affect all species examined in a given sample. However, three general explanations can be offered. Problems with analytical accuracy and precision probably caused the larger than expected variations in Ca, Mg, K, Br−, Li, B, and Fe and may directly relate to the use of a new inductively coupled plasma–optical emission spectrometer (ICP-OES; in atomic emission spectrometer [AES] mode) installed at the beginning of the expedition. The choice of method probably caused the difference in Ba concentrations. Lower Ba concentrations in Rhizon samples compared with squeeze samples have been documented previously and may relate to filtering (Tada et al., 2015) because Rhizons have a smaller pore size than the filters used during squeezing (see Geochemistry in the Expedition 371 methods chapter [Sutherland et al., 2019a]) and barite often occurs as very small crystals. Filtering or true variability over short depth increments may cause the difference in Fe concentrations. As observed previously (Tada et al., 2015), Fe concentrations and magnetic susceptibility (see Petrophysics) show similarity over depth. If correct, either colloidal Fe passes through filtering or rapid turnover of solid Fe phases (dissolution and precipitation) occurs over short depth intervals.
Stratigraphic correlation
Pliocene–Pleistocene splice
Whole-Round Multisensor Logger (WRMSL) data were collected at 2 cm intervals from Holes U1510A and U1510B. For Hole U1510B, core sections were measured prior to temperature equilibration to use the WRMSL data and monitor coring operations at the site in near-real time.
The reported CSF-A depths of cores were shifted to construct a CCSF scale and generate a splice on the basis of NGR and color reflectance (reflectance spectroscopy and colorimetry [RSC]) data. This splice was constructed to the bottom of Core 371-U1510A-5H (43.05 m CSF-A; 44.15 m CCSF) (Figures F34, F35), thus avoiding intervals with significant disturbance, distortion, or IW sample locations. Despite coring to 66.30 m CSF-A in Hole U1510B, no reliable correlation between Cores 371-U1510A-6H through 8H and Cores 371-U1510B-6H through 7H was possible using shipboard physical properties measurements. Core 371-U1510B-6H has major drilling disturbance in Section 6H-1 and inflow in Section 6H-5. Cores 371-U1510A-6H through 8H and Core 371-U1510B-7H might be affected by coring disturbance, slumping, or turbidities.
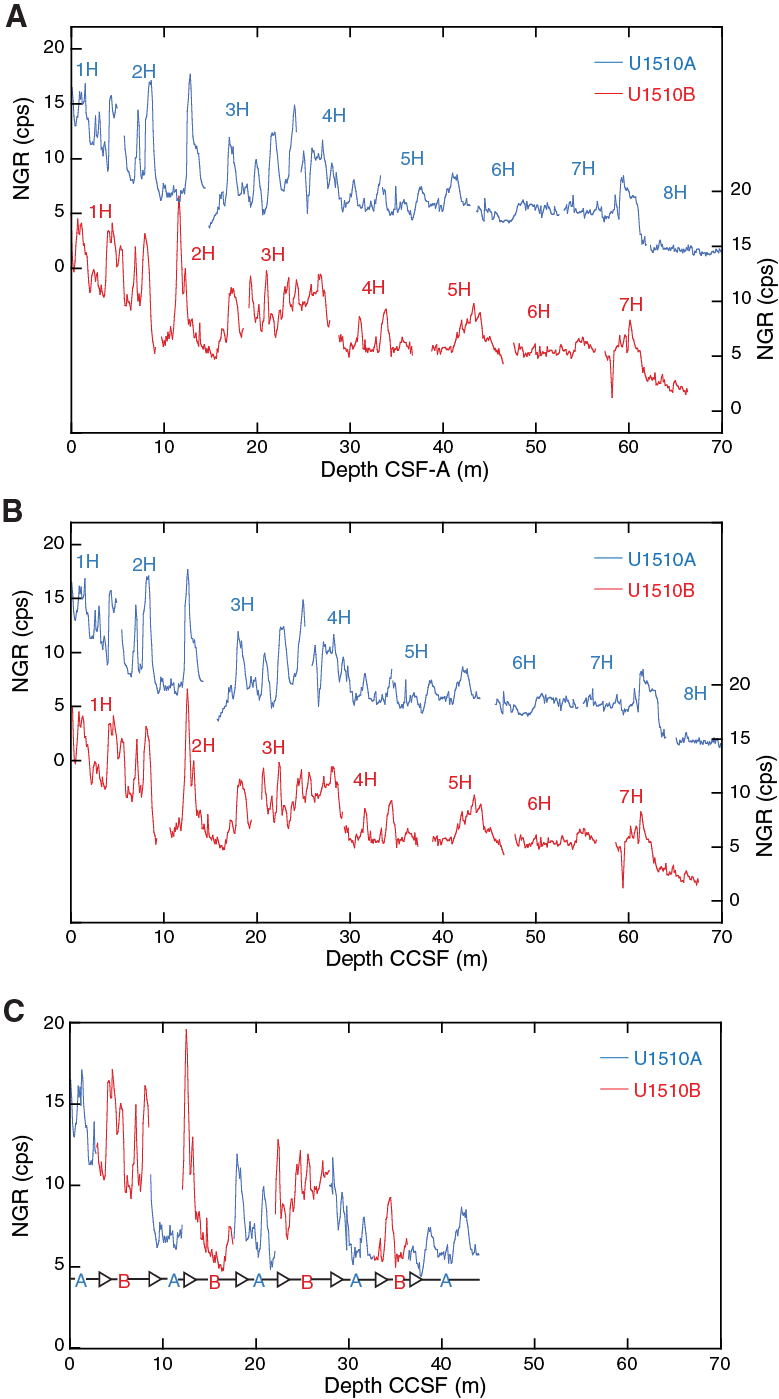
Figure F34. NGR data for spliced interval.
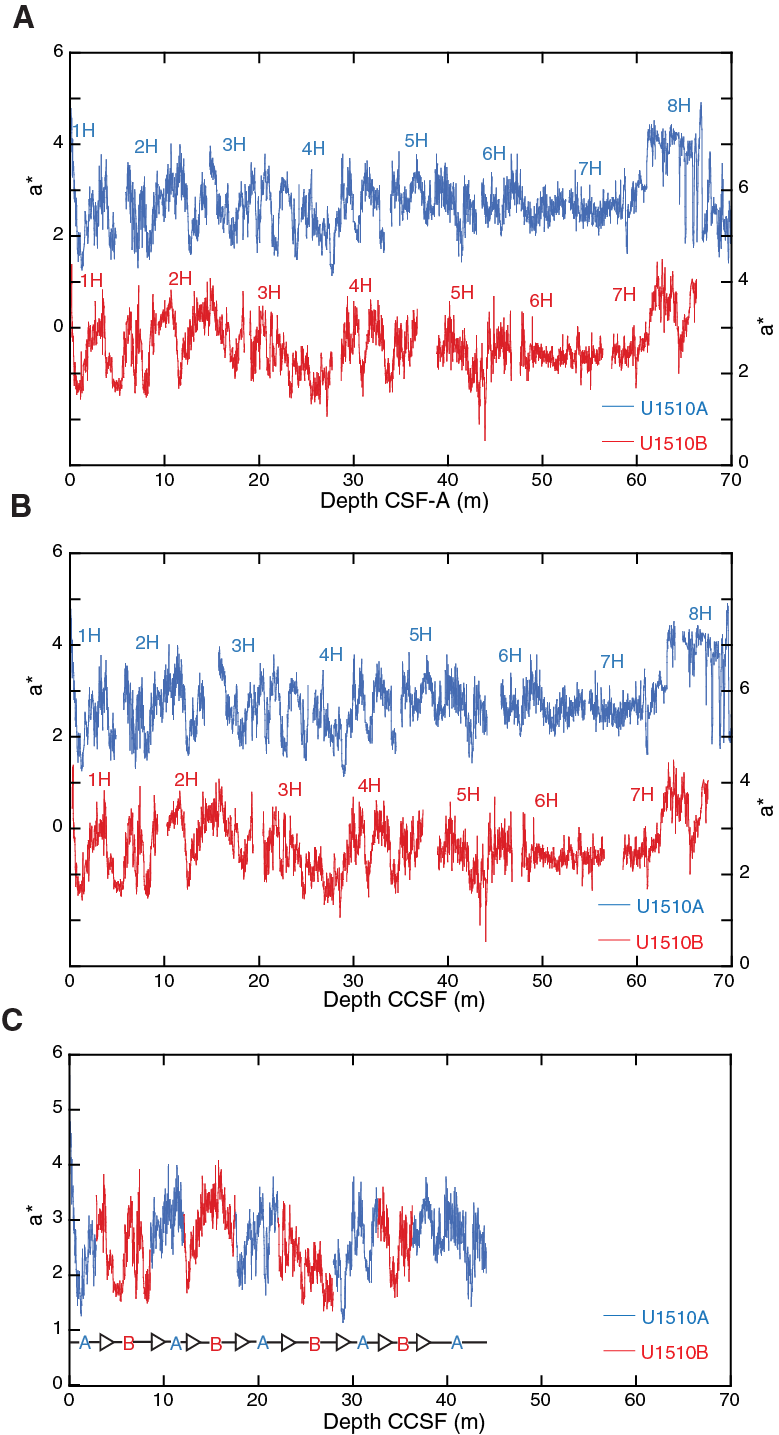
Figure F35. Color reflectance data for spliced interval.
For the 44.15 m splice, offsets between successive cores range from −2.32 to 1.19 m (Table T10). Splice intervals are identified in Table T11. The Site U1510 splice can be used as a sampling guide to recover a single sedimentary sequence between 0 and ~44 m CCSF. Compression and stretch of sedimentary features in the core logging data of aligned cores indicate physical distortion in tops and bottoms of the cores. Because much of the distortion occurs in individual cores on depth scales of <9 m, it was not possible to align every feature in the NGR records or core images. However, care was taken to align distinctive features from cores in each hole (Table T11). A growth factor of 1.03 was derived by linear regression of CSF-A and CCSF core top depths for Holes U1510A and U1510B, which represents a 3% increase in CCSF relative to CSF-A (Figure F36).
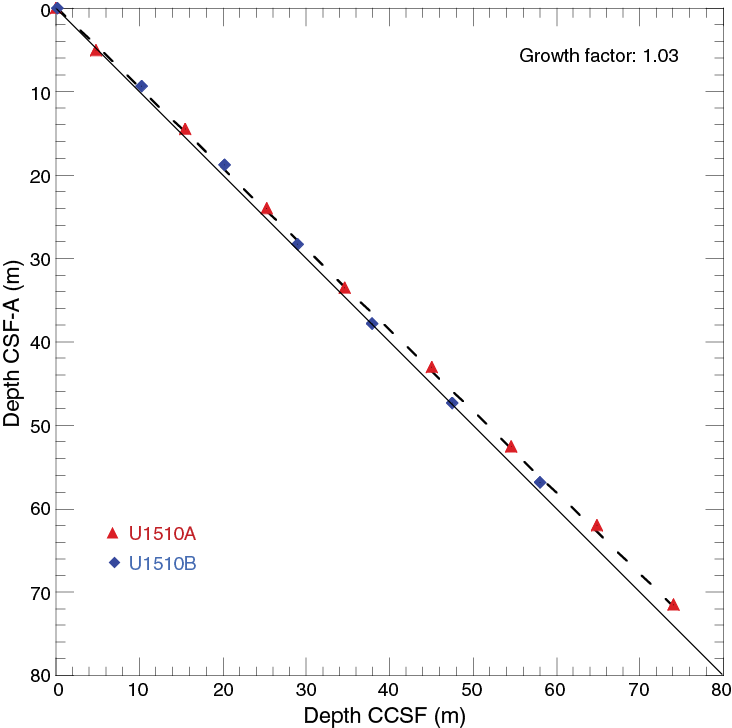
Figure F36. CSF-A vs. CCSF depths for tops of cores.
Off-splice interstitial water collection
Many drilling expeditions use a default plan for collecting IW samples. In Hole A, one IW sample is taken from each of the upper three cores, followed by one IW sample every one to three cores below; the whole-round samples, typically 5–15 cm long, are cut from the base of either Section 3 or 4, often opposite headspace (HS) samples for hydrocarbon gas analyses. With only two holes at a drill site, even such minimal IW sampling ordinarily removes portions of the spliced sedimentary record.
Geochemists and microbiologists increasingly desire high-resolution pore water profiles for a myriad of purposes (e.g., D’Hondt et al., 2004; Insua et al., 2014). This resolution requires intensive IW sampling, especially over the upper 100 m of the sediment column where microbially mediated reactions and variations in deep ocean chemistry can drive significant changes in pore water composition over short depth increments. Without modification, increased removal of whole-round IW samples is detrimental to the collection of a continuous sedimentary record. Solutions offered to date include drilling an extra hole, which takes time and often lacks a means of detailed depth correlation with other holes at the site (D’Hondt et al., 2004), or Rhizon sampling (e.g., Dickens et al., 2007).
A cursory look at how splices are generated reveals a basic improvement for routine IW sample collection, at least across depth zones at sites where high APC recovery rates are expected (Figure F37). The splice is ideally built using intervals in the central parts of cores, which almost always means tie points somewhere between the middle of Section 2 through the middle of Section 6 for two adjacent holes. Such splicing necessarily means that nominally 40%–50% of recovered sediment at each hole becomes designated as “off-splice.” The removal of whole-round IW samples from the bases of Sections 1 and 6 in two adjacent holes might therefore quadruple the resolution of pore water chemistry profiles without compromising the splice.
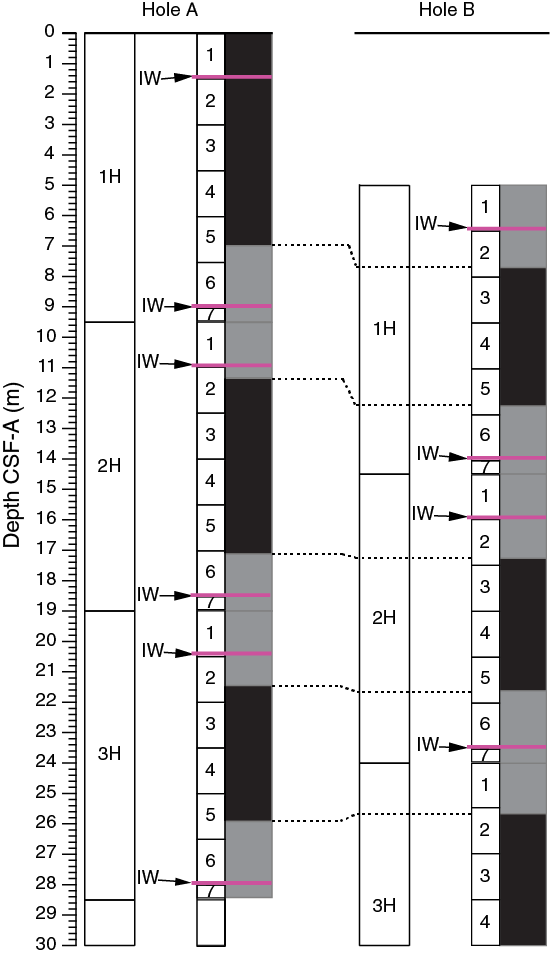
Figure F37. Concept for improved routine IW sample collection at sites with high APC recovery.
The proposed sampling strategy was employed at Site U1510. Whole-round IW samples of 5 cm length were cut from the bases of Sections 1 and 6 over the upper 70 m from Holes U1510A and U1510B. The samples were squeezed by routine methods and analyzed for a range of dissolved species (see Geochemistry). Once the measurements are placed onto the composite depth scale, they show detailed variations in chemical composition at a resolution much improved from the generic IW sampling plan (Figure F38). Importantly, the greatly increased whole-round IW sampling of sediment did not compromise construction of the splice.

Figure F38. IW samples taken and strontium concentrations.
Age model and sedimentation rates
A 480 m thick sequence of Pleistocene to upper Eocene nannofossil ooze and chalk was recovered at Site U1510. A series of calcareous nannofossil datums are present in lithostratigraphic Units I and II and provide first-order age control. Using this information, linear sedimentation rates (LSRs) and mass accumulation rates (MARs) were calculated for Site U1510 on the CSF-A depth scale from 54 to 0 Ma (Table T3; Figure F39; see Biostratigraphy and paleoenvironment).
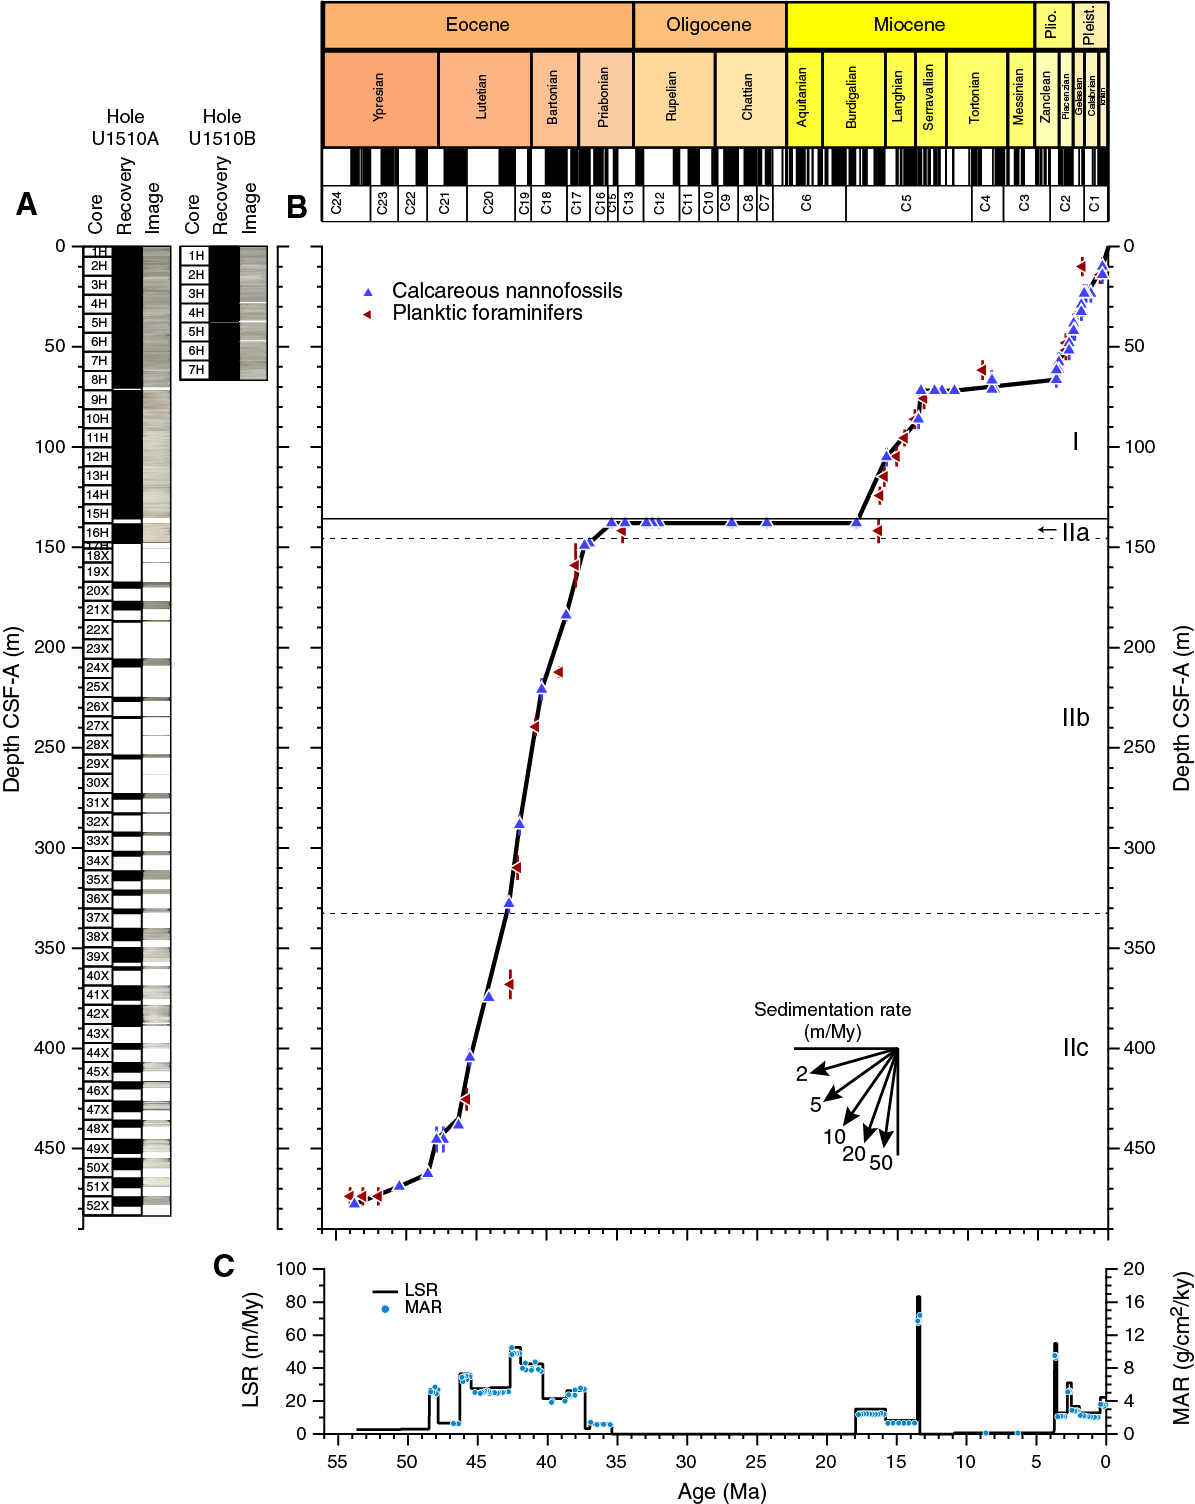
Figure F39. Sedimentation accumulation over time.
Sedimentation at Site U1510 was variable and included two major stratigraphic gaps. Early Eocene LSRs were about 2 m/My from 54 to 48 Ma. LSRs increased to ~20 m/My during the middle to late Eocene. A major hiatus spanned the late Eocene, entire Oligocene, and early Miocene (35–18 Ma). Middle Miocene (18–13 Ma) LSRs ranged from 5 to 20 m/My. The second major gap in time occurred in the middle to late Miocene from 13 to 4 Ma. LSRs of ~15 m/My characterized the mid- to late Pleistocene.
At Site U1510, changes in MARs closely mimic those of LSRs with respect to age. This is due to less pronounced variations in dry bulk density relative to those of LSR. MARs averaged 4 g/cm2/ky in the early to middle Eocene. From the middle Miocene to the Pleistocene, they averaged 2 g/cm2/ky excluding the condensed interval from 13 to 4 Ma. At Site U1510, minimal sedimentation occurred during the late Miocene to early Pliocene “biogenic bloom” event (Dickens and Owen, 1999). A gap across this stratigraphic interval was also observed at Site U1509 but not at previous sites drilled during Expedition 371 (i.e., Sites U1506, U1507, and U1508).
References
Baker, P.A., 1986. Pore-water chemistry of carbonate-rich sediments, Lord Howe Rise, Southwest Pacific Ocean. In Kennett, J.P., von der Borch, C.C., et al., Initial Reports of the Deep Sea Drilling Project, 90: Washington, DC (U.S. Government Printing Office), 1249–1256. https://doi.org/10.2973/dsdp.proc.90.132.1986
Bukry, D., 1974. Coccoliths as paleosalinity indicators—evidence from Black Sea: biology. In Degens, E.T., and Ross, D.A. (Eds.), The Black Sea—Geology, Chemistry, and Biology, AAPG Memoir, 20:353–363. http://archives.datapages.com/data/specpubs/sedimen1/data/a145/a145/0001/0350/0353.html
Burns, R.E., and Andrews, J.E., 1973. Regional aspects of deep sea drilling in the southwest Pacific. In Burns, R.E., Andrews, J.E., et al., Initial Reports of the Deep Sea Drilling Project, 21: Washington, DC (U.S. Government Printing Office), 897–906. https://doi.org/10.2973/dsdp.proc.21.128.1973
Crundwell, M.P., Morgans, H.E.G., and Hollis, C.J., 2016. Micropaleontological report on dredge samples collected during the 2015 VESPA (Volcanic Evolution of South Pacific Arcs) expedition. GNS Science Internal Report.
D’Hondt, S., Jørgensen, B.B., Miller, D.J., Batzke, A., Blake, R., Cragg, B.A., Cypionka, H., et al., 2004. Distributions of microbial activities in deep subseafloor sediments. Science, 306(5705):2216–2221. https://doi.org/10.1126/science.1101155
Dickens, G.R., Koelling, M., Smith, D.C., Schneiders, L., and the IODP Expedition 302 Scientists, 2007. Rhizon sampling of pore waters on scientific drilling expeditions: an example from the IODP Expedition 302, Arctic Coring Expedition (ACEX). Scientific Drilling, 4:22–25. https://doi.org/10.2204/iodp.sd.4.08.2007
Dickens, G.R., and Owen, R.M., 1999. The latest Miocene–early Pliocene biogenic bloom: a revised Indian Ocean perspective. Marine Geology, 161(1):75–91. https://doi.org/10.1016/S0025-3227(99)00057-2
Dwyer, G.S., Cronin, T.M., Baker, P.A., Raymo, M.E., Buzas, J.S., and Corrège, T., 1995. North Atlantic deepwater temperature change during late Pliocene and late Quaternary climatic cycles. Science, 270(5240):1347–1351. https://doi.org/10.1126/science.270.5240.1347
Erbacher, J., Mosher, D.C., Malone, M.J., et al., 2004. Proceedings of the Ocean Drilling Program, Initial Reports, 207: College Station, TX (Ocean Drilling Program). https://doi.org/10.2973/odp.proc.ir.207.2004
Froelich, P.N., Klinkhammer, G.P., Bender, M.L., Luedtke, N.A., Heath, G.R., Cullen, D., Dauphin, P., Hammond, D., Hartman, B., and Maynard, V., 1979. Early oxidation of organic matter in pelagic sediments of the eastern equatorial Atlantic: suboxic diagenesis. Geochimica et Cosmochimica Acta, 43(7):1075–1090. https://doi.org/10.1016/0016-7037(79)90095-4
Gardner, J.V., Nelson, C.S., and Baker, P.A., 1986. Distribution and character of pale green laminae in sediment from Lord Howe Rise: a probable late Neogene and Quaternary tephrostratigraphic record. In Kennett, J.P., von der Borch, C.C., et al., Initial Reports of the Deep Sea Drilling Project, 90: Washington, DC (U.S. Government Printing Office), 1145–1159. https://doi.org/10.2973/dsdp.proc.90.125.1986
Gieskes, J.M., and Lawrence, J.R., 1981. Alteration of volcanic matter in deep-sea sediments: evidence from the chemical composition of interstitial waters from deep sea drilling cores. Geochimica et Cosmochimica Acta, 45(10):1687–1703. https://doi.org/10.1016/0016-7037(81)90004-1
Hackney, R., Sutherland, R., and Collot, J., 2012. Rifting and subduction initiation history of the New Caledonia Trough, southwest Pacific, constrained by process-oriented gravity models. Geophysical Journal International, 189(3):1293–1305. https://doi.org/10.1111/j.1365-246X.2012.05441.x
Hayward, B.W., 1986. A guide to paleoenvironmental assessment using New Zealand Cenozoic foraminiferal faunas. New Zealand Geological Survey Report, 109.
Holbourn, A., Henderson, A.S., and MacLeod, N., 2013. Atlas of Benthic Foraminifera: Chichester, United Kingdom (John Wiley & Sons, Ltd.). https://doi.org/10.1002/9781118452493
Hornibrook, N.d.B., Brazier, R.C., and Strong, C.P., 1989. Manual of New Zealand Permian to Pleistocene foraminiferal biostratigraphy. New Zealand Geological Survey Paleontological Bulletin, 56.
Insua, T.L., Spivack, A.J., Graham, D., D’Hondt, S., and Moran, K., 2014. Reconstruction of Pacific Ocean bottom water salinity during the Last Glacial Maximum. Geophysical Research Letters, 41(8):2914–2920. https://doi.org/10.1002/2014GL059575
Kirschvink, J.L., 1980. The least-squares line and plane and the analysis of palaeomagnetic data. Geophysical Journal of the Royal Astronomical Society, 62(3):699–718. https://doi.org/10.1111/j.1365-246X.1980.tb02601.x
McFadden, P.L., and Reid, A.B., 1982. Analysis of paleomagnetic inclination data. Geophysical Journal of the Royal Astronomical Society, 69(2):307–319. https://doi.org/10.1111/j.1365-246X.1982.tb04950.x
Raine, J.I., Beu, A.G., Boyes, A., Campbell, H.J., Cooper, R.A., Crampton, J.S., Crundwell, M.P., Hollis, C.J., and Morgans, H.E., 2015. A revised calibration of the New Zealand Geological Timescale: NZGT2015 [paper presented at International Conference and Exhibition, Melbourne, Australia, 13–16 September 2015]. https://doi.org/10.1190/ice2015-2211449
Shipboard Scientific Party, 1986. Site 592: Lord Howe Rise, 36°S. In Kennett, J.P., von der Borch, C.C., et al., Initial Reports of the Deep Sea Drilling Project, 90: Washington, DC (U.S. Government Printing Office), 139–252. https://doi.org/10.2973/dsdp.proc.90.108.1986
Sutherland, R., Collot, J., Bache, F., Henrys, S., Barker, D., Browne, G., Lawrence, M., Morgans, H., Hollis, C., and Clowes, C., 2017. Widespread compression associated with Eocene Tonga-Kermadec subduction initiation. Geology, 45(4):355–358. https://doi.org/10.1130/G38617.1
Sutherland, R., Dickens, G.R., Blum, P., Agnini, C., Alegret, L., Asatryan, G., Bhattacharya, J., Bordenave, A., Chang, L., Collot, J., Cramwinckel, M.J., Dallanave, E., Drake, M.K., Etienne, S.J.G., Giorgioni, M., Gurnis, M., Harper, D.T., Huang, H.-H.M., Keller, A.L., Lam, A.R., Li, H., Matsui, H., Morgans, H.E.G., Newsam, C., Park, Y.-H., Pascher, K.M., Pekar, S.F., Penman, D.E., Saito, S., Stratford, W.R., Westerhold, T., and Zhou, X., 2019a. Expedition 371 methods. In Sutherland, R., Dickens, G.R., Blum, P., and the Expedition 371 Scientists, Tasman Frontier Subduction Initiation and Paleogene Climate. Proceedings of the International Ocean Discovery Program, 371: College Station, TX (International Ocean Discovery Program). https://doi.org/10.14379/iodp.proc.371.102.2019
Sutherland, R., Dickens, G.R., Blum, P., Agnini, C., Alegret, L., Asatryan, G., Bhattacharya, J., Bordenave, A., Chang, L., Collot, J., Cramwinckel, M.J., Dallanave, E., Drake, M.K., Etienne, S.J.G., Giorgioni, M., Gurnis, M., Harper, D.T., Huang, H.-H.M., Keller, A.L., Lam, A.R., Li, H., Matsui, H., Morgans, H.E.G., Newsam, C., Park, Y.-H., Pascher, K.M., Pekar, S.F., Penman, D.E., Saito, S., Stratford, W.R., Westerhold, T., and Zhou, X., 2019b. Site U1508. In Sutherland, R., Dickens, G.R., Blum, P., and the Expedition 371 Scientists, Tasman Frontier Subduction Initiation and Paleogene Climate. Proceedings of the International Ocean Discovery Program, 371: College Station, TX (International Ocean Discovery Program). https://doi.org/10.14379/iodp.proc.371.105.2019
Sutherland, R., Dickens, G.R., Blum, P., Agnini, C., Alegret, L., Bhattacharya, J., Bordenave, A., Chang, L., Collot, J., Cramwinckel, M.J., Dallanave, E., Drake, M.K., Etienne, S.J.G., Giorgioni, M., Gurnis, M., Harper, D.T., Huang, H.-H.M., Keller, A.L., Lam, A.R., Li, H., Matsui, H., Morgans, H.E.G., Newsam, C., Park, Y.-H., Pascher, K.M., Pekar, S.F., Penman, D.E., Saito, S., Stratford, W.R., Westerhold, T., and Zhou, X., 2019c. Site U1509. In Sutherland, R., Dickens, G.R., Blum, P., and the Expedition 371 Scientists, Tasman Frontier Subduction Initiation and Paleogene Climate. Proceedings of the International Ocean Discovery Program, 371: College Station, TX (International Ocean Discovery Program). https://doi.org/10.14379/iodp.proc.371.106.2019
Tada, R., Murray, R.W., Alvarez Zarikian, C.A., Anderson, W.T., Jr., Bassetti, M.-A., Brace, B.J., Clemens, S.C., da Costa Gurgel, M.H., Dickens, G.R., Dunlea, A.G., Gallagher, S.J., Giosan, L., Henderson, A.C.G., Holbourn, A.E., Ikehara, K., Irino, T., Itaki, T., Karasuda, A., Kinsley, C.W., Kubota, Y., Lee, G.S., Lee, K.E., Lofi, J., Lopes, C.I.C.D., Peterson, L.C., Saavedra-Pellitero, M., Sagawa, T., Singh, R.K., Sugisaki, S., Toucanne, S., Wan, S., Xuan, C., Zheng, H., and Ziegler, M., 2015. Site U1424. In Tada, R., Murray, R.W., Alvarez Zarikian, C.A., and the Expedition 346 Scientists, Proceedings of the Integrated Ocean Drilling Program, 346: College Station, TX (Integrated Ocean Drilling Program). https://doi.org/10.2204/iodp.proc.346.105.2015
The Leg 90 Staff, 1983. Deep-Sea Drilling Project Leg 90: the South Pacific Cenozoic. Nature, 303:18–19. https://doi.org/10.1038/303018a0
The Shipboard Scientific Party, 1973. Site 207. With contribution by D. Burns, W.A. Watters, and P.N. Webb. In Burns, R.E., Andrews, J.E., et al., Initial Reports of the Deep Sea Drilling Project, 21: Washington, DC (U.S. Government Printing Office), 197–214. https://doi.org/10.2973/dsdp.proc.21.107.1973
van Morkhoven, F.P.C.M., Berggren, W.A., Edwards, A.S., and Oertli, H.J., 1986. Cenozoic cosmopolitan deep-water benthic foraminifera. Bulletin des Centres de Recherches Exploration-Production Elf-Aquitaine: Mémoire, 11.
Wade, B.S., Pearson, P.N., Berggren, W.A., and Pälike, H., 2011. Review and revision of Cenozoic tropical planktonic foraminiferal biostratigraphy and calibration to the geomagnetic polarity and astronomical time scale. Earth-Science Reviews, 104(1–3):111–142. https://doi.org/10.1016/j.earscirev.2010.09.003
Zijderveld, J.D.A., 1967. AC demagnetization of rocks: analysis of results. In Collinson, D.W., Creer, K.M., and Runcorn, S.K. (Eds.), Developments in Solid Earth Geophysics (Volume 3): Methods in Palaeomagnetism: Amsterdam (Elsevier), 254–286. https://doi.org/10.1016/B978-1-4832-2894-5.50049-5
1 Sutherland, R., Dickens, G.R., Blum, P., Agnini, C., Alegret, L., Bhattacharya, J., Bordenave, A., Chang, L., Collot, J., Cramwinckel, M.J., Dallanave, E., Drake, M.K., Etienne, S.J.G., Giorgioni, M., Gurnis, M., Harper, D.T., Huang, H.-H.M., Keller, A.L., Lam, A.R., Li, H., Matsui, H., Morgans, H.E.G., Newsam, C., Park, Y.-H., Pascher, K.M., Pekar, S.F., Penman, D.E., Saito, S., Stratford, W.R., Westerhold, T., Zhou, X., 2019. Site U1510. In Sutherland, R., Dickens, G.R., Blum, P., and the Expedition 371 Scientists, Tasman Frontier Subduction Initiation and Paleogene Climate. Proceedings of the International Ocean Discovery Program, 371: College Station, TX (International Ocean Discovery Program). https://doi.org/10.14379/iodp.proc.371.107.2019
2 Expedition 371 Scientists’ affiliations.
This work is distributed under the Creative Commons Attribution 4.0 International (CC BY 4.0) license. 
- F1. Regional bathymetry, seismic reflection lines, and boreholes.
- F2. Seismic reflection Line TAN1409_LHRS_02.
- F3. Seismic reflection Line TAN1409_LHRS_06.
- F4. Lithostratigraphic summary of sedimentary section.
- F5. Major biogenic and lithologic constituent abundances.
- F6. Representative Subunit Ia and Ib lithologies.
- F7. Representative Unit I lithologies.
- F8. Color banding, Subunit Ia.
- F9. Nannofossil ooze with bioclasts in Subunit IIa.
- F10. Representative Subunit IIb lithologies.
- F11. Representative Subunit IIb lithologies.
- F12. Representative Subunit IIc lithologies.
- F13. Representative Subunit IIc lithologies.
- F14. Chert and cherty limestone.
- F15. XRD analysis of volcaniclastic sediments from Subunit IIc.
- F16. XRF analysis of volcaniclastic sediments from Subunit IIc.
- F17. Microfossil preservation and abundance.
- F18. Biozonations and reworking/resedimentation of microfossil assemblages.
- F19. Ostracod preservation, abundance, and assemblage composition.
- F20. Pass-through paleomagnetic data, Hole U1510A.
- F21. Pass-through paleomagnetic data, Hole U1510B.
- F22. Inclination values.
- F23. Vector endpoint demagnetization diagrams.
- F24. AMS data for 10 discrete samples.
- F25. Bulk density, grain density, porosity, and P-wave velocity.
- F26. Magnetic susceptibility, NGR, and L*, a*, b*.
- F27. Heat flow.
- F28. Shear and compressive strength.
- F29. Core data compared with MCS reflection Line TAN1409_LHRS_02.
- F30. Squeeze IW chemistry for uppermost 477 m.
- F31. Squeeze and Rhizon IW chemistry for uppermost 30 m CCSF.
- F32. Bulk sediment profiles.
- F33. Dissolved Ca vs. Mg in IW.
- F34. NGR data for spliced interval.
- F35. Color reflectance data for spliced interval.
- F36. CSF-A vs. CCSF depths for tops of cores.
- F37. Concept for improved routine IW sample collection at sites with high APC recovery.
- F38. IW samples taken and strontium concentrations.
- F39. Sedimentation accumulation over time.
- T1. Core summary.
- T2. Lithostratigraphic units.
- T3. Microfossil datums and chrons used to construct age model.
- T4. Nannofossil distribution and occurrence data.
- T5. Planktic foraminifer distribution and occurrence data.
- T6. Benthic foraminifer distribution and abundance data.
- T7. Radiolarian distribution and abundance data.
- T8. Interstitial water chemistry.
- T9. Bulk sediment geochemistry.
- T10. Shipboard core top and composite depths.
- T11. Splice intervals.