Sutherland, R., Dickens, G.R., Blum, P., and the Expedition 371 Scientists
Proceedings of the International Ocean Discovery Program Volume 371
publications.iodp.org
https://doi.org/10.14379/iodp.proc.371.106.2019

Site U15091
R. Sutherland, G.R. Dickens, P. Blum, C. Agnini, L. Alegret, J. Bhattacharya, A. Bordenave, L. Chang, J. Collot, M.J. Cramwinckel, E. Dallanave, M.K. Drake, S.J.G. Etienne, M. Giorgioni, M. Gurnis, D.T. Harper, H.-H.M. Huang, A.L. Keller, A.R. Lam, H. Li, H. Matsui, H.E.G. Morgans, C. Newsam, Y.-H. Park, K.M. Pascher, S.F. Pekar, D.E. Penman, S. Saito, W.R. Stratford, T. Westerhold, and X. Zhou2
Keywords: International Ocean Discovery Program, IODP, JOIDES Resolution, Expedition 371, Site U1509, Tasman Frontier, Zealandia, Reinga, Challenger, Eastern Australian Current, Lord Howe, Murihiku, New Caledonia, Norfolk, Northland, Pacific, Ring of Fire, Tasman, Taranaki, Tonga, Kermadec, Waka Nui, Wanganella, subduction, Early Eocene Climatic Optimum, EECO, Middle Eocene Climatic Optimum, MECO, biogenic bloom, stratigraphy, diagenesis, compaction, volcanism
MS 371-106: Published 2 February 2019
Background and objectives
International Ocean Discovery Program (IODP) Site U1509 (34°39.13ʹS, 165°49.66ʹE; 2911 m water depth) lies ~640 km west of the northern tip of New Zealand, ~300 km south of Deep Sea Drilling Project (DSDP) Site 206, and ~200 km north of DSDP Site 592 (Figure F1). It is located on the western margin of New Caledonia Trough (NCT) at the base of the Lord Howe Rise slope, near the mouth of a canyon that drains northeast around the end of a small spur (Figure F2). Site U1509 was chosen to determine the timing of Cenozoic folding in the southern NCT and to constrain the timing of vertical tectonic movements and volcanism. In particular, the site was chosen to test alternate hypotheses for the relative magnitudes of Cretaceous versus Eocene subsidence in the region (Baur et al., 2014; Sutherland et al., 2010).
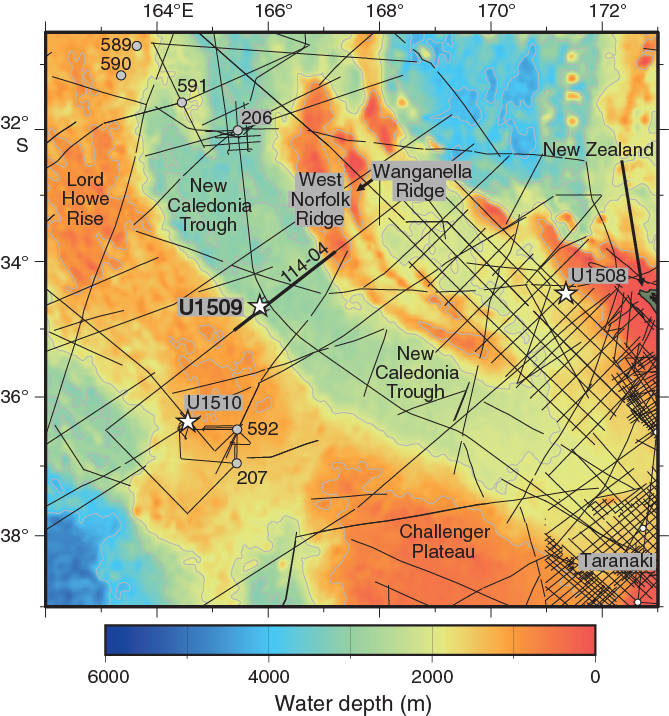
Figure F1. Regional bathymetry, seismic reflection lines, and boreholes.
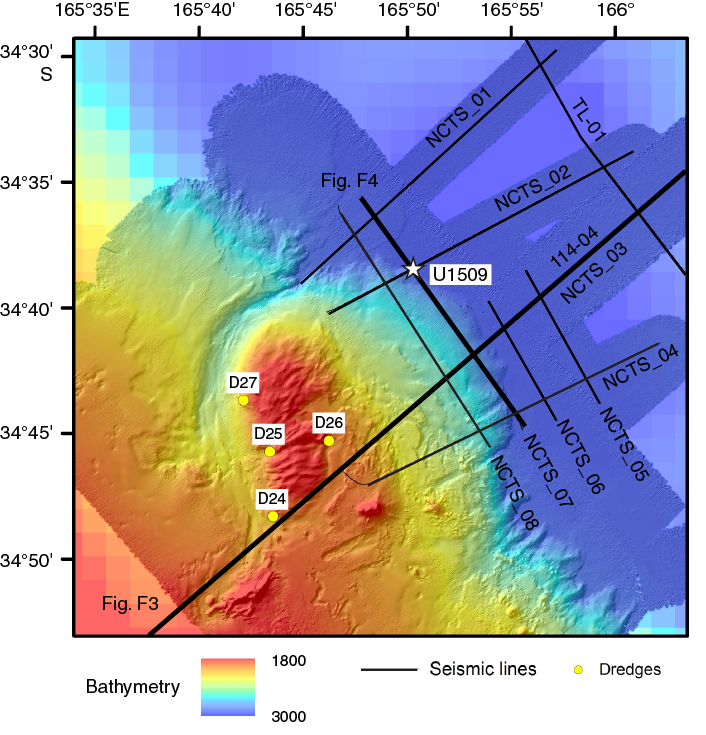
Figure F2. Bathymetry, seismic reflection lines, and dredge locations.
The sedimentary sequence at the southern end of NCT is contiguous with that in Taranaki Basin, where flat-lying (undeformed) strata overlie a Cretaceous rift sequence in most places (Uruski and Wood, 1991). Samples dredged from West Norfolk Ridge and Wanganella Ridge (Figure F1) include Cretaceous (~95–86 Ma) terrestrial arkosic sandstone containing coal and silicic volcanic fragments and Cretaceous (~86–66 Ma) upper bathyal (400–600 m water depth) sandstone and mudstone containing carbonaceous debris (Browne et al., 2016; Herzer et al., 1997, 1999). Mapping of seismic reflectors tied to petroleum wells in Taranaki Basin shows that similar facies and a relict Cretaceous to Eocene shelf-edge morphology is buried across a large area (50,000 km2) of southern NCT (Baur et al., 2014).
Of particular relevance to Expedition 371 are observations such as a buried shelf edge that suggest anomalously large tectonic subsidence (>2 km) since the Eocene in southern NCT and, moreover, that such subsidence was rapid and approximately coincided with local folding and reverse faulting (Tectonic Event of the Cenozoic in the Tasman Area [TECTA]) (Baur et al., 2014; Sutherland et al., 2017, 2010). The spur on which Site U1509 is located is inferred to have been created by TECTA deformation and is underlain by the northeast-dipping limb of a west-verging fold (Figures F2, F3). Paleocene bathyal claystone and late Oligocene (~25 Ma) basaltic volcanic material were dredged from the eastern edge of a canyon that appears to have been diverted by growth of the fold (Browne et al., 2016; Mortimer et al., 2018). The Paleocene claystone is early Teurian (Danian) in age (dinoflagellate Zones NZDP1–NZDP2) based on the presence of Trithyrodinium evittii and Palaeoperidinium pyrophorum and the absence of Alterbidinium pentaradiatum (Browne et al., 2016).
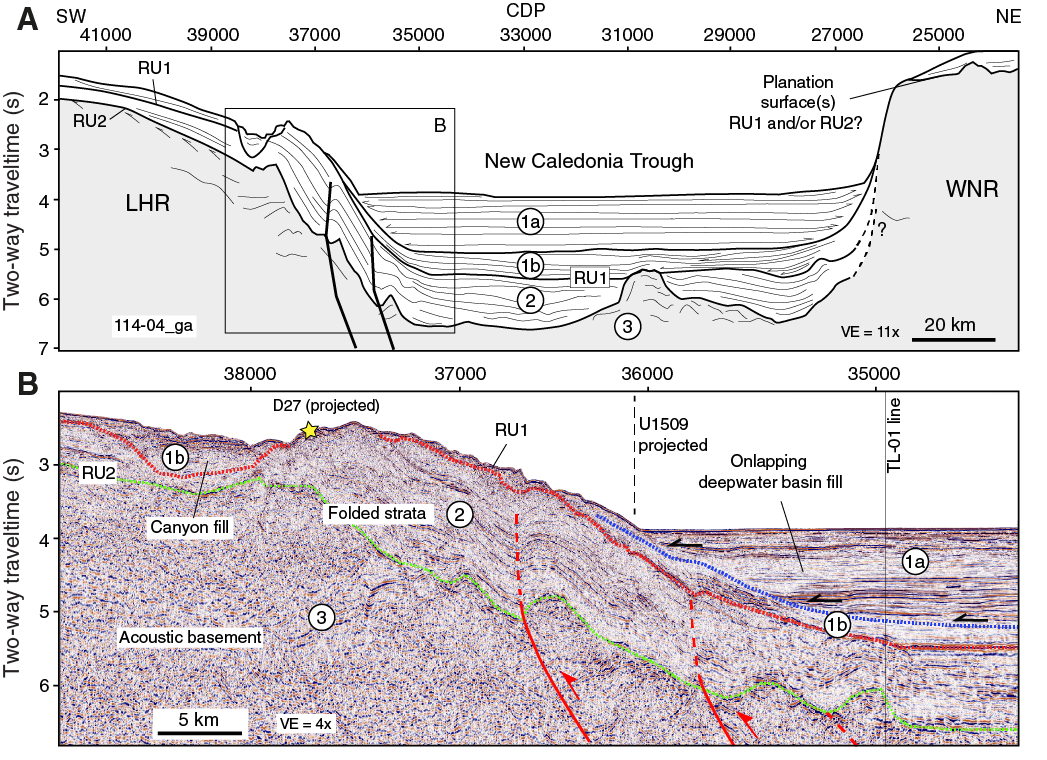
Figure F3. Seismic reflection Line 114-04 near Site U1509.
Four seismic units were identified in the vicinity of Site U1509 (Figures F3, F4, F5) (Etienne et al., 2018). The upper unit found beneath the axis of NCT (seismic Unit 1a1) comprises continuous parallel reflectors with moderate or high amplitude that onlap the basin margin and are interpreted to be turbidites. Seismic Unit 1a1 was drilled at Site 206 and is composed of clay-bearing nannofossil ooze of Oligocene to recent age (Shipboard Scientific Party, 1973). Seismic Unit 1a2 is the upper unit beneath the spur and is composed of moderate- or low-amplitude reflectors that have relatively complex geometries, including wavy geometries with a stacking pattern suggesting upslope-migrating bedforms. Seismic Unit 1a2 is interpreted to be a pelagic or hemipelagic unit that is time equivalent to the basin fill sequence, particularly the basal part of seismic Unit 1a1, and has been winnowed by bottom currents (Etienne et al., 2018).
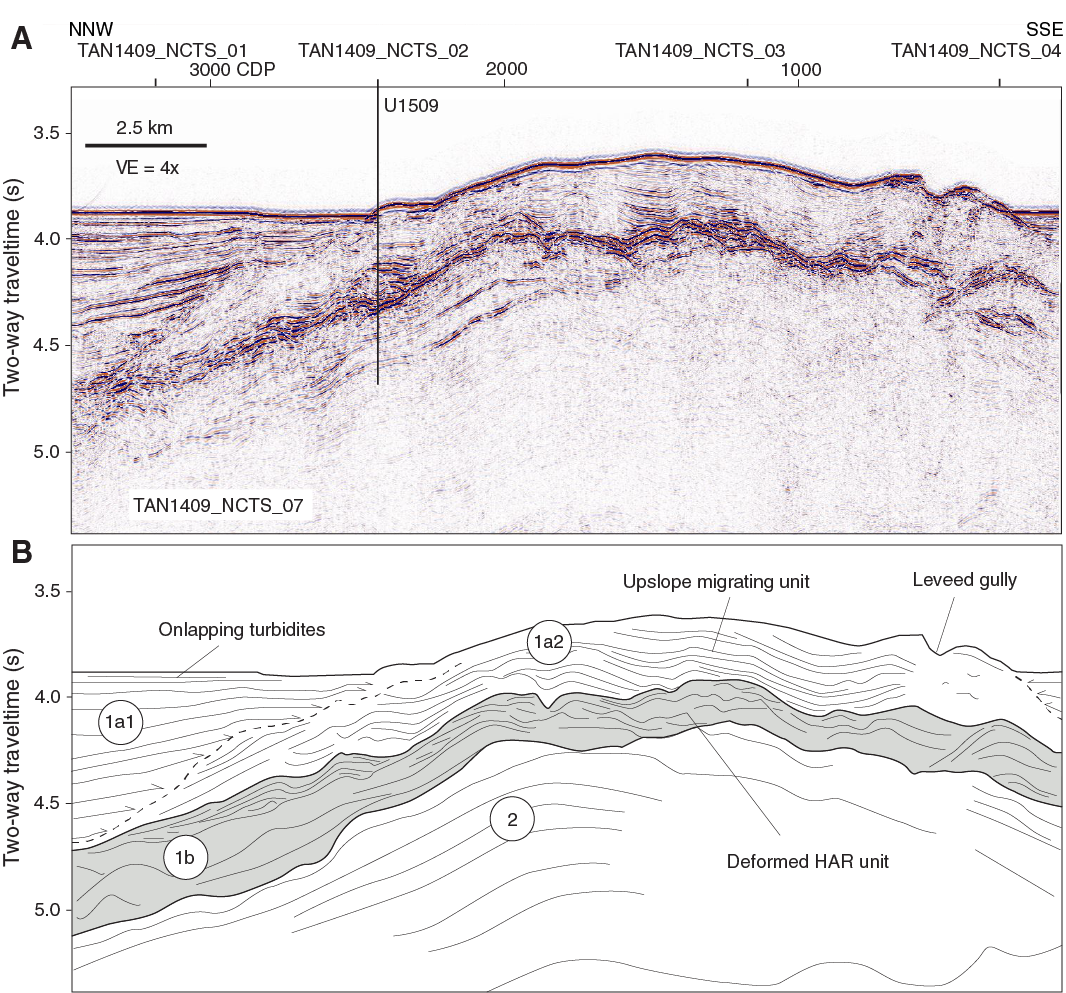
Figure F4. Seismic reflection Line TAN1409_NCTS_07 and seismic units.

Figure F5. Seismic reflection Line TAN1409_NCTS_02 and drilled Reflectors A–F.
Seismic Unit 1b1 comprises high-amplitude, discontinuous reflectors with complex geometries that occur in packets, in some places with downlap relationships. The unit thins dramatically away from the mouth of the canyon, appears to be locally deformed and tilted, and truncates reflectors of seismic Unit 2, below. The upper surface of seismic Unit 1b is marked as a downward transition to higher amplitudes and is not a discrete reflector in most places. Seismic Unit 2 comprises moderate-amplitude, parallel reflectors with moderate or high continuity. This unit correlates with strata that crop out in the canyon, from which samples of early Paleocene mudstone were dredged (Browne et al., 2016).
The drilling objectives at Site U1509 were to sample the sequence of seismic Units 1a2–2 in a location with a relatively expanded seismic Unit 1b and minimal burial by seismic Unit 1a2. The predrilling working hypothesis was that high-amplitude, chaotic reflectors of seismic Unit 1b represented a syntectonic (TECTA) unit that contained material derived from the local canyon and was subsequently uplifted by folding.
Operations
Hole locations, water depths, and the number of cores recovered are listed in Table T1. All times are local ship time (UTC + 11 h).
We arrived at Site U1509 at 0630 h on 2 September 2017, completing a 273 nmi transit from Site U1508. After lowering thrusters and hydrophones and establishing dynamic positioning, the rig floor was cleared for operations at 0700 h. While the rotary core barrel (RCB) bottom-hole assembly was being assembled, a seafloor positioning beacon was deployed. The drill string was deployed to just above the seafloor, and the top drive was engaged. A “wiper pig” was pumped through the drill pipe in an attempt to remove excessive rust observed during drill string assembly.
Given lost time at Site U1508, success with rotary drilling, and the primary objectives for Site U1509, rotary coring was deemed the best option. Coring in Hole U1509A began at 1825 h on 2 September and continued until 2345 h on 6 September to a total depth of 690.7 m drilling depth below seafloor (DSF) (Core 74R). The hole was cleaned with 10–15 bbl mud sweeps, which were pumped on every third core for Cores 9R through 49R. Starting with Core 50R, the frequency and volume of mud sweeps were increased to every other core and 20–25 bbl, respectively. Total recovery in Hole U1509A was 462.86 m (67%).
In preparation for logging, Hole U1509A was cleaned with a 30 bbl high-viscosity mud sweep. The rotary shifting tool (RST) was deployed to trigger the mechanical bit release (MBR) and drop the bit at the bottom of the hole (0015 h on 7 September). The reverse RST was deployed to shift the MBR sleeve back into the circulation position (0145 h). Next, the hole was displaced with 214 bbl of 10.5 lb/gal mud, the top drive was set back, and the drill string was pulled back to the logging depth of 81 m (0530 h). The modified triple combo logging tool string was rigged up when at 0645 h the operational decision was made to stop logging operations based on ship heave exceeding 3.0 m. The drill string was retrieved, and the rig was secured for transit by 1434 h, ending Hole U1509A and Site U1509. A total of 127.5 h or 5.3 days were spent on Hole U1509A. After recovering the seafloor positioning beacon and retrieving positioning thrusters and hydrophones at 1630 h on 7 September, the ship began a ~200 nmi transit north to a waiting on weather location to avoid severe weather forecasted for 9–10 September at the remaining two proposed drilling sites.
Lithostratigraphy
The sedimentary sequence at Site U1509 consists of ~415 m of Pleistocene to upper Paleocene calcareous ooze, chalk, and limestone (lithostratigraphic Unit I; Figure F6) overlying ~275 m of Paleocene to Upper Cretaceous claystone (lithostratigraphic Unit II). Sediments and rocks in these two units are divided into subunits based on differences in lithology and sedimentological features identified by macroscopic and microscopic (smear slide, thin section, and scanning electron microscope studies) core descriptions (Table T2; Figures F6, F7).
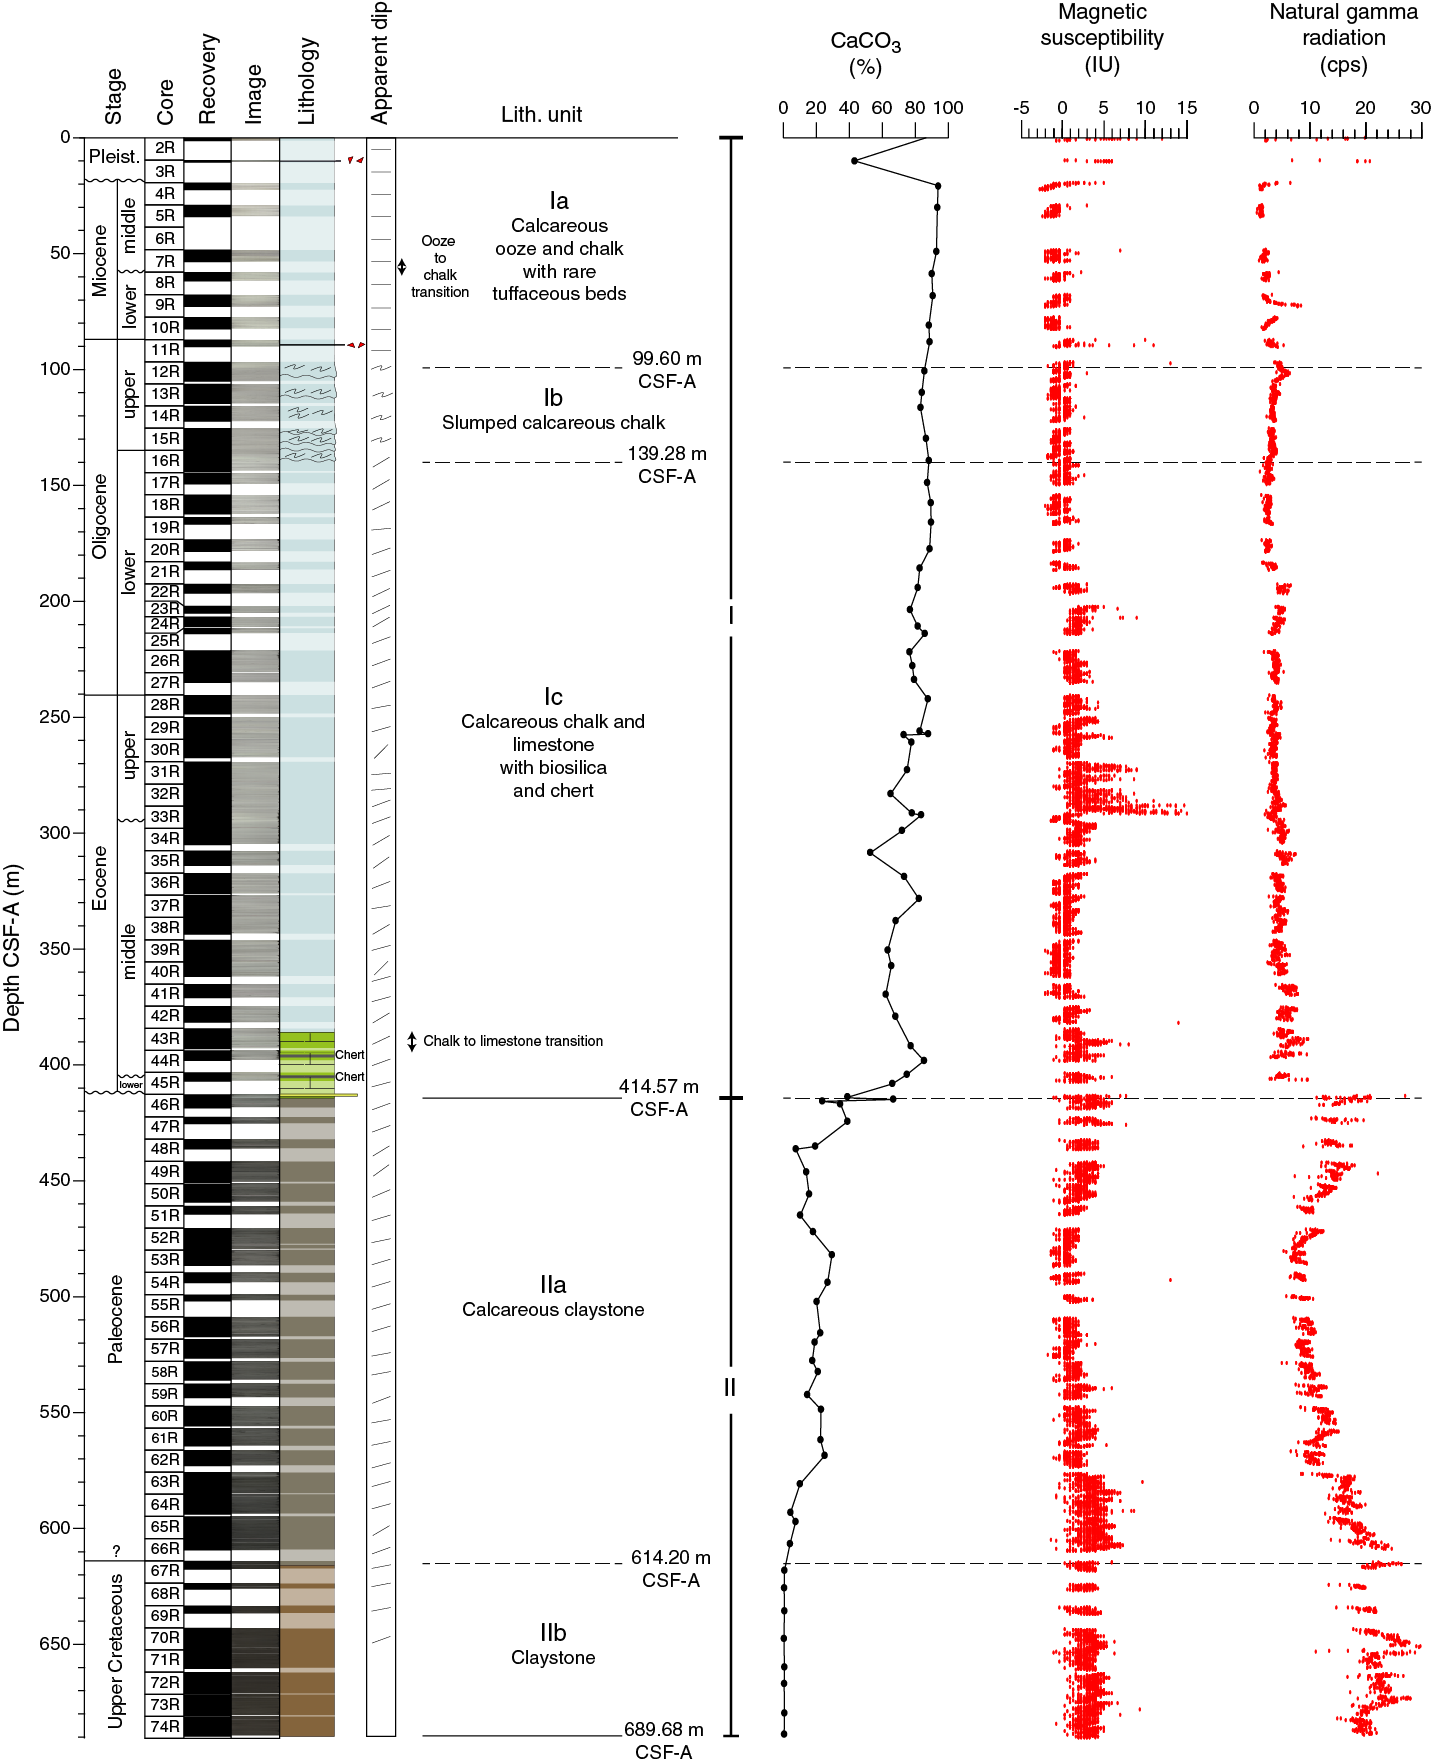
Figure F6. Lithostratigraphic summary of sedimentary section.

Figure F7. Major biogenic and lithologic constituent abundances.
Lithostratigraphic Unit I is divided into three subunits. Subunit Ia consists of Pleistocene to upper Oligocene calcareous ooze and chalk with rare tuffaceous beds. Subunit Ib comprises upper to lower Oligocene calcareous chalk with a composition similar to that of Subunit Ia but with significant synsedimentary deformation (i.e., slumps). Subunit Ic consists of lower Oligocene to upper Paleocene calcareous chalk and limestone with biosilica and chert. At ~387 m, the lithology changes downhole from chalk to limestone, and a heterogeneous succession of limestone, calcareous claystone with silt, and clayey limestone lies between ~387 and 415 m. Rare chert beds and chert nodules are present in this interval. This succession, forming the lower ~30 m of Subunit Ic, apparently represents discontinuous intervals spanning from the middle Eocene to upper Paleocene (see Biostratigraphy and paleoenvironment). Subunit Ic exhibits consistently tilted bedding (average apparent dip of 22° on randomly split section half surfaces) in places accompanied by fractures, stepped microfaults, and shear zones.
Lithostratigraphic Unit II is divided into two subunits. Subunit IIa consists of Paleocene massive to laminated calcareous claystone with varying amounts of other siliciclastic (silt-sized quartz and feldspar) and calcareous (predominantly nannofossils and less commonly foraminifers) components. Subunit IIb consists of Upper Cretaceous massive dark grayish brown claystone with very low carbonate content (see Geochemistry). Like Subunit Ic, tilted bedding was consistently observed throughout Unit II (average apparent dip of 20° on randomly split section half surfaces) and often revealed by planar laminations and bioturbation fabrics.
RCB drilling imparted soupy and mousse-like drilling disturbance in soft sediments in the upper ~50 m and biscuits, horizontal cracks, and fracturing in the more compacted sediments and rocks below. From Subunit Ic downward, cores are fractured along bedding planes or microfaults and shear bands.
Unit I
Lithostratigraphic Unit I consists of ~415 m of relatively homogeneous Pleistocene to upper Paleocene calcareous ooze, chalk, and limestone. Some intervals contain siliceous microfossils or chert. Three subunits (Ia, Ib, and Ic; Table T2; Figure F6) were defined in this unit based on the relative proportion and vertical distribution of macroscopic and microscopic components and on the occurrence of a discrete slumped interval that separates subhorizontal strata from tilted strata.
Subunit Ia
Subunit Ia consists of ~100 m of Pliocene to upper Oligocene calcareous sediments dominated by white to light greenish gray (predominantly N 8.5 to GLEY 1 8/5GY) nannofossil ooze and chalk with varying foraminifer abundance (Figure F8A). Gray (GLEY 1 6/N) blebs, likely representing pyritized burrows, are common. From Section 371-U1509A-7R-3 (~51 m) downhole, scattered green mineral grains and pale green laminae were observed (Figure F8B). Rare sponge spicules and radiolarians were observed below Section 10R-1 (77.5 m). Bioturbation remains slight to moderate throughout the subunit and is dominated by Planolites, Zoophycos, and Nereites burrows.
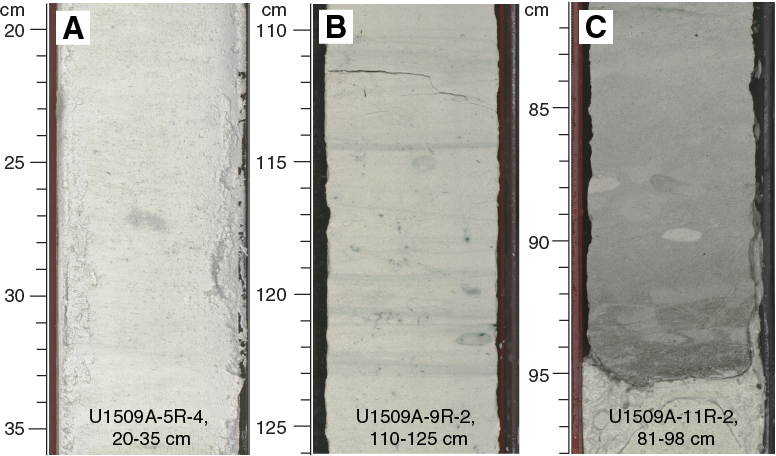
Figure F8. Common Subunit Ia lithologies.
Two sharp-based volcaniclastic beds occur in Sections 3R-1 (~9–10 m) and 11R-2 (89.3 m) (Figure F8C). They vary from light gray (GLEY 1 7/N) nannofossil ooze with ash and sand (siliciclastic quartz and feldspar) to light greenish gray (GLEY 1 7/10GY) tuffaceous foraminiferal chalk with sand, reflecting varying proportions of volcanic glass and silicate minerals of igneous origin determined by smear slide analysis (Figures F7, F9).
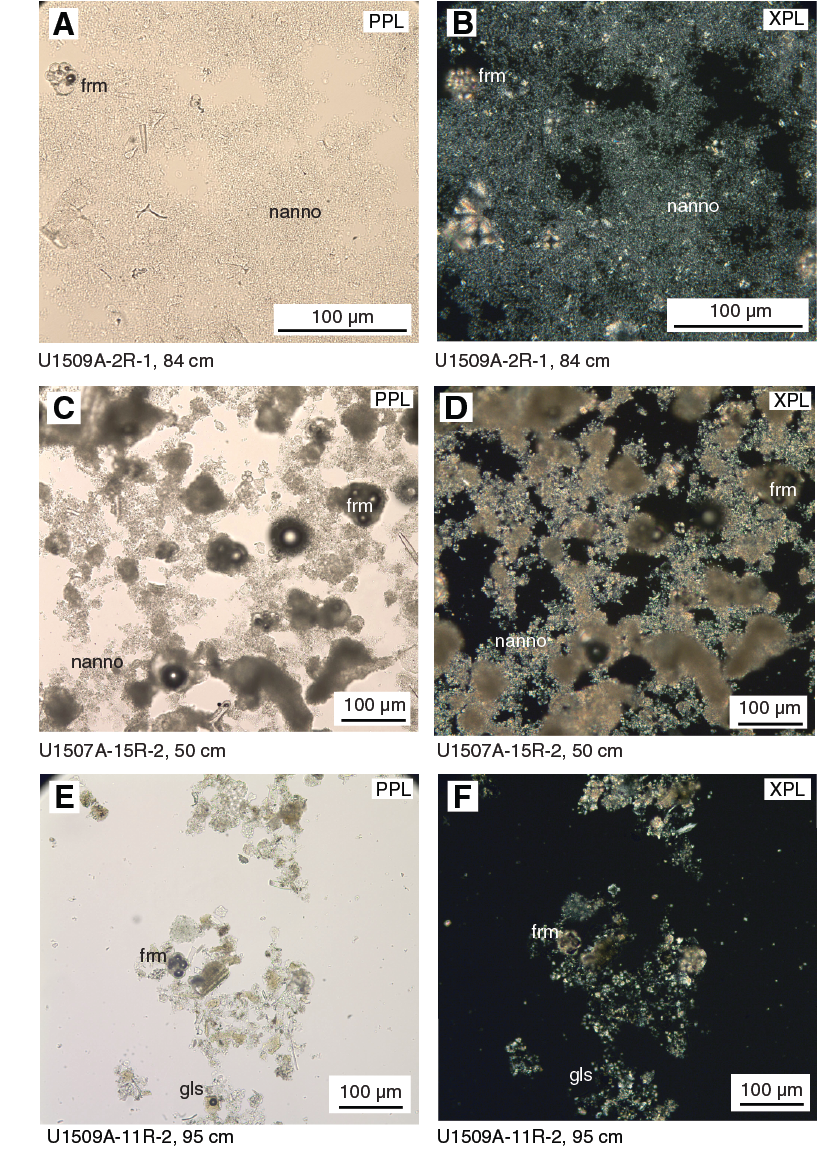
Figure F9. Representative Subunit Ia lithologies.
The ooze–chalk transition between Cores 7R and 8R (~53–58 m; Figure F6) coincides with the appearance of pale green laminae and gray halos, possibly owing to diagenetic processes. This transition also coincides with a rise in P-wave velocity (see Petrophysics). The shallow depth of the ooze–chalk transition (~53–58 m) may be the result of previous burial at greater depths, presumably underneath Miocene or younger sediments that have since been removed.
Subunit Ia displays no significant disrupted fabrics, and the pale green laminae seen in the calcareous chalk are horizontal, indicating that Subunit Ia is undeformed.
Subunit Ib
Subunit Ib consists of ~40 m of upper to lower Oligocene light greenish gray (GLEY 1 8/5GY) calcareous chalk. The dominant lithology is the same as that in Subunit Ia, with dominant nannofossils and common to abundant foraminifers. In some intervals between 99.6 and 102.8 m, sponge spicules are common. Pale green laminae and diagenetic halos are consistently present. Bioturbation varies from moderate to heavy throughout the cores, with a progressive decrease downhole from Section 371-U1509A-16R-1 (~135 m).
Subunit Ib differs from Subunit Ia because of the occurrence of soft-sediment deformation features. The Subunit Ia/Ib boundary marks the appearance of a disrupted fabric in the calcareous chalk in Section 12R-2 (99.6 m) (see example from Section 15R-3 in Figure F10A). The subunit is in general characterized by an alternation of slumped intervals, revealed by overturned folding of strata, with several discrete, sharp-based, convoluted to parallel laminated beds (Figure F10C). These deposits record soft-sediment deformation through gravity flow processes. Notably, a brecciated and severely faulted interval occurs at the base of Subunit Ib in Section 16R-3 (~137–139 m). Such structures suggest that slope instabilities occurred during deposition of Subunit Ib.
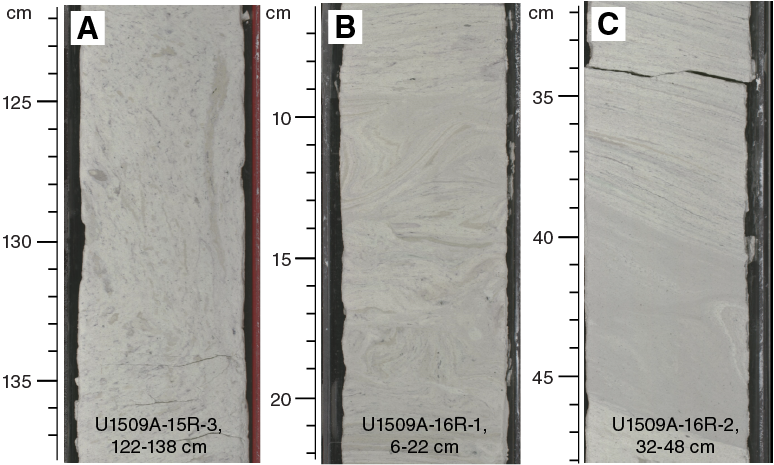
Figure F10. Common Subunit Ib lithologies.
Subunit Ic
Subunit Ic comprises ~275 m of light greenish gray (GLEY 1 8/5GY) lower Oligocene to upper Paleocene calcareous chalk and limestone with varying amounts of siliceous microfossils or chert nodules (Figures F11, F12). The calcareous component has dominant nannofossils and rare to common foraminifers (Figure F7). In total, siliceous microfossils are common to abundant, and specifically diatoms, sponge spicules, radiolarians, and silicoflagellates were observed. Pale green laminae and diagenetic halos occur throughout, with rare occurrences between Sections 371-U1509A-20R-1 and 20R-CC (~174–178 m) and between Sections 33R-1 and 34R-1, 149 cm (~290–303 m).
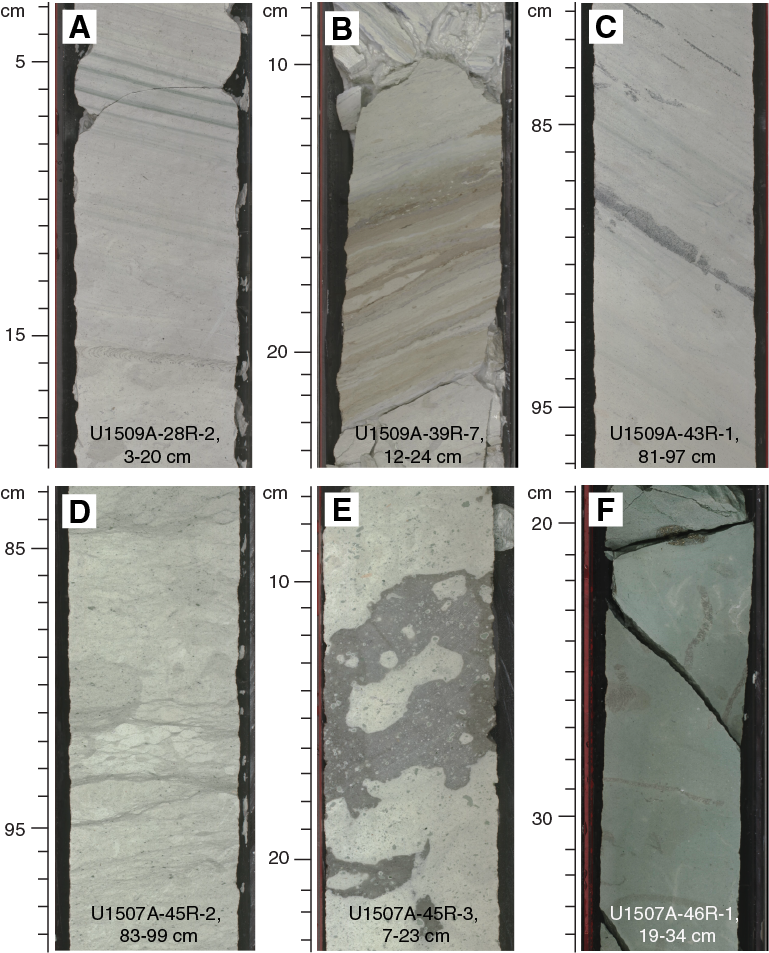
Figure F11. Common Subunit Ic lithologies.
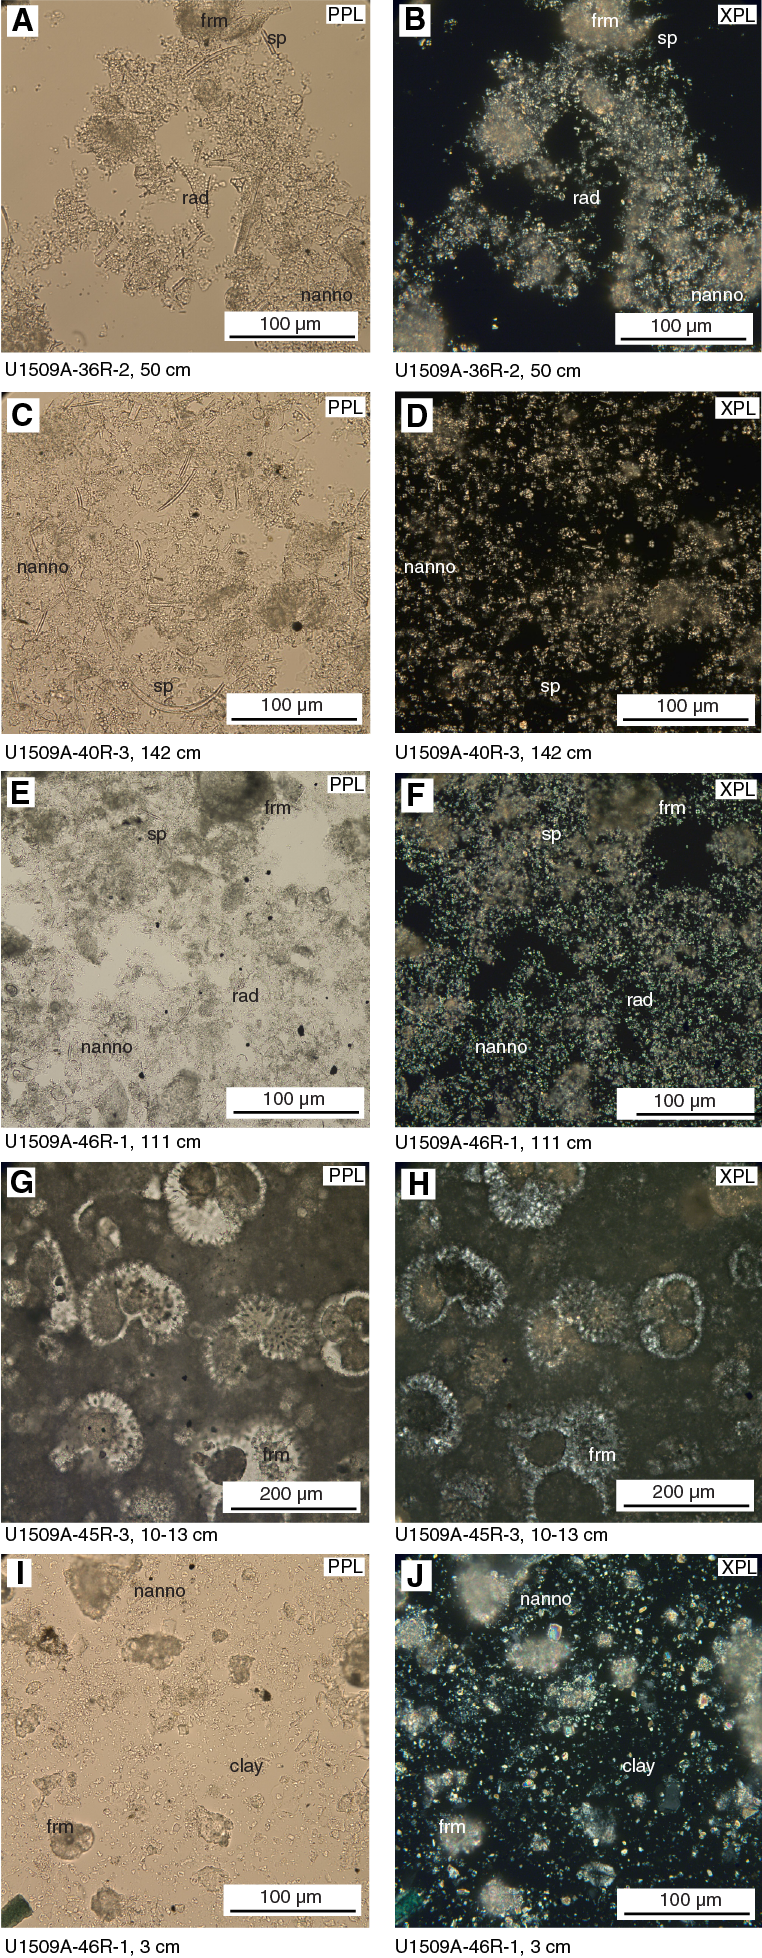
Figure F12. Representative Subunit Ic lithologies.
At Section 33R-2, 135 cm (291.35 m), a sharp bioturbated contact separates calcareous chalk with biosilica, foraminifers, rare clay, and volcanic glass from underlying calcareous chalk with biosilica, absent of clay or volcanic glass (Figure F13). This change is accompanied by a downhole lightening of color and coincides with a slight drop (~10 instrument units [IU]) in magnetic susceptibility (see Petrophysics). Notably, a ~3 My hiatus occurs between Sections 32R-CC and 33R-CC from the Priabonian to the Bartonian (see Biostratigraphy and paleoenvironment), which might correlate with this change in lithology, color, and physical properties.
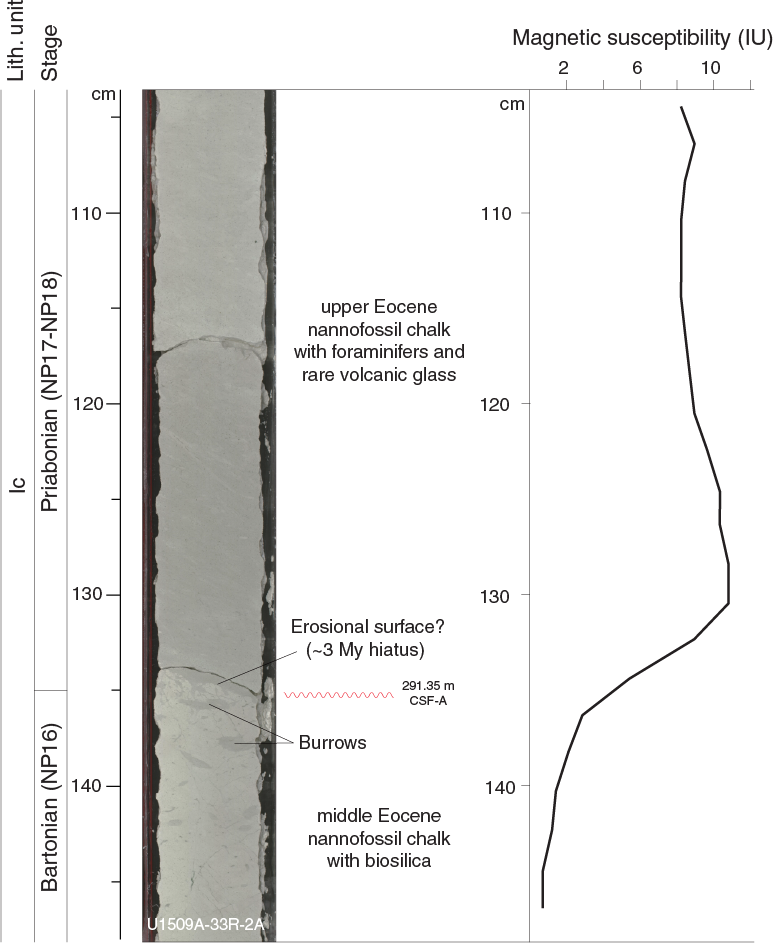
Figure F13. Distinct color change across middle Eocene.
In interval 39R-4, 30 cm, to 43R-2, 130 cm (~351 and 387 m), thin brown beds of nannofossil chalk with abundant biosilica are present; in some places, very thin sharp-based beds of fine sand–sized foraminiferal limestone were also encountered (Figure F11B–F11C). The chalk–limestone transition was observed in Section 43R-2 (~387 m) and is followed downhole by the occurrence of chert (Figure F6).
Throughout Subunit Ic, bedding planes, burrows, and diagenetic pale green laminae are consistently tilted at an average apparent dip of 22° and a maximum dip of 45° (Figure F14). Additionally, stepped microfaults are common, apparent in many cases as centimeter-scale offsets of planar or linear features, including pale green laminae, horizontal burrows, and thin beds of biosiliceous nannofossil chalk or foraminiferal limestone. Normal faults are the most common brittle deformation identified, but a small number of fractures have reverse displacement. Other types of brittle deformation occur in places as discrete bands of synthetic and antithetic fractures associated with a change in color that is probably due to pressure solution. In the basal part of Subunit Ic, especially in Sections 371-U1509A-45R-2 and 45R-3, sheared zones contain ductile fabrics in which a foliation developed, probably through pressure solution–mediated creep. Asymmetric fish and incipient S-C fabrics are consistent with a normal sense of shear in this zone.
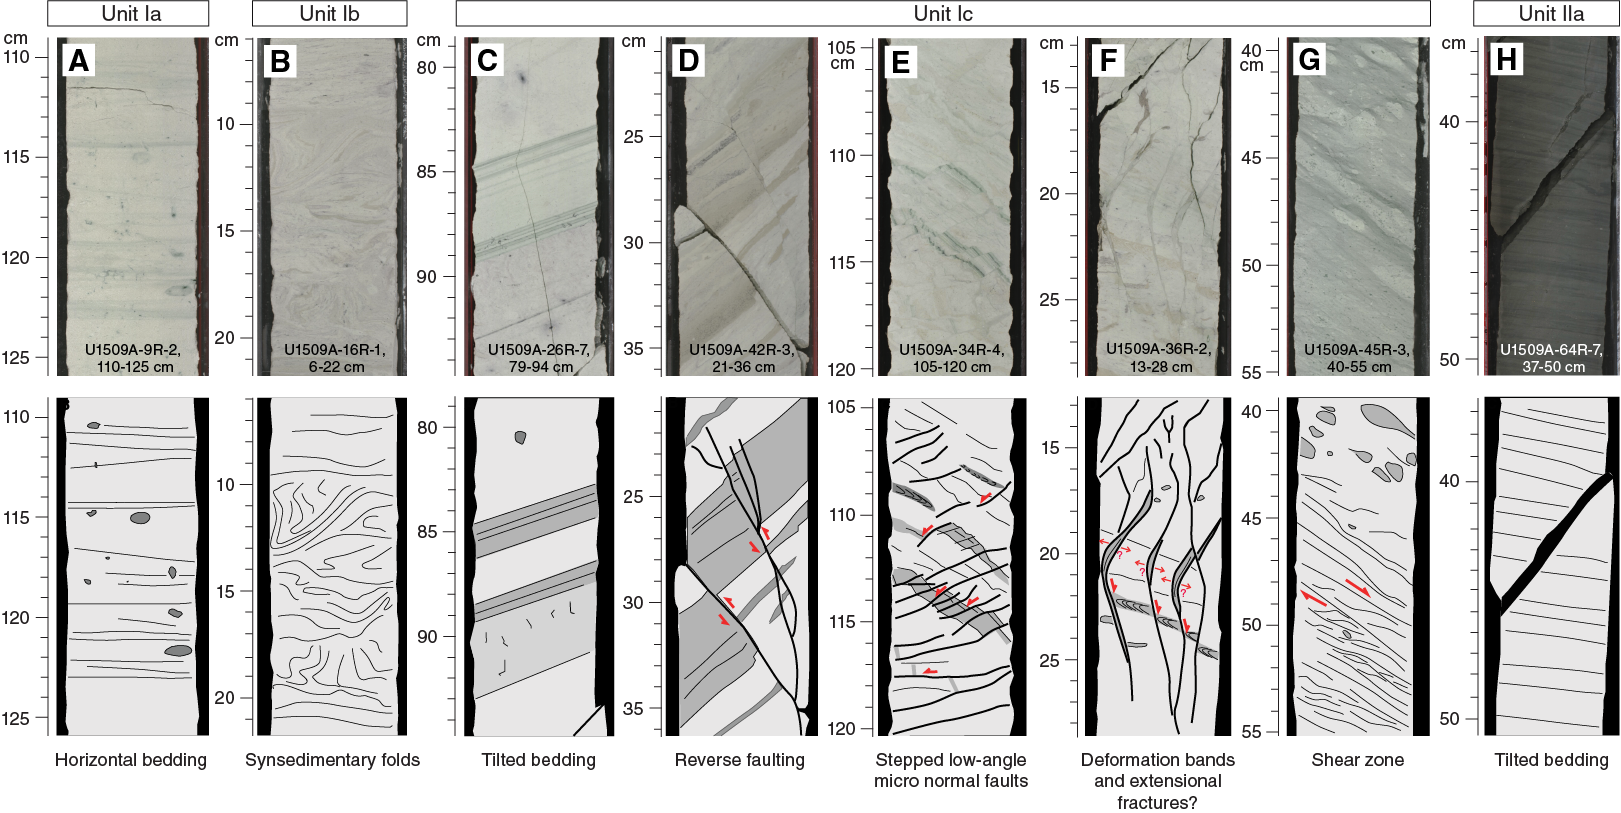
Figure F14. Evolution of deformation features in succession recovered.
The basal part of Subunit Ic displays a complex heterogeneous succession that includes a significant increase in clay content. In Core 46R, the Unit I/II boundary is marked by a transition from limestone and chert to calcareous claystone with silt-sized quartz, feldspar, and other siliciclastic components (Figure F15). Preliminary X-ray diffraction (XRD) analysis is consistent with macroscopic and microscopic observations regarding the transition from Unit I to II, including abundant calcite, quartz, clinoptilolite, albite, and montmorillonite, whereas Unit II contains abundant illite and does not contain montmorillonite or clinoptilolite (Figure F16). Consistent with this lithologic succession, the natural gamma radiation (NGR) count increases downhole (see Petrophysics) and carbonate content decreases (see Geochemistry). Of particular note is the calcareous claystone with silt that occurs immediately below a hiatus of ~5 My from the lower Eocene to the upper Paleocene (see Biostratigraphy and paleoenvironment).
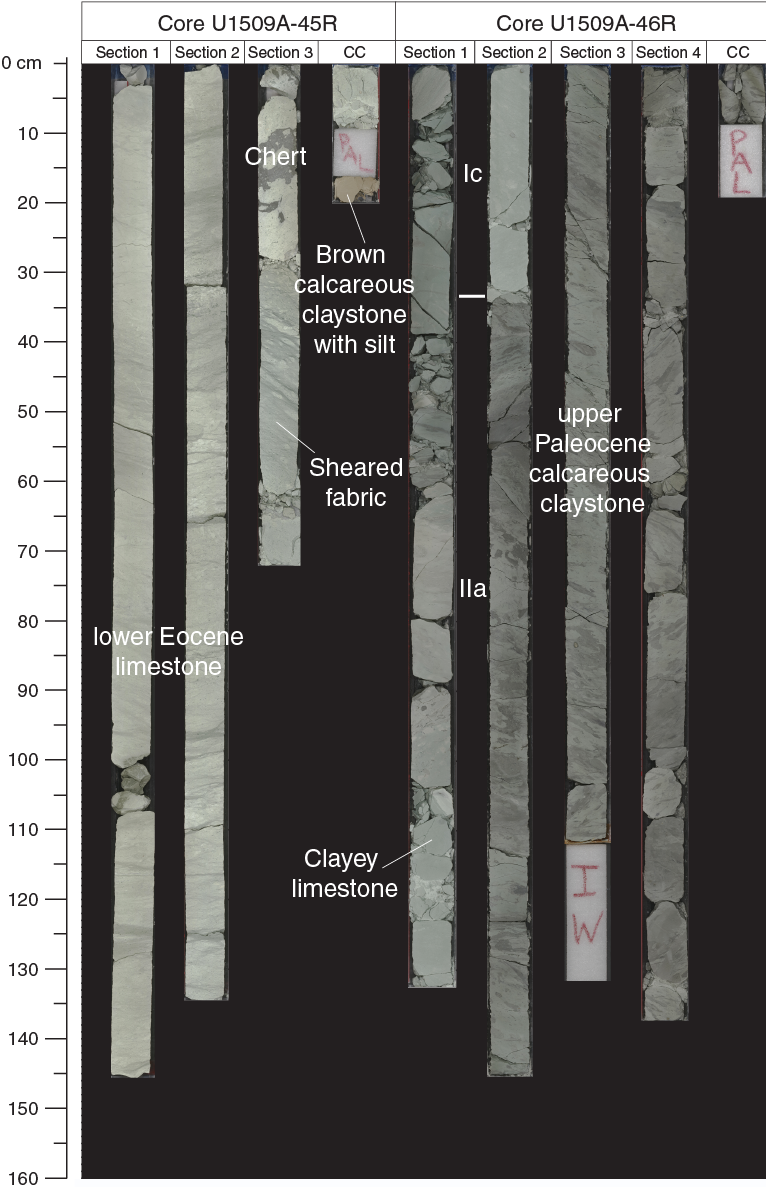
Figure F15. Transition from Unit I to II.
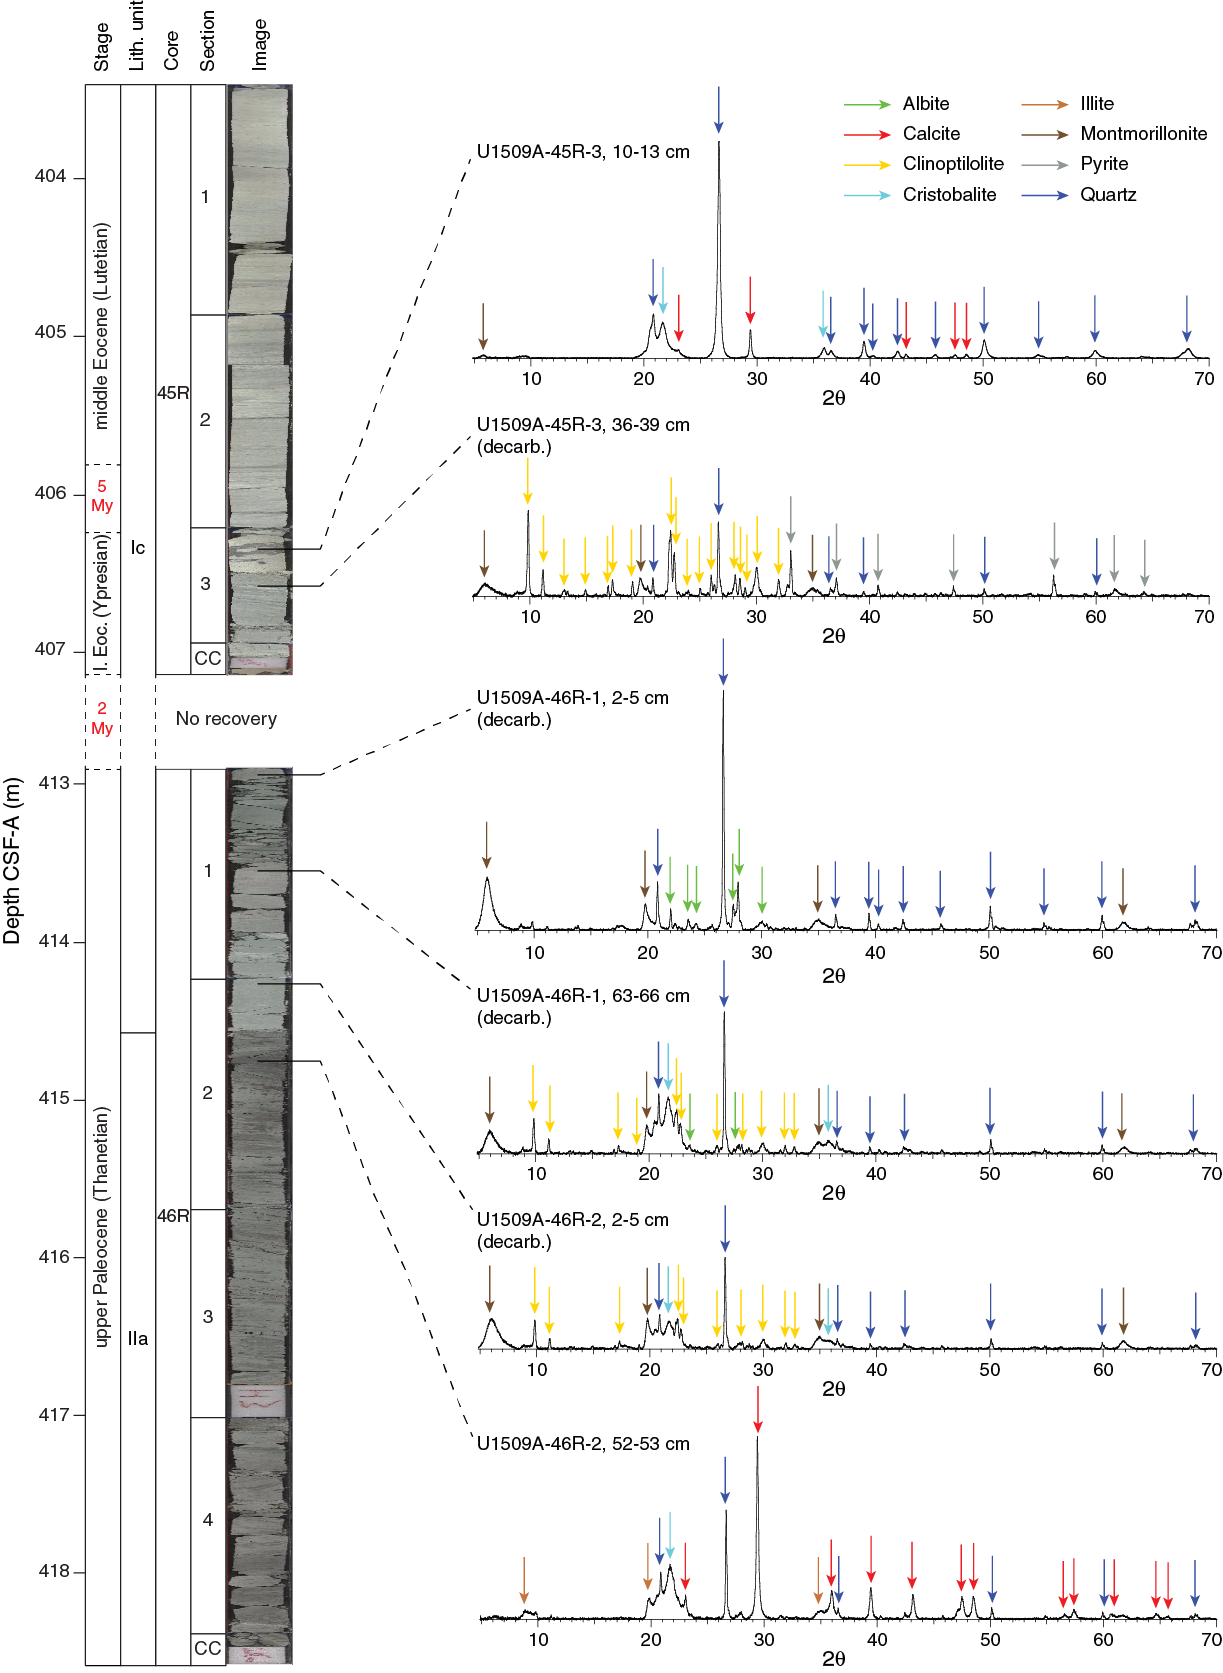
Figure F16. XRD results over transition from Unit I to II.
Unit II
Unit II comprises ~275 m of Paleocene to Upper Cretaceous claystone. The unit is further divided into two subunits based on changes in the proportion of calcareous components, color, and sedimentary features (Figures F6, F7). Subunit IIa consists of ~200 m of Paleocene calcareous claystone, and Subunit IIb consists of ~76 m of Upper Cretaceous claystone. Tilted bedding persists throughout Unit II, with an average apparent dip of 20° and maximum dip of 50°. The change in lithologic composition from Subunit IIa to IIb includes a sharp decrease in carbonate content and an increase in organic carbon content (see Geochemistry) and coincides with a rise in NGR (see Petrophysics).
Subunit IIa
Subunit IIa comprises ~200 m of dark greenish gray to dark gray (GLEY 1 6/10Y to GLEY 1 4/N) Paleocene calcareous claystone. Calcareous components include common to abundant nannofossils and rare foraminifers (Figures F17, F18). Recrystallized foraminifers (e.g., Nodosaria sp.) occur as white specks throughout the cores and as clusters in burrows. Nannofossil abundance progressively decreases (from dominant to abundant) downhole in Subunit IIa. Bioturbation shows an overall downhole decrease in intensity and diversity throughout the subunit (from heavy to sparse). Ichnofossils are dominated by undifferentiated centimeter-scale burrows, Nereites, and Phycosiphon. Notably, and in stark contrast with Unit I, Zoophycos decreases in abundance. Additionally, rare occurrences of iron sulfide crystals can be seen throughout the subunit in the form of blebs and centimeter thick veins along fracture planes.
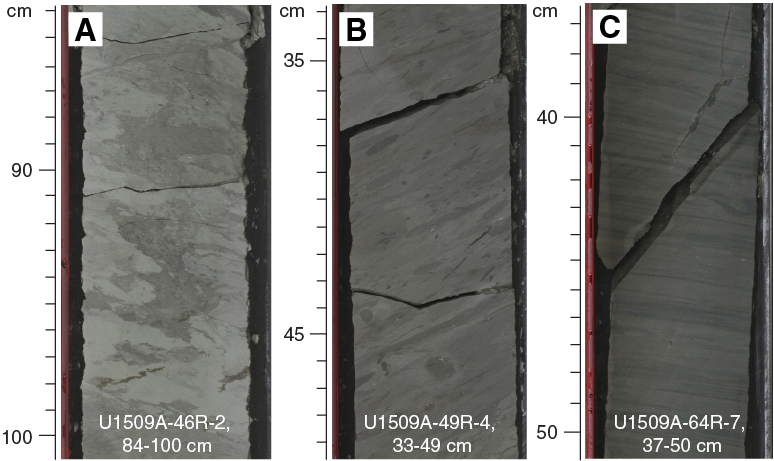
Figure F17. Common Subunit IIa lithologies.
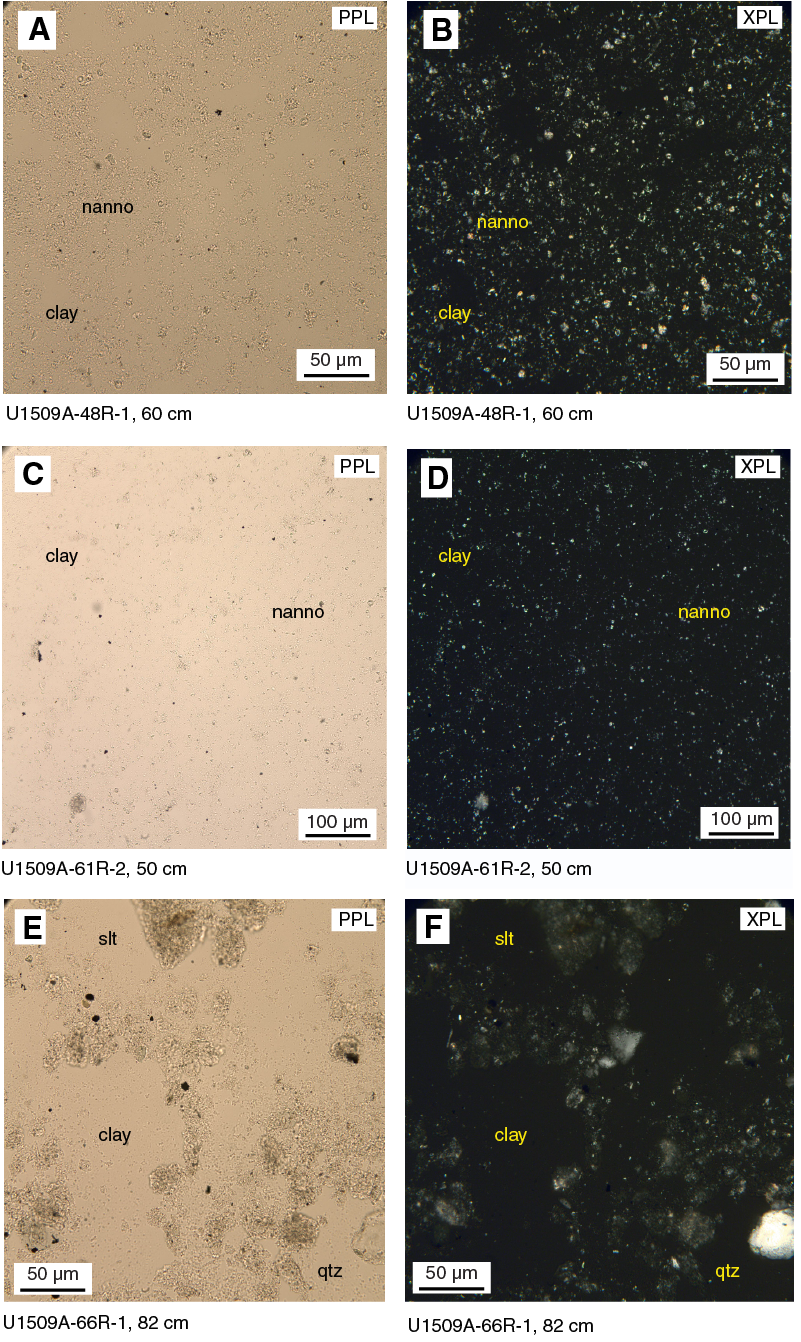
Figure F18. Representative Subunit IIa lithologies.
Calcareous claystone between Sections 371-U1509A-62R-CC and 65R-CC (572–604 m) exhibits parallel laminated variations in the proportion of silt-sized siliciclastic components like quartz, feldspar, and polycrystalline quartz (Figure F17C). The basal part of Subunit IIa, spanning Sections 66R-2 through 66R-CC (~604–614 m), is characterized by relatively massive claystone with nannofossils, reduced bioturbation, and homogeneous lithologic composition. Consistent with macroscopic and microscopic observations, XRD analysis identified quartz, cristobalite, illite, and calcite (Figure F16). Subunit IIa exhibits tilted bedding similar to that in Subunit Ic, as revealed by bioturbation fabrics and tilted parallel laminations (Figure F14).
Subunit IIb
Subunit IIb comprises ~76 m of Upper Cretaceous very dark grayish brown (10YR 3/2) massive homogeneous claystone (Figure F19). Calcareous nannofossils and foraminifers are absent in Subunit IIb based on smear slide observations (Figure F7). Calcium carbonate content is <1%, whereas organic carbon content averages ~1% (see Geochemistry). Rare polycrystalline quartz and possible occurrences of fish teeth were observed macroscopically and on smear slides.

Figure F19. Representative Subunit IIb lithologies.
Bioturbation appears to be moderate but visibly indistinct, mainly because of minimal lithologic contrast. A significant change in ichnofossil diversity occurs from Subunit IIa to IIb, with a dominance of Phycosiphon in Subunit IIb. In some places in Subunit IIb, cores have a faint smell of hydrocarbons. Notably, the cores in Subunit IIb exhibited a distinct change in color on drying, from dark brown to relatively lighter yellowish brown.
A lack of clear bedding planes and sedimentary structures in Subunit IIb precluded recognition of tilted bedding; however, burrows appear to be oriented along the same general tilt of Subunits Ic and IIa (Figure F19D–F19E).
Biostratigraphy and paleoenvironment
Microfossil biostratigraphy was employed to determine the age of sediments on the southwest edge of the NCT and to constrain the timing of convergent deformation and subsidence. Palynomorph, benthic foraminifer, and ostracod assemblages were used to constrain the uplift history and paleobathymetry of the site. Intervals of reworked material found in the section can be used to assess the age and setting of episodes of potential erosion. Importantly, the source of this material might constrain the dynamics of regional tectonic evolution.
At Site U1509, microfossil abundance is generally higher in the upper part of the sequence. Below ~440 m (middle Paleocene), most groups (calcareous nannofossils, planktic foraminifers, and radiolarians) significantly decrease in abundance. Benthic foraminifers only make up a small portion of sediment particles throughout the studied interval, as expected in deep-sea settings (Figure F20). Planktic foraminifers are absent below Core 371-U1509A-64R (593.88 m), and calcareous nannofossils are absent below Core 66R (609.32 m). Benthic foraminifers, radiolarians, and dinoflagellates are the only groups present through the base of Hole U1509A, although low in abundances.

Figure F20. Microfossil preservation and abundance.
Microfossil preservation decreases downhole, with most fossil groups showing a decrease below ~150–200 m. Radiolarians follow a slightly different pattern; their preservation significantly decreases from ~420 m downhole. An interesting feature of the nannofossil preservation is that it decreases during the lower Miocene to upper Oligocene interval, which coincides with an increase in reworking of older microfossils.
Sediments obtained from Site U1509 are dated as Pleistocene to Late Cretaceous using nannofossils, planktic and benthic foraminifers, radiolarians, and palynomorphs (Table T3; Figure F21). Five stratigraphic gaps were identified: between the Pleistocene and early Miocene (with a minimum duration of >10.5 My), in the middle–early Miocene (>2 My), in the middle Eocene (~3 My), and two in the early to middle Eocene (~5 and ~2 My).
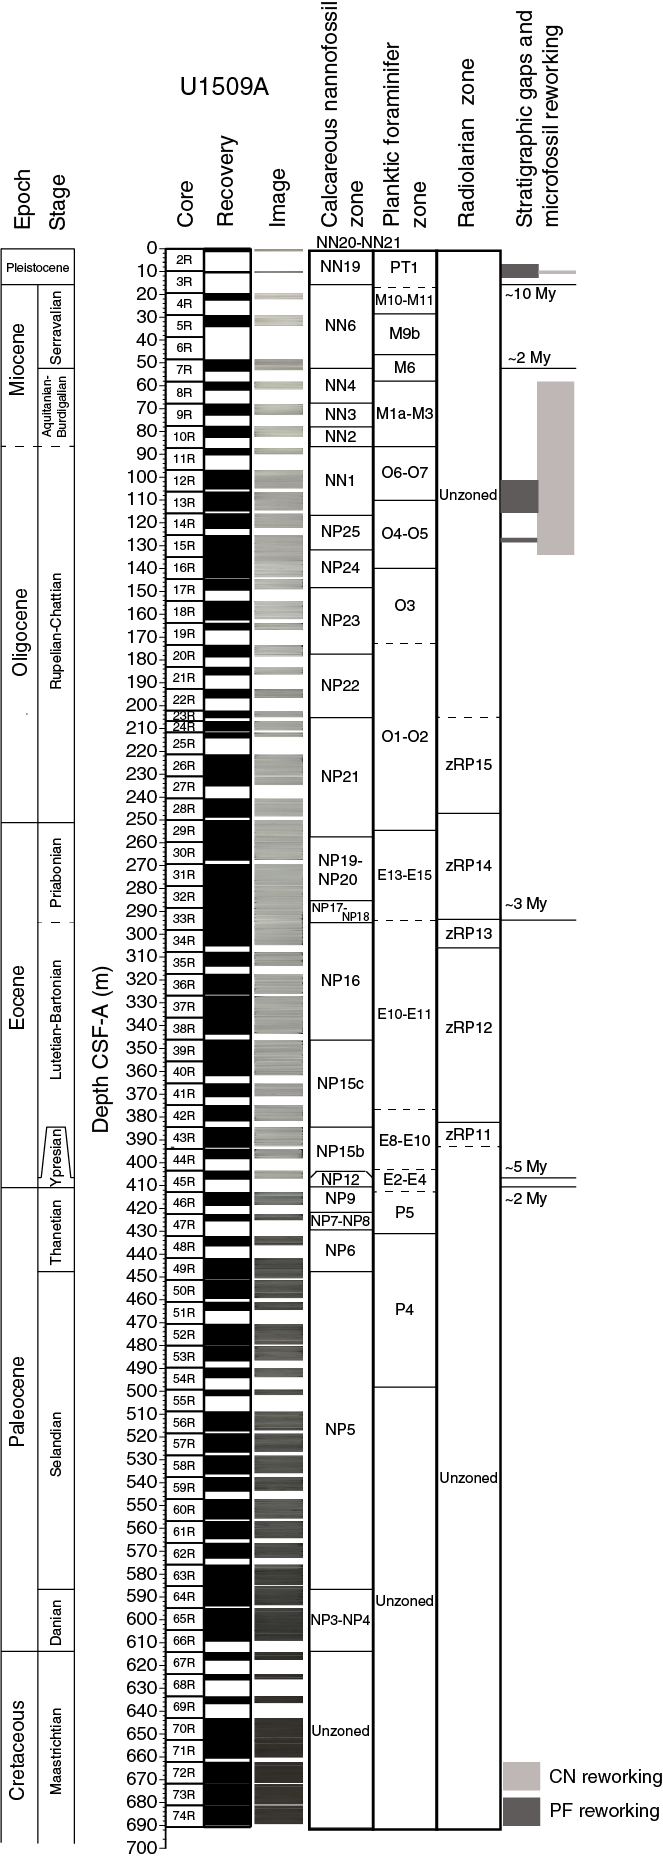
Figure F21. Biozonations.
Reworked early Miocene to late Eocene microfossils were recorded in the Pleistocene (Sample 2R-CC; 1.16–1.26 m), and late–middle Eocene nannofossils and foraminifers were identified in the early Miocene–late Oligocene (Cores 8R through 15R; 61.68–135.22 m) (Figure F21). The abundance of reworked microfossils is related to the redeposition of older and/or syndepositional sediments present in the basin or in the nearby area.
The site represents a lower bathyal–abyssal environment during the Pleistocene to Eocene. Below the 2 My hiatus that separates the early Eocene from late Paleocene, water depths shallow slightly from middle to upper bathyal.
Calcareous nannofossils
Calcareous nannofossil biozones were assigned to sediments from Cores 371-U1509A-1R through 66R (0–614 m). Cores 67R through 74R (614–691 m) are barren or contain minor contamination. Analyses are primarily based on core catcher samples (paleontology; PAL), and additional samples from working-half sections were used to refine ages for select intervals, particularly across hiatuses and critical boundaries. Calcareous nannofossil distribution data are based on shipboard observations that focus on age diagnostic species and may not represent the full nannofossil assemblage (Table T4).
Calcareous nannofossils are common to abundant in the upper part of Hole U1509A to Sample 47R-2, 48 cm (424.08 m). In Samples 47R-CC to 66R-CC (425.33–609.32 m), they vary in abundance from few to very rare. Preservation at Site U1509 varies from good to poor, generally decreasing with increasing depth (Figure F20). The exception is the late Miocene to middle Oligocene Samples 8R-CC to 15R-CC (61.68–135.22 m), an interval with a high abundance of biosilica and reworked nannofossils of mainly middle to late Eocene age.
The sequences drilled in Hole U1509A represent the Pleistocene (Zones NN20/NN21 through NN19); late Miocene (Zones NN6 through NN1); Oligocene (Zones NP25 through NP21); late, middle, and early Eocene (Zones NP19/NP20 through NP18, Zone NP16 through Subzone NP15b, and Zone NP12, respectively); and late to middle Paleocene (Zones NP9 and NP7–NP8 through NP5). Cores 67R through 74R contain sediments of Late Cretaceous age but are barren of calcareous nannofossils.
The uppermost section of Hole U1509A (0.00–10.59 m) is Pleistocene based on the presence of Gephyrocapsa spp. in Sample 1R-CC (Zone NN20/NN21), the presence of Pseudoemiliania lacunosa in Samples 2R-CC and 3R-CC, and the absence of Discoaster spp. (Zone NN19). Sample 2R-CC contains significant reworking of Oligocene and Eocene nannofossils.
A major hiatus of at least 10.5 My (2–12 Ma) spans from the early Pleistocene to middle Miocene between Zones NN19 and NN6 (Samples 3R-CC and 4R-1, 75 cm; 10.59 and 20.15 m). The presence of Coccolithus miopelagicus and Cyclicargolithus floridanus assigns Sample 4R-1, 75 cm (21.65 m), to Zone NN6, which extends to Sample 7R-2, 75 cm (52.04 m). Zone NN5 was not recorded, indicating a gap of ~1.4 My (13.6–15 Ma). The early Miocene spans Samples 7R-CC (Zone NN4) to 13R-CC (Zone NN1) (53.43–114.73 m). Zone NN4 was recognized in Sample 7R-CC by the presence of Sphenolithus heteromorphus, and Zone NN3 was recorded in Sample 9R-CC by the presence of Sphenolithus belemnos. The base of Sphenolithus disbelemnos between Samples 10R-CC and 11R-CC (86.30 ± 3.78 m) approximates the base of Zone NN2. The common presence of Zygrhablithus bijugatus and Dictyococcites bisectus assigns Samples 11R-CC to 13R-CC (90.08–114.73 m) to Zone NN1. Sphenolithus capricornutus and Sphenolithus delphix, whose presence constrains the Miocene/Oligocene (M/O) boundary, were not found at Site U1509; consequently, this boundary could not be identified using nannofossil biostratigraphy.
Cores 14R through 33R span Zones NP25 through NP21, including the Oligocene and the late Eocene. Sample 14R-CC was assigned to Zone NP25 due to the presence of Sphenolithus ciperoensis and the absence of Sphenolithus distentus and Sphenolithus predistentus. Because the duration of Zone NP25 is ~2.5 My, this interval is clearly condensed. The simultaneous presence of S. ciperoensis, S. distentus, and S. predistentus in Samples 15R-CC and 16R-CC identifies Zone NP24. The base of S. distentus between Samples 19R-CC and 20R-CC (171.23 ± 4.47 m) marks the base of Zone NP23. Zone NP22 was identified in Samples 20R-CC and 21R-CC (178.45–186.44 m) by the presence of Reticulofenestra umbilicus and Isthmolithus recurvus. The presence of Coccolithus formosus in Sample 22R-CC marks the top of Zone NP21. To constrain the Oligocene/Eocene boundary (O/E), a number of additional samples were taken in Core 29R to identify the base acme of Clausicoccus subdistichus, which usually lies close the O/E boundary (Agnini et al., 2014). This biohorizon was observed between Samples 28R-CC and 29R-1, 75 cm (249.77 ± 1.09 m). The base of Zone NP21 was defined by the top of Discoaster saipanensis between Samples 29R-5, 85 cm, and 29R-5, 98 cm (257.06 ± 0.06 m). Zone NP19/NP20 is marked by the base of I. recurvus between Samples 29R-5, 98 cm, and 32R-2, 65 cm (257.12 and 281.00 m). The base of Chiasmolithus oamaruensis between Samples 33R-2, 70 cm, and 33R-CC (290.70 and 298.36 m) marks Zone NP18. A hiatus of at least 3 My (37.4–40.9 Ma), identified by the absence of Zone NP17, occurs between Samples 32R-CC and 33R-CC. Zone NP16 was identified by the absence of D. bisectus, the presence of Sphenolithus spiniger, and the base of Reticulofenestra reticulata at 331.40 m (±5.20 m). The base of Zone NP16 extends from Sample 33R-CC to Sample 38R-CC (298.36–343.67 m), approximated by the top of Nannotetrina spp. at 346.04 m (±2.37 m). Zone NP16 through Subzone NP15c are defined by the top of Nannotetrina cristata between Samples 38R-CC and 39R-2, 50 cm (346.04 ± 2.37 m), because the base of R. umbilicus is not considered a reliable datum. The base and top of Chiasmolithus gigas were used to define Subzone NP15b, which spans Samples 43R-CC to 45R-2, 72 cm (392.98–405.58 m).
The presence of Tribrachiatus orthostylus in Sample 45R-3, 72 cm, indicates a middle to early Eocene hiatus of at least 5 My between Samples 45R-2, 72 cm, and 45R-3, 72 cm (406.26 ± 0.68 m), that spans between Subzone NP15b and Zone NP12 (45.6–50.6 Ma). Zone NP12 spans Samples 45R-3, 72 cm, to 45R-CC and is followed by an early Eocene to late Paleocene hiatus of at least 2 My. This hiatus occurs between Samples 45R-CC and 46R-1, 23 cm (410.14 ± 3.00 m), between Zones NP12 and NP9 (53.7–55.9 Ma). Therefore, the Paleocene/Eocene Thermal Maximum was not recovered at Site U1509. Zone NP9 was recognized by the presence of the rosette discoasters Discoaster multiradiatus, Discoaster salisburgensis, and Prinsius spp. from Samples 46R-1, 23 cm, to 46R-CC (413.13–418.58 m). Two samples (47R-2, 48 cm, and 47R-CC) record undifferentiated Zone NP7–NP8 due to the presence of Discoaster mohleri. The base of Heliolithus kleinpelli between Samples 49R-2, 80 cm, and 49R-CC (447.30 ±3.30 m) defines the base of Zone NP6. An expanded middle Paleocene section (Zone NP5) was recorded in Samples 49R-CC to 63R-CC (450.70–584.81 m). Heliolithus cantabriae is present in Samples 49R-CC to 57R-CC (450.60–526.60 m), indicating the uppermost part of Zone NP5. The anomalously high sedimentation rate estimated for this interval, on the order of hundreds of meters per million years, may indicate that the sediments are folded. Samples 58R-CC to 63R-CC (536.06–584.91 m) do not contain H. cantabriae, but Fasciculithus tympaniformis is still present, and thus the interval was ascribed to Zone NP5. Calcareous nannofossils are rare in Samples 64R-CC and 65R-CC (593.88 and 604.74 m), but it was possible to ascribe this interval to Zone NP4 because of the presence of Toweius pertusus. Sample 66R-CC contains a sparse assemblage that has undergone dissolution and was tentatively ascribed to undifferentiated Zone NP3–NP4 due to the presence of Prinsius martini, which approximates the base of Zone NP3.
Samples 67R-CC to 74R-CC are barren of in situ calcareous nannofossils, with the few specimens of Paleogene age recorded in Samples 70R-CC to 73R-CC. However, these specimens are considered contamination.
Planktic foraminifers
Planktic foraminifers are dominant to abundant in the upper part of the section (Samples 371-U1509A-1R-CC to 22R-CC; 0.00–196.43 m) and common to barren further downhole (Samples 23R-CC to 74R-CC; 205.11–689.57 m). Preservation follows a similar trend to abundance, with a steady decrease into older sediments (Figure F22). A number of marker species commonly found in low to middle latitudes (Wade et al., 2011) are missing from Site U1509 (Table T5). Planktic foraminiferal biozones were assigned to Cores 1R through 55R (0.10–501.79 m). Below this interval, samples are barren of planktic foraminifers (Figure F20).
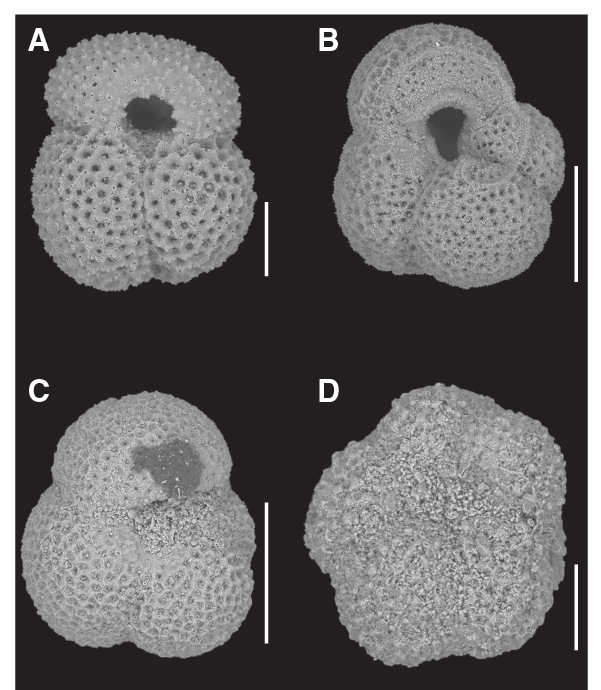
Figure F22. Preservation state of planktic foraminifers.
Samples 1R-CC to 3R-CC (0.00–10.49 m) contain Globorotalia truncatulinoides, which indicates a Pleistocene age for this interval. Extreme reworking was observed in Sample 2R-CC, which corresponds to the observed slumps and/or soft-sediment deformation observed in lithostratigraphic Unit I. Several Oligocene and Eocene taxa such as Chiloguembelina cubensis, Globigerinatheka index, and Acarinina spp. were observed in this sample. A ~10 My gap was identified between Samples 3R-CC and 4R-CC (16.48 ± 5.89 m). In this interval, the base of G. truncatulinoides, a Pleistocene datum, coincides with the top of Paragloborotalia mayeri and includes the middle Miocene Fohsella lineage (Fohsella fohsi lobata, Fohsella peripheroacuta, and Fohsella robusta). This evolutionary lineage, along with the presence of P. mayeri, indicates middle to late Miocene Subzone M9b is present but compressed. In turn, middle Miocene Zone M6 was identified in Samples 7R-CC to 8R-CC (53.43–61.48 m) by the co-occurrence of Praeorbulina sicana and Orbulina universa.
The M/O boundary was defined between Samples 10R-CC and 11R-CC (86.30 ± 3.78 m) based on the top of Globigerina euapertura. The base of Globigerina angulisuturalis and the top and base of Paragloborotalia opima were utilized to assign an Oligocene age to Samples 11R-CC to 28R-CC (90.08–248.58 m). The O/E boundary was tentatively placed between Samples 28R-CC and 29R-CC (254.31 ± 5.63 m) based on the top of G. index (Raine et al., 2015). The absence of Orbulinoides beckmanni may indicate the lack of Zone E12, or the zone was not recognized due to the absence of this species in cooler waters. Middle to early Eocene Zones E11–E10 were recognized in Samples 33R-CC to 41R-CC (298.36–370.96 m) based on the common occurrence of G. index, Acarinina primitiva, and Acarinina bullbrooki. The base of G. index was placed between Samples 41R-CC and 42R-CC (376.30 ± 5.24 m). This biohorizon was dated at 42.63 and 42.60 Ma in the geologic timescale (GTS2012) and New Zealand timescale (Raine et al., 2015), respectively. However, nannofossil biostratigraphy indicates this species evolved ~1 My earlier in New Zealand waters, an age that agrees with the last occurrence of G. index in the Austral realm (Huber and Quillévéré, 2005).
Samples 42R-CC to 44R-CC (381.53–398.07 m) were assigned to Zones E9–E8 based on the absence of Morozovella crater. The co-occurrence of Morozovella aequa and Pseudohastigerina wilcoxensis in Sample 45R-CC (412.81 m) indicates early Eocene Zones E4–E2 for this sample. Although the Paleocene/Eocene boundary was not recognized via planktic foraminiferal biostratigraphy due to the lack of marker species, late to middle Paleocene assemblages were recognized in Samples 46R-CC to 49R-CC (418.48–450.60 m). Samples 50R-CC to 63R-CC (459.22–584.91 m) contain very few specimens. Recognition of Subzones P4c–P4a was only possible in Sample 54R-CC (497.87 m), which contains Acarinina acarinata and Globanomalina pseudomenardii. Samples 64R-CC to 74R-CC (593.78–689.57 m) are barren of planktic foraminifers.
Benthic foraminifers
Benthic foraminifers were examined semiquantitatively from 68 Hole U1509A cores (Table T6). Overall, this faunal group is present but rare relative to total sediment particles in the >63 µm fraction of most studied samples. No benthic foraminifers were recovered from Paleocene Samples 371-U1509A-51R-CC and 52R-CC.
Benthic foraminifer preservation in Hole U1509A ranges from excellent to very good in the Pleistocene and upper middle Miocene (Cores 1R through 6R) to moderate in the lower middle to early Miocene and late Oligocene (Cores 7R through 16R). In the remaining early Oligocene, Eocene, Paleocene, and Cretaceous sections, preservation is poor (Figure F20). A total of 1581 specimens were picked from Hole U1509A, and 159 taxa were identified. Most samples are dominated by calcareous taxa, and agglutinated taxa generally form a minor component of assemblages. The exception is the lowermost part of Hole U1509A (lower Paleocene and Cretaceous; Cores 66R through 74R), where agglutinated taxa, although of low diversity, comprise 100% of the assemblages.
The Pleistocene interval in Hole U1509A contains common Globocassidulina subglobosa, Fissurina spp., Fursenkoina spp., Favocassidulina favus, Cassidulina spp., Bulimina marginata, and Nonionella spp. among other species, and the assemblages are dominated by infaunal morphogroups. The middle to early Miocene interval is dominated by Bolivina spp. (including Bolivina byramensis and Bolivina pusilla), Cibicidoides spp. (including Cibicidoides mundulus and Cibicidoides laurisae), Epistominella exigua, Fursenkoina spp., G. subglobosa, nodosariids, Oridorsalis umbonatus, Pleurostomella spp., stilostomellids, and Nuttallinella spp. The Oligocene assemblages are slightly less diverse, and they contain common Bolivina spp., Cibicides collinsi, C. mundulus, G. subglobosa, Gyroidinoides spp., nodosariids, O. umbonatus, Pleurostomella spp., stilostomellids, Spiroplectammina cubensis, Trifarina spp., and Vulvulina spinosa. The Eocene assemblages are broadly similar to those in the Oligocene, but they also include abundant Bulimina spp. (Bulimina thanetensis and Bulimina tuxpamensis), Anomalinoides spp., Cibicidoides eocaenus, Lenticulina spp., and Nuttallides truempyi.
Paleocene assemblages are significantly different from those in the Eocene (middle Ypresian). In addition, they are less diverse and mainly dominated by nodosariids with common Stensioeina beccariiformis, Bulimina spp., and Lenticulina spp. Benthic foraminifers with upper age ranges restricted to the Paleocene in the New Zealand region (Hornibrook et al., 1989), including S. beccariiformis, Anomalinoides piripaua, Valvulineria teuriensis, Coryphostoma midwayensis, and Remesella varians, were recovered from Samples 46R-1, 21 cm, and 46R-CC.
The lowermost seven core catcher samples in Hole U1509A (Cores 67R through 74R) contain a very sparse, low-diversity, agglutinated benthic assemblage that includes Bathysiphon spp., trochamminids, Haplophragmoides spp., Cyclammina amplectens, Dorothia elongata, and Spiroplectammina spectabilis. Fragments and pieces of Bathysiphon and possible Cyclammina or Haplophragmoides were observed across this interval. According to Hornibrook et al. (1989), D. elongata is restricted to the Haumurian (Campanian and Maastrichtian), and its topmost occurrence in Cores 67R through 72R indicates a Late Cretaceous age.
Site U1509 currently lies at ~3000 m water depth, yet few distinctly abyssal benthic foraminifers were recovered from the Pleistocene interval apart from E. exigua, a predominantly lower bathyal to abyssal dweller. Other potentially useful paleobathymetric taxa that are common at lower bathyal to abyssal paleodepths include G. subglobosa, Planulina wuellerstorfi, and F. favus (van Morkhoven et al., 1986; Holbourn et al., 2013). Such assemblages indicate depths ranging from deep middle bathyal to abyssal, consistent with modern conditions. However, shelf-restricted or upper to middle bathyal–restricted benthic foraminifers, including Nonionella flemingi, B. marginata, Discorbis dimidiatus, and Virgulopsis turris, are also present, likely indicating some redeposition of shelf material, perhaps in turbidites.
Similarly, the middle to early Miocene section contains common lower bathyal to abyssal taxa such as E. exigua, G. subglobosa, O. umbonatus, or C. mundulus (van Morkhoven et al., 1986). The occurrence of abundant B. byramensis, which is common at bathyal depths, narrows the paleodepth to lower bathyal (van Morkhoven et al., 1986). No obvious reworked (older) or redeposited benthic foraminifers were observed in the Miocene interval.
The Oligocene interval contains a number of middle to lower bathyal and abyssal dwellers, including Anomalina aotea, Cibicides ihungia, Cibicides robertsonianus, Cibicidoides havanensis, C. mundulus, Eggerella bradyi, G. subglobosa, Laticarinina pauperata, Nuttallides umbonifera, and O. umbonatus. The upper depth limit of some of these species (C. mundulus and N. umbonifera) is 1000 m during the Oligocene (van Morkhoven et al., 1986), suggesting that the paleodepth was at least lower bathyal.
A similar paleodepth is suggested by late to middle Eocene assemblages, including Bulimina rostrata, B. tuxpamensis, C. eocaenus, N. truempyi, and Osangularia culter. The presence of occasional specimens of E. exigua and Cibicidoides dohmi are added evidence that the paleodepth was at least lower bathyal.
Primarily lower bathyal and abyssal taxa are scarce across the Paleocene (e.g., Nuttallinella florealis, Cibicidoides hyphalus, and S. beccariiformis; van Morkhoven et al., 1986), but the middle bathyal to abyssal species N. truempyi is common. These data, together with the occurrence of Anomalinoides rubiginosus, Chilostomella sp., Glomospira sp., C. midwayensis, R. varians, Rzehakina epigona, S. spectabilis, and Allomorphina conica and the absence of upper bathyal–restricted taxa (Hayward, 1986), suggest a middle bathyal paleodepth.
The Cretaceous interval paleodepth is difficult to interpret due to the very poor material recovered. Relatively common Bathysiphon spp., C. amplectens, and S. spectabilis and rare Glomospira spp. place the paleodepth at bathyal or possibly middle to upper bathyal depths. van Morkhoven et al. (1986) and Holbourn et al. (2013) give the paleodepth of S. spectabilis at bathyal to abyssal. The paleodepth of all Glomospira spp. in Kaminski and Gradstein (2005) is bathyal to abyssal, although Hayward (1986) has this genera’s uppermost paleodepth near 400 m. The identification of C. amplectens is presently uncertain, but C. amplectens also has a bathyal to abyssal paleodepth (Kaminski and Gradstein, 2005). Evidence against a shallower paleodepth is the complete absence of shelf-restricted benthic foraminifers.
Ostracods
In total, 223 specimens of ostracods were picked and 34 taxa were identified at Site U1509. Abundance data are normalized to the number of specimens per 45 cm2 tray and fluctuate between 0 and 6.6 from Sample 371-U1509A-1R-CC to Sample 20R-CC (0–178.55 m) (Figure F23). Abundance decreases to rare and mostly barren from Sample 21R-CC to Sample 74R-CC (186.34–689.67 m).
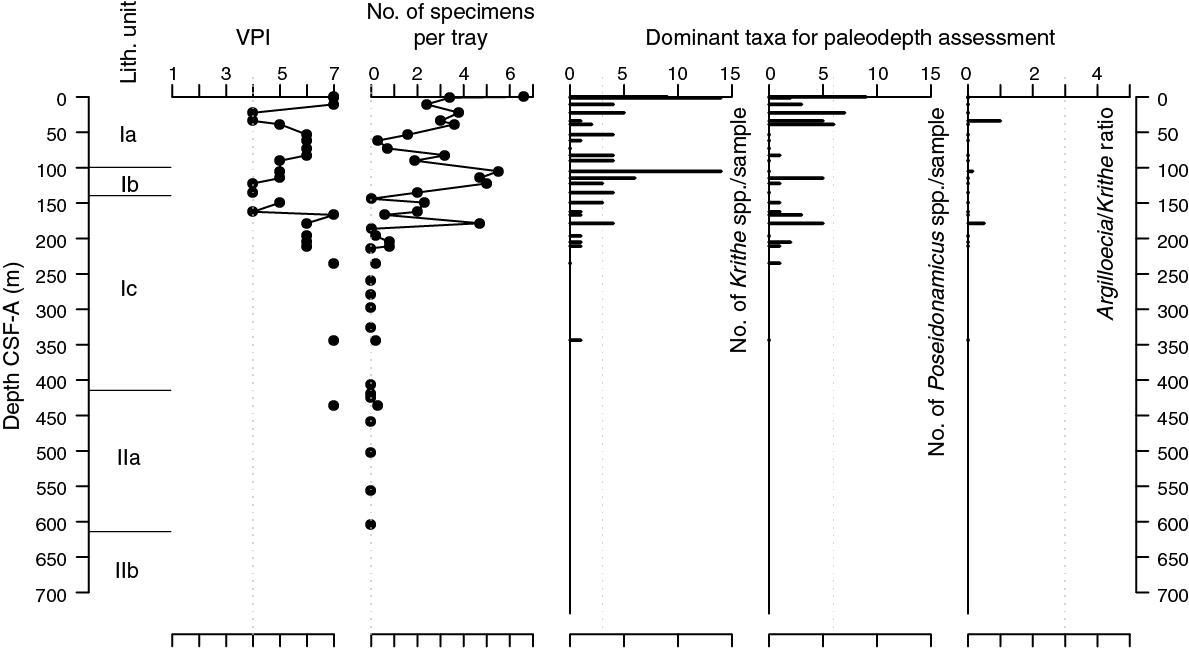
Figure F23. Ostracod preservation, abundance, and assemblage composition.
Ostracod preservation assessed using the visual preservation index (VPI) (Dwyer et al., 1995) fluctuates between 4 and 7 (Figure F23). This pattern differs from that at Sites U1506–U1508, where preservation progressively decreases throughout the holes.
From the Pleistocene to early Oligocene, paleodepth estimates based on ostracods suggest abyssal to lower bathyal settings. The dominant genera are Krithe and Poseidonamicus, which mostly and exclusively inhabit lower bathyal and abyssal depths, respectively. Other common taxa, including Bradleya, Cytheropteron, and blind trachyleberidids, have relatively wide distribution ranges. In addition, two poorly preserved specimens of neritic Callistocythere(?) spp. are present in Sample 3R-CC.
Radiolarians
A total of 40 core catcher samples from Cores 371-U1509A-1R through 74R were processed and analyzed for radiolarian abundance and preservation (Table T7). The upper part of Hole U1509A (Samples 1R-CC to 43R-CC; 0–393.08 m) contains well-preserved radiolarians (Figure F20). Abundance varies between trace and common in Samples 1R-CC to 7R-CC (0–53.53 m) and between few and abundant in Samples 9R-CC to 43R-CC (72.7–393.08 m). Preservation deteriorates in the lower part of the hole from Samples 45R-CC to 71R-CC (407.04–660.41 m), and abundance varies between trace and few. Samples are barren below 680.73 m.
In radiolarian-rich samples (0–393.08 m), other siliceous microfossils such as spicules, diatoms, and sometimes silicoflagellates were present. Because of time constraints, radiolarian biostratigraphy was applied on a selected interval from the early Oligocene to the Cretaceous (Samples 25R-CC to 71R-CC, 213.98–660.31 m; Table T7).
Samples 25R-CC and 27R-CC were assigned to the lower Oligocene radiolarian Zone zRP15 based on the base of Eucyrtidium antiquum (33.83 Ma) between Samples 27R-CC and 29R-CC (247.45 ± 12.47 m). The base of Theocyrtis tuberosa (32.99 Ma), which determines the base of low-latitude Zone RP20b, was also observed between Samples 27R-CC and 29R-CC (247.45 ± 12.47 m). The base of Artophormis gracilis (32.54 Ma), which occurs in upper Zone RP20b, was observed between Samples 25R-CC and 27R-CC (224.43 ± 10.45 m). In Sample 25R-CC, Eocene restricted species Buryella tetradica, Eusyringium fistuligerum, and Artobotrys biaurita were observed due to either reworking or contamination of the sample in the laboratory. At this level, no reworking was observed in other microfossil groups.
Based on nannofossil and planktic foraminifer biostratigraphy, a late to early Eocene interval in Hole U1509A was determined from 249.77 to 410.14 m. The base of upper Eocene Zone zRP14 was placed between Samples 32R-CC and 33R-CC (293.53 ± 4.82 m) based on the base of Eucyrtidium spinosum (38.15 Ma). This datum constrains the upper boundary of a ~3 My hiatus at ~300 m. In Sample 32R-CC, T. tuberosa is present. This species was found in the upper Eocene at Site U1507 and at other sites in the southwest Pacific (Pascher, 2017) and in the southern Atlantic and Indian Ocean (Takemura, 1992; Takemura and Ling, 1997).
The base of middle Eocene Zone zRP13 (base of Zealithapium mitra) and the top of A. biaurita were found between Samples 33R-CC and 35R-CC (306.17 ± 7.71 m), just below the hiatus. The low-latitude age of both datums fits the age-depth plot better than the mid-latitude age (Figure F41). The base of middle Eocene Zone zRP12 was placed between Samples 41R-CC and 43R-CC (382.02 ± 10.96 m) based on the base of E. fistuligerum. Based on nannofossil and planktic foraminifer age-depth plots, the low-latitude age (43.9 Ma) for this datum fits the age model better than the mid-latitude age (42.6 Ma) (Figure F41). Sample 43R-CC was assigned to Zone zRP11 due to the absence of E. fistuligerum.
No further radiolarian biostratigraphy was applied downhole for the lower Eocene to Upper Cretaceous interval (407.04–689.67 m) due to the scarcity of radiolarians. According to the age-depth plot, bioevents for middle Eocene Zones zRP12 and zRP13 (bases of E. fistuligerum and Z. mitra) are in better agreement with the timing of the events in low latitudes than mid latitudes.
Palynology
A total of 18 core catcher samples from Hole U1509A were processed and analyzed for their palynological content (Table T8), with a particular focus on the mudstones of lithostratigraphic Unit II. Although samples from Unit I yield some palynomorphs, those from Unit II contain rich palynological associations. Subunit IIa assemblages consist almost exclusively of dinocysts, whereas Subunit IIb assemblages contain mixtures of marine dinocysts and terrestrial sporomorphs and phytoclasts (Figures F24, F25, F26, F27), as well as occurrences of resin.
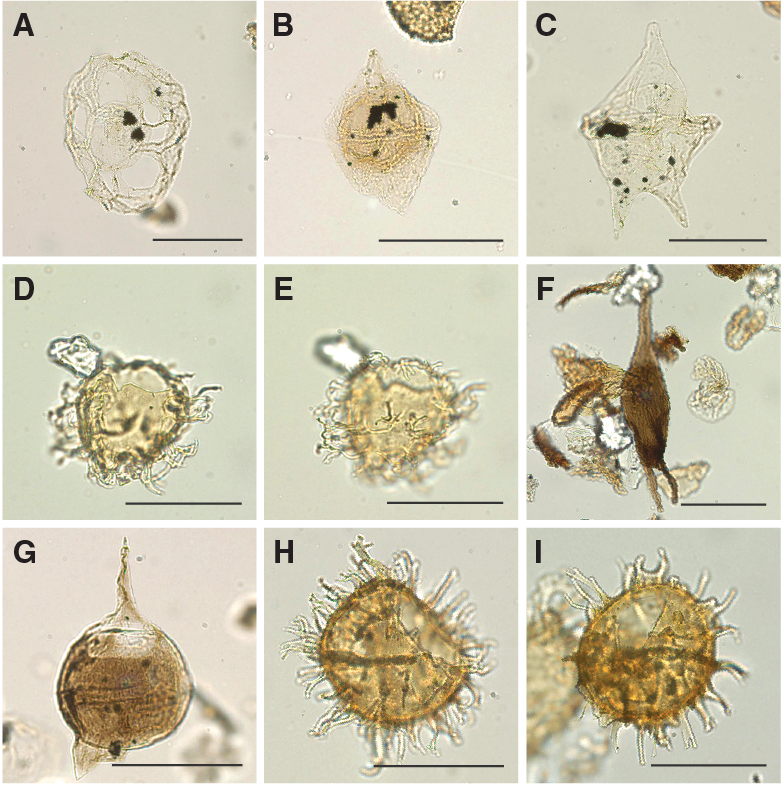
Figure F24. Selected dinocyst taxa.
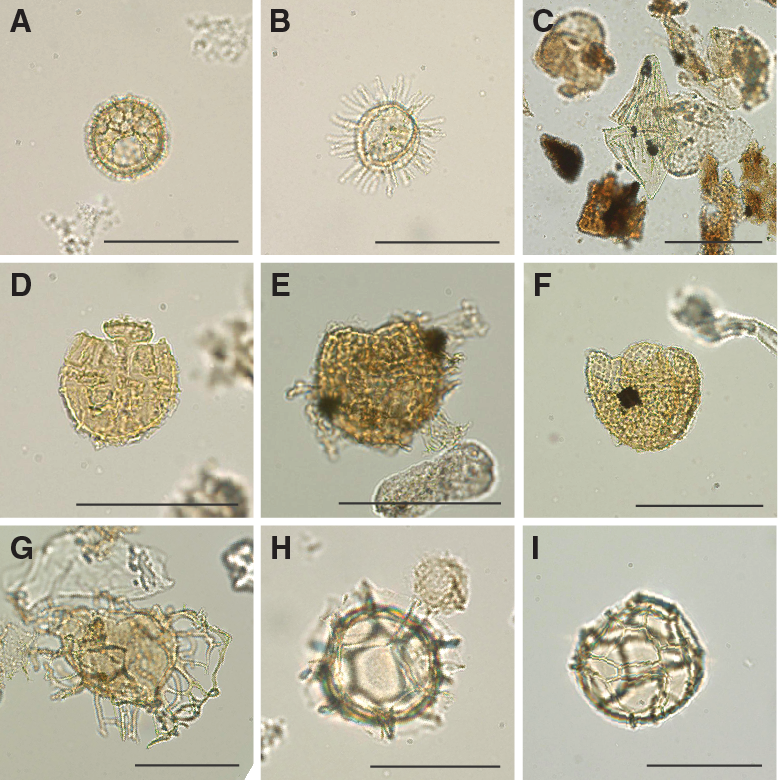
Figure F25. Selected dinocyst taxa.
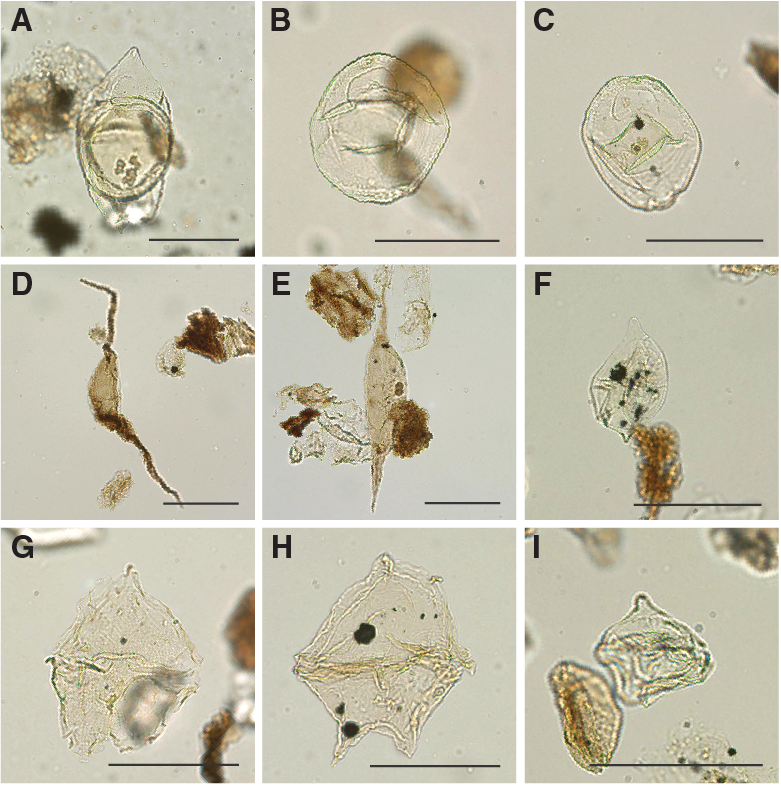
Figure F26. Selected dinocyst taxa.
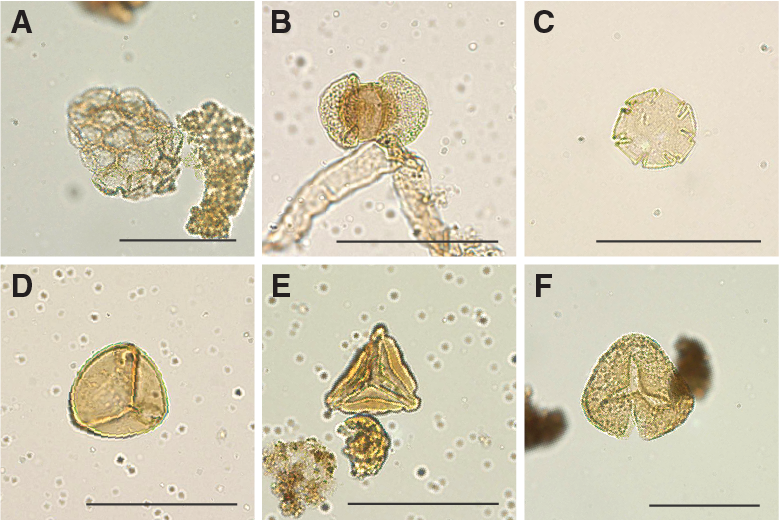
Figure F27. Selected algal and sporomorph taxa.
Claystones of lowermost Subunits IIa and IIb are barren of planktic calcareous microfossils, but dinocyst biostratigraphy dates them as Paleocene to Upper Cretaceous (Table T9). Furthermore, semiquantitative analysis of the palynological assemblages provides information for paleoenvironmental interpretations such as coastal proximity. This information includes the relative proportions between inner neritic, outer neritic, and pelagic dinocysts; the abundance of likely heterotrophic dinocysts; and relative contributions of marine and terrestrial palynomorphs.
Stratigraphy
Oligocene samples from Subunit Ib yield no age-diagnostic dinocysts. One sample from Subunit Ic (356 m) records a dinocyst assemblage of likely Priabonian–Bartonian age, indicated by the occurrence of Hemiplacophora semilunifera and by typical late to middle Eocene forms of Corrudinium spp. This age agrees with age constraints based on calcareous nannofossils and planktic foraminifers.
A number of Paleocene biostratigraphic index taxa were found in Subunit IIa. These include Cerodinium striatum and Palaeoperidinium pyrophorum, which occur below 459 m and indicate an expanded lower Paleocene sequence. Other taxa that support a Paleocene age are Aiora fenestrata, Thalassiphora spp., Palaeocystodinium golzowense, Eisenackia reticulata- and circumtabulata-type, and several forms in the Cordosphaeridium–Damassadinium morphological continuum. Notably, dinocysts indicative of the earliest Danian, specifically T. evittii and Senoniasphaera inornata, were not found, nor were high abundances of P. pyrophorum. These findings seem to indicate that the Paleogene/Cretaceous boundary is represented by a hiatus between Subunits IIa and IIb at ~614.1 m at a distinct lithologic break (see Lithostratigraphy).
The uppermost sample in Subunit IIb, at 614.23 m, yields a typical Southern Hemisphere Maastrichtian assemblage (Thorn et al., 2009) characterized by Manumiella spp., including Manumiella seymourensis. A similar Maastrichtian age is indicated by taxa throughout Subunit IIb, such as a wide range of Alterbidinium- and Isabelidinium-like forms and Cerodinium sp. A sensu Brinkhuis et al. (2003). Other taxa indicative of Cretaceous age are Dinogymnium spp. and Dinopterygium spp. The presence of these age-diagnostic dinocyst taxa, in combination with a diverse and well-preserved suite of sporomorphs (see below), shows potential for postexpedition refinement of palynological biostratigraphy.
Paleoenvironment
Oligocene–Eocene (5 samples; 115–407 m)
Of the five samples analyzed in the Oligocene–Eocene interval, three are effectively barren of palynomorphs. The remaining two samples contain well-preserved dinocysts and no terrestrial components, except for the occasional phytoclast. One upper Oligocene sample (115 m) contains dominant outer neritic Spiniferites spp., notably very large forms, and pelagic Nematosphaeropsis labyrinthus. Below this sample, one upper–middle Eocene sample (356 m) is dominated by Impagidinium spp. and Spiniferites spp., indicating full pelagic conditions. Of all the samples studied from Site U1509, the assemblage of this sample represents conditions that are most distal from the coast.
Paleocene (7 samples; 415–614.15 m)
Paleocene palynological assemblages consist almost exclusively of dinocysts. Other components are the colonial alga Palambages morulosa, some brown woody phytoclasts, and occasional pyritized siliceous microfossils. In general, Paleocene dinocyst assemblages at Site U1509 are similar to those from Ocean Drilling Program Site 1172 on the East Tasman Plateau (Brinkhuis et al., 2003) and to a lesser extent those at DSDP Site 283 on the Tasman Abyssal Plain (Haskell and Wilson, 1975). This similarity may indicate that regional surface water masses were relatively well connected via ocean currents in the Paleocene.
From 415 to 594 m, outer neritic Spiniferites spp. and Cleistosphaeridium spp. dominate assemblages. More inner neritic dinocysts belonging to the Areoligera/Glaphyrocysta complex (cpx) were found in the lower part of the section (609–614.15 m). This peak in inner neritic taxa could be representative of a transgressive sequence (Schiøler et al., 1997; Sluijs et al., 2008a).
Cretaceous (6 samples; 614.23–690 m)
In sharp contrast to the Paleocene assemblages, Cretaceous claystones contain equivalent mixtures of marine (dinocysts, some prasinophytes, the colonial alga P. morulosa, and amorphous organic matter) and terrestrial (sporomorphs, phytoclasts, and some resin) components. Both groups of palynomorphs are well preserved. The ratio of spores to dinocysts (a proxy for terrestrial input; e.g., Sluijs and Dickens, 2012) varies between 0.4 and 1.4 (Table T8). Large amounts of terrestrial input are further supported by relatively high carbon to nitrogen (C/N) ratios (see Geochemistry). The occurrence of resin, which is easily degraded, suggests the terrigenous components have not been transported far. These findings indicate deposition in a marine setting that was proximal to land.
Upper Cretaceous dinocyst assemblages are comparable with those from Sites 1172 and 283. The assemblages are characterized by large amounts of peridinioid dinocyst genera, including Alterbidinium- and Isabelidinium-like forms, Manumiella spp., Palaeocystodinium spp., Cerodinium spp., and frequent small, nonspiny peridinioid cysts that are typically grouped into the Senegalinium cpx (Figures F24, F25, F26, F27). These cysts were likely produced by dinoflagellates that required high nutrient conditions (Dale, 1996; Sluijs et al., 2005). Additionally, some of these taxa were likely tolerant to low surface water salinities (Brinkhuis et al., 2006; Pross and Brinkhuis, 2005; Sluijs et al., 2008b). Additional taxa include pelagic Impagidinium spp. and outer neritic Spiniferites cpx.
Because Upper Cretaceous–lower Paleocene deposits at Site 283 are void of terrestrial palynomorphs (Haskell and Wilson, 1975), it seems unlikely that sporomorphs were transported northward to Site U1509 from Antarctica. Terrestrial palynomorph assemblages seem similar to time-equivalent flora from the Taranaki Basin, New Zealand (Browne et al., 2008; Killops et al., 1995); Mid-Waipara, New Zealand (Vajda et al., 2001); and southeast Australia (Nagalingum et al., 2002). However, the high relative abundance of sporomorphs seems to indicate a more nearby source of vegetation, which could suggest that the surrounding rises were partially above sea level during the Late Cretaceous.
Conclusions
Sediments obtained from Hole U1509A are Pleistocene to Late Cretaceous in age based on nannofossils, planktic and benthic foraminifers, radiolarians, and palynomorphs. Reworking of late–middle Eocene microfossils was identified in the early Miocene–late Oligocene (Cores 371-U1509A-8R through 15R). Late Eocene to early Miocene taxa, in addition to shallow-water benthic foraminifers, were identified in Pleistocene Core 2R.
Five stratigraphic gaps were identified: a ~10.5 My gap between the Pleistocene and early Miocene (nannofossil Zones NN19 through NN6; 2–12 Ma), a ~2 My gap in the middle–early Miocene (Zones NN6 through NN4; 13.6–15.0 Ma), a ~3 My gap in the middle Eocene (Zones NP18 through NP16; 37.4–40.4 Ma), and two hiatuses in Core 45R that span ~5 My (middle to early Eocene; Subzone NP15b through Zone NP12; 45.6–50.6 Ma) and ~2 My (early Eocene to late Paleocene; Zones NP12 through NP9; 53.7–55.9 Ma).
A lower bathyal–abyssal depth of deposition has been inferred across the Pleistocene to Eocene sequence, and benthic foraminifers indicate a slightly shallower middle to upper bathyal depositional environment for the Paleocene interval.
Paleomagnetism
Pass-through paleomagnetic measurements were performed on all archive-half sections from Site U1509. A total of 70 discrete samples were collected. Samples from the ooze interval in Subunit Ia were taken by pushing 7 cm3 paleomagnetic cubes into sediment, whereas all other samples were trimmed from cores as 2 cm × 2 cm × 2 cm cubes. The natural remanent magnetizations (NRMs) of all discrete samples were subjected to remanence measurement after alternating field (AF) demagnetization, followed by anisotropy of magnetic susceptibility (AMS) measurement.
Paleomagnetic results
Most sediment sections from Hole U1509A have relatively weak NRMs, with intensity ranging between 10−4 and 10−3 A/m (Figure F28). Weak NRMs result in generally noisy pass-through paleomagnetic inclination data that do not show bimodal distribution (Figure F29). Additionally, the pass-through measurements on Hole U1509A cores may be biased by tilting of strata in multiple lithostratigraphic units and by the presence of slumps in Subunit Ib (see Lithostratigraphy). Nonetheless, 42 out of 70 (60%) discrete samples gave reliable paleomagnetic results after AF demagnetization (Figure F30). Therefore, the shipboard magnetostratigraphic interpretation at Site U1509 is almost entirely based on paleomagnetic directions obtained from discrete samples. To further evaluate the reliability of the discrete sample–based characteristic remanent magnetization (ChRM) directions, we plotted them on a stereographic projection. The samples are characterized by a randomly distributed declination (Figure F31), which is expected from RCB coring. Using the approach by McFadden and Reid (1982), the average inclination for the combined upward- and downward-pointing vectors is 35.6° (±7.3°)
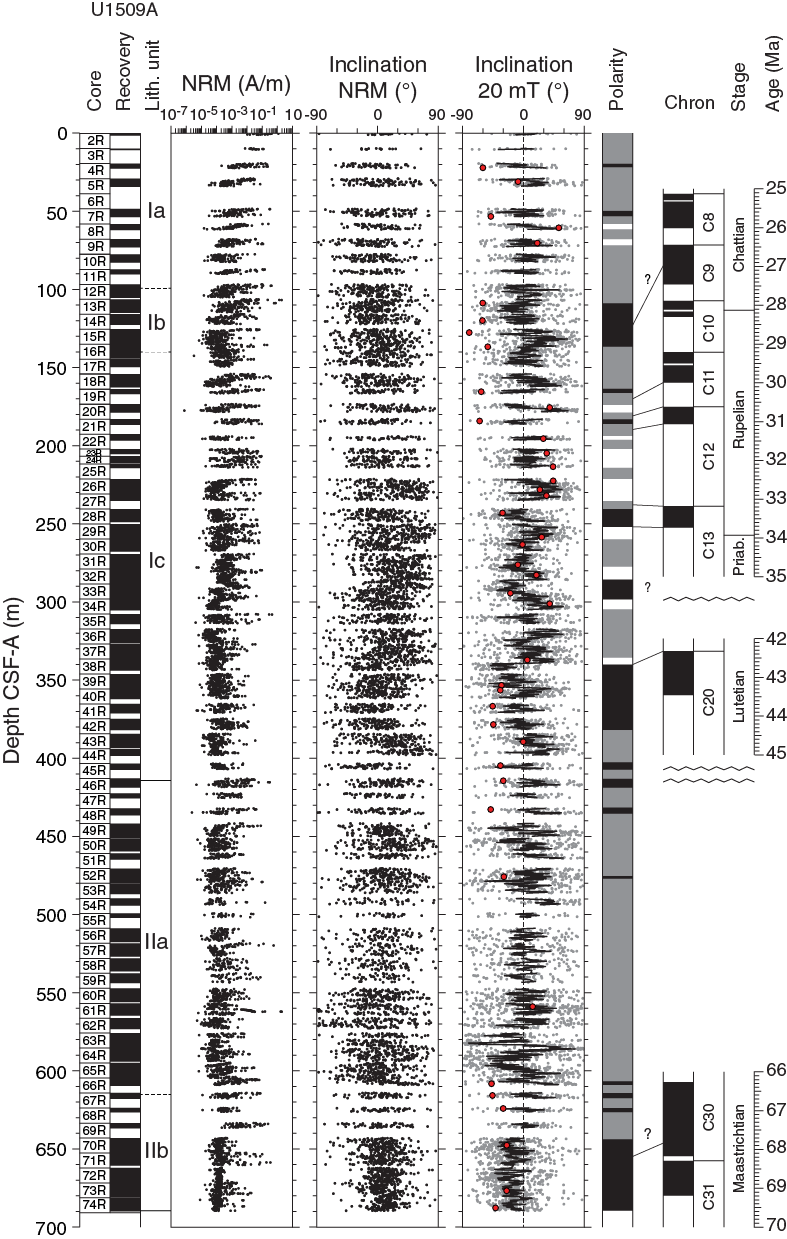
Figure F28. Pass-through paleomagnetic data.
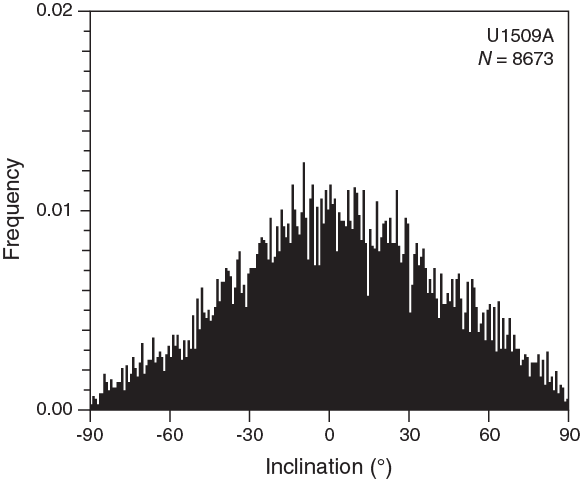
Figure F29. Paleomagnetic inclination after 20 mT AF demagnetization.
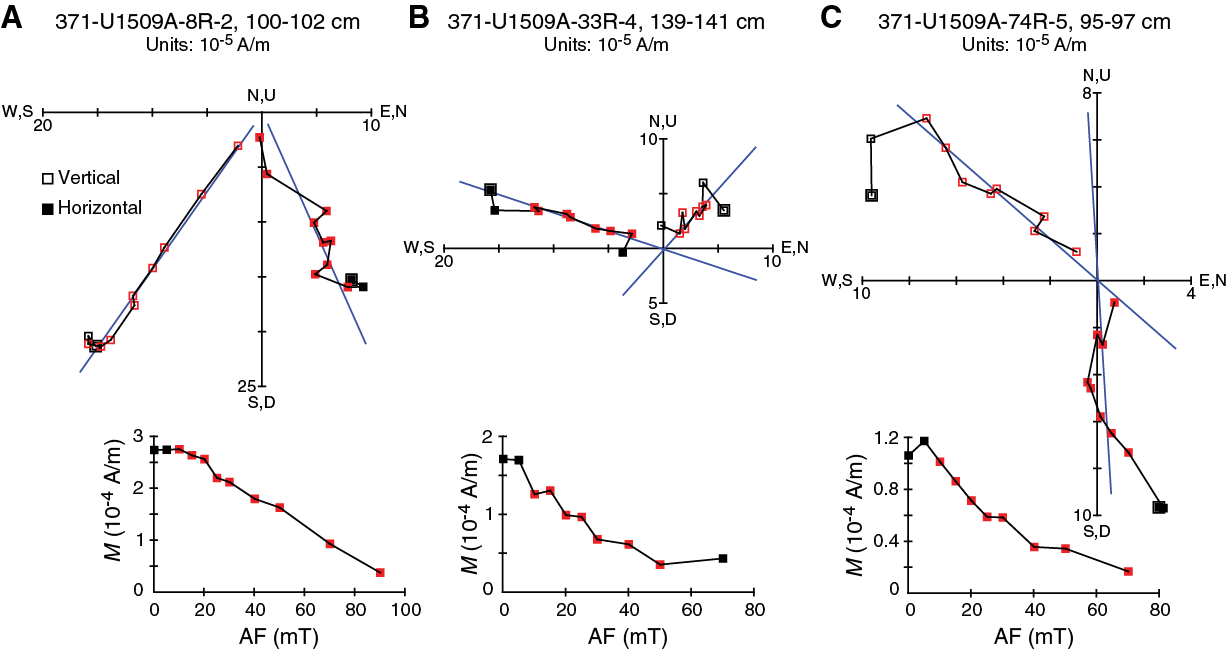
Figure F30. Vector endpoint demagnetization diagrams.
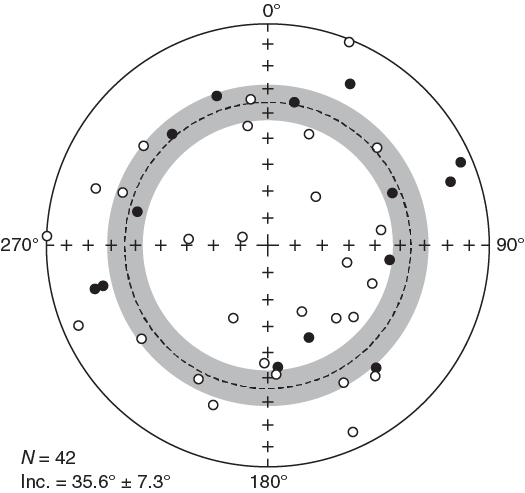
Figure F31. ChRM paleomagnetic directions.
Anisotropy of magnetic susceptibility
Samples from the ooze interval and part of the upper chalk interval (Subunit Ia) have negative susceptibility values (i.e., dominated by diamagnetic material such as carbonate), and AMS measurements have large errors. Therefore, AMS results from these samples were disregarded. Samples from the slumped calcareous chalk interval (Subunit Ib; 99.6–139.28 m) were also excluded from AMS analysis because of clear sediment distortion.
Samples from Subunit Ic and Unit II were trimmed in cubes with precise orientation control. Orientation of the AMS tensor is generally poorly defined. Nevertheless, the AMS tensor is generally oblate, with the κmin axis statistically oriented perpendicular to the horizontal plane (Figure F32). Dispersion of the κmin axes around the vertical axis is probably caused by tectonic tilting of strata after sediment deposition and compaction (see Lithostratigraphy).
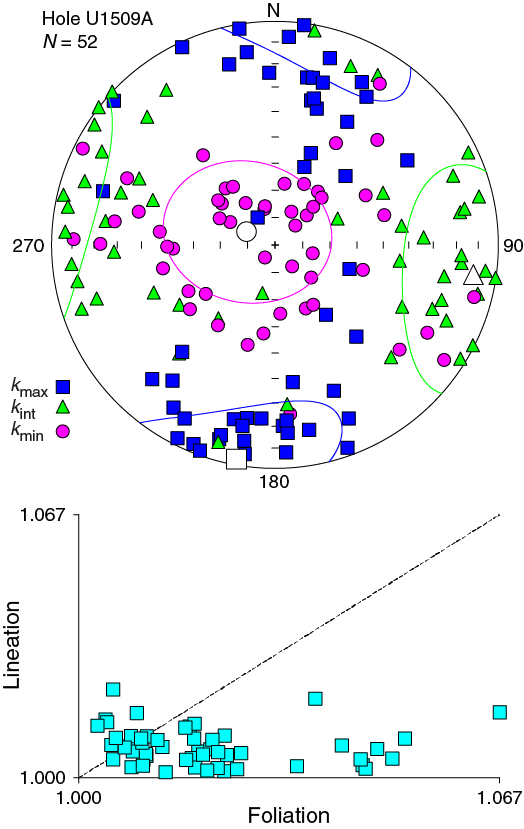
Figure F32. AMS data for discrete samples.
Magnetostratigraphy
After integrating paleomagnetic data with biostratigraphy (see Biostratigraphy and paleoenvironment), we correlated the normal polarity interval between Cores 371-U1509A-13R and 16R (~110–140 m) with Chron C9n, although without assigning its base or top (Figure F28; Table T10). This polarity zone is followed downcore by two short intervals of normal polarity centered at ~165 and 184 m (Cores 19R and 21R) that likely correspond to Chrons C11n and C12n, respectively. The normal polarity interval at ~240 m (Core 28R) correlates with Chron C13n. A reliable normal/reversed paleomagnetic pattern centered at ~340 m in Core 38R in both pass-through and discrete sample data correlates with the top of Chron C20n (42.3 Ma). The lower claystone interval of Subunit IIb is characterized by better pass-through data than the upper intervals. Paleomagnetic inclination data from archive-half sections between ~640 and 690 m in Subunit IIb, although rather dispersed, indicate sedimentation during normal geomagnetic polarity and are supported by data from discrete samples (Figures F28, F30). Because biostratigraphic results (see Biostratigraphy and paleoenvironment) suggest a Maastrichtian (Upper Cretaceous) age for this part of Hole U1509A, the normal polarity of cores from Subunit IIb is tentatively correlated with either Chron C30n or 31n, which collectively span 2.9 My from 66.4 to 69.3 Ma (Ogg, 2012).
Petrophysics
Hole U1509A cores were analyzed with the full suite of physical properties measurements (see Petrophysics in the Expedition 371 methods chapter [Sutherland et al., 2019a]). Neither downhole temperature nor wireline logging measurements were made. Measurable variations in physical properties arise from increasing lithification and variations in composition, including calcareous ooze, calcareous chalk, limestone, claystone, and layers containing chert.
In Hole U1509A, P-wave velocity, bulk density, and porosity all change slightly with depth in the calcareous sediments of Unit I. The exception is a discrete, ~27 m thick layer limestone between 388 and 415 m, where bulk density and P-wave velocity increase by ~40% and porosity decreases from about 55% to about 40%. Physical properties are approximately constant in the claystone of Unit II, except NGR, which increases with depth and is variable in the lower 100 m of the unit.
Density and porosity
Bulk density was estimated using the gamma ray attenuation (GRA) method on whole-round sections and the moisture and density (MAD) method on discrete samples from section halves (Figure F33). The decrease in porosity (φ) with depth (z) (i.e., φ = φoe−z/c) has a best fit with φo = 61.8% ± 0.8% and c = 1952 ± 140 m and is similar to Taranaki mudstone (φo = 54% and c = 2000 m; Funnell et al., 1996). Subunits Ia and Ib have higher porosity, which is expected for shallowly buried calcareous ooze and chalk. Subunit Ic and Unit II are consistent with the best-fitting exponential; however, the base of Subunit Ic has lower porosity than expected.

Figure F33. Bulk density, grain density, porosity, and P-wave velocity.
The lithostratigraphic change from nannofossil ooze to nannofossil chalk between Cores 371-U1509A-7R and 8R (58 m) correlates with an increase in P-wave velocity (see below) but is not associated with a distinctive change in bulk density, grain density, or porosity. The ooze–chalk transition usually occurs at burial depths of ~300 m, and the shallow depth of 58 m observed at Site U1509 may indicate that overburden has been removed by slumping. In lithostratigraphic Subunit Ia (the uppermost 100 m), MAD bulk density values vary between 1.55 and 1.80 g/cm3, grain density is 2.65–2.72 g/cm3, and porosity varies between ~60% and 70%. Porosity variations are similar above and below the ooze–chalk transition. The first notable change in MAD bulk density and porosity occurs at ~139 m at the transition between Subunit Ib (chalk with abundant soft-sediment deformation) and Subunit Ic (chalk and limestone with biosilica), where bulk density increases downhole from ~1.60 to ~1.75 g/cm3. Likewise, porosity decreases from 65% to 55% at this depth. These variations could be due to soft-sediment deformation rather than compositional changes, considering the invariant nature of grain density through this interval.
In lithostratigraphic Subunit Ic (chalk and limestone), bulk density fluctuates between 1.65 and 1.90 g/cm3, mean grain density decreases downhole from ~2.70 to 2.60 g/cm3, and mean porosity is variable between 45% and 60% (139–388 m). At the ~27 m thick limestone layer between 388 and 415 m, bulk density increases by 0.3 g/cm3 and porosity decreases from ~55% to ~35%. In this layer, grain density increases to 2.75 g/cm3, probably due to carbonate cement. Below this layer, in Unit II, bulk density and porosity remain constant with depth and grain density values are <2.55 g/cm3, reflecting high clay content.
P-wave velocity
P-wave velocity was measured on whole-round sections (P-wave logger [PWL]) and working-half sections (P-wave caliper [PWC]) (Figure F33). P-wave velocity (PWC) in the upper 50 m of Site U1509 is 1500–1600 m/s in nannofossil ooze. Between 50 and 60 m (ooze–chalk transition; see Lithostratigraphy), P-wave velocity increases downhole to 1700–1800 m/s. Between 60 and 140 m, P-wave velocity (PWC) varies from 1650 to 1800 m/s with local spikes to 1900–2000 m/s. P-wave velocity is around 1800 m/s in the nannofossil chalk with biosilica in Subunit Ic (140–380 m; see Lithostratigraphy), where lithology and physical properties vary little with depth. In the 390–410 m interval, P-wave velocity (PWC) increases to 2900 m/s in limestone with chert. Velocity values decrease sharply to ~1800 m/s by 420 m, which is below the boundary between limestone (base of lithostratigraphic Subunit Ic) and claystone (top of Subunit IIa). P-wave velocity (PWC and PWL) remains approximately constant at ~1800 m/s throughout lithostratigraphic Unit II.
Magnetic susceptibility
Magnetic susceptibility was measured with the pass-through system (loop magnetic susceptibility [MSL]) on all whole-round sections and the point measurement system (point magnetic susceptibility [MSP]) on all section halves (Figure F34).
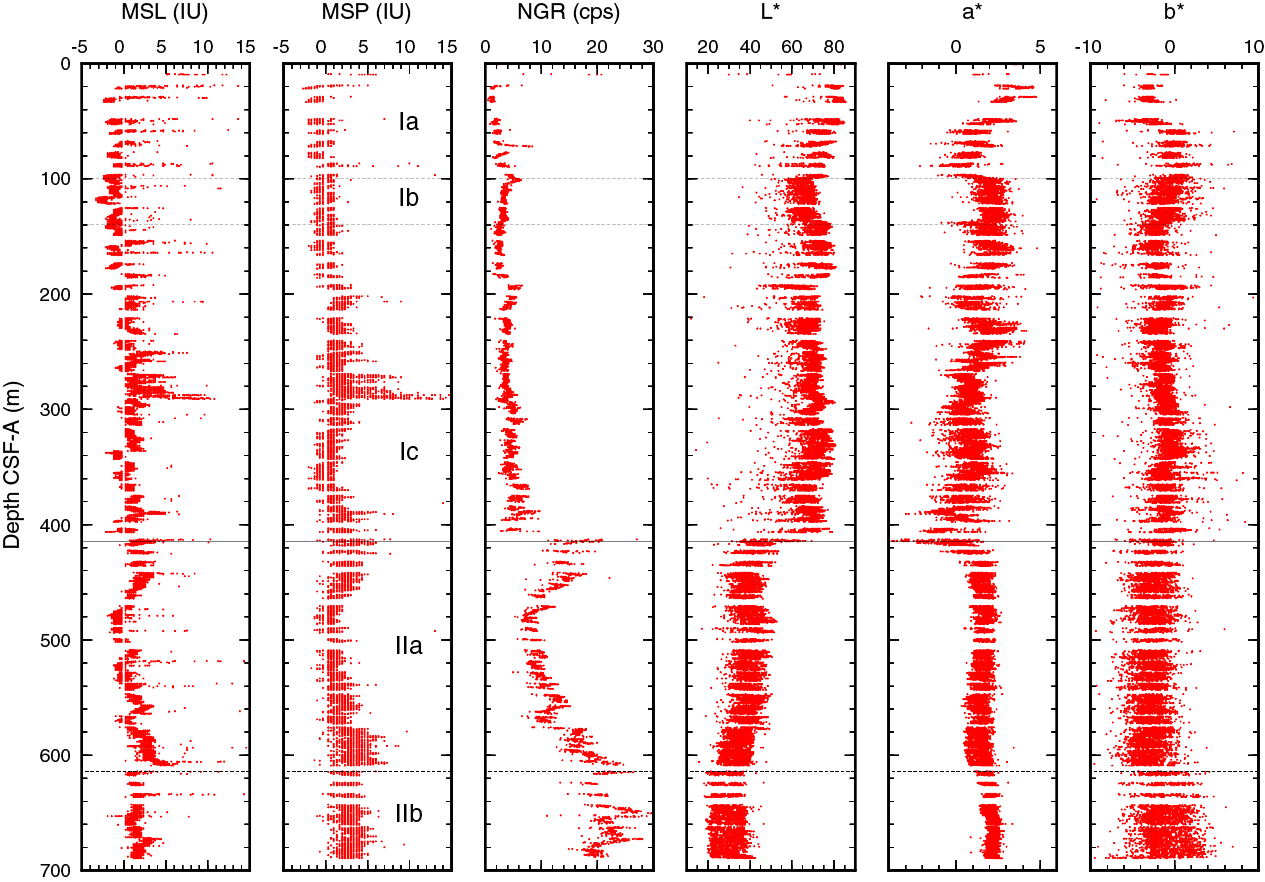
Figure F34. Magnetic susceptibility, NGR, and L*, a*, b*.
Magnetic susceptibility is low (generally <3 IU) throughout Hole U1509A. In Subunit Ia, local spikes reach ~40 IU and correspond to tuffaceous layers (e.g., Section 371-U1509A-11R-2; 89.6 m). A deviation from the general trend occurs at ~270–290 m (Cores 31R through 33R), where magnetic susceptibility values are highest. This change in magnetic susceptibility is not reflected in any other physical property or lithology changes. A gentle broad excursion to 5 IU occurs from 370 to 460 m across the Unit I/II boundary. Slightly higher MSP values at 580–610 m correlate with silt occurrence in the Unit II claystone (see Lithostratigraphy).
Natural gamma radiation
NGR was measured on all Hole U1509A whole-round sections (Figure F34). The NGR data show a distinct difference between Units I and II. Unit I has generally low values that increase slightly with depth. NGR values are from 1 to 5 counts/s between 20 and ~100 m and decrease from 5 to 3 counts/s between ~100 and ~200 m, followed by a step increase to ~5 counts/s at 190 m, where the sediments contain biogenic silica (see Lithostratigraphy). Below ~200 m, the values are between ~3 and ~7 counts/s to the bottom of Subunit Ic.
Higher NGR values vary significantly in the Unit II claystone. A sharp downhole increase in NGR values occurs at the top of the unit to ~20 counts/s. Values then decrease to ~8 counts/s by ~480 m, range between ~7 and 15 counts/s at 480–580 m, and then gradually increase to ~25 counts/s to the base of Subunit IIa (615 m). The relatively high values in intervals 415–480 and ~580–615 m are correlated with silt occurrence in the claystone (see Lithostratigraphy). NGR values are variable in Subunit IIb between 15 and 30 counts/s, with a highest spike at 652 m.
Thermal conductivity and temperature
Thermal conductivity measurements were made on the dominant lithology in each core. Thermal conductivity is about 1.2 W/(m·K) to 139 m (lithostratigraphic Subunit Ib/Ic boundary). Throughout much of Subunit Ic, thermal conductivity varies between 1.3 and 1.4 W/(m·K), and, like most other physical properties, it increases at the base of Subunit Ic (between 380 and 430 m), where values are between 1.4 and 1.6 W/(m·K) in the limestone unit with biosilica. Through the remainder of Unit II, thermal conductivity varies between 1.2 and 1.3 W/(m·K).
Because no APC coring occurred at Site U1509, no in situ temperatures were measured.
Sediment strength
Sediment strength was measured with both the automated vane shear and penetrometer on Cores 371-U1509A-2R through 7R (0.0–58.1 m) (Figure F35). Vane shear strength increases from ~12 kPa near the seafloor to ~30 kPa at ~50 m. Compressive strength increases from ~0 kPa near the seafloor to between ~25 and ~120 kPa by ~50 m and then sharply decreases to ~25 kPa below 50 m. Sediments below ~58 m (Core 8R) are too hard to penetrate with the tool because lithology changes downhole from ooze to chalk (see Lithostratigraphy).
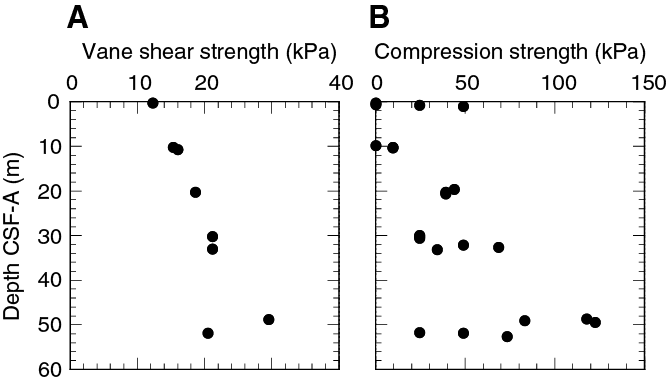
Figure F35. Shear and compressive strength.
Color spectrophotometry
Color reflectance variation in Hole U1509A can be divided into three intervals with a baseline shift at the base of each. Between 0 and ~100 m (lithostratigraphic Subunit Ia), L*, a*, and b* values vary between 65 and 85, −1 and 4, and −5 and 2, respectively. An ooze–chalk transition at ~60 m coincides with a change in downhole color gradient in the middle of this interval. At around 100 m, reflectance values are offset. The largest offset is in a* values, which change from 0–2 to 1–3 (more reddish). Between ~100 and 415 m (lithostratigraphic Subunits Ib and Ic), L* (55–80), a* (−1–3), and b* (−4–2) values vary with small-scale fluctuations. A distinct baseline shift occurs at 415 m at the top of lithostratigraphic Subunit IIa, where L* values decrease to 35–50, a* values increase to 0–2, and b* values are −5–0. In the claystone in Subunit IIb, L* values indicate a darker (20–40) color and a* values indicate a more reddish color.
Two-way traveltime to depth conversion
Using a combination of P-wave velocity and bulk density data obtained from core measurements, acoustic impedance and a synthetic trace (Figure F36) were computed (see Petrophysics in the Expedition 371 methods chapter [Sutherland et al., 2019a]). Because little unlithified material was cored at Site U1509, data are not rebound corrected. The synthetic trace was compared with a trace extracted from the multichannel seismic (MCS) data. Where prominent reflections on the seismic trace and the synthetic trace are well correlated, two-way traveltime (TWT) depth points were selected (red circles in figure and listed in Table T11).
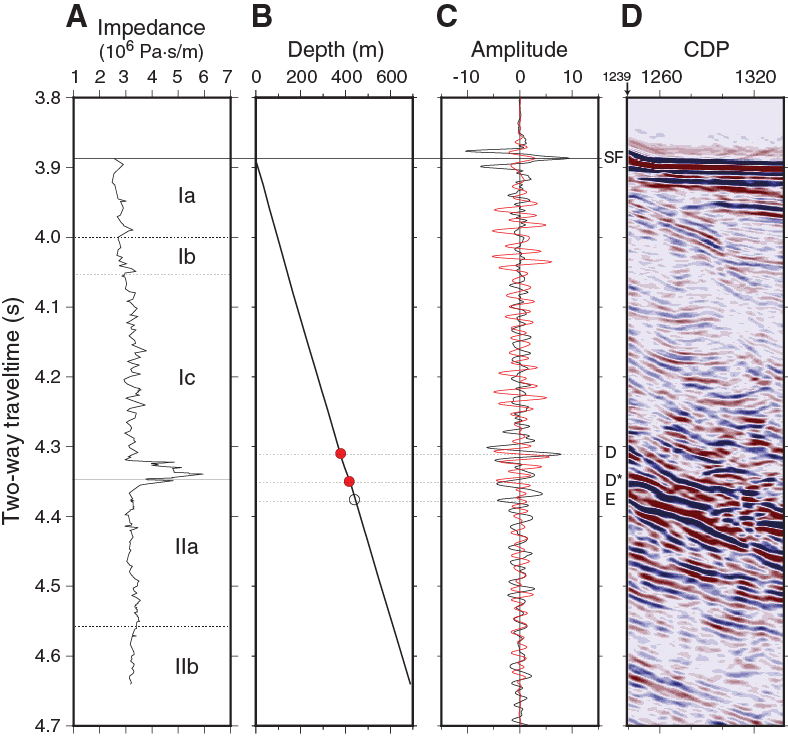
Figure F36. Core data compared with MCS Line TAN1409_NCTS_02.
The impedance against TWT plot (Figure F36) shows one anomalous layer that corresponds to the limestone at the base of lithostratigraphic Subunit Ic. A positive reflection (D) occurs at the top of the layer, and a negative reflection (D*) occurs at the base. Ties to reflections from the top and bottom of this layer give confidence in the TWT with depth relationship calculated for the borehole (see Petrophysics in the Expedition 371 methods chapter [Sutherland et al., 2019a]).
A strong negative reflection (E) occurs just below the limestone layer at 4.376 s TWT and has a computed depth of ~440 m. The reflection is interpreted to occur at a boundary in a claystone layer (see Lithostratigraphy). The laboratory-measured physical properties do not resolve low P-wave velocity or density at this depth, and we suggest that nonrecovered material or in situ properties such as fracturing or bedding parallel faulting in the claystone may be reducing the velocity and/or density in this layer.
Geochemistry
The geochemistry program at Site U1509 in the south NCT was designed to characterize the composition of pore water and solid sediment and to assess the potential presence of volatile hydrocarbons. Site U1509 has a relatively thin Cenozoic sedimentary cover overlying thicker and older strata (see Background and objectives). Pore water should record indications of diagenesis due to dissolution of primary components and precipitation of secondary authigenic minerals. The latter is especially important for assessing potential modifications to sedimentary components employed for paleoceanographic reconstructions, including biogenic carbonate and magnetic minerals. Organic-rich rock that produces thermogenic gases is known from depth in the Taranaki Basin to the southeast and might have lateral equivalents in the NCT (Uruski et al., 2004, Uruski, 2010; Stagpoole, 2011). Thus, downhole chemical profiles might also give indications of gases migrating from depth.
Headspace hydrocarbon gases
A total of 74 headspace (HS) gas samples were taken, typically one from every core in the top of the last section or core catcher. Some HS samples from below 450 m were measured multiple times to assess reproducibility.
Light hydrocarbon gas concentrations were below the detection limit for the upper 340 m. Below this depth, methane (CH4) concentration generally increases downhole to a high of 15,034 parts per million by volume (ppmv) at 617 m (Table T12; Figure F37). From 417 m downhole, the increase in CH4 is accompanied by increasing ethane (C2H6) and propane (C3H8) concentrations to maxima of 91 and 21 ppmv, respectively, at 670 m. Scatter in the gas profiles is attributed to the sampling method (see Geochemistry in the Expedition 371 methods chapter [Sutherland et al., 2019a]), including the loss of gas during core recovery and handling and potentially large differences in the volume of sediment (and pore space) placed into vials.

Figure F37. Methane, sulfate, ammonium, and barium.
Interstitial water analyses
A total of 23 interstitial water (IW) samples were collected from Site U1509 (Table T13). The deepest IW sample came from 456 m. We were not able to extract IW samples from the bottom 150 m of the hole, even after precrushing 20 cm long whole-round samples. One mudline sample was collected from above Core 371-U1509A-4R; however, this mudline sample is mostly drilling fluid rather than bottom seawater. Therefore, this sample was not regarded to be a true mudline sample. Its chemistry is displayed in Table T14 in the Expedition 371 methods chapter [Sutherland et al., 2019a]). The downhole IW chemistry profiles start at 21 m.
Salinity, pH, and alkalinity
Salinity decreases steadily downhole, whereas the pH and alkalinity profiles mirror each other, with significant variations at the 100–200 m scale (Table T13; Figure F38). Salinity is 35.5 at 21 m, the same as that in the overlying surface seawater (see Table T14 in the Expedition 371 methods chapter [Sutherland et al., 2019a]), and decreases to 31.0 at 456 m. pH decreases from 7.76 at 21 m to 7.55 at 213 m; below this depth, pH increases to 7.71 at 313 m, decreases to 7.62 at 369 m, and increases again to 7.71 at 392 m. Alkalinity increases from 3.97 mM at 21 m to 6.80 mM at 213 m; below this depth, alkalinity decreases to 3.68 mM at 313 m, increases to 4.65 mM at 369 m, and decreases to 2.29 mM at 392 m.
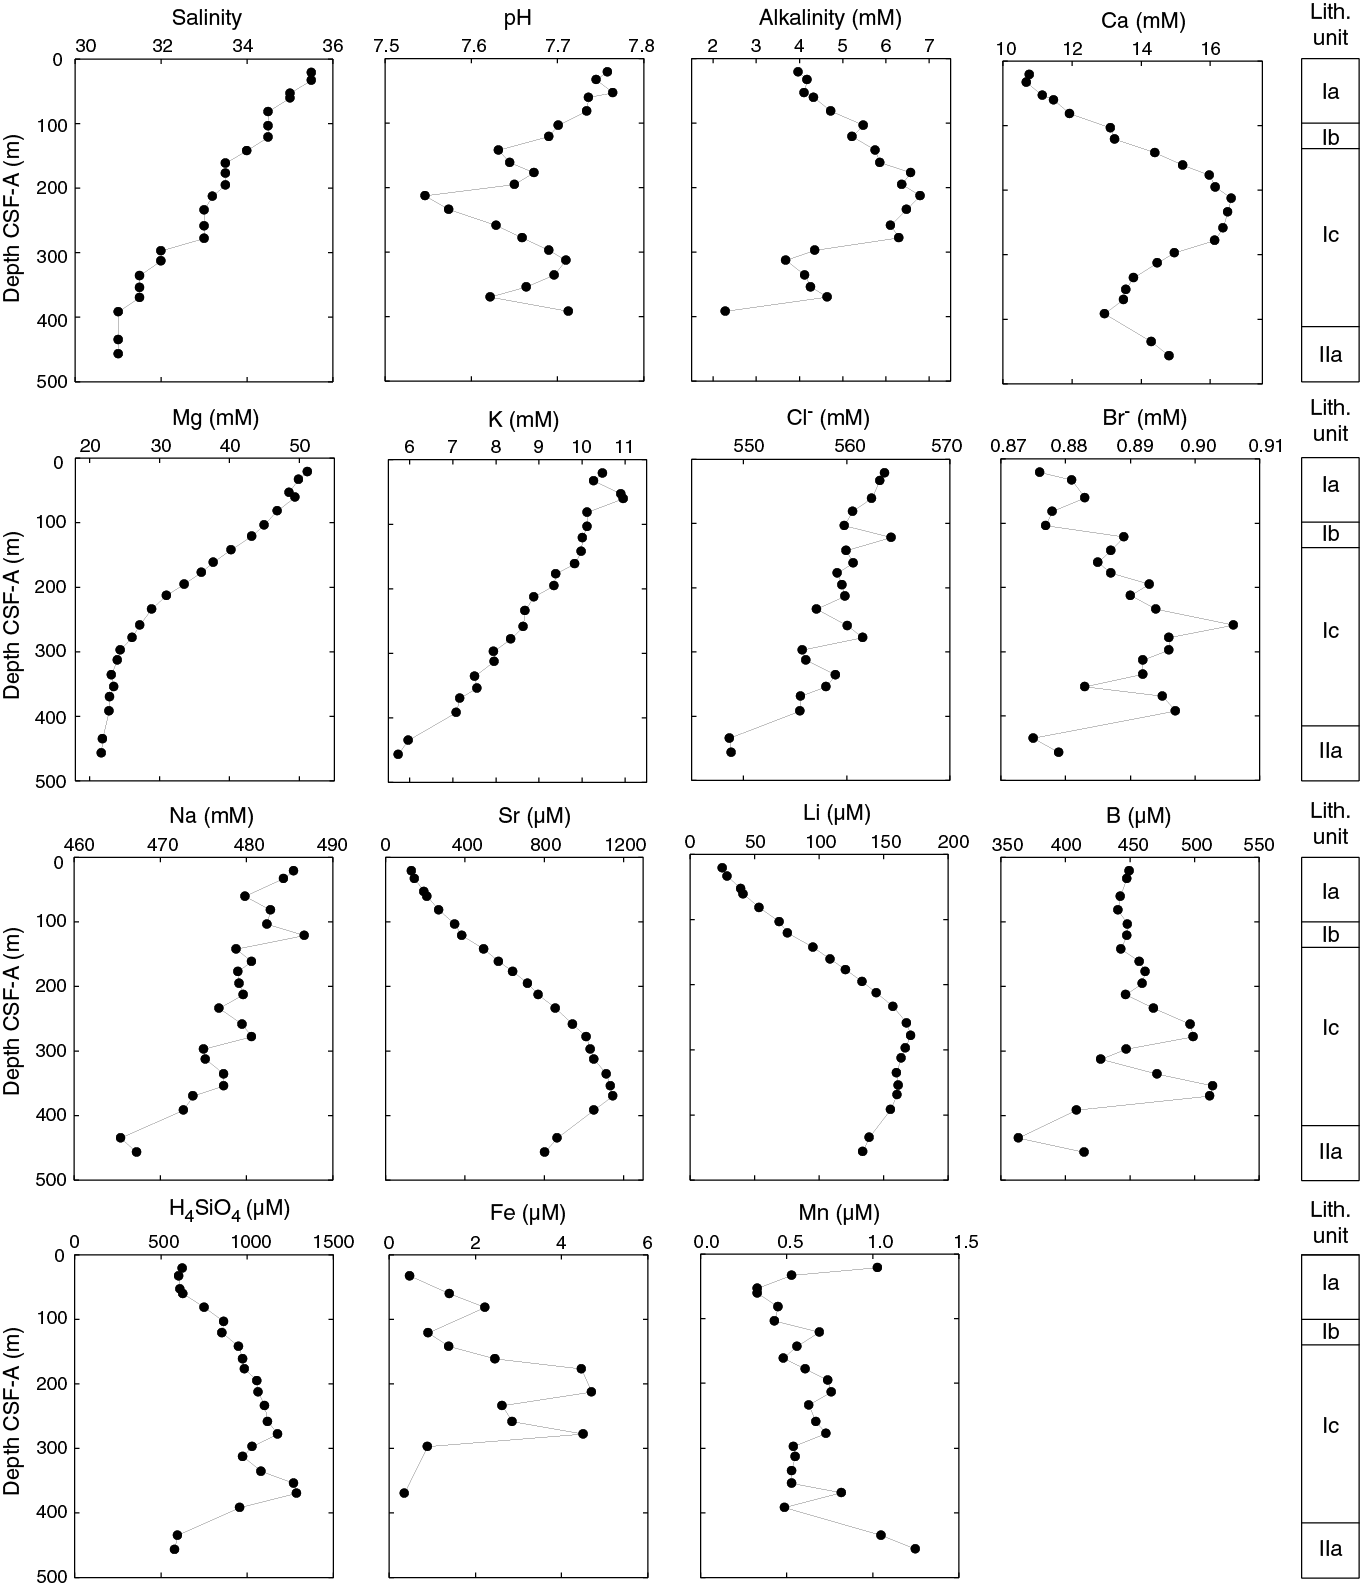
Figure F38. IW chemistry.
Sulfate and ammonium
In general, the SO42− and NH4+ concentration profiles mirror each other, with SO42− decreasing and NH4+ increasing downhole (Table T13; Figure F37). SO42− and NH4+ concentrations are 27.6 mM and 67.5 µM, respectively, at 21 m, which is significantly different from concentrations in the International Association for the Physical Sciences of the Oceans (IAPSO) standard seawater (i.e., 29.1 mM and 8.9 µM, respectively) (see Table T14 in the Expedition 371 methods chapter [Sutherland et al., 2019a]). Below this depth, SO42− decreases monotonously to 0.8 mM at 456 m. In contrast, NH4+ concentration increases to a maximum of 1364 µM at 335 m and then decreases to 915 µM at 456 m.
Calcium, magnesium, and potassium
Dissolved Ca concentration behaves differently above and below ~200 m, whereas dissolved Mg and K concentrations both show decreasing trends downhole (Table T13; Figure F38). Ca, Mg, and K concentrations start at 10.8, 51.2, and 10.5 mM, respectively, at 21 m. These values are similar to those in surface seawater (i.e., 10.6, 54.3, and 10.3 mM) (see Table T14 in the Expedition 371 methods chapter [Sutherland et al., 2019a]). Below 21 m, Ca concentration increases downhole to a maximum of 16.6 mM at 213 m. Below this depth, Ca decreases to 13.0 mM at 392 m and then increases to 14.8 mM at 456 m. Mg concentration decreases linearly at a gradient of 0.10, 0.07, and 0.02 mM/m at 21–234, 234–297, and 297–456 m, respectively. K concentration decreases slightly from 10.5 mM at 21 m to 9.8 mM at 161 m, decreases linearly with a gradient of 0.01 mM/m to 7.1 mM at 392 m, and finally decreases to 5.7 mM at 456 m.
Chloride, bromide, and sodium
The Cl− and Na concentration profiles share similar decreasing trends downhole, whereas Br− concentration shows an inflection at 259 m (Table T13; Figure F38). Cl− and Na concentrations decrease from 564 and 485 mM, respectively, at 21 m, which is slightly lower than concentrations in the seawater (see Table T14 in the Expedition 371 methods chapter [Sutherland et al., 2019a]), to 549 and 467 mM, respectively, at 456 m. Br− concentration minimally increases from 0.88 mM, the same concentration as seawater, to 0.91 mM at 259 m and then decreases to 0.88 mM at 456 m.
Strontium, lithium, and barium
The Sr, Li, and Ba concentration profiles display large changes downhole, although at different depths with different magnitudes (Table T13; Figures F38, F37). For reference, dissolved concentrations of these elements in the IAPSO standard seawater are 89, 26.2, and 0.77 µM, respectively (see Table T14 in the Expedition 371 methods chapter [Sutherland et al., 2019a]). Sr concentration increases from 132 µM at 21 m to 1148 µM at 369 m. Below 369 m, Sr decreases linearly to 805 µM at 456 m. Li concentration increases from 25.1 µM at 21 m to 171.1 µM at 278 m and then decreases slowly to 134.1 µM at 456 m. Ba concentration is consistently <1 µM from 21 to 234 m. Below this depth, Ba increases gradually to 8.6 µM at 369 m, increases sharply to 414.7 µM at 435 m, and finally decreases slightly to 338.7 µM at 456 m. Such extreme values exceed Sr, Li, and Ba concentrations in seawater by more than 12, 6, and 500 times, respectively.
Boron and silica
The B and H4SiO4 concentration profiles show significant variations downhole (Table T13; Figure F38). B concentration averages 450 µM between 21 and 213 m, only slightly higher than the 445 µM of standard seawater (see Table T14 in the Expedition 371 methods chapter [Sutherland et al., 2019a]). Below 213 m, B oscillates between 364 and 514 µM. H4SiO4 concentration is 623 µM at 21 m, over 13 times higher than that in standard seawater. Below 21 m, H4SiO4 concentration increases to a maximum of 1287 µM at 369 m and decreases to 579 at 456 m.
Iron and manganese
Dissolved Fe concentration shows significant variation with depth, whereas dissolved Mn concentration mostly remains <1 µM (Table T13; Figure F38). Fe concentration is <1.0 µM above 61 m and below 297 m; Fe generally exceeds 1.0 µM in the middle part of the hole, with a maximum value of 4.7 µM at 213 m.
Bulk sediment geochemistry
Bulk sediment contents correspond well to lithostratigraphic units (Table T14; Figure F39). Unit I is characterized by high CaCO3 contents that generally decrease downhole from about 94 wt% at 20 m to about 65 wt% between 360 and 380 m. Although the profile is relatively smooth across the uppermost 200 m, greater variability between adjacent samples (~10 wt%) was found in the lower part. Carbonate contents decrease drastically in the transition from Unit I to Unit II (415 m) to values averaging 18 and 0.5 wt% in Subunits IIa and IIb, respectively. In contrast, organic carbon contents are low throughout Unit I and Subunit IIa (0.28 ± 0.18 wt%) and much higher in Subunit IIb (1.04 ± 0.15 wt%). In Upper Cretaceous Subunit IIb, nitrogen contents also increase above the detection limit to 0.05 ± 0.01 wt%. Thus, atomic C/N ratios are approximately 22, strongly indicating a predominantly terrestrial organic carbon source (Meyers, 1994).
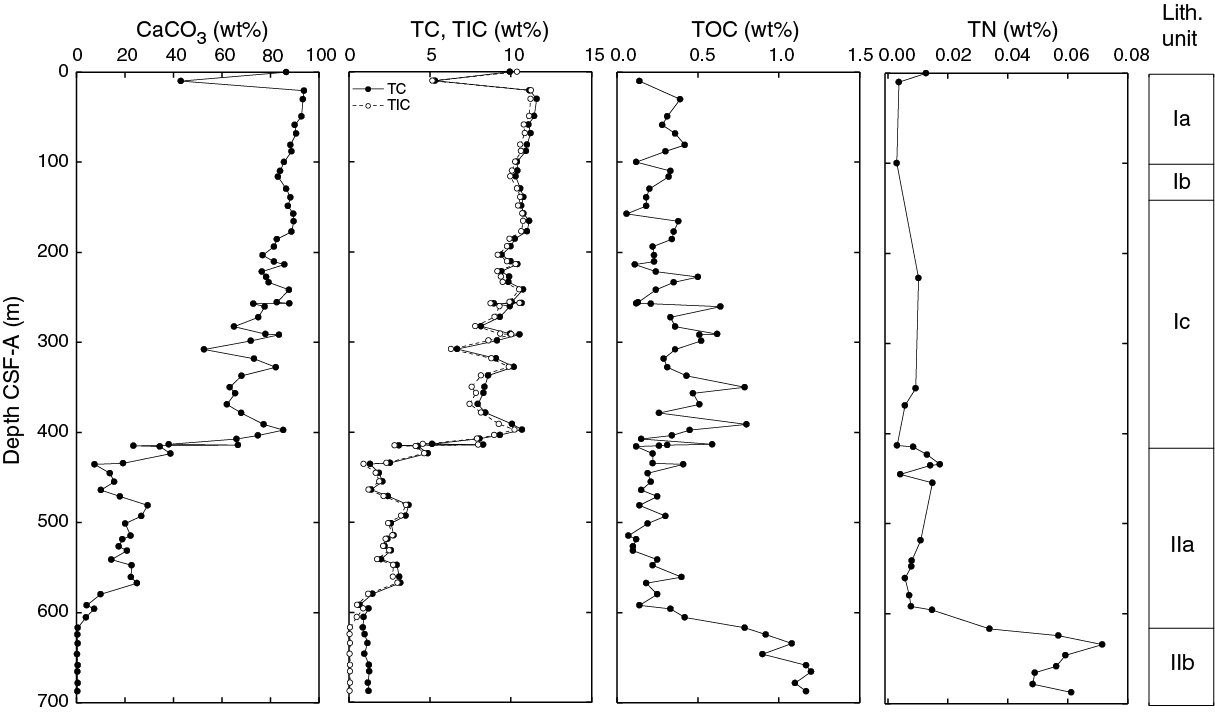
Figure F39. Bulk sediment profiles.
Discussion
Hydrocarbon gases
Elevated light hydrocarbon gas concentrations at depth resemble the findings at Site U1508 but reach higher maxima. Note that particulate organic carbon contents are mostly <0.5 wt% in the upper ~600 m at both sites. Such values are common to open ocean settings and probably insufficient to generate significant in situ gas. More likely, thermogenic gases produced from organic-rich sediment below the recovered sequence are migrating from depth. Although microbial processes predominantly produce methane, thermogenic hydrocarbon gases are characterized by relatively elevated concentrations of the heavier ethane and propane. For this purpose, the methane/ethane ratio (C1/C2) is typically employed to deduce the origin of hydrocarbon gases in the context of downhole temperature (Pimmel and Claypool, 2001).
At Site U1509, the C1/C2 ratio decreases with depth from ~1700 at 417 m to ~130 at the bottom of the hole (Table T12; Figure F40). Because no direct thermal measurements were performed at Site U1509, we extrapolated downhole temperature gradients from Sites U1507 and U1510 (see Petrophysics in the Site U1507 chapter and Petrophysics in the Site U1510 chapter [Sutherland et al., 2019c, 2019e]). Interestingly, if the warmer geotherm from Site U1510 is used, the C1/C2 profile at Site U1509 corresponds better to that at Site U1508. Regardless of the geotherm used, however, relatively low C1/C2 ratios relative to sediment temperature, together with the presence of propane (Table T12), corroborate a scenario in which thermogenic gases migrate upward from depth.

Figure F40. Methane/ethane ratio gradient with sediment temperature.
Sulfate reduction
The coupled changes in SO42− and NH4+ in the upper ~370 m may support limited organoclastic sulfate reduction of particulate organic carbon. However, despite the depth, the nearly linear drop in SO42− concentration to <1.0 mM at ~370 m suggests a deep sulfate–methane transition (SMT) and a depth where anaerobic oxidation of methane presently occurs. These processes are presented and discussed in Geochemistry in the Site U1508 chapter (Sutherland et al., 2019d).
Other elements
The chemistry profiles for some species (e.g., Ca, Mg, SO42−, and Sr) exhibit inflections at 213 m. The coupled changes in pH, alkalinity, and dissolved Ca concentrations with similar amplitudes suggest dissolution of CaCO3 dominant above 213 m and precipitation of authigenic CaCO3 dominant below that depth. Furthermore, planktic foraminifer abundance changes from dominant and abundant to fair at ~190 m (see Biostratigraphy and paleoenvironment).
Dissolved H4SiO4 concentration peaks near 369 m, and both radiolarian abundance and preservation decrease significantly at ~400 m (see Biostratigraphy and paleoenvironment), suggesting dissolution of biogenic silica and diffusion of H4SiO4 with different gradients upward and downward. Indeed, a thin layer of cherty limestone occurs at ~370 m (see Lithostratigraphy); it may impede diffusion of dissolved species and may have also slowed down the migration rate of hydrocarbon gases upward.
Age model and sedimentation rates
Site U1509 contains a 689 m thick sequence of Pleistocene to upper Cretaceous nannofossil ooze, chalk, and claystone divided into three main lithostratigraphic units. Calcareous nannofossil datums found in Unit I and Subunit IIa provide first-order age control. One agglutinated foraminifer datum marks the top of carbonate-free Subunit IIb. Using these datums, linear sedimentation rates (LSRs) and mass accumulation rates (MARs) were calculated for Site U1509 on the core depth below seafloor (CSF-A) depth scale from 0 to 66 Ma (Table T3; Figure F41) (see Biostratigraphy and paleoenvironment).
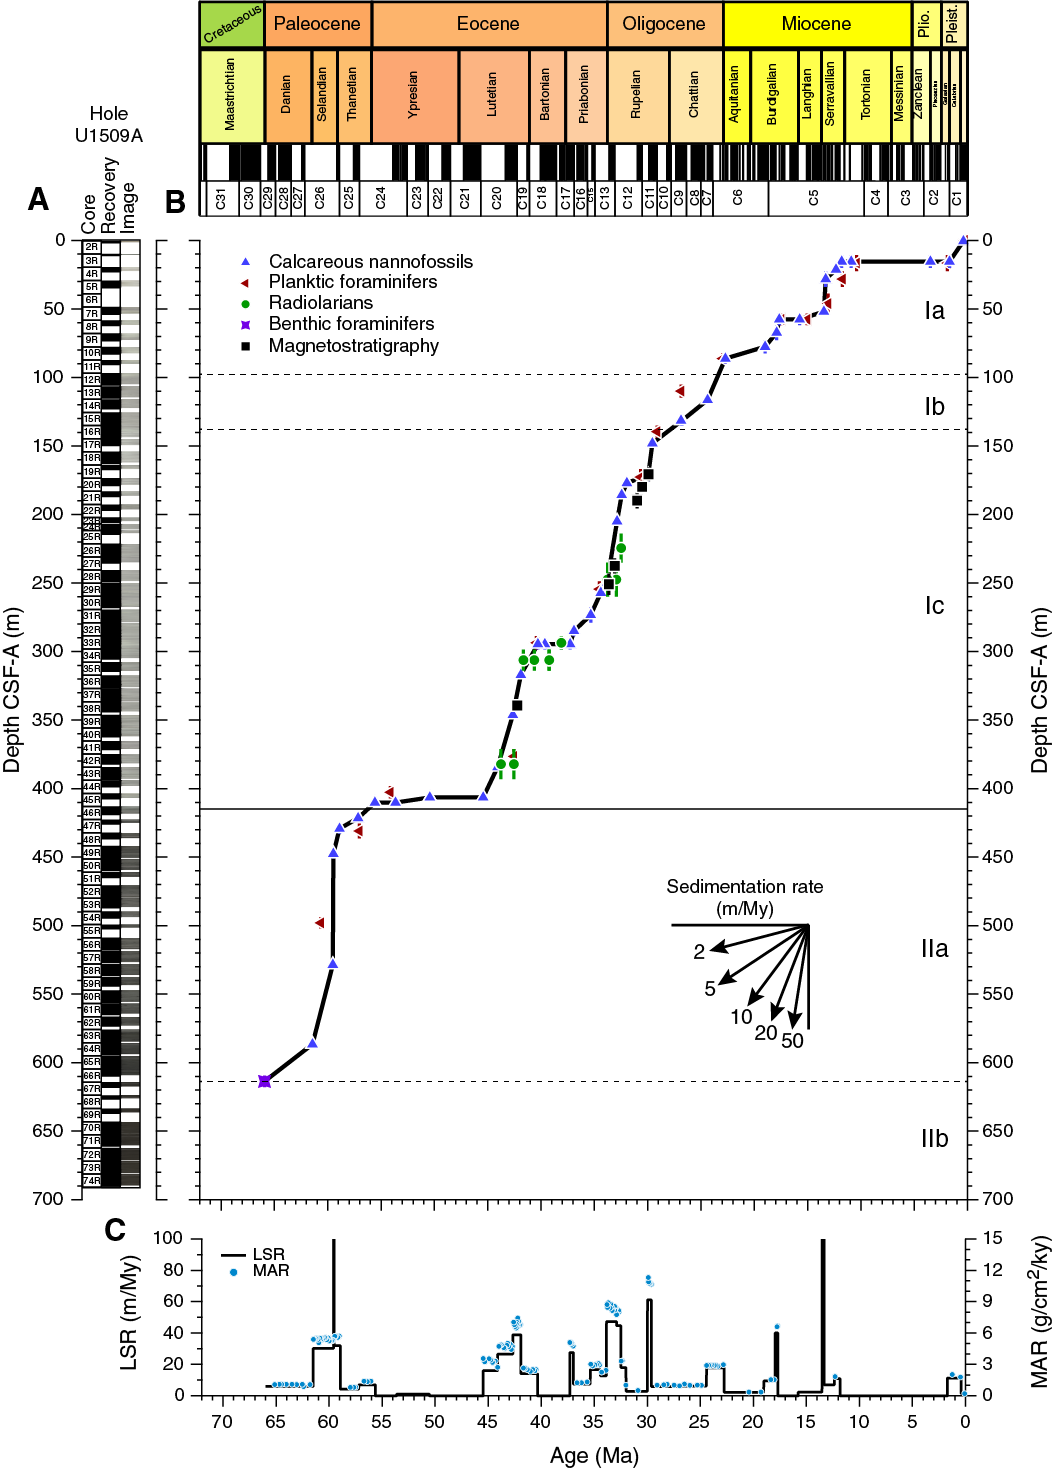
Figure F41. Sedimentation accumulation over time.
Sedimentation rates at Site U1509 are highly variable (1–135 m/My). This overall record includes several stratigraphic gaps, notably one spanning the early to middle Eocene (56–45 Ma) and one spanning the middle Miocene to Pliocene (13–2 Ma). Unusually high sedimentation rates in the early Paleocene, early Oligocene, and middle Miocene could indicate sequence thickening by tectonic activity (see the Expedition 371 summary chapter [Sutherland et al., 2019b]).
Late Cretaceous to Paleocene LSRs are about 6 m/My, interrupted by high LSRs of 30 m/My from 61.5 to 59 Ma. Exceptionally high LSRs of over 100 m/My occur in the clay-rich interval from 450 to 575 m and centered at 59.5 Ma. Following the early to middle Eocene hiatus, LSRs are ~20 m/My in the middle to late Eocene and Oligocene, except for a hiatus from 40 to 38 Ma. LSRs then decrease to ~10 m/My during the early Miocene. LSRs of ~15 m/My occur in the mid- to late Pleistocene.
Similar to most time intervals at Expedition 371 sites, LSRs and MARs closely mimic each other with respect to age because MARs are calculated from dry bulk density and LSR, but variations in the latter are much more pronounced. For the noncondensed intervals, MARs average 3 g/cm2/ky during the early to middle Eocene and 2 g/cm2/ky during the Oligocene to Pleistocene. Site U1509 MARs are similar to those at Site U1508. The primary difference compared with other Expedition 371 sites is that no sediments were deposited during the late Miocene to early Pliocene biogenic bloom at Site U1509.
References
Agnini, C., Fornaciari, E., Raffi, I., Catanzariti., R., Pälike, H., Backman, J., and Rio, D., 2014. Biozonation and biochronology of Paleogene calcareous nannofossils from low and middle latitudes. Newsletters on Stratigraphy, 47(2):131–181. https://doi.org/10.1127/0078-0421/2014/0042
Bache, F., Mortimer, N., Sutherland, R., Collot, J., Rouillard, P., Stagpoole, V., and Nicol, A., 2014. Seismic stratigraphic record of transition from Mesozoic subduction to continental breakup in the Zealandia sector of eastern Gondwana. Gondwana Research, 26(3–4):1060–1078. https://doi.org/10.1016/j.gr.2013.08.012
Baur, J., Sutherland, R., and Stern, T., 2014. Anomalous passive subsidence of deep-water sedimentary basins: a prearc basin example, southern New Caledonia Trough and Taranaki Basin, New Zealand. Basin Research, 26(2):242–268. https://doi.org/10.1111/bre.12030
Brinkhuis, H., Schouten, S., Collinson, M.E., Sluijs, A., Sinninghe Damsté, J.S., Dickens, G.R., Huber, M., et al., 2006. Episodic fresh surface waters in the Eocene Arctic Ocean. Nature, 441(7093):606–609. https://doi.org/10.1038/nature04692
Brinkhuis, H., Sengers, S., Sluijs, A., Warnaar, J., and Williams, G.L., 2003. Latest Cretaceous–earliest Oligocene and Quaternary dinoflagellate cysts, ODP Site 1172, East Tasman Plateau. In Exon, N.F., Kennett, J.P., and Malone, M.J. (Eds.), Proceedings of the Ocean Drilling Program, Scientific Results, 189: College Station, TX (Ocean Drilling Program), 1–36. https://doi.org/10.2973/odp.proc.sr.189.106.2003
Browne, G.H., Lawrence, M.J.F., Mortimer, N., Clowes, C.D., Morgans, H.E.G., Hollis, C.J., Beu, A.G., Black, J.A., Sutherland, R., and Bache, F., 2016. Stratigraphy of Reinga and Aotea basins, NW New Zealand: constraints from dredge samples on regional correlations and reservoir character. New Zealand Journal of Geology and Geophysics, 59(3):396–415. https://doi.org/10.1080/00288306.2016.1160940
Browne, G.H., Kennedy, E.M., Constable, R.M., Raine, J.I., Crouch, E.M., and Sykes, R., 2008. An outcrop-based study of the economically significant Late Cretaceous Rakopi Formation, northwest Nelson, Taranaki Basin, New Zealand. New Zealand Journal of Geology and Geophysics, 51(4):295–315. https://doi.org/10.1080/00288300809509867
Dale, B., 1996. Dinoflagellate cyst ecology: modelling and geological applications. In Jansonius, J., and McGregor, D.C. (Eds.), Palynology: Principles and Applications. American Association of Stratigraphic Palynologists Foundation, 3:1249–1275.
Dwyer, G.S., Cronin, T.M., Baker, P.A., Raymo, M.E., Buzas, J.S., and Corrège, T., 1995. North Atlantic deepwater temperature change during late Pliocene and late Quaternary climatic cycles. Science, 270(5240):1347–1351. https://doi.org/10.1126/science.270.5240.1347
Etienne, S., Collot, J., Sutherland, R., Patriat, M., Bache, F., Rouillard, P., Henrys, S., Barker, D., and Juan, C., 2018. Deepwater sedimentation and Cenozoic deformation in the southern New Caledonia Trough (northern Zealandia, SW Pacific). Marine and Petroleum Geology, 92:764–779. https://doi.org/10.1016/j.marpetgeo.2017.12.007
Funnell, R., Chapman, D., Allis, R., and Armstrong, P., 1996. Thermal state of the Taranaki Basin, New Zealand. Journal of Geophysical Research: Solid Earth, 101(B11):25197–25215. https://doi.org/10.1029/96JB01341
Haskell, T.R., and Wilson, G.L., 1975. Palynology of Sites 280–284, DSDP Leg 29, off southeastern Australia and western New Zealand. In Kennett, J.P., Houtz, R.E., et al., Initial Reports of the Deep Sea Drilling Project, 29: Washington, DC (U.S. Government Printing Office), 731–741. https://doi.org/10.2973/dsdp.proc.29.116.1975
Hayward, B.W., 1986. A guide to paleoenvironmental assessment using New Zealand Cenozoic foraminiferal faunas. New Zealand Geological Survey Report, 109.
Herzer, R.H., Chaproniere, G.C.H., Edwards, A.R., Hollis, C.J., Pelletier, B., Raine, J.I., Scott, G.H., Stagpoole, V., Strong, C.P., Symonds, P., Wilson, G.J., and Zhu, H., 1997. Seismic stratigraphy and structural history of the Reinga Basin and its margins, southern Norfolk Ridge system. New Zealand Journal of Geology and Geophysics, 40: 425–451. https://doi.org/10.1080/00288306.1997.9514774
Herzer, R.H., Sykes, R., Killops, S.D., Funnell, R.H., Burggraf, D.R., Townend, J., Raine, J.I., and Wilson, G.J., 1999. Cretaceous carbonaceous rocks from the Norfolk Ridge system, southwest Pacific: implications for regional petroleum potential. New Zealand Journal of Geology and Geophysics, 42(1):57–73. https://doi.org/10.1080/00288306.1999.9514831
Holbourn, A., Henderson, A.S., and MacLeod, N., 2013. Atlas of Benthic Foraminifera: Chichester, United Kingdom (John Wiley & Sons, Ltd.). https://doi.org/10.1002/9781118452493
Hornibrook, N.d.B., Brazier, R.C., and Strong, C.P., 1989. Manual of New Zealand Permian to Pleistocene foraminiferal biostratigraphy. New Zealand Geological Survey Paleontological Bulletin, 56.
Huber, B.T., and Quillévéré, F., 2005. Revised Paleogene planktonic foraminiferal biozonation for the Austral realm. Journal of Foraminiferal Research, 35(4):229–314. https://doi.org/10.2113/35.4.299
Kaminski, M.A., and Gradstein, F.M., 2005. Atlas of Paleogene cosmopolitan deep-water agglutinated foraminifera. Grzybowski Foundation Special Publication, 10. http://www.foraminifera.eu/atlas.html
Killops, S.D., Raine, J.I., Woolhouse, A.D., and Weston, R.J., 1995. Chemostratigraphic evidence of higher-plant evolution in the Taranaki Basin, New Zealand. Organic Geochemistry, 23(5):429–445. https://doi.org/10.1016/0146-6380(95)00019-B
Kirschvink, J.L., 1980. The least-squares line and plane and the analysis of palaeomagnetic data. Geophysical Journal of the Royal Astronomical Society, 62(3):699–718. https://doi.org/10.1111/j.1365-246X.1980.tb02601.x
McFadden, P.L., and Reid, A.B., 1982. Analysis of paleomagnetic inclination data. Geophysical Journal of the Royal Astronomical Society, 69(2):307–319. https://doi.org/10.1111/j.1365-246X.1982.tb04950.x
Meyers, P.A., 1994. Preservation of elemental and isotopic source identification of sedimentary organic matter. Chemical Geology, 114(3–4):289–302. https://doi.org/10.1016/0009-2541(94)90059-0
Mortimer, N., Gans, P.B., Meffre, S., Martin, C.E., Seton, M., Williams, S., Turnbull, R.E., et al., 2018. Regional volcanism of northern Zealandia: post-Gondwana break-up magmatism on an extended, submerged continent. In Sensarma, S., and Storey, B.C. (Eds.), Large Igneous Provinces from Gondwana and Adjacent Regions. Geological Society of Special Publication, 463(1):199–226. https://doi.org/10.1144/SP463.9
Nagalingum, N.S., Drinnan, A.N., Lupia, R., and McLoughlin, S., 2002. Fern spore diversity and abundance in Australia during the Cretaceous. Review of Palaeobotany and Palynology, 119(1–2):69–92. https://doi.org/10.1016/S0034-6667(01)00130-0
Ogg, J.G., 2012. Geomagnetic polarity time scale. In Gradstein, F.M., Ogg, J.G., Schmitz, M.D., and Ogg, G.M. (Eds.), The Geologic Time Scale 2012: Amsterdam (Elsevier), 85–113. https://doi.org/10.1016/B978-0-444-59425-9.00005-6
Pascher, K.M., 2017. Paleobiogeography of Eocene radiolarians in the Southwest Pacific [Ph.D. thesis]. Victoria University of Wellington, New Zealand. http://hdl.handle.net/10063/6114
Pimmel, A., and Claypool, G., 2001. Technical Note 30: Introduction to Shipboard Organic Geochemistry on the JOIDES Resolution. Ocean Drilling Program. https://doi.org/10.2973/odp.tn.30.2001
Pross, J., and Brinkhuis, H., 2005. Organic-walled dinoflagellate cysts as paleoenvironmental indicators in the Paleogene; a synopsis of concepts. Paläontologische Zeitschrift, 79(1):53–59. https://doi.org/10.1007/BF03021753
Raine, J.I., Beu, A.G., Boyes, A., Campbell, H.J., Cooper, R.A., Crampton, J.S., Crundwell, M.P., Hollis, C.J., and Morgans, H.E., 2015. A revised calibration of the New Zealand Geological Timescale: NZGT2015 [paper presented at International Conference and Exhibition, Melbourne, Australia, 13–16 September 2015]. https://doi.org/10.1190/ice2015-2211449
Schiøler, P., Brinkhuis, H., Roncaglia, L., and Wilson, G.J., 1997. Dinoflagellate biostratigraphy and sequence stratigraphy of the Type Maastrichtian (Upper Cretaceous), ENCI Quarry, the Netherlands. Marine Micropaleontology, 31(1–2):65–95. https://doi.org/10.1016/S0377-8398(96)00058-8
Shipboard Scientific Party, 1973. Site 206. With contributions by D. Burns and P.N. Webb. In Burns, R.E., Andrews, J.E., et al., Initial Reports of the Deep Sea Drilling Project, 21: Washington, DC (U.S. Government Printing Office), 103–195. https://doi.org/10.2973/dsdp.proc.21.106.1973
Sluijs, A., Brinkhuis, H., Crouch, E.M., John, C.M., Handley, L., Munsterman, D., Bohaty, S.M., et al., 2008a. Eustatic variations during the Paleocene–Eocene greenhouse world. Paleoceanography, 23(4):PA4216. https://doi.org/10.1029/2008PA001615
Sluijs, A., and Dickens, G.R., 2012. Assessing offsets between the δ13C of sedimentary components and the global exogenic carbon pool across early Paleogene carbon cycle perturbations. Global Biogeochemical Cycles, 26(4):GB4005. https://doi.org/10.1029/2011GB004224
Sluijs, A., Pross, J., and Brinkhuis, H., 2005. From greenhouse to icehouse: organic-walled dinoflagellate cysts as paleoenvironmental indicators in the Paleogene. Earth-Science Reviews, 68(3–4):281–315. https://doi.org/10.1016/j.earscirev.2004.06.001
Sluijs, A., Röhl, U., Schouten, S., Brumsack, H.-J., Sangiorgi, F., Sinninghe Damsté, J.S., and Brinkhuis, H., 2008b. Arctic late Paleocene–early Eocene paleoenvironments with special emphasis on the Paleocene–Eocene Thermal Maximum (Lomonosov Ridge, Integrated Ocean Drilling Program Expedition 302). Paleoceanography, 23(1):PA1S11. https://doi.org/10.1029/2007PA001495
Stagpoole, V.M., 2011. Two-way time-depth relationship for the Waka Nui-1 well to aid geological interpretations of the offshore northwestern New Zealand. New Zealand Journal of Geology and Geophysics, 54(3)341–346. https://doi.org/10.1080/00288306.2011.567993
Sutherland, R., Collot, J., Bache, F., Henrys, S., Barker, D., Browne, G., Lawrence, M., Morgans, H., Hollis, C., and Clowes, C., 2017. Widespread compression associated with Eocene Tonga-Kermadec subduction initiation. Geology, 45(4)3255–358. https://doi.org/10.1130/G38617.1
Sutherland, R., Collot, J., Lafoy, Y., Logan, G.A., Hackney, R., Stagpoole, V., Uruski, C., et al., 2010. Lithosphere delamination with foundering of lower crust and mantle caused permanent subsidence of New Caledonia Trough and transient uplift of Lord Howe Rise during Eocene and Oligocene initiation of Tonga-Kermadec subduction, western Pacific. Tectonics, 29(2). https://doi.org/10.1029/2009TC002476
Sutherland, R., Dickens, G.R., Blum, P., Agnini, C., Alegret, L., Asatryan, G., Bhattacharya, J., Bordenave, A., Chang, L., Collot, J., Cramwinckel, M.J., Dallanave, E., Drake, M.K., Etienne, S.J.G., Giorgioni, M., Gurnis, M., Harper, D.T., Huang, H.-H.M., Keller, A.L., Lam, A.R., Li, H., Matsui, H., Morgans, H.E.G., Newsam, C., Park, Y.-H., Pascher, K.M., Pekar, S.F., Penman, D.E., Saito, S., Stratford, W.R., Westerhold, T., and Zhou, X., 2019a. Expedition 371 methods. In Sutherland, R., Dickens, G.R., Blum, P., and the Expedition 371 Scientists, Tasman Frontier Subduction Initiation and Paleogene Climate. Proceedings of the International Ocean Discovery Program, 371: College Station, TX (International Ocean Discovery Program). https://doi.org/10.14379/iodp.proc.371.102.2019
Sutherland, R., Dickens, G.R., Blum, P., Agnini, C., Alegret, L., Asatryan, G., Bhattacharya, J., Bordenave, A., Chang, L., Collot, J., Cramwinckel, M.J., Dallanave, E., Drake, M.K., Etienne, S.J.G., Giorgioni, M., Gurnis, M., Harper, D.T., Huang, H.-H.M., Keller, A.L., Lam, A.R., Li, H., Matsui, H., Morgans, H.E.G., Newsam, C., Park, Y.-H., Pascher, K.M., Pekar, S.F., Penman, D.E., Saito, S., Stratford, W.R., Westerhold, T., and Zhou, X., 2019b. Expedition 371 summary. In Sutherland, R., Dickens, G.R., Blum, P., and the Expedition 371 Scientists, Tasman Frontier Subduction Initiation and Paleogene Climate. Proceedings of the International Ocean Discovery Program, 371: College Station, TX (International Ocean Discovery Program). https://doi.org/10.14379/iodp.proc.371.101.2019
Sutherland, R., Dickens, G.R., Blum, P., Agnini, C., Alegret, L., Asatryan, G., Bhattacharya, J., Bordenave, A., Chang, L., Collot, J., Cramwinckel, M.J., Dallanave, E., Drake, M.K., Etienne, S.J.G., Giorgioni, M., Gurnis, M., Harper, D.T., Huang, H.-H.M., Keller, A.L., Lam, A.R., Li, H., Matsui, H., Morgans, H.E.G., Newsam, C., Park, Y.-H., Pascher, K.M., Pekar, S.F., Penman, D.E., Saito, S., Stratford, W.R., Westerhold, T., and Zhou, X., 2019c. Site U1507. In Sutherland, R., Dickens, G.R., Blum, P., and the Expedition 371 Scientists, Tasman Frontier Subduction Initiation and Paleogene Climate. Proceedings of the International Ocean Discovery Program, 371: College Station, TX (International Ocean Discovery Program). https://doi.org/10.14379/iodp.proc.371.104.2019
Sutherland, R., Dickens, G.R., Blum, P., Agnini, C., Alegret, L., Asatryan, G., Bhattacharya, J., Bordenave, A., Chang, L., Collot, J., Cramwinckel, M.J., Dallanave, E., Drake, M.K., Etienne, S.J.G., Giorgioni, M., Gurnis, M., Harper, D.T., Huang, H.-H.M., Keller, A.L., Lam, A.R., Li, H., Matsui, H., Morgans, H.E.G., Newsam, C., Park, Y.-H., Pascher, K.M., Pekar, S.F., Penman, D.E., Saito, S., Stratford, W.R., Westerhold, T., and Zhou, X., 2019d. Site U1508. In Sutherland, R., Dickens, G.R., Blum, P., and the Expedition 371 Scientists, Tasman Frontier Subduction Initiation and Paleogene Climate. Proceedings of the International Ocean Discovery Program, 371: College Station, TX (International Ocean Discovery Program). https://doi.org/10.14379/iodp.proc.371.105.2019
Sutherland, R., Dickens, G.R., Blum, P., Agnini, C., Alegret, L., Bhattacharya, J., Bordenave, A., Chang, L., Collot, J., Cramwinckel, M.J., Dallanave, E., Drake, M.K., Etienne, S.J.G., Giorgioni, M., Gurnis, M., Harper, D.T., Huang, H.-H.M., Keller, A.L., Lam, A.R., Li, H., Matsui, H., Morgans, H.E.G., Newsam, C., Park, Y.-H., Pascher, K.M., Pekar, S.F., Penman, D.E., Saito, S., Stratford, W.R., Westerhold, T., and Zhou, X., 2019e. Site U1510. In Sutherland, R., Dickens, G.R., Blum, P., and the Expedition 371 Scientists, Tasman Frontier Subduction Initiation and Paleogene Climate. Proceedings of the International Ocean Discovery Program, 371: College Station, TX (International Ocean Discovery Program). https://doi.org/10.14379/iodp.proc.371.107.2019
Takemura, A., 1992. Radiolarian Paleogene biostratigraphy in the southern Indian Ocean, Leg 120. In Wise, S.W., Jr., Schlich, R., et al., Proceedings of the Ocean Drilling Program, Scientific Results, 120: College Station, TX (Ocean Drilling Program), 735–756. https://doi.org/10.2973/odp.proc.sr.120.177.1992
Takemura, A., and Ling, H.Y., 1997. Eocene and Oligocene radiolarian biostratigraphy from the Southern Ocean: correlation of ODP Legs 114 (Atlantic Ocean) and 120 (Indian Ocean). Marine Micropaleontology, 30(1–3):97–116. https://doi.org/10.1016/S0377-8398(96)00017-5
Thorn, V.C., Riding, J.B., and Francis, J.E., 2009. The Late Cretaceous dinoflagellate cyst Manumiella—biostratigraphy, systematics, and palaeoecological signals in Antarctica. Review of Palaeobotany and Palynology, 156(3–4):436–448. https://doi.org/10.1016/j.revpalbo.2009.04.009
Uruski, C., and Wood, R., 1991. A new look at the New Caledonia Basin, an extension of the Taranaki Basin, offshore North Island, New Zealand. Marine and Petroleum Geology, 8(4):379–391. https://doi.org/10.1016/0264-8172(91)90061-5
Uruski, C.I., 2010. New Zealand’s deepwater frontier. Marine and Petroleum Geology, 27(9):2005–2026. https://doi.org/10.1016/j.marpetgeo.2010.05.010
Uruski, C.I, Cook, R.A., Herzer, R.H., and Isaac., M.J., 2004. Petroleum geology of the Northland sector of the Greater Taranaki Basin. PESA News, 69:42–49. http://archives.datapages.com/data/petroleum-exploration-society-of-australia/news/069/069001/pdfs/42.html
Vajda, V., Raine, J.I., and Hollis, C.J., 2001. Indication of global deforestation at the Cretaceous-Tertiary boundary by New Zealand fern spike. Science, 294(5547):1700–1702. https://doi.org/10.1126/science.1064706
van Morkhoven, F.P.C.M., Berggren, W.A., Edwards, A.S., and Oertli, H.J., 1986. Cenozoic cosmopolitan deep-water benthic foraminifera. Bulletin des centres de recherches Exploration-production Elf-Aquitaine: Mémoire, 11.
Wade, B.S., Pearson, P.N., Berggren, W.A., and Pälike, H., 2011. Review and revision of Cenozoic tropical planktonic foraminiferal biostratigraphy and calibration to the geomagnetic polarity and astronomical time scale. Earth-Science Reviews, 104(1–3):111–142. https://doi.org/10.1016/j.earscirev.2010.09.003
Zijderveld, J.D.A., 1967. AC demagnetization of rocks: analysis of results. In Collinson, D.W., Creer, K.M., and Runcorn, S.K. (Eds.), Developments in Solid Earth Geophysics (Volume 3): Methods in Palaeomagnetism: Amsterdam (Elsevier), 254–286. https://doi.org/10.1016/B978-1-4832-2894-5.50049-5
1 Sutherland, R., Dickens, G.R., Blum, P., Agnini, C., Alegret, L., Bhattacharya, J., Bordenave, A., Chang, L., Collot, J., Cramwinckel, M.J., Dallanave, E., Drake, M.K., Etienne, S.J.G., Giorgioni, M., Gurnis, M., Harper, D.T., Huang, H.-H.M., Keller, A.L., Lam, A.R., Li, H., Matsui, H., Morgans, H.E.G., Newsam, C., Park, Y.-H., Pascher, K.M., Pekar, S.F., Penman, D.E., Saito, S., Stratford, W.R., Westerhold, T., Zhou, X., 2019. Site U1509. In Sutherland, R., Dickens, G.R., Blum, P., and the Expedition 371 Scientists, Tasman Frontier Subduction Initiation and Paleogene Climate. Proceedings of the International Ocean Discovery Program, 371: College Station, TX (International Ocean Discovery Program). https://doi.org/10.14379/iodp.proc.371.106.2019
2 Expedition 371 Scientists’ affiliations.
This work is distributed under the Creative Commons Attribution 4.0 International (CC BY 4.0) license. 
- F1. Regional bathymetry, seismic reflection lines, and boreholes.
- F2. Bathymetry, seismic reflection lines, and dredge locations.
- F3. Seismic reflection Line 114-04 near Site U1509.
- F4. Seismic reflection Line TAN1409_NCTS_07 and seismic units.
- F5. Seismic reflection Line TAN1409_NCTS_02 and drilled Reflectors A–F.
- F6. Lithostratigraphic summary of sedimentary section.
- F7. Major biogenic and lithologic constituent abundances.
- F8. Common Subunit Ia lithologies.
- F9. Representative Subunit Ia lithologies.
- F10. Common Subunit Ib lithologies.
- F11. Common Subunit Ic lithologies.
- F12. Representative Subunit Ic lithologies.
- F13. Distinct color change across middle Eocene.
- F14. Evolution of deformation features in succession recovered.
- F15. Transition from Unit I to II.
- F16. XRD results over transition from Unit I to II.
- F17. Common Subunit IIa lithologies.
- F18. Representative Subunit IIa lithologies.
- F19. Representative Subunit IIb lithologies.
- F20. Microfossil preservation and abundance.
- F21. Biozonations.
- F22. Preservation state of planktic foraminifers.
- F23. Ostracod preservation, abundance, and assemblage composition.
- F24. Selected dinocyst taxa.
- F25. Selected dinocyst taxa.
- F26. Selected dinocyst taxa.
- F27. Selected algal and sporomorph taxa.
- F28. Pass-through paleomagnetic data.
- F29. Paleomagnetic inclination after 20 mT AF demagnetization.
- F30. Vector endpoint demagnetization diagrams.
- F31. ChRM paleomagnetic directions.
- F32. AMS data for discrete samples.
- F33. Bulk density, grain density, porosity, and P-wave velocity.
- F34. Magnetic susceptibility, NGR, and L*, a*, b*.
- F35. Shear and compressive strength.
- F36. Core data compared with MCS Line TAN1409_NCTS_02.
- F37. Methane, sulfate, ammonium, and barium.
- F38. IW chemistry.
- F39. Bulk sediment profiles.
- F40. Methane/ethane ratio gradient with sediment temperature.
- F41. Sedimentation accumulation over time.
- T1. Core summary.
- T2. Lithostratigraphic units.
- T3. Microfossil datums and chrons used to construct age model.
- T4. Nannofossil distribution and occurrence data.
- T5. Planktic foraminifer distribution and occurrence data.
- T6. Benthic foraminifer distribution and abundance data.
- T7. Radiolarian distribution and abundance data.
- T8. Palynological assemblage data.
- T9. Dinocyst and sporomorph distribution and occurrence data.
- T10. Magnetostratigraphic tie points.
- T11. Seismic reflectors, two-way traveltimes, and depths.
- T12. Gas elements data.
- T13. Interstitial water chemistry.
- T14. Bulk sediment geochemistry.