Sutherland, R., Dickens, G.R., Blum, P., and the Expedition 371 Scientists
Proceedings of the International Ocean Discovery Program Volume 371
publications.iodp.org
https://doi.org/10.14379/iodp.proc.371.108.2019

Site U15111
R. Sutherland, G.R. Dickens, P. Blum, C. Agnini, L. Alegret, J. Bhattacharya, A. Bordenave, L. Chang, J. Collot, M.J. Cramwinckel, E. Dallanave, M.K. Drake, S.J.G. Etienne, M. Giorgioni, M. Gurnis, D.T. Harper, H.-H.M. Huang, A.L. Keller, A.R. Lam, H. Li, H. Matsui, H.E.G. Morgans, C. Newsam, Y.-H. Park, K.M. Pascher, S.F. Pekar, D.E. Penman, S. Saito, W.R. Stratford, T. Westerhold, and X. Zhou2
Keywords: International Ocean Discovery Program, IODP, JOIDES Resolution, Expedition 371, Site U1511, Tasman Frontier, Zealandia, Reinga, Challenger, Eastern Australian Current, Lord Howe, Murihiku, New Caledonia, Norfolk, Northland, Pacific, Ring of Fire, Tasman, Taranaki, Tonga, Kermadec, Waka Nui, Wanganella, subduction, Early Eocene Climatic Optimum, EECO, Middle Eocene Climatic Optimum, MECO, biogenic bloom, stratigraphy, diagenesis, compaction, volcanism
MS 371-108: Published 2 February 2019
Background and objectives
International Ocean Discovery Program (IODP) Site U1511 (proposed Site TASS-2A; 37.5611°S, 160.3156°E; 4858 m water depth) is located on the Tasman Abyssal Plain, ~945 km east of Australia and ~990 km northwest of New Zealand (Figure F1). Site U1511 lies west of Lord Howe Rise on oceanic crust that formed during the Late Cretaceous (Chron 33n; 74–80 Ma) (Gaina et al., 1998; Sutherland, 1999). Regional seismic reflection data reveal a thick (>800 m) sequence of sediments deformed by reverse faults and folds (Sutherland et al., 2017). Site U1511 was chosen to determine the age of this deformation and to provide the first comprehensive record of sedimentation on the areal extensive Tasman Abyssal Plain.
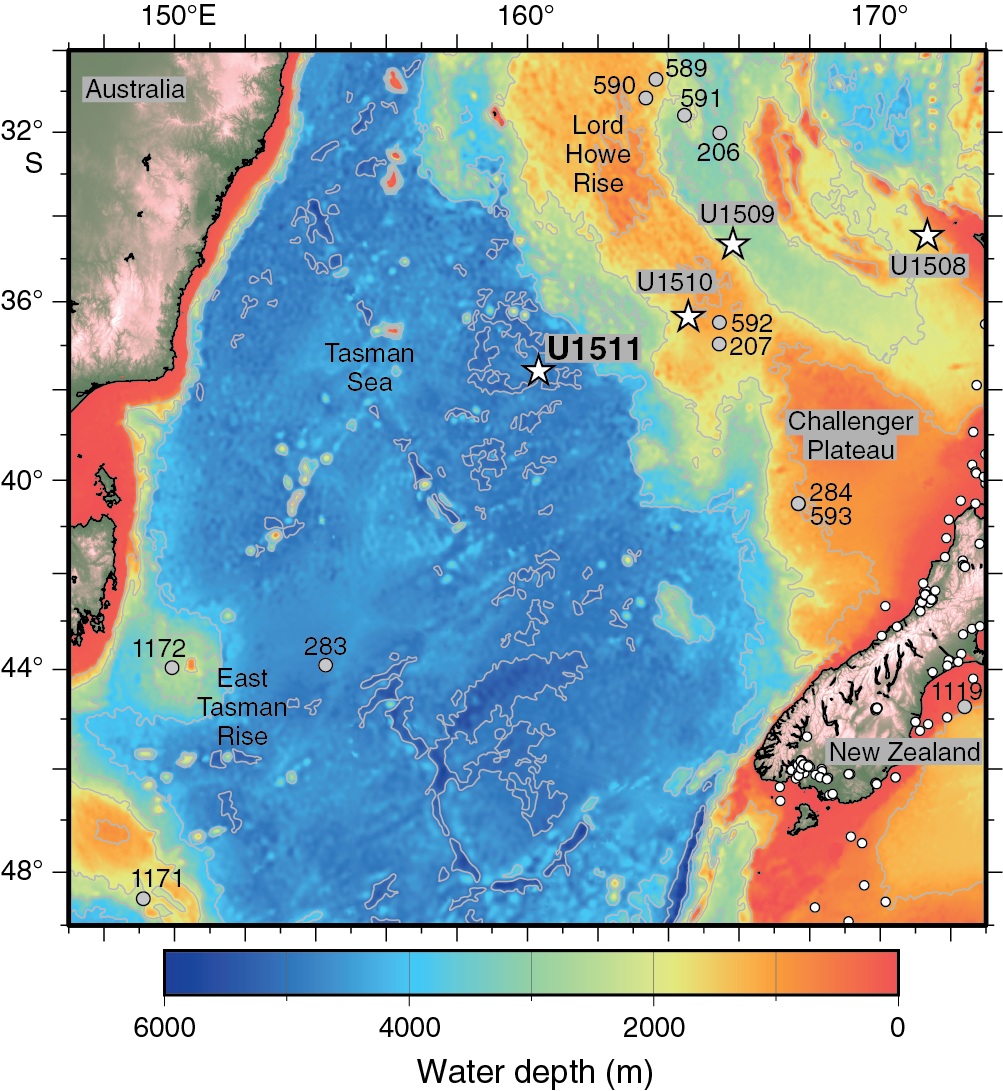
Figure F1. Regional bathymetry and boreholes.
The only previous scientific borehole into Tasman Abyssal Plain sediment was drilled with spot coring at Deep Sea Drilling Project (DSDP) Site 283 (The Shipboard Scientific Party, 1975), which is located on conjugate oceanic crust of Late Cretaceous age near southeast Australia (Figure F1). Hole 283 collected 61.6 m of core from a total penetration of 592 m. The drilled sequence included 16 m of Pleistocene to late Miocene zeolite clay above a major unconformity. Strata beneath the unconformity included upper Eocene diatom ooze with calcareous nannofossils (~164 m thick), middle Eocene silty clay (~225 m thick), and sparsely fossiliferous Paleocene silty and/or pyritic claystone (283 m thick). Highly altered basalt was sampled at the base of Hole 283, where seismic reflection data image 0.72 s two-way traveltime (TWT) of sedimentary strata.
Three seismic units were identified at Site U1511 from a grid of seismic lines (Figure F2) that image folded and reverse-faulted strata (Figures F3, F4). The upper seismic unit (1) is acoustically transparent, except for a thin layer observed just (0.05 s TWT) beneath the seabed. The unit varies in thickness along seismic profiles such that it fills in lows of underlying folded units. The middle seismic unit (2) is defined by a reflective package in its upper part and a high-amplitude, normal polarity reflector at its base. The upper reflective part of seismic Unit 2 contains fanning relationships and variations in thickness associated with folds and faults that are interpreted to be syntectonic. The lower seismic unit (3) contains low-amplitude reflections with moderate continuity and is bounded at its base by high-amplitude reflectors that are interpreted to be oceanic basement. Localized packages of high-amplitude reflections in the lower unit are interpreted to be basaltic intrusions. Regional mapping of the seismic grid reveals a negative correlation between the thicknesses of Units 1 and 3. Likely, Unit 3 depocenters were controlled by normal faults that were active during crust formation (seafloor spreading). These faults were reactivated as reverse faults during deposition of the upper part of seismic Unit 2.
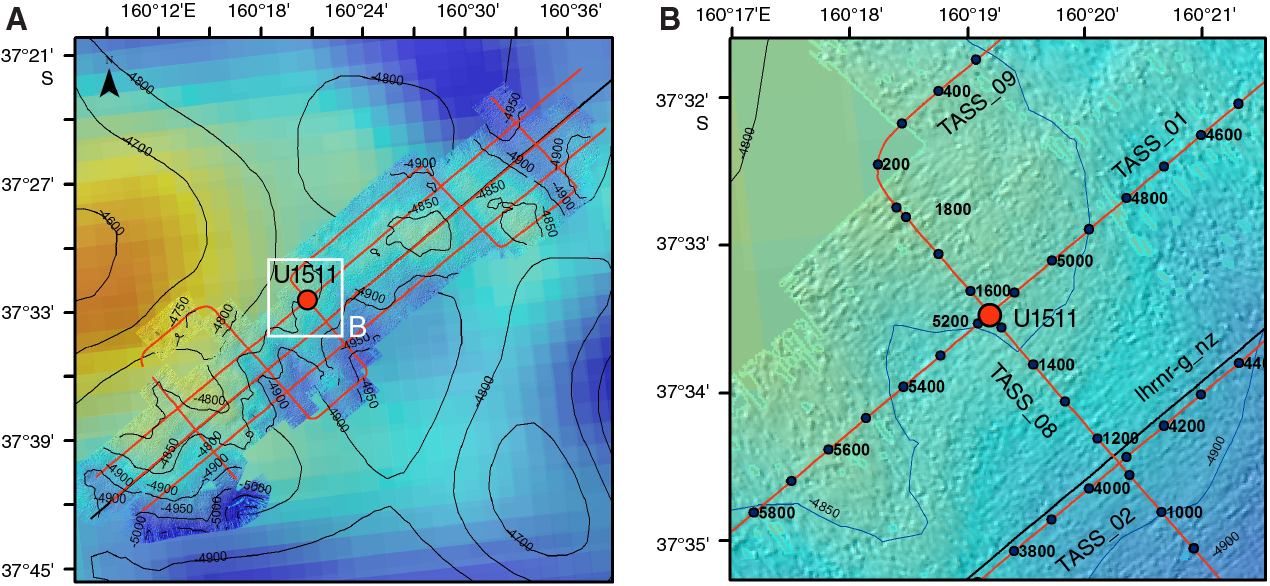
Figure F2. Bathymetry and seismic reflection lines.
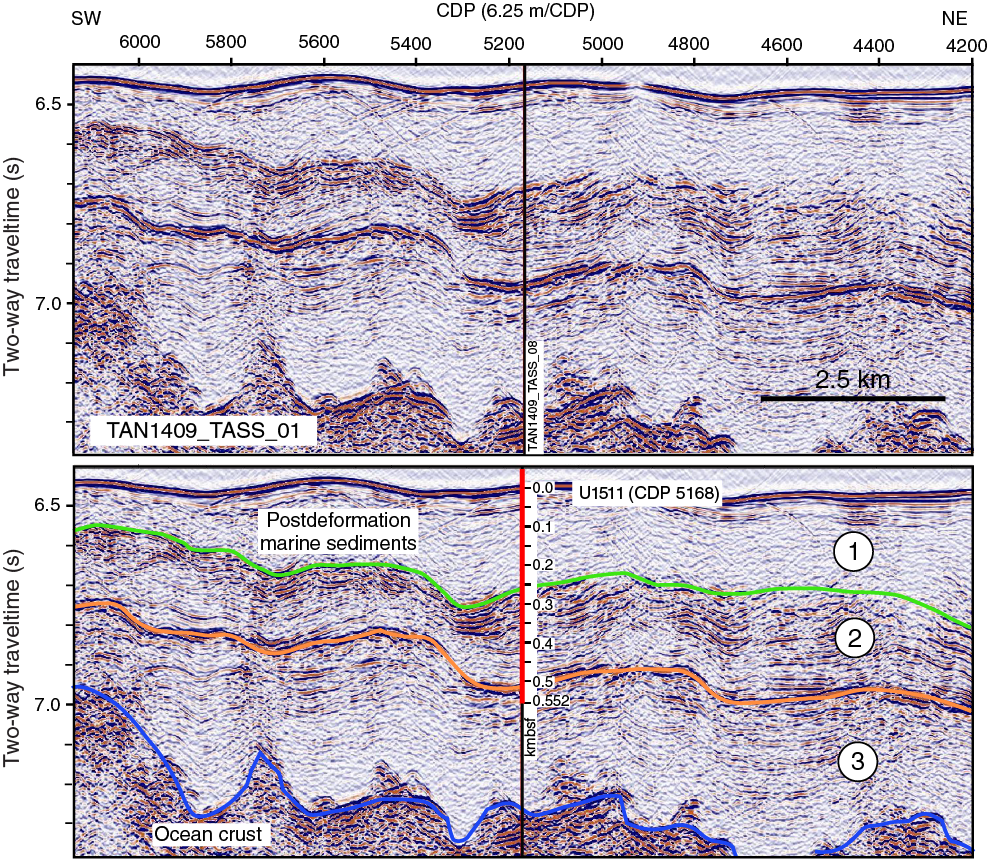
Figure F3. Seismic reflection dip Line TAN1409_TASS_01.
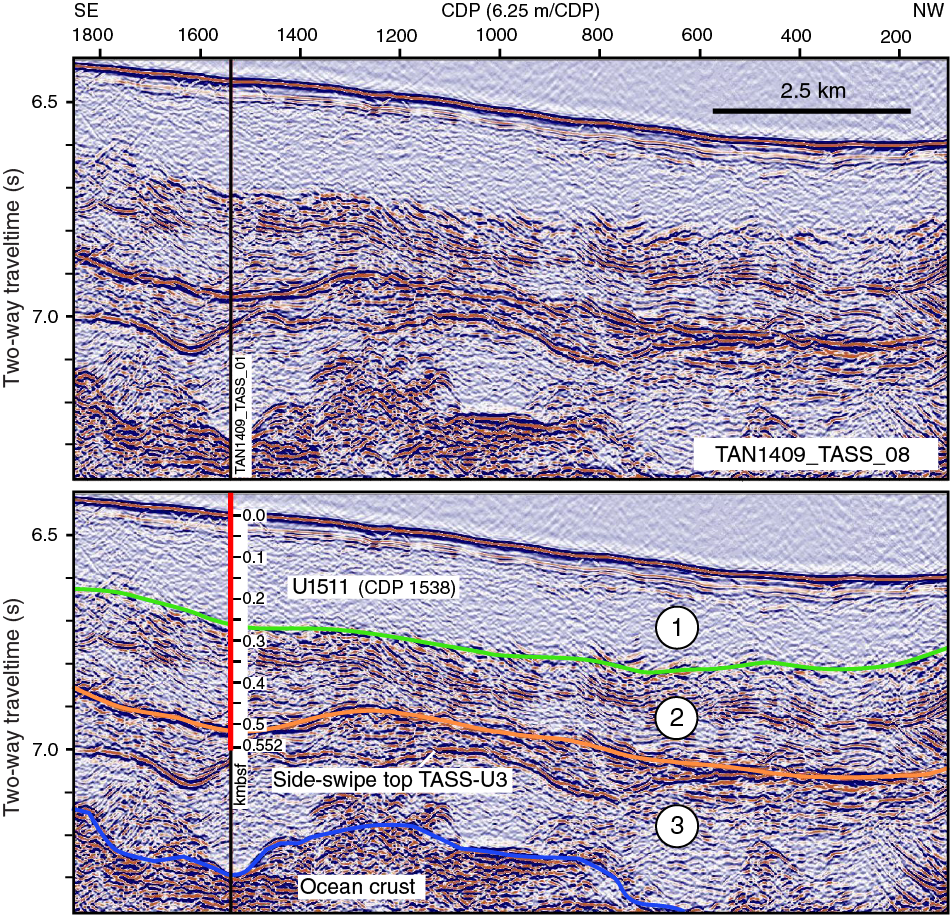
Figure F4. Seismic reflection strike Line TAN1409_TASS_08.
The primary drilling objectives at Site U1511 were to sample (1) the top of the middle seismic unit to constrain the age of folding and (2) thick intervals deeper in the sedimentary sequence to develop an understanding of this abyssal location in the past.
Operations
Hole locations, water depths, and the number of cores recovered are listed in Table T1. All times are local ship time (UTC + 11 h).
The ship completed the 216 nmi transit from IODP Site U1510 at an average speed of 7.7 kt and arrived at Site U1511 at 1248 h on 16 September 2017. The thrusters were lowered, and dynamic positioning was established. No acoustic beacon was deployed at Site U1511.
Logging was eliminated from the operations plan following the stuck logging tool incident earlier during the expedition. After losing ~2000 m of logging wireline, the combination of water depth and hole depth precluded logging at Site U1511.
Operations in Hole U1511A began at 1334 h on 16 September with the assembly of a rotary core barrel (RCB) bottom-hole assembly (BHA). Drill pipe assembly was completed at 0245 h on 17 September, and a wiper “pig” was pumped through the pipe to clean out potential debris. RCB coring in Hole U1511A began at 0425 h. After retrieving Core 3R at 0810 h, the drill string was pulled clear of the seafloor because of excessive heave and wind. Cores 1R through 3R penetrated from 0 to 26.6 m drilling depth below seafloor (DSF) and recovered 7.9 m (30%). The time spent on Hole U1511A was 19.25 h or 0.8 days.
After waiting with the drill string suspended just above the seafloor from 0845 h on 17 September to 0145 h on 18 September (17 h) for the weather to improve, Hole U1511B began by washing down (i.e., drilling without coring and without a center bit installed) to 19.8 m DSF, near the total depth of Hole U1511A (26.6 m DSF). We resumed coring from 0215 to 1015 h on 18 September, and Cores 2R through 7R penetrated from 19.8 to 77.2 m DSF. At 1015 h, we deployed a center bit and drilled without coring from 77.2 to 192.2 m DSF to accelerate penetration. This strategy was chosen so that key target depths pertinent to tectonic objectives could be reached in the time remaining for operations during Expedition 371. At 1500 h on 18 September, we resumed coring, and Cores 9R through 41R penetrated from 192.2 to 508.8 m DSF. At 1630 h on 20 September, coring was suspended because of excessive heave, and the drill string was raised ~37 m above the bottom of the hole (472 m DSF) while maintaining circulation and rotation in the hole. While waiting a second time for the weather to improve, the ship had difficulties maintaining position. At 0315–0630 h on 21 September, the drill string was raised to 163 m DSF as a precaution. As the swell began to subside, the drill string was lowered back to the bottom of the hole at 1030–1400 h. After pumping a 25 bbl mud sweep and recovering the wash barrel, coring resumed at 1600 h on 21 September, following 23.5 h of waiting on weather, and ended with the recovery of the last core (47R; 566.2 m DSF) at 0450 h on 22 September.
During the course of drilling and coring in Hole U1511B, a total of 265 bbl of high-viscosity mud was pumped in 15–20 bbl mud sweeps for hole cleaning. The cored interval was 431.4 m with a recovery of 279.3 m (65%). The two intervals drilled without coring amounted to 134.8 m.
The rig floor was secured for transit to Hobart, Australia, at 1630 h on 22 September, ending Hole U1511B and Site U1511. The time spent on Hole U1511B was 110.75 h or 4.6 days. The total time spent at Site U1511 was 130.0 h or 5.4 days, which includes 40.5 h lost because of weather.
Expedition 371 officially ended with the first line ashore at 0930 h on 26 September. However, Expedition 371 scientists gave several talks and interviews related to initial findings through 27 September in Hobart.
Lithostratigraphy
Site U1511 lies on the Tasman Abyssal Plain below the present-day calcite compensation depth (CCD). The only previous drill site in the region, Site 283, is a conjugate location to Site U1511; these sites have similar water depths and distances relative to the extinct Tasman spreading ridge but lie east and west of this feature. Site 283 contains ~15 m of Pleistocene–upper Miocene zeolite clay separated by a major unconformity from 164 m of upper Eocene diatom ooze with calcareous nannofossils and ~500 m of mid-Eocene–Paleocene silty clay underlain by basalt.
The cored and drilled part of the sedimentary sequence at Site U1511 consists of ~560 m of Pleistocene to Paleocene clay and diatomite with varying minor abundances of other siliceous microfossils, calcareous nannofossils, and silt (Figures F5, F6; Table T2). Three lithostratigraphic units were described. Unit I is ~80 m of gray to brown Pleistocene–upper Miocene clay. A ~125 m interval immediately below Unit I was drilled without recovery but may be represented by Oligocene nannofossil clay that occurs as fall-in in subsequent cores. Below the drilled interval, Unit II consists of ~200 m of greenish gray to yellowish brown lower Oligocene to lower Eocene diatomite and claystone. Unit III is ~160 m of red to greenish gray lower Eocene to lower Paleocene claystone with rare to common radiolarians near the top of the unit and rare to common calcareous nannofossils near the base. A variety of diagenetic features were observed at Site U1511, including manganese nodules in Unit I, rhodochrosite nodules in Unit II, and native copper in Units II and III. Lithostratigraphic units and boundaries are defined by changes in lithology identified by macroscopic core description, smear slide examination, and particularly X-ray fluorescence (XRF) and X-ray diffraction (XRD) analyses. Representative lithologies of each unit were analyzed by XRD, and regular XRF analyses were performed approximately every 150 cm over the interval from 255 to 560 m.

Figure F5. Lithostratigraphic summary of sedimentary section.

Figure F6. Major biogenic and lithologic constituent abundances.
Unit I
Unit I consists of ~80 m of Pleistocene–upper Miocene clay with color ranging between greenish gray (GLEY 1 6/5GY), light yellow brown (10YR 6/4), gray (GLEY 1 6/N and 10YR 6/1), and very pale brown (10YR 7/4) (Figure F7). Clay of several different colors typically repeats in 5–100 cm intervals, but the nature of the spatial relationships between different colored intervals (layering in beds, color banding, patchy coloration, etc.) is obscured by core gaps, sediment flowage, voids, and other drilling disturbance imparted by RCB coring. Evidence of bioturbation is nearly absent from Unit I, except for sparse burrows in the upper 20 m.
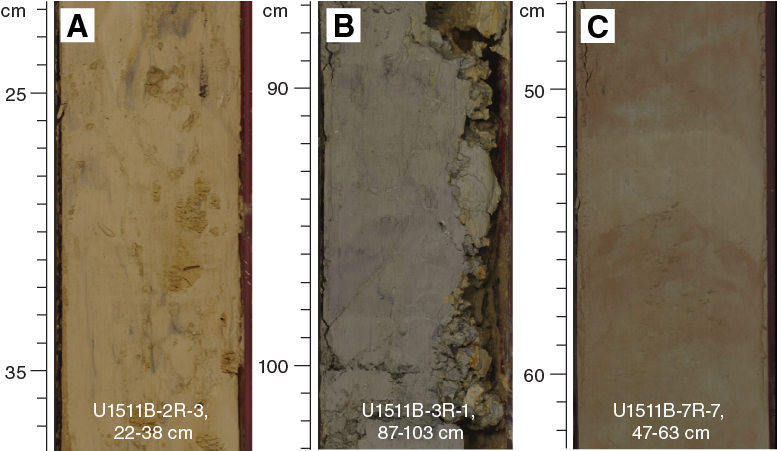
Figure F7. Common Unit I lithologies.
The dominant clay minerals identified by XRD in Unit I are illite and kaolinite; quartz and albite are also present, presumably as silt-sized detritus (Figure F8). Black specks and blebs of iron sulfide were observed throughout the unit (Figure F6), and silt (quartz, feldspar, and mica) was found in trace to rare abundance in smear slide analysis. Several centimeter-scale nodules of manganese oxide occur in Core 371-U1511B-4R (39–48 m; Figure F9A).
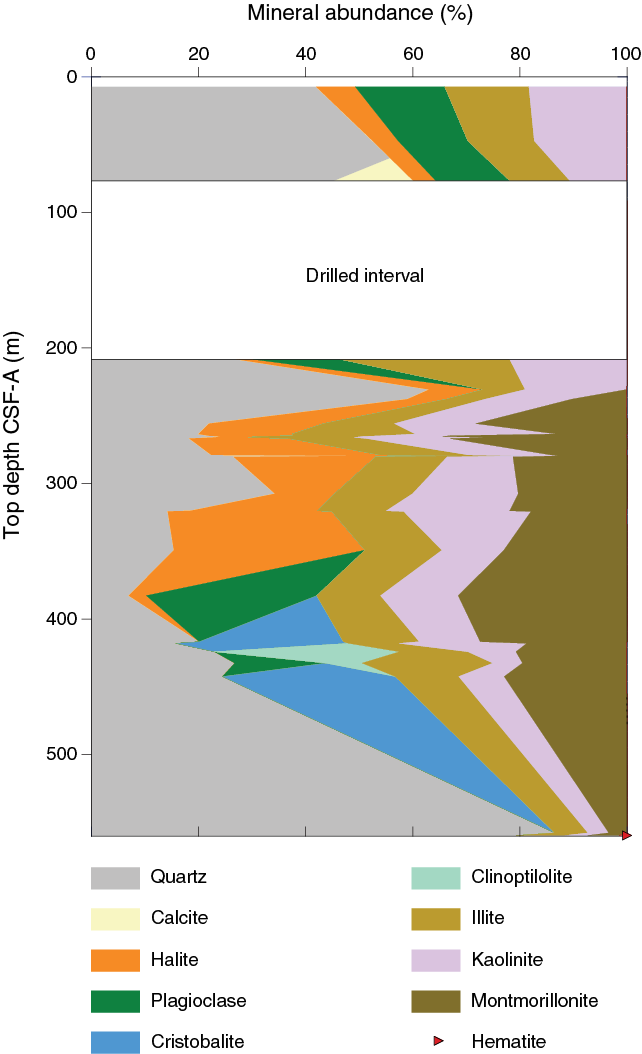
Figure F8. Estimated abundance variation of major minerals.
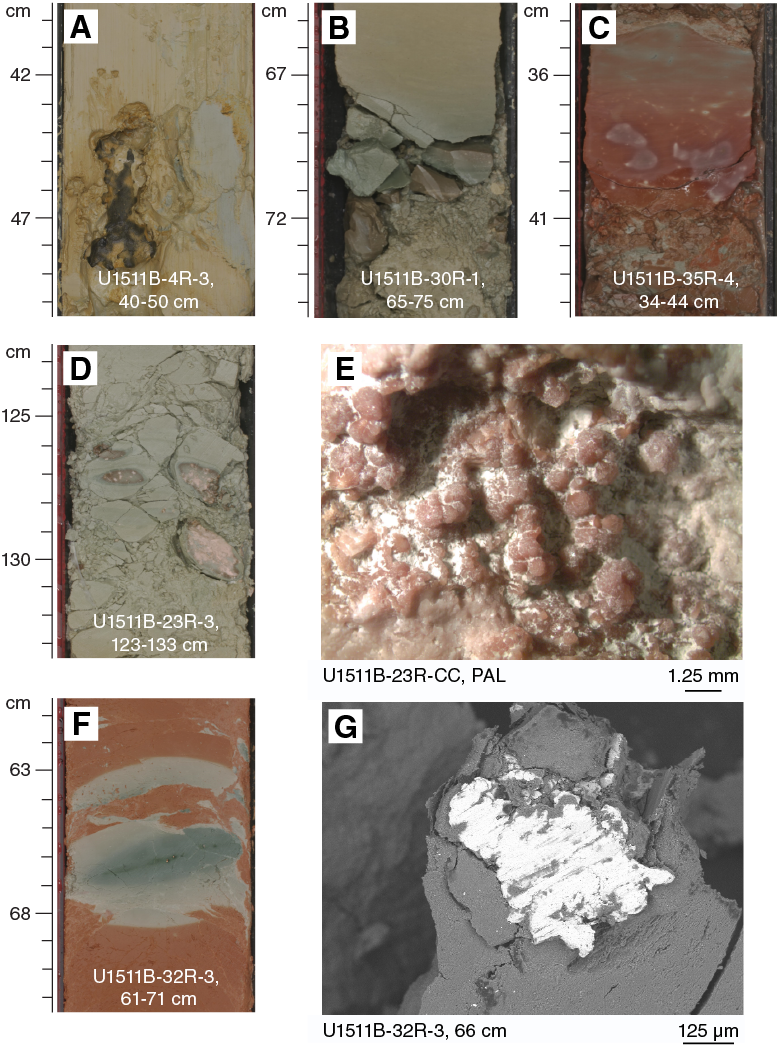
Figure F9. Several authigenic features.
The lowermost ~40 cm of Unit I (the bottom of Section 7R-7) consists of grayish brown (10YR 5/2) clay with nannofossils (Figures F6, F10E–F10F). This nannofossil-bearing interval is underlain by ~125 m drilled without recovery, separating Unit I from Unit II.
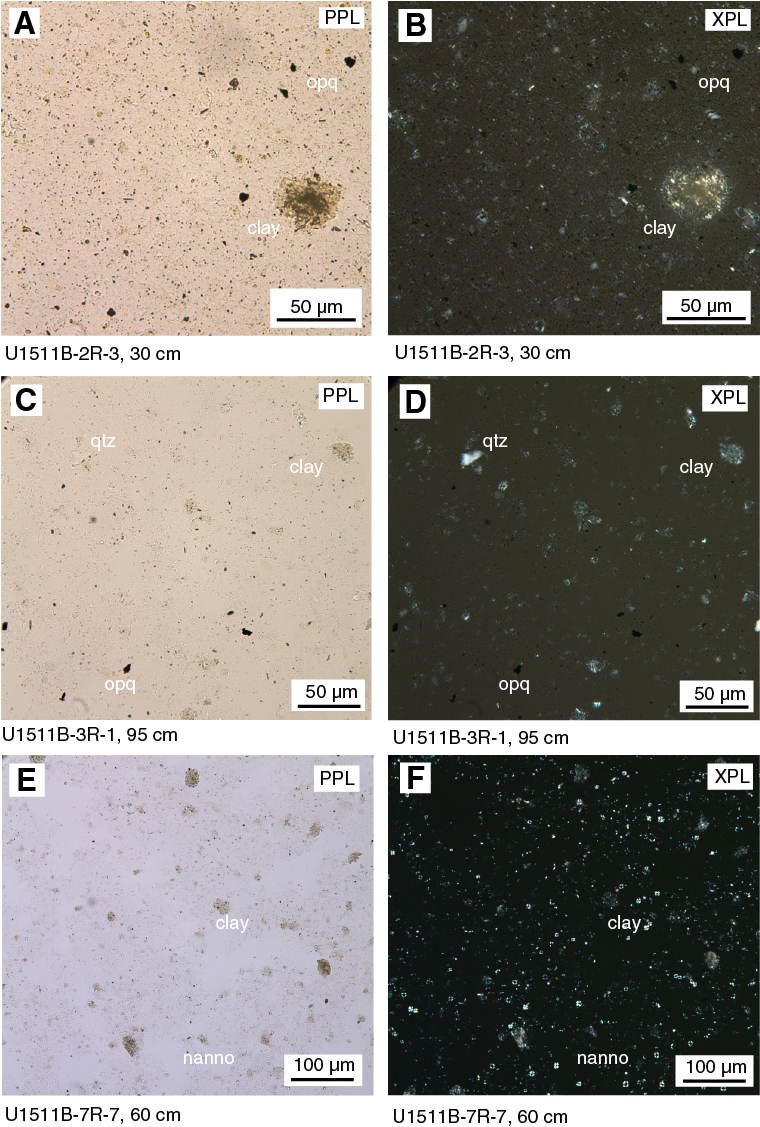
Figure F10. Representative Unit I lithologies.
Recovery was variable throughout Unit I, ranging from 0% to 101%. Several cores are disturbed by sediment flowage, evident as vertical shearing of color contacts and sulfide blebs. Rare fall-in and fragmentation-type drilling disturbance were also observed.
Drilled interval and Unit II upper contact
A ~125 m interval drilled without recovery in Hole U1511B separates Unit I from Unit II (Figure F5), which causes complications for defining lithostratigraphic unit boundaries. The first attempt at core recovery below this drilled interval (Core 371-U1511B-9R) yielded only 8 cm of material that may be fall-in, all of which was consumed for biostratigraphic analysis. Because no sediment was logged, imaged, or described, this 8 cm interval is not included in either lithostratigraphic Unit I (which ends at the base of Core 7R) or Unit II (which begins at Section 10R-1, 12 cm). However, a single smear slide prepared from the micropaleontology sample in Core 9R contains greenish gray (GLEY 1 6/10Y) nannofossil ooze with clay, dated by nannofossil biostratigraphy as early Oligocene in age (see Biostratigraphy and paleoenvironment). Similar material of the same nannofossil age was found as fall-in in the uppermost 12 cm of the subsequent core (10R), which is therefore also included in the drilled interval rather than Unit II. The presence of nannofossils suggests that the likely fall-in material in Core 9R and interval 10R-1, 0–12 cm (and by interpolation with the base of Unit I, perhaps much of the drilled interval), bears a greater similarity to the bottom 40 cm of Unit I than to either the remainder of Unit I or to Unit II, neither of which contain any significant carbonate.
The top of Unit II occurs immediately below the interval of fall-in (which is grouped with the drilled interval because it is clearly not in place) in interval 10R-1, 0–12 cm. The upper ~7 m of Unit II (the remainder of Core 10R) features lower abundance of biosiliceous components (rare diatoms, radiolarians, and sponge spicules; described as claystone with biosilica) than the underlying remainder of the unit (which typically contains common to dominant diatoms), suggesting a gradual downhole transition to increasing biosilica abundance at the top of Unit II or a more complex lithostratigraphic succession that cannot be precisely characterized because of the lack of recovery in the drilled interval and the poor recovery in Cores 9R and 11R.
Unit II
Unit II is ~200 m of lower Oligocene to lower Eocene diatomite with varying amounts of other biosiliceous components, as well as clay (Figure F5). Colors of the major lithology range between light yellowish brown (2.5Y 6/3), greenish gray (GLEY 1 5/5GY), and light greenish gray (2.5Y 6/4) (Figure F11). These colors vary on the meter to centimeter scale, with increasing subtle color banding occurring from Core 371-U1511B-25R to the base of the unit (346.64–400.82 m). Bioturbation is slight or sparse with traces of possible Zoophycos burrows noted throughout. An exception is an interval of just over 1 m that has moderate bioturbation intensity and distinguishable Planolites and Nereites burrows in Sections 10R-2 (203.40–204.09 m) and 10R-5 (207.9–208.97 m).
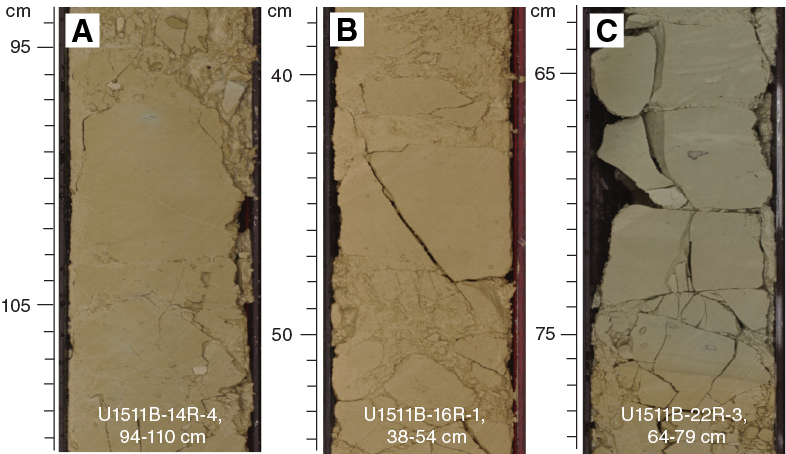
Figure F11. Common Unit II lithologies.
Although diatoms consistently represent the most abundant microfossil component in Unit II, other biosiliceous components include varying abundances (trace to common) of radiolarians, silicoflagellates, ebridians, and sponge spicules (Figures F6, F12). In Section 29R-1 (384.30–385.39 m), macroscopic white specks are likely large (0.1–1 mm) radiolarians. Trace amounts of calcareous nannofossils in a few smear slides from Cores 12R through 20R (228.37–303.20 m) are likely laboratory contamination because only a few specimens were ever seen in these slides and biostratigraphers determined that interval to be barren of nannofossils (see Biostratigraphy and paleoenvironment).
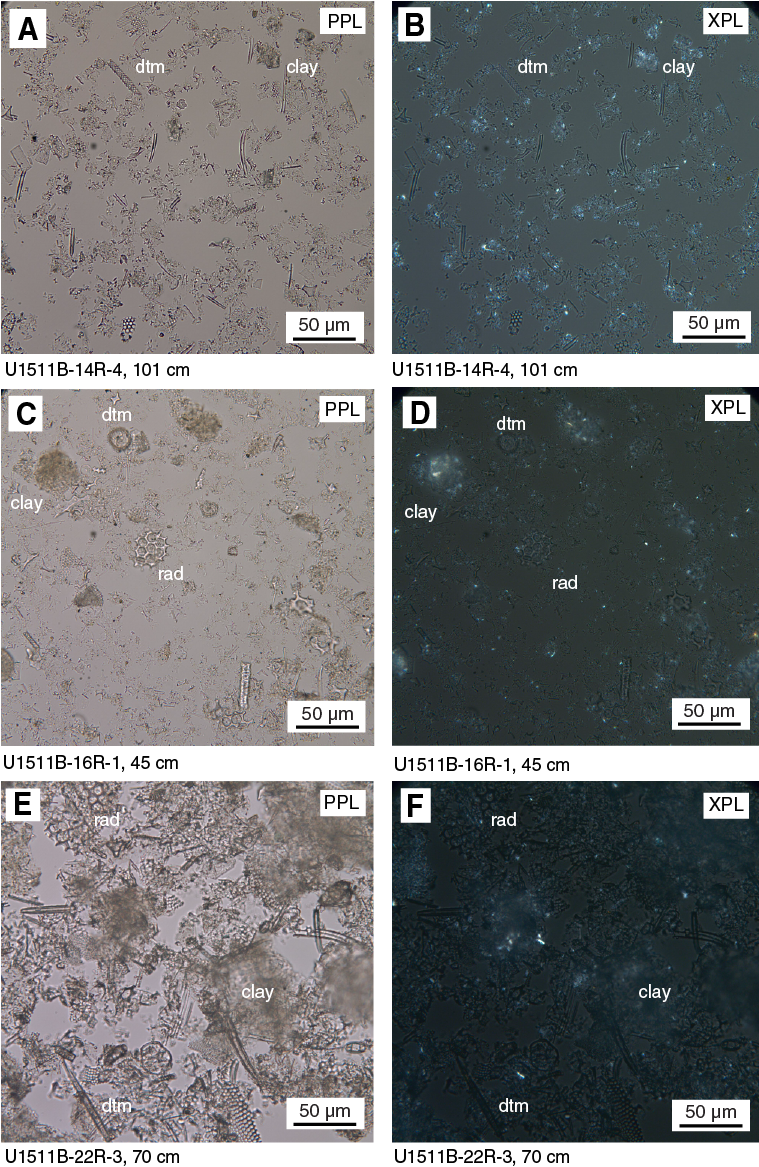
Figure F12. Representative Unit II lithologies.
Clay minerals identified by XRD (Figure F8) include illite, montmorillonite, and only minor amounts of kaolinite. Quartz was noted throughout the unit, likely as detrital silt. Halite was also identified in XRD throughout the unit (and in Unit I in lesser abundance), but it likely crystallizes from pore fluids upon freeze-drying during XRD sample preparation. This issue is uniquely significant in Unit II because of the high porosity (see Petrophysics), and hence high pore fluid content, of diatomite and the fact that most of the solid sediment is amorphous opal, which is not recognized as peaks in XRD spectra (hence, a small concentration of halite in dried diatomite XRD powder represents a large fraction of the crystalline phases identified in XRD). Additionally, trace amounts of albite were recognized in Core 371-U1511B-10R, and plagioclase was found only in Sample 28R-6, 54–55 cm.
Rare millimeter- to centimeter-scale concretions of light pink rhodochrosite (confirmed by XRD) were found throughout the unit (Figure F9). Other rare features in Unit II include millimeter-scale native copper grains (which were also found in Unit III and are discussed in more detail below) in Section 27R-2 (366.60–368.10 m) and centimeter-scale silicified nodules and chert layers from Section 25R-6 (353.40–354.20 m) to the end of the unit.
Recovery in Unit II ranges from 1% to 103% but generally exceeds 50%. Almost all cores in the unit suffer from moderate to severe biscuiting and fracturing caused by RCB drilling. Rare instances of fall-in also occur.
Unit III
Unit III is ~160 m of lower Eocene to lower Paleocene claystone (Figure F5). A ~30 m red to reddish brown interval near the top of the unit contains minor abundances of radiolarians, and a ~40 m grayish green interval near the bottom of the unit contains minor abundances of calcareous nannofossils. The intervening interval and the bottom ~25 m of Unit III lack microfossils (Figure F6). Several centimeter-scale intervals of greenish gray claystone containing fine to coarse sand–sized native copper occur, especially in the upper part of the unit (Figure F9).
The claystone in Unit III displays both abrupt and gradual changes in color with depth (Figure F13). The upper ~30 m (403.4–432.37 m) is nonbioturbated reddish brown (5YR 4/4) to red (2.5YR 5/6), which contrasts abruptly with the overlying pale olive diatomite in Unit II. Below the red claystone, color alternates on ~10 cm scales between reddish brown (5YR 5/3) and greenish gray (GLEY 1 5/10Y) with slight to moderate bioturbation for the next ~50 m (432.37–482.43 m). Below this interval of mixed coloration, moderately bioturbated greenish gray (GLEY 1 5/5G) dominates for the remaining ~80 m of the unit (489.70–560.69 m). Color variations do not appear to covary with any major sedimentary component identified macroscopically or in smear slides (Figure F6). However, remnant magnetization intensity does seem to increase in red intervals (see Paleomagnetism). These remnant magnetization variations likely reflect variations in iron oxide minerals, including hematite. Although no hematite was identified by XRD in the red or alternating color intervals, only very small amounts of hematite can impart a red color in claystone.

Figure F13. Common Unit III lithologies.
Biogenic components are sparse in Unit III. The red claystone in the upper ~30 m contains trace to common radiolarians of early Eocene age, observed macroscopically as white specks visible on cut section half surfaces and microscopically as large fragments of radiolarians, along with other undifferentiated siliceous microfossils (Figure F14). This radiolarian-rich interval also coincides with an increase in Si/Ti in the XRF data (Figure F15) and the presence of cristobalite in the XRD data (Figure F8). Farther downcore, an interval of greenish gray claystone (489.70–528.05 m) contains as much as 15 wt% CaCO3 and trace to common calcareous nannofossils of middle Paleocene age (see Geochemistry and Biostratigraphy and paleoenvironment; Figures F13, F14). In the intervening interval of mixed coloration and the remainder of the greenish gray interval extending to the bottom of the hole (528.05–560.69 m), no significant quantities of biogenic components were observed.
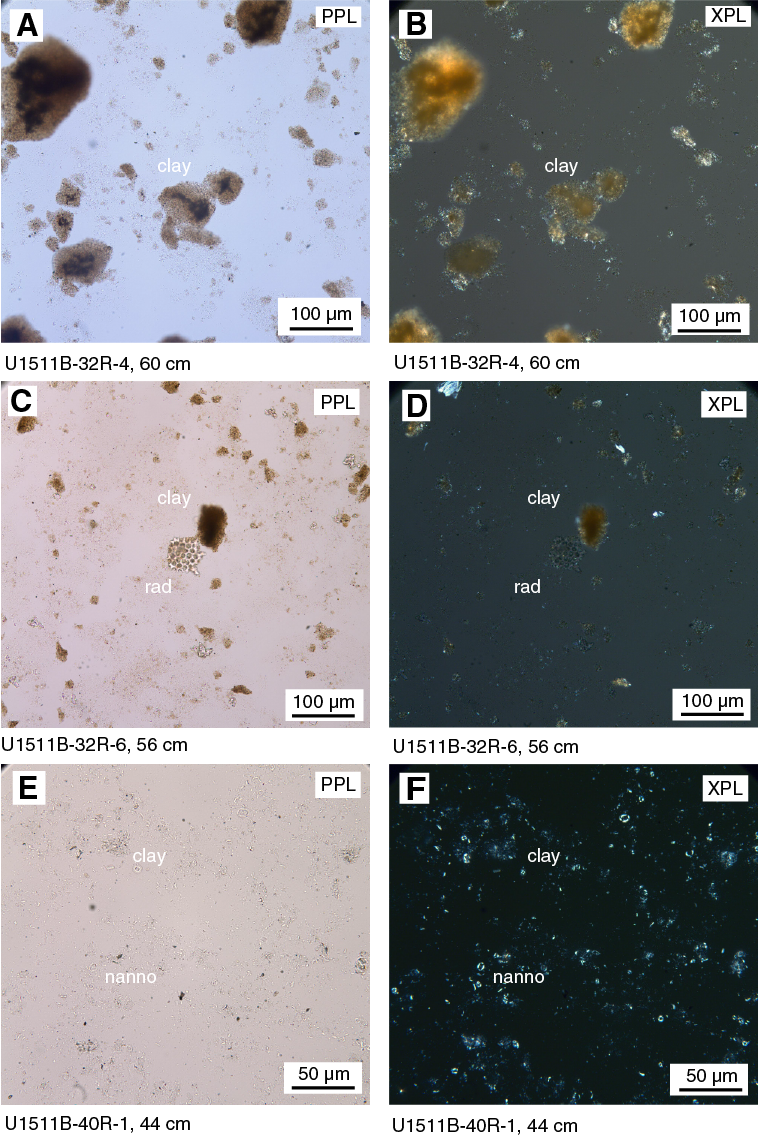
Figure F14. Representative Unit III lithologies.
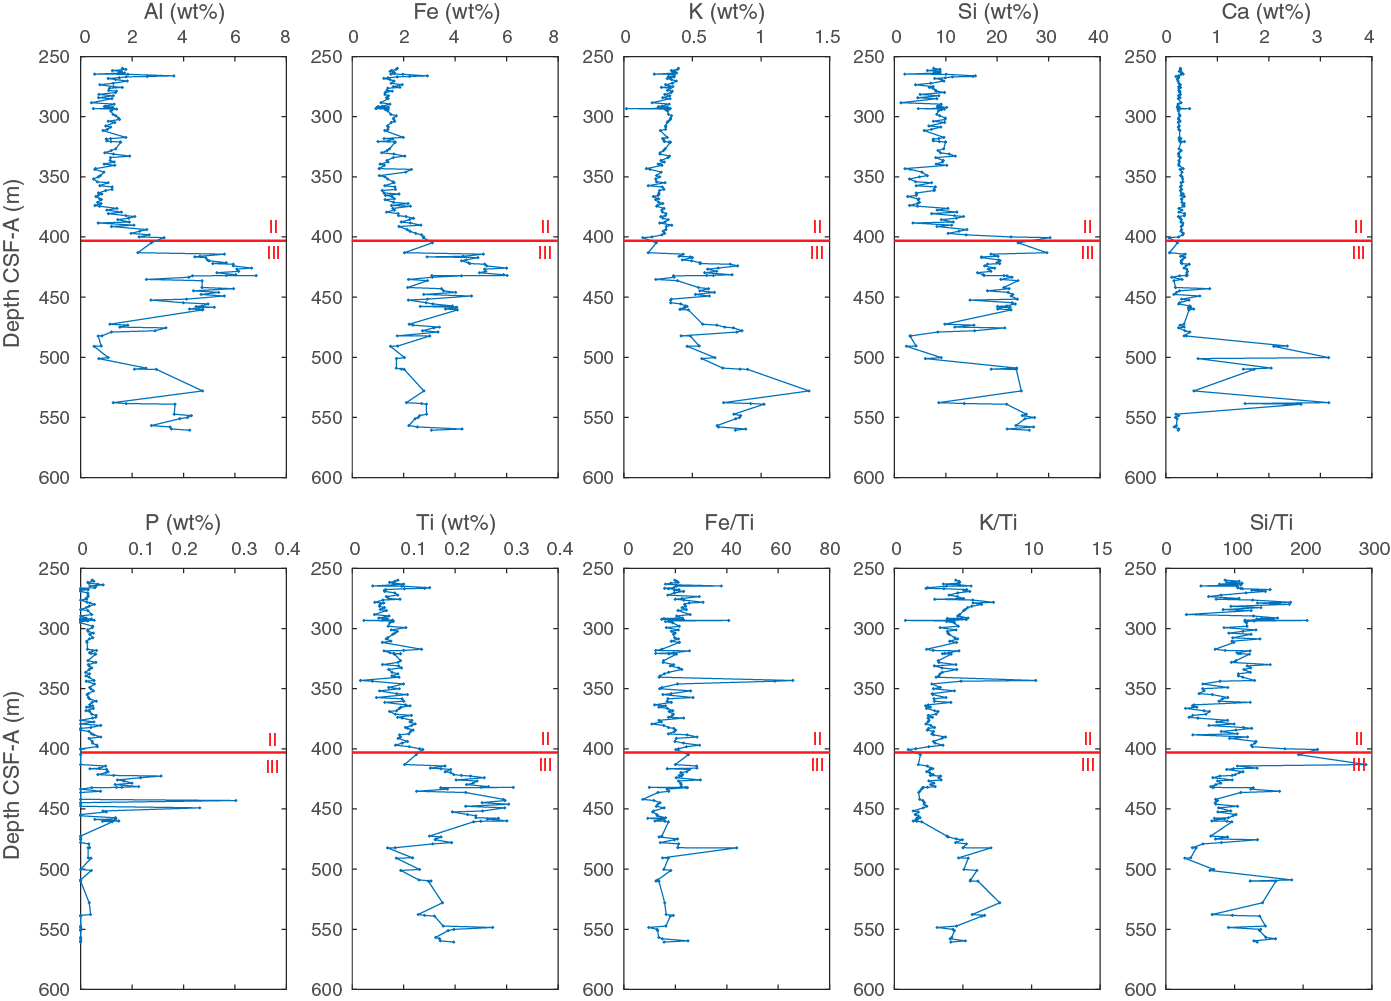
Figure F15. Handheld XRF analysis from Units II and III.
The dominant clay minerals identified by XRD in Unit III are (in decreasing abundance) montmorillonite, illite, and kaolinite (Figure F8). Cristobalite was identified by XRD, likely representing a diagenetic product of biosilica. Quartz was also identified throughout Unit III, likely a second diagenetic product of biosilica in the upper ~40 m, and may either reflect total silica diagenesis in the remainder of the unit (where no siliceous microfossils were observed in smear slides), detrital silt, or both. Zeolite (clinoptilolite) was identified in an isolated interval in Core 371-U1511B-33R (424.15 m).
Native copper grains are surrounded by concentric halos of greenish gray and light gray claystone that contrast sharply with the surrounding red or reddish brown claystone (Figure F9F). In Section 35R-4, a red to pink centimeter-scale bleb (Figure F9C) of fluorapatite was observed in clear stratigraphic association with a spike in phosphorous weight percent observed in XRF data in the overlying few tens of meters (Figure F15).
Core recovery in Unit III ranges from 0% to 104% and generally decreases downhole. All cores in the unit are severely biscuited and fractured, with fall-in at the tops of most cores sometimes consisting of fragments of overlying reddish brown claystone. Cores 33R and 34R (422.60–437.30 m, near the top of the unit) are more pervasively fractured, including the atypical occurrence of fractures in drilling biscuits. This observation, along with the anomalously poor recovery of those two cores, suggests in situ brittle sediment deformation near the top of Unit III.
Discussion
XRF analysis
Core description at Site U1511 employed a high-resolution (average sampling interval of ~150 cm) campaign of handheld XRF analyses on archive-half sections in Units II and III to document changes in elemental abundance with clay mineralogy and chemical alterations related to the variety of diagenetic minerals observed macroscopically. Of particular note is the issue of sediment porosity: XRF analysis of freshly cut, undried section halves unavoidably samples pore water (included in the undifferentiated Light elements column of the XRF results), as well as solid sediment. Because Site U1511 sediments feature a range of porosity across lithology and depth, with especially high porosity in the diatomite in Unit II (see Petrophysics), the measured abundance of all major elements is significantly lower in the highly porous Unit II. For this reason, interpretations are best presented using elemental ratios that compensate for the porosity effect on measurements of individual elements. In most cases, ratios are calculated with respect to Ti, which should reflect detrital input, independent of the composition of specific clay minerals assemblages or authigenic mineral precipitation.
Several robust trends in XRF data (Figure F15) highlight variations in primary and diagenetic sedimentary composition. For example, the Si/Ti peaks near the Unit II/III boundary coincide with the presence of cristobalite and silicified (chert) layers near the base of Unit II and common radiolarians near the top of Unit III. An interval of elevated P near the top of Unit III overlaps with the presence of fluorapatite nodules.
Diagenetic alteration
Diagenetic alteration products were found throughout Site U1511, including manganese nodules and specks of iron sulfides (found in Unit I), rhodochrosite nodules (found in Unit II), native copper crystals (found in Units II and III) (Figure F9), and fluorapatite nodules (found in Unit III). These authigenic features, and the broad red to grayish green color gradient and decimeter-scale alternation of those colors in Unit III, indicate a complex redox and diagenetic history speculatively mediated by hydrothermal fluid flow, especially in Units II and III.
Comparison with Site 283
Located southwest of Site U1511 on the Tasman Abyssal Plain, Site 283 invites comparison with Site U1511 to establish the regional extent of recovered lithologies and observed diagenetic processes. The 630 m of sediment from Site 283 was divided into four units: fossiliferous upper Pliocene–Pleistocene zeolite clay, Miocene to upper Eocene diatom ooze with calcareous nannofossils, upper to middle Eocene silty clay, and Paleocene poorly fossiliferous silty claystone, underlain by basalt (The Shipboard Scientific Party, 1975).
Sediment intervals at Site 283 loosely correlate with units at Site U1511. The uppermost unit at Site 283 may correlate with Unit I at Site U1511, although the latter extends to the Miocene and contains no calcareous nannofossils except in the lowest ~40 cm. The upper Eocene diatom ooze with nannofossils at Site 283 may correlate with part of the diatomite in Unit II at Site U1511, although nannofossils are absent from this interval at Site U1511. The diatomite in Unit II at Site U1511 also encompasses a greater age range, extending from the lower Oligocene (which falls within a hiatus at Site 283) to the middle–lower Eocene, which is represented by silty clay and another hiatus at Site 283. The lower Eocene–lower Paleocene claystone in Unit III at Site U1511 may be partially correlated with the Paleocene silty claystone at Site 283; however, the lower Eocene is absent at Site 283, as is the middle Paleocene interval of common nannofossils found at Site U1511.
Evidence for similar sediment diagenesis at Site 283 includes manganese nodules occurring in the clay in the upper 50 m, which were also observed at Site U1511. However, rhodochrosite and native copper were not observed at Site 283, suggesting less extensive diagenesis in the Paleogene sediments of this site.
Biostratigraphy and paleoenvironment
Biostratigraphic efforts at Site U1511 centered on two primary objectives: (1) determining the age of primary lithostratigraphic units and (2) constraining the depth of the CCD during the Paleogene. At present, water depths exceed 4900 m, well below the regional lysocline (Bostock et al., 2011). Therefore, radiolarian biostratigraphy was a special focus. Rare nannofossils and planktic foraminifers constrained ages across some depth intervals (Table T3).
Nannofossil and planktic foraminifer abundances, where found, are very low (Figures F16, F17). Benthic foraminifer abundance is low throughout the recovered sequence, with peaks in agglutinated species between ~400 and 460 m and at ~530 m. Nannofossil, planktic foraminifer, and benthic foraminifer (mainly calcareous) preservation is moderate to poor throughout the recovered sequence. Ostracods are barren in all investigated samples, except for one recrystallized fragment of Krithe? sp. in Sample 371-U1511B-47R-CC (560.69 m). Because of the low abundance and poor preservation of calcareous microfossils, calcareous nannofossil and planktic foraminifer biostratigraphy was only able to constrain sediment ages at the top and bottom of the hole.
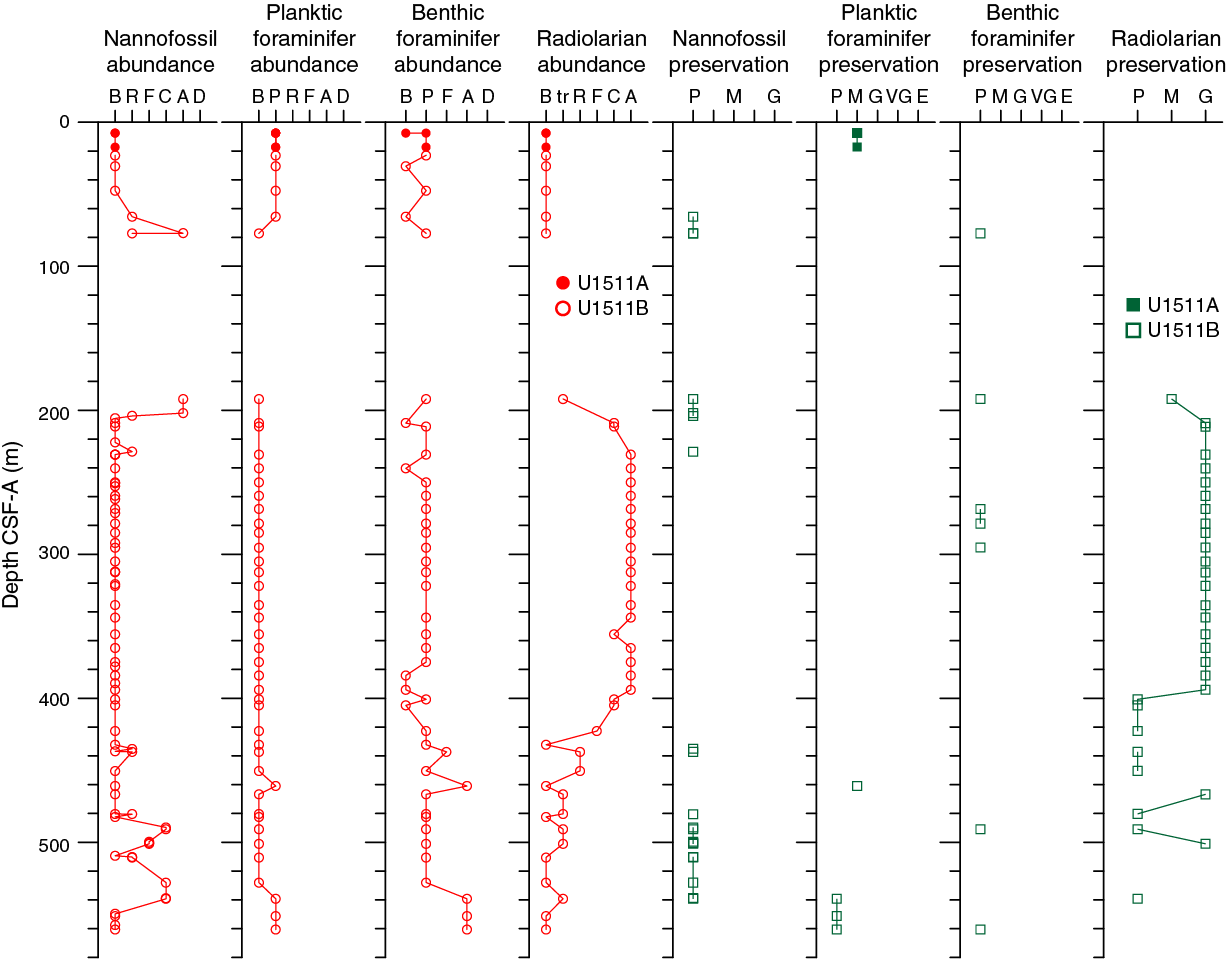
Figure F16. Microfossil preservation and abundance.
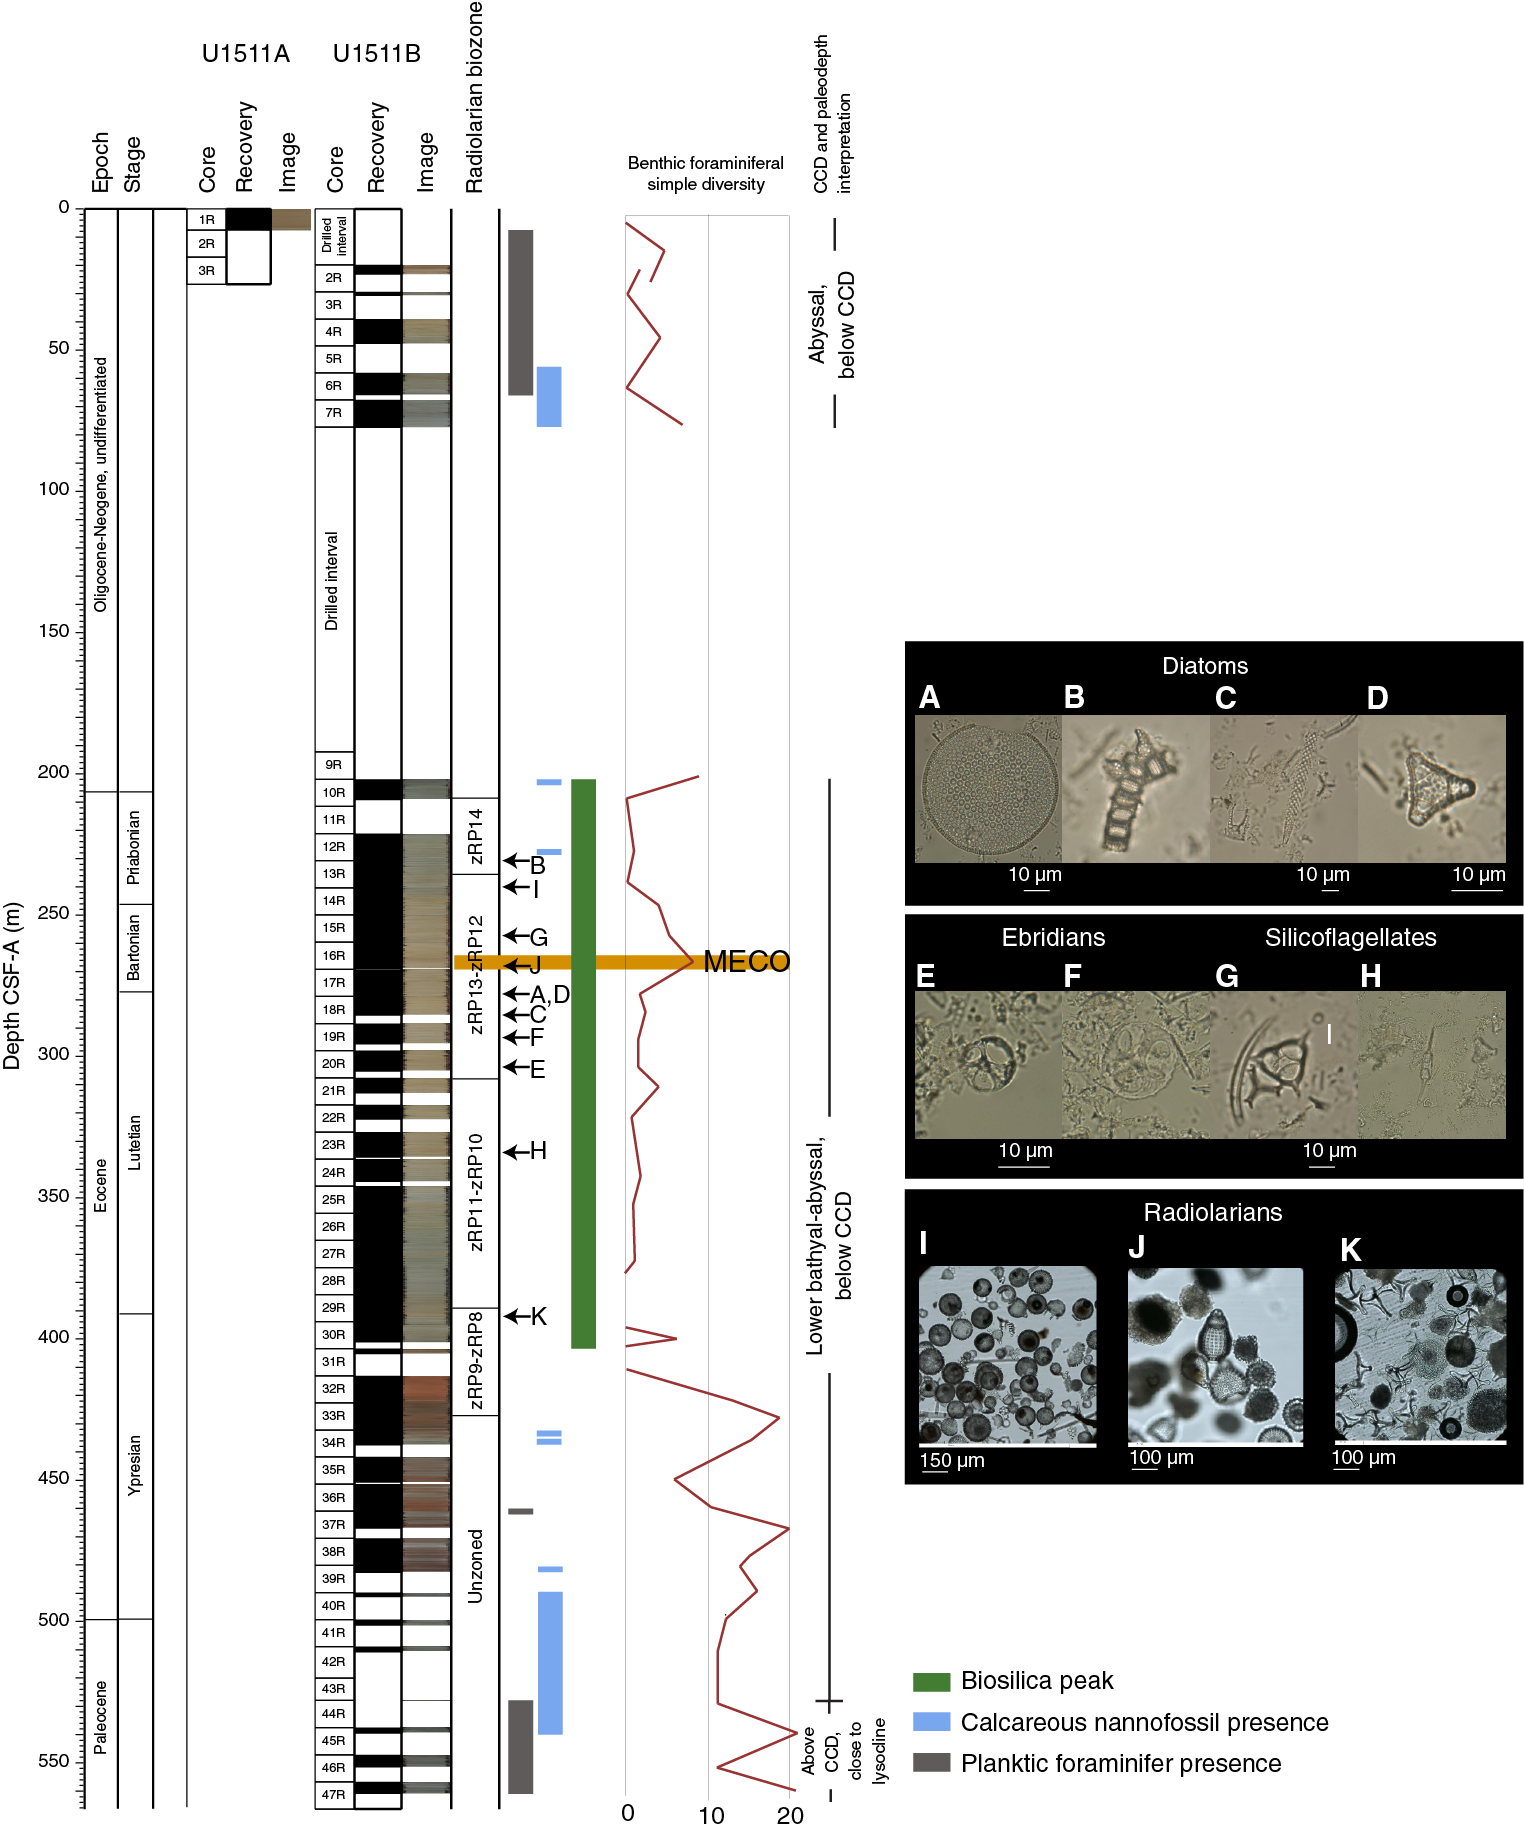
Figure F17. Radiolarian biozones and dominant microfossil groups.
A distinct change in microfossil assemblages occurs in Samples 9R-CC to 29R-CC (192.20–394.19 m): siliceous microfossils, including diatoms, ebridians, silicoflagellates, spicules, and radiolarians, dominate the sediment (Figure F17). Radiolarian preservation is mostly good from ~190 to 400 m (Figure F16). Above and below this interval, radiolarian preservation is poor except in two samples. Radiolarian biostratigraphy firmly dates the middle part of the sequence as early to late Eocene.
Toward the base of Hole U1511B (528.06–560.79 m), a few specimens of calcareous benthic foraminifers, rare planktic foraminifers, and a few poorly preserved calcareous nannofossils were found along with agglutinated benthic foraminifers (Figure F17), which may indicate an interval of the Paleocene when sediments accumulated above the CCD but below the lysocline.
Calcareous nannofossils
Calcareous nannofossil analyses are primarily based on core catcher samples (paleontology; PAL), with additional samples from working-half sections. Calcareous nannofossil distribution data are based on shipboard observations that focused on age-diagnostic species (Table T4).
Hole U1511A (0–17.3 m) is barren of calcareous nannofossils. In Hole U1511B (0–560.79 m), calcareous nannofossils occur in only 20 of the 71 samples analyzed. Abundance ranges from abundant to very rare, and preservation is poor throughout.
Calcareous nannofossils are present in Samples 371-U1511B-6R-CC to 10R-2, 51 cm (65.60–204.01 m). This depth interval is of special interest because it spans a lengthy drilled interval (371-U1511B-81) (see Lithostratigraphy). The scarcity and very poor preservation of nannofossils inhibit any biostratigraphic assignment to Samples 6R-CC and 7R-CC. The presence of taxa with no overlapping ranges (e.g., Toweius callosus in Sample 6R-CC and Dictyococcites bisectus in Sample 7R-CC) suggests reworking. The intervening sample (7R-7, 60 cm) has abundant nannofossils with a common occurrence of D. bisectus. This species ranges from the middle Eocene to late Oligocene, so we were unable to assign an age to this sample. Because of the poor preservation of these specimens, the possibility of reworking cannot be omitted.
The presence of Reticulofenestra umbilicus and Isthmolithus recurvus and the absence of Coccolithus formosus and rosette discoasters in Samples 9R-CC and 10R-1, 11 cm (192.28–202.01 m), are indicative of early Oligocene Zone NP22. However, it must be noted that these samples lie in Unit II and may have fallen from any point in this drilled interval.
Samples 12R-6, 100 cm; 34R-2, 145 cm; 34R-CC; and 39R-1, 50 cm, contain very rare and poorly preserved nannofossils. Thus, these samples cannot be used for calcareous nannofossil biostratigraphy.
Samples 40R-1, 9 cm, to 41R-2, 40 cm (489.79–500.59 m), were tentatively assigned to Zone NP5 of the middle Paleocene based on the presence of Fasciculithus tympaniformis. Because this species is missing in Sample 41R-CC, the base of this zone can be placed at 500.87 m (±0.27 m). Samples 41R-CC and 42R-CC contain rare to few calcareous nannofossils, making it difficult to assign these samples to a biozone. Samples 45R-2, 21 cm (538.81 m), and 45R-CC (539.32 m) were assigned to Zone NP4 based on the presence of Prinsius martini, Prinsius bisulcus, and Toweius spp. and the absence of F. tympaniformis.
Planktic foraminifers
Planktic foraminifers are scarce in core catcher samples examined at Site U1511. A very limited number of cores can be dated using planktic foraminiferal biostratigraphy (Table T5).
In Hole U1511A, Sample 1R-CC (7.51 m) was placed in Zone PL1 based on the presence of Globoconella pliozea. Both Neogloboquadrina acostaensis and Neogloboquadrina pachyderma were found in Sample 2R-CC (7.50 m), which indicates an early Pliocene–late Miocene age based on the range of N. acostaensis (Kennett and Srinivasan, 1983). Sample 3R-CC (17.20 m) contains Globoturborotalia woodi and N. pachyderma and was also assigned an early Pliocene–late Miocene age.
In Hole U1511B, only samples from the upper 65.7 m (Samples 1R-CC to 6R-CC) were dated using planktic foraminiferal biostratigraphy. These samples indicate an early Pliocene–late Miocene age. The bottom of N. acostaensis, which defines the base of Subzone M13a, was tentatively placed between Samples 4R-CC and 6R-CC (56.60 ± 9.00 m). Samples 7R-CC and 9R-CC to 38R-CC (77.20 and 192.20–501.24 m, respectively) are barren of planktic foraminifers, with the exception of the Eocene species Acarinina collactea in Sample 36R-CC (461.03 m).
The last four core catcher samples from Hole U1511B (Samples 44R-CC to 47R-CC; 528.06–560.79 m) contain Subbotina triloculinoides, Subbotina cancellata, and Parasubbotina varianta. Together, these species indicate Subzones P1c–P4a, undifferentiated.
Benthic foraminifers
Benthic foraminifers were examined qualitatively in 45 core catcher samples from Holes U1511A and U1511B (Table T6). Eight samples from the upper part of Hole U1511B (~80–190 m) are barren, and most of the rest have poor abundance relative to total sediment particles in the >63 µm fraction (Figure F16). Benthic foraminifers are more common to abundant in five core catcher samples from the lower part of Hole U1511B, especially in Sample 36R-CC (461.13 m) and in the three lowermost samples of Hole U1511B (539.42–560.79 m). Across all studied samples from Site U1511, 76 benthic foraminifer taxa were identified, and 61 of these taxa are agglutinated. In general, samples are dominated by agglutinated taxa, and calcareous benthic foraminifer preservation is poor.
The Pliocene to Oligocene interval is poorly fossiliferous. Considering the present water depth of the site, calcareous taxa recovered from Samples 371-U1511B-7R-CC and 9R-CC (77.30 and 192.28 m) could have been preserved from dissolution, even below the CCD, in the small hard clay balls observed when these samples were washed and picked.
Two different Eocene benthic foraminiferal assemblages were identified. The youngest assemblage contains very low diversity agglutinated benthic foraminifers of early Oligocene to early Eocene age. The second Paleocene to early Eocene-aged assemblage has higher diversity and contains both agglutinated and calcareous taxa. The change between these two assemblages is abrupt, and it coincides with the contact between lithostratigraphic Units II and III at 403.4 m. The early Oligocene to early Eocene assemblage (Cores 10R through 30R; 208.97–400.92 m) has a sparse, low-diversity fauna that mainly includes astrorhizids (Bathysiphon, Hyperammina, and Rhizammina) and Spiroplectammina spectabilis. The earliest Eocene to early Paleocene assemblage (422.91–528.16 m) is more diverse, and in addition to very abundant astrorhizids (Bathysiphon, Hyperammina, Rhizammina, and Rhabdammina) and S. spectabilis, it also contains abundant Rzehakina spp. (including Rzehakina epigona), Ammodiscus, Glomospira, and Repmanina charoides. Calcareous taxa, including Stensioeina beccariiformis, were recorded from Sample 40R-CC (491.09 m) downcore. The lowermost sample (47R-CC; 560.79 m) contains a poorly preserved bryozoan, probably reworked.
Other than the taxa noted above, agglutinated benthic foraminifers present in Eocene and Paleocene intervals include Ammodiscus cretaceous, Caudammina ovula, Cyclammina amplectens, G. charoides, Glomospira spp., R. epigona, S. spectabilis, and Subreophax scalaris. All these taxa have bathyal to abyssal affinity (Kaminski and Gradstein, 2005). The lack of calcareous taxa in Pliocene to early Eocene samples suggests that this site was located below the CCD for much of the Cenozoic. However, the common occurrence of calcareous species (including S. beccariiformis) from Sample 40R-CC (491.09 m) downcore indicates deposition closer to the lysocline during part of the Paleocene.
Radiolarians
A total of 46 core catcher samples from Site U1511 were processed and analyzed (Table T7) to determine radiolarian abundance, preservation, and biostratigraphic events. In general, sample processing was difficult, because most samples did not disaggregate completely because of high clay content (see Lithostratigraphy), resulting in clumps of siliceous debris on the prepared strewn slides.
Siliceous microfossil abundance, including radiolarians, varies significantly with depth at Site U1511. The interval from 7.51 to 77.30 m is barren of radiolarians (Figure F16). Sample 371-U1511B-9R-CC (192.20–192.28 m) contains a trace amount of moderately preserved specimens. In striking contrast, radiolarians are common to abundant and well preserved between 208.97 and 394.19 m (Cores 10R through 29R). These samples from the Unit II diatomite also contain abundant diatoms, silicoflagellates, ebridians, and spicules. From 400.82 to 560.79 m, radiolarians generally decrease in abundance and exhibit poor preservation. The exceptions are Samples 37R-CC and 41R-CC, which contain trace amounts of well-preserved specimens, possibly as a result of laboratory contamination. Four samples contain single specimens of well- and poorly preserved radiolarians (Samples 31R-CC, 32R-CC, 34R-CC, and 38R-CC); the well-preserved specimens likely resulted from laboratory contamination.
Because of time constraints, samples containing radiolarian assemblages were scanned for a few marker species for biostratigraphic analysis (Table T7). Samples 10R-CC to 32R-CC can be ascribed to late to early Eocene radiolarian zones.
The base of late Eocene radiolarian Zone zRP14 was identified between Samples 12R-CC and 13R-CC (235.65 ± 4.74 m) based on the appearance of Eucyrtidium spinosum (38.15 Ma). Samples 10R-CC and 11R-CC were also assigned to this zone based on the absence of the marker species for Zone zRP15 (Eucyrtidium antiquum). The top of Eucyrtidium nishimurae, a datum in Zone zRP14 (37.14 Ma), was observed in this zone at 245.29 m (±4.81 m) (Table T7).
The base of middle Eocene undifferentiated Zones zRP13–zRP12 was placed between Samples 20R-CC and 21R-CC (308.91 ± 3.77 m) based on the appearance of Eusyringium fistuligerum. Zealithapium mitra, whose base defines the base of Zone zRP13, has a single occurrence in Sample 17R-CC. The top of Artobotrys biaurita, which usually occurs in Zone zRP14, was observed between Samples 15R-CC and 16R-CC. This event and additional age constraints by magnetostratigraphy allow for identification of the Middle Eocene Climatic Optimum (MECO) (see Stratigraphic correlation). For all three events, the mid- and low-latitude datums are shown in the age-depth plot for Site U1511 (Figure F31). For the base of Z. mitra and A. biaurita, a low-latitude datum fits the age-depth plot better when compared with the magnetostratigraphic tie points.
The base of early to middle Eocene undifferentiated Zones zRP11–zRP10 was placed between Samples 28R-CC and 29R-CC (389.22 ± 4.87 m) based on the appearance of Dictyoprora mongolfieri. The first appearance of this species better fits with the low-latitude datums (47.41 Ma) rather than the mid-latitude (50 Ma) datums. The marker species whose base defines the base of Zone zRP11 (Eusyringium lagena) was observed only in Sample 20R-CC. Samples 30R-CC to 32R-CC were assigned to undifferentiated Zones zRP8–zRP9 based on the first occurrence of Podocyrtis papalis (base of Zone zRP8) in Sample 32R-CC.
Because radiolarians are scarce in Samples 33R-CC to 47R-CC (432.35–560.79 m), this interval remained unzoned. Buryella tetradica, whose base defines the base of Zone zRP5 (62.3 Ma), was observed in Sample 38R-CC. One specimen of Buryella foremanae, whose base defines the base of Zone zRP4 (64 Ma), was found in Sample 45R-CC. The interval from 432.35 to 539.42 m can therefore be assigned to the Paleocene, younger than 64 Ma.
In summary, at Site U1511 only the southwest Pacific zonation scheme (see Biostratigraphy and paleoenvironment in the Expedition 371 methods chapter [Sutherland et al., 2019a]) could be applied to Paleogene radiolarian assemblages. However, even this scheme comes with limitations because two marker species (Z. mitra and E. lagena) have only isolated occurrences.
Palynology
A palynological reconnaissance study was carried out on eight core catcher samples from Hole U1511B. Samples are barren of palynomorphs, likely because of oxidation. Barren samples are expected in pelagic clay deposits that contain little organic carbon (see Lithostratigraphy and Geochemistry).
Comparison with Site 283
Sites U1511 and 283 are conjugate locations on the Tasman Abyssal Plain with similar basement age but apparently inconsistent biostratigraphic data. A late Eocene nannofossil assemblage was recorded at Site 283 with Reticulofenestra reticulata and Discoaster saipanensis observed, whereas late Paleogene calcareous nannofossils at Site U1511 record an early Oligocene age; however, both sites had little recovery in this interval. Early to middle Paleocene nannofossil assemblages recorded at Site U1511 were not recorded at Site 283.
Planktic foraminifers at Site 283 are scarce: only one specimen of Globoconella inflata, which ranges from the Pliocene to recent, was found. At Site U1511, an early Pliocene to late Miocene and a middle to early Paleocene planktic foraminiferal assemblage was recorded. Only one specimen of the Eocene species A. collactea was found at Site U1511.
At Site 283, agglutinated benthic foraminifers were documented for Paleocene (and perhaps early Eocene) sediments (Webb, 1983), and no specimens were observed in younger intervals. The assemblages had relatively high abundance but low diversity. These assemblages contrast with the more diverse benthic foraminifer assemblage at Site U1511, which includes both calcareous and agglutinated taxa in the earliest Eocene and Paleocene. These results may suggest that deposition during the Paleocene took place above the CCD but below the lysocline.
Abundant and well-preserved late middle to late Eocene radiolarian assemblages recovered at Site 283 were assigned to Zones zRP13 and zRP14 (Pascher et al., 2015). According to the Site 283 report (The Shipboard Scientific Party, 1975), radiolarians are rare in early to middle Eocene strata and absent in Paleocene strata. At Site U1511, however, radiolarians are abundant throughout the entire Eocene and present in the Paleocene.
In sharp contrast to the rich palynological assemblages recovered throughout the sedimentary column at Site 283, sediments at Site U1511 are barren of palynomorphs. The similar (surface) oceanographic setting makes it unlikely that this dominantly represents a productivity signal. Instead, sediments at Sites U1511 and 283 likely had very different oxidation histories during and/or postdeposition, possibly related to different bottom water masses, currents, or local diagenetic history.
Paleomagnetism
Most of the sedimentary record for Site U1511 lacks carbonate, hampering reliable calcareous nannoplankton and foraminifer biostratigraphy. For this reason, paleomagnetic results are particularly important for construction of an age model at this site. Pass-through paleomagnetic measurements were performed on nearly all archive-half sections from Site U1511 (drilled using the RCB system), except for some highly disturbed sections in Core 371-U1511B-40R and below (>489.7 m). A total of 60 discrete samples were taken: 6 from Unit I by pushing 7 cm3 standard plastic cubes into sediment and 54 trimmed from cores as 2 cm × 2 cm × 2 cm cubes. Discrete samples were subjected to remanence measurement after alternating field (AF) demagnetization of natural remanent magnetization (NRM) up to 120 mT followed by anisotropy of magnetic susceptibility (AMS) measurement. A reliable correlation of polarity chrons with those of the early to middle Eocene geomagnetic polarity timescale (GPTS) was obtained from Unit II and III sediments at Site U1511.
Paleomagnetic results
The quality of paleomagnetic data from Site U1511 varies with lithostratigraphic units. In Unit I (0–77.2 m), NRM intensity is high, mostly between 10−3 and 10−1 A/m (Figure F18). However, pass-through paleomagnetic data after 20 mT AF cleaning do not show a clear bimodal pattern. This could derive from a combination of drilling disturbance (see Lithostratigraphy) and coring-induced remagnetization of the soft clay sediments. Polarity interpretation in Unit I is based mainly on discrete samples.
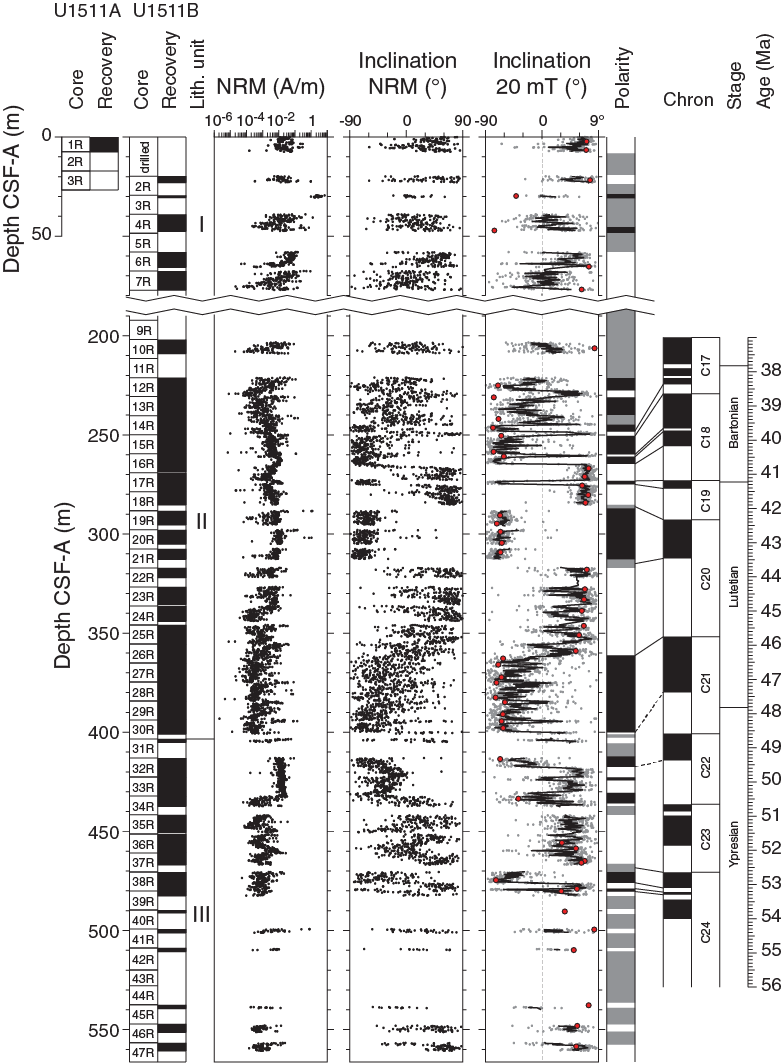
Figure F18. Pass-through paleomagnetic data.
Across Unit II (201.9–403.4 m), high-quality paleomagnetic data were observed. NRM intensity ranges between 10−4 and 10−2 A/m (Figure F18) with higher values between ~250 and 340 m. Between 250 and 405 m, inclination data after 20 mT AF cleaning show a well-defined series of negative and positive values.
In Unit III (403.40–560.69 m), red sediments from Cores 371-U1511B-32R and 33R (413–432.4 m) show an NRM intensity of ~10−2 A/m (Figure F18). The NRM intensity of deeper cores drops back to ~10−3 A/m. For Cores 32R through 38R (413–480 m), inclination data after 20 mT AF cleaning show a fairly well defined bimodal pattern (Figures F18, F19). Downhole from Core 39R, recovery is very low and characterized by mostly negative paleomagnetic inclination.
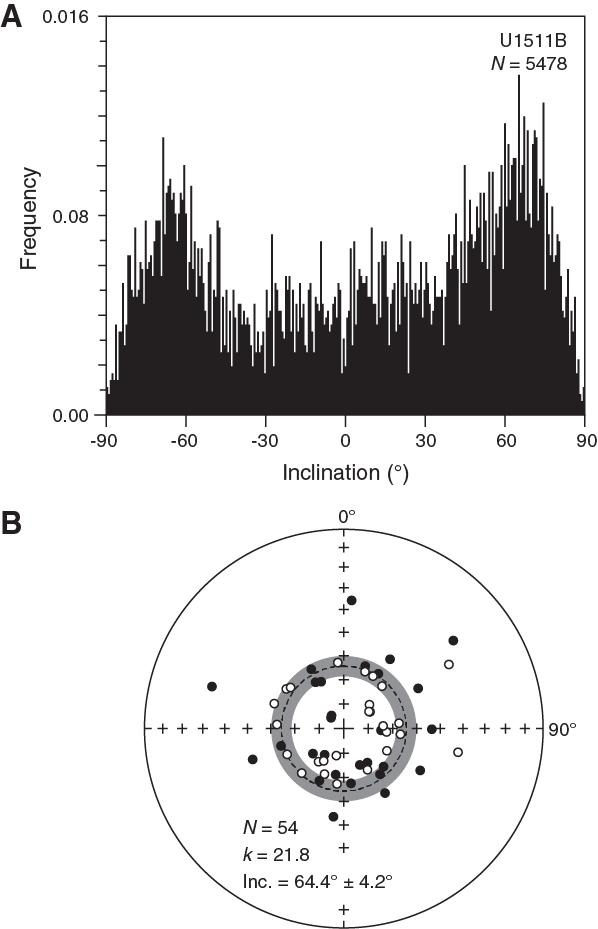
Figure F19. Pass-through paleomagnetic inclination and ChRM directions.
In addition to stable paleomagnetic directional data, the remanence intensity of sediments from Units II and III exhibits possible cyclicity. For two sections (Figure F20), NRM intensity and remanence after AF demagnetization appear related to sediment color. The red-brown intervals generally have a higher magnetization compared with gray sediment intervals. Such patterns in magnetization may be related to dissolution of iron oxides in the gray sediments. These periodic fluctuations in magnetization might be controlled by climatic-driven redox conditions, as has been observed in some marine sediment environments, such as in abyssal Pacific Ocean sediments (Korff et al., 2016). However, the origin of magnetization intensity variations could be caused by other processes and needs further investigation.
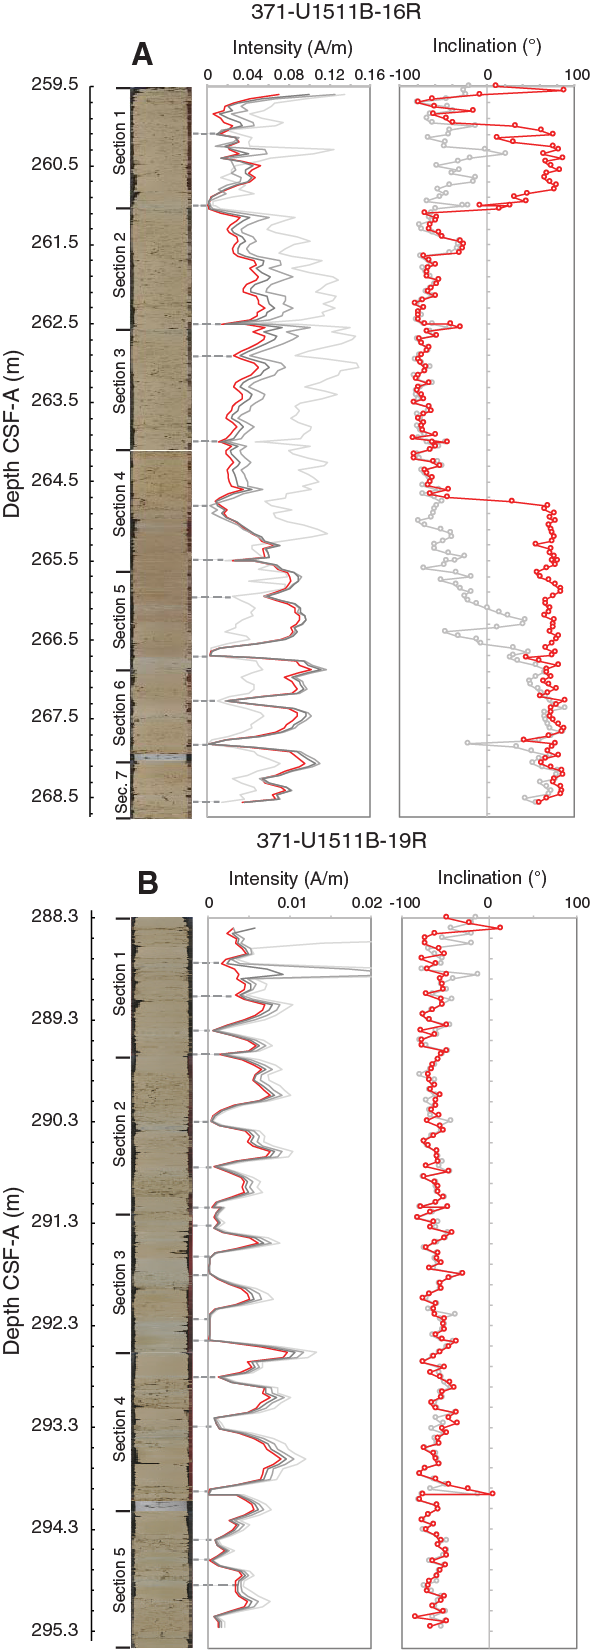
Figure F20. Remanence intensity and inclination.
Paleomagnetic results on discrete samples
Discrete samples from Site U1511 have a high magnetization intensity and produce high-quality AF demagnetization behavior. Most of the samples are characterized by linear patterns of vector endpoints pointing toward the origin of the demagnetization diagrams after AF demagnetization of 10–20 mT (Figure F21). Characteristic remanent magnetization (ChRM) directions were isolated from 56 out of 60 (93%) samples. Stereographic projection of principal component analysis (PCA)-derived directions shows randomly distributed declination (Figure F19B), as expected from unoriented RCB cores. The average inclination for the combined upward- and downward-pointing vectors was calculated following the method of McFadden and Reid (1982). Paleomagnetic inclination of ChRM directions from Units II and III is highly consistent with pass-through inclination data, supporting the magnetic polarity interpretation.
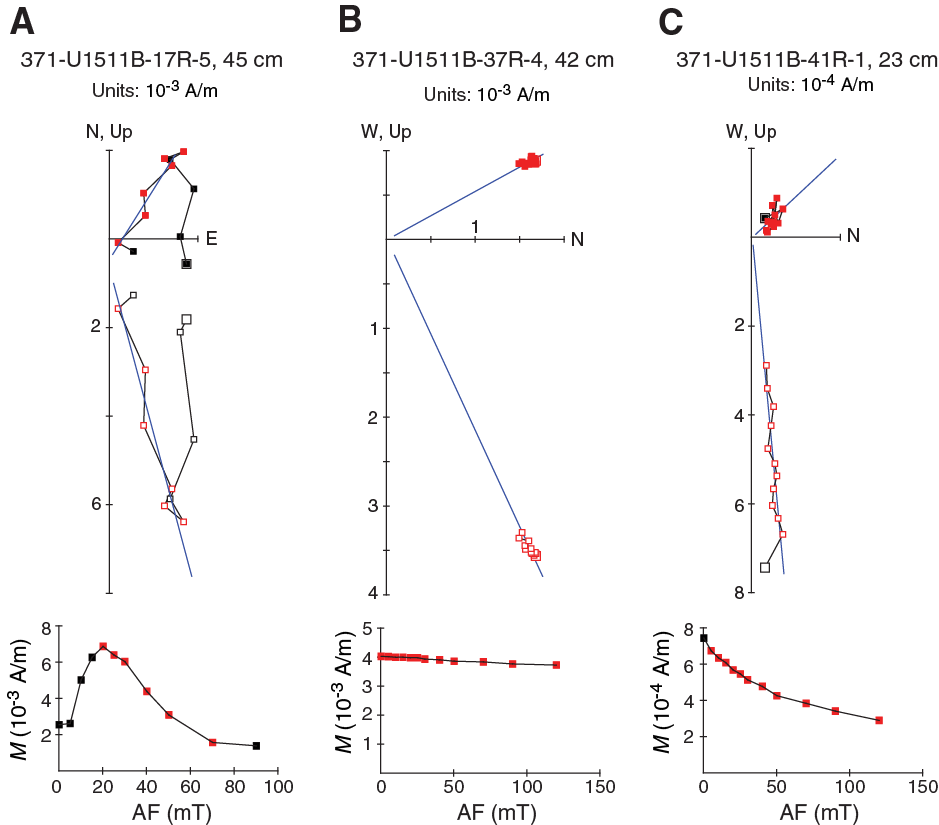
Figure F21. Vector endpoint demagnetization diagrams.
Discrete samples from different intervals in Units II and III exhibit variable AF demagnetization behavior, reflecting changes in magnetic mineralogy (Figure F21). Most samples from Unit II are characterized by a magnetic overprint removed after AF demagnetization at ~20 mT, followed by a ChRM component removed after AF demagnetization at 70 mT. In contrast, many samples in Unit III show magnetically “hard” NRM behavior that is not affected by AF demagnetization, with a negligible remanence loss after AF demagnetization up to 120 mT. Some samples have a gradual remanence decrease with increasing AFs but with a large portion of remanence remaining after AF demagnetization at 120 mT. The high-coercivity remanence components are likely carried by hematite, which is commonly present in sediments from Site U1511. The presence of hematite also probably contributes to the reddish color of sediments in Unit III (see Lithostratigraphy).
Anisotropy of magnetic susceptibility
AMS was measured on 57 discrete samples from Site U1511. Magnetic susceptibility values of discrete samples are relatively high, in the range of 3.9 × 10⁻⁵ to 5.2 × 10⁻⁴ SI. Samples from Units I and II indicate random orientation of the AMS tensor (Figure F22A). This probably relates to random deposition of minerals without sediment compaction. Porosity values of sediments from Unit II are high (~80%), likely due to the high resistance of diatomite to sediment compaction (see Petrophysics). In contrast, sediments from Unit III exhibit a well-defined oblate AMS fabric where the minimum axis of the AMS ellipsoids (κmin) is statistically oriented perpendicular to the bedding plane and where the maximum and intermediate axes are distributed randomly within the horizon plane. This AMS pattern is typical for compacted sedimentary rocks. The AMS results from Unit III are consistent with the lower porosity (~50%–60%) measured in the claystone interval (see Petrophysics).
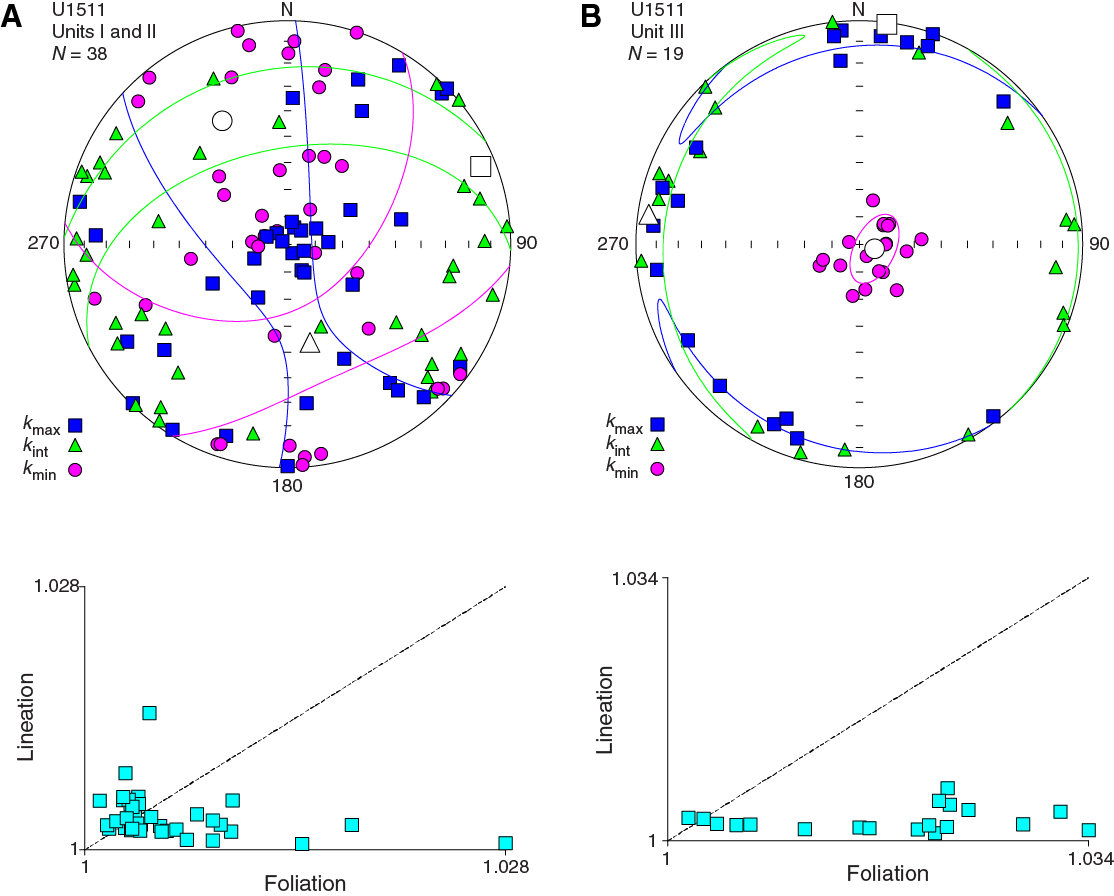
Figure F22. AMS data for 57 discrete samples.
Magnetostratigraphy
Sediment in Unit I at Site U1511 cannot be correlated with the reference GPTS2012 because of a combination of poor recovery and an absence of well-constrained magnetic reversals. In contrast, a high-quality series of reversals can be correlated robustly with the GPTS2012 from ~240 to 480 m in Units II and III. This correlation, based on consistent results from both pass-through archive-half sections and discrete sample analysis, is supported by radiolarian biostratigraphy (see Biostratigraphy and paleoenvironment). From Cores 371-U1511B-14R through 30R (~240–400 m), all polarity reversals from the base of Chron 17n.3n to Chron 21n are identified (Figure F18; Table T8), indicating that Unit II spans from ~38 to 47.5 Ma (Bartonian–Lutetian). The reversals identified in Unit III from Cores 31R through 37R (~410–470 m) cannot be unambiguously correlated with the GPTS2012. However, the four magnetic polarity reversals observed in Core 38R can be successfully correlated with Chrons C24n.1n–C24n.2n (Figure F23). From Core 40R downhole, core recovery is low, but directional data obtained from discrete samples indicate reversed polarity. Biostratigraphic data indicate this part of Unit III accumulated during the middle Paleocene, a time interval characterized by dominantly reversed geomagnetic polarity.
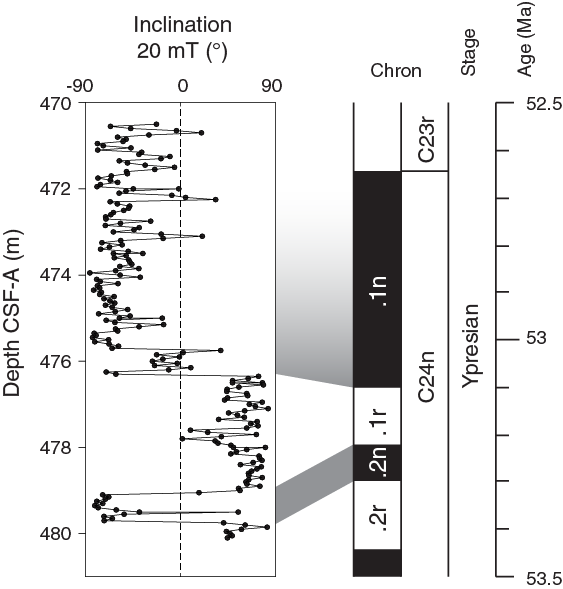
Figure F23. Pass-through paleomagnetic inclination data.
Petrophysics
Cores recovered from Holes U1511A and U1511B were analyzed with the full suite of physical properties measurements (see Petrophysics in the Expedition 371 methods chapter [Sutherland et al., 2019a]). No wireline logging or downhole temperature measurements were made. The dominant lithology at Site U1511 is clay in the shallow section and diatomite and claystone below 200 m. Variations in P-wave velocity, bulk density, and porosity correlate with changes in fossil content. Units I and III follow compaction trends typical of siliciclastic and carbonate sediments, with porosity decreasing and density and velocity increasing with depth. Physical properties in Unit II deviate from these typical trends; this deviation is attributed to diatom content. Variations in magnetic susceptibility, natural gamma radiation (NGR), and color reflectance are more likely due to changes in clay composition or alteration.
Density and porosity
Bulk density was estimated using the gamma ray attenuation (GRA) method on whole-round sections and the moisture and density (MAD) method on discrete samples from section halves (Figure F24).
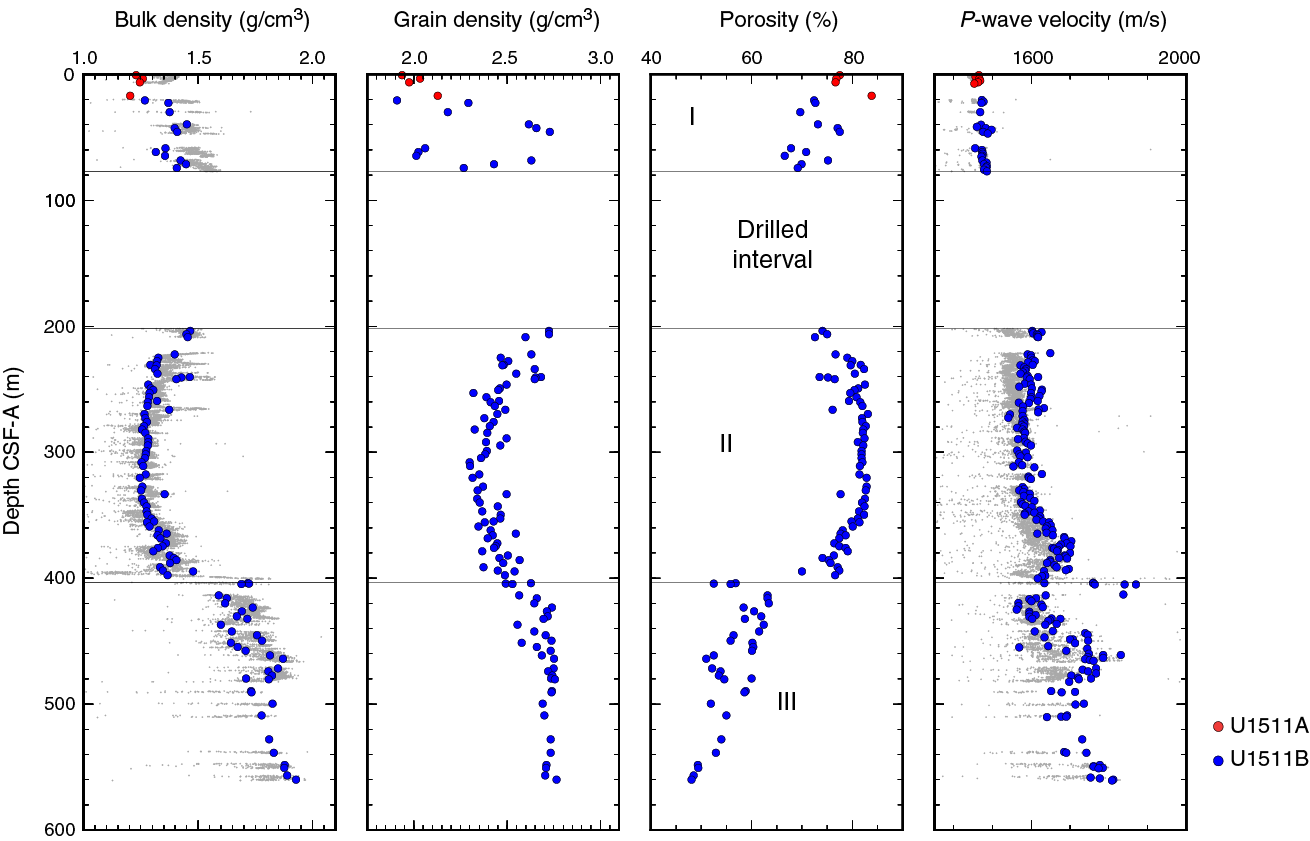
Figure F24. Bulk density, grain density, porosity, and P-wave velocity.
Bulk density increases in Unit I from 1.22 g/cm3 at the seafloor to 1.43 g/cm3 at ~77 m. The soft clay decreases in porosity from ~80% to 65% over this interval. Grain density varies between 1.91 and 2.73 g/cm3. In Unit II (diatomite with clay and biosilica), bulk density, grain density, and porosity have comparable trends with depth that show values are affected by diatom content in the sediment. Between 202 and 225 m, bulk density and grain density decrease from 1.47 to 1.33 g/cm3 and from 2.72 to 2.47 g/cm3, respectively. Porosity increases from 74% to 80% in the same depth range, associated with increasing biosilica and clay content in the sediment. From 225 to 350 m, porosity remains at an extremely high value of about 80%, only returning to values of around 70% at the base of Unit II. Bulk density does not conform to typical compaction trends in the diatomite interval (225–350 m), ranging from 1.25 to 1.30 g/cm3. Grain density is low at 2.30–2.50 g/cm3, reflecting the dominance of biosilica. Near the base of Unit II at ~400 m, bulk density and grain density increase downhole to 1.50 and 2.65–2.70 g/cm3, respectively.
At the top of Unit III, bulk density sharply increases from 1.37 to 1.72 g/cm3 and porosity decreases from 77% to 53% in claystone in Core 371-U1511B-31R (403–405 m). Below this interval, bulk density and porosity profiles show compaction trends typical of siliciclastic sediments. From ~413 m to the bottom of the hole, bulk density increases from ~1.60 to ~1.90 g/cm3 and porosity decreases from 63% to 48%. In Unit III, grain density varies between 2.50 and 2.70 g/cm3 at 403–465 m (claystone with radiolarians) and is constant at around 2.70 g/cm3 below 465 m (claystone with nannofossils).
P-wave velocity
P-wave velocity was measured on whole-round sections (P-wave logger [PWL]) and working-half sections (P-wave caliper [PWC]) (Figure F24). Where possible, PWC measurements were taken on undisturbed sections of core. The laboratory P-wave velocity data are likely to require correction to in situ values because of the severe drilling disturbance. Trends in P-wave velocity rather than absolute velocities should be considered. PWC velocity values are higher than PWL values (Figure F24).
In Unit I (0–77.2 m), P-wave velocity (PWC) is low (~1450–1500 m/s) in unconsolidated clay. Below the drilled interval (72.2–202.0 m), P-wave velocity is approximately constant at 1600 m/s between 202 and 340 m, gradually increases to 1700 m/s at 370 m, and decreases to 1600 m/s at 403 m, the Unit II/III boundary.
A sharp increase in P-wave velocity to ~1800 m/s is measured at the top of Unit III in Core 371-U1511B-31R and in the uppermost 5 cm of Core 32R (404–413 m). Although recovery is poor, measurements of high velocity in the two cores indicate this layer could be 10 m thick. The lithology is claystone, and the sharp increase in P-wave velocity is attributed to the absence of diatoms (see Lithostratigraphy); the sediments would have undergone compaction with an increase in bulk density and a decrease in porosity (see Density and porosity). P-wave velocity below the high-velocity claystone layer is ~1600 m/s in claystone with radiolarians, increasing to 1750 m/s by 470 m in claystone with no siliceous fossils. P-wave velocity decreases again to ~1700 m/s at 500 m in claystone with nannofossils and increases to 1750 m/s at 560 m at the base of the hole in claystone.
Magnetic susceptibility
Magnetic susceptibility was measured with the pass-through system (loop magnetic susceptibility [MSL]) on all whole-round sections and with the point measurement system (point magnetic susceptibility [MSP]) on all section halves (Figure F25).
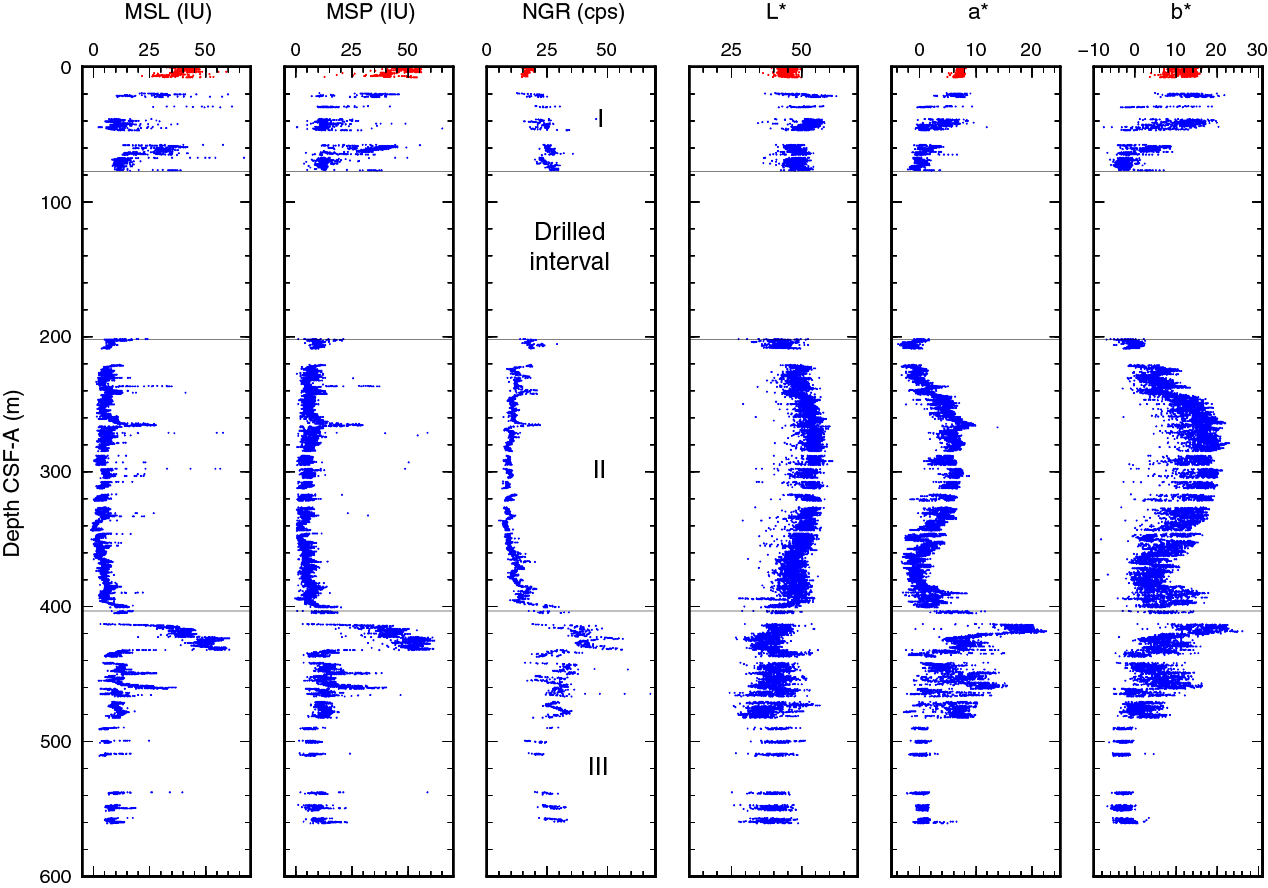
Figure F25. Magnetic susceptibility, NGR, and L*, a*, b*.
In Unit I, magnetic susceptibility varies from 5 to 60 instrument units (IU) in unconsolidated clay. In Unit II (202–403 m), magnetic susceptibility generally varies at 0–10 IU with localized spikes of 20–30 IU at 236, 265, and 300 m (Figure F25). A sharp increase to 60 IU occurs near the top of Unit III at 410 m in high-velocity claystone and claystone with radiolarians and may relate to chemical alteration of the sediments. Values are 5–15 IU between 420 and 560 m with localized spikes as high as 40 IU between 430 and 470 m in claystone.
Natural gamma radiation
NGR was measured on all whole-round sections from Holes U1511A and U1511B (Figure F25). NGR trends are similar to those of magnetic susceptibility. In Unit I (0–77 m), NGR increases from 15 to 30 counts/s. In Unit II, NGR decreases from 30 to 7 counts/s to 350 m and then increases to 20 counts/s at 400 m in diatomite with clay and clayey diatomite. NGR sharply increases at the top of Unit III (402 m) and is 50 counts/s at ~410 m. Values gradually decrease with depth and are 20 counts/s at 500 m. Between 500 and 560 m, values increase to 30 counts/s in claystone with nannofossils.
Thermal conductivity and temperature
Conductivity measurements were made in each core on the dominant lithology in both Holes U1511A and U1511B. Thermal conductivity data show a decreasing trend with depth from about 1.0 to 0.7 W/(m·K) from the seafloor to about ~370 m, reflecting the extremely high porosity in the diatomite. No measurements were taken below 370 m.
Sediment strength
Sediment strength was measured with both the automated vane shear (AVS) and penetrometer (compressional) on Cores 371-U1511A-1R and 371-U1511B-1R through 7R. Vane shear strength values increase with depth from ~16 kPa near the seafloor to ~30 kPa at 70 m. Compressional strength is very low (<5 kPa) from the seafloor to 70 m with local spikes at 30 m (~10 kPa) and at 60–70 m (~25 kPa). Cores recovered from below ~70 m are too hard to penetrate with the strength tools.
Color spectrophotometry
Color reflectance shows similar downhole trends to those of porosity and density, indicating biosilica content, which may be a main cause of color change. Lightness (L*) values vary from 40 to 60 in Unit I, whereas redness (a*) and yellowness (b*) values decrease with depth from 7 to 0 and 12 to −5, respectively. All three values show similar trends in Unit II, increasing from 202 to 300 m and then decreasing from 300 to 400 m. L*, a*, and b* values increase from 45, −2, and −2, respectively, at 202 m to 55, 7, and 12, respectively, at 300 m. At 400 m, L*, a*, and b* values are around 45, 0, and 2, respectively. Sediments in this depth range are diatomite with clay and clayey diatomite. At ~405 m in claystone, a* and b* values increase to ~20 and then decrease to ~10 by 420 m in claystone with radiolarians. Greater variance in L*, a*, and b* was observed in Unit II between 420 and 480 m in brown claystone, ranging from 30 to 50, 0 to 15, and −5 to 15, respectively. L*, a*, and b* values are all lower at the base of the hole, where sediments are more gray in color. Below 480 m, variance decreases, L* values decrease with depth from 45 to 35, and a* and b* values are approximately constant at 0 and −2, respectively.
Geochemistry
The geochemistry program at Site U1511 aimed at characterizing the composition of pore water and solid sediment. Sediment was expected to be similar to that at Site 283, conjugate across the now-extinct spreading axis (see Background and objectives). Site 283 recovered ~600 m of sedimentary sequence deposited generally beneath the CCD and on top of oceanic basalt (The Shipboard Scientific Party, 1975). Site 283 was spot cored, but diagenetic phases were noted in the sediment, and 11 interstitial water (IW) samples were collected by conventional squeezing. The IW samples, with a resolution of one sample every 50–100 m, were analyzed for salinity, alkalinity, and pH (The Shipboard Scientific Party, 1975). Despite the low sampling resolution, the pore water profiles show 100 m scale variations downhole (The Shipboard Scientific Party, 1975). The IW sampling program at Site U1511 was designed to provide better resolution chemical profiles of multiple species that are important for understanding the potential modification of sediment components.
Headspace hydrocarbon gases
A total of 44 headspace (HS) gas samples were taken, typically one from every core in the top 5 cm of the last section or core catcher. Light hydrocarbon gas concentrations were consistently below the detection limit.
Interstitial water analyses
A total of 50 IW samples were collected at Site U1511 (Table T9). The suite included 1 sample by squeezing and 16 samples by Rhizons from Hole U1511A and 26 samples by squeezing and 7 samples by Rhizons from Hole U1511B. Additionally, a mudline sample was taken from the top of Section 371-U1511A-1R-1. The deepest IW sample collected for squeezing came from 431 m in Hole U1511B; Rhizon samples from both holes were restricted to the upper 30 m.
To present and discuss general aspects of downhole pore water chemistry, samples from the two holes are considered together. Rhizon samples generally yield similar chemistry to squeezed samples, at least at the precision of general downhole trends at Site U1511. As such, samples by method are not discussed explicitly.
Salinity, pH, and alkalinity
The three most basic water chemistry profiles exhibit different downhole trends (Table T9; Figure F26). Salinity remains close to that of bottom water (35.8 in the mudline sample) for the shallowest samples to 80 m. Salinity decreases to 34.5 at 208 m, jumps to 36.0 at 229 m, varies between 35.7 and 36.0 to 278 m, and then remains close to 35.5 to 393 m. At 400 m, salinity sharply decreases to 32.0 and remains between 32.0 and 32.5 to the base of the hole. pH varies between 7.68 and 7.86 in the upper 30 m. Below 30 m, pH increases from 7.69 at 45 m to 7.85 at 76 m, decreases to a minimum of 7.43 at 259 m, and increases slightly to 7.49 at 312 m. At 320 m, pH peaks at 8.04; below 320 m, pH fluctuates between 7.41 and 7.53 to 393 m. Alkalinity increases from 2.3 mM in the mudline sample to 5.3 mM at 208 m. Below this maximum, alkalinity overall decreases to 3.7 mM at 393 m.
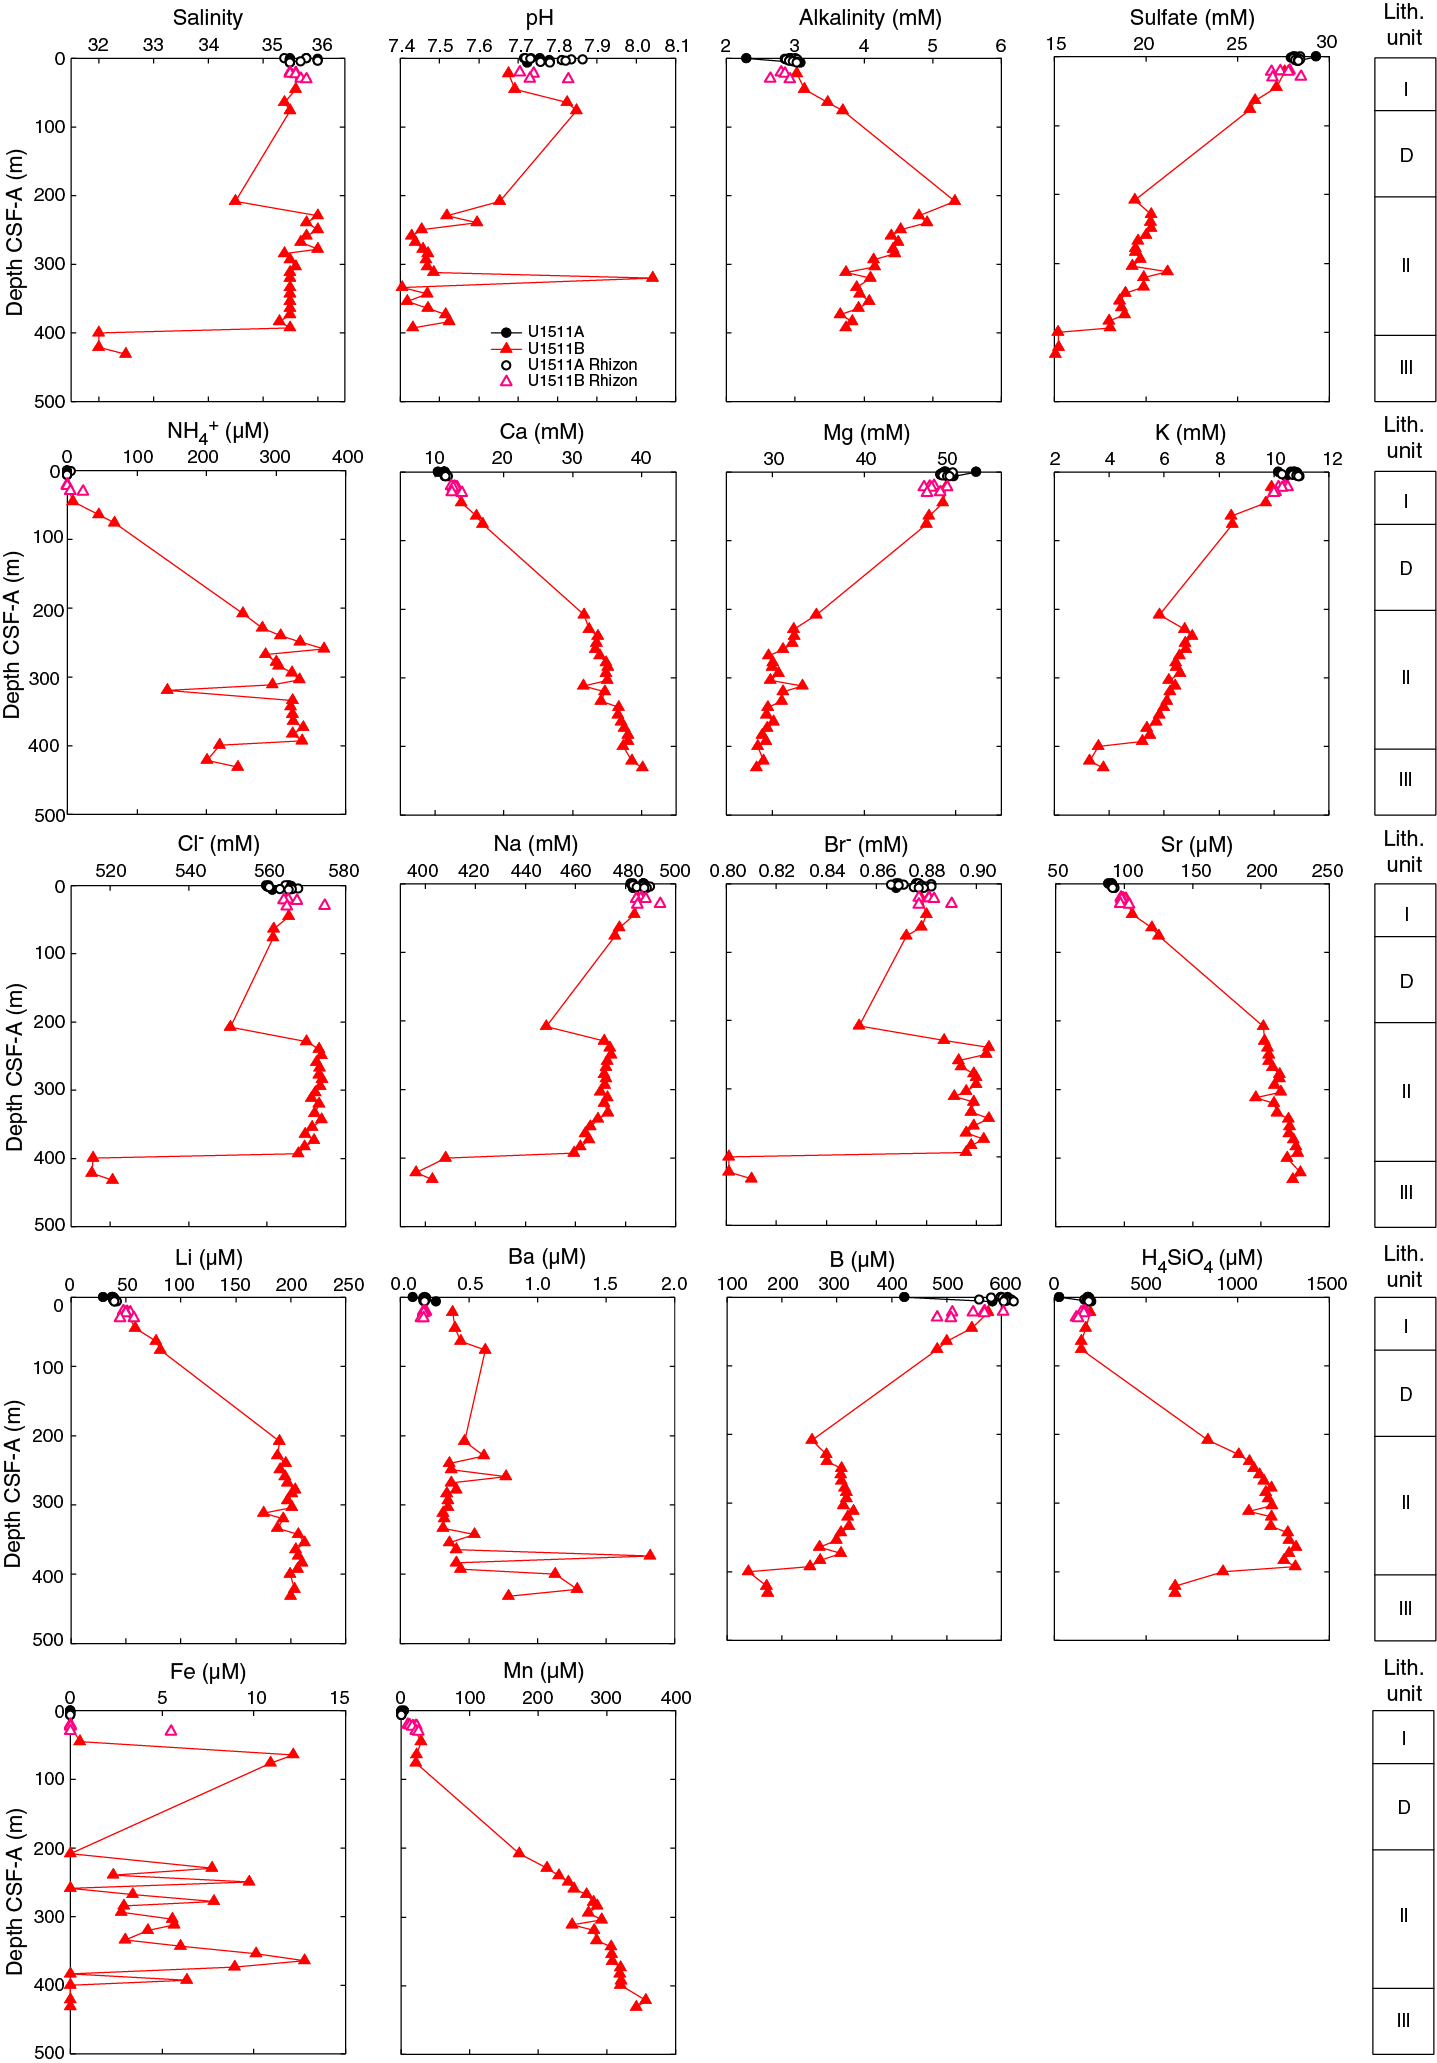
Figure F26. Squeeze and Rhizon IW chemistry.
Sulfate and ammonium
In general, the SO42− and NH4+ concentration profiles mirror each other, with SO42− decreasing and NH4+ increasing downhole (Table T9; Figure F26). Sulfate and NH4+ concentrations are 29.3 mM and 0 µM, respectively, in the mudline sample. From the seafloor to 208 m (near the drilled interval/Unit II boundary), SO42− decreases to 19.4 mM. Importantly, NH4+ remains close to 0 µM to 30 m but then increases to ~250 µM at 208 m. From 208 to 393 m, SO42− decreases gradually to 18.1 mM, whereas NH4+ fluctuates between 281 and 370 µM. Superimposed on these trends, NH4+ displays a local low of 144 µM at 320 m, and SO42− displays a local high of 21.2 mM at 312 m. At and below ~400 m, both SO42− and NH4+ decrease sharply by about 17% and 35%, respectively, reaching minima of 15.1 mM and 201 µM, respectively.
Calcium, magnesium, and potassium
Major cation concentrations change significantly with depth (Table T9; Figure F26) from near the seafloor, where they are close to those of seawater with a salinity of 35.5 (see Geochemistry in the Expedition 371 methods chapter [Sutherland et al., 2019a]). Dissolved Ca increases linearly from 10.4 mM in the mudline sample to 31.7 mM at 208 m and then increases with a smaller slope to a maximum of 40.1 mM at 431 m. In contrast, dissolved Mg decreases linearly from 52.2 mM in the mudline sample to a minimum of 29.6 mM at 268 m. Below 268 m, Mg decreases slightly to a minimum of 28.3 mM at 431 m, except for a local high of 33.3 mM at 312 m. Dissolved K decreases from 10.2 mM in the mudline sample to a local minimum of 5.8 mM at 208 m. Below 208 m, K decreases linearly from 6.7 mM at 229 m to 5.2 mM at 393 m, decreases sharply to 3.6 mM at 400 m, and remains ~3.6 mM to the base of the hole.
Two important features become evident in the major cation profiles. First, over the sequence examined, the change in calcium relative to the change in magnesium (ΔCa/ΔMg) approximates −1.2 mol/mol. Second, below 400 m, K concentration decreases by ~30%, whereas Ca and Mg do not. Note that the decrease in K at ~400 m is consistent with the abrupt decrease in salinity at the same depth, which was measured by a different instrument. This consistency confirms the changes in the profiles are real rather than an analytical error or a result of contamination.
Chloride, sodium, and bromide
The Cl−, Na, and Br− concentration profiles share similar decreasing trends downhole (Table T9; Figure F26). Cl−, Na, and Br− concentrations in the mudline sample are 566, 487, and 0.88 mM, respectively, which are essentially the values for standard seawater (see Geochemistry in the Expedition 371 methods chapter [Sutherland et al., 2019a]). Over the upper 208 m, Cl−, Na, and Br− concentrations decrease to lows of 551, 449, and 0.85 mM, respectively, meaning that Na concentration decreases by 23 mM more than that of Cl−. This difference compensates well for the charge balance deficit induced by the low downhole ΔCa/ΔMg ratio. The lows at 208 m also correspond to the low in salinity. All three elements increase sharply at 229 m. Below 229 m, Cl− and Na decrease slightly to 568 and 459 mM, respectively, whereas Br− fluctuates between 0.89 and 0.91 mM to 393 m. Similar to changes in K, concentrations of Cl−, Na, and Br− decrease abruptly at 400 m by ~10% to 516, 408, and 0.80 mM, respectively, and remain low below 400 m.
Strontium, lithium, and barium
Dissolved Sr, Li, and Ba concentrations generally increase downhole but with different patterns (Table T9; Figure F26). The Sr and Li profiles increase from 89 and 29.5 µM, respectively, in the mudline sample to 202 and 189.9 µM, respectively, at 208 m. Below 208 m, Sr and Li generally increase with lower gradients to maxima of 229 and 212.6 µM, respectively. Both Sr and Li show local minima at 312 m of 196 and 175.7 µM, respectively. The dissolved Ba concentration profile displays a background value of ~0.5 µM to 400 m with some values as high as 1.8 µM between 200 and 400 m. At 400 m, Ba concentration increases to 1.1 µM, and it remains close to this value to 431 m. Despite such variation, Ba concentration at Site U1511 is trivial considering changes documented at other Expedition 371 sites (see Geochemistry in the Site U1508 chapter and Geochemistry in the Site U1509 chapter [Sutherland et al., 2019b, 2019c]).
Boron and silica
The B and H4SiO4 concentration profiles show similarities and differences, depending on the depth interval (Table T9; Figure F26). Dissolved B and H4SiO4 concentrations are 424 and 27 µM in the mudline sample, respectively. Below the mudline sample, B and H4SiO4 decrease from 583 and 204 µM, respectively, at 7 m to 483 and 149 µM, respectively, at 76 m. Then dissolved B decreases to 254 µM, whereas H4SiO4 increases to 837 µM at 208 m. Below 208 m, B increases gradually to a local maximum of 330 µM at 312 m, decreases gradually to 251 µM at 393 m, decreases sharply at 400 m near the Unit II/III boundary, and increases slightly to 175 µM at 431 m. Over the same depth interval, H4SiO4 exhibits a concave-down increase to a maximum of 1315 µM at 393 m and decreases sharply right below this depth to a minimum of 659 µM at 431 m. The lows in B and H4SiO4 in the hole correspond to those for other species, but the decreases are proportionally more significant (i.e., 45% and 30%, respectively).
Iron and manganese
The dissolved Fe and Mn concentration profiles display different trends, with Fe showing multiple local peaks and Mn generally increasing downhole (Table T9; Figure F26). Iron concentration is below the detection limit in the upper 30 m. Below 30 m, Fe concentration shows peaks at ~70 m and varies mostly between 2.4 and 12.8 µM below 200 m, with some values below the detection limit at 208, 259, and below 374 m. Mn concentration is 4.5 µM in the mudline sample and is mostly below 1.0 µM for the upper 7 m. Below 20 m, Mn fluctuates between 10.0 and 29.4 µM to 76 m and increases sharply to 172.3 µM at 208 m. From this depth, Mn increases downhole to a maximum of 357 µM at 421 m and decreases slightly to 343 µM at 431 m. Mn concentration in deeper sediment at this site is extremely high for marine pore water.
Bulk sediment geochemistry
Throughout the sedimentary column at Site U1511, carbonate and organic carbon remain very low (Table T10; Figure F27). Carbonate contents are predominantly <1 wt% and indicate sediment was chiefly deposited below the CCD. However, modest CaCO3 between 1 and 15 wt% occurs in two intervals: at the bottom of Unit I (71–77 m) and in the lower half of Unit III (490–539 m). Both intervals coincide with increases in calcareous nannofossil abundance from rare to abundant and from barren to common, respectively (see Biostratigraphy and paleoenvironment). Total organic carbon (TOC) contents are mostly <0.1 wt% but are represented by slightly higher values (0.3 wt%) intermittently throughout the hole. Nitrogen contents are low throughout the sedimentary column, with those in the upper 200 m slightly higher (~0.04 wt%) than those in the lower sequence (<0.02 wt%).

Figure F27. Bulk sediment profiles.
Discussion
Several processes impact IW chemistry at Site U1511. As at Site U1510, but for very different reasons, the pore water profiles strongly relate to lithology and physical properties.
The chemistry profiles at Site U1511 show some general trends reported at previous sites. Modest oxidation of particulate organic carbon leads to production of alkalinity and NH4+ and removal of SO42−. The coupled changes in Ca, Mg, and K are similar to those at IODP Sites U1506–U1510, suggesting reaction of pore water with silicate minerals. However, the ΔCa/ΔMg ratio at Site U1511 is much lower than those at the other sites, and the maximum Ca concentration at this site is almost twice as high as those at the other sites (Figure F28), which probably results from reactions with underlying basalt rather than continental crust. In fact, the ΔCa/ΔMg ratio of −1.3 mol/mol at Site U1511 is close to that observed at previously drilled sites with basaltic crust underneath (Baker, 1986; McDuff, 1981). Reaction of pore water with silicates at the basement probably caused increases in Ca, Sr, and Li and decreases in Mg and K.
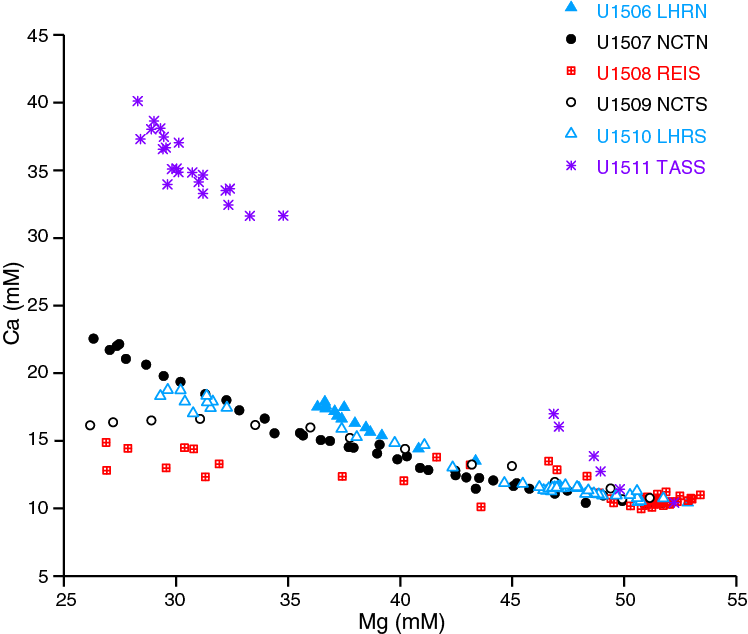
Figure F28. Dissolved Ca vs. Mg in IW.
Many chemical species display an inflection at 208 m, approximately where the lithology changes from clay to diatomite, and a major decrease in concentration at ~400 m (see Lithostratigraphy). Some species also display local maxima and minima at ~310 m, corresponding to the peak in pH and the small “bumps” in physical properties such as porosity and P-wave velocity (see Petrophysics). The coupled changes in chemical and physical properties suggest a change in sediment composition in a narrow layer near 310 m, although this change is not shown in lithology. Ammonium is absent in the upper 22 m and remains lower than 10 µM to ~50 m, which is uncommon in pelagic sediment and may indicate a deep horizon of ammonia oxidation, which releases H+ to the pore water and decreases pH, as observed in the pH profile.
Limited dissolution of biogenic silica occurs that increases dissolved H4SiO4 (particularly in Unit II). H4SiO4 concentrations >1 mM were also reported at Site U1509 (see Geochemistry in the Site U1509 chapter [Sutherland et al., 2019c]). The abrupt decrease in H4SiO4 concentration at ~400 m suggests dissolution of SiO2·H2O at equilibrium and conversion to cristobalite, which releases water and dilutes H4SiO4 and many other element concentrations. This abrupt decrease also corresponds to the gradual decrease in radiolarian abundance from abundant to common and the abrupt decrease in radiolarian preservation from good to poor at 400 m (see Biostratigraphy and paleoenvironment).
The concave-down increasing Mn profile between 200 and 400 m suggests continuous reaction of pore water with Mn-rich sediment, coincident with the widespread concretions of rhodochrosite throughout Unit II (see Lithostratigraphy). The occurrence of a Mn maximum at 421 m is consistent with the abrupt changes in reflectance a* and b* at this depth that show bright red color, different from the greenish yellow above and dark brown layers below (see Petrophysics). Such consistently high Mn concentration at depth in pelagic sediment was also reported at Ocean Drilling Program (ODP) Site 1226, although the absolute values of Mn concentration at that site are lower (Shipboard Scientific Party, 2003). Centimeter-scale manganese nodules were reported at DSDP Site 851 and multiple DSDP Leg 29 sites, although pore water Mn concentration was not measured at that time (Shipboard Scientific Party, 1992; Margolis, 1975). High Mn concentration near the sediment base at Site 1226 was correlated with a Miocene “carbonate crash” (Shipboard Scientific Party, 2003). However, the high Mn concentration at Site U1511 likely reflects reaction with basalt underneath.
Stratigraphic correlation
The Eocene was characterized by two intervals of prolonged warming, the Early Eocene Climatic Optimum (EECO) and the MECO, and several transient hyperthermal events (Bohaty and Zachos, 2003; Zachos et al., 2008). Recovery of middle and lower Eocene sediment in Hole U1511B presents an opportunity to study these past climate events at a South Pacific location. To that aim, magnetic susceptibility, NGR, color reflectance, and NRM data (see Paleomagnetism and Petrophysics), as well as biostratigraphic datums (see Biostratigraphy and paleoenvironment), were compiled to identify the MECO and the putative Chron 19r event in Hole U1511B.
The MECO has been identified in several sediment records, including in New Zealand strata (Bohaty et al., 2009; Dallanave et al., 2015). The event spans polarity Chrons C18r and C18n.2n with an overall duration of ~500 ky and a peak warmth in Chron C18n.2n at ~40 Ma. Interpretation of the inclination data and radiolarian assemblages suggests that the MECO was recovered in Core 371-U1511B-16R (Figure F29). Significantly higher magnetic susceptibility and NGR values occur across most of Sections 16R-4, 16R-5, and 16R-6. This interval (267.5–264.0 m) approximately corresponds to the age of the MECO, with peak magnetic susceptibility and NGR occurring in the top of Section 16R-5 (~265.7 m). Given linear sedimentation rate (LSR) estimates for middle Eocene sediment at Site U1511, the interval with elevated magnetic susceptibility and NGR values was emplaced over ~350 ky, which is slightly shorter than that observed elsewhere (Bohaty et al., 2009).

Figure F29. Paleomagnetic, biostratigraphic, MSL, NGR, and L* data.
The Chron C19r event may be present in Core 18R. This event was first highlighted at ODP Site 1260, where an interval of anomalous warmth apparently occurred approximately 72% of the way through Chron C19r or at ~41.8 Ma (Edgar et al., 2007). At Site U1511, an increase in superconducting rock magnetometer (SRM) intensity is found between 279.5 and 281.5 m (peak at 279.7 m), which is between 53% and 64% of the way through Chron C19r depending on the polarity of the interval without recovery. (Figure F30). However, other physical properties data from Core 18R show no obvious change with respect to background variability across this interval.
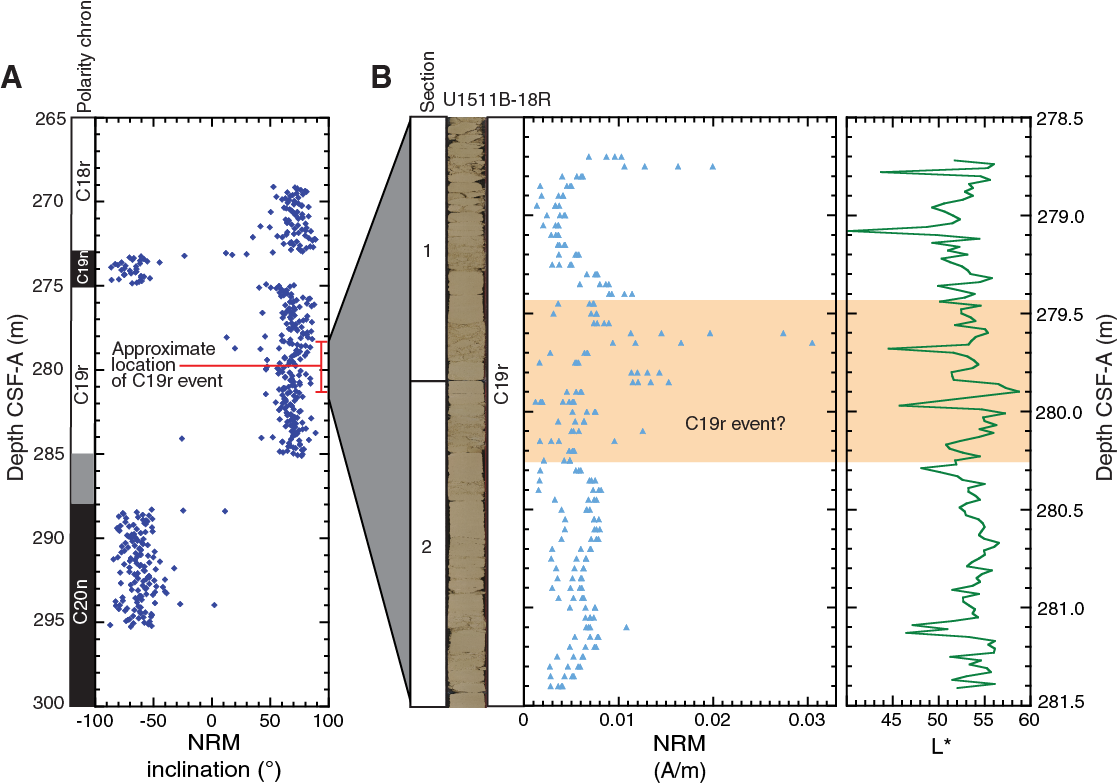
Figure F30. SRM inclination data.
Age model and sedimentation rates
A 560 m thick sequence of Pleistocene to lower Paleocene clay, diatomite, and claystone was recovered at Site U1511. Age control for the upper 200 m of strata is not straightforward because of severe coring disturbance, a lengthy drilled interval (advance 77.2–192.2 m), and very low fossil occurrence. Below 200 m in Eocene and Paleocene sediments, several magnetic polarity reversals and a limited number of radiolarian and calcareous nannofossil datums provide first-order age control. Using these age markers, LSRs and mass accumulation rates (MARs) were calculated for the lower part of Site U1511 (62–33 Ma) on the core depth below seafloor (CSF-A) depth scale (Table T3; Figure F31; see Biostratigraphy and paleoenvironment).
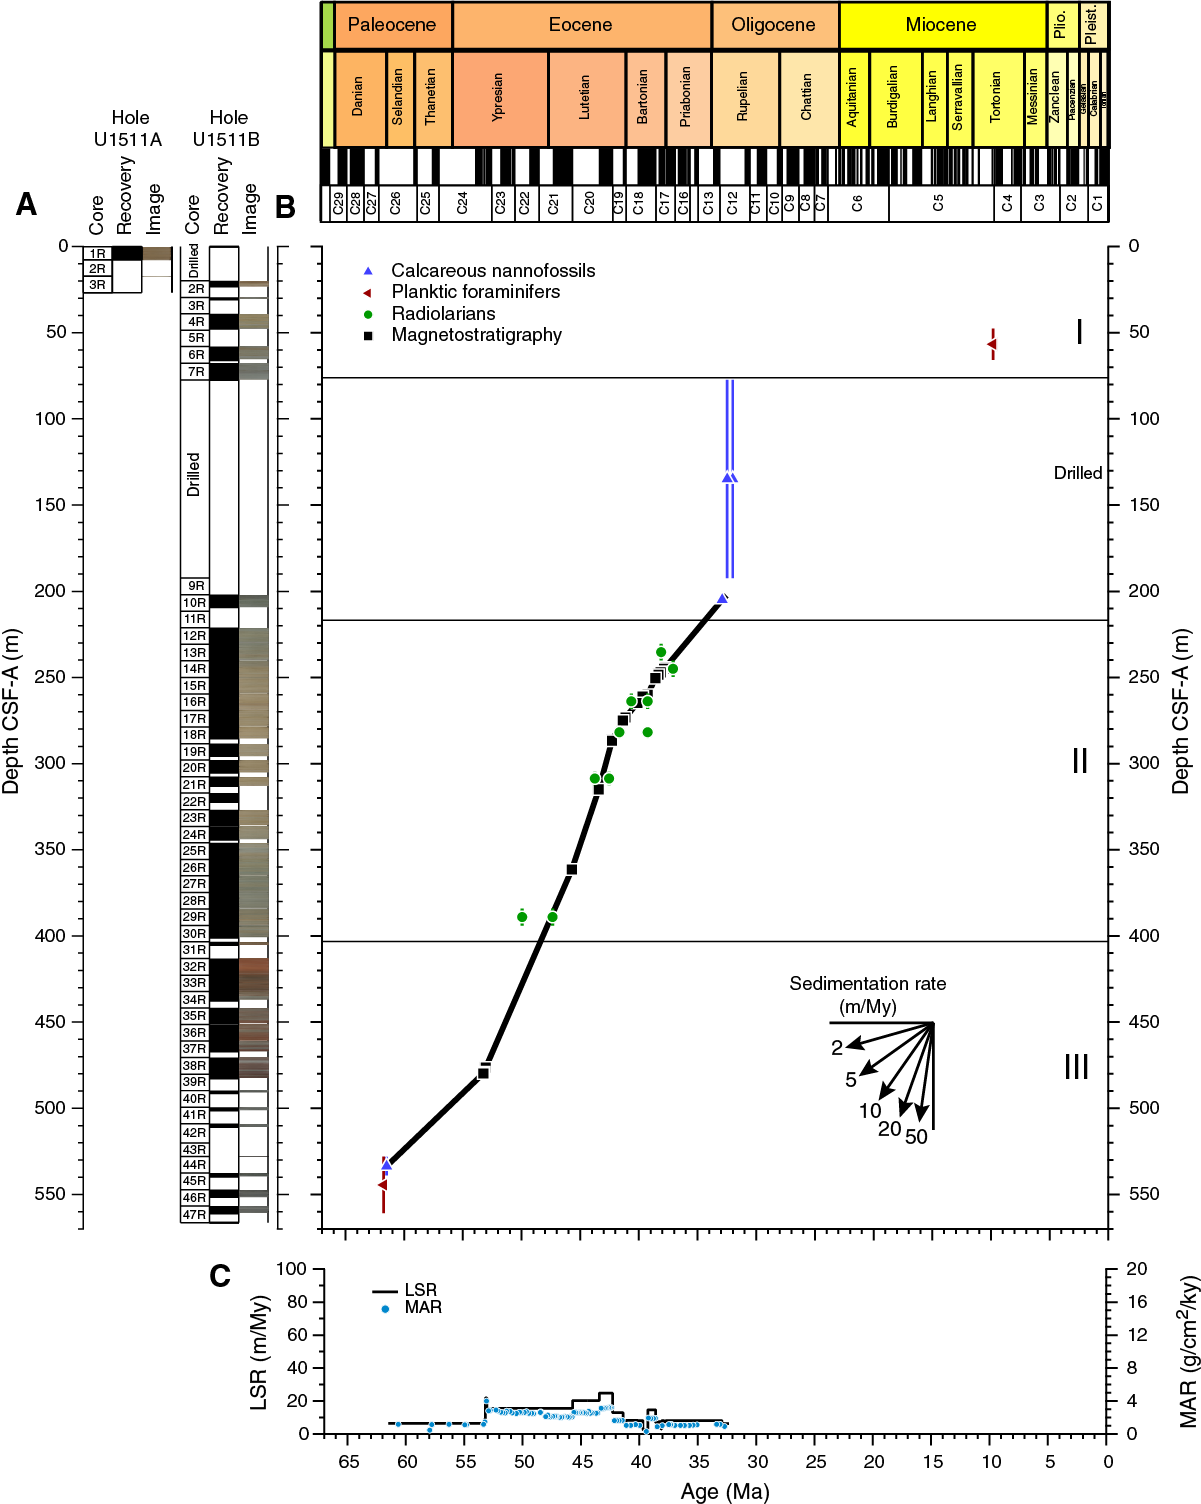
Figure F31. Sedimentation accumulation.
Sedimentation across the recovered Paleogene section at Site U1511 appears relatively uniform, although precise LSR and MAR values depend on datums used for calculations (Figure F31). LSRs were ~5 m/My at 62–53 Ma, ~20 m/My at 53–42 Ma, and 10 m/My at 42–33 Ma. From the early Oligocene to the present, LSRs cannot be constrained rigorously, although they must average ~6 m/My. The depth (56.60 m) and age (9.83 Ma) of the one planktic foraminifer datum in Pleistocene to Miocene sediments (base of N. acostaensis) is consistent with such sedimentation rates.
Changes in MARs closely mimic those of LSRs with respect to age. MARs ranged 1–3 g/cm2/ky during the Paleocene and Eocene.
Site U1511 has the overall lowest LSRs and MARs of the Expedition 371 sites. This comparison is especially true when intervals of continuous sedimentation are considered. For example, across the entire Cenozoic, Site U1509 has only slightly greater LSRs and MARs but also at least two major hiatuses that truncate the sedimentation history.
It is also worth comparing LSRs at Site U1511 with those at Site 283, the previous sole drilling location in abyssal depths of the Tasman Sea (see Background and objectives). At Site 283, LSRs were ~28 m/My during the middle Paleocene through middle Eocene (60–40 Ma) and ~1 m/My from the Oligocene to present. Either late Cenozoic sedimentation was very different at the two locations or late Cenozoic stratigraphy needs revision at one or both sites.
References
Baker, P.A., 1986. Pore-water chemistry of carbonate-rich sediments, Lord Howe Rise, Southwest Pacific Ocean. In Kennett, J.P., von der Borch, C.C., et al., Initial Reports of the Deep Sea Drilling Project, 90: Washington, DC (U.S. Government Printing Office), 1249–1256. https://doi.org/10.2973/dsdp.proc.90.132.1986
Bohaty, S.M., and Zachos, J.C., 2003. Significant Southern Ocean warming event in the late middle Eocene. Geology, 31(11):1017–1020. https://doi.org/10.1130/G19800.1
Bohaty, S.M., Zachos, J.C., Florindo, F., and Delaney, M.L., 2009. Coupled greenhouse warming and deep-sea acidification in the middle Eocene. Paleoceanography, 24(2):PA2207. https://doi.org/10.1029/2008PA001676
Bostock, H.C., Hayward, B.W., Neil, H.L., Currie, K.I., and Dunbar, G.B., 2011. Deep-water carbonate concentrations in the southwest Pacific. Deep-Sea Research, Part I: Oceanographic Research Papers, 58(1):72–85. https://doi.org/10.1016/j.dsr.2010.11.010
Dallanave, E., Agnini, C., Bachtadse, V., Muttoni, G., Crampton, J.S., Strong, C.P., Hines, B.R., Hollis, C.J., and Slotnick, B.S., 2015. Early to middle Eocene magneto-biochronology of the southwest Pacific Ocean and climate influence on sedimentation: insights from the Mead Stream section, New Zealand. Geological Society of America Bulletin, 127(5–6):643–660. https://doi.org/10.1130/B31147.1
Edgar, K.M., Wilson, P.A., Sexton, P.F., and Suganuma, Y., 2007. No extreme bipolar glaciation during the main Eocene calcite compensation shift. Nature, 448(7156):908–911. https://doi.org/10.1038/nature06053
Gaina, C., Müller, D.R., Royer, J.-Y., Stock, J., Hardebeck, J., and Symonds, P., 1998. The tectonic history of the Tasman Sea: a puzzle with 13 pieces. Journal of Geophysical Research: Solid Earth, 103(B6):12413–12433. https://doi.org/10.1029/98JB00386
Kaminski, M.A., and Gradstein, F.M., 2005. Atlas of Paleogene cosmopolitan deep-water agglutinated foraminifera. Grzybowski Foundation Special Publication, 10. http://www.foraminifera.eu/atlas.html
Kennett, J.P., and Srinivasan, M.S., 1983. Neogene Planktonic Foraminifera: A Phylogenetic Atlas: Stroudsburg, PA (Hutchinson Ross).
Kirschvink, J.L., 1980. The least-squares line and plane and the analysis of palaeomagnetic data. Geophysical Journal of the Royal Astronomical Society, 62(3):699–718. https://doi.org/10.1111/j.1365-246X.1980.tb02601.x
Korff, L., von Dobeneck, T., Frederichs, T., Kasten, S., Kuhn, G., Gersonde, R., and Diekmann, B., 2016. Cyclic magnetite dissolution in Pleistocene sediments of the abyssal northwest Pacific Ocean: evidence for glacial oxygen depletion and carbon trapping. Paleoceanography and Paleoclimatology, 31(5):600–624. https://doi.org/10.1002/2015PA002882
Margolis, S.V., 1975. Manganese deposits encountered during Deep Sea Drilling Project, Leg 29, in subantarctic waters. In Kennett, J.P., Houtz, R.E., et al., Initial Reports of the Deep Sea Drilling Project, 29: Washington, DC (U.S. Government Printing Office), 1083–1091. https://doi.org/10.2973/dsdp.proc.29.135.1975
McDuff, R.E., 1981. Major cation gradients in DSDP interstitial waters: the role of diffusive exchange between seawater and upper oceanic crust. Geochimica et Cosmochimica Acta, 45(10):1705–1713. https://doi.org/10.1016/0016-7037(81)90005-3
McFadden, P.L., and Reid, A.B., 1982. Analysis of paleomagnetic inclination data. Geophysical Journal of the Royal Astronomical Society, 69(2):307–319. https://doi.org/10.1111/j.1365-246X.1982.tb04950.x
Pascher, K.M., Hollis, C.J., Bohaty, S.M., Cortese, G., McKay, R.M., Seebeck, H., Suzuki, N., and Chiba, K., 2015. Expansion and diversification of high-latitude radiolarian assemblages in the late Eocene linked to a cooling event in the southwest Pacific. Climate of the Past, 11(12):1599–1620. https://doi.org/10.5194/cp-11-1599-2015
Shipboard Scientific Party, 1992. Site 851. In Mayer, L., Pisias, N., Janecek, T., et al., Proceedings of the Ocean Drilling Program, Initial Reports, 138: College Station, TX (Ocean Drilling Program), 891–965. https://doi.org/10.2973/odp.proc.ir.138.116.1992
Shipboard Scientific Party, 2003. Site 1226. In D’Hondt, S.L., Jørgensen, B.B., Miller, D.J., et al., Proceedings of the Ocean Drilling Program, Initial Reports, 201: College Station, TX (Ocean Drilling Program), 1–96. https://doi.org/10.2973/odp.proc.ir.201.107.2003
Sutherland, R., 1999. Basement geology and tectonic development of the greater New Zealand region: an interpretation from regional magnetic data. Tectonophysics, 308(3):341–362. https://doi.org/10.1016/S0040-1951(99)00108-0
Sutherland, R., Collot, J., Bache, F., Henrys, S., Barker, D., Browne, G., Lawrence, M., Morgans, H., Hollis, C., and Clowes, C., 2017. Widespread compression associated with Eocene Tonga-Kermadec subduction initiation. Geology, 45(4)3255–358. https://doi.org/10.1130/G38617.1
Sutherland, R., Dickens, G.R., Blum, P., Agnini, C., Alegret, L., Asatryan, G., Bhattacharya, J., Bordenave, A., Chang, L., Collot, J., Cramwinckel, M.J., Dallanave, E., Drake, M.K., Etienne, S.J.G., Giorgioni, M., Gurnis, M., Harper, D.T., Huang, H.-H.M., Keller, A.L., Lam, A.R., Li, H., Matsui, H., Morgans, H.E.G., Newsam, C., Park, Y.-H., Pascher, K.M., Pekar, S.F., Penman, D.E., Saito, S., Stratford, W.R., Westerhold, T., and Zhou, X., 2019a. Expedition 371 methods. In Sutherland, R., Dickens, G.R., Blum, P., and the Expedition 371 Scientists, Tasman Frontier Subduction Initiation and Paleogene Climate. Proceedings of the International Ocean Discovery Program, 371: College Station, TX (International Ocean Discovery Program). https://doi.org/10.14379/iodp.proc.371.102.2019
Sutherland, R., Dickens, G.R., Blum, P., Agnini, C., Alegret, L., Asatryan, G., Bhattacharya, J., Bordenave, A., Chang, L., Collot, J., Cramwinckel, M.J., Dallanave, E., Drake, M.K., Etienne, S.J.G., Giorgioni, M., Gurnis, M., Harper, D.T., Huang, H.-H.M., Keller, A.L., Lam, A.R., Li, H., Matsui, H., Morgans, H.E.G., Newsam, C., Park, Y.-H., Pascher, K.M., Pekar, S.F., Penman, D.E., Saito, S., Stratford, W.R., Westerhold, T., and Zhou, X., 2019b. Site U1508. In Sutherland, R., Dickens, G.R., Blum, P., and the Expedition 371 Scientists, Tasman Frontier Subduction Initiation and Paleogene Climate. Proceedings of the International Ocean Discovery Program, 371: College Station, TX (International Ocean Discovery Program). https://doi.org/10.14379/iodp.proc.371.105.2019
Sutherland, R., Dickens, G.R., Blum, P., Agnini, C., Alegret, L., Bhattacharya, J., Bordenave, A., Chang, L., Collot, J., Cramwinckel, M.J., Dallanave, E., Drake, M.K., Etienne, S.J.G., Giorgioni, M., Gurnis, M., Harper, D.T., Huang, H.-H.M., Keller, A.L., Lam, A.R., Li, H., Matsui, H., Morgans, H.E.G., Newsam, C., Park, Y.-H., Pascher, K.M., Pekar, S.F., Penman, D.E., Saito, S., Stratford, W.R., Westerhold, T., and Zhou, X., 2019c. Site U1509. In Sutherland, R., Dickens, G.R., Blum, P., and the Expedition 371 Scientists, Tasman Frontier Subduction Initiation and Paleogene Climate. Proceedings of the International Ocean Discovery Program, 371: College Station, TX (International Ocean Discovery Program). https://doi.org/10.14379/iodp.proc.371.106.2019
The Shipboard Scientific Party, 1975. Site 283. With contributions by P.N. Webb and G. Wilson. In Kennett, J.P., Houtz, R.E., et al., Initial Reports of the Deep Sea Drilling Project, 29: Washington, DC (U.S. Government Printing Office), 365–402. https://doi.org/10.2973/dsdp.proc.29.110.1975
Webb, P.N. 1983. Paleocene foraminifera from DSDP Site 283, South Tasman Basin. In Kennett, J.P., Houtz, R.E., et al., Initial Reports of the Deep Sea Drilling Project, 21: Washington, DC (U.S. Government Printing Office), 541–573. https://doi.org/10.2973/dsdp.proc.29.122.1975
Zachos, J.C., Dickens, G.R., and Zeebe, R.E., 2008. An early Cenozoic perspective on greenhouse warming and carbon-cycle dynamics. Nature, 451(7176):279–283. https://doi.org/10.1038/nature06588
1 Sutherland, R., Dickens, G.R., Blum, P., Agnini, C., Alegret, L., Bhattacharya, J., Bordenave, A., Chang, L., Collot, J., Cramwinckel, M.J., Dallanave, E., Drake, M.K., Etienne, S.J.G., Giorgioni, M., Gurnis, M., Harper, D.T., Huang, H.-H.M., Keller, A.L., Lam, A.R., Li, H., Matsui, H., Morgans, H.E.G., Newsam, C., Park, Y.-H., Pascher, K.M., Pekar, S.F., Penman, D.E., Saito, S., Stratford, W.R., Westerhold, T., Zhou, X., 2019. Site U1511. In Sutherland, R., Dickens, G.R., Blum, P., and the Expedition 371 Scientists, Tasman Frontier Subduction Initiation and Paleogene Climate. Proceedings of the International Ocean Discovery Program, 371: College Station, TX (International Ocean Discovery Program). https://doi.org/10.14379/iodp.proc.371.108.2019
2 Expedition 371 Scientists’ affiliations.
This work is distributed under the Creative Commons Attribution 4.0 International (CC BY 4.0) license. 
- F1. Regional bathymetry and boreholes.
- F2. Bathymetry and seismic reflection lines.
- F3. Seismic reflection dip Line TAN1409_TASS_01.
- F4. Seismic reflection strike Line TAN1409_TASS_08.
- F5. Lithostratigraphic summary of sedimentary section.
- F6. Major biogenic and lithologic constituent abundances.
- F7. Common Unit I lithologies.
- F8. Estimated abundance variation of major minerals.
- F9. Several authigenic features.
- F10. Representative Unit I lithologies.
- F11. Common Unit II lithologies.
- F12. Representative Unit II lithologies.
- F13. Common Unit III lithologies.
- F14. Representative Unit III lithologies.
- F15. Handheld XRF analysis from Units II and III.
- F16. Microfossil preservation and abundance.
- F17. Radiolarian biozones and dominant microfossil groups.
- F18. Pass-through paleomagnetic data.
- F19. Pass-through paleomagnetic inclination and ChRM directions.
- F20. Remanence intensity and inclination.
- F21. Vector endpoint demagnetization diagrams.
- F22. AMS data for 57 discrete samples.
- F23. Pass-through paleomagnetic inclination data.
- F24. Bulk density, grain density, porosity, and P-wave velocity.
- F25. Magnetic susceptibility, NGR, and L*, a*, b*.
- F26. Squeeze and Rhizon IW chemistry.
- F27. Bulk sediment profiles.
- F28. Dissolved Ca vs. Mg in IW.
- F29. Paleomagnetic, biostratigraphic, MSL, NGR, and L* data.
- F30. SRM inclination data.
- F31. Sedimentation accumulation.
- T1. Core summary.
- T2. Lithostratigraphic units.
- T3. Microfossil datums and chrons used to construct age model.
- T4. Nannofossil distribution and occurrence data.
- T5. Planktic foraminifer distribution and occurrence data.
- T6. Benthic foraminifer distribution and abundance data.
- T7. Radiolarian distribution data.
- T8. Magnetostratigraphic tie points.
- T9. Interstitial water chemistry.
- T10. Bulk sediment geochemistry.