McKay, R.M., De Santis, L., Kulhanek, D.K., and the Expedition 374 Scientists
Proceedings of the International Ocean Discovery Program Volume 374
publications.iodp.org

https://doi.org/10.14379/iodp.proc.374.106.2019
Site U15241
R.M. McKay, L. De Santis, D.K. Kulhanek, J.L. Ash, F. Beny, I.M. Browne, G. Cortese, I.M. Cordeiro de Sousa, J.P. Dodd, O.M. Esper, J.A. Gales, D.M. Harwood, S. Ishino, B.A. Keisling, S. Kim, S. Kim, J.S. Laberg, R.M. Leckie, J. Müller, M.O. Patterson, B.W. Romans, O.E. Romero, F. Sangiorgi, O. Seki, A.E. Shevenell, S.M. Singh, S.T. Sugisaki, T. van de Flierdt, T.E. van Peer, W. Xiao, and Z. Xiong2
Keywords: International Ocean Discovery Program, IODP, JOIDES Resolution, Expedition 374, Site U1524, Ross Sea, West Antarctic, ice sheet history, sea ice, Miocene, Pliocene, Quaternary, Antarctic Bottom Water, Antarctic water masses, turbidites, contourites, glaciomarine sediments, subglacial sediments, ice-rafted debris, paleobathymetry, seismic stratigraphy, paleoclimate, paleoceanography
MS 374-106: Published 10 August 2019
Background and objectives
International Ocean Discovery Program (IODP) Site U1524 is located on the continental rise at 74°13.05′S, 173°37.98′W in 2394 m of water on the eastern levee of the Hillary Canyon (Figure F1). The levee at this site has a relief of ~500 m and is located ~120 km north of the Ross Sea continental shelf edge. The head of the Hillary Canyon system is located at the mouths of the Pennell and Glomar Challenger Basins. The Hillary Canyon is one of the largest conduits for newly formed Ross Sea Bottom Water (RSBW; a type of Antarctic Bottom Water [AABW]), which is focused in this channel by cascading dense water formed on the Ross Sea continental shelf passing down the continental rise (Bergamasco et al., 2002). The site also lies beneath the modern-day westward-flowing Antarctic Slope Current (ASC). The targeted sediments are interpreted from seismic-reflection profiles to be channel overspill and drift deposits characterized by stratified, parallel, high- to medium-amplitude seismic reflectors (Figure F2). High-resolution seismic-reflection Profiles TAN0602_08 and IT17RS-303B (Figures F2, F3) show that the overall units (~1500 m thick) are finely stratified down to the acoustic basement at 4.6 s two-way traveltime (TWT). Reflectors spaced ~10–20 ms apart are subparallel, laterally continuous, and subhorizontal in both the southwest–northeast and southeast–northwest directions. Below an angular unconformity (Ross Sea Unconformity [RSU] 3; 3.7 s TWT), seismic reflectors are undulated and show lateral changes in thickness. The lowermost strata downlap and onlap against the irregular surface of the acoustic basement.
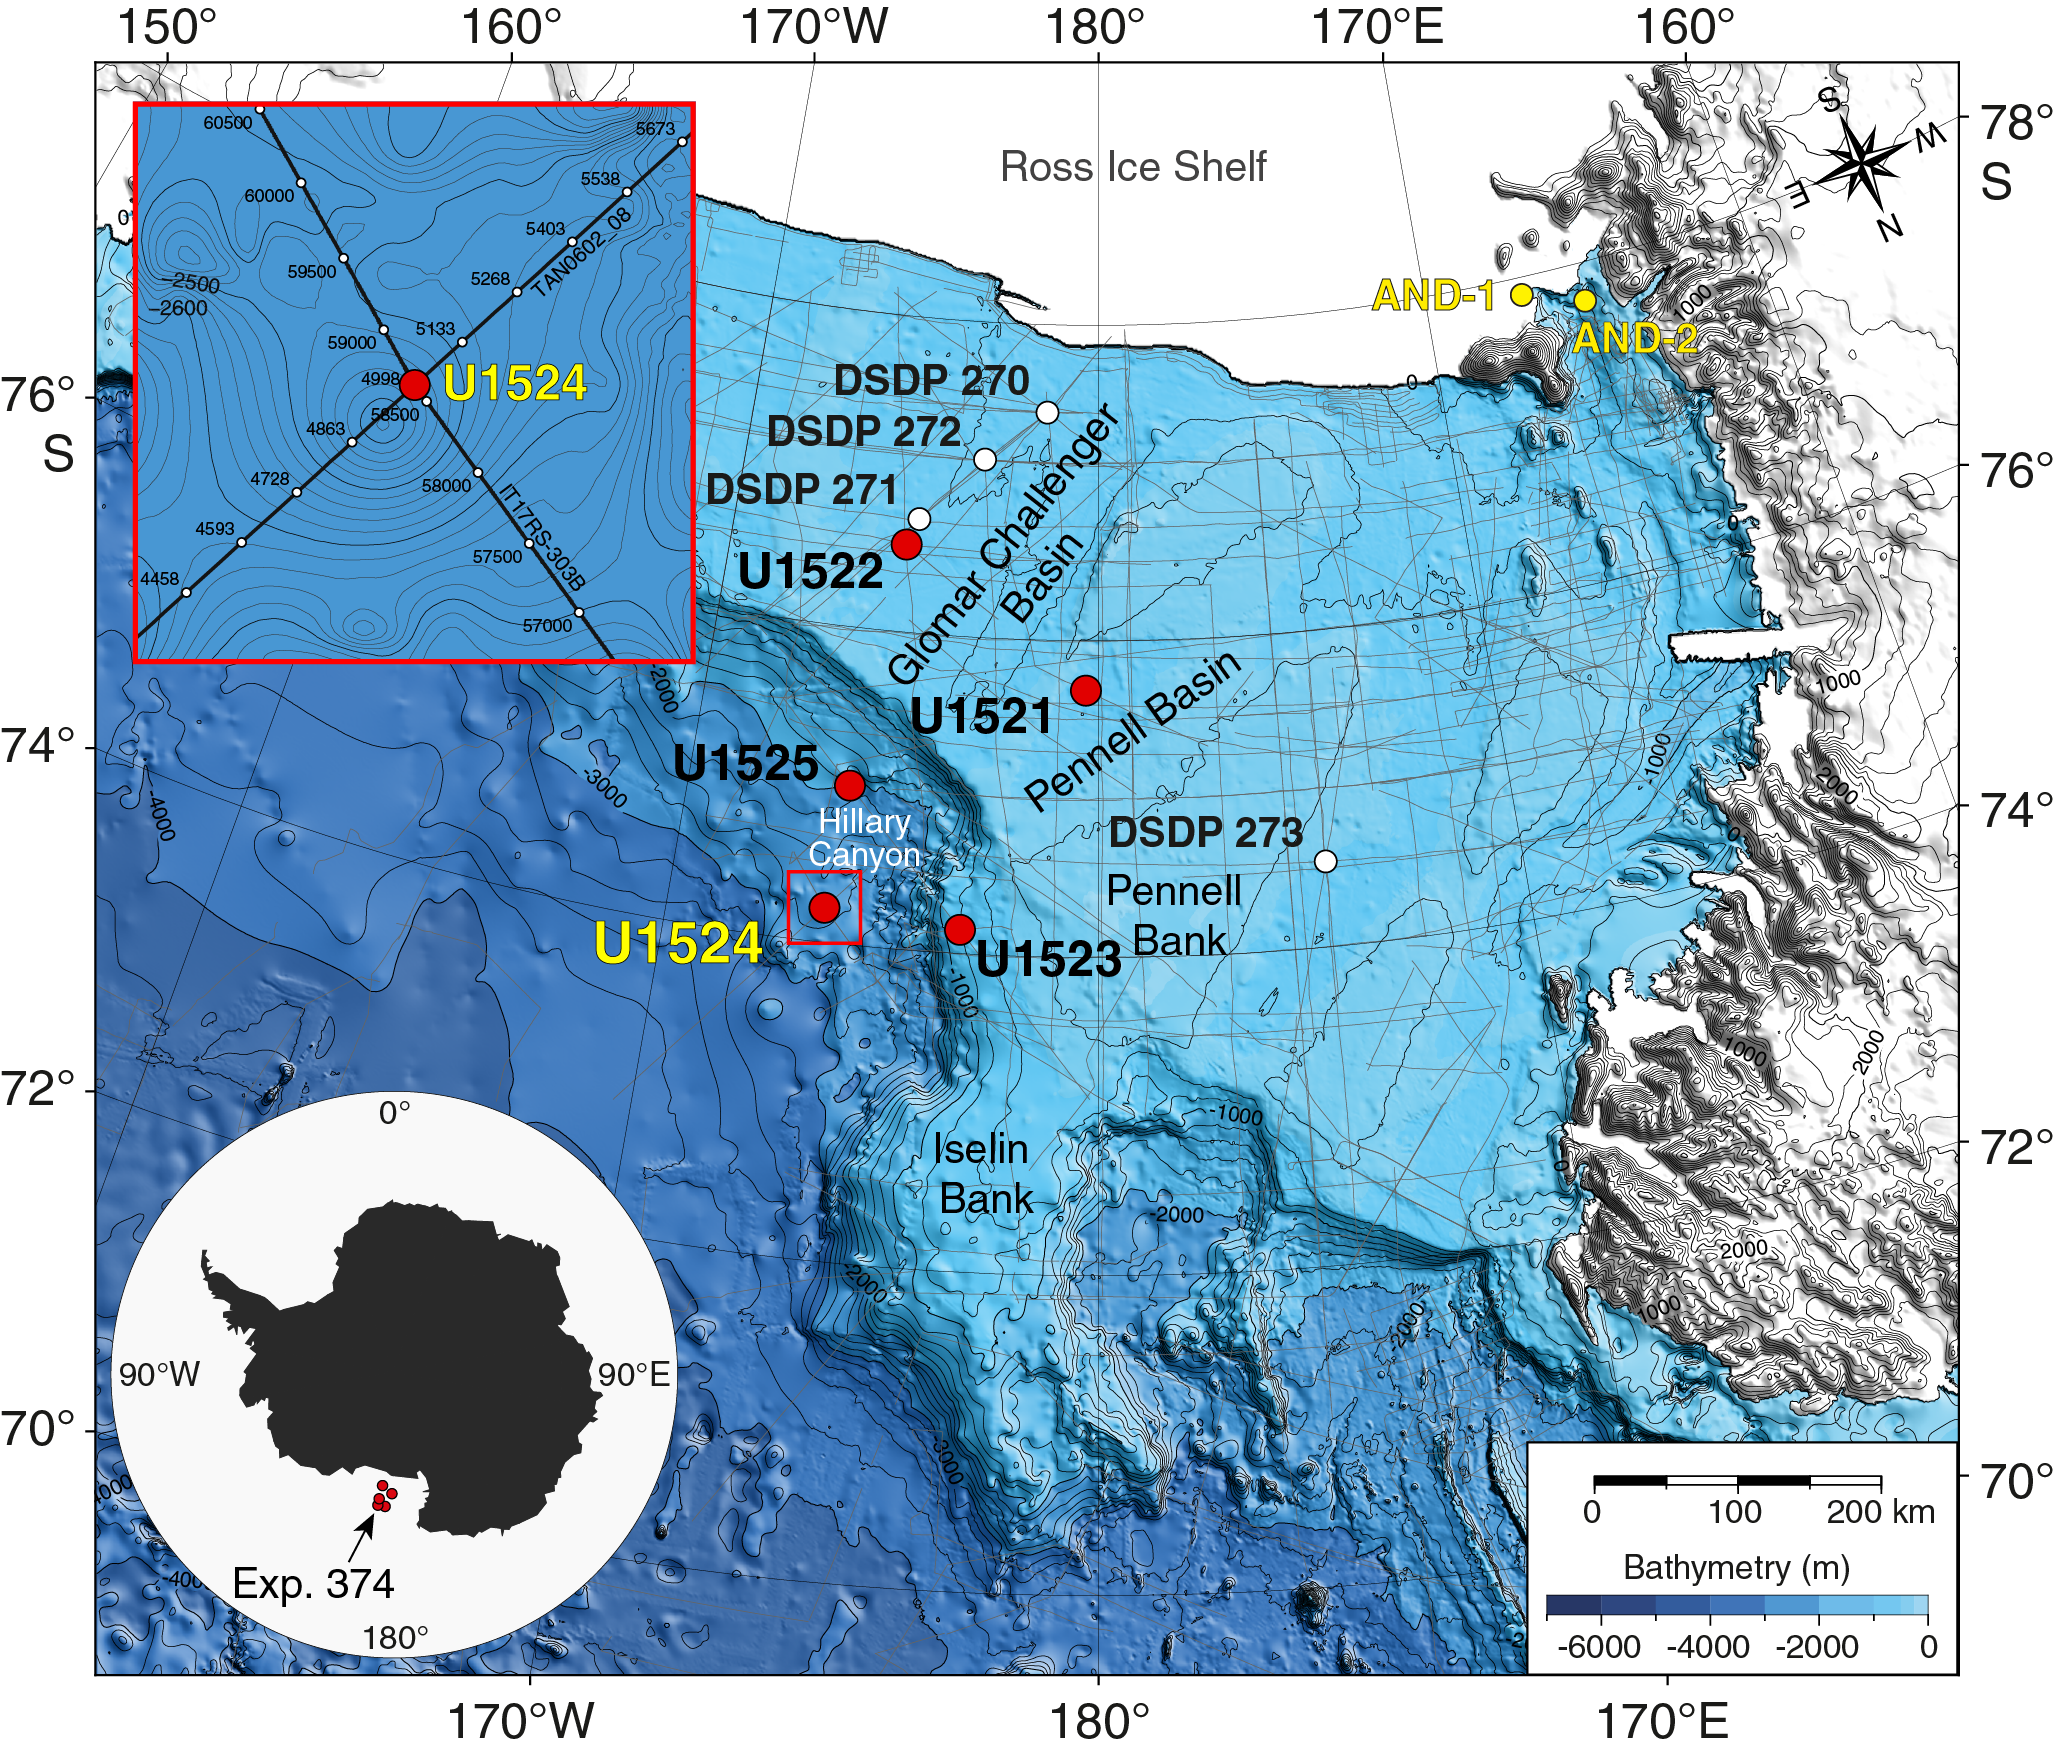
Figure F1. Bathymetric map and site locations.
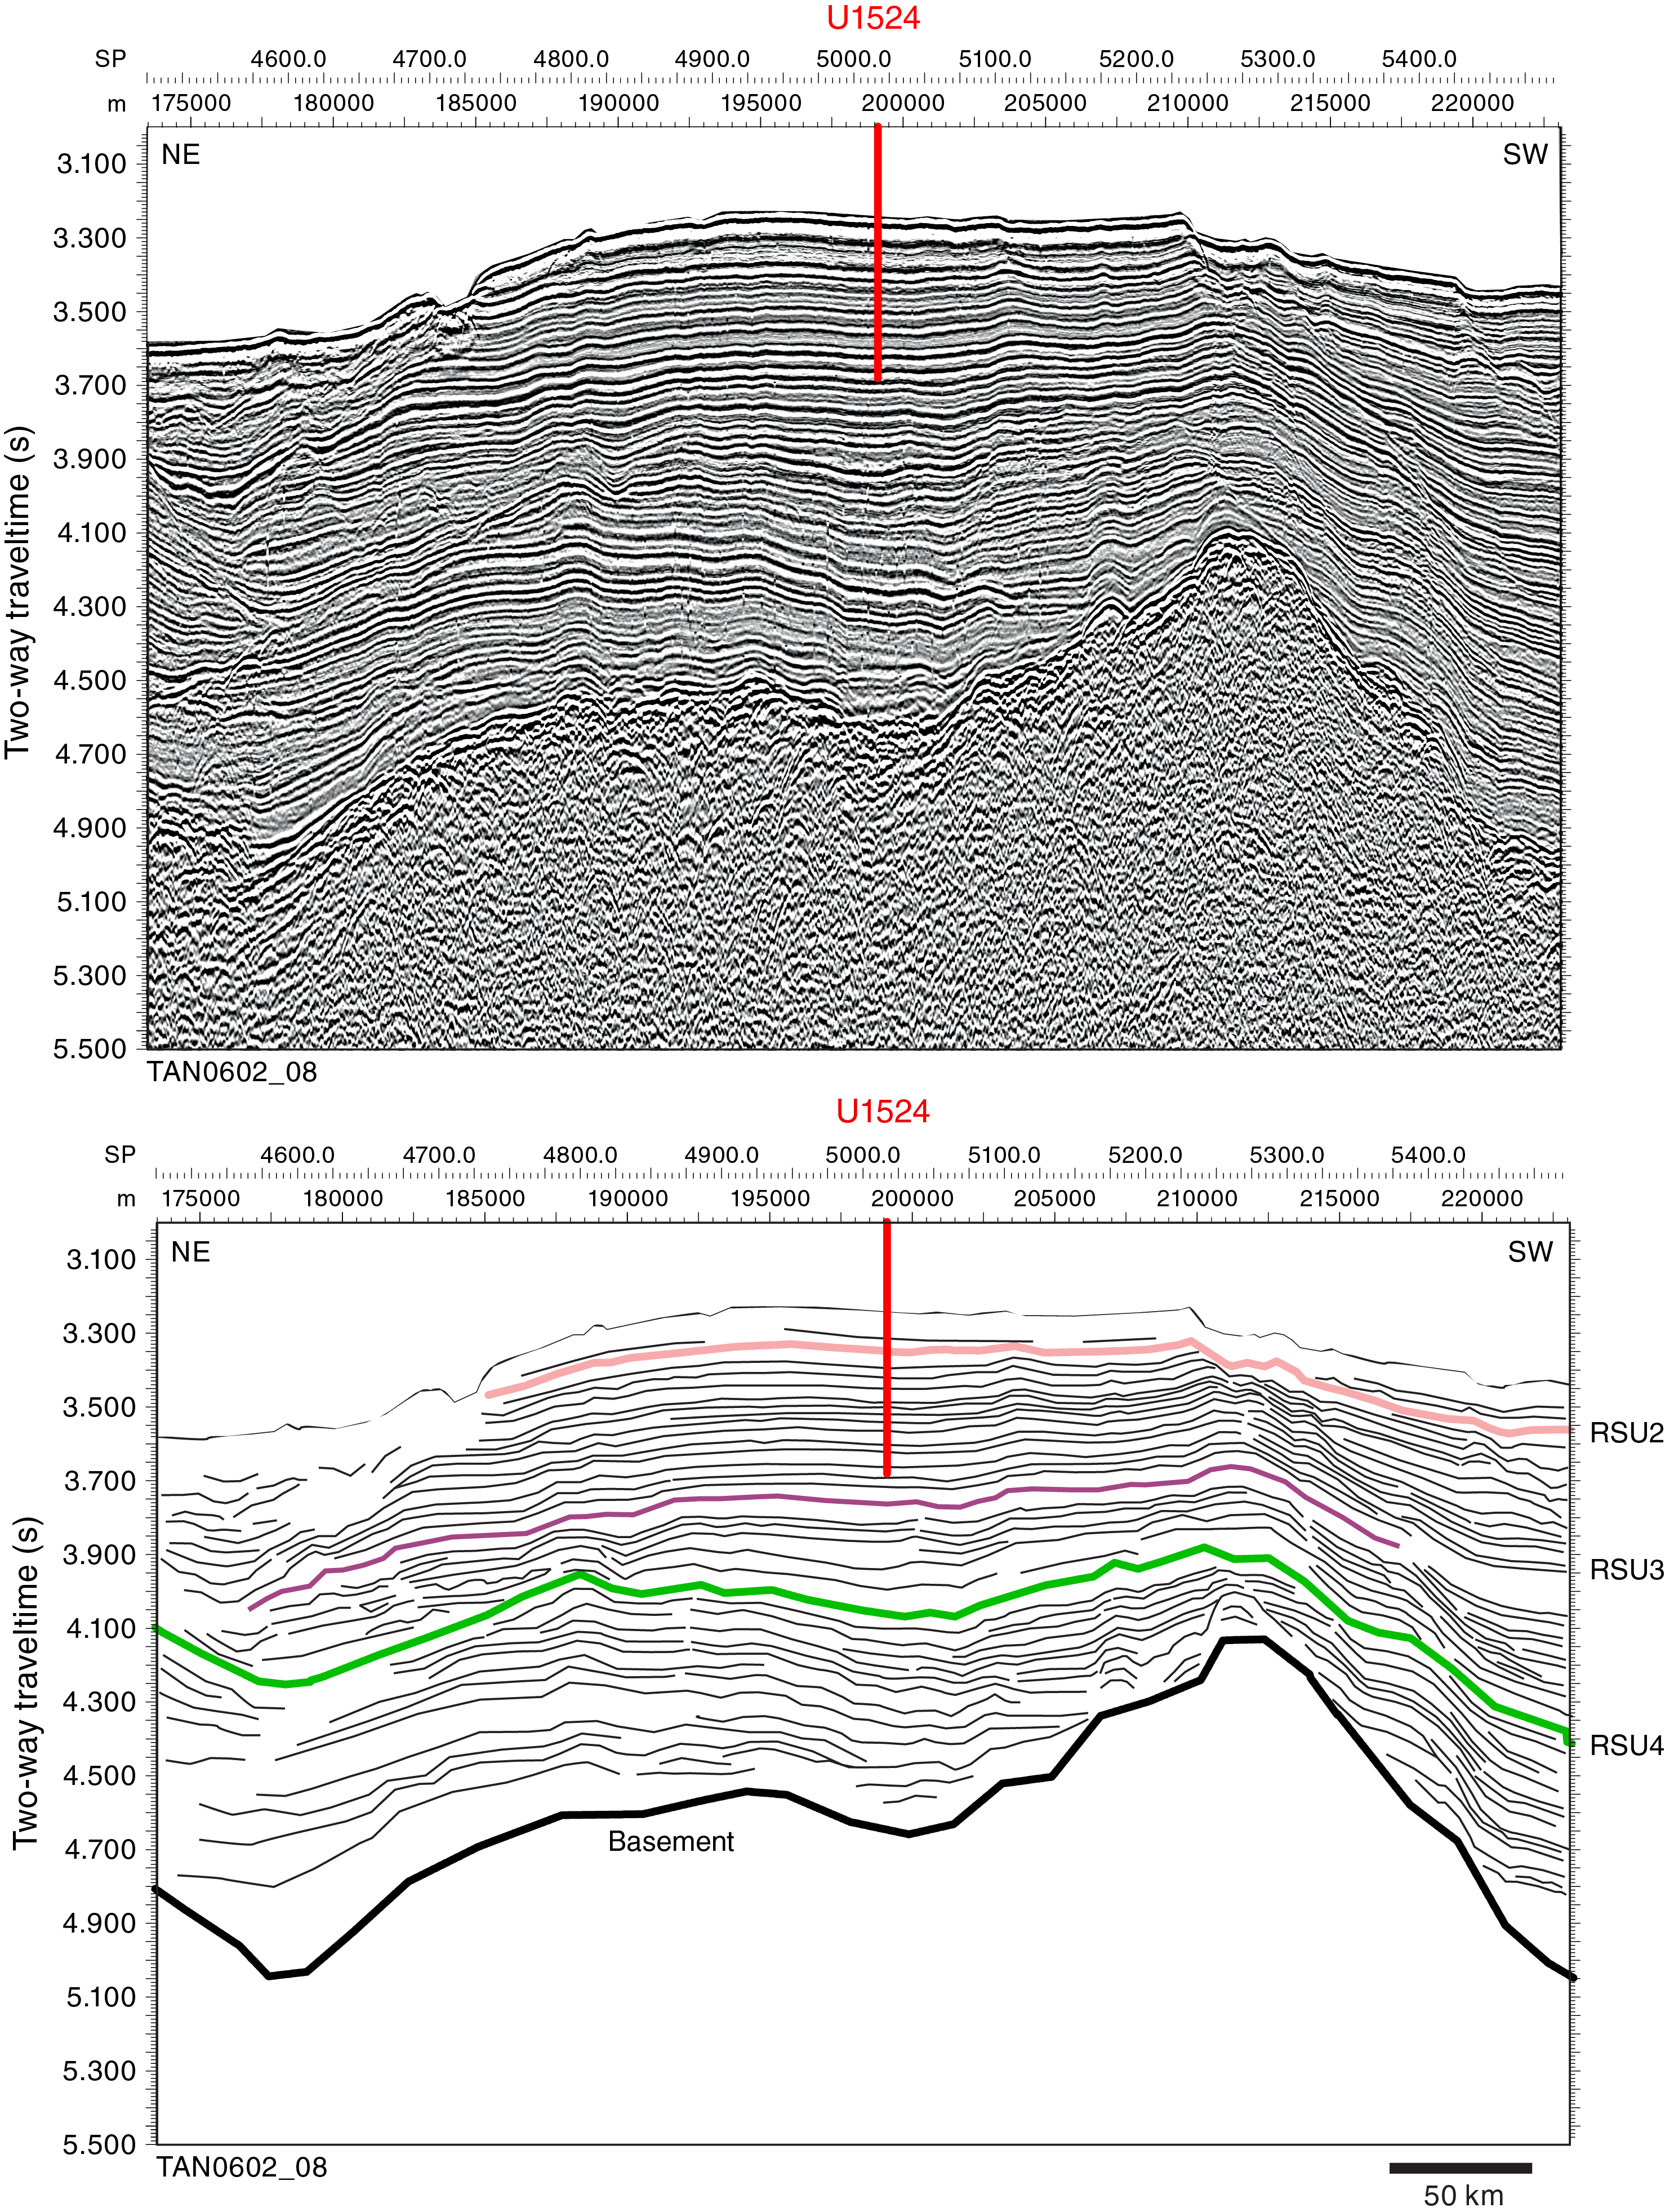
Figure F2. Seismic-reflection Profile TAN0602_08.
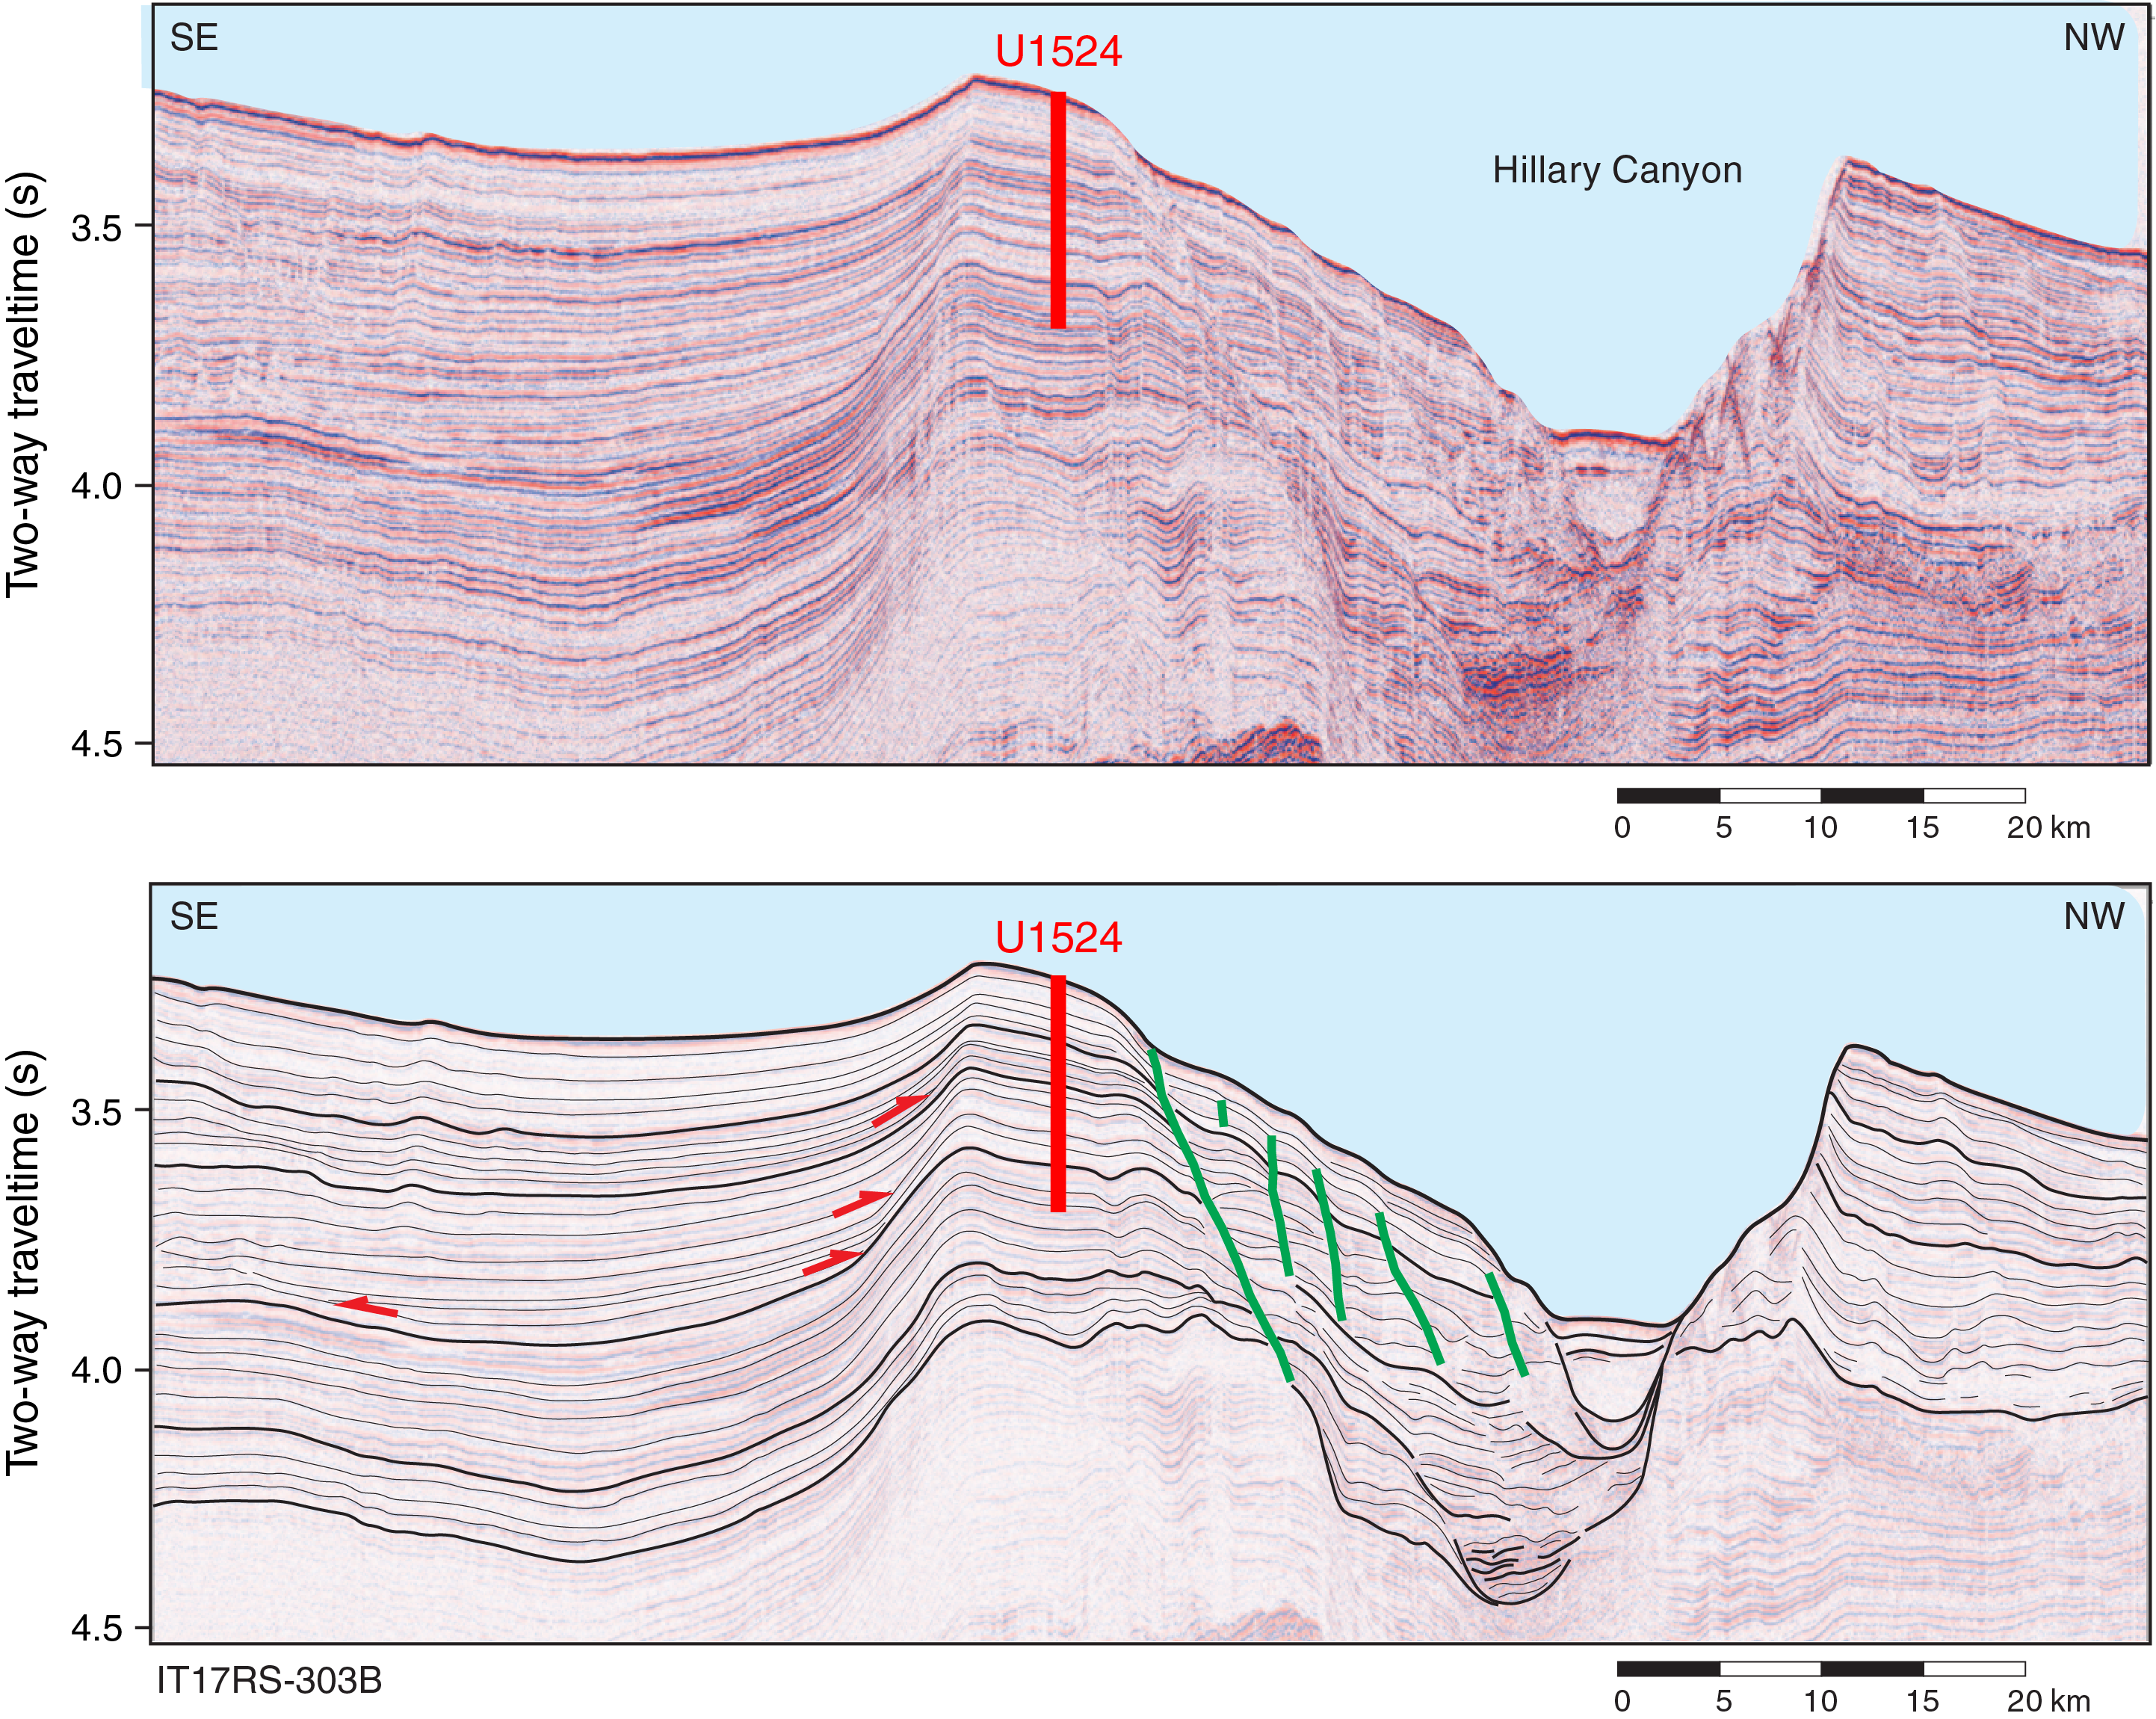
Figure F3. Seismic-reflection Profile IT17RS-303B.
The primary objectives at Site U1524 were to obtain a near-continuous sediment sequence bounding RSU3 to provide a high-resolution, ice-distal record of glacial–interglacial cycles. The continental rise location of this site should allow for development of a more complete assessment of oceanic forcings for (and response to) Antarctic Ice Sheet variability than is possible from the continental shelf strata. The record of deposition at Site U1524 was anticipated to be primarily influenced by RSBW flowing down the Hillary Canyon but also by an along-slope component associated with the westward-flowing ASC. Consequently, this site will enable assessment of the ocean influence on ice sheet variability and bottom water production (Objective 2 in Scientific objectives in the Expedition 374 summary chapter [McKay et al., 2019b]). The direct record of AABW flow down the Hillary Canyon obtained at Site U1524 could potentially be extrapolated to high-fidelity paleoceanographic records farther afield in the abyssal Pacific Ocean to better constrain the Antarctic influences on global deep ocean circulation. The Hillary Canyon is also a main route for glacial sediments being eroded and transported by ice streams from the innermost continental shelf to its edge, and provenance studies of the terrigenous sediment may allow for identification of changing ice sheet drainage pathways through the Neogene and Quaternary. Site U1524, near the crest of the levee of the Hillary Canyon, will also provide a high-resolution record for documenting the deep-sea response to ice sheet change on the continental shelf, which is recorded in the Ross Sea inner continental shelf (Antarctic Geological Drilling Project [ANDRILL] Site AND-1B; Naish et al., 2009) and outer continental shelf (Site U1522). Ice-rafted debris could be sourced by icebergs calving from the Ross Sea or transported from the east by the ASC and provides a proxy for dynamic ice discharge from the Pacific coastline sector of the West Antarctic Ice Sheet (WAIS). Pelagic deposits from periods of high productivity or a lull in turbidity current overspill deposition will provide a proxy record of surface water properties, including sea ice cover, sea-surface temperature, stratification, and salinity. This proxy record will enable an assessment of the magnitude of polar amplification during past warm climates (Objective 2) and the role of oceanic forcing on driving ice sheet retreat or advance at these times (Objective 3). In addition, continuous deposition, anticipated at this site through much of the late Neogene and Quaternary, will allow assessment of the orbital response of the WAIS and adjacent oceanic/biological system over a range of past climatic conditions (Objective 4).
Operations
Site U1524 (proposed Site RSCR-10A) is an alternate for primary proposed Site RSCR-02B. We decided to occupy the alternate site because the highest priority target is shallower, the seismic facies show less evidence for transported sediment, and the sea ice edge was farther away. The original plan called for three holes, one cored to refusal with the advanced piston corer (APC) system followed by an APC/extended core barrel (XCB) hole to 350 m drilling depth below seafloor (DSF). The third hole was to be cored to 1000 m DSF with the rotary core barrel (RCB) system and then logged with three tool strings. We ultimately cored three holes (Table T1). Hole U1524A was cored with the APC/XCB system to 299.5 m DSF. Hole U1524B consisted of a single mudline core collected for high-resolution sampling. Hole U1524C was an RCB hole cored to 441.9 m DSF.
Hole U1524A was cored to APC refusal at 270.3 m DSF. We then deployed the half-length APC (HLAPC) system; however, the first core advanced only 0.4 m to 270.7 m DSF, indicating HLAPC refusal. We deployed the XCB system and cored to 299.5 m DSF. Each XCB core returned with a shattered liner and highly disturbed sediment. At that point, we terminated coring to pull out of the hole due to approaching sea ice. After pulling out of the hole, enough time remained to collect a single mudline core (Hole U1524B) for high-resolution interstitial water and microbiological studies. After terminating coring in Hole U1524B, we retrieved the drill string and departed Site U1524 at 2030 h on 6 February 2018. With sea ice estimated to remain over Site U1524 for at least 2 days, we opted to occupy Site U1525 (proposed Site RSCR-03A), located only 47 nmi away but in a position south of the sea ice edge. After ice monitoring determined that the sea ice was moving away from Site U1524, we ended operations at Site U1525 at 0535 h on 9 February to return to Site U1524.
After arriving back at Site U1524 at 1006 h on 9 February, we prepared for RCB coring operations in Hole U1524C. While deploying the drill string, we lowered the subsea camera to retrieve the acoustic positioning beacon, which had failed to release when the site was abandoned. After retrieving the beacon, Hole U1524C was drilled without coring to 260.5 m DSF and then RCB cored to 441.9 m DSF. We were forced to terminate operations at this time because of a mechanical breakdown of the port stern tube shaft and arrangement, which ended Expedition 374 science operations. The rig floor was secured for transit at 1835 h on 11 February, ending Site U1524 and Expedition 374 coring operations. Total time spent at Site U1524 was 117.25 h (4.9 days).
We collected 54 cores at Site U1524. The APC system was deployed 31 times, collecting 284.17 m of core (102%). The HLAPC system was deployed once, recovering 0.43 m of core (108%). The XCB system collected 5.51 m over three cores (19%). The RCB system was used 19 times, collecting 19.2 m of core (11%) (Table T1).
Transit to Site U1524
The 52 nmi transit to Site U1524 was completed in 4.7 h at an average speed of 11.1 kt. The vessel arrived at Site U1524 at 1027 h (all times are local ship time; UTC + 13 h) on 4 February 2018. The thrusters were lowered and secured at 1044 h, clearing the drill floor for operations. The acoustic positioning beacon was deployed at 1100 h.
Hole U1524A
Operations for Hole U1524A began by picking up an APC/XCB bottom-hole assembly (BHA) and lowering it toward the seafloor. Because this site was in deeper water than the previous sites, some of the drill pipe was drifted (checked to ensure that the interior was clear) and strapped (measured) while being deployed. After positioning the drill string with the bit at 2400 m drilling depth below rig floor (DRF) based on the precision depth recorder depth for the site, we installed the Icefield MI-5 core orientation tool with sinker bars. We then deployed a nonmagnetic APC core barrel and started Hole U1524A at 2025 h on 4 February 2018. Core 374-U1524A-1H recovered 4.02 m of core, indicating a seafloor depth of 2394 meters below sea level (mbsl).
Oriented APC coring continued through Core 374-U1524A-30H (270.3 m DSF). After Core 30H recorded a partial stroke, indicating piston core refusal, we removed the Icefield MI-5 core orientation tool and switched to the HLAPC system to collect Core 31F. This core also recorded a partial stroke and recovered only 0.4 m of sediment. We then switched to the XCB coring system and cut Cores 32X through 34X to 299.5 m DSF; all XCB core liners were shattered upon recovery, resulting in highly disturbed sediment. We suspect that the XCB liners were shattering at a high rate because of extremely cold sea-surface temperatures (−1.5° to −2.0°C) coupled with the small gap between the core liner and core barrel, which allows vibration of the core liner. After collecting Core 34X, we had to terminate coring and pull out of the hole because of approaching sea ice. After pulling the bit up to 249.5 m DSF, we set back the top drive and continued to pull out of the hole, clearing the seafloor at 0950 h on 6 February and ending Hole U1524A. We attempted to retrieve the acoustic positioning beacon while pulling out of the hole, but it would not release. Total time spent in Hole U1524A was 47.0 h (2.0 days).
Overall recovery in Hole U1524A was 282.35 m (94%). The APC coring system was deployed 30 times, recovering 276.41 m of core over 270.3 m of coring (102%). The HLAPC coring system was deployed once, recovering 0.43 m of core over a 0.4 m advance (108%). The XCB coring system was deployed 3 times, recovering 5.51 m of core over 28.8 m of coring (19%) (Table T1).
Hole U1524B
With ~1.5 h of time left before the arrival of sea ice, we decided to collect a single mudline core for high-resolution interstitial water and microbiological studies. We moved the vessel 20 m east of Hole U1524A and started Hole U1524B at 1155 h on 6 February 2018. Core 374-U1524B-1H recovered 7.76 m of sediment, establishing a seafloor depth of 2394 mbsl. We terminated Hole U1524B because the sea ice continued to approach. We began to retrieve the drill string back to the ship, and the dynamic positioning system was engaged at 1215 h to move away from the ice while we continued to retrieve the drill string. The drill collar stands were secured in the derrick, and the BHA components were disassembled and inspected. After the bit cleared the rig floor, the remaining rig floor equipment was secured at 2030 h on 6 February, ending Hole U1524B. A total of 10.75 h (0.4 days) was spent at Site U1524B.
A single APC core collected 7.76 m of core over a 7.7 m advance (101%) (Table T1).
Transit to Site U1525 and return to Site U1524
After abandoning Site U1524 because of encroaching sea ice, we departed for Site U1525 at 2030 h on 6 February 2018. We decided to go to this alternate site because it was close to Site U1524 (47 nmi) but outside the sea ice edge and RSU3 (primary objective at Site U1524) is located at a shallower depth. After a 50 nmi transit (including a small deviation in course to navigate around sea ice) averaging 8.9 kt, we arrived at Site U1525 at 0200 h on 7 February 2018. Operations continued at Site U1525 (see Operations in the Site U1525 chapter [McKay et al., 2019d]) until ice conditions were forecast to improve at Site U1524. We then terminated coring at Site U1525, with operations ending at 0535 h on 9 February. The transit back to Site U1524 covered 47 nmi in 4.4 h at an average speed of 10.7 kt. We arrived back at Site U1524 at 1006 h on 9 February, and the vessel was positioned over the acoustic positioning beacon we had left there.
Hole U1524C
We elected to proceed directly to RCB coring for Hole U1524C to obtain the higher priority, deeper stratigraphic section below RSU3, with the intention to APC/XCB core a fourth hole to recover the softer lithologies above RSU3 that were not recovered in Hole U1524A because encroaching sea ice forced earlier abandonment of that hole. We also intended to conduct real-time stratigraphic correlation while coring to recover core gaps present between cores in Hole U1524A. We prepared an RCB BHA and lowered the drill string toward the seafloor. After the drill bit reached 1766 m DRF, we deployed the subsea camera to recover the seafloor acoustic positioning beacon because it had failed to release when we previously abandoned the site. We lowered the drill string to near the seafloor, maneuvered the vessel to the beacon, and captured it with a grapple hanging from the camera frame. We recovered the subsea camera to the ship, with the beacon arriving on deck at 1915 h on 9 February 2018. After securing the subsea camera, we continued to prepare for drilling operations. We dropped an RCB core barrel with center bit and started Hole U1524C at 2110 h on 9 February. The hole was advanced by drilling without coring to 260.5 m DSF. A 30 bbl high-viscosity mud sweep was pumped at the end of the drilled interval, and the RCB core barrel with the center bit was retrieved. We started RCB coring and cut Cores 374-U1524C-2R through 20R (260.5–441.9 m DSF). At 0915 h on 11 February, coring operations for the remainder of the expedition were terminated because of a mechanical breakdown of the port stern tube and shaft arrangement. After recovering the last core, 50 bbl of high-viscosity mud was circulated to improve hole conditions for the trip out of the hole. The drill string was pulled out of the hole, with the bit clearing the seafloor at 1150 h and arriving on the rig floor at 1820 h on 11 February. The rig floor was secured for transit at 1835 h, ending Hole U1524C and Expedition 374 science operations. The time spent in Hole U1524C was 56.50 h (2.4 days).
The RCB coring system was deployed 19 times, collecting 19.20 m of core over 181.4 m of coring (11%) (Table T1).
Transit to Lyttelton, New Zealand
After abandoning operations at Site U1524, we headed north toward Lyttelton while attempting to resolve the mechanical problem. When it became clear that the problem could not be fixed without returning to port, we set a course for a waypoint 12 nmi from the Lyttelton pilot station. The 1876 nmi transit was completed in 173.0 h (7.2 days) at an average speed of 10.8 kt. We arrived at the waypoint at 0148 h on 19 February 2018. The thrusters were lowered, and we switched to dynamic positioning control at 0230 h. Our original plan was to take on supplies to fix the mechanical problem at sea; however, with the approach of Cyclone Gita we asked and received confirmation that we could move to a berth in Lyttelton for shelter. We raised the thrusters and proceeded to the pilot station. The pilot boarded the vessel at 1342 h on 19 February, and the 30 nmi transit to Lyttelton ended with the first line ashore at Berth #2 West at 1512 h on 19 February.
Tie-up in Lyttelton
Upon arrival in Lyttelton, we loaded supplies to repair the vessel. Repairs were completed on 22 February 2018. A pilot boarded the vessel at 0754 h on 22 February, and we shifted to Berth #7 East, with the first line secure at 0902 h. After completing the expedition science reports and conducting our final science meeting, Expedition 374 scientists were free to disembark the vessel after 1200 h on 22 February. While tied up in Lyttelton, we began to load supplies for upcoming Expedition 375 and offload core and samples from Expedition 374. While at Berth #7 East, we loaded two refrigerated containers of catering supplies and three flats of drill pipe on 23 February. We also offloaded an empty core liner box. At 0558 h on 25 February, the harbor pilot arrived to shift the vessel to the Lyttelton Oil Berth. Bunkering began at 0735 h, and loading of 1100 metric tons of marine gas oil was completed at 2350 h on 25 February. A harbor pilot boarded the vessel at 1624 h on 26 February and shifted the vessel to Berth #2 West with the aid of two harbor tugs. We remained tied up at this berth until 1500 h on 7 March. During this time we loaded 10¾ inch casing, 4½ inch casing, and pup joints to the riser hold. We also loaded seven flats of equipment for Expedition 375, including four flats of CORK equipment; two 40 foot containers, one each for IODP and Siem Offshore equipment; and some of the IODP airfreight. The Expedition 374 cores were offloaded to a refrigerated container on 1 March, and 10 coolers of Expedition 374 samples packed in dry ice were offloaded for shipment on 2 March. A 20 foot container was also loaded with equipment for return to College Station, TX. Fresh food for Expedition 375 was loaded on 6 March. We met with the Expedition 375 expedition project manager/staff scientist to finalize logistics for critical equipment to be transferred to the ship, which occurred on 7 March.
Because of a scheduled strike at the Port of Lyttelton, we opted to shift the vessel to the Port of Timaru, New Zealand, for the end of Expedition 374 to avoid the possibility of getting stuck in port because of the shutdown. Prior to departing on 7 March, we gave a ship tour to local government and business officials. The pilot boarded the vessel at 1456 h, and the last line was released at 1518 h. The pilot departed the vessel at 1536 h, and we began our sea voyage to Timaru.
Transit to Timaru
The 138 nmi transit to Timaru was completed in 17.5 h at an average speed of 7.6 kt. The pilot boarded the vessel at 0746 h on 8 March 2018. Expedition 374 officially ended with the first line ashore at Berth 2N, Port of Timaru, at 0848 h.
Lithostratigraphy
Site U1524 includes three holes, with the deepest cored to 441.9 m DSF. The 309.31 m of sediment recovered from Site U1524 is divided into three lithostratigraphic units based largely on changing diatom abundance (Figure F4; Table T2). Lithostratigraphic Unit I is further divided into three subunits (IA–IC) based on gradual changes in diatom content. Unit I is characterized by diatom-bearing mud interbedded with diatom-rich mud. Unit II consists of interbedded diatom-rich mud and diatom ooze. Unit III consists of diatom-rich mud with a larger siliciclastic component than that in Unit II. Diamict beds are also present. A lithologic summary of Holes U1524A and U1524C is shown in Figure F4. The dominant facies include diatom-rich mud, diatom ooze, and mud. Photographs of primary lithologies, sedimentary structures, and accessories are shown in Figures F5 and F6 and summarized in Figure F7, which highlights lithologic variations and trends based on data distilled from DESClogik.
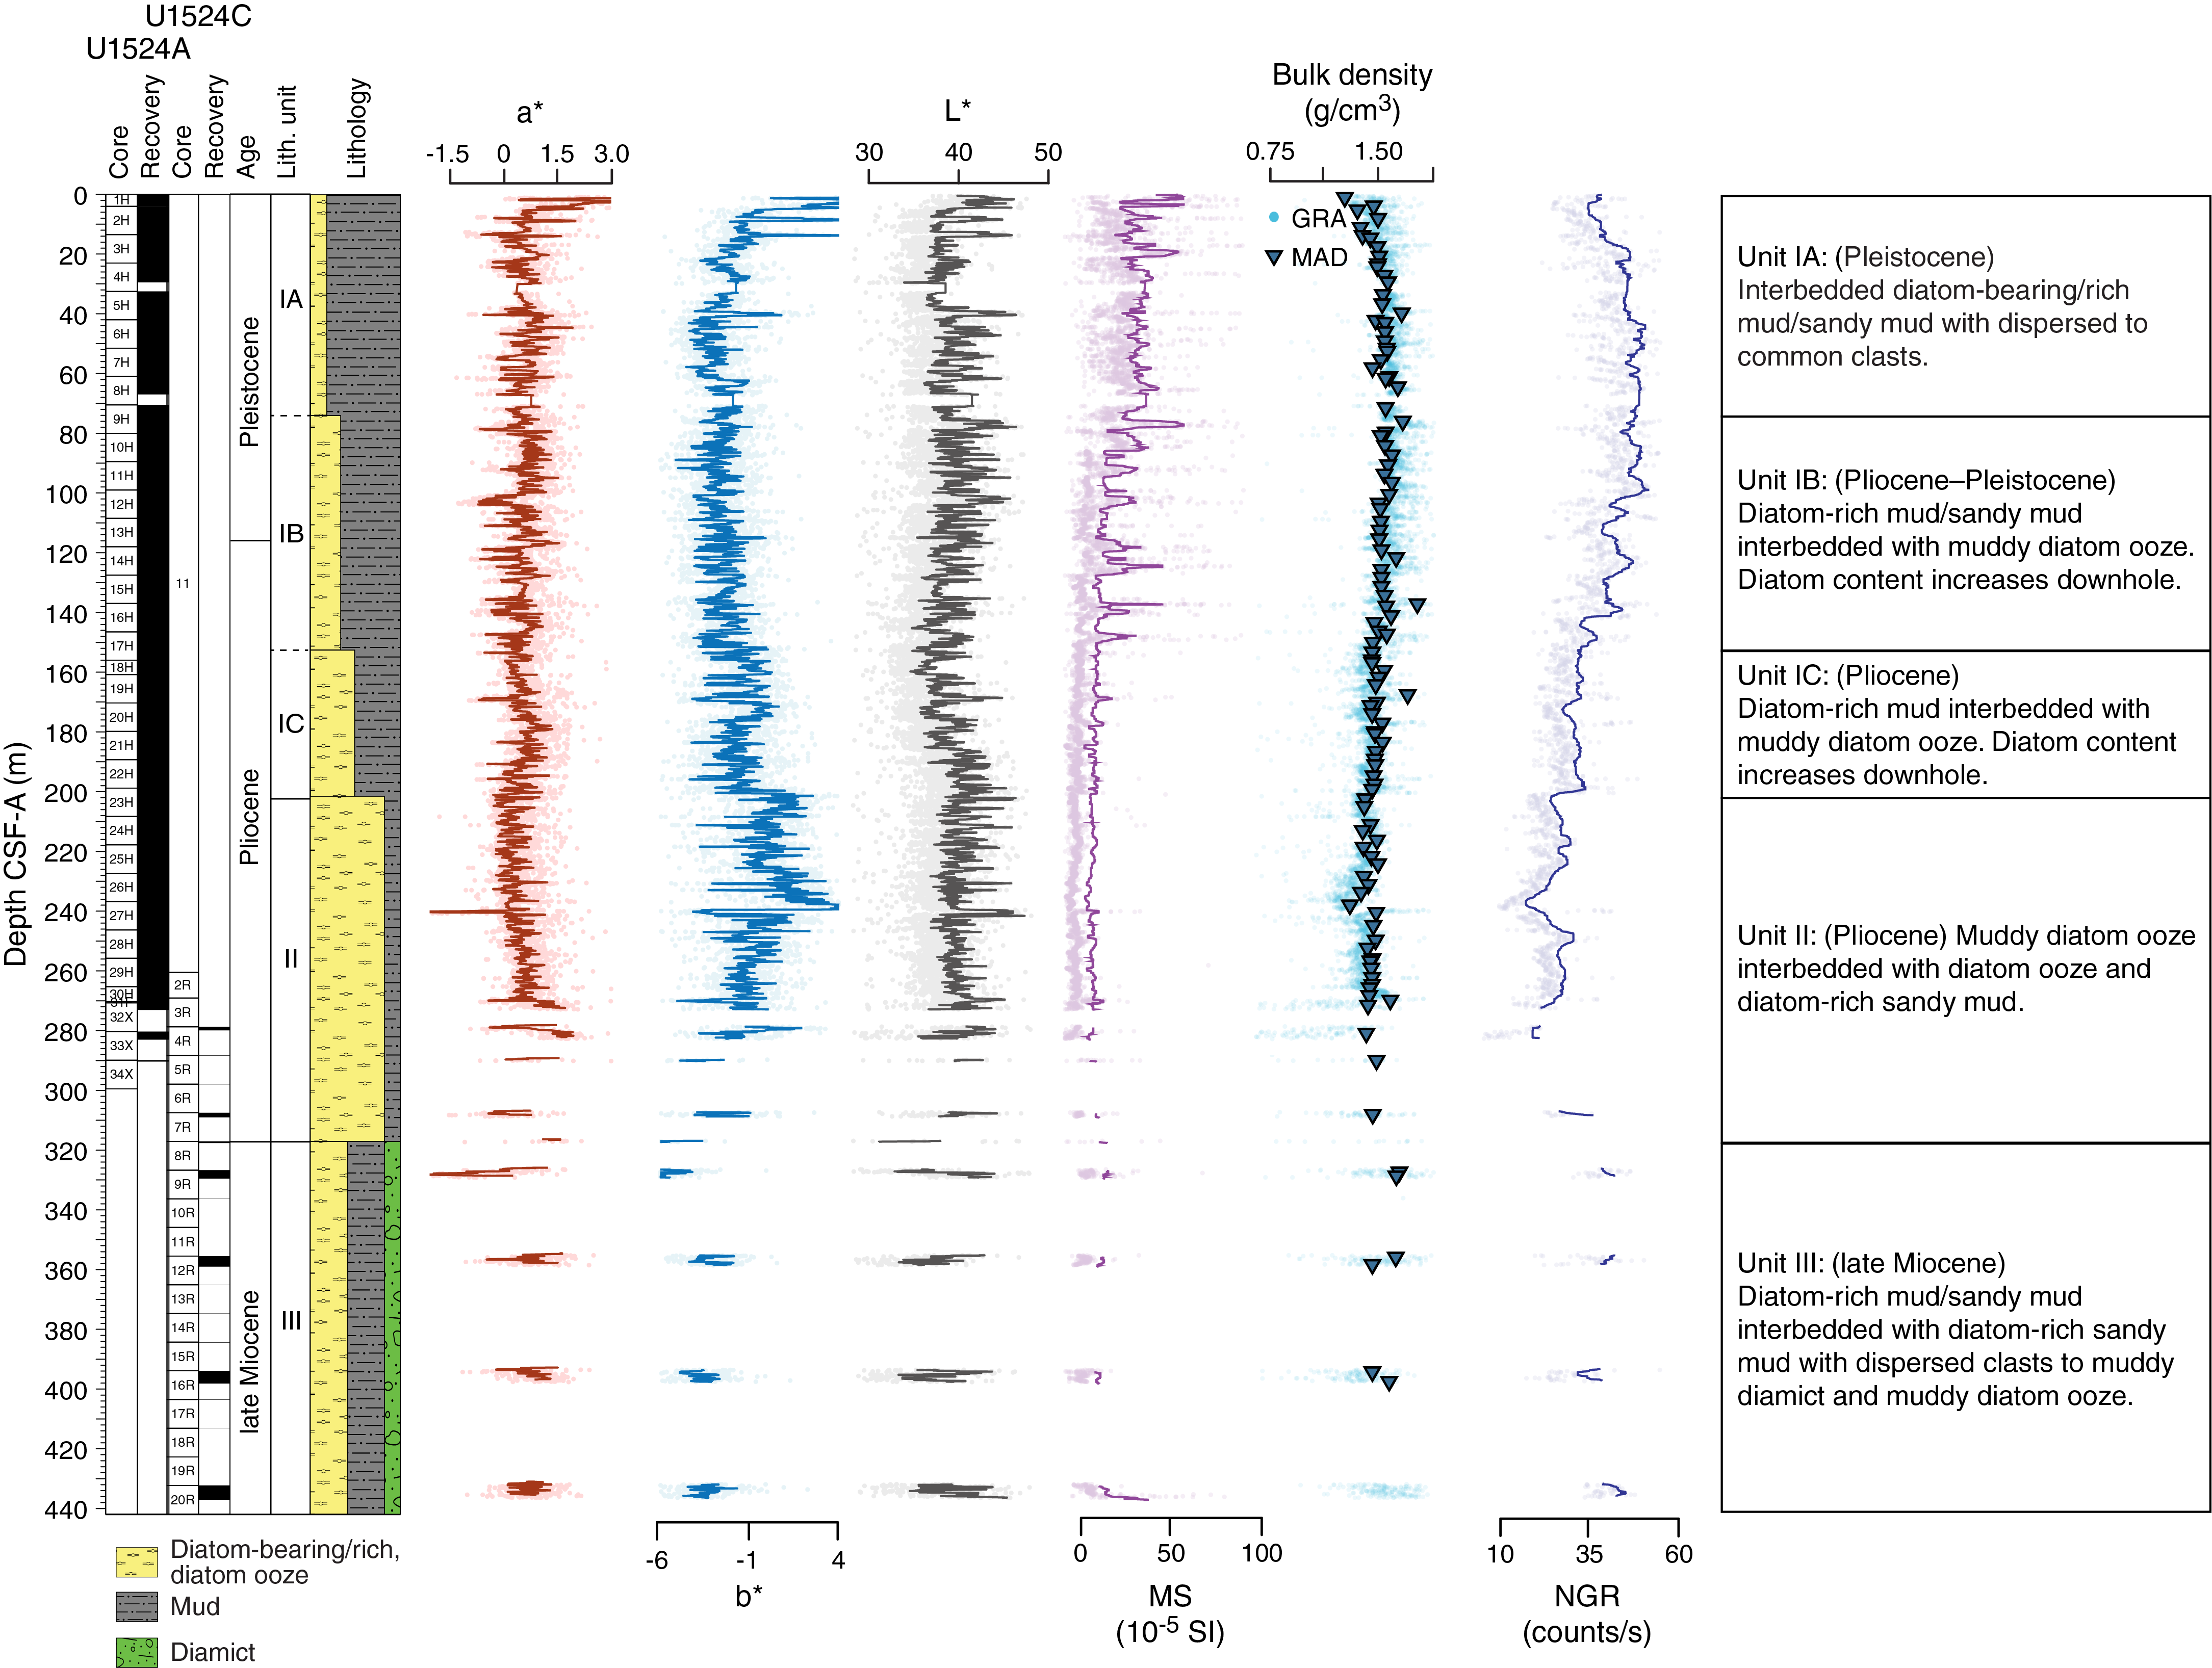
Figure F4. Lithostratigraphic summary.
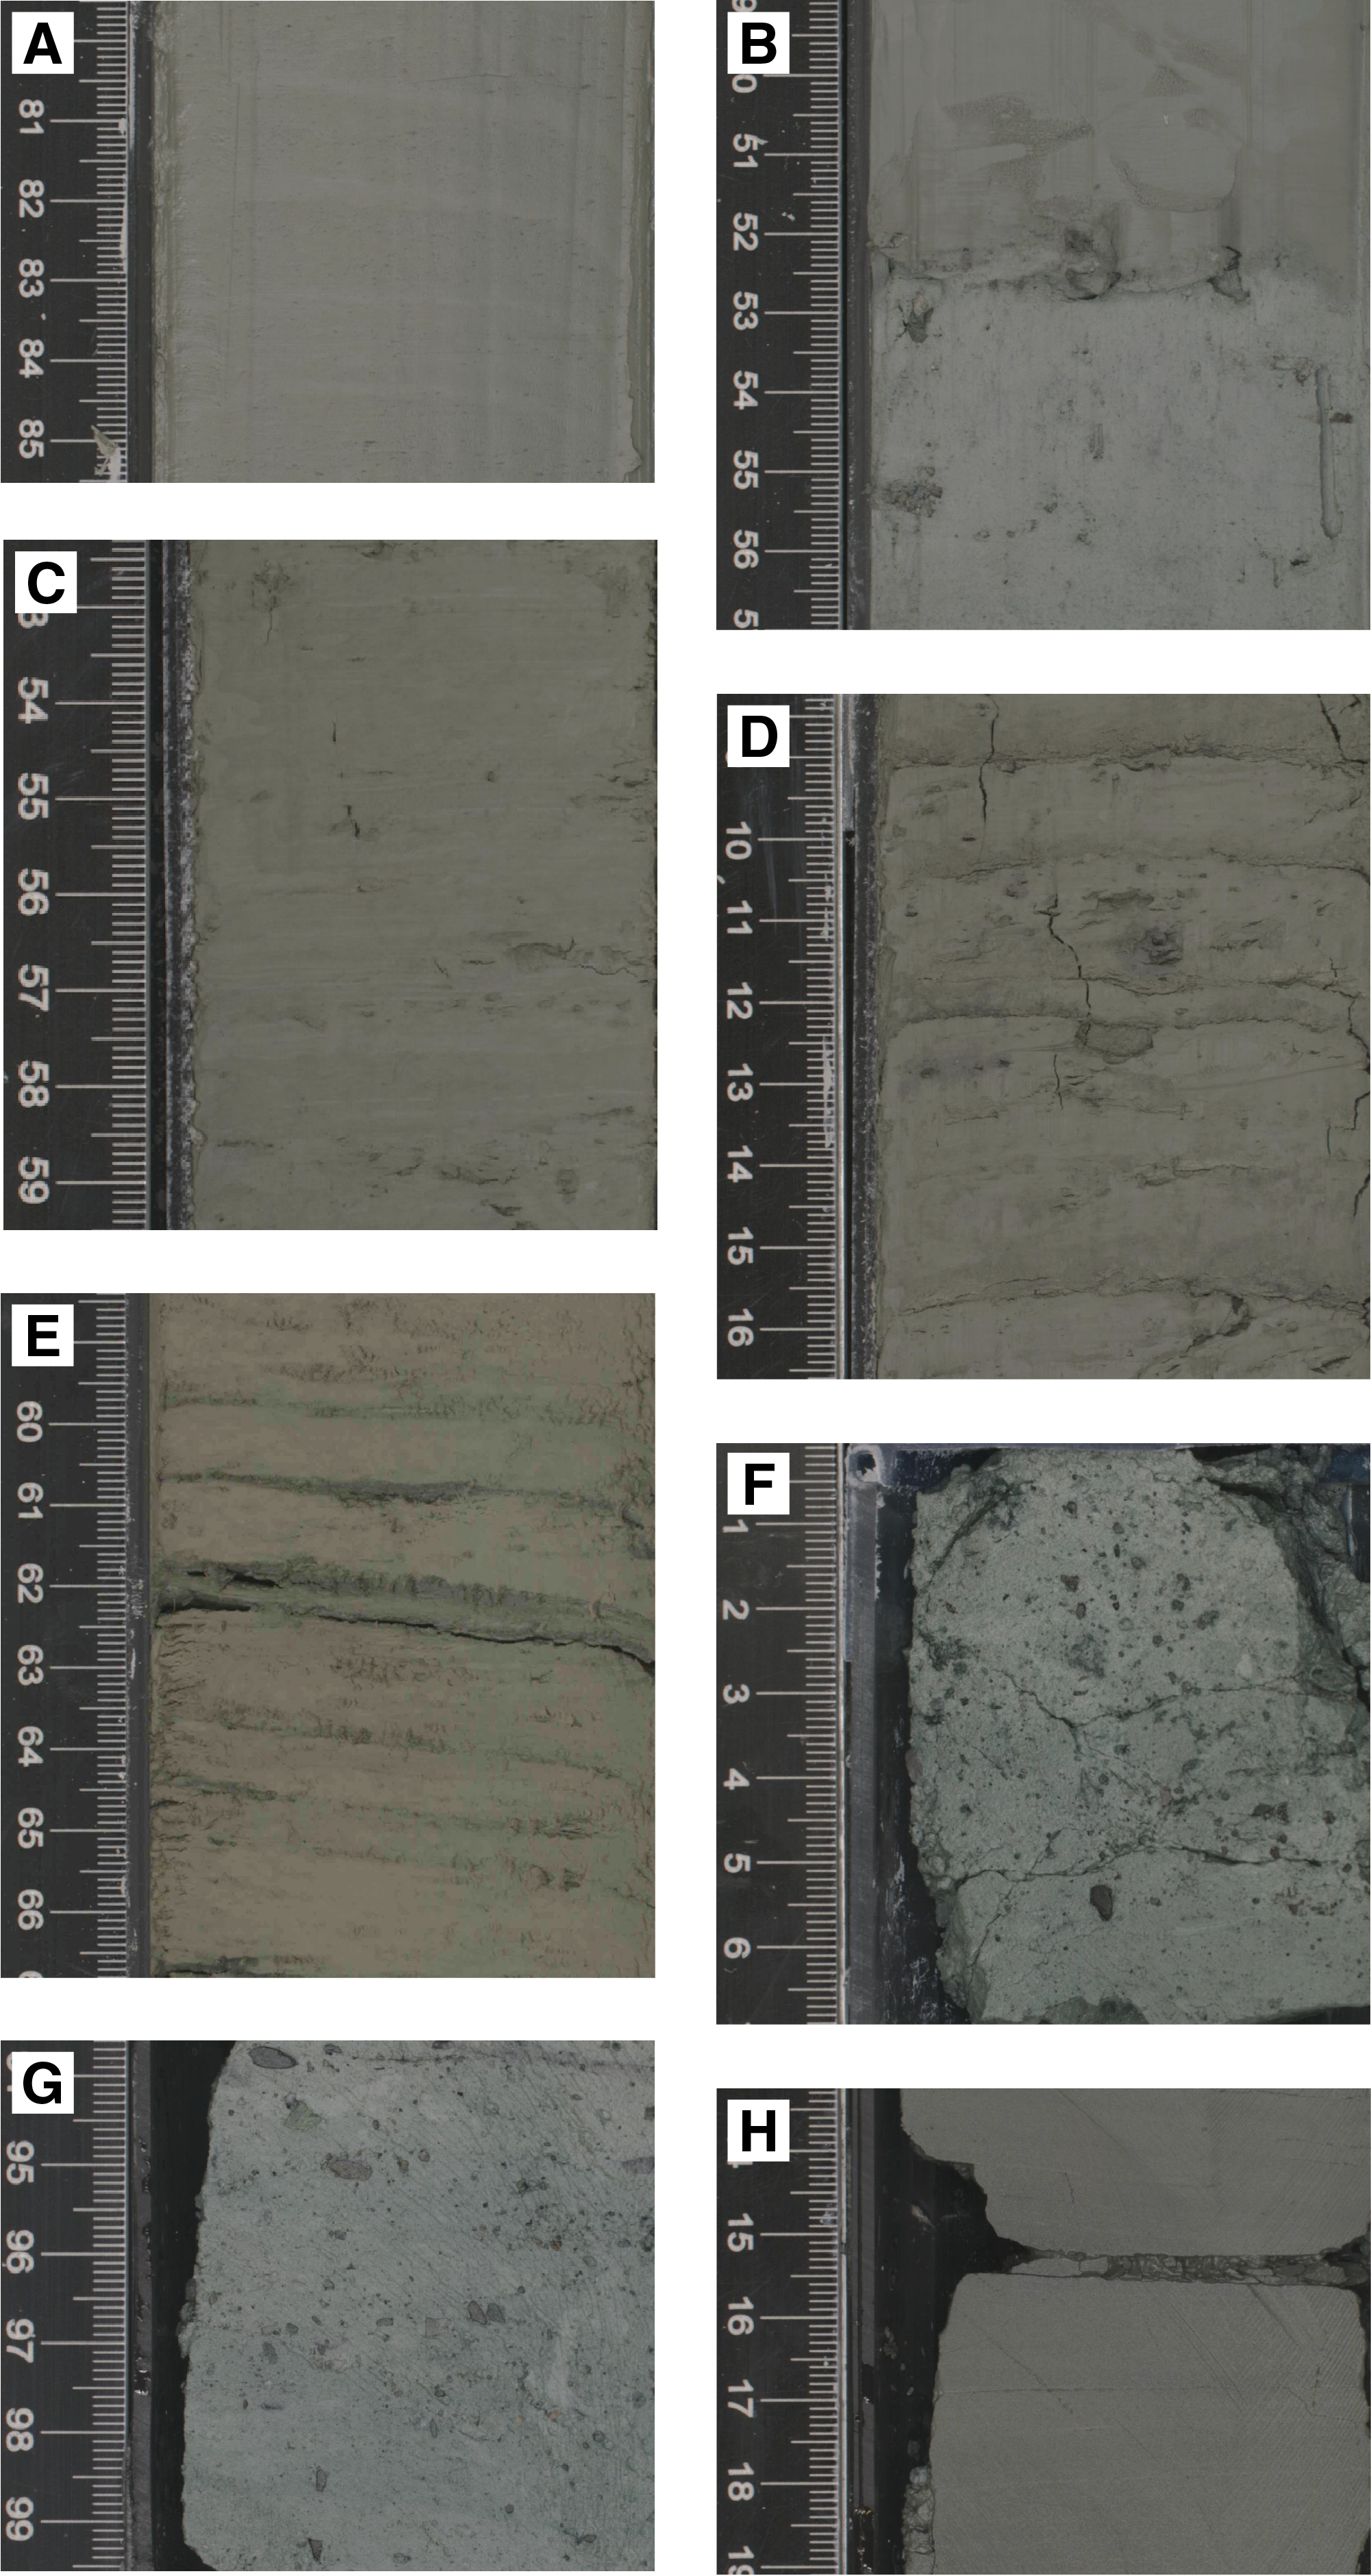
Figure F5. Primary lithologies.

Figure F6. Sedimentary structures and diagenetic features.
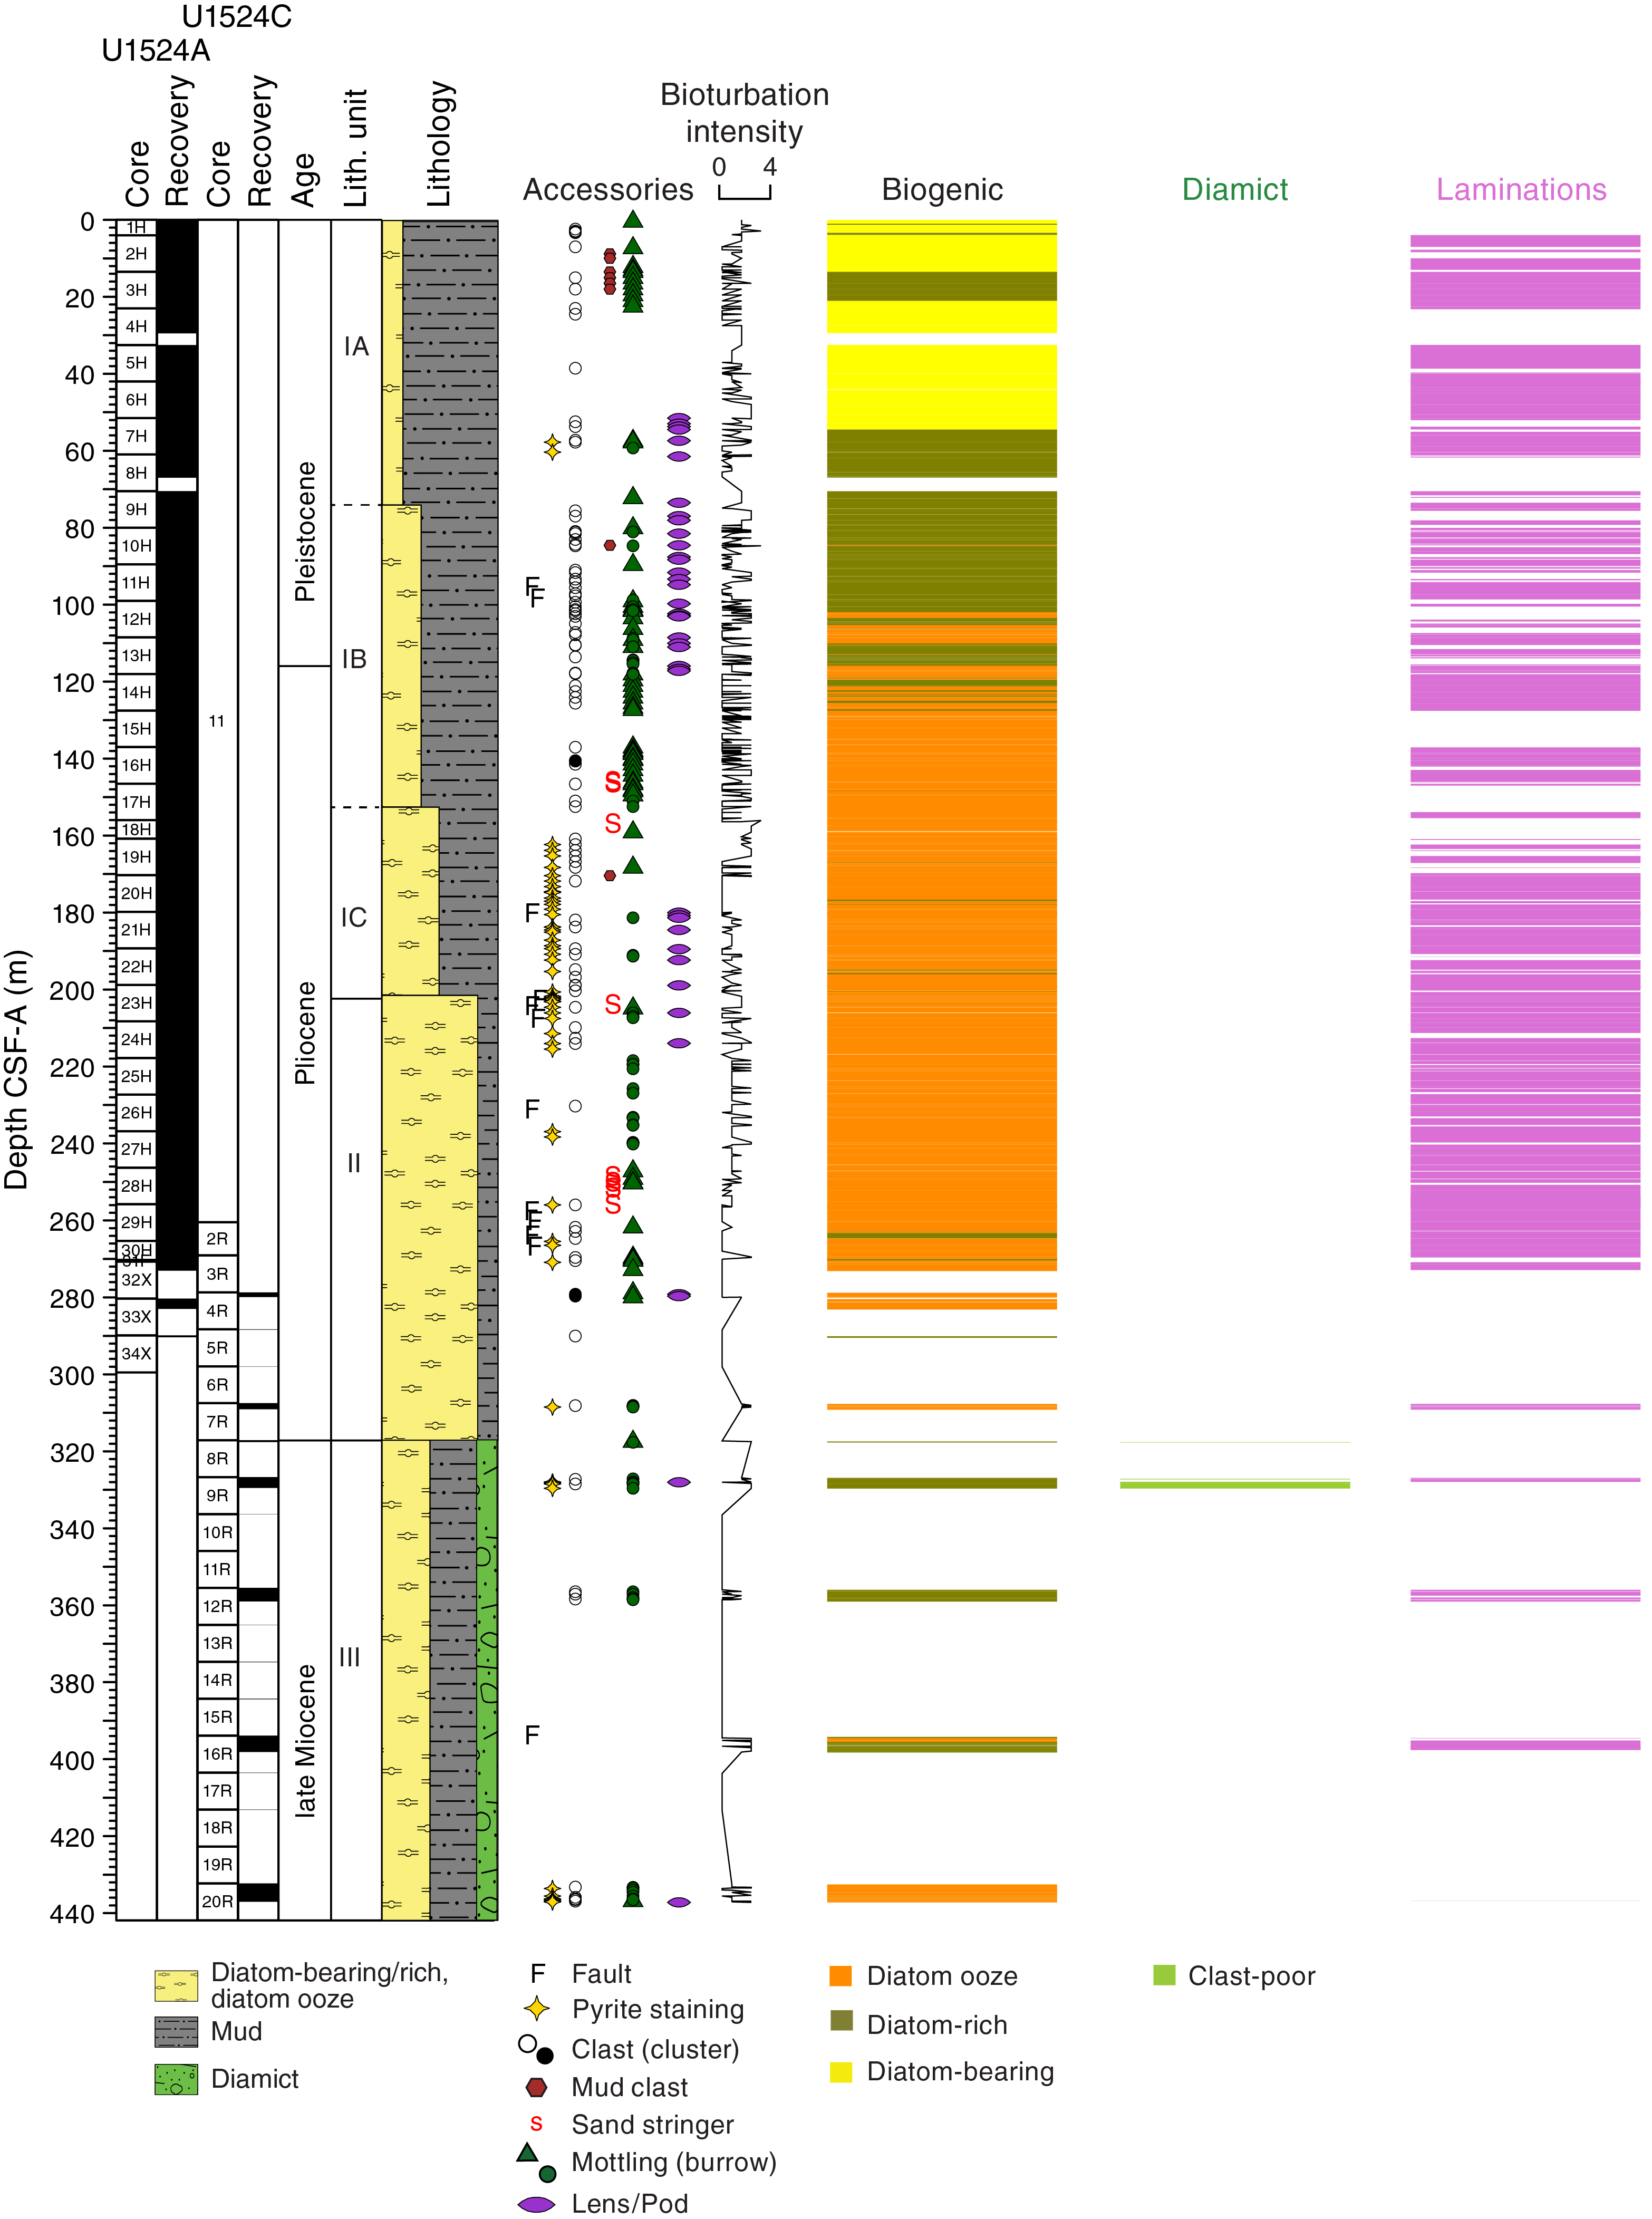
Figure F7. Lithology and sedimentary structures.
Unit descriptions
Site U1524 is dominated by diatom-bearing mud to diatom ooze, but gradual changes in diatom abundance downhole enable definition of three lithostratigraphic units (I–III; youngest to oldest) (Figure F4; Table T2). Units are identified using a combination of visual core description, microscopic examination of smear slides, and color spectral observations (see Lithostratigraphy in the Expedition 374 methods chapter [McKay et al., 2019a]). In each hole, the units are defined based on the first and last observation of the defining unit lithology (Table T2). Unit I is divided into three subunits (IA–IC; youngest to oldest). Missing stratigraphy resulting from nonrecovery in each hole makes the boundary between Units II and III uncertain.
Unit I
- Interval: 374-U1524A-1H-1, 0 cm, to 23H-2, 33 cm
- Depth: 0–200.55 m core depth below seafloor, Method A (CSF-A)
- Thickness: 200.55 m
- Age: Pliocene–Pleistocene
- Lithology: diatom-bearing/rich mud/sandy mud, muddy diatom ooze
Lithostratigraphic Unit I consists of unconsolidated massive bioturbated to laminated diatom-bearing/rich mud/sandy mud (Subunit IA), diatom-rich mud interbedded with muddy diatom ooze (Subunit IB), and diatom-rich mud/sandy mud interbedded with muddy diatom ooze (Subunit IC) (Figures F4, F5A–F5D, F7; Table T2). Throughout Unit I, the diatom content increases downhole in association with distinct color changes. The base of Unit I is defined by the top of a diatom ooze interval at 200.55 m CSF-A. Recovery in Unit I is 202.6 m (101%).
Subunit IA
- Interval: 374-U1524A-1H-1, 0 cm, to 9H-6, 0 cm
- Depth: 0–78.03 m CSF-A
- Thickness: 78.03 m
- Age: Pleistocene
- Lithology: diatom-bearing/rich mud/sandy mud
Lithostratigraphic Subunit IA consists of massive bioturbated to laminated light yellowish brown to brown diatom-bearing/rich mud interbedded at the decimeter to meter scale with greenish gray diatom-bearing/rich mud/sandy mud with dispersed clasts (Figures F4, F5A, F5B; Table T2). Contacts are sharp to gradational and associated with color changes (Figure F6A, F6B). Generally, massive diatom-bearing mud contains sand and coarsens upward, resulting in higher sand and clast concentrations at the top of the bed. Clasts and mud clasts are dispersed to common (Figure F6C, F7). A volcanic ash occurs in interval 374-U1524A-6H-2A, 48–68 cm (Figure F6D, F7). In Section 7H-1A, sand laminae, lenses, and pods become increasingly abundant downsection (Figure F6E, F6F). The base of Subunit IA is indicated by a gradual transition from laminated diatom-rich mud to interbedded (centimeter to decimeter scale) massive diatom-rich mud and sandy mud. Recovery in Subunit IA is 73.68 m (94%).
Subunit IB
- Interval: 374-U1524A-9H-6, 0 cm, to 17H-7, 21 cm
- Depth: 78.03–155.58 m CSF-A
- Thickness: 77.55 m
- Age: Pliocene–Pleistocene
- Lithology: diatom-rich mud, diatom-rich sandy mud, muddy diatom ooze
Lithostratigraphic Subunit IB consists of massive bioturbated to laminated olive gray diatom-rich mud to muddy diatom ooze interbedded at the decimeter to meter scale with greenish gray diatom-rich mud/sandy mud to muddy diatom ooze with dispersed clasts (Figures F4, F5C, F7; Table T2). Contacts are sharp to gradational and associated with color changes. Generally, massive diatom-rich mud/sandy mud to muddy diatom ooze intervals coarsen upward, resulting in higher sand and clast concentrations at the top of each bed. Subunit IB is distinguished from Subunit IA by higher diatom abundance and an increase in the frequency of silty to sandy laminations with sharp lower contacts and diffuse upper boundaries (Figure F6G). In some intervals (e.g., 374-U1524A-11H-6A, 44–56 cm; Figure F6H), laminations are discontinuous to contorted, suggesting localized soft-sediment deformation and/or bioturbation. Clasts, mud clasts, and sand lenses/pods are observed throughout. The base of Subunit IB is indicated by an increase in the thickness and frequency of sandy mud beds with clasts. Recovery in Subunit IB is 81.21 m (105%).
Subunit IC
- Interval: 374-U1524A-17H-7, 21 cm, to 23H-2, 33 cm
- Depth: 155.58–200.55 m CSF-A
- Thickness: 44.97 m
- Age: Pliocene
- Lithology: diatom-rich mud/sandy mud, muddy diatom ooze
Lithostratigraphic Subunit IC consists of massive bioturbated to laminated olive gray diatom-rich mud to muddy diatom ooze interbedded at the decimeter scale with greenish gray diatom-rich mud to muddy diatom ooze with dispersed to common clasts (Figures F4, F5D, F7; Table T2). Bed contacts are sharp to gradational and associated with color changes. Generally, massive bioturbated diatom-rich mud contains sand and often coarsens upward, resulting in higher sand and clast concentrations at the tops of beds. Clasts and mud clasts are dispersed to common. Subunit IC is distinguished from Subunit IB by an increase in muddy diatom ooze, pyrite staining, and a decrease in the thickness of greenish gray bioturbated diatom-rich mud and muddy diatom ooze beds (Figure F5D, F7). Laminae are pyrite stained toward the base of the unit and generally sandier, less frequent, and more discontinuous than in Subunits IA and IB. Clasts, sand lenses/pods, and pyrite staining are dispersed to common (Figure F6I). The base of Subunit IC is indicated by an increase in the thickness and frequency of muddy diatom ooze beds. Recovery in Subunit IC is 47.71 m (106%).
Unit II
- Intervals: 374-U1524A-23H-2, 33 cm, to 34X-CC, 46 cm; 374-U1524C-2R-1, 0 cm, to 8R-1, 0 cm
- Depths: Hole U1524A = 200.55–290.36 m CSF-A (total depth); Hole U1524C = 260.50–317.10 m CSF-A
- Thicknesses: Hole U1524A = 89.81 m (minimum); Hole U1524C = 56.60 m (minimum)
- Age: Pliocene
- Lithology: diatom-rich sandy mud, muddy diatom ooze, diatom ooze
Lithostratigraphic Unit II consists of massive bioturbated to laminated olive gray diatom ooze interbedded at the decimeter to meter scale with massive bioturbated greenish gray muddy diatom ooze with dispersed clasts and diatom-rich sandy mud (Figures F4, F5E, F7; Table T2). Contacts are sharp to gradational and associated with color changes. Pyrite staining, laminations, and sand lenses/pods occur throughout the diatom ooze (Figure F6J, F7). Laminae in Unit II are planar to wavy, rich in biogenic silica, and often pyrite stained. The bottom of Unit II (317.10 m CSF-A) is defined at the first occurrence of a massive sandy to muddy diamict (Figure F5F). Overall recovery in Unit II is 79.75 m (81%) in Hole U1524A. The APC/HLAPC system recovered 74.24 m (106%), and recovery in XCB cores was 5.51 m (19%). Recovery was 2.91 m (5%) in Hole U1524C, which was RCB cored.
Unit III
- Interval: 374-U1524C-8R-1, 0 cm, to 20R-CC, 17 cm
- Depth: 317.10–437.03 m CSF-A
- Thickness: 119.93 m
- Age: late Miocene
- Lithology: muddy diamict, diatom-rich mud, diatom-rich sandy mud, muddy diatom ooze
Lithostratigraphic Unit III consists of massive bioturbated to laminated greenish gray diatom-rich mud/sandy mud interbedded at the decimeter to meter scale with massive bioturbated greenish gray diatom-rich sandy mud with dispersed clasts to muddy diamict and muddy diatom ooze (Figures F4, F5F–F5H, F7; Table T2). Intervals of poor recovery likely resulted from RCB coring in relatively soft lithologies combined with large clasts plugging the drill bit (see Operations for detailed explanation of why this interval was cored using the RCB system rather than the XCB system). The greenish gray diatom-rich sandy mud with dispersed clasts to muddy diamict intervals are bioturbated throughout, up to centimeters to decimeters below their lower contacts (Figure F6K). The lower contacts of the sandy mud beds and some of the laminated diatom-rich mud beds are also bioturbated (Figure F6L). Recovery in Unit III is 16.29 m (13%).
Facies distribution
At Site U1524, three main lithofacies are identified based on common lithologic, sedimentologic, and textural characteristics (Table T3). Although textural similarities exist between the shelf and rise sites, the depositional processes in the channel levee complex are different from those on the shelf (e.g., Stow and Piper, 1984; Lucchi et al., 2002; Carburlotto et al., 2010; Rebesco et al., 2014). Thus, the facies identified at Sites U1524 and U1525 differ from those defined for Sites U1521, U1522, and U1523 and are distinguished by adding “r” to the facies number.
Massive to stratified diamict
Facies 1r consists of clast-poor to clast-rich muddy to sandy diamict. Diatom abundance ranges from bearing to rich (25%–50%), with both whole frustules and fragments observed. Clasts are subangular to rounded and poorly sorted and include a range of lithologies similar to those observed on the continental shelf (e.g., metasedimentary, sedimentary, basalt, dolerite, marble, granite, and mud clasts). Stratification is identified from clast concentration and alignment. Some intervals contain coarse-tail inverse grading with aligned clasts defining upper contacts. Faceted and/or outsized clasts are present in some intervals. This facies was rare in the cores and likely represents a continuum of processes that includes turbidity currents, current winnowing, and ice rafting.
Mud
Facies 2r consists of massive to laminated diatom-bearing mud with dispersed clasts and includes millimeter- to decimeter-scale packages of laminae. The laminae are composed of silt, fine sand, medium to coarse sand, and/or biogenic ooze and often have sharp planar lower contacts and internal normal grading. Soft-sediment and postdepositional deformation is observed in laminated intervals. Massive bioturbated diatom-bearing mud contains clasts, sand pods, lenses, and sand stringers. Facies 2r predominately reflects low energy turbidity current processes of siliciclastic and biogenic sediment in a marine environment with intervals of pelagic deposition and ice rafting.
Diatom-rich mud and diatom ooze
Facies 3r is similar to shelf Facies 6 but is unlithified and massive bioturbated to laminated, with laminae defined by color and texture. Diatom ooze laminae occur in diatom-rich mud intervals. Large clasts, sand pods, lenses, and stringers are common. Facies 3r is associated with low-density turbidity currents that remobilize pelagic sediment, pelagic sedimentation, and ice rafting.
Diagenesis
The presence of pyrite is indicative of postdepositional diagenesis from bacterial decomposition of organic material in a sulfate-reducing environment and is observed in laminated and bioturbated beds in lithostratigraphic Subunit IC and Units II and III (Figure F7).
Preliminary depositional interpretation
A sequence of late Miocene to Pleistocene sediments was recovered from Site U1524, a channel levee complex situated on the eastern flank of the Hillary Canyon on the continental rise of the Ross Sea, Antarctica. The sedimentary sequence was deposited by downslope processes and pelagic sedimentation in an ice-distal glaciomarine setting. Siliciclastic sediment content increases upsection in Units II and I, as indicated by bioturbated diatom-bearing/rich mud and muddy diatom ooze intervals interbedded with massive to laminated mud intervals. The former includes well-preserved whole diatom frustules and dispersed clasts, indicating (hemi)pelagic sedimentation influenced by ice rafting. Massive and laminated mud beds (e.g., Stow and Piper, 1984) likely formed by overspill from turbidity currents in Hillary Canyon and/or nearby canyon-channel systems. More faintly laminated intervals could be related to overspill or to biogenic blooms in the overlying water column. Lithostratigraphic Unit III has a larger siliciclastic component than Units I and II that includes muddy diamict, which suggests a change in the style of siliciclastic sediment delivery to the canyon system and/or decreased biological productivity over the continental shelf.
Biostratigraphy and paleontology
Forty-seven core catcher samples from Holes U1524A and U1524C were analyzed for siliceous (diatoms, radiolarians, silicoflagellates, ebridians, and chrysophycean cysts), calcareous (foraminifers), and organic (dinoflagellate cysts [dinocysts] and other aquatic palynomorphs, pollen, and spores) microfossils. The mudline and core catcher samples from Core 374-U1524B-1H were also examined. The occurrence and abundance of the different microfossil groups varies greatly throughout the sediment column of Site U1524 (Figure F8). Rich assemblages of diatoms, with rare silicoflagellates and ebridians, occur throughout, whereas radiolarians are generally rare but common to abundant in several samples, particularly in the lower Pliocene and Miocene interval, where they provide valuable biostratigraphic control (Table T4). Foraminifers and palynomorphs are generally sparse.
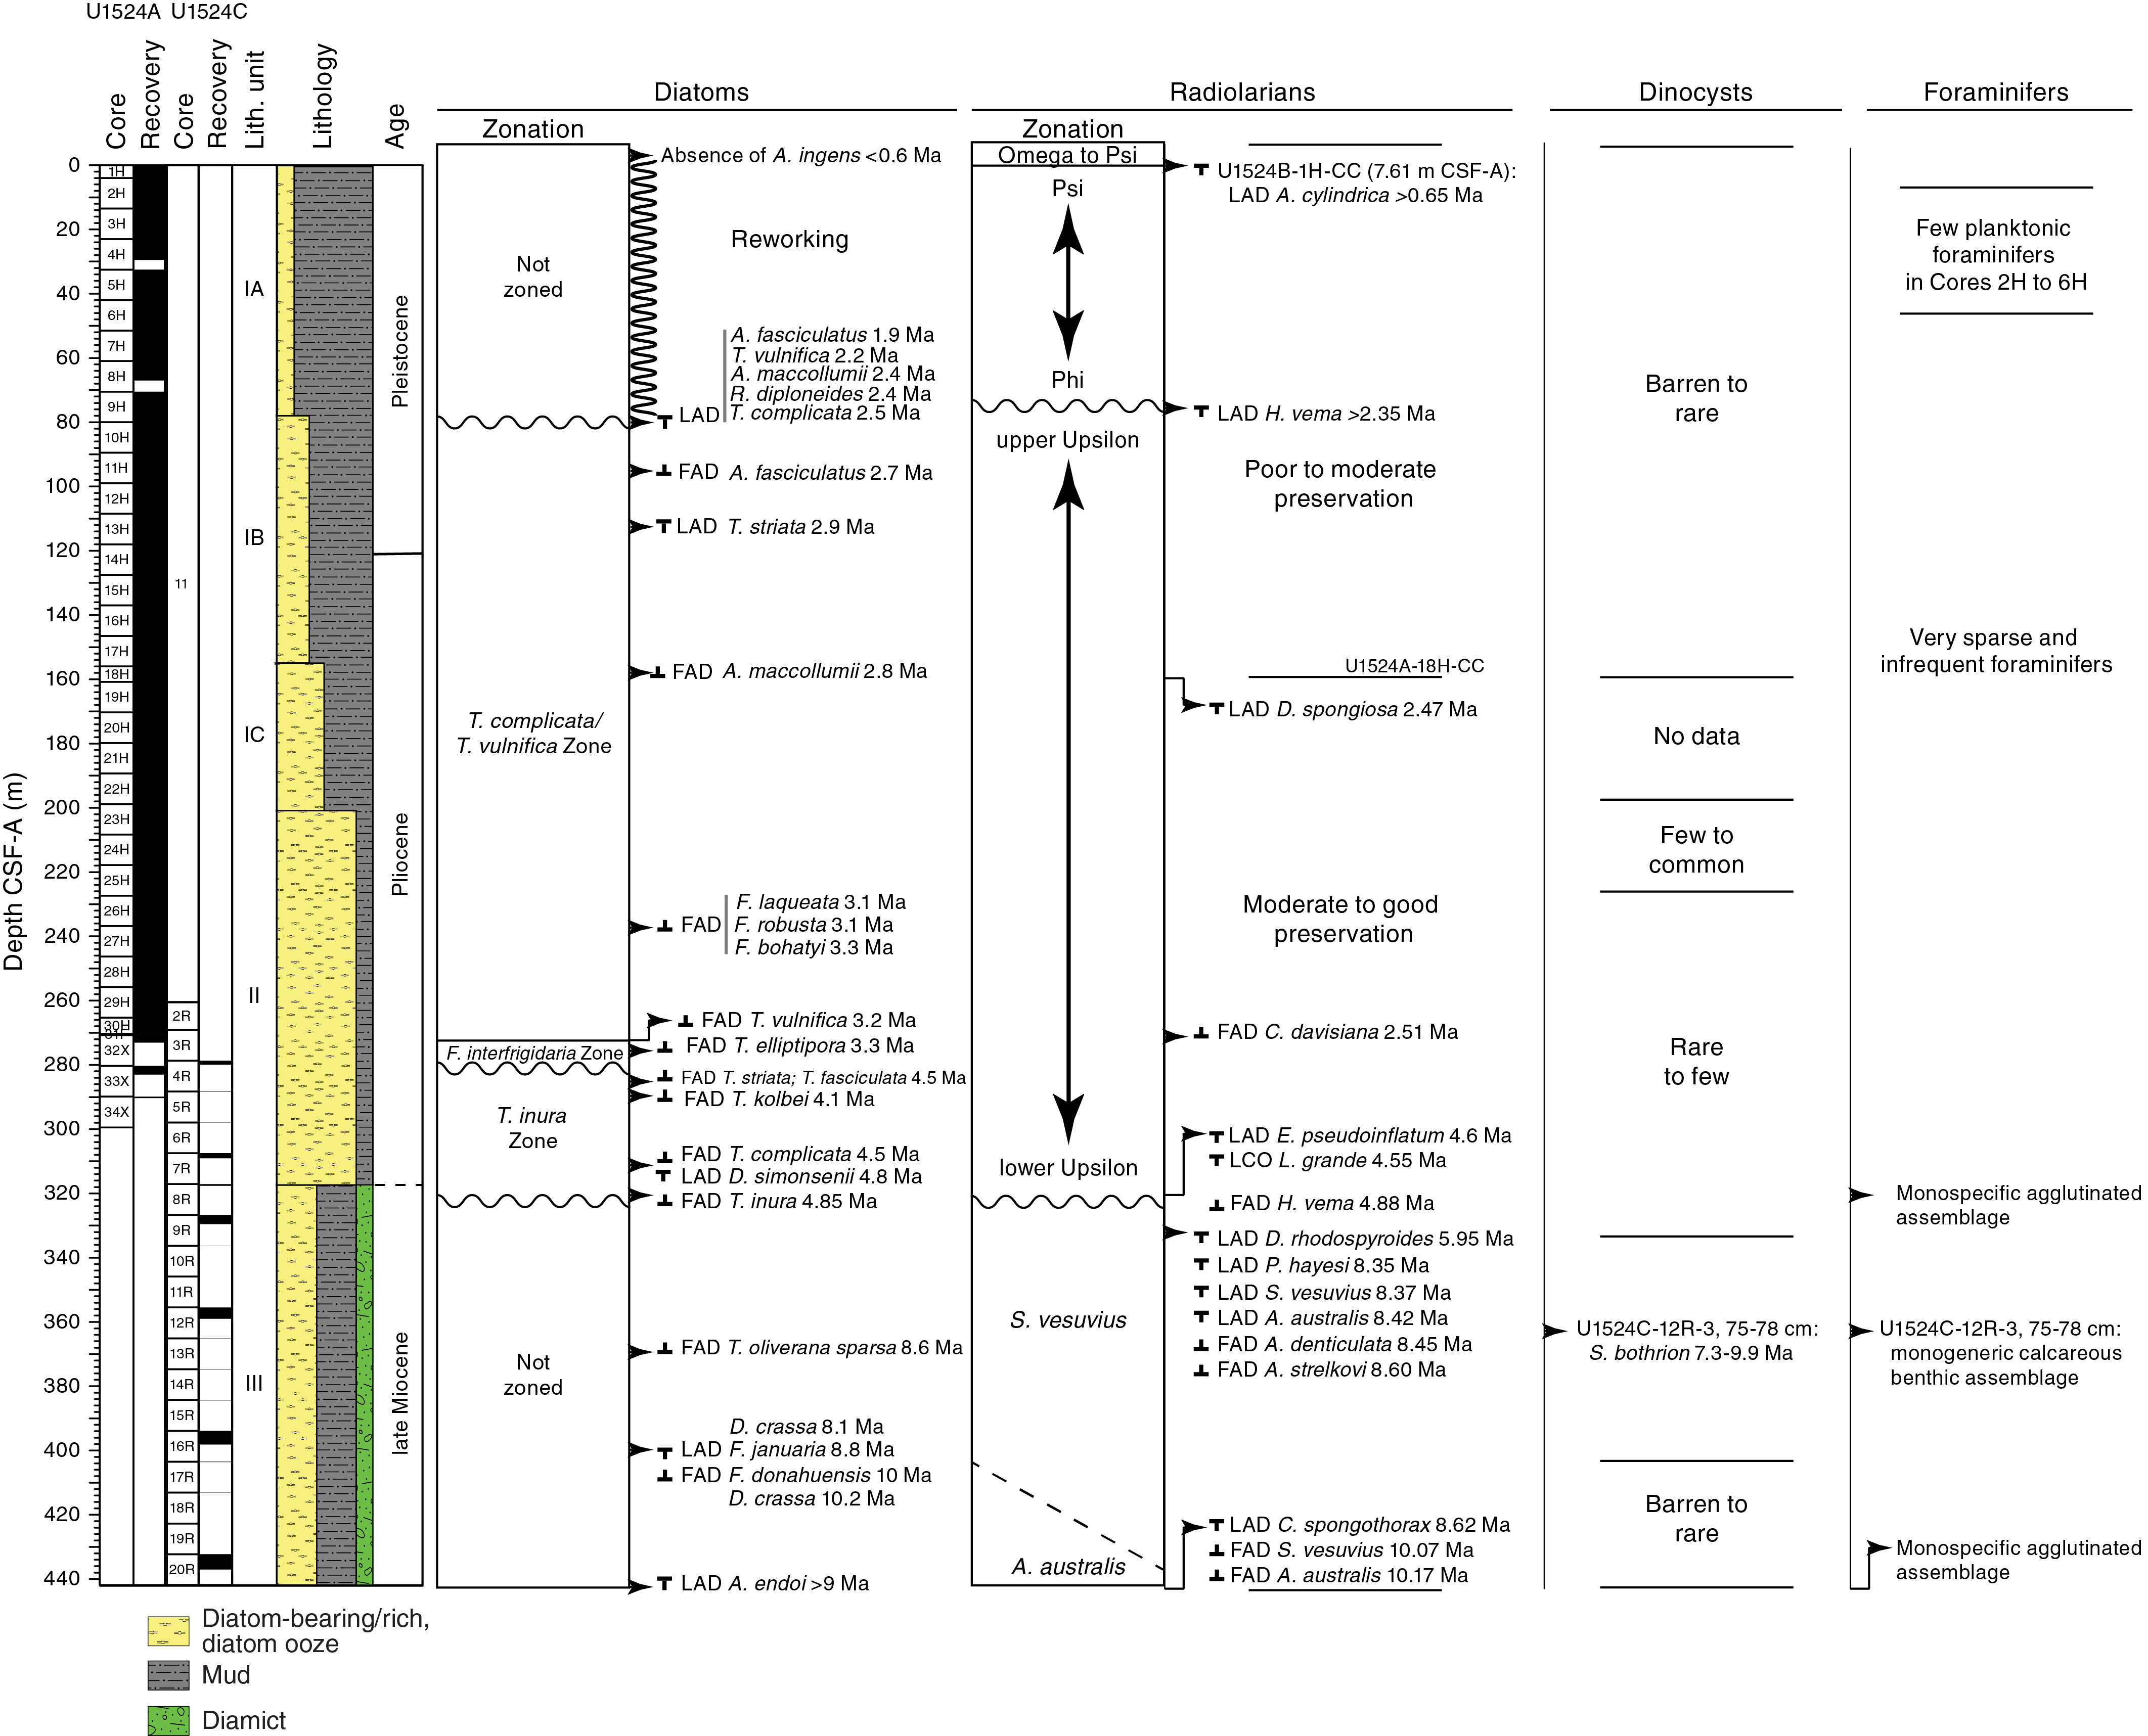
Figure F8. Micropaleontology summary.
Although all investigated microfossil groups supply valuable information, radiolarians and diatoms provide well-constrained age-diagnostic events used to develop an age-depth model for the site (Figures F9, F10). The upper ~80 m of the sequence is affected by reworking; however, microfossils present in this interval indicate a tentative assignment to the (middle?) Pleistocene. Deeper than 80 m CSF-A, the assemblages are less affected by reworking and provide more robust age control, indicating that the sequence between ~80 and ~120 m CSF-A is early Pleistocene in age. A thick ~200 m Pliocene interval in Samples U1524A-10H-CC to 32X-CC (89.94–273.01 m CSF-A) unconformably overlies an upper Miocene (~8.5–10 Ma) interval identified by radiolarians, diatoms, and dinoflagellate cyst biostratigraphic events.
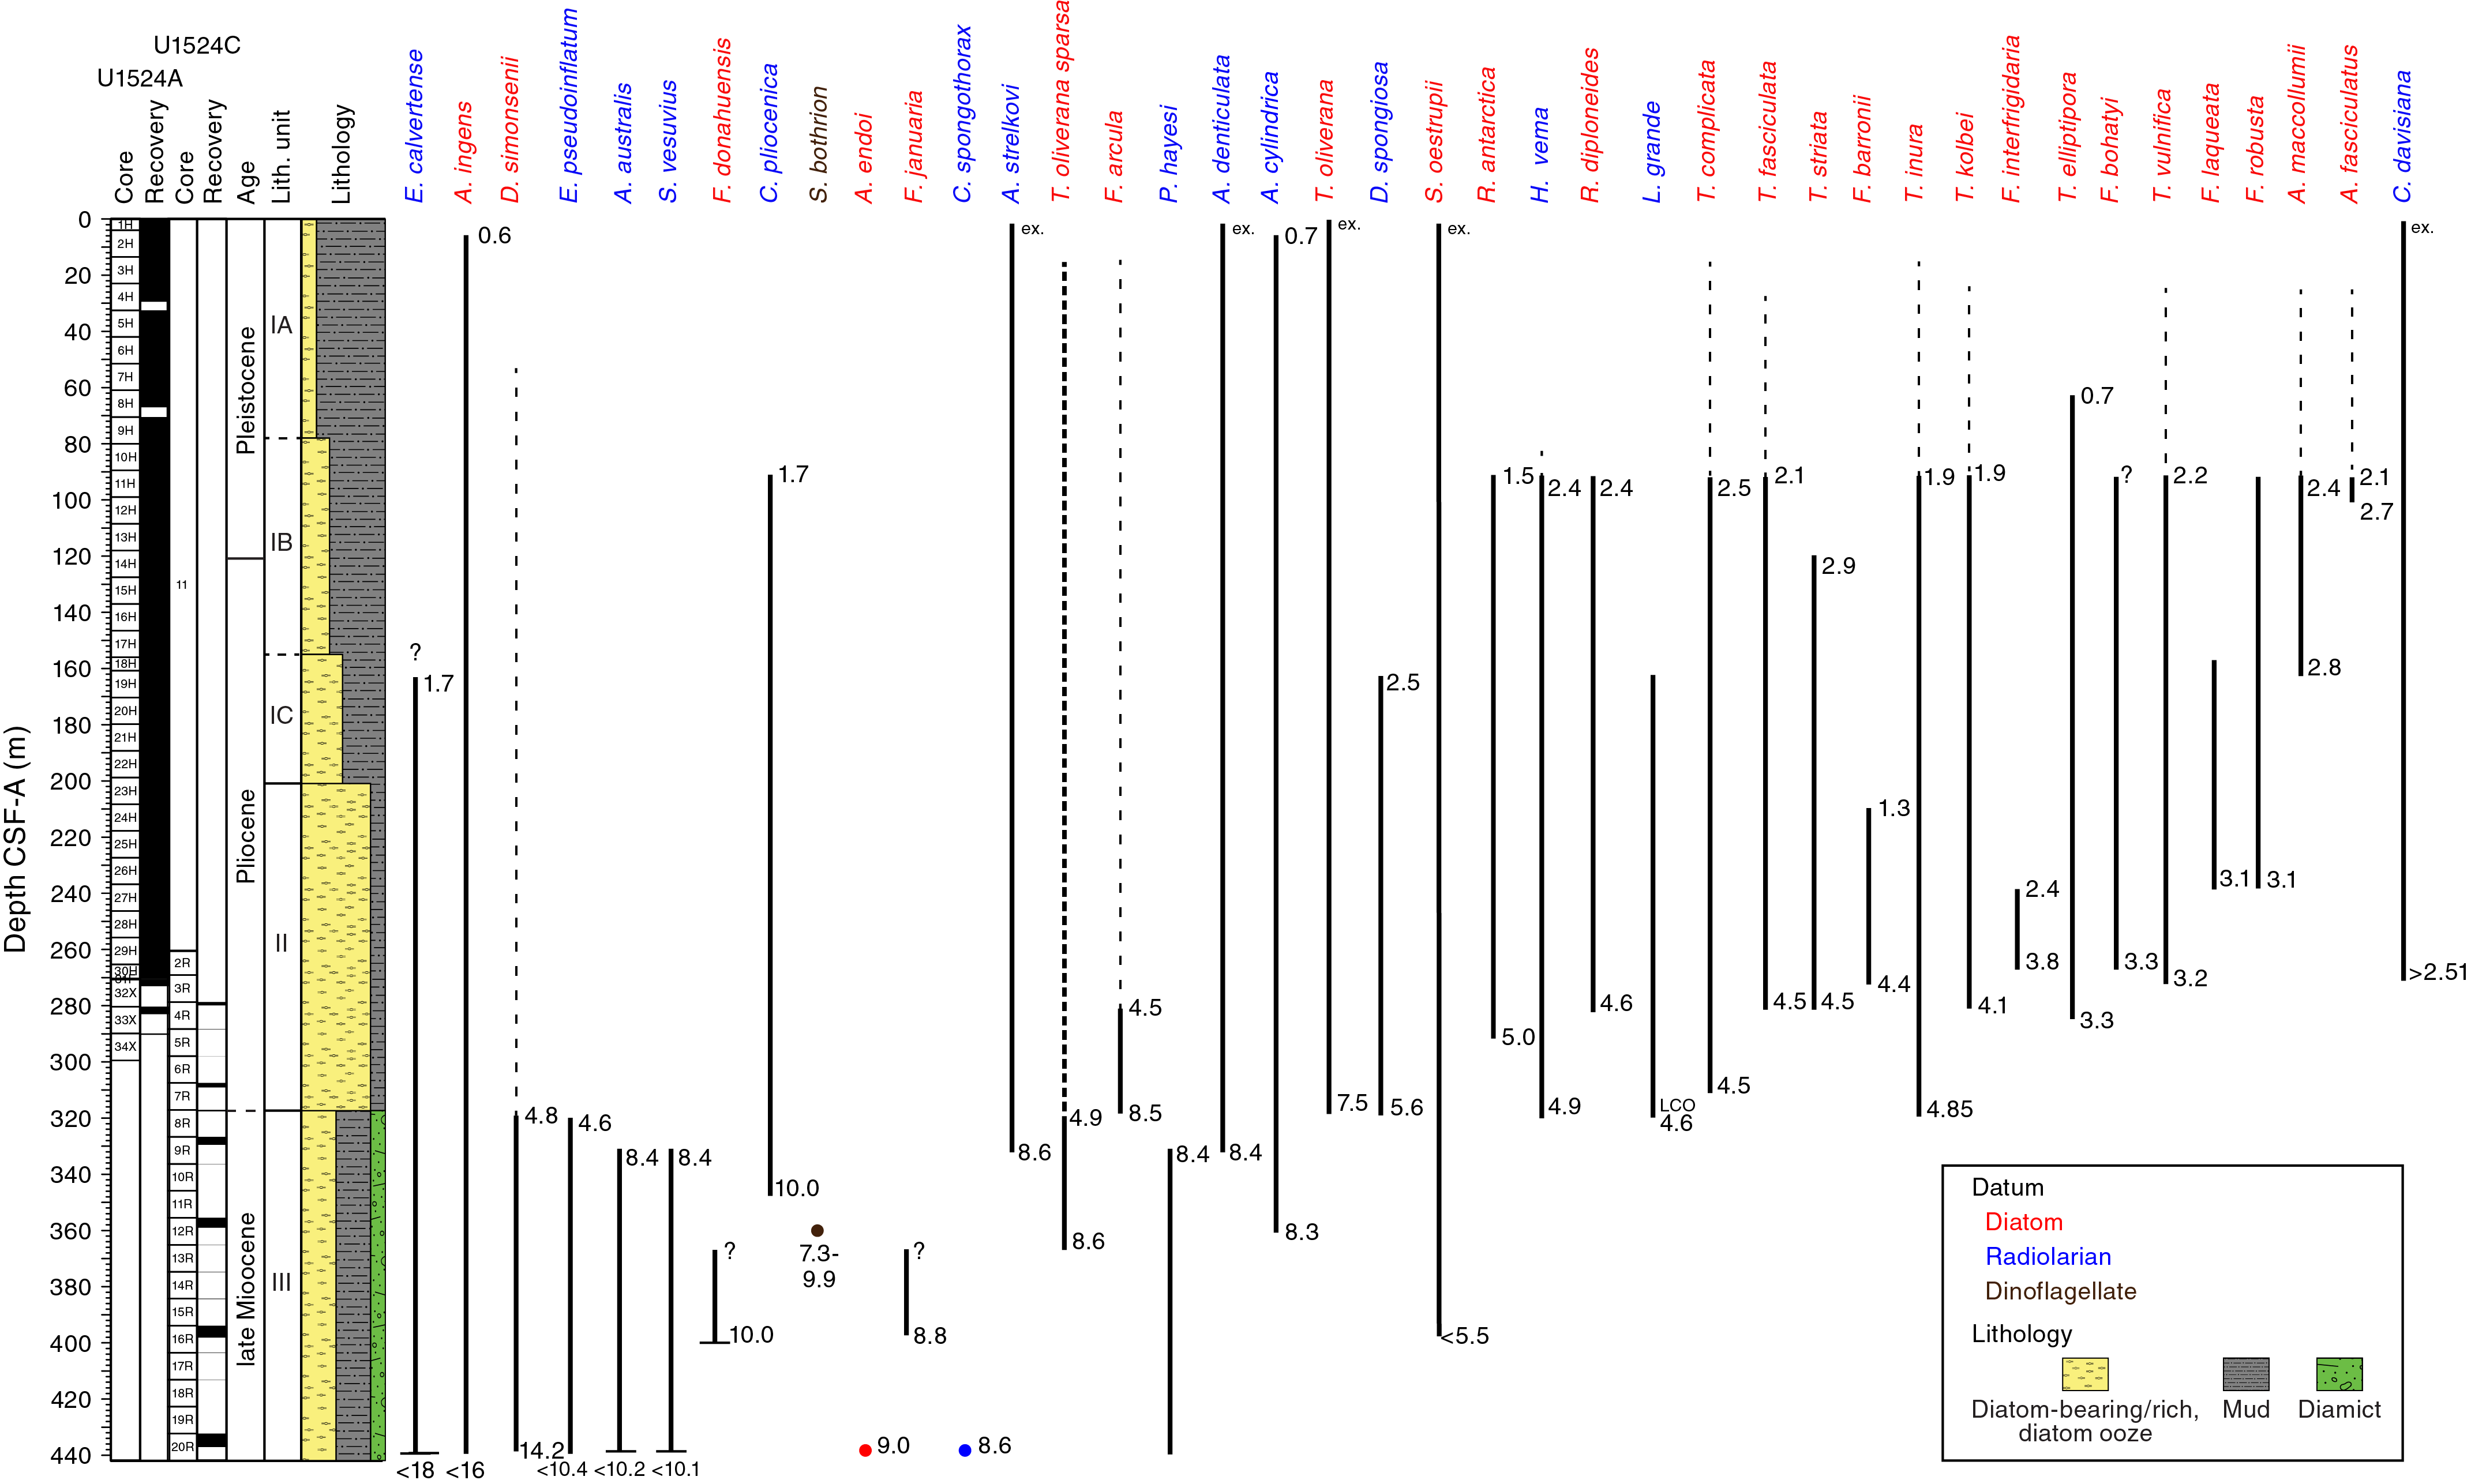
Figure F9. Selected diatom, radiolarian, and dinoflagellate distribution.

Figure F10. Shipboard age model.
Diatoms
All samples examined from Site U1524 contain diatoms (Table T5; Figure F8). As observed at the other Expedition 374 sites, changes in diatom assemblage preservation and composition reflect shifts between in situ diatom production and deposition and reworking of older diatoms to the site. Diatom genera that most likely represent in situ production of diatoms in the overlying water column are Fragilariopsis, Rouxia, Thalassiosira, Actinocyclus, Thalassionema, and Chaetoceros spores. Transported/reworked assemblages are mostly characterized by the presence of strongly silicified taxa that are resistant to fragmentation, including Actinocyclus ingens, Aulacodiscus sp. cf. Aulacodiscus browni, Eucampia, Paralia, Stellarima, Coscinodiscus, and Stephanopyxis (e.g., Cunningham et al., 1999), and the nearly ubiquitous presence of reworked late Miocene to early Pliocene Thalassiosira oliverana var. sparsa.
Sample ages at this site were established for intervals where reworking is prevalent by invoking a “younger than” constraint: applying the first appearance datum (FAD) age of the youngest identifiable diatoms present in an assemblage. Although reworked assemblages are persistent background components of many Site U1524 diatom assemblages, several biostratigraphically useful diatom events were recognized (Tables T4, T5; Figures F8, F9, F10). Figure F9 presents the occurrence, range, and age of common and distinctive taxa of diatoms and radiolarians that provide useful age constraints at Site U1524, together with one dinocyst datum.
The Hole U1524A mudline sample contains common to frequent diatoms with obvious signs of dissolution. Although many valves appear intact, the main valve features are difficult to resolve in many specimens. Sample 374-U1524A-1H-CC (3.97 m CSF-A) contains frequent moderately preserved diatoms characterized by a diverse assemblage typical of a late Pleistocene age, including Chaetoceros resting spores, Eucampia antarctica, Actinocyclus actinochilus, Stellarima microtrias, Fragilariopsis spp., Thalassiosira oliverana, Thalassiosira lentiginosa, and Thalassiosira spp. The absence of Actinocyclus ingens indicates that this sample and the sediments above it are younger than 0.6 Ma and occur in the T. lentiginosa Zone (Figure F8).
Rare occurrences and poor preservation characterize diatoms in Samples 374-U1524A-2H-CC to 9H-CC (13.77–80.47 m CSF-A). Reworking of strongly silicified Pliocene to Miocene species dominate the diatom assemblages in this interval. The reworking is presumably caused by downslope transport of eroded material from the shelf, which can also be observed at Site U1525 (see Biostratigraphy and paleontology in the Site U1525 chapter [McKay, 2019d]). Species that typically indicate in situ production are generally absent. Thus, reliable diatom biostratigraphic events cannot be identified for this interval, which is left unzoned (Figure F8). A dashed line at the upper range of several taxa presented in Figure F9 indicates the extent of this upsection reworking. Some of the signature taxa that indicate the presence of a reworked component of fossil taxa older than the age of the sediment are T. oliverana var. sparsa (a late Miocene to early Pliocene diatom), A. ingens var. nodus (a middle Miocene diatom), and other robust resistant taxa.
Although no reliable, in situ, biostratigraphically useful diatoms are identified in the upper ~80 m CSF-A, the underlying Sample 374-U1524A-10H-CC (89.94 m CSF-A) indicates a Pleistocene age for this upper interval. Sample 10H-CC contains an abundant and moderately well preserved assemblage containing Rouxia, Fragilariopsis, and Chaetoceros resting spores and a reduced presence of reworked species, which suggests in situ production and deposition and good preservation of fine diatom structures and weakly silicified diatoms.
The highest occurrence of Rouxia diploneides (last appearance datum [LAD] at 2.4 Ma) and the overlapping ranges of Actinocyclus maccollumii (LAD at 2.4 Ma) and Actinocyclus fasciculatus (FAD at 2.7 Ma) indicate an age of younger than 2.5 Ma above this sample. The LAD of R. diploneides is coincident with the LAD of Thalassiosira complicata (2.5 Ma), which defines the boundary between the overlying Thalassiosira vulnifica Zone and underlying T. complicata/T. vulnifica Zone (2.5–3.2 Ma). Therefore, the absence of R. diploneides and the continued presence of T. complicata in the samples shallower than ~80 m CSF-A may result from upsection reworking of T. complicata. The change in diatom assemblage composition and preservation above Sample 10H-CC (89.94 m CSF-A) and the convergence of five diatom LAD events (Figures F8, F9) suggest the presence of a disconformity between Samples 10H-CC and 9H-CC (between 89.94 and 80.47 m CSF-A). This stratigraphic break corresponds to the boundary between lithostratigraphic Subunits IA and IB (Figures F9, F10).
The continued presence of T. vulnifica in core catcher samples downhole to Sample 374-U1524A-31F-CC (270.68 m CSF-A) suggests an age of younger than 3.2 Ma above the base of the T. complicata/T. vulnifica Zone, which is defined by the FAD of T. vulnifica (3.2 Ma). The FADs of Fragilariopsis laqueata and Fragilariopsis robusta (3.1 Ma) in Sample 26H-CC (237.07 m CSF-A), Shionodiscus tetraoestrupii var. reimerei (~2.4–3.1 Ma) in Sample 29H-CC (266.13 m CSF-A), T. vulnifica (3.2 Ma) in Sample 31F-CC (270.68 m CSF-A), and Thalassiosira elliptipora (3.3 Ma) in Sample 32X-CC (273.01 m CSF-A) indicate a late Pliocene (~3.3 Ma) to earliest Pleistocene (~2.5 Ma) age for this interval (Tables T4, T5; Figures F9, F10). The first occurrence of T. vulnifica in Sample 31F-CC (270.68 m CSF-A) also defines the upper boundary of the Fragilariopsis interfrigidaria Zone, the lower portion of which appears to be missing in a hiatus (Figure F8).
Several extended intervals of hemipelagic to pelagic deposition were recognized based on moderate preservation and higher abundances of Rouxia spp., Fragilariopsis spp., Thalassionema nitzschioides var. nitzschioides, and Chaetoceros resting spores between Samples 374-U1524A-21H-CC and 32X-CC (189.71–273.01 m CSF-A). These assemblages are interpreted to represent sustained or extended intervals of hemipelagic to pelagic conditions and are more common in the lower part of the T. complicata/T. vulnifica Zone. However, not all of the diatom production is from the pelagic realm because occurrences of neritic and benthic diatoms (e.g., Paralia sulcata) reveal intermittent transport of shallower water diatoms to this site (Table T5). Postcruise research will allow the identification of sedimentological facies where initial diatom production and final deposition ages are closely aligned, which may reveal more about the processes driving diatom production and deposition.
Between 279.85 and 309.00 m CSF-A (Samples 374-U1524A-33X-CC and 34H-CC and 374-U1524C-4R-CC to 7R-CC), the FAD of Thalassiosira kolbei (4.1 Ma) occurs together with a number of diatoms with FADs at 4.5–4.6 Ma (Thalassiosira striata, Thalassiosira fasciculatus, T. complicata, and R. diploneides), which suggests that the appearance of T. kolbei may be older at this high-latitude continental rise site. Sample 374-U1524A-32X-CC (273.01 m CSF-A) contains diatoms with FADs at 3.2 and 3.3 Ma (T. elliptipora and T. vulnifica, respectively), suggesting ~1.3–1.4 My is missing across this disconformity (Figures F8, F9, F10).
Sample 374-U1524C-8R-CC (317.54 m CSF-A) contains a well-preserved and diverse assemblage of diatoms interpreted to be in situ. This sample aligns with the lower boundary of lithostratigraphic Unit II. The FAD of Thalassiosira inura indicates an age younger than 4.85 Ma for this sample, which contains the LAD or FAD of six radiolarian taxa with ages ranging between 3.53 and 5.57 Ma (Table T4; see Radiolarians). Below this interval, Sample 9R-CC (329.49 m CSF-A) is dated to ~8.4 Ma (constrained with radiolarian and diatom biostratigraphic control) and includes the FAD of T. oliverana var. sparsa (8.6 Ma) (Table T4). The large age difference between these two samples indicates the presence of a disconformity of ~4 My duration between the upper Miocene and lower Pliocene (Figures F8, F9, F10).
The presence of A. ingens var. nodus (12.6–14.6 Ma) with sparse, poorly preserved diatoms in Sample 374-U1524C-10R-CC (336.36 m CSF-A) is indicative of reworking in this sample. Diatoms are moderately preserved with common to rare occurrences in Samples 12R-CC to 20R-CC (358.85–436.98 m CSF-A), except for Sample 18R-CC (413.10 m CSF-A), which is characterized by poor preservation and only trace numbers of diatoms. The FAD of T. oliverana var. sparsa in Sample 13R-CC (413.10 m CSF-A) suggests an age of 8.6 Ma for this sample. Several other age-diagnostic diatom species are identified in Sample 16R-2, 107 cm (395.98 m CSF-A) (Table T5; Figure F8), including Fragilariopsis donahuensis, Fragilariopsis januaria, and Denticulopsis crassa, which allows an age estimation between 8.8 and 10.0 Ma for the lower interval of this site.
Radiolarians
All core catcher samples and the mudline sample from Site U1524 were analyzed for radiolarian content. A distribution chart is given in Table T6, and a list of radiolarian datum events is provided in Table T4. The mudline sample contains frequent, well-preserved radiolarians. The assemblage resembles that from the mudline sample at Site U1525 in that it is very diverse with a strong imprint of Arctic/Subarctic components and a clear presence of intermediate- and deep-water species. In contrast to Site U1525, the two taxa representative of the Antarctic shelf/coastal assemblages (Rhizoplegma boreale and the Phormacantha hystrix/Plectacantha oikiskos group) are absent (see Biostratigraphy and paleontology in the Site U1525 chapter [McKay et al., 2019d]).
Sample 374-U1524A-1H-CC (3.97 m CSF-A) contains an abundant, well-preserved radiolarian assemblage that strongly resembles the assemblage observed in the mudline sample and is therefore interpreted as being modern/late Pleistocene in age. In Sample 374-U1524B-1H-CC (7.61 m CSF-A), radiolarian abundance drops to rare and preservation is moderate. The LAD of Antarctissa cylindrica indicates an age of older than 0.65 Ma for this sample.
The ~300 m thick interval between Samples 374-U1524A-2H-CC and 374-U1524C-7R-CC (13.77–309.00 m CSF-A) is characterized by sporadic radiolarian occurrences. Three samples with abundant or common radiolarians (Samples 374-U1524A-23H-CC, 30H-CC, and 31F-CC [208.66, 270.27, and 270.68 m CSF-A, respectively]) and five samples with rare but well-preserved radiolarians stand out against a background of barren to trace abundances and poor to moderate preservation (Table T6). The strong input of terrigenous and/or biogenic material, presumably responsible for the highly expanded upper Pliocene section, potentially diluted the abundances of radiolarian microfossils in this part of the section. The synsedimentary remobilization of sediment in fine-grained turbidites/contourites might explain the occasional occurrence of common to abundant radiolarian faunas in some samples. In these instances, the core catcher sample would have sampled one of the more biogenic silica–rich lithologies (e.g., diatom ooze and diatom-rich mud) interpreted to represent a phase of pelagic sedimentation (see Lithostratigraphy).
Biostratigraphically useful radiolarian taxa were recognized throughout the site, on occasion even from samples with trace abundances. The LAD of Helotholus vema (2.35 Ma) occurs in Sample 374-U1524A-9H-CC (80.47 m CSF-A), the LAD of Desmospyris spongiosa (2.47 Ma) occurs in Sample 18H-CC (160.86 m CSF-A), and the FAD of Cycladophora davisiana (2.51 Ma) occurs in Sample 30H-CC (270.27 m CSF-A). Two additional events are very distinctive, the LAD of Cycladophora pliocenica in Sample 10H-CC (89.94 m CSF-A) and the LAD of Eucyrtidium calvertense in Sample 23H-CC (208.66 m CSF-A), but these events are not retained for the construction of the age model because they seem to occur at slightly different ages than other parts of the Southern Ocean. These two events should be found close together in a stratigraphic sequence because they are calibrated at 1.72 and 1.73 Ma, respectively; however, in Hole U1524A they occur ~120 m apart, and the LAD of C. pliocenica is observed in Sample 10H-CC (89.94 m CSF-A), indicated as R3 on Figure F10. This sample is demonstrably older than 2.35 Ma; it is located below the LAD of H. vema. E. calvertense is found in Sample 23H-CC (208.66 m CSF-A), which must be older than 2.47 Ma because it is ~50 m deeper than the LAD of D. spongiosa. We therefore propose a recalibration of the LAD of C. pliocenica for the Ross Sea region to ~2.15–2.4 Ma (in contrast to 1.72 Ma from other locations in the Southern Ocean; see Florindo et al., 2013; Lazarus, 1992). The proposed age range is based on paleomagnetic reversals above and below Sample 10H-CC that are constrained by the more robust biostratigraphic datums given in Table T4: the top of Subchron C2r.2r (2.148 Ma) at ~78 m CSF-A and the base of the Matuyama Chron (Subchron C2r.2r; 2.581 Ma) at ~120 m CSF-A (see Paleomagnetism). The age calibration of this datum is also constrained at Sites U1523 and U1525 (see Biostratigraphy and paleontology and Paleomagnetism in the Site U1523 chapter and Biostratigraphy and paleontology and Paleomagnetism in the Site U1525 chapter [McKay et al., 2019c, 2019d]).
The interval between Samples 374-U1524C-8R and 10R-CC (317.54–336.36 m CSF-A) contains very diverse, abundant to frequent, moderately to well-preserved radiolarians. The ages of the first two samples are extremely well constrained, providing good control for the age and duration of the unconformity between Cores 8R and 9R. Moreover, the radiolarian ages for Samples 8R-CC and 9R-CC are also robust; very similar ages are provided by diatom biostratigraphy for these two samples (4.8–5.5 and 8.5 Ma, respectively). Three biostratigraphic datums are observed in Sample 8R-CC (317.54 m CSF-A): the FAD of H. vema (calibrated at 4.88 Ma), the last common occurrence of Lychnocanium grande (4.55 Ma), and the LAD of Eucyrtidium pseudoinflatum (4.6 Ma). These datums indicate an age of 4.55–4.88 Ma for this sample and an upper bound for the age of the underlying unconformity. The lowest occurrence of Desmospyris spongiosa is also present in this sample, but this bioevent appears slightly truncated because its FAD is calibrated at 5.57 Ma. Five reliable datums are identified in Sample 9R-CC (329.49 m CSF-A): the LAD of Acrosphaera australis (calibrated at 8.42 Ma), the FADs of Antarctissa denticulata and Antarctissa strelkovi (8.45 and 8.60 Ma, respectively), the LAD of Siphono-sphaera vesuvius (8.37 Ma), and the LAD of Prunopyle hayesi (8.35 Ma). The LAD of Desmospyris rhodospyroides (5.95 Ma) seems to occur substantially below its calibrated age at this site. The resulting age range for Sample 9R-CC (8.42–8.60 Ma) provides a lower constraint for the age of the overlying unconformity.
Samples 374-U1524C-10R-CC and 12R-3, 75–78 cm (336.36 and 358.85 m CSF-A), contain a radiolarian assemblage similar to that of Sample 9R-CC and are therefore similar in age (<8.6 Ma). A marked change in environmental conditions might have occurred at this point unless the core catcher samples fortuitously collected lithologies not conducive to biogenic silica preservation; radiolarians are absent in the next two samples (13R-CC [365.15 m CSF-A] and 16R-CC [398.07 m CSF-A]). The deepest sample recovered at this site (Sample 20R-CC [436.98 m CSF-A]) contains common, well-preserved radiolarians and is dated to between 8.6 and 10.1 Ma based on the presence of Cycladophora spongothorax (LAD calibrated at 8.6 Ma), A. australis (FAD at 10.17 Ma), and S. vesuvius (FAD at 10.07 Ma).
Foraminifers
Foraminifers are infrequent and sparse throughout the upper Neogene sequence recovered at Site U1524 (Table T7; Figure F8). No foraminifers were found during initial investigation of Sample 374-U1524A-1H-CC (3.97 m CSF-A). Planktonic foraminifers, exclusively Neogloboquadrina pachyderma, are rare to few in Samples 2H-CC to 6H-CC (13.77–51.98 m CSF-A). Below this depth, planktonic foraminifers are intermittent. When N. pachyderma is present below Sample 2H-CC (13.77 m CSF-A), its tests are always small (<250 µm), suggesting size sorting and winnowing by bottom currents or other displacement processes that resulted in the selective deposition of smaller specimens. In addition, some samples include tests of individual specimens with holes or fragments of tests; both suggest that dissolution in the water column or at the seafloor has altered the original assemblage.
The water depth at the site (2394 m), an elevated carbonate compensation depth, high sedimentation rates, and/or unfavorable substrate conditions all may have contributed to the paucity of planktonic and calcareous and agglutinated benthic foraminifers at this site. The more robust benthic foraminifer species do not show obvious postmortem alterations, but the benthic foraminifers are remarkably few based on preliminary shipboard analyses. Noteworthy are the monospecific agglutinated assemblages of Martinottiella communis in Samples 374-U1524C-8R-CC (317.54 m CSF-A) and 20R-CC (436.98 m CSF-A) and the monogeneric calcareous benthic assemblage of Nonionella (Nonionella iridea and Nonionella bradii?) in Sample 12R-3, 75–78 cm (358.85 m CSF-A).
Palynology
Seventeen core catcher samples, ten from Hole U1524A (Samples 1H-CC to 34X-CC [3.97–290.36 m CSF-A]) and seven from Hole U1524C (Samples 4R-CC to 20R-CC [279.85–437.03 m CSF-A]), and two additional samples from split-core sections of Core 374-U1524C-12R were analyzed for palynomorph content (Table T8). In general, palynomorph preservation at this site ranges from poor to good. Although most of the samples are devoid or almost devoid of dinocysts, few to common dinocysts occur in Samples 374-U1524A-22H-CC (199.66 m CSF-A) and 25H-CC (227.81 m CSF-A) (Figure F8). Samples 6H-CC (51.98 m CSF-A) and 10H-CC (89.94 m CSF-A) contain only a few acritarchs of the genus Leiosphaeridia and a few pollen grains, which are potentially reworked.
Samples 374-U1524A-14H-CC (127.47 m CSF-A) and 18H-CC (160.91 m CSF-A) are almost devoid of dinoflagellates except for a few in situ protoperidinioid cysts (Brigantedinium spp., Lejeunecysta spp., and Protoperidinium spp.) and some specimens of reworked cysts from older Eocene and Oligocene sequences (e.g., Deflandrea sp., Enneadocysta diktiostyla, and Vozzhennikovia spp.). Samples 22H-CC (199.66 m CSF-A) and 25H-CC (227.81 m CSF-A) contain a similar assemblage characterized by Brigantedinium spp., Lejeunecysta spp., and a specific type of yet undescribed Selenopemphix with striated walls, herein informally referred to as Selenopemphix “striata” (Figure F11). Specimens of Lejeunecysta “reticulata,” the same morphotype found in the Pliocene interval at Site U1523, are found together with another morphotype characterized by a striated wall, named Lejeunecysta “striae.” Other palynomorphs present are the acritarch Leiosphaeridia and the Prasinophyta Cymatiosphaera. Sample 25H-CC (227.81 m CSF-A) also contains specimens of Selenopemphix antarctica and S. nephroides, as well as the frequent presence of the acritarch Leiosphaeridia and the Prasinophyta Cymatiosphaera.
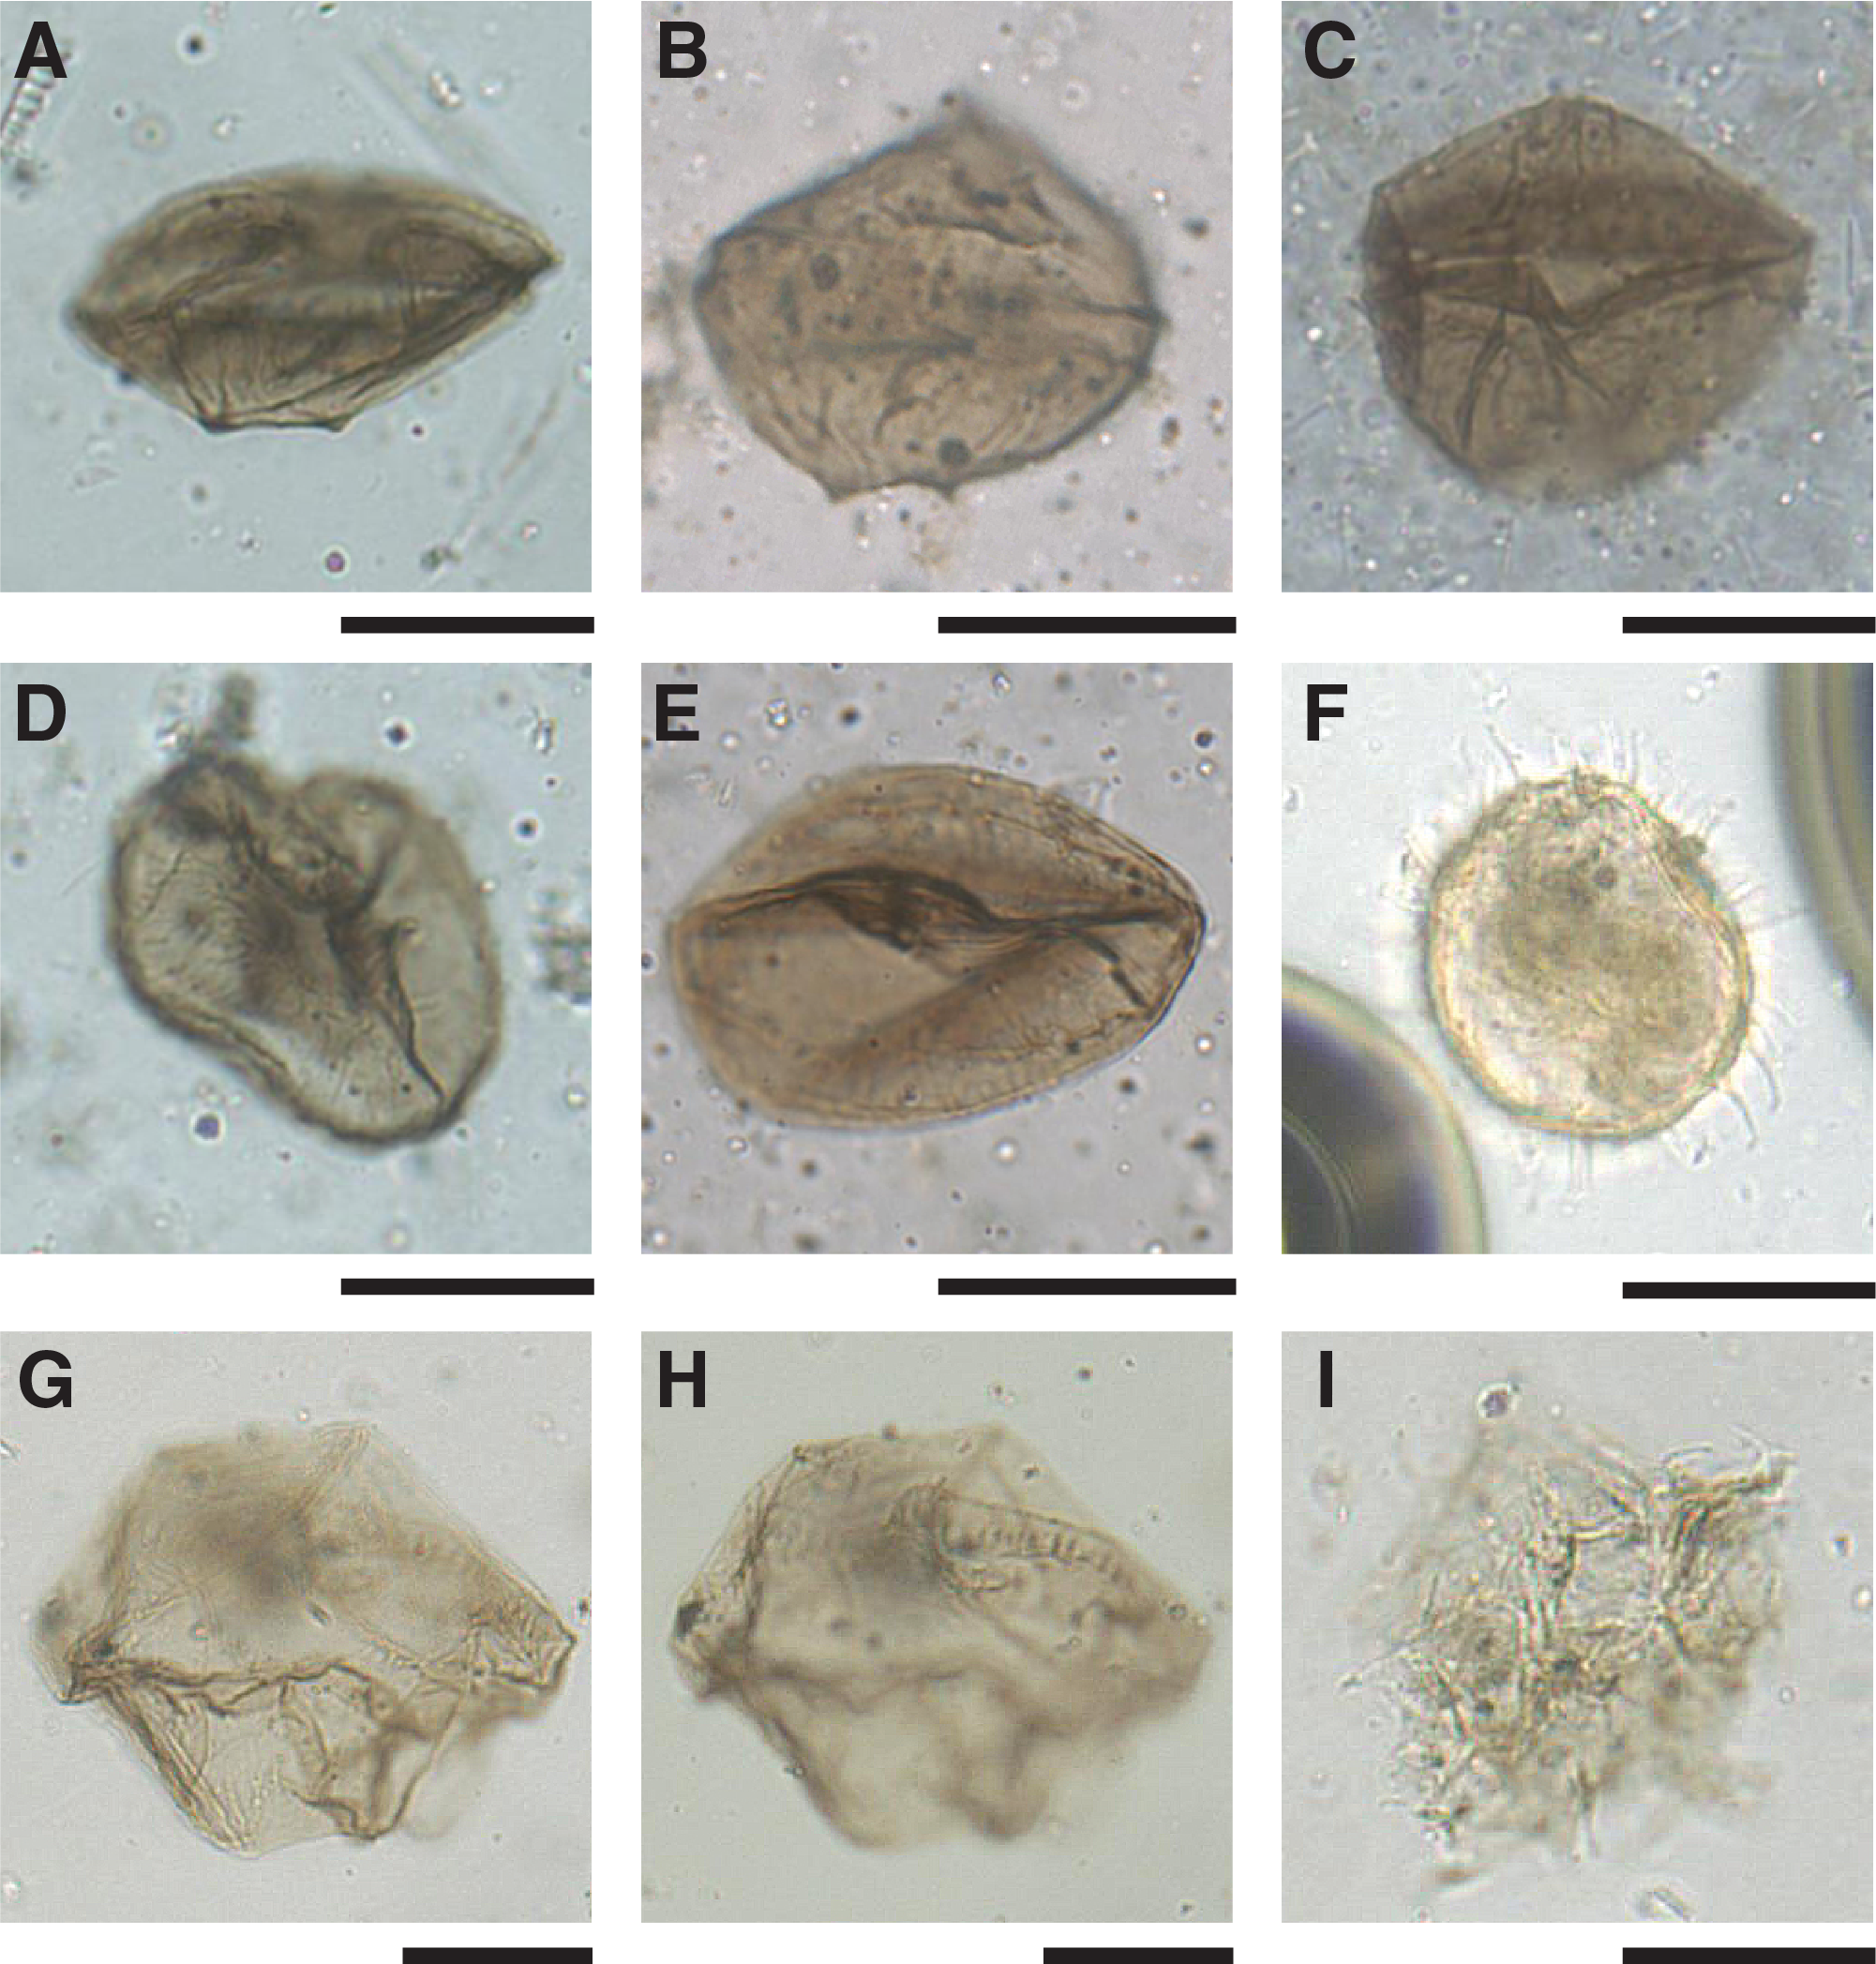
Figure F11. Dinocysts.
Dinocysts are almost absent in Sample 374-U1524A-28H-CC (256.48 m CSF-A), although the sample does include a few specimens of Brigantedinium spp. and S. nephroides. Sample 32X-CC (273.01 m CSF-A) contains few Brigantedinium spp. and rare S. nephroides together with few specimens of Leiosphaeridia, the transparent cyst Cymatiosphaera sp. 1, and the brown cyst Cymatiosphaera sp. 3 of Hannah et al. (1998). Sample 34X-CC (290.31 m CSF-A) is devoid of palynomorphs.
Samples 374-U1524C-4R-CC to 9R-CC (279.85–329.49 m CSF-A) contain only rare specimens or are completely devoid of dinocysts. Sample 16R-CC (398.07 m CSF-A) contains rare specimens of the protoperidinioid Brigantedinium spp., Selenopemphix spp., and the acritarch Leiosphaeridia. Sample 20R-CC (436.98 m CSF-A) is completely devoid of palynomorphs (Table T8; Figure F8).
Samples 374-U1524C-12R-1, 27–28 cm (355.77 m CSF-A) and 12R-3, 75–78 cm (358.85 m CSF-A), contain few palynomorphs. The former sample contains few dinocysts, namely Operculodinium spp. (Table T8; Figure F11), rare Brigantedinium spp., Batiacasphaera spp., and Protoperidinium spp. The acritarch Leiosphaeridia and Cymatiosphaera are also rare. Sample 12R-3, 75–78 cm (358.85 m CSF-A), includes few dinocysts, including Brigantedinium spp., Lejeunecysta spp., Operculodinium spp., and Selenopemphix spp. Notable is the appearance of the stratigraphic marker Selenopemphix bothrion (Figures F8, F11) which indicates an age between 7.3 and 9.9 Ma for this sample (Harland and Pudsey, 2002). In addition, rare Leiosphaeridia and Cymatiosphaera are present.
The in situ assemblages at Site U1524 are formed mainly by protoperidinioid dinocysts, likely cysts of heterotrophic dinoflagellates and mostly Brigantedinium spp., Lejeunecysta spp., and Selenopemphix spp., and few spiny round brown Protoperidinium spp. cysts, indicating high-productivity water (Zonneveld et al., 2013). Cysts of autotrophic genera are less represented and include few Operculodinium spp. and rare Batiacasphaera spp., which are found only in Hole U1524C.
Age model
Radiolarians and diatoms provide well-constrained age-diagnostic events used to develop an age-depth model for Site U1524 (Figures F9, F10; Table T4). Reworking and mixing of diatom assemblages of multiple ages limited their biostratigraphic utility in the interval from the top of the site to Sample 374-U1524A-9H-CC (80.47 m CSF-A). The underlying stratigraphic sequence is assigned to several biostratigraphic zones that are sometimes bounded by unconformities (Figures F8, F10). The interval from Core 10H through Core 13H (~80–120 m CSF-A) is dated to the early Pleistocene. Below this interval is an ~160 m thick Pliocene interval rich in diatoms (Cores 14H through 32X [~127–283 m CSF-A]). A disconformity representing >1.0 My is interpreted to be located between Samples 32X-CC and 33X-CC (273.01–282.94 m CSF-A). An ~30 m thick lower Pliocene interval between Samples 374-U1524A-33X-CC and 374-U1524C-8R-CC (~283–317.54 m CSF-A) overlies another disconformity interpreted between Samples 374-U1524C-8R-CC and 9R-CC (3217.54–329.49 m CSF-A). Sediment below this disconformity is dated to older than 8.5 Ma (late Miocene), with the deepest sample from the site (Sample 20R-CC [436.98 m CSF-A]) dated to ~9 Ma by a number of diatom and radiolarian events (Figures F8, F9, F10; Table T4). The occurrence of the age-diagnostic (late Miocene) dinocyst species S. bothrion, found in just one sample at 358.85 m CSF-A (Sample U1524C-12R-3, 75–78 cm), confirms the age provided by diatoms and radiolarians. Zonal assignments are shown in Figure F8, and a preliminary shipboard age model constructed using biostratigraphic datums listed in Table T4 is presented in Figure F10.
Paleomagnetism
Paleomagnetic investigations at Site U1524 focused on constructing a magnetostratigraphy interpreted from the characteristic remanent magnetization (ChRM). The magnetostratigraphy is supported by biostratigraphic datums and tied to the geomagnetic polarity timescale (GPTS) that establishes the chronostratigraphy for this site. Rock magnetic properties were measured to assess the stability of the paleomagnetic record and investigate magnetic fabrics that relate to depositional and postdepositional processes.
Natural remanent magnetization (NRM) measurements followed alternating field (AF) demagnetization in 5 mT steps between 0 and 20 mT peak fields for archive-half core sections of Cores 374-U1524A-1H through 2H (0–13.82 m CSF-A). NRM measurements of Cores 3H through 30H (13.50–270.32 m CSF-A) followed AF demagnetization in 0, 10, and 20 mT steps to keep up with increased core flow through the laboratory. A 5 mT peak AF demagnetization and measurement step was introduced for Hole U1524C to better understand the effects of potential drilling overprints and low-coercivity component(s).
The XCB system was used to recover sediments at the base of Hole U1524A, but it frequently yielded sediments that were too disturbed to be used for paleomagnetic purposes (e.g., Cores 374-U1524A-33X and 34X [280.30–290.36 m CSF-A]). The RCB system was used for Hole U1524C but only recovered limited material. Therefore, only a few cores from Hole U1524C were available for paleomagnetic studies. Some cores (e.g., 374-U1524A-33X or 374-U1524C-20R) were too disturbed for archive-half measurements but contained a few undisturbed intervals in the working-half core section from which oriented discrete samples could be collected.
All data from disturbed intervals and those collected within 10 cm of section ends were excluded in the data analysis. Processed (relatively disturbance free) data sets were used to determine ChRM directions and a magnetostratigraphy. This magnetostratigraphy was correlated to the GPTS of Gradstein et al. (2012) aided by independent biostratigraphic age control (see Biostratigraphy and paleontology).
Oriented discrete paleomagnetic samples typically collected every other section (116 total samples; 110 from Hole U1524A and 6 from Hole U1524C) were used to determine the ChRM range and to test the directions determined on archive-half core sections. A subset of 20 samples was progressively demagnetized using a 20-step AF demagnetization protocol (0–20 mT in 2 mT steps and 20–60 mT in 5 mT steps followed by 70 and 80 mT peak AF demagnetization) to assess and remove potential overprint(s) and to investigate the coercivities of the magnetic minerals that carry the remanent signal.
Mean (bulk) magnetic susceptibility in the discrete samples was measured for comparison with magnetic susceptibility measurements made on archive-half core sections using the Section Half Multisensor Logger (SHMSL) and on whole-round core sections with the Whole-Round Multisensor Logger (WRMSL). Furthermore, the anisotropy of magnetic susceptibility (AMS), which represents magnetic fabric, was determined.
NRM measurements
Archive-half measurements
NRM intensities prior to demagnetization are mostly ~10−1 to 10−2 A/m in Cores 374-U1524A-1H through 10H (0–90.01 m CSF-A) and oscillate between ~10−1 and ~10−3 A/m in Cores 11H through 18H (89.50–160.91 m CSF-A). These oscillations are more subdued (~10−2 to ~10−3 A/m) in the lower half of Hole U1524A (Cores 19H through 30H [160.80–270.32 m CSF-A]). The large initial NRM intensity variations between ~80 and 160 m CSF-A match well with variations in magnetic susceptibility from the WRMSL, SHMSL, and Kappabridge measurements (Figure F12), which suggests that changes in magnetic particle concentration influences these parameters similarly. A downhole decrease in magnetic susceptibility and initial NRM intensity may be caused by the reduction of iron oxides and the occurrence of anoxic conditions at ~90 m CSF-A (see Geochemistry and microbiology). Further postcruise work is required to test this hypothesis.
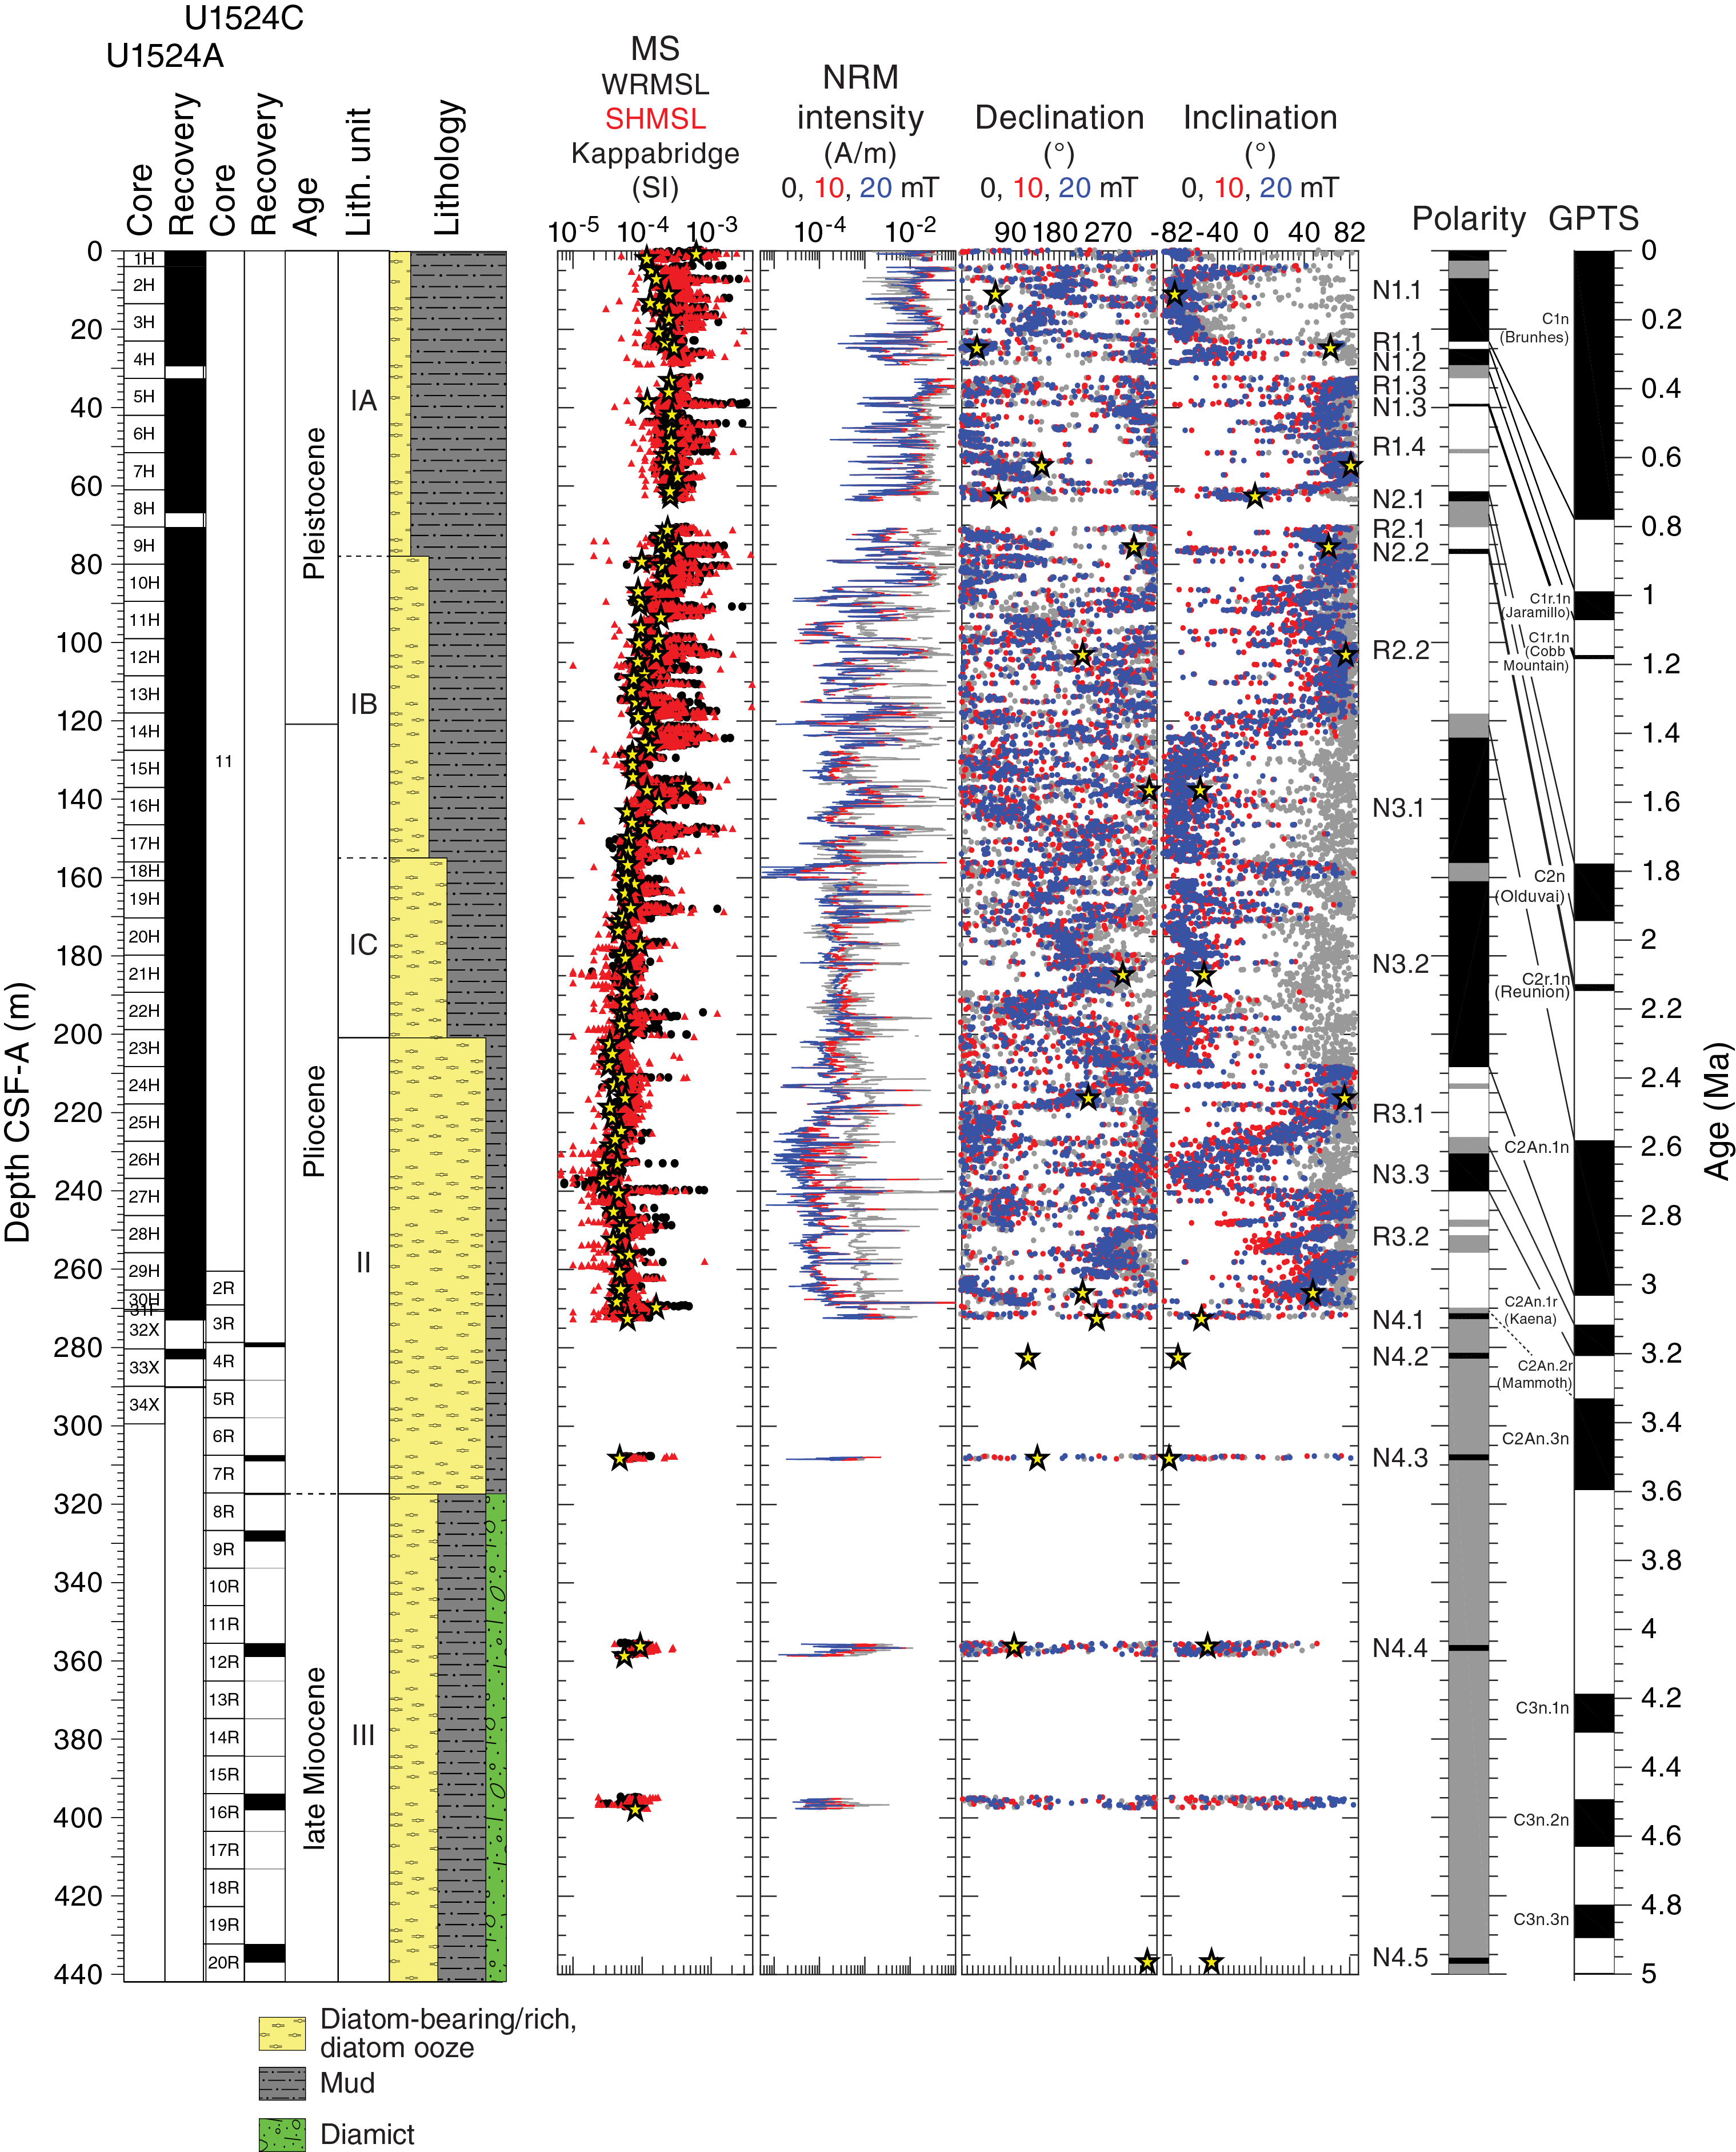
Figure F12. Paleomagnetic data.
A downward-directed drilling overprint common to APC intervals influenced NRM intensities in Hole U1524A. This overprint can add or subtract to the vector length of the initial NRM intensity, depending on the polarity of the NRM. For example, NRM intensities of a few intervals interpreted to be normal polarity intervals (e.g., Core 374-U1524A-2H [4.00–13.82 m CSF-A] and most of Core 22H [189.30–199.71 m CSF-A]) increase following AF demagnetization up to about 10–20 mT. In contrast, NRM intensities of intervals with reversed polarity decrease during demagnetization (e.g., lower half of Core 11H [~94–99 m CSF-A]). In the case of normal polarity intervals, the drilling overprint with a low coercivity has a direction nearly antipodal to the ChRM, which has a higher coercivity (Figure F12). The overprint therefore reduces the total vector length of the NRM in normal polarity intervals and increases the total vector length of the NRM in reversed intervals.
Demagnetization of 10 and 20 mT peak AF is generally sufficient to remove this overprint, as demonstrated by the inclinations that often cluster either steeply upward (negative inclination) or steeply downward (positive inclination). The notable exception is Core 374-U1524A-18H (156.00–160.91 m CSF-A), where AF demagnetization removes more than an order of magnitude of the initial NRM intensity (NRM is ~10−5 A/m after 20 mT peak AF). Resulting inclinations are scattered in shallow directions and we therefore refrain from assigning a polarity to this core. The two groups of steeply upward- and downward-directed inclinations are interpreted to represent normal and reversed polarity zones because Site U1524 is located in the Southern Hemisphere. We expect the inclinations to center at ±82.0° under the geocentric axial dipole assumption (Site U1524 is located at 74.2°S). The observed inclinations are generally shallower than ±82.0°, suggesting an influence of factors that include (1) inclination flattening yielding (too) shallow inclinations, (2) a nondipolar geomagnetic field, and (3) incomplete removal of overprints.
Discrete sample measurements
The NRM of oriented discrete samples was measured before and after progressive AF demagnetization. The 20-step AF demagnetization and measurement protocol shows the presence of multiple components with variable coercivities (Figure F13). The first component is present between 0 and 2 mT and has random orientations that suggest viscous remanent magnetization. A steep downward-directed component has a coercivity of up to 16 mT and is interpreted to be the drilling overprint. The magnetization of a third component decays nearly linearly toward the origin of the demagnetization diagrams when sequentially demagnetized between 20 and 80 mT peak AF. One or more components with a coercivity higher than 80 mT may also be present because generally only 5%–10% of the magnetic remanence remains after 80 mT peak AF demagnetization (Figure F13A–F13C), except for Sample 374-U1524C-20R-4, 52 cm (436.82 m CSF-A), where ~50% of the remanence is present after 80 mT demagnetization (Figure F13D). Postcruise work is required to identify the magnetic mineralogy of these potential components and to disentangle their influence on the NRM and ChRM.
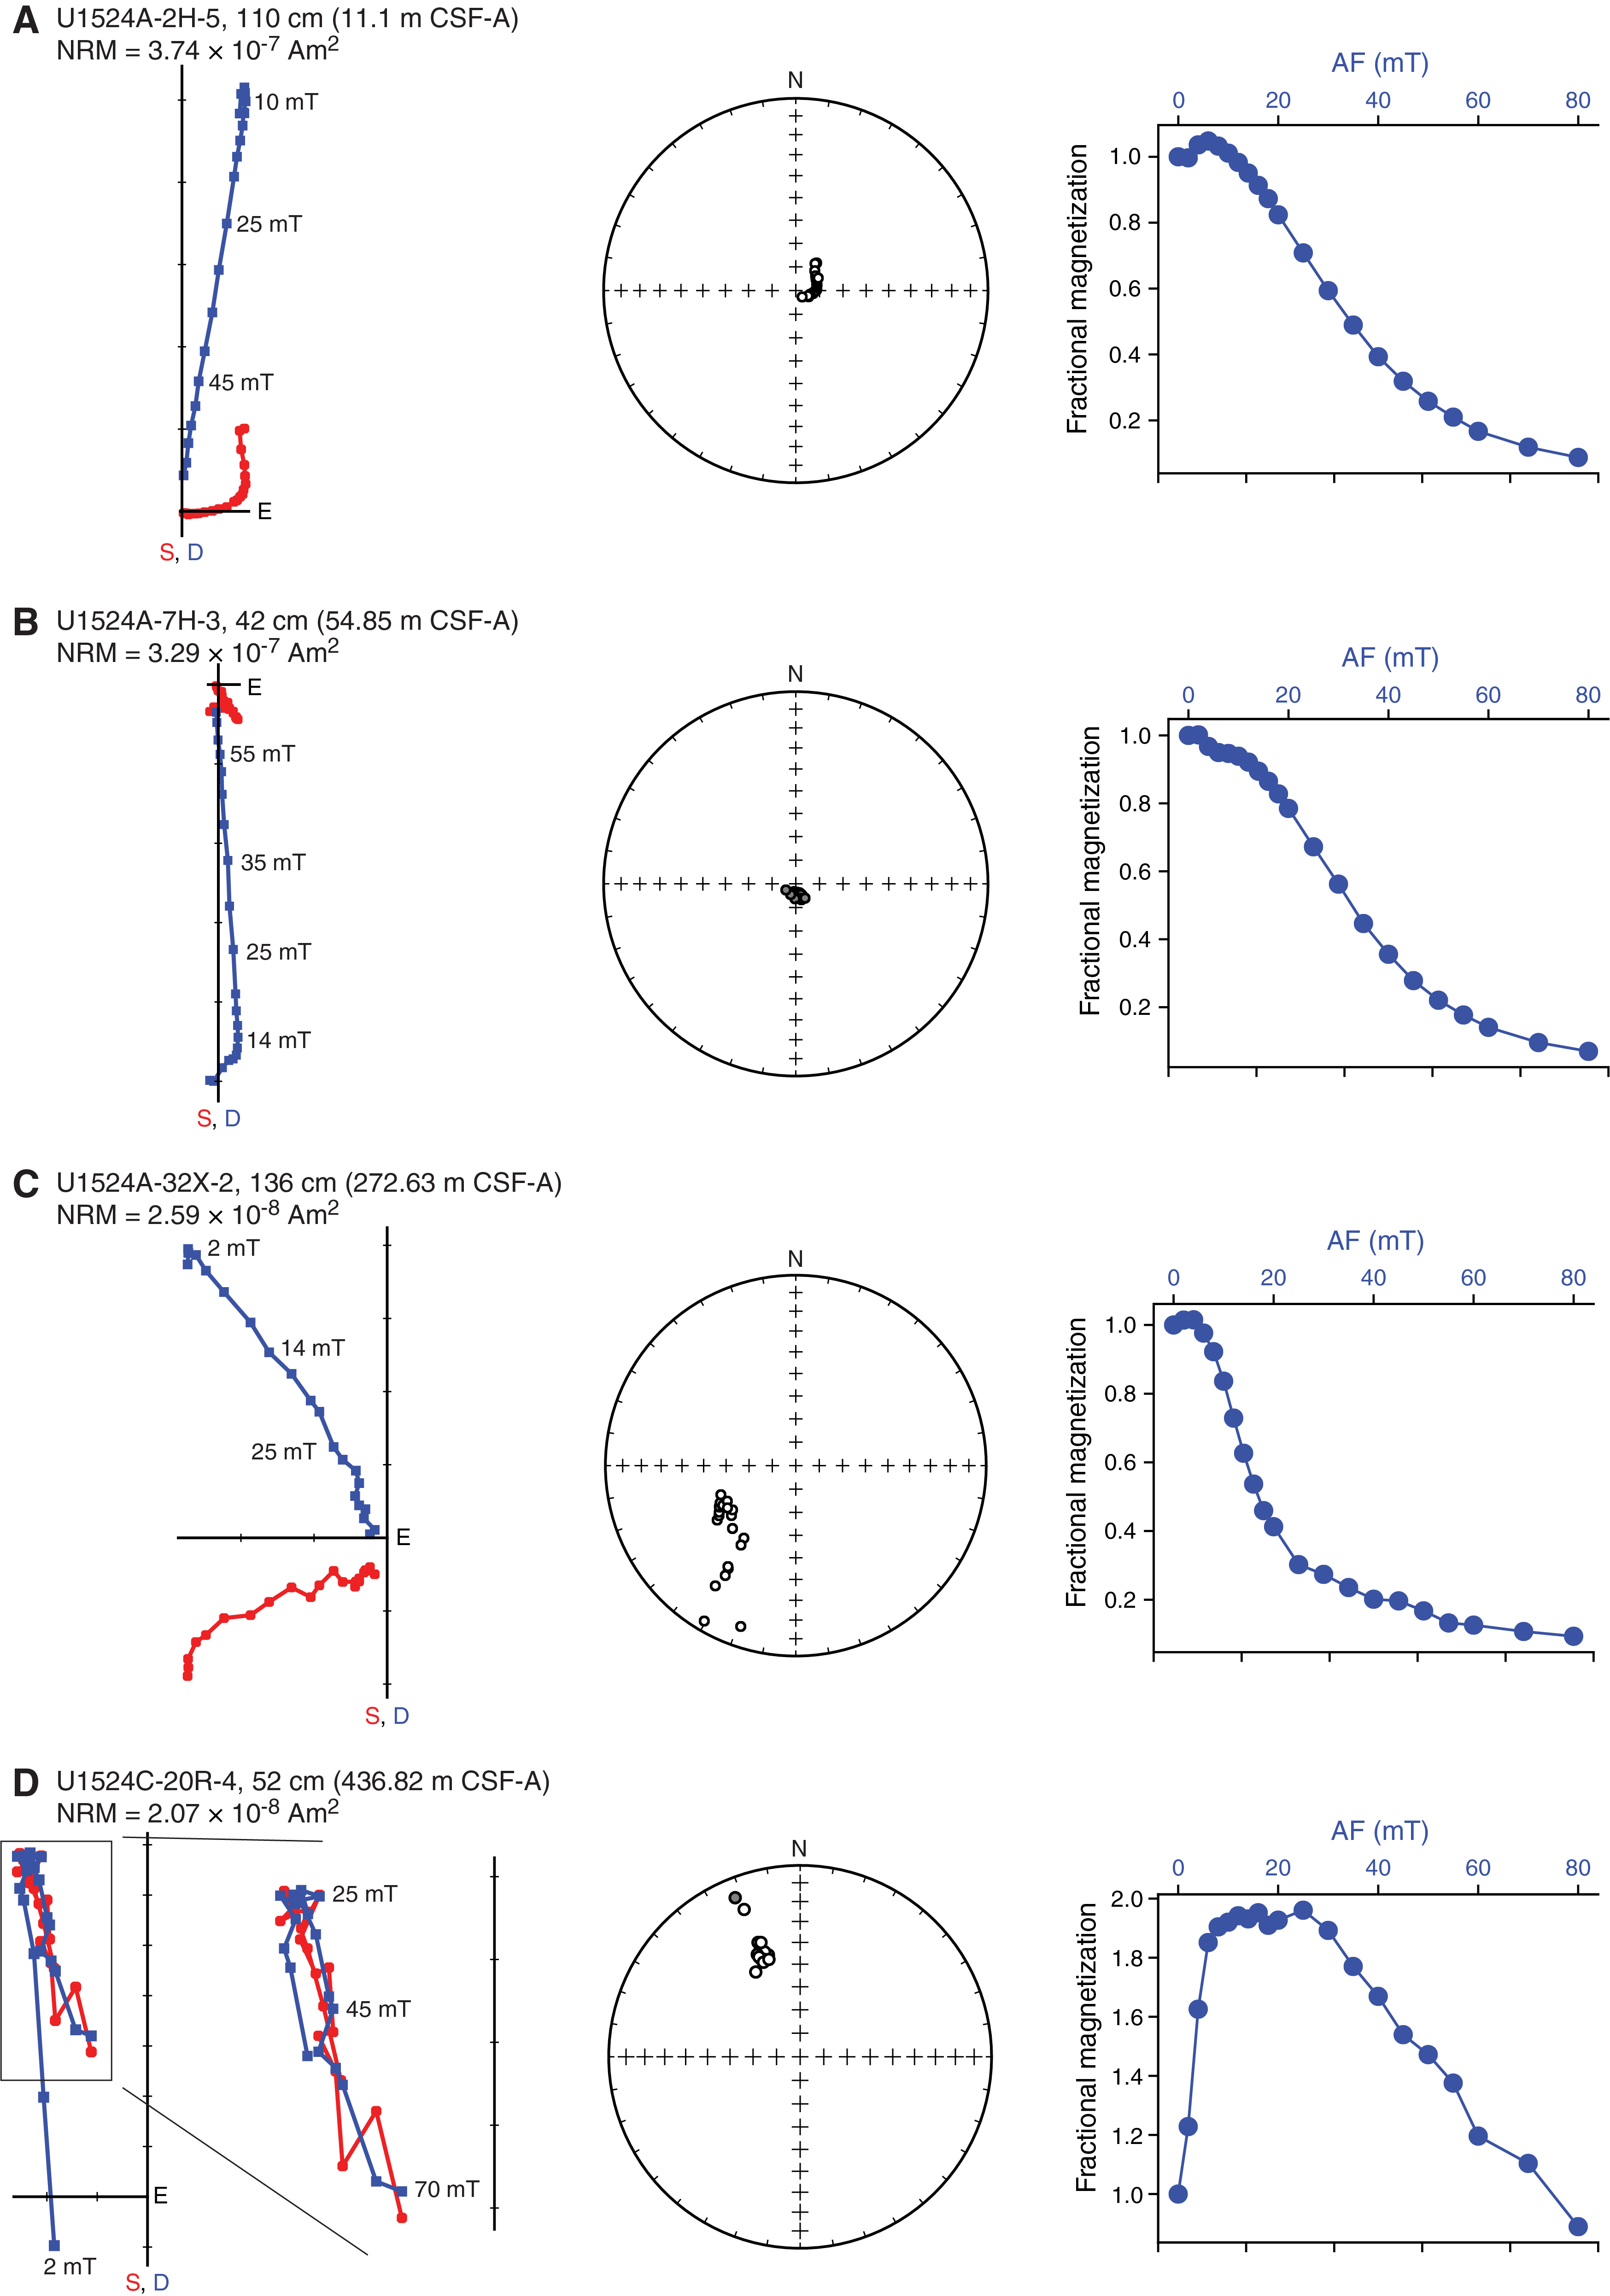
Figure F13. Representative AF demagnetization behavior.
We interpret the ChRM to be of intermediate coercivity (<80 mT but greater than the drilling overprint) and a reliable recorder of the paleomagnetic field so that we can construct a magnetostratigraphy. Low signal-to-noise ratios are occasionally present in discrete samples and archive-half core sections (e.g., Core 374-U1524A-18H), and such data are excluded from the polarity interpretations.
Magnetostratigraphy
Inclination data from archive-half core sections and oriented cubes reveal stable intervals of positive and negative inclination that we interpret to be reversed and normal polarity zones, respectively (Figure F12), because of this site’s location in the Southern Hemisphere. We define four normal and three reversed polarity zones (N1–N4 and R1–R3, respectively) that are divided into subzones (e.g., N1.1 and R1.1). The zone definitions are slightly arbitrary and depend on data quality and core recovery. For example, we refrained from assigning a polarity subzone to Core 374-U1524A-18H because of its shallow inclinations, but we divided Subzones N3.1 and N3.2 because of the uncertainty associated with Core 18H.
We recognize the normal polarity Subzone N1.1 in the uppermost ~23 m CSF-A (Cores 374-U1524A-1H through 3H) (Figure F12). The top of Core 4H exhibits reversed polarity (Subzone R1.1), implying a reversal in the core gap in between Cores 3H and 4H. In Cores 4H through 9H (23.00–80.54 m CSF-A), we identify a variety of thin and thick subzones (R1.1–N2.2). Incomplete recovery of Cores 4H and 8H resulted in the placement of a reversal boundary in a core gap. Polarity Subzone R2.2 is present between the lowest sections of Core 9H and 13H (76.11–118.24 m CSF-A). The reversal between Subzones R2.2 and N3.1 coincides with a core gap and a thick interval of uncertain polarity at the top of Core 14H (~120 m CSF-A). The reversals between Subzones N3.2/R3.1 and R3.1/N3.3 also occur in core gaps between Cores 23H and 24H (~208 m CSF-A) and between Cores 25H and 26H (~227 m CSF-A), respectively. The reversal between Subzones N3.3 and R3.2 is well constrained in Core 27H (240.20 ± 0.785 m CSF-A). Normal polarity Zone N4 is based on measurements on oriented discrete samples and a select group of relatively undisturbed archive-half core sections (Figure F12). Although we include all these individual cores (374-U1524A-32X through 374-U1524C-20R) in Zone N4, we do not imply that all of these measurements correlate to the same (sub)chron; we merely label them consecutively for clarity.
Confident correlation of Zones N1–N3 to the GPTS depends on available independent biostratigraphic age control (see Biostratigraphy and paleontology). Limited biostratigraphic age control is available for the upper ~110 m CSF-A of Hole U1524A, but good biostratigraphic tie points are present below that depth and suggest that this interval corresponds to the early Pleistocene to possibly the latest Pliocene. Correlation of consecutive normal and reversed polarity (sub)zones to the GPTS reveals an excellent match (Figures F10, F12; Table T9). Subzones N1.1–N2.2 can be tied to the interval between the Brunhes Chron and Reunion Subchron (C1n–C2r.1n [0–2.148 Ma]). The Subzone R2.2/N3.1 reversal corresponds to the Matuyama/Gauss reversal (C2r.2r/C2An.1n [2.581 Ma]). Subzones R3.1 and R3.2 contain sediments deposited during the Kaena (C2An.1r [3.032–3.116 Ma]) and Mammoth Subchrons (C2An.2r [3.207–3.330 Ma]), respectively. The normal polarity Subzones N4.1–N4.5 identified in Cores 374-U1524A-32X through 33X and 374-U1524C-4R through 20R can be tied to multiple late Miocene to Pliocene normal polarity (sub)chrons. We refrained from providing temporal tie points for these subzones.
Magnetic susceptibility and AMS
For all collected discrete samples, the mean magnetic susceptibility and AMS that prescribes the shape and size of the magnetic susceptibility ellipsoid was determined. Here, we mainly use the orientation of the maximum (kmax), intermediate (kint), and minimum (kmin) susceptibilities and (the ratios of) their magnitudes (Figure F14). For instance, the degree of anisotropy (P) is approximated by the kmax/kmin ratio, where P = 1 indicates no anisotropy (spherical shape) and P > 1 indicates a high degree of anisotropy. The highest P values (often greater than ~1.1; Figure F14) are observed in lithostratigraphic Subunit IA, with P relatively constant at ~1.05 in Subunit IC and Unit II. P values decrease around the boundary between Subunits IA and IB (~80 m CSF-A), which coincides with the sharp change in sedimentation rate and supports the presence of a potential short hiatus (Figure F14). Alternatively, the decrease in P may also reflect a diagenetic effect around the sulfate–methane transition zone at ~90 m CSF-A (see Geochemistry and microbiology). Further postcruise work is required to separate these influences.

Figure F14. Anisotropy of magnetic susceptibility.
The AMS parameters reflect sedimentary compaction when P is >1 (i.e., the sample is anisotropic) and kmin inclination is >60° (i.e., minimum susceptibility axis is steep). If kmin inclination is <60°, the sediments may be disturbed by drilling or natural processes (e.g., Sample 374-U1524A-8H-1, 40 cm [61.40 m CSF-A], has a kmin inclination of ~30°), even if that disturbance is not clearly visible in the core. The kmin inclination of most of the samples is steeper than 60° (e.g., Figure F14) and sometimes approaches 90° (i.e., perfectly vertical). The consistently steep inclination suggests a homogeneous form of compaction (Figure F14), supporting continuous sedimentation as interpreted in the age model.
Physical properties
Physical property measurements were completed on whole-round sections, section halves, and discrete samples from Site U1524. Some outliers and unreliable values were excluded from the plotted data (Table T10). Following thermal equilibration (~4 h), gamma ray attenuation (GRA) bulk density, magnetic susceptibility, P-wave velocity (P-wave logger [PWL]; APC and HLAPC cores only), and natural gamma radiation (NGR) measurements were made on all whole-round sections using the WRMSL and Natural Gamma Radiation Logger (NGRL). Sampling resolution for the WRMSL was 2.5 cm, and NGR was measured at 10 cm intervals. Thermal conductivity measurements were conducted using the full-space needle probe for APC and HLAPC cores, typically on Sections 2 and 5. Discrete samples from the working-half core sections (typically from Sections 1, 3, 5, and 7) were taken for moisture and density (MAD) measurements for generating bulk and grain density and porosity data. Shear strength measurements were also taken on every other section half in APC and HPLAC cores using the Torvane shear device. Discrete compressional wave velocity measurements were conducted on each of the working-half core sections using the P-wave caliper (PWC) contact probe system on the Section Half Measurement Gantry (SHMG). Color reflectance and point magnetic susceptibility data were collected from the archive-half sections using the SHMSL. Red, green, and blue (RGB) were measured on the Section Half Imaging Logger (SHIL) (see Lithostratigraphy and Physical properties in the Expedition 374 methods chapter [McKay et al., 2019a]). The physical property measurements are in good overall agreement with the defined lithostratigraphic units. Intervals with lower magnetic susceptibility, NGR, and density and higher b* correspond to diatom-rich lithologies (diatom-rich mud and diatom ooze). Higher magnetic susceptibility, NGR, and density and lower b* correspond to mud with lower percentages of diatoms (e.g., diatom bearing) and diamict in Unit III. All physical property data are available from the Laboratory Information Management System (LIMS) database (http://web.iodp.tamu.edu/LORE).
Magnetic susceptibility
Both whole-round measurements on the WRMSL and discrete point measurements on the SHMSL were used to characterize magnetic susceptibility at Site U1524 (Figure F15). Both methods yielded similar downhole variability and values ranging from <5 × 10⁻⁵ to ~200 × 10−5 SI, with rare intervals exceeding 300 × 10−5 SI. From the top of Hole U1524A to ~78 m CSF-A (Core 374-U1524A-9H), magnetic susceptibility is relatively high, corresponding to the diatom-bearing mud of lithostratigraphic Subunit IA. From ~78 to ~156 m CSF-A (base of Core 17H), magnetic susceptibility decreases relative to overlying intervals, reflecting increasing diatom content downhole in Subunit IB. Relatively thin intervals of very high magnetic susceptibility occur in this interval and likely reflect the interbedded character of this lithostratigraphic unit. From ~156 to ~200 m CSF-A (Cores 18H through 23H), overall magnetic susceptibility decreases further and there are significantly fewer intervals with high values that correspond to increasing diatom richness in Subunit IC. The interval from ~200 to ~270 m CSF-A (Cores 374-U1524A-24H through 31F and 374-U1524C-2R) has the lowest overall magnetic susceptibility of the site, corresponding to mud-bearing diatom ooze in Unit II. Although the basal interval of the site, from ~270 to 437 m CSF-A (Cores 374-U1524A-32X through 34X and 374-U1524C-3R through 20R), is poorly recovered, the variable magnetic susceptibility reflects the interbedded diatom-rich mud and muddy diamict of Unit III.
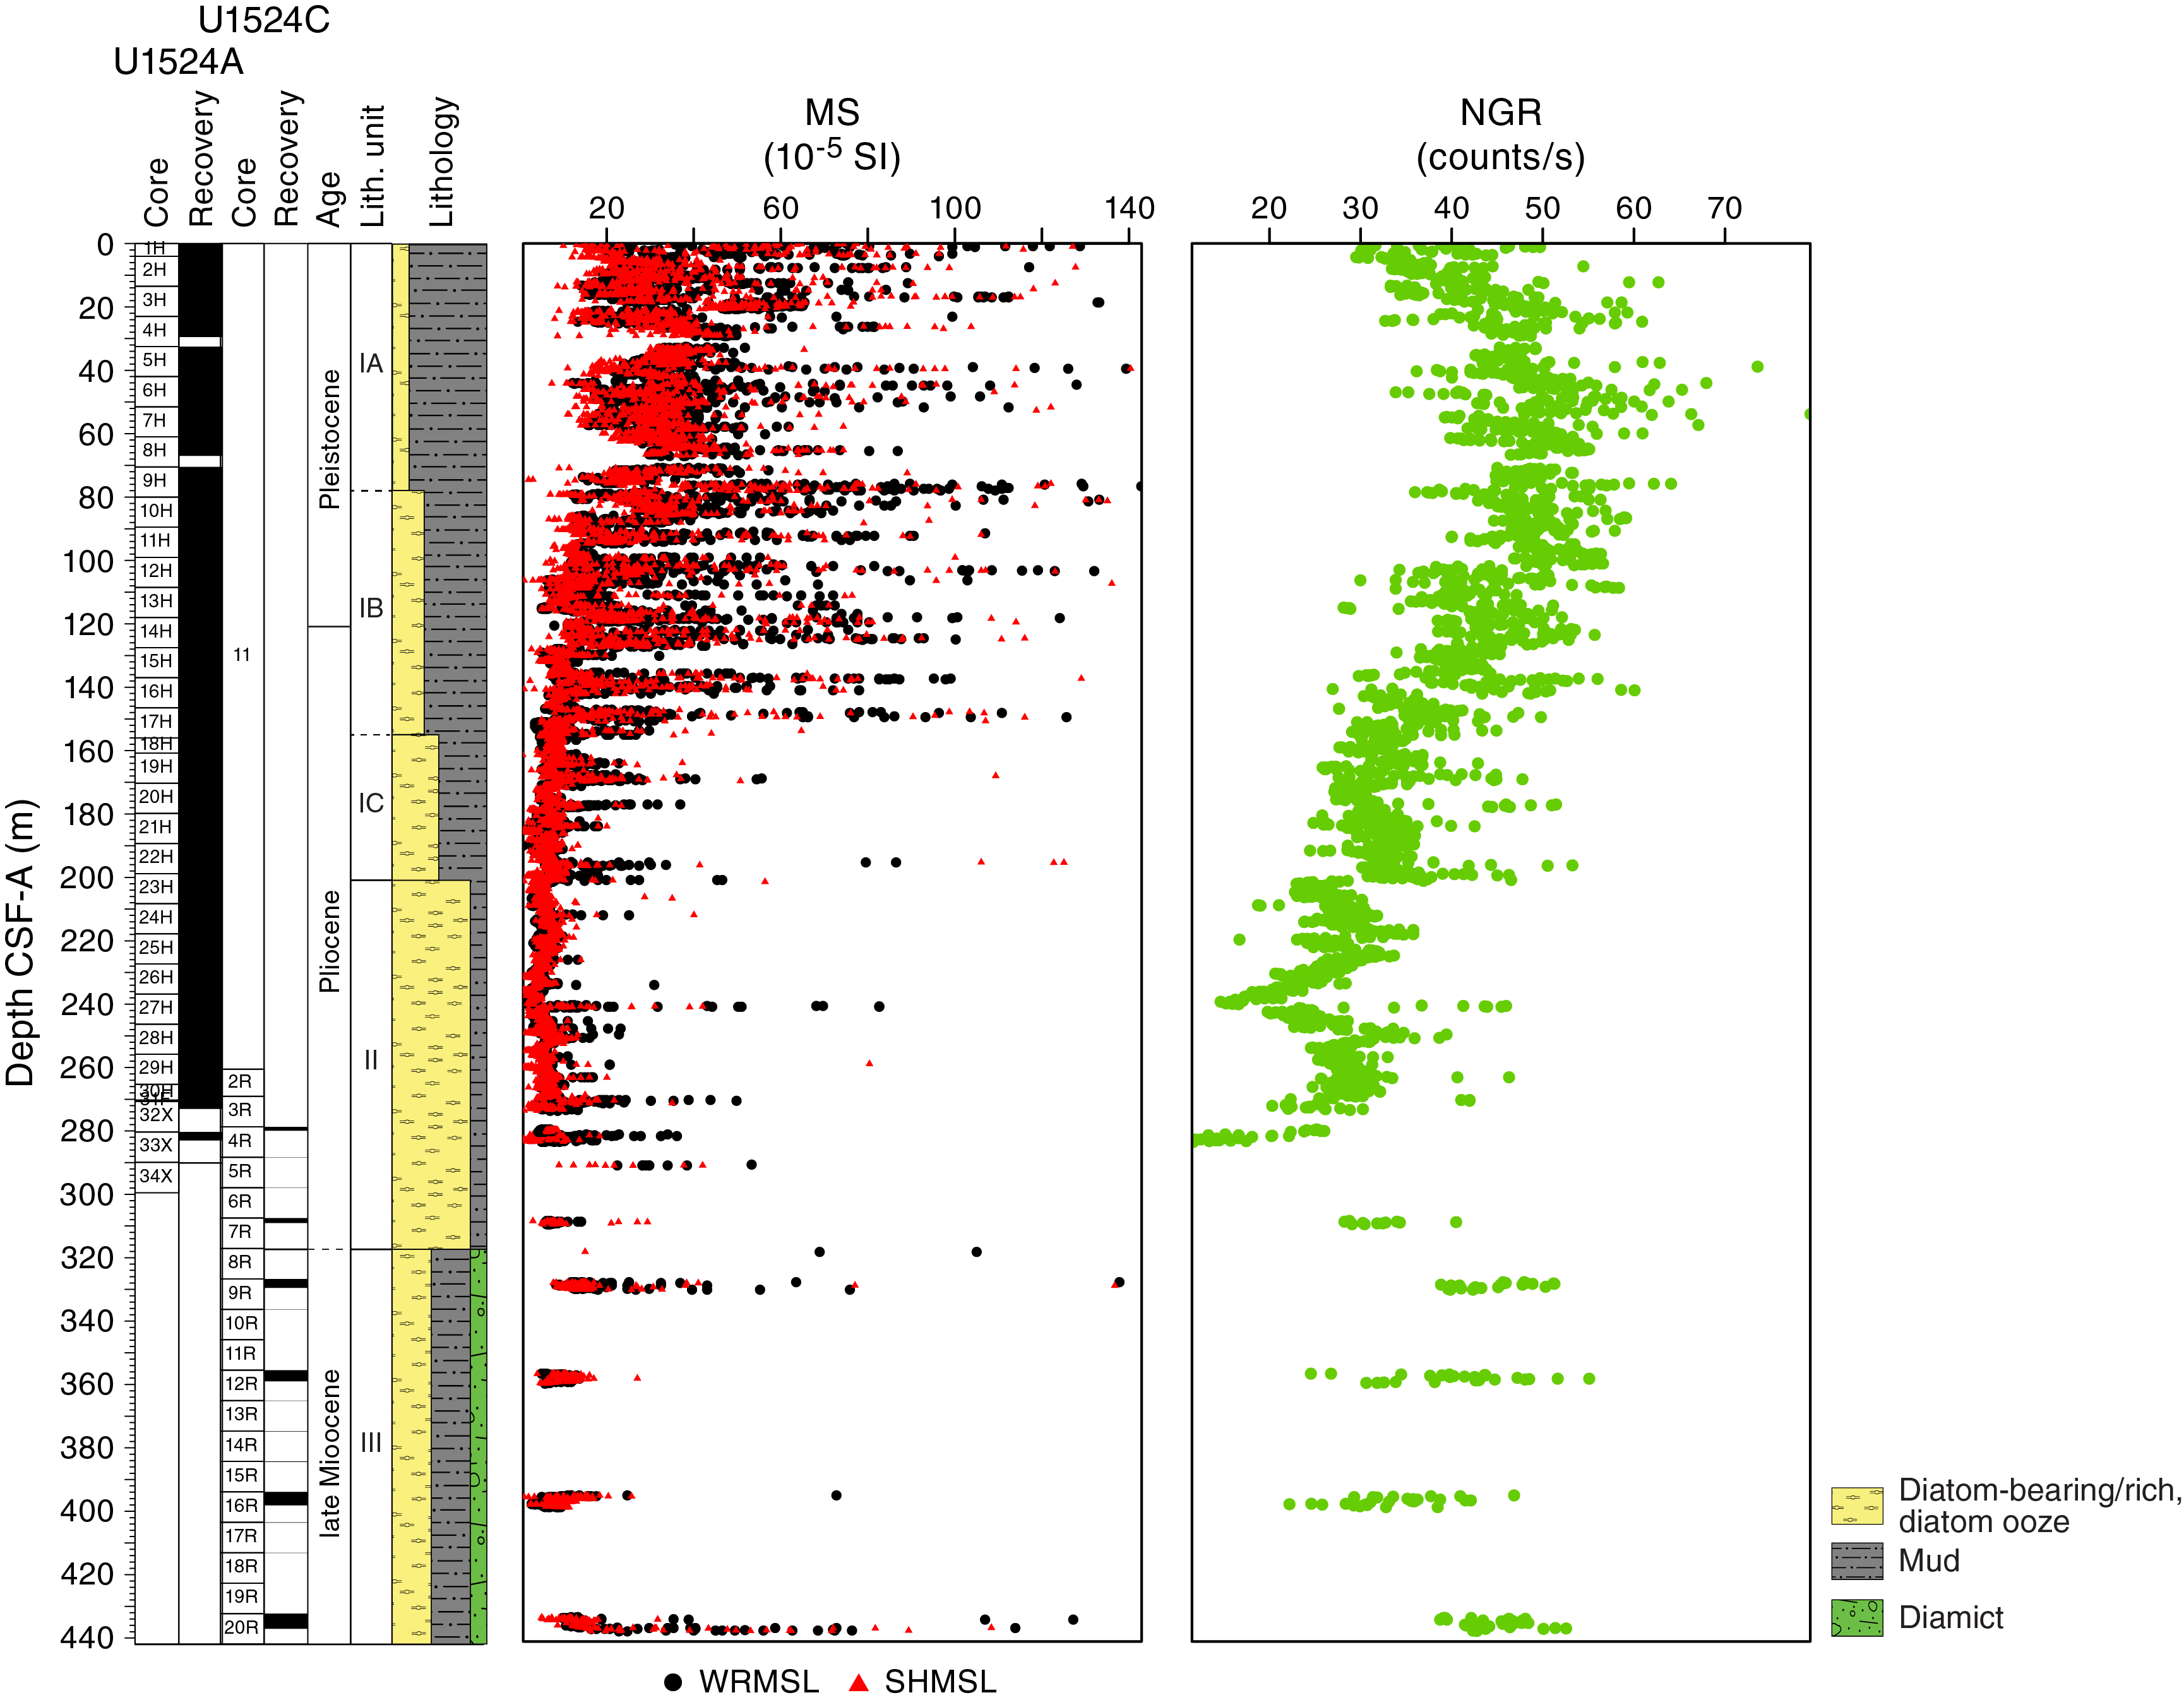
Figure F15. MS and NGR.
Natural gamma radiation
NGR measurements show downhole variations between 10 and 80 counts/s (Figure F15). In lithostratigraphic Subunit IA (0–78.03 m CSF-A), NGR increases downhole from 30 to 50 counts/s, which is perhaps related to a downhole decrease in diatom content or change in mud composition in this diatom-bearing mud. In Subunits IB and IC (78.03–200.55 m CSF-A), NGR decreases downhole from 50 to 30 counts/s, associated with increasing diatom richness with depth in these subunits. In Unit II (200.55–317.10 m CSF-A), NGR is relatively low compared with the other units but varies between 35 and 10 counts/s. The low NGR is associated with diatom ooze, and variability may be related to changes in the amount of mud. Unit III (cored with the RCB system) has poor recovery relative to the upper units and demonstrates higher average NGR values compared with Unit II, varying between 20 and 55 counts/s. The higher average NGR likely reflects the presence of diamict and mud in this unit.
Bulk density, grain density, and porosity
Both whole-round GRA and discrete MAD bulk density values are concentrated in a relatively narrow range (~1.4 to ~1.8 g/cm3) (Figure F16). Overall, bulk and grain density values decrease downhole. Average GRA bulk density is higher than MAD bulk density in Cores 374-U1524A-1H through 15H (0 to ~137 m CSF-A). Below Core 15H, GRA bulk density is lower than MAD bulk density, likely as a result of core expansion caused by degassing during equilibration of the cores to room temperature. In lithostratigraphic Subunit IA (0–78.03 m CSF-A), bulk density slightly increases (from ~1.5 to ~1.8 g/cm3) and porosity decreases (from ~70% to ~60%) downhole, indicating sediment compaction with depth. In contrast, grain density decreases downhole in Subunit IA, which is likely due to increased diatom content. Both bulk and grain densities decrease downhole in Subunits IB and IC (78.03–200.55 m CSF-A), corresponding to a gradual transition from diatom-bearing mud to diatom-rich mud/diatom ooze. Although very low core recovery in Unit III (317.10–437.03 m CSF-A) precludes the determination of downhole trends, bulk and grain densities slightly increase and porosity varies with depth.
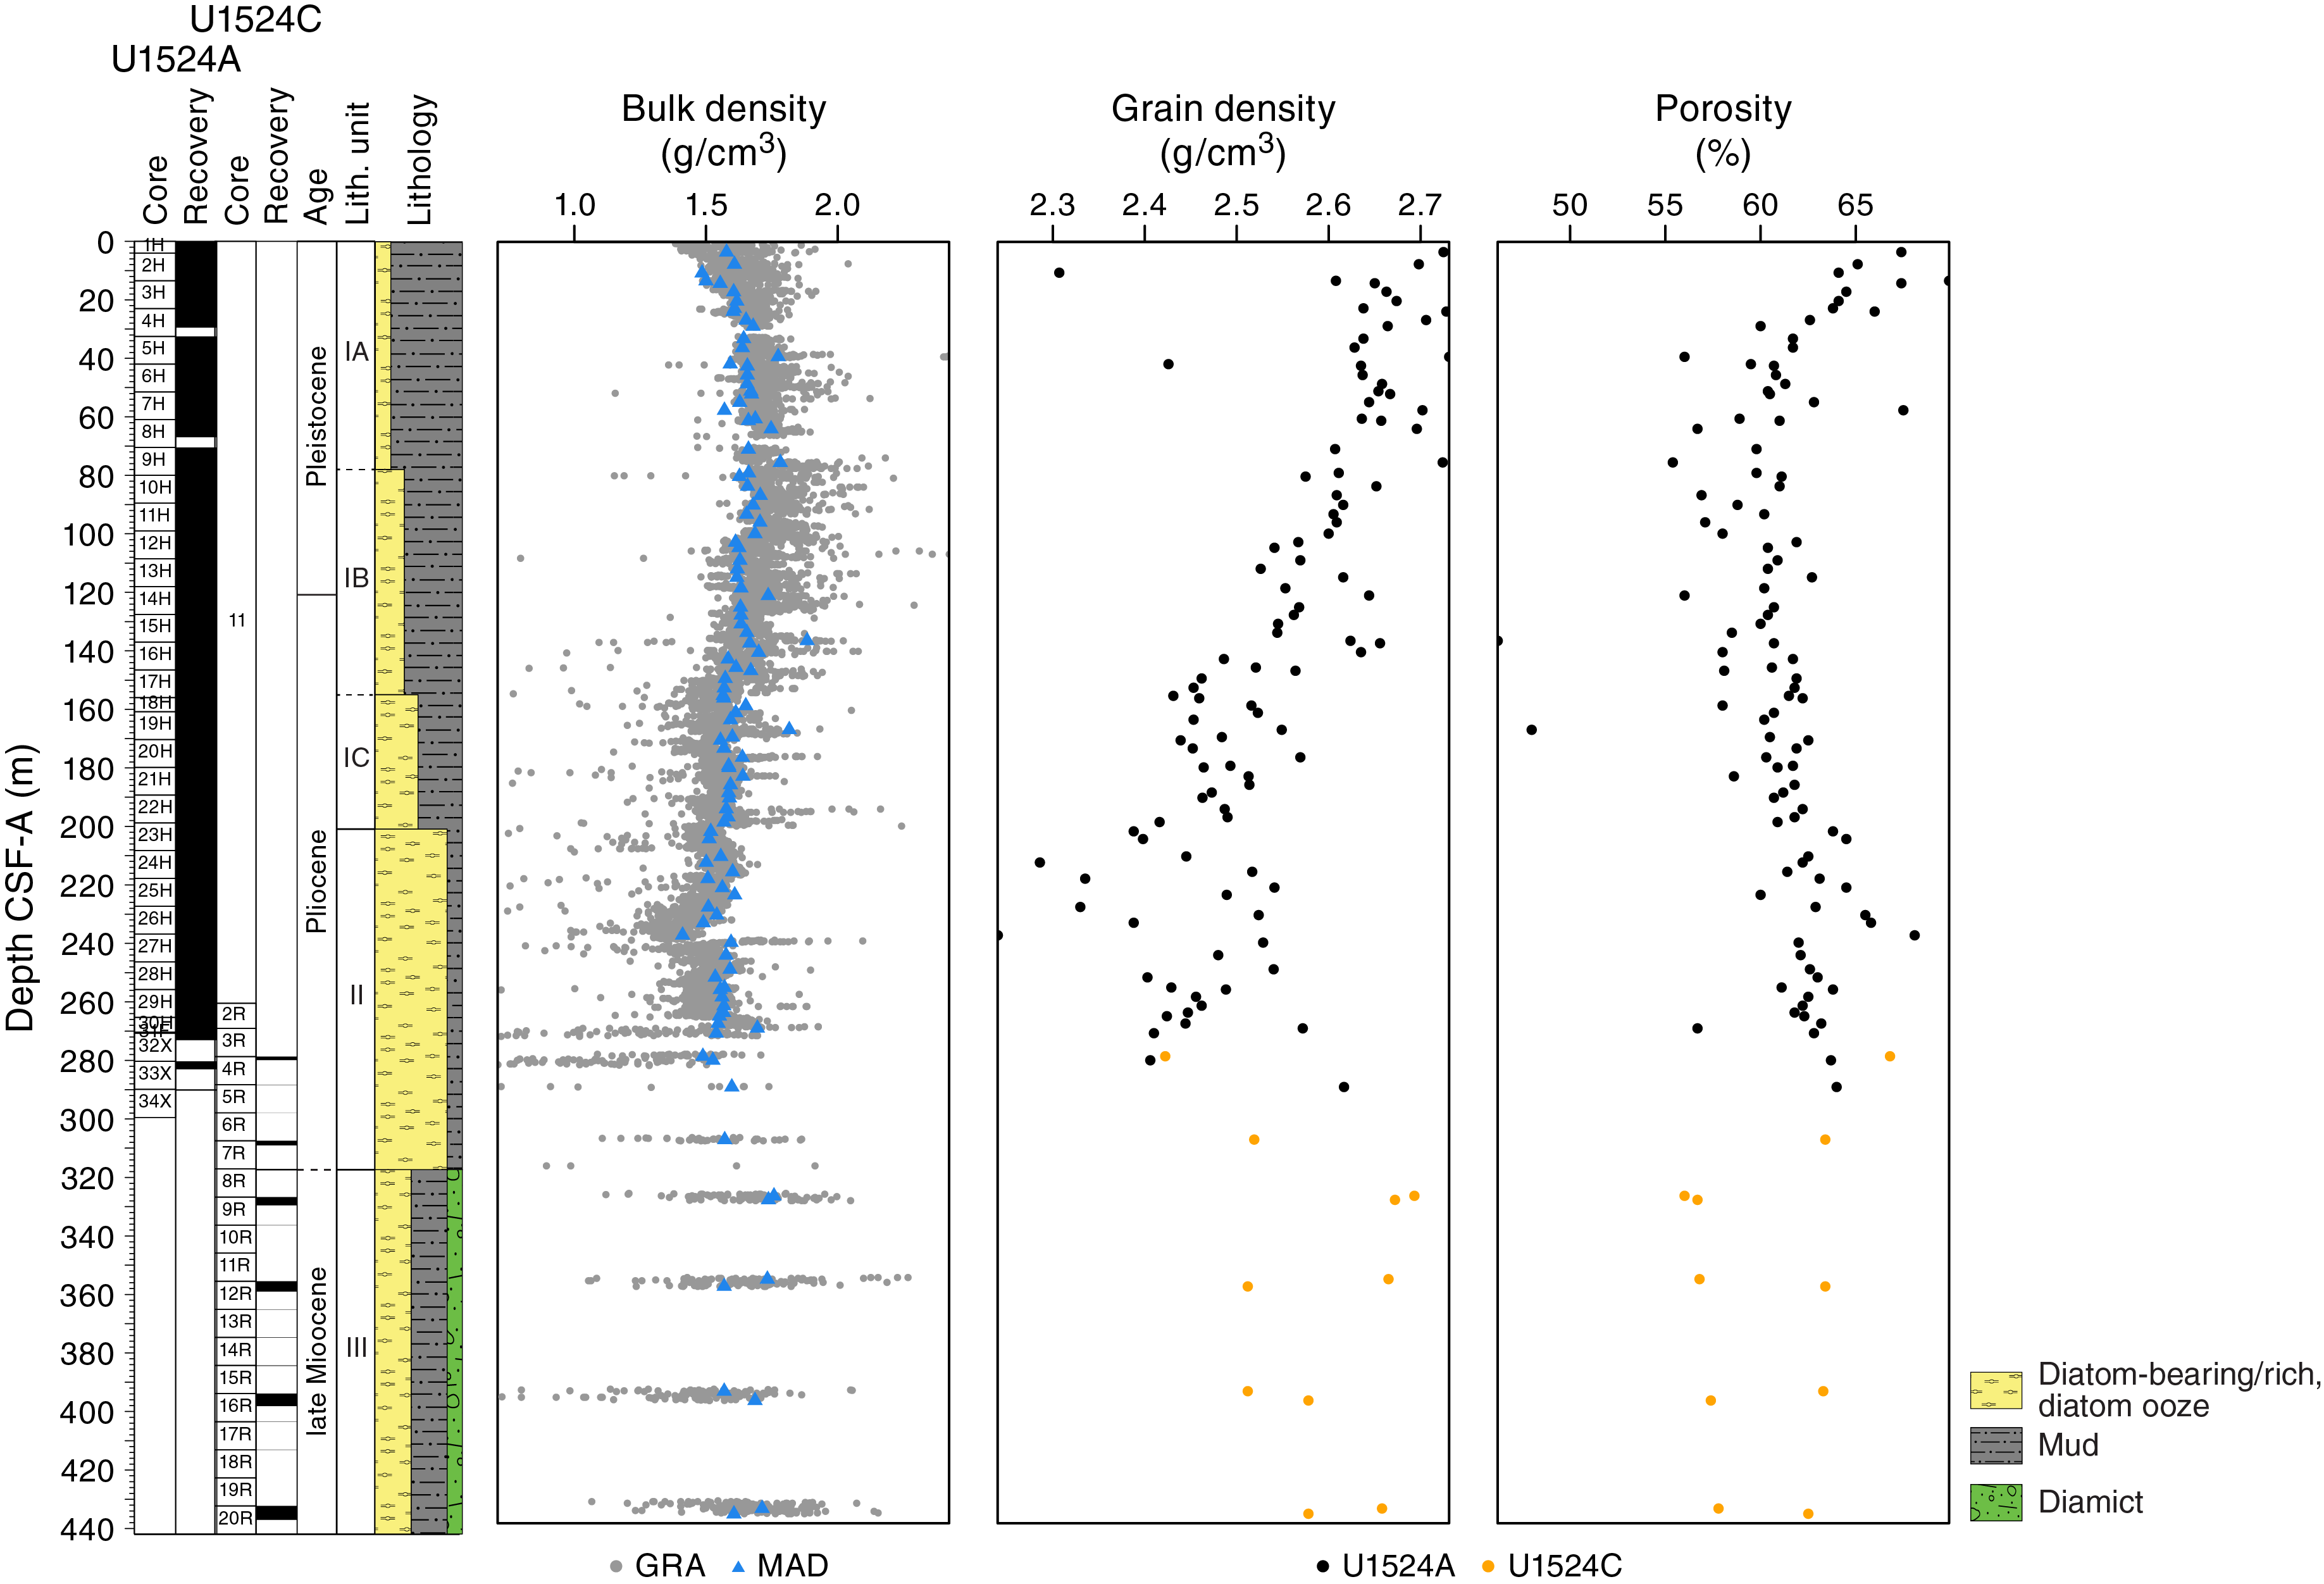
Figure F16. GRA and MAD bulk density, grain density, and porosity.
Compressional P-wave velocity
P-wave velocity measured on the PWL ranges from ~1300 to ~1700 m/s, whereas it ranges from ~1500 to ~1700 m/s when measured on the PWC. Overall, the values from both measurement systems are in good agreement from 0 to ~100 m CSF-A (Figure F17); however, a small discrepancy between values is observed below this depth, which is likely due to core expansion caused by degassing during equilibration of the core to room temperature and resulting in lower PWC values compared with PWL values. From 0 to ~120 m CSF-A, P-wave velocity increases downhole from ~1500 to ~1600 m/s, likely due to increased compaction with depth in lithostratigraphic Subunit IA and the upper part of Subunit IB. From 120 to 230 m CSF-A, P-wave velocity decreases relative to the overlying sediment from ~1600 to ~1480 m/s, which is consistent with the downhole increase in diatom content (diatom-rich mud to mud-rich diatom ooze) in Subunits IB and IC. At 240 m CSF-A, a distinct peak in P-wave velocity (~1660 m/s) is caused by the presence of gravels and coarse clasts, below which P-wave velocity decreases to ~1500 m/s at 260 m CSF-A. Although measurements are sparse in Unit III (317.10–437.03 m CSF-A) because of poor recovery, P-wave velocity is generally higher than in overlying units (~1650–1750 m/s), with anomalously high values likely caused by individual clasts in the diamict intervals.
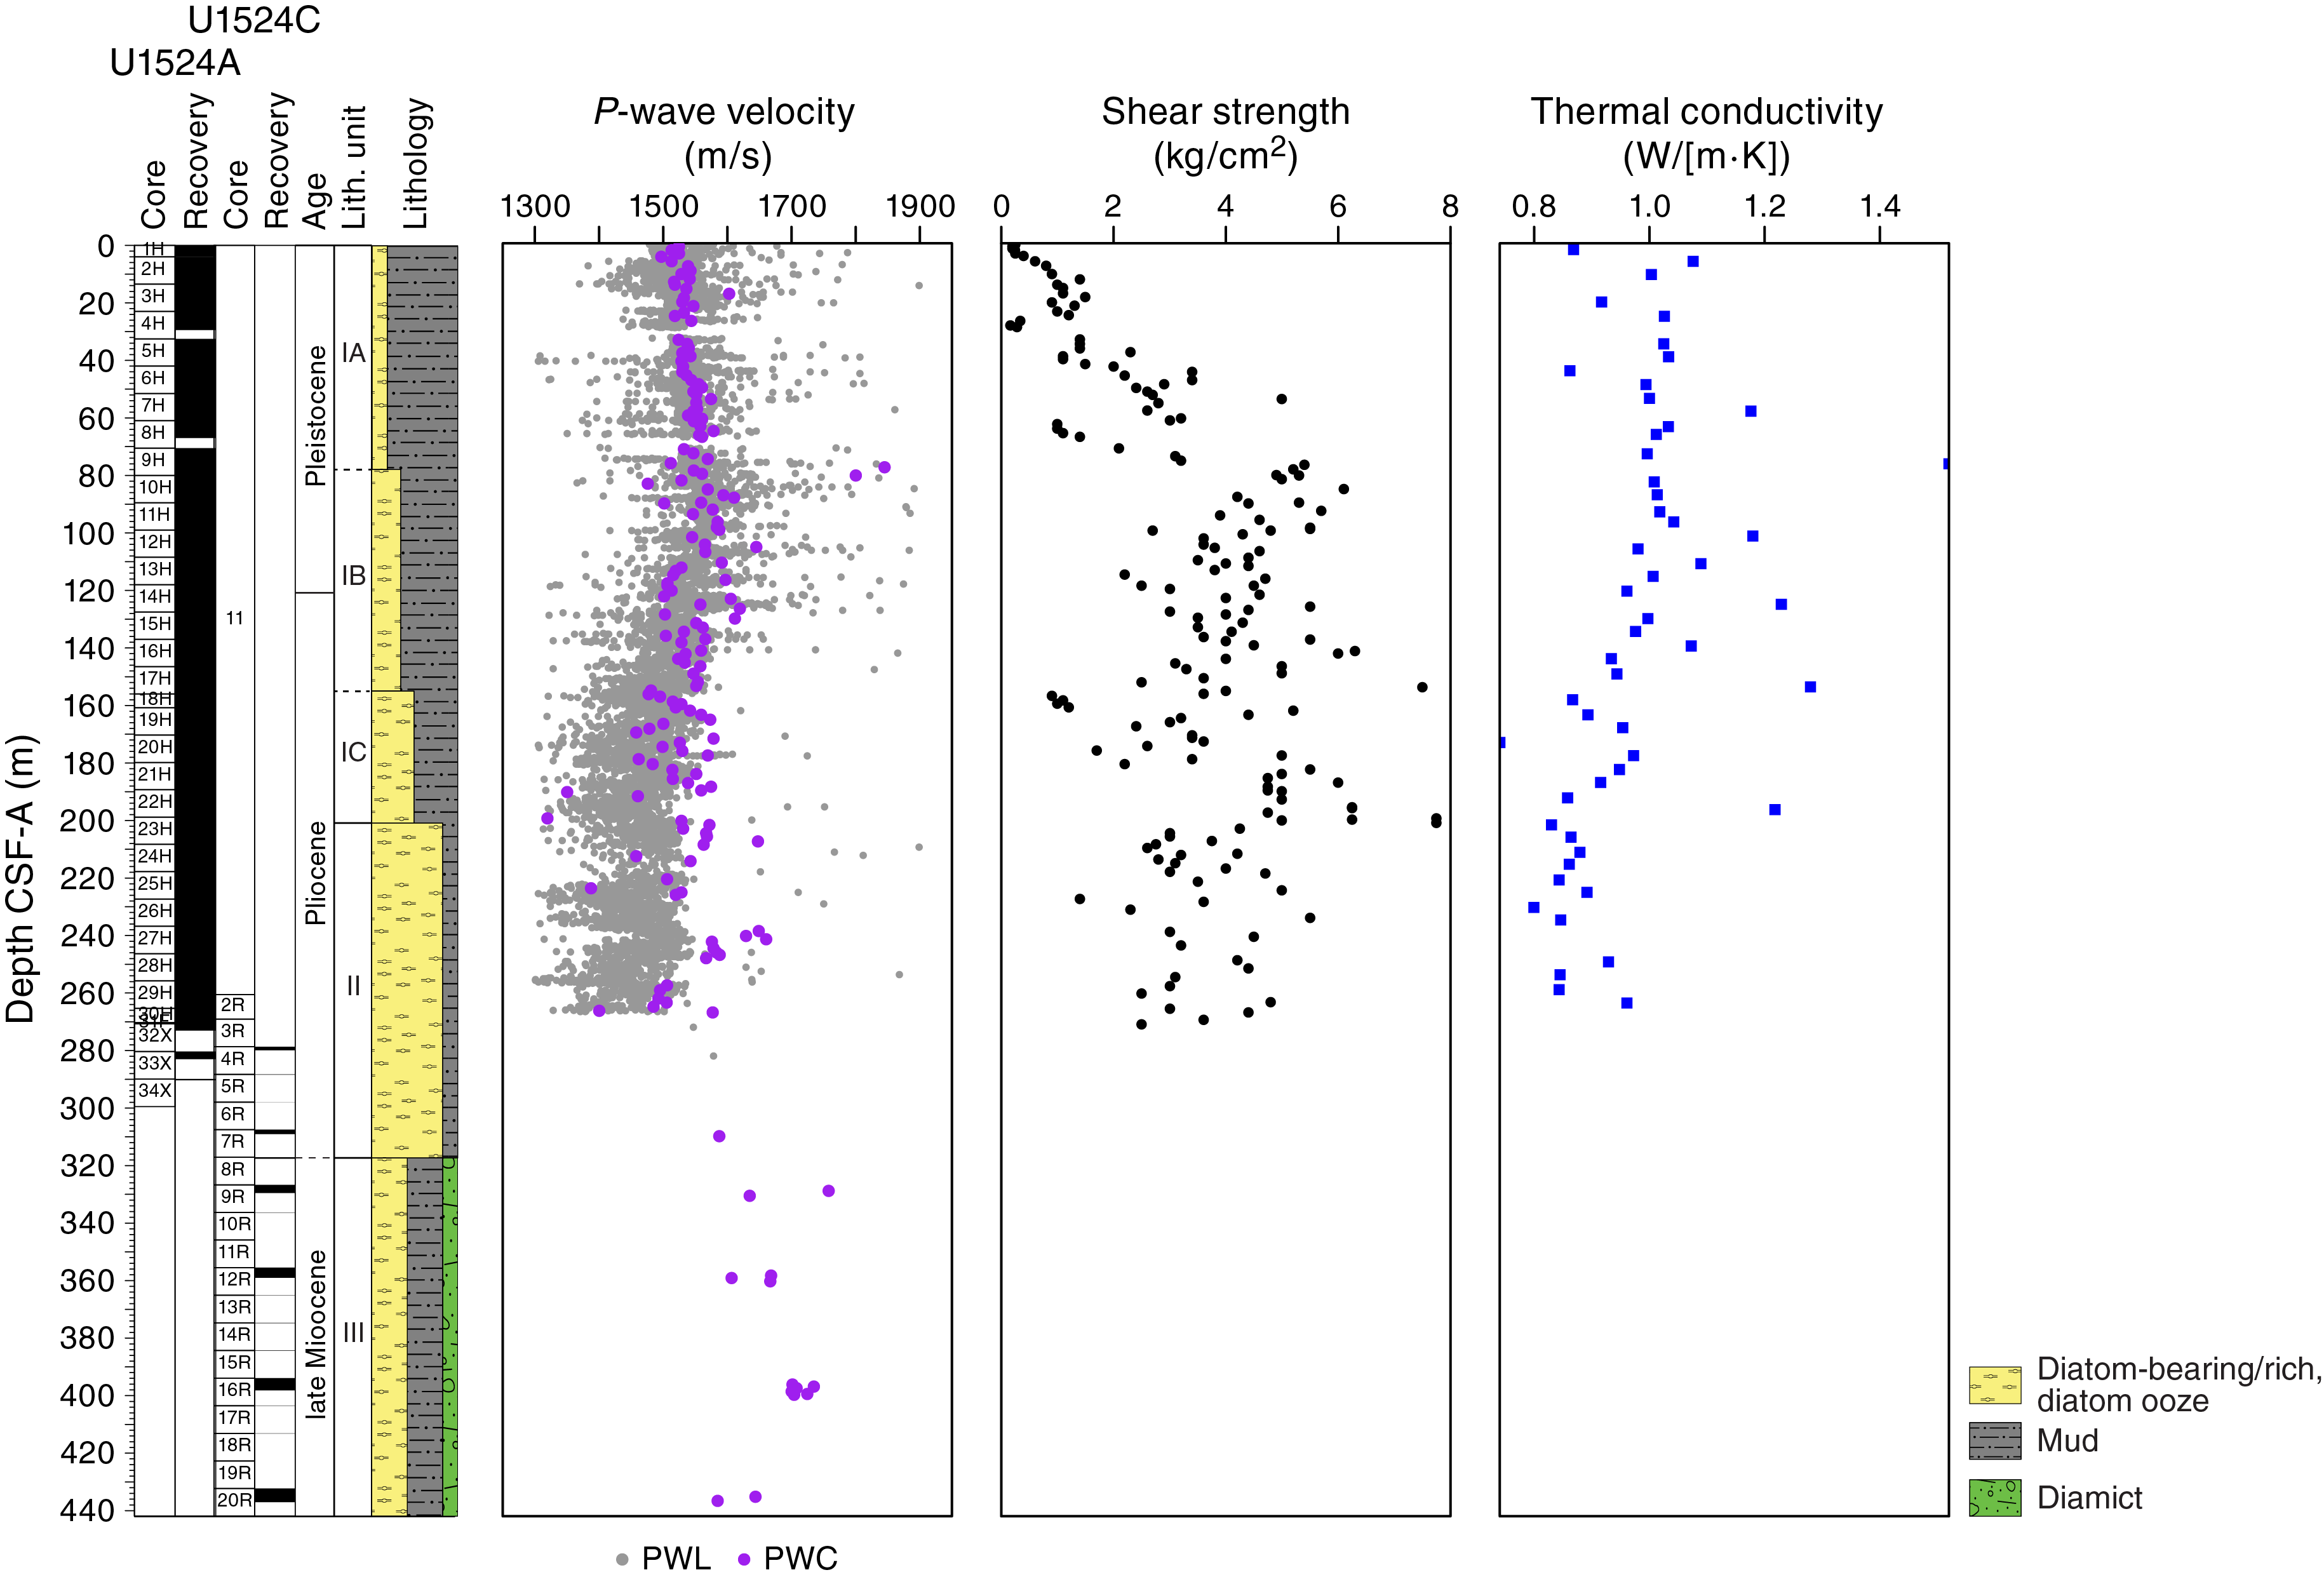
Figure F17. P-wave velocity, shear strength, and thermal conductivity.
Shear strength
Shear strength measurements from the Torvane shear device vary from 0.16 to 8.75 kg/cm2 (Figure F17). From 0 to ~90 m CSF-A, shear strength increases downhole to ~6 kg/cm2. This increase is likely related to sediment compaction with depth in lithostratigraphic Subunits IA and IB. From ~90 to 270 m CSF-A, shear strength varies between ~2 and 6 kg/cm2 with no systematic downhole trend. This high variability in shear strength measurements from ~90 to 270 m CSF-A (Subunits IB and IC and upper part of Unit II) is likely due to sampling bias from measuring a range of different interbedded lithologies in these units, such as laminated mud-rich diatom ooze and coarser lithologies.
Thermal conductivity and downhole temperature measurements
The quality of thermal conductivity measurements from APC and HPLAC cores was evaluated by two parameters: (1) the number of solutions acquired and (2) the shape of the curve formed on the temperature versus time plot of these points. A valid measurement must have a sufficient number of solutions to form an exponential curve. All measurements with a low number of solutions and/or a bad repartition of these values on the temperature versus time plot (i.e., forming two curves or no curve) were deleted. As a result, 24 measurements were deleted, corresponding to ~15% of the original data set. Thermal conductivity decreases downhole from ~1.1 to 0.8 W/(m·K), with some higher values (~1.2 W/[m·K]) interrupting this trend (Figure F17).
In situ temperature measurements were made with the advanced piston corer temperature tool (APCT-3) (see Downhole measurements in the Expedition 374 methods chapter [McKay et al., 2019a]) on Cores 374-U1524A-6H, 9H, 12H, and 15H. An exponential decrease in temperature is expected for the time interval from ~0 to 600 s after penetration, and this decrease was used to estimate ambient temperature. In situ temperatures from 2.99°C at 51.5 m CSF-A to 7.96°C at 137.0 m CSF-A yield a calculated geothermal gradient of 0.058°C/m (Figure F18).
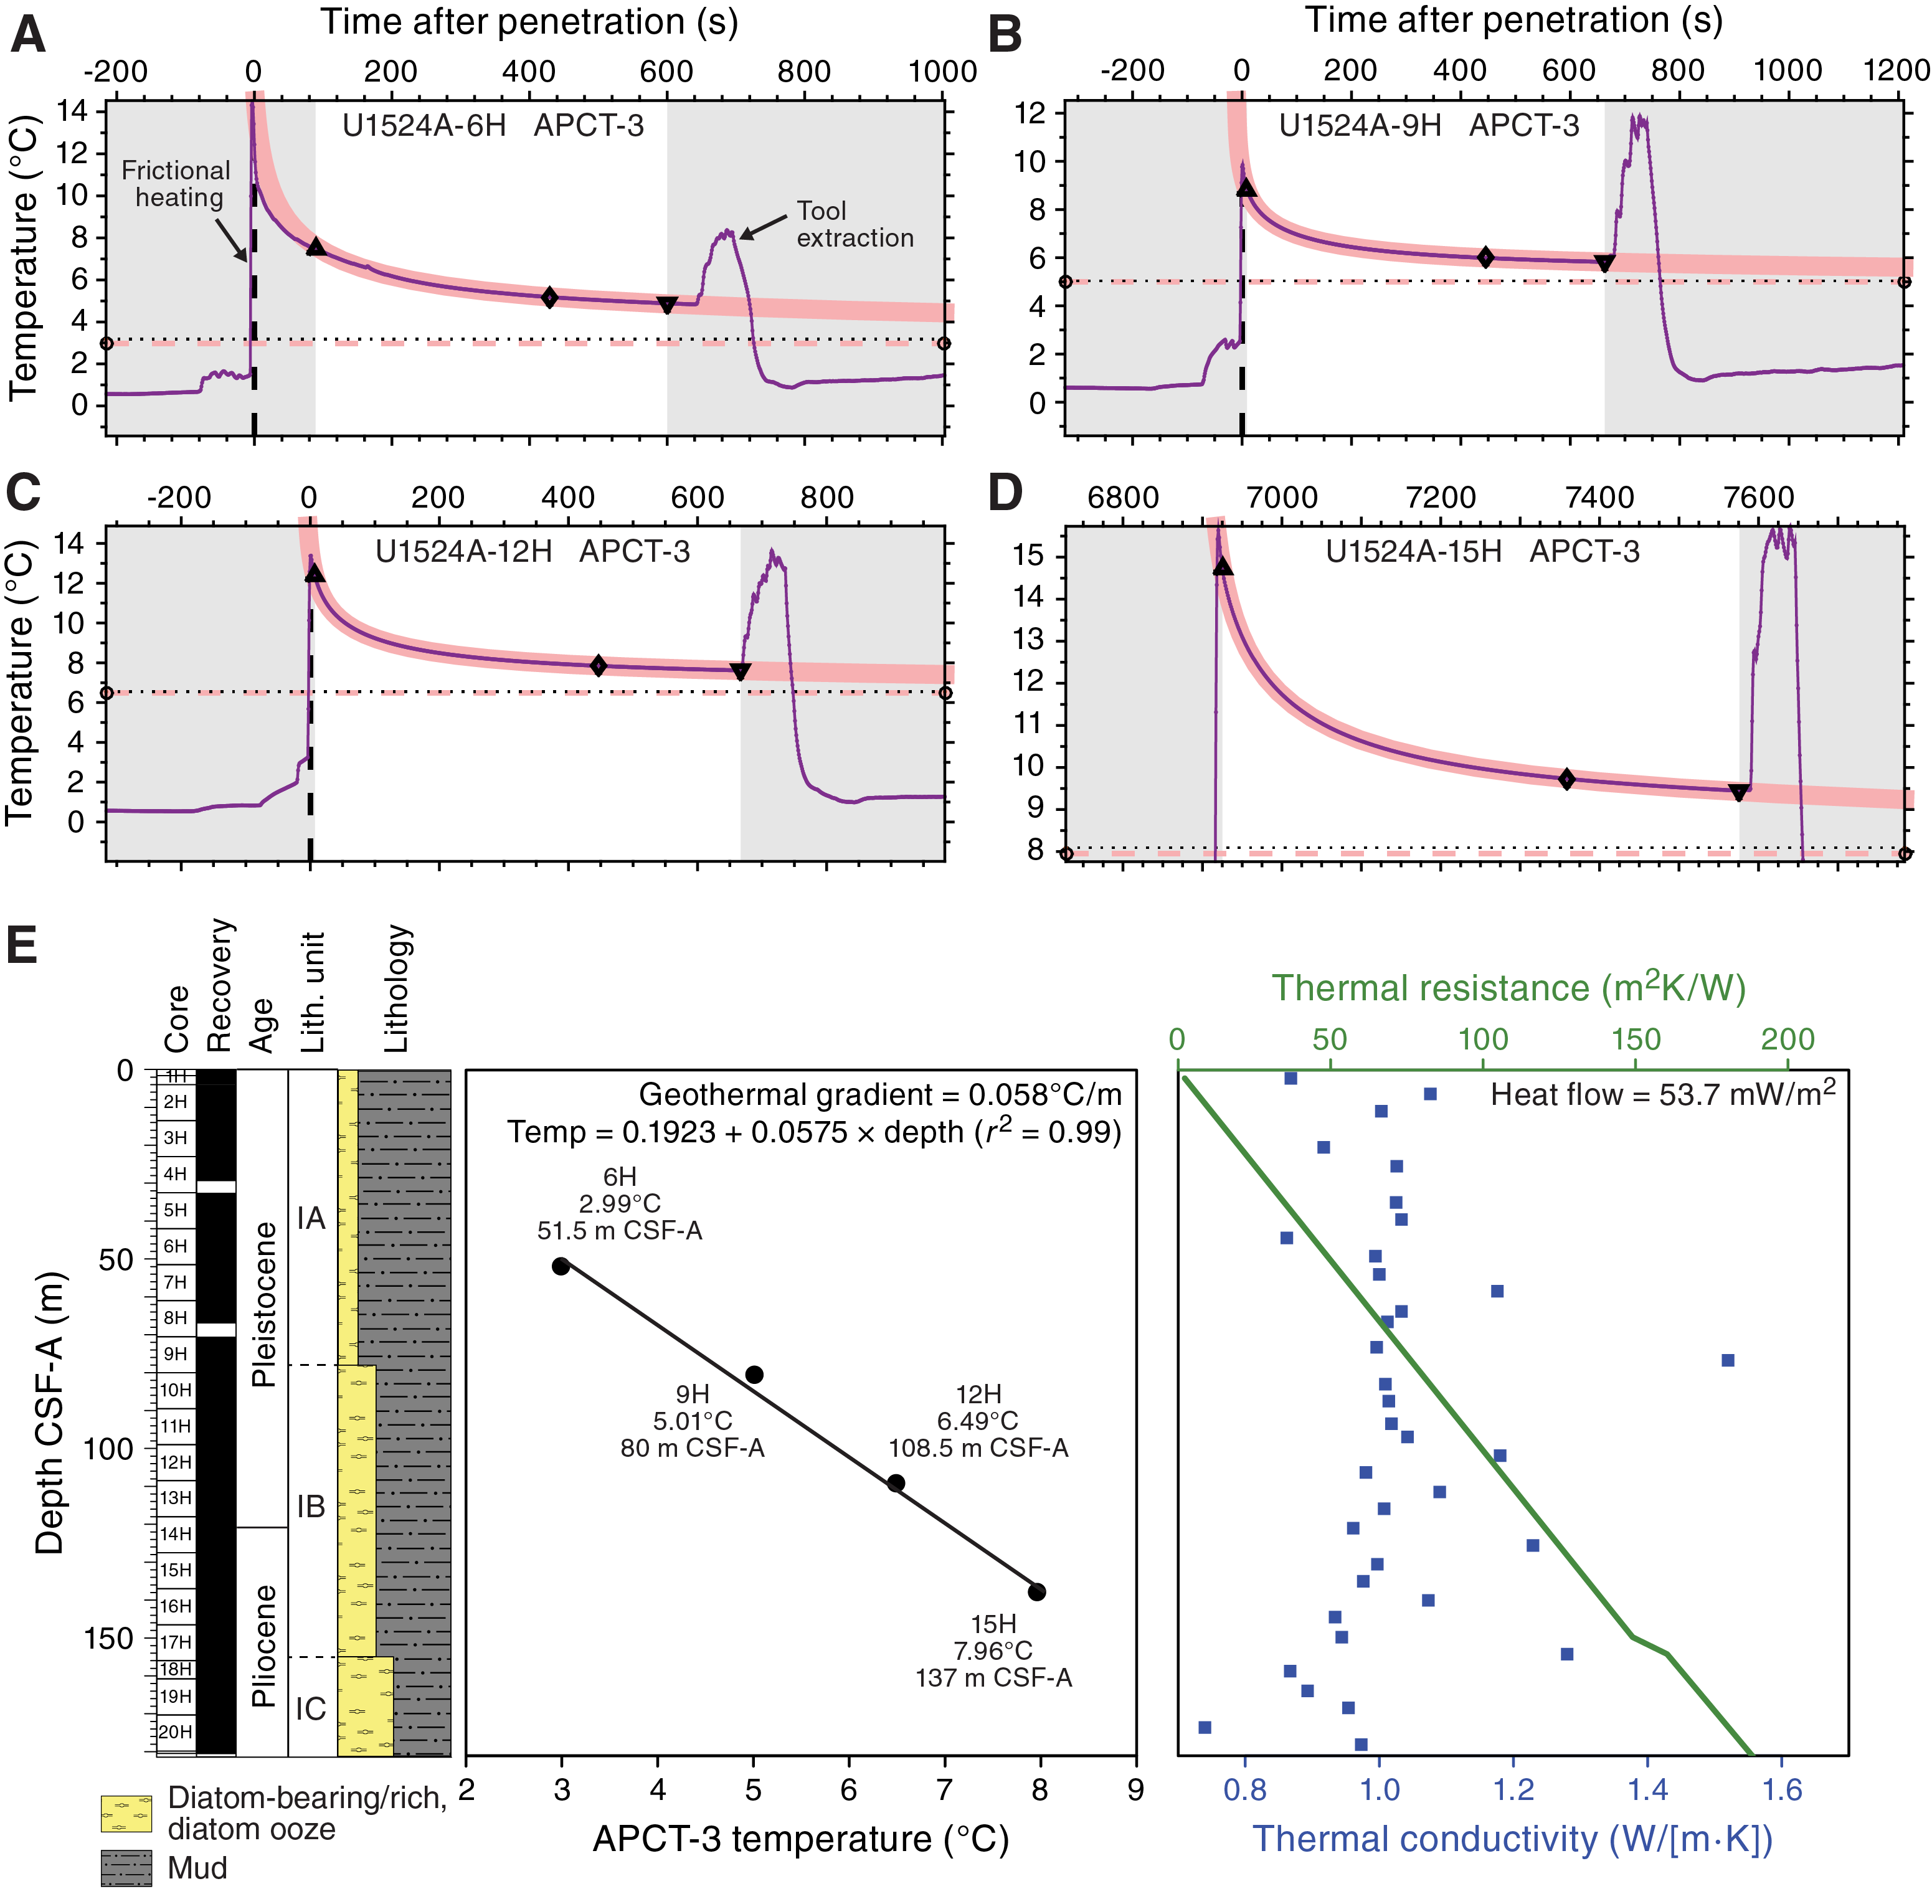
Figure F18. APCT-3 data.
We estimated a thermal conductivity profile using the thermal conductivity data mentioned above. Thermal resistance was calculated with the “average approach” outlined in Pribnow et al. (2000) using an average thermal conductivity of 0.93 W/(m·K) measured in the upper 140 m CSF-A (Figure F18). The slope of the linear fit between temperature and thermal resistance indicates a heat flow of 53.7 mW/m2 (Pribnow et al., 2000). This estimate of heat flow is equivalent to 102 Ma ocean crust according to the model of Stein and Stein (1992).
Color reflectance spectroscopy
Color reflectance spectroscopy data were acquired on section halves using the SHMSL. L* ranges from ~30 to ~50, a* ranges from approximately −1 to ~5, and b* ranges from approximately −8 to ~8 (Figure F19). L* and a* values show slight variation in lithostratigraphic Subunits IA and IB, whereas b* slightly decreases downhole in Subunit IA and varies in Subunit IB. Subunit IC shows a downhole increase in L* and fluctuation of a* and b* compared with overlying subunits. b* abruptly increases and then decreases at the Unit I/II boundary and the middle of Core 374-U1524A-27H (~200 m CSF-A), respectively.
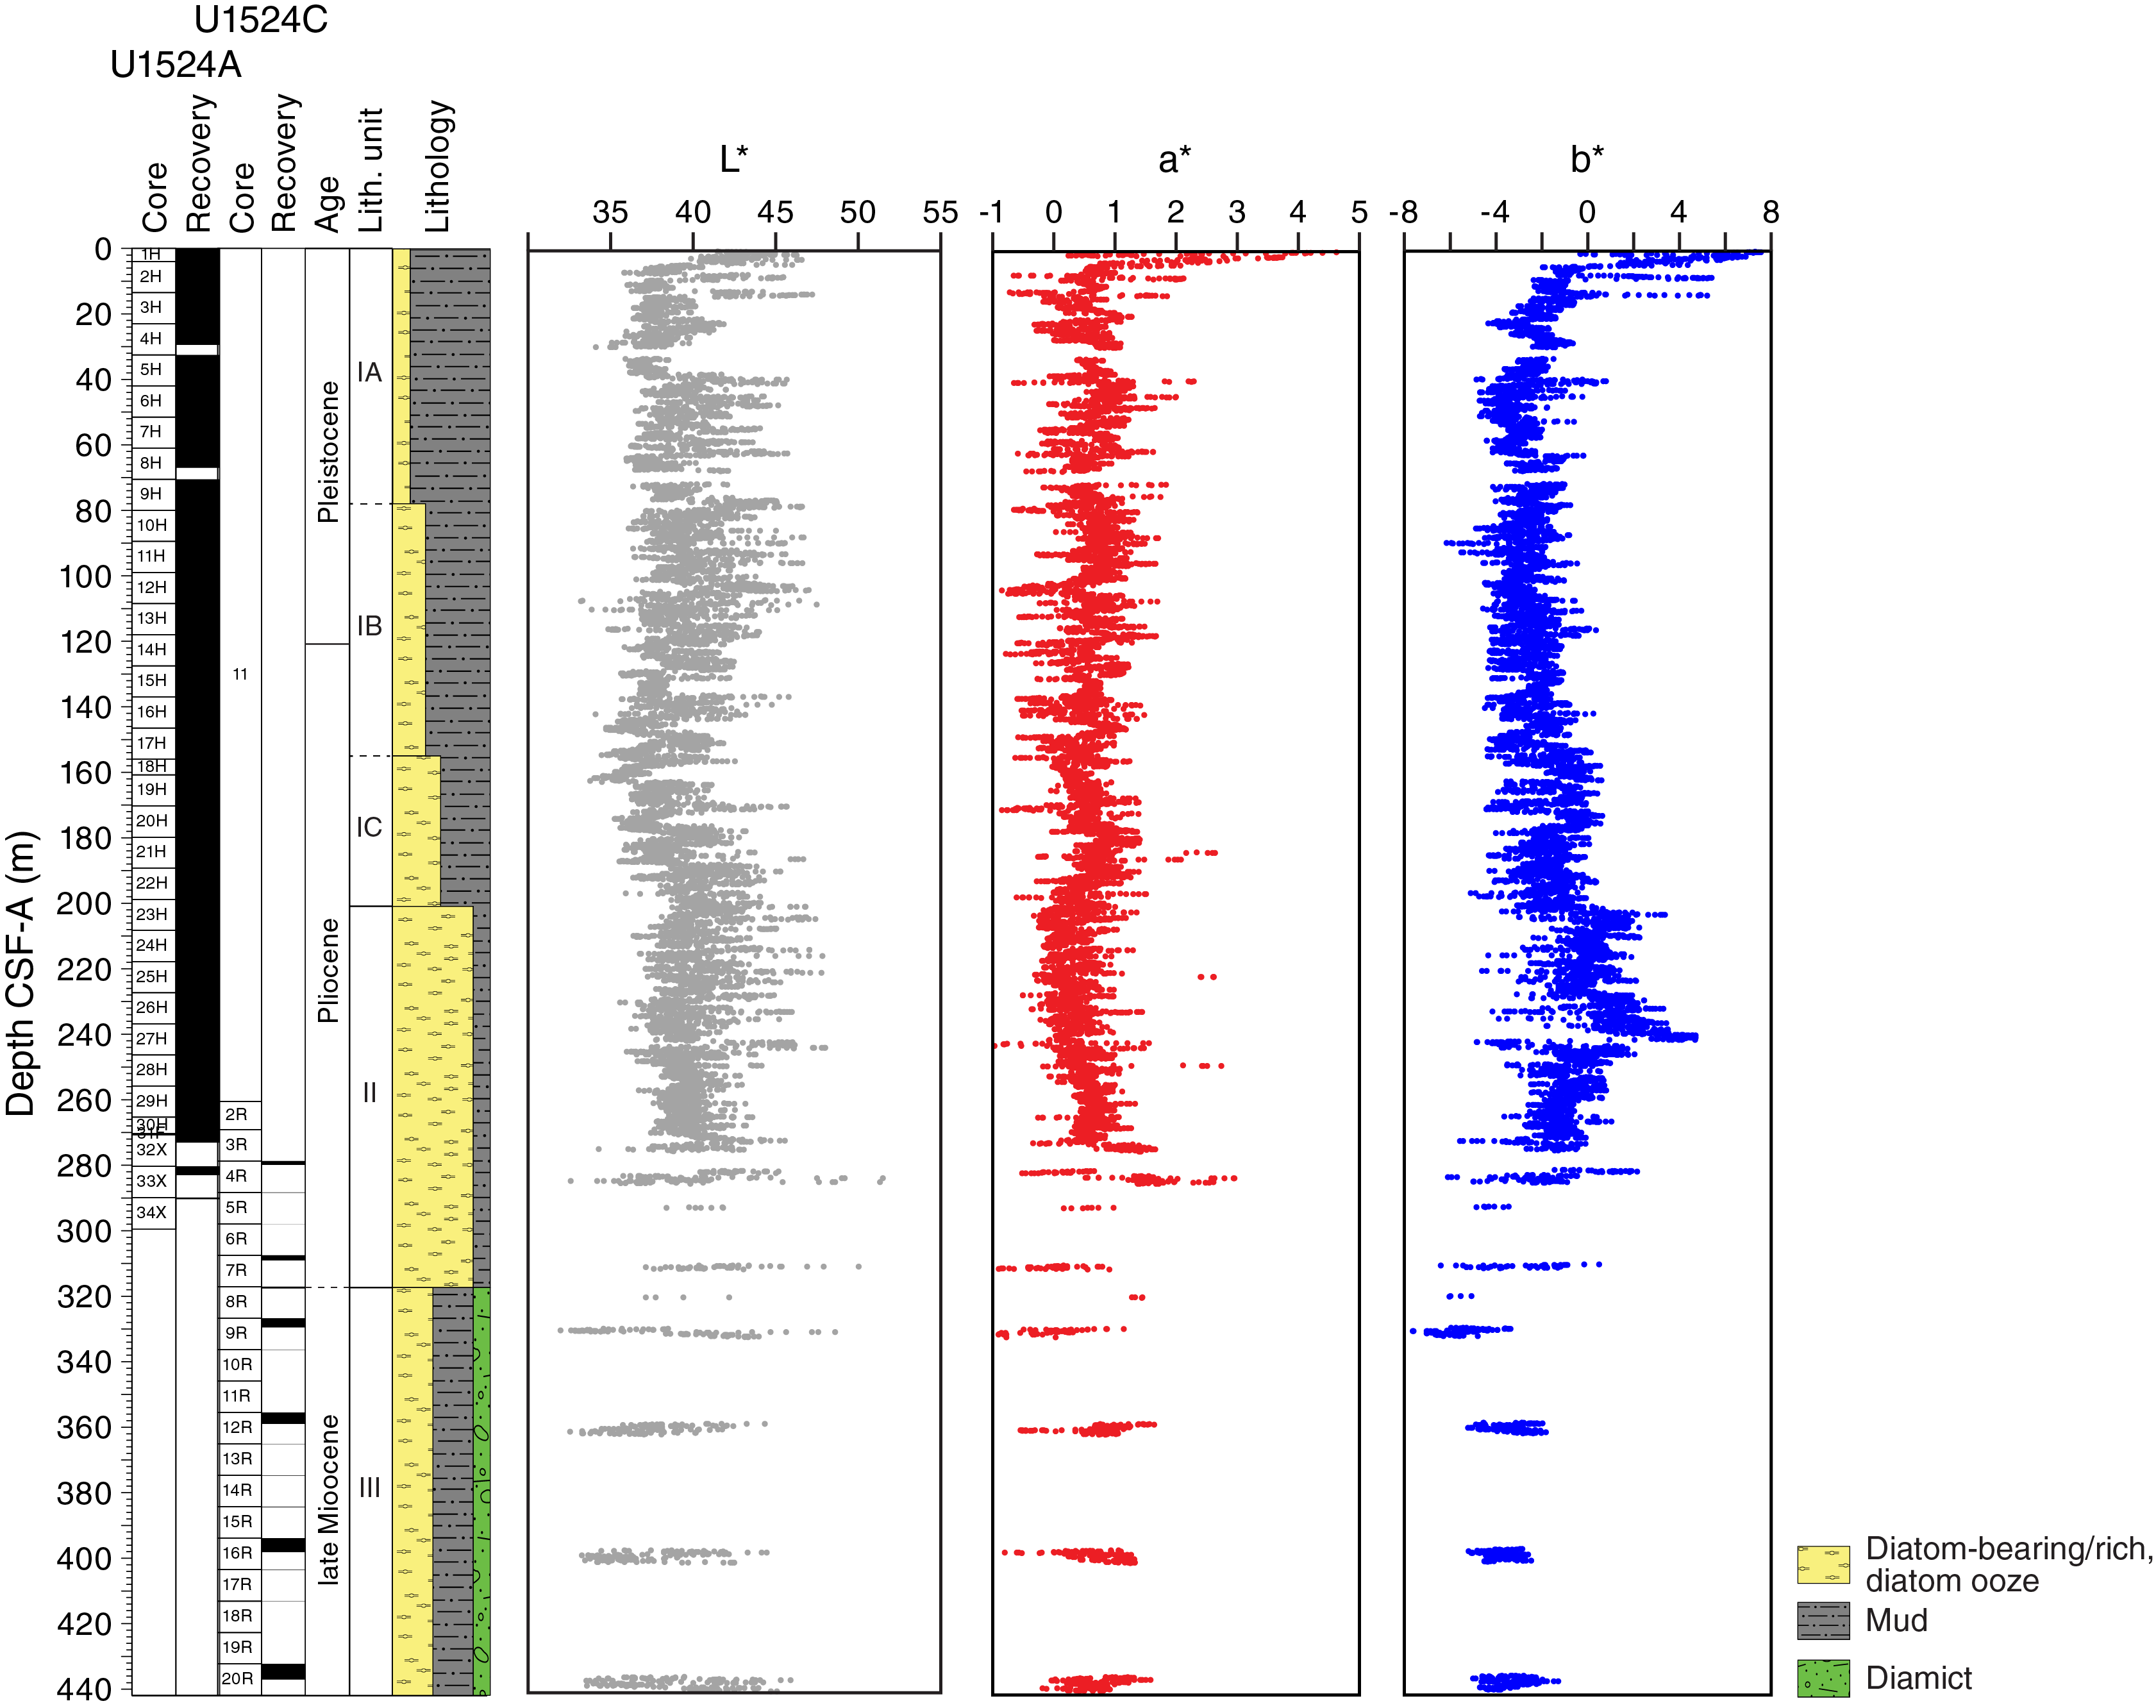
Figure F19. Color reflectance spectroscopy.
Summary
In general, data from whole-round measurements are in good agreement with those from split-core measurements. However, a small deviation of some whole-round measurements (GRA bulk density and PWL) compared with discrete measurements is observed deeper than ~100 m CSF-A in Hole U1524A, caused by core expansion generated by degassing during the equilibration of the cores to room temperature. Downhole changes in physical properties are in good overall agreement with the defined lithostratigraphic units based on sedimentological characteristics (see Lithostratigraphy; Figure F20; Table T11), and changes in physical properties can provide insight into lithologic changes in and seismic-reflection expression of each unit (Figure F21). Because of the lack of reliable downhole sonic measurements, PWL and PWC data were used for depth-converting the lithostratigraphic and physical property units and to correlate them with the seismic profiles crossing Site U1524.
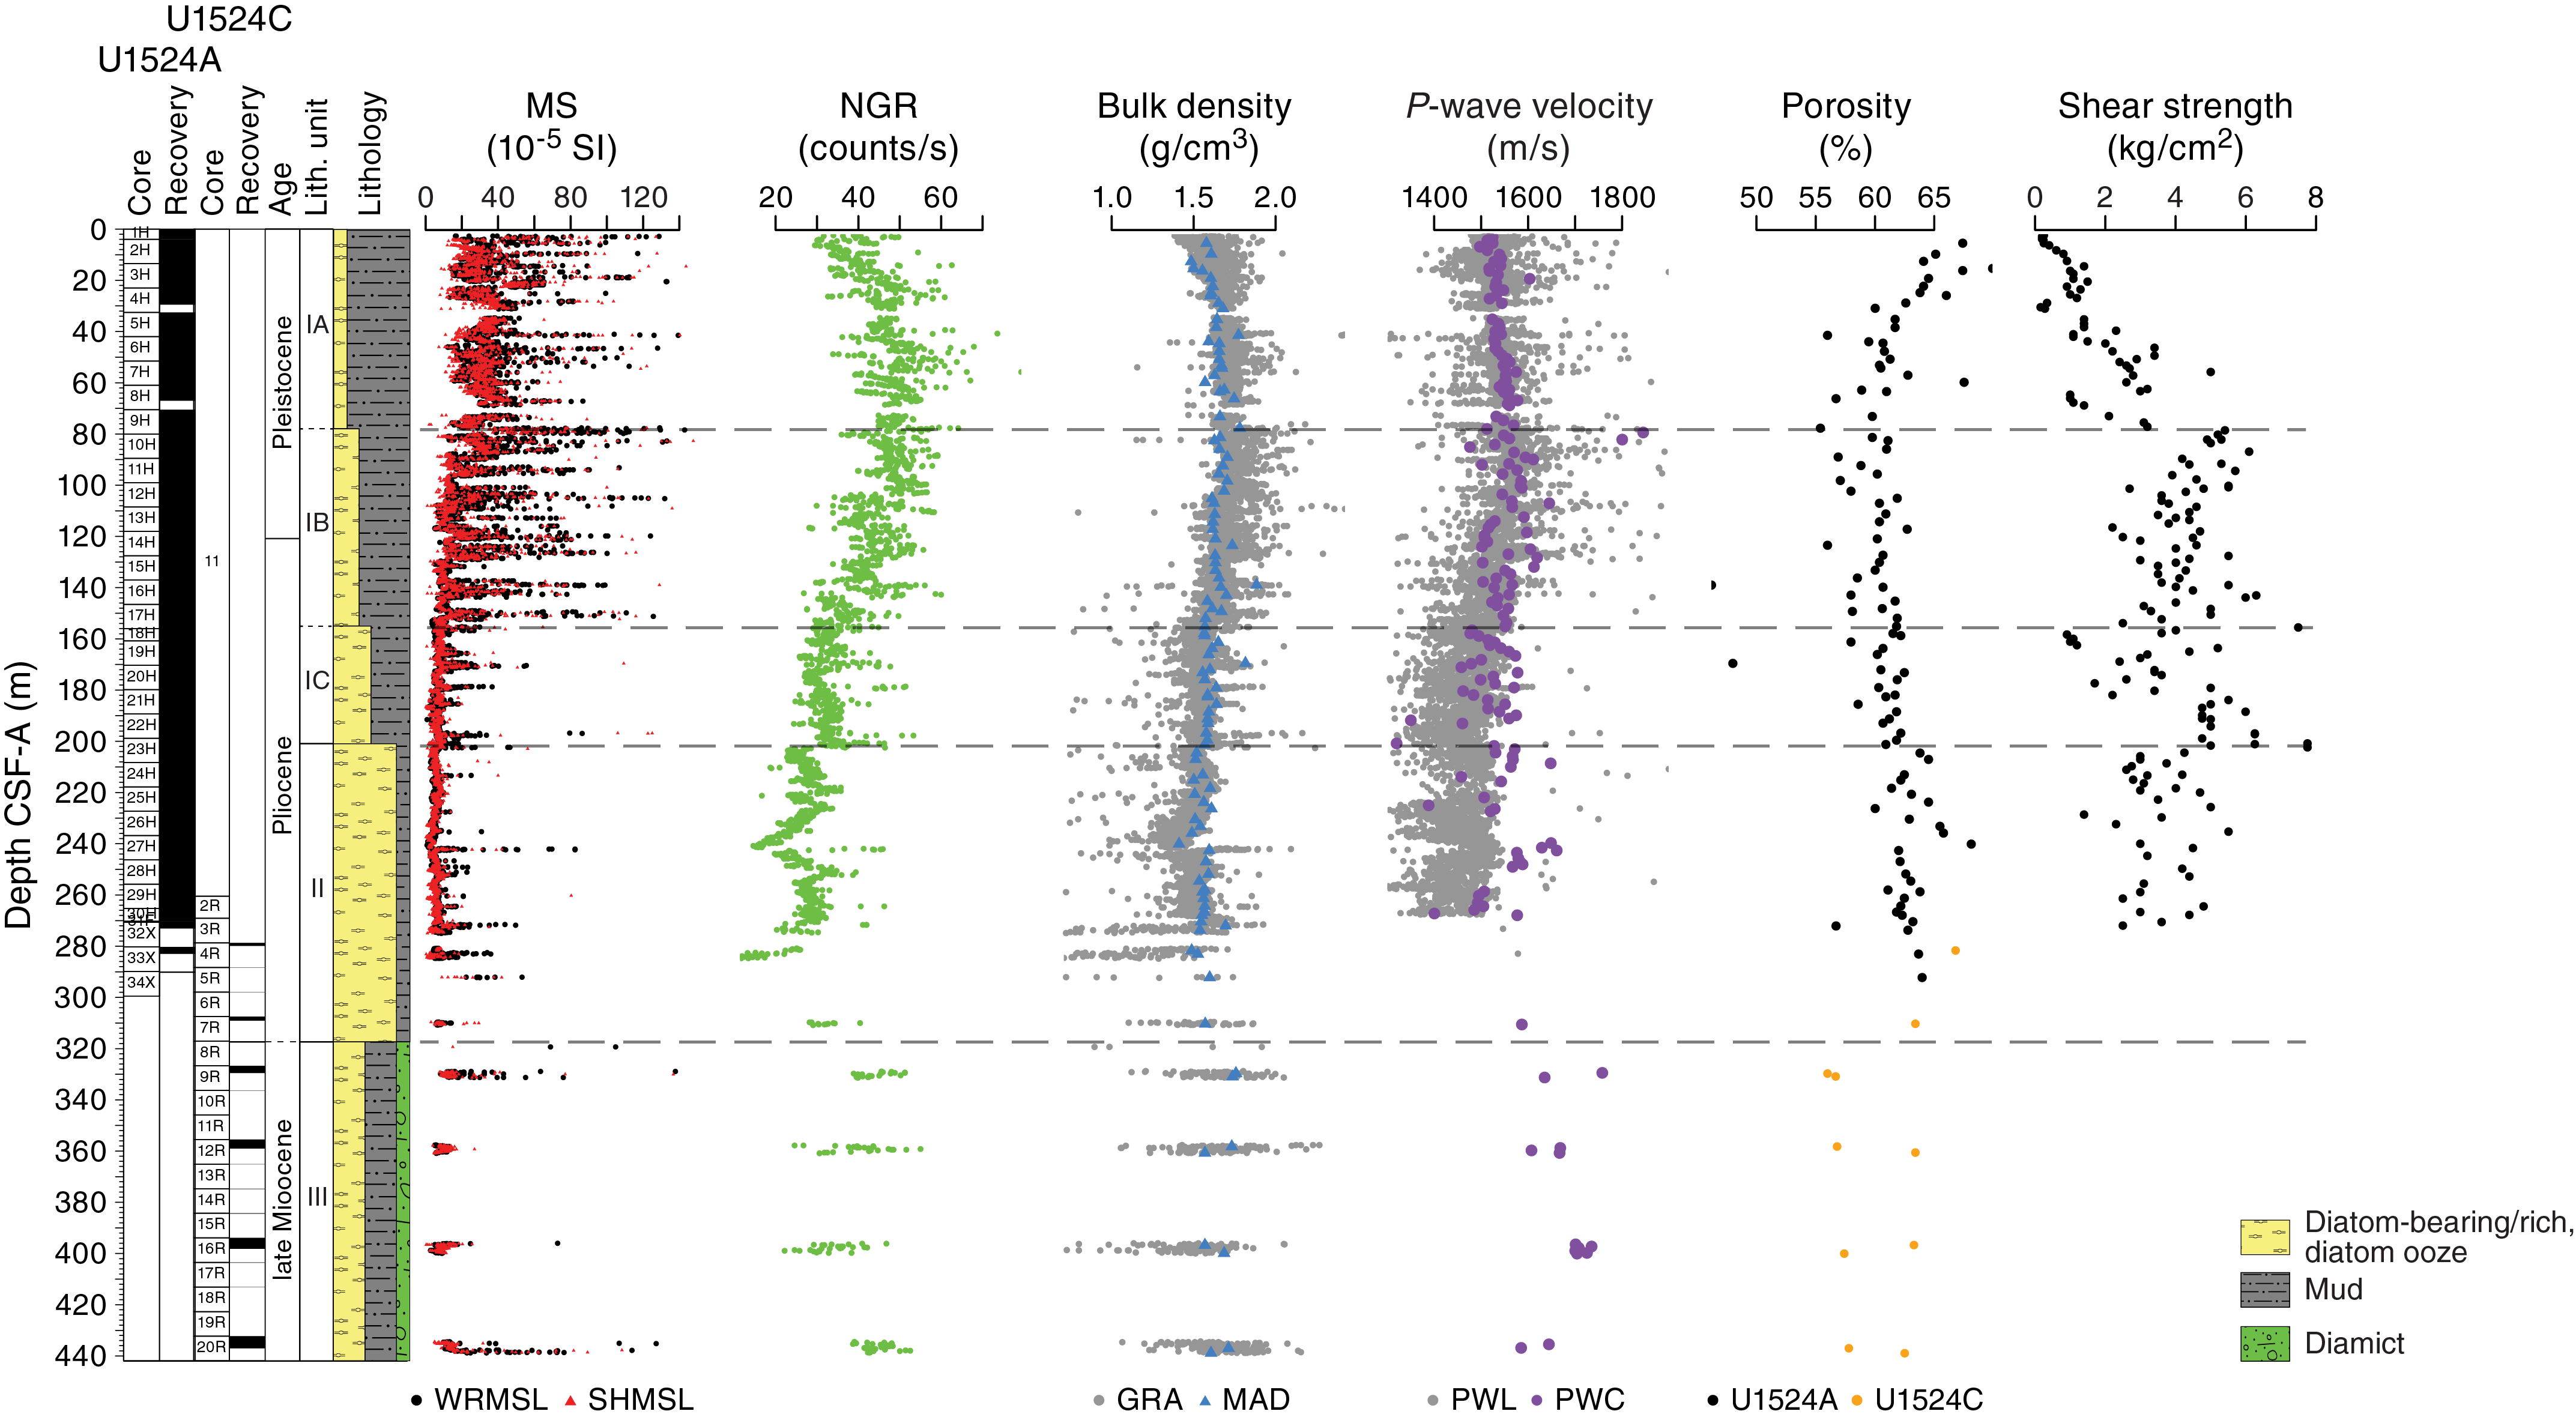
Figure F20. Physical properties summary.
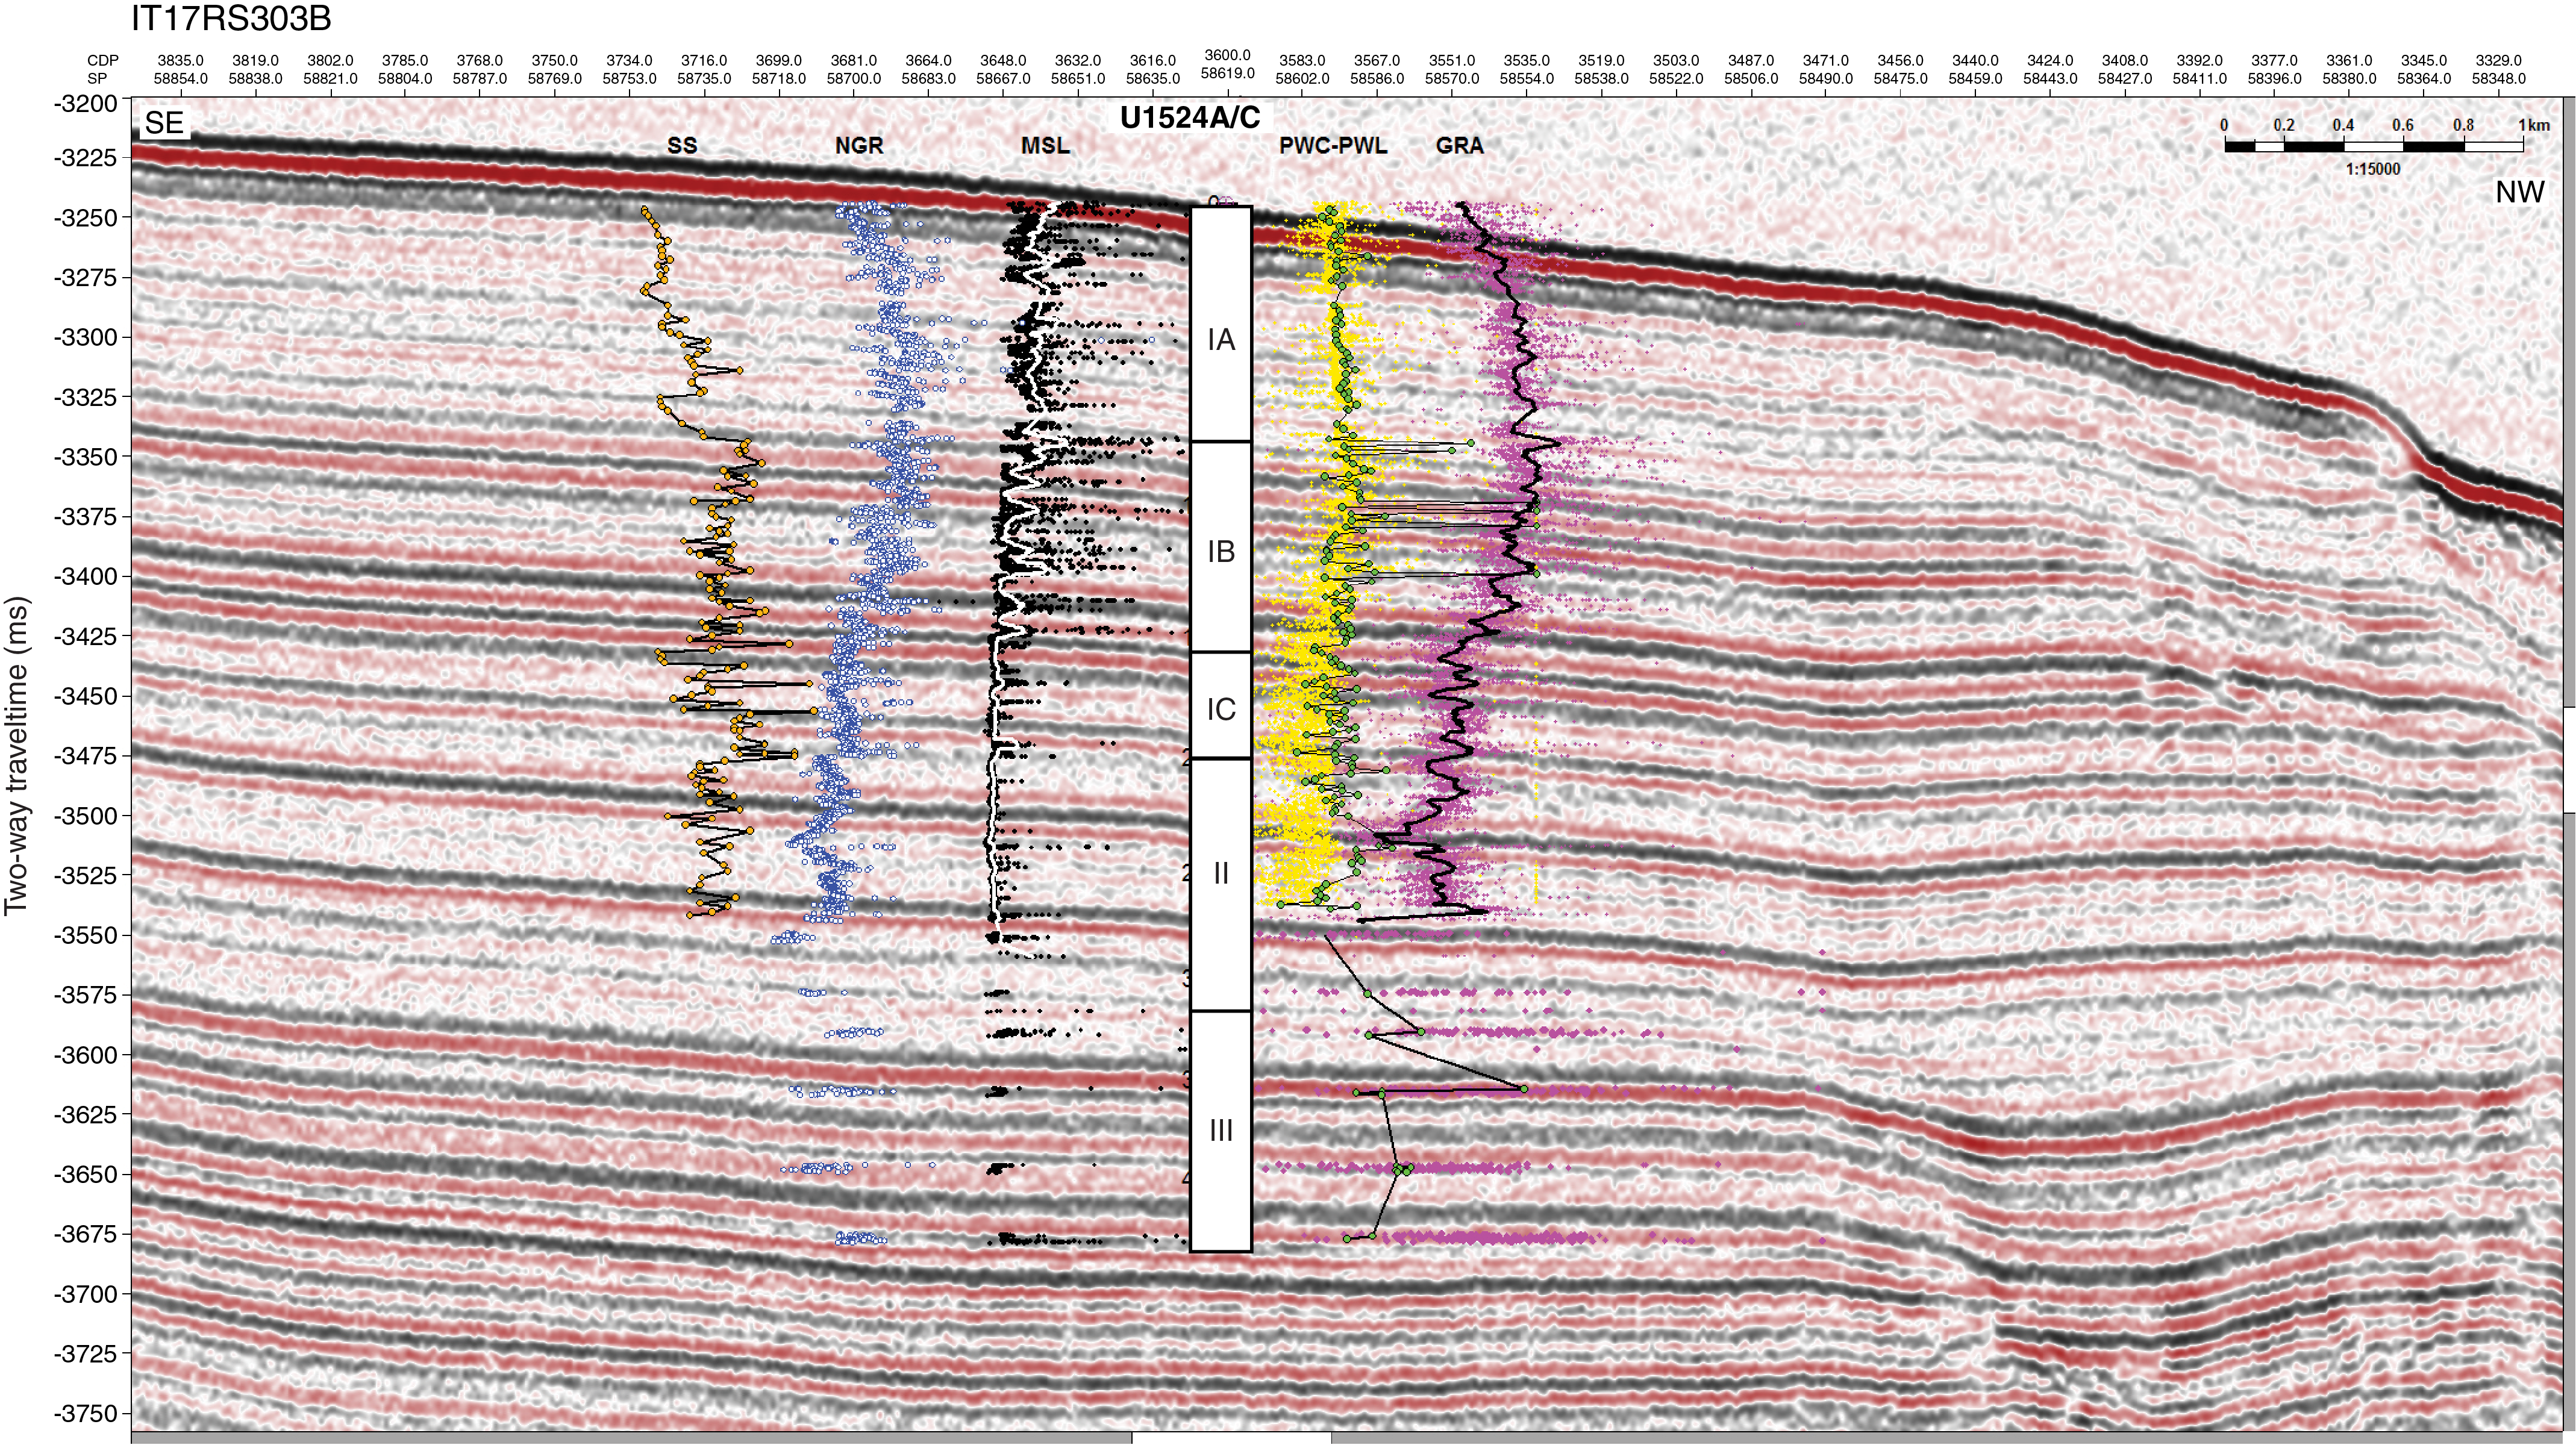
Figure F21. Core-seismic integration.
Overall, magnetic susceptibility, NGR, and bulk density measurements correlate well (Figure F20). These parameters are inversely correlated with b* (Figures F19, F20), reflecting an overall downhole increase in diatom content with variability caused by interbedded lithologies. Collectively, these results suggest that sedimentary processes are governed by the dominance of biogenic and terrigenous inputs, with higher terrigenous content in lithostratigraphic Subunit IA, decreasing terrigenous content and increasing biogenic content downhole in Subunits IB and IC, and maximum biogenic content in Unit II, corresponding to predominantly diatom ooze. Unit III has higher terrigenous content that corresponds to interbedded diamict and diatom-rich mud. This unit division is also reflected by the seismic facies, showing an overall stratified character with subhorizontal and subparallel reflectors (Figure F21). The upper unit, which corresponds to Subunit IA, shows a generally very low amplitude. High to medium amplitude reflector packages interlayered with very low amplitude reflector packages correspond to Subunits IB and IC and Unit II. A generally high amplitude characterizes the reflectors that correspond to Unit III.
Site U1524 was abandoned before penetrating the targeted RSU3, which is inferred to be below lithostratigraphic Unit III (see Operations).
Geochemistry and microbiology
Site U1524 samples were analyzed for headspace gas, interstitial water chemistry, and bulk sediment geochemistry. Methane and ethane concentrations at Site U1524 are close to or below the detection limit for the uppermost ~100 m CSF-A before increasing to higher concentrations in the lower parts of Holes U1524A and U1524C. In addition to low-resolution interstitial water sampling throughout Holes U1524A and U1524C, a high-resolution profile of interstitial water chemistry was obtained for the upper 7.56 m CSF-A of Hole U1524B. Low- and high-resolution downhole trends show clear manganese and sulfate reduction in the suboxic–anoxic transition zone in the upper ~90 m CSF-A. Rapid increases in both silicon and manganese concentrations in the upper 2 m CSF-A probably reflect shallow diagenesis of silica. Bulk sediment total organic carbon (TOC) and calcium carbonate (CaCO3) content is generally low throughout the site but reveals a distinct variability in lithostratigraphic Unit I. Higher percentages of carbonate content are observed in Subunits IB and IC and in a carbonate-cemented mudstone in Unit III. Total nitrogen (TN) content in the bulk sediments is very low, and the TOC/TN ratio displays trends similar to those of TOC.
Volatile hydrocarbons
Headspace gas analyses were performed at a resolution of one sample per core (9.6 m advance) throughout Holes U1524A and U1524C as part of the routine environmental protection and safety monitoring program. Methane (CH4) is the dominant hydrocarbon, whereas ethane (C2H6) is present in low concentration. Methane concentration is low (<45 ppmv) in the upper 65.50 m CSF-A and increases to ~42,000 ppmv at 179.07 m CSF-A (Figure F22; Table T12). Ethane concentration is below detection limit in the upper 79.23 m CSF-A and increases to 58 ppmv at 179.07 m CSF-A (Figure F22). Deeper than ~180 m CSF-A, concentrations of both methane and ethane are highly variable. The methane/ethane ratio varies between 808 and 321 from 89 to 436 m CSF-A (Figure F22), with decreasing ratios downhole.

Figure F22. Headspace gas concentrations.
Interstitial water chemistry
A total of 36 interstitial water samples were squeezed from whole-round samples from 0 to 396.28 m CSF-A at Site U1524 (Table T13). In detail, a mudline sample and 17 (5 cm) whole-round interstitial water samples were taken from 0 to 245.38 m CSF-A in Hole U1524A, a mudline sample and 18 (5 cm) whole-round interstitial water samples were obtained from 0 to 7.56 m CSF-A in Hole U1524B, and one 10 cm whole-round interstitial water sample was collected from 396.28 m CSF-A in Hole U1524C. Core 374-U1524B-1H (0–7.56 m CSF-A) was collected primarily for high-resolution interstitial water and microbiology sampling (Figure F23). The interstitial water sample from Hole U1524C was only analyzed for alkalinity, pH, and salinity. Filtered subsamples of all other interstitial water samples were prioritized in the order detailed in Geochemistry and microbiology in the Expedition 374 methods chapter (McKay et al., 2019a) for shipboard and shore-based analyses. General downhole trends for all measured interstitial water properties are in excellent agreement across Holes U1524A and U1524B and are illustrated in Figures F24, F25, and F26.
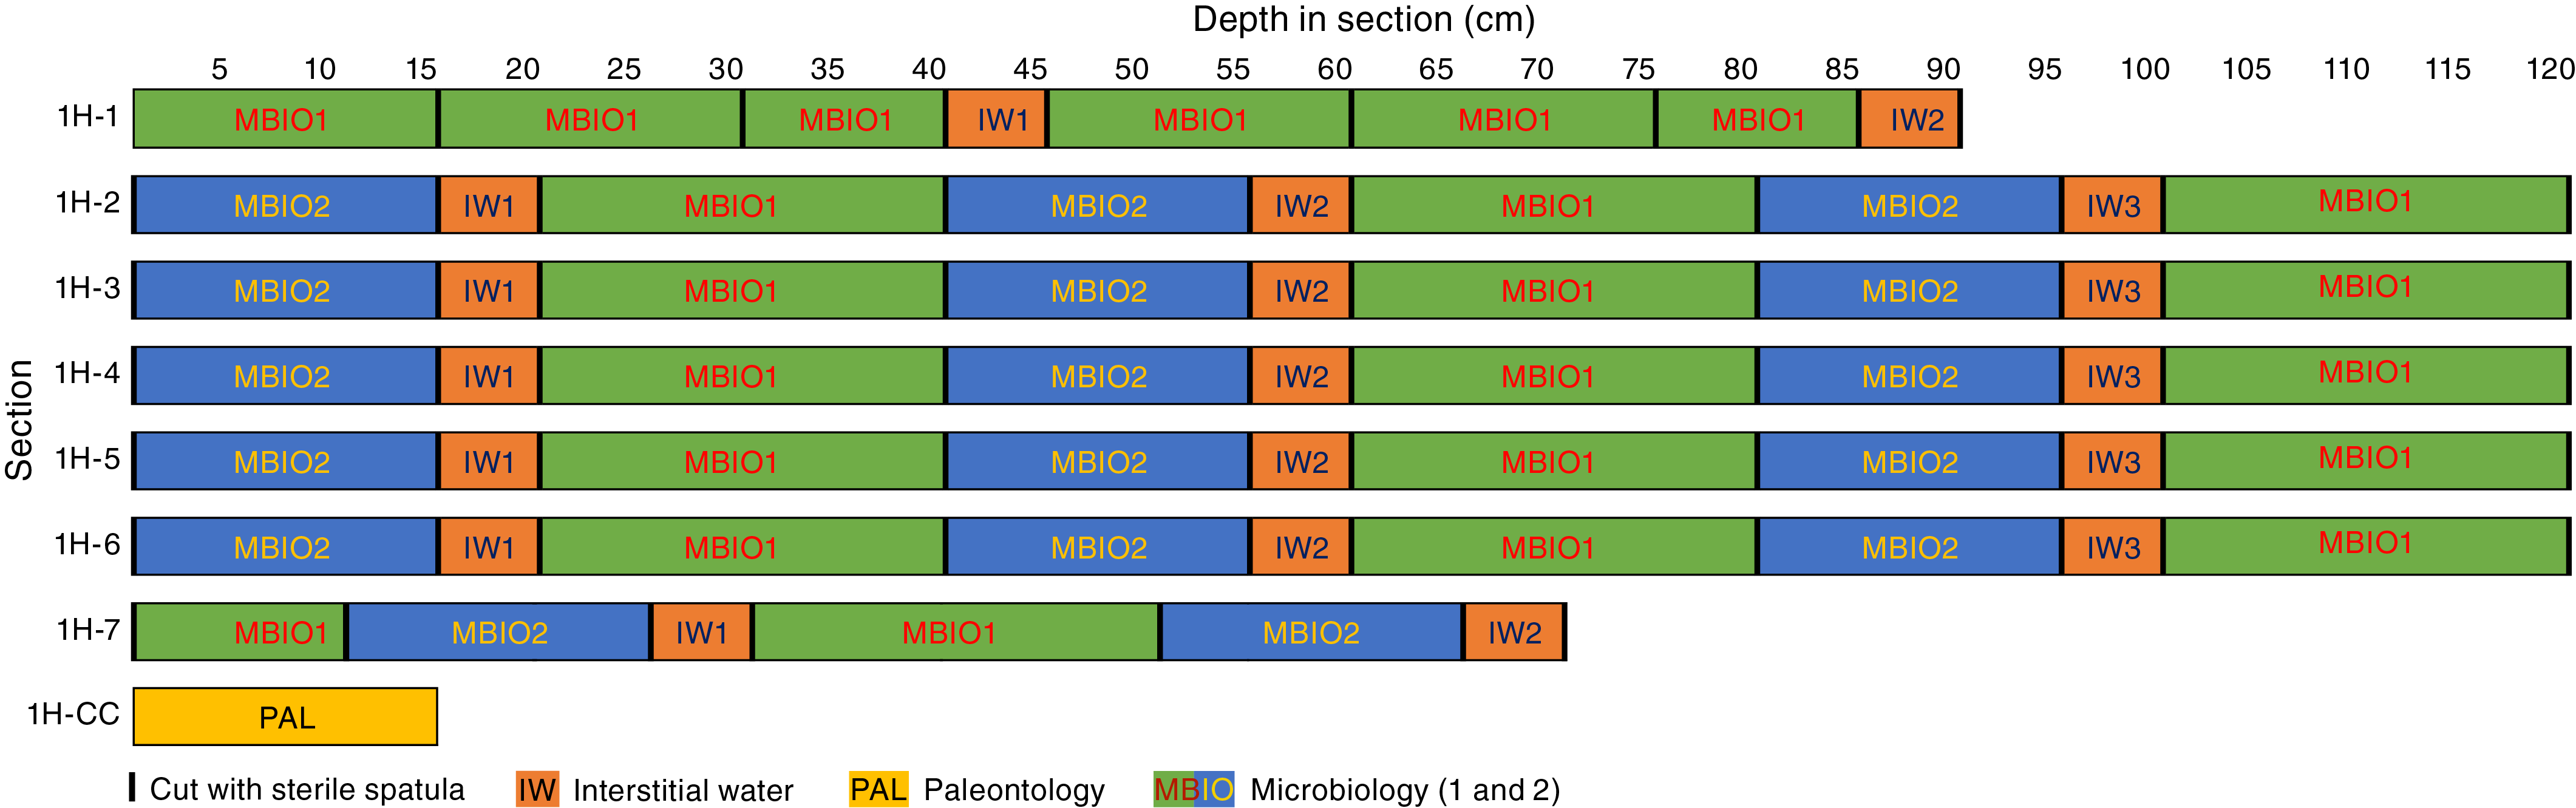
Figure F23. Interstitial water and microbiology sampling scheme.
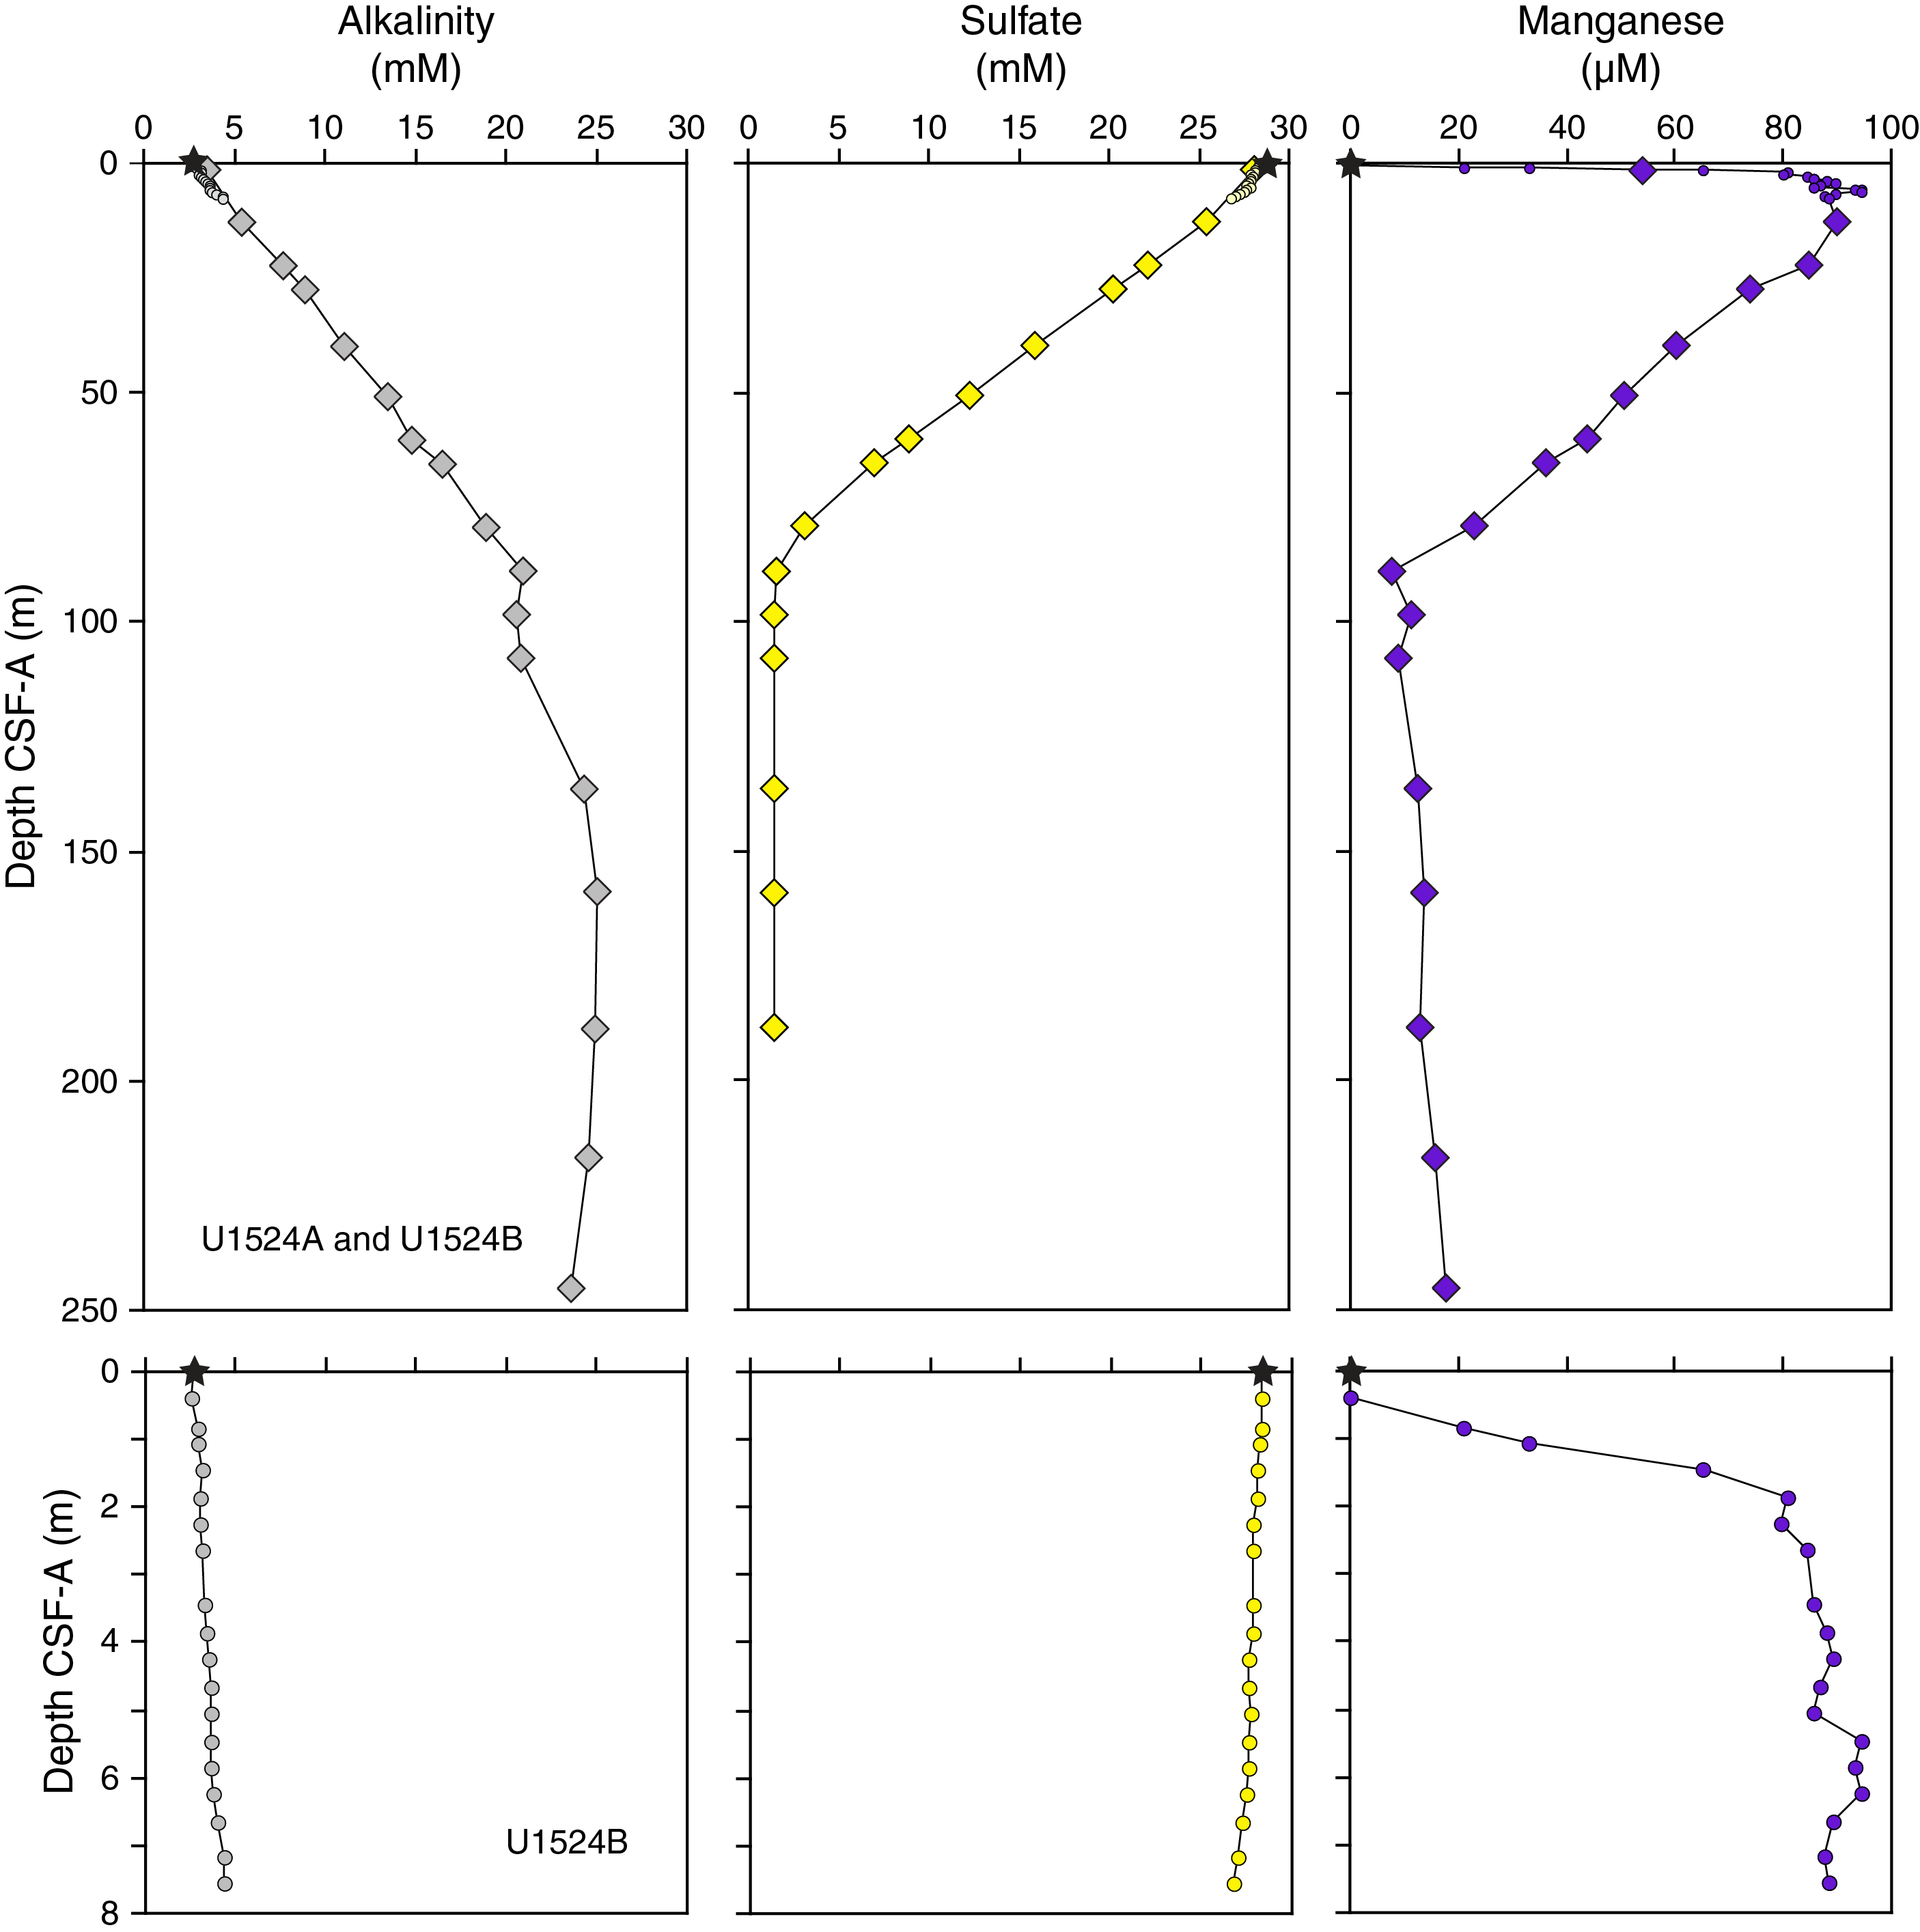
Figure F24. Interstitial water geochemistry.
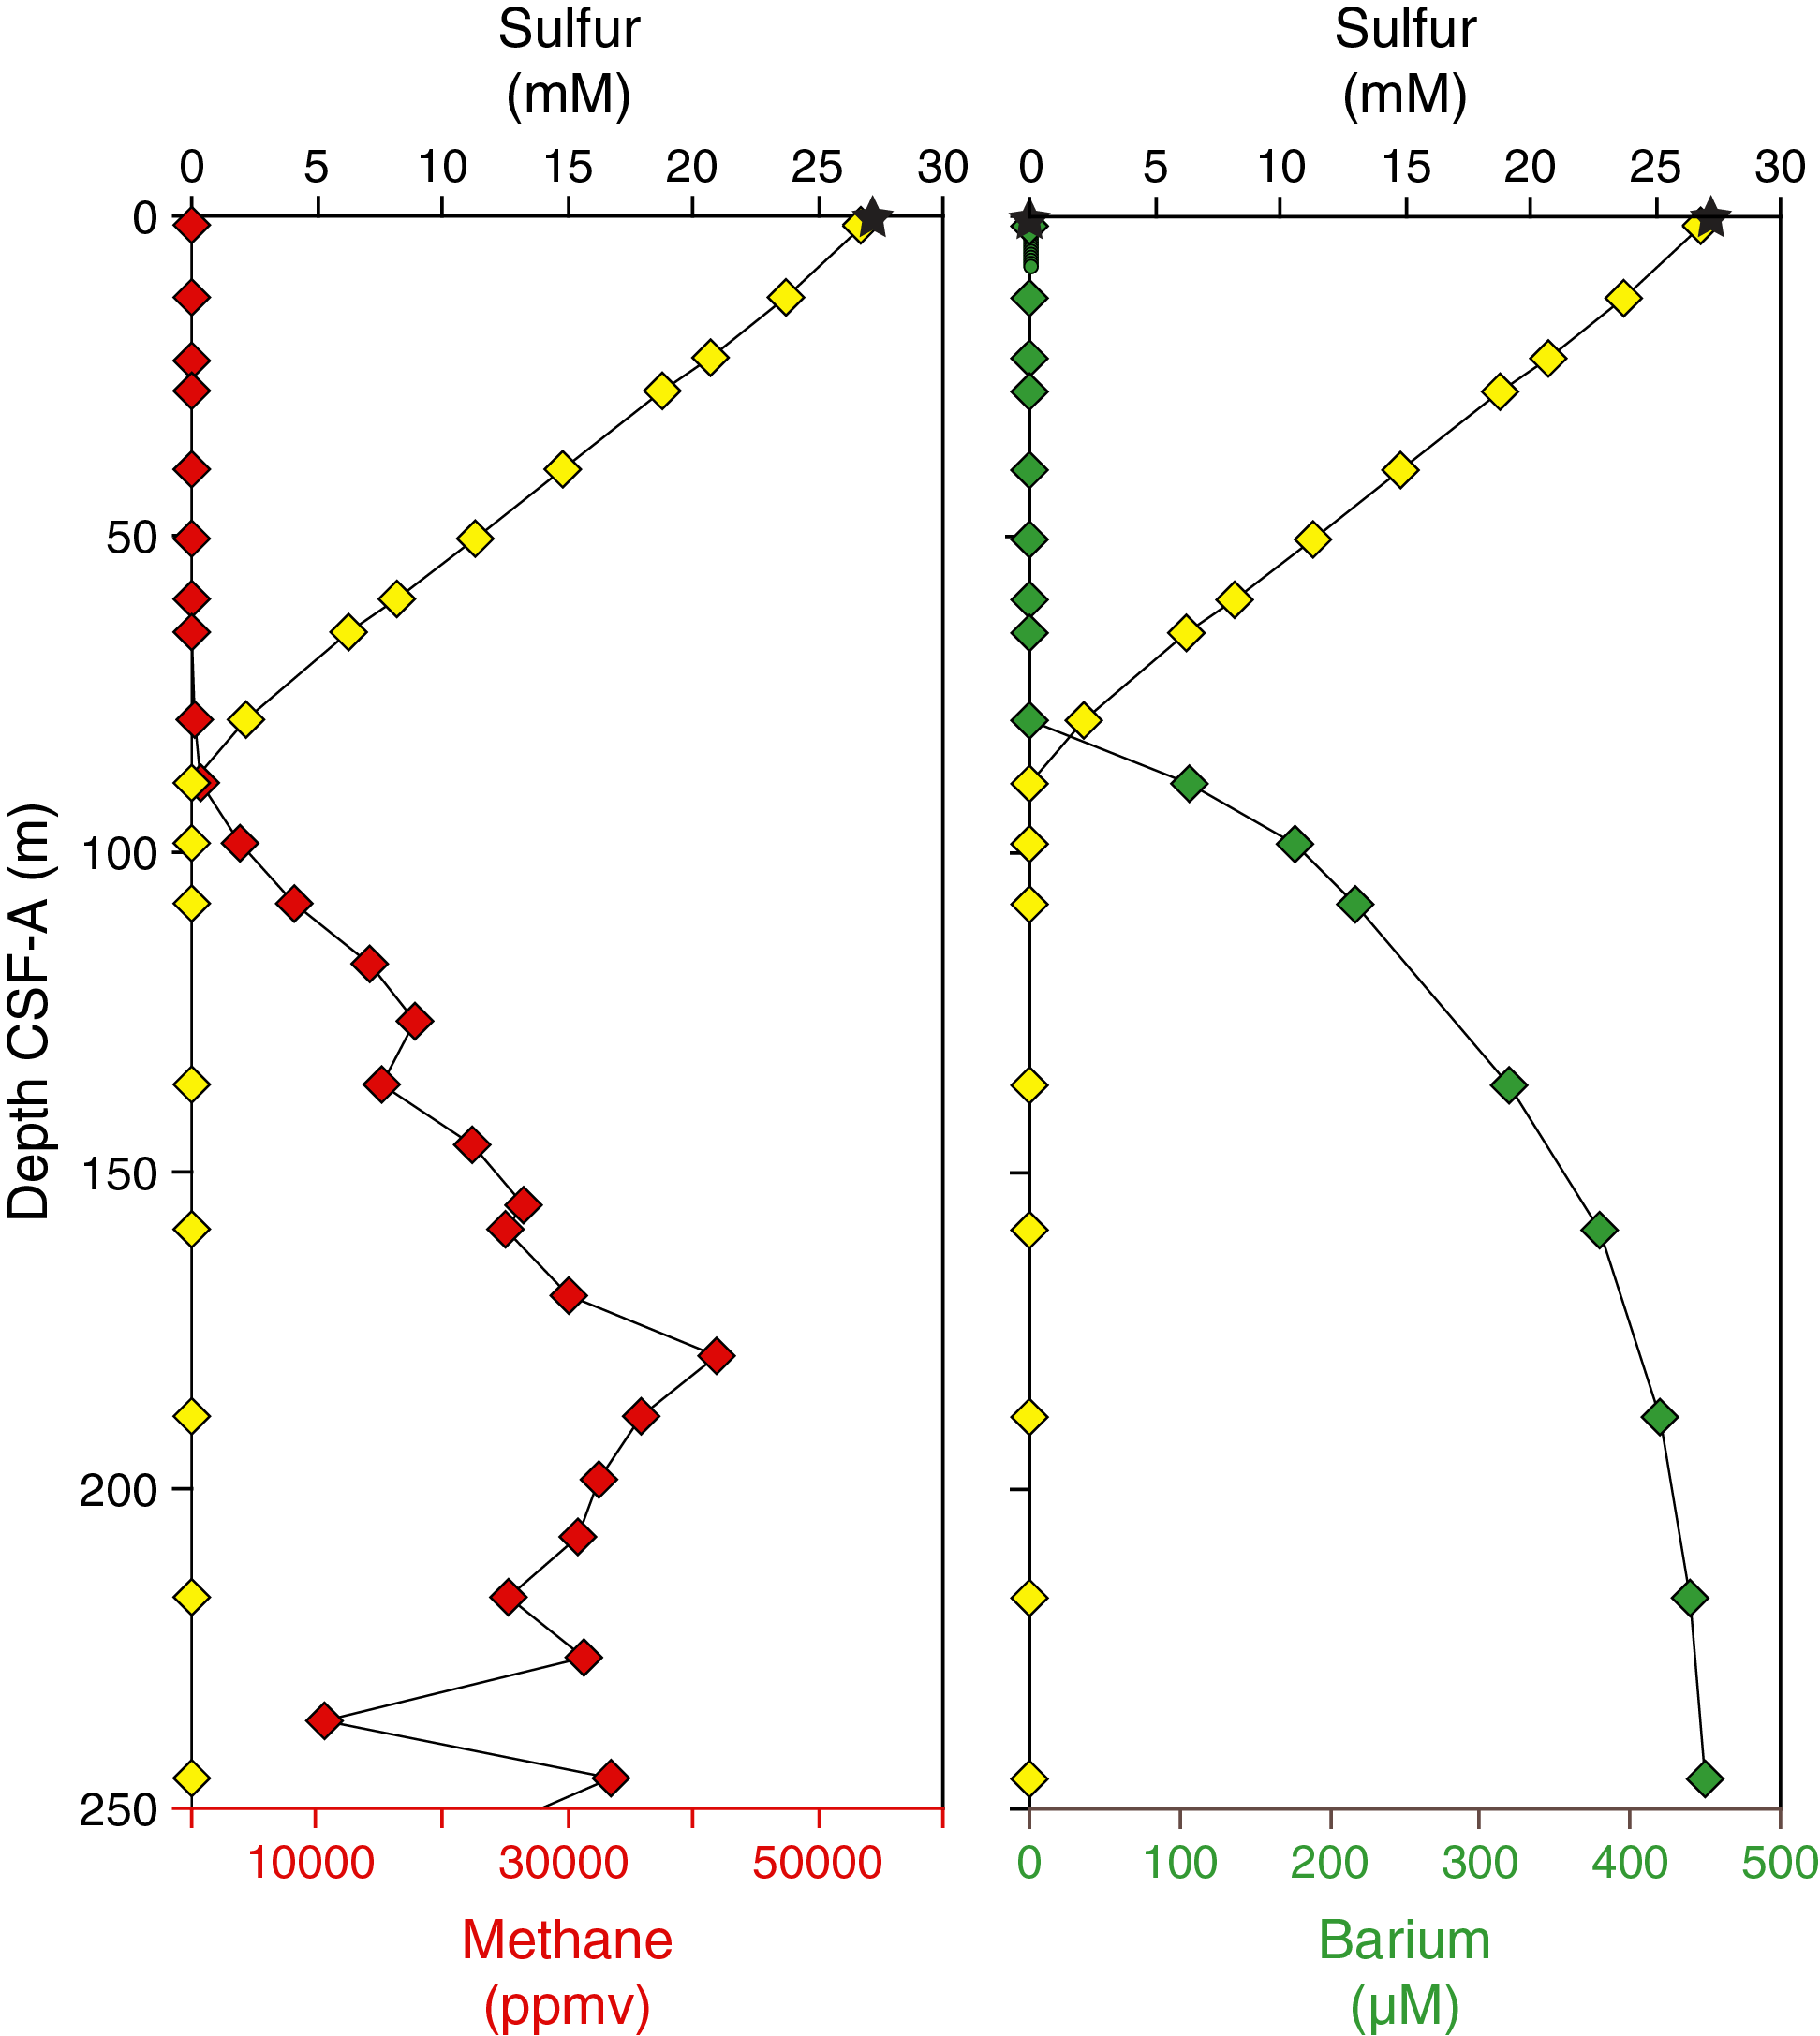
Figure F25. Interstitial water geochemistry.
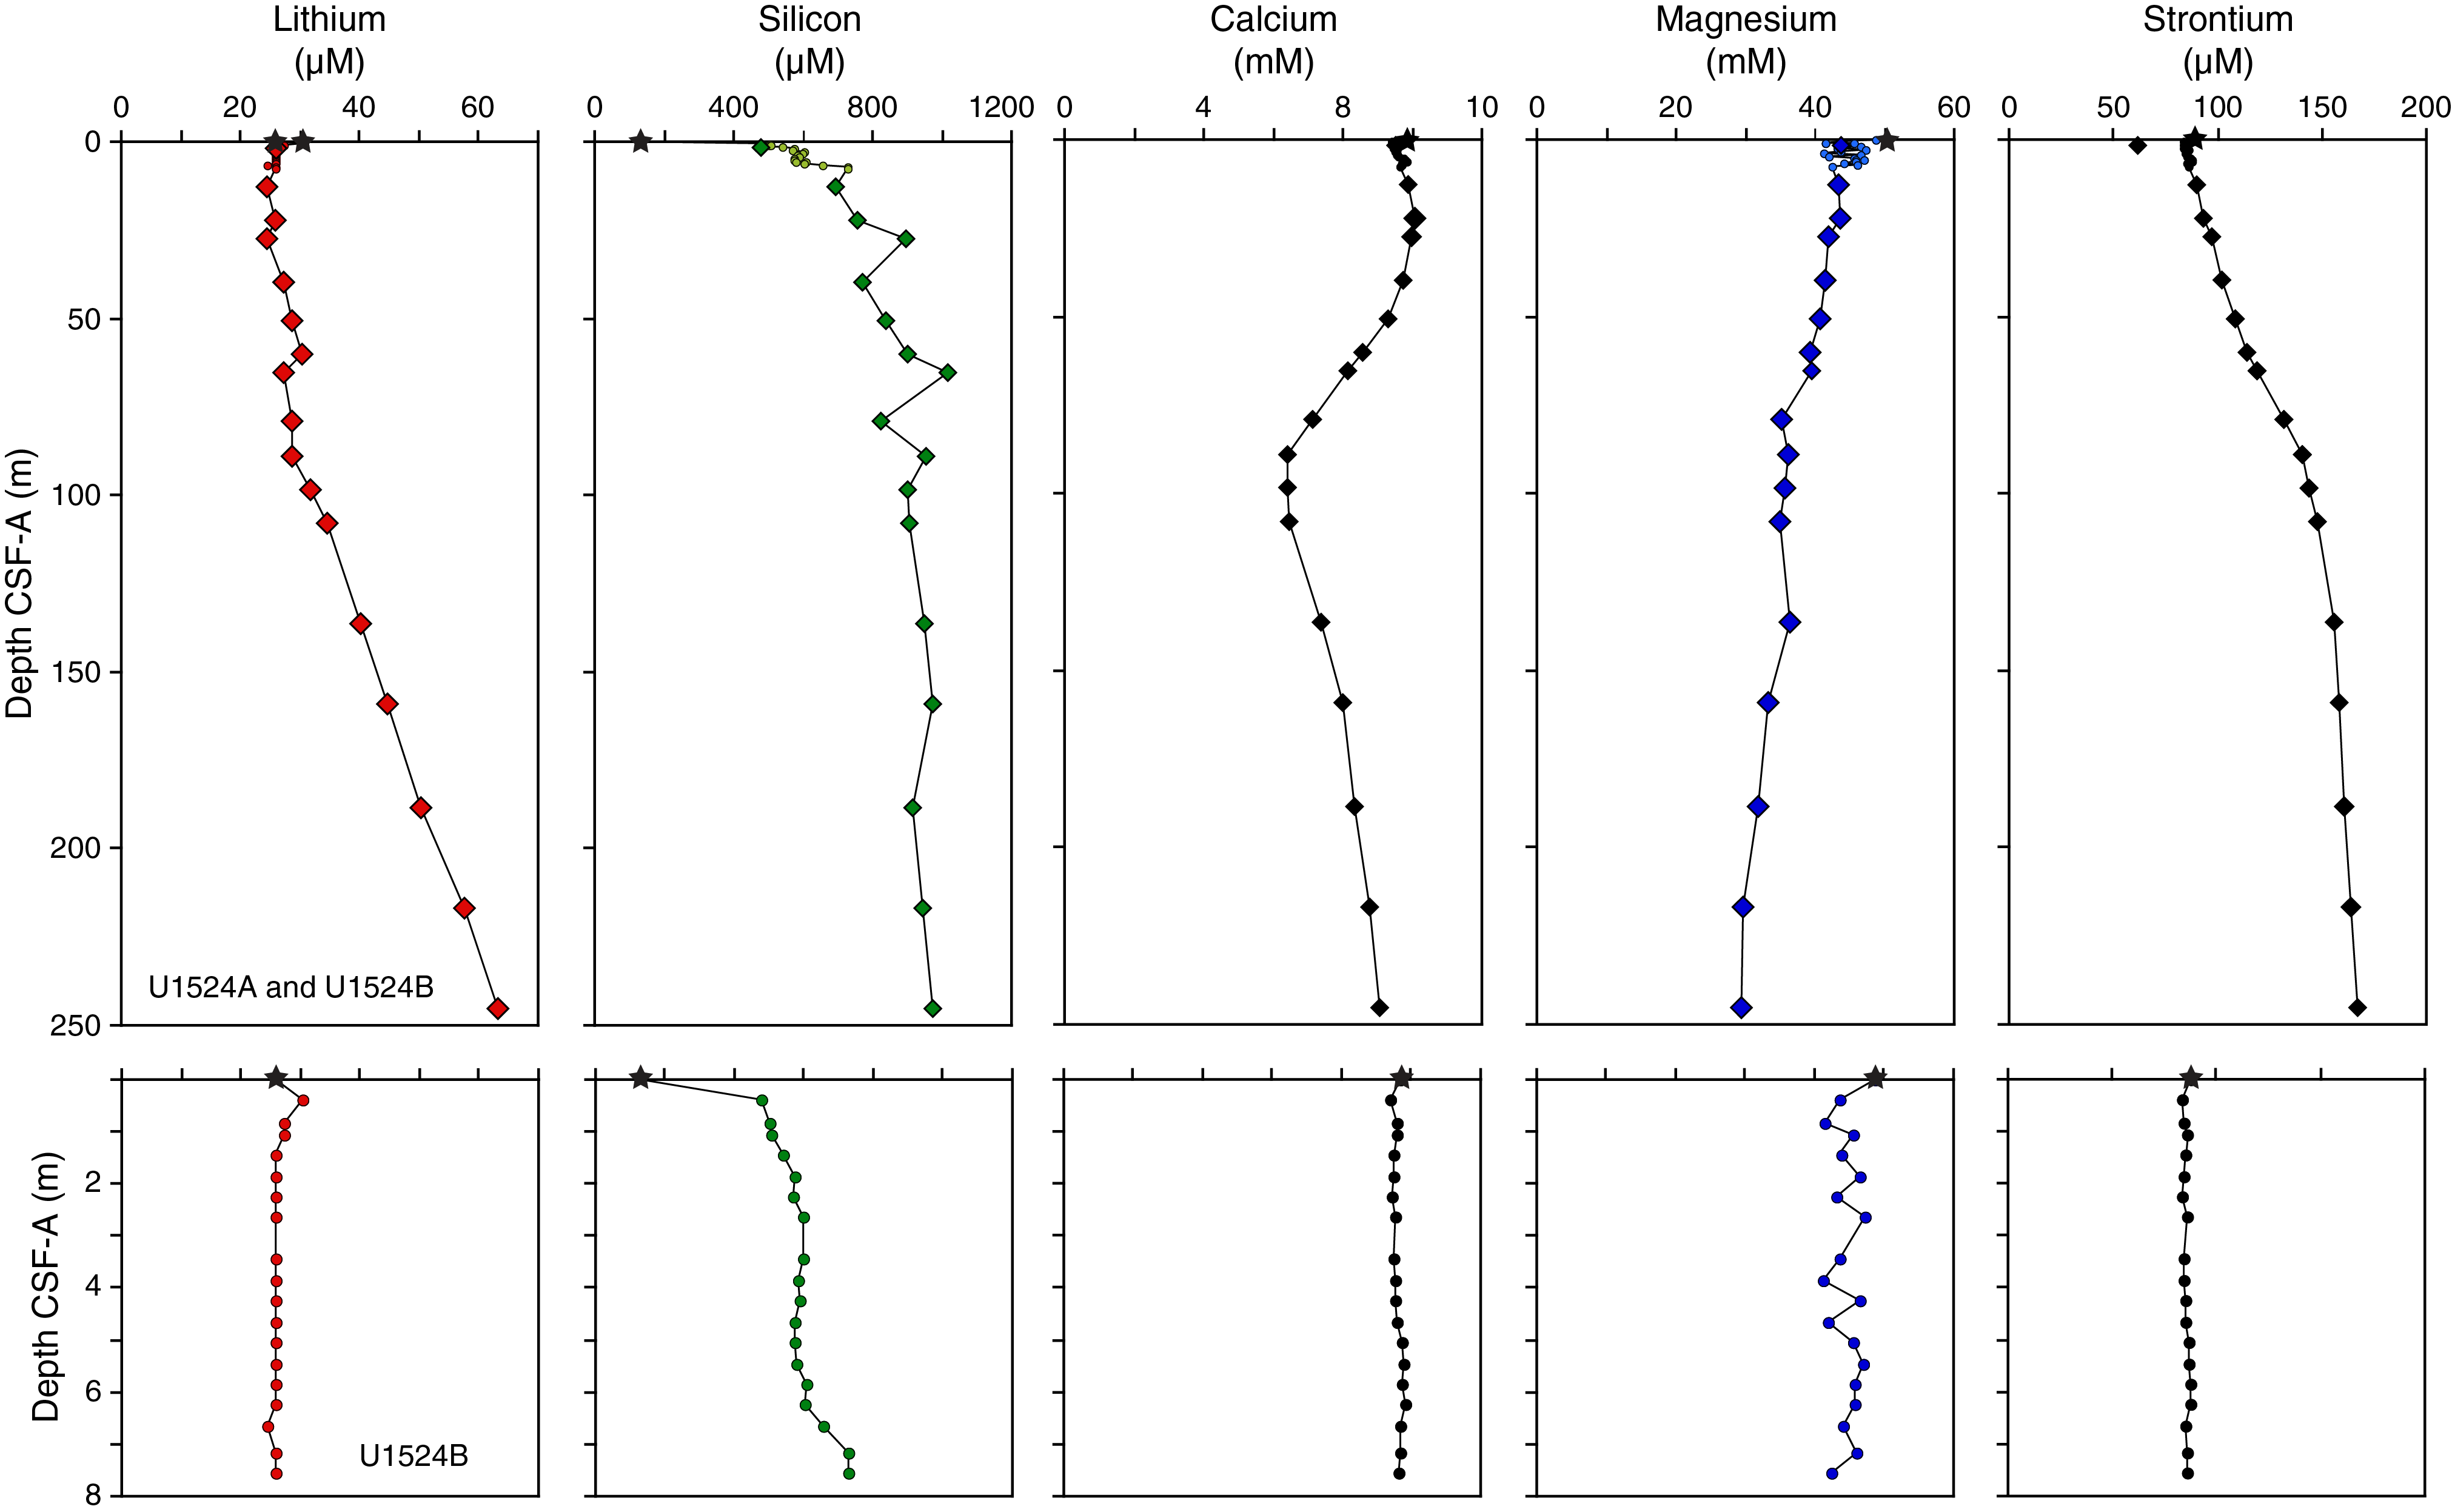
Figure F26. Interstitial water geochemistry.
Salinity, pH, ammonium, alkalinity, sulfate, manganese, and barium
Salinity for all samples from the upper 50.63 m in Holes U1524A and U1524B is 35, similar to ambient seawater. Salinity at the mudline is slightly higher (36), and values are lower (32–34.5) between 60.28 and 396.28 m CSF-A. Interstitial water pH ranges from 7.5 to 7.8. Ammonium concentration increases linearly (r2 = 0.99) from values below the detection limit in the two mudline samples and the shallowest interstitial water samples (shallower than 5 m CSF-A in Holes U1524A and U1524B) to 1715 mM in the deepest interstitial water sample measured for ammonium at Site U1524 (245.38 m CSF-A in Hole U1524A). Alkalinity increases linearly from 2.8 and 2.6 mM in mudline water from Holes U1524A and U1524B, respectively, to 21 mM between 89.02 and 107.74 m CSF-A in Hole U1524A (Figure F24) and further increases to a maximum of 25 mM between 158.89 and 216.69 m CSF-A. Values from below this depth slightly decrease downhole to the deepest interstitial water sample from Hole U1524A (24 mM at 245.38 m CSF-A). The single data point obtained in Hole U1524C has an alkalinity of 16 mM at 396.28 m CSF-A.
Sulfate in the mudline water from Hole U1524A is slightly elevated (~29 mM) above the typical seawater value, but results are in error of modern seawater in the mudline water from Hole U1524B (~28 mM) (Figure F24). Low- and high-resolution interstitial water sulfate data from Holes U1524A and U1524B show a linear decrease from seawater values downhole to 89.02 m CSF-A. Below this depth, sulfate concentration is close to or below the ion chromatography detection limit (<1.6 mM). Sulfate reduction is complete by ~90 m CSF-A at Site U1524, which is similar to Sites U1521 and U1522 but shallower than Sites U1523 and U1525. Manganese concentration reveals a very well defined increase from values below detection limit in mudline samples and at 0.40 m CSF-A (uppermost interstitial water sample of the high-resolution profile in Hole U1524B) to 94 µM between 5.45 and 6.25 m CSF-A in Hole U1524B (Figure F24). An equally well defined decrease in manganese concentration is observed from 6.25 to 89.02 m CSF-A, where concentration reaches 8 µM in Hole U1524A. For the remainder of the sampled profile (Hole U1524A), manganese varies around a low concentration of 13 ± 3 µM. All downhole profiles described above are consistent with manganese and sulfate reduction in sediments based on oxidation of sediment organic matter. Comparison of methane and sulfur concentration, the latter of which parallels sulfate concentration, shows a clear pattern of increasing methane concentration from 89.02 m CSF-A downhole to the exact depth sulfate reduction is completed, indicating a classic sulfate–methane transition zone (SMTZ) (Figure F25). Barium concentration in interstitial water increases below that depth, indicating barite (BaSO4) dissolution deeper than ~90 m CSF-A in an environment where interstitial water is undersaturated with respect to barite (Figure F25).
Silicon, lithium, magnesium, calcium, and strontium
Silicon concentration in mudline water samples from Holes U1524A and U1524B is ~130 µM, reflecting low dissolved silica that is common in the ambient water column. A pronounced increase in concentration (476 µM) is observed in the first interstitial water sample from 0.40 m CSF-A in Hole U1524B. Silicon concentration reaches a maximum of 1018 µM at 65.45 m CSF-A (Figure F26). From 89.02 to 245.38 m CSF-A, equilibrium conditions between diagenesis/dissolution of biogenic silica and silica saturation in the interstitial water are reflected by the relatively narrow range of silicon concentration (940 ± 29 µM; Figure F26). Lithium concentration in interstitial water samples is generally between 26 and 30 µM in the uppermost ~90 m CSF-A of Holes U1524A and U1524B. High-resolution sampling reveals relatively invariant lithium levels in the uppermost 7.56 m CSF-A. Deeper than 89.02 m CSF-A, lithium linearly increases downhole to a maximum concentration of 63 µM at 245.38 m CSF-A (Figure F26). Boron concentration (not shown) has a very similar profile, with more than double the concentration at depth than at the subsurface. Magnesium and potassium concentrations, in contrast, decrease with depth in interstitial water samples (~30%). Calcium and strontium concentrations increase smoothly deeper than 107.74 m CSF-A but differ in their trends above this depth (Figure F26). Although strontium in interstitial water increases from 84 µM at 1.41 m CSF-A to 147 µM at 107.74 m CSF-A, calcium concentration is relatively constant around a typical seawater value of 10 mM in the uppermost 27.45 m CSF-A and then decreases to a relative minimum of 6 mM between 89.02 and 107.74 m CSF-A.
Bulk sediment geochemistry
Carbon, nitrogen, and carbonate
Discrete sediment samples (N = 93) from all major lithostratigraphic units identified at Site U1524 were analyzed for total carbon, TN, and total inorganic carbon. TOC and CaCO3 contents were subsequently calculated (Table T14). TOC content is generally low (<0.9 wt%). A continuous increase in average TOC content (from ~0.1 to 0.65 wt%) is observed in the upper 320 m CSF-A. In the diatom-bearing and diatom-rich mud of lithostratigraphic Subunits IA and IB (0–155.58 m CSF-A), distinct higher frequency variability is superimposed on the general increasing trend (Figure F27). TN content is very low (<0.1 wt%) throughout the site. Except for one sample collected from Section 374-U1524C-12R-1 (355.57 m CSF-A), the TOC/TN ratio ranges between 0.1 and 17 (Figure F27), suggesting a mixed (i.e., marine and terrigenous) source of organic matter deposited at Site U1524. Similar to the TOC/TN ratio observed at Site U1525 (see Geochemistry and microbiology in the Site U1525 chapter [McKay et al., 2019d]), the mean TOC/TN ratio at Site U1524 is lower than that at shelf Sites U1521–U1523 and suggests a reduced input of terrigenous-derived organic matter. CaCO3 content is generally low and ranges between ~0.3 and 3 wt%. An increase in CaCO3 content is observed in the diatom-bearing and diatom-rich mud of Unit I between 0 and 200 m CSF-A (Figure F27), and a decrease is noted in the diatom ooze of Unit II. Remarkably high CaCO3 content (64 wt%) corresponds to a CaCO3-cemented interval (Sample 374-U1524C-12R-1, 7–8 cm [355.57 m CSF-A]).
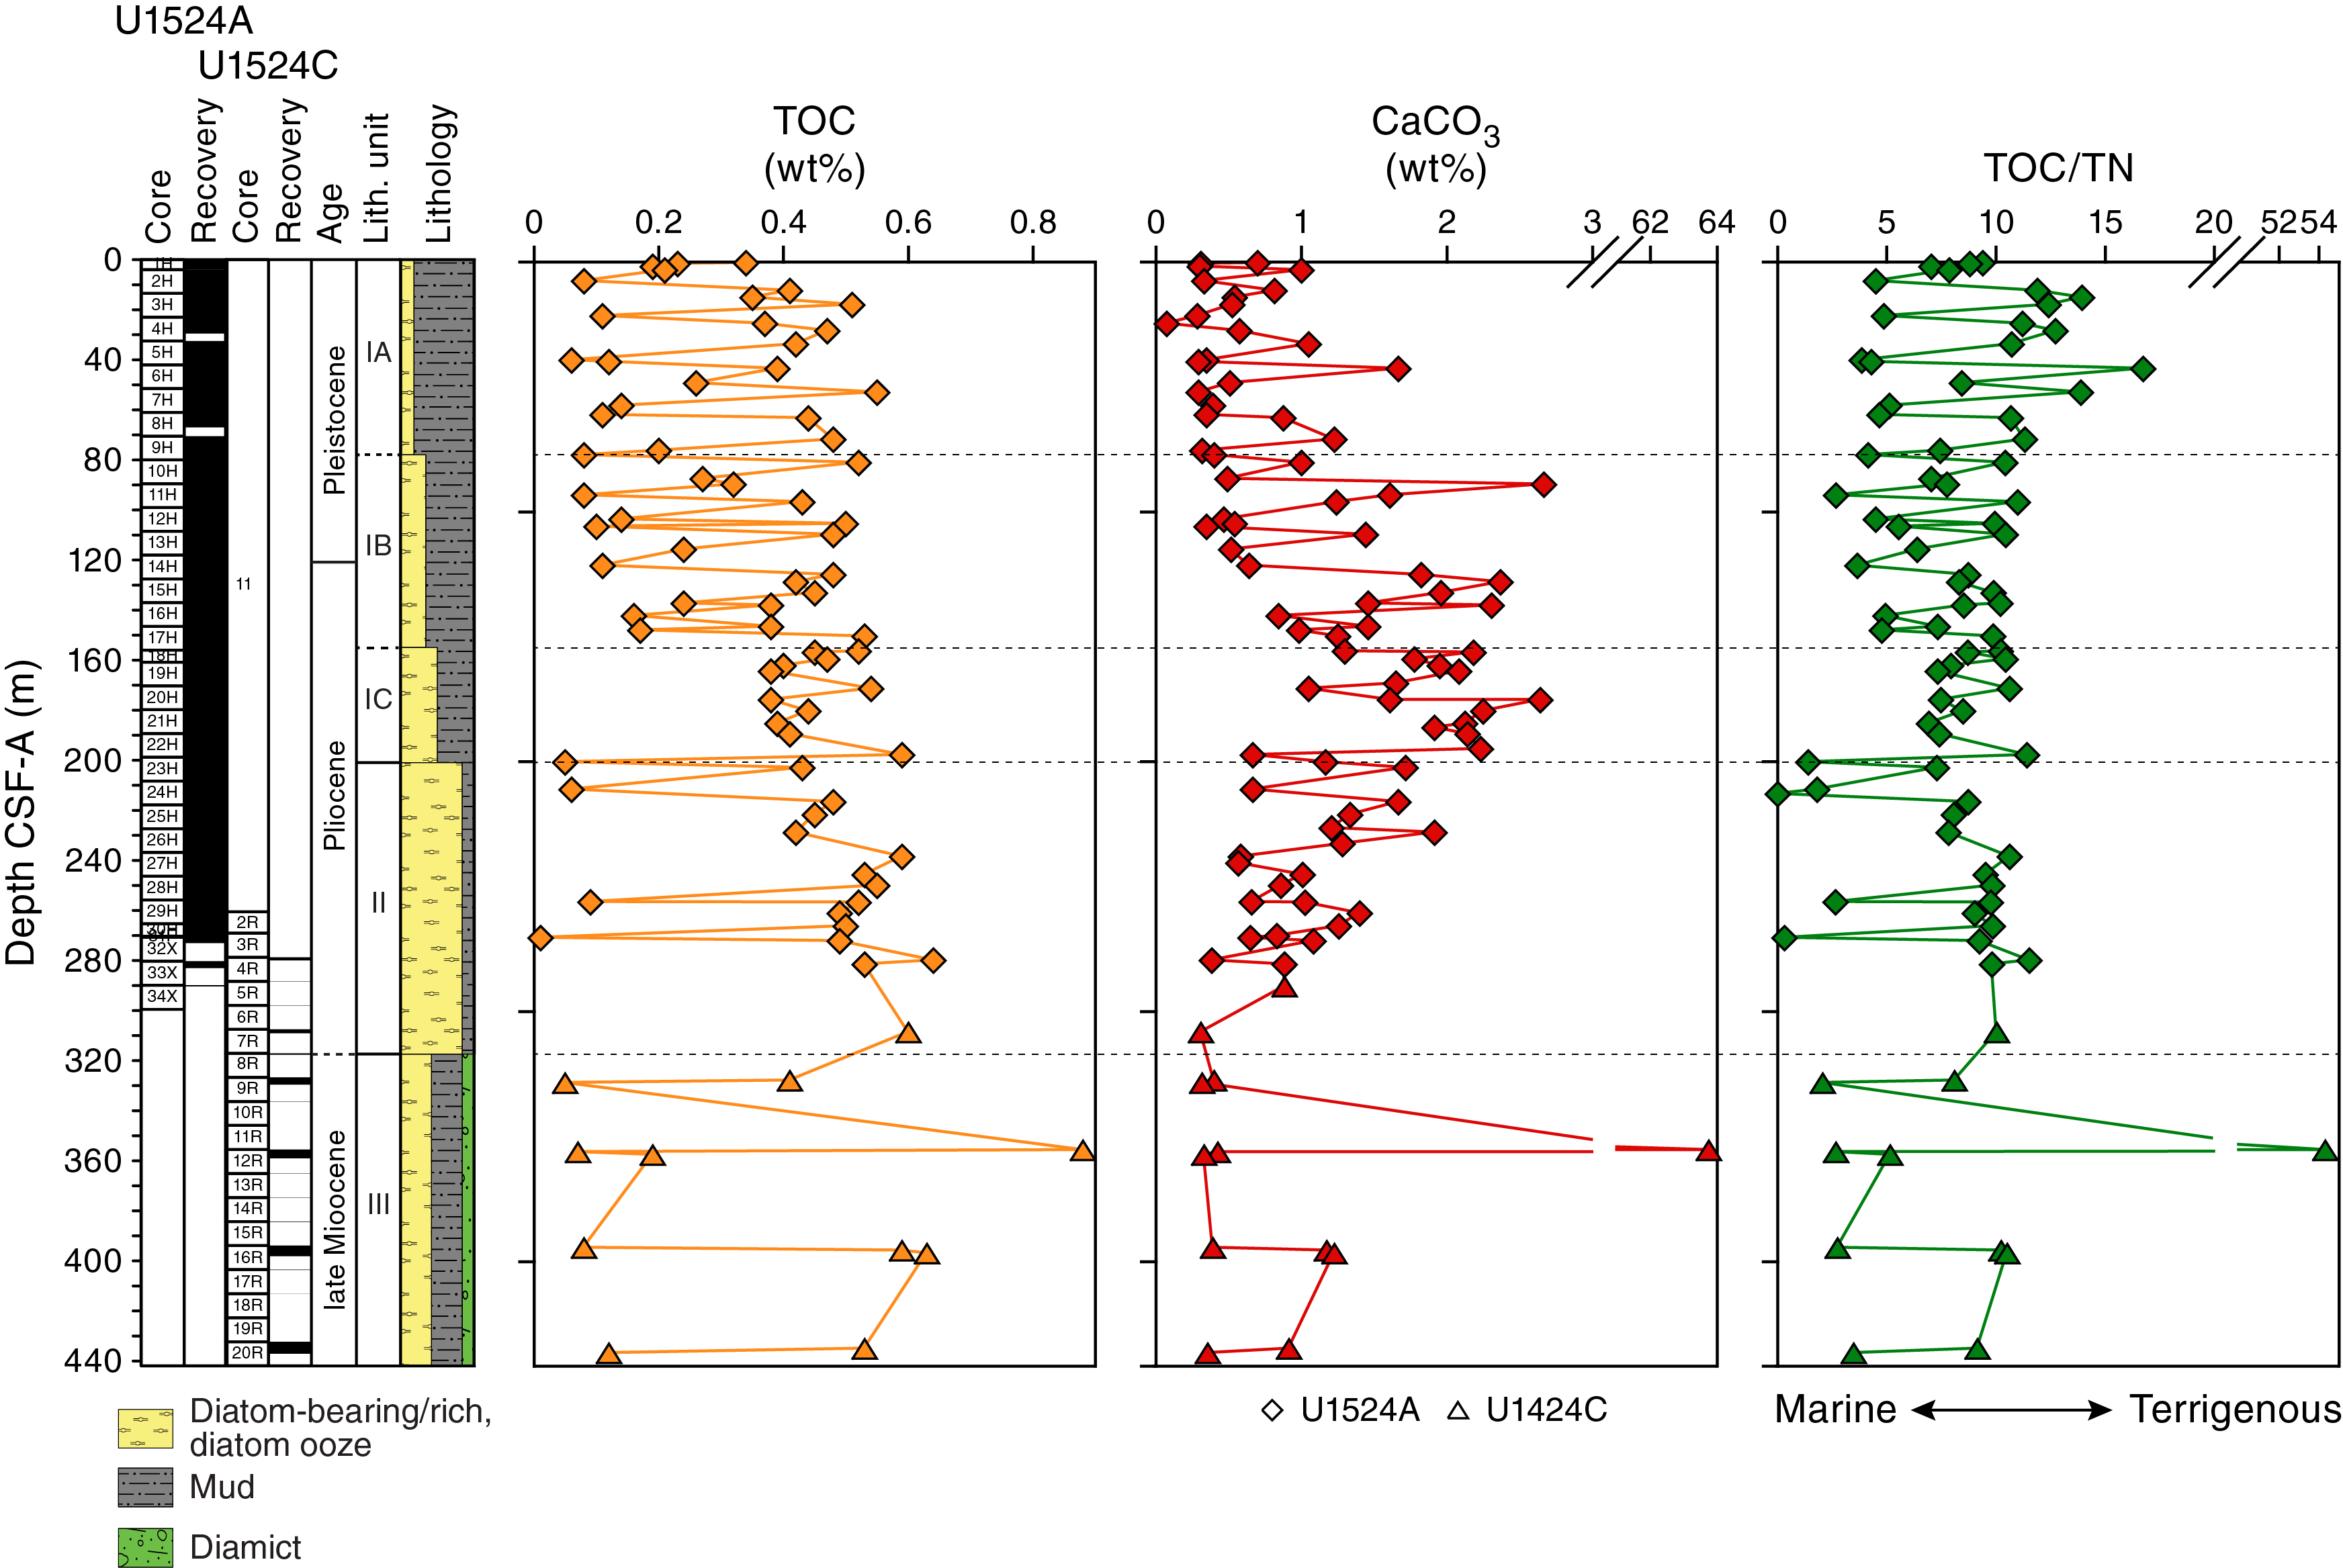
Figure F27. Bulk sediment carbon and TOC/TN.
Microbiological sampling
In total, 37 samples for shore-based stable and clumped isotope analyses of methane and ethane were collected from Holes U1524A and U1524B. Syringe samples for detailed analyses of metagenomics, cell counts, metabolomics, and cultures were taken from Sections 374-U1524A-3H-6, 6H-6, 9H-6, 12H-6, 15H-6, 18H-2, 21H-6, 24H-6, and 27H-6 (see Geochemistry and microbiology in the Expedition 374 methods chapter [McKay et al., 2019a] for details). High-resolution interstitial water sampling from Core 374-U1524B-1H was accompanied by high-resolution sampling for microbiology. In detail, 40 whole-round samples of 10, 15, or 20 cm were collected from 0 to 7.56 m CSF-A from Sections 1H-1 through 1H-7 (Figure F23) for shore-based analyses of metagenomics and culturing.
References
Arndt, J.E., Schenke, H.W., Jakobsson, M., Nitsche, F.O., Buys, G., Goleby, B., Rebesco, M., et al., 2013. The International Bathymetric Chart of the Southern Ocean (IBCSO) Version 1.0—a new bathymetric compilation covering circum-Antarctic waters. Geophysical Research Letters, 40(12):3111–3117. https://doi.org/10.1002/grl.50413
Bergamasco, A., Defendi, V., Zambianchi, E., and Spezie, G., 2002. Evidence of dense water overflow on the Ross Sea shelf-break. Antarctic Science, 14(3):271–277. https://doi.org/10.1017/S0954102002000068
Carburlotto, A., Lucchi, R.G., De Santis, L., Macrì, P., and Tolotti, R., 2010. Sedimentary processes on the Wilkes Land continental rise reflect changes in glacial dynamic and bottom water flow. International Journal of Earth Sciences, 99(4):909–926. https://doi.org/10.1007/s00531-009-0422-8
Cunningham, W.L., Leventer, A., Andrews, J.T., Jennings, A.E., and Licht, K.J., 1999. Late Pleistocene–Holocene marine conditions in the Ross Sea, Antarctica: evidence from the diatom record. The Holocene, 9(2):129–139. https://doi.org/10.1191/095968399675624796
Florindo, F., Farmer, R.K., Harwood, D.M., Cody, R.D., Levy, R., Bohaty, S.M., Carter, L., and Winkler, A., 2013. Paleomagnetism and biostratigraphy of sediments from Southern Ocean ODP Site 744 (southern Kerguelen Plateau): implications for early-to-middle Miocene climate in Antarctica. Global and Planetary Change, 110(C):434–454. https://doi.org/10.1016/j.gloplacha.2013.05.004
Gradstein, F.M., Ogg, J.G., Schmitz, M.D., and Ogg, G.M. (Eds.), 2012. The Geological Time Scale 2012: Amsterdam (Elsevier). https://doi.org/10.1016/C2011-1-08249-8
Hannah, M.J., Wrenn, J.H., and Wilson, G.J., 1998. Early Miocene and Quaternary marine palynomorphs from Cape Roberts Project CRP-1, McMurdo Sound, Antarctica. Terra Antarctica, 5(3):527–538. https://epic.awi.de/27440/1/Han1998g.pdf
Harland, R., and Pudsey, C.J., 2002. Protoperidiniacean dinoflagellate cyst taxa from the upper Miocene of ODP Leg 178, Antarctic Peninsula. Review of Palaeobotany and Palynology, 120(3–4):263–284. https://doi.org/10.1016/S0034-6667(02)00080-5
Lazarus, D., 1992. Antarctic Neogene radiolarians from the Kerguelen Plateau, Legs 119 and 120. In Wise, S.W., Jr., Schlich, R., et al., Proceedings of the Ocean Drilling Program, Scientific Results, 120: College Station, TX (Ocean Drilling Program), 785–809. https://doi.org/10.2973/odp.proc.sr.120.192.1992
Lindeque, A., Gohl, K., Henrys, S., Wobbe, F., and Davy, B., 2016. Seismic stratigraphy along the Amundsen Sea to Ross Sea continental rise: a cross-regional record of pre-glacial to glacial processes of the West Antarctic margin. Palaeogeography, Palaeoclimatology, Palaeoecology, 443:183–202. https://doi.org/10.1016/j.palaeo.2015.11.017
Lucchi, R.G., Rebesco, M., Camerlenghi, A., Busetti, M., Tomadin, L., Villa, G., Persico, D., Morigi, C., Bonci, M.C., and Giorgetti, G., 2002. Mid–late Pleistocene glacimarine sedimentary processes of a high-latitude, deep-sea sediment drift (Antarctica Peninsula Pacific margin). Marine Geology, 189(3–4):343–370. https://doi.org/10.1016/S0025-3227(02)00470-X
McKay, R.M., De Santis, L., Kulhanek, D.K., Ash, J.L., Beny, F., Browne, I.M., Cortese, G., Cordeiro de Sousa, I.M., Dodd, J.P., Esper, O.M., Gales, J.A., Harwood, D.M., Ishino, S., Keisling, B.A., Kim, S., Kim, S., Laberg, J.S., Leckie, R.M., Müller, J., Patterson, M.O., Romans, B.W., Romero, O.E., Sangiorgi, F., Seki, O., Shevenell, A.E., Singh, S.M., Sugisaki, S.T., van de Flierdt, T., van Peer, T.E., Xiao, W., and Xiong, Z., 2019a. Expedition 374 methods. In McKay, R.M., De Santis, L., Kulhanek, D.K., and the Expedition 374 Scientists, Ross Sea West Antarctic Ice Sheet History. Proceedings of the International Ocean Discovery Program, 374: College Station, TX (International Ocean Discovery Program). https://doi.org/10.14379/iodp.proc.374.102.2019
McKay, R.M., De Santis, L., Kulhanek, D.K., Ash, J.L., Beny, F., Browne, I.M., Cortese, G., Cordeiro de Sousa, I.M., Dodd, J.P., Esper, O.M., Gales, J.A., Harwood, D.M., Ishino, S., Keisling, B.A., Kim, S., Kim, S., Laberg, J.S., Leckie, R.M., Müller, J., Patterson, M.O., Romans, B.W., Romero, O.E., Sangiorgi, F., Seki, O., Shevenell, A.E., Singh, S.M., Sugisaki, S.T., van de Flierdt, T., van Peer, T.E., Xiao, W., and Xiong, Z., 2019b. Expedition 374 summary. In McKay, R.M., De Santis, L., Kulhanek, D.K., and the Expedition 374 Scientists, Ross Sea West Antarctic Ice Sheet History. Proceedings of the International Ocean Discovery Program, 374: College Station, TX (International Ocean Discovery Program). https://doi.org/10.14379/iodp.proc.374.101.2019
McKay, R.M., De Santis, L., Kulhanek, D.K., Ash, J.L., Beny, F., Browne, I.M., Cortese, G., Cordeiro de Sousa, I.M., Dodd, J.P., Esper, O.M., Gales, J.A., Harwood, D.M., Ishino, S., Keisling, B.A., Kim, S., Kim, S., Laberg, J.S., Leckie, R.M., Müller, J., Patterson, M.O., Romans, B.W., Romero, O.E., Sangiorgi, F., Seki, O., Shevenell, A.E., Singh, S.M., Sugisaki, S.T., van de Flierdt, T., van Peer, T.E., Xiao, W., and Xiong, Z., 2019c. Expedition 374 summary. In McKay, R.M., De Santis, L., Kulhanek, D.K., and the Expedition 374 Scientists, Ross Sea West Antarctic Ice Sheet History. Proceedings of the International Ocean Discovery Program, 374: College Station, TX (International Ocean Discovery Program). https://doi.org/10.14379/iodp.proc.374.101.2019
McKay, R.M., De Santis, L., Kulhanek, D.K., Ash, J.L., Beny, F., Browne, I.M., Cortese, G., Cordeiro de Sousa, I.M., Dodd, J.P., Esper, O.M., Gales, J.A., Harwood, D.M., Ishino, S., Keisling, B.A., Kim, S., Kim, S., Laberg, J.S., Leckie, R.M., Müller, J., Patterson, M.O., Romans, B.W., Romero, O.E., Sangiorgi, F., Seki, O., Shevenell, A.E., Singh, S.M., Sugisaki, S.T., van de Flierdt, T., van Peer, T.E., Xiao, W., and Xiong, Z., 2019d. Site U1523. In McKay, R.M., De Santis, L., Kulhanek, D.K., and the Expedition 374 Scientists, Ross Sea West Antarctic Ice Sheet History. Proceedings of the International Ocean Discovery Program, 374: College Station, TX (International Ocean Discovery Program). https://doi.org/10.14379/iodp.proc.374.105.2019
McKay, R.M., De Santis, L., Kulhanek, D.K., Ash, J.L., Beny, F., Browne, I.M., Cortese, G., Cordeiro de Sousa, I.M., Dodd, J.P., Esper, O.M., Gales, J.A., Harwood, D.M., Ishino, S., Keisling, B.A., Kim, S., Kim, S., Laberg, J.S., Leckie, R.M., Müller, J., Patterson, M.O., Romans, B.W., Romero, O.E., Sangiorgi, F., Seki, O., Shevenell, A.E., Singh, S.M., Sugisaki, S.T., van de Flierdt, T., van Peer, T.E., Xiao, W., and Xiong, Z., 2019d. Site U1525. In McKay, R.M., De Santis, L., Kulhanek, D.K., and the Expedition 374 Scientists, Ross Sea West Antarctic Ice Sheet History. Proceedings of the International Ocean Discovery Program, 374: College Station, TX (International Ocean Discovery Program). https://doi.org/10.14379/iodp.proc.374.107.2019
Naish, T.R., Powell, R., Levy, R., Wilson, G., Scherer, R., Talarico, F., Krissek, L., et al., 2009. Obliquity-paced Pliocene West Antarctic Ice Sheet oscillations. Nature, 458(7236):322–329. https://doi.org/10.1038/nature07867
Pribnow, D., Kinoshita, M., and Stein, C., 2000. Thermal Data Collection and Heat Flow Recalculations for Ocean Drilling Program Legs 101–180: Hanover, Germany (Institute for Joint Geoscientific Research, Institut für Geowissenschaftliche Gemeinschaftsaufgaben [GGA]). http://www-odp.tamu.edu/publications/heatflow/ODPReprt.pdf
Rebesco, M., Hernàndez-Molina, F.J., Van Rooij, D., and Wåhlin, A., 2014. Contourites and associated sediments controlled by deep-water circulation processes: state-of-the-art and future considerations. Marine Geology, 352:111–154. https://doi.org/10.1016/j.margeo.2014.03.011
Stein, C.A., and Stein, S., 1992. A model for the global variation in oceanic depth and heat flow with lithospheric age. Nature, 359(6391):123–129. https://doi.org/10.1038/359123a0
Stow, D.A.V., and Piper, D.J.W., 1984. Deep-water fine-grained sediments: facies models. In Stow, D.A.V., and Piper, D.J.W. (Eds.), Fine-Grained Sediments: Deep-Water Processes and Facies. Geological Society Special Publication, 15(1):611–646. https://doi.org/10.1144/GSL.SP.1984.015.01.38
Zonneveld, K.A.F., Marret, F., Versteegh, G.J.M., Bogus, K., Bonnet, S., Bouimetarhan, I., Crouch, E., et al., 2013. Atlas of modern dinoflagellate cyst distribution based on 2405 data points. Review of Palaeobotany and Palynology, 191. https://doi.org/10.1016/j.revpalbo.2012.08.003
1 McKay, R.M., De Santis, L., Kulhanek, D.K., Ash, J.L., Beny, F., Browne, I.M., Cortese, G., Cordeiro de Sousa, I.M., Dodd, J.P., Esper, O.M., Gales, J.A., Harwood, D.M., Ishino, S., Keisling, B.A., Kim, S., Kim, S., Laberg, J.S., Leckie, R.M., Müller, J., Patterson, M.O., Romans, B.W., Romero, O.E., Sangiorgi, F., Seki, O., Shevenell, A.E., Singh, S.M., Sugisaki, S.T., van de Flierdt, T., van Peer, T.E., Xiao, W., and Xiong, Z., 2019. Site U1524. In McKay, R.M., De Santis, L., Kulhanek, D.K., and the Expedition 374 Scientists, Ross Sea West Antarctic Ice Sheet History. Proceedings of the International Ocean Discovery Program, 374: College Station, TX (International Ocean Discovery Program). https://doi.org/10.14379/iodp.proc.374.106.2019
2 Expedition 374 Scientists’ affiliations.
This work is distributed under the Creative Commons Attribution 4.0 International (CC BY 4.0) license. 