de Ronde, C.E.J., Humphris, S.E., Höfig, T.W., and the Expedition 376 Scientists
Proceedings of the International Ocean Discovery Program Volume 376
publications.iodp.org

https://doi.org/10.14379/iodp.proc.376.104.2019
Site U15281
C.E.J. de Ronde, S.E. Humphris, T.W. Höfig, P.A. Brandl, L. Cai, Y. Cai, F. Caratori Tontini, J.R. Deans, A. Farough, J.W. Jamieson, K.P. Kolandaivelu, A. Kutovaya, J.M. Labonté, A.J. Martin, C. Massiot, J.M. McDermott, I.M. McIntosh, T. Nozaki, V.H. Pellizari, A.G. Reyes, S. Roberts, O. Rouxel, L.E.M. Schlicht, J.H. Seo, S.M. Straub, K. Strehlow, K. Takai, D. Tanner, F.J. Tepley III, and C. Zhang2
Keywords: International Ocean Discovery Program, IODP, JOIDES Resolution, Expedition 376, Brothers Arc Flux, Brothers volcano, Site U1528, Kermadec arc, submarine arc volcano, hydrothermal systems, volcaniclastics, dacite lava, hydrothermal alteration, borehole fluids, hypersaline brine, fluid inclusions, acidic fluids, alteration mineral assemblages, Upper Cone, Lower Cone, NW Caldera
MS 376-104: Published 5 July 2019
Summary
Background and objectives
Site U1528 (proposed Site UC-1A) is located inside a small (~40 m diameter at the top; ~25 m diameter at the bottom) pit crater at the summit of the Upper Cone of Brothers volcano at a water depth of 1228 m. The primary objective at this site was to drill into the upflow zone of a Type II hydrothermal system strongly influenced by magmatic degassing. In this area, relatively gas-rich, very acidic fluids are being discharged, resulting in advanced argillic alteration. Site U1528 was designed to address important Expedition 376 objectives related to the role of magmatically influenced hydrothermal fluids in transporting metals to the seafloor and to provide a comparison of fluid-rock reactions with the seawater-dominated Type I hydrothermal system drilled at Sites U1527 and U1530.
Operations
We implemented operations in four holes at Site U1528. Hole U1528A is located at 34°52.9177ʹS, 179°4.1070ʹE at a water depth of 1228.4 m. In Hole U1528A, we used the rotary core barrel (RCB) system to core from the seafloor to 84.4 meters below seafloor (mbsf) with a recovery of 17.1 m (20%). The downhole conditions encountered in Hole U1528A dictated the need for deploying a reentry system to achieve our objectives. Hole U1528B is located 10 m south of Hole U1528A at 34°52.9222ʹS, 179°4.1077ʹE at a water depth of 1229.4 m. We drilled-in 10¾ inch (~27.3 cm) casing to 24.3 mbsf, and the drilling assembly penetrated to 25.6 mbsf. We had trouble extracting our drilling assembly from the reentry system, which ultimately took several hours. Because of drilling-induced suspension of sediment in the surrounding seawater, visibility was limited and we could only see the top of the reentry funnel. The funnel of the reentry system was observed at a water depth of 1224.8 m, which was consistent with it being properly set on the seafloor. After two separate, unsuccessful attempts at reentering Hole U1528B with both the RCB coring system and the turbine-driven coring system (TDCS), we suspended our operational efforts in Hole U1528B. Further visual observations showed a slight angle of the reentry system that prevented the drill string from passing through the throat of the reentry funnel.
Our next objective was to perform the first offshore test of the TDCS. In Hole U1528C, which is located at 34°52.9215ʹS, 179°4.1128ʹE at a water depth of 1229.1 m, we drilled using the TDCS without coring to 22 mbsf and then cored to 53.5 mbsf with a recovery of 3.6 m (12%). Further advancement was prevented by a broken core barrel that remained in the TDCS bottom-hole assembly (BHA). This equipment failure forced us to abandon operations in Hole U1528C. Next we installed casing in Hole U1528D, which is situated at 34°52.9219ʹS, 179°4.1164ʹE in the very limited, flat central area of the pit crater at a water depth of 1228.1 m. We drilled-in 13⅜ inch (~34.0 cm) casing to 59.4 mbsf, and the drilling assembly penetrated to 61.3 mbsf. We then RCB cored to 359.3 mbsf and recovered 87.2 m (29%) under good hole conditions. After the bit had reached 40 h of rotation time, whereupon it would normally be changed before continuing to core, we decided to take borehole temperature measurements and obtain fluid samples in the open hole through the existing bit. The Elevated Borehole Temperature Sensor (ETBS) tool was deployed, and it recorded a maximum temperature of 37.6°C at the bottom of the hole. The subsequent deployment of the 1000 mL Kuster Flow Through Sampler (FTS) tool ended with its failure under compression in the open hole. After losing the 1000 mL Kuster FTS tool, we made an unsuccessful attempt to recover it with a fishing tool BHA equipped with boot-type junk baskets. Reentry of Hole U1528D was complicated by a dark-colored plume emanating from the reentry funnel. Next we deployed a logging BHA so that we could obtain downhole wireline log data and make another attempt to collect borehole fluids (BFs). We deployed our backup 600 mL Kuster FTS tool on the core line and successfully recovered a fluid sample from 279 mbsf. A subsequent ETBS downhole temperature measurement at the same depth recorded a maximum temperature of 212°C. This temperature allowed deployment of the flasked wireline High-Temperature Triple Combo (HTTC) logging tool string (natural gamma ray, litho-density, and temperature tools). We successfully performed two upward logging passes from 323 mbsf. Another deployment of the 600 mL Kuster FTS tool that recovered a second BF sample from 313 mbsf was followed by another deployment of the ETBS that recorded a maximum temperature of 165°C. We drilled down with a tricone bit BHA to clean out the hole to 356 mbsf, the depth of the top of the lost 1000 mL Kuster FTS tool.
The operation that followed was deployment of a concave mill bit along with two boot-type junk baskets to attempt to remove any remaining parts of the lost 1000 mL Kuster FTS tool. After reentering Hole U1528D, despite very poor visibility around the reentry funnel, we advanced the mill bit to the bottom of the hole at 359.3 mbsf. However, the drill string and junk baskets did not recover any evidence of the 1000 mL Kuster FTS tool in the boot baskets. The next fishing attempt involved the reverse-circulation junk basket (RCJB), which was assembled in conjunction with the boot-type junk baskets. With the next reentry of Hole U1528D, we worked the RCJB BHA back to the bottom of the hole (359.3 mbsf), where we circulated 25 bbl (~4.0 m3) of high-viscosity mud for ~15 min while working the RCJB up and down. We then pulled the drill string out of the hole. When the end of the drill string cleared the rig floor, we discovered that the lowermost 172.8 m of the drill string was missing, which essentially ended Hole U1528D operations. The drill string failed in a piece of 5 inch (12.7 cm) pipe above the BHA. The recovered broken piece showed significant damage directly attributable to the corrosive downhole environment. After completion of Site U1531 coring operations, we returned one more time to Hole U1528D. We conducted a series of alternating downhole temperature measurements using both the ETBS and the Petrospec spool-in thermocouple memory tool (TCMT), and deployed the 600 mL Kuster FTS twice, one of which recovered a BF sample from 160 mbsf. Two temperature measurement runs were successful and recorded maximum values of 198°C (ETBS) and 156°C (Petrospec TCMT) at 160 mbsf. Site U1528 operations were concluded with the successful recovery of the failed Hole U1528B reentry system at the end of Expedition 376. In total, the 568.9 h, or 23.7 days, spent at Site U1528 included eight successful reentries.
Principal results
Igneous petrology and volcanology
Rocks cored at Site U1528 are divided into three igneous units. Igneous Unit 1, recovered in Holes U1528A (0–6.03 mbsf) and U1528C (26.50–31.41 mbsf), consists of polymict lapilli tephra made up of subangular to subrounded volcanic clasts that have experienced varying degrees of alteration. Igneous Unit 2, recovered in Holes U1528A (16.30–83.57 mbsf), U1528C (35.50–46.00 mbsf), and U1528D (61.30–269.30 mbsf), is divided into three subunits based on internal rock fabric and the presence of primary minerals. Igneous Subunits 2a and 2c are composed of sequences of altered lapillistone and lapilli-tuff with subordinate intervals of altered tuff and tuff-breccia. Clasts are volcanic in origin and altered to differing degrees; the matrix consists of secondary mineral assemblages. Identification of original lithologies becomes increasingly difficult with depth (especially in Subunit 2c). More coherent, massive dacite lava affected by a lesser degree of alteration occurs between 152.90 and 160.17 mbsf and makes up Subunit 2b. Igneous Unit 3, recovered exclusively in Hole U1528D (162.50–269.03 mbsf), consists of altered dacite lava with some relatively unaltered intervals.
The dacitic pyroclastic rocks and lava at Site U1528 are pervasively altered but still show distinct similarities in petrography and whole-rock geochemistry to unaltered volcanic material encountered in Igneous Unit 1 at Sites U1527, U1529, and U1531 and to published descriptions and geochemical results for unaltered dacite recovered elsewhere at Brothers volcano. Even though intervals with (partially) unaltered phenocrysts are rare, primary igneous textures such as vesicles and the crystal shapes of plagioclase and (rarely) pyroxene phenocrysts and microlites—now infilled and replaced by secondary minerals—can be recognized in most samples. Petrography and the abundance of elements that are less affected by alteration suggest that the Site U1528 protolith was dacitic tephra and lava similar to that previously encountered at Brothers volcano.
Alteration
Four distinct alteration types were observed in core material recovered from Site U1528. Alteration Type I (0–35.76 mbsf) occurs in unconsolidated gravels and is classified as slightly altered. The dominant alteration mineral assemblage consists of smectite with minor pyrite, natroalunite, pyrophyllite, and native sulfur. Two distinct volcanic clast colors were observed, and dark gray clasts contain more smectite than light gray clasts. Native sulfur occurs in two different grain morphologies: crystalline-tabular (orthorhombic) and globular.
Alteration Type II occurs in several intervals throughout Site U1528 (e.g., 148.1–150.5 mbsf) and is characterized by an alteration mineral assemblage of illite, smectite, quartz, pyrite, and anhydrite. Alteration Type II is classified as highly altered, is typically blue-gray in color and brecciated, and exhibits a relict perlitic texture. Plagioclase phenocrysts are variably pseudomorphed by natroalunite and anhydrite, whereas pyroxene is pseudomorphed by anhydrite, smectite, and pyrite. The latter is abundant (average = 1–5 vol%) and occurs not only in pyroxene pseudomorphs but also as subhedral to euhedral disseminated grains and in discrete veins associated with anhydrite. Primary titanomagnetite is rimmed and shows progressive replacement by pyrite that exhibits a skeletal texture and contains abundant anhydrite inclusions.
Alteration Type III is intercalated with Alteration Type II (e.g., 239.3–268.1 mbsf), and the boundary between these alteration types can be variable, ranging from gradational through sharp. Alteration Type III is represented by pervasively altered volcaniclastic rocks that are white-gray in color and classified as highly to intensely altered. A mineral assemblage of natroalunite, pyrophyllite, and rutile with lesser quartz, smectite, pyrite, and anhydrite characterizes Alteration Type III. Natroalunite, pyrophyllite, and silica are more abundant in the matrix, whereas smectite is enriched in clast material. Plagioclase and pyroxene are completely pseudomorphed by natroalunite, anhydrite, and pyrite. Late-stage anhydrite-pyrite veins commonly cut pseudomorphed plagioclase crystals. Titanomagnetite is almost completely replaced with leucoxene and pyrite. Vugs are infilled with anhydrite and minor pyrite, native sulfur, natroalunite, and silica. In addition, fine-grained pyrite occurs finely disseminated throughout matrix and clasts.
Alteration Type IV forms discrete to diffuse white veins that cut and postdate Alteration Types II and III. Alteration Type IV is first observed at 77.2 mbsf and occurs to the cored bottom of Hole U1528D at 355.1 mbsf. It is characterized by an alteration assemblage of natroalunite, anhydrite, rutile, quartz, native sulfur, and pyrophyllite. Mineralogically, Alteration Type IV is distinguished from Alteration Types II and III by higher abundances of native sulfur, quartz, and rutile. Alteration Type IV occurs as discrete white veins and distinct alteration halos that are typically <1 cm but occasionally as wide as 4 cm. They commonly exhibit a vuggy texture and overprint previous alteration, and they often preserve earlier alteration textures. Pyrite is generally absent or oxidized to Fe oxyhydroxides in the halos, and native sulfur is the major mineral phase infilling vugs.
Fluid inclusions (FIs) in the most recent vug and vein crystals of anhydrite, quartz, natroalunite, and gypsum indicate that the hydrothermal system at Site U1528 is highly dynamic. Two dominant fluid types variably affect water-rock interaction. The first is buoyant, hot (220–360°C), S-rich, and acidic hypersaline brine (NaCl >10 wt%), and the second is modified seawater. A massive influx of seawater (NaCl = 3.5 wt%) locally overwhelms the hypersaline brine along fractures or pervasively diffuses into the hot formation, which allows it to be heated to 55°–360°C. FIs with salinities both higher and lower than seawater compositions and inclusions with hypersaline brines that plot on the NaCl saturation curve are attributed to depressurization in the formation caused by sudden fracturing events that result in phase separation. Phase separation results in a more saline, higher density aqueous solution for both hypersaline brine and seawater as well as a low-density vapor phase that condenses through cooling to a low-salinity aqueous solution.
Structural geology
Site U1528 has several structures across all three holes cored (U1528A, U1528C, and U1528D) including volcanic fabrics, alteration veins, and fractures. Volcanic fabrics are best observed in Holes U1528A and U1528D and are defined by vesicles and plagioclase microlites (primary and altered) and, to a lesser extent, phenocrysts. Volcanic fabrics have two forms: those in volcanic clasts and those in coherent lava. Volcanic fabrics in clasts can be weak to strong, but each clast has a distinct fabric orientation. Fabrics were typically only measured in lava, have a similar orientation, and tend to dip more than 45°. Peaks in volcanic fabric intensity were observed in Igneous Subunit 2b and Igneous Unit 3 in Hole U1528D.
Alteration veins occur throughout Holes U1528A and U1528D and across all igneous units and alteration types. Veins are most commonly filled by anhydrite, pyrite, silica, and native sulfur. Veins are typically uniform but can be vuggy, and some have halos. The presence of halos is the basis for Alteration Type IV. Acmes in vein density were found between 100 and 190 mbsf, which is coincident with an acme in native sulfur, vuggy veins, and a deviation in borehole temperature. Vein dip is variable, ranges from horizontal to vertical, and averages ~60° in both holes. The distribution of dips downhole is variable; a few zones have a large range in dip (e.g., 0°–90°), and other zones only have dips >45°. Vein thickness ranges from 0.05 to 1 cm and averages ~0.2 cm. It is variable downhole but tends to increase in intervals with a large range of vein dip, and thicker veins tend to have steeper dips.
Fractures were observed in all three holes, but their abundance is limited. Fractures in Hole U1528C are irregular and lined with native sulfur. Native sulfur is more abundant where fractures are irregular. In Hole U1528D, fractures are typically clustered in the uppermost 175 m of the hole and have steeper dips (i.e., >60°). Fracture density has three acmes, and the one at ~270 mbsf coincides with a deviation in borehole temperature and a large range in vein dip.
Geochemistry
Geochemical analysis of 75 powders from Hole U1528D was performed via inductively coupled plasma–atomic emission spectroscopy (ICP-AES) for major, minor, and trace elements and elemental analysis for total carbon (TC), total nitrogen (TN), and total sulfur. Results of these analyses were used to define major geochemical changes during hydrothermal fluid-seawater-rock interactions in Hole U1528D.
Variable extents of depletion in alkalis (K, Na), Mg, Fe, and Mn and strong enrichment in total sulfur (as much as 15 wt%) occur throughout the hole. In Igneous Unit 1, Zr/Ti values range from 30.0 to 31.3 mg/g and are indistinguishable from average Zr/Ti values for Unit 1 in Hole U1527A and at Site U1529 (i.e., 30.5 ± 2.3 mg/g). This similarity suggests that the upper lava and tephra units recovered at Sites U1527–U1529 may derive from similar parental magmas. Considering that Y is mobile under hydrothermal conditions relative to Zr, the Y/Zr value of altered volcaniclastics is used as a tracer for the extent of alteration. Two main intervals are characterized by lower Y/Zr values (i.e., relative to unaltered dacite from Brothers volcano): (1) 46–95.5 mbsf in Igneous Subunit 2a, which is dominated by Alteration Type III, and (2) 240–325 mbsf in Igneous Subunit 2c and Igneous Unit 3 and associated alternating Alteration Types II and III.
Based on average compositions of discrete intervals throughout the entire ~360 m section cored, we estimate >75% of both Mn and Mg have been lost at this site because of hydrothermal alteration. Other significantly depleted elements include Na and K (>50% loss of each element) and Ca and P (>30% loss of each element). Total sulfur concentrations vary between 2.1 and 15.1 wt% because of the formation of S-dominated secondary minerals (e.g., natroalunite, native sulfur, pyrite, and anhydrite), and anhydrite represents a significant component of the total sulfur inventory (about 22% on average), based on water-soluble elemental analysis by ICP-AES.
Iron appears to be strongly depleted in late-stage Alteration Type IV, suggesting that pH, fO2, and fS2 conditions changed substantially from Alteration Types II and III, leading to extensive loss of Fe in possibly SO4-rich but H2S-poor hydrothermal fluids. Similar to Site U1527, organic carbon comprises the bulk of measured TC contents but remains very low, yielding an average of about 250 μg/g at Site U1528.
One sample of interstitial water (IW) (376-U1528C-7N-1, 140–150 cm) recovered from 45.9 mbsf gave a low pH value of 4.1, consistent with the presence of acidic magmatic fluids. Nearby equimolar enrichments in Ca and SO4 suggest that the dissolution of anhydrite at low temperatures may be occurring in the pore waters.
Three BF samples were collected from Hole U1528D using the 600 mL Kuster FTS tool at ~279 and 313 mbsf and then 23 days later at 160 mbsf. Estimated temperatures of 212° and >236°C for the first two samples and 140°C for the later sample were determined by downhole logging. The fluids have nearly identical Na, Cl, Br, and Mg concentrations, which are all lower than seawater. Highly elevated ΣSO4 and very acidic pH values (as low as 1.8) are characteristic of acid sulfate fluids. The fluids are also highly gas rich. Results indicate that the low-salinity BFs are not derived from phase separation of circulating seawater, but rather they acquired their geochemical signatures through the direct input of magmatic fluids to unaltered seawater at temperatures of at least 350°C. During fluid origin and upflow, Mg and K are removed from rock and added to fluids during fluid-rock reaction, which is balanced by a net removal of ΣSO4, Ca, and Sr from the fluids into secondary minerals, primarily as natroalunite and/or anhydrite.
Gas pore space components, including H2, CO2, and acid volatile sulfur, are elevated over ambient atmospheric levels. These gas anomalies may originate from subseafloor hydrothermal fluid input of volatile-rich fluids that share similar chemical properties with the seafloor hydrothermal fluids discharging at the Upper and Lower Cone sites.
Paleomagnetism
At Site U1528, the natural remanent magnetization (NRM) of 83 archive halves was measured and alternating field (AF) demagnetization experiments were conducted using the cryogenic magnetometer. The sections show generally low NRM intensities where the largest pieces have primary magnetization components after AF steps of 20 mT, and negative inclinations suggest normal polarities. AF and thermal demagnetization (TD) experiments on 82 discrete samples from Igneous Units 2 and 3 were also carried out. The drilling-induced overprint was generally removed after 20 mT AF demagnetization on discrete samples, in most cases leaving a stable primary magnetization. The two igneous units have very low NRM intensities, in agreement with the observations from the cryogenic magnetometer. However, both units show a consistent direction of magnetization with an average inclination compatible with the inclination of a geomagnetic axial dipole (GAD) of −55° at the present-day latitude of Brothers volcano. This coherence in results from both units suggests a young age for these rocks, almost certainly during the current normal polarity Brunhes geomagnetic epoch. TD experiments from these units show a complex pattern, suggesting irreversible transformation of magnetic minerals during heating to >400°C; this transformation is confirmed by changes in the magnetic susceptibilities measured before and after heating. In addition, isothermal remanent magnetization (IRM) experiments suggest that these rocks contain minerals with large magnetic coercivities such as titanohematite in addition to titanomagnetite.
Physical properties
Physical property measurements for Igneous Unit 1 (Alteration Type I) are consistent with the ranges expected for fresh unconsolidated dacitic volcaniclastics. In Units 2 and 3, more complex variations in physical properties associated with igneous unit and/or alteration type were observed. For example, magnetic susceptibility (MS) values are generally higher in intervals of Alteration Type II than in those of Alteration Type III, which may be explained by the observed partial replacement of titanomagnetite by rutile and pyrite in the relatively more altered Alteration Type III rocks. Downhole measurements also indicate an association between Alteration Type II and increases in natural gamma ray attributed to 40K; however, this association could not be confirmed by NGR measurements in the laboratory because of the fragmented core material that was recovered. The relatively high 40K natural gamma radiation (NGR) signal identified in a core from an Alteration Type II interval (Section 376-U1528D-48R-1) is consistent with this observation.
The boundary between Igneous Units 2 and 3 is clearly defined by changes in grain density, bulk density, porosity, P-wave velocity, and thermal conductivity as well as by an increase in MS associated with the concurrent transition from Alteration Type III to Alteration Type II. These changes likely reflect the change in primary igneous lithology from volcaniclastics to massive lava. In contrast, subunit boundaries in Unit 2 are less clearly defined by variations in physical properties. An interval of relatively lower bulk density and P-wave velocity and higher porosity was observed between ~145 and ~220 mbsf, but it is not associated with defined igneous subunit or alteration type boundaries. Instead, this interval corresponds to the depth at which H2S odor was present during core splitting, and its boundaries correspond to a borehole temperature anomaly and increased fracture densities, vein thicknesses, and range of vein dip. Hence, in this depth interval, physical properties may identify a zone related to the current hydrothermal system that cuts across identified igneous units and alteration types.
Downhole measurements
A series of downhole measurements was conducted and BF samples were collected at the end of Hole U1528D coring operations. Three runs of the ETBS memory tool were completed in Hole U1528D. The first deployment, made prior to logging to help determine which logging tools could be used, measured an average temperature of 33°C at the bottom of the hole. After we collected BF samples using the 600 mL Kuster FTS tool at 279 and 313 mbsf, two other temperature measurements were made. The temperatures of the fluids sampled at 279 and 313 mbsf are estimated to be 212°C and >236°C, respectively.
A high-temperature flasked wireline logging string consisting of litho-density, natural gamma ray, and logging head temperature tools was run to 332 mbsf in Hole U1528D. Variations in total natural gamma ray are mostly related to peaks in potassium, generally correlated with Alteration Type II, which is rich in illite. Overall, the downhole density log correlates well with the bulk density measured on the core samples and shows trends that are generally correlated with the igneous units: (1) from 65 to 145 mbsf (Subunit 2a), density gradually decreases downhole; (2) from 145 to 250 mbsf, a sharp decrease in density (140–155 mbsf; Subunit 2b) is followed by a gradual increase with depth (Subunit 2c); and (3) from 250 to 330 mbsf, density is highly variable (Unit 3).
The three temperature profiles acquired during wireline logging suggest a convective temperature regime with small temperature increases at ~100 and 150 mbsf and larger increases at ~275 and 295 mbsf. A temperature reversal (i.e., a decrease in temperature with depth) was observed at ~250–260 mbsf. Over the 2.5 h of logging, the temperature increased by about 8°C in the isothermal zones and by 24.5°C at 270–310 mbsf, reaching 247°C. These increases suggest that the downhole temperatures had not yet reached equilibrium. The temperature anomalies at ~150 and ~295 mbsf are accompanied by increases in borehole diameter, peaks in potassium, the first instance of sulfur odor emanating from the cores, native sulfur observed in veins, high fracture density with varied fracture dips, crosscutting fractures, and increased vein density. These zones are interpreted to be structurally controlled permeable intervals.
Twenty-three days after the first set of measurements, the ETBS recorded a stable temperature of 198°C at 185 mbsf. A strong temperature increase (3°C/m) centered at 157.5 mbsf confirms the presence of a permeable zone at ~150 mbsf. A fluid sample with an estimated temperature of 140°C, based on the prior ETBS temperature run, was collected at 160 mbsf. The last temperature measurement, conducted with the Petrospec TCMT sensors, indicated a temperature of 156°C at 168 mbsf. Temperature strips suggest that the Petrospec TCMT measurements overestimated the fluid temperature by ~15°C, albeit in conditions which largely exceeded the operation capabilities of the data loggers.
Microbiology
For microbiological analysis, 3 (from Hole U1528A), 1 (from Hole U1528C), and 13 (from Hole U1528D) whole-round samples (3–16 cm long) were collected. The sampled lithologies represent the various igneous units recovered. Samples were processed for shore-based DNA and RNA analyses and cell and viral counting as well as viral and microbial activity measurements. All samples were analyzed on board for adenosine triphosphate (ATP) concentration, and two samples had positive values. The other samples contained compounds that inhibited the enzyme luciferase used for the ATP test. Nutrient addition bioassays with inorganic nitrogen and phosphorus or organic carbon were initiated to determine the nutritional constraints on biomass in this environment. Perfluoromethyl decaline (PFMD) was used for contamination testing. It was usually detected on the outside of uncleaned cores, and on rare occasions it was above detection levels on the cleaned outside of cores. However, it was usually below detection on the inside of cores, indicating that penetration of drilling fluid to the interior of whole-round drill cores (where we collected samples) is unlikely.
Background and objectives
Site U1528 is located inside a small (~40 m diameter at the top; ~25 m diameter at the bottom) (Figure F1) pit crater at the summit of the Upper Cone of Brothers volcano at 34°52.9177′S, 179°04.1070′E at a water depth of 1232 m (Figure F2). The primary objective at this site was to drill into the upflow zone of a Type II hydrothermal system (i.e., one strongly influenced by magmatic degassing) (de Ronde et al., 2011). In this area, relatively gas-rich, very acidic fluids are being discharged, resulting in advanced argillic alteration. No hydrothermal venting was observed in the pit crater during submersible expeditions by the R/V Shinkai 6500 in 2004 or the deep-submergence vehicle Pisces V in 2005, although both surveys noted some venting on the flank of the cone near its summit. In early 2017, the ROV Quest 4000 (R/V Sonne, Leg SO-253) reaffirmed the absence of venting in the pit crater but discovered a vigorous, active hydrothermal field ~75 m northeast of the crater perched on a small plateau. This site was revisited in early 2018 by the ROV Jason (R/V Thompson, Expedition TN350). Tremor data recovered from hydrophones deployed on the caldera floor at Brothers volcano indicate a two-phase zone beneath the general cone area ~800 m below the cone summit (Dziak et al., 2008).
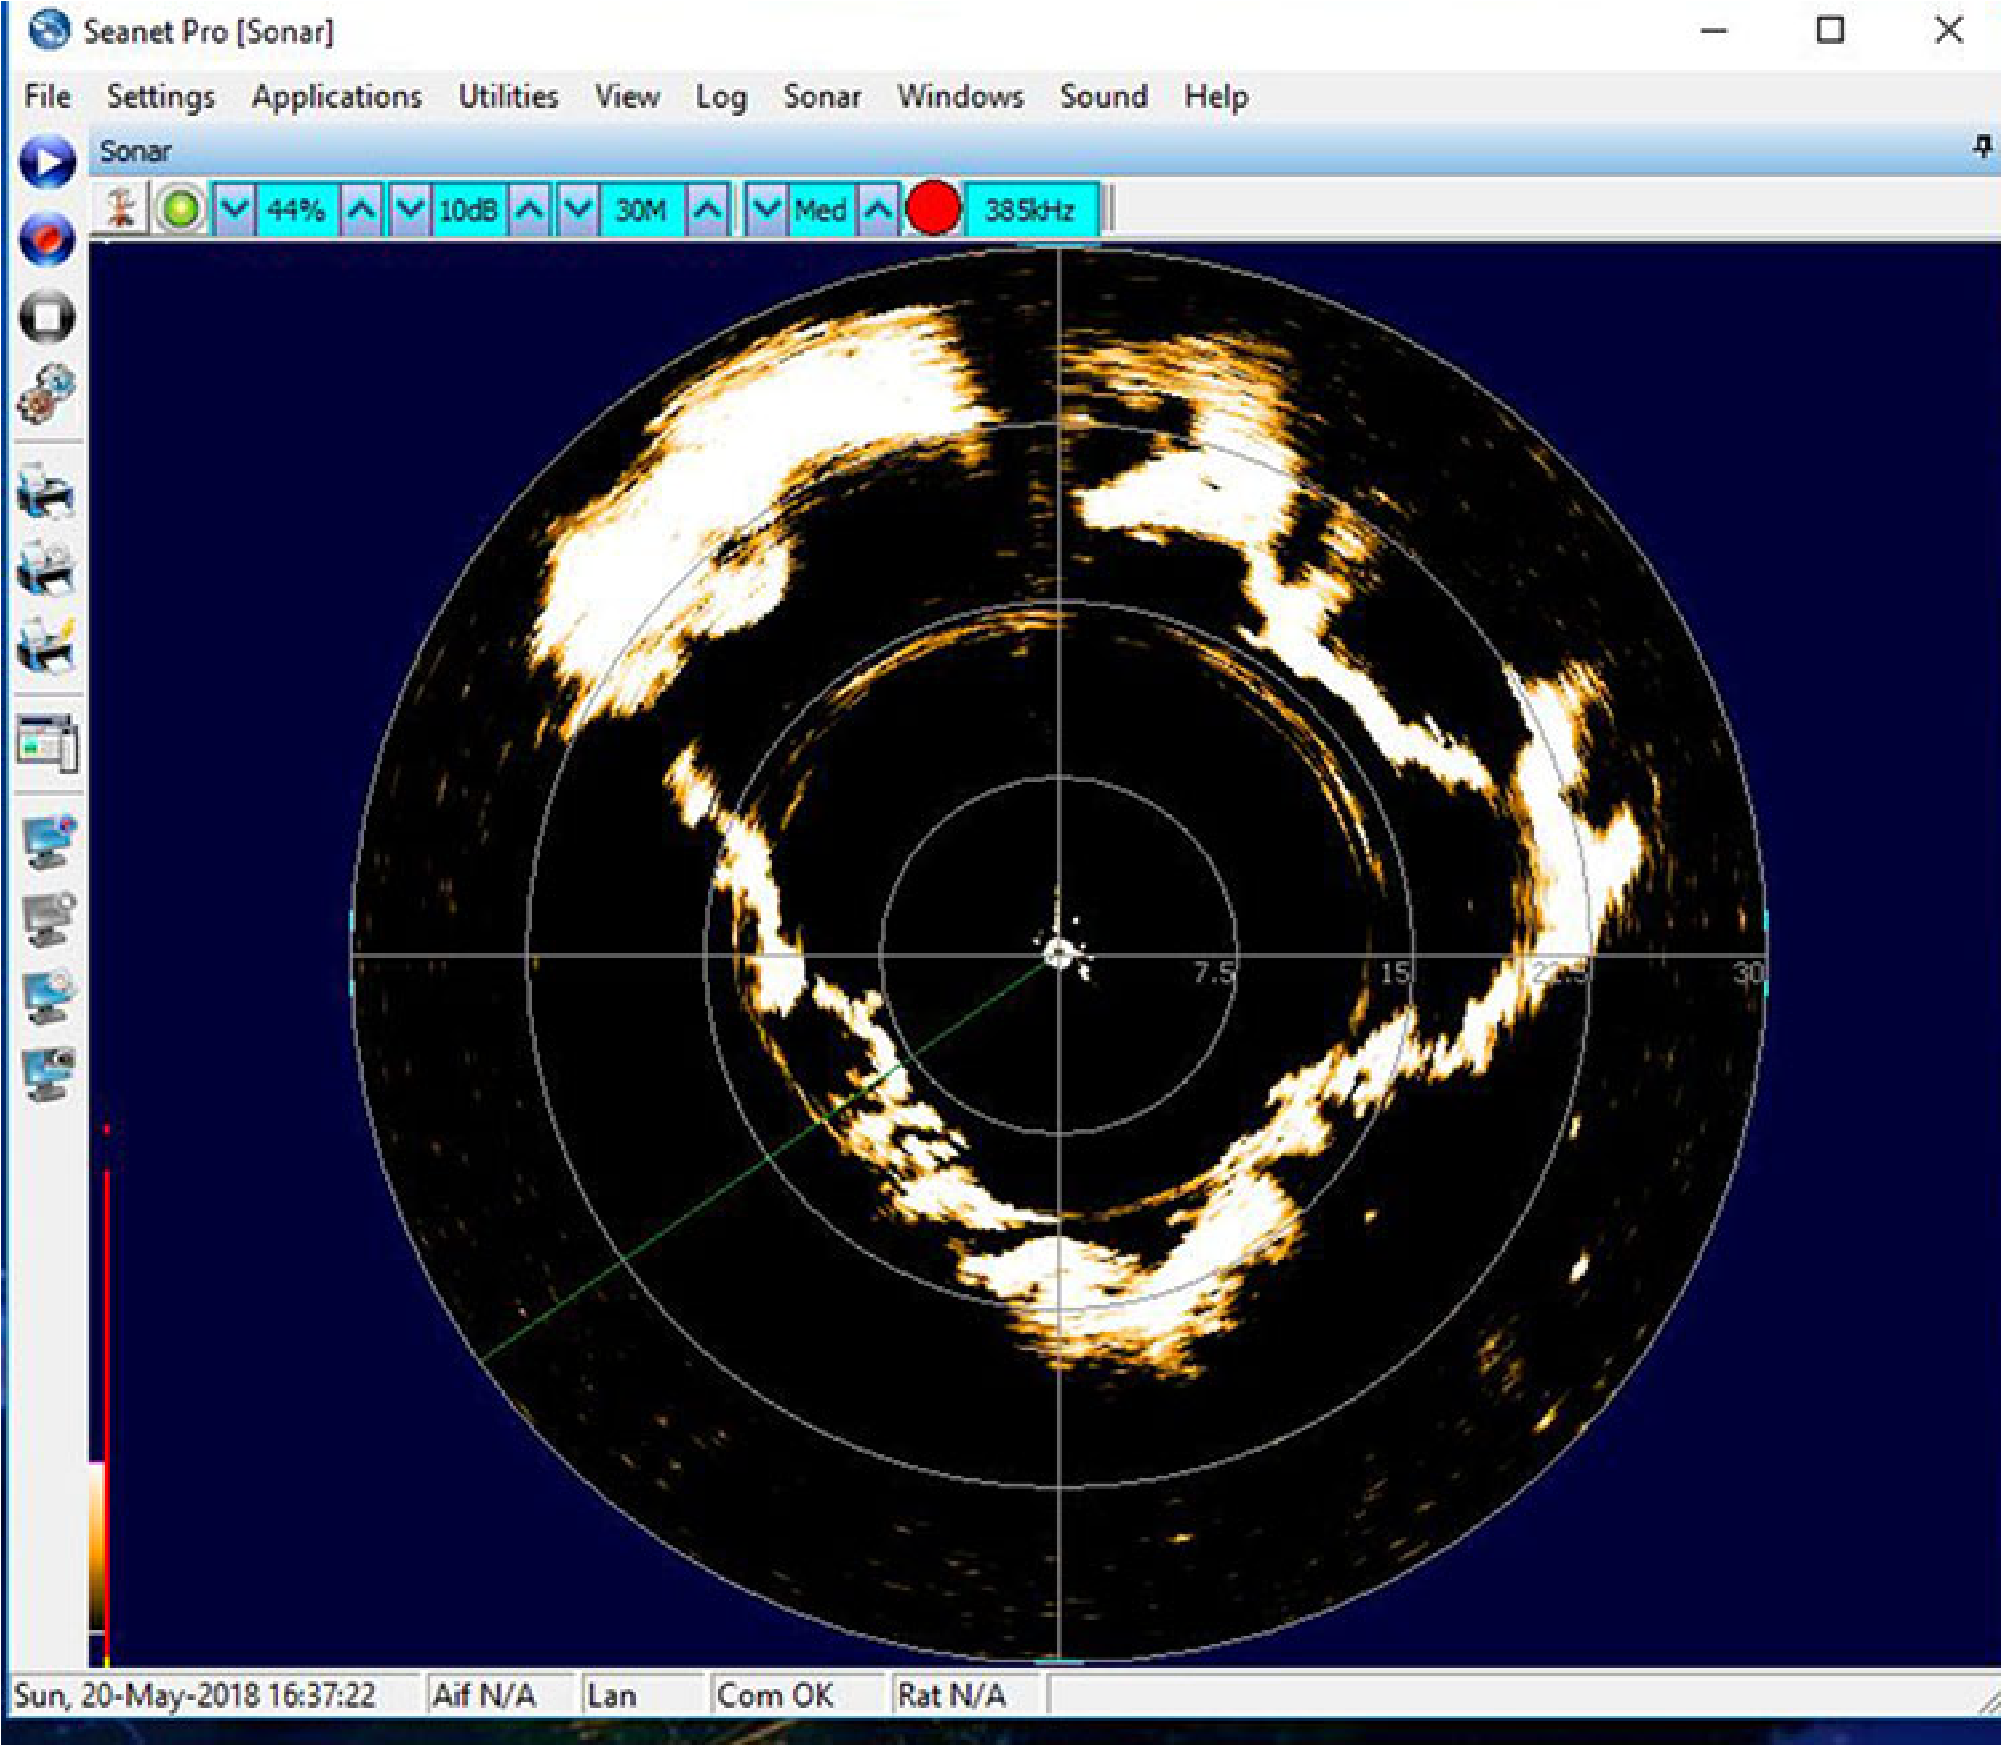
Figure F1. Pit crater atop Brothers Cone.
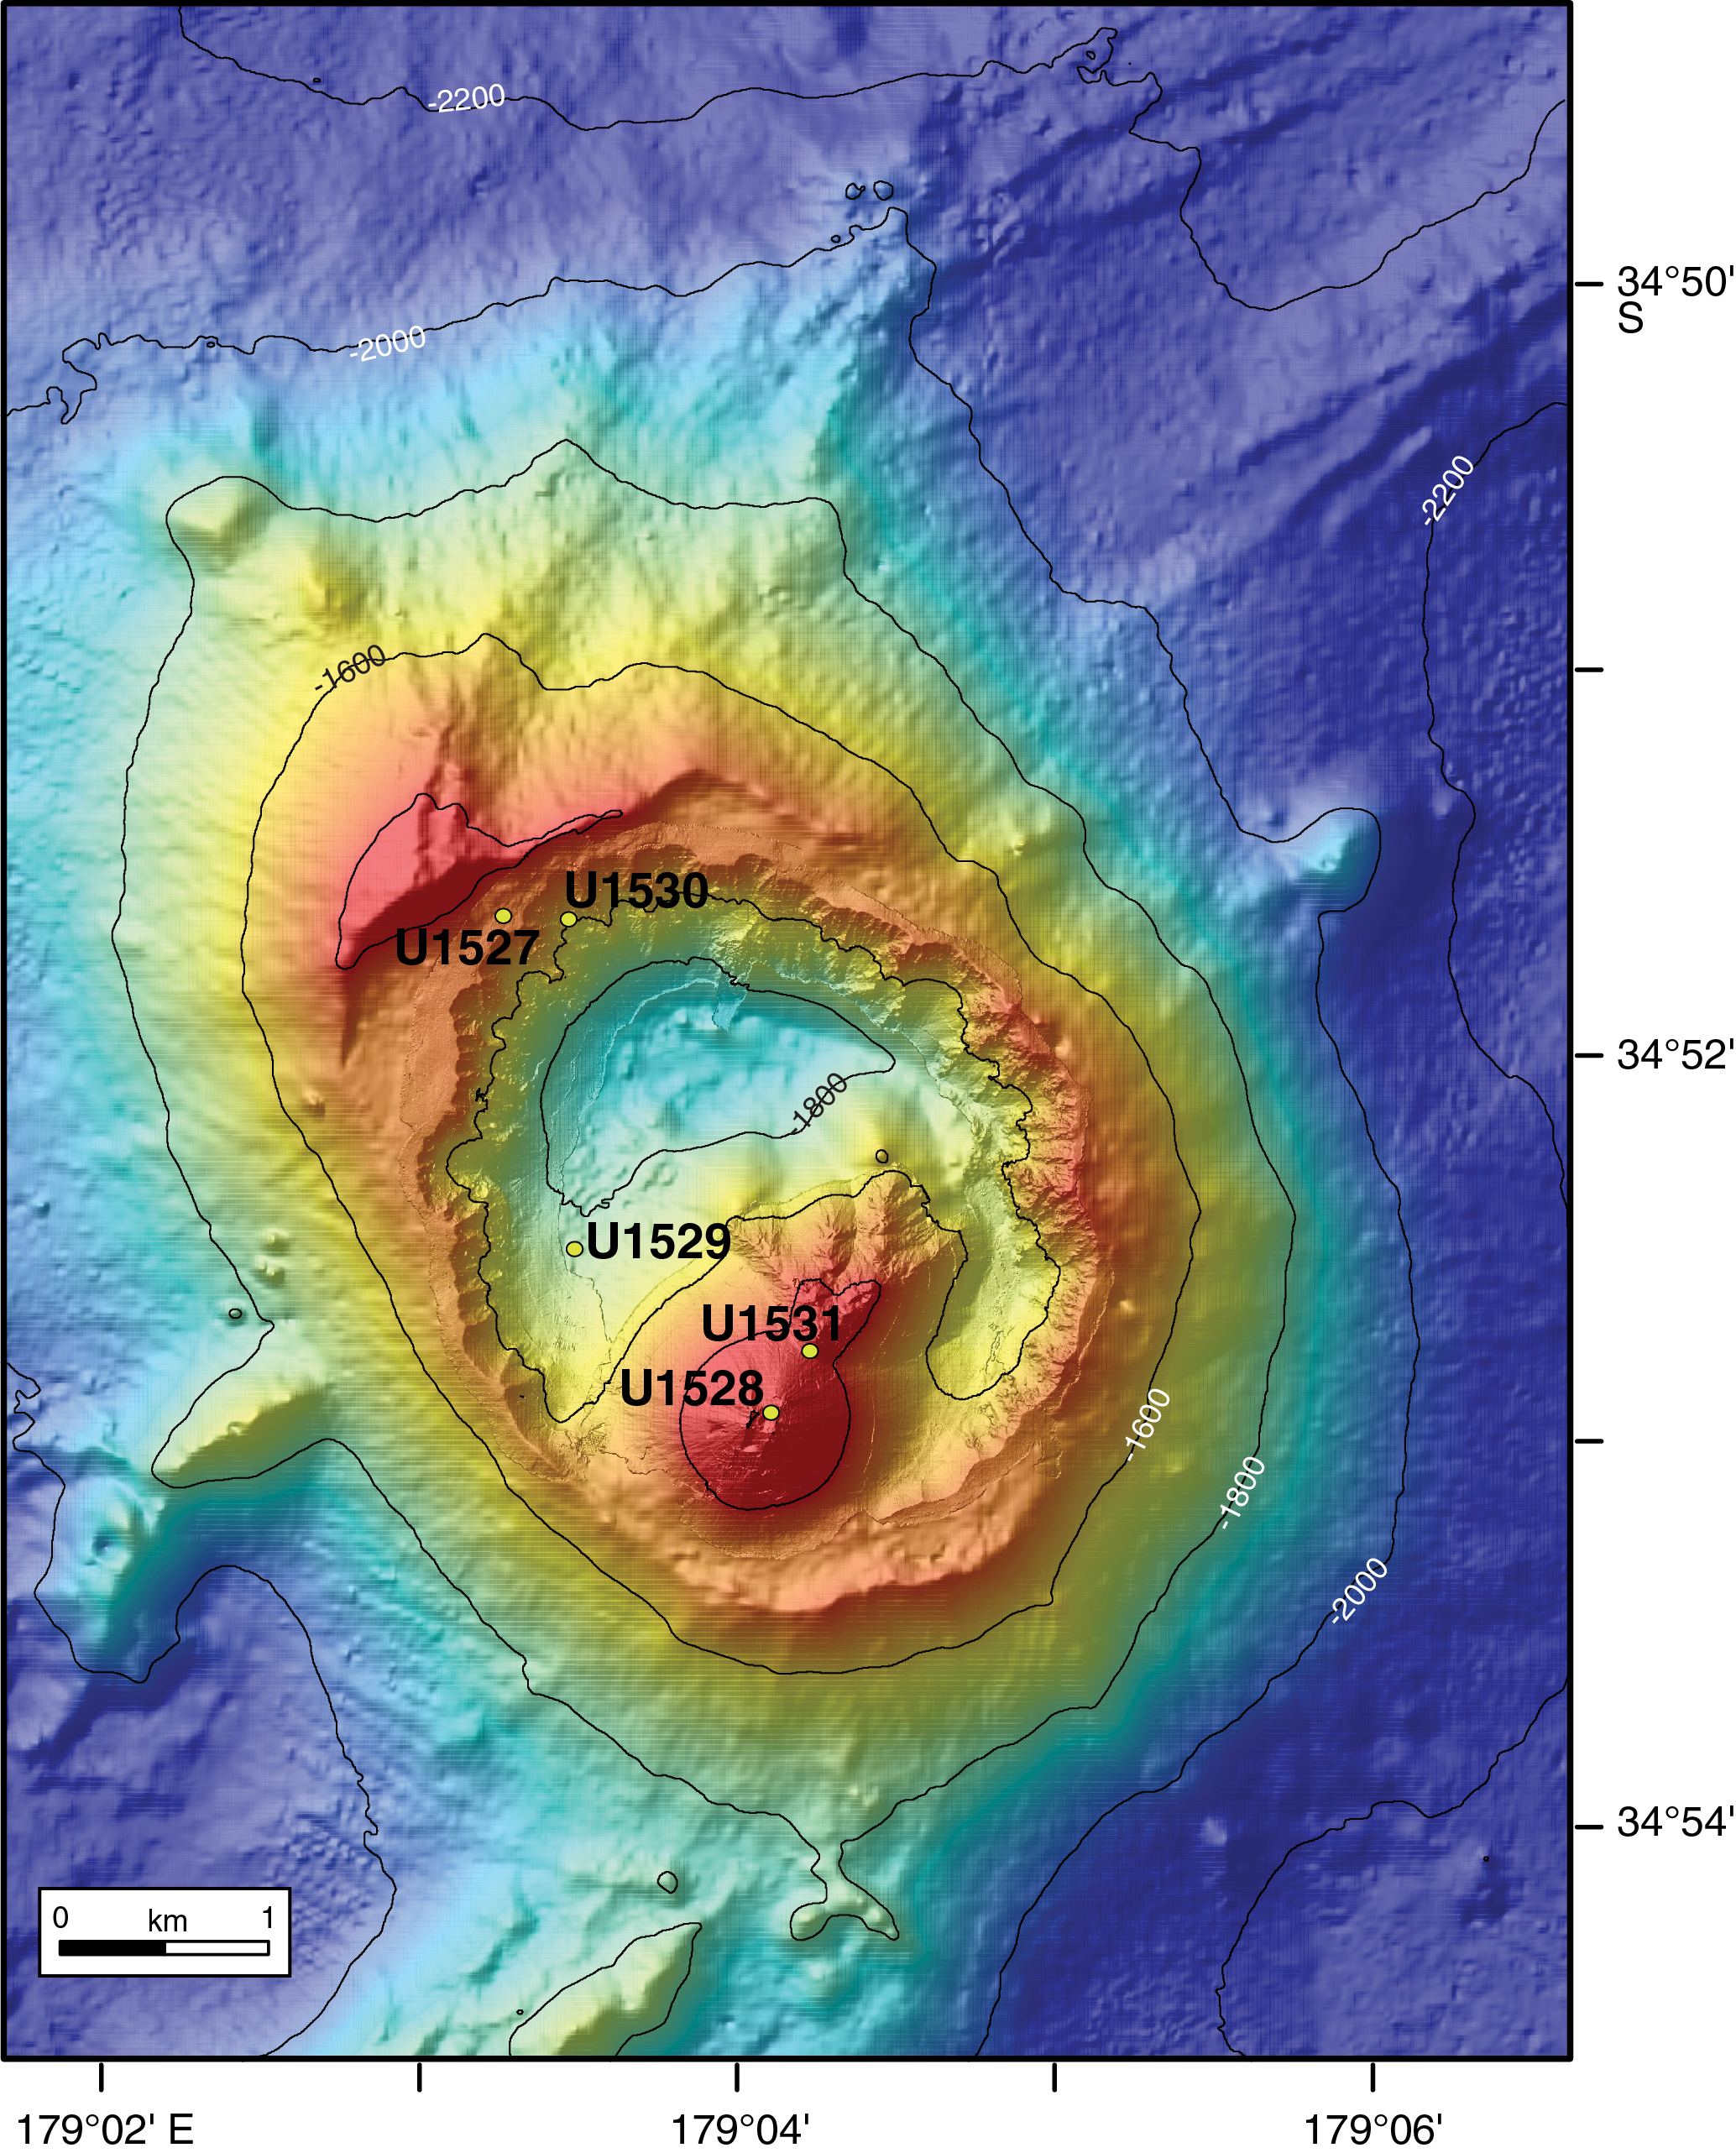
Figure F2. Site locations.
The plan for drilling, coring, and logging at Site U1528 was to penetrate ~800 m below the crater floor into the inferred zones of magmatic fluid flow and hopefully intersect the two-phase zone for fluid sampling (Figure F3). Furthermore, the site was positioned to intersect the boundaries of at least three prominent stratigraphic units indicated by seismic data, thereby ensuring coring of several volcanic cycles of Upper Cone growth. Two main types of lithology were anticipated: dacitic lava and volcaniclastic material, both affected to varying degrees by advanced argillic alteration. The one core drilled by Neptune Minerals, Inc. inside the pit crater atop the Upper Cone intersected volcaniclastics, gravels, and rocks, together with native sulfur, to 10 mbsf. Site U1528 had the highest potential for Expedition 376 to successfully penetrate and sample deep rocks from the magmatically influenced hydrothermal system of Brothers volcano.
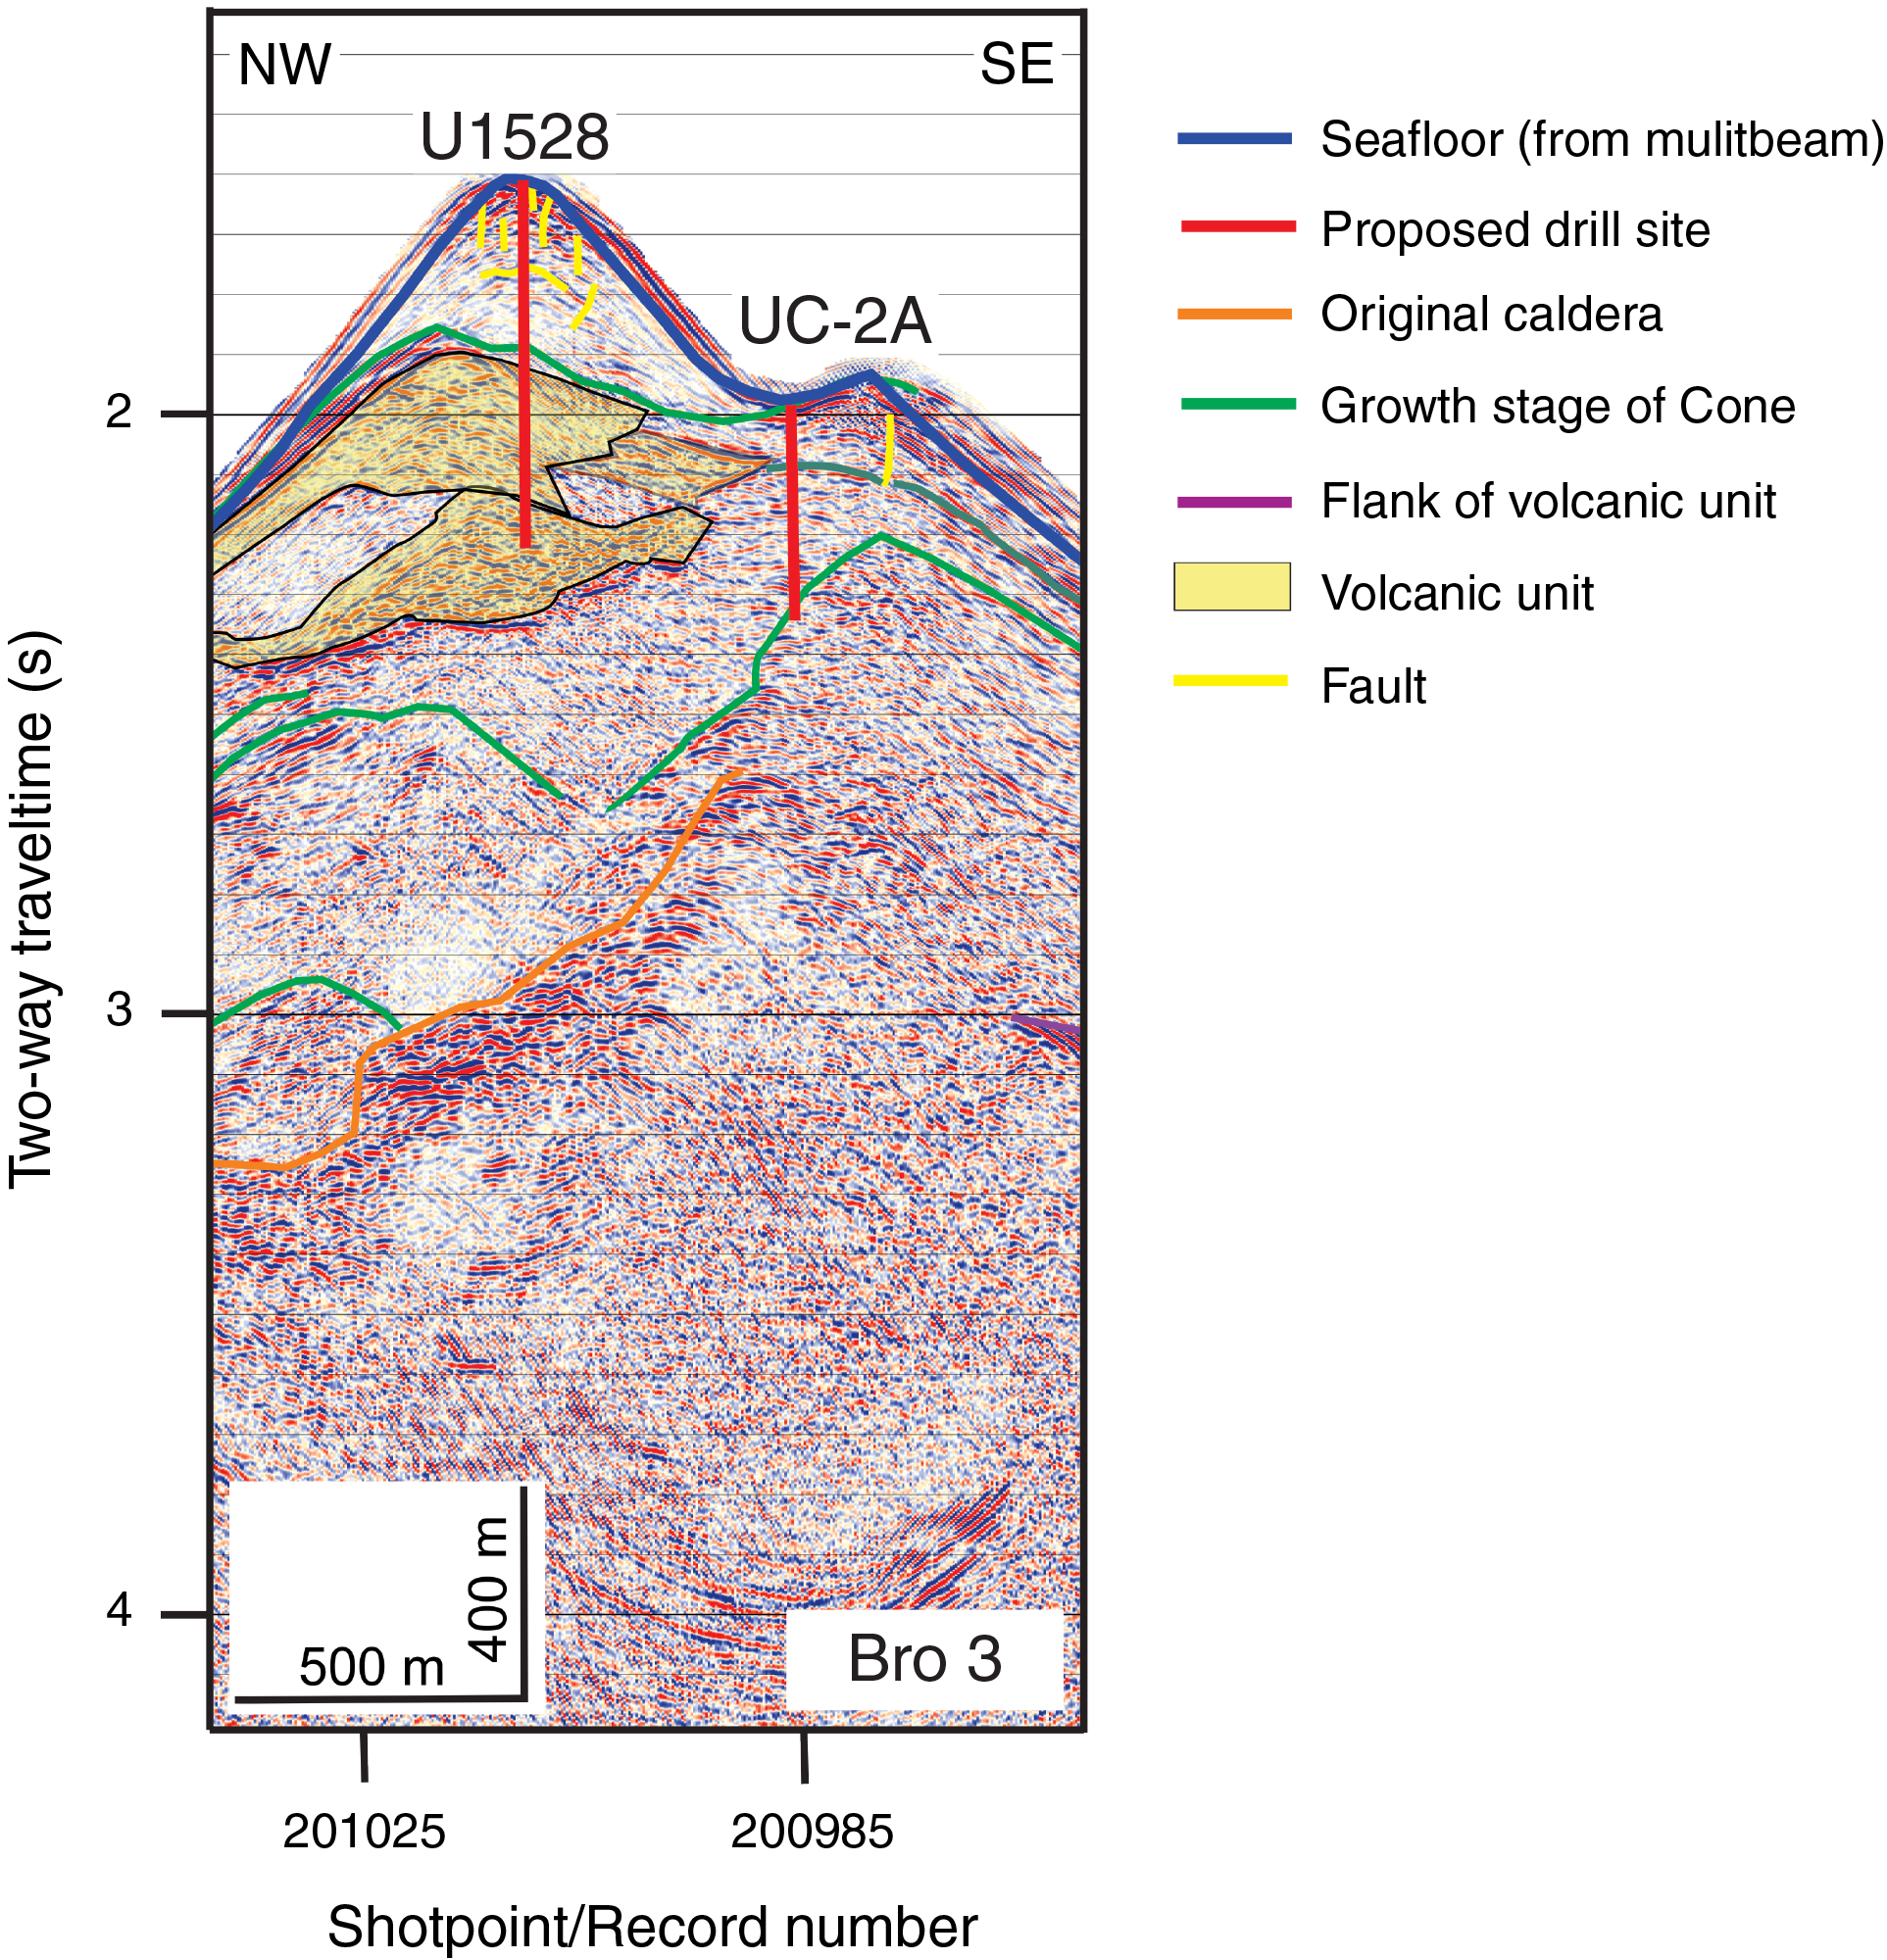
Figure F3. Line Bro-3.
Operations
The original plan for our highest priority site, Site U1528, included a two-hole operation: a pilot hole cored to ~50 mbsf with the RCB system (see Figure F3 in the Site U1527 chapter [de Ronde et al., 2019c]), followed by installation of a reentry system in a hole to a depth determined by lithologic conditions encountered in the pilot hole. In the end, we drilled four holes. Penetration to 800 mbsf at Site U1528 was envisioned. All operations at Site U1528 were challenged by the fact that the space to operate was restricted to a small, flat area only ~25 m in diameter at the bottom of a steep-walled pit crater at the summit of the Upper Cone. Thus, we relied heavily on the subsea sonar system on the vibration isolated television frame throughout operations at Site U1528 for conducting seafloor surveys, drill-in casing, and reentries.
Hole U1528A was cored with the RCB system to 84.4 mbsf as a pilot hole. Coring was terminated when we determined that the hole conditions were worsening and would likely result in a stuck drill string. Hole U1528B was drilled to 25.6 mbsf to install 24.3 m of casing but could not be reentered because the reentry system tilted. Hole U1528C saw the first offshore test of the Center for Deep Earth Exploration (CDEX) TDCS, which drilled down to 22 mbsf and cored to a final depth of 53.5 mbsf. At that depth, the reduction gear section of the coring system failed and the hole had to be terminated.
In Hole U1528D, we drilled-in a reentry system to 61.3 mbsf and installed 59.4 m of casing. Upon reentry, Hole U1528D was cored with the RCB system to 359.3 mbsf.
After coring 40 h and 10 min with the RCB bit, coring was halted for BF sampling, downhole temperature measurements, and downhole logging. We ran our in-house ETBS memory tool three times to record downhole temperatures. These runs alternated with three deployments of the Kuster FTS using two different devices (i.e., a primary 1000 mL tool and a spare 600 mL tool). Two runs with the latter tool recovered BF samples. The first Kuster FTS deployment using the primary 1000 mL tool was unsuccessful; the tool failed in the hole, and the majority of it was not retrieved. Downhole wireline logging was implemented after the second ETBS and 600 mL Kuster FTS tool deployment. Because the ETBS measured a maximum temperature of 212°C, we assembled the flasked HTTC wireline logging string, consisting of the litho-density, natural gamma ray, and logging head temperature tools. After two successful logging passes between the seafloor and debris (fill) at 332 mbsf, we deployed a drill bit to clean out Hole U1528D from 326 to 356 mbsf (i.e., the depth of the top of the 1000 mL Kuster FTS tool that was still in the bottom of the hole). To ensure that we could resume coring, we deployed a milling bit and two boot-type junk baskets to remove the lost 1000 mL Kuster FTS tool from the bottom of the hole. The milling bit drilled down to the bottom of the hole at 359 mbsf, but the junk baskets did not retrieve any remnants of the 1000 mL Kuster FTS tool. We then deployed a RCJB with twin boot-type baskets for another attempt at clearing the hole so we could continue coring. We worked the tool down to 359 mbsf and circulated high-viscosity mud sweeps. However, when the end of the drill string arrived back on the rig floor, we discovered that the lowermost 172.8 m of the drill string was missing. This ended any further attempt to resume coring in Hole U1528D.
After completion of coring at Site U1531, we returned to Hole U1528D 23 days later to successfully deploy the ETBS, 600 mL Kuster FTS tool, and Petrospec spool-in TCMT. In addition, we also pulled the failed reentry system in Hole U1528B back to the surface at the very end of Site U1528 operations. In total, 568.9 h, or 23.7 days, was spent at Site U1528.
Hole U1528A
After pulling out of Hole U1527C, the vessel was moved ~1.1 nmi to Site U1528 in dynamic positioning (DP) mode, and Hole U1527C ended at 1725 h on 20 May 2018 once we were positioned over the site. We made up an RCB BHA for coring in Hole U1528A. While we were running the RCB BHA to the seafloor, we began a camera and sonar survey of the seafloor to identify four possible hole locations in the narrow confines of the Upper Cone pit crater, tagging the seafloor at each location to verify the water depth (1228.4 m) and absence of vent-related animals.
After retrieving the subsea camera and sonar system and reassembling the rig floor, we picked up the top drive, dropped a core barrel, and spudded Hole U1528A at 0825 h on 21 May. Cores 376-U1528A-1R through 15R penetrated from the seafloor to a final total depth of 84.4 mbsf (reached at 1430 h on 22 May) and recovered 22.2 m (26%). We switched to half-length advances (4.8 m) after Core 6R. We pumped high-viscosity mud sweeps during coring to keep the hole clean, adding as much as 670 bbl (~106.5 m3) of high-viscosity mud. A substantial change to a hard formation was observed at 12.7 mbsf. Once Core 15R was cut, we had to work a stuck drill string, which was finally freed after 3 h. While we were pulling out of the hole, we had to work through poor hole conditions with high torque from 83 to 66 mbsf, likely due to unconsolidated volcanic debris from the uppermost ~13 m of the hole. The drill string finally cleared the seafloor at 1850 h on 22 May. We were ultimately able to retrieve Core 15R at 1945 h, ending Hole U1528A. All cores, penetration depths, core recovery, and times recovered on deck are displayed in Table T1. In total, 50.3 h, or 2.1 days, was spent in Hole U1528A.
Hole U1528B
After the drill string cleared the seafloor from Hole U1528A, we offset the vessel 10 m south to the surveyed location of Hole U1528B. Our initial objective for this hole was to determine the length of casing needed to stabilize the uppermost unconsolidated formation to enable deeper coring. At 2040 h on 22 May 2018, we started RCB drilling without coring using a center bit in Hole U1528B. After reaching 13 mbsf and verifying the hard formation encountered in Hole U1528A, the drill string was pulled back to the surface, clearing the seafloor at 2100 h.
Once the drill bit returned to the rig floor, we started casing operations for Hole U1528B. After assembling 24.3 m of 10¾ inch casing, we lowered it to the moonpool and latched it to the mud skirt (Figure F4). We then made up the casing drilling stinger with a BHA consisting of an 8 inch (~20.3 cm) mud motor, an underreamer set to 12¾ inches (~32.4 cm), and a 9⅞ inch (~25.1 cm) tricone drill bit to drill-in the reentry system (Figure F4). Following a successful test of the mud motor and underreamer in the moonpool, the drilling assembly was run inside the casing and attached to the casing flange on the mud skirt with the hydraulic release tool (HRT). After assembling the reentry funnel and welding it to the casing hanger, we shut down operations at 1500 h on 23 May due to inclement weather and spent the next 20 h waiting for the weather to improve enough so that we could safely deploy the reentry system and precisely position Hole U1528B.
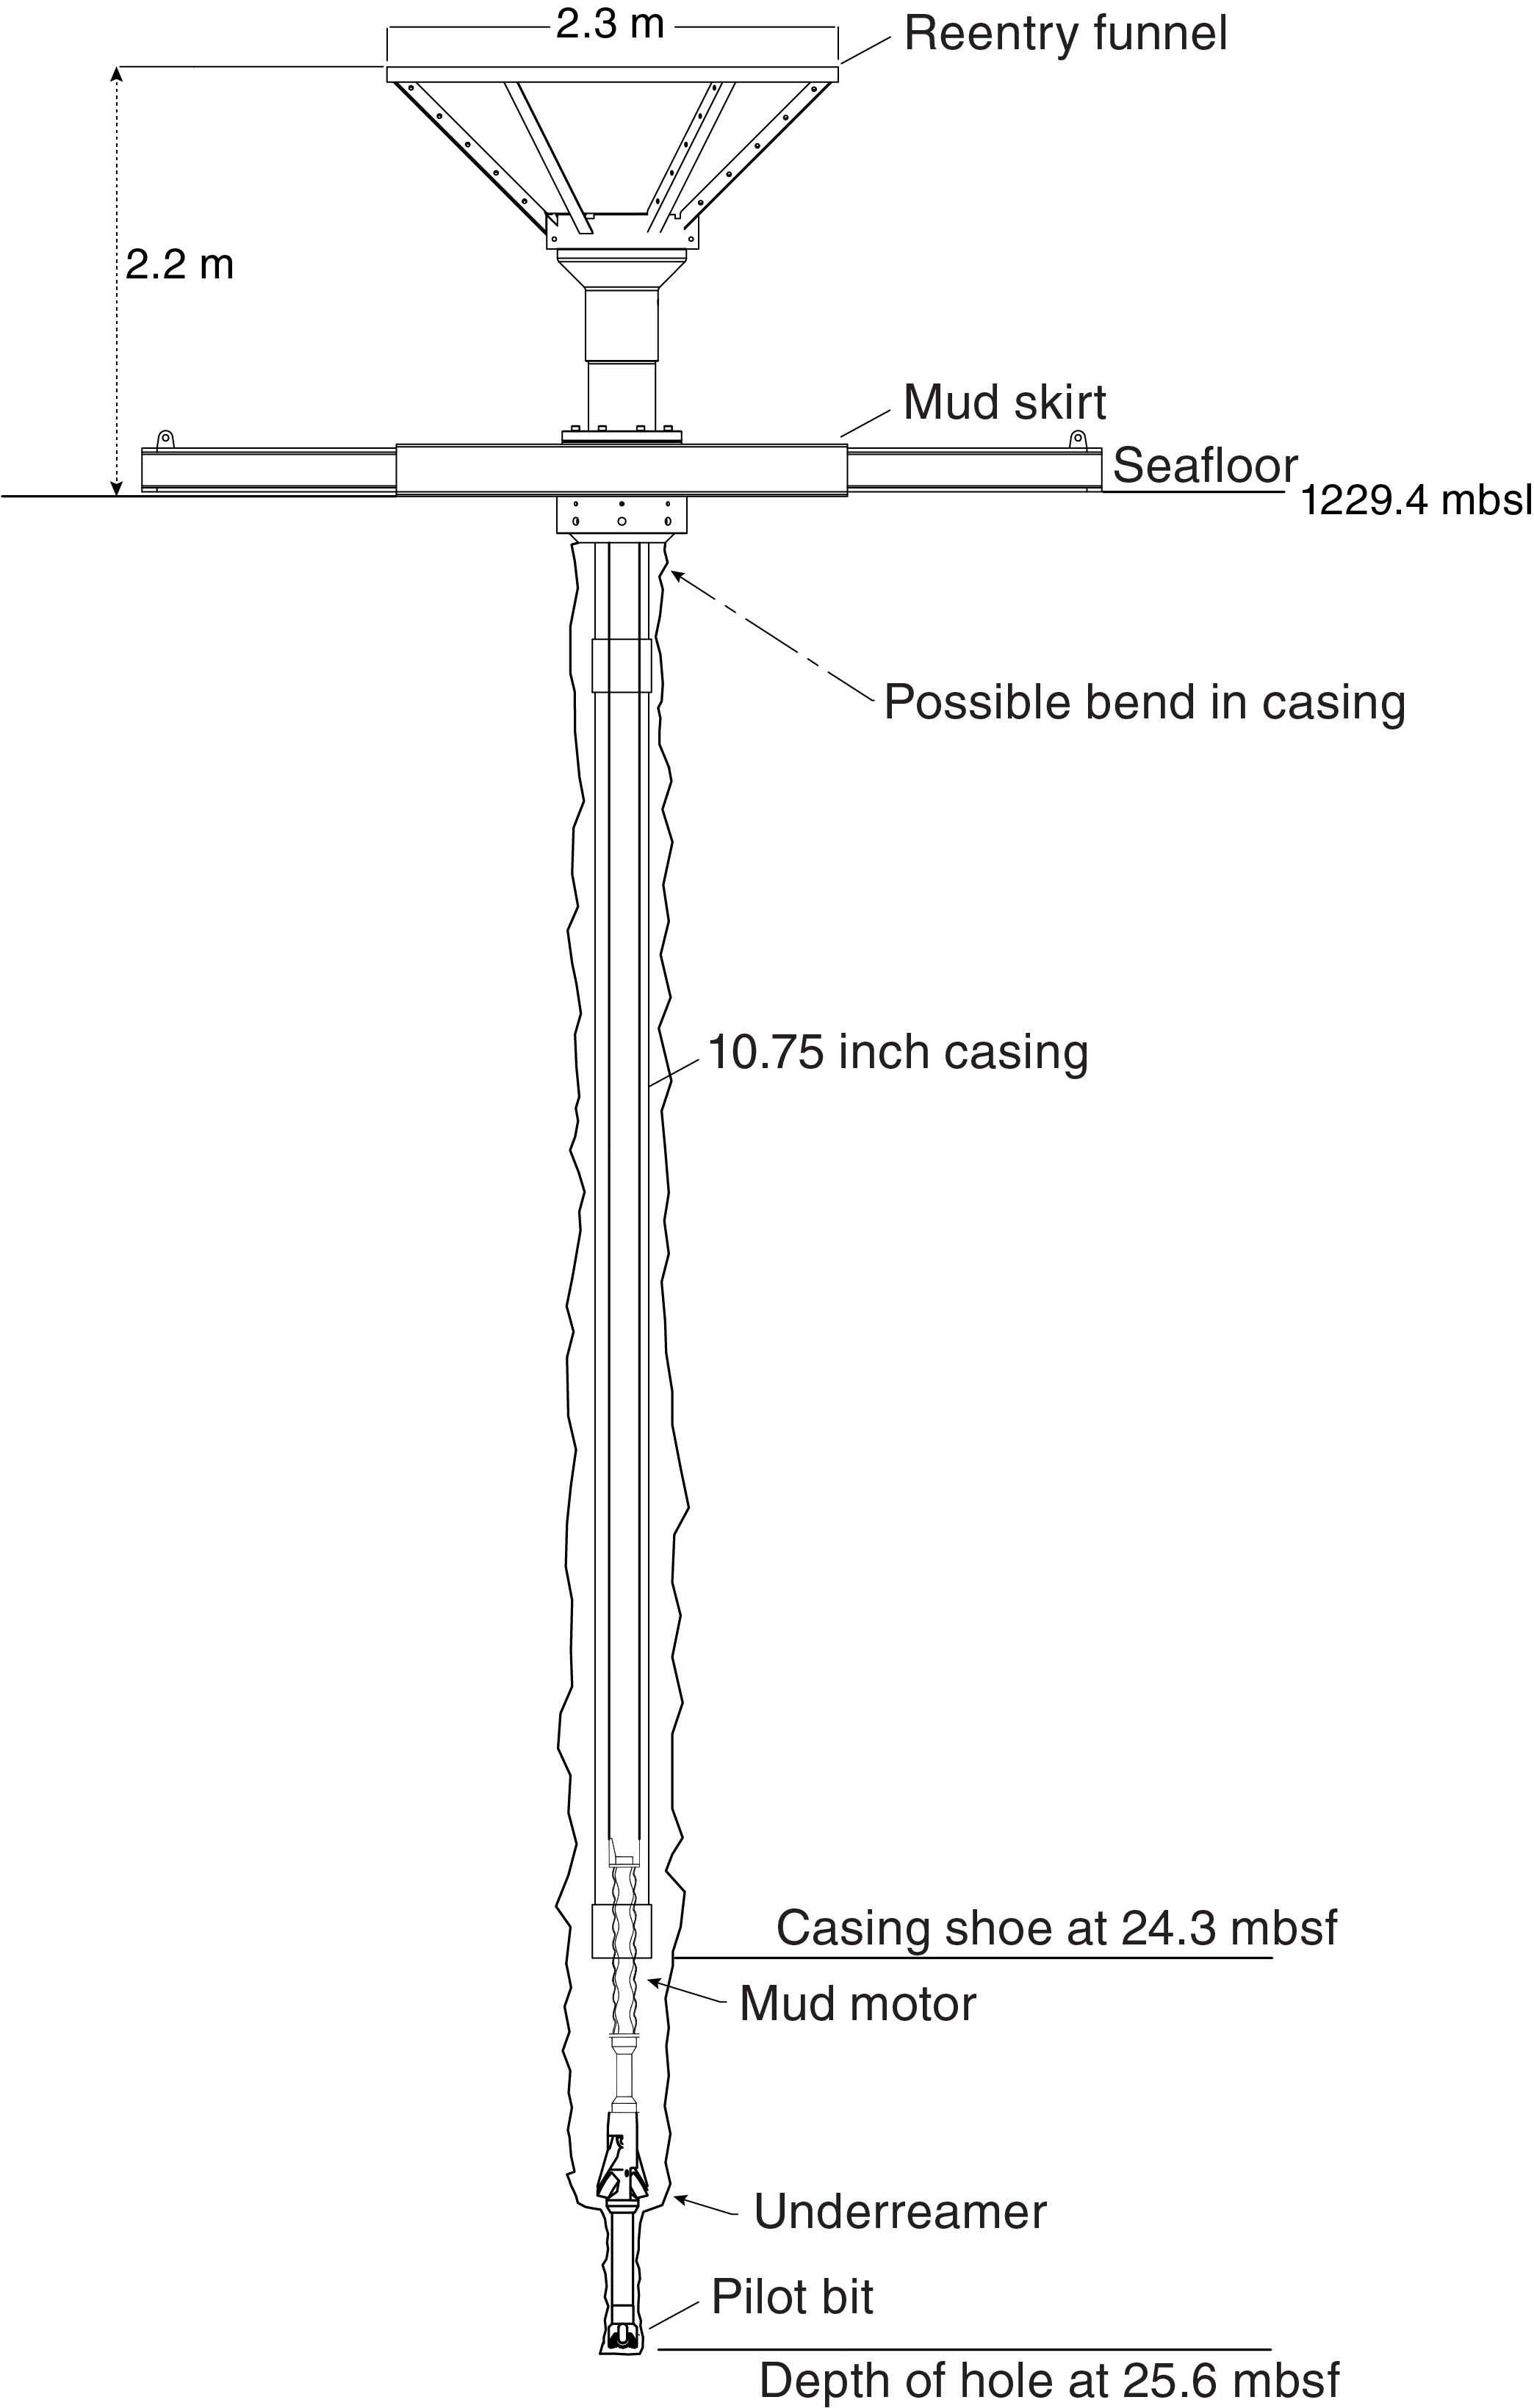
Figure F4. Reentry system and casing installation, Hole U1528B.
At 1100 h on 24 May, we picked up the reentry system and lowered it to the seafloor. With rough seas, it was very difficult to position the vessel over the intended coordinates. After reaching 13 mbsf, the casing was drilled-in to 25.6 mbsf and the drilling assembly released from the casing using the go-devil (an iron weight) (Table T1). Drilling-in the casing caused disturbance of the seafloor and the visibility was very poor, but the HRT inside the throat of the reentry funnel was visible. We had trouble extracting our drilling assembly from the reentry system. After working the drill string with varying pump strokes for several hours, we finally managed to retract it from the reentry system. We pulled the drill string out of the reentry system with the drilling assembly sliding through the casing with drag and clearing the top of the reentry funnel at 2330 h on 24 May. The subsea camera system was retrieved, and the inner drill pipe sleeve was removed so that the camera system could be deployed over the HRT to examine the reentry funnel and confirm its landing position. Visibility remained poor, but the very top of the reentry system was observed although the seafloor was not visible. The top of the funnel was observed at 1224.7 m water depth, which appeared to verify that it was in the correct position. We recovered the subsea camera system and pulled the drill string out of Hole U1528B.
Once the drilling assembly reached the moonpool, the mud motor and underreamer were flushed with freshwater. The drilling bit returned to the rig floor at 0450 h on 25 May. This essentially ended operations in Hole U1528B because two separate attempts to reenter using (1) the TDCS (Hole U1528C) and (2) the RCB coring system failed because the reentry system was damaged while landing the mud skirt and attached casing too close to the crater walls (i.e., one end of the mud skirt was nominally upslope). The second unsuccessful attempt to reenter was made at 1730 h on 28 May after completion of coring at Site U1529 (see Operations in the Site U1529 chapter [de Ronde et al., 2019d]). The final operation of Expedition 376 saw another return to Hole U1528B 35 days later to retrieve the failed reentry system. We reentered Hole U1528B at 0958 h on 3 July, latched into the mock hanger, and pulled the reentry system back to the surface on the same day. In total, 79.3 h, or 3.3 days, was recorded while in Hole U1528B.
Hole U1528C
After installing the reentry system and casing in Hole U1528B, our intention was to reenter the hole to start coring operations. For this purpose, we assembled the TDCS to implement its first offshore test. Once the TDCS BHA, including a polycrystalline diamond compact (PDC) bit, was assembled (Figure F5), we successfully tested the function of the TDCS core barrel on the rig floor to verify the operation of the equipment prior to beginning the pipe trip to bottom (Figure F6).
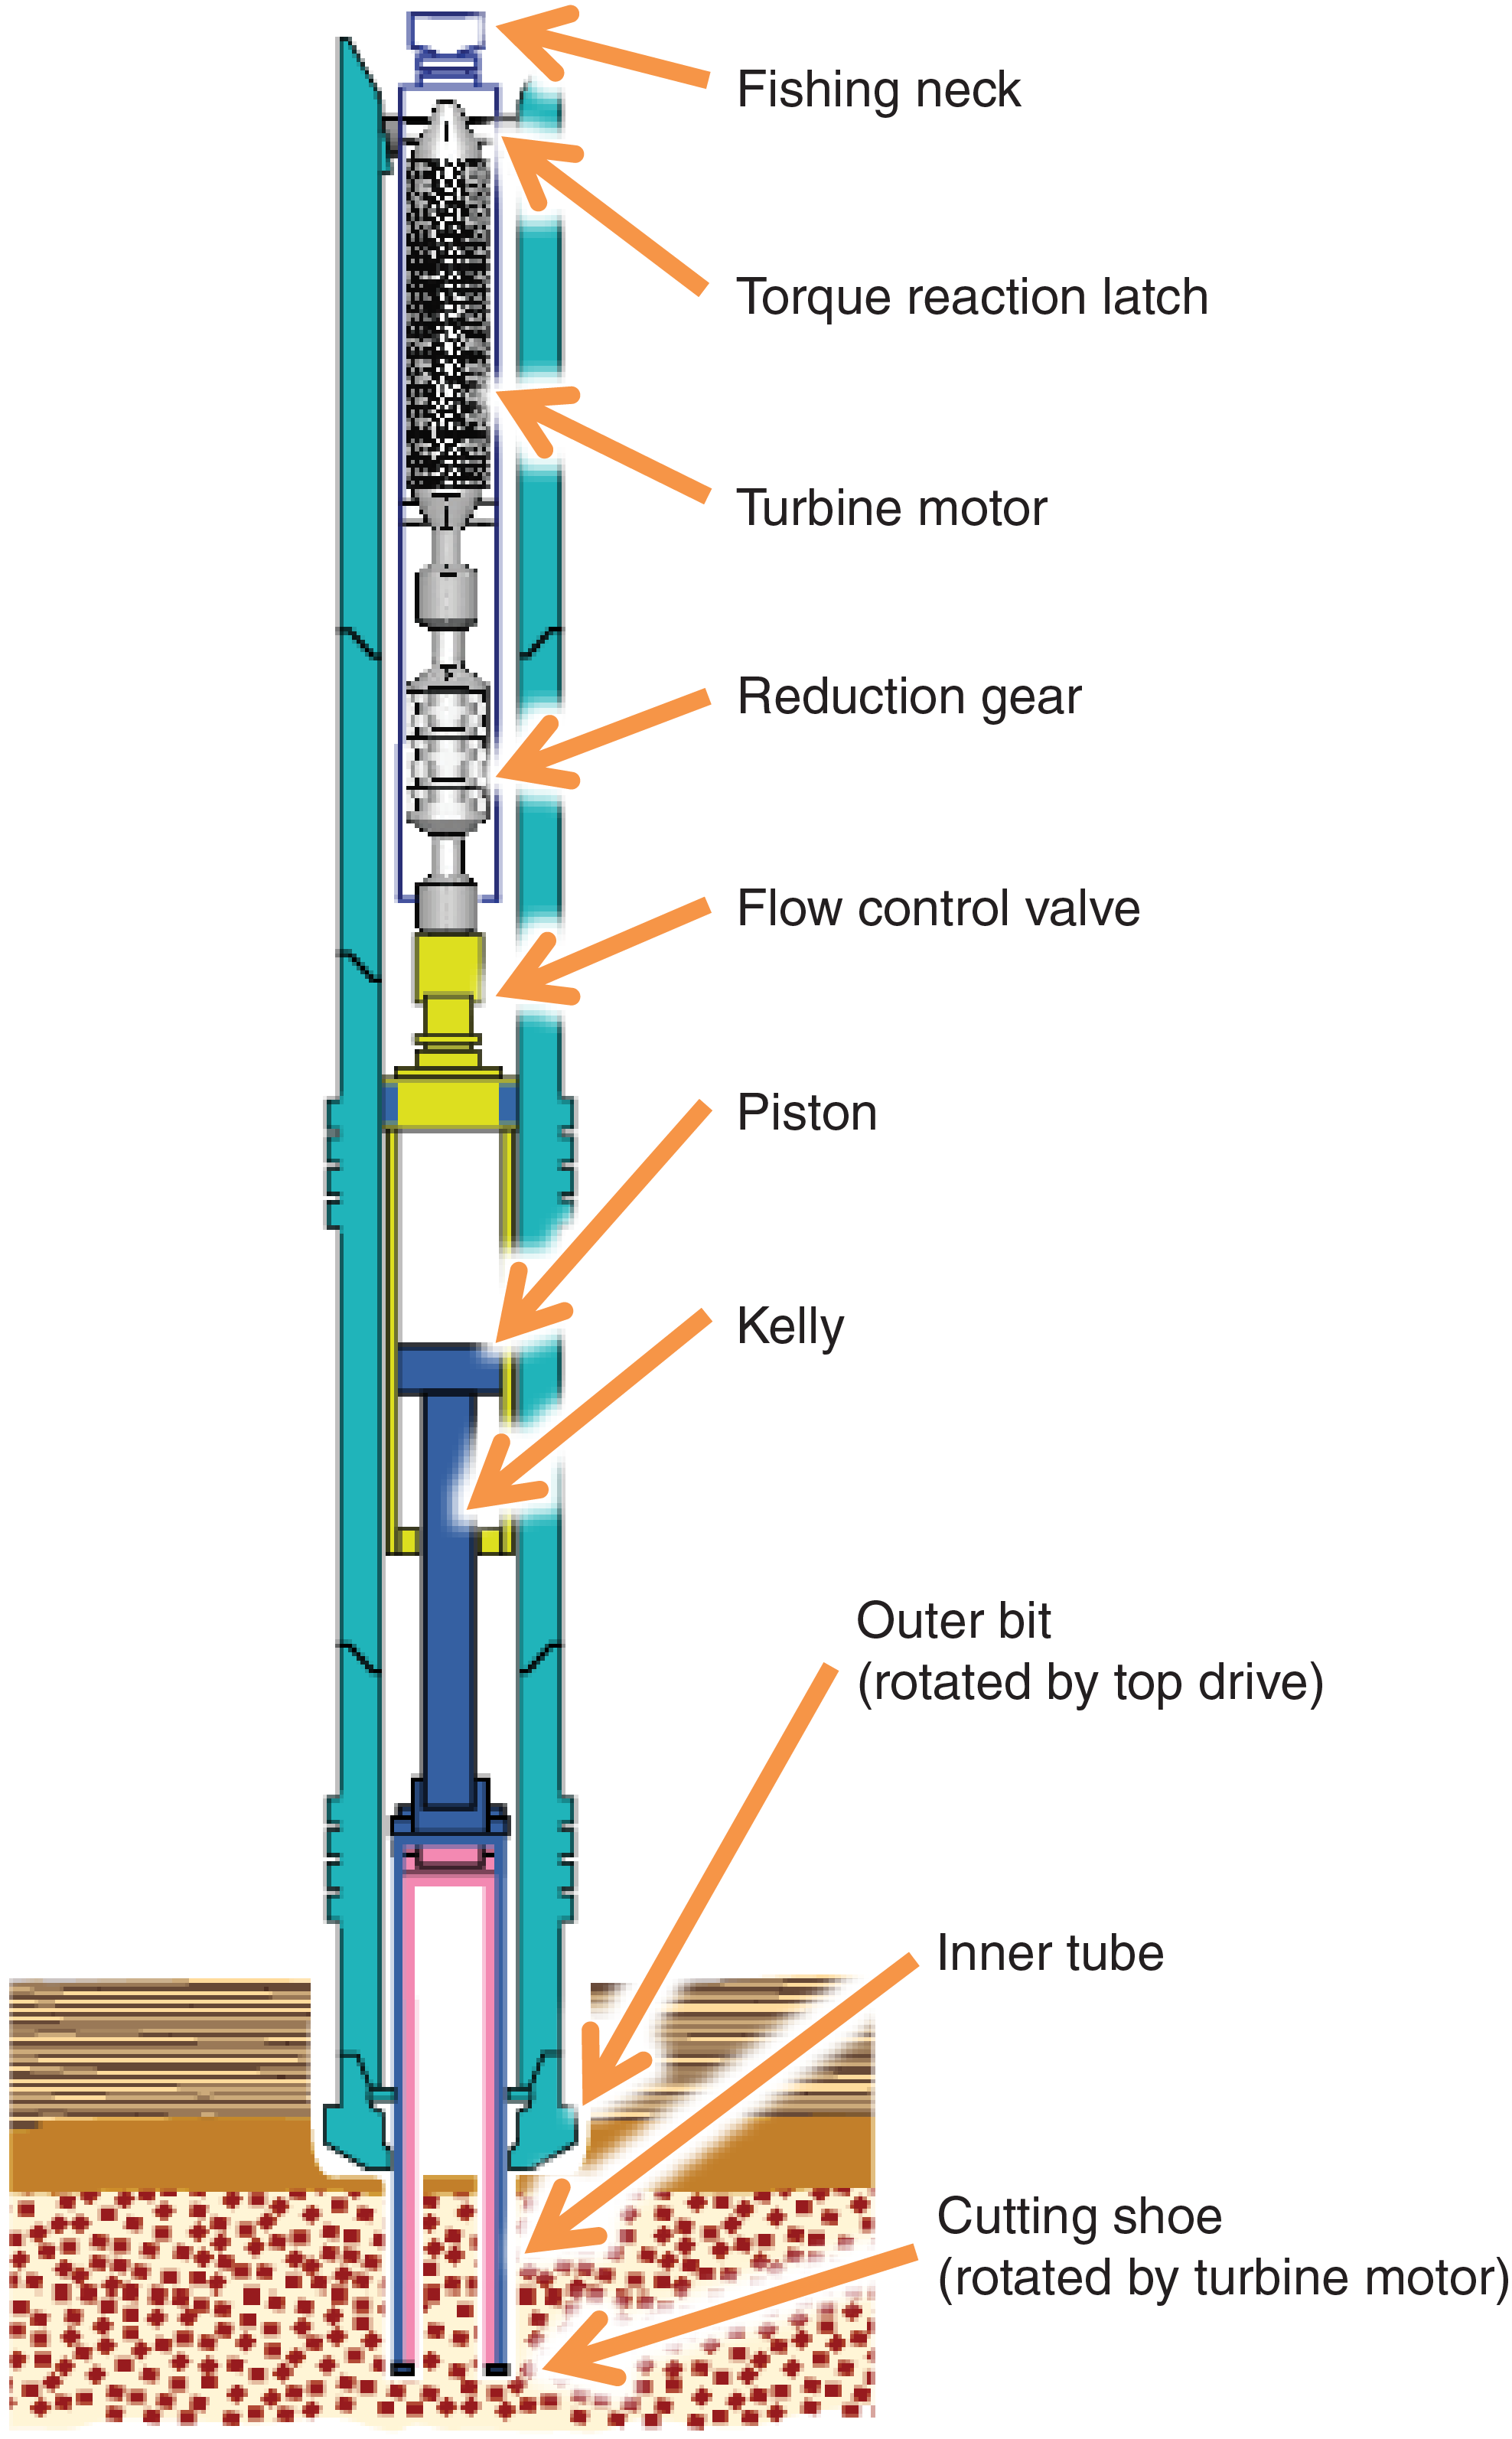
Figure F5. TDCS BHA, Hole U1528C.
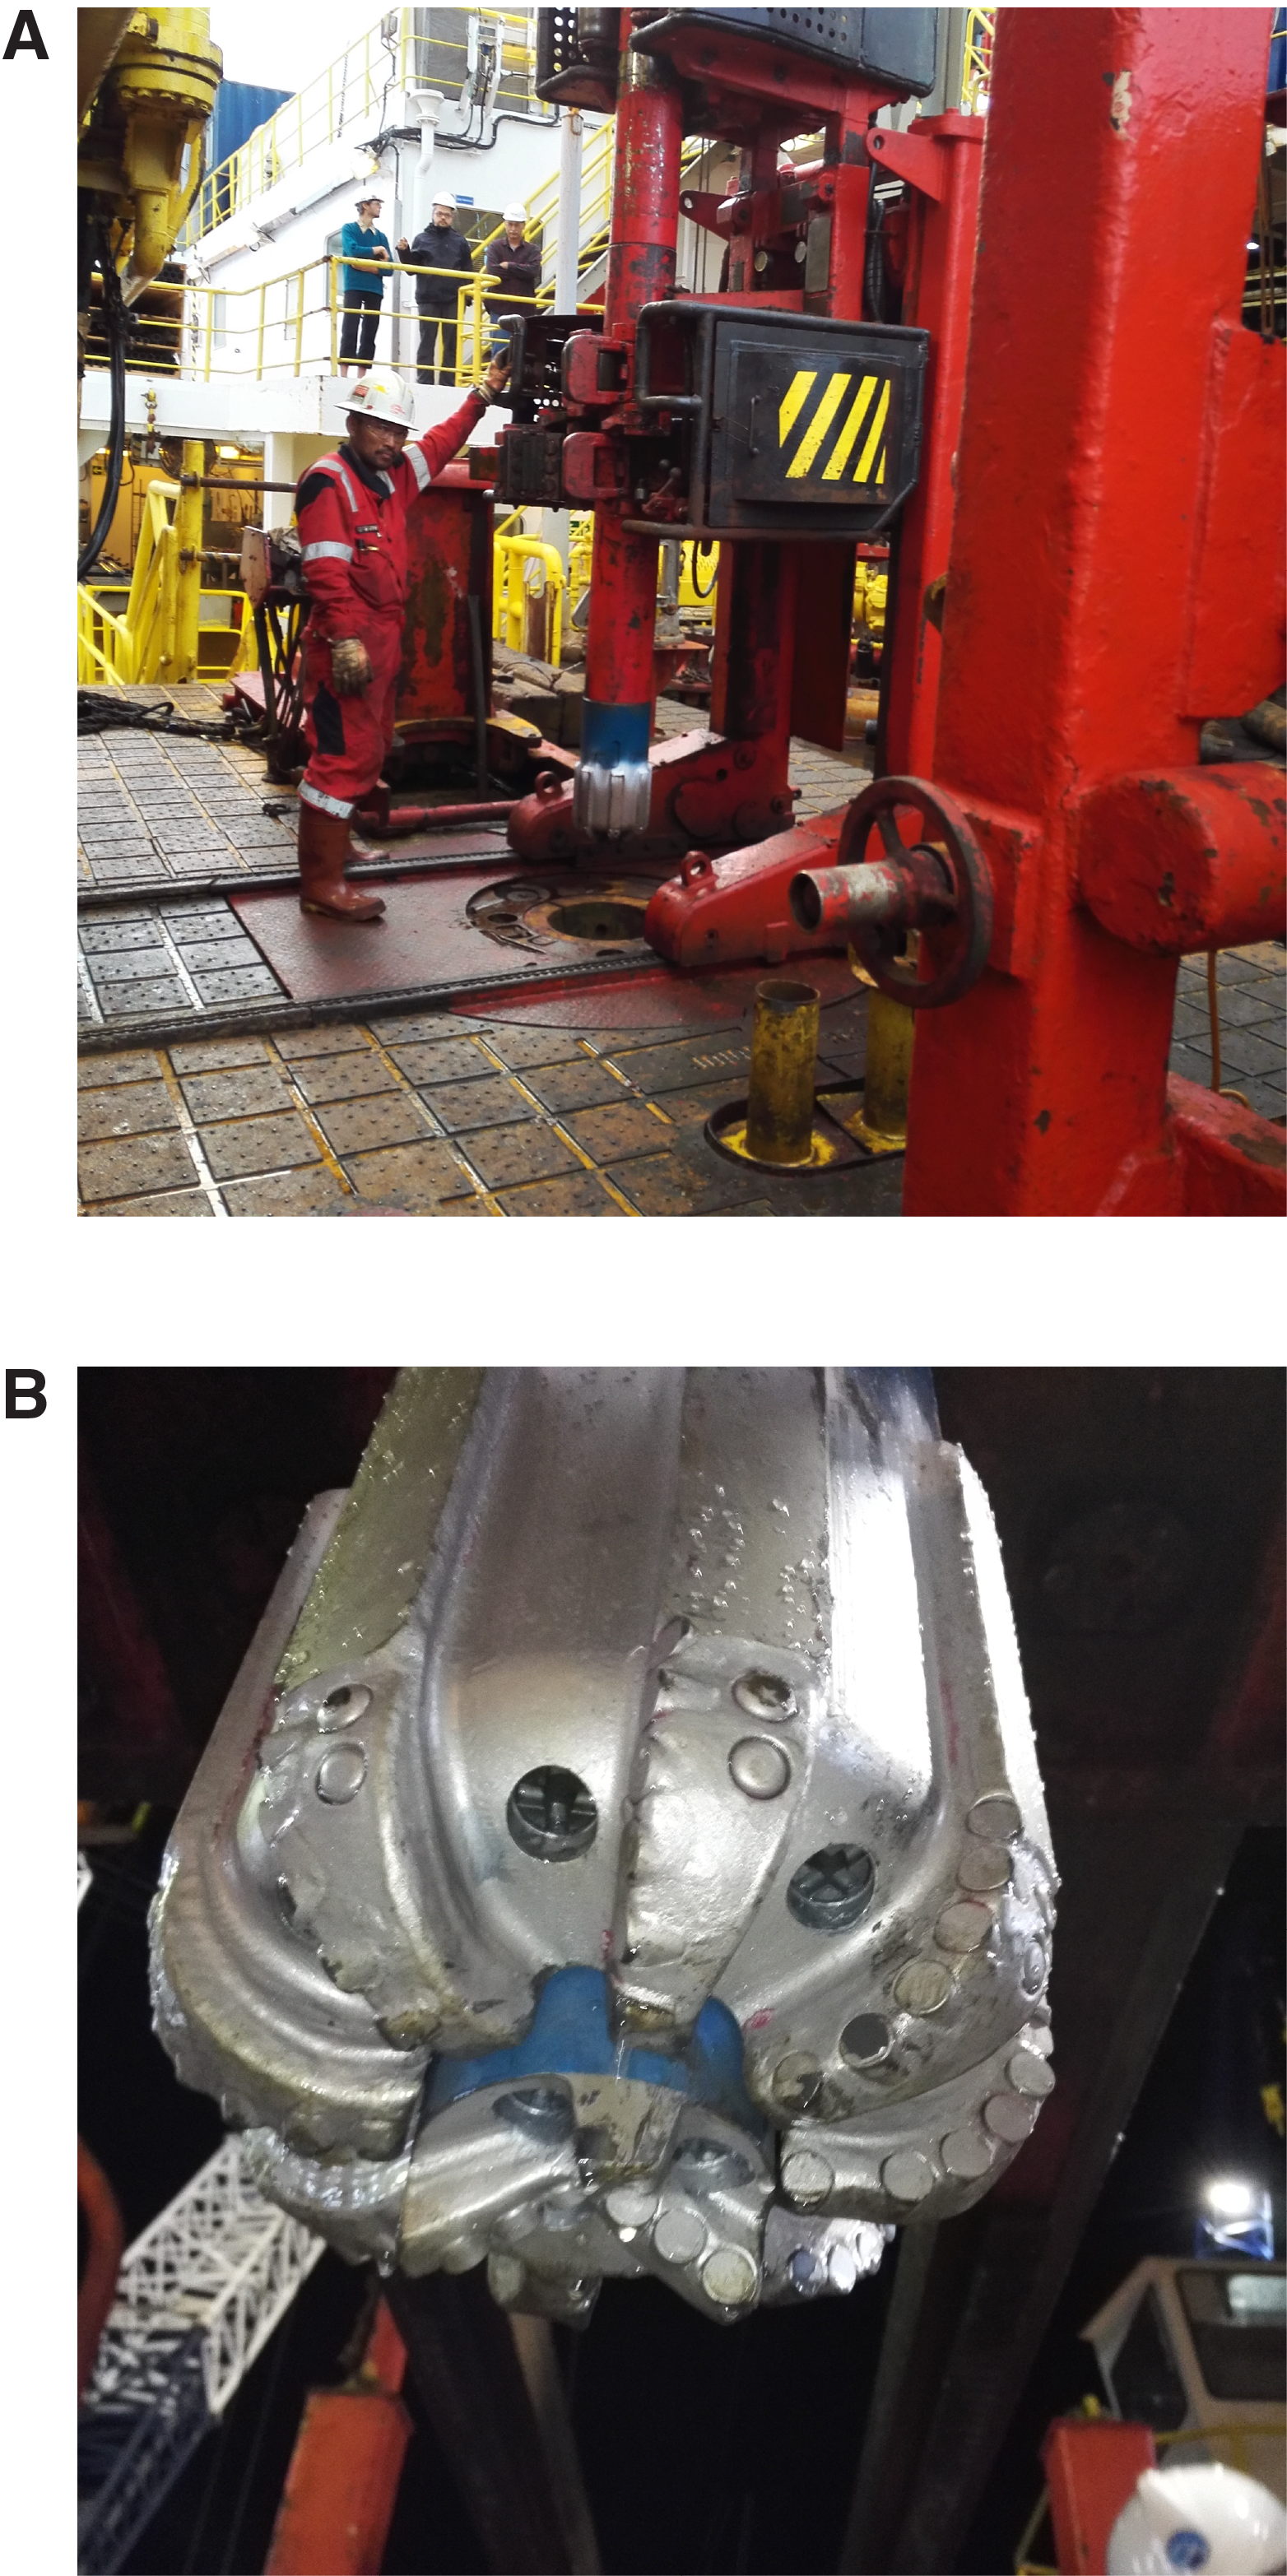
Figure F6. TDCS core barrel and PDC bit.
At 1800 h on 25 May 2018, we started lowering the TDCS BHA to the seafloor. We deployed the subsea camera system and made a reentry attempt at 2245 h on 25 May. The PDC bit hung up in the reentry funnel throat, probably because the base of the reentry system was not sitting flat on the seafloor. After we made several unsuccessful attempts to reenter Hole U1528B, we offset the vessel to a preselected hole position, tagged the seafloor to verify the water depth, retrieved the subsea camera, and spudded Hole U1528C at 0230 h on 26 May. We advanced with a center bit installed to 22 mbsf, pulled it, and deployed a TDCS core barrel on a wireline. Cores 376-U1528C-2N through 8N penetrated from 22.0 to 53.5 mbsf with full 4.5 m advancements and recovered 3.6 m (12%). All cores, penetration depths, core recovery, and times recovered on deck are displayed in Table T1. We pumped 30 bbl (~4.8 m3) of mud sweeps at several depths to keep the hole clean. When Core 8N was pulled, only the top third of the core barrel was recovered. The core barrel parted in the reduction gear, and the lower core barrel remained in the BHA. We pulled the drill string out of the hole, and the bit cleared the seafloor at 2330 h on 26 May. The drill string was pulled to the surface, and then the TDCS BHA was disassembled and the lower section of the core barrel was recovered from the BHA. The TDCS PDC bit cleared the rig floor at 0430 h on 27 May, ending Hole U1528C. While laying out the TDCS subs, the vessel moved to Site U1529 using the DP system (a ~1.0 nmi transit). In total, 47.8 h, or 2.0 days, was recorded while in Hole U1528C.
Hole U1528D
Upon returning from Site U1529 to make another unsuccessful attempt to reenter Hole U1528B, we prepared to install casing in Hole U1528D by (1) assembling a 9½ inch (~24.1 cm) mud motor, an underreamer (set to 16½ inches, or ~41.9 cm), and a 12¼ inch (~31.1 cm) tricone drilling bit to form the drilling assembly (Figure F7); (2) connecting five joints of 13⅜ inch (~34.0 cm) casing to form a 59.4 m long casing string; (3) installing and testing the drilling assembly; and (4) landing the casing running tool (HRT) in the moonpool and attaching it to the casing string. We then installed and welded the reentry funnel and inverted hard rock landing frame (Figure F8). Although the reentry system was ready to deploy at 0500 h on 30 May 2018, we had to wait 7 h until the weather improved sufficiently to start lowering the reentry funnel and casing to the seafloor.
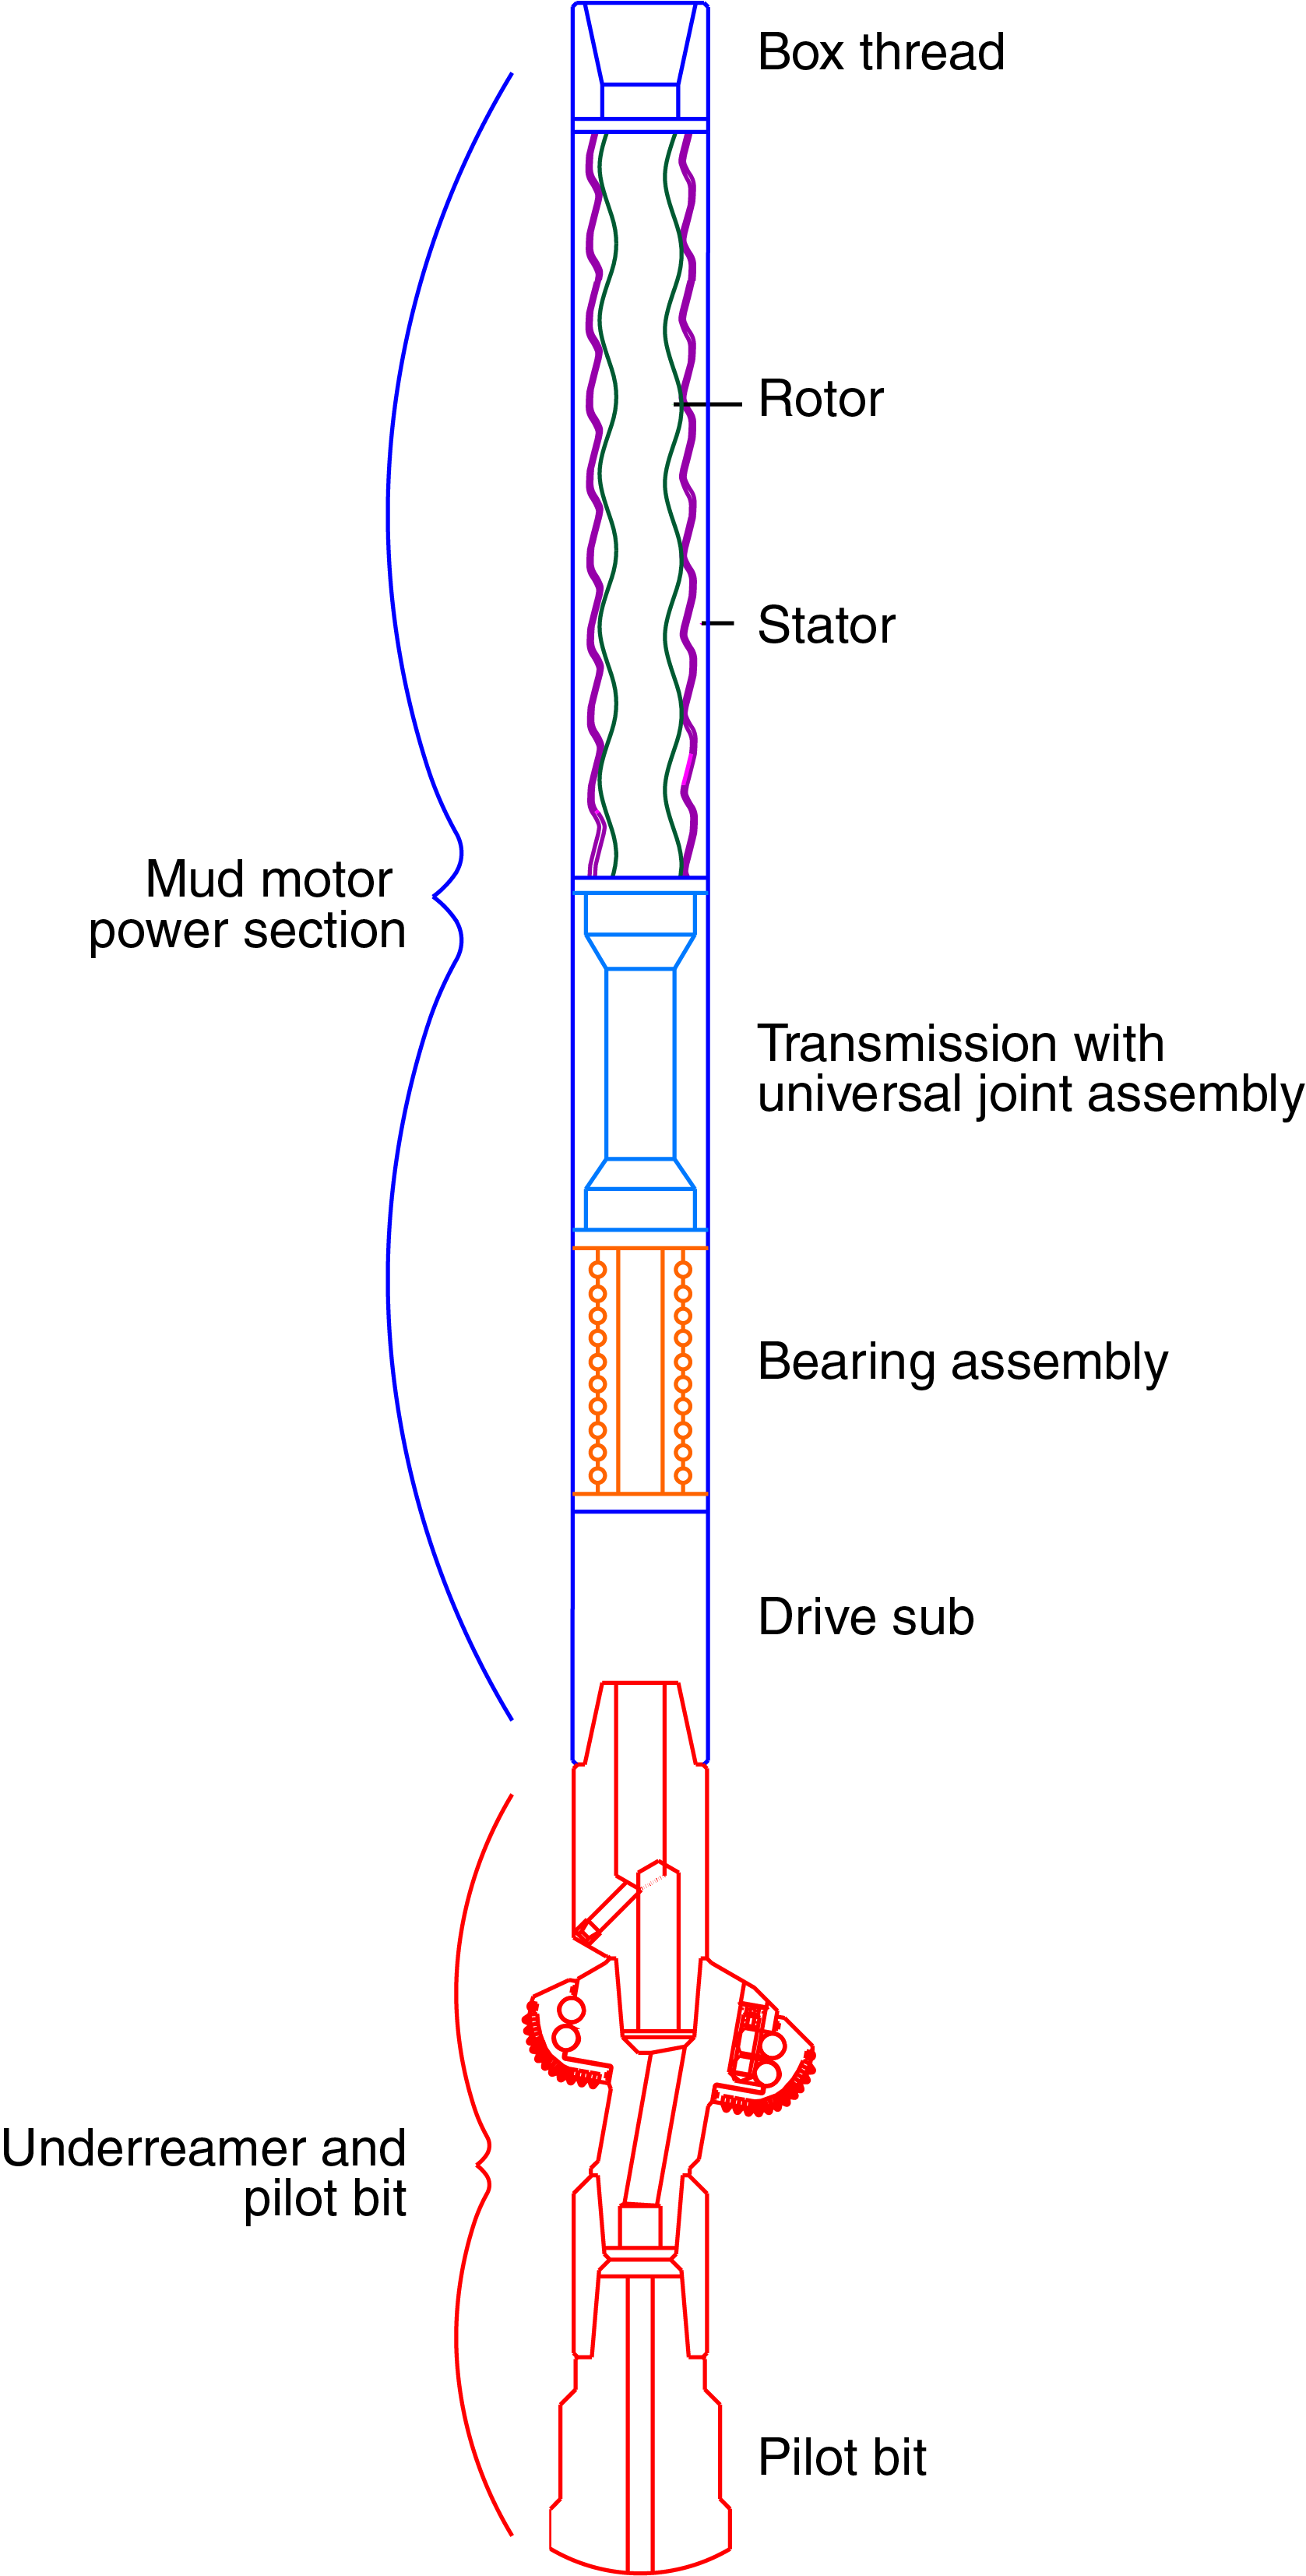
Figure F7. Drilling assembly.

Figure F8. Reentry system and casing installation, Hole U1528D.
Once the rough seas abated, we lowered the reentry system to the seafloor and deployed the subsea camera and sonar system. We began drilling the casing into Hole U1528D at 1750 h on 30 May. We encountered a firm lithology at 13–15 mbsf. The HRT prematurely released at 35.5 mbsf while we were pumping a mud sweep. We decided to continue drilling down with the possibility that the casing would continue to settle into the hole following the bit. The bit eventually reached 50 mbsf. However, after observing that the casing was not following the bit, we attempted to move the casing with the underreamer arms for 2 h to no avail. We continued drilling the 16½ inch hole from 50 mbsf to the planned total depth of 61.3 mbsf, which was reached at 0640 h on 31 May. After reaming and circulating the hole clean, we pulled out of the hole while observing the reentry funnel. Hole U1528D appeared to be located in the flat central area of the pit crater, with the casing and funnel standing independently 23 m above the seafloor. We set back the top drive, recovered the subsea camera, and pulled the drill string out of the hole. The bit cleared the rig floor at 1605 h on 31 May. Subsequent function tests of both the mud motor and underreamer indicated that they were both working properly.
Our next objective was to reenter Hole U1528D to get the reentry funnel and casing to settle to the appropriate depth. For this purpose, we installed a 13⅜ inch cup seal on top of the drilling assembly (54.4 m above the bit) to seal the inside of the casing while circulating. This was intended to clean the annulus between casing and surrounding formation to promote complete settling of the casing string into the hole. We deployed the subsea camera and sonar system, continued lowering the drill string to the seafloor, picked up the top drive, and reentered the funnel of Hole U1528D at 0110 h on 1 June. We lowered the drill string to position the cup seal inside the casing with the mud motor and underreamer below the casing shoe, pumped a 20 bbl (~3.2 m3) mud sweep, and began to circulate and work the drill string down. After 3 h, the casing began falling at 0534 h on 1 June, and the reentry system finally landed on the seafloor at 0602 h. After circulating the hole, we pulled the drill string out of the hole, set back the top drive, recovered the subsea camera, retrieved the drill string, disassembled the drilling assembly, and flushed the mud motor and underreamer.
We made up the RCB BHA, lowered it to the seafloor, deployed the subsea camera and sonar system, and reentered Hole U1528D at 2035 h on 1 June. After installing the top drive and retrieving the subsea camera system, we lowered the bit through the casing and circulated ~7 m of soft debris out of the bottom of the hole with 30 bbl of high-viscosity mud. We started RCB coring from 61.3 mbsf at 2337 h on 1 June. Half-length (4.8 m advance) Cores 376-U1528D-2R through 63R penetrated from 61.3 to 359.3 mbsf and recovered 87.2 m (29%). Hole conditions for the entire interval remained optimum, and 30 bbl of mud sweeps were pumped on each core to keep the hole clean. The only short interruption (1.5 h) of that coring period was caused by a failure of the hydraulic return line from the top drive (after cutting Core 50R). All cores, penetration depths, core recovery, and times recovered on deck are displayed in Table T1.
After Core 376-U1528D-63R was cut, we stopped coring because the bit had reached 40 h of rotating time and needed to be changed. Before recovering the drill string to change the bit and resume coring, we decided to measure the borehole temperature and obtain a BF sample. At 0500 h on 6 June, we started preparing the ETBS memory tool and the primary (1000 mL) Kuster FTS tool for deployment on the coring line. First, we lowered the ETBS attached to a core barrel and let the tool collect data for 15 min at the bottom of the hole; on recovery, it revealed an average temperature of 33°C. Second, we deployed the 1000 mL Kuster FTS tool with a core barrel to sample BF. However, sometime during the sampling run the tool failed under compression. Only the top connector from the tool returned to the surface, leaving almost 3 m of tool behind. Finally, we recovered the drill string, and the bit reached the rig floor at 1450 h on 6 June.
A fishing tool BHA with a Gotco junk basket and two boot-type junk baskets was assembled to recover the lost Kuster FTS. It was lowered to the seafloor, followed by deployment of the subsea camera and sonar system for reentering Hole U1528D. This third reentry was hampered by a hydrothermal plume emanating from the reentry funnel (Figure F9), but we successfully reentered at 0235 h on 7 June. We recovered the subsea camera system, picked up the top drive, and continued lowering the BHA to the bottom of the hole. We started circulating at 335 mbsf and had to work the assembly through soft debris from 341 to 350 mbsf, which was circulated out with high-viscosity mud sweeps. At 350.0 mbsf, we encountered hard debris fill. After washing/drilling down, we tagged the final hole depth of 359.3 mbsf. The junk basket was worked up and down with rotation while the mud pumps were cycled on and off. We started pulling the drill string out of the hole at 0945 h on 7 June and set back the top drive, and the drill string cleared the seafloor at 1140 h. The Gotco junk basket came back with all the fingers missing from the junk basket catchers. We emptied the boot baskets and saved the contents, which consisted of rock debris and minor unidentifiable small pieces of metal. We were subjected to 5 m ship heave and had to wait for the weather to improve for 8 h before starting to prepare for downhole measurements and BF sampling in Hole U1528D.
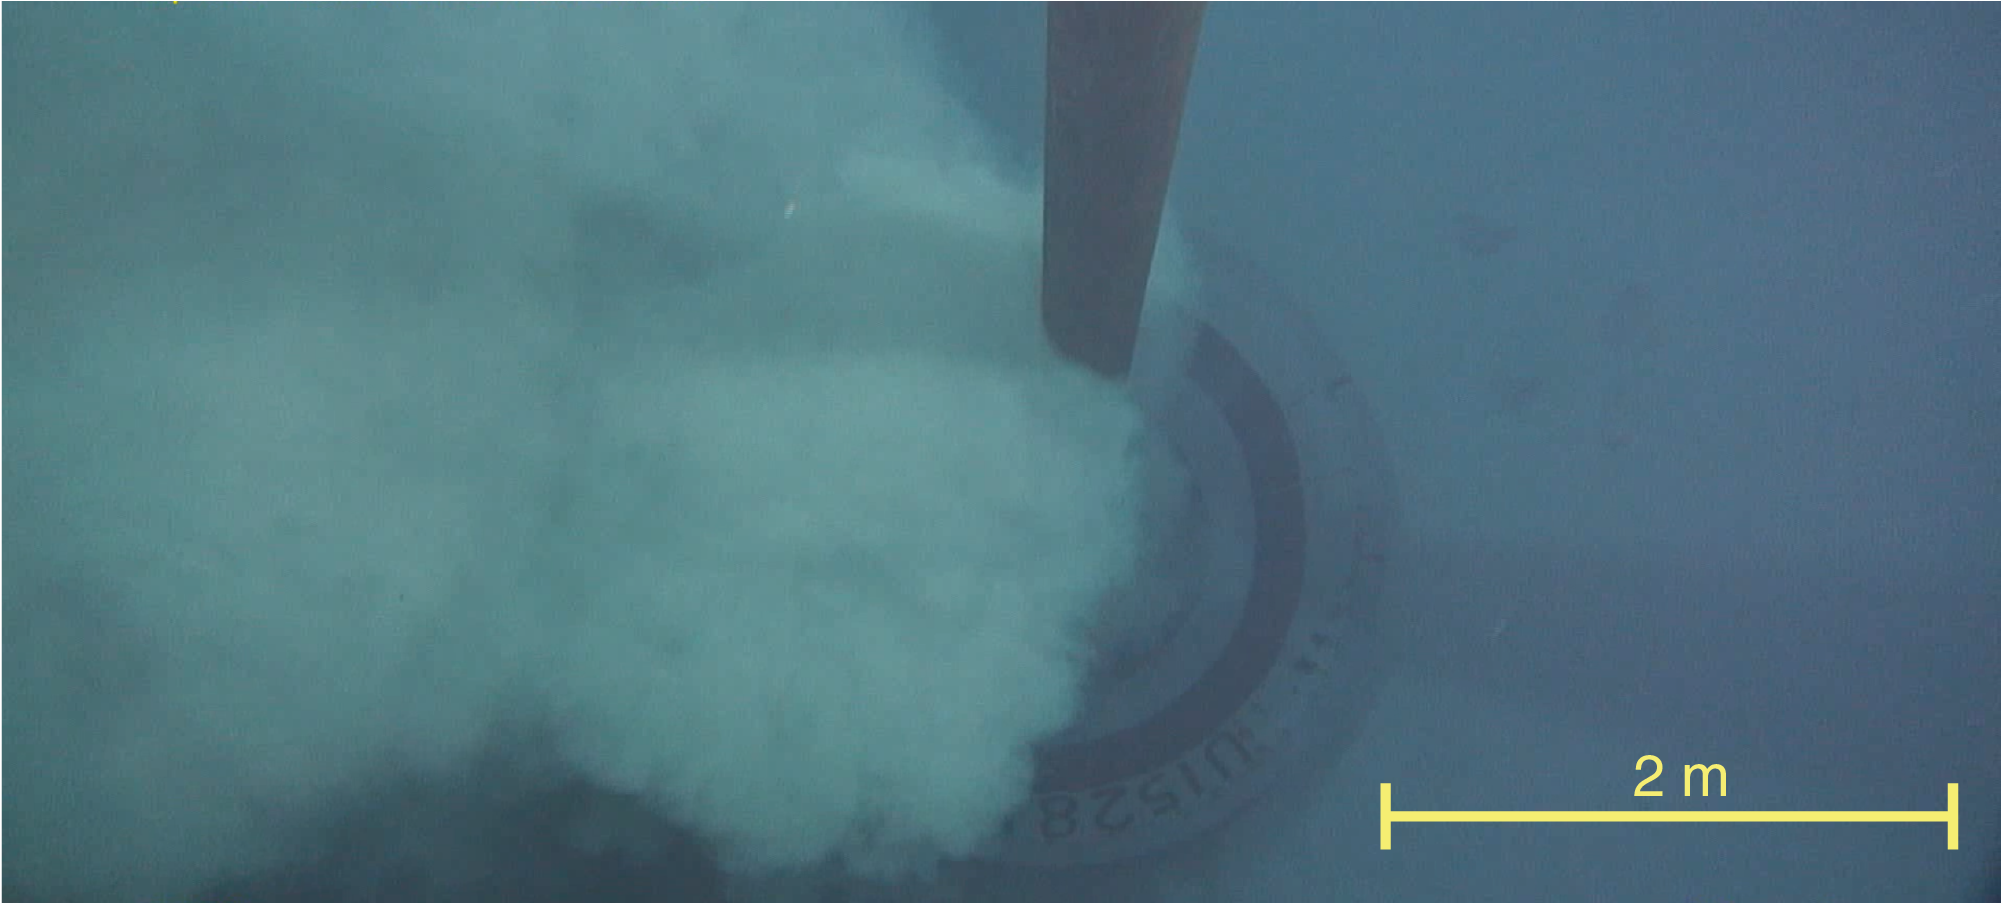
Figure F9. Reentry funnel hydrothermal plume, Hole U1528D.
At 0330 h on 8 June, we made up a logging BHA and lowered it to the seafloor. We deployed the subsea camera system, continued lowering the drill string, and positioned the vessel for reentry. We maneuvered for more than 2 h in poor visibility because of a hydrothermal plume emerging from the reentry funnel, but we finally reentered Hole U1528D for the fourth time at 0950 h. We tagged hard debris fill at 303 mbsf. We picked up the top drive and deployed the backup (600 mL) Kuster FTS tool on the core line, successfully recovering a BF sample. We then lowered the ETBS, which measured a maximum temperature of 212°C. When the bit reached 323 mbsf, a high-viscosity mud sweep was circulated to clean the hole and the bit was raised to 50.6 mbsf inside the 13⅜ inch casing. The HTTC tool string, consisting of the logging equipment head-mud temperature tool (LEH-MT), Enhanced Digital Telemetry Cartridge (EDTC), Hostile Environment Natural Gamma Ray Sonde (HNGS), and Hostile Environment Litho-Density Sonde (HLDS), was assembled and lowered to 332 mbsf. Two upward logging passes were conducted, and the tools were back on the rig floor at 0210 h on 9 June. The logging tools were disassembled, cleaned, and secured.
We lowered the drill string back to the bottom of Hole U1528D in preparation for another 600 mL Kuster FTS run and encountered hard debris fill at 330 mbsf. The top drive was picked up, and the end of the drill pipe was set at ~323 mbsf. We deployed the 600 mL Kuster FTS tool and successfully recovered a BF sample from 313 mbsf. On breaking the drill string connection at the rig floor, we measured an H2S concentration of 20 ppm. The connection was made back up, and the drill pipe was circulated out to clear the drill string of H2S. We deployed the ETBS memory tool to 313 mbsf, which yielded a stationary temperature measurement of ~165°C following 15 min of equilibration. After recovering the ETBS tool, we started pulling the drill string out of the hole and set back the top drive. The logging BHA cleared the seafloor at 1200 h on 9 June, and the bit arrived on the rig floor at 1535 h.
We assembled a new 9⅞ inch tricone bit BHA to clean out Hole U1528D. We lowered the drill string and deployed the subsea camera and sonar system to aid in the reentry. We reentered Hole U1528D for the fifth time at 2110 h on 9 June. After the subsea camera was recovered, we picked up the top drive and lowered the bit to 326 mbsf, where we encountered hard debris fill. The bit was worked down to 356.0 mbsf, where we observed torque at the depth of the top of the 1000 mL Kuster FTS tool that was left in the bottom of the hole. After working the top of the tool remnants, two 30 bbl mud sweeps were pumped and the hole was circulated out. The bit was raised to 291.2 mbsf, and the top drive was set back. We continued to pull the drill string out of the hole, clearing the top of the reentry funnel at 0535 h on 10 June. The remainder of the drill string was pulled back to surface, and the bit cleared the rig floor at 0840 h. The bit and the float were inspected at the rig floor. The bit was intact, with slight markings indicating its interaction with the 1000 mL Kuster FTS leftovers; however, the Baker float was severely damaged by heat, and all the rubber components were partially disintegrated.
We assembled a milling bit and two boot-type junk baskets and lowered the drill string to the seafloor in an attempt to clean the lost 1000 mL Kuster FTS tool from the hole. We reentered Hole U1528D for the sixth time at 1519 h on 10 June, lowered the bit to 356 mbsf, and started grinding up the Kuster FTS tool with the milling bit from 356 to 359 mbsf. No torque was observed during the milling. After reaching 359 mbsf, we worked the junk basket multiple times, circulated high-viscosity mud sweeps, and started pulling the drill string out of the hole. The milling bit cleared the rig floor at 0225 h on 11 June. The junk baskets contained rock debris but no leftovers from the lost 1000 mL Kuster FTS tool.
We then assembled the RCJB with twin boot-type baskets for a last attempt at clearing the hole. At 0415 h, we stopped operations because of storm-force winds and high seas. The next 31.75 h were spent waiting for the weather to improve enough to continue operations.
Once the weather had abated, we completed assembling the RCJB BHA, lowered it to the seafloor, and deployed the subsea camera and sonar system to assist in positioning the ship for reentry. We reentered Hole U1528D for the seventh time at 1714 h on 12 June. We continued lowering the drill string into the hole, retrieved the subsea camera, picked up the top drive, and washed down from 327 to 352.3 mbsf. At this depth, we tagged hard debris fill that led to high torque. We continued attempting to work the drill string back to the bottom of the hole and started to divert the flow path on the RCJB at 2100 h. When we reached 359.3 mbsf, we pumped 25 bbl of high-viscosity mud, worked the RCJB BHA to the bottom of Hole U1528D, and circulated for 15 min in an attempt to recover any parts of the lost Kuster FTS tool. At 0030 h on 13 June, we started pulling the drill string out of the hole. The drill string cleared the seafloor at 0220 h. When the end of the drill string arrived back on the rig floor at 0405 h, we discovered that the lowermost 172.8 m of the drill string was missing; this loss ended our Hole U1528D drilling operations. The drill string failed in a piece of 5 inch pipe above the BHA. Furthermore, the broken piece that was recovered showed significant damage from corrosion (Figure F10A), likely due to the strong acid and H2S embrittlement conditions encountered in the hole. These conditions are reflected by encrustations of sulfate and native sulfur at the recovered latch sleeve (Figure F10B).
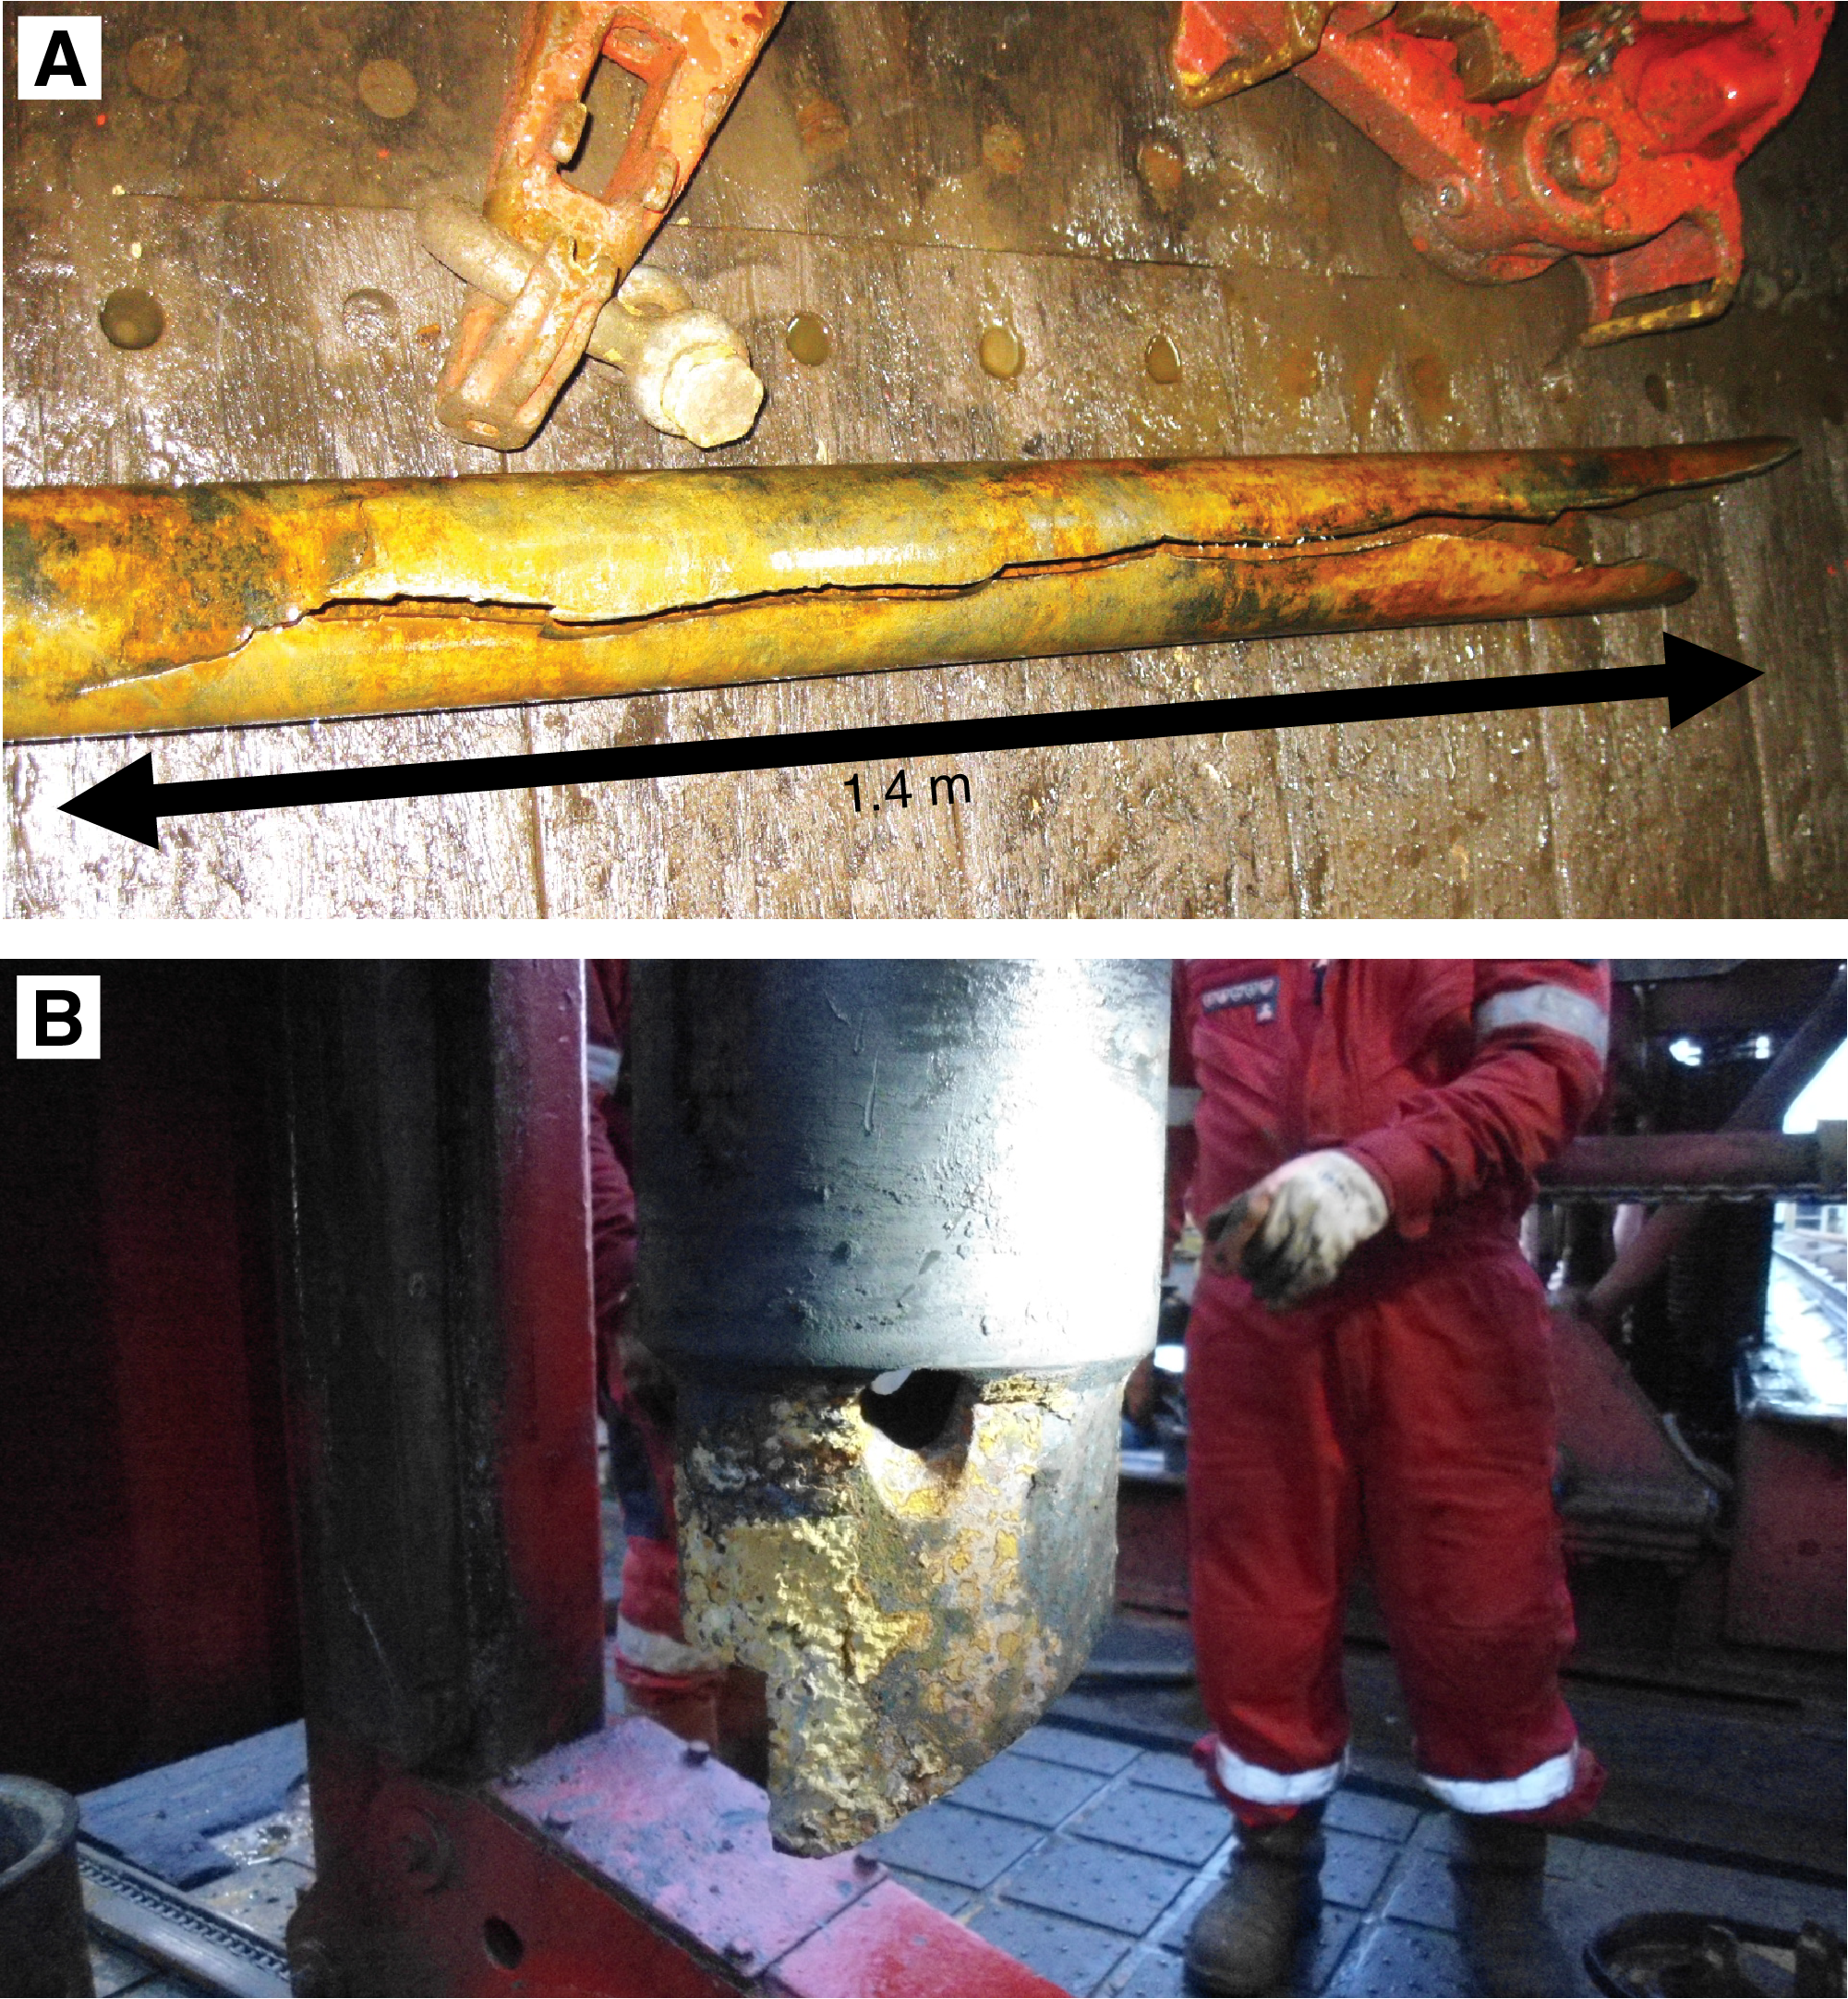
Figure F10. Damage from downhole corrosion, Hole U1528D.
After conducting operations at Sites U1530 and U1531, we returned to Hole U1528D to perform downhole temperature measurements and fluid sampling, marking our final science operations of Expedition 376. At 1720 h on 1 July, we lowered the drill string to reenter Hole U1528D at 1805 h for the eighth time. We lowered the end of the drill string to 27.2 mbsf and started an alternating series of temperature measurements and two BF sampling attempts. These measurements consisted of (1) the ETBS memory tool tagged the bottom of the hole at 195 mbsf and recorded a maximum temperature of 198°C at 160 mbsf; (2) the 600 mL Kuster FTS tool successfully recovered BF at 160 mbsf; (3) the TCMT flooded and did not obtain any data; (4) a second 600 mL Kuster FTS tool deployed at 160 mbsf returned to the ship empty because the sample chamber valves failed to close; and (5) another deployment of the TCMT to 160 mbsf, where it recorded a temperature of 156°C. We pulled the drill string out of the hole, and it cleared the seafloor at 0630 h on 2 July. After an ETBS memory tool deployment in Hole U1531E, we returned for a ninth time to Hole U1528D in an attempt to perform another 600 mL Kuster FTS tool run. We abandoned the attempt when we observed the Hole U1528D reentry funnel on its side on the seafloor, ending all operations at this hole. In total, 391.5 h, or 16.3 days, was spent in Hole U1528D, with eight successful reentries.
Igneous petrology and volcanology
At Site U1528, three igneous units were recovered: Unit 1, Unit 2 (Subunits 2a, 2b, and 2c), and Unit 3 (Figure F11). Igneous Unit 1 consists of unaltered to highly altered polymict dacitic lapilli tephra recovered from intervals 376-U1528A-1R-1, 0 cm, to 1R-CC, 14 cm (0–6.03 mbsf); 3G-1, 0 cm, to 3G-CC, 12 cm; and 376-U1528C-3N-1, 0 cm, to 4N-1, 41 cm (26.50–31.41 mbsf). Igneous Unit 2 consists of sequences of altered lapillistone and lapilli-tuff with subordinate intervals of altered tuff, tuff-breccia, and more coherent dacite lava with a variable degree of alteration recovered in intervals 376-U1528A-4R-1, 0 cm, to 15R-1, 17 cm (16.30–83.57 mbsf); 376-U1528C-5N-1, 0 cm, to 7N-1, 150 cm (35.50–46.00 mbsf); and 376-U1528D-2R-1, 0 cm, to 45R-1, 93 cm (61.30–269.30 mbsf). This unit also includes several intervals where the original, most likely volcaniclastic rock could not be unequivocally identified (i.e., most of Subunit 2c). Igneous Unit 3 consists of altered dacite lava with some relatively unaltered intervals recovered from interval 376-U1528D-46R-1, 0 cm, to 63R-1, 57 cm (162.50–269.03 mbsf).
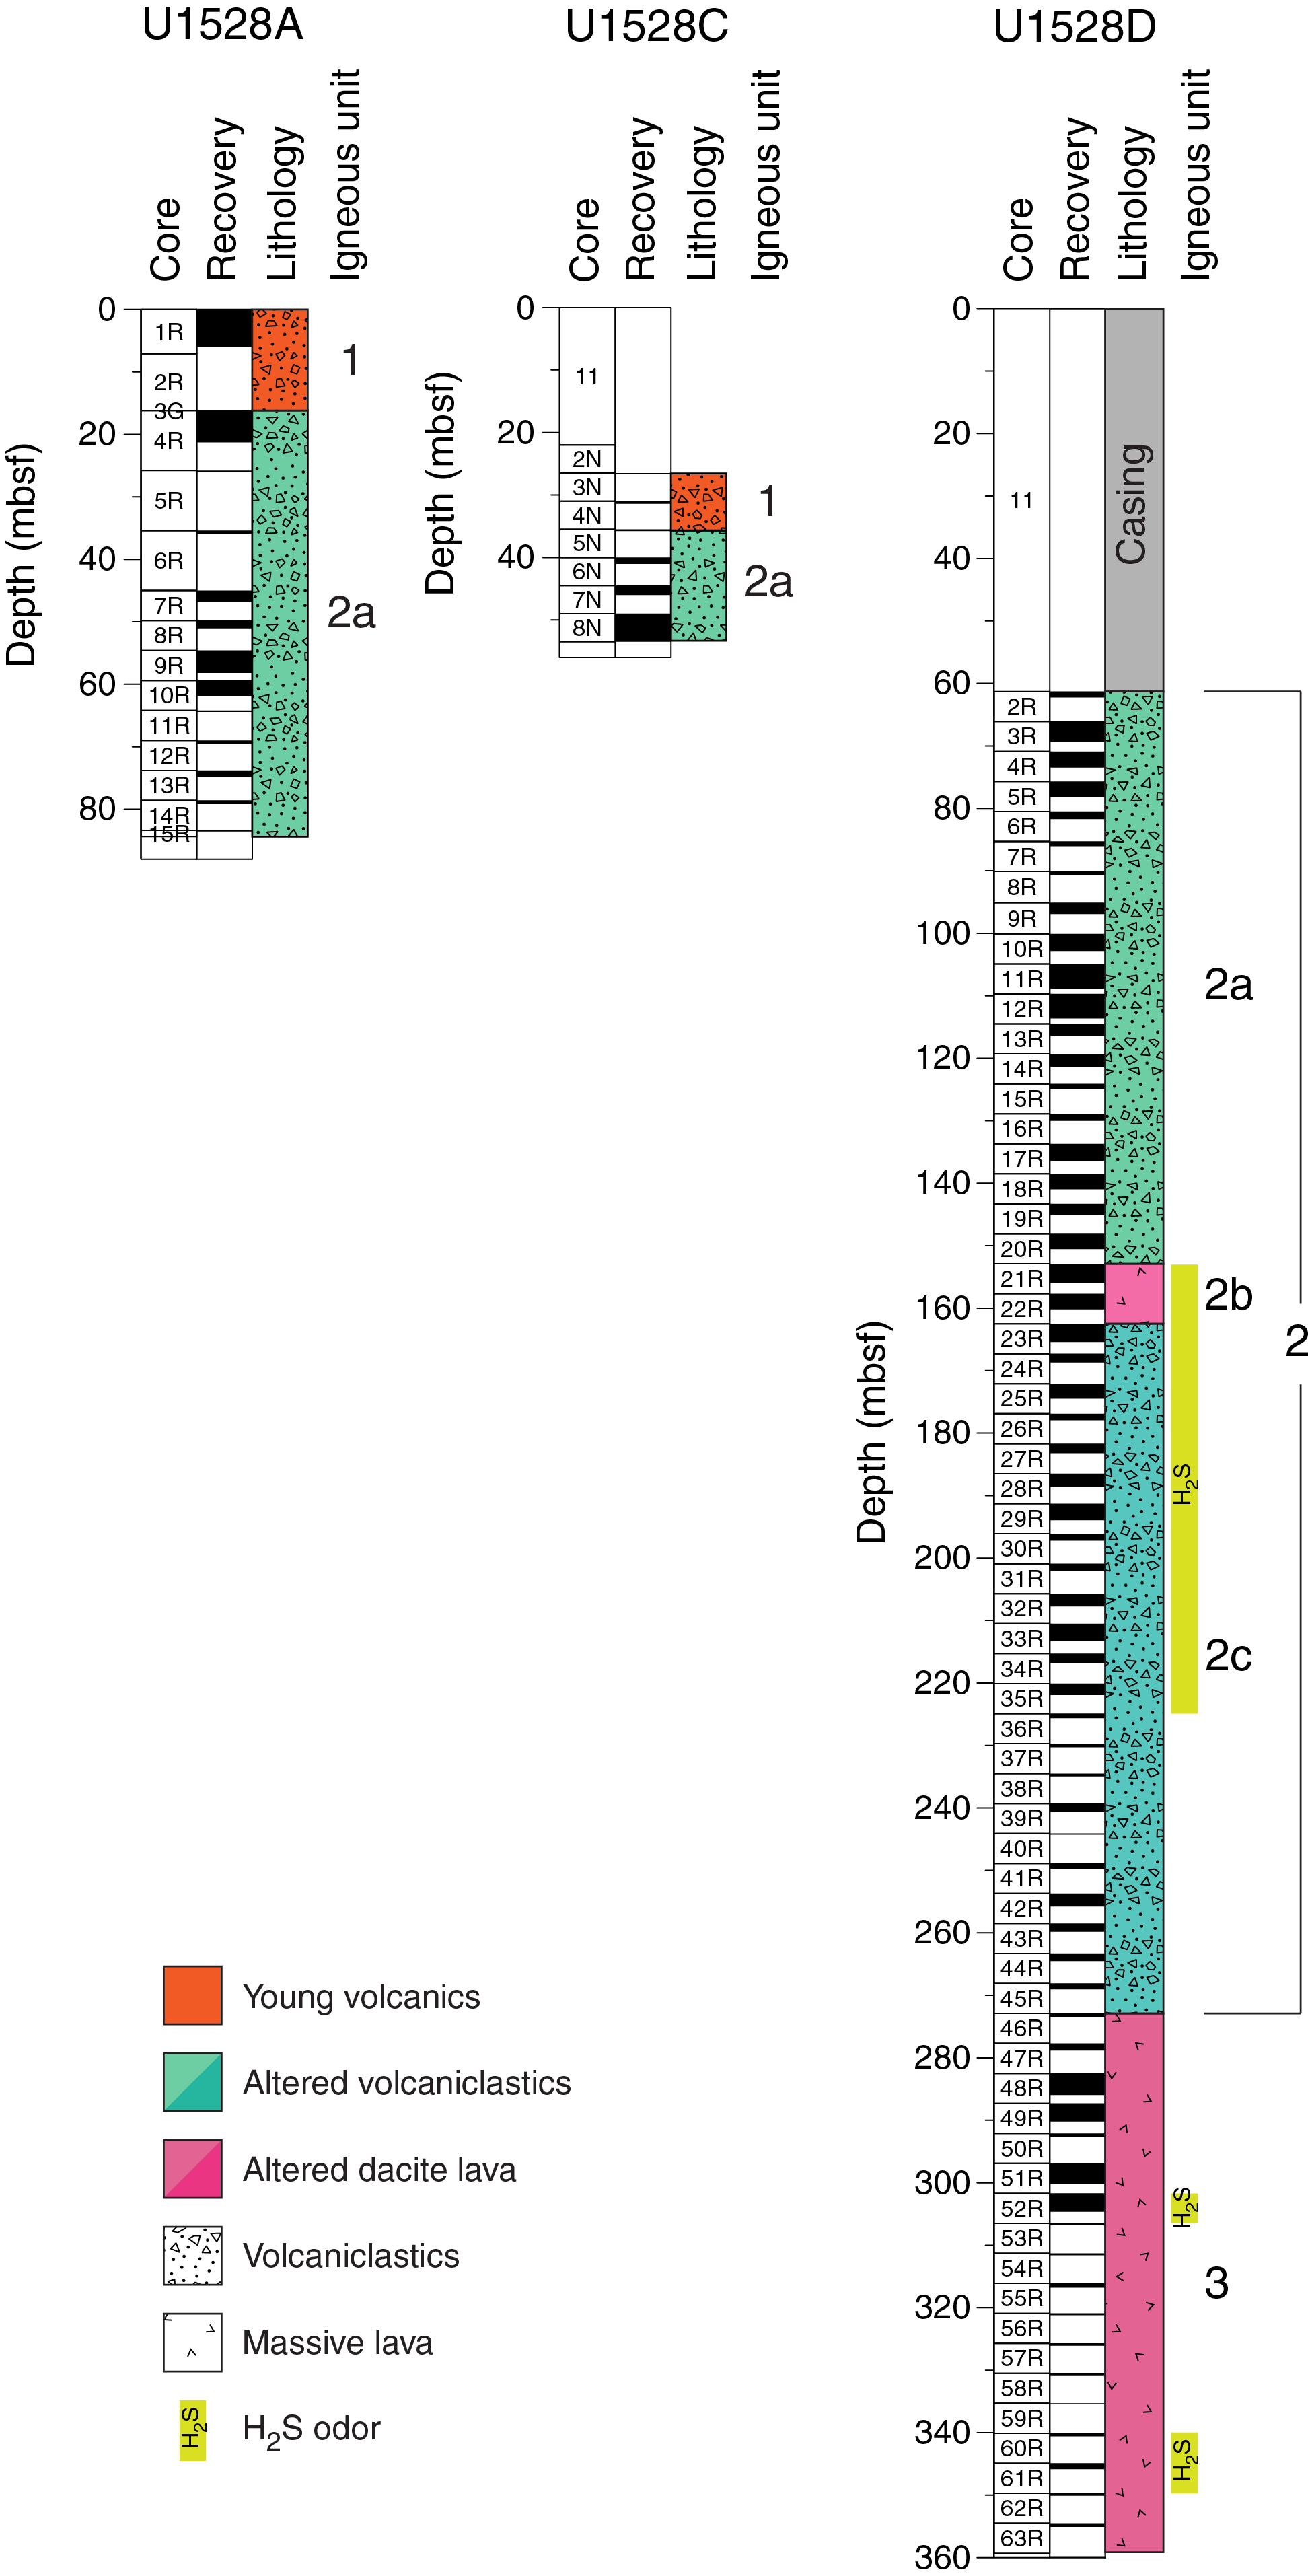
Figure F11. Lithostratigraphic summary, Holes U1528A, U1528C, and U1528D.
Igneous Unit 1
- Intervals: 376-U1528A-1R-1, 0 cm, to 1R-CC, 14 cm; 3G-1, 0 cm, to 3G-CC, 12 cm; 376-U1528C-3N-1, 0 cm, to 4N-1, 41 cm
- Depths: Hole U1528A = 0–6.03 mbsf; Hole U1528C = 26.50–31.41 mbsf
- Lithology: altered polymict dacitic lapilli tephra with at least two types of volcanic clasts and subrounded sulfur lapilli
Unconsolidated polymict dacitic lapilli tephra was recovered in the upper parts of Holes U1528A and U1528C (Figure F12). Overall, the lapilli tephra is bluish gray, but individual clasts range from dark gray to almost white due to variable degrees of alteration of a probably similar volcanic protolith. Clasts are subangular to subrounded. Macroscopically, darker clasts largely represent the least-altered end-member, which often retains volcanic features such as plagioclase phenocrysts, vesicles, and rare pyroxene phenocrysts. Light gray to white, fine-grained clasts are highly altered with no discernible trace of the original lithology. Transitions between these clast varieties are common, and often the clasts show a darker gray core and a lighter rim. One clast recovered in Section 376-U1528A-3G-CC appears to be an altered volcaniclastic rock, although distinction between clasts and matrix is challenging. It does, however, contain vugs and pseudomorphs of secondary minerals after plagioclase. Subrounded sulfur lapilli (>1 vol%) occur throughout Igneous Unit 1, and native sulfur is also observed in vesicles and on the surface of the clasts (Figure F12A). A rounded clast in Section 1R-4 has a white rim resembling a bread-crust texture (Figure F12C). Fragments of such clasts with similar textures are found elsewhere in Unit 1.
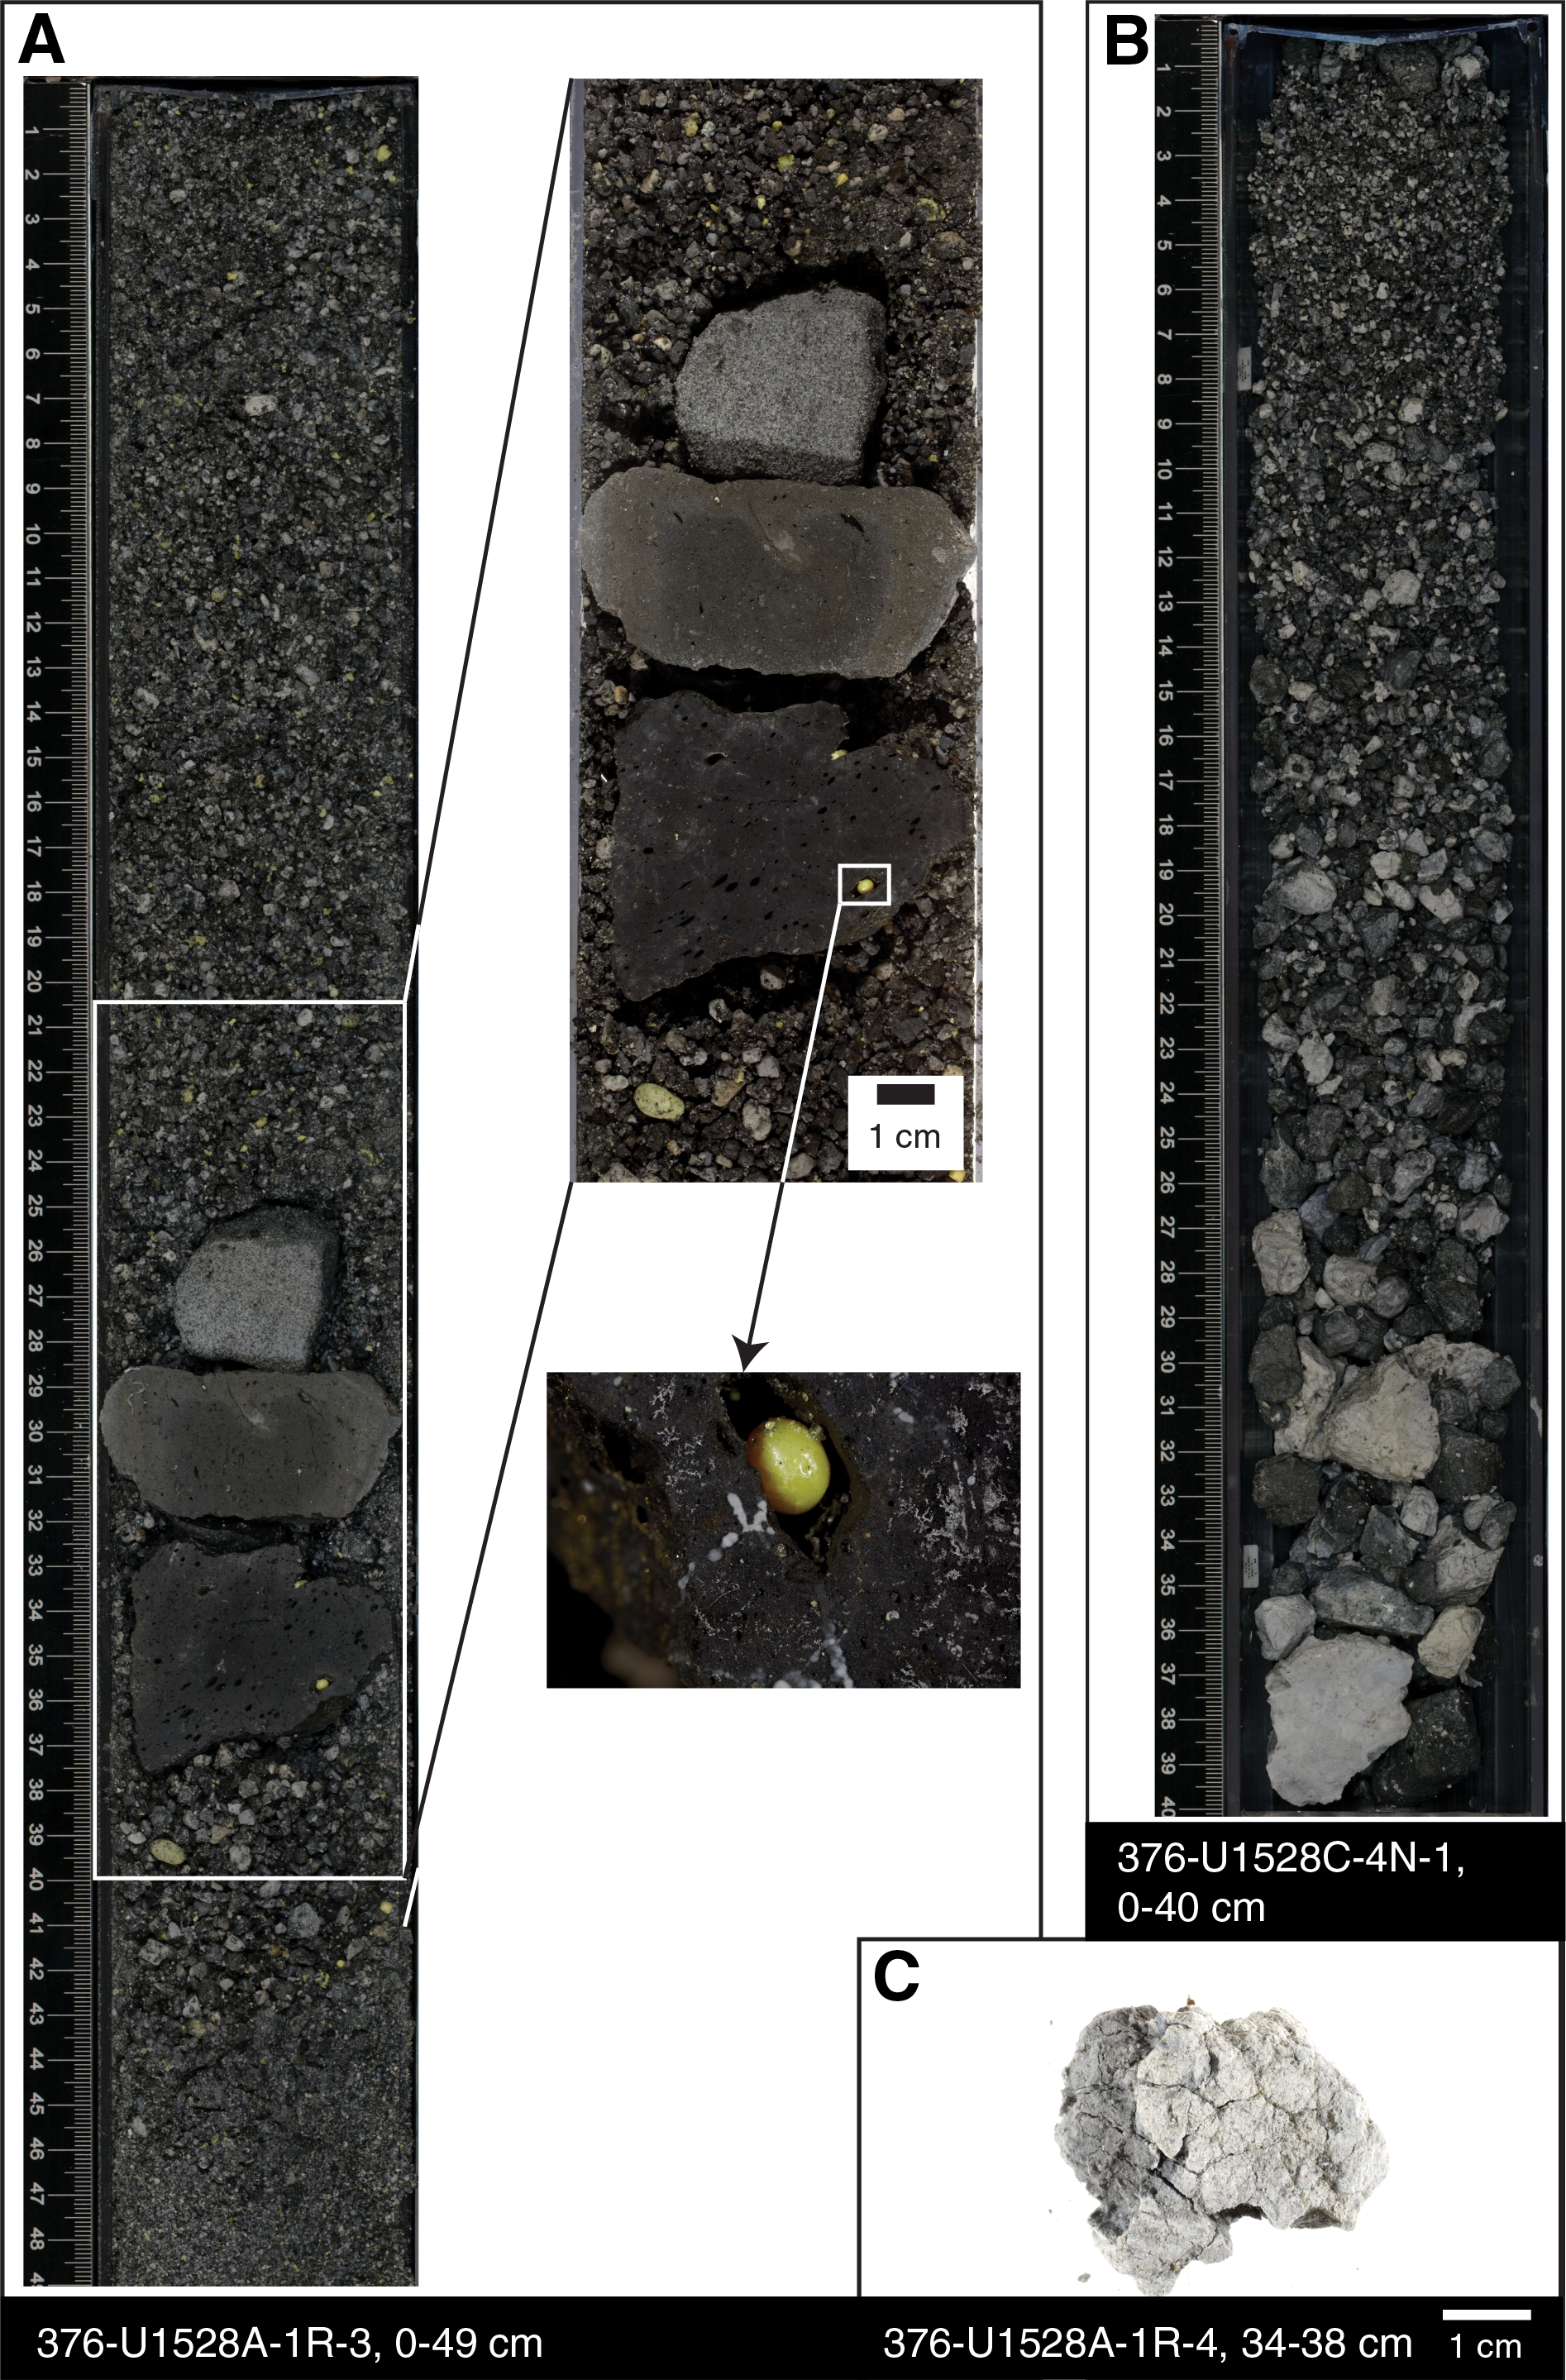
Figure F12. Igneous Unit 1 macroscopic samples, Holes U1528A and U1528C.
The average grain size of the dacitic lapilli tephra ranges from sand to large pebble. The largest clasts (found in Section 376-U1528A-1R-3) are cobble sized. Drilling effects on the reduction of recovered grain sizes in these unconsolidated tephra deposits are considered to be minor. However, normal gradation and the generally moderate to good sorting of the tephra are likely drilling induced.
Thin section petrography confirms that the dacitic lapilli tephra in Igneous Unit 1 is variably altered and polymict. Some clasts have a perlitic matrix with plagioclase microlites and unaltered remnants of plagioclase phenocrysts embedded in altered glass (Figure F13). In other clasts, no original features are recognizable in the groundmass and most of the primary igneous phases (i.e., plagioclase and clinopyroxene) have been replaced by secondary minerals (see Alteration). Native sulfur is present in these clasts.
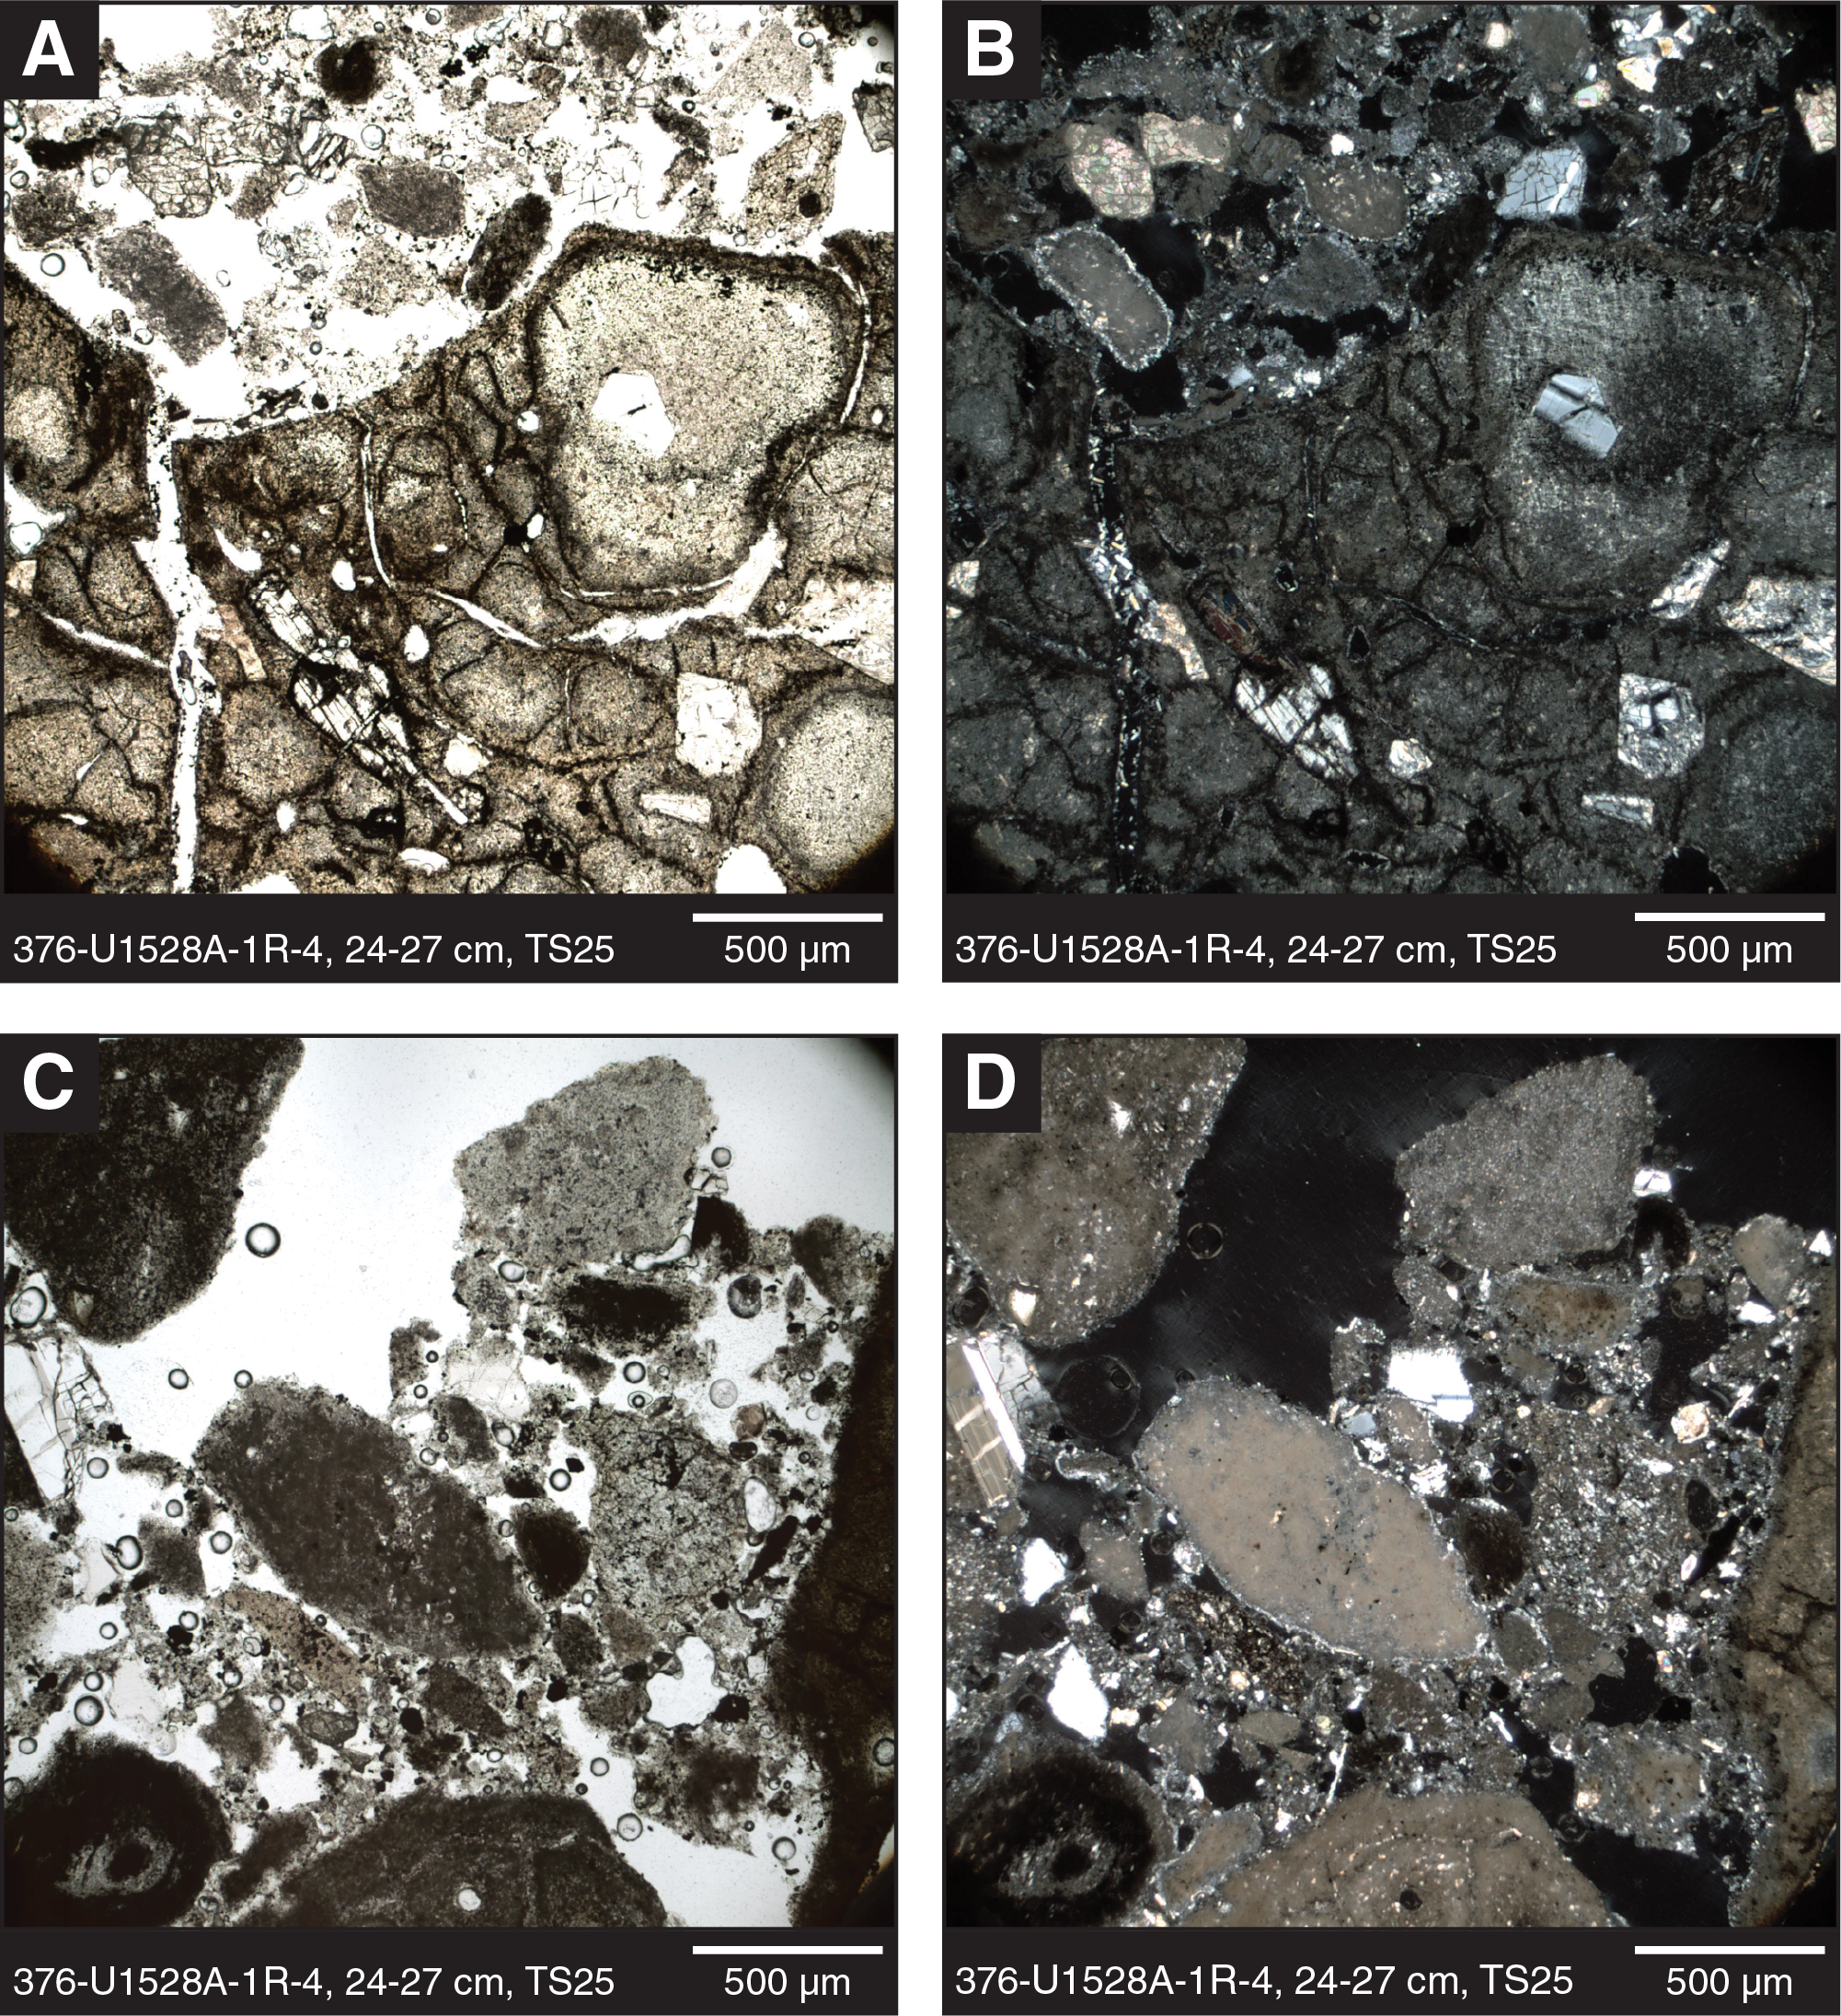
Figure F13. Igneous Unit 1 clasts.
Shipboard geochemical analyses (ICP-AES) confirmed that the altered lapilli-tuff has a dacitic composition.
The boundary between Igneous Units 1 and 2 in Holes U1528A and U1528C was not recovered, but it occurs between 6.03 and 16.30 mbsf in Hole U1528A (Cores 1R and 4R) and between 31.41 and 35.50 mbsf in Hole U1528C (Cores 4N and 5N) and reflects a lithologic change. Unit 1 rocks were not recovered in Hole U1528D.
Igneous Unit 2
- Intervals: 376-U1528A-4R-1, 0 cm, to 15R-1, 17 cm; 376-U1528C-5N-1, 0 cm, to 7N-1, 150 cm; 376-U1528D-2R-1, 0 cm, to 45R-1, 93 cm
- Depths: Hole U1528A = 16.20–83.57 mbsf; Hole U1528C = 35.50–46.00 mbsf; Hole U1528D = 61.30–269.30 mbsf
- Lithology: altered volcaniclastic rocks with subordinate horizons of more coherent altered dacite lava
Igneous Unit 2 consists mostly of altered, cemented volcaniclastic rocks. Intercalated are subordinate intervals of less altered and more coherent plagioclase-phyric dacite lava in Cores 376-U1528A-21R and 22R. Because of their minor occurrence, missing contacts, and hence unclear relationship to the principal volcaniclastic lithology, these intervals are included in Unit 2 but are distinguished as a subunit. Unit 2 is therefore divided into three subunits based on internal fabrics, the presence of primary minerals, and to a lesser extent thickness (Figure F14). Subunit 2a was observed in each hole from this site, whereas Subunits 2b and 2c were recovered only in Hole U1528D.

Figure F14. Stratigraphic correlation, Hole U1528D.
Igneous Subunit 2a
- Interval: 376-U1528A-4R-1, 0 cm, to 15R-1, 17 cm; 376-U1528C-5N-1, 0 cm, to 7N-1, 150 cm; 376-U1528D-2R-1, 0 cm, to 20R-2, 101 cm
- Depths: Hole U1528A = 16.20–83.57 mbsf; Hole U1528C = 35.50–46.00 mbsf; Hole U1528D = 61.30–150.53 mbsf
- Lithology: altered lapillistone, lapilli-tuff, minor tuff, and tuff-breccia
Igneous Subunit 2a consists mostly of altered, cemented volcaniclastic rocks that are composed of clast-supported lapillistone and matrix-supported lapilli-tuff as well as subordinate tuff-breccia and tuff (Figure F15). Some sections of Subunit 2a are altered to an extent that distinction between matrix and clasts is no longer possible, and the rock is thus described as “altered volcaniclastic.” Most intervals appear to be polymict (Figures F15A, F15D, F16A), but in many cases, individual clasts cannot be easily distinguished. In general, this subunit is mostly bluish gray with some intervals that are light gray, gray, very dark bluish gray, and light bluish gray. Sorting is generally poor to moderate, and average clast size ranges between granules and very large pebbles although some clasts reach cobble size. The clasts are subangular to subrounded and represent variably altered volcanic rocks (Figure F16B), although in many cases the original lithology can no longer be determined due to intensive alteration. Some clasts, however, still display original volcanic features in the form of vesicles (sometimes elongated and often filled with secondary minerals), remnant plagioclase phenocrysts (Figure F16C, F16D), or pseudomorphs after plagioclase formed by secondary minerals (Figure F16E). Variable degrees of alteration, as well as zoned alteration of many clasts that have a darker core surrounded by a lighter rim, and vice versa, were observed (Figure F16F). Many intervals contain clasts composed of various lithofragments and/or show evidence for incipient fracturing.
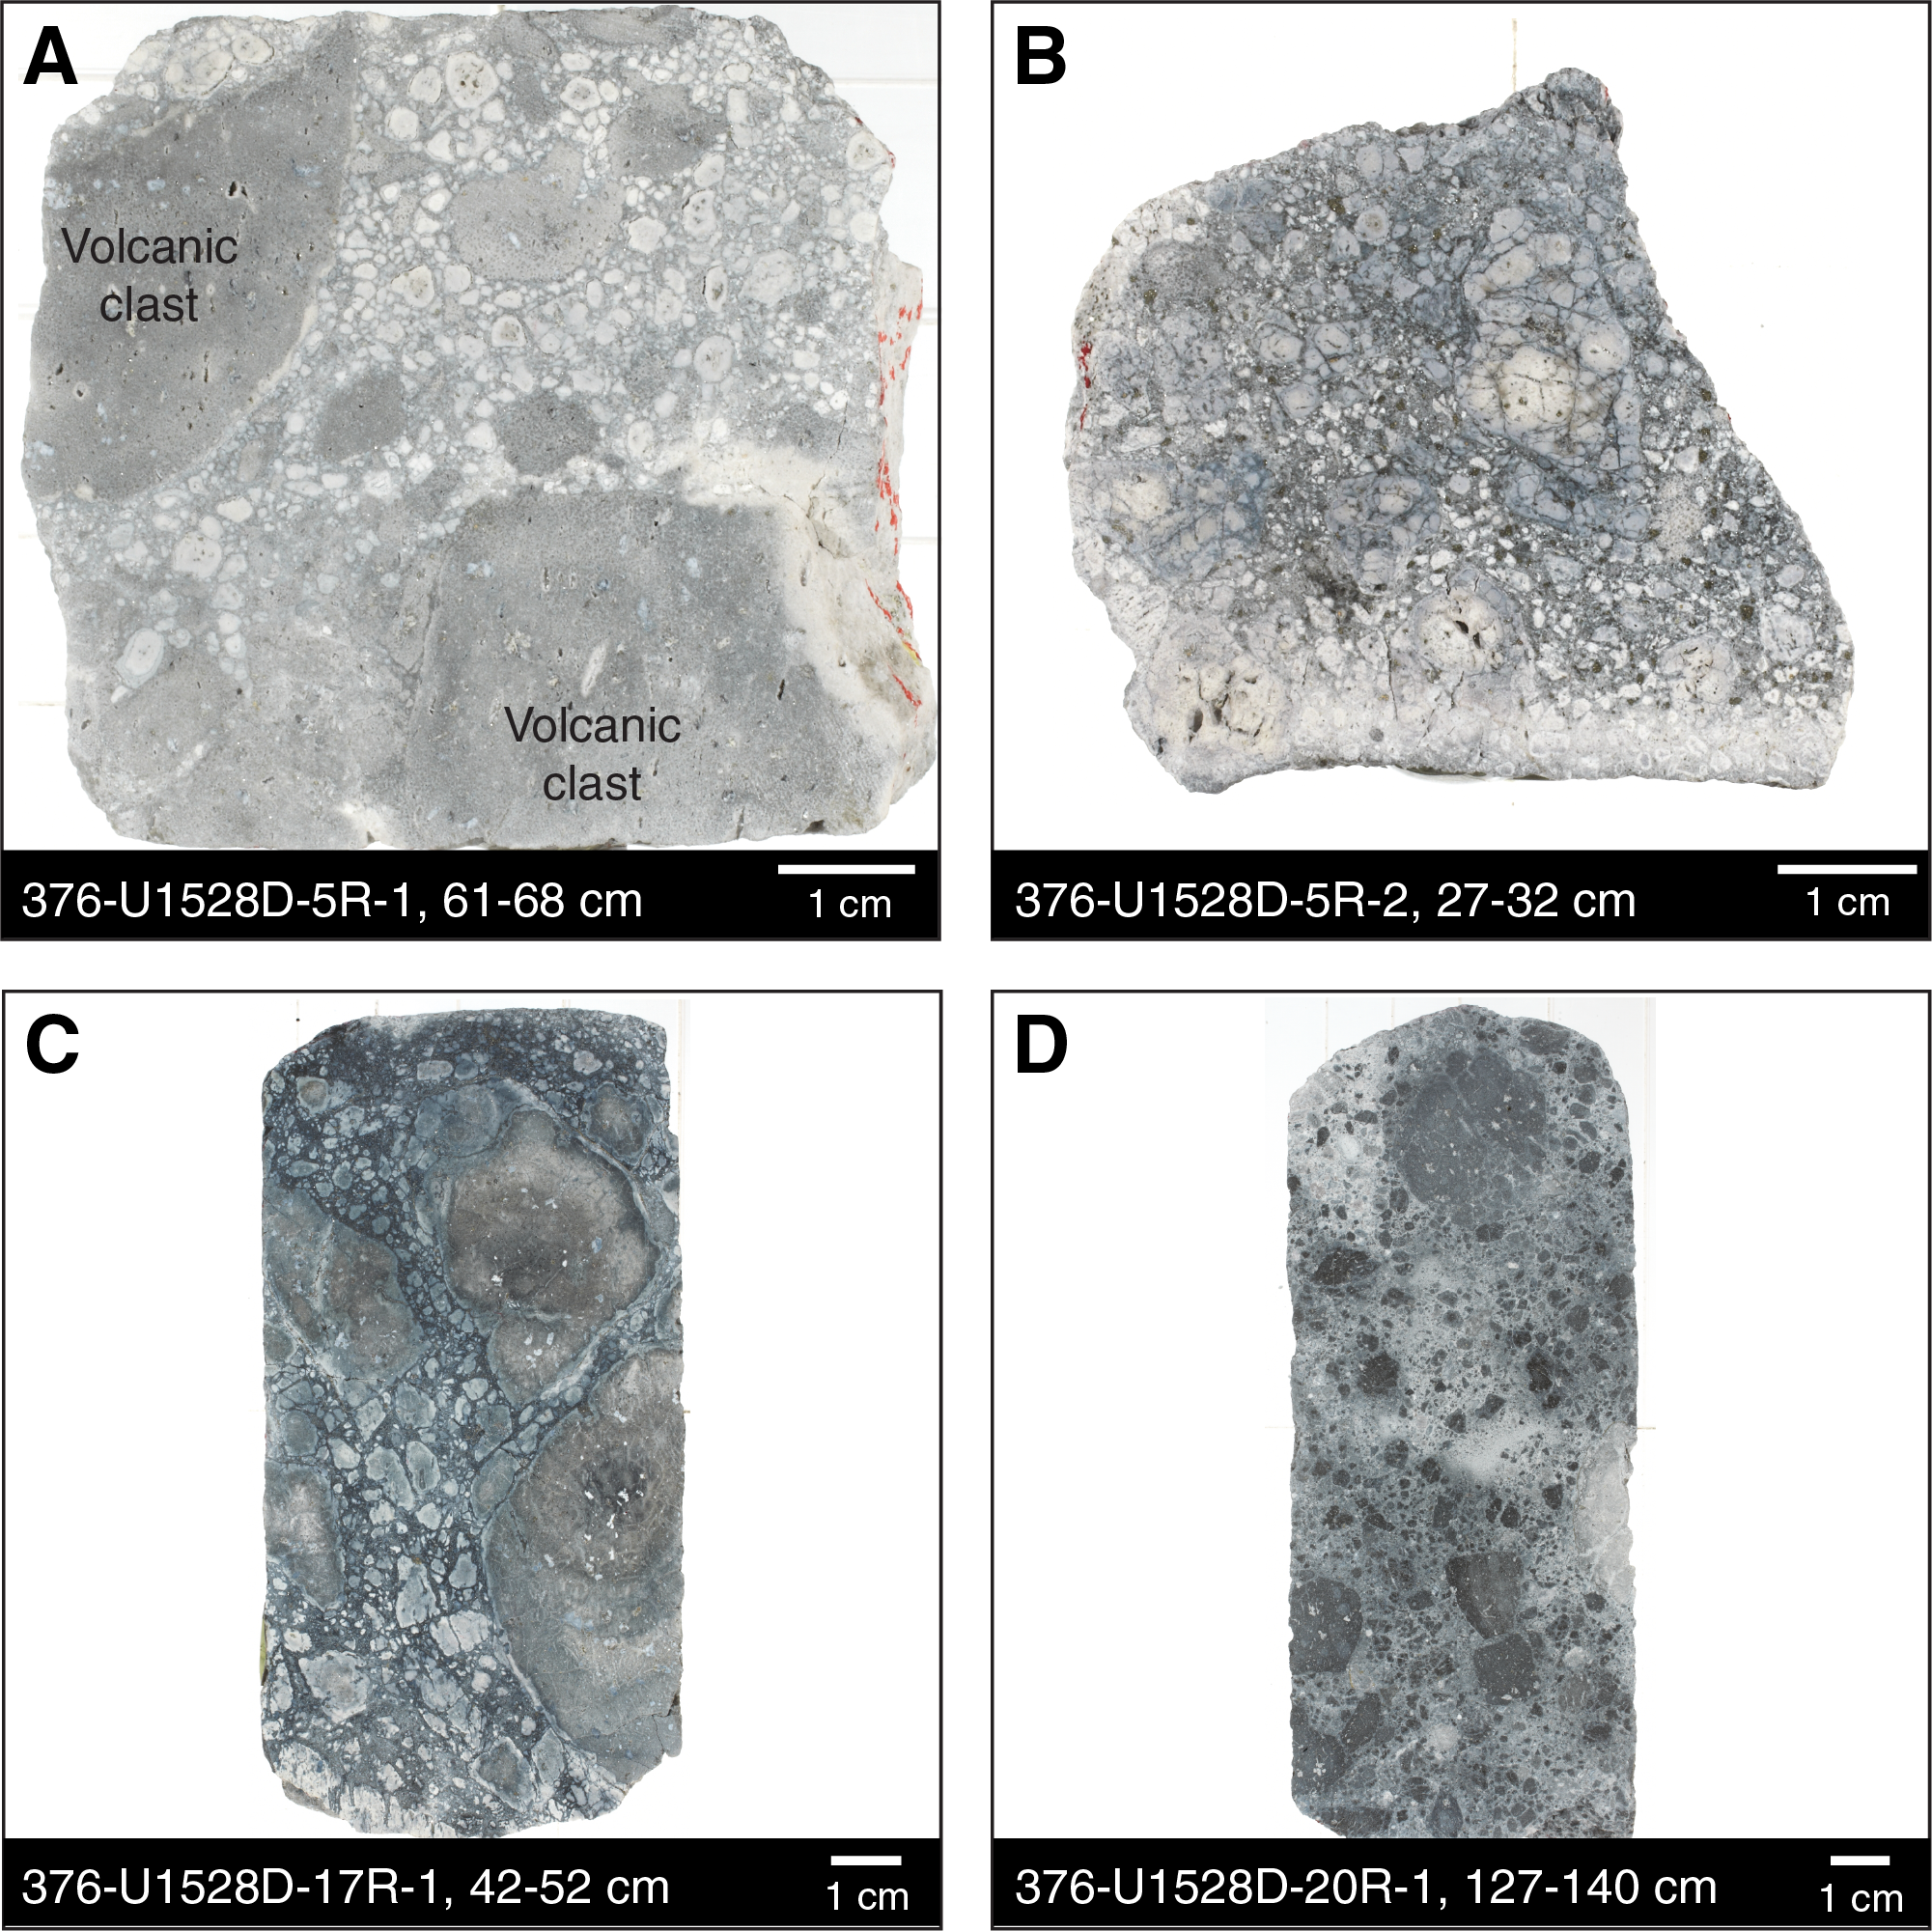
Figure F15. Subunit 2a macroscopic samples, Hole U1528D.
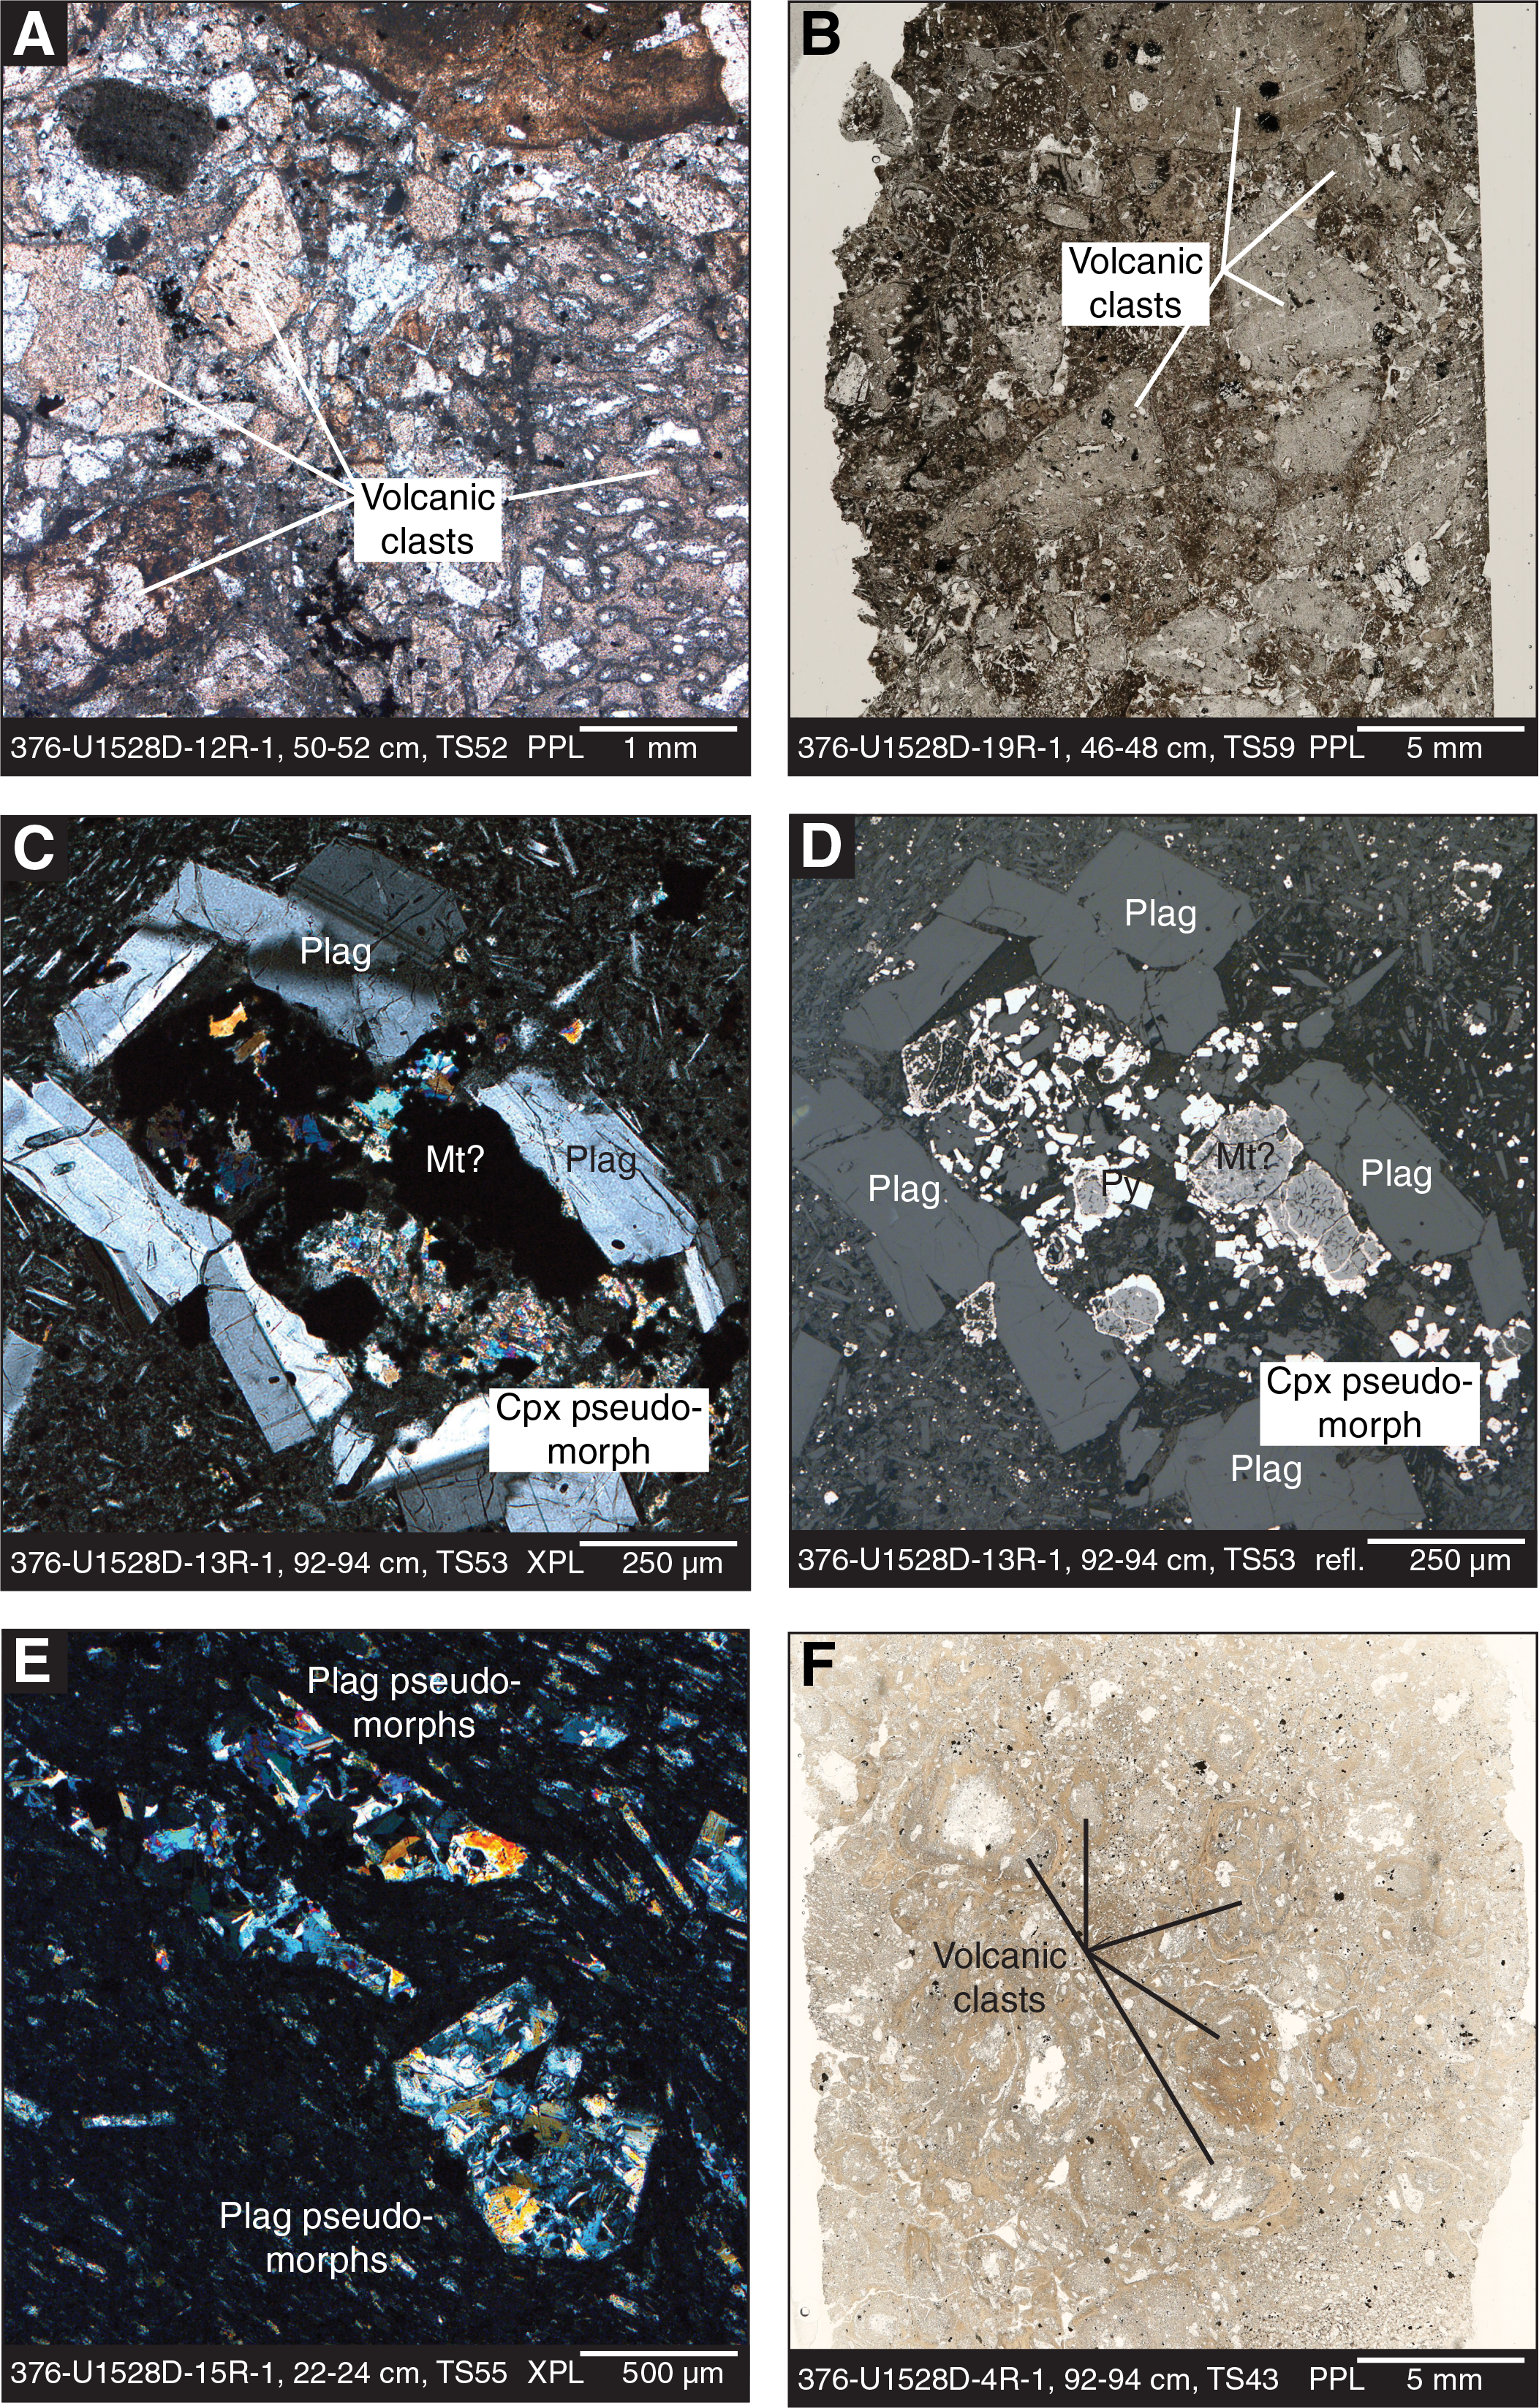
Figure F16. Subunit 2a volcanic clasts and glomerocryst, Hole U1528D.
Matrix abundances range between 25 and 70 vol% in the lapilli-tuff and between 5 and 20 vol% in the lapillistone. The matrix consists of highly altered and cemented tuff or volcanic ash and/or hydrothermal precipitates. The rocks of Igneous Subunit 2a are poorly sorted with a continuum of grain sizes from matrix (<2 mm) to clasts (>2 mm), making the distinction between clasts and matrix difficult, particularly when combined with a pervasive alteration overprint. Native sulfur and hydrothermal sulfides are sometimes present in the matrix together with thin (~1–2 mm) sulfate/sulfide-bearing veins with alteration halos. The matrix in Hole U1528C is unconsolidated and mostly consists of clay. In Holes U1528A and U1528D, the matrix is typically cemented.
Microscopically, there is a general downhole increase in alteration of the protolith in Igneous Subunit 2a. For example, from the top of Subunit 2a through Section 376-U1528D-5R-1, thin section observations of clasts in the altered, matrix-supported, polymict lapilli-tuff show about 10 vol% primary plagioclase phenocrysts (as large as 1.5 mm) and relics of clinopyroxene and magnetite. Clinopyroxene, however, is intensely altered or completely replaced by secondary minerals, and the rims of the magnetite are resorbed to form pyrite. From Section 7R-1 downhole, individual clasts are covered by brownish clay and the matrix contains alteration-induced vugs. Primary igneous minerals are completely replaced by secondary minerals including sulfates, sulfides, quartz, amorphous silica, and/or native sulfur; pseudomorphs after plagioclase phenocrysts and vesicles are the only primary textural features that have remained from the protolith. From Section 9R-1 downhole, no original phenocrysts, groundmass, or other igneous features or textures are recognizable. The clasts and matrix have similar mineralogy consisting of sulfate minerals, clay, and silica. Sulfide minerals are dominated by pyrite. Phenocryst-shaped vugs are filled with bluish secondary sulfate minerals (including alunite), sulfide minerals, and native sulfur (see Alteration).
The boundary between Igneous Subunits 2a and 2b was delineated by a change in the character of the rock from predominantly volcaniclastic to more coherent and less altered lava (Figure F14). This change occurs between Cores 376-U1528D-20R and 21R (150.53 and 152.90 mbsf). Although the lava is fractured in some intervals in Subunit 2b, fractures are thin and the fragmentation mostly seems to have been in situ. Individual fragments can be fitted together such that the texture of the coherent rock is clearly discernible (e.g., by continuous vesicle lines) (Figure F17B, F17D). However, both the upper and lower boundaries of Subunit 2b are gradational. At the margins of Subunit 2b the lava gradually becomes more clastic, exhibiting more intense fragmentation of the dacite. These gradational changes make it difficult to discern clear subunit boundaries; however, macroscopic and microscopic observations (see below) are in good agreement in Cores 21R and 22R (Figure F14), which are thus defined as Subunit 2b.
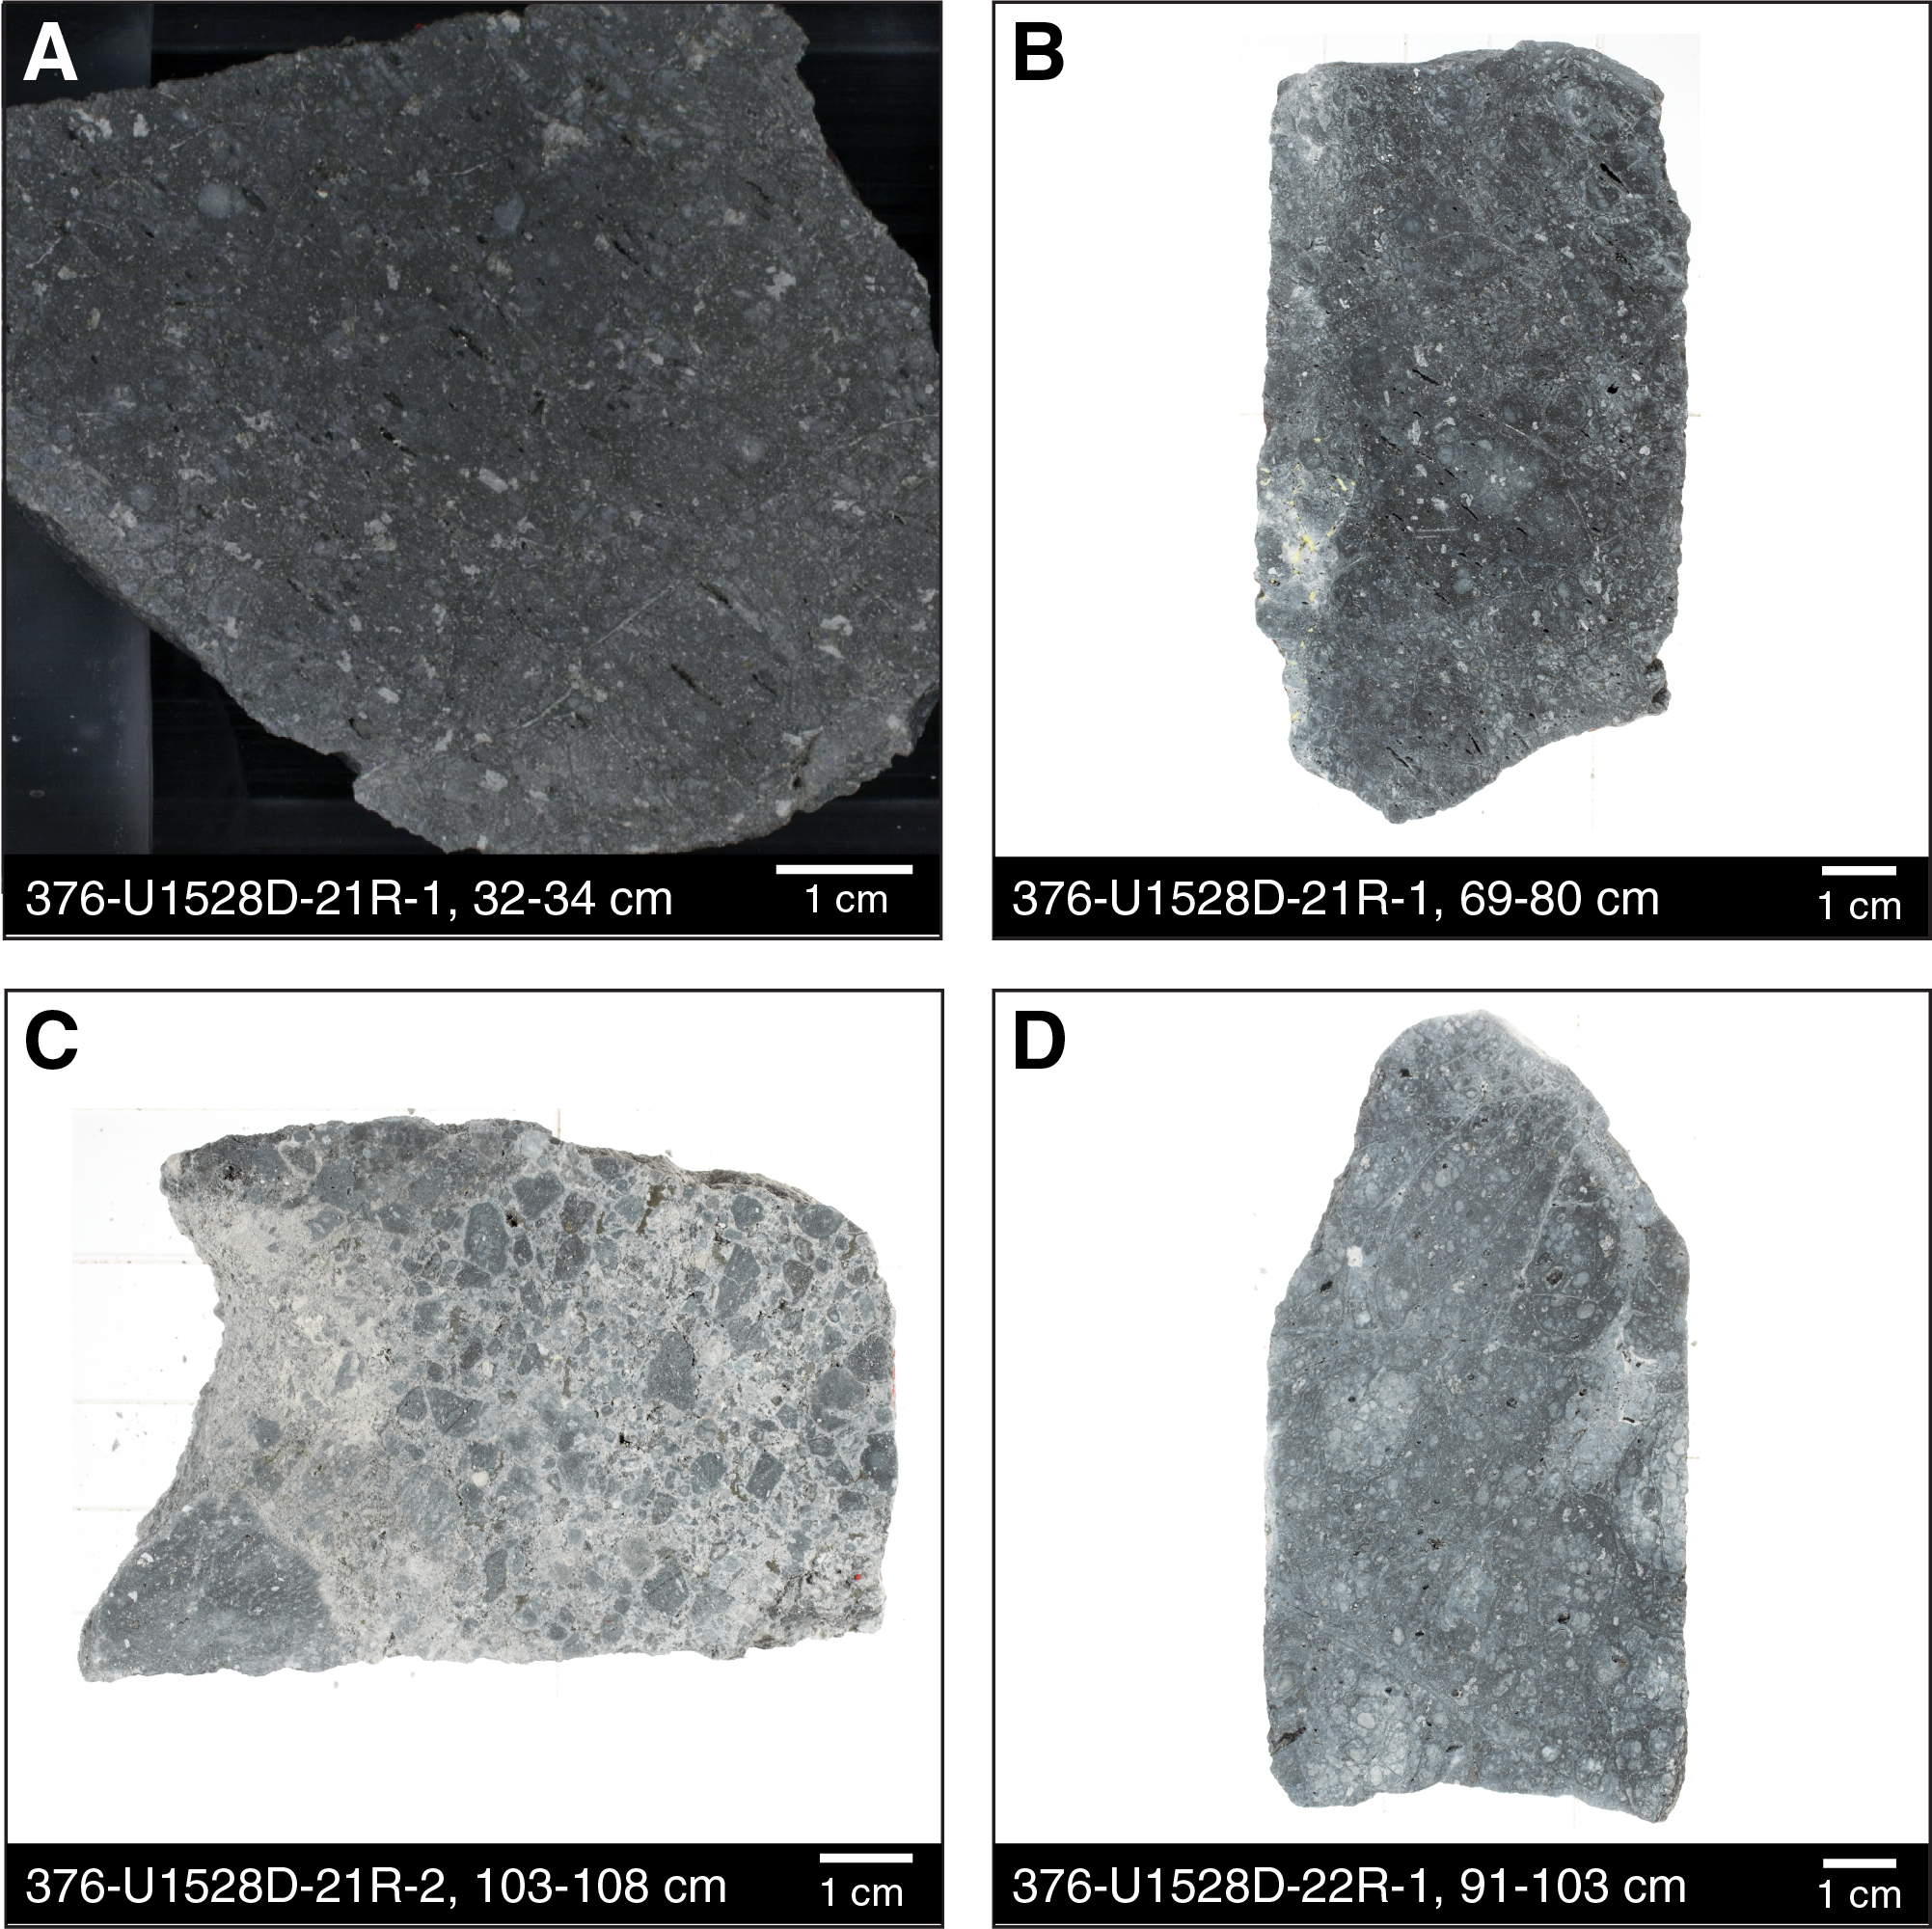
Figure F17. Subunit 2b macroscopic samples, Hole U1528D.
Igneous Subunit 2b
- Interval: 376-U1528D-21R-1, 0 cm, to 22R-2, 101 cm
- Depth: 152.90–160.17 mbsf
- Lithology: altered plagioclase-phyric dacite lava with subordinate volcaniclastic horizons
Igneous Subunit 2b predominantly consists of very dark bluish gray, altered, largely coherent plagioclase-phyric dacite lava with a macroscopically and microscopically preserved primary volcanic texture and unaltered plagioclase phenocrysts (Figures F17, F18). The lava contains 5 vol% euhedral plagioclase phenocrysts (unaltered or only partially altered) and glomerocrysts in a microcrystalline groundmass with patchy alteration. Vesicles make up 5–6 vol% and are lined with secondary minerals. Some pieces have aligned and elongated open vesicles (most likely primary) that suggest a flow texture (e.g., Section 376-U1528D-21R-1).
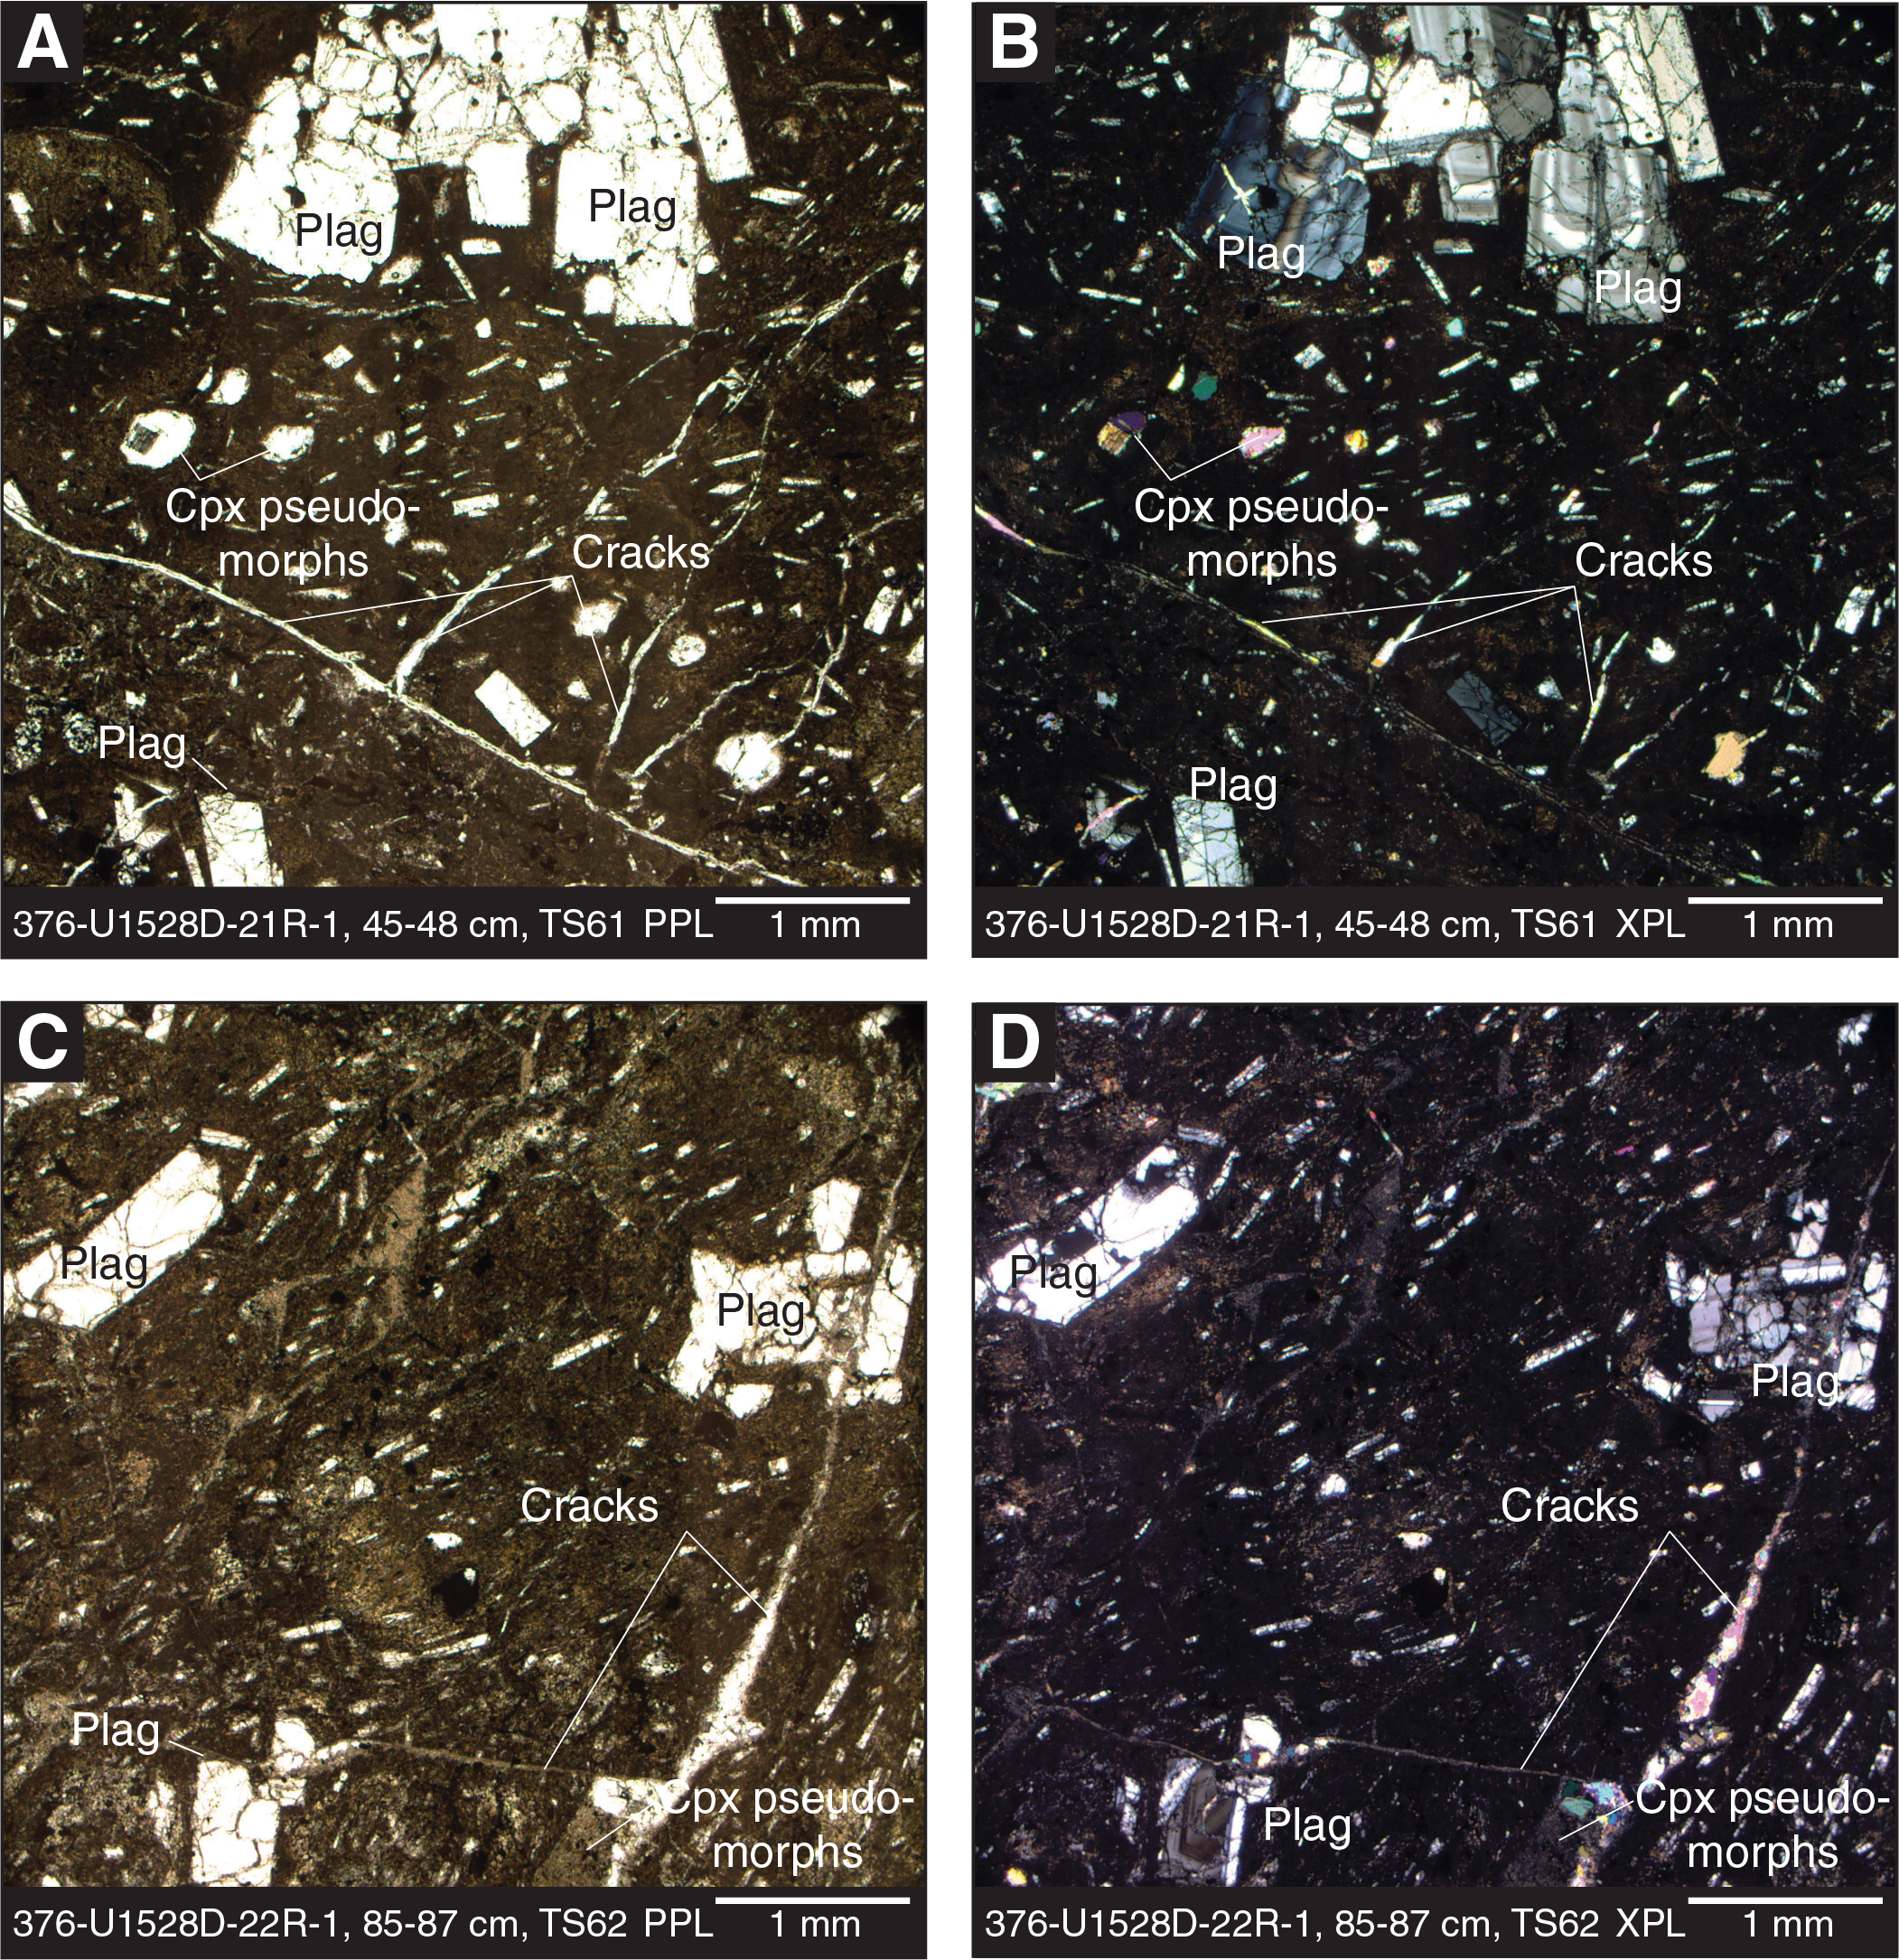
Figure F18. Subunit 2b plagioclase and dacite with glomerocrysts, Hole U1528D.
Thin section observations of samples from Igneous Subunit 2b (Figure F18) show euhedral, subequant to tabular plagioclase phenocrysts (~8–10 vol%) as large as 2.5 mm that may show oscillatory zoning and occasionally form glomeroporphyritic aggregates. Smaller, tabular to acicular microlites of plagioclase exhibit both random distribution and trachytic texture in the groundmass. Plagioclase crystals are generally unaltered and reside in a groundmass (~70 vol%) that is pervasively altered; however, partly concentric (hydro)fracturing is still recognizable and includes preferred fluid ingress along the fractures. The lava is vesicular (~20 vol%) with millimeter-sized rounded but elongated vesicles commonly filled by secondary minerals. Although the phenocrysts and groundmass microlites appear unaltered, secondary phases are distributed pervasively throughout the sample.
The boundary between Igneous Subunits 2b and 2c was determined where the predominant lithology type changes from dacite lava to volcaniclastic lithologies, and primary textures and mineral phases are unrecognizable (Figure F14). This (transitional) boundary occurs between Cores 376-U1528D-22R and 23R (160.17 and 162.50 mbsf).
Igneous Subunit 2c
- Interval: 376-U1528D-23R-1, 0 cm, to 45R-1, 93 cm
- Depth: 162.50–269.03 mbsf
- Lithology: altered volcaniclastic rocks
Igneous Subunit 2c consists mostly of variably altered volcaniclastic rocks. Intervals where clasts and matrix can be distinguished and the volcanic origin of clasts is still identifiable consist of cemented lapilli-tuff (matrix- and clast-supported), tuff, and clast-supported lapillistone. With depth, increased alteration makes the distinction between matrix and clasts and the identification of clast lithology increasingly difficult (Figures F19, F20). In most intervals from Core 376-U1528D-27R downhole, clasts are present but the clast/matrix boundary is blurred. These intervals were classified as altered volcaniclastic rocks with no further distinction based on grain size or matrix abundance. In Cores 41R and 42R, clasts are no longer recognizable, and these intervals are simply classified as altered volcanic rock (Figure F14). Subunit 2c is mostly gray or bluish gray, but it also displays dark bluish gray to light bluish gray and light gray colors. Average grain size ranges between clay and medium pebbles, whereas individual clasts are as large as cobbles. The lapillistone and lapilli-tuff intervals are poorly to moderately sorted, whereas tuff intervals are well sorted. Altered fragments of volcanic rocks make up the clasts, which are angular to subrounded. Hydraulic fracturing is often observed. Matrix abundances range from 30 to 70 vol% for the lapilli-tuff and from 15 to 25 vol% for the lapillistone. Pseudomorphs after plagioclase and (partially infilled) vesicles still occur in individual intervals but are rarer than in Subunit 2a.
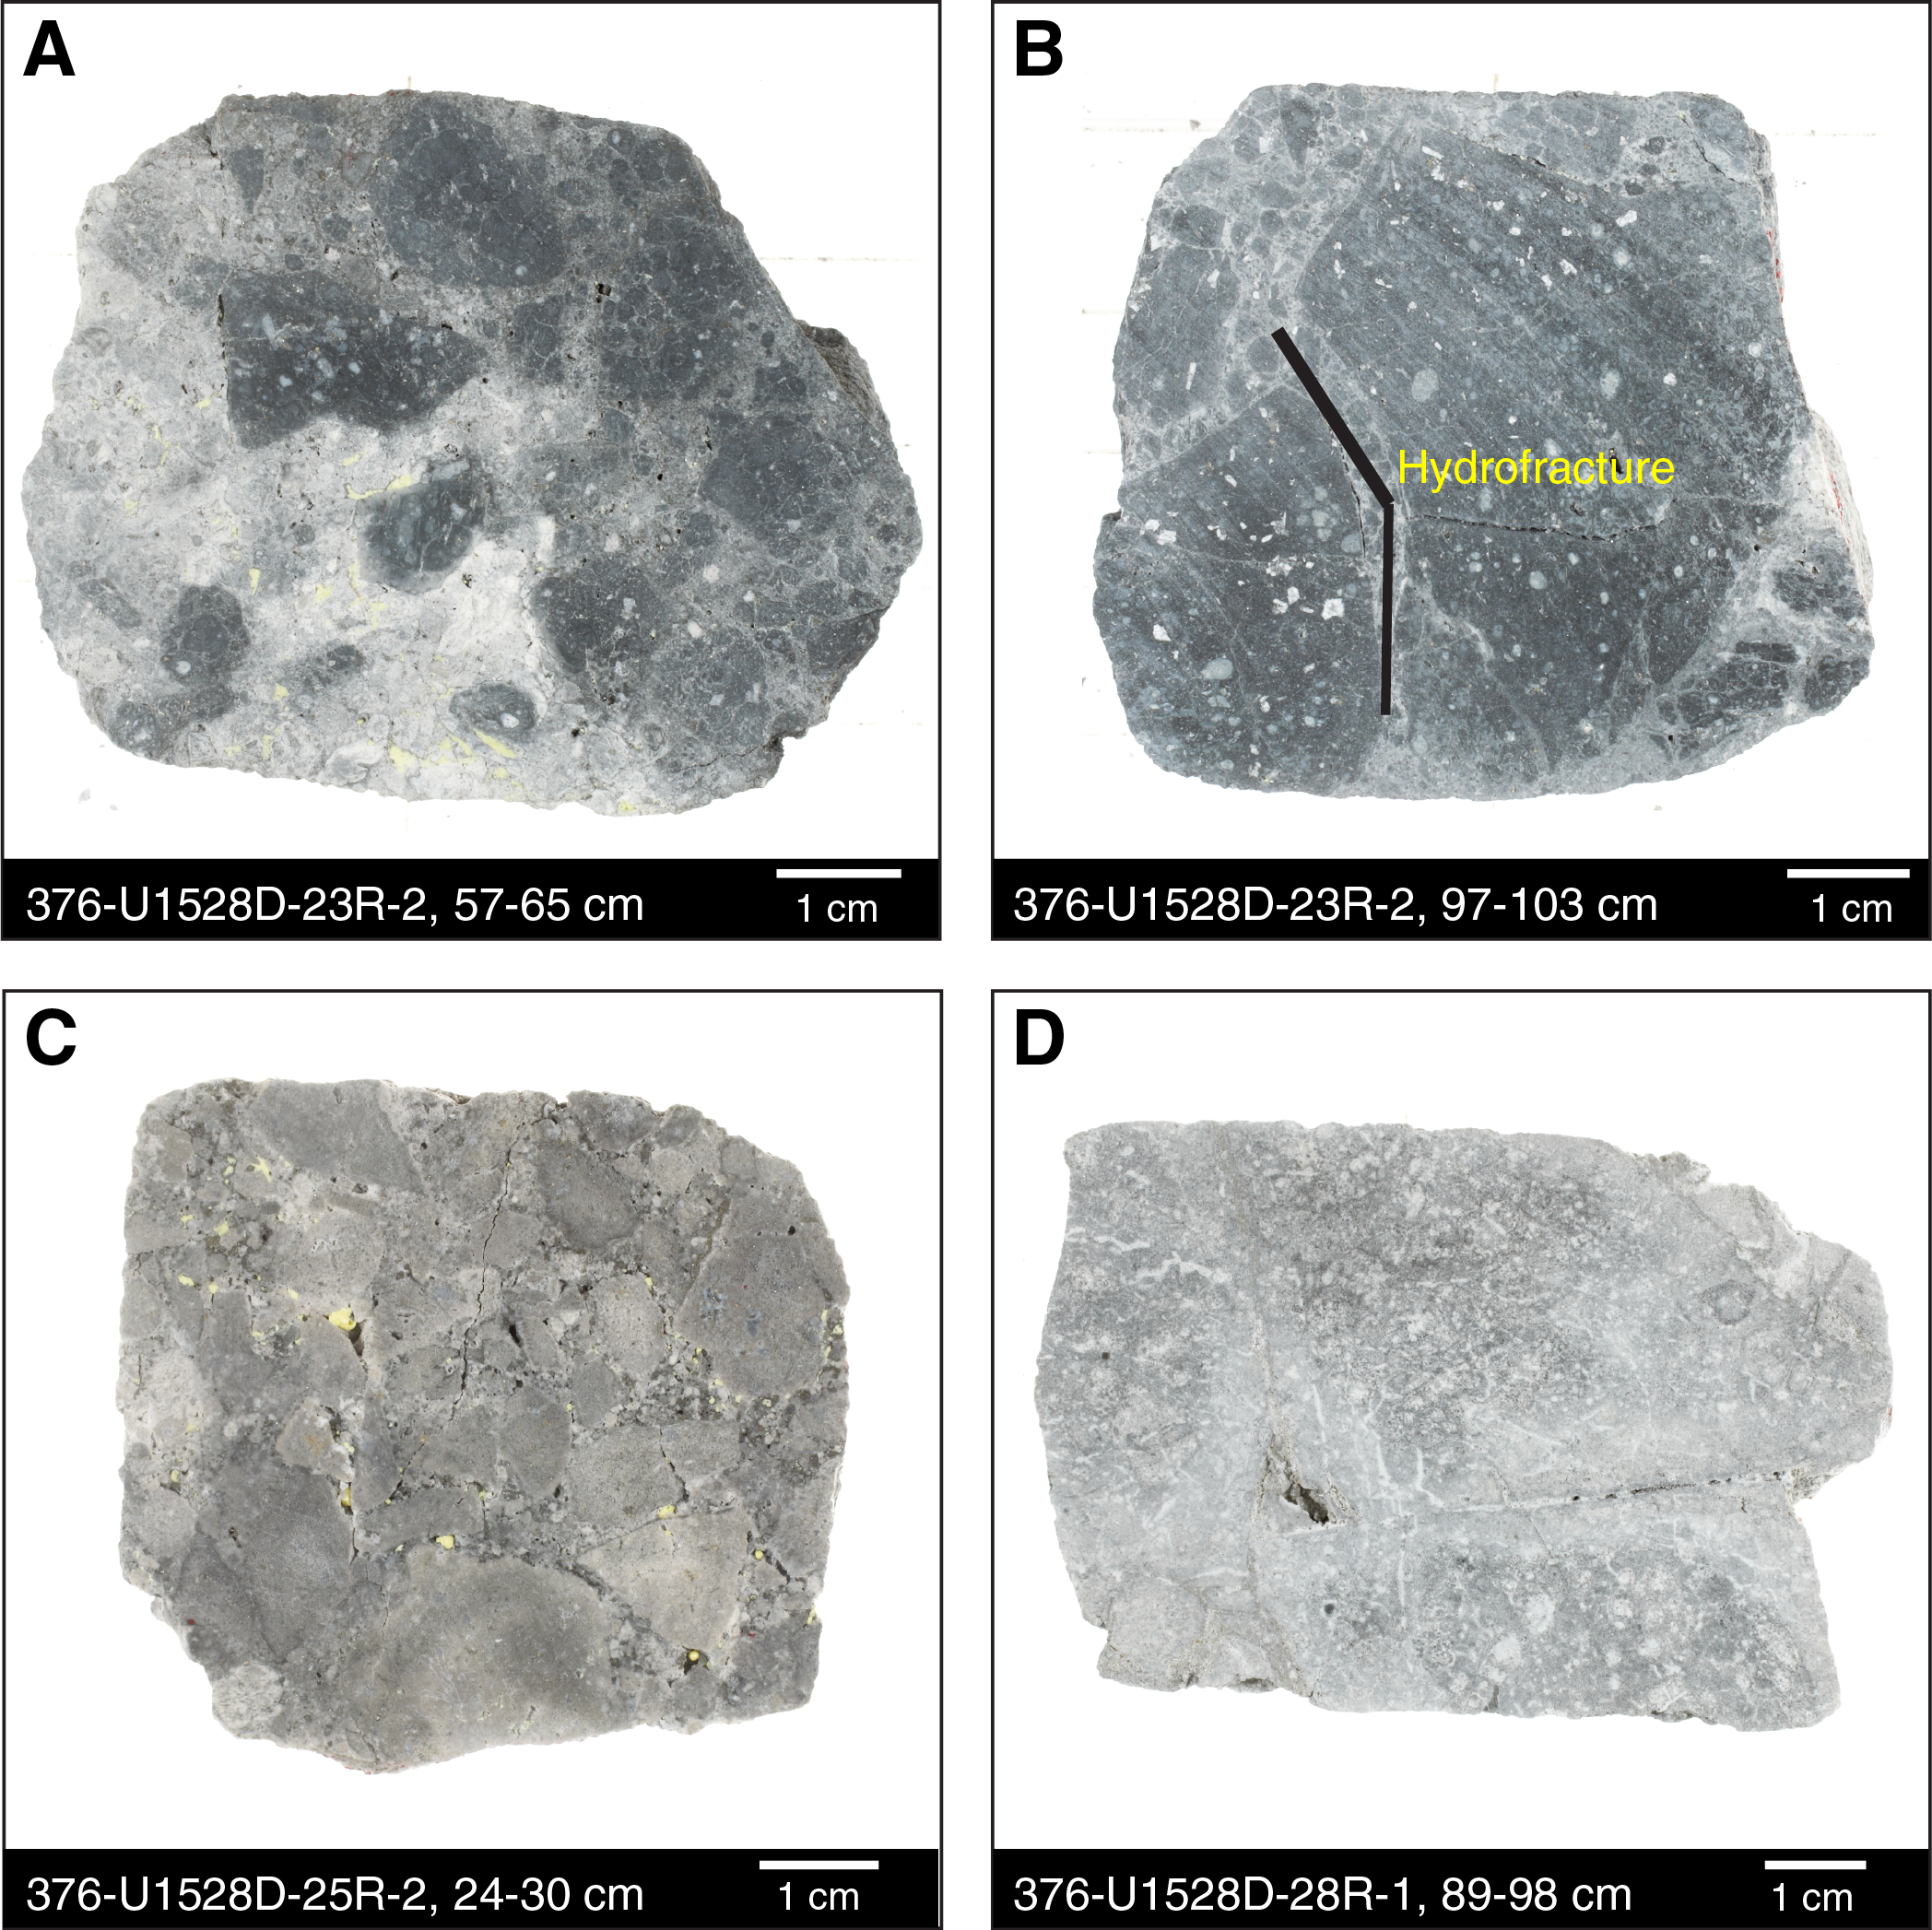
Figure F19. Subunit 2c macroscopic samples, Hole U1528D.
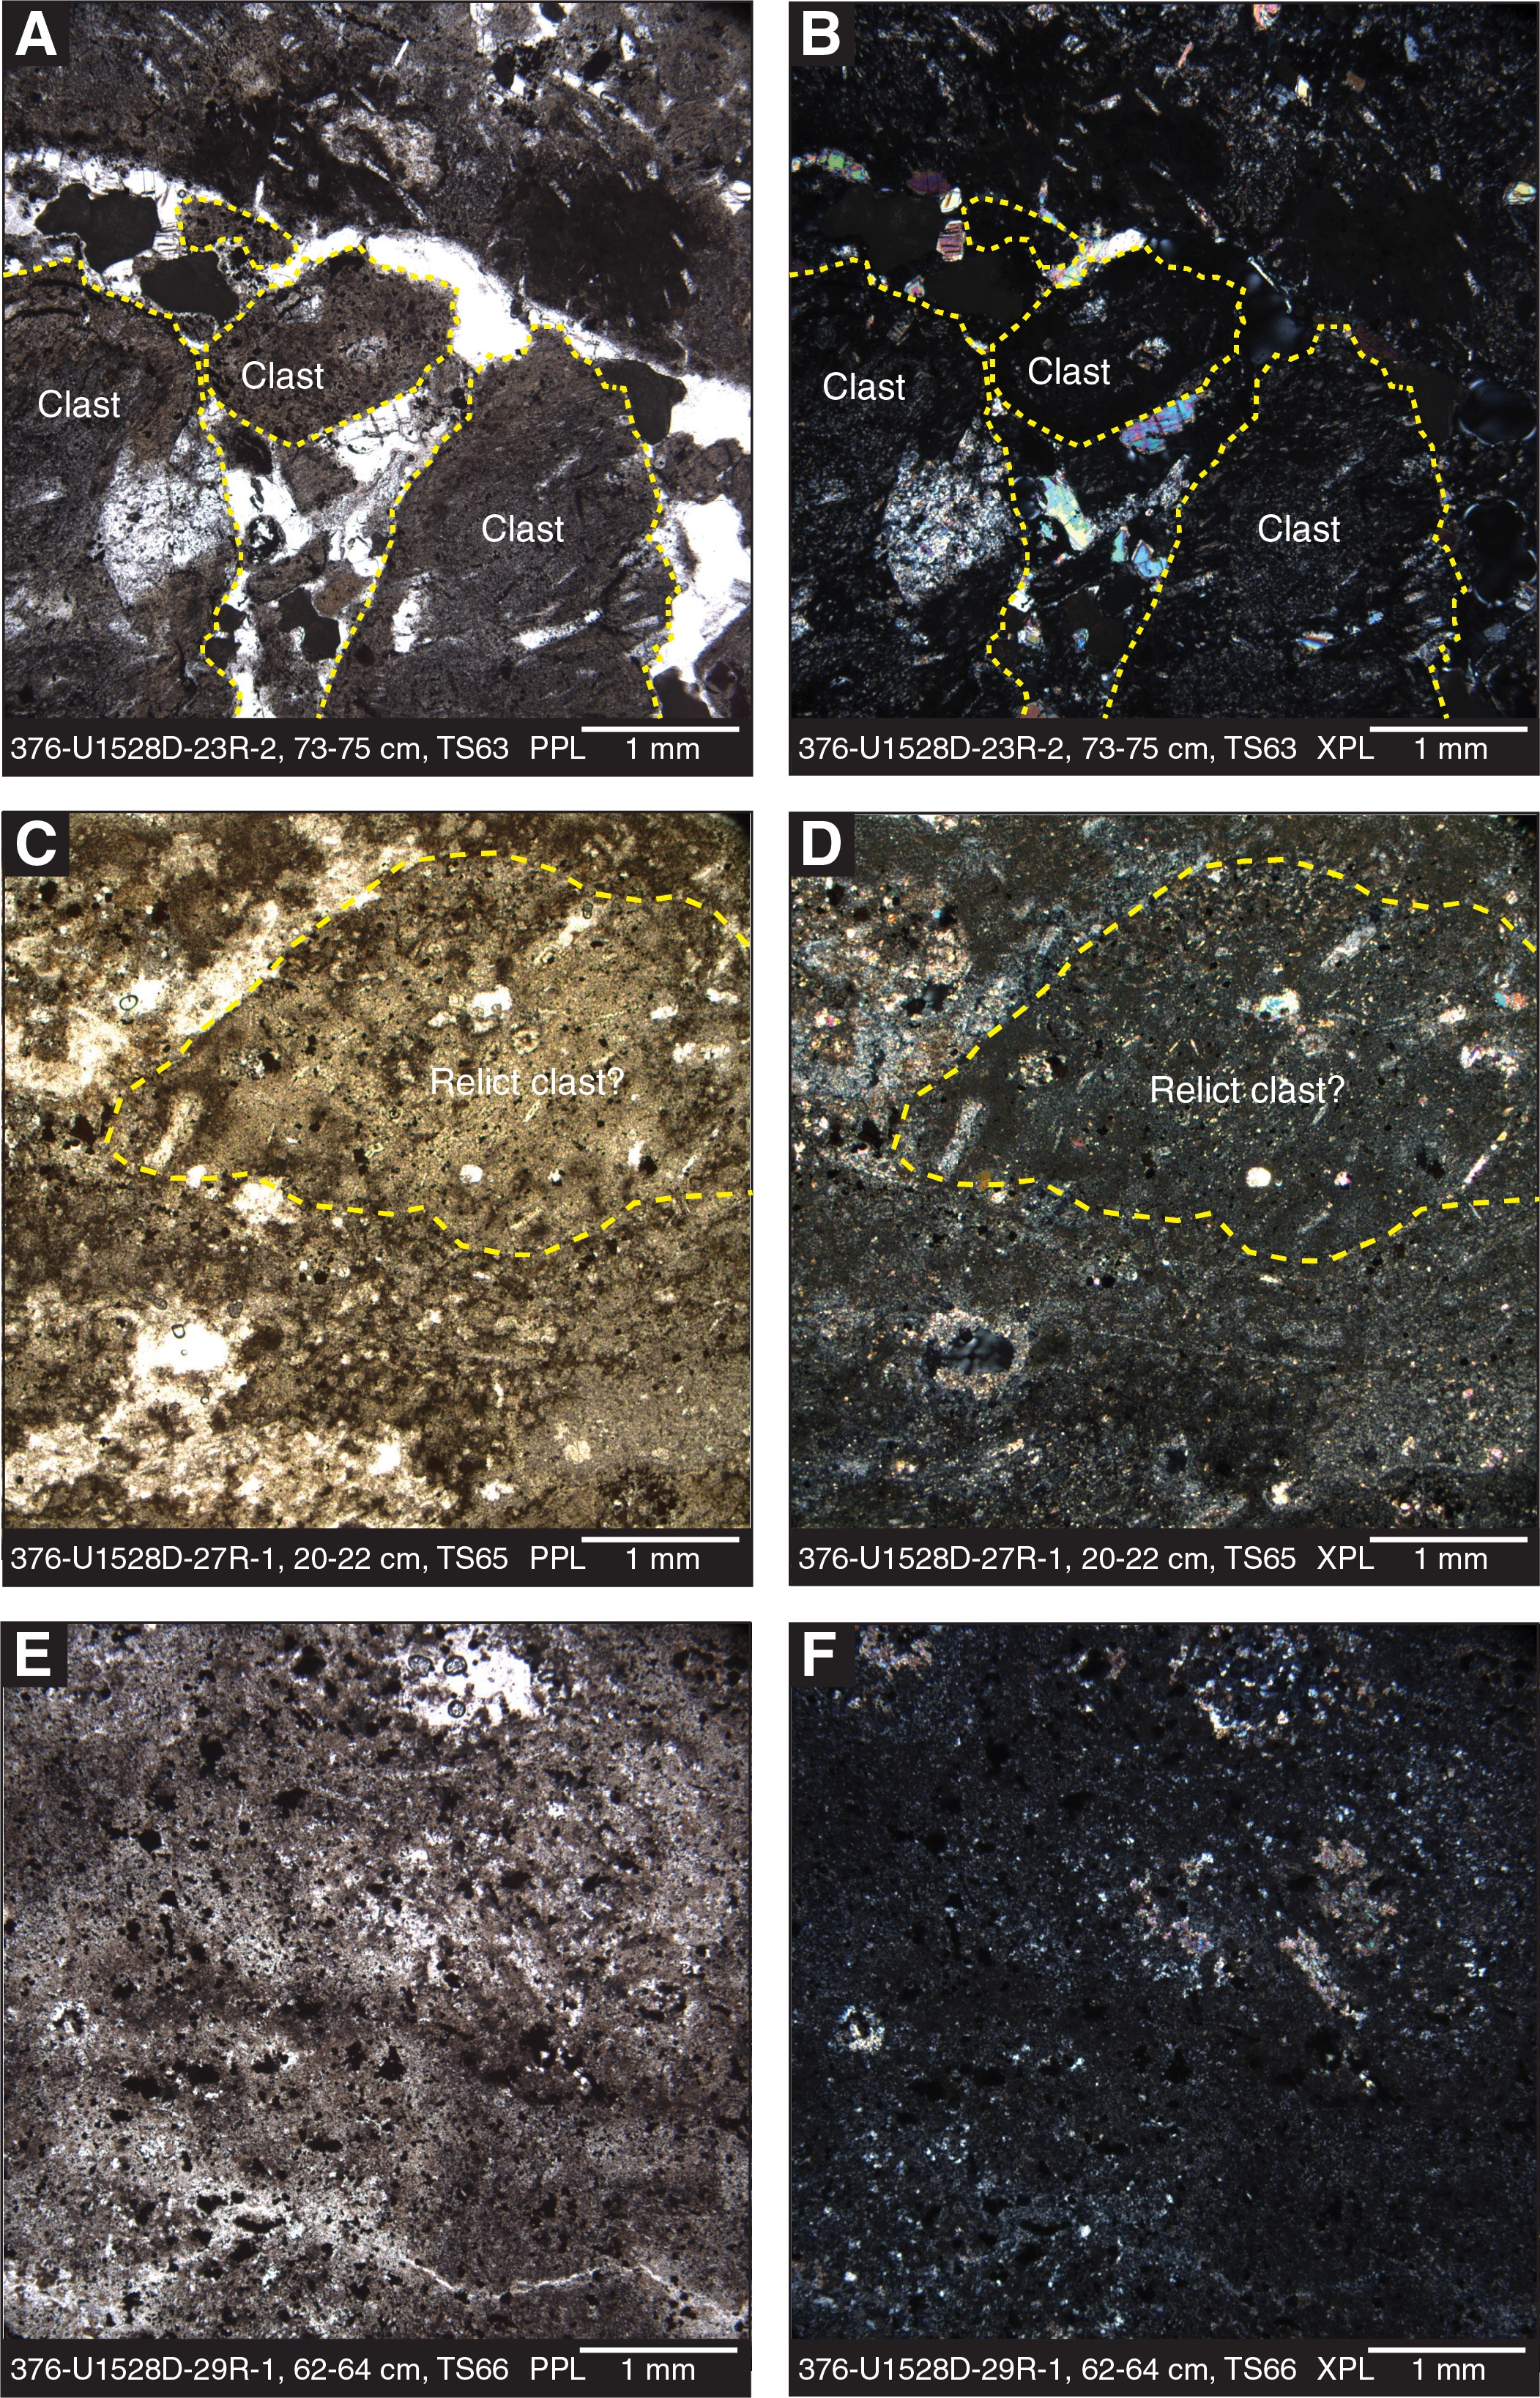
Figure F20. Subunit 2c microscopic samples, Hole U1528D.
Microscopic evaluation of the altered volcaniclastic rocks reveals a range in the preservation of igneous and volcanic features (Figure F20). The least-altered rocks are altered, matrix-supported, monomict lapilli-tuffs or altered volcaniclastic rocks with distinct clast outlines. In these samples, clasts are subangular and surrounded by a fine-grained matrix that probably represents completely altered volcanic ash or is composed of hydrothermal secondary minerals. In all rocks in Subunit 2c, primary magmatic minerals have been replaced by secondary minerals in their entirety. In the few cases where some primary mineral textures are preserved, they are pseudomorphs after plagioclase glomerocrysts (as large as 1 mm) in a trachytic groundmass with pseudomorphs after plagioclase phenocrysts (average size is 0.25 mm). In the most altered samples, all igneous phases including both phenocrysts and groundmass have been replaced beyond the point of recognition. No igneous textures remain, and no volcaniclastic features are distinguishable (such as clasts vs. matrix).
The boundary between Igneous Units 2 and 3 is based on a distinct change in internal macroscopic and microscopic fabrics of the rock, generally greater MS values, and the preservation of primary phases (Figure F14). This boundary occurs between Cores 376-U1528D-45R and 46R (269.09 and 272.90 mbsf).
Igneous Unit 3
- Interval: 376-U1528D-46R-1, 0 cm, to 63R-1, 57 cm
- Depth: 272.90–355.07 mbsf
- Lithology: altered plagioclase-pyroxene-phyric dacite lava
Igneous Unit 3 consists of gray, hydrothermally altered, mostly coherent dacite lava that macroscopically appears altered to varying degrees but retains original igneous textures and is thereby distinct from Igneous Unit 2 (Figure F21). Less altered sections contain ~4 vol% euhedral plagioclase phenocrysts and glomerocrysts (probably unaltered or only partially altered) as well as 1 vol% euhedral pyroxene in plagioclase glomerocrysts. The homogeneous groundmass is fine grained and often includes vugs and pyrite. In more intensely altered intervals, the volcanic texture of the rock can be inferred from its homogeneity and occasionally dispersed tabular pseudomorphs after plagioclase phenocrysts. Several peaks in MS in Unit 3 are unrelated to macroscopically identifiable changes in lithology but support the classification as a less altered unit (indicative of the preservation of magnetite; see Paleomagnetism).
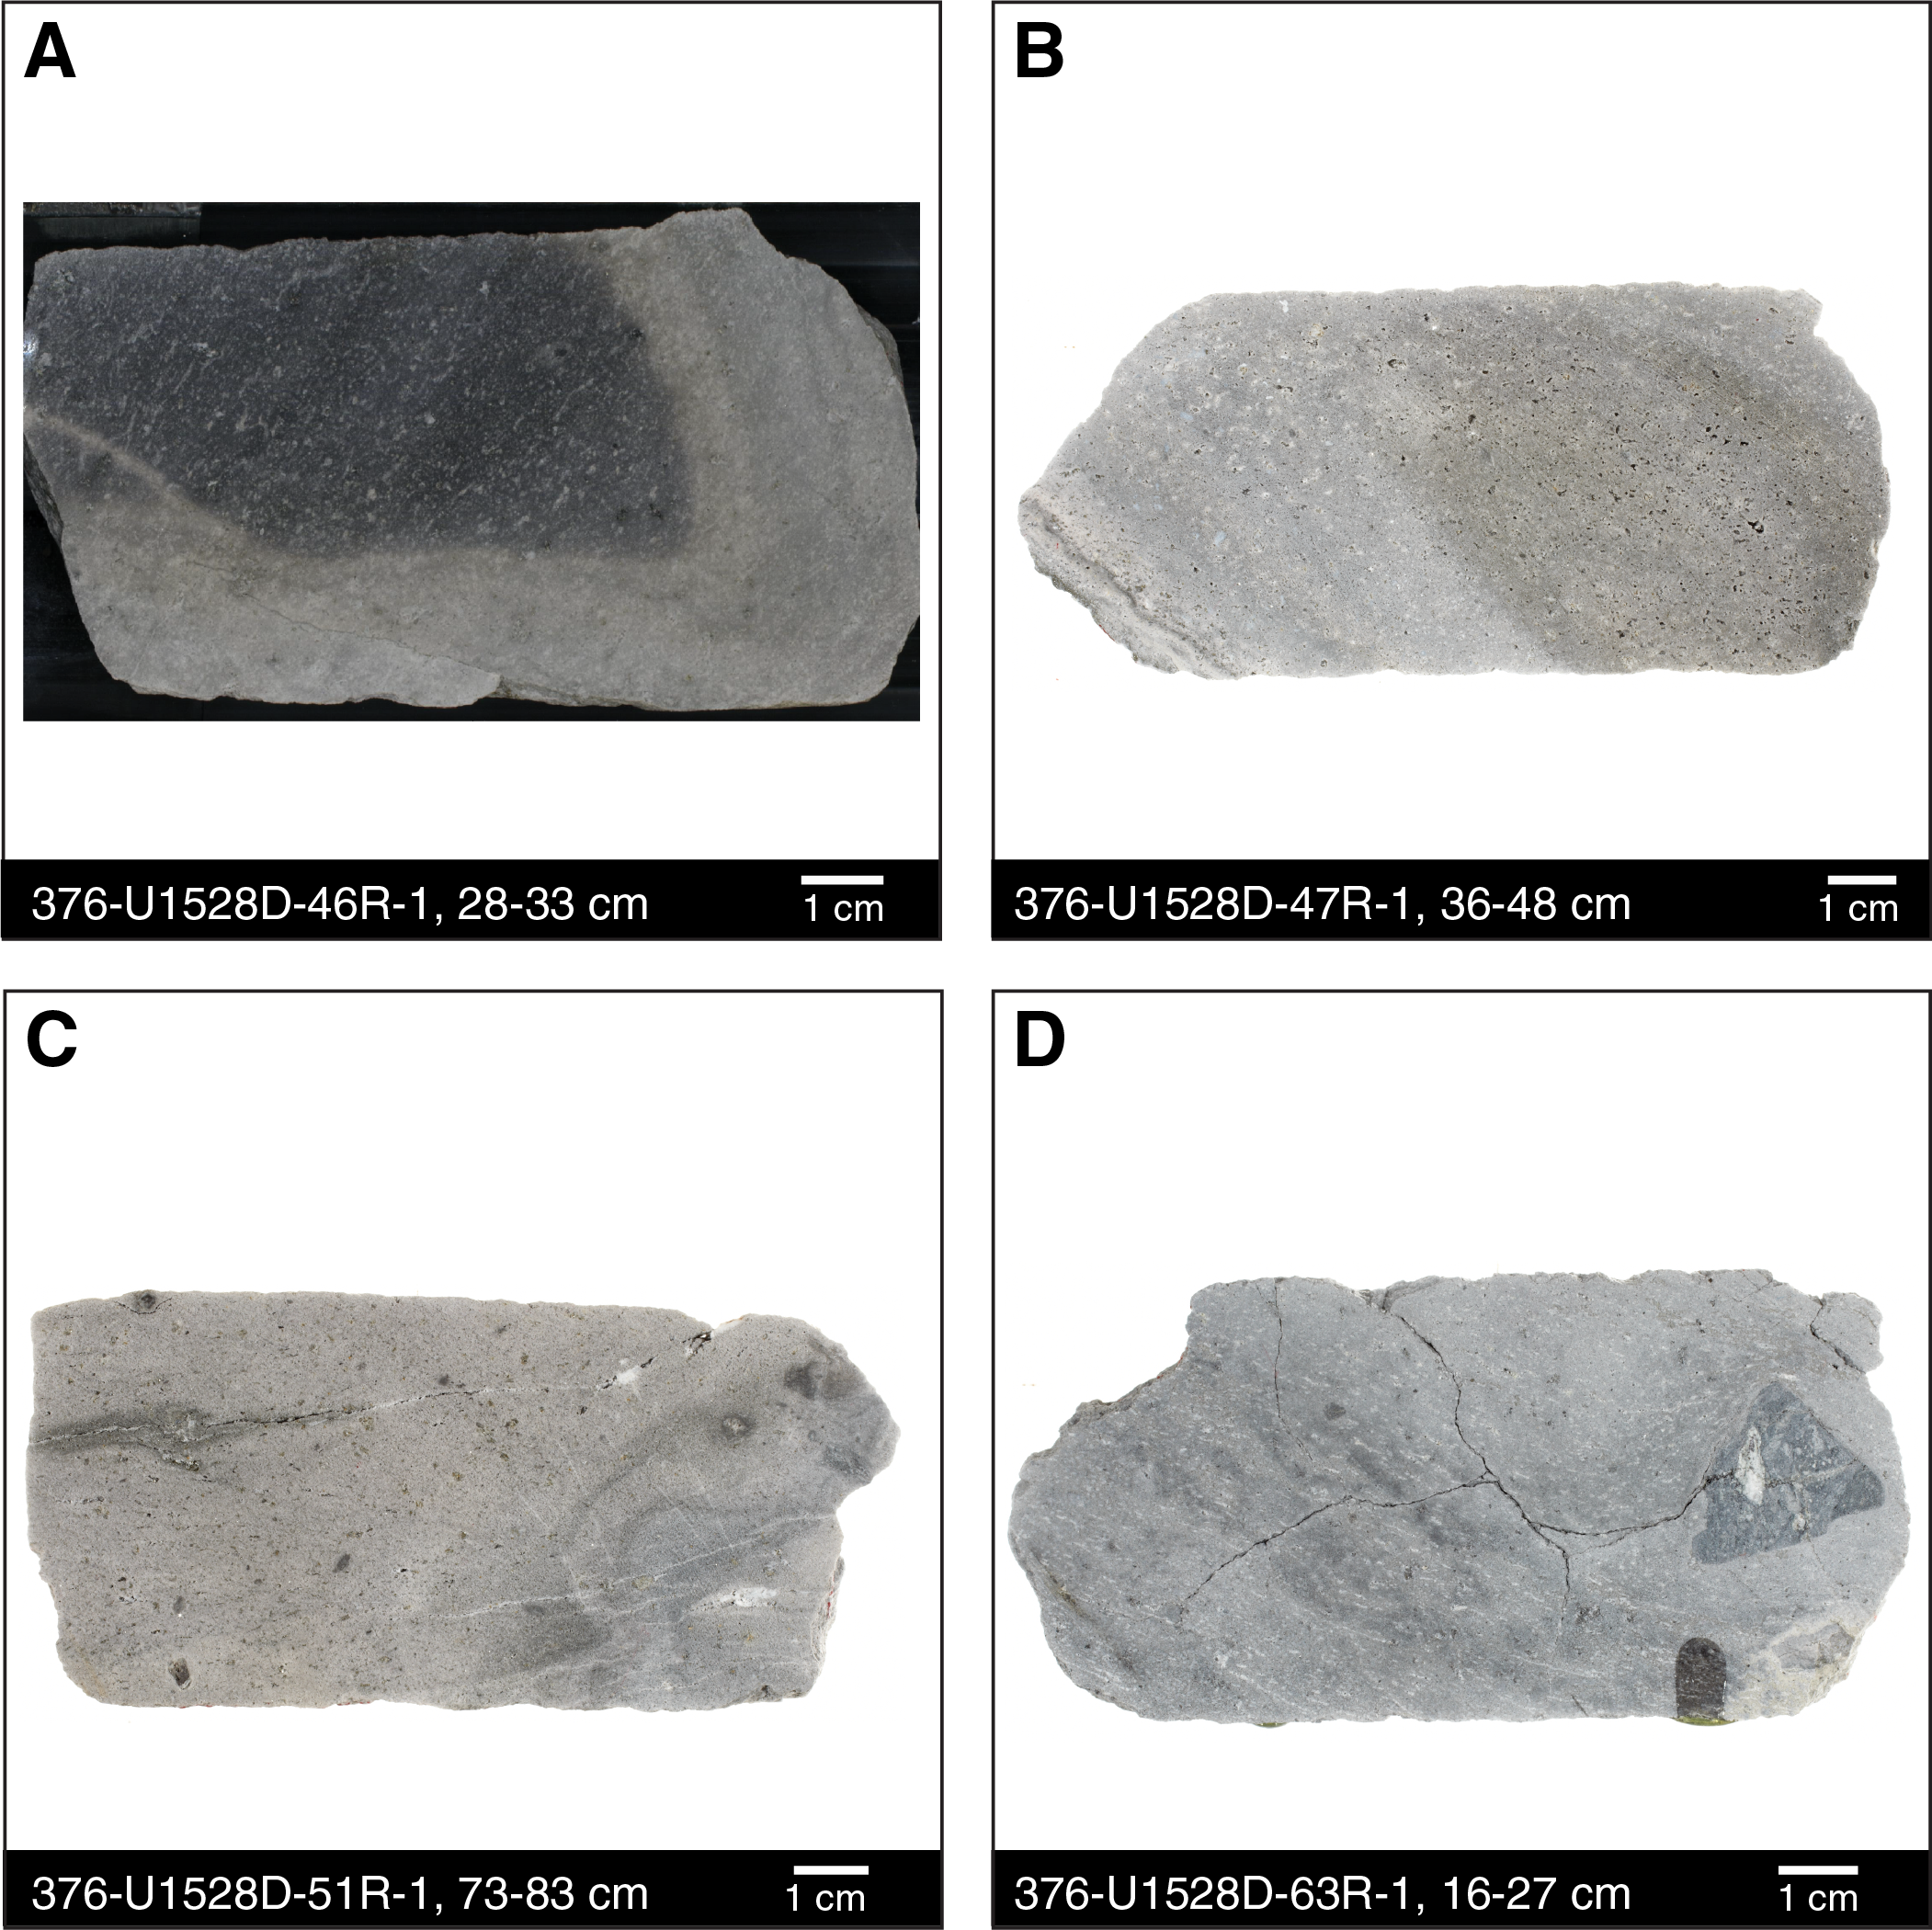
Figure F21. Igneous Unit 3 macroscopic samples, Hole U1528D.
Microscopic evaluation of altered lava intervals in Unit 3 shows that they display a range of preservation of igneous features (Figure F22). The least-altered rocks are plagioclase-clinopyroxene-phyric dacites in which unaltered plagioclase phenocrysts and glomerocrysts make up 10–20 vol% of the sample (Figure F22), average 0.5–0.75 mm in size, and are as long as 3 mm in glomerocrystic clots. The crystals are euhedral and tabular in crystal shape and form. The samples also contain 1–2 vol% clinopyroxene crystals that are associated with glomerocrystic clots and mostly replaced by secondary minerals, although some unaltered material remains (Figure F22C, F22D). Equant Fe-Ti oxides are present to as much as ~1 vol% and ~0.1 mm in size, being largely if not completely altered to pyrite. The groundmass makes up 50–70 vol% of the sample and consists mostly of secondary minerals. Unaltered acicular plagioclase microlites that are ubiquitous in the groundmass are either randomly oriented or form a trachytic flow texture. In the most altered samples, all igneous phases have been replaced by secondary alteration minerals. Although the pseudomorphic textures of phenocrysts remain, the original grain size of the groundmass is lost. In some cases where spherical vesicles are preserved, they are infilled and replaced by secondary minerals.
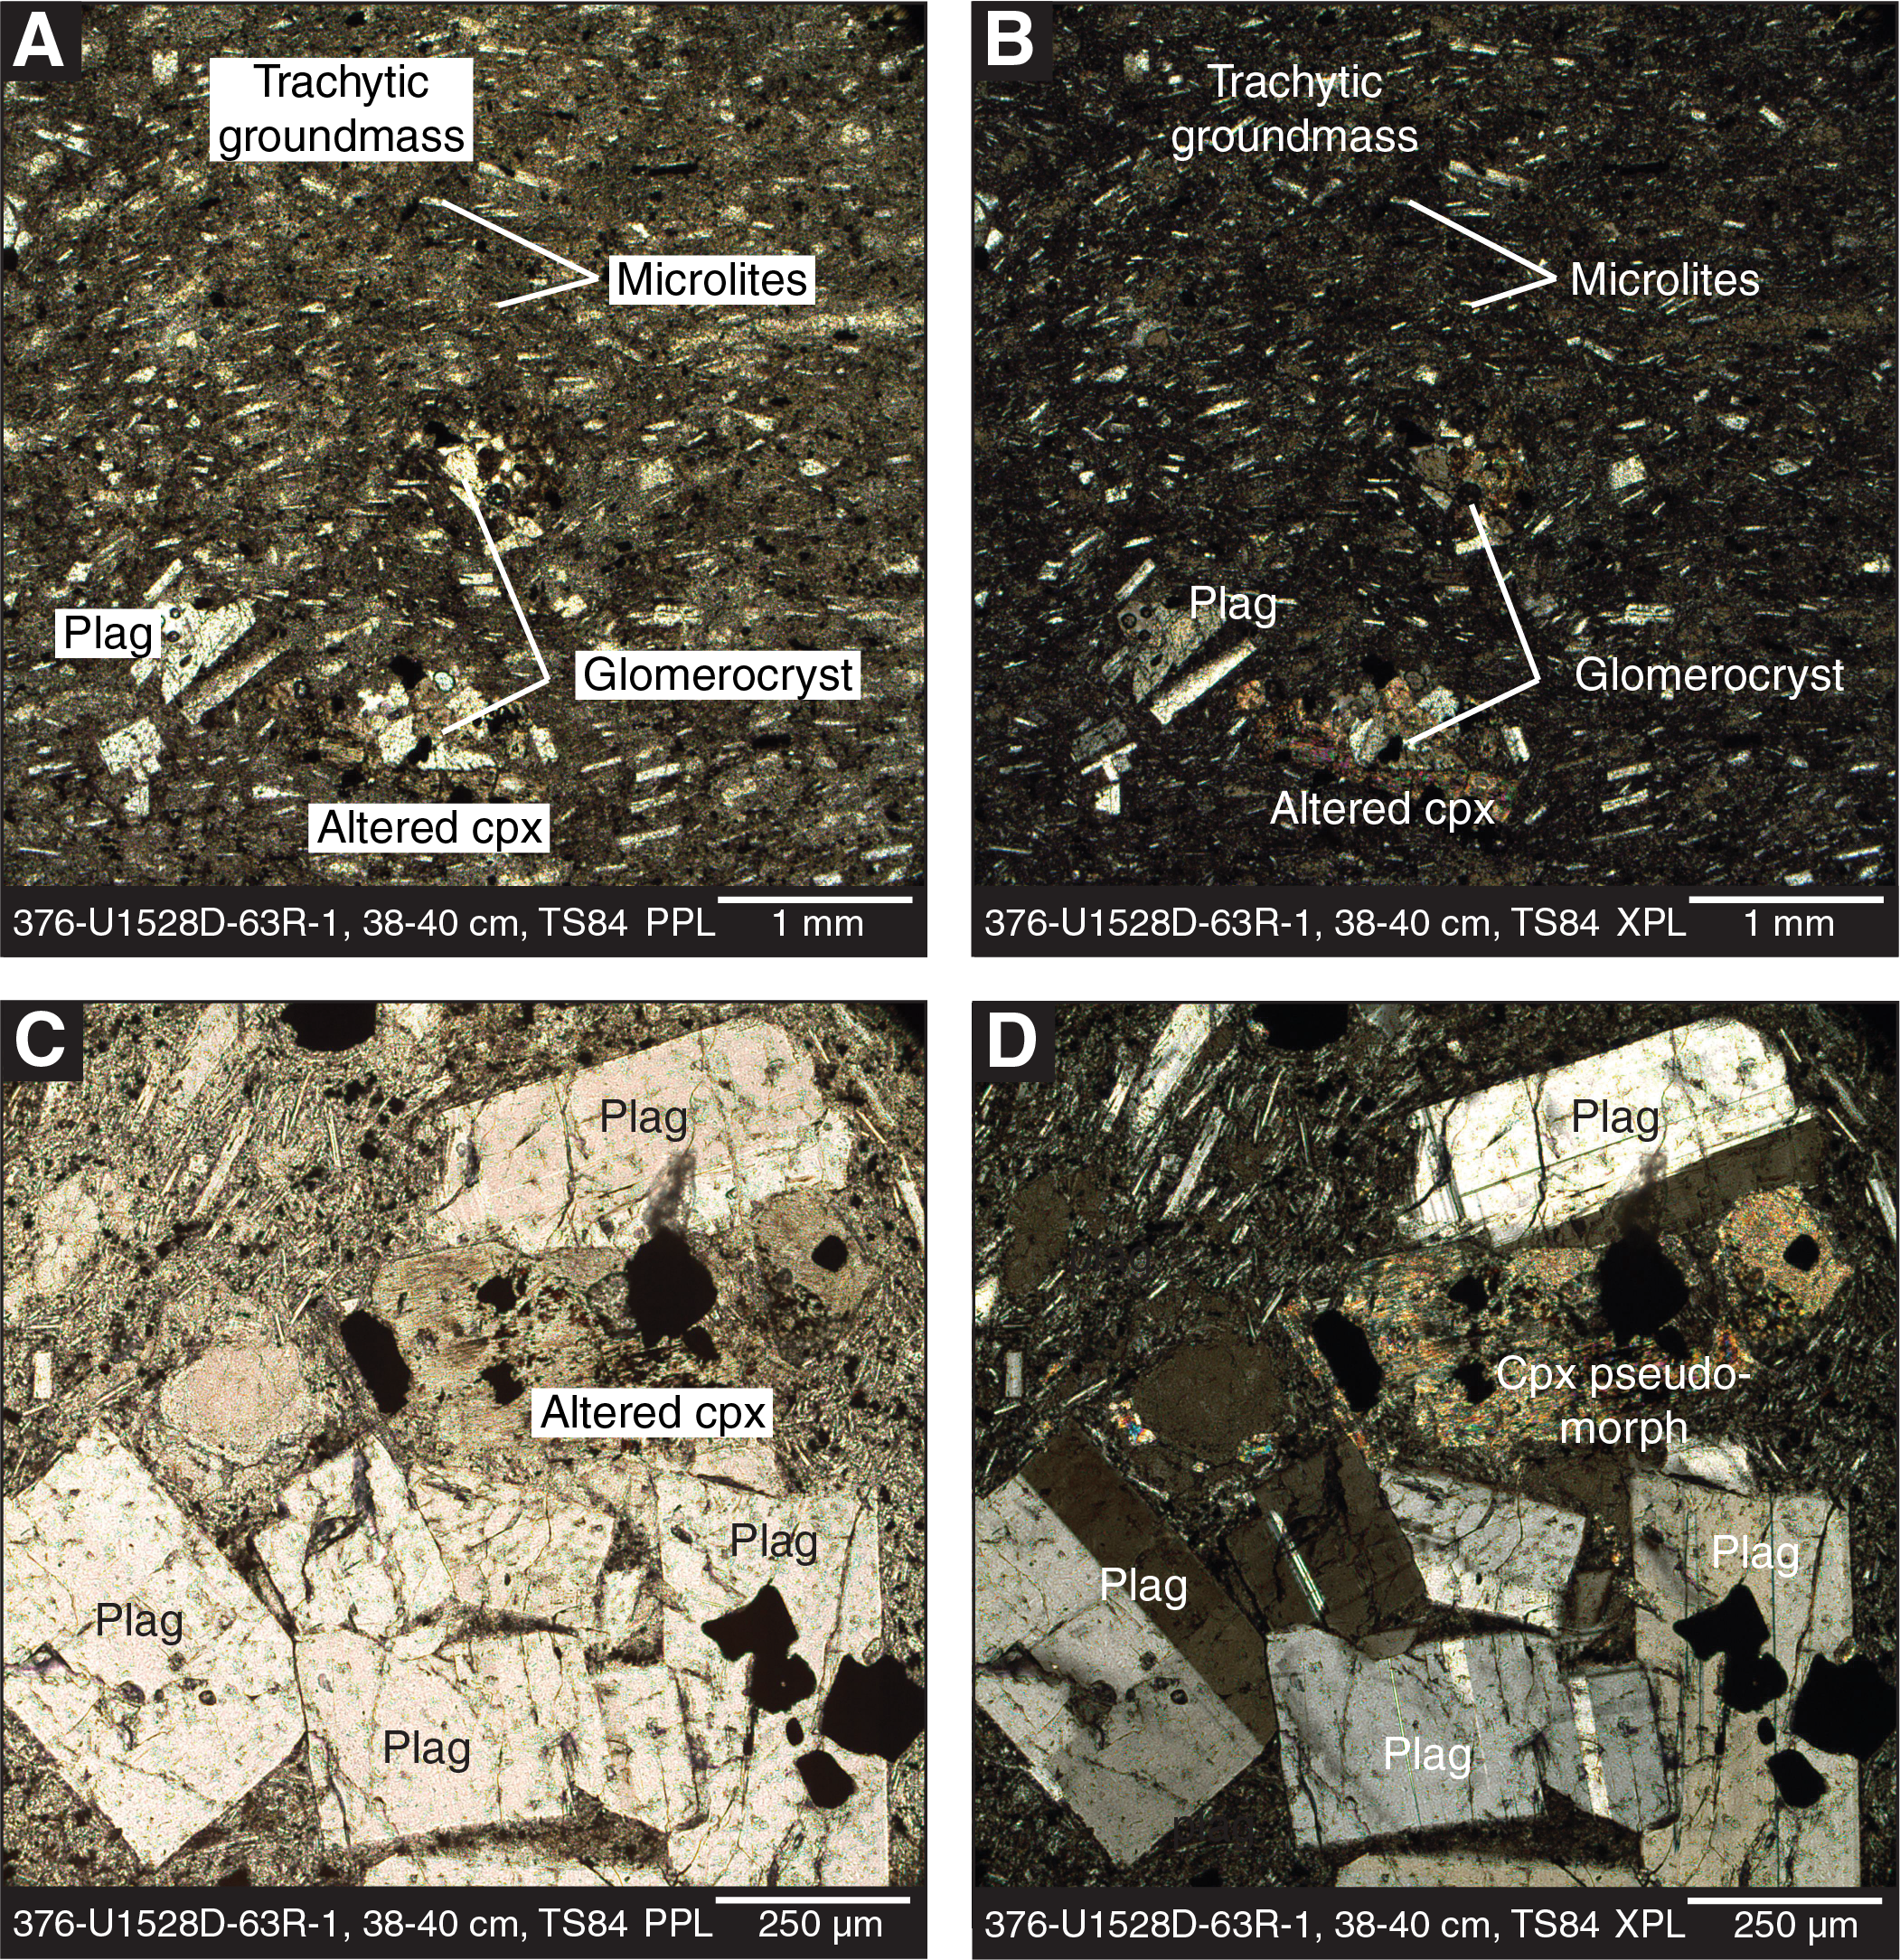
Figure F22. Igneous Unit 3 unaltered dacitic lava, Hole U1528D.
Correlation between holes
Each of the holes drilled at Site U1528 was located within the ~20 m radius of the pit crater of the Upper Cone. Igneous Unit 1 and Igneous Subunit 2a were both intersected by Holes U1528A and U1528C. Because the uppermost part of Hole U1528D was lined with ~60 m of casing, only Igneous Units 2 and 3 were intersected (Figure F11). In Hole U1528A, a 5.07 m long ghost core was recovered without depth advance at 16.20 mbsf and curated as intervals 3G-1, 0 cm, to 3G-CC, 12 cm. The ghost core recovered material from Unit 1 only.
There is no stratigraphic overlap between Holes U1528C and U1528D. Holes U1528A and U1528D are about 8 m apart and overlap stratigraphically for ~25 m based on their respective depths below seafloor. The MS record includes significant peaks in Hole U1528A at ~26 and ~78 mbsf and at about 108 mbsf in Hole U1528D. However, a 30 m vertical offset of individual lithologic layers between the two neighboring holes is unlikely, and recovered rocks at those respective depths show little similarity. The depth below seafloor thus remains the most reasonable proxy for correlation between Holes U1528A and U1528D. The macroscopic appearance of rocks in overlapping depth sections of the two holes is similar, and parameters such as lithology, matrix abundance, and grain size support the justification of depth-proxy correlation. Lastly, the structural fabric is similar at equivalent depths below seafloor (see Structural geology).
Interpretation
Igneous Unit 1
The plagioclase- and clinopyroxene-bearing dacitic pyroclastic rocks from Igneous Unit 1 are altered (see Alteration), but they show similarities in petrography and whole-rock geochemistry to unaltered volcanic rocks from Sites U1527 and U1529 and to published descriptions of rocks from Brothers volcano (Wright and Gamble, 1999; Haase et al., 2006; Keith et al., 2018; Timm et al., 2012). As at Sites U1527 and U1529, the igneous crystal assemblage suggests growth either in a subvolcanic magma reservoir or conduit before eruption. The abundance of plagioclase microlites in the groundmass of the dacites with swallowtail quench textures suggests rapid cooling of the samples.
The recovered pyroclastic sediments of Igneous Unit 1 show that Site U1528 has a 6 to 36 m thick (based on recovery) overburden of unconsolidated volcanic material of varying grain size, vesicularity, and degree of alteration. Because of its stratigraphic position, it probably represents the youngest eruptive activity of Brothers volcano. The abundant subrounded lapilli of native sulfur most likely formed in hydrothermal plumes and were deposited as fallout from the water column. Their preservation suggests that this deposit is recent. The polymict nature of the deposit indicates that it may represent more than one eruptive episode of the Upper Cone, whose deposits have been subject to different styles of alteration and/or were altered over varying amounts of time. Erosion and partial (inward) collapse of crater walls and resulting redeposition is a likely explanation for the heterogeneous mixture of pyroclastic materials that cover the crater floor, although drilling might have disturbed the original stratigraphy of Unit 1.
The thickness of the lapilli layers, which have almost no pieces of lava exceeding coarse lapilli size, suggests that primary emplacement was not in the form of a lava flow but as pyroclastic fragments. However, considering their low vesicularity, shape, and mostly absent fluidal structure and the absence of glassy rims, most clasts do not resemble typical scoria clasts, which would be expected from volcanic eruptions with even minor explosiveness. The strong overprint by alteration and rounding of clasts during redeposition and drilling could have affected the original volcanic texture of the clasts and thus significantly limits the interpretation of Igneous Unit 1 regarding emplacement and fragmentation processes.
Igneous Unit 2
The petrology and geochemistry of variably altered volcaniclastic rocks and lava from Igneous Unit 2 are typical of the dacite lava from Brothers volcano (see Igneous petrology and volcanology in the Site U1527 chapter and Igneous petrology and volcanology in the Site U1529 chapter [de Ronde et al., 2019c, 2019d]) (Wright and Gamble, 1999; Haase et al., 2006; Keith et al., 2018; Timm et al., 2012), suggesting a common protolith. In the least-altered samples, primary mineralogy and glomerocrystic textures are preserved. These observations indicate that the minerals are likely cumulates from the magmatic reservoir that were entrained during eruption. Pseudomorphs after plagioclase microlites suggest that the original glassy groundmass of the dacite had a trachytic texture, which suggests rapid quenching of dacite clasts and lava upon eruption.
Volcaniclastic intervals in Igneous Subunits 2a and 2c resemble the textures of Igneous Unit 2 at Site U1527, and the possible models for their emplacement and primary fragmentation are therefore almost identical. They include gravitational collapse of a massive lava formation, most likely a lava dome growing on the cone, or primary emplacement as a pyroclastic deposit by explosive eruptions, the interaction of lava flows with seawater (forming hyaloclastites), or a submarine pyroclastic flow. The latter could stem both from an explosive eruption or the gas-driven collapse of a lava dome (e.g., Fisher and Schmincke, 1984). One difference from Site U1527 lies in hydraulic (in situ) fracturing and intense vein networks in some clasts, demonstrating that hydrothermal fluids facilitated further grain size reduction of the clasts, making the estimation of the degree of primary fragmentation and other processes more challenging. However, it is unlikely that all fragmentation was induced by hydrothermal fluids.
An additional fragmentation process for Site U1528 may be hydrothermal explosions. The hydrothermal system at the Cone site is presently active, and the existence of a two-phase zone was previously suggested by Gruen et al. (2012). The correlation between the seismic section of the Cone (Figure F1 in the Expedition 376 summary chapter [de Ronde et al., 2019b]) with the stratigraphy determined from the core suggests that some seismic horizons within the Cone could represent impermeable caps that facilitate the formation of gas pockets (see below). If overpressurized gas or fluid pockets exist at depth, sudden depressurization (e.g., due to collapse of overlying formations) could lead to explosive expansion and fragmentation of the overlying rocks.
Igneous Subunit 2b is interpreted to be a more coherent lava flow rather than a volcaniclastic deposit because the macroscopic texture of the core appears homogeneous in some intervals, which is confirmed by the presence of coherent groundmass textures in thin sections. Cores from this more coherent subunit (Sections 376-U1528D-21R-1 through 22R-2) were the first to emit a strong H2S odor (see Operations). This suggests that Subunit 2b may have acted as a less permeable barrier in the present-day hydrothermal system, facilitating the accumulation of gas (see Physical properties).
Each subunit in Igneous Unit 2 could represent a different eruptive episode or different phase in an eruption of the Upper Cone. However, given the transitional upper boundary of Subunit 2b, Subunit 2a could also represent the same lava formation that was brecciated either by collapse, interaction of the top of a lava flow with seawater, or hydrothermal explosions.
Igneous Unit 3
Igneous Unit 3 is interpreted to be coherent dacite lava that may represent part of a volcanic plug, a lava dome, or (multiple) lava flows exceeding 80 m in thickness. In any case, the emplacement mechanism of this unit was effusive and hence more quiescent than the formation of Igneous Units 1 and 2. When considering volcano chronology, Igneous Unit 3 most likely represents a different eruptive episode of the cone, preceding the emplacement of Unit 2.
Whole-rock composition of Site U1528 igneous rocks
Analyses of 83 rock powders by portable X-ray fluorescence (pXRF) (Table T7) from Igneous Units 2 and 3 confirm the pervasive alteration of the Site U1528 volcanic rocks. Elements like K, Rb, Mg, Mn, and Zn, which are typically removed by seawater and hydrothermal circulation, are depleted relative to their abundance in the unaltered Brothers volcano dacites (Figures F23, F24) (see Alteration). Occasionally, short intervals with higher K2O and Rb abundances tend to coincide with the presence of unaltered plagioclase and/or Fe-Ti oxides in the rock (Figure F24). In contrast, elements that are not as easily affected by secondary overprinting (i.e., Ti, Zr, P, and Nb) still have ratios that coincide with those of the unaltered dacite lava from Sites U1527 and U1529 (e.g., Ti/Zr; Figure F24). The exception is a rutile-bearing interval with increased Ti/Zr at 40–80 mbsf that is very strongly altered, suggesting that hydrothermal alteration eventually also affects this ratio (see Alteration). Overall, the compositional variations are consistent with the Site U1528 volcanic host rock being a typical Brothers volcano dacite.
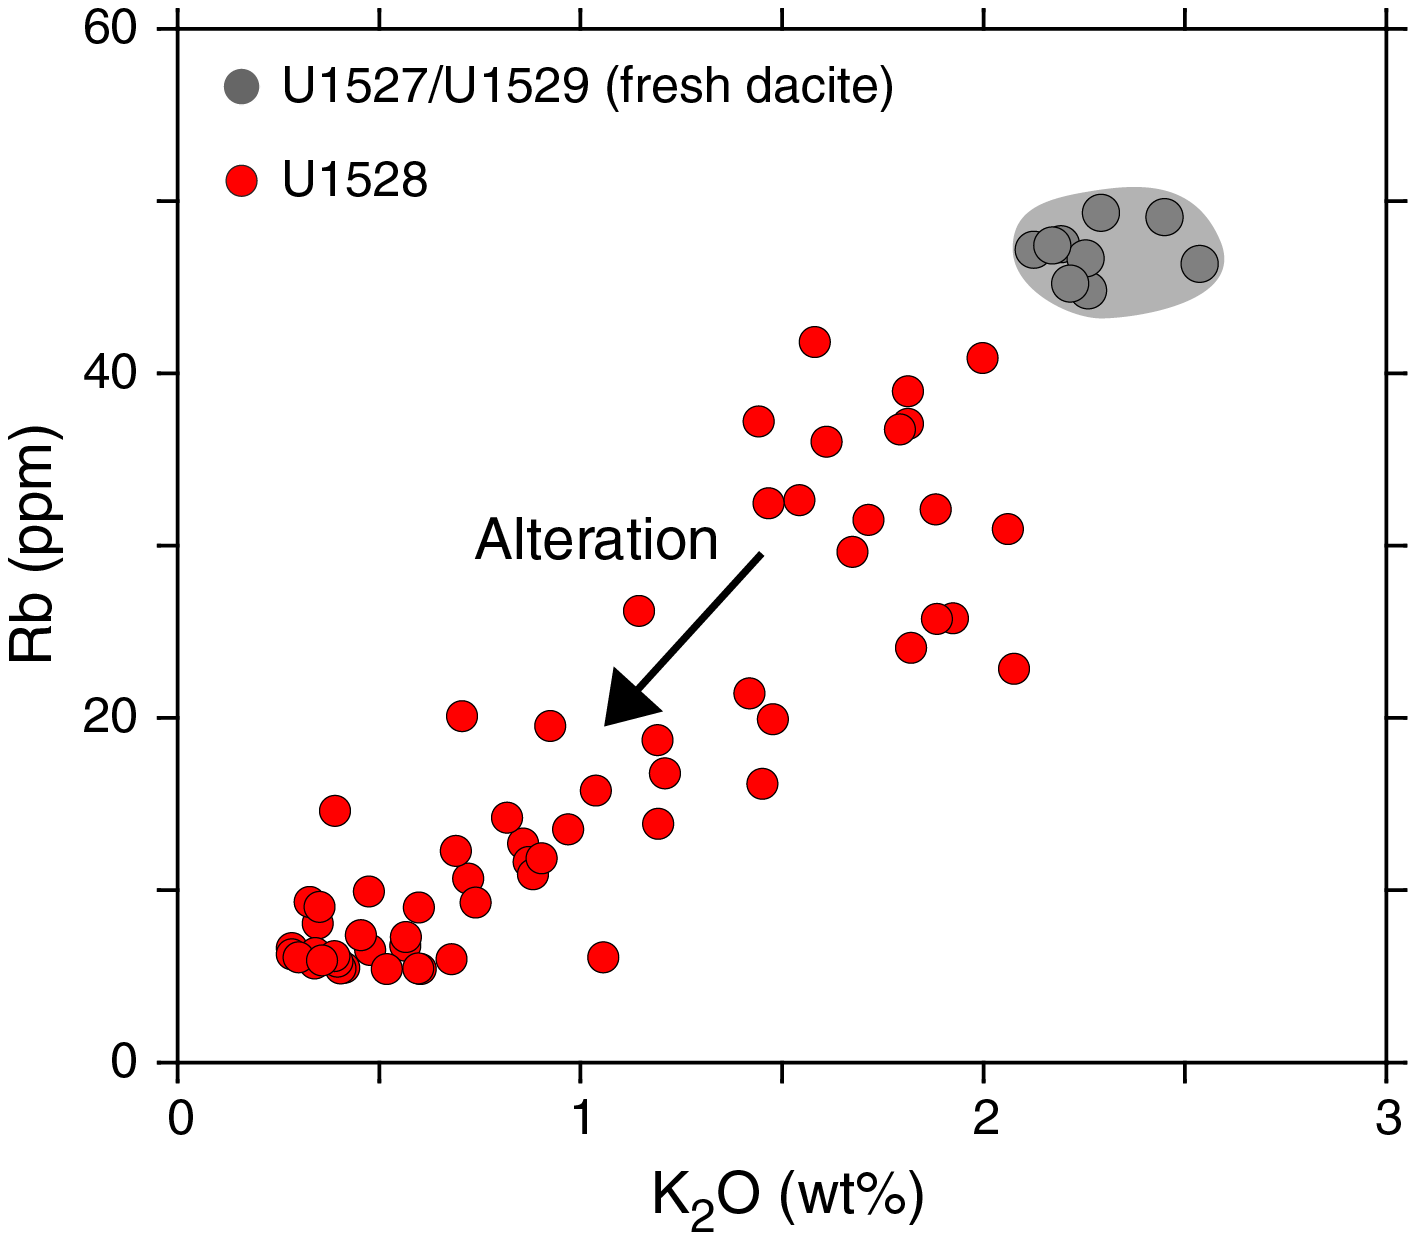
Figure F23. Rb vs. K2O.
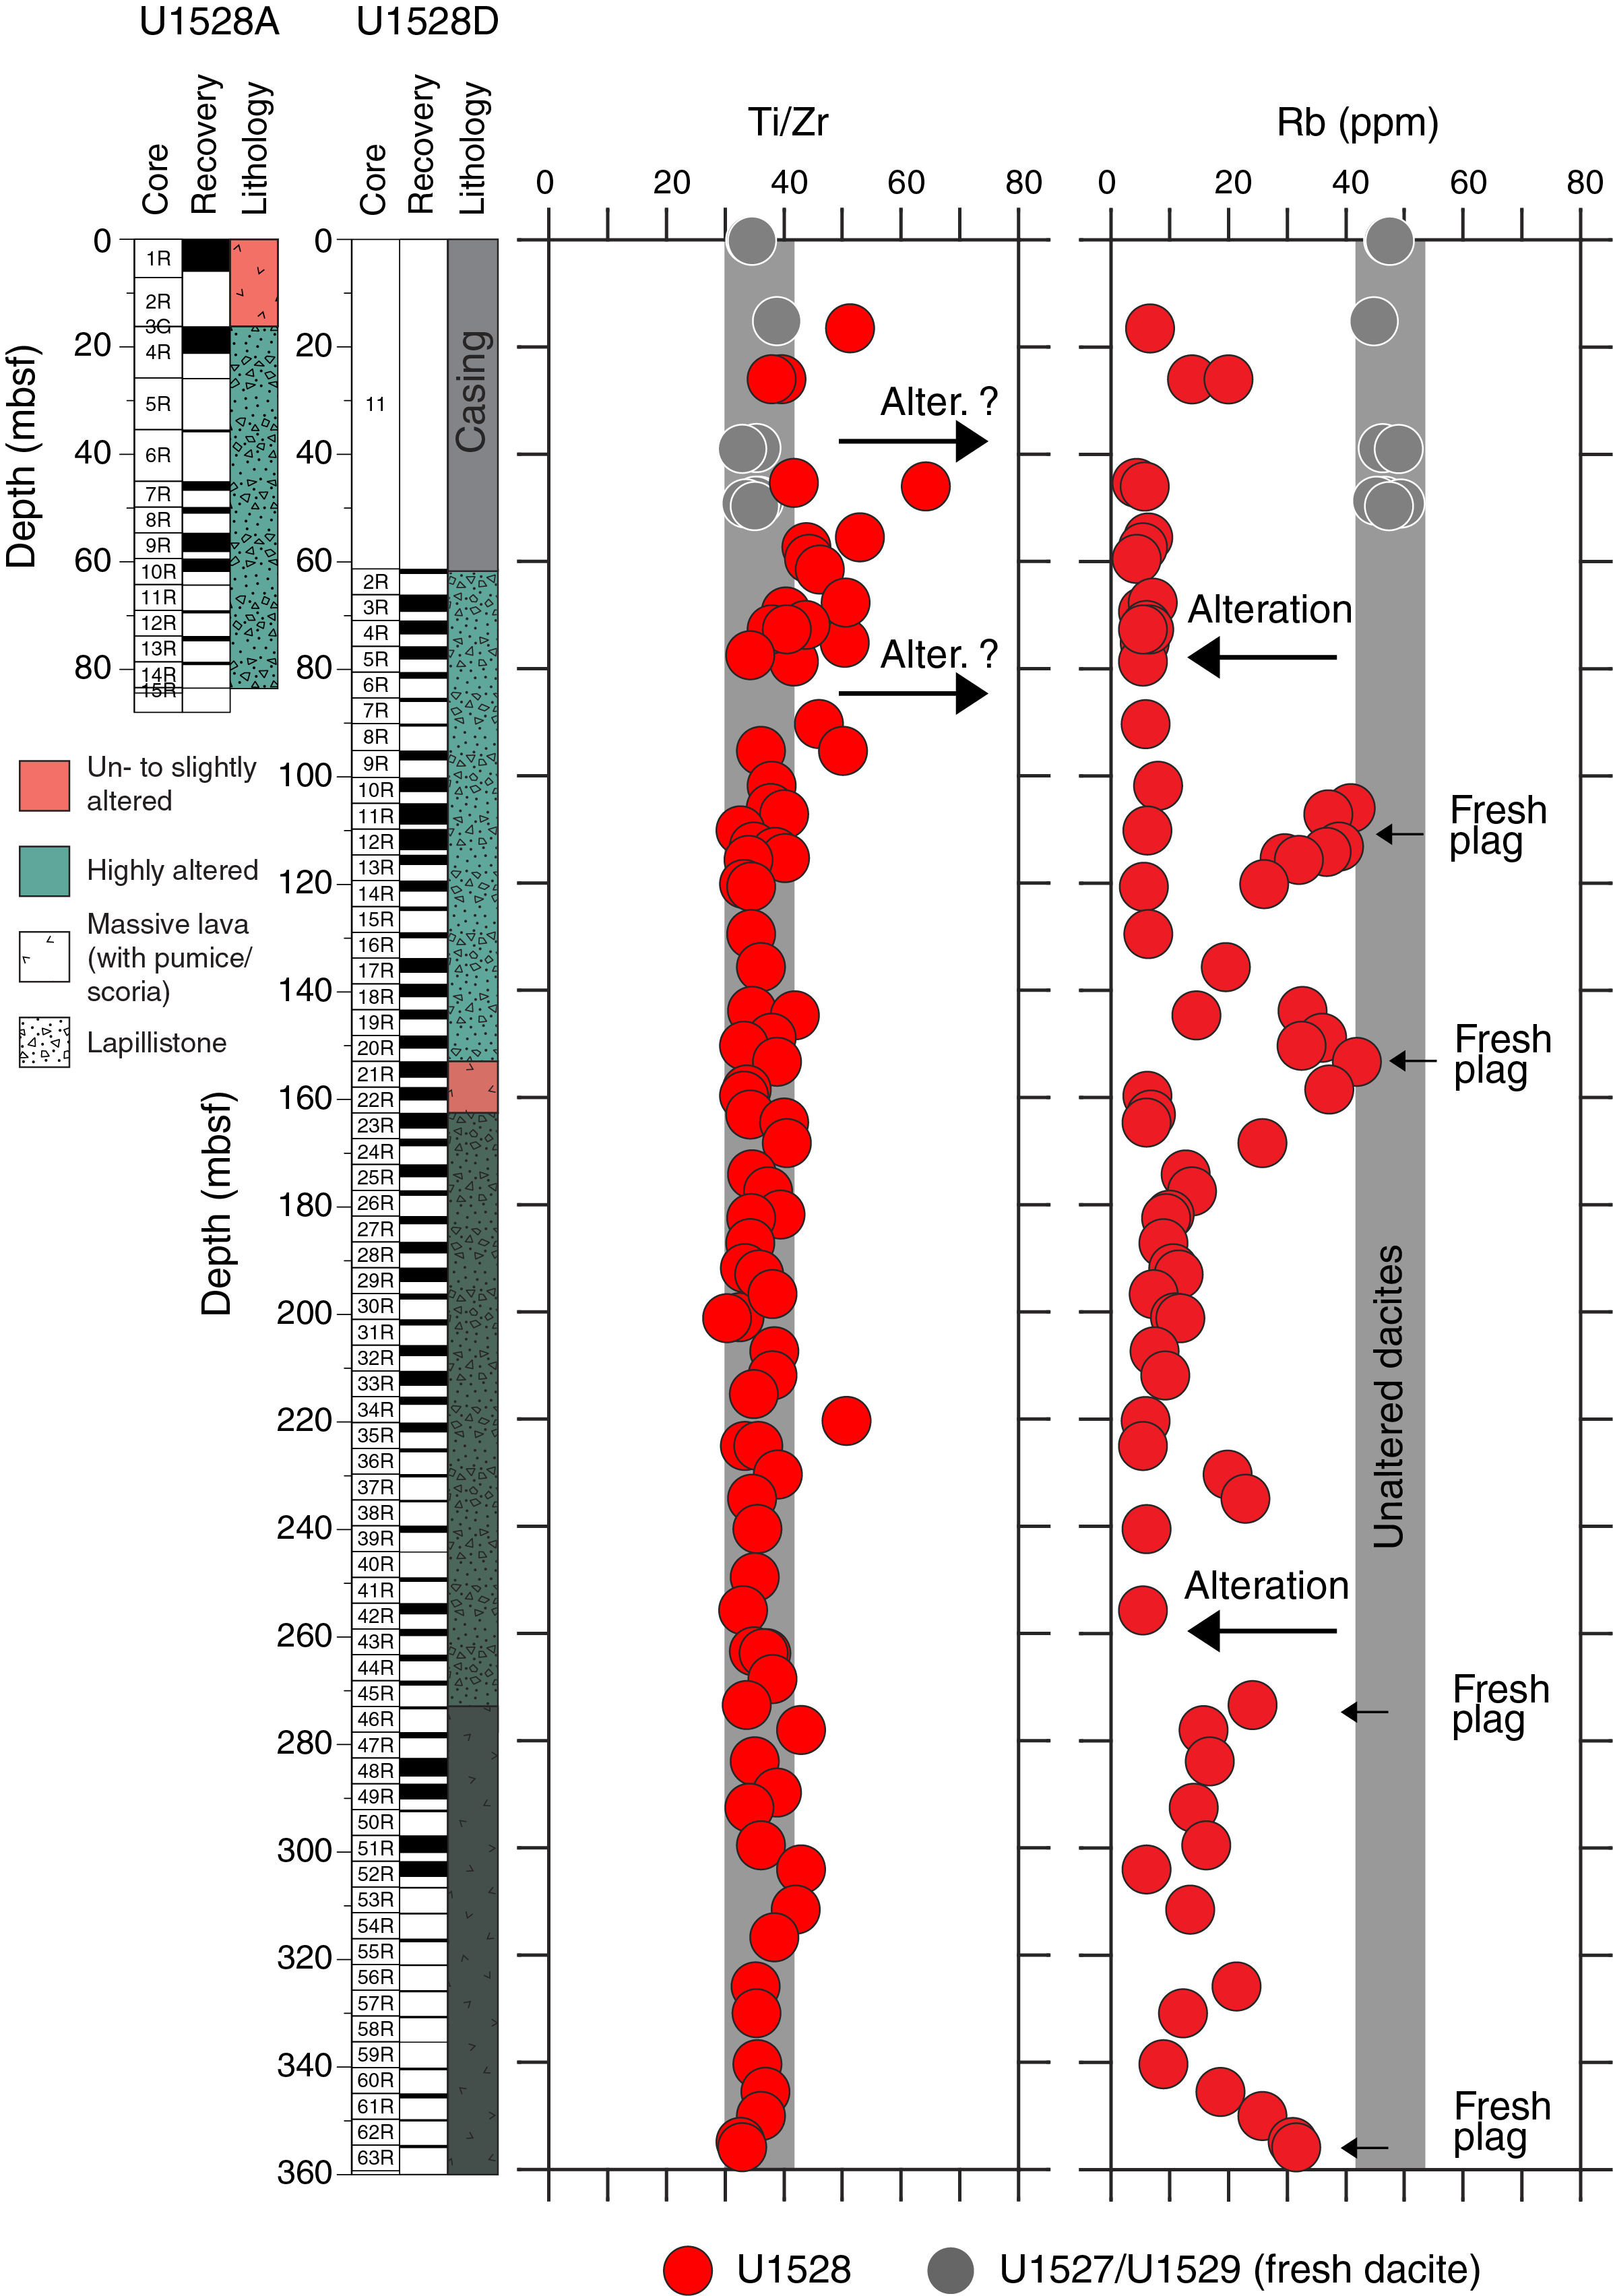
Figure F24. TI/ZR and RB.
Alteration
Four alteration types (I–IV) were identified at Site U1528 (Figures F25, F26). They were defined by the presence of a dominant alteration mineral assemblage together with the recognition of macroscopic and microscopic textural characteristics. Alteration Type I consists of smectite and pyrite as well as minor natroalunite and pyrophyllite. Alteration Type II is defined by the appearance of illite with smectite, pyrite, and anhydrite. Alteration Type III is defined by pervasive alteration and the presence of pyrophyllite, natroalunite, and rutile with lesser quartz, smectite, pyrite, and anhydrite. Alteration Types II and III are overprinted by a fracture-controlled, light-colored Alteration Type IV that is defined primarily by occurrence of natroalunite and anhydrite and develops as halos around later stage fractures or veins. The occurrence of a distinct alteration type is defined by a representative section interval and corresponding depth range shown below. A complete list of intervals for all alteration types in any hole at Site U1528 is given in Table T2.
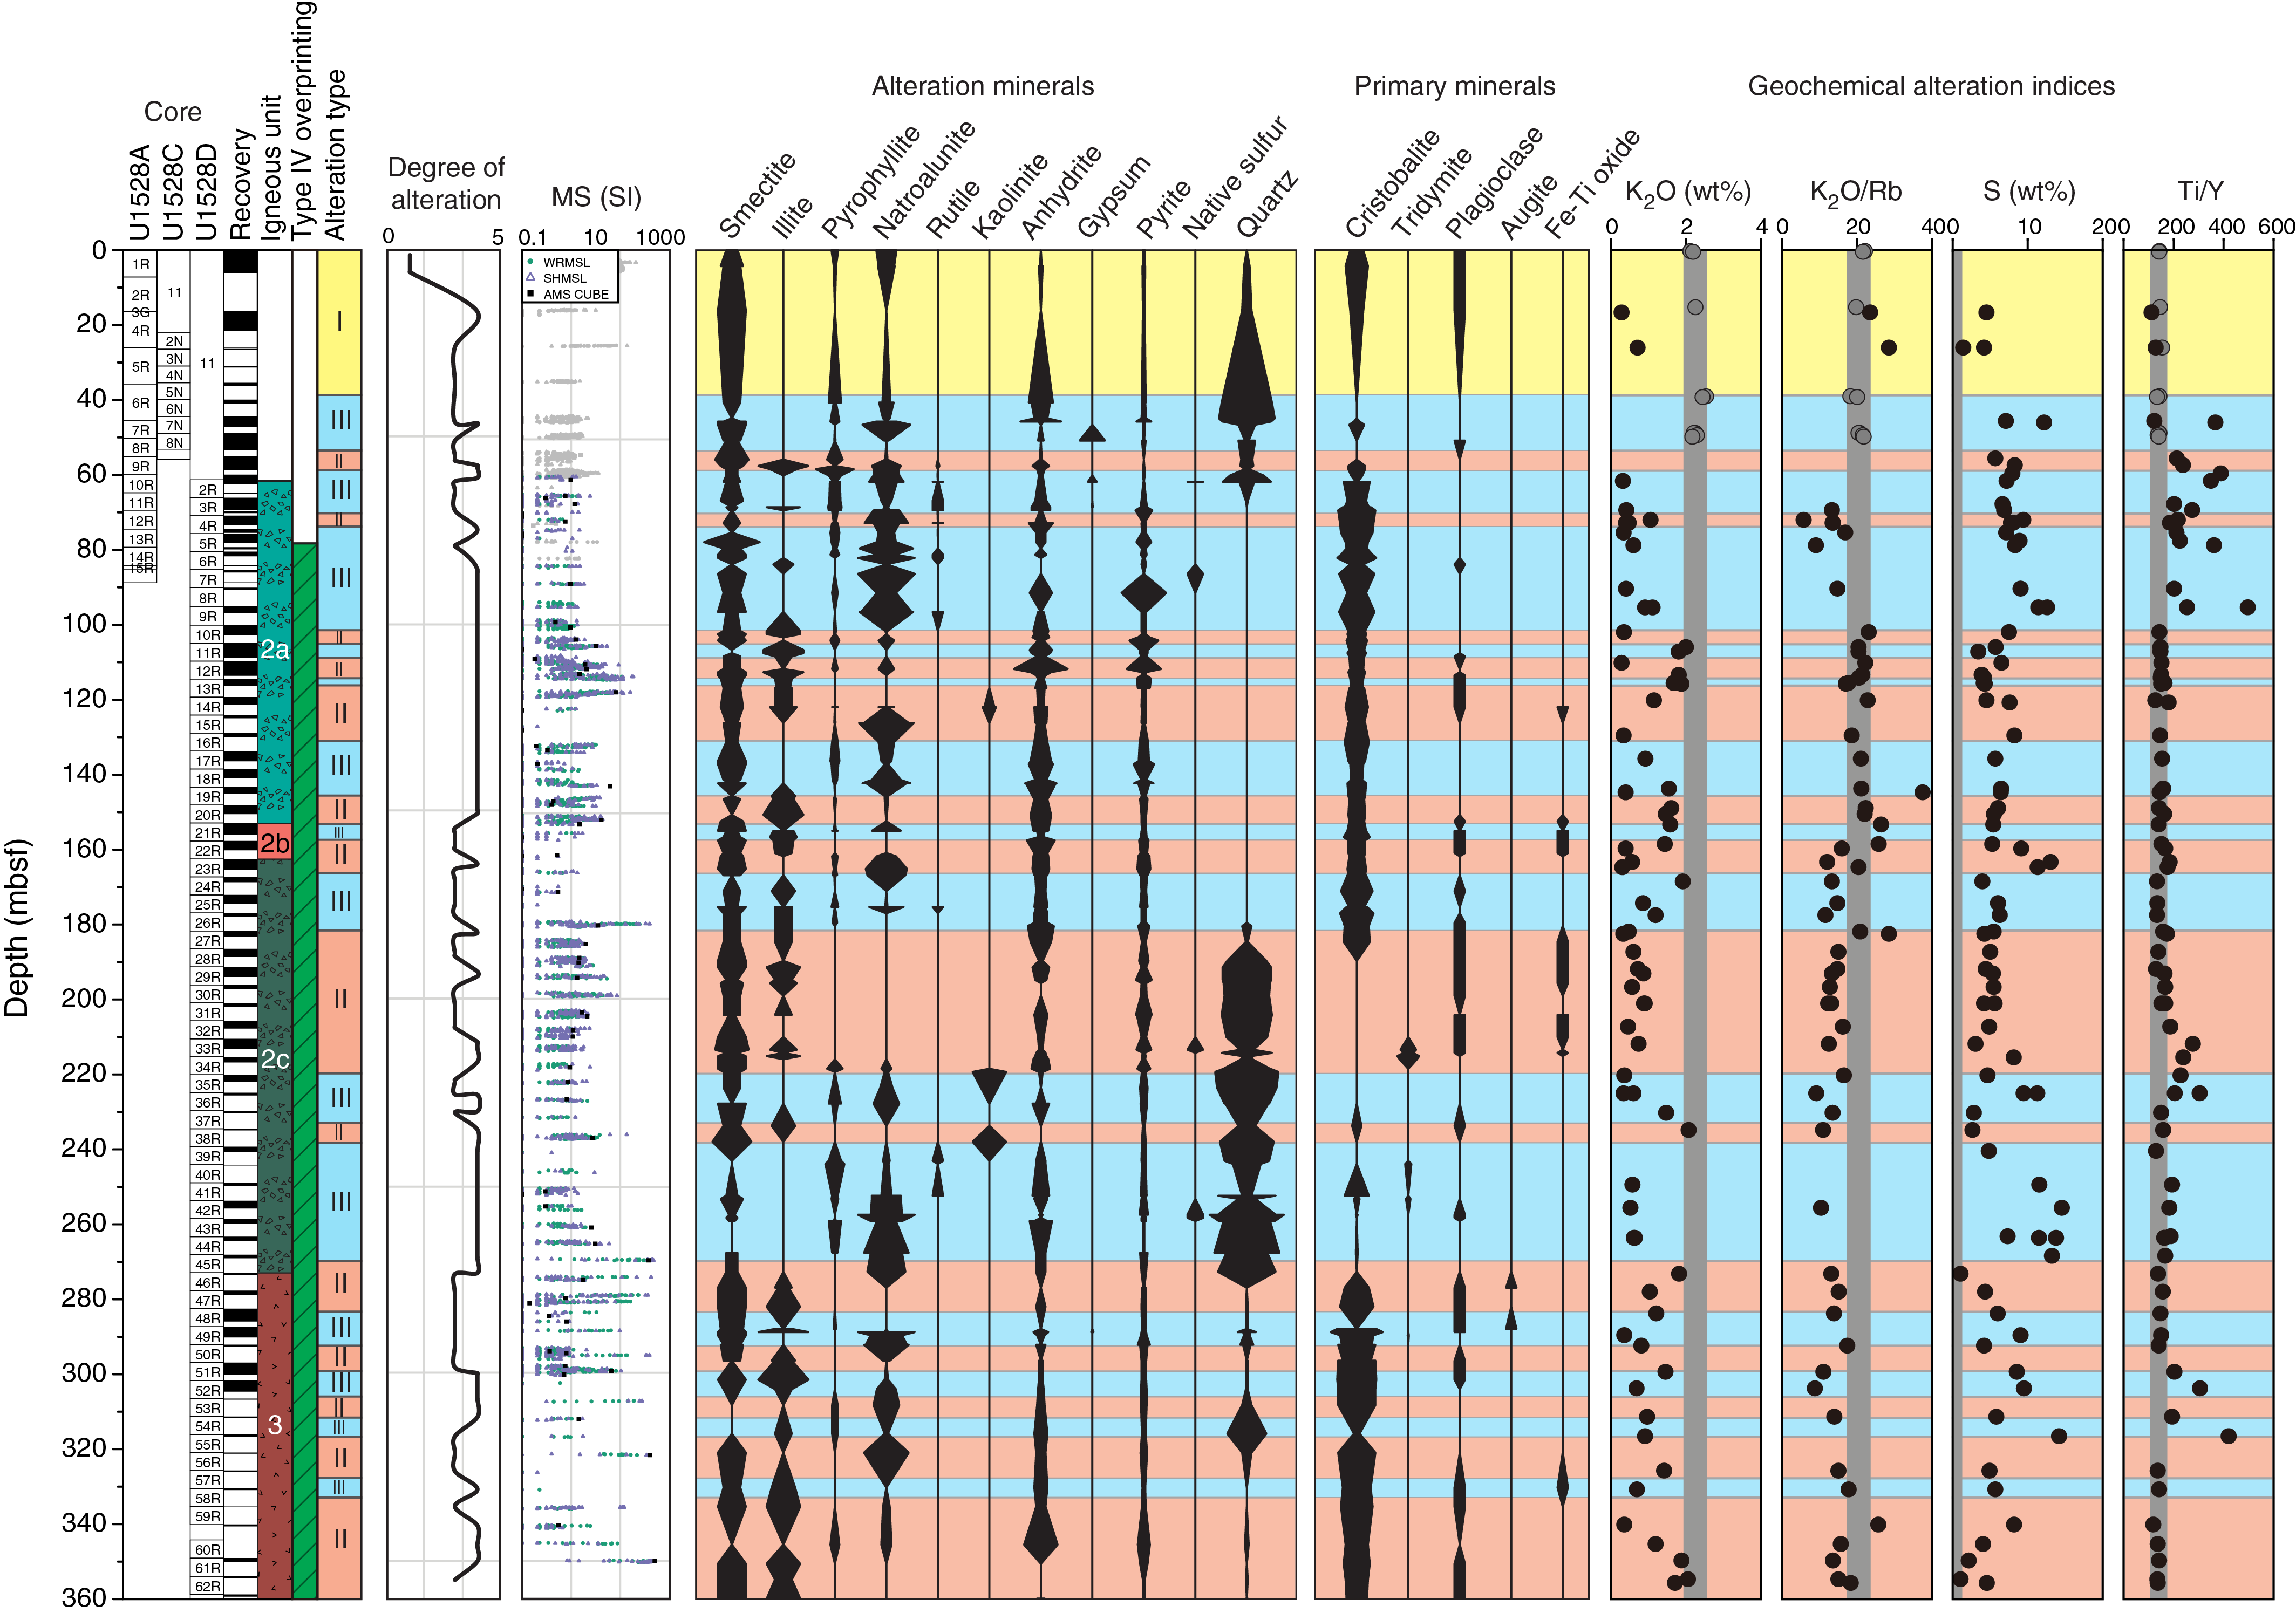
Figure F25. Stratigraphic column.
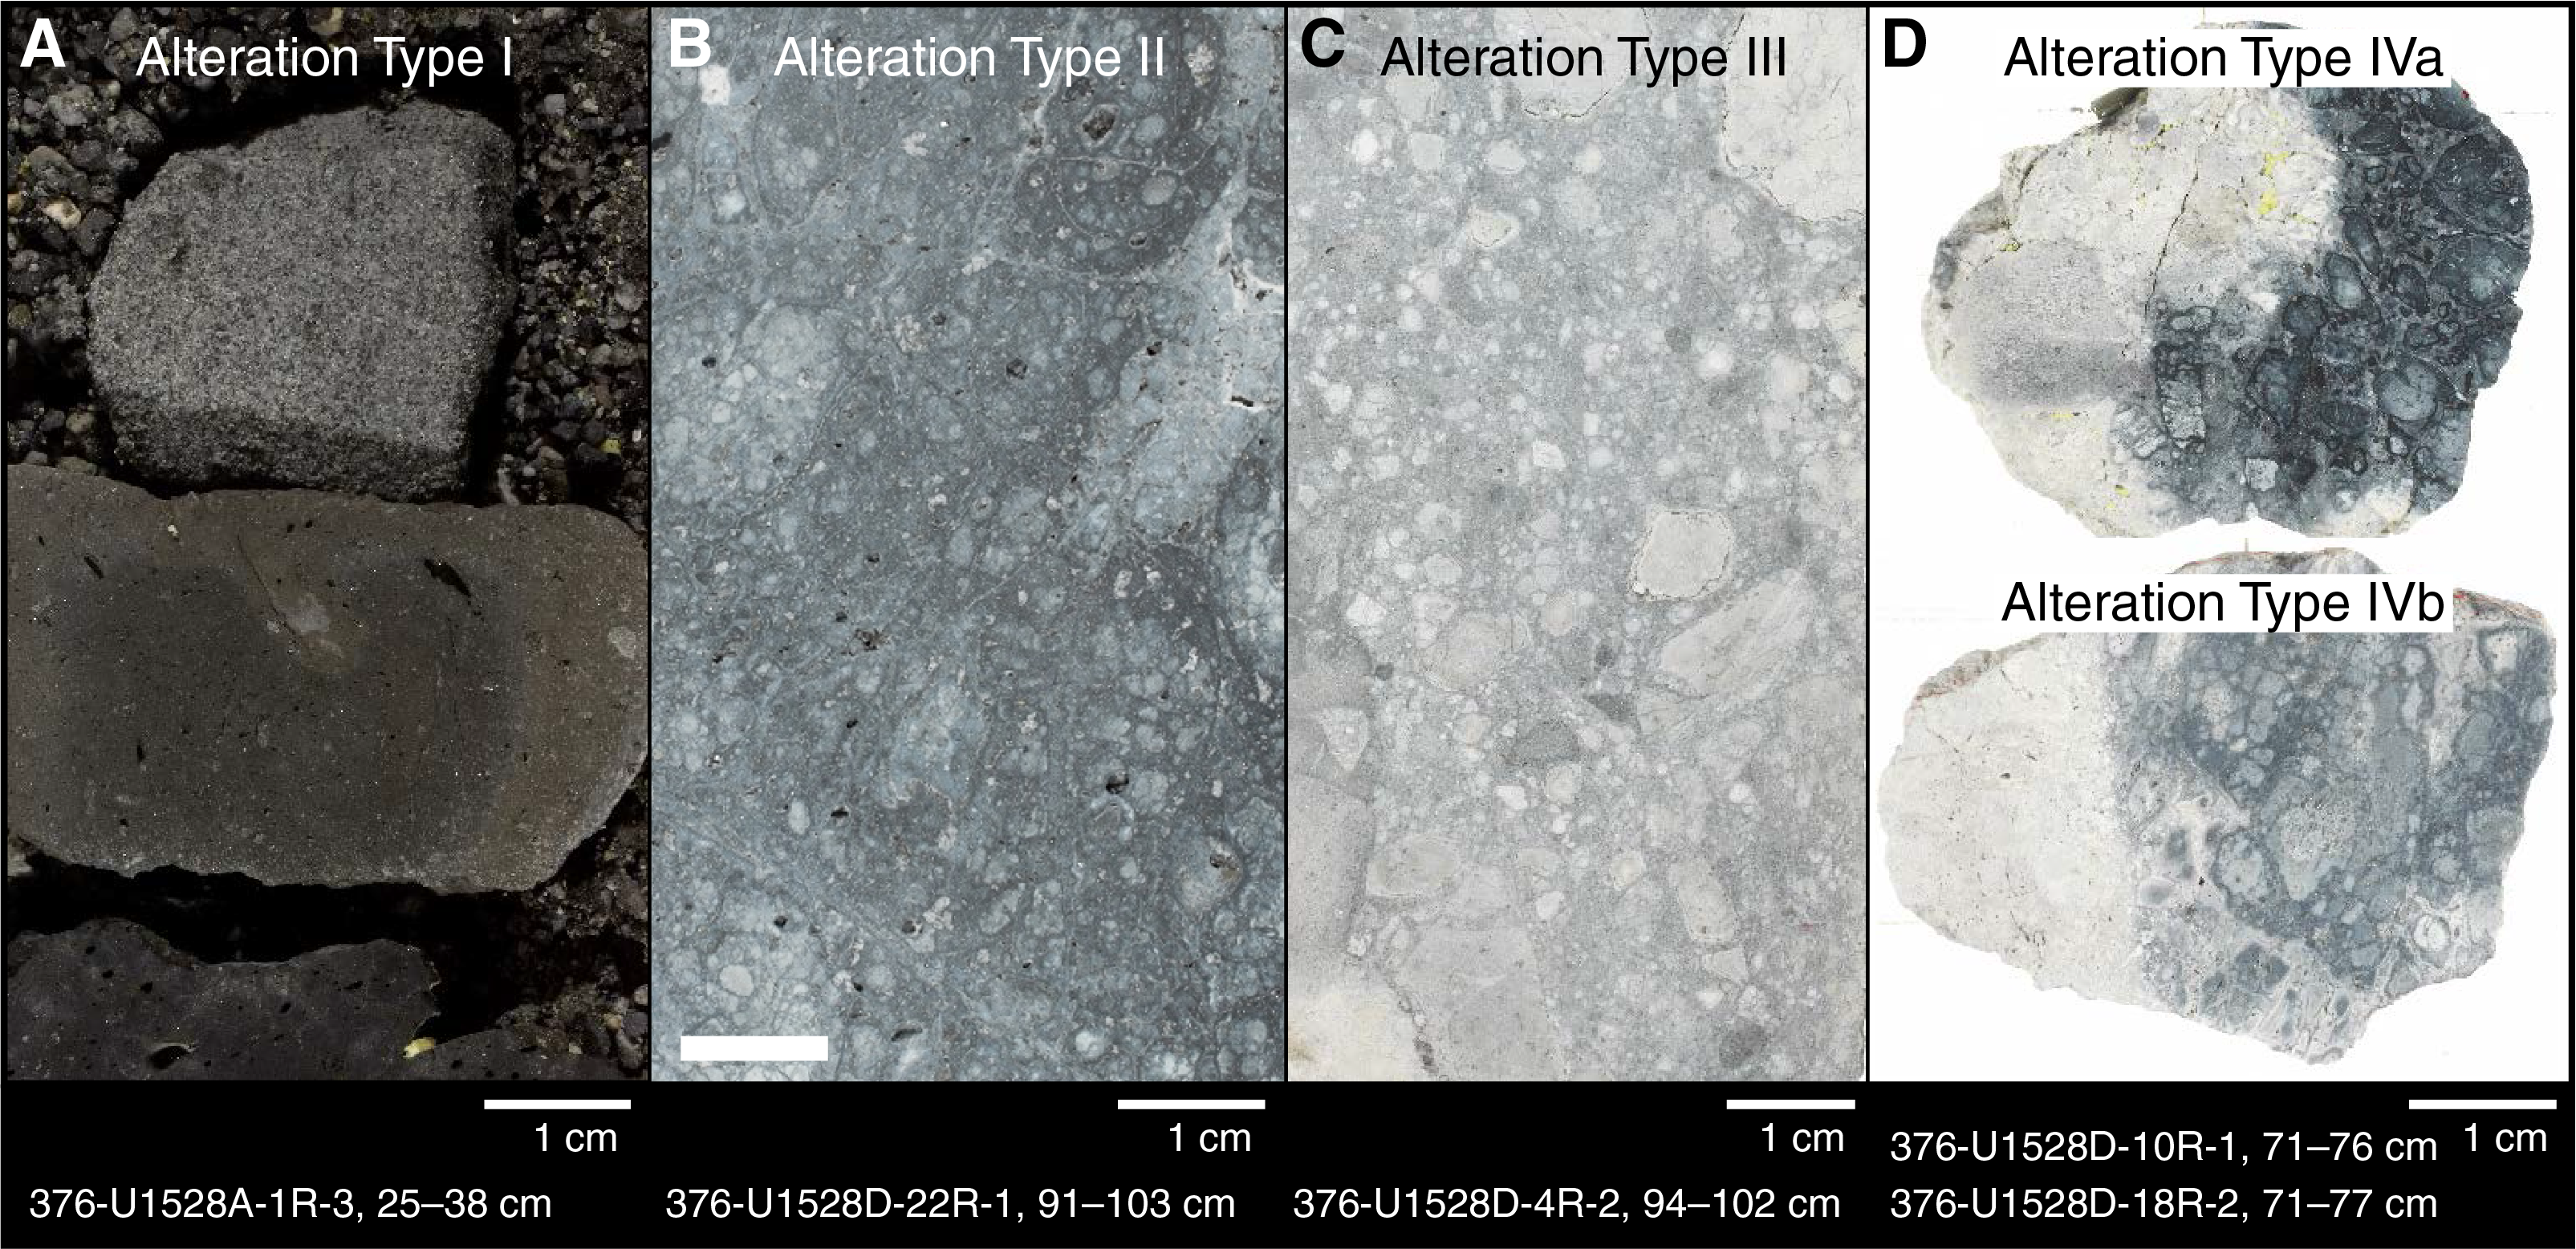
Figure F26. Alteration types.
Alteration Type I
- Distinguishing alteration minerals: smectite + pyrite ± natroalunite ± pyrophyllite
- Degree of alteration: slightly altered
- Interval: 376-U1528A-1R-1, 0 cm, to 6R-1, 50 cm
- Depth: 0–35.9 mbsf
Alteration Type I occurs in Igneous Unit 1 (Holes U1528A and U1528C), which consists of unconsolidated gravels of slightly to moderately altered igneous material (Table T2). The predominant alteration minerals are smectite and pyrite with minor natroalunite and pyrophyllite as well as grains of native sulfur (Tables T3, T4). Dark gray gravels are slightly altered and partly replaced by smectite. Light gray gravels are more highly altered and contain natroalunite and disseminated pyrite. Native sulfur grains have two distinct morphologies: a crystalline tabular (orthorhombic) form and a globular form (Figure F27). At 3.25–3.37 mbsf, two dacitic clasts exhibit slight alteration and contain globules of native sulfur infilling vesicles (Figure F28).
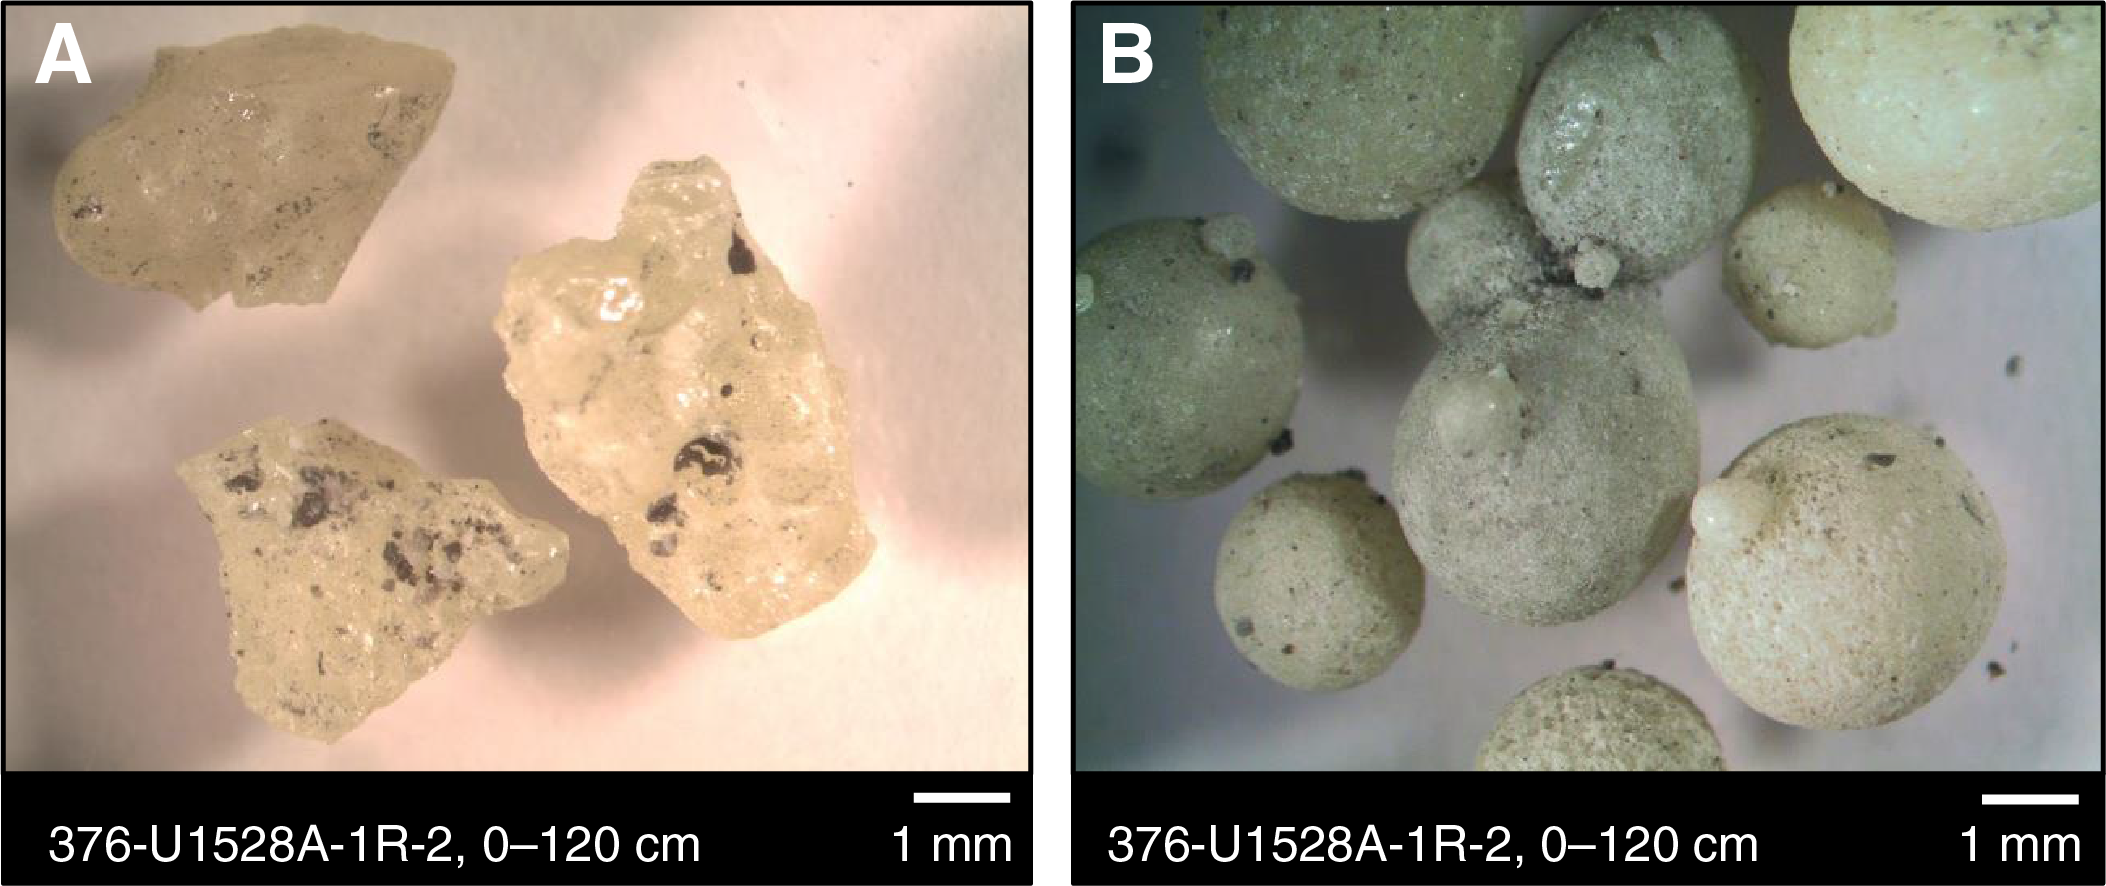
Figure F27. Native sulfur morphologies.
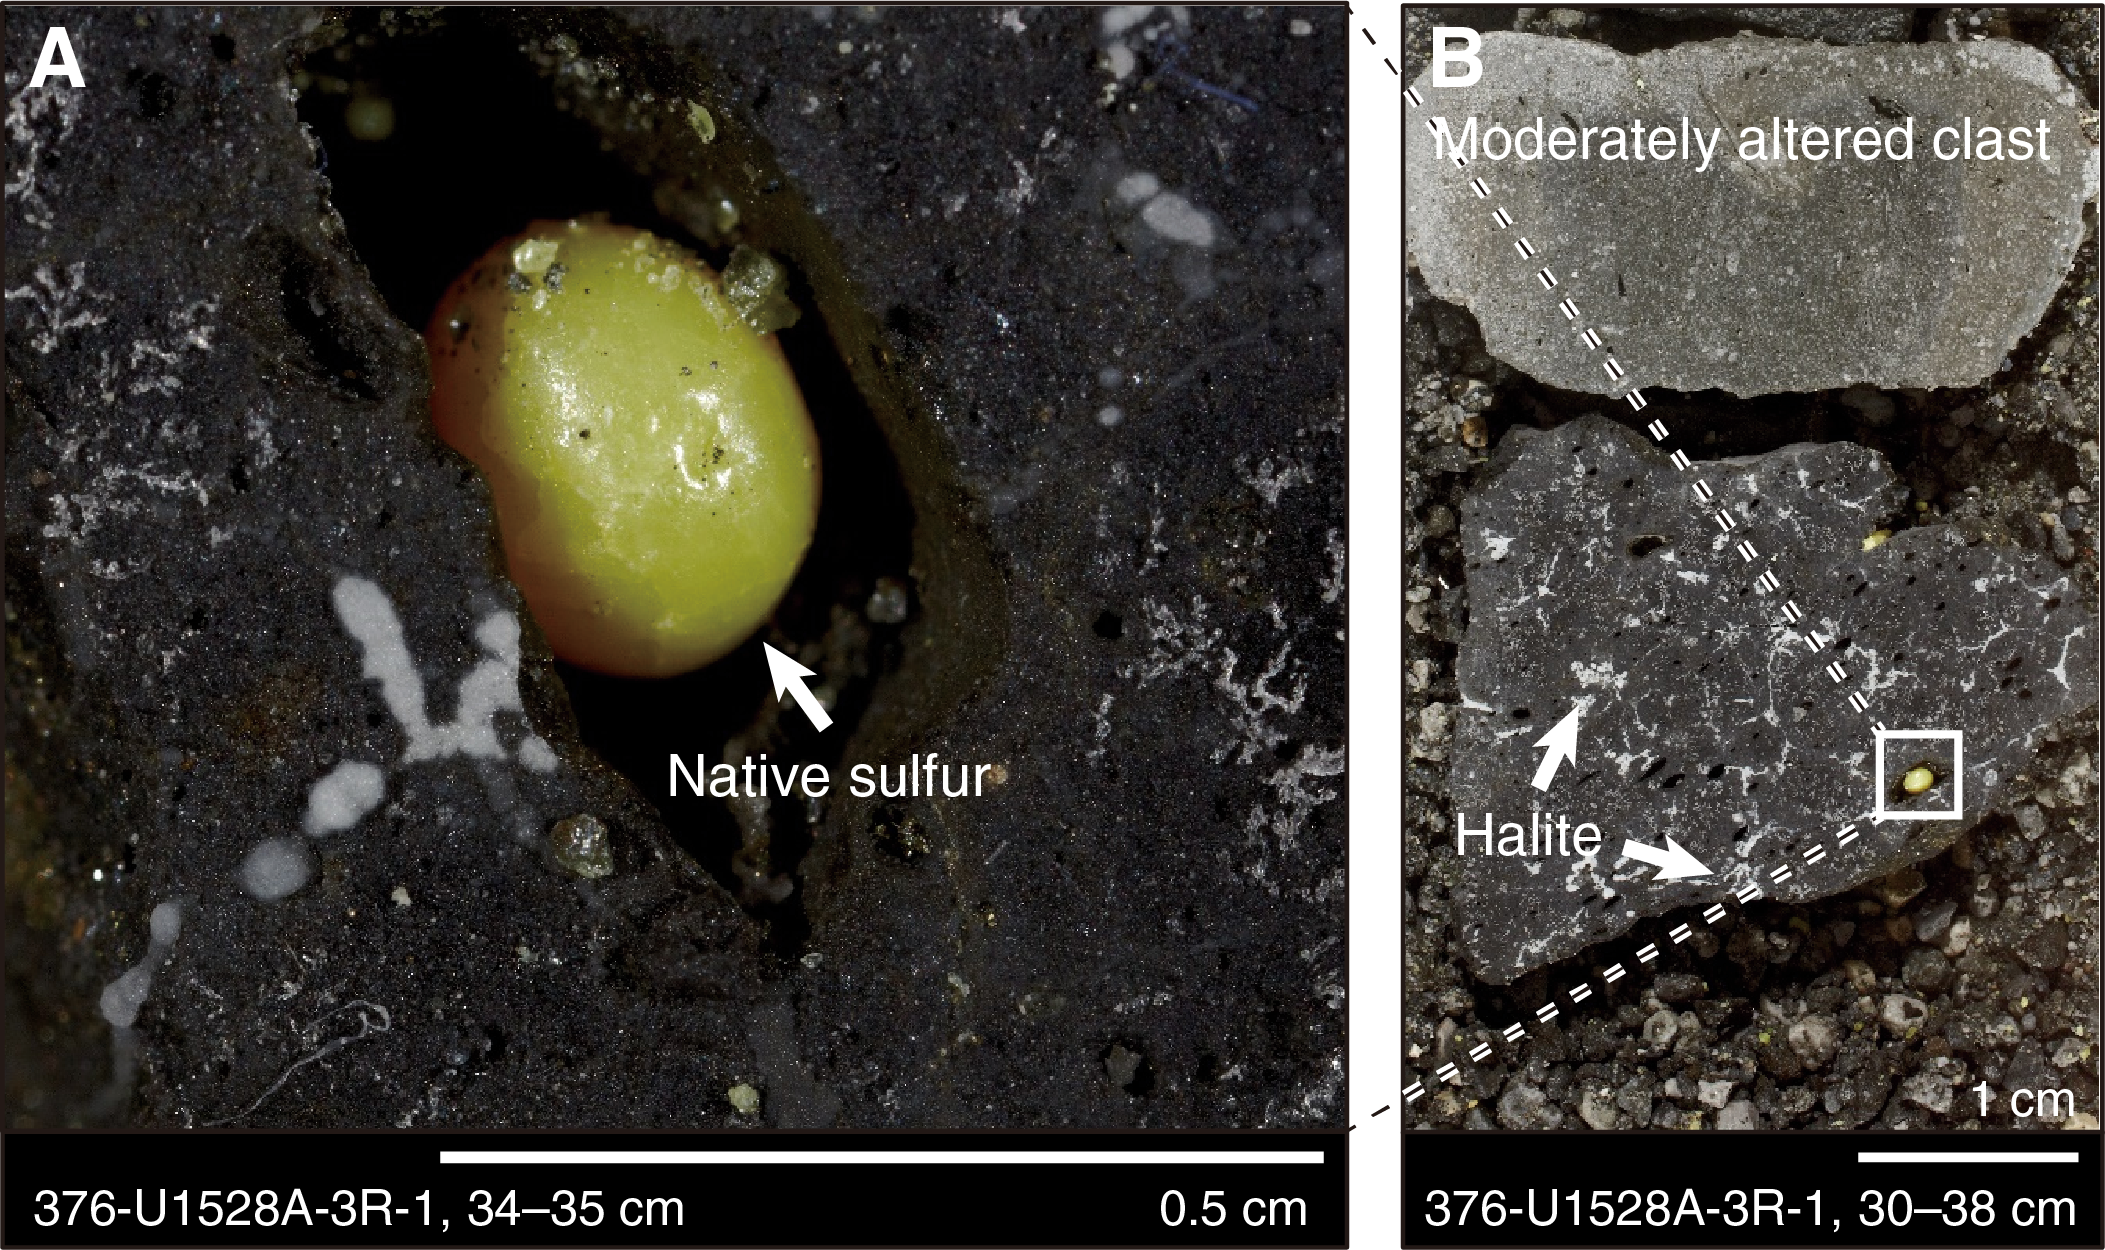
Figure F28. Alteration Type I, Hole U1528A.
Alteration Type II
- Distinguishing alteration minerals: illite + smectite + quartz + pyrite + anhydrite ± natroalunite ± pyrophyllite ± rutile
- Degree of alteration: highly altered
- Interval: 376-U1528D-22R-1, 0 cm, to 24R-1, 13 cm
- Depth: 157.7–167.4 mbsf
Alteration Type II is highly altered and characterized by illite with smectite, pyrite, and anhydrite (Table T3). Natroalunite, pyrophyllite, and rutile are minor phases. Alteration Type II is typically gray-blue (Figure F29) and in places preserves a relict perlitic texture and plagioclase phenocrysts (Figure F30). Alteration of the matrix is characterized by a fine mesh texture of silica and pyrite with minor intergrown anhydrite. The clasts are variably altered and range in color from light gray to blue-gray. The darker blue-gray clasts are mainly composed of smectite (with minor illite), silica, pyrite, and anhydrite, whereas the lighter clasts are dominantly illite (with minor smectite) with lesser silica, pyrite, and anhydrite. In the pyroclastic rocks, darker clasts often preserve a more angular appearance and are frequently rimmed by a fine band of pyrite. Some clasts are strongly resorbed and difficult to distinguish from the matrix (Figure F29). Other clasts are replaced by concentric layers of light and dark secondary minerals. In the dark layers, the plagioclase phenocrysts are pseudomorphed by a blue mineral, likely natroalunite, whereas the lighter layers show plagioclase pseudomorphed by anhydrite. Some plagioclase pseudomorphs are rimmed by a veneer of natroalunite, which illustrates the progressive replacement of plagioclase by secondary alteration minerals (Figure F30). Clinopyroxene crystals are extensively pseudomorphed by anhydrite + smectite + pyrite (Figure F31). No unaltered pyroxene was observed in thin section; however, X-ray diffraction (XRD) data suggest it is present below 273.33 mbsf. Primary titanomagnetite is commonly replaced by pyrite. The observed textures suggest that the pyrite initially mantles the magnetite and then penetrates the crystal along fractures before complete replacement by a lattice-like texture (Figure F32).
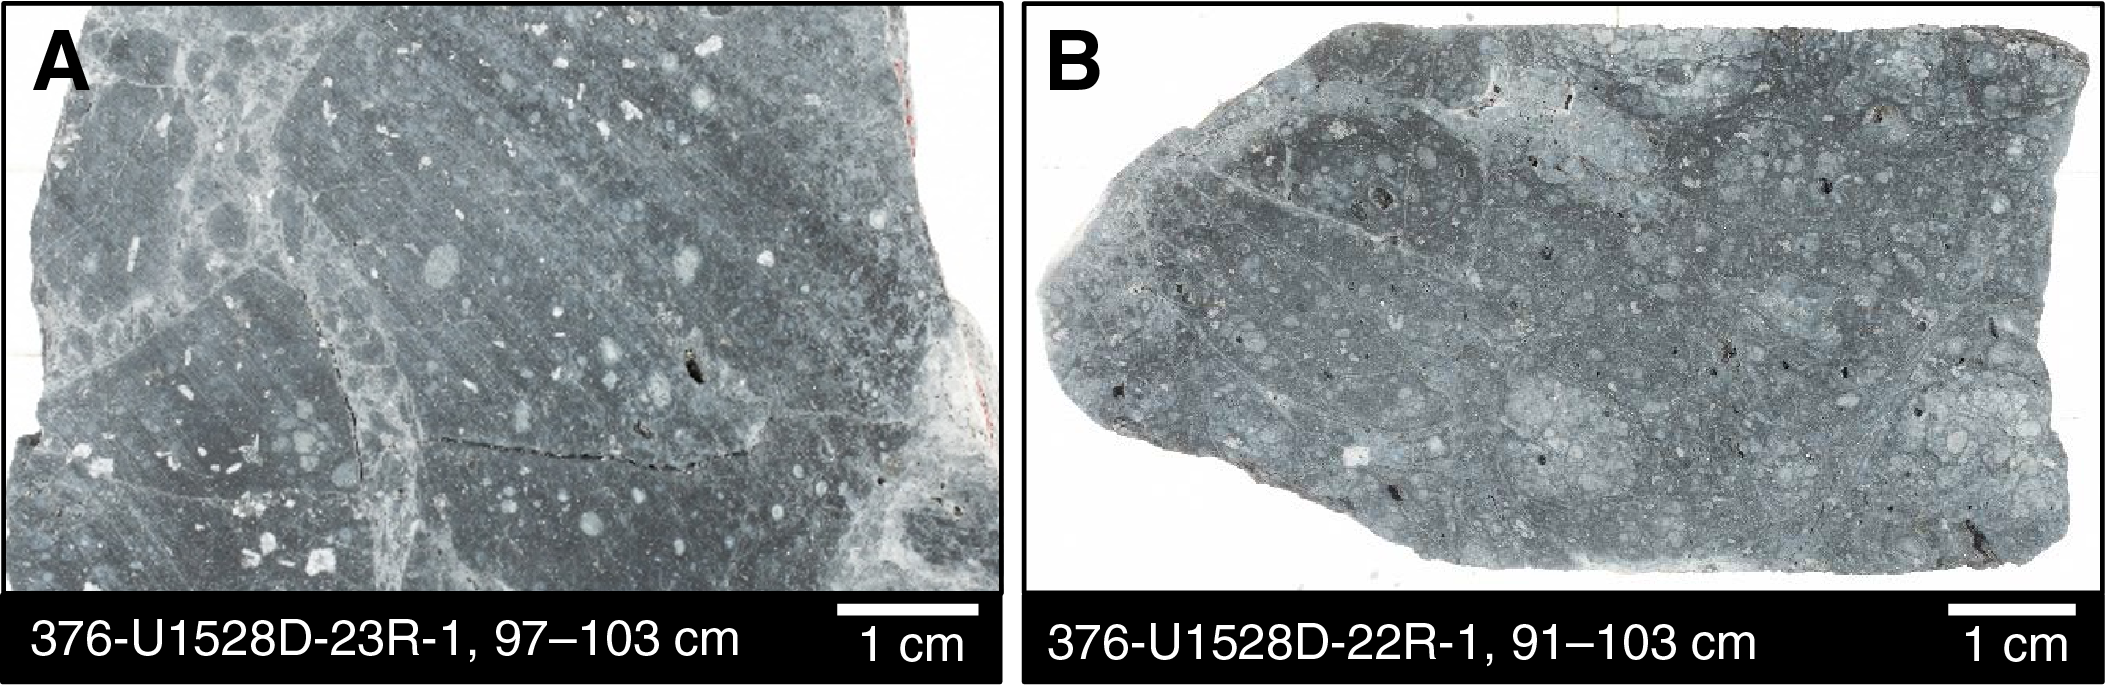
Figure F29. Alteration Type II, Hole U1528D.
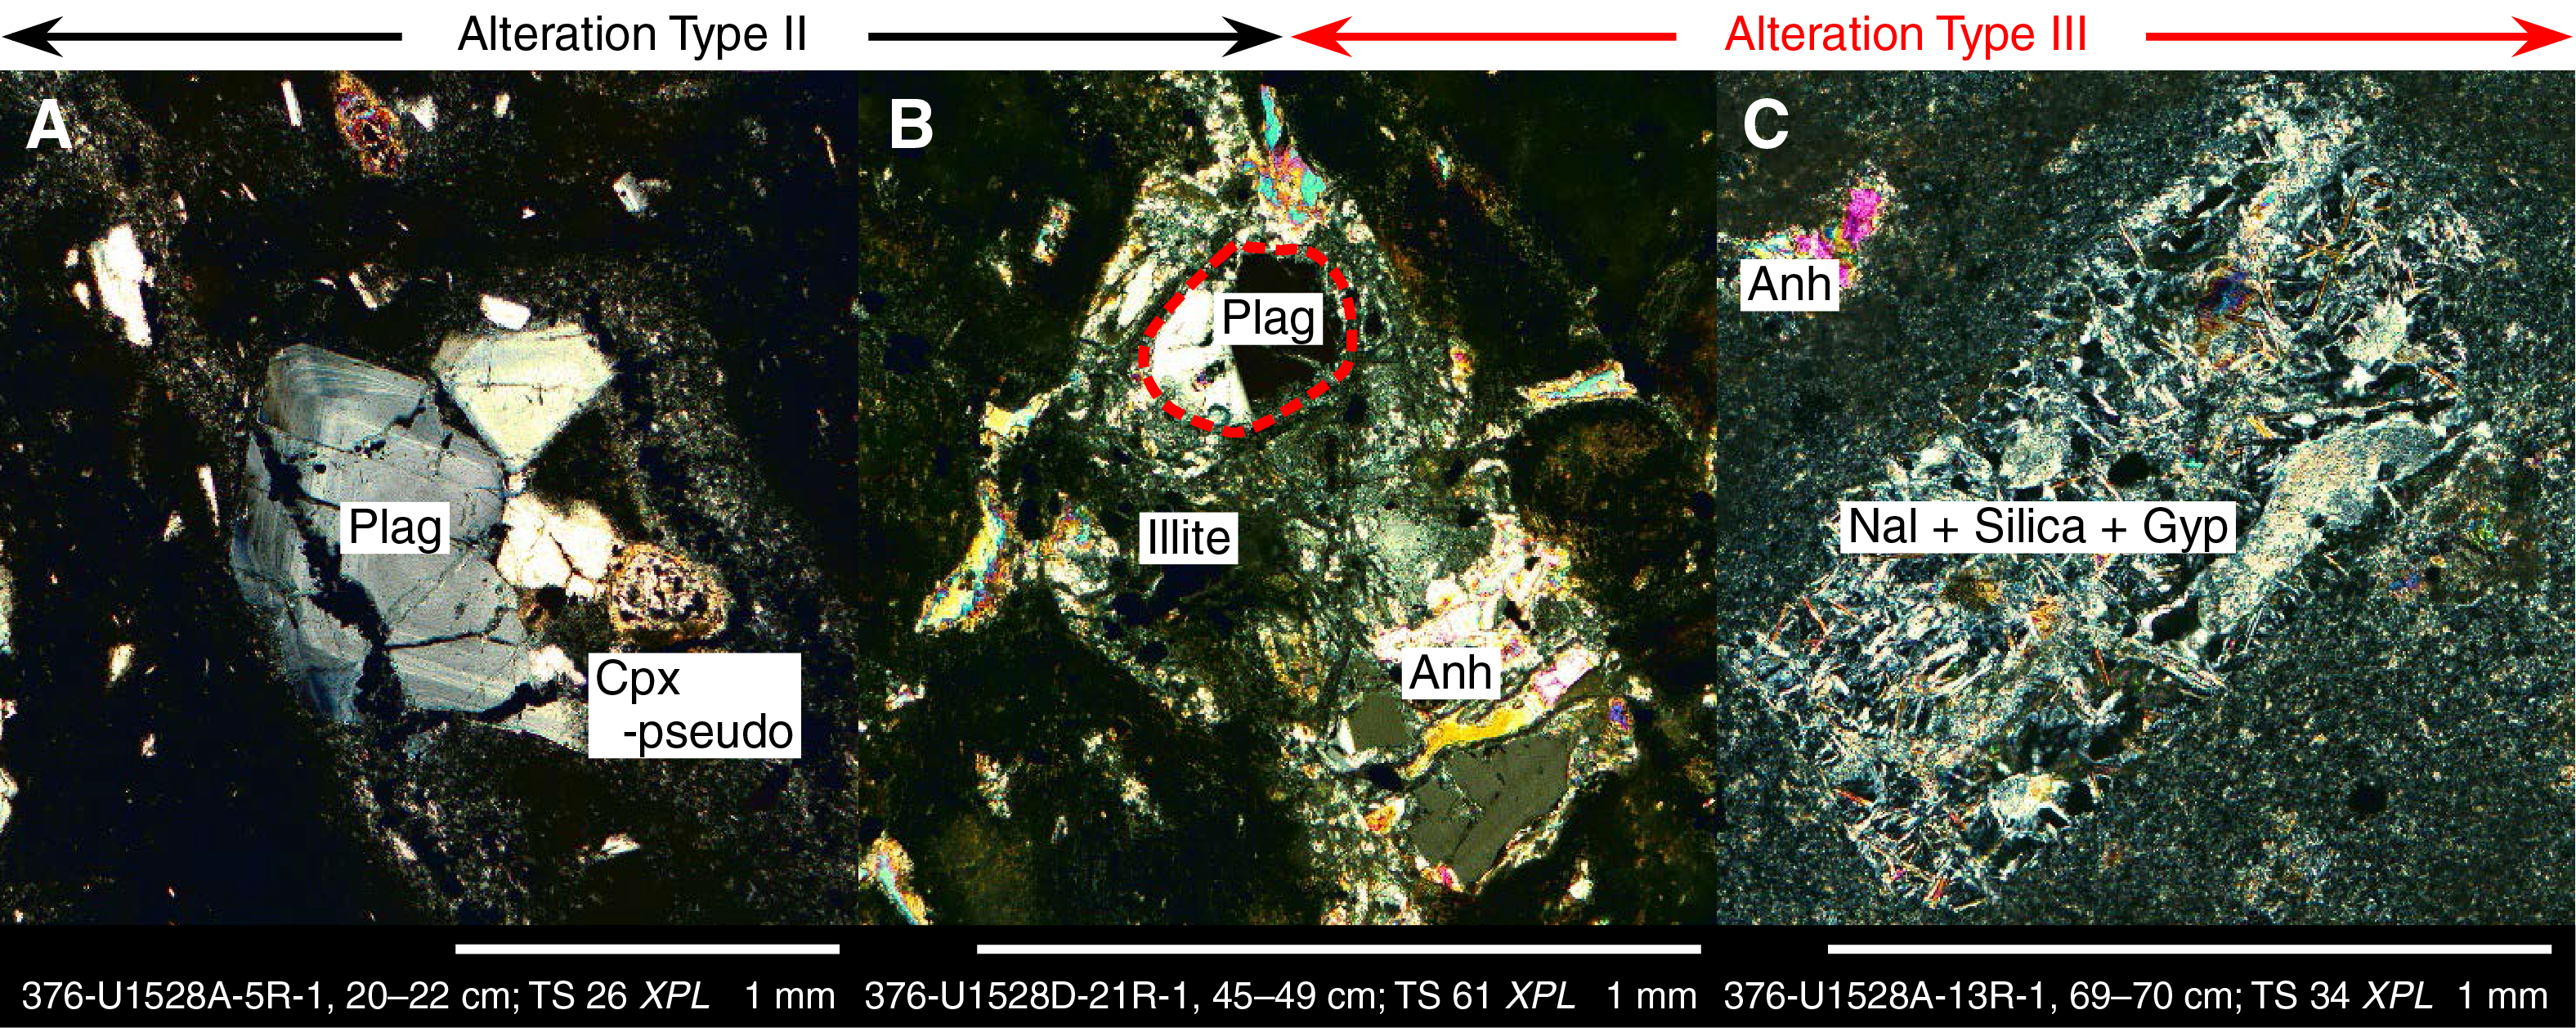
Figure F30. Alteration of plagioclase.
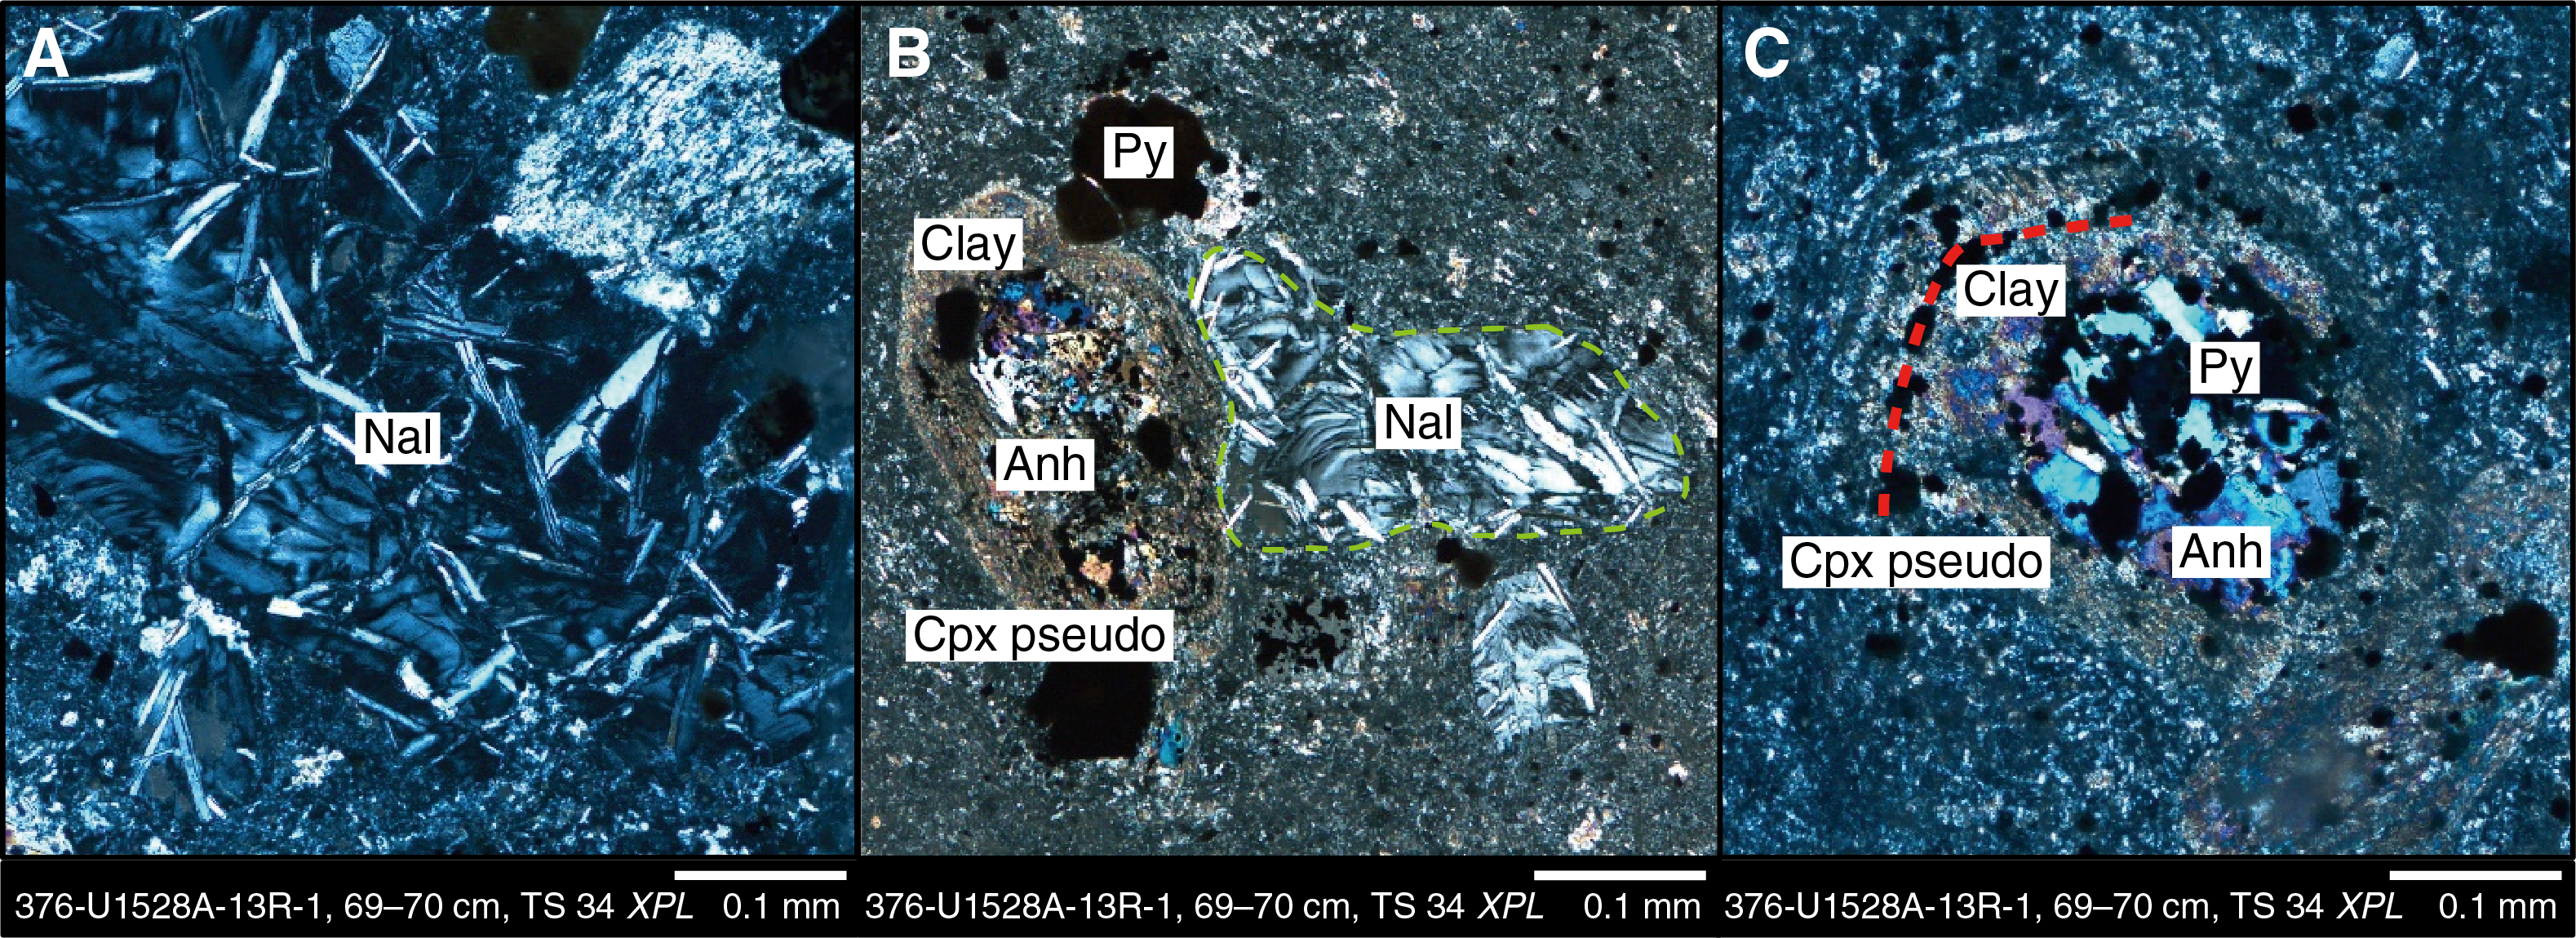
Figure F31. Alteration Type II.
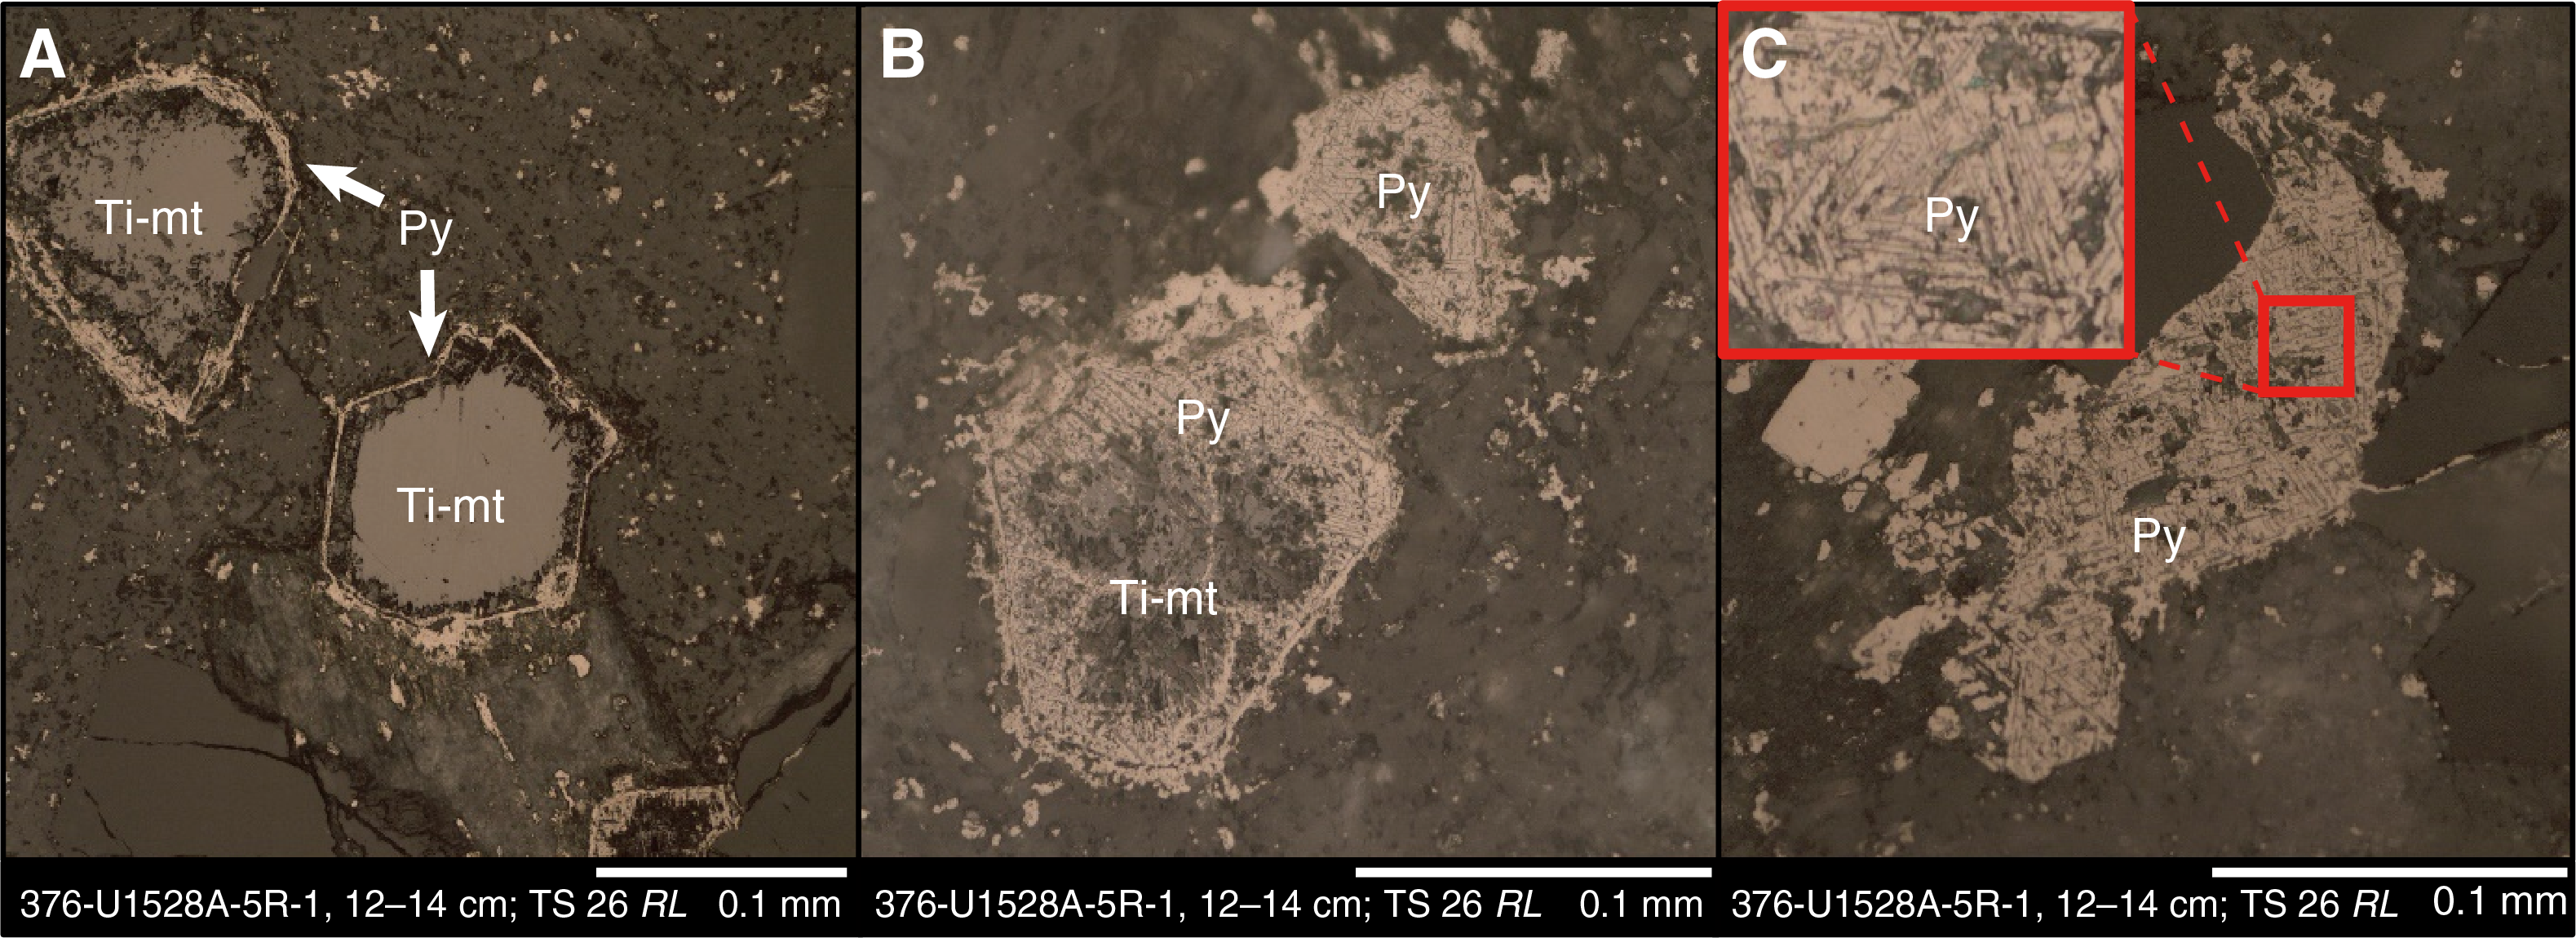
Figure F32. Oxidization of Ti-Mt to Py.
Alteration Type III
- Distinguishing alteration minerals: natroalunite + pyrophyllite + rutile ± quartz ± pyrite ± smectite ± anhydrite ± gypsum
- Degree of alteration: highly to intensely altered
- Interval: 376-U1528D-2R-1, 0 cm, to 3R-3, 25 cm
- Depth: 61.3–69.3 mbsf
Alteration Type III is characterized by natroalunite, pyrophyllite, and rutile with lesser quartz, smectite, pyrite, and anhydrite (Table T3). Alteration Type III is white-gray and in places exhibits a vuggy texture with silica as the major infilling material. The degree of alteration of Alteration Type III is highly to intensely altered (Figure F33). The boundary between Alteration Types II and III ranges between sharp and diffuse over several meters. Clasts are extensively resorbed with an alteration assemblage dominated by smectite with lesser alunite, pyrophyllite, anhydrite, silica, and gypsum (Figure F34). The matrix is mainly altered to pyrophyllite, alunite, silica, anhydrite, and minor gypsum. The change in the constituent mineral assemblage between clast and matrix is subtle, although smectite is more abundant in the clasts, whereas natroalunite, pyrophyllite, and silica are more abundant in the matrix (Figure F34).
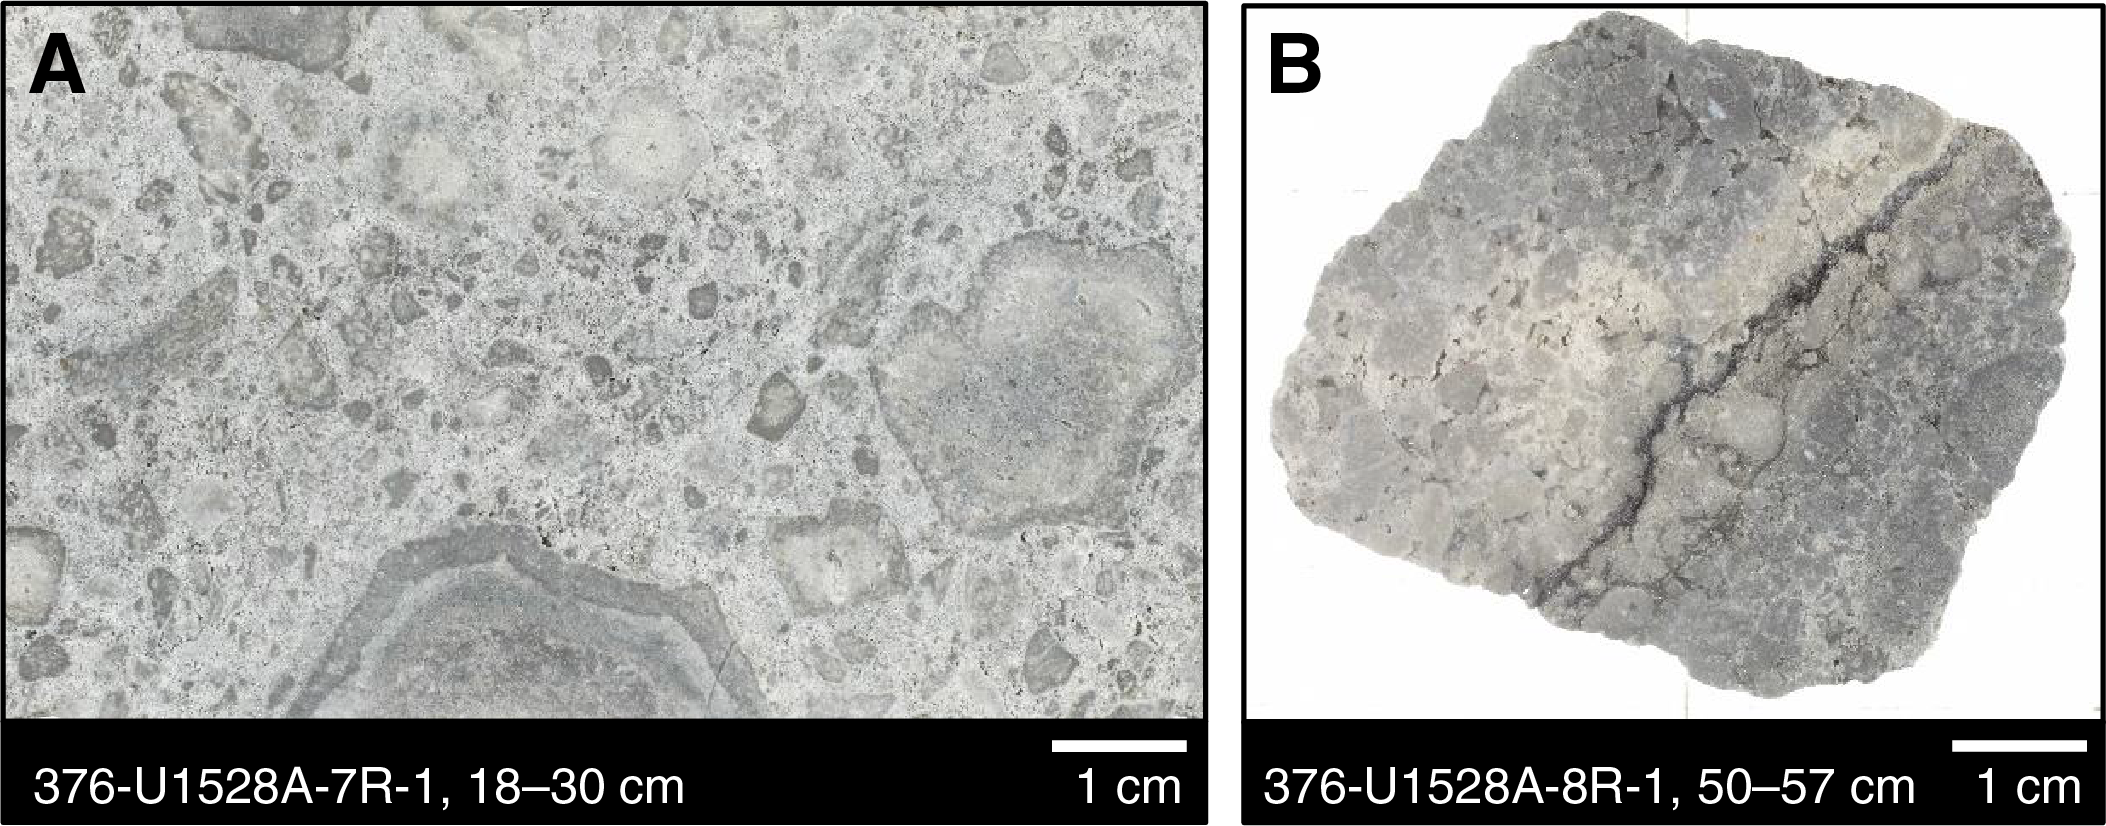
Figure F33. Alteration Type III, Hole U1528A.
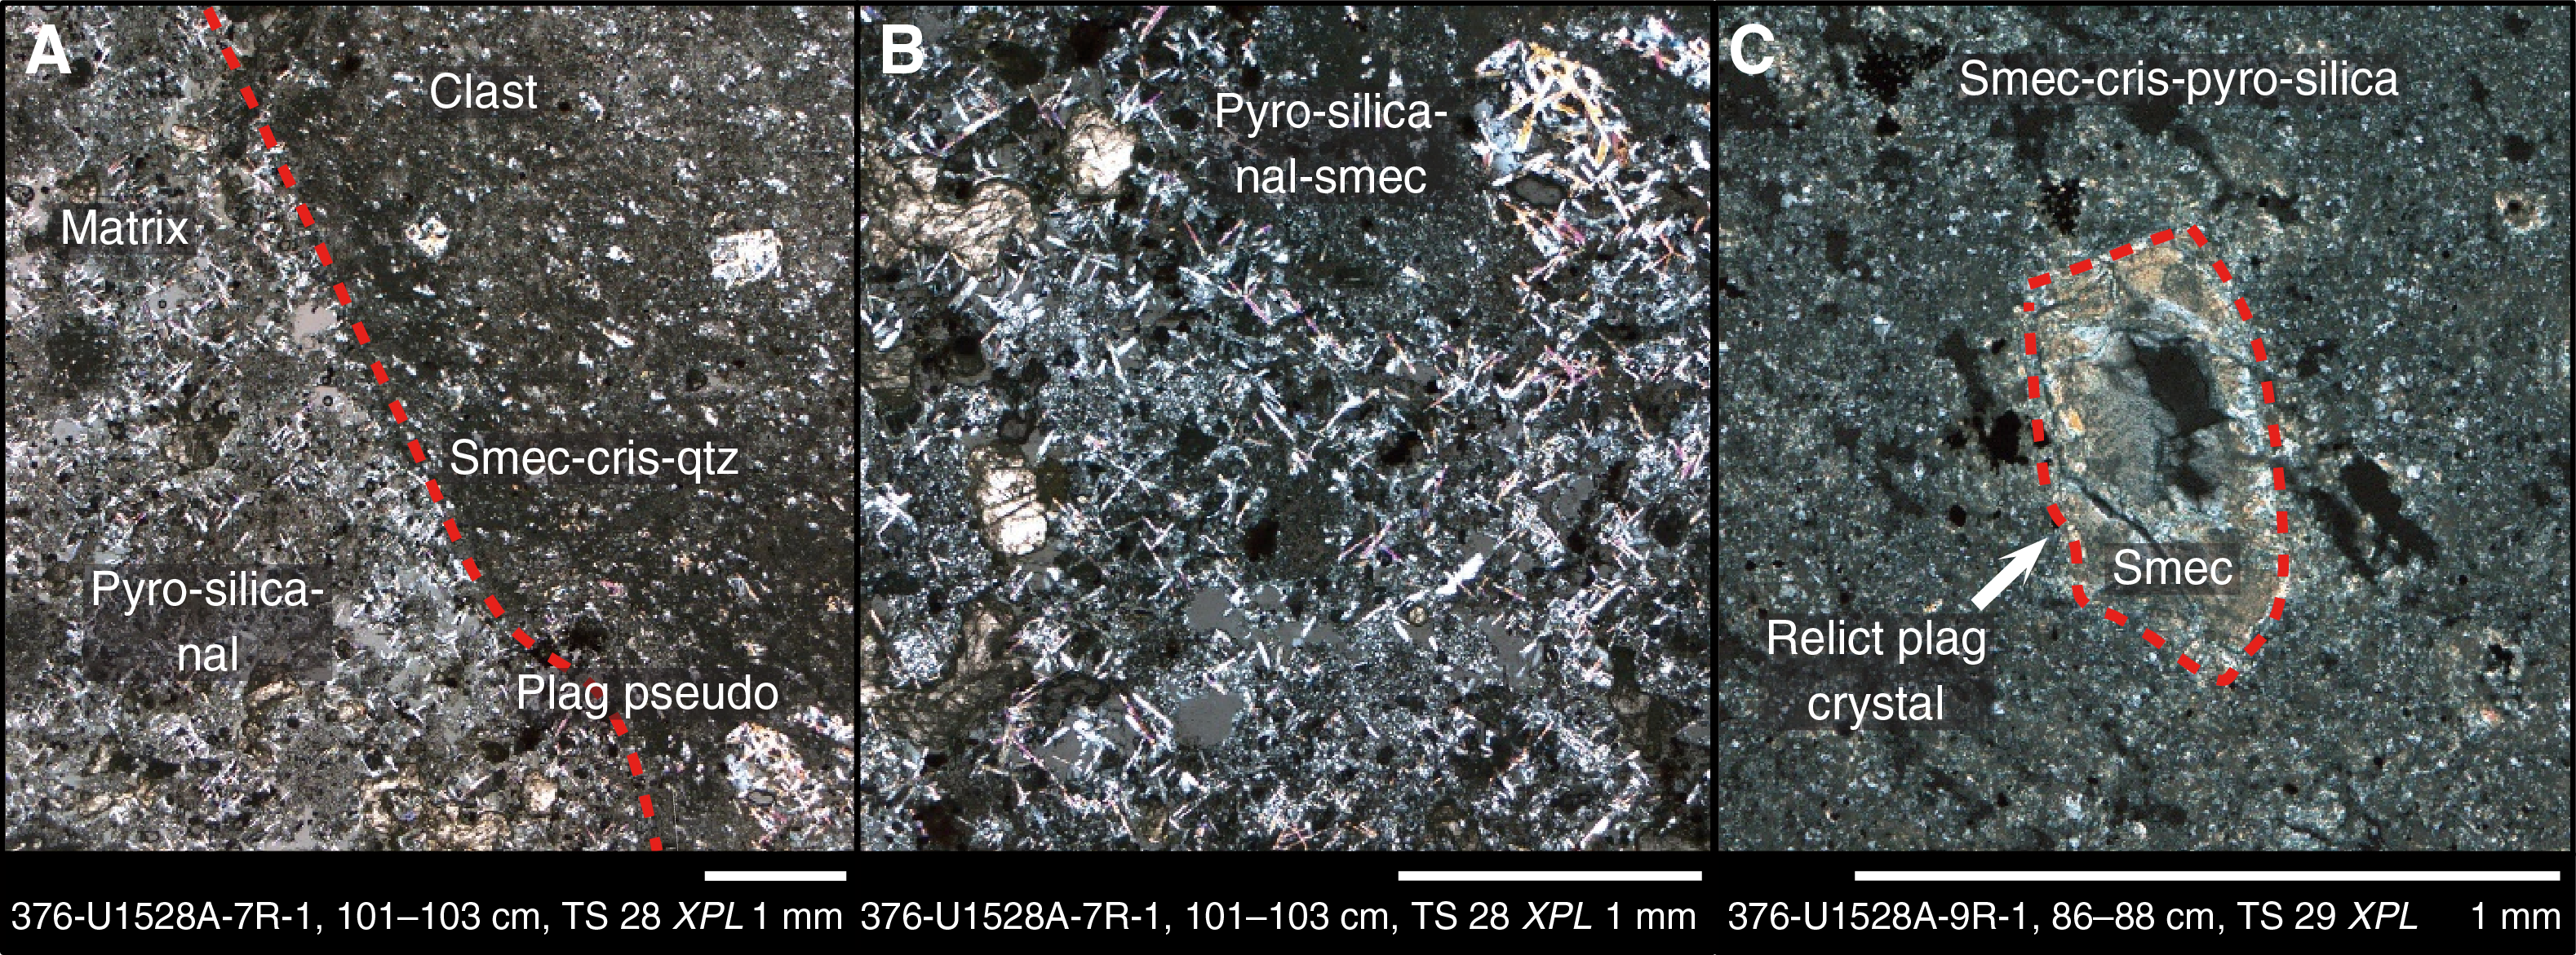
Figure F34. Clast-matrix boundary.
Plagioclase and pyroxene in clasts and matrix are pseudomorphed by natroalunite, anhydrite, smectite, and minor gypsum, and igneous magnetite is replaced by leucoxene and pyrite (Figure F35). Vein composition associated with Alteration Type III includes silica-pyrite, anhydrite-pyrite, and native sulfur with anhydrite and gypsum. Anhydrite-pyrite veins truncate and offset earlier gypsum veins and cut pseudomorphs of plagioclase (Figure F36). Matrix and clasts are commonly cut by a network of pyrite-rich veinlets (<0.1 mm) with silica-rich alteration halos (Figure F37) that cut fragmented plagioclase pseudomorphs.

Figure F35. Pseudomorphed plagioclase and pyroxene in clasts.
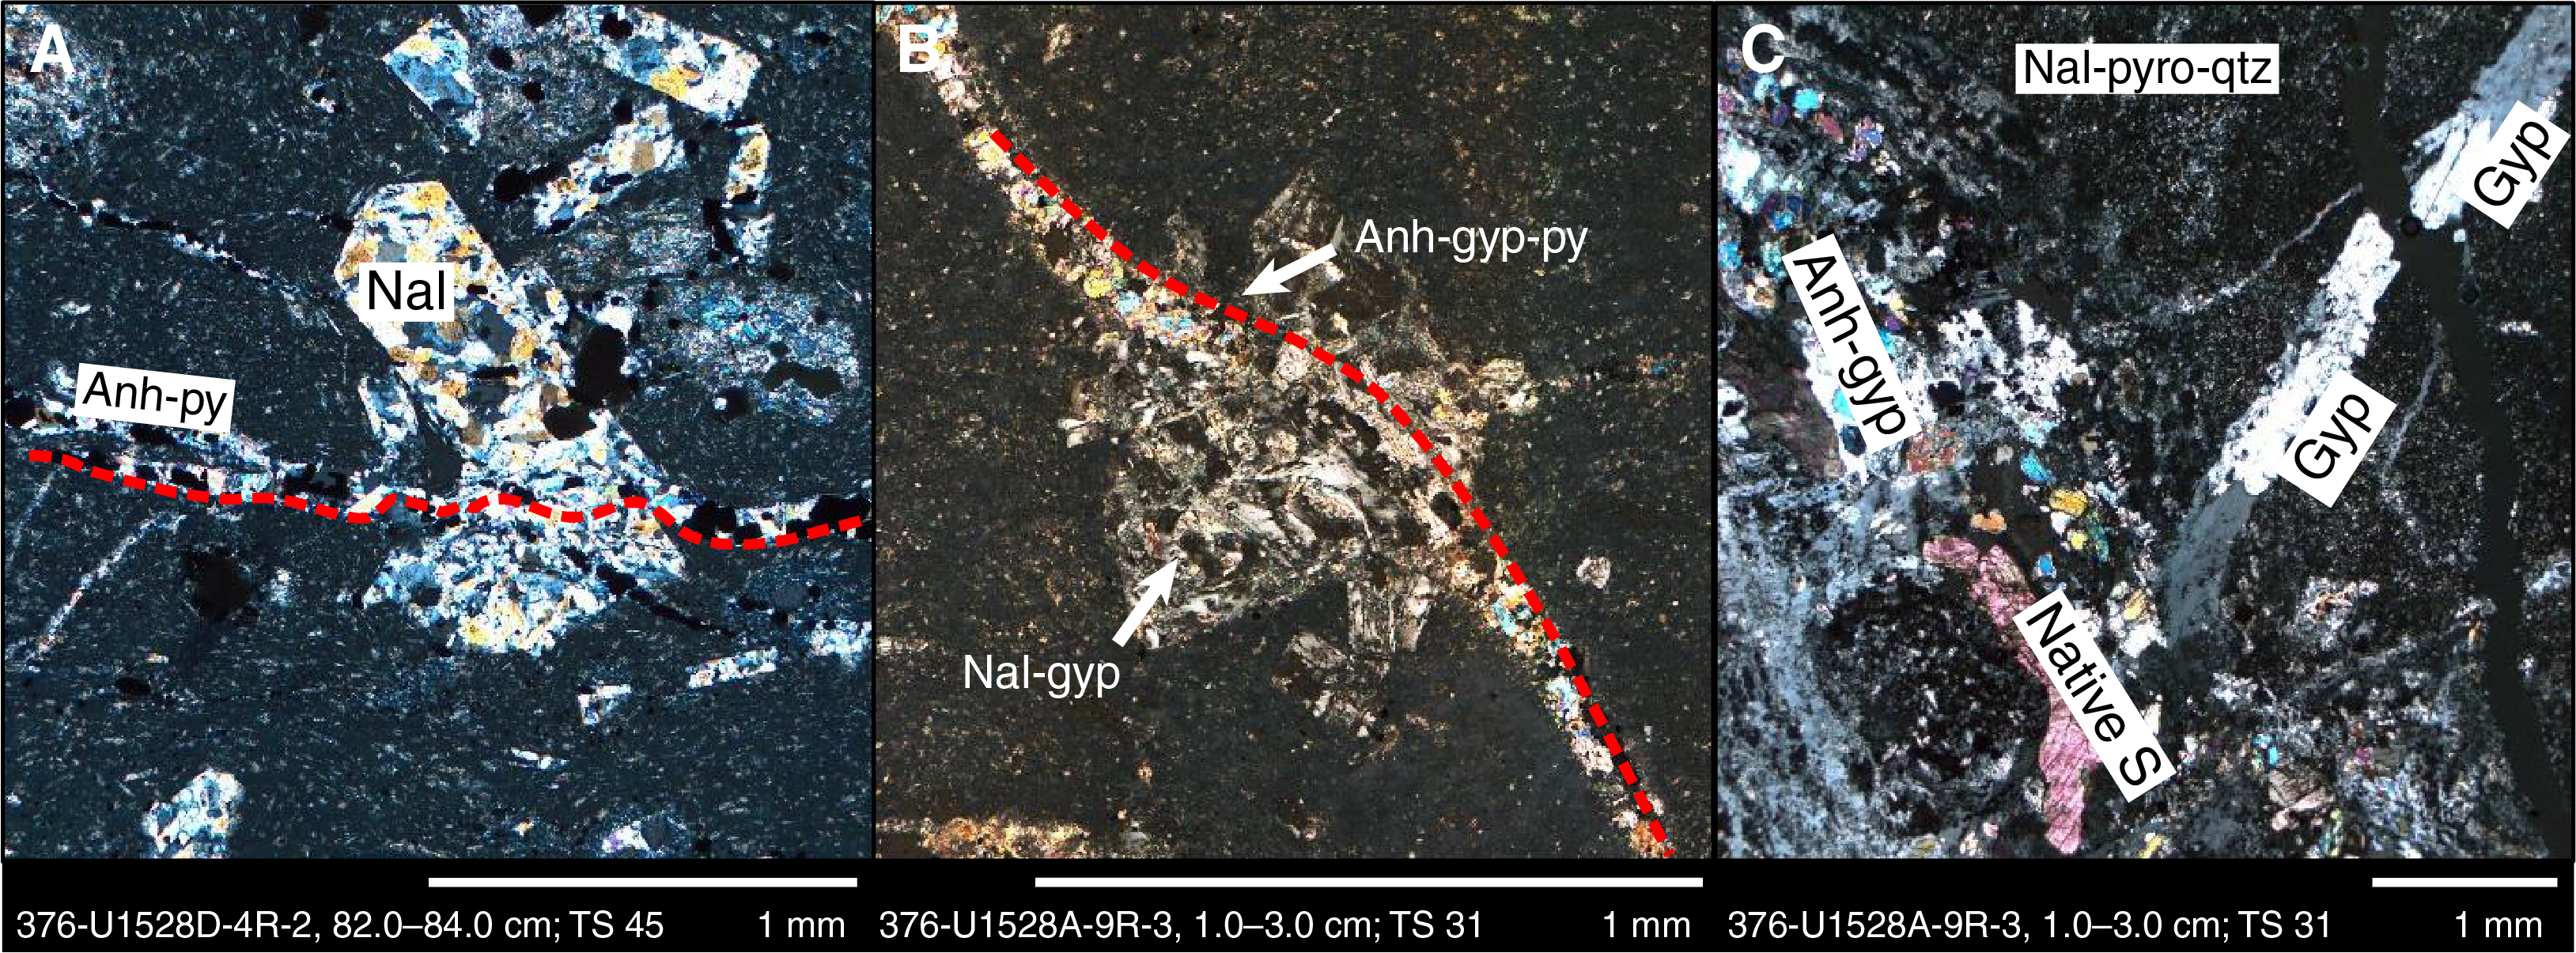
Figure F36. Pseudomorphed plagioclase and veins.
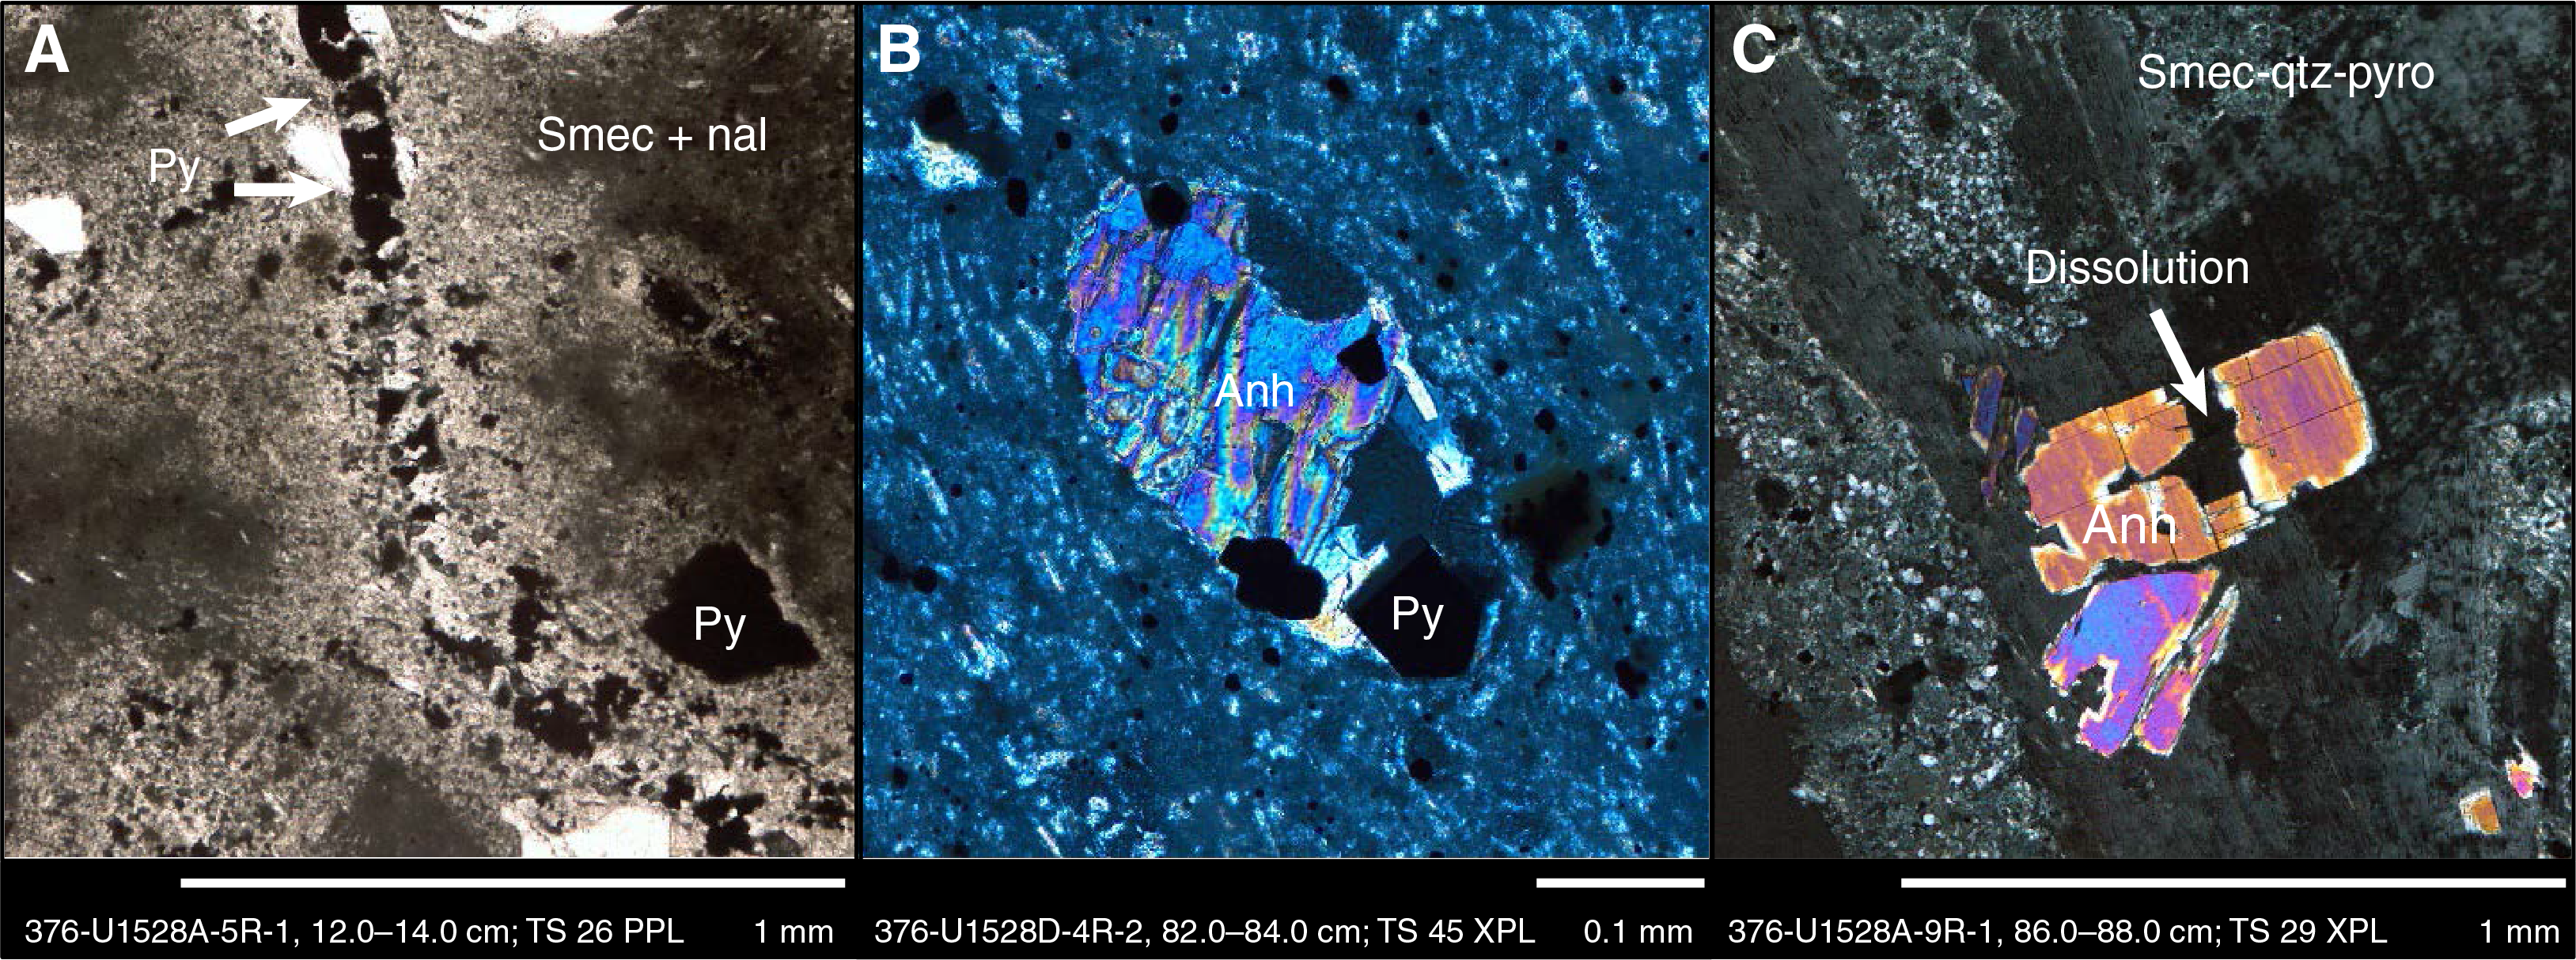
Figure F37. Matrix and clasts cut by a network of pyrite-rich veinlets.
Vugs are filled with anhydrite with variable amounts of pyrite, natroalunite, silica, and native sulfur; anhydrite occasionally exhibits dissolution features (Figure F37). In addition to infilling vugs, pyrite also occurs as finely disseminated subhedral to euhedral crystals within clasts and matrix (Figure F37).
Alteration Type IV
- Distinguishing alteration minerals: natroalunite + anhydrite + rutile ± quartz ± native sulfur ± pyrophyllite
- Degree of alteration: intensely altered
- Interval: 376-U1528D-18R-2, 0–98 cm
- Depth: 140.0–141.0 mbsf
Alteration Type IV occurs as a late-stage, fracture-controlled, vein-style alteration that overprints Alteration Types II and III and occurs down the length of Hole U1528D from 77.20 mbsf (Figure F38). The veins vary in thickness from <1 to ~2 cm, but because only one vein contact is often preserved in the case of thicker veins, reported maximum vein thickness should be considered a minimum value. The vein fills display a range of morphologies from vuggy to massive. Veins commonly have a uniform or banded texture and distinct white to light gray alteration halos that typically extend several millimeters on either side of individual veins. Halos overprint volcanic clasts and plagioclase pseudomorphs and in some cases may be discontinuous along some segments of a vein. The veins and alteration halos are characterized by a mineral assemblage of natroalunite, anhydrite, silica, and rutile ± quartz ± native sulfur ± pyrophyllite. The alteration halos have increased amounts of natroalunite, anhydrite, and silica as well as a reduction (or absence) of pyrite and smectite compared with the pervasive background alteration (Table T3; Figure F39). The boundary between the background alteration and overprinting halo may be either diffuse over several millimeters or sharp (Figure F38). When diffuse, the relict brecciated texture of the rocks is usually preserved within the halos. Where alteration halos have an abundance of elongated vugs, they often contain native sulfur (Figure F39) with minor pyrite within the halo oxidized to Fe oxyhydroxides (Figure F38).

Figure F38. Alteration Type IV.
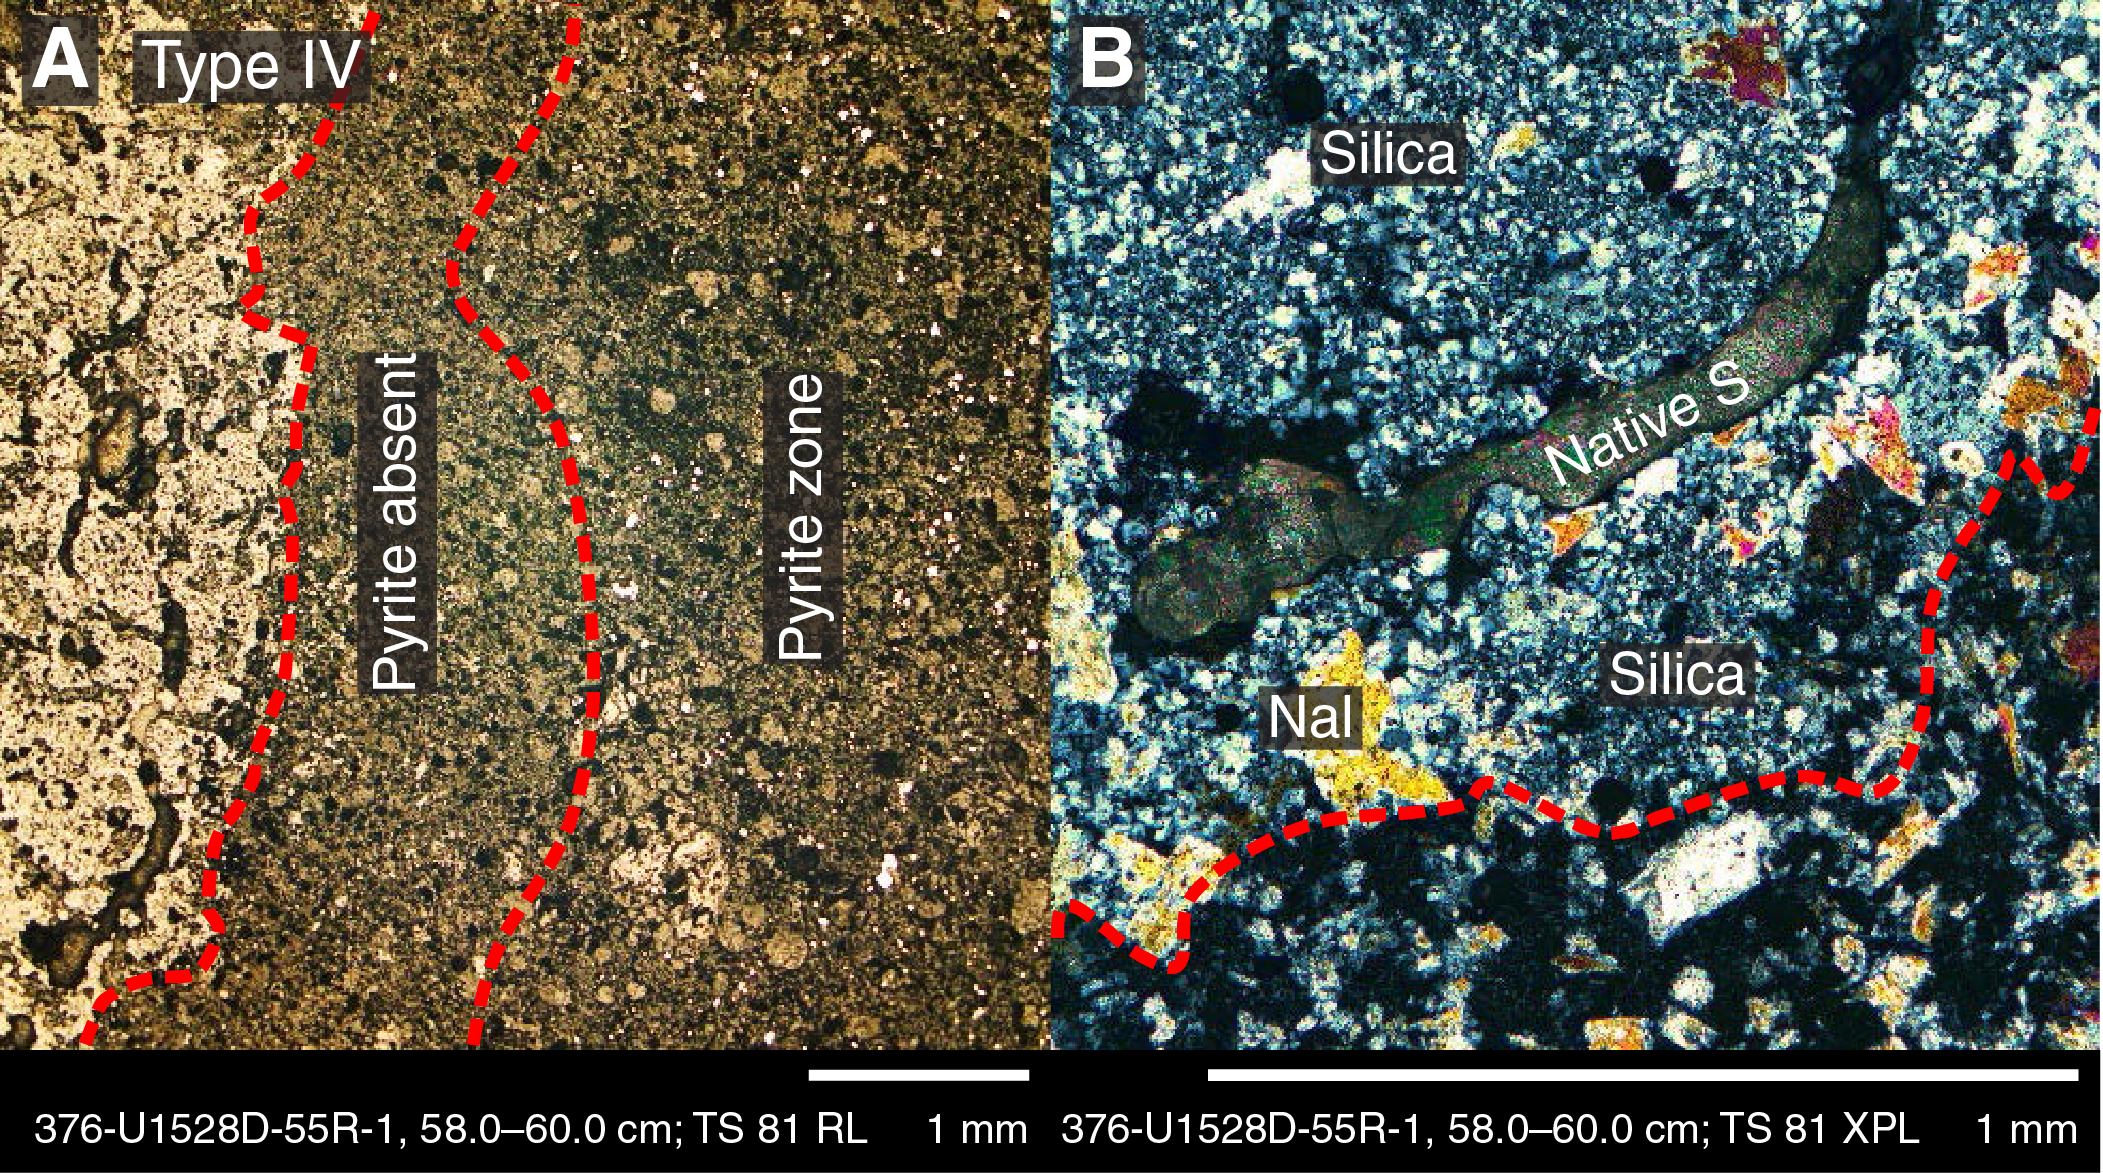
Figure F39. Contact between Alteration Types III and IV.
Fluid inclusions
Sampling
In total, 44 samples for shipboard FI measurements were collected from Holes U1528A, U1528C, and U1528D (Table T5). Twenty-five samples were analyzed after initial examination for viable crystals using a stereomicroscope. As much as possible, drusy crystals jutting into partially open vugs and fractures were sampled for FI measurements to determine the present or most recent fluid temperatures and compositions involved in rock alteration (Figure F40). Samples collected from closed veins (interval 376-U1528D-10R-2, 49–50 cm; 102 mbsf), bleached parts of the rock (interval 9R-1, 24–25 cm; 95 mbsf), or the cementing material (interval 11R-2, 18–19 cm; 107 mbsf) commonly did not yield crystals that were suitable for FI measurements.
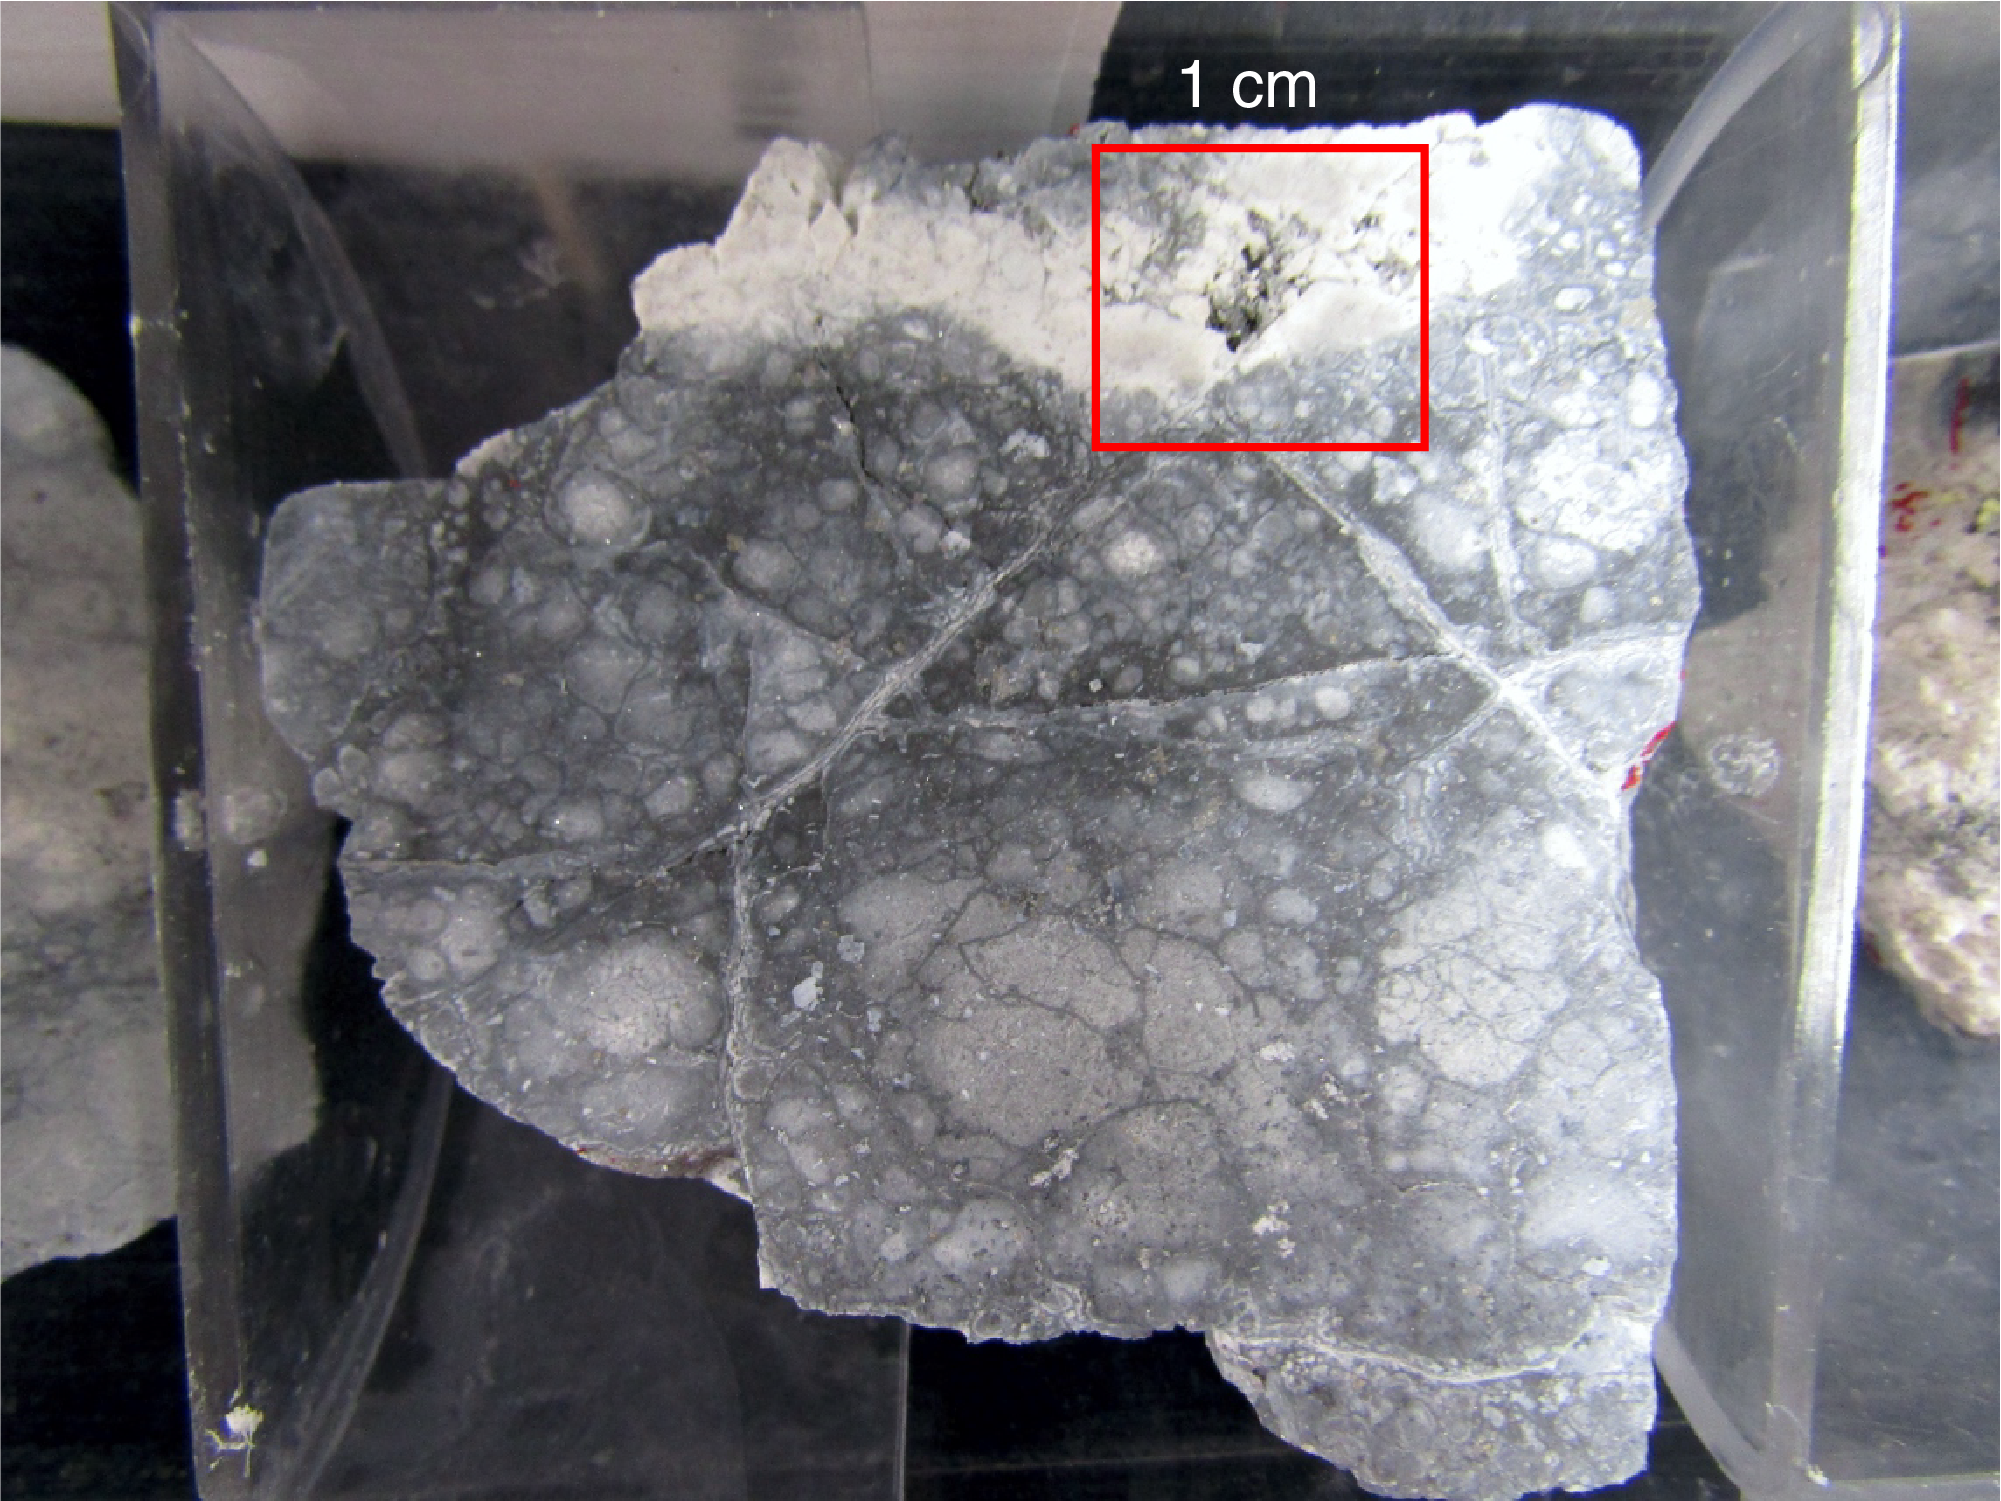
Figure F40. Drusy anhydrite in open vug, Hole U1528D.
FIs were analyzed microthermometrically in translucent crystals of anhydrite, quartz, natroalunite, and gypsum. Anhydrite was the most common crystal available for shipboard FI measurements at Site U1528. The disadvantages of using anhydrite for FI studies include a tendency to split along cleavage planes where large (>20 µm diameter) FIs are closely spaced and/or individual FIs are stretched or decrepitated. These problems were overcome by preparing several slides of crystals and rechecking measurements in different slides. Because stretching is exhibited by some individual FIs, the accuracy of homogenization temperatures for anhydrite is estimated at ±5°C. The same measurement difficulties may affect natroalunite but not quartz.
Gypsum is a common late-stage vug or fracture fill in Holes U1528A, U1528C, and U1528D. All FIs in gypsum stretch below 90°C, the temperature above which gypsum starts to dehydrate. The mineral turns brown after complete dehydration at 150°–160°C.
Types of fluid inclusions
Because the FIs in this study were measured in the latest crystals deposited by the hydrothermal system, no distinction has been made between primary and secondary inclusions. For samples collected at 62–288 mbsf (intervals 376-U1528D-2R-1, 56–57 cm, through 49R-6, 2–63 cm), FIs are two-phase with a vapor bubble that homogenizes to the liquid phase, except at 288 mbsf, where some FIs also homogenized into the vapor phase. The diameters of the measured FIs range from 2.5 to 60 µm (median = 8 µm) with the vapor bubble occupying about 5 to 60 vol% (median = 33 vol%) of the vacuole. The vapor bubble for the FI that homogenized into the vapor phase occupied 90 vol% of the vacuole.
The FIs are provisionally divided into three types (Table T6): (1) FIs that homogenized into the liquid phase with (Subtype 1a) or without (Subtype 1b) halite daughter minerals; (2) complex FIs that contain S or multiple anisotropic, elongated translucent daughter minerals; and (3) FIs that homogenize to the vapor phase (Figure F41). Homogenization temperatures for Subtype 1a range from about 55° to nearly 360°C, and those for Subtype 1b from about 220° to nearly 360°C (Table T6). Type 2 inclusions are complex FIs that homogenize into the liquid phase and contain various daughter minerals including halite, sulfates, and other anisotropic minerals or contain S that homogenized at >325°C. Type 3, a vapor-rich FI, homogenized into the vapor phase at about 335°C.
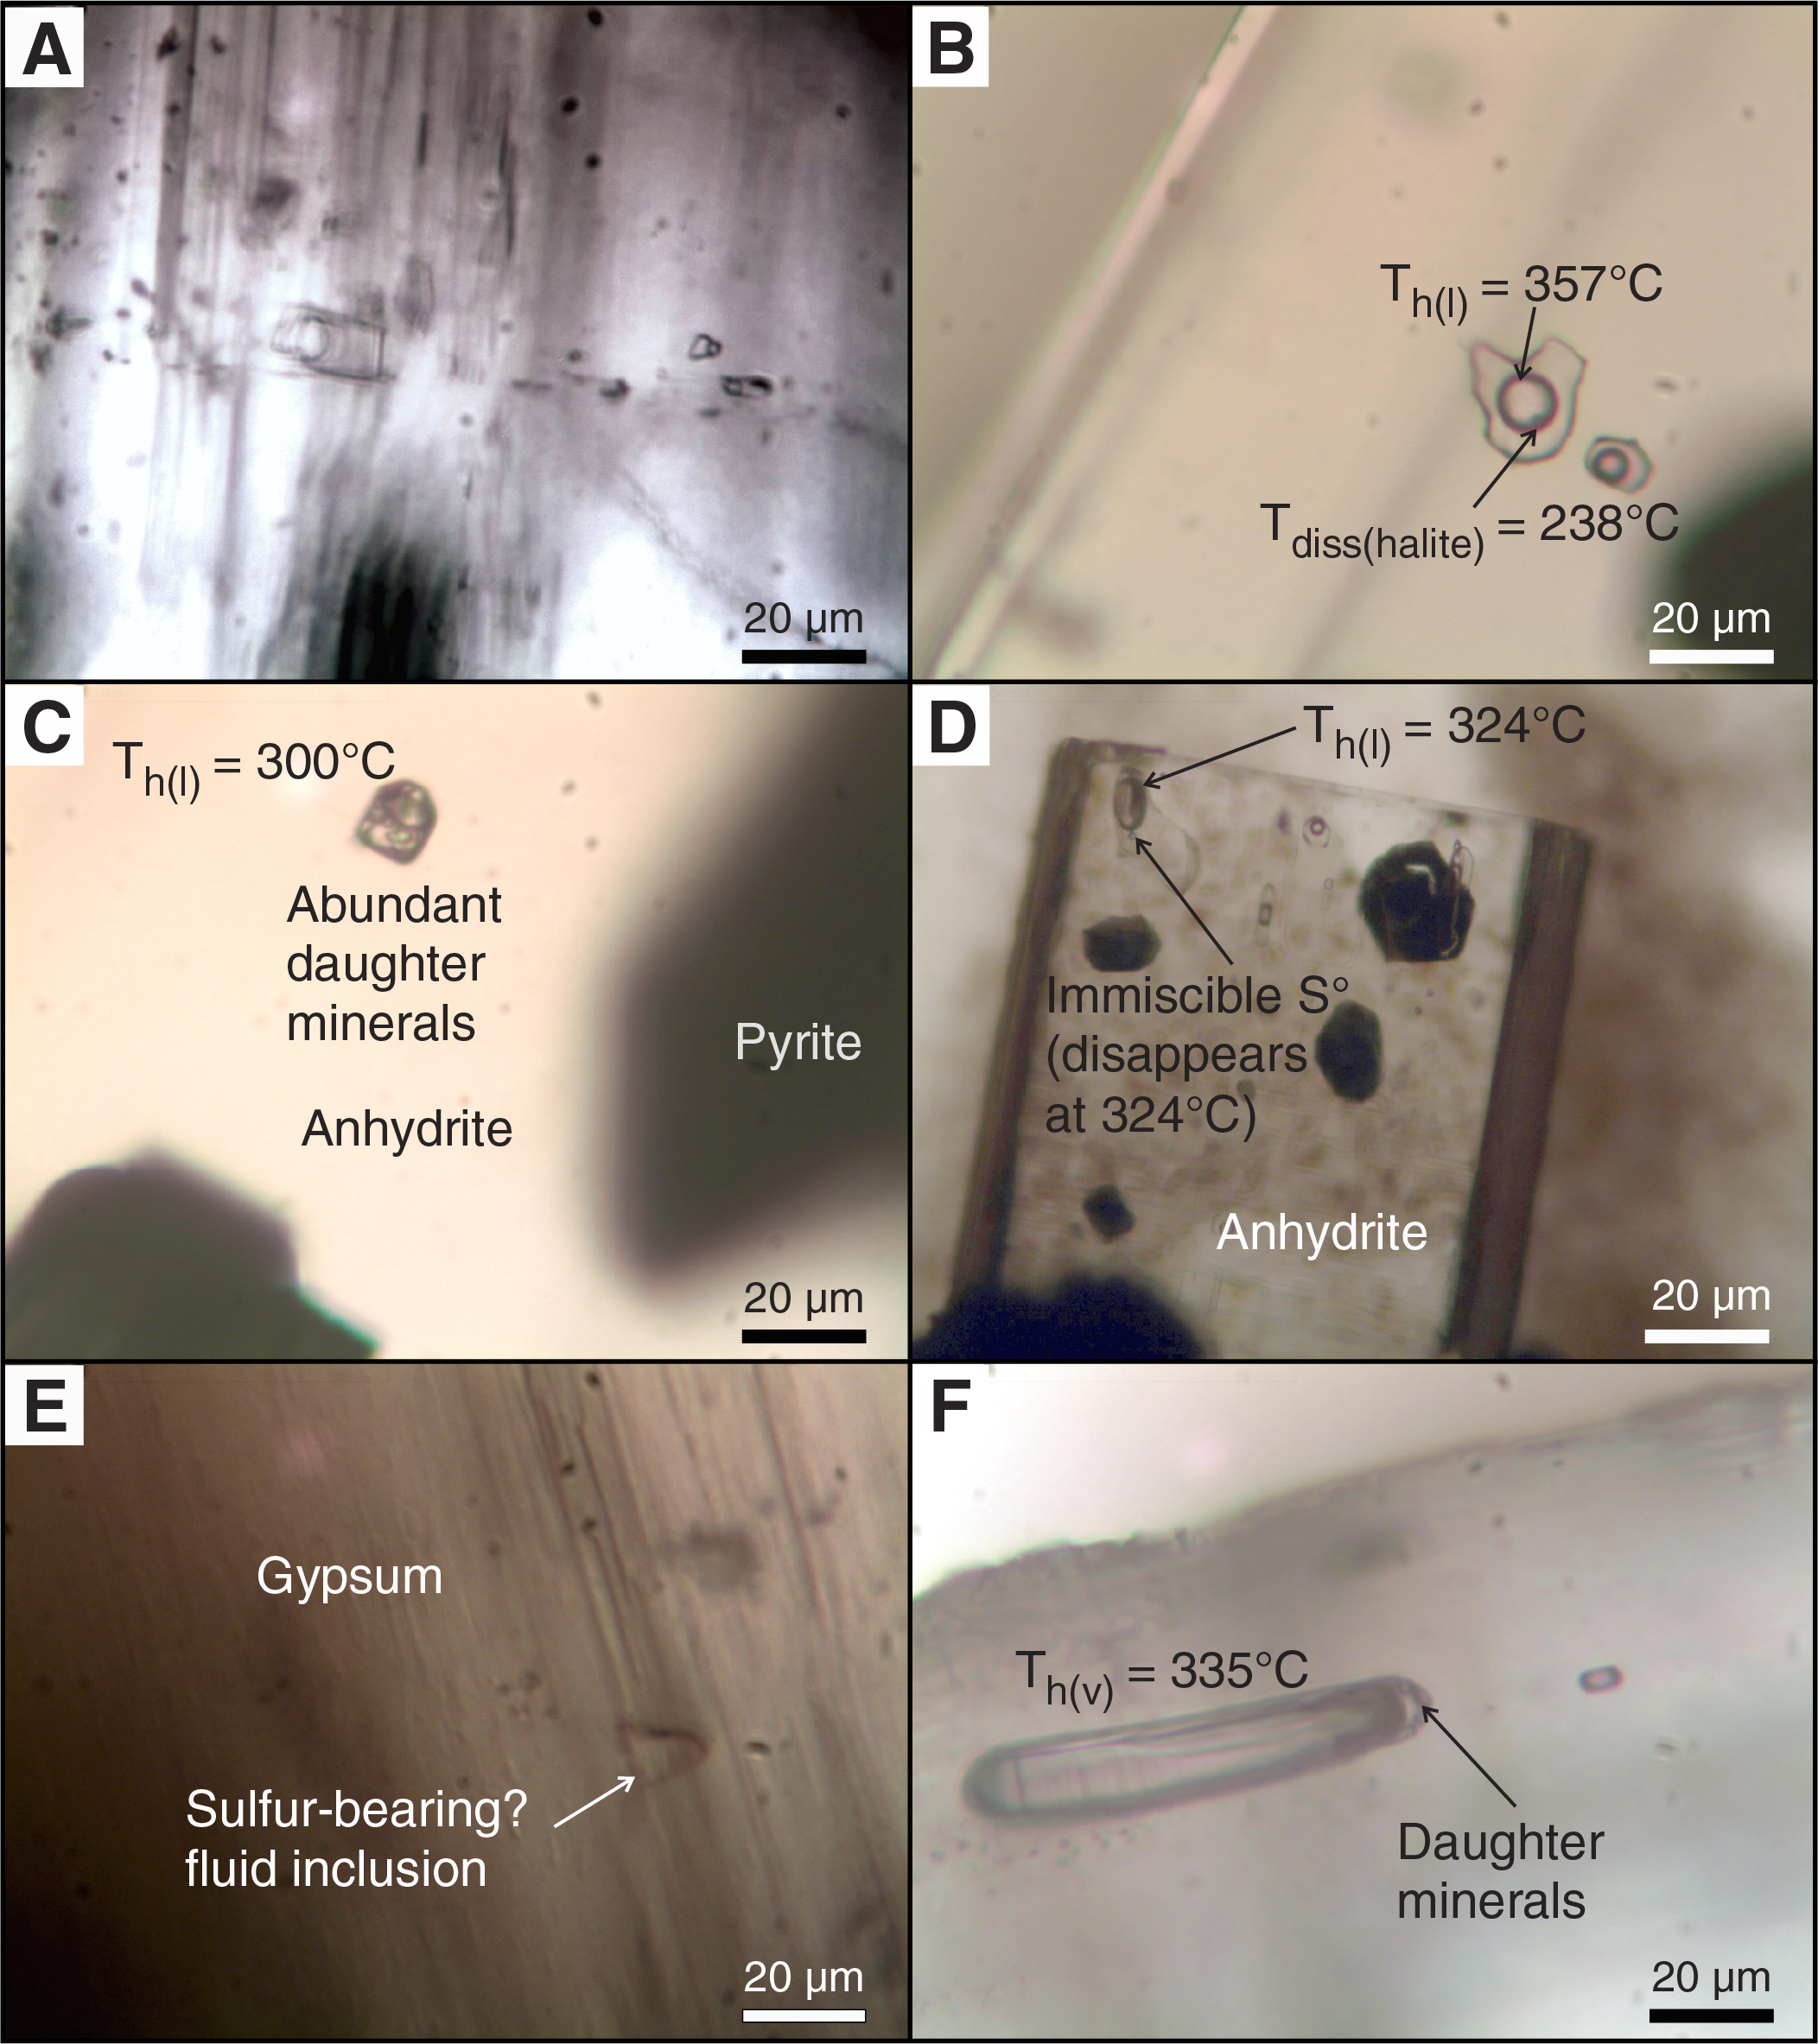
Figure F41. Types of fluid inclusions, Hole U1528D.
Temperatures
Two sets of FI homogenization temperatures were identified in Hole U1528D: a median of 65°C associated with low-temperature gypsum that appears sporadically from about 61 to 284 mbsf and a zigzagging higher temperature profile where median temperatures vary from about 180°C to nearly 340°C (Figure F42). The highest temperature measured is nearly 360°C at 196 mbsf, and at 288 mbsf the temperature was ~335°C. By comparison, the Schlumberger wireline temperature logging tool measured downhole temperatures as high as 248°C at ~90 mbsf in unequilibrated hole conditions. Major minerals in Alteration Types II and III (below the last appearance of kaolinite at 240 mbsf) that include pyrophyllite, illite, quartz, and anhydrite indicate deposition temperatures of about 220°–350°C (Figure F42). The difference between the lowest and highest homogenization temperatures varies from 4°C at 71.7 mbsf to 171°C at about 196 mbsf; at any given depth, the greater the difference, the suggestion is of greater input of cooler fluids (i.e., seawater).
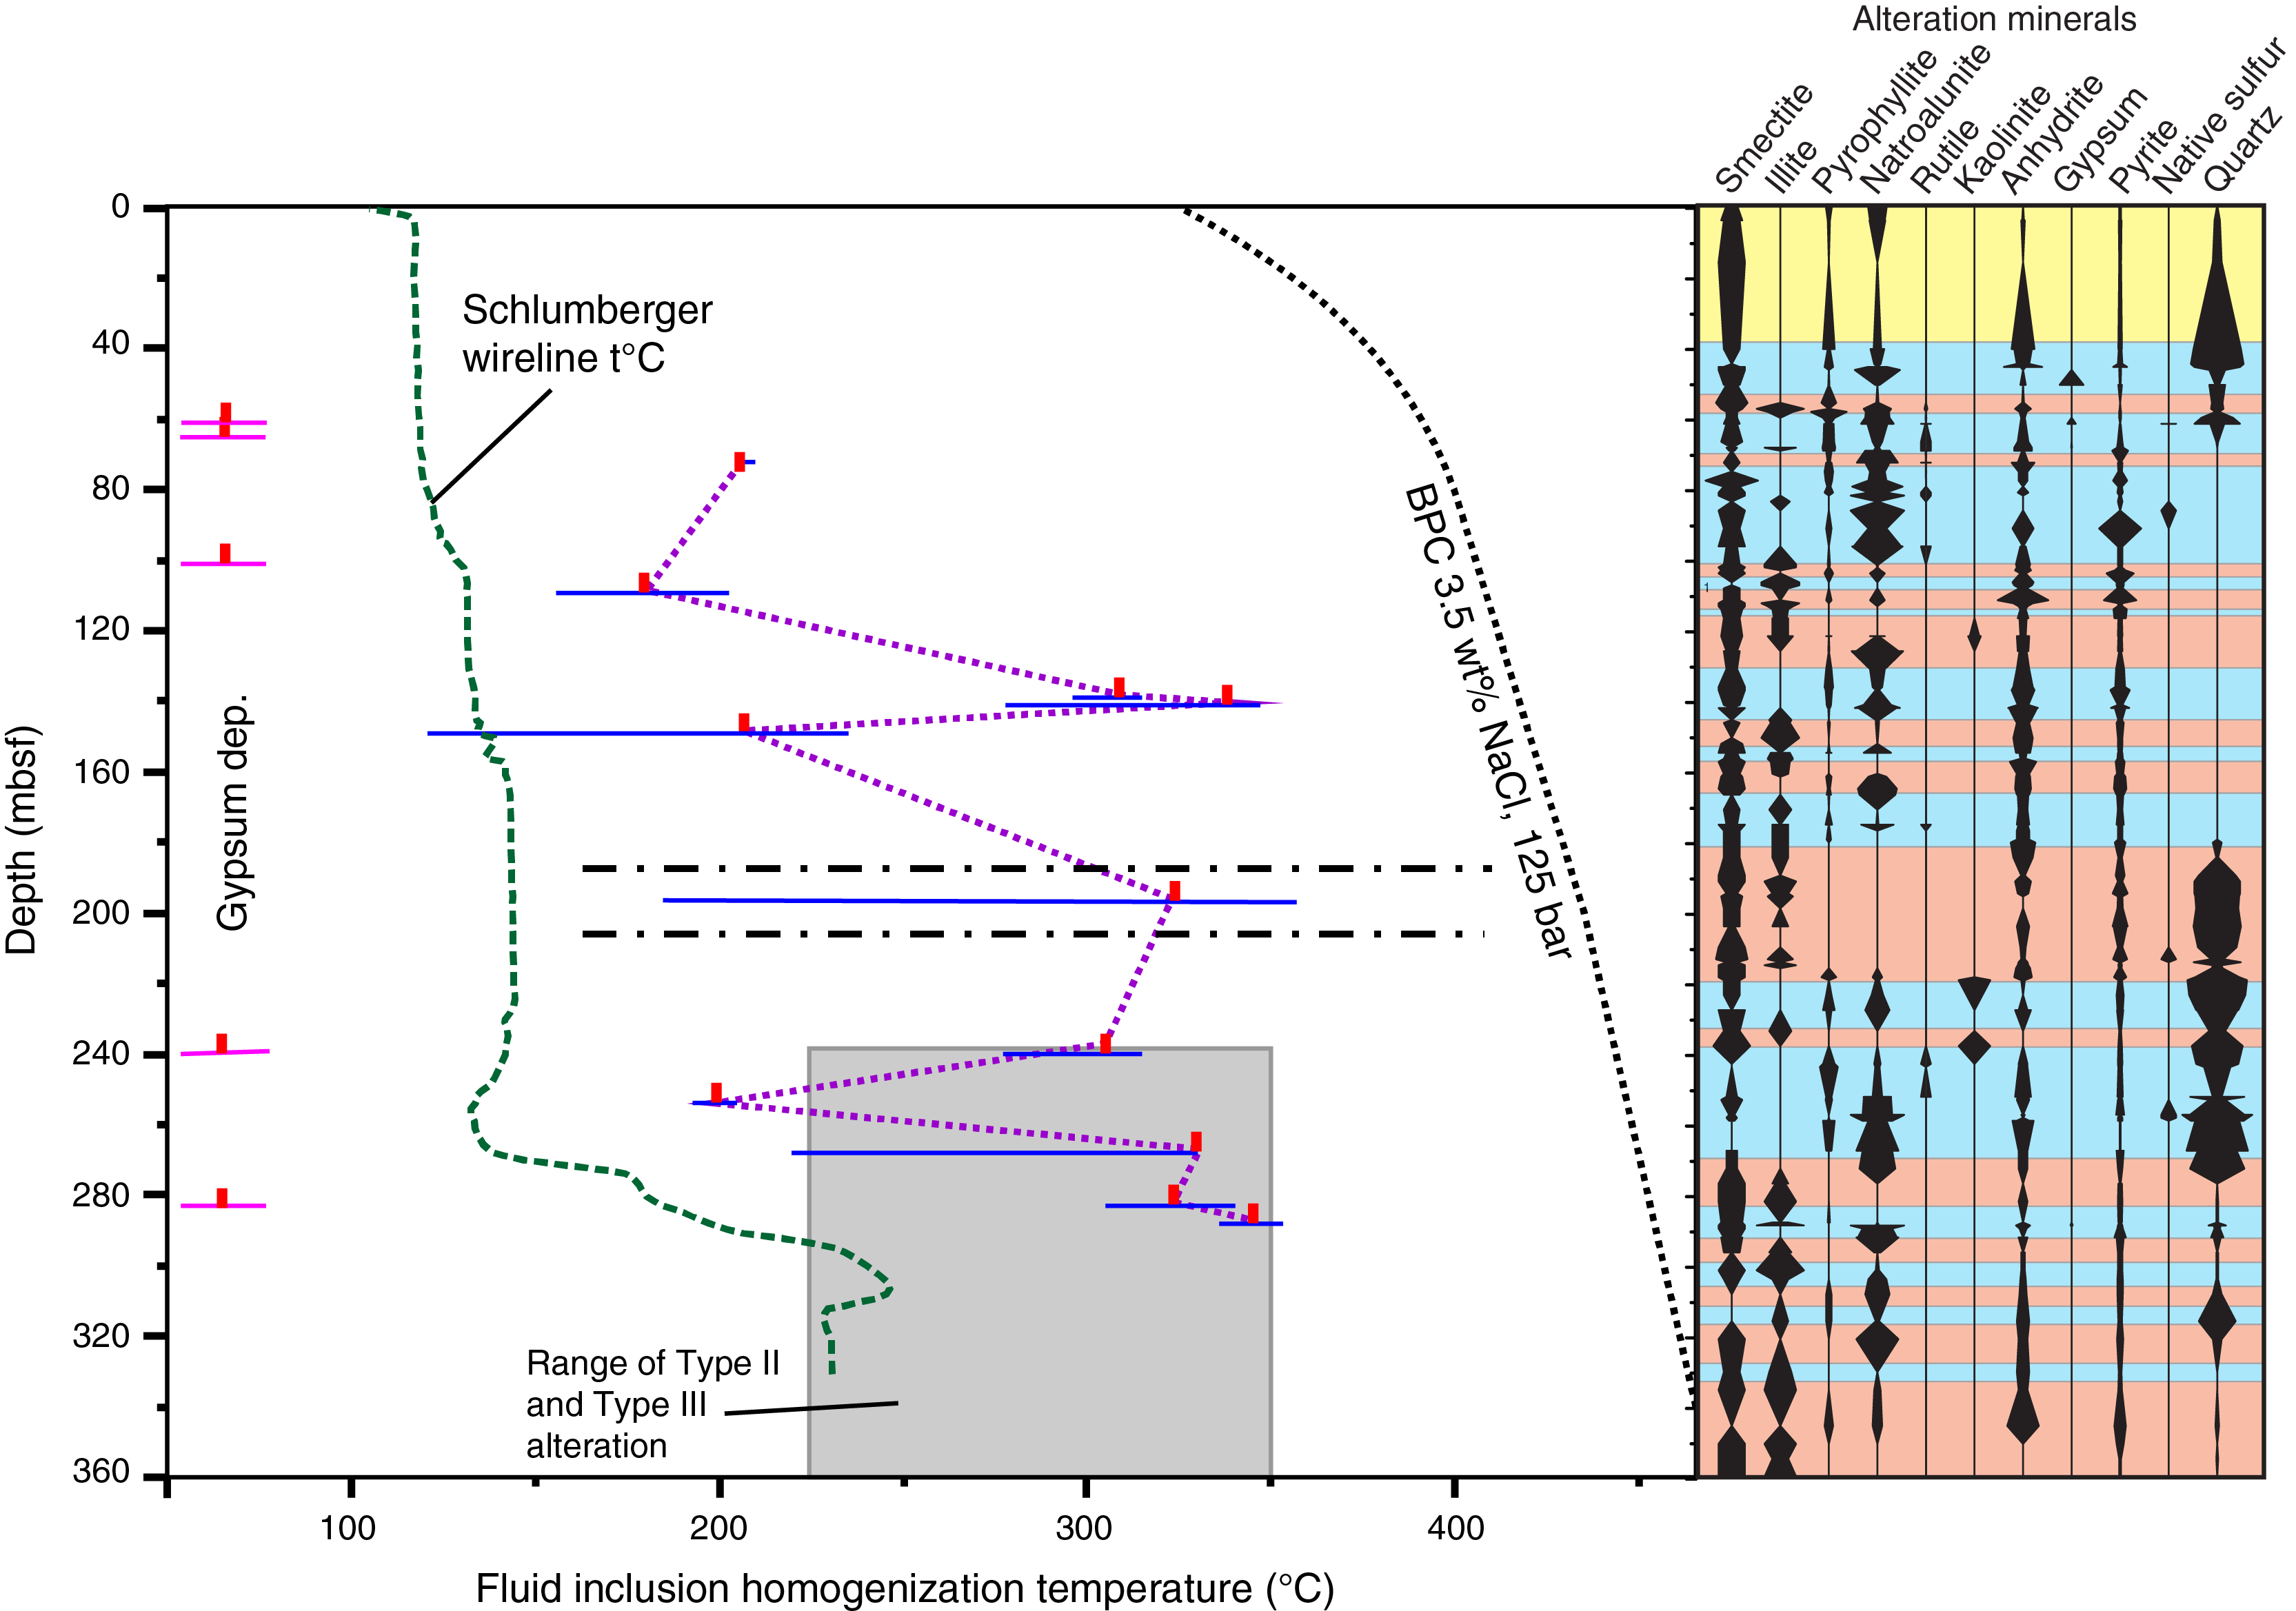
Figure F42. Fluid homogenization temperatures, Hole U1528D.
The highest FI median homogenization temperatures at 140 mbsf (340°C) and 288 mbsf (335°C) occur at depths where the high-temperature (>220°C), acidic assemblage of natroalunite ± pyrophyllite + silica polymorphs (Alteration Type III) occurs. In contrast, where the difference between the highest and lowest homogenization temperatures is greatest (i.e., 171°C at 196 mbsf), the acid assemblage is no longer present (i.e., between the dashed lines in Figure F42).
Gypsum occurs sporadically from about 62 to 284 mbsf. It is a low-temperature mineral that is deposited at temperatures <75°C (Blount and Dickson, 1973) and, as shown by heating measurements in this study, completely dehydrates at 150°–160°C. At 282.5 mbsf (interval 376-U1528-48R-1, 1–2 cm), gypsum is precipitated on euhedral anhydrite that has been formed at a higher temperature of 305°C. In contrast to the sporadic occurrence of gypsum, smectite was identified throughout the hole despite the occurrence of high-temperature clays such as illite and pyrophyllite (Alteration Types II and III).
In summary, significant influxes of cooler seawater precipitated gypsum and caused formation temperatures to be pushed down by as much as 170°C. In addition, a more pervasive and possibly slower percolation of seawater has diffused into the formation, as indicated by the pervasive occurrence of smectite throughout the hole. The higher temperature fluids that are least affected by seawater influx (Figure F43) are associated with acid alteration and have temperatures as high as 355°–360°C.
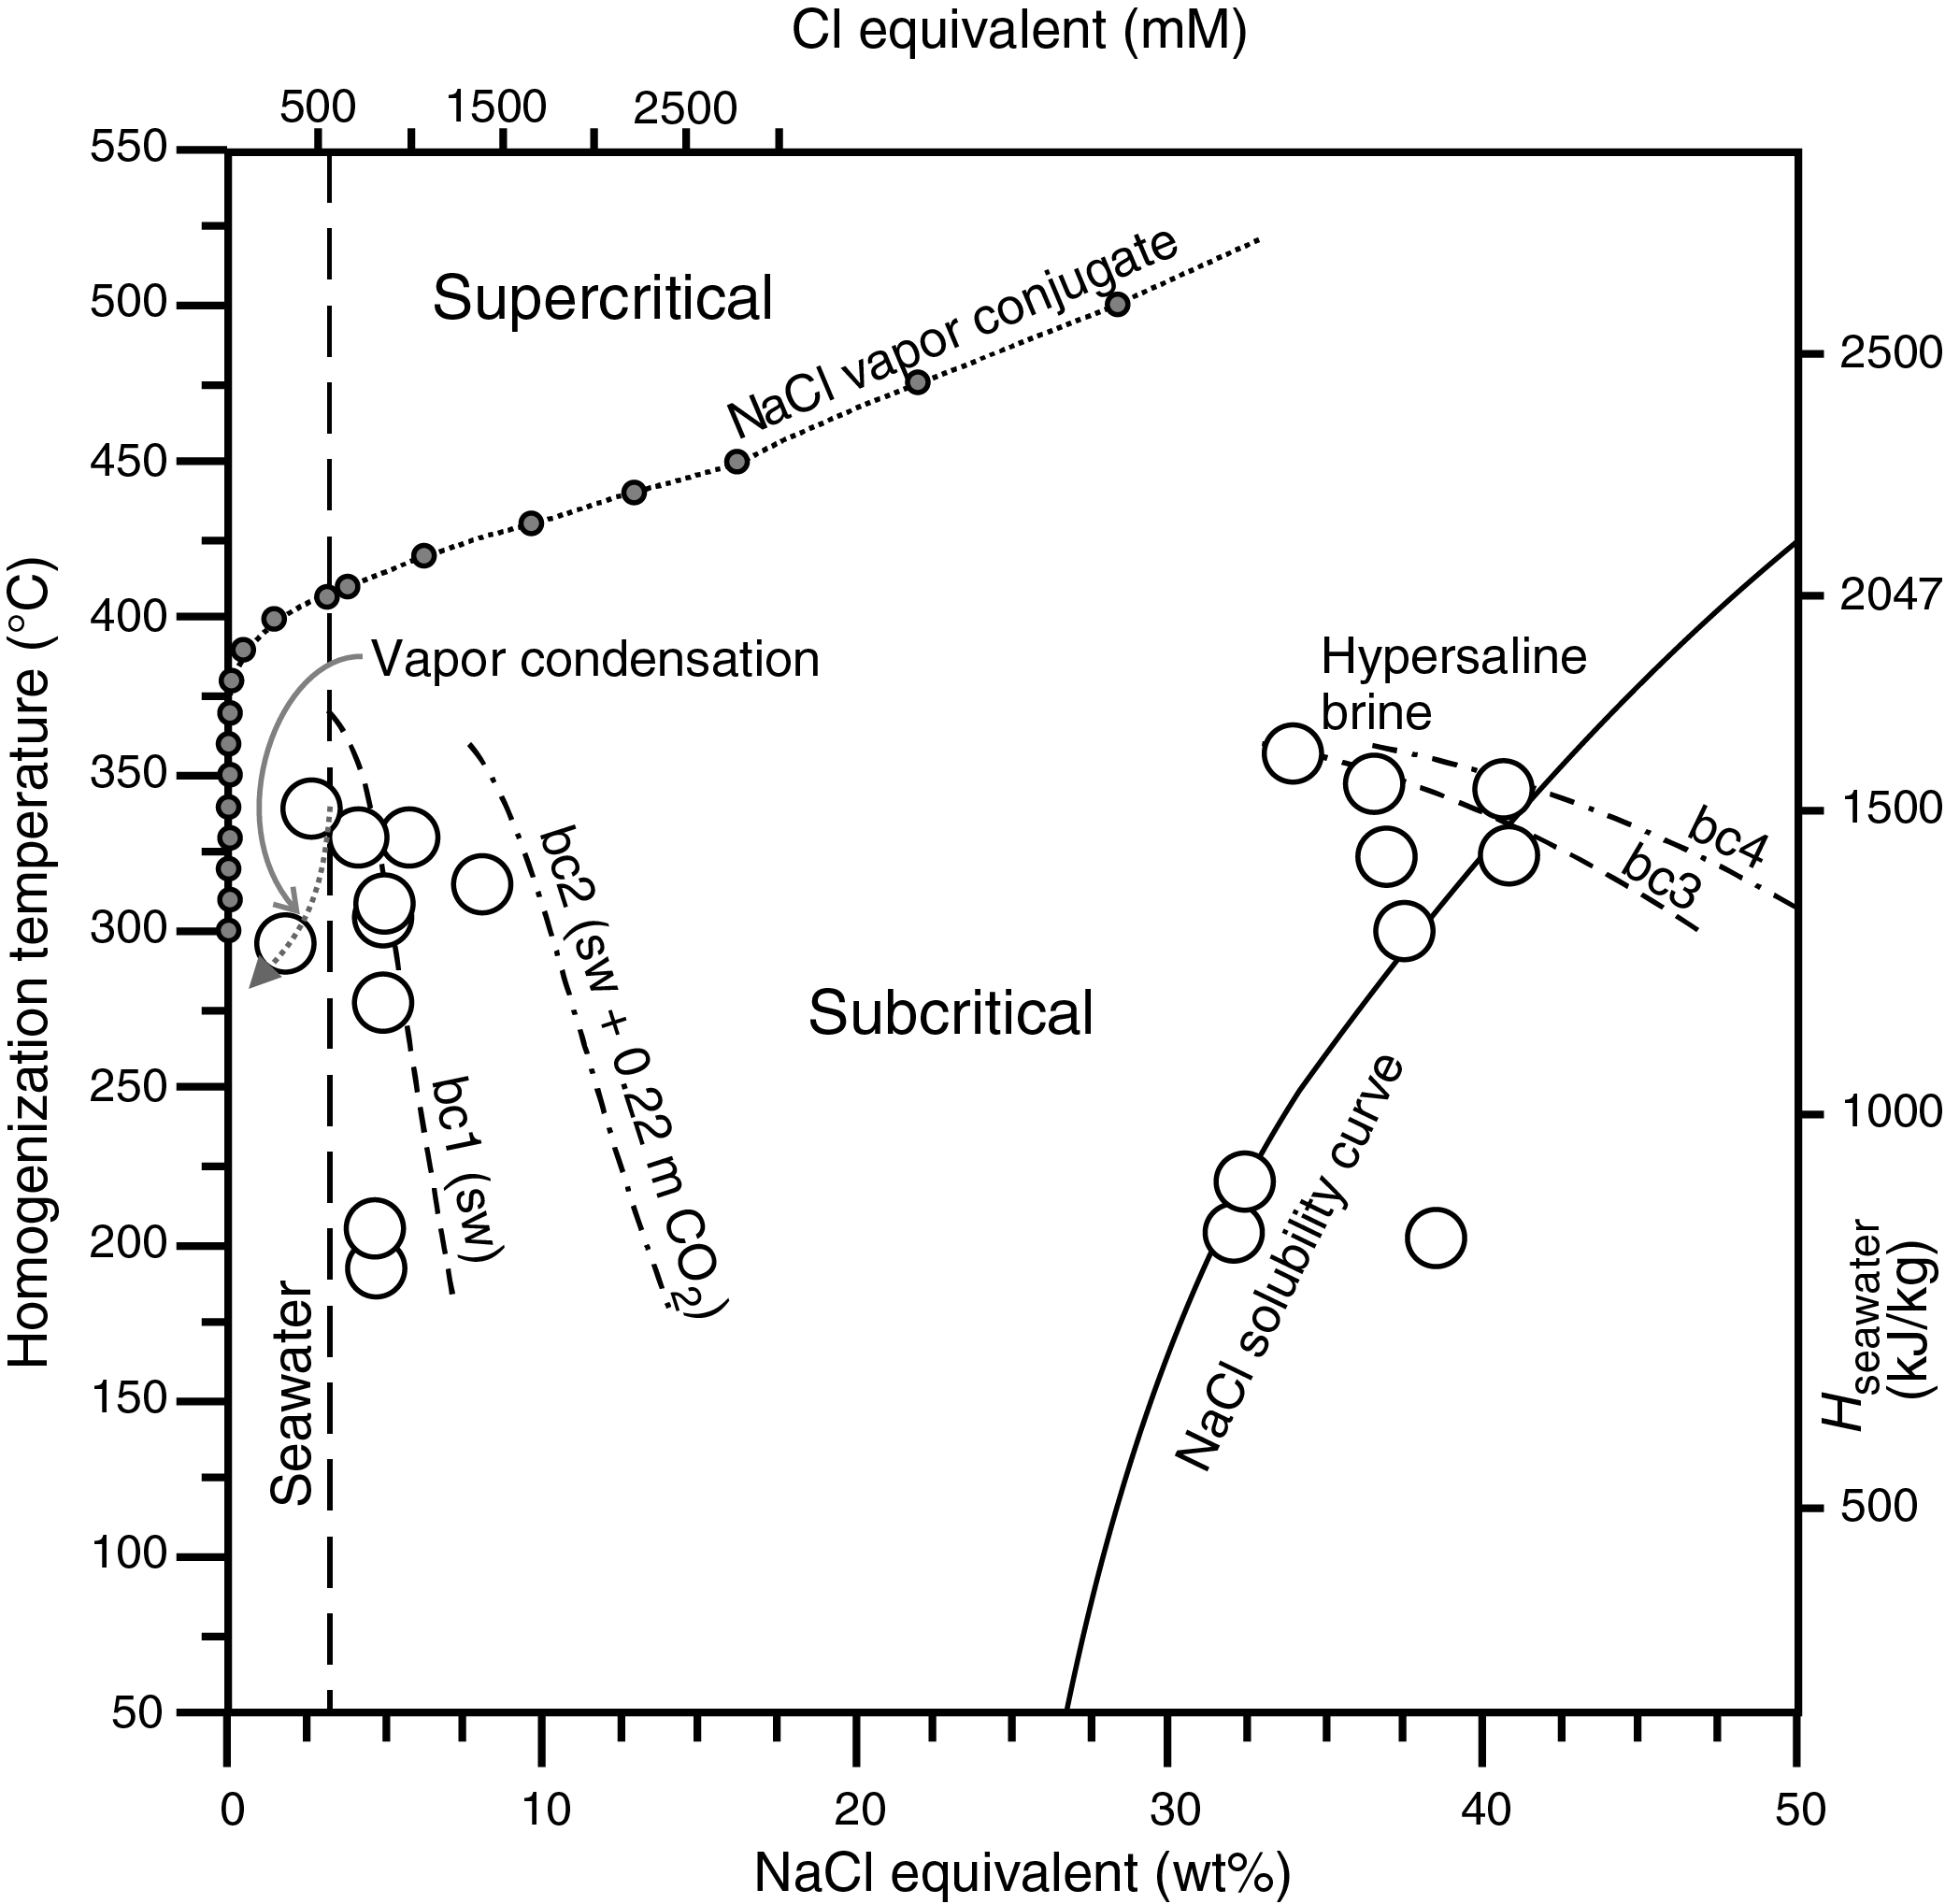
Figure F43. Salinity vs. homogenization temperature.
Fluid compositions
The salinities of FIs plot into two separate regions on a homogenization temperature versus salinity diagram: at or near ambient seawater composition and as a hypersaline brine at or parallel to the NaCl saturation curve (Figure F43). There are a few points that plot above the NaCl saturation curve. All but two samples exhibit salinities higher than seawater, which is indicative of phase separation. The only way a vapor phase can occur in a subsea environment without temperatures going beyond the boiling point curve (Figure F42) is through phase separation (Vanko et al., 2004) caused by depressurization related to sudden rock fracturing (e.g., Berger and Henley, 2011). Salinities lower than seawater compositions, in the absence of a source of meteoric water, are possibly a magmatic water input or product of steam condensation following phase separation (Reyes et al., 1993; Vanko et al., 2004). Thus, there appears to be two different fluids causing water-rock interaction in the Brothers Upper Cone: seawater that has been heated to 55°–360°C and a hypersaline brine with temperatures of 220°–360°C and low pH, high S, and high total dissolved solids expressed as salinities ≥10 times that of seawater combined with the abundance and variety of daughter minerals.
Synthesis and interpretation
The low degree of alteration in the shallow intervals of unconsolidated rock (Alteration Type I) suggests that these rocks were subject to low-temperature seawater alteration with limited or no substantive interaction with hydrothermal fluids. The occurrence of more highly altered clasts in this alteration type is likely due to the incorporation of previously altered rocks during the eruptive event that initially deposited this interval (see Igneous petrology and volcanology).
Below ~36 mbsf, alteration changes from a relatively low degree of alteration of unconsolidated material to more pervasive hydrothermal alteration of volcaniclastics and lava characterized by higher temperature mineral assemblages (Alteration Types II and III). These two alteration types, which are distinguished primarily by the relative amounts of illite, natroalunite, and pyrophyllite, occur in an irregular, repeating sequence that varies over scales of decimeters to meters (Figure F25).
For Alteration Type II, the characteristic mineral assemblage of illite + smectite, the preservation of some primary plagioclase and pyroxene and lesser natroalunite and pyrophyllite suggests that alteration developed through the interaction of hot (<300°C), near-neutral pH hydrothermal fluids with volcanic rocks. The preservation of igneous textures suggests preferential channeling of the hydrothermal fluid through a discrete vein network.
The pervasive Alteration Type III, which includes ubiquitous natroalunite and pyrophyllite, development of vuggy silica textures, and complete replacement of igneous plagioclase and pyroxene, suggests alteration by fluids with a pH < 4 and a temperature of ~335°C. Because of the pervasive nature of Alteration Type III, fluid flow was penetrative with a limited degree of fluid channeling. The abundance of anhydrite, gypsum, and natroalunite and the progressive dissolution and replacement of titanomagnetite by rutile, leucoxene, and pyrite reflect changes in the prevailing pH, ƒO2, and ƒS2 during alteration.
The boundaries between Alteration Types II and III are often subtle and difficult to distinguish on a macro scale. Nevertheless, an excellent example is evident at 70–110 mbsf in Hole U1528D where there is a clear progression and overprint of Alteration Type II by Alteration Type III. However, with average core recoveries of 20%, 12%, and 29% for Holes U1528A, U1528C, and U1528D, respectively, the actual contacts between the alteration types were not often recovered. Consequently, the location of alteration type boundaries (Figure F25) is largely a function of the resolution of the XRD sampling.
The lack of correlation between alteration types and igneous units suggests that the original protolith does not exert a major influence on the alteration mineral assemblage. Instead, the changing alteration type results from variable degrees of fluid-rock interaction associated with the ingress of heated seawater and local-scale fluctuations in permeability and/or the relative influence of heated seawater and magmatic-influenced hydrothermal fluid.
Increased MS values (>1000 × 10−5 IU) are coincident with intervals containing Alteration Type II (Figure F25; see Physical properties). These values are attributed to the presence of titanomagnetite in the rock. XRD analyses indicate that titanomagnetite occurs in the same intervals as plagioclase, and both minerals are interpreted to be igneous phases. MS values at Site U1528 are therefore a proxy indicator for lower degrees of alteration.
Alteration Type IV overprints Alteration Types II and III and records a distinct, more recent alteration event that is characterized by a change from blue-gray in Alteration Types II and III to white-gray in Alteration Type IV. The contacts between Alteration Type IV and Alteration Types I–III are either diffuse over several millimeters or marked by a sharp transition in alteration mineralogy. Smectite, illite, and pyrite are depleted in Alteration Type IV relative to Alteration Types II and III, whereas silica and native sulfur are enriched. The lack of illite and smectite suggests that Alteration Type IV represents intense alteration that is most likely due to a more recent period of magmatic-dominated hydrothermal fluid confined in discrete fractures.
Geochemical signatures in the alteration profile at Site U1528 (from ICP-AES and pXRF analyses; see Geochemistry) are consistent with hydrothermal alteration of igneous rocks of dacitic composition (i.e., elevated concentrations of S [typically >5 wt%], lower K2O [0–1 wt%], and elevated Ti/Y values [>200]) relative to unaltered dacite from the caldera (Figure F25). The S concentrations are particularly elevated in parts of the alteration profile dominated by Alteration Type III (average = 6.37 wt%) with a maximum value of 15.14 wt% in Section 376-U1528D-42R-1, 136–138 cm. In contrast, short intervals where K2O and Rb abundances are closer to the values of the unaltered dacite host rocks tend to coincide with Alteration Type II and the presence of plagioclase and/or Fe-Ti oxides in the rock. Major and trace element analyses confirm the higher degree of alteration represented by Alteration Type III compared with Alteration Type II, and the former has higher average values of S, Sr, and Ba and lower values of Mg and Ca. Relatively immobile elements such as Al, Si, Ti, and Zr show no significant enrichment or depletion between the two alteration types (see Geochemistry for further details).
Relatively late anhydrite-pyrite veins cut earlier generations of veins and alteration. The source of sulfate responsible for the precipitation of the sulfate mineral phases encountered in most of the cores from Site U1528 (i.e., natroalunite and anhydrite) is a result of either infiltrating seawater or disproportionation of ascending magmatic SO2. A multiple origin for anhydrite at Site U1528 is also consistent with the significant range of Ca/Sr observed in water-soluble sulfates (see Geochemistry).
A significant magmatic volatile influence is suggested by the strong similarities between the mineral assemblages and textures of Alteration Types III and IV in previous work on Brothers volcano (de Ronde et al., 2011) and the advanced argillic alteration assemblages described for high sulfidation subaerial epithermal deposits (Hedenquist et al., 1996). Limited δ34S isotopic analyses of vent fluid and natroalunite samples from the Cone site are consistent with a largely magmatic influenced sulfate source (de Ronde et al., 2005).
The magmatic-hydrothermal system at the Brothers Cone is a highly dynamic system where ascending hot (355°–360°C) hypersaline brine is locally overwhelmed by massive influx of seawater, resulting in (1) deposition of late-stage gypsum, (2) a nonlinear temperature profile marked by several depths where temperatures are pushed back by as much as 170°C, and (3) the regression of acid sulfate alteration signifying an increase in altering fluid pH. The hypersaline brine and its associated fluids are most likely S rich and acidic in contrast to seawater-derived fluids, which are less virulent and less corrosive.
There is evidence for slow inflow of seawater into the hot formation that allows it to be heated to temperatures as high as 360°C. This inferred slow diffusive inflow is marked by the consistent occurrence of smectite throughout the hole despite the presence of higher temperature pyrophyllite and illite.
There is also evidence that sudden events of fracturing may contribute to depressurization in the formation, causing phase separation in the hypersaline brine and heated seawater. This process leaves a more saline, higher density aqueous solution for both hypersaline brine and seawater and at the same time forms a low-density vapor phase that, upon cooling, subsequently condenses to a low-salinity aqueous solution.
Structural geology
Hole U1528A: Igneous Units 1 and 2
Hole U1528A is host to structures including alteration veins and volcanic fabrics (see Structure, Vein_fracture_density, and Vein tabs in files in DESC_WKB in Supplementary material). Volcanic fabrics are present in the form of a shape-preferred orientation (SPO) defined by vesicles in Igneous Unit 1 and volcanic fabrics in volcanic clasts in Igneous Unit 2. In Unit 2, open vesicles are not as common because most are filled with secondary minerals. Because of the lack of oriented pieces in Unit 1 and the presence of volcanic clasts in lapilli tuffs in Unit 2, it was not possible to record meaningful orientation of volcanic fabrics, so they were not measured. Alteration contacts are diffuse and were thus not measured. Lastly, no fractures or faults were observed.
Alteration veins
Alteration vein density is variable downhole, and it is highest in Igneous Unit 2 (Figure F44). Veins used for vein density include those that are discrete and longer than the diameter of the core, those that are shorter than the diameter of the core, and network veins. Alteration vein density can be separated into three distinct groups: 10–30, 30–65, and 65–85 mbsf.
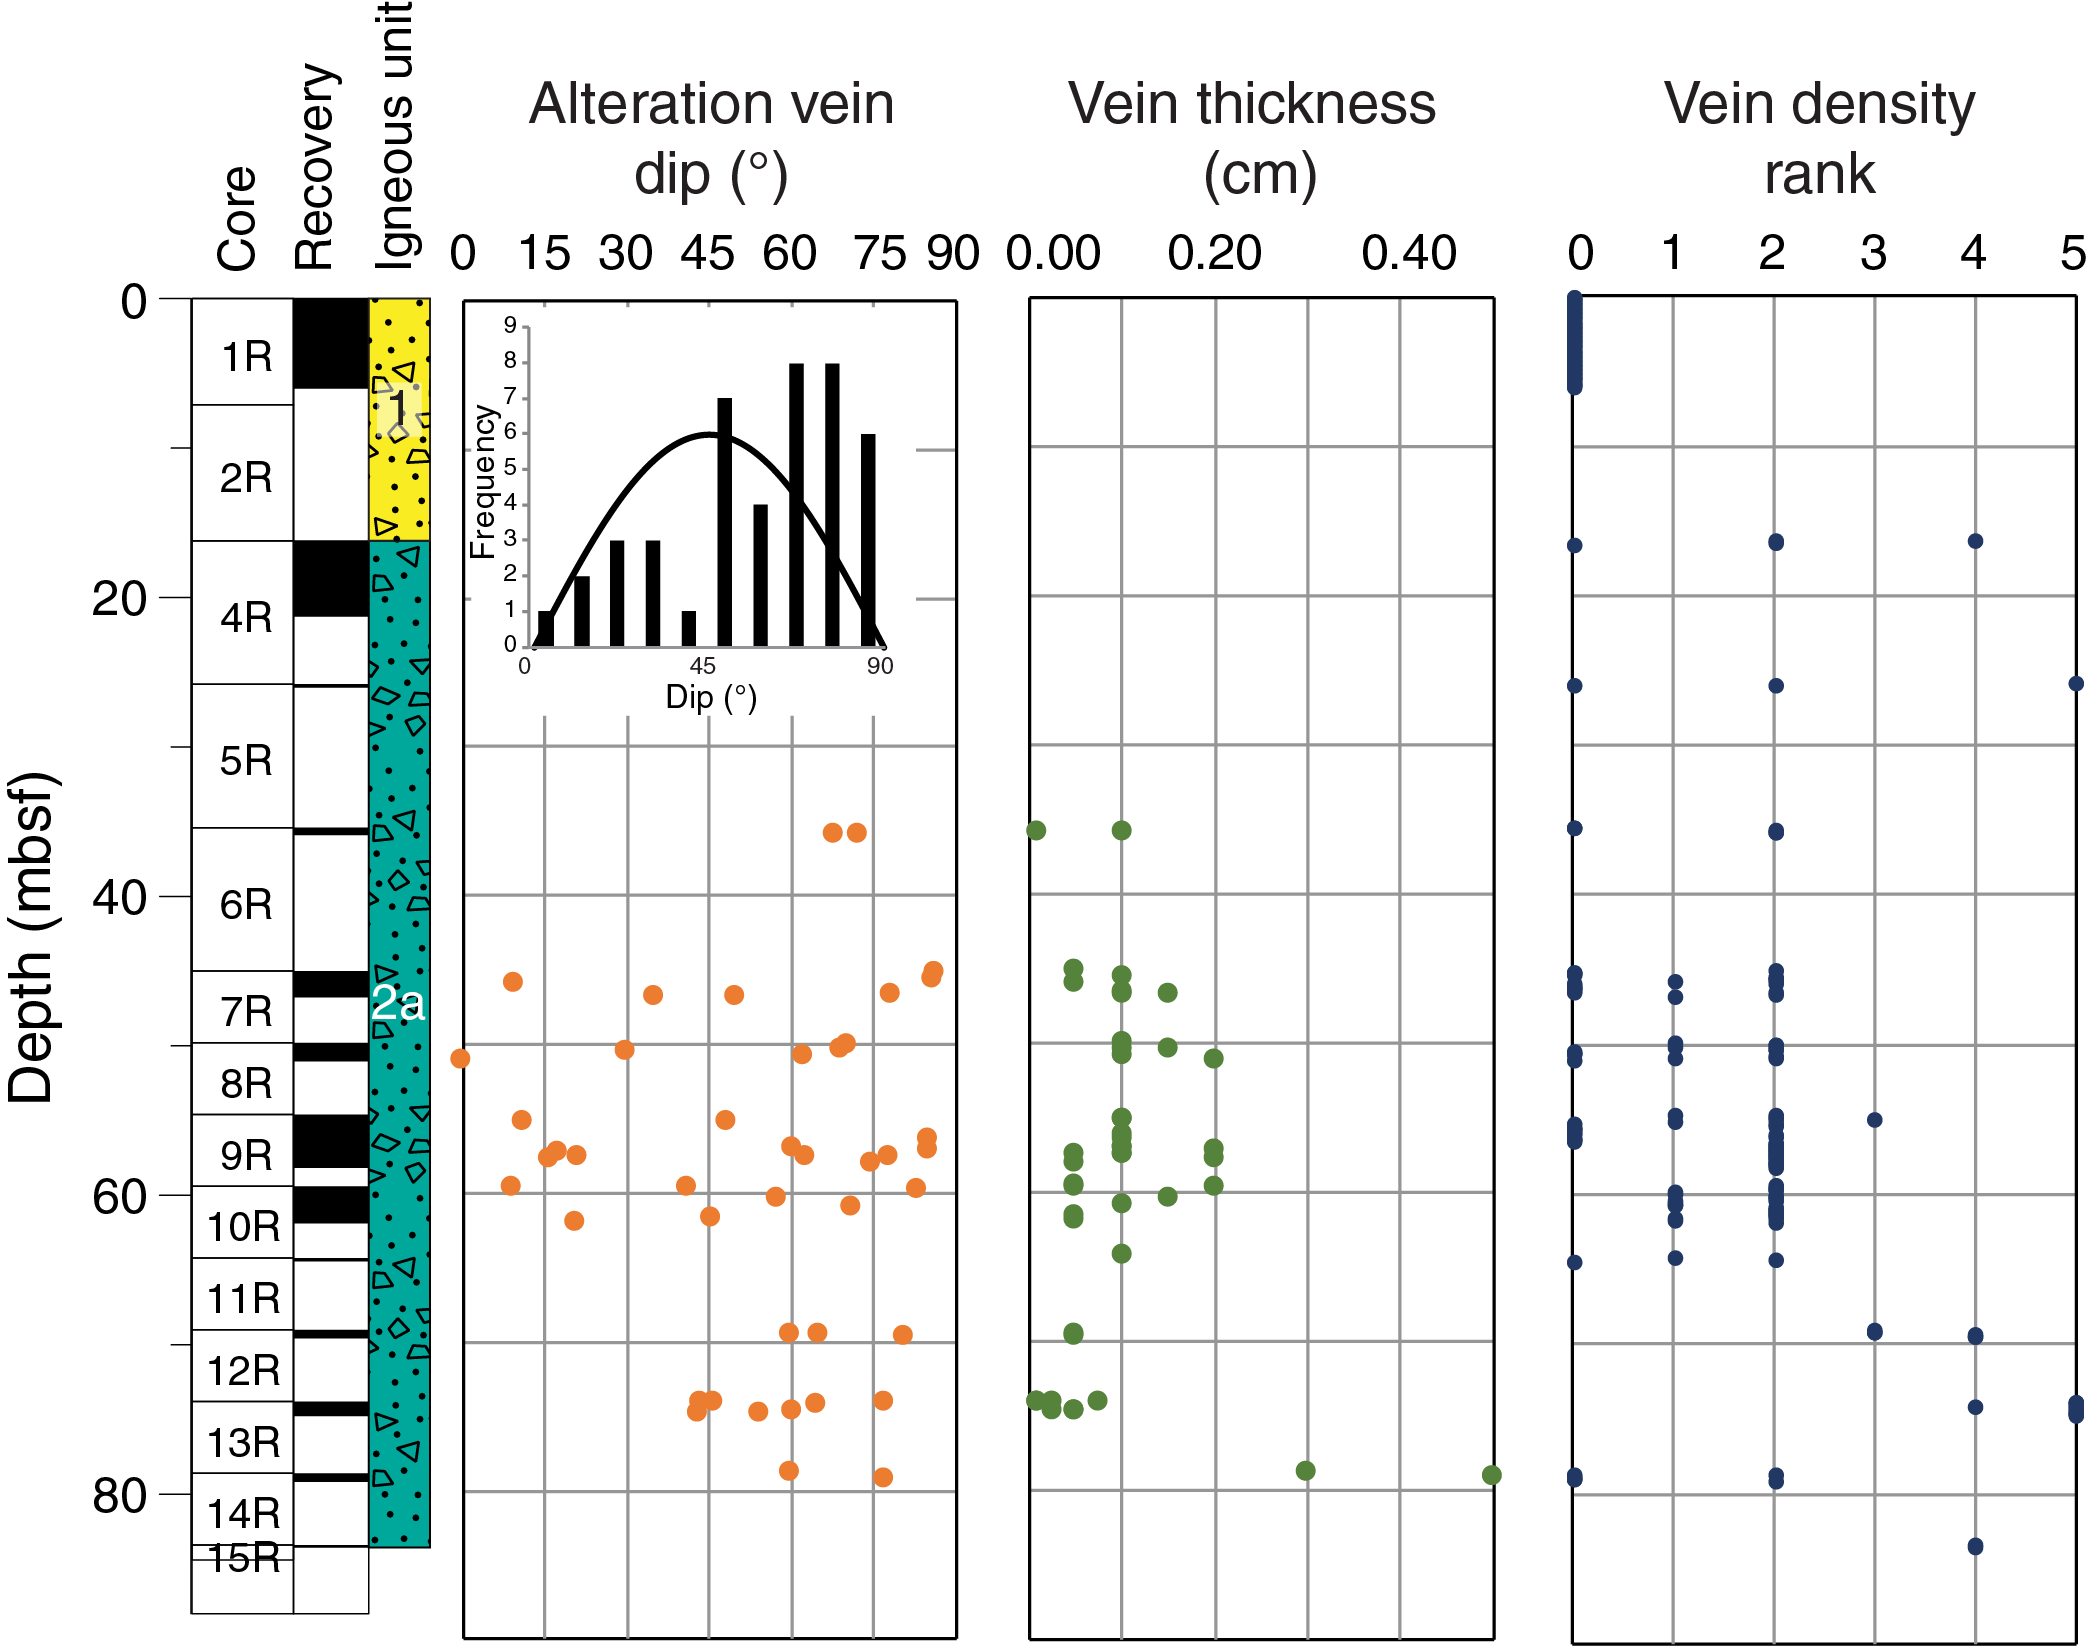
Figure F44. Vein attributes, Hole U1528A.
The first group has a higher alteration vein density (rank as high as 5), the second a lower density (rank ≤ 2), and the third a higher density (rank as high as 5). Vein density does not appear to correlate with vein fill type, although at the bottom of the hole network veins are more prominent and more siliceous. The second zone, which has lower vein density, corresponds to the presence of discrete veins with a large range in dip (see below).
Alteration veins are typically filled with anhydrite, gypsum, and to a lesser extent native sulfur and pyrite. Vein morphology is typically irregular but can be planar and also braided to dendritic (Figure F45). Veins are typically no more than a few millimeters thick. In the upper half of the hole, veins are more curviplanar and anastomose through the matrix and around volcanic clasts (Figure F45). Halos are present, although rare, and are usually white. Vein dip ranges from horizontal to 86° with a mean of 54°, a standard deviation of 24°, and a median of 60°. The majority of veins (70%) have dip angles greater than 45°. All veins that have a dip angle <45° occur at 45–65 mbsf (Figure F44). If these veins are removed, the vein dip average becomes 68°, similar to veins at Site U1527.
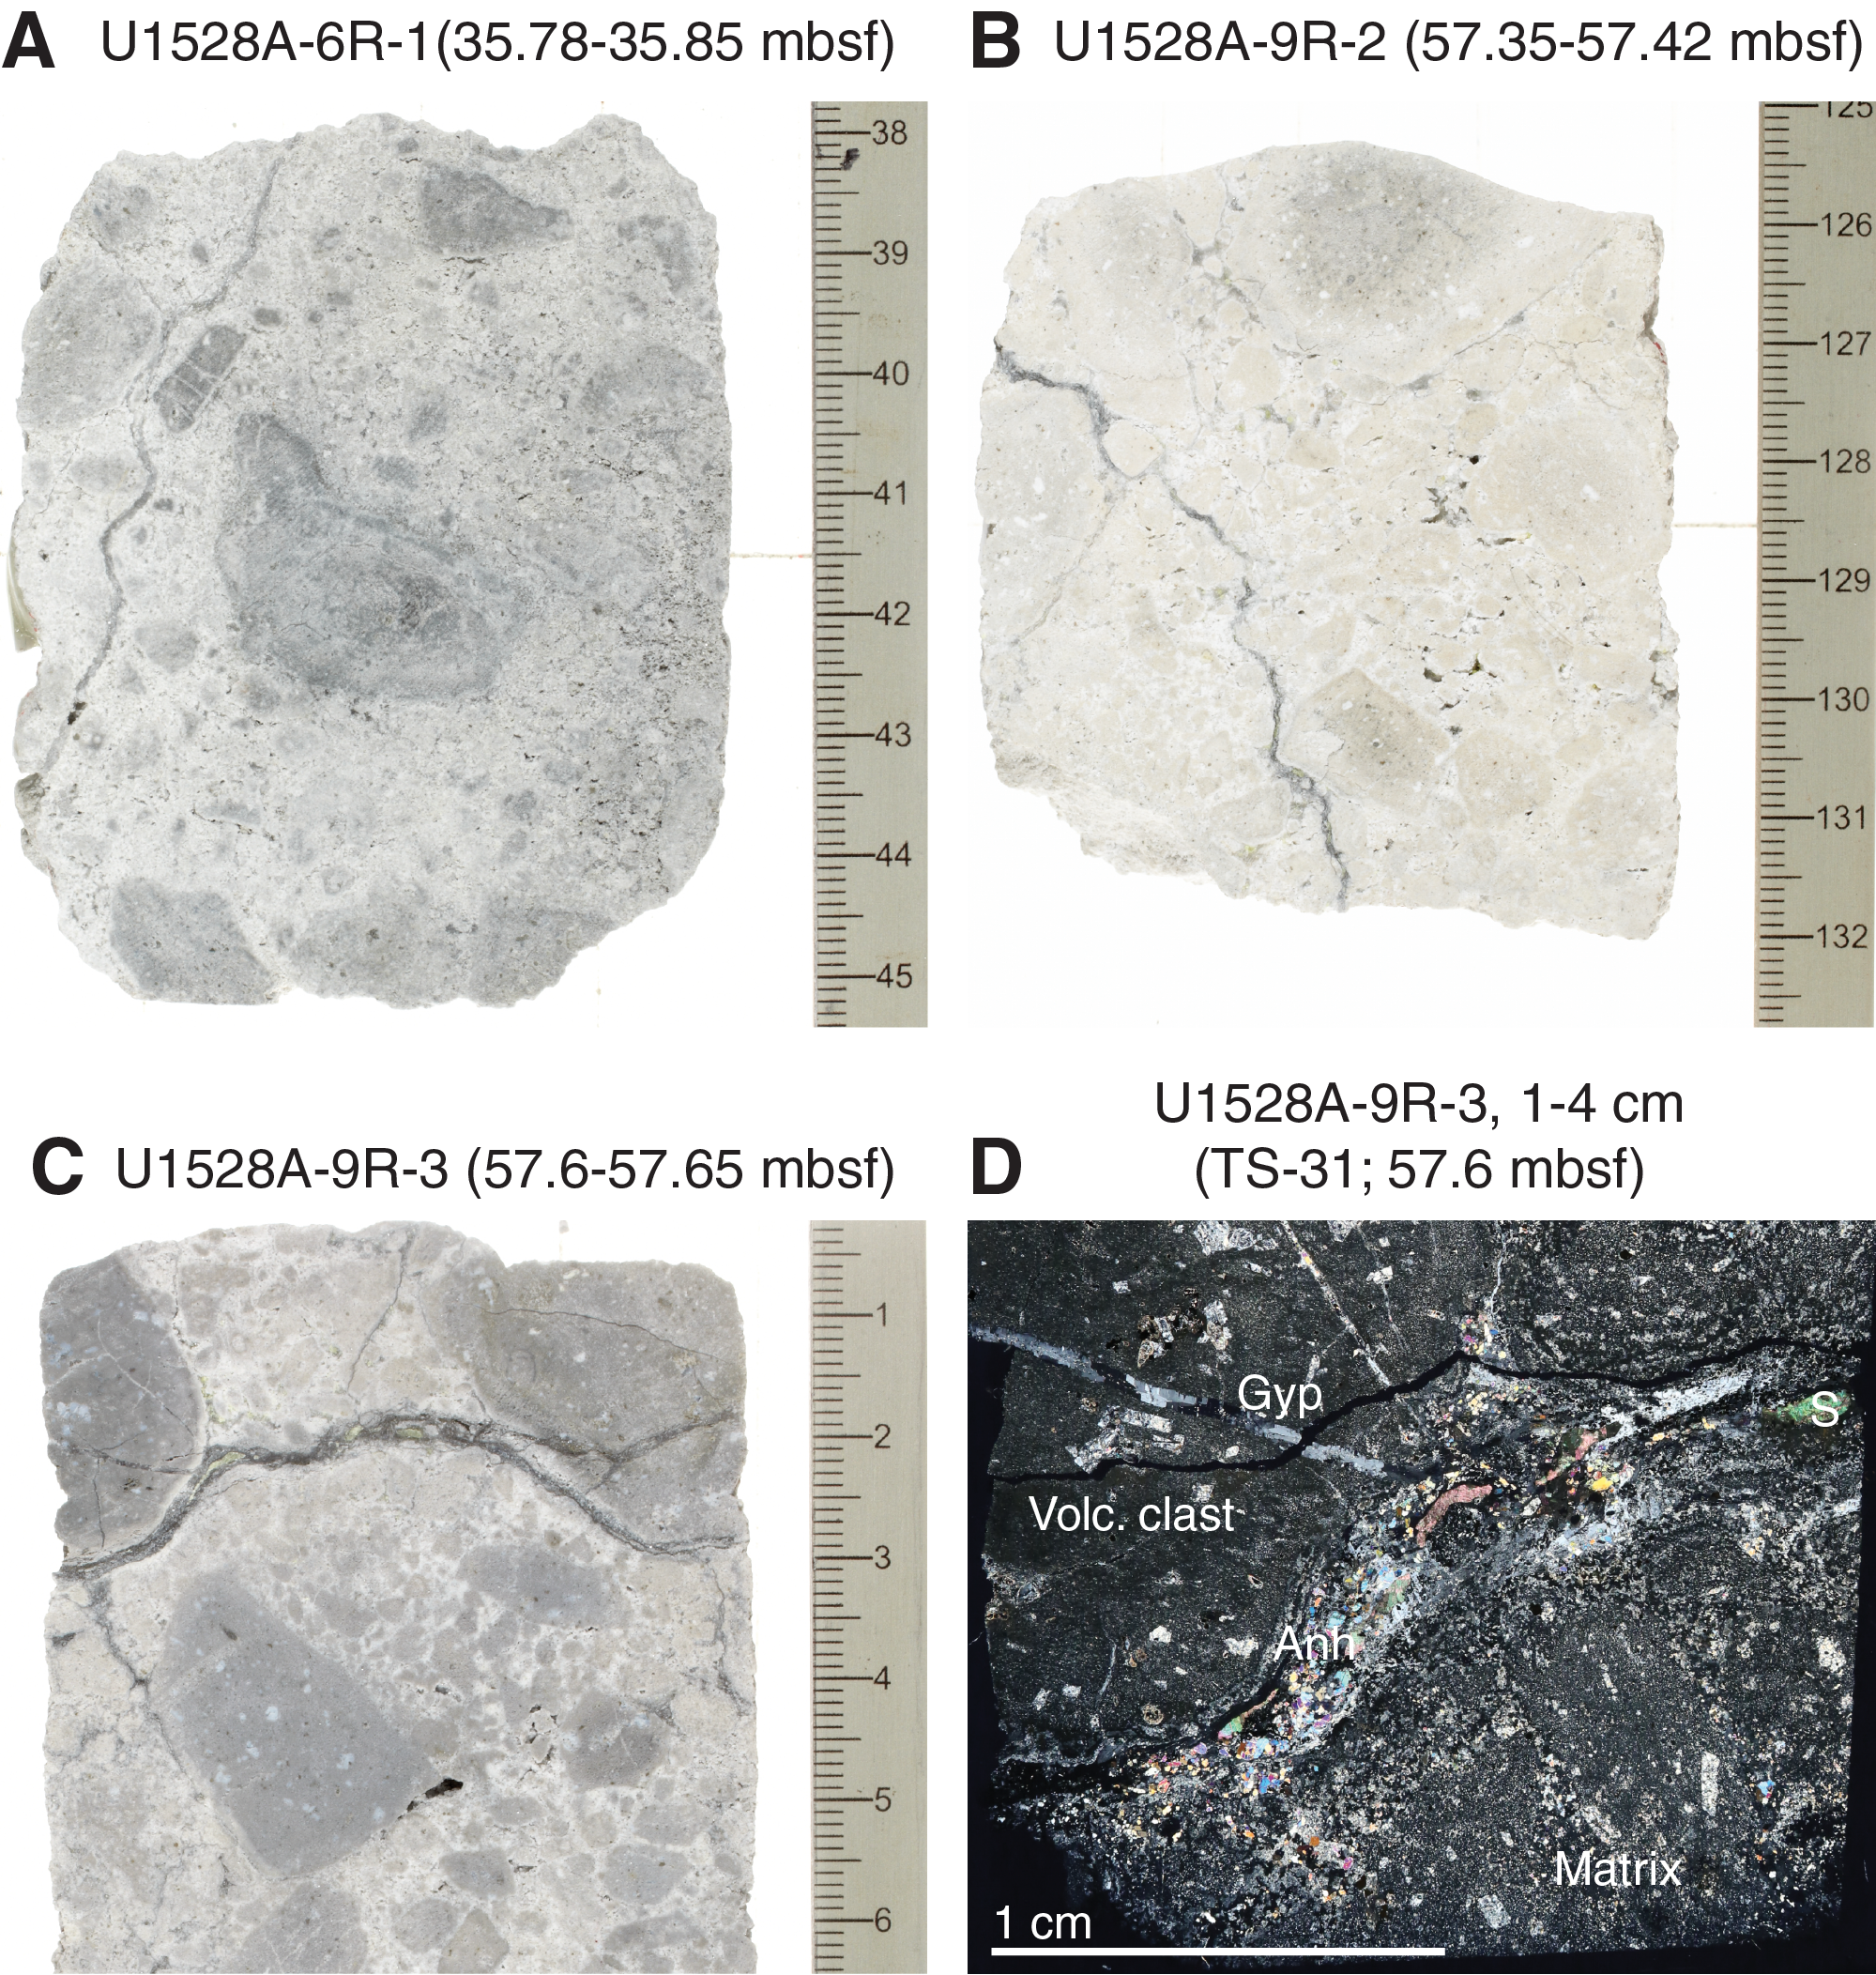
Figure F45. Vein morphologies, Hole U1528A.
In thin section, it was determined that some veins are filled with anhydrite, native sulfur, and gypsum, whereas other veins have only anhydrite or gypsum (Figure F45D). This difference may indicate distinct generations of veins with gypsum postdating anhydrite. However, there are some examples of anhydrite-filled veins cutting gypsum veins (Figure F45B). Native sulfur appears to be a later mineral phase, partially filling along the center of some veins (Figure F45B) and partially filling vugs.
Hole U1528C: Igneous Units 1 and 2
Hole U1528C has very limited deformation including volcanic fabrics, fractures, and veins. Volcanic fabrics include volcanic clasts with an SPO defined by vesicles in Igneous Units 1 and 2. No meaningful measurements of vesicle SPO could be made. Fracture and vein densities are low throughout these units. Fractures are highly irregular and steeply dipping, and they occur in Sections 376-U1528C-5N-1 and 6N-1. Fractures are lined with native sulfur or pyrite and more rarely with both. Accumulations of native sulfur and pyrite are the highest where fractures are the most irregular. Two alteration veins occur in interval 5N-1, 18–26 cm (35.68–35.76 mbsf). The veins are haloed, vuggy, and filled with clay and native sulfur. Their dips are 28° and 85° (see Vein tab in files in DESC_WKB in Supplementary material).
Hole U1528D: Igneous Units 2 and 3
Hole U1528D has several structures including volcanic fabrics, fractures, and alteration veins across all igneous units and subunits. No faults or crystal-plastic fabrics were observed. All observations and measurements were recorded in the DESClogik macroscopic and microscopic worksheets (see DESC_WKB in Supplementary material).
Volcanic fabrics
Volcanic fabrics were observed throughout the hole and range from isotropic to strongly anisotropic defined by aligned vesicles, phenocrysts, and/or microlites (Figures F46, F47). The majority of fabrics are either isotropic or have a weak alignment. Intervals logged as isotropic may have a volcanic fabric but are now masked by alteration. The majority of intervals logged as having a weak volcanic fabric typically have individual volcanic clasts with fabrics of distinct orientation (Figure F48), and therefore these intervals were logged as having a weak volcanic fabric instead of logging each clast. Within a clast, the fabric can be moderate to strong. These rocks are typically lapilli-tuffs, part of Igneous Subunits 2a and 2c. The presence of distinctly oriented fabrics in clasts indicates the fabrics formed before amalgamation into lapilli-tuff. Moderate to strong volcanic fabrics typically form in more massive units (e.g., Igneous Subunit 2b and parts of Subunit 2c and Unit 3) (Figure F46). The majority of moderate volcanic fabrics were checked and validated in thin section. The orientation of volcanic fabrics was measured if several consecutive pieces had a well-defined, continuous fabric (Figures F46 and F47). Strong volcanic fabrics occur in three places, all confirmed in thin section: intervals 376-U1528D-16R-1, 0–112 cm (128.9–130.2 mbsf); 52R-2, 50–125 cm (303.7–304.45 mbsf); and 63R–1, 16–57 cm (354.66–355.07 mbsf) (Figure F46).
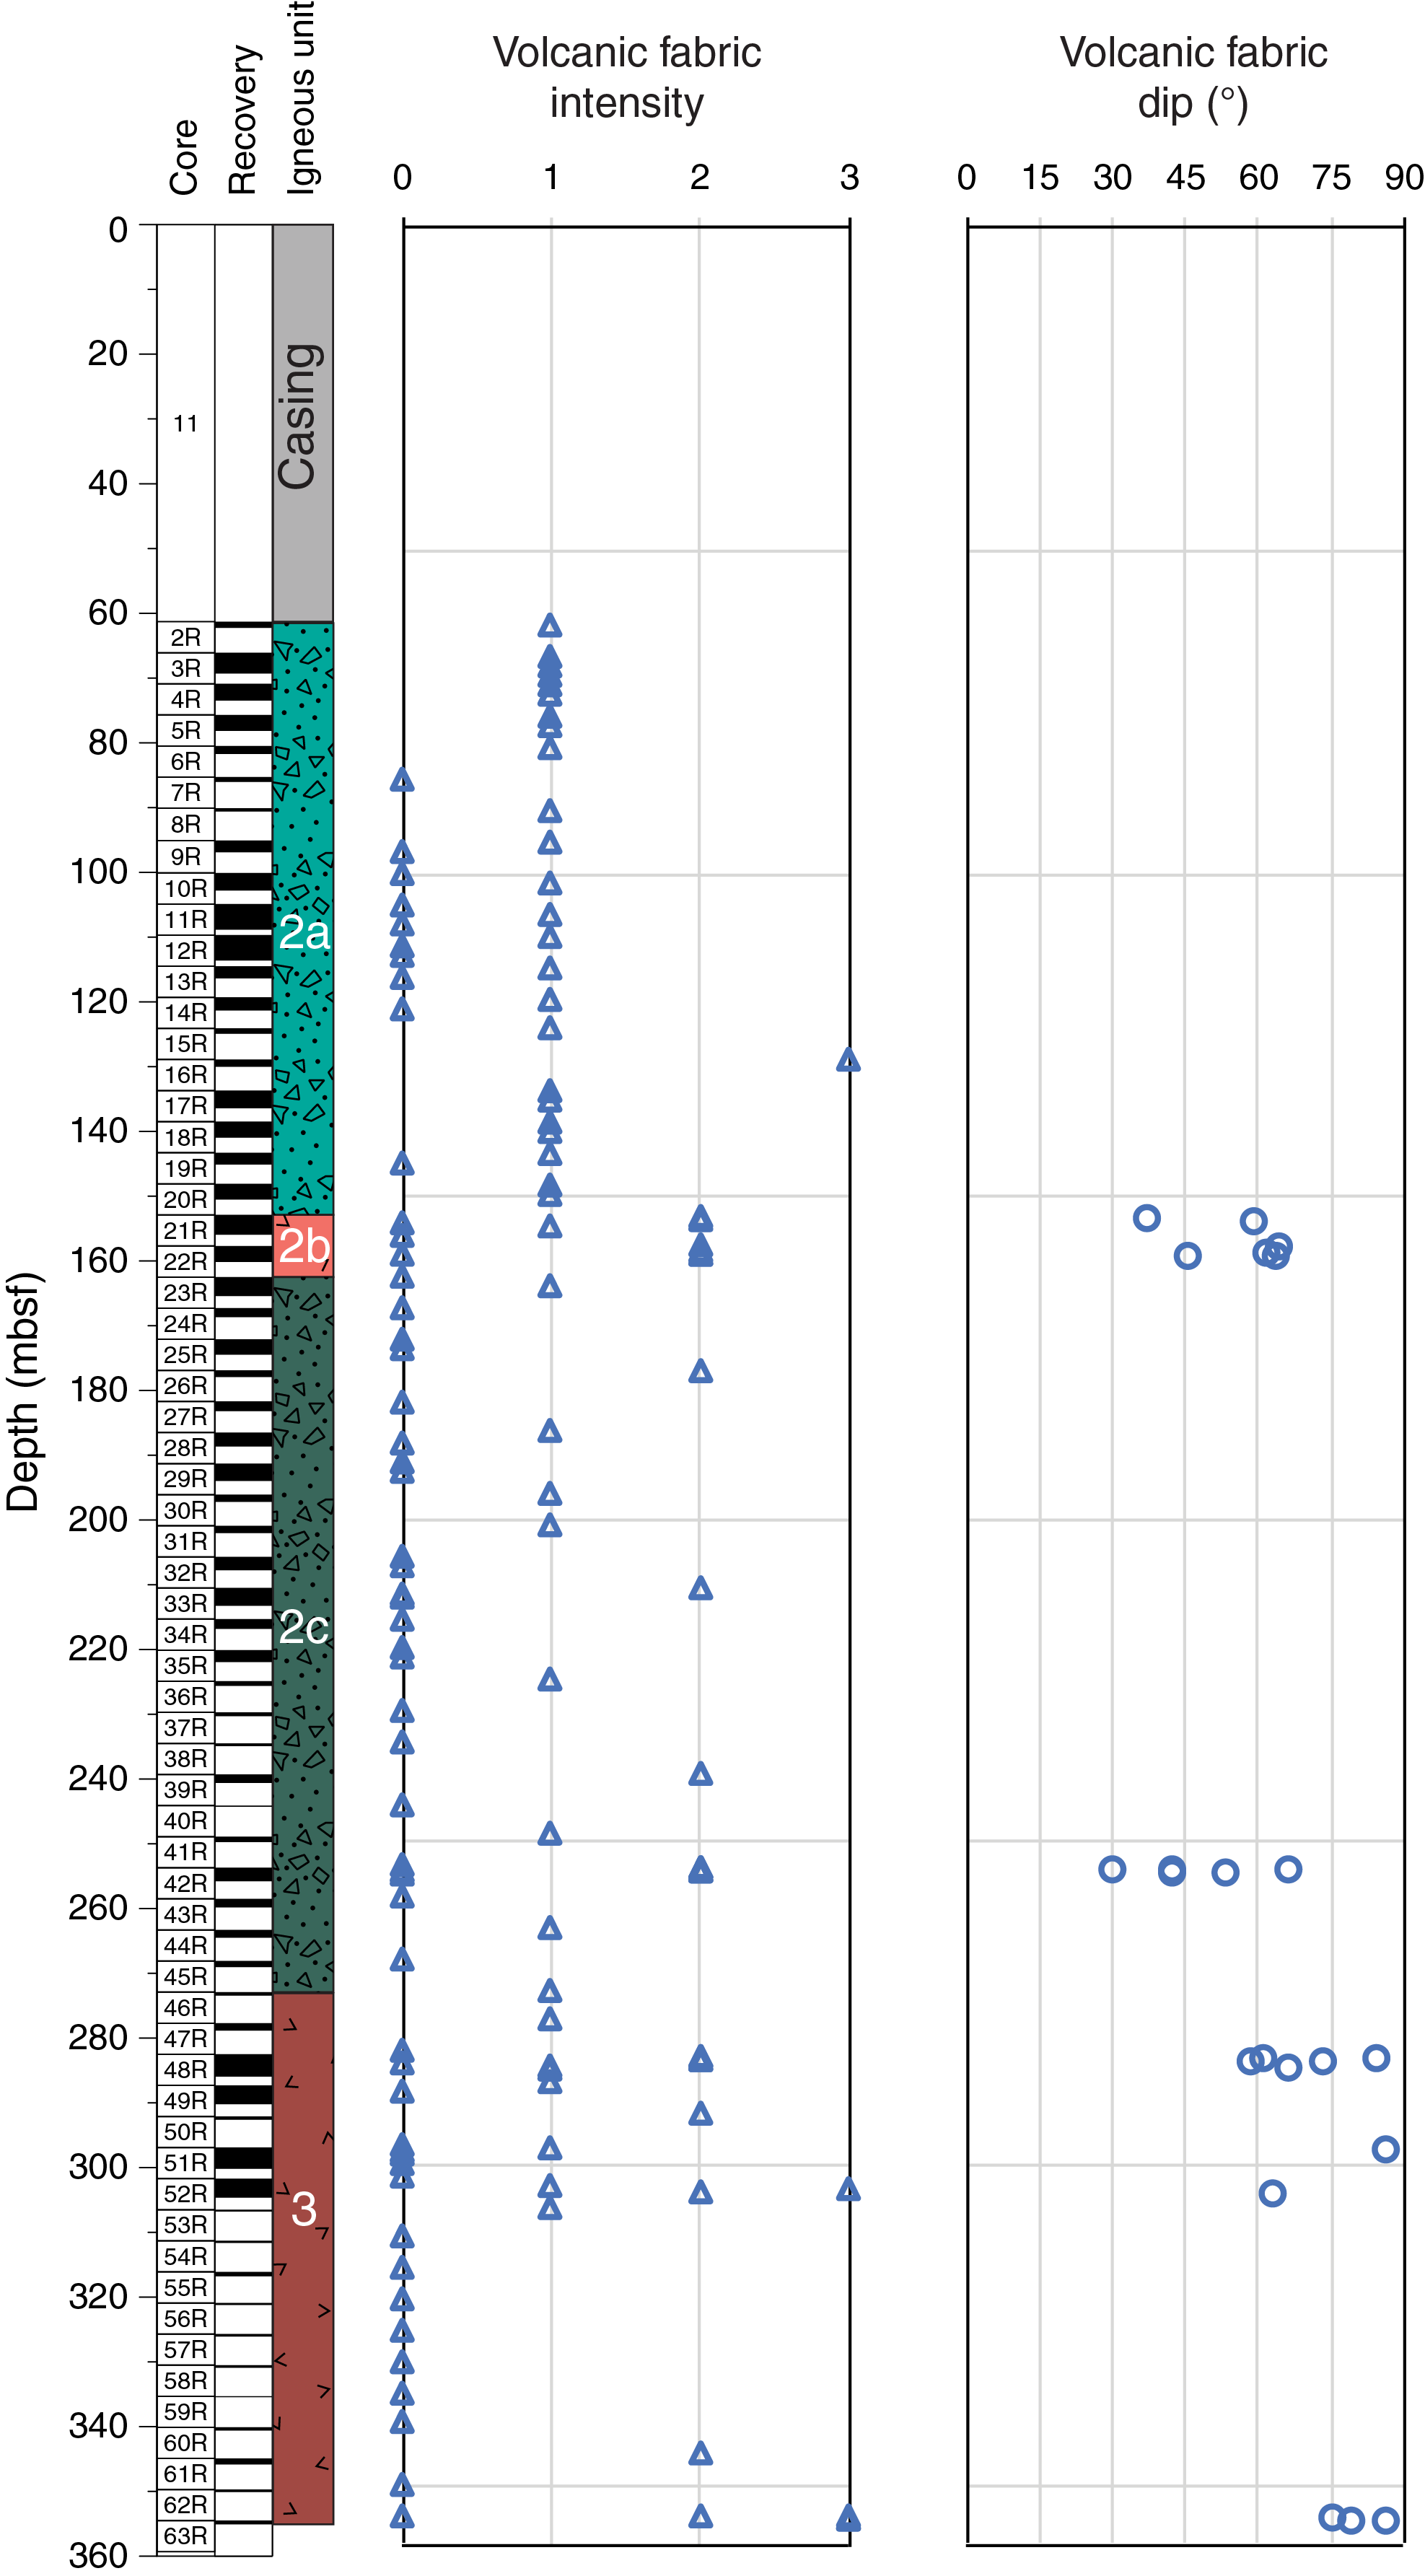
Figure F46. Volcanic fabric intensity and dip angle, Hole U1528D.
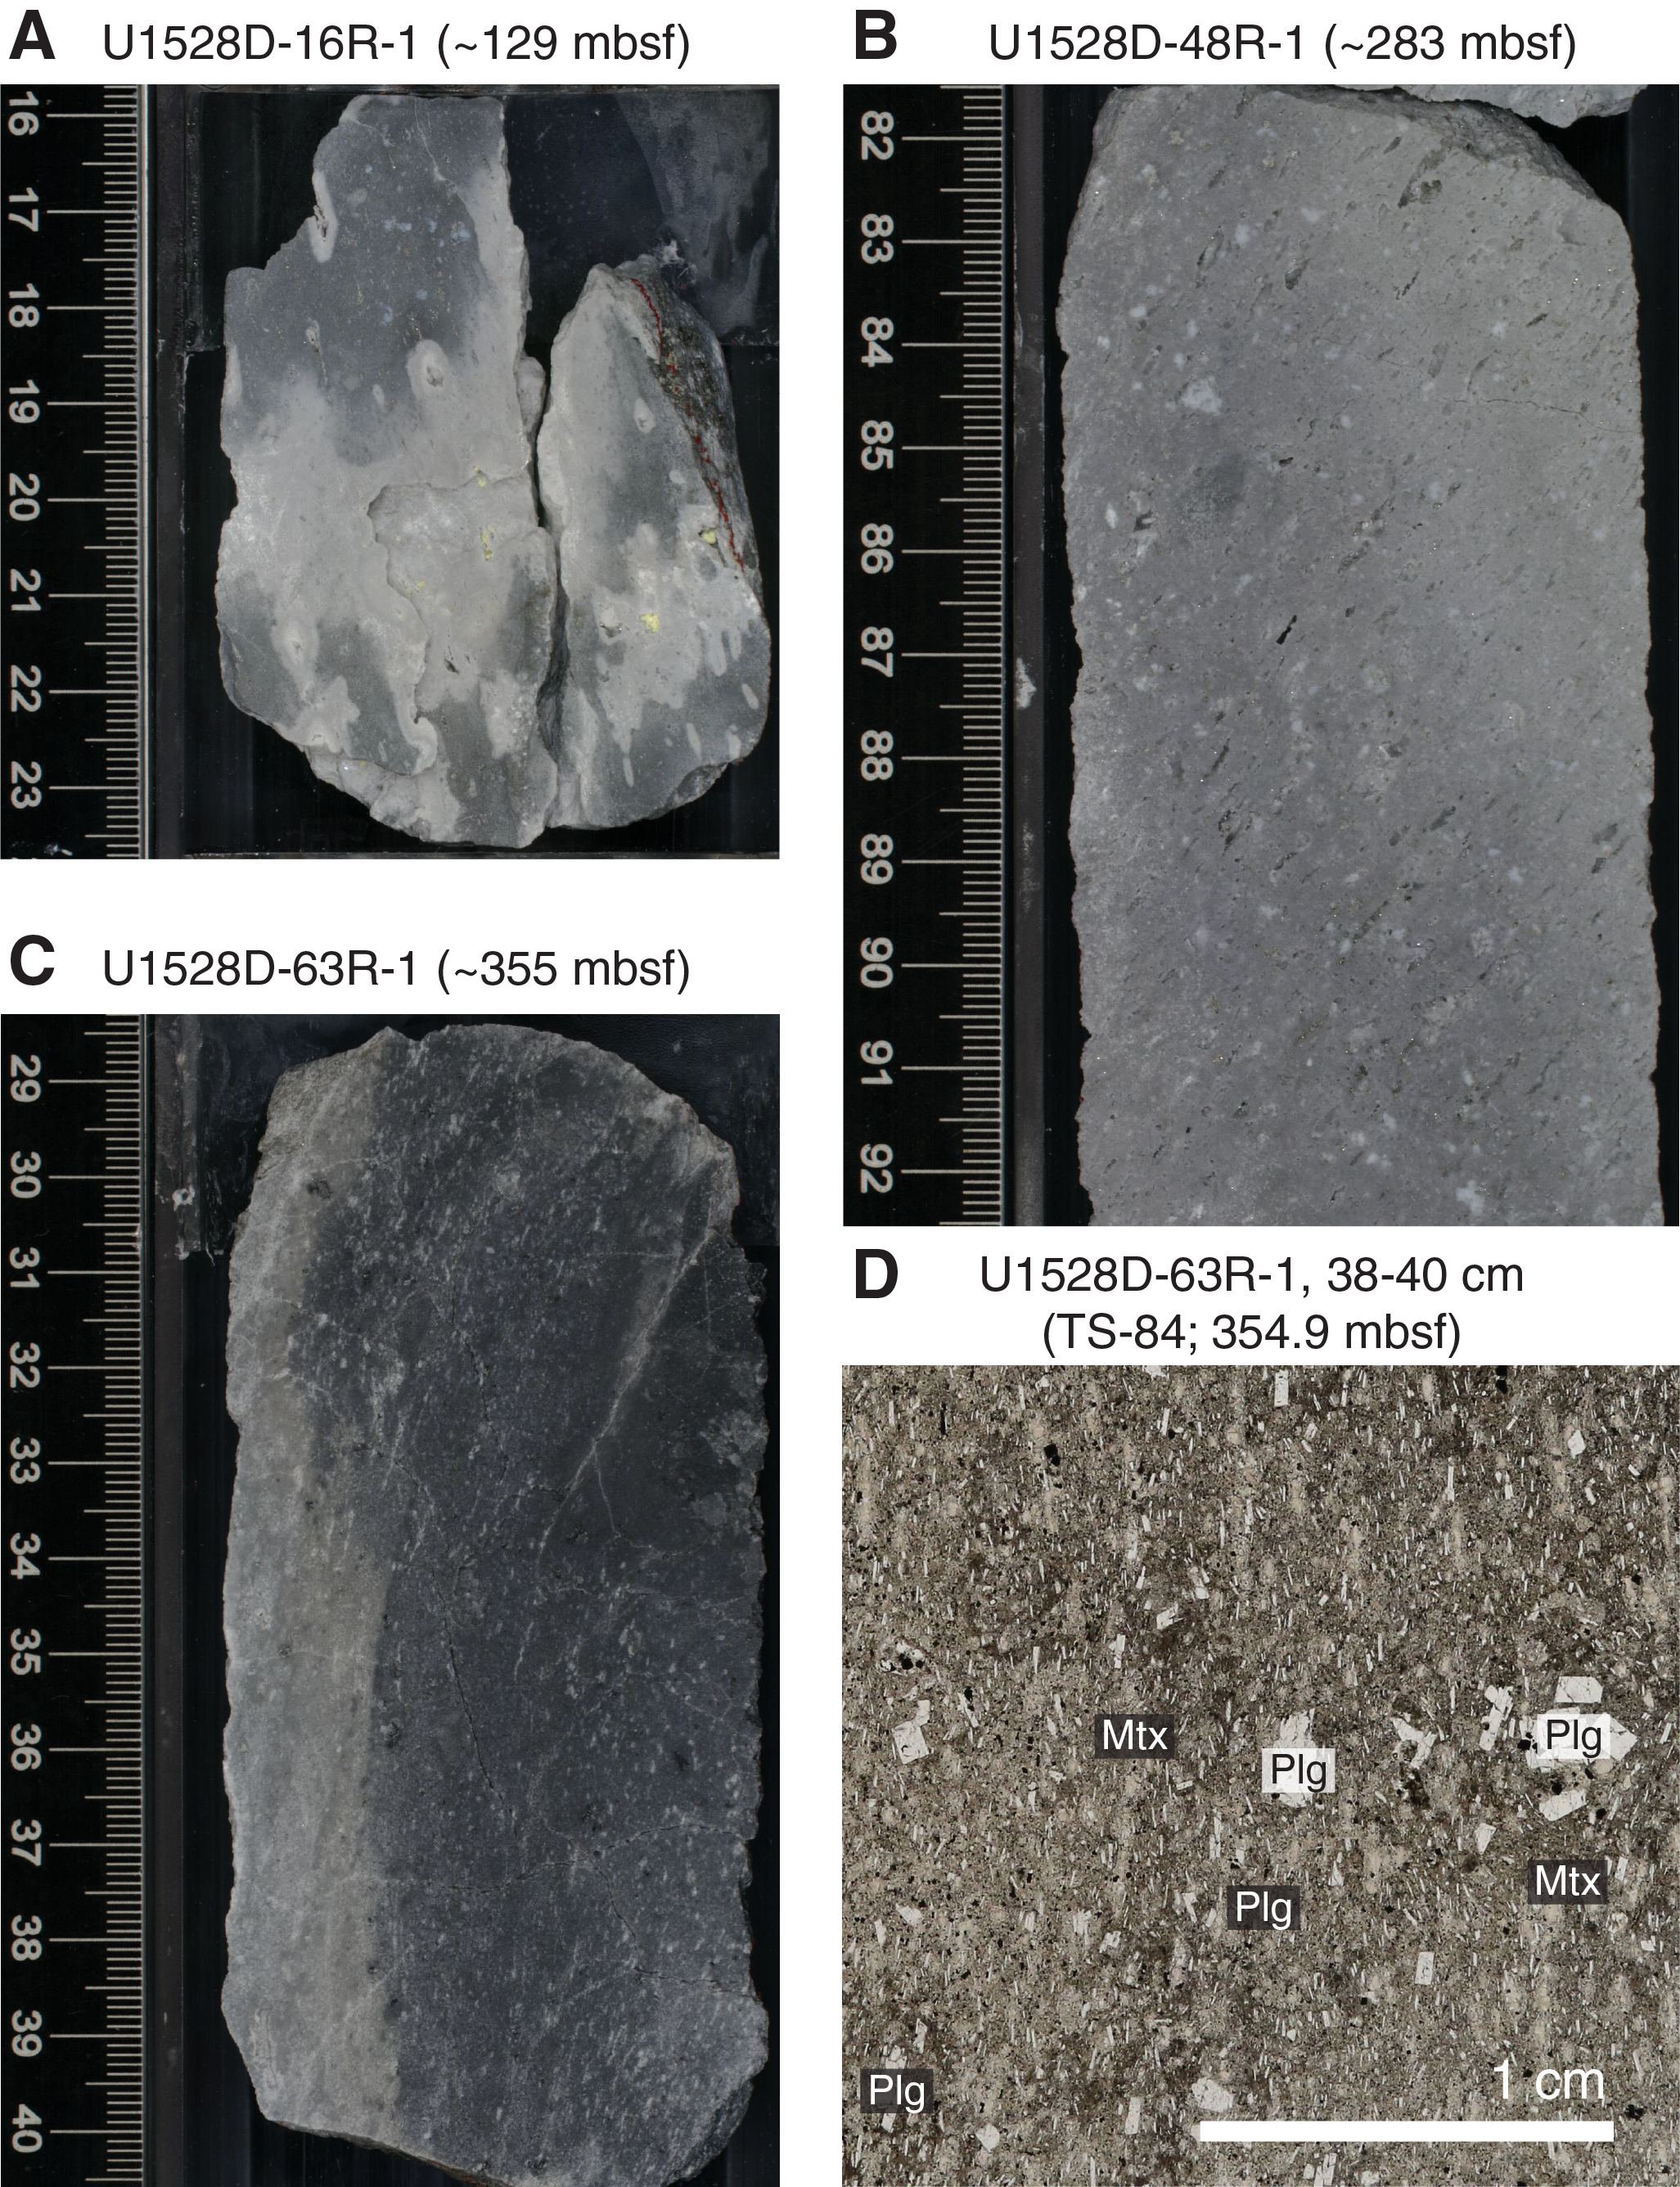
Figure F47. Volcanic fabrics, Hole U1528D.
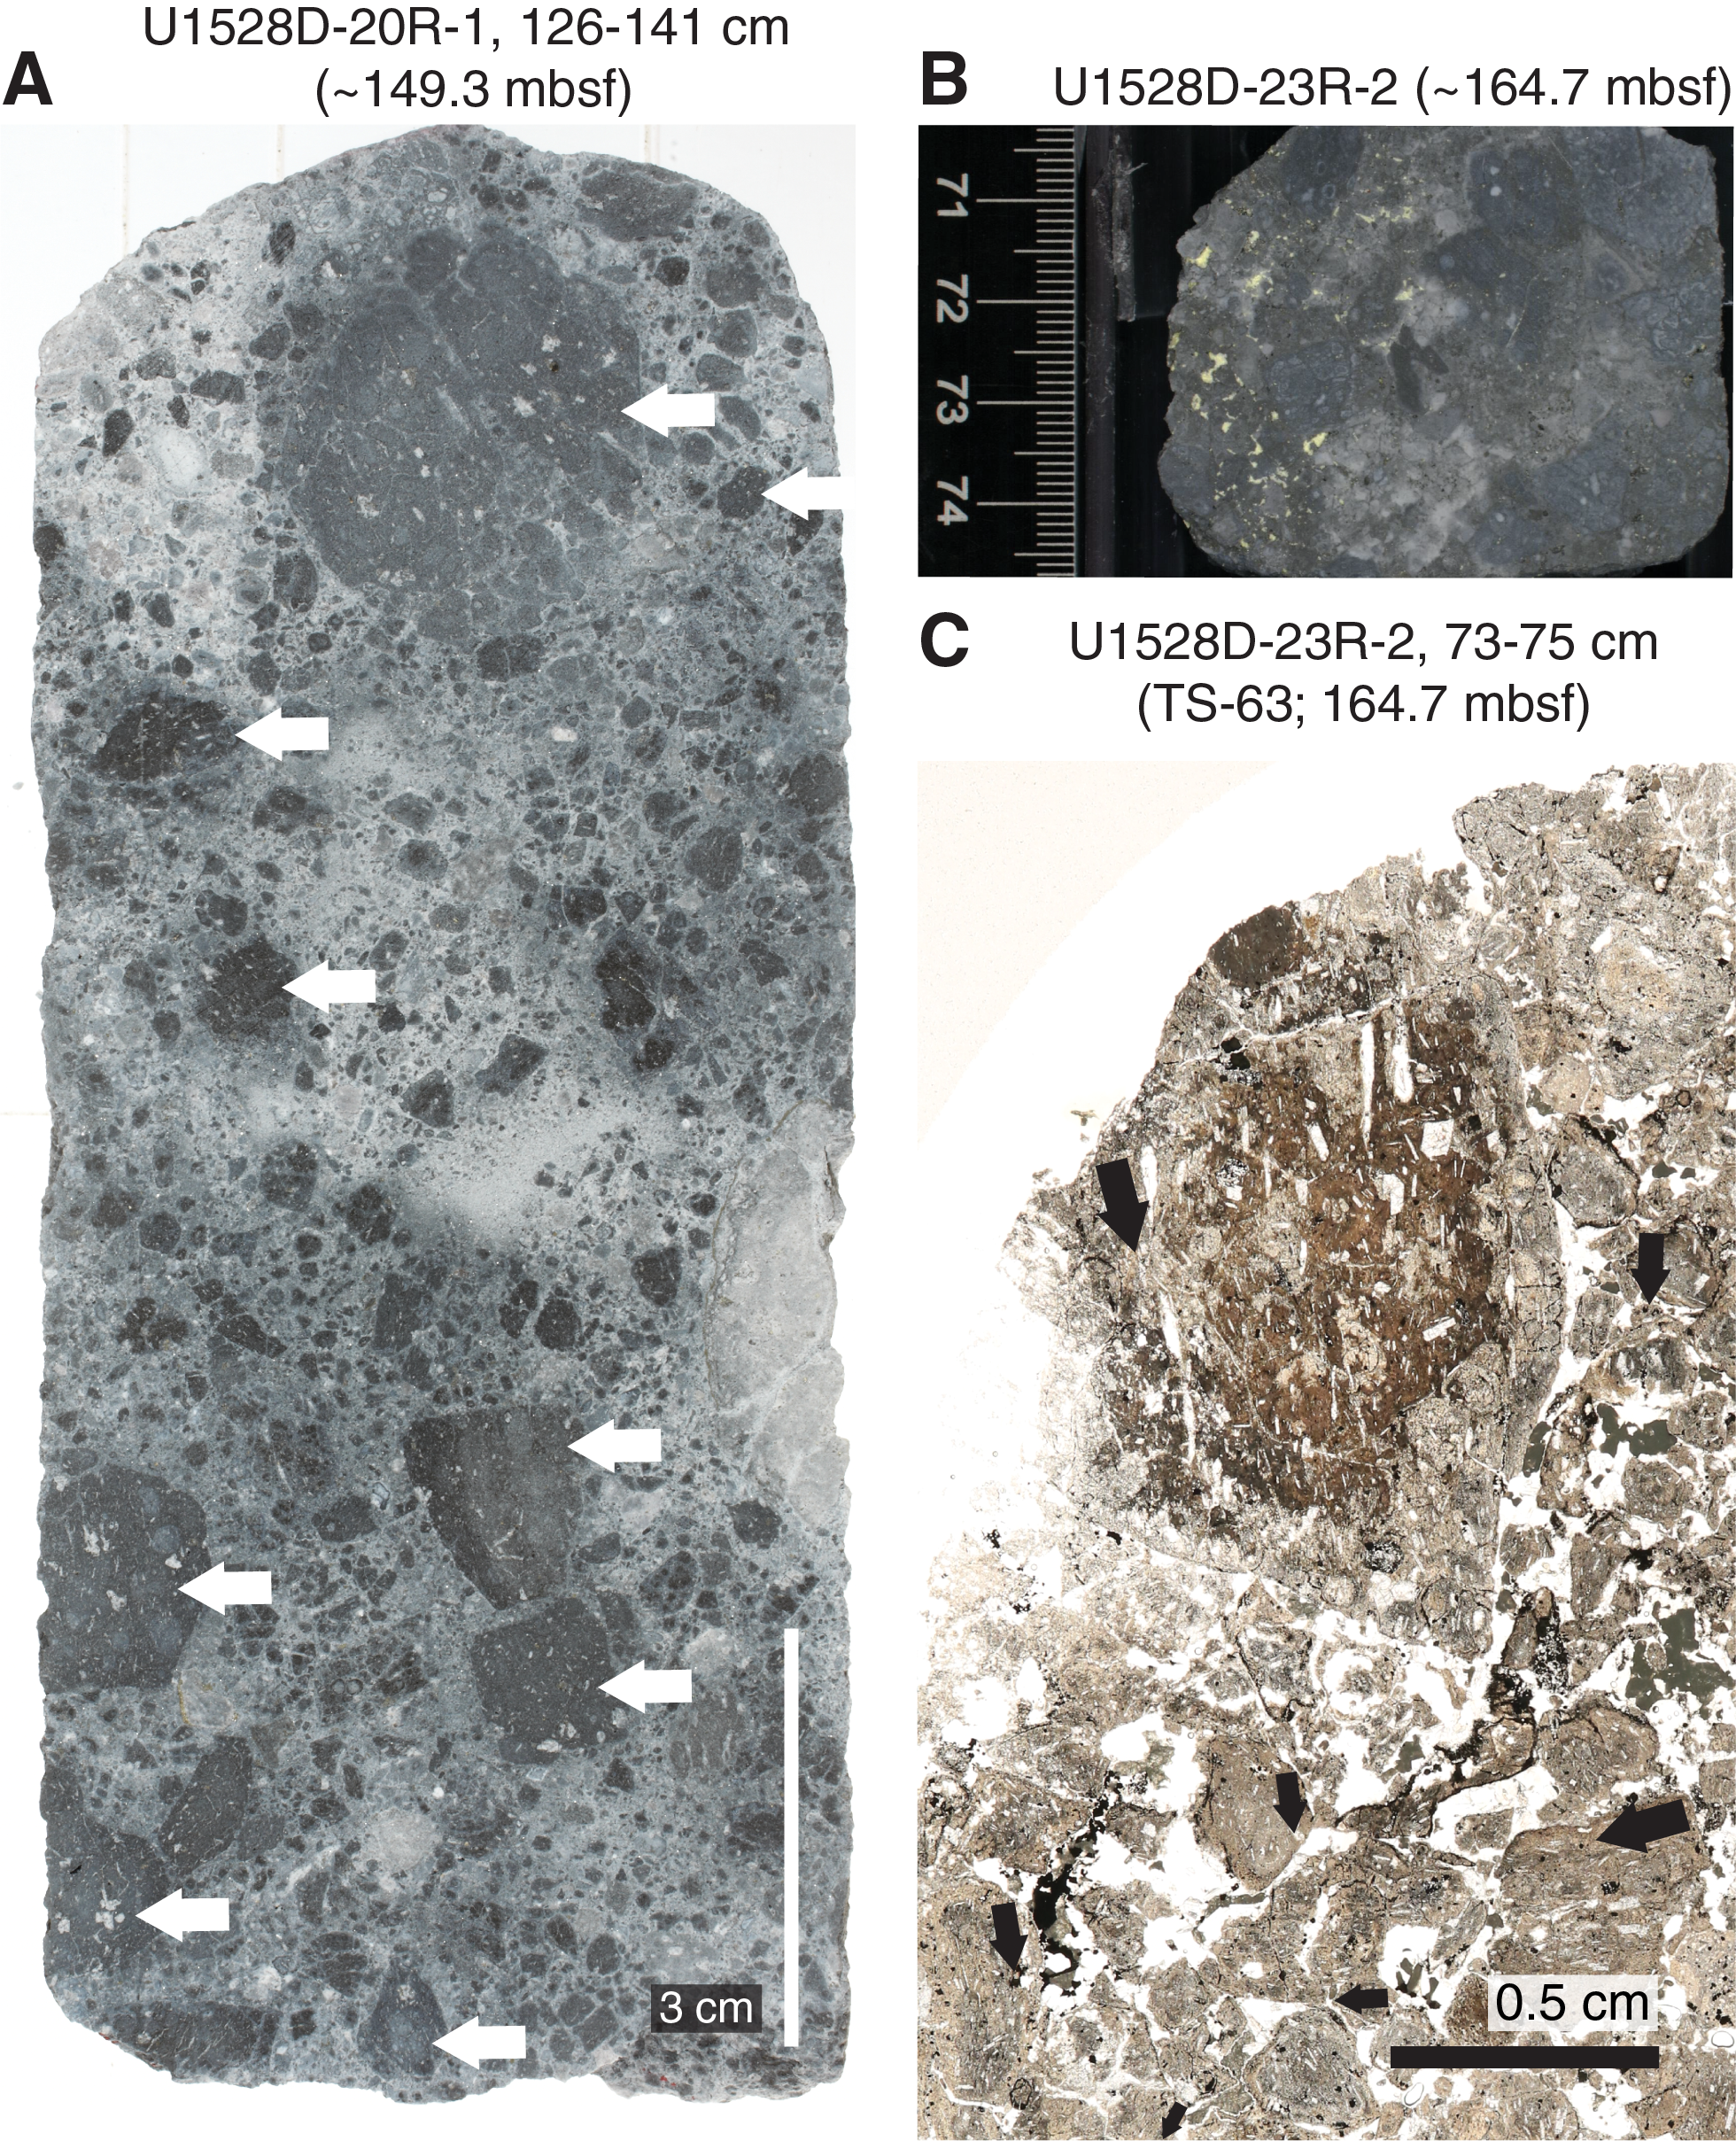
Figure F48. Volcanic fabrics in different volcanic clasts, Hole U1528D.
The orientations of 22 volcanic fabrics were measured. Volcanic fabrics have a range in dip from 30° to 86° and an average dip of 62° (Figure F46). Moderate volcanic fabrics have a larger range of dip, whereas weak and strong fabrics are only steep with dips greater than 66°. The majority of volcanic fabrics are located in clasts in lapilli-tuff, and therefore no meaningful orientation measurements could be made.
Alteration veins
Alteration veins occur throughout the hole and across all igneous units and alteration types (Figure F49). Veins are typically filled with anhydrite, pyrite, silica, gypsum, native sulfur, and clay. Vein fill is independent of igneous unit and alteration type. The majority of veins are filled with some type of sulfate mineral and pyrite. Veins filled with anhydrite and pyrite occur throughout the drilled interval. Veins filled with native sulfur occur throughout the drilled interval, although the abundance is higher at 100–165 mbsf. Veins filled with silica, and usually also clay, tend to cluster at 100–150, 268–302, and 340–354 mbsf. Vein geometry is typically uniform, massive, and to some extent vuggy. Vuggy veins are most abundant at 100–150 and 260–310 mbsf. Crosscutting relationships are very limited. The identification of crosscutting veins is further complicated by the fact that the majority of the veins have similar vein fill. Where veins do intersect, they are rarely offset or they exhibit overprinting relationships. In one example where two veins intersect, both are filled with anhydrite and the intersection is marked with a vug filled with drusy anhydrite (Figure F50B). The only consistent timing relationship seems to be related to native sulfur because it fills vugs and the middle of veins, indicating that it is likely a later phase.
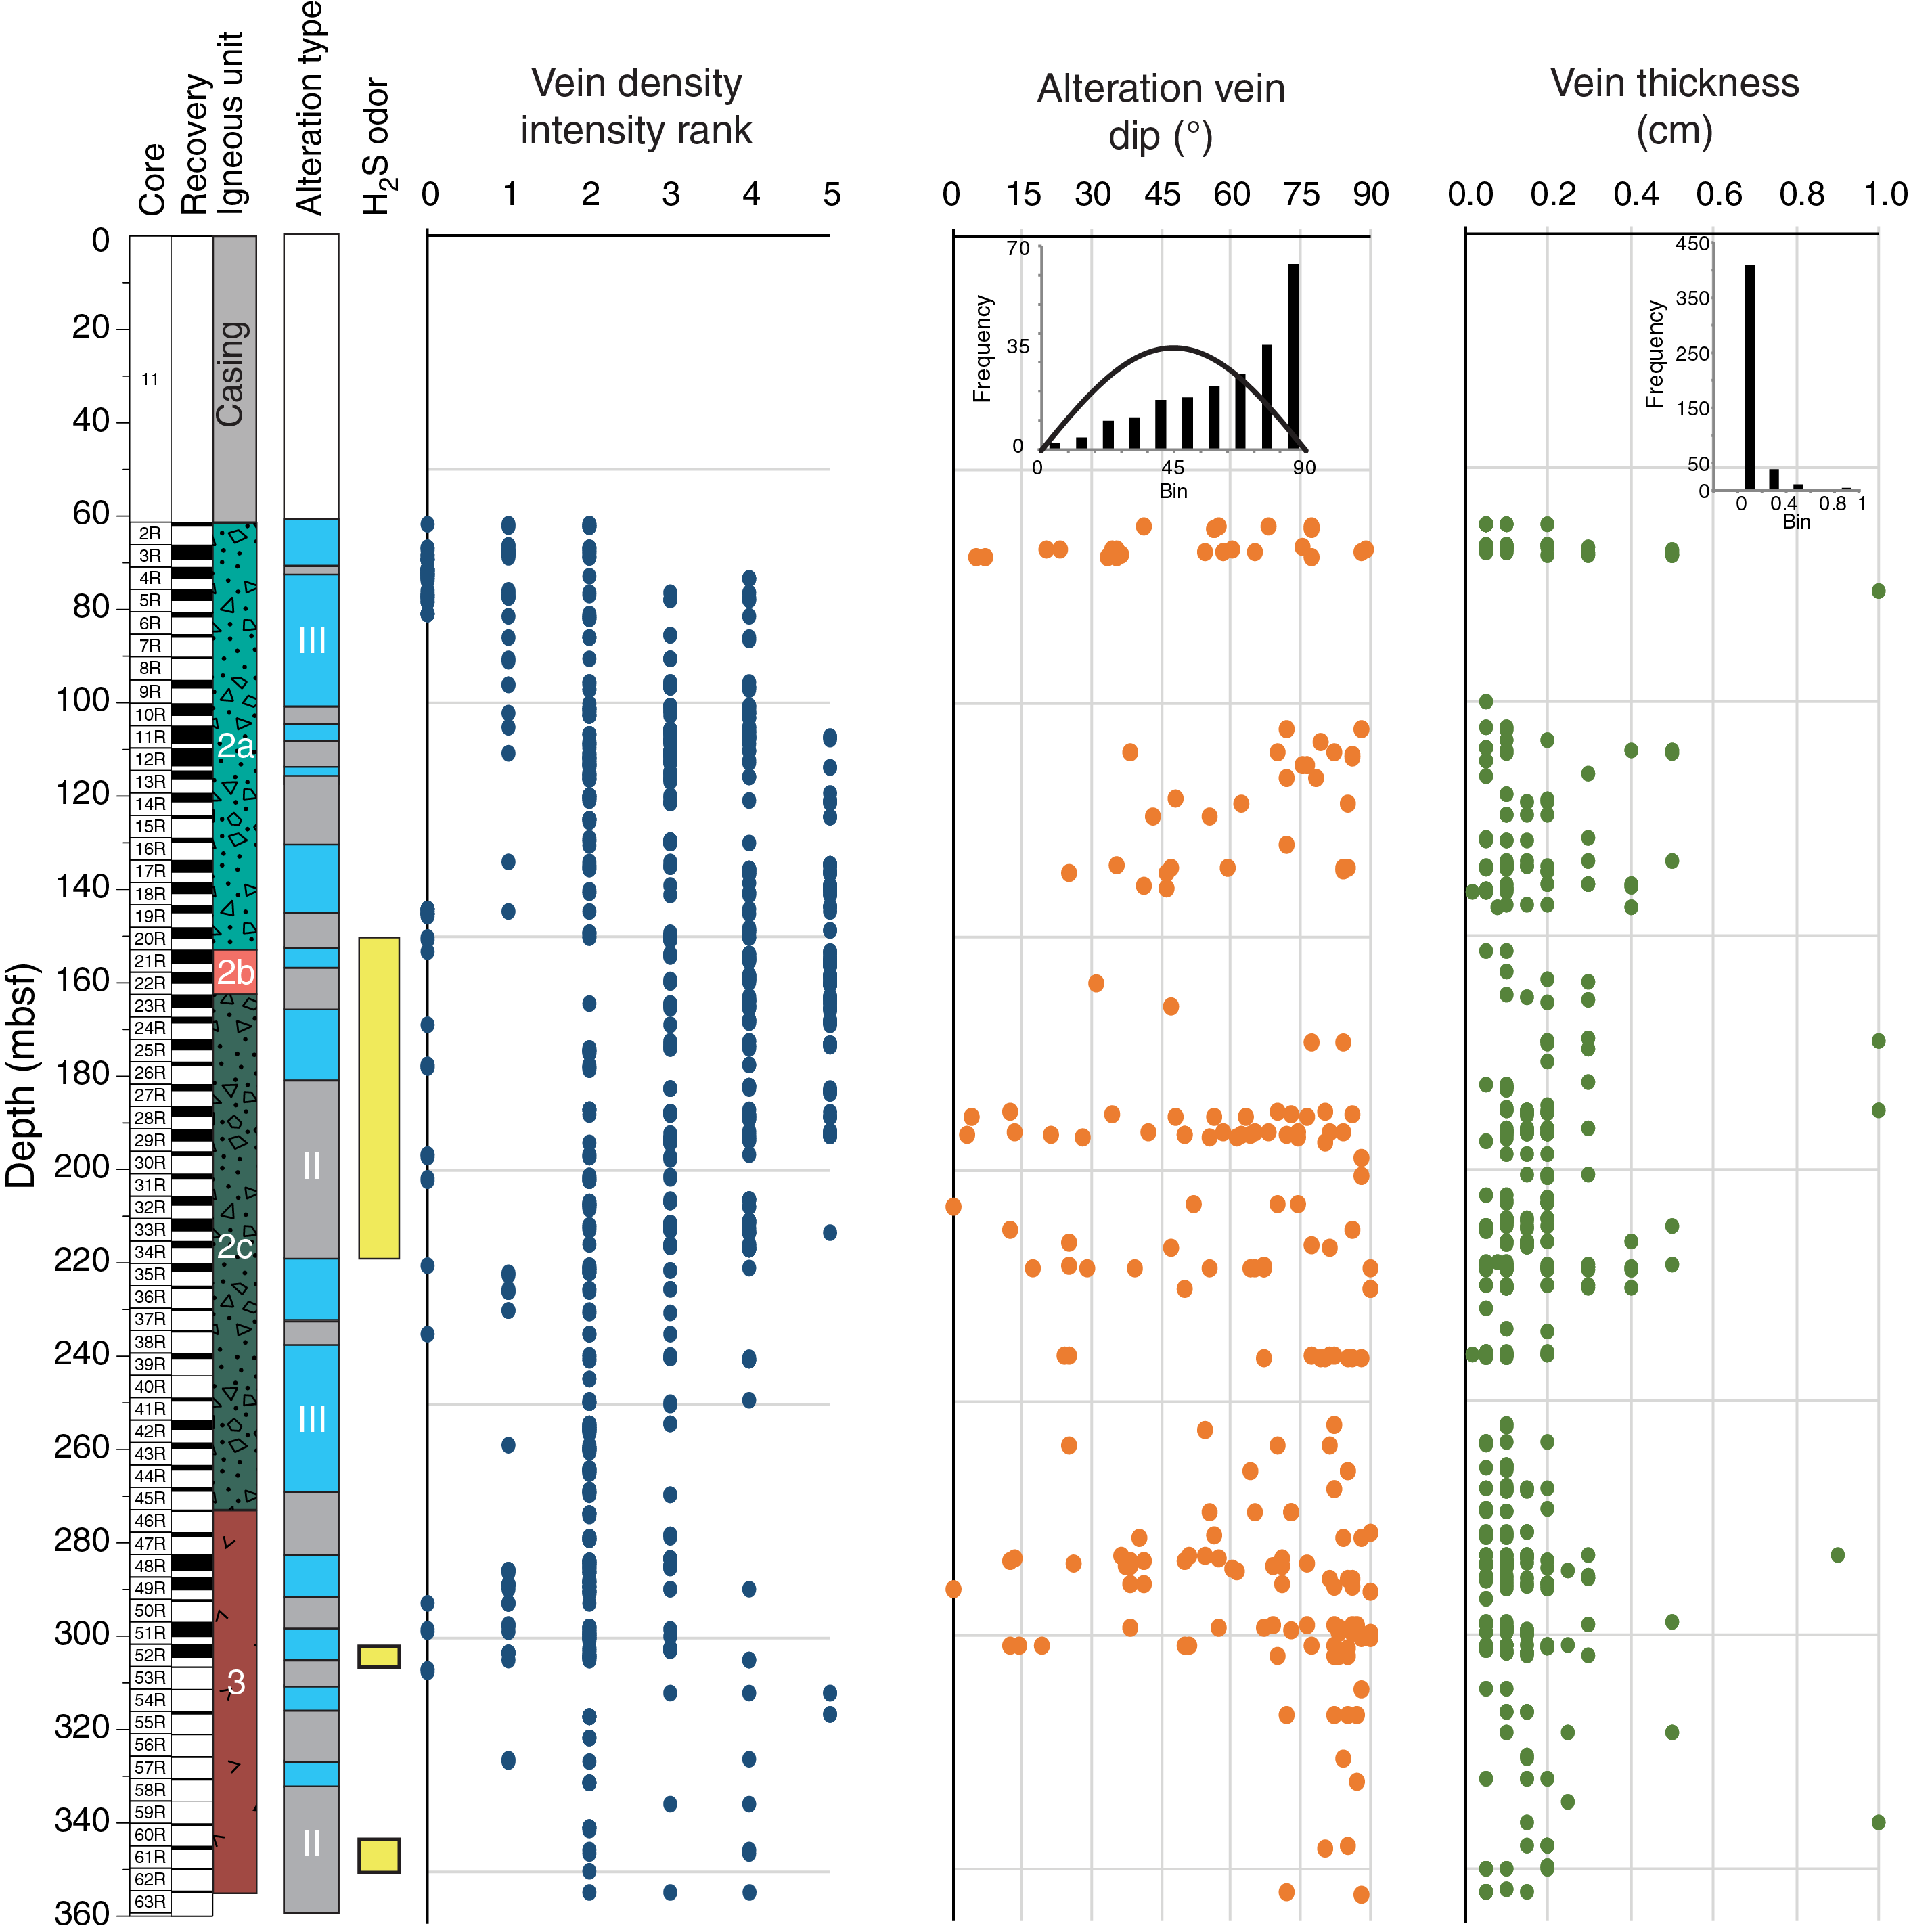
Figure F49. Alteration vein attributes, Hole U1528D.
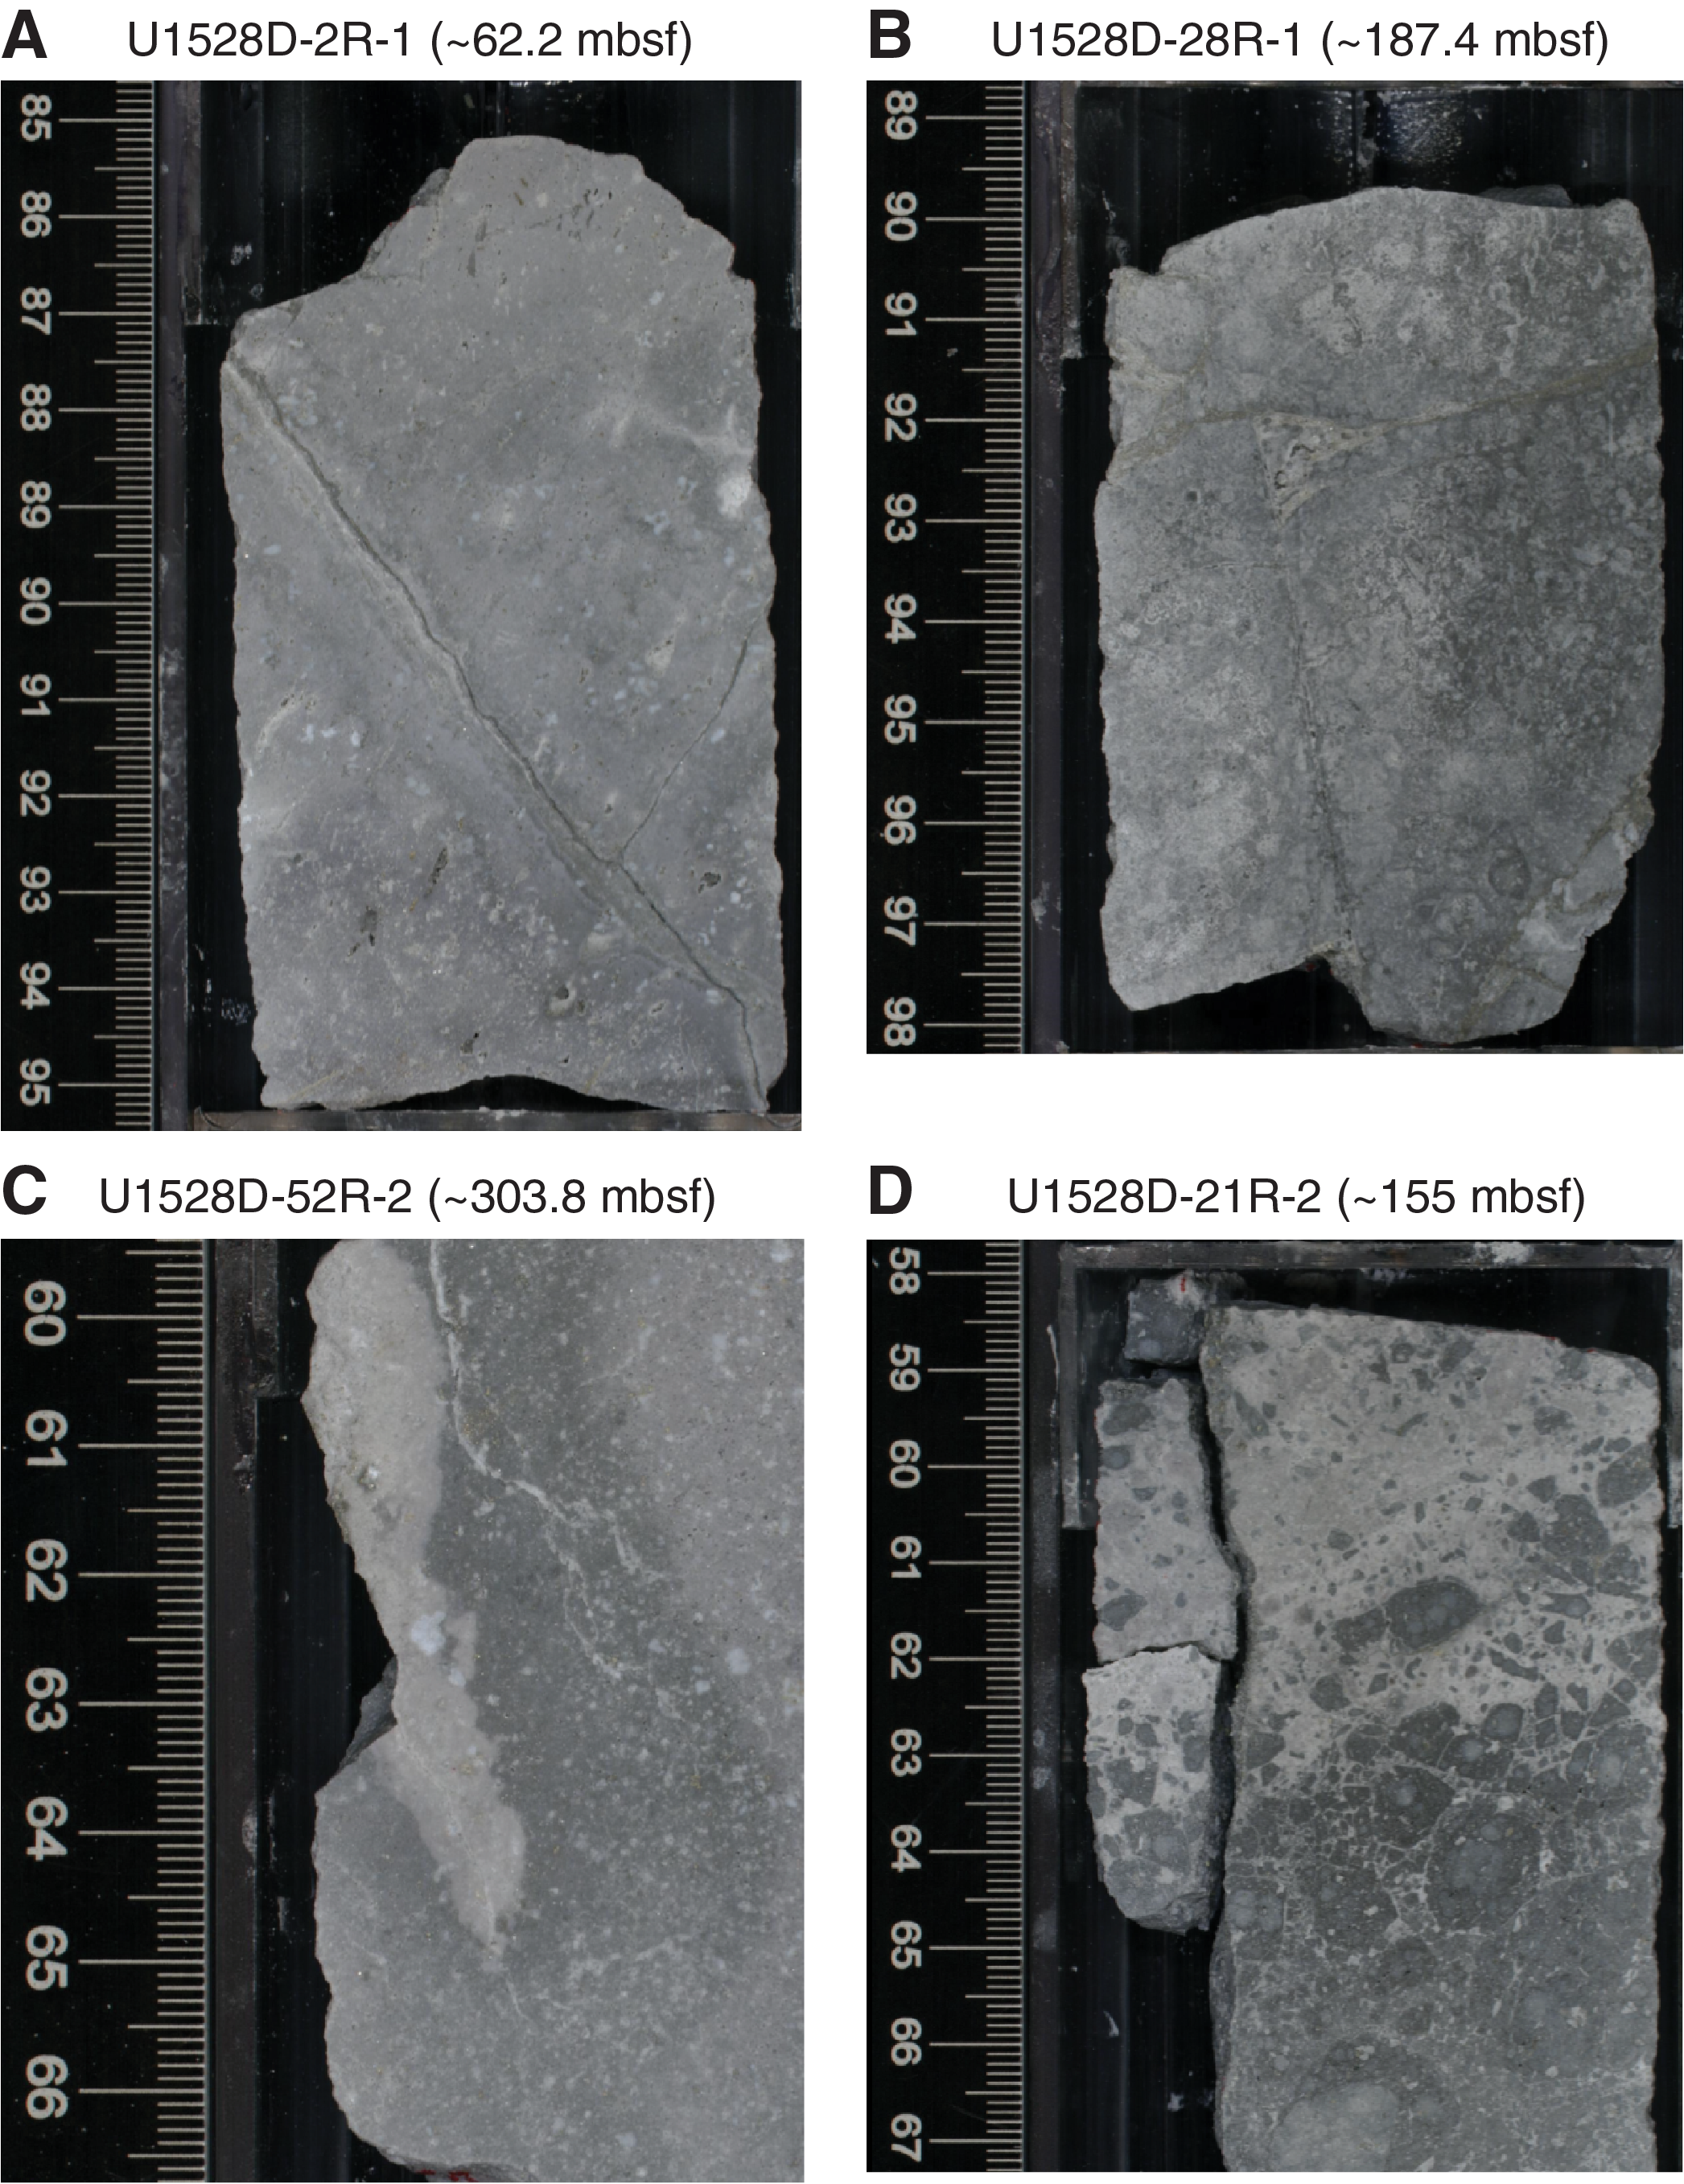
Figure F50. Alteration vein types, Hole U1528D.
Some veins have halos that are typically white. The presence of vein halos and specifically discrete bleached zones is the basis for Alteration Type IV (see Alteration). Veins with halos are more common below ~200 mbsf. In some cases, a vein is discrete and through-going but its halo is discontinuous (Figure F50C). In other examples, a white halo is present but a discrete vein is not easily discernible. This may indicate that the halo was secondary or part of a continued progression of fluid flow and reaction through the vein conduit.
Vein density is variable downhole and has two acmes in intensity (Figure F49). Vein density is relatively low at the top of the hole; it has one acme between 107 and 192 mbsf and another at ~315 mbsf. The highest vein density, which indicates more than 20 veins in a 10 cm interval (see Structural geology in the Expedition 376 methods chapter [de Ronde et al., 2019a]), is characterized by vein networks, especially where volcanic clasts and matrix are permeated with veins and associated alteration (Figure F50D). The upper acme in vein density coincides with both Alteration Types II and III and Igneous Unit 2. The lower acme in vein density coincides with Alteration Type III and Igneous Unit 3. The presence of acmes in vein density across all igneous units and alterations types indicates that network veins are not limited to specific alteration types and protoliths.
Changes in vein density may be correlated with changes in alteration type (Figure F49). In 12 examples, a change in vein density is related to a change from Alteration Type II to III or vice versa. The change in vein density can be from a lower density to a higher density or from a higher density to a lower density (e.g., 76, 220, 306, and 335 mbsf). This is significant because alteration type was determined mainly using XRD (see Alteration), which provided a test of alteration types independent of core observations.
We identified 480 alteration veins and measured the orientation of 211 (Figure F49). The majority of veins have a dip greater than 45°, and 30% of the veins have a dip >80°. The average dip is 62°, and the standard deviation is 24°. The histogram of vein dips is positively skewed and has a very regular stepwise decrease in vein dip and abundance. Veins with dips less than 45° occur in restricted intervals including 61–68, 187–193, 212–225, and 278–303 mbsf (Figure F49). These intervals are characterized by a range in dip from vertical to horizontal, which is in contrast to intervening intervals that have dips typically >45°. In intervals with a large range in dip, the range does not seem to be related to vein density, alteration type, or igneous unit. There does seem to be a relationship between the zones with a large range in dip and higher recovery. This may suggest that veins with shallow dip were not recovered in some intervals. However, intervals ~100–120 and 135–165 mbsf have higher recovery and only two veins with dips below 30°.
Vein thickness varies downhole and ranges from 0.05 to 1 cm with an average of 0.18 cm (Figure F49). More than 85% of veins are less than 0.2 cm thick. The thickest veins tend to have a steeper dip. However, veins with dips less than 45° and greater than 45° have a similar average thickness. Intervals that have a large range of dip tend to have veins with greater thickness. For example, at 278–303 mbsf, the thickest veins have dips greater than 45°.
Fractures
Fracturing downhole is characterized by a relatively low abundance of discrete, through-going fractures. Brittle deformation intensity is minor (see Structural geology in the Expedition 376 methods chapter [de Ronde et al., 2019a]), and no faults were identified. The majority of brittle deformation is related to discrete fractures and microfractures forming network veins. Open fracture density is also limited, but it does have acmes at 70–80 and ~150 to ~290 mbsf (Figure F51).
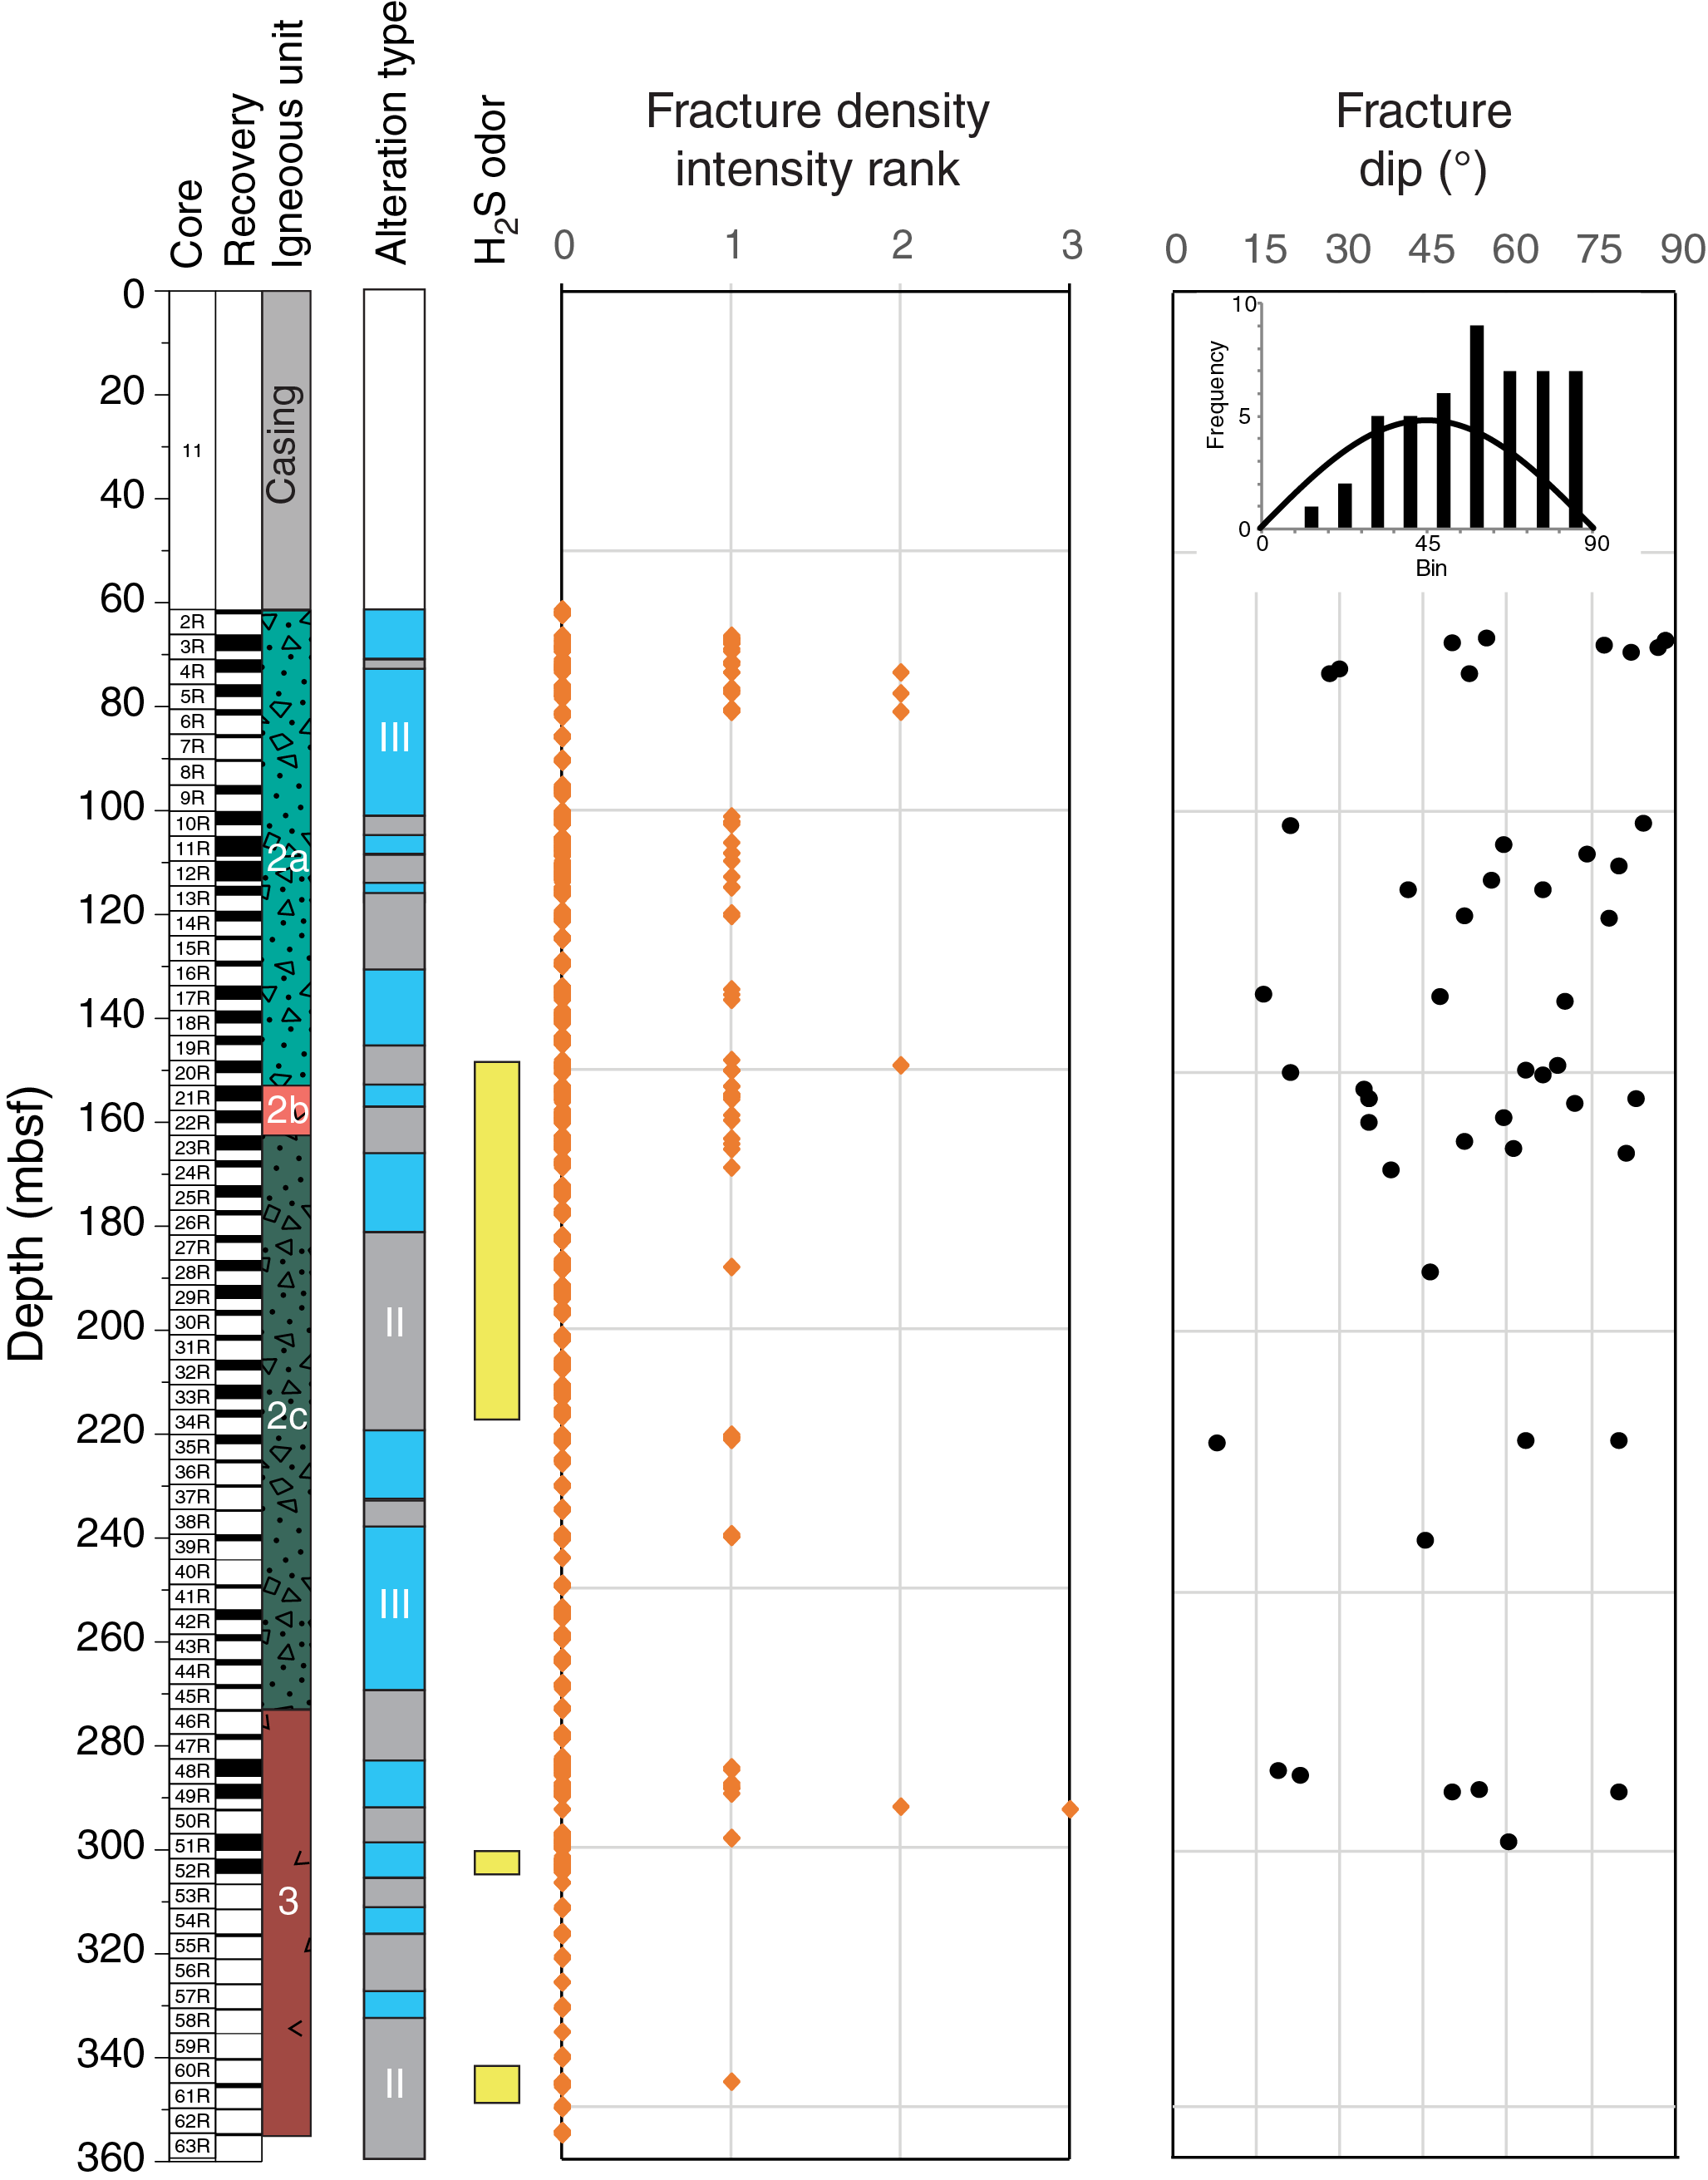
Figure F51. Fracture attributes, Hole U1528D.
Fractures are present throughout the drilled interval but seem to be clustered in the uppermost 175 m of the hole (Figure F51). In total, 55 fractures were identified, and the orientations of 50 were measured. Dip ranges from 8° to 88° with an average of 56° and a standard deviation of 21°. Fracture dips are skewed to higher dips (Figure F51).
Structural summary
The variety, distribution, and intensity of structures at Site U1528 are consistent with the eruption of distinct volcanic units and subsequent pervasive alteration at a volcanic cone. The following is an attempt to summarize the breadth of observed structures as they relate to this part of an evolving caldera system.
Volcanic fabrics
Brothers volcano has distinct eruptive units established by texture (e.g., massive or volcaniclastic) and volcanic fabrics. Igneous Unit 1, represented in Holes U1528A and U1528C, is massive lava with aligned vesicles. In thin section, volcanic fabrics are defined by vesicles, plagioclase microlites, and to some extent plagioclase phenocrysts. Volcanic fabrics in Igneous Unit 2, represented in Holes U1528A, U1528C, and U1528D, are distinct from Unit 1. Fabrics in Unit 2, including lapilli-tuff, are also defined by vesicles, plagioclase microlites, and phenocrysts. However, fabrics typically occur only in individual volcanic clasts, and there is no common fabric orientation between clasts. The alignment of volcanic phases most likely formed during eruption and could be the result of flow during inflation, flow during deflation soon after emplacement, or compaction after final deposition (Fisher and Schminke, 1984). The presence of distinctly oriented volcanic fabrics in volcanic clasts may indicate that a volcanic unit formed in a previous eruption and was subsequently brecciated, explaining the random orientation of volcanic fabrics. However, measurements of the paleomagnetic remanent vector determined an inclination, as predicted by the GAD (see Paleomagnetism), which indicates there was no post-eruption rotation below the Curie temperature of magnetite (580°C). No post-eruption rotation indicates that the lapilli-tuff must have been emplaced and coherent below the Curie temperature of magnetite. If the lapilli-tuffs formed by brecciating a previous eruption, it must have reached a temperature greater than 580°C, which is very unlikely if brecciation occured at or near the seafloor. This assumed temperature may indicate that during one eruptive event, lava erupted and cooled enough to form volcanic fabrics, brecciated and deposited, and then cooled to less than 580°C.
Alteration veining and fracturing
Alteration veins with a large range in dip over a relatively short depth interval were observed in Holes U1528A and U1528D. A range in dip was observed at 45–60 mbsf in Hole U1528A and at 60 (bottom of casing) to 68 mbsf in Hole U1528C; both ranges were near the top of the hole. This interval is also consistent with an acme in vein thickness over the same interval in both holes. The similarities of depth of large ranges in vein dip and increases in vein thickness, along with similar vein fill types (i.e., anhydrite) and the proximity of the two holes, indicate that these are the same interval (Figures F44, F49). There are, however, some distinctions between the two holes over this interval, such as vein morphology. For example, in Hole U1528A, veins are often irregular and meander between clasts and form along clast/matrix boundaries. This vein morphology was not observed in Hole U1528D, where veins are more commonly uniform and pass through clast and matrix alike.
Several vein and fracture attributes in Hole U1528D culminate at or around 150 mbsf. For example, there is an acme in vein density, an increase in vuggy veins, the presence of native sulfur and silica veins, and a higher abundance of fractures. Additionally, H2S gas-related odor was first noticed emanating from the cores at ~150 mbsf (Figures F49, F51), and borehole temperature deviates near that depth (see Downhole measurements). These findings may indicate some fundamental boundary at this depth that led to an acme in these attributes.
The majority of veins have a dip greater than 60°, and ~30% of veins have a dip greater than 80°, indicating that the majority of fluid flow through this system is near vertical. However, fluid flow is limited to vein aperture, and in these holes vein thickness is restricted. With the average vein thickness of ~0.15 cm, fluid flow may have been limited. This is especially true in comparison to other hydrothermal systems such as the Trans-Atlantic Geotraverse hydrothermal mound and PACMANUS hydrothermal field, where multicentimeter veins were recovered (Humphis et al., 1996; Binns, Barriga, Miller, et al., 2002). A few discrete intervals have a large range in vein dip from subhorizontal to subvertical. It is not entirely clear why the veins have this pattern, but it is possibly related to some sort of flow/permeability boundary. If the hydrothermal fluids migrate vertically through the system and meet a less permeable or more coherent boundary, then fluids may flow laterally, forming subhorizontal veins, until they can break through the barrier.
The limited presence of fractures indicates that when a fracture is created it is filled by secondary minerals, indicating a robust hydrothermal system. Fractures that are open tend to cluster in a few areas. In Hole U1528D at 280–300 mbsf, one of these areas overlaps with an interval of veins with a large range in dip. This peak in fracture density also coincides with another zone (~300 mbsf) where H2S odor was noted. This combination of discrete fractures, fracture density, and veins with a large range in dip also correlates with a large increase in borehole temperature (see Downhole measurements). This correlation may indicate that the fractures and veins are currently active preferential pathways for fluids, which is the reason for the large number of veins, and therefore a temperature anomaly. Because this temperature increase at ~300 mbsf correlates with a zone of veins that have a large range in dip, fluids may be preferentially moving laterally in this zone, causing the large spike in temperature instead of a more diffuse temperature change. Other zones of veins with a large range in dip have no current temperature anomalies at these depths.
Geochemistry
Hard rock geochemistry
Sample selection was based on variations of lithology and alteration type (see Igneous petrology and volcanology and Alteration for characterization of the igneous units and alteration types) and spans the depth range of Holes U1528A, U1528C, and U1528D from 0.73 mbsf (Sample 376-U1528A-1R-1, 73–74 cm) to 355.91 mbsf (Sample 376-U15285D-63R-1, 38–40 cm). These samples represent the dominant lithologies recovered from Site U1528 briefly described as follows:
- Three slightly to moderately altered dacites (Hole U1528A, all from Igneous Unit 1, Alteration Type I);
- Twelve altered lapilli tephra, or lapillistone (Hole U1528A, Igneous Subunit 2a);
- Six highly altered lapilli tephra, or lapillistone (Hole U1528C, Igneous Subunit 2a);
- Thirty-nine highly altered lapilli tephra, or lapillistone (Hole U1528D, Igneous Subunit 2a);
- Four altered plagioclase-phyric dacites (Hole U1528D, Igneous Subunit 2b);
- Forty altered volcaniclastic rocks (Hole U1528D, Igneous Subunit 2c); and
- Twenty-four altered plagioclase-pyroxene phyric dacite lava (Hole U1528D, Igneous Unit 3).
Major and trace element compositions of 98 powders were analyzed by ICP-AES, and 83 were analyzed by handheld pXRF (Tables T7, T8); 51 powders were analyzed by both techniques. Calibrated standards for mafic, intermediate, and silicic rocks were analyzed in replicate as unknowns to determine precision and accuracy of both methods (see Geochemistry in the Expedition 376 methods chapter [de Ronde et al., 2019a]). A comparison of ICP-AES with pXRF results for elements that were measured via both methods is shown in Table T9.
Reasonable agreement between ICP-AES and pXRF data (i.e., r2 > 0.90; regression slope = 1.0 ± 0.1) was observed for CaO, Fe2O3, MnO, and Sr. Other elements including K2O, Sr, Y, and Zr show relatively consistent results between pXRF and ICP-AES (i.e., r2 > 0.80; regression slope = 1.0 ± 0.2) (Table T9). Although good correlation was observed between MgOpXRF and MgOICP-AES (r2 = 0.931), a regression line slope >1.4 and/or nonzero intercepts suggest significant issues regarding Mg calibration and/or baseline determination on the pXRF instrument. The discrepancies for SiO2 and TiO2 measurements may result from the relatively small variation of these elements in altered rocks. Hence, only a subset of pXRF-generated data (i.e., K2O, CaO, Fe2O3, MnO, Zn, Y, Zr, Cu, and Sr) are included in the discussion relative to downhole variations. However, none of the pXRF data are included in the determination of bulk geochemical changes (see Synthesis and determination of bulk geochemical changes).
Igneous geochemistry
The least-altered igneous rocks recovered at Site U1528 (Igneous Unit 1) are described as unconsolidated polymict lapilli tephra with two types of volcanic clasts (two samples from Hole U1528A and one sample from Hole U1528C). Individual clasts range in color from dark gray to light gray as a result of variable degrees of alteration. The clasts are dacitic in composition, SiO2 ranges from 63.1 to 69.2 wt%, and Na2O + K2O ranges from 2.1 to 4.8 wt% (Table T8). Total alkali contents are, however, lower than values reported for unaltered dacites from Sites U1527 and U1529, for which Na2O + K2O ranges from 6.1 to 7.8 wt%. Considering that the darker clasts represent the least-altered type in Unit 1, the lower contents of K2O (1.38 wt% vs. 2.3 ± 0.4 wt% for unaltered dacites) and MnO (0.08 wt% vs. 0.13 ± 0.01 wt% for unaltered dacites) suggest significant alteration and dissolution of primary silicates, which is consistent with the observed presence of smectite. The darker clasts also contain high total sulfur content (~2.6 wt%), which is also consistent with the presence of native sulfur infilling vesicles (see Alteration). Hence, both geochemical composition and petrographical observations suggest that Unit 1 was affected by significant and variable alteration that led to depletion of alkalis and formation of sulfur/sulfate-rich mineral assemblages.
To evaluate the differences in the composition of primitive magmas between Sites U1527–U1529, variations of classic fluid-immobile element ratios (e.g., Zr/Ti) were examined. For Igneous Unit 1, Zr/Ti values range from 30.0 to 31.3 (mg/g), indistinguishable from average Zr/Ti values for Unit 1 in Hole U1527A and at Site U1529 (i.e., 30.54 ± 2.3). This observation suggests that the upper lava and tephra units recovered at Sites U1527–U1529 may derive from similar parental magmas. In contrast, deeper, less altered dacites and altered volcaniclastic rocks from Igneous Units 1 and 2 in Hole U1527C (176–220 mbsf) have Zr/Ti values of 41.2 ± 2.4 (mg/g), which suggests a different lava source (e.g., affected by different degrees of melting). The average Zr/Ti values for altered volcaniclastic material from Igneous Subunit 2a at Site U1528 are 30.7 ± 0.5 (mg/g) for Hole U1528A, 30.1 ± 0.5 for Hole U1528C, and 33.4 ± 1.0 for Hole U1528D. Igneous Subunits 2b and 2d and Igneous Unit 3 in Hole U1528C also yield higher Zr/Ti values (34.4 ± 0.8 mg/g) than shallower lava and tephra units recovered at Sites U1527–U1529. It is presently unclear whether the systematic difference in Zr/Ti values between Holes U1528A, U1528C, and U1528D represents a different lava source or is the result of extensive to extreme alteration (Alteration Types II–IV) under acidic and magmatic fluid–dominated conditions (see below).
Volatile geochemistry
All sample powders analyzed by ICP-AES were also measured by elemental analyzer and coulometry to determine concentrations of the volatile elements C, N, and S. The data set includes five samples collected for microbiological analysis (referred to as MBIO). In total, 97 samples for Site U1528 were analyzed for TC, TN, and total sulfur abundance. For Holes U1528A and U1528C, all samples were also processed for total inorganic carbon (TIC) analysis. Results are reported in Table T10. Because TIC contents were all below the detection limit (<30 μg/g), total organic carbon (TOC) is equal, within uncertainty, to TC in Holes U1528A and U1528C. The average TC content for the samples from Site U1528 is about 250 μg/g. One sample from Igneous Unit 1 (376-U1528A-4R-1, 27–28 cm) and one sample from Subunit 2a (5R-1, 12–13 cm) contain relatively high TC contents (1128 and 2109 μg/g, respectively) (Figure F52). TN is below detection for all samples except for measureable TN in one duplicate measurement of Sample 5R-2, 40–42 cm.

Figure F52. Total sulfur and TC with TOC.
Loss on ignition (LOI) was analyzed on a subset of samples and ranged from 3.98 to 19.3 wt%. As expected, LOI and total sulfur are generally related (i.e., high values for LOI (>15 wt%) correspond to samples with total sulfur content >7 wt%. LOI values vary greatly for compositionally similar samples collected from nearby depth intervals, as shown by several samples (e.g., 376-U1528A-8R-1, 60–61 cm, and 9R-1, 90–92 cm) of altered lapilli tephra or lapillistone (Igneous Subunit 2a) that have LOI values between 3.98 and 18.5 wt%, which suggests that they have been variably affected by secondary hydration.
Assessment of pyrite-associated sulfur
Downhole variations in total sulfur, pyrite, and native sulfur (the latter two estimated macroscopically; see Alteration) are illustrated in Figure F52. Select pyrite data reported in Figure F52 represent data collected for the same depth interval (i.e., same piece number) as the sample measured for total sulfur content. This approach was expected to yield a better agreement between visual core descriptions and geochemical results than using average pyrite content in cores. Results show several depths where pyrite may be the dominant form of S in the rock. For example, there is good agreement between pyrite abundance and total sulfur content between 60–80 mbsf (total sulfur ranges 3.38–8.22 wt%) and 100–160 mbsf (total sulfur ranges 3.25–7.26 wt%). This correlation becomes less pronounced deeper in the core, which is consistent with mineralogy derived from core descriptions. For example, below the Igneous Subunit 2b/2c boundary at ~160 mbsf, a more significant proportion of total sulfur occurs as native sulfur or other S-bearing minerals (e.g., anhydrite or natroalunite).
Assessment of anhydrite-associated sulfur
Following an approach similar to that used during Ocean Drilling Program (ODP) Expedition 193 (Binns et al., 2002), the weight percent of anhydrite in bulk powdered rock samples was determined in splits of bulk powders from Holes U1528A and U1528C by first determining the abundance of water-soluble elements, expressed as micrograms per gram, originally present in the rock. Concentrations of Ca and S in solution were used to determine the anhydrite fraction (see Geochemistry in the Expedition 376 methods chapter [de Ronde et al., 2019a]). At Site U1528, results show that water-soluble Ca and S are derived from anhydrite, as demonstrated by nearly equimolar abundances in solution (Table T11) and a linear regression S/Ca slope of 0.818 g/g (R2 = 0.97), which is equivalent to 1.02 mol/mol (Figure F53). Natroalunite did not dissolve under the leaching experiment conditions because Al is either below detection or present in minor amounts relative to Ca and S. Dissolved Sr associated with anhydrite was released into solution at varying ratios to Ca (Figure F53). Variability in the Sr/Ca slope indicates the presence of populations of anhydrite with differing Sr/Ca values. Anhydrite ranges in abundance from <1 to 11.6 wt% in bulk rock, which is consistent with XRD analyses (see Alteration) on the same samples. The results also show that the proportion of anhydrite is relatively minor in the upper 5 m of Hole U1528A but is otherwise very variable deeper downhole, where it represents about 22% of the total sulfur pool. This finding confirms that anhydrite is a significant mineral host for S, which may derive either from magmatic fluid input or fracture-controlled seawater entrainment at depth. The other principal mineral hosts for S include pyrite and possibly native sulfur and natroalunite.
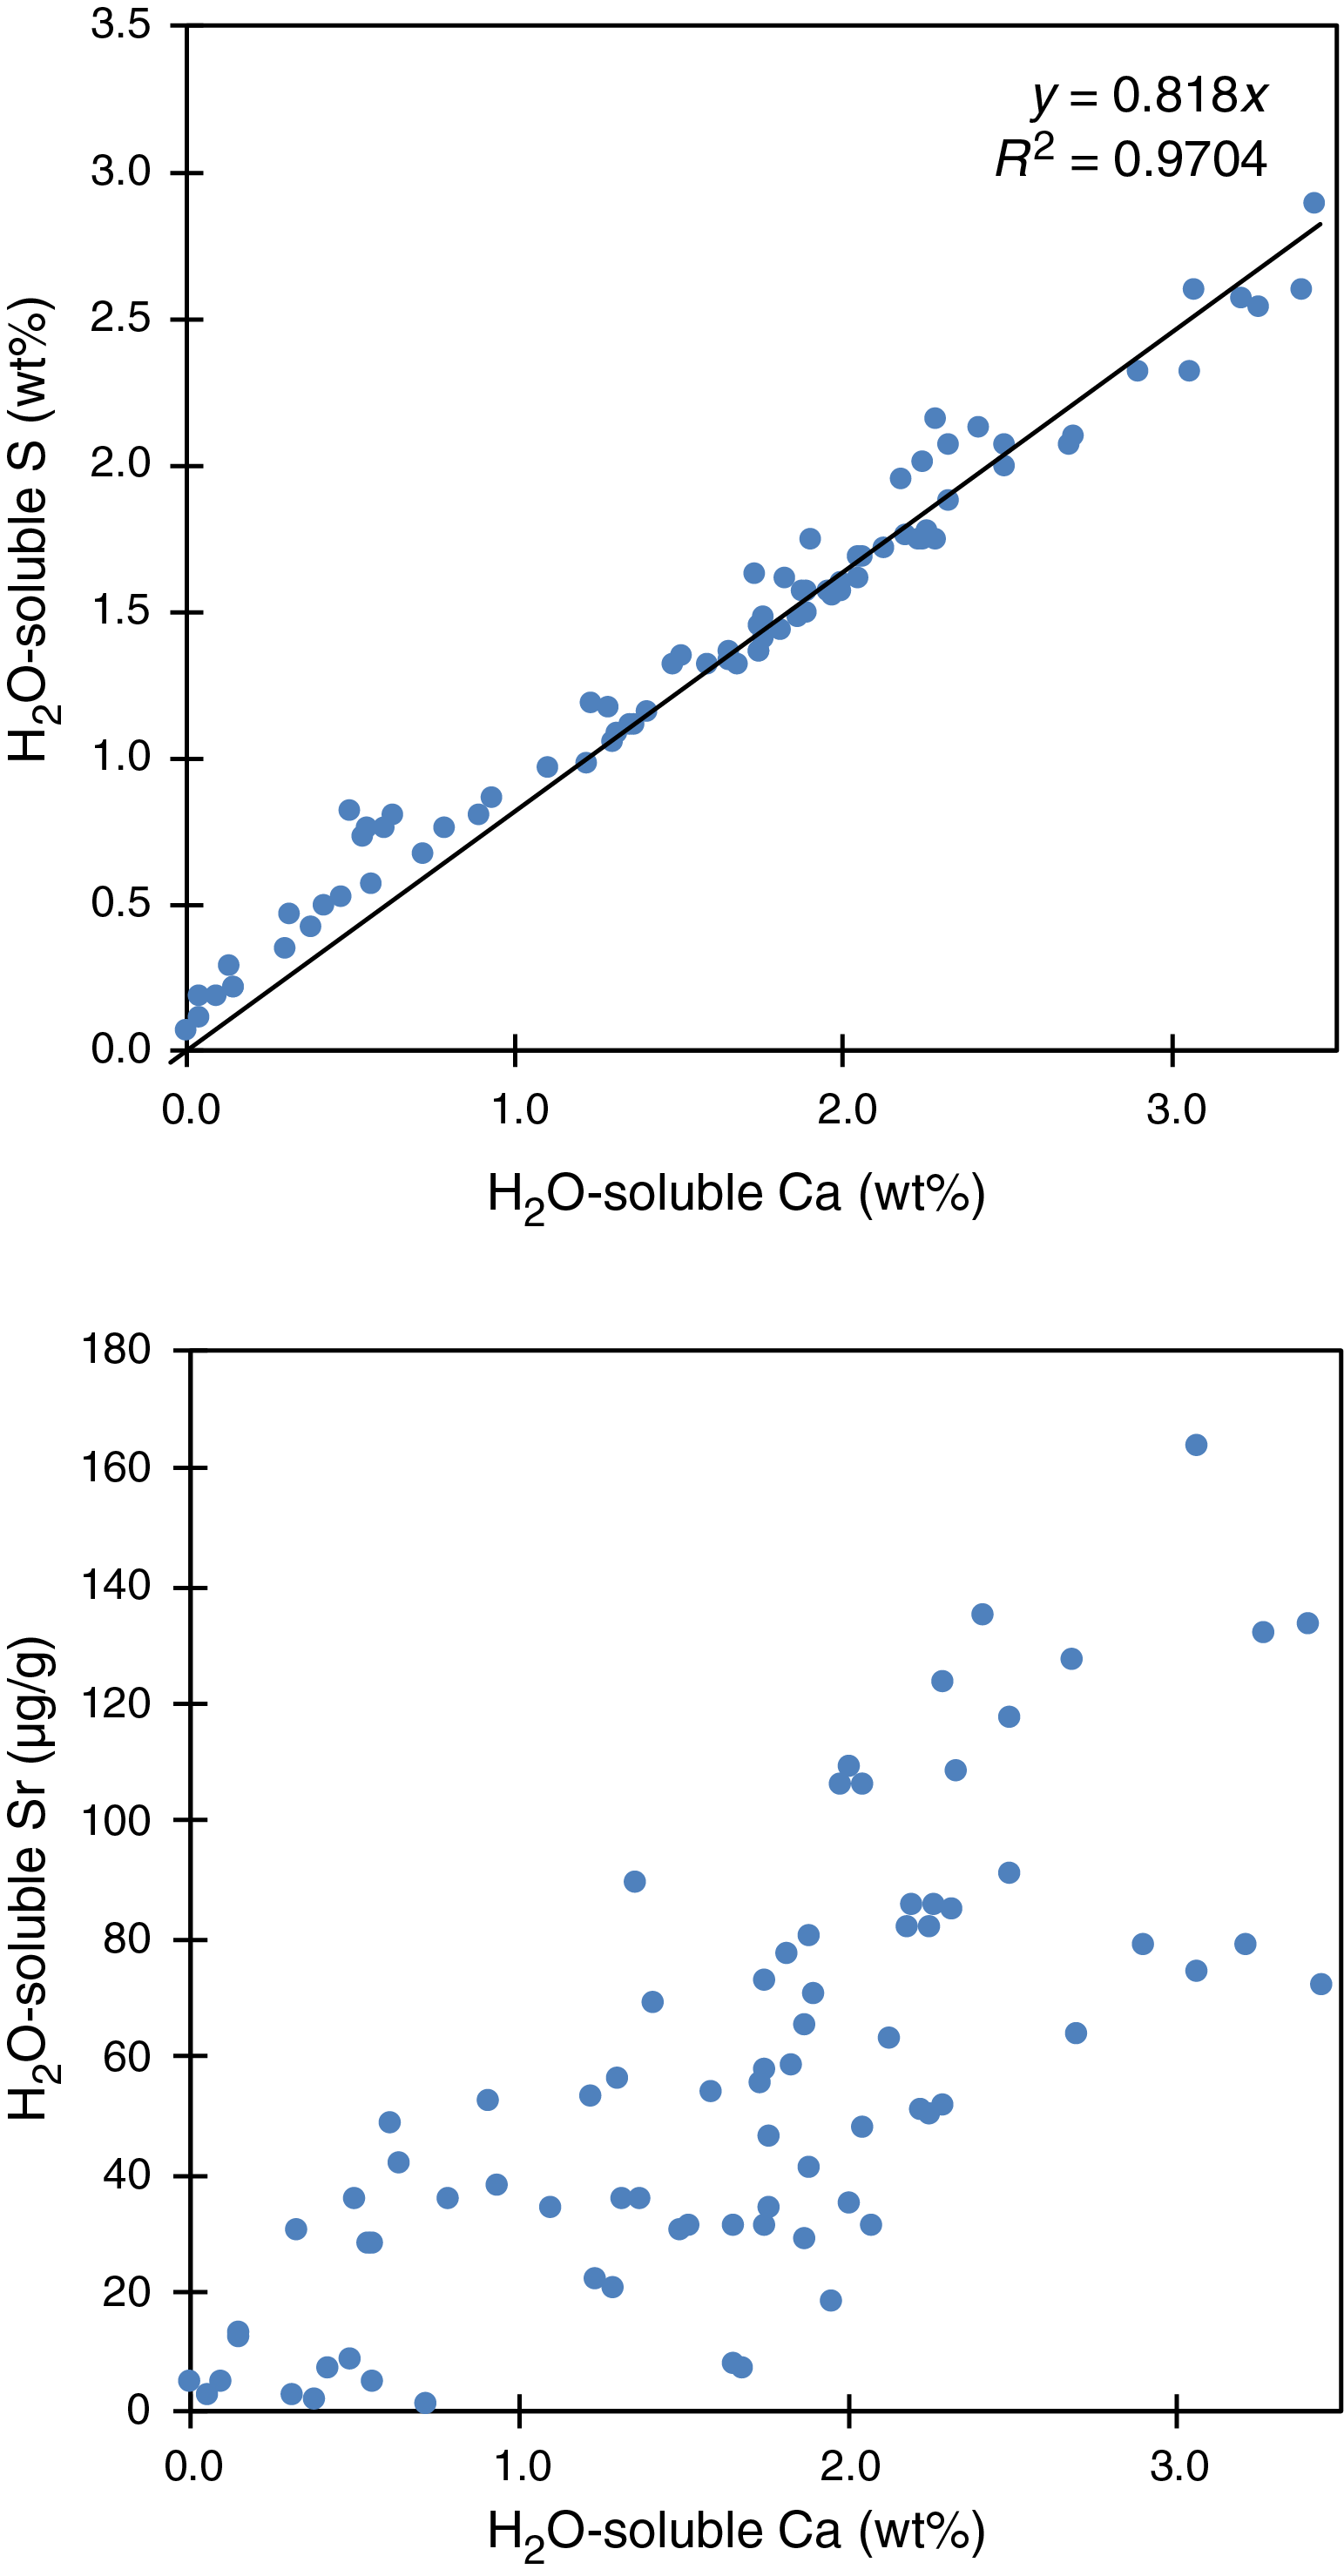
Figure F53. S and Sr vs. Ca.
Alteration geochemistry
The variations of selected major oxide and trace element compositions with depth are plotted with relevant bulk mineralogy from XRD analysis and the alteration log in Figures F54, F55, and F56. The observed chemical variations are more pronounced than at Sites U1527 and U1530, including the extensive loss of alkali metals (K and Na) and Mg and the gain in total sulfur. These trends are generally consistent with the mineralogy and alteration types observed in thin section and XRD. In general, higher K2O and MgO contents (Figure F55) correspond to the presence of illite (Alteration Type II) and smectite (Alteration Types II and III). Strong depletions of K2O, Na2O, MgO, and Fe2O3t are generally encountered in the most intense alteration types (III and IV). However, no clear or unique relationships can be drawn from the downhole variations of major or trace elements with igneous subunits or alteration types.

Figure F54. Zr, TiO2, Al2O3, Zr/Ti, and Y/Zr.
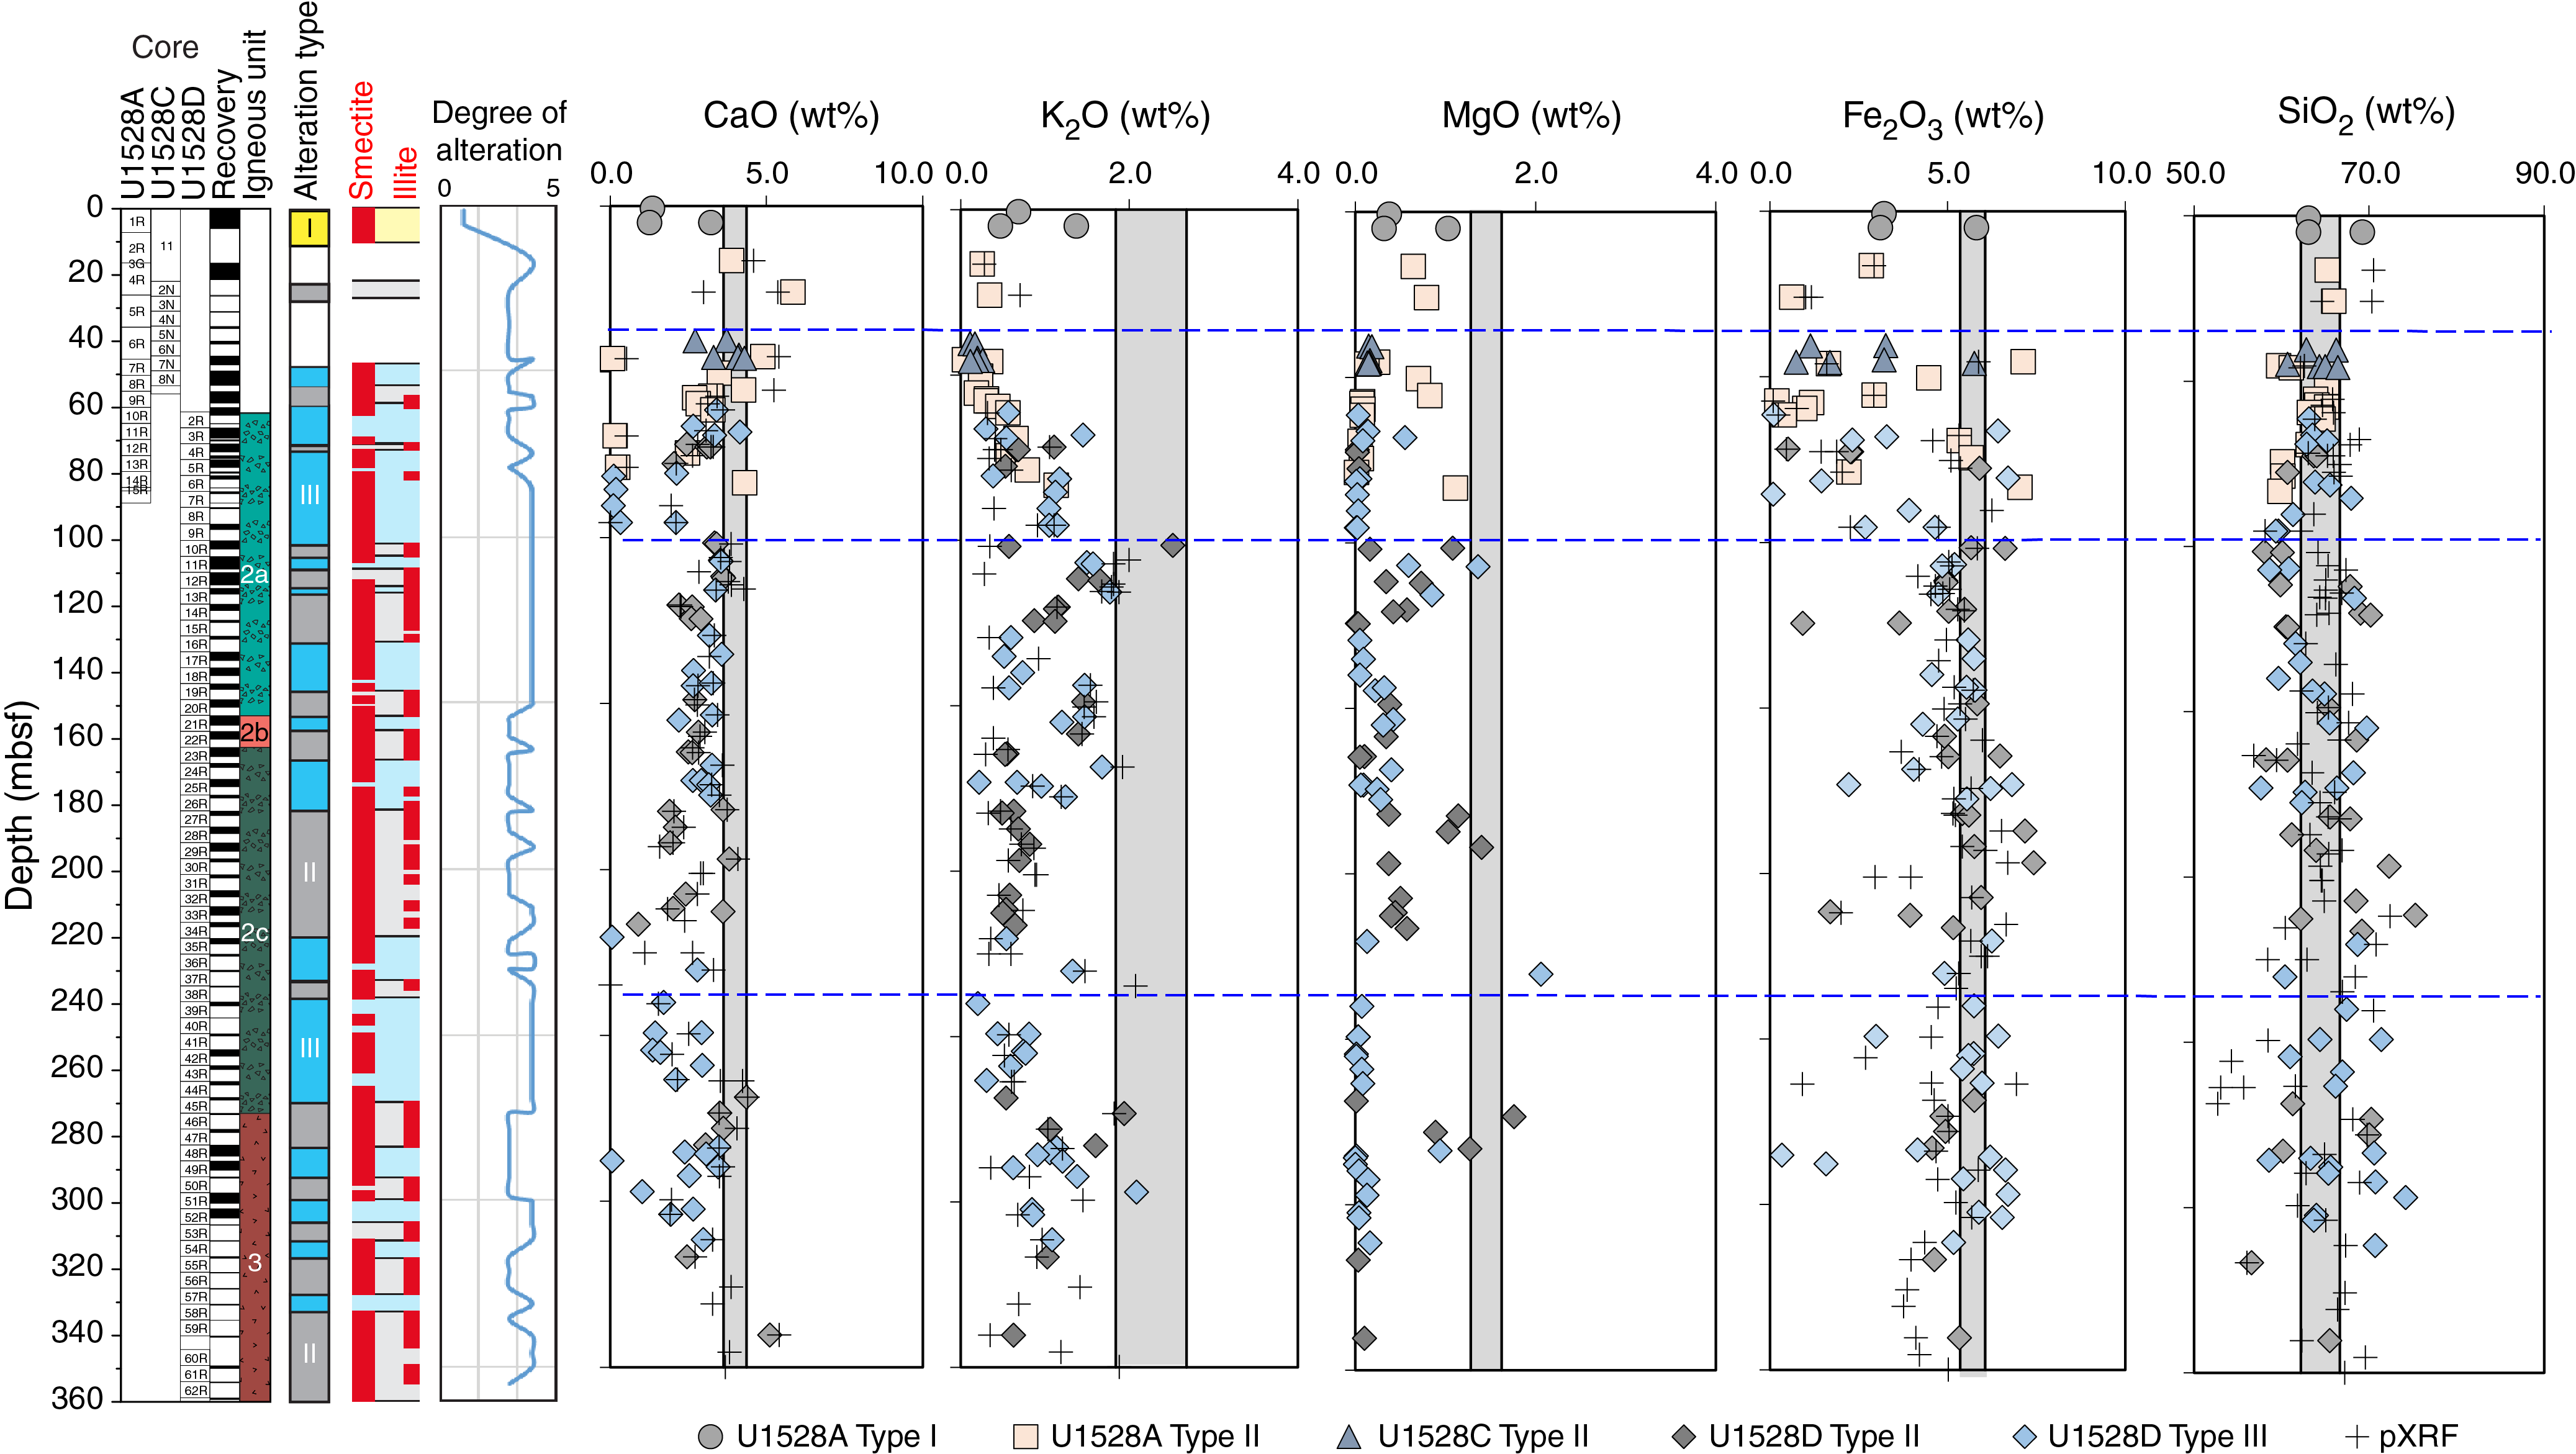
Figure F55. CaO, K2O, MgO, Fe2O3, and SiO2.

Figure F56. Trace elements and total sulfur.
Perhaps the strongest geochemical features in Hole U1528D occur at ~100 mbsf with distinctive changes in element ratios such as Y/Zr (Figure F54). Considering that Y displays much higher mobility than Zr under hydrothermal conditions (Douville et al., 1999), the Y/Zr value of altered volcaniclastics in comparison to the Y/Zr of fresh rock can be a useful tracer of alteration extent. In particular, significant depletion in Y may suggest extensive dissolution of plagioclase under hydrothermal and SSO4-rich conditions (Douville et al., 1999). Two main intervals are characterized by lower Y/Zr values (i.e., relative to unaltered dacite from Brothers volcano): (1) 46–95.5 mbsf in Igneous Subunit 2a, which is dominated by Alteration Type III, and (2) 240–325 mbsf, which overlaps with Igneous Subunit 2c and Unit 3 and alternating Alteration Types II and III. In contrast to Y/Zr, Zr/Ti is generally considered less prone to being affected by water-rock interactions. However, the general depletion in TiO2 content observed across intervals 46–95.5 and 240–325 mbsf together with rare occurrences of rutile, especially in the upper interval (Figure F54), suggest potential Ti mobility. Significant loss of Ti during extreme hydrothermal alteration may therefore explain Zr/Ti values observed in the upper 40 m of Hole U1528C are slightly higher than those in Holes U1528A and U1528B at the same depth interval (Figure F55).
Identification of depth intervals with the most extreme geochemical changes enables us to place important constraints on relationships between alteration types and their downhole variations as described in more detail below.
Interval 0.0–35.9 mbsf: Alteration Type I
Interval 0.0–35.9 mbsf has the following distinguishing geochemical signatures:
- Moderate depletion in Ca, K, Mg, and Fe;
- Moderate to strong enModeraterichment in Sr and total sulfur; and
- Immobile Al and Ti.
Alteration Type I occurs in Igneous Unit 1 (Holes U1528A and U1528C), which consists of unconsolidated gravels of slightly to moderately altered igneous material. Total sulfur enrichment ≤6.5 wt% (average = 4.1 wt%) is consistent with secondary minerals dominated by pyrite, natroalunite, and native sulfur. Loss of K2O, MgO, and Fe2O3t was observed in the most altered samples and reflects the extent of primary mineral and rock groundmass alteration and the heterogeneous occurrence of secondary minerals such as smectite and pyrite. Moderate changes in Al2O3 and SiO2 content reflect the limited mobility of these elements that results from formation of various polymorphs of silica and pyrophyllite as alteration assemblages.
Interval 40.5–95.4 mbsf: dominantly Alteration Type III
Interval 40.5–95.4 mbsf has the following distinguishing geochemical signatures:
- Strong depletion in Ca, K, Mg, Fe, and Y;
- Moderate to strong enrichment in total sulfur;
- Moderate mobility of Ba and Sr; and
- Significant depletion in Ti.
Alteration Type III occurs in Igneous Subunit 2a (Holes U1528A, U1528C, and U1528D) and is characterized by low and variable Y/Zr, which is consistent with strong Y depletion relative to unaltered dacites. An increase in Zr/Ti values in Hole U1528D relative to Hole U1528A for the same interval is also related to a small but significant loss of Ti that is probably due to the intense hydrothermal alteration indicated by the occurrence of rutile and complete alteration of primary minerals. Total sulfur contents range from 2.6 to 6.6 wt% (average = 6.0 wt%) and do not show clear relationships with potentially sulfate-hosted elements such as Ca, Sr, and Ba or sulfide-hosted elements such as Fe and Cu. Barium contents range greatly from 301 to 1905 mg/g, but the average of 969 mg/g remains essentially similar to unaltered dacite values. Al2O3 and SiO2 contents remain relatively constant throughout, reflecting their retention in the rock as secondary minerals such as quartz, natroalunite, diaspore, and pyrophyllite. The main geochemical characteristic of Alteration Type III in this depth interval is the extreme to near quantitative loss of several major element oxides including CaO, Fe2O3, K2O, MnO, and Na2O.
Interval 101.6–230.3 mbsf: Alteration Types II/III (alternating)
Interval 101.6–230.3 mbsf has the following distinguishing geochemical signatures:
- Moderate depletion in Ca, K, Mg, Fe;
- Limited mobility of Ba;
- Moderate to strong enrichment in total sulfur; and
- Slight mobility of Al.
The alternating alteration types (II and III) that occur in Igneous Subunits 2a, 2b, and 2c in Hole U1528D are characterized by less extensive depletion in major element oxides, in particular CaO, K2O, and Fe2O3t, than Alteration Type I. A marked transition from low and variable Y/Zr values to Y/Zr values similar to unaltered dacites was observed at 101 mbsf. Other important characteristics include strong total sulfur enrichment (average = 5.3 ± 1.6 wt%) and limited Ba and Al mobility. Considering that one of the main differences between Alteration Types II and III is the presence of illite in Alteration Type II, K2O contents should show clear distinctions between these alteration types. Surprisingly, even though the highest K2O value of 2.5 wt% was measured in volcaniclastic rocks affected by Alteration Type II (i.e., Sample 376-U1528D-10R-2, 1–3 cm), no systematic downhole variations in K2O contents can be clearly related to Alteration Types II and III. Similar observations apply to MgO, although Alteration Type II is often associated with higher MgO contents, suggesting a higher abundance of smectite.
Interval 240.0–355.1 mbsf: Alteration Types II/III (alternating)
Interval 240.0–355.1 mbsf has the following distinguishing geochemical signatures:
- Moderate to strong depletion in Ca, K, Mg, Fe, and Y;
- Strong enrichment in total sulfur;
- Significant mobility of Ba and Sr; and
- Significant depletion in Ti.
The alternating alteration types (II and III) that occur in Igneous Subunit 2c and Igneous Unit 3 (Hole U1528D) are characterized within discrete intervals by significant loss of Y and possibly Ti, strong total sulfur enrichment ≤15.1 wt% (average total sulfur ≈ 7.2 wt%), and strong depletion in major element oxides (e.g., Na2O, MgO, K2O, and Fe2O3t). The upper limit of this distinct interval is rather gradational and is marked by a general downhole increase in alteration extent, as illustrated by the predominance of Alteration Type III and minor rutile identification by XRD (Figure F54) and a decrease in Y/Zr values. The transition between Subunit 2c (altered volcaniclastic rocks) and Unit 3 (altered phyric dacite lava) at 273–283 mbsf is marked by significant geochemical changes related to a marked decrease in alteration degree, corresponding to Alteration Type III. This translates into Y/Zr values identical to unaltered dacites; a lack of CaO, Na2O, and MgO depletion; and a moderate K2O depletion consistent with the preservation of plagioclase phenocrysts and pyroxene (see Alteration and Igneous petrology and volcanology).
Synthesis and determination of bulk geochemical changes
Alteration Types I–IV were identified at Site U1528 based on the presence of distinct alteration mineral assemblages and macro- and microscopic textural characteristics (see Alteration). Alteration Type IV is designated as later stage, intense alteration and appears to overprint Alteration Types II and III. It is characterized by a change in color (from blue-gray in Alteration Type II and III to white-gray in Alteration Type IV) and depletion in smectite and pyrite. Hence, significant depletion in Mg and Fe is expected for samples affected by Alteration Type IV. Because the boundary between Alteration Types III and IV is rather gradual, we operationally define the geochemical characteristics of Alteration Type IV as having Fe2O3t < 2 wt% and MgO < 0.15 wt% (Table T8). This corresponds to a total loss >65% for Fe and >90% for Mg relative to unaltered dacites.
To further assess bulk geochemical exchange during alteration, average compositions of each alteration type were compared with those of the least-altered dacites (Figure F57). These average compositions were obtained using
- Five samples from Alteration Type I;
- Fifty-one samples from Alteration Type II;
- Forty-four samples from Alteration Type III; and
- Twelve samples from Alteration Type IV.
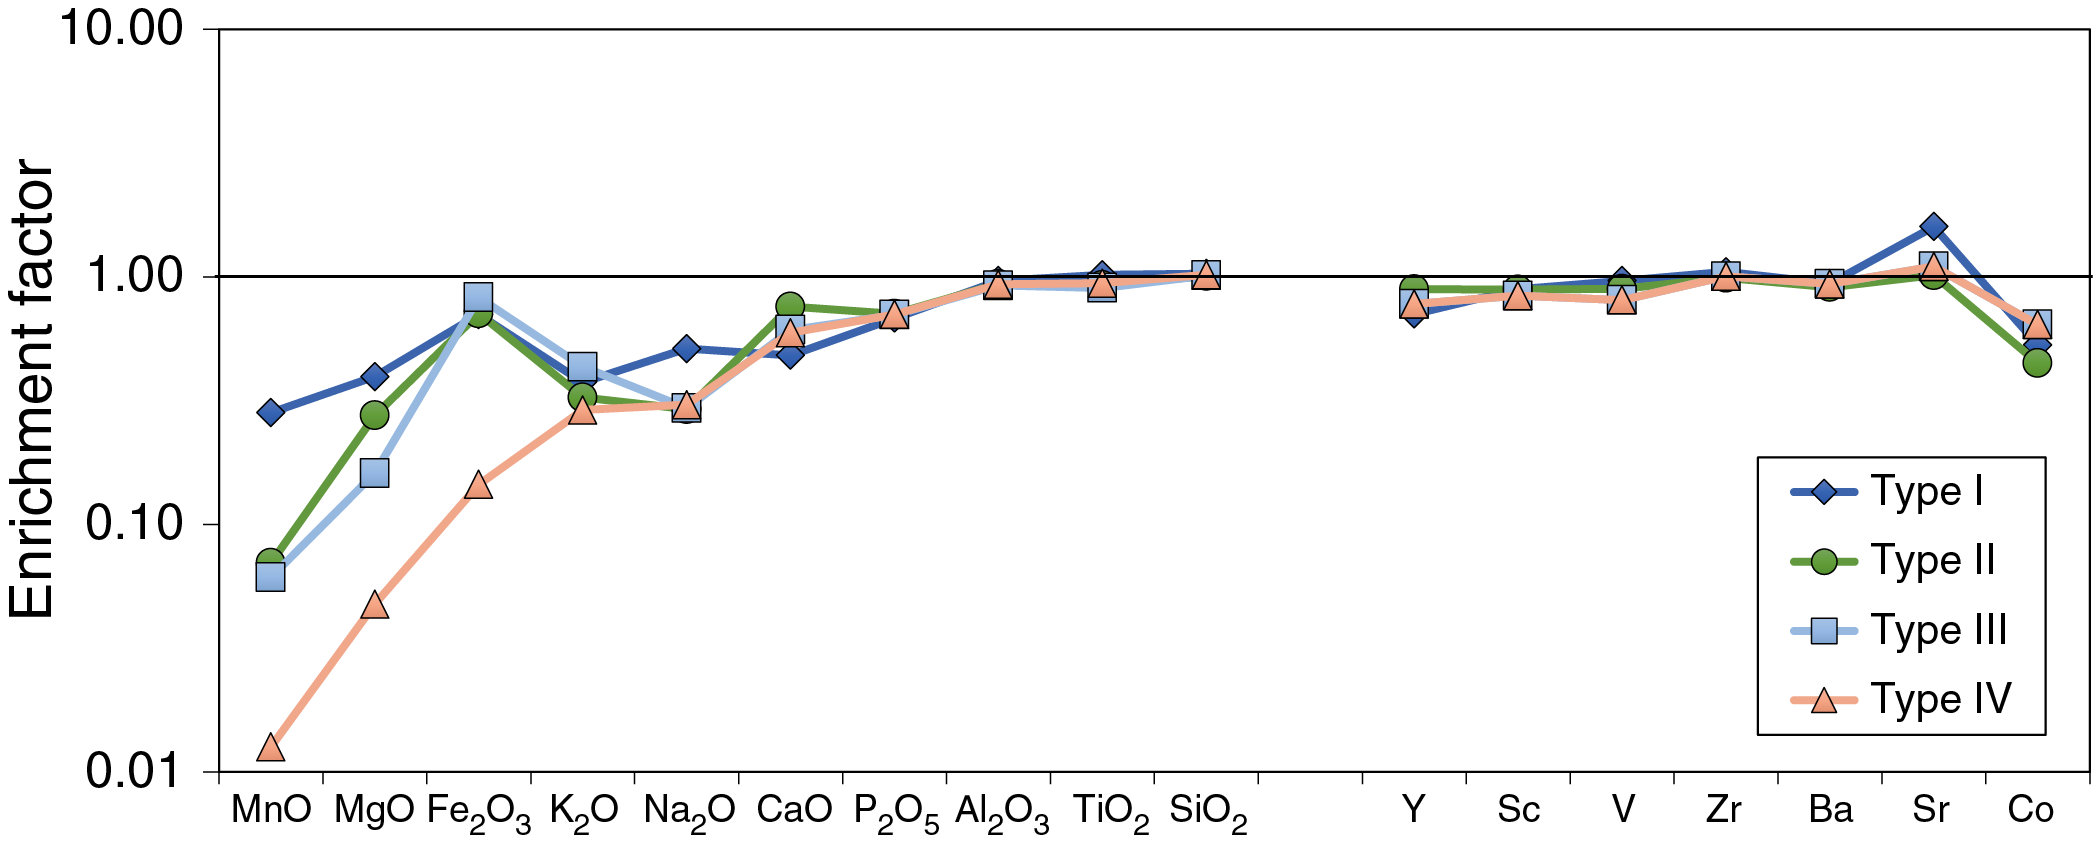
Figure F57. Igneous Unit 1 chemical enrichment factors, Hole U1528C and Site U1529.
All averaged data were normalized to the average composition of unaltered dacites from Holes U1527A, U1529A, and U1529B on the basis that dacitic material from Igneous Unit 1 is derived from a similar parental magma source. In general, geochemical changes between the different alteration types are consistent with the following petrological observations:
- Alteration Type I has the least changes in major elements (except for S), consistent with the lower degree of alteration.
- The difference between Alteration Types II and III are subtle and are mainly related to the extent of Mg depletion, which is higher in Alteration Type III; both Alteration Types II and III show significant depletion in MnO, MgO, K2O, and Na2O.
- Alteration Type IV has the most extreme depletion in many major element oxides, including MnO, MgO, Fe2O3t, K2O, CaO, and P2O5, consistent with intense alteration and color change related to illite and smectite removal.
- Each alteration type has, on average, very large total sulfur enrichments (ranging from 4.3 wt% in Alteration Type I to 6.3 wt% in Alteration Type III) compared with total sulfur in unaltered dacite, which averages 0.02 wt%.
Considering the strong enrichment of about 6 wt% of total sulfur at Site U1528, the overall depletion of Fe in late-stage Alteration Type IV relative to fresh dacite is rather surprising. In general, Fe is easily precipitated as pyrite under ΣH2S-rich hydrothermal fluid conditions. The presence of pyrite as an ubiquitous secondary mineral in Alteration Types I–III is consistent with this hypothesis. Alteration Type IV, however, is characterized by alteration mineral assemblages with natroalunite, native sulfur, and anhydrite (see Alteration). This suggests that pH, ƒO2, and ƒS2 conditions changed substantially over time and resulted in multiple stages of mineral precipitation and dissolution in the upper 350 m of the volcanic edifice. Presumably, the loss of Fe in Alteration Type IV is related to later stage, SSO4-rich but ΣH2S-poor acidic hydrothermal fluids. Considering that high levels of ΣH2S were measured in BFs at Site U1528 (see Borehole fluids, it is possible that the ΣH2S/SSO4 ratio in the hydrothermal fluids at the Cone site is rapidly fluctuating, possibly as a result of magmatic input pulses.
Headspace analysis of H2, CO, ΣCO2, CH4, C2H6, and acid-volatile sulfide
Pore space H2, CO, ΣCO2, CH4, and C2H6 abundances were determined via headspace analysis of several intervals of the recovered cores from Holes U1528A, U1528C, and U1528D (Table T12). Headspace concentrations of C2H6 were below the detection limit (<0.03 µmol/L) for all depths, as previously observed at Site U1527. Concentrations of pore space ΣCO2 (an integrated measurement of dissolved CO2, bicarbonate, and carbonate species as well as any trace solid phase carbonate) were measured by gas chromatography-helium ionization detector (GC-HID). In addition, acid-volatile sulfide (AVS) concentrations (e.g., dissolved ΣH2S species, FeS clusters, nanoparticulate iron sulfides, and AVS minerals) were determined using a Unisense electrochemical sensor. Highly elevated ΣCO2 abundances associated with magmatic degassing were previously determined in venting fluids at the Brothers volcano Upper Cone site (de Ronde et al., 2011). Thus, headspace ΣCO2 values are likely derived from magmatic CO2 input trapped in pore space and minerals in addition to seawater bicarbonate input. The AVS values may be derived from ΣH2S supplied by magmatic volatiles or from reduction of magmatic or seawater-derived ΣSO4.
High concentrations of H2, ΣCO2, and AVS were detected at 31.35–35.7 mbsf (Hole U1528C), 61.25 mbsf (Hole U1528A), 188.52–206.75 mbsf (Hole U1528D), 300.03–303.92 mbsf (Hole U1528D), and 340.40–345.39 mbsf (Hole U1528D) (Table T12; Figure F58).
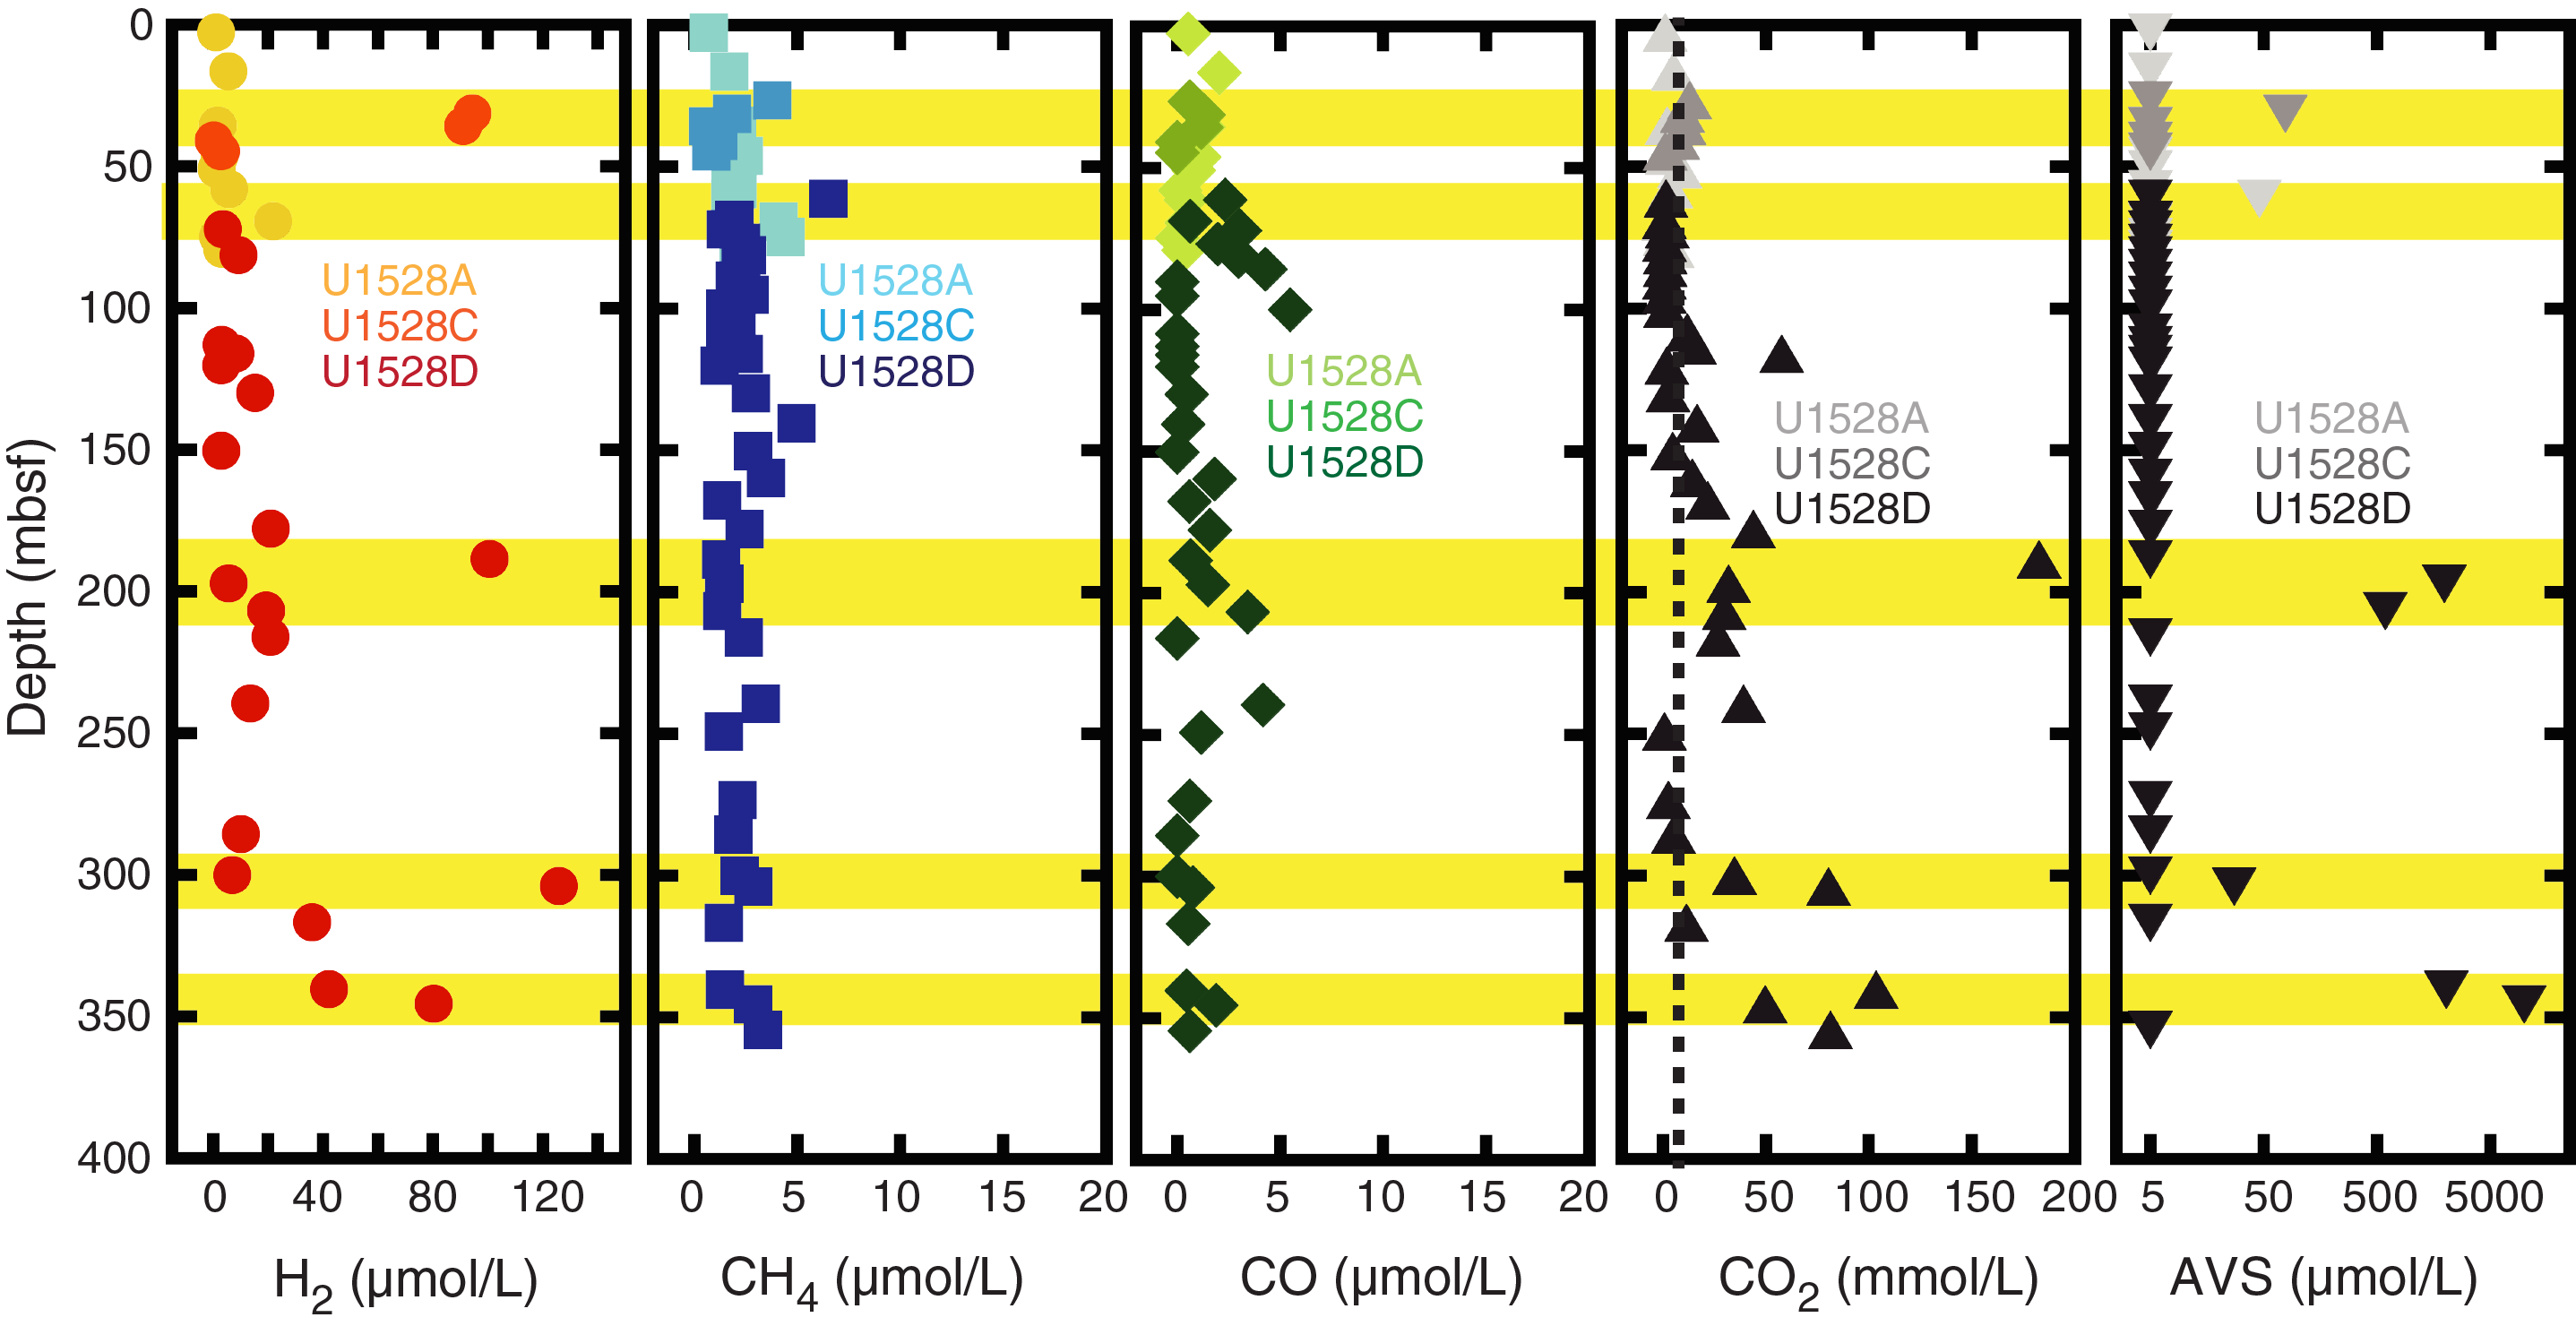
Figure F58. Pore space gas concentrations, Holes U1528A, U1528C, and U1528D.
The highest H2S and ΣCO2 values in fluids venting at the Upper and Lower Cone seafloor vents were 14 mmol/L for H2S and 206 mmol/L for ΣCO2 (de Ronde et al., 2011). These values are similar in magnitude and relative abundance to the maximum measured pore fluid AVS and ΣCO2 concentrations of 20 and 183 mmol/L, respectively, in Hole U1528D (Table T12). The five zones of high gas concentrations identified in Figure F58 thus likely represent zones of subseafloor hydrothermal fluid input. In addition, the spatial distribution of these high gas content zones appears related to depth intervals that host a greater percentage of horizontal and near-horizontal veins (see Structural geology). These results suggest that the presence of high-gas zones is related to permeability and that horizontal hydrothermal fluid flow is important in addition to vertical flow.
Interstitial water geochemistry
One IW sample was collected at Site U1528 (376-U1528C-7N-1, 140–150 cm). To reduce the effects of contamination of the IW by drilling fluids, ~5–10 mm of the outer core surface was removed. Water (about 12 mL) was then extracted from a 10 cm whole round composed of fine clay-rich material (classified as Alteration Type III) that was collected from the core catcher by ramping to 30,000 lb of applied force on the Manheim squeezer. Geochemical data for the IW sample are given in Table T13 (see Geochemistry in the Expedition 376 methods chapter [de Ronde et al., 2019a] for analysis details). The IW has a relatively low pH value of 4.1. Dissolved K is depleted relative to seawater by 89%, and Ca and ΣSO4 (ΣSO4 = SO42− + HSO4− + H2SO4) are enriched compared with seawater by 307% and 131%, respectively. Near-equimolar enrichments in Ca and ΣSO4 suggest that the dissolution of anhydrite at low temperatures may be occurring in the pore waters. A small excess enrichment of ΣSO4 over Ca also supports the dissolution of a relatively smaller quantity of natroalunite. Dissolved Mg, Cl, Na, and Br abundances are unchanged from those of drilling water (surface seawater). The IW is enriched in many metals and other species that are trace or minor in ambient seawater (e.g., Al, Fe, Mn, Si) and are contributed by fluid-clay reactions.
Borehole fluids
Three fluid samples were collected from Hole U1528D using the 600 mL Monel steel Kuster FTS at approximately 279 mbsf (Fluid Sample 1; aligned with Core 376-U1528D-47R; in situ pressure = 152 bar), 313 mbsf (Fluid Sample 2; aligned with Core 54R; in situ pressure = 155 bar), and 160 mbsf (Fluid Sample 3; aligned with Core 22R; in situ pressure = 140 bar). Maximum temperatures of 212°C and 247°C were determined after Fluid Sample 1 and before Fluid Sample 2 collection, respectively, using the ETBS and the LEH-MTs. Fluid Sample 3 was collected 23 days after the first two samples. This latter sampling was limited to depths shallower than 195 mbsf and above the BHA that was previously lost downhole. Logging with the ETBS prior to the 600 mL Kuster FTS tool deployment returned a maximum temperature of 198°C at 194 mbsf. A temperature of 140°C was measured at a depth of 160 mbsf where the fluid sample was collected (see Downhole measurements).
Samples were extracted and processed immediately after recovery of the 600 mL Kuster FTS tool and were concluded within 2–5 h. During the first two sampling events, the 600 mL Kuster FTS interior was overpressurized relative to atmospheric pressure following tool recovery. Expelled fluids were very gas rich. The third sample was observed to be leaking water before recovery due to grit lodged in the top valve and was thus not overpressured. Although anoxic conditions were maintained during fluid sampling from the 600 mL Kuster FTS tool, the sampler depressurized to ambient conditions as successive aliquots were drawn, and two phases (liquid and gas headspace) formed within the sampler. Fluid Sample 1 contained more gas in general than Fluid Sample 2.
Results
The three fluid samples are characterized by low pH values of 5.4, 2.1, and 1.8 for Fluid Samples 1, 2, and 3, respectively (Table T14). These acidic pH values are coincident with ΣSO4 concentrations that are highly elevated relative to seawater (i.e., 202%–98% of seawater values) (88.9, 58.2, and 58.8 mmol/L for Fluid Samples 1, 2, and 3, respectively). The fluid compositions are depleted in Na by 30%–37% (337, 305, and 353 mmol/L for Fluid Samples 1, 2, and 3, respectively) and in Cl by 12%–16% (500, 495, and 480 mmol/L for Fluid Samples 1, 2, and 3, respectively) relative to seawater (Table T14). Measured Br and Sr abundances are also depleted relative to seawater with Br concentrations of 0.659, 0.652, and 0.680 mmol/L and Sr concentrations of 23.9, 21.0, and 5.0 μmol/L for Fluid Samples 1, 2, and 3, respectively. Aqueous Si abundance is highly enriched relative to seawater, with concentrations of 9.34, 19.7, and 0.310 mmol/L for Fluid Samples 1, 2, and 3, respectively. Dissolved K is also higher than seawater, with concentrations of 13.1, 18.6, and 12.8 mmol/L for Fluid Samples 1, 2, and 3, respectively. The first two samples contain lower Ca than seawater, 5.25 and 6.50 mmol/L, respectively, whereas the third sample contains more Ca than seawater, 18.2 mmol/L.
Because the dominant anion in hydrothermal fluids is Cl− and the dominant cation is Na+, it is common practice to normalize species abundances to Cl or Na to assess the relative degree of enrichment or depletion of another species relative to seawater concentrations. The fluid is characterized by measured Na/Cl and Br/Cl values that are lower than those of seawater. The Br/Na ratio, in contrast, is very similar to that of seawater (Table T14).
The three fluid samples contain highly elevated transition metal abundances relative to seawater (Table T15). Because of the high-temperature and corrosive conditions in the borehole and the necessity to sample fluids from within the galvanized steel drill pipe, it is likely that fluids are highly contaminated by corrosion products. Based on the composition of the dregs recovered (Table T16), Fluid Sample 1 contains a significant component of steel-derived elements (e.g., C, Zn, Ni, Cu, and Cr) compared with Fluid Sample 2. In total, 26 g of solid dregs were recovered from Fluid Sample 2, and Fe/S molar ratios of 0.6 and 0.82 for dregs Aliquots 1 and 2 (Table T16) from this sample indicate that a significant fraction of material recovered consists of pyrite (FeS2) with possibly pyrrhotite (Fe(1−x)S) and more minor contributions from steel. In contrast, the Fe/S value of 3.5 for dregs recovered from Fluid Sample 1 indicates that Fe, other metals, and C in the sample are likely contributed primarily by steel corrosion. Fluid Sample 3 was blue in color, likely due to a strikingly high dissolved Ni concentration of 382 mmol/L. The different distribution of dissolved metals in this sample (Ni > Fe > Cr > Al > Mn > Zn > Co > Cu) compared with Samples 1 and 2 (Fe > Mn > Zn ≈ Al > Ni > Cr > Co > Cu) likely reflects the input of metals contributed by dissolution of the drill pipe and BHA at low pH and elevated temperatures > 200°C.
Measured ΣH2S contents were below detection in Fluid Sample 1 (<10 μmol/L), highly enriched in Fluid Sample 2 (14.6 mmol/L), and also elevated in Fluid Sample 3 (>2 mmol/L). Reported aqueous ΣH2S contents were determined on filtered samples so that suspended pyrite (and potential trace pyrrhotite) would not dissolve during analysis and contribute to ΣH2S. Dissolved H2 was determined only on Fluid Samples 2 and 3 due to technical issues with Fluid Sample 1, and abundances were 190 and 185 μmol/L, respectively. To mitigate the effects of sampler depressurization on dissolved gas compositions, aliquots for dissolved ΣH2S and H2 were taken right after initial aliquots were sampled for pH determination. However, reported ΣH2S and H2 abundances should be considered minima because it is not possible to determine the extent to which the sampler may have degassed and vented during its ascent from the sampled depths of 279 and 313 mbsf to the sea surface for Fluid Samples 1 and 2. A fraction of Fluid Sample 3 gas contents were lost prior to sampling due to leaking from the valve. Sampler degassing during ascent and sampling would have a larger effect on H2 than ΣH2S because of its lower aqueous solubility (see Geochemistry in the Expedition 376 methods chapter [de Ronde et al., 2019a]).
Discussion
Many geochemical aspects of the acid-sulfate fluids sampled from Hole U1528D are similar to those sampled from naturally occurring seafloor hydrothermal vents previously reported at the Upper Cone of Brothers volcano (de Ronde et al., 2011), whereas other aspects differ. The fluid chemistries also parallel compositional trends determined in acid-sulfate hydrothermal fluids emitted from other submarine volcanoes where advanced argillic alteration of dacitic lavas was observed (i.e., alteration to alunite and/or natroalunite, clays, and pyrite), such as DESMOS caldera and North Su in the Manus Basin, Papua New Guinea (Seewald et al., 2015). A comparison can also be made with acid-sulfate fluids emitted from the basaltic and andesitic NW Rota-1 volcano, Mariana Arc (Butterfield et al., 2011).
The Na, Cl, Mg, and Br contents of BFs and Brothers Upper Cone vent fluids are consistently lower than seawater and lie along one mixing line that passes through the seawater composition (Figure F59). Elevations in Si, K, and ΣSO4 and depletions in Ca and Sr align with past observations at the Upper Cone vents. Anomalies relative to seawater that are more pronounced in the BFs compared with the natural vent compositions are due to higher measured temperatures and a greater proportion of source fluid to admixed unaltered seawater in borehole samples (Figure F59). The abundance of ΣH2S was previously determined to be ~1–2 mmol/L at Brothers Upper Cone vent fluids, when detectable (de Ronde et al., 2011). Pronounced ΣH2S variability is also evident in borehole samples where the dissolved abundance was <10 μmol/L in the first sampled BF in Hole U1528D, whereas the second fluid contains the highest measured ΣH2S concentration reported to date from any submarine acid-sulfate fluid (14.6 mmol/L) (Figure F59). Several processes may contribute to the distinct geochemical signatures of BFs recovered at Brothers volcano relative to surface samples (de Ronde et al., 2005) and acid-sulfate hydrothermal fluids recovered elsewhere (e.g., Gamo et al., 1997; Seewald et al., 2015). These processes, including phase separation, magmatic volatiles, and fluid-rock reaction during fluid origin and upflow are discussed in more detail below.
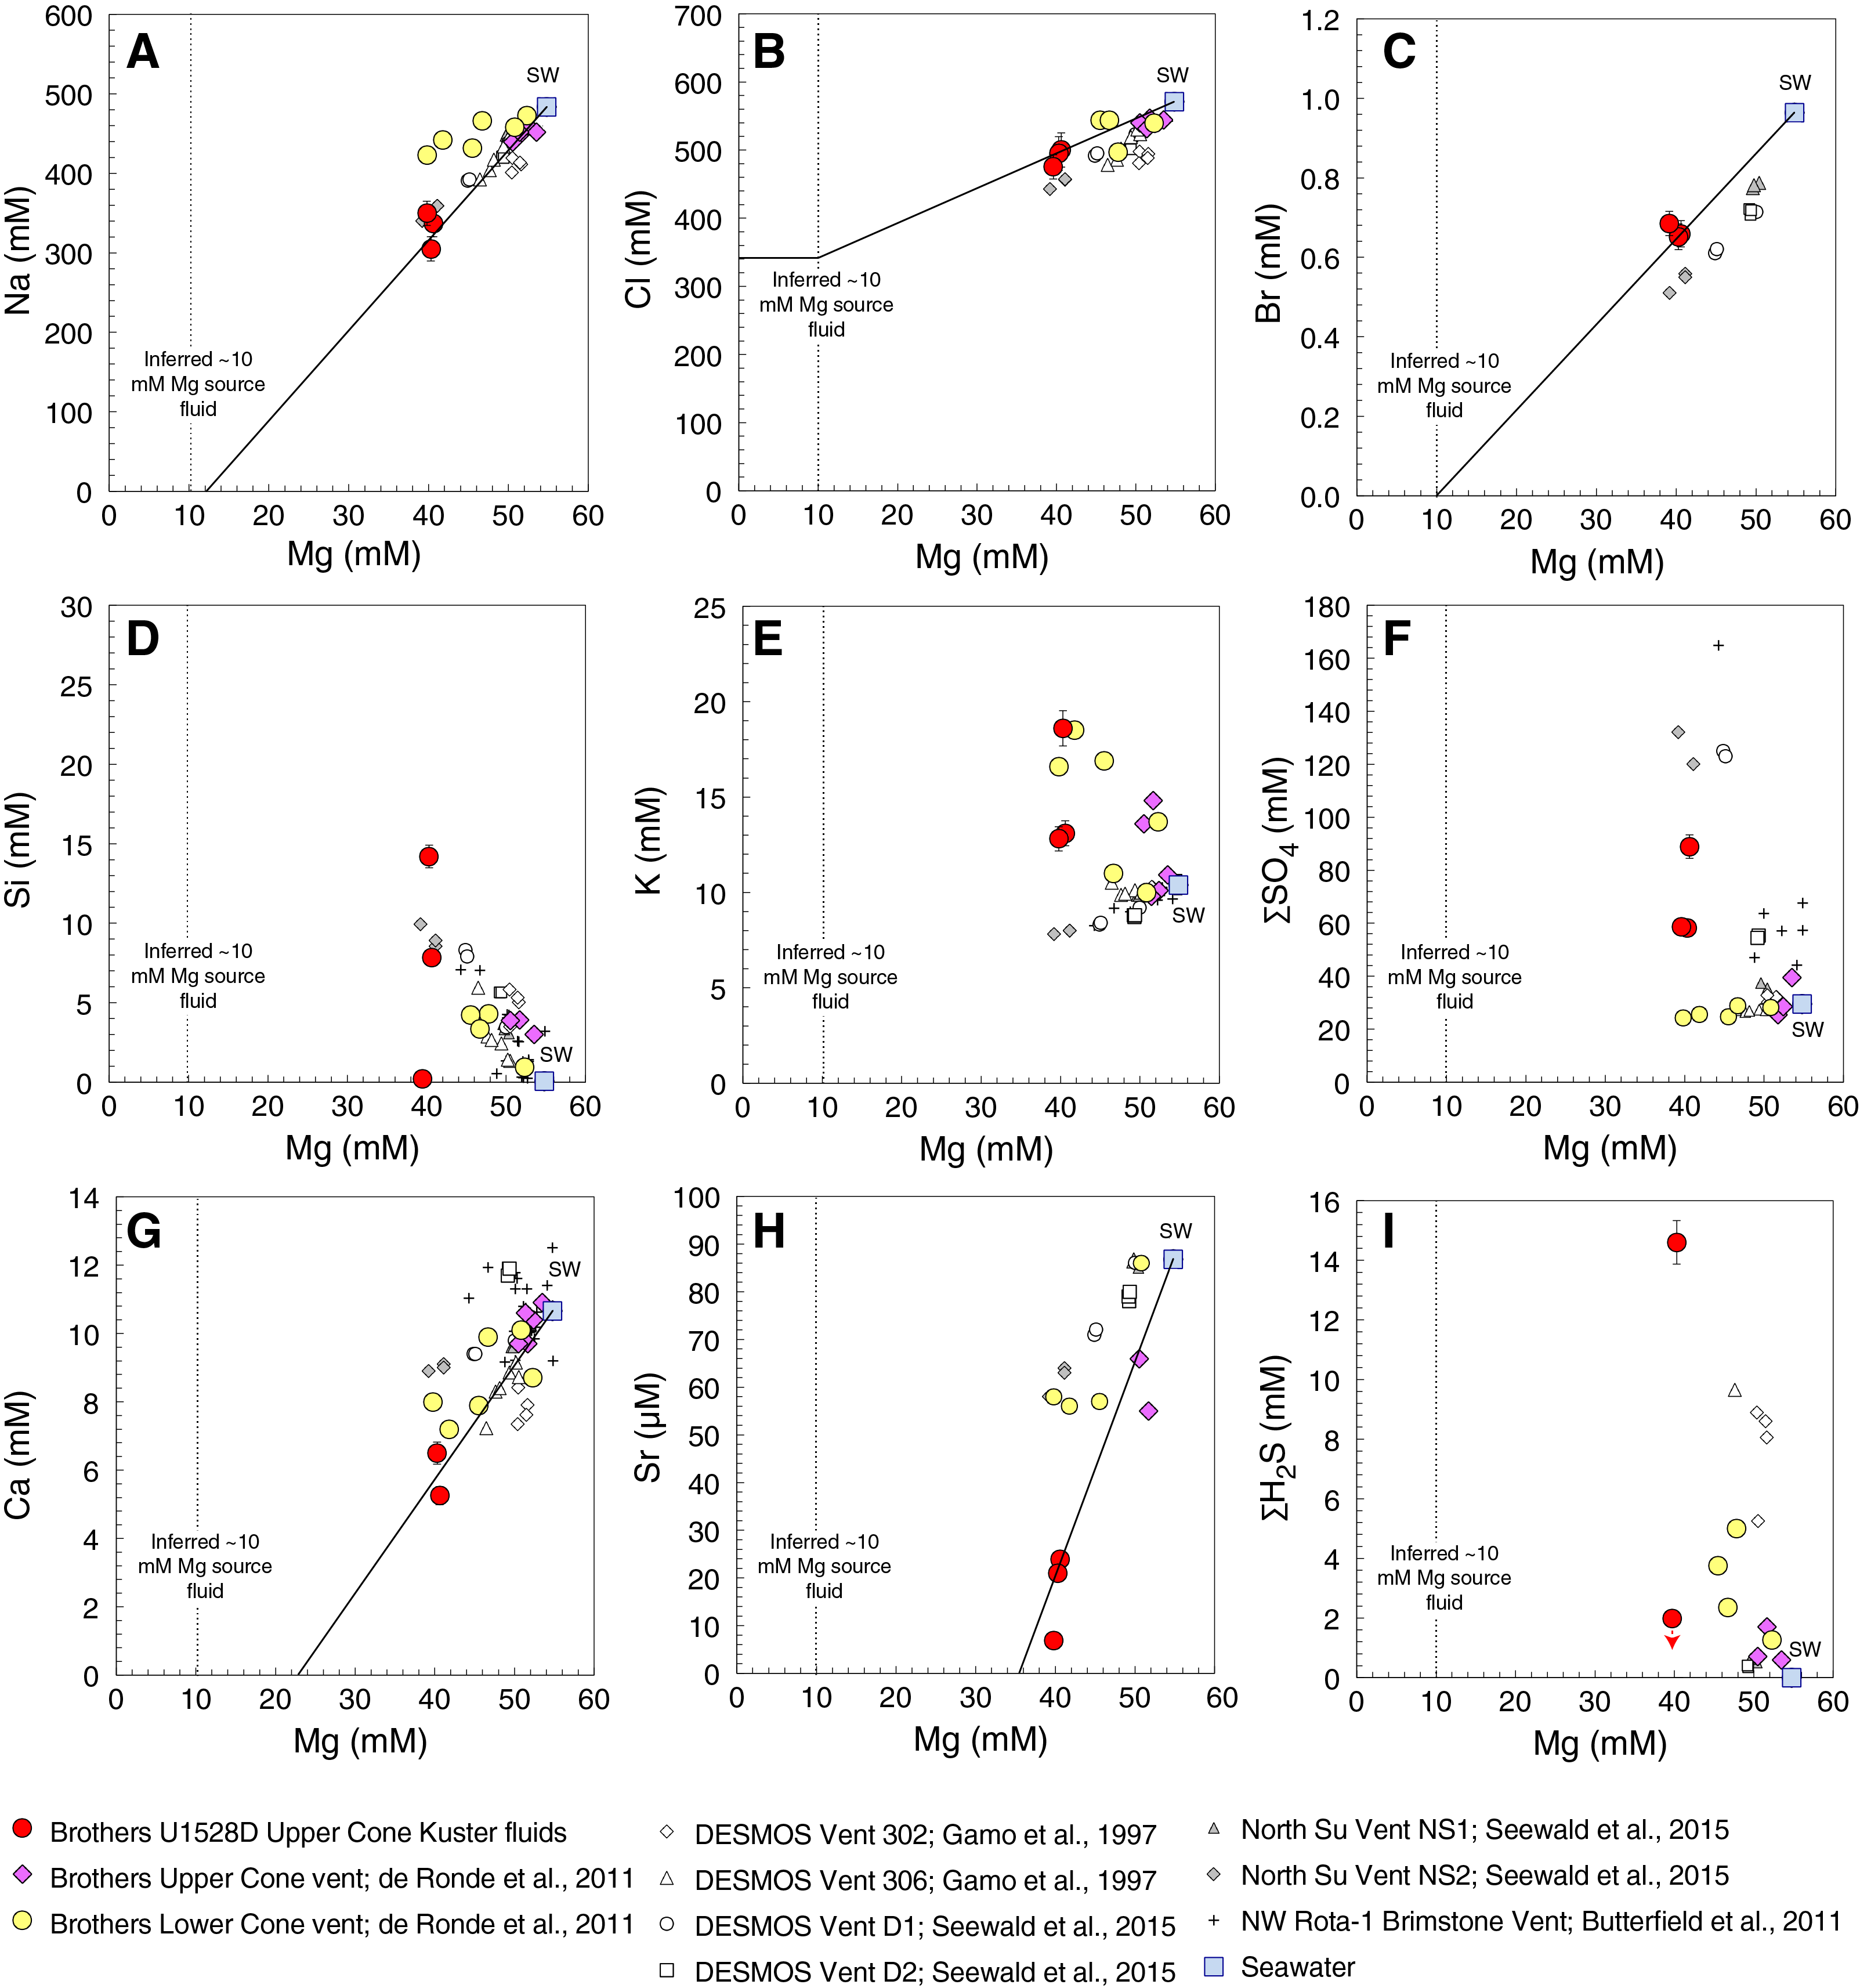
Figure F59. Mineral concentrations, Hole U1528D.
Phase separation
Fluids at the NW Caldera vent field are discharging with temperatures between 265° and 302°C and exhibit Cl contents that are both depleted and elevated relative to seawater (de Ronde et al., 2011). These compositions are interpreted to represent Cl-depleted and Cl-enriched fluids that were generated by phase separation of a seawater-derived source fluid as it circulated subseafloor. At Site U1528, measured borehole temperatures are at least 100°C below the two-phase boundary of seawater at 152–155 bar. However, higher temperatures at the depth of fluid origin are expected based on borehole temperature records and cooling from seawater circulation during drilling as well as fluid composition with Si concentrations well above quartz or amorphous silica saturation at sampled temperatures and pressure (Von Damm et al.,1991). Fluids therefore must have originated at temperatures higher than those determined by downhole logging. Median FI homogenization temperatures derived from Site U1528 core samples provide additional context for possible fluid formation temperatures in the subsurface at Brothers volcano (see Alteration). Median inclusion homogenization temperatures range from 180° to 340°C, and a maximum temperature of 360°C was observed at 196 mbsf.
Upper Cone BFs contain Cl and Br contents that are lower than seawater and are characterized by Br/Cl values that are well below that of seawater. In mid-ocean-ridge–hosted hydrothermal systems, dissolved Br and Cl are generally considered to behave conservatively during fluid-rock reaction. Deviations from the seawater Br/Cl value are thus historically interpreted to arise due to phase separation effects. Bromide does not preferentially partition into either the vapor or brine phase relative to Cl along the phase boundary of seawater (388°–550°C, 250–350 bar). At significantly higher temperatures (e.g., 420°C at 250 bar) in the halite + vapor + brine stability field, Br can partition preferentially into the vapor phase because of its exclusion from halite, elevating the Br/Cl ratio of the fluid (Foustoukos and Seyfried, 2007).
Therefore, the lower Br/Cl value of Hole U1528D fluids relative to seawater and the lower Na/Cl (Table T14) cannot be explained by simple phase separation of seawater in the two-phase vapor-brine region. Low Br/Cl values may represent either dissolution of halite or the injection of magmatic HCl into a low-salinity, Br-poor fluid. The presence of Cl-enriched fluids in the Brothers volcano subsurface (see Magmatic volatiles) is demonstrated by FIs identified in Hole U1528A rocks that are characterized by saturated NaCl brines and by salinities at or near seawater compositions (see Alteration). The absence of a free-flowing, upwelling Cl-rich fluid phase at the seafloor could be explained by the density contrast between the two fluid phases and preferential venting of the less dense Cl-depleted phase. The Cl-enriched phase may vent episodically or may be stored in the subsurface (e.g., in the sampled NaCl-saturated FIs) (see Alteration).
Magmatic volatiles
Several lines of evidences suggest that the BFs are formed by the injection of an acid- and volatile-rich aqueous magmatic fluid directly into seawater. First, an assessment of Na, Br, and Mg abundances in the BFs predicts a source composition that would contain implausible “negative” Na and Br contents at ~0 mmol/L Mg (Figure F59), which is the typical assumption made to determine source and “end-member” fluid compositions in many hydrothermal systems (e.g., Von Damm et al., 1985). Instead, the observation that both mixing lines project to ~10 mmol/L Mg at 0 mmol/L Na and 0 mmol/L Br suggests that the source fluid may contain negligible Na and Br and somewhat elevated Mg. Observed nonzero Na and Br contents in the fluids are best explained by this low-salinity magmatic fluid mixing with ambient seawater, as confirmed by a measured BF Br/Na value that matches that of seawater (Table T15). This assumption of a ~10 mmol/L Mg, 0 mmol/L Na, and 0 mmol/L Br end-member forms the simplest basis for an assessment of the origin of these species and others; however, the true source composition may lie on the mixing line anywhere between the sampled fluid composition and the axis intercept for any given plot (i.e., ~10–40.3 mmol/L Mg, 0–305 mmol/L Na, 0–0.652 mmol/L Br, and 320–495 mmol/L Cl) (Figure F59).
The inferred Cl content of the borehole source fluid projected from 10 mmol/L Mg and 0 mmol/L Na is 320 mmol/L Cl (Figure F59), which provides strong evidence for direct input of HCl into the hydrothermal system. Along with SO2, CO2, and HF, HCl is one of the most abundant magmatic volatiles associated with vapor-rich fluid exsolution from arc magmas (Carroll and Webster, 1994; Yang and Scott, 2013). All three fluid samples contain very elevated ΣSO4 abundances, and one of the two fluids contains ΣH2S in an abundance among the highest measured in an arc volcano setting. These abundances are consistent with major magmatic input of both species (Figure F59).
Fluid-rock reaction during fluid origin and upflow
Elevated Si and K contents in the fluids are likely due to the dissolution of Si- and K-bearing mineral assemblages in the presence of highly acidic fluids (Figure F59). Although the acidic (pH = 2.1) Fluid Sample 2 contains highly elevated Si and K abundances that indicate the likely mobilization of minerals during fluid upflow, the Si content of the higher pH Sample 1 (pH 5.4) lies along the Mg-Si trendline observed for other vent fluid samples collected at Brothers volcano and can be interpreted to be most representative of the source fluid (Figure F59). A projection of the measured Si content of Fluid Sample 1 to the ~10 mmol/L Mg source predicts a source fluid Si content of 25 mmol/L, which is consistent with quartz equilibrium at a minimum temperature of ~350°C (Von Damm et al., 1991). This minimum BF formation temperature calculated on the basis of Si geothermometry is consistent with the 340°–360°C maximum FI homogenization temperatures determined in Hole U1528D (see Alteration).
Estimated Mg contents of ~10 mmol/L in the source fluid may be mobilized from fluid-rock reactions. These fluids were collected from depths that align with Alteration Type II and III rocks that show major depletions in major oxides, including MgO, relative to the dacitic protolith (see Synthesis and determination of bulk geochemical changes). Our integrated results from BF and rock geochemistry therefore support mobilization of Mg during fluid-rock reaction. The assumption of a ~10 mmol/L source end-member would also apply for Sr and Ca. The fact that measured abundances of both elements would project to “negative” source compositions at ~10 mmol/L Mg is indicative of the nonconservative behavior of both elements during fluid-seawater mixing (see Fluid-rock reaction during fluid origin and upflow) (Figure F59). Fluids are supersaturated with respect to anhydrite at sampled conditions, and anhydrite is abundant throughout the depth intervals. Anhydrite would be expected to precipitate readily when high-temperature ΣSO4-rich fluids mix with Ca-rich seawater at temperatures exceeding 150°C. Assessment of measured fluid metal abundances and any possible solubility calculations involving metal-rich minerals will require additional contamination tests on drill pipe steel samples.
In summary, multiple lines of evidence (e.g., Br/Cl value, Br/Na value, low pH, Cl, and Si, and elevated ΣSO4) suggest that low-salinity BFs acquired their geochemical signatures through the direct input of magmatic fluids to ambient seawater at temperatures of at least 350°C. The BFs are not derived from phase separation of circulating seawater. As evidenced from hard rock geochemistry and petrographic descriptions, the subsurface hydrothermal fluids at Brothers volcano are multifaceted in nature and generally involve the net input of rock-derived cations to the fluid. In particular, Mg and K are removed from rock and added to fluids during fluid-rock reaction, which is balanced by a net removal of ΣSO4, Ca, and Sr from the fluids into secondary minerals, primarily as natroalunite and/or anhydrite. It is therefore possible that, in contrast to mid-oceanic-ridge hydrothermal systems, the source of salinity in acid sulfate fluids is not related to seawater-rock reactions (i.e., reaction zone processes) but results instead from the direct injection of a low-salinity magmatic fluid into seawater followed by reaction with volcanic rocks in the upflow zone. The observation of free-flowing, Cl-depleted BFs in addition to Cl-enriched fluids (hypersaline brines) trapped in NaCl-saturated FIs in the Brothers volcano subsurface is compelling. A very low pH magmatic fluid that is rich in HCl may react with Na-bearing protoliths to generate NaCl-rich fluids without the direct involvement of seawater, in accordance with the highly Na-depleted mineral assemblages observed.
Paleomagnetism
Magnetization directions and intensities were measured on oriented pieces larger than ~8 cm from archive-half core sections from Holes U1528A, U1528C, and U1528D using the superconducting cryogenic rock magnetometer. The overprint magnetization from drilling and coring was reduced by using the inline AF demagnetizer up to 70 mT. We first measured each archive half using the cryogenic magnetometer in continuous sampling mode, and then we analyzed sections of the archive half at the intervals of the largest oriented pieces using PuffinPlot v. 1.0.3 (Lurcock and Wilson, 2012). These are nonstandard measurements, and discontinuous recovery compromises accurate measurements of the magnetization parameters. For this reason, care should be taken when downloading the magnetization directions and intensities from the shipboard Laboratory Information Management System (LIMS) database because it contains all the continuous measurements from the entire archive halves, including small pieces. Nevertheless, this approach provided a rapid evaluation of the magnetic properties of the cores and enabled shipboard discrete sampling to be optimized. In total, 82 oriented samples (67 from Igneous Unit 2 and 15 from Unit 3; Table T17) from the working core halves from Site U1528 were selected for detailed measurements of anisotropy of MS, AF, and TD as well as IRM experiments.
Igneous Unit 1
No paleomagnetic measurements were performed on the samples from Igneous Unit 1 because of the absence of any oriented pieces of core.
Igneous Unit 2
The analysis of archive halves from 61.30 to 269.03 mbsf consistently shows relatively low NRM intensities (~10−3–10−2 A/m) before AF demagnetization and almost complete AF demagnetization from 50 to 70 mT. Inclination data for the large oriented pieces are generally characterized by negative values between −40° and −70° that correspond to normal polarity in the southern hemisphere. The mean magnetic susceptibilities of the discrete samples from Igneous Unit 2, measured using the Agico Kappa Bridge KLY 4, are also characterized by relatively low values (smaller than ~100 × 10−5 SI) and show good agreement with the continuous MS measurements (see Physical properties).
AF demagnetization experiments were carried out on 31 discrete samples from Igneous Unit 2 (Table T17). NRM measured before AF demagnetization is in the range ~10−3–10−2 A/m, which is in good agreement with the results from the cryogenic magnetometer. In general, the original NRM intensity is reduced to less than 20% after AF steps of 70–80 mT (Figure F60). The soft magnetic drilling overprint (e.g., Richter et al., 2007) was removed after AF demagnetization of ~10–20 mT, leaving a primary stable component that could be analyzed with principal component analysis (PCA) (Kirschvink, 1980) in vector component diagrams (Zijderveld, 1967). The AF demagnetized samples show an average inclination of −57.7°, calculated using the method of McFadden and Reid (1982).
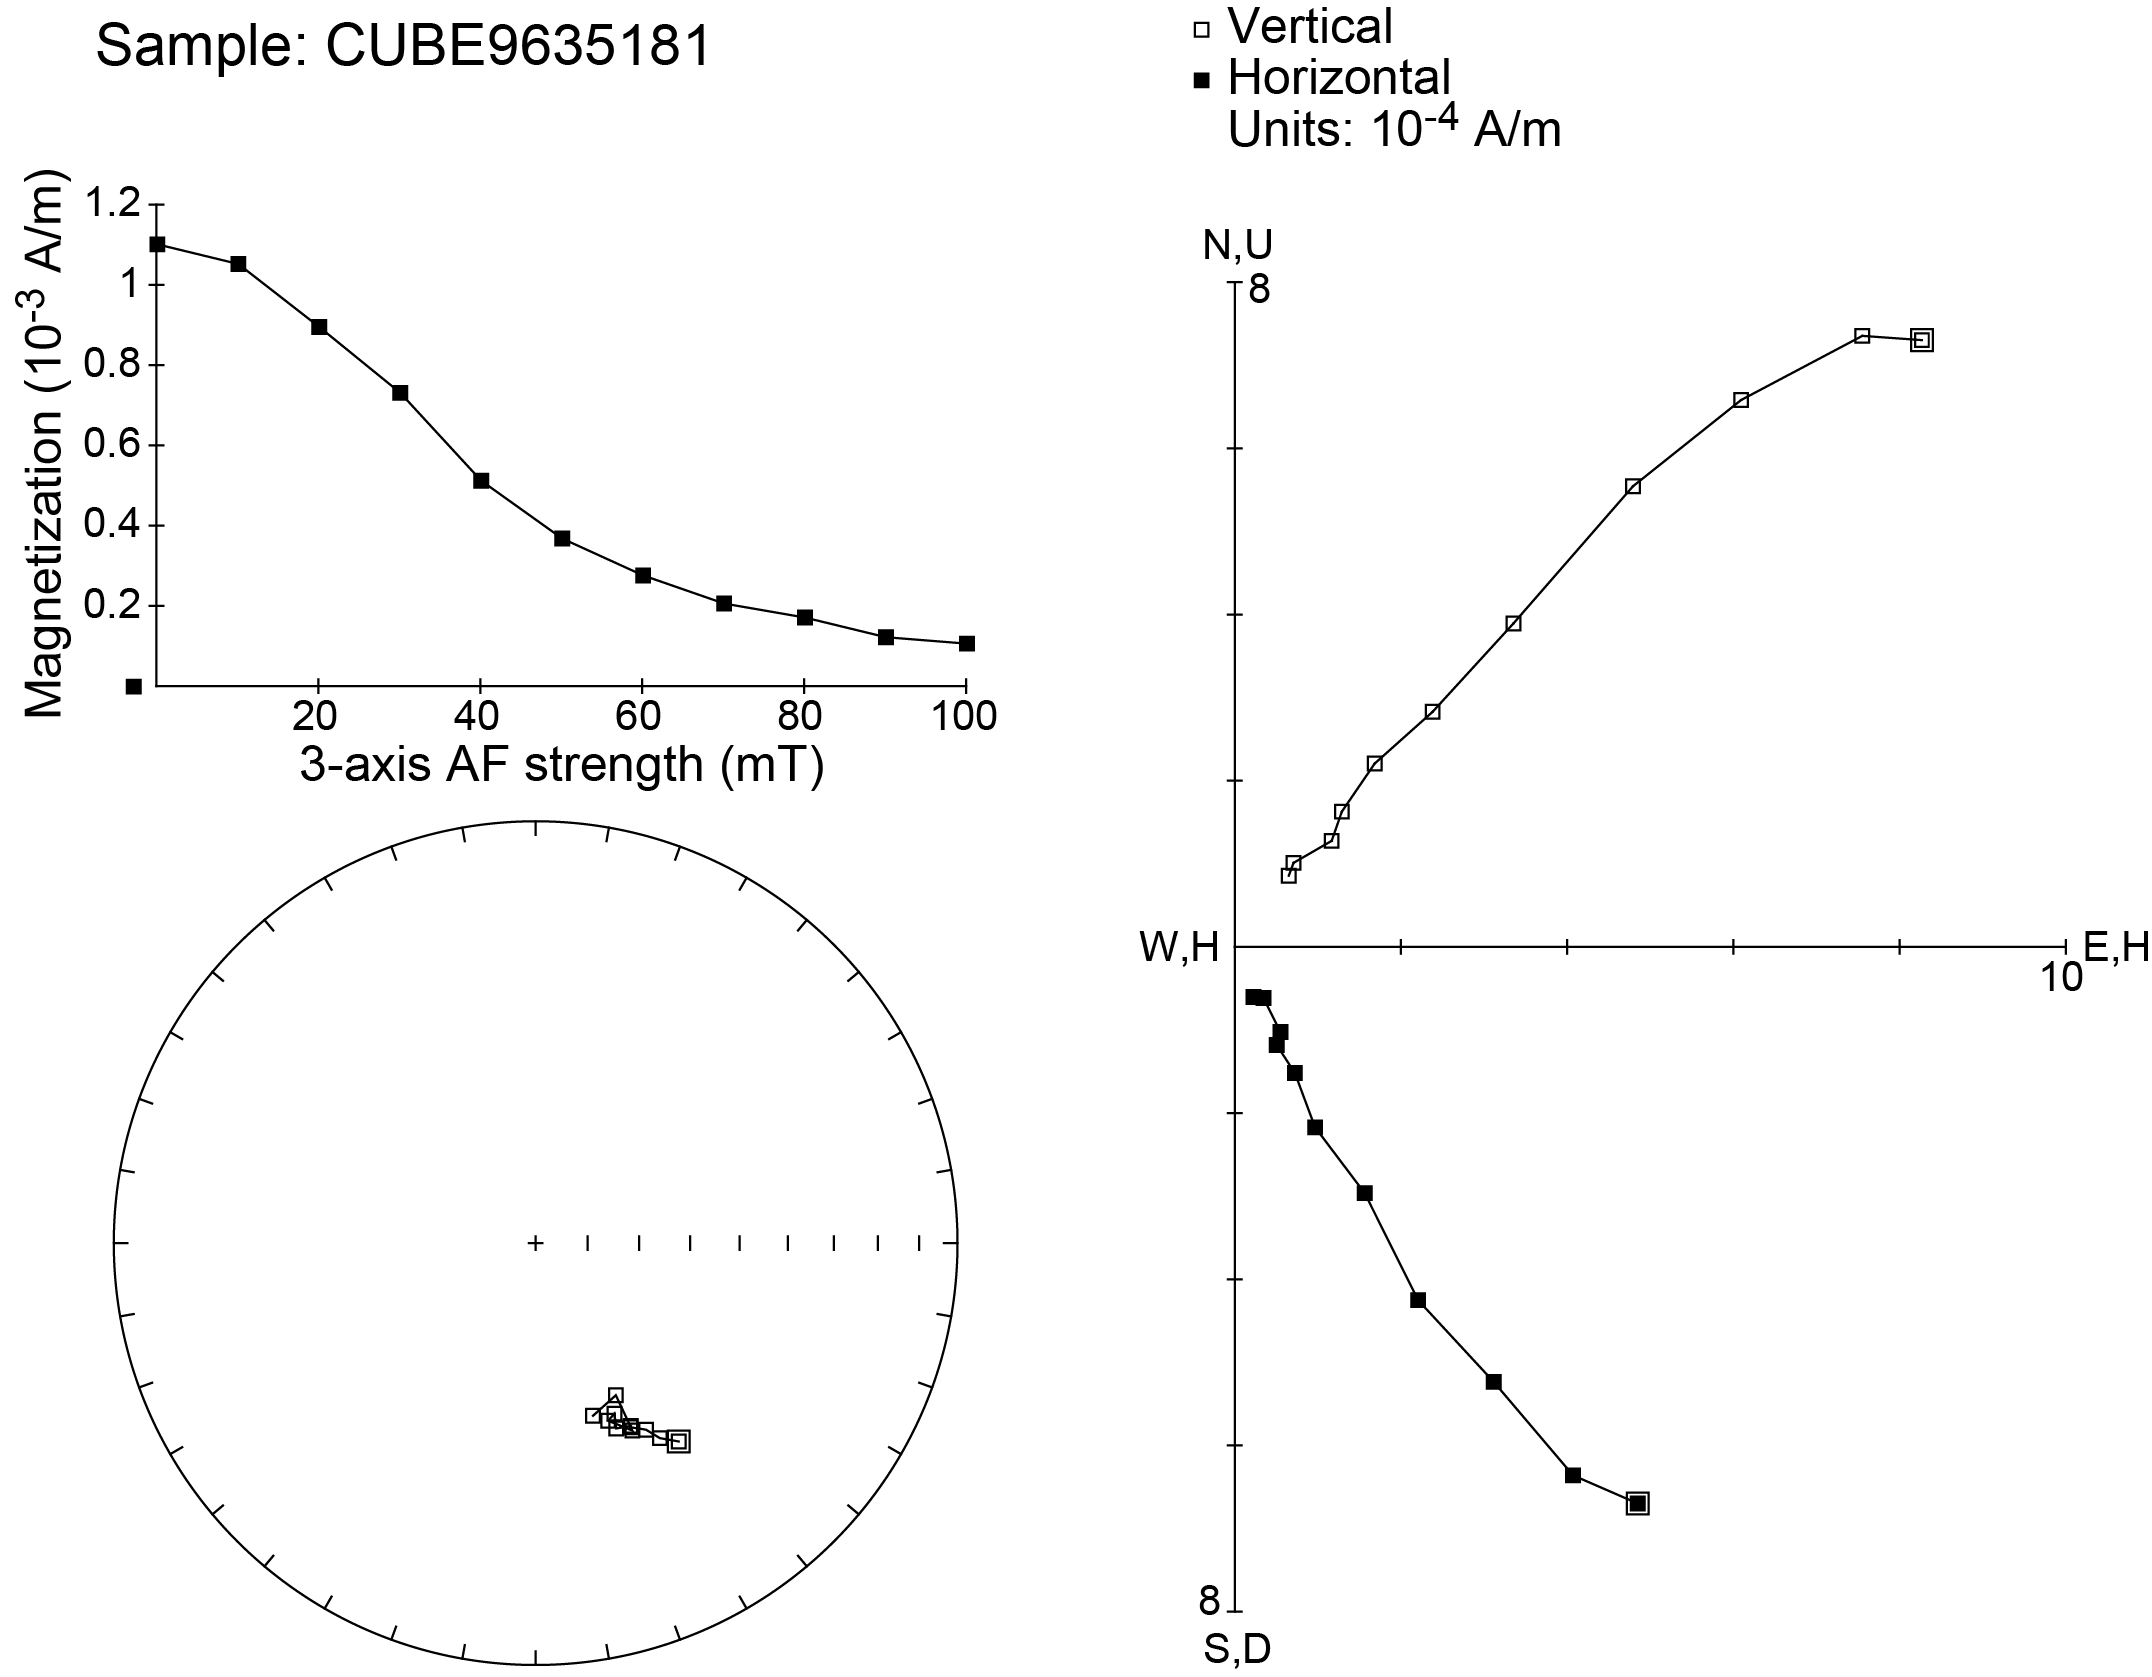
Figure F60. Igneous Unit 2 AF demagnetization experiment, Hole U1528D.
We carried out TD experiments on the remaining 36 discrete samples from Igneous Unit 2. After measuring NRM at room temperature, the samples were shared with the Physical Properties group for MAD measurements, which required heating the samples to 105°C. The initial NRM measured before TD (~10−3–10−2 A/m) was also in general agreement with the observed values from the archive halves measured with the cryogenic magnetometer. After the MAD measurements, these samples were thermally demagnetized to a maximum temperature of 700°C starting from an initial step of 110°C to erase any magnetic overprint resulting from MAD measurements. The samples in general show a linear decrease of the magnetization intensity to about 40% of the original intensity at ~400°C, and about 80% of the samples are characterized by peaks and increases of NRM after 400°C (Figure F61).

Figure F61. Igneous Unit 2 TD experiment, Hole U1528D.
Igneous Unit 3
In total, 15 archive halves from 272.90 to 355.07 mbsf were measured. The rocks in this interval have slightly larger NRM intensities before AF demagnetization when compared with those from Igneous Unit 2, and some intensities are as high as ~1 A/m for the less altered samples. The demagnetization curves for Igneous Unit 3 are similar to those of Unit 2, suggesting similar coercivities. Inclination data of the larger oriented pieces are generally characterized by negative values, as we would expect for normal polarities in the Southern Hemisphere. In total, 15 discrete samples were analyzed in the interval covering Unit 3. Mean magnetic susceptibilities measured from the Agico Kappa Bridge KLY 4 for this unit are in general agreement with the values of Unit 2 (less than ~100 × 10−5 SI), with the exception of four samples from the less altered rocks where measured magnetic susceptibilities are higher (greater than 100 × 10−5 and as much as 2000 × 10−5 SI).
The NRM of six discrete samples (Table T17) was measured before and after AF demagnetization up to 100 mT (Figure F62), which was enough to demagnetize the samples to less than 10% of the original magnetization. For this lithologic unit, NRM intensities measured before AF demagnetization largely agree with the results from archive halves measured with the cryogenic magnetometer. The magnetic drilling overprint (Richter et al., 2007) was removed after AF demagnetization to >15–20 mT, leaving clear primary components that could be analyzed by PCA (Lurcock and Wilson, 2012; Kirshvink, 1980) in vector component diagrams (Zijderveld, 1967). One of these samples provided a positive inclination of ~69°, which was also measured with the cryogenic magnetometer in the corresponding archive half. However, we found this anomalous inclination only in this very limited interval of core, and thus we cannot interpret this as an example of reversed polarity with a high degree of certainty. For example, the remaining five samples show negative inclinations with an average value of −55.0°, calculated using the method of McFadden and Reid (1982).
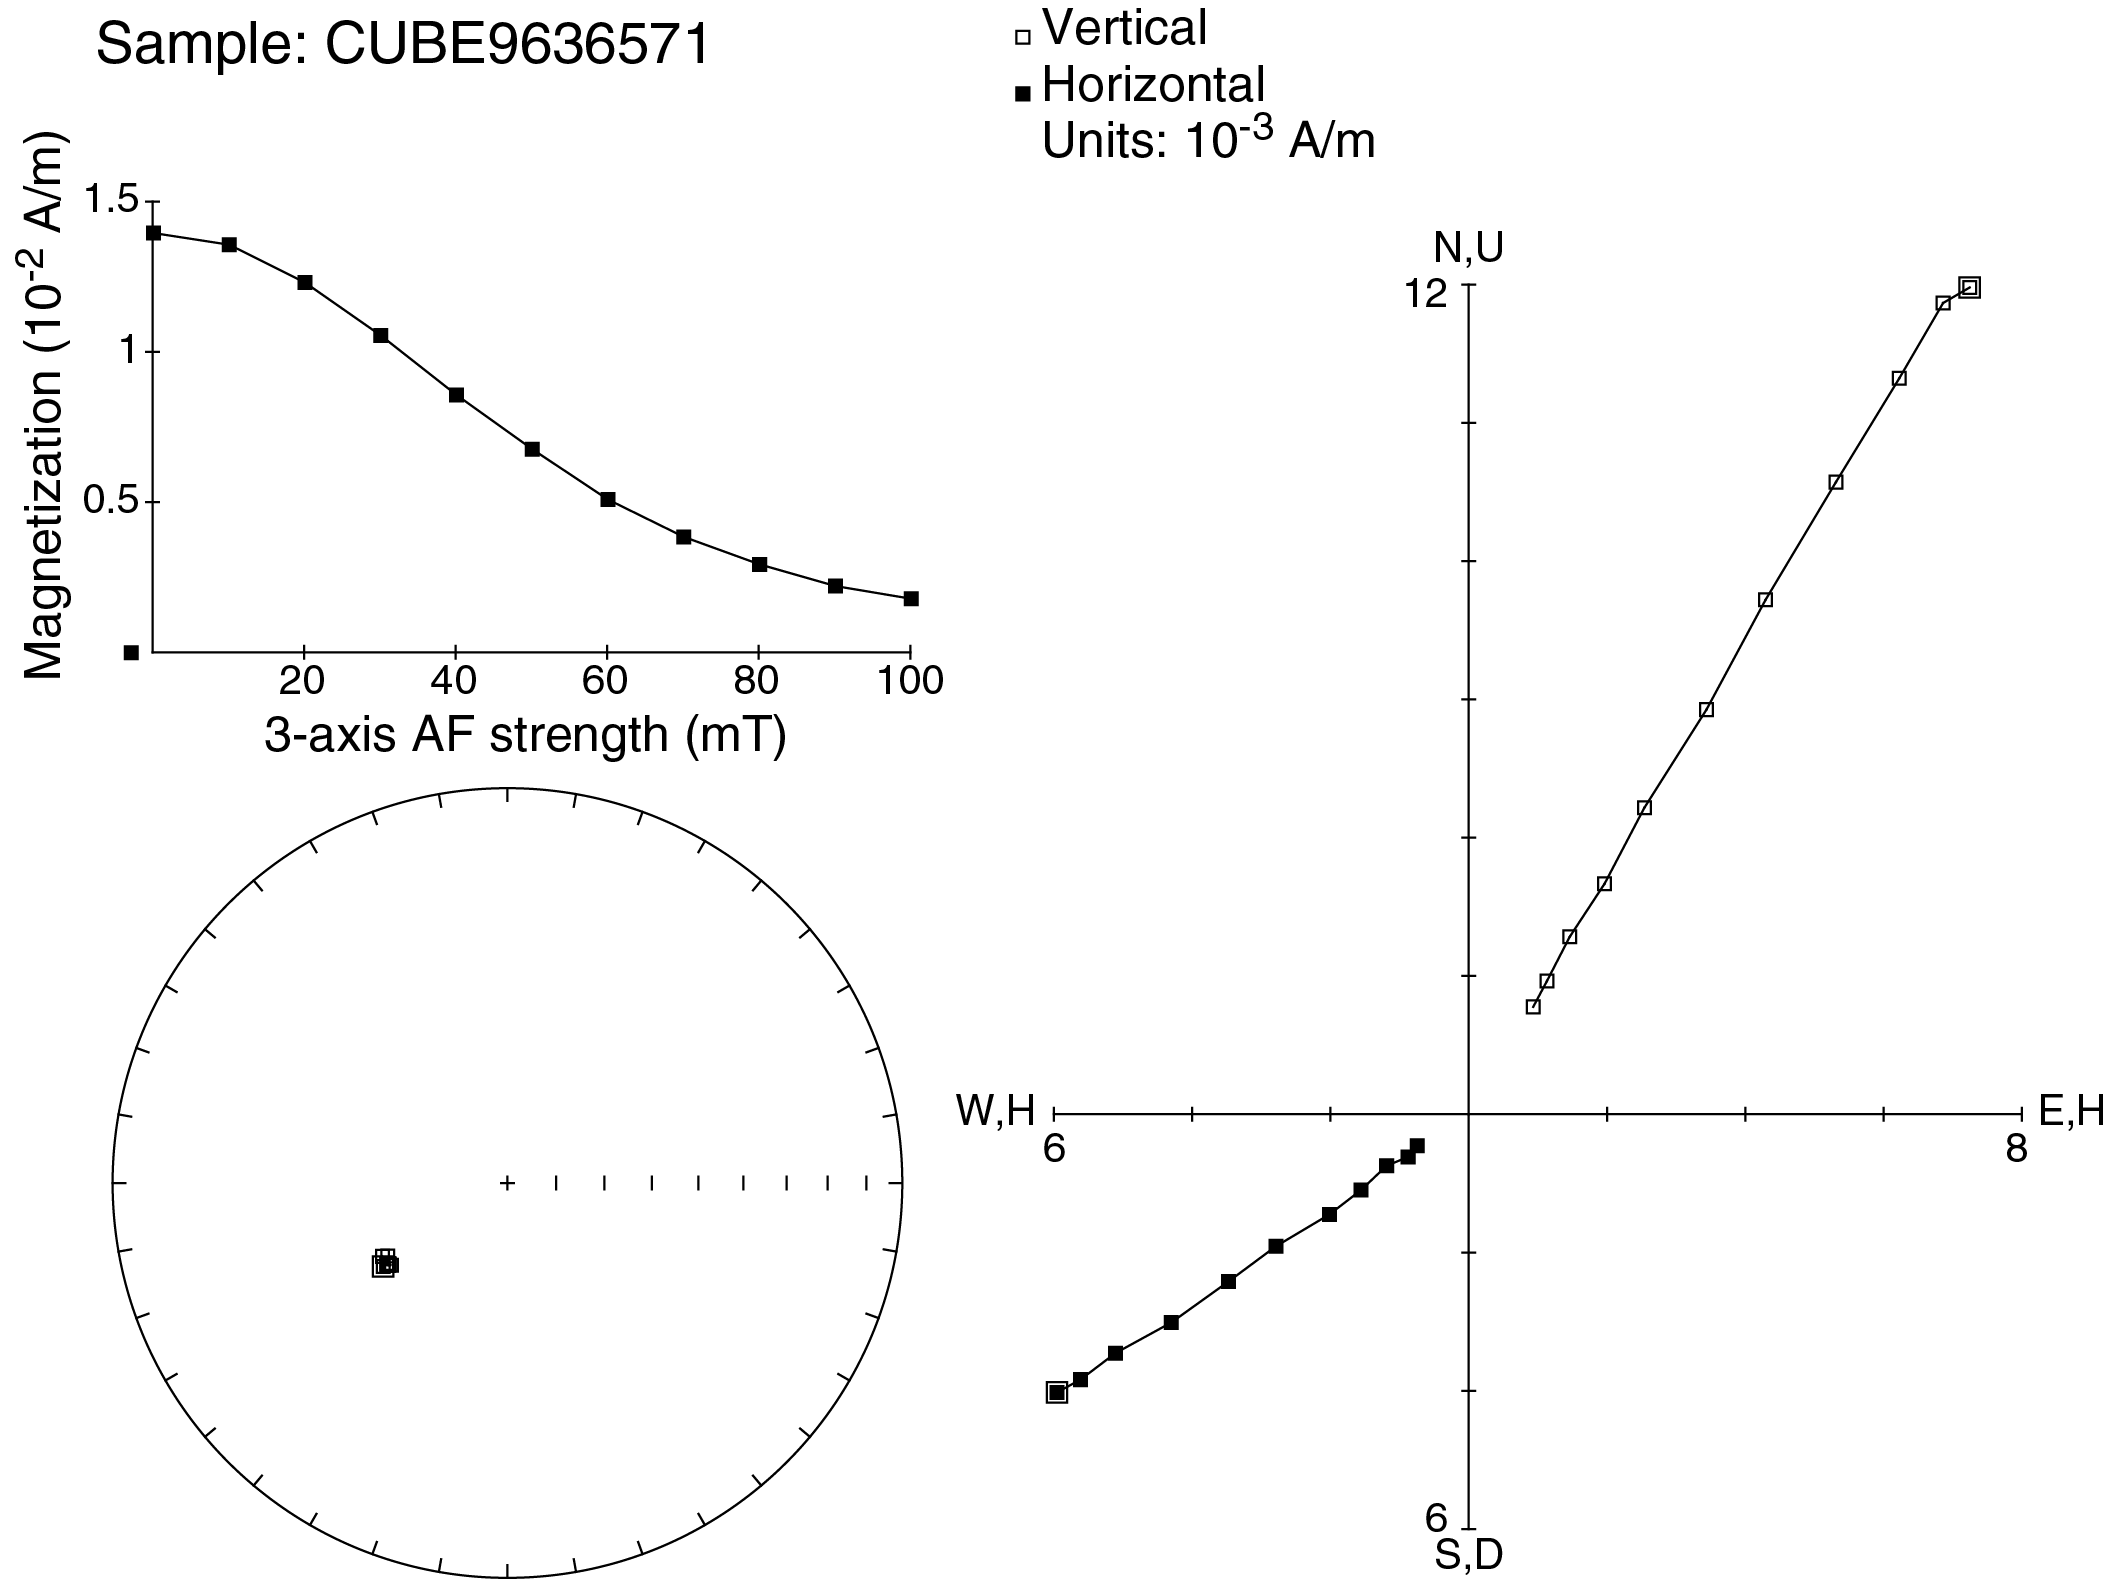
Figure F62. Igneous Unit 3 AF demagnetization, Hole U1528D.
We carried out TD experiments on the remaining nine discrete samples. Similar to the samples from Igneous Unit 2, samples from Igneous Unit 3 were shared with the Physical Properties group for MAD measurements. Initial NRM values measured before TD were also in agreement with the values observed with the cryogenic magnetometer on the corresponding archive halves. The TD experiments were carried out to temperatures >600°C (Table T17) starting from an initial step of 110°C to erase the magnetic overprint from MAD experiments. The magnetic overprint from drilling and coring appears to be removed at temperatures >200°C. The samples show a general linear decrease in magnetization intensity to less than 50% of the original intensity at temperatures ~500°C, with complete demagnetization at temperatures greater than ~570°C (Figure F63). A few samples show increases in NRM intensities at temperatures greater than ~400°C, similar to the samples from Unit 2 (Figure F61).
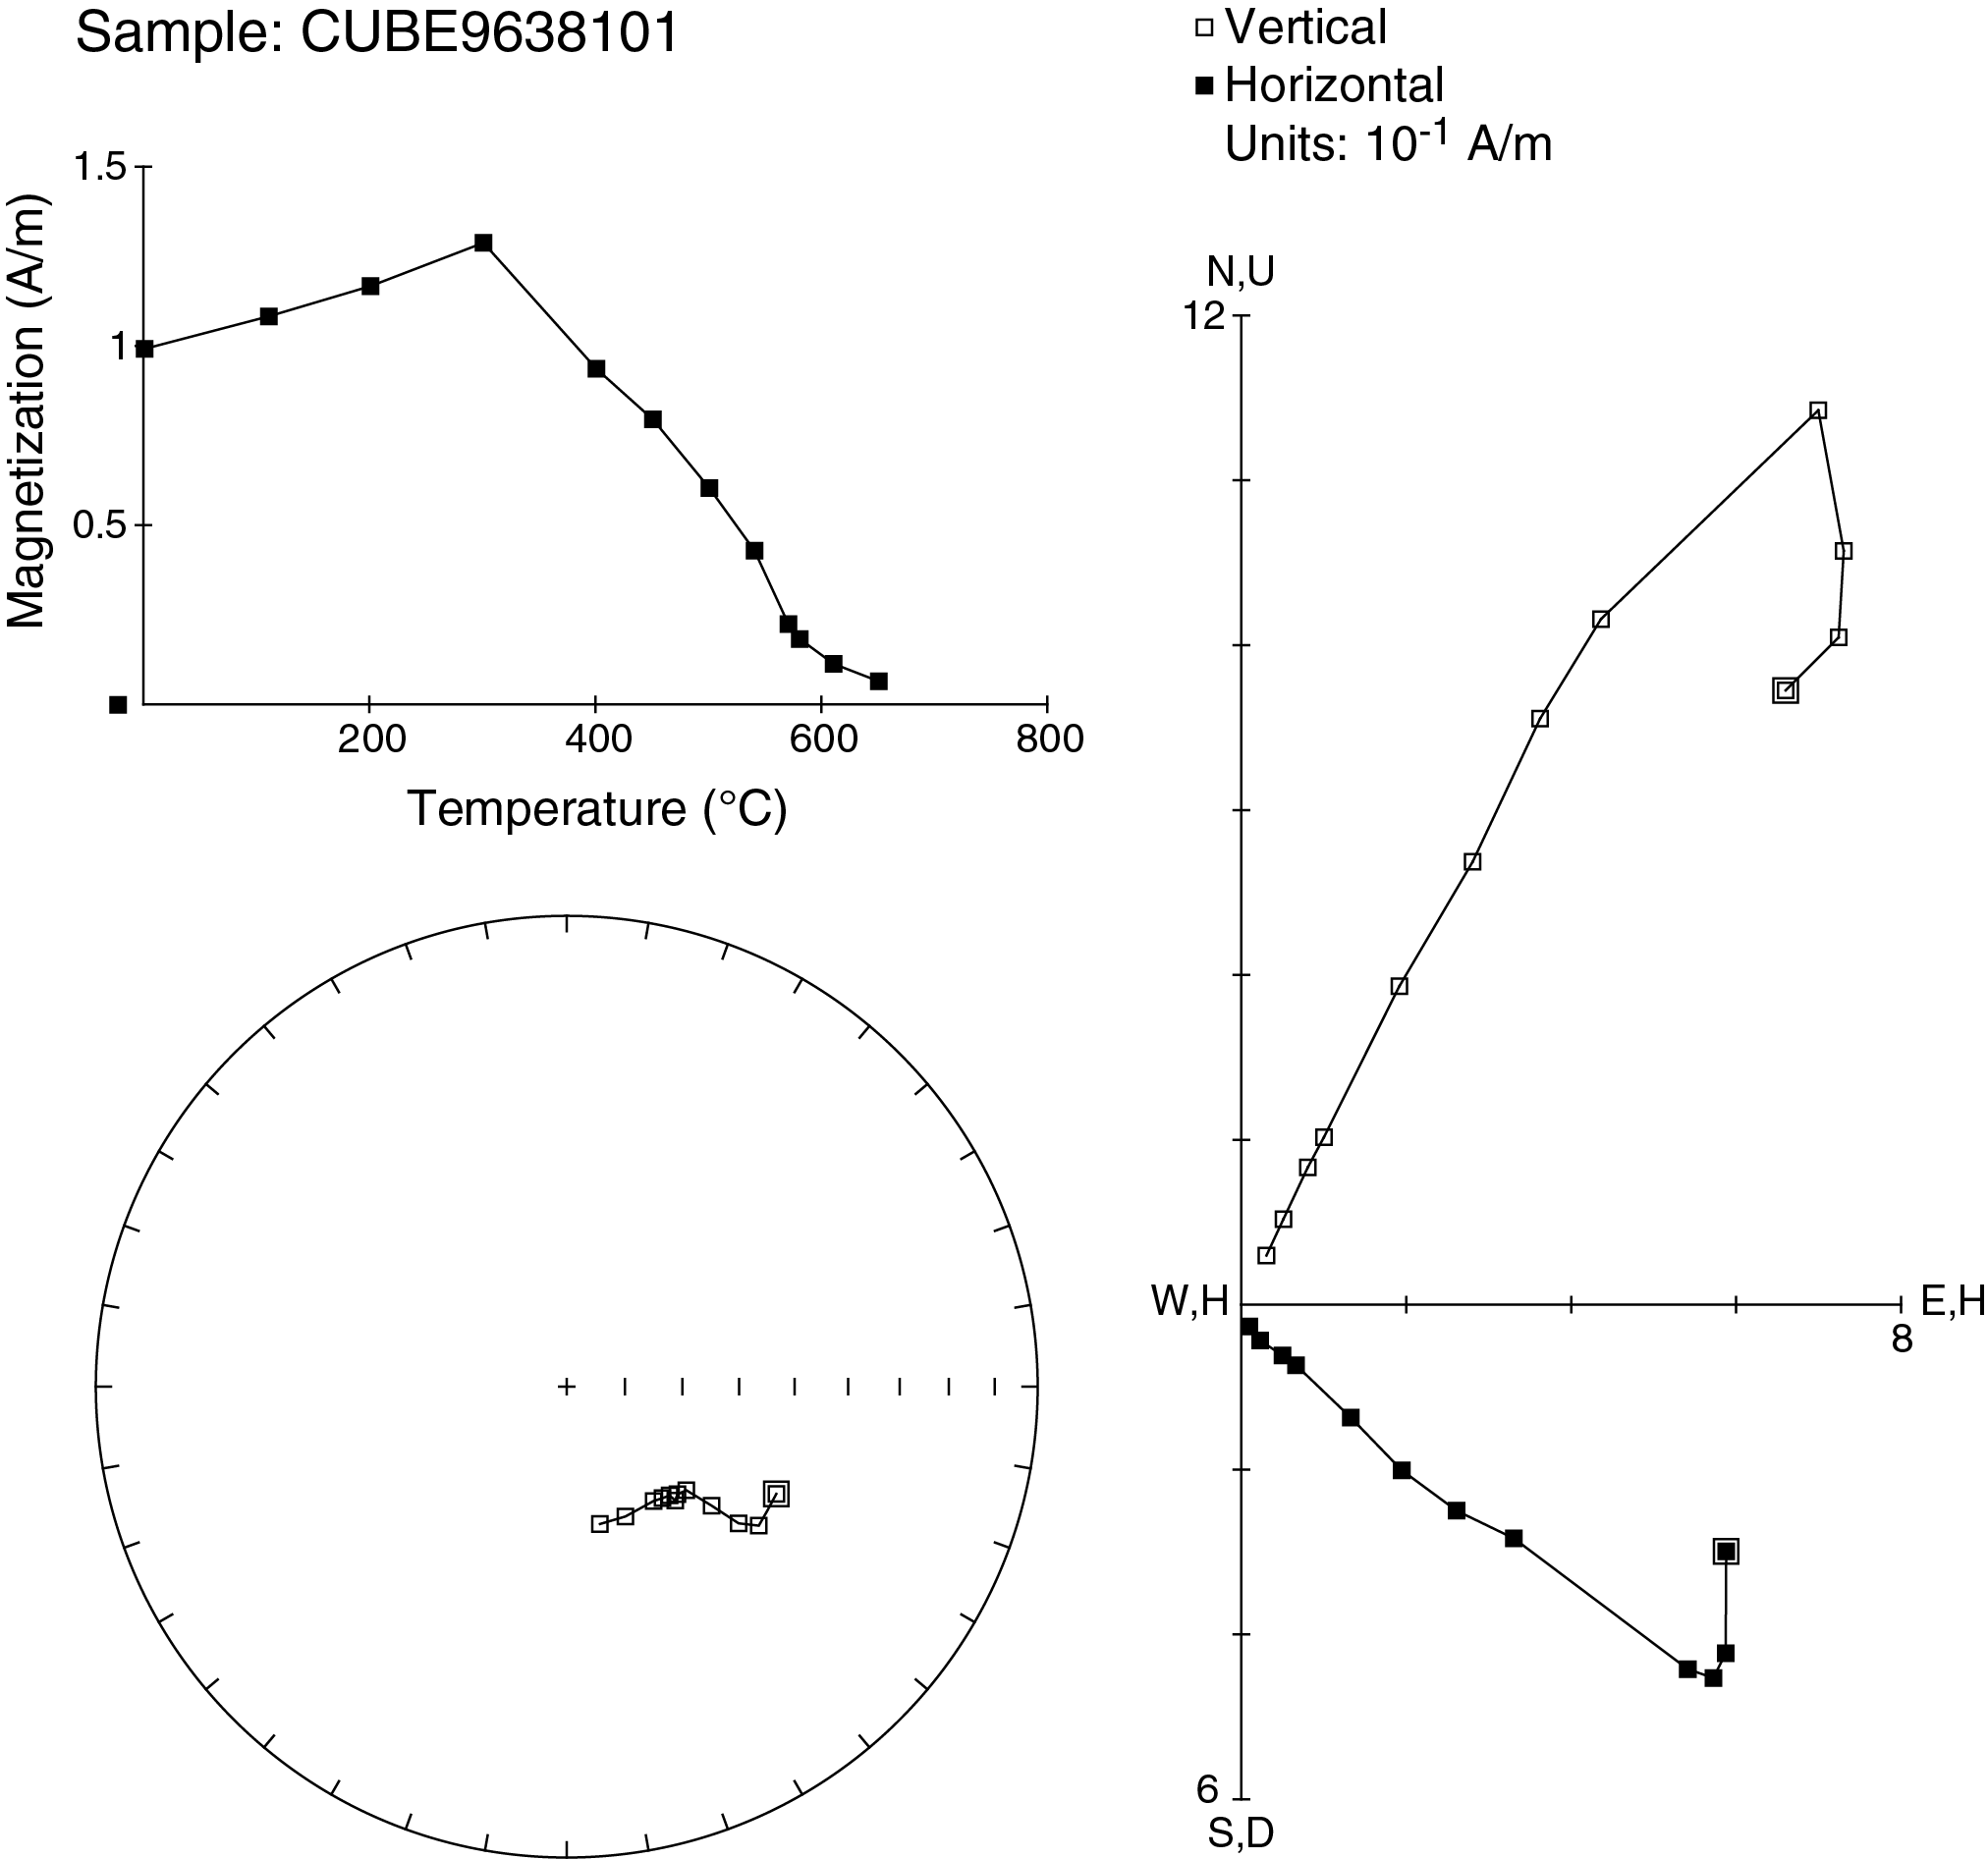
Figure F63. Igneous Unit 3 TD experiment, Hole U1528D.
Discussion
Magnetic directions calculated using PCA on discrete samples from Igneous Units 2 and 3 consistently show univectorial decay toward the origin at AF steps greater than 15–20 mT. This set of directions is assumed to represent remanent magnetization recorded at the time of cooling of these rocks. The average inclinations for both lithologies are virtually indistinguishable from the geocentric axial dipole (GAD) inclination of −55° (Figure F64; we have excluded the anomalous sample with the positive inclination from this plot). This indicates a very young age for the primary magnetization component, almost certainly from the current normal chron, C1n (Cande and Kent, 1995). Some of the TD experiments carried out on samples from both igneous units show a linear decrease in the magnetization intensity to 400°C followed by a more rapid decline between 500° and 600°C. These curves suggest that these samples contain pure magnetite (Curie temperature = ~575°C; Tauxe, 2010) and titanomagnetite with variable Ti content (i.e., increasing Ti content produces a decrease in the Curie temperature) (O’Reilly, 1984). The comparison with AF-demagnetized samples shows that some residual NRM intensity was observed in some samples after the final 100 mT demagnetization step. This indicates the presence of magnetic minerals with larger coercivities, such as titanohematite, which is also confirmed by the IRM experiments on these samples, which show a continuous increase of NRM intensities for fields up to 1.2 T. A significant number (24) of the TD experiments from both igneous units show increases of NRM intensity after heating at temperatures >400°C, which suggests irreversible transformation of magnetic minerals during heating (Figure F61). MS was monitored before and after TD experiments and significantly increased in these samples, which indicates the transformation of the original minerals to ferrimagnetic minerals, such as magnetite (O’Reilly, 1984; Reagan et al., 2015).
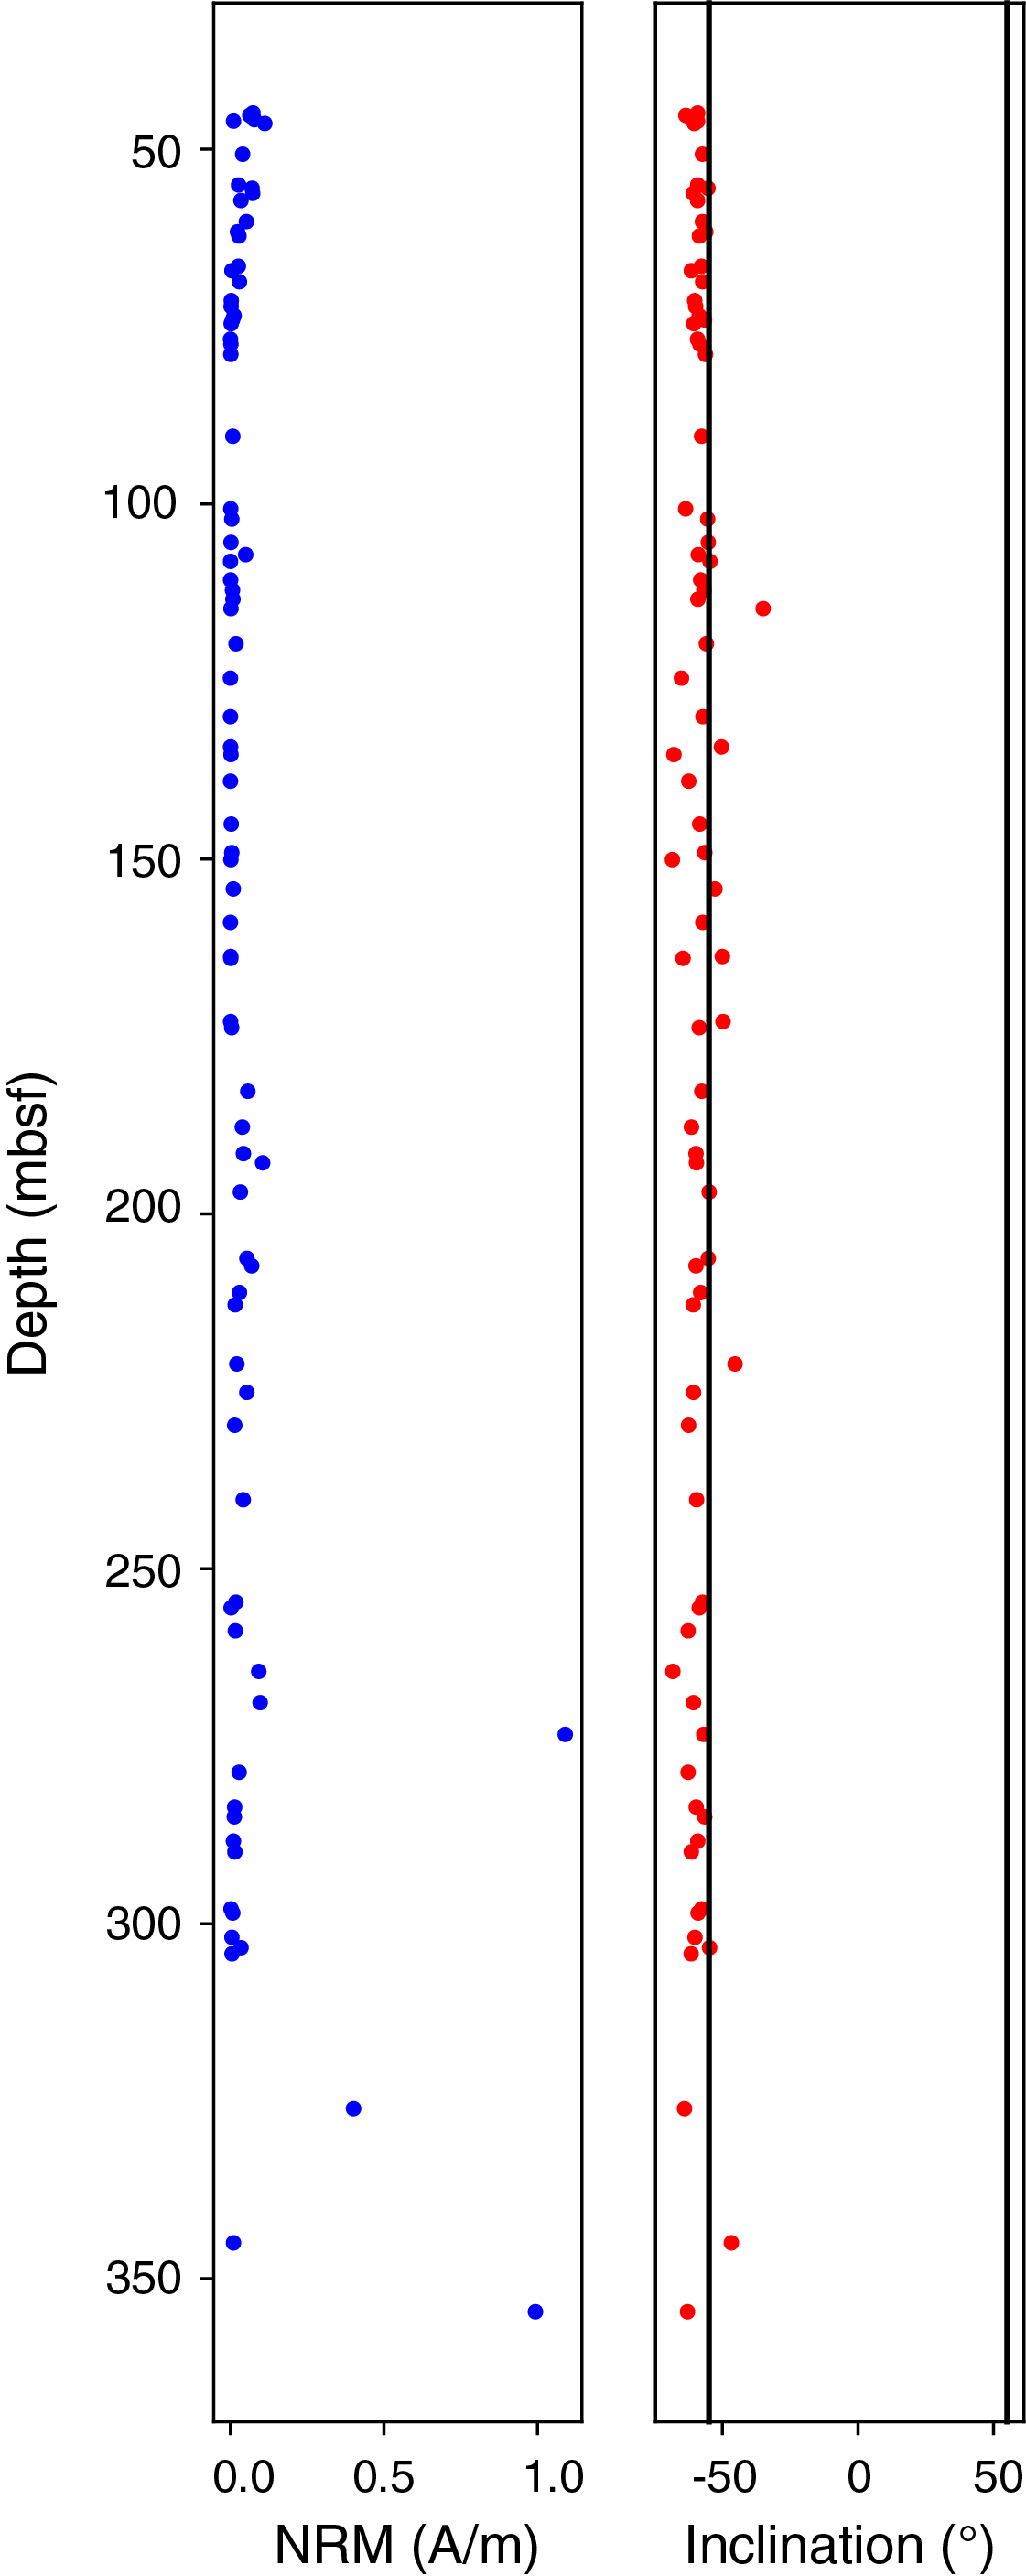
Figure F64. NRM, Hole U1528D.
Physical properties
Physical property data for Site U1528 were obtained for cores from Holes U1528A, U1528C, and U1528D. Core temperatures were ~11°–20°C upon arrival on the core deck and were left to equilibrate to room temperature (~20°C) prior to further analyses. Recovered cores were fragmented and of variable thickness, so continuous measurements on whole-round cores (i.e., gamma ray attenuation bulk density, magnetic susceptibility logger [MSL], and NGR) yielded noisy data (see Physical properties in the Expedition 376 methods chapter [de Ronde et al., 2019a]). Measurements of P-wave velocity, density, porosity, MS, and thermal conductivity made on section-half cores and discrete samples therefore provide the basis for the petrophysical characterization of Site U1528. In total, 21 discrete samples from Hole U1528A, 8 from Hole U1528C, and 86 from Hole U1528D were analyzed, including cut cubes, sediments, and pebbles, to encompass the various igneous lithologies and alteration styles. Cube samples were shared between paleomagnetic, moisture and density (MAD), and P-wave measurements. Thermal conductivity was measured on 9 working-half pieces from Hole U1528A, 1 piece from Hole U1528C, and 40 pieces from Hole U1528D. An overview of all physical property data sets collected at Site U1528 is given in Figures F65 (Holes U1528A and U1528C) and F66 (Hole U1528D).
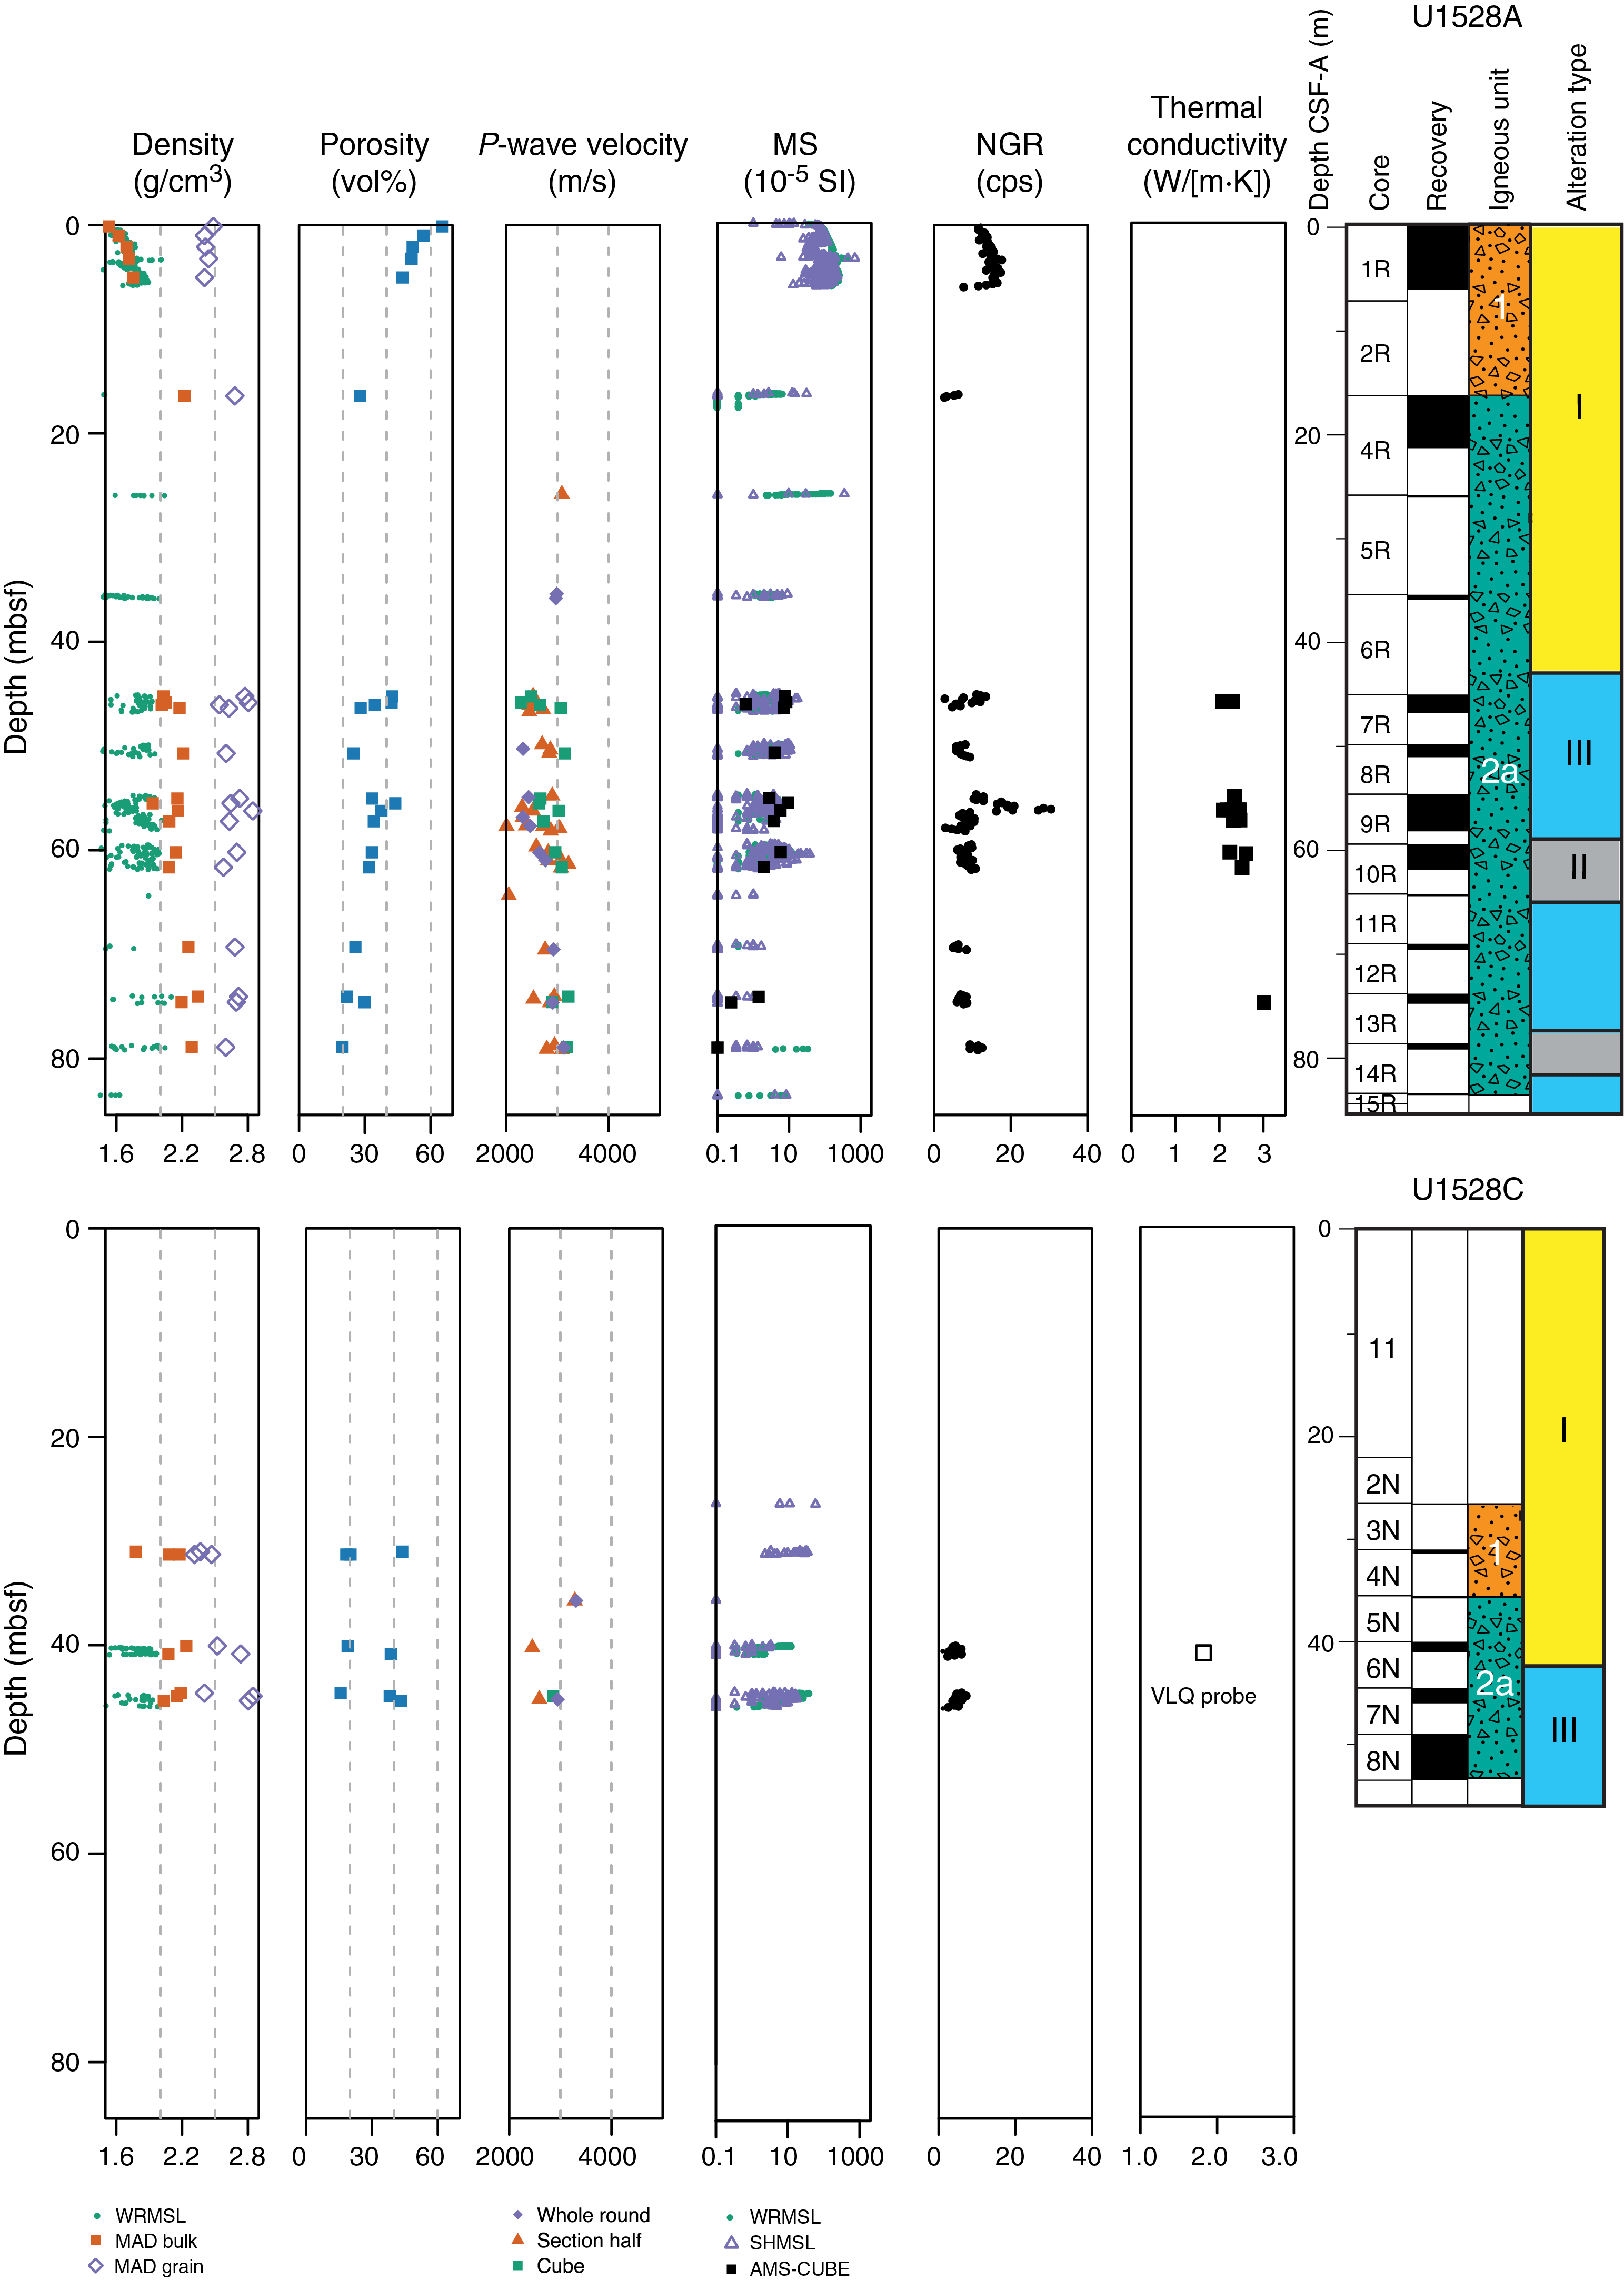
Figure F65. Physical properties, Holes U1528A and U1528C.
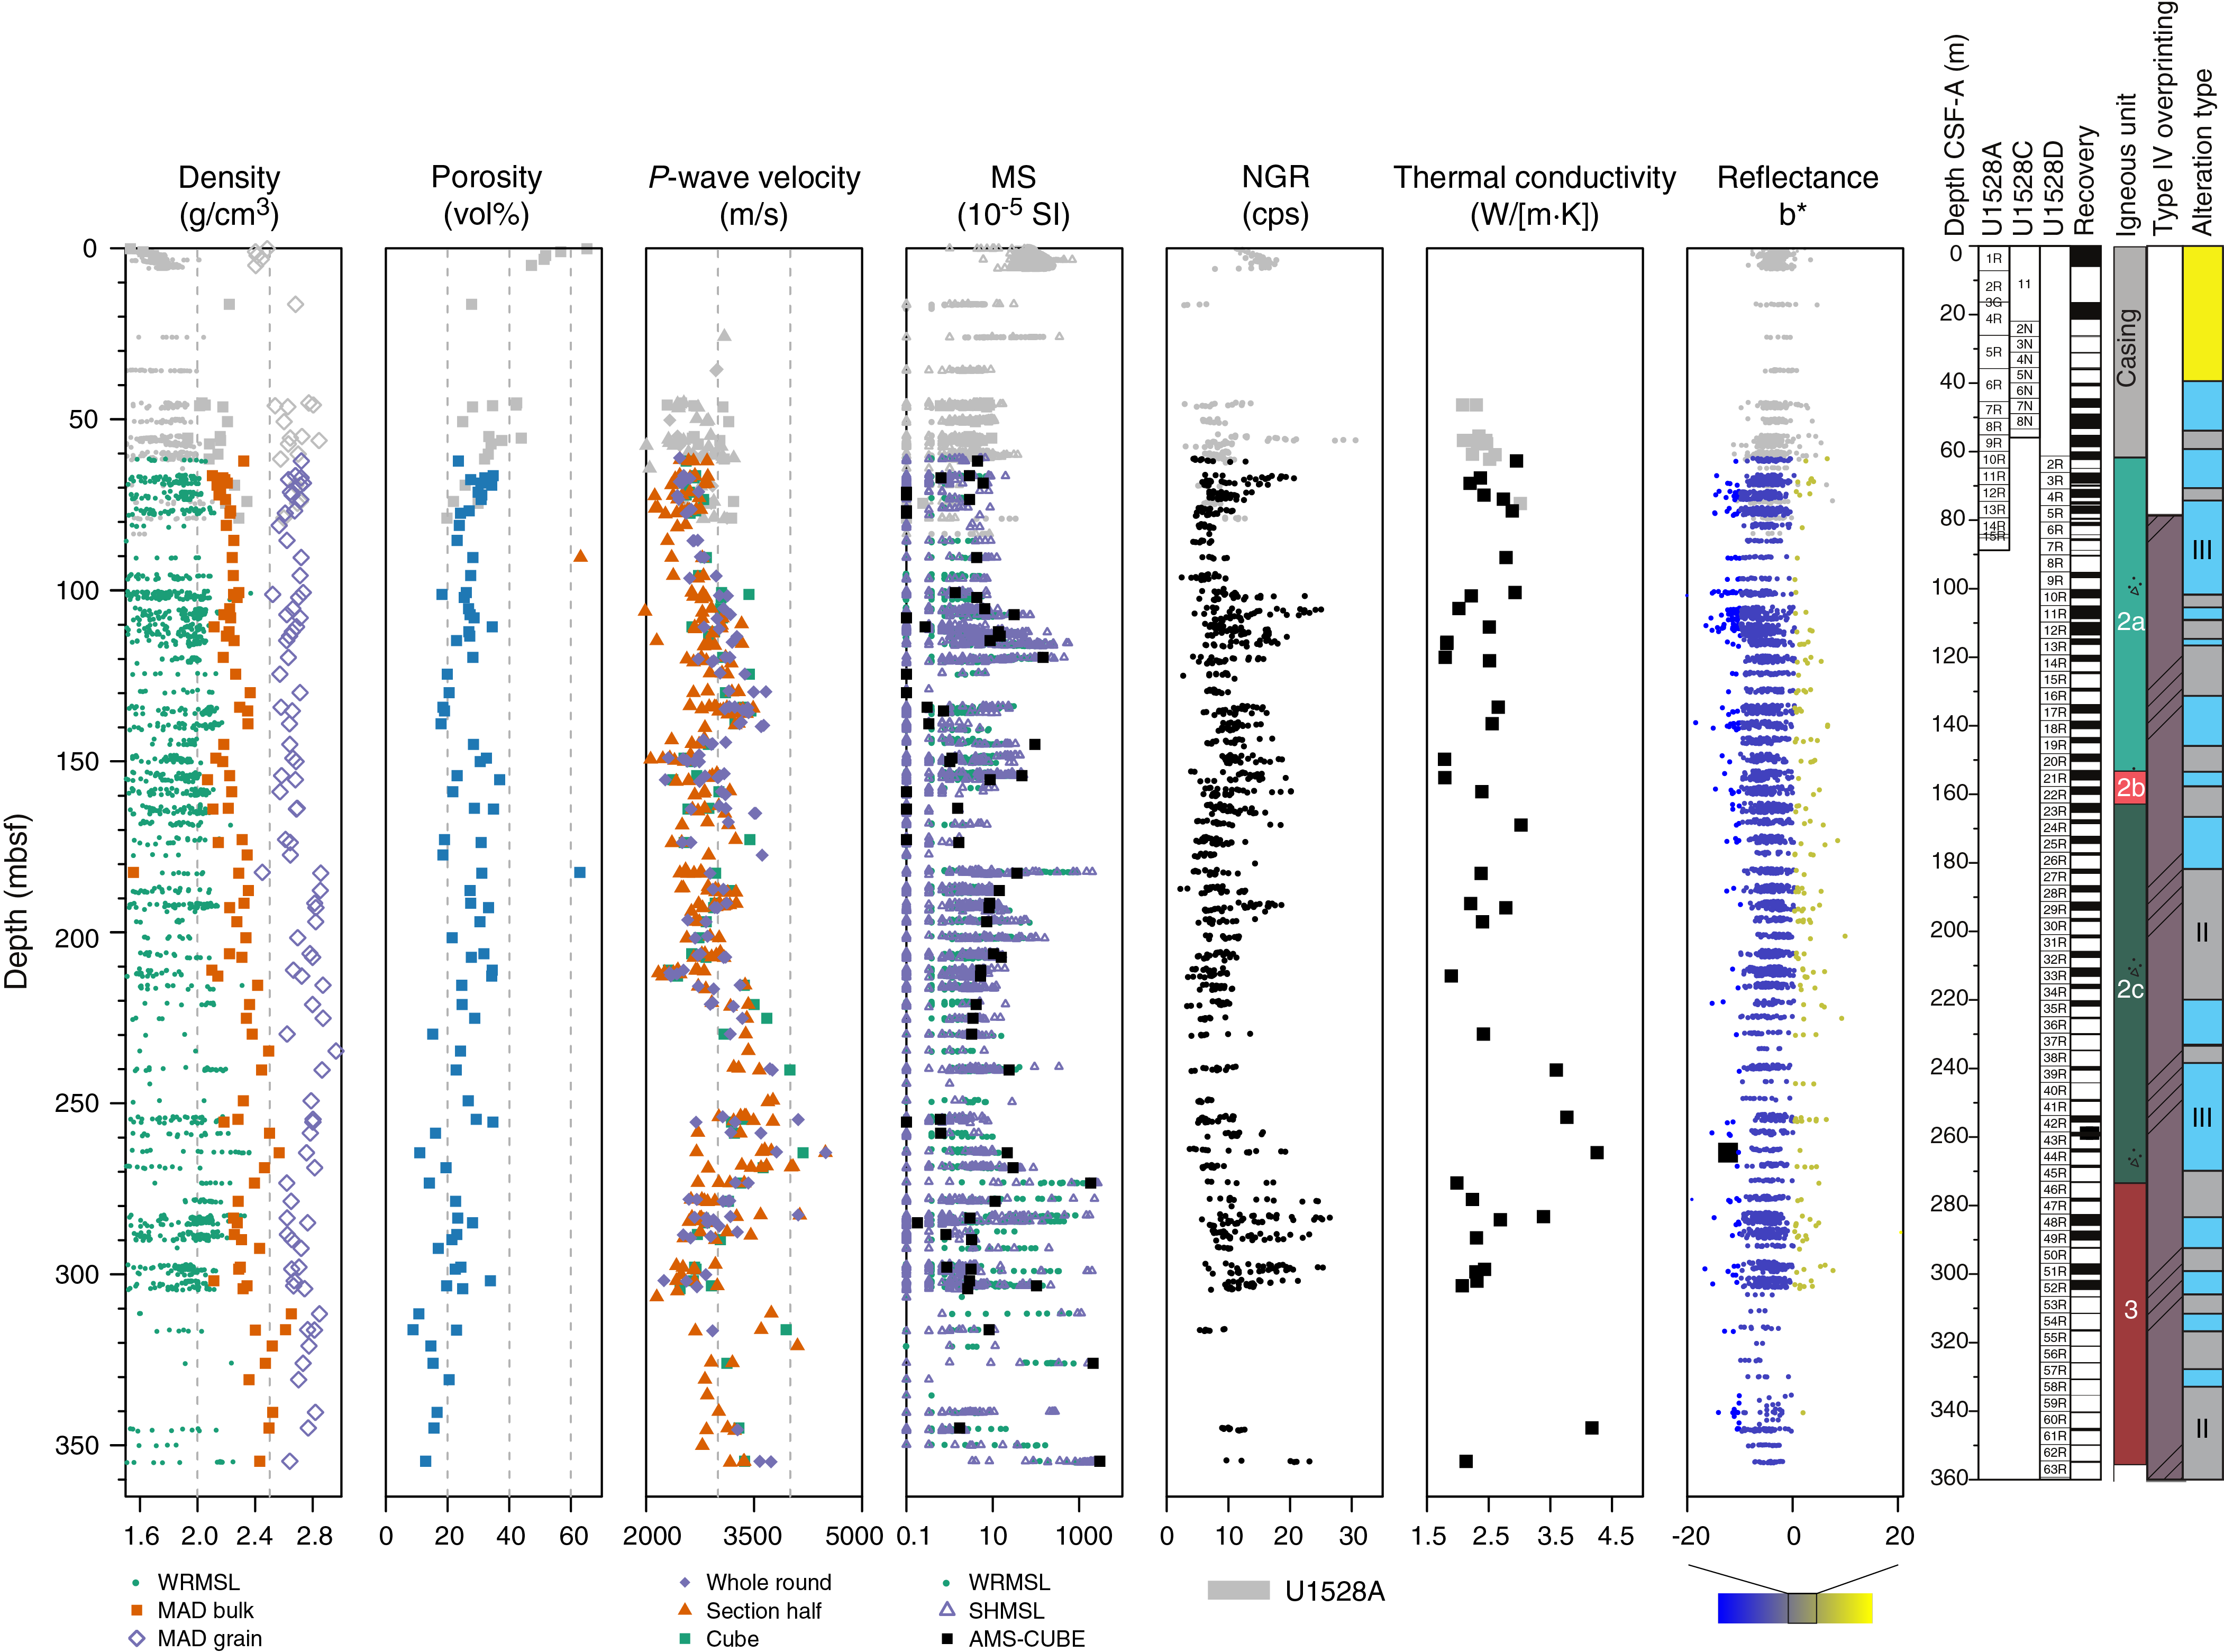
Figure F66. Physical properties, Hole U1528D.
Density and porosity
Individual porosity and bulk, dry, and grain density values from MAD measurements of discrete samples from Site U1528 are shown in Table T18. Data include 25 samples of sediments and rough clasts and 90 cut cubes. MAD grain density values range from 2.31 to 2.96 g/cm3 and have a mean value of 2.68 g/cm3 (Figures F65, F66). MAD bulk density values range from 1.53 to 2.65 g/cm3 with a mean value of 2.22 g/cm3 (Figures F65, F66). MAD porosity values range from 9 to 65 vol% with a mean value of 28 vol% and vary inversely with bulk density (Figures F65, F66, F67).
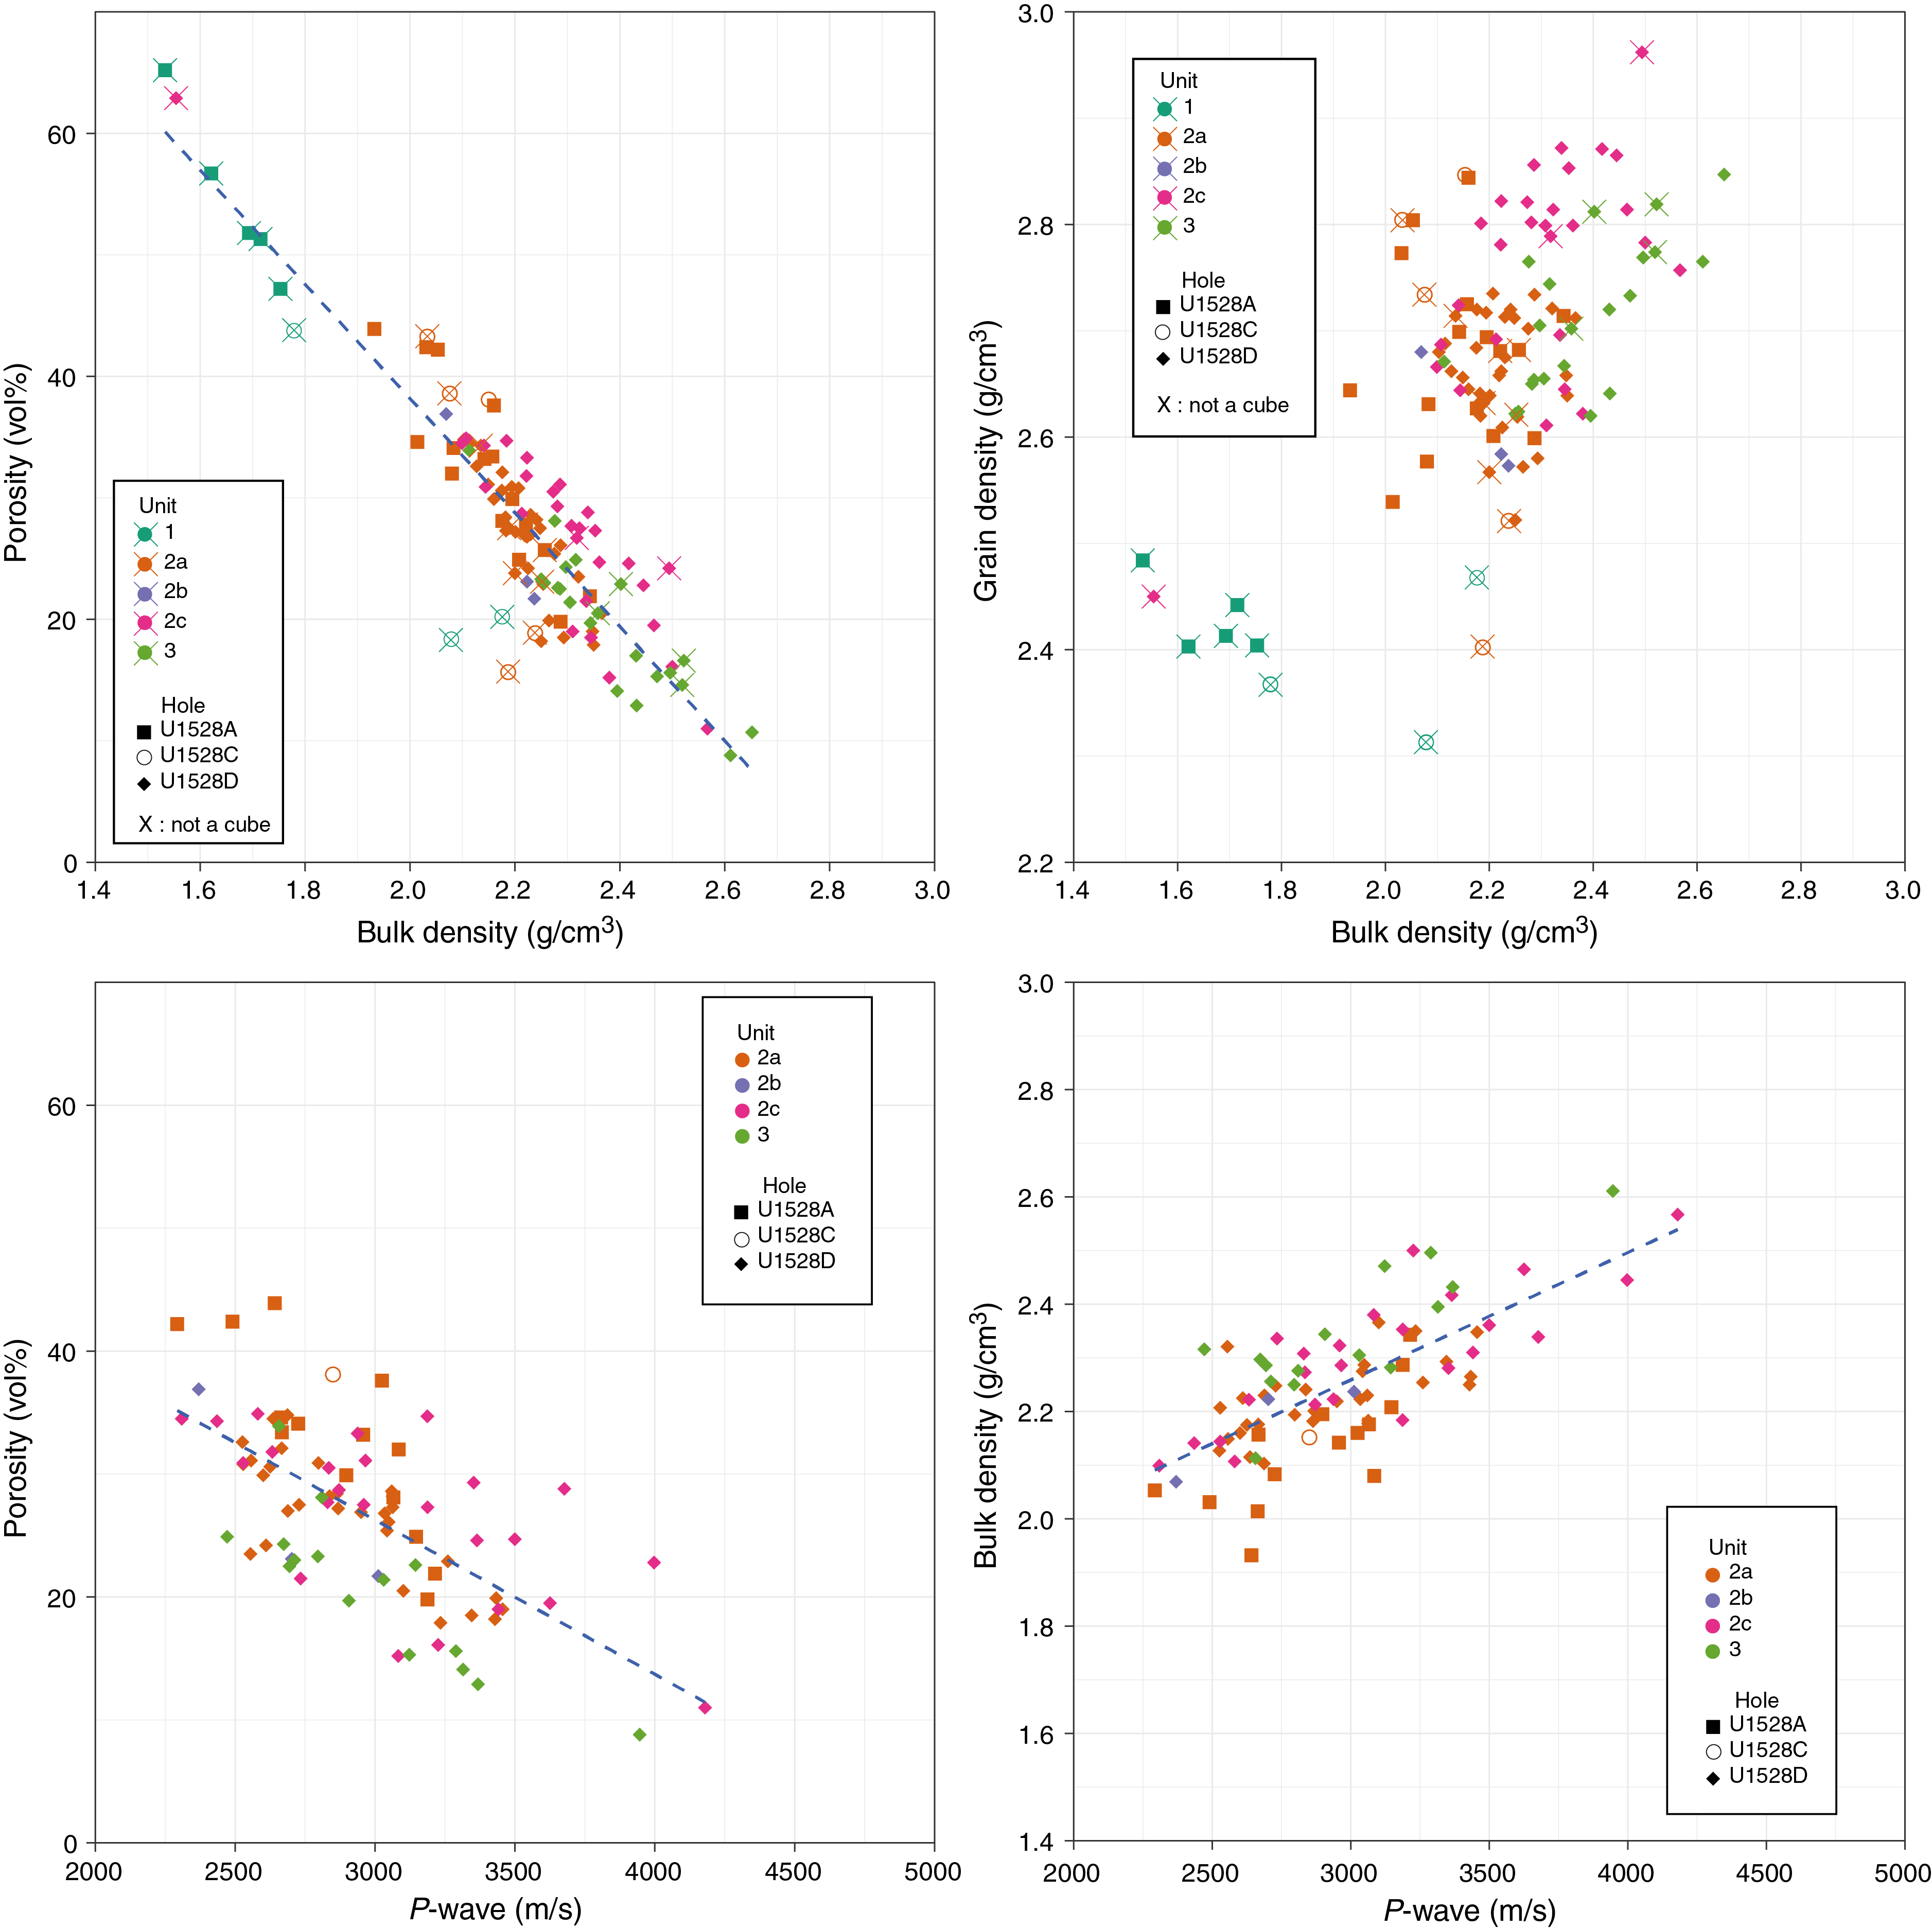
Figure F67. MAD and P-wave velocity, Holes U1528A, U1528C, and U1528D.
Some of the lowest grain density values occur in Core 376-U1528A-1R (0–5.04 mbsf), which contains fresh, unconsolidated volcaniclastics (Igneous Unit 1; Alteration Type I). The five discrete samples taken from this core have a mean grain density of 2.43 g/cm3. Samples from Unit 1 form a separate cluster on the plot of grain density versus bulk density (Figure F67). Below 5.04 mbsf, grain density values are slightly higher and fairly consistent with depth to 177.4 mbsf (mean = 2.65 g/cm3; Cores 376-U1528A-4R through Core 376-U1528D-26R). At this depth, grain density sharply increases and then remains fairly consistent with depth to 268.85 mbsf (mean = 2.78 g/cm3; Cores 376-U1528D-27R through 45R). Below this depth, grain density values initially decrease again to ~2.65 g/cm3 but then exhibit more scatter with depth (Cores 45R–63R). The increase in grain density at ~178 mbsf corresponds to a transition between Alteration Types III and II, and the decrease at ~270 mbsf corresponds to transitions from Alteration Type III to II and from Igneous Unit 2 to 3, respectively. However, there are several other transitions between alteration types and igneous subunits at these depths that do not correspond to grain density variations.
Bulk density is also low in the unaltered, fine-grained volcaniclastics of Igneous Unit 1. It ranges from 1.53 to 1.75 g/cm3, and porosity ranges from 65 to 47 vol%. Bulk density generally increases with depth throughout Igneous Units 1 and 2 to ~269 mbsf, the transition between Alteration Types III and II and Igneous Units 2 and 3, which is also associated with a decrease in grain density. Small variations within this general trend sometimes roughly correspond to the depths of other transitions in alteration types. For example, the decrease in bulk density around 145 mbsf (from 2.35 to 2.18 g/cm3 from Core 376-U1528D-18R through Core 19R; close to mineralogical transition from Alteration Type III to II) and the increase in bulk density around 214 mbsf (from 2.14 to 2.41 g/cm3 from Core 33R through Core 34R; somewhat above the mineralogically determined transition from Alteration Type II to III). Other small variations, however, occur within individual alteration types (e.g., the increase around 256 mbsf from 2.18 to 2.50 g/cm3; Cores 42R and 43R; Alteration Type III). Below 269 mbsf, bulk density values become more scattered and show no clear downhole trend. Porosity is inversely correlated with bulk density (Figure F67), so porosity values mirror bulk density values, and a general decrease with depth is overlain by smaller scale variations.
One significantly different value in grain density, bulk density, and porosity at 182.5 mbsf (Core 376-U1528D-27R) (Figure F66) comes from a sample of soft clay material that has low grain density (2.45 g/cm3), low bulk density (1.55 g/cm3), and high porosity (63 vol%). No XRD data exist for this specific point, but the observed grain density value is consistent with the grain densities of illite and smectite clays that occur in Alteration Type II at this depth, whereas the low bulk density and high porosity are consistent with clay minerals that contain water in their structure.
P-wave velocity
At Site U1528, P-wave velocity measurements included 86 pieces of the whole-round core in x- and y-directions, 302 measurements on section-half cores in the x-direction, and 87 discrete cubes in the x-, y-, and z-directions (Figures F65, F66). Measured P-wave velocity and calculated anisotropy data are given in Table T19.
Measured P-wave velocities are consistent between whole-round, section-half, and cube analyses and range from ~2004 to ~4496 m/s with a mean value of ~2908 m/s. P-wave anisotropy values range from 0% to 18% between the z-direction (vertical) and the x-y plane (horizontal) and between 0% and 37% between the x- and y-axes (Figure F68). There is no discernible trend in anisotropy or preferred fast direction. P-wave velocity exhibits an inverse correlation with porosity (Figure F67). No P-wave measurements could be made for the unconsolidated volcanic materials that make up Igneous Unit 1.

Figure F68. P-wave velocity and anisotropy, Holes U1528A, U1528C, and U1528D.
From the top of Igneous Subunit 2a, P-wave velocity increases with depth and there is a corresponding decrease in porosity from 2300 m/s and 42 vol%, respectively, at 45.84 mbsf (Core 376-U1528A-7R) to 3200 m/s and 18 vol%, respectively, at 139.04 mbsf (Core 376-U1528D-18R). P-wave velocity values then sharply decrease at the base of Subunit 2a to a minimum of ~2400 m/s with a corresponding increase in porosity to 33 vol% at ~149 mbsf (Core 20R). The transition to Igneous Subunit 2b is marked by an increase to ~3000 m/s (Core 21R), but there is no clear change in P-wave velocity at the transition from Igneous Subunit 2b to Subunit 2c at ~160 mbsf (Core 23R). P-wave velocity in Subunit 2c is relatively consistent with depth to 215.3 mbsf (Core 34R). At this depth, which corresponds to a transition zone from Alteration Type II to III, P-wave velocity begins to increase to a maximum value of 4496 m/s at 264.44 mbsf (Core 44R). P-wave velocities drop to ~3000 m/s at the top of Igneous Unit 3 and continue to decrease to a minimum of ~2500 m/s by ~300 mbsf. Overall, although some variations correspond to boundaries of igneous units or alteration types, several changes in igneous units and alteration types have no discernible relationship to P-wave velocity.
Magnetic susceptibility
MS values for Holes U1528A and U1528C are shown in Figure F65, and those for Hole U1528D are shown in Figure F66. MS data include Whole-Round Multisensor Logger (WRMSL) MSL measurements on whole-round cores, Section Half Multisensor Logger (SHMSL) point magnetic susceptibility (MSP) measurements on working halves, and bulk MS measurements on discrete cubes (see Paleomagnetism). SHMSL MSP data are in good agreement with bulk MS data for discrete cubes. MSP values have a mean of 25 × 10−5 SI but span three orders of magnitude and have a maximum value of 2718 × 10−5 SI. For Igneous Unit 1, the mean value is 51 × 10−5 SI and the maximum value is 692 × 10−5 SI at 3.3 mbsf (Core 376-U1528A-1R). However, the unconsolidated nature of the volcaniclastics in this unit means that these values are likely to underestimate the true range. This maximum value for Site U1528 occurs at 273.2 mbsf in Section 376-U1528D-46R-1 at the transition from Igneous Unit 2 to 3, which is somewhat coincident with a change of alteration type (from Type III to II). Throughout the site, other observed peaks in MS (≥1000 × 10−5 SI) all occur in intervals of Alteration Type II (e.g., ~182, ~299, and ~354 mbsf).
Natural gamma radiation
NGR measurements are summarized in Figures F65 and F66. A visual comparison of counts per second with the quality of core recovery indicates that the range of NGR values obtained largely reflects intervals of low or fragmented recovery. Therefore, qualitative comparisons of NGR values are made only between intervals that contain coherent pieces longer than 20 cm, which limits the comparison to 4 pieces from Hole U1528A, 1 piece from Hole U1528C, and 40 pieces from Hole U1528D. These 45 pieces have NGR values that range from 6 to 31 counts/s with a mean value of 14 counts/s. The maximum value of 31 counts/s occurs at ~56 mbsf (Section 376-U1528A-9R-1) in Igneous Subunit 2a and Alteration Type I. Another NGR peak of 27 counts/s was observed at 284 mbsf in Section 376-U1528D-48R-1 in Igneous Unit 3 and Alteration Type III. These two core sections with significant NGR counts per second were selected for additional 18 h of NGR analyses to estimate relative abundances of different radiogenic isotopes from relative peak heights in NGR spectra. High counts per second observed in Piece 6 from Section 376-U1528A-9R-1 (Subunit 2a; Alteration Type II) appear to be associated with a lower 40K to 226Ra ratio than Piece 7b from Section 376-U1528D-48R-1 (Unit 3; Alteration Type III) (Figure F69). Overall, however, no clear association between alteration types and NGR counts per second was measured for this subset of coherent samples.
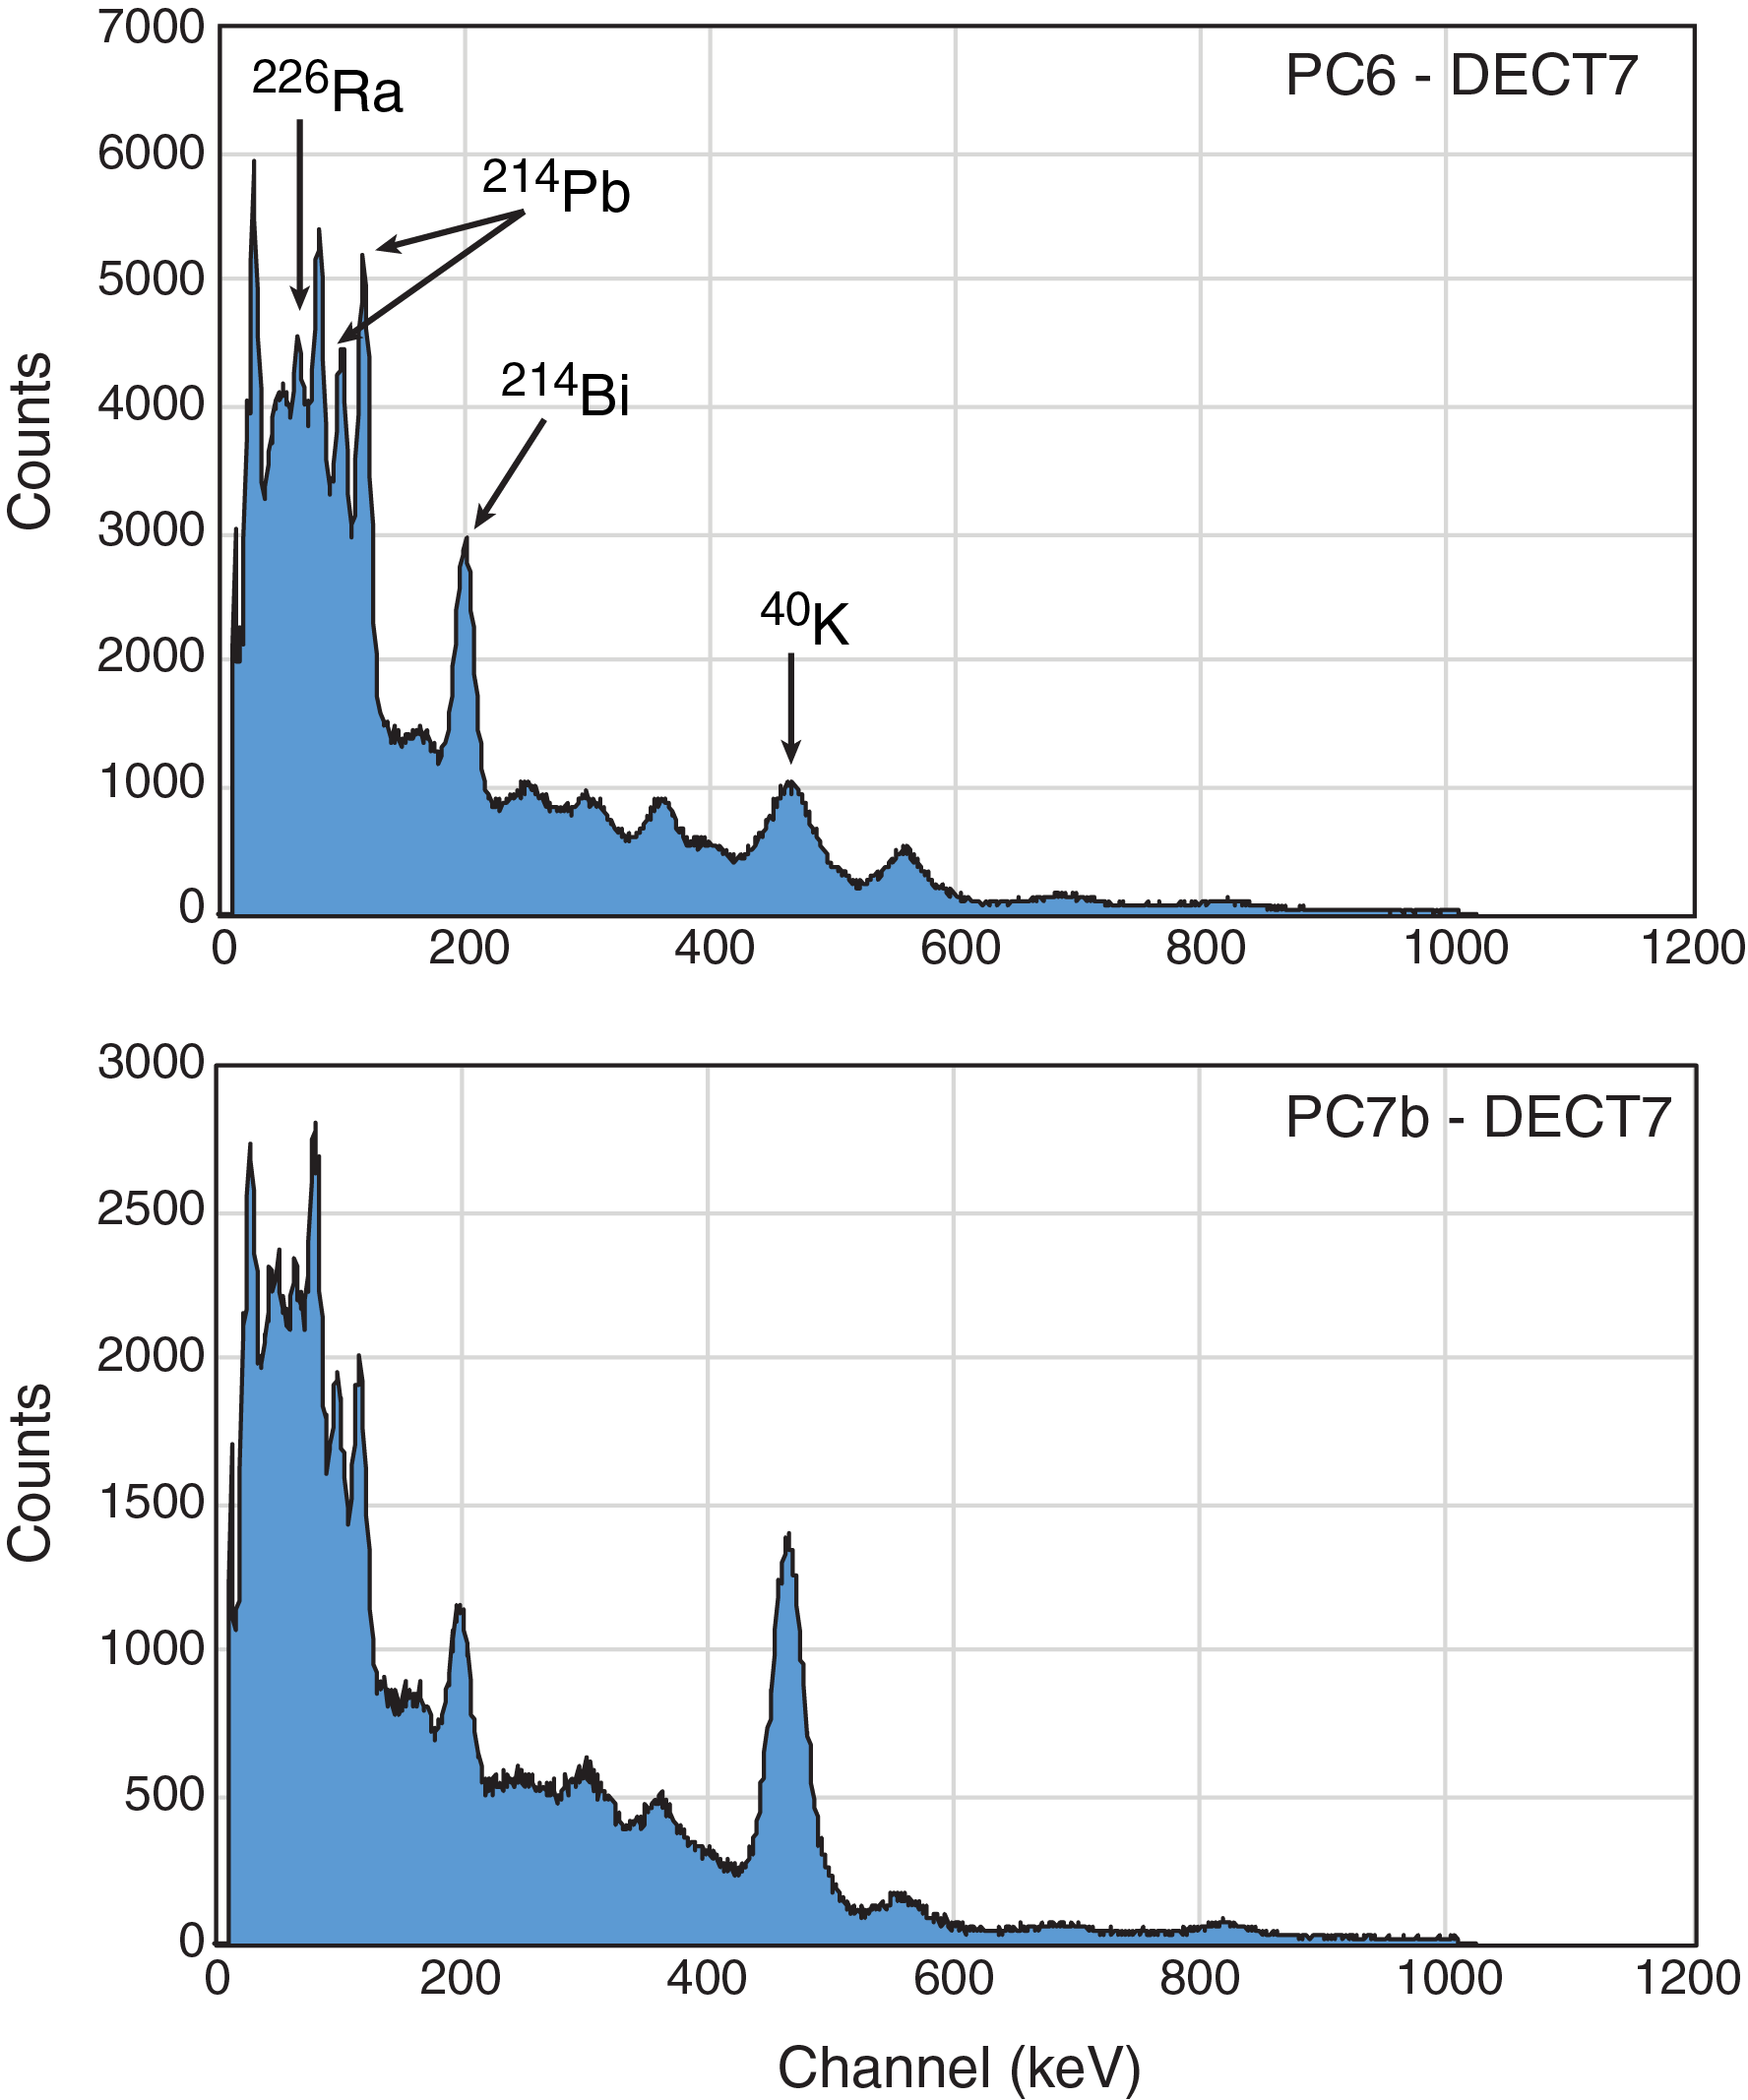
Figure F69. NGR analyses, Holes U1528A and U1528D.
Thermal conductivity
At Site U1528, thermal conductivity was measured on 50 samples considered representative of variations in lithology and/or alteration types (Figure F70; Table T20). Measurements range from 1.79 to 4.17 W/(m·K) with an average of 2.44 W/(m·K) for the site (Figures F65, F66). No measurements were made on the loose volcaniclastics in Igneous Unit 1. In Unit 2, data are generally between ~2 and ~3 W/(m·K) and show no systematic variation with depth to ~200 mbsf. Below this depth, thermal conductivity values increase with depth from 1.89 W/(m·K) (Core 376-U1528D-33R; 212.78 mbsf) to 3.77 W/(m·K) (Core 42R; 254.10 mbsf) at the base of Igneous Subunit 2c. Thermal conductivity values then decrease sharply to 1.99 W/(m·K) at 273.32 mbsf (Core 46R), which corresponds to the top of Igneous Unit 3. Data from Unit 3 display a wide range of values, including the highest value recorded at this site (4.17 W/[m·K] at 344.94 mbsf; Core 61R). Overall, there is no clear correlation between thermal conductivity and alteration type.
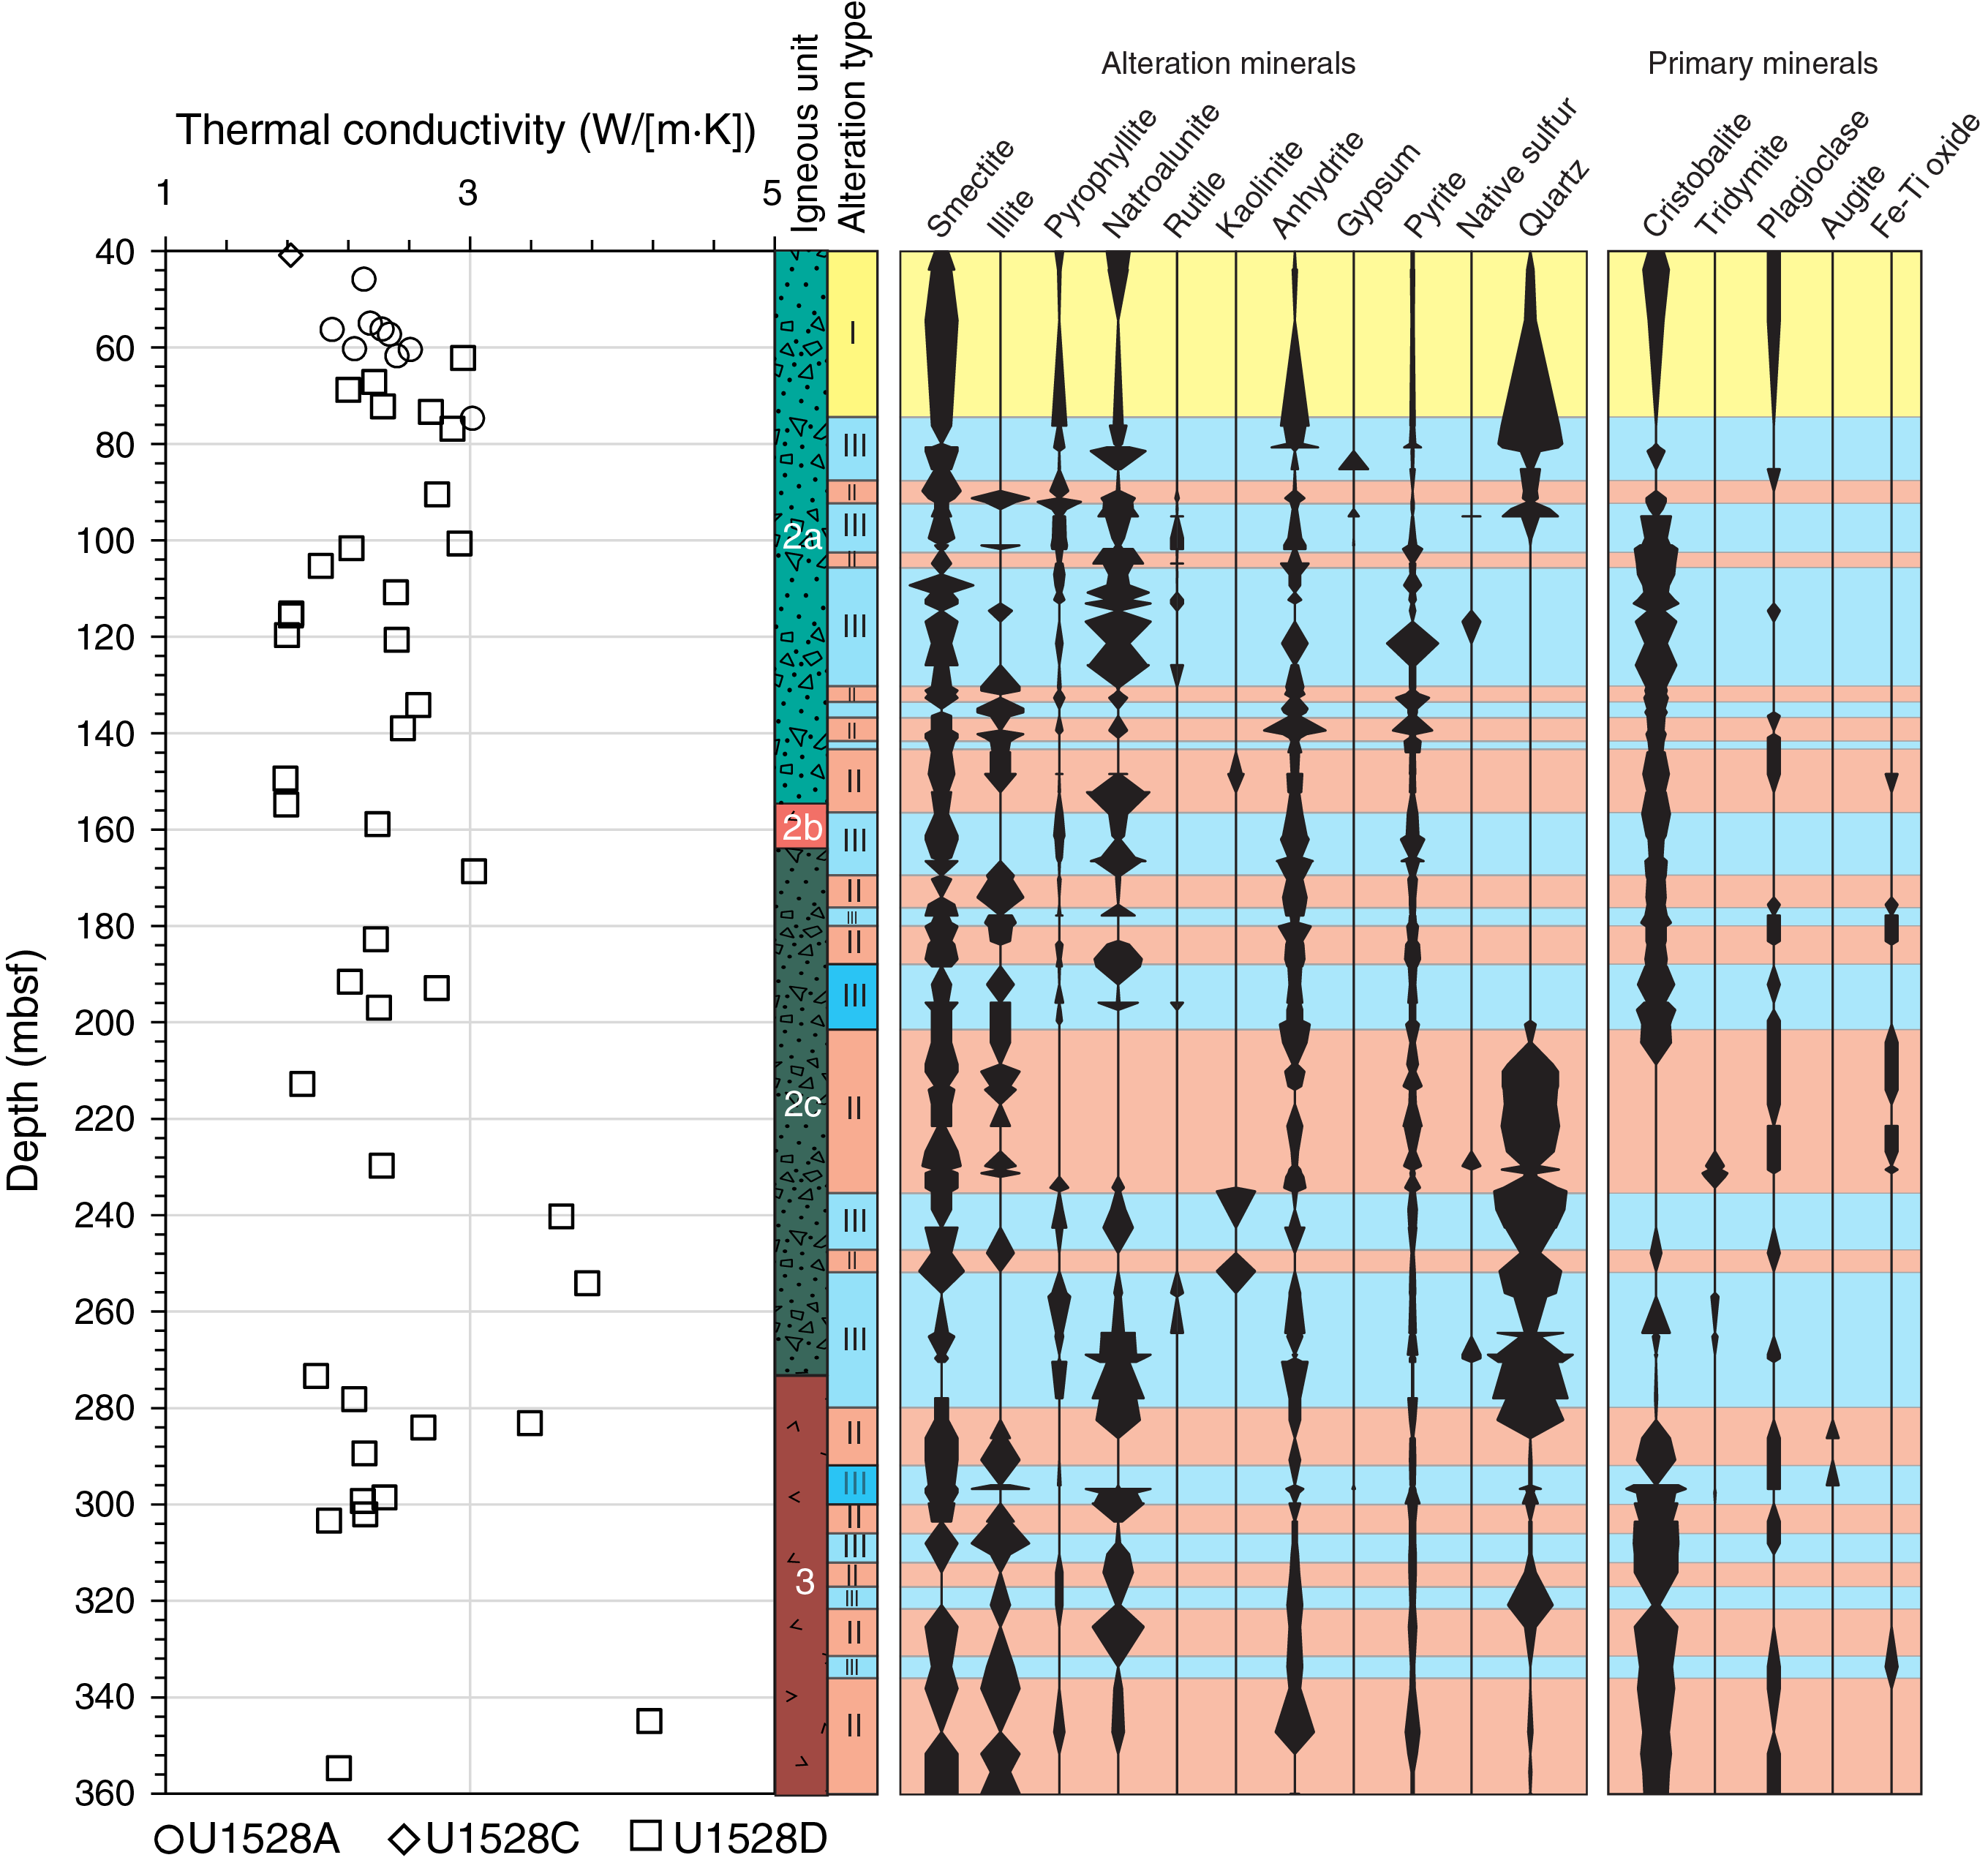
Figure F70. Thermal conductivity.
Reflectance colorimetry
The reflectance colorimetry data obtained with SHMSL do not show significant correlations with alteration types or igneous units. Igneous Unit 1 has a slightly narrower range of b* values than Igneous Units 2 and 3, which have a slightly wider range that incorporates both higher and lower b* values (Figure F66). Below ~300 mbsf in Unit 3, b* values decrease to <0.
Integration of observations
Material recovered from Site U1528 spans several different eruptive deposits of dacitic composition that have been overprinted by variable degrees of fluid-rock interactions (see Igneous petrology and volcanology, Alteration, and Geochemistry). Comparison of physical property data sets with identified igneous units and alteration types at Site U1528 shows that some variations are correlated and others are not. These inconsistencies in correlation suggest that not all variation in physical properties is controlled by the original igneous lithology and/or degree and extent of alteration and that some physical property variations may be characterizing other aspects of the structure and hydrothermal system of the Cone site.
Cores recovered from Igneous Unit 1 correspond to Alteration Type I and are characterized by higher porosity values and lower bulk density values. This unit also contains some of the lowest grain density values at this site, which may reflect a slightly higher glass content than in other more crystallized lava or altered units (see Igneous petrology and volcanology). MS values are likely to be underestimated because of unconsolidated material but are consistent with expected values for unaltered dacitic volcanic materials. These characteristic physical properties are similar to those for fresh volcaniclastics recovered from Sites U1527, U1529, and U1531.
In Igneous Units 2 and 3, the alteration style alternates between Alteration Type II and Alteration Type III. Although identification of these transitions is limited by the sampling resolution of XRD analyses (see Alteration), it is clear that many intervals of Alteration Type II correspond to peaks in MS. This suggests that material in Alteration Type II intervals contains more magnetically susceptible minerals. In Alteration Type II rocks, primary plagioclase has not been totally replaced by secondary alteration minerals, whereas in Alteration Type III rocks, primary plagioclase has been totally replaced. Using the presence of remaining primary plagioclase as a proxy for the freshness of the rocks, this may indicate that the observed peaks in MS in Alteration Type II are caused by significant contributions from primary magnetic minerals such as titanomagnetite (see Alteration and Paleomagnetism). These values are close to those of the fresh dacitic volcanics of Unit 1. In Alteration Type III rocks, lower MS values may be explained by a smaller presence of the original magnetic mineral such as titanomagnetite (see Paleomagnetism) with more pronounced alteration to less magnetic minerals such as pyrite or rutile (see Alteration).
Other physical property data sets show no clear correlation with alteration types in Igneous Units 2 and 3. Continuous downhole measurements of NGR, however, do indicate a correlation between Alteration Type II and an increase in NGR signal from 40K, which could be associated with the increase in K-bearing illite in this assemblage (see Alteration and Downhole measurements). Piece 7 of Section U1528D-48R-1, identified by physical property measurements as having a relatively high NGR contribution from 40K, is also from Alteration Type III (Table T3). The apparent lack of NGR correlation with alteration type in the physical property data set is therefore primarily a consequence of the limited recovery of coherent material for comparison.
Other physical property data sets distinguish a clear boundary between Igneous Units 2 and 3 at ~273 mbsf, which corresponds to a decrease in grain density, bulk density, P-wave velocity, and thermal conductivity and an increase in porosity. This boundary also corresponds to the depth of an observed increased abundance in fractures (see Structural geology) and a temperature anomaly in the borehole (see Downhole measurements). This correspondence suggests that the variation in these physical properties at this depth could reflect the transition between primary igneous lithologies (from volcaniclastics to more massive lava), as well as a structurally controlled permeable zone.
Although the boundary between Igneous Units 2 and 3 is thus clearly defined in physical property data sets, boundaries between individual subunits in Unit 2 are less clearly defined. Subunit 2a is characterized by an increase in bulk density and P-wave velocity and a decrease in porosity with depth. This trend changes, however, at ~145 mbsf with a sharp shift to lower bulk density and P-wave velocity and higher porosity, which remain relatively consistent with depth to ~220 mbsf. This transition in physical property data at ~145 mbsf therefore occurs ~5 m above the currently identified boundary between Subunits 2a and 2b and has no variation at the boundary between Subunits 2b and 2c. In part, this may reflect the diffuse nature of the identified boundaries for Subunit 2b (see Igneous petrology and volcanology). In this context, the sharp increase in grain density at ~177 mbsf and brief appearance of clay material at ~182 mbsf may indicate some more distinct transition between the material in Subunits 2b and 2c. It is notable, however, that the interval of relatively consistent bulk density, porosity, and P-wave velocity between ~145 and ~220 mbsf corresponds to the interval in which H2S gas was detected during core recovery (see Operations). The upper boundary corresponds to the depth of a temperature anomaly in the borehole (see Downhole measurements), and both the upper and lower boundaries correspond to depths of higher fracture density, wider range in observed vein dip, and increased vein thickness. Thus, the bulk density, porosity, and P-wave velocity data sets may be picking out a zone related to the active hydrothermal system that cuts across identified igneous units and alteration types.
Below ~220 mbsf in Igneous Subunit 2c, bulk density and P-wave velocity increase and porosity decreases with depth to the bottom of the unit. There is also an increase in measured thermal conductivity values in the same depth interval. Thermal conductivity measurements of saturated porous samples will be lower than nonporous equivalents, so it is possible that the observed decrease in porosity contributes to this trend. However, it is likely that the distribution of minerals with high thermal conductivities will exert stronger control. A detailed analysis of mineral compositions and distributions in each measured thermal conductivity sample will be necessary to investigate the cause of this trend in thermal conductivity.
In Igneous Unit 3, data exhibit scattering, partly as a consequence of poor core recovery. Overall, bulk density and porosity appear to indicate an increase in density with depth. This possibly reflects the original density profile of the primary igneous material in this unit.
Downhole measurements
A series of downhole measurements and sampling was performed in Hole U1528D after completion of drilling operations (Table T21): (1) temperature monitoring while coring with temperature strips and capillary thermometers located in a housing on top of the core barrel; (2) three runs of the ETBS memory tool to collect temperature logs; and (3) three runs of the Kuster FTS, the first with a 1000 mL sampling chamber, which was subsequently lost in the hole, followed by two successful runs with a 600 mL chamber. In addition, a suite of measurements was acquired with the HTTC. The timing and sequence of deployments relative to the circulation pumping rates, times, and volume are shown in Figure F71.
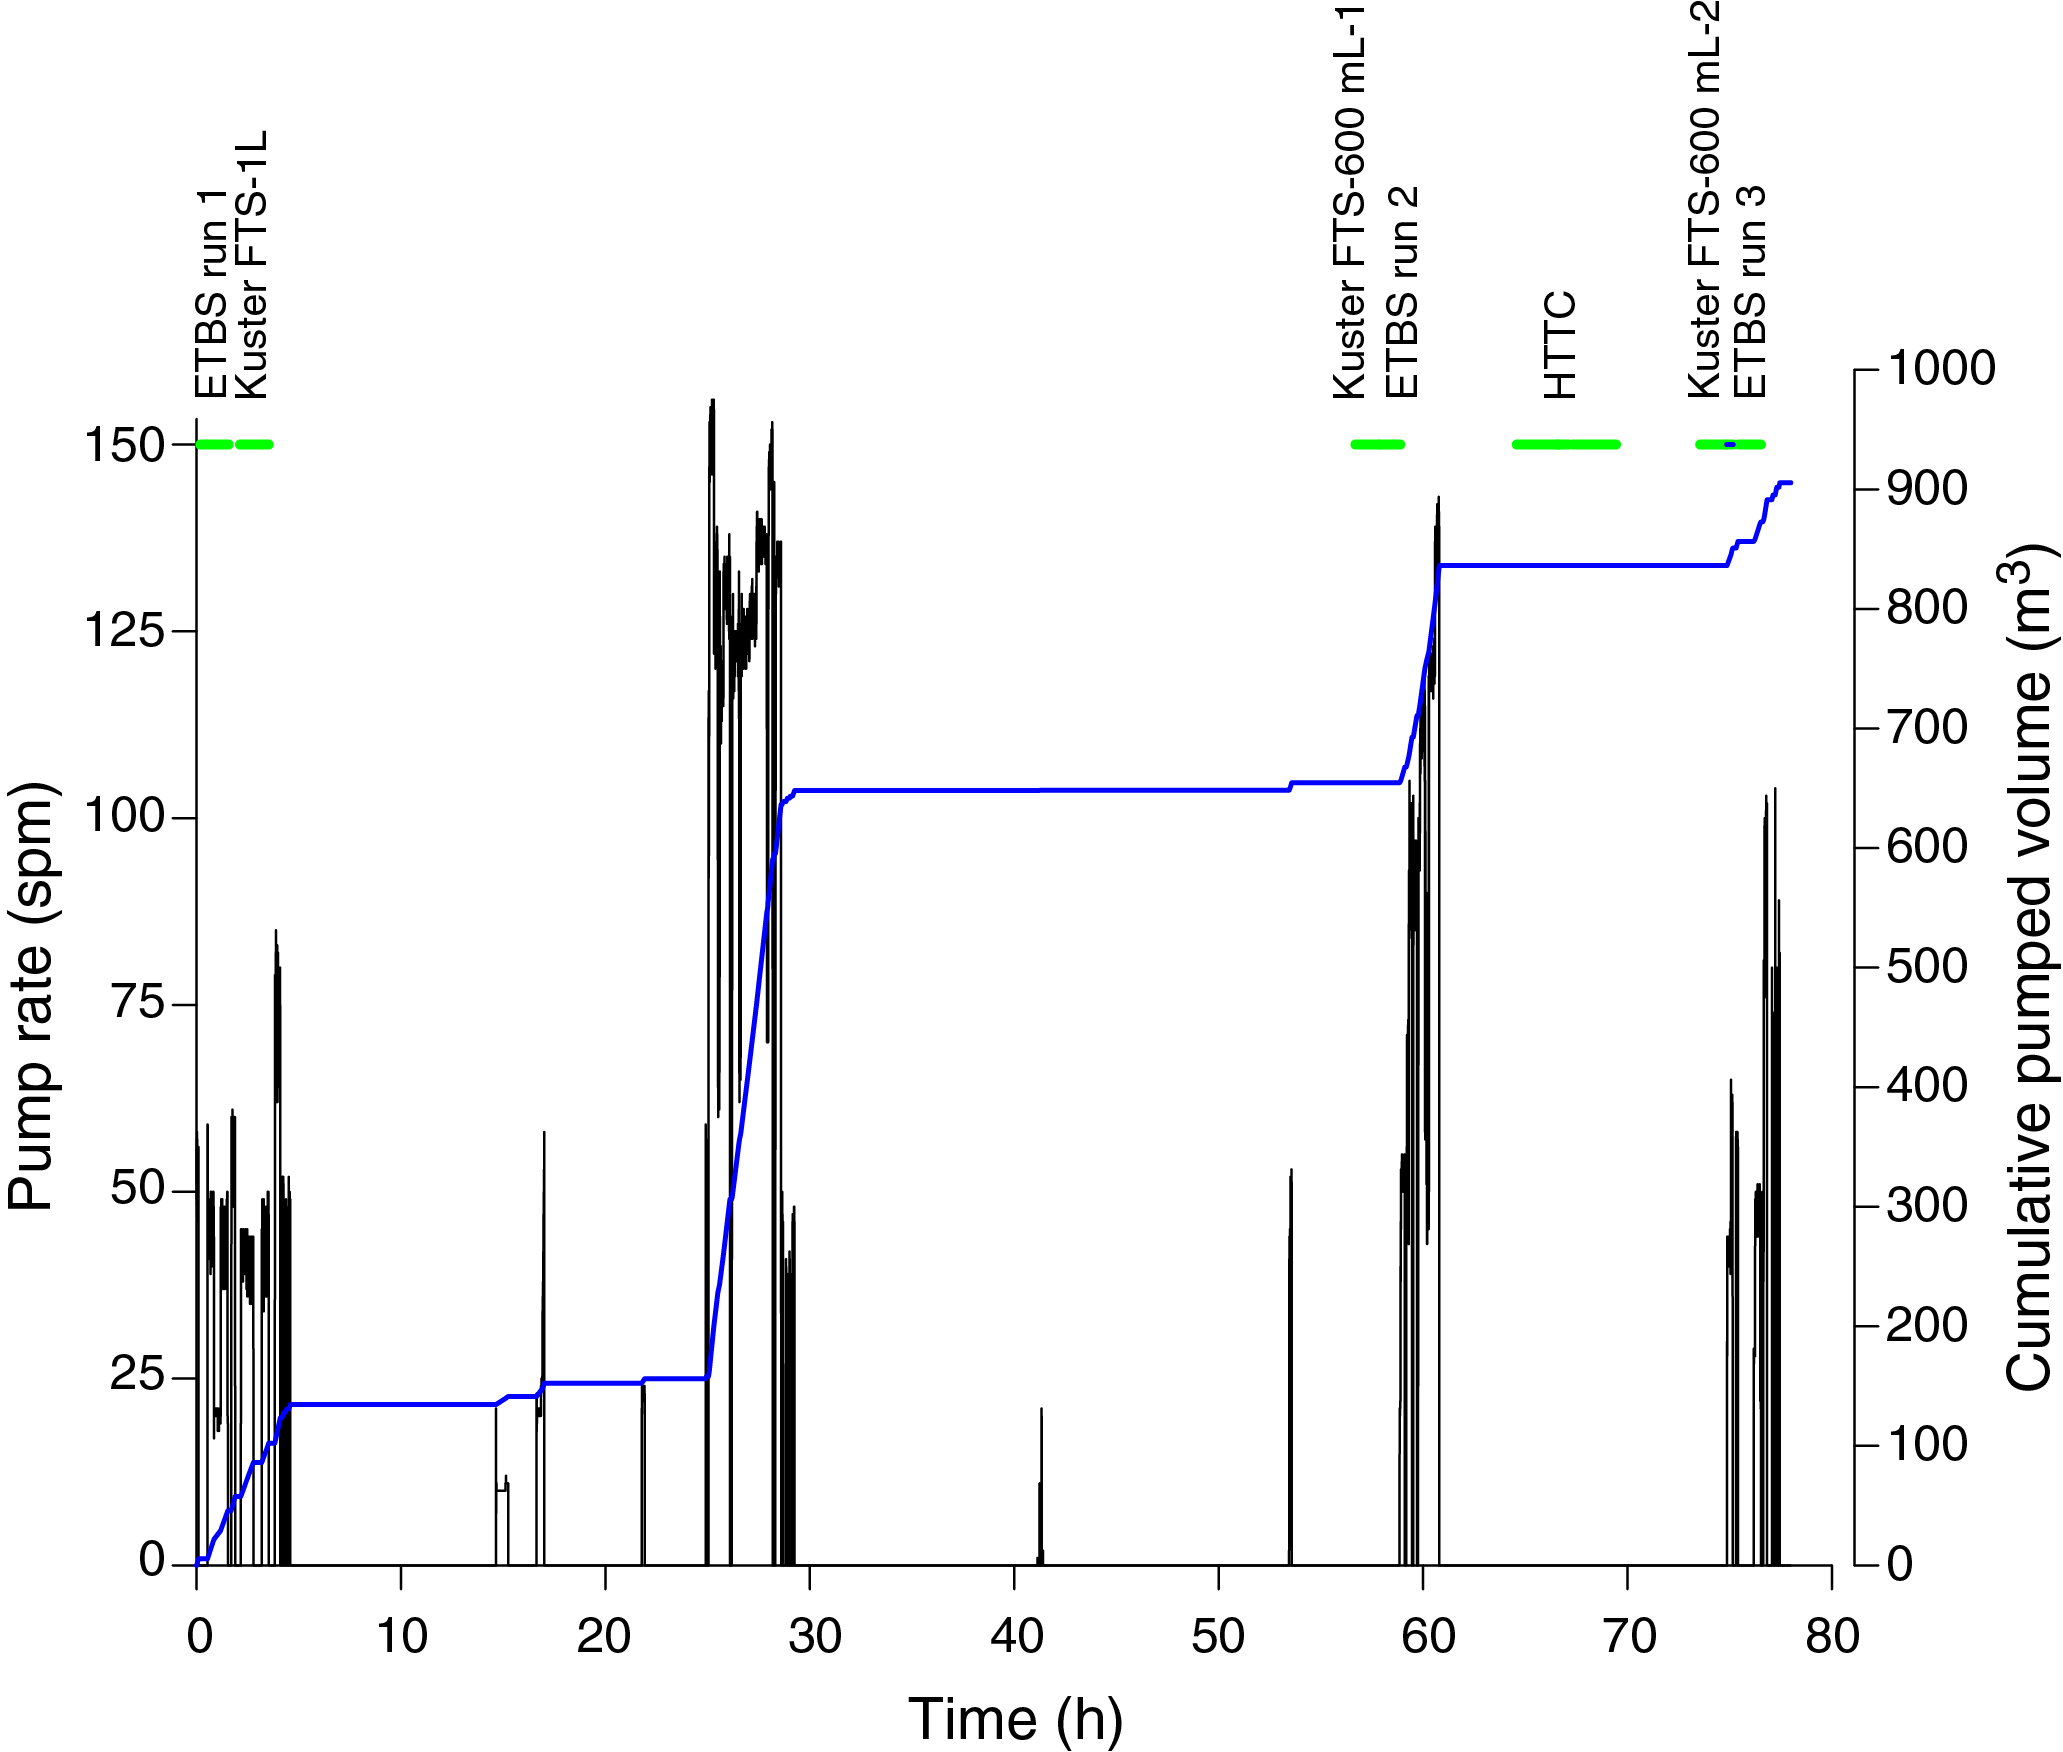
Figure F71. Downhole measurements and sampling operations, Hole U1528D.
On 1 July 2018, 23 days after the first set of measurements, we returned to Hole U1528D to conduct additional downhole temperature measurements with the ETBS and the Petrospec TCMT and also sampled fluids with the 600 mL Kuster FTS tool (Table T21).
Operations
After retrieving Core 376-U1528D-63R at 359.3 mbsf, the drill string was brought up to 348 mbsf. The ETBS tool was connected to the core line via the newly designed attachment compatible with the Kuster FTS (see Downhole logging operations in the Expedition 376 methods chapter [de Ronde et al., 2019a]), which allows deployment through the throat of the RCB system bit. The ETBS was run in the drill string while circulating seawater at 40 strokes/min to 312 mbsf (Figure F71). The pumping rate was then lowered to 20 strokes/min, which was sufficient to keep the flapper valve of the RCB core barrel open and allow the ETBS to be lowered through the flapper valve to 357 mbsf, below the zone where pumped fluids circulate. After 15 min of recording temperature at the bottom of the hole, the ETBS was pulled through the flapper valve and up onto the rig floor.
The ETBS run was followed by deployment of the 1000 mL Kuster FTS tool to collect a BF sample. During this operation, the tool thread connection between the 1000 mL Kuster FTS and the core barrel failed, resulting in the loss of this tool in the drill hole (see Operations).
Following one unsuccessful fishing run to recover the 1000 mL Kuster FTS tool, the decision was made to conduct further sampling and downhole logging prior to continuing efforts to clean out the hole. The 600 mL Kuster FTS tool was thus lowered to 279 mbsf in the drill string, which had been deployed with a logging bit, and tagged in debris at 292 mbsf after ~28 h without circulation (Table T21). This run successfully sampled BFs (see Geochemistry). This was followed by an ETBS run with 10 min spent at 279 mbsf.
With the end of the drill string at 50.3 mbsf, or about 10 m above the casing shoe (60.3 mbsf), the HTTC tool string (see Downhole logging operations in the Expedition 376 methods chapter [de Ronde et al., 2019a]) was run in wireline mode with a live surface readout 4 h after the last cold-water (seawater and freshwater) circulation. The 14.9 m long tool string recorded bulk density and photoelectric effect (HLDS), spectral (HNGS) and total count (EDTC) natural gamma ray, and fluid temperature (LEH-MT). Three passes were made: a downhole pass with the one-arm caliper closed (yielding an invalid HLDS) and two uphole passes. The first downhole pass reached 332 mbsf, where a bridge in the hole was encountered. After three unsuccessful attempts at passing that bridge, the downhole pass was concluded at 332 mbsf. The two uphole passes were conducted with the HLDS arm open, thereby yielding caliper and HLDS density measurements. In total, the measurements below seafloor occurred over a 2 h period, whereupon the maximum temperature increased by 24.5°C at ~310 mbsf and by varying amounts at other depths.
After the logging string was retrieved and the drill string was advanced in the hole to 323 mbsf without circulating, a second 600 mL Kuster FTS tool fluid sample was collected from 313 mbsf. Detection of 18–20 ppm of H2S upon recovery of the sample at the rig floor required the drill string to be flushed with cold seawater immediately before running the ETBS. Hence, the temperature recorded during this third ETBS run was strongly affected by this flushing. The ETBS spent 15 min at 313 mbsf.
After each 600 mL Kuster FTS tool run, and especially after the second one, the exterior of the tool turned from its natural metallic gray color to a green-black color, reflecting the high temperature, strongly acidic conditions (minimum pH = 1.8) (see Geochemistry), and high H2S concentrations in the BFs. The flask of the ETBS did not change color, but the steel nose of the tool was slightly black.
On 1 July 2018, we returned to Hole U1528D to complete additional downhole measurements and sampling in the hole above the BHA that was lost on 13 June. Hole U1528D was reentered, and the drill string was lowered to 23 mbsf. The ETBS was deployed and tagged the bottom of the BHA left in the hole at 195 mbsf. The tool was then brought up to 185 mbsf for a 10 min long static measurement. This was followed by a 600 mL Kuster FTS tool run that was unsuccessful because of grit locking the valves open and thus preventing the sampler from closing. Circulation started once the 600 mL Kuster FTS tool was at the seafloor on the uphole log. The TCMT was then run in to only 22 mbsf to keep the data loggers within the drill string while circulating. The bottom of the tool containing the sensors was thus 8 m below the end of pipe. Upon recovery, it was found that the data logger housing had leaked and the lithium batteries had imploded.
A second attempt was made to collect a BF sample with the 600 mL Kuster FTS tool, and a fluid sample was collected from 160 mbsf even though the upper valve was partially blocked by fine debris. After application of Teflon tape to the thread of the data logger housing, the TCMT was run to 160 mbsf while cold seawater was circulated to the bottom of the string at 23 mbsf. Although the data loggers were rated to only 40°C, they provided realistic temperature readings. One of the sensors, however, deteriorated at depth and subsequently gave some erratic readings. Temperature strips suggest that temperatures reached between 120° and 150°C inside the data logger housing. The downhole measurements at this hole concluded with an attempt to recover a second fluid sample, which was again unsuccessful due to grit blocking the valves. Furthermore, the metal valve springs disintegrated upon tool disassembly, likely in response to H2S embrittlement due to exposure to high concentrations of this gas and low pH in the fluid.
Temperature
The six temperature logs acquired in Hole U1528D were obtained using two different tools following differing episodes of cold seawater circulation (Table T21). In the presence of a high thermal gradient and when employing a 60–65 m/min logging speed, the ETBS measurements tended to underestimate temperatures in the downward logging passes and conversely overestimate them in the upward logging passes. The LEH-MT temperature logs acquired at 10 m/min in the open hole are closer to the real fluid temperatures than those acquired with the ETBS. The delay in equilibration of the ETBS is clearly observed at the seafloor where the uphole ETBS measurements are significantly higher than the downhole measurements (120° and 80°C for Runs 2 and 3, respectively) (Figure F72). However, the ETBS data are still very useful because they provide insight into how quickly the formation conditions of the hole heated up over 10–15 min periods where the temperature was measured statically at the deepest point reached during each logging run (this operation is known as a “heat-up” profile).
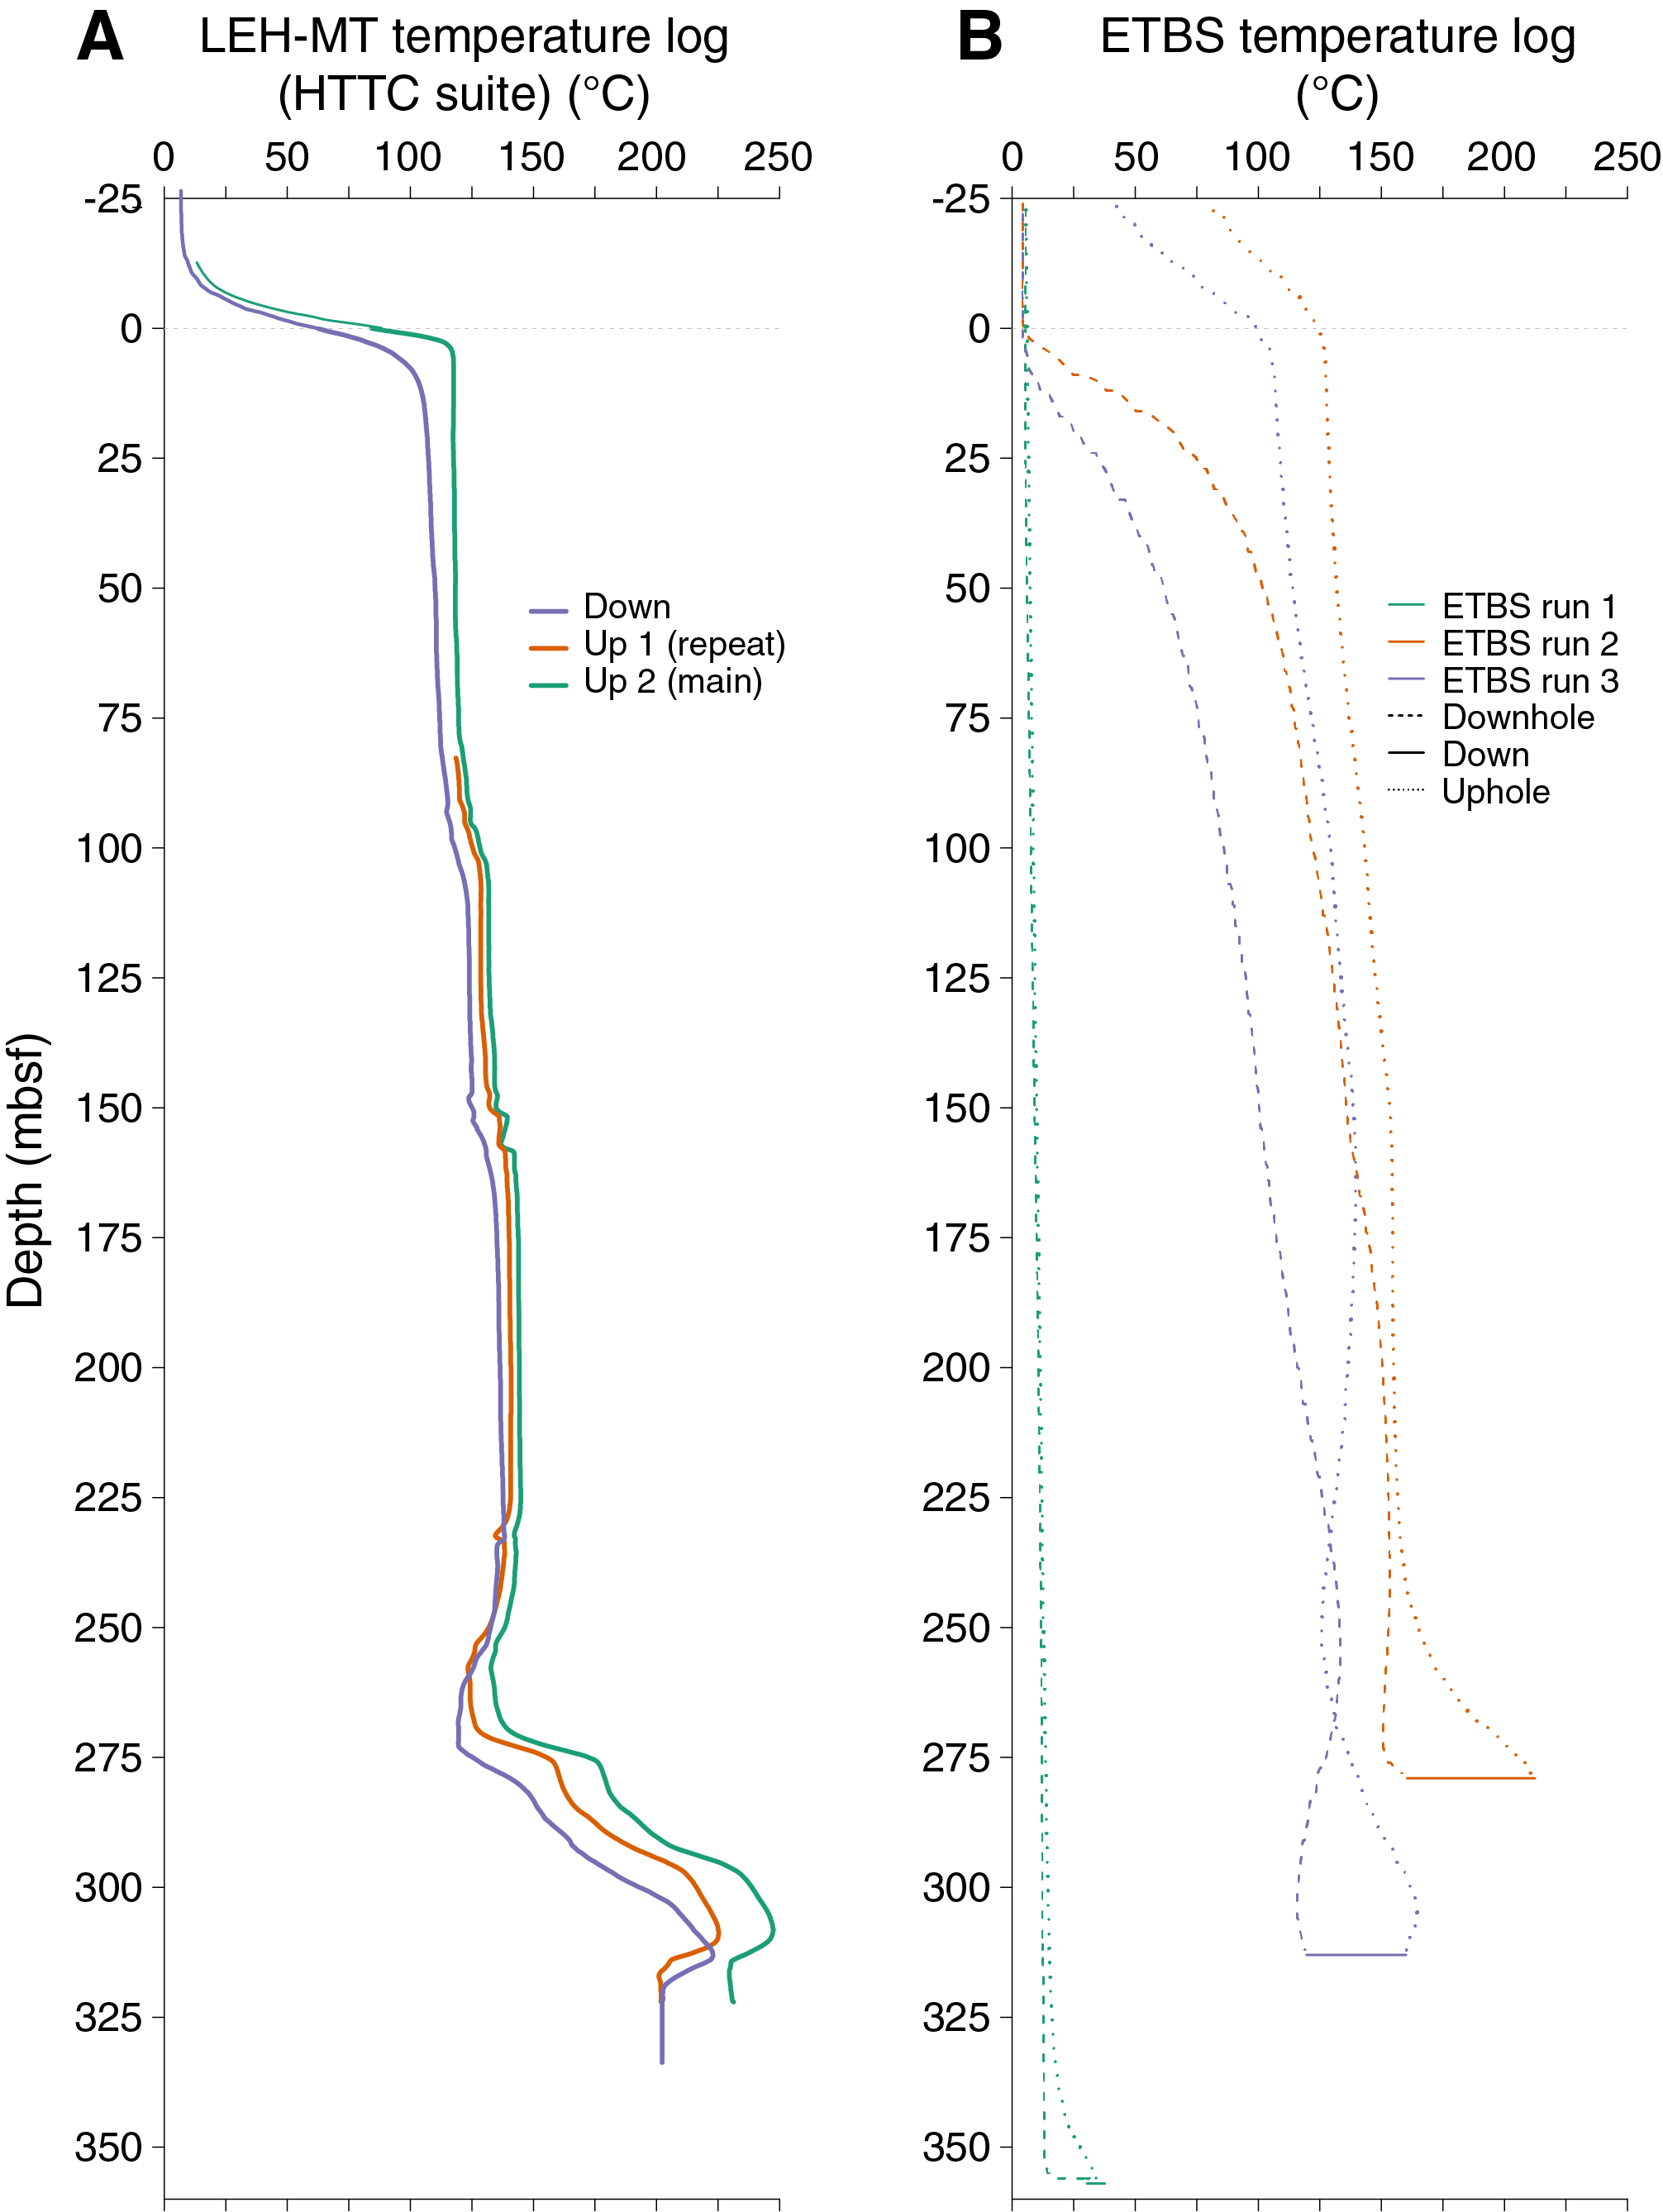
Figure F72. Temperature measurements, Hole U1528D.
The LEH-MT temperature logs show four zones of temperature increase: slight increases at ~100 and 150 mbsf and larger increases at 275 and 295 mbsf (Figure F72). There is a temperature reversal (i.e., a decrease in temperature with depth) at ~250–260 mbsf. In between, the temperature profile is isothermal (i.e., constant temperature with depth). Over the 2.5 h of HTTC logging (between the first downhole and second uphole passes), the temperature increased at all depths, including by ~8°C in the isothermal zones and by 24.5°C between 270 and 310 mbsf. These increases show that the downhole temperature had not reached equilibrium during the logging runs and that the hole was still heating up.
Near the seafloor is a 35 m thick mixing zone between the upwelling hot fluids from the deeper parts of the hole and ambient seawater (Figure F72). The LEH-MT measurements show a dramatic increase in temperature between 20 m above seafloor (7°C) and 13 mbsf (105°C for the downward logging pass; 117.6°C for the second upward pass). Upwelling of hot fluids from the hole was further confirmed by subsea camera footage during reentry into the hole that showed a gray plume emanating from the reentry funnel.
ETBS Run 1 shows a gradual increase in temperature with depth in the drill string from 5°C at the seafloor to 14°C at 359 mbsf (Figure F72). Once the tool was beyond the RCB bit, the temperature increased quickly to 30°C and then slowly increased from 30° to 35°C over a period of 13 min (0.3°C/min) (Figure F73). This temperature agrees with the temperature strip readings, which did not show evidence for temperatures >37°C while drilling. ETBS Run 2 shows an increase in temperature downhole followed by a stable reading of 212°C during the 8 min spent at 279 mbsf. The increase in temperature observed at the start of the static measurement at 279 mbsf reflects the equilibration of the temperature sensor with the fluid formation. ETBS Run 3 shows a continuous increase in temperature while the tool was being lowered down and an increase from 125° to 160°C (~3°C/min) over the 13 min of measurement at 313 mbsf.
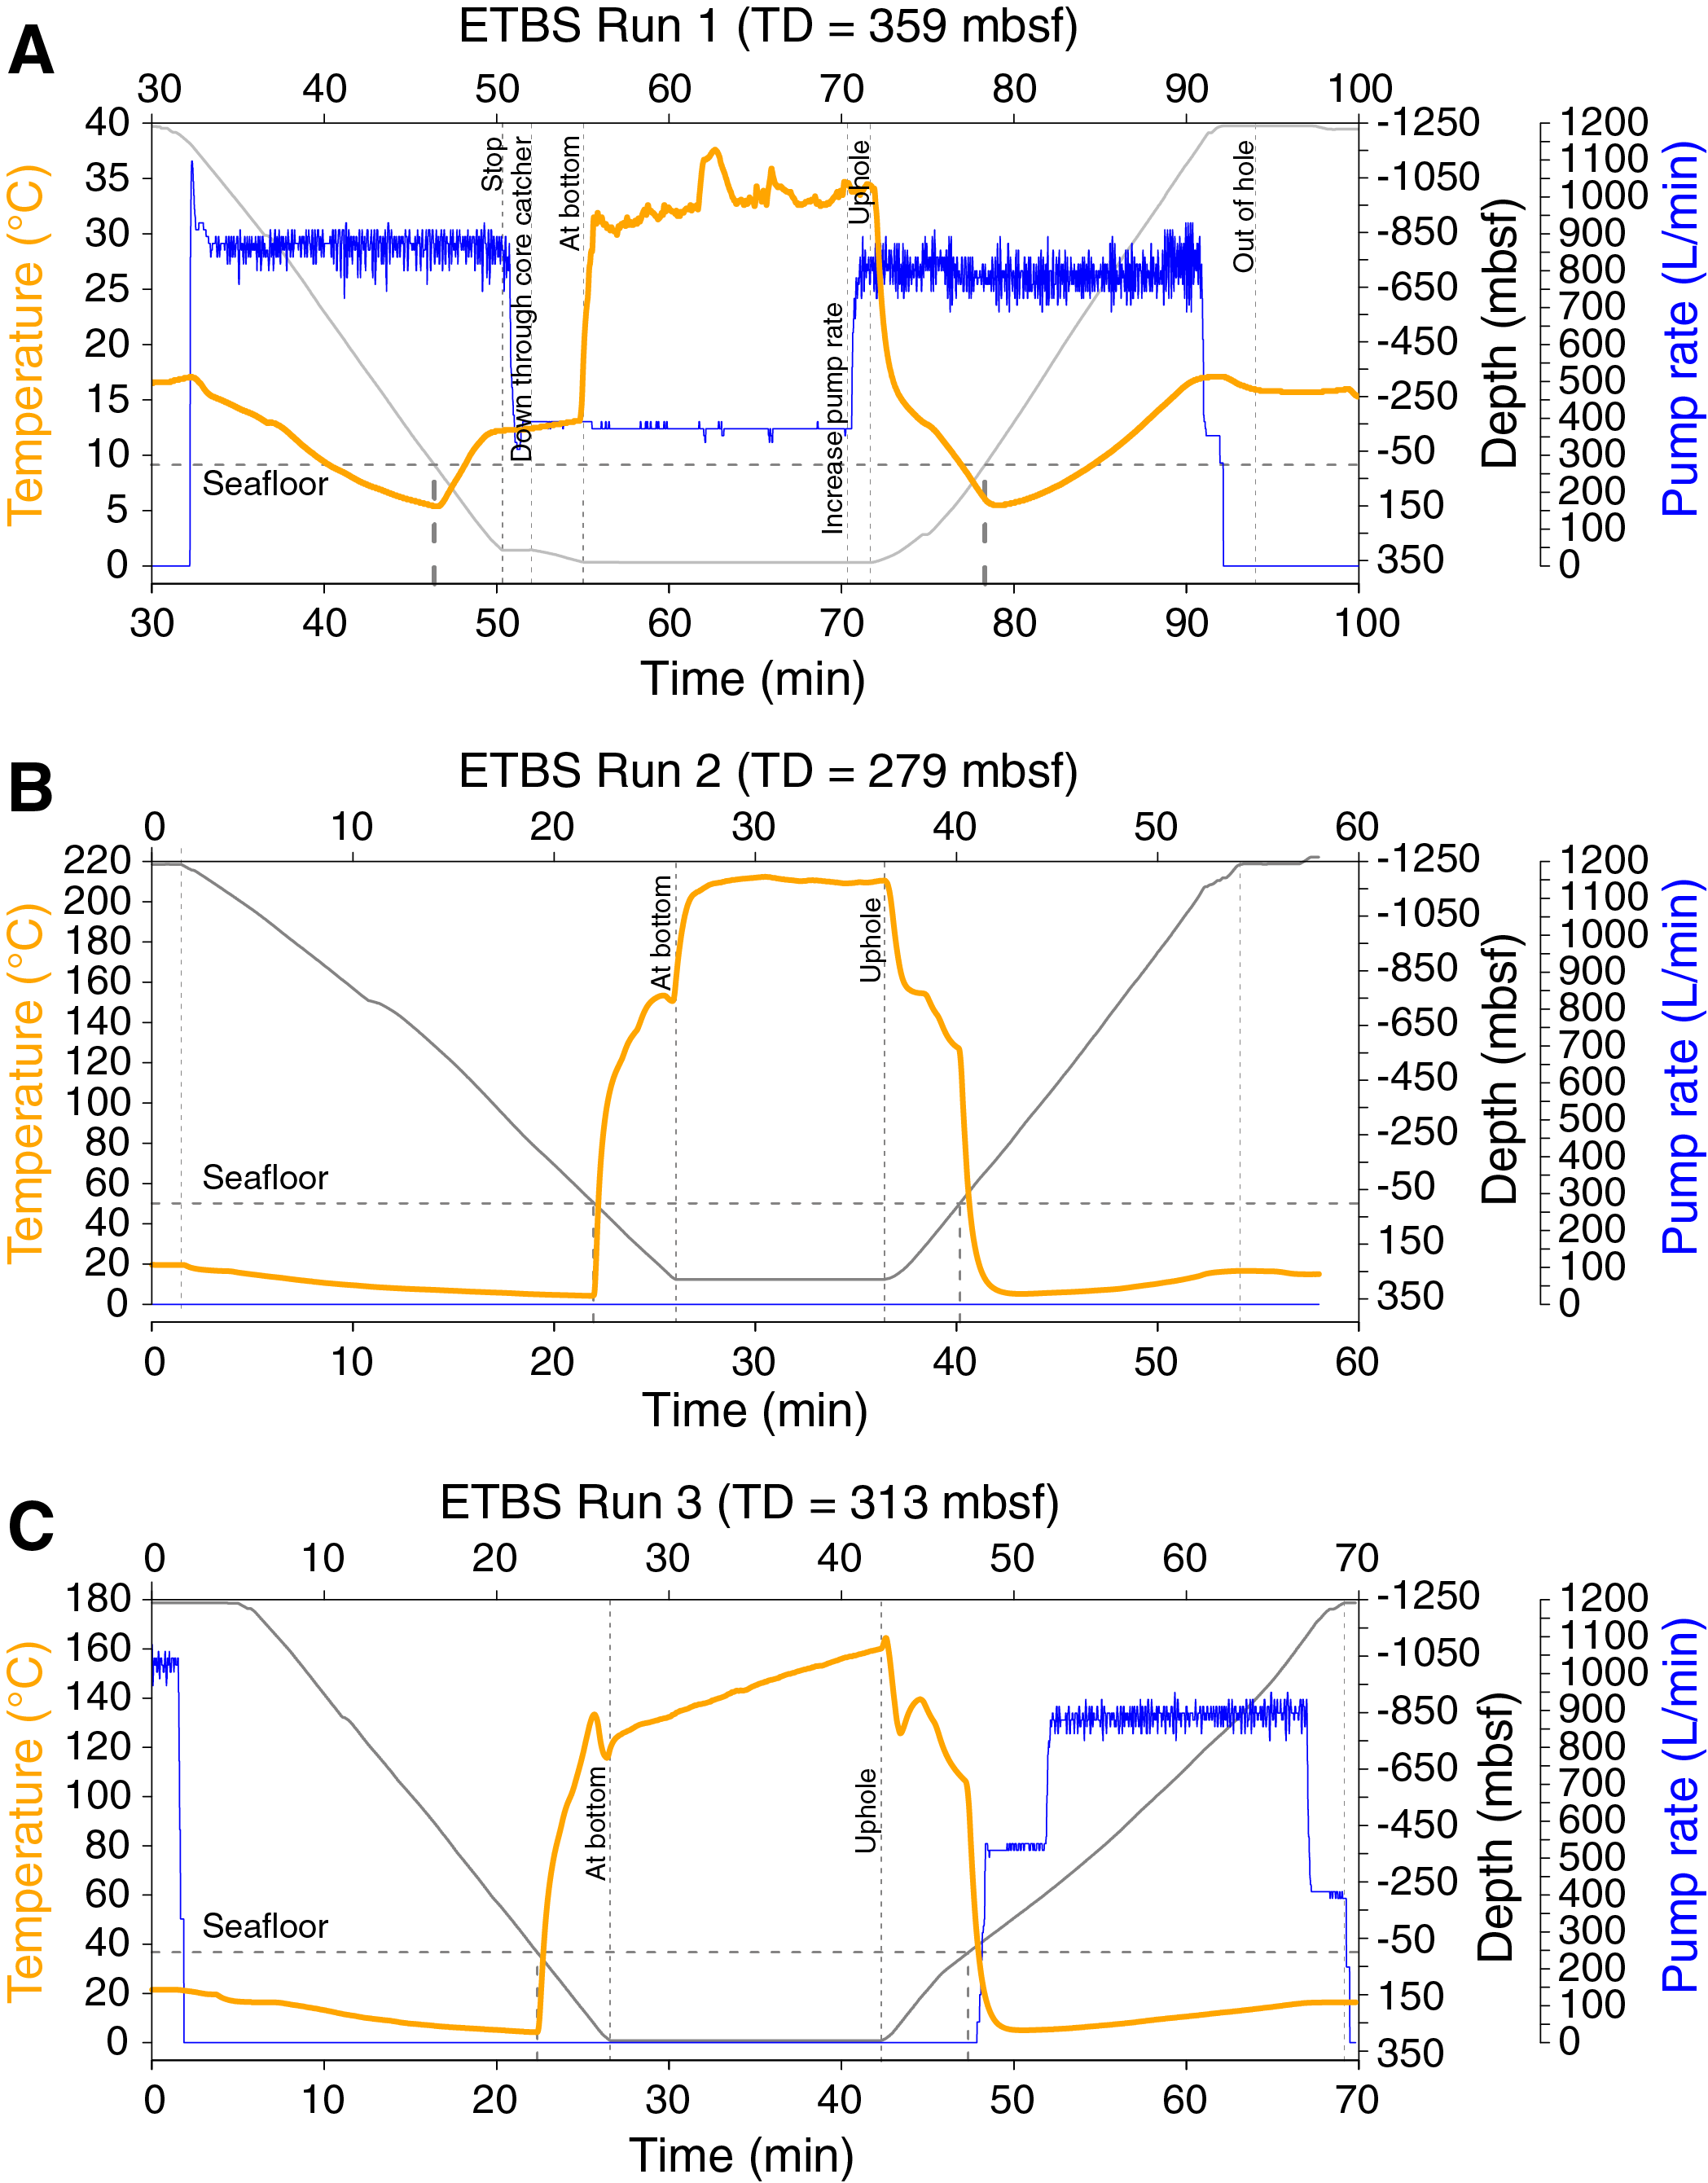
Figure F73. Temperature heat-up profiles.
During downhole measurements on 1 July, the ETBS recorded a stable temperature of 198°C at 185 mbsf during the 10 min of static measurement and showed a strong temperature gradient that increased from 86° to 177°C between 142 and 173 mbsf (average gradient of 3°C/m over this 31 m long interval). The temperature at the depth of the fluid sample (160 mbsf) was 140°C. After 3 h of intermittent ambient seawater circulation to the bottom of the drill string (22 mbsf), the Petrospec TCMT sensors indicated a temperature of 156°C at 168 mbsf. Temperature strips taped on the outside of the 9 m long tool suggest a fluid temperature between 134° and 142°C, which is also the temperature measured by the ETBS at that depth. Thus, the Petrospec TCMT measurements seem to have overestimated the fluid temperature by ~15°C, albeit in conditions which exceeded the operation capabilities of the data loggers.
Formation radiation
Total natural gamma ray logs are consistent between the three runs, ranging between 20 and 55 counts/s (median = 33 counts/s; Figure F74). Most of the peaks in natural gamma ray correlate with increases in K, which exceeds 1 wt% at 110–120, 152–156, 260–265, 272–285, 292–300, and 300–308 mbsf. The Th and U concentrations are noisier because their radiation counts are typically much lower than radiation counts from K. The Th content has a median of 3.2 ppm and exceeds 5 ppm at 290–300 mbsf (maximum = 6.8 ppm). The U content has a median of 1.3 ppm and exceeds 2.5 ppm at 315–325 mbsf (maximum = 6.2 ppm). These increases may be due to the presence of U-bearing minerals at that depth in the formation, or they could be a consequence of U-bearing minerals falling down from upper parts of the hole and accumulating at the bottom.
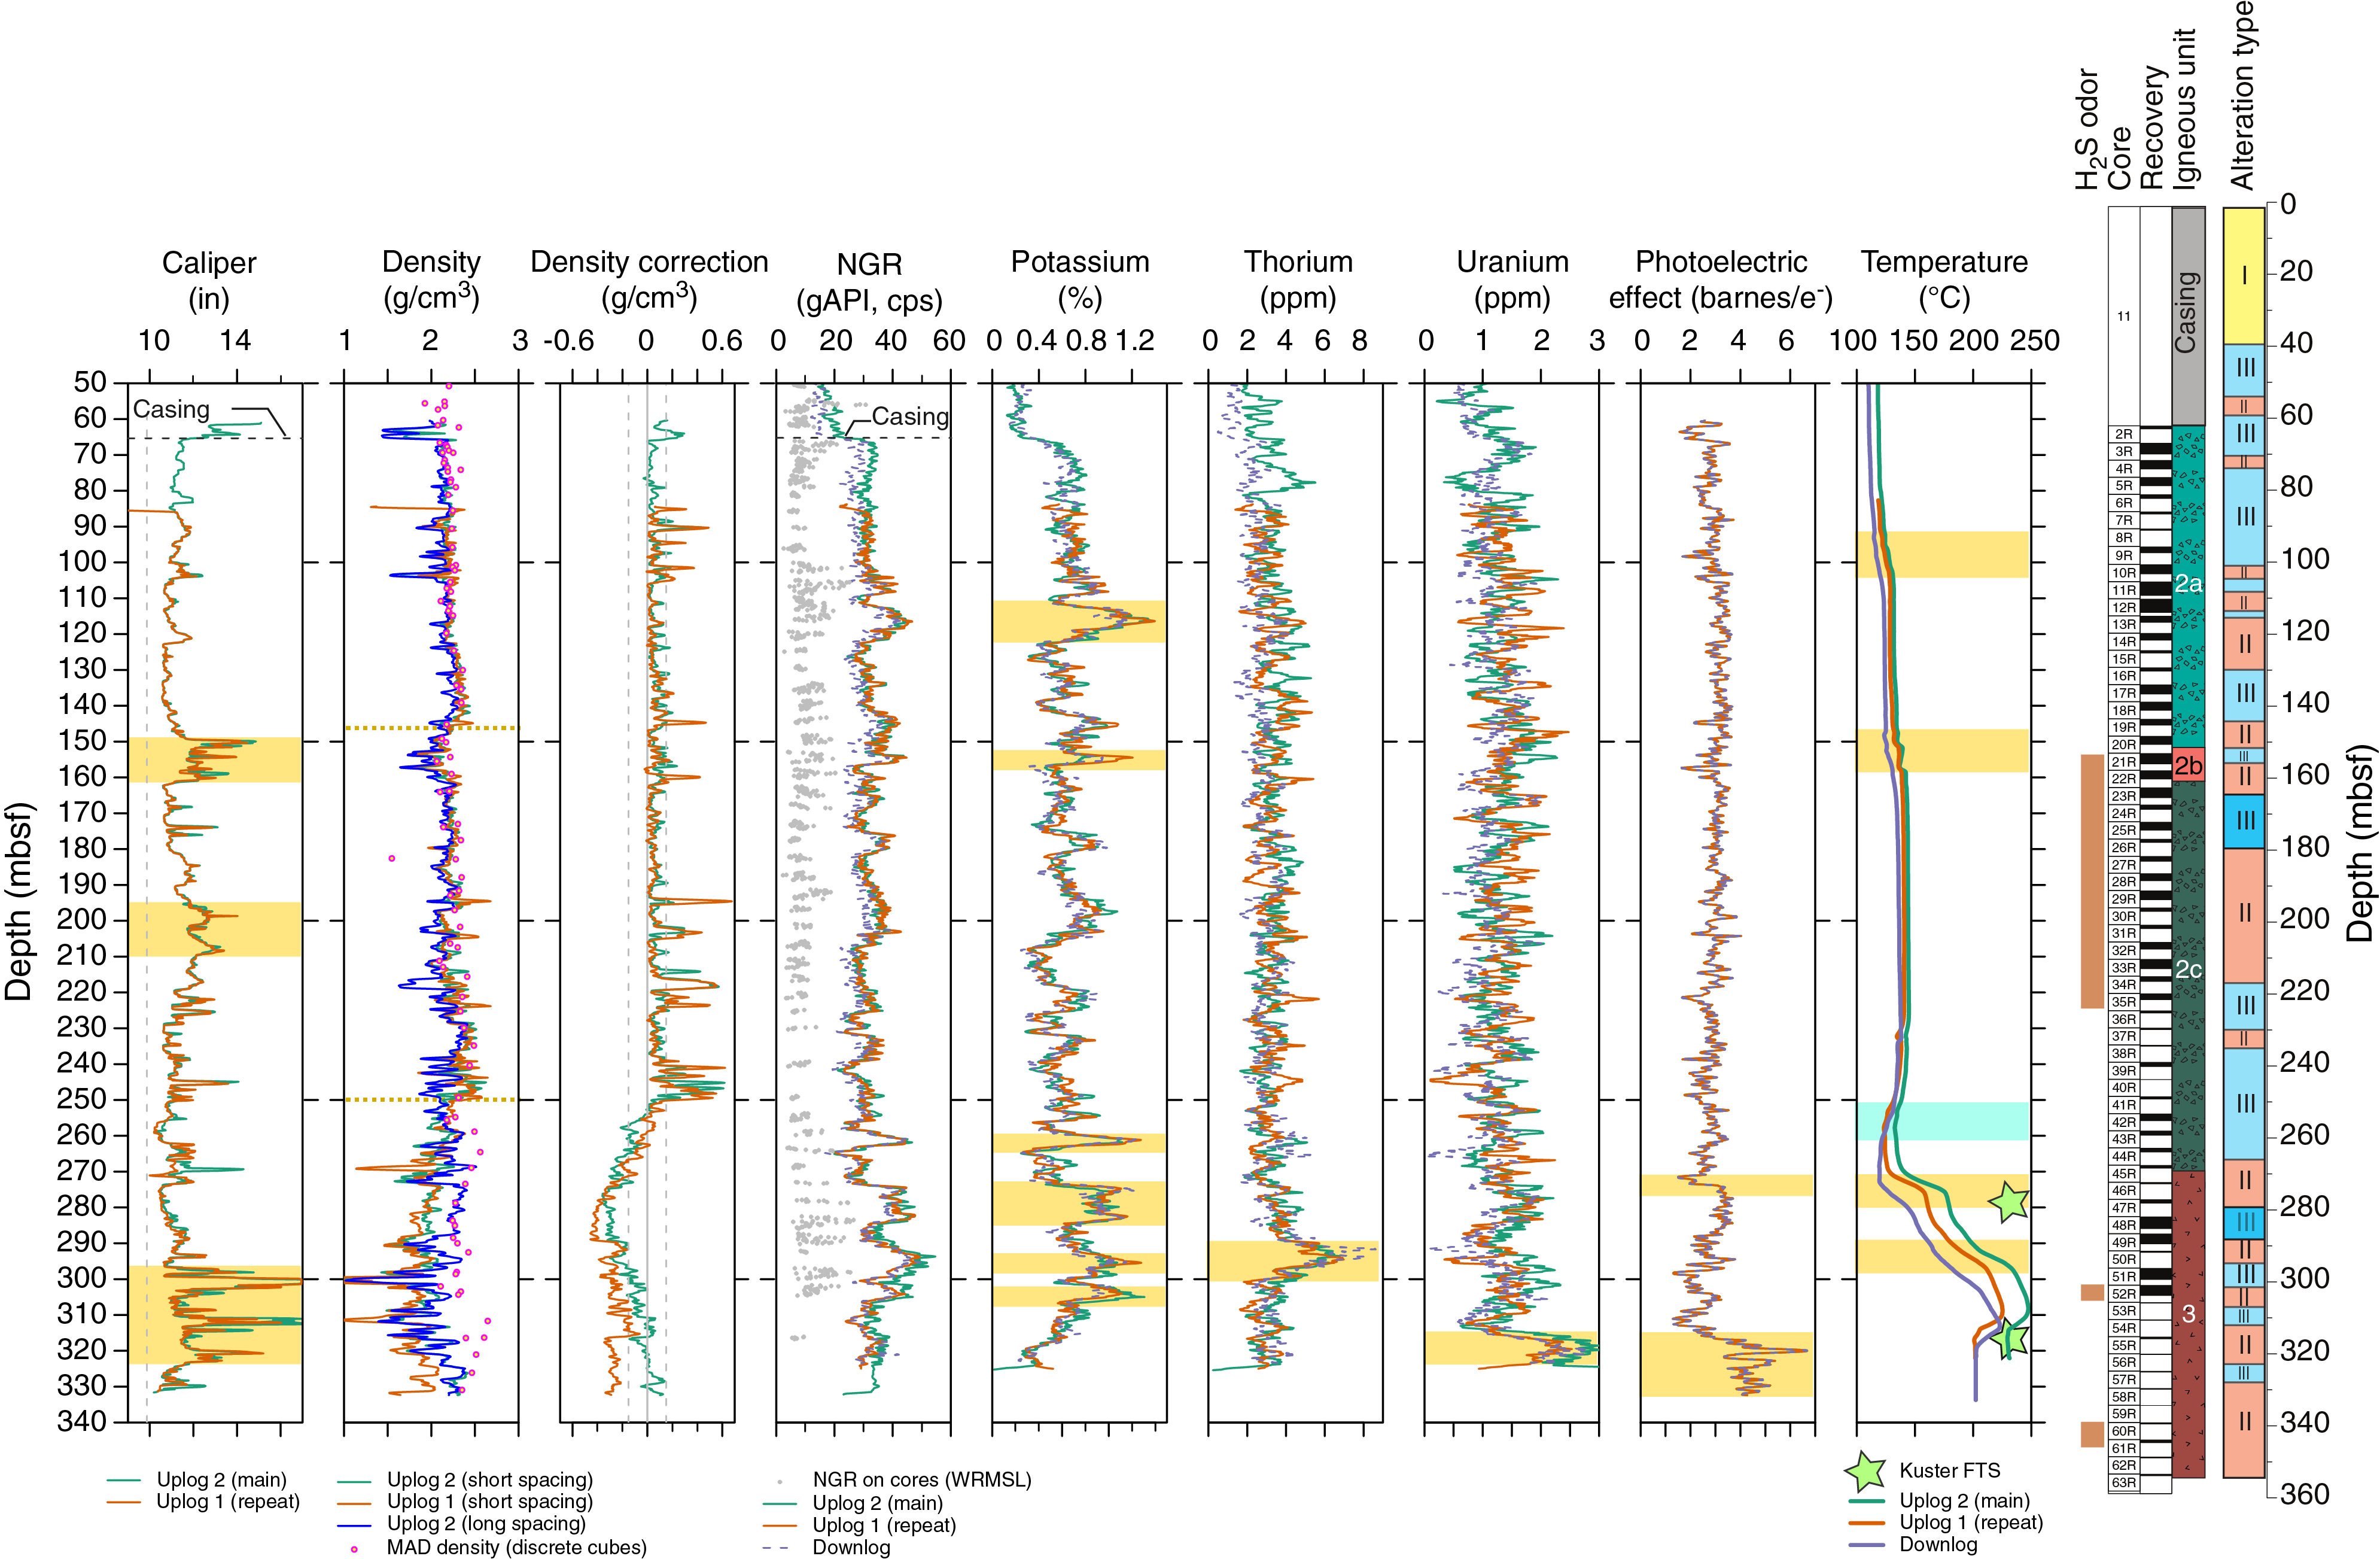
Figure F74. HTTC downhole measurements.
NGR measured on whole-round cores with the WRSML (see Physical properties) shows a general correlation with the downhole natural gamma ray measurements (Figure F75). Increases are noted in both data sets between 270 and 305 mbsf and, to a lesser extent, between 100 and 110 mbsf. However, the difference in vertical resolution (2 cm for cores; 15 cm for downhole logs) and the limited number of core pieces >20 cm required to provide a reliable measurement limit further correlations.
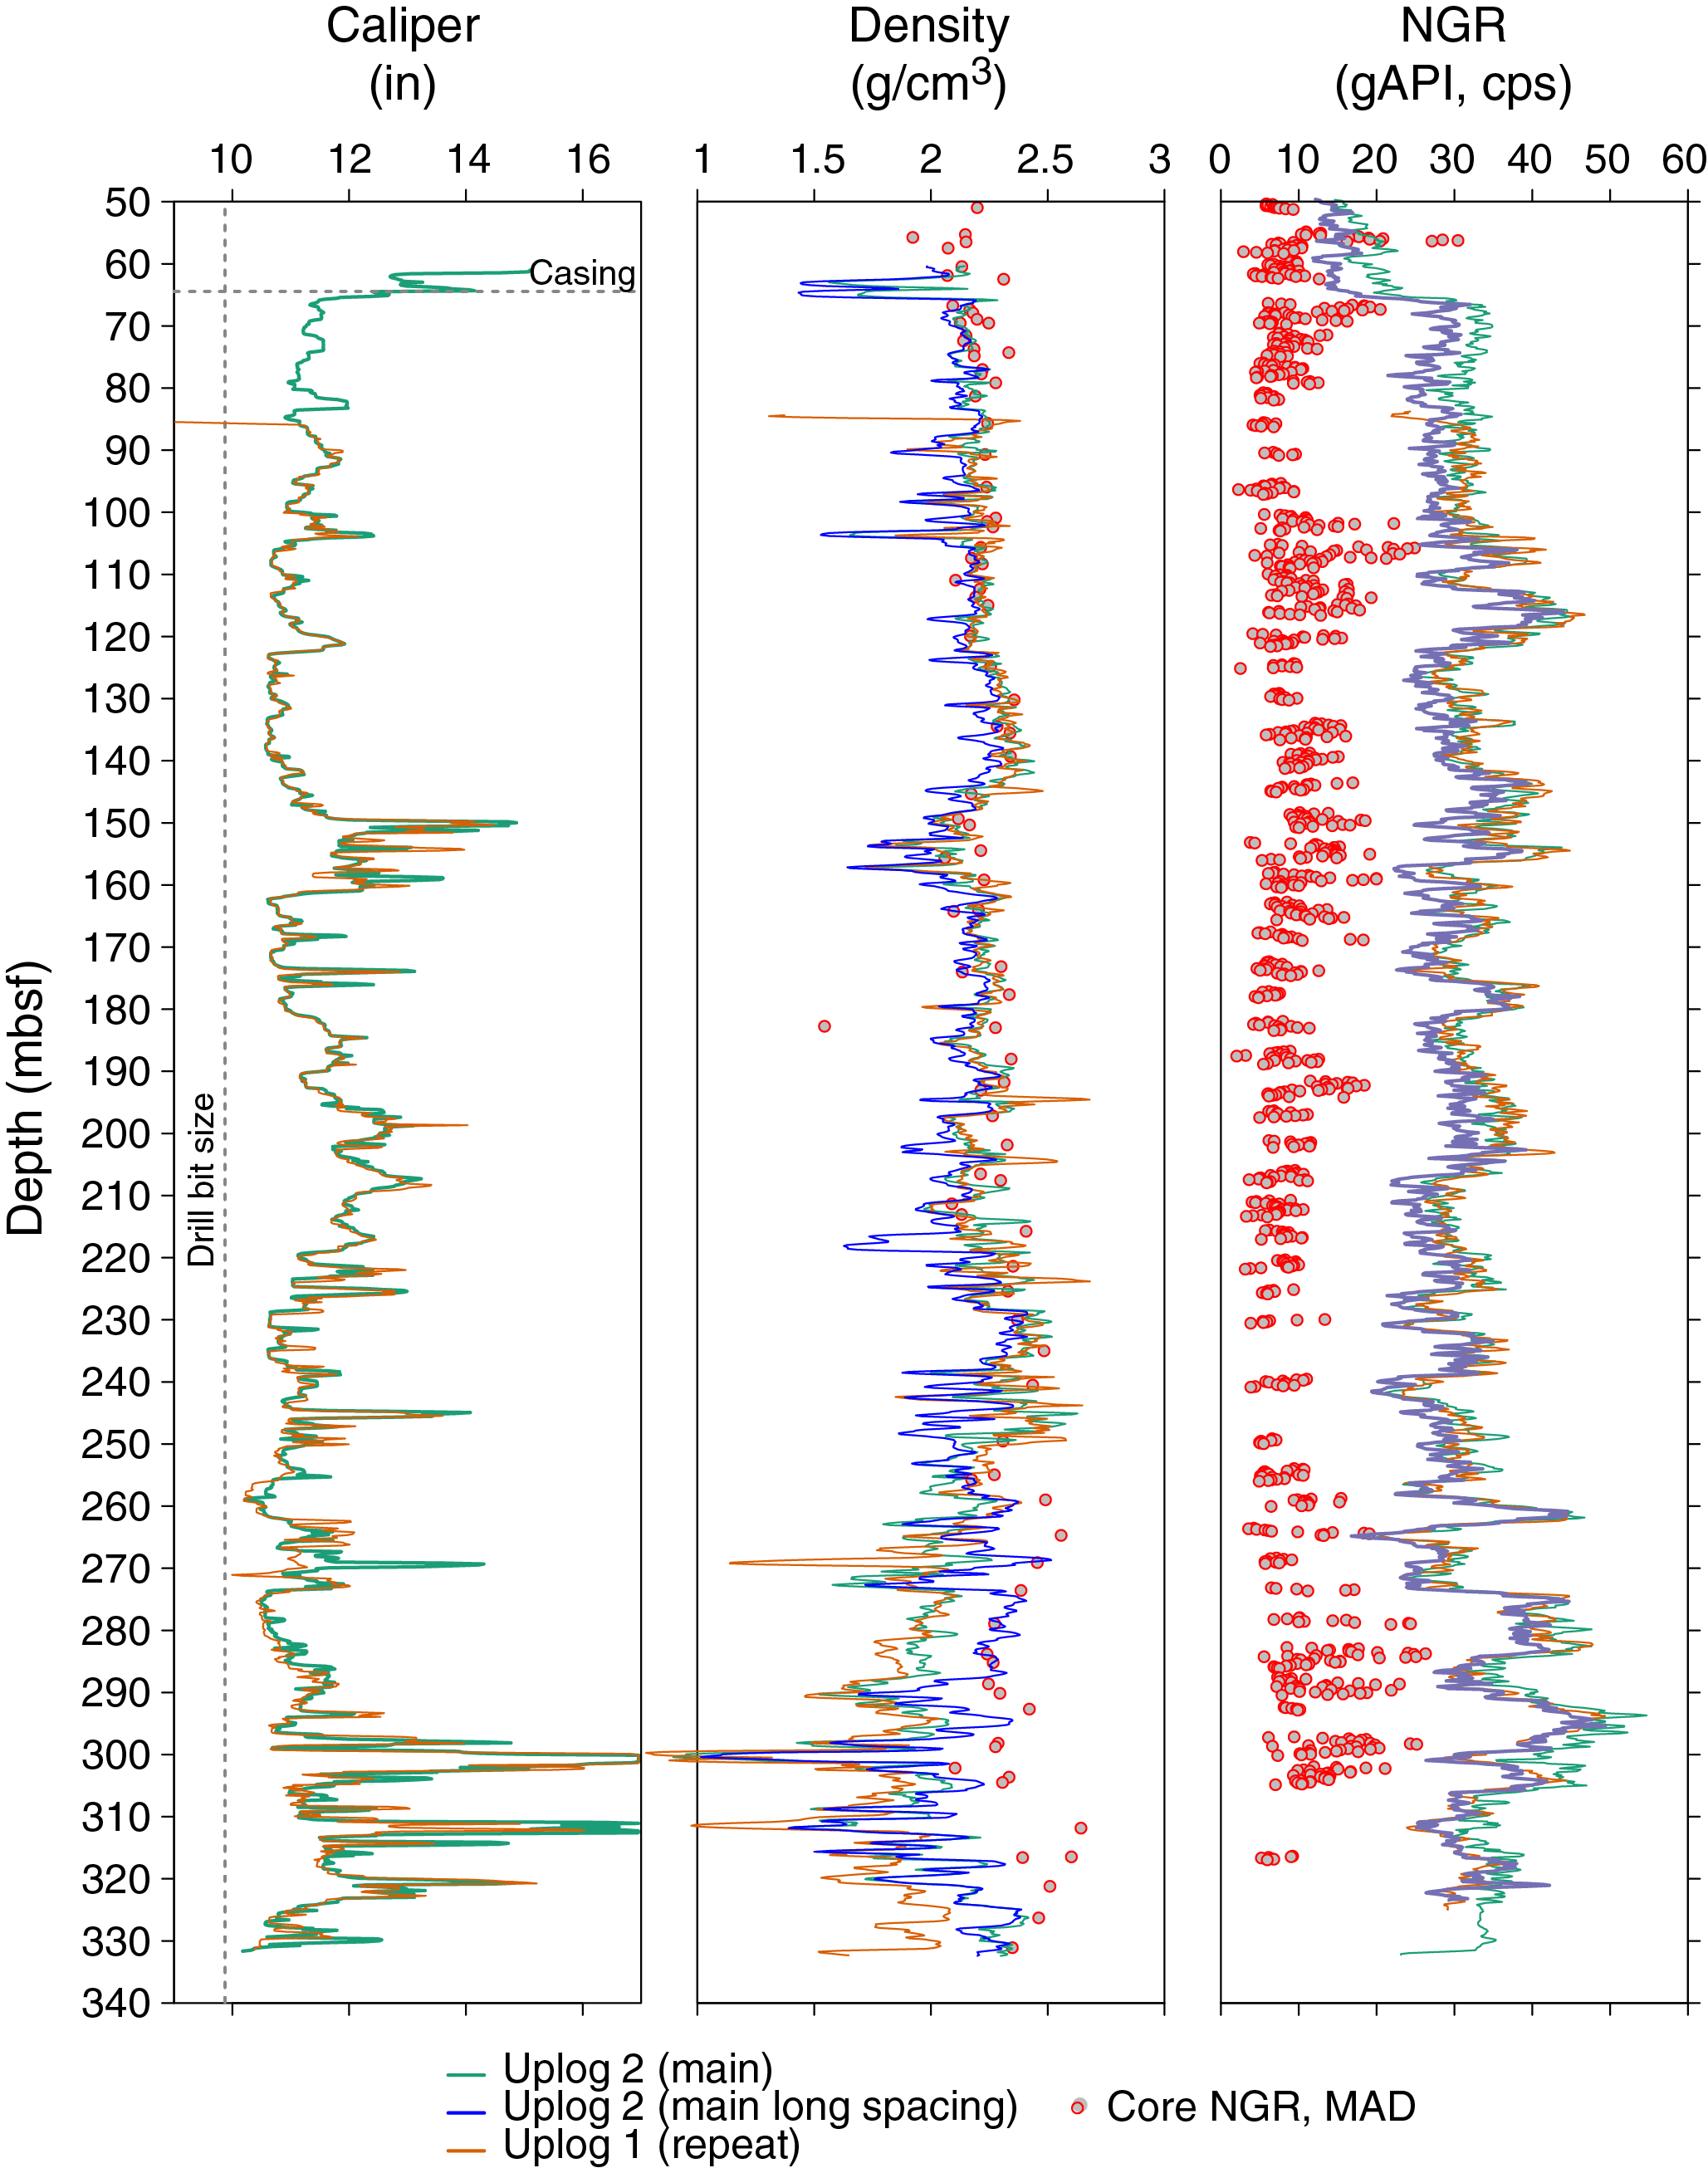
Figure F75. Core and downhole measurements.
Borehole diameter (caliper), formation density, and photoelectric effect
Several washouts with borehole diameter increases of as much as 17 inches (43.2 cm) were observed below 261 mbsf, particularly below 295 mbsf, affecting the HLDS density log. Thus, the long-spaced density (which is less affected by narrow washouts as it is averaged over a longer distance) is presented alongside the short-spaced, high-resolution density log (Figures F74, F75).
The one-arm caliper of the HLDS was deployed during the two uphole logs. The base of the casing is identified on the caliper and natural gamma ray logs in Figures F74 and F75. The borehole is generally within gauge (median = 11.2 ± 1 inch; error is 1σ; drill bit size = 9⅞ inches). The diameter exceeds 13 inches in three zones of washout: 149–162, 195–210, and 297–324 mbsf. The two bridges encountered while lowering the drill string with the logging bit were located at the top (292 mbsf) and bottom (323 mbsf) of the deepest washout zone. The second upward logging pass showed larger hole diameters than the first upward logging pass at 270 and 312 mbsf. These differences are caused by the tool aligning at different azimuths on the two passes and show that the borehole is not circular at these depth intervals.
Overall, the bulk density values measured on discrete samples (see Physical properties) are very well correlated with the downhole density log (Figure F75). Although the density log is continuous, it is affected by the borehole shape; this is automatically corrected for during logging and presented in the density correction curve. However, the elevated temperatures below 250 mbsf caused erratic readings, resulting in the calculated density overestimating the effect of borehole shape on density measurements. Hence, data from the longer spaced detector were used between 250 and 305 mbsf because they do not appear to have been affected by the expansion between the hotter shielding flask and the cooler electronics cartridge. This is confirmed by the density measurements on discrete core samples that do not show a decrease in density below 250 mbsf and correlate well to the long-spacing density log between 250 and 295 mbsf (Figure F75). None of the short- and long-spaced density measurements are reliable below 295 mbsf, the part of the hole characterized by the most intense washouts and higher temperatures.
Three main zones are identified from the density downhole measurements log and the discrete density measurements:
- 65–145 mbsf: density increases downhole from 2.1 to 2.4 g/cm3.
- 145–250 mbsf: density decreases to 2.0 g/cm3 between 140 and 155 mbsf and then increases downhole from to 2.0 g/cm3 at 145 mbsf to 2.5 g/cm3 at 250 mbsf.
- 250–330 mbsf: density is very variable. As noted above, density logs are not reliable below 295 mbsf.
The photoelectric absorption factor, also measured by the HDLS as the photoelectric effect (PEF), shows little variability (median = 3.0 barns/e−; standard deviation = 0.6 barns/e−). A sharp increase in the PEF from 1.5 to 3.2 barns/e− at 270 mbsf corresponds to the boundary between Igneous Subunit 2c and Igneous Unit 3. The PEF also increases below 315 mbsf, which, in the absence of any barite identified in cores, may be due to an increase in sulfide minerals at that depth (Bartetzko et al., 2003) or to sulfide minerals falling down from the hole wall and accumulating at the bottom of the hole.
Initial core-log integration
Potassium peaks in Cores 376-U1528D-12R through 14R (110–120 mbsf), 43R (~260 mbsf), 45R–48R (272–285 mbsf), and 50R–51R (292–300 mbsf) (Figure F74) generally correlate with Alteration Type II, which contains more illite than Alteration Type III. In addition, Core 52R contains abundant natroalunite and possible alunite (a K-bearing sulfate). However, the correlation is not systematic, and the K peak at 260 mbsf in Cores 42R and 43R is characterized as Alteration Type III. This discrepancy could be caused by the different sampling rates for XRD analysis compared with those for downhole measurements.
The temperatures measured by the HTTC (as high as 248°C) and the temperature increase between the three HTTC runs indicate that the hole temperature was still equilibrating, and the undisturbed formation fluid temperature is likely higher than 248°C (Figure F72). This is consistent with temperatures estimated from FIs (300°–360°C) and from the alteration mineral assemblage (230°–350°C). The temperature measurements conducted 23 days after borehole equilibration, which should be close to undisturbed conditions, reached 198°C at 195 mbsf. For comparison, the HTTC logs 23 days earlier indicated a temperature of 144°C at 195 mbsf that increased by 8°C over the 2.5 h of measurements, confirming that the hole was still heating up at that time. The highest temperature (195°C at 195 mbsf) recorded during this revisit to Hole U1528D is still lower than the highest temperature recorded 23 days earlier at a greater depth (248°C at ~300 mbsf). This indicates that the thermal profile in Hole U1528D during the last measurements reflects either a natural partitioning of the fluid temperatures in the hole or a borehole collapse that blocked the deepest permeable zone at ~300 mbsf.
In general, increases in borehole diameter (caliper) occur where there are more fractures or where the rock is weaker. The intervals between 297 and 305 mbsf and between 310 and 324 mbsf (Cores 376-U1528D-51R, 54R, and 55R) show the largest increase in caliper diameter of Hole U1528D (Figure F75). Cores 51R and 55R have a high vein density (see Structural geology). In addition, although fracture density is low, fractures are steeply dipping and hence subparallel to the hole axis, so the borehole wall rock may preferentially cleave along these veins and/or fractures. Core 54R does not show high fracture density. Two intervals also have elevated K (300–308 mbsf) and U (315–325 mbsf) contents, which may reflect a particular mineral assemblage that favors failure at the borehole wall. The increased borehole diameter at 149–162 mbsf (Cores 20R–22R) is associated with a high fracture density.
Two closely spaced hole size increases at 197 mbsf (Core 376-U1528D-30R) and 208 mbsf (Core 32R) mirror the vein density, which is lower in Core 31R than in Cores 30R and 32R (Figure F75). Unlike other zones of hole size increase, fractures do not seem important in the widening of the hole. Subrounded lava fragments with bleached rims occurring as rubble are seen in Cores 30R and 32R; thus, it is possible that the cement of this rubble was clay rich and was washed away during drilling.
Temperature profiles acquired with the LEH-MT suggest a convective temperature regime with several discrete permeable zones. In such hot convective holes, the flow rate of each permeable zone is not proportional to the amplitude of the temperature anomalies (Grant and Bixley, 2011). The deepest, hottest permeable zones commonly show large temperature anomalies (Figure F72). In contrast, shallower, cooler permeable zones display smaller temperature anomalies. It is thus possible that the two uppermost zones of temperature increase (at ~100 and ~150 mbsf) are in fact of similar (or higher) permeability and flow rate to the deeper ones (at ~275 and ~295 mbsf). The presence of a permeable zone at ~150 mbsf with potentially high fluid flow rates was confirmed by the final temperature measurement on 1 July 2018, which shows a major temperature increase of 91°C (from 86°C at 142 mbsf to 177°C at 173 mbsf) centered at 157.5 mbsf.
The intervals between 145 and 160 mbsf (Cores 376-U1528D-20R through 22R) and between 290 and 300 mbsf (Cores 49R–51R) that show temperature anomalies and increases in borehole diameter are interpreted to be structurally controlled permeable zones. The base of these two zones coincides with the start of the H2S odor emanating from the cores and the native sulfur observed in veins (see Structural geology). Both intervals have high fracture density with variable dips as well as increased vein density (see Structural geology). The zone at 145–160 mbsf coincides with the boundary between Igneous Subunits 2a and 2b and a decrease in density at 145 mbsf. Core 22R, which is beneath the 145–160 mbsf temperature anomaly, is more massive lava (Subunit 2b; see Igneous petrology and volcanology) that is largely silicified and has less common renewed fracturing and less variability in fracture direction, yielding fewer crosscutting fractures. The contrast in rock type occurring at this subunit boundary may thus aid the focus of fluid flow. The two other temperature anomalies at ~100 mbsf (Cores 9R–11R) and ~275 mbsf (Cores 45R–47R) contain fewer veins and open fractures and are thus considered less likely to be structurally controlled.
Three of the temperature increase anomaly zones (i.e., 145–160, 270–280, and 290–300 mbsf) also have high (>1%) K contents and coincide with the predominant presence of Alteration Type II in those depth intervals. The 290–300 mbsf temperature anomaly zone also has an increase in Th content (to 7 ppm). The shallowest temperature increase zone (95–105 mbsf) and the temperature decrease zone (250–260 mbsf) are both located in Alteration Type III and do not show any increase in K.
Microbiology
Whole-round samples (3–16 cm long) were collected for microbiological analysis: 3 from Hole U1528A, 1 from Hole U1528C, and 13 from Hole U1528D (Figure F76). Two fluid samples were also obtained from the Kuster FTS. Microbiological samples were selected based on various criteria: (1) good core recovery (i.e., an 11 cm whole round is required at minimum for routine microbiology sampling), (2) representation of various types of hydrothermal alteration, and (3) the presence of softer materials such as clays.
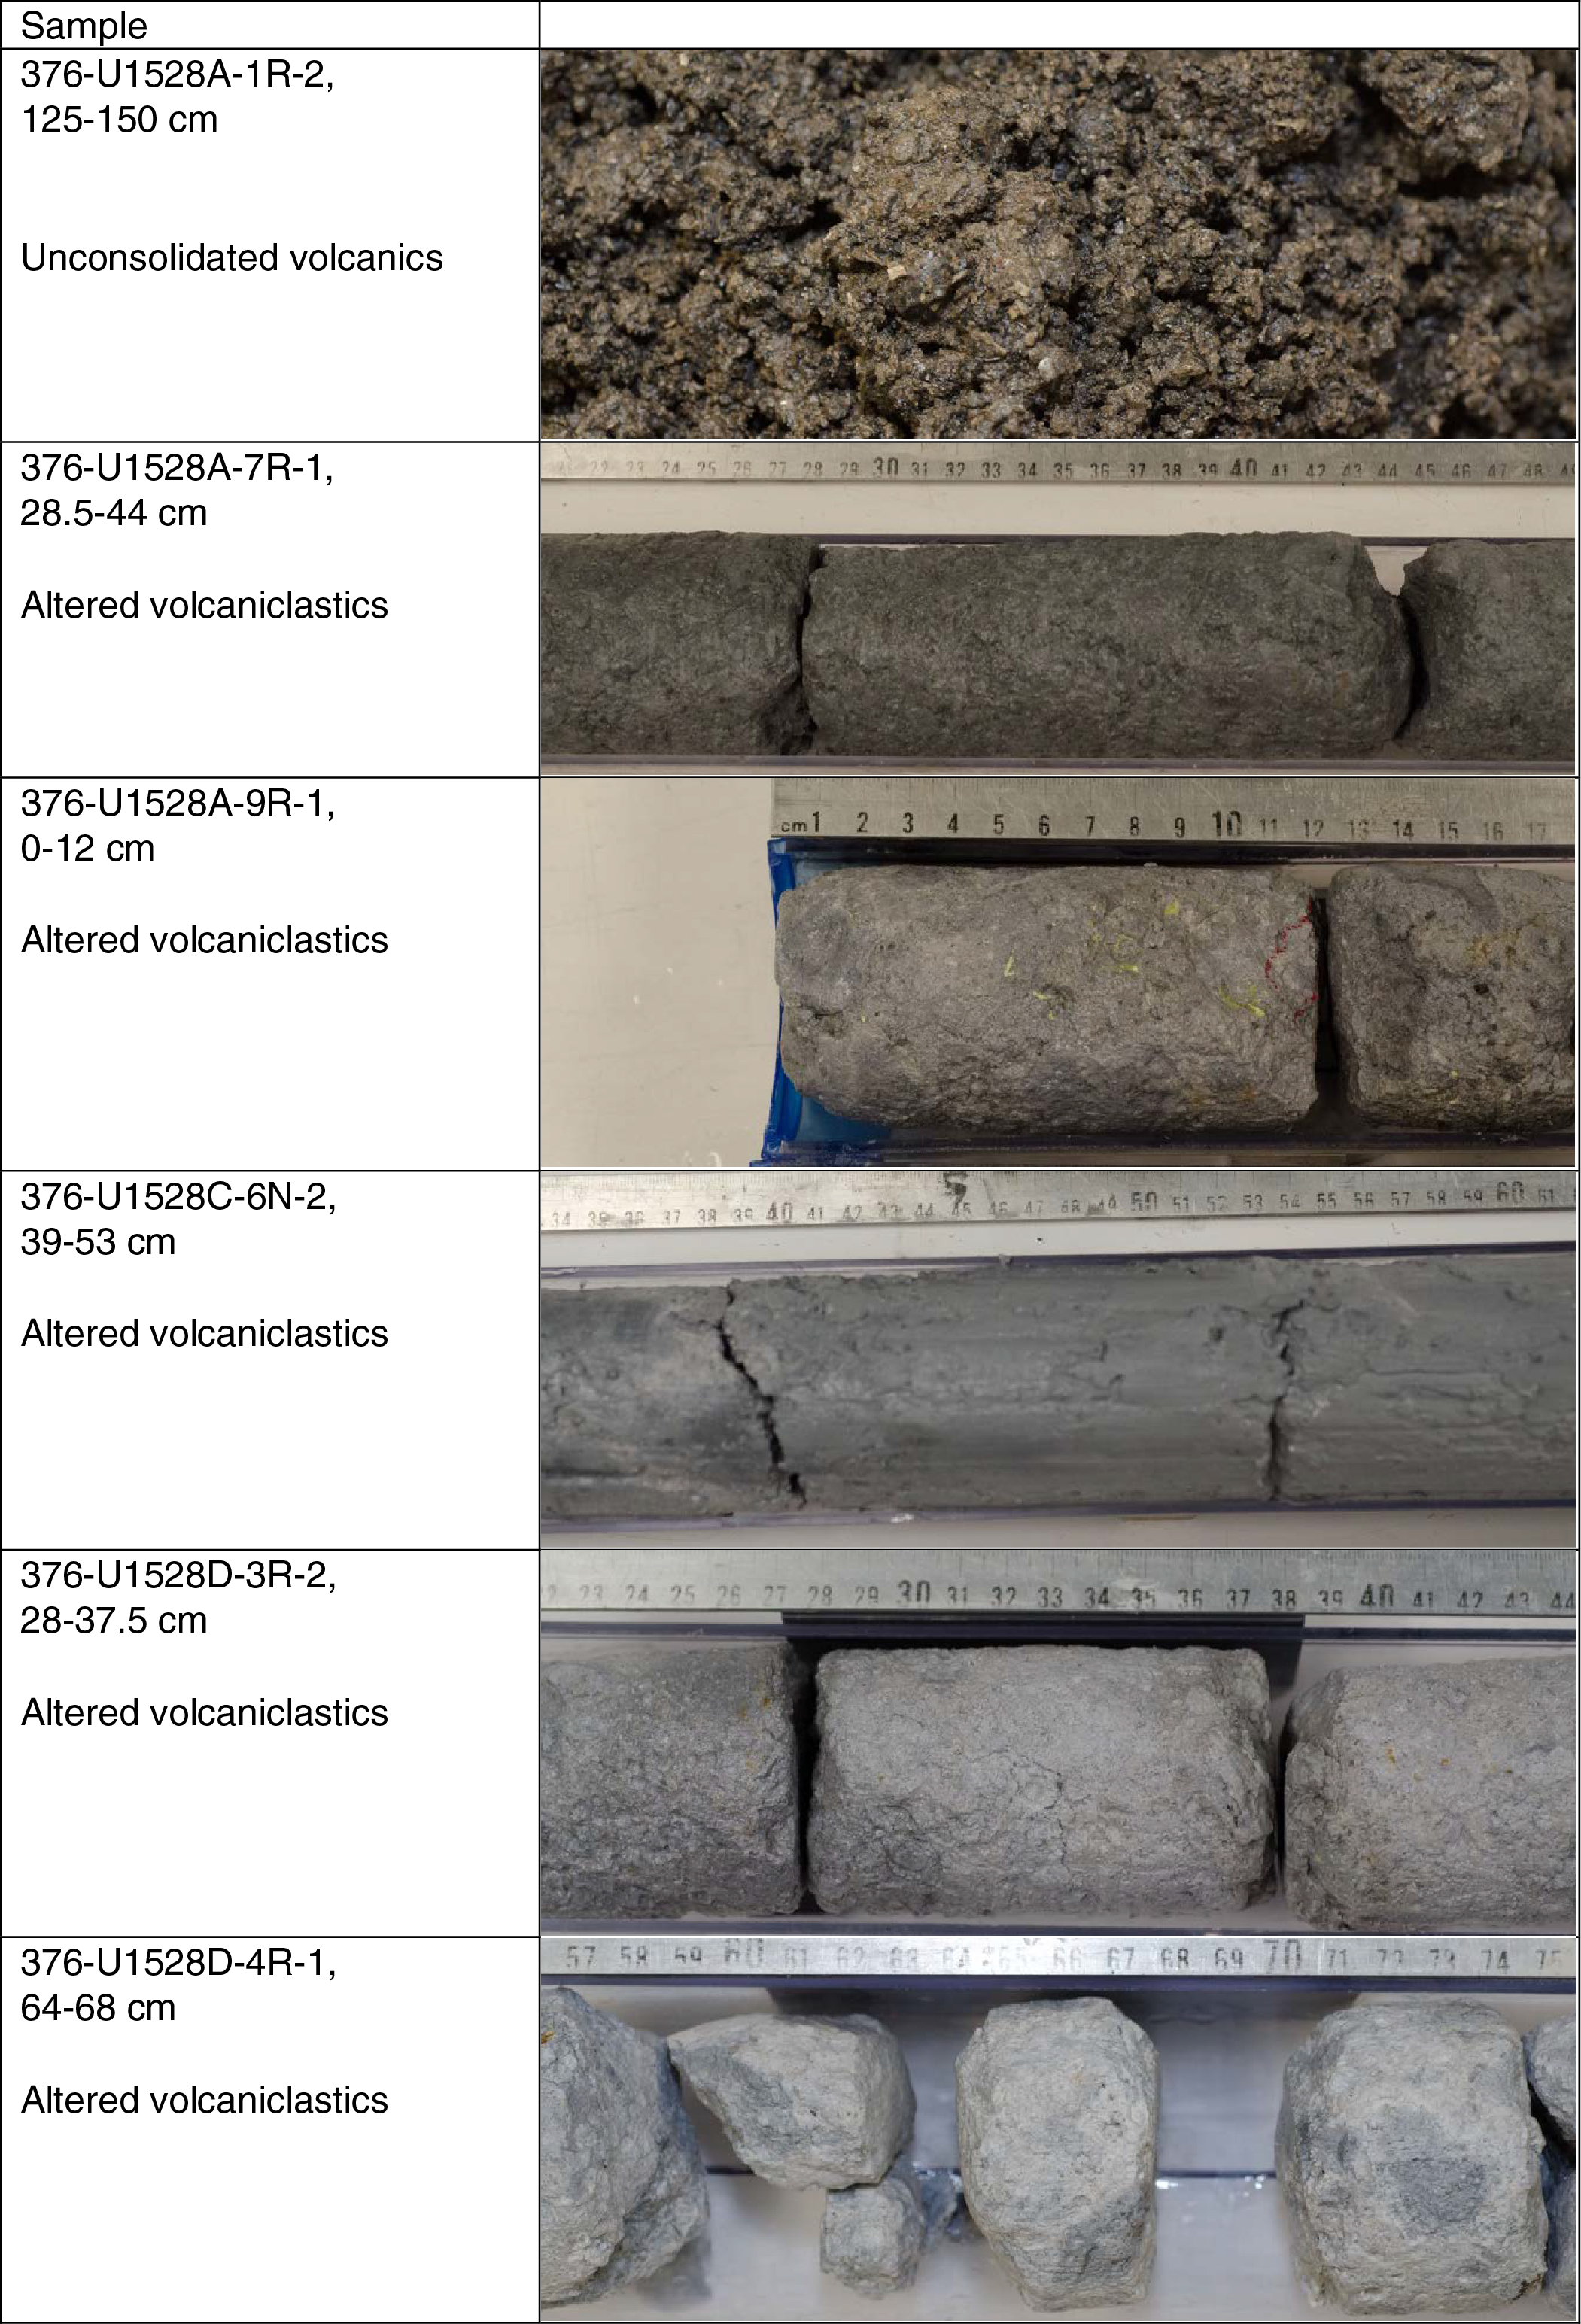
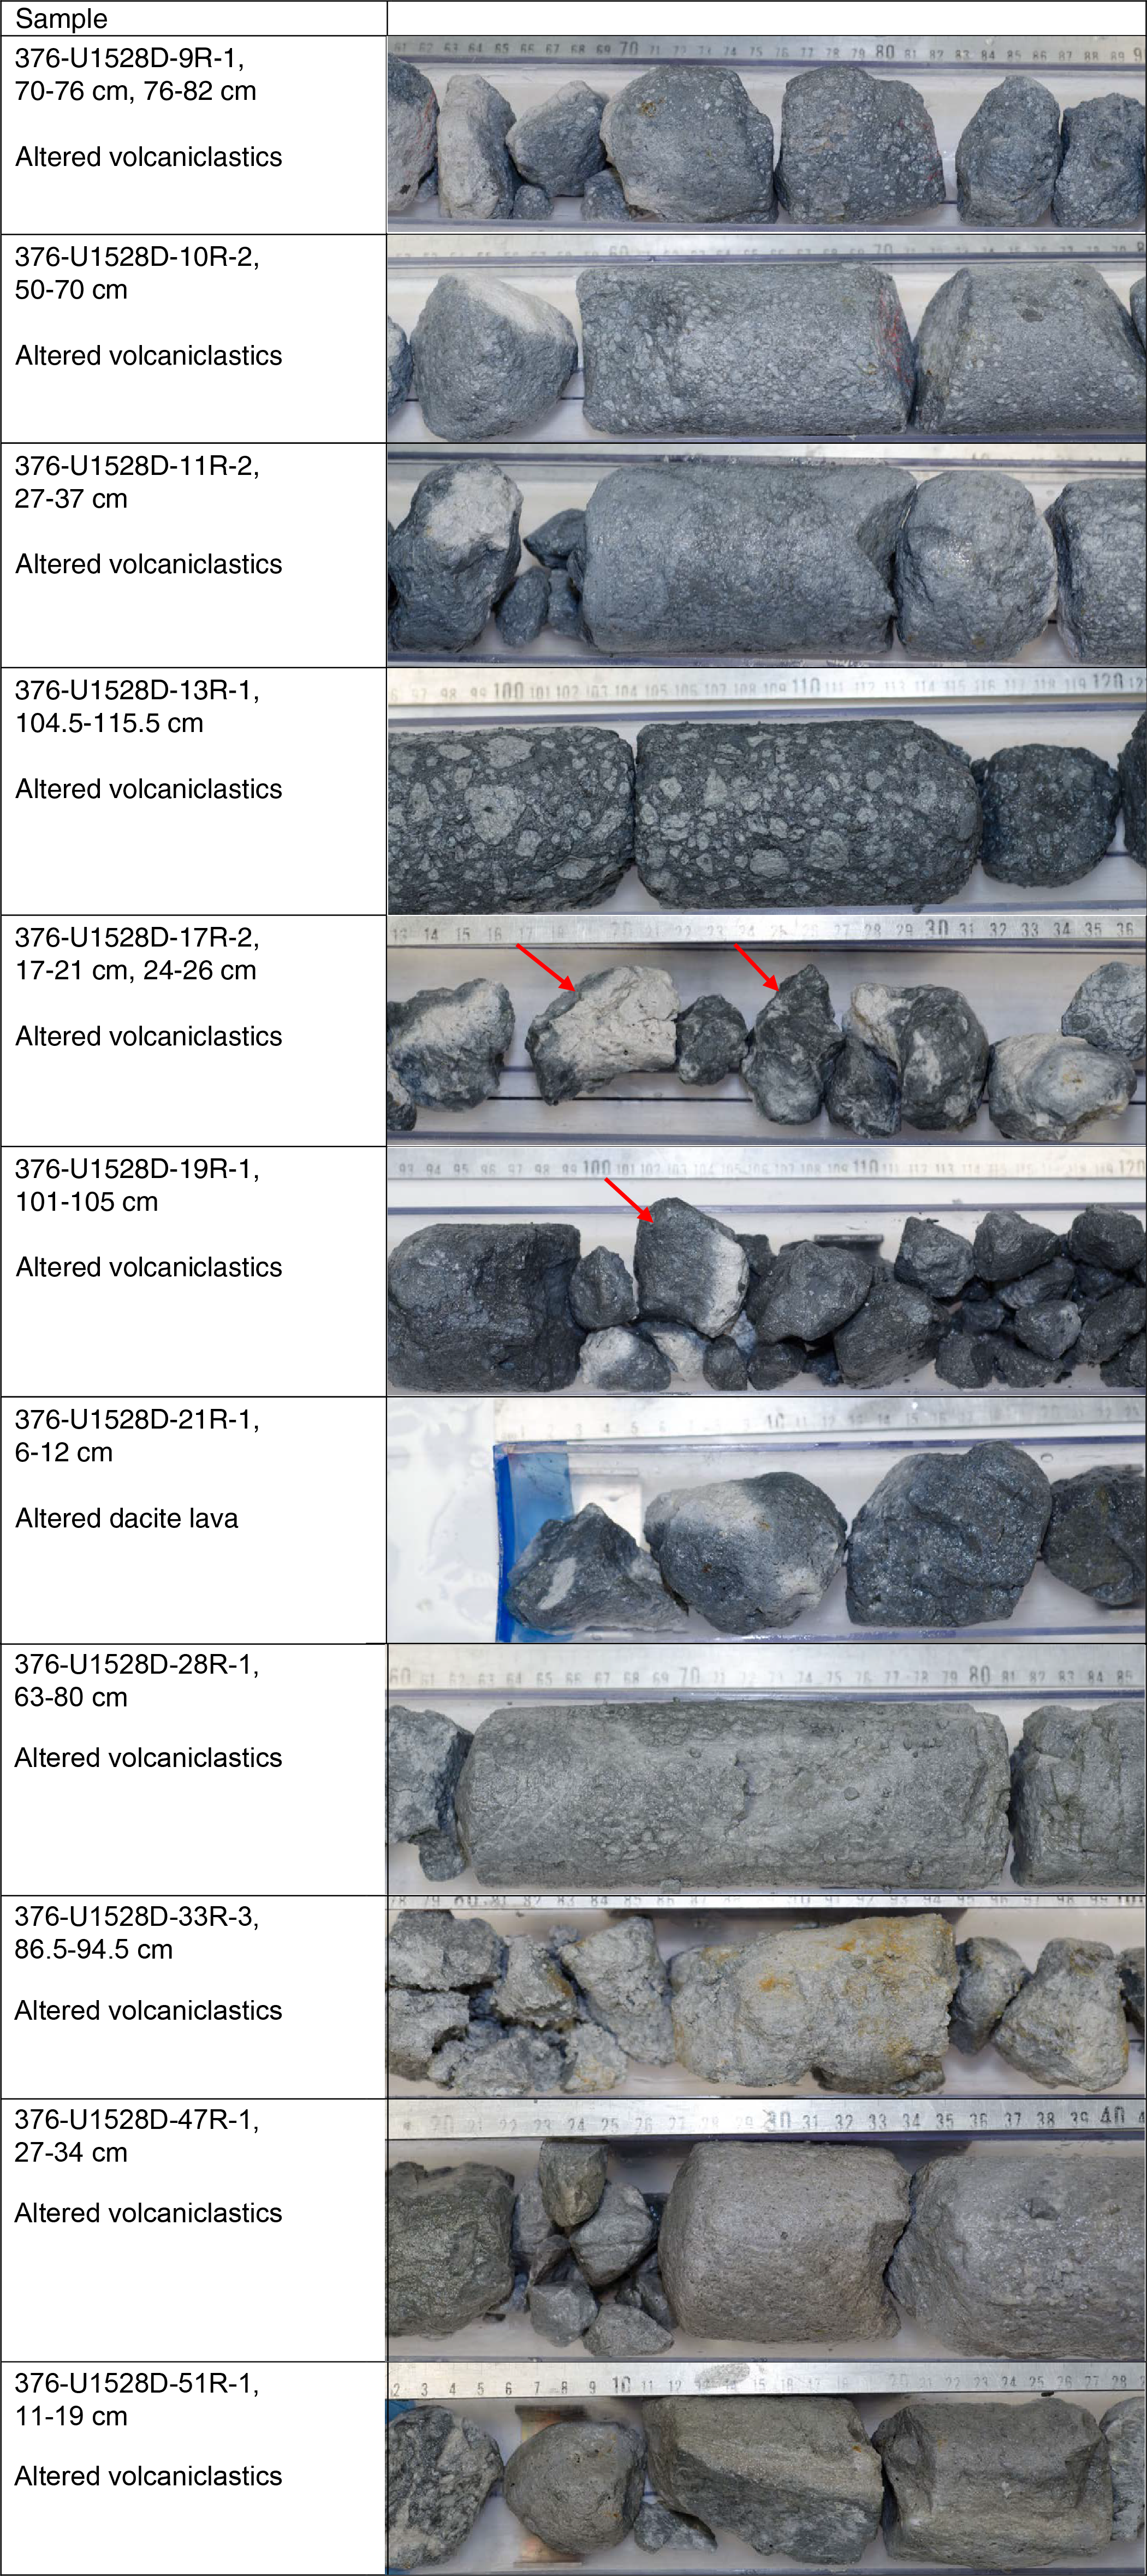
Figure F76. Whole-round samples.
Lithologies represented by sampling, as defined by the Igneous Petrology and Volcanology group, were unconsolidated volcanics (1 sample), altered volcaniclastics (13), and altered dacite lava (3). The number of analyses possible for each sample depended on the size of the core sample available for microbiology, which dictated the amount of material we were able to harvest for analyses (Figure F77):
- Seventeen samples were processed for shore-based DNA analyses (metagenomic and single-cell genomic analysis),
- Fifteen samples were preserved for RNA analyses (metatranscriptomics and ribosomal RNA community analyses),
- Seventeen samples were preserved for shore-based cell counting,
- Fifteen samples were preserved for viral and microbial activity measurements,
- Seventeen samples were analyzed on board for ATP concentration, and
- Seventeen samples were used to initiate nutrient addition bioassays with inorganic nitrogen and phosphorus or organic carbon to determine the nutritional constraints on biomass in this environment.
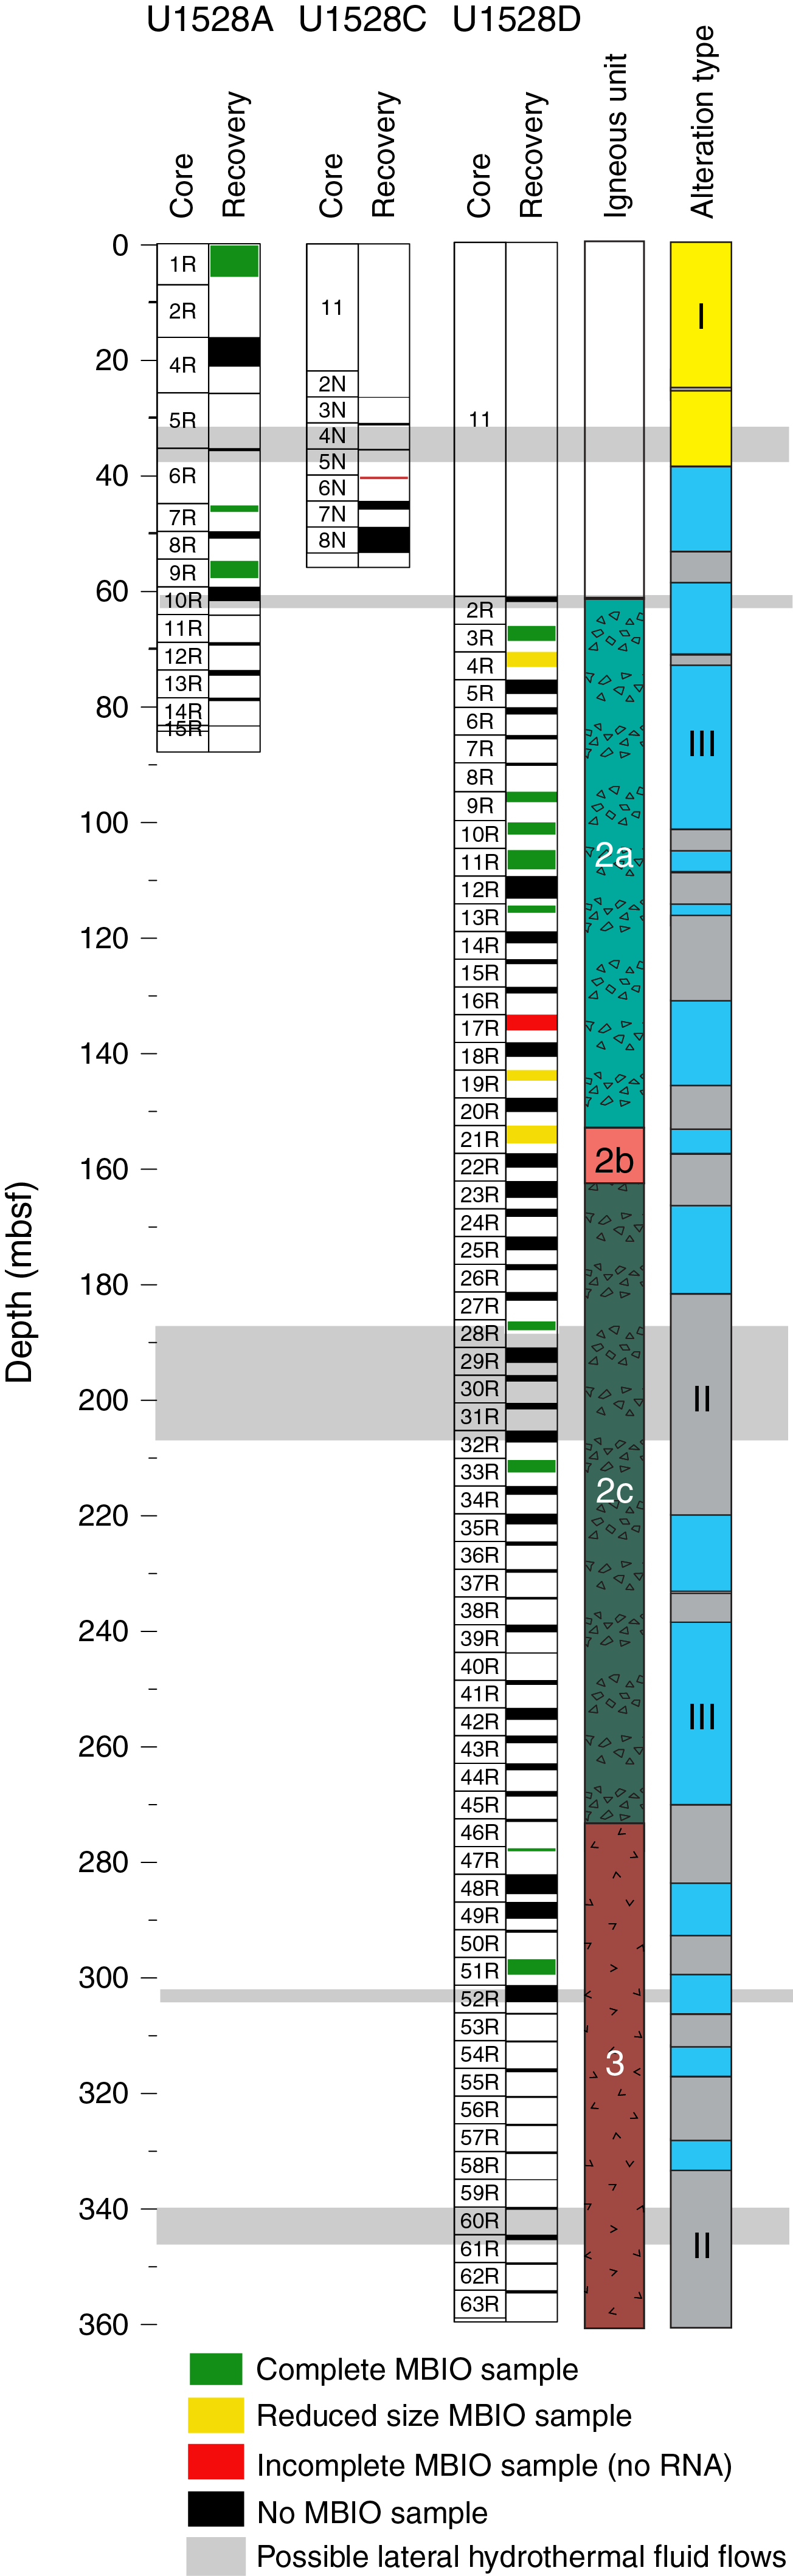
Figure F77. Microbiological samples.
In addition, PFMD was used for contamination testing (Table T22). It was usually detected on the outside of uncleaned cores and, on rare occasions, was above detection levels on the outside of cleaned cores. However, it was usually below detection on the inside of cores, indicating that penetration of drilling fluid to the interior of whole-round drill cores (where we collected samples) is unlikely.
Sampling for shore-based DNA and RNA analyses
DNA and RNA analyses will be performed in shore-based laboratories. Material for DNA analyses was collected as described (see Microbiology in the Expedition 376 methods chapter [de Ronde et al., 2019a]) and placed into sterile 50 mL Falcon tubes, labeled, and immediately frozen at −80°C. Material for RNA analysis was preserved in RNAlater before freezing. In total, 17 samples were processed for shore-based DNA-based analysis, and of those, sufficient material was available for 15 coupled RNA-based analyses (Figure F77). We estimate that 20–40 g of material is required to obtain sufficient DNA for metagenomics. This amount of rock was available for 13 of the 17 DNA samples. Sufficient material (an additional 40 g) for metatranscriptome analyses of gene expression was obtained for 11 samples. It should be noted that four samples (from Cores 376-U1528D-4R, 17R, 19R, and 21R) were very small and the routine sample sizes were reduced (Figure F77), which will likely prevent further molecular analyses.
Cell and virus counts
Shipboard cell and virus counts on rock samples were not possible because of the difficulty in separating cells from rock material. Between 5 and 10 cm3 of rock was fixed in 4% paraformaldehyde and frozen at −80°C for cell counts, and approximately 10 cm3 samples were frozen at −80°C for virus counting.
Sampling for activity measurements
Approximately 20 cm3 of sample was collected and stored in glass bottles with the addition of 0.5–1 mL of 5% (w/v) neutralized sodium sulfide solution (pH 7.5). The gas phase of the bottle was replaced by 100% N2 (2 atm) to maintain anaerobic conditions, and the bottles were stored at 4°C for shore-based analysis of bacterial activity.
In total, 15 samples (~40 cm3) were collected for further shore-based virus activity measurements. The samples were placed in sterile vacuum-packed bags, labeled, and stored at 4°C.
ATP measurements
The presence of ATP is indicative of the presence of nucleic acids. If the ATP comes from living cells, it should be proportional to cell abundance, although there are complicating factors that prevent direct correlation (e.g., low-activity cells have lower than average ATP concentrations). The assay for ATP concentrations uses the luciferase enzyme and light detection, which is easy to employ and relatively sensitive.
ATP was detectable in 2 of the 17 analyzed samples (from Cores 376-U1528D-1R and 9R; ATP concentrations = ~50 pg/cm3). Positive detection of ATP supports the possibility of subsurface microbial biomass, but negative results do not necessarily indicate a lack of microbial activity. For all the samples other than the two showing a positive result, the addition of cell suspension resulted in lower fluorescence than in the negative control with water, suggesting the presence of inhibiting and/or denaturing compounds in the samples. The enzyme luciferase is easily denatured by toxic compounds (i.e., arsenate compounds are known to degrade the enzyme). The samples positive for ATP detection will be the initial priority targets for shore-based research, but cell counts, once performed, will be the main discriminant to identify the best samples for molecular data.
Cultivation experiments (nutrient addition experiments)
Seventeen samples were used to initiate nutrient addition bioassays to determine the nutritional constraints on microbial communities in this environment. For these experiments, ~1 cm3 of rock powder (fine particles <3 mm) were added to 20 mL serum vials, and the volume of the experiment was brought to 18 mL using 0.22 µm filtered and autoclaved seawater. Nutrients were then added to the bottles as follows:
- No added nutrients (control);
- Added 750 μM NH4Cl;
- Added 750 μM NH4Cl and 50 μM K2HPO4; and
- Added 200 μM each of acetate, formate, and lactate.
Because of the small sample sizes typically available for hard rock microbiology sampling, these enrichments were established using one vial per treatment. Following inoculation and nutrient addition, vials were sealed, crimped, gassed with N2, and incubated at 40°C for the remainder of the expedition. These enrichments will be allowed to incubate in the laboratory postexpedition for at least 6 months prior to sampling to test for cell growth and microbial diversity.
Fluid sampling and culturing experiment
Triplicates of 1 mL of hydrothermal borehole fluids were preserved in glyTE (15% glycerol in Tris-EDTA buffer; pH = 8) and immediately frozen at −80°C. These samples will be used for single-cell genomics.
The Kuster FTS Fluid Samples 1 (273 mbsf) and 2 (313 mbsf), both of which have high salinity and low pH, were inoculated in a specific culture media to allow growth of extremophiles that can be halophile and/or acidophile and incubated on board in temperatures of 40° and 50°C. These cultures will be allowed to incubate in the shore laboratory for at least 6 months prior to sampling to test for cell growth and microbial diversity.
Contamination tracer testing
PFMD was run during all coring operations to test for contamination (Table T22). The tracer was usually detected on the outside of core samples in low concentrations with levels close to the limit of detection on the insides of cores. This indicates that penetration of drilling fluids to the interior of whole-round cores, where samples were collected, was minimal. We tested the sepiolite drilling mud for detection of PFMD tracer prior to it being mixed with seawater and found it in very low concentrations (0.36 ppb). Five samples were also taken from core liners in the core-splitting room, and PFMD concentrations were found to be low, similar to the outside of the core. The outside of one sample (376-U1528D-21R-1, 6–14 cm) showed signs of drilling contamination (247 ppb of PFMD detected). This result reinforces the importance of selectively keeping the inside of the core only.
References
Bartetzko, A., Paulick, H., Iturrino, G., and Arnold, J., 2003. Facies reconstruction of a hydrothermally altered dacite extrusive sequence: evidence from geophysical downhole logging data (ODP Leg 193). Geochemistry, Geophysics, Geosystems, 4(10):1087. https://doi.org/10.1029/2003GC000575
Berger, B.R., and Henley, R.W., 2011. Magmatic-vapor expansion and the formation of high-sulfidation gold deposits: structural controls on hydrothermal alteration and ore mineralization. Ore Geology Reviews, 39(1–2):75–90. https://doi.org/10.1016/j.oregeorev.2010.11.004
Binns, R.A., Barriga, F.J.A.S., Miller, D.J., et al., 2002. Proceedings of the Ocean Drilling Program, Initial Reports, 193: College Station, TX (Ocean Drilling Program). https://doi.org/10.2973/odp.proc.ir.193.2002
Bischoff, J.L., 1991. Densities of liquids and vapors in boiling NaCl-H2O solutions: a PTVX summary from 300° to 500°C. American Journal of Science, 291(4):309–338. https://doi.org/10.2475/ajs.291.4.309
Blount, C.W., and Dickson, F.W., 1973. Gypsum-anhydrite equilibria in systems CaSO4-H2O and CaSO4-NaCl-H2O. American Mineralogist, 58(1):323–331. http://www.minsocam.org/ammin/AM58/AM58_323.pdf
Butterfield, D.A., Nakamura, K., Takano, B., Lilley, M.D., Lupton, J.E., Resing, J.A., and Roe, K.K., 2011. High SO2 flux, sulfur accumulation, and gas fractionation at an erupting submarine volcano. Geology, 39(9):803–806. https://doi.org/10.1130/G31901.1
Cande, S.C., and Kent, D.V., 1995. Revised calibration of the geomagnetic polarity timescale for the Late Cretaceous and Cenozoic. Journal of Geophysical Research: Solid Earth, 100(B4):6093–6095. https://doi.org/10.1029/94JB03098
Carroll, M.R., and Webster, J.D., 1994. Solubilities of sulfur, noble gases, nitrogen, chlorine, and fluorine in magmas. In Carroll, M.R., and Holloway, J.R. (Eds.), Reviews in Mineralogy & Geochemistry (Volume 30):Volatiles in Magmas. Swainson, I. (Series Ed.): Berlin (De Gruyter), 231–279. https://doi.org/10.1515/9781501509674
de Ronde, C.E.J., Hannington, M.D., Stoffers, P., Wright, I.C., Ditchburn, R.G., Reyes, A.G., Baker, E.T., et al., 2005. Evolution of a submarine magmatic-hydrothermal system: Brothers Volcano, southern Kermadec arc, New Zealand. Economic Geology, 100(6):1097–1133. https://doi.org/10.2113/gsecongeo.100.6.1097
de Ronde, C.E.J., Humphris, S.E., Höfig, T.W., Brandl, P.A., Cai, L., Cai, Y., Caratori Tontini, F., Deans, J.R., Farough, A., Jamieson, J.W., Kolandaivelu, K.P., Kutovaya, A., Labonté, J.M., Martin, A.J., Massiot, C., McDermott, J.M., McIntosh, I.M., Nozaki, T., Pellizari, V.H., Reyes, A.G., Roberts, S., Rouxel, O., Schlicht, L.E.M., Seo, J.H., Straub, S.M., Strehlow, K., Takai, K., Tanner, D., Tepley, F.J., III, and Zhang, C., 2019a. Expedition 376 methods. In de Ronde, C.E.J., Humphris, S.E., Höfig, T.W., and the Expedition 376 Scientists, Brothers Arc Flux. Proceedings of the International Ocean Discovery Program, 376: College Station, TX (International Ocean Discovery Program). https://doi.org/10.14379/iodp.proc.376.102.2019
de Ronde, C.E.J., Humphris, S.E., Höfig, T.W., Brandl, P.A., Cai, L., Cai, Y., Caratori Tontini, F., Deans, J.R., Farough, A., Jamieson, J.W., Kolandaivelu, K.P., Kutovaya, A., Labonté, J.M., Martin, A.J., Massiot, C., McDermott, J.M., McIntosh, I.M., Nozaki, T., Pellizari, V.H., Reyes, A.G., Roberts, S., Rouxel, O., Schlicht, L.E.M., Seo, J.H., Straub, S.M., Strehlow, K., Takai, K., Tanner, D., Tepley, F.J., III, and Zhang, C., 2019b. Expedition 376 summary. In de Ronde, C.E.J., Humphris, S.E., Höfig, T.W., and the Expedition 376 Scientists, Brothers Arc Flux. Proceedings of the International Ocean Discovery Program, 376: College Station, TX (International Ocean Discovery Program). https://doi.org/10.14379/iodp.proc.376.101.2019
de Ronde, C.E.J., Humphris, S.E., Höfig, T.W., Brandl, P.A., Cai, L., Cai, Y., Caratori Tontini, F., Deans, J.R., Farough, A., Jamieson, J.W., Kolandaivelu, K.P., Kutovaya, A., Labonté, J.M., Martin, A.J., Massiot, C., McDermott, J.M., McIntosh, I.M., Nozaki, T., Pellizari, V.H., Reyes, A.G., Roberts, S., Rouxel, O., Schlicht, L.E.M., Seo, J.H., Straub, S.M., Strehlow, K., Takai, K., Tanner, D., Tepley, F.J., III, and Zhang, C., 2019c. Site U1527. In de Ronde, C.E.J., Humphris, S.E., Höfig, T.W., and the Expedition 376 Scientists, Brothers Arc Flux. Proceedings of the International Ocean Discovery Program, 376: College Station, TX (International Ocean Discovery Program). https://doi.org/10.14379/iodp.proc.376.103.2019
de Ronde, C.E.J., Humphris, S.E., Höfig, T.W., Brandl, P.A., Cai, L., Cai, Y., Caratori Tontini, F., Deans, J.R., Farough, A., Jamieson, J.W., Kolandaivelu, K.P., Kutovaya, A., Labonté, J.M., Martin, A.J., Massiot, C., McDermott, J.M., McIntosh, I.M., Nozaki, T., Pellizari, V.H., Reyes, A.G., Roberts, S., Rouxel, O., Schlicht, L.E.M., Seo, J.H., Straub, S.M., Strehlow, K., Takai, K., Tanner, D., Tepley, F.J., III, and Zhang, C., 2019d. Site U1529. In de Ronde, C.E.J., Humphris, S.E., Höfig, T.W., and the Expedition 376 Scientists, Brothers Arc Flux. Proceedings of the International Ocean Discovery Program, 376: College Station, TX (International Ocean Discovery Program). https://doi.org/10.14379/iodp.proc.376.105.2019
de Ronde, C.E.J., Humphris, S.E., Höfig, T.W., and the Expedition 376 Scientists, 2019b. Supplementary material, https://doi.org/10.14379/iodp.proc.376supp.2019. Supplement to de Ronde, C.E.J., Humphris, S.E., Höfig, T.W., and the Expedition 376 Scientists, 2019. Brothers Arc Flux. Proceedings of the International Ocean Discovery Program, 376: College Station, TX (International Ocean Discovery Program). https://doi.org/10.14379/iodp.proc.376.2019
de Ronde, C.E.J., Massoth, G.J., Butterfield, D.A., Christenson, B.W., Ishibashi, J., Ditchburn, R.G., Hannington, M.D., et al., 2011. Submarine hydrothermal activity and gold-rich mineralization at Brothers Volcano, Kermadec arc, New Zealand. Mineralium Deposita, 46(5–6):541–584. https://doi.org/10.1007/s00126-011-0345-8
Douville, E., Bienvenu, P., Charlou, J.L., Donval, J.P., Fouquet, Y., Appriou, P., and Gamo, T., 1999. Yttrium and rare earth elements in fluids from various deep-sea hydrothermal systems. Geochimica et Cosmochimica Acta, 63(5):627–643. https://doi.org/10.1016/S0016-7037(99)00024-1
Dziak, R.P., Haxel, J.H., Matsumoto, H., Lau, T.K., Merle, S.G., de Ronde, C.E.J., Embley, R.W., and Mellinger, D.K., 2008. Observations of regional seismicity and local harmonic tremor at Brothers Volcano, south Kermadec arc, using an ocean bottom hydrophone array. Journal of Geophysical Research: Solid Earth, 113(B8):B08S04. https://doi.org/10.1029/2007JB005533
Embley, R.W., de Ronde, C.E.J., Merle, S.G., Davy, B., and Catatoni Tontini, F., 2012. Detailed morphology and structure of an active submarine arc caldera: Brothers Volcano, Kermadec arc. Economic Geology,107(8):1557–1570. https://doi.org/10.2113/econgeo.107.8.1557
Fisher, R.V., and Schmincke, H.-U., 1984. Pyroclastic Rocks: Berlin (Springer-Verlag). https://doi.org/10.1007/978-3-642-74864-6
Foustoukos, D.I., and Seyfried, Jr., W.E., 2007. Trace element partitioning between vapor, brine and halite under extreme phase separation conditions. Geochimica et Cosmochimica Acta 71(8):2056–2071. https://doi.org/10.1016/j.gca.2007.01.024
Gamo, T., Okamura, K., Charlou, J.-L., Urabe, T., Auzende, J.-M., Ishibashi, J., Shitashima, K., and Chiba, H., 1997. Acidic and sulfate-rich hydrothermal fluids from the Manus back-arc basin, Papua New Guinea. Geology, 25(2):139–142. https://doi.org/10.1130/0091-7613(1997)025<0139:AASRHF>2.3.CO;2
Graber, K.K., Pollard, E., Jonasson, B., and Schulte, E. (Eds.), 2002. Technical Note 31: Overview of Ocean Drilling Program engineering tools and hardware. Ocean Drilling Program. https://doi.org/10.2973/odp.tn.31.2002
Grant, M.A., and Bixley, P.F., 2011. Geothermal Reservoir Engineering (2nd ed.): Cambridge, MA (Academic Press).
Gruen, G., Weis, P., Driesner, T., de Ronde, C.E.J., and Heinrich, C.A., 2012. Fluid-flow patterns at Brothers Volcano, southern Kermadec arc: insights from geologically constrained numerical simulations. Economic Geology, 107(8):1595–1611. https://doi.org/10.2113/econgeo.107.8.1595
Haase, K.M., Stroncik, N., Garbe-Schönberg, D., and Stoffers, P., 2006. Formation of island arc dacite magmas by extreme crystal fractionation: an example from Brothers Seamount, Kermadec island arc (SW Pacific). Journal of Volcanology and Geothermal Research, 152(3–4):316–330. https://doi.org/10.1016/j.jvolgeores.2005.10.010
Hedenquist, J.W., lzawa, E., Arribas, A., and White, N.C., 1996. Epithermal gold deposits: styles, characteristics, and exploration. Resource Geology Special Publication, 1.
Humphris, S.E., Herzig, P.M., Miller, D.J., et al., 1996. Proceedings of the Ocean Drilling Program, Initial Reports, 158: College Station, TX (Ocean Drilling Program). https://doi.org/10.2973/odp.proc.ir.158.1996
Keith, M., Haase, K.M., Klemd, R., Smith, D.J., Schwarz-Schampera, U., and Bach, W., 2018. Constraints on the source of Cu in a submarine magmatic-hydrothermal system, Brothers volcano, Kermadec island arc. Contributions to Mineralogy and Petrology, 173(5):40. https://doi.org/10.1007/s00410-018-1470-5
Kirschvink, J.L., 1980. The least-squares line and plane and the analysis of palaeomagnetic data. Geophysical Journal of the Royal Astronomical Society, 62(3):699–718. https://doi.org/10.1111/j.1365-246X.1980.tb02601.x
Lurcock, P.C., and Wilson, G.S., 2012. PuffinPlot: a versatile, user-friendly program for paleomagnetic analysis. Geochemistry, Geophysics, Geosystems, 13(6):Q06Z45. https://doi.org/10.1029/2012GC004098
McFadden, P.L., and Reid, A.B., 1982. Analysis of paleomagnetic inclination data. Geophysical Journal of the Royal Astronomical Society, 69(2):307–319. https://doi.org/10.1111/j.1365-246X.1982.tb04950.x
Miyazaki, E., Shinmoto, Y., Kyo, M., Suzuki, T., Hayashi, M., and Sumitani, N., 2014. Development of turbine driven coring system for hard rock sampling [paper presented at Offshore Technology Conference, Houston, Texas, 5–8 May 2014]. (Abstract OTC-25149-MS) https://doi.org/10.4043/25149-MS
O’Reilly, W., 1984. Rock and Mineral Magnetism: New York (Chapman and Hall). https://doi.org/10.1007/978-1-4684-8468-7
Reagan, M.K., Pearce, J.A., Petronotis, K., Almeev, R., Avery, A.A., Carvallo, C., Chapman, T., Christeson, G.L., Ferré, E.C., Godard, M., Heaton, D.E., Kirchenbaur, M., Kurz, W., Kutterolf, S., Li, H.Y., Li, Y., Michibayashi, K., Morgan, S., Nelson, W.R., Prytulak, J., Python, M., Robertson, A.H.F., Ryan, J.G., Sager, W.W., Sakuyama, T., Shervais, J.W., Shimizu, K., and Whattam, S.A., 2015. Expedition 352 methods. In Reagan, M.K., Pearce, J.A., Petronotis, K., and the Expedition 352 Scientists, Izu-Bonin-Mariana Fore Arc. Proceedings of the International Ocean Discovery Program, 352: College Station, TX (International Ocean Discovery Program). https://doi.org/10.14379/iodp.proc.352.102.2015
Reyes, A.G., Giggenbach, W.F., Saleras, J.R.M., Salonga, N.D., and Vergara, M.C., 1993. Petrology and geochemistry of Alto Peak, a vapor-cored hydrothermal system, Leyte Province, Philippines. Geothermics, 22(5–6):479–520. https://doi.org/10.1016/0375-6505(93)90033-J
Richter, C., Acton, G., Endris, C., and Radsted, M., 2007. Technical Note 34: Handbook for Shipboard Paleomagnetists. Ocean Drilling Program. https://doi.org/10.2973/odp.tn.34.2007
Seewald, J.S., Reeves, E.P., Bach, W., Saccocia, P.J., Craddock, P.R., Shanks, W.C., III, Sylva, S.P., Pichler, T., Rosner, M., and Walsh, E., 2015. Submarine venting of magmatic volatiles in the eastern Manus Basin, Papua New Guinea. Geochimica et Cosmochimica Acta, 163:178–199. https://doi.org/10.1016/j.gca.2015.04.023
Tauxe, L., 2010. Essentials of Paleomagnetism: Berkeley, California (University of California Press).
Timm, C., de Ronde, C.E.J., Leybourne, M.I., Layton-Matthews, D., and Graham, I.J., 2012. Sources of chalcophile and siderophile elements in Kermadec arc lavas. Economic Geology, 107(8):1527–1538. https://doi.org/10.2113/econgeo.107.8.1527
Vanko, D.A., Bach, W., Roberts, S., Yeats, C.J., and Scott, S.D., 2004. Fluid inclusion evidence for subsurface phase separation and variable fluid mixing regimes beneath the deep-sea PACMANUS hydrothermal field, Manus Basin backarc rift, Papua New Guinea. Journal of Geophysical Research: Solid Earth, 109(B3):B03201. https://doi.org/10.1029/2003JB002579
Von Damm, K.L., Bischoff, J.L., and Rosenbauer, R.J., 1991. Quartz solubility in hydrothermal seawater: an experimental study and equation describing quartz solubility for up to 0.5M NaCl solutions. American Journal of Science., 291:977–1007. https://doi.org/10.2475/ajs.291.10.977
Von Damm, K.L., Edmond, J.M., Grant, B., Measures, C.I., Walden, B., and Weiss, R.F., 1985. Chemistry of submarine hydrothermal solutions at 21°N, East Pacific Rise. Geochimica et Cosmochimica Acta, 49(11):2197–2220. https://doi.org/10.1016/0016-7037(85)90222-4
Wright, I.C., and Gamble, J.A., 1999. Southern Kermadec submarine caldera arc volcanoes (SW Pacific): caldera formation by effusive and pyroclastic eruption. Marine Geology, 161(2–4):207–227. https://doi.org/10.1016/S0025-3227(99)00040-7
Yang K.H., and Scott, S.D., 2013. Magmatic fluids as a source of metals in seafloor hydrothermal systems. In Christie, D.M., Fisher, C.R., Lee, S.-M., and Givens, S. (Eds.), Back-Arc Spreading Systems: Geological, Biological, Chemical, and Physical Interactions. Geophysical Monograph, 166:163–184. https://agupubs.onlinelibrary.wiley.com/doi/10.1029/166GM09
Zijderveld, J.D.A., 1967. AC demagnetization of rocks: analysis of results. In Collinson, D.W., Creer, K.M., and Runcorn, S.K. (Eds.), Developments in Solid Earth Geophysics (Volume 3): Methods in Palaeomagnetism: Amsterdam (Elsevier), 254–286. https://doi.org/10.1016/B978-1-4832-2894-5.50049-5
1 de Ronde, C.E.J., Humphris, S.E., Höfig, T.W., Brandl, P.A., Cai, L., Cai, Y., Caratori Tontini, F., Deans, J.R., Farough, A., Jamieson, J.W., Kolandaivelu, K.P., Kutovaya, A., Labonté, J.M., Martin, A.J., Massiot, C., McDermott, J.M., McIntosh, I.M., Nozaki, T., Pellizari, V.H., Reyes, A.G., Roberts, S., Rouxel, O., Schlicht, L.E.M., Seo, J.H., Straub, S.M., Strehlow, K., Takai, K., Tanner, D., Tepley, F.J., III, and Zhang, C., 2019. Site U1528. In de Ronde, C.E.J., Humphris, S.E., Höfig, T.W., and the Expedition 376 Scientists, Brothers Arc Flux. Proceedings of the International Ocean Discovery Program, 376: College Station, TX (International Ocean Discovery Program). https://doi.org/10.14379/iodp.proc.376.104.2019
2 Expedition 376 Scientists’ affiliations.
This work is distributed under the Creative Commons Attribution 4.0 International (CC BY 4.0) license. 
- F1. Pit crater atop Brothers Cone.
- F2. Site locations.
- F3. Line Bro-3.
- F4. Reentry system and casing installation, Hole U1528B.
- F5. TDCS BHA, Hole U1528C.
- F6. TDCS core barrel and PDC bit.
- F7. Drilling assembly.
- F8. Reentry system and casing installation, Hole U1528D.
- F9. Reentry funnel hydrothermal plume, Hole U1528D.
- F10. Damage from downhole corrosion, Hole U1528D.
- F11. Lithostratigraphic summary, Holes U1528A, U1528C, and U1528D.
- F12. Igneous Unit 1 macroscopic samples, Holes U1528A and U1528C.
- F13. Igneous Unit 1 clasts.
- F14. Stratigraphic correlation, Hole U1528D.
- F15. Subunit 2a macroscopic samples, Hole U1528D.
- F16. Subunit 2a volcanic clasts and glomerocryst, Hole U1528D.
- F17. Subunit 2b macroscopic samples, Hole U1528D.
- F18. Subunit 2b plagioclase and dacite with glomerocrysts, Hole U1528D.
- F19. Subunit 2c macroscopic samples, Hole U1528D.
- F20. Subunit 2c microscopic samples, Hole U1528D.
- F21. Igneous Unit 3 macroscopic samples, Hole U1528D.
- F22. Igneous Unit 3 unaltered dacitic lava, Hole U1528D.
- F23. Rb vs. K2O.
- F24. TI/ZR and RB.
- F25. Stratigraphic column.
- F26. Alteration types.
- F27. Native sulfur morphologies.
- F28. Alteration Type I, Hole U1528A.
- F29. Alteration Type II, Hole U1528D.
- F30. Alteration of plagioclase.
- F31. Alteration Type II.
- F32. Oxidization of Ti-Mt to Py.
- F33. Alteration Type III, Hole U1528A.
- F34. Clast-matrix boundary.
- F35. Pseudomorphed plagioclase and pyroxene in clasts.
- F36. Pseudomorphed plagioclase and veins.
- F37. Matrix and clasts cut by a network of pyrite-rich veinlets.
- F38. Alteration Type IV.
- F39. Contact between Alteration Types III and IV.
- F40. Drusy anhydrite in open vug, Hole U1528D.
- F41. Types of fluid inclusions, Hole U1528D.
- F42. Fluid homogenization temperatures, Hole U1528D.
- F43. Salinity vs. homogenization temperature.
- F44. Vein attributes, Hole U1528A.
- F45. Vein morphologies, Hole U1528A.
- F46. Volcanic fabric intensity and dip angle, Hole U1528D.
- F47. Volcanic fabrics, Hole U1528D.
- F48. Volcanic fabrics in different volcanic clasts, Hole U1528D.
- F49. Alteration vein attributes, Hole U1528D.
- F50. Alteration vein types, Hole U1528D.
- F51. Fracture attributes, Hole U1528D.
- F52. Total sulfur and TC with TOC.
- F53. S and Sr vs. Ca.
- F54. Zr, TiO2, Al2O3, Zr/Ti, and Y/Zr.
- F55. CaO, K2O, MgO, Fe2O3, and SiO2.
- F56. Trace elements and total sulfur.
- F57. Igneous Unit 1 chemical enrichment factors, Hole U1528C and Site U1529.
- F58. Pore space gas concentrations, Holes U1528A, U1528C, and U1528D.
- F59. Mineral concentrations, Hole U1528D.
- F60. Igneous Unit 2 AF demagnetization experiment, Hole U1528D.
- F61. Igneous Unit 2 TD experiment, Hole U1528D.
- F62. Igneous Unit 3 AF demagnetization, Hole U1528D.
- F63. Igneous Unit 3 TD experiment, Hole U1528D.
- F64. NRM, Hole U1528D.
- F65. Physical properties, Holes U1528A and U1528C.
- F66. Physical properties, Hole U1528D.
- F67. MAD and P-wave velocity, Holes U1528A, U1528C, and U1528D.
- F68. P-wave velocity and anisotropy, Holes U1528A, U1528C, and U1528D.
- F69. NGR analyses, Holes U1528A and U1528D.
- F70. Thermal conductivity.
- F71. Downhole measurements and sampling operations, Hole U1528D.
- F72. Temperature measurements, Hole U1528D.
- F73. Temperature heat-up profiles.
- F74. HTTC downhole measurements.
- F75. Core and downhole measurements.
- F76. Whole-round samples.
- F77. Microbiological samples.
- T1. Operations summary.
- T2. Alteration types.
- T3. Key primary and alteration minerals by XRD onboard analysis.
- T4. Key primary and alteration minerals by XRD postcruise analysis.
- T5. Fluid inclusion samples.
- T6. Fluid inclusion types.
- T7. pXRF analyses on rock powders.
- T8. Major and trace element abundances.
- T9. pXRF and ICP-AES on sample powders.
- T10. TC, total sulfur, TN, TIC, and total volatiles.
- T11. Water-soluble element abundance.
- T12. Headspace gas concentrations.
- T13. Interstitial water sample, Hole U1528D.
- T14. Major and minor elements, Hole U1528D.
- T15. Metal abundances, Hole U1528D.
- T16. Solid dregs fraction, Hole U1528D.
- T17. Discrete samples from Site U1528, measurements, and experiments.
- T18. Moisture and density (MAD) data.
- T19. P-wave velocity data.
- T20. Thermal conductivity data.
- T21. Downhole measurement sequence and operations, Hole U1528D.
- T22. PFMD measurements.