de Ronde, C.E.J., Humphris, S.E., Höfig, T.W., and the Expedition 376 Scientists
Proceedings of the International Ocean Discovery Program Volume 376
publications.iodp.org

https://doi.org/10.14379/iodp.proc.376.106.2019
Site U15301
C.E.J. de Ronde, S.E. Humphris, T.W. Höfig, P.A. Brandl, L. Cai, Y. Cai, F. Caratori Tontini, J.R. Deans, A. Farough, J.W. Jamieson, K.P. Kolandaivelu, A. Kutovaya, J.M. Labonté, A.J. Martin, C. Massiot, J.M. McDermott, I.M. McIntosh, T. Nozaki, V.H. Pellizari, A.G. Reyes, S. Roberts, O. Rouxel, L.E.M. Schlicht, J.H. Seo, S.M. Straub, K. Strehlow, K. Takai, D. Tanner, F.J. Tepley III, and C. Zhang2
Keywords: International Ocean Discovery Program, IODP, JOIDES Resolution, Expedition 376, Brothers Arc Flux, Brothers volcano, Site U1530, Kermadec arc, submarine arc volcano, hydrothermal systems, volcaniclastics, dacite lava, hydrothermal alteration, borehole fluids, hypersaline brine, fluid inclusions, acidic fluids, alteration mineral assemblages, Upper Cone, Lower Cone, NW Caldera
MS 376-106: Published 5 July 2019
Summary
Background and objectives
Site U1530 (proposed Site NWC-3A) is located on a narrow bench on the NW Caldera (NWC) site at Brothers volcano at a water depth of 1595 m. The primary objective at this site was to drill through the lower part of a seawater-dominated, Type I hydrothermal system. Site U1530 is located ~400 m east of Site U1527 on a ~30 m long by ~10 m wide bench toward the upper part of the NWC wall. It is situated structurally above a known prominent metal-rich stockwork zone. The operations plan at Site U1530 was to penetrate ~450 m through the upper stockwork and then into deeper portions of the inferred hydrothermal upflow zone and continue through a thicker stratigraphic section of lava in the caldera to hopefully intersect the footwall of the original caldera. Intersection of stockwork was expected to provide the best opportunity to investigate the transport of metals through the Brothers volcano hydrothermal system.
Operations
Operations were conducted in one hole at Site U1530. Hole U1530A is located at 34°51.6588ʹS, 179°3.4572ʹE at a water depth of 1594.9 m. We used the rotary core barrel (RCB) system to core from the seafloor to 453.1 meters below seafloor (mbsf) with a recovery of 76.8 m (17%). We encountered optimum downhole conditions throughout coring. After successfully penetrating to our target depth, we decided to terminate coring in Hole U1530A to take advantage of the good hole conditions for downhole measurements and fluid sampling. Hence, we released the bit at the bottom of the hole by deploying the rotary shifting tool (RST).
Our downhole measurement plan for Hole U1530A consisted of running (1) the Elevated Temperature Borehole Sensor (ETBS) memory tool, (2) the 600 mL Kuster Flow-Through Sampler (FTS) tool, (3) the triple combination (triple combo) logging tool string (natural gamma ray, porosity, and density sondes including resistivity, caliper, and logging head temperature), (4) the Formation MicroScanner (FMS)-sonic logging tool string, and (5) the Petrospec spool-in thermocouple memory tool (TCMT). After recording a temperature of 40°C at the bottom of the hole (stationary measurement time of 15 min) with the ETBS, we lowered the 600 mL Kuster FTS tool on the core line to ~433 mbsf but could not recover a fluid sample because the valves did not close completely. We then raised the end of the drill string to a logging depth of 67.1 mbsf, lowered the triple combo tool string into the hole, and performed two passes from a debris fill at 442 mbsf to the seafloor. This run was followed by two logging passes with the FMS-sonic tool string from 442 mbsf to just below the end of the pipe at 51.8 mbsf. We then lowered the end of the drill string to 416.2 mbsf and obtained a borehole fluid (BF) sample with the 600 mL Kuster FTS tool. Finally, the third-party Petrospec TCMT was deployed on the core line and, with the temperature-sensitive Petrospec TCMT data logger kept inside the drill string, the two thermocouple joints were lowered 8 m past the end of the drill pipe and held at 447 mbsf for 10 min. This first test of the newly designed high-temperature TCMT recorded a temperature of 20°C. This completed our operations at Site U1530. In total, 184.1 h, or 7.7 days, was spent at Site U1530.
Principal results
Igneous petrology and volcanology
Five igneous units were identified at Site U1530. Igneous Unit 1 (0–26.62 mbsf) consists of clast-supported polymict lapillistone with occasional blocks and bombs. Clasts are volcanic in origin and reside in a matrix of altered, smaller volcanic fragments and secondary minerals. Igneous Unit 2 (30.70–59.62 mbsf) consists of a sequence of altered tuffaceous mudstone, siltstone, and sandstone with one subordinate layer of polymict lapillistone. The unit is divided into five subunits (2a–2e) based on color, grain size, and internal structures. Unit 2 displays various sedimentary textures including normal and reverse grading as well as horizontal, wavy, lenticular, and inclined bedding, which indicates transport, depositional, and soft-sediment deformation events. Igneous Unit 3 (59.62–64.40 mbsf) consists of altered plagioclase-phyric lava with pseudomorphs after glomerocrystic plagioclase. Igneous Unit 4 (64.40–218.21 mbsf) is a sequence of highly altered volcaniclastic rocks with discernible monomict and polymict lapillistone and monomict lapilli-tuff in the upper half that consist of altered volcanic clasts in a fine-grained, completely altered matrix. Significantly pronounced alteration hinders detailed classification in the lower half of Unit 4. Igneous Unit 5 (222.70–448.68 mbsf) consists of highly altered volcanic rocks with five discrete horizons of less altered plagioclase-phyric lava containing pseudomorphs after glomerocrystic plagioclase.
Despite the pervasive alteration, the volcanic and volcaniclastic rocks retain residual volcanic textures and original compositions of alteration-resistant elements and ratios (Ti, Zr, Ti/Zr), which suggests that the protolith was a typical Brothers volcano dacite. Similar to the volcaniclastic rocks of Igneous Unit 2 in Hole U1527C, Hole U1530A rocks appear to have the same systematically lower Ti/Zr value compared with volcanic rocks of Sites U1528 and U1529. Although this disparity is small compared with the overall range observed in Kermadec arc lava, it points toward slight genetic variability among the Brothers volcano dacitic magma series.
Alteration
Five distinct alteration types were identified based on their alteration mineral assemblage in core material recovered from Hole U1530A.
Alteration Type I is classified as highly to intensely altered and has an alteration mineral assemblage of smectite, pyrite, anhydrite, sphalerite, and barite with minor quartz, chlorite, and illite. A network of anhydrite-barite veins with fine- to medium-grained sphalerite cuts blue-gray lapillistone. The clasts are variably altered/silicified, and the contacts between clasts and matrix are distinct. Anhydrite is most abundant in veins and only rarely infills vugs in clasts. In one sample, an acicular mineral, most likely natroalunite, was observed microscopically cutting anhydrite-pyrite-silica veins but was not detected by X-ray diffraction (XRD) analysis.
Alteration Type II, classified as intensely altered, has a characteristic green-gray color and an alteration mineral assemblage of quartz, illite, and chlorite with variable amounts of anhydrite, pyrite, and smectite. Alteration Type II occurs in three distinct lithologies throughout the hole: tuffaceous fine-grained sediments, coherent lava, and volcaniclastic rocks. The abundance of individual alteration minerals varies with lithology. For example, pyrite is more abundant in the fine-grained sediments than the volcaniclastic rocks. The fine-grained sediment unit is frequently cut by coarse-grained, vuggy anhydrite veins. The altered lava unit exhibits a vuggy texture with vugs filled with quartz, anhydrite, and minor pyrite. Chlorite and illite are intergrown with microcrystalline quartz, forming a homogeneous matrix. The volcaniclastic unit is characterized by subangular clasts that are visually distinguishable from the matrix material. Clasts are rich in chlorite and illite relative to the silica- and pyrite-rich matrix. Plagioclase is completely pseudomorphed by chlorite, quartz, and occasionally smectite.
Alteration Type III, classified as intensely altered, is characterized by an alteration mineral assemblage of quartz and illite with minor smectite, anhydrite, and chlorite. It is divided into two subtypes (IIIa and IIIb) based on relative abundances of anhydrite (enriched in Alteration Subtype IIIa) and chlorite (enriched in Alteration Subtype IIIb). Subtype IIIa is white-gray and consists of a well-defined pyroclastic texture with soft, illite-rich clasts in a silica- and pyrite-rich matrix. Subtype IIIb is blue-gray, and both matrix and clasts are intensely silicified. Pyrite occurs as a minor phase disseminated throughout. Fe oxyhydroxide is likely derived from pyrite oxidization. Magnetite is an accessory phase and is frequently resorbed and overprinted by pyrite.
Alteration Type IV is light gray and intensely altered and has a mineral assemblage of pyrophyllite, quartz, illite, and smectite with minor pyrite and rutile. Clasts are poorly defined and strongly resorbed. Pyrophyllite is patchy and intergrown with illite and disseminated fine-grained anhydrite and likely represents the core of relict clasts. Quartz is intergrown with illite and forms discrete veins associated with subhedral pyrite. Rutile and leucoxene are common, form < 0.1 mm grains, and are variably overprinted by pyrite.
Alteration Type V has a buff color and occurs as two distinct textures: fine-grained homogeneous and coarse-grained equigranular with a mottled texture. Both have the same alteration mineral assemblage of diaspore, quartz, pyrophyllite, smectite, and rutile with minor illite, pyrite, and anhydrite. Fe oxyhydroxide staining is well developed throughout this alteration type, whereas pyrite is absent in some samples. Vugs are abundant and commonly lined by chalcedony, and anhydrite fills the cores of the vugs. Anhydrite occurs as two distinct generations: coarse euhedral grains that infill vugs and veins and a fine-grained subhedral to euhedral form intergrown in the matrix. Trace rutile is found mantled, or overprinted, by pyrite.
Most fractures in Hole U1530A are sealed by anhydrite + sulfides + quartz, and only a few vugs are partly filled by drusy quartz or anhydrite. All fluid inclusions (FIs) homogenize to the liquid phase at 209°–390°C, except for one that exhibited critical point behavior at 345°C. The FI data are consistent with two different fluids being responsible for the alteration assemblages: a pervasive fluid of modified seawater composition that has been heated to about 390°C and a hypersaline brine heated to 288°–390°C. However, the influx of a hypersaline brine has waned where fractures have been sealed. At present, the major fluids influencing water-rock interaction in Hole U1530A represent a hydrothermal fluid of modified seawater origin that has been heated to 250°–260°C, indicating mixing with ambient seawater. Site U1530 was once the site of high-temperature active magmatic input into a hydrothermal system where fluids periodically precipitated quartz, anhydrite, and sulfide minerals in fractures at temperatures as high as 390°C. Acidic hypersaline brines altered the rock to a cation-depleted assemblage of pyrophyllite, diaspore, and quartz (Alteration Type V), which, upon interaction with the rock and seawater, reintroduced Mg into the system, as evidenced by an increase in the Mg concentration of the rocks at the contact between Alteration Types V and II and by the abundance of chlorite (Type II). Alteration Types IV and I were formed with a decrease in hypersaline brine and an increase in the proportion of modified seawater. As avenues for ascending hot fluids were progressively sealed in a localized region intersected by Hole U1530A, renewed fracturing formed pathways that channeled cold seawater into the formation and changed the hydrological regime from a region of hot fluid input to a region of cold water recharge where temperatures are about 250°–260°C but most likely <150°C, based on the occurrence of late-stage smectite. However, numerous vents discharge fluids with temperatures as high as 320°C in the vicinity of Site U1530, indicating that ascending hot fluids are now being channeled through different structural pathways that were not intersected by Hole U1530A.
Structural geology
Structures in Hole U1530A consist of volcanic fabrics, alteration veins, fractures, and sedimentary boundaries. The latter, defined by changes in grain size and/or texture, are all subhorizontal (<10°). Volcanic fabrics occur in two forms (i.e., volcanic clasts or coherent lava). In both forms, the fabric is defined by vesicles and plagioclase microlites. Volcanic fabrics in clasts can be weak to strong but do not share a common orientation across clasts. This type of fabric was observed in the top half of Hole U1530A in lapilli-tuffs that define Igneous Units 1 and 4. Moderate to strong volcanic fabrics that occur over decimeters define Igneous Units 3 and 5, which consist of lava. Volcanic fabrics in the lava tend to be moderate to steep and dip >45°.
Alteration veins occur throughout the hole and are typically filled with anhydrite, silica, and/or pyrite. Vein density is variable downhole, and the highest density is related to the presence of network veins that are typically filled with pyrite or silica. The highest abundance in network veins is at the very top of the hole (0–25 mbsf). Discrete veins are most abundant at ~70 and ~270 mbsf. These depths also correspond to a large range in vein dip (0°–90°), an increase in vein thickness, and a deviation in borehole temperature (~270 mbsf). These depth intervals are also related to changes in igneous rock type between tuffaceous sediments and lava above lapilli-tuffs at ~70 mbsf and a change from lapilli-tuff to lava at ~270 mbsf. The presence of volcaniclastic sediments and volcanic rocks, a large range in vein dip and thickness, and a deviation in borehole temperature may indicate the presence of lateral flow zones related to permeability contrasts. Fractures are less abundant than veins but are more common than at any other site. Fractures have a large range in dip and occur more frequently at ~55 and ~255 mbsf, coincident with zones of more abundant veins. Slickenlines were identified from ~190 to 290 mbsf and typically have a steep rake and a normal sense of shear.
Geochemistry
All hard rock samples from Site U1530 show various degrees of hydrothermal alteration, as confirmed by petrographic descriptions and analysis via XRD and ICP-AES/portable X-ray fluorescence (pXRF). Despite pervasive alteration, the volcanic and volcaniclastic rocks have retained original chemical compositions of alteration-resistant elements and ratios (Ti, Zr, and Ti/Zr) that suggest the protolith was a typical Brothers volcano dacite. Relative to Site U1528 and U1529 rocks that have a Ti/Zr value of ~36, Hole U1530A and U1527C volcanic and volcaniclastic rocks appear to share the slightly but systematically lower Ti/Zr value of ~27. Although this disparity is smaller than the overall range observed in Kermadec arc lava (Ti/Zr ≤ 220), it points to slight genetic variability among the Brothers volcano dacitic magma series. For a large range of alteration-sensitive elements, the recovered rocks display strong geochemical changes and major loss of Mn, Ca, and Na. The observed downhole variations of major oxides and trace elements are much more pronounced at Site U1530 than at Site U1527, including the extensive loss of Na2O relative to unaltered dacites recovered at Sites U1527 and U1529. Other alkali elements, such as potassium (K2O) and the alkaline-earth metals (Mg, Ca, Sr, and Ba), show both depletions and enrichments relative to fresh dacites. The strongest geochemical shifts in Hole U1530A occur at 189–191 mbsf, where a decrease in K2O, Ba, Y, and Cu concentrations corresponds to the transition from Alteration Type III to IV and the disappearance of illite and first appearance of pyrophyllite. Alteration Types IV and V in Igneous Unit 5 form two important end-members and display the strongest depletions in Mg, Ba, Sr, Fe, Cu, and Zn. The reverse pattern is seen in Alteration Type I in Igneous Unit 1, suggesting that some of the loss of elements observed at the bottom of the hole may partially be balanced by a gain of these elements in the upper part of the hole. Depletions in CaO are associated with higher Sr concentrations and the identification of anhydrite by XRD, suggesting that the abundance of CaO is mainly controlled by the occurrence of anhydrite. Principally hosted in barite, Ba at Site U1530 ranges from trace levels of about 20 µg/g in Alteration Types IV and V to very high abundances of about 3 wt% in Alteration Type I. A pronounced correlation was observed between total S and Fe concentrations throughout Hole U1530A, suggesting that pyrite represents the primary form of S in the rock (predominantly in Igneous Units 1, 2, and 4). Significant enrichments in Zn (≤5.2 wt%), Cu (≤1760 ppm), As (≤660 ppm), Pb (≤100 ppm), and Mo (≤560 ppm) were also recorded in pyrite-rich intervals, consistent with high-temperature hydrothermal fluid contributions.
Total carbon (TC) abundances in the majority of Hole U1530A samples are less than 200 µg/g and overall lower than TC abundances at Sites U1527–U1529. An average total sulfur concentration at Site U1530 of 5.1 wt% is similar to the 5.9 wt% average at Site U1528. In contrast to Site U1528, however, total sulfur concentrations decrease with depth from ~11 wt% to ~3.5 wt% on average.
Pore space dissolved gas abundances including H2, CO, CH4, C2H6, ΣCO2, and acid volatile sulfur (AVS) were determined via headspace analysis from several intervals of the recovered cores in Hole U1530A. As reported at Sites U1527–U1529, pore space dissolved C2H6 concentrations were below the detection limit (<0.03 µM) for all depths in Hole U1530A. However, five intervals with elevated H2, CH4, ΣCO2, and AVS concentrations were identified. Maximum pore-fluid AVS and ∑CO2 concentrations of 1.6 and 37 mmol/L, respectively, are similar to those previously determined by de Ronde et al. (2011) in fluids venting at the NWC hydrothermal field and may reflect interaction with fluids rich in magmatic volatiles.
A fluid sample was collected with the 600 mL Kuster FTS tool at 435 mbsf (the same depth as Core 376-U1530A-90R). The in situ fluid temperature was estimated to be <38°C based on downhole temperature logging. The BF sample is slightly acidic relative to seawater, has a pH value of 6.8, and is characterized by the same major and minor species composition (i.e., dissolved Na, K, Ca, Sr, Mg, Cl, Br, and SO4) as drilling fluid (surface seawater) within analytical error. Dissolved ΣH2S is below detection limit. Several metal species are highly elevated above seawater abundances and are likely derived from contamination by the steel bit and drill string or the 600 mL Kuster FTS tool itself.
Paleomagnetism
Natural remanent magnetization (NRM) of 81 archive halves from Hole U1530A was measured using the cryogenic superconducting rock magnetometer. The overprint magnetization from drilling and coring was reduced by using the in-line alternating field (AF) demagnetizer. Detailed measurements of anisotropy of magnetic susceptibility (AMS), AF and thermal demagnetization (TD), and isothermal remanent magnetization (IRM) experiments on 65 discrete oriented samples were also conducted (4 from Igneous Unit 1, 5 from Igneous Unit 2, 2 from Igneous Unit 3, 24 from Igneous Unit 4, and 30 from Igneous Unit 5). Magnetic directions for discrete samples show relatively shallow inclinations compared with Sites U1527 and U1528. In particular, three samples from Igneous Unit 2 (Cores 376-U1530A-10R through 11R; 50–55 mbsf) show consistent positive inclinations that are confirmed by corresponding pieces measured in the cryogenic magnetometer. The NRM intensities and MS values also highlight relative differences between the various igneous units. For example, Igneous Unit 1 is characterized by low NRM intensities, low coercivities, and erratic TD curves. Igneous Units 2 and 4 are characterized by very low NRM intensities and complex AF and TD curves but higher coercivities. Igneous Units 3 and 5 show low NRM intensities, low to medium magnetic coercivities, and relatively simple AF and TD curves with a minor overprint from drilling. Units 1, 2, and 4 also show increases in NRM intensity after heating to >400°C that suggest irreversible transformation of the original magnetic minerals during heating.
Physical properties
Variations of physical properties at Site U1530 show good correlations with defined igneous units and subunits but are less well correlated with transitions in alteration types. Igneous Unit 1, which corresponds to Alteration Type I, contains the peak values for magnetic susceptibility (MS) and natural gamma radiation (NGR) at the site. NGR peaks are also recorded by downhole measurements with the Hostile Environment Natural Gamma Ray Sonde (HNGS) and are an order of magnitude higher than those recorded at the other drill sites, which is attributed to radioactive U-series isotopes in the sulfide and barite veins observed at this depth.
Transitions between and within igneous units and subunits are clearly defined by variations in bulk density, porosity, and P-wave velocity. These data do not show strong correlation with structural features such as fractures or alteration veins. Observed variations in MS and thermal conductivity do not correspond clearly to the observed abundance or distribution of particular minerals, but there is a large increase in MS from Igneous Unit 4 to Igneous Unit 5.
Overall, physical property data sets define two intervals of markedly different characteristics: ~30 to ~35 mbsf in Igneous Unit 2 and ~75 to ~85 mbsf in Igneous Unit 4. These intervals are characterized by high grain density, low bulk density, and high porosity. They also correspond to increased concentrations of Fe2O3, S, trace metals, and metalloids and are located directly beneath intervals characterized by increased fracture density and wide ranges in dip angles of alteration veins. These intervals may thus be important for understanding the past fluid-rock interactions and flow pathways of the hydrothermal system at Site U1530.
Downhole measurements
Downhole measurements were acquired after coring in Hole U1530A. Multiple borehole temperature measurements obtained over the downhole logging period indicate that the hole warmed from ~35° to 94°C at around 430 mbsf during the first 5 h after stopping circulation and then cooled down to 37°C during the subsequent 10 h. The temperature profile shows a gradual increase in temperature with depth that is indicative of a largely conductive-dominated regime in the borehole and also displays a concave-up shape suggestive of recharge into the formation. Thermal anomalies in the temperature profiles observed at 255–295 mbsf may indicate a permeable flow zone. This interval is also characterized by the highest number of veins and has a large range in vein dip and a higher abundance of fractures, suggesting structural control for this permeable zone. Downhole caliper measurements show an overall comparatively large borehole diameter that partially exceeds the measurable 43.2 cm (minimum = 24.0 cm; median = 41.1 cm). Downhole natural gamma ray measurements reveal high uranium-series isoptope content at 23–35 mbsf, which correlates well with high values measured on the recovered core and is most likely related to the barite identified by XRD analysis. High potassium values correspond to Alteration Types II and III, both of which contain abundant illite. Downhole density and porosity measurements agree well with discrete core measurements. The 70–85 mbsf interval corresponds to Igneous Unit 4 and Alteration Subtype IIIa and has low bulk density and high porosity from both discrete and downhole measurements as well as low resistivity. This depth interval corresponds to high grain density and low P-wave velocities measured on the cores. Combined, these observations suggest that this interval may be important for understanding past fluid circulation and fluid-rock interactions at this site. Initial observations obtained from the FMS-sonic images suggest the presence of numerous fractures and veins throughout the logged interval.
Microbiology
In total, 18 whole-round samples (5–11 cm long) were collected from Hole U1530A for microbiological analysis. Samples were processed for shore-based DNA and RNA analyses, cell and viral counting, and viral and microbial activity measurements. Perfluoromethyl decaline (PFMD) was used for contamination testing and was usually detected on the outside of uncleaned cores. On rare occasions, it was above detection levels on the cleaned outside of cores. However, concentrations of PFMD in drilling fluid samples were much lower than the expected 500 ppb value. Based on these results, the decision was made to increase the PFMD tracer pumping rate ten times at the next drill site (U1531) and collect drilling fluid from every core.
Background and objectives
Site U1530 is located on a narrow bench on the NWC site of Brothers volcano at 34°51.6588ʹS, 179°03.4572ʹE at a water depth of 1595 m (Figure F1). This site was not proposed prior to Expedition 376 but was added and received approval from the International Ocean Discovery Program (IODP) and the New Zealand Ministry of Foreign Affairs and Trade on 9 June 2018. The request to add this new site was based on the much thicker than expected loose, unconsolidated volcanic sands, gravels, and ash-like material encountered during drilling early in the expedition. Although this lithology proved problematic at Site U1527 on the upper rim of the NWC, the difficulties were partially overcome by drilling-in casing. However, drilling a pilot hole on the caldera floor at Site U1529 was even more difficult because of a catastrophic collapse of the hole after only ~34 m. We thus proposed moving the approved alternate Site NWC-2A, also located on the caldera floor, to a new location on a bench on the caldera wall (proposed Site NWC-3A; Figure F1) to minimize the likelihood of an overburden of volcaniclastic material.
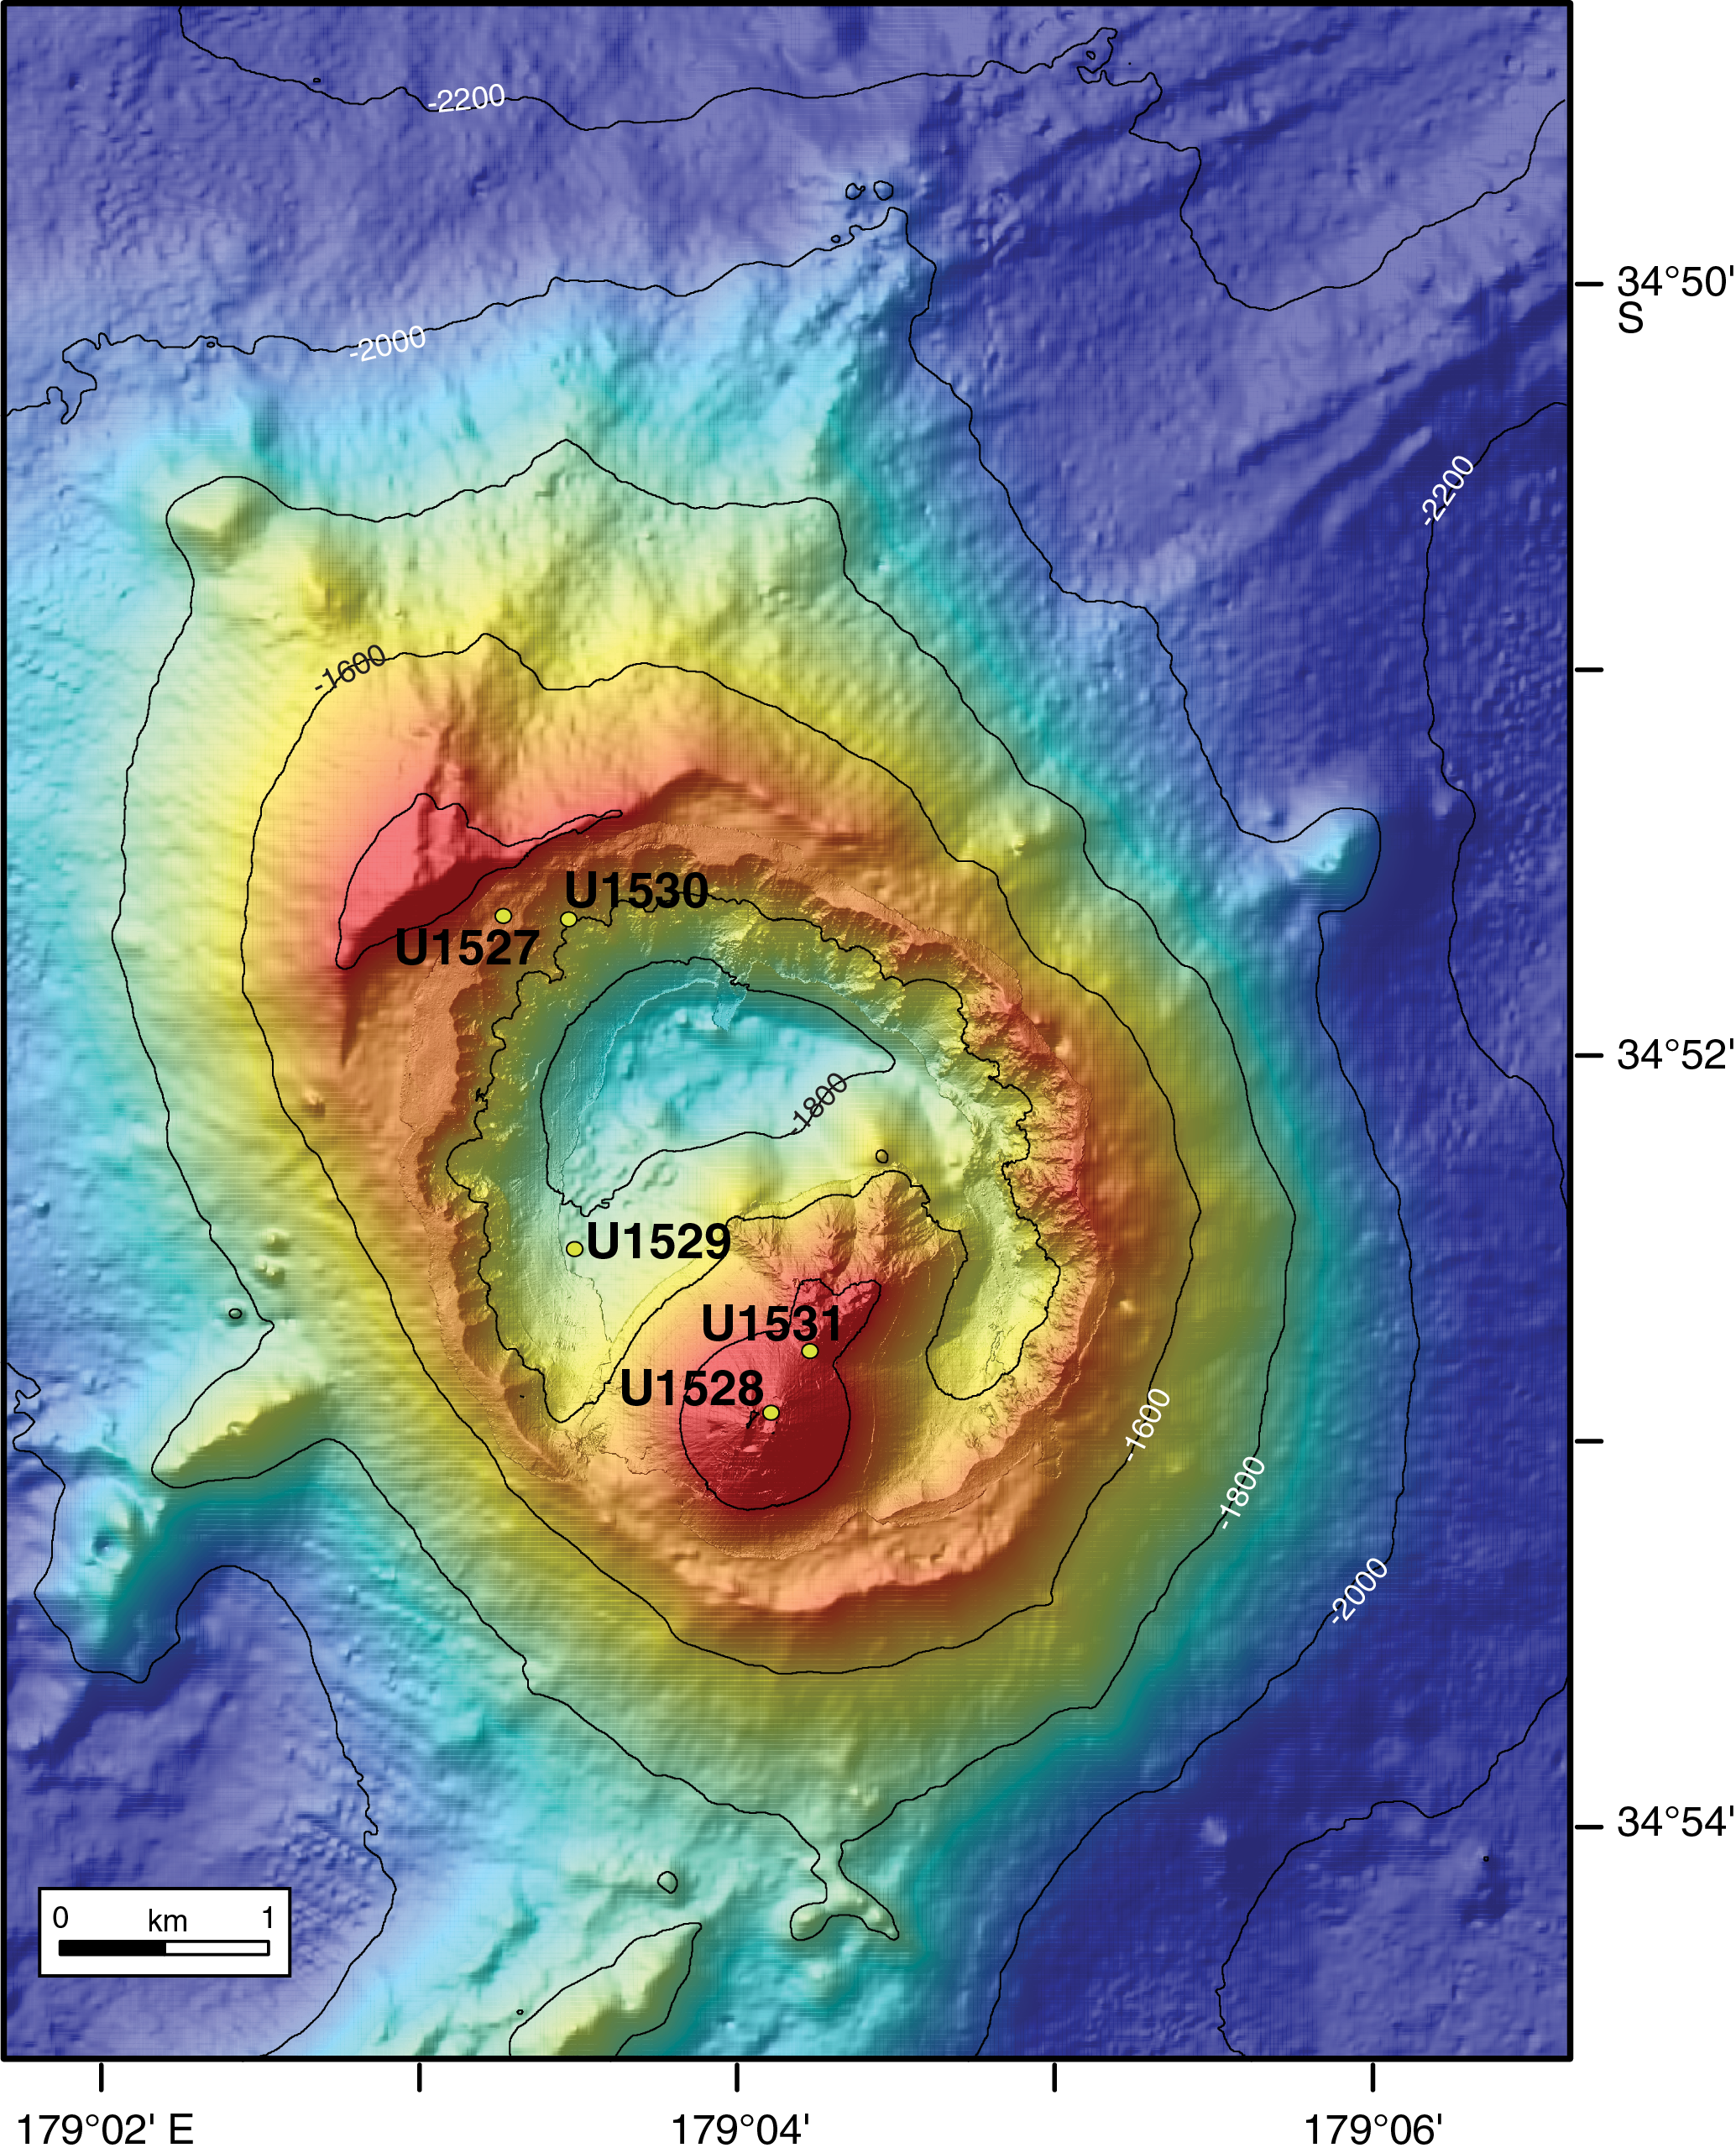
Figure F1. Sites drilled, Expedition 376.
Site U1530 retained the primary objective of proposed Site NWC-2A on the caldera floor: to drill through the lower part of the Type 1 hydrothermal system. Site U1530 is located ~400 m east of Site U1527 (see Figure F6 in the Expedition 376 summary chapter [de Ronde et al., 2019b]) on a ~30 m wide bench toward the upper part of the NWC wall. It is situated structurally above a known prominent metal-rich stockwork zone discovered in January 2017 by the remotely operated vehicle (ROV) Quest 4000 and then confirmed during the March 2018 ROV Jason expedition (Figure F2).
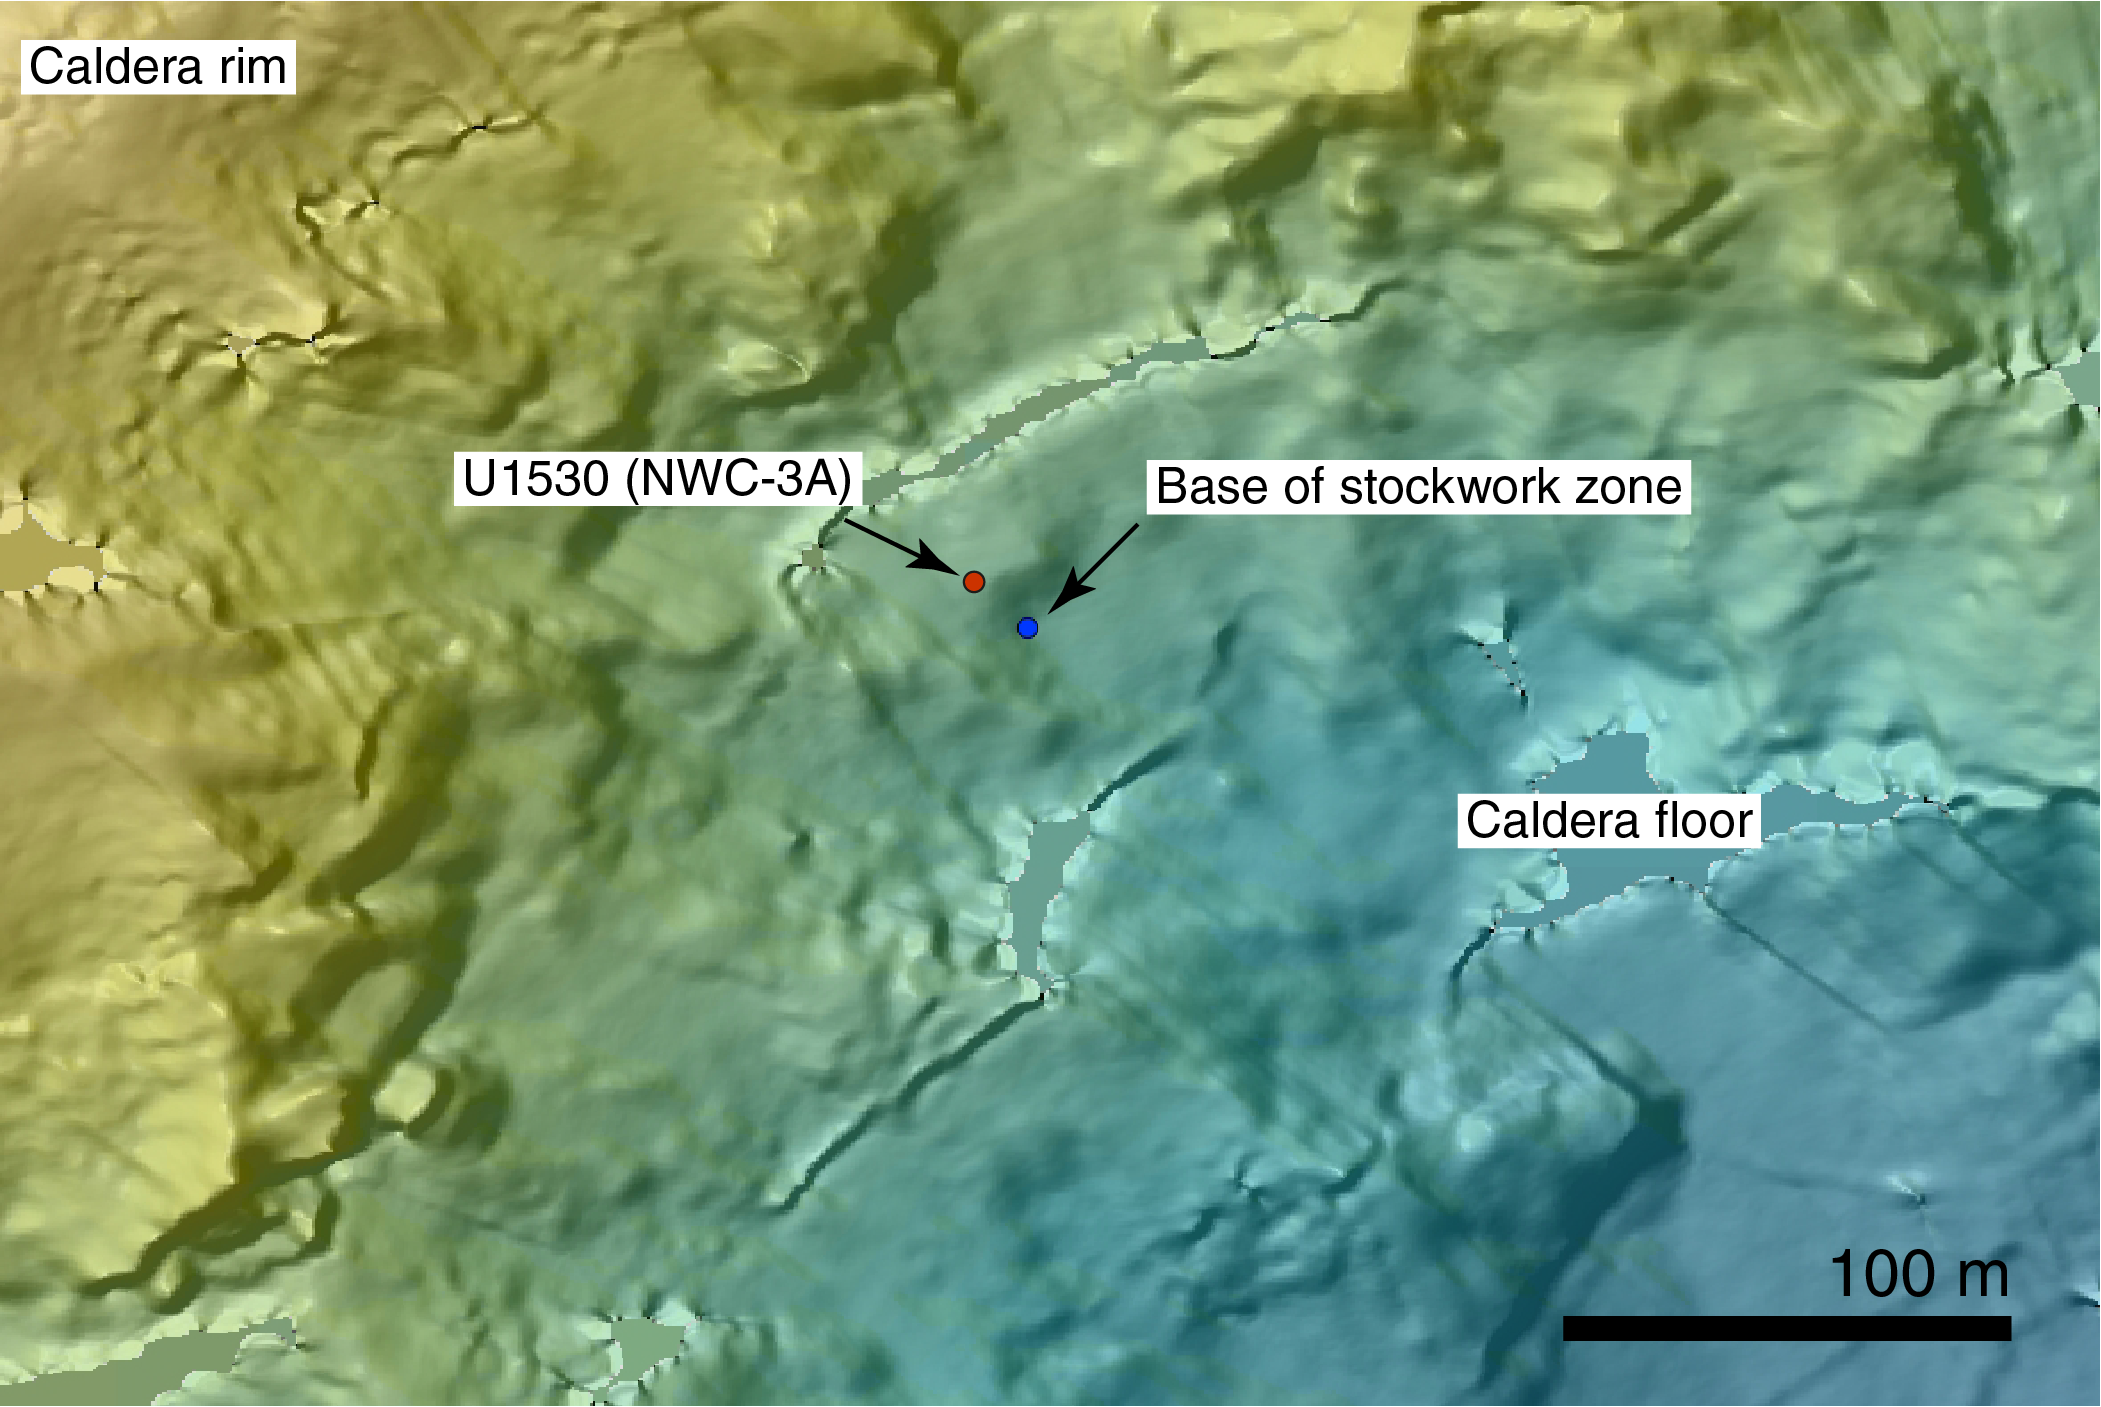
Figure F2. Location of Site U1530.
The plan for drilling, coring, and logging at Site U1530 was to penetrate ~450 m through the upper stockwork and deeper portions of the inferred hydrothermal upflow zone and continue through a thicker stratigraphic section of lava in the caldera to hopefully intersect the footwall of the original caldera. Intersecting the stockwork was expected to provide the best opportunity to investigate the transport of metals through the Brothers volcano hydrothermal system.
Operations
The original plan for Site U1530 was to drill two holes. The first one, a pilot hole, was intended to core to ~50 mbsf with the RCB system (see Figure F3 in the Site U1527 chapter [de Ronde et al., 2019c]). The second hole was designed to install a reentry system to a depth determined by lithologies intersected by the pilot hole to allow 450 m of penetration. Actual operations involved RCB coring of only a single hole. Hole U1530A was RCB cored to the target depth of 453.1 mbsf without the need for a reentry system. Coring was then terminated, and the bit was dropped at the bottom of the hole. The ETBS and the 600 mL Kuster FTS tool were deployed, followed by two wireline logging runs with both the triple combo and FMS sonic tool strings. At the conclusion of logging, we deployed the 600 mL Kuster FTS tool again to sample BFs and the new Petrospec spool-in TCMT to record borehole temperatures.
Hole U1530A
After the drill string cleared the seafloor in Hole U1528D at 0220 h on 13 June 2018, the vessel moved slowly in dynamic positioning (DP) mode from Site U1528 to Site U1530 at the NWC wall while we continued to recover the drill string. The transit was completed before the end of the drill string reached the rig floor (officially ending Site U1528). A new RCB bottom-hole assembly (BHA; see Figure F4 in the Site U1527 chapter [de Ronde et al., 2019c]) was assembled with a new CC-7 bit into which a perforated brass insert (see Figure F2 in the Site U1529 chapter [de Ronde et al., 2019e]) containing quartz crystals (supplied by the science party) was inserted to enable potential trapping of BFs.
The RCB bit was lowered to just above the seafloor, and the subsea camera and sonar system were deployed. A subsea survey for Site U1530 was conducted where three prospective hole positions were located, confirming the suitability of the site for drilling and ensuring no vent-related animals were present. Seafloor tags were performed with the bit to verify precise water depths of the seafloor at each hole position. The top drive was picked up while the subsea camera system was retrieved and secured at the surface. We then pumped a pig (a drill pipe scraping device) to clean out the inside of the new pieces of drill string. The PFMD tracer pump was turned on, and slow circulating pressure was recorded.
RCB coring in Hole U1530A (water depth = 1594.4 m) began at 1900 h on 13 June with a 7.2 m mudline core to enable the first pipe connection to be made without clearing the seafloor. After a 9.7 m cored interval that recovered Core 376-U1530A-2R, the decision was made to switch to half-length (4.8 m) coring advances to maximize core recovery. In total, 30 bbl (~4.8 m3) of high-viscosity mud was pumped with every other core to keep the hole clean. Hole conditions remained good throughout coring. Coring continued to a final depth of 453.1 mbsf (Core 93R) and recovered 76.8 m (17%) of core material. Total depth for Hole U1530A was reached at 0505 h on 19 June 2018. All cores, penetration depths, core recovery, and times recovered on deck are displayed in Table T1.
After coring to the target depth, another 30 bbl sweep of high-viscosity mud was pumped, followed by 30 bbl of salt water and a second 30 bbl sweep of high-viscosity mud to condition the hole for downhole measurements. The RST was lowered on the core line to release the bit at the bottom of the hole. The RST was then pulled back to the surface, and the reverse RST tool was run to move the releasing sleeve back into the circulating position. Because of conflicting indications as to whether the bit had actually released, an RCB core barrel was deployed, and after a few minutes of testing, it was verified that the bit had indeed released. Apparently, sufficient debris fill had accumulated underneath the end of the mechanical bit release (MBR) at the end of the drill string to give a false indication. While laying out the RCB core barrel, damage to some of the strands of the coring line was observed, so 150 m of core line was cut and slipped. The sinker bars and the oil saver were reattached. The end of the drill string was spaced out one stand of drill pipe above the bottom of Hole U1530A.
The downhole measurement plan for Hole U1530A consisted of running (1) the ETBS, (2) the 600 mL Kuster FTS tool, and (3) the triple combo logging tool string. At 1030 h on 19 June, the ETBS was assembled and lowered to 429.1 mbsf, where it was held stationary for 16 min before retrieval. The highest temperature recorded was around 39.7°C. The 600 mL Kuster FTS tool was then lowered at half the normal core line speed to just below the end of the pipe, ~20 m above the bottom of the hole (436.1 mbsf). Circulation was stopped for ~20 min to allow the clock timer on the 600 mL Kuster FTS tool to activate and the sample to be taken. Upon retrieval of the tool, it was determined that a cap screw on the upper valve assembly had unscrewed, preventing the lower valve from closing and hence precluding collection of a sample. The tool was repaired and readied for another sampling run at the end of the logging activity.
We then raised the end of the drill string to 67.1 mbsf, rigged up the drill floor for logging, and started preparing the triple combo tool string. The average heave was estimated to be 0.75 m just prior to logging. The active heave compensator was utilized whenever the logging tools were in the open hole. A standard (low-temperature) triple combo logging tool string was made up with the following tools:
- High-Resolution Laterolog Array (HRLA),
- Hostile Environment Litho-Density Sonde (HLDS; with source),
- Accelerator Porosity Sonde (APS),
- Hostile Environment Logging Natural Gamma Ray Sonde (HNGS),
- Enhanced Digital Telemetry Cartridge (EDTC), and
- Logging equipment head-mud temperature (LEH-MT).
The tool string was lowered at 1820 h on 19 June, and a downward logging pass was performed from just above the seafloor to the full accessible hole depth above debris fill at 442 mbsf. The hole was then logged upward for a 182 m pass, the string was lowered back to the bottom (442 mbsf), and we once again logged upward with the triple combo tool string through the casing and drill string to the seafloor. The caliper was closed prior to entering the casing. The tools were pulled from the hole, clearing the seafloor at 2300 h, and were rigged down by 0030 h on 20 June.
A second tool string with the FMS was made up with the following logging tools:
Deployment of the tool string commenced at 0140 h on 20 June, and a downward logging pass with the FMS calipers closed began from just above the seafloor and extended to 442 mbsf, where debris was encountered ~11 m above the bottom of the hole. NGR was logged through the drill pipe to identify where the seafloor began to match the depth results on the first logging run. At the depth of the debris fill, the first upward log was started, and it logged from 442 to ~116 mbsf with the FMS calipers open. The tools were then run back down to 442 mbsf, and a second upward log was run with the calipers open. The calipers were closed just prior to entering the drill pipe at 51.8 mbsf, and logging continued all the way to the seafloor. The FMS-sonic tool string returned to the rig floor at 0725 h on 20 June and was rigged down by 0830 h.
Upon completion of downhole logging, the drill string was lowered back to the top of the debris fill at 442 mbsf and the end of the pipe was pulled back to 428.2 mbsf. The 600 mL Kuster FTS tool was lowered to ~20 m above the drilled bottom of the hole while circulation stopped. After waiting 15 min for the mechanical clock of the 600 mL Kuster FTS tool to trigger the valves to close, the tool was pulled back to the rig floor, having successfully recovered a fluid sample.
At 1245 h on 20 June, the newly designed high-temperature TCMT was deployed for the first time on the core line. While lowering the two thermocouple joints 8 m past the end of the drill pipe to 447 mbsf, circulation was started at 20 strokes/min to cool the temperature-sensitive TCMT data logger inside the drill string. After waiting for 10 min, the tool was pulled back into the drill pipe and returned to the surface. The TCMT recorded a maximum temperature of 20°C. With the downhole measurements complete, the drill string was pulled out of the hole, clearing the seafloor at 1540 h. While the drill pipe was being tripped, we began moving the vessel slowly to Site U1531 at 1600 h using the DP system. The end of the drill string (MBR) arrived back on the rig floor at 2005 h on 20 June, ending Hole U1530A and thus Site U1530. The total time spent in Hole U1530A was 184 h, or 7.7 days.
Igneous petrology and volcanology
Five igneous units were identified at Site U1530 (Figure F3). Igneous Unit 1 consists of clast-supported, polymict lapillistone with blocks and/or bombs recovered in interval 376-U1530A-1R-1, 0 cm, to 5R-1, 72 cm (0–26.62 mbsf). Igneous Unit 2 is a sequence of altered tuffaceous mudstone, siltstone, and sandstone and altered polymict lapillistone recovered in interval 6R-1, 0 cm, to 12R-1, 12 cm (30.70–59.62 mbsf). This unit is divided into five subunits (2a–2e) based on color, grain size, and internal structures. Subunit 2a consists of massive altered tuffaceous sandstone (interval 6R-1, 0–58 cm; 30.70–31.28 mbsf). Subunit 2b is composed of bedded altered tuffaceous mudstone, siltstone, and fine sandstone (interval 7R-1, 0 cm, to 11R-1, 16 cm; 35.50–54.86 mbsf). Subunit 2c includes altered tuffaceous sandstone and lapillistone (interval 11R-1, 16–83 cm; 54.86–55.53 mbsf). Subunit 2d consists of reworked altered tuffaceous siltstone (interval 11R-1, 83–94 cm; 55.53–55.64 mbsf). Subunit 2e is composed of altered tuffaceous mudstone, siltstone, and sandstone (interval 11R-1, 94 cm, to 12R-1, 12 cm; 55.64–59.62 mbsf). Igneous Unit 3 consists of altered plagioclase-phyric lava recovered in interval 12R-1, 12 cm, to 13R-1, 10 cm (59.62–64.40 mbsf). Igneous Unit 4 was recovered in interval 13R-1, 10 cm, to 45R-1, 31 cm (64.40–218.21 mbsf) and is a sequence of altered volcaniclastic rocks which become increasingly altered downhole. The shallower portion of Unit 4 (i.e., down to Core 36R) is mostly monomict and polymict lapillistone and monomict lapilli-tuff; H2S odor was recorded in Cores 24R, 31R, and 36R. Variable degrees of alteration hindered detailed identification of the rocks downhole; when alteration masks the original lithology, the strata are classified as altered volcaniclastic rocks. Igneous Unit 5 consists generally of altered volcanic rocks with no remaining igneous or volcanic features and was recovered in interval 46R-1, 0 cm, to 93R-1, 38 cm (222.70–448.68 mbsf). However, five texturally less altered lava with abundant pseudomorphs after plagioclase glomerocrysts were seen intercalated throughout Unit 5 (Figure F3). Notable H2S odor was again recorded in Cores 48R–51R, 53R–55R, and 61R.
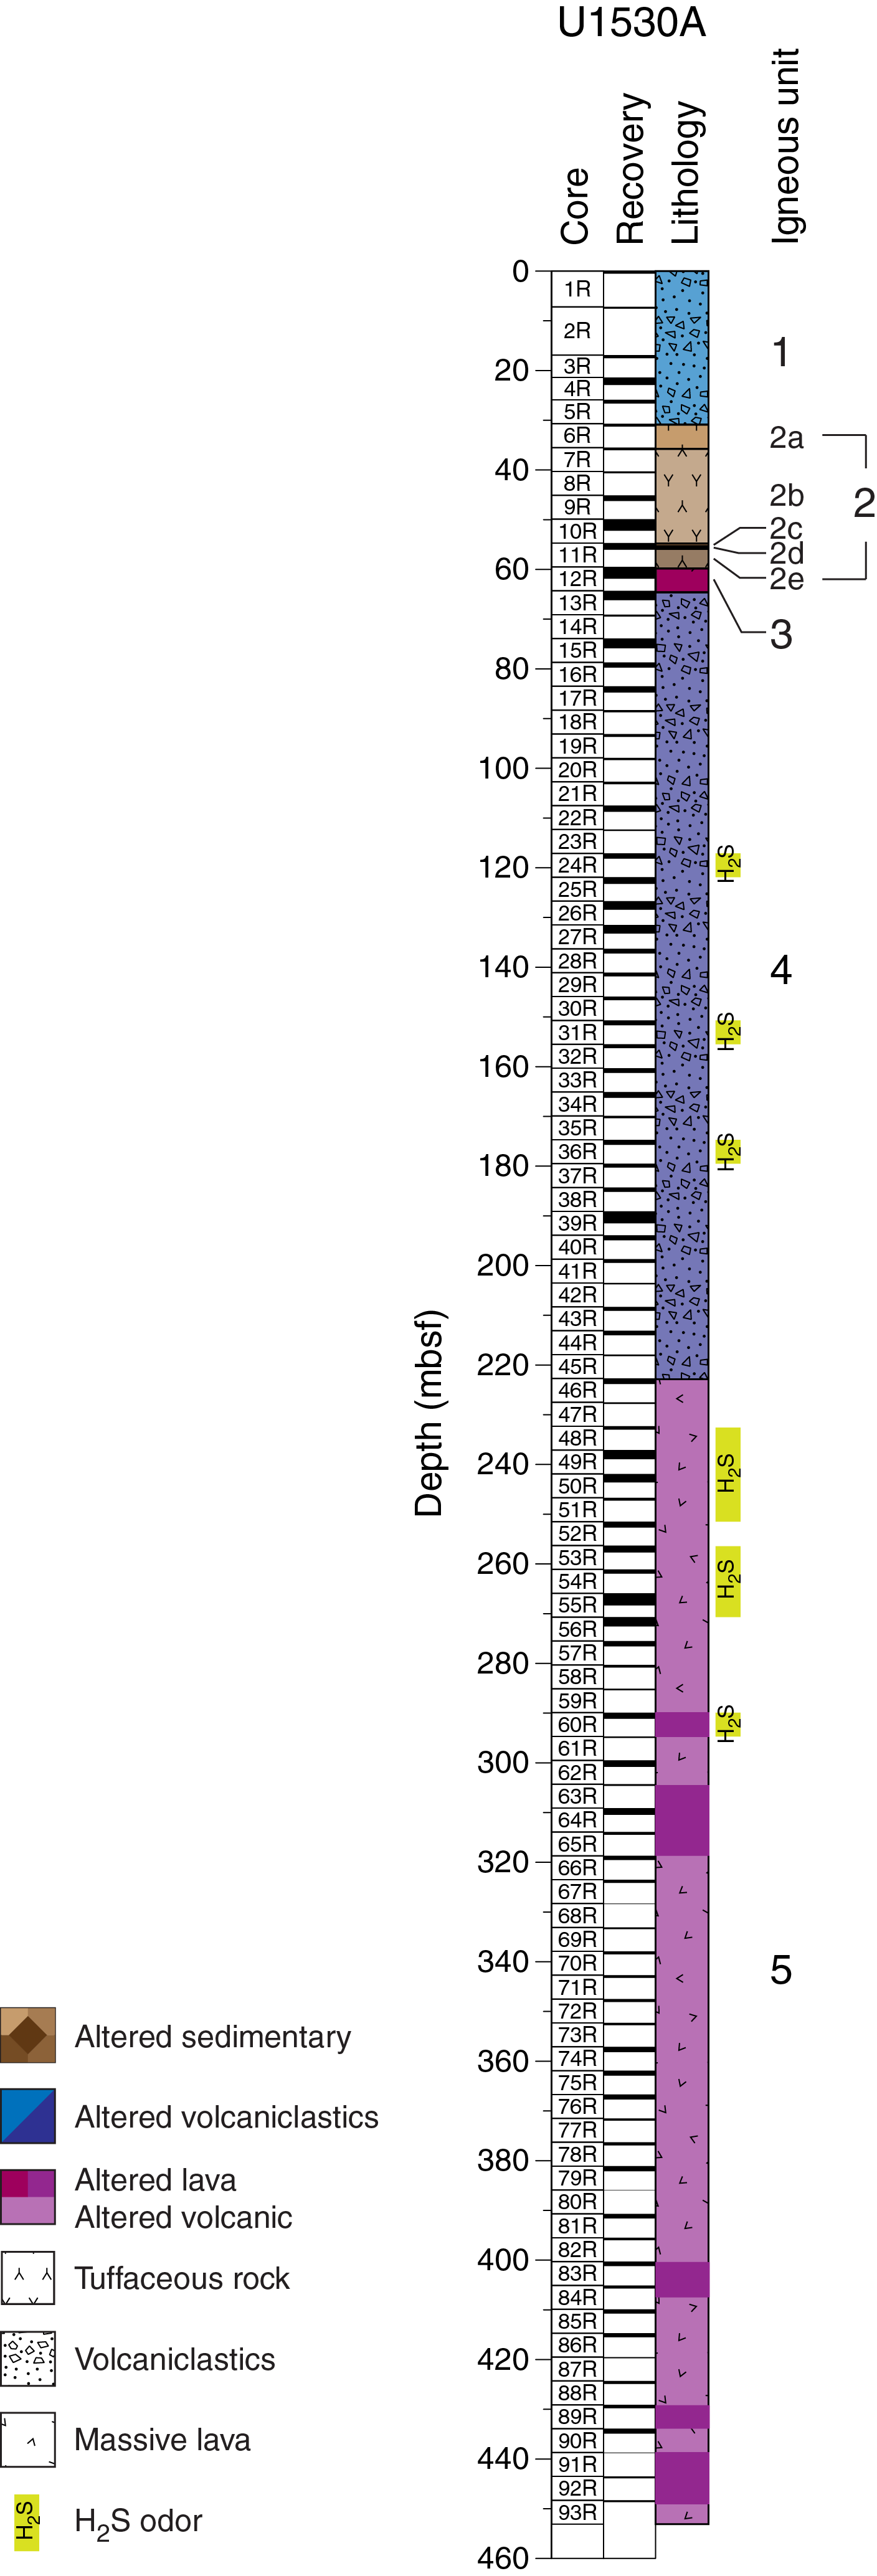
Figure F3. Lithostratigraphic summary, Hole U1530A.
Igneous Unit 1
- Interval: 376-U1530A-1R-1, 0 cm, to 5R-1, 72 cm
- Depth: 0–26.62 mbsf
- Lithology: clast-supported polymict lapillistone, sometimes with blocks and/or bombs
Igneous Unit 1 consists of clast-supported polymict lapillistone with occasional blocks and/or bombs with moderate to poor sorting (Figure F4). The dominant color is bluish gray to greenish gray, and the color range is controlled by variable degrees of alteration of both clasts and matrix. The matrix is composed of small volcanic clasts (<2 mm), clay, and secondary minerals. The matrix often contains vugs lined with sulfate and sulfide minerals. Two types of clasts are present (Figure F4), listed in order of their relative abundance:
- Clast Type 1-1: fine-grained volcanic clasts with occasional pseudomorphs after plagioclase. Smaller clasts are typically light gray; the cores of pebble-sized clasts are a distinctive bluish gray or greenish gray.
- Clast Type 1-2: fine-grained dark gray clasts of unknown origin that have no internal structure and commonly contain fine-grained disseminated sulfides.

Figure F4. Macroscopic samples from Igneous Unit 1, Hole U1530A.
Microscopic evaluations confirm that Clast Type 1-1 is most abundant. The outlines of these clasts are preserved, but the clasts themselves and the interstitial matrixes are almost completely altered by secondary minerals (Figure F5A). Many clasts contain pseudomorphs of secondary minerals after plagioclase as well as partially altered plagioclase crystals. The euhedral and tabular plagioclase crystals (average = 1 mm; maximum = 3 mm) are usually completely altered at the margins, but some of their primary igneous characteristics in the cores are preserved (some with albite twinning) (Figure F5B). Some clasts show vesicles (Figure F5A). However, in other clasts, no primary phases, pseudomorphs, or igneous textures remain. A bomb or block of an altered plagioclase-phyric lava in Section 376-U1530A-5R-1, which could represent an intercalated lava flow, contains partially altered plagioclase phenocrysts and about 10 vol% of mostly infilled spherical vesicles. Although all other igneous phases have been replaced, the original glomeroporphyritic and vesicular texture is still visible.

Figure F5. Thin sections of igneous units, Hole U1530A.
Igneous Unit 2
- Interval: 376-U1530A-6R-1, 0 cm, to 12R-1, 12 cm
- Depth: 30.70–59.62 mbsf
- Lithology: altered tuffaceous mudstone, siltstone, and sandstone; altered polymict lapillistone
Igneous Unit 2 consists of a sequence of bluish gray and greenish gray altered tuffaceous mudstone, siltstone, and sandstone in addition to altered polymict lapillistone. Igneous Unit 2 lithologies, which are overprinted by alteration (see Alteration), display various sedimentary structures (Figure F6). Unit 2 is divided into five subunits based on color, grain size, and internal structures.
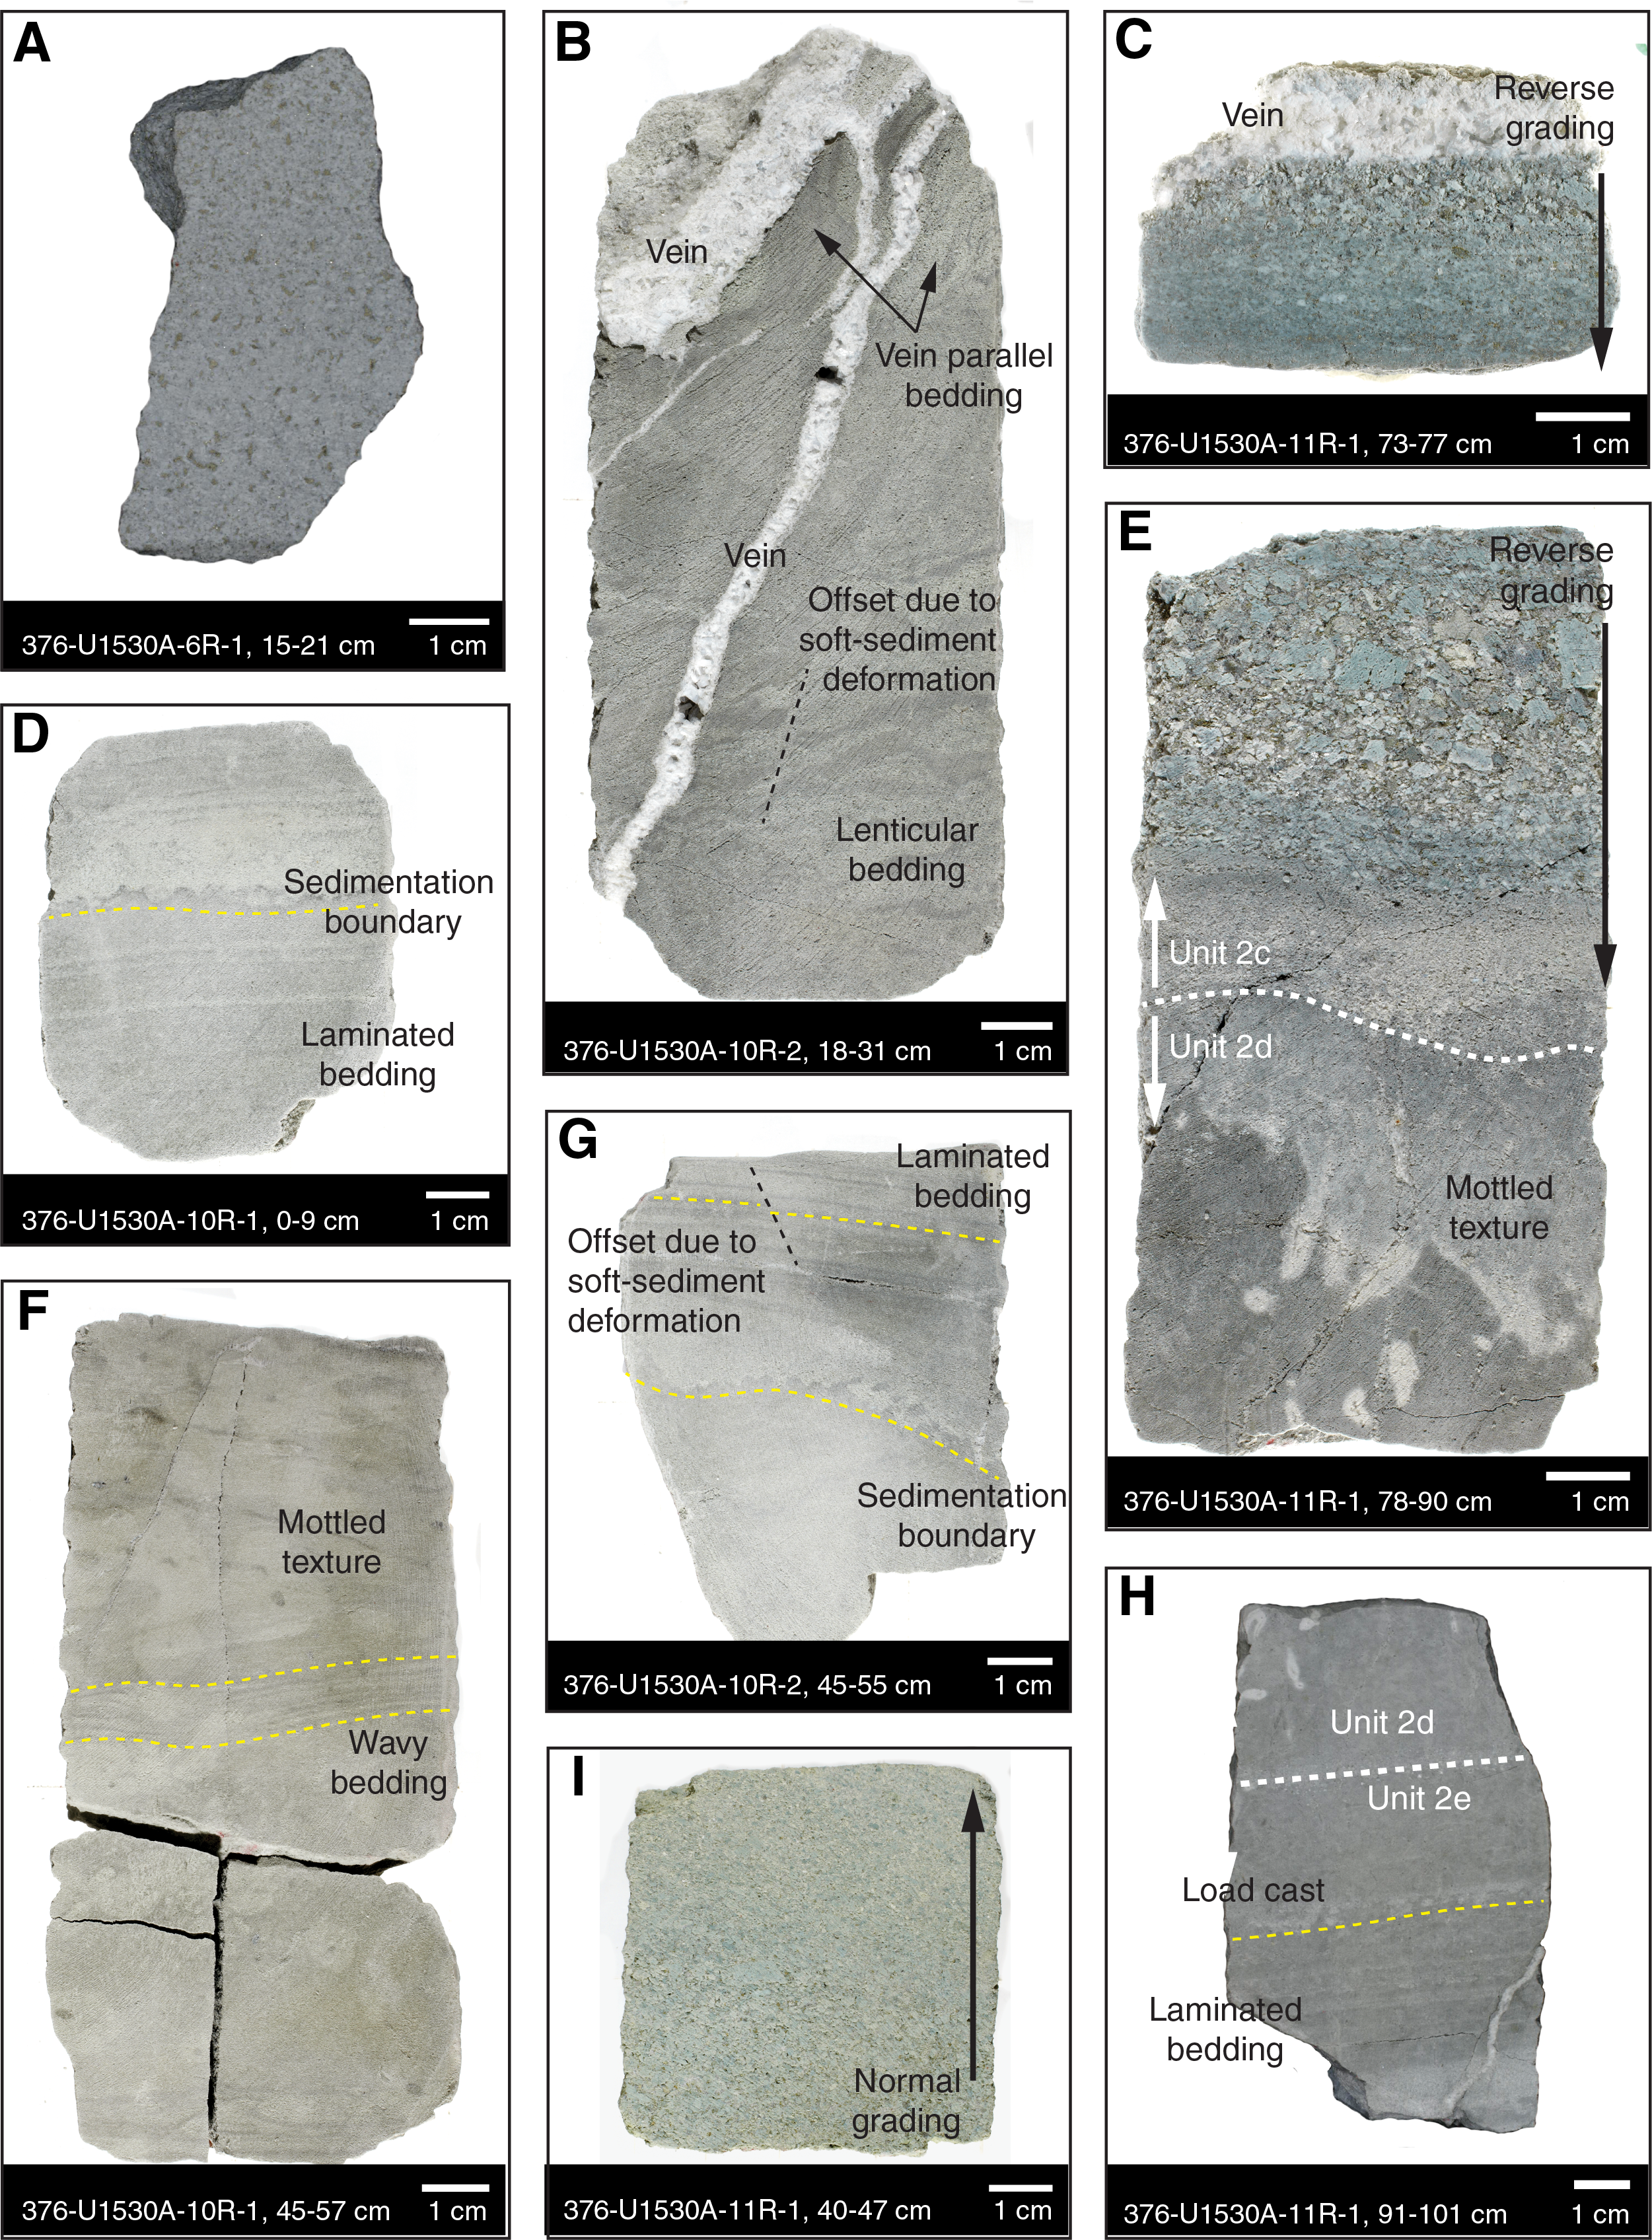
Figure F6. Sedimentary textures in Igneous Unit 2, Hole U1530A.
Igneous Subunit 2a
- Interval: 376-U1530A-6R-1, 0 cm, to 58 cm
- Depth: 30.70–31.28 mbsf.
- Lithology: altered tuffaceous sandstone
Igneous Subunit 2a is bluish gray and consists of altered massive tuffaceous sandstone that is intensely impregnated by pyrite (Figure F6A). It differs from underlying subunits because of its lack of any internal structures and coarser grain size.
The Subunit 2a/2b boundary was not recovered. It is inferred by a distinct decrease in grain size, a change in color, and the onset of bedded intervals in Subunit 2b.
Igneous Subunit 2b
- Interval: 376-U1530A-7R-1, 0 cm, to 11R-1, 16 cm
- Depth: 35.5–54.86 mbsf
- Lithology: altered tuffaceous silty mudstone, clayey siltstone, siltstone, fine sandstone, and sandstone
Igneous Subunit 2b is composed of a sequence of light bluish gray and bluish gray altered tuffaceous silty mudstone, clayey siltstone, siltstone, fine sandstone, and sandstone with alternating massive and bedded intervals. Bedding forms are vague to absent in some intervals but well defined in others. The bedding forms include horizontal (Figure F6D), inclined, and wavy lamination; horizontal stratification; and wavy and lenticular beds (Figure F6B, F6G). We also observed mottled textures and tubular structures that resemble bioturbation or fluid escape structures (Figure F6F). This subunit contains several veins that cut the sedimentary textures in some intervals and are concordant with laminations in others (Figure F6B). Two boundaries between sedimentation events marked by erosive and/or load cast structures are present in intervals 376-U1530A-10R-1, 4 cm (49.94 mbsf), and 10R-2, 52 cm (51.83 mbsf) (Figure F6D, F6G). The small offset between laminae in Section 376-U1530A-10R-2 indicates the presence of soft-sediment deformation features (see Structural geology) (Figure F6B, F6G).
Microscopically, the silty mudstone in interval 376-U1530A-8R-1, 19–21 cm, and the siltstone in interval 11R-1, 11–13 cm, have a crystalline framework of silica, which may indicate a hydrothermal origin or intense hydrothermal silicification (Figure F5C). Based on macroscopic observations, white clay minerals appear to comprise the infilling of the framework but are lost during thin section preparation. However, two smear slides from less consolidated Samples 9R-1, 95 cm, and 10R-1, 84 cm, show the presence of fragments of both primary (i.e., plagioclase) and secondary (i.e., silica, sulfide, or sulfate) minerals (Figure F7). Biogenic components were not observed.

Figure F7. Smear slide images from Igneous Unit 2, Hole U1530A.
The contact between Subunits 2b and 2c was not observed. It is inferred by an increase in grain size, a change in color, and the onset of a massive but graded structure in Subunit 2c.
Igneous Subunit 2c
- Interval: 376-U1530A-11R-1, 16 cm, to 11R-1, 83 cm
- Depth: 54.86–55.53 mbsf
- Lithology: altered tuffaceous sandstone and polymict lapillistone
Igneous Subunit 2c is greenish gray and consists of massive normally graded (coarse to fine) sandstone (Figure F6I) overlying clast-supported, reversely graded polymict lapillistone (Figure F6C). The two portions are separated in the core by a short interval containing heterogeneous fragments of sandstone (likely drilling induced). A crystalline, horizontal vein lies directly above the lapillistone (Figure F6C), which shows horizontal stratification and a twice-repeated pattern of reverse grading (Figures F6C, F6E). The subangular clasts are likely of volcanic origin and similar to clastic components in Igneous Unit 1. On average, the clasts are sand to granule in size, and individual clasts reach small pebble size.
The contact between Subunits 2c and 2d is wavy and unconformable (Figure F6E). It was determined based on a decrease in grain size and the onset of intensely reworked structures in Subunit 2d.
Igneous Subunit 2d
- Interval: 376-U1530A-11R-1, 83 cm, to 11R-1, 94 cm
- Depth: 55.53–55.64 mbsf
- Lithology: reworked altered tuffaceous silty mudstone
Igneous Subunit 2d consists of a light gray (to about interval 376-U1530A-11R-1, 87 cm) to gray (below that interval) altered tuffaceous silty mudstone. This color boundary is highly irregular, as it is throughout Subunit 2d, and it is intensely disturbed by pipelike structures caused by either bioturbation or fluid flow through the soft sediment (Figure F6E, F6H). The Subunit 2d/2e boundary is marked by a 0.5 cm thick horizontal layer of slightly coarser grain size and the disappearance of the pipelike structures (Figure F6H).
Igneous Subunit 2e
- Interval: 376-U1530A-11R-1, 94 cm, to 12R-1, 12 cm
- Depth: 55.64–59.62 mbsf
- Lithology: altered tuffaceous mudstone, siltstone, and fine sandstone
Igneous Subunit 2e consists of hydrothermally altered, bluish gray tuffaceous mudstone, siltstone, and fine sandstone with alternating massive and horizontally bedded intervals. A boundary marked by load casts is present in interval 376-U1530A-11R-1, 96 cm (55.66 mbsf) (Figure F6H).
The boundary between Subunit 2e and Igneous Unit 3 was not observed.
Igneous Unit 3
- Interval: 376-U1530A-12R-1, 12 cm, to 13R-1, 10 cm
- Depth: 59.62–64.40 mbsf
- Lithology: altered plagioclase-phyric lava
Igneous Unit 3 consists of distinct greenish gray, pervasively altered, and largely coherent plagioclase-phyric lava (Figure F8). The lava contains 20 vol% pseudomorphs after euhedral plagioclase. They are 2 mm long on average (maximum = 5 mm) and are either empty or filled with secondary minerals in an altered microcrystalline groundmass. The shape of some pseudomorphs is similar to glomerocrysts observed in less altered volcanic rocks from Brothers volcano (see Igneous petrology and volcanology in the Site U1527 chapter and Igneous petrology and volcanology in the Site U1529 chapter [de Ronde et al., 2019c, 2019e]). Vugs constitute <5 vol% of the groundmass and are lined with secondary minerals. This unit is cut by multiple generations of veins with a range of orientations (see Alteration and Structural geology).
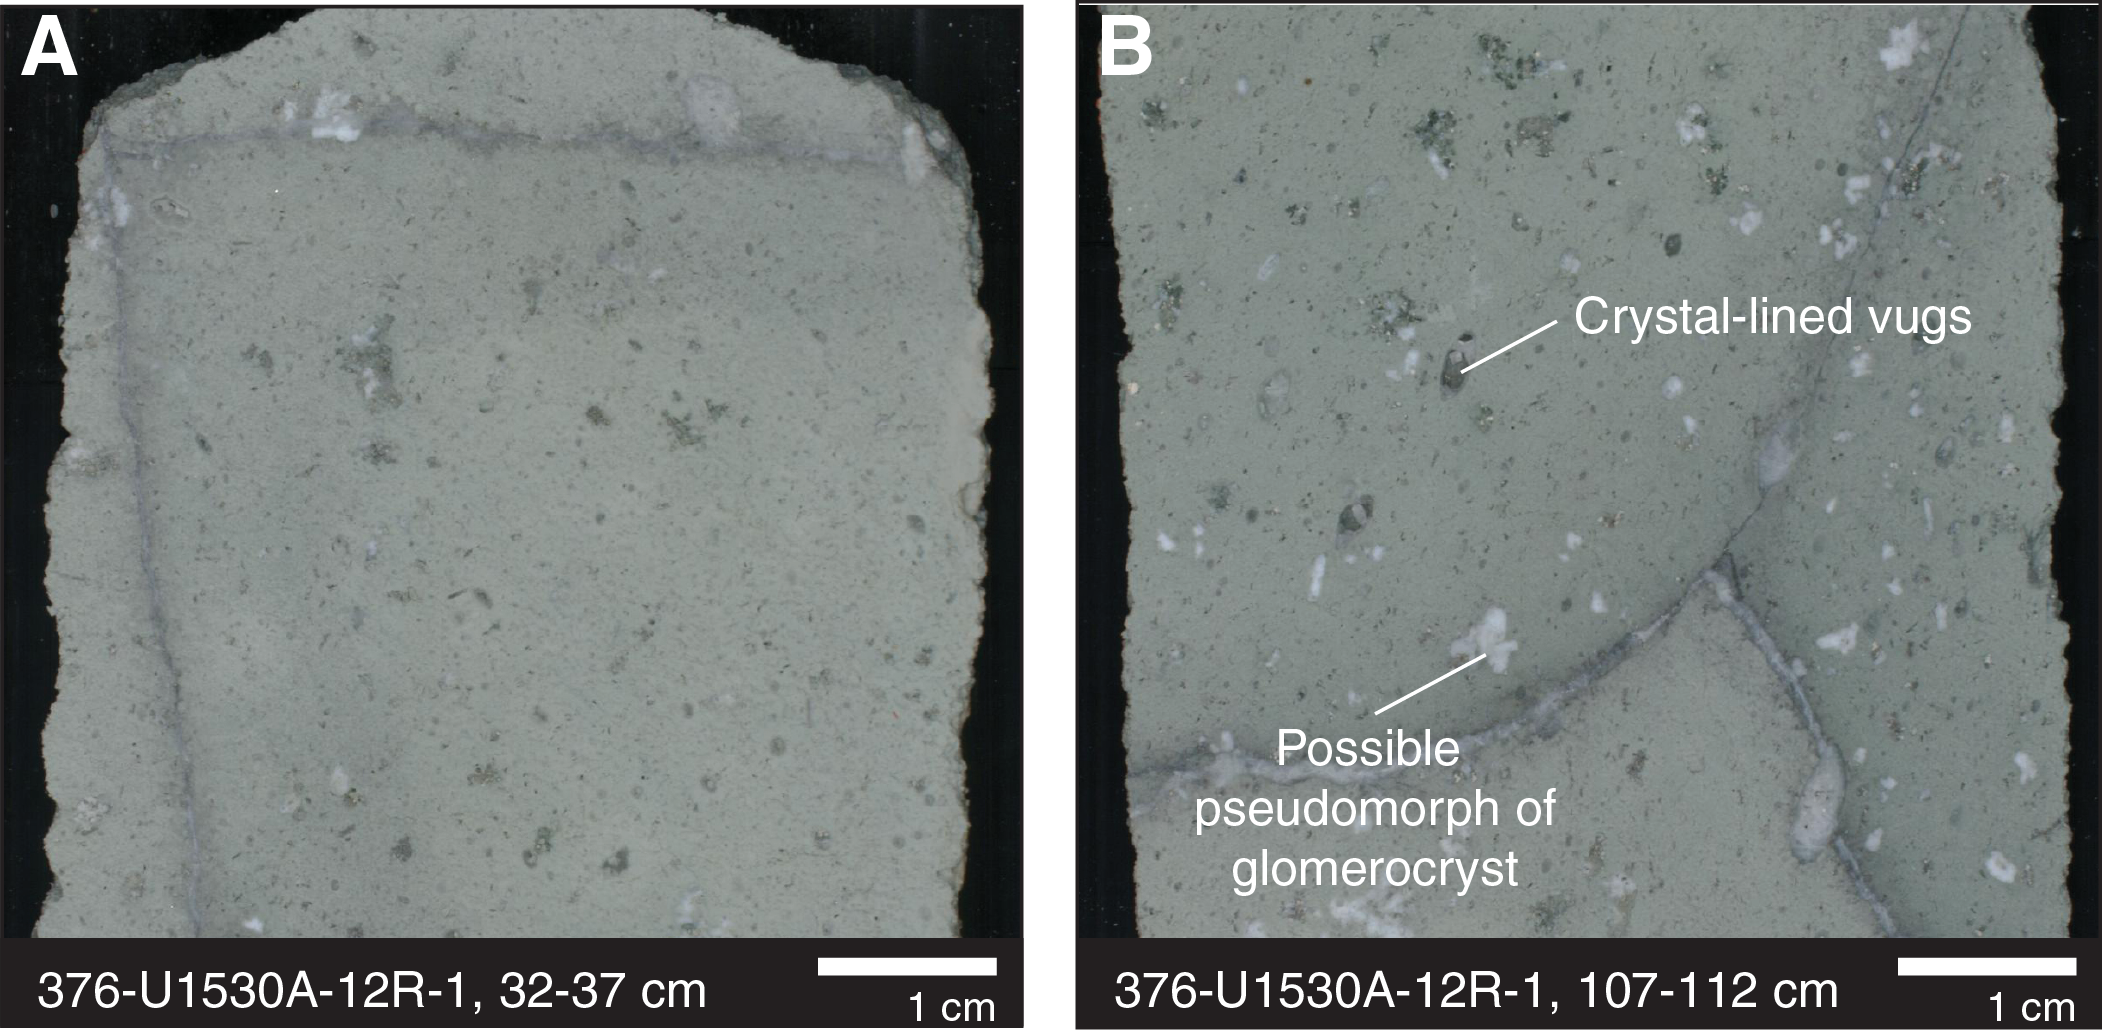
Figure F8. Macroscopic samples from Igneous Unit 3, Hole U1530A.
A microscopic examination of a rock from Igneous Unit 3 shows that the primary volcanic features have been completely overprinted by alteration except for pseudomorphs after euhedral plagioclase that are filled with silica and pyrite (as large as 2 mm) (Figure F5D) or preserved as vugs. No other primary igneous textures or minerals remain. The groundmass has been replaced by silica and clay minerals. Vugs are present throughout the sample and are filled with secondary minerals (see Alteration).
Igneous Unit 4
- Interval: 376-U1530A-13R-1, 10 cm, to 45R-1, 31 cm
- Depth: 64.40–218.21 mbsf
- Lithology: altered volcaniclastic rocks
Igneous Unit 4 is a sequence of hydrothermally altered volcaniclastic rocks that becomes increasingly altered downhole (Figure F9). From the top of Unit 4 through Core 376-U1530A-24R, the dominant lithology is poorly sorted greenish gray to bluish gray monomict and polymict lapillistone (Figure F9A). There are also subordinate horizons of lapilli-tuff and tuff with lapilli. One fragment of a silty mudstone, which may have fallen into the hole from overlying layers, was recovered in interval 17R-1, 0–8 cm. In Cores 25R–36R, the dominant lithology is a bluish gray to dark bluish gray matrix-supported, mostly monomict lapilli-tuff (Figure F9B) with one subordinate interval of clast-supported monomict lapillistone. Clasts are volcanic in origin. Their average size ranges from granule to very large pebbles but reaches as large as cobble. The clasts are subangular or angular to 84.33 mbsf (Core 17R), mostly subrounded at 84.33–128.42 mbsf (Core 26R), and angular to subangular at 131.50–175.71 mbsf (Cores 27R–36R) (Figure F9C). Two clast types were identified:
- Clast Type 4-1: dark gray to gray clasts that commonly display volcanic textures and sometimes contain pseudomorphs after plagioclase, and
- Clast Type 4-2: light gray clasts that are fine grained but their lithology cannot be identified.
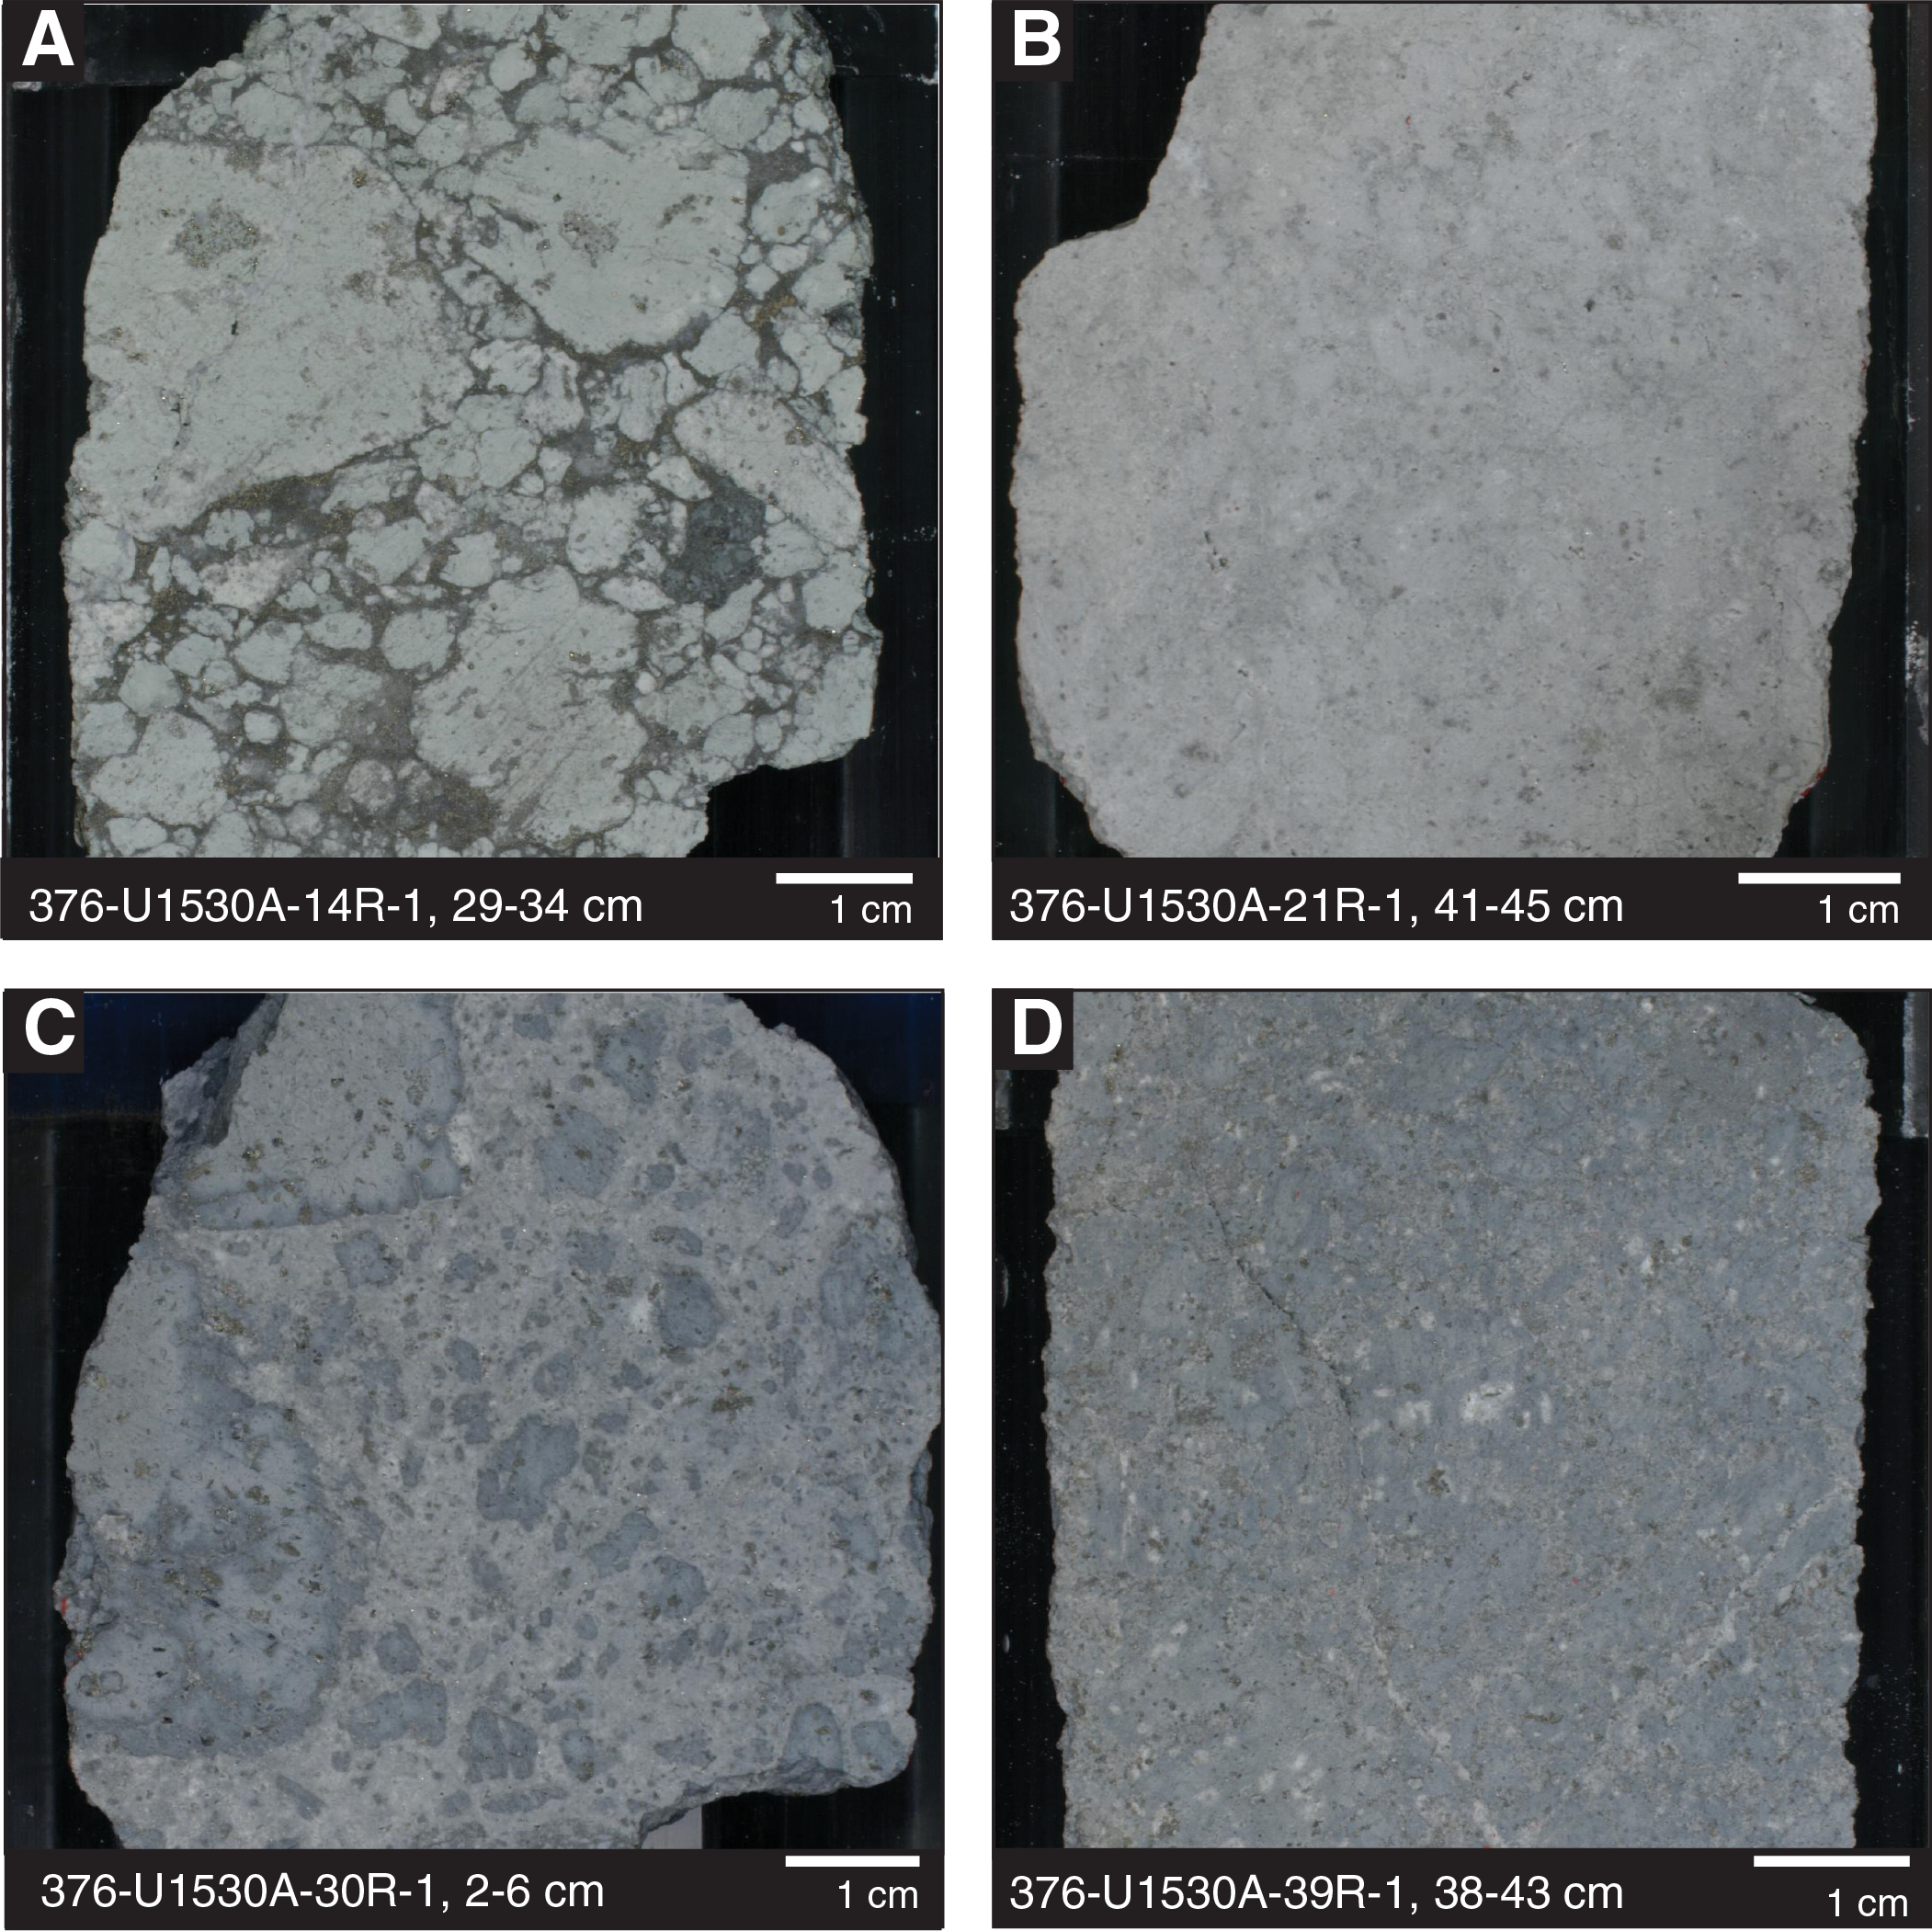
Figure F9. Macroscopic samples from Igneous Unit 4, Hole U1530A.
The dominant type varies between intervals. Clasts are distinct from the matrix in thin section (Figure F5E), although the boundaries become less clear downhole. The clasts are altered to varying degrees; no volcanic or igneous textures or phases remain in some clasts, but others contain pseudomorphs of secondary minerals or vugs after plagioclase phenocrysts and glomerocrysts (Figure F5E) or vesicles. These textures confirm a volcanic origin for the clasts in the altered clastic rocks of Igneous Unit 4. Matrix abundances range from 5 to 20 vol% for the lapillistone and 30 to 70 vol% for the lapilli-tuff. Thin section observations show that the matrix is fine grained and completely replaced by secondary minerals. The matrix is usually poorly sorted and ranges from clay to sand in grain size.
From Section 376-U1530A-37R-1 (179.50 mbsf) downhole, alteration increases in intensity and is more pervasive. Phenocryst pseudomorphs are no longer recognizable, and clast boundaries are increasingly difficult to identify (Figure F9D). Although boundaries are more blurred and the original lithology is more difficult to identify, clasts are still identifiable in most intervals. Hence, the rocks have been classified as altered volcaniclastic rocks. Their color in the lowermost part of Igneous Unit 4 ranges from gray and dark bluish gray to li-ght bluish gray. Some subordinate, possibly slightly fresher intervals are intercalated in Cores 38R (184.98–185.16 mbsf) and 41R (198.99–199.44 mbsf), where clastic textures are more distinct and lithologies consist of a monomict tuff with lapilli and a monomict lapillistone. The subangular to subrounded clasts in those intervals are altered volcanics that have an average grain size of small pebbles and that reside in a highly altered matrix.
Microscopically, few volcanic or volcaniclastic textures are recognizable below Core 376-U1530A-36R. The primary mineralogy is completely replaced by a secondary mineral assemblage. Pseudomorphs after plagioclase are sparse, and patchy mottled textures may indicate blurred clast/matrix boundaries.
Igneous Unit 5
- Interval: 376-U1530A-46R-1, 0 cm, to 93R-1, 38 cm
- Depth: 222.70–448.68 mbsf
- Lithology: altered volcanic rock with intercalated altered plagioclase-phyric lava
Except for some fall-in from overlying Igneous Unit 4, Igneous Unit 5 consists mostly of rocks with no remaining igneous or clastic features, and they have therefore been recorded as altered volcanic rock (Figure F10). These rocks are considered volcanic because they underlie a major volcano and are geochemically similar to other (altered) eruption products from Brothers volcano (see Geochemistry). Colors are gray to light gray, light bluish gray, and light greenish to greenish gray. All igneous phases have been replaced by secondary minerals; clasts, pseudomorphs after phenocrysts, and infilled vesicles cannot be recognized—neither macroscopically (Figure F10A, F10B) nor in thin sections.
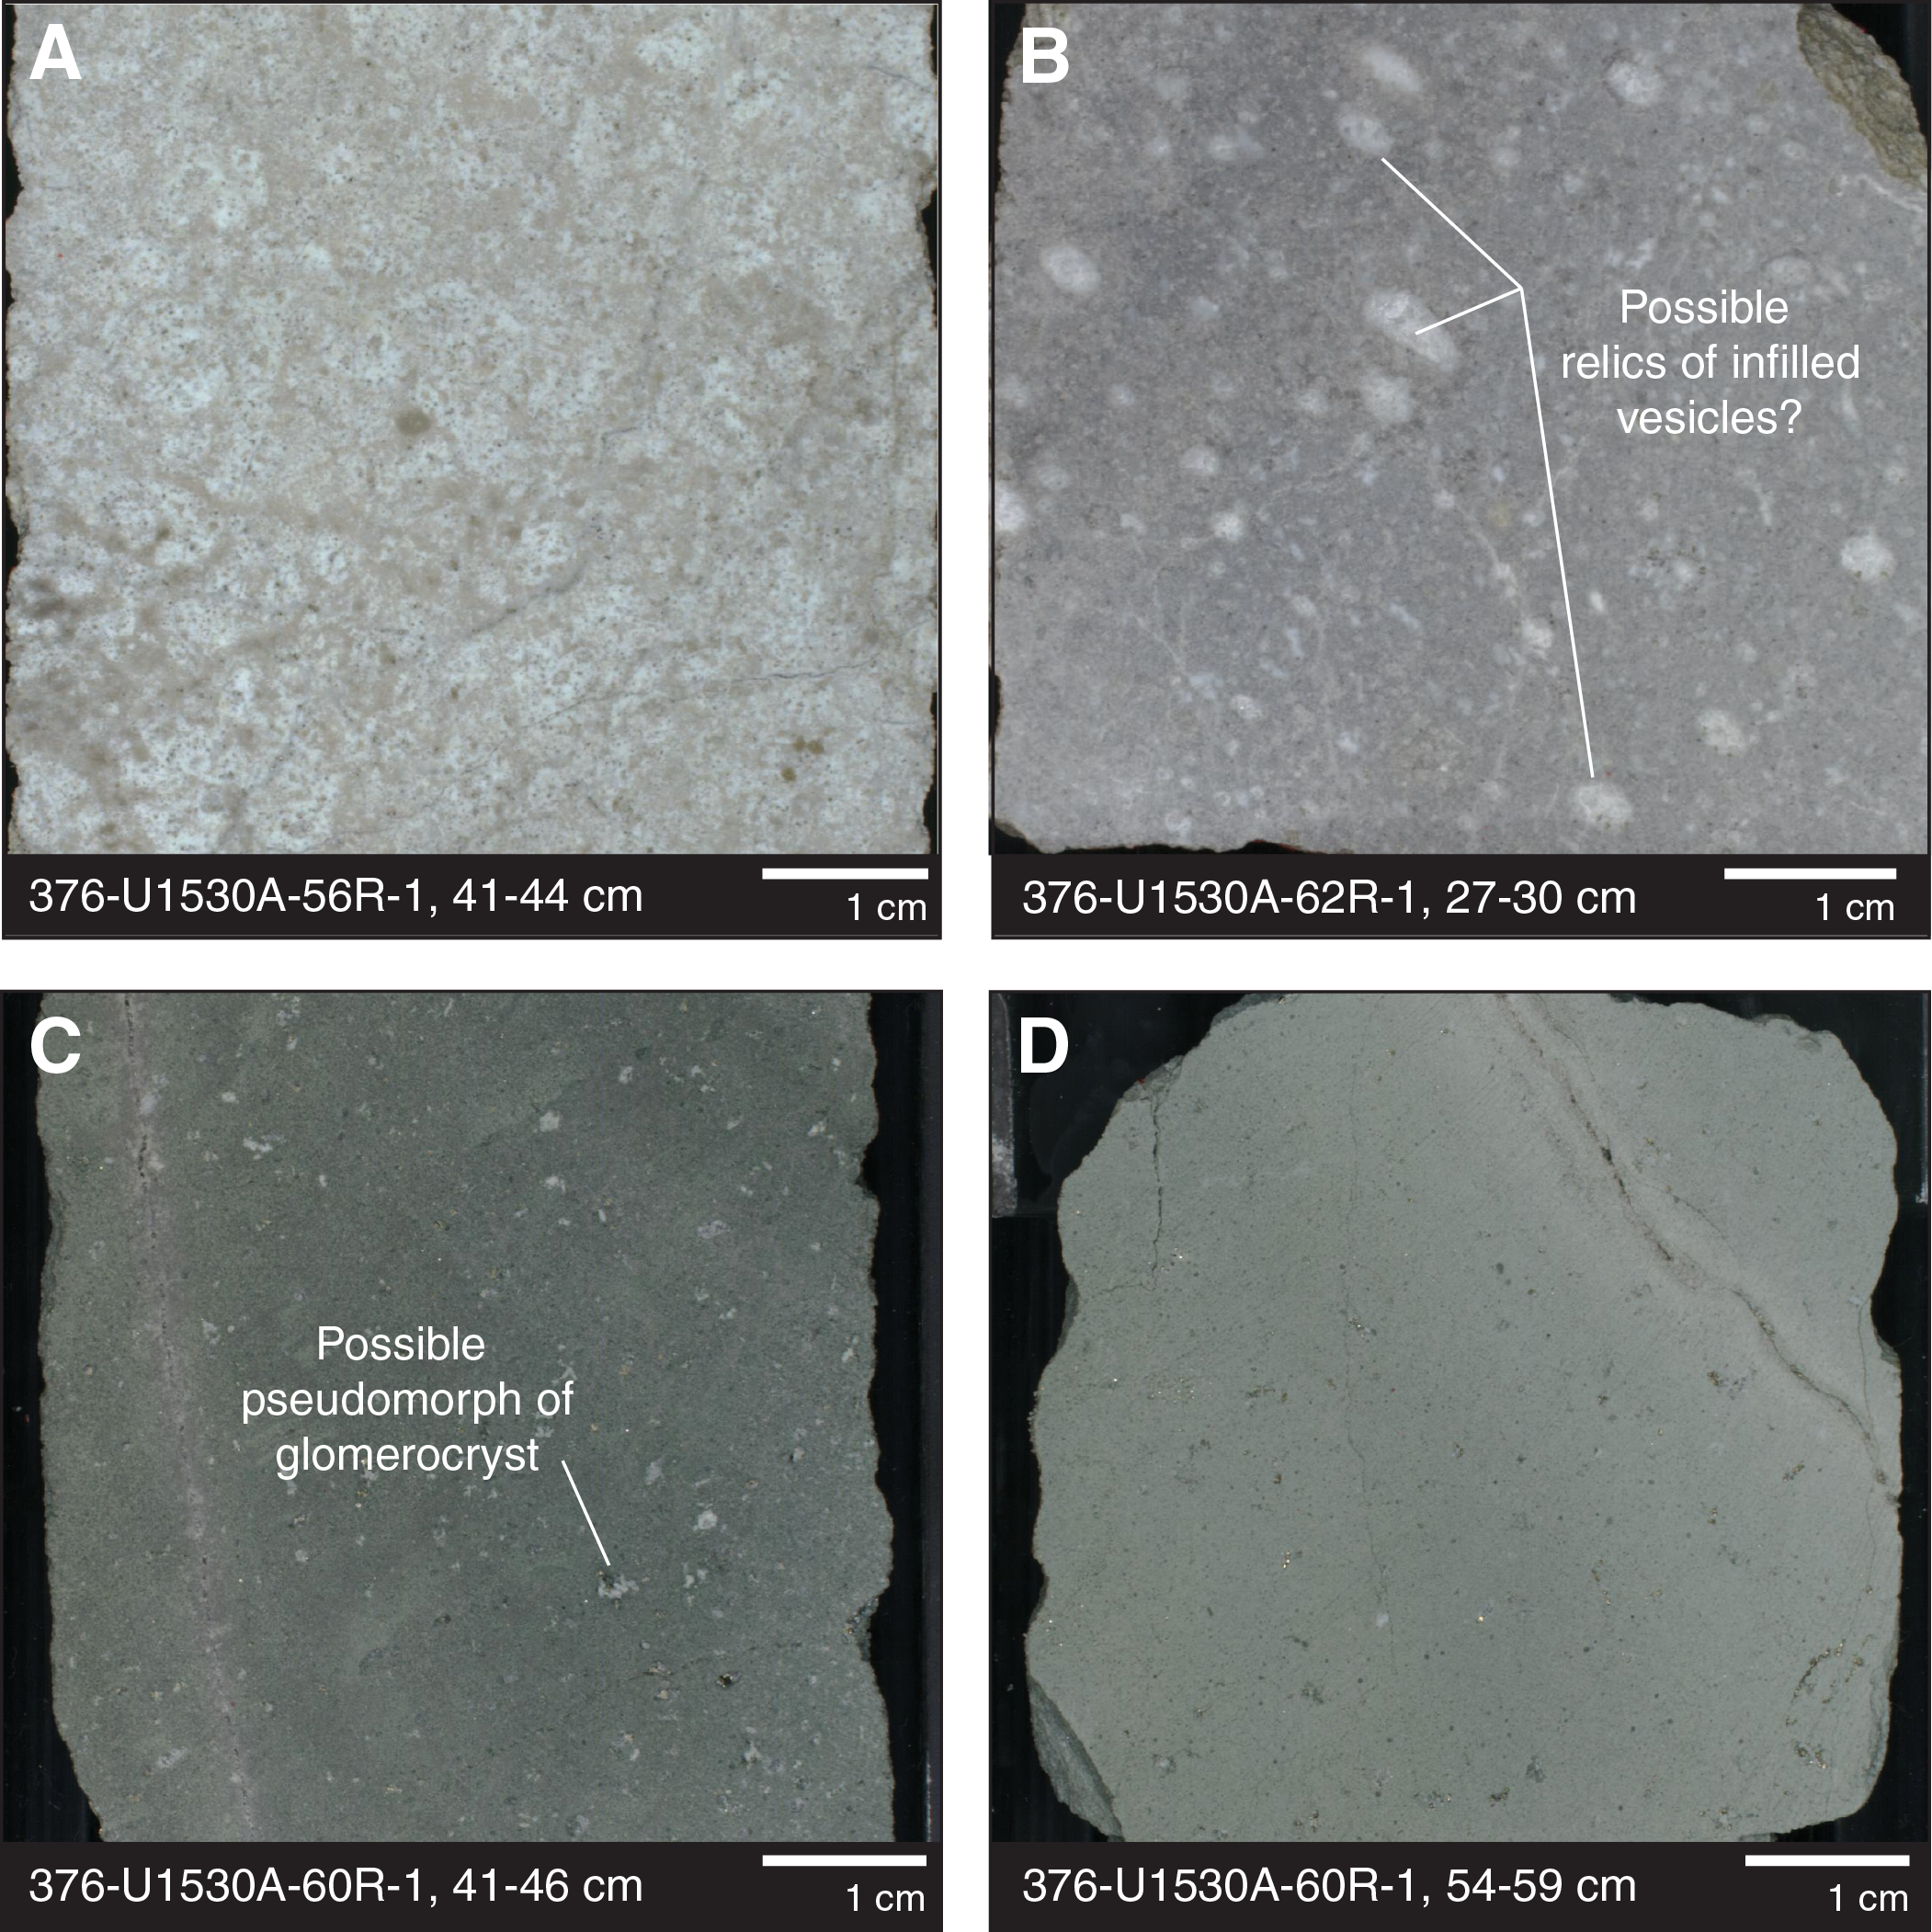
Figure F10. Macroscopic samples from Igneous Unit 5, Hole U1530A.
Intercalated throughout Igneous Unit 5 are, however, five greenish gray, less altered, coherent plagioclase-phyric lava horizons (Figure F10C, F10D) in intervals 376-U1530A-60R-1, 8–115 cm (289.98–291.05 mbsf); 63R-1, 8 cm, to 65R-1, 57 cm (304.38–314.47 mbsf); 83R-1, 27 cm, to 84R-1, 37 cm (400.57–405.47 mbsf); 89R-1, 0–67 cm (429.10–429.77 mbsf); and 91R-1, 0 cm, to 93R-1, 8 cm (438.70–448.38 mbsf). On average, the lava contains 5 vol% pseudomorphs after euhedral plagioclase that are typically 1 mm and as large as 3 mm and are either empty or filled with secondary minerals (see Alteration) in an altered microcrystalline groundmass. The shape of some pseudomorphs is similar to glomerocrysts observed in less altered volcanic rocks from Brothers volcano (see Igneous petrology and volcanology in the Site U1527 chapter and Igneous petrology and volcanology in the Site U1529 chapter [de Ronde et al., 2019c, 2019e]). Vugs constitute <5 vol% of the groundmass and are lined with secondary minerals (Figure F5F). Thin section observations confirm the less altered and coherent macroscopic appearance of the porphyritic lava intervals. Pseudomorphs of quartz or chalcedony and other alteration minerals (see Alteration) after tabular plagioclase phenocrysts (as they are typically found in unaltered glomerocrysts) make up to 5 vol% of the samples. Some samples have ~10 vol% spherical, quartz-filled vesicles.
Interpretation
Igneous Unit 1
Volcaniclastic rocks recovered in Igneous Unit 1 at Site U1530 resemble other clastic lithologies recovered during Expedition 376, in particular Igneous Unit 2 at Site U1527, which points to a similar origin and mechanisms of emplacement and primary fragmentation. The volcanic clasts probably derived from a dacite magma typical for Brothers volcano. Fragmentation mechanisms include (1) gravitational collapse of a massive lava formation, (2) primary emplacement as pyroclastic deposits by explosive eruptions, (3) interaction of lava flows with seawater (forming hyaloclastites), or (4) a submarine pyroclastic flow that could stem both from an explosive eruption or the gas-driven collapse of a lava dome (e.g., Fisher and Schmincke, 1984).
Igneous Unit 2
Sediments recovered in Igneous Unit 2 are unique in cores recovered during Expedition 376. Although only minor primary igneous components were observed, the similarity in mineral assemblage to other altered volcanic lithologies at Brothers volcano suggests that the recovered sediments are erosional products of altered dacite lava or volcaniclastic lithologies. Therefore, they are classified as altered tuffaceous sedimentary rocks. However, they have significantly smaller grain size and better sorting than the more common lapillistones and lapilli-tuffs recovered at Sites U1527 and U1528. Depositional, transport-related, and/or soft-sediment deformation textures suggest that the sediments have been reworked, likely causing grain size reduction. Inward collapse and rotation of the caldera wall along a listric fault may have produced small-scale, gravity-driven sediment flows that were deposited in a small depositional basin likely created by ring faulting along and inside the caldera wall. Separation of finer particles during flow, which then settled from the water column, could explain the horizontal and graded beds observed in Subunits 2b–2e. The small offset in sediment beds and the inclined and lenticular bedding observed in Unit 2 can be explained by postdepositional slumping. Whether erosion and transport are solely responsible for the small grain sizes of Unit 2 or whether this unit was originally fine grained (i.e., an ash deposit from a volcanic eruption) cannot be resolved owing to the complete replacement of original igneous minerals together with reworking. Hydrothermal fluids permeating through the soft sediments can explain the mottled textures, whereas later veins are produced by fluids passing through Igneous Unit 2 after initial consolidation. The intercalated lapillistone in Igneous Subunit 2c might represent a coarser grained layer of a gravity flow that may mark the boundary between two different gravity flow events.
Reverse grading in these sediments may be caused by multiple processes. In pyroclastic regimes, reverse grading can be caused by an increase in height in the eruption column, a change in vent morphology (causing material to be ejected at lower angles), or changes in the velocity and direction of ocean currents (e.g., Fisher and Schminke, 1984). Reverse grading can also be formed by mud-rich debris flows and clast-supported turbidites (Naylor, 1980). Lastly, reverse grading can be explained by a prealteration difference in density between highly vesicular volcanic clasts and less vesicular smaller clasts, causing clasts with higher vesicularity to float atop a density current. The presence of pumice lapilli in unconsolidated tephra at Site U1527 suggests that Brothers volcano is capable of producing highly vesicular pyroclasts despite its ambient water depth.
Igneous Unit 3
Igneous Unit 3 is interpreted to be a plagioclase-phyric lava flow. It is pervasively overprinted by a distinct secondary mineral assemblage (see Alteration). Because no primary minerals or textures are preserved, it is difficult to assess the chemical character of Unit 3 with respect to the ubiquitous dacite lava. However, this unit contains distinctive ~2 mm silica pseudomorphs after glomerocrysts of plagioclase, very similar to the glomeroporphyritic texture observed in unaltered or only slightly altered Brothers volcano dacite at Sites U1527–U1529.
Igneous Unit 4
Clasts in volcaniclastic lithologies recovered in Igneous Unit 4 are highly altered, although they most likely represent fragments of altered dacite lava typical for Brothers volcano. Possible fragmentation mechanisms are the same as those outlined in the interpretation of Igneous Unit 1. The lack of marker horizons, the variable but intense degree of alteration, and the presence of fault displacements along the caldera walls preclude correlation of this igneous unit with volcaniclastic lithologies at other sites.
Igneous Unit 5
Igneous Unit 5 consists of a sequence of completely altered volcanic rocks intercalated with five distinctive 0.7–10.1 m thick, originally plagioclase-phyric lava horizons. No evidence preserved in the altered volcanic rocks allows us to distinguish the protolith. However, based on the lack of clastic textures and the intercalated intervals that still retain coherent igneous features, it is likely to have been a more coherent volcanic unit when compared with the volcaniclastic deposits observed at the top of Igneous Unit 4.
Whole-rock composition of Site U1530 igneous and tuffaceous sedimentary rocks
Analyses of 86 rock powders by pXRF (Table T8) from all five igneous units confirm the extensive and pervasive hydrothermal and seawater alteration of Hole U1530A (see Alteration). There is no perceptible compositional difference between altered tuffaceous sediments and altered igneous rocks. This is consistent with both the proposed origin of the sediments as erosional products of the altered igneous rocks (see above) or with the hydrothermal alteration postdating the emplacement of sedimentary and igneous strata.
Because of the extensive alteration, clues to the composition of the volcanic protolith must be obtained from elements that are most resilient to alteration (e.g., Ti, Zr, and Y) (Pearce and Norry, 1979). Downhole variations can be used for a first-order comparison of these elements between the unaltered and altered dacite rocks recovered at Site U1530 and previously drilled Sites U1527–U1529 (Figure F11). Although TiO2 abundances (with a few exceptions) are similar to values for unaltered Brothers volcano dacites from Sites U1527 and U1529 (~1 wt% TiO2; gray bars in Figure F11), Zr and in particular Y are more variable and have ranges similar to that observed in the Site U1528 altered dacitic rocks. Thus, analogous to Site U1528, lower Y concentrations may indicate partial alteration-induced loss of this element in the most intensely altered sections of Hole U1530A. However, at ~100–180 mbsf (corresponding to Alteration Subtype IIIb; see Alteration), all three elements show the least amount of variation, and their abundances and ratios are similar to those of unaltered Brothers volcano dacites recovered from the uppermost sections of Site U1527 (Hole U1527A) and from Site U1529. Thus, in this interval, the elemental abundances and trace element ratios of the protolith are likely best preserved, and they are very similar to those of the typical Brothers volcano dacites (Wright and Gamble, 1999; Haase et al., 2006; Timm et al., 2012). Moreover, although the Ti/Zr values at ~100–180 mbsf in Hole U1530A resemble those of the altered volcaniclastic series in nearby Hole U1527C, they have slightly but systematically lower Ti/Zr values than the unaltered volcanic rocks at Sites U1529 and U1527 and the least altered rocks of Upper Cone Site U1528. In the least altered rocks from any of the drill sites, there is no indication of secondary rutile or any other primary or secondary mineral phase that may potentially affect these elements or their ratios (see Alteration). We suggest that the dacites with the lower Ti/Zr values in Holes U1527C and U1530A belong to the strata of the older and partially collapsed Brothers volcano caldera. In contrast, Site U1528 and U1529 dacites belong to the youngest, resurgent volcanism at Brothers volcano. Remarkably, the unaltered pyroclastic deposits recovered in Hole U1527A have the higher Ti/Zr values of the resurgent volcanism, suggesting they were possibly emplaced significantly later than the Hole U1527C altered volcaniclastics and concurrently with the resurgent cone phase of volcanism at Brothers volcano (see Geochemistry). Although the Ti/Zr value range at Brothers volcano is small compared with the overall range in the Kermadec arc (e.g., Gamble et al., 1997; Turner et al., 1997; Haase et al., 2002; Smith et al., 2003; Graham et al., 2008; Timm et al., 2012, 2013, 2016; Barker et al., 2013), the small disparity in Ti/Zr has been, so far, the only indication of a possible genetic variability among the Brothers volcano dacite magma series.
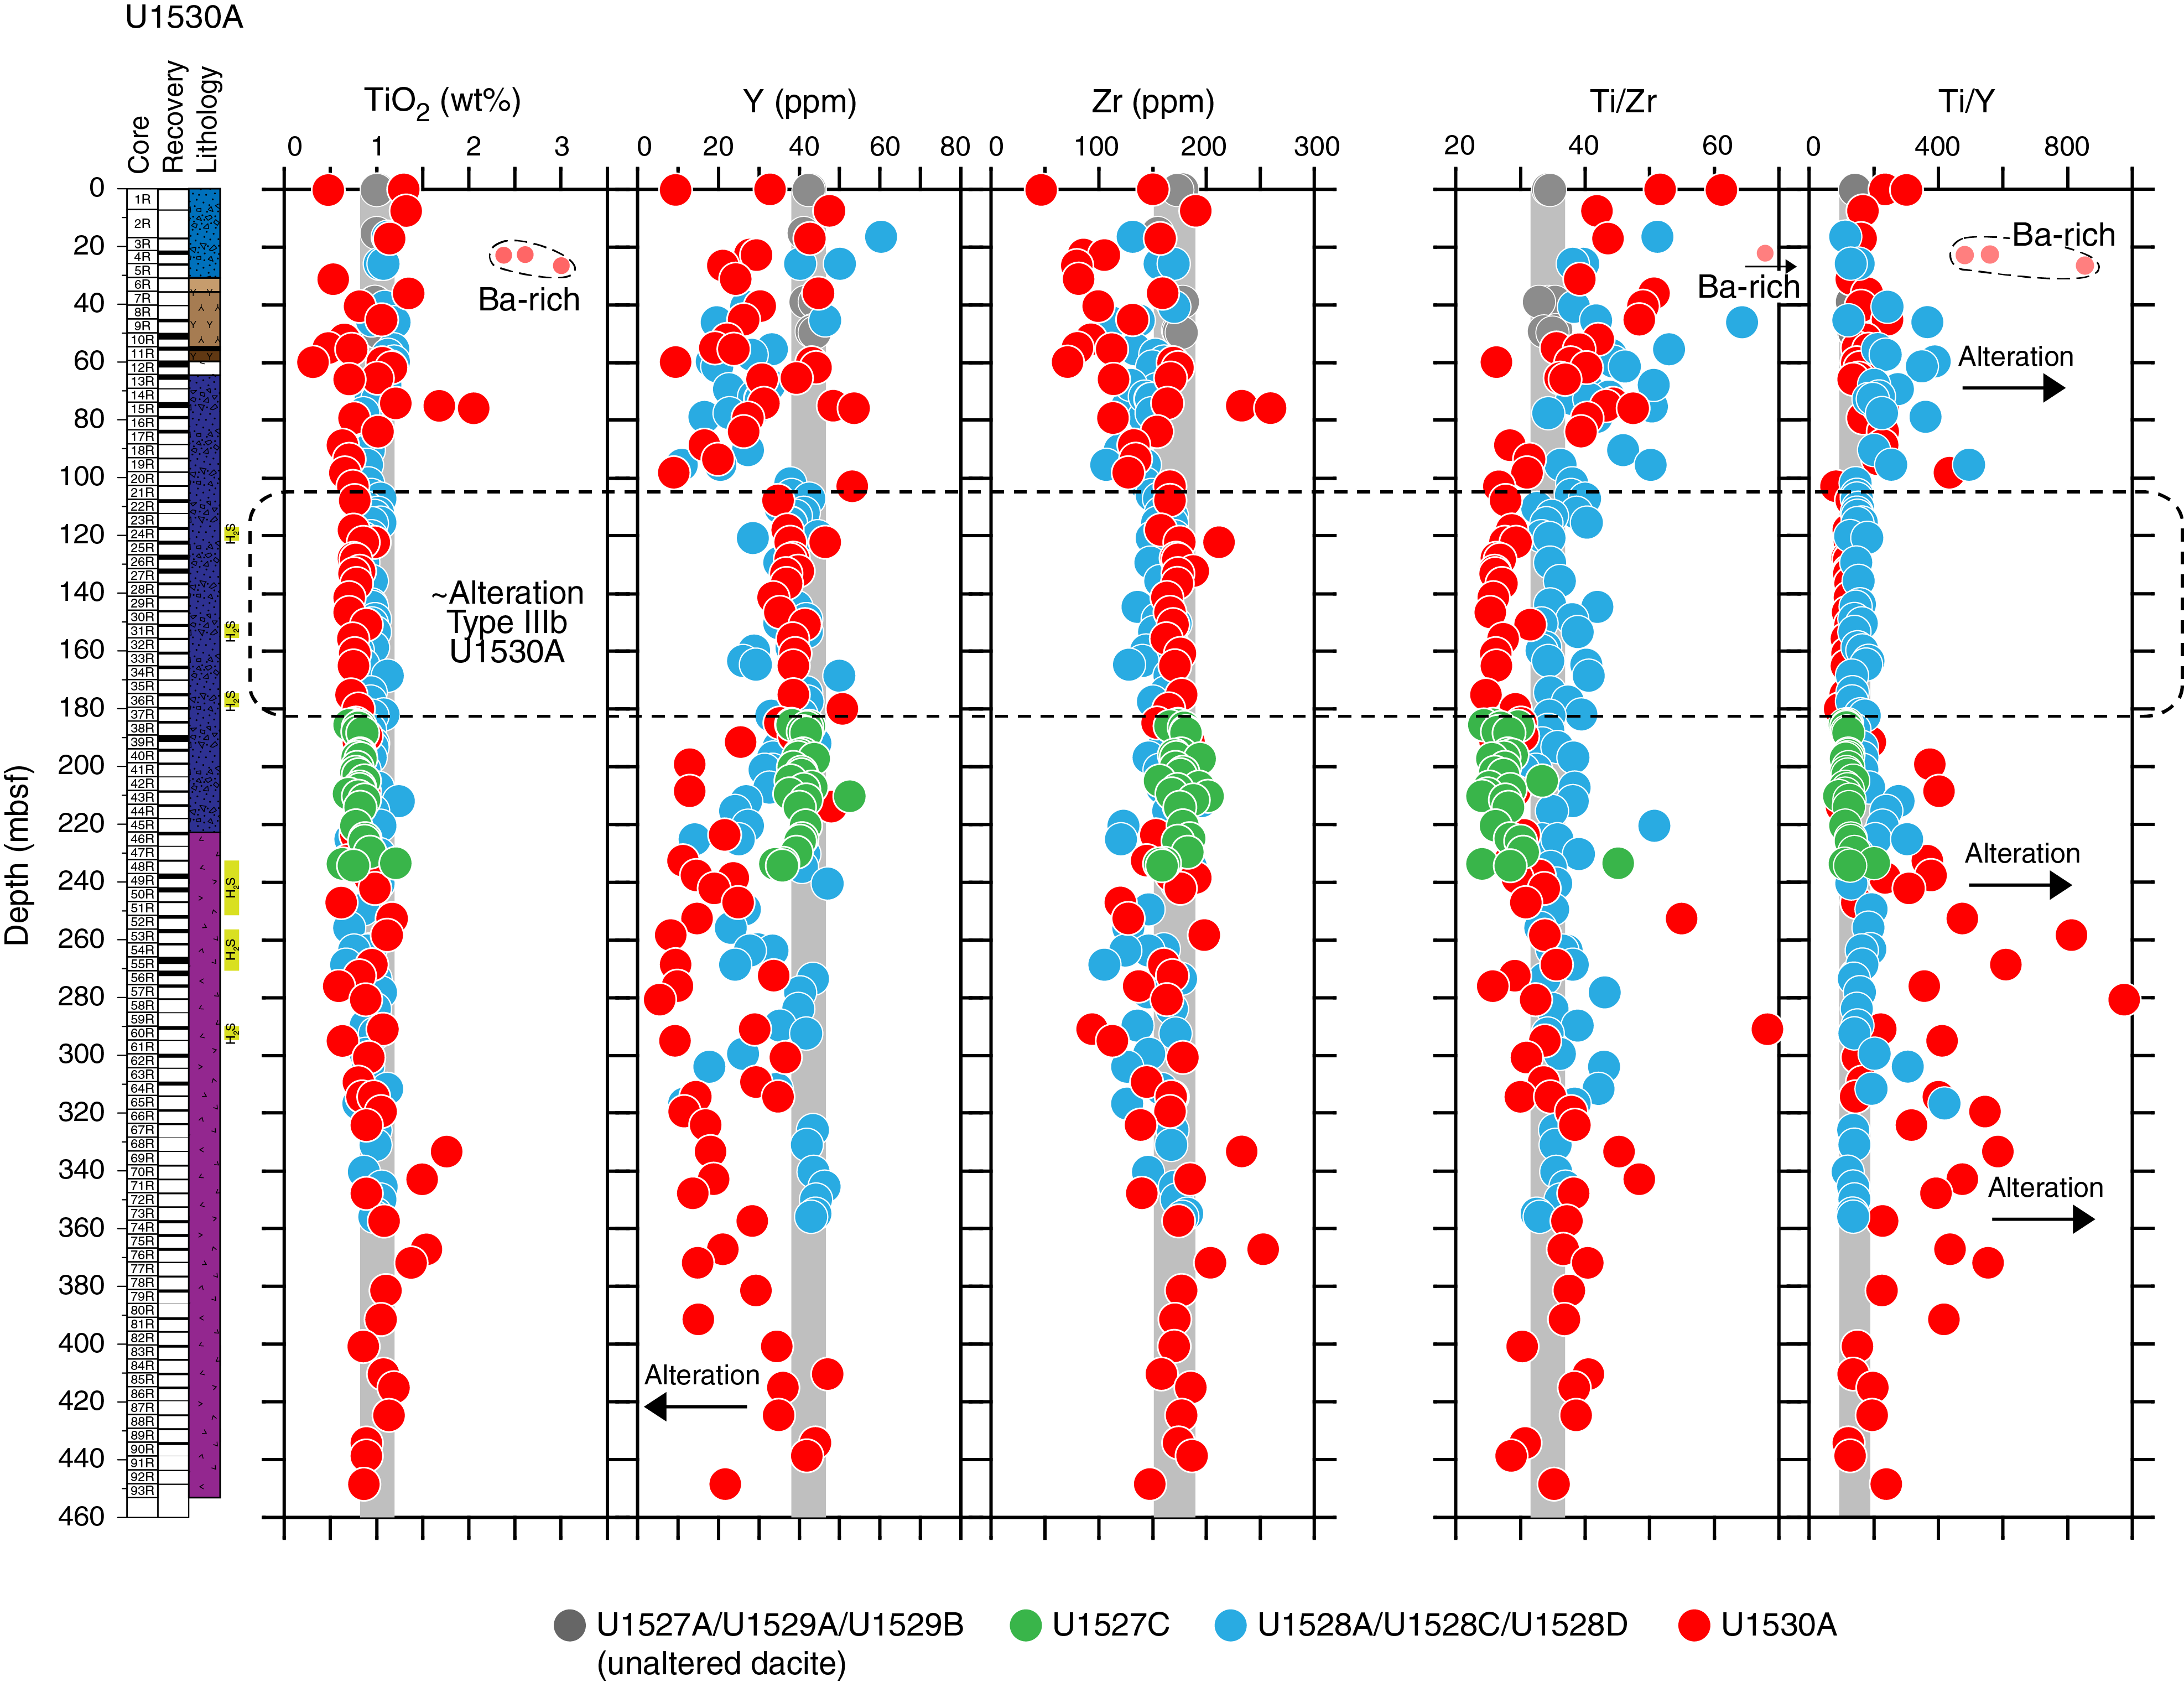
Figure F11. Comparison of Hole U1530A samples with Hole U1527A, Hole U1527C, Site U1528, and Site U1529.
Alteration
Five alteration types (I–V) are defined at Site U1530 (Figure F12). Alteration Type I represents high to intense alteration of polymict lapillistone and consists of smectite, pyrite, anhydrite, sphalerite, and barite with minor quartz, chlorite, and illite. This alteration type coincides with Igneous Unit 1 (see Igneous petrology and volcanology). Alteration Type II reflects intense alteration, has a characteristic green-gray color, and consists of quartz, illite, and chlorite with lesser anhydrite, pyrite, sphalerite, and smectite. Alteration Type II overprints three different host lithologies (Igneous Units 1–3) with varying proportions of secondary minerals depending on whether the precursor rock was a sediment, a plagioclase-phyric lava, or a pyroclastic rock. Alteration Type III is characterized by the intense alteration of volcaniclastic rocks, has a characteristic white-blue-gray color, and features a mineral assemblage that consists of quartz and illite with minor pyrite, smectite, chlorite, and anhydrite. This alteration type is divided into two subtypes with Alteration Subtype IIIa having a lower abundance of smectite and chlorite and higher abundance of anhydrite than Alteration Type IIIb (Figure F12). Alteration Type IV is predominantly white in color and replaces a volcaniclastic precursor rock with quartz, pyrophyllite, illite, smectite, and subordinate pyrite. Alteration Type V is defined by the appearance of diaspore, rutile, and minor zunyite. Depths of occurrence for Alteration Types II, IV, and V given below refer to representative intervals only. A complete list of intervals for all alteration types is provided in Table T2.
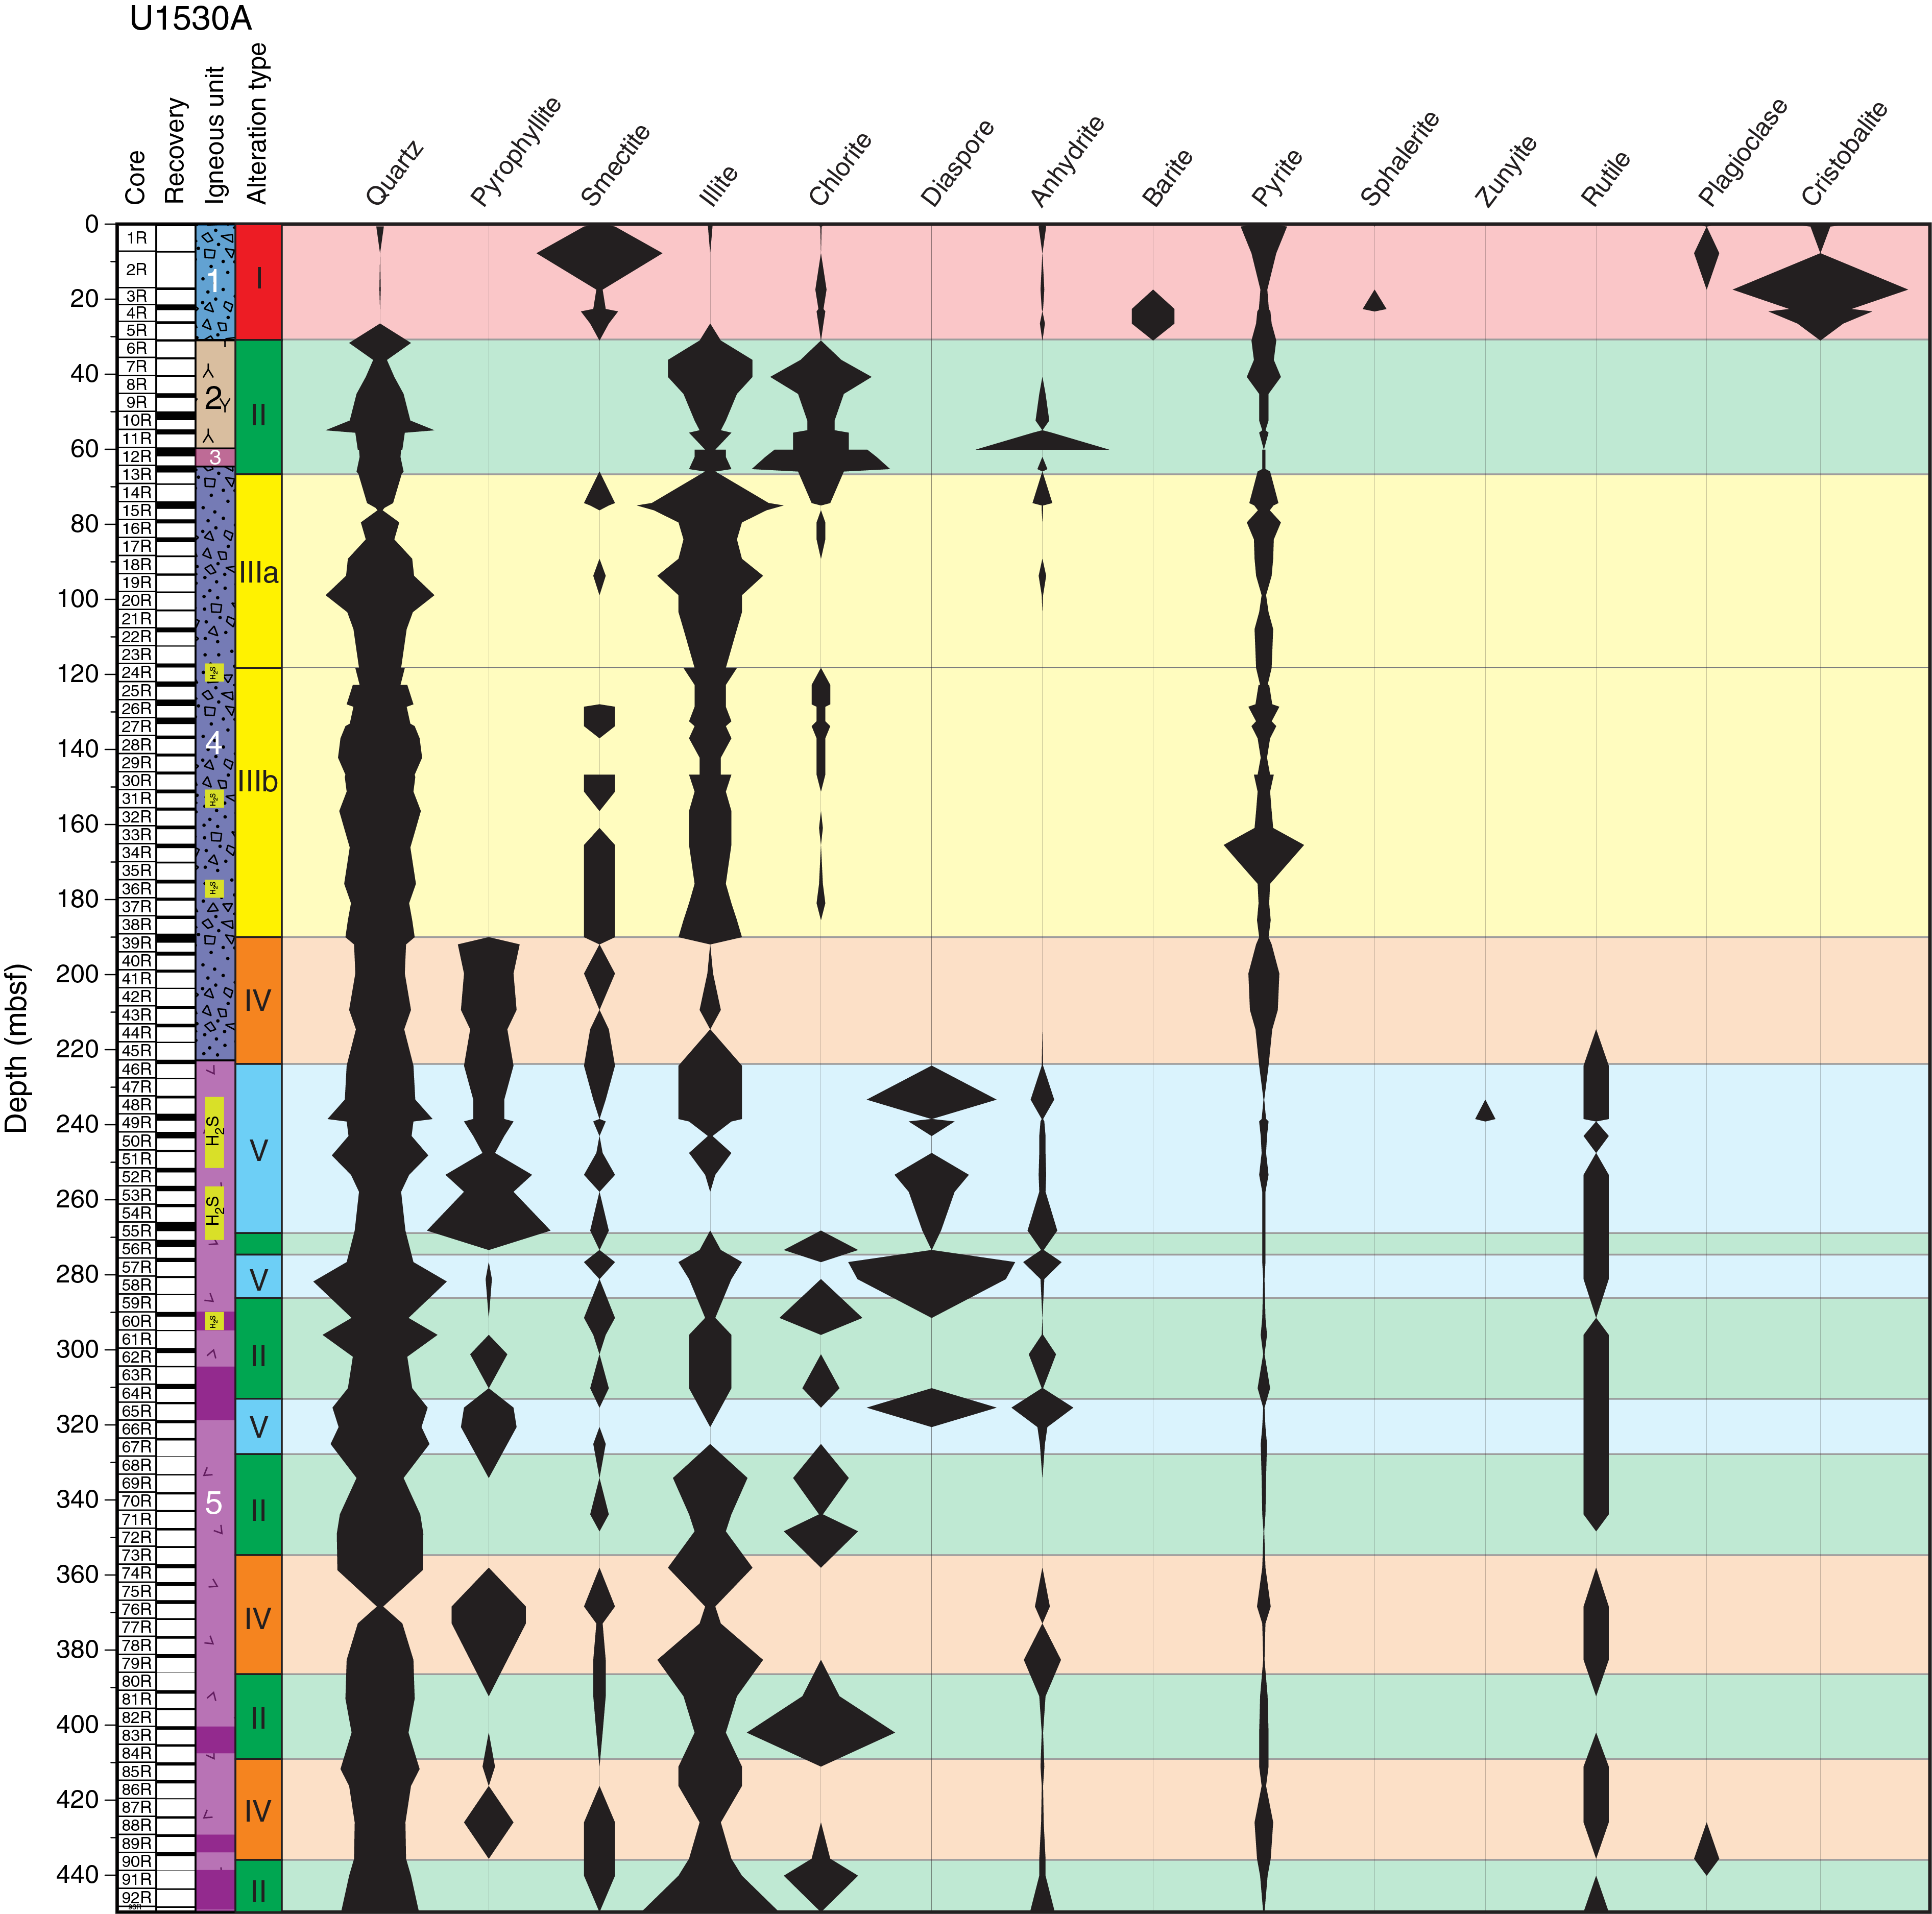
Figure F12. Alteration Types I–V by XRD, Hole U1530A.
Alteration Type I
- Distinguishing alteration minerals: smectite + pyrite + anhydrite + sphalerite + barite ± quartz ± chlorite ± illite
- Degree of alteration: highly to intensely altered
- Interval: 376-U1530A-1R-1, 0 cm, to 6R-1, 58 cm
- Depth: 0.00–31.28 mbsf
Alteration Type I corresponds to the clast-supported polymict lapillistone of Igneous Unit 1 (see Igneous petrology and volcanology) and is highly to intensely altered (see Table T7 in the Expedition 376 methods chapter [de Ronde et al., 2019a]). The alteration assemblage is composed of smectite, pyrite, anhydrite, sphalerite, and barite with minor quartz, chlorite, and illite (Tables T3, T4). Alteration Type I is characterized by blue-gray angular clasts that are altered to illite-smectite or a mixed layer illite-montmorillonite (± chlorite). Clasts are variably silicified, and a higher abundance of silica is associated with the blue-gray clasts (Figure F13). The clasts lack anhydrite, other than as vug infill, and are lower in pyrite content compared with the matrix (Figure F14). Plagioclase phenocrysts in the clasts are mostly pseudomorphed by white illite, although relict plagioclase is confirmed by XRD analyses in Section 376-U1530A-2R-1.
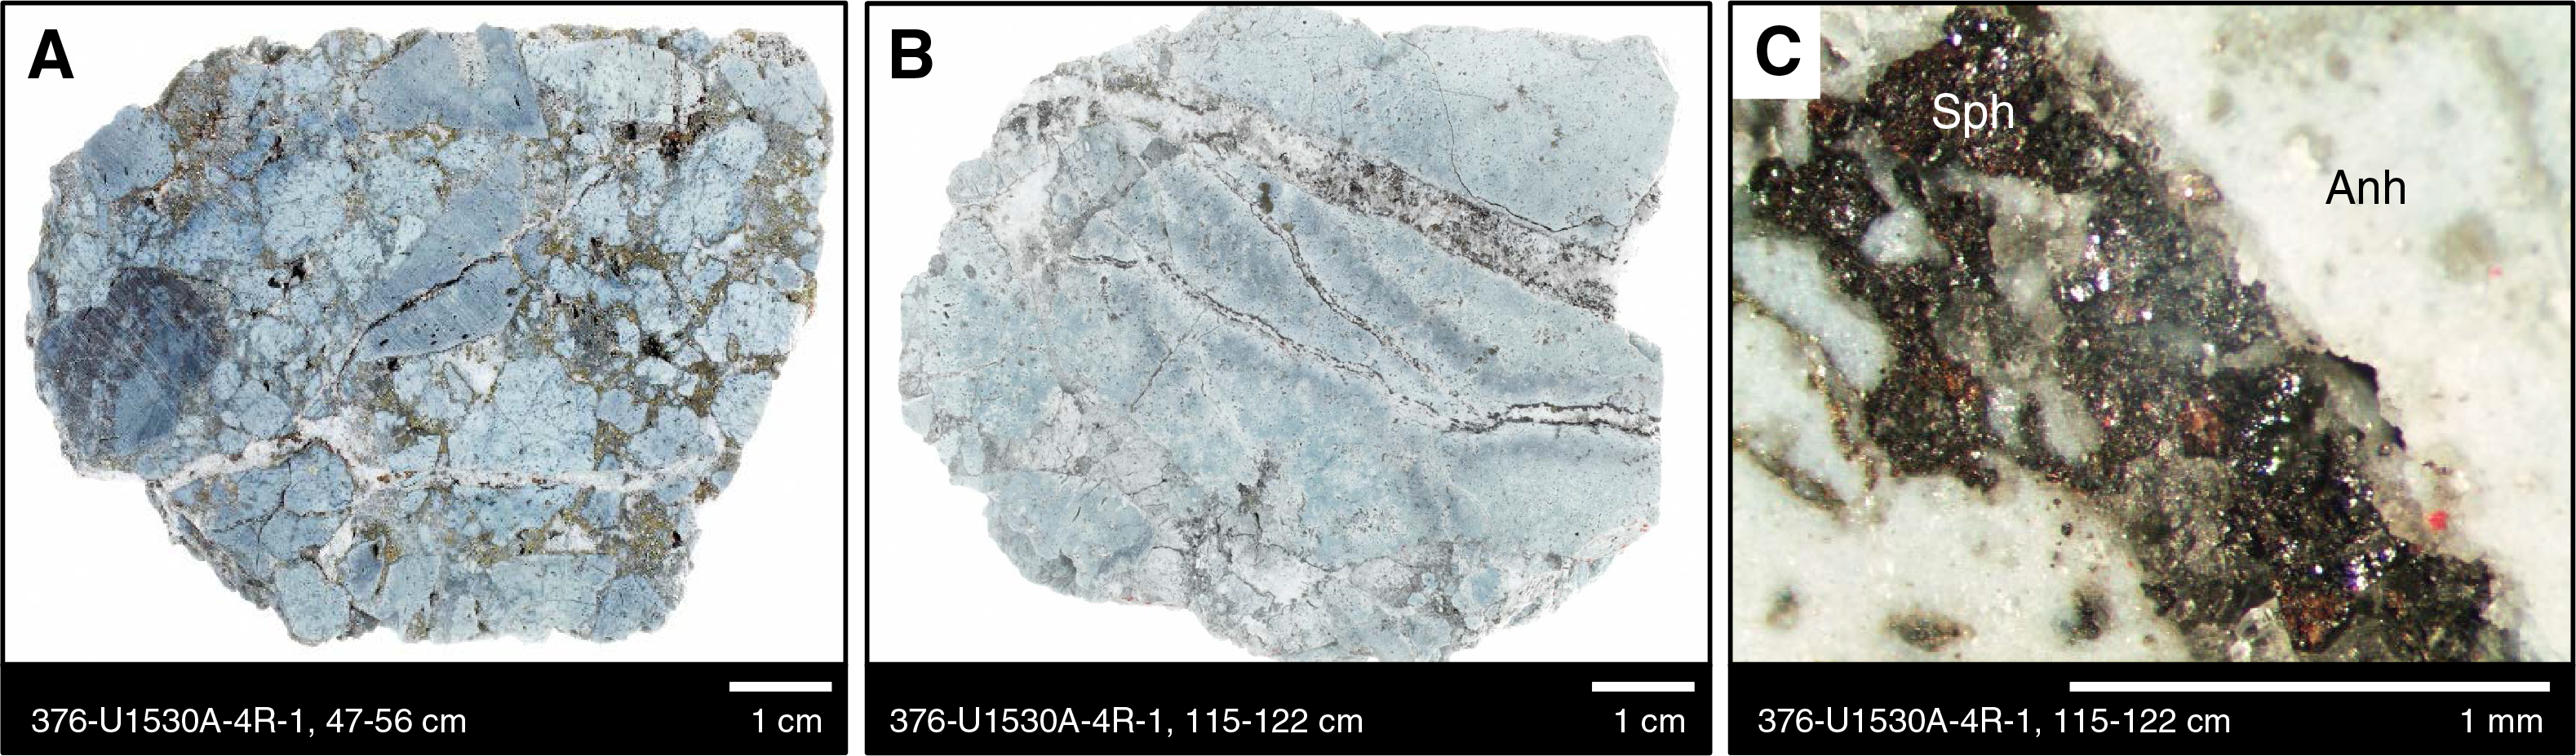
Figure F13. Alteration Type I, Hole U1530A.

Figure F14. Alteration Type I (RL), Hole U1530A.
Contacts between the matrix and clasts are well defined, indicating little to no resorption during alteration (Figure F13). The matrix is dominated by variable amounts of pyrite, silica, barite, and anhydrite with trace amounts of sphalerite (Figure F14) that form a mesh texture. Barite was detected by XRD in the lower part of Alteration Type I at ~20–30 mbsf (Figure F12), which is the only interval in Hole U1530A that contains barite. Sphalerite occurs in close association with barite, often as discrete euhedral grains concentrated at the margin of veins or disseminated in the barite (Figure F13). In thin section, veins are often complex and have anhydrite or barite located in the center and vein margins dominated by chalcedony or quartz (Figure F14). Rarely, anhydrite and/or barite veins are overprinted by well-developed acicular crystals that are most likely natroalunite (Figure F14). Natroalunite was not detected by XRD because of its minor abundance and its appearance in thicker veins that were not sampled for XRD analysis.
Alteration Type I exhibits some of the highest concentrations of MgO at Site U1530 (Figure F37), which is likely related to the presence of abundant Mg-rich smectite and a lesser contribution from chlorite (Figure F12). The pXRF and ICP-AES data also show high contents of Zn and Cu (Figure F41). Sphalerite was observed in both hand specimen and thin section and was detected by XRD. However, no primary Cu-bearing phases (e.g., chalcopyrite) were noted in Type I alteration.
Alteration Type II
- Distinguishing alteration minerals: quartz + illite + chlorite ± anhydrite ± pyrite ± smectite ± rutile
- Degree of alteration: intensely altered
- Interval: 376-U1530A-7R-1, 0 cm, to 12R-2, 81 cm
- Depth: 35.50–61.88 mbsf
Alteration Type II has a characteristic green color that reflects the presence of chlorite as the dominant secondary mineral (Figure F15; Table T3). XRD data indicate a downhole increase in chlorite and a corresponding decrease in illite abundance to ~74 mbsf (Figure F12). This trend corresponds to a relative increase in MgO and decrease in K2O contents downhole (Figure F37).
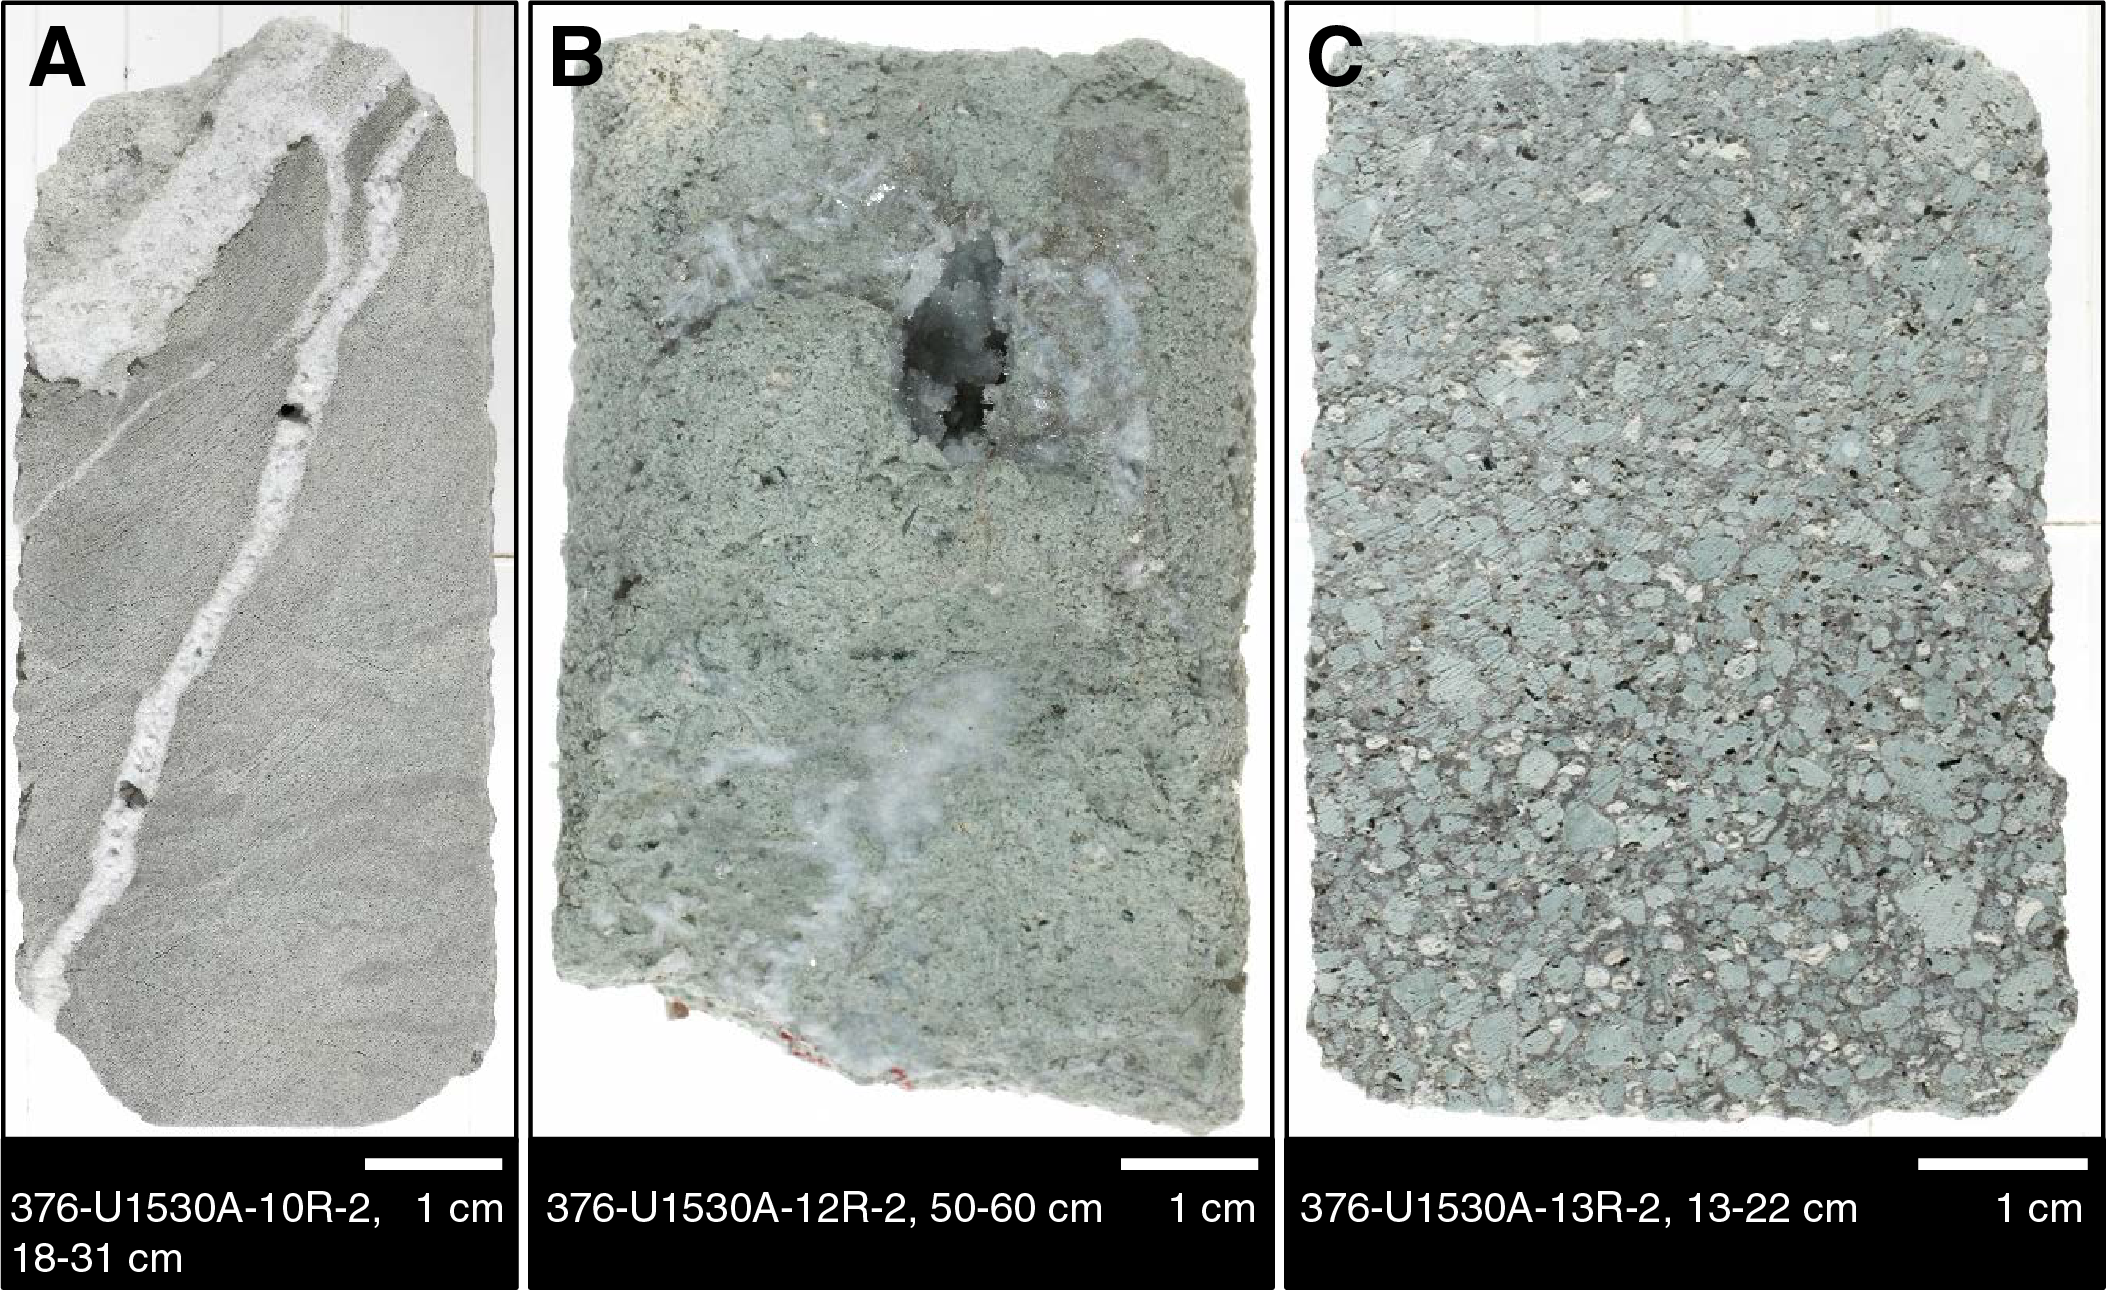
Figure F15. Lithologies affected by Alteration Type II, Hole U1530A.
Alteration Type II occurs in three distinct lithologies: fine-grained tuffaceous sediments (mudstones, siltstones, and sandstones), coherent lava, and pyroclastic rocks (see Igneous petrology and volcanology; Figure F15). All three lithologies contain a common alteration mineral assemblage of quartz, chlorite, and illite with lesser anhydrite and pyrite (Table T3), although the proportions of the different secondary minerals vary with lithology. For example, a pronounced increase in pyrite was observed in the fine-grained sedimentary unit when compared with the lava and coarser pyroclastic units.
In the fine-grained sedimentary unit, steeply dipping to subhorizontal veins of coarsely crystalline anhydrite (as wide as 1.5 cm) cut and clearly postdate layering (Figure F15). The upper part of the volcaniclastic sediment (Igneous Subunit 2a) hosts disseminated subhedral to framboidal pyrite that forms aggregates that completely infill fractures.
The lower part of the volcaniclastic unit (Igneous Subunit 2c) is characterized by subangular clasts that are clearly distinguishable from the matrix material (Figure F15). The white to green-gray clasts are friable and unsilicified and are composed mainly of chlorite and illite with some preservation of a relict perlitic texture. The clasts often have an illite-rich rim in contact with the matrix. Plagioclase phenocrysts and microlites in clasts are completely pseudomorphed by chlorite, smectite, and quartz. The matrix is replaced by silica and pyrite and contains numerous vugs lined by pyrite, quartz, and minor anhydrite.
The altered lava of Igneous Units 3 and 5 often has a vuggy texture and vugs filled with pyrite, anhydrite, and rare silica. The matrix of this lava consists of massive, equigranular chlorite and illite intergrown with microcrystalline quartz (Figure F16). Occasionally, the lava unit is cut by veins (< 1 mm) of anhydrite that are lined with quartz (Figure F16). Deeper in the section, Alteration Type II is repeated (e.g., Section 376-U1530A-81R-1; 390 mbsf), and it is intercalated with and overprints Alteration Type IV (see below). Here, anhydrite no longer forms discrete veins but instead infills vugs and is intergrown with chlorite and quartz (Figure F16). Pyrite remains disseminated as subhedral grains with a uniform morphology throughout the core. In intervals of Alteration Type II from the lower sections of Hole U1530A (i.e., below Section 55R-1; 265.9 mbsf), rutile occurs as minor, fine-grained, brown-to-red crystals (0.1–0.5 mm) with distinct skeletal textures. These crystals are subsequently overprinted by subhedral pyrite which shows evidence for oxidation (i.e., Fe oxyhydroxide staining on crystal surfaces).
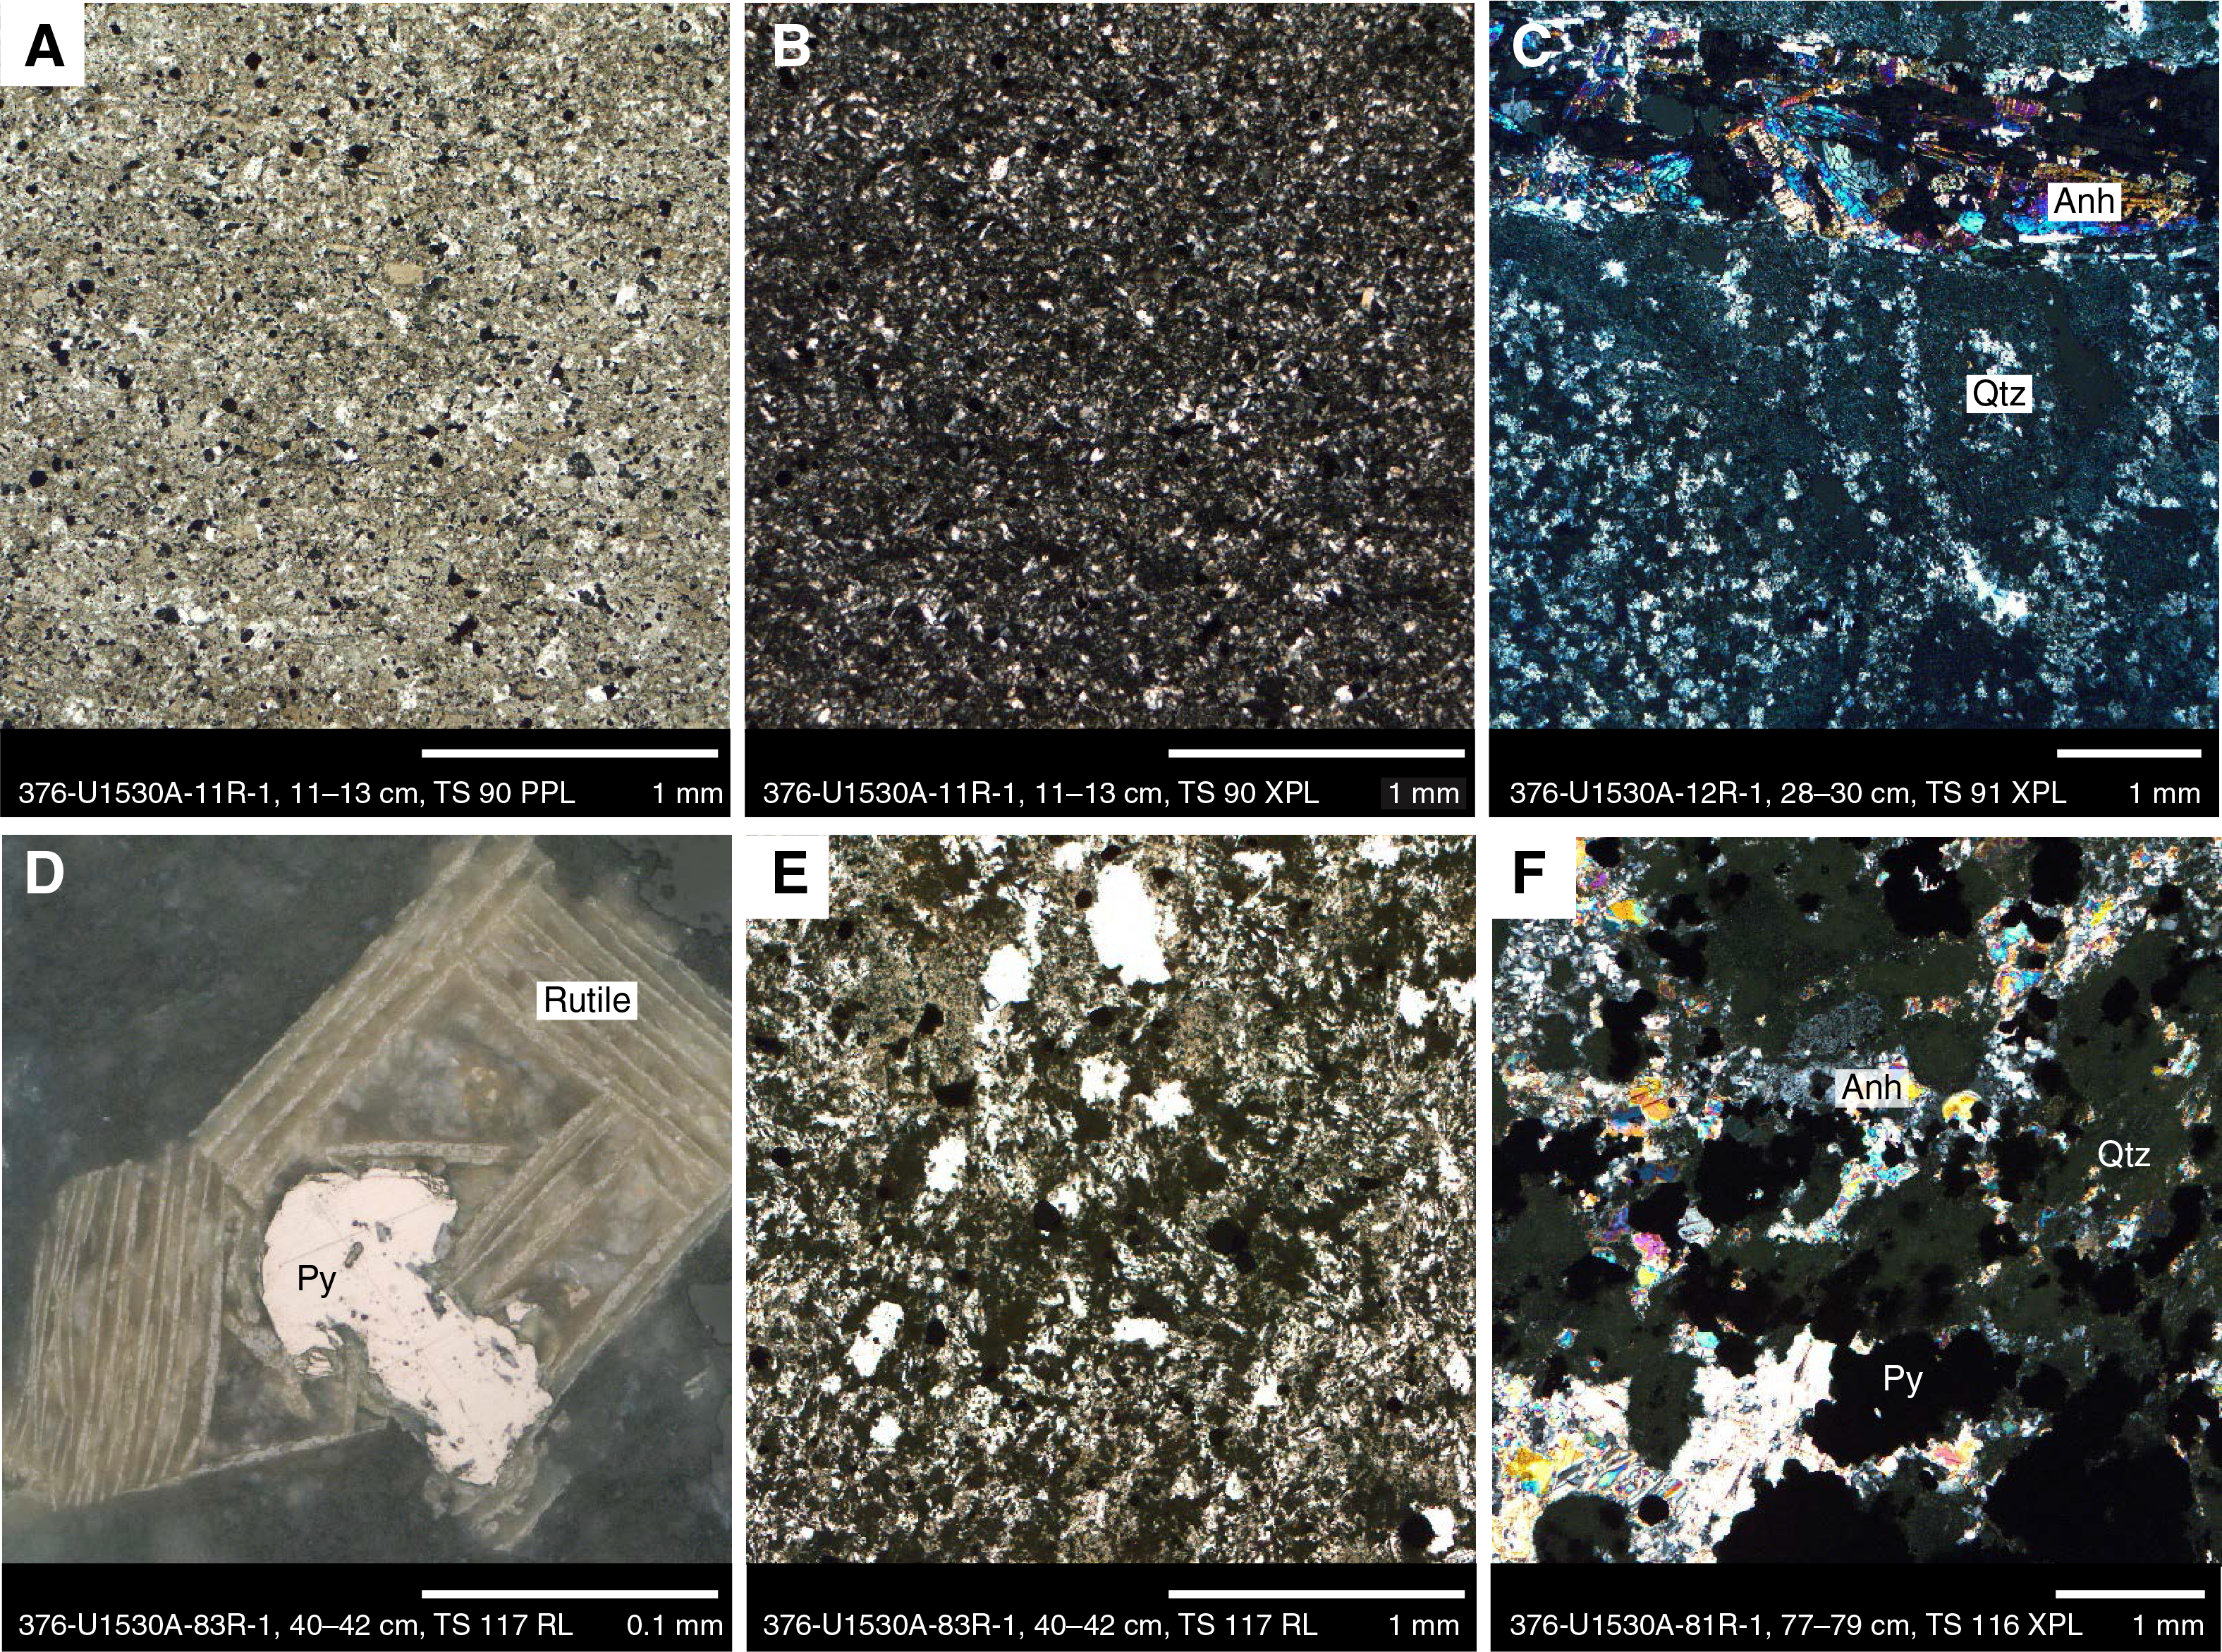
Figure F16. Alteration Type II, Hole U1530A.
Alteration Type III
- Distinguishing alteration minerals: quartz + illite ± pyrite ± smectite ± anhydrite ± chlorite
- Degree of alteration: intensely altered
- Interval: 376-U1530A-13R-1, 0 cm, to 38R-1, 86 cm
- Depth: 64.30–185.16 mbsf
Alteration Type III occurs in the intensely altered volcaniclastic rocks of Igneous Unit 4 and is characterized by a mineral assemblage of quartz and illite with minor pyrite, smectite, and anhydrite (Table T3). Illite is the dominant clay mineral throughout this alteration type. Alteration Type III is divided into two subtypes based on the relative abundances of anhydrite (enriched in Alteration Subtype IIIa) and chlorite (enriched in Alteration Subtype IIIb). Similar to Alteration Type II, slight enrichments of K2O contents in Alteration Subtype IIIa and MgO contents in Alteration Subtype IIIb reflect the relative enrichment of illite and chlorite, respectively (Figures F12, F15).
Alteration Subtype IIIa
Alteration Subtype IIIa contains abundant anhydrite and occurs in volcaniclastic intervals characterized by lighter clay-rich clasts surrounded by a darker silica- and pyrite-rich matrix. Throughout Alteration Subtype IIIa, the color transitions from white-gray in the upper sections to darker gray in the lower sections below Section 376-U1530A-22R-1 (Figure F17). This change in color coincides with a decrease in anhydrite in the lower part of Alteration Subtype IIIa. The clasts are clearly distinguishable from the silica-pyrite matrix and vary in size from 1 to 3 cm with no obvious resorption of their margins (Figures F17, F18). The white-gray clasts are illite rich and contain minor silica and pyrite. The intensity of silicification of both clasts and matrix is highly variable throughout Alteration Subtype IIIa. However, in general, the abundance of silica and pyrite is significantly higher in the matrix than in the clasts.

Figure F17. Alteration Subtype IIIa clasts in a pyrite-rich matrix, Hole U1530A.
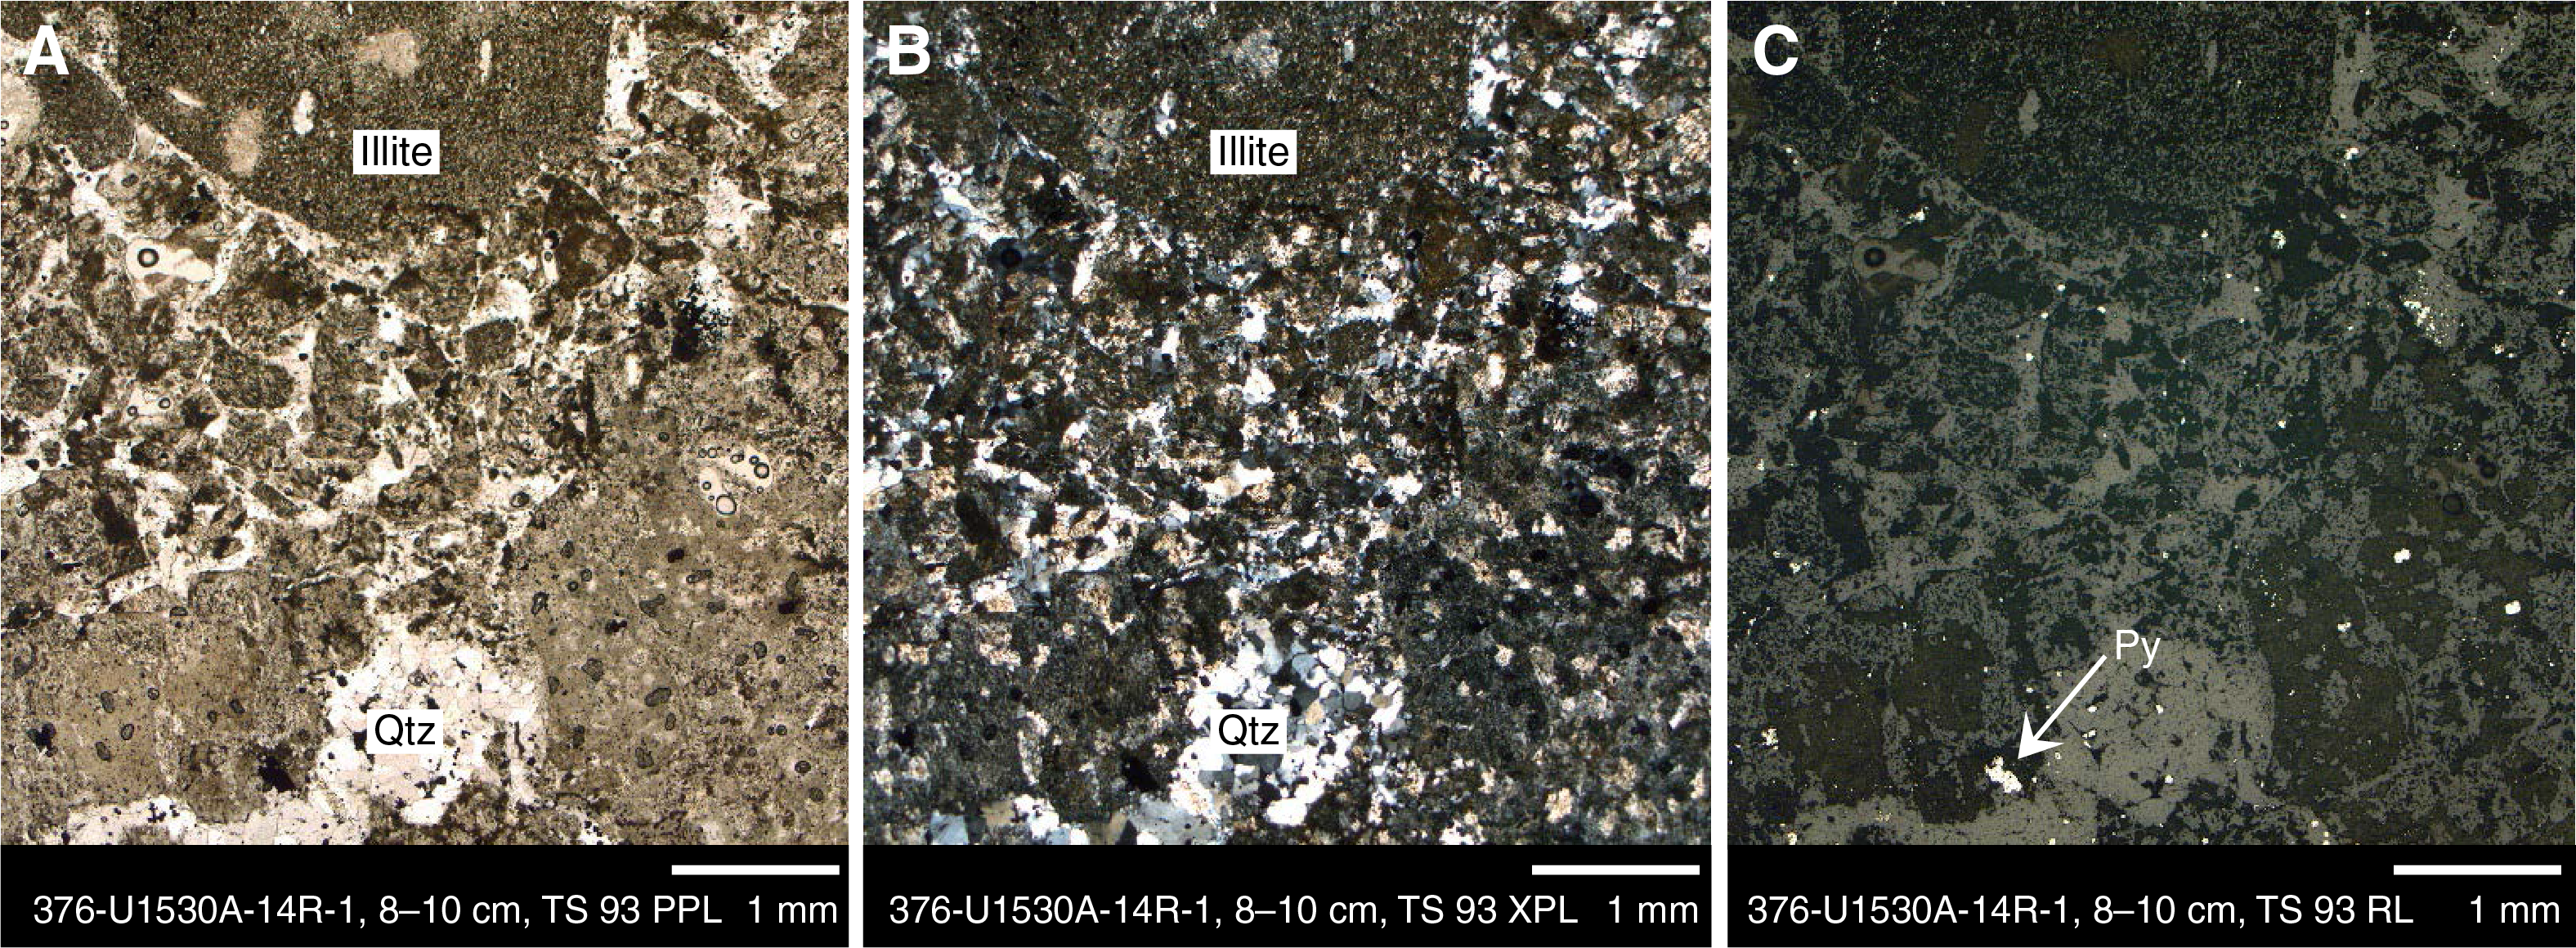
Figure F18. Alteration Subtype IIIa illite-rich clasts in a quartz matrix, Hole U1530A.
Alteration Subtype IIIb
Alteration Subtype IIIb is blue-gray and has an alteration mineral assemblage similar to Alteration Subtype IIIa but with more abundant chlorite and less abundant anhydrite. Macroscopically, clasts are visually distinguishable but are commonly highly resorbed and variably silicified (Figure F19). The clasts have a vuggy texture, and pyrite and quartz are the dominant vug-filling minerals. The matrix is intensely silicified relative to the illite-, chlorite-, and occasionally smectite-rich clast material and has intergrown microcrystalline quartz. Pyrite is disseminated throughout as subhedral to euhedral grains (Figure F20). Pyrite abundance is higher in the matrix and commonly mantles individual clasts. Fe oxyhydroxide occurs as an accessory phase throughout but is more abundant in the matrix, most likely following the oxidization of pyrite (Figure F20). In some clasts, a white clay-rich interior is evident along with pseudomorphs after plagioclase. Magnetite is a minor phase that exhibits variable degrees of resorption, and it is frequently rimmed with pyrite and occasionally rutile or leucoxene (Figure F20).

Figure F19. Alteration Subtype IIIb clasts in a pyrite matrix, Hole U1530A.
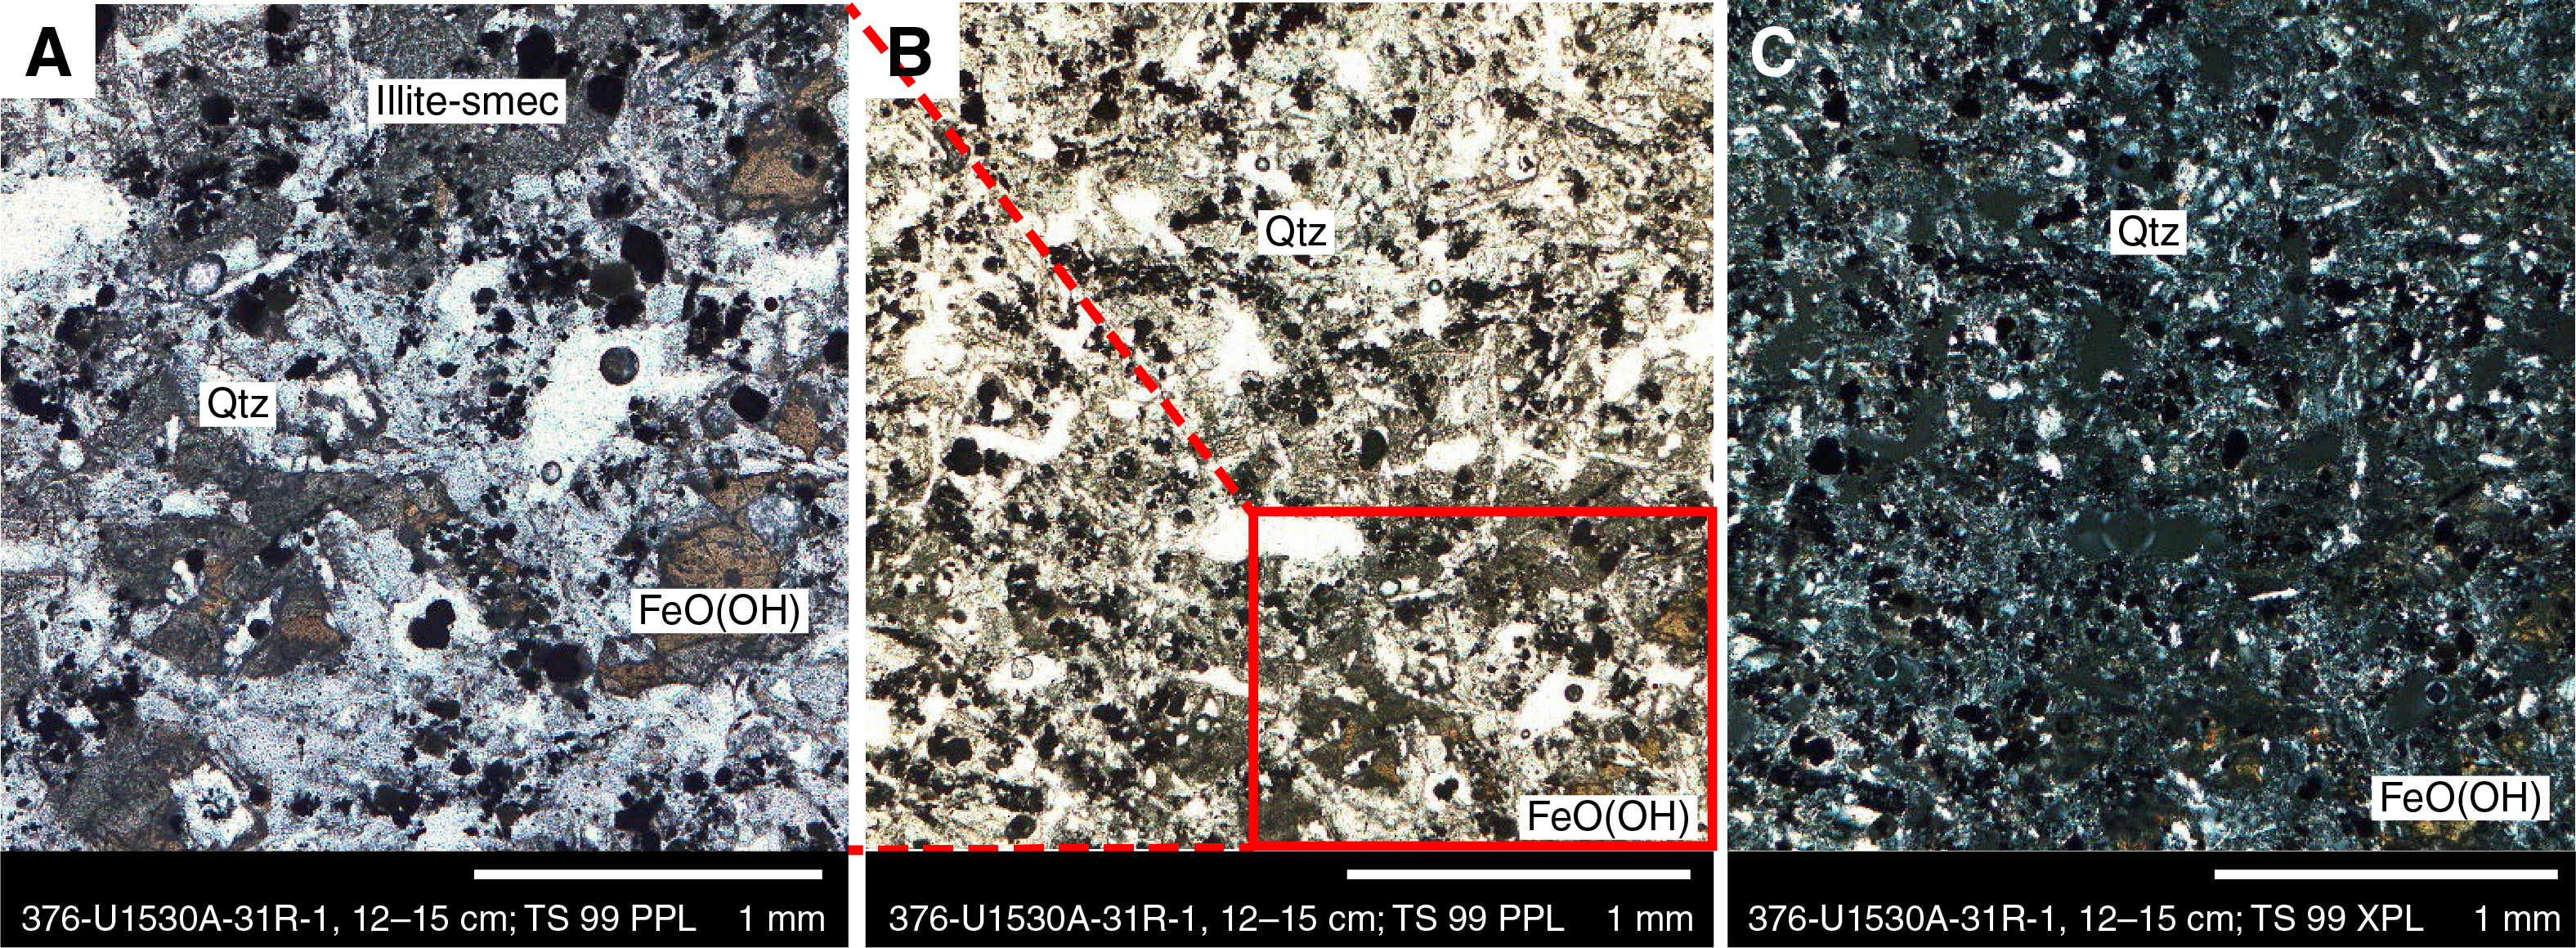
Figure F20. Alteration Subtype IIIb illite-smectite (smec) matrix with quartz, Hole U1530A.
Alteration Type IV
- Distinguishing alteration minerals: pyrophyllite + quartz + illite + smectite ± pyrite ± rutile
- Degree of alteration: intensely altered
- Interval: 376-U1530A-39R-1, 0 cm, to 46R-1, 120 cm
- Depth: 189.10–223.81 mbsf
Alteration Type IV displays a light gray color and overprints Igneous Units 4 and 5 (Figure F21). It first occurs at 189.1 mbsf (Section 376-U1530A-39R-1) and repeats lower in the stratigraphy at 357.1 mbsf (Section 74R-1) and at 409.9 mbsf (Section 85R-1). At these deeper intervals, it is intercalated with Alteration Type II. The alteration mineral assemblage consists of pyrophyllite, quartz, illite, smectite, and pyrite (Table T2). Macroscopically, altered clasts are poorly defined and strongly resorbed. The distinct patchy appearance of pyrophyllite and illite most likely reflects the alteration of relict clasts that were subsequently overprinted and resorbed by silica (Figure F22). In thin section, patchy pyrophyllite and illite are intergrown with and cut by coarse-grained quartz-pyrite veins (Figure F22). Silica is the most abundant component in the matrix. Minor anhydrite occurs as finely disseminated euhedral grains mainly in clast material. Pyrite is almost exclusively associated with quartz in discrete veins that cut patchy pyrophyllite- and illite-dominated areas (Figure F22).

Figure F21. Alteration Type IV homogeneous gray matrix with poorly distinguishable clasts, Hole U1530A.
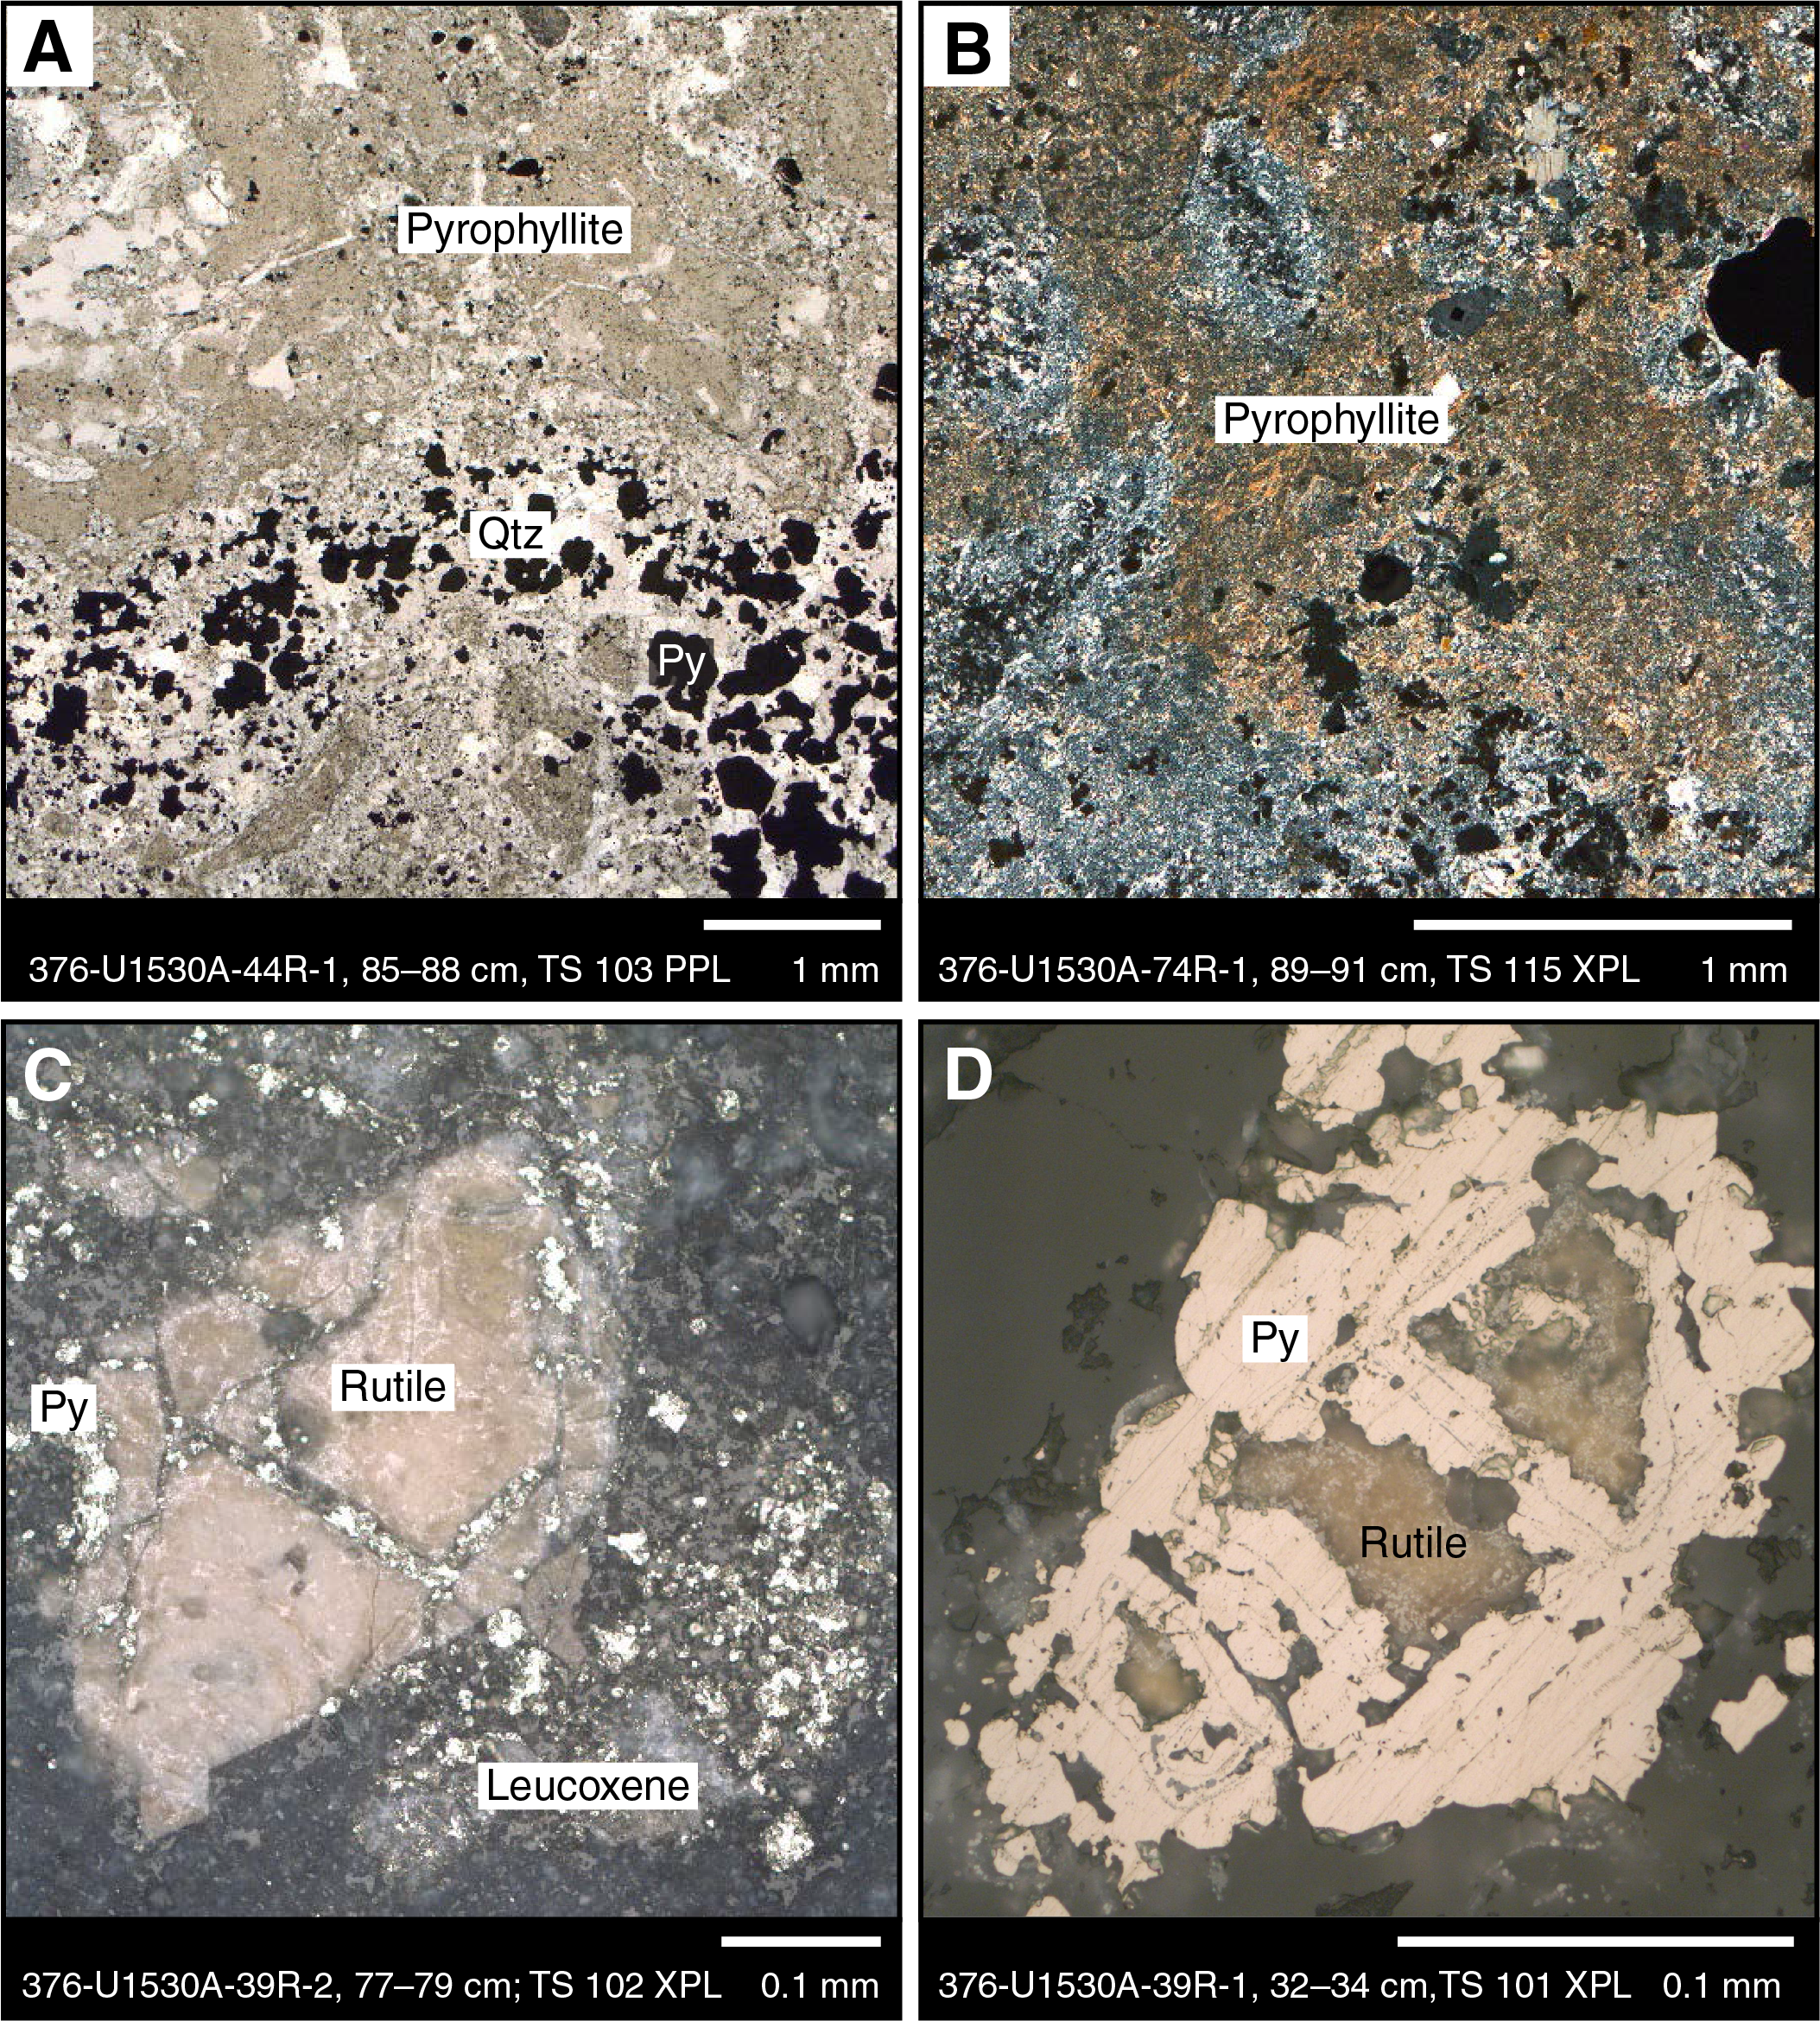
Figure F22. Alteration Type IV pyrophyllite- and quartz-dominant matrix, Hole U1530A.
Rutile was observed microscopically throughout Alteration Type IV, usually associated with pyrite and possibly leucoxene (Figure F22). The rutile grains average 0.1 mm in size and generally form aggregates that show variable degrees of overprinting (i.e., they are either mantled or completely overprinted by disseminated pyrite) (Figure F22).
Alteration Type V
- Distinguishing alteration minerals: diaspore + quartz + pyrophyllite + smectite + rutile ± illite ± pyrite ± anhydrite
- Degree of alteration: intensely altered
- Interval: 376-U1530A-47R-1, 0 cm, to 55R-2, 82 cm
- Depth: 227.5–268.33 mbsf
Alteration Type V is characterized by an alteration mineral assemblage dominated by diaspore, quartz, pyrophyllite, smectite, and rutile with variable amounts of illite, pyrite, and anhydrite (Table T3). Alteration Type V has a characteristic buff-brown color and a massive to mottled texture (Figure F23). The extent of silicification and the abundance of pyrite in Alteration Type V is highly variable. Two distinct subtextures with the same alteration mineral assemblage are distinguished: (1) massive, light brown-buff, fine grained, and commonly cut by quartz-anhydrite veins and (2) equigranular with distinct light and dark grains and hosting fewer veins (Figure F23). Veins of silica intergrown with anhydrite and rimmed with pyrite sporadically cut the areas characterized by the finer grained examples.
Figure F23. Alteration Type V diaspore-rich massive unit, Hole U1530A.
Diaspore and pyrophyllite occur as well-defined patches in an otherwise pervasively silicified matrix that consists of coarse-grained euhedral quartz and variable amounts of anhydrite and minor smectite (Figure F24). The matrix is subsequently cut by networks of veins of fine-grained anhydrite intergrown with microcrystalline silica.

Figure F24. Alteration Type V anhydrite, Hole U1530A.
Pyrite content is generally low in Alteration Type V, which is mirrored by low bulk rock Fe2O3 contents (Figure F38). The most notable occurrence of pyrite is in Section 376-U1530A-65R-1 (Thin Section [TS] 112; 314.43 mbsf), where it is concentrated in quartz-rich areas. The subhedral pyrite hosts abundant vacuoles or inclusions of quartz and anhydrite. Sphalerite inclusions occur in larger pyrite grains that are associated with a coarse-grained quartz vein.
Fe oxyhydroxide staining is well developed throughout, especially on uncut surfaces. In some samples, the oxidation is so extreme that pyrite is completely absent; in these samples, anhydrite is most abundant. Vugs, in the form of primary vesicles, are abundant in finer grained layers and are completely infilled with chalcedony with an anhydrite core (Figure F24). Two distinct generations of anhydrite were observed: (1) coarse euhedral grains that infill vugs and veins and (2) a fine-grained subhedral to euhedral form that is intergrown with the matrix (Figure F24). In many instances, coarse euhedral grains of anhydrite are mantled by finer grains.
MgO concentrations in Alteration Types IV and V are relatively low compared with the overlying sections and correspond to the absence of chlorite and only minor occurrences of smectite (see Geochemistry). The K2O content in Alteration Types IV and V is variable but generally lower than that in illite-rich Alteration Types II and III (Figures F12, F17).
Fluid inclusions
Sampling
FIs in anhydrite and/or quartz occurring in veins and as vug fills (Figure F25) were analyzed microthermometrically in 14 intervals from Hole U1530A (Table T5) to (1) enable further characterization of Alteration Types II–V, (2) determine equilibrated borehole temperatures and fluids, and (3) determine the cause of cooling in the downhole temperature profile. In contrast to Hole U1528D, most veins in Hole U1530A are sealed by anhydrite + sulfides + quartz. Few samples have maintained an open space with drusy quartz and anhydrite that may record the latest fluid compositions and temperatures (e.g., interval 376-U1530-60R-1, 100–101 cm; 291 mbsf). FIs hosted by translucent crystals of anhydrite range in diameter from 2 to 100 µm (median = 15 µm), whereas those hosted by quartz are typically <10 µm in diameter (median = 4 µm). Vapor bubbles occupy 20–60 vol% of the FIs (median = 25 vol%).
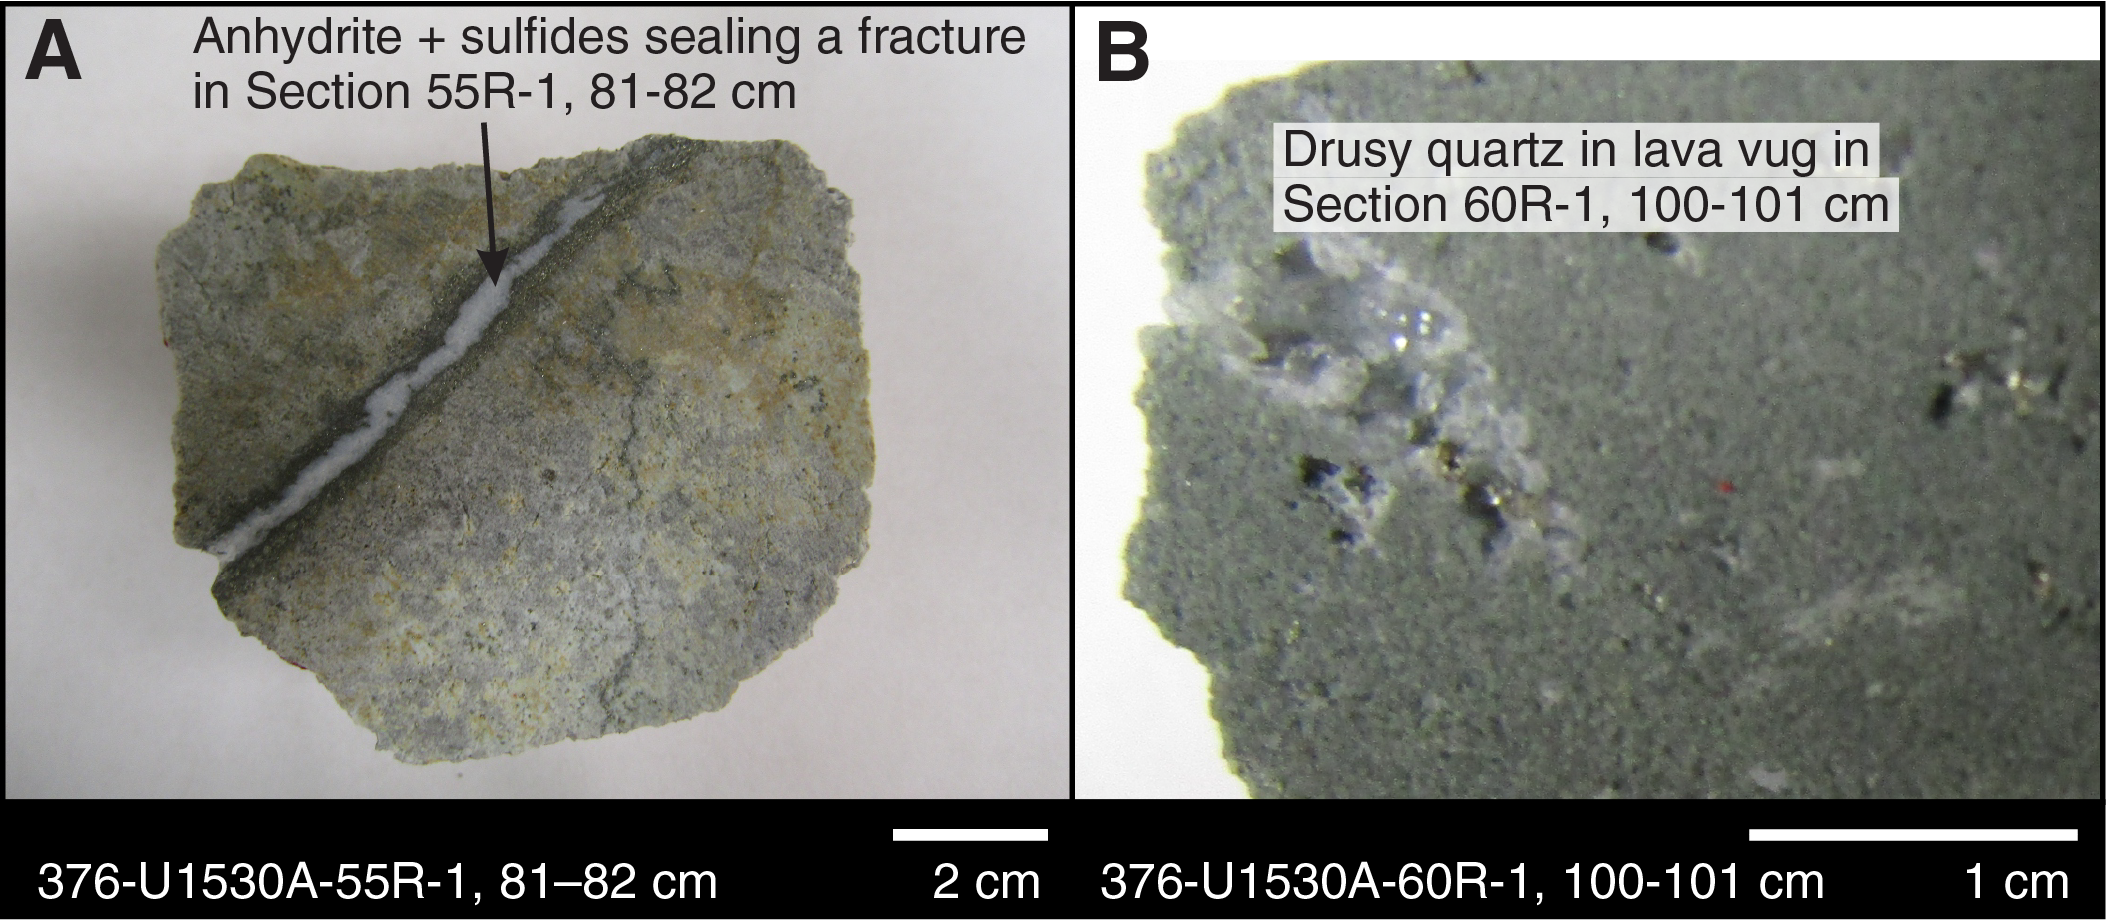
Figure F25. Anhydrite, pyrite, and quartz, Hole U1530A.
Types of fluid inclusions
All FIs from 22.6 to 444 mbsf (Sections 376-U1530A-4R-1 through 92R-1) are two-phase and homogenize to the liquid phase except at 406 mbsf (interval 84R-1, 62–63 cm), where a single FI homogenized to the critical point at 345°C. This critical point temperature is lower than expected for an aqueous solution in the NaCl-H2O or CO2-H2O system (e.g., Roedder, 1984); the fluid could not be identified using shipboard equipment.
The FIs are provisionally divided into three types (Table T6): (1) Type 1 FIs that homogenize to the liquid phase without (Subtype 1a) or with (Subtype 1b) halite daughter minerals; (2) Type 2 complex FIs that contain multiple anisotropic elongated translucent and anisotropic daughter minerals; and (3) Type 3, a single FI that homogenized to the critical point at 345°C (Figure F26). S was not observed as a daughter mineral in Hole U1530A nor does it form a solution with aqueous fluids in inclusions, unlike in Hole U1528D.
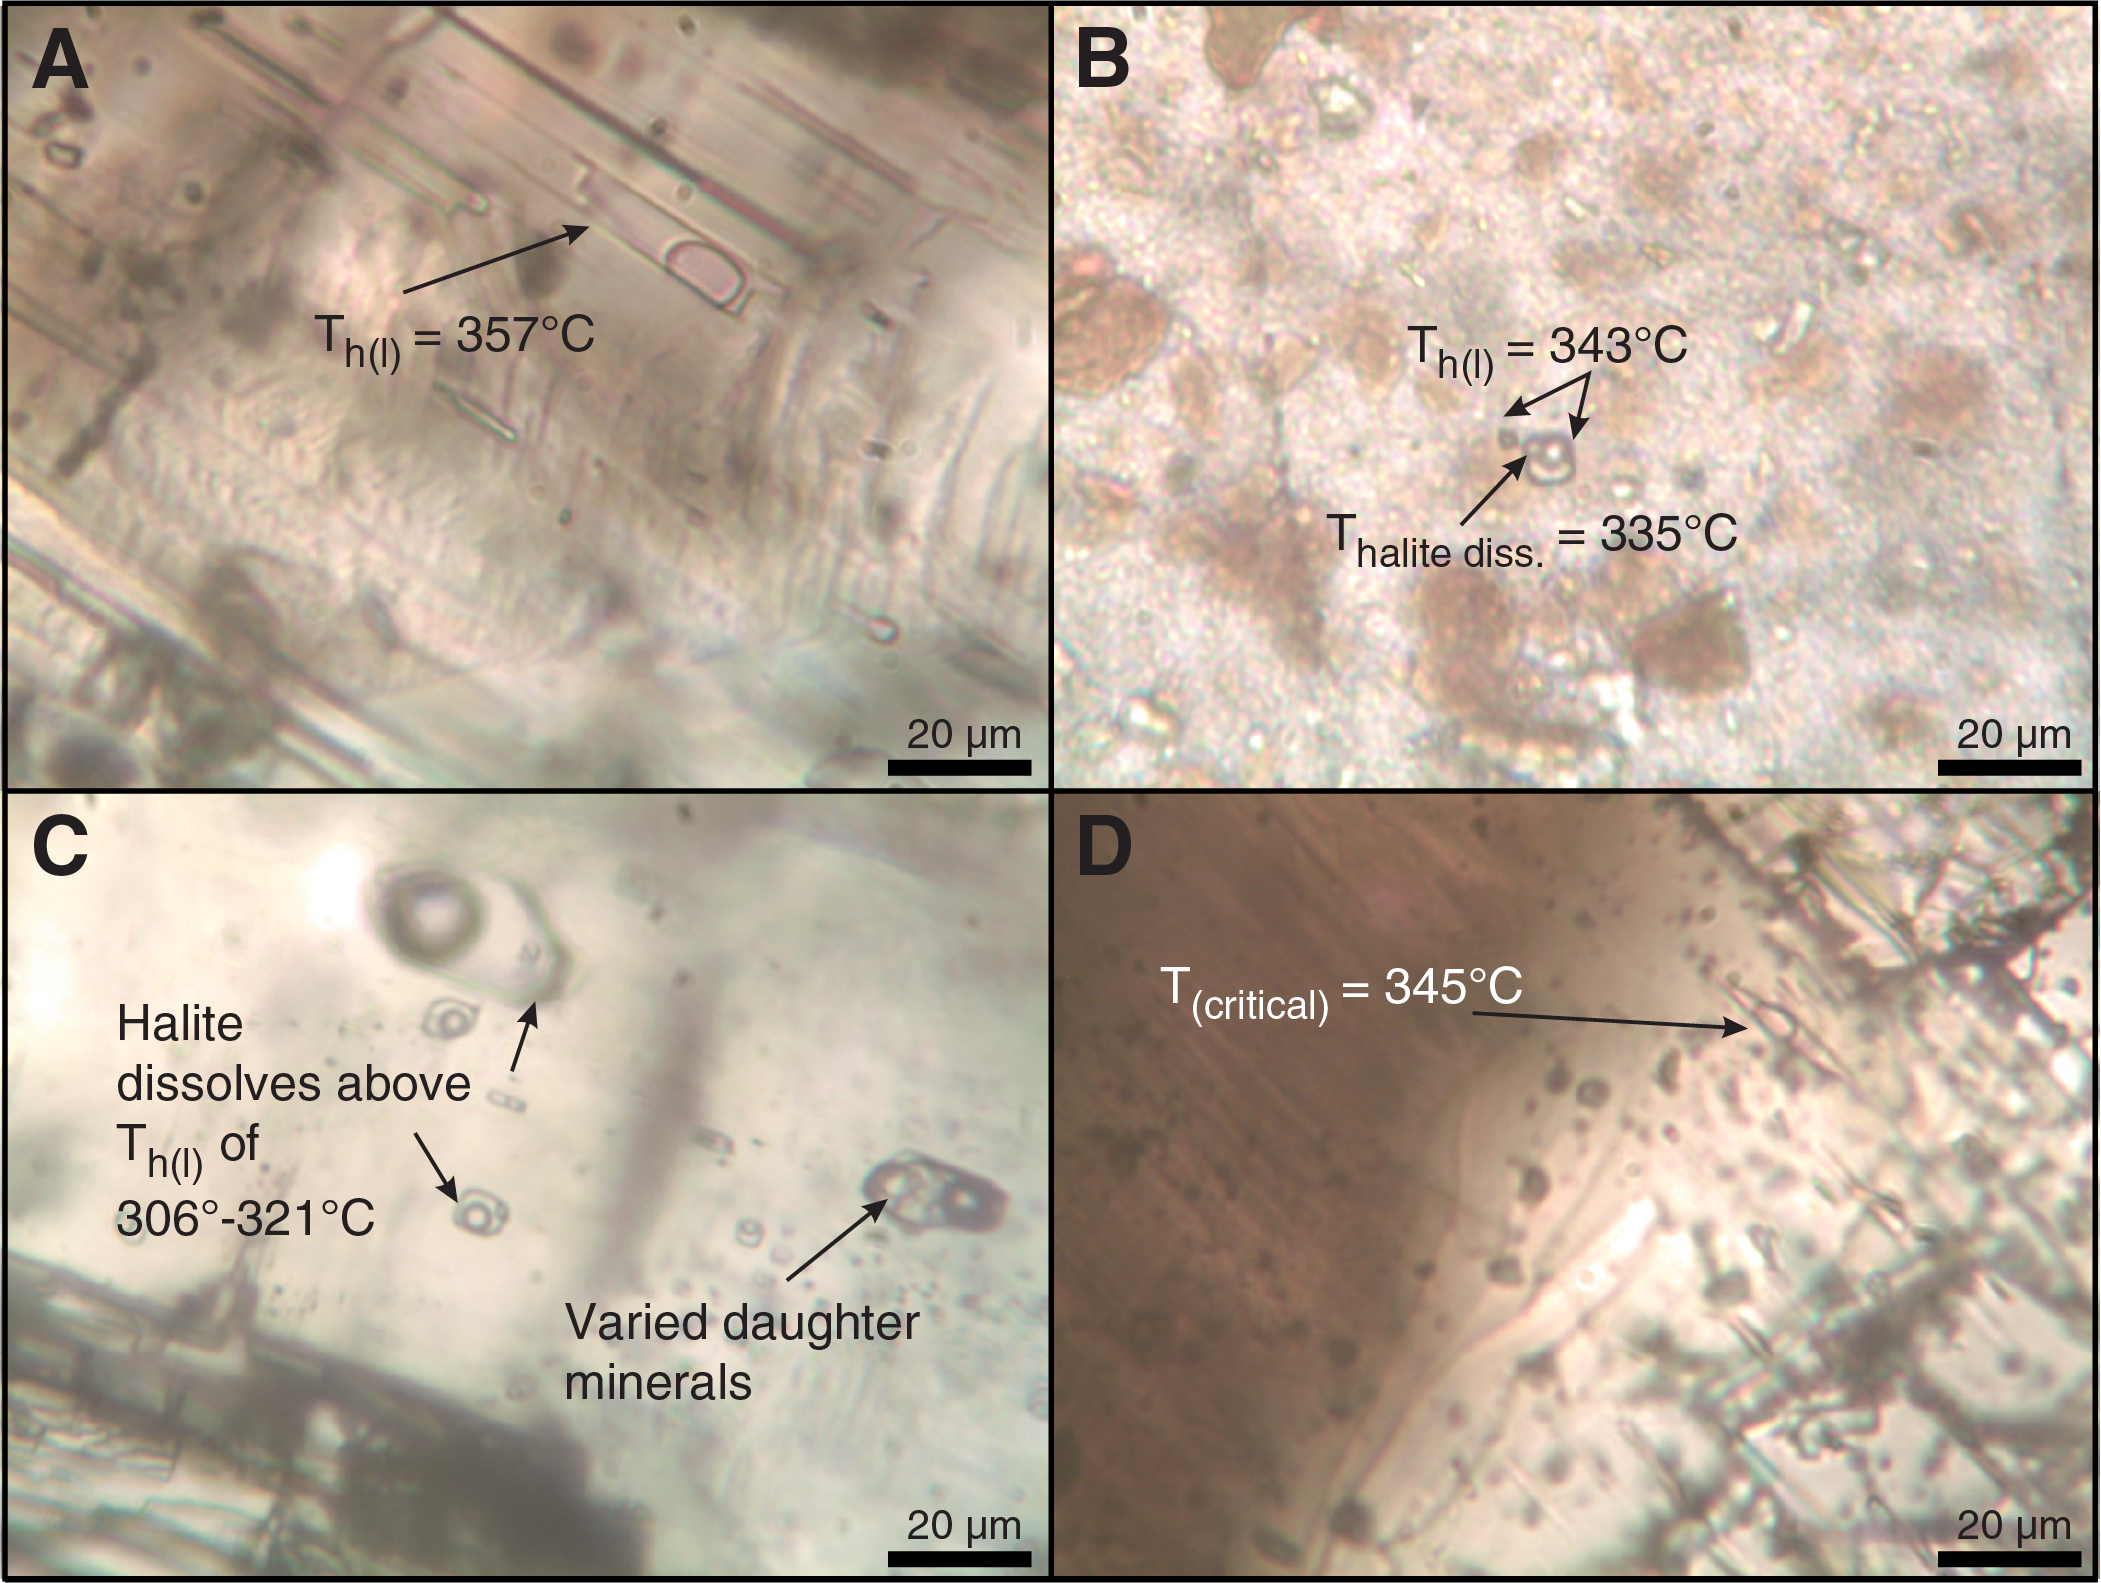
Figure F26. Types of FIs.
Temperatures
FI homogenization temperatures in Hole U1530A vary from 209° to 390°C, and the highest temperatures are measured in Alteration Type V (key minerals: pyrophyllite + diaspore) and Alteration Type II (key minerals: illite + chlorite) (Figure F27). The FI homogenization temperature-depth profile is irregular, and the highest median temperature of 390°C occurs at 406 mbsf (interval 376-U1530A-84R-1, 62–63 cm), where Alteration Type II is dominant. In contrast, the lowest median temperature of 255°C occurs at 291 mbsf (interval 60R-1, 100–101 cm), coincident with a permeable zone identified in the Schlumberger temperature log where cold fluids are flowing into the borehole and lowering the temperatures even without fluid circulation (see Downhole measurements).
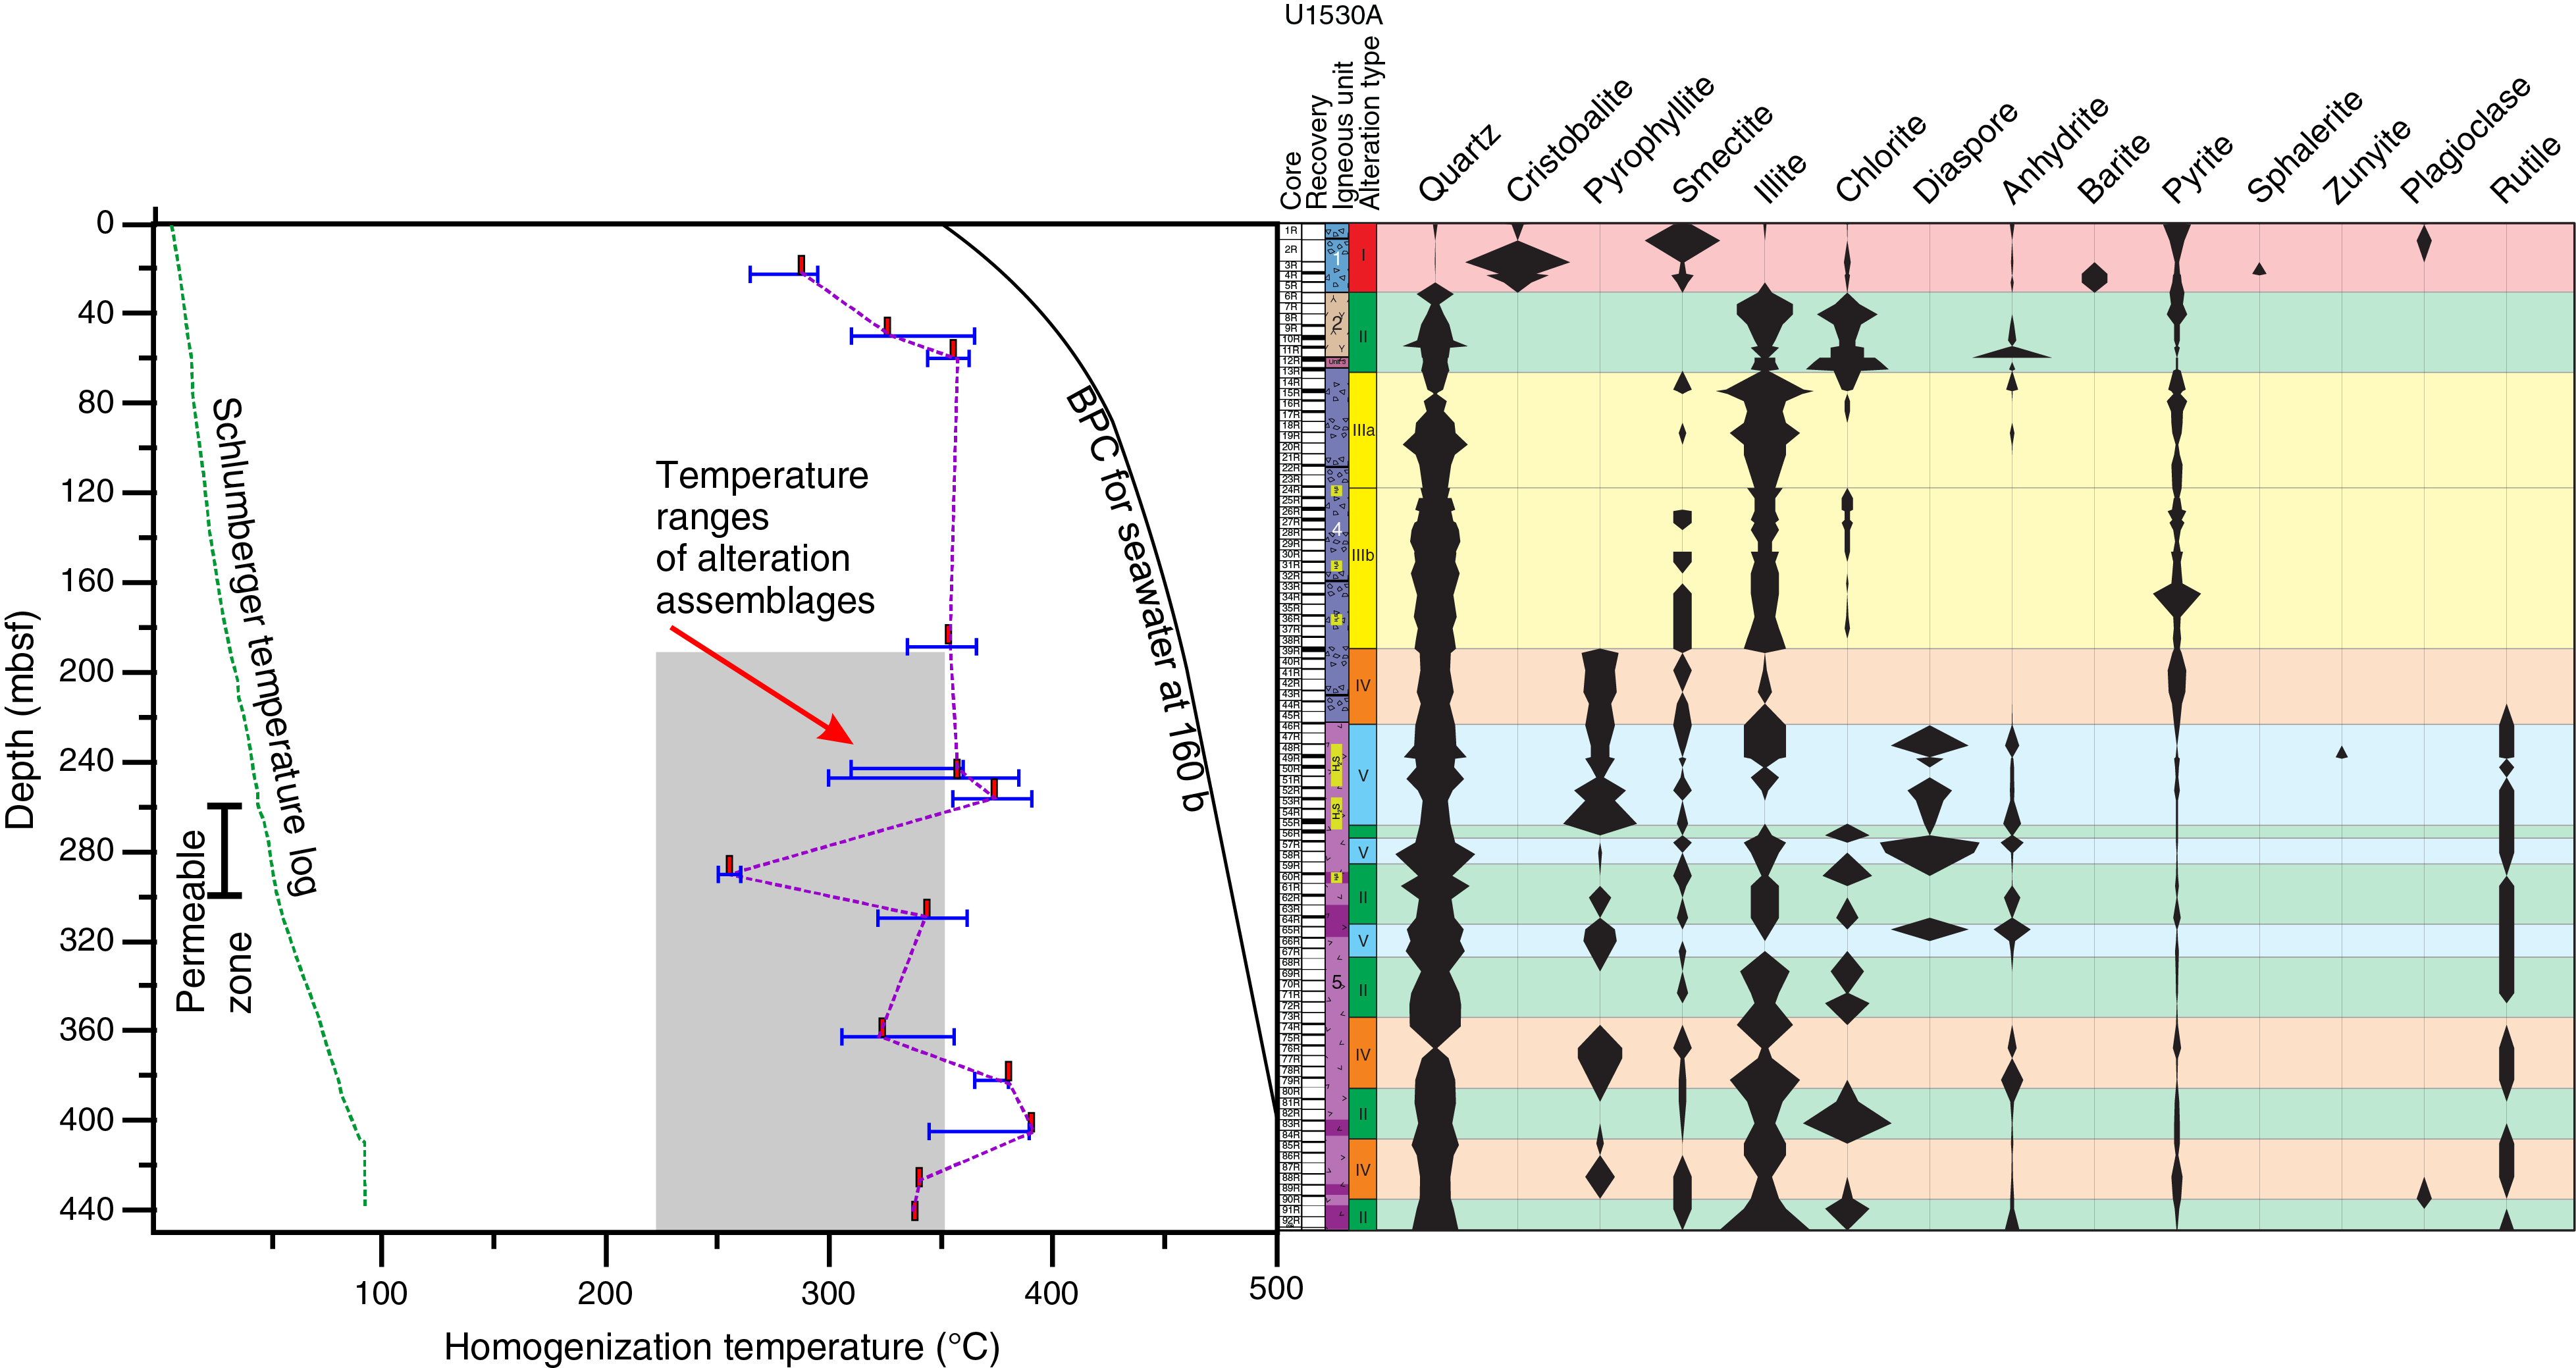
Figure F27. Fluid homogenization temperatures, Hole U1530A.
In individual crystals, such as the anhydrite in interval 376-U1530-39R-1, 68–69 cm (190 mbsf), cooling was observed by comparing temperatures measured from primary and pseudosecondary FIs (354°–360°C) to those from secondary FIs (335°C). Similarly, cooling by at least 140°C is evident throughout Site U1530, from homogenization temperatures of 390°C in sealed veins of anhydrite and quartz to 250°C in drusy quartz growing in vugs. There is also evidence of cooling, or the ingress of ambient seawater into the formation, in the form of smectite (≤150°C) after deposition of higher temperature Alteration Types II–V (>220°C). Thus, although the latest FIs trapped fluids at about 250°C, the presence of smectite indicates even lower temperatures (~150°C) at present. The rapid and voluminous inflow of ambient seawater into the formation is confirmed by the Schlumberger wireline logging, which recorded an initial temperature of 96°C at 410 mbsf that rapidly cooled down by 60°C to about 30°C over a 6 h period (see Downhole measurements).
The alteration assemblages between 200 and 440 mbsf are in or below the range of measured FI homogenization temperatures (Figure F28). Smectite was identified throughout the borehole regardless of the occurrence of high-temperature clays such as illite and pyrophyllite. The presence of smectite suggests a continuous inflow of cold fluids (seawater) into the formation that is then heated and mixed with hot ascending hydrothermal fluids.
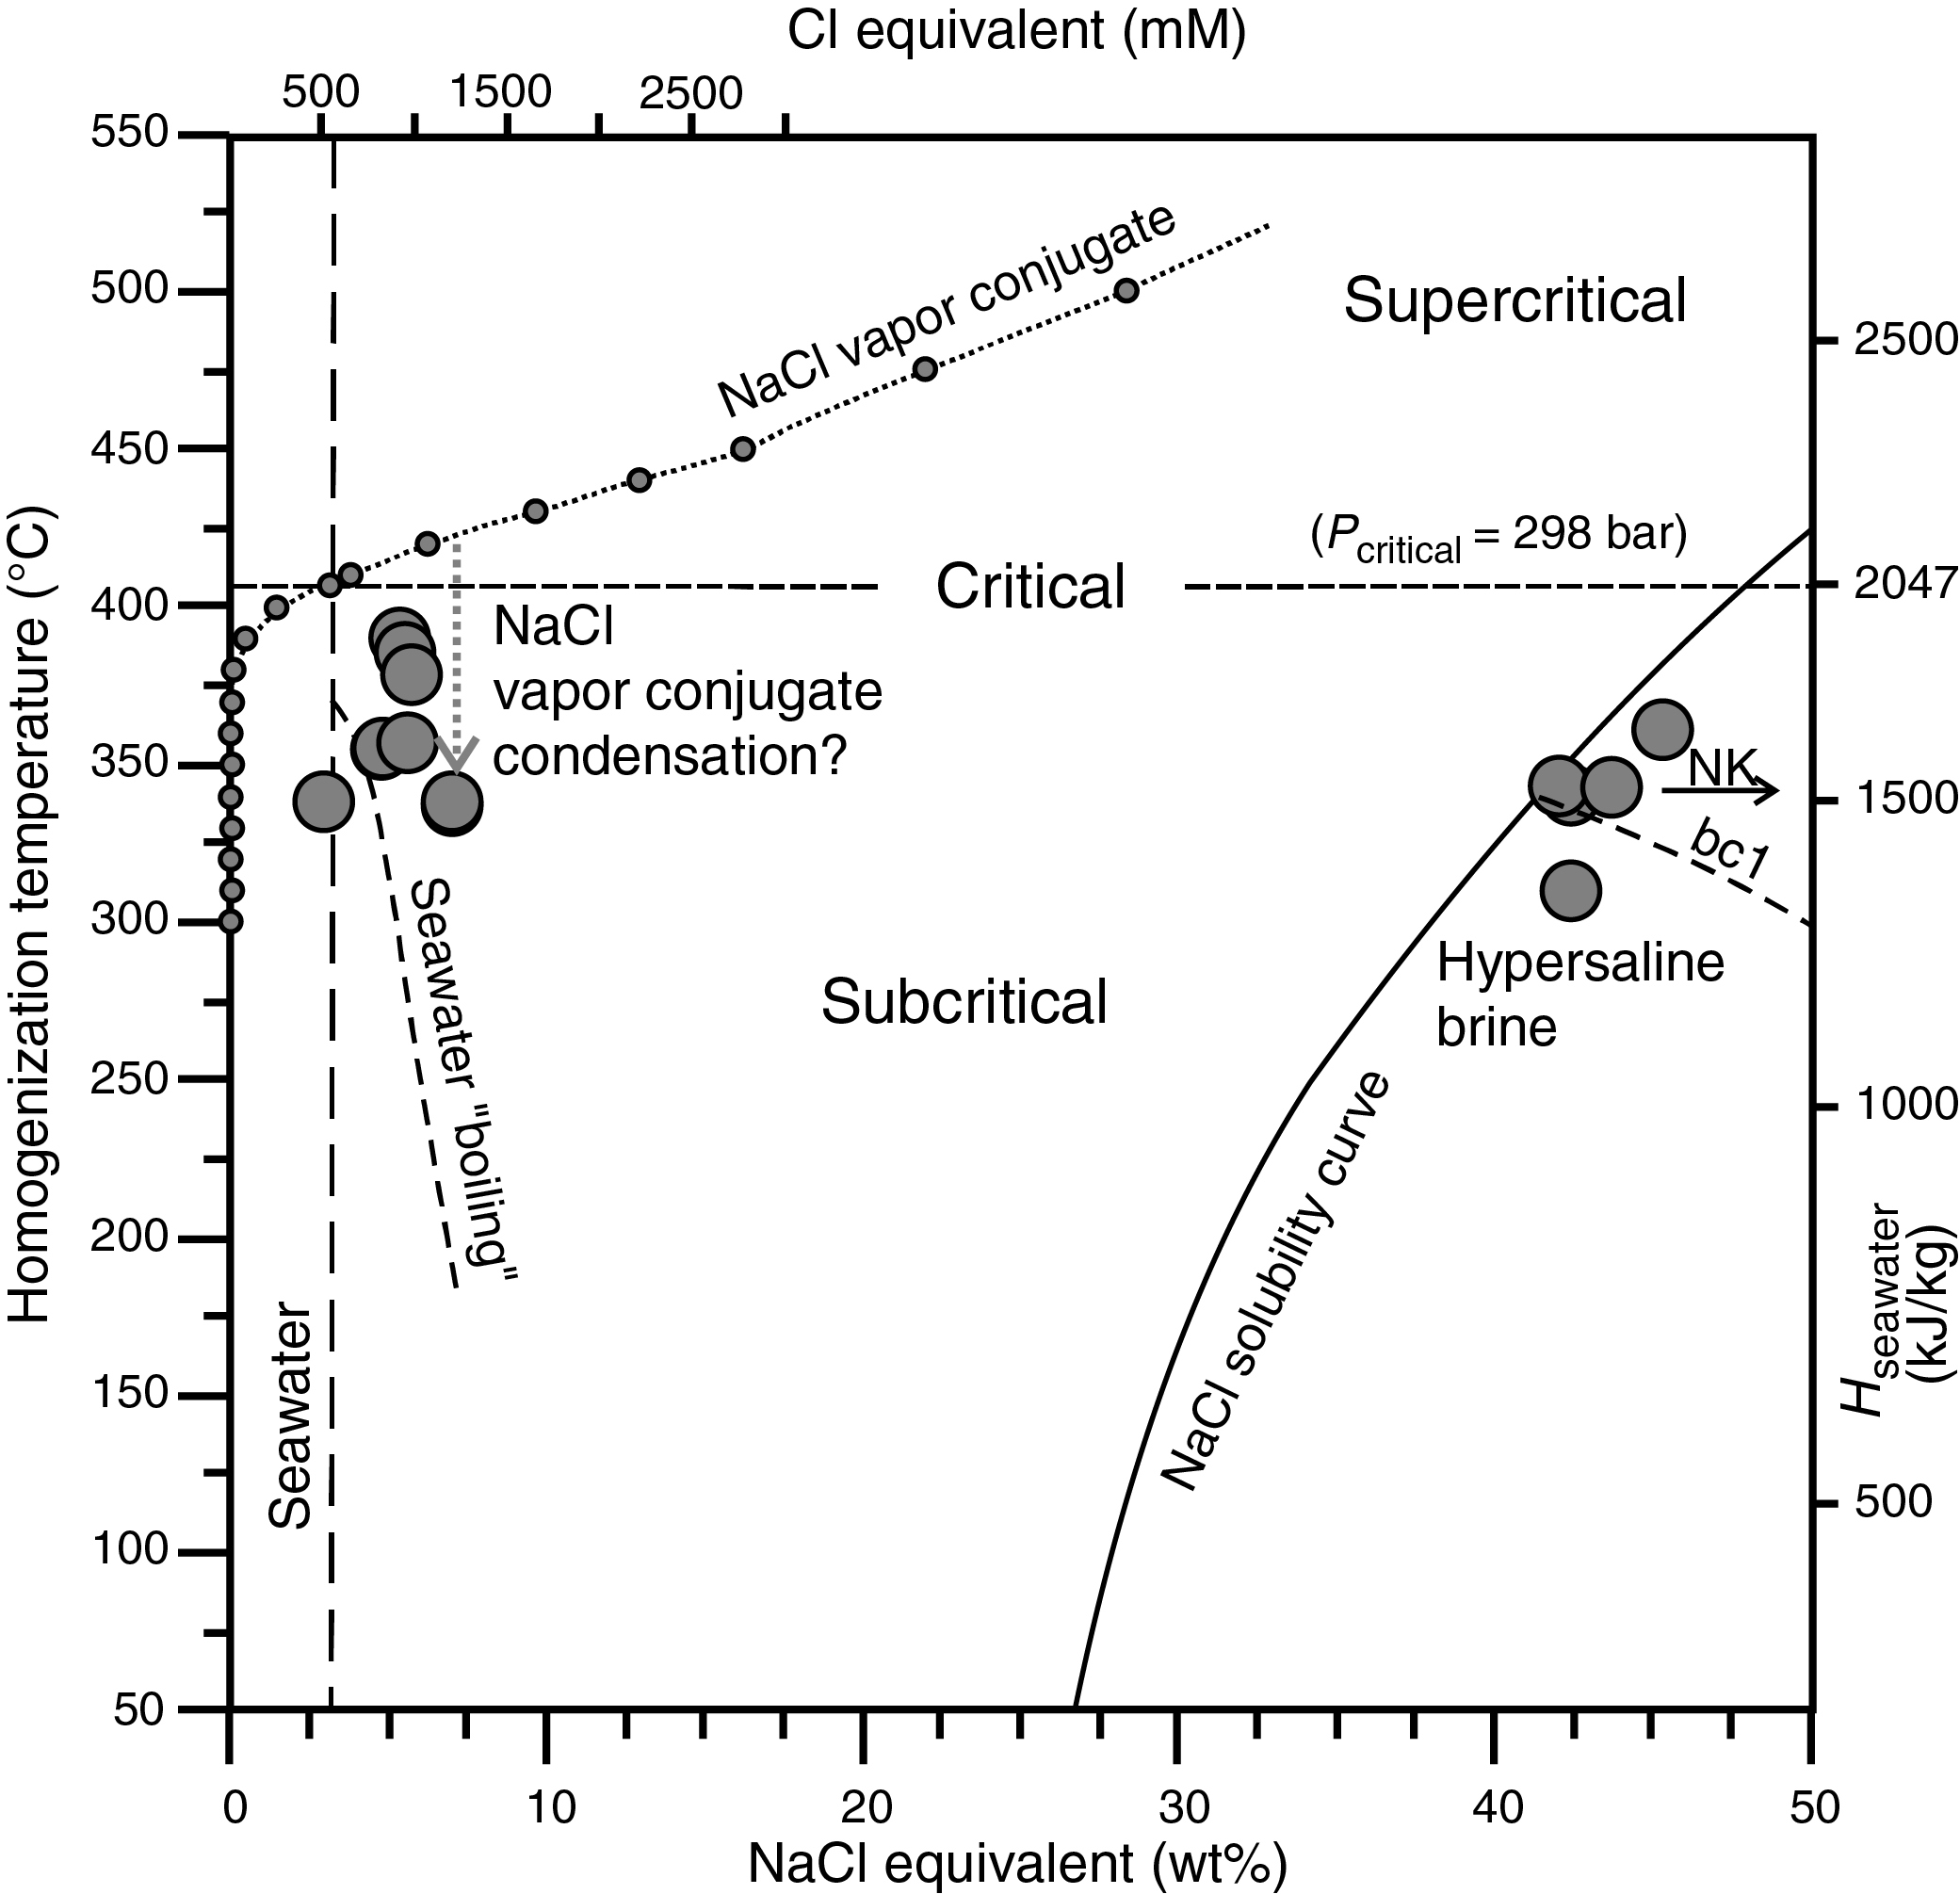
Figure F28. Salinity vs. homogenization temperature, Site U1530.
Fluid compositions
FI salinities plot into two separate regions: (1) at or near seawater compositions and (2) as a hypersaline brine at or along the NaCl saturation curve (Figure F28). However, Figure F28 is deceptive because it apparently shows similar proportions of seawater and hypersaline brine flowing into the formation. Instead, it is estimated that ~90% of fluids in the inclusions in Hole U1530A are seawater derived and only ~10% are hypersaline brines. Only Alteration Types II and V can be associated with hypersaline brines (Figure F27).
Most points plotting above the NaCl saturation curve or at salinities greater than seawater are indicative of phase separation (Reyes et al., 2003; Vanko et al., 2004; de Ronde et al., 2011). The presence of a single FI that homogenizes to the critical point at temperatures lower than would be expected for the NaCl-H2O or CO2-H2O system (Roedder, 1984) may indicate the presence of unusual fluids at depth, as yet unidentified.
The FI data are also consistent, and two different fluids are responsible for the alteration assemblages observed in Hole U1530A: (1) a pervasive fluid of modified seawater composition that has been heated to about 390°C and (2) a hypersaline brine heated to 288°–390°C. However, the influx of a hypersaline brine has waned where fractures were sealed. Presently, the major fluids influencing water-rock interaction in Hole U1530A are a hydrothermal fluid of modified seawater origin that has been heated to 250°–260°C and ambient seawater. Site U1530 is therefore interpreted to have once been the site of high-temperature magmatic input into a subsea hydrothermal system where fluids periodically deposited quartz, anhydrite, and sulfide minerals in fractures at temperatures as high as 390°C. Acidic hypersaline brines altered the rock to pyrophyllite, diaspore, quartz, and illite, which, upon interaction with the rock and seawater, redeposited Mg. The remobilization of Mg is characterized both by a sharp increase in the Mg concentration of the rocks at the contact between Alteration Types V and II (see Geochemistry) and by the abundance of chlorite in rocks affected by Alteration Type II. Because avenues for ascending hot fluids were progressively sealed in a localized region drilled by Hole U1530A, renewed fracturing and other pathways formed to channel ambient seawater into the formation. This changed the hydrological regime from a region of hot fluid input to a region of cold-water recharge, where temperatures may have reached a maximum of about 250°–260°C but most likely were <150°C based on the occurrence of late-stage smectite. However, numerous vents discharging fluids with temperatures as high as 302°C occur in close proximity to Site U1530 (de Ronde et al., 2011), indicating that ascending hot fluids are now being channeled through different structural pathways.
Synthesis and interpretation
The upper ~270 m of Hole U1530A has alteration mineral assemblages consistent with a gradual increase in fluid temperature and decrease in fluid pH with depth (Figure F12). Concentrations of immobile elements such as TiO2 and Zr indicate alteration of a precursor volcanic rock of dacitic composition (i.e., similar to unaltered dacitic material recovered from Site U1527). The abundance of smectite, chlorite, pyrite, barite, and sphalerite in the upper 30 m of the hole (Alteration Type I) suggests relatively low to intermediate temperature conditions (100°–300°C) during alteration (Figure F12). Abundant barite-filled veins indicate the presence of a mixing zone between oxidized seawater and hot hydrothermal fluid. The occurrence of sphalerite and pyrite in close proximity to the sulfate minerals and the presence of a dense vein network are consistent with recent submersible observations of a nearby stockwork zone (Humphris et al., 2018) and nearby active venting with fluid temperatures in the range of 274°–302°C (de Ronde et al., 2011).
In Alteration Type II, quartz replaces cristobalite as the primary silica-bearing mineral phase, suggesting progressively higher temperatures than in the overlying Alteration Type I, where primary cristobalite is predominant (Figure F12). The replacement of smectite by higher temperature illite and chlorite is consistent with this interpretation. However, the lack of discrete chlorite-only zones suggests that the upper temperature limit at which smectite transforms to illite-chlorite and discrete chlorite forms in geothermal systems (i.e., ~275°C) was not reached (Schiffman and Fridleifsson, 1991). Abundant anhydrite veins in this interval are consistent with the influx and mixing of seawater with hydrothermal fluid (Humphris et al., 1998).
The primary alteration assemblage of quartz and illite together with minor pyrite and smectite in Alteration Type III suggests that temperature conditions continue to increase downhole (Figure F12). Alteration Types IV and V record the first appearance of pyrophyllite in Hole U1530A below ~190 mbsf (Alteration Type IV) and diaspore with minor zunyite below ~225 mbsf (Alteration Type V). Pyrophyllite formation in hydrothermal environments was previously described in the Kuroko deposits of Japan (Marumo, 1989), geothermal systems such as the Otake area in Japan (Hayashi, 1973), and modern seafloor hydrothermal sites such as PACMANUS (Lackschewitz et al., 2004) and the Desmos Caldera (Gena et al., 2001). The presence of pyrophyllite and diaspore in Hole U1530A is consistent with the influx of hydrothermal fluid with a low pH (<4) (Dill, 2016) and a relatively high SiO2 content (log a SiO2 (aq) > −2) that favors precipitation of pyrophyllite over kaolinite at 250°–300°C (Hemley et al., 1980; Gena et al., 2001). In addition to the pyrophyllite, diaspore, and minor zunyite, this part of Hole U1530A, which exhibits an increase in fracture density, also contains smectite and anhydrite (see Structural geology). The presence and increased abundances of smectite, chlorite, and anhydrite in Alteration Type V reflect the later incursion and mixing of seawater with hydrothermal fluid. As a result, lower temperature and less acidic fluids of predominantly seawater composition have overprinted alteration resulting from earlier, more acidic fluids (i.e., Alteration Type II overprints Alteration Types IV and V deeper in the hole).
In addition to the alteration mineral assemblages, FI studies confirm that Site U1530 had previously been subjected to fluids as hot as 390°C and more recent circulating fluids had temperatures of 250°–260°C or possibly lower in some places. The decrease in temperature by as much as 140°C was likely caused either by the influx of ambient seawater, as indicated by the pervasive occurrence of smectite and cutting fractures that are sealed by anhydrite, quartz, and pyrite (see Structural geology), or by simply sealing (and thereby constricting) the pathways for the flow of hot fluids.
Structural geology
Hole U1530A: Igneous Units 1–5
Structures in Hole U1530A consist of volcanic fabrics, alteration veins, fractures, and sedimentary contacts. All observations were recorded in the Structure, Vein, Vein_fracture_density, and Volcaniclastic_sedimentary tabs in DESClogik (see DESC_WKB in Supplementary material). Sedimentary contacts, which are defined by changes in grain size and/or texture, are all subhorizontal. There is some evidence for soft-sediment deformation in the form of discontinuous, millimeter-scale faults (e.g., interval 376-U1530A-10R-2, 50 cm; 51.81 mbsf). Sedimentary rocks and their contacts are described in more detail in Igneous petrology and volcanology.
Volcanic structures
Volcanic fabrics are typically defined by elongated vesicles filled with secondary minerals and defined to a lesser extent by plagioclase phenocrysts now pseudomorphed by secondary minerals (Figure F29). Volcanic fabric intensity varies downhole, and the majority is weak (see Structural geology in the Expedition 376 methods chapter [de Ronde et al., 2019a]) in the upper half of the hole and moderate to strong in the bottom half (Figure F30). The majority of volcanic fabrics logged as weak is in lapilli-tuffs (e.g., Igneous Units 1 and 4) and consists of matrix without any discernible fabric and individual volcanic clasts with weak to strong fabrics. Each clast has a distinct fabric orientation (Figure F29), so no meaningful orientation measurement could be made. A few intervals have a continuous fabric over decimeters, so an orientation measurement was possible (Figure F29): interval 376-U1530A-12R-1, 12–150 cm (59.6–61 mbsf), which coincides with Igneous Unit 3, and intervals 62R-1, 0–93 cm (299.5–300.43 mbsf), 90R-1, 0–99 cm (433.9–434.89 mbsf), and 93R-1, 0–8 cm (448.3 mbsf), which are in Igneous Unit 5 and more specifically in intercalated altered plagioclase-phyric lava (see Igneous petrology and volcanology). The fifteen fabrics measured range in dip from 16° to 88° (average = 61°) (Figure F30). Some fabrics were measured multiple times in different pieces of core because each piece can independently rotate during core retrieval and processing. These multiple measurements should not impact the true dip. In an igneous unit or intercalated lava, the range in dip of volcanic fabrics can be as much as 20°, even over a short depth interval (Figure F30).
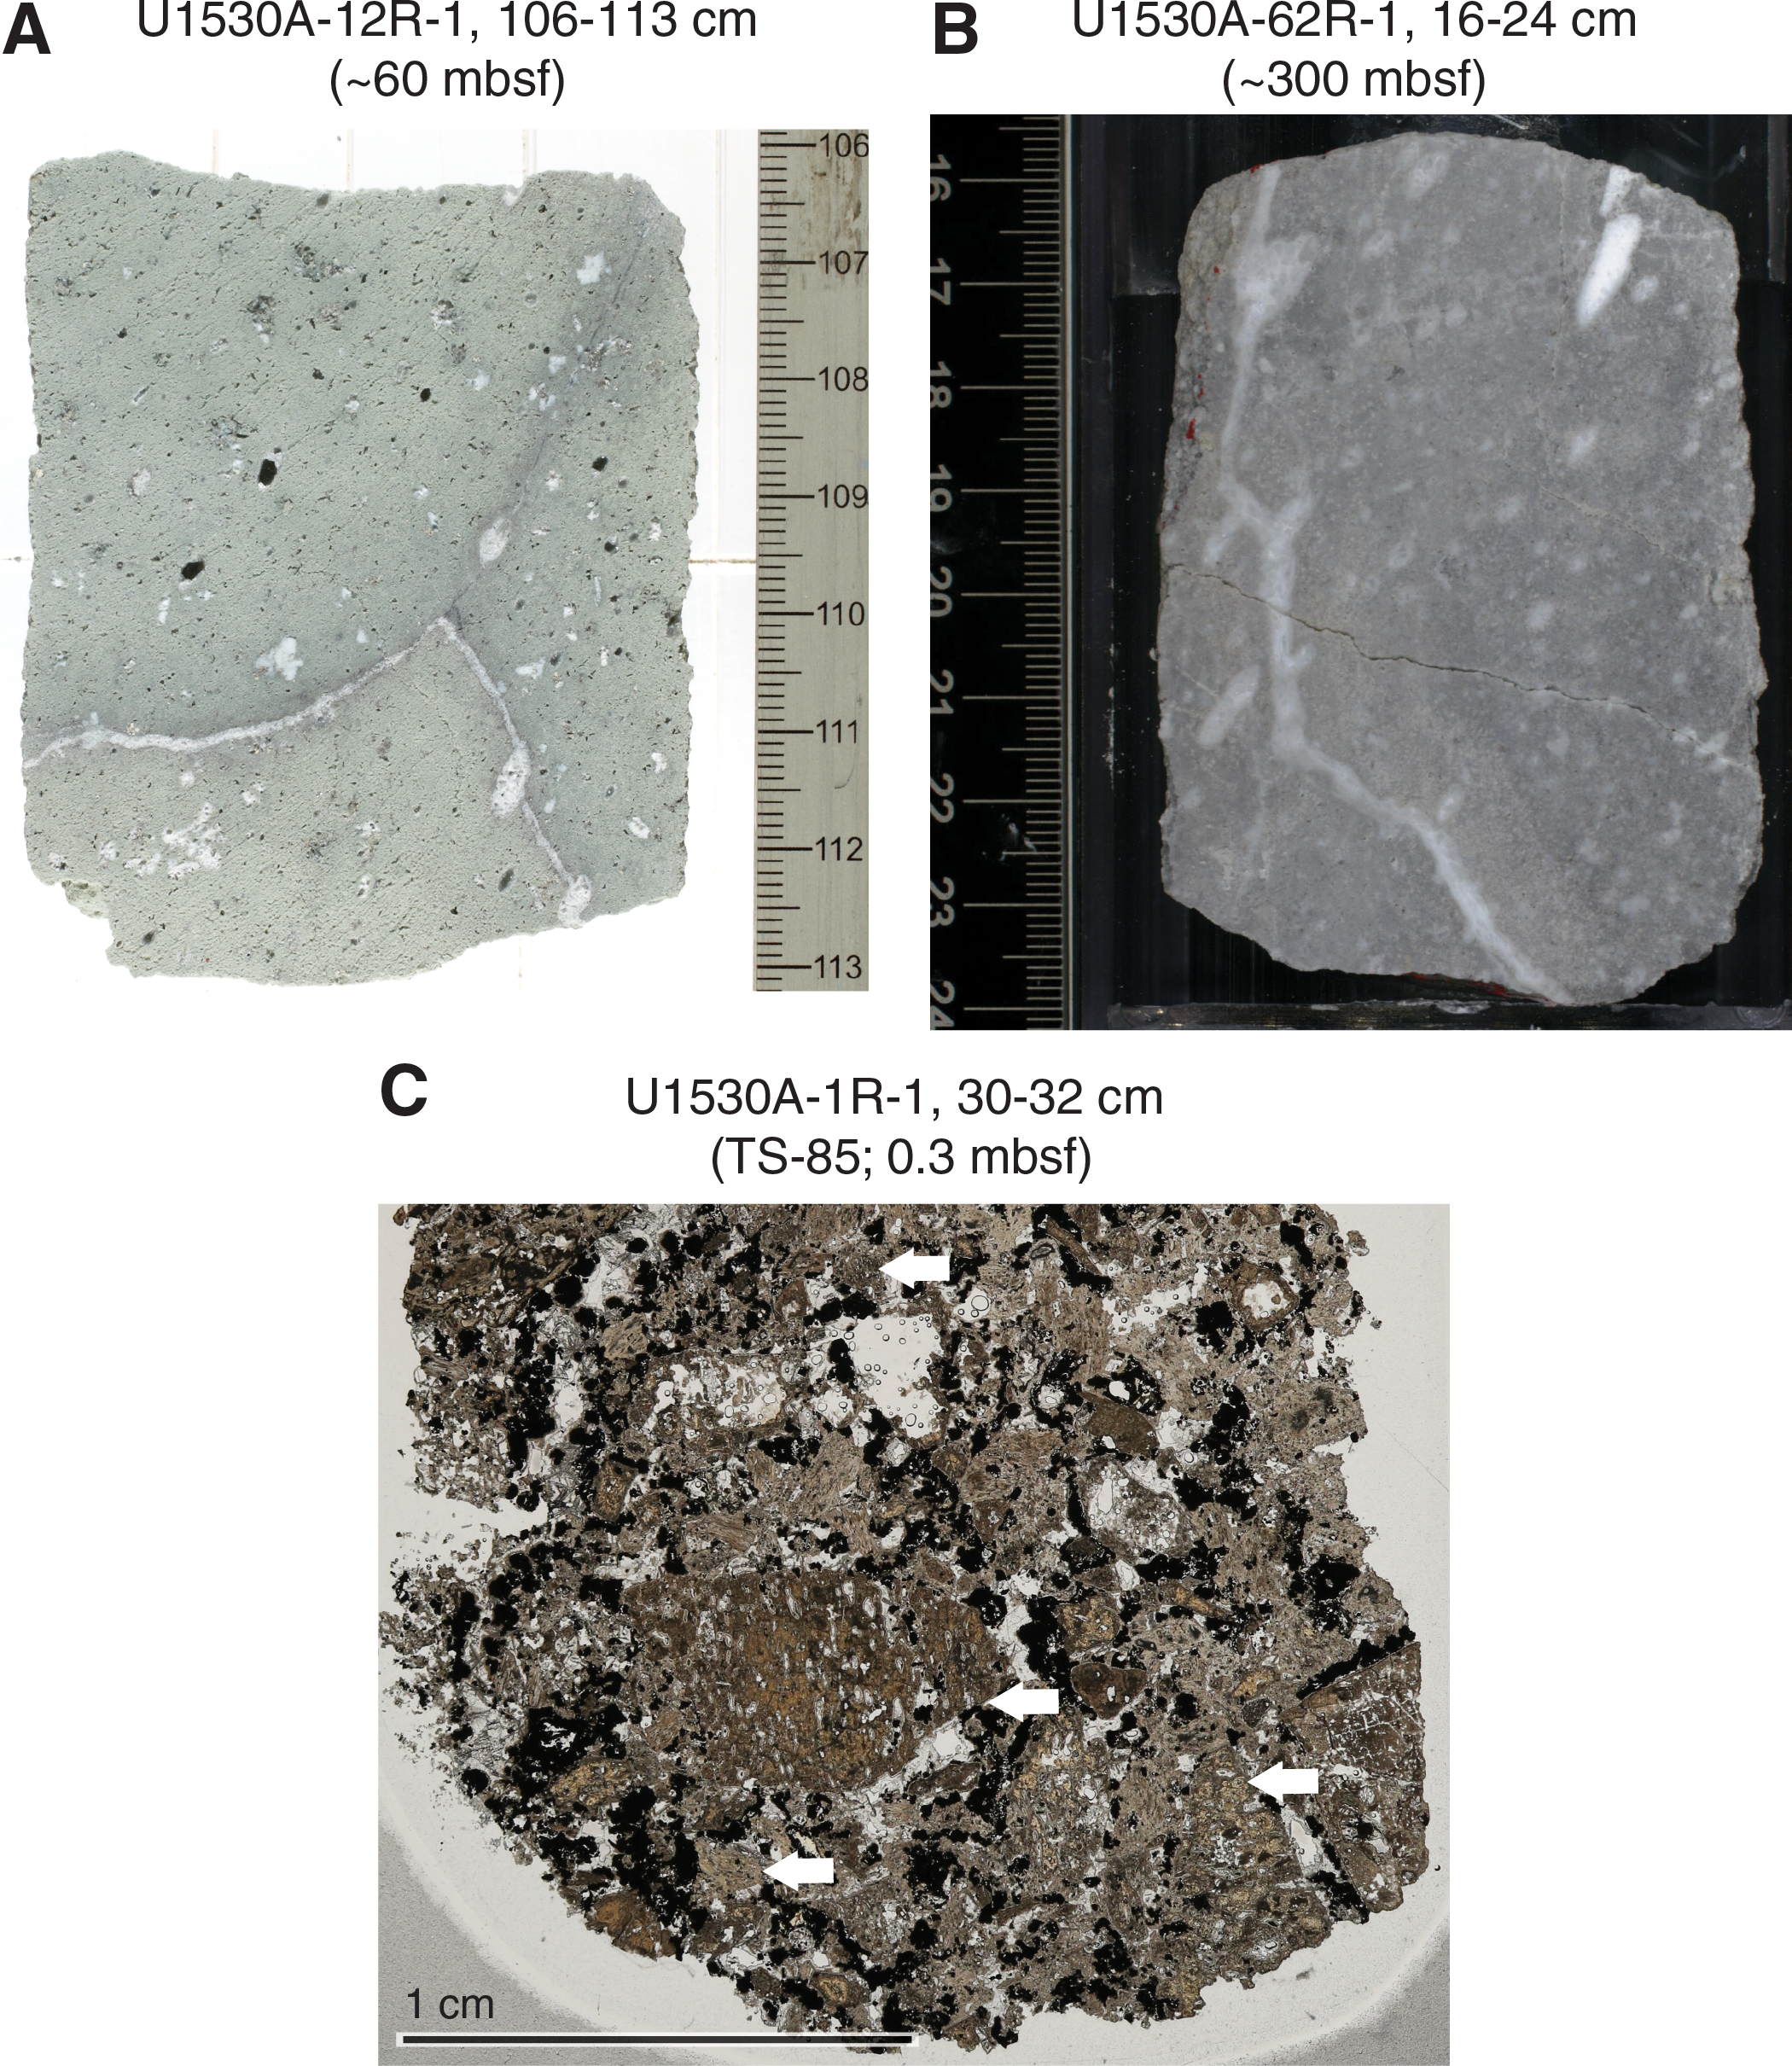
Figure F29. Volcanic fabrics, Hole U1530A.
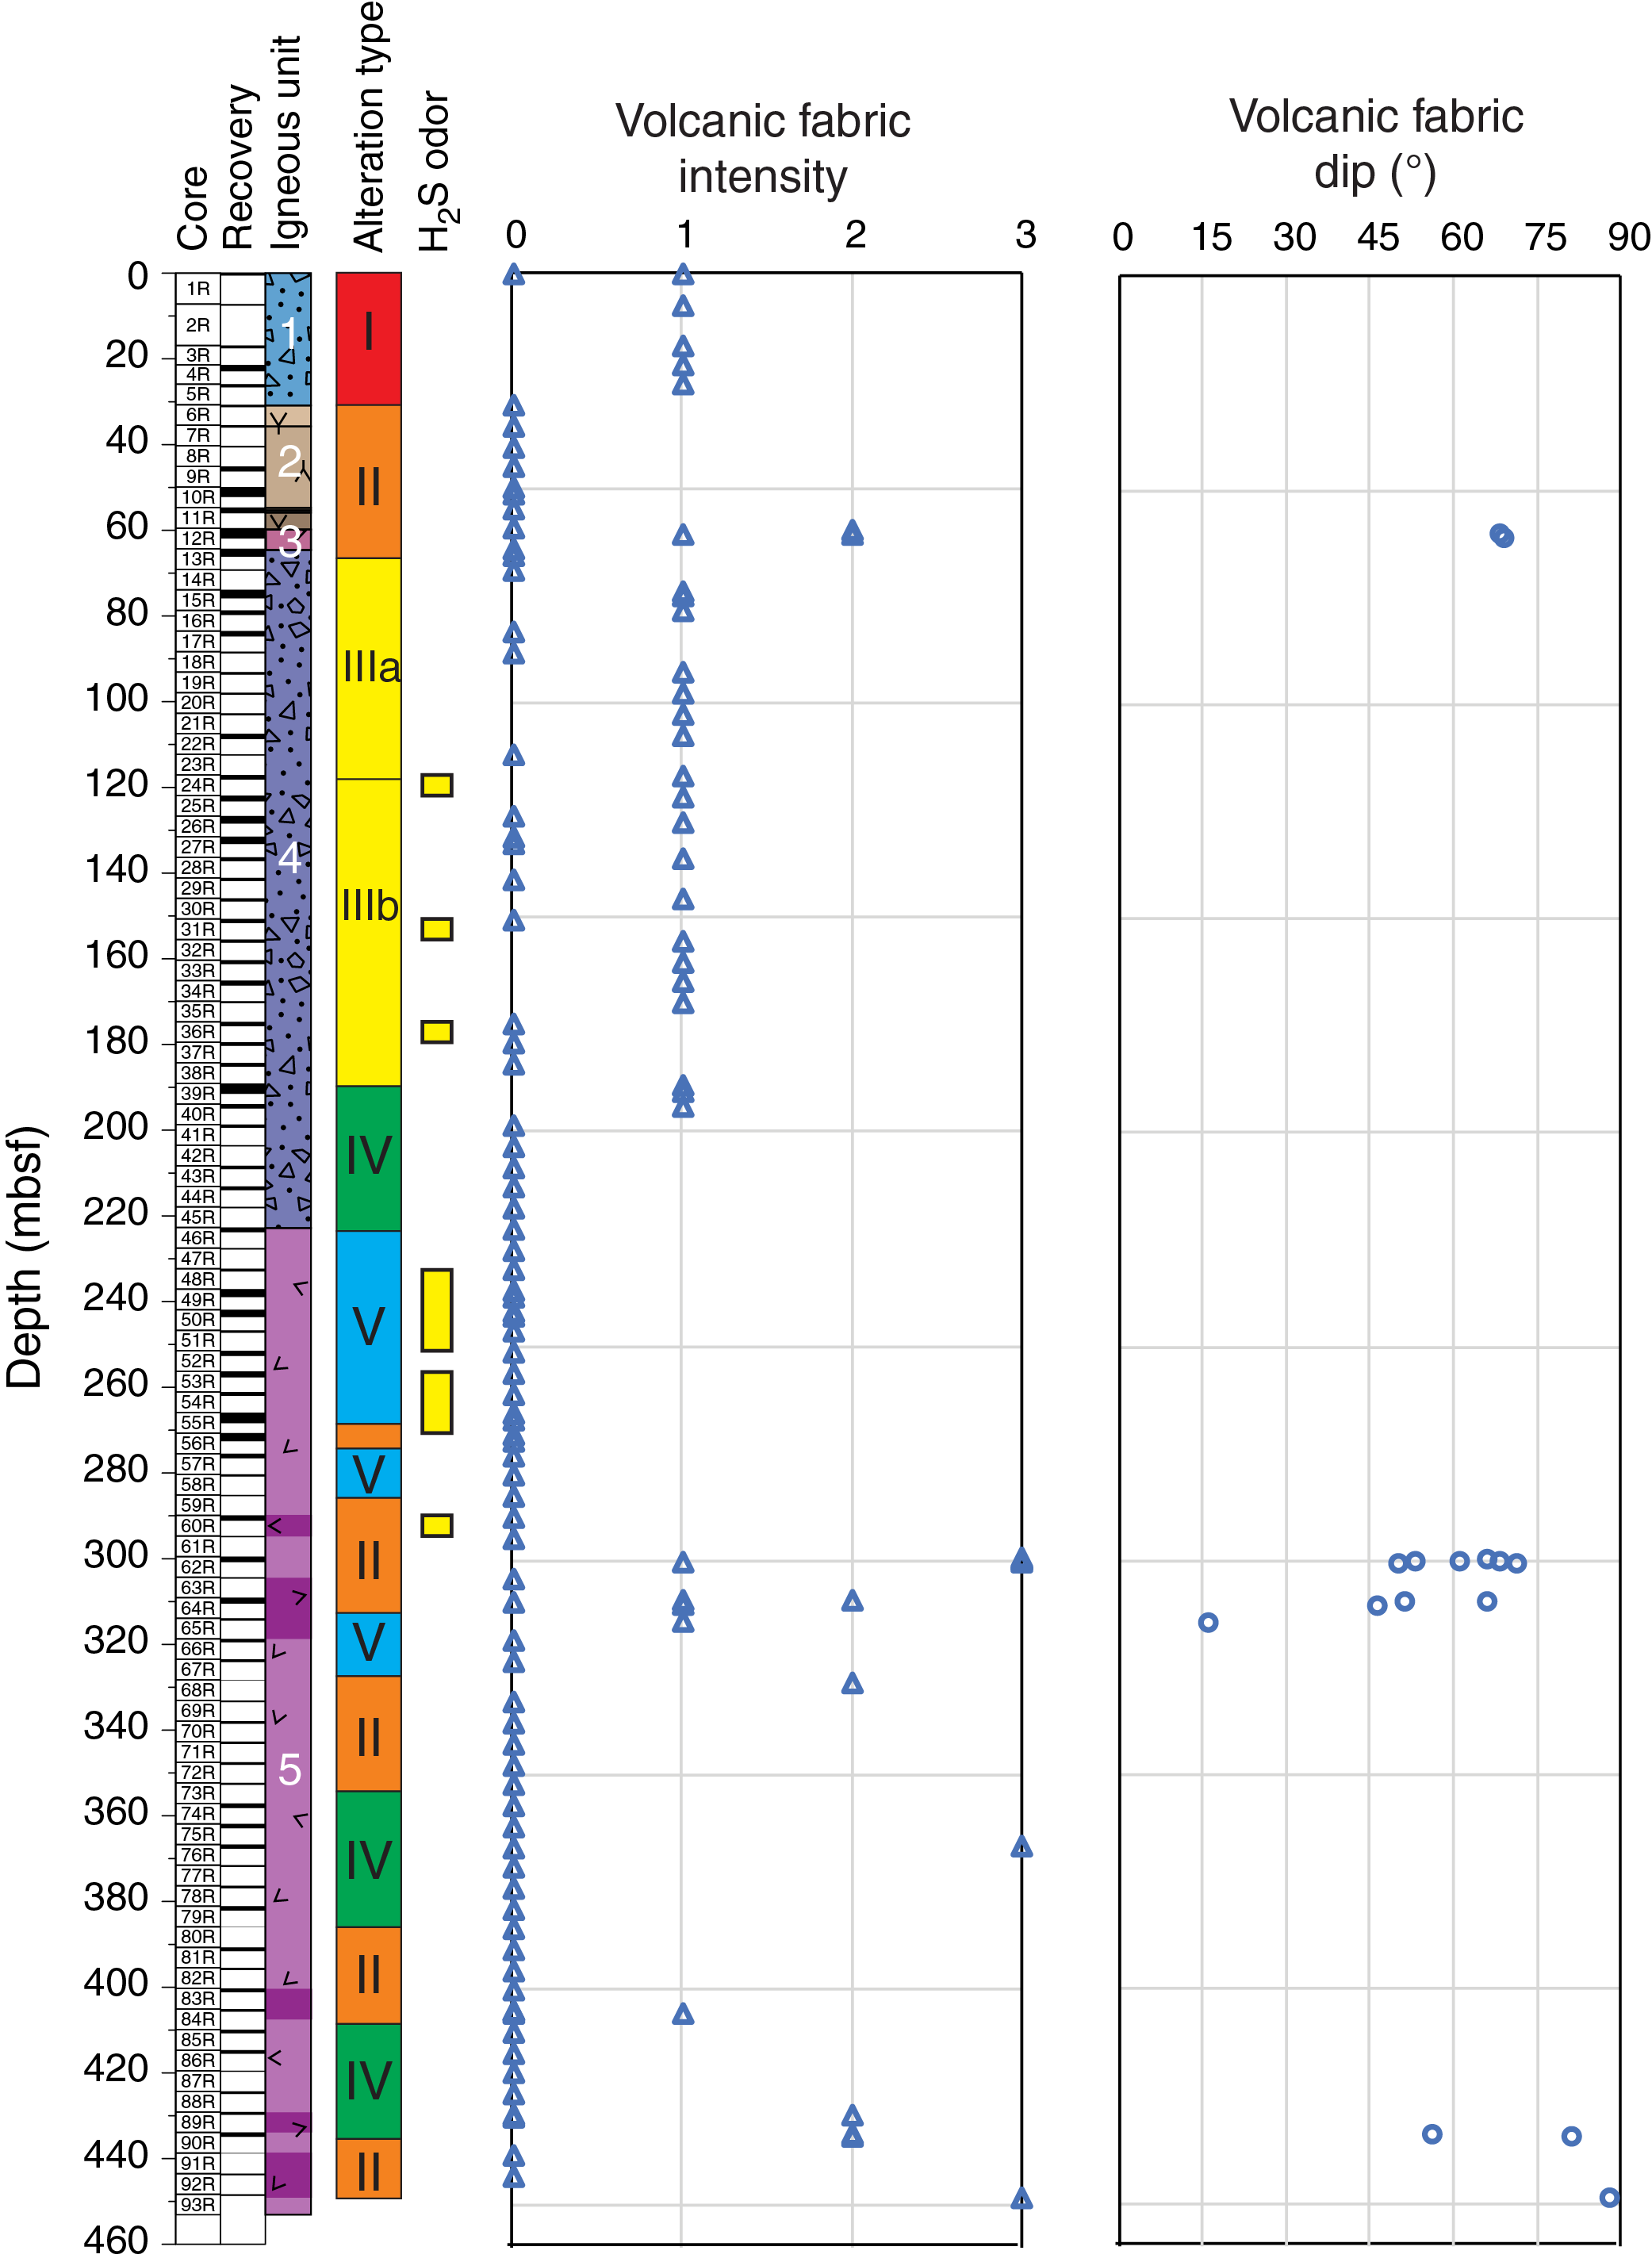
Figure F30. Volcanic fabric variation, Hole U1530A.
Alteration veins
Alteration veins occur throughout Hole U1530A and are filled with anhydrite, silica, pyrite, and to a lesser extent clay (Figure F31). The only exception is an apparent paucity of discrete veins at ~125–175 mbsf (Figure F32). Anhydrite veins occur throughout the hole but have their highest density between 50–75 and 230–270 mbsf. Silica veins also occur throughout the hole, starting below 50 mbsf, and the highest density occurs at 230–330 mbsf. Pyrite veins are also present throughout the hole, and the highest density is at 240–300 mbsf. Pyrite is commonly associated with silica or anhydrite. In some cases, silica-pyrite veins have center zones filled with anhydrite (Figure F31D). In other cases, anhydrite veins have center zones filled with quartz (Figure F31C).
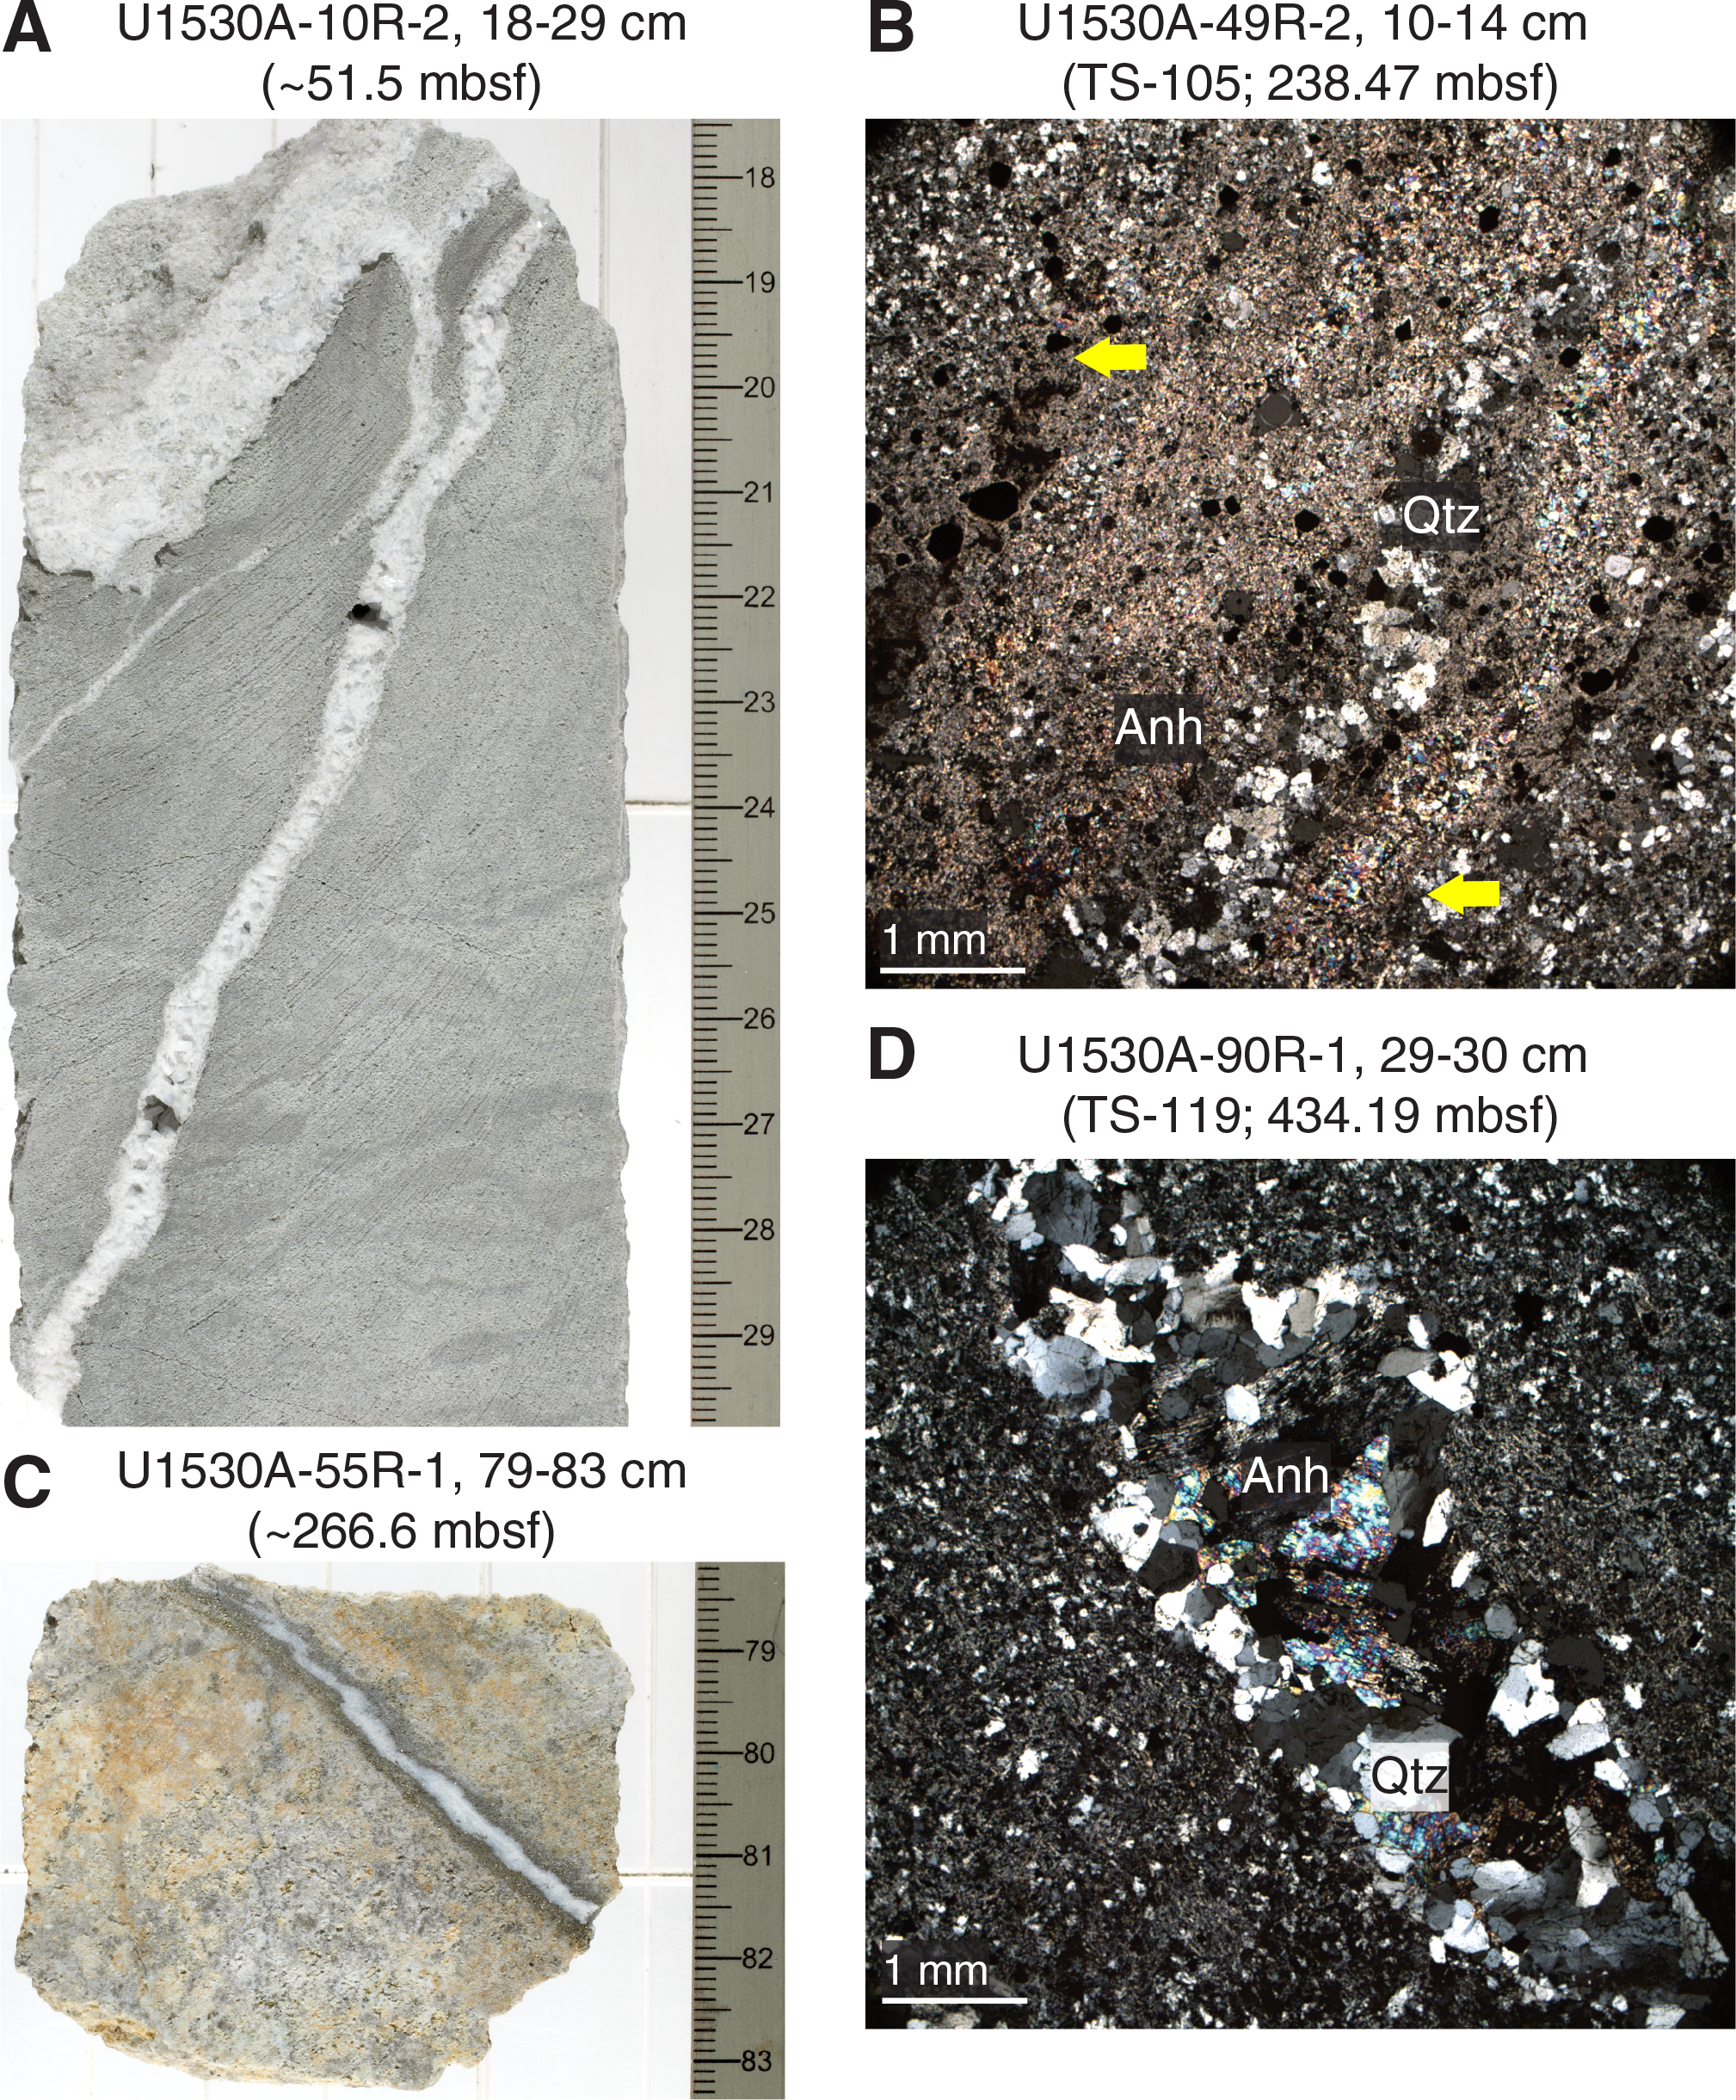
Figure F31. Alteration veins and crosscutting relationships, Hole U1530A.
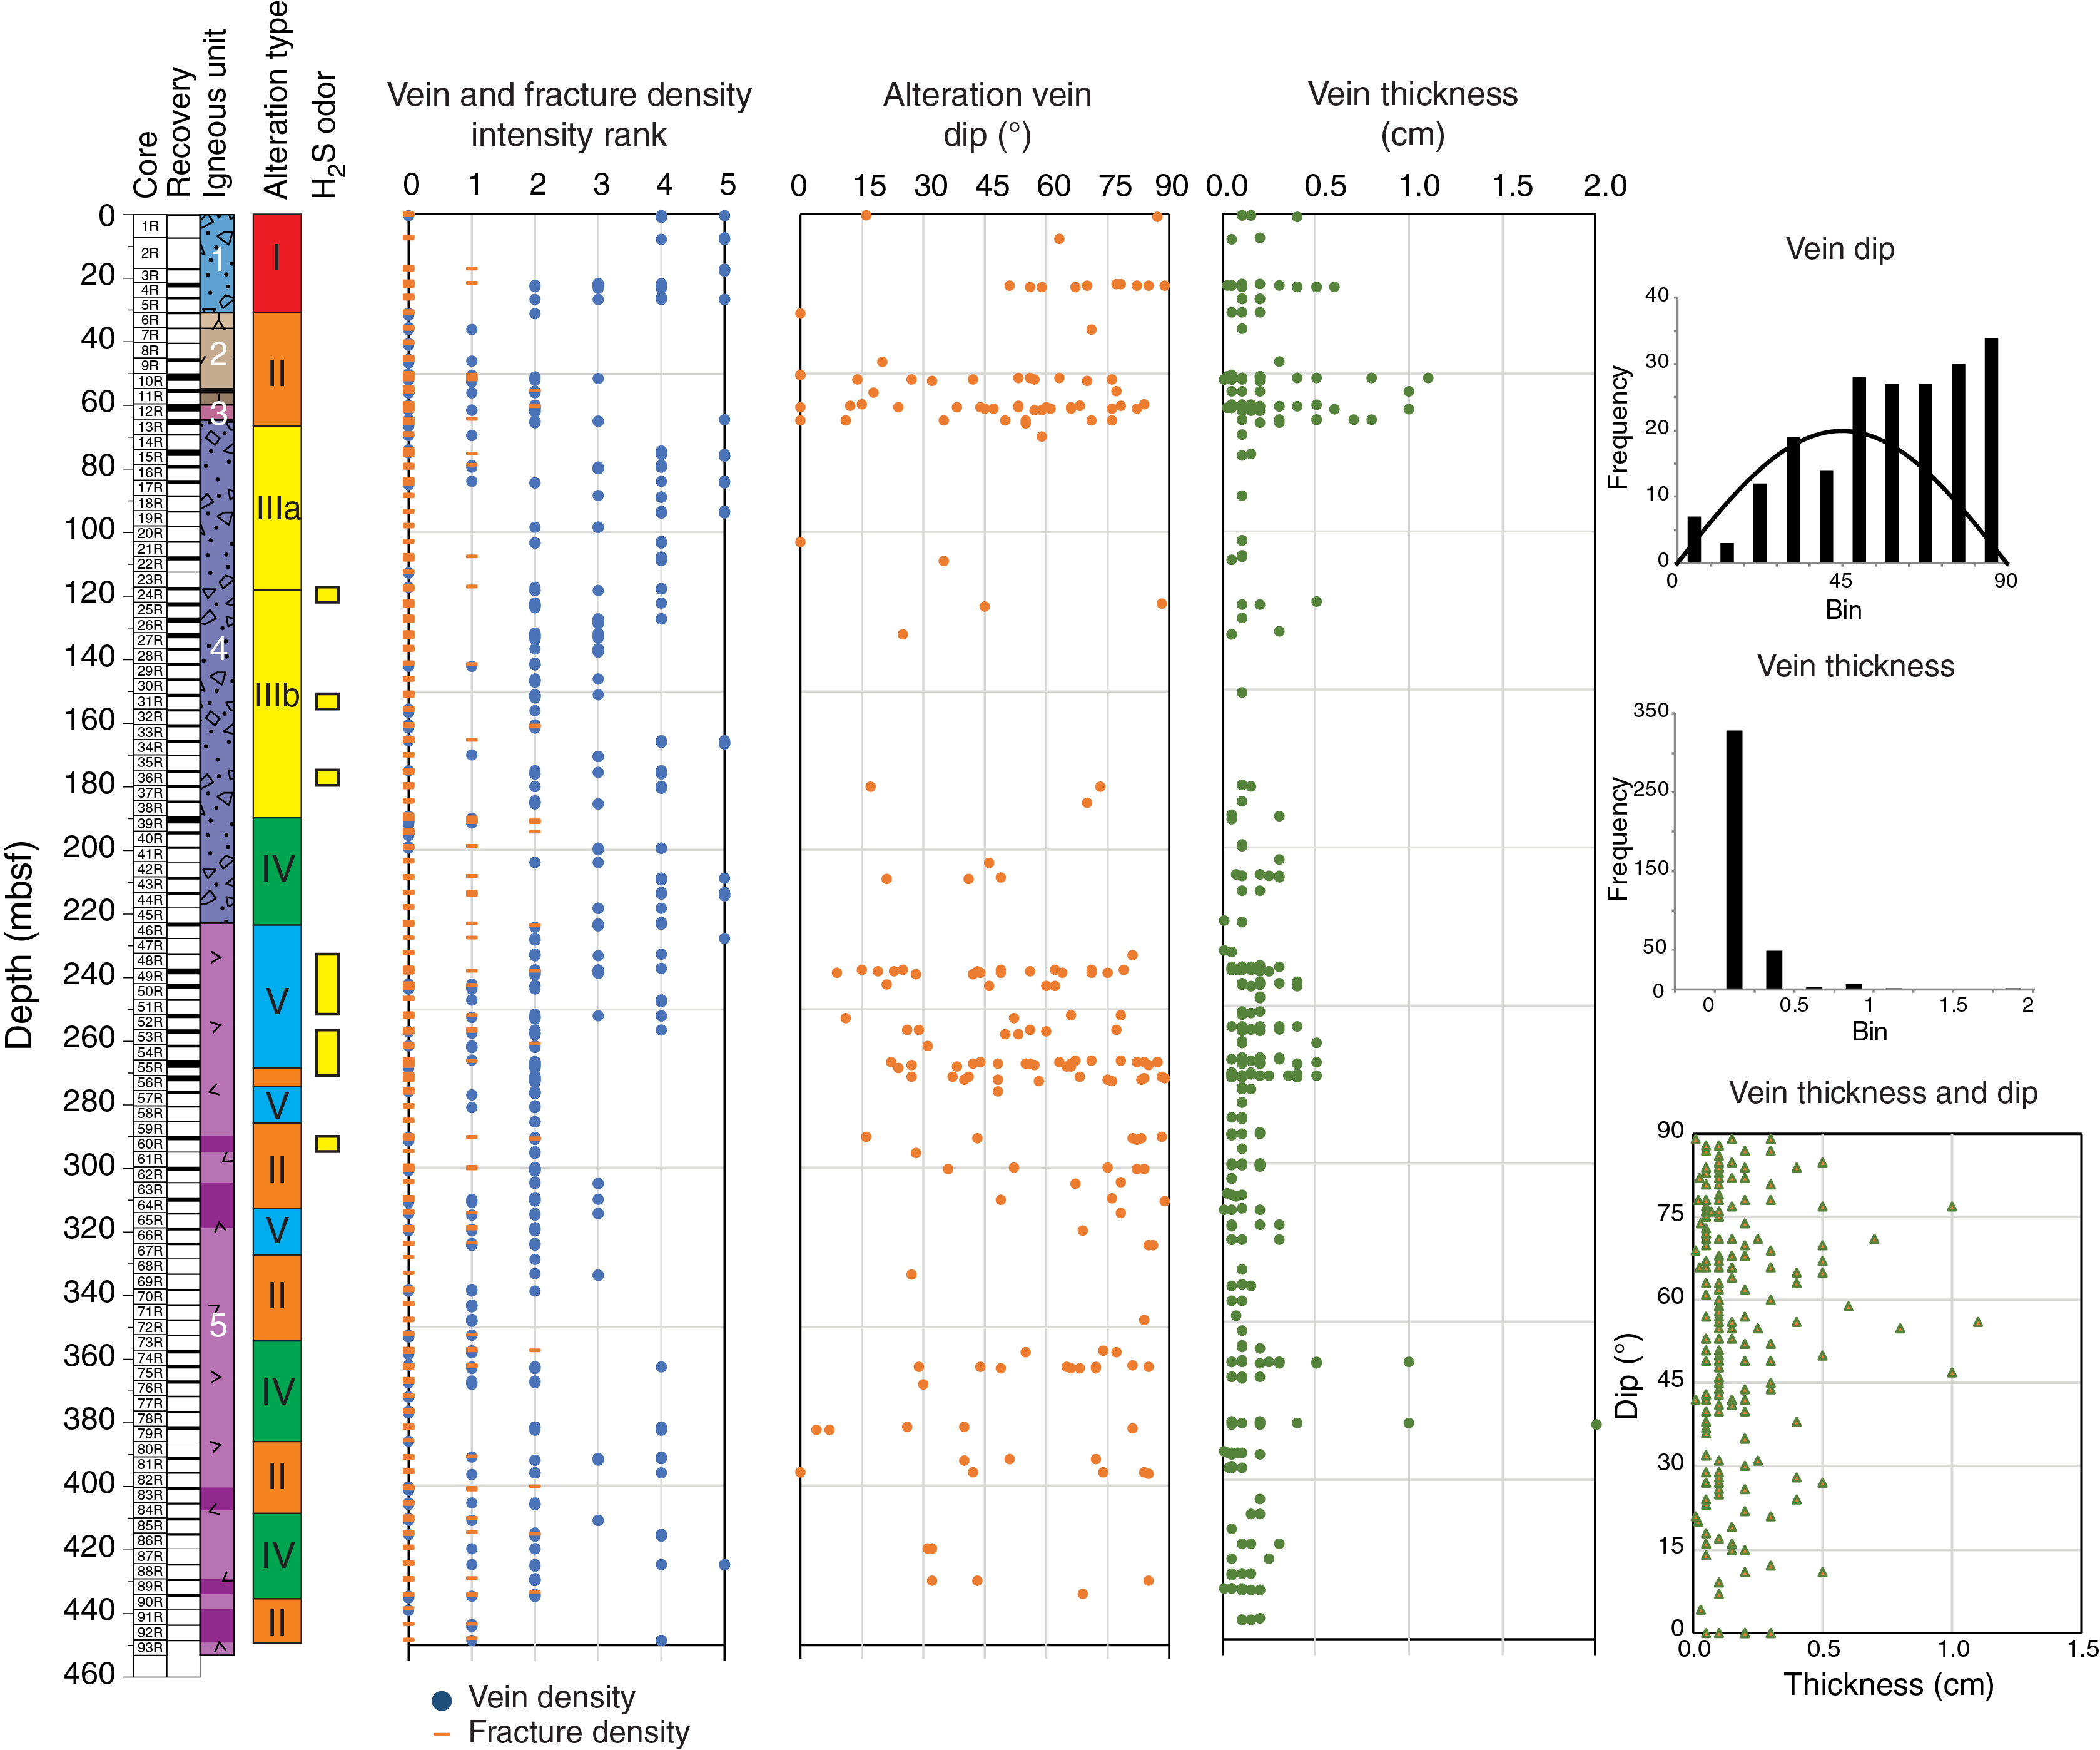
Figure F32. Alteration vein variation, Hole U1530A.
Vein density is variable downhole and is highest at 0–25, 75–95, and 200–260 mbsf (Figure F32). The highest vein densities correspond to zones of network veins and, to a lesser extent, discrete veins. Most network veins are filled with silica or pyrite. Variations in vein density appear to correlate with changes in alteration type. For example, the contact between Alteration Types I and II at ~30 mbsf is marked by a large decrease in vein density; similarly, the contact between Alteration Subtype IIIb and Alteration Type IV at ~190 mbsf is also marked by a large decrease in vein density.
Vein morphology is typically massive, but veins can also be vuggy and haloed. Vuggy veins are most common at the top of the hole at 0–75 mbsf and again at ~200 mbsf. Vein thickness ranges from 0.05 to 2 cm and averages 0.2 cm with a standard deviation of 0.18 cm (Figure F32). More than 95% of veins are <0.5 cm thick. Thickness varies downhole and peaks at 50–65, 260–280, and ~380 mbsf. Vein thickness and dip are correlated; thicker veins have higher dips (Figure F32).
Orientation was measured for 201 (51%) of the 392 veins identified. Vein dip ranges from horizontal to subvertical and averages 54° with a standard deviation of 24° (Figure F32). Vein dips are positively skewed to higher dips; 72% of veins have a dip greater than 45°, and 45% have a dip greater than 70° (Figure F32). A few intervals have a large range in dip and a higher abundance of veins over a limited depth interval (e.g., 50–64 and 240–270 mbsf). The 240–270 mbsf interval is of interest because it correlates the appearance of Alteration Type V with diaspore, pyrophyllite, and zunyite (see Alteration), H2S-related odor (Figure F32), and a deviation in borehole temperature (see Downhole measurements). The intervals with large ranges in vein dip seem to correlate with higher core recovery. However, some intervals with relatively high core recovery lack the density of veins and large range in dip, such as Sections 376-U1530A-4R-1 (~20 mbsf) and 15R-1 through 17R-1 (~80 mbsf), 24R-1 through 27R-1 (~125 mbsf), and 39R-1 through 40R-1 (~190 mbsf). The high abundance and large range in vein dip may therefore be distinct to these intervals and not just sampling bias. Intervals with large ranges in dip correlate with igneous and/or alteration contacts, such as the contact between Igneous Units 2 (tuffaceous sediments) and 3 (lava) at ~70 mbsf. This depth also coincides with the transition from Alteration Type II to Alteration Subtype IIIa and with changes in various physical properties, such as an increase in porosity and decrease in density (see Physical properties and Downhole measurements). Another example is the contact between Alteration Types V and II at ~270 mbsf.
Fractures
Fracture density varies downhole with a few weakly to moderately fractured zones; no highly fractured zones were observed. A few intervals have higher fracture density, including ~55, ~190, ~255, ~290, ~400, and ~430 mbsf (Figure F33). All of these depth intervals correspond to intervals of discrete conductive and resistive planes in FMS logs (see Downhole measurements) except ~55 mbsf, where there is no record (FMS measurement cannot be done through the drill pipe or casing). Two of these intervals, ~190 and ~290 mbsf, are coincident with the presence of slickensides and slickenlines (see below). Intervals of fractures at ~55 and ~255 mbsf parallel intervals of higher discrete vein density and a larger range in vein dip (see above; Figure F32). The zone at ~255 mbsf is also coincident with a deviation in borehole temperature (see Downhole measurements); the presence of diaspore, pyrophyllite, and zunyite (see Alteration); and H2S-related odor.
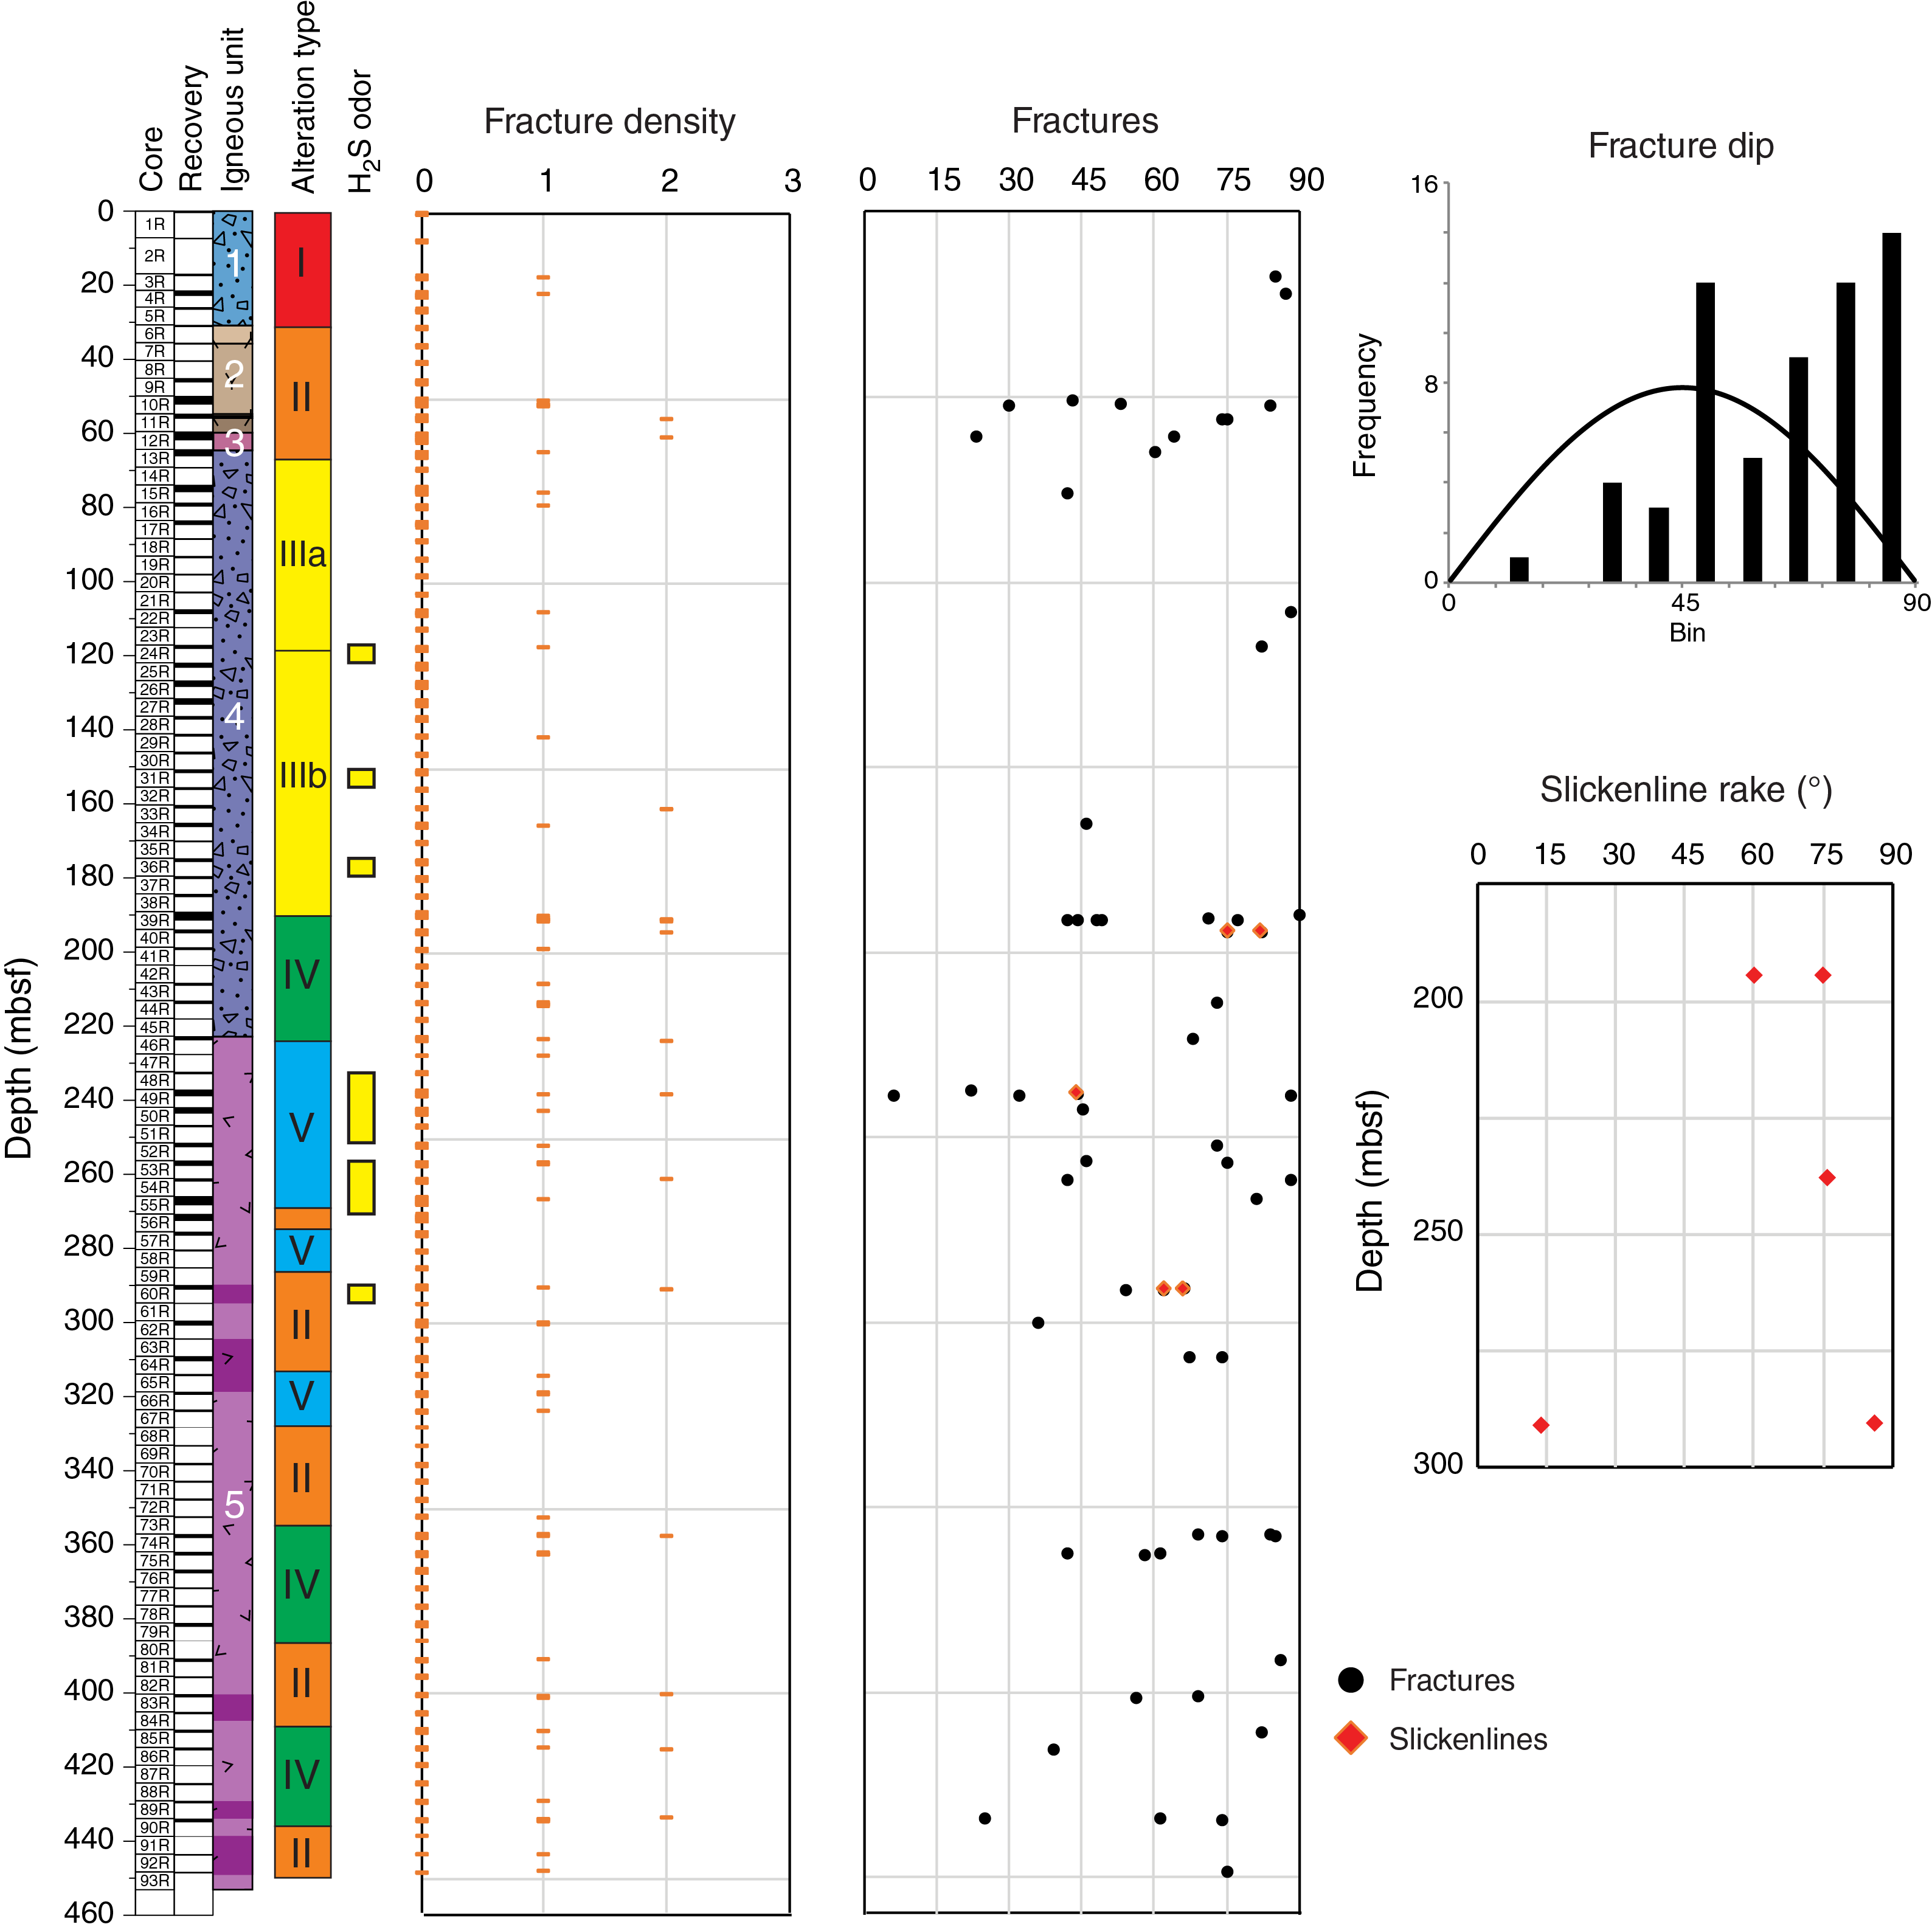
Figure F33. Fracture variation, Hole U1530A.
The orientation of 60 of 83 observed fractures was measured. Fractures are typically irregular and found along ends of core pieces. Fractures range in dip from subhorizontal to vertical and average 62° with a standard deviation of 20° (Figure F33). Most intervals have a large range in fracture dip, and the largest range occurs at ~240 mbsf. This depth corresponds to a large increase in discrete vein abundance and a large range in vein dip (see above). Fracture dip is positively skewed to higher values; 86% of fractures have a dip greater than 45°, and 58% have a dip greater than 70° (Figure F33).
Slickensides were identified in three intervals: 376-U1530-40R-1, 45–46 cm (~194.3 mbsf); 49R-1, 82 cm (237.9 mbsf); and 60R-1, 77 and 100 cm (~290.7 mbsf) (Figure F33). Slickensides are characterized by a clay-rich, smeared surface, and all identified slickensides have slickenlines. In Sections 40R-1 and 60R-1, slickensides and slickenlines are defined by clay. Slickenlines in Section 49R-1 are defined exclusively by a white mineral, possibly anhydrite, and in interval 40R-1, 45 cm, they are defined by clay and anhydrite. The rake of slickenlines is typically steep (>60°) with one exception in interval 60R-1, 100 cm, where the rake is 14°. Steeper rakes are consistent with dip-slip to oblique-slip. In contrast, one shallow rake is consistent with strike-slip to oblique-slip. Four of five of the slickensides show a normal sense of shear. The slickenline in interval 60R-1, 100 cm (the shallow rake), has a reverse sense of shear.
Structural summary and conclusions
Structures in Hole U1530A are consistent with the eruption of distinct volcanic units and subsequent pervasive alteration with the presence of primary volcanic structures, alteration veins, and fractures. This site also contains tuffaceous sedimentary units and slickensides and/or slickenlines not observed at other sites.
Volcanic structures
The presence of volcanic clasts with distinct fabric orientations, especially in the lapilli-tuffs, indicates brecciation either during eruption or postdeposition. Because the paleomagnetic remanent vector (PMRV) inclination is similar in each unit, brecciation must have occurred above the Curie temperature of magnetite (580°C). This suggests that brecciation occurred during eruption and is not the result of a subsequent eruption brecciating an older unit (see Structural geology in the Site U1528 chapter [de Ronde et al., 2019d]).
The majority of volcanic fabrics in dacite lava have a relatively steep dip. Steeply dipping fabric may indicate the flow of the lava was up (or down) instead of related to vertical compaction. In addition, the range in volcanic fabric dip of as much as 20° over a limited depth interval may indicate some variation in flow during eruption and deposition. The location of Hole U1530A in the caldera wall suggests it could have been subject to rotation along caldera wall–parallel faults. Even though we did not appear to have drilled through a fault capable of larger rotations, the PMRV is 10°–15° shallower than predicted for this latitude (see Paleomagnetism), indicating the possibility of fault rotation. Because we do not know the declination azimuth of the PMRV or the strike direction of the fabrics in the geographic reference frame, the amount of rotation cannot be constrained. Even so, the steeper fabrics could be the result of a shallower fabric rotated to higher dips. This would be consistent with a back rotation of the hanging wall toward a normal fault and steepening of fabrics. However, sedimentary unit boundaries are subhorizontal, so if volcanic fabrics were rotated, sedimentary units did not seem to record rotation.
Alteration veins
The two main examples of veins with multiple generations are a silica-pyrite vein infilled with anhydrite and an anhydrite vein infilled with silica. In antitaxial veins (i.e., where vein fill is of different composition than the host rock), the weakest plane is along a median suture, so if a vein were to reopen and a new phase precipitate, it would be along the middle of the vein. These relationships indicate in one case that silica and pyrite were early and anhydrite was later. In the other case, anhydrite was early and silica was later. This suggests that pulses of fluids of different composition and under different conditions may have moved through the hydrothermal system at different times.
The majority of veins have a high dip angle and tend to be thicker than veins with shallower dips, which may indicate that the main fluid pathway is near-vertical. Other zones that have a large range in dip, specifically at ~70 and ~270 mbsf, may indicate that lateral fluid movement is/was a more important component in these zones. The presence of lateral flow may be supported by deviations in borehole temperature coincident with the zone at 270 mbsf (see Downhole measurements).
Fractures and slickenlines
The majority of slickenlines have a steep rake and a normal sense of shear. Moreover, a greater abundance of fractures was observed in Hole U1530A and supported by cursory observations of FMS logs than in any other hole at Brothers volcano. These observations of steep, normal-sense slickenlines and an abundance of fractures are consistent with normal faulting in the caldera, possibly related to caldera floor down-drop. This observation is also supported by the location of Hole U1530A in an active vent field with some chimneys, seemingly oriented along faults and/or fracture zones, located only tens of meters away from this site (e.g., de Ronde et al., 2011).
Geochemistry
Hard rock geochemistry
Samples were selected based on lithologic and alteration type variations (see Igneous petrology and volcanology and Alteration). Samples span the depth range of Hole U1530A (i.e., from 0.32 mbsf [Sample 376-U1530A-1R-1, 32–34 cm] to 448.58 mbsf [Sample 93R-1, 28–30 cm]). Major and trace element compositions of 68 powders were analyzed by inductively coupled plasma–atomic emission spectroscopy (ICP-AES), whereas 86 were analyzed by handheld pXRF (Tables T7, T8). In total, 63 powders were analyzed by both ICP-AES and pXRF.
The following samples represent the dominant lithologies (i.e., igneous units) and alteration types recovered from Site U1530:
- 7 clast-supported polymict lapillistones (Igneous Unit 1, 0–26.62 mbsf), all Alteration Type I;
- 11 rocks from Igneous Unit 2 (Subunits 2a–2e, 30.70–59.62 mbsf) composed of altered tuffaceous mudstone, siltstone, sandstone, and altered polymict lapillistone, all Alteration Type II;
- 3 altered plagioclase-phyric lavas (Igneous Unit 3, 59.62–64.40 mbsf), all Alteration Type II;
- 29 altered volcaniclastic rocks (Igneous Unit 4, 64.40–218.21 mbsf), Alteration Types II and III; and
- 35 altered volcanic rocks and six intercalated altered plagioclase phyric lavas (Igneous Unit 5, 222.70–448.68 mbsf), Alteration Types IV and V.
Mafic, intermediate, and silicic rock standards were analyzed in replicate as unknowns to determine the precision and accuracy of both methods (see Geochemistry in the Expedition 376 methods chapter [de Ronde et al., 2019a]). A comparison of ICP-AES and pXRF results for elements measured using both methods is shown in Table T9. Reasonable agreement between ICP-AES and pXRF data (i.e., r2 > 0.90; regression slope = 1.0 ± 0.1) was observed for CaO and Y. Other elements show relatively consistent results between pXRF and ICP-AES (i.e., r2 > 0.80; regression slope = 1.0 ± 0.2), including Fe2O3t, MnO, TiO2, Sr, and Zr. Significant interference from Ba-rich samples was observed for Ti and Mn determinations by pXRF. Although good correlation was observed for MgOpXRF and MgOICP-AES (r2 = 0.968 and 0.974, respectively), a slope of the regression line >1.4 and/or a nonzero intercept suggest significant issues regarding calibration and/or baseline determination on the pXRF instrument. Hence, in this section, only ICP-AES results are presented and discussed.
Igneous geochemistry
At Site U1530, no unaltered or slightly altered igneous materials were recovered. Petrographic descriptions and XRD and ICP-AES/pXRF analyses confirm that all five igneous units are affected by various degrees of hydrothermal alteration (see Alteration). Igneous Units 2–5 are essentially andesitic to dacitic in composition, and average SiO2 concentrations for each unit range from 55.6 to 66.8 wt%. The large range in Al2O3 versus SiO2 resulting from both Al and Si mobility and the general depletion in total alkali (Na2O + K2O) (Figure F34) preclude further assessment of the protolith composition using major element compositions.
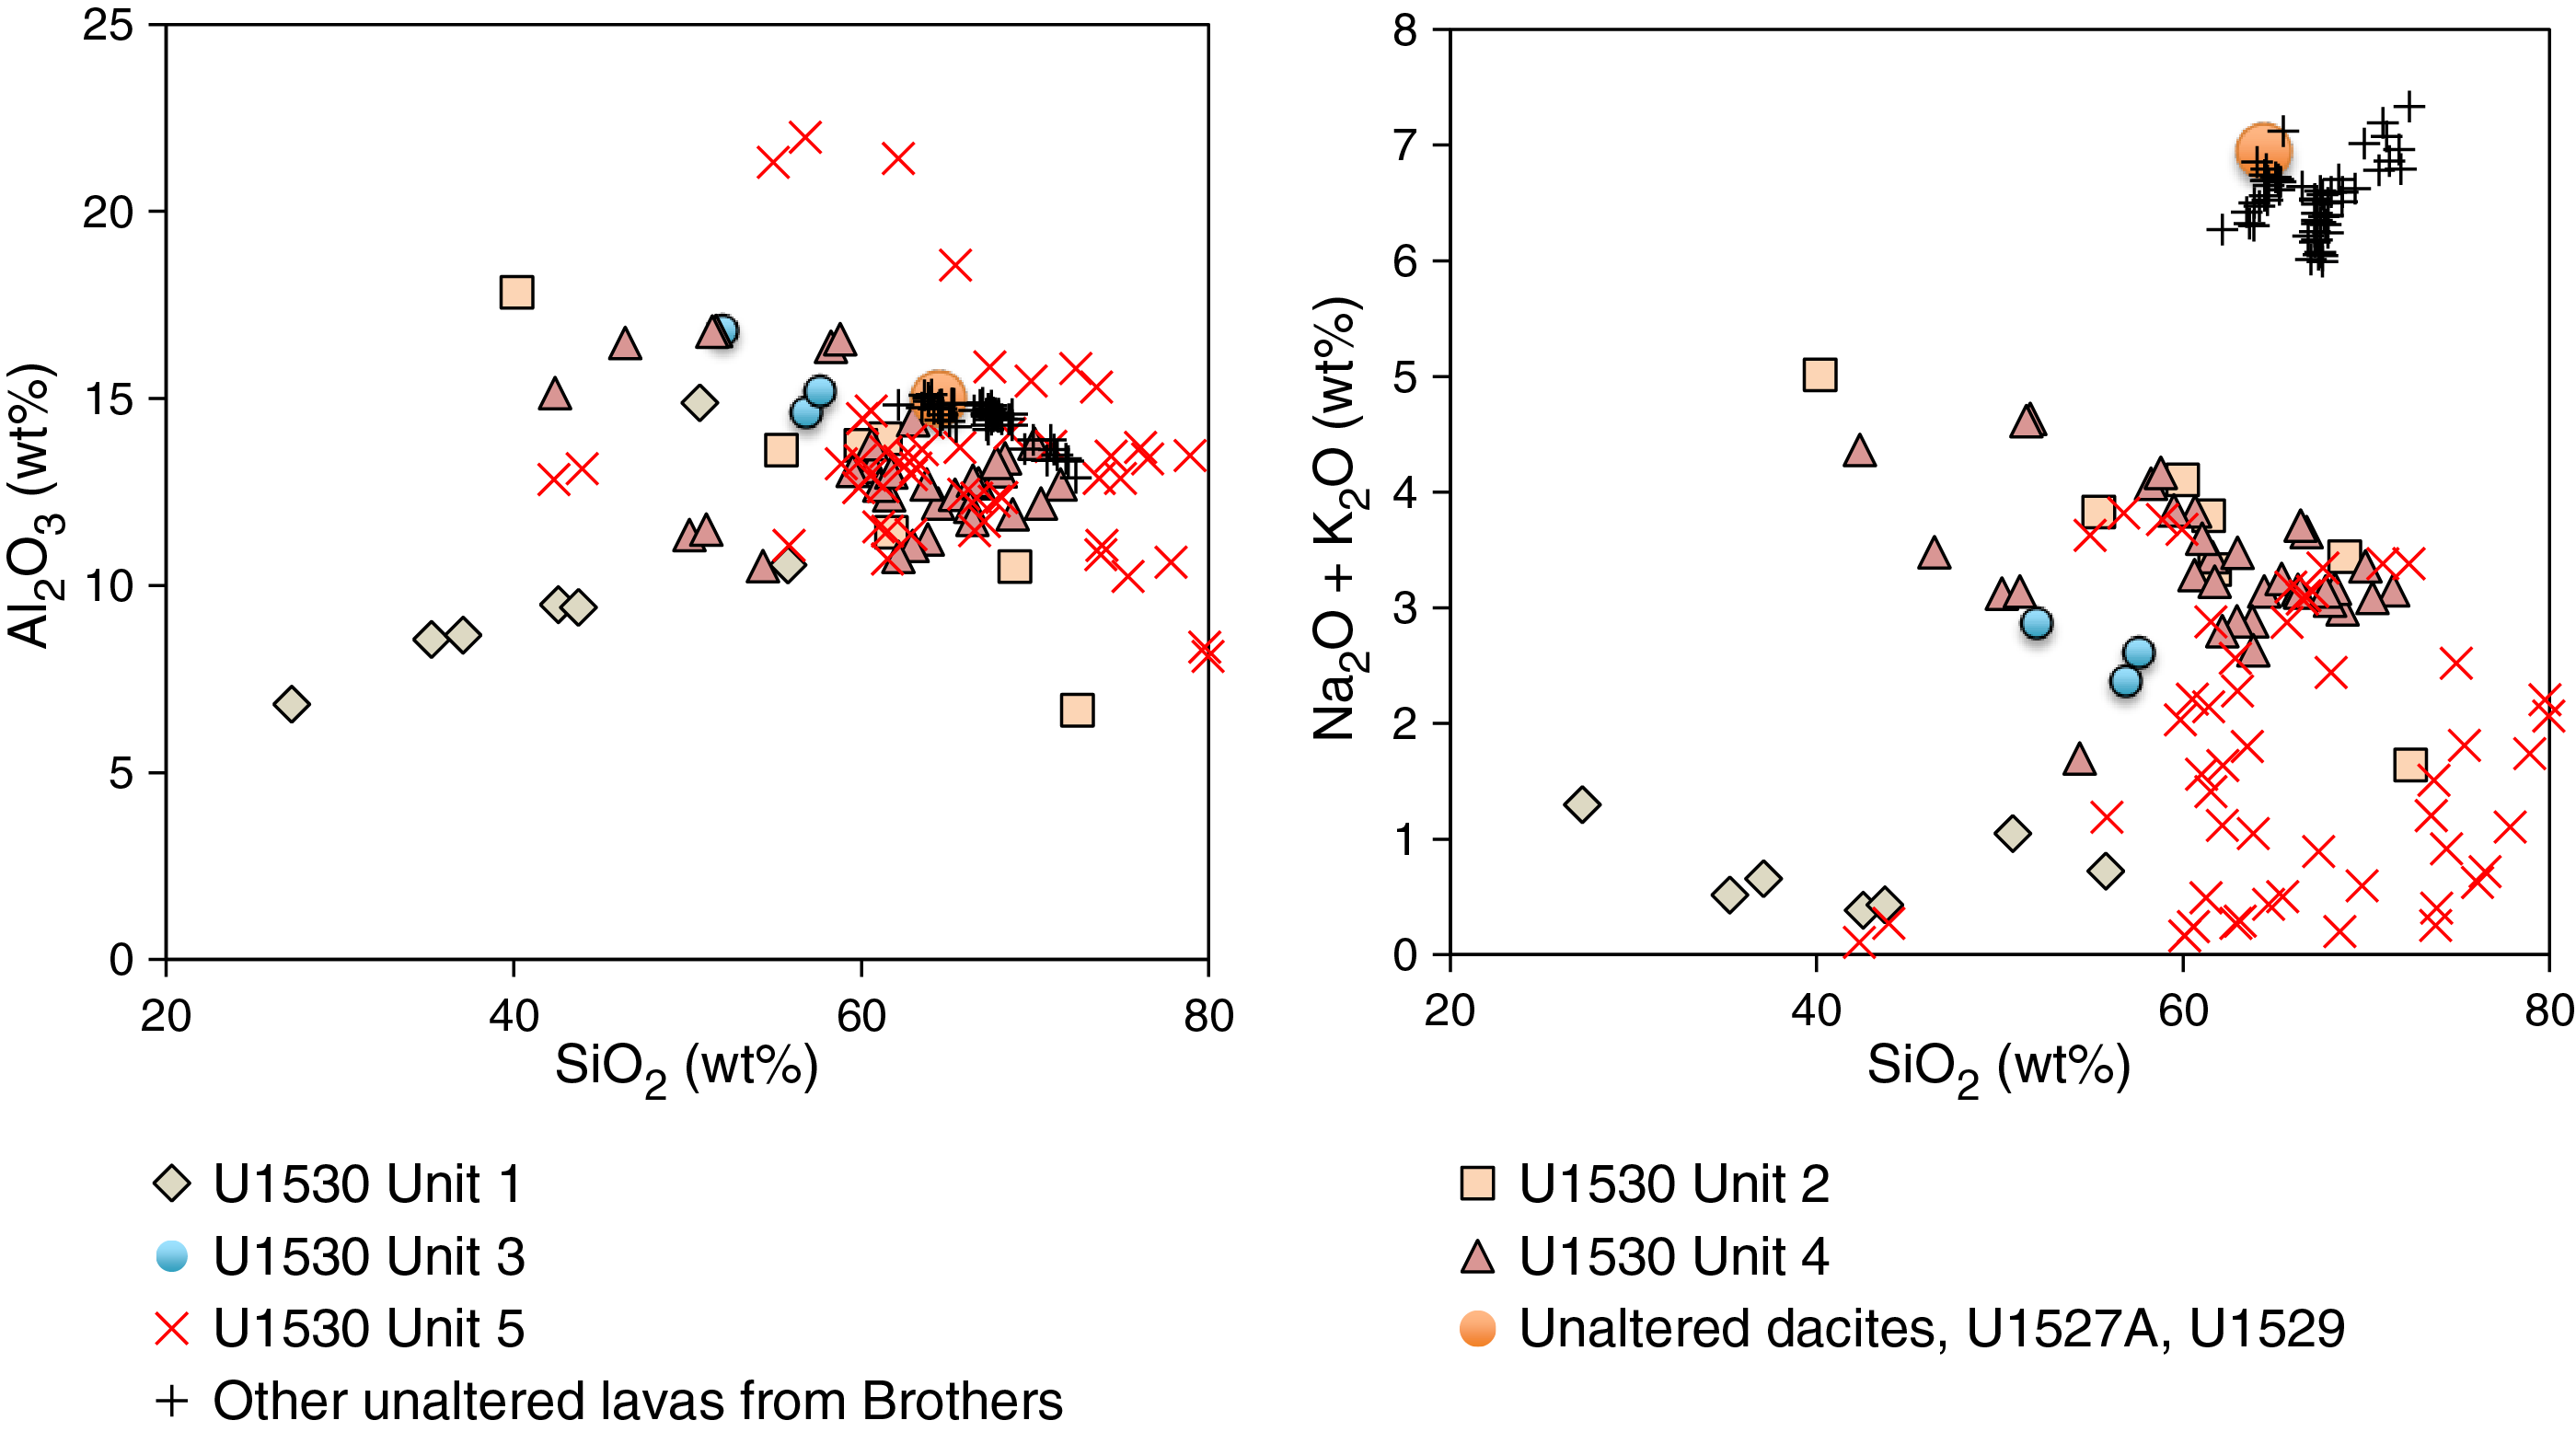
Figure F34. Major element Harker diagrams, Site U1530.
To further evaluate the differences in the composition of lava at Site U1530 and unaltered dacites recovered from Hole U1527A and Site U1529, variations of fluid-immobile or least mobile element concentrations (i.e., Zr, TiO2, and Y) and their ratios (e.g., Zr/Ti) were examined (Figure F35). For Igneous Units 1–3, Zr/Ti values range on average from 26.3 to 28.8 mg/g (Unit 1: 26.3 ± 0.7, Unit 2: 27.6 ± 1.4, and Unit 3: 28.8 ± 0.6 mg/g), slightly lower than the average Zr/Ti value for Igneous Unit 1 in Hole U1527A and at Site U1529 (i.e., 30.54 ± 2.3 mg/g). In contrast, Zr/Ti increases substantially at the top of Igneous Unit 4 (~30–45 mg/g), yielding an average Zr/Ti value of 39.4 ± 4.6 mg/g before decreasing downhole across the Igneous Unit 4/5 boundary. This suggests that the upper lavas, tephra intervals, and lapillistone recovered at Sites U1527–U1529 may be genetically related or derived from similar parental magmas. In contrast, deeper unaltered dacites and altered volcaniclastic rocks from Hole U1527C (176–220 mbsf) are associated with Zr/Ti values of 41.2 ± 2.4 mg/g, suggesting a different lava composition (e.g., produced by different degrees of melting). These Zr/Ti values are more similar to the deeper Igneous Unit 5 of Hole U1530A (64.4–218.2 mbsf). For comparison, the average Zr/Ti value for highly altered volcaniclastic materials at Site U1528 ranges only from 30.7 ± 0.5 in Hole U1528A to 30.1 ± 0.5 in Hole U1528C and 34.2 ± 1.0 mg/g in Hole U1528D. Considering the extremely acid conditions encountered at Site U1528 combined with the petrographic evidence of titanomagnetite alteration and rutile precipitation, the relative homogeneity of Zr/Ti in Hole U1528D is remarkable and confirms that the relatively large variations of Zr/Ti observed in Hole U1530A are not a result of alteration processes. The implication of Zr/Ti as a tracer of the possible genetic variability among the Brothers volcano dacitic magma series is further discussed in Igneous petrology and volcanology. In contrast to Zr/Ti, Y/Zr values show strong evidence of alteration overprinting (see Alteration geochemistry), precluding the use of the Y/Zr value as a robust indicator of magmatic processes.

Figure F35. Downhole plots of rocks and lavas, Hole U1530A.
Volatile geochemistry
At Site U1530, 70 bulk rock powders were analyzed for TC, total sulfur, and total nitrogen (TN) using the elemental analyzer (EA). This set of powders included 10 samples collected for microbiological analysis. Measured data and associated uncertainties for these measurements are reported in Table T10. Downhole variations in total sulfur and TC are presented in Figure F36. The majority of the samples recovered from Hole U1530A contain <200 µg/g TC (TC detection limit = 40 µg/g) (Table T10). Compared with Sites U1527–U1529, Site U1530 is characterized by overall lower TC values. One sample from Igneous Unit 1 (376-U1530A-5R-1, 39–41 cm; 26.3 mbsf) and one sample from Igneous Unit 5 (376-U1530A-60R-1, 91–93 cm; 291 mbsf) contain TC contents of 1230 and 849 µg/g, respectively, which are elevated relative to the other measured samples from Site U1530. TN is below detection limit (<40 µg/g) in all Site U1530 samples, as at Sites U1528 and U1529.
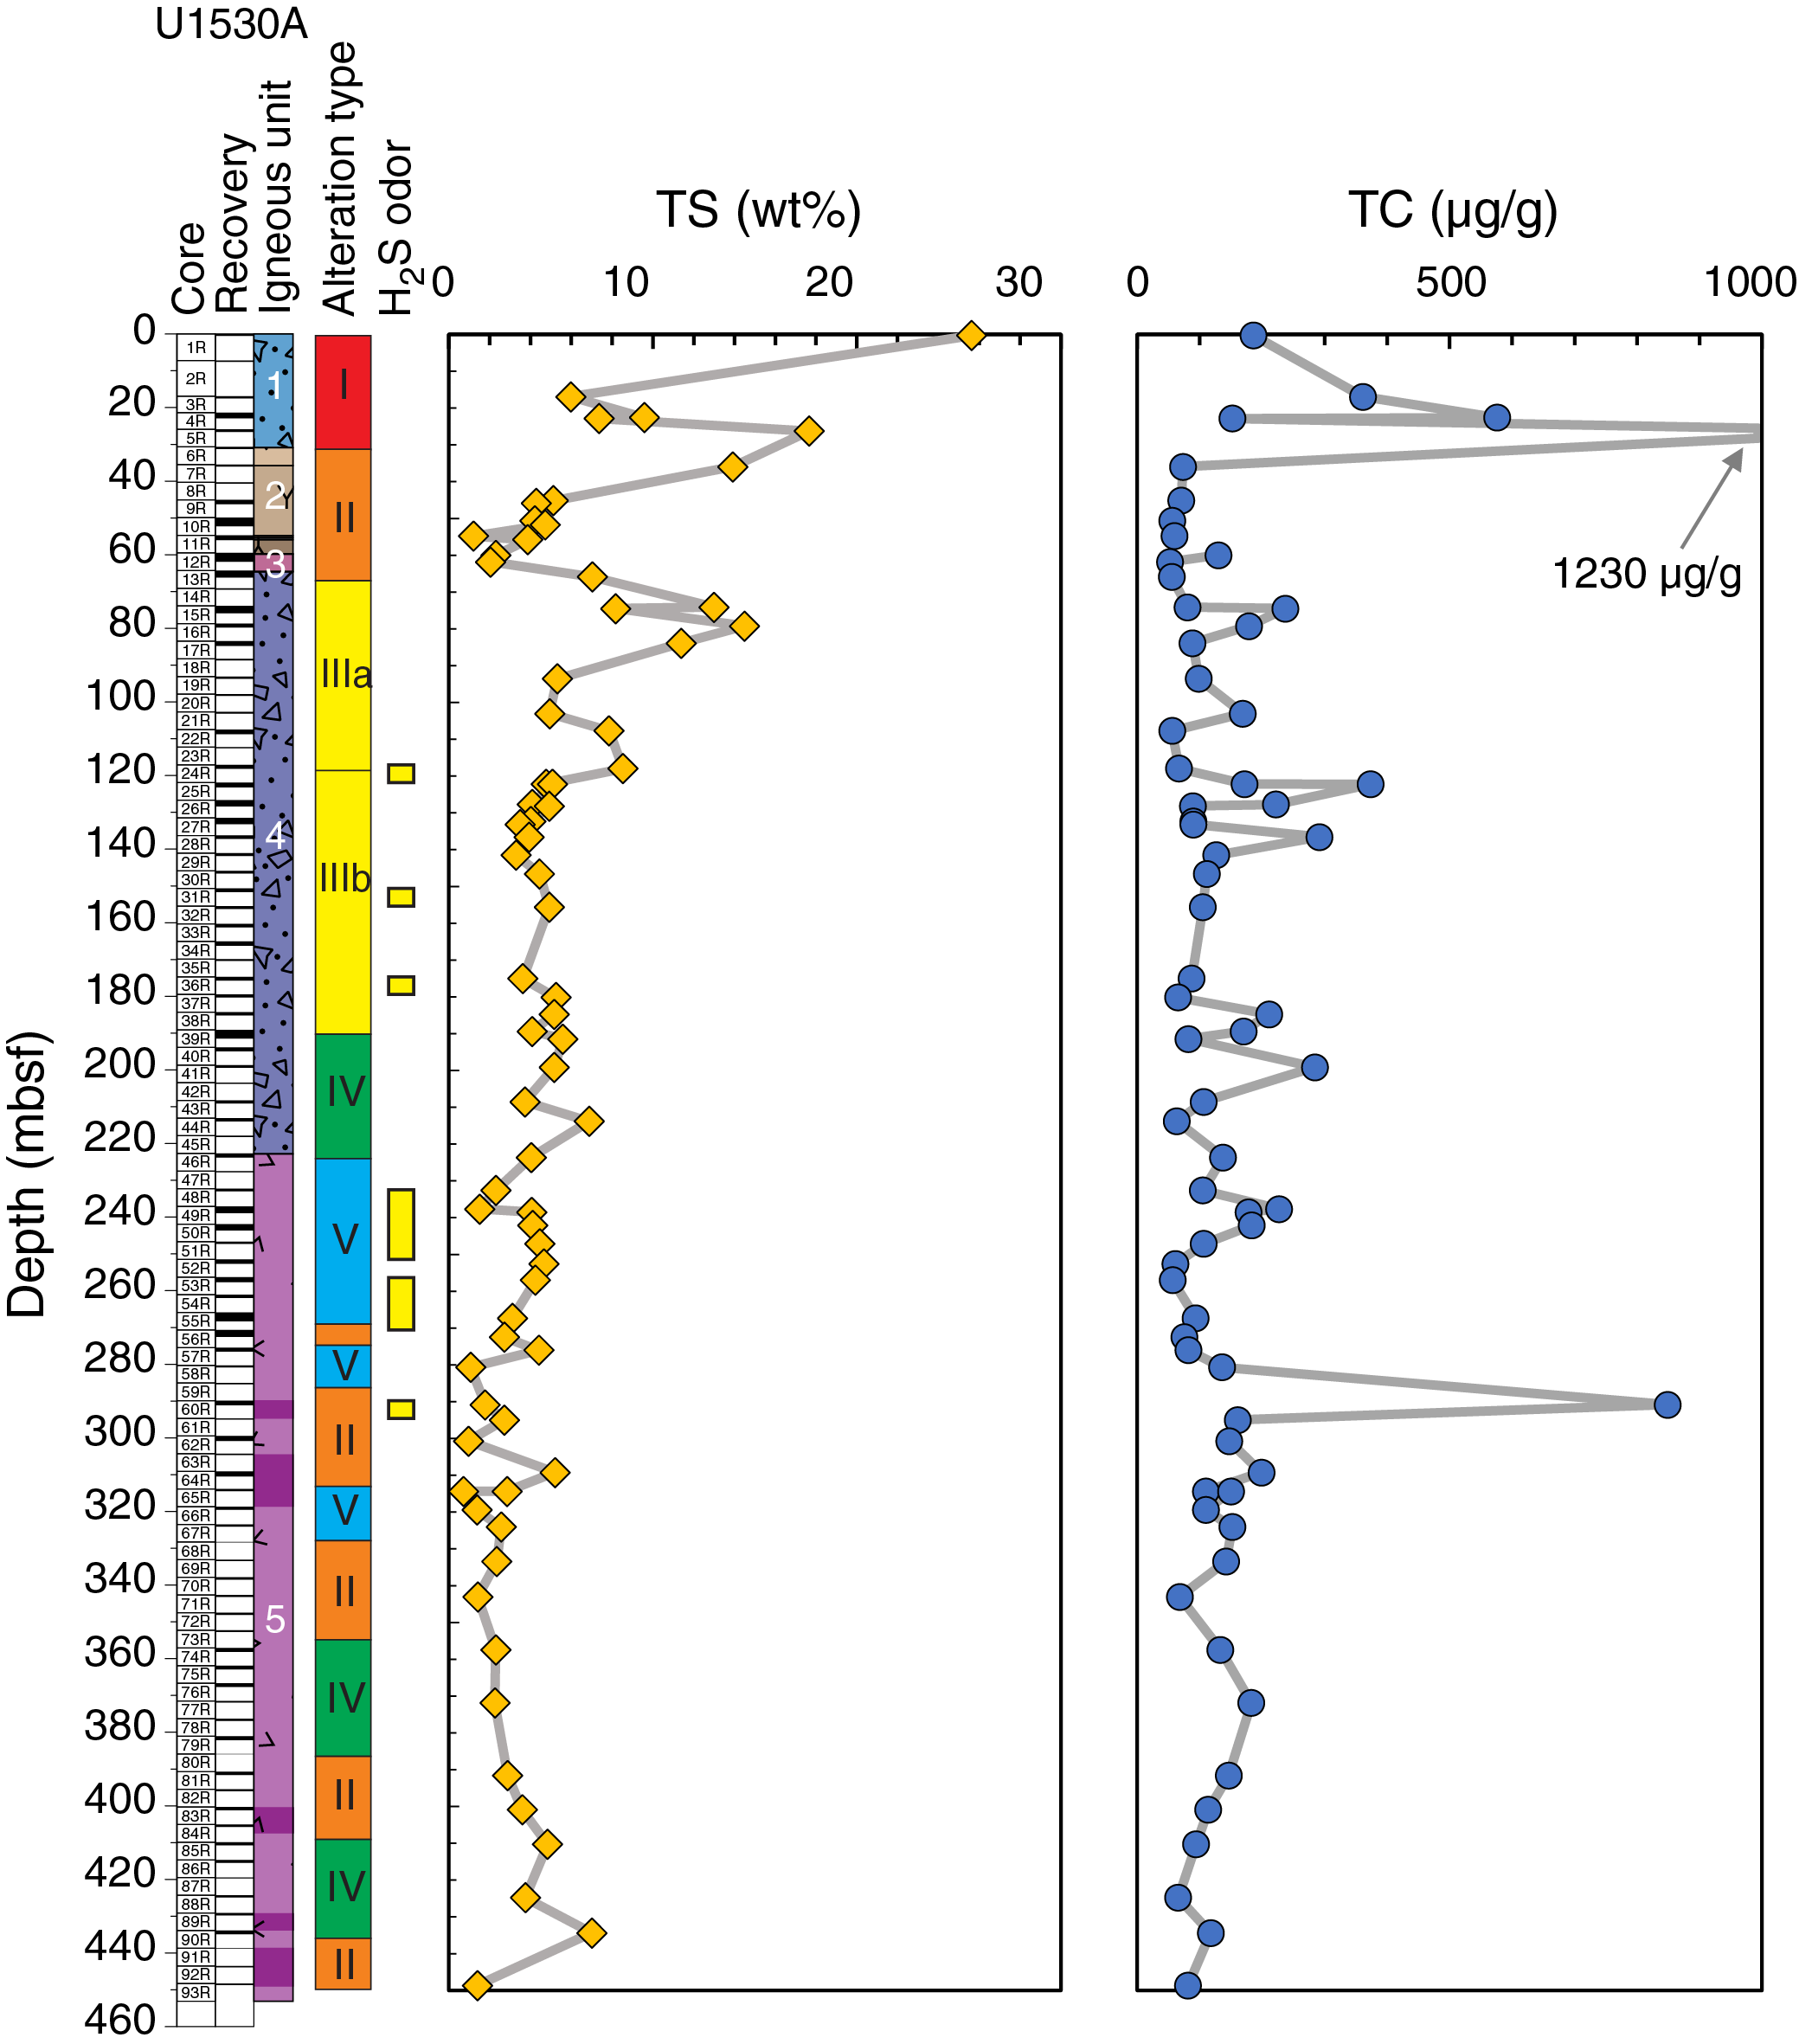
Figure F36. Downhole variations of TS and TC abundance, Hole U1530A.
Total sulfur contents are within the range of those observed at Site U1528. The average total sulfur concentration at Site U1530 is 5.1 wt%, whereas Site U1528 has a total sulfur average value of 5.9 wt%. However, in contrast to Site U1528, total sulfur concentrations decrease with depth from about 11 wt% to about 3.5 wt% on average from the shallowest to the deepest cores (averages calculated from the eight shallowest and eight deepest samples; see Figure F32 in the Site U1527 chapter [de Ronde et al., 2019c]). Maximum total sulfur concentrations (~10–25 wt%) appear at 0–85 mbsf and occur at shallower depths than the H2S odor noticed during core recovery at ~120–395 mbsf.
Alteration geochemistry
The downhole variations of selected major oxide and trace element compositions are plotted together with relevant bulk mineralogy from XRD analysis in Figures F35, F37, and F38. The observed chemical variations are much more pronounced than those at Site U1527, including the extensive loss of Na2O (average ≈ 0.33 wt% in Hole U1530A) relative to unaltered dacites (average ≈ 4.69 wt% at Sites U1527 and U1529). Other alkali metals, such as potassium (K2O) and the alkaline-earth metals (Mg, Ca, Sr, and Ba), show both depletions and enrichments relative to fresh dacites. As discussed in Alteration, these trends are generally consistent with the mineralogy and alteration types observed in thin section and XRD. In particular, MgO is enriched in Alteration Type II (≤7.5 wt% at 62 mbsf), which is likely related to the presence of chlorite. Igneous Unit 1, affected by Alteration Type I, is also characterized by enriched MgO concentrations above the unaltered dacite value of ≈1.45 wt%. This finding is consistent with the high abundance of Mg-rich smectite in the uppermost parts of Hole U1530A.
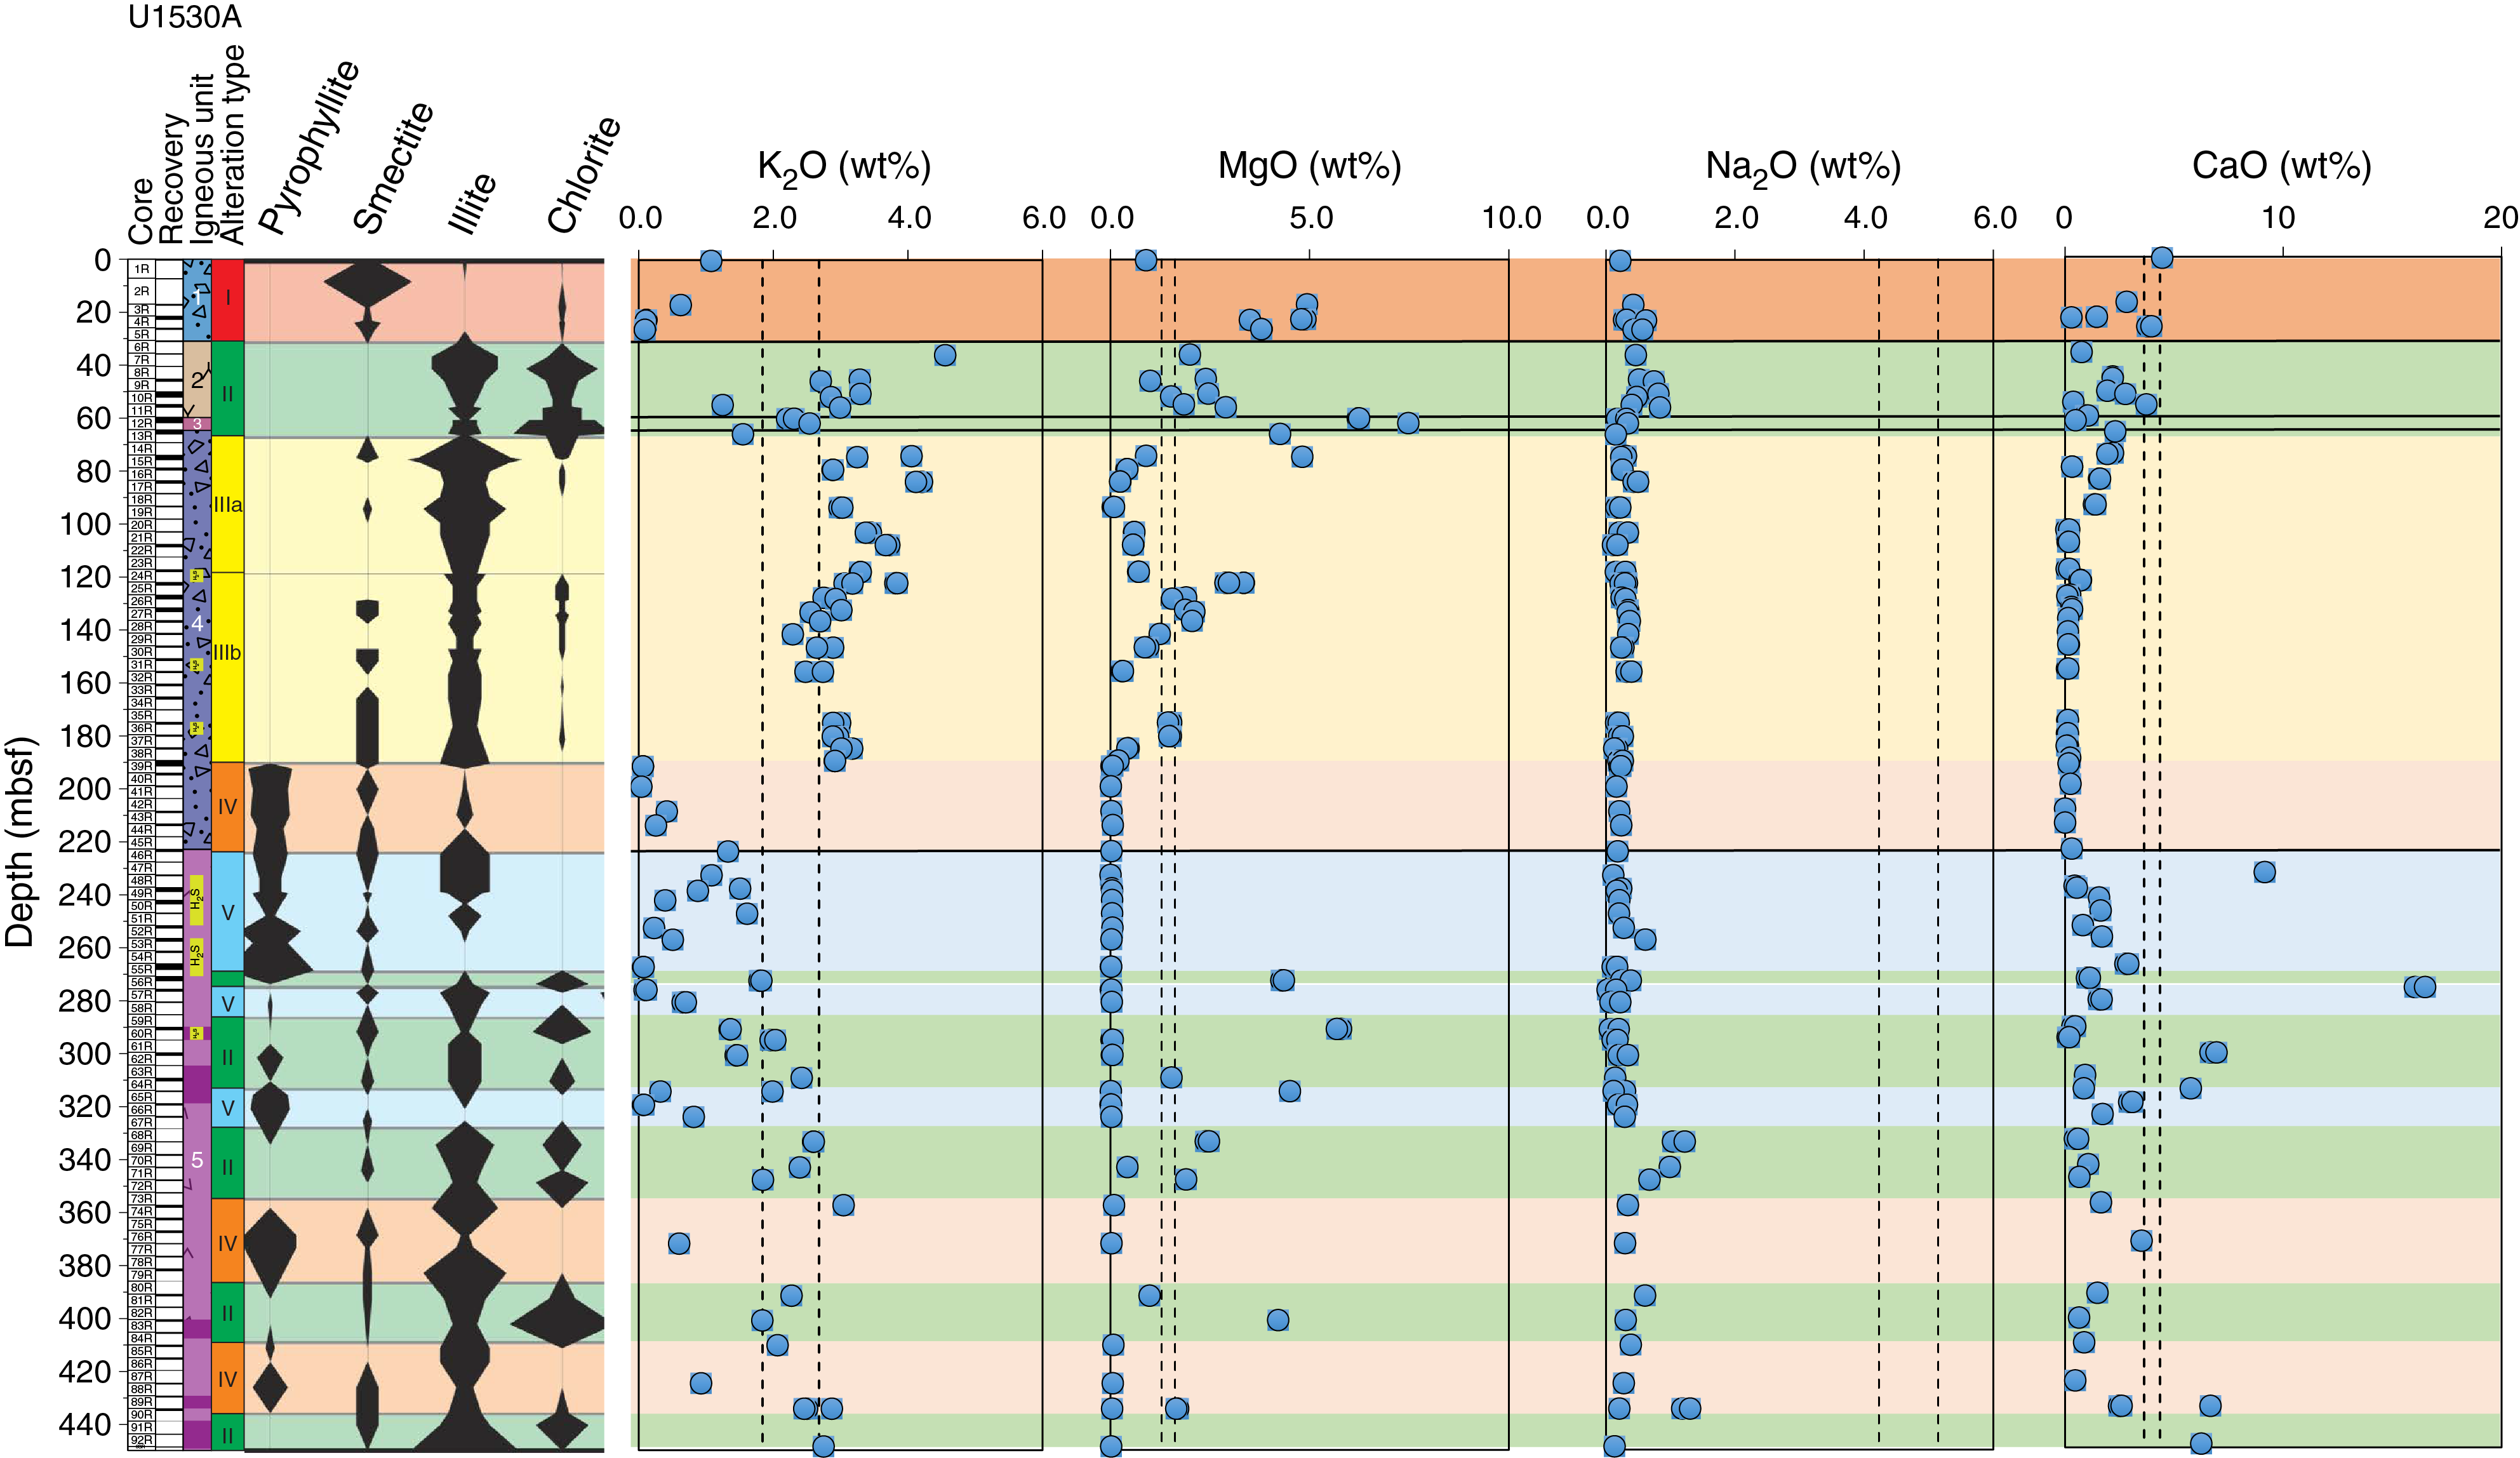
Figure F37. Downhole plots of K2O, MgO, Na2O, and CaO concentrations, Hole U1530A.
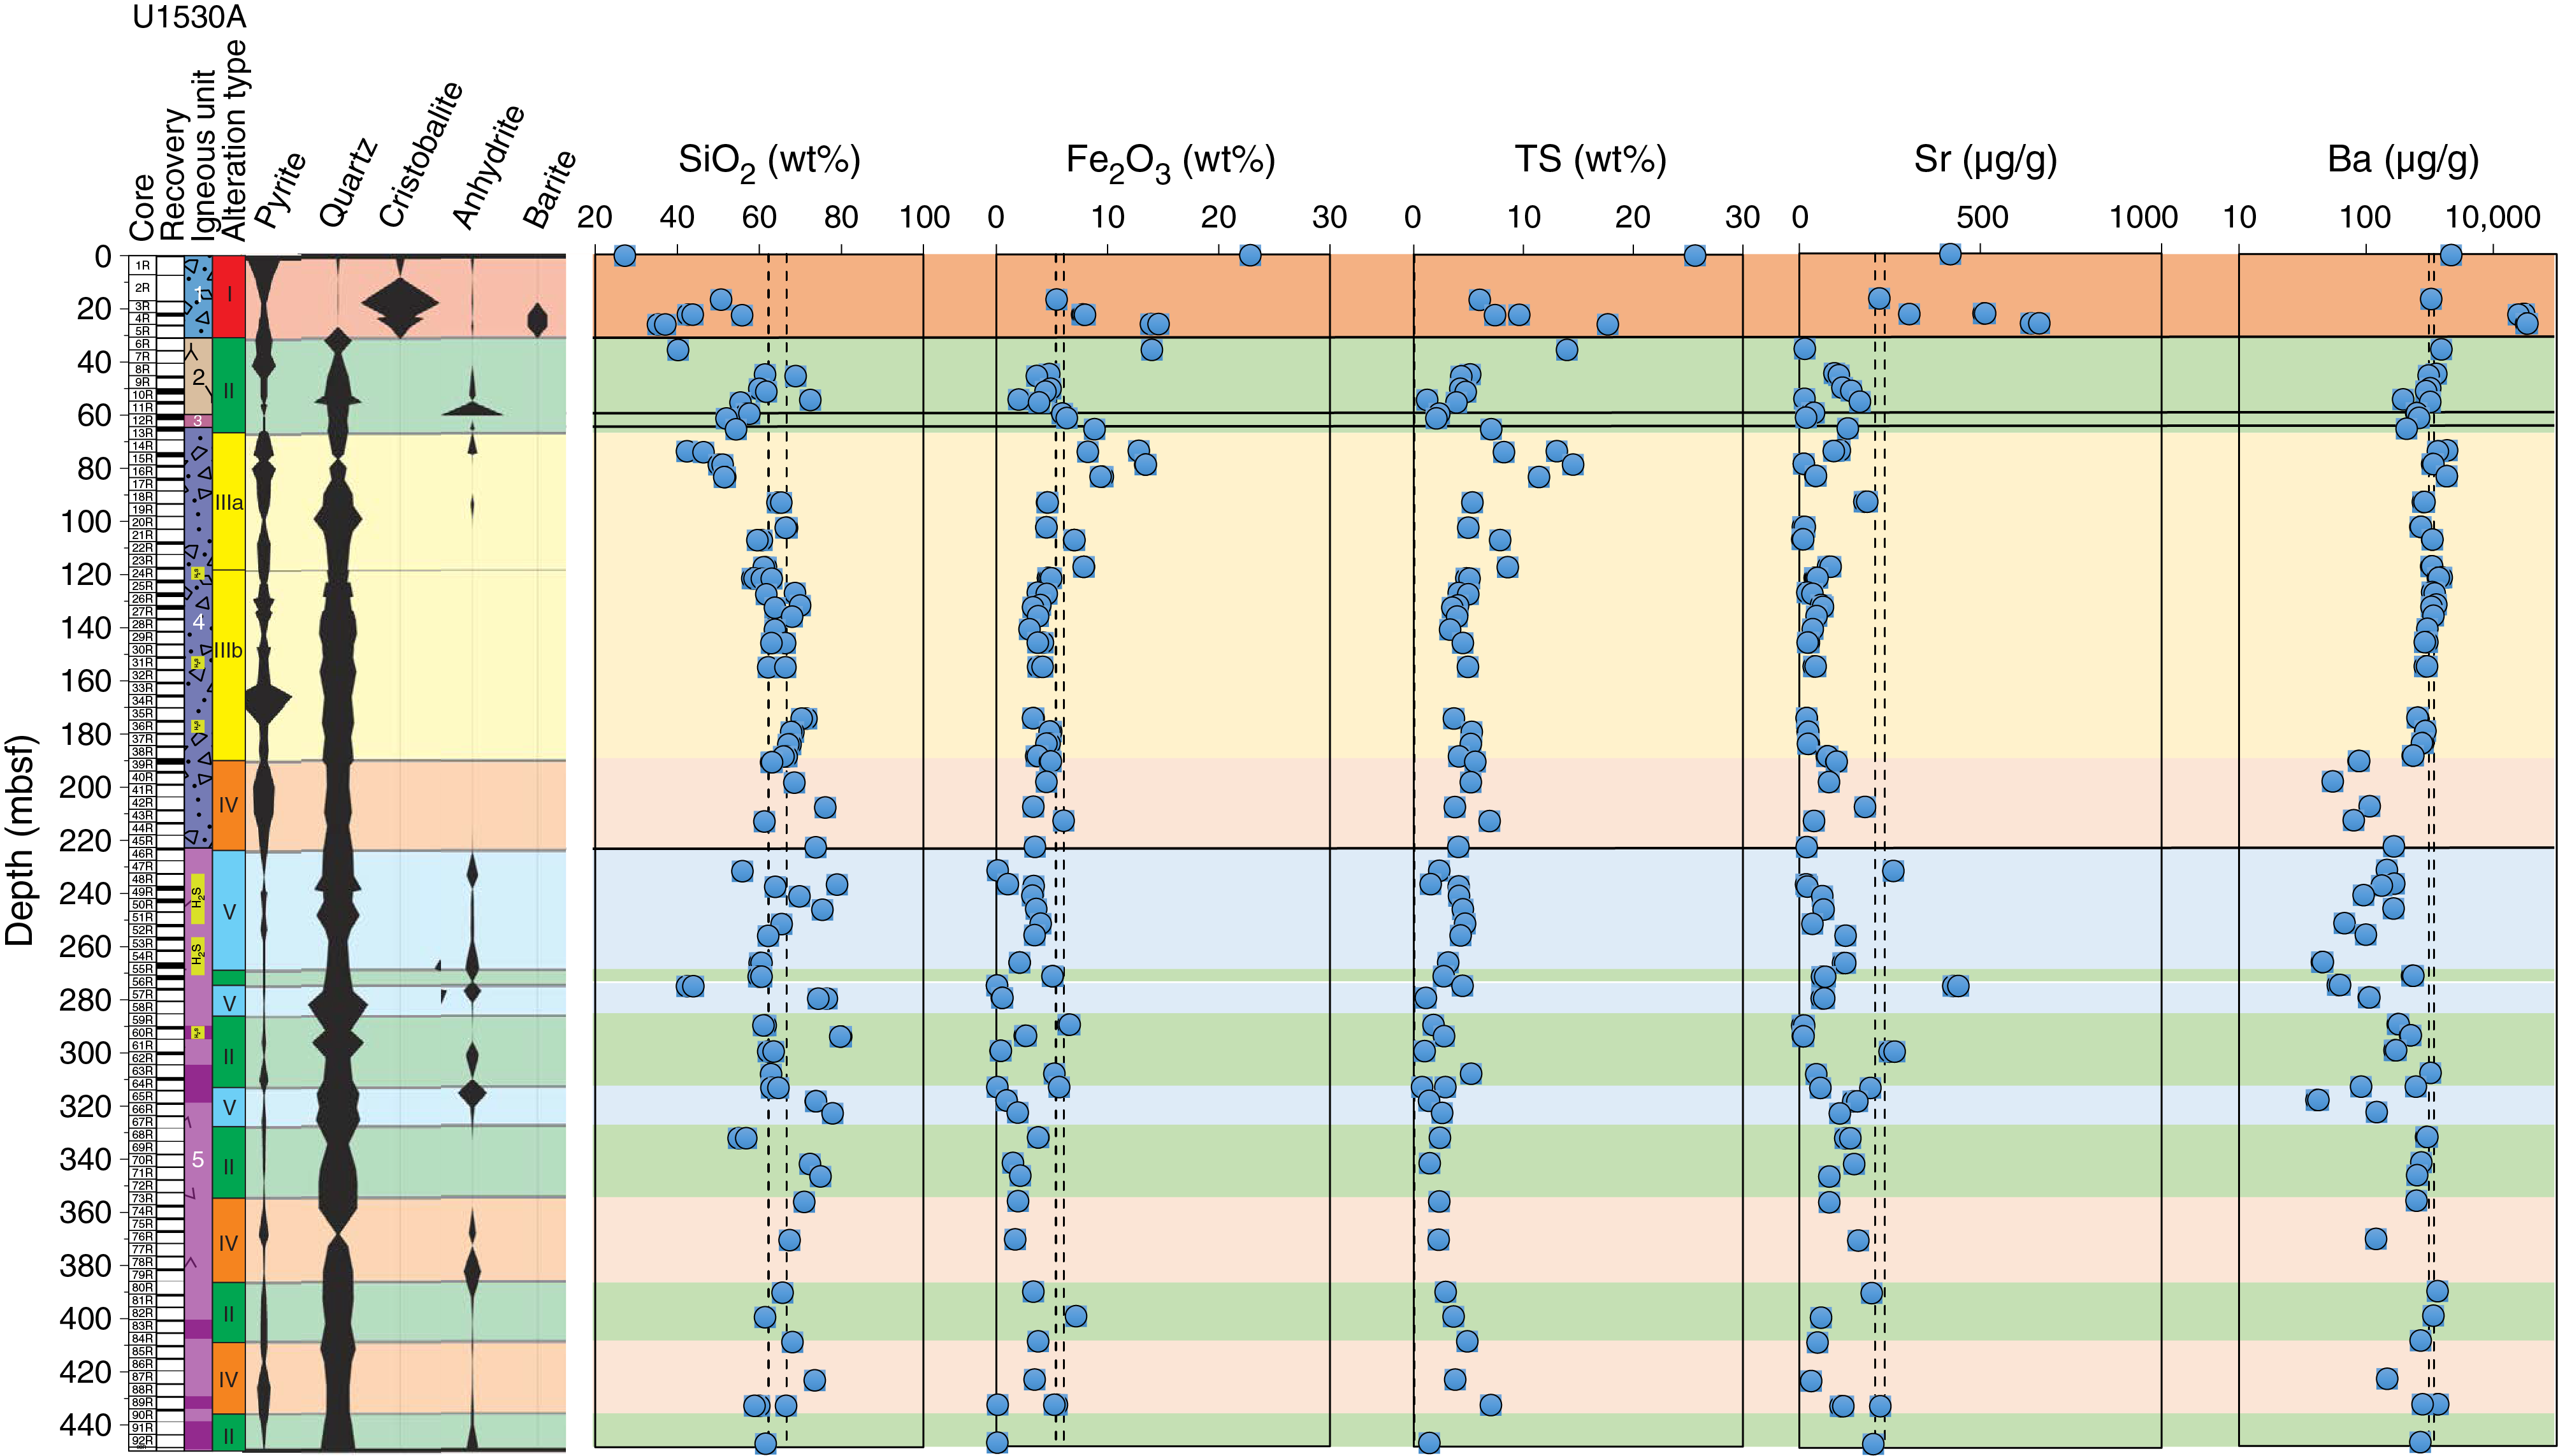
Figure F38. Downhole plots of SiO2, Fe2O3, TS, Sr, and Ba concentrations, Hole U1530A.
Arguably the strongest geochemical characteristics in Hole U1530A occur between 189 and 191 mbsf and include distinctive changes in K2O concentrations (from ~3 to <0.1 wt%) that correspond to the transition to Alteration Type IV. This transition is also marked by a change in color from blue-gray to light gray and mineral assemblages rich in pyrophyllite. In general, K2O abundances throughout Hole U1530A reflect the presence of illite, which is particularly abundant in Alteration Subtypes IIIa and IIIb (see Alteration). Hence, the abrupt decrease in K2O content deeper than 189 mbsf corresponds to the disappearance of illite in Alteration Type IV. The 190 mbsf interval is also marked by a decrease in Y/Zr, which is ubiquitously observed in Alteration Types IV and V. A decrease in Y/Zr is consistent with significant mobility of Y under hydrothermal conditions (Douville et al., 1999) and is probably associated with extensive dissolution of plagioclase and other igneous minerals at high temperatures.
Strong depletion in CaO was observed throughout Hole U1530A except for discrete intervals in Igneous Unit 5 that are also associated with higher Sr concentrations (Figure F39). Hence, these results, together with the identification of anhydrite by XRD (see Alteration), suggest that the abundance of CaO is mainly controlled by the occurrence of anhydrite. In contrast to Site U1528, which is characterized by very limited Ba mobility despite the extreme extent of alteration related to acidic fluids, Ba concentration at Site U1530 ranges from trace levels of about 20 mg/g in Alteration Types IV and V to very high abundances of about ≤3 wt% in Alteration Type I. The presence of barite as the principal mineral host for Ba in Alteration Type I is confirmed by XRD analysis and petrographic observations (see Alteration) and is also evidenced by the strong enrichment in Sr (Figure F39). In contrast, Alteration Types II and III show very limited Ba mobility and have average concentrations similar to unaltered dacites (~1060 mg/g). A marked depletion in Ba occurs at 189–191 mbsf, which corresponds to the transition interval between Alteration Types III and IV.
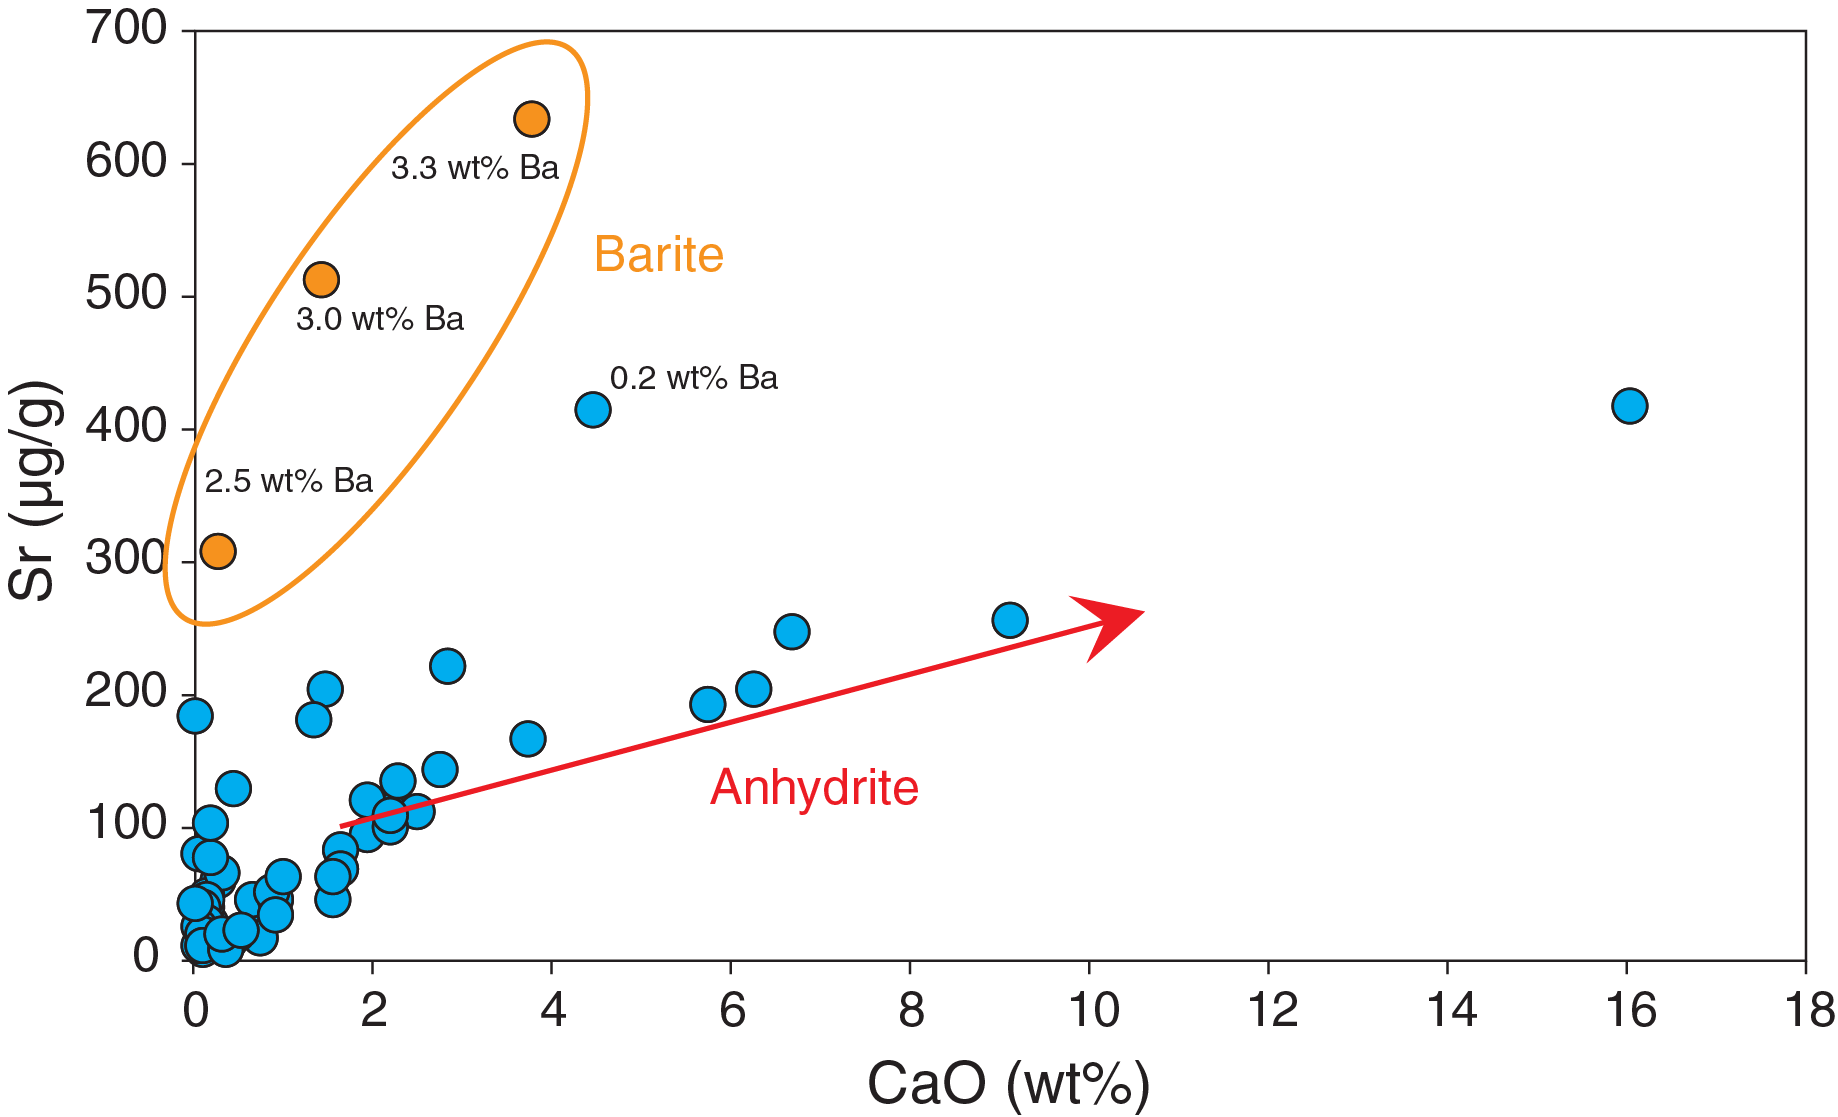
Figure F39. Sr vs. CaO, Hole U1530A.
A pronounced correlation between total sulfur and Fe contents was observed throughout Hole U1530A (Figure F40), in particular in the highest S-enriched Igneous Units 1, 2, and 4. A regression line with a slope of 0.866 suggests that Fe/S is identical, within uncertainty, to Fe/S in pyrite (Fe/Spyrite = 0.872 g/g). Hence, pyrite represents the primary form of S in the rock (predominantly in Igneous Units 1, 2, and 4), and an additional but minor proportion of Fe is hosted in smectite, chlorite, or illite, particularly in Igneous Unit 5.
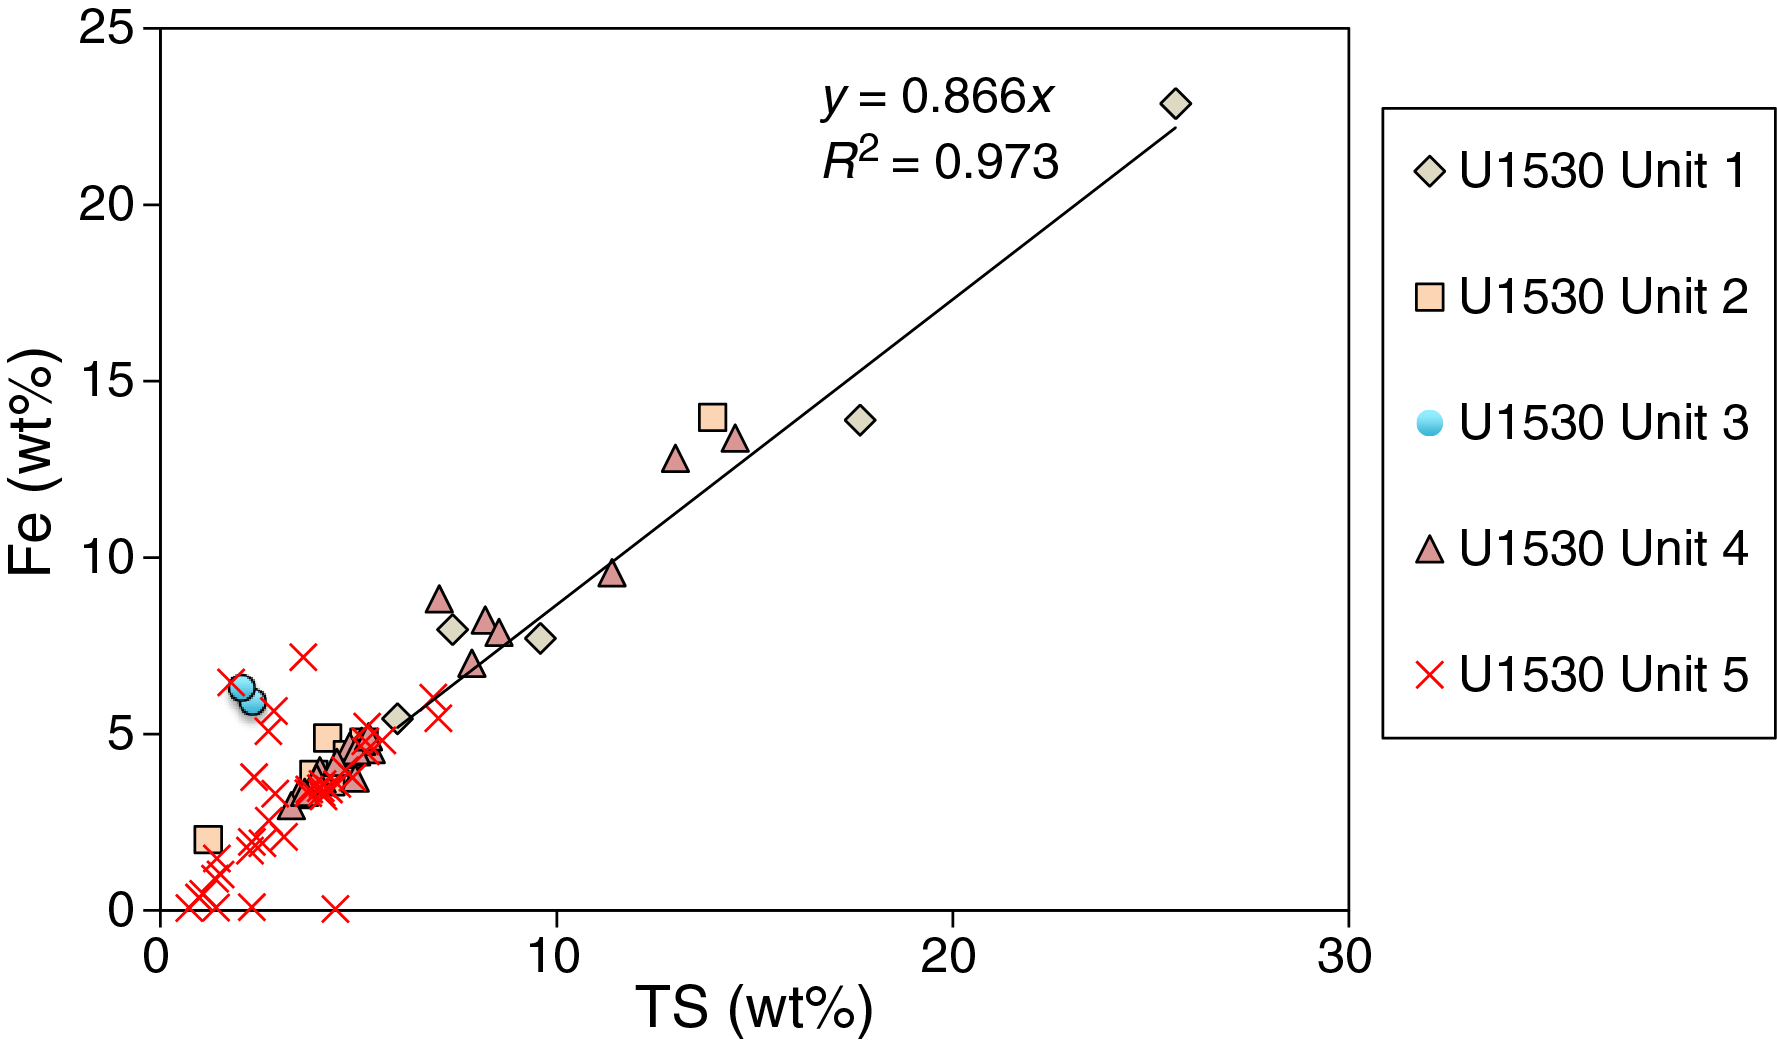
Figure F40. Fe vs. total sulfur, Hole U1530A.
The transition metals Cu and Zn were measured throughout Hole U1530A, whereas other trace metals and metalloids (i.e., As, Sb, Pb, Cd, Mo, and Se) were measured only in the uppermost 150 m of Hole U1530A (Figure F41). In general, the highest concentrations of transition metals and metalloids are observed in Igneous Unit 1, which is characterized by Alteration Type I. Sample 376-U1530A-5R-1, 39–41 cm, displays the highest enrichment in Cu and As (≤1762 and 658 mg/g, respectively), although no Cu-bearing phases were noted in Alteration Type I. Sample 4R-1, 124–129 cm, has ~5 wt% Zn, 276 mg/g Cd, and 101 mg/g Pb, and sphalerite was observed in hand specimen and thin section and detected by XRD. The presence of both Cu and As may suggest the occurrence of Cu sulfosalts that are commonly observed in felsic-hosted hydrothermal systems (Dekov et al., 2016). Interestingly, Mo and Se are significantly enriched only at the top of Igneous Unit 4 (≤582 and 74 mg/g of Mo and Se, respectively). The significant enrichment in Se is consistent with the presence of Bi and Au tellurides, as seen in seafloor chimneys from the NWC vent field (Berkenbosch et al., 2012), and/or a higher temperature of precipitation (Rouxel et al., 2004).
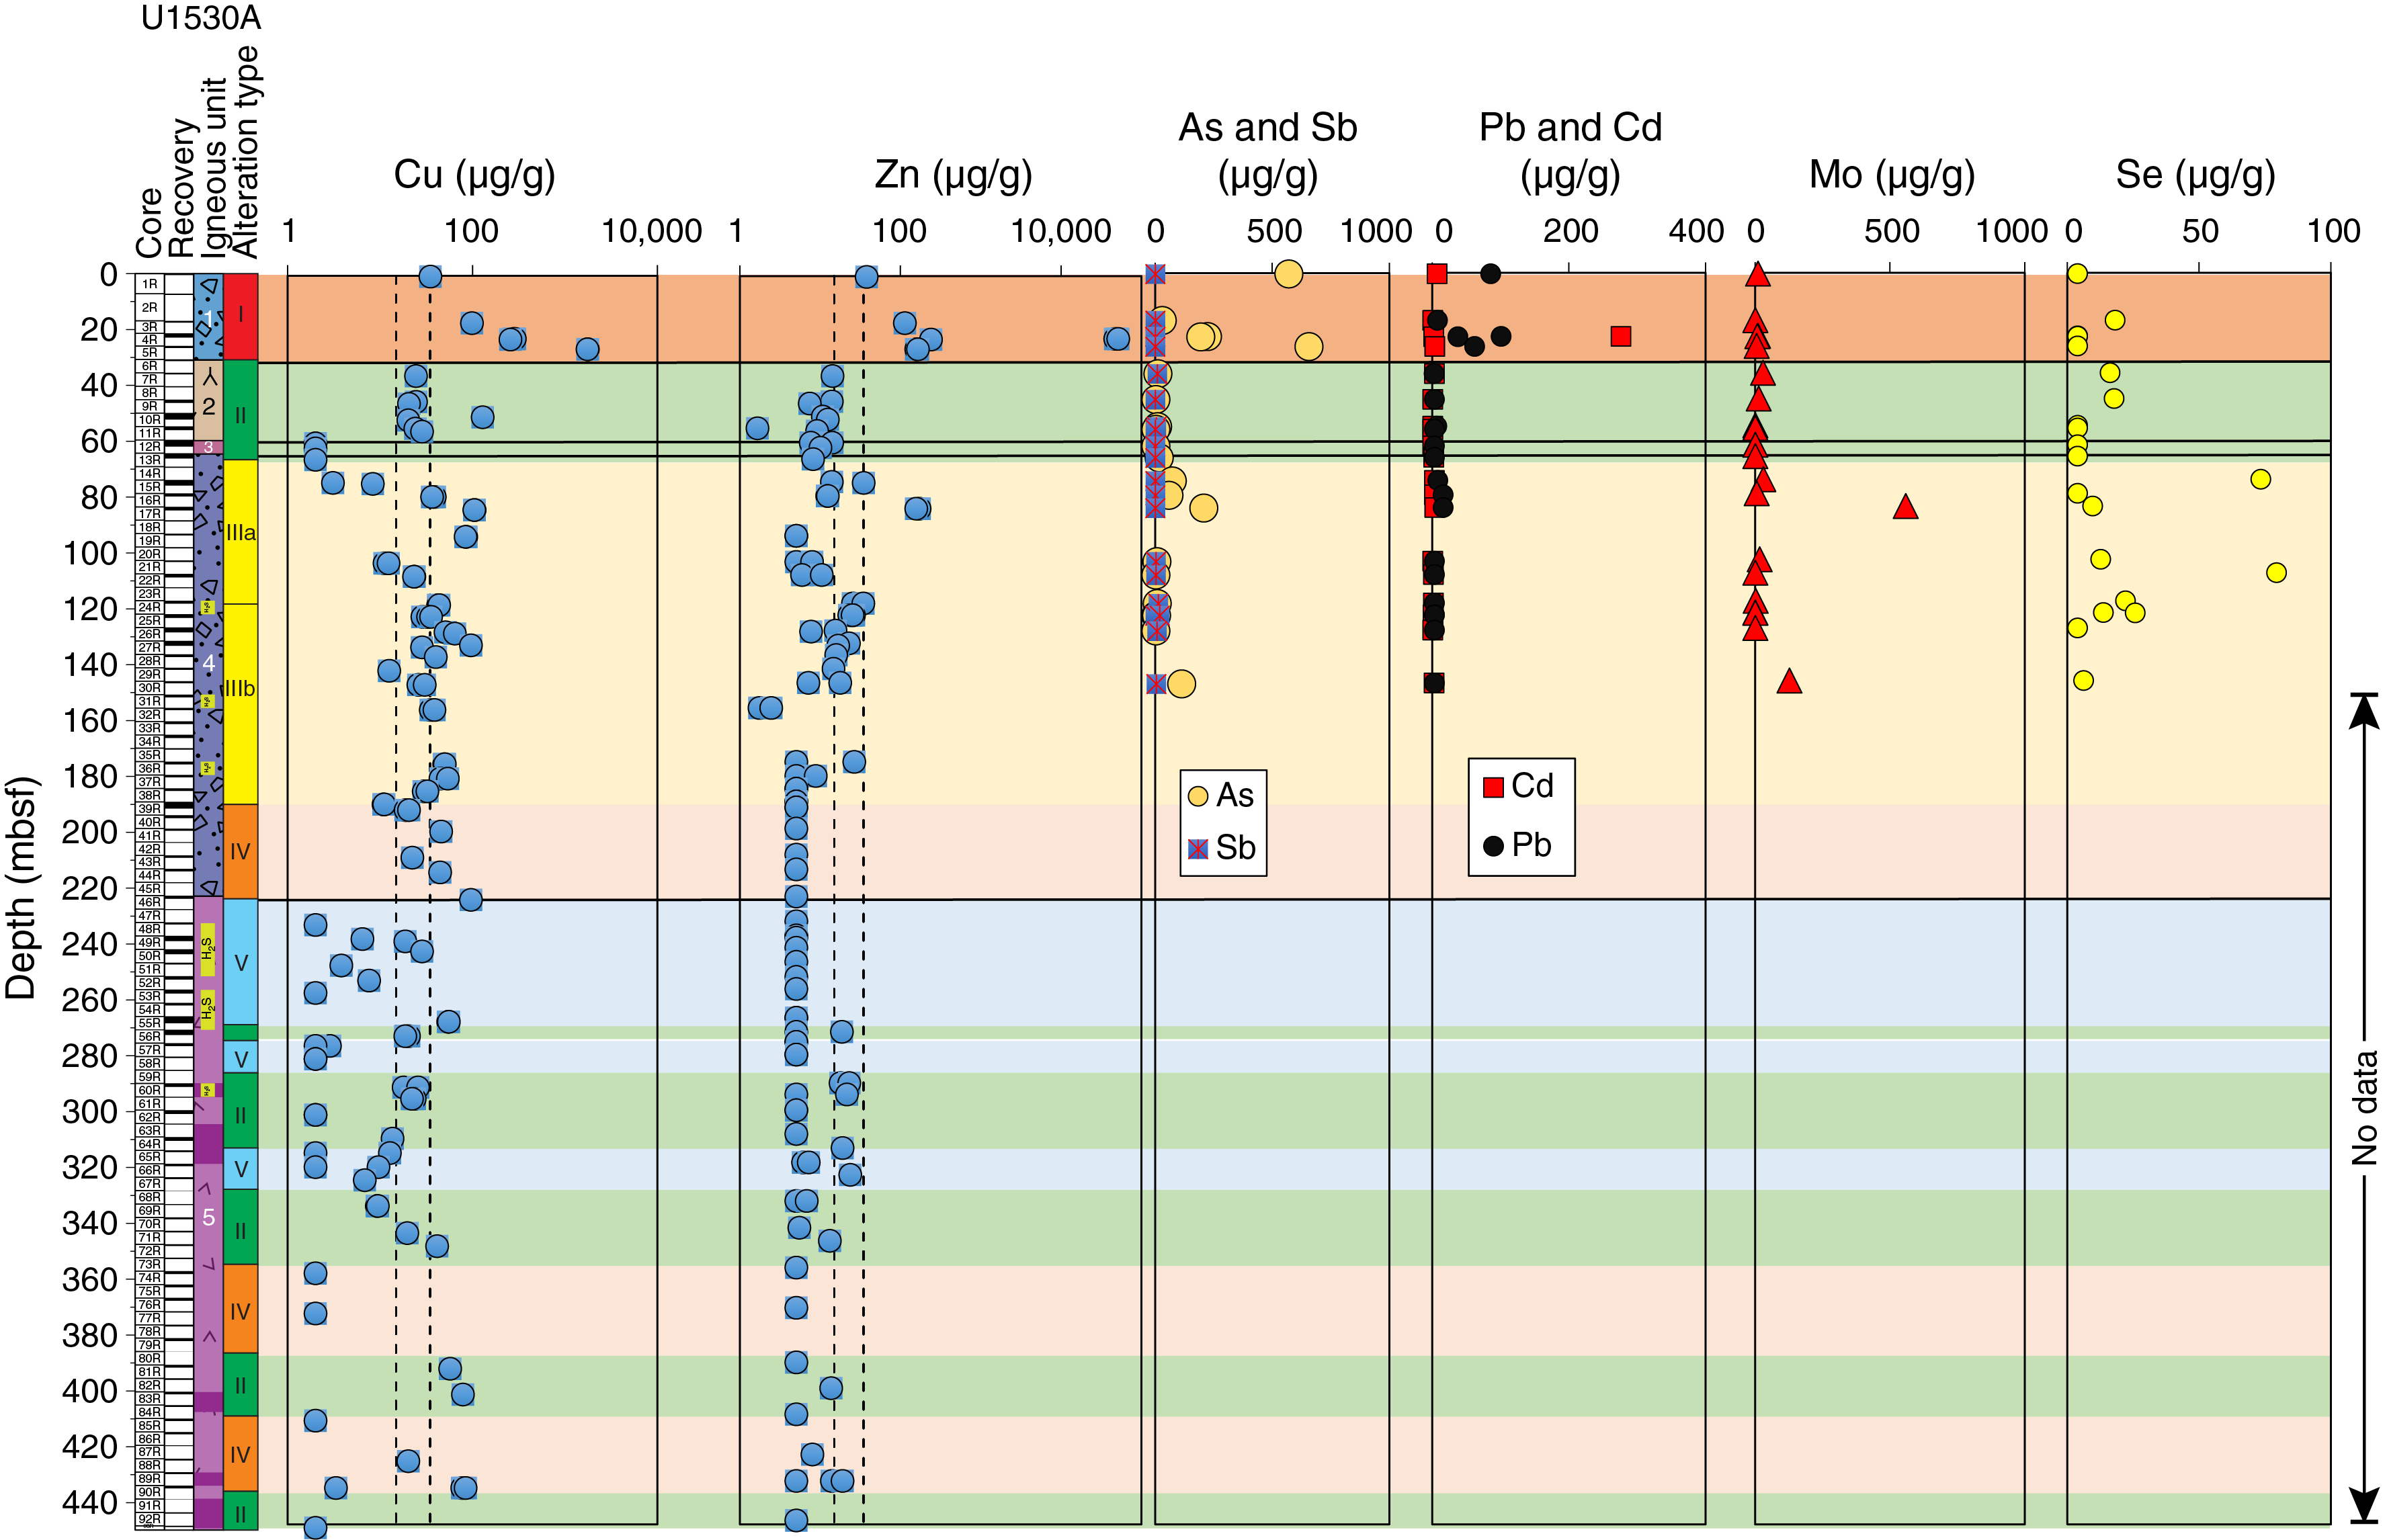
Figure F41. Downhole plots of Cu, Zn, As, Sb, Pb, Cd, Mo, and Se, Hole U1530A.
Synthesis and interpretation
To assess the bulk geochemical exchange during alteration, average compositions of alteration types for each igneous unit were compared with those of the unaltered protolith (Figure F42). All average data were normalized to the composition of unaltered dacites recovered in Igneous Unit 1 from Hole U1527A and from Site U1529 on the basis that unaltered dacitic materials recovered during Expedition 376 have very limited compositional variations. Altered volcaniclastic materials and lavas recovered from Hole U1530A show strong geochemical changes for a large range of elements and major losses of Mn, Ca, and Na. Alteration Types IV and V in Igneous Unit 5 form two important end-members and display the strongest depletion in Mg, Ba, Sr, Fe, Cu, and Zn. The reverse pattern is seen in Alteration Type I in Unit 1, suggesting that some of the loss of elements observed at the bottom of the hole may be balanced in part by the accumulation of these elements in the upper part of the hole.
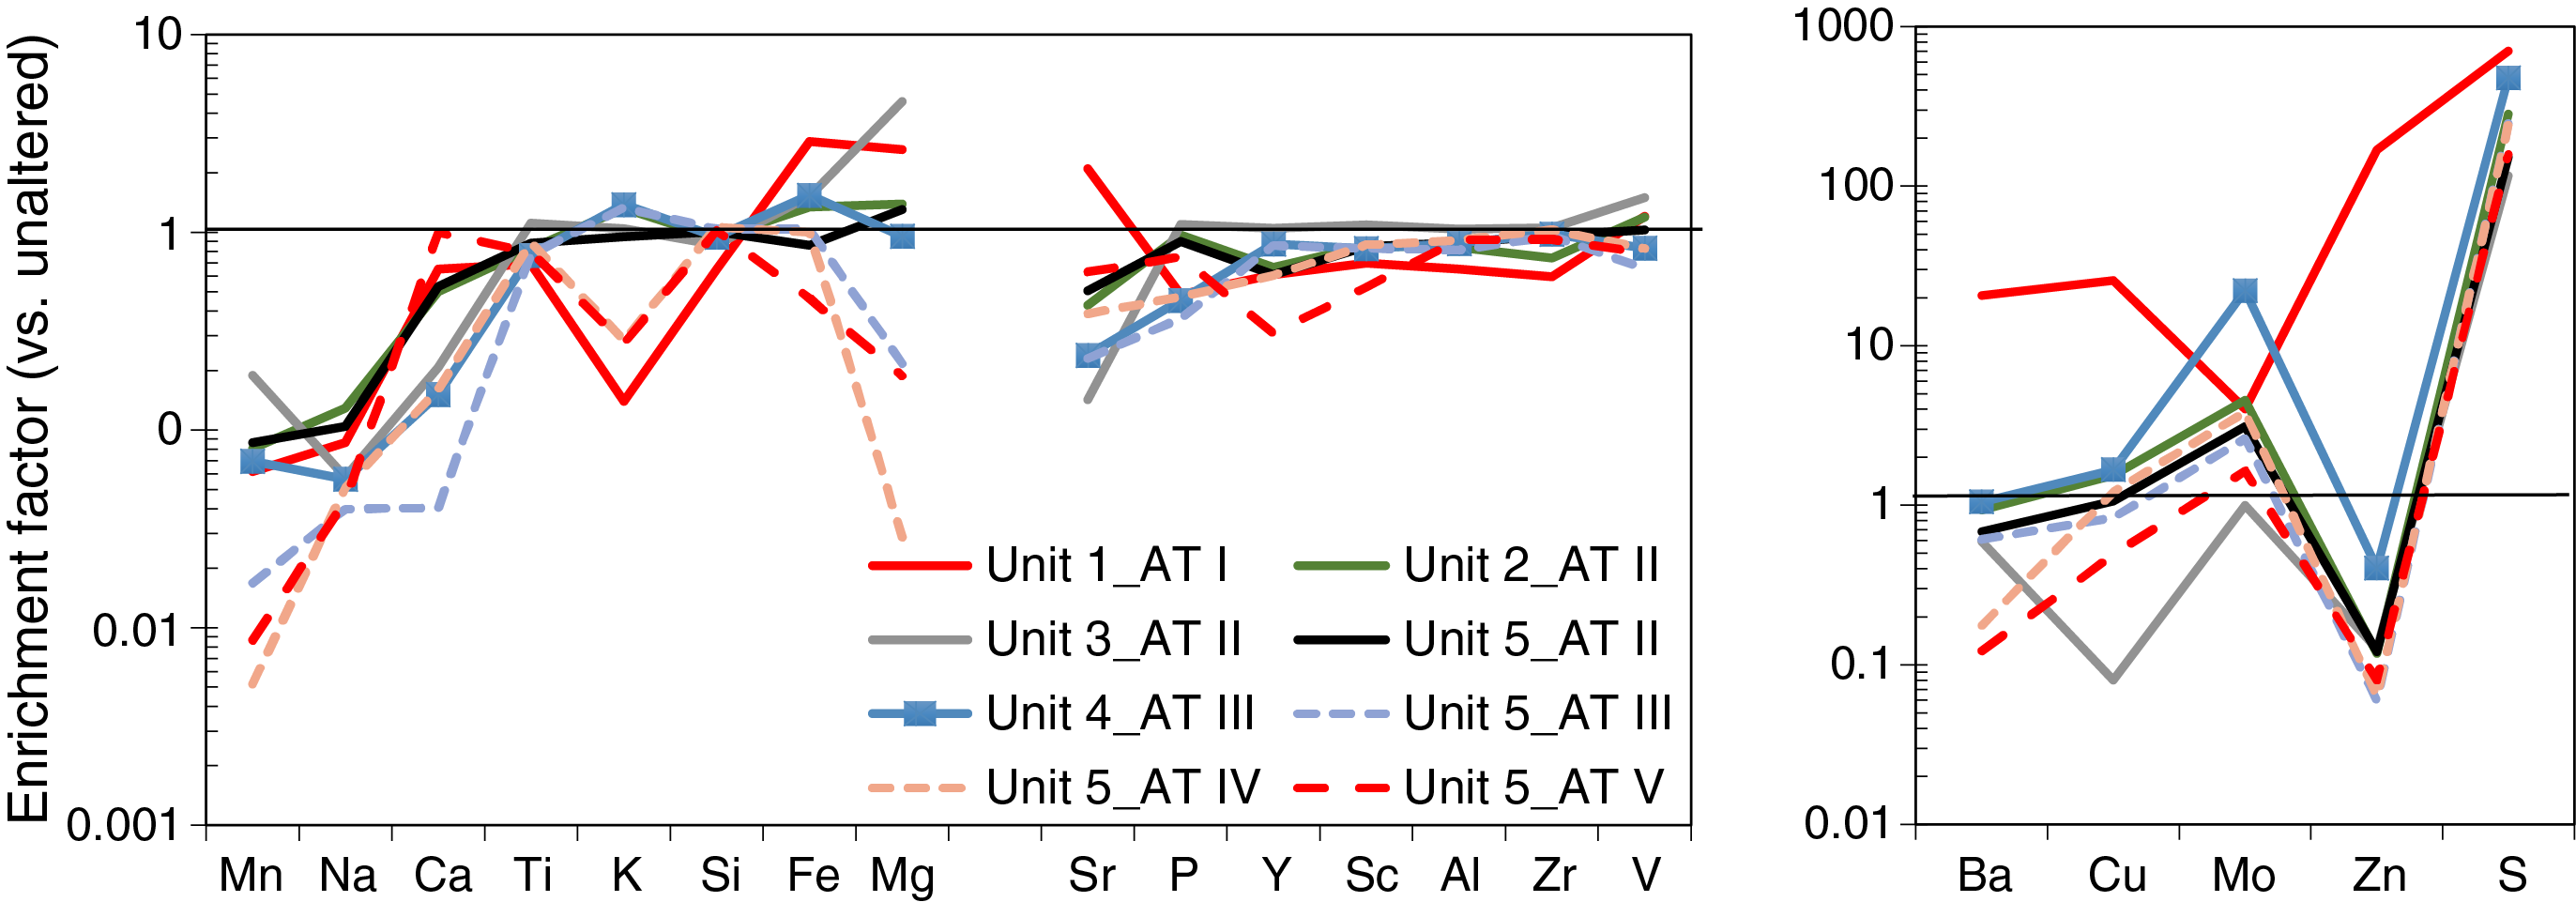
Figure F42. Chemical enrichment factors, Site U1530.
The loss of K, Ba, Y, and Cu deeper than ~190 mbsf (Alteration Type IV) and an increase in the magnitude of loss deeper than ~225 mbsf (Alteration Type V) corresponds to the first appearance of pyrophyllite and diaspore. Hence, both geochemistry and mineralogy tend to indicate a marked decrease in pH and increase in temperature (above ~250°C) of fluid-rock reaction (see Alteration). The observed mineral assemblages and associated geochemical trends have been produced by the circulation of hydrothermal fluids. It remains unclear, however, whether these fluids are genetically associated with the hydrothermal mineralization located in Igneous Unit 1. The occurrence of sphalerite and pyrite in close proximity to sulfate minerals (i.e., anhydrite) suggests that Unit 1 represents a mixing zone between rising hydrothermal fluid and seawater. The presence of sphalerite is suggestive of fluid temperatures less than 300°C (see Alteration). The enrichment in pyrite as well as Mo and Se at the top of Igneous Unit 4 may also be related to hydrothermal fluid upflow. Considering that Igneous Unit 2 (tuffaceous sediment) and Igneous Unit 3 (altered lava) lack significant pyrite and metal or metalloid enrichment, it is possible that both units acted as permeability barriers (i.e., cap rocks) and restricted the penetration of seawater into deeper units. It is important to note, however, that anhydrite veins occur throughout the hole, and their highest densities are found between 50–75 and 230–270 mbsf. This indicates that episodic pulses of fluids of different composition (e.g., seawater vs. magmatic-dominated hydrothermal fluids) moved through the system at different times (see Structural geology).
Headspace analysis of H2, CO, CH4, C2H6, ΣCO2, and acid-volatile sulfide
Pore space dissolved gas abundances including H2, CO, CH4, C2H6, and ΣCO2 were determined by headspace analysis of several intervals of the recovered cores from Hole U1530A (Table T11). As for Sites U1528 and U1531 (see Geochemistry in the Expedition 376 methods chapter [de Ronde et al., 2019a]), the concentrations of pore-fluid acid-volatile sulfide (AVS) were also measured.
As at Sites U1527–U1529 and U1531, dissolved C2H6 concentrations are below the detection limit (<0.03 µmol/L) for all sampled depths in Hole U1530A. Five intervals with elevated H2, CH4, CO2, and AVS concentrations occur at 7.25–26.2, 108.2–127.2, 156.0–175.5, 272.4–300.8, and 424.8–434.6 mbsf (Table T11; Figure F43). The H2S and CO2 concentrations in the end-member hydrothermal fluids of the NWC site are 2.2–7.8 mmol/L for H2S and 17.3–42.8 mmol/L for CO2 (de Ronde et al., 2011). The maximum pore space AVS and ΣCO2 concentrations of 1.58 and 36.6 mmol/L, respectively, are similar to those previously determined by de Ronde et al. (2011) for actively venting fluids at the NWC vent field. It is thus possible that the five zones of high pore space gas concentrations identified in Figure F43 represent trapped subseafloor hydrothermal fluids with gas compositions similar to those being expelled by black smoker chimneys today. In addition, the spatial distributions of these gas anomalies are vertically restricted, and some of them are co-aligned with zones in the cores that show a greater intensity of veins and fractures.
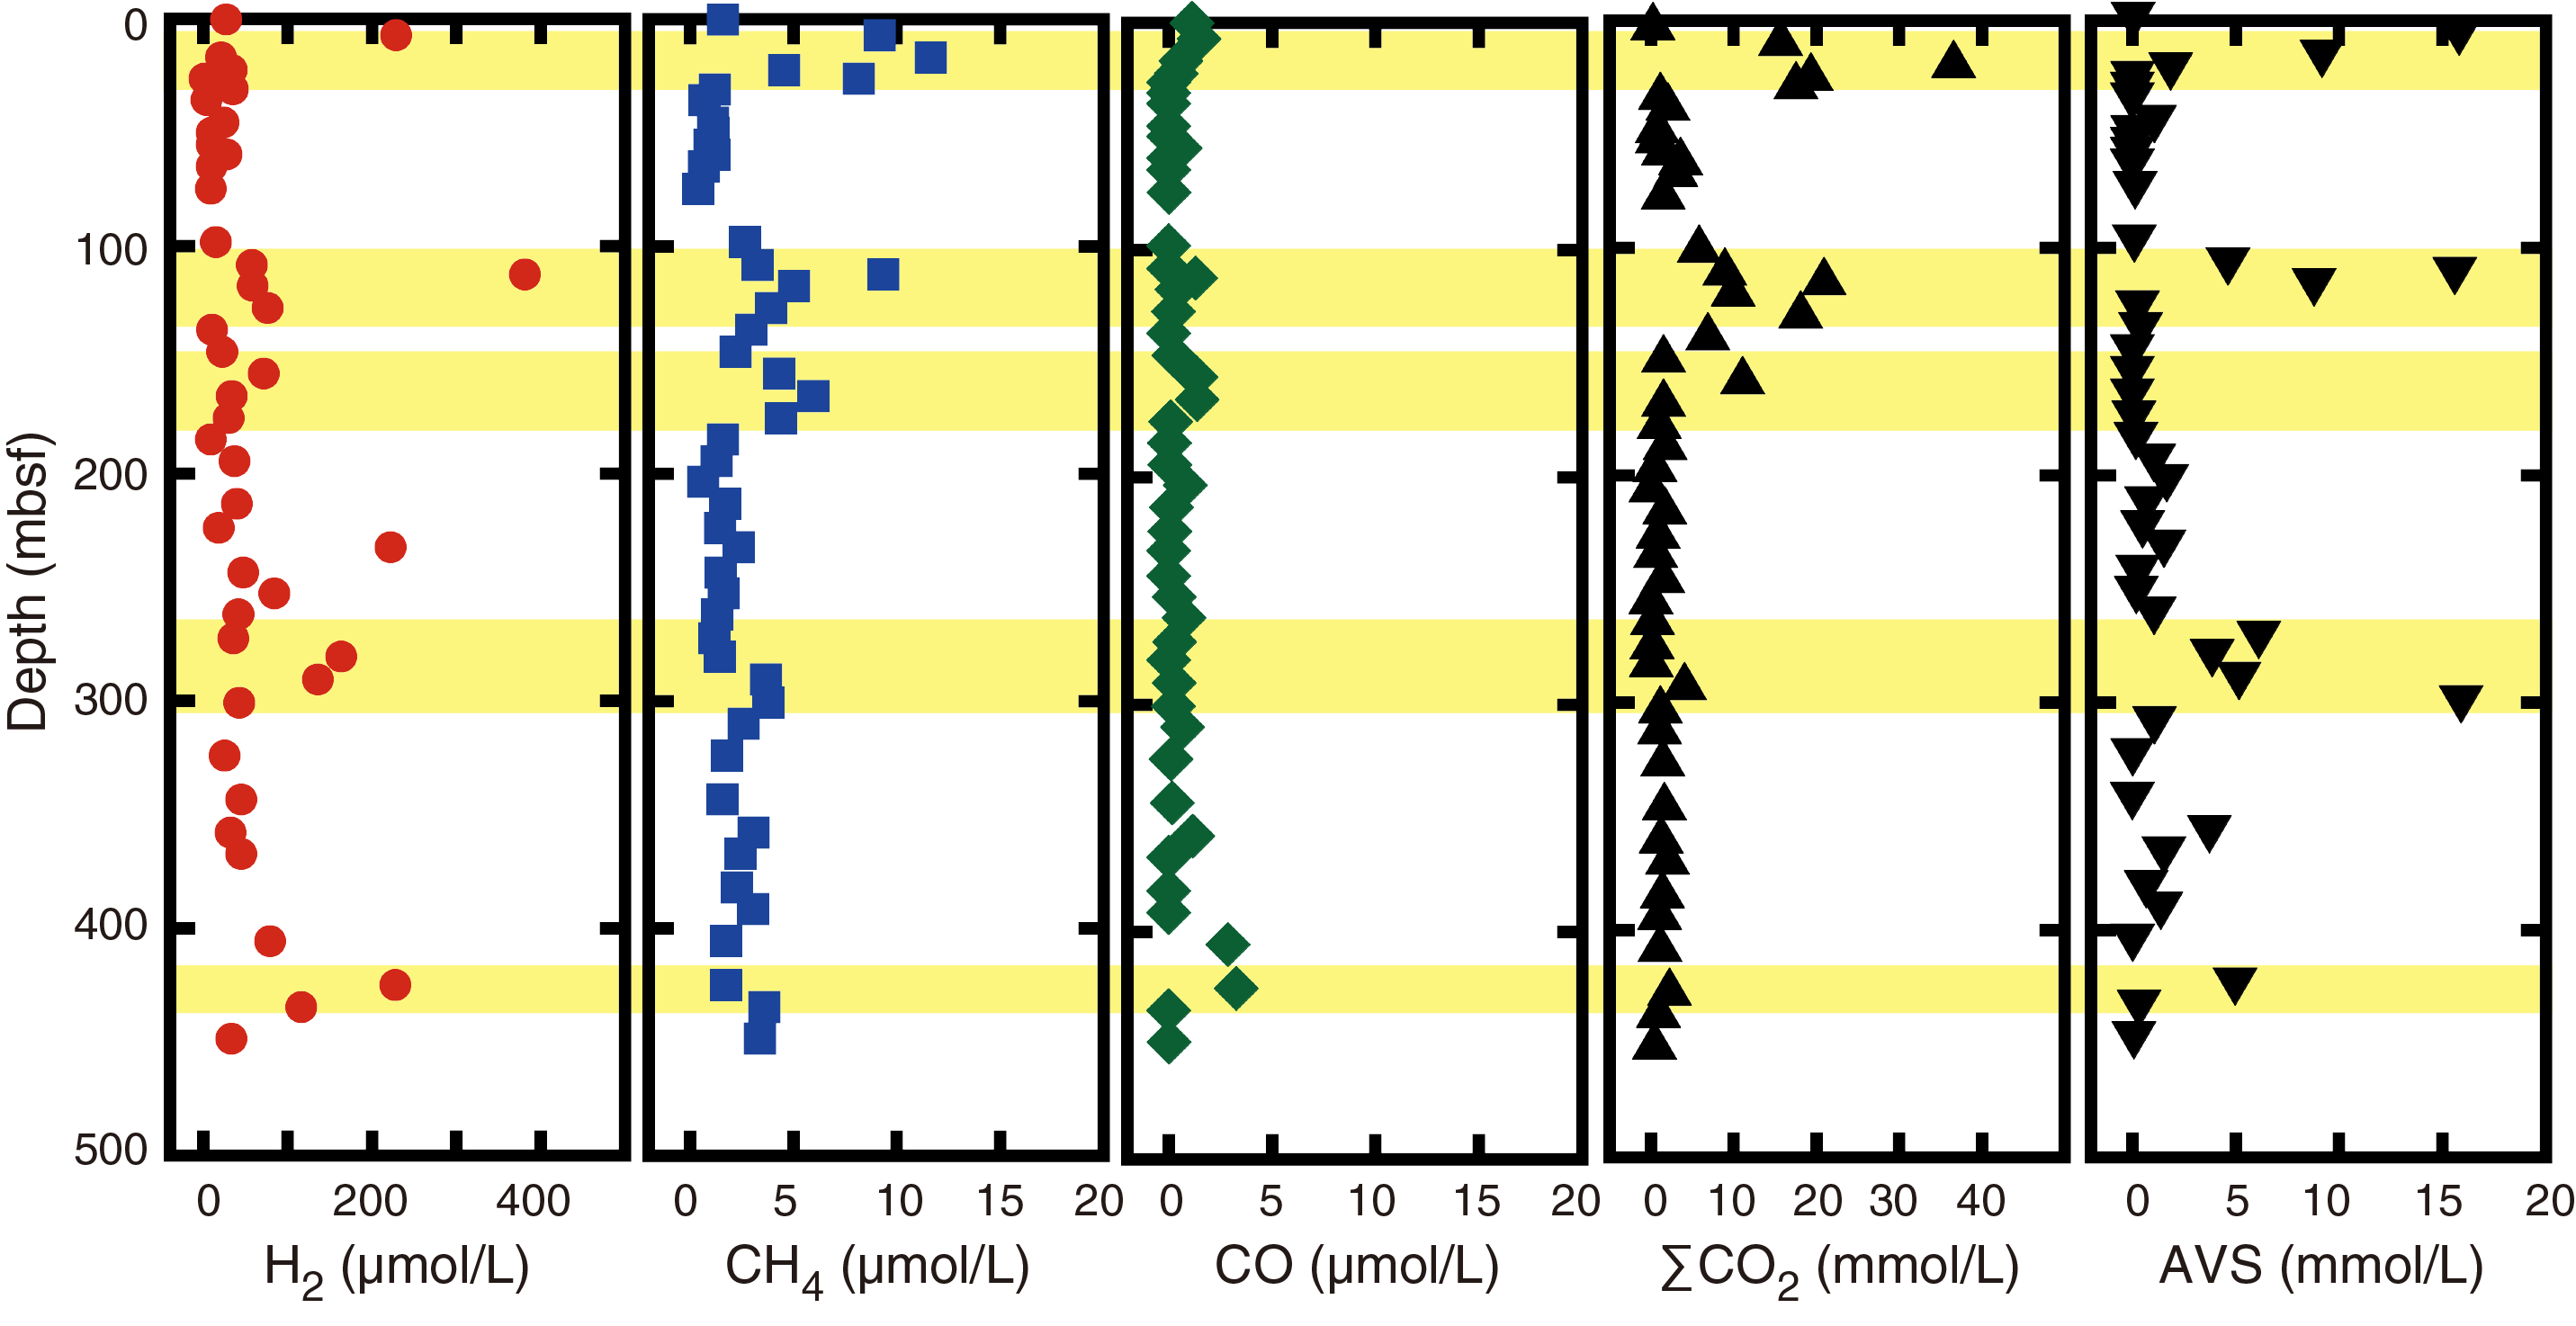
Figure F43. Pore space gas concentrations, Hole U1530A.
Variations in pore space concentrations of H2, ΣCO2, and AVS from Sites U1527 and U1530, which are associated with the NWC field, were compared with those at Site U1528 on the Upper Cone (Figure F44). Only relatively high concentrations of H2 (>1 µmol/L), ΣCO2 (>2 mmol/L), and AVS (>10 µmol/L) are shown in Figure F44.
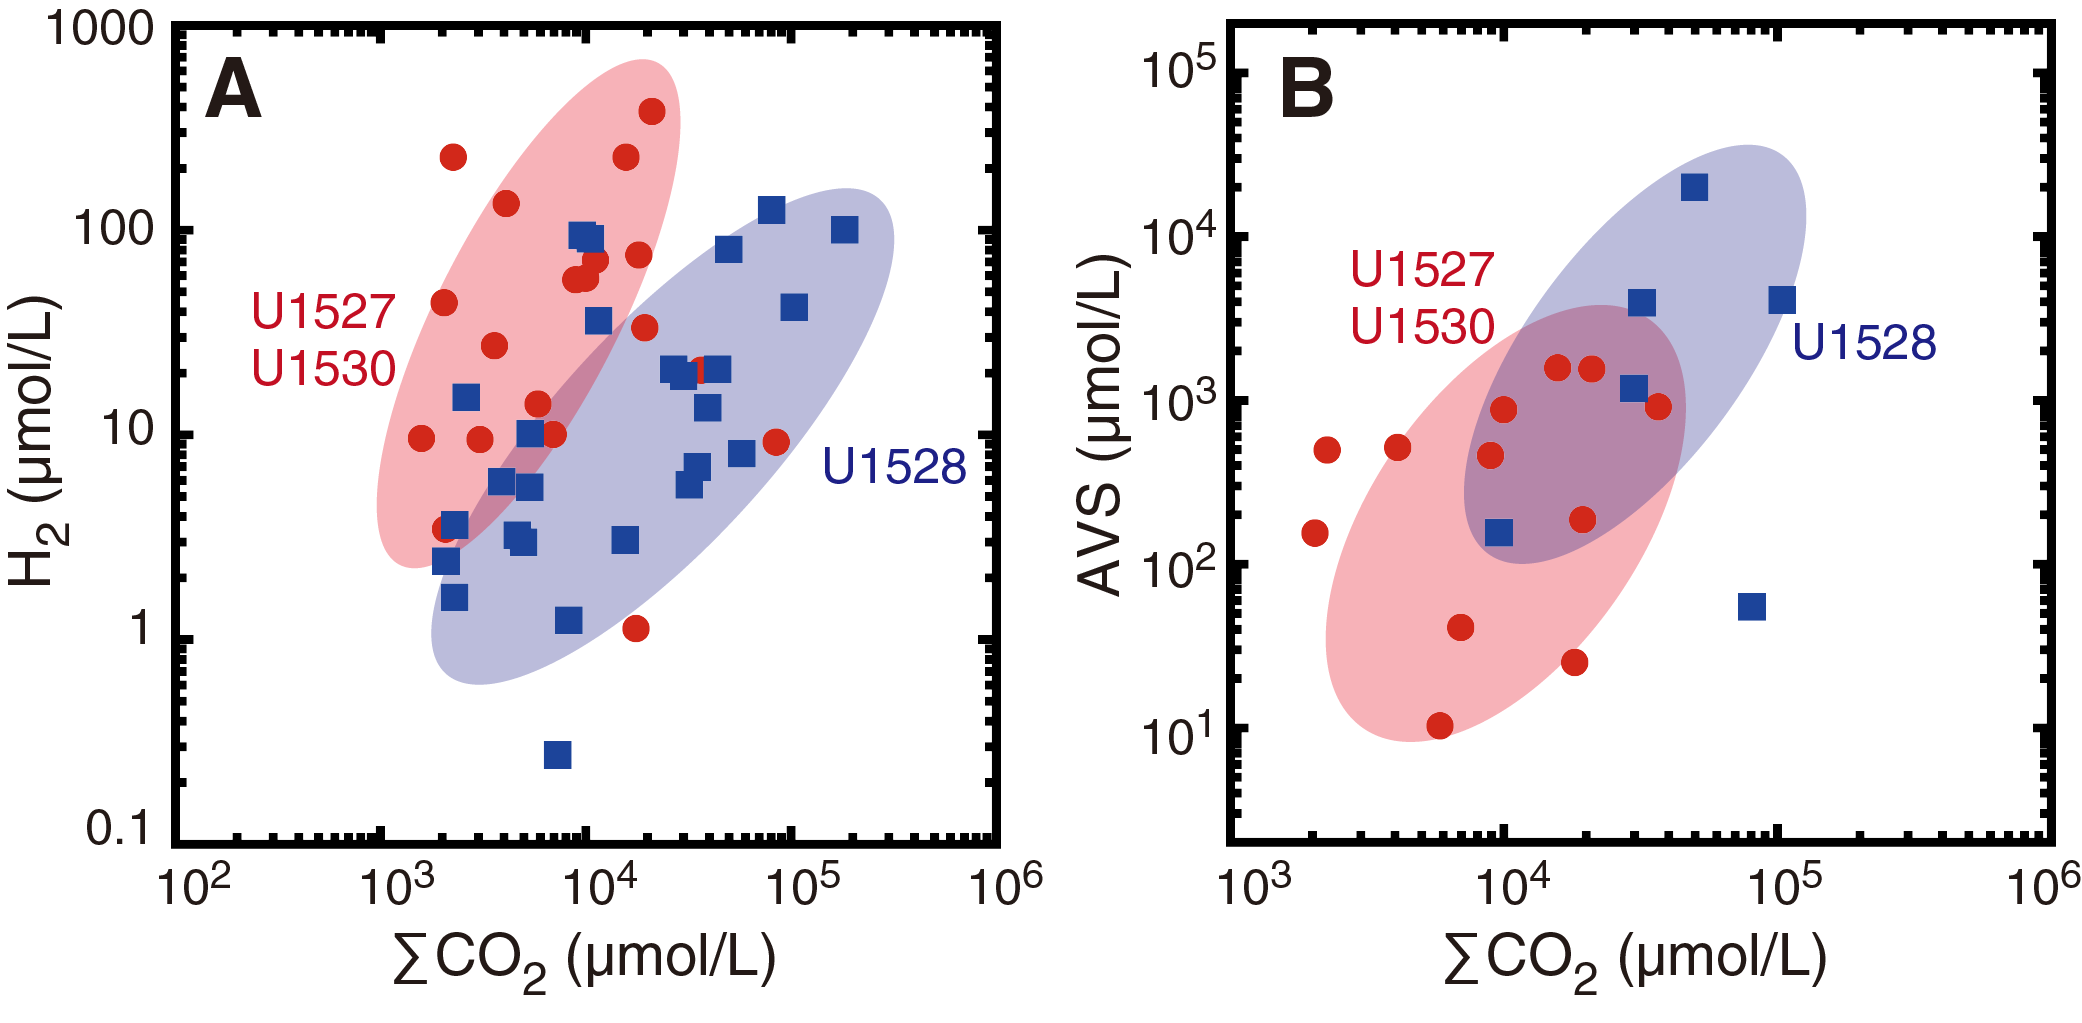
Figure F44. H2, ΣCO2, and AVS in pore space gases at Sites U1527, U1530, and U1528.
Two distinct trends in H2 versus ΣCO2 were observed, one for Sites U1527 and U1530 of the NWC and the other for Site U1528 of the Upper Cone (Figure F44A). These trends describe the variation of the H2/ΣCO2 ratio observed in pore spaces in the subseafloor environment of the Brothers volcano hydrothermal system (Figure F44A).
In the ΣCO2 versus AVS diagram, ΣCO2 and AVS concentrations overlap at the NWC-associated Sites U1527 and U1530 and the Upper Cone Site U1528 (Figure F44). These results suggest that different gas components (e.g., H2, ΣCO2, and H2S) are the product of subseafloor processes that are driven by magmatic volatile input and water-rock reactions. In the Brothers volcano hydrothermal system, H2 and CH4 are likely derived from water-rock reaction, whereas ΣCO2 and H2S are sourced primarily from magmatic gases.
Borehole fluids
A fluid sample was collected with the 600 mL Kuster Flow-Through Sampler (FTS) tool at 435 mbsf (aligned with Core 376-U1530A-90R) by running the tool through the drill string. The in situ fluid temperature was estimated at <38°C based on downhole temperature logging with the ETBS that preceded the collection of the fluid sample by 5 h (see Downhole measurements). Samples were extracted and processed immediately after recovery of the 600 mL Kuster FTS tool and were concluded within 2–5 h.
The BF sample is slightly acidic relative to seawater, has a pH value of 6.8, and is characterized by the same major and minor species composition (dissolved Na, K, Ca, Sr, Mg, Cl, Br, and SSO4) as drilling fluid (surface seawater) within analytical error (Table T12). Dissolved ΣH2S is below detection. The abundances of several metal species are highly elevated above seawater abundances, including dissolved Fe (138 μmol/L), Mn (14.9 μmol/L), Cr (7.21 μmol/L), and Ni (100 μmol/L) as well as total Fe (367 μmol/L), Mn (15.7 μmol/L), Co (0.170 μmol/L), Cr (7.16 μmol/L), and Ni (123 μmol/L) (Table T13). These metals are associated closely with the composition of steel and are likely derived from contamination by the steel drill string and bit during drilling. The seawater-like composition of the sample may be due to recent flushing of the borehole with pumped drilling fluid or may be a result of downwelling of seawater through the drill string. This latter interpretation is consistent with the observation that the temperature profile and the occurrence of Fe oxyhydroxides on the surface of rocks recovered at depth in the borehole may indicate a zone of fluid recharge into the crust (see Downhole measurements).
Paleomagnetism
Magnetization directions and intensities were measured on oriented pieces larger than ~8 cm in archive halves from Hole U1530A using the superconducting cryogenic rock magnetometer. The overprint magnetization from drilling and coring (Richter et al., 2007) was reduced by using the inline AF demagnetizer up to 70 mT. We first measured each archive half using the cryogenic magnetometer in continuous sampling mode, and then we analyzed the largest oriented core pieces of the archive half using PuffinPlot v. 1.0.3 (Lurcock and Wilson, 2012). These are nonstandard measurements where discontinuous recovery compromises accurate measurements of the magnetization parameters because it contains all the continuous measurements from the entire archive halves, including small pieces. For this reason, care should be taken when calculating the magnetization direction and intensities from the data downloaded from the shipboard Laboratory Information Management System (LIMS) database. Nevertheless, this approach provided a rapid evaluation of the magnetic properties of the cores and enabled the shipboard discrete sampling to be optimized.
Detailed measurements of AMS, AF, TD, and IRM experiments were carried out on 65 discrete oriented samples (4 from Igneous Unit 1, 5 from Unit 2, 2 from Unit 3, 24 from Unit 4, and 30 from Unit 5) (Table T14) from the working halves. The samples subjected to TD were shared with the Physical Properties group for MAD measurements, which required them to heat the samples to 105°C. Room temperature measurements of NRM intensity were carried out before the MAD measurements. After MAD measurements, these samples were thermally demagnetized starting from an initial step of 110°C to erase any magnetic overprint resulting from MAD measurements.
Igneous Unit 1
Two AF and two TD experiments were carried out on samples from Igneous Unit 1 (Table T14). These samples are characterized by low NRM intensity (~10−3 A/m) except for Sample 376-U1530A-4R-1, 90–92 cm (Figure F45), which had an initial NRM intensity of ~0.3 A/m before demagnetization was measured. AF demagnetization experiments on the samples show stable primary magnetization components (Figure F45) with very shallow inclinations (approximately −10°). These values are consistent with the results of AF demagnetization on larger oriented pieces in the archive halves measured with the cryogenic magnetometer. Thermally demagnetized samples were then heated to a maximum temperature of 700°C. The samples show complex TD curves in which a stable magnetic direction is difficult to identify and a significant increase of NRM intensity after heating to >400°C (Figure F46). The mean MS values of the discrete samples from Igneous Unit 1, which were measured using the Agico Kappabridge KLY 4, are characterized by small values (~10 × 10−5 SI) except for the samples measured from Section 4R-1, where MS values are more intense (~1000 × 10−5 SI). These values are consistent with the continuous MS measurements (see Physical properties).
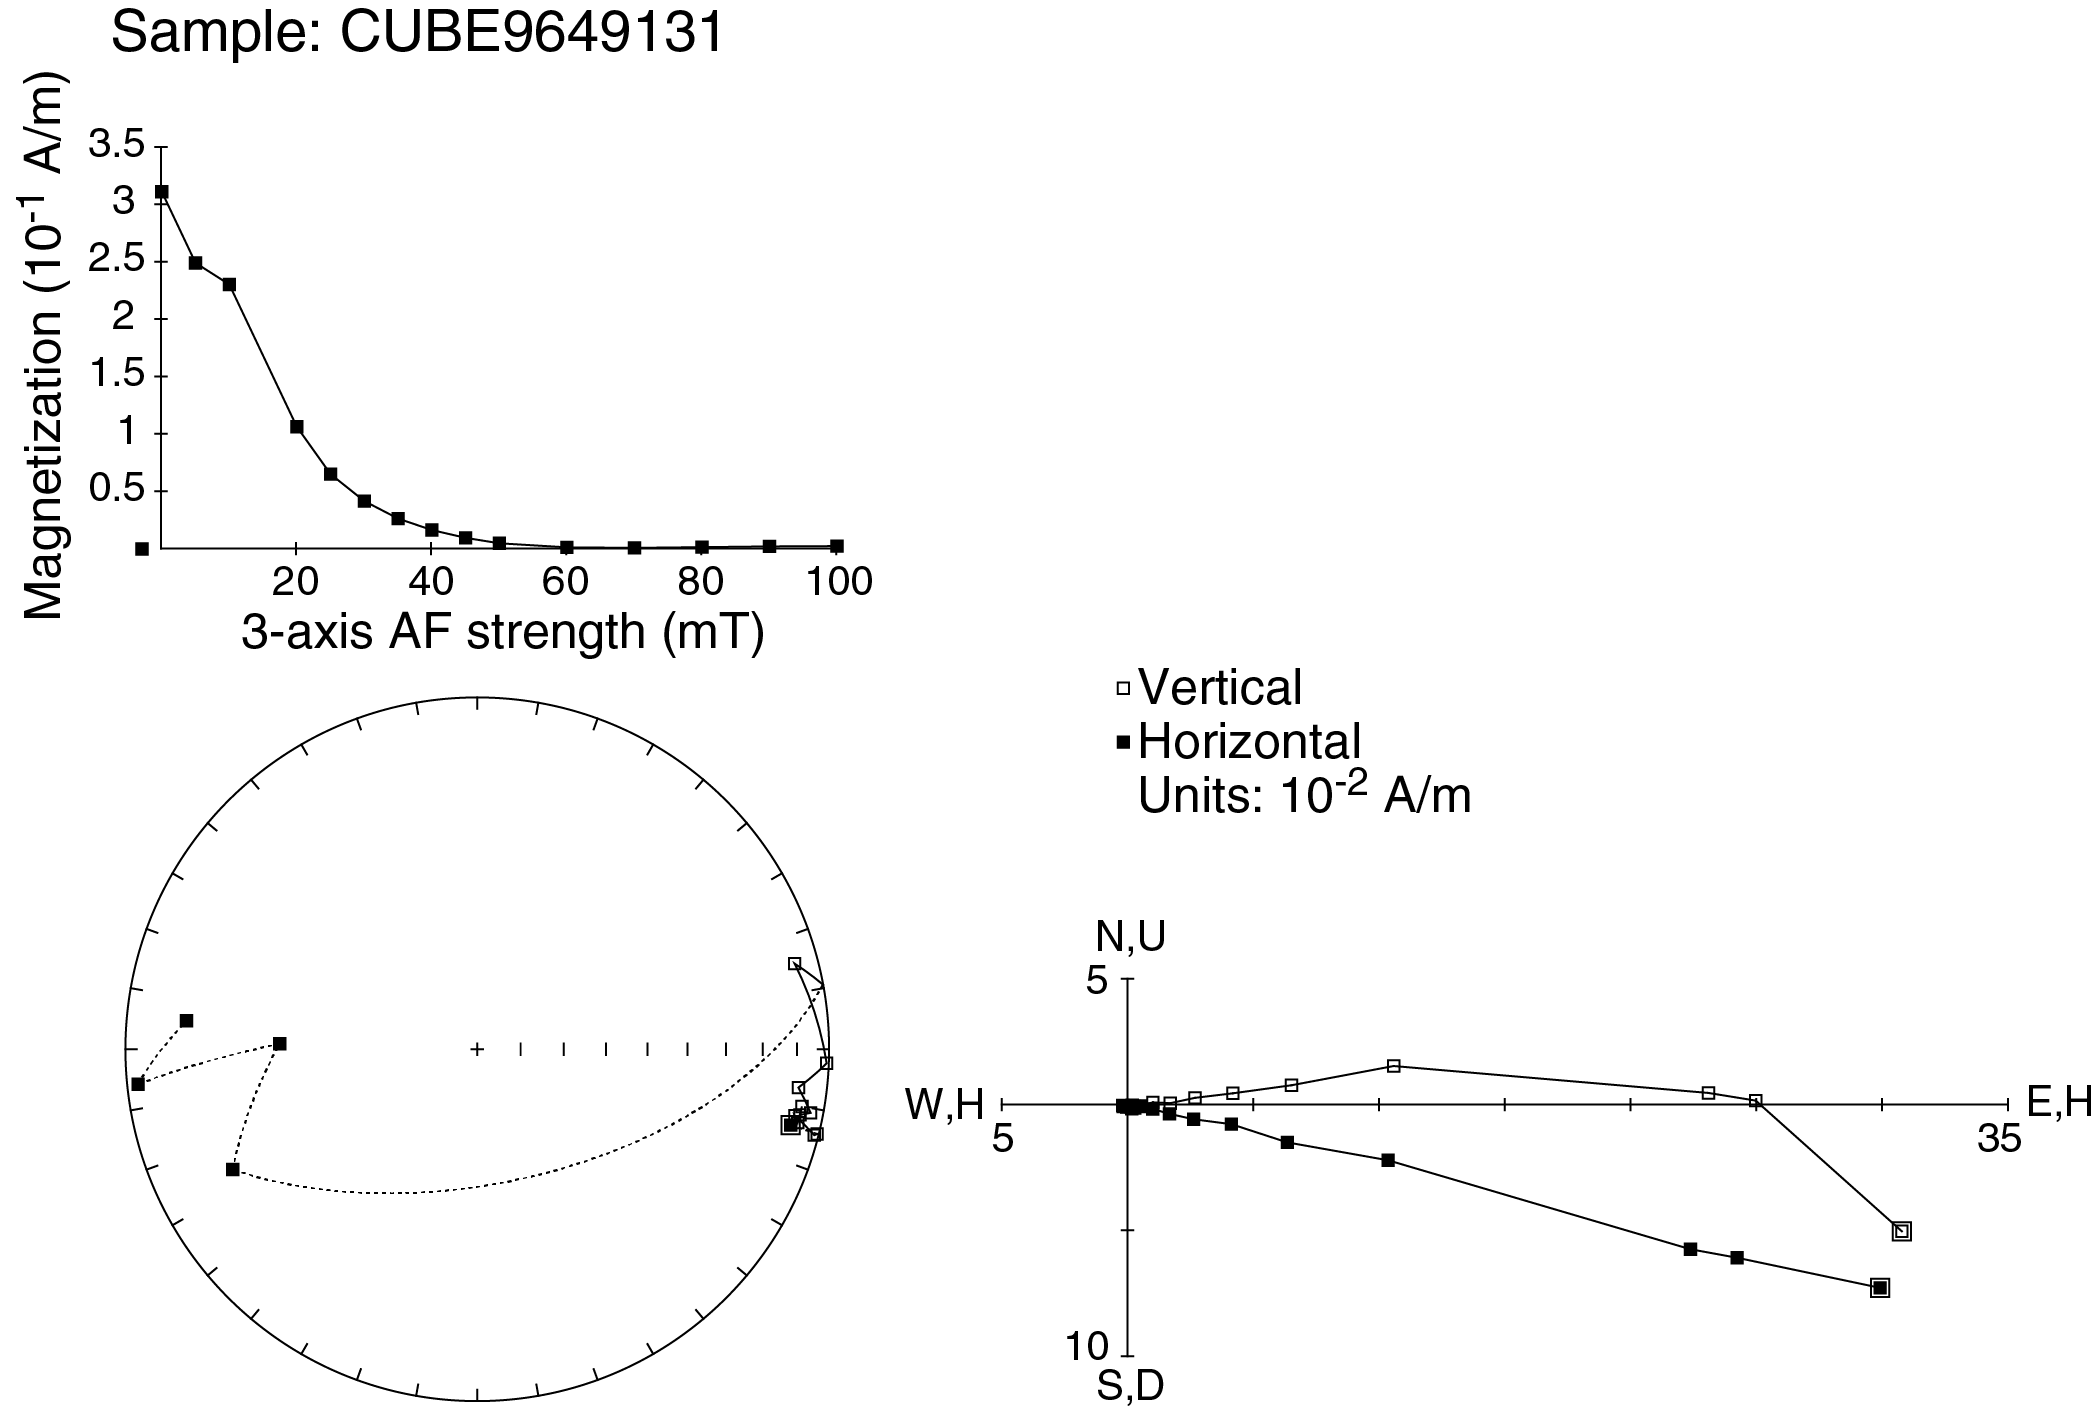
Figure F45. AF demagnetization in Sample 376-U1530A-4R-1, 90–92 cm, Igneous Unit 1.
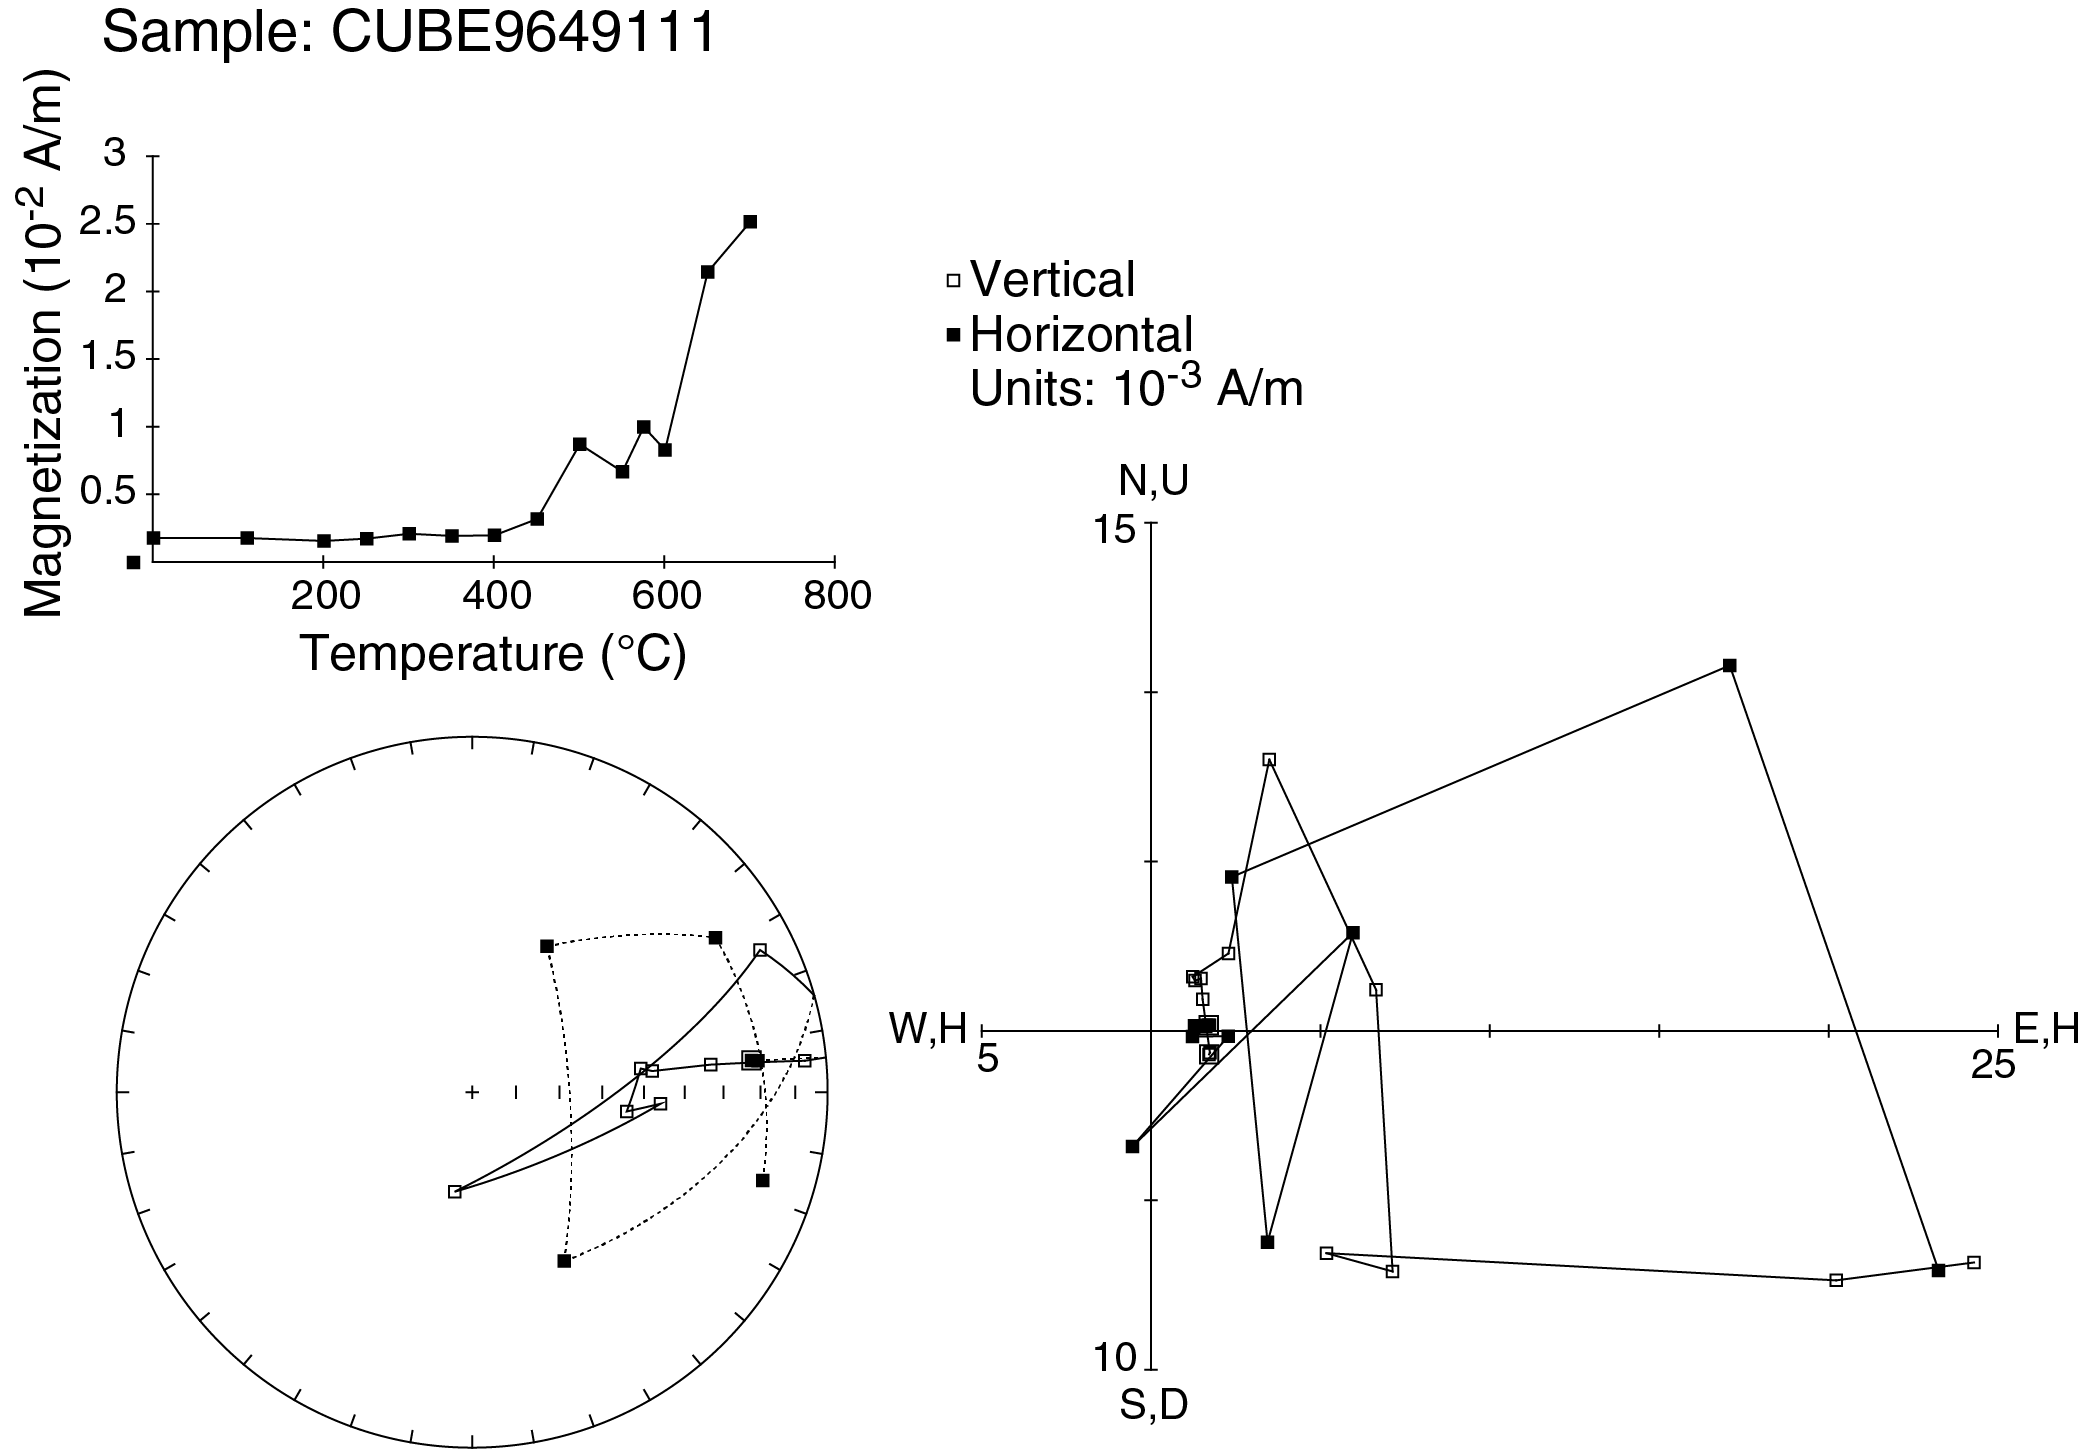
Figure F46. TD experiment on Sample 376-U1530A-1R-1, 26–28 cm, Igneous Unit 1.
Igneous Unit 2
Two AF and three TD experiments were carried out on discrete samples from Igneous Unit 2 (Table T14). These samples show very low NRM intensities (~10−4 A/m) before demagnetization. Furthermore, plots of the AF demagnetization experiments show complex shapes (Figure F47) with positive inclinations of ~45°. Similar positive inclination values were also measured with the cryogenic magnetometer after AF demagnetization of the larger oriented pieces in the archive halves. The TD experiments, which reached a maximum temperature of 700°C, are quite complex and show scattered directions of magnetization from which it is difficult to extract a stable primary component (Figure F48). These TD experiments also show a significant increase in NRM intensity after heating to >400°C. However, for temperature steps <400°C, the sample in Figure F48, for example, is also characterized by a positive value of inclination. Discrete samples from Igneous Unit 2 are characterized by low MS values (~10 × 10−5 SI) measured using the Agico Kappa Bridge KLY 4. These values are consistent with the continuous MS measurements on the cores (see Physical properties).

Figure F47. AF demagnetization in Sample 376-U1530A-10R-1, 77–79 cm, Igneous Unit 2.
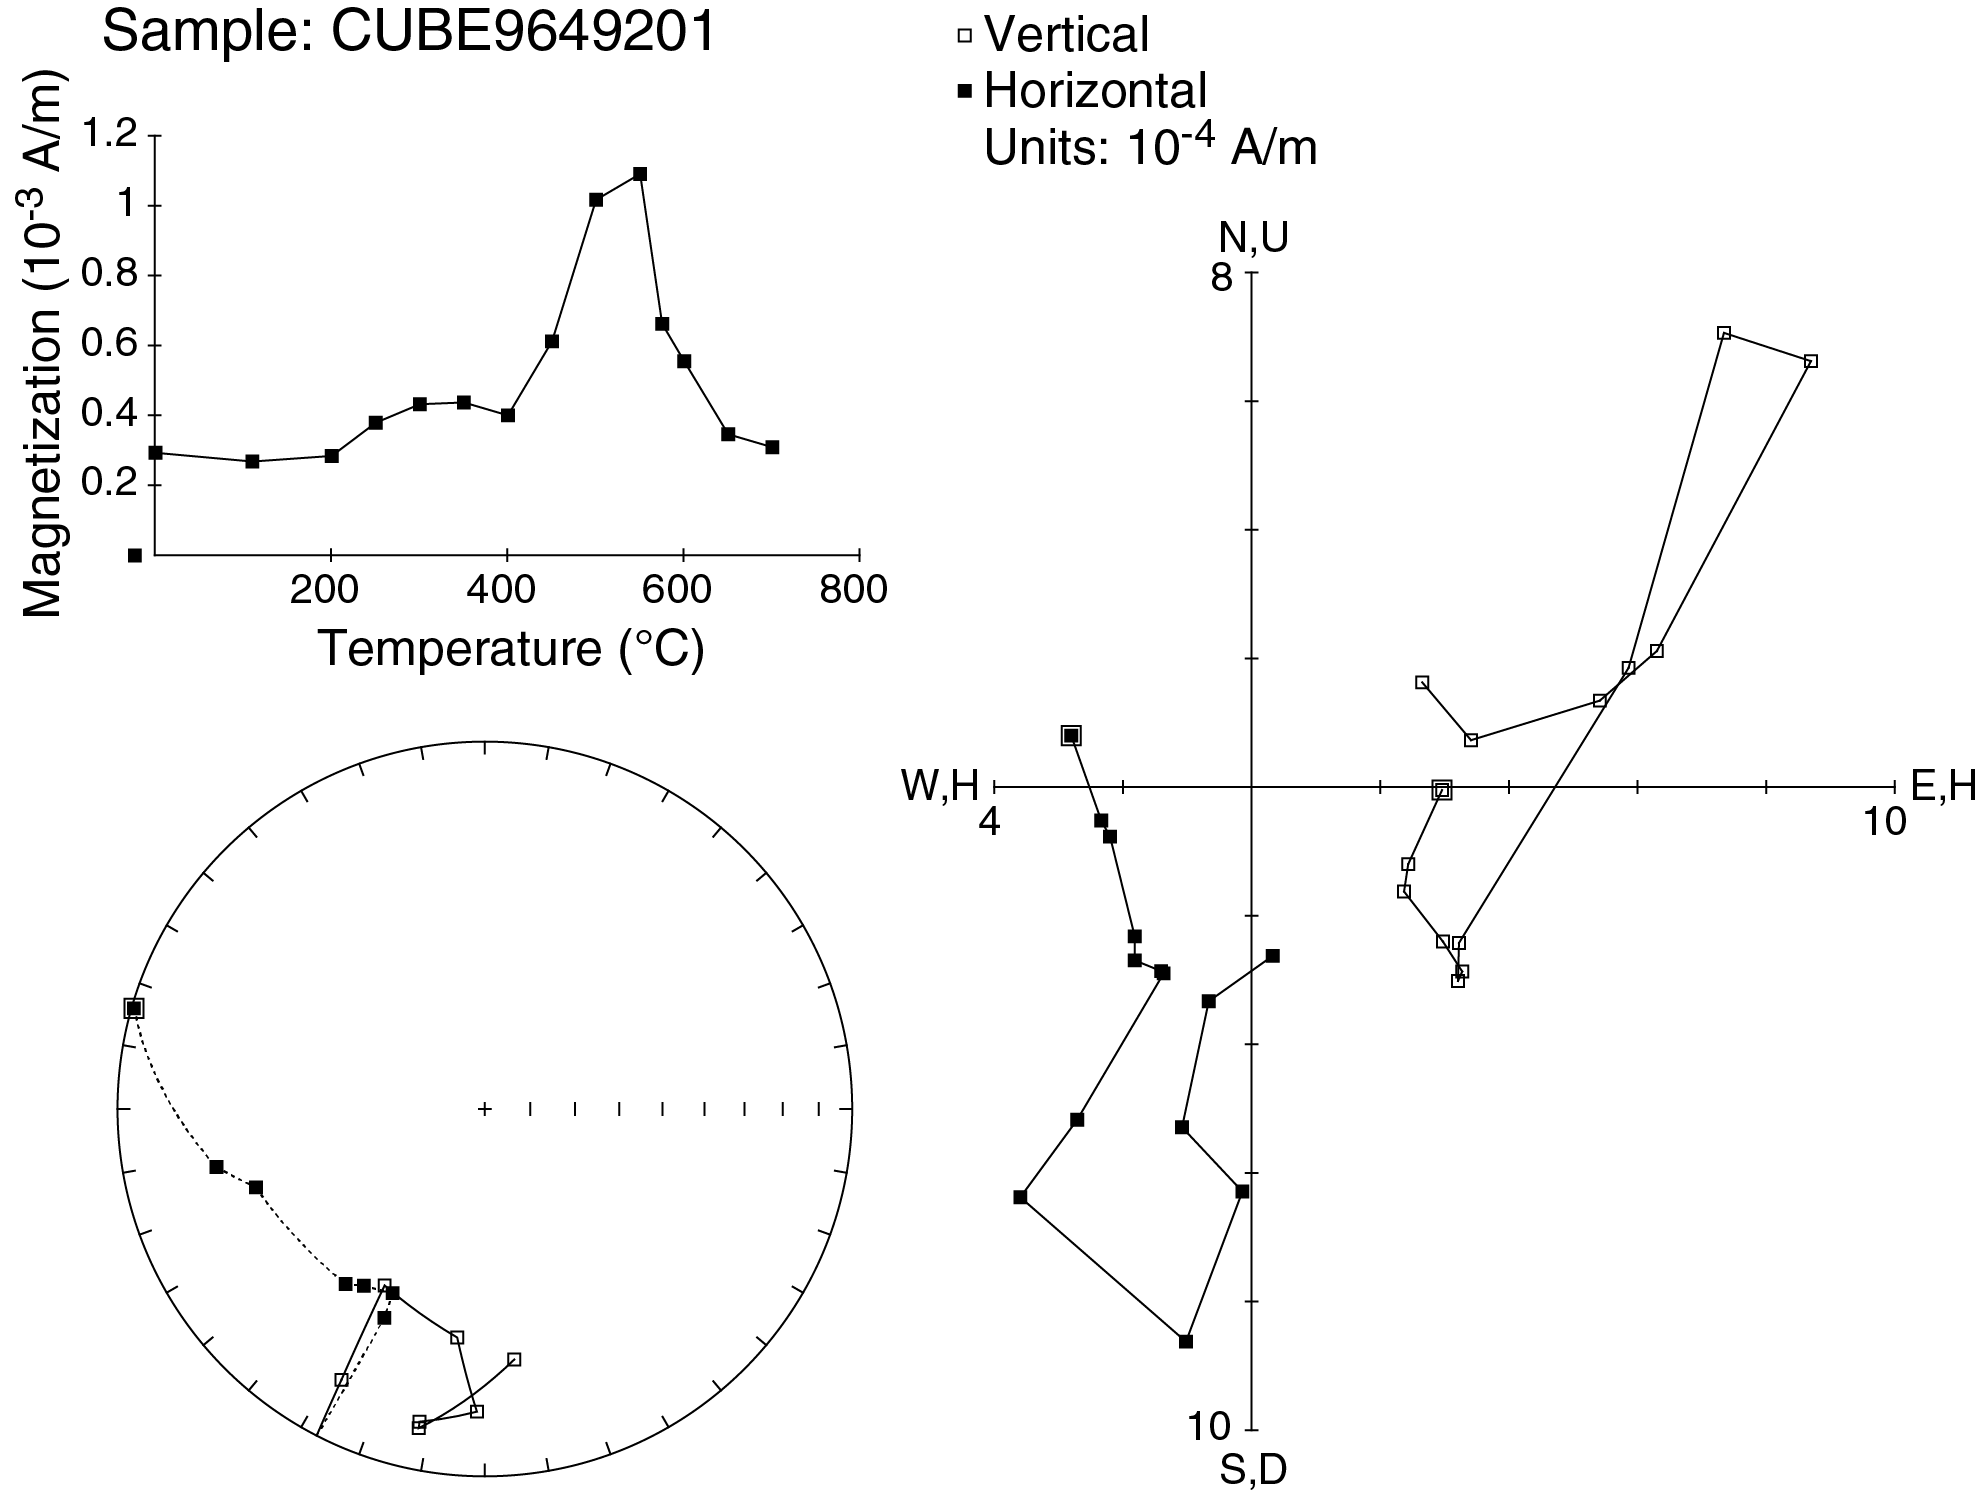
Figure F48. TD experiment on Sample 376-U1530A-10R-2, 31–33 cm, Igneous Unit 2.
Igneous Unit 3
One AF demagnetization experiment (Figure F49) and one TD experiment to 680°C (Figure F50) were performed on samples from Igneous Unit 3. These two experiments show larger NRM intensities (~10−2 A/m) and very minor overprints from drilling. A stable primary magnetization direction could be identified by principal component analysis (PCA) (Lurcock and Wilson, 2012; Kirschvink, 1980) in vector component diagrams (Zijderveld, 1967), giving inclination values of approximately −42° and −52° for the AF and thermal experiments, respectively. Similar NRM intensities and directions are observed after AF demagnetization on larger oriented pieces in the archive halves from this unit that were measured with the cryogenic magnetometer. The thermally demagnetized sample shows a rapid decline of NRM intensity from 500° to 600°C. Larger MS values (~100 × 10−5 SI) for these discrete samples are consistent with continuous MS measurements made on the cores (see Physical properties).
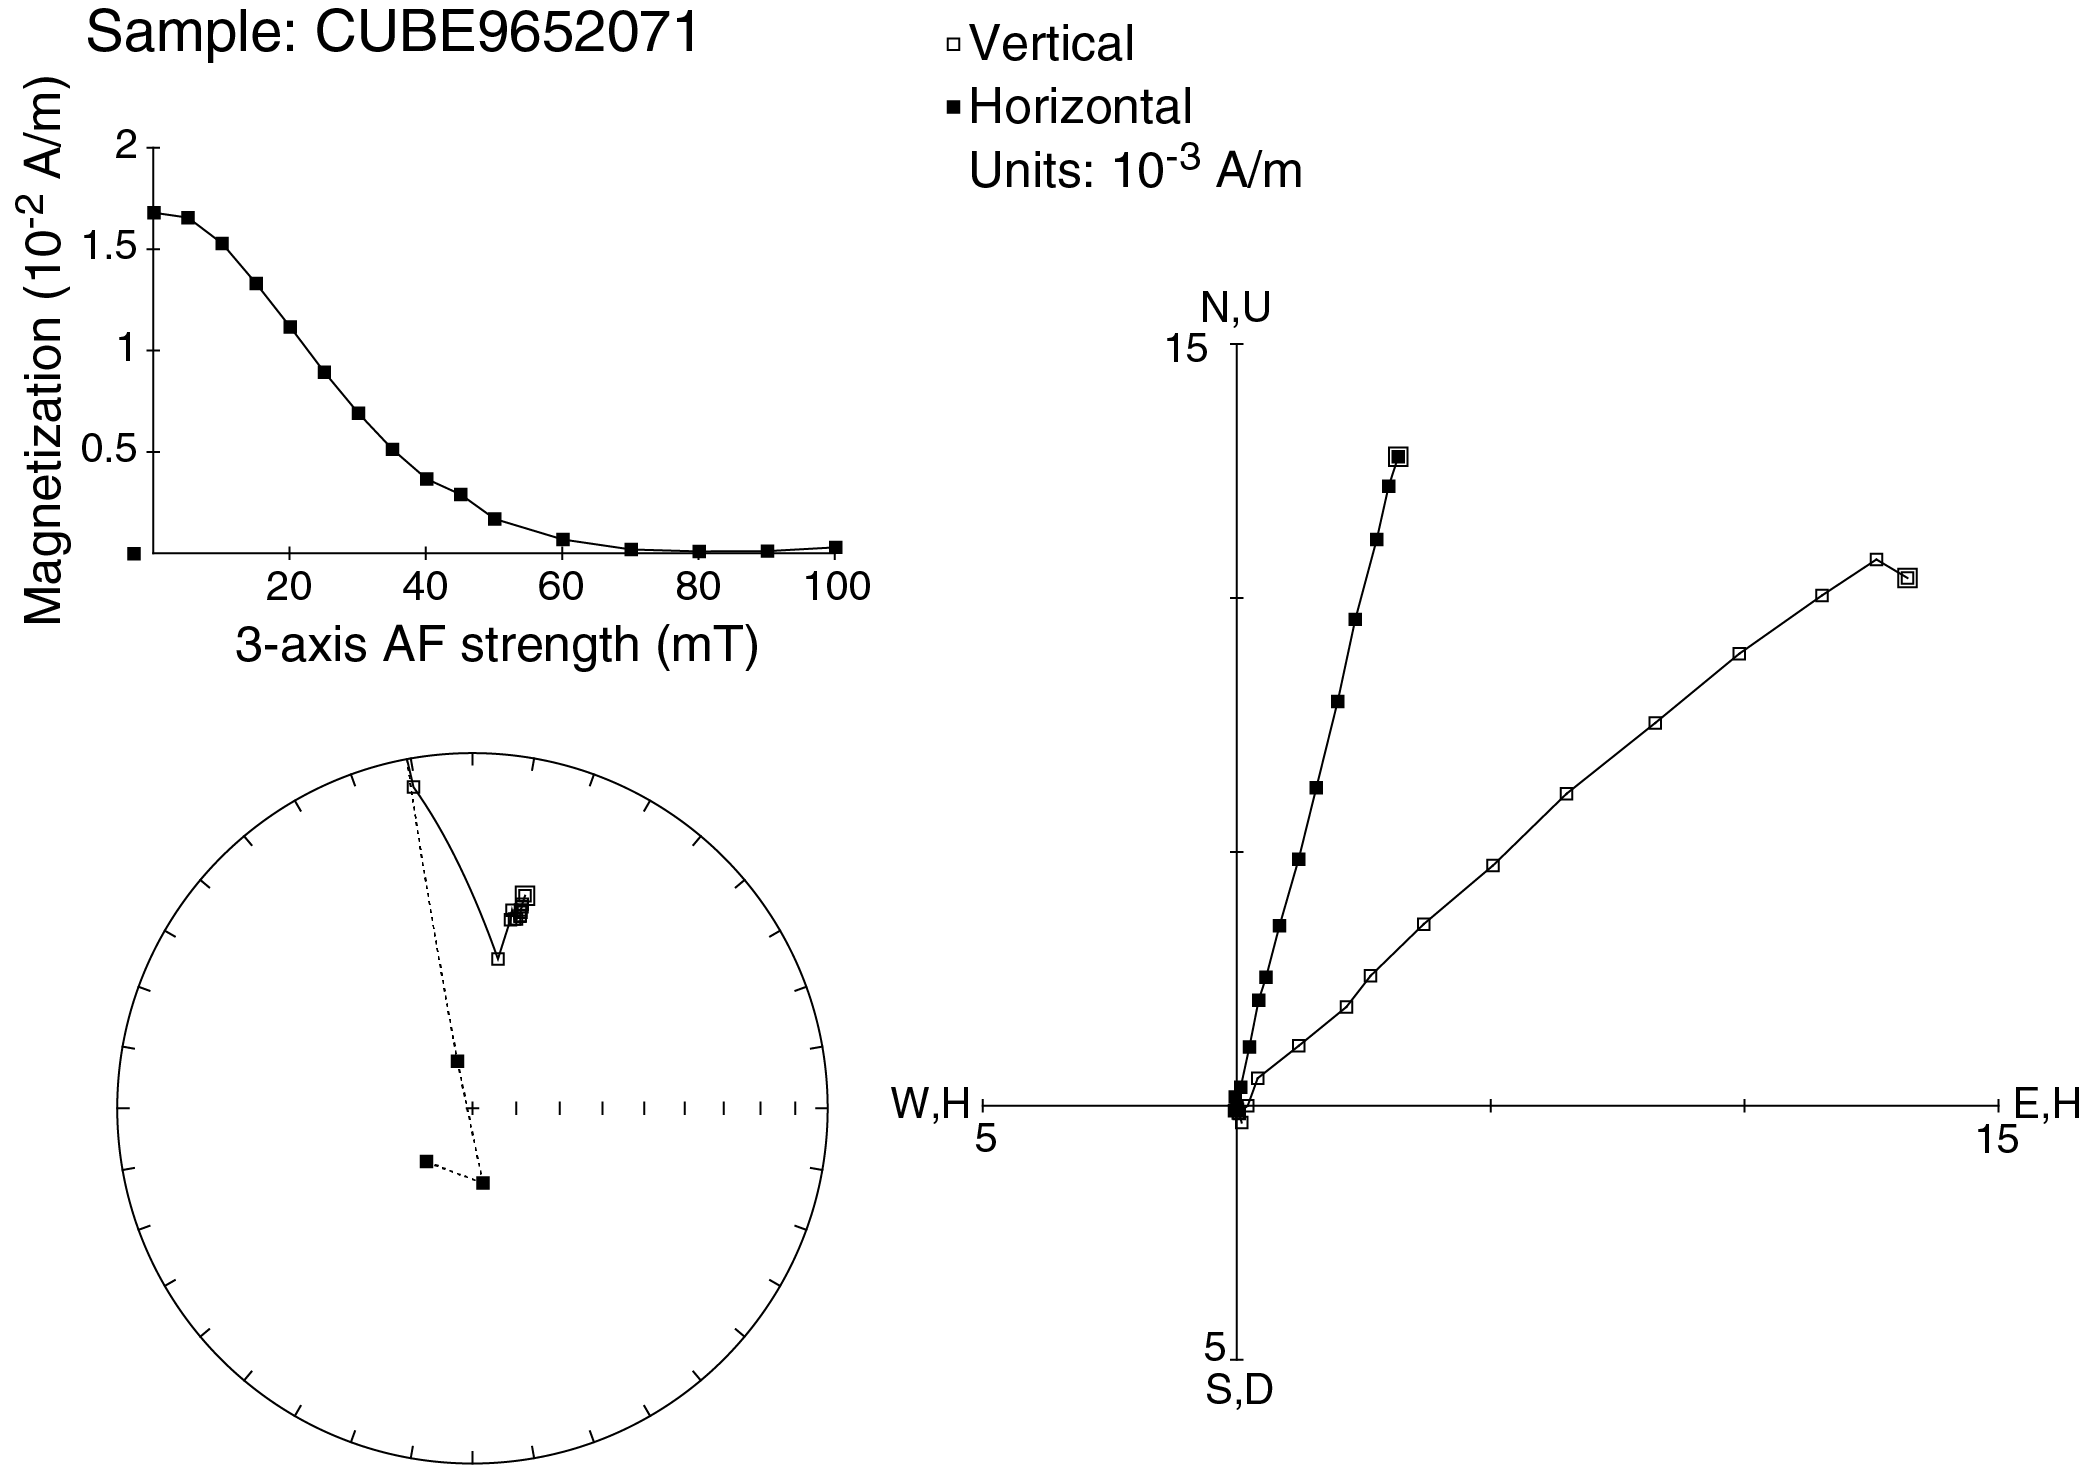
Figure F49. AF demagnetization in Sample 376-U1530A-12R-2, 13–15 cm, Igneous Unit 3.
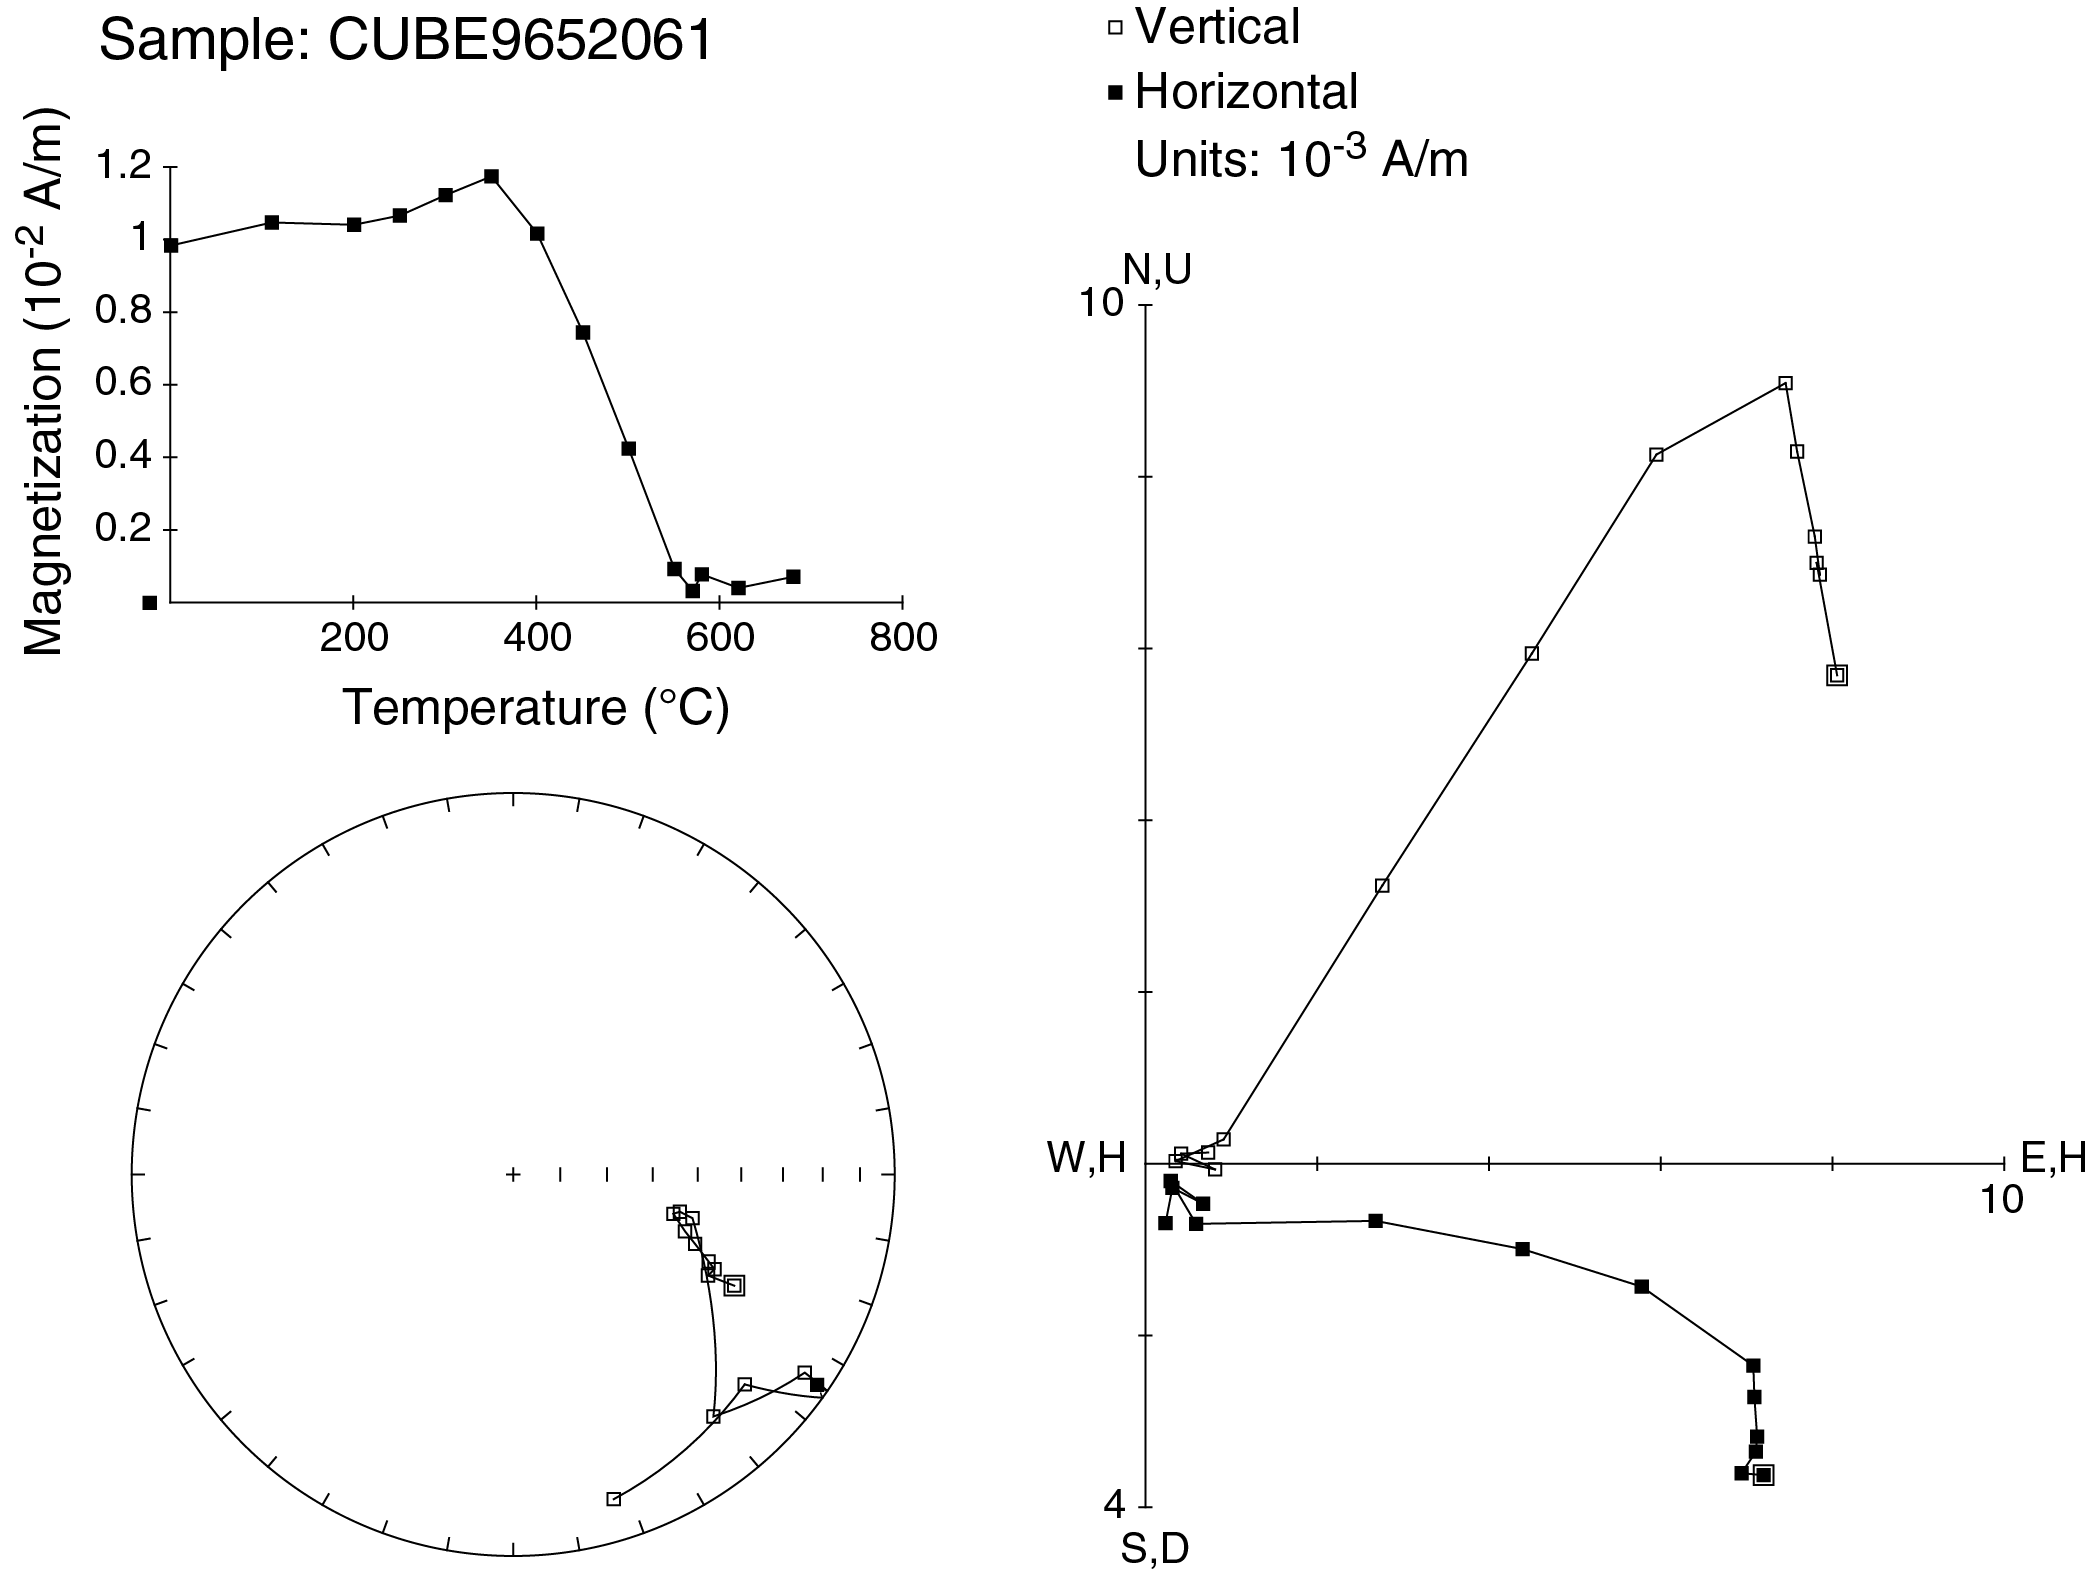
Figure F50. TD experiment on Sample 376-U1530A-12R-1, 37–39 cm, from Igneous Unit 3.
Igneous Unit 4
In total, 11 AF and 13 TD experiments were performed. Discrete samples from Igneous Unit 4 are characterized by the lowest NRM intensities measured at Site U1530 (~10−4–10−5 A/m). For some of these samples, the resolution of the spinner magnetometer (>10−5 A/m) limits the precision of the measurements, and some scatter in the demagnetization curves was observed (Figure F51). However, a stable primary component could be extracted for the AF treated samples, giving an average magnetization inclination of approximately −40°, which was calculated using the method of McFadden and Reid (1982). TD experiments for this unit show complex demagnetization curves with significant increases of NRM intensities after heating to >400°C (Figure F52). Only five of the TD experiments provided a stable primary magnetization with a similar average inclination of approximately −40°. Shallower inclinations and very low NRM intensities were also observed after AF demagnetization on larger oriented pieces in the archive halves measured with the cryogenic magnetometer. The smallest MS values (~1 × 10⁻⁵ SI) for this site were measured over this interval using the Agico Kappabridge KLY 4, in agreement with the continuous MS measurements on the cores (see Physical properties).

Figure F51. AF demagnetization in Sample 376-U1530A-25R-1, 64–66 cm, Igneous Unit 4.
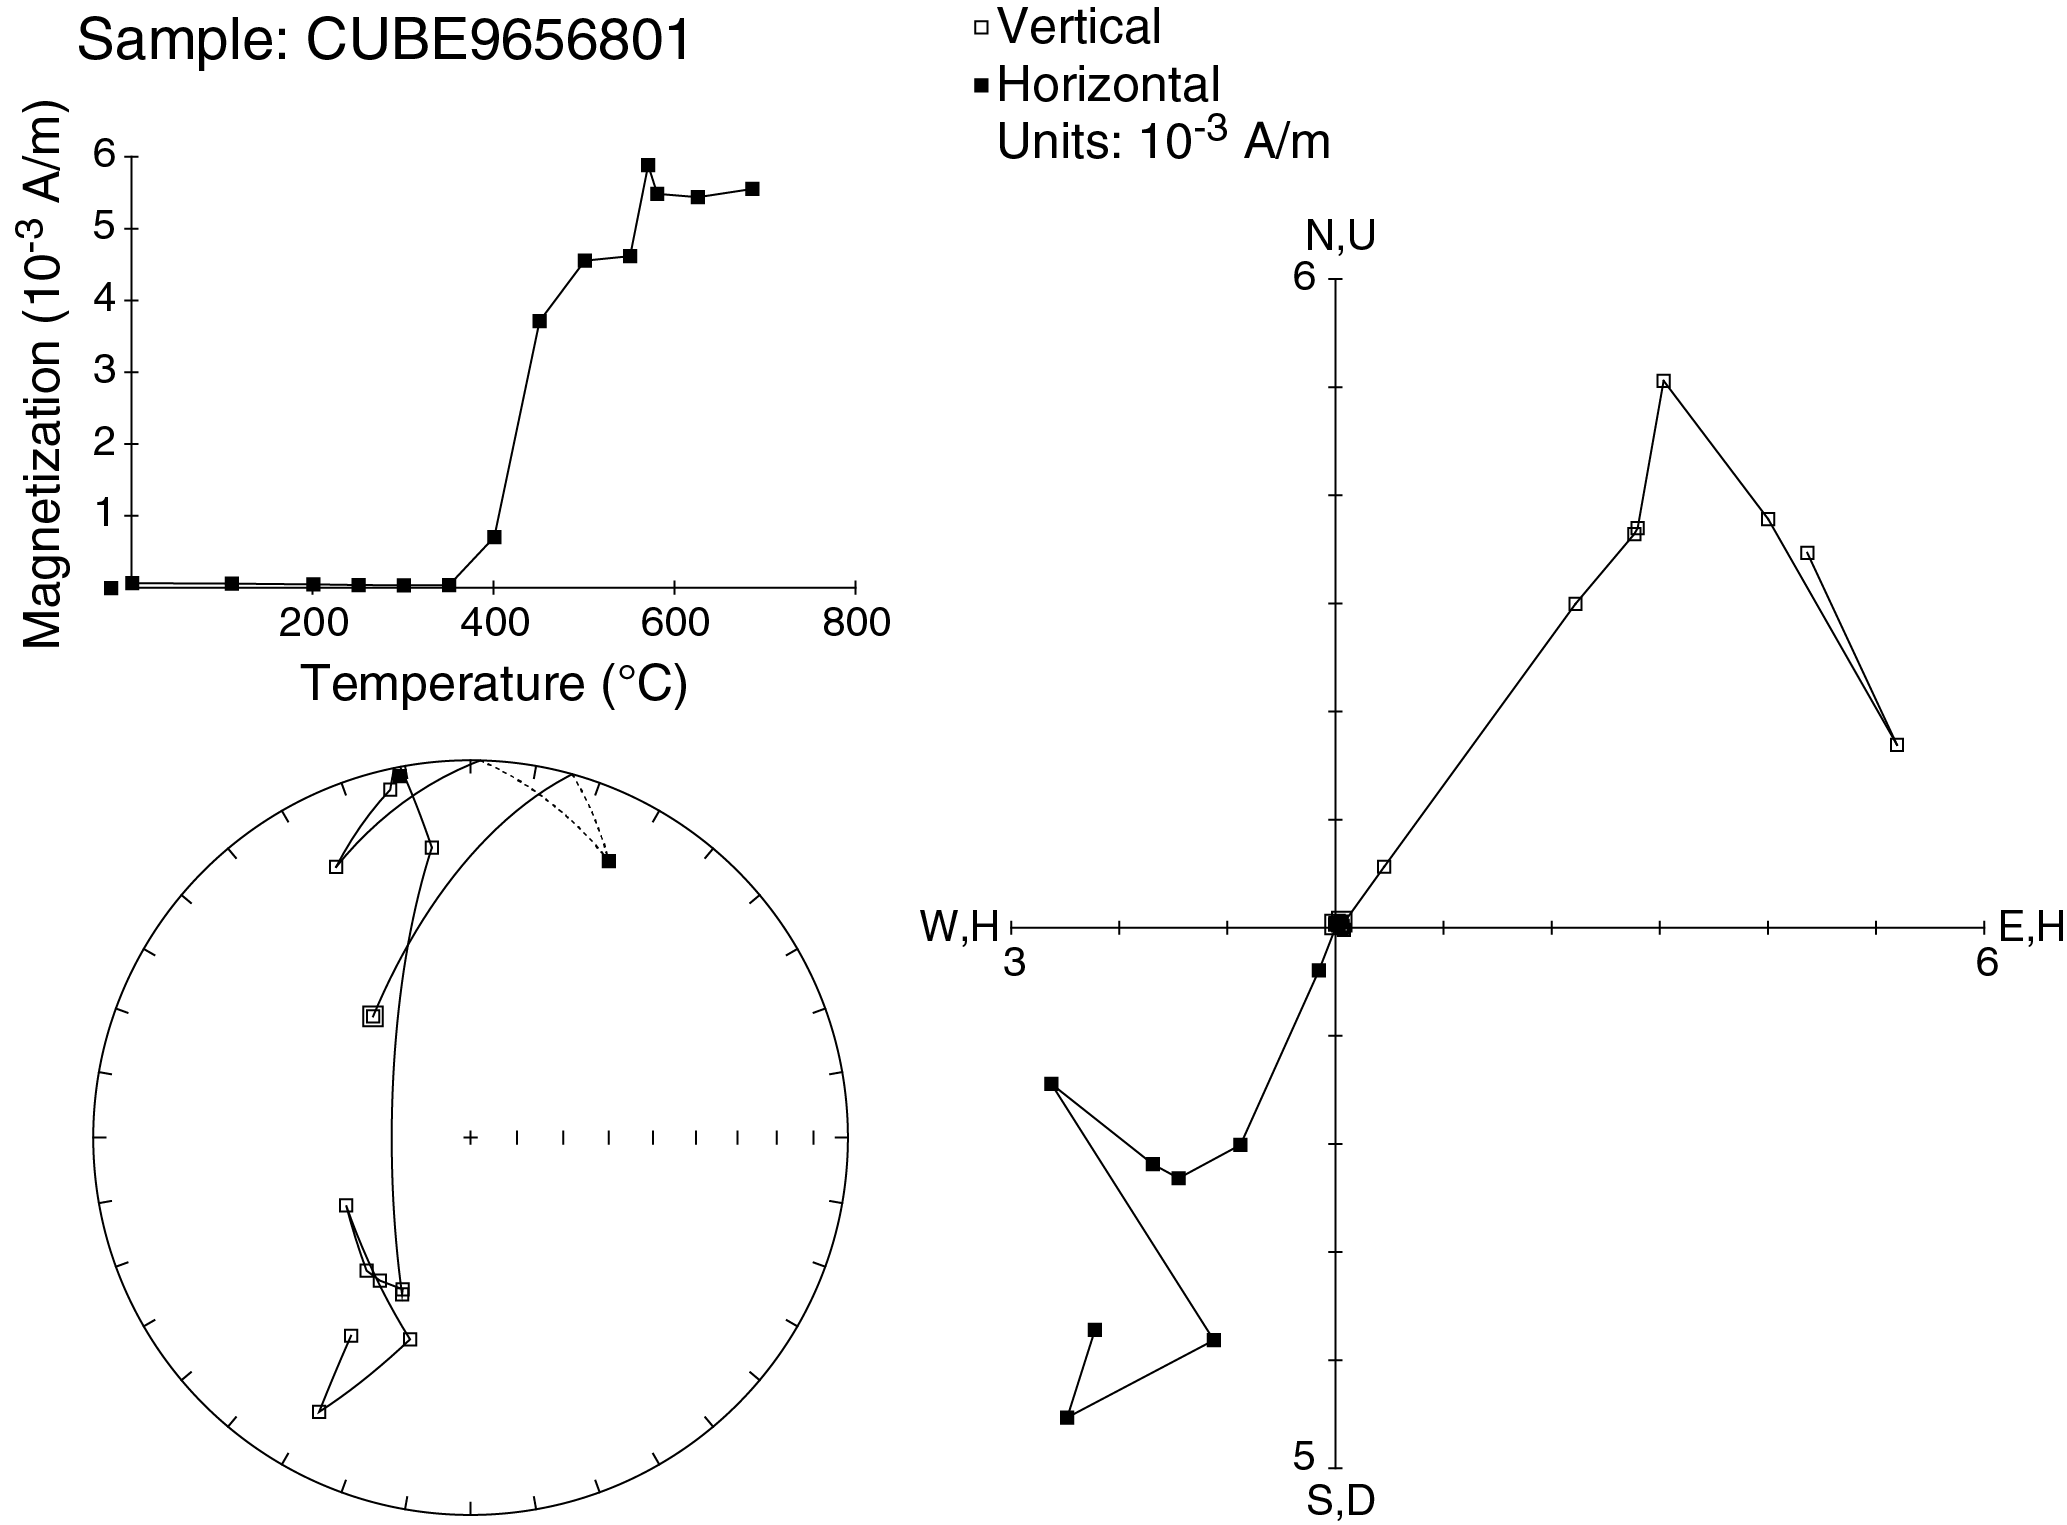
Figure F52. TD experiment on Sample 376-U1530A-38R-1, 69–71 cm, Igneous Unit 4.
Igneous Unit 5
We carried out 14 AF and 16 TD experiments on discrete samples from Igneous Unit 5. The NRM intensities are some of the largest values for this site (~10−3–10−2 A/m). The AF demagnetization experiments plot as relatively simple curves with a stable primary component and very limited overprint from drilling (Figure F53). AF treated samples show average inclinations of approximately −45°, which were determined using the method of McFadden and Reid (1982). TD experiments were carried out at a maximum temperature of 685°C, and NRM intensity rapidly declined from 500° to 600°C (Figure F54). A stable primary component of the magnetization could be extracted in all thermally demagnetized samples (average = approximately −44°). Similar values of NRM intensities and inclinations were also observed after AF demagnetization on larger oriented pieces in the archive halves measured with the cryogenic magnetometer. MS measurements from the Agico Kappabridge KLY 4 show values in the range of 1–10 × 10−5 SI, in agreement with the continuous MS measurements on the cores (see Physical properties).
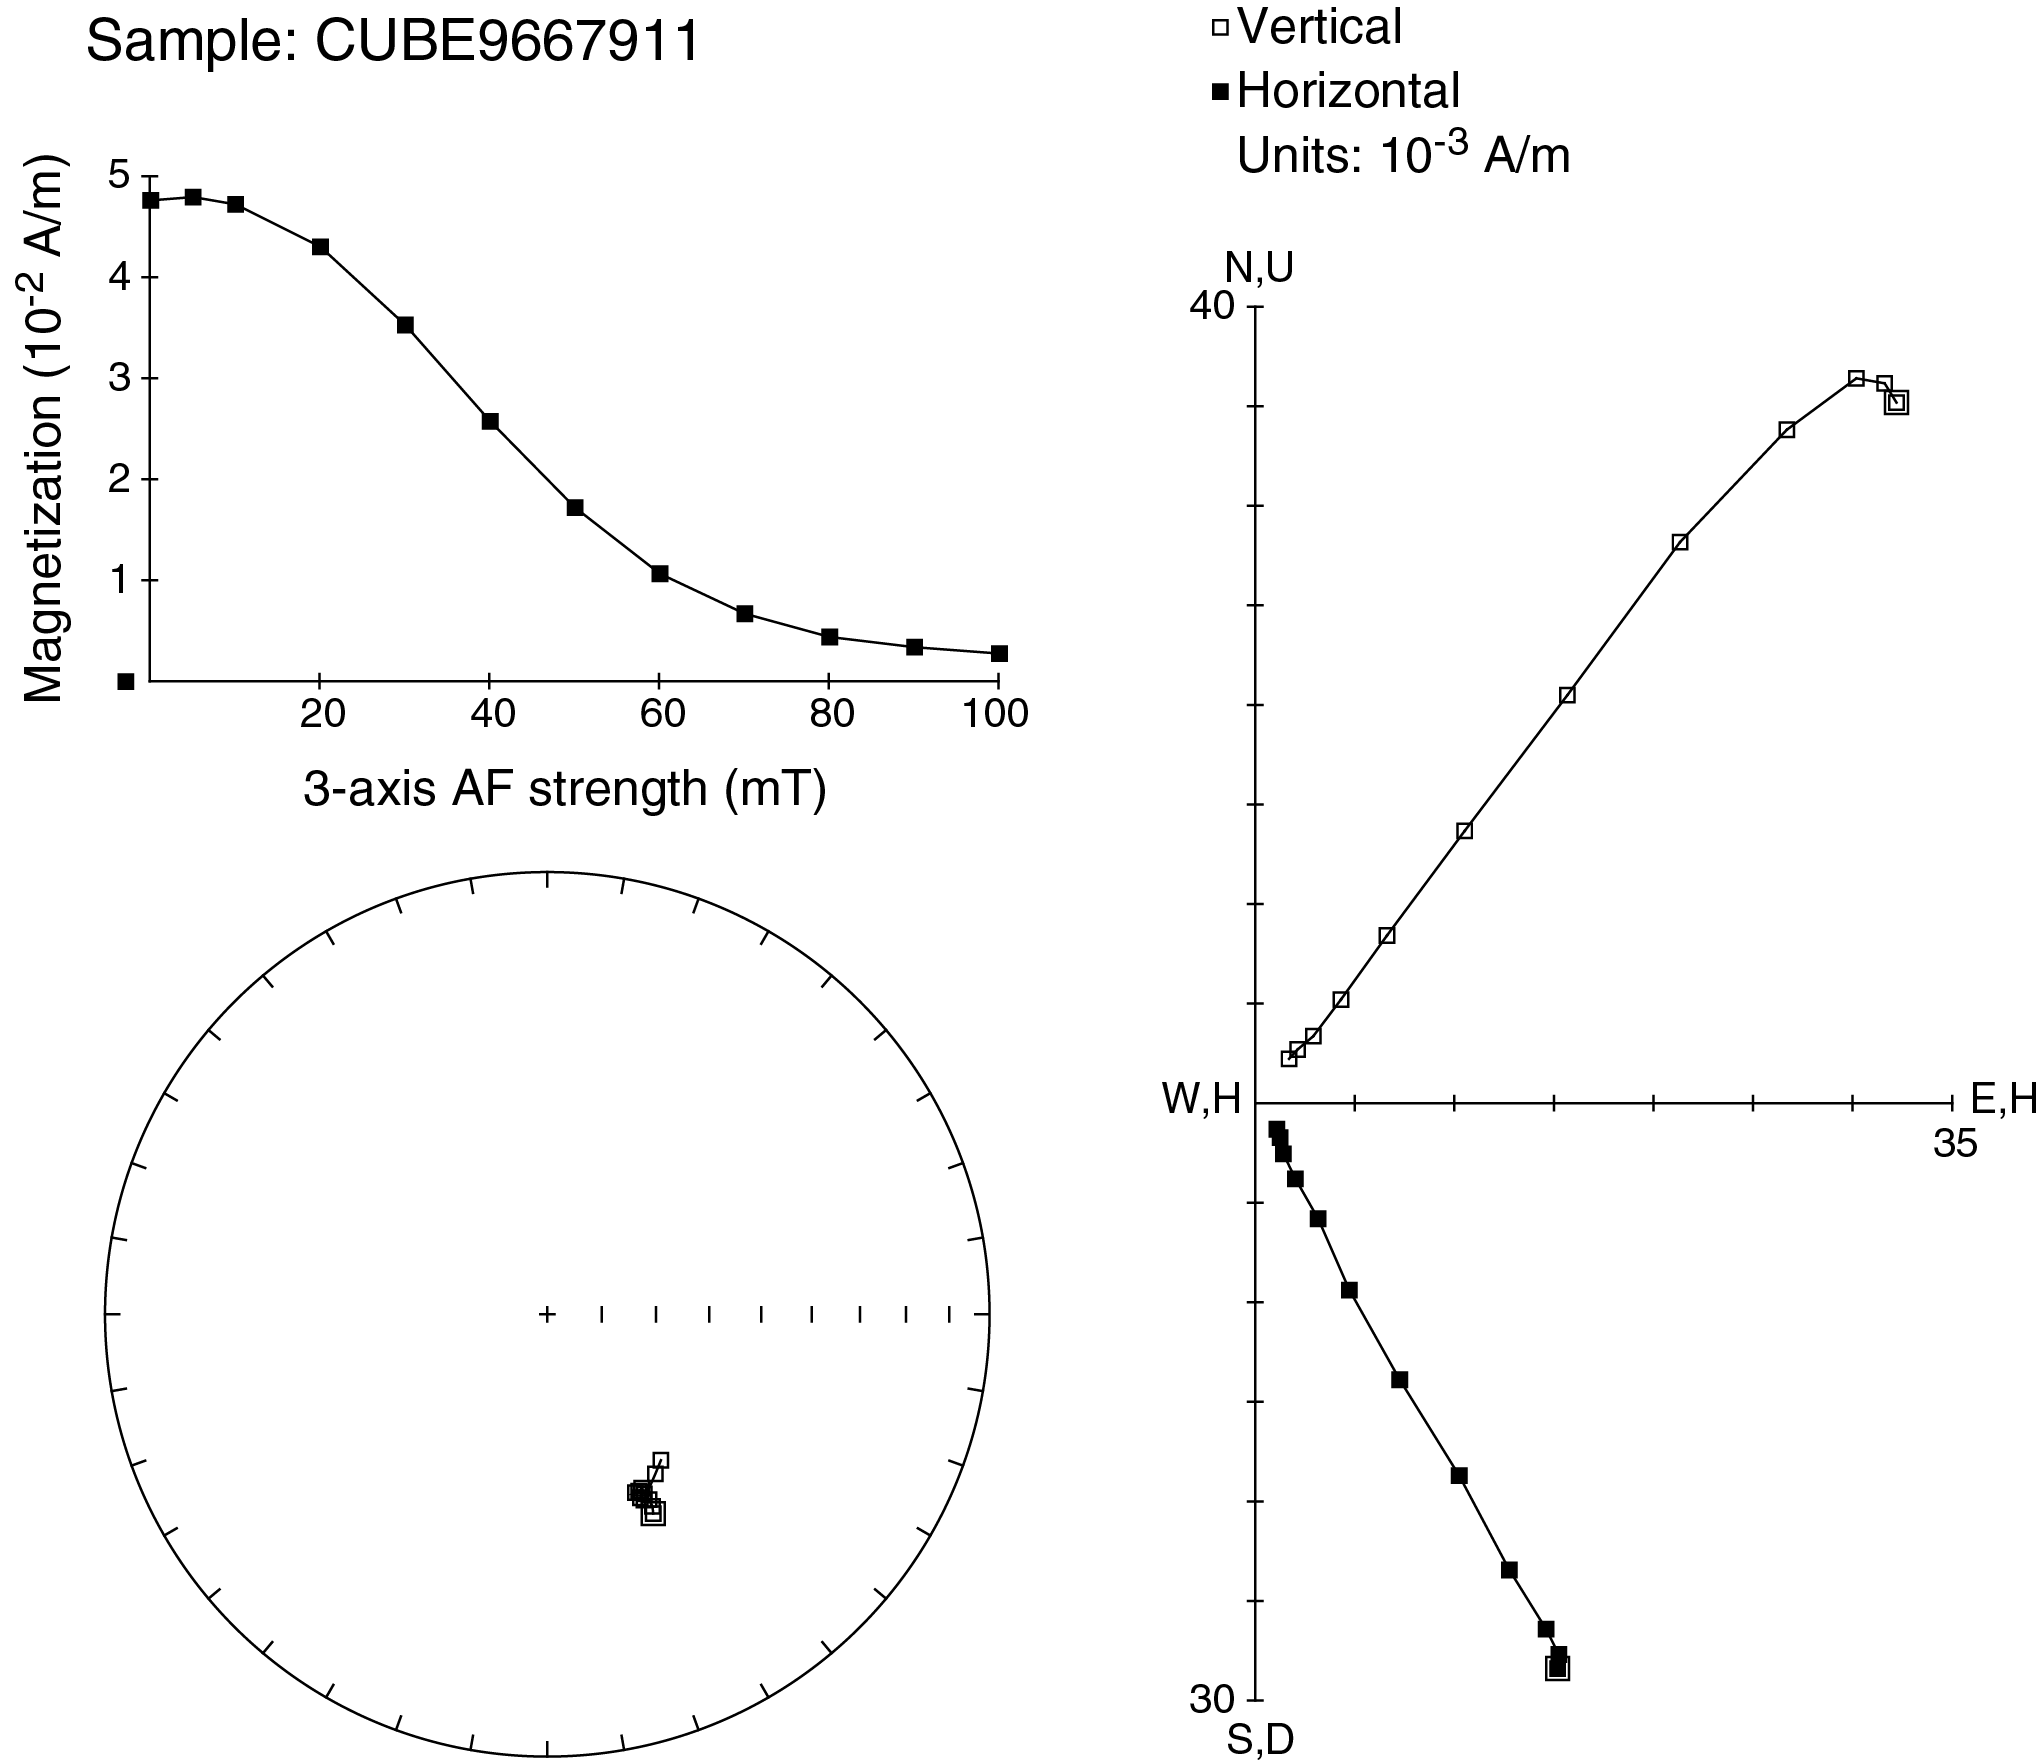
Figure F53. AF demagnetization in Sample 376-U1530A-56R-1, 98–100 cm, Igneous Unit 5.

Figure F54. TD experiment on Sample 376-U1530A-12R-1, 37–39 cm, Igneous Unit 5.
Discussion
Magnetic directions calculated using PCA on discrete samples from Site U1530 show relatively shallow inclinations compared with Sites U1527 and U1528 (Figure F55) (see Figure F42 in the Site U1527 chapter [de Ronde et al., 2019c] and Figure F64 in the Site U1528 chapter [de Ronde et al., 2019d]). In particular, three samples from Igneous Unit 2 (from Cores 376-U1530A-10R through 11R; 50–55 mbsf) show consistent positive inclinations that are confirmed by corresponding pieces that were measured in the cryogenic magnetometer and indicate that these values are not due to measurement errors. This section of the core is either reversed in magnetic polarity (Cande and Kent, 1995) or indicates tectonic rotation. Self-reversed thermoremanent magnetization (Tauxe, 2010) could be another possibility, particularly considering the dacitic composition of the volcanic and sedimentary rocks at Brothers volcano and the possible presence of magnetic minerals with larger coercivities, such as titanohematite, which is suggested by IRM experiments on these samples.
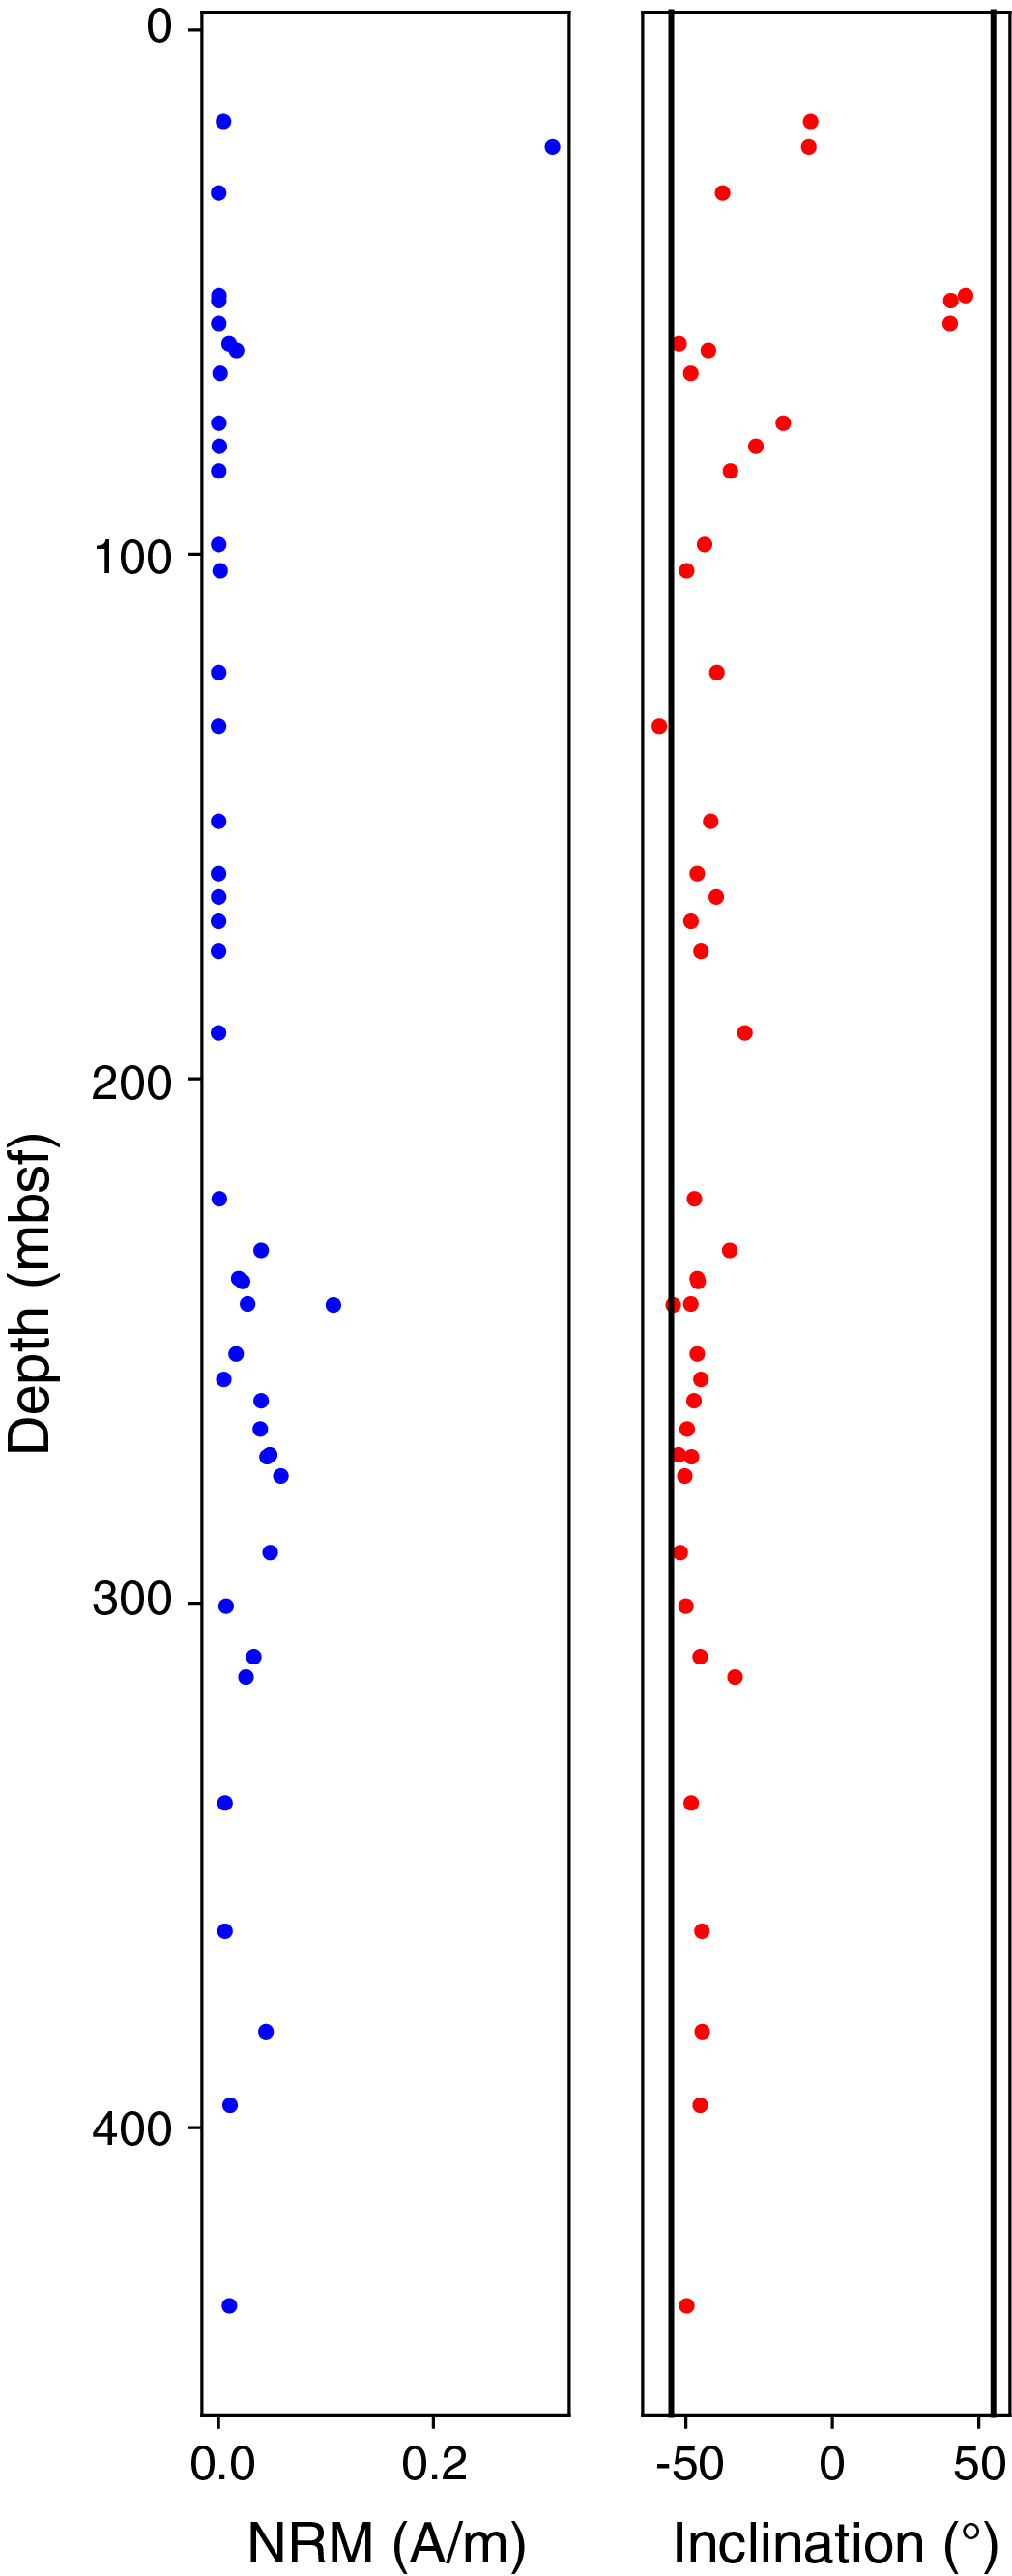
Figure F55. NRM variations, Hole U1530A.
NRM intensities and MS values highlight relative differences between the various igneous units. For example, Igneous Unit 1 is characterized by low NRM intensities, low coercivities, and erratic TD curves (Figures F45, F46). Igneous Units 2 and 4 are characterized by very low NRM intensities and complex AF and TD curves (Figures F47, F48, F51, F52) but include larger coercivities where ~10% of the original NRM intensities are still present after 60 mT demagnetization steps, indicative of magnetic minerals such as titanohematite. This is also confirmed by the IRM experiments on these samples, which show continuous increases of the NRM intensities for fields up to 1.2 T. Igneous Units 3 and 5 (Figures F49, F50, F53, F54) show low NRM intensities, low to medium magnetic coercivities, relatively simple AF and TD curves, and minor overprint from drilling. Igneous Units 1, 2, and 4 show increases in NRM intensity after heating to >400°C, suggesting irreversible transformation of magnetic minerals during heating (Figures F46, F48, F52). This indicates the transformation of original minerals such as pyrite to ferrimagnetic minerals such as magnetite (O’Reilly, 1984; Reagan et al., 2015). The MS for these samples was monitored before and after the TD experiments and significantly increases, confirming these irreversible changes. The rapid decline of the TD curves from 500° to 600°C for Igneous Units 3 and 5 (Figures F50, F54) suggests that these samples contain almost pure magnetite (Curie temperature of ~575°C; Tauxe, 2010).
Physical properties
Physical property data for Site U1530 were obtained from Hole U1530A cores. Unlike previous holes, core temperatures were no longer measured upon arrival on the core receiving deck. Given the lack of temperature variation in cores from the hotter formation at Site U1528, it was concluded that even hot cores equilibrate with sea temperature during retrieval. Cores were left to equilibrate to room temperature (~20°C) prior to analysis. Recovered cores were in multiple pieces and of variable length, so continuous measurements on whole-round cores (i.e., gamma ray attenuation bulk density, MS, and NGR) yielded noisy data (see Physical properties in the Expedition 376 methods chapter [de Ronde et al., 2019a]). Measurements of P-wave velocity, density, porosity, MS, and thermal conductivity made on section halves and discrete samples therefore provided the basis for the petrophysical characterization of Site U1530. In total, 91 discrete samples were analyzed, including cut cubes, sediments, and loose clasts, to encompass the various igneous lithologies and alteration types. Cube samples were shared between paleomagnetic, moisture and density (MAD), and P-wave measurements. Thermal conductivity was measured on 21 working-half pieces. An overview of all physical property data sets collected at Site U1530 is given in Figure F56.
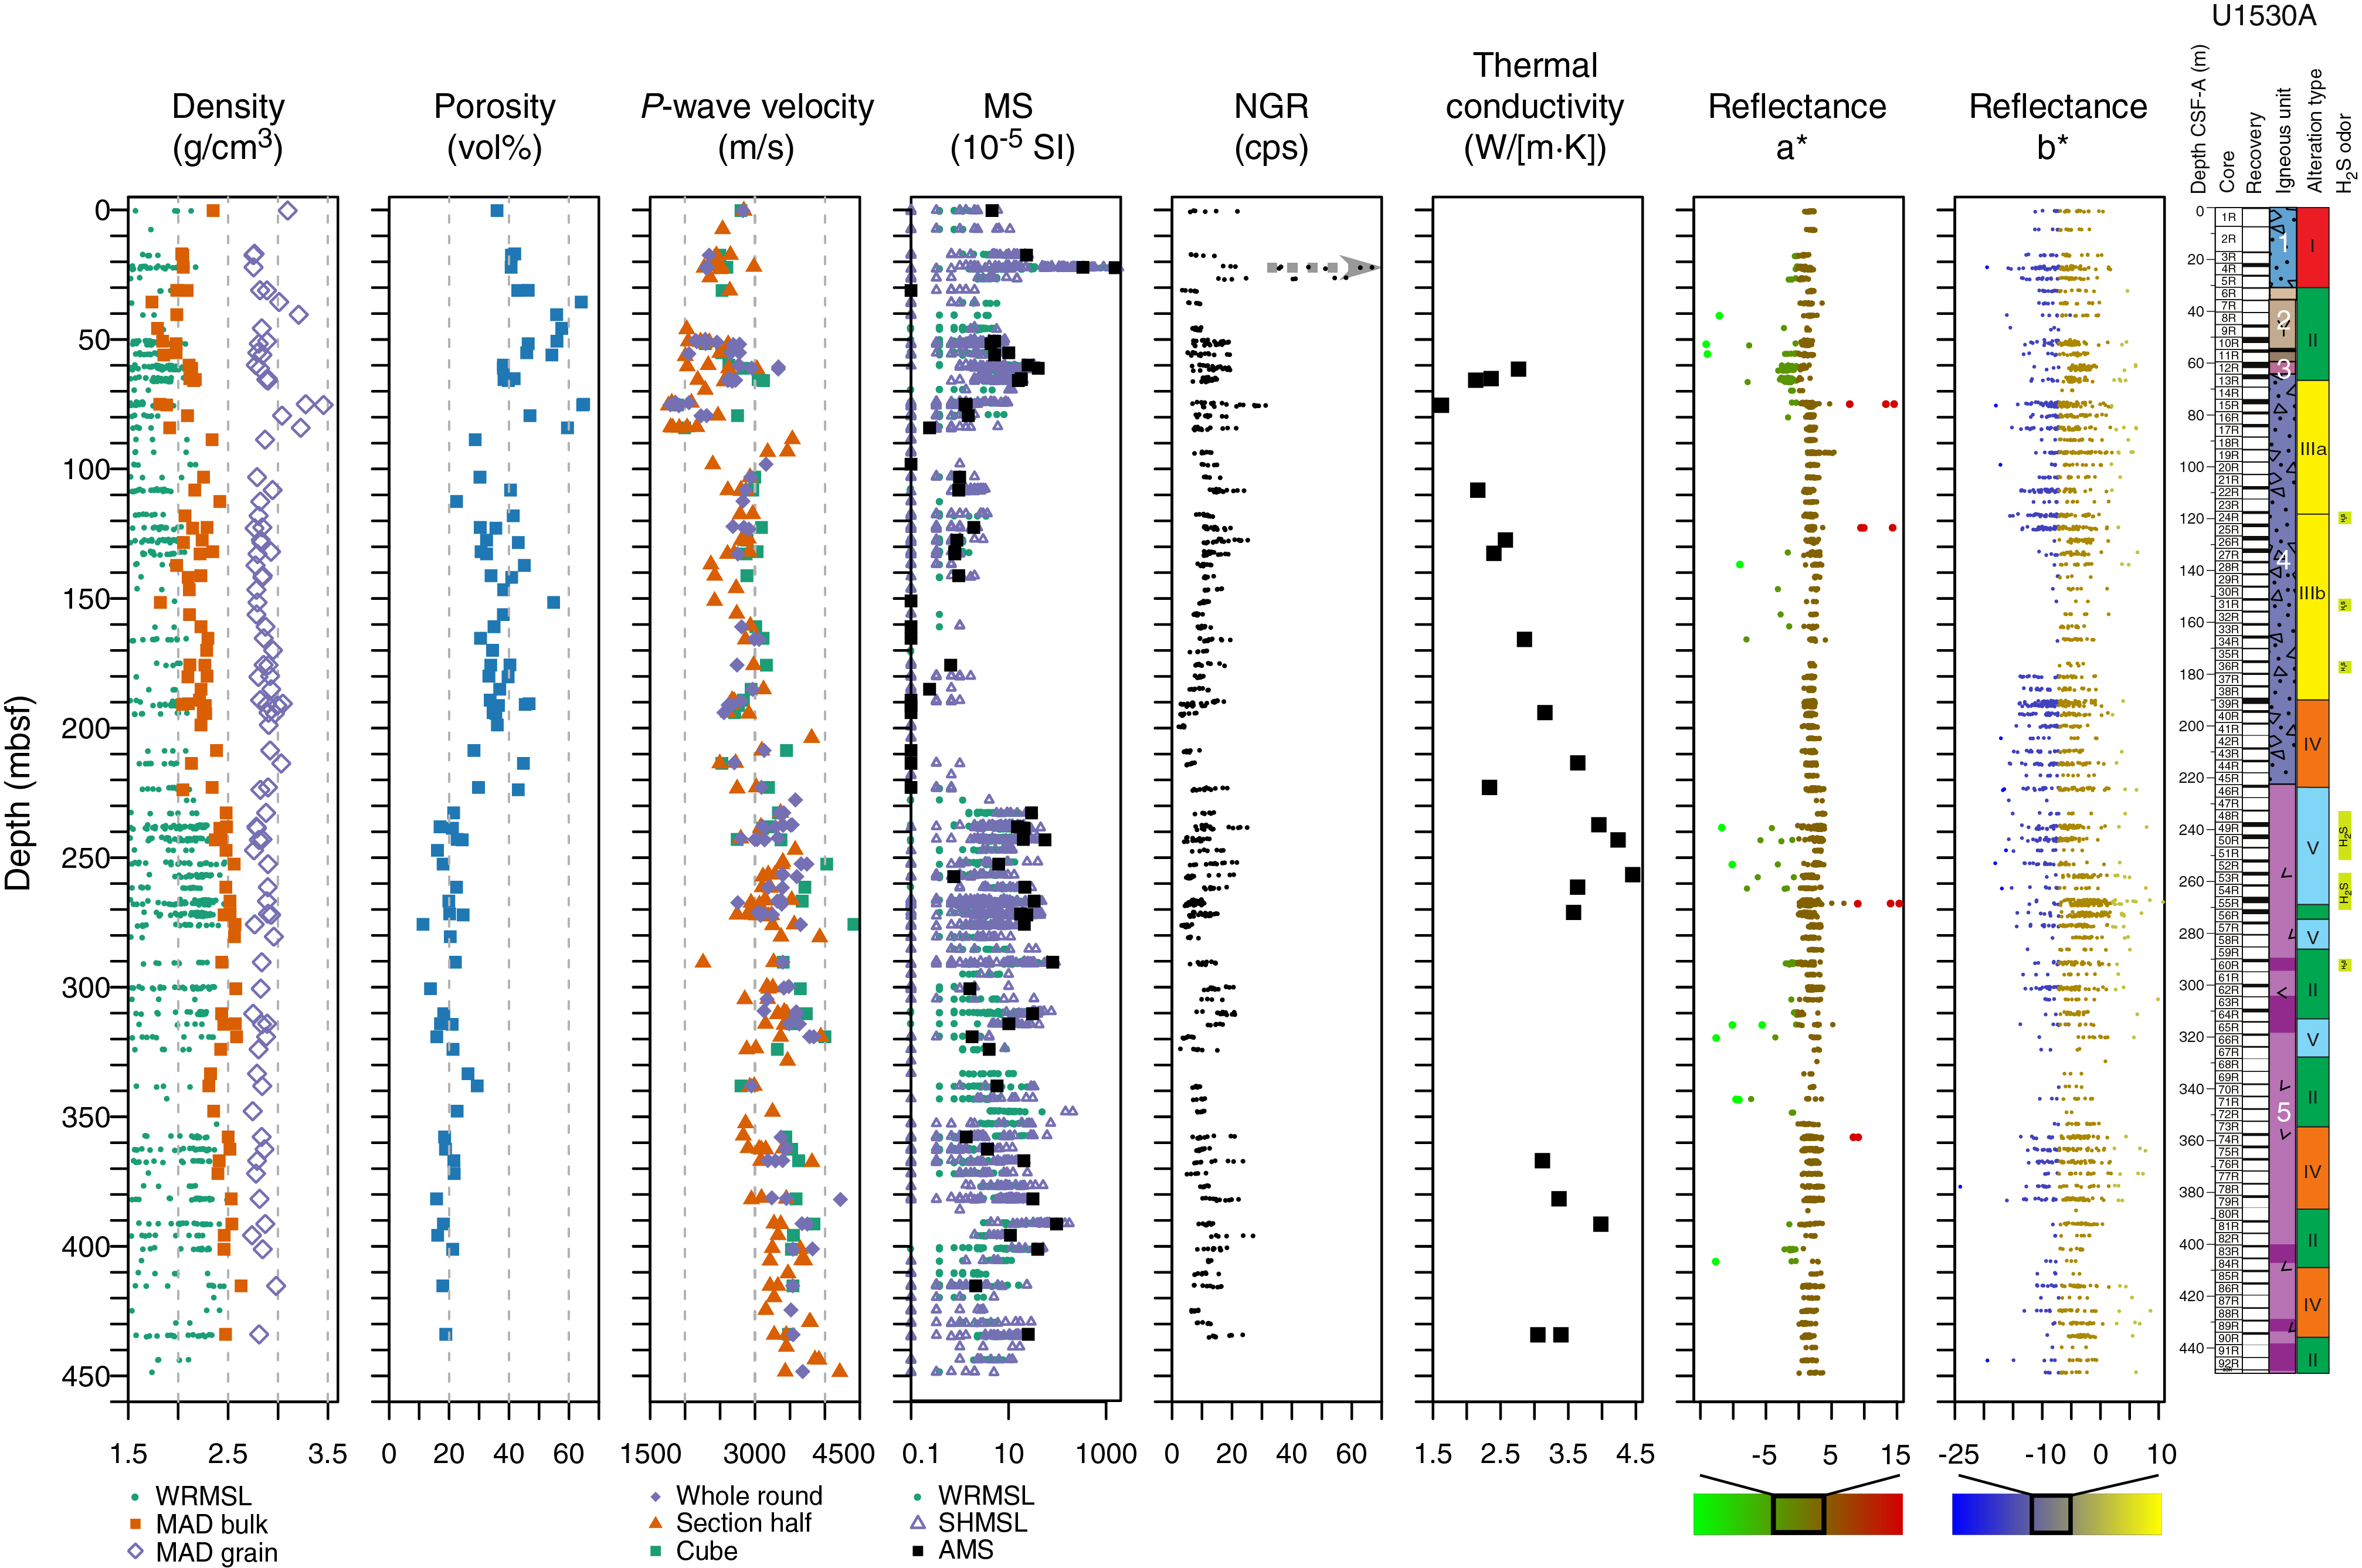
Figure F56. Physical properties, Hole U1530A.
Density and porosity
Individual MAD porosity and bulk, dry, and grain density values for discrete samples at Site U1530 are given in Table T15. Data include 27 samples of tuffaceous sediments and loose clasts and 64 cut cubes. Some of the cubes that were cut from friable lithologies disintegrated either during paleomagnetic or P-wave velocity measurements and were ultimately processed as sediments during MAD measurements. Grain density values range from 2.74 to 3.46 g/cm3 with a mean value of 2.88 g/cm3 (Figure F56). Bulk density values range from 1.74 to 2.63 g/cm3 with a mean value of 2.25 g/cm3 (Figure F56). Porosity values range from 11 to 65 vol% with a mean value of 33 vol% and vary inversely with bulk density (Figures F56, F57).
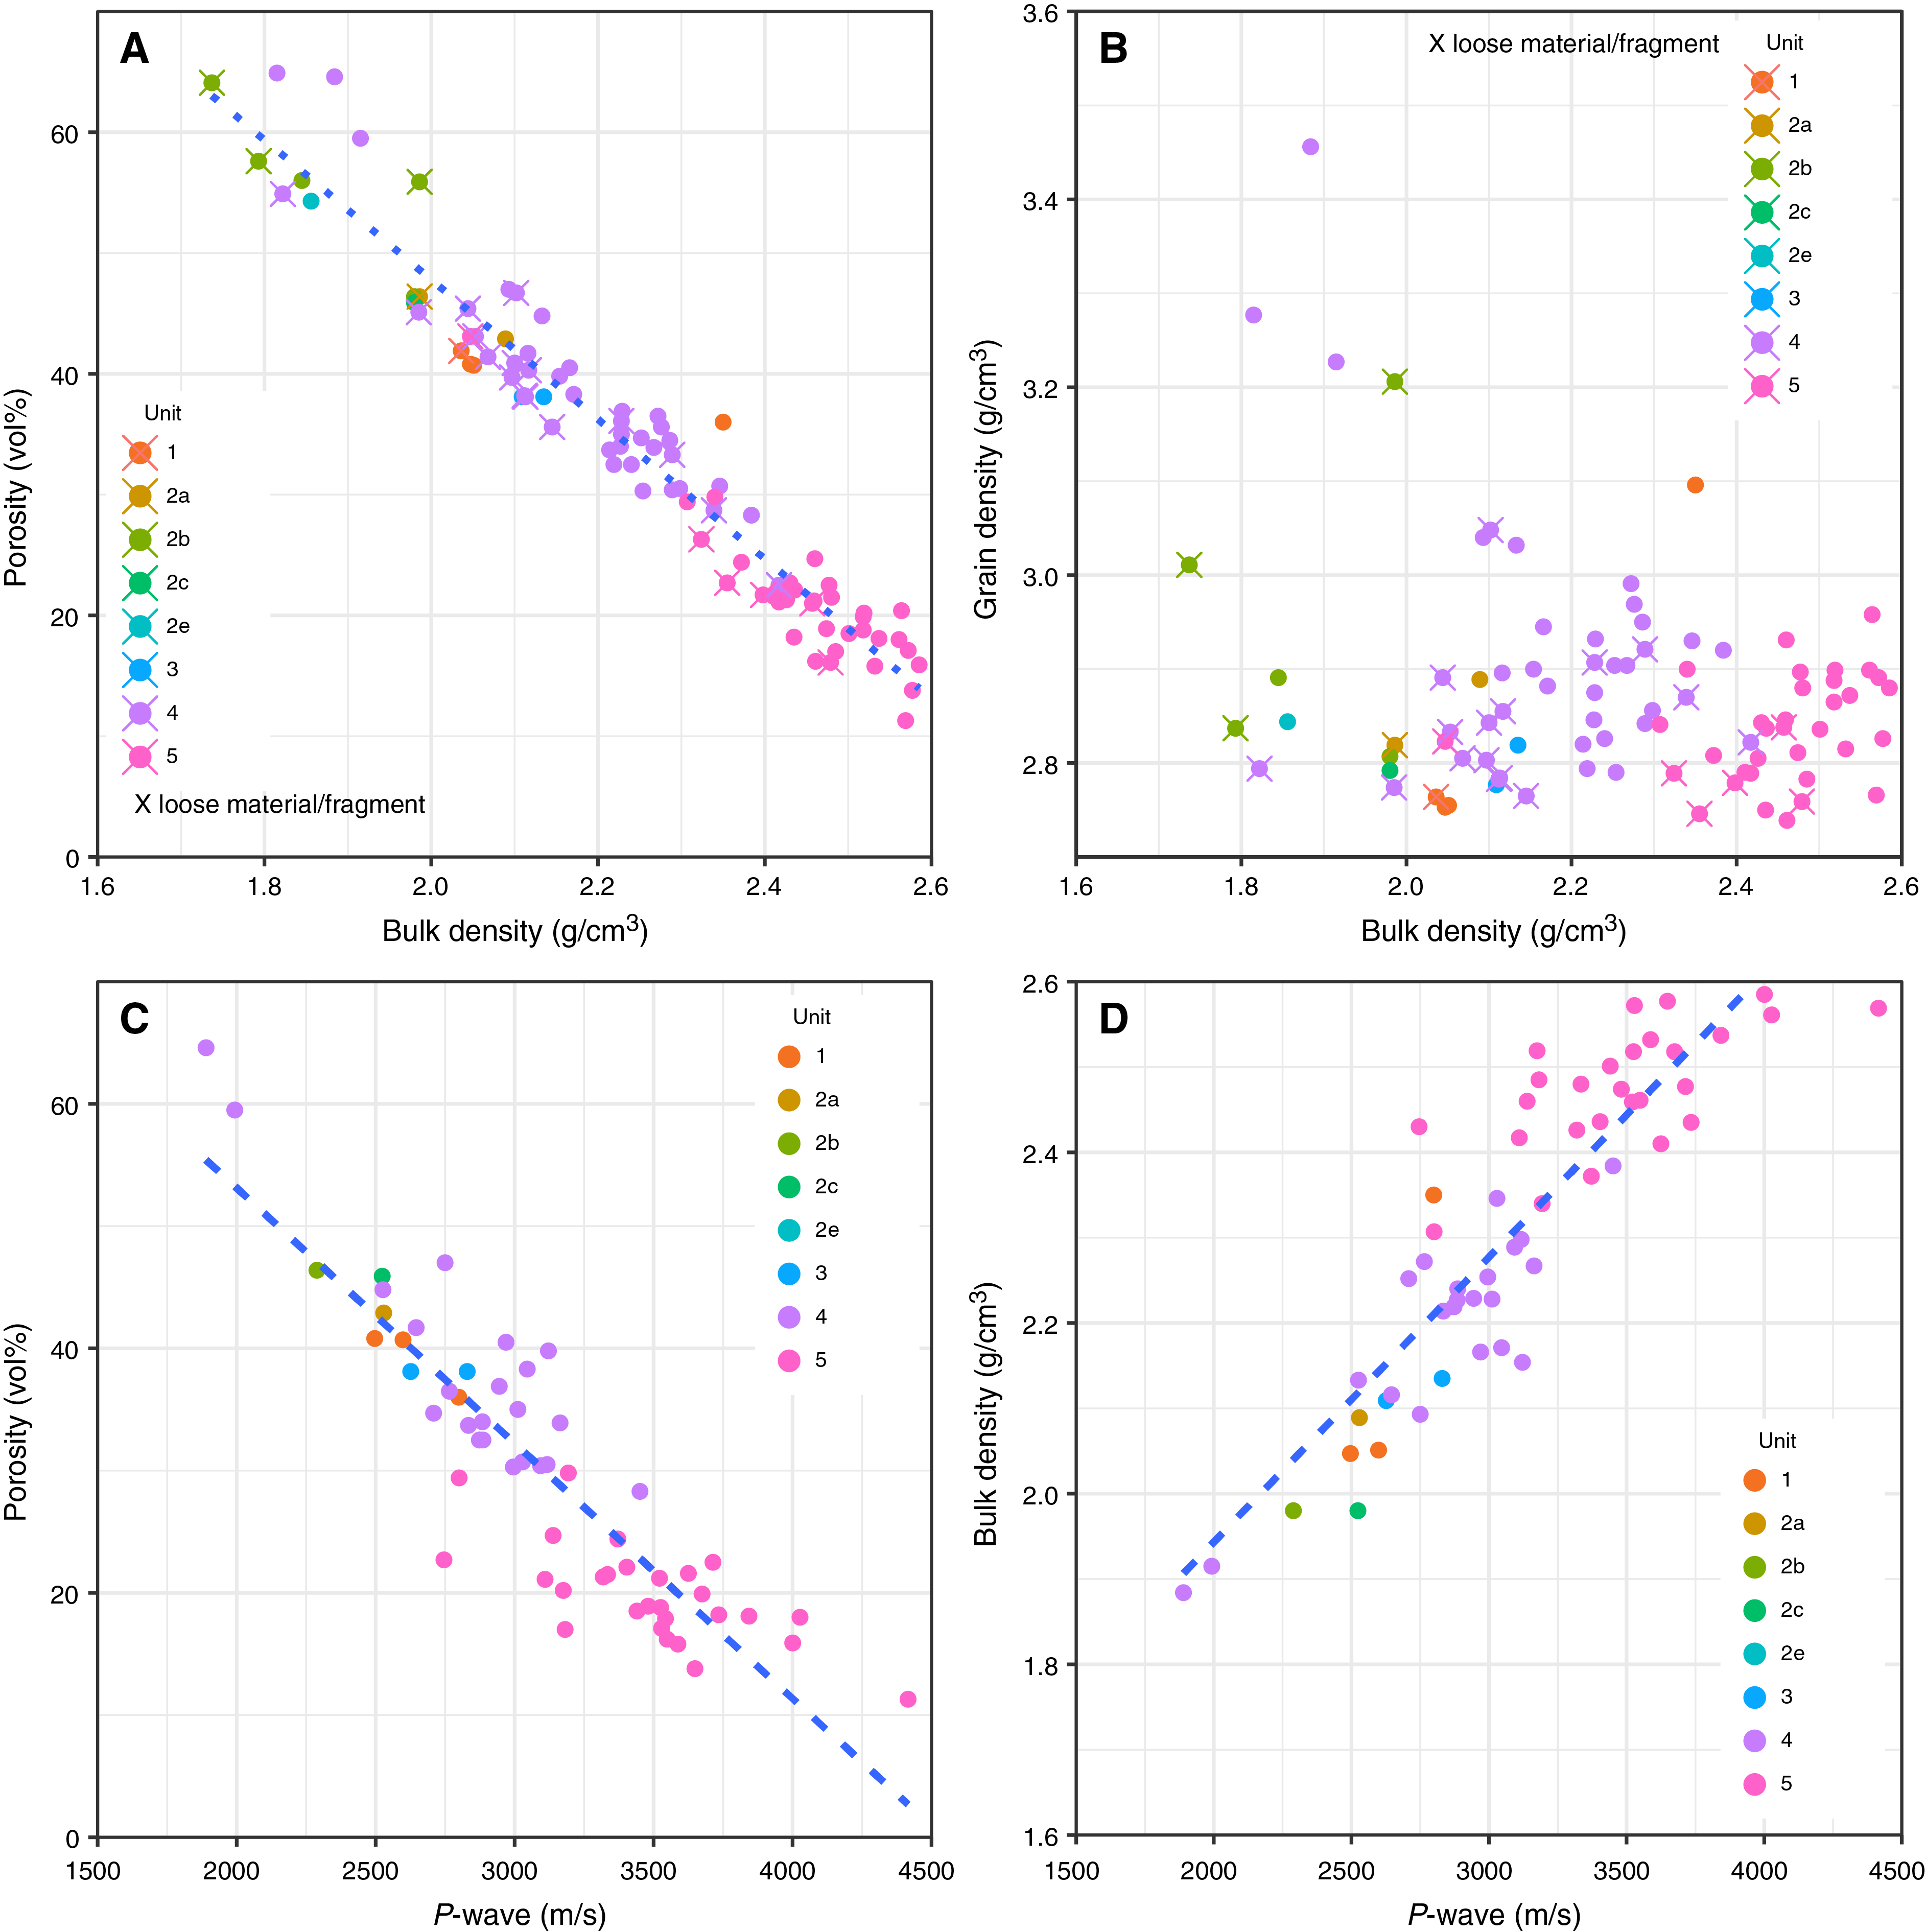
Figure F57. MAD and P-wave velocity data, Hole U1530A.
Grain density values are generally constant with depth throughout Site U1530 except for three depth intervals with markedly higher values. These occur in Igneous Unit 1 and Alteration Type I at 0.26 mbsf (3.10 g/cm3; Core 376-U1530A-1R), in Igneous Unit 2 and Alteration Type II at 35.5–40.7 mbsf (3.01–3.21 g/cm3; Cores 7R and 8R), and in the upper part of Igneous Unit 4 and Alteration Type III at 75.0–84.1 mbsf (3.04–3.46 g/cm3; Cores 15R–17R). These higher grain densities are associated with both cut cubes and loose clast samples. The depths of these increased grain density values correspond to increases in Fe2O3 and S (see Geochemistry) and therefore likely reflect an increase in the abundance of pyrite (grain density = 5.02 g/cm3) that was also observed optically (see Alteration).
Overall, bulk density increases downhole (<2.0 to ~2.5 g/cm3) and porosity decreases (>50 to ~20 vol%). There are two intervals of particularly low bulk density and high porosity. The first corresponds to the Igneous Unit 2 interval (30.70–59.62 mbsf), which has a mean bulk density of 1.92 g/cm3 and mean porosity of 52 vol%. The second interval occurs toward the top of Igneous Unit 4 (75.0–84.1 mbsf), where mean bulk density is 1.92 g/cm3 and mean porosity is 59 vol%. This interval corresponds to one of the intervals of higher grain density. Below this depth, both bulk density and porosity remain fairly constant with depth for the rest of Igneous Unit 4 (mean = 2.19 g/cm3 and 37 vol%, respectively). There is a distinct increase in bulk density and decrease in porosity at the transition to Igneous Unit 5. In the latter, bulk density and porosity values are generally constant with depth and have mean values of 2.46 g/cm3 and 21 vol%, respectively. There is a small excursion to slightly lower bulk density values and higher porosity values between ~333 and ~338 mbsf (2.32 and 2.31 g/cm3 and 26 and 29 vol% in Cores 376-U1530A-69R and 70R, respectively). This variation is also seen in downhole measurements of density and porosity at this depth (see Downhole measurements).
P-wave velocity
P-wave velocity data include 111 measurements on pieces of whole-round core in x- and y-directions, 171 measurements on section halves in the x-direction, and 58 measurements on discrete cubes in the x-, y-, and z-directions (Figure F56). Measured P-wave velocity and calculated anisotropy data are shown in Table T16. Measured velocities are consistent between the three measurement types.
Measured P-wave velocities range from ~1761 to ~4614 m/s with an average of ~3025 m/s. P-wave anisotropy values range from 0% to 17% between the z-direction (vertical) and the x-y plane (horizontal) and from 0% to 23% between the x- and y-axes (Figure F58). There is no discernible trend in anisotropy or preferred fast direction. P-wave velocity exhibits an inverse correlation with porosity (Figure F57).
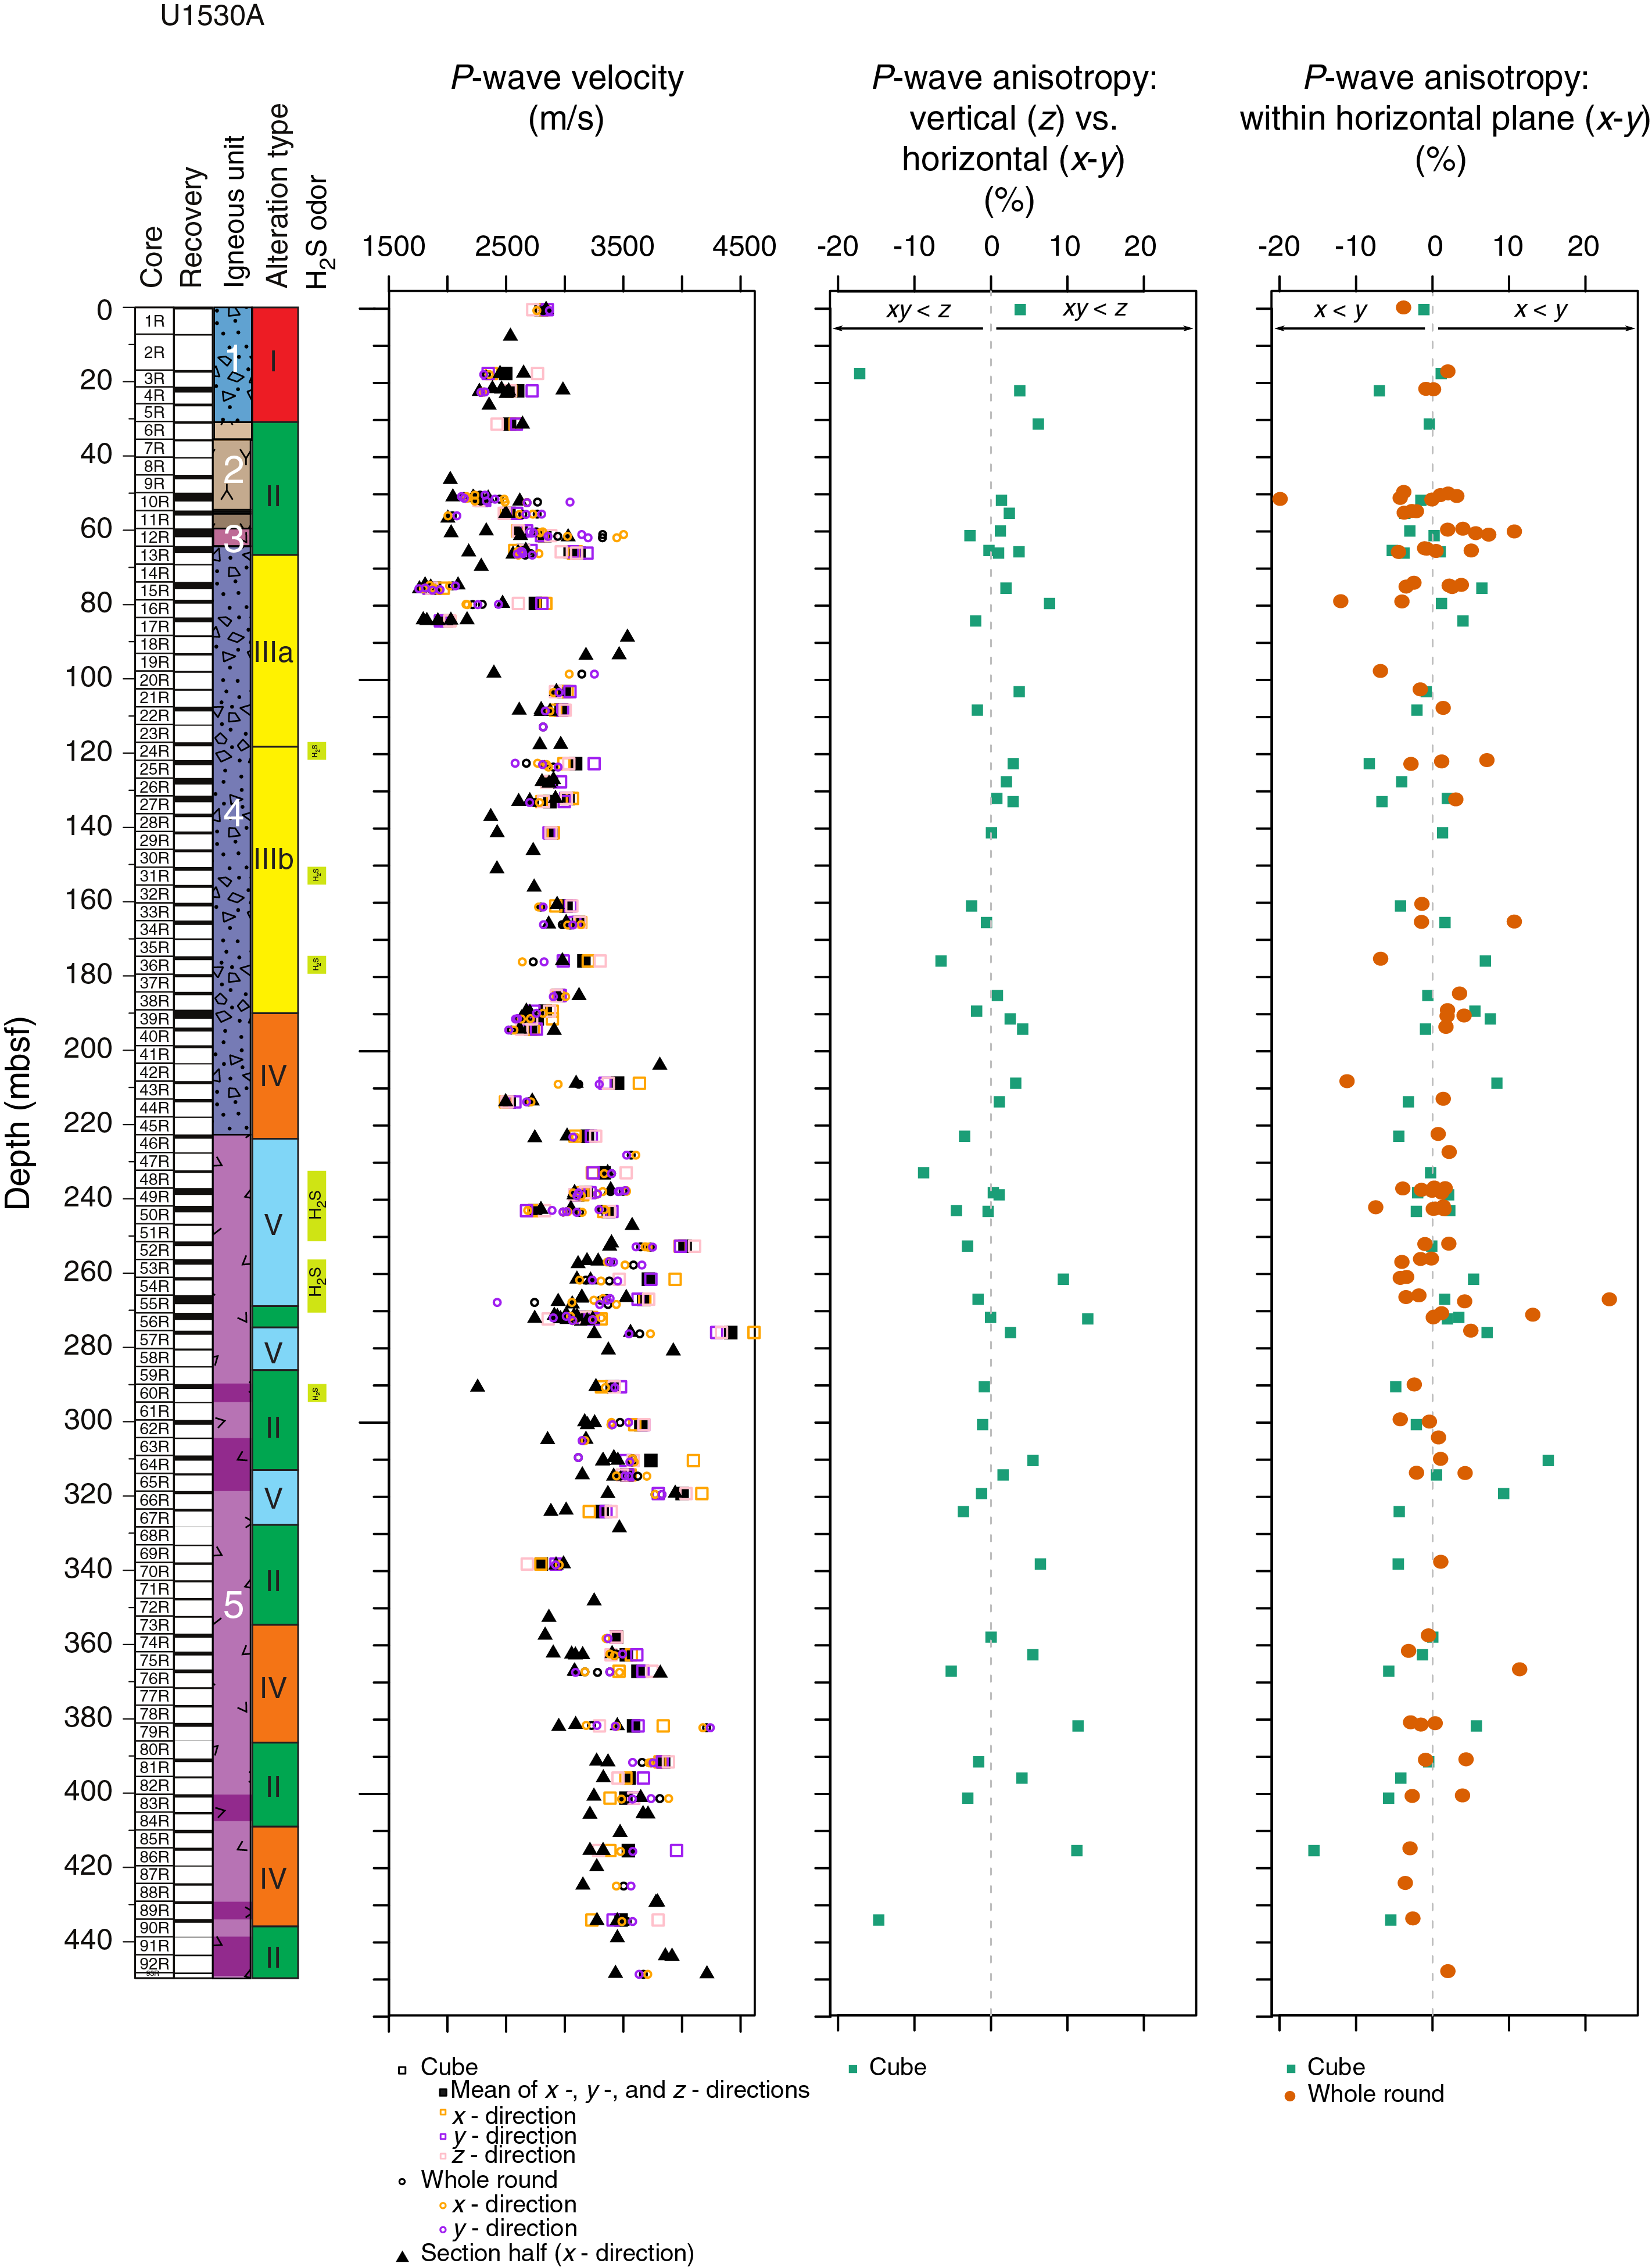
Figure F58. P-wave velocity and anisotropy, Hole U1530A.
P-wave velocities increase downhole (~2000 to ~4000 m/s), similar to bulk density and inverse to porosity. However, there are some notable variations in this overall trend. In Igneous Unit 1, P-wave velocity decreases with depth from ~2800 to ~2400 m/s (mean = 2550 m/s [the mean is not decreasing]). The mean P-wave velocity of Igneous Unit 2 is ~2370 m/s, but there are variations in the subunits. The two measurements from Subunit 2a are 2529 and 2640 m/s (Core 376-U1530A-6R). There are no P-wave data for the uppermost ~10 m of Subunit 2b because the material was either too fragmented or too friable for a successful measurement (Cores 7R and 8R). At 46.03 mbsf, P-wave velocity is markedly lower (2024 m/s) than in Subunit 2a, and subsequently it increases with depth through Subunit 2b to 2690 m/s at 51.99 mbsf. Subunit 2c has a mean value of 2613 m/s and no trend with depth. Subunits 2d and 2e have lower P-wave velocities of 2090 and 2003 m/s, respectively. Igneous Unit 3 is marked by a higher mean value of 2785 m/s, although values span a broad range from ~2030 to ~3330 m/s. Igneous Unit 4 has a mean P-wave velocity of ~2670 m/s but is marked by two short intervals of particularly low P-wave velocities from 74.27 to 75.55 mbsf (mean = ~1890 m/s; Core 15R) and from 83.80 to 84.10 mbsf (mean = ~1950 m/s; Core 17R). P-wave velocities are then generally constant with depth throughout the rest of the unit. Igneous Unit 5 is characterized by higher P-wave velocities (mean value = 3334 m/s) that remain relatively constant with depth. A small excursion to slightly lower velocities is seen in Core 70R at ~338 mbsf (mean = 2916 m/s), which corresponds to the depth of the noted decrease in bulk density and increase in porosity that is also seen in downhole measurements.
Magnetic susceptibility
MS data include Whole-Round Multisensor Logger (WRMSL) magnetic susceptibility logger (MSL) measurements on whole-round cores, Section Half Multisensor Logger (SHMSL) point magnetic susceptibility (MSP) measurements on working halves, and bulk MS measurements on discrete cubes (see Paleomagnetism) (Figure F56). SHMSL MSP data are in good agreement with bulk MS data for discrete cubes. The mean value of MSP is 8.6 × 10⁻⁵ SI, but values span three orders of magnitude. The maximum value of 1818 × 10−5 SI was measured at 22.32 mbsf in Core 376-U1530A-4R (Igneous Unit 1). Core 4R has markedly higher MS values than the rest of Unit 1 (>210 × 10−5 SI). Smaller peaks of MS of the order of 10 × 10−5 SI occur in Igneous Units 3 and 5, whereas Igneous Units 2 and 4 generally exhibit low MS values on the order of 0.1 × 10⁻⁵ to 1 × 10⁻⁵ SI. Overall, Igneous Unit 4 has the smallest MS values recorded in Hole U1530A (see Paleomagnetism).
Natural gamma radiation
A visual comparison of counts per second with the quality of core recovery indicates that the range of NGR values obtained largely reflects intervals of low recovery and small core pieces (Figure F56). Core 376-U1530A-4R has a maximum NGR value of 342 counts/s at 22.9 mbsf in Igneous Unit 1 and Alteration Type I. This is the maximum value recorded for all Expedition 376 sites. Values of >40 counts/s also occur in the top part of Core 5R (to ~26.4 mbsf). Below this depth, the highest NGR value is 32 counts/s at 75.2 mbsf in Core 15R (Alteration Subtype IIIa), which corresponds to the depth of a distinct peak in NGR from 40K seen in downhole measurements (see Downhole measurements). This increase in NGR is consistent with the increase in K-bearing illite and higher K2O concentrations observed at this depth (see Alteration and Geochemistry). Although NGR data measured in the Physical Properties Laboratory are strongly affected by core recovery, they also indicate a slight increase in NGR in Alteration Type III and a decrease beginning with the transition to Alteration Type IV. This trend is seen clearly in downhole measurements of NGR (see Downhole measurements) and is thought to correspond to the changes in illite abundance and K2O concentrations observed between Alteration Types III and IV (see Alteration and Geochemistry).
Thermal conductivity
Thermal conductivity was measured on 21 samples considered representative of different lithologies and/or alteration types (Table T17). Measurements ranged from 1.63 to 4.45 W/(m·K) with a mean of 3.08 W/(m·K) (Figure F56). No measurements were made in Igneous Units 1 and 2 or Alteration Type I due to the small size or fragile nature of the recovered material. Between 61.44 and 65.71 mbsf (transition from Igneous Unit 3 to Unit 4 and from Alteration Type II to Subtype IIIa), the mean thermal conductivity is 2.42 W/(m·K). The lowest thermal conductivity measured at Site U1530 occurs at 75.39 mbsf (1.63 W/[m·K]; Core 376-U1530A-15R). This finding is somewhat unexpected because the increased grain density at this depth is attributed to an increase in pyrite abundance, which has a high thermal conductivity. However, the relatively high abundances of water-rich smectite, illite, and chlorite (which have low thermal conductivities) in the same interval may be the cause of the low thermal conductivity value. Thermal conductivity steadily increases with depth through Igneous Unit 4 and into Igneous Unit 5 to the highest measured value for this site of 4.45 W/(m·K) at 256.56 mbsf (Core 53R). An exception to this increasing trend occurs at the boundary between Igneous Units 4 and 5, where thermal conductivity drops to 2.34 W/(m·K) at 222.89 mbsf (Core 46R). In the rest of Igneous Unit 5, thermal conductivity values remain relatively high but scattered, and there is no clear variation with alteration types. This may also be due to the limited core recovery (which results in a large gap in measurements from ~270 to ~370 mbsf) and a sampling bias toward selecting more coherent pieces for measurement.
Reflectance colorimetry
Reflectance colorimetry data obtained with SHMSL for the a* (green-red variation) and b* (blue-yellow variation) parameters are shown in Figure F56. Negative a* values (indicating higher green character) are seen particularly from ~40 to ~75 mbsf, and they correspond to Alteration Type II (to ~62 mbsf) and the uppermost part of Alteration Subtype IIIa. This likely reflects the presence of blue-green chlorite over this interval (see Alteration). This association of negative a* values with Alteration Type II is not seen so clearly in Igneous Unit 5 where Alteration Type II is present in several distinct intervals with the uppermost one starting at ~271 mbsf; however, this may partly be due to limited core recovery. b* values do not show any strong correlation with alteration type or igneous unit.
Integration of observations
Overall, physical property variations at Site U1530 show good correlation with igneous units and subunits but are less well correlated with transitions in alteration types that occur in igneous units. Igneous Unit 1 has poor core recovery, but the recovered material has some of the most striking physical property characteristics for the site. Igneous Unit 1 corresponds to Alteration Type I and contains the peak values for MS and NGR. The peak in MS (1818 × 10−5 SI; Section 376-U1530A-4R-1) is on the same order of magnitude as maximum peaks found at previous sites. However, the NGR values measured in the same core (as high as 342 counts/s) exceed measured values at previous sites by an order of magnitude. The high values of NGR observed at the same depth in the downhole measurements are attributed to radioactive U-series isotopes that may be present in the sulfide and barite vein network observed in Alteration Type I (see Downhole measurements, Alteration, and Geochemistry). Measured bulk density, porosity, and P-wave velocity values in this interval are intermediate compared with the rest of the site. The high NGR values and, to a lesser extent, the high MS values may therefore be the most characteristic physical properties of this alteration type.
Transitions between and in igneous units and subunits are clearly defined by variations in bulk density, porosity, and P-wave velocity data. For example, variations in these data sets in the subunits of Igneous Unit 2 appear to reflect varying grain size and degree of consolidation, and lower bulk density and P-wave velocity and higher porosity are associated with friable and/or fine-grained material (see Igneous petrology and volcanology). Bulk density, porosity, and P-wave velocity are not strongly correlated with structural features such as fractures or alteration veins. The excursion in bulk density, porosity, and P-wave velocity between ~330 and ~340 mbsf does correspond to a decrease in fracture density and restricted range of vein dip over this depth; however, this may be an artifact of poor core recovery (see Structural geology). These smaller variations in density, porosity, and P-wave velocity are also seen clearly in the continuous data sets acquired by downhole measurements, which may be useful for identifying additional subunits or features that are not recognized due to poor core recovery (see Downhole measurements).
Transitions between alteration types are not clearly defined by variations in physical properties except where they coincide with an igneous unit boundary. An exception to this is the apparent correlation of higher NGR counts in Alteration Type III due to the increase in illite (see Alteration, Geochemistry, and Downhole measurements). It is interesting that MS does not vary clearly with alteration types at Site U1530, which is in contrast to Site U1528 (see Physical properties in the Site U1528 chapter [de Ronde et al., 2019d]). It is not clear to what extent MS is determined by the original mineralogy of the primary igneous material versus the type and intensity of subsequent alteration or whether similar MS values can be used as a basis for correlating material of potentially similar origin recovered at different sites (e.g., Igneous Unit 1 of Site U1530 and Igneous Unit 2 of Site U1527; see Igneous petrology and volcanology). Although MS undoubtedly varies between igneous units at Site U1530, there is no clear pattern in the observed type or abundance of magnetically susceptible mineral phases in these units. Similarly, observed variations in thermal conductivity at Site U1530 do not clearly correspond to the observed abundance or distribution of particular minerals, although this may be partly due to a lack of measurements over some depth intervals.
Physical property data sets at Site U1530 also define an interval of markedly different characteristics toward the top of Igneous Unit 4 (~75 to ~85 mbsf). This depth interval is characterized by low bulk density and high porosity, high grain density, very low P-wave velocity, relatively high NGR (identified as a result of high 40K concentrations by downhole measurements of NGR), and low thermal conductivity. This same zone is also denoted by geochemical variations including an increase in Fe2O3 and S concentrations that correspond to an increase in pyrite abundance (hence grain density) but also includes variations in trace metals and metalloids, such as increases in Cu and As concentrations (see Geochemistry). Although data are more limited because of poor core recovery, a similar interval of high grain density associated with low bulk density, high porosity, and increased concentrations of Fe2O3, S, K2O, trace metals, and metalloids occurs at ~30 to ~35 mbsf in Igneous Unit 2 (see Geochemistry). The high porosity of these two intervals is likely due to their high clay contents (see Alteration), which means that they can contain large amounts of fluid bound within clay minerals but potentially form relatively impermeable layers, therefore forming a potential locus of fluids. It is notable that these layers are not themselves associated with increased veins or fractures but are instead directly beneath intervals characterized by increased fracture density and wide ranges in dip angles of alteration veins (~15 to ~25 mbsf; ~50 to ~65 mbsf) (see Structural geology). These intervals may therefore be important for understanding the fluid-rock interactions and flow pathways of the hydrothermal system at Site U1530.
Downhole measurements
The series of downhole measurements performed in Hole U1530D (Table T18) consisted of (1) temperature monitoring while coring (with temperature strips and capillary thermometers located in a housing on top of the core barrel), (2) one run of the ETBS memory tool to measure temperature, (3) two runs of the 600 mL Kuster FTS tool (the first run was unsuccessful due to a mechanical failure, and the second one was successful), (4) suites of measurements acquired with both the triple combo and the FMS-sonic tool strings, and (5) one run of the Petrospec TCMT to record temperature after completion of all downhole measurements. The timing and sequence of deployments relative to circulation pumping rates, times, and volume are shown in Figure F59.
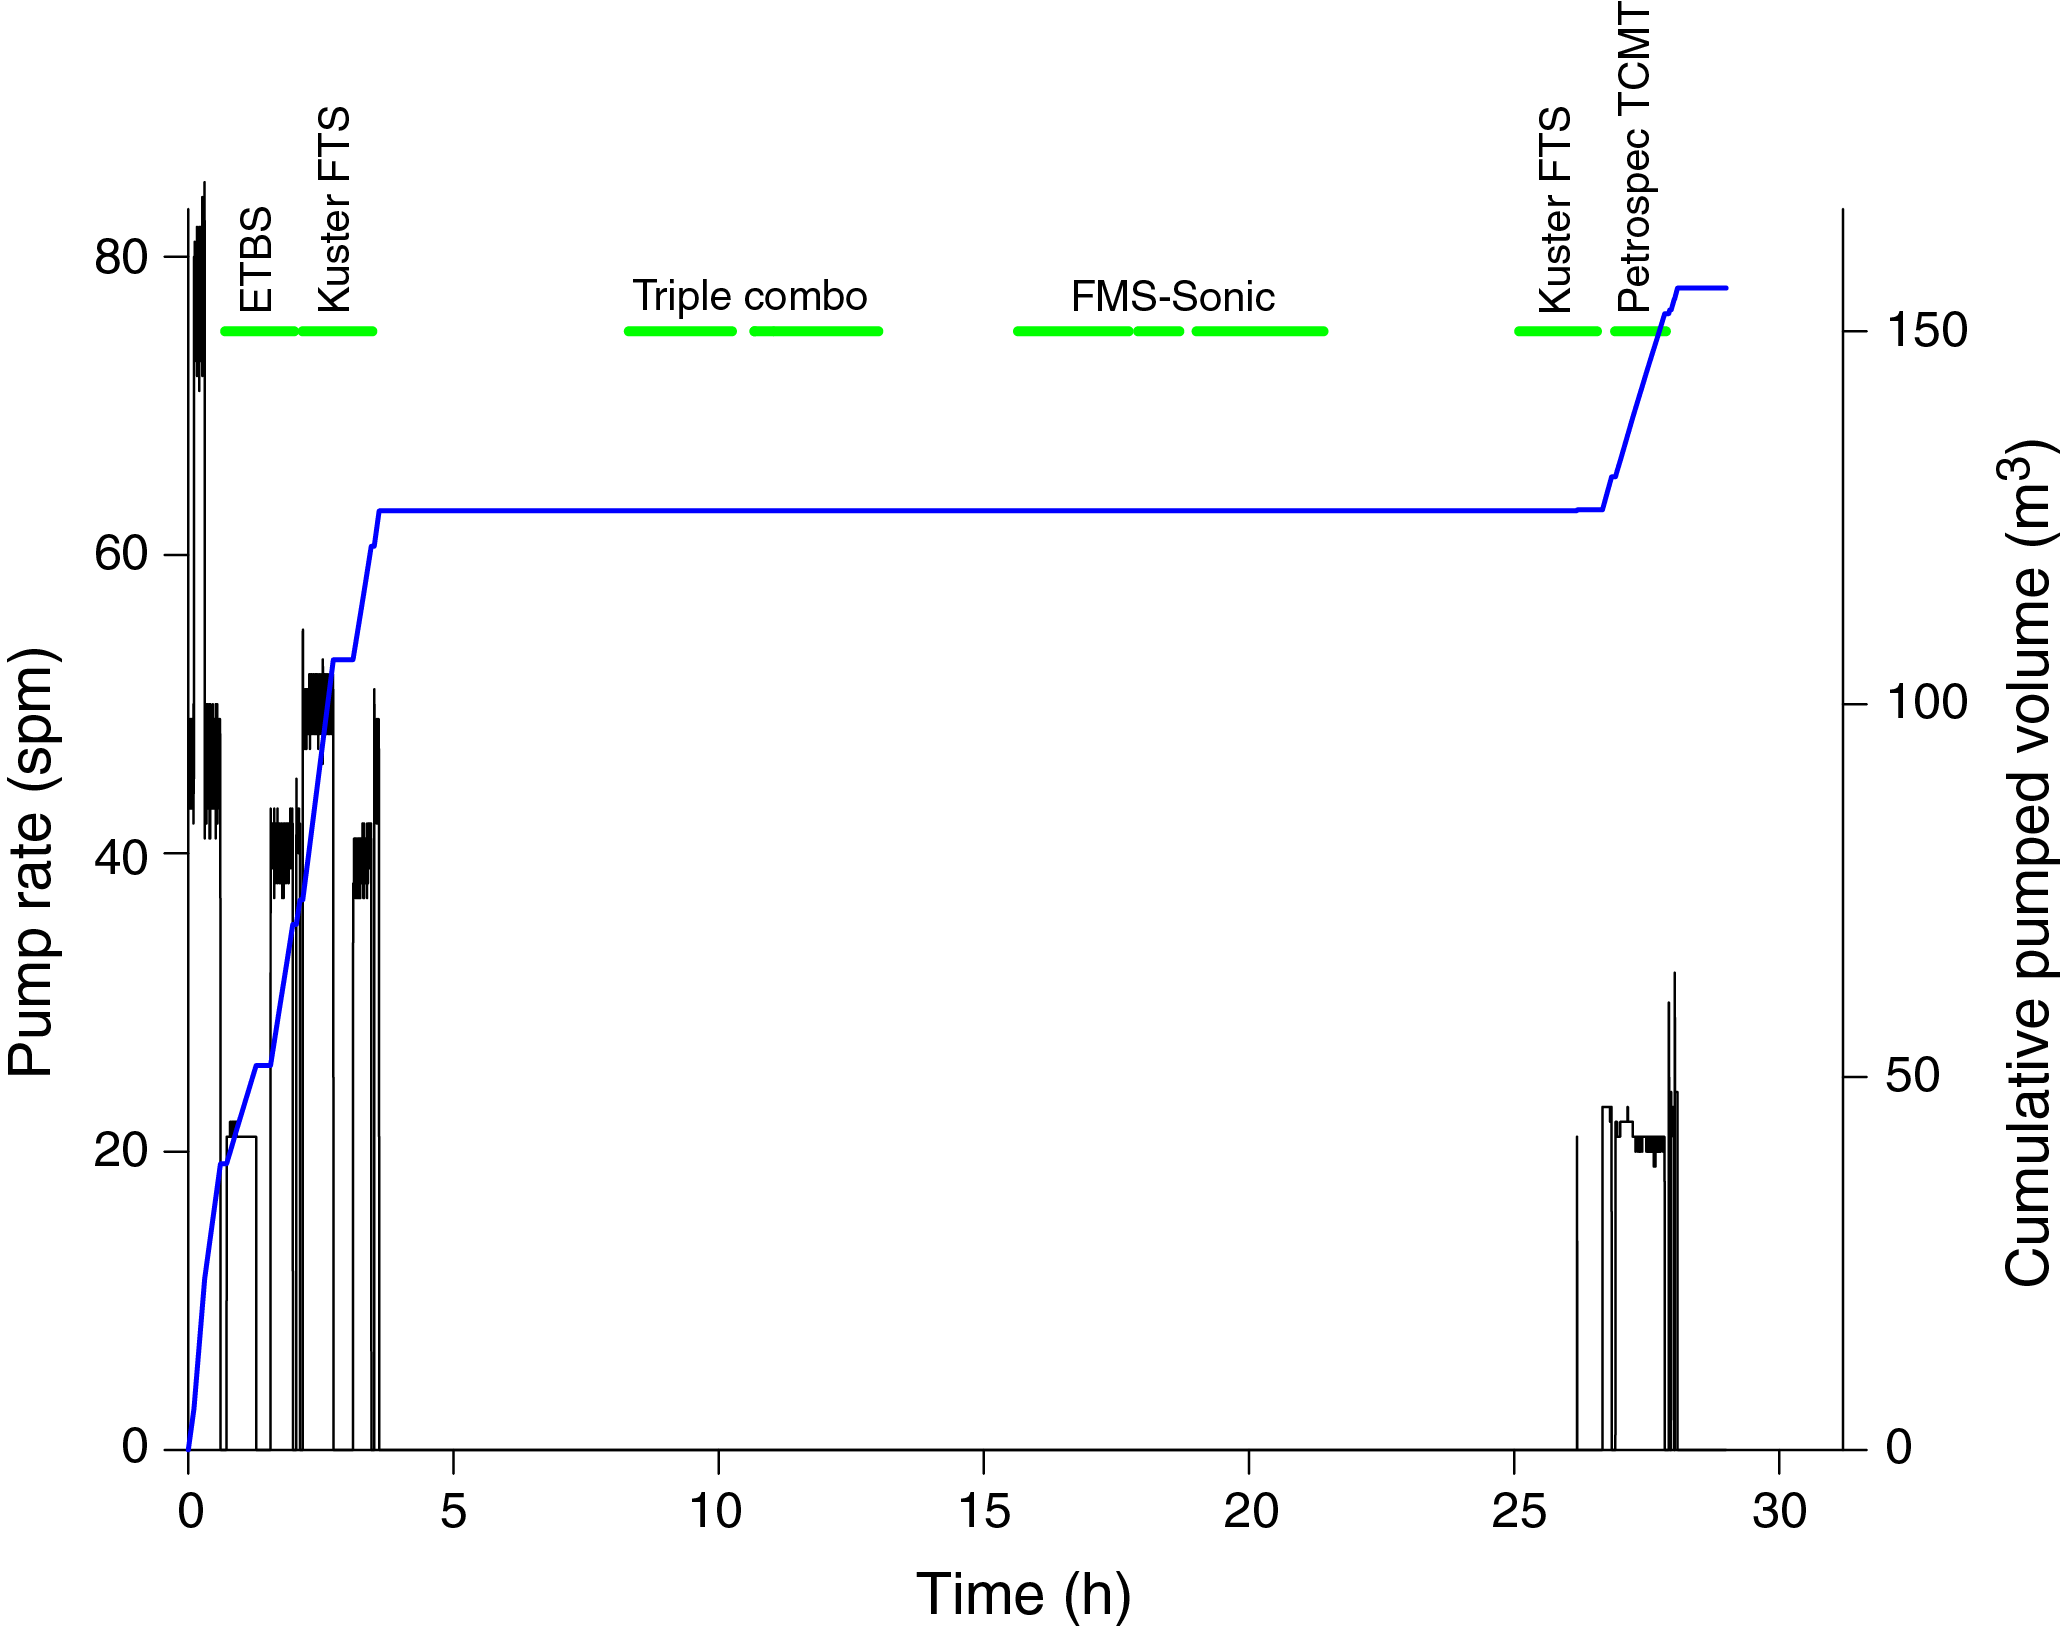
Figure F59. Operations for downhole measurements, Hole U1530A.
Operations
Downhole measurement operations started in Hole U1530A after recovering the last core (penetration depth = 453.1 mbsf), dropping the RCB coring bit, and pulling up the drill string to 427 mbsf. The ETBS was run at 20 m/min to 429.1 mbsf while pumping at 20 strokes/min, and then circulation was stopped for 15 min to obtain a temperature measurement indicative of heating rate in the borehole (Figure F60). The ETBS was then pulled up the drill string at 40 m/min while pumping at 40 strokes/min. The 600 mL Kuster FTS tool was lowered to 436.1 mbsf. Circulation was stopped for ~20 min to allow the clock timer to activate and the sample to be taken. Upon retrieval of the tool, it was determined that a cap screw in the upper valve assembly had unscrewed, preventing the lower valve from closing, and hence no sample was collected.
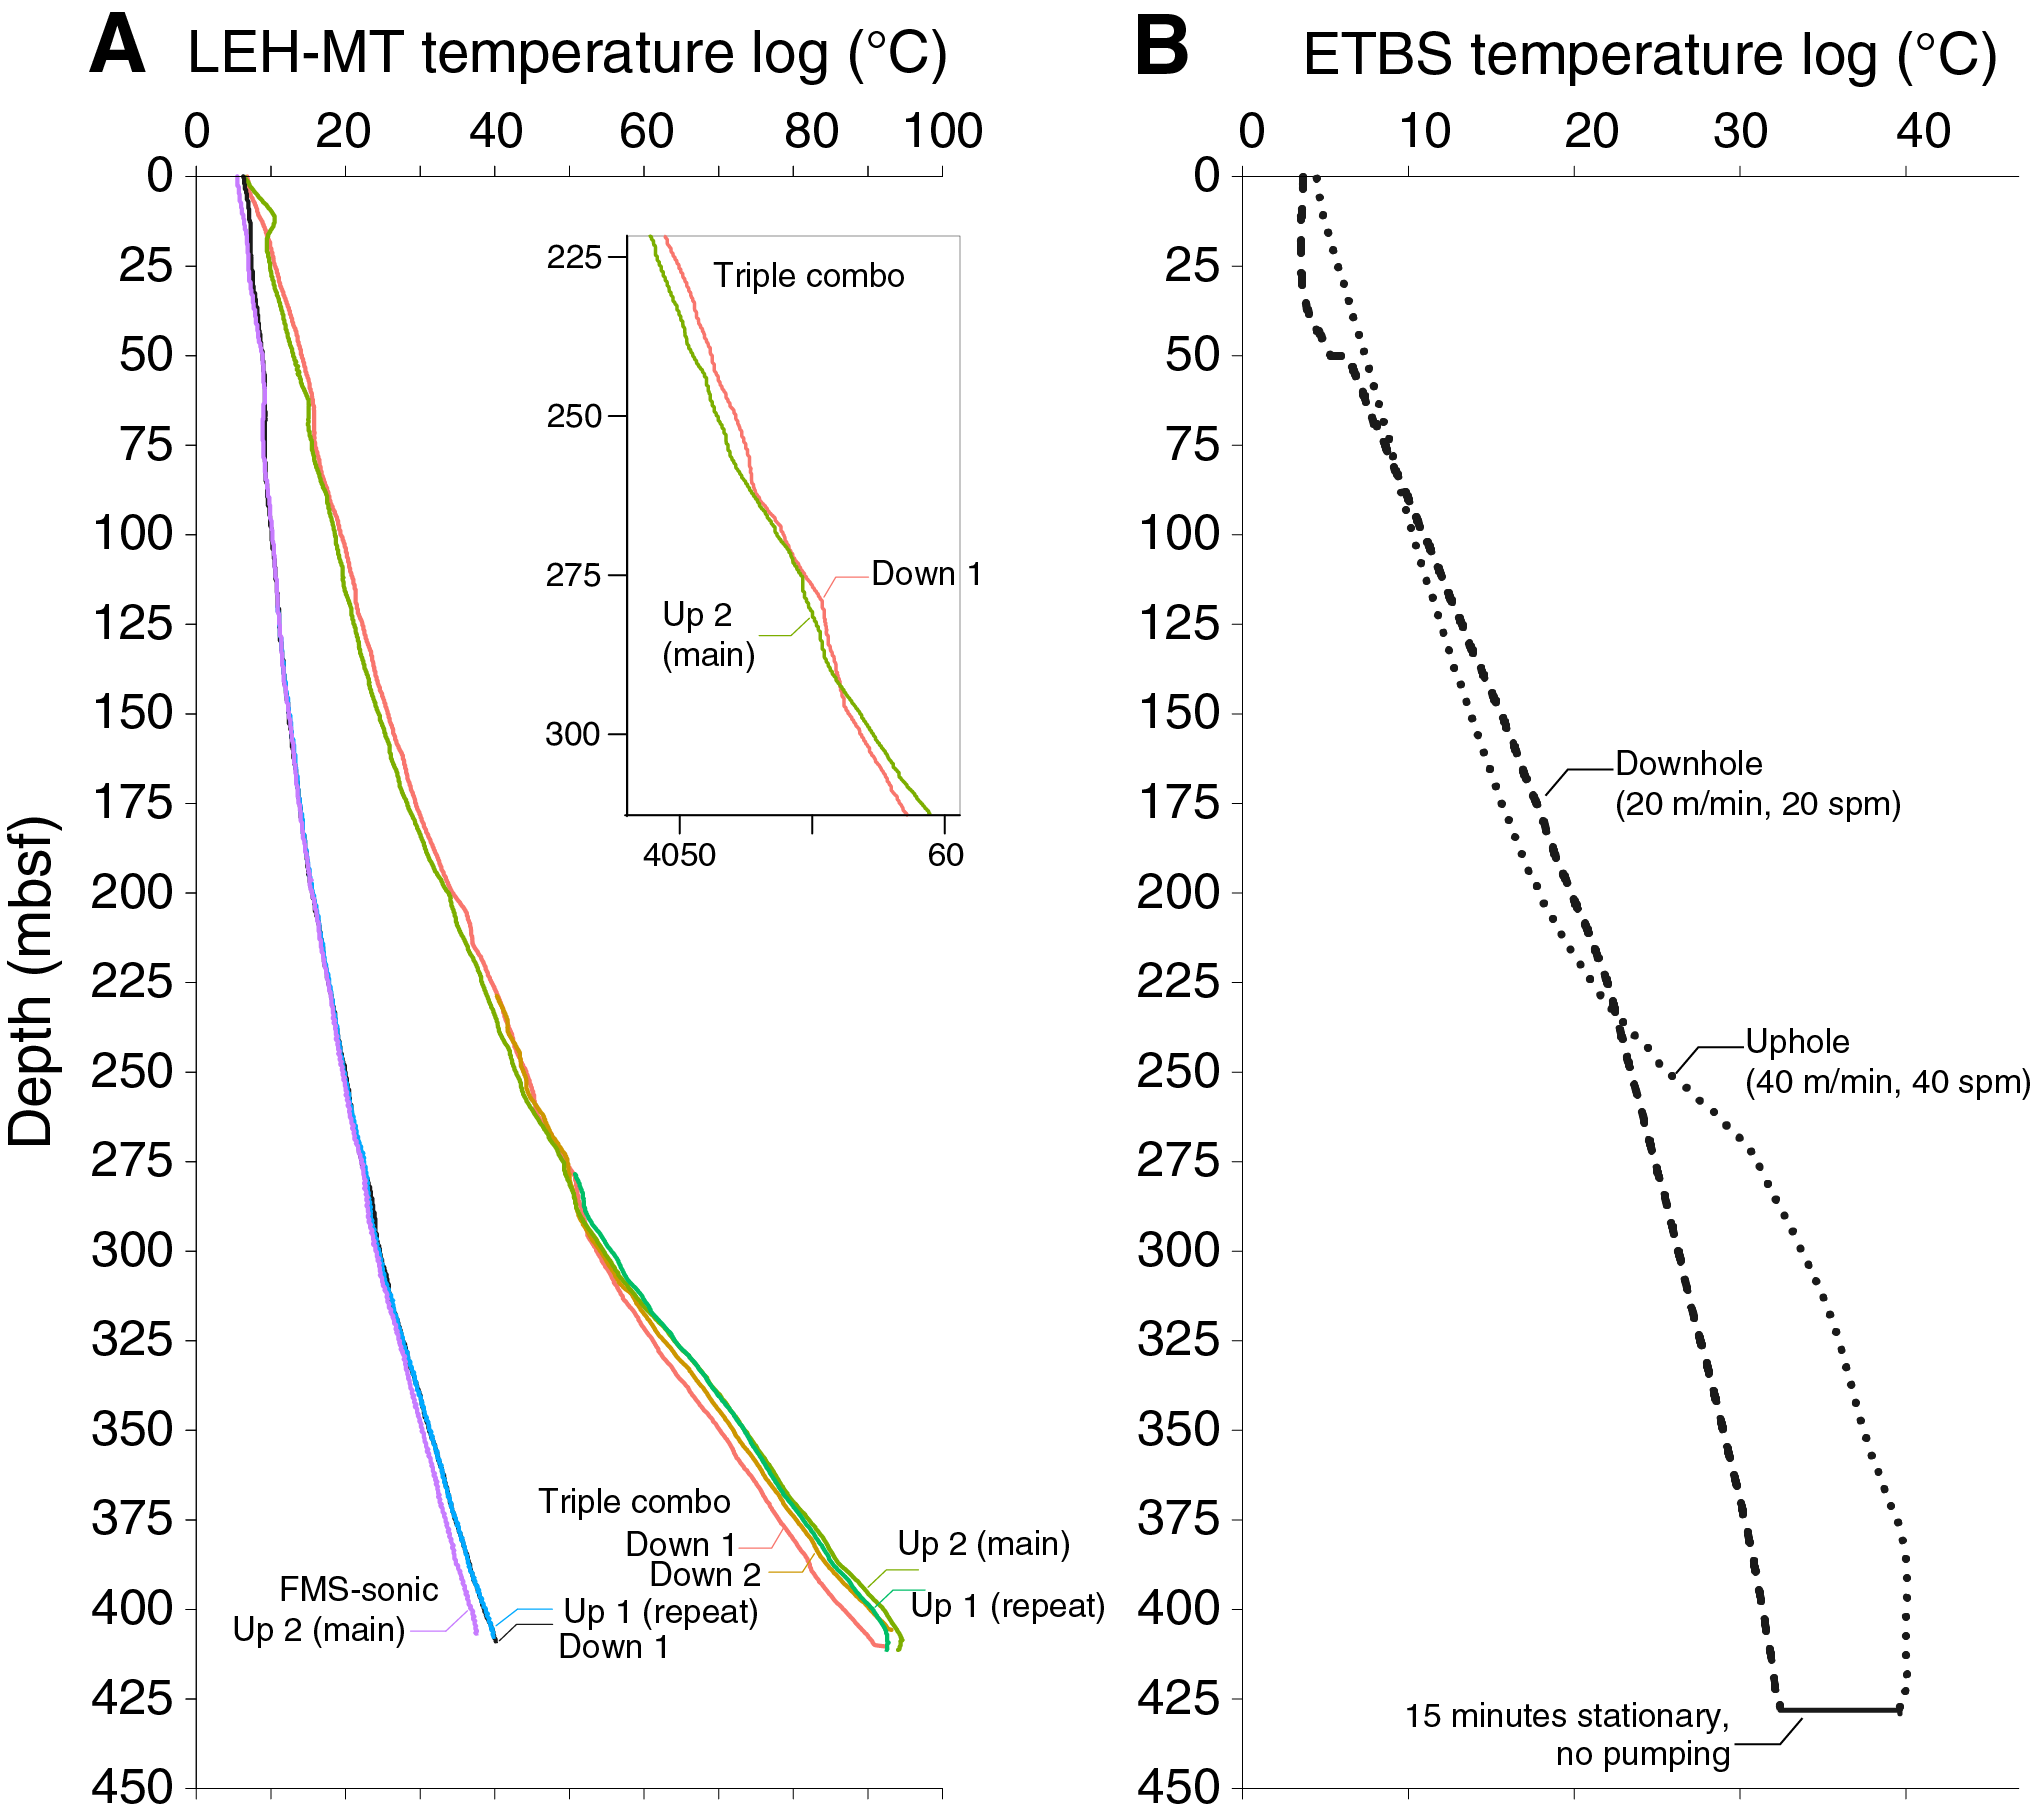
Figure F60. Temperature measurements, Hole U1530A.
Based on the low temperature (~40°C) recorded by the ETBS, the triple combo suite (consisting of the HLDS, HNGS, EDTC, APS, and LEH-MT tool) was deployed. The drill string was raised to 67 mbsf. Measurements started in the open hole 5 h after stopping circulation. Four passes with the triple combo suite were made in total (two downhole and two uphole). The first downhole pass was terminated at 447 mbsf due to debris (infill) at the bottom of the hole. The first uphole pass (i.e., the “repeat pass”) was acquired uphole to 273 mbsf and was followed by a second downhole log to record temperature. Note that the natural gamma ray readings of this second downhole pass are higher than those that occur naturally because the formation was still emitting higher radiation as a result of the previous pass of the APS tool (which emits neutrons that interact with the formation). The second uphole pass was measured from the bottom of the hole to the seafloor (i.e., the “main pass”).
Based on a maximum temperature reading from the LEH-MT of 94.4°C at the start of the second uphole pass of the triple combo tool string, the decision was made to run the FMS-sonic tool string, which produces a resistivity image (FMS) and measures compressive, shear, and Stoneley wave velocities (DSI); spectral gamma ray (HNGS); and temperature (LEH-MT). Four passes with the FMS-sonic string were made in total (two downhole and two uphole). During the first downhole pass, the DSI recorded only compressive and shear waves as per IODP standard procedures, and Stoneley waves were recorded on the two uphole passes. The second downhole pass was run without recording any data, as per standard procedures. The temperature at the end of the first FMS-sonic downhole pass was 40.5°C at 447 mbsf, lower than the previous measurement of 94.4°C by the triple combo suite. During the 2.5 h of FMS-sonic logging, the temperature decreased further to 37.6°C.
Following the FMS-sonic logging run, the drill string was lowered to 440.7 mbsf. The 600 mL Kuster FTS tool was once again deployed and successfully collected a sample at 435 mbsf (see Geochemistry). Finally, the Petrospec TCMT was run into the drill string while pumping at 20 strokes/min. The upper part of the tool remained in the drill pipe to keep the data logger at <40°C, and the lower part of the tool extended 8 m below the end of the pipe.
Temperature
Four temperature logs were acquired from three different tools in Hole U1530A after varying times of seawater circulation (Table T18). The temperature recorded by the ETBS, with a logging speed of 20 m/min and while circulating seawater, increased with depth from 3.5°C at the seafloor to 32.4°C at 429.1 mbsf. The temperature then increased from 32.4° to 39.7°C within 16 min during a stationary measurement at 429.1 mbsf without seawater circulation (Figures F60, F61).

Figure F61. Temperature heat-up profile, Hole U1530A.
During the first downhole run of the LEH-MT tool, temperature increased with depth from 6°C at the seafloor to 92.6°C at 445 mbsf. By the end of the second downhole run (1.5 h later), the temperature at 445 mbsf had increased slightly to 94.1°C. All LEH-MT profiles show several positive and negative thermal anomalies with respect to the linear estimated geothermal gradient (e.g., Drury and Jessop, 1982). Such anomalies are often interpreted to be related to fluids flowing into and out of the borehole. These can aid in the identification of possible fluid flow zones and can serve as indicators of more permeable lithologies (Serra, 1984; Ziagos and Blackwell, 1986; Anderson, 2005; Baujard et al., 2017). In Hole U1530A, a sequence of negative-positive-negative thermal anomalies was observed from ~255 to 295 mbsf in the first (i.e., least disturbed) downhole temperature profile (Figure F60).
Another set of LEH-MT temperature data was obtained during downhole logging with the FMS-sonic string. During the first downhole pass, temperatures increased steadily from 6°C at the seafloor to 40.5°C at 417 mbsf. By the start of the second uphole pass (2.5 h later), the temperature at 417 mbsf had decreased to 37.6°C (Figure F61). These values are lower than the temperatures from the previous triple combo run, indicating that the borehole cooled down from 94.4° to 37.6°C over a period of ~7.5 h.
The temperatures recorded at the end of the downhole measurement session by the two thermocouple sensors in the Petrospec TCMT included a maximum temperature of 20°C at 427 mbsf while pumping seawater at 20 strokes/min.
Formation natural radiation
The natural gamma ray radiation measured by the HNGS tool exhibits variability throughout the logged interval (Figure F62). Note that HNGS elemental data are reported in quantitative units in parts per million (ppm) and percent, but this method is based on a standard calibration for spectral natural gamma ray tools and is only qualitative in this application. For quantitative assessment, these data can be adjusted using geochemical analyses (see Geochemistry). The following discussion is based on a qualitative assessment of the relative contents of uranium, thorium, and potassium.
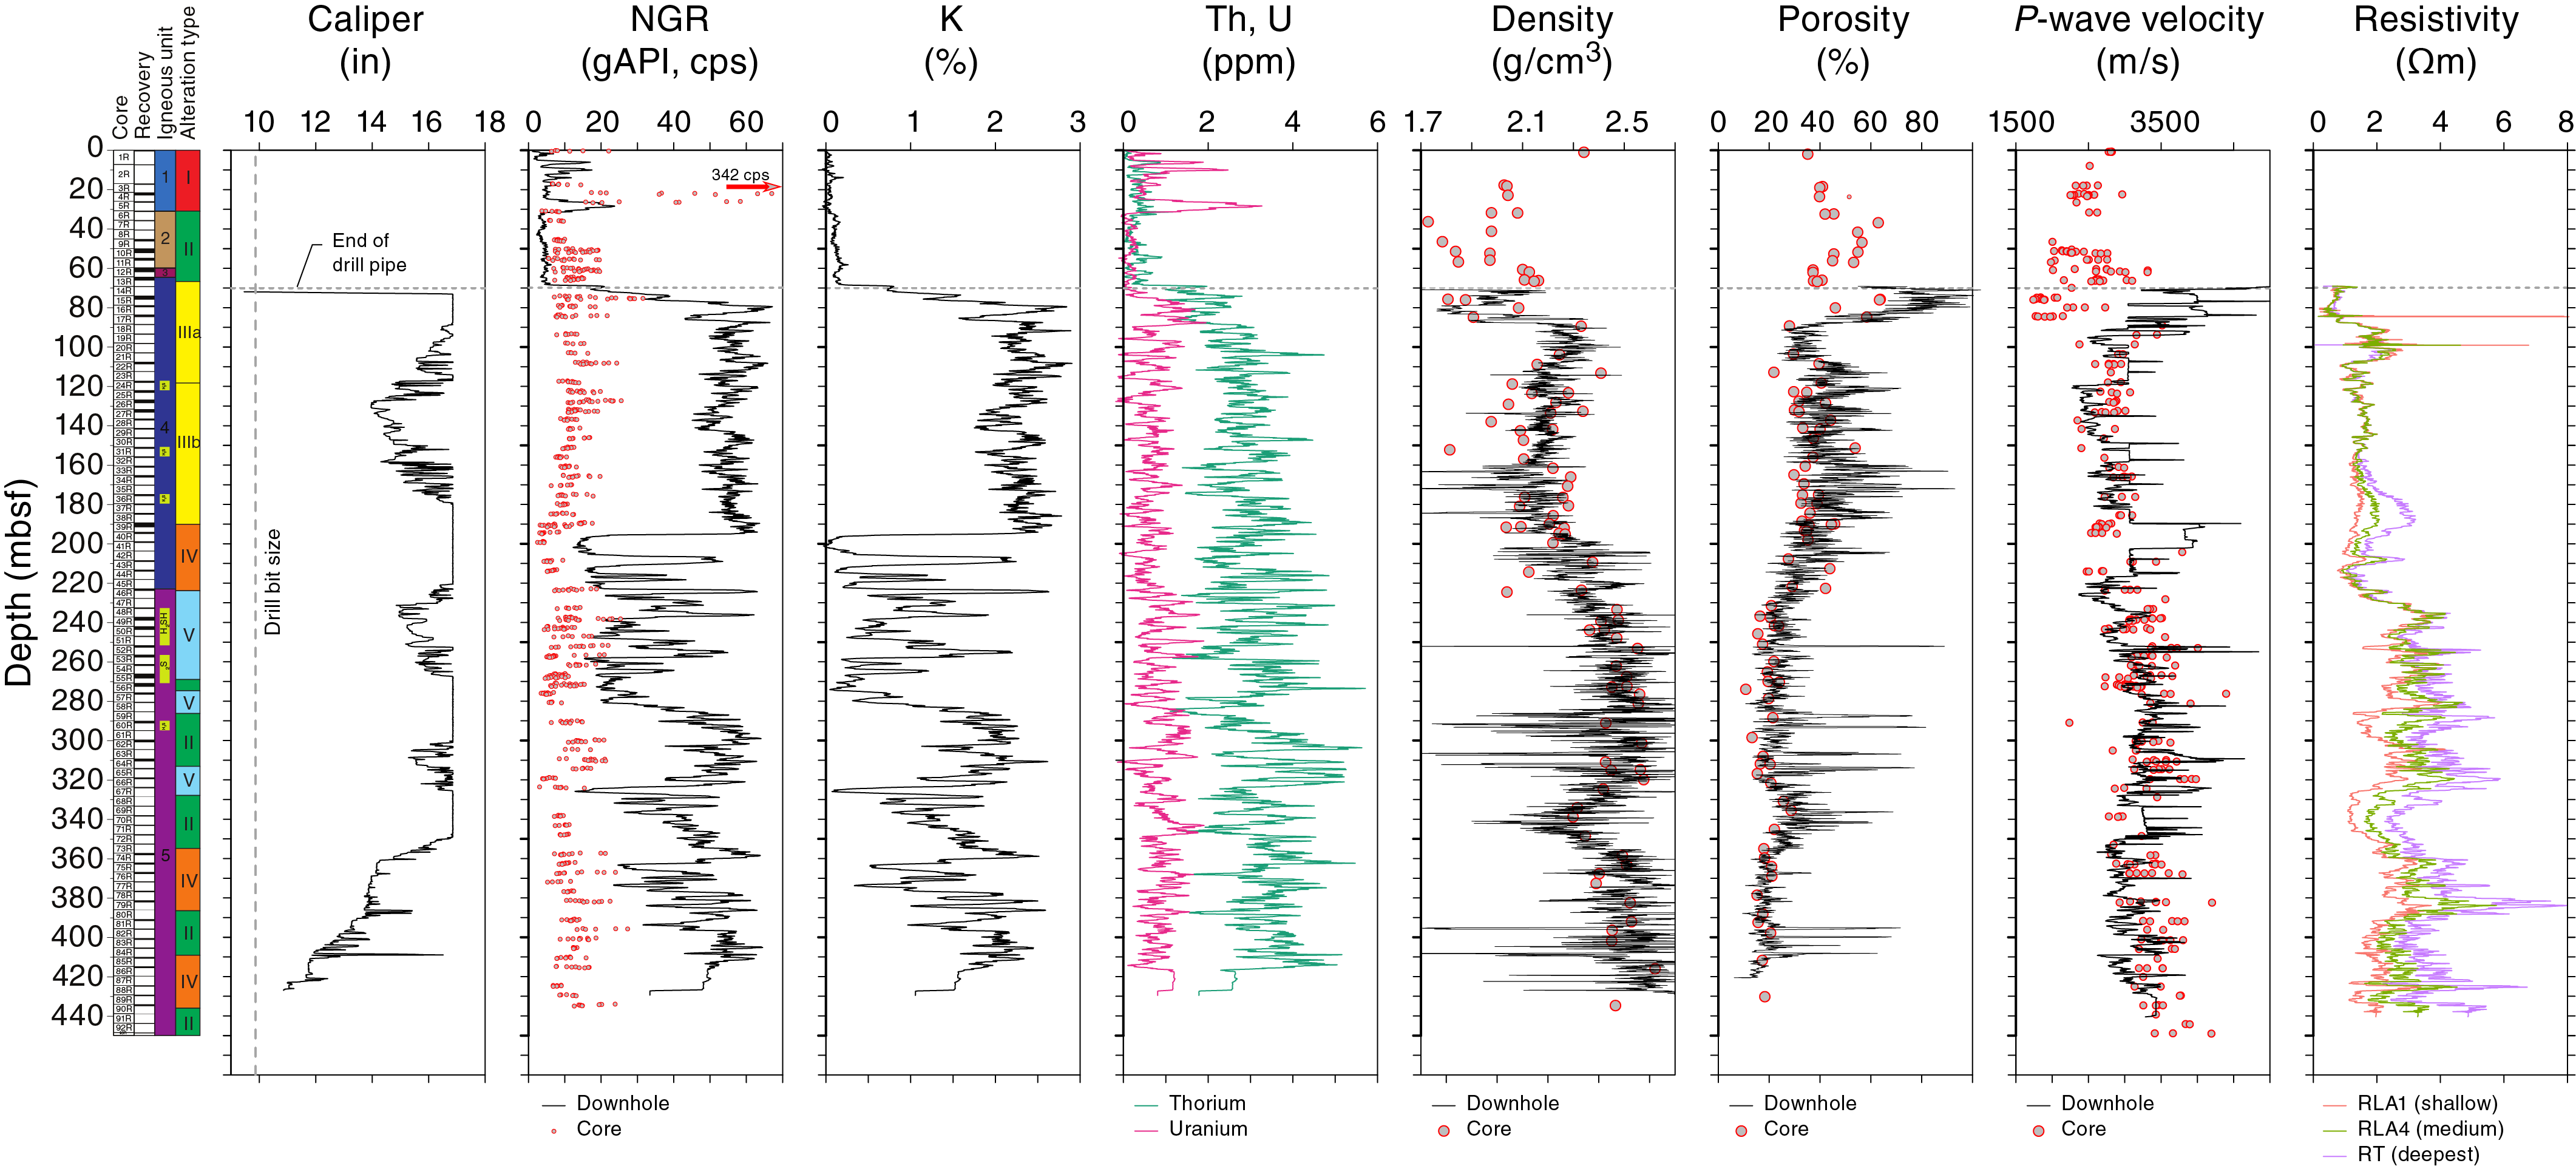
Figure F62. Downhole measurements, Hole U1530A.
A peak of uranium concentration of 3.3 ppm was observed between 23 and 35 mbsf, even though this interval was recorded through the drill pipe, which strongly attenuates radiation. In the open hole, the natural gamma ray radiation typically varies in relation to changes in potassium (K) content. Potassium is high (1.8%–3%) between the bottom of the drill pipe (67 mbsf) and 195 mbsf. From 195 to 275 mbsf, K oscillates between <0.8% and >1.5%. From 275 to 410 mbsf, K also shows large variations between 0% and 2.6%. However, there are some general downhole trends: an increase from 0% to 2% from 275 to 285 mbsf, steady values of ~2% between 285 and 316 mbsf, a decrease from 2% to 0% from 316 to 325 mbsf, and an increase from 0% to 2.2% from 325 to 360 mbsf.
Borehole diameter (caliper), formation density, and neutron porosity
The 1-arm caliper of the HLDS and 4-arm calipers of the FMS show that Hole U1530A, which was drilled with a 9.725 inch diameter bit, was significantly washed out over most of the logged section as a result of pumping seawater (Figure F62). The hole diameter exceeds the reach of the 1-arm caliper (17 inches) at 70–90, 175–220, 268–300, and 325–350 mbsf. Despite the enlarged borehole, good measurements of density (HLDS tool) and neutron porosity (APS tool) were achieved, and these independent measurements show a strong inverse correlation between these parameters. In addition, these measurements are consistent with density and porosity measurements made on the cores (see Physical properties) (Figure F62).
A qualitative assessment of the data shows that density ranges between ~1.8 and 2.8 g/cm3 and neutron porosity ranges between ~15% and ~80%. The neutron porosity measurements quantify the amount of water located in fractures and vesicles together with the water trapped in clay minerals. High clay mineral content can thus cause high neutron porosity values.
Several intervals of distinct density and porosity characteristics are identified:
- ~65–88 mbsf: low density (median = ~1.75 g/cm3) and high neutron porosity (median = ~80%).
- ~88–190 mbsf: medium density and neutron porosity (median = ~2.2 g/cm3 and ~40%, respectively).
- ~190–230 mbsf: downhole increasing density (from ~2.2 to ~2.4 g/cm3) and decreasing neutron porosity (from ~40% to ~20%).
- ~230–430 mbsf: constant high density (median = ~2.5 g/cm3) and low neutron porosity (median = ~20%) overall with a narrower interval (~325 to ~345 mbsf) of decreasing and then increasing density (to a minimum of ~2.2 g/cm3) associated with increasing and then decreasing neutron porosity (to a maximum of ~30%).
Resistivity
The resistivity log is composed of six measurements at increasing lateral depth of investigation into the formation. The measurement at the deepest depth of investigation (RT; purple line on Figure F62) is ~4 m into the formation away from the borehole wall. Because it is the least affected by BFs infiltrating the formation, it is used here to describe variations of resistivity with depth.
Resistivity downhole measurements show large relative variations of 0.1–8.6 Ωm (Figure F62) that typically correlate with variations in density and porosity:
- 65–88 mbsf: relatively lower resistivity (<1 Ωm).
- 88–105 mbsf: intermediate resistivity (median = 1.9 Ωm).
- 105–212 mbsf: lower resistivity (median = 1.7 Ωm) and two narrow intervals of higher resistivity (~3 Ωm) at 173–181 and ~210 mbsf.
- 212–235 mbsf: a gradual increase in resistivity from ~1.0 to 2.9 Ωm.
- 235–430 mbsf: generally higher resistivity (median = 3.6 Ωm) with peaks as high as 6.7 Ωm at 425 mbsf and 8.6 Ωm at 385 mbsf. Includes a narrower zone of lower resistivity (median = 3.0 Ωm) at 325–345 mbsf.
Sonic velocities
Dipole sonic signals were quite weak in some intervals throughout the hole due to an attenuating formation and/or the effect of the enlarged borehole. Further processing is therefore needed to obtain high-quality velocities. An initial assessment of P-wave velocities automatically picked up from the recorded sonic waveform suggests that general agreement with P-wave velocity measurements made on core material (see Physical properties) (Figure F62). An exception occurs at 70–85 mbsf (~4000 and ~2000 m/s for the downhole and core measurements, respectively). Because this interval was just below the drill pipe and showed a weak signal while logging, downhole measurements may not be reliable for this depth.
Formation imaging
Many geological features are seen throughout the FMS resistivity image (Figure F63), although any quantitative geological interpretation of the image awaits further onshore processing and analyses. Despite the enlarged borehole, there are fortunately only limited intervals in which some of the FMS pads were not in contact with the surrounding formation (Figure F63). The main and repeat passes imaged different azimuths of the borehole in places. A visual inspection of the preliminary processed images shows variability in the resistivity of background rock mass that reflects variability in the host rock texture. Numerous planar features intersect the borehole, which is consistent with the occurrence of fractures (i.e., that are fluid filled and therefore conductive) or veins (i.e., that are either conductive or resistive, depending on the electrical conductivity of the infilling minerals).
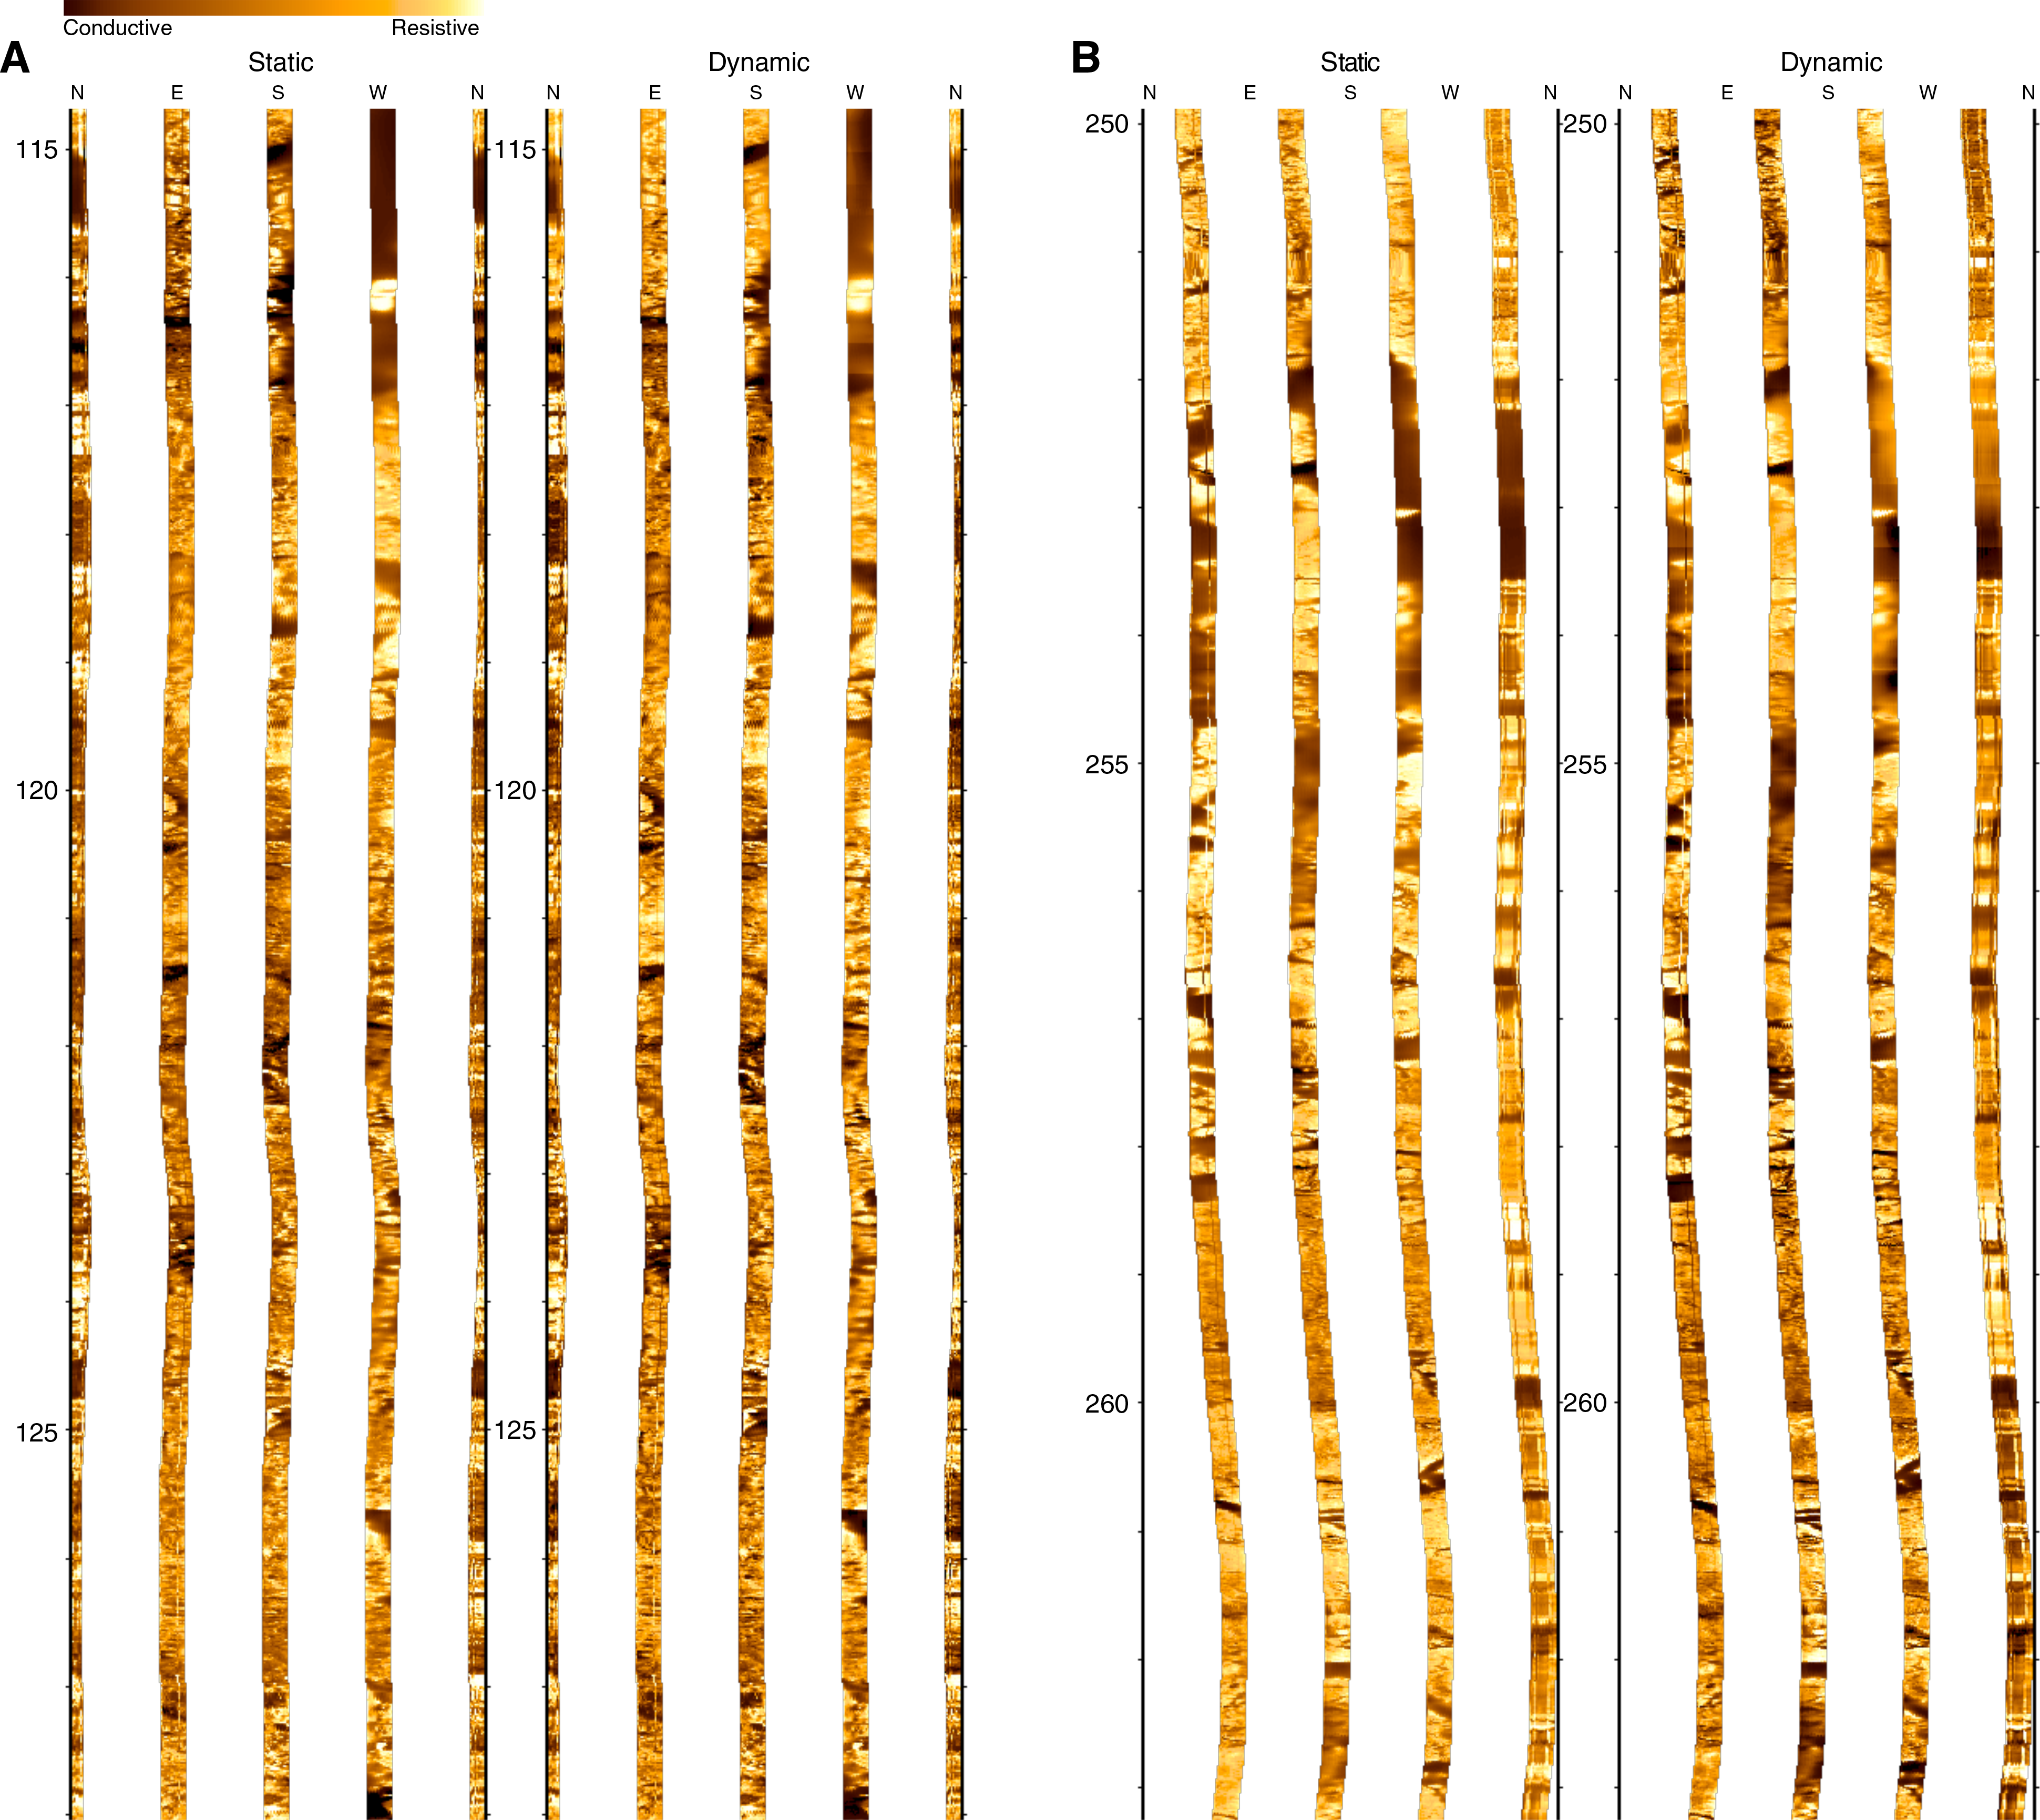
Figure F63. FMS resistivity images, Hole U1530A.
Initial core-log integration
Multiple temperature measurements acquired while logging indicate heating of the hole from ~35° to 94°C during the first 8 h after stopping seawater circulation followed by cooling to 37°C during the next 7 h (Figure F60; Table T18). The gradual increase in temperature with depth seen in the LEH-MT logs indicates a largely conductive-dominated regime in the borehole, whereas the concave upward shape of the profile indicates that this is a recharge area (Taniguchi et al., 1999; Fisher et al., 2003; Anderson, 2005). The appearance of repeated negative-positive-negative thermal anomalies in the temperature profiles (specifically Run 1) at ~255–295 mbsf indicates a permeable flow zone (Figure F60 insert), wherein the abrupt change in thermal gradient is attributed to zones of fluid exchange between the borehole and the formation. However, because these temperature anomalies are only ~1°C in magnitude, the flow rates are considered small (Bredehoeft and Papadopulos, 1965; Lowell and Yao, 2002). This zone is also characterized by the highest number of veins, and a large range in vein dip and varying thicknesses were observed in cores (see Structural geology). Initial observations on the FMS-sonic images suggest the presence of fractures or veins in this zone that could be potential fluid pathways.
Downhole natural gamma ray radiation shows similar variations to measurements made on the cores (Figure F62). For example, the uranium peak observed at 30 mbsf in the downhole log correlates well with very high NGR measured from the core (as high as 340 counts/s) (see Physical properties). This peak, which indicates the presence of radioactive elements of the uranium series including radium, most likely relates to barite (see Geochemistry). The potassium log also correlates remarkably well with geochemical measurements done on the core (see Geochemistry). These correlations will provide opportunities to calibrate the qualitative values recorded continuously downhole (and reported in percentages) with the discrete quantitative measurements made on the core. High K values of 1.8%–3% measured between 70 and 195 mbsf mostly correspond to Alteration Type III, which contains abundant illite. The high K values of ~2% at 285–316 and 395–410 mbsf essentially correspond to Alteration Type II, which contains illite. Alteration Types IV and V show greater variability in K values measured downhole than the other alteration types.
Density and porosity downhole measurements are in close agreement with discrete measurements made on the cores (Figure F62). Together with the resistivity downhole measurements, they can generally be related to igneous units and/or alteration types. Igneous Unit 4 has a lower density and resistivity than Igneous Unit 5, although the downhole measurements suggest the transition between the two units is located ~10 m deeper than suggested by core descriptions. This difference could be attributed to poor core recovery over this interval. The gradual increase in resistivity from ~1.0 to 2.9 Ωm from 212 to 235 mbsf suggests a gradual transition between Igneous Units 4 and 5 and/or between Alteration Types IV and V, rather than a sharp boundary. A narrow zone of varying density, porosity, and lower resistivity in Igneous Unit 5 (325–355 mbsf) corresponds to an interval of Alteration Type II (Cores 376-U1530A-68R through 73R; 328.30–352.76 mbsf), although other intervals of this type do not display the same variation in petrophysical properties (see Physical properties).
At 70–85 mbsf, in Igneous Unit 4 and Alteration Subtype IIIa, a specific set of petrophysical properties was noted: a peak in K content from the downhole measurements, low bulk density and high porosity from both discrete and downhole measurements, and low resistivity. This depth interval also corresponds to high grain density and low P-wave velocities measured on cores (Figure F62; see Physical properties). Combined, these observations suggest that this interval may be important for understanding past fluid circulation at this site.
Microbiology
In total, 18 whole-round samples (5–11 cm long) were collected from Hole U1530A for microbiological analysis (Figure F64).
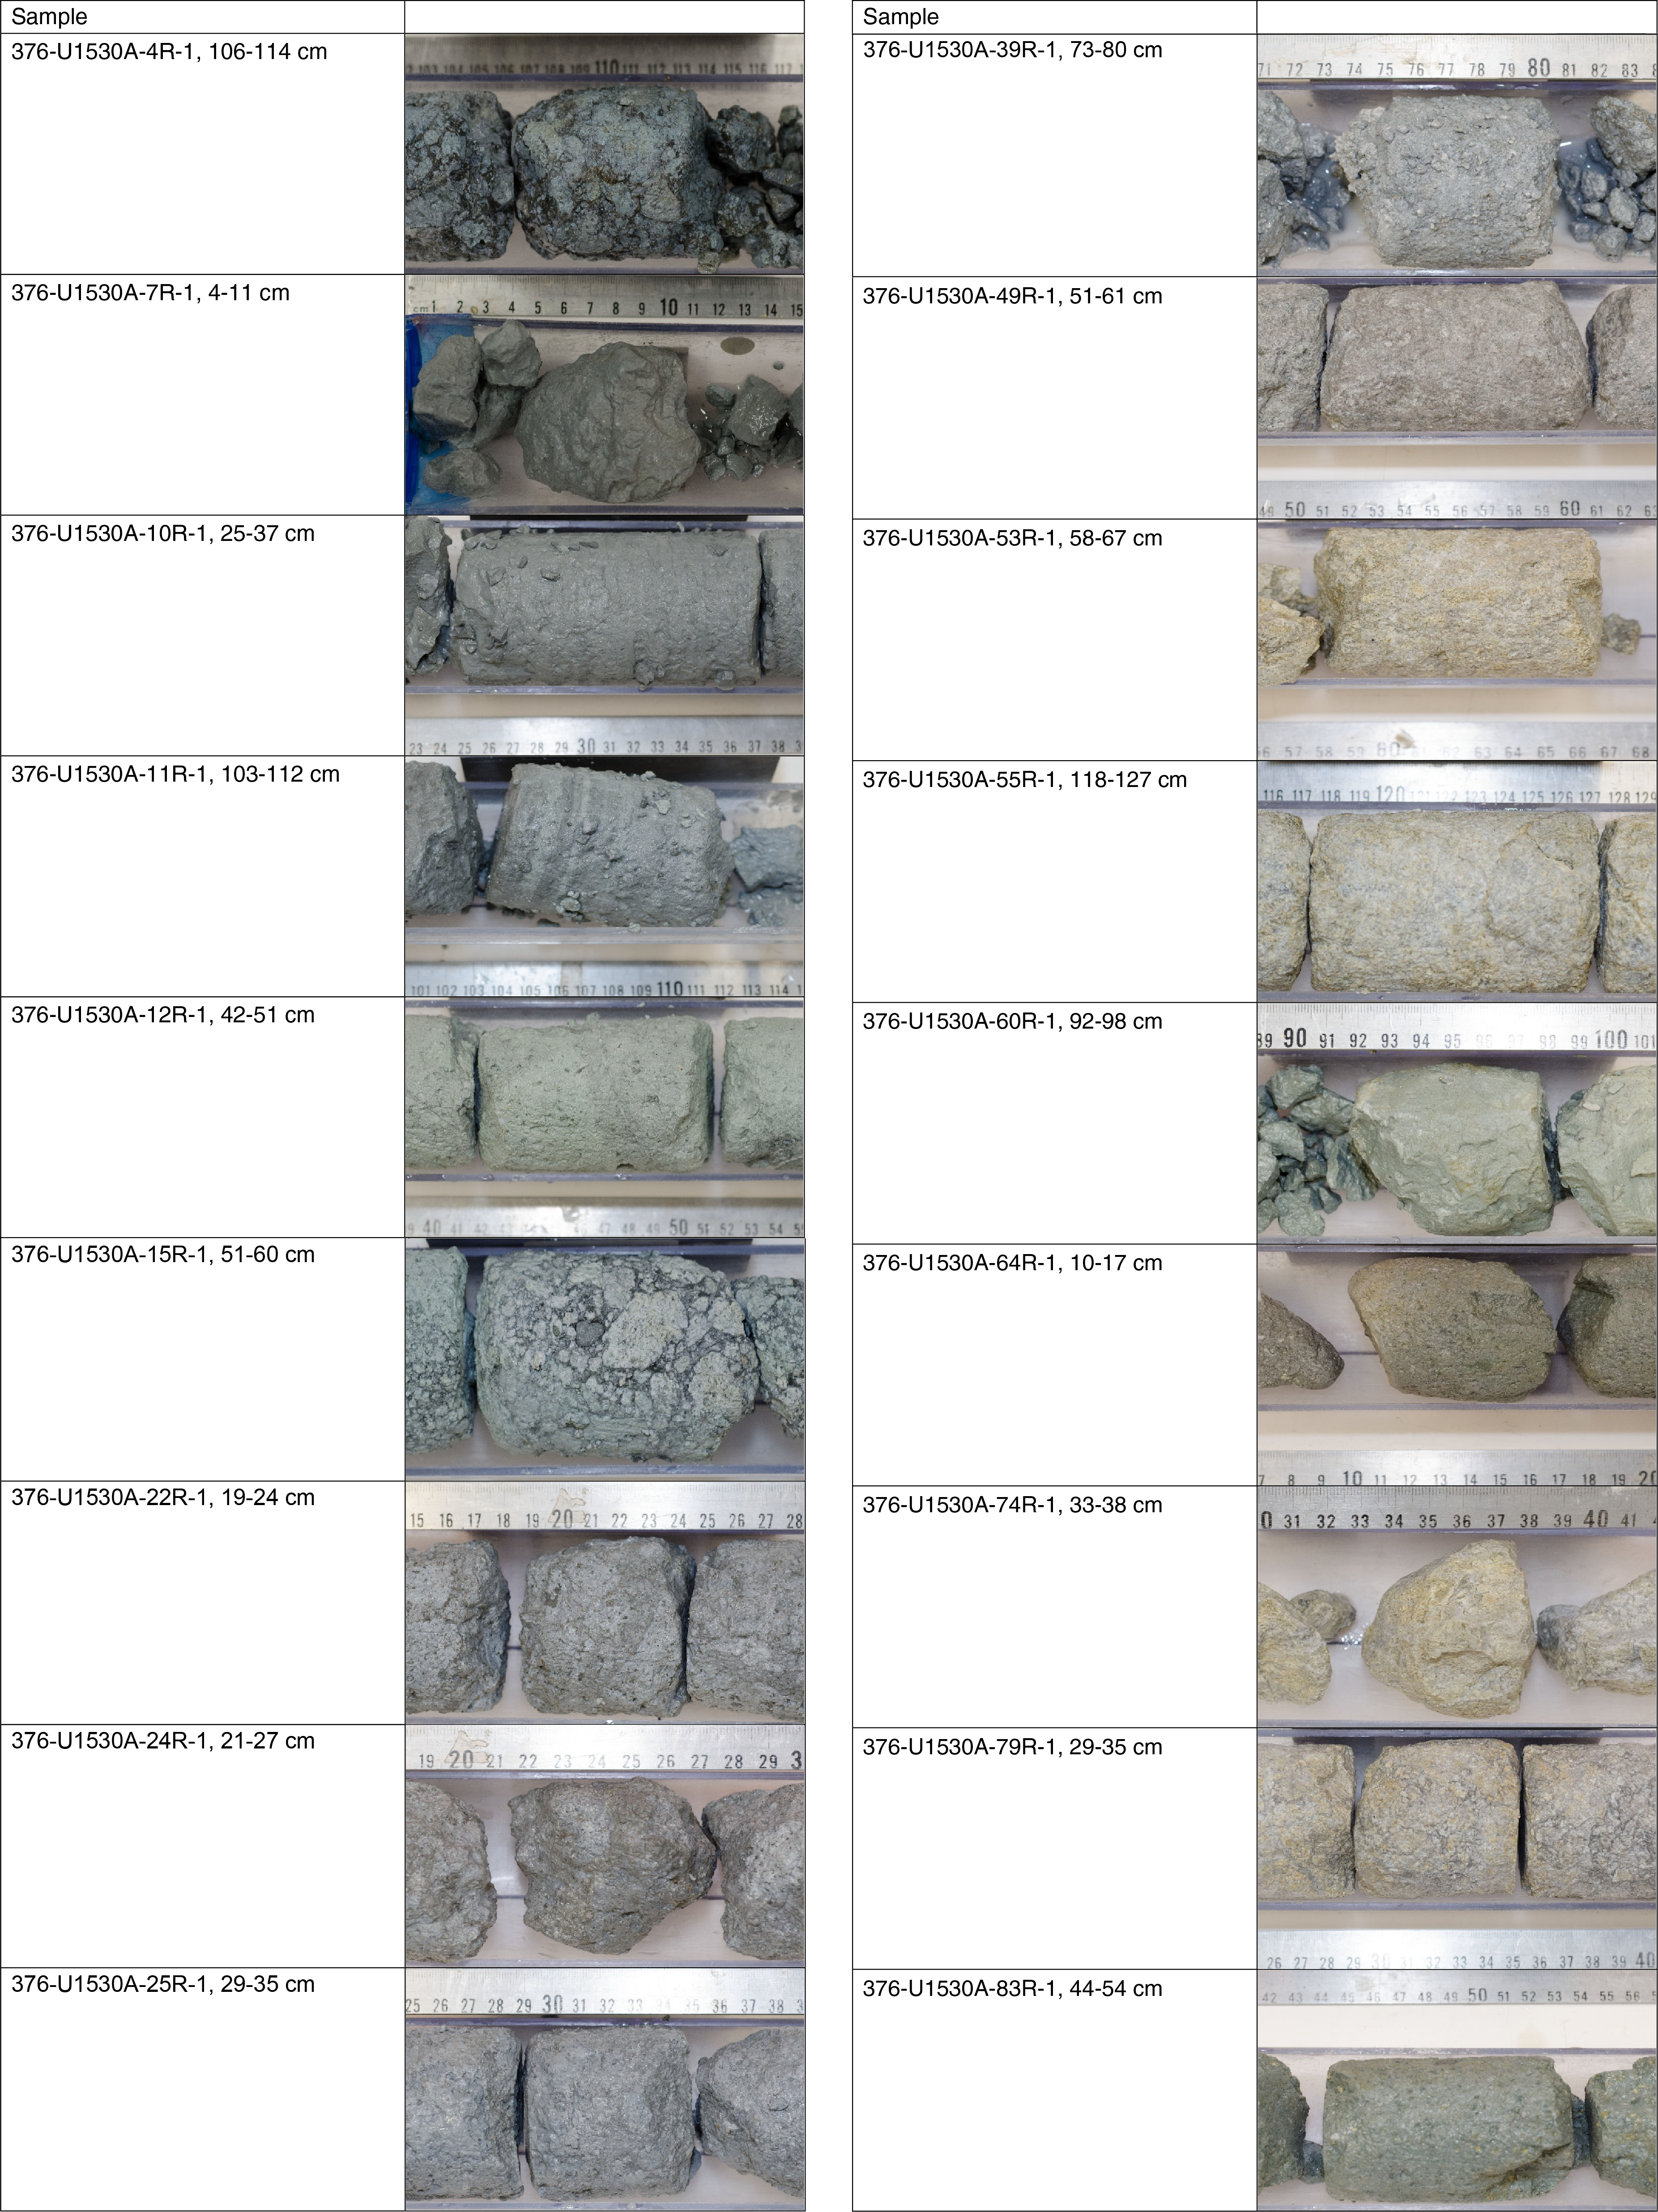
Figure F64. Whole-round samples, Site U1530.
Lithologies represented by sampling, as defined by the Igneous Petrology and Volcanology group, are clast-supported polymict lapillistone (1 sample); altered tuffaceous mudstone, siltstone, and sandstone (3 samples); altered plagioclase-phyric lava (1 sample); altered volcaniclastic rocks (5 samples); and altered volcanic rocks (8 samples). The number of analyses possible for each sample depended on the size of the core sample available for microbiology and hence the amount of material collected for analyses (Figure F65):
- 17 samples were processed for shore-based DNA analyses (metagenomic and single cell genomic analysis),
- 16 samples were preserved for RNA analyses (metatranscriptomics and ribosomal RNA community analyses),
- 18 samples were preserved for shore-based cell counting, and
- 18 samples were preserved for viral and microbial activity measurements.
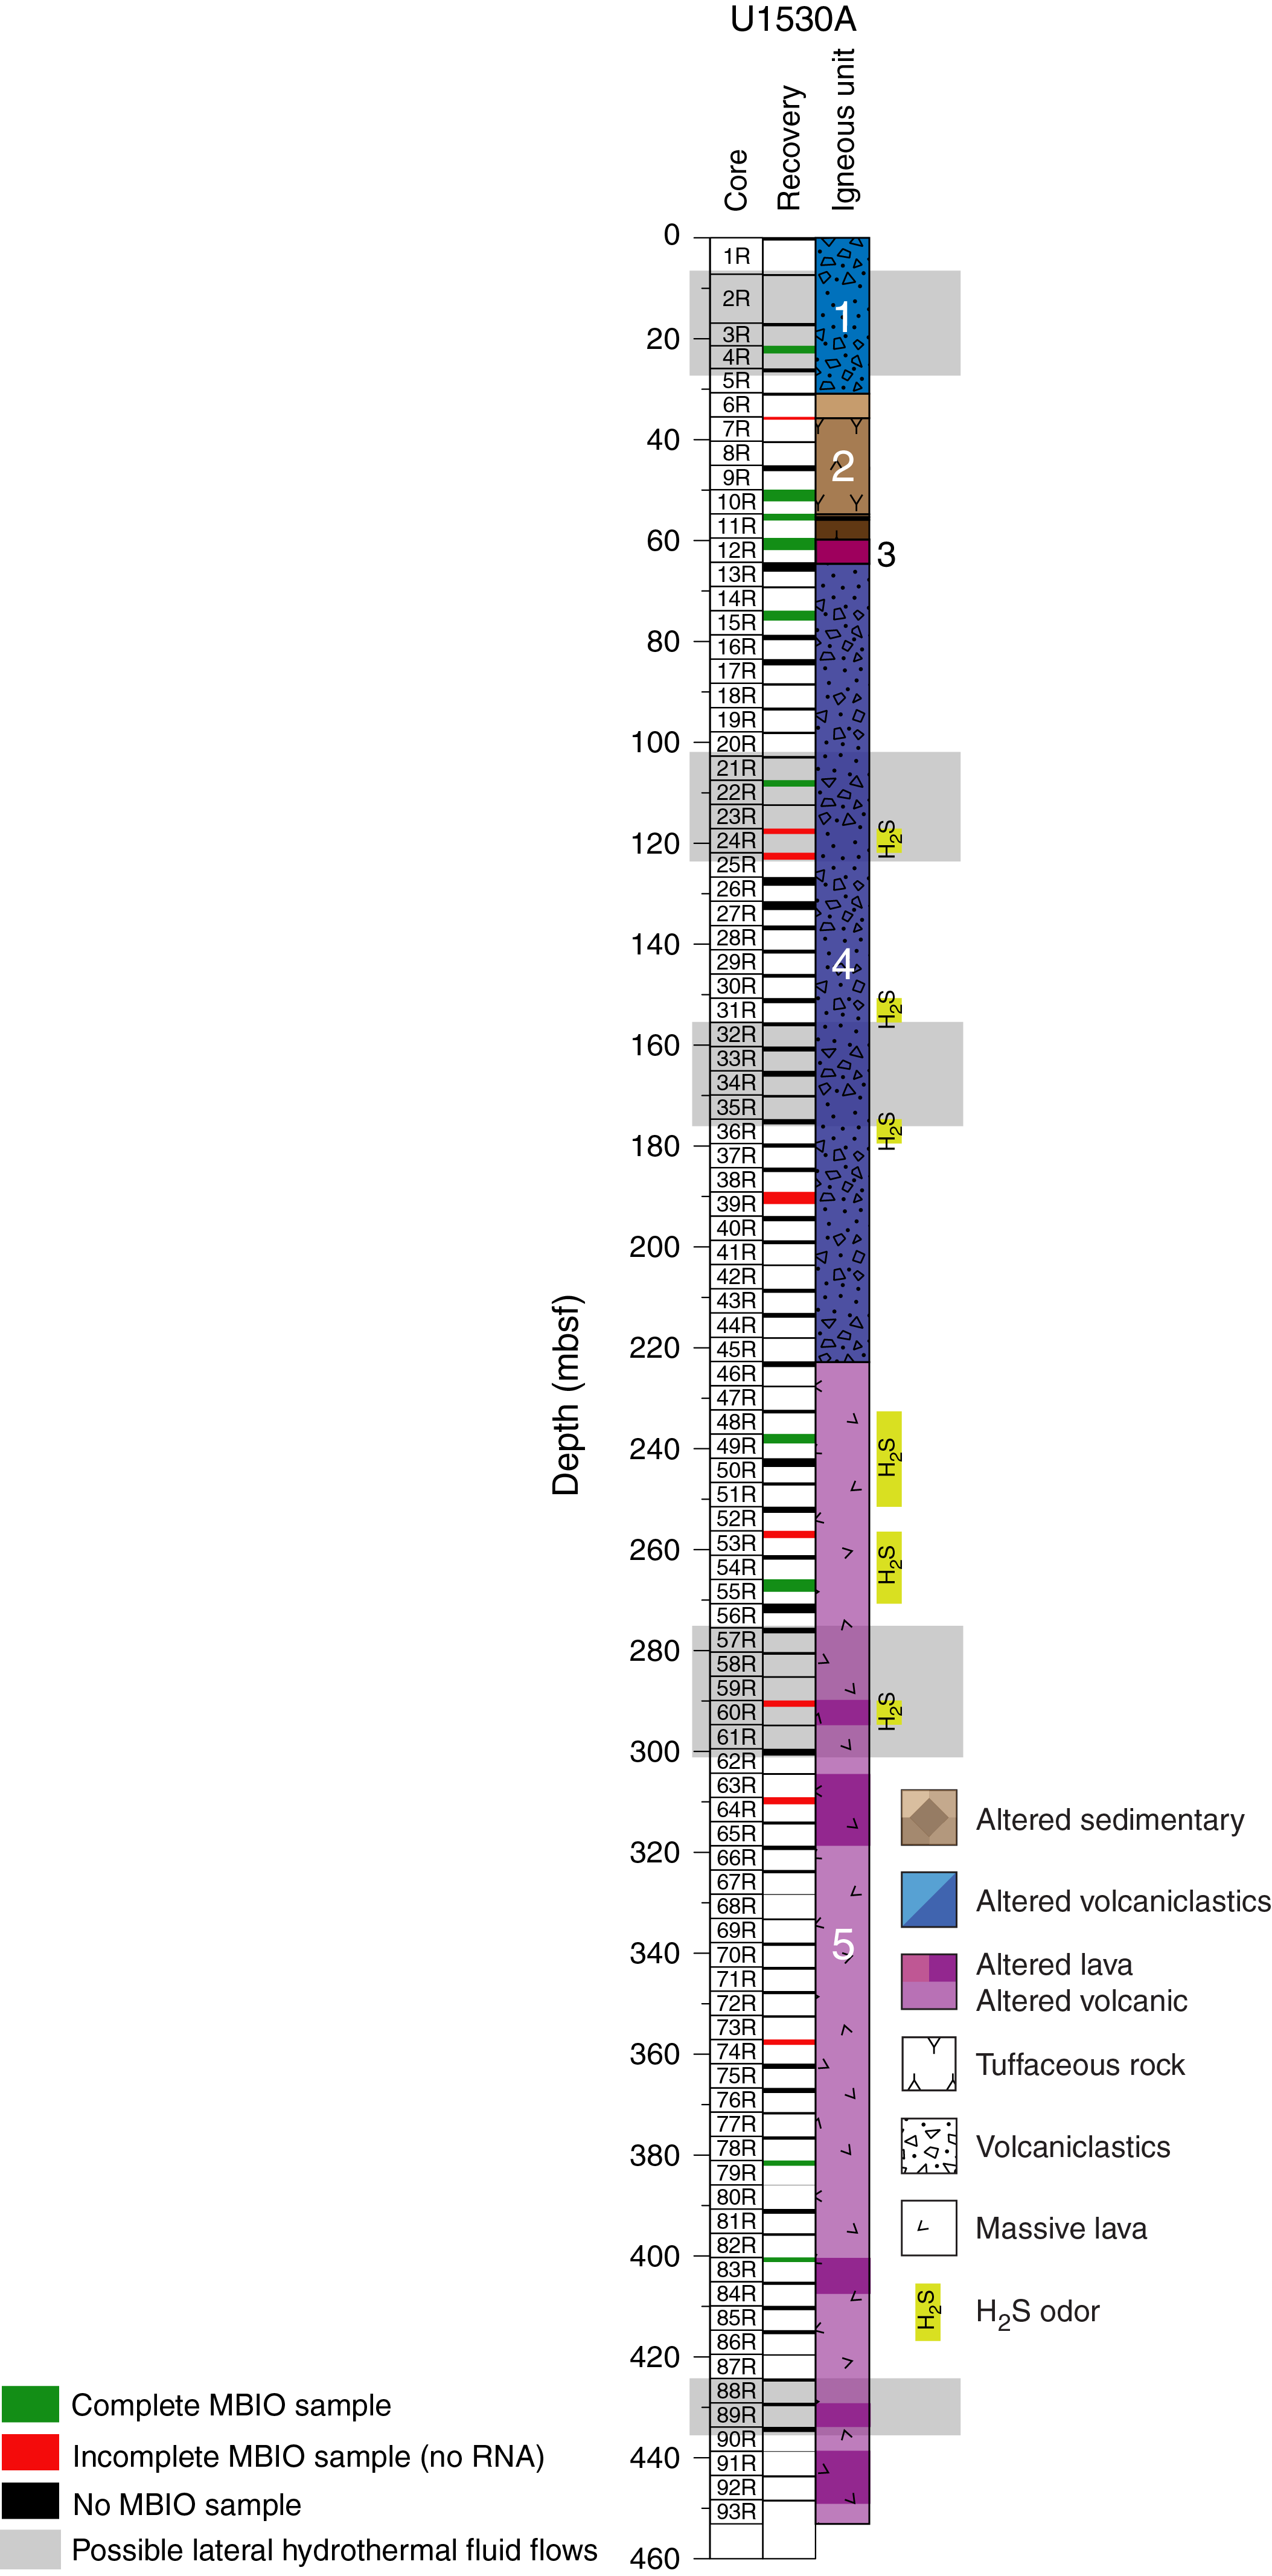
Figure F65. MBIO samples, Site U1530.
Sampling for shore-based DNA and RNA analyses
DNA and RNA analyses will be performed in shore-based laboratories. Material for DNA analyses was collected (see Microbiology in the Expedition 376 methods chapter [de Ronde et al., 2019a]) and placed into sterile 50 mL Falcon tubes, labeled, and immediately frozen at −80°C. Material for RNA analyses was preserved in RNAlater before freezing. In total, 17 samples were processed for shore-based DNA-based analysis, and of those, sufficient material was provided for 16 coupled RNA-based analyses (Figure F65). We estimate that 20–40 g of material is required to obtain sufficient DNA for metagenomics. This amount of rock was available for 14 of the 17 DNA samples. Sufficient material (an additional 40 g) for metatranscriptome analyses of gene expression was obtained for only 12 samples. It should be noted that 8 samples were very small and the routine amount of sample taken was reduced, which will likely prevent further molecular analyses.
Cell and virus counts
Cell and virus counts on rock samples could not be performed on board because of the difficulty in separating cells from rock material. Between 5 and 10 cm3 of rock were fixed in 4% paraformaldehyde and frozen at −80˚C for cell counts, and approximately 10 cm3 of sample were frozen at −80˚C for virus counting.
Sampling for activity measurements
Approximately 20 cm3 of sample were collected and stored in glass bottles with the addition of 0.5 mL of 5% (w/v) neutralized sodium sulfide solution (pH 7.5), and then the gas phase of the bottle was replaced by 100% N2 (2 atm) to maintain anaerobic conditions. The bottles were then stored at 4˚C for shore-based analysis of bacterial activity.
In total, 15 samples (approximately 40 cm3) were collected for further shore-based virus activity measurements. The samples were placed in vacuum-packed, sterile Whirl-Pak bags, labeled, and stored at 4°C.
Fluid sampling and culturing experiment
One fluid sample was obtained from the Kuster FTS fluid sampling tool in Hole U1530A from 435 mbsf. Triplicates of 1 mL of hydrothermal fluid were preserved in glyTE (15% glycerol in Tris-EDTA buffer, pH 8) and immediately frozen at −80˚C. These samples will be used for single-cell genomics.
The Kuster FTS fluid sample was inoculated in a specific culture media to allow growth of extremophiles that could be halophile and/or acidophile and incubated on board at 40° and 50°C. These cultures will be allowed to incubate in the onshore laboratory for at least 6 months prior to sampling to test for cell growth and microbial diversity.
Contamination tracer testing
PFMD was run during all coring operations to test for contamination from drilling fluid (Table T19). For most of the samples, PFMD was present in low levels. One sample, 376-U1530A-49R-1, 56–63 cm, showed high concentrations (orders of magnitude higher) of PFMD in both the outside (>2000 parts per billion [ppb]) and inside parts (>290 ppb). Concentrations of PFMD in three drilling fluid samples (2.2, 0.94, and 0.54 ppb) were much lower than the expected 500 ppb value. Based on these results, the decision was made to increase the PFMD tracer pumping rate ten times for drilling at following Site U1531 and to collect drilling fluid from each core from Site U1531.
References
Anderson, M.P., 2005. Heat as a ground water tracer. Groundwater, 43(6):951–968. https://doi.org/10.1111/j.1745-6584.2005.00052.x
Barker, S.J., Wilson, C.J.N., Baker, J.A., Millet, M.-A., Rotella, M.D., Wright, I.C., and Wysoczanksi, R.J., 2013. Geochemistry and petrogenesis of silicic magmas in the intra-oceanic Kermadec arc. Journal of Petrology, 54(2):351–391. https://doi.org/10.1093/petrology/egs071
Baujard, C., Genter, A., Dalmais, E., Maurer, V., Hehn, R., Rosillette, R., Vidal, J., and Schmittbuhl, J., 2017. Hydrothermal characterization of wells GRT-1 and GRT-2 in Rittershoffen, France: implications on the understanding of natural flow systems in the Rhine graben. Geothermics, 65:255–268. https://doi.org/10.1016/j.geothermics.2016.11.001
Berkenbosch, H.A., de Ronde, C.E.J., Gemmell, J.B., McNeill, A.W., and Goemann, K., 2012. Mineralogy and formation of black smoker chimneys from Brothers submarine volcano, Kermadec arc. Economic Geology, 107(8):1613–1633. https://doi.org/10.2113/econgeo.107.8.1613
Bischoff, J.L., 1991. Densities of liquids and vapors in boiling NaCl-H2O solutions: a PTVX summary from 300° to 500°C. American Journal of Science, 291(4):309–338. https://doi.org/10.2475/ajs.291.4.309
Bischoff, J.L., and Rosenbauer, R.J., 1985. An empirical equation of state for hydrothermal seawater (3.2 percent NaCl). American Journal of Science, 285(8):725–763. https://doi.org/10.2475/ajs.285.8.725
Bredehoeft, J.D., and Papadopulos, I.S., 1965. Rates of vertical groundwater movement estimated from the earth’s thermal profile. Water Resources Research, 1(2):325–328. https://doi.org/10.1029/WR001i002p00325
Cande, S.C., and Kent, D.V., 1995. Revised calibration of the geomagnetic polarity timescale for the Late Cretaceous and Cenozoic. Journal of Geophysical Research: Solid Earth, 100(B4):6093–6095. https://doi.org/10.1029/94JB03098
de Ronde, C.E.J., Humphris, S.E., Höfig, T.W., Brandl, P.A., Cai, L., Cai, Y., Caratori Tontini, F., Deans, J.R., Farough, A., Jamieson, J.W., Kolandaivelu, K.P., Kutovaya, A., Labonté, J.M., Martin, A.J., Massiot, C., McDermott, J.M., McIntosh, I.M., Nozaki, T., Pellizari, V.H., Reyes, A.G., Roberts, S., Rouxel, O., Schlicht, L.E.M., Seo, J.H., Straub, S.M., Strehlow, K., Takai, K., Tanner, D., Tepley, F.J., III, and Zhang, C., 2019a. Expedition 376 methods. In de Ronde, C.E.J., Humphris, S.E., Höfig, T.W., and the Expedition 376 Scientists, Brothers Arc Flux. Proceedings of the International Ocean Discovery Program, 376: College Station, TX (International Ocean Discovery Program). https://doi.org/10.14379/iodp.proc.376.102.2019
de Ronde, C.E.J., Humphris, S.E., Höfig, T.W., Brandl, P.A., Cai, L., Cai, Y., Caratori Tontini, F., Deans, J.R., Farough, A., Jamieson, J.W., Kolandaivelu, K.P., Kutovaya, A., Labonté, J.M., Martin, A.J., Massiot, C., McDermott, J.M., McIntosh, I.M., Nozaki, T., Pellizari, V.H., Reyes, A.G., Roberts, S., Rouxel, O., Schlicht, L.E.M., Seo, J.H., Straub, S.M., Strehlow, K., Takai, K., Tanner, D., Tepley, F.J., III, and Zhang, C., 2019b. Expedition 376 summary. In de Ronde, C.E.J., Humphris, S.E., Höfig, T.W., and the Expedition 376 Scientists, Brothers Arc Flux. Proceedings of the International Ocean Discovery Program, 376: College Station, TX (International Ocean Discovery Program). https://doi.org/10.14379/iodp.proc.376.101.2019
de Ronde, C.E.J., Humphris, S.E., Höfig, T.W., Brandl, P.A., Cai, L., Cai, Y., Caratori Tontini, F., Deans, J.R., Farough, A., Jamieson, J.W., Kolandaivelu, K.P., Kutovaya, A., Labonté, J.M., Martin, A.J., Massiot, C., McDermott, J.M., McIntosh, I.M., Nozaki, T., Pellizari, V.H., Reyes, A.G., Roberts, S., Rouxel, O., Schlicht, L.E.M., Seo, J.H., Straub, S.M., Strehlow, K., Takai, K., Tanner, D., Tepley, F.J., III, and Zhang, C., 2019c. Site U1527. In de Ronde, C.E.J., Humphris, S.E., Höfig, T.W., and the Expedition 376 Scientists, Brothers Arc Flux. Proceedings of the International Ocean Discovery Program, 376: College Station, TX (International Ocean Discovery Program). https://doi.org/10.14379/iodp.proc.376.103.2019
de Ronde, C.E.J., Humphris, S.E., Höfig, T.W., Brandl, P.A., Cai, L., Cai, Y., Caratori Tontini, F., Deans, J.R., Farough, A., Jamieson, J.W., Kolandaivelu, K.P., Kutovaya, A., Labonté, J.M., Martin, A.J., Massiot, C., McDermott, J.M., McIntosh, I.M., Nozaki, T., Pellizari, V.H., Reyes, A.G., Roberts, S., Rouxel, O., Schlicht, L.E.M., Seo, J.H., Straub, S.M., Strehlow, K., Takai, K., Tanner, D., Tepley, F.J., III, and Zhang, C., 2019d. Site U1528. In de Ronde, C.E.J., Humphris, S.E., Höfig, T.W., and the Expedition 376 Scientists, Brothers Arc Flux. Proceedings of the International Ocean Discovery Program, 376: College Station, TX (International Ocean Discovery Program). https://doi.org/10.14379/iodp.proc.376.104.2019
de Ronde, C.E.J., Humphris, S.E., Höfig, T.W., Brandl, P.A., Cai, L., Cai, Y., Caratori Tontini, F., Deans, J.R., Farough, A., Jamieson, J.W., Kolandaivelu, K.P., Kutovaya, A., Labonté, J.M., Martin, A.J., Massiot, C., McDermott, J.M., McIntosh, I.M., Nozaki, T., Pellizari, V.H., Reyes, A.G., Roberts, S., Rouxel, O., Schlicht, L.E.M., Seo, J.H., Straub, S.M., Strehlow, K., Takai, K., Tanner, D., Tepley, F.J., III, and Zhang, C., 2019e. Site U1529. In de Ronde, C.E.J., Humphris, S.E., Höfig, T.W., and the Expedition 376 Scientists, Brothers Arc Flux. Proceedings of the International Ocean Discovery Program, 376: College Station, TX (International Ocean Discovery Program). https://doi.org/10.14379/iodp.proc.376.105.2019
de Ronde, C.E.J., Humphris, S.E., Höfig, T.W., and the Expedition 376 Scientists, 2019f. Supplementary material, https://doi.org/10.14379/iodp.proc.376supp.2019. Supplement to de Ronde, C.E.J., Humphris, S.E., Höfig, T.W., and the Expedition 376 Scientists, 2019. Brothers Arc Flux. Proceedings of the International Ocean Discovery Program, 376: College Station, TX (International Ocean Discovery Program). https://doi.org/10.14379/iodp.proc.376.2019
de Ronde, C.E.J., Massoth, G.J., Butterfield, D.A., Christenson, B.W., Ishibashi, J., Ditchburn, R.G., Hannington, M.D., et al., 2011. Submarine hydrothermal activity and gold-rich mineralization at Brothers Volcano, Kermadec arc, New Zealand. Mineralium Deposita, 46(5–6):541–584. https://doi.org/10.1007/s00126-011-0345-8
Dekov, V.M., Rouxel, O., Kouzmanov, K., Bindi, L., Asael, D., Fouquet, Y., Etoubleau, J., Burgaud, G., and Wälle, M., 2016. Enargite-luzonite hydrothermal vents in Manus Back-Arc Basin: submarine analogues of high-sulfidation epithermal mineralization. Chemical Geology, 438:36–57. https://doi.org/10.1016/j.chemgeo.2016.05.021
Dill, H.G., 2016. Kaolin: soil, rock and ore: from the mineral to the magmatic, sedimentary and metamorphic environments. Earth-Science Reviews, 161:16–129. https://doi.org/10.1016/j.earscirev.2016.07.003
Douville, E., Bienvenu, P., Charlou, J.L., Donval, J.P., Fouquet, Y., Appriou, P., and Gamo, T., 1999. Yttrium and rare earth elements in fluids from various deep-sea hydrothermal systems. Geochimica et Cosmochimica Acta, 63(5):627–643. https://doi.org/10.1016/S0016-7037(99)00024-1
Driesner, T., and Heinrich, C.A., 2007. The system H2O-NaCl. Part I: correlation formulae for phase relations in temperature-pressure-composition space from 0 to 1000 °C, 0 to 5000 bar, and 0 to 1 XNaCl. Geochimica et Cosmochimica Acta, 71(20):4880–4901. https://doi.org/10.1016/j.gca.2006.01.033
Drury, M.J., and Jessop, A.M., 1982. The effect of a fluid-filled fracture on the temperature profile in a borehole. Geothermics, 11(3):145–152. https://doi.org/10.1016/0375-6505(82)90023-2
Embley, R.W., de Ronde, C.E.J., Merle, S.G., Davy, B., and Catatoni Tontini, F., 2012. Detailed morphology and structure of an active submarine arc caldera: Brothers Volcano, Kermadec arc. Economic Geology,107(8):1557–1570. https://doi.org/10.2113/econgeo.107.8.1557
Fisher, A.T., Davis, E.E., Hutnak, M., Spiess, V., Zühlsdorff, L., Cherkaoui, A., Christiansen, L., Edwards, K., Macdonald, R., Villinger, H., Mottl, M.J., Wheat, C.G., and Becker, K., 2003. Hydrothermal recharge and discharge across 50 km guided by seamounts on a young ridge flank. Nature, 421(6923):618–621. https://doi.org/10.1038/nature01352
Fisher, R.V., and Schmincke, H.-U., 1984. Pyroclastic Rocks: Berlin (Springer-Verlag). https://doi.org/10.1007/978-3-642-74864-6
Gamble, J.A., Christie, R.H.K., Wright, I.C., and Wysoczanski, R.J., 1997. Primitive K-rich magmas from Clark volcano, southern Kermadec arc: a paradox in the K-depth relationship. The Canadian Mineralogist, 35(2):275–290. https://pubs.geoscienceworld.org/canmin/article-pdf/35/2/275/4006312/275_35_2_cm.pdf
Gena, K., Mizuta, T., Ishiyama, D., and Urabe, T., 2001. Acid‐sulphate type alteration and mineralization in the Desmos caldera, Manus back‐arc basin, Papua New Guinea. Resource Geology, 51(1):31–44. https://doi.org/10.1111/j.1751-3928.2001.tb00079.x
Graham, I.J., Reyes, A.G., Wright, I.C., Peckett, K.M., Smith, I.E.M., and Arculus, R.J., 2008. Structure and petrology of newly discovered volcanic centers in the northern Kermadec–southern Tofua arc, South Pacific Ocean. Journal of Geophysical Research: Solid Earth, 113(B8):B08S02. https://doi.org/10.1029/2007JB005453
Haase, K.M., Stroncik, N., Garbe-Schönberg, D., and Stoffers, P., 2006. Formation of island arc dacite magmas by extreme crystal fractionation: an example from Brothers Seamount, Kermadec island arc (SW Pacific). Journal of Volcanology and Geothermal Research, 152(3–4):316–330. https://doi.org/10.1016/j.jvolgeores.2005.10.010
Haase, K.M., Worthington, T.J., Stoffers, P., Garbe-Schönberg, D., and Wright, I., 2002. Mantle dynamics, element recycling, and magma genesis beneath the Kermadec arc-Harve Trough. Geochemistry, Geophysics, Geosystems, 3(11):1071. https://doi.org/10.1029/2002GC000335
Hayashi, A., 1973. Hydrothermal alteration in the Otake geothermal area, Kyushu. Journal of the Japan Geothermal Energy Association, 10:9–46.
Hemley, J.J., Montoya, J.W., Marinenko, J.W., and Luce, R.W., 1980. Equilibria in the system Al2O3-SiO2-H2O and some general implications for alteration/mineralization processes. Economic Geology, 75(2):210–228. https://doi.org/10.2113/gsecongeo.75.2.210
Humphris, S.E., Alt, J.C., Teagle, D.A.H., and Honnorez, J.J., 1998. Geochemical changes during hydrothermal alteration of basement in the stockwork beneath the active TAG hydrothermal mound. In Herzig, P.M., Humphris, S.E., Miller, D.J., and Zierenberg, R.A. (Eds.), Proceedings of the Ocean Drilling Program, Scientific Results, 158: College Station, TX (Ocean Drilling Program), 255–276. https://doi.org/10.2973/odp.proc.sr.158.220.1998
Humphris, S.E., Reysenbach, A.-L., Tivey, M., de Ronde, C.E.J., and Caratori Tontini, F., 2018. Brothers volcano, March 6-26, 2018. R/V Thomas G. Thompson, ROV Jason TN350 Cruise Report.
Kirschvink, J.L., 1980. The least-squares line and plane and the analysis of palaeomagnetic data. Geophysical Journal of the Royal Astronomical Society, 62(3):699–718. https://doi.org/10.1111/j.1365-246X.1980.tb02601.x
Lackschewitz, K.S., Devey, C.W., Stoffers, P., Botz, R., Eisenhauer, A., Kummetz, M., Schmidt, M., and Singer, A., 2004. Mineralogical, geochemical and isotopic characteristics of hydrothermal alteration processes in the active, submarine, felsic-hosted PACMANUS field, Manus Basin, Papua New Guinea. Geochimica et Cosmochimica Acta, 68(21):4405–4427. https://doi.org/10.1016/j.gca.2004.04.016
Lowell, R.P., and Yao, Y., 2002. Anhydrite precipitation and the extent of hydrothermal recharge zones at ocean ridge crests. Journal of Geophysical Research: Solid Earth, 107(B9):EPM 2-1–EPM 2-9. https://doi.org/10.1029/2001JB001289
Lurcock, P.C., and Wilson, G.S., 2012. PuffinPlot: a versatile, user-friendly program for paleomagnetic analysis. Geochemistry, Geophysics, Geosystems, 13(6):Q06Z45. https://doi.org/10.1029/2012GC004098
McFadden, P.L., and Reid, A.B., 1982. Analysis of paleomagnetic inclination data. Geophysical Journal of the Royal Astronomical Society, 69(2):307–319. https://doi.org/10.1111/j.1365-246X.1982.tb04950.x
Marumo, K., 1989. Genesis of kaolin minerals and pyrophyllite in Kuroko deposits of Japan: implications for the origins of the hydrothermal fluids from mineralogical and stable isotope data. Geochimica et Cosmochimica Acta, 53(11):2915–2924. https://doi.org/10.1016/0016-7037(89)90168-3
Naylor, M.A., 1980. The origin of inverse grading in muddy debris flow deposits: a review. Journal of Sedimentary Research, 50(4)1111–1116. https://doi.org/10.1306/212F7B8F-2B24-11D7-8648000102C1865D
O’Reilly, W., 1984. Rock and Mineral Magnetism: New York (Chapman and Hall). https://doi.org/10.1007/978-1-4684-8468-7
Pearce, J.A., and Norry, M.J., 1979. Petrogenetic implications of Ti, Zr, Y, and Nb variations in volcanic rocks. Contributions to Mineralogy and Petrology, 69(1):33–47. https://doi.org/10.1007/BF00375192
Reagan, M.K., Pearce, J.A., Petronotis, K., Almeev, R., Avery, A.A., Carvallo, C., Chapman, T., Christeson, G.L., Ferré, E.C., Godard, M., Heaton, D.E., Kirchenbaur, M., Kurz, W., Kutterolf, S., Li, H.Y., Li, Y., Michibayashi, K., Morgan, S., Nelson, W.R., Prytulak, J., Python, M., Robertson, A.H.F., Ryan, J.G., Sager, W.W., Sakuyama, T., Shervais, J.W., Shimizu, K., and Whattam, S.A., 2015. Expedition 352 methods. In Reagan, M.K., Pearce, J.A., Petronotis, K., and the Expedition 352 Scientists, Izu-Bonin-Mariana Fore Arc. Proceedings of the International Ocean Discovery Program, 352: College Station, TX (International Ocean Discovery Program). https://doi.org/10.14379/iodp.proc.352.102.2015
Reyes, A.G., Grapes, R., and Clemente, V.C., 2003. Fluid-rock interaction at the magmatic-hydrothermal interface of the Mount Cagua geothermal system, Philippines. In Simmons, S.F., and Graham, I. (Eds.), Volcanic, Geothermal, and Ore-Forming Fluids: Rulers and Witnesses of Processes within the Earth. Society of Economic Geologists Special Publication, 10:197–222. https://pubs.geoscienceworld.org/books/book/1233/chapter/107036465/fluid-rock-interaction-at-the-magmatic
Richter, C., Acton, G., Endris, C., and Radsted, M., 2007. Technical Note 34: Handbook for Shipboard Paleomagnetists. Ocean Drilling Program. https://doi.org/10.2973/odp.tn.34.2007
Roedder, E., 1984. Fluid inclusions. In Ribbe P.H. (Series Ed.), Reviews in Mineralogy (Volume 12): Washington, DC (Mineralogical Society of America). https://doi.org/10.1515/9781501508271
Rouxel, O., Fouquet, Y., and Ludden, J.N., 2004. Subsurface processes at the Lucky Strike hydrothermal field, Mid-Atlantic Ridge: evidence from sulfur, selenium, and iron isotopes. Geochimica et Cosmochimica Acta, 68(10):2295–2311. https://doi.org/10.1016/j.gca.2003.11.029
Schiffman, P., and Fridleifsson, G.O., 1991. The smectite-chlorite transition in drillhole NJ-15, Nesjavellir geothermal field, Iceland: XRD, BSE and electron microprobe investigations. J. Metamorph. Geol., 9(6):679–696. https://doi.org/10.1111/j.1525-1314.1991.tb00558.x
Serra, O., 1984. Fundamentals of Well-Log Interpretation (Volume 1): The Acquisition of Logging Data: Amsterdam (Elsevier).
Smith, I.E.M., Worthington, T.J., Stewart, R.B., Price, R.C., and Gamble, J.A., 2003. Felsic volcanism in the Kermadec arc, SW Pacific: crustal recycling in an oceanic setting. In Larter, R.D., and Leat, P.T. (Eds.), Intra-Oceanic Subduction Systems: Tectonic and Magmatic Processes. Geological Society Special Publication, 219(1):99–118. https://doi.org/10.1144/GSL.SP.2003.219.01.05
Taniguchi, M., Shimada, J., Tanaka, T., Kayane, I., Sakura, Y., Shimano, Y., Dapaah-Siakwan, S., and Kawashima, S., 1999. Disturbances of temperature‐depth profiles due to surface climate change and subsurface water flow: 1. An effect of linear increase in surface temperature caused by global warming and urbanization in the Tokyo metropolitan area, Japan. Water Resources Research, 35(5):1507–1517. https://doi.org/10.1029/1999WR900009
Tauxe, L., 2010. Essentials of Paleomagnetism: Berkeley, California (University of California Press).
Timm, C., Bassett, D., Graham, I.J., Leybourne, M.I., de Ronde, C.E.J., Woodhead, J., Layton-Matthews, D., and Watts, A.B., 2013. Louisville seamount subduction and its implication on mantle flow beneath the central Tonga-Kermadec arc. Nature Communications, 4:1720, https://doi.org/10.1038/ncomms2702
Timm, C., de Ronde, C.E.J., Leybourne, M.I., Layton-Matthews, D., and Graham, I.J., 2012. Sources of chalcophile and siderophile elements in Kermadec arc lavas. Economic Geology, 107(8):1527–1538. https://doi.org/10.2113/econgeo.107.8.1527
Timm, C., Leybourne, M.I., Hoernle, K., Wysoczanski, R.J., Hauff, F., Handler, M., Caratori Tontini, F., and de Ronde, C.E.J., 2016. Trench-perpendicular geochemical variation between two adjacent Kermadec arc volcanoes Rumble II East and West: the role of the subducted Hikurangi Plateau in element recycling in arc magmas. Journal of Petrology, 57(7):1335–1360. https://doi.org/10.1093/petrology/egw042
Turner, S., Hawkesworth, C., Rogers, N., Bartlett, J., Worthington, T., Hergt, J., Pearce, J., and Smith, I., 1997. 238U-230Th disequilibria, magma petrogenesis, and flux rates beneath the depleted Tonga-Kermadec island arc. Geochimica et Cosmochimica Acta, 61(22):4855–4884. https://doi.org/10.1016/S0016-7037(97)00281-0
Vanko, D.A., Bach, W., Roberts, S., Yeats, C.J., and Scott, S.D., 2004. Fluid inclusion evidence for subsurface phase separation and variable fluid mixing regimes beneath the deep-sea PACMANUS hydrothermal field, Manus Basin backarc rift, Papua New Guinea. Journal of Geophysical Research: Solid Earth, 109(B3):B03201. https://doi.org/10.1029/2003JB002579
Wright, I.C., and Gamble, J.A., 1999. Southern Kermadec submarine caldera arc volcanoes (SW Pacific): caldera formation by effusive and pyroclastic eruption. Marine Geology, 161(2–4):207–227. https://doi.org/10.1016/S0025-3227(99)00040-7
Ziagos, J.P., and Blackwell, D.D., 1986. A model for the transient temperature effects of horizontal fluid flow in geothermal systems. Journal of Volcanology and Geothermal Research, 27(3–4):371–397. https://doi.org/10.1016/0377-0273(86)90021-1
Zijderveld, J.D.A., 1967. AC demagnetization of rocks: analysis of results. In Collinson, D.W., Creer, K.M., and Runcorn, S.K. (Eds.), Developments in Solid Earth Geophysics (Volume 3): Methods in Palaeomagnetism: Amsterdam (Elsevier), 254–286. https://doi.org/10.1016/B978-1-4832-2894-5.50049-5
1 de Ronde, C.E.J., Humphris, S.E., Höfig, T.W., Brandl, P.A., Cai, L., Cai, Y., Caratori Tontini, F., Deans, J.R., Farough, A., Jamieson, J.W., Kolandaivelu, K.P., Kutovaya, A., Labonté, J.M., Martin, A.J., Massiot, C., McDermott, J.M., McIntosh, I.M., Nozaki, T., Pellizari, V.H., Reyes, A.G., Roberts, S., Rouxel, O., Schlicht, L.E.M., Seo, J.H., Straub, S.M., Strehlow, K., Takai, K., Tanner, D., Tepley, F.J., III, and Zhang, C., 2019. Site U1530. In de Ronde, C.E.J., Humphris, S.E., Höfig, T.W., and the Expedition 376 Scientists, Brothers Arc Flux. Proceedings of the International Ocean Discovery Program, 376: College Station, TX (International Ocean Discovery Program). https://doi.org/10.14379/iodp.proc.376.106.2019
2 Expedition 376 Scientists’ affiliations.
This work is distributed under the Creative Commons Attribution 4.0 International (CC BY 4.0) license. 
- F1. Sites drilled, Expedition 376.
- F2. Location of Site U1530.
- F3. Lithostratigraphic summary, Hole U1530A.
- F4. Macroscopic samples from Igneous Unit 1, Hole U1530A.
- F5. Thin sections of igneous units, Hole U1530A.
- F6. Sedimentary textures in Igneous Unit 2, Hole U1530A.
- F7. Smear slide images from Igneous Unit 2, Hole U1530A.
- F8. Macroscopic samples from Igneous Unit 3, Hole U1530A.
- F9. Macroscopic samples from Igneous Unit 4, Hole U1530A.
- F10. Macroscopic samples from Igneous Unit 5, Hole U1530A.
- F11. Comparison of Hole U1530A samples with Hole U1527A, Hole U1527C, Site U1528, and Site U1529.
- F12. Alteration Types I–V by XRD, Hole U1530A.
- F13. Alteration Type I, Hole U1530A.
- F14. Alteration Type I (RL), Hole U1530A.
- F15. Lithologies affected by Alteration Type II, Hole U1530A.
- F16. Alteration Type II, Hole U1530A.
- F17. Alteration Subtype IIIa clasts in a pyrite-rich matrix, Hole U1530A.
- F18. Alteration Subtype IIIa illite-rich clasts in a quartz matrix, Hole U1530A.
- F19. Alteration Subtype IIIb clasts in a pyrite matrix, Hole U1530A.
- F20. Alteration Subtype IIIb illite-smectite (smec) matrix with quartz, Hole U1530A.
- F21. Alteration Type IV homogeneous gray matrix with poorly distinguishable clasts, Hole U1530A.
- F22. Alteration Type IV pyrophyllite- and quartz-dominant matrix, Hole U1530A.
- F23. Alteration Type V diaspore-rich massive unit, Hole U1530A.
- F24. Alteration Type V anhydrite, Hole U1530A.
- F25. Anhydrite, pyrite, and quartz, Hole U1530A.
- F26. Types of FIs.
- F27. Fluid homogenization temperatures, Hole U1530A.
- F28. Salinity vs. homogenization temperature, Site U1530.
- F29. Volcanic fabrics, Hole U1530A.
- F30. Volcanic fabric variation, Hole U1530A.
- F31. Alteration veins and crosscutting relationships, Hole U1530A.
- F32. Alteration vein variation, Hole U1530A.
- F33. Fracture variation, Hole U1530A.
- F34. Major element Harker diagrams, Site U1530.
- F35. Downhole plots of rocks and lavas, Hole U1530A.
- F36. Downhole variations of TS and TC abundance, Hole U1530A.
- F37. Downhole plots of K2O, MgO, Na2O, and CaO concentrations, Hole U1530A.
- F38. Downhole plots of SiO2, Fe2O3, TS, Sr, and Ba concentrations, Hole U1530A.
- F39. Sr vs. CaO, Hole U1530A.
- F40. Fe vs. total sulfur, Hole U1530A.
- F41. Downhole plots of Cu, Zn, As, Sb, Pb, Cd, Mo, and Se, Hole U1530A.
- F42. Chemical enrichment factors, Site U1530.
- F43. Pore space gas concentrations, Hole U1530A.
- F44. H2, ΣCO2, and AVS in pore space gases at Sites U1527, U1530, and U1528.
- F45. AF demagnetization in Sample 376-U1530A-4R-1, 90–92 cm, Igneous Unit 1.
- F46. TD experiment on Sample 376-U1530A-1R-1, 26–28 cm, Igneous Unit 1.
- F47. AF demagnetization in Sample 376-U1530A-10R-1, 77–79 cm, Igneous Unit 2.
- F48. TD experiment on Sample 376-U1530A-10R-2, 31–33 cm, Igneous Unit 2.
- F49. AF demagnetization in Sample 376-U1530A-12R-2, 13–15 cm, Igneous Unit 3.
- F50. TD experiment on Sample 376-U1530A-12R-1, 37–39 cm, from Igneous Unit 3.
- F51. AF demagnetization in Sample 376-U1530A-25R-1, 64–66 cm, Igneous Unit 4.
- F52. TD experiment on Sample 376-U1530A-38R-1, 69–71 cm, Igneous Unit 4.
- F53. AF demagnetization in Sample 376-U1530A-56R-1, 98–100 cm, Igneous Unit 5.
- F54. TD experiment on Sample 376-U1530A-12R-1, 37–39 cm, Igneous Unit 5.
- F55. NRM variations, Hole U1530A.
- F56. Physical properties, Hole U1530A.
- F57. MAD and P-wave velocity data, Hole U1530A.
- F58. P-wave velocity and anisotropy, Hole U1530A.
- F59. Operations for downhole measurements, Hole U1530A.
- F60. Temperature measurements, Hole U1530A.
- F61. Temperature heat-up profile, Hole U1530A.
- F62. Downhole measurements, Hole U1530A.
- F63. FMS resistivity images, Hole U1530A.
- F64. Whole-round samples, Site U1530.
- F65. MBIO samples, Site U1530.
- T1. Operations summary, Hole U1530A.
- T2. Interval depths of alteration types, Hole U1530A.
- T3. XRD, Hole U1530A.
- T4. XRD mineralogy summary, Hole U1530A.
- T5. Fluid inclusion sample data, Hole U1530A.
- T6. Types of fluid inclusions, Hole U1530A.
- T7. ICP-AES analyses of rock powders, Site U1530.
- T8. pXRF analyses on rock powders, Site U1530.
- T9. pXRF vs. ICP, Site U1530.
- T10. TC, TS, and TN measured by EA, Hole U1530A.
- T11. Pore-fluid gas concentrations, Site U1530.
- T12. Element composition of borehole fluid, Hole U1530A.
- T13. Metal abundances in borehole fluid, Hole U1530A.
- T14. Discrete samples, measurements, and experiments, Site U1530.
- T15. MAD data, Site U1530.
- T16. P-wave velocity data, Site U1530.
- T17. Thermal conductivity data, Site U1530.
- T18. Downhole measurement sequence and operations, Hole U1530A.
- T19. GC measurements of PFMD, Site U1528.