Gohl, K., Wellner, J.S., Klaus, A., and the Expedition 379 Scientists
Proceedings of the International Ocean Discovery Program Volume 379
publications.iodp.org

https://doi.org/10.14379/iodp.proc.379.104.2021
Site U15331
J.S. Wellner, K. Gohl, A. Klaus, T. Bauersachs, S.M. Bohaty, M. Courtillat, E.A. Cowan, M.A. De Lira Mota, M.S.R. Esteves, J.M. Fegyveresi, T. Frederichs, L. Gao, A.R. Halberstadt, C.-D. Hillenbrand, K. Horikawa, M. Iwai, J.-H. Kim, T.M. King, J.P. Klages, S. Passchier, M.L. Penkrot, J.G. Prebble, W. Rahaman, B.T.I. Reinardy, J. Renaudie, D.E. Robinson, R.P. Scherer, C.S. Siddoway, L. Wu, and M. Yamane2
Keywords: International Ocean Discovery Program, IODP, JOIDES Resolution, Expedition 379, Amundsen Sea West Antarctic Ice Sheet History, Site U1533, Amundsen Sea Embayment, Pine Island Glacier, Thwaites Glacier, Marie Byrd Land, paleoclimate, paleo–ice sheet, marine ice sheet, continental rise, deep-sea sediments, sediment drift, contourite, ocean-bottom current, seismic stratigraphy, ice-rafted debris, glacial–interglacial cyclicity, core X-ray, headspace gas, contamination tracer
MS 379-104: Published 23 February 2021
Site summary
Background
Site U1533 (Proposed Site ASRE-09A) is located 62 km west-southwest of Site U1532 on the westernmost lower flank of Resolution Drift, the same sediment drift where Site U1532 was drilled, on the continental rise of the Amundsen Sea (Figure F1; see Figure F1 in the Expedition 379 summary chapter [Gohl et al., 2021b]). This lowermost flank is bound by a north–south oriented deep-sea channel west of Site U1533 (Uenzelmann-Neben and Gohl, 2012). The channel is likely the path of sediment transported downslope from the shelf via turbidity currents and mass transport deposits and, as such, is likely the major source of sedimentary components to the drill site (e.g., Dowdeswell et al., 2006). Bottom currents transported the finer fractions of the sediments and deposited them to form a drift (e.g., Nitsche et al., 2000). A robust horizon correlation from Site U1532 performed via three connected seismic lines indicates that sedimentary sequences of the same age are more condensed at Site U1533.

Figure F1. Site U1533 on Seismic Line TH86003B.
Four holes (U1533A–U1533D) were drilled at Site U1533 in water depths between 4179 and 4184 m (Figure F2). The deepest penetration (Hole U1533B) reached 383 m with an overall core recovery of 70%. As at Site U1532, frequent approaches of icebergs of various sizes were the primary reason for the larger number of holes.

Figure F2. Distribution of Holes U1533A–U1533D.
Lithostratigraphy
Sediments recovered at Site U1533 consist mainly of silty clay with varying biogenic content and amount of bioturbation and with rare occurrences of diamict and conglomerate. Thin sand and silt beds and laminae occur throughout, and intervals of carbonate cementation and volcaniclastic material were also observed. The recovered sediments are categorized into seven lithofacies based on visual characteristics and lithologic information supported by smear slide observations. The drilled sequence is divided into Lithostratigraphic Subunits IA and IB based on changes in facies assemblages. Whole-core X-radiographs were used to aid in the identification of sedimentary structures, clast occurrence, and drilling disturbance. Site U1533 is dominated by deposition of fine-grained sediments interpreted to have been initially supplied by sediment gravity flows from the continental shelf and subsequently reworked by contour currents. Silt and sand laminae and beds are interpreted to have been deposited during submarine channel overflow. Additionally, a significant amount of biosiliceous material in the sediments is supplied from the overlying surface waters or advected from farther offshore.
The association of facies in Lithostratigraphic Subunit IA predominantly reflects the interplay of downslope and contouritic sediment transport with phases of relatively higher pelagic sediment input during seasonally open-marine conditions. The amount of biogenic material is generally high throughout Subunit IA, suggesting sustained periods of relatively high marine productivity. Deposits related to downslope transport are present throughout the sedimentary record at Site U1533. In Subunit IA, coarse-grained layers probably indicate overspill deposition originating from downslope transport through the adjacent deep-sea channel. In Subunit IB, generally higher amounts of clasts and pebbles in comparison to Subunit IA were observed. Dispersed granules and pebbles, as well as clast nests and discontinuous bands of coarse sand and granules in Subunit IB, are inferred to indicate persistent but likely low-intensity ice rafting. This style of ice rafting may have increased periodically during warmer periods. This is particularly evident by the deposition of ice-rafted debris (IRD) in diatom ooze intervals.
Biostratigraphy
In contrast with Site U1532, which contains significant intervals that are barren of microfossils, the majority of Site U1533 samples from the mudline to the lowermost sediments contain microfossils. Preservation and abundance of microfossils is highly variable, including some unfossiliferous intervals noted in the lowermost Pleistocene–uppermost Pliocene and lower Pliocene sections. A general pattern of alternating gray-beige to brownish sediments (Lithostratigraphic Subunit IA) and gray-beige to greenish sediments (Subunit IB) similar to that observed at Site U1532 was commonly observed at Site U1533 and consisted of gray, laminated, microfossil-poor, largely terrigenous mudstones punctuated by thinner brownish to greenish, bioturbated, variably biosilica-bearing intervals, some with sand- to pebble-sized material interpreted to be IRD. However, the brownish and greenish bioturbated units have a higher overall concentration of biosiliceous material than those at Site U1532.
The upper ~40 m of Site U1533 spans from the recent to Pleistocene and contains variable concentrations of diatoms, radiolarians, and foraminifers, rare marine and reworked terrestrial palynomorphs, and very rare calcareous nannofossils. Diatoms and radiolarians are present in most samples examined from this interval. Foraminifers are present only in a few intervals in the upper ~10 m of the sequence. Marine and terrestrial palynomorphs are absent in the upper ~40 m of Site U1533 except for rare occurrences of marine palynomorphs and reworked terrestrial palynomorphs.
Pleistocene to upper Miocene sediments were recovered in Hole U1533B and are dated primarily by diatoms and radiolarians. Diatoms and radiolarians are documented with variable abundance from the top of Hole U1533B to the base. Samples from the lowermost cores generally contain common to abundant diatoms, although the frustules are highly fragmented. Diatoms and radiolarians provide a latest Miocene age (6.2–6.7 Ma) for the basal sediments recovered in Hole U1533B; combined with magnetostratigraphic constraints, the basal sediments in Hole U1533B are ~6.4–6.75 Ma. Foraminifers and calcareous nannofossils were not observed in the Pliocene sediments in Hole U1533B, whereas rare to common marine and reworked terrestrial palynomorphs are present throughout the hole.
Paleomagnetism
For Hole U1533A, demagnetization of natural remanent magnetization (NRM) at the 20 mT level identifies the Brunhes–Matuyama transition (0.781 Ma), the termination and beginning of the Jaramillo Subchron (C1r.1n; 0.988 and 1.072 Ma, respectively), and the termination and beginning of the Cobb Mountain Subchron (C1r.2n; 1.173 and 1.185 Ma, respectively).
The magnetostratigraphy for Hole U1533B is more complex than that for Hole U1533A because of reduced core recovery and drilling disturbance of some intervals. The shipboard interpretation identifies the beginning of the Olduvai Subchron (C2n; 1.945 Ma), the termination and beginning of Subchron C2An.1n (2.581 and 3.032 Ma, respectively), the termination and beginning of Subchron C2An.3n (3.330 and 3.596 Ma, respectively), the termination and beginning of the Cochiti Subchron (C3n.1n; 4.187 and 4.300 Ma, respectively), and the termination and beginning of the Nunivak Subchron (C3n.2n; 4.493 and 4.631 Ma, respectively). Subchron C2An.2n (3.116–3.207 Ma) might be present in very condensed form in Core 379-U1533B-5H at ~58 m. Farther downhole, paleomagnetic measurements revealed the termination and beginning of the Sidufjall Subchron (C3n.3n; 4.799 and 4.896 Ma, respectively) and the termination and beginning of the Thvera Subchron (C3n.4n; 4.997 and 5.235 Ma, respectively). Below an interval without core recovery, the deepest cores with significant recovery, 39R and 43R, are of mainly normal polarity, suggesting a basal age for Hole U1533B between the termination of Subchron C3An.1n (6.033 Ma) and the beginning of Subchron C3An.2n (6.733 Ma). Oscillating values of normal and reversed polarity at the bottom of Hole U1533B provide no clear evidence that Subchron C3Ar was recovered.
For Hole U1533C, no magnetic polarity reversal was recorded, suggesting that the recovered sediments are younger than the Brunhes–Matuyama transition (0.781 Ma).
For Hole U1533D, paleomagnetic measurements identified the Brunhes–Matuyama transition (0.781 Ma), the termination and beginning of the Jaramillo Subchron (C1r.1n; 0.988 and 1.072 Ma, respectively), the termination and beginning of the Cobb Mountain Subchron (C1r.2n; 1.173 and 1.186 Ma, respectively), and the termination and beginning of the Olduvai Subchron (C2n; 1.778 and 1.945 Ma, respectively).
Chronostratigraphy
Combining biostratigraphy and magnetostratigraphy, the interval above ~37 m is assigned a recent to Pleistocene age, the interval from ~37 to 265 m is assigned a Pliocene age, and the interval from ~265 to 383 m (base of recovery at Site U1533) is assigned a latest Miocene age. The combined data indicate an age of 6.4–6.75 Ma for the base of Hole U1533B at 381.23 m.
Geochemistry
Interstitial water salinity at Site U1533 has a constant value of 35 from the seafloor to ~235 m and a slightly lower value (33 to ~34) from 255 to 375 m. Chloride (Cl) concentration ranges between 557 and 596 mM. The elevated Cl concentrations in the deeper section of Site U1533 could be due to hydration reactions during clay formation. Sodium (Na) concentration ranges between 440 and 483 mM throughout the section. Below ~17 m, sulfate (SO4) decreases continuously with depth and reaches a minimum value (~1.6 mM) at 375 m. However, sulfate concentration is still detected in the lowermost sediments recovered at the site. Pore water alkalinity increases linearly with depth from 1.5 m to a maximum (~10.5 mM) at ~185 m, which is the opposite trend to that of sulfate concentration. Below ~185 m, alkalinity slightly decreases with depth and is lowest at the bottom of Hole U1533B.
Strontium (Sr) concentrations show an overall increase from 82 μM at 1.5 m to 196 μM at 374.8 m, reaching maximum values approximately 2.5 times higher than the measured modern seawater value (~82 μM). The higher Sr indicates either higher fluid-rock reaction with volcaniclastic material or dissolution of carbonates.
Methane concentrations are ~4 ppmv, close to the instrumental background signal, in Hole U1533A and most of Hole U1533B. At ~325.60 m, there is an abrupt downhole increase in methane concentrations, which peak at 6373 ppmv at 375.02 m. No hydrocarbons other than methane were detected at Site U1533. Increased methane concentrations were found only at the base of Lithostratigraphic Subunit IB, where the lowest sulfate values were observed. Together with the absence of higher hydrocarbons, this may suggest a biological source of methane at Site U1533.
Total carbon (TC) contents vary from 0.02 to 0.5 wt% and show an increasing trend with depth. Calcium carbonate (CaCO3) is low at Site U1533 and ranges from 0.02 to 2.54 wt%. Total organic carbon (TOC) content varies between 0.01 and 0.41 wt% and is similar in terms of trends and abundances to the TC record, indicating that organic carbon constitutes most of the TC pool.
Samples for contamination testing were collected from the exterior and center of freshly exposed core sections or whole-round samples. Tracers were present in variable concentrations in samples taken from most advanced piston corer (APC) core exteriors due to the direct exposure of the core surface to circulating drilling fluids. However, tracer concentrations are approximately four orders of magnitude lower in these samples than the target concentrations of tracers in the drilling fluid. Tracers were below detection in the interior of most APC and half-length APC (HLAPC) cores. The absence of tracers from the central parts of most APC/HLAPC cores and their generally low presence in core exteriors suggest low overall contamination. Extended core barrel (XCB) cores generally showed low contamination in both the interior and exterior samples, but in contrast to APC/HLAPC cores, contamination was consistently present in the center of the cores. The sampled rotary core barrel (RCB) cores generally showed higher levels of tracer contamination than APC/HLAPC and XCB cores.
Physical properties
Collected physical property data include magnetic susceptibility, natural gamma radiation (NGR), gamma ray attenuation (GRA) bulk density, moisture and density (MAD), P-wave velocity, thermal conductivity, and spectral color reflectance. Whole-round magnetic susceptibility trends follow those observed in GRA bulk density and NGR, likely indicating changes in terrigenous sediment content. Magnetic susceptibility data were used as a primary tool for correlating cores from adjacent holes to create a shipboard splice for the uppermost ~44 m of the site. Measured whole-round magnetic susceptibility ranges between 5 × 10⁻⁵ and 805 × 10−5 SI. Average magnetic susceptibility values increase downhole from ~50 × 10−5 to ~100 × 10−5 SI at ~55 m, which corresponds to the Lithostratigraphic Subunit IA/IB boundary. Measured NGR ranges between 13 and 235 counts/s with an overall average of 56 counts/s. Average NGR values increase downhole from ~20 counts/s at the mudline to ~60 counts/s at ~55 m, which corresponds to the Subunit IA/IB boundary. Below ~55 m, magnetic susceptibility and NGR vary cyclically between ~10 × 10−5 and ~130 × 10−5 SI and ~30 and ~75 counts/s, respectively. The GRA bulk density record shows a sharp downhole increase from ~1.3 to ~1.8 g/cm3 in the uppermost 55 m, which corresponds to Subunit IA. Below this depth, GRA bulk density exhibits several stepwise changes. The overall increase in GRA bulk density with depth at this site reflects the increasing compaction of sediment with depth. Smaller scale variability indicates changes in sediment lithology and correlates well with NGR and magnetic susceptibility variability. In the upper ~15 m of Holes U1533A, U1533C, and U1533D, magnetic susceptibility, NGR, and GRA bulk density exhibit a “sawtooth” pattern with a sharp increase in overall value followed by a more gradual decline downcore. Sediment porosity decreases from 86% at the seafloor to 65% at ~30 m and decreases further with depth to 45% at the bottom of Hole U1533B, reflecting the downward compaction trend of marine sediments. P-wave velocity increases from ~1480 m/s at the seafloor to an average of ~1760 m/s at the termination of Hole U1533B at 380 m. Below ~55 m in Subunit IB, P-wave velocity varies with sediment texture. Thermal conductivity increases with depth from ~0.7 W/(m·K) at the seafloor to ~1.4 W/(m·K) at ~375 m and corresponds to a downhole increase in dry bulk density and decrease in porosity from compaction.
Operations
We conducted coring operations in four holes at Site U1533 (Tables T1, T2, T3, T4). Given the frequent interruptions due to icebergs at our previous site, we decided to deploy a free-fall reentry system as early as possible after starting to core. APC coring in Hole U1533A penetrated from the seafloor to 28.5 m and recovered 29.54 m (104%), but approaching ice forced us to pull out of the hole before deploying the reentry system. Hole U1533B was drilled without coring to 25.5 m, after which we cored to a total depth of 382.6 m with the APC, HLAPC, XCB, and RCB systems for an overall recovery of 70%. Shortly after beginning APC coring in Hole U1533B, we deployed a free-fall reentry system with 24.35 m of 10¾ inch casing (Figure F3). This allowed us to reenter the hole two times after we were driven off by approaching ice. The first time the ice forced us to pull out of Hole U1533B, we used the time to conduct shallow-penetration APC coring in Holes U1533C and U1533D before returning to Hole U1533B. Hole U1533C consisted of a single mudline core that recovered 7.74 m, but increased ship heave forced us to stop drilling operations. After the seas subsided, we conducted APC coring in Hole U1533D from the seafloor to 40.0 m and recovered 40.01 m (100%).
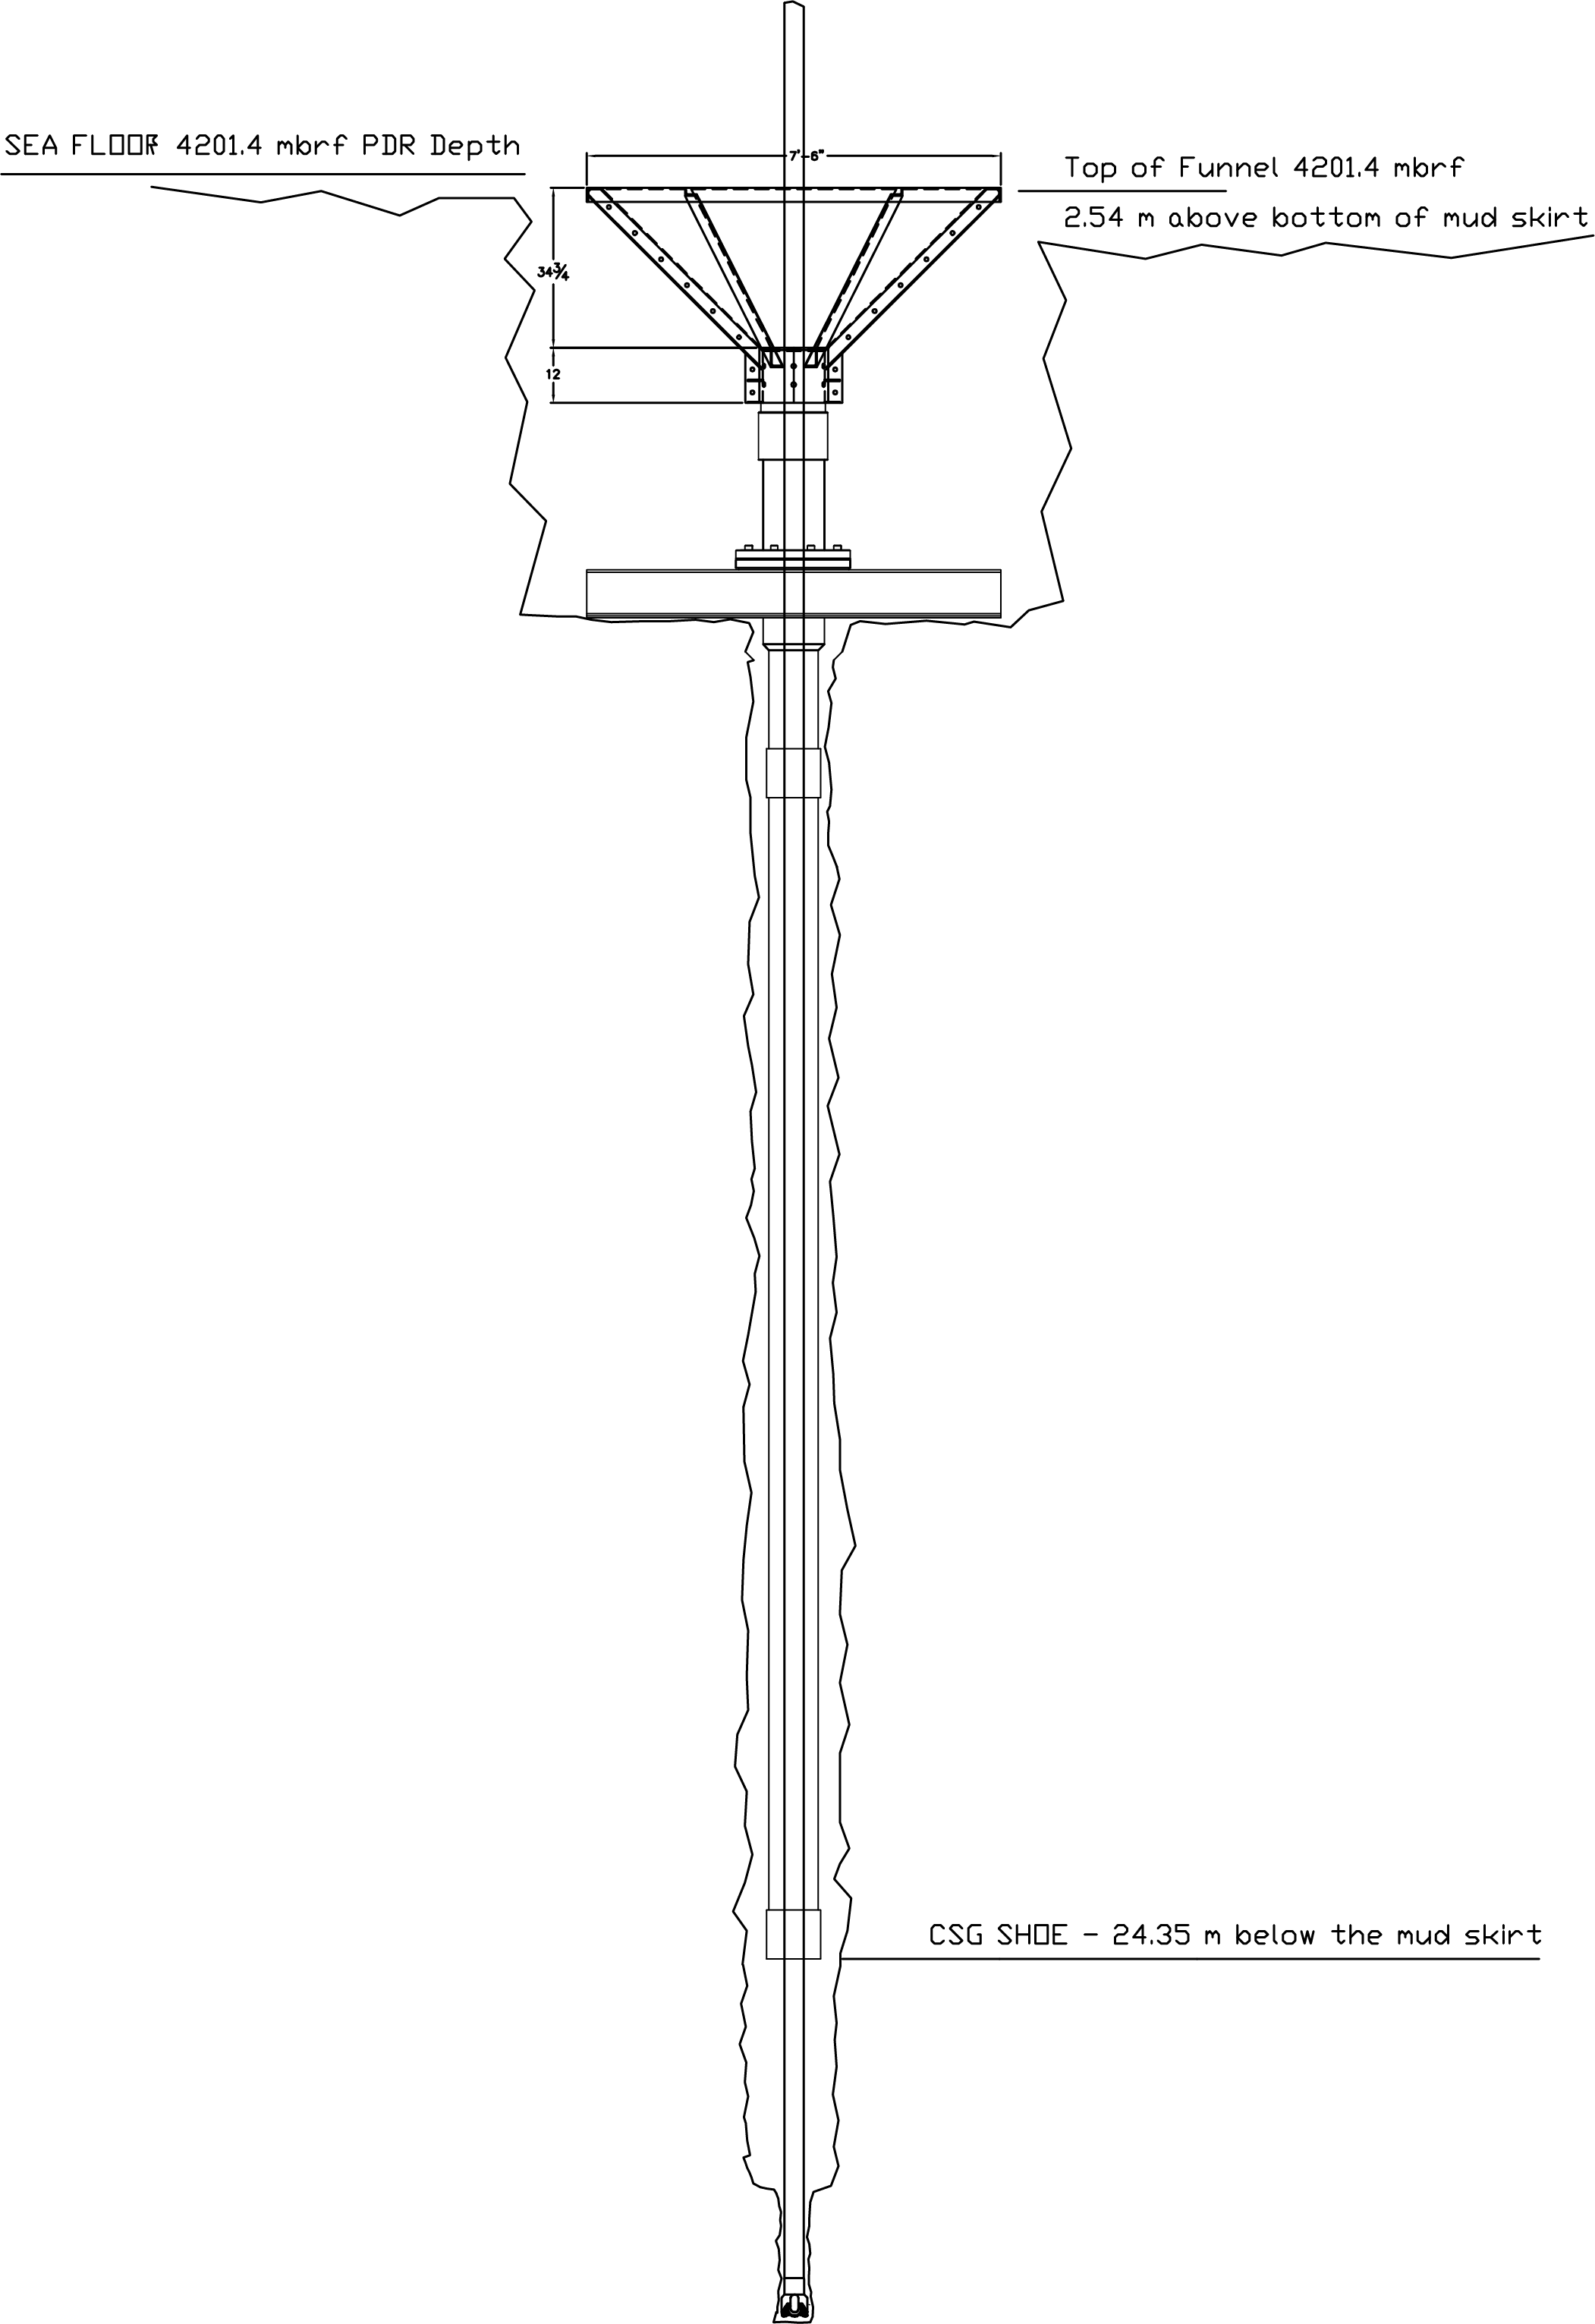
Figure F3. Free-fall reentry system.
We spent a total of 11.68 days at Site U1533. Drifting icebergs caused multiple interruptions that resulted in nearly half of this time (5.22 days) being spent waiting for ice to clear the area or conducting operations not originally planned (pipe trips, reentries, or repeated drilled intervals). The frequency of interruptions due to drifting icebergs and significant variations in their speed and direction proved problematic. We had to stop any further expedition drilling operations at 0315 h on 7 March 2019 to return to Chilean waters to evacuate an injured crew member.
Unless otherwise noted, all depths presented in this volume are core depths below seafloor calculated as core depth below seafloor, Method A (CSF-A), and are reported as “m.” All times in this report are in ship local time (UTC − 3 h).
Hole U1533A
After completing operations at Site U1532, we started our transit to Site U1533 at 1618 h on 23 February 2019. After the 31 nmi transit (4.4 h; 7.1 nmi/h), we arrived at Site U1533 and switched to dynamic positioning at 2109 h on 23 February. Once on site, we conducted routine servicing of the drill line (slip and cut), prepared the rig floor and moonpool for assembling a reentry system, and then assembled the free-fall reentry system (free-fall funnel, mud skirt, and two joints of 10¾ inch casing). At 0330 h on 24 February, the reentry system was completed and centered in the moonpool. We attached an APC bit to the bottom-hole assembly (BHA) and lowered it through the reentry system. We used an APC polycrystalline diamond compact bit, which has a smaller outside diameter (9⅞ inches) than our normal APC bits and can pass through the 10¾ inch casing used in the reentry system. While lowering the bit to the seafloor, we had to stop for 2 h (0800–1000 h) to repair a line in the rig floor compressed air system. After the bit arrived at ~90 m above the seafloor at 1500 h on 24 February, we had to pause operations because of approaching ice. At 1715 h, we installed the top drive and adjusted the bit to start coring. Unfortunately, we had to stop operations again at 1930 h on 24 February because of approaching ice.
After ice cleared the area at 0515 h on 25 February, we adjusted the bit depth and started APC coring in Hole U1533A at 0640 h (Table T1). Cores 1H–3H penetrated to 28.5 m and recovered 29.54 m (104%). Ice approached once again, so we had to pull out of Hole U1533A at 1045 h on 25 February before we could deploy the reentry system.
Hole U1533B (first visit)
We resumed operations at 1300 h on 25 February 2019 (Table T2). We offset the ship ~1620 m west (264°) of Hole U1533A along the range of locations on the seismic profile approved for drilling at this site because the ice conditions would allow us to start operations sooner at this location. Hole U1533B was started at 1355 h on 25 February and was drilled without coring to 25.5 m. APC Cores 2H–7H penetrated to 82.5 m. While retrieving Core 4H, we deployed the free-fall reentry system with 24.35 m of 10¾ inch casing (Figure F3).
After Core 7H arrived at the rig floor (0050 h on 26 February), approaching ice caused us to pause operations and raise the bit to 50.4 m below the seafloor. We resumed operations at 0230 h on 26 February, and Cores 8H–12H penetrated to 130.0 m. After recovering Core 12H, approaching ice forced us to pause operations again at 1100 h, and the bit was raised back up to 50.6 m. At 1415 h on 26 February, we lowered the bit back to the bottom of the hole and resumed APC coring. Cores 13H–18H penetrated to 187.0 m before we had to pause operations again at 2330 h on 26 February. We raised the bit up to 50.6 m below the seafloor to wait for the ice to clear the area.
At 0330 h on 27 February, we had to pull completely out of Hole U1533B because of approaching ice. Because the ice situation would not allow us to reenter Hole U1533B soon, we decided to make use of this time to take a few surficial APC cores.
Holes U1533C and U1533D
We offset the ship to a more ice free portion of the seismic profile and adjusted the bit for a mudline core. As we prepared to shoot Core 379-U1533C-1H at 0805 h on 27 February 2019, the core fired early because of significant ship heave. However, we recovered what appeared to be a good 7.7 m long mudline core (Table T3). Before we could take additional cores, increasing ship heave forced us to stop operations at 0900 h. We raised the bit up ~100 m above the seafloor and had to wait until 0645 h on 28 February for the seas to subside enough to resume coring operations. Our preference was to reenter Hole U1533B and continue to deepen it, but this required calmer seas because we didn’t want to risk the bit heaving down on the reentry funnel and damaging our ability to reenter. Instead, we offset the ship 15 m east of Hole U1533C and started APC coring from the seafloor in Hole U1533D (Table T4). APC Cores 379-U1533D-1H through 5H penetrated to 40 m and recovered 40.01 m (100%). Because this was deep enough to provide overlap with the shallowest Hole U1533B cores and the swell had decreased enough to safely reenter Hole U1533B to core deeper, we terminated Hole U1533D at 1545 h on 8 February.
Hole U1533B (second visit)
We moved back to Hole U1533B, deployed the camera system, and reentered at 1838 h on 8 February 2019. The top of the cone was observed to be roughly level with the seafloor but clear on all sides from a depression made by the mud skirt. We recovered the camera system and lowered the bit toward the bottom of the hole. The bit encountered some resistance at 160 m, so we installed the top drive and rotated/circulated the remaining 27 m to the bottom of the hole (187.0 m). We resumed coring at 2215 h on 28 February, and Cores 19F and 20F penetrated to 196.4 m. After Core 20F arrived on the rig floor at 0055 h on 1 March, we had to stop coring because of approaching ice. At 0130 h, we raised the bit up to 165.6 m, removed the top drive, and continued raising the bit up to 50.6 m below the seafloor. At 0600 h on 1 March, we resumed operations, lowered the bit to the bottom of the hole and started coring again. After two HLAPC cores (21F and 22F; 196.4–205.8 m), we decided to switch to XCB coring. Unfortunately, we had to stop operations at 1115 h on 1 March because of approaching ice. We raised the bit back up to 50.6 m below seafloor and waited until 1515 h on 1 March to resume operations. We lowered the bit back to the bottom of the hole and recovered Cores 23X–28X from 205.8 to 262.1 m. After Core 28X arrived back on the rig floor, we had to stop operations at 0915 h on 2 March because of approaching ice. We raised the bit back up to 50.6 m below seafloor and waited until 1315 h to resume operations. While lowering the bit back to the bottom of the hole, it encountered hard fill at 232.6 m. We installed the top drive, deployed an XCB core barrel with a center bit, and drilled back down to 262.1 m. After recovering the center bit, we resumed coring at 1645 h on 2 March, and Cores 29X–31X penetrated to 283.9 m. At 2145 h on 2 March, we had to stop coring again because of approaching ice. Instead of waiting for the ice to leave the area to resume XCB coring, we decided to make use of this time to retrieve the drill string and switch to RCB coring. We pulled the bit out of Hole U1533B at 2303 h and retrieved the drill string.
The APC/XCB bit arrived back on the rig floor at 0820 h on 3 March. Core 31X was recovered with the drill string. We prepared the RCB BHA and lowered it to the seafloor. We deployed the camera system to prepare for reentering Hole U1533B. During this deployment of the camera system, we attached the advanced piston corer temperature tool (APCT-3) to the camera system to measure the seawater temperature from the surface to just above the seafloor (Figure F4). Once the camera system reached the bit, we adjusted the bit depth to reenter Hole U1533B, but approaching ice forced us to raise the bit back up to 70 m above the seafloor at 2045 h on 3 March. We were cleared to resume operations at 2215 h and reentered Hole U1533B at 2305 h on 3 March. We recovered the camera system and lowered the bit into Hole U1533B. After the camera system was back on board, we installed the top drive and circulated and rotated back to the bottom of the hole (283.9 m). Because of approaching ice, we had to wait to start coring from 0315 to 0630 h on 4 March. Unfortunately, the ice kept converging on our location, so we had to raise the bit back up to 66 m below the seafloor. At 1215 h on 4 March, we resumed operations and lowered the bit back toward the bottom of the hole. The bit encountered resistance at 257.6 m, and we had to drill back down to the bottom of the hole. At 1345 h on 4 March, we started RCB coring from 283.9 m. Cores 32R–35R then penetrated to 316.0 m but recovered only 0.07 m (0.2%). At 2245 h on 4 March, we raised the bit back up to 65.5 m below the seafloor because of approaching ice.
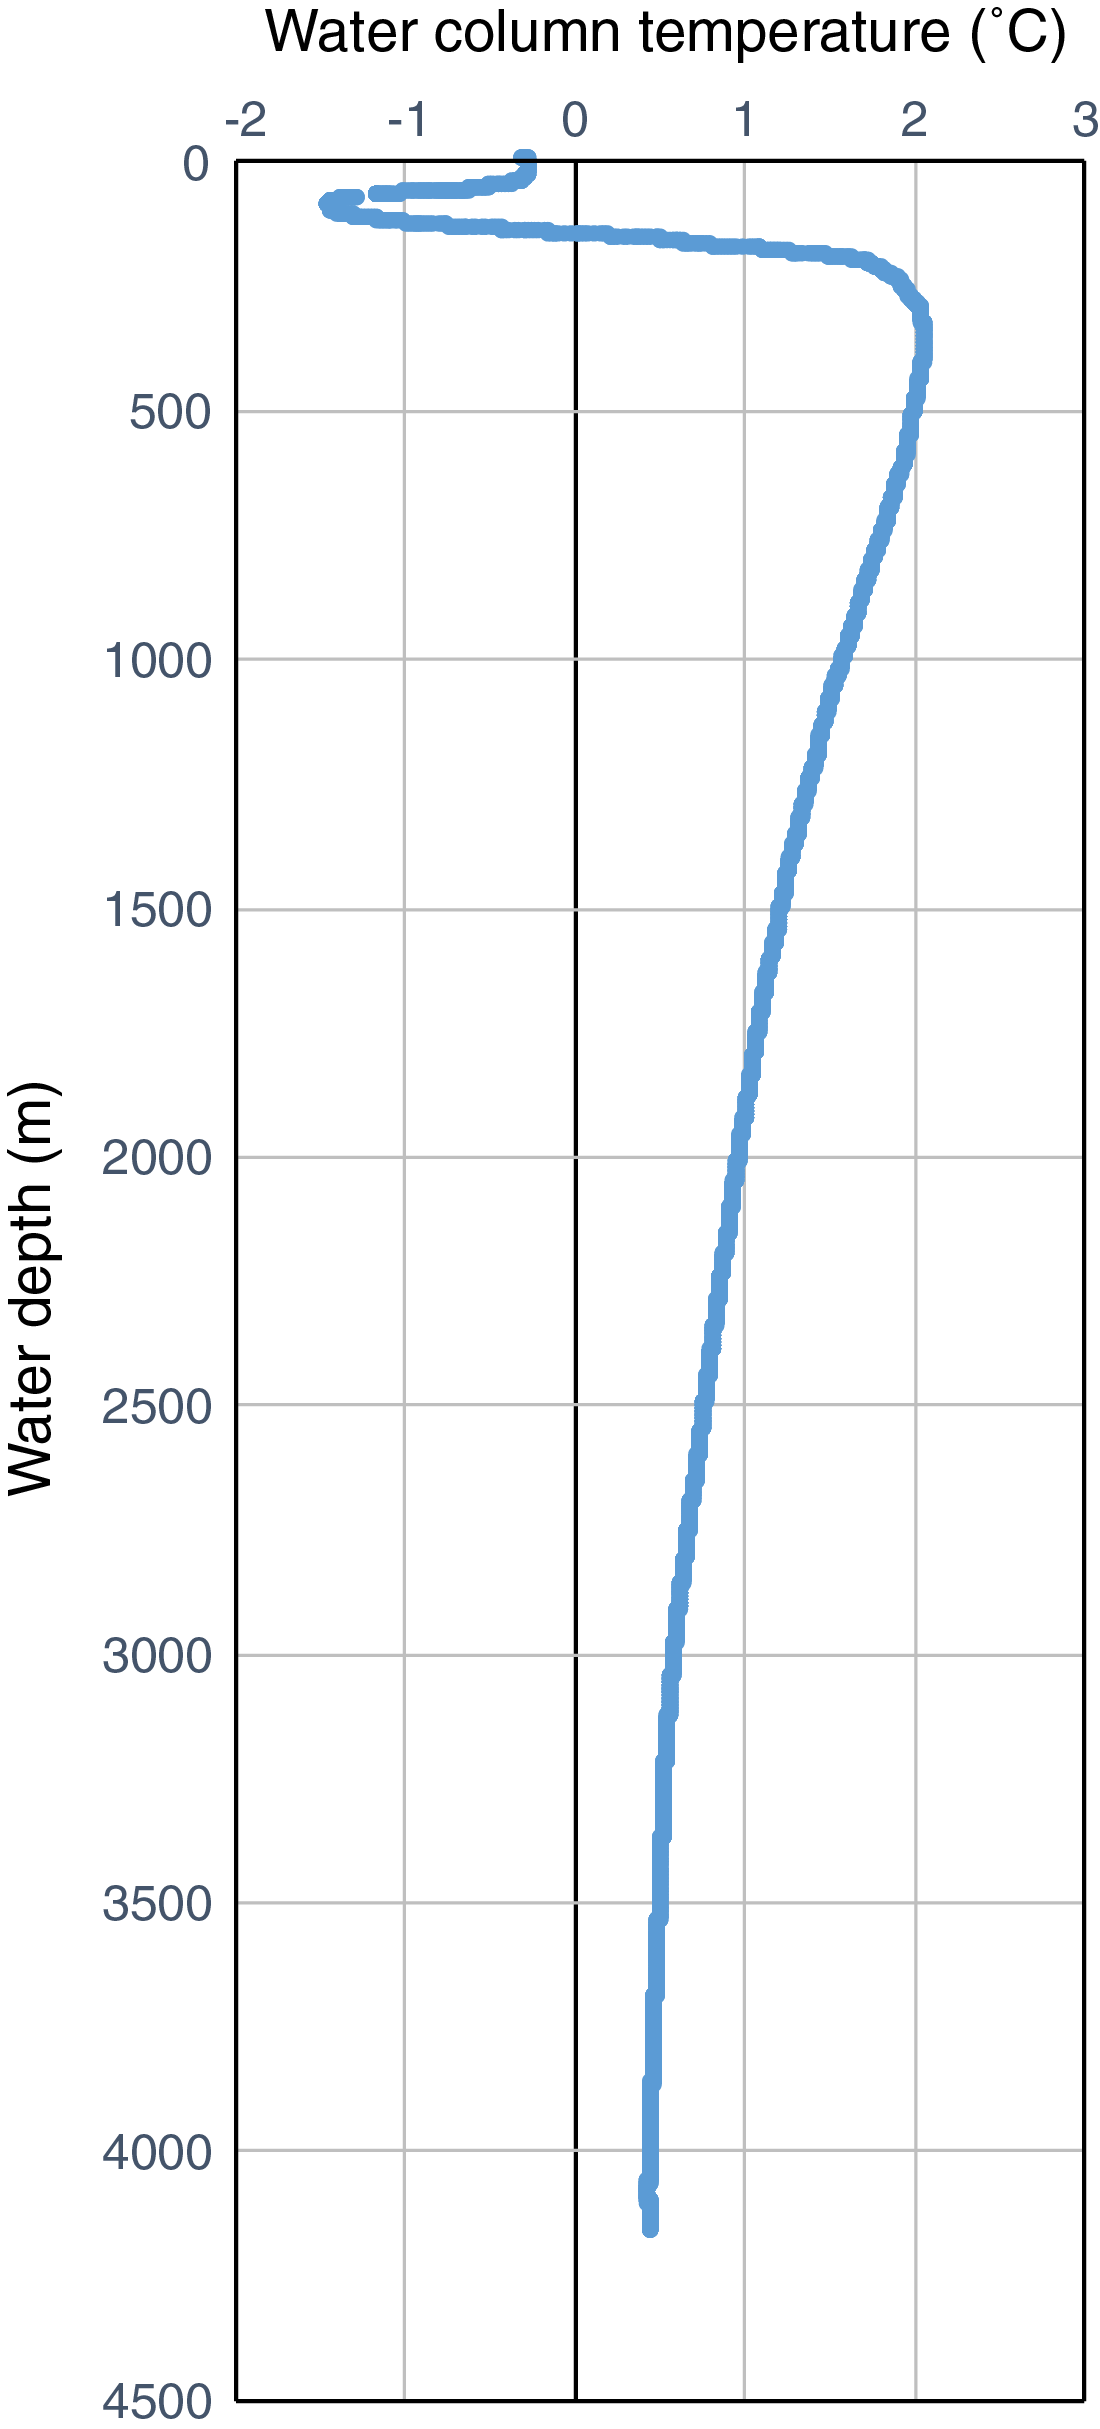
Figure F4. APCT-3 temperature data.
After ice cleared the area at 0145 h on 5 March, we lowered the bit from 65.6 m back down the hole. The bit encountered fill at 267.6 m, so we installed the top drive and circulated/rotated the rest of the way down. We resumed RCB coring from 316.0 m at 0415 h on 5 March. Cores 36R–38R then penetrated to 341.7 m before we had to stop coring again at 1130 h on 5 March because of approaching ice. We raised the bit back up to 65.5 m, reinstalled the top drive, and recovered Core 38R at 1415 h on 5 March. At 1845 h, we were able to resume operations, so we lowered the bit back down the hole, installed the top drive when the bit was at 324.6 m, and circulated/rotated back to the bottom of the hole (341.7 m). We then cut Cores 39R and 40R to 360.9 m. Before we could recover Core 40R, approaching ice forced us to pause operations again at 2315 h on 5 March. We waited for the ice with the bit near the bottom of the hole. We didn’t install the core line to retrieve Core 40R because it would have increased the time required to pull out of the hole if the ice kept approaching. At 0315 h on 6 March, we were finally able to recover Core 40R and resume coring. Cores 41R–43R penetrated from 360.9 to 382.6 m. At 0930 h on 6 March, approaching ice again forced us to raise the bit back up to 65.6 m below the seafloor. The ice kept approaching, and we had to pull the bit completely out of Hole U1533B at 1115 h. With the bit 106 m above the seafloor, we installed the top drive, installed the core line, and recovered Core 43R at 1300 h. We then deployed the camera system at 1330 h on 6 March so that we would be ready to reenter Hole U1533B as soon as the ice allowed. While waiting for the ice to move away, we conducted a camera survey of the seafloor from 1845 to 2030 h on 6 March.
We continued to wait for ice to clear the area with the bit 50 m above the seafloor until 0100 h on 7 March. We then reentered Hole U1533B at 0155 h, started to retrieve the camera system, and began lowering the bit into the hole. When the bit reached 324.6 m at 0315 h on 7 March, we had to stop any further operations to return to Chilean waters to evacuate an injured crew member. After the camera system was back on board at 0430 h on 7 March, we recovered the drill string, and the rig floor was secured for transit at 1330 h. We raised the thrusters and began the transit to Chile at 1448 h on 7 March.
Lithostratigraphy
Sediments recovered at Site U1533 consist mainly of silty clay with varying biogenic content and amount of bioturbation and rare occurrences of diamict and conglomerate intervals. Four holes were drilled at this site, reaching a total core depth of 382.6 m (Figure F5). Thin sand and silt beds and laminae occur throughout, and intervals of carbonate cementation and volcaniclastic material were also observed. The recovered sediments were categorized into seven lithofacies based on visual characteristics and lithologic information supported by smear slide observations (Figure F6; Table T5). The drilled sequence was divided into Lithostratigraphic Subunits IA and IB based on changes in facies assemblages. Whole-core X-radiographs were used to aid in identification of sedimentary structures, clast occurrence, and drilling disturbance.
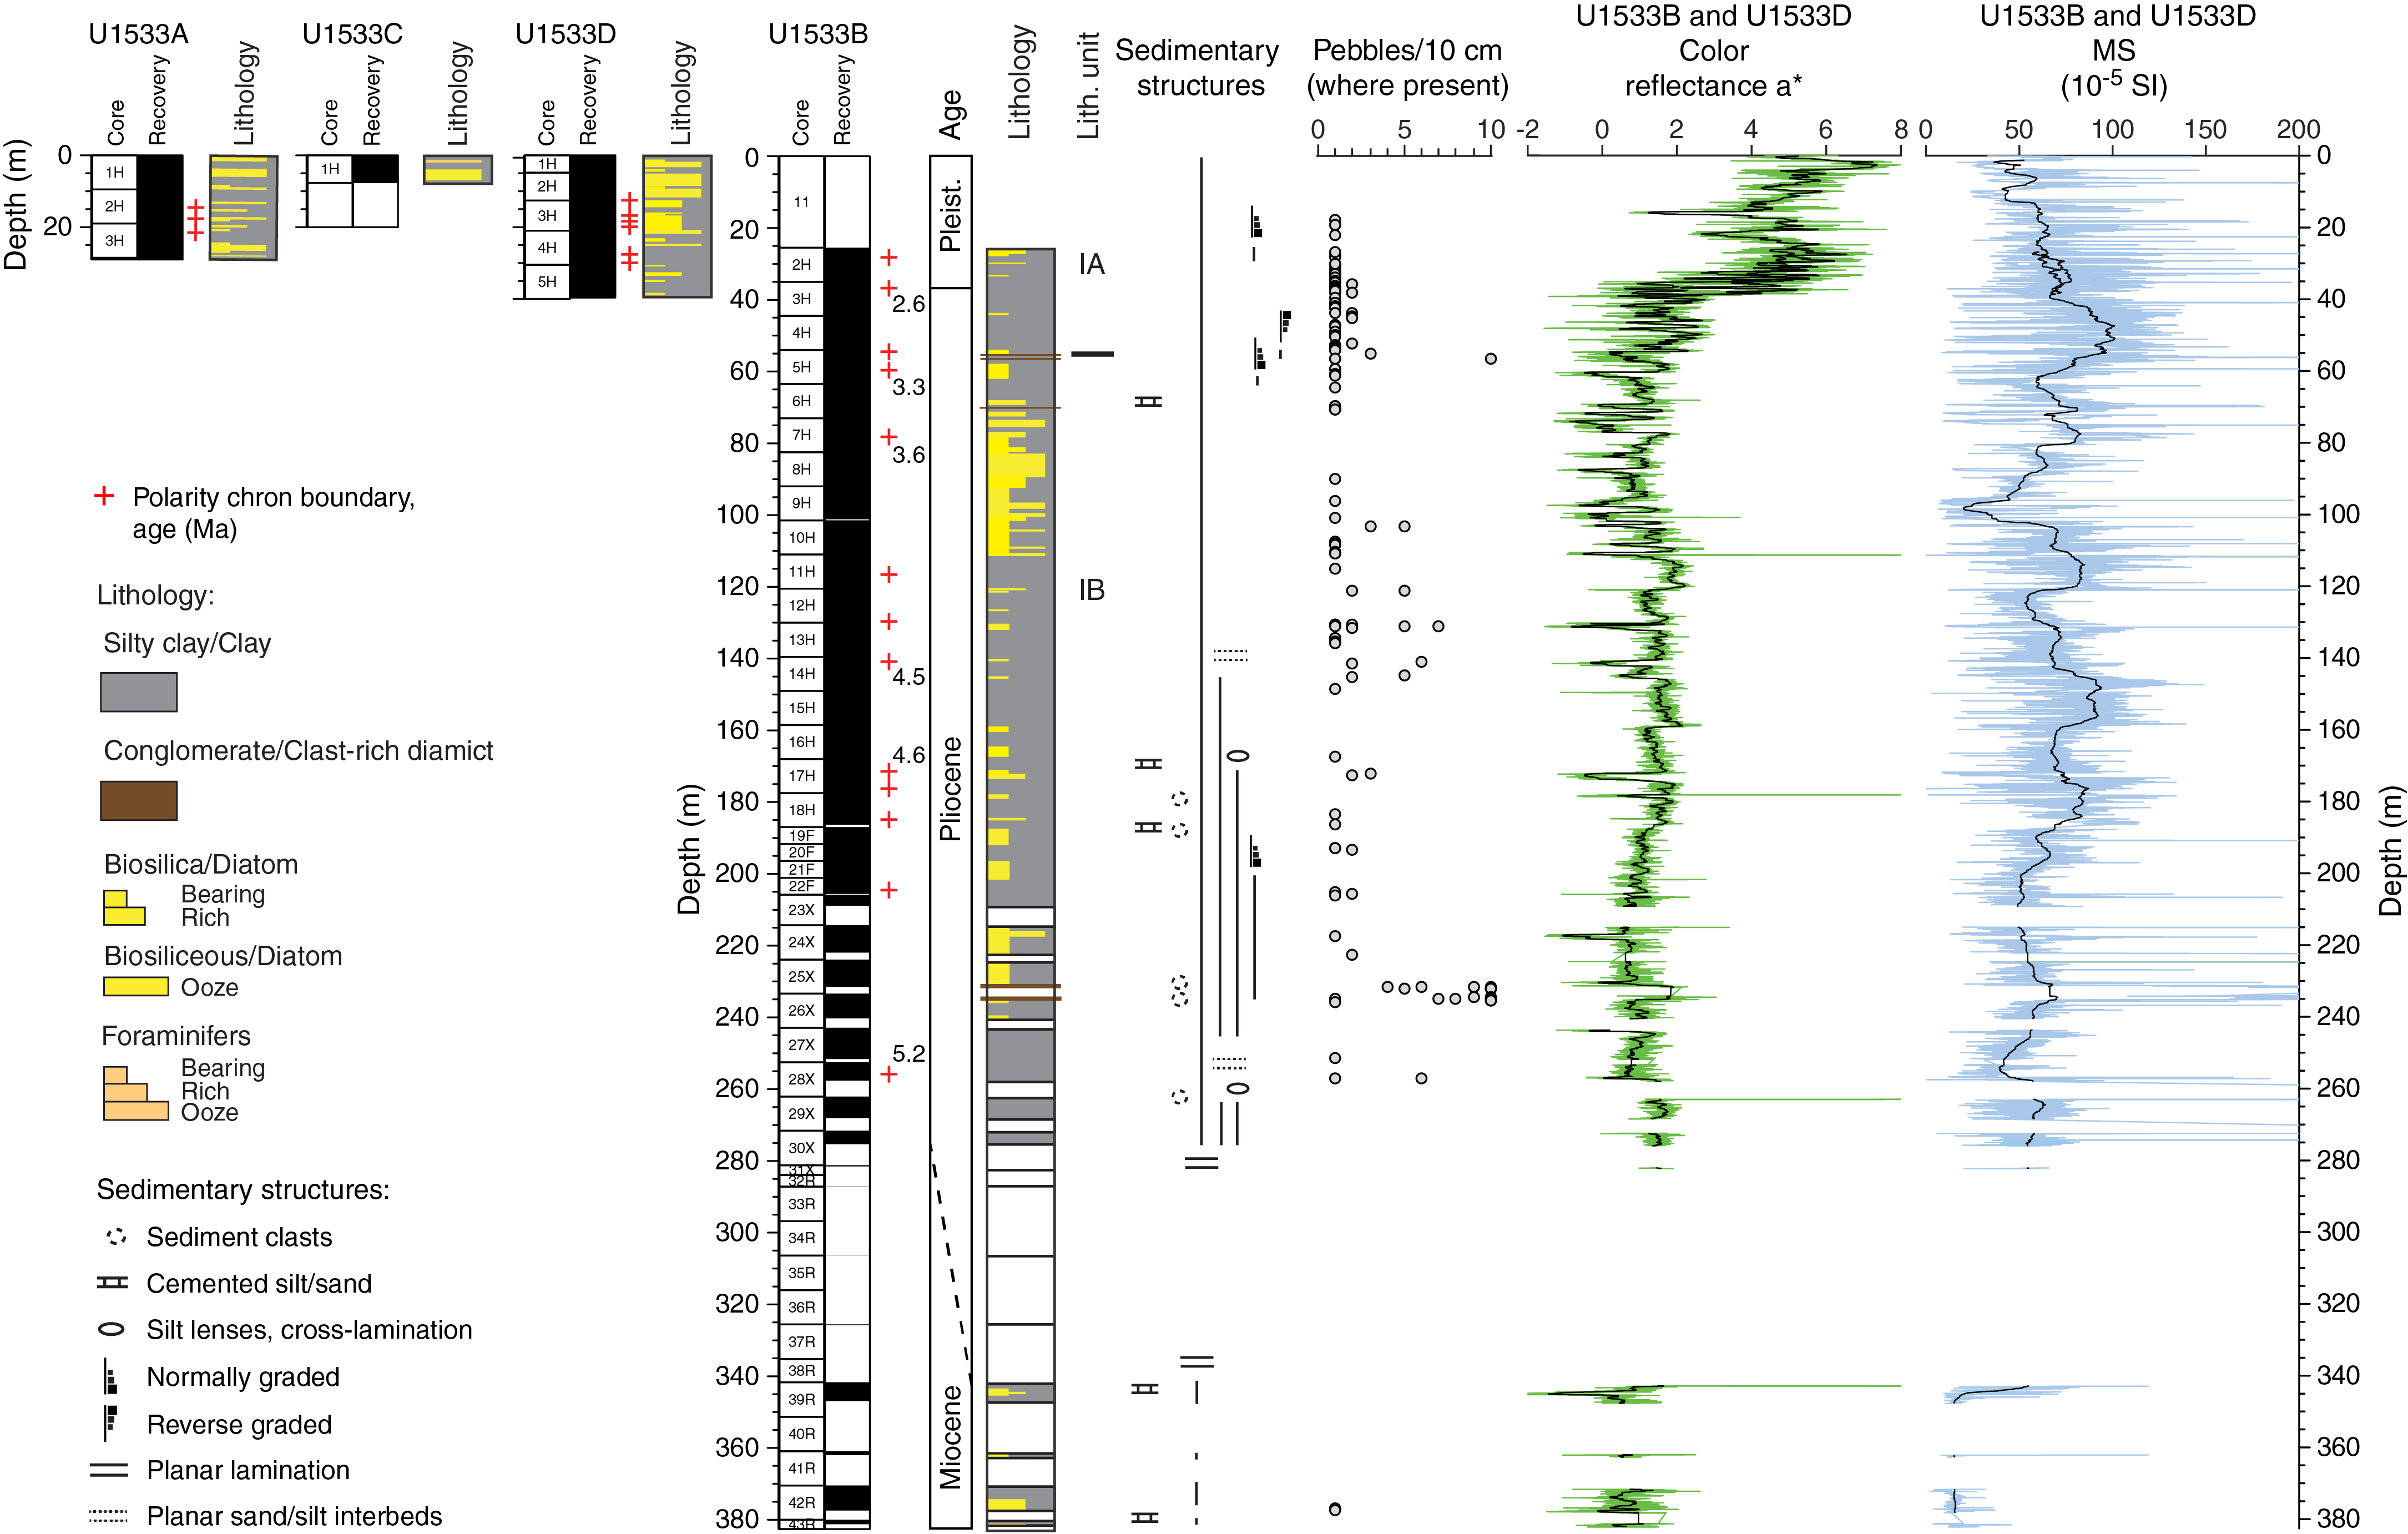
Figure F5. Composite lithostratigraphic summary.
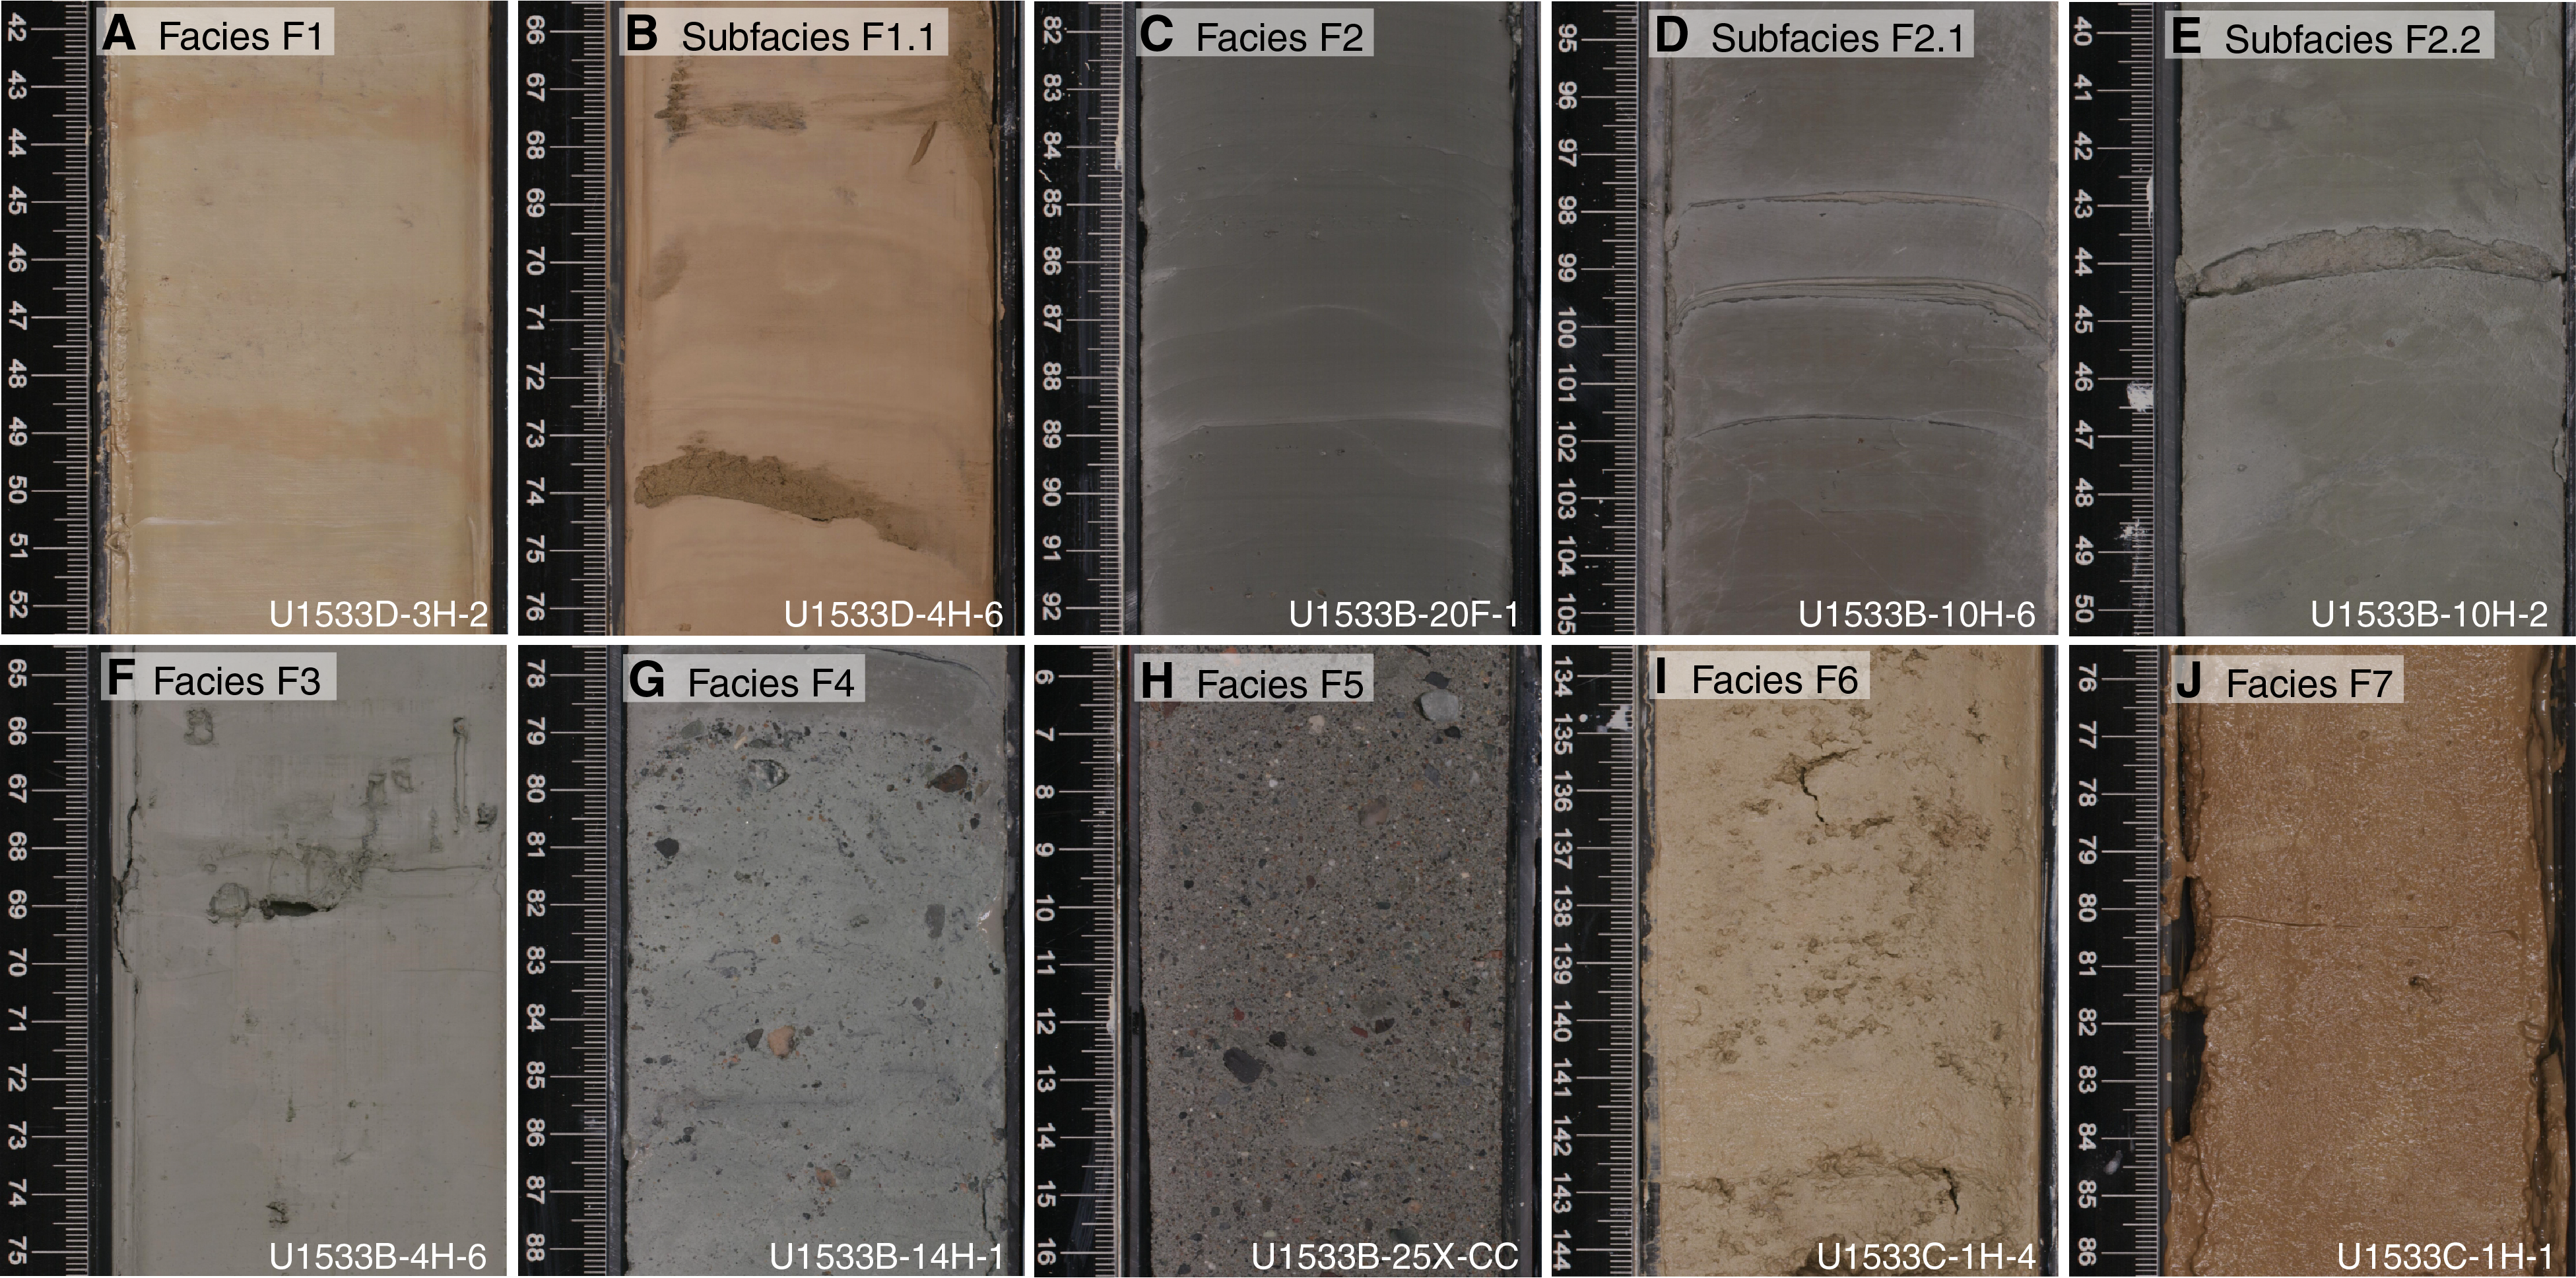
Figure F6. Facies and subfacies.
Core recovery and quality
The APC system was used from 0 to 187.0 m in Holes U1533A–U1533D. Cores acquired with APC drilling had very high recovery (Hole U1533A = 104%, Hole U1533B =104%, Hole U1533C = 101%, and Hole U1533D = 100%) and experienced low drilling disturbance down to 141 m with occasional slight bowing of laminae. Suck-in affected only the lower portions of cores between 141 and 160 m, but between 160 and 186 m cores were moderately to highly disturbed. In contrast, HLAPC coring between 187 and 206 m recovered good quality cores with only slightly bowed laminae. XCB coring was performed in Hole U1533B from 205.8 to 283.9 m with a recovery of 63%. Core disturbance from XCB and RCB drilling was slight to moderate due to biscuiting, and there were some discrete intervals of highly disturbed sediments. Core recovery and quality were generally good between 206 and 268 m but decreased below this depth. RCB coring from 283.9 to 382.6 m had a recovery of 15%. Cores 379-U1533B-31X through 38R had <12% recovery of highly disturbed sediments, no recovery, or only fall-in pebbles. Cores 39R and 42R and to a lesser extent Cores 41R and 43R (341–382 m) were of better quality and recovery, whereas Core 40R had no recovery. Two cores (22F and 39R) were collected through a barite slug, meaning that barite was added to the pumped seawater before the recovery of the core barrel from the drill string. Cores from 0 to 101.5 m were split using a wire, whereas more consolidated sediments below 101.5 m required the use of a saw for splitting.
Facies description
The facies scheme presented in Table T5 is similar to the scheme used at Site U1532; however, it was slightly modified to describe the sediments at Site U1533. Facies F1 is composed of silty clay to clay and commonly has thick brown to gray color bands (Figure F6A). Color banding is on a centimeter to decimeter scale, and color boundaries are moderately bioturbated. Mottling, black laminae, and dispersed coarse sand and granules are also present. Subfacies F1.1 additionally includes laminae to thin beds of silt to fine sand that have sharp lower contacts and are bioturbated along their upper contacts (Figure F6B). A thin bed of volcaniclastic-bearing silt occurs in Section 379-U1533B-2H-5. Thin and medium sand beds appear normally graded (Figure F7A).
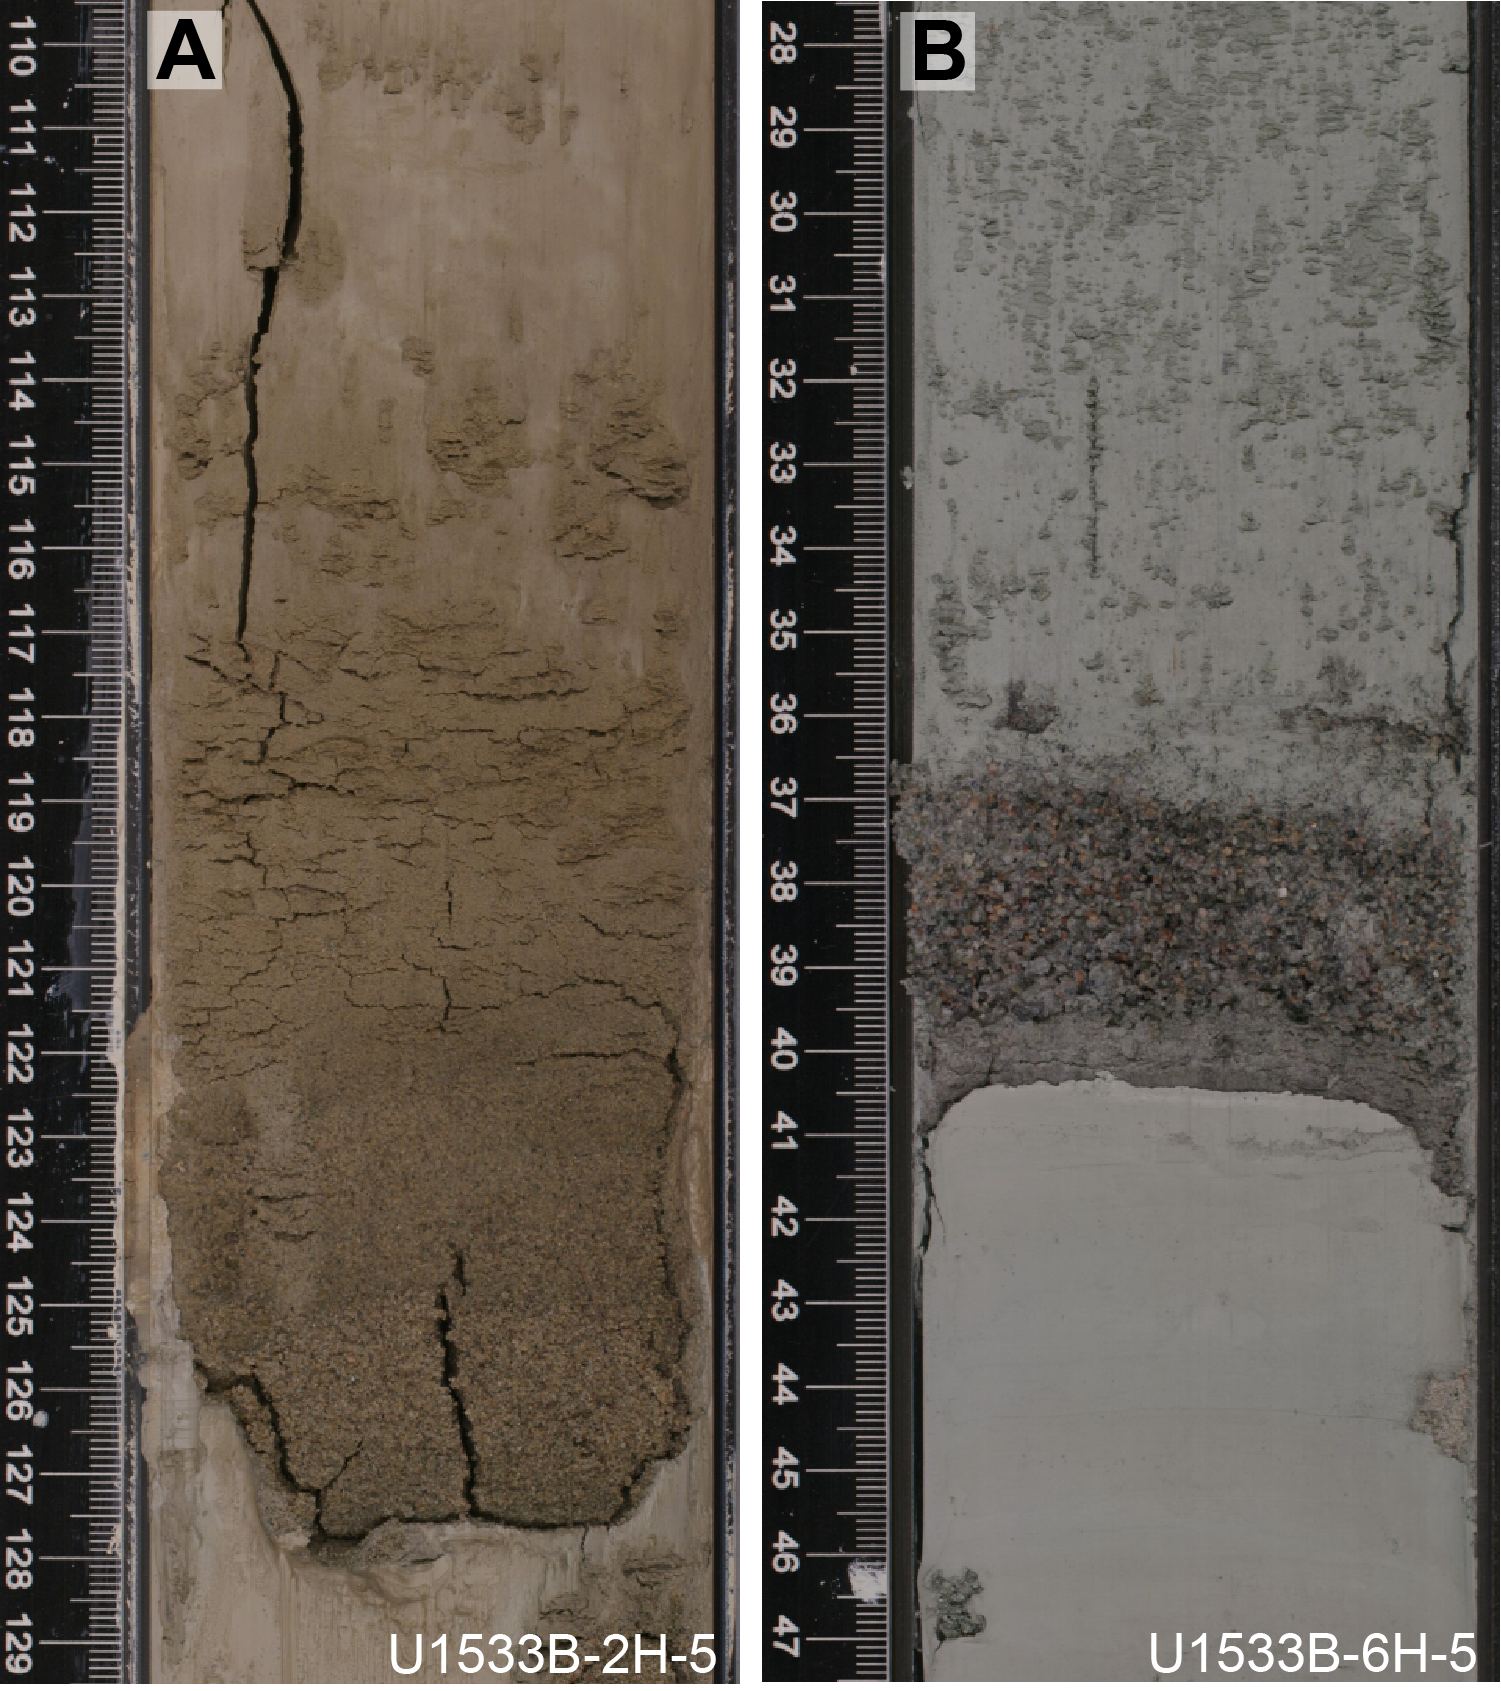
Figure F7. Downslope transport structures.
Facies F2 is composed of thinly laminated silty clay to clay with common mottling (Table T5; Figure F6C). The dominant color is dark greenish gray with occasionally millimeter- to centimeter-scale color banding from greenish gray to dark gray. Black discontinuous laminae are locally present, and very dark greenish gray laminae or interbeds of semilithified sediment locally occur near its upper boundary with Facies F4 (see Clay and bulk mineralogy). Facies F2 is commonly biosilica bearing and occasionally biosilica rich. Bioturbation is moderate to none. Soft-sediment clasts, coarse sand, granules, and pebbles may be present, and occasionally sand and granules are concentrated in continuous and discontinuous bands of single-grain thickness. Subfacies F2.1 is silty clay to clay with laminae to very thin beds of light gray to dark gray silt (Figure F6D). Subfacies F2.2 is identified by the presence of thinly bedded sand, which may be normally graded. Sand beds are quartz rich, contacts appear sharp, and occasionally the sand beds contain laminae of mud (Figure F6E). In some sections, these beds were not completely recovered because the sand beds were washed out, leaving the more cohesive mud laminae in the core. Silt and sand laminae and interbeds in both Subfacies F2.1 and F2.2 may be occasionally cemented with carbonate.
Facies F3 is light gray to dark greenish gray massive (sandy) silt to (silty) clay with common coarse sand and granules (Table T5; Figure F6F). This facies is commonly moderately to heavily bioturbated and biosilica bearing or diatom bearing. Coarse sand, granules, and pebbles sometimes increase toward the top of Facies F3 and its transition to Facies F4 with one exception in Section 379-U1533B-14H-4, where Facies F4 transitions back to Facies F3. The greenish color of Facies F3 correlates with lower a* color reflectance values (Figure F5).
Facies F4 is biosilica-bearing to biosilica-rich greenish gray to dark gray sandy mud with dispersed clasts or clast-poor to clast-rich muddy diamict (Table T5; Figure F6G). Clast concentrations in Facies F4 are noticeably greater than in Facies F3 and usually increase toward the boundary of the overlying facies, commonly Facies F2 (Figure F6G).
Facies F5 is a muddy granule conglomerate to clast-rich sandy diamict (Table T5; Figure F6H). This facies is the coarsest grained and most clast rich facies at Site U1533, dominantly containing subrounded granules and pebbles. The composition of Facies F5 is variable, and its lower contact is sharp (Figure F7B). Individual beds of Facies F5 range in thickness from 3.5 to 89 cm and may be massive or normally or reversely graded (Figure F7B). Mud intraclasts are present.
Facies F6 and F7 are characterized by abundant biogenic material. Pale brown to greenish gray biosilica-rich mud to biosiliceous ooze, primarily consisting of diatoms and sponge spicules, makes up Facies F6 (Table T5; Figure F6I). Facies F6 may also contain granules and pebbles. Facies F7 consists of brown foraminifer ooze that was only observed once in interval 379-U1533C-1H-1, 73–99 cm (Table T5; Figure F6J).
Lithostratigraphic units
Based on visual core descriptions supported by smear slide analyses, one lithostratigraphic unit with two subunits was identified (Figure F5; Table T5).
Unit I
Subunit IA
- Intervals: 379-U1533A-1H-1, 0 cm, to 3H-CC, 26 cm; 379-U1533B-2H-1, 0 cm, to 5H-1, 85.5 cm; 379-U1533C-1H-1, 0 cm, to 1H-CC, 12 cm; 379-U1533D-1H-1, 0 cm, to 5H-CC, 27 cm
- Depths: Hole U1533A = 0–28.95 m; Hole U1533B = 25.5–54.86 m; Hole U1533C = 0–7.68 m; Hole U1533D = 0–39.86 m
- Age: recent to Pliocene
In Holes U1533A, U1533C, and U1533D, cores were recovered with stratigraphic overlap for the upper 40 m (see Stratigraphic correlation), and the entire sequence recovered in these holes falls within Lithostratigraphic Subunit IA. In Hole U1533B, Core 2H through Section 5H-1 falls within the subunit. Subunit IA is composed of Facies F1 and F2, which alternate with Subfacies F1.1, F2.1, and F2.2 and are interbedded with Facies F3, F6, and F7; Facies F4 occurs only near the base of the subunit (Figures F6, F8). One ash bed was identified at ~31.5 m in intervals 379-U1533B-2H-4, 145–150 cm, and 379-U1533D-5H-3, 39–44 cm. Sediments in Subunit IA include a volcaniclastic component (see Petrology). Dispersed gravel and packages of interlaminated silt and clay and thin, normally graded sand beds are also present (Figure F7A).

Figure F8. Representative facies associations.
A downcore color change from brown to green is clearly visible on the split-core surface of the archive half of Section 379-U1533D-5H-6, 71 cm, which corresponds to 38 m. Dark mottling is especially common above the color transition. The color change observed during core description correlates to a shift observed in the a* measurements (see a* reflectance in Figure F5). The color change does not exactly coincide with any change in facies and is possibly due to a change in the oxidation state of the sediments. Color also gradually changes slightly from grayish brown to dark (greenish) gray from 50 to 54.8 m (see a* reflectance in Figure F5). The boundary between Lithostratigraphic Subunits IA and IB at 54.86 m is defined by the lowermost occurrence of Facies F1 and an increase in gravel abundance below this depth (Figure F5).
An example of Lithostratigraphic Subunit IA is shown in Figure F9A. In the upper part of Subunit IA, biosiliceous Facies F6 is common, but Facies F7 is only present in Section 379-U1533C-1H-1 between 73 and 99 cm. In Subunit IA, biosiliceous Facies F6 alternates with Facies F1 or Subfacies F1.1 dominated by thinly laminated silty clay (Figure F9A). This pattern is apparent in the magnetic susceptibility data, which show generally lower values in Facies F6 and higher values in Facies F1. The laminated silts in Subfacies F1.1 are characterized by higher and variable magnetic susceptibility (Figure F9A).
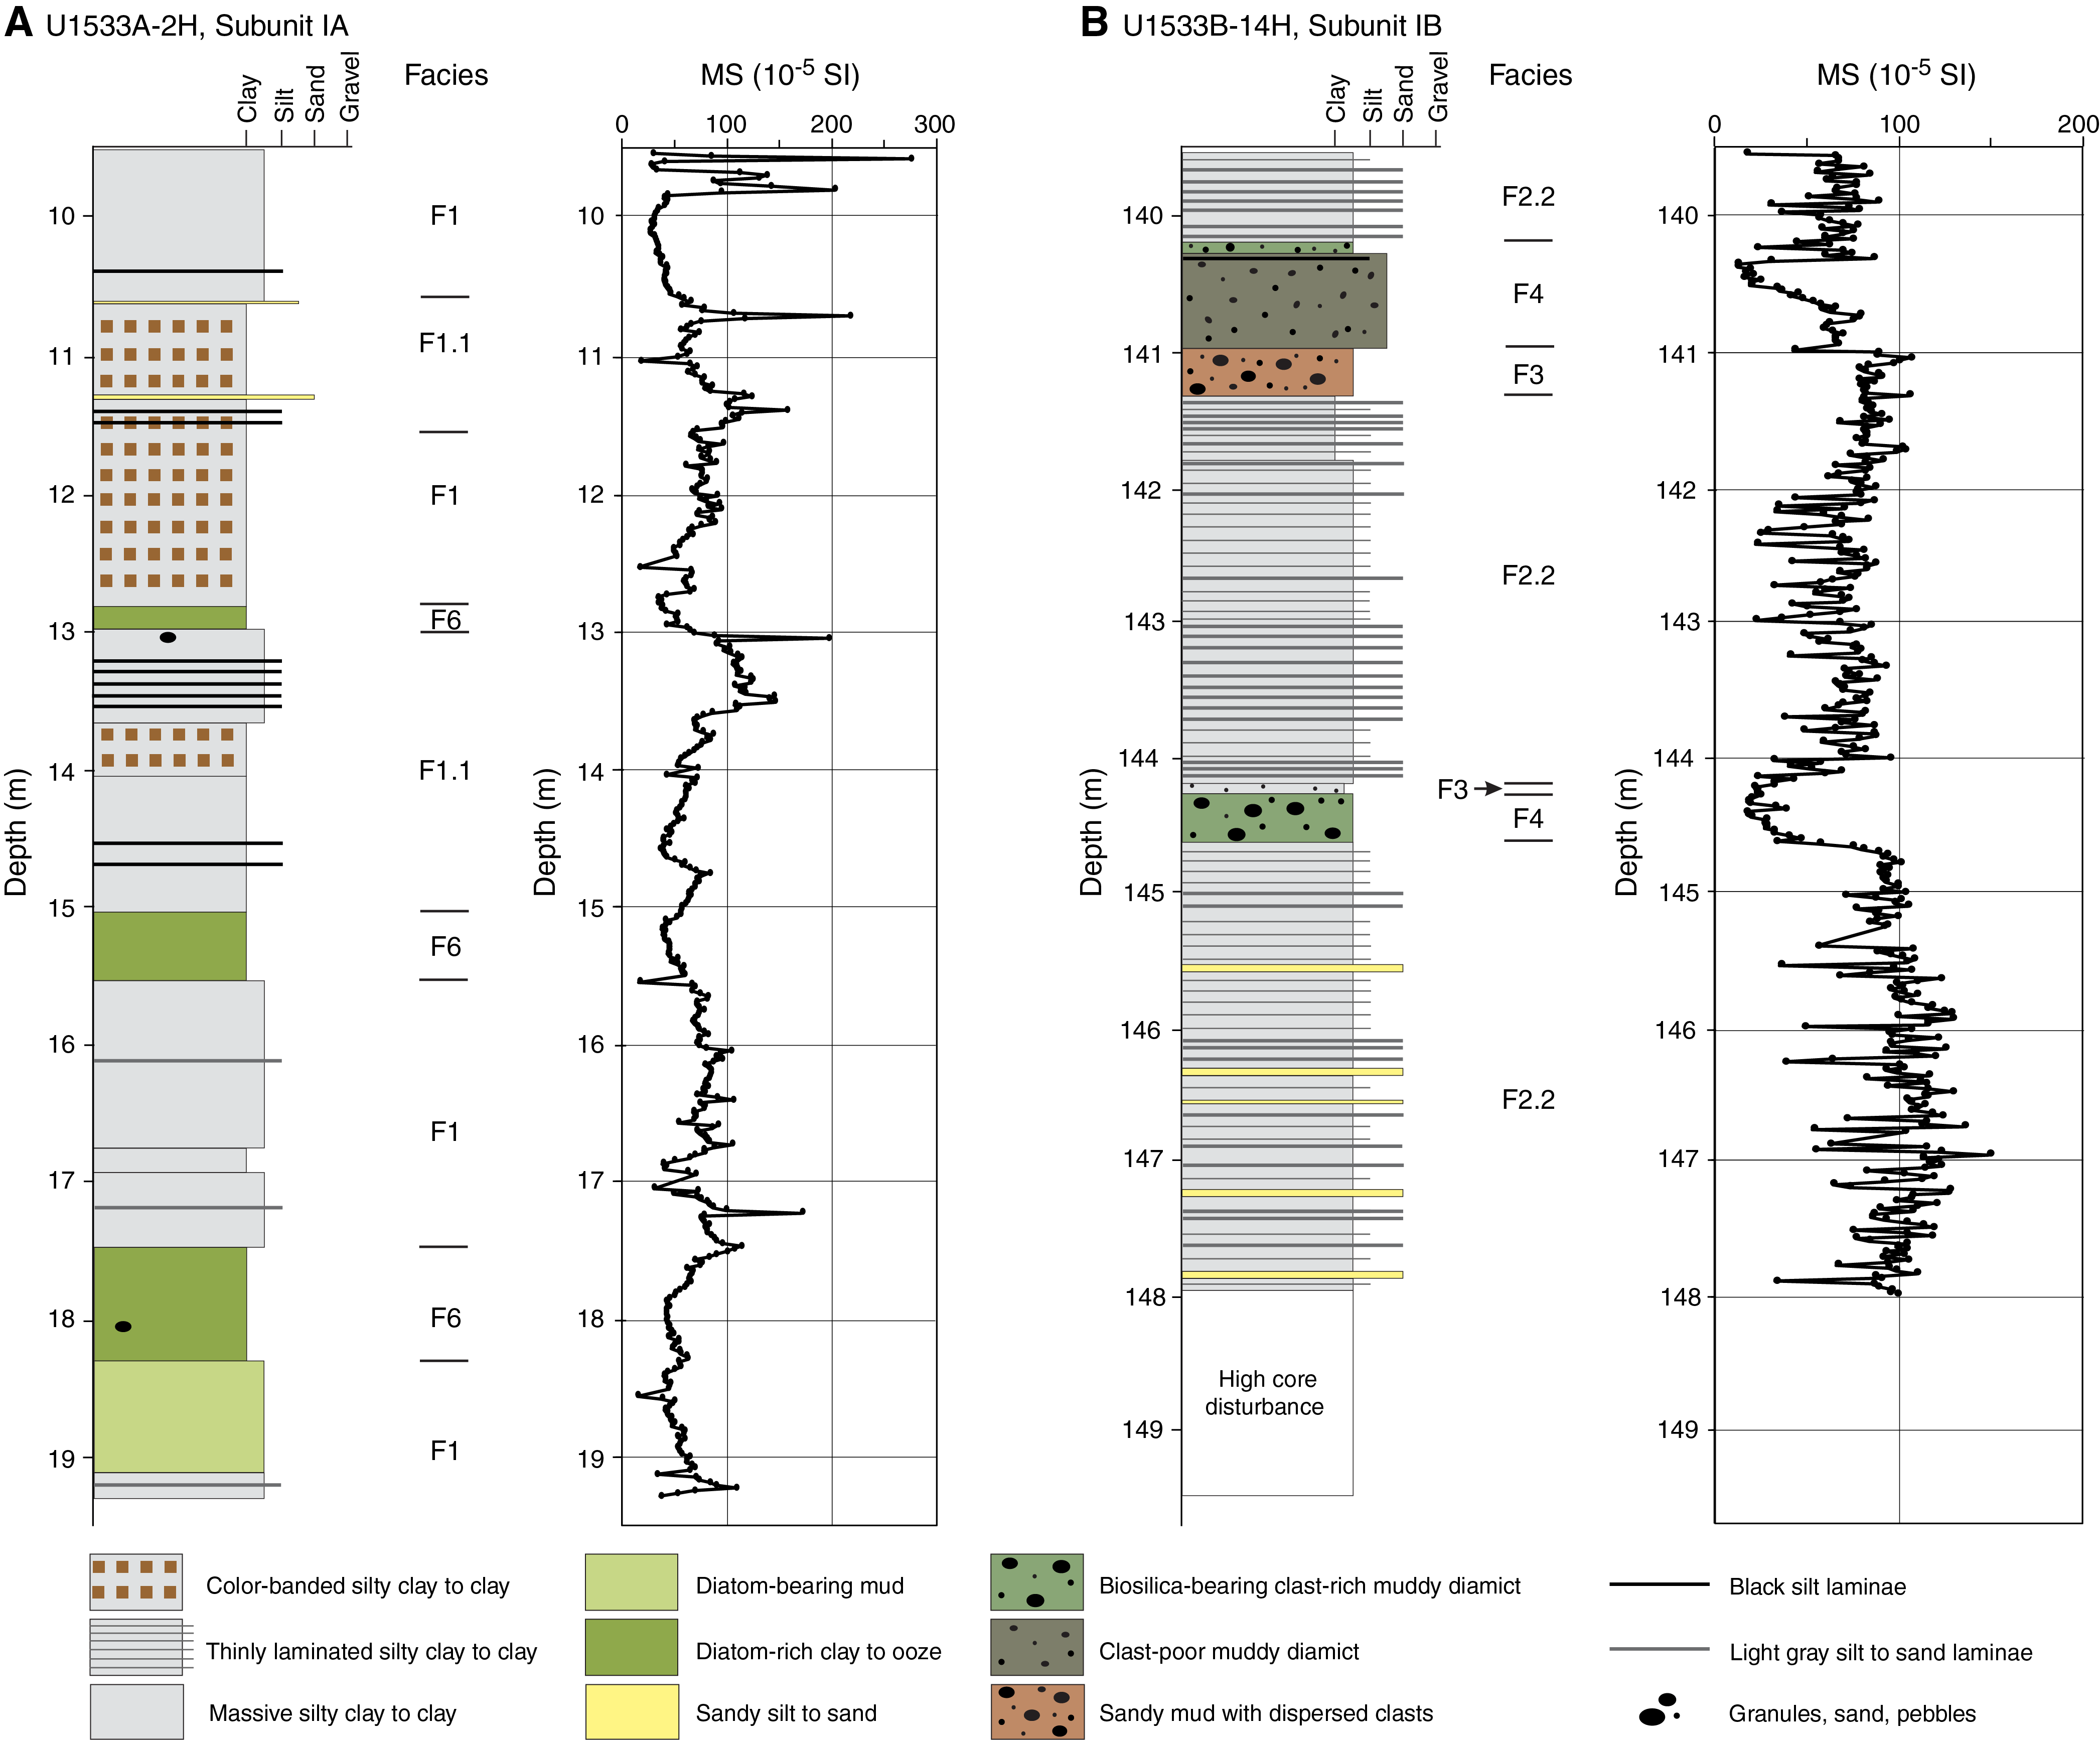
Figure F9. Facies associations.
Subunit IB
The top of Lithostratigraphic Subunit IB at 54.86 m coincides with the uppermost conglomerates and clast-rich sandy diamicts (Facies F5; Figures F6H, F8C). Cemented silt or sand, sediment clasts, and silt lenses were observed exclusively in Subunit IB (Figure F5). Subunit IB is further characterized by a more clast-rich Facies F4 compared to Subunit IA. In Subunit IB, Facies F2 and its Subfacies F2.1 and F2.2 are dominant and interbedded with Facies F3, F4, F5, and F6 (Figures F6, F8B–F8D, F9B; Table T5). Furthermore, Facies F2 (including Subfacies F2.1 and F2.2) is usually thicker than the greenish gray interbeds of Facies F3 and F4. Usually Facies F3 is associated with Facies F4 (Figure F9B); however, both Facies F3 and F4 can occur independently. Facies F3 and F4 have sharp upper boundaries with the overlying laminated silty clays of Facies F2 in most cases (Figure F8B). The boundary between Facies F2 and F5 is sharp (Figure F8C). Muddy diatom ooze (Facies F6) in Subunit IB occurs as part of the greenish gray interbeds, contains clasts, and is bioturbated along the contact with Facies F2 (Figure F8D).
Subfacies F2.2 occurs commonly in Lithostratigraphic Subunit IB and is associated with high and variable magnetic susceptibility values (Figure F9B; see Physical properties), probably as a result of higher terrigenous content in the silt and sand laminae. Commonly, Facies F4 and F3 contain varying amounts of biogenic components and as a result have the lowest magnetic susceptibility values (Figure F9B). The pattern of magnetic susceptibility follows that observed for Subunit IA (i.e., lower values in Facies F3 and F4 and higher values in Facies F2 and its subfacies) but remains generally higher due to the more frequent silts and sands. Sediments in Subunit IB include a volcaniclastic component (see Petrology).
Sediment cemented by carbonate-fluorapatite, fluorapatite, and manganese (Mn) carbonate (see Clay and bulk mineralogy) occurs in intervals 379-U1533B-6H-4, 99–101 cm (68.8 m), 17H-3, 63–67 cm (171.47 m), 18H-6, 69–74 cm (185.6 m), 39R-3, 22–25 cm (344.9 m), and 43R-1, 68–108 cm (380.6 m).
Petrology
Visible pebble abundance is generally low throughout Lithostratigraphic Subunit IA and variable to high in Subunit IB (Figure F5). The abundance increases in Facies F3, F4, and F5 between 105 and 144 m and between 225 and 235 m. The greatest concentration of pebbles (long axis = 0.4–2.0 cm) was observed in granule conglomerate to sandy diamict of Facies F5. Clast-supported intervals of pebbles are rare but were observed (e.g., 230.5–234.1 m; Figure F8C). Pebbles are generally subrounded to subangular (Figures F6H, F8C).
At Site U1533, 16 clasts with a long axis >2 cm were observed on cut faces. The majority of cobbles occur in short intervals of fall-in material at the top of cores, and the cobbles show evidence of flaking, abrasion, and rounding likely resulting from drilling and core recovery (Figure F10).
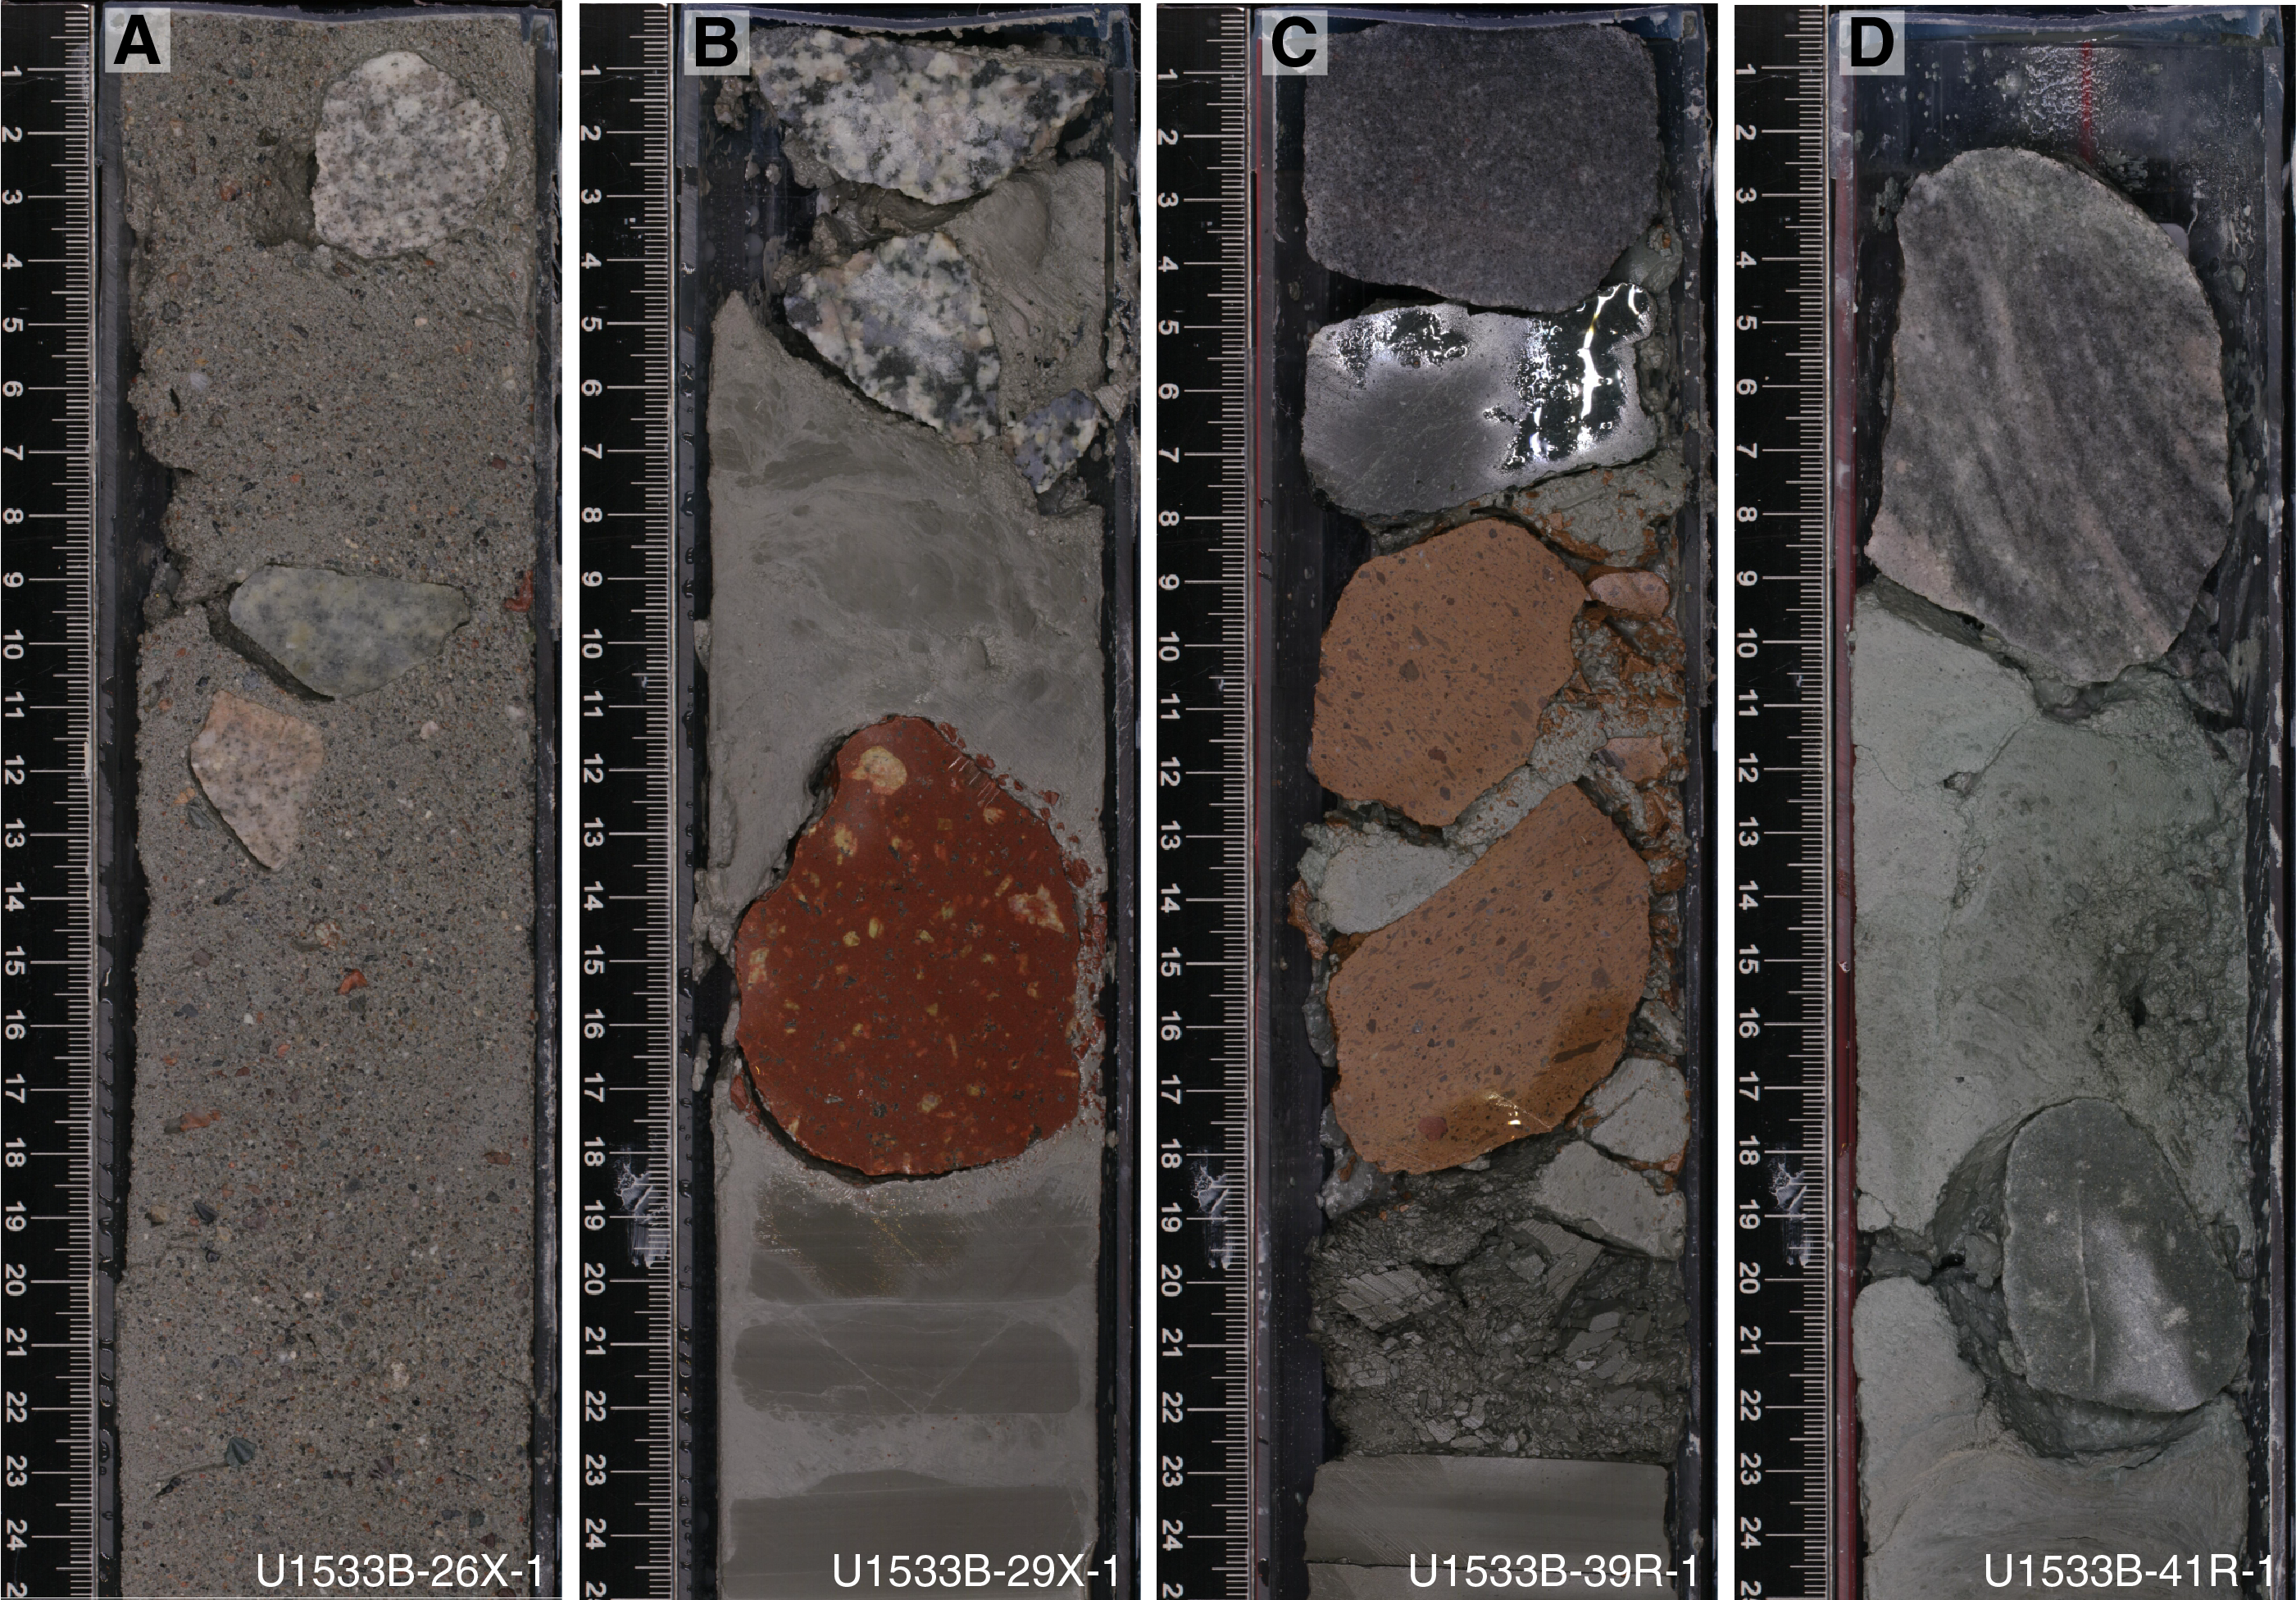
Figure F10. Rock types in fall-in.
The main lithologies of granule- to cobble-sized clasts were determined from direct observations in core tops (Figure F10), selected Facies F4 and F5 intervals in cut core faces of the archive sections, or lithic grains (0.7–2 mm size) available as sieved residues of core catcher samples. The analyzed core catcher samples came from material washed and sieved for shipboard micropaleontological investigations of every core (see Biostratigraphy).
The proportions of lithic types were determined for clast-rich intervals of Facies F4 and F5 by identifying lithic type and counting grains. Counts were obtained from the cut faces of the archive half of one core (interval 379-U1533B-26X-1, 70–105 cm; N = 615) and the residue of washed, sieved material from one core catcher section that remained after preparation for micropaleontology (Section 25X-CC; N = 260). In addition, one sample consisted of a “scrape” of coarse granules from a slightly disturbed, “bulged” core surface (interval 5H-1A, 86–90 cm; N = 865). A total of 1740 grains were counted (Table T6).
The majority of cobbles, pebbles, and granules consists of crystalline rocks. The common lithic types are polycrystalline quartz and K-feldspar granite (Figures F10, F11). Biotite-bearing leucogranite and diorite are also present. (Meta)sedimentary (Figure F10D) and volcanic (Figure F12) rock types are rarely found as granules or small pebbles in situ in cores.
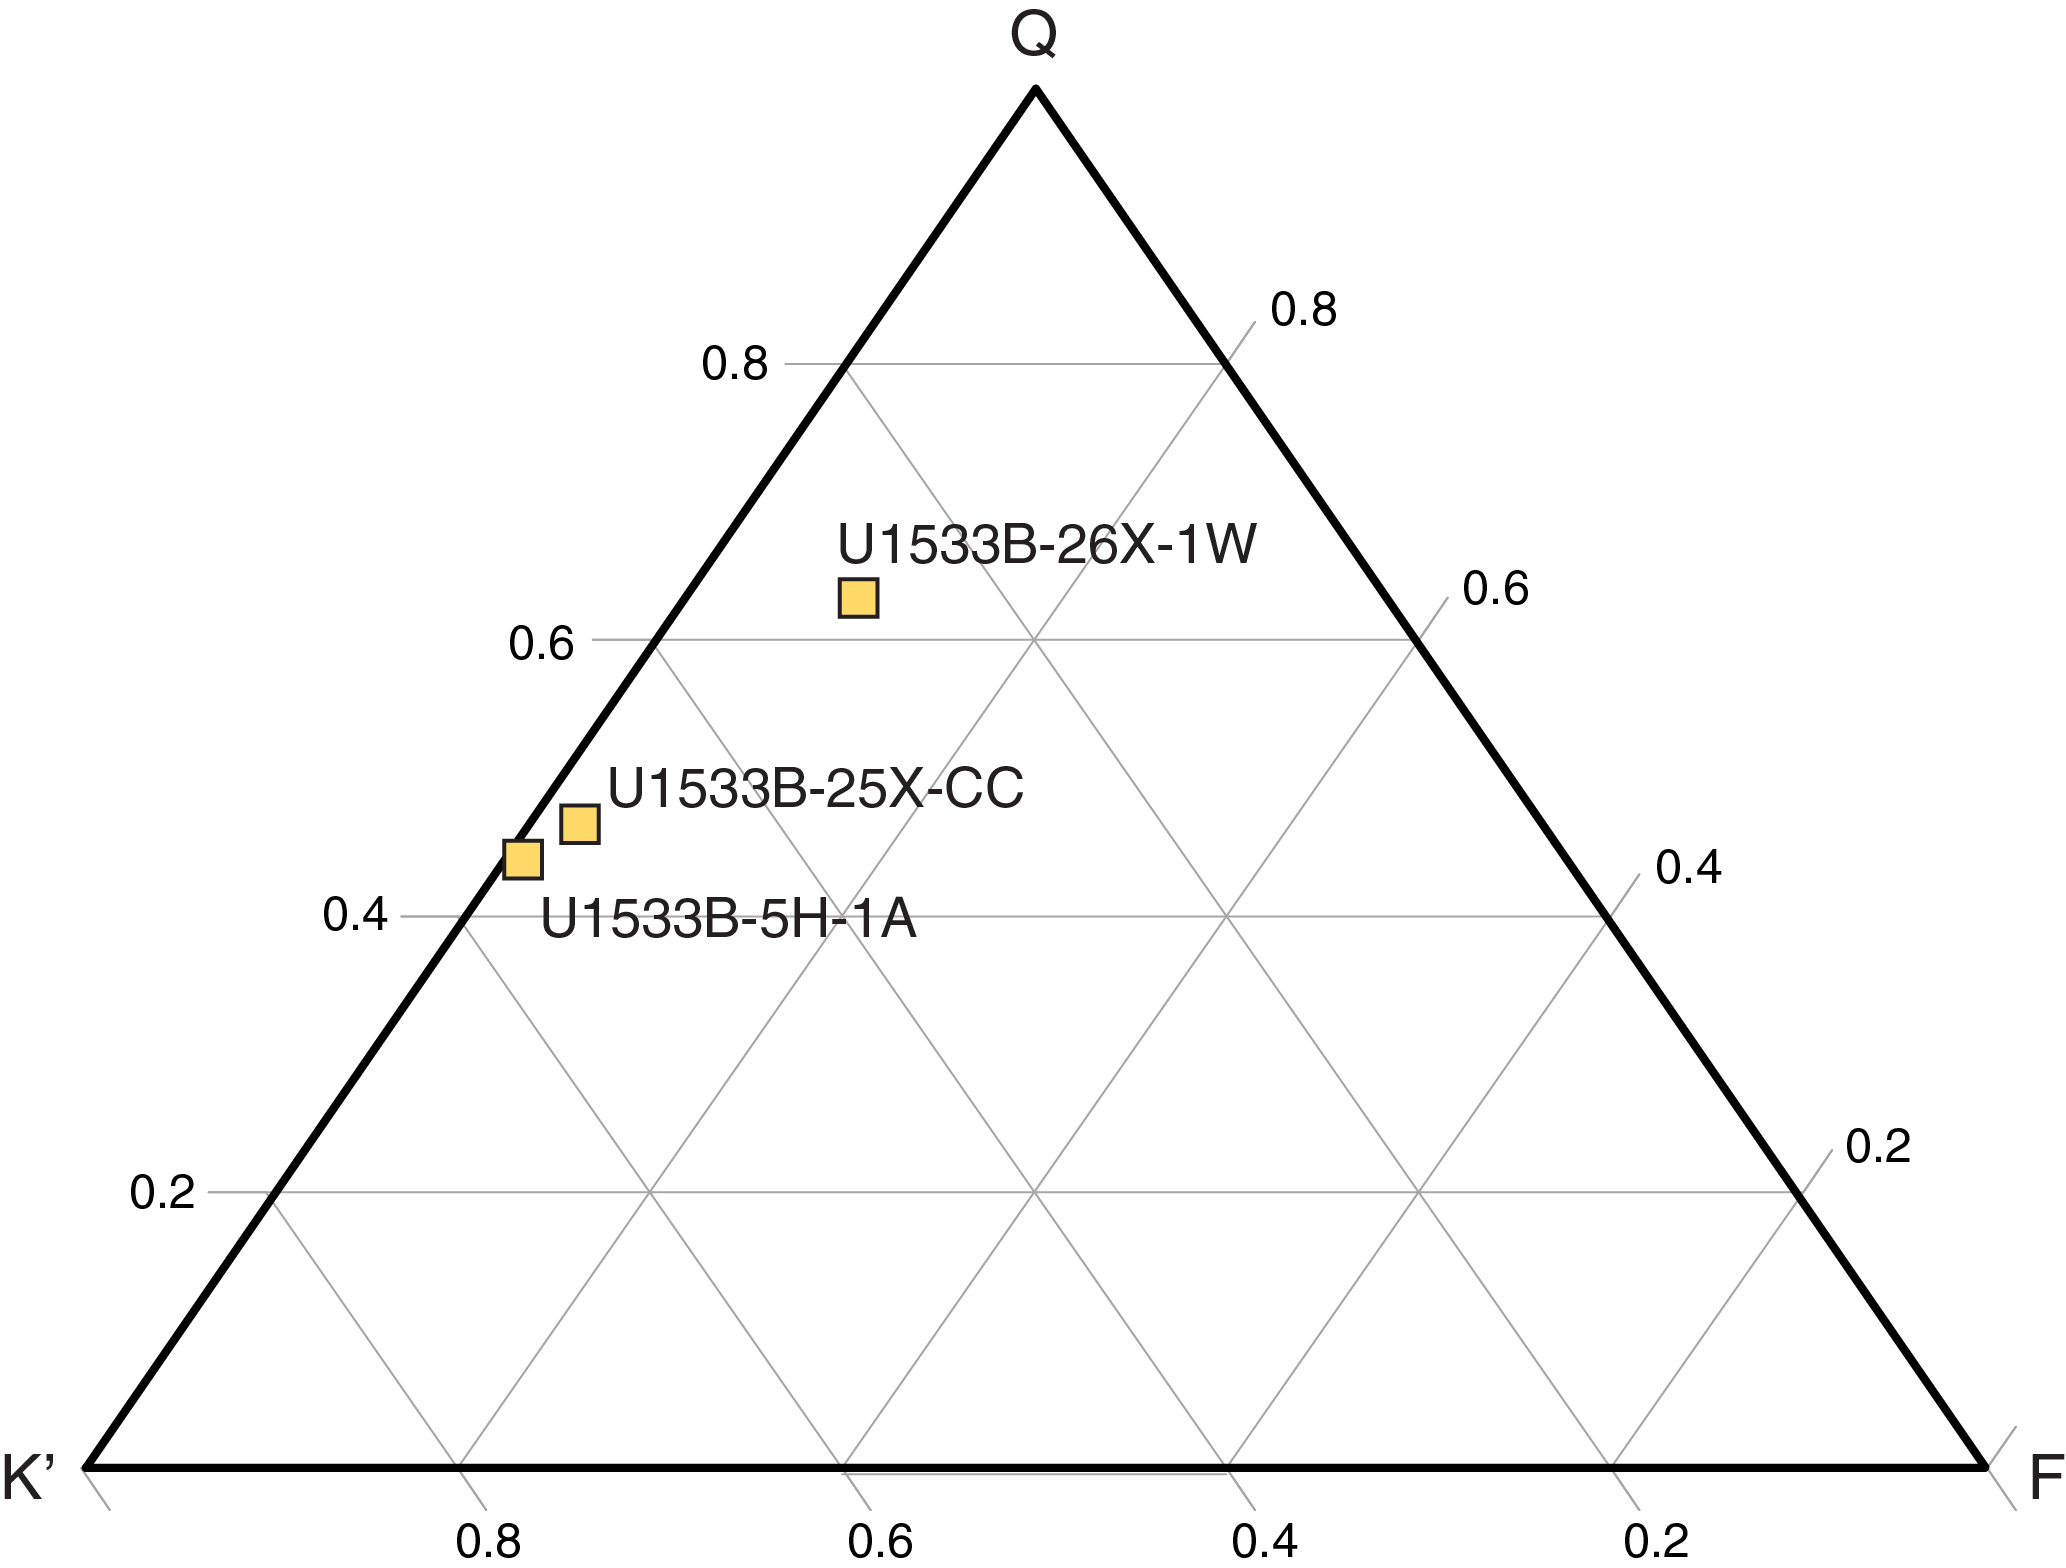
Figure F11. Adapted QKF ternary diagram.
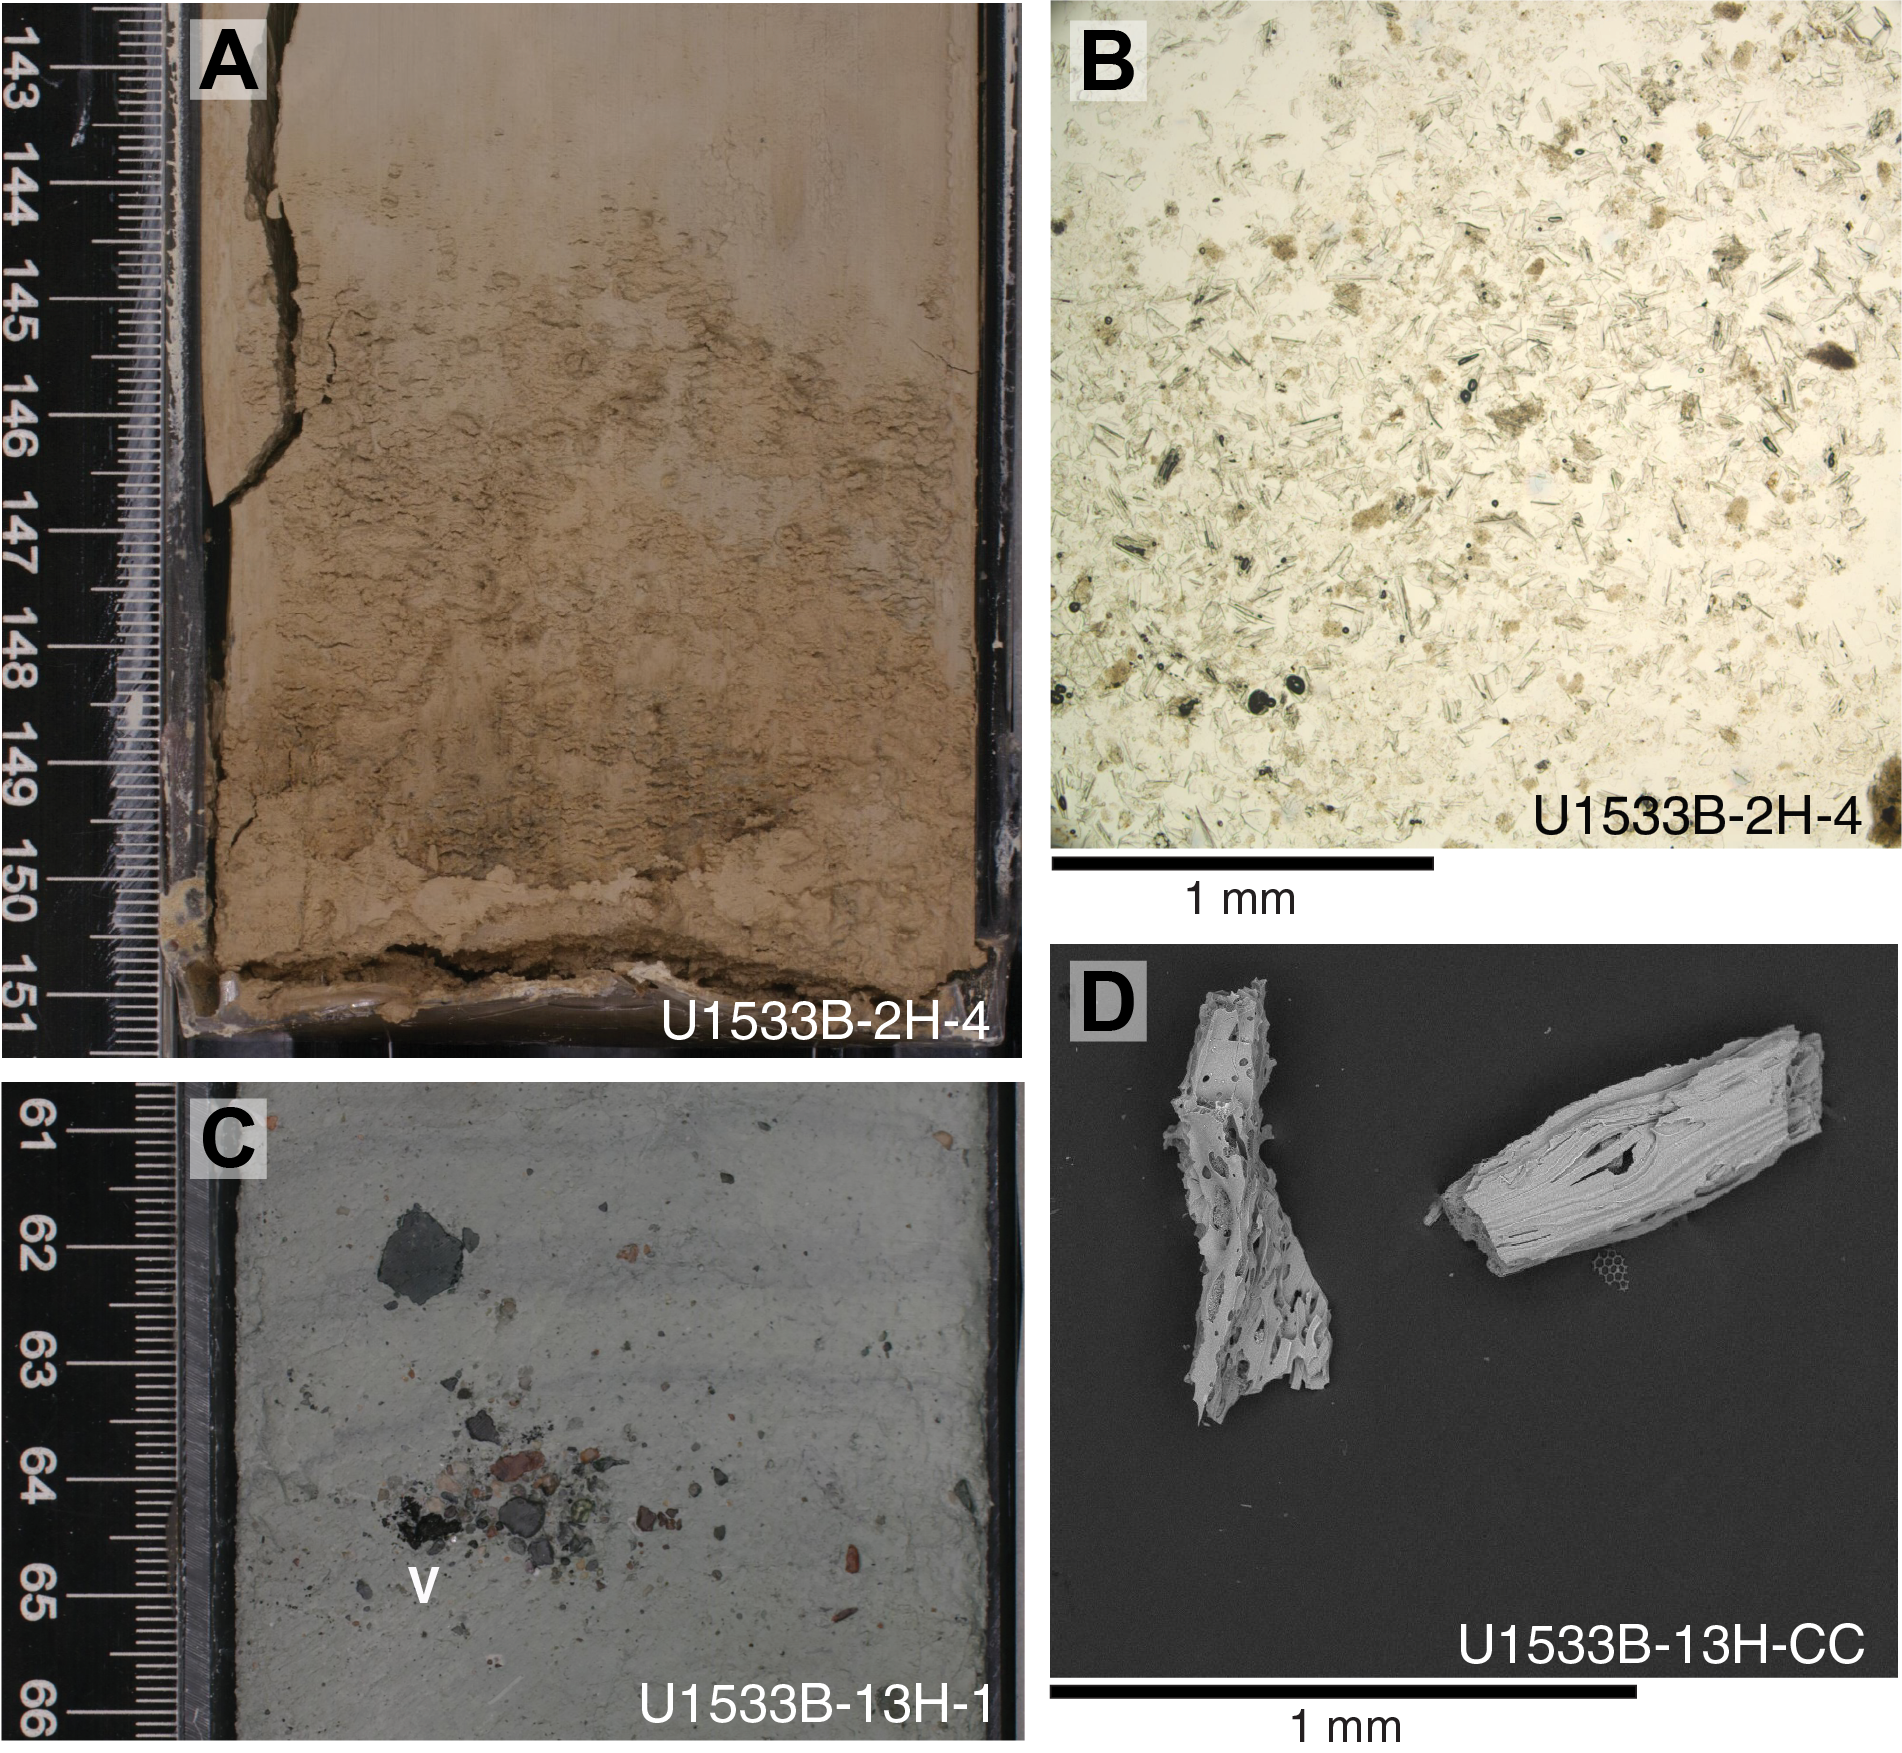
Figure F12. Volcanic components.
The prevalent rock and mineral types identified at Site U1533 are similar to those found in sparse rock exposures of plutonic rocks bordering the Amundsen Sea Embayment and in coastal Marie Byrd Land (Leat et al., 1993; Pankhurst et al., 1993; Mukasa and Dalziel, 2000; Kipf et al., 2012; Yakymchuk et al., 2015; Brown et al., 2016; Riley et al., 2017). A more distant provenance of the coarse-grained portion is possible (e.g., Williams et al., 2010), provided that low-grade metamorphic rocks and plutonic sources rich in quartz and K-feldspar are present in the source region.
Volcanic components
Volcanic components identified at Site U1533 include dispersed microscopic vitric grains, volcanic glass fragments (tephra), and isolated volcanic rock clasts. The microscopic vitric grains were observed in smear slides prepared from Cores 379-U1533B-2H, 13H–16H, 26X–28X, and 379-U1533D-5H. Typically, the abundance of volcanic glass fragments is only trace (≤1%) or rare (1%–10%). One discrete bed of volcanic ash was identified (Figure F12A). At its base, volcanic glass is dominant (>50%; Figure F12B), and it grades upward to abundant (25%–50%) over a 5 cm interval.
Small clasts of volcanic rock with long axes <0.5 cm typically are black to brown, fresh, and unweathered (Figure F12C). Shapes range from angular to subrounded. Clasts may be isolated or occur within clusters of diverse lithic types (Figure F12C). Rock types include vesicular glass, vesicular lava, and porphyritic lava of intermediate to mafic composition. Felsic volcanic and subvolcanic rock types are rare in Hole U1533B, but they are represented by cobbles and pebbles of rhyolite and felsic porphyry (e.g., Figure F10B, F10C) and delicate transparent pumice fragments (Figure F12D).
The presence of olivine, pyroxene, and plagioclase in vesicular mafic to intermediate lava rock clasts is possible evidence of volcano-sourced detritus originating in Marie Byrd Land (Wilch et al., 1999; Wilch and McIntosh, 2002, 2007; LeMasurier, 2013). In composition and/or texture, the rhyolite and felsic porphyry clasts (Figure F10B, F10C) resemble the porphyry dikes that form a part of a Cretaceous dike array in Marie Byrd Land (Siddoway et al., 2005; Kipf et al., 2012). A proximal source of felsic extrusive rocks is Thurston Island (Leat et al., 1993; Riley et al., 2017).
X-ray fluorescence analysis
A semiquantitative geochemical data set was obtained using an Olympus Vanta portable X-ray fluorescence spectrometer (pXRF) on interstitial water squeeze cake samples (Figure F13; Table T7). Interstitial water whole-round samples and thus the squeeze cake residues were preferentially taken from laminated or disturbed intervals when possible, which skewed the XRF data sets toward such facies. The measurements span from 0 to 260 m with a systematic spacing of ~5 to ~16 m and record downcore geochemical trends that can reveal changes in the source and composition of the bulk sediments throughout the drilled interval. A total of 36 interstitial water squeeze cake samples were analyzed. Of these, six samples were influenced by flow-in core disturbance (horizons designated with dashed lines in Figure F13). Table T7 reports mean values obtained from three discrete measurements on each sample. Squeeze cake samples represent an integrated measurement of sediments deposited throughout 5 cm (from 0 to 109 m), 10 cm (from 109 to 204 m), or 15 cm (below 204 m) of the recovered whole-round core.
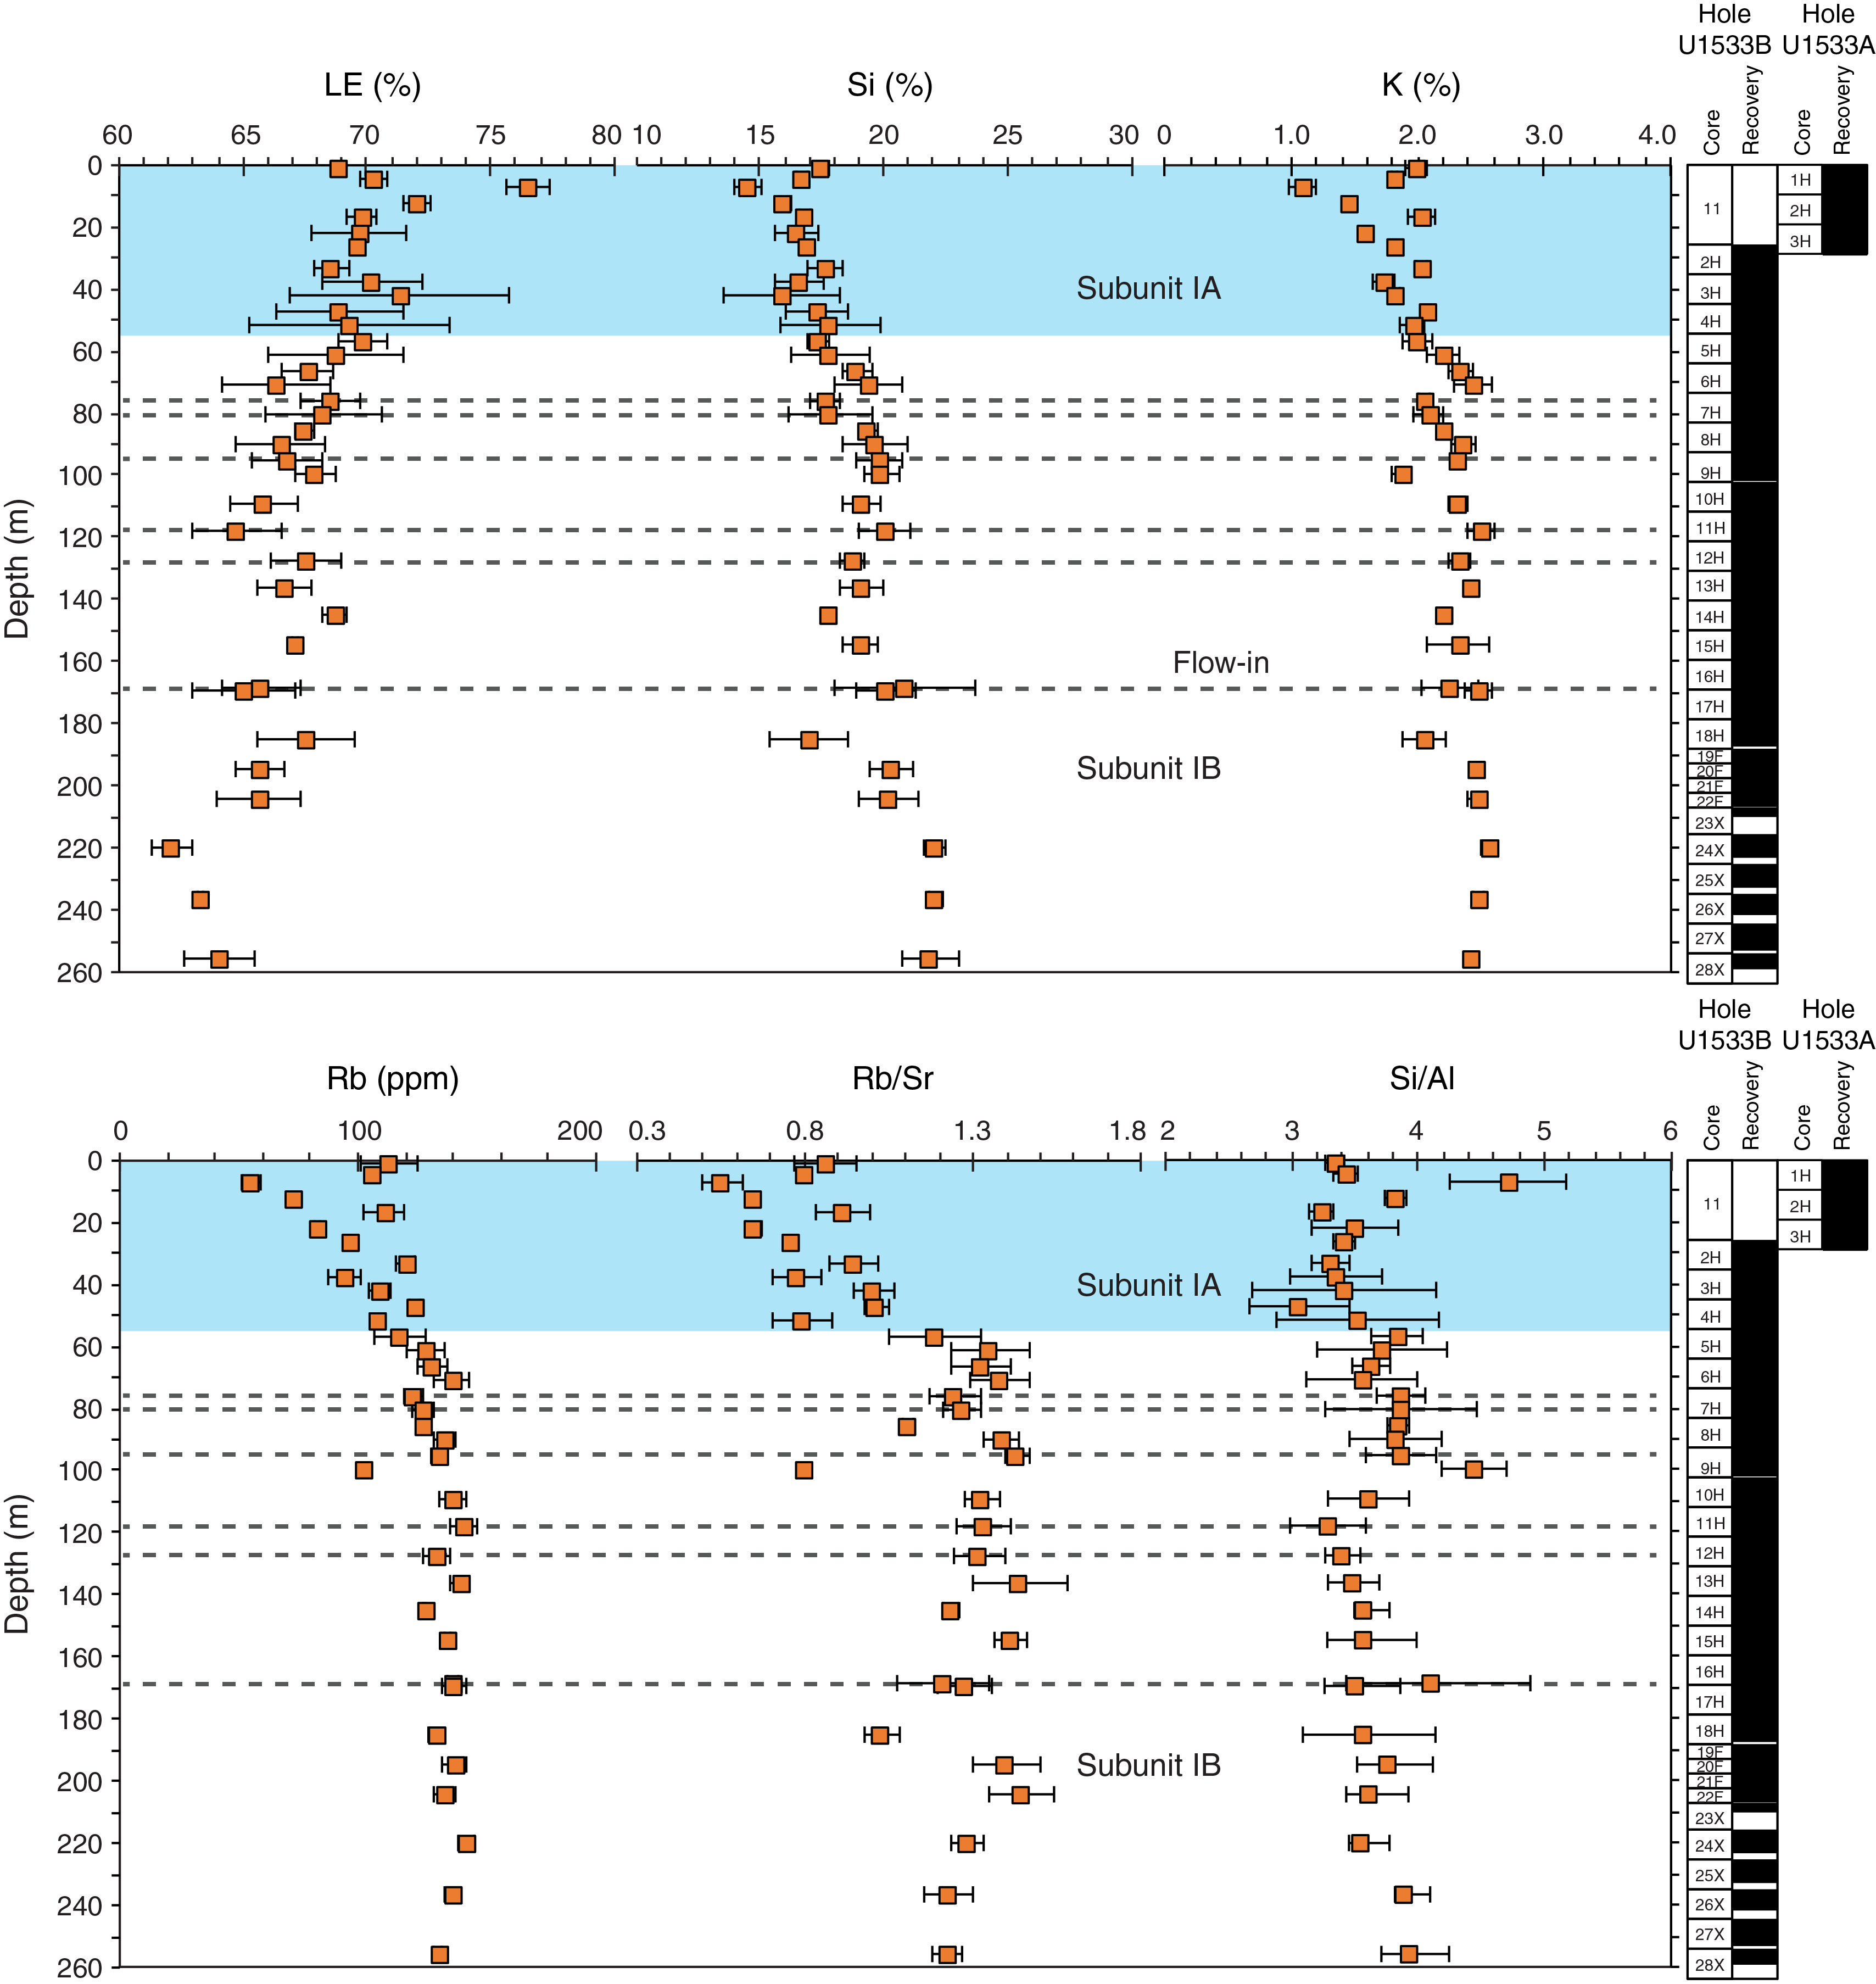
Figure F13. Selected pXRF data.
Light element (elements having atomic mass lighter than Na) content ranges from 62% to 76% with an average of 68% for the interstitial water squeeze cake samples (Figure F13). This content and variability is significantly lower than in situ measurements of split-core surfaces (64%–90%; see X-ray fluorescence analysis in the Expedition 379 methods chapter [Gohl et al., 2021a]).
Informative results that bear on bulk sediment composition come from silica (Si), potassium (K) and rubidium (Rb) together with the silica/aluminum ratio (Si/Al) (Figure F13). Si increases downcore with only slight fluctuations between 14% and 22%. K and Rb contents increase from 0 to ~60 m and remain constant at greater depths. Rubidium/strontium ratios (Rb/Sr; 0.55–1.44) show a similar downcore increase up to ~60 m. Below ~60 m, Rb/Sr follows no evident trend and values are highly variable (0.8–1.44). Variations in Rb/Sr ratios may arise from variability in grain size and changes in sediment provenance, a possibility that can be explored using grain size measurements and quantitative geochemical analyses of fine-grained sediments during postcruise research.
Si/Al ratios show considerable variability and exceed the analytical uncertainty in Hole U1533A. The relatively larger 1σ error for Si/Al ratios results from the combined propagation error of Al and Si measurements. Despite the larger uncertainty of Si/Al ratios, this parameter detects the unit boundary between Lithostratigraphic Subunits IA and IB at 54.86 m. The highest Si/Al ratio was measured in Sample 379-U1533A-1H-5, 144–149 cm (7.48–7.53 m), which corresponds to an interval of diatom ooze in interval 379-U1533D-2H-2, 82–88 cm (7.12–7.18 m) based on the core composite depth below seafloor, Method M (CCSF-M), depth scale (10.37–10.42 m CCSF-M) (see Stratigraphic correlation for explanation of depth scale method). The diatom ooze exhibits the highest Si/Al ratio measured in Hole U1533A. The inflection in downcore trends of Si, K, Rb, and Si/Al ratio at ~60 m is also observed in the NGR values and illite contents. Such a correlation is expected because NGR measures the natural gamma radiation emitted from K, uranium (U), and thorium (Th). K is a constituent of illite, the dominant clay mineral below ~60 m. K can be replaced with Rb in illite because the ionic radii of Rb (1.48 Å) and K (1.33 Å) are similar. Therefore, the downcore trend of Rb resembles the K and NGR trends. Taken together, the pXRF analyses provide geochemical evidence of a transition in the geochemical compositions of bulk sediments that reflects the presence of pelagic material in Subunit IA giving way to more terrigenous sediments in underlying Subunit IB.
Clay and bulk mineralogy
Diffractograms obtained from X-ray diffraction (XRD) of the clay fraction (<2 µm) samples were investigated following the methodology detailed in X-ray diffraction analysis in the Expedition 379 methods chapter (Gohl et al., 2021a).
As at Site U1532, the clay mineral assemblages at Site U1533 consist predominantly of illite, chlorite, kaolinite, and smectite (Figure F14), and only one sample (379-U1533B-39R-2, 83–85 cm) apparently contains just traces of both chlorite and kaolinite. Illite and chlorite, which are probably mainly derived from glacially eroded granitic and gneissic rocks as well as mafic volcanics from the Amundsen Sea hinterland (Ehrmann et al., 2011), are the most abundant clay minerals at Site U1533. The kaolinite content is relatively high for Neogene–Quaternary sediments from the Antarctic margin, pointing to a supply of reworked kaolinite-bearing detritus from unknown pre-Oligocene source rocks located in the vicinity of the Amundsen Sea Embayment (Hillenbrand et al., 2003; Ehrmann et al., 2011). Smectite may have been delivered by erosion of well-documented volcanic source rocks cropping out elsewhere in the Amundsen Sea hinterland (Hillenbrand et al., 2003; Ehrmann et al., 2011).
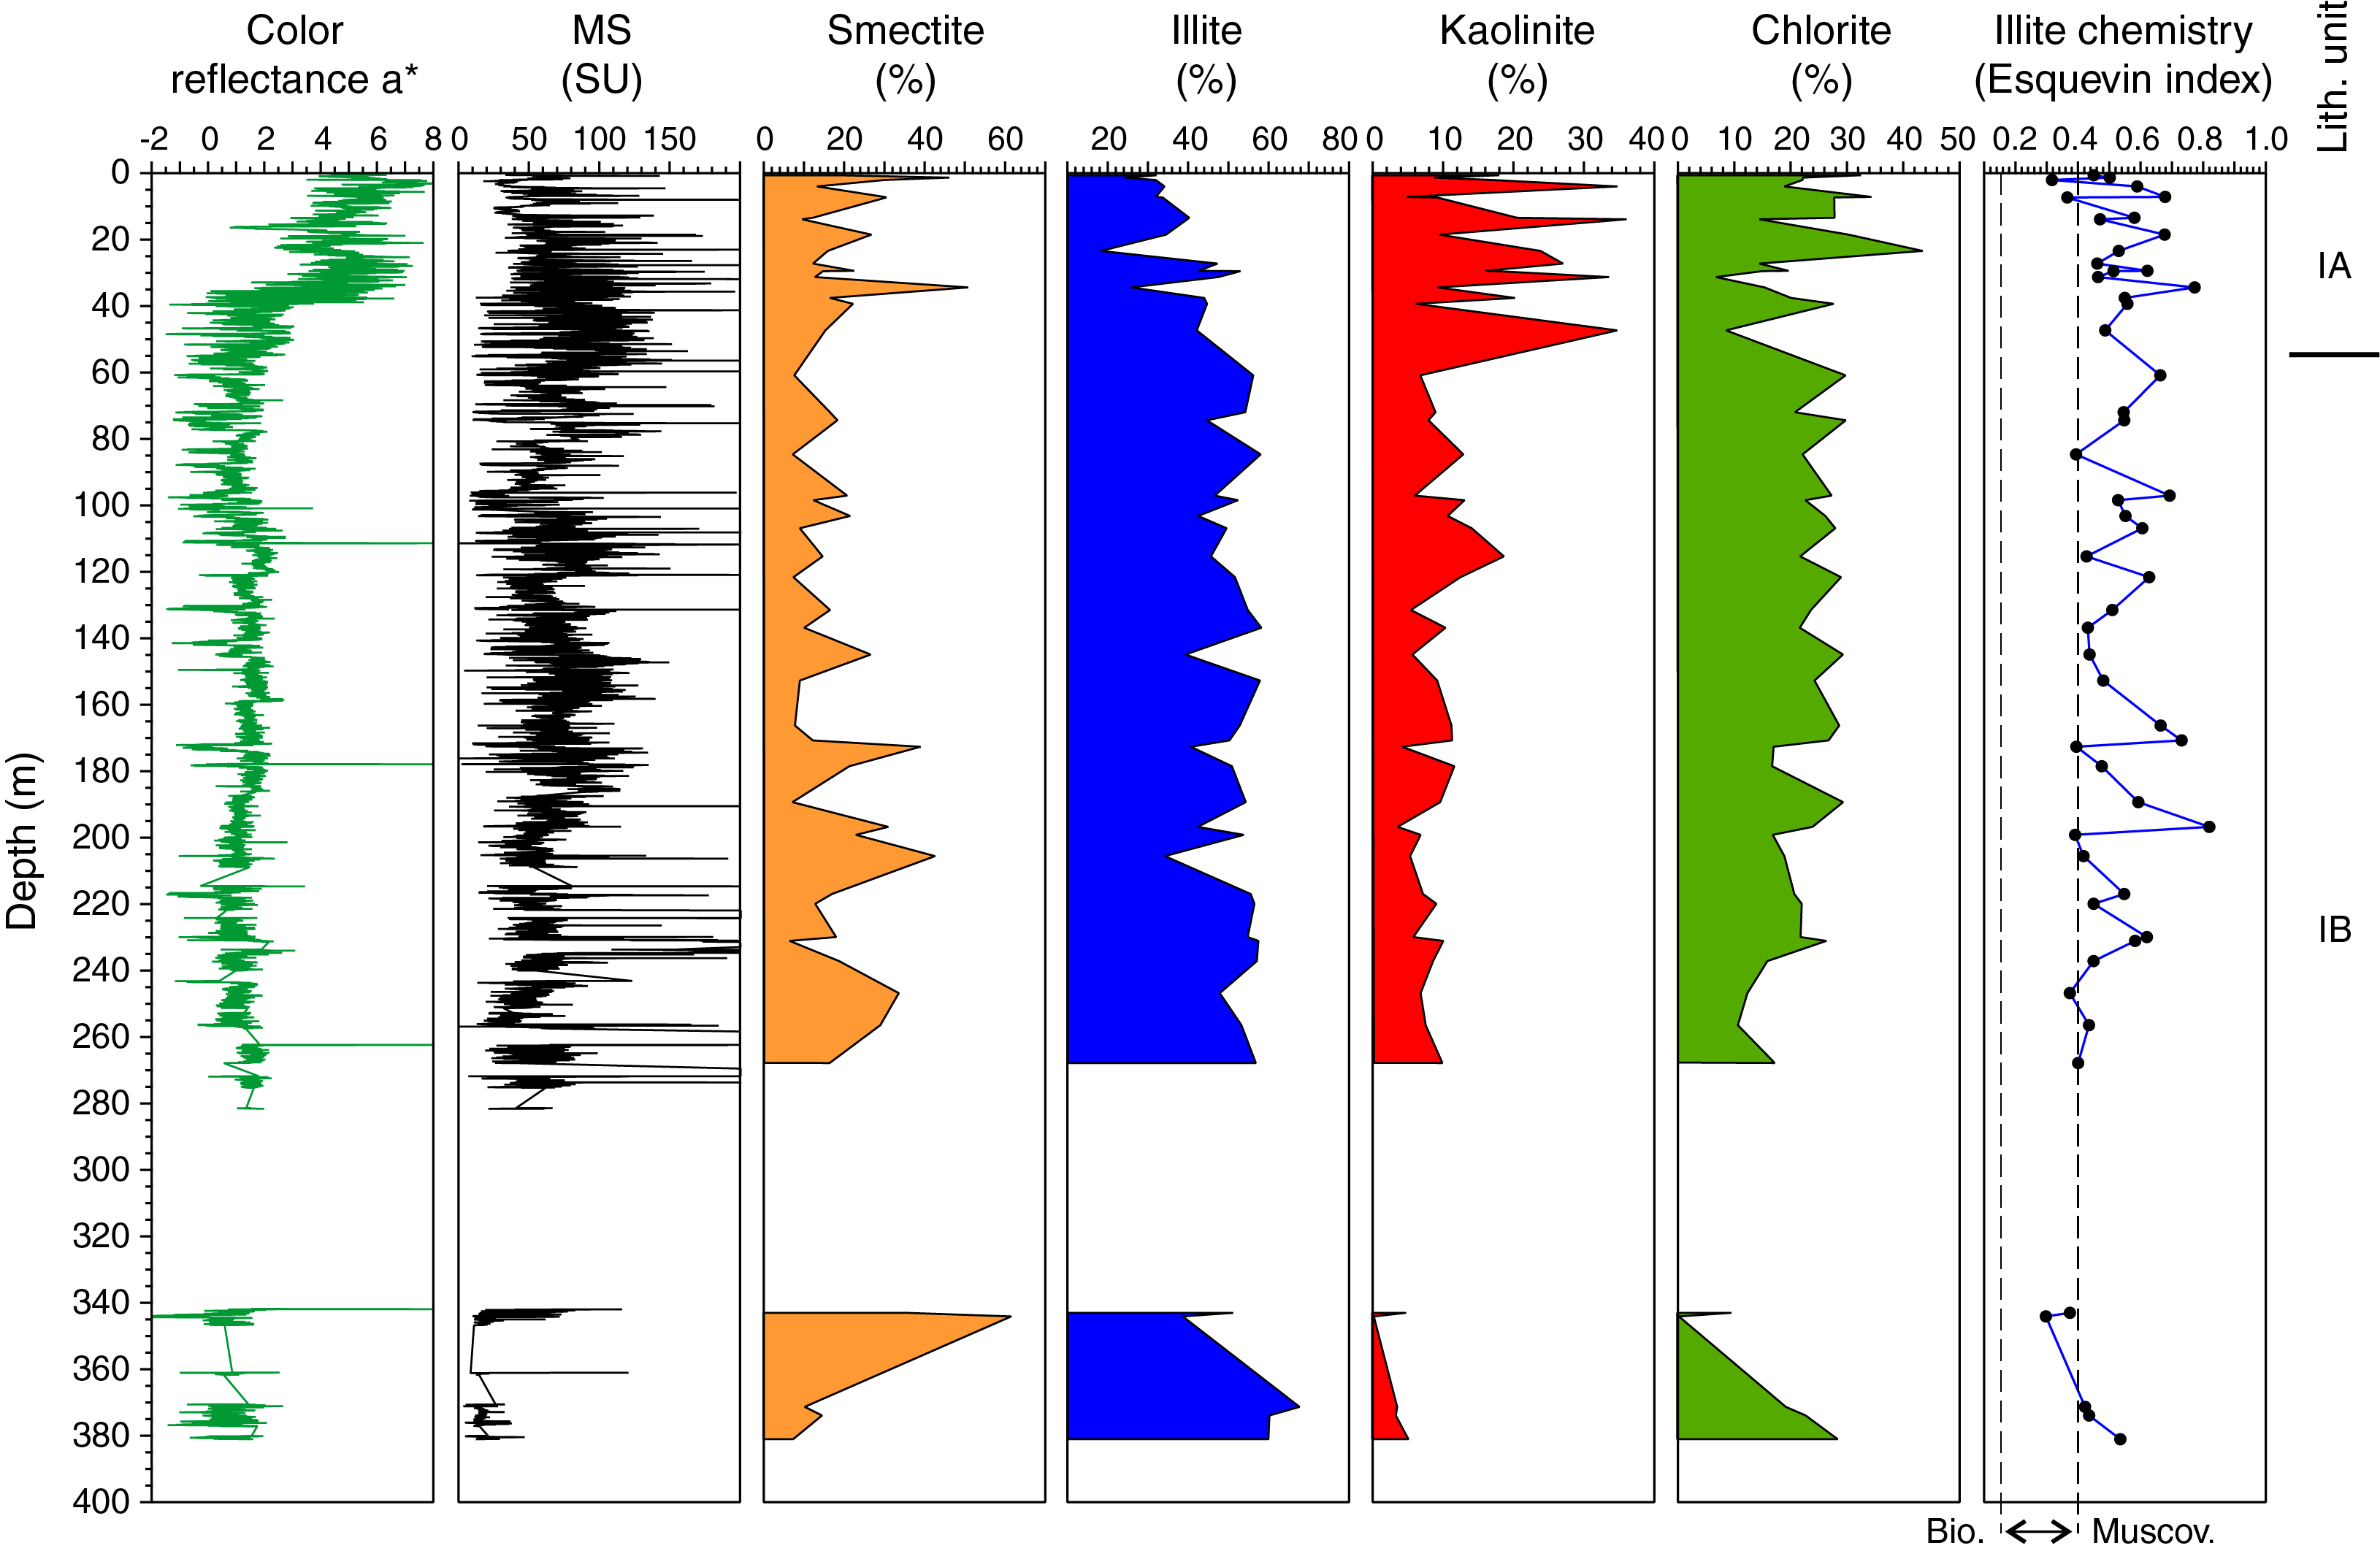
Figure F14. Clay mineralogy.
Kaolinite contents in Lithostratigraphic Subunit IA (above 54.86 m) reach 36% and are on average higher than in underlying Subunit IB (Figure F14). As observed for Site U1532, the kaolinite maximum in Subunit IA corresponds to elevated a* color reflectance values, but in contrast to Site U1532 no clear correlation with magnetic susceptibility was found. Throughout the upper part of Subunit IB from ~55–190 m, kaolinite contents are rarely higher than 15%, and they do not exceed 10% in the lower part of Subunit IB from ~190 to 381 m. Chlorite contents show pronounced fluctuations in Subunit IA and more subdued variations in the upper part of Subunit IB (Figure F14). In the lower part of Subunit IB, chlorite rarely exceeds 25% and decreases slightly with depth down to 344 m. In the few samples analyzed from below 370 m, however, chlorite contents range from 19% to 28%.
Illite contents are generally lower in Lithostratigraphic Subunit IA than in underlying Subunit IB, and the illite chemistry is predominantly muscovitic throughout most of the cores (Figure F14). Illite contents show some variability throughout Subunit IB. Smectite contents display changes with distinct maxima throughout Subunit IA and the lower part of Subunit IB (below ~170 m), and more subdued fluctuations were observed in the upper part of Subunit IB (from ~55 to 170 m; Figure F14). Smectite maxima in Subunits IA and IB often coincide with the presence of Facies F3, F4, F6, and F7 and/or minima in magnetic susceptibility. In the lower part of Subunit IB, however, smectite reaches additional maxima in sediments of other facies and/or sediments with relatively high magnetic susceptibility values. Furthermore, a few intervals were found at Site U1533 where microfossil content is relatively high and/or sediments are characterized by low magnetic susceptibility values but smectite concentrations are not elevated. The smectite maxima in Subunit IA and the upper part of Subunit IB coincide with minima in chlorite and illite contents and often also with pronounced minima in kaolinite contents. Similar variations of smectite and kaolinite contents were previously reported from late Quaternary sedimentary sequences from the Amundsen Sea continental margin (Hillenbrand et al., 2002, 2009). They were interpreted to be the result of an enhanced supply of kaolinite-bearing terrigenous detritus to the margin during glacial times when grounded ice had advanced across the Amundsen Sea shelf.
An unidentified mineral, possibly the zeolite analcime, shows a very weak peak at ~5.64 Å in the diffractogram taken from a sample at 33.8 m (379-U1533B-2H-4, 77–79 cm). The peak becomes increasingly pronounced downcore from 231 to 344 m (Sample 25X-5, 97–99 cm, to Sample 39R-2, 83–85 cm), and the lowermost samples from this interval show a prominent broad peak. In diffractograms of samples taken from below 344 m, the peak at ~5.64 Å displays only a very weak expression.
In addition to the clay mineral analyses, X-ray diffractograms (goniometer scans of untreated samples from 3.5–70°2θ) were also investigated from the bulk fraction of four samples taken from Hole U1533B. Two samples (379-U1533B-18H-6, 69–71 cm, at 185.60 m and 39R-3, 23–25 cm, at 344.93 m) targeted concretions to identify the composition of their cement. A high degree of drilling disturbance recognized during core description suggests that the concretion at 185.6 m was probably sucked into the core, whereas the sample taken from 344.9 m is likely in situ. pXRF analysis of the former sample conducted prior to XRD analysis indicated elevated concentrations of the elements calcium (Ca) and phosphorus (P). The results of the XRD analyses revealed that the two concretions consist of lithogenic minerals (quartz, feldspars, and clay minerals) cemented by carbonate-fluorapatite, fluorapatite, and Mn carbonate. The other two potentially silica-cemented samples taken for bulk XRD analysis (39R-2, 112–114 cm, at 344.32 m and 42R-1, 62–64 cm, at 380.64 m) targeted a diatom-bearing claystone and a silty claystone of Facies F2, respectively, which are characterized by a dark greenish color, possibly indicating the presence of glauconite and/or a chert-like rock. The diffractograms of these two samples show the main peaks of lithogenic minerals (quartz, feldspars, and clay minerals), a diagnostic glauconite peak at ~1.511 Å, and a subtle opal peak at ~4.10 Å. The subtle opal peak may indicate the earliest stages of diagenetic transformation from opal-A to opal-CT with weak silicification.
Interpretation
Site U1533 is located on the lower part of a sediment drift adjacent to a deep-sea channel that conveyed terrigenous sediment from the Amundsen Sea continental shelf to the deep sea (e.g., Uenzelmann-Neben and Gohl, 2012). Site U1533 is dominated by deposition of fine-grained sediments of Facies F1 and F2, which were initially supplied by sediment gravity flows from the continental shelf and subsequently reworked by contour currents (cf. Hillenbrand et al., 2002, 2009; Konfirst et al., 2012). Deposition related to gravitational downslope transport processes in the channel is identified by silt and sand laminae and beds in Subfacies F1.1 and F2.2 in addition to well-sorted and normal- or reverse-graded coarse-grained sediments (Figure F7), which in Subunit IB often resemble the coarse-grained diamict facies in more clearly defined stacked channel-levee deposits on the Antarctic margin (Passchier et al., 2018).
The association of facies in Lithostratigraphic Subunit IA predominantly reflects the interplay of downslope and contouritic sediment transport (Facies F1 and F2) with phases of more intense pelagic sediment input during seasonal open-marine conditions, resulting in deposition of Facies F6 and F7 (Figure F9A). Facies F7, however, is restricted to near the top of Hole U1533C (Figure F5). Bioturbation is generally high throughout Subunit IA, suggesting relatively sustained periods of high marine productivity. The presence of a thin volcanic ash bed in Facies F1 probably signals volcanic activity in the Marie Byrd Land region (e.g., LeMasurier, 2013), most likely during open-marine conditions. Deposits related to downslope transport are present throughout the sedimentary record at Site U1533. In Subunit IA, the coarse-grained layers of Subfacies F1.1, F2.1, and F2.2 probably indicate overspill deposition originating from downslope transport through the adjacent deep-sea channel (Figure F7A). The presence of Facies F5 in addition to normally graded laminae and beds of Subfacies F2.1 and F2.2 in Subunit IB (Figure F8C) marks increased downslope transport activity in this channel. The location of prominent conglomerate beds in Subunit IB is shown in Figure F5. The petrology of clasts in Facies F5 suggests an Amundsen Sea Embayment source. In Subunit IB, generally higher amounts of clasts and pebbles in comparison to Subunit IA were observed. Dispersed granules and pebbles as well as clast nests and discontinuous bands of coarse sand and granules in Facies F2 of Subunit IB indicate persistent but likely low-intensity ice rafting, which may have increased periodically during warm periods, as indicated by the presence of biosilica-bearing to biosilica-rich Facies F3 and F4 and by the deposition of diatom oozes with dispersed sand and gravel (Facies F6) (cf. Passchier et al., 2018).
Biostratigraphy
Samples from core catchers and additional samples from split-core sections from Holes U1533A–U1533D were examined to determine the abundance and assemblage composition of diatoms, silicoflagellates, radiolarians, calcareous nannofossils, foraminifers, ostracods, and palynomorphs. The occurrence and abundance data for the main microfossil groups are summarized in Figure F15.
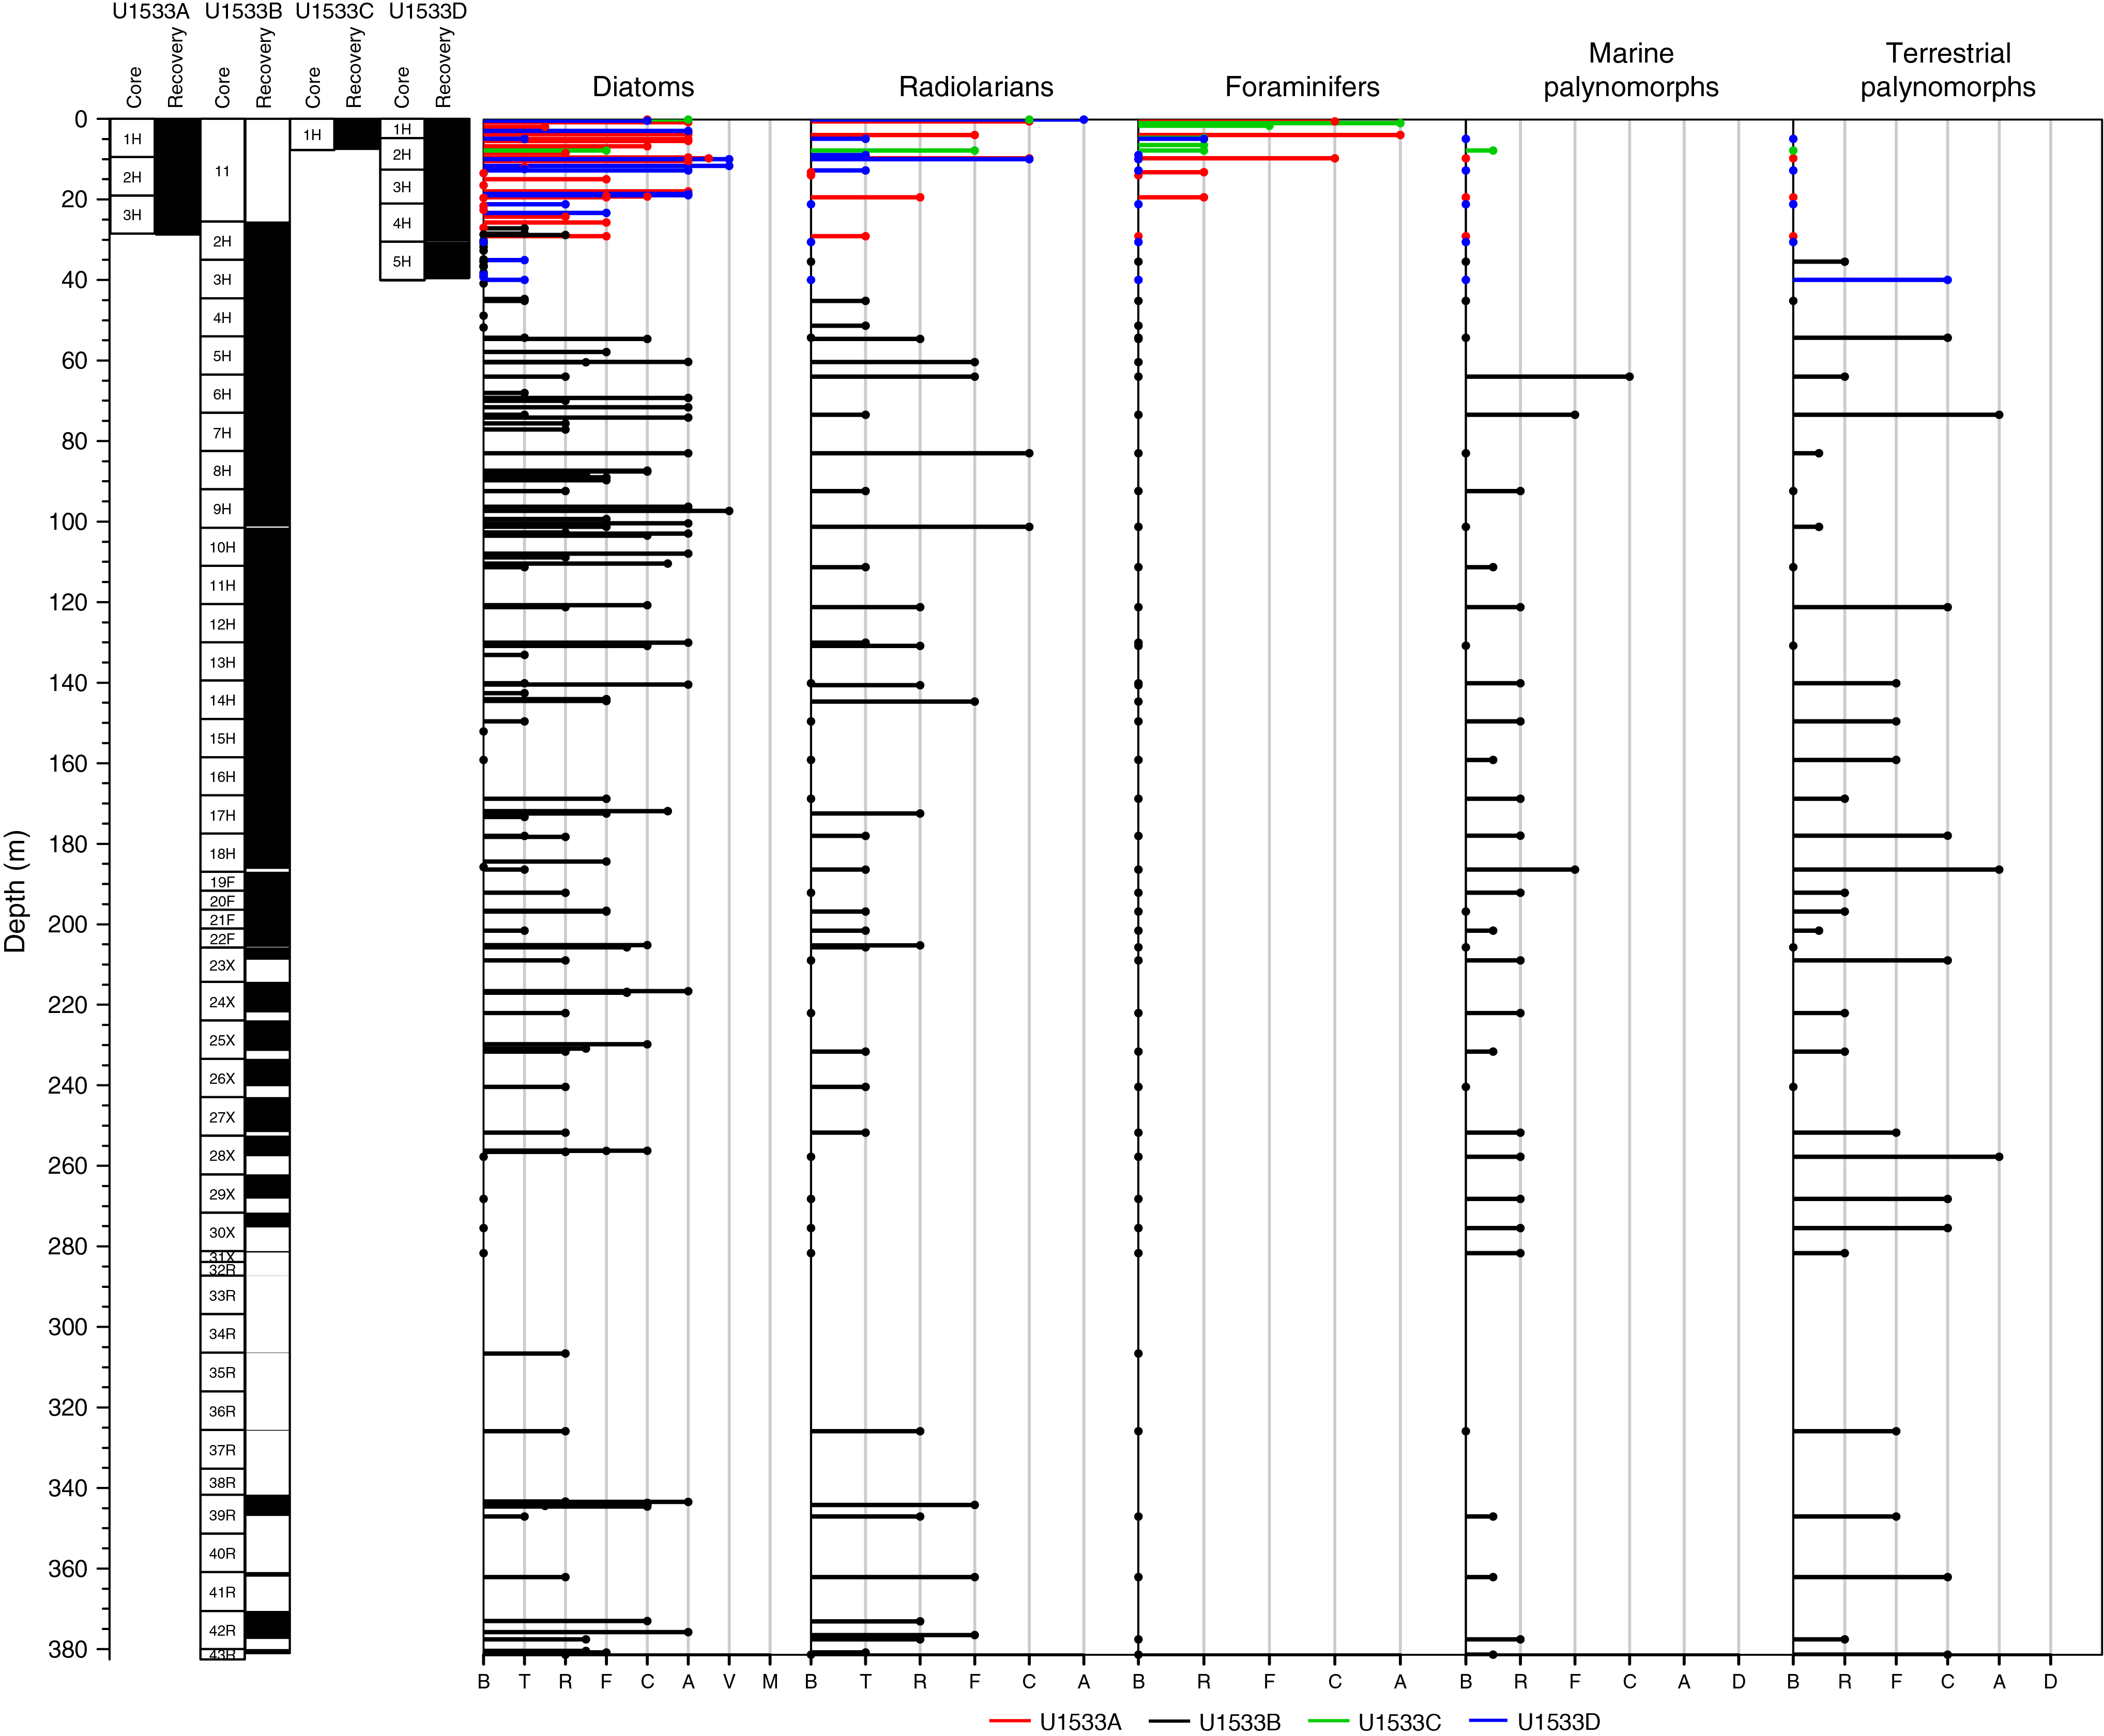
Figure F15. Relative abundance of microfossils.
In contrast with Site U1532, which contains significant intervals that are barren of microfossils, the majority of samples from the mudline to the basal sediments recovered at Site U1533 (Hole U1533B; ~381 m) contain some microfossils, which are predominantly siliceous. Preservation and abundance of microfossils is highly variable, including some unfossiliferous intervals noted in the uppermost Pliocene–lowermost Pleistocene section (Cores 379-U1533B-2H through 4H; ~27–54 m) and lower Pliocene section (Cores 28X–30X; ~258–275 m) of the Site U1533 sequence. At Site U1532, slightly more distal from the Resolution Drift, the dominant lithologies are gray, laminated, poorly fossiliferous mudstones punctuated by thinner greenish, bioturbated, variably biosilica-bearing intervals, some with sand- to pebble-sized material interpreted to be IRD (see Lithostratigraphy in the Site U1532 chapter [Wellner et al., 2021]). At Site U1533, we observed a similar general pattern of alternating gray to greenish units, but the greenish units have a higher overall concentration of biosiliceous material than at Site U1532. Higher concentration and better preservation of biosilica in the Pliocene interval of Hole U1533B can in part be explained by a lower terrigenous sediment flux and a shallower burial depth compared with correlative intervals at Site U1532, which was subjected to enhanced burial depth–related silica diagenesis (see Lithostratigraphy in the Site U1532 chapter [Wellner et al., 2021]). Higher diatom abundance and better preservation in the Pleistocene section at Site U1533 compared with Site U1532, which is only 62 km away and in a water depth only 200 m shallower, is more difficult to explain but is likely related to the depositional differences related to the position of the two sites with respect to their location in this sediment drift and their different distances to the deep-water channel, which may have influenced advection and deposition of pelagic diatoms.
The upper ~40 m of the sequence cored at Site U1533 was recovered in overlapping APC cores in Holes U1533A–U1533D. This upper sequence spans the Pleistocene and contains variable concentrations of diatoms, radiolarians, and foraminifers along with rare marine and terrestrial palynomorphs and very rare calcareous nannofossils. Diatoms and radiolarians are present in most samples examined from this interval at Site U1533 except for the lower part of Core 379-U1533D-5H (~35–39 m), which is largely barren of siliceous microfossils. Foraminifers are present only in a few levels interpreted to be Pleistocene interglacials in the upper ~10 m of the sequence (Cores 379-U1533C-1H and 379-U1533D-1H). Marine and terrestrial palynomorphs are absent in the upper ~40 m at Site U1533 except for rare occurrences of marine palynomorphs in Core 379-U1533C-1H at 7.70 m and reworked terrestrial palynomorphs in Core 379-U1533D-5H at 39.86 m.
Hole U1533B was drilled without coring to 25.50 m and then cored to a total depth of 381.23 m. Pleistocene to upper Miocene sediments were recovered from Hole U1533B and dated by diatoms and radiolarians along with some age dating contributions from dinoflagellate cysts (dinocysts) and silicoflagellates. Diatoms and radiolarians are documented with variable abundance from the top of Hole U1533B to the base with the exception of the mostly barren lower Pleistocene and lower Pliocene intervals noted above. No useful age data were derived from the small amounts of recovered sediment in the zone of poor recovery between Cores 379-U1533B-31X and 38R (~280–340 m). Samples from the lowermost section cored at Site U1533 (Cores 39R through 43R; 343.25–381.23 m) generally contain common to abundant diatoms, though the assemblages are highly fragmented. Diatoms and radiolarians provide a latest Miocene age (6.2–6.7 Ma) for the basal sediments recovered in Hole U1533B (see Chronostratigraphy). Foraminifers and calcareous nannofossils were not observed in the Pliocene sediments from Hole U1533B, whereas rare to common marine and reworked terrestrial palynomorphs are present throughout the hole.
The following descriptions of microfossil group occurrences and biostratigraphic age constraints for Site U1533 are organized by grouping together the upper ~40 m of sediments recovered in Holes U1533A–U1533D, which span the Pleistocene interval. Microfossil occurrence and biostratigraphic age constraints for the lower Pleistocene to upper Miocene succession recovered in Hole U1533B are described subsequently.
Diatoms
A total of 184 sample horizons at Site U1533 were analyzed for diatoms to establish diatom biostratigraphic age constraints and provide limited paleoenvironmental evaluation for Site U1533. Smear slides were prepared from all core catcher samples from Holes U1533A–U1533D, and selected core catcher samples were sieved at 10 and 20 µm to concentrate diatoms where abundance is low and the diatoms are highly fragmented. Additional toothpick samples were collected for smear slides from whole-round section ends on the catwalk and from selected intervals of the split cores. Intervals with low bulk density (as determined from whole-round GRA bulk density measurements) and magnetic susceptibility (see Physical properties) were specifically targeted for sampling. The most productive lithofacies for diatoms was greenish units, some of which are rich enough in diatoms to be classified as biosilica-rich muds and biosiliceous oozes. Principal diatom datums and their hole/core depths identified at Site U1533 are listed in Table T8, and an occurrence chart of overall diatom abundance and occurrence of key (biostratigraphically calibrated) diatom species is provided in Table T9.
Holes U1533A, U1533C, and U1533D
Cores 379-U1533A-1H through 3H (0–29.02 m) were obtained from Hole U1533A with a total penetration depth of 28.5 m and core recovery of more than 100%. Sample 1H-1, 0 cm (mudline), contains common diatoms with an assemblage dominated by Fragilariopsis kerguelensis. The Pliocene–Pleistocene diatom Rhizosolenia harwoodii (3.6–0.6 Ma) was encountered in trace occurrence in the mudline sample and is considered reworked. However, no notable uniquely pre-Pleistocene diatoms were observed in this sample.
At least one smear slide per section was prepared from Cores 379-U1533A-2H and 3H and examined to detect Pleistocene zonal marker species. Several complete valves of Actinocyclus ingens were observed in Sample 2H-4, 80 cm (14.82 m), and down to the bottom of the hole in Sample 3H-CC (28.97 m) (Table T9). A. ingens was not found in Sample 2H-1, 80 cm (10.30 m), which contains abundant diatoms. Rare fragments of A. ingens, however, were noted above this level in Samples 1H-7, 50 cm (9.41 m), and 1H-CC (9.65 m), and these occurrences are considered to be reworked. A. ingens is common in Miocene and Pliocene sediments in the Southern Ocean, and as a robust taxon it is frequently reworked, especially in active sediment drifts, making the determination of the last appearance datum (LAD) of the taxon difficult in most Pleistocene sequences. Clearly reworked specimens of Miocene Denticulopsis spp. also occur in Samples 1H-7, 50 cm, 2H-CC, and 3H-CC, further suggesting that A. ingens may be reworked in these samples. Despite reworking issues, the calibrated LAD of A. ingens (0.6 Ma) is a biostratigraphically useful boundary that distinguishes the Thalassiosira lentiginosa Zone and A. ingens Zone in the Southern Ocean. As such, we tentatively place the LAD of A. ingens between Samples 2H-1, 80 cm (10.30 m), and 2H-4, 80 cm (14.82 m), defining the interval above this level as the T. lentiginosa Zone (0–0.6 Ma).
The LAD of Fragilariopsis barronii is identified between Samples 379-U1533A-3H-1, 12 cm (19.12 m), and 3H-4, 60 cm (24.12 m), allowing the interval between Samples 2H-4, 80 cm (14.82 m), and 3H-1, 12 cm (19.12 m), to be assigned to the A. ingens Zone (0.6–1.3 Ma). All samples below Sample 3H-4, 60 cm (24.12 m), in Hole U1533A are placed in the F. kerguelensis Zone (1.3–1.9 Ma).
A single mudline core was recovered from Hole U1533C. The mudline water sample from Section 379-U1533C-1H-1, 0 cm (0 m), contains abundant diatoms and a typical modern Southern Ocean assemblage. Diatoms were observed throughout Core 1H with variable abundance and preservation. Detailed sampling and observation was not done on board for this core, but the entire core is likely positioned in the T. lentiginosa Zone (0–0.6 Ma).
The LAD of A. ingens is recognized in Hole U1533D between Samples 379-U1533D-2H-4, 54 cm (9.85 m), and 2H-5, 69 cm (11.50 m), placing the interval above this level in the T. lentiginosa Zone (0–0.6 Ma). Samples 2H-5, 69 cm (11.50 m), to 4H-4, 107 cm (26.59 m), are assigned to the A. ingens Zone based on the co-occurrence of A. ingens and F. kerguelensis and absence of F. barronii. Samples 4H-CC (30.41–30.46 m) to 5H-CC (39.83 m; bottom of Hole U1533D) are barren or contain only trace occurrences of diatoms.
Hole U1533B
Hole U1533B was drilled without coring down to 25.50 m, and Cores 379-U1533B-2H through 43R were recovered between 25.50 and 381.23 m. Samples from Cores 2H–4H (25.50–54.22 m) are barren or contain only trace occurrences of diatoms. F. kerguelensis occurs in Sample 2H-3, 15 cm (28.67 m), indicating an age younger than 2.3 Ma for this level based the first appearance datum (FAD) of F. kerguelensis. The interval between Samples 5H-1, 47 cm (54.47 m), and 8H-4, 25 cm (87.18 m), is assigned to the late Pliocene Fragilariopsis interfrigidaria Zone (3.2–3.8 Ma) based on the presence of F. interfrigidaria and the absence of Thalassiosira vulnifica. The occurrence of Fragilariopsis weaveri above Sample 6H-4, 123 cm (69.12 m), tentatively constrains the interval between 54.47 and 69.12 m to Subzone b of the F. interfrigidaria Zone (3.2–3.5 Ma). The interval between Samples 8H-CC (92.26 m) and 11H-7, 85 cm (120.69 m), is assigned to the F. barronii Zone (3.8–4.4 Ma) based on the occurrence of F. barronii and the absence of F. interfrigidaria. Additional documentation of marker diatom species in greenish bioturbated intervals is needed to further refine zonal and subzonal boundary datums in the mid- to upper Pliocene section of Hole U1533B.
The presence of Thalassiosira inura in the absence of F. barronii between Samples 379-U1533B-12H-7, 50 cm (129.89 m), and 23X-CC (~208.8 m) allows assignment of this interval to the T. inura Zone (4.4–5.55 Ma; sensu Winter and Iwai, 2002). Occurrences of T. inura in Hole U1533B are rare and sporadic, however, and it is difficult to detect the first abundant appearance datum of this species, which was originally defined as the base of the T. inura Zone by Harwood and Maruyama (1992). However, the sporadic occurrence of Thalassiosira complicata (FAD at 5.1 Ma) and Rhizosolenia costata (4.2–4.7 Ma) in samples from this interval supports the general assignment to this zone. The first occurrence of T. complicata in Sample 20F-CC (~196.7 m) allows the recognition of the boundary of Subzones a and b of the T. inura Zone at this sample horizon.
Sporadic occurrences of a distinctive Stephanogonia spp. were observed in the Pliocene sequence of Hole U1533B with a relatively continuous presence between Samples 379-U1533B-20F-CC and 24X-2, 63 cm (~197–216 m), and between Samples 26X-CC and 28X-3, 54 cm (~240–256 m). At Antarctic Peninsula Ocean Drilling Program (ODP) Leg 178 Site 1095, the appearance of relatively common Stephanogonia spp. was also observed nearly coincident with the FAD of T. complicata in the T. inura Zone and the relatively continuous presence of similar Stephanogonia spp. in samples dated between 4.7 and 5.3 Ma in Hole 1095B (M. Iwai, unpubl. data).
Magnetostratigraphic analysis of Hole U1533B (see Paleomagnetism) recognized normal polarity zones between 176.63 and 185.66 m and between 205.55 and 256.07 m that are interpreted to be polarity Chrons C3n.3n (4.799–4.896 Ma) and C3n.4n (4.997–5.235 Ma), respectively. Thus, the magnetostratigraphic and biostratigraphic events present a stratigraphically coherent picture for the lower Pliocene sediments recovered at Site U1533 (see Chronostratigraphy; Figure F22).
Generally poor core recovery between Core 379-U1533B-29X (~268 m) and the base of the hole in Core 43R (381.23 m) makes it difficult to assign diatom zones and constrain diatom-based ages in most samples from the lowermost sequence drilled at Site U1533. However, several diatom-bearing or diatom-rich samples were identified between Sections 42R-2 and 42R-CC (~373–377 m). The assemblage present in Sample 42R-5, 12 cm (376.65 m), includes Thalassiosira miocenica (6.7–6.0 Ma; Barron, 2003), Thalassiosira oliverana var. sparsa (LAD at 4.9 Ma), and Thalassiosira convexa var. aspinosa (FAD at 6.8 Ma; Barron, 2003), indicating an upper Miocene diatom-based age between 6.0 and 6.7 Ma for the strata near the base of Hole U1533B.
Reworking of siliceous microfossils
As at Site U1532, relatively rare diatoms interpreted to be stratigraphically displaced (reworked) occur in many or most diatom-bearing samples from Site U1533. This is a common characteristic of all diatom-rich deep-sea sediments but is especially apparent in glacially influenced sediments and sediment drifts near Antarctica. Eocene to Miocene age fossils, such as Denticulopsis dimorpha, Denticulopsis ovata, and Pyxilla spp., are particularly notable throughout the Pliocene sections at Site U1533, as are long-ranging, non–age diagnostic taxa such as those in the genera Paralia, Stephanopyxis, and Stellarima. In some cases, reworking of robust diatoms such as A. ingens and Denticulopsis spp. complicate pinpointing stratigraphic last occurrences.
Dissolution of siliceous microfossils
Although Site U1533 does contain barren samples and intervals, which usually correspond to laminated silty mudstones, biogenic silica is generally better preserved at Site U1533 than at Site U1532 despite the proximity and similar water depth of the two sites. Unlike Site U1532, where most of the Pleistocene sediments are barren of diatoms, including foraminifer- and nannofossil-bearing interglacial units, many brownish color-banded units of the Pleistocene sections at Site U1533 contain diatoms, often in high abundance. It is difficult to explain why diatoms reflecting Pleistocene interglacial deposition were observed at Site U1533 but not at Site U1532, but we speculate that Site U1533 may be influenced by enhanced deposition of advected diatoms.
Diatom-rich Pliocene and upper Miocene units in Hole U1533B are composed of greenish silty mudstones, often with coarse-grained material and bioturbation (see Lithostratigraphy). These intervals are also characterized by low density and, although not always, low magnetic susceptibility (see Physical properties). Site U1532 has similar lithologies and alternating lithofacies, but most of the more deeply buried greenish units at that site are barren of diatoms. These units were likely initially diatomaceous after deposition, but deep burial resulted in loss of diatoms to diagenesis (see Biostratigraphy in the Site U1532 chapter [Wellner et al., 2021]). Comparable units at Site U1533 generally retain identifiable diatoms, confirming the interpretation of the greenish units at Site U1532. Higher abundance and better preservation of diatoms in these units at Site U1533 are attributed largely to less dilution and more shallow burial depths resulting from lower sedimentation rates of terrigenous material at Site U1533.
Calcareous nannofossils
Calcareous nannofossils were not noted in diatom smear slides from Site U1533. However, rare nannofossils were observed in smear slides prepared by the core description team from Sections 379-U1533A-1H-1 and 379-U1533D-1H-1, coinciding with foraminifer-bearing layers.
Radiolarians
All radiolarian assemblages observed at Site U1533 (Table T10) are preserved as opal-A, but most Miocene and Pliocene assemblages contain a large amount of broken specimens. No recognizably reworked specimens were observed. A single sample (379-U1533B-37R-CC; 325.7 m) contains a few fragments of pyritized radiolarians and diatoms.
Holes U1533A, U1533C, and U1533D
Holes U1533A, U1533C, and U1533D contain Pleistocene radiolarian assemblages, as indicated by the occurrence of Phormospyris antarctica (FAD at 1.88 Ma). In Hole U1533A, these assemblages consist of frequent to common well-preserved radiolarians above ~10 m; below this depth, radiolarians are rare or sediments are barren. In the mudline core of Hole U1533C, Pleistocene radiolarian assemblages are frequent to common and well preserved throughout both the mudline and the core catcher. In Hole U1533D, the mudline sample (379-U1533D-1H-1, 0 cm) contains abundant and diverse radiolarians, and Sample 2H-4, 53 cm (9.84 m), yielded an assemblage of common and well-preserved radiolarians. All other samples analyzed from Hole U1533D are either barren or contain only trace amounts of mostly fragmented radiolarians despite the fact that some of these intervals are highly diatomaceous.
Hole U1533B
Hole U1533B yielded nearly no radiolarians from the top of the hole at 25.5 m to Sample 379-U1533B-5H-1, 47 cm (54.47 m). However, rare to common radiolarians are present between ~54.5 and 144.5 m and are assigned to the Upsilon Zone based on the occurrence of Helotholus vema (2.4–4.59 Ma). The interval between ~83 m (Sample 7H-CC) and ~144.5 m (Sample 14H-4, 60 cm) is assigned to the lower part of the Upsilon Zone (3.48–4.59 Ma) based on the last occurrence of Lampromitra coronata (3.72 Ma), which is recognized between Samples 7H-CC (82.85 m) and 5H-CC (63.83 m) (Table T8). The first occurrence of H. vema (4.59 Ma) is recognized between Samples 14H-4, 60 cm (144.51 m), and 17H-4, 39 cm (172.31 m). The interval from ~172 to 347 m is therefore assigned to the Tau Zone (4.59–6.22 Ma). Samples from the Tau Zone are barren or are characterized by rare occurrence of radiolarians except for Sample 39R-2, 80 cm (344 m), which contains frequent radiolarians. The lower part of the Tau Zone (~5–6.22 Ma) is recognized between ~326 and 347 m based on the occurrence of several specimens of Lychnocanium grande (last common occurrence at ~5 Ma). Based on the presence of Amphymenium challengerae in Samples 41R-CC and 42R-4, 130 cm, the interval in Hole U1533B between ~362 and 376 m is assigned to the A. challengerae Total Range Zone (6.22–6.84 Ma). Samples below ~376 m contain either no radiolarians or only a few fragments and thus are not assigned to a biostratigraphic zone. However, fragments of Acrosphaera labrata (FAD at 7.84 Ma) are documented in Sample 43R-1, 64 cm (380.64 m), thus giving a maximum age to the samples between ~376 and 381 m. As at Site U1532, late Miocene and Pliocene radiolarian assemblages are more abundant in the green bioturbated facies that contain (inferred) IRD than in the greenish gray laminated facies. Overall radiolarian abundance is higher at Site U1533 than at Site U1532.
Palynology
In situ dinocysts are absent in nearly all samples above 54.17 m, including all of Holes U1533A, U1533C, and U1533D and the upper cores of Hole U1533B (Table T11), although rare marine palynomorphs are noted in Section 379-U1533C-1H-CC. Below this depth, exclusive to Hole U1533B, most samples contain rare in situ dinocysts with most frequent occurrences between ~63.8 and 192.0 m. The in situ assemblages are dominated by Brigantedinium spp. and Selenopemphix spp. Rare reworked dinocyst occurrences are also noted below ~63.8 m. In contrast to Site U1532, where presumed in situ dinocysts are present in similar concentrations to reworked specimens, >80% of the dinocysts observed at Site U1533 are presumed to be in situ. The most common reworked taxon is Enneadocysta spp.
The terrestrial palynomorph assemblage at Site U1533 is dominated by Nothofagidites spp. and Podocarpidites spp. with common occurrences of spores and other angiosperm pollen (Table T11). All the terrestrial palynomorphs observed at Site U1533 are assumed to be reworked from Cretaceous to Neogene strata.
Palynofacies analysis shows similar trends to those seen at Site U1532, including predominant palynodebris in most samples (mean > 80%). However, in the lower upper Pliocene (above ~73.3 m), a pronounced shift is observed; phytoclasts drop to ~60% and amorphous organic matter increases from an average of ~10% to >20%, possibly suggesting a reduction in the proportion of terrestrial organic matter (Tyson, 1995) through the section.
Foraminifers
A total of 45 core catcher samples and 16 samples from split-core sections were investigated for foraminifers from Site U1533. Planktonic foraminifers are present in the upper ~10 m of the sequence (with occurrences ranging from rare to abundant), but they are absent in all samples below this level (Table T12). Only one planktonic species, Neogloboquadrina pachyderma (sinistral coiling), was noted in foraminifer-bearing samples. Two horizons with abundant N. pachyderma were observed in the upper part of Holes U1533A and U1533C (Table T12).
Only one interval in Hole U1533C was found to contain benthic foraminifers in high abundance and diversity: Sample 379-U1533C-1H-1, 88–90 cm (0.88 m) (Table T12). The well-preserved benthic assemblage in this sample is dominated by Epistominella exigua, Cibicides grossepunctatus, Pullenia salisbury, Nuttalides umbonifera, and Textularia antarctica.
No ostracods were recovered in washed foraminiferal preparations from Site U1533.
Paleomagnetism
We performed pass-through paleomagnetic measurements on all archive halves from Site U1533. The magnetic polarity stratigraphy was interpreted using only inclination values after 20 mT demagnetization (Figure F16). Data from high–drilling disturbance intervals (i.e., described as fall-in, flow-in, or suck-in) recorded by the core description team (see Lithostratigraphy) were excluded from paleomagnetic interpretation. A total of 68 discrete samples were taken from the least-disturbed intervals of the working halves. These samples were subjected to stepwise alternating field (AF) demagnetization to integrate with and verify pass-through paleomagnetic data. Anisotropy of magnetic susceptibility (AMS) was measured for all discrete samples to study the magnetic fabric. The stepwise acquisition of isothermal remanent magnetization (IRM) up to a peak field of 1 T was determined for a subset of six representative samples for a preliminary investigation of rock magnetic characteristics (e.g., grain size, mineralogy, and concentration of magnetic particles).
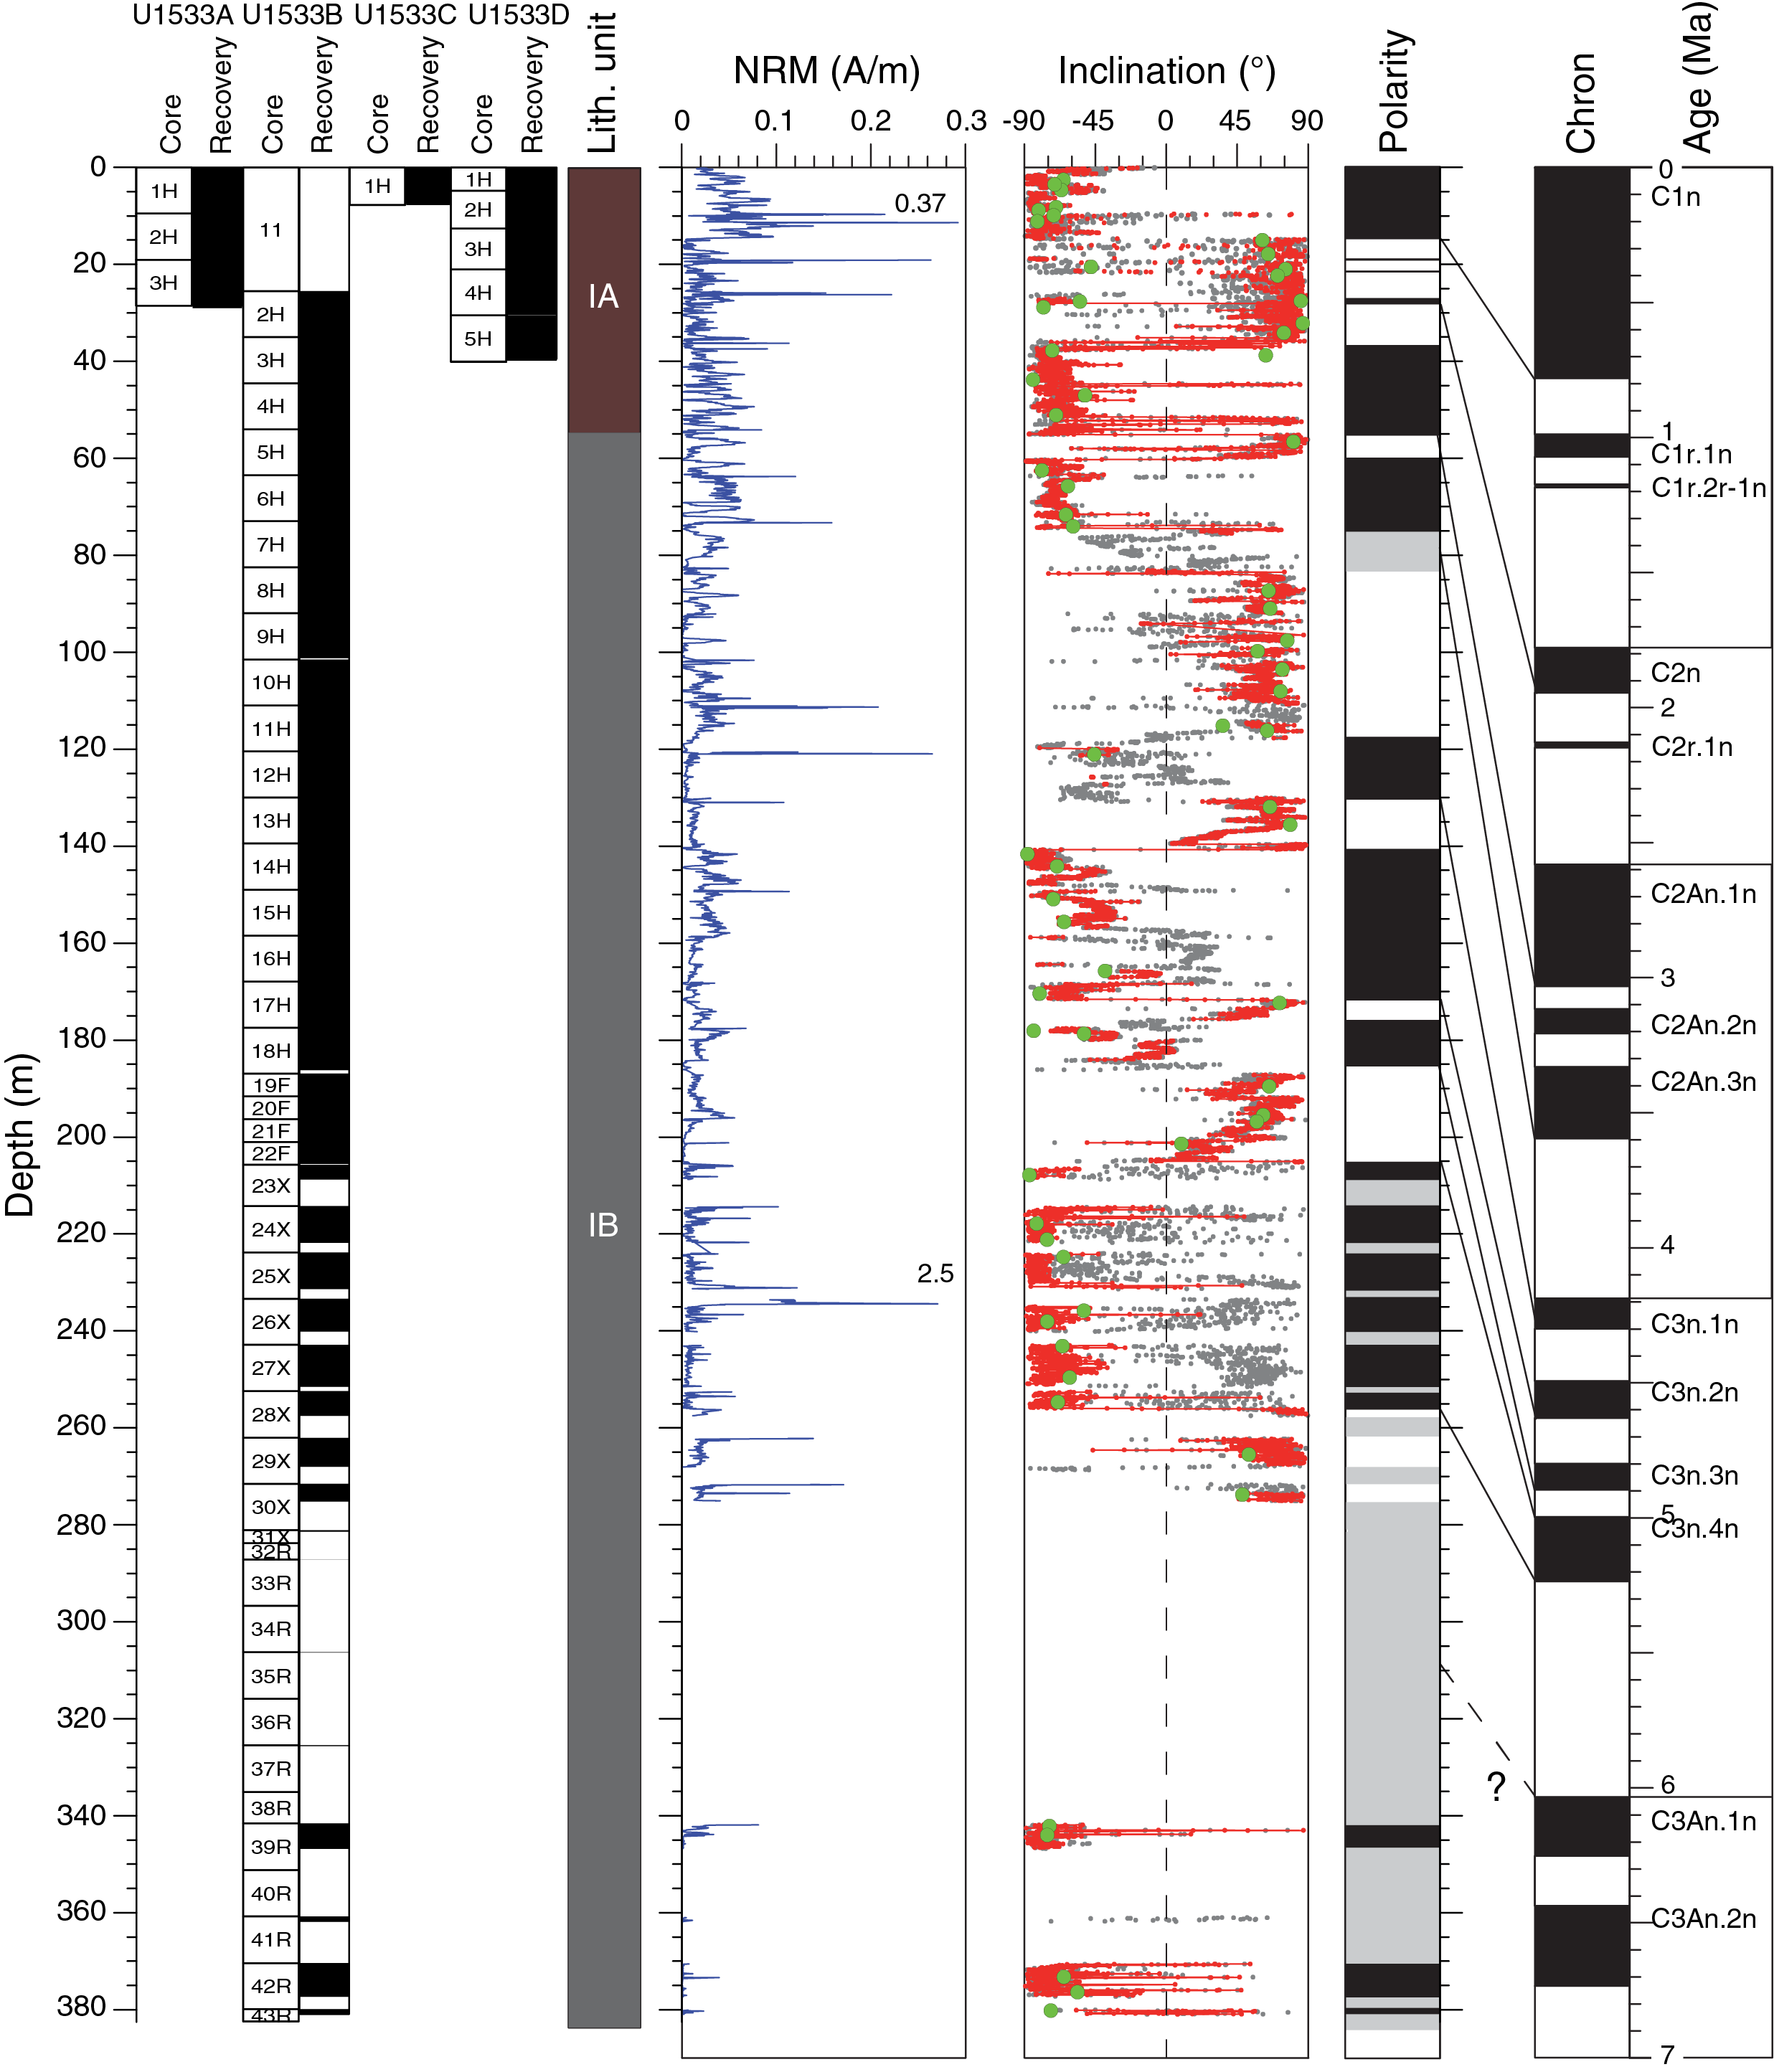
Figure F16. Paleomagnetic data.
Results from paleomagnetic measurements of archive halves
Paleomagnetic data from Hole U1533A archive halves, including NRM intensity and inclination, show an overall good to reasonable quality for all recovered lithologies. For Hole U1533A (Figure F16), NRM intensity ranges from low to high (~10−4 to 10−1 A/m). Although it is usually below 0.15 A/m, a peak value of ~0.37 A/m, which is apparently not related to the presence of rock fragments with high magnetic susceptibility, occurs in the upper part of Section 379-U1533A-2H-1. NRM intensity is variable and changes on the meter and submeter scale. NRM inclination before AF cleaning exhibits several intervals of positive and negative values documenting several polarity changes (Figure F16). This pattern is persistent at the 20 mT demagnetization level, indicating a stable magnetic record. Sections 1H-1 through 2H-4 (0–14.72 m) are characterized by negative inclinations (i.e., normal polarity). A short interval in Section 2H-1 (9.6–9.9 m) shows positive inclination (i.e., reversed polarity). From ~15 m (Section 2H-4) down to ~28.6 m, inclinations are mostly positive, but there are three intercalated intervals of negative values in Cores 2H and 3H. NRM and 20 mT demagnetization data show a clear bimodal clustering (Figure F17) close to the inclination of ~79° expected for a geocentric axial dipole (GAD) for a site latitude of ~68.7°S. In summary, the paleomagnetic properties of the sediments recovered in Hole U1533A provide a reliable record of the geomagnetic field.

Figure F17. Inclinations.
For Hole U1533B, NRM intensity is low to moderate and ranges from ~10−4 to 10−2 A/m except for a few intervals where it peaks to ~10−1 A/m (Figure F16). The high peak of ~2.5 A/m at the top of Section 379-U1533B-26X-1 is caused by two rock fragments. AF demagnetization revealed several intervals of negative and positive inclinations. At the very top of Hole U1533B, inclinations are negative (normal polarity) and change to positive values at ~28 m (Section 2H-2) and back to negative values at ~37 m (Section 3H-1). Normal polarity continues downcore to ~79 m (Cores 7H–8H) but is interrupted by several reversed polarity intervals at ~45 m (Section 4H-1), from ~51.6 to ~53 m (Sections 4H-5–4H-6), and from ~55 to ~60 m (Sections 5H-1 through 5H-4). The following mostly positive inclinations downcore to ~141 m (Core 14H) are interrupted by a poorly recorded interval of normal polarity between ~118 and ~129 m (Cores 11H and 12H). From ~141 m down to ~206 m (Section 22F-3), the sequence is characterized by several intervals of alternating negative and positive as well as intermediate inclination. Downcore, normal polarity is revealed to ~256 m (Section 28X-3). Cores 31X–38R, 40R, and 41R had only poor or no recovery. The only inclination data available are from Cores 39R and 42R, which both exhibit normal polarity. A viscous remanent magnetization or IRM drilling-induced overprint of reversed polarity was observed for all Hole U1533B XCB cores (23X–31X). The distribution of NRM inclinations shows a strong bias to shallow or even positive values as a consequence of this reversed polarity overprint (Figure F17). After AF demagnetization, the typical bimodal distribution of inclination values returns to close to the GAD inclination value of ~79° at the site latitude (Figure F17). Thus, we infer that the XCB cores also provide a reliable paleomagnetic signal. The drilling-induced vertical overprint was not observed for any of the APC cores from Hole U1533B. In summary, the paleomagnetic properties of the sediments recovered from Hole U1533B provide a reliable record of the geomagnetic field except for the poorly recovered intervals.
AF demagnetization of the single APC core from Hole U1533C reveals normal polarity. NRM intensity of Core 379-U1533C-1H is moderate and ~10−2 A/m. The maximum of the inclination distribution is slightly lower than the GAD inclination for this location (Figure F17).
NRM intensity in Hole U1533D is low to moderate and ranges from less than ~10−3 to ~10−2 A/m with a peak value of ~0.3 A/m in Section 379-U1533D-4H-CC that is probably not related to sediment properties. NRM demagnetization at the 20 mT level reveals seven polarity transitions between ~13 and ~30 m. Inclinations are negative from ~6 to ~13 m (Sections 2H-2–3H-1) and are mostly positive down to the bottom of Hole U1533D. Core 1H and Section 2H-1 were not interpreted because of drilling disturbance. Intervals of normal polarity occur from ~17 to ~18 m (Section 3H-4), at ~20 m (Section 3H-6), and from ~27 to ~30 m (Sections 4H-5 through 4H-7). Reversed magnetic polarity continues down to the deepest core (5H) recovered in Hole U1533D. NRM and 20 mT demagnetization data show a clear bimodal clustering (Figure F17) close to the GAD inclination of ~79° at the site latitude. In summary, the paleomagnetic properties of the sediments recovered in Hole U1533D provide a reliable record of the geomagnetic field.
Discrete sample measurements
A total of 68 discrete samples from Site U1533 underwent AF demagnetization up to 100 mT. Of these, 67 show clear demagnetization behavior with mostly straight vector endpoint data pointing toward the origin of the demagnetization diagrams after demagnetization at the 10–20 mT level. Therefore, we applied principal component analysis (PCA; Kirschvink, 1980) to obtain the characteristic remanent magnetization components of these samples. Two representative examples are shown in Figure F18. The good demagnetization behavior of the discrete samples strongly supports the magnetostratigraphic interpretations from the pass-through paleomagnetic data.
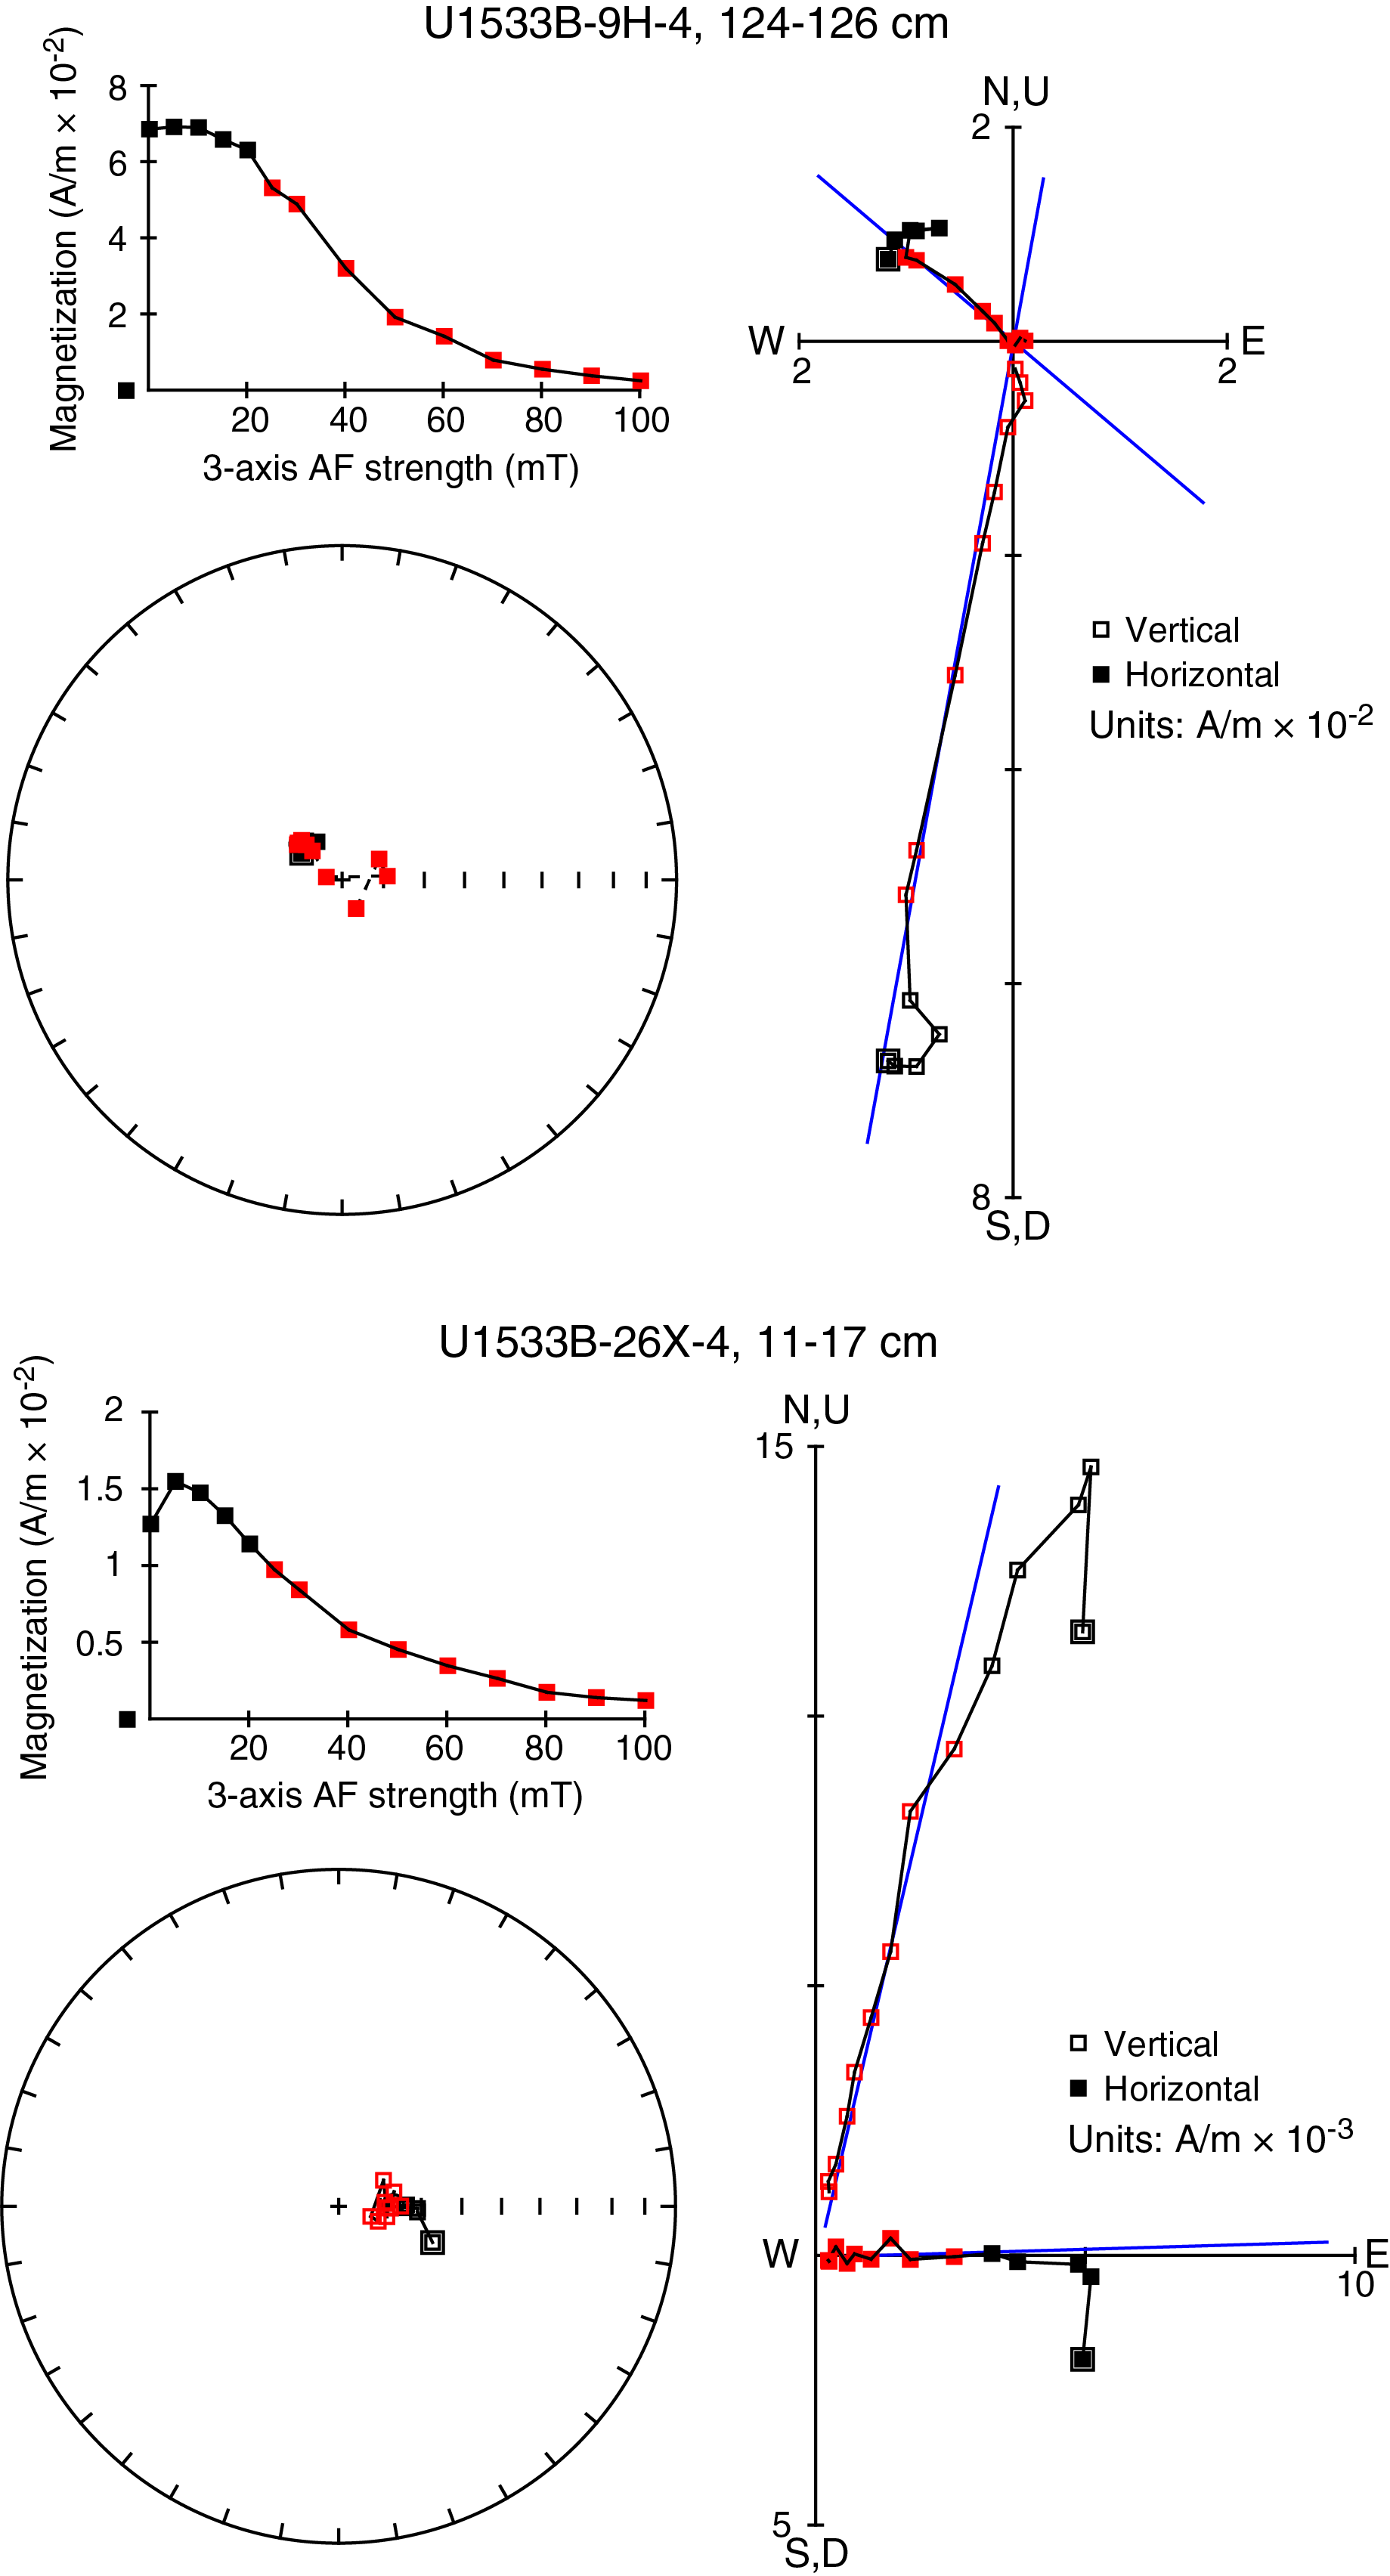
Figure F18. Demagnetization and NRM.
Anisotropy of magnetic susceptibility
We measured the AMS of all discrete samples (Figure F19). All samples from Holes U1533A, U1533C, and U1533D and 42 samples from Hole U1533B were collected by pushing 7 cm3 plastic cubes into the soft sediment. Nine samples from Hole U1533B with a volume of 8 cm3 were cut by a rock saw with two parallel blades. AMS is highly variable with a clear trend from weak anisotropies in the upper part of Holes U1533A–U1533D (lowest P = κmax/κmin = 1.006) to strong anisotropies deeper in the section (highest P = 1.288). The κmin axes of the AMS ellipsoids of almost all samples are oriented almost perpendicular to the horizontal plane, indicating a clear oblate magnetic fabric of the sediments (Figure F19), which is typically observed for sedimentary rocks deposited in an undisturbed environment and not affected by any significant syn- or postdepositional process other than magnetic ordering. There is no obvious clustering of the preferred orientation of κmax for samples from Hole U1533A. For the samples from Hole U1533B, κmax shows a clear orientation toward the x-axis of the specimens coordinate system, whereas for the two samples from Hole U1533C, κmax is oriented toward the y-axis of the specimen coordinate system (see Figure F15 in the Expedition 379 methods chapter [Gohl et al., 2021a]).
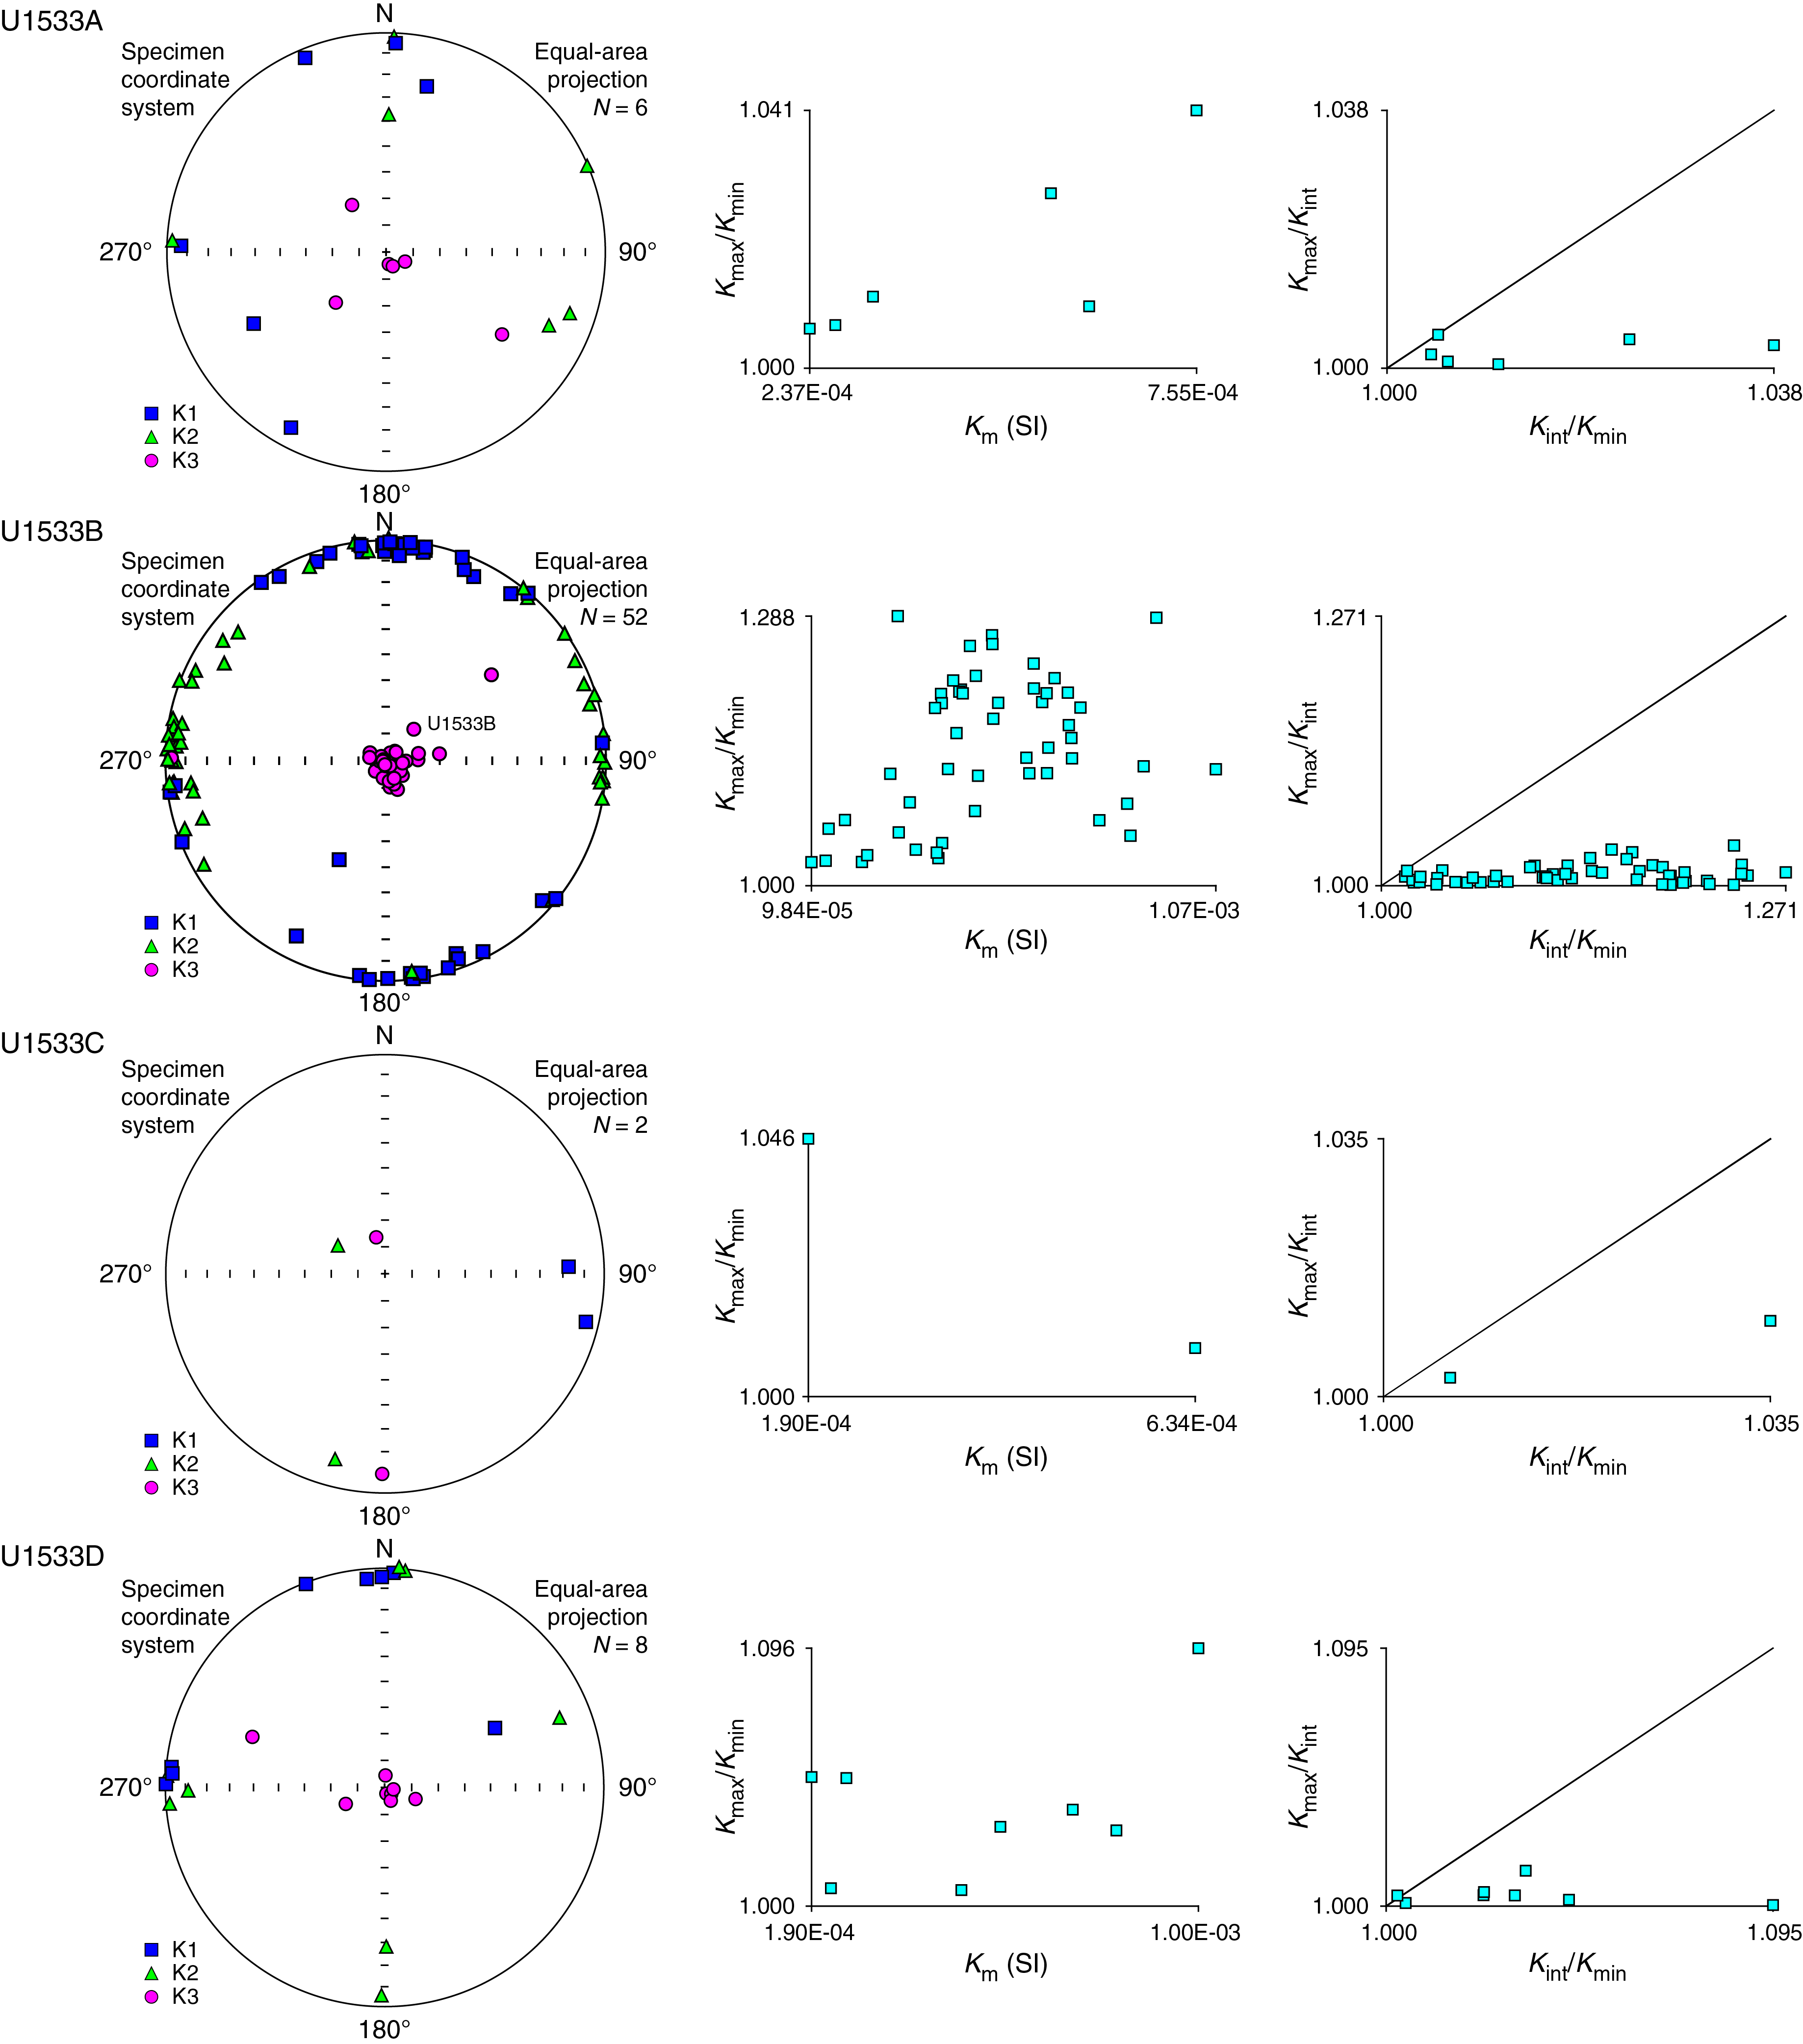
Figure F19. AMS data.
For Hole U1533D, cored by the APC system, κmax values cluster almost equally toward both the x- and y-axis (see Figure F15 in the Expedition 379 methods chapter [Gohl et al., 2021a]).
Therefore, directional data obtained from paleomagnetic measurements on the same samples are considered to be reliable.
Isothermal remanent magnetization
The IRM acquisition curves for the discrete samples show steep slopes at low magnetic fields (Figure F20). Saturation IRM (SIRM) is reached at a direct current (DC) field of 0.3 T for Sample 379-U1533B-3H-6, 127–129 cm (43.81–43.83 m), suggesting (titano)magnetite is the main magnetic remanence carrier. Other samples from Holes U1533A–U1533D reached magnetic saturation at higher DC fields, indicating that smaller magnetic particle sizes and/or a second, magnetically more stable mineral phase occur (Figure F20).
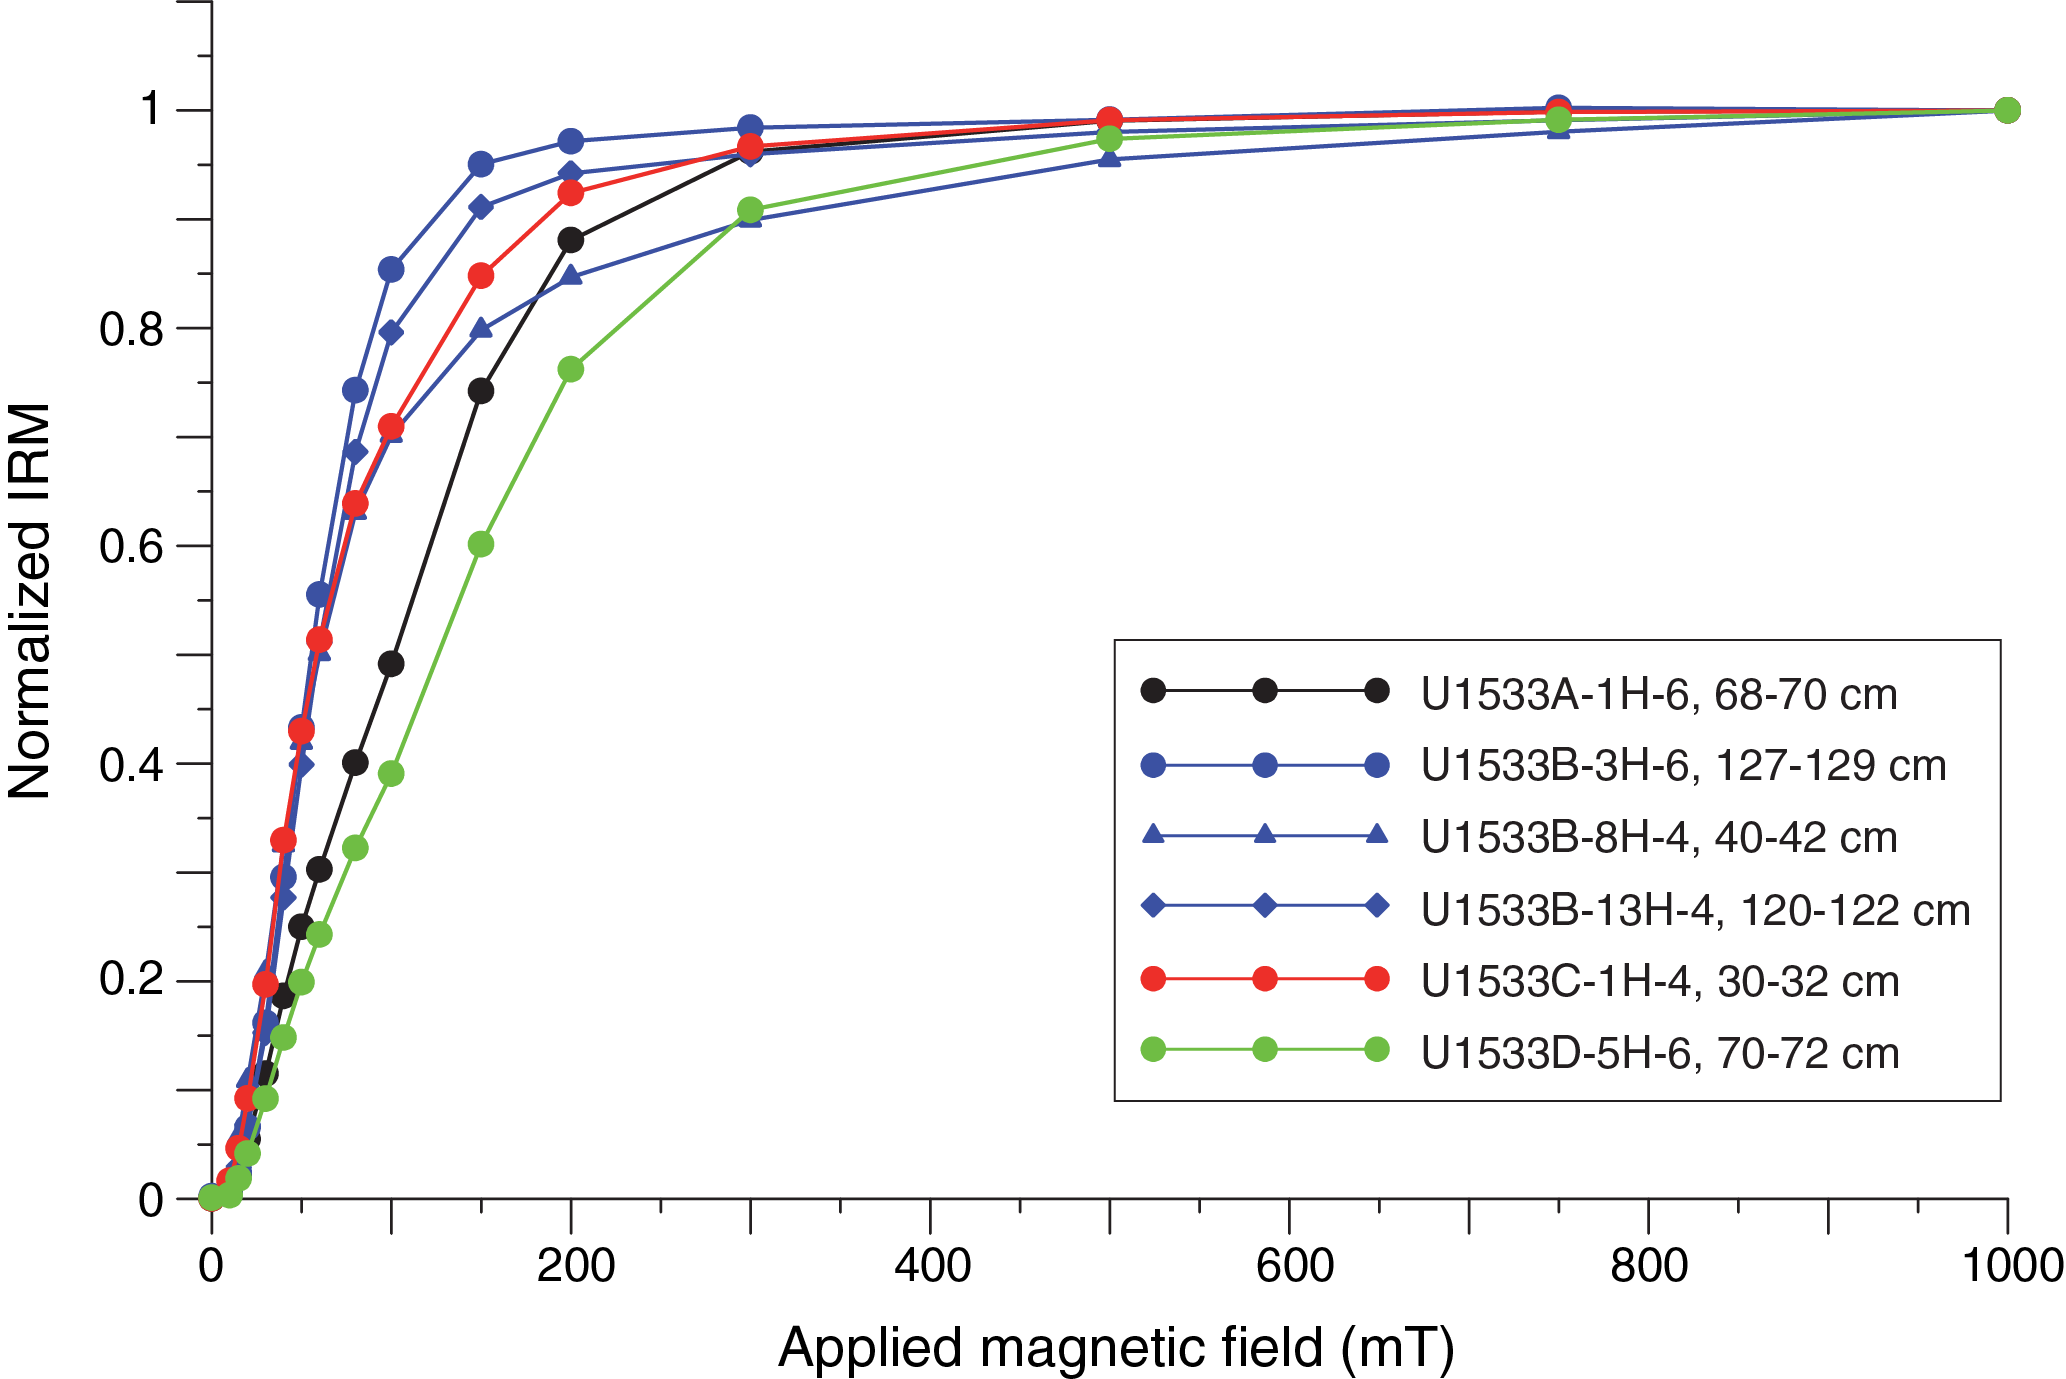
Figure F20. Normalized IRM versus applied DC field.
Orientation tool data
The Icefield MI-5 core orientation tool was deployed while taking all APC cores from Holes U1533A, U1533B, and U1533D except for Cores 379-U1533D-1H and 2H (Table T13). At Site U1533, the MI-5 orientation tool data show significantly more scatter when compared to the results of Site U1532. Apparently, the measurements by MI-5 instrument Icefield 2052 (Cores 379-U1533A-8H through 12H and 379-U1533D-3H through 5H) in particular show a strong bias to roughly southerly directions (see hatched data in Figure F21). Whether this is an instrumental effect is not yet clear. Without the data of instrument Icefield 2052, the corrected declination values (Table T13) still exhibit a bias to (south)westerly directions, but the majority of the data cluster closer to the expected value of 0° (Figure F21). Therefore, we conclude that the orientation data are at least partially reliable. We did not apply the correction for shipboard interpretation; however, it may help to improve postcruise interpretation of paleomagnetic measurements.

Figure F21. Declinations.
Magnetostratigraphy
The interpreted magnetic polarity of Site U1533 (Figure F16) was correlated to the geological timescale of Gradstein et al. (2012; GTS2012). The resulting key paleomagnetic age data (Table T14) were then integrated with biostratigraphic data to produce the age model presented in Chronostratigraphy.
For Hole U1533A, demagnetization of NRM at the 20 mT level identifies the Brunhes–Matuyama transition (0.781 Ma), the termination and beginning of the Jaramillo Subchron (C1r.1n; 0.988 and 1.072 Ma, respectively), and the termination and beginning of the Cobb Mountain Subchron (C1r.2n; 1.173 and 1.185 Ma, respectively). A reversed polarity zone ranging from ~9.6 to ~9.9 m (Section 379-U1533A-2H-1) and two normal polarity zones at ~16 m (Section 2H-5) and ~19.5 m (Section 3H-1) were not yet assigned to the geological timescale but may help to improve the postcruise magnetostratigraphy.
The magnetostratigraphy for Hole U1533B is more complex because of reduced core recovery and drilling disturbance of some intervals primarily deeper in the hole. The shipboard interpretation identifies the beginning of the Olduvai Subchron (C2n; 1.945 Ma), the termination and beginning of Subchron C2An.1n (2.581 and 3.032 Ma, respectively), the termination and beginning of Subchron C2An.3n (3.330 and 3.596 Ma, respectively), the termination and beginning of the Cochiti Subchron (C3n.1n; 4.187 and 4.300 Ma, respectively), and the termination and beginning of the Nunivak Subchron (C3n.2n; 4.493 and 4.631 Ma, respectively). Subchron C2An.2n (3.116–3.207 Ma) might be recovered in very condensed form in Core 379-U1533B-5H at ~58 m. Farther downcore, paleomagnetic measurements revealed the termination and beginning of the Sidufjall Subchron (C3n.3n; 4.799 and 4.896 Ma, respectively) and the termination and beginning of the Thvera Subchron (C3n.4n; 4.997 and 5.235 Ma, respectively). Below an interval without core recovery, the oldest cores, 39R and 43R, are of mainly normal polarity, suggesting a bottom age of Hole U1533B between the termination of Subchron C3An.1n (6.033 Ma) and the beginning of Subchron C3An.2n (6.733 Ma). Oscillating values of normal and reversed polarity at the bottom of Hole U1533B provide no clear evidence that Subchron C3Ar (6.733-7.140 Ma) was recovered.
For Hole U1533C, no magnetic polarity reversal was recorded, suggesting that the recovered sediments are younger than the Brunhes–Matuyama transition (0.781 Ma).
For Hole U1533D, paleomagnetic measurements identified the Brunhes–Matuyama transition (0.781 Ma), the termination and beginning of the Jaramillo Subchron (C1r.1n; 0.988 and 1.072 Ma, respectively), the termination and beginning of the Cobb Mountain Subchron (C1r.2n; 1.173 and 1.185 Ma, respectively), and the termination and beginning of the Olduvai Subchron (C2n; 1.778 and 1.945 Ma, respectively).
The results from discrete sample demagnetization generally confirm the findings from the archive-half measurements (see green dots in Figure F16).
Chronostratigraphy
A shipboard age-depth model was developed for the sequence recovered at Site U1533 (Figure F22) using biostratigraphic age datums (Table T8) to constrain correlation of magnetostratigraphic polarity zones to the Gradstein et al. (2012) geological timescale (GTS2012). This preliminary shipboard age-depth model will be refined with further postcruise biostratigraphic and magnetostratigraphic work. Additional age control will also be provided in postcruise work by application of other age-dating techniques, such as high-resolution cyclostratigraphy and radiometric dating of volcanic mineral grains and bulk tephra samples.
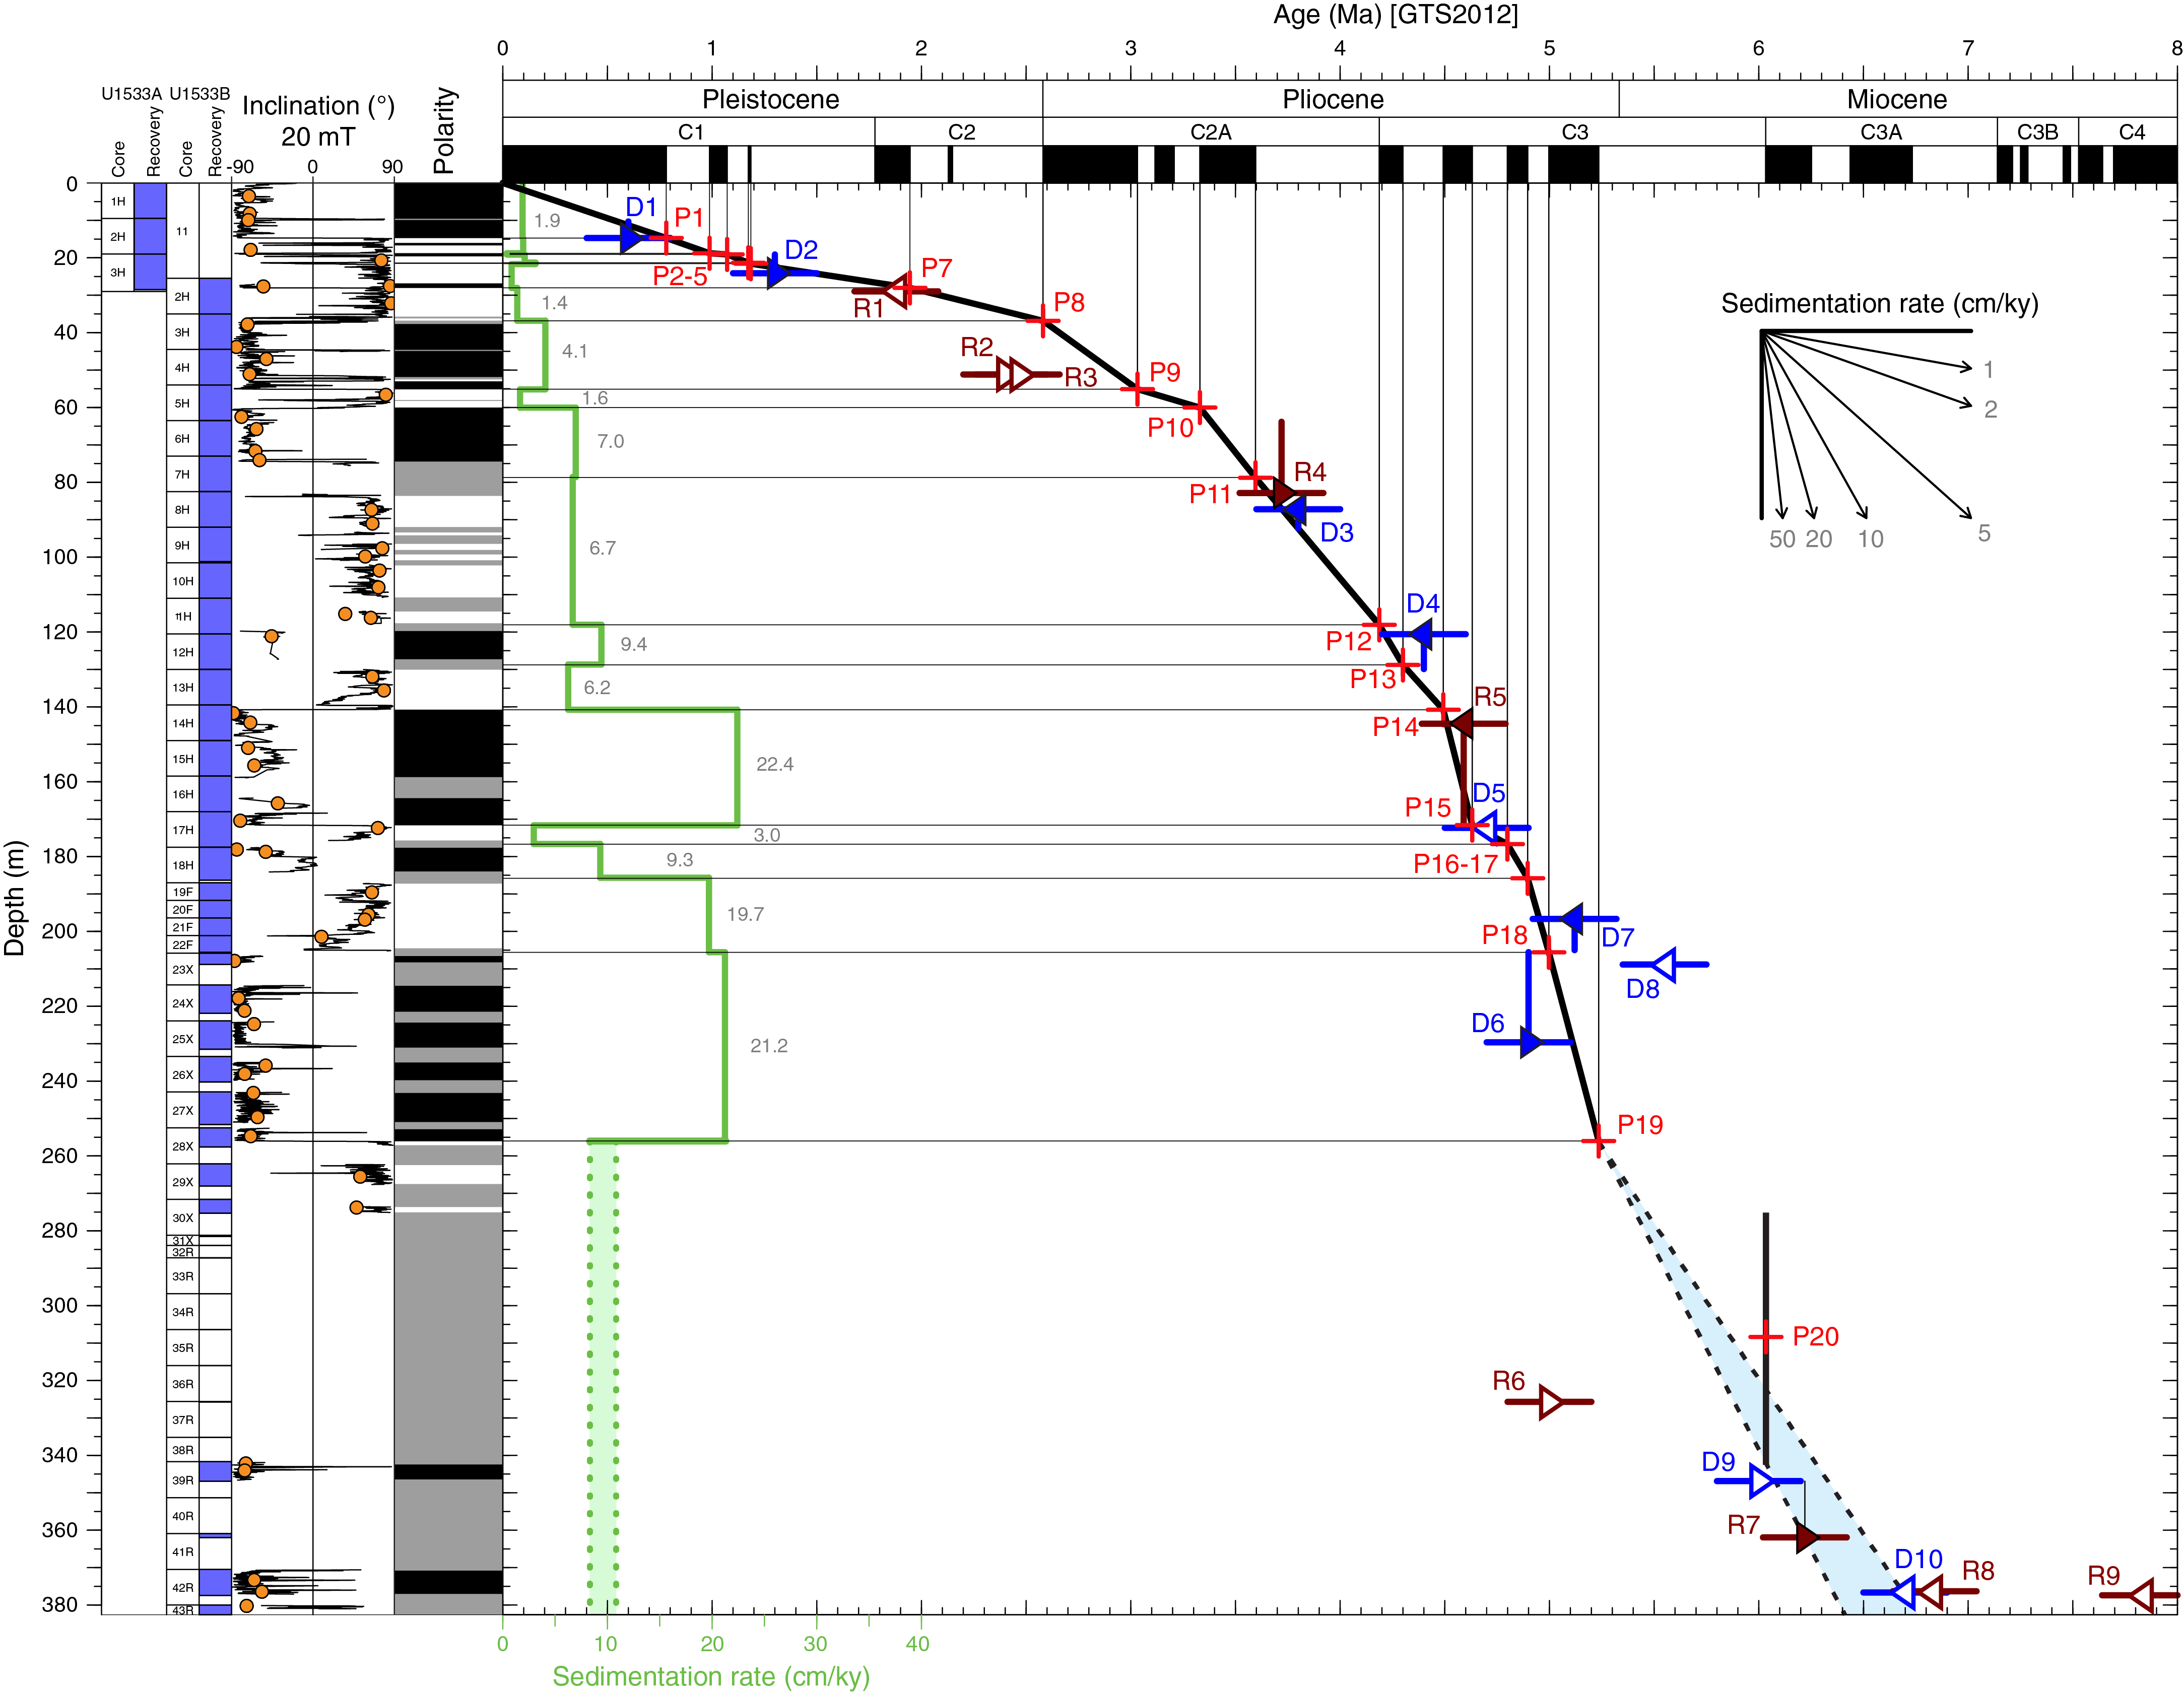
Figure F22. Age-depth model.
Only Holes U1533A and U1533B are considered here in the construction of the age-depth model for Site U1533. Overlapping cores in the uppermost part of the sequence were also recovered in Holes U1533C and U1533D, but vertical offsets between cores on the CSF-A depth scale require the use of a composite depth scale to integrate age data between the four holes. Detailed correlation of physical property data between Holes U1533A–U1533D and construction of a composite splice for the upper ~50 m of the section is considered separately (see Stratigraphic correlation). Compilation of magnetostratigraphic data on the shipboard composite depth scale in this uppermost sequence provides a clear sequence of polarity zones that can be confidently correlated to the GTS2012 (Figure F40).
The following discussion of age-depth relationships for the longer sequence recovered at Site U1533 exclusively utilizes CSF-A depths in Holes U1533A and U1533B. Several issues with the overlap and correlation between Cores 379-U1533A-3H and 379-U1533B-2H on the CSF-A depth scale will be resolved with application of a composite depth scale to the entire sequence in postcruise age-model work.
Biostratigraphic age control for Site U1533 is primarily based on diatom and radiolarian datums (Table T8). In contrast to Site U1532, no significant portion of Site U1533 was devoid of microfossils, thus allowing a good overall biostratigraphic age control for Site U1533. Using 19 biostratigraphic age tie points (Table T8), correlation of magnetostratigraphic polarity zones identified at Site U1533 (Table T14) to the GTS2012 is relatively unambiguous for the upper ~275 m of the sequence (Figure F22).
The interval above ~37 m is assigned a Pleistocene age. The interval from ~37 to 265 m is assigned a Pliocene age. The interval from ~265 to 383 m (base of recovery at Site U1533) is assigned a latest Miocene age. Because of low core recovery in the interval from ~275 to 340 m, interpretation of magnetostratigraphic data below ~340 m is ambiguous. However, normal polarity zones in Cores 379-U1533B-39R and 42R along with the presence of the radiolarian Amphymenium challengerae (6.22–6.87 Ma) in Core 42R and the diatom Thalassiosira miocenica (6.0–6.7 Ma) in Cores 39R and 42R indicate that the lower part of the section is likely correlated to late Miocene Subchrons C3An.1n (6.033–6.252 Ma) and C3An.2n (6.436–6.733 Ma) or potentially both. The combined biomagnetostratigraphic data therefore indicate an age between 6.4 and 6.75 Ma for the base of Hole U1533B at 381.23 m (Figure F22).
Linear sedimentation rates calculated between magnetostratigraphic age tie points (Table T15; Figure F22, green line) show an overall downcore increase in accumulation rates at Site U1533, which average ~1.4 cm/ky in the Pleistocene (~37–0 m), ~5.4 cm/ky between ~4.5 and 2.6 Ma in the mid- to late Pliocene (~141–37 m), and ~15.5 cm/ky between ~5.2 and 4.5 Ma in the early Pliocene (~256–141 m). The highest sedimentation rates (~21–22 cm/ky) at Site U1533 are computed for the early Pliocene in Subchrons C3n.2n (4.493–4.631 Ma) and C3n.4n (4.997–5.235 Ma). Similar trends in sedimentation rates are documented at Site U1532 (see Chronostratigraphy in the Site U1532 chapter [Wellner et al., 2021]), but sedimentation rates are a factor of 2–3 lower at Site U1533 (peak sedimentation rates of ~43–61 cm/ky at Site U1532 versus ~21–22 cm/ky at Site U1533). The lowest sedimentation rates in the Pliocene section of Site U1533 (~3 cm/ky) are calculated for Subchron C3n.2r (4.631–4.799 Ma). This apparent transient decrease in sedimentation rates is also documented at Site U1532 (see Chronostratigraphy in the Site U1532 chapter [Wellner et al., 2021]) and at ODP Site 1095 (Antarctic Peninsula; Acton et al., 2002).
Geochemistry and microbiology
Inorganic geochemistry
We collected a total of 38 interstitial water samples, including 31 from APC cores, 2 from HLAPC cores, 3 from XCB cores, and 2 from RCB cores. The volume of extracted interstitial water varied with depth from a maximum of 30 mL down to 4 mL. Aliquots of interstitial water samples were used for shipboard analyses, and the remaining water was subsampled and distributed for postcruise analyses (see Geochemistry and microbiology in the Expedition 379 methods chapter [Gohl et al., 2021a]). The chemical composition of the interstitial water is listed in Table T16.
Salinity, chloride, and sodium
The downhole profiles of salinity, Cl, and Na at Site U1533 are shown in Figure F23. Salinity shows a constant value of 35.0 from the seafloor to ~235 m. It has slightly lower values (33.0 to ~34.0) from 255 to 375 m.
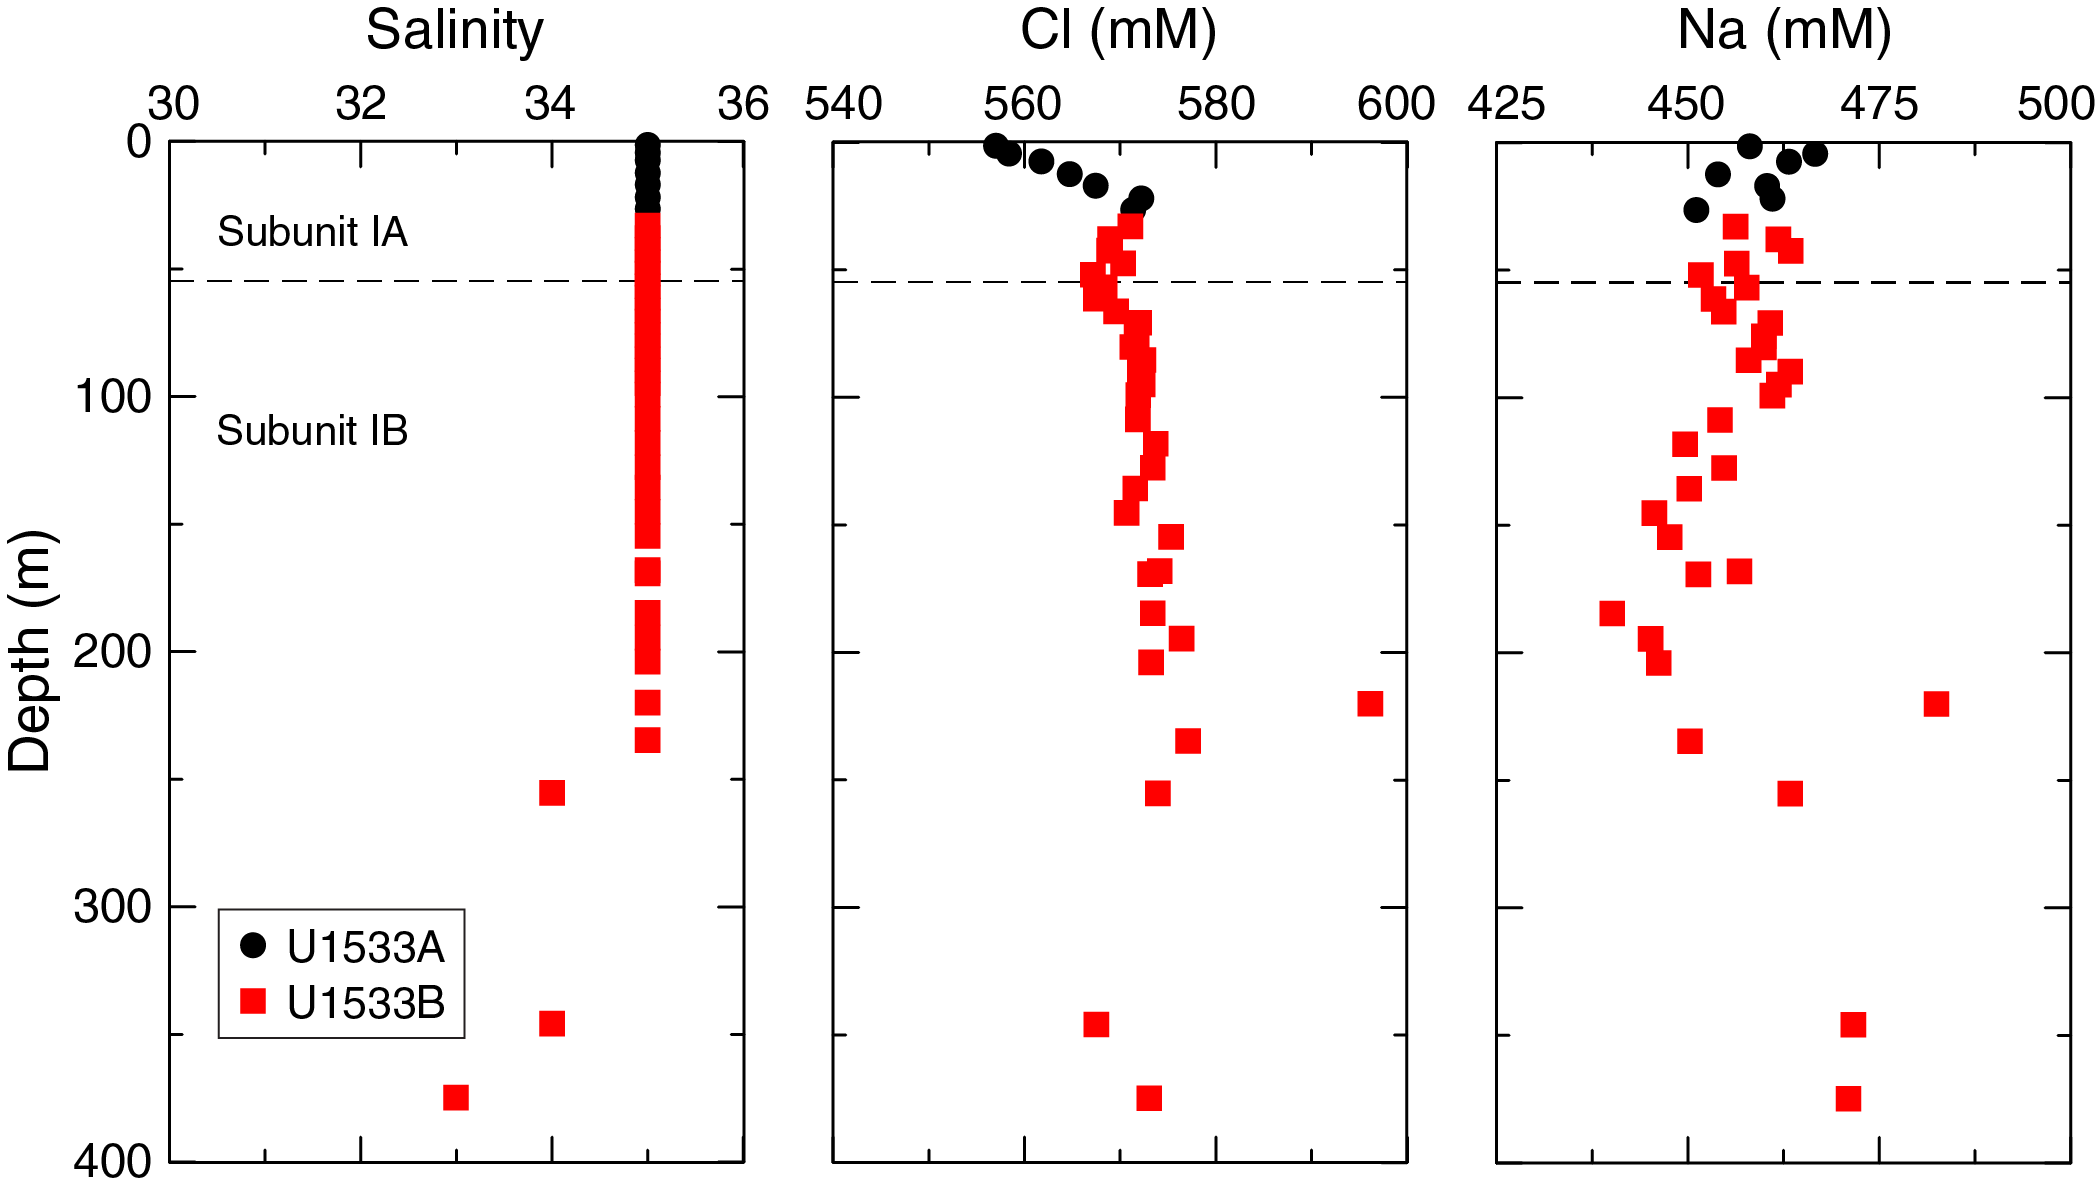
Figure F23. Interstitial water salinity, Cl, and Na.
Cl concentration at Site U1533 ranges between 557 and 596 mM, which is at a similar order of magnitude to slightly higher than the average value of ~559 mM found in modern seawater. The elevated Cl concentrations could be due to hydration reactions during clay formation. Cl concentrations increase steadily with depth and reach a high of ~572 mM at around ~22 m. It varies within a narrow range (568–577 mM) between 26 and 375 m except for one anomalously higher value of 596 mM observed at 220 m. This high value is consistent with the highest concentration of Na at the same depth.
Na concentration ranges between 440 and 483 mM throughout the section and gradually decreases with depth to a minimum at ~185 m. Below this depth, Na concentration displays a generally increasing trend and reaches a maximum at 220 m (~483 mM).
Sulfate, alkalinity, ammonium, and phosphate
Between 1.5 and ~12.5 m, sulfate concentration in Hole U1533A is constant at 28.3 ± 0.1 mM (Figure F24; Table T16). Below ~17 m, sulfate decreases continuously with depth and reaches a minimum of~1.6 mM at 375 m but is still detected farther downcore. The slow drawdown of sulfate indicates only low consumption rates at this site, which reflects low biogeochemical activity.

Figure F24. Interstitial water sulfate, alkalinity, ammonium, and phosphate.
Alkalinity increases linearly with depth from 1.5 m (~2.8 mM) to a maximum (~10.5 mM) at ~185 m, which is the opposite trend to sulfate. Below this depth, alkalinity slightly decreases downcore with values of 7.6–7.7 mM in the two deepest samples from Hole U1533B (Figure F24; Table T16).
Dissolved ammonium (NH4) is not detected in interstitial water samples from 1.5 to 7.5 m in Hole U1533A. It is first detected at 12.5 m and thereafter increases gradually up to 0.92 mM in the deepest sample analyzed at 374.8 m (Figure F24; Table T16). The rate of increase of ammonium with depth slightly changes and slows down around 120 m. Increasing ammonium concentration is likely associated with organic matter decomposition by sulfate reduction.
Dissolved phosphate (PO4) has low concentrations (<25 μM) throughout the cored section. It increases from 5.0 μM at 1.5 m to 20.3 µM at 43 m and then decreases continuously from 43 to 100 m. Below 100 m, phosphate concentration is relatively uniform and mostly below 5.0 µM (Figure F24; Table T16).
Calcium, magnesium, and potassium
Ca concentration shows a linear increase from ~11 mM at 1.5 m to ~24 mM at 220 m (Figure F25; Table T16). From 234 m to the bottom of Hole U1533B, it varies within a narrow range from ~22 to 23 mM (average = 22.5 mM), which is approximately two times higher than that of the modern seawater value. In contrast, K concentration shows a continuous decrease from ~11 mM at 1.5 m to 3.9 mM at 255 m (Figure F25; Table T16). In the two lowermost samples, K concentration increases slightly to an average value of 4.7 mM.
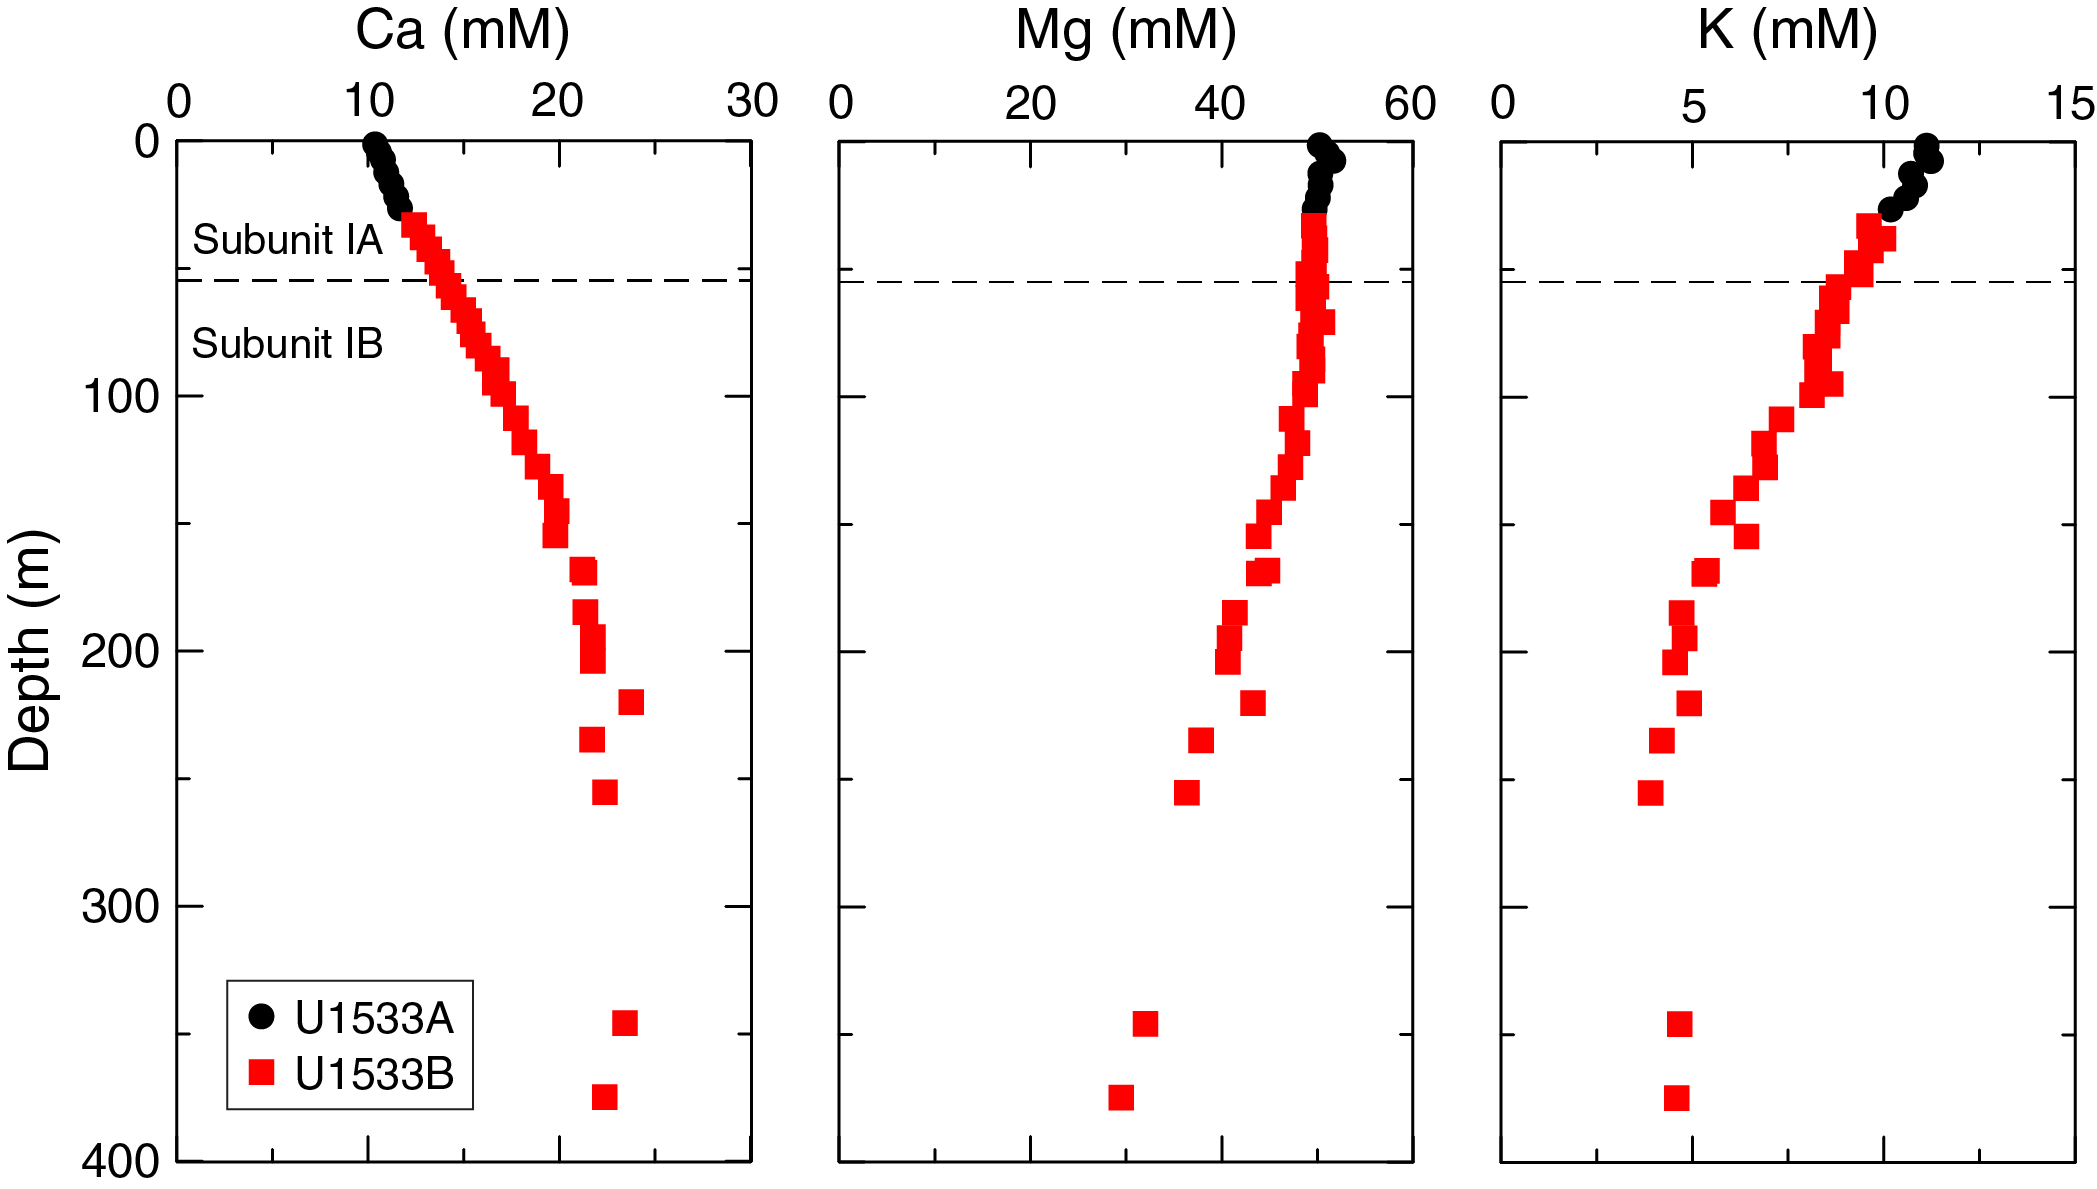
Figure F25. Interstitial water Ca, Mg, and K.
Magnesium (Mg) concentration slightly increases with depth from ~50 mM at 1.5 m to 52 mM at 7.5 m and then shows a steady decrease below 12.5 m, yielding a minimum value of 30 mM at 374.8 m (Figure F25; Table T16). Ca increases while K and Mg decrease with depth likely due to either clay formation or diffusional communication with a deeper fluid that reacted with volcanic rocks or ash. Some volcanic clasts and ash were indeed observed at Site U1533 (see Lithostratigraphy).
Sr, Li, Mn, Fe, B, Ba, and silica
The downcore profiles of Sr, lithium (Li), iron (Fe), Mn, boron (B), barium (Ba), and silica (H4Si[OH]4) are shown in Figure F26. Sr concentration shows an overall increase from 82 μM at 1.5 m to 196 μM at 374.8 m. Maximum values are ~2.5 times higher than the modern seawater value (~82 μM). The higher Sr concentration indicates either higher fluid-rock reaction with volcaniclastic material or dissolution of carbonates (e.g., Gieskes et al., 1990; Torres et al., 2004; Teichert et al., 2005).
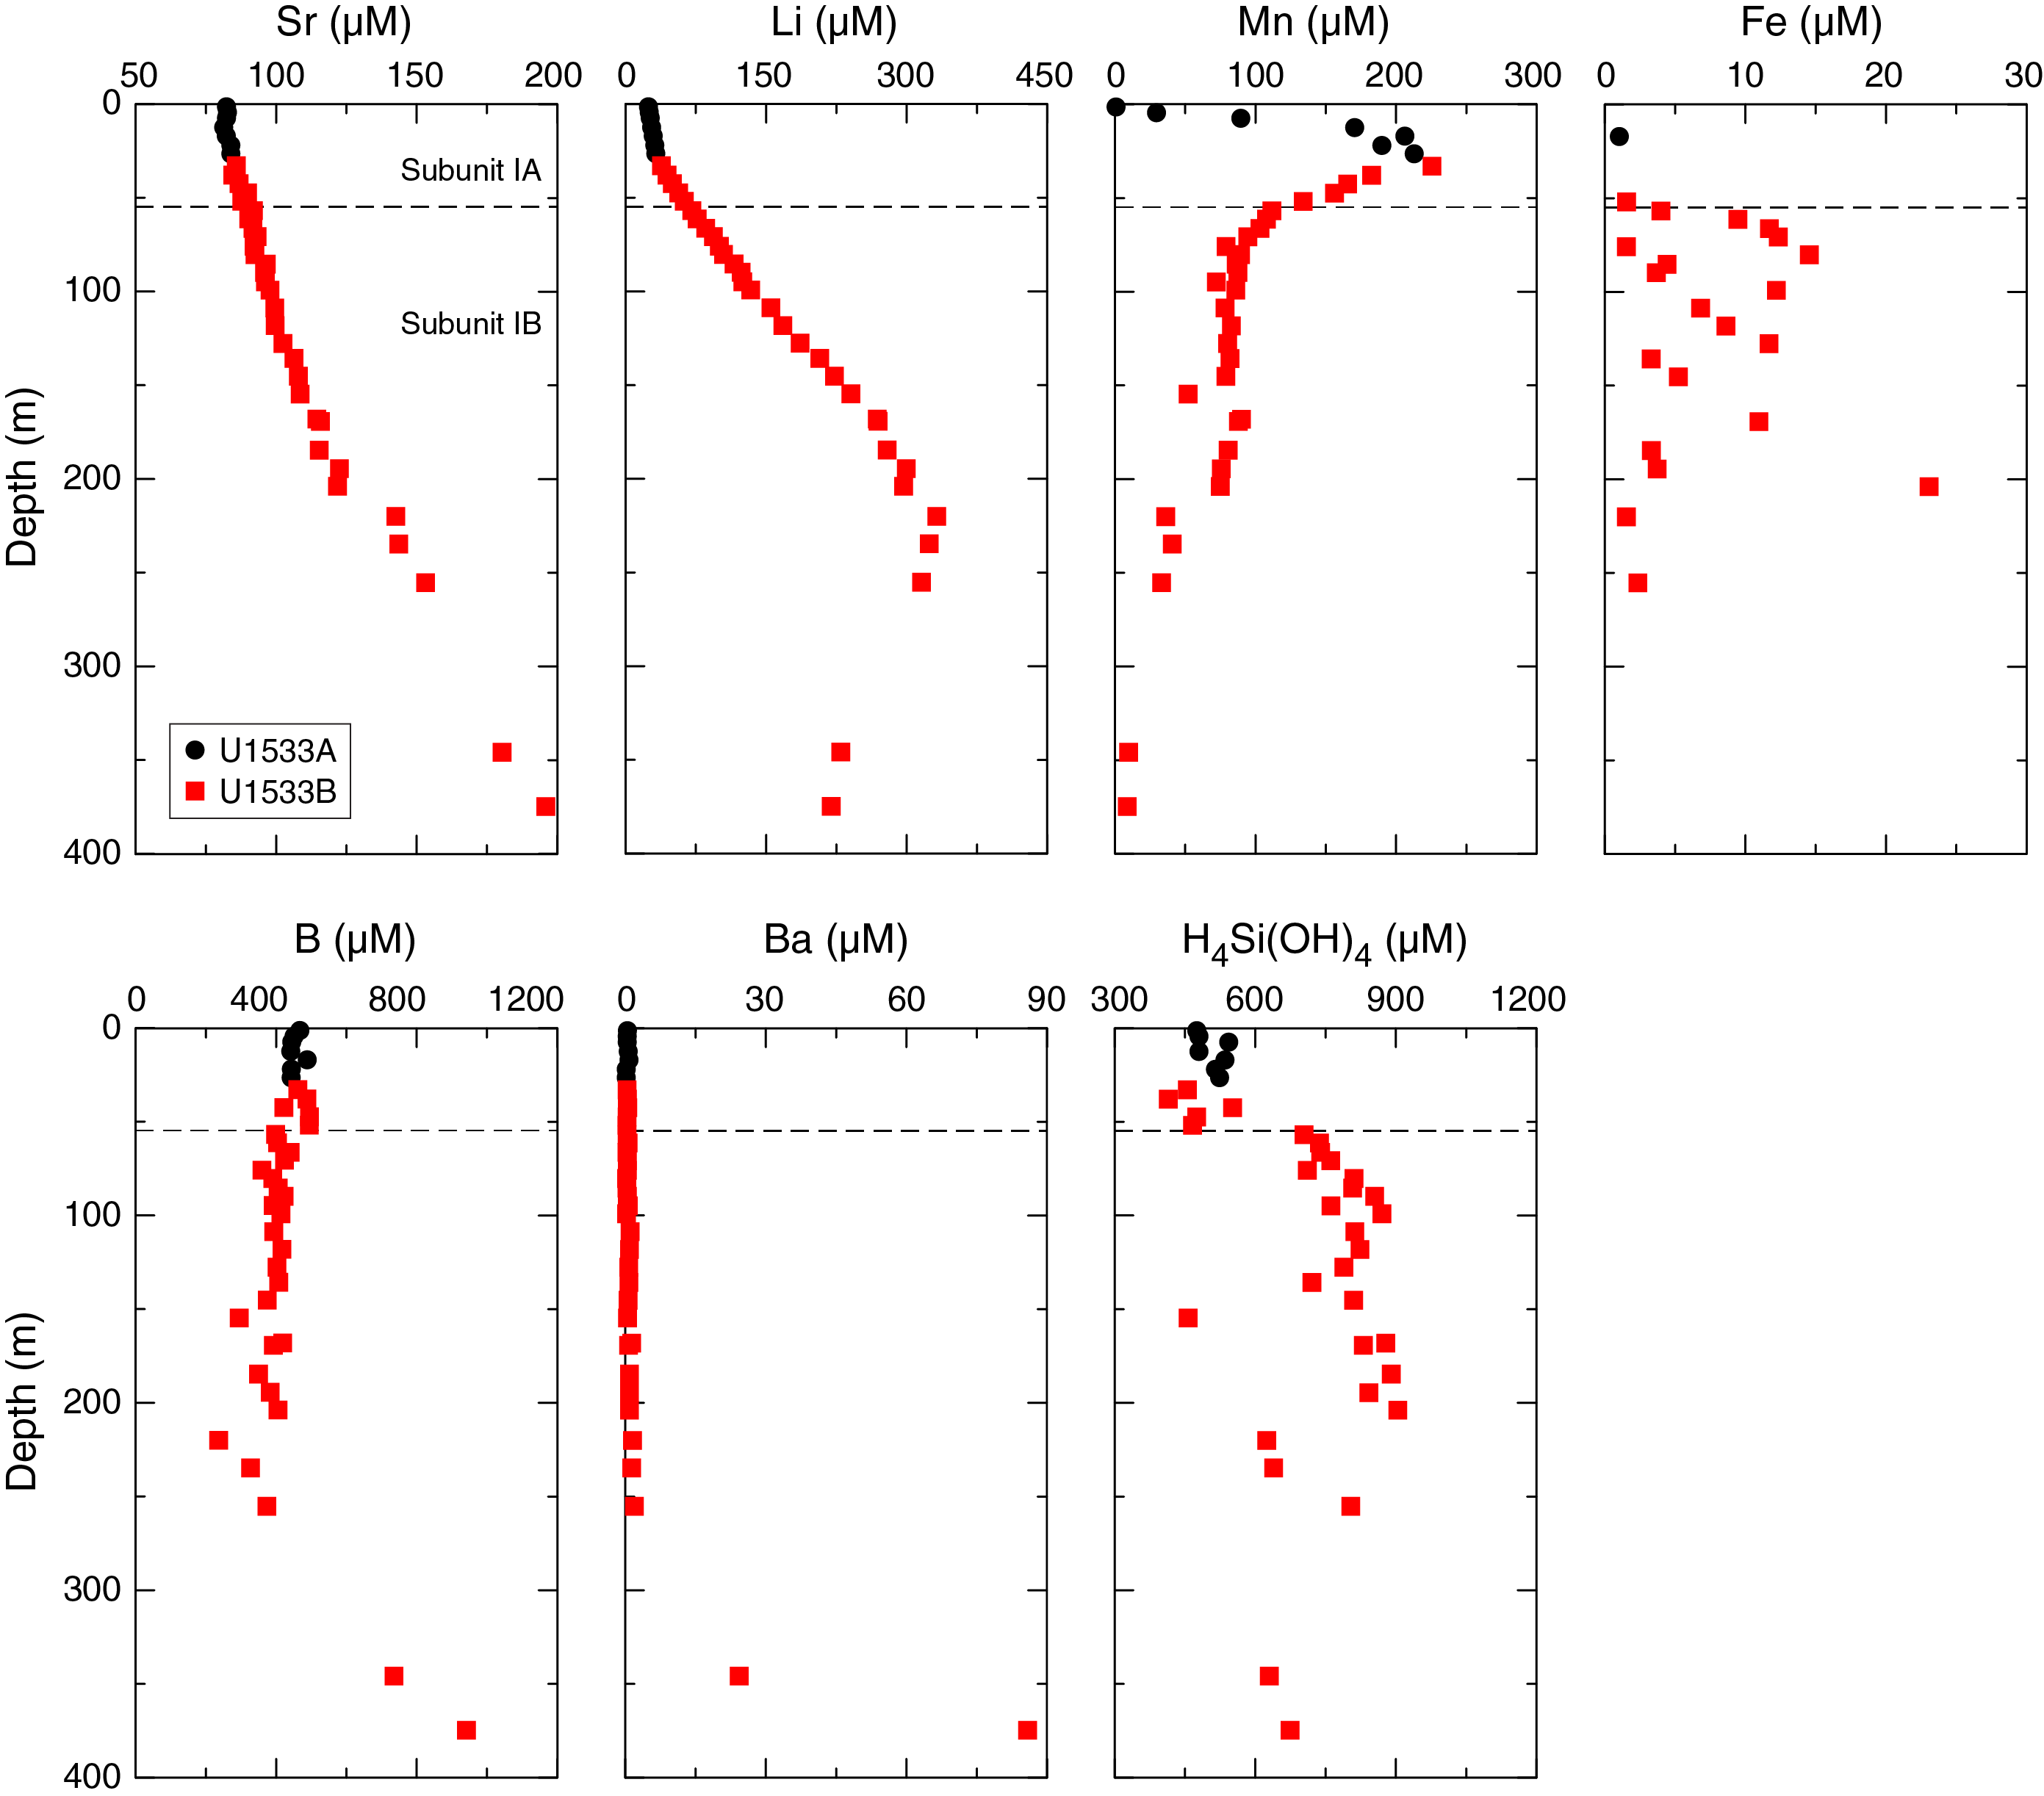
Figure F26. Interstitial water Sr, Li, Mn, Fe, B, Ba, and silica, Holes U1533A and U1533B.
Li concentrations display only a slight increase from 25 μM at 1.5 m to 32 μM at 26.5 m. Below 33 m, Li concentrations sharply increase with depth and reach a maximum value of 332 μM at 220 m. They then decrease from 324 μM at 235 m to 220 μM at 374.8 m.
Mn concentrations increase rapidly from 0.8 μM at 1.5 m to 226 μM at 33 m. They sharply decrease from 183 μM at 38 m to 112 μM at 57 m. Below this depth, Mn concentrations show a slight decrease down to 204 m and thereafter rapidly decline to 36 μM at ~220 m. They decrease to 8–9 µM in the two deepest samples. Fe concentrations are consistently low (usually <15 µM) throughout the entire cored section at Site U1533 and are mostly below the detection limit above 50 m. Fe concentrations are somewhat higher in the interval between 55 and 170 m, with the exception of a single high value of 23.1 µM at 204 m. The decrease in Mn concentrations together with relatively constant sulfate and Fe concentrations from 1.5 to 13 m indicate that in this interval Mn reduction may be the dominant biogeochemical reaction degrading organic matter rather than sulfate or Fe reduction. Because sulfate reduction seems to be low in sediments deeper than 17 m, Mn reduction overlaps with sulfate reduction from 17 to 378 m, resulting in high Mn concentrations in this interval.
B concentrations show an overall decreasing trend from 467 μM at 1.5 m to 237 μM at 220 m (Figure F26; Table T16). They rapidly increase in the two deepest samples and reach a maximum value of 942 μM at 374.8 m.
Ba concentrations are low and show little variation (0.2–2.0 μM) from 1.5 to 255 m (Figure F26; Table T16). Once again, the two deepest samples show higher values; Ba concentrations reach a maximum of 86 μM, which coincides with the minimum in sulfate concentration. This Ba enrichment may be due to barite (BaSO4) dissolution.
Silica concentrations are relatively low and do not show any trend down to ~50 m. Below this depth, silica concentrations increase to 204 m. From 220 m to the deepest sample, silica concentrations vary from ~625 to 674 μM (with the exception of the sample at 255 m with a value of 804 μM) and do not show any apparent trend. This site has a relatively higher abundance of diatoms throughout the cored section (see Biostratigraphy). Diagenesis and dissolution of these diatoms likely resulted in the higher interstitial water silica concentrations.
Organic geochemistry
Hydrocarbon analysis
A total of 36 headspace gas samples were taken at Site U1533 for routine safety monitoring (Pimmel and Claypool, 2001) and analyzed by gas chromatography (GC; see Geochemistry and microbiology in the Expedition 379 methods chapter [Gohl et al., 2021a]). Methane concentrations are ~4 ppmv, close to the instrumental background signal, in Hole U1533A and most of Hole U1533B (Figure F27). At ~325.60 m, methane concentrations increase rapidly to a maximum of 6374 ppmv at 375.02 m. Thereafter, methane concentrations decrease to ~1755 ppmv in the deepest sample analyzed (380.00 m). No hydrocarbons other than methane were detected (Table T17). Increased methane concentrations were found only at the base of Lithostratigraphic Subunit IB (see Lithostratigraphy), which coincides with the lowest sulfate values (Figure F24; see Inorganic geochemistry). Together with the absence of higher hydrocarbons (i.e., C2–C3), this may suggest a biological source of methane at Site U1533.
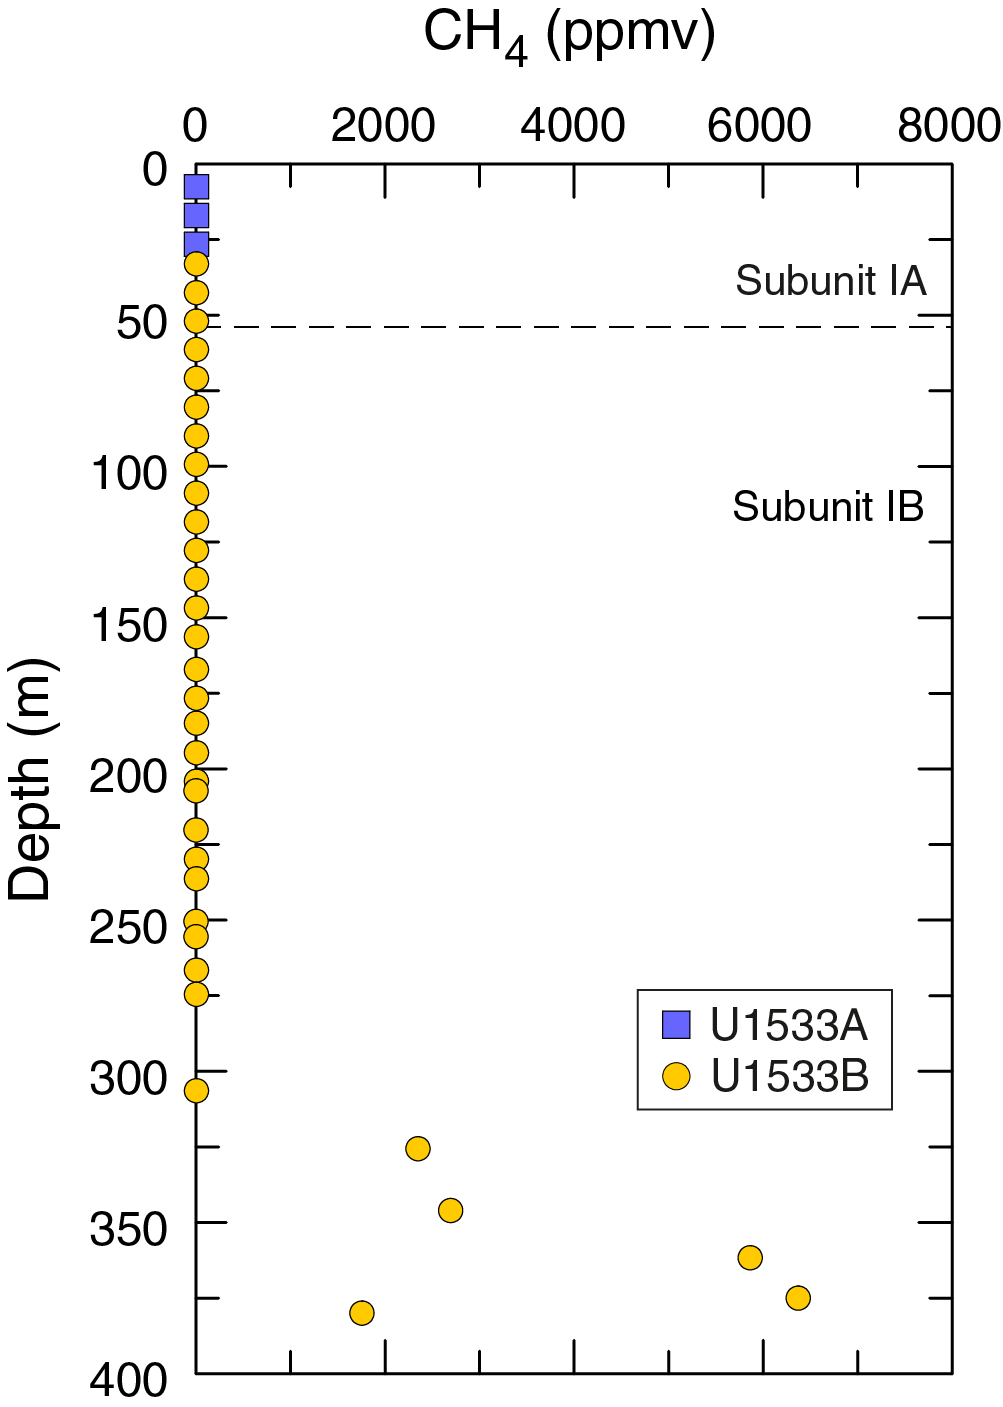
Figure F27. Methane.
Bulk sediment analysis
A total of 87 samples were collected for the analysis of bulk geochemical properties at Site U1533 (Figure F28; Table T18). TC contents vary from 0.02 to 0.5 wt% (mean = 0.20 ± 0.14 wt%), and samples with higher values show an increasing trend with depth. CaCO3 content is low at Site U1533 and ranges from 0.02 to 2.54 wt% (mean = 0.35 ± 0.44 wt%). It is generally higher in Lithostratigraphic Subunit IB and shows a maximum between 139.7 and 265.5 m (Figure F28). The higher CaCO3 content in this interval is likely attributed to the more common occurrence of Facies F2, which contains carbonate-cemented silt and sand laminae (see Lithostratigraphy). TOC content varies between 0.01 and 0.41 wt% (mean = 0.16 ± 0.12 wt%) and is similar in terms of trends and abundances to the TC record, indicating that organic carbon contributes most to the TC pool. TOC is ≤0.8 wt% and particularly low in Subunit IA. Comparatively high total sulfur (TS) values in this subunit (up to 0.16 wt%) suggest that sulfate reduction may have resulted in the degradation of the initially deposited organic matter. In Subunit IB, the TOC content shows an abrupt increase and higher downcore variability. Samples with elevated TOC content in this subunit are usually associated with the laminated gray clays of Facies F2, whereas low values are found in the green to gray bioturbated silts and clays of Facies F3 and F4 (see Lithostratigraphy). TOC/total nitrogen (TN) ratios, which are commonly used to identify sources of sedimentary organic matter (Meyers, 1997), vary from 0.3 to 3.8 in Subunit IA and from 0.7 to 11.9 in Subunit IB. TOC/TN ratios in this order of magnitude are commonly considered to indicate a predominantly marine origin of the preserved organic matter. However, low values of this ratio (<4) may also arise from a high loading of inorganic nitrogen (e.g., ammonia) to the TN pool. A bias toward low TOC/TN ratios has been documented previously in siliciclastic deep-sea sediments in which large proportions of ammonia are bound to clay particles (Müller, 1977). As the contribution of inorganic nitrogen will have a particularly strong impact on TOC/TN ratios in organic-lean sediments, this might explain some of the exceptional low ratios encountered at Site U1533.
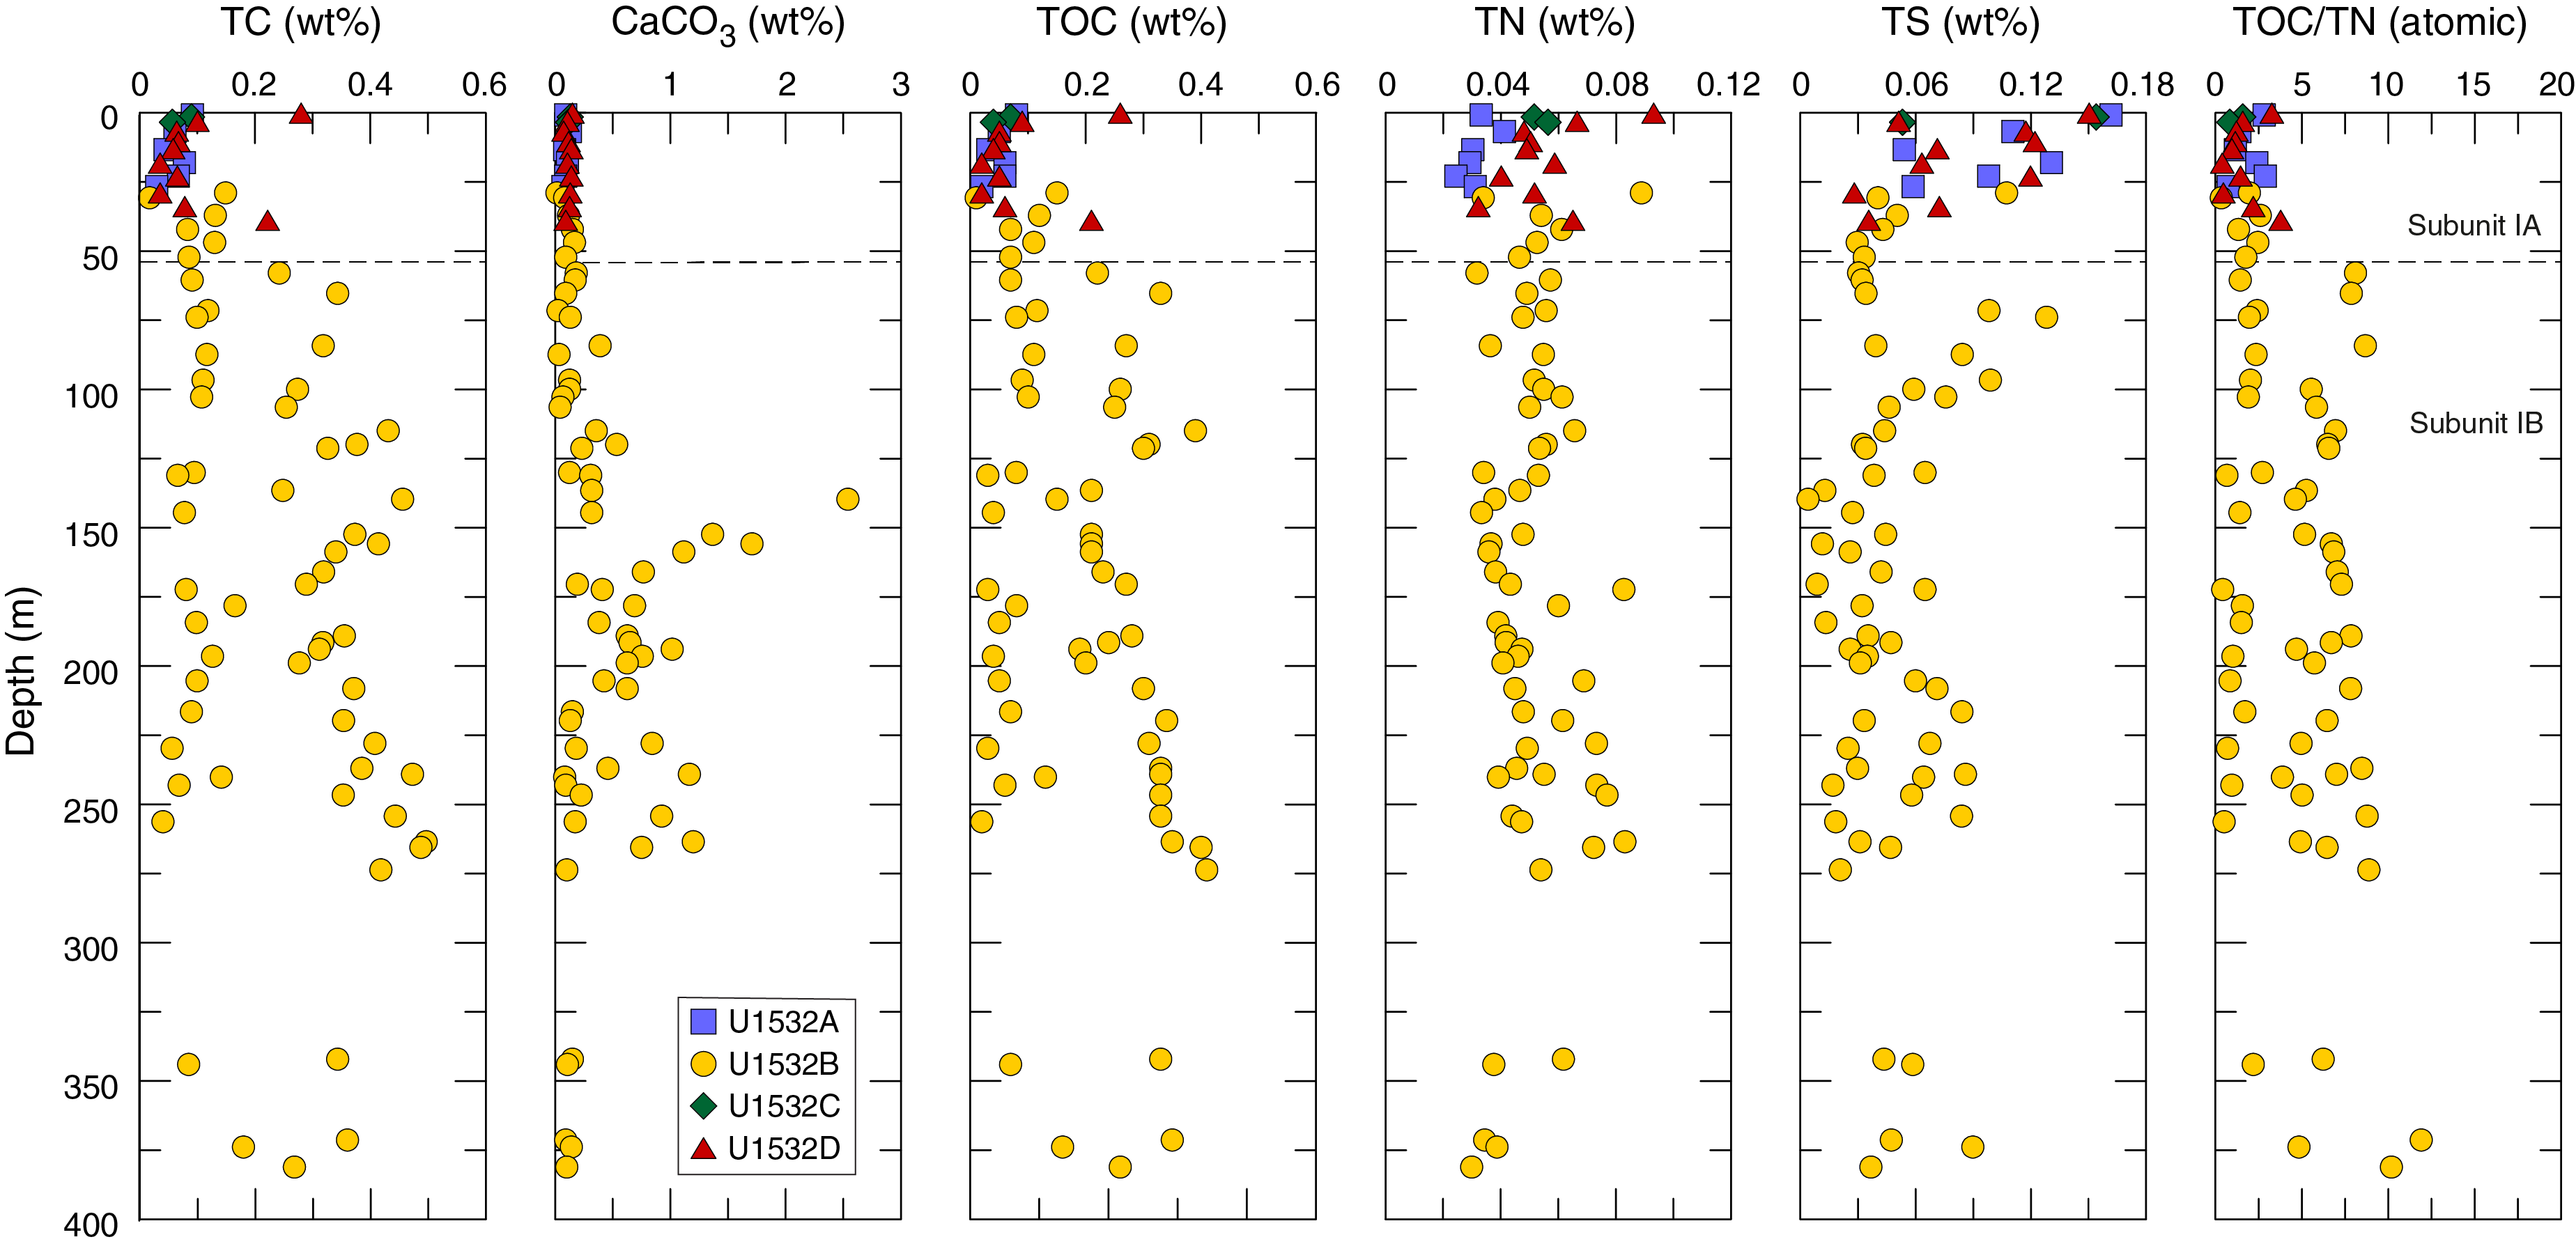
Figure F28. Carbon, nitrogen, sulfur, and TOC/TN.
Microbiology
Contamination testing
To determine the degree of contamination of sediments due to the drilling and coring process, samples for the analysis of perfluorocarbon tracer (PFT) were collected from cores that were chosen for microbiological studies. Perfluoromethylcyclohexane (PMCH) was used as a tracer throughout the shallow Holes U1533A, U1533C, and U1533D. Perfluoromethyldecalin (PFMD) was added to the drilling fluid in Hole U1533B at the end of APC coring and continuously used during HLAPC, XCB, and RCB coring. Sediment samples for contamination testing were collected from (1) the outermost portion of the core adjacent to the core liner and (2) the center of the core furthest from the core liner. Occasionally, whole-round samples were taken and sampled in the same way in a laminar flow cabinet in the microbiology laboratory. Tracers were present in variable concentrations in samples taken from most APC cores’ exteriors because of the direct exposure of the core surface to circulating drilling fluids (Figure F29; Table T19). However, tracer concentrations were usually four orders of magnitude lower in these samples than the target concentrations of PMCH and PFMD in the drilling fluid. Tracers were below detection in the interior of most APC and HLAPC cores with the exception of samples from Sections 379-U1533A-2H-4, 18H-5, and 20F-2, in which low concentrations of PMCH and PFMD were observed. However, the absence of tracers from the central parts of most APC/HLAPC cores and their generally low presence in the cores’ exteriors suggests a low overall contamination with microbial cells from seawater.
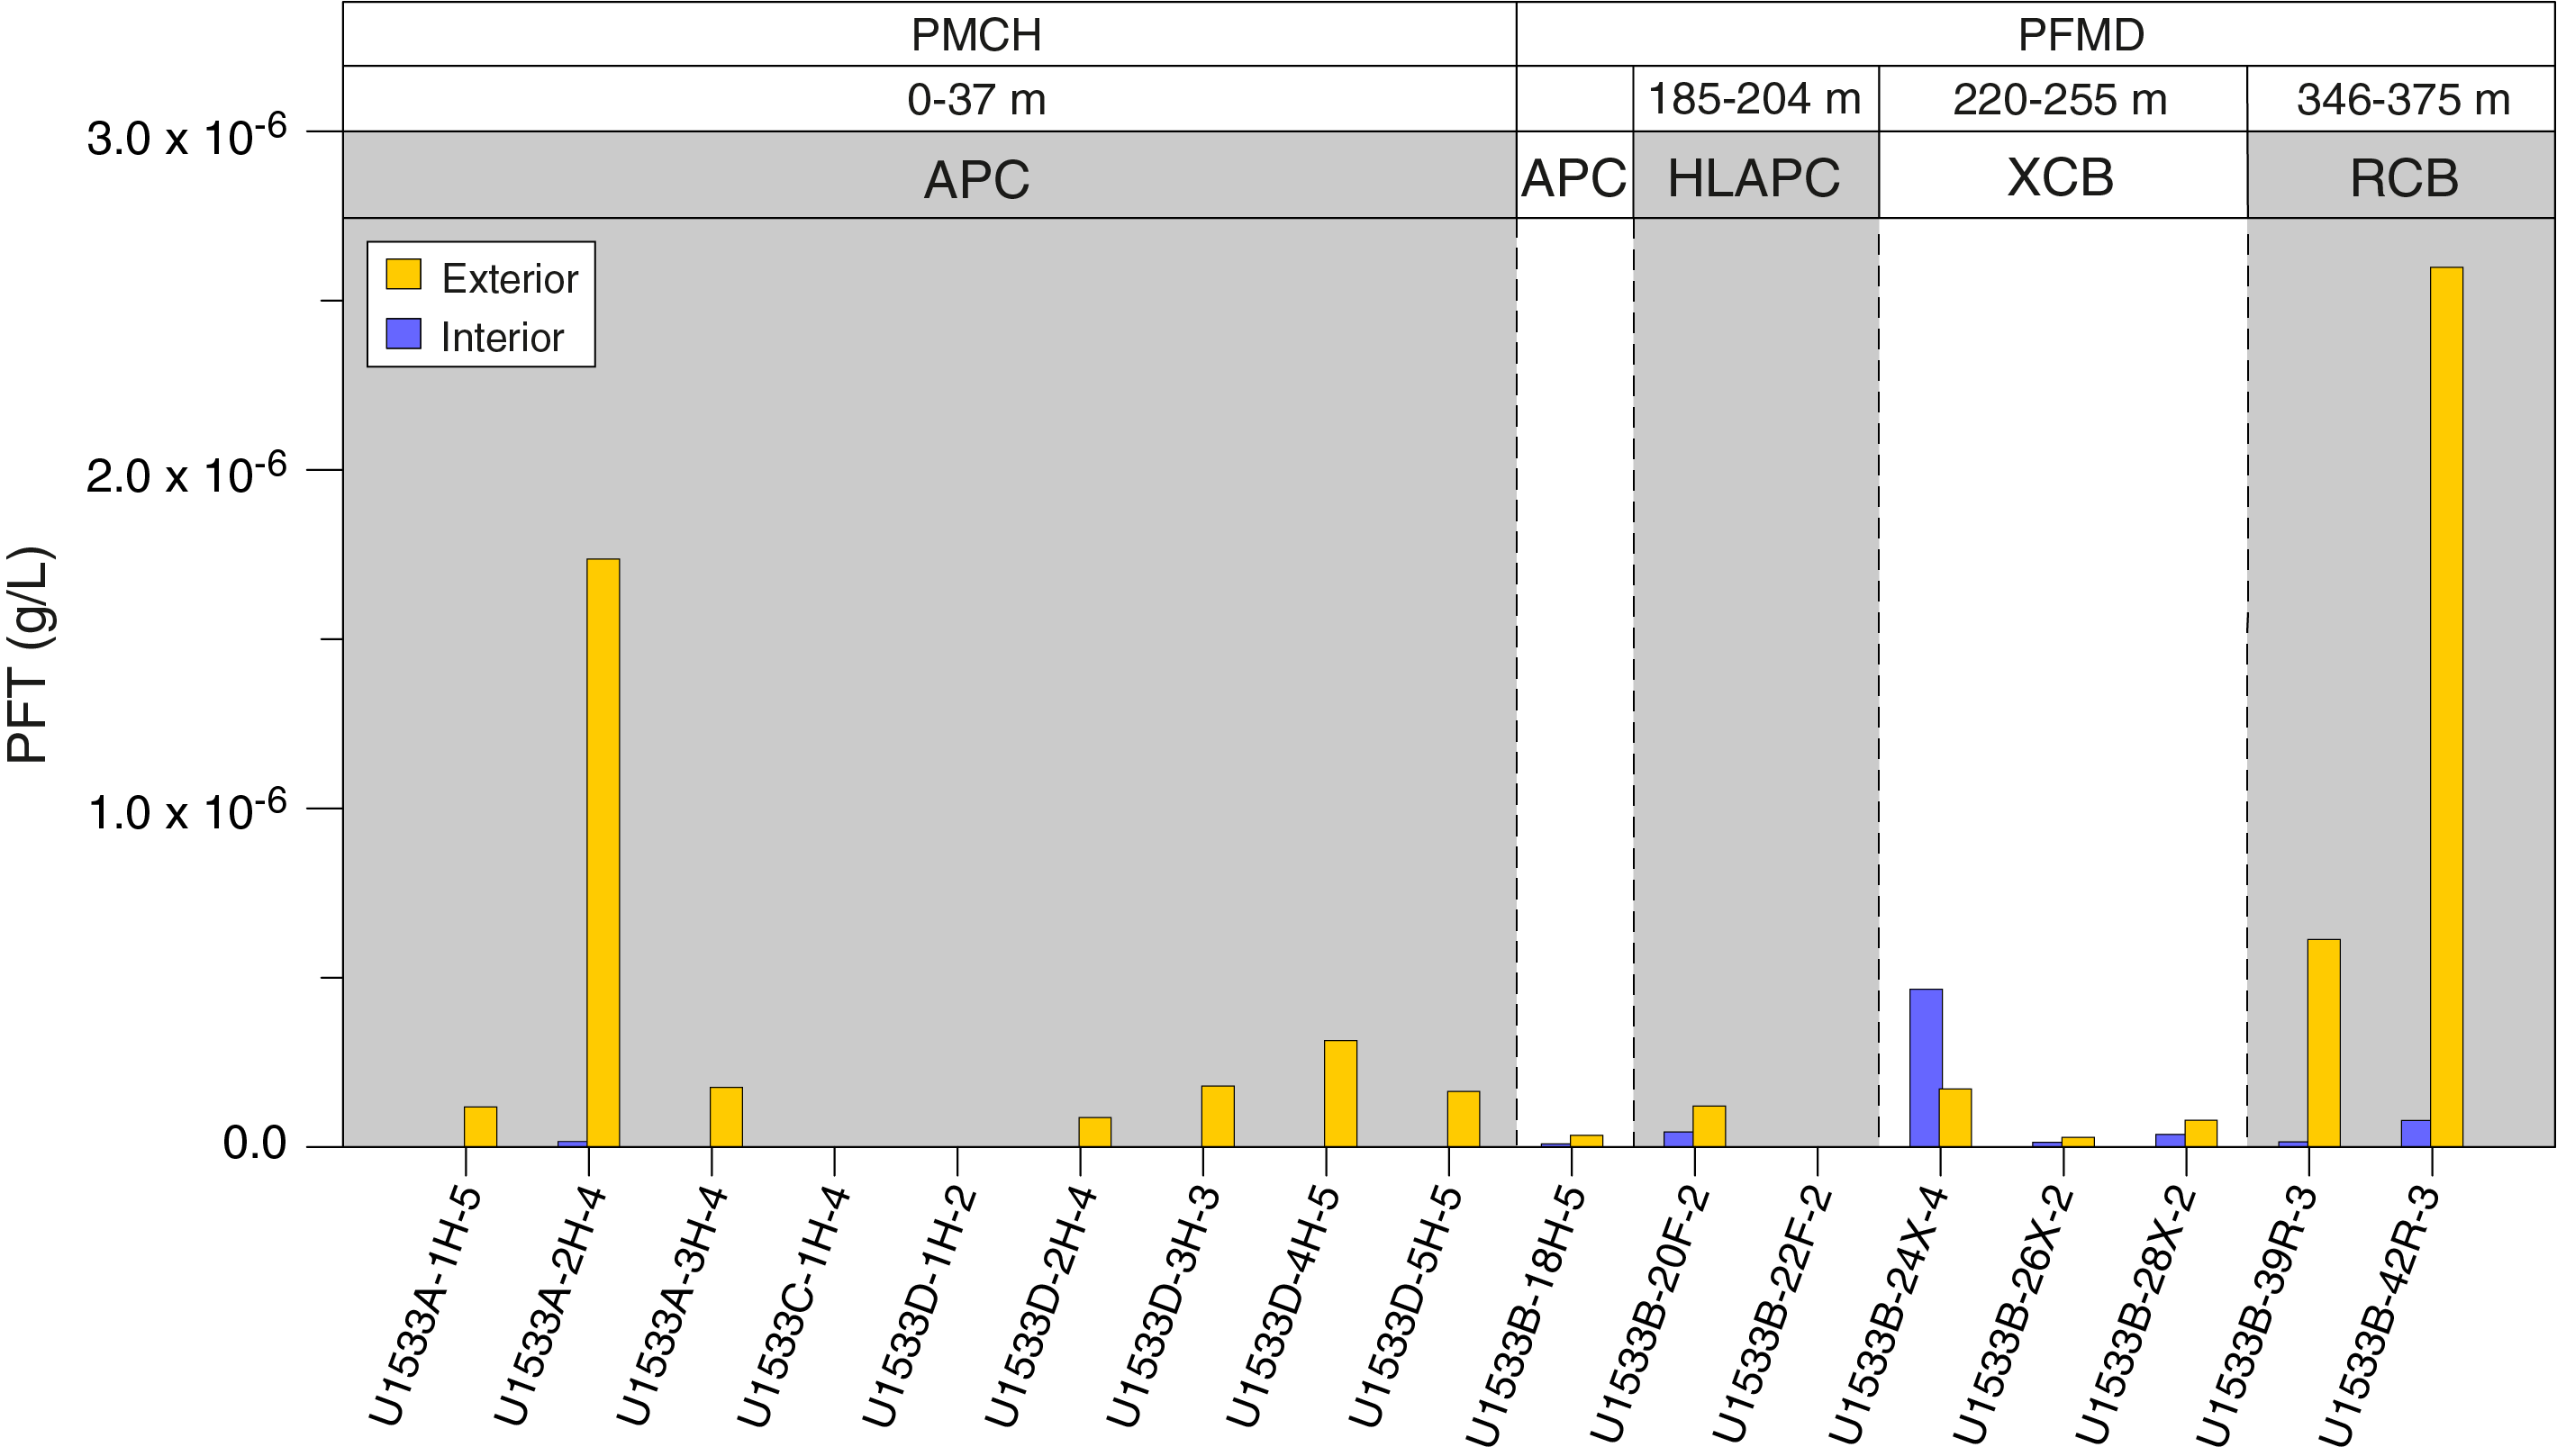
Figure F29. PFT concentrations.
Cores collected using the XCB system generally showed low contamination in both the interior and exterior samples. Contamination with PFMD was again low compared to the tracer’s concentration in the drilling fluid, but in contrast to APC/HLAPC coring it was consistently present in the center of the cores. The sample from Section 379-U1533B-24X-4 showed the highest concentration of PFMD in the core interior, which was likely related to strong drilling disturbance (biscuiting and fracturing) and the presence of comparatively high abundances of drilling mud. The sample from Section 24X-4 is thus considered to be not suited for microbiological analyses.
Both samples collected by RCB coring (from Sections 379-U1533B-38R-3 and 42R-3) generally showed higher levels of contamination with tracer when compared to samples collected by APC, HLAPC, and XCB coring. Contamination was most pronounced in the cores’ exteriors but was generally one to two orders of magnitude below the target concentration of the tracer in the drilling fluid. Both cores also showed contamination in their central part, which is likely related to the higher degree of core disturbances (including fracturing, biscuiting, and injection of drilling fluid/mud) and therefore possible contamination pathways. However, contamination was three orders of magnitude lower in the core interior when compared to the drilling fluid, suggesting that careful sampling from the central part might still allow microbiological analyses despite the more destructive nature of RCB coring.
Physical properties
The shipboard physical properties measured at Site U1533 include nondestructive whole-round measurements of GRA bulk density, magnetic susceptibility, P-wave velocity with the Whole-Round Multisensor Logger (WRMSL), and NGR on core sections from Holes U1533A–U1533D. These measurements were made on all recovered sections with the exception of specific P-wave velocity measurements that were suspended for any sections with incompletely filled liners (all XCB and RCB cores). Thermal conductivity measurements were also made with a needle probe on whole-round soft sediments and later with a puck probe on the working halves of split cores with more consolidated sediments. After splitting the core sections, discrete samples were taken from suitable working halves for MAD measurements. Discrete P-wave velocity measurements were made with the Section Half Measurement Gantry (SHMG) on working halves. Archive halves were measured with the Section Half Multisensor Logger (SHMSL) for magnetic susceptibility and color reflectance. Whole-round physical property data were also used for hole-to-hole stratigraphic correlation and splicing (see Stratigraphic correlation).
Magnetic susceptibility
Magnetic susceptibility was measured on all whole-round sections with a pass-through “loop” sensor on the WRMSL and on split sections with a “point” sensor on the SHMSL, and WRMSL data were postprocessed to account for edge effects (see Physical properties in the Expedition 379 methods chapter [Gohl et al., 2021a]). Both instruments measured magnetic susceptibility at 2 cm intervals. Measured whole-round magnetic susceptibility values range from 5 × 10⁻⁵ to 805 × 10−5 SI (the highest values, above 240 × 10−5 SI, denote sandy layers and large clasts that exist as fall-in at the tops of several cores) with an overall average of 65 × 10−5 SI and a 1σ standard deviation of 32 × 10−5 SI. Average magnetic susceptibility values increase downcore from ~50 × 10−5 to ~100 × 10−5 SI at 55 m, the boundary of Lithostratigraphic Subunits IA and IB (Figure F30). Within this general increase, the upper ~15 m of the shorter, more shallow Holes U1533A, U1533C, and U1533D exhibit a sawtooth pattern of magnetic susceptibility cyclicity, where a sharp increase in overall magnetic susceptibility values is followed by a more gradual decline downcore (Figure F31). Below 55 m, magnetic susceptibility varies cyclically downcore between ~10 × 10−5 and ~130 × 10−5 SI. An increase in average whole-round magnetic susceptibility values from ~20 × 10−5 to ~90 × 10−5 SI at 103 m is followed by a decrease in magnetic susceptibility values (of ~20 × 10−5 SI) at 205 m that corresponds to the transition from APC to XCB and RCB coring (Figure F30). Both XCB and RCB coring return cores with a smaller internal sediment diameter than APC coring, resulting in a slight negative bias and lower measurement values. Whole-round magnetic susceptibility trends follow those observed in GRA bulk density and NGR, likely indicating changes in terrigenous sediment input (Figure F30). Point magnetic susceptibility measurements show the same trends as the whole-round measurements (Figure F32).
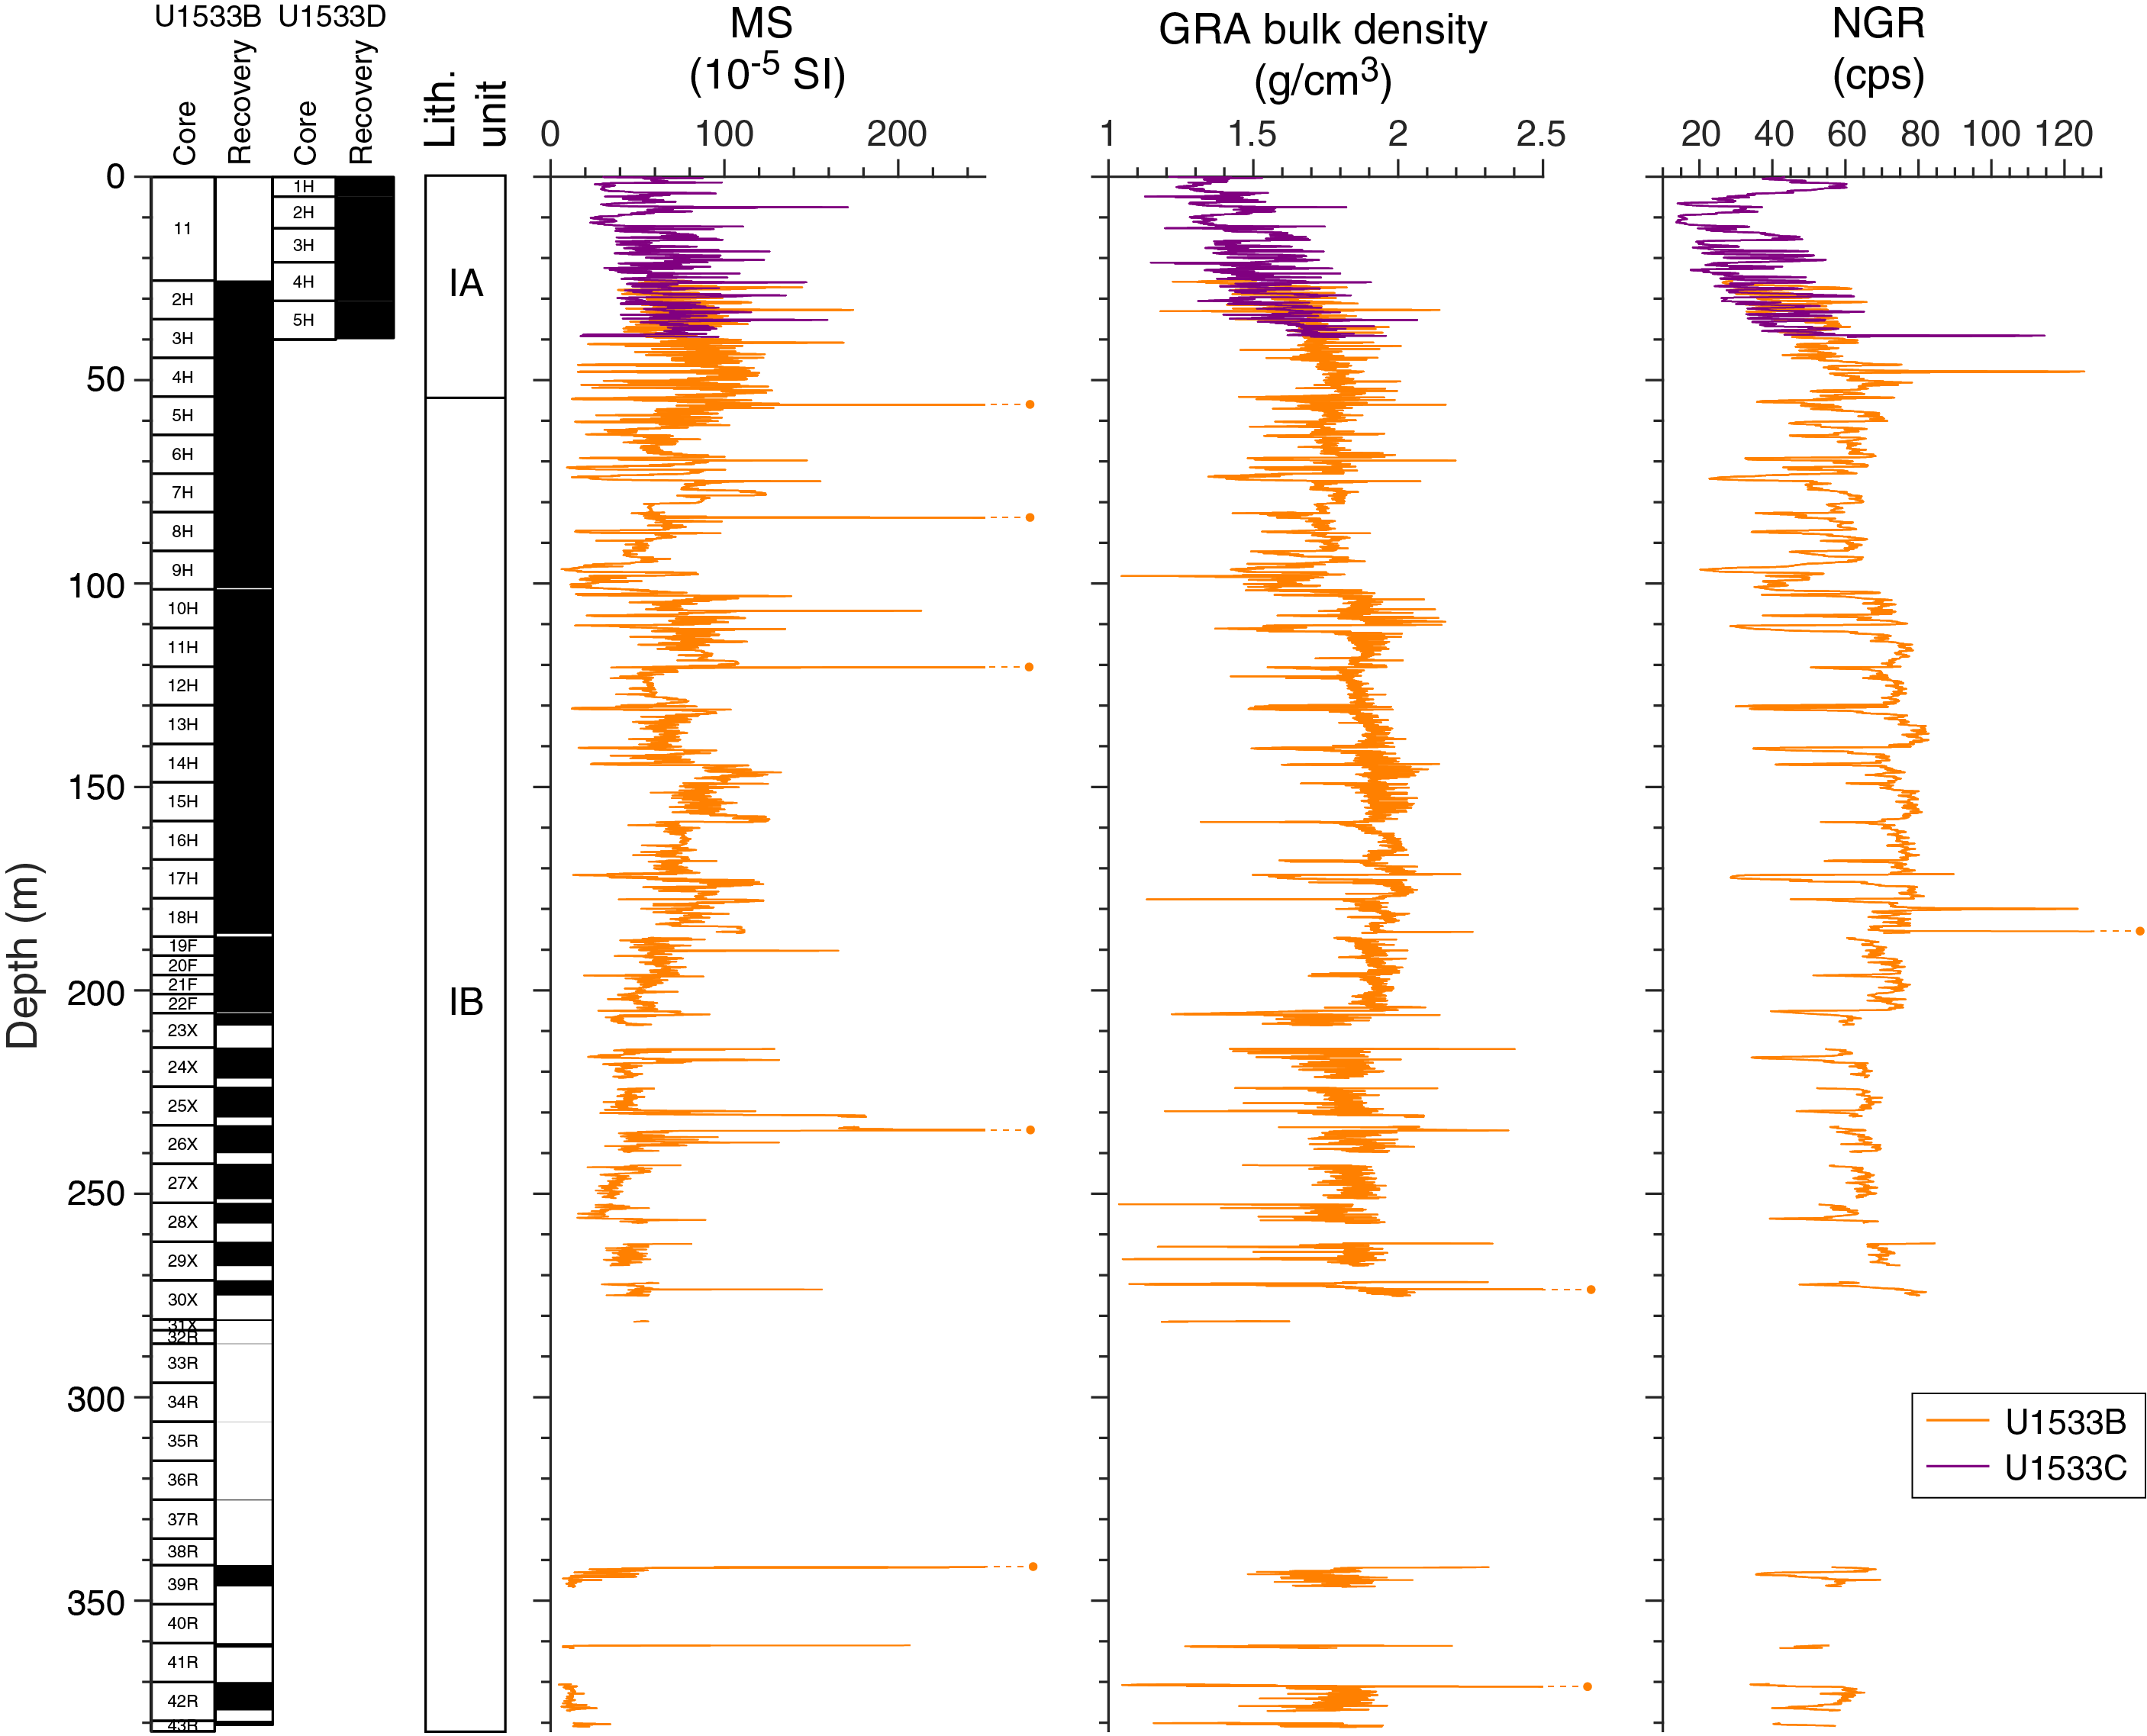
Figure F30. Whole-round physical properties, Holes U1533B and U1533D.
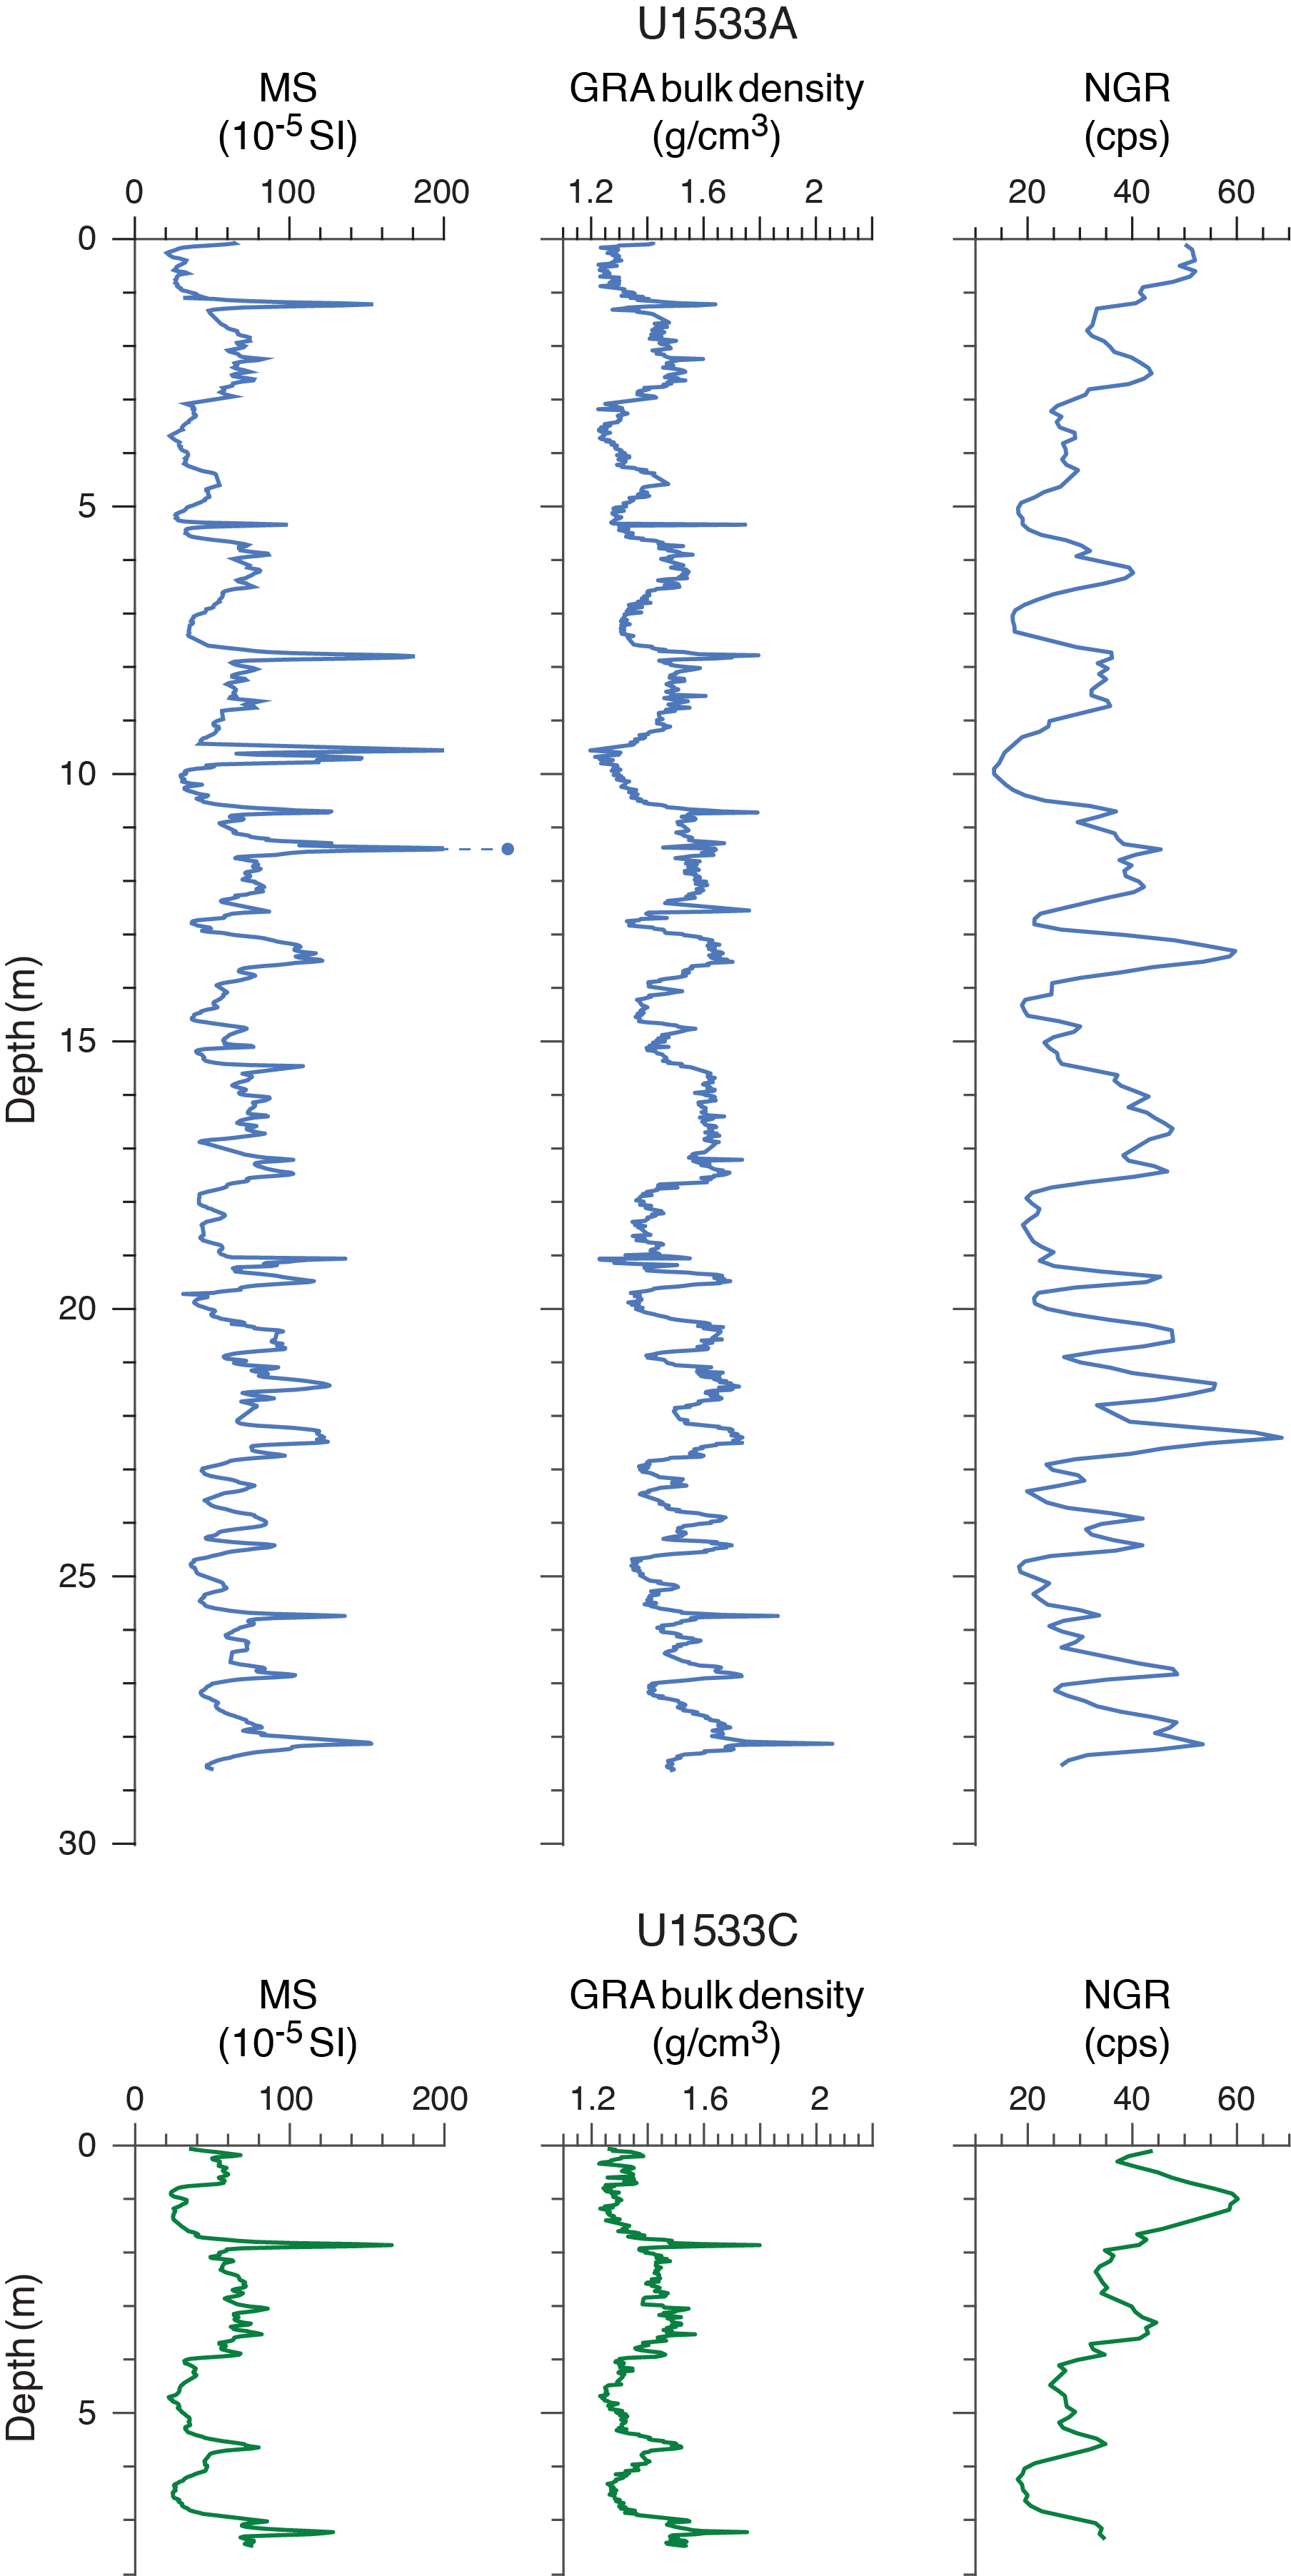
Figure F31. Whole-round physical properties, Holes U1533A and U1533C.
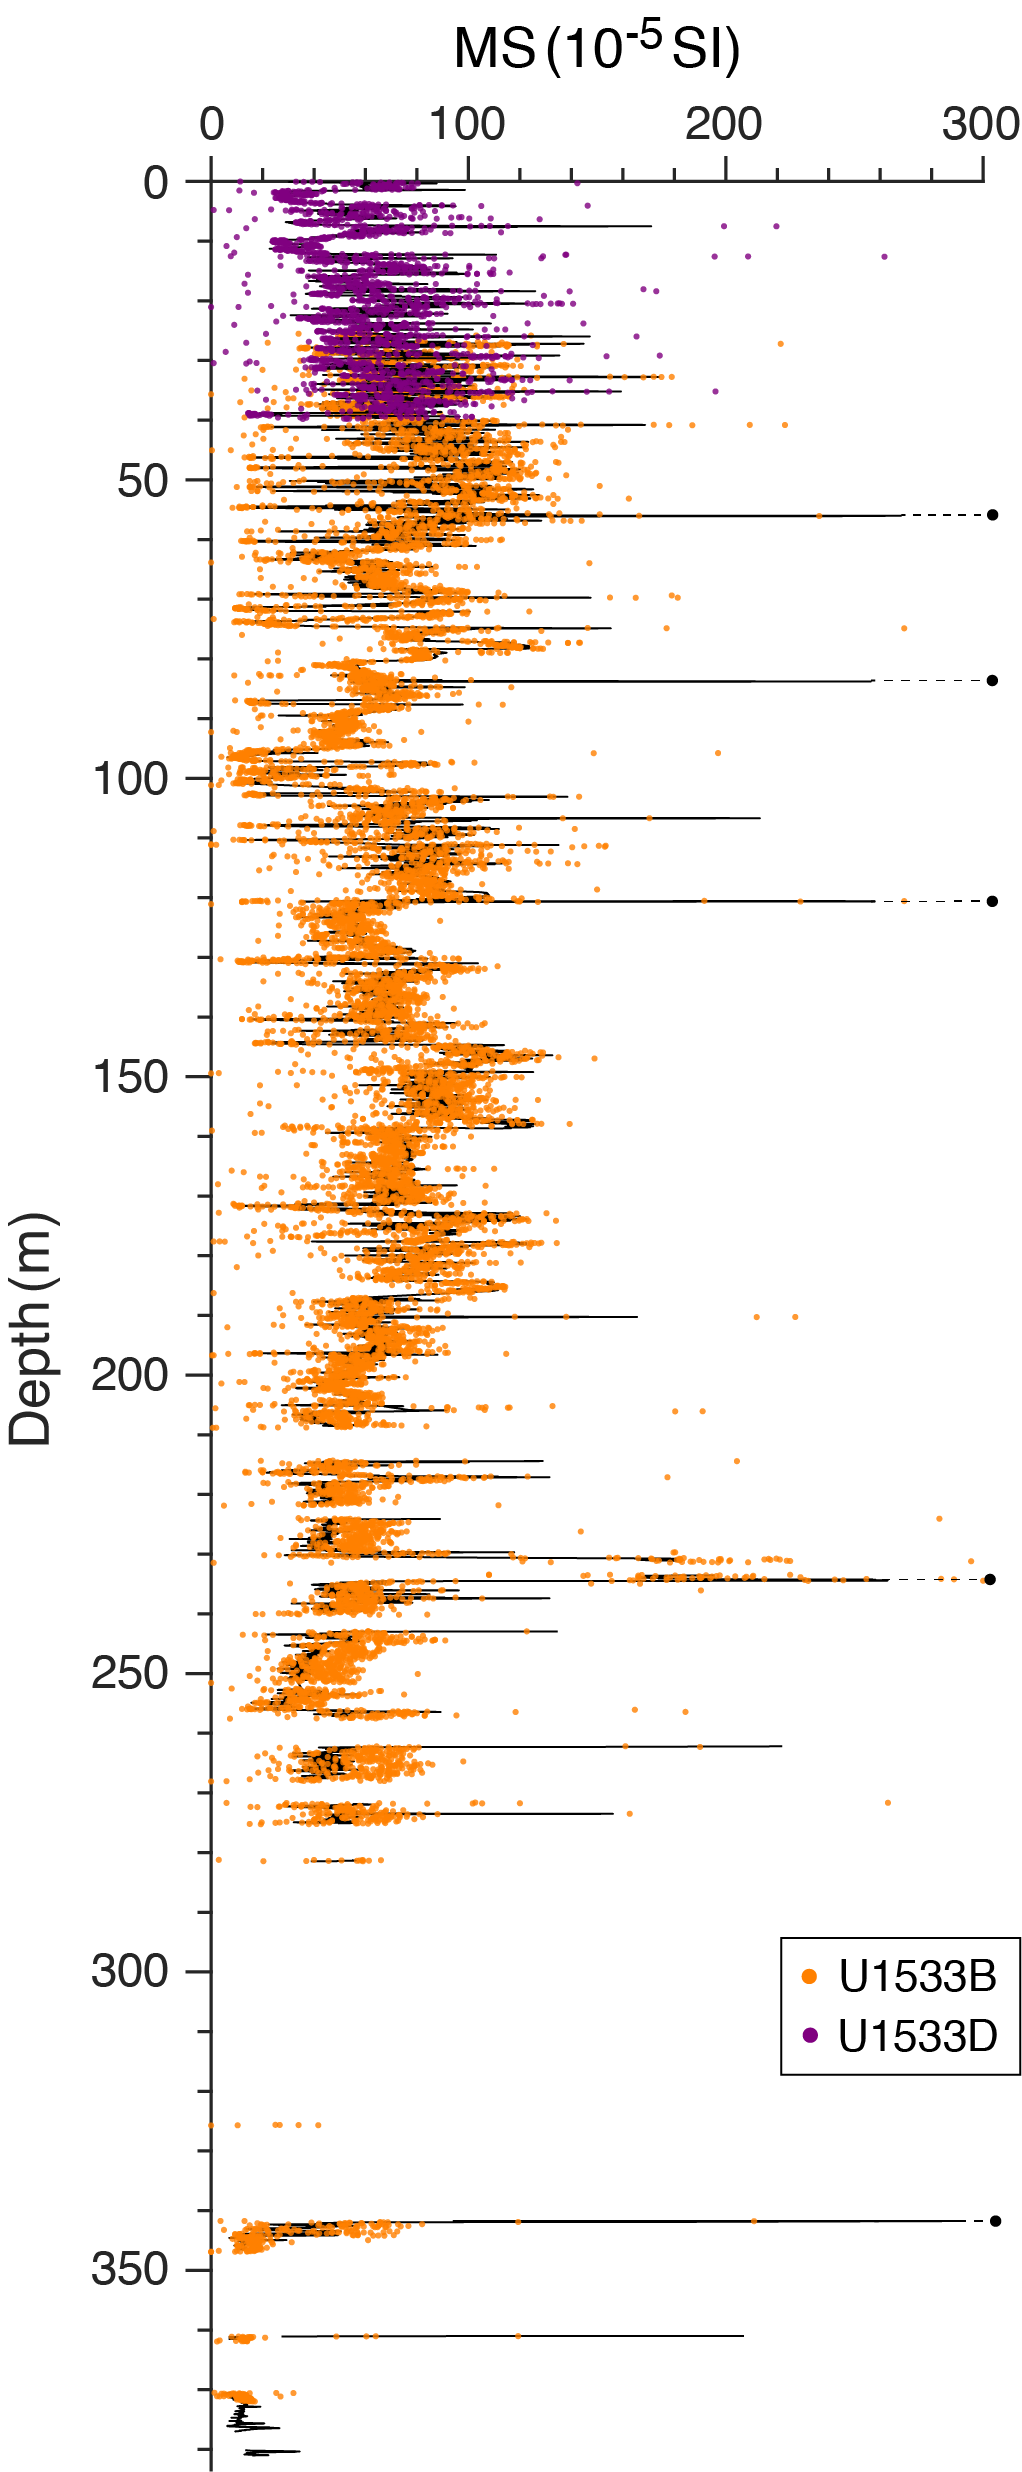
Figure F32. WRMSL and point SHMSL MS.
Mass-normalized magnetic susceptibility (cm3/g) is calculated for the WRMSL data using GRA bulk density to help reduce biases that may reflect variability in parameters such as sediment compaction, porosity, and recovered core diameter (Walczak et al., 2015). Prior to normalization, both magnetic susceptibility and GRA bulk density were interpolated to 2 cm intervals and smoothed with a 4.5 cm Gaussian filter to accommodate the response function of the WRMSL magnetic susceptibility loop. This mass-normalized data may better represent more accurate sediment magnetic susceptibility measurements (Figure F33). General trends in the mass-normalized magnetic susceptibility agree with those observed in the raw data.
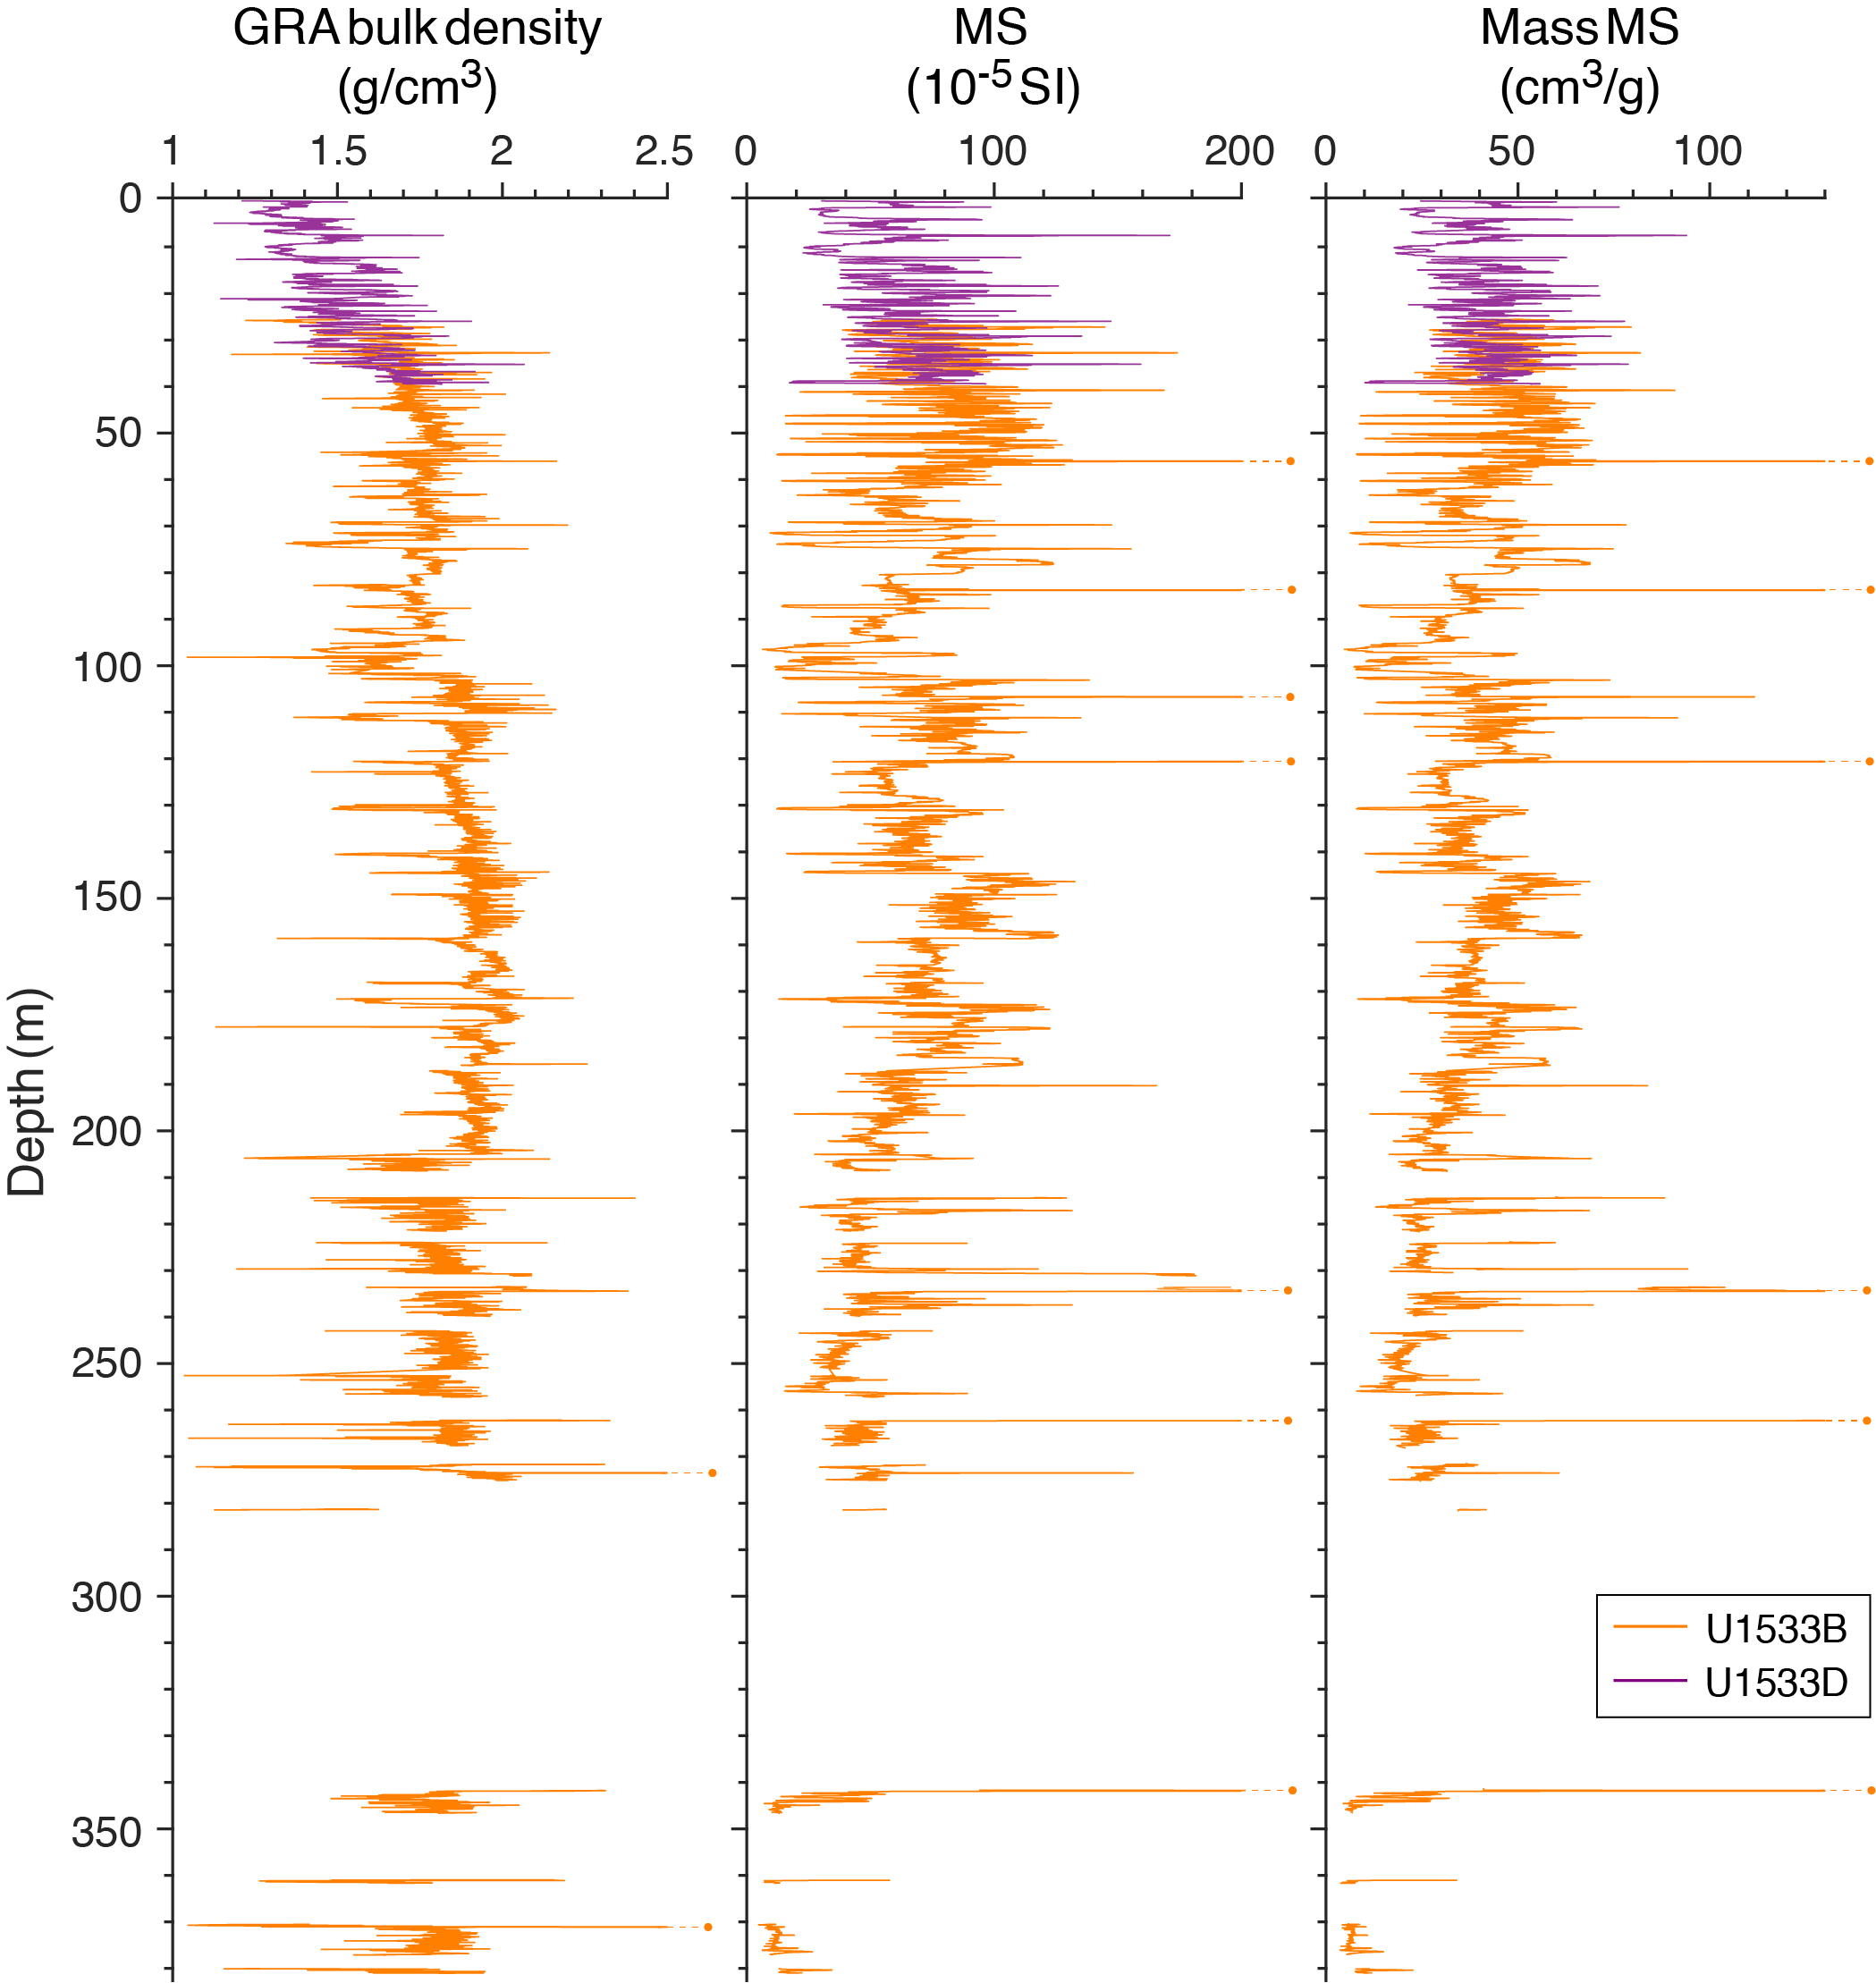
Figure F33. Mass-normalization of WRMSL MS data using GRA bulk density.
Natural gamma radiation
NGR was measured on all whole-round core sections at 10 cm intervals, and data were postprocessed to account for edge effects (see Physical properties in the Expedition 379 methods chapter [Gohl et al., 2021a]). Measured NGR values range from 13 to 235 counts/s (the highest value denotes a section of cemented sediment at 185.6 m) with an overall average of 56 counts/s and a 1σ standard deviation of 18 counts/s (Figures F30, F31). Average NGR values increase downcore from ~20 to ~60 counts/s at 55 m, the boundary between Lithostratigraphic Subunits IA and IB (Figure F30). The upper ~15 m of the shorter, more shallow Holes U1533A, U1533C, and U1533D exhibit a sawtooth pattern of NGR cyclicity, where a sharp increase in overall magnetic susceptibility values is followed by a more gradual decline downcore (Figure F31). Below 55 m, there are cyclical downcore variations between ~30 and ~75 counts/s. NGR trends follow those observed in magnetic susceptibility and GRA bulk density, likely indicating changes in terrigenous sediment input. Average NGR values increase at 103 m, and a stepwise decrease in NGR counts observed at 205 m is associated with the transition from APC to XCB coring. XCB and RCB coring recovers core with a smaller diameter than APC coring, which results in a decrease in raw NGR counts.
As with WRMSL magnetic susceptibility, mass-normalized NGR is calculated using GRA bulk density to help reduce biases that may reflect variability in parameters such as sediment compaction, porosity, and recovered core diameter (Walczak et al., 2015). Prior to normalization, both NGR and GRA bulk density were interpolated to 10 cm intervals and smoothed with a 20 cm Gaussian filter to accommodate the response function of the WRMSL magnetic susceptibility loop. In addition, raw NGR data (counts/s) were first volumetrically normalized by the effective volume in the NGR detection window (655 cm3) before mass normalization by GRA bulk density (g/cm3). Resultant mass-normalized NGR (counts/s/g) data may better represent more accurate sediment NGR measurements (Figure F34). General trends in the mass-normalized NGR data agree with those observed in the raw data.
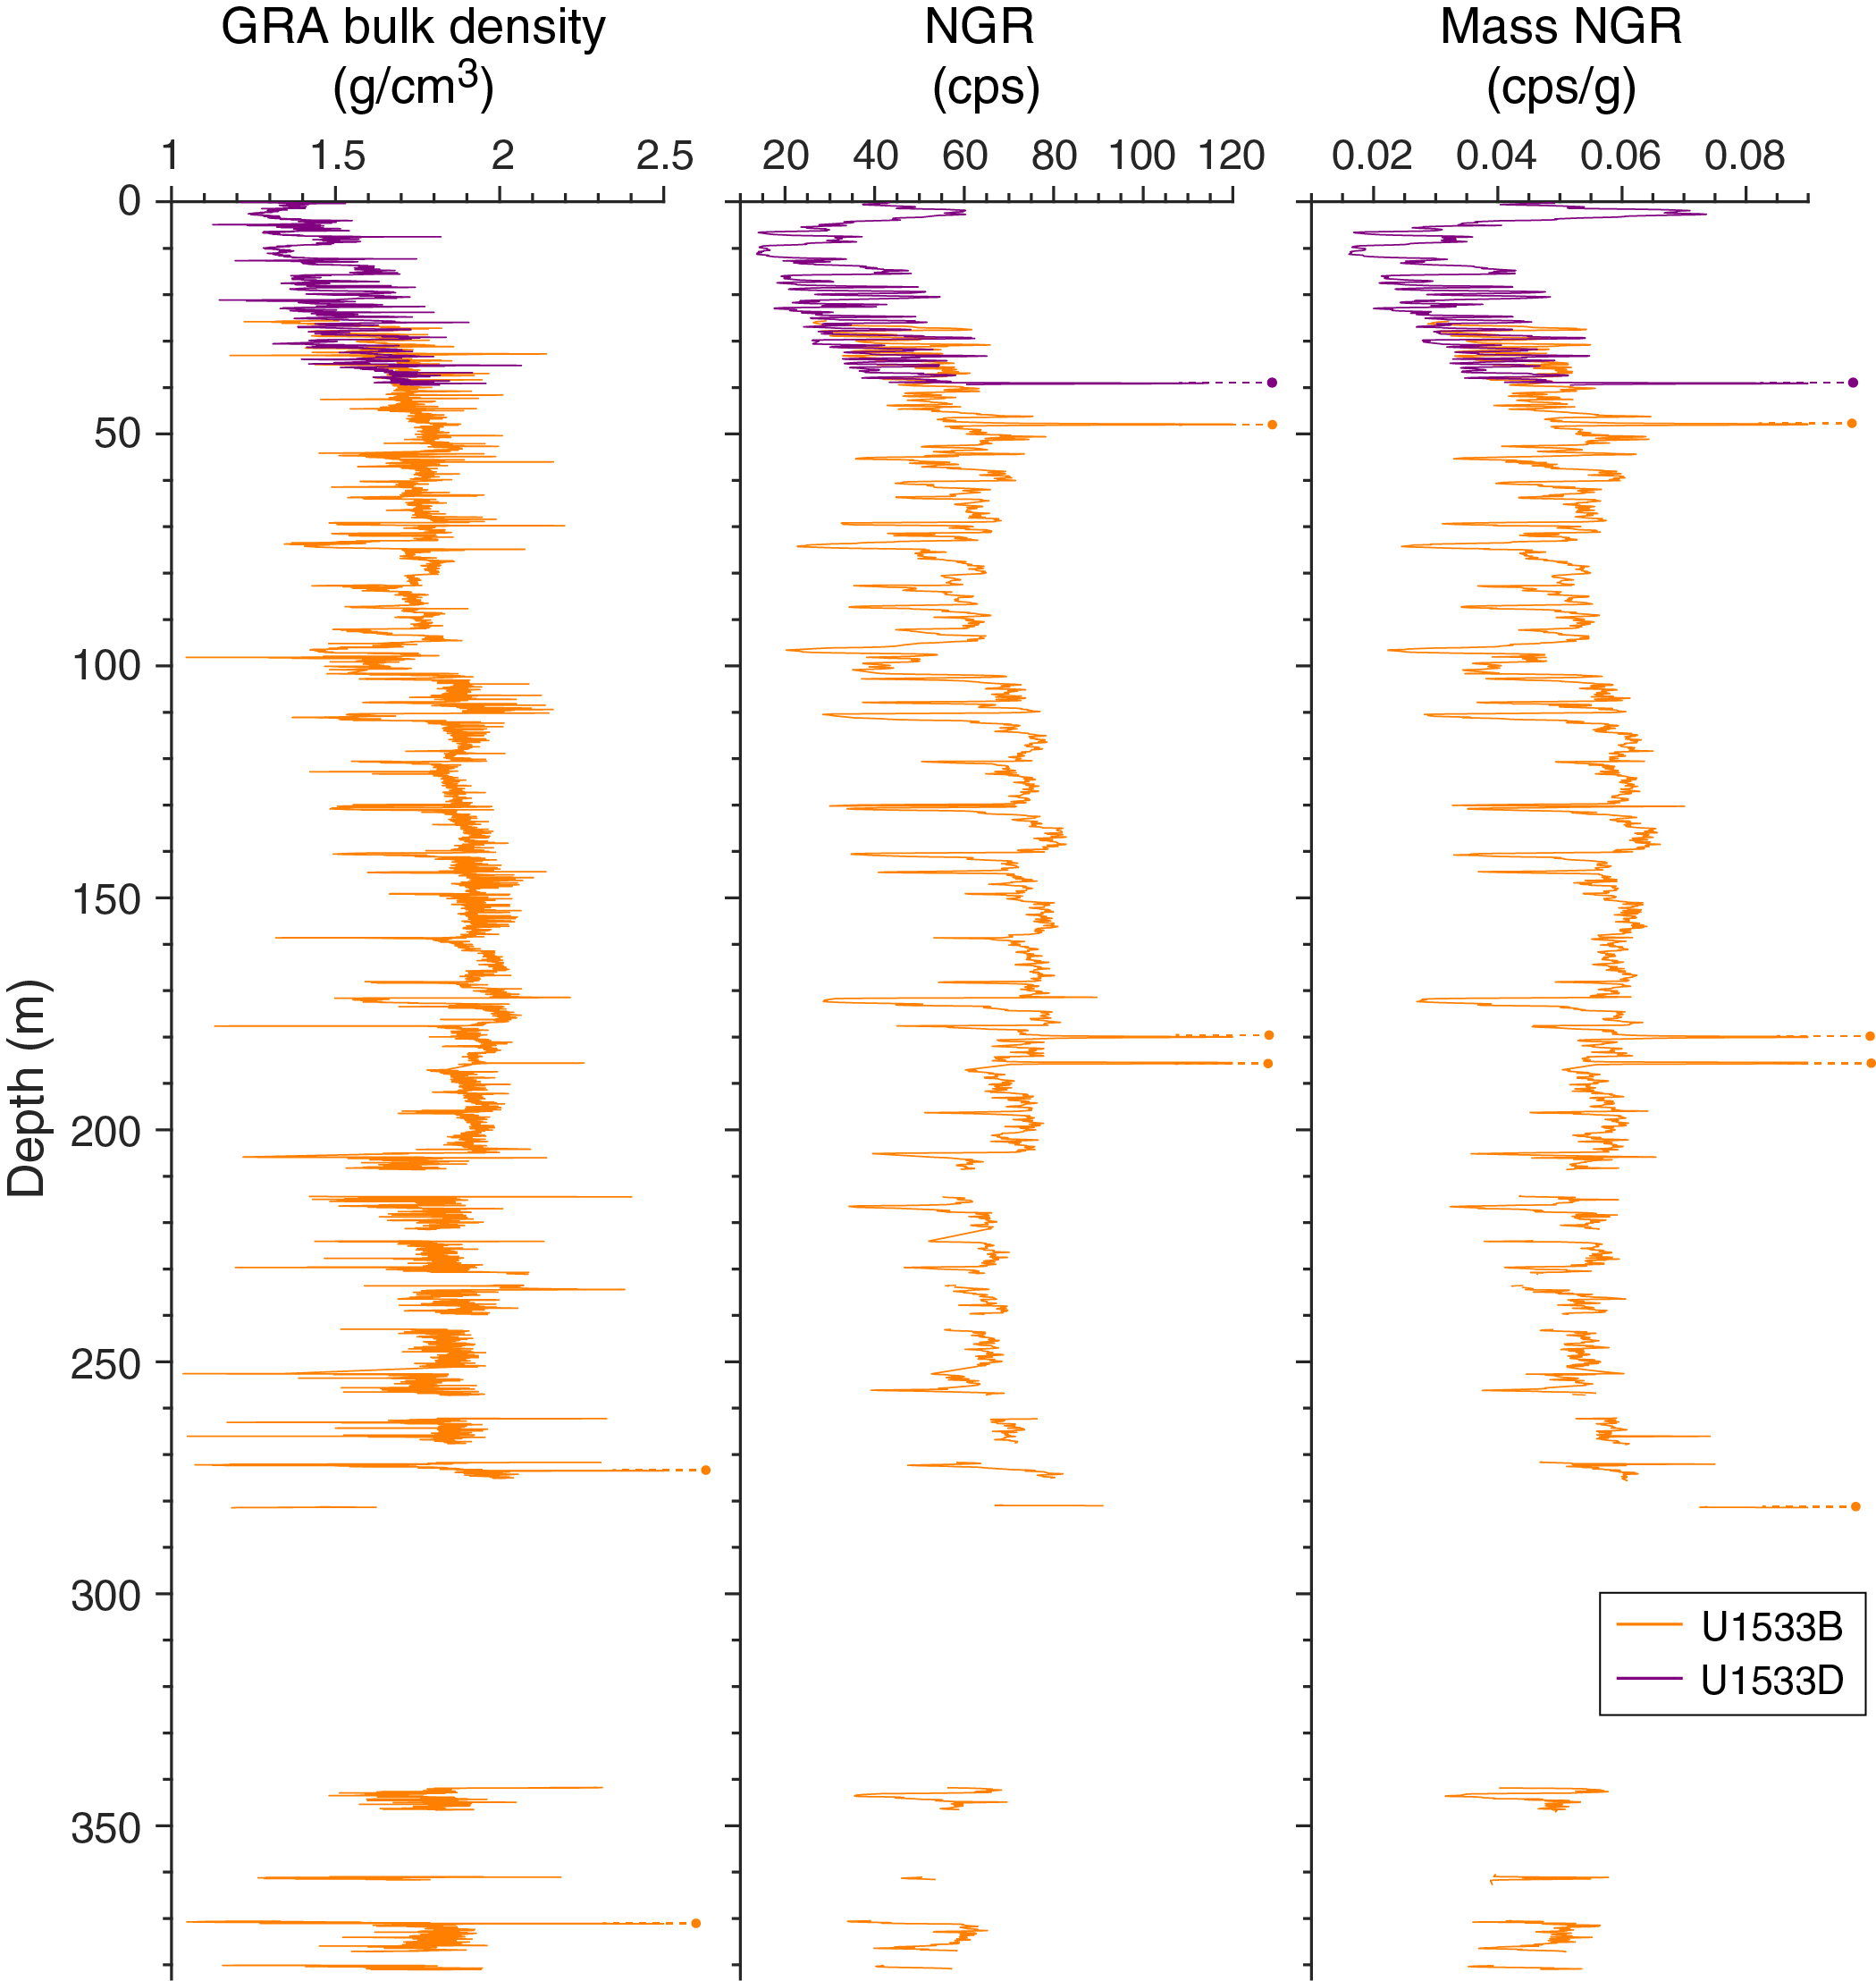
Figure F34. Mass-normalization of whole-round NGR data using GRA bulk density.
GRA bulk density
GRA bulk density was measured on whole-round sections using the WRMSL at 2 cm intervals with a 3 s integration time (see Physical properties in the Expedition 379 methods chapter [Gohl et al., 2021a]). Measured GRA bulk density values range from 1.1 to 2.5 g/cm3 with an overall average of 1.7 g/cm3 and a 1σ standard deviation of 0.2 g/cm3. The GRA bulk density record shows a rapid increase in average values from ~1.3 to ~1.8 g/cm3 for the first 55 m that corresponds to the transition from Lithostratigraphic Subunit IA to Subunit IB (Figure F30). The upper ~15 m of the shorter, more shallow Holes U1533A, U1533C, and U1533D exhibit a sawtooth pattern of GRA bulk density cyclicity, in which a sharp increase in overall magnetic susceptibility values is followed by a more gradual decline downcore (Figure F31). Below 55 m, GRA bulk density values exhibit several stepwise changes. A decrease of average values to ~1.7 g/cm3 from 55 to 103 m is followed by an increase of average values to ~1.9 g/cm3 from 103 to 205 m. At 205 m, an observed decrease in average GRA bulk density from ~1.9 to ~1.7 g/cm3 corresponds to the switch from APC to XCB/RCB coring. This transition to lower density measurements reflects the smaller internal sediment volume recovered by XCB coring. Average GRA bulk density remains relatively constant (~1.7 g/cm3) below 205 m to the termination of Hole U1533B at 381 m (Figure F30). The overall increase in GRA bulk density with depth at this site reflects the increasing compaction of sediment with depth. Smaller scale variability denotes changes in sediment lithology and correlates well with NGR and magnetic susceptibility variability. General trends in GRA bulk density follow those observed in magnetic susceptibility and NGR, likely indicating changes in terrigenous sediment input. The MAD bulk density data collected on discrete samples from the split cores provide more accurate bulk densities in the XCB- and RCB-cored intervals (see Moisture and density; Figure F35).

Figure F35. WRMSL GRA bulk density and discrete sample MAD.
Moisture and density
MAD bulk density values were calculated from mass and volume measurements of 94 discrete samples collected from the working halves of split cores (see Physical properties in the Expedition 379 methods chapter [Gohl et al., 2021a]). MAD bulk density increases steeply from ~1.3 g/cm3 at the seafloor to ~1.7 g/cm3 at 50 m, corresponding with a decrease in porosity (Figure F36). From 50 m to the termination of Hole U1533B, bulk density increases more gradually, ranging from 1.7 to 1.9 g/cm3 at 381 m (Figure F36). Some low MAD bulk density values correspond with an increase in biogenic material. MAD bulk density corresponds well with GRA bulk density to 205 m, below which depth GRA bulk density trends lower than MAD values because of reduced sediment diameter in XCB and RCB cores (Figure F35).
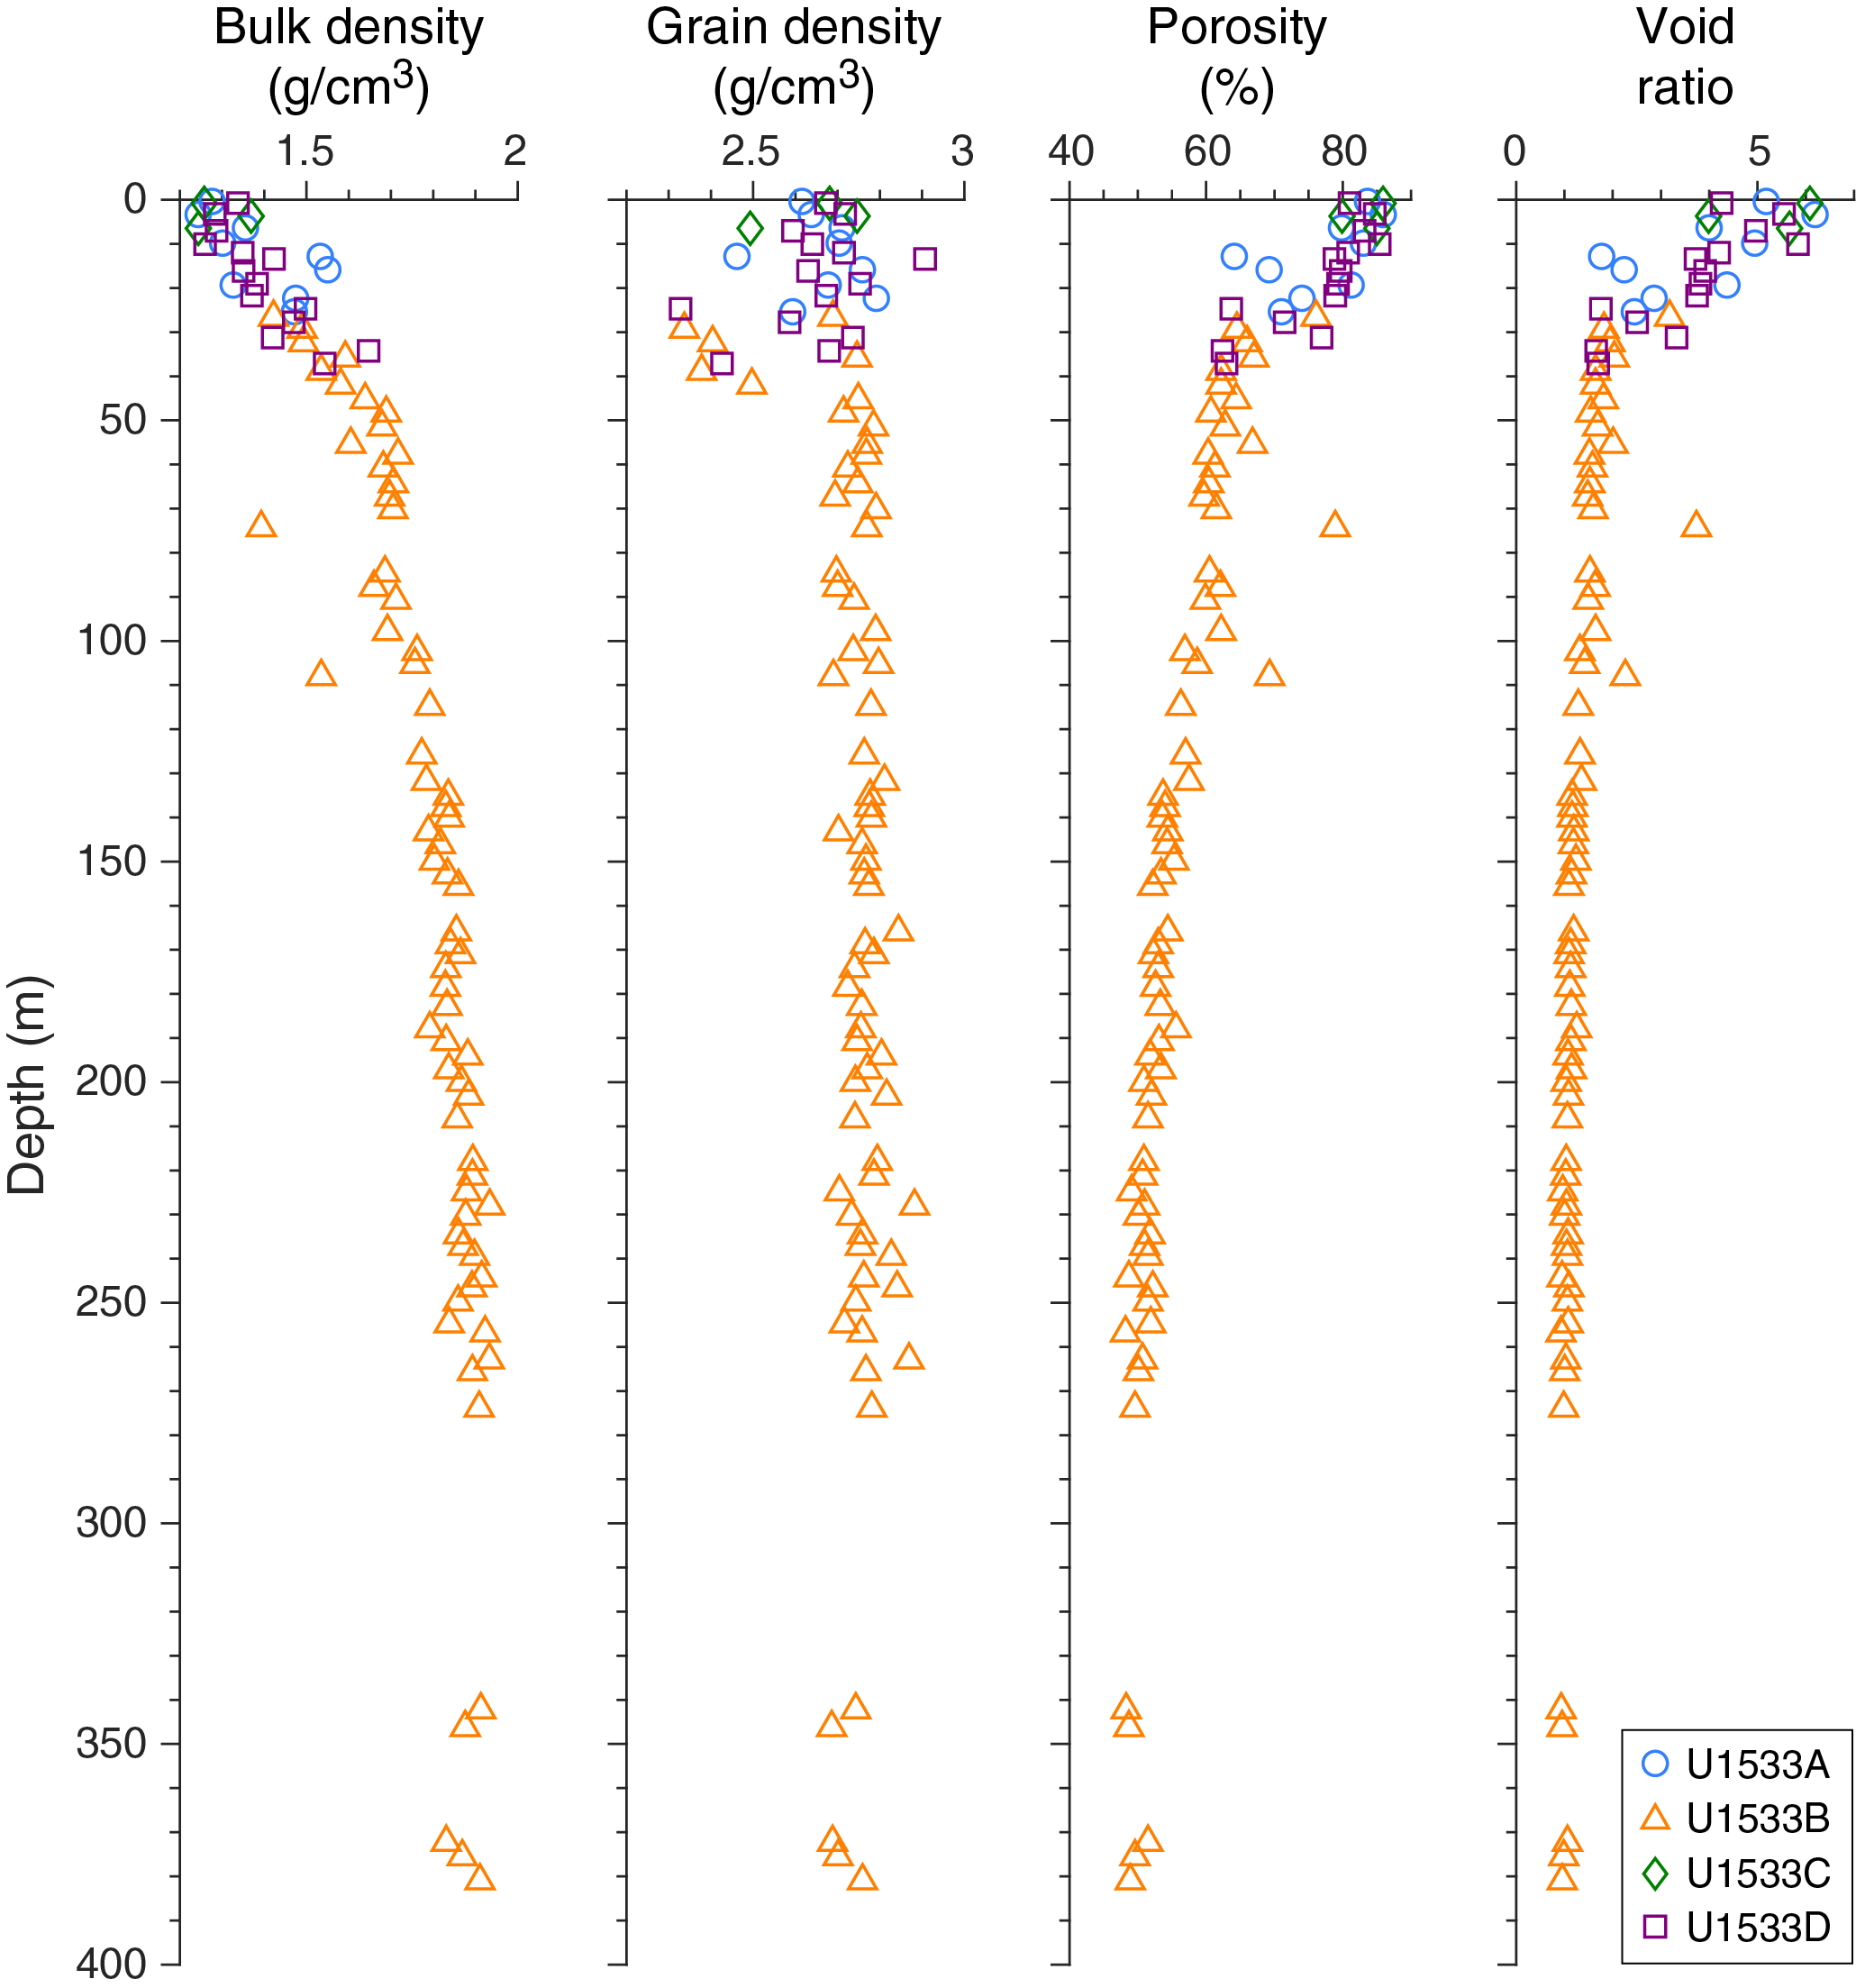
Figure F36. MAD data.
Measured grain density values are generally constant with depth, ranging from 2.3 to 2.8 g/cm3 (Figure F36) with the most variability observed in the upper 60 m. Sediment porosity rapidly decreases from 86% to 65% with depth from the seafloor to 30 m. This is followed by a more gradual decrease from 65% to 45% with depth to the termination of Hole U1533B at 381 m (Figure F36). Similar trends to porosity were also observed in the void ratio. These data show clear compaction trends that are consistent with marine clay-rich sediments (Busch, 1989).
P-wave velocity
P-wave velocity was measured on the WRMSL P-wave logger (PWL) at a resolution of 2 cm for Holes U1533A–U1533D to 205 m. Reliable measurements with the WRMSL were not available at deeper depths because of the presence of void space between the core material and core liner caused by the decrease in core diameter associated with XCB and RCB coring in Hole U1533B. PWL velocities increase with depth, ranging from ~1480 m/s at the seafloor to ~1600 m/s at 205 m (Figure F37).

Figure F37. P-wave velocity.
Discrete P-wave velocity measurements were made on the SHMG (see Physical properties in the Expedition 379 methods chapter [Gohl, et al., 2021a]) in the dominant lithology for the core interval. P-wave caliper (PWC) measurements track well with the PWL measurements for the upper 205 m, showing a similar increase with depth. Below 205 m, PWC velocities continue to increase with depth as consolidation increases to an average velocity of ~1760 m/s at 380 m (Figure F37). Below 55 m, variations in lower-than-average P-wave velocities tend to correspond with dips in magnetic susceptibility, NGR, and GRA bulk density. Higher-than-average velocities are associated with coarser grained intervals. P-wave velocity measurements made on the y- and z-axis with the P-wave bayonets (PWBs) range from 1340 to 1520 m/s in the y-direction and from 1440 to 1530 m/s in the z-direction, increasing with depth (although with greater variability than the PWC). PWB measurements were only collected until the sediment became too compacted for adequate penetration and contact by the bayonet sensors (63 m). PWC and PWB measurement values were automatically picked by the native SHMG instrument software when possible and manually picked only when the automatic algorithm encountered increased noise.
Thermal conductivity
Thermal conductivity measurements were made on core sections collected from Holes U1533A–U1533D once per core where possible (see Physical properties in the Expedition 379 methods chapter [Gohl et al., 2021a]). A needle probe was used for all measurements on recovered whole-round cores down to 205 m. Below this depth, a puck contact probe was used on working halves because the core sediments became too consolidated and compacted for proper needle probe insertion. Thermal conductivity measurements, however, were not possible on all collected cores because of poor core quality or probe contact, a prevalent issue for both needle and puck probe. As a first approximation, thermal conductivity in fine-grained sediments represents a combination of the conductivity of both sediment grains and interstitial water. It is therefore dependent on both porosity and lithology. Because the thermal conductivity of typical sediment-forming minerals is higher than water, thermal conductivity is expected to increase with increasing dry bulk density. Overall, thermal conductivity values increase with depth from ~0.7 W/(m·K) at the seafloor to ~1.4 W/(m·K) at 375 m (Figure F38), corresponding to a downcore increase in dry bulk density and a decrease in porosity from compaction (Figure F36). The rate of increase in thermal conductivity values decreases at 55 m with an anomalously high value at 231 m that was measured in coarse-grained Facies F5 (see Lithostratigraphy).
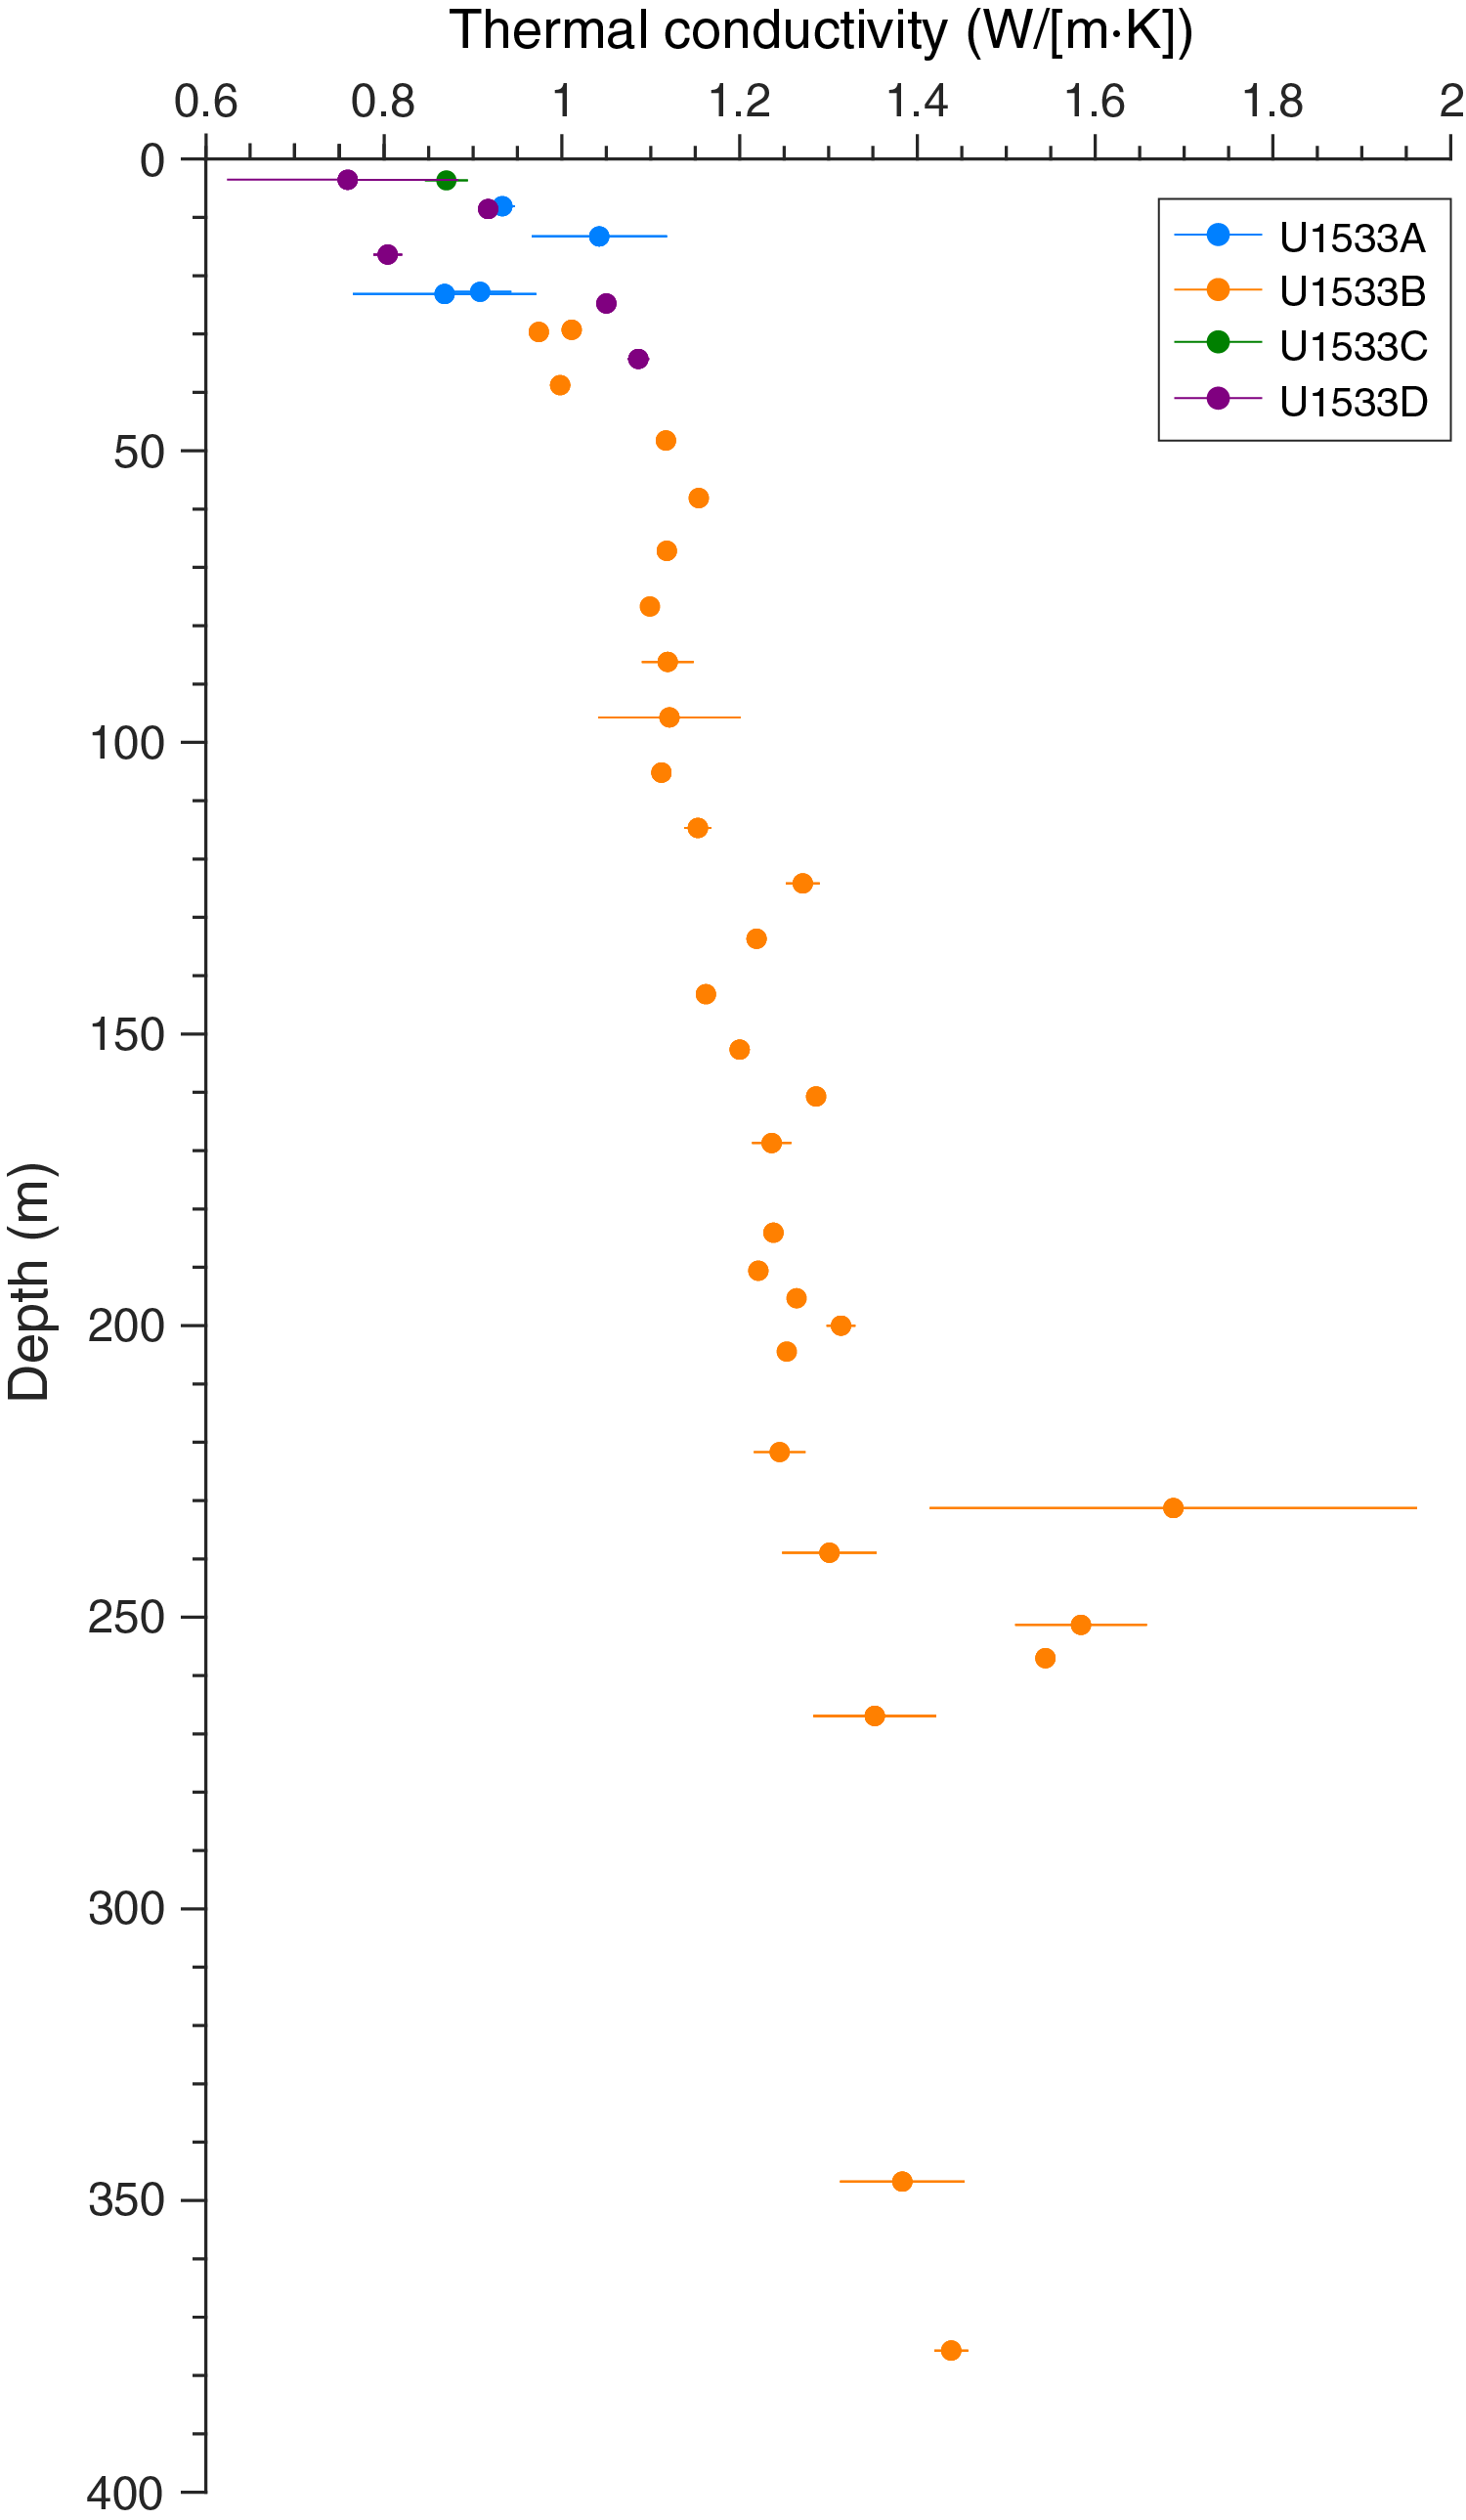
Figure F38. Thermal conductivity.
Color reflectance
Spectral color reflectance was measured on the archive halves from all core sections using the SHMSL (see Physical properties in the Expedition 379 methods chapter [Gohl et al., 2021a]). In general, L* values range from ~30 to ~55 with a general decrease downcore. a* and b* measurements range from −2 to 8 and −6 to 14, respectively (Figure F39). A decrease in a* and b* at 55 m corresponds to a transition from Lithostratigraphic Subunit IA to Subunit IB. Below 55 m, a* shows variations ranging from approximately −1.5 to 2 that are associated with compositional changes (e.g., more biogenic versus terrigenous sediments).
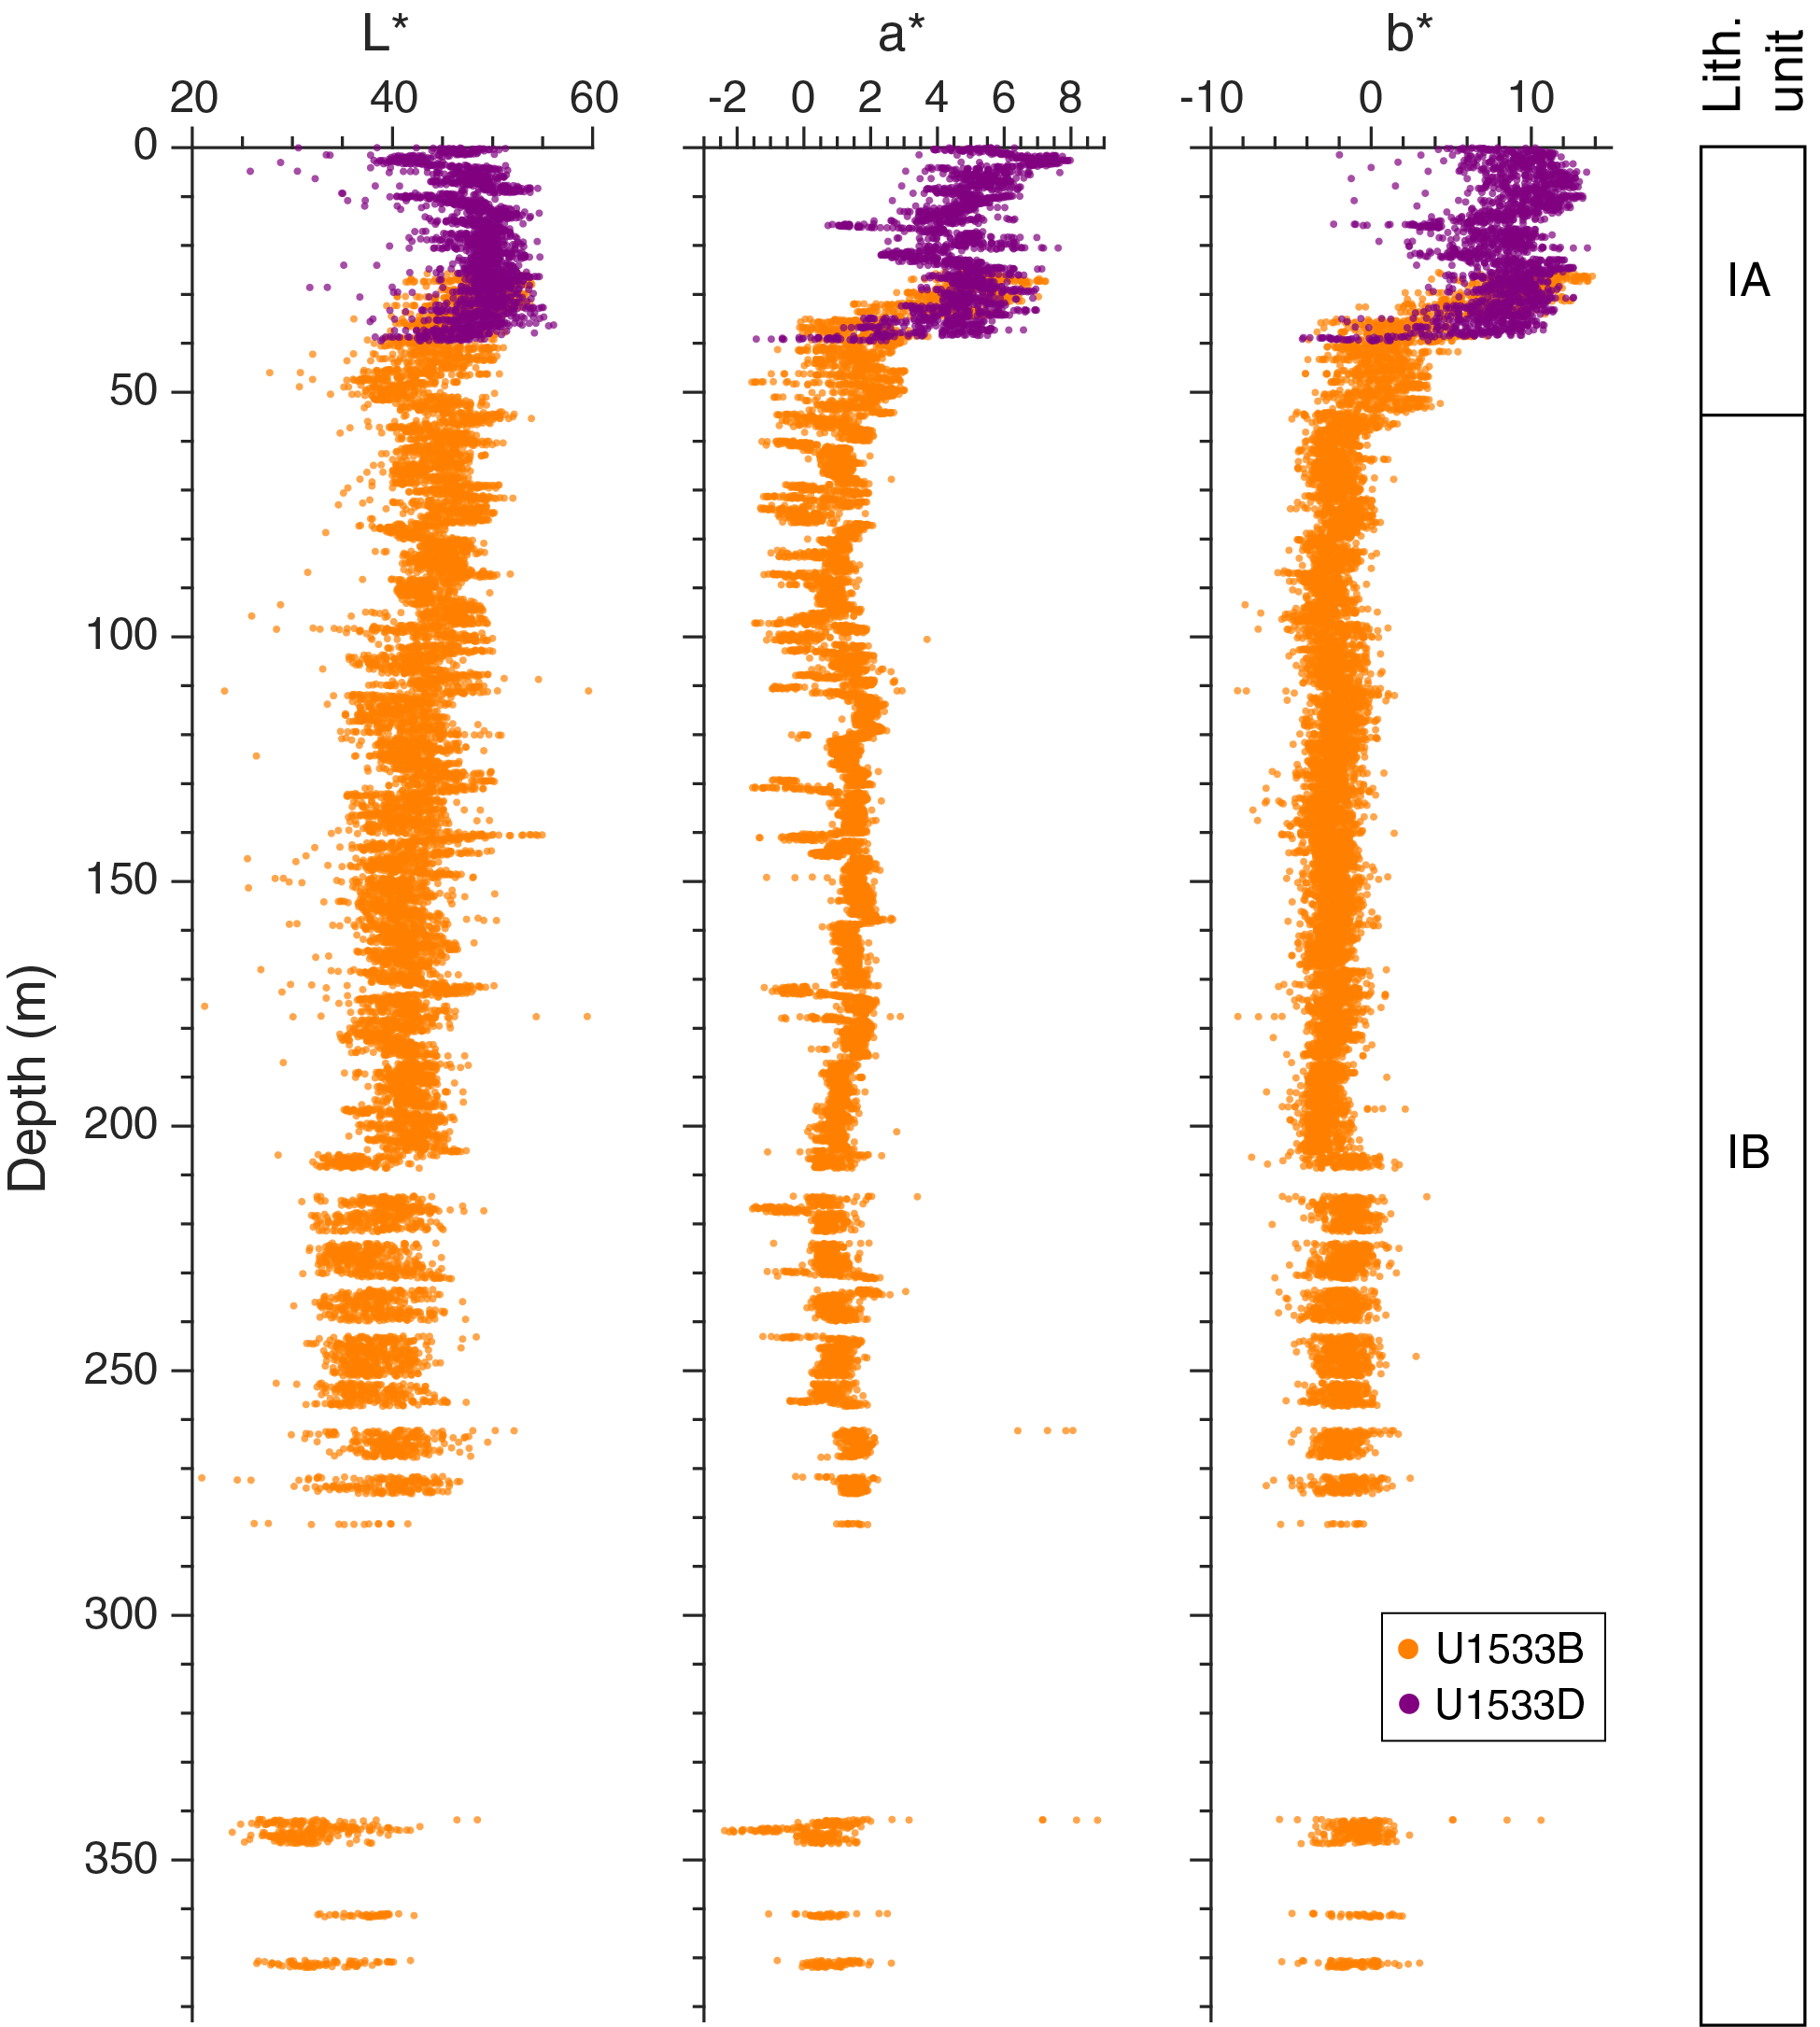
Figure F39. SHMSL color reflectance.
Stratigraphic correlation
Overlapping APC cores were recovered in the upper ~50 m of the sequence drilled at Site U1533. A composite depth scale for these cores was constructed primarily by correlating whole-round magnetic susceptibility data for Cores 379-U1533A-1H through 3H, 379-U1533B-2H and 3H, 379-U1533C-1H, and 379-U1533D-1H through 5H (see Physical properties). Compositing of these core sections was performed in a two-step process. First, the cores were offset (Table T20) to align selected magnetic susceptibility tie points and delineate the splice along a CCSF, Method A (CCSF-A), depth scale (Table T21). Out-of-splice intervals were then correlated to intervals within the splice to fully align the records through selection of “mapping pair” tie points (Table T22; Figure F40). Several core-top intervals were excluded from this process because of disturbance (Table T23). The resulting CCSF-M depth scale is designated as the shipboard splice. This shipboard composite splice and depth scale will likely be refined and updated in postcruise work using XRF core-scanning data.

Figure F40. Composite splice framework.
Stacking the whole-round magnetic susceptibility data on the CCSF-M depth scale shows that there is good correlation between holes and that most intervals are well correlated in detail (Figure F40C). A few excursions in the magnetic susceptibility records that cannot be correlated between holes are due to the presence of clasts and, in one case, downhole displacement of sand along the core liner (Table T24). Nine lithostratigraphic correlations were also identified, including a tephra horizon (Table T25). The lithostratigraphic correlations were initially used to test the splice and then were incorporated as direct ties in the mapping-pair correlations for out-of-splice intervals (Table T22). In the lowermost interval of the section considered in the splice (~45–48 m CCSF-M), correlation between the bottom of Core 379-U1533D-5H and the top of Core 379-U1533B-3H (Figure F40) is unclear. A clear correlation between these cores could not be established either with physical property data or through visual lithostratigraphic observations, and therefore these cores were appended with a small gap (5 cm) inserted between cores.
The magnetostratigraphic data for the upper part of Site U1533 (see Paleomagnetism) were also compiled and compared in detail using the shipboard CCSF-M depth scale (Figure F40D). There is good agreement between composited and stacked inclination records from the different holes, and a clear sequence of polarity zones is defined. With the help of biostratigraphic age constraints (see Biostratigraphy), several ties to the GTS2012 are identified spanning the latest Pliocene through Pleistocene. Normal Subchrons C1n (Brunhes), C1r.1n (Jaramillo), C1r.2n (Cobb Mountain), and C2n (Olduvai) and the top of Subchron C2An.1n (Gauss) are identified in the composite record (Figure F40D), providing robust age control for the sequence (see Paleomagnetism and Chronostratigraphy). Several thin (<1 m) polarity reversals are also noted throughout the uppermost sequence recovered at Site U1533 (Figure F40D). With more thorough analysis in postcruise work, it may be possible to tie some of these thin polarity zones to short Pleistocene polarity excursions identified at other sites (e.g., Roberts, 2008; Channell et al., 2017).
References
Acton, G.D., Guyodo, Y., and Brachfeld, S.A., 2002. Magnetostratigraphy of sediment drifts on the continental rise of West Antarctica (ODP Leg 178, Sites 1095, 1096, and 1101). In Barker, P.F., Camerlenghi, A., Acton, G.D., and Ramsay, A.T.S. (Eds.), Proceedings of the Ocean Drilling Program, Scientific Results, 178: College Station, TX (Ocean Drilling Program), 1–61. https://doi.org/10.2973/odp.proc.sr.178.235.2002
Barron, J.A., 2003. Planktonic marine diatom record of the past 18 m.y.: appearances and extinctions in the Pacific and Southern Oceans. Diatom Research, 18(2):203–224. https://doi.org/10.1080/0269249X.2003.9705588
Brown, C.R., Yakymchuk, C., Brown, M., Fanning, C.M., Korhonen, F.J., Piccoli, P.M., and Siddoway, C.S., 2016. From source to sink: petrogenesis of Cretaceous anatectic granites from the Fosdick migmatite–granite complex, West Antarctica. Journal of Petrology, 57(7):1241–1278. https://doi.org/10.1093/petrology/egw039
Busch, W.H., 1989. Patterns of sediment compaction at Ocean Drilling Program Sites 645, 646, and 647, Baffin Bay and Labrador Sea. In Srivastava, S.P., Arthur, M.A., Clement, B., et al., Proceedings of the Ocean Drilling Program, Scientific Results, 105: College Station, TX (Ocean Drilling Program), 781–790. https://doi.org/10.2973/odp.proc.sr.105.143.1989
Channell, J.E.T., Vázquez Riveiros, N., Gottschalk, J., Waelbroeck, C., and Skinner, L.C., 2017. Age and duration of Laschamp and Iceland Basin geomagnetic excursions in the South Atlantic Ocean. Quaternary Science Reviews, 167:1–13. https://doi.org/10.1016/j.quascirev.2017.04.020
Dowdeswell, J.A., Evans, J., Ó Cofaigh, C., and Anderson, J.B., 2006. Morphology and sedimentary processes on the continental slope off Pine Island Bay, Amundsen Sea, West Antarctica. Geological Society of America Bulletin, 118(5–6):606–619. https://doi.org/10.1130/B25791.1
Ehrmann, W., Hillenbrand, C.-D., Smith, J.A., Graham, A.G.C., Kuhn, G., and Larter, R.D., 2011. Provenance changes between recent and glacial-time sediments in the Amundsen Sea Embayment, West Antarctica: clay mineral assemblage evidence. Antarctic Science, 23(5):471–486. https://doi.org/10.1017/S0954102011000320
Esquevin, J., 1969. Influence de la composition chimique des illites sur le cristallinité. Bulletin du Centre de recherches de Pau, 3:147–154.
Gieskes, J.M., Blanc, G., Vrolijk, P., Elderfield, H., and Barnes, R., 1990. Interstitial water chemistry—major constituents. In Moore, J.C., Mascle, A., et al., Proceedings of the Ocean Drilling Program, Scientific Results, 110: College Station, TX (Ocean Drilling Program), 155–178. https://doi.org/10.2973/odp.proc.sr.110.170.1990
Gohl, K., Wellner, J.S., Klaus, A., Bauersachs, T., Bohaty, S.M., Courtillat, M., Cowan, E.A., De Lira Mota, M.A., Esteves, M.S.R., Fegyveresi, J.M., Frederichs, T., Gao, L., Halberstadt, A.R., Hillenbrand, C.-D., Horikawa, K., Iwai, M., Kim, J.-H., King, T.M., Klages, J.P., Passchier, S., Penkrot, M.L., Prebble, J.G., Rahaman, W., Reinardy, B.T.I., Renaudie, J., Robinson, D.E., Scherer, R.P., Siddoway, C.S., Wu, L., and Yamane, M., 2021a. Expedition 379 methods. In Gohl, K., Wellner, J.S., Klaus, A., and the Expedition 379 Scientists, Amundsen Sea West Antarctic Ice Sheet History. Proceedings of the International Ocean Discovery Program, 379: College Station, TX (International Ocean Discovery Program). https://doi.org/10.14379/iodp.proc.379.102.2021
Gohl, K., Wellner, J.S., Klaus, A., Bauersachs, T., Bohaty, S.M., Courtillat, M., Cowan, E.A., De Lira Mota, M.A., Esteves, M.S.R., Fegyveresi, J.M., Frederichs, T., Gao, L., Halberstadt, A.R., Hillenbrand, C.-D., Horikawa, K., Iwai, M., Kim, J.-H., King, T.M., Klages, J.P., Passchier, S., Penkrot, M.L., Prebble, J.G., Rahaman, W., Reinardy, B.T.I., Renaudie, J., Robinson, D.E., Scherer, R.P., Siddoway, C.S., Wu, L., and Yamane, M., 2021b. Expedition 379 summary. In Gohl, K., Wellner, J.S., Klaus, A., and the Expedition 379 Scientists, Amundsen Sea West Antarctic Ice Sheet History. Proceedings of the International Ocean Discovery Program, 379: College Station, TX (International Ocean Discovery Program). https://doi.org/10.14379/iodp.proc.379.101.2021
Gradstein, F.M., Ogg, J.G., Schmitz, M.D., and Ogg, G.M. (Eds.), 2012. The Geological Time Scale 2012: Amsterdam (Elsevier). https://doi.org/10.1016/C2011-1-08249-8
Harwood, D.M., and Maruyama, T., 1992. Middle Eocene to Pleistocene diatom biostratigraphy of Southern Ocean sediments from the Kerguelen Plateau, Leg 120. In Wise, S.W., Jr., Schlich, R., et al., Proceedings of the Ocean Drilling Program, Scientific Results, 120: College Station, TX (Ocean Drilling Program), 683–733. https://doi.org/10.2973/odp.proc.sr.120.160.1992
Hillenbrand, C.-D., Fütterer, D.K., Grobe, H., and Frederichs, T., 2002. No evidence for a Pleistocene collapse of the West Antarctic Ice Sheet from continental margin sediments recovered in the Amundsen Sea. Geo-Marine Letters, 22(2):51–59. https://doi.org/10.1007/s00367-002-0097-7
Hillenbrand, C.-D., Grobe, H., Diekmann, B., Kuhn, G., and Fütterer, D.K., 2003. Distribution of clay minerals and proxies for productivity in surface sediments of the Bellingshausen and Amundsen seas (West Antarctica)—relation to modern environmental conditions. Marine Geology, 193(3–4):253–271. https://doi.org/10.1016/S0025-3227(02)00659-X
Hillenbrand, C.-D., Kuhn, G., and Frederichs, T., 2009. Record of a mid-Pleistocene depositional anomaly in West Antarctic continental margin sediments: an indicator for ice-sheet collapse? Quaternary Science Reviews, 28(13–14):1147–1159. https://doi.org/10.1016/j.quascirev.2008.12.010
Kipf, A., Mortimer, N., Werner, R., Gohl, K., Van Den Bogaard, P., Hauff, F., and Hoernle, K., 2012. Granitoids and dykes of the Pine Island Bay region, West Antarctica. Antarctic Science, 24(5):473–484. https://doi.org/10.1017/S0954102012000259
Kirschvink, J.L., 1980. The least-squares line and plane and the analysis of palaeomagnetic data. Geophysical Journal of the Royal Astronomical Society, 62(3):699–718. https://doi.org/10.1111/j.1365-246X.1980.tb02601.x
Konfirst, M.A., Scherer, R.P., Hillenbrand, C.-D., and Kuhn, G., 2012. A marine diatom record from the Amundsen Sea—insights into oceanographic and climatic response to the Mid-Pleistocene Transition in the West Antarctic sector of the Southern Ocean. Marine Micropaleontology, 92–93:40–51. https://doi.org/10.1016/j.marmicro.2012.05.001
Leat, P.T., Storey, B.C., and Pankhurst, R.J., 1993. Geochemistry of Palaeozoic–Mesozoic Pacific rim orogenic magmatism, Thurston Island area, West Antarctica. Antarctic Science, 5(3):281–296. https://doi.org/10.1017/S0954102093000380
LeMasurier, W., 2013. Shield volcanoes of Marie Byrd Land, West Antarctic rift: oceanic island similarities, continental signature, and tectonic controls. Bulletin of Volcanology, 75(6):726. https://doi.org/10.1007/s00445-013-0726-1
Lurcock, P.C., and Wilson, G.S., 2012. PuffinPlot: a versatile, user-friendly program for paleomagnetic analysis. Geochemistry, Geophysics, Geosystems, 13(6):Q06Z45. https://doi.org/10.1029/2012GC004098
Meyers, P.A., 1997. Organic geochemical proxies of paleoceanographic, paleolimnologic, and paleoclimatic processes. Organic Geochemistry, 27(5–6):213–250. https://doi.org/10.1016/S0146-6380(97)00049-1
Mukasa, S.B., and Dalziel, I.W.D., 2000. Marie Byrd Land, West Antarctica: evolution of Gondwana’s Pacific margin constrained by zircon U-Pb geochronology and feldspar common-Pb isotopic compositions. Geological Society of America Bulletin, 112(4):611–627. https://doi.org/10.1130/0016-7606(2000)112<611:MBLWAE>2.0.CO;2
Müller, P.J., 1977. C/N ratios in Pacific deep-sea sediments: effect of inorganic ammonium and organic nitrogen compounds sorbed by clays. Geochimica et Cosmochimica Acta, 41(6):765–776. https://doi.org/10.1016/0016-7037(77)90047-3
Nitsche, F.O., Cunningham, A.P., Larter, R.D., and Gohl, K., 2000. Geometry and development of glacial continental margin depositional systems in the Bellingshausen Sea. Marine Geology, 162(2–4):277–302. https://doi.org/10.1016/S0025-3227(99)00074-2
Pankhurst, R.J., Millar, I.L., Grunow, A.M., and Storey, B.C., 1993. The pre‐Cenozoic magmatic history of the Thurston Island Crustal Block, west Antarctica. Journal of Geophysical Research: Solid Earth, 98(B7):11835–11849. https://doi.org/10.1029/93JB01157
Passchier, S., Ciarletta, D.J., Henao, V., and Sekkas, V., 2018. Sedimentary processes and facies on a high-latitude passive continental margin, Wilkes Land, East Antarctica. In Le Heron, D.P., Hogan, K.A., Phillips, E.R., Huuse, M., Busfield, M.E., and Graham, A.G.C. (Eds.), Glaciated Margins: The Sedimentary and Geophysical Archive. Geological Society Special Publications, 475:181–201. https://doi.org/10.1144/SP475.3
Pimmel, A., and Claypool, G., 2001. Technical Note 30: Introduction to Shipboard Organic Geochemistry on the JOIDES Resolution. Ocean Drilling Program. https://doi.org/10.2973/odp.tn.30.2001
Riley, T.R., Flowerdew, M.J., Pankhurst, R.J., Leat, P.T., Millar, I.L., Fanning, C.M., and Whitehouse, M.J., 2017. A revised geochronology of Thurston Island, West Antarctica, and correlations along the proto-Pacific margin of Gondwana. Antarctic Science, 29(1):47–60. https://doi.org/10.1017/S0954102016000341
Roberts, A.P., 2008. Geomagnetic excursions: knowns and unknowns. Geophysical Research Letters, 35(17):L17307. https://doi.org/10.1029/2008GL034719
Siddoway, C.S., Sass, L.C., III, and Esser, R.P., 2005. Kinematic history of western Marie Byrd Land, West Antarctica: direct evidence from Cretaceous mafic dykes. In Vaughan, A.P.M., Leat, P.T., and Pankhurst, R.J. (Eds.), Terrane Processes at the Margin of Gondwana. Geological Society Special Publication, 246:417–438. https://doi.org/10.1144/GSL.SP.2005.246.01.17
Teichert, B.M.A., Torres, M.E., Bohrmann, G., and Eisenhauer, A., 2005. Fluid sources, fluid pathways and diagenetic reactions across an accretionary prism revealed by Sr and B geochemistry. Earth and Planetary Science Letters, 239(1–2):106–121. https://doi.org/10.1016/j.epsl.2005.08.002
Torres, M.E., Teichert, B.M.A., Tréhu, A.M., Borowski, W., and Tomaru, H., 2004. Relationship of pore water freshening to accretionary processes in the Cascadia margin: fluid sources and gas hydrate abundance. Geophysical Research Letters, 31:L22305. https://doi.org/10.1029/2004GL021219
Tyson, R.V., 1995. Sedimentary Organic Matter: Organic Facies and Palynofacies: London (Chapman and Hall).
Uenzelmann-Neben, G., and Gohl, K., 2012. Amundsen Sea sediment drifts: archives of modifications in oceanographic and climatic conditions. Marine Geology, 299–302:51–62. https://doi.org/10.1016/j.margeo.2011.12.007
Walczak, M.H., Mix, A.C., Willse, T., Slagle, A., Stoner, J.S., Jaeger, J., Gulick, S., LeVay, L., Kioka, A., and the IODP Expedition 341 Scientific Party, 2015. Correction of non-intrusive drill core physical properties data for variability in recovered sediment volume. Geophysical Journal International, 202(2):1317–1323. https://doi.org/10.1093/gji/ggv204
Wellner, J.S., Gohl, K., Klaus, A., Bauersachs, T., Bohaty, S.M., Courtillat, M., Cowan, E.A., De Lira Mota, M.A., Esteves, M.S.R., Fegyveresi, J.M., Frederichs, T., Gao, L., Halberstadt, A.R., Hillenbrand, C.-D., Horikawa, K., Iwai, M., Kim, J.-H., King, T.M., Klages, J.P., Passchier, S., Penkrot, M.L., Prebble, J.G., Rahaman, W., Reinardy, B.T.I., Renaudie, J., Robinson, D.E., Scherer, R.P., Siddoway, C.S., Wu, L., and Yamane, M., 2021. Site U1532. In Gohl, K., Wellner, J.S., Klaus, A., and the Expedition 379 Scientists, Amundsen Sea West Antarctic Ice Sheet History. Proceedings of the International Ocean Discovery Program, 379: College Station, TX (International Ocean Discovery Program). https://doi.org/10.14379/iodp.proc.379.103.2021
Wilch, T.I., and McIntosh, W.C., 2002. Lithofacies analysis and 40Ar/39Ar geochronology of ice–volcano interactions at Mt. Murphy and the Crary Mountains, Marie Byrd Land, Antarctica. In Smellie, J.L. (Ed.), Volcano–Ice Interaction on Earth and Mars, Geological Society Special Publications, 202:237–253. https://doi.org/10.1144/GSL.SP.2002.202.01.12
Wilch, T.I., and McIntosh, W.C., 2007. Miocene–Pliocene ice-volcano interactions at monogenetic volcanoes near Hobbs Coast, Marie Byrd Land. In Cooper, A., and Raymond, C. (Eds.), Antarctica: A Keystone in a Changing World: U.S. Geological Survey and The National Academies (USA) Open-File Report 2007-1047. https://doi.org/10.3133/ofr20071047SRP074
Wilch, T.I., McIntosh, W.C., and Dunbar, N.W., 1999. Late Quaternary volcanic activity in Marie Byrd Land: potential 40Ar/39Ar-dated time horizons in West Antarctic ice and marine cores. Geological Society of America Bulletin, 111(10):1563–1580. https://doi.org/10.1130/0016-7606(1999)111<1563:LQVAIM>2.3.CO;2
Williams, T., van de Flierdt, T., Hemming, S.R., Chung, E., Roy, M., and Goldstein, S.L., 2010. Evidence for iceberg armadas from East Antarctica in the Southern Ocean during the late Miocene and early Pliocene. Earth and Planetary Science Letters, 290(3–4):351–361. https://doi.org/10.1016/j.epsl.2009.12.031
Winter, D., and Iwai, M., 2002. Data report: Neogene diatom biostratigraphy, Antarctic Peninsula Pacific margin, ODP Leg 178 rise sites. In Barker, P.F., Camerlenghi, A., Acton, G.D., and Ramsay, A.T.S. (Eds.), Proceedings of the Ocean Drilling Program, Scientific Results, 178: College Station, TX (Ocean Drilling Program), 1–25. https://doi.org/10.2973/odp.proc.sr.178.230.2002
Yakymchuk, C., Brown, C.R., Brown, M., Siddoway, C.S., Fanning, C.M., and Korhonen, F.J., 2015. Paleozoic evolution of western Marie Byrd Land, Antarctica. Geological Society of America Bulletin, 127(9–10):1461–1484. https://doi.org/10.1130/B31136.1
Yamaguchi, K., Tamura, Y., Mizukoshi, I., and Tsuru, T., 1988. Preliminary report of geophysical and geological surveys in the Amundsen Sea, West Antarctica. Proceedings of NIPR Symposium on Antarctic Geosciences, 2:55–67.
Zijderveld, J.D.A., 1967. AC demagnetization of rocks: analysis of results. In Collinson, D.W., Creer, K.M., and Runcorn, S.K. (Eds.), Developments in Solid Earth Geophysics (Volume 3): Methods in Palaeomagnetism: Amsterdam (Elsevier), 254–286. https://doi.org/10.1016/B978-1-4832-2894-5.50049-5
1 Wellner, J.S., Gohl, K., Klaus, A., Bauersachs, T., Bohaty, S.M., Courtillat, M., Cowan, E.A., De Lira Mota, M.A., Esteves, M.S.R., Fegyveresi, J.M., Frederichs, T., Gao, L., Halberstadt, A.R., Hillenbrand, C.-D., Horikawa, K., Iwai, M., Kim, J.-H., King, T.M., Klages, J.P., Passchier, S., Penkrot, M.L., Prebble, J.G., Rahaman, W., Reinardy, B.T.I., Renaudie, J., Robinson, D.E., Scherer, R.P., Siddoway, C.S., Wu, L., and Yamane, M., 2021. Site U1533. In Gohl, K., Wellner, J.S., Klaus, A., and the Expedition 379 Scientists, Amundsen Sea West Antarctic Ice Sheet History. Proceedings of the International Ocean Discovery Program, 379: College Station, TX (International Ocean Discovery Program). https://doi.org/10.14379/iodp.proc. 379.104.2021
2 Expedition 379 Scientists’ affiliations.
This work is distributed under the Creative Commons Attribution 4.0 International (CC BY 4.0) license. 