Lamy, F., Winckler, G., Alvarez Zarikian, C.A., and the Expedition 383 Scientists
Proceedings of the International Ocean Discovery Program Volume 383
publications.iodp.org

https://doi.org/10.14379/iodp.proc.383.106.2021
Site U15421
F. Lamy, G. Winckler, C.A. Alvarez Zarikian, H.W. Arz, C. Basak, A. Brombacher, O.M. Esper, J.R. Farmer, J. Gottschalk, L.C. Herbert, S. Iwasaki, V.J. Lawson, L. Lembke-Jene, L. Lo, E. Malinverno, E. Michel, J.L. Middleton, S. Moretti, C.M. Moy, A.C. Ravelo, C.R. Riesselman, M. Saavedra-Pellitero, I. Seo, R.K. Singh, R.A. Smith, A.L. Souza, J.S. Stoner, I.M. Venancio, S. Wan, X. Zhao, and N. Foucher McColl2
Keywords: International Ocean Discovery Program, IODP, JOIDES Resolution, Expedition 383, Dynamics of the Pacific Antarctic Circumpolar Current, Site U1542, Southern Ocean, South Pacific, Chilean margin, paleoceanography, Antarctic Circumpolar Current, oceanic fronts, Circumpolar Deep Water, Antarctic Intermediate Water, marine carbon cycle, dust, biological productivity, iron fertilization, southern westerly winds, Patagonian ice sheet, West Antarctic ice sheet
MS 383-106: Published 18 July 2021
Background and objectives
Site U1542 is located at the Chilean continental margin in the eastern South Pacific at 52°42.2917ʹS, 75°35.76915ʹ W, ~30 nmi west of the entrance of the Strait of Magellan at 1101 m water depth (Figure F1). North of ~53°S, subduction in the Chile Trench is more orthogonal relative to the coast and results in a steep slope incised by canyons that run perpendicular to the trench axis. Recent sediment cover is minor at the lower slope, but a relatively small-scale sediment depocenter (“sediment drift”) has been identified at the upper continental slope where Site U1542 is located.
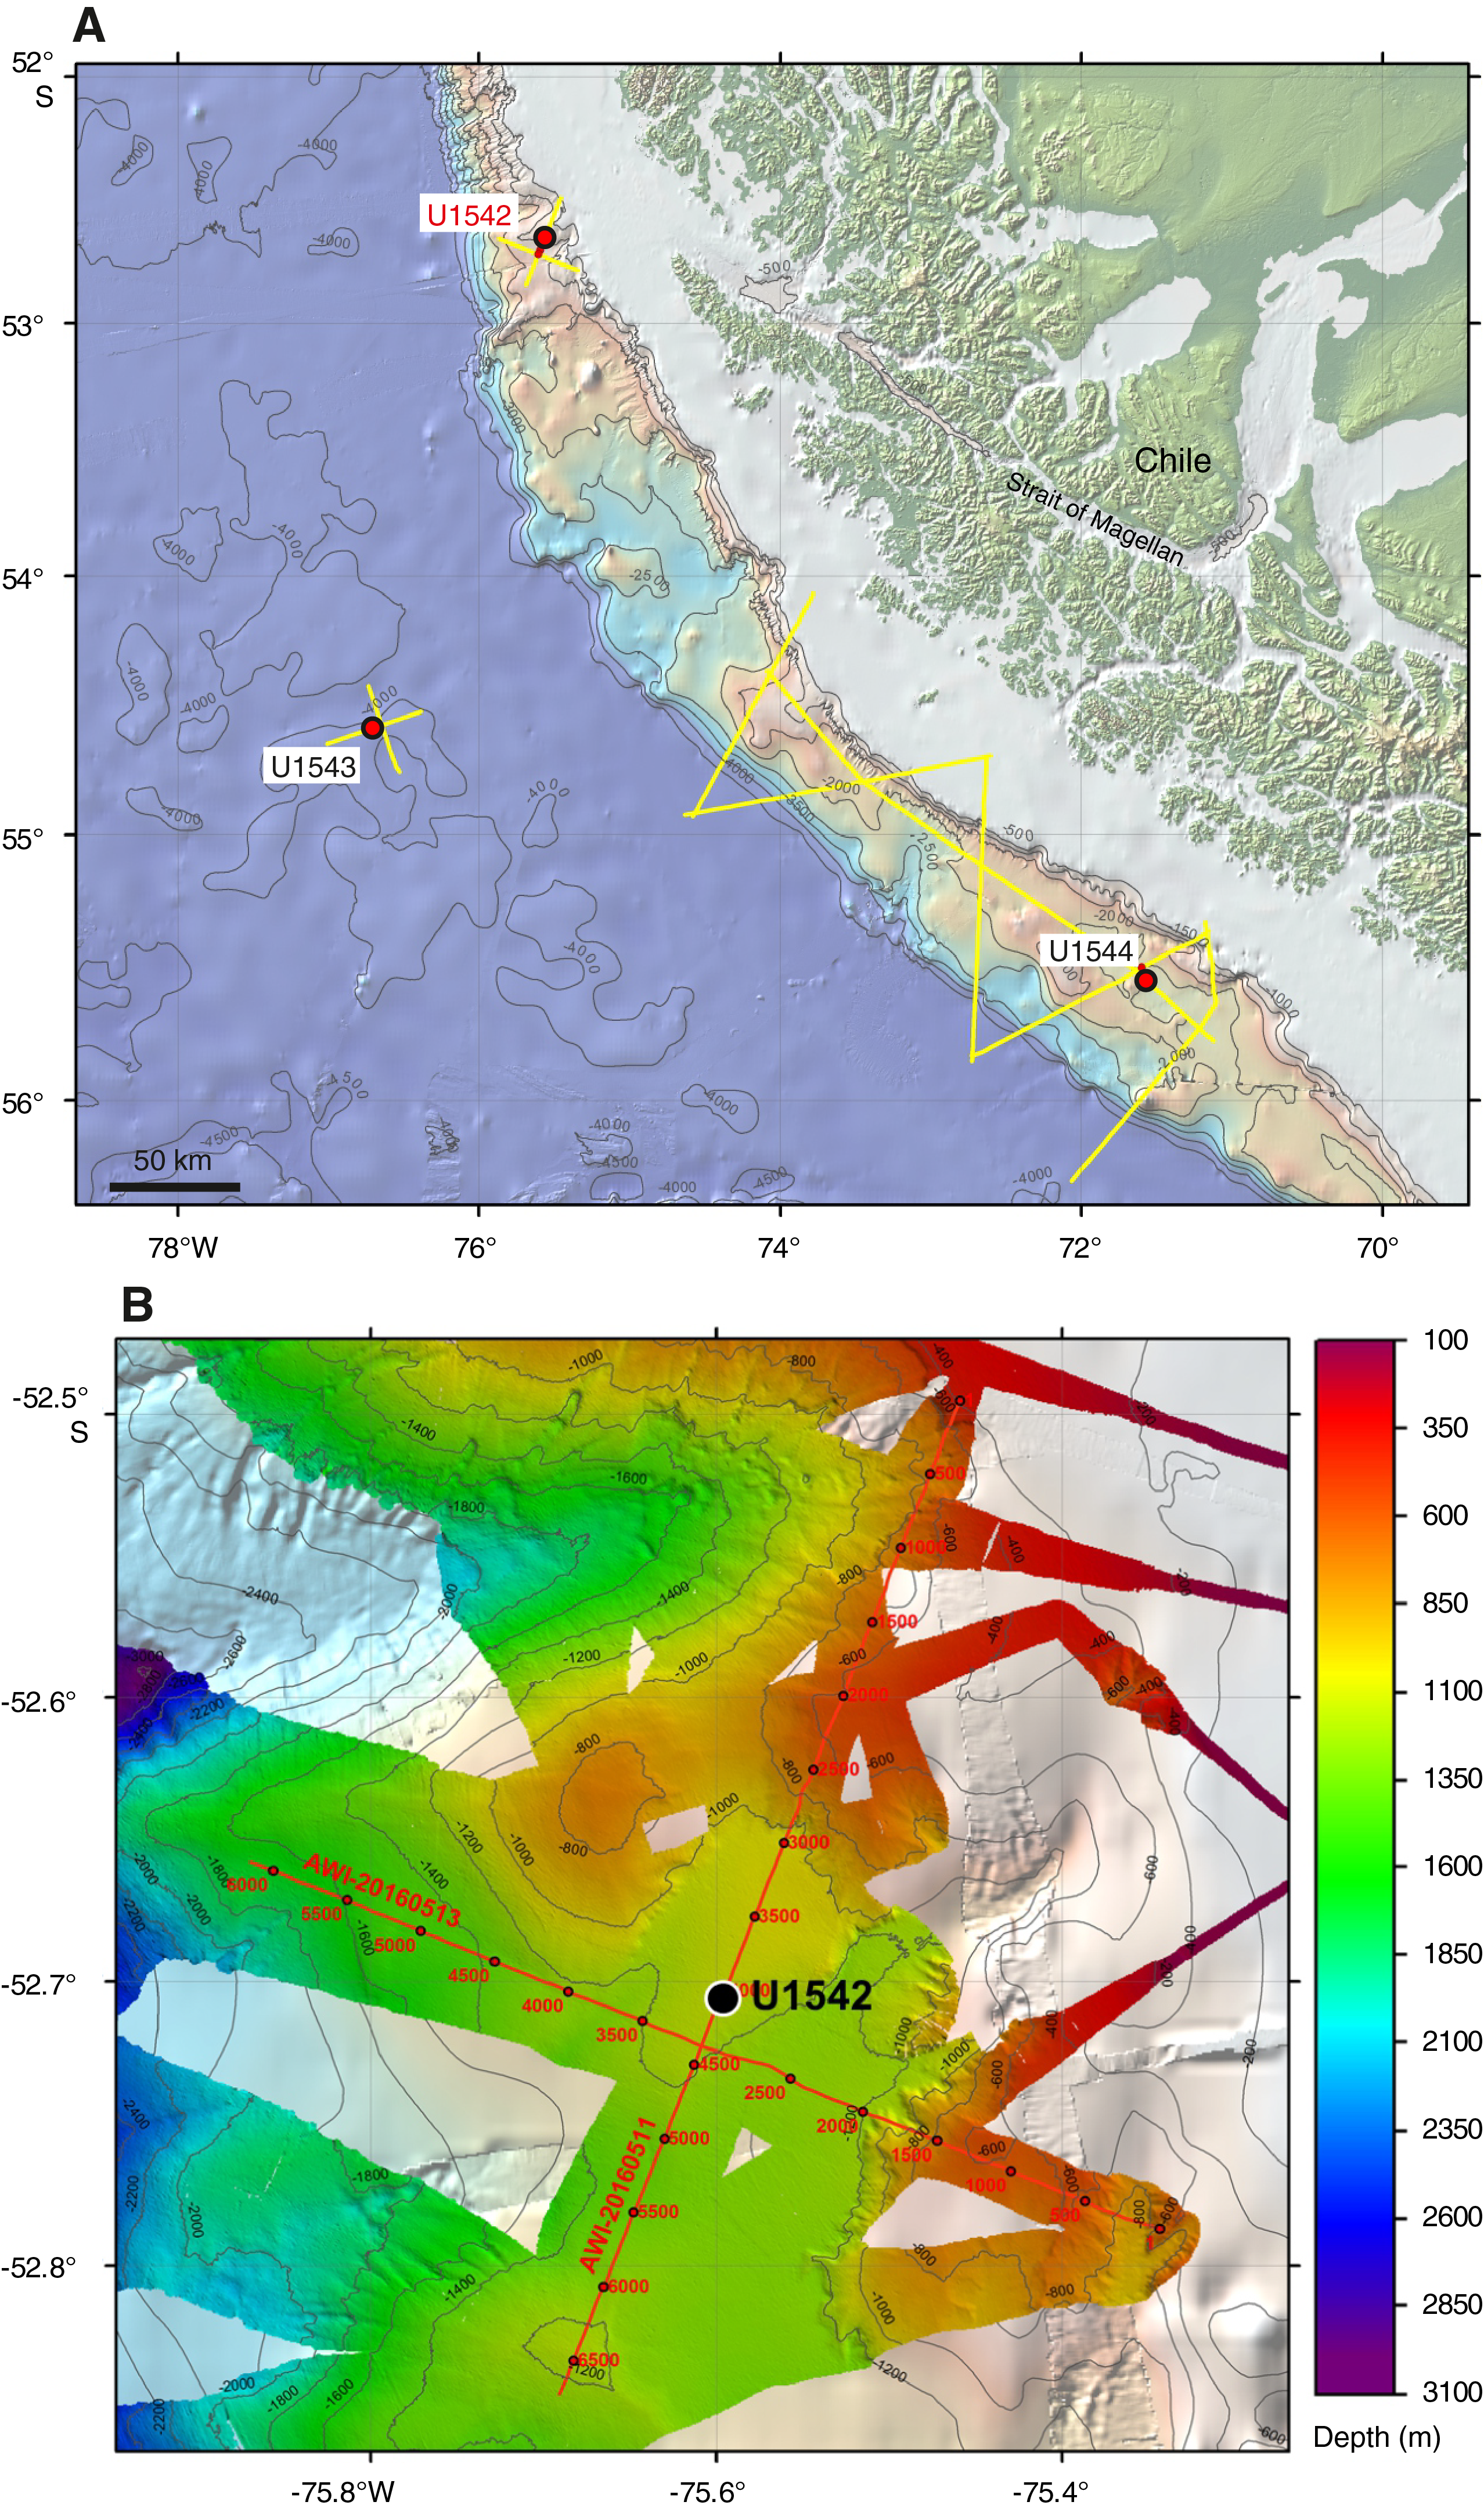
Figure F1. Oceanographic and bathymetric setting.
Site U1542 lies along Multichannel Seismic Line AWI-20160511 ~1 nmi north of the intersection with Line AWI-20160513 (Figure F2A) (Lamy, 2016). The seismic cross-lines indicate sediments as thick as ~700 m above continental basement. The basement age of the drift is unknown; a maximum age of ~10 Ma can be derived from the end of the tectonic erosion and start of subsidence at the continental margin (Polonia et al., 2007). Sediments are mostly well stratified and have slightly irregular reflectors. Low to moderately reflecting layers become stronger below ~350 m sediment depth. Sediment echo sound (Parasound) profiles (Lamy, 2016) reveal moderate penetration (~50 m) and distinct layering (Figure F2B), suggesting a succession of fine- to medium-grained sediments with varying lithologic composition.
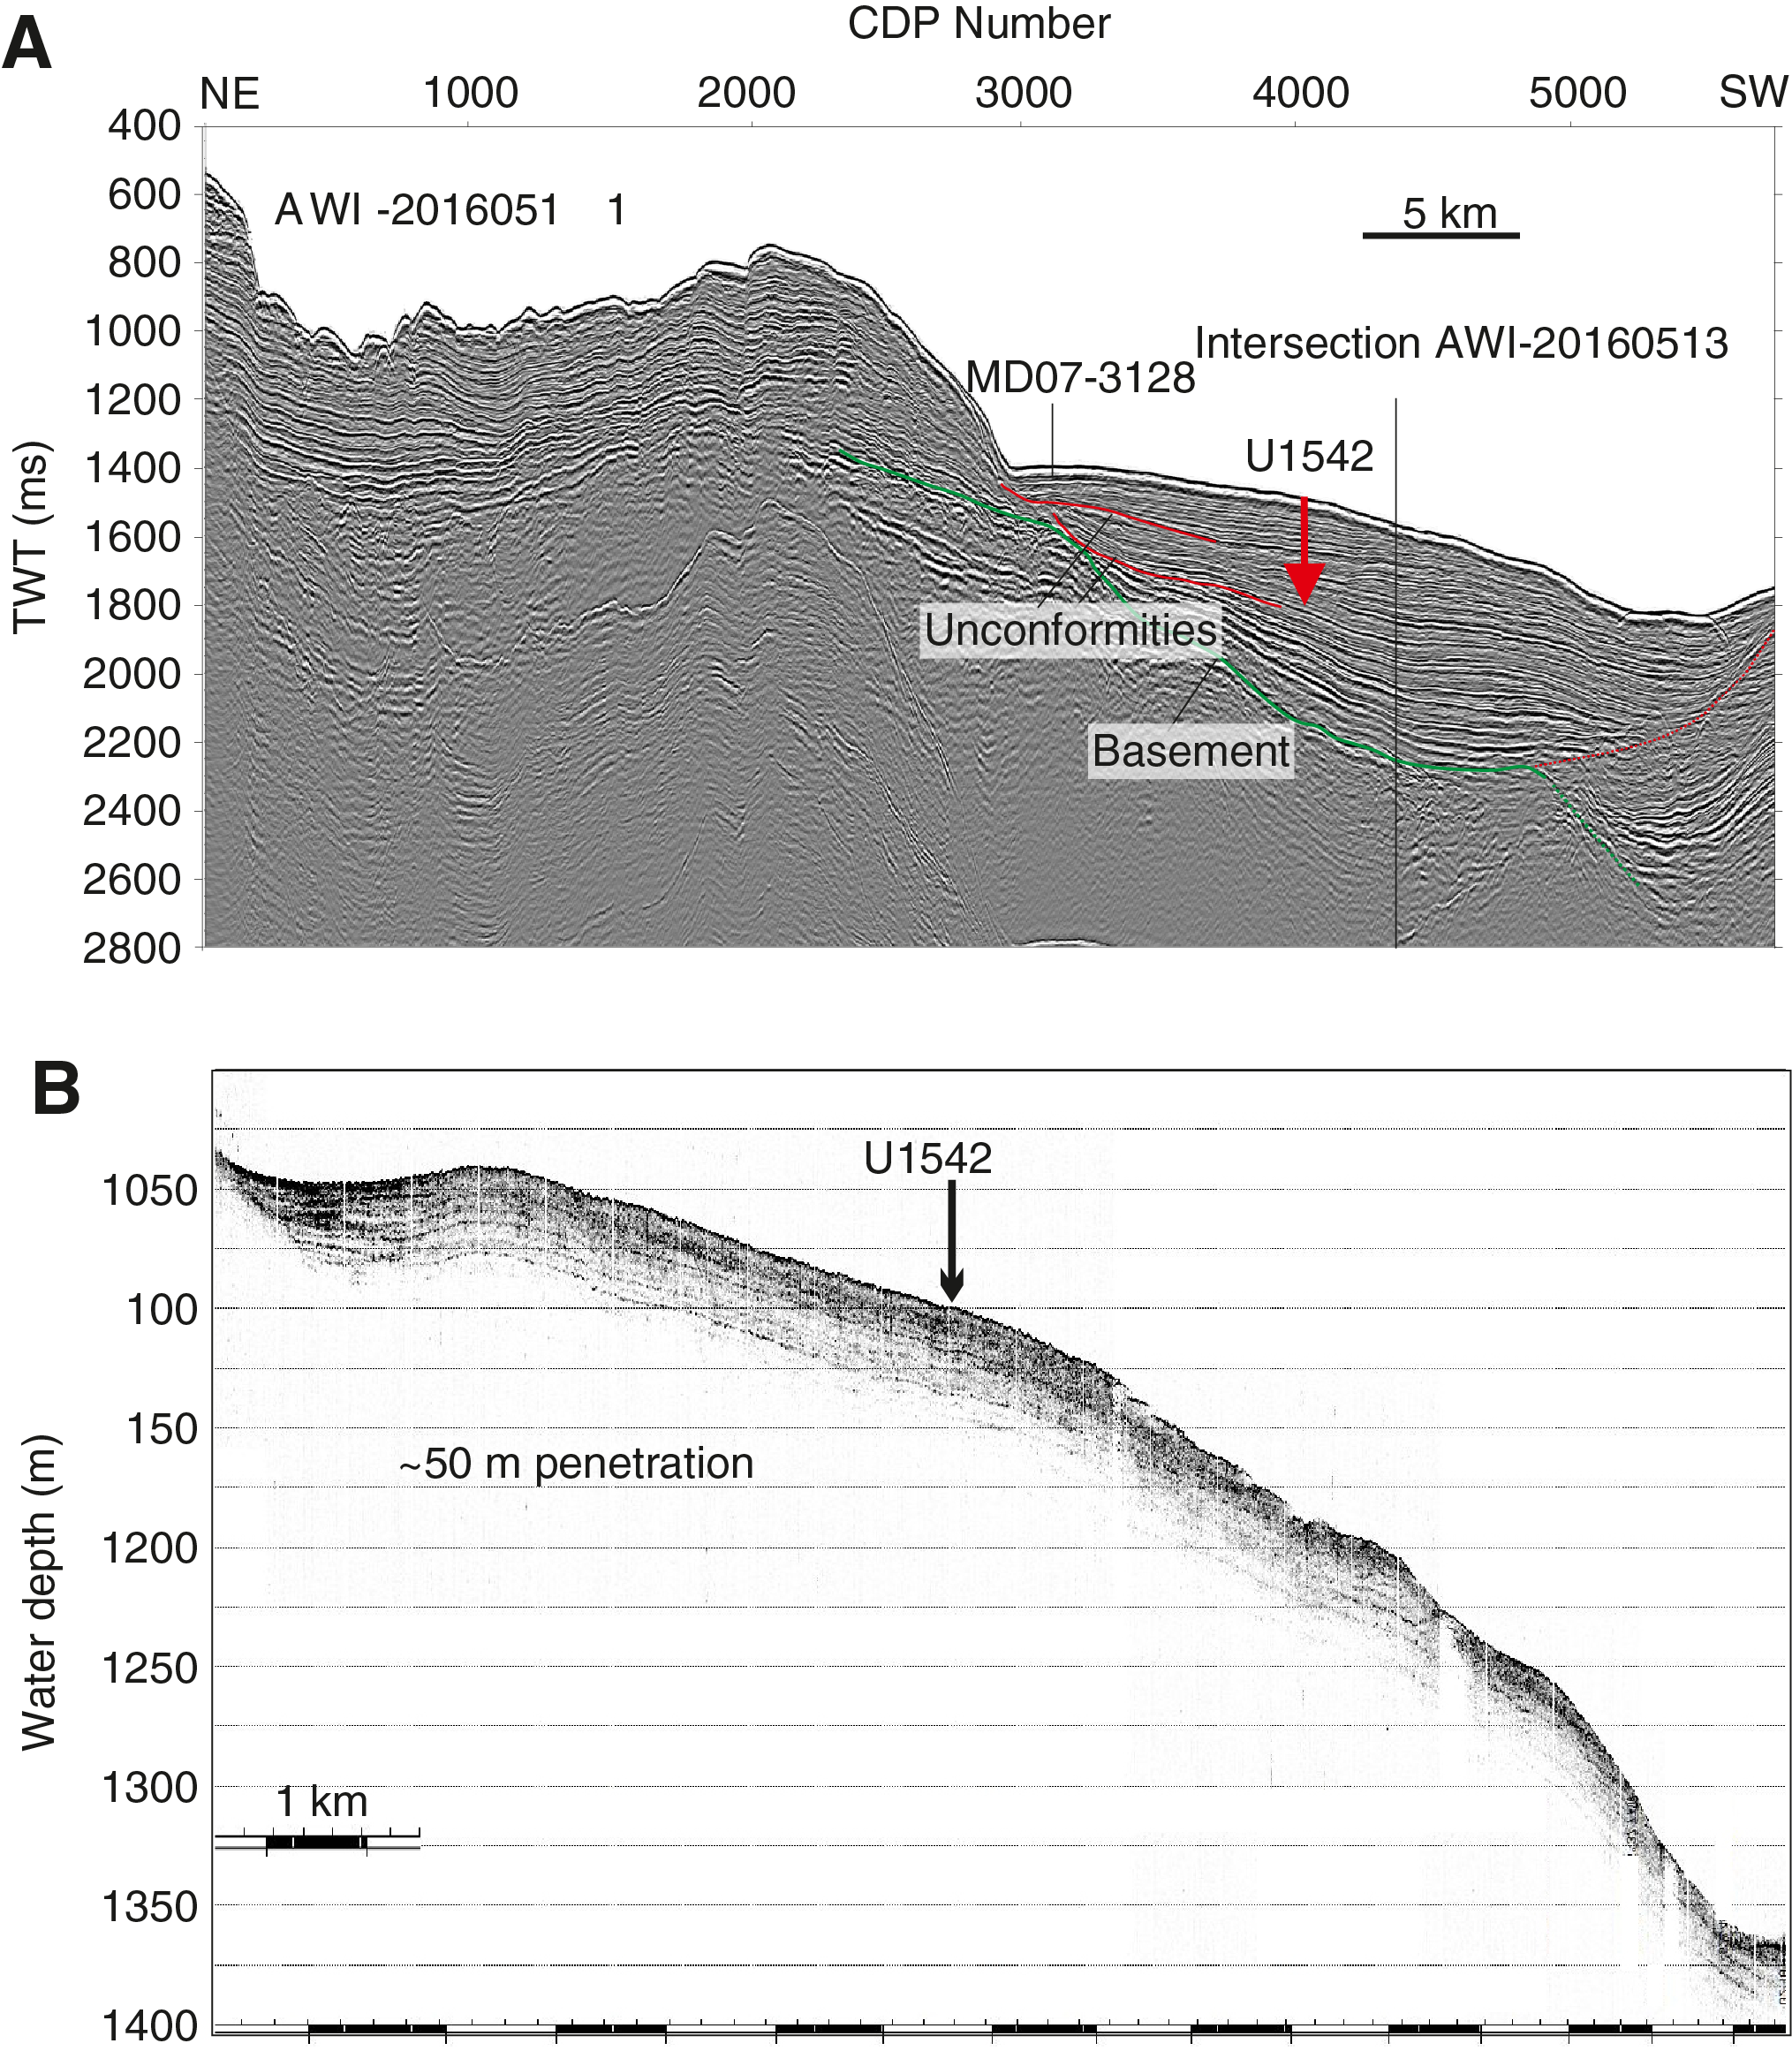
Figure F2. MCS and Parasound profiles.
Site U1542 sits underneath the southward flowing Cape Horn Current (CHC), a northern branch of the Antarctic Circumpolar Current (ACC) that continues toward the Drake Passage and provides a major fraction of the present-day northern Drake Passage transport (Well and Roether, 2003). Satellite-tracked surface drifters reveal that after crossing the East Pacific Rise, Subantarctic surface water of the ACC is transported northeastward across the Southeast Pacific toward the Chilean coast at ~45°S/75°W (Figures F3, F4). Here, presently only a minor part of ACC water is deflected northward into the Humboldt Current System, whereas the major fraction is deviated southward toward the Drake Passage. The CHC thus transports a significant amount of northern ACC water toward the Drake Passage in a narrow, ~100–150 km wide belt along the coast (Chaigneau and Pizarro, 2005). Modern surface current velocities within the CHC reach >35 cm/s, and high flow speeds of ~20 cm/s extend to middepths (Boisvert, 1969; Chaigneau and Pizarro, 2005).
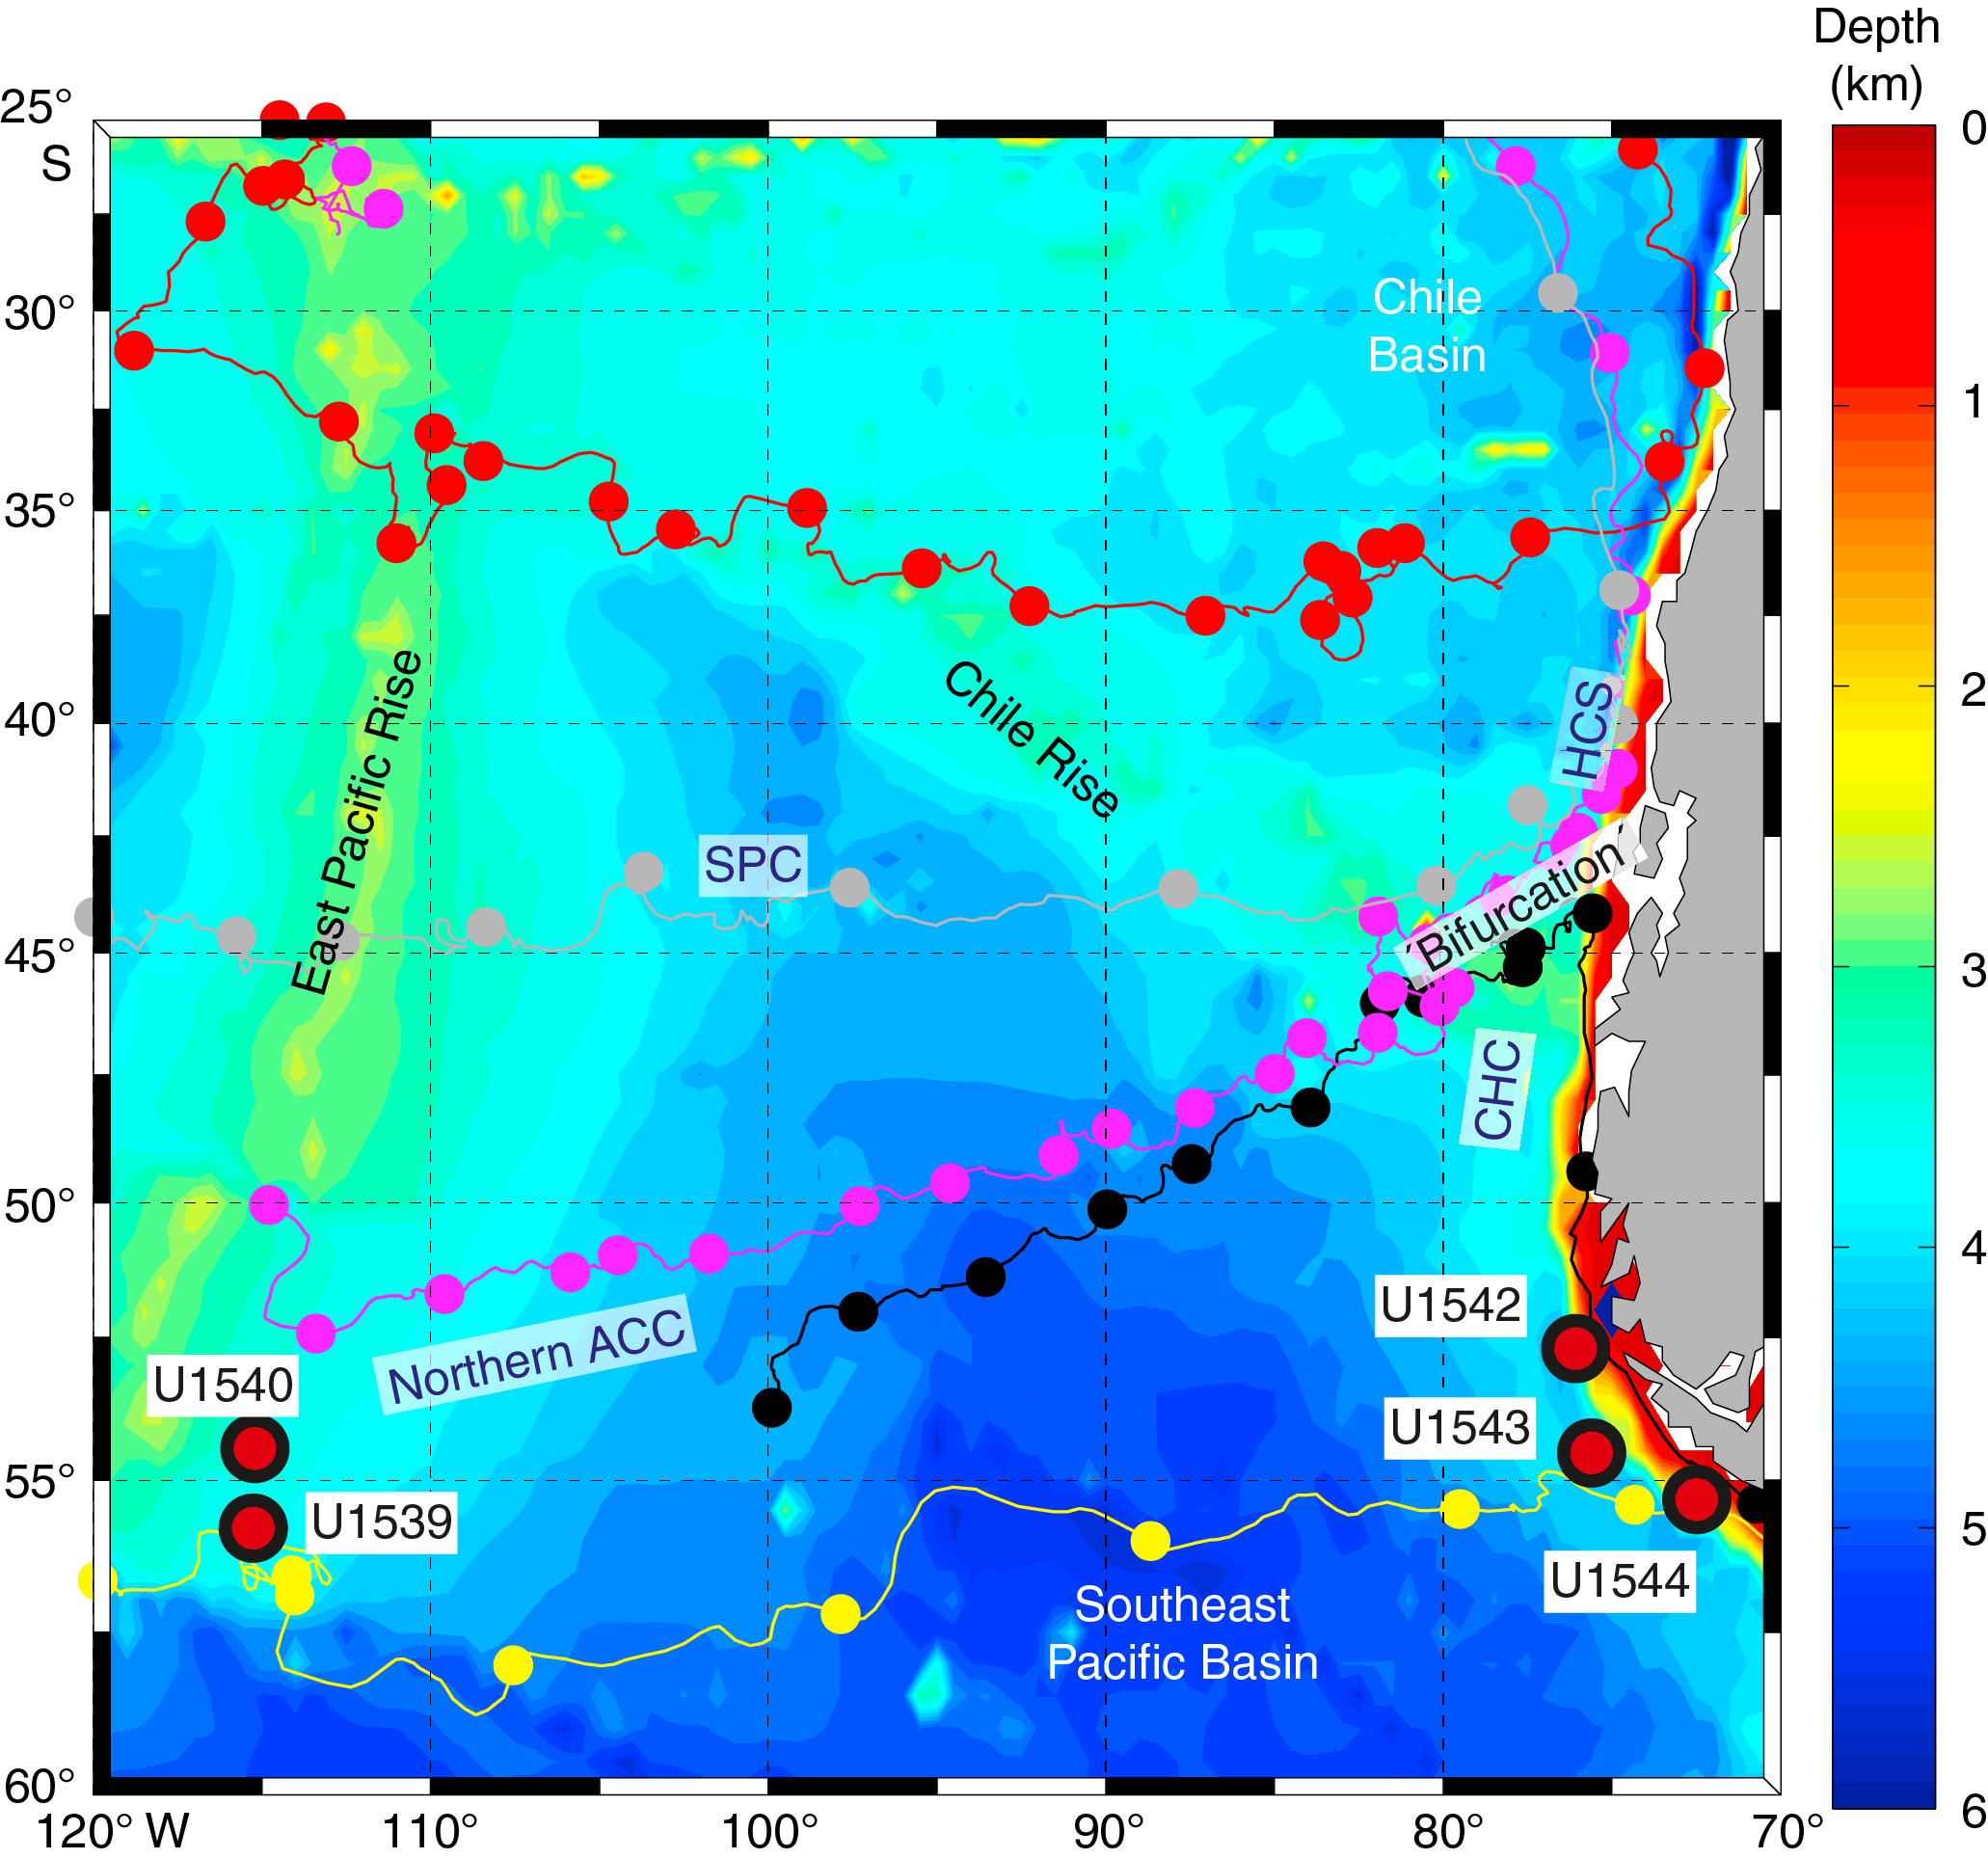
Figure F3. Surface circulation.
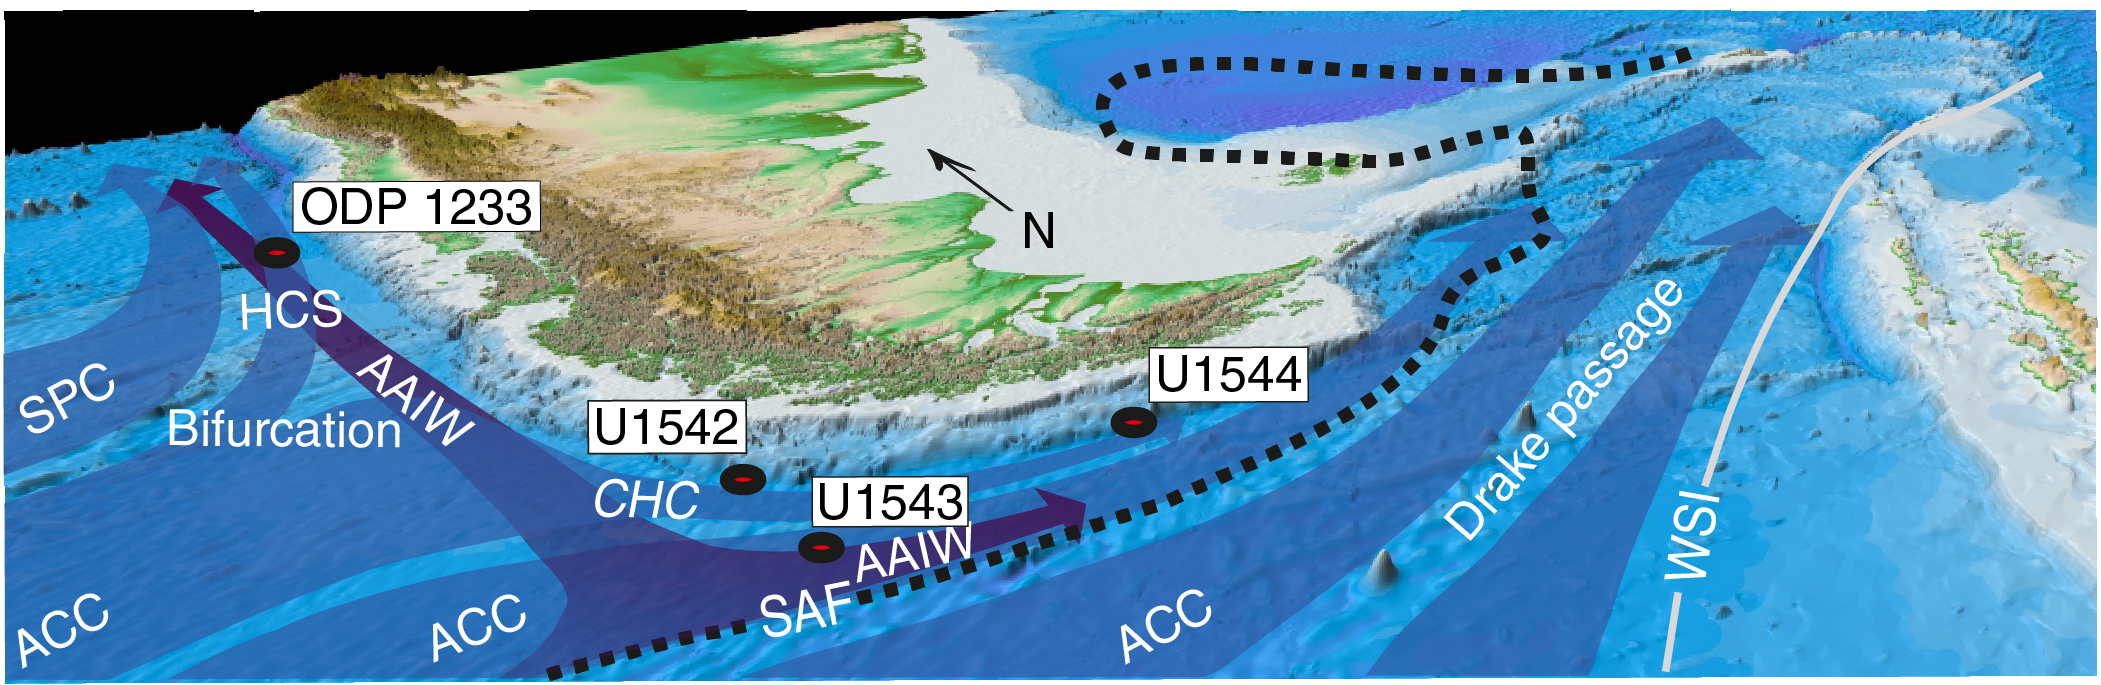
Figure F4. Major surface and intermediate water circulation.
Site U1542 is located at the lower limit of Antarctic Intermediate Water (AAIW) and lies close to or within the major modern AAIW formation area in the Southeast Pacific (e.g., Bostock, et al., 2013). Circumpolar Deep Water (CDW) underlies AAIW in this region (Figure F5). The area off the Strait of Magellan is located ~5° latitude north of the present Subantarctic Front. Modern mean annual sea-surface temperature (SST) in this area is ~8°C, and the seasonal range is ~3°C.
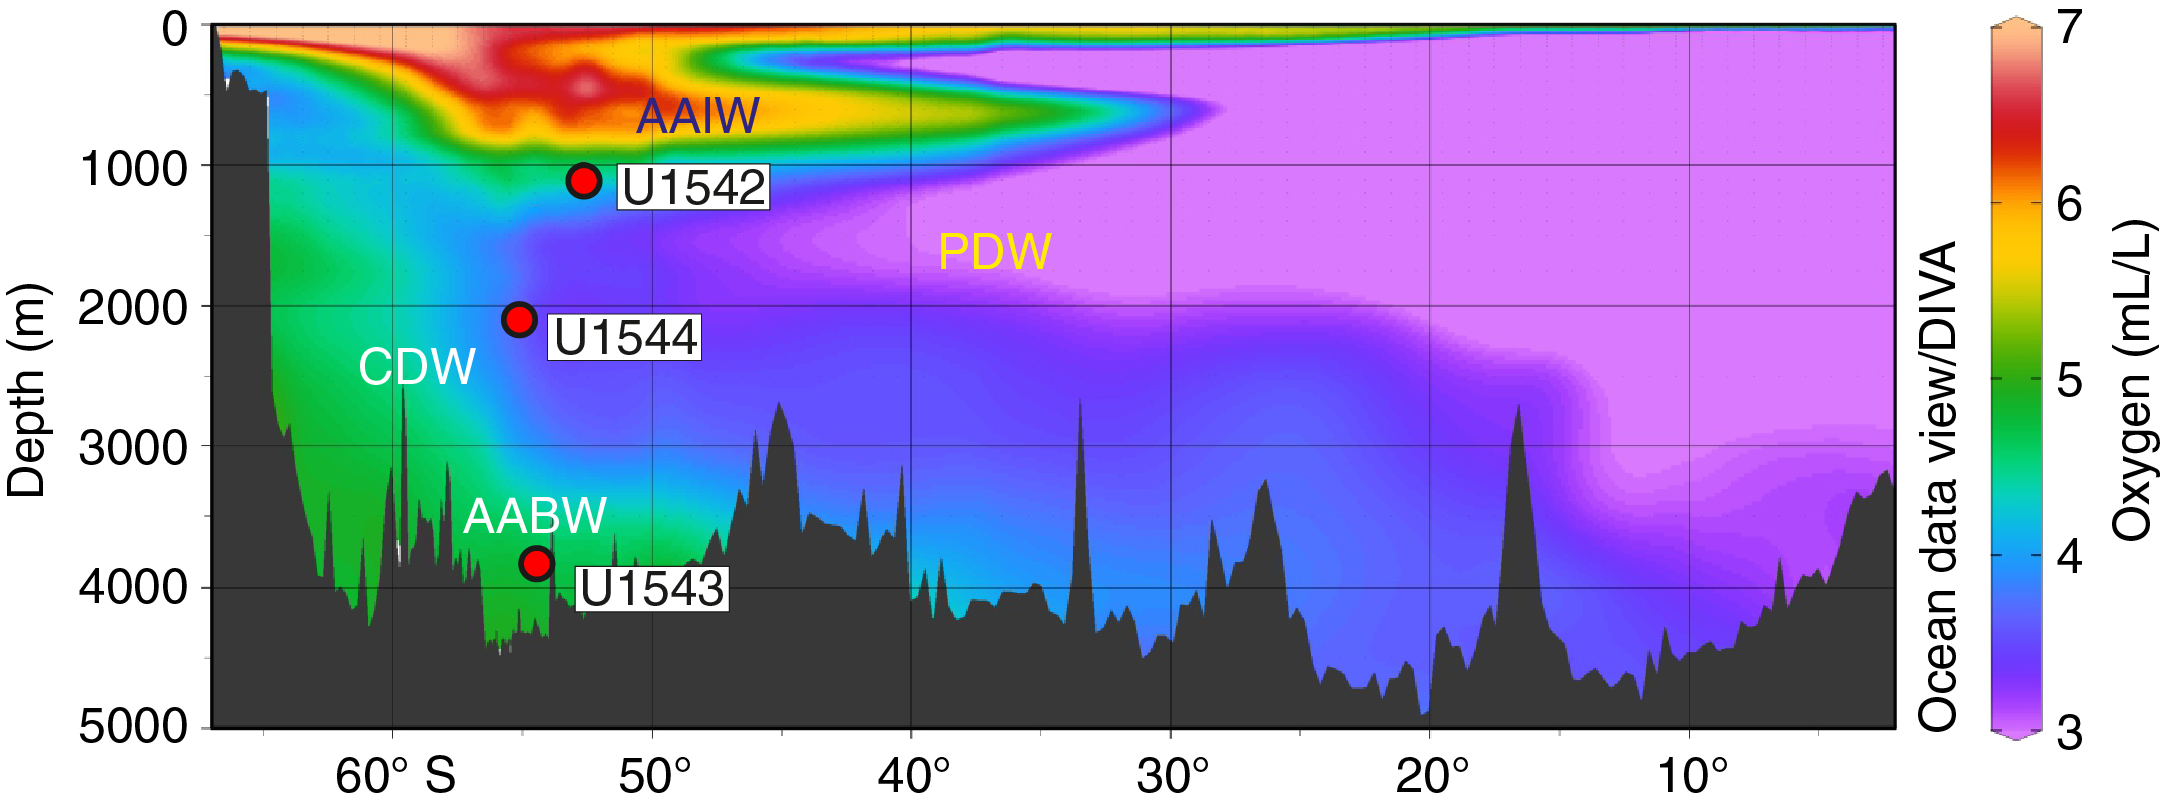
Figure F5. Modern oxygen distribution.
Precruise site survey Core MD07-3128 (~30 m long), located ~2 nmi north of Site U1542, provides excellent high-resolution paleoceanographic records over the past 65 ky (e.g., Caniupán, et al., 2011; Lamy, et al., 2015.). The core contains sandy foraminiferal ooze (~30–55 wt% CaCO3) deposited during the Holocene underlain by glacial, primarily siliciclastic sediments (~1–12 wt% CaCO3). Biogenic silica contents range from 1 to 4 wt%. The lower biogenic carbonate and silica contents during glacial periods are primarily due to dilution by enhanced supply of terrigenous sediment from the glaciated hinterland, the absence of sediment trapping in the fjords, and reduced winnowing by the overlying CHC (Lamy, et al., 2015). Average sedimentation rates range from ~5 cm/ky during the Holocene to >50 cm/ky in the last glacial period.
Scientific objectives
The main objectives at Site U1542 were to
- Recover Pleistocene paleoceanographic records over the past several glacial–interglacial cycles with suborbital-scale resolution,
- Reconstruct the strength of the CHC (Subantarctic ACC) before entering the Drake Passage,
- Investigate AAIW and CDW water mass properties,
- Investigate changes in continental paleoclimate, and
- Recover a potential near-field record of Patagonian ice sheet variability.
Operations
Four holes were cored at Site U1542 using the full-length advanced piston corer (APC) system. Hole U1542A was cored from 0 to 169.5 m core depth below seafloor, Method A (CSF-A) (181.74 m recovered; 107%), Hole U1542B was cored from 0 to 1.4 m CSF-A (1.46 m recovered; 104%), Hole U1542C was cored from 0 to 234 m CSF-A (225 m cored and 236.9 m recovered; 105%), and Hole U1542D was cored from 0 to 213.7 m CSF-A (202.7 m cored and 205.4 m recovered; 101%).
Transit to Site U1542
At 0236 h on 20 June 2019, the vessel got underway at full speed to the northeast of Site U1541 to avoid heavy weather headed toward the operational area. Taking advantage of the transit, we deployed the towed magnetometer. The vessel continued transiting on a northeasterly course for 1109 nmi over 4.7 days until 1845 h on 24 June, when sea conditions allowed us to turn around and start heading to our operational area at the southwest Chilean margin. During the northward transit on 21 June, we passed just 120 nmi east of Point Nemo, the most remote location on our planet.
At 1845 h on 24 June, we set a southeast course toward Proposed Site CHI-1C, located at the southernmost Chilean margin close to the Pacific entrance of the Drake Passage, which provided the best ability to change course for Proposed Site CHI-4B or ESP-1B if the weather improved over those sites first. We continued on this course until 1230 h on 28 June, covering 873 nmi, when a strong system of high winds and seas was predicted to begin moving across the transit path and into the Chilean margin operational area, forcing us to stop at 48°44.0ʹS, 089°24.7ʹW. The thrusters were lowered to wait for the system to pass.
At 1300 h on 1 July, the weather system we were monitoring had moved past our projected course and subsided enough over the operational area in the Chilean margin to resume transit for the remaining 575 nmi. The thrusters were raised, and at 1330 h we resumed navigation on a course of 122° southeast to the southwest margin of Chile. At 1345 h on 2 July, we adjusted the heading to 109° southeast for Proposed Site CHI-4B (Site U1542).
Site U1542
Hole U1542A
We arrived at Site U1542 at 1948 h on 3 July 2019. The thrusters were lowered, and the vessel switched to dynamic positioning mode by 2030 h. An APC/extended core barrel (XCB) bottom-hole assembly (BHA) was made up and lowered to the seafloor. Based on a precision depth recorder reading of 1111.4 meters below rig floor (mbrf), an APC shooting depth of 1108.4 mbrf was chosen, and Hole U1542A was spudded at 0215 h on 4 July. Core 383-U1542A-1H retrieved 7.1 m of sediment, determining the seafloor depth at 1110.8 mbrf (1099.8 meters below sea level [mbsl]).
APC coring continued to 165.6 m CSF-A (Cores 383-U1542A-1H through 19H), at which point the core barrel became detached from the sinker bars during retrieval. The core barrel fell ~50 m back to the landing seat. Three attempts were needed to finally retrieve the barrel. Once at the surface, we found that only 1.05 m of core was recovered, and we decided to switch to the half-length APC (HLAPC) system to deepen the hole. The HLAPC system was used for one core, recording a partial stroke and recovering 3.91 m before the hole was abandoned because of high seas and winds. The bit was pulled to 1033 mbrf, clearing the seafloor at 2359 h on 4 July and ending Hole U1542A. A total of 19 APC and 1 HLAPC cores were taken over a 169.5 m interval, recovering 181.74 m (107.2%).
Nonmagnetic core barrels and the core orientation tool were used on all cores. The advanced piston corer temperature (APCT-3) tool was used to measure formation temperature on Cores 383-U1542A-4H, 7H, 10H, 13H, and 16H. Partial strokes were recorded on Cores 10H–13H and 16H–21F. The total time spent in Hole U1542A was 27.5 h (1.1 days).
Hole U1542B
The vessel waited for the seas and winds to calm from 0030 to 1545 h on 5 July 2019 with the bit set at 1033 mbrf. The vessel was offset 20 m east of Hole U1542A, the bit was lowered to 1104.0 mbrf, and Hole U1542B was spudded at 1745 h on 5 July. Core 383-U1542B-1H recovered only 1.46 m of sediment. Because of the low recovery and quality of the core, we decided to obtain a better mudline core, so Hole U1542B was abandoned.
Hole U1542C
The vessel stayed at the same coordinates, and the bit was lowered to 1105.0 mbrf. Hole U1542C was spudded at 1830 h on 5 July 2019. Based on the recovery from Core 383-U1542C-1H (3.3 m), the seafloor was calculated at 1111.2 mbrf (1100.2 mbsl). APC coring continued in Hole U1542C to 169.3 m CSF-A with Core 20H. While running in the core barrel for Core 21H, the Captain terminated operations because of high currents and winds. When the core barrel was retrieved, it was found that the pins had sheared and 3.57 m of core had been retrieved for an advance of 3.0 m.
At 0900 h on 6 July, the bit was pulled to 71.8 m CSF-A, and the top drive was set back to wait on weather with the bit in the hole. The crew continued to wait on weather until the seas subsided at 1630 h. The top drive was picked up, the hole was washed to the bottom by 1815 h, and coring continued with Cores 383-U1542C-22H through 28H to 226.0 m CSF-A at midnight on 6 July.
A total of 28 cores were taken over a 234.0 m interval with two 4.5 m drilled intervals (total drilled = 9 m). A total of 236.86 m was recovered (105% recovery). Nonmagnetic core barrels were used with all cores, and the core orientation tool was removed after Core 383-U1542C-20H. A misfire was recorded on Core 8H, and partial strokes were recorded on Cores 10H, 12H, 13H, 16H, 17H, and 20H–28H.
Hole U1542D
The vessel was offset 20 m south of Hole U1542C, and the bit was spaced out to 1107 mbrf. Hole U1542D was spudded at 0600 h on 7 July 2019. Based on recovery from Core 383-U1542D-1H, the seafloor was calculated at 1111.7 mbsl (1100.7 mbrf). The hole was then cored to a total depth of 213.7 m CSF-A using the full-length APC system, with three drilled intervals without recovery over a total of 11.0 m to help eliminate gaps in core coverage between holes. After reaching total depth, the bit was recovered to the surface, clearing the seafloor at 0245 h and the rotary table at 0545 h on 8 July. The BHA was racked back in the derrick, and the rig floor was secured for transit at 0555 h. The vessel was switched from dynamic positioning to cruise mode at 0558 h, ending Hole U1542D and Site U1542.
Nonmagnetic core barrels were used on all cores, but no core orientation or temperature measurements were taken in Hole U1542D. Partial strokes were recorded on Cores 383-U1542D-10H and 12H–27H. A total of 24 cores were taken over a 202.7 m interval with 205.4 m recovery (101.2%). Three drilled intervals followed Cores 12H, 22H, and 24H. The hole was advanced by recovery on all partial strokes. Coring summaries for Holes U1542A–U1542D are shown in Table T1.
Sedimentology
Site U1542 is located along the Chilean continental margin ~50 km west-northwest of the western entrance of the Strait of Magellan. Holes U1542A–U1542D were cored from an upper continental slope sediment drift and contain a Pleistocene sedimentary sequence consisting mostly of siliciclastic sediments. The southern Chilean margin location and the hydrographic setting of Site U1542 make it ideal to reconstruct changes in AAIW dynamics, the strength of a northern branch of the ACC (i.e., the CHC), SSTs, land-sea interactions along the continental margin, and Patagonian glacier ice extent.
Although sea conditions were generally more favorable than at previous Expedition 383 sites, relatively high heave still led to instances of core disturbance, including fall-in at the top of cores and uparching/suck-in throughout the base of some cores. The identification and classification of sediments disturbed by drilling operations is described in Sedimentology in the Expedition 383 methods chapter (Winckler et al., 2021a) and is largely based on Jutzeler et al. (2014). Severe drilling-disturbed sediments were classified as mixed siliciclastic sediments in the visual core descriptions (VCDs) and hole summaries (Figure F6). Examples are found in Sections 383-U1542A-10H-4 through 10H-7, 383-U1542C-6H-1 through 6H-8, and 383-U1542D-8H-1.
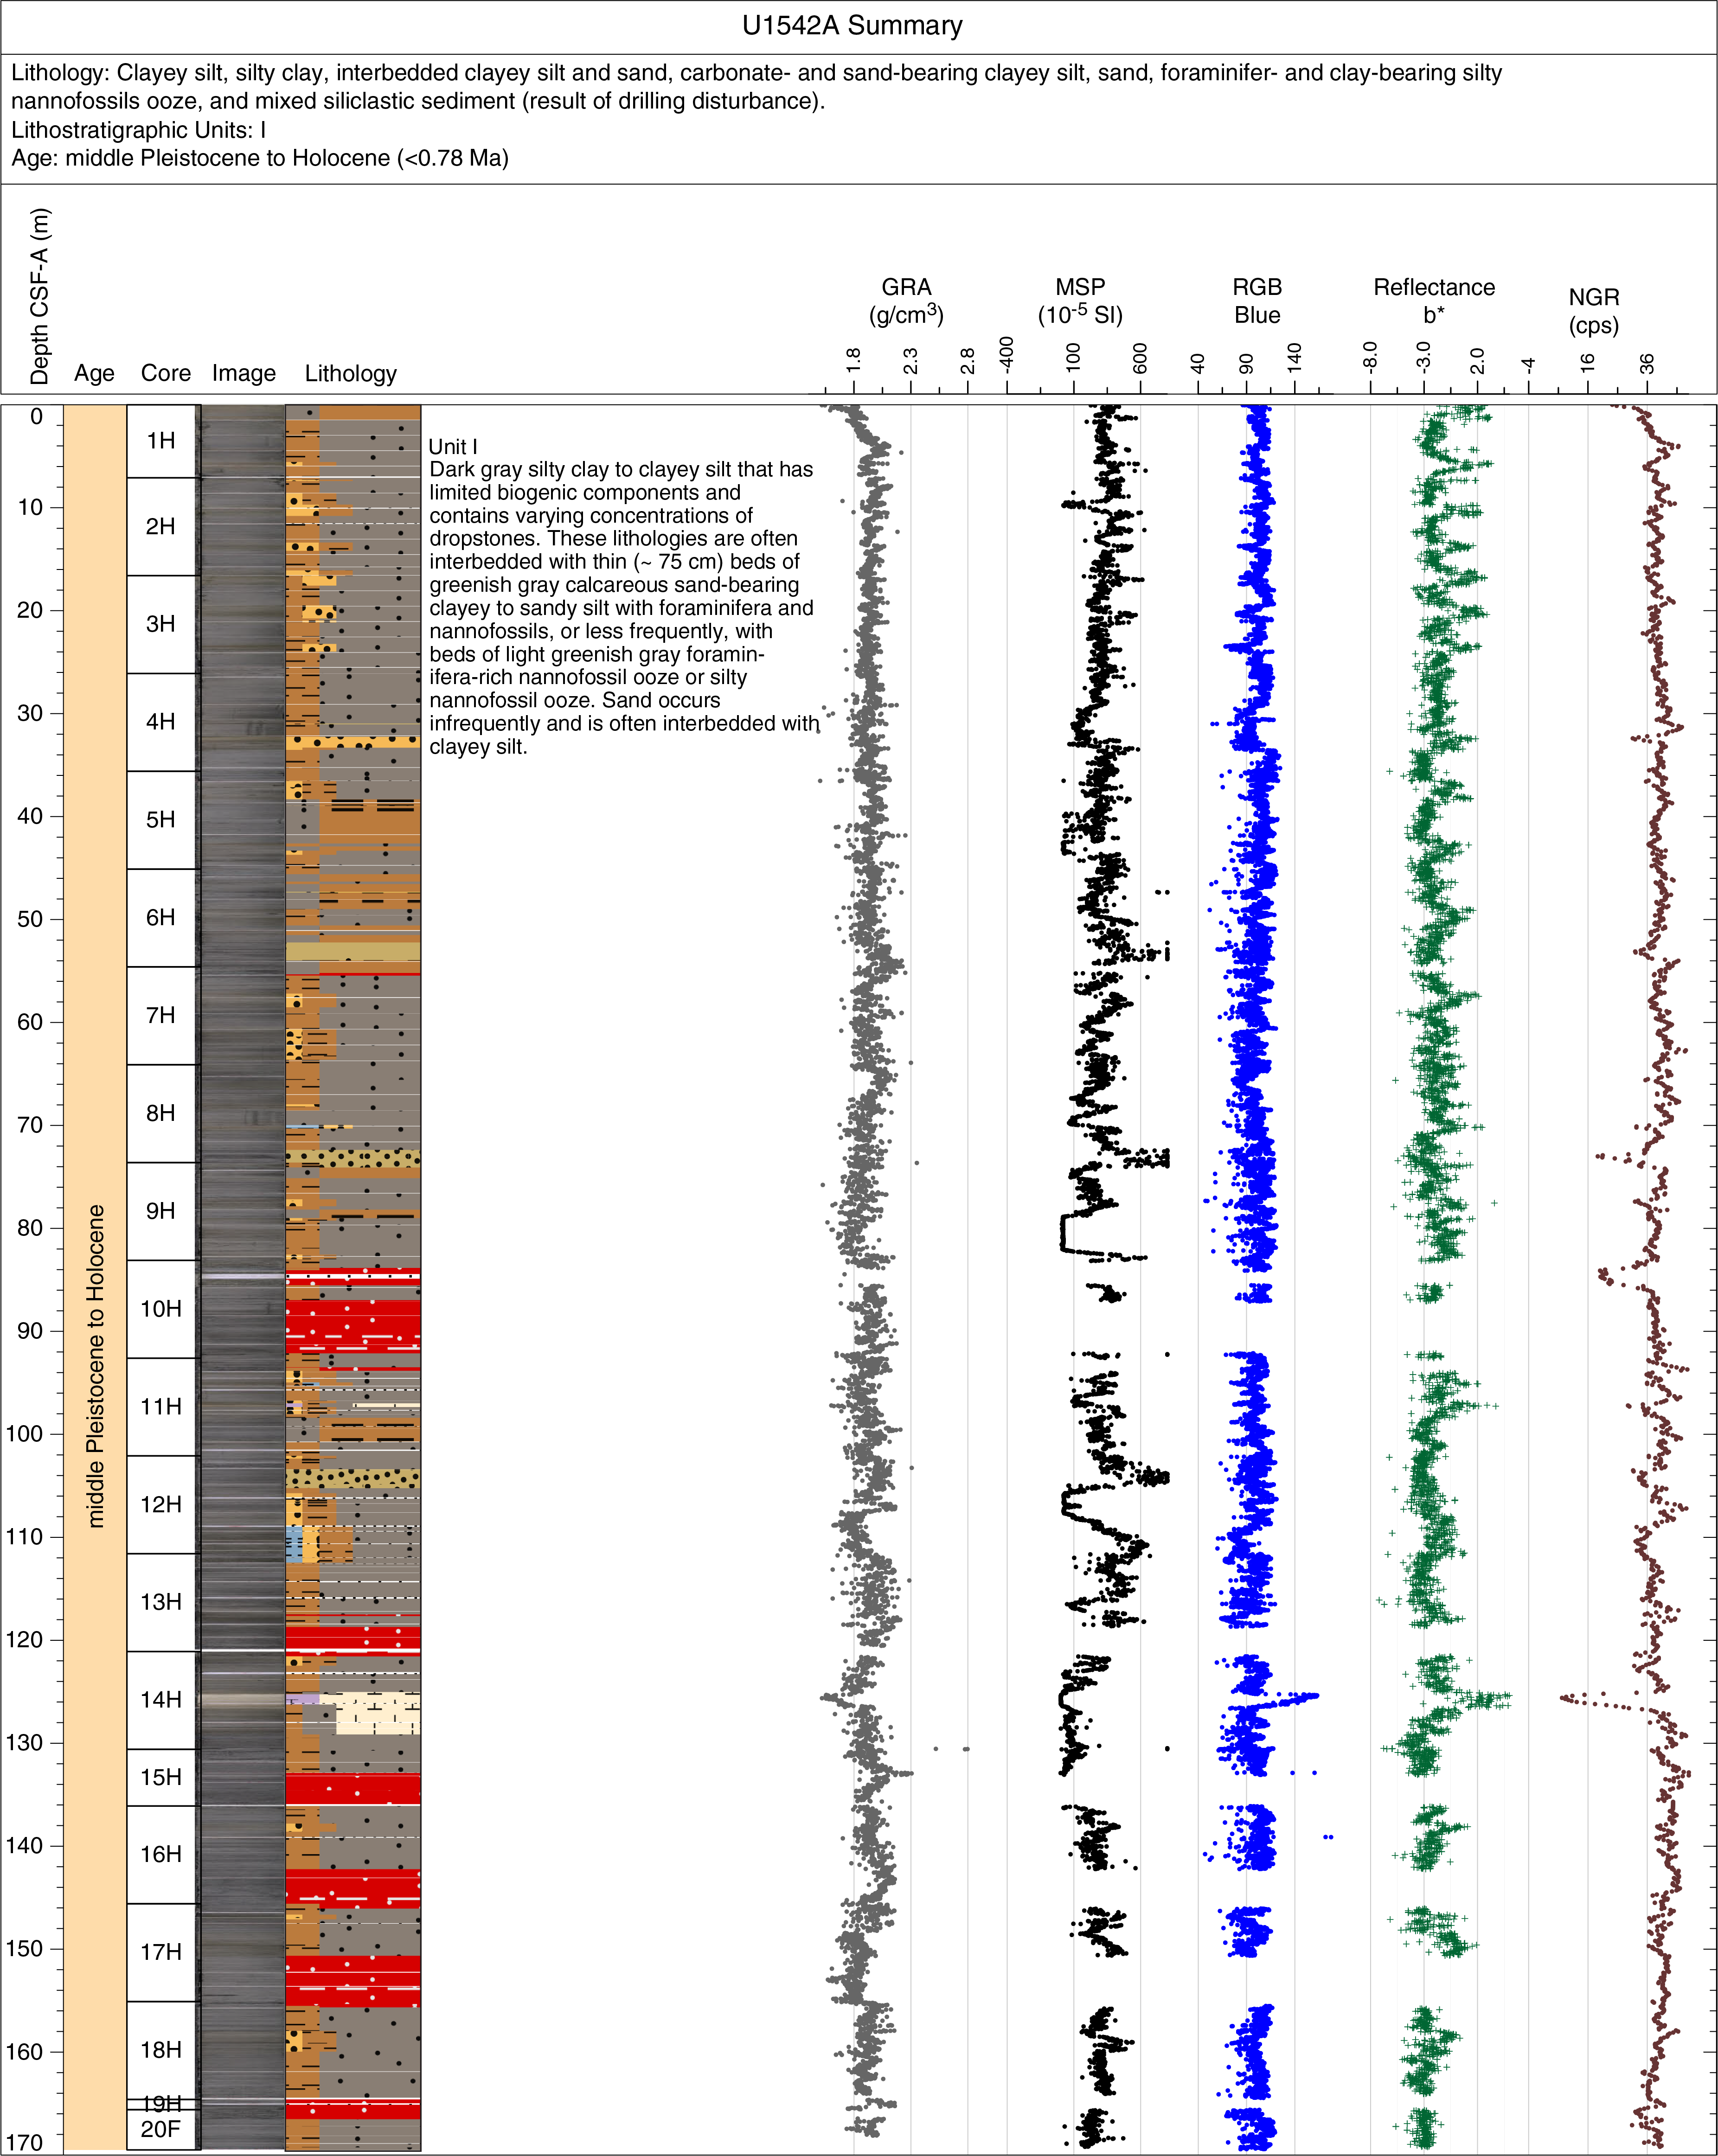


Figure F6. Hole summaries.
Lithofacies description
Five lithofacies were identified at Site U1542 (Table T2). The numbering of the facies is based on all lithofacies documented at Expedition 383 sites, but only lithofacies documented and introduced at Site U1542 are described and discussed here in detail. Sediments from Lithofacies 8, 9, and 11 are composed of siliciclastic sediments that can be represented in a ternary sand-silt-clay diagram (Figure F7). Lithofacies 4 is a foraminifer-rich variety of the nannofossil ooze described at previous sites (Lithofacies 4; Figure F8). The dominant lithofacies at this site is silty clay to clayey silt (Lithofacies 8; Figure F9). The major component of the regularly interbedded, decimeter-thick Lithofacies 9 is detrital with calcareous components (i.e., foraminifers and nannofossils) as minor modifiers (Lithofacies 9; Figure F10). The less abundant Lithofacies 10 is nannofossil ooze with silt as a major modifier and clay and sand as minor modifiers (Lithofacies 10; Figure F11). Lithofacies 11 is moderately to well-sorted quartz-rich siliciclastic sand and occurs sporadically throughout the sedimentary sequence at Site U1542 (Figure F12).
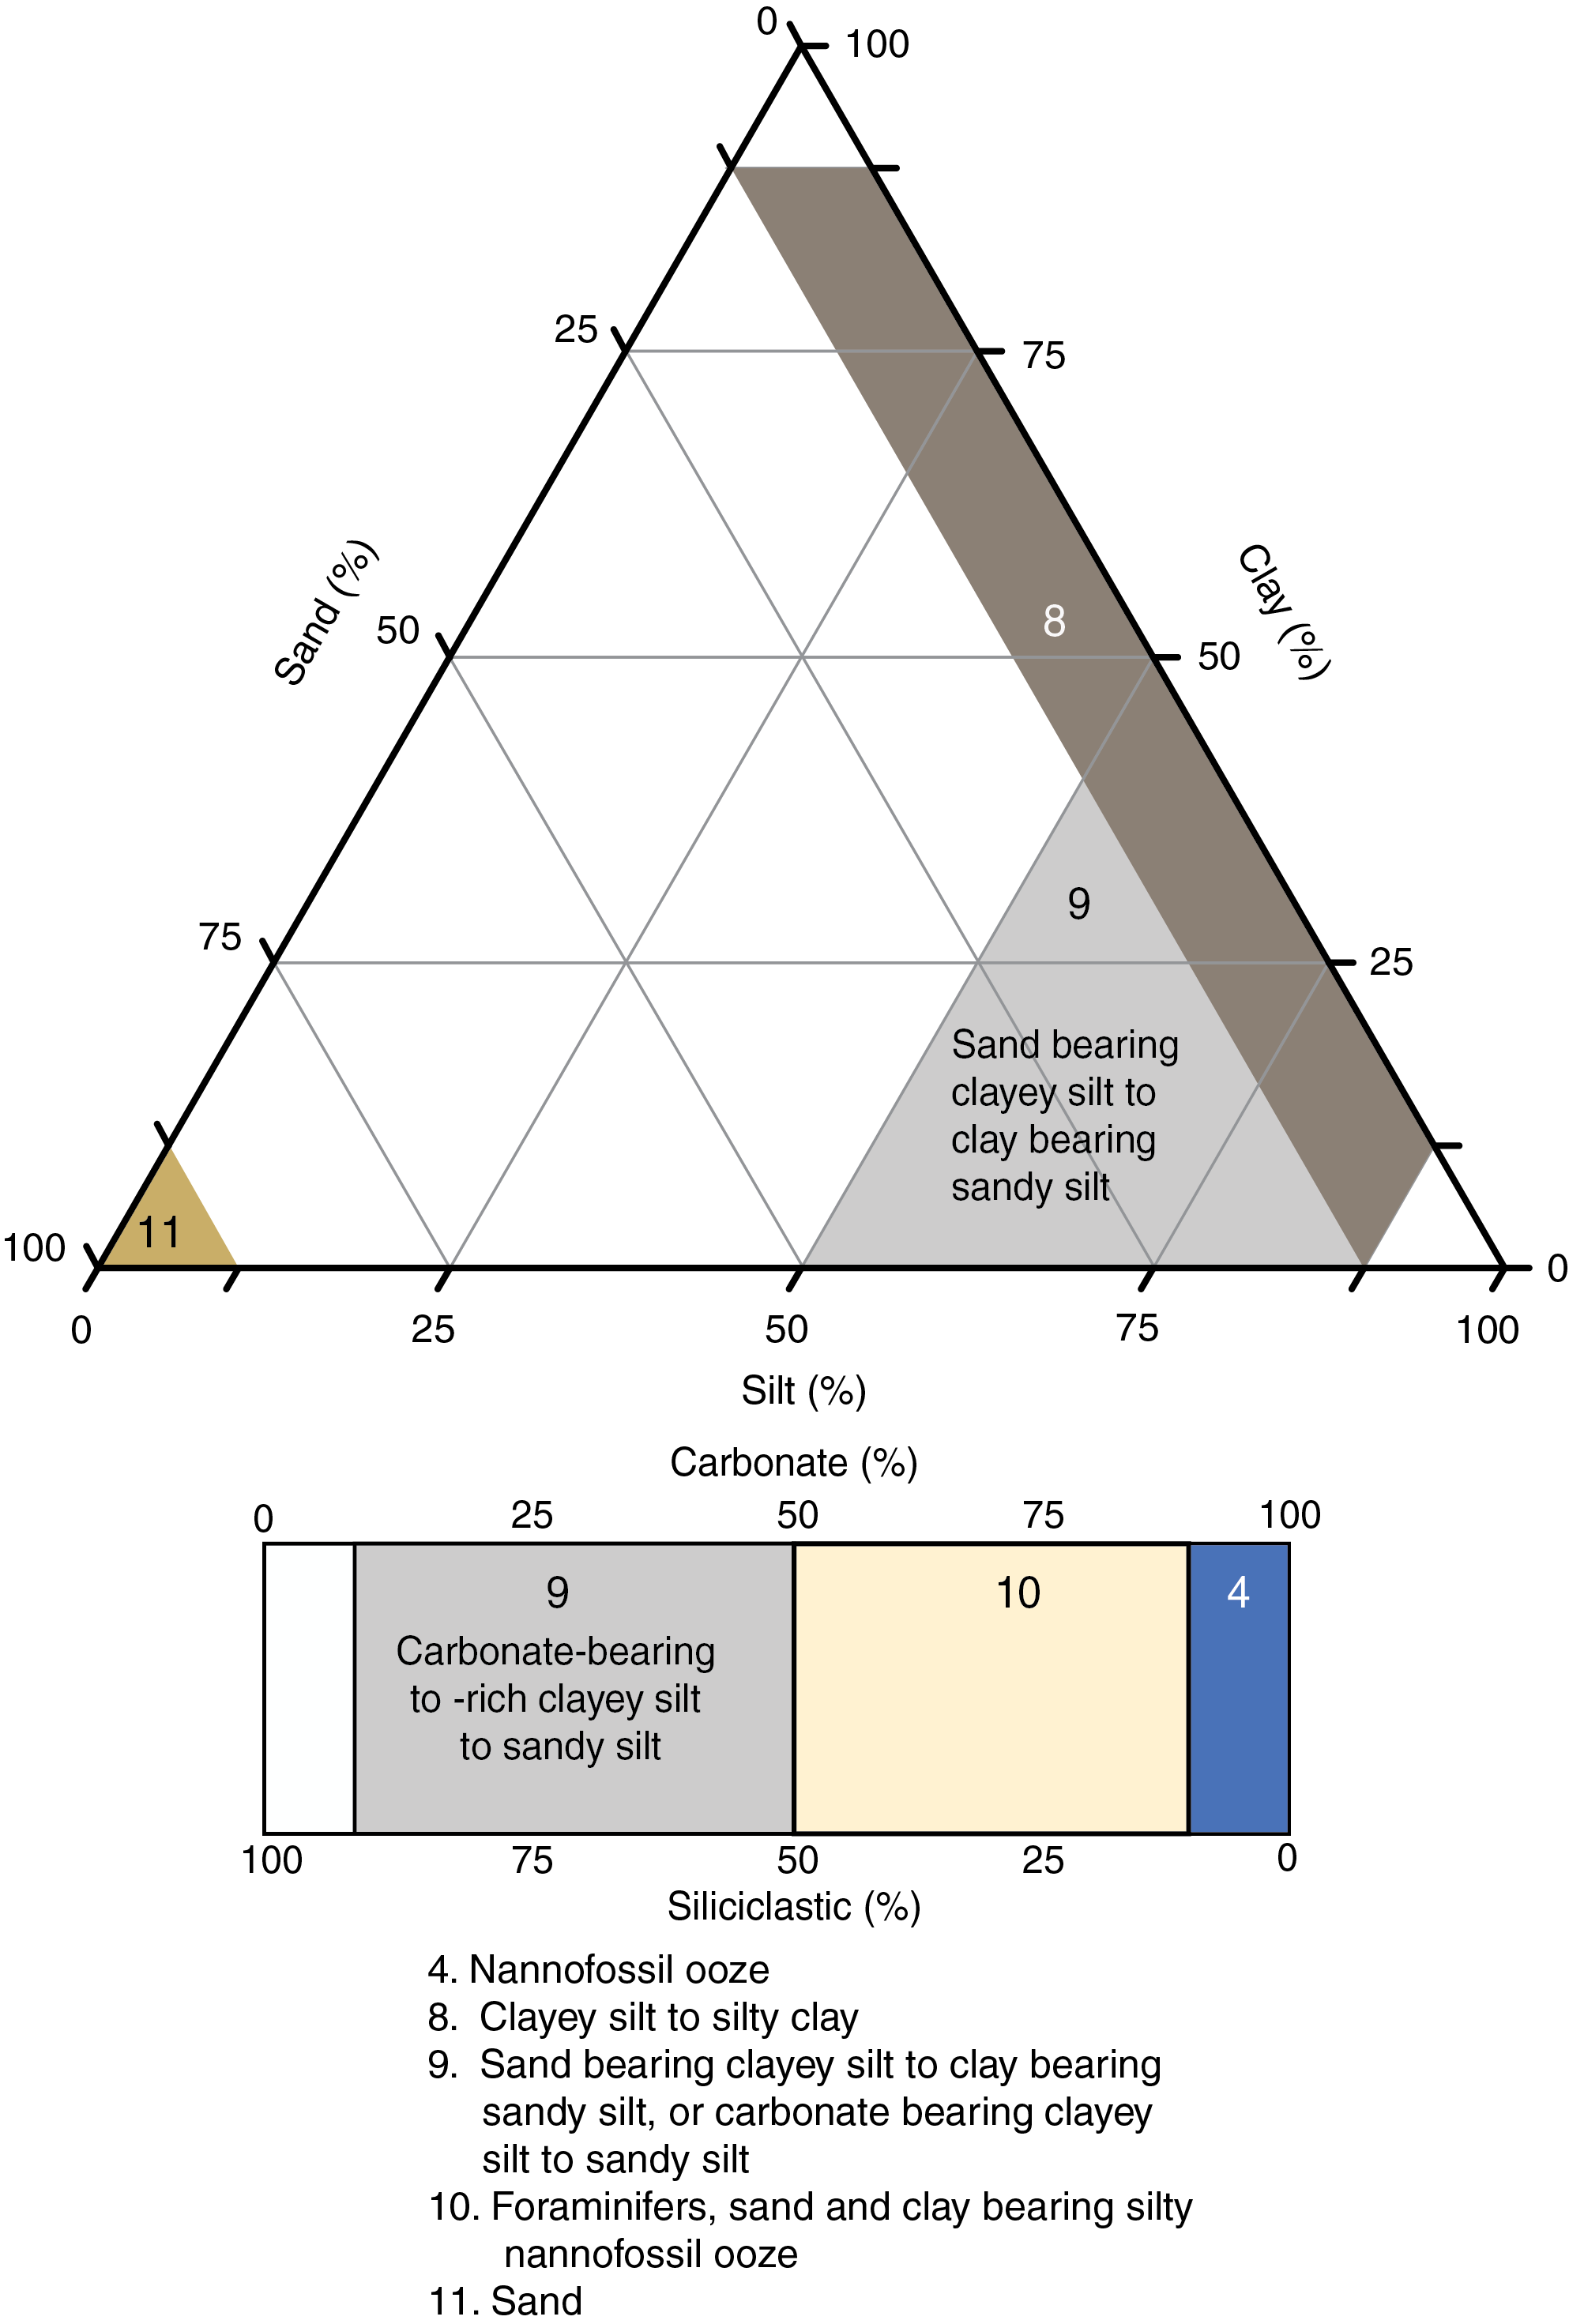
Figure F7. Primary lithologies.
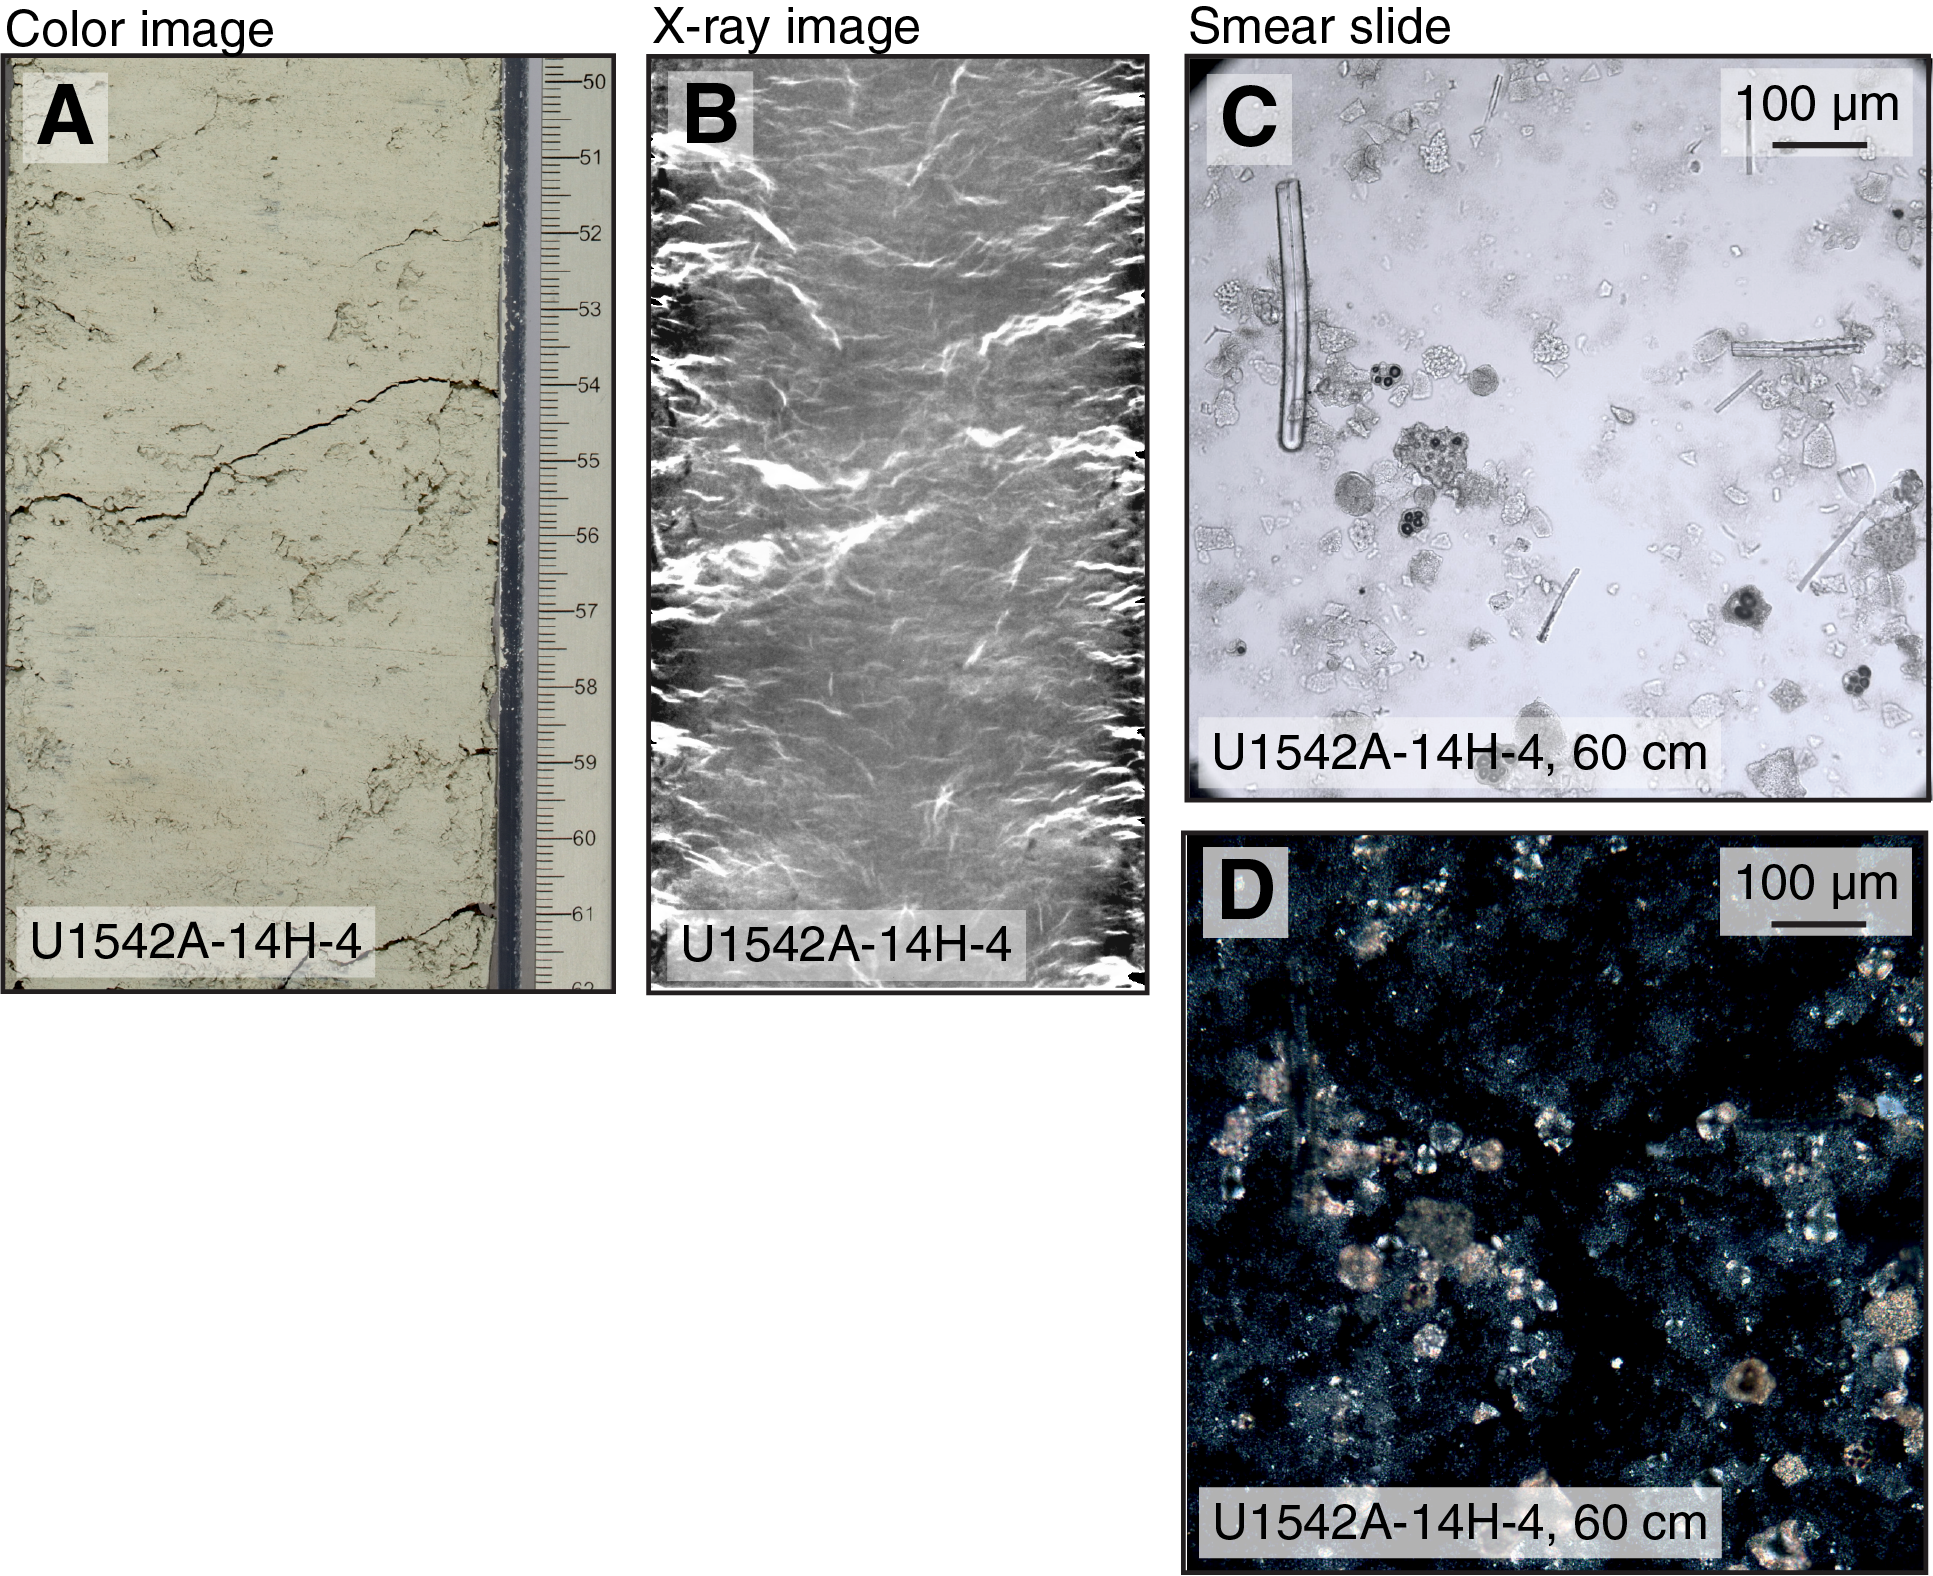
Figure F8. Mineral properties of Lithofacies 4.
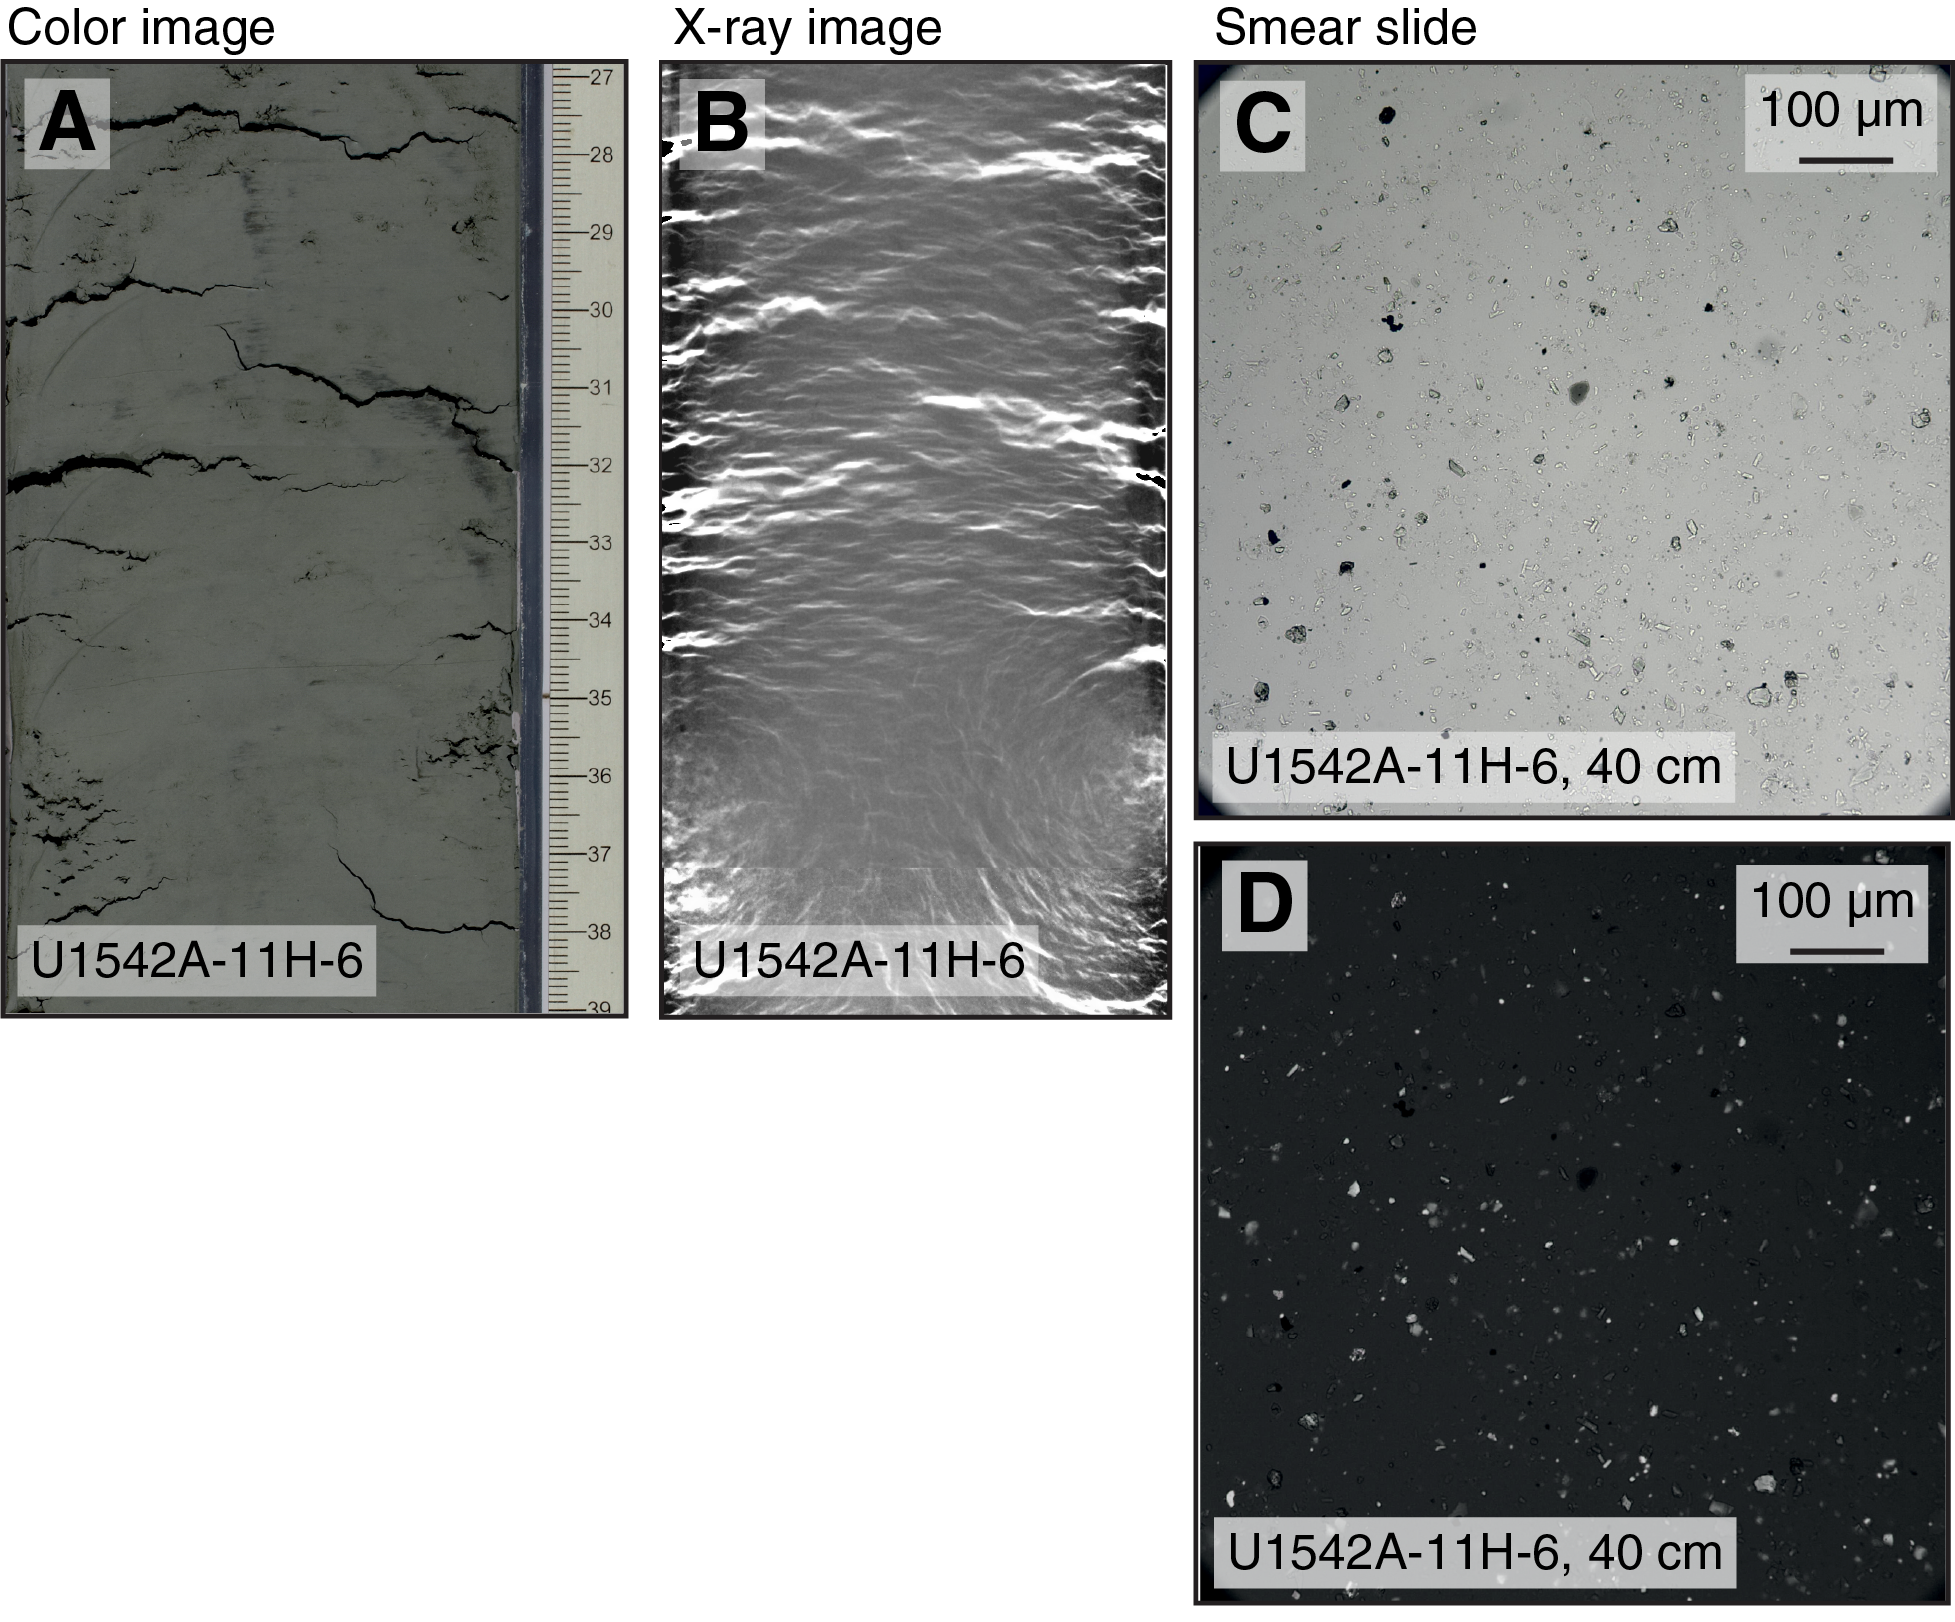
Figure F9. Mineral properties of Lithofacies 8.
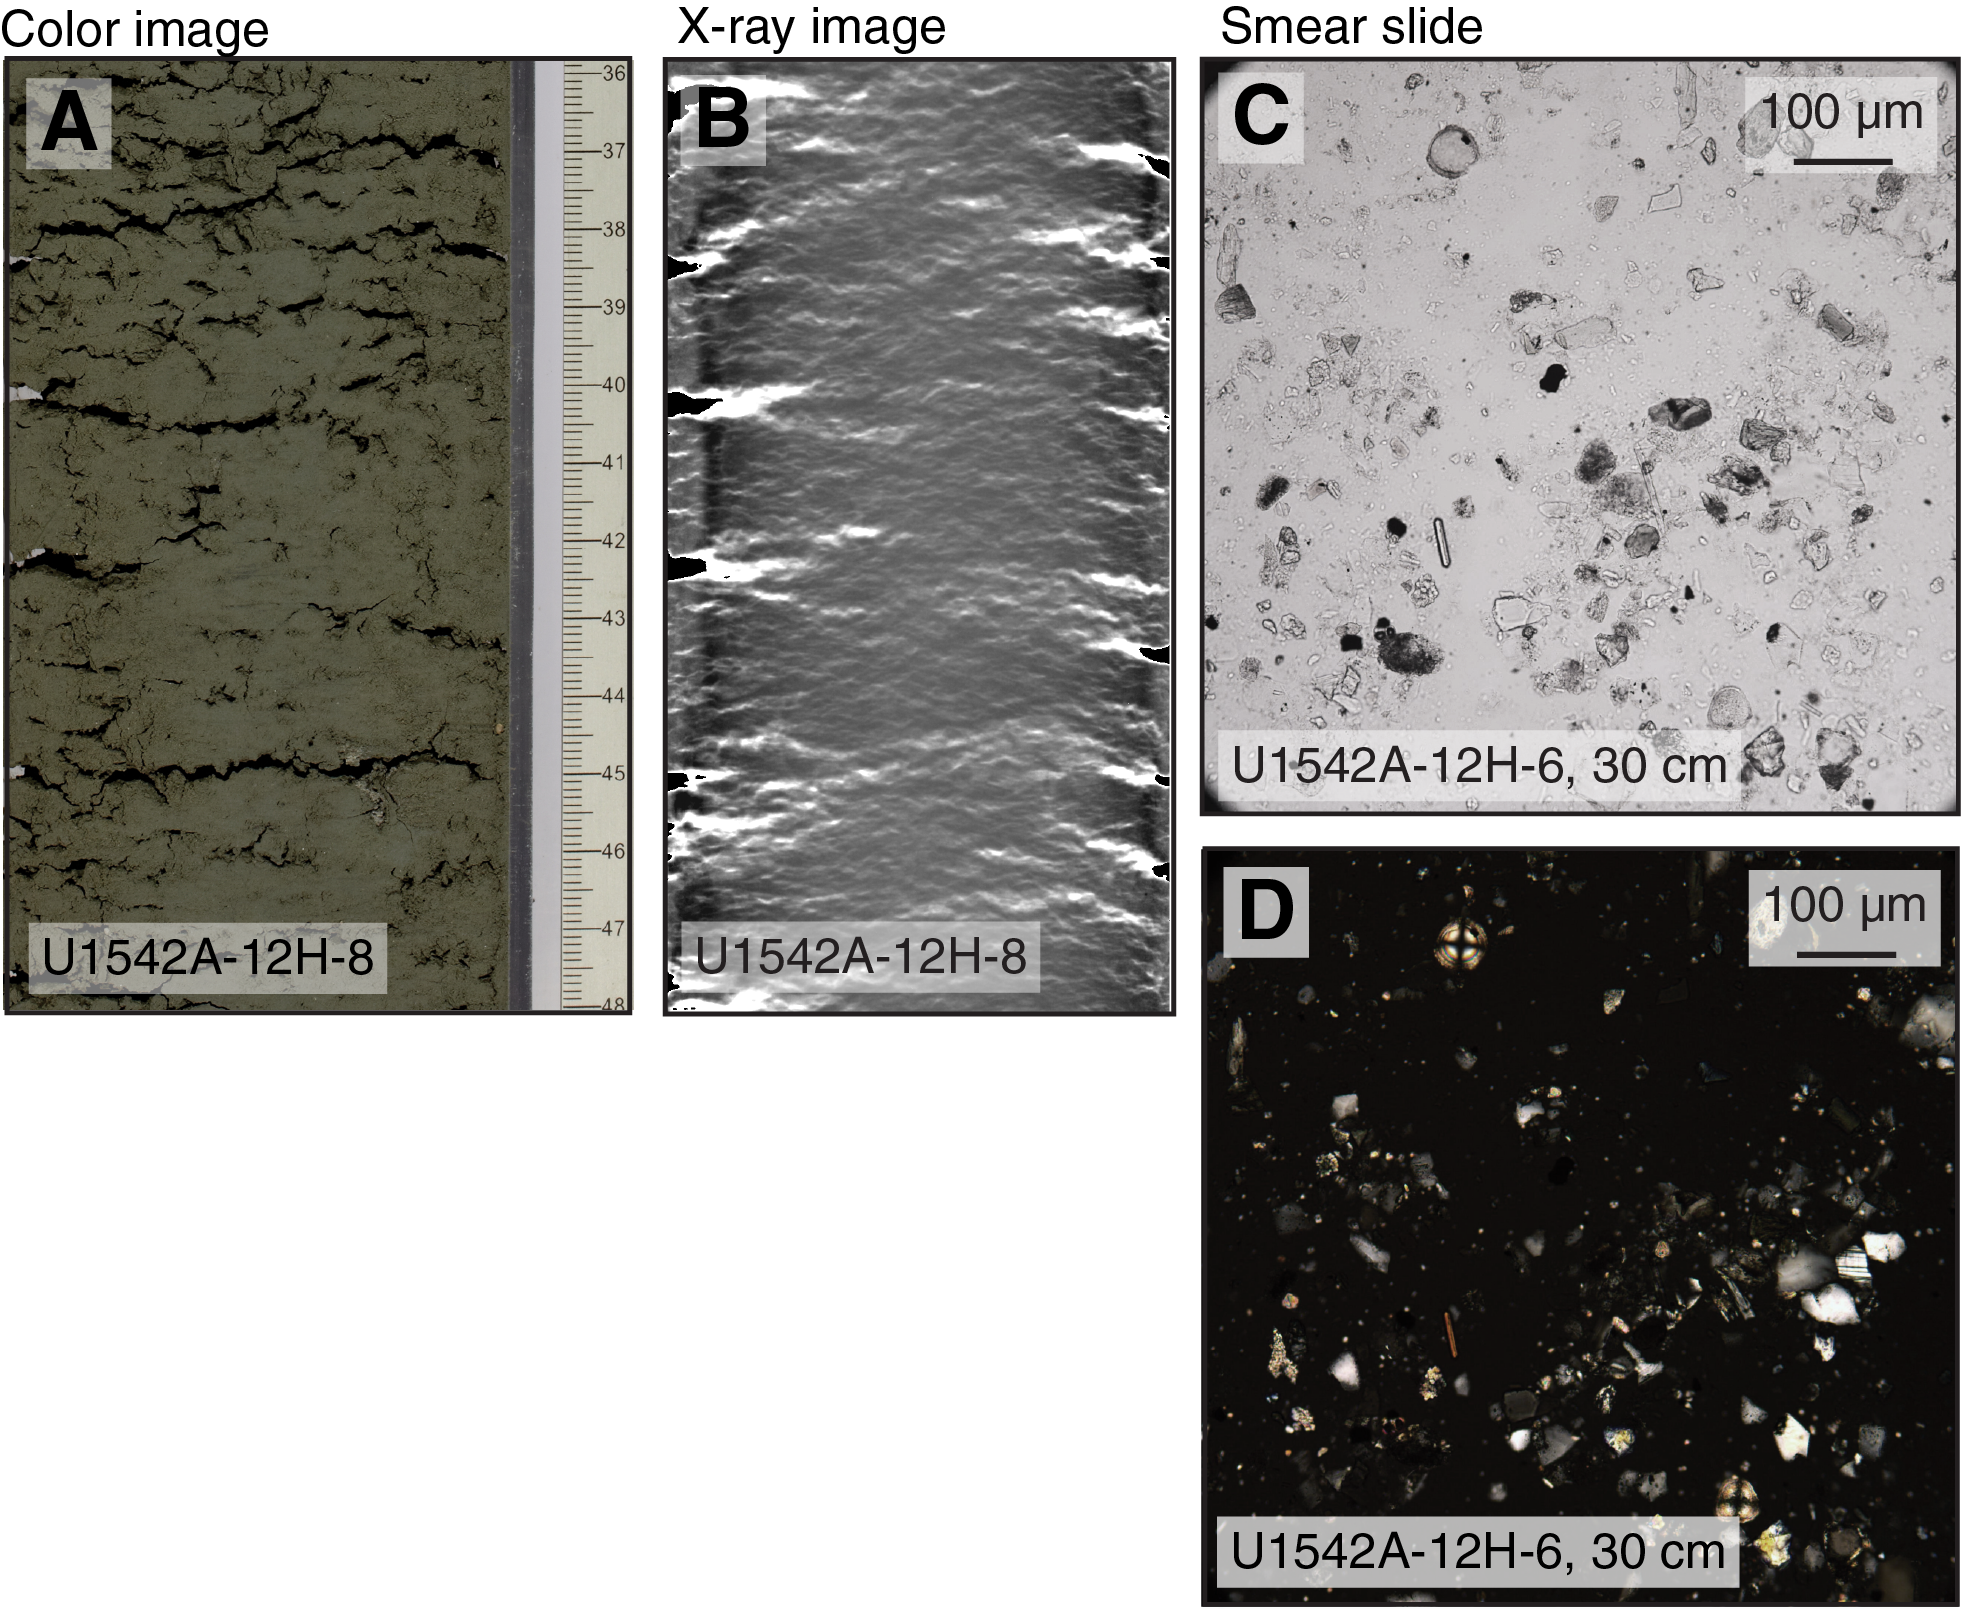
Figure F10. Mineral properties of Lithofacies 9.
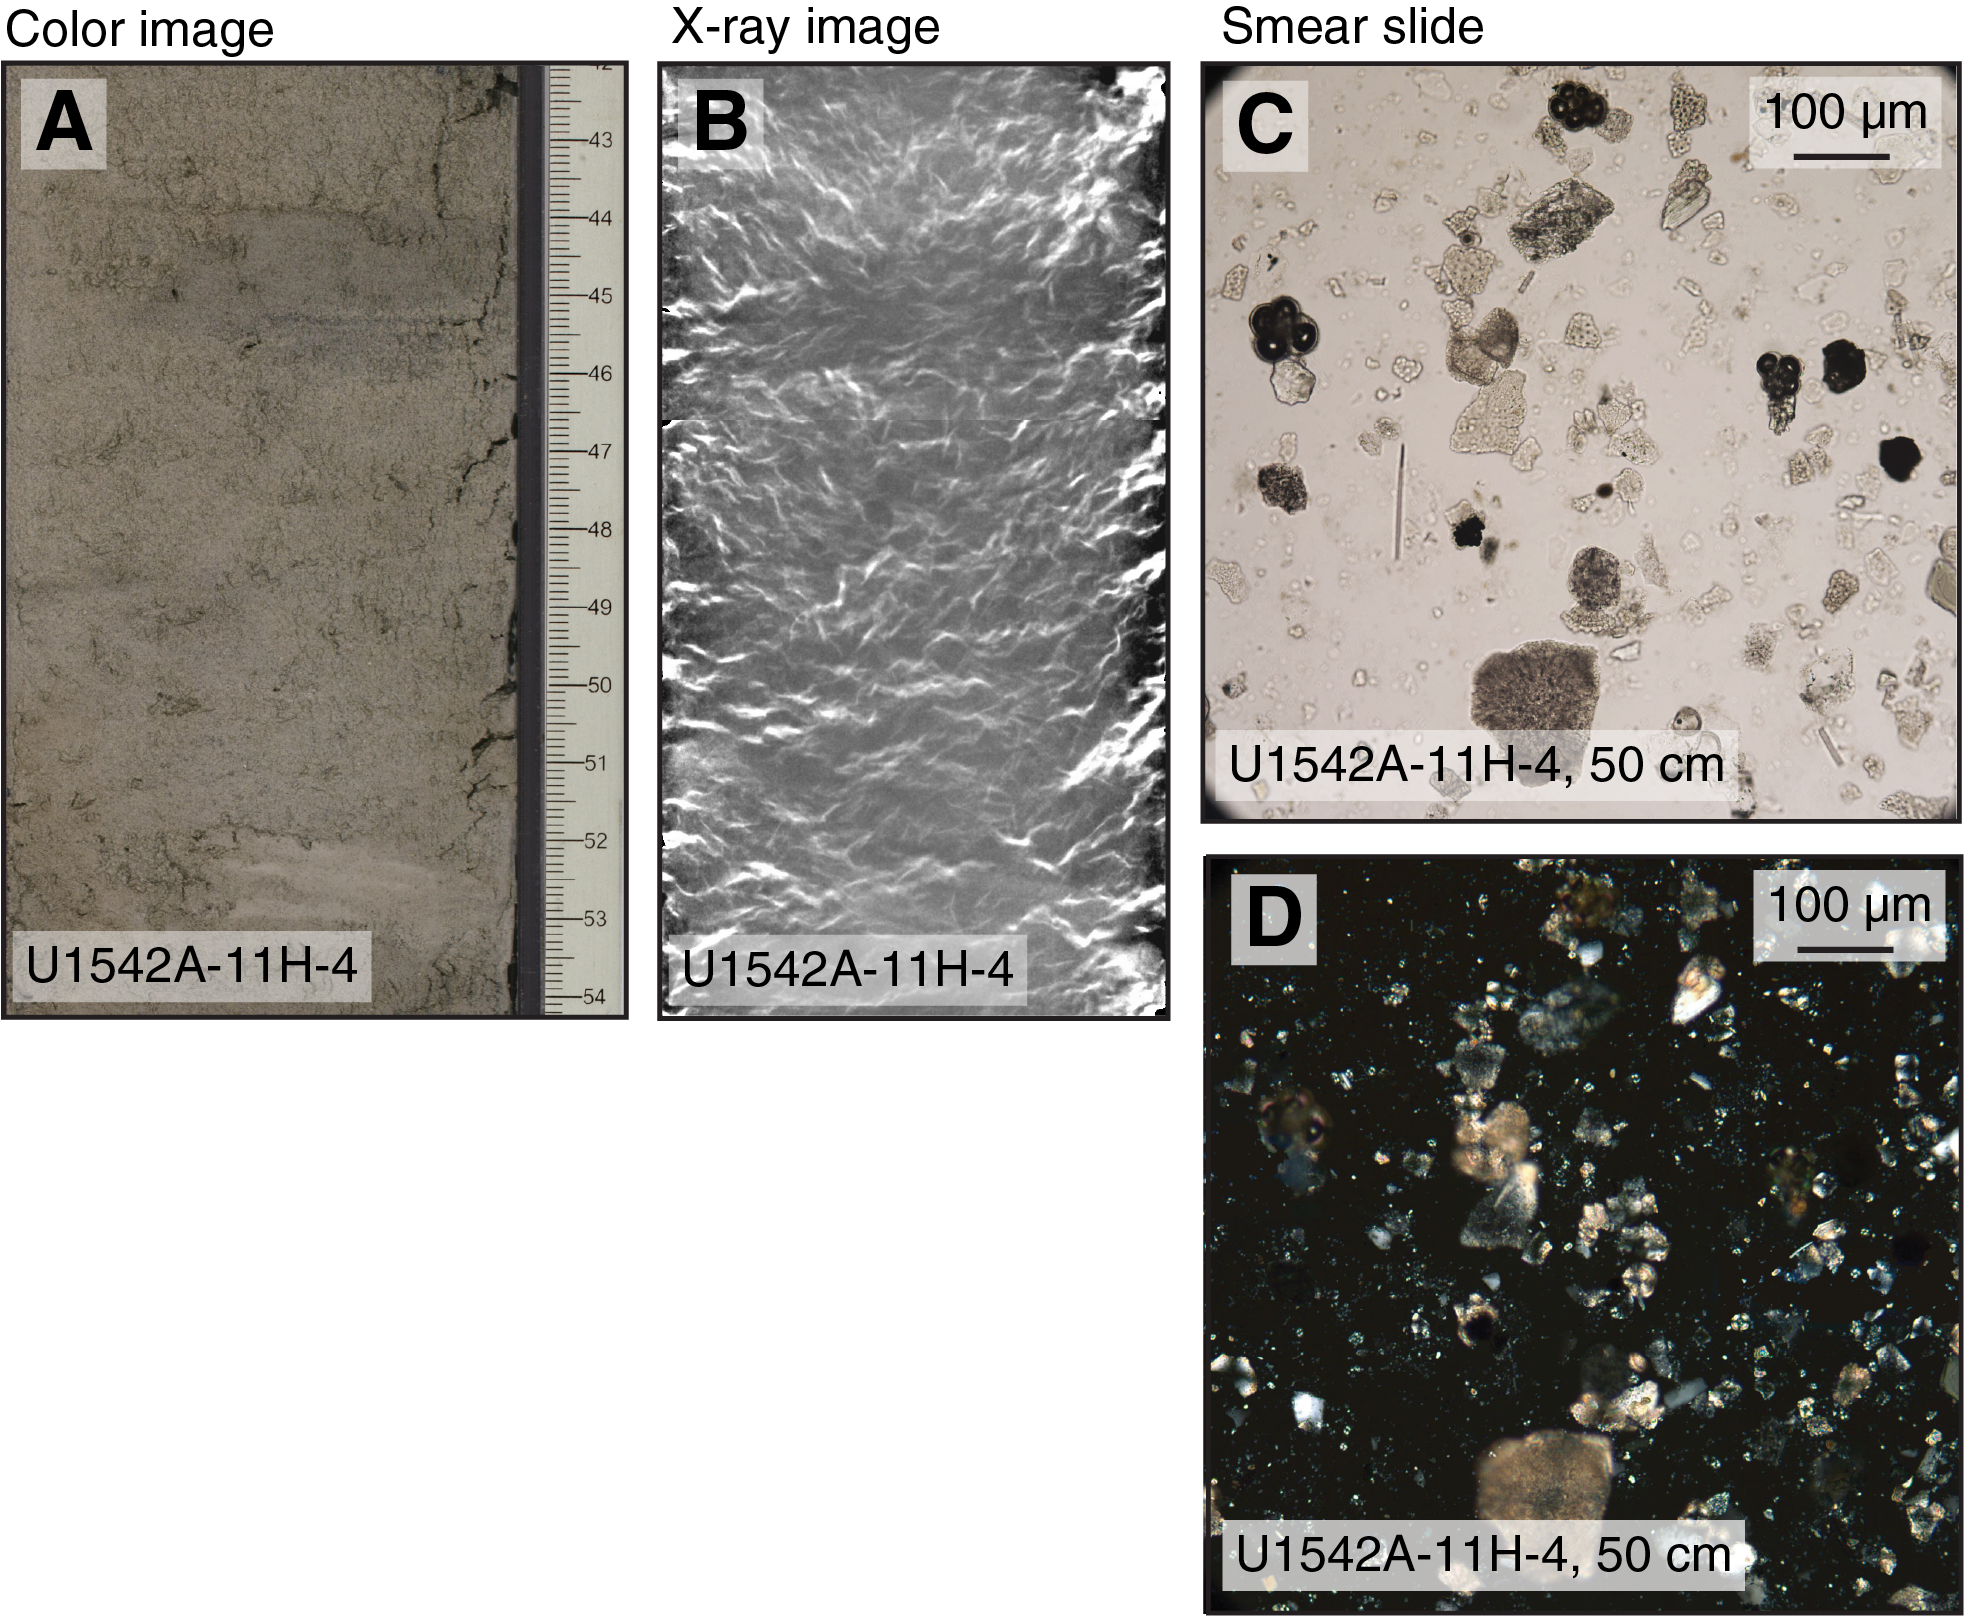
Figure F11. Mineral properties of Lithofacies 10.
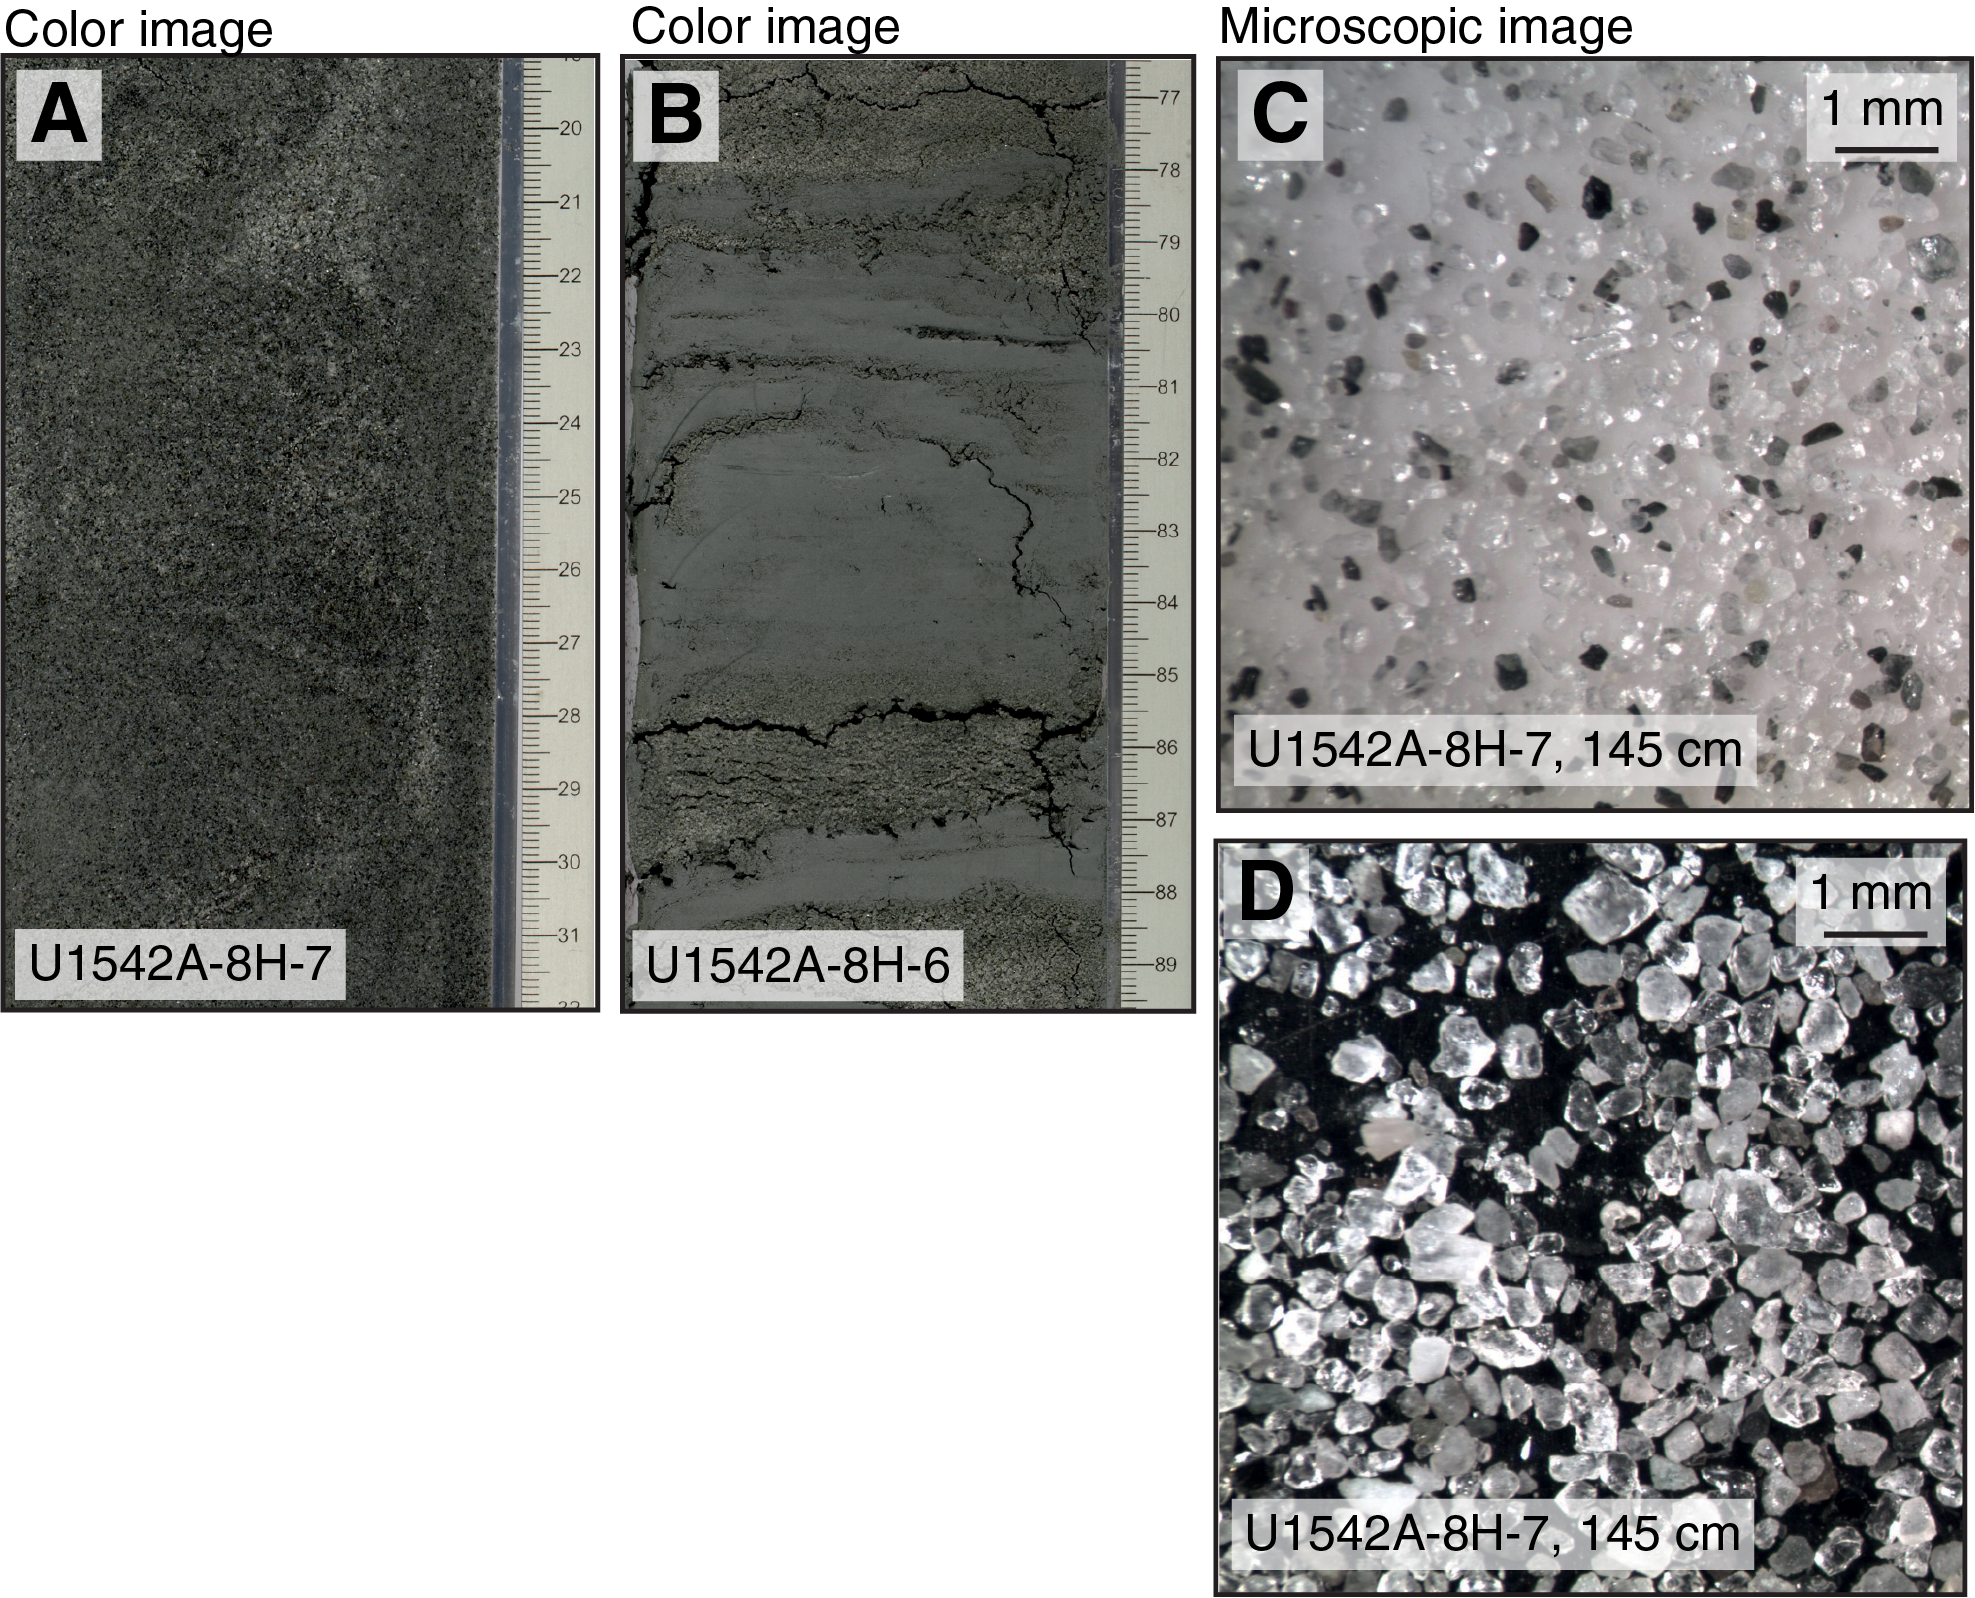
Figure F12. Mineral properties of Lithofacies 11.
Lithofacies 4
Lithofacies 4 is light greenish gray (10Y 8/1) foraminifer-rich nannofossil ooze containing traces of sponge spicules, silt, and/or sand. This facies is heavily bioturbated to homogeneous and has a massive appearance (Figure F8). Dropstones are absent in this lithofacies. The bed thickness of Lithofacies 4 at Site U1542 varies from 0.2 to 6 m.
Lithofacies 8
Lithofacies 8 is gray (N 5/0) to very dark gray (N 4/0) silty clay to clayey silt largely barren of biogenic components (Figure F9). It is commonly mottled due to diagenetic overprints. Centimeter-sized dropstones are frequent in this lithofacies. Sediments in Lithofacies 4 often show planar bedding (millimeter- to centimeter-scale), may contain sporadically centimeter-scale lenses of sand or millimeter-thick sand laminae, and are only slightly bioturbated. The thickness of this lithofacies in the sedimentary record varies from 0.2 to 6.7 m.
Lithofacies 9
Lithofacies 9 is greenish gray (10Y 5/1) to very dark greenish gray (10Y 3/1) carbonate- and/or sand-bearing clayey to sandy silt (Figure F10). The calcareous minor component may be composed of foraminifers and/or calcareous nannofossils. This lithofacies shows slight to moderate bioturbation and contains only trace dropstones. Lithofacies 9 contains significantly more calcareous components and/or coarser siliciclastic material (i.e., sand) than Lithofacies 8. The bed thickness of Lithofacies 9 varies from 0.2 to 1.4 m.
Lithofacies 10
Lithofacies 10 is greenish gray (10Y 5/1) to very dark greenish gray (10Y 3/1) nannofossil ooze that contains a significant proportion of siliciclastic material (i.e., more silt than clay and sand combined) and foraminifers (<24%). It most frequently occurs in the form of sand-, foraminifer-, and/or clay-bearing silty nannofossil ooze that is moderately to heavily bioturbated (Figure F11). The bed thickness of Lithofacies 10 varies from 0.1 to 1.5 m.
Lithofacies 11
Lithofacies 11 is gray (N 5/0) sand that is found frequently interbedded with Lithofacies 8 in millimeter- to centimeter-scale beds or occasionally as an isolated massive centimeter- to decimeter-scale bed. This lithofacies is characterized by angular to subangular, moderately to well-sorted felsic and mafic minerals that include quartz, feldspar, mica, and accessory mafic minerals (Figure F12). Sand beds commonly exhibit normal grading and a sharp irregular erosive contact with the underlying sediment, suggesting rapid deposition by a gravity-driven flow. The bed thickness of Lithofacies 11 varies from several centimeters to 1.5 m.
Lithostratigraphic units
The Site U1542 sedimentary sequence comprises one lithostratigraphic unit (Figure F13). Key unit characteristics, including depths within the Site U1542 sedimentary sequence and corresponding ages according to the preliminary shipboard age model, are discussed below.
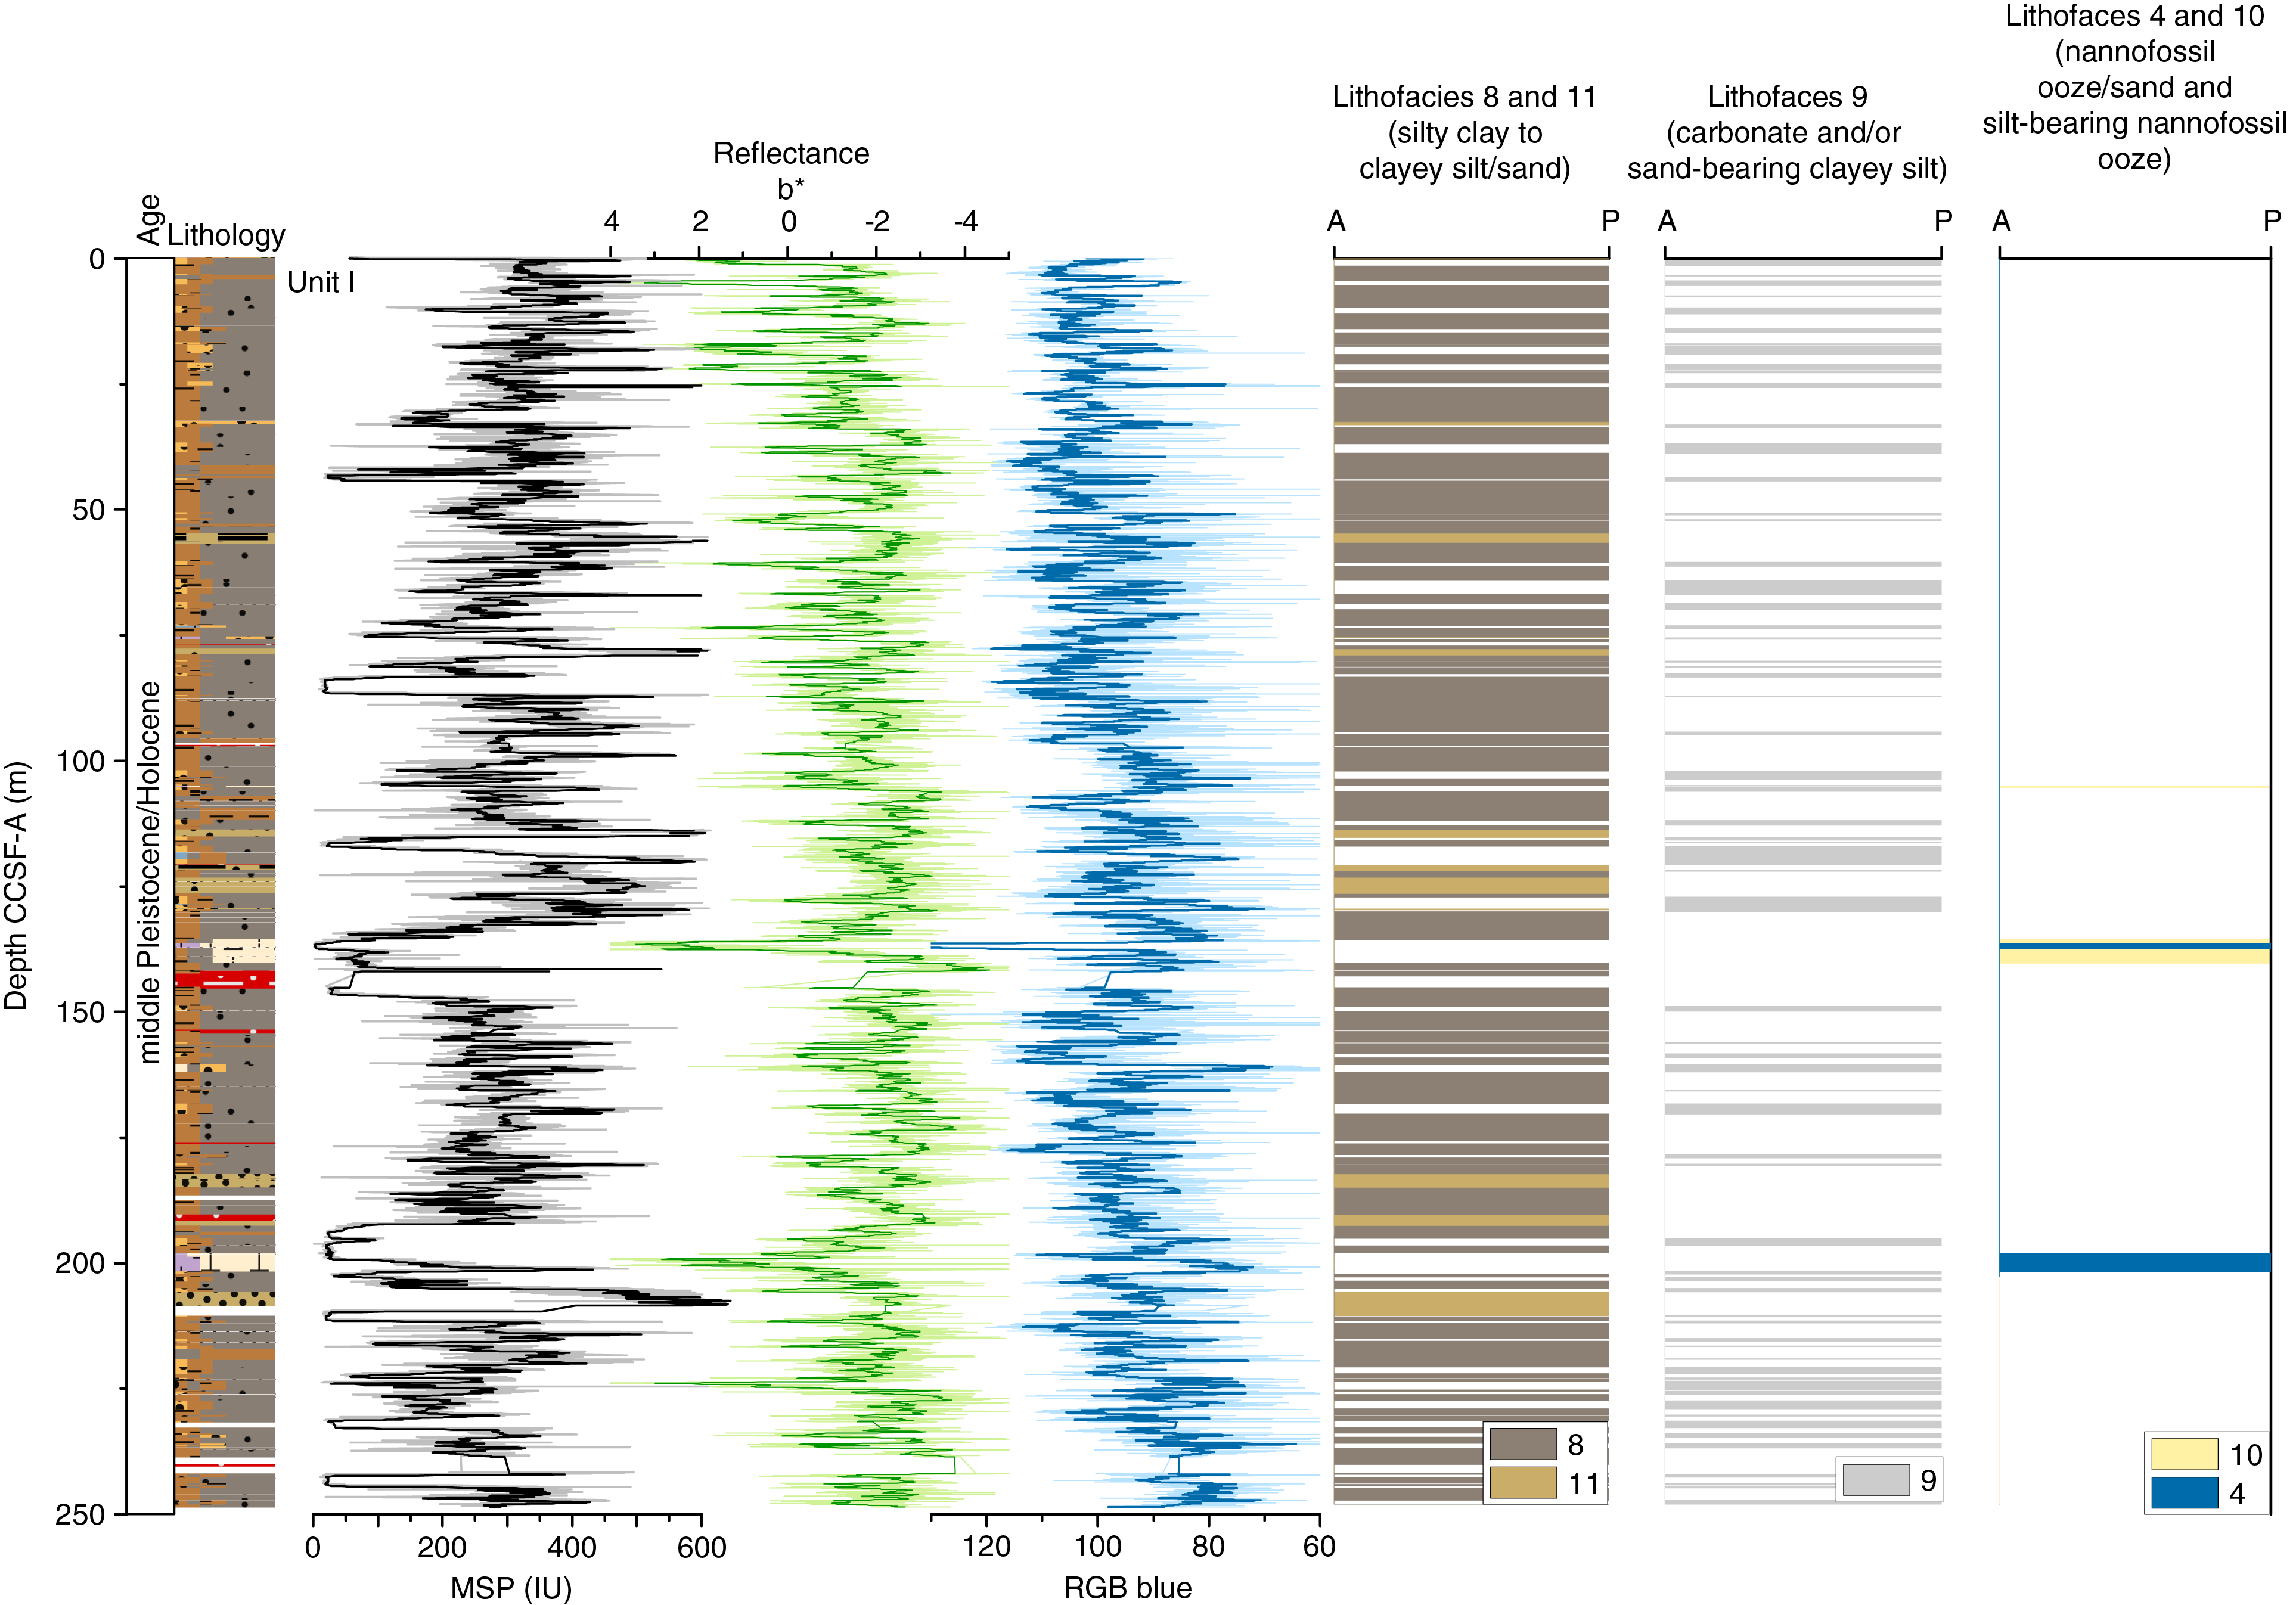
Figure F13. Primary lithostratigraphic variations.
Unit I
- Intervals: 383-U1542A-1H-1, 0 cm, to 20F-CC, 25 cm; 383-U1542B-1H-1, 0 cm, to 1H-CC, 21 cm; 383-U1542C-1H-1, 0 cm, to 30H-CC, 41 cm; 383-U1542D-1H-1, 0 cm, to 27H-CC, 61 cm
- Depths: Hole U1542A = 0–181.74 m CSF-A, Hole U1542B = 0–1.46 m CSF-A, Hole U1542C = 0–236.86 m CSF-A, Hole U1542D = 0–205.04 m CSF-A, Site U1542 composite section = 0–249 m CCSF-A
- Thickness: 249 m
- Age: middle Pleistocene to Holocene (younger than 0.7 Ma)
- Lithology: silty clays to clayey silts, interbedded clayey silts and sands, carbonate- and sand-bearing clayey silts, and sand-, foraminifer-, and clay-bearing silty nannofossil oozes
Lithostratigraphic Unit I spans the entirety of the Site U1542 sedimentary sequence and largely consists of dark gray silty clay to clayey silt (Lithofacies 8) that has limited biogenic components and contains varying concentrations of dropstones (Figure F6). Lithofacies 8 makes up 64.2% of Unit I (Figure F14). These two lithologies are often interbedded with thin (~75 cm) beds of greenish gray calcareous sand-bearing clayey to sandy silt with foraminifers and nannofossils (Lithofacies 9; 20.6%) or less frequently with beds of light greenish gray foraminifer-rich nannofossil ooze (Lithofacies 4; 2.1%). Representing 7.3% of the sedimentary sequence, Lithofacies 11 occurs infrequently and is often interbedded with Lithofacies 8. Bioturbation is moderate, dropstones generally occur more frequently in Lithofacies 8, and sedimentary transitions between lithofacies are mostly gradational.
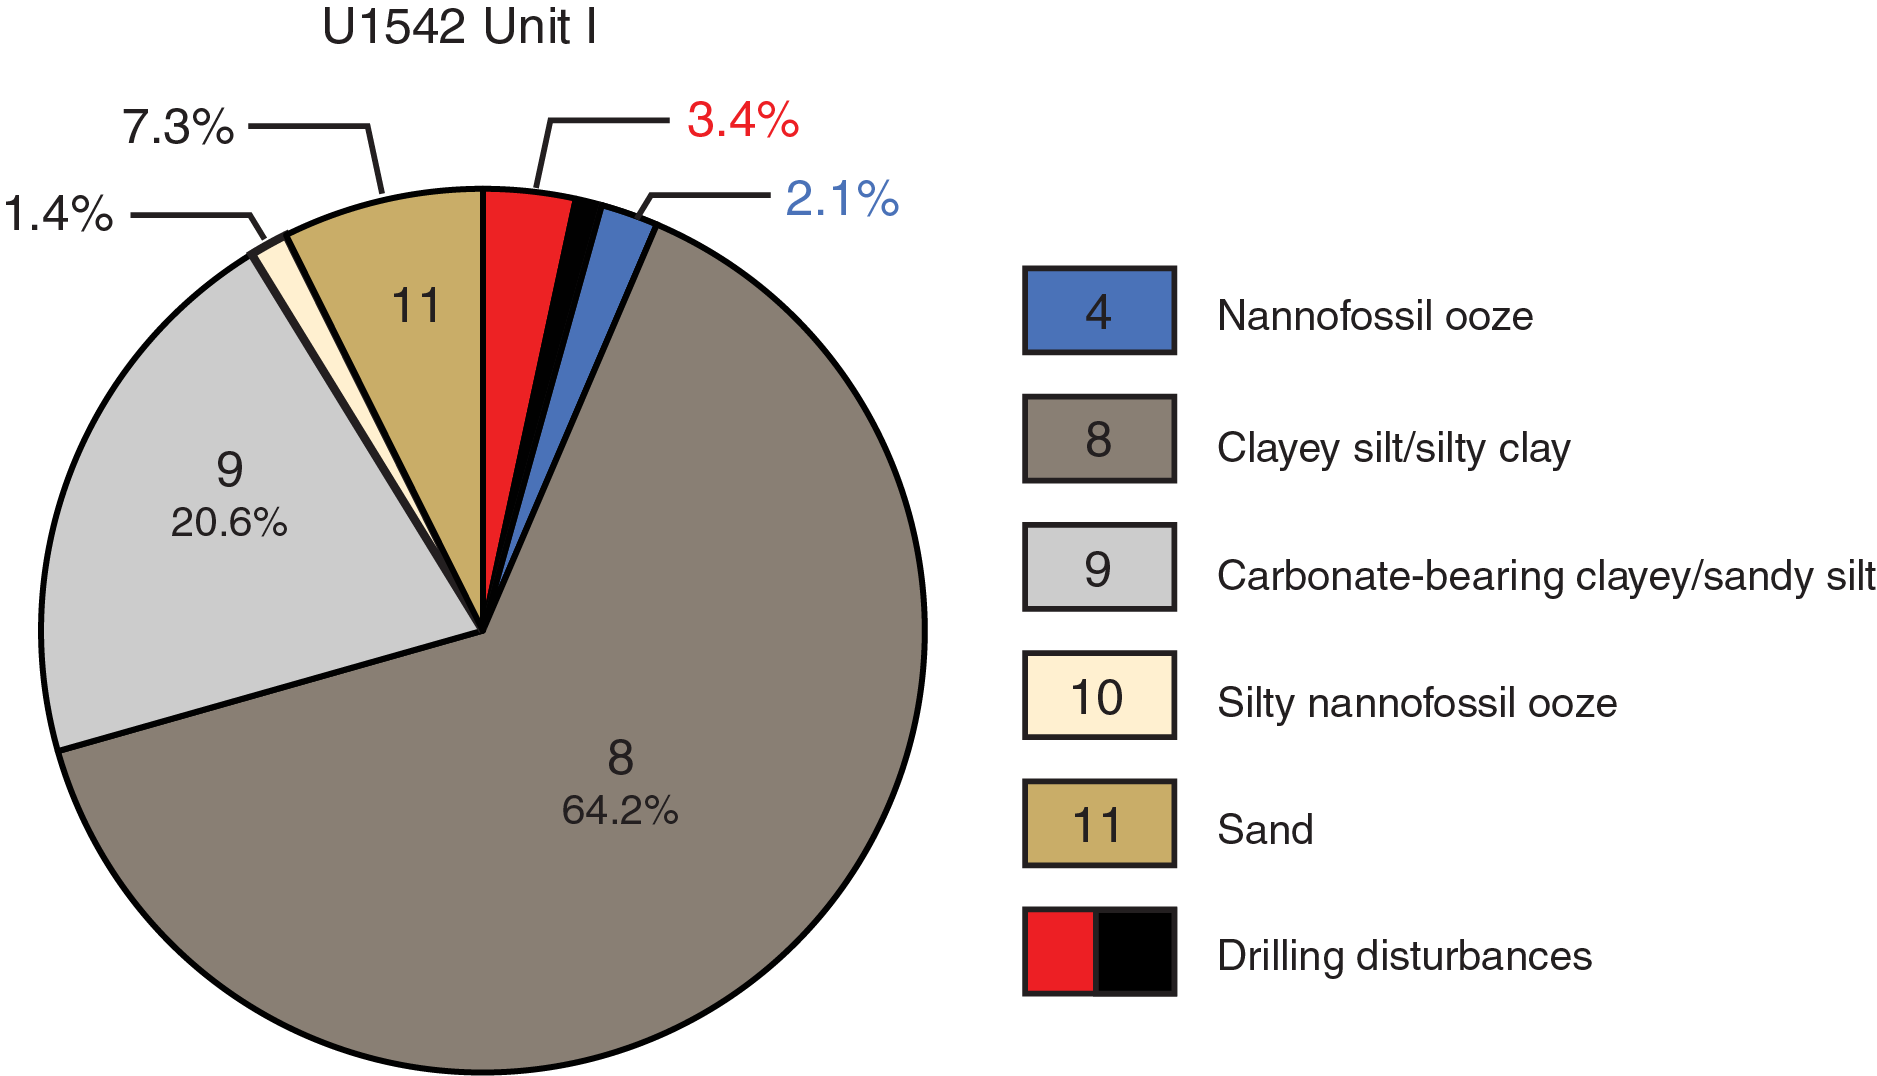
Figure F14. Relative contribution of lithofacies.
Complementary analyses
X-radiography textural analysis
In contrast to previous Expedition 383 sites, Site U1542 sediments contain very high gas concentrations (see Geochemistry). This resulted in significant gas expansion during core retrieval and splitting, which produced cracks and voids, particularly in core sections from below ~25 m CSF-A. These features were also apparent in X-ray images as both black and white shadings (Figure F15). For instance, within the same stratigraphic interval in Holes U1542A and U1542C, cracks and voids cover ~17% of the 12 cm interval captured in each X-radiograph.

Figure F15. Cracks and voids from gas expansion.
In addition to estimating the degree of bioturbation in the sedimentary sequence of Site U1542 (see Bioturbation in the Site U1540 chapter [Winckler et al., 2021c]) (Figure F16), X-ray images were used to quantitatively assess the abundance of dropstones. Dropstone abundance at Site U1542 was documented by assessing the concentration of dropstones in each X-ray image and assigning abundance criteria using the following categories: dominant, abundant, common, rare, and trace (see Sedimentology in the Expedition 383 methods chapter [Winckler et al., 2021a]; also see Core descriptions). Examples shown in Figure F16 are from selected X-ray images of Cores 383-U1542A-1H, 2H, 4H, and 12H. In Lithofacies 8, dropstones are generally rare to abundant and are dominant only in a few isolated layers. Lithofacies 9 shows only rare to trace occurrences, and Lithofacies 4, 10, and 11 are largely barren of dropstones.
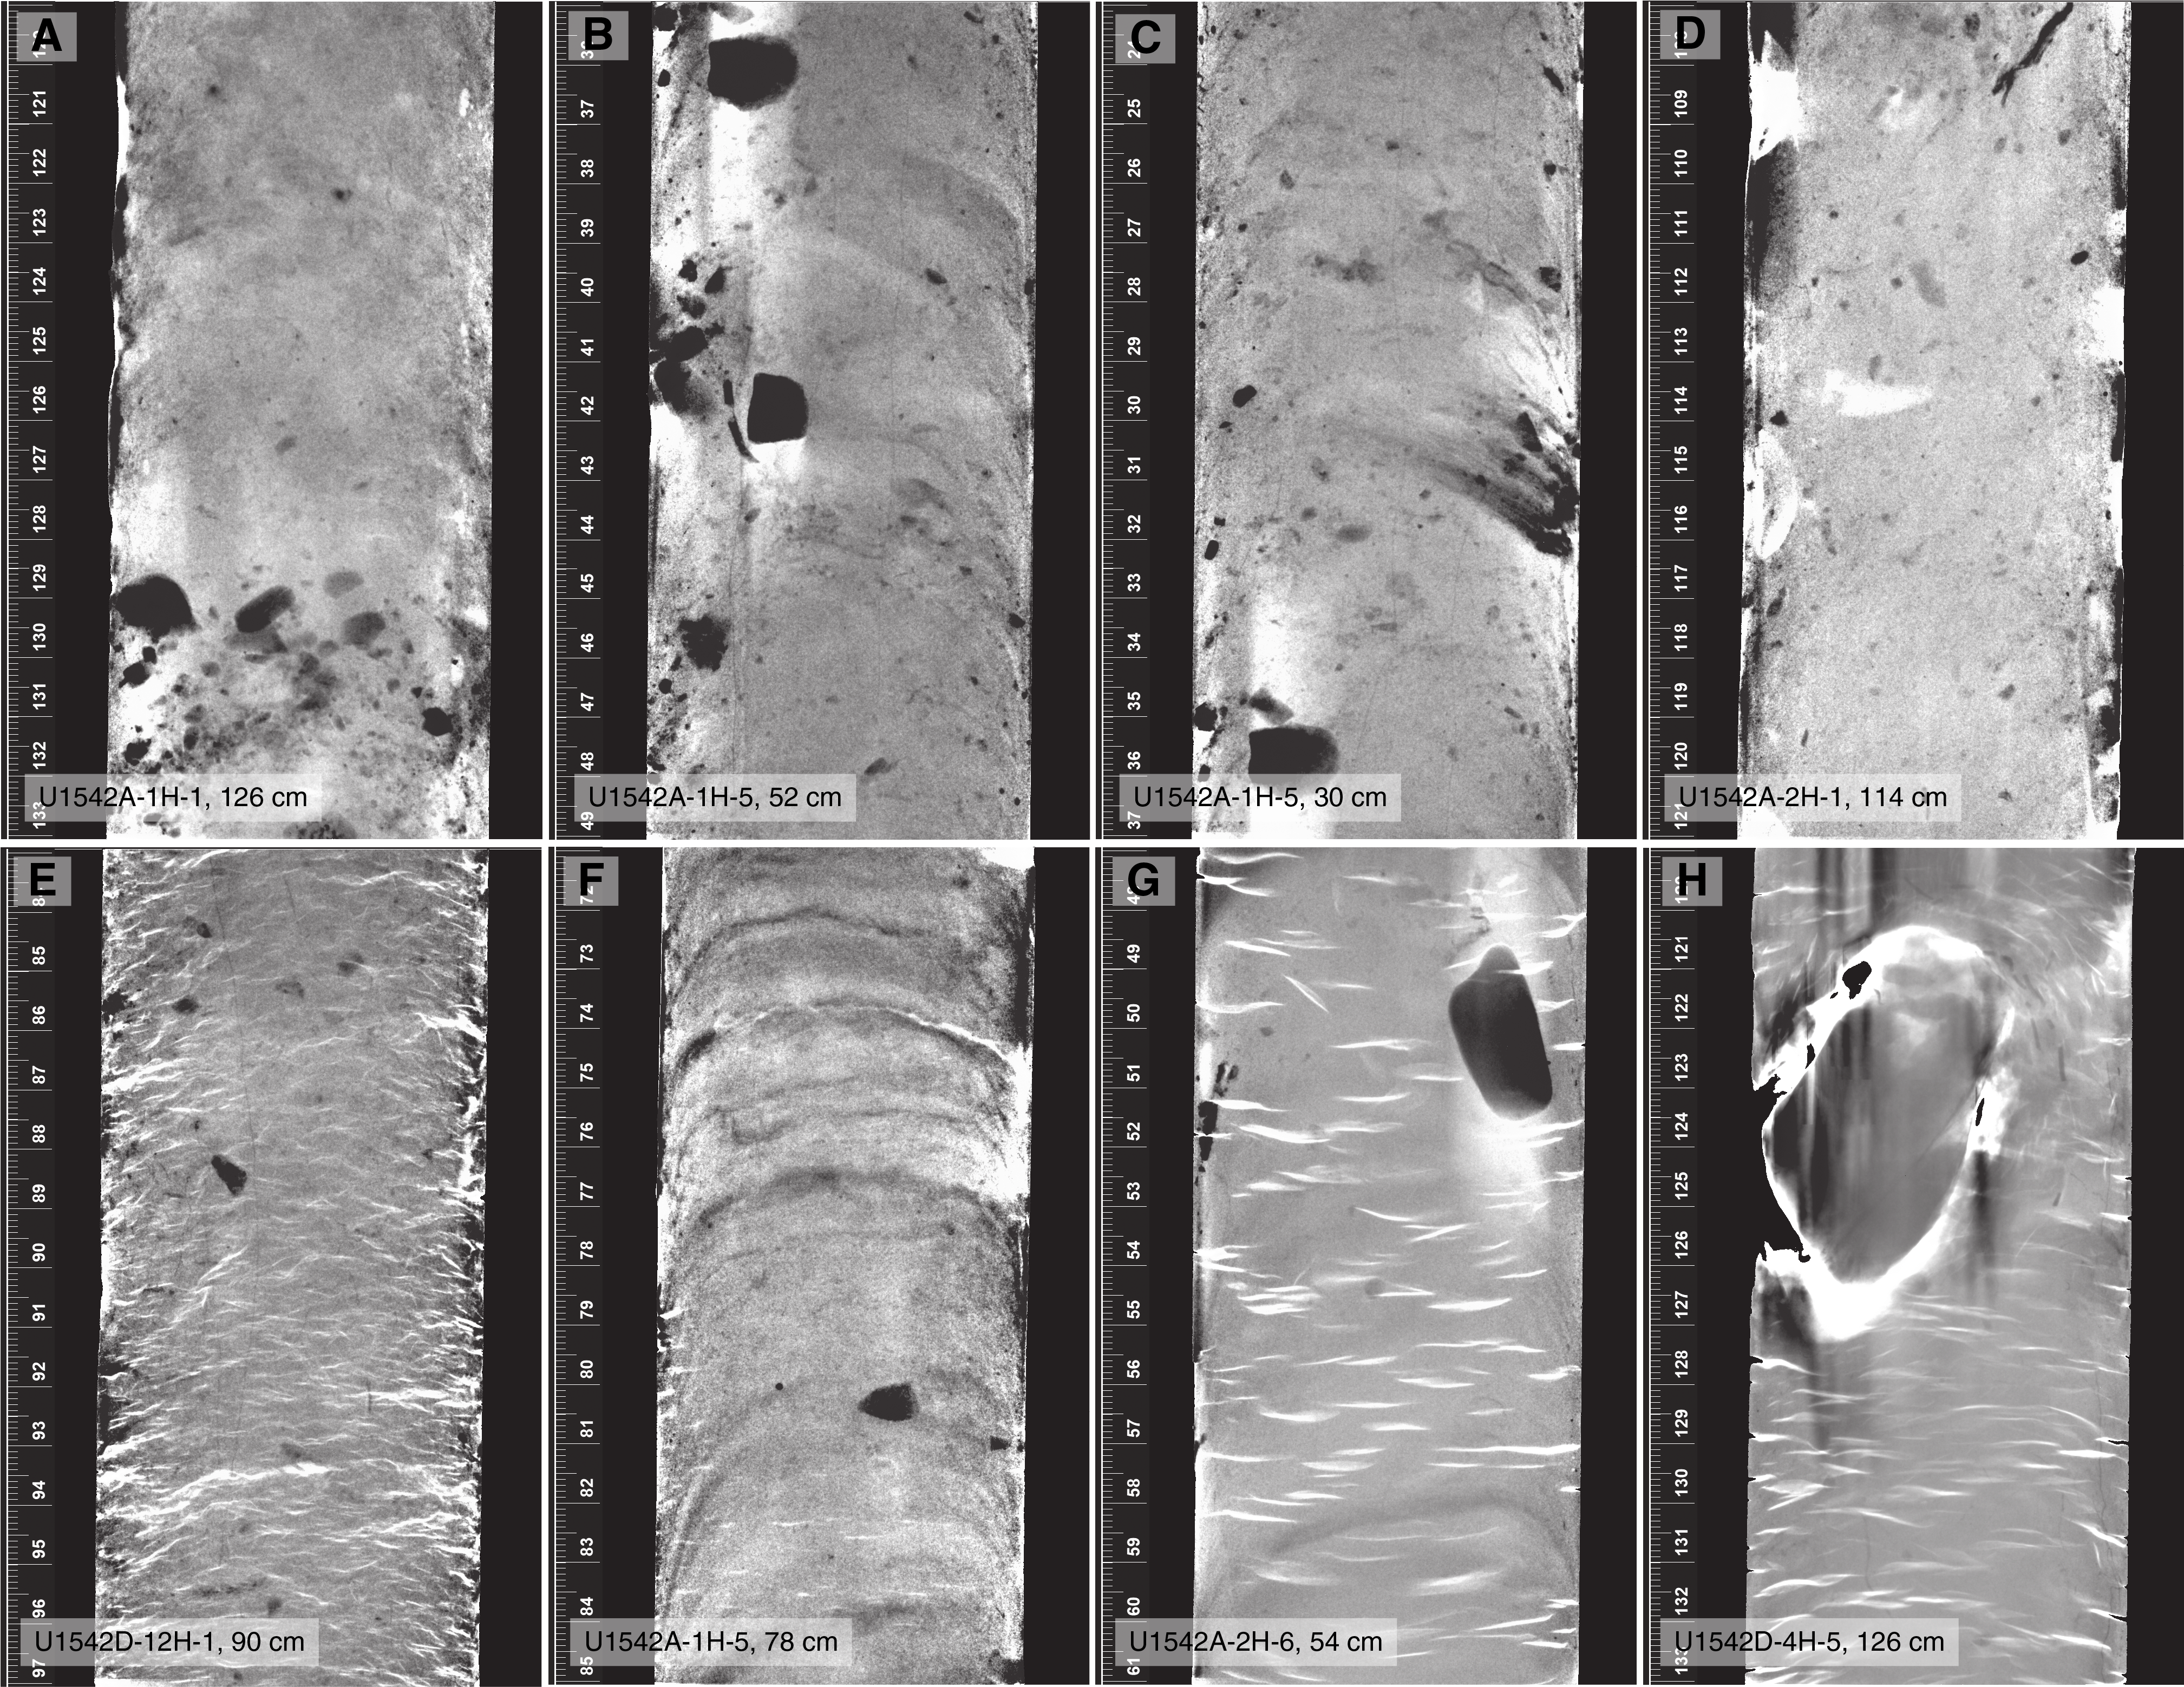
Figure F16. Dropstone abundance.
X-ray diffraction clay mineralogy
X-ray diffraction (XRD) analyses were performed on 27 samples obtained from Holes U1542A and U1542C to identify the mineralogy and composition of the clay fraction of sediments at this site. Although the relative contribution of each sedimentary component (i.e., sand, clay, silt, and carbonates) varies between the lithofacies identified at Site U1542, the composition of the clay fraction in each lithofacies is similar (Figure F17). The acid treatment and the extraction of the clay size fraction (<2 µm) during XRD sample preparation (see Sedimentology in the Expedition 383 methods chapter [Winckler et al., 2021a]) excluded the carbonate phase and the mineral phase bounded in coarse-grained siliciclastics that are the defining characteristics of the lithofacies identified at Site U1542.
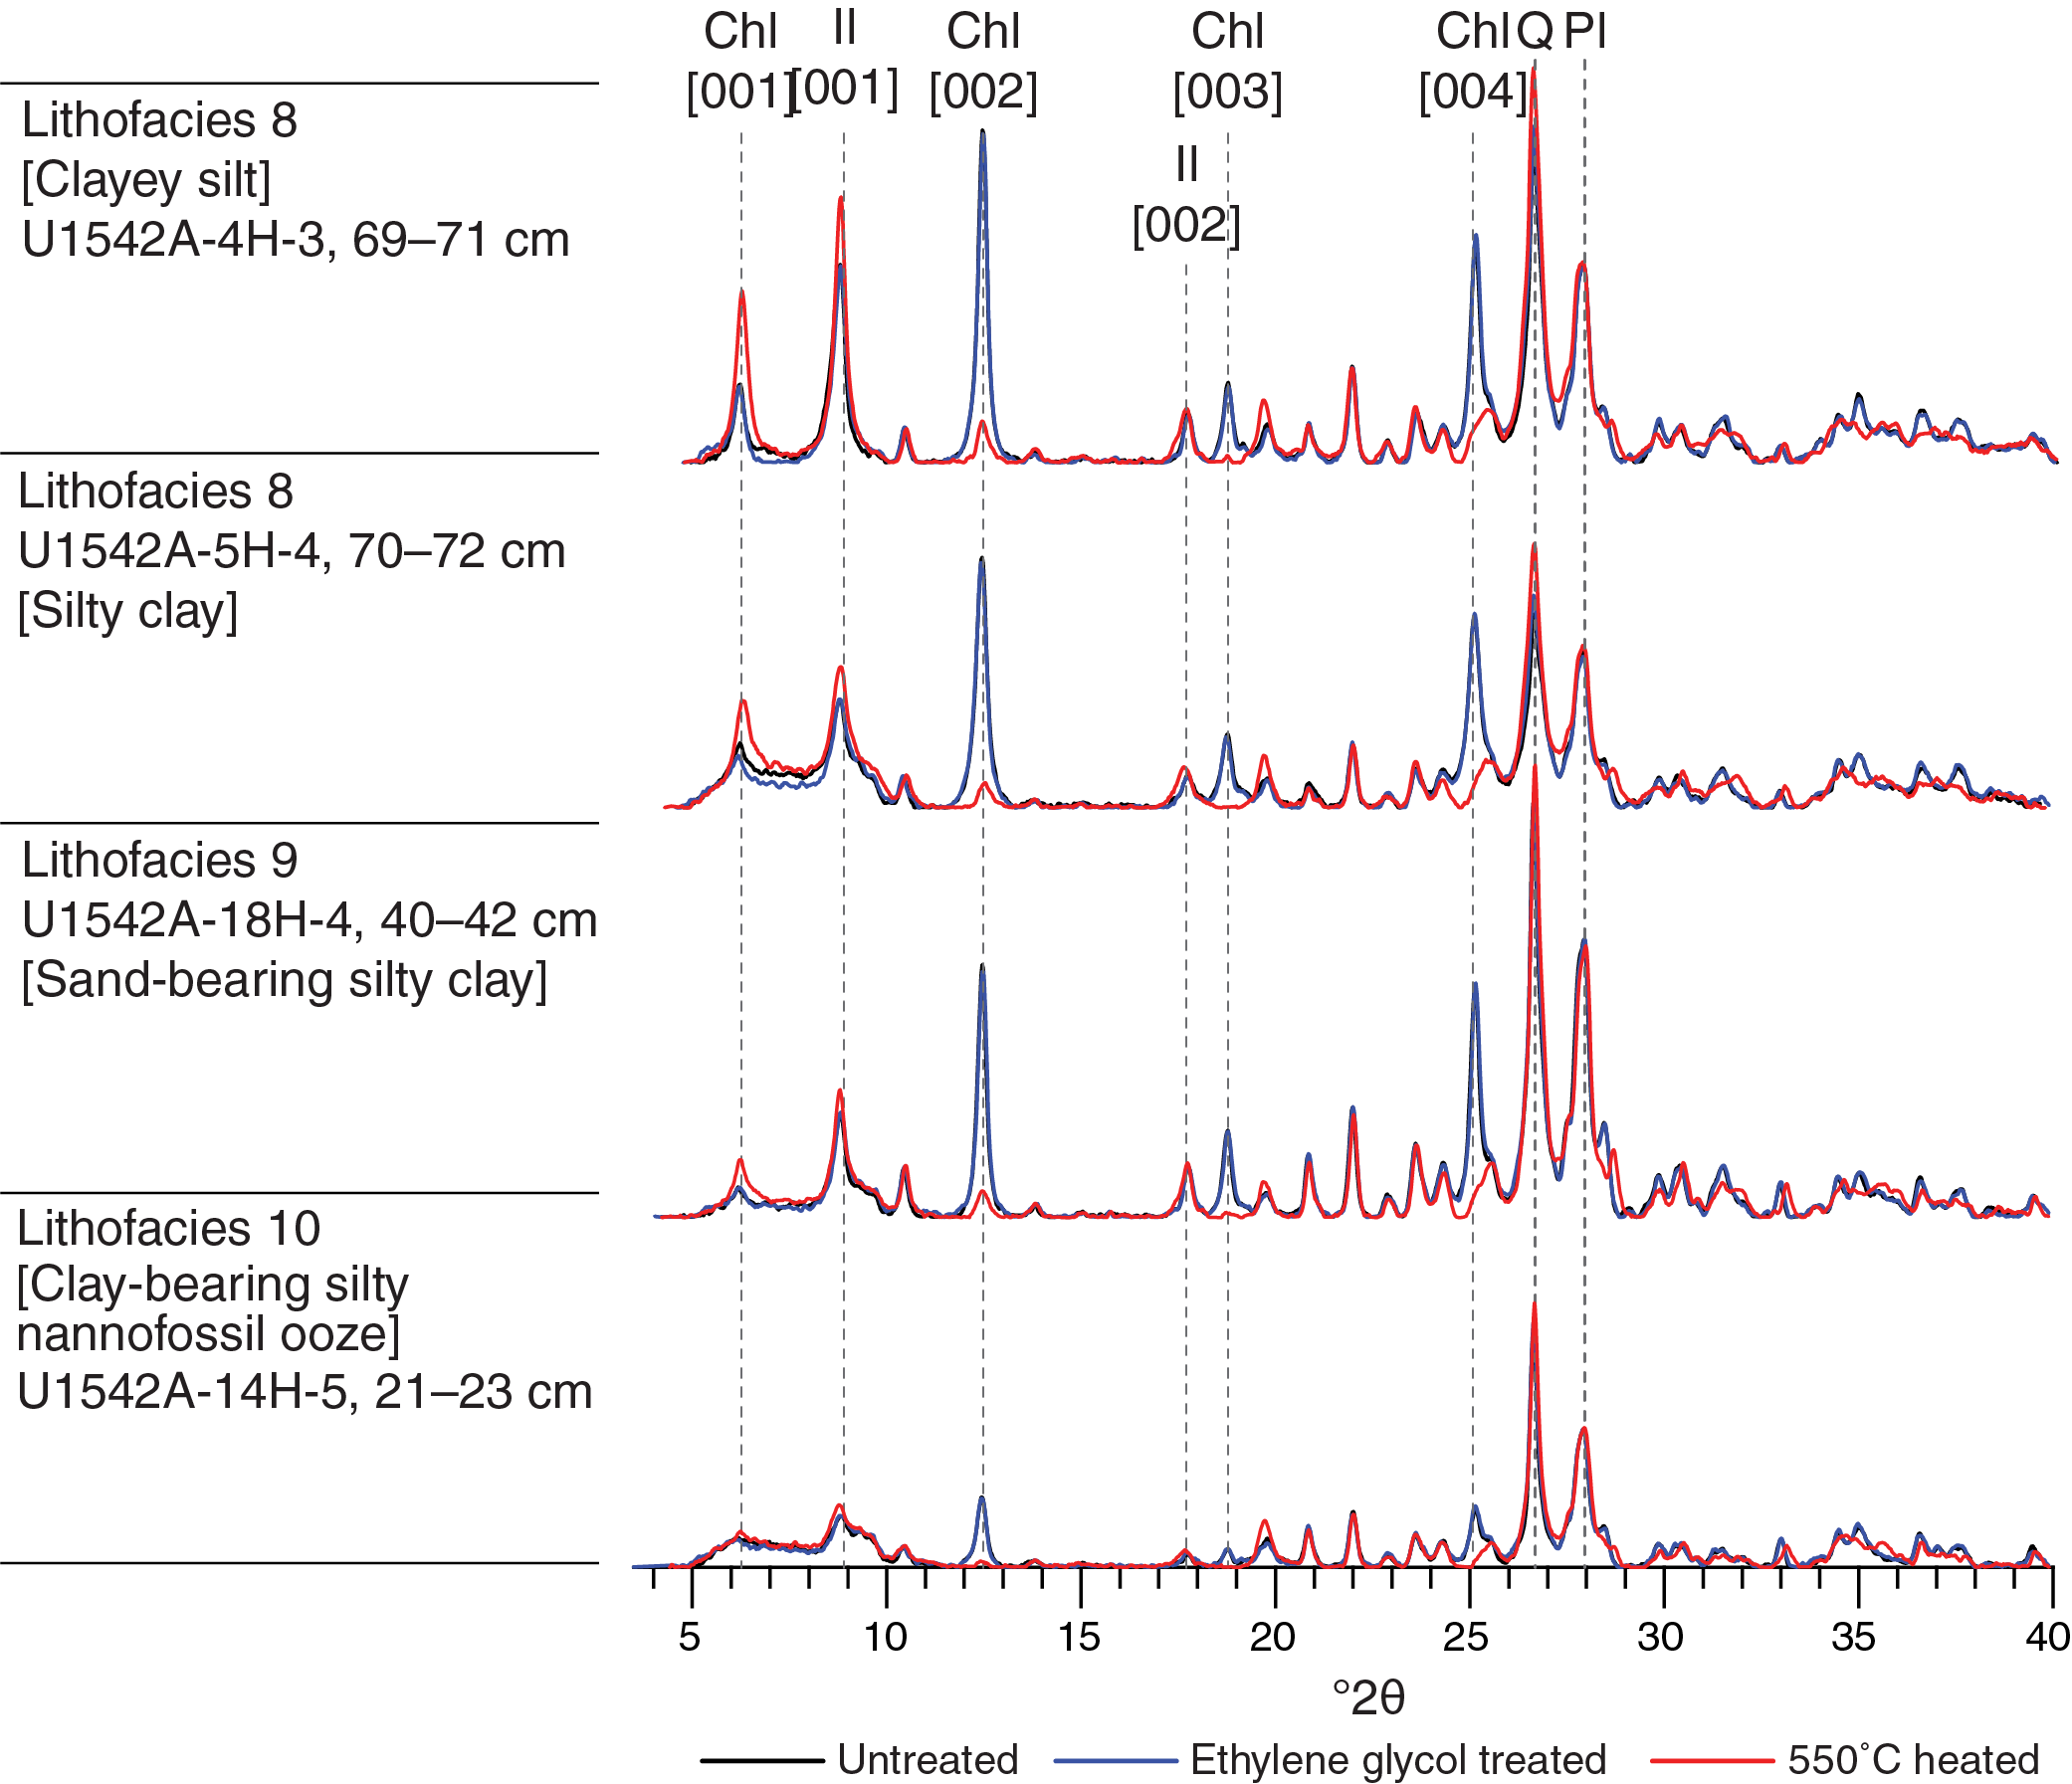
Figure F17. Representative samples of lithofacies.
Characteristic peaks of illite at 10.1 Å (8.9°θ) and 5 Å (17.8°θ) are found in most samples, along with other common mineral phases such as quartz and plagioclase (Figure F17). The most prominent feature of Site U1542 clay mineralogy is the dominance of chlorite appearing as strong 7.1 Å (12.5°θ) and 3.58 Å (25.2°θ) peaks in the X-ray diffractograms of most samples. The reduced intensity of these two peaks and the increase of the 14.2 Å (6°θ) peak after heating to 550°C verifies the presence of chlorite in the clay fraction of all lithofacies. Because chlorite is mainly derived from the low-grade metamorphic and mafic igneous rocks (Chamley, 1989; Weaver, 1989; Hillier, 1995), its dominance points to a proximal detrital provenance. This is supported by the fact that chlorite is not abundant at previous Expedition 383 Sites U1539–U1541 (see Sedimentology in the Site U1539, Site U1540, and Site U1541 chapters [Winckler et al., 2021b, 2021c, 2021d]). The immaturity of the clays is coherent with the observed presence of angular to subangular sand grains with unweathered mafic mineral phases (such as biotite and hornblende) in Lithofacies 11 (Figure F12). The kaolinite/chlorite double peaks at 3.54/3.58 Å (25.2°θ) cannot be resolved because of dominant chlorite peaks masking the presence of kaolinite. Kaolinite, indicative of intense chemical weathering in the tropical regions, and smectite, mainly originating from altered volcanic glass, are not abundant in most samples at Site U1542.
Integrating physical property measurements with lithofacies observations
The distribution of lithologies at Site U1542 was compared to downcore physical property measurements including gamma ray attenuation (GRA) bulk density, natural gamma radiation (NGR), point magnetic susceptibility (MSP), red-green-blue color space (RGB) blue intensity, and color reflectance b* (see Physical properties in the Expedition 383 methods chapter [Winckler et al., 2021a]) to identify relationships between lithology and physical property data (Figure F18). Intervals dominated by biogenic carbonates (Lithofacies 4 and 10), although rare at Site U1542, are generally characterized by low MSP, lower b*, and higher RGB blue intensity, as observed in Core 383-U1542C-14H between 125 and 126 m CSF-A. Outside of calcareous intervals, lithologic variations between the dominantly terrigenous lithofacies at Site U1542 exhibit complex relationships with physical property data. For instance, interbedded sands (Lithofacies 11) in Core 13H between 112 and 115 m CSF-A are associated with high MSP, but clayey silts (Lithofacies 8) characterize an equally high MSP interval between 118 and 120 m. Smaller amplitude variations in RGB blue and b* throughout Cores 13H and 14H may reflect differences in minor contributors to the lithology, such as biogenic components (biosiliceous and calcareous), and/or changes in grain size of the terrigenous fraction, such as the relative contribution of clay versus silt versus sand, provenance, or other properties. These relationships will require further study.

Figure F18. Major lithology and physical properties.
The complexity of relationships between lithology and physical properties at Site U1542 is further illustrated by a comparison of RGB blue and reflectance L* with bulk sedimentary carbonate weight percentages (Figure F19). Although samples with elevated carbonate content still exhibit higher RGB blue and L* intensity values, as was observed at the central South Pacific Expedition 383 sites, the majority of Site U1542 data exhibit <10% carbonate and relatively low RGB blue and L*. For these data, changes in RGB blue and L* are uncorrelated to carbonate content, suggesting that other lithologic factors are responsible for these physical property variations.
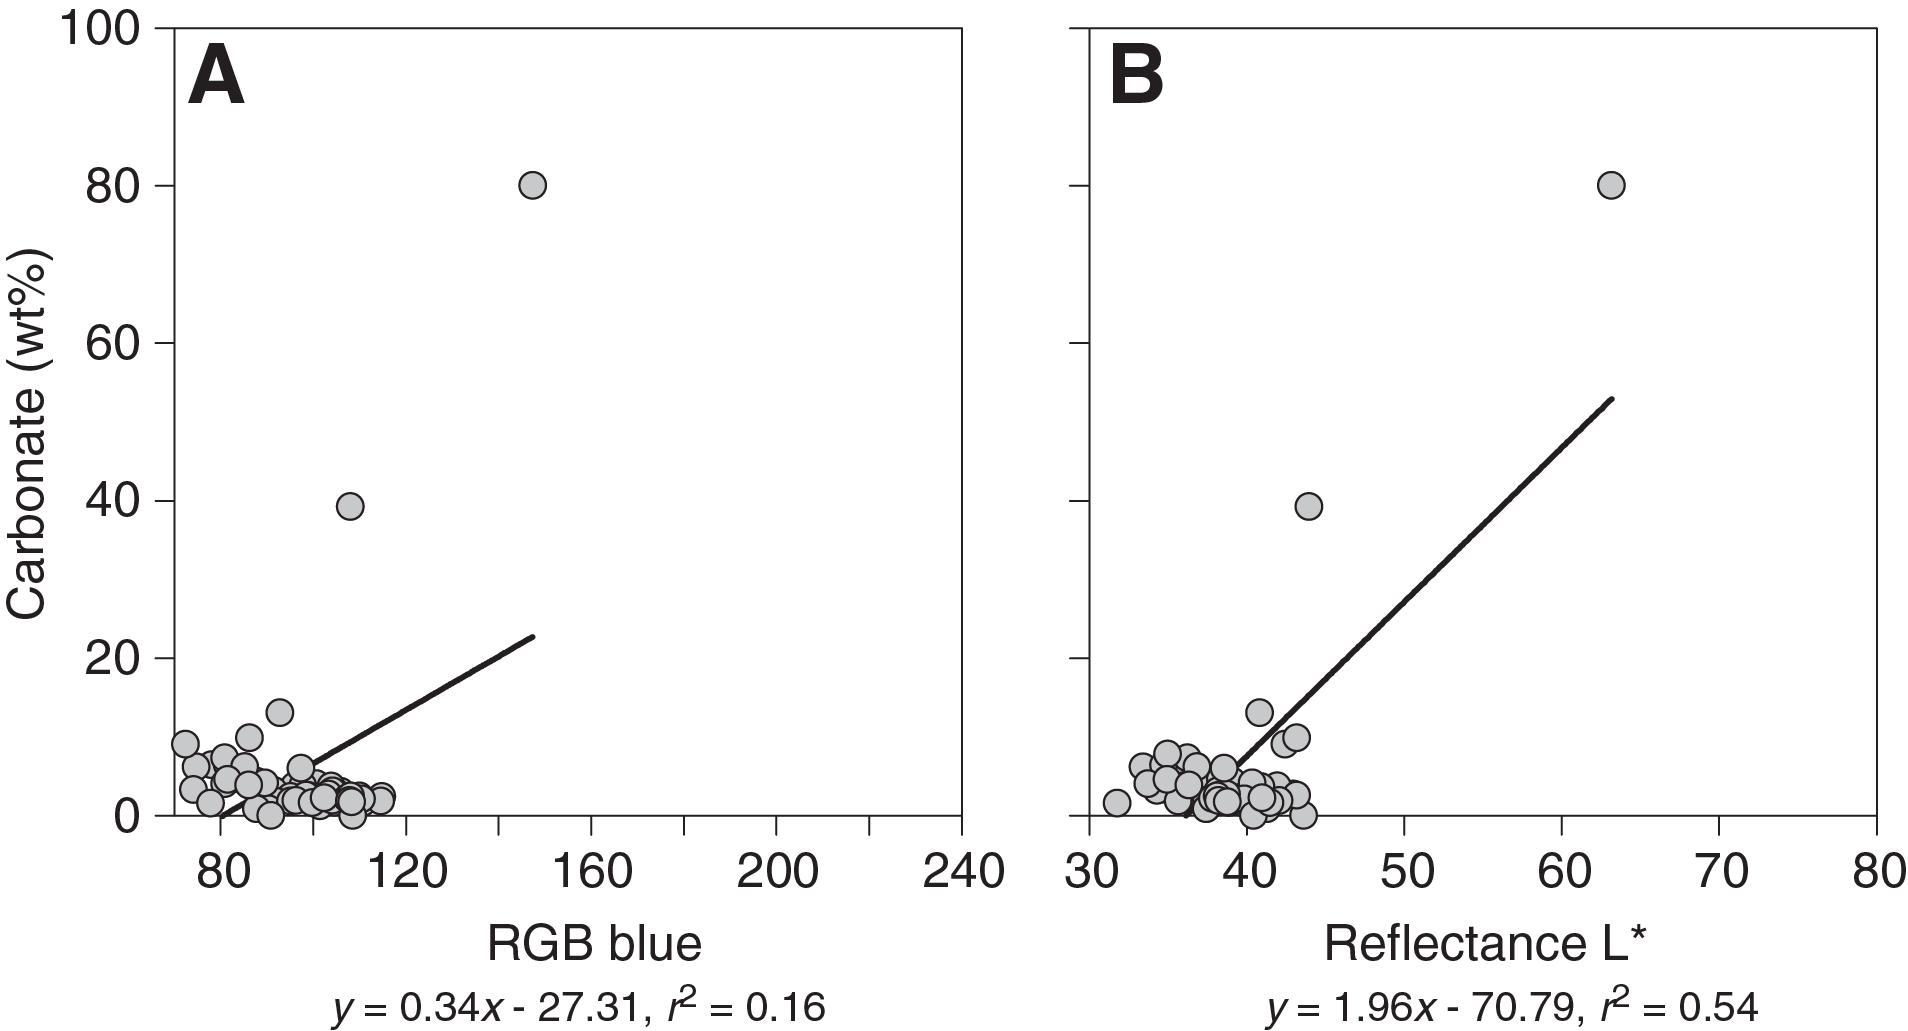
Figure F19. Bulk sedimentary carbonate content, RGB blue, and L*.
Summary and preliminary site interpretation
The Site U1542 sedimentary sequence is characterized by the rapid accumulation of siliciclastic sediments during the middle to late Pleistocene (see Biostratigraphy). The 249 m composite record largely consists of dark gray clayey silts and silty clays that are occasionally interbedded with moderately sorted coarser sands (Figure F13). Greenish gray calcareous sand-bearing clayey to sandy silt and foraminifer-rich nannofossil oozes occur as distinct light-colored beds that generally have higher b* values and in some instances lower MSP. Dropstones are observed throughout the sequence (see Core descriptions) and are most often associated with Lithofacies 8.
Depositional processes at Site U1542 are more varied and complex than those observed in the pelagic central and eastern Pacific Expedition 383 sites due to the close proximity of this upper slope drift deposit to a glaciated continental margin. Terrigenous sediment is likely delivered to the site by a combination of ice rafting, glacial meltwater plumes, freshwater plumes from nonglaciated catchments, episodic downslope transport from the outer continental shelf, and fine-grained sediments transport by the CHC entering the Drake Passage as a northern branch of the ACC (Lamy et al., 2015). Glacial–interglacial changes in sea level, coastal current strength, Patagonian glacier extent, related isostatic adjustments, and deglaciation of landward sediment-trapping fjord basins will further influence the nature and rate of sedimentation during the Pleistocene (Caniupán et al., 2011). Postcruise work will be needed to deconvolve these processes.
The very high sedimentation rates at Site U1542 (exceeding 30 cm/ky based on the preliminary shipboard age model) allow a continuous reconstruction of Patagonian glacial variability over orbital and millennial timescales, thus providing an important Pacific counterpart to the fragmentary or discontinuous land-based reconstructions of the Late Cenozoic Patagonian glaciations (Rabassa et al., 2011). Moreover, this site will allow for a detailed study of the AAIW dynamics, the strength of the ACC and CHC, SST, and land-sea interactions along the southern Chilean continental margin.
Biostratigraphy
Core catcher samples from Site U1542 were analyzed for siliceous (diatoms, radiolarians, and silicoflagellates) and calcareous (nannofossils, foraminifers, and ostracods) microfossils. Calcareous nannofossils, planktonic and benthic foraminifers, ostracods, and diatoms were also analyzed in the mudline samples. The occurrence and abundance of the different microfossil groups varies throughout the sequence. Diatoms are rare to common throughout the succession, and many samples are barren; they show low fragmentation and moderate to high dissolution. Radiolarians are absent in the majority of the samples studied, but rare and poorly preserved radiolarians occur sparsely throughout the sequence. Silicoflagellates are absent in all samples analyzed, excluding one specimen in Sample 383-U1542C-23H-CC. Calcareous nannofossils show variable preservation and abundance throughout the sequence, generally ranging from rare to common but becoming dominant in a nannofossil ooze interval in Section 383-U1542A-14H-4 and abundant in Section 383-U1542C-23H-CC. Planktonic foraminifers are common to abundant, apart from a few samples in which they are rare, and their preservation is moderate to good. Benthic foraminifers are abundant and very well preserved except in a few samples. Ostracods are generally sparse, and their preservation is moderate to good. Interestingly, organic dinoflagellates are abundant and well preserved in some samples, suggesting high bioproductivity and low bottom water oxygen conditions at the time those intervals were deposited. Some wood fragments were also recovered along the sediment succession. The biostratigraphy at Site U1542 is based on Hole U1542A and the lower part of Hole U1542C. A ~169.51 m thick sediment succession was recovered in Hole U1542A, and core recovery in Hole U1542C reached 234 m CSF-A. In total, eight biostratigraphic constraints were identified, providing a tentative middle to late Pleistocene basal age for the sequence, with an average sedimentation rate of ~33 cm/ky (Figures F20, F21; Table T3). Well-constrained age-diagnostic events are provided by diatoms and radiolarians at ~208.05 m CSF-A. Calcareous nannofossils provide two potential bioevents, but their application is tentative given the low abundance of this microfossil group and the absence of a key biostratigraphic marker species. Planktonic foraminifers suggest an age of ~0.7 Ma for the bottom of Hole U1542C. Abundances of the different microfossil groups from Holes U1542A and U1542C are shown in Figures F22 and F23, respectively.
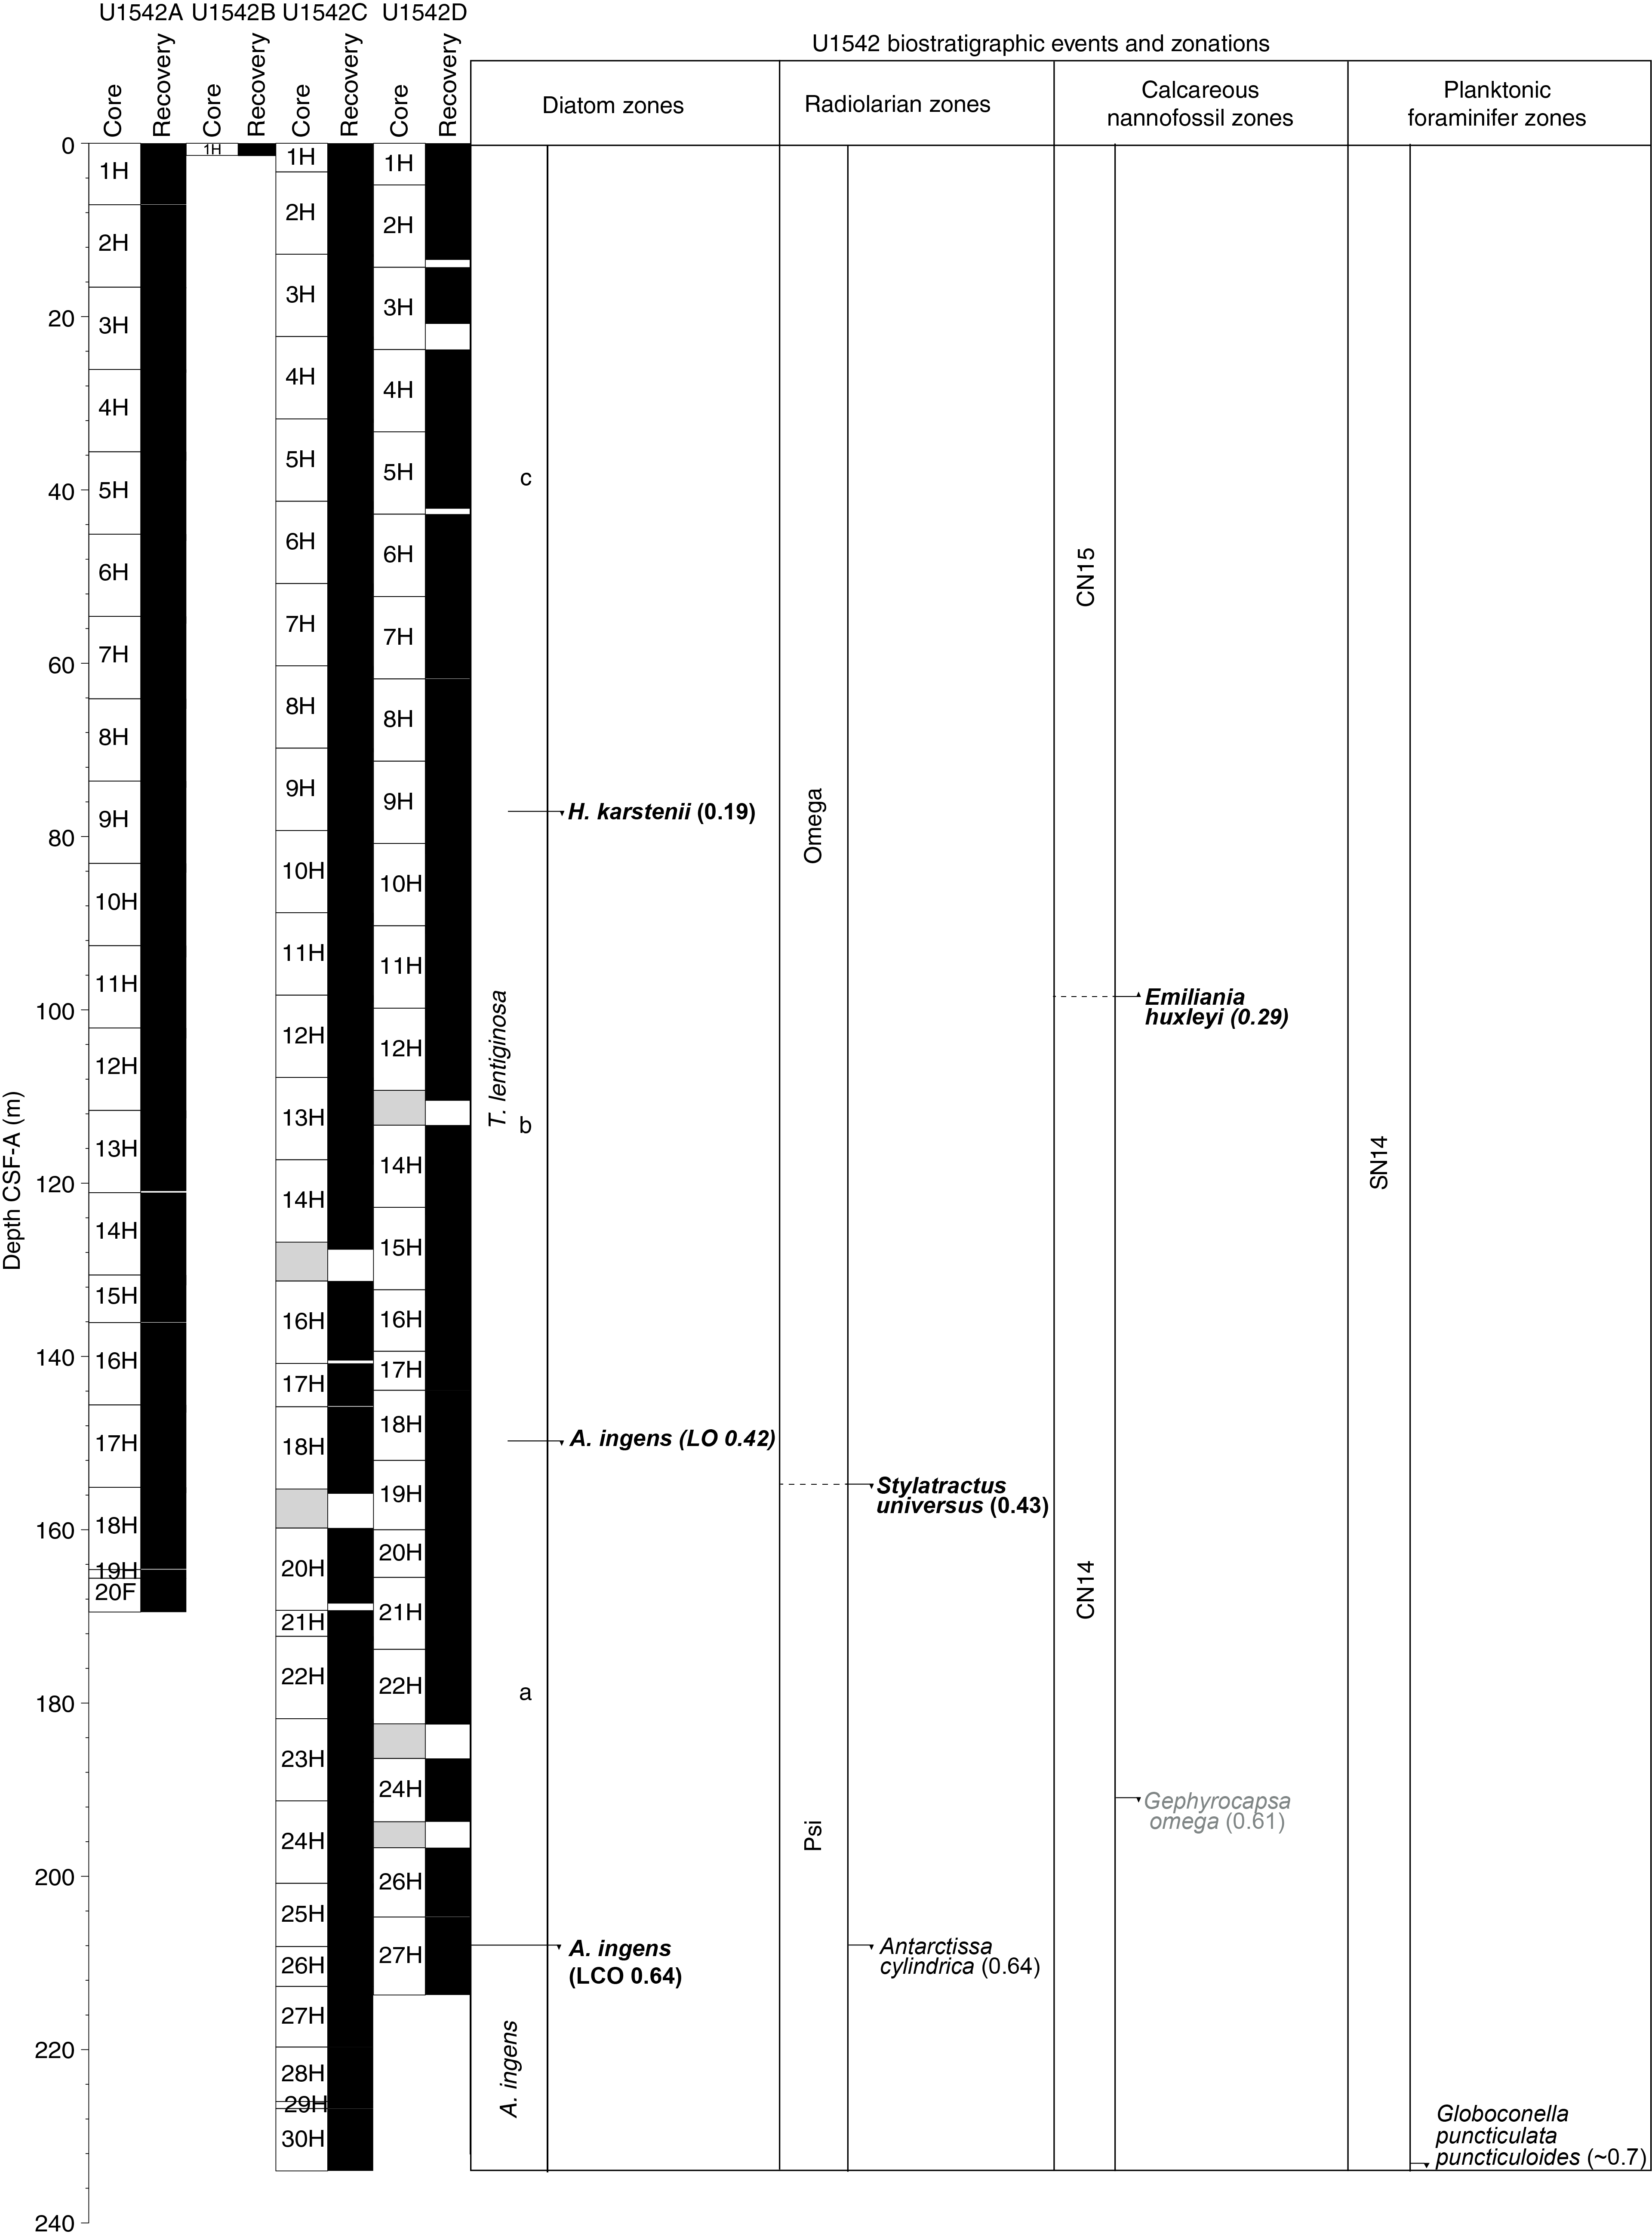
Figure F20. Zonations and biostratigraphic events.
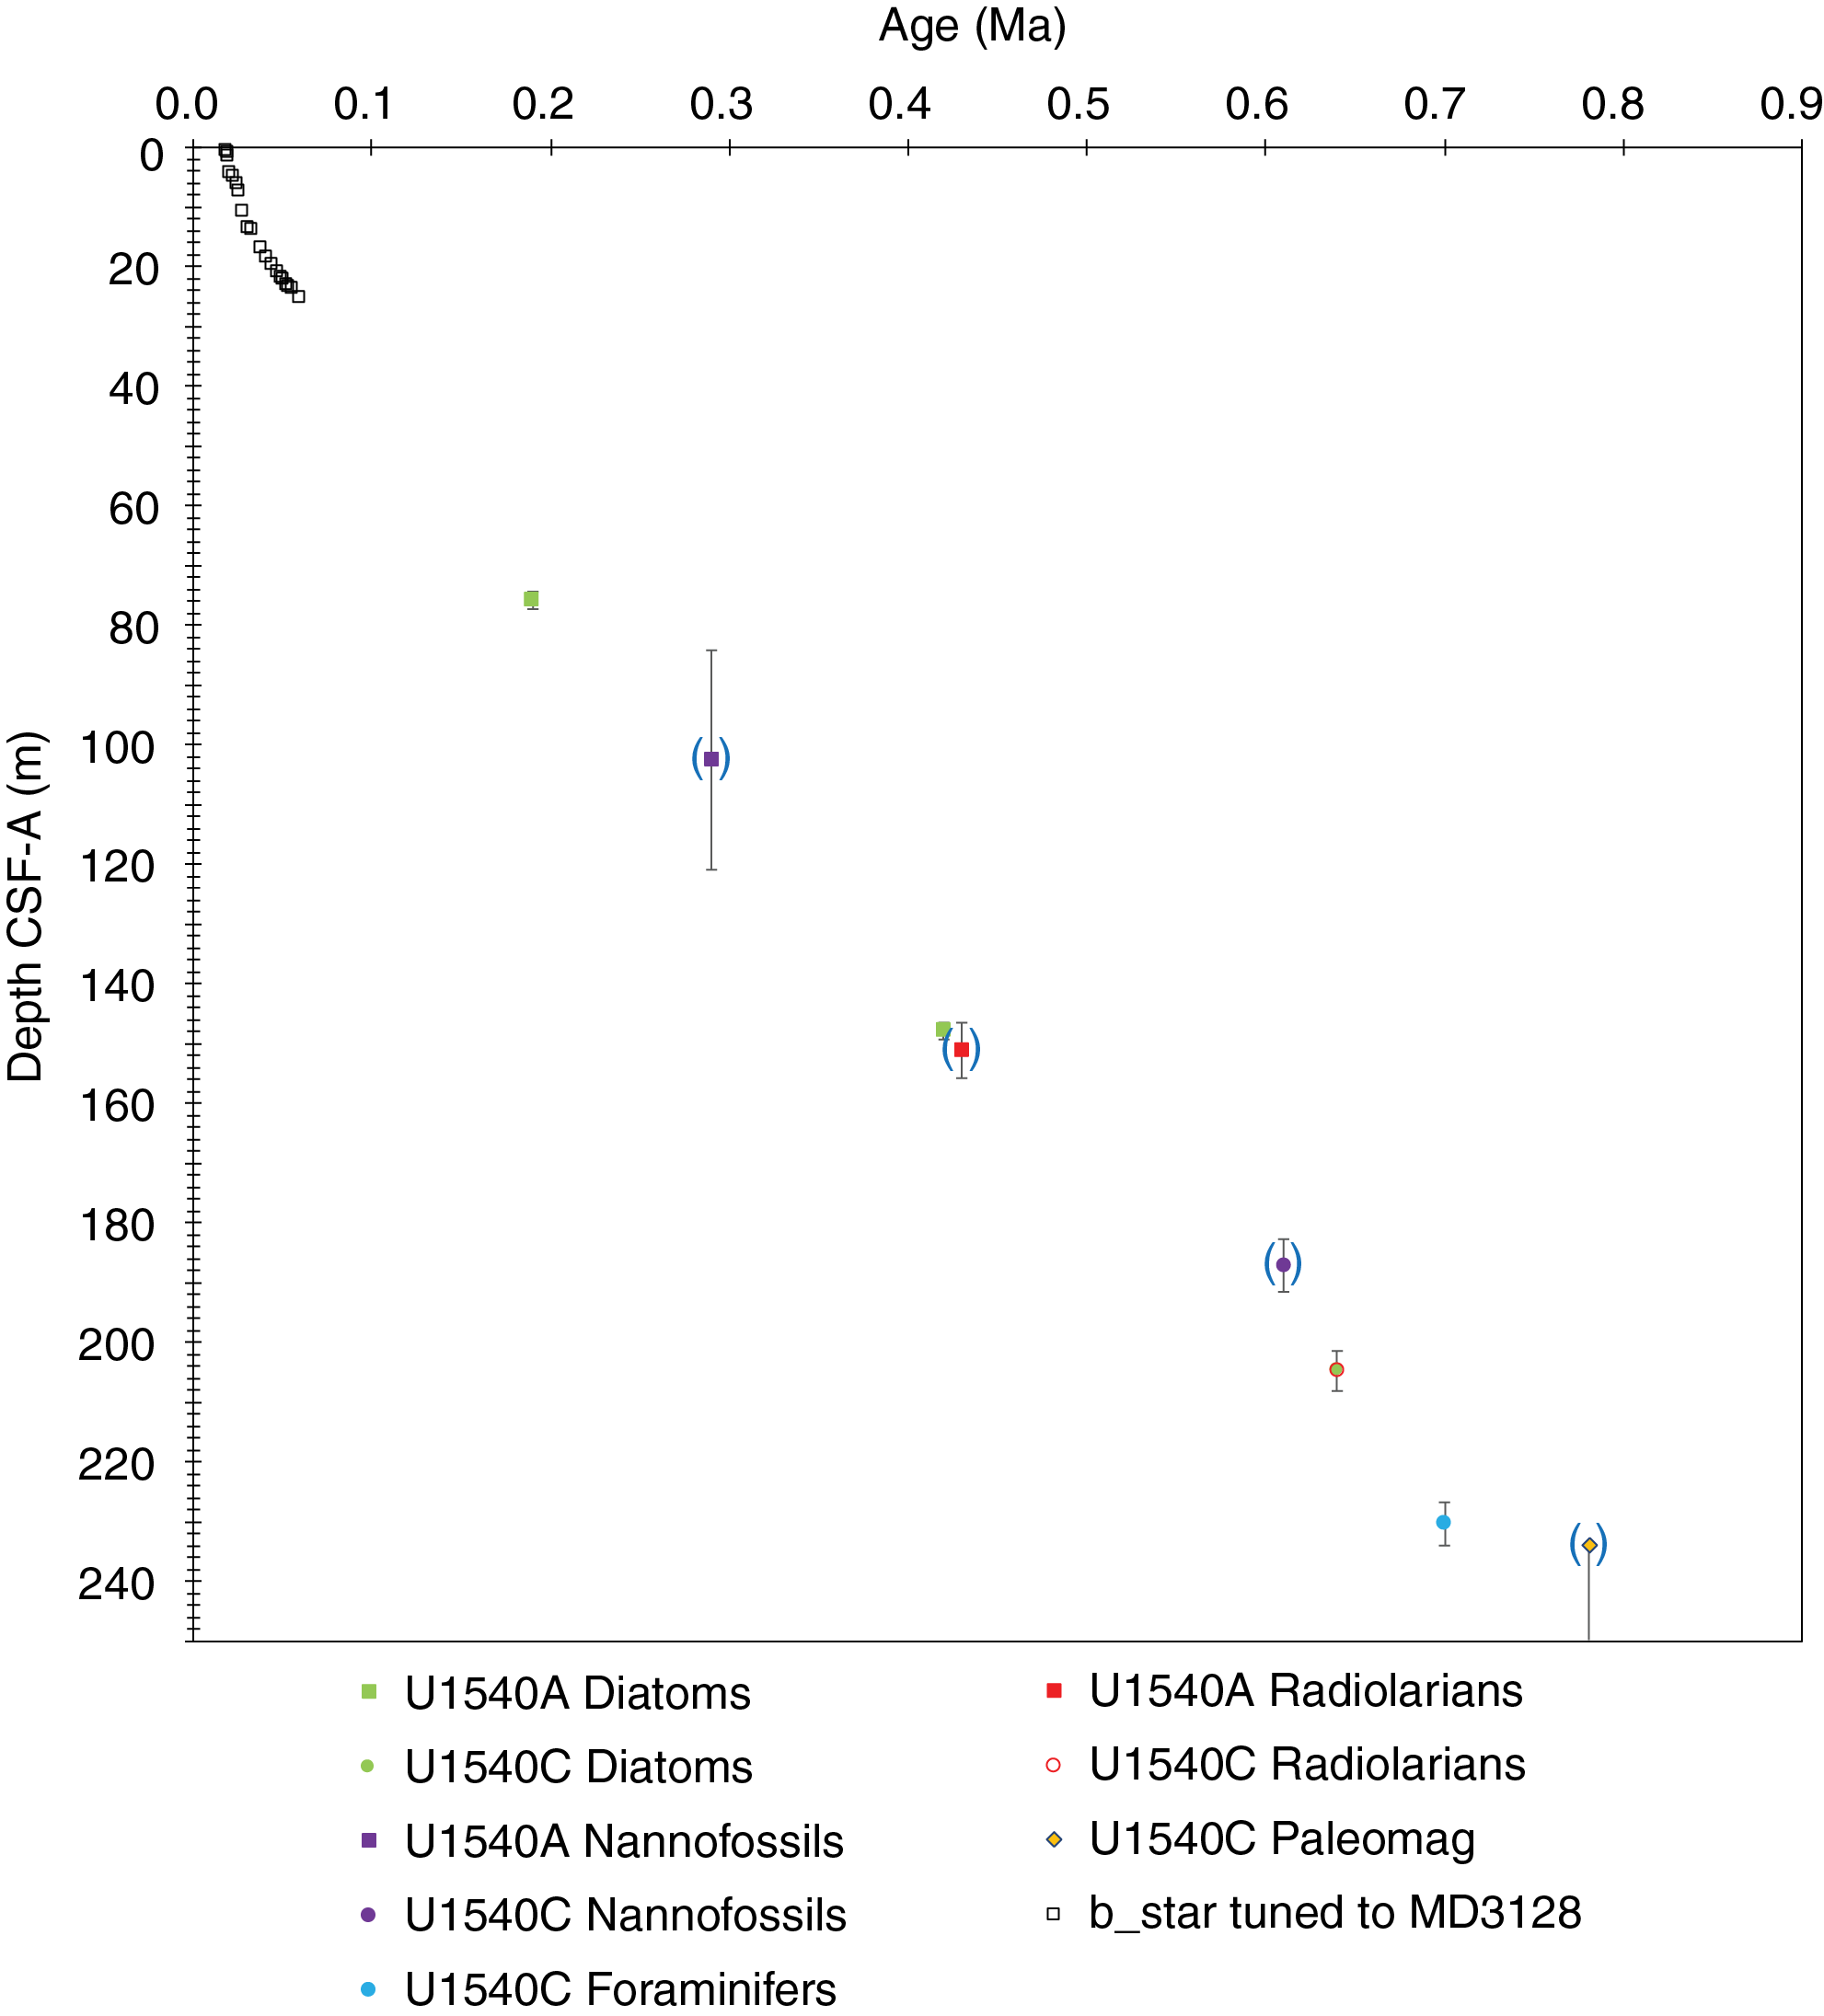
Figure F21. Age-depth plot.
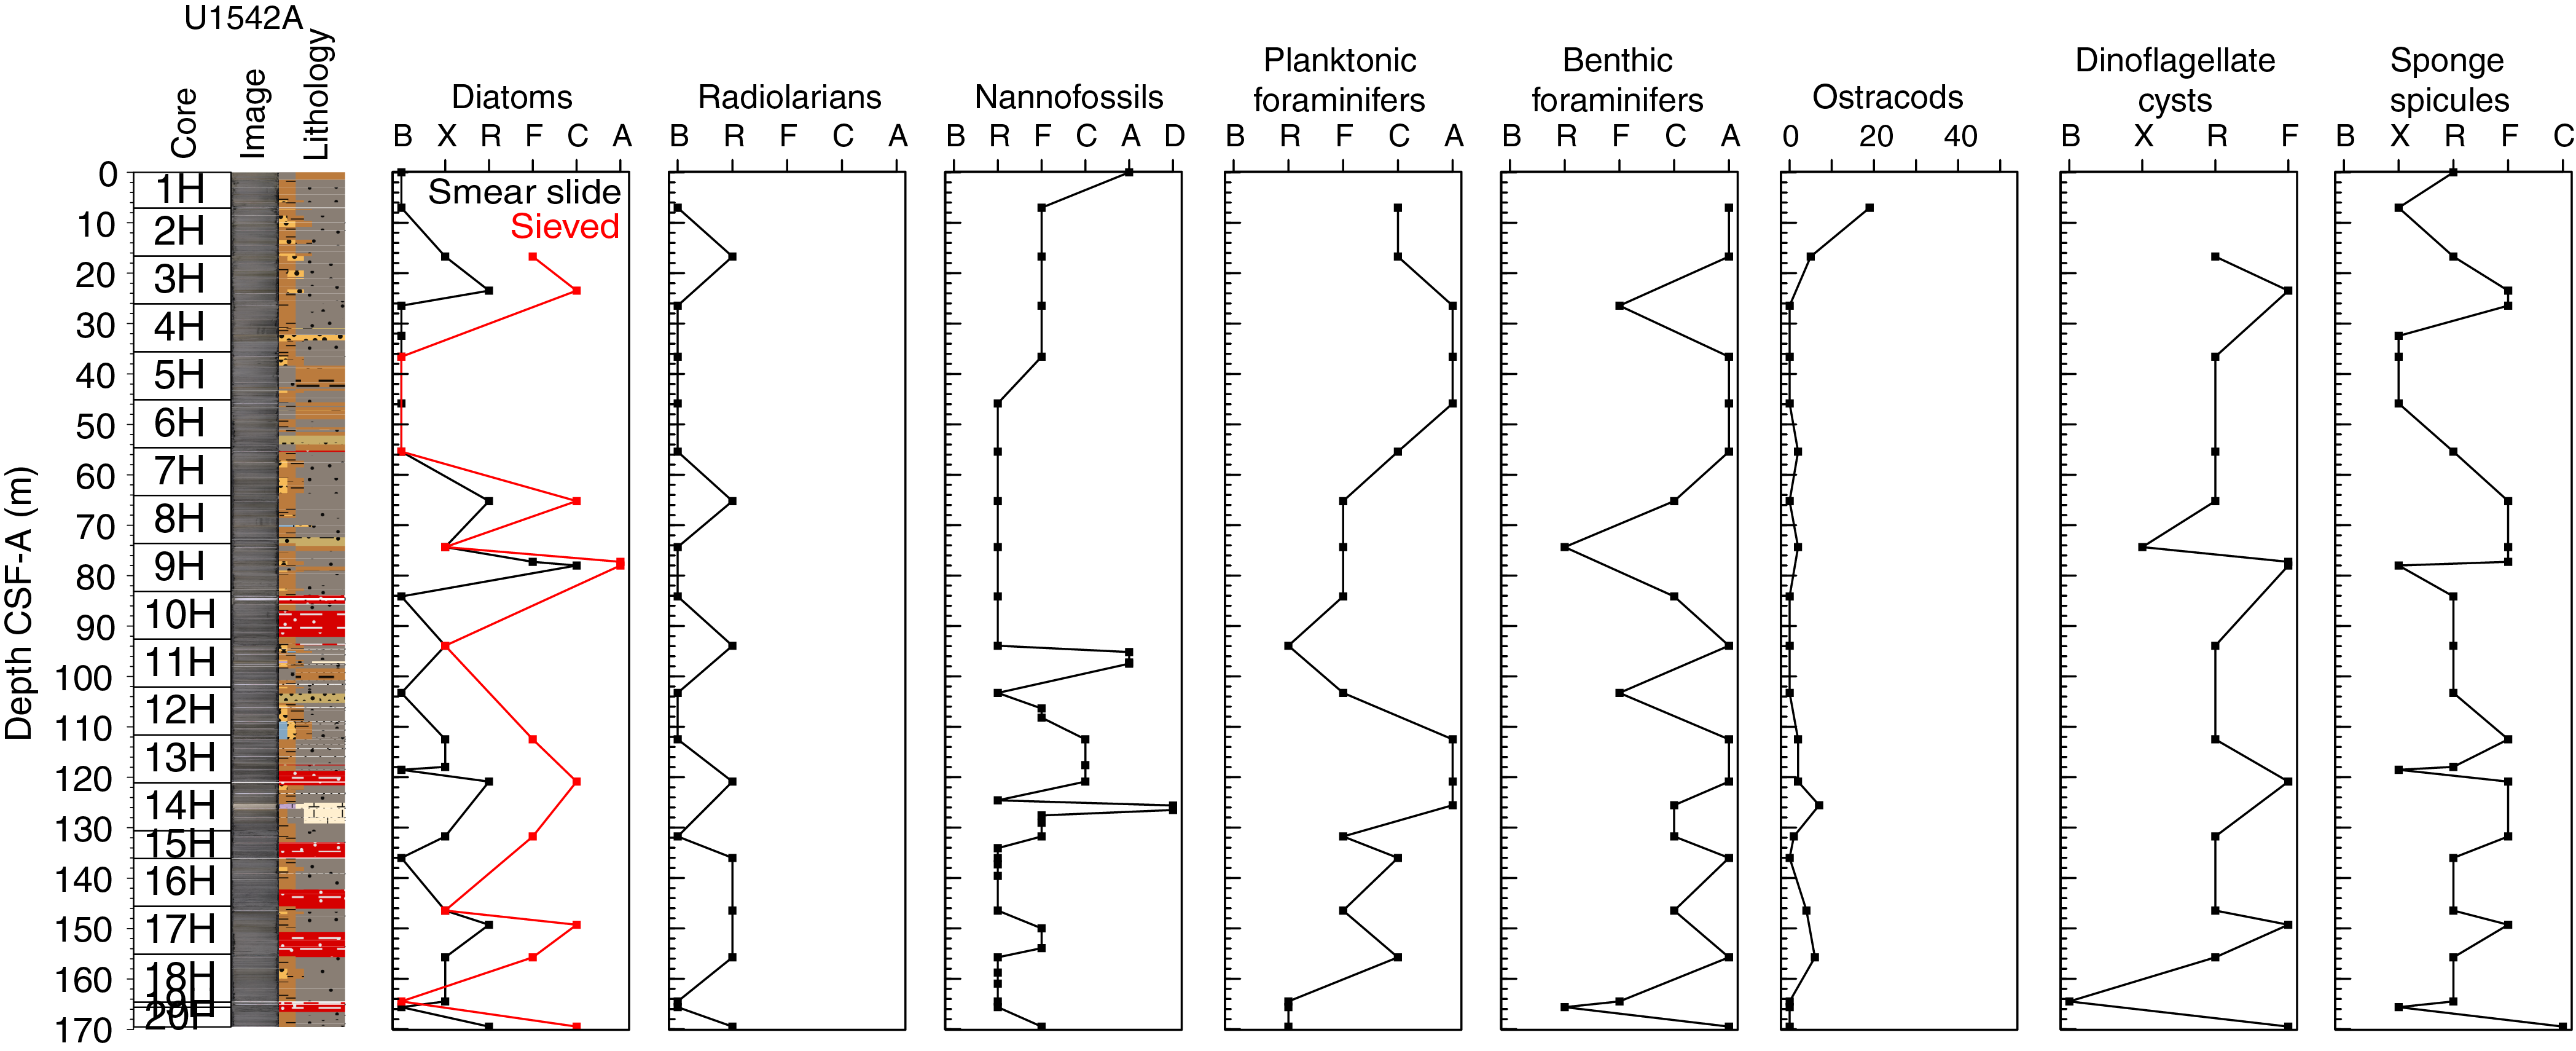
Figure F22. Siliceous and calcareous microfossils, Hole U1542A.
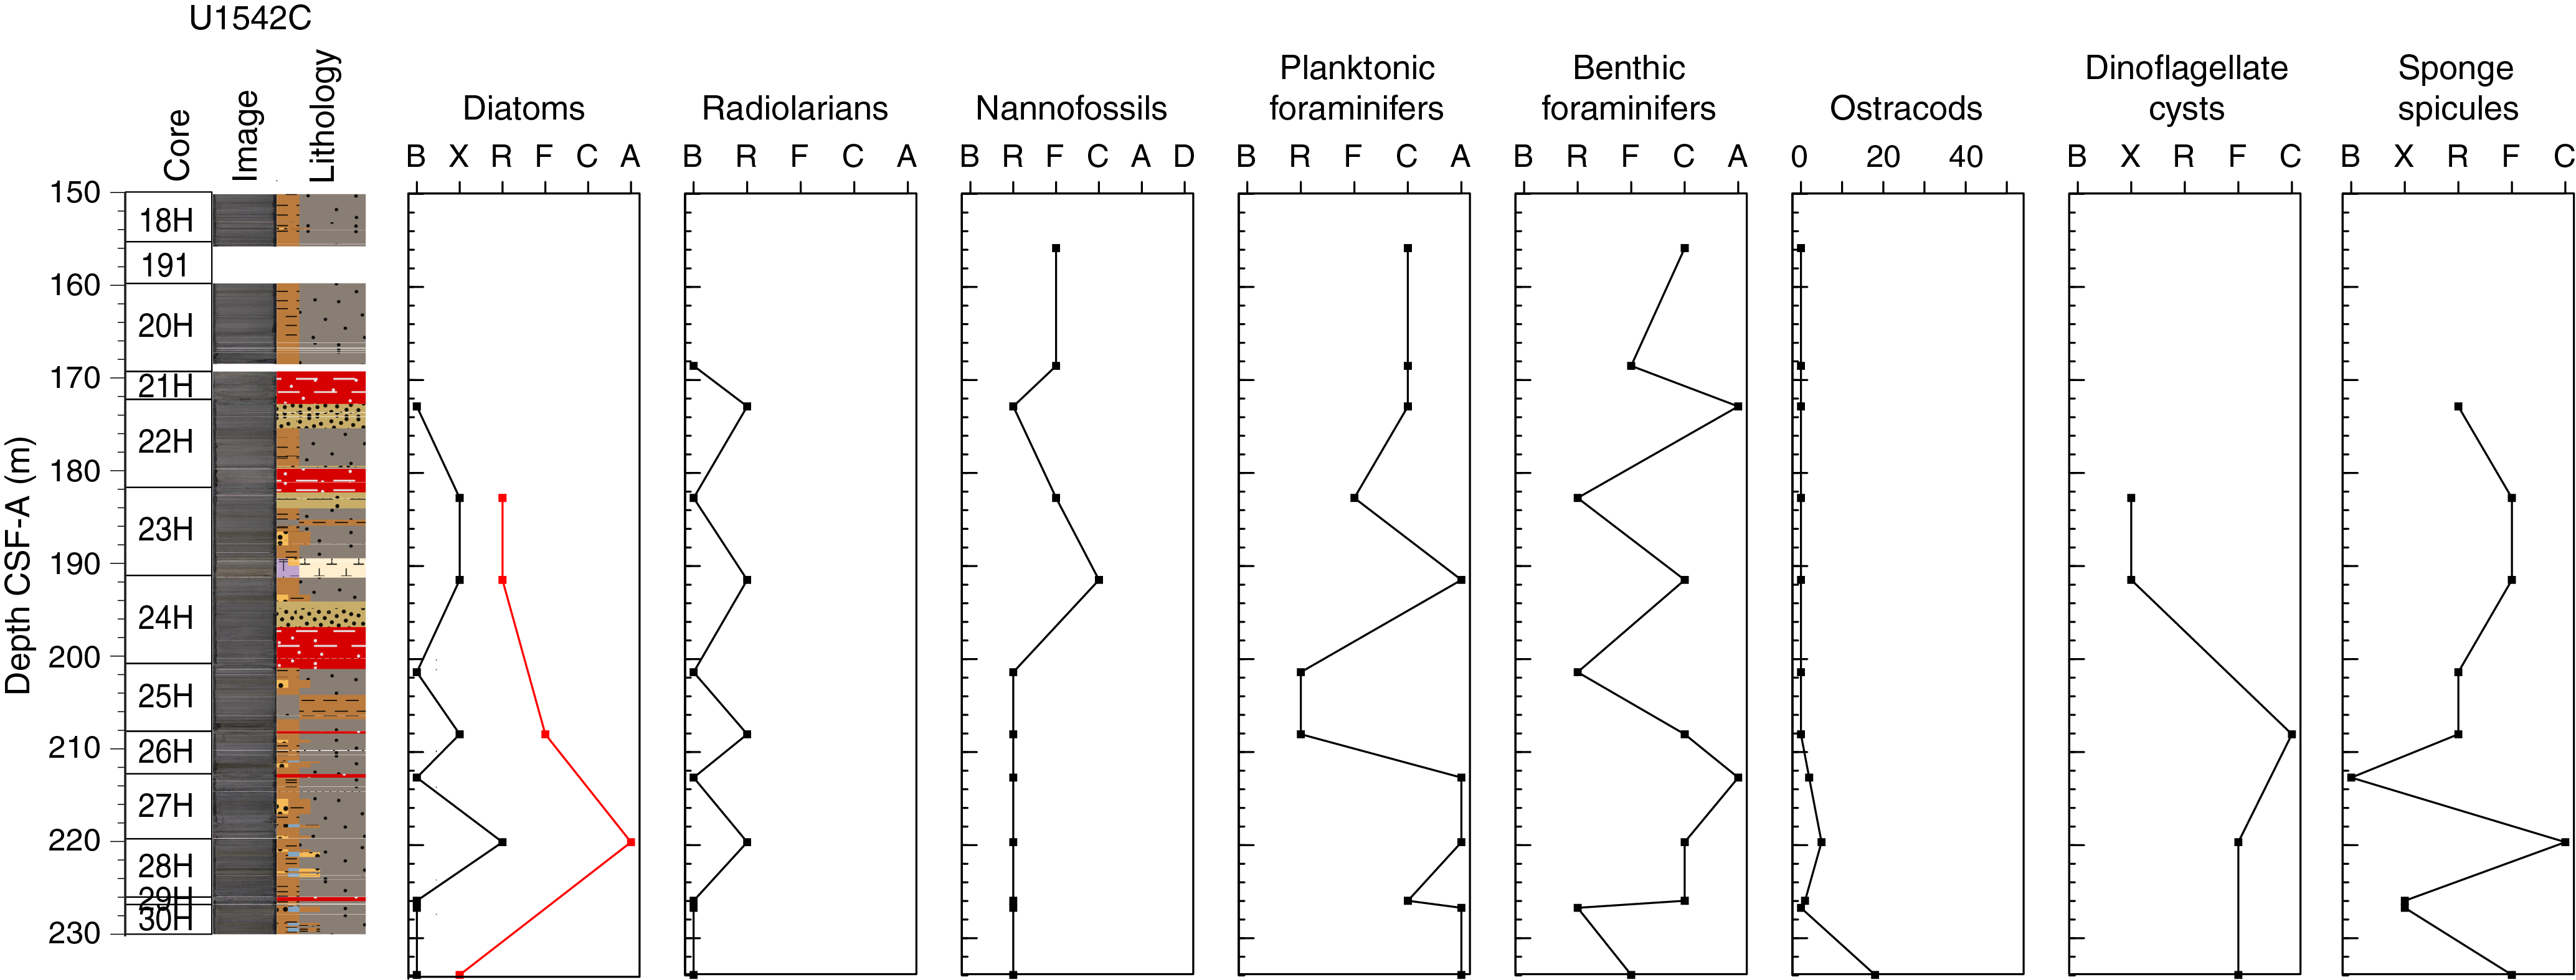
Figure F23. Siliceous and calcareous microfossils, Hole U1542C.
Diatoms
The sediments at Site U1542 consist mostly of terrigenous mud with some biogenic components, including highly diluted diatom frustules. Thus, regular smear slide preparation resulted in microscopic slides containing only silty to clayey terrigenous particles that are mostly barren of diatoms. In addition to regular smear slides, we therefore produced sieved slides from all samples in which diatoms appeared at trace or higher abundance in smear slides (see Biostratigraphy in the Expedition 383 methods chapter [Winckler et al., 2021a]). Concentrating biogenic particles by sieving at 15 µm considerably improved the yield of diatoms (Figures F22, F23, F24; Table T4) and permitted the identification of three biostratigraphic datums.
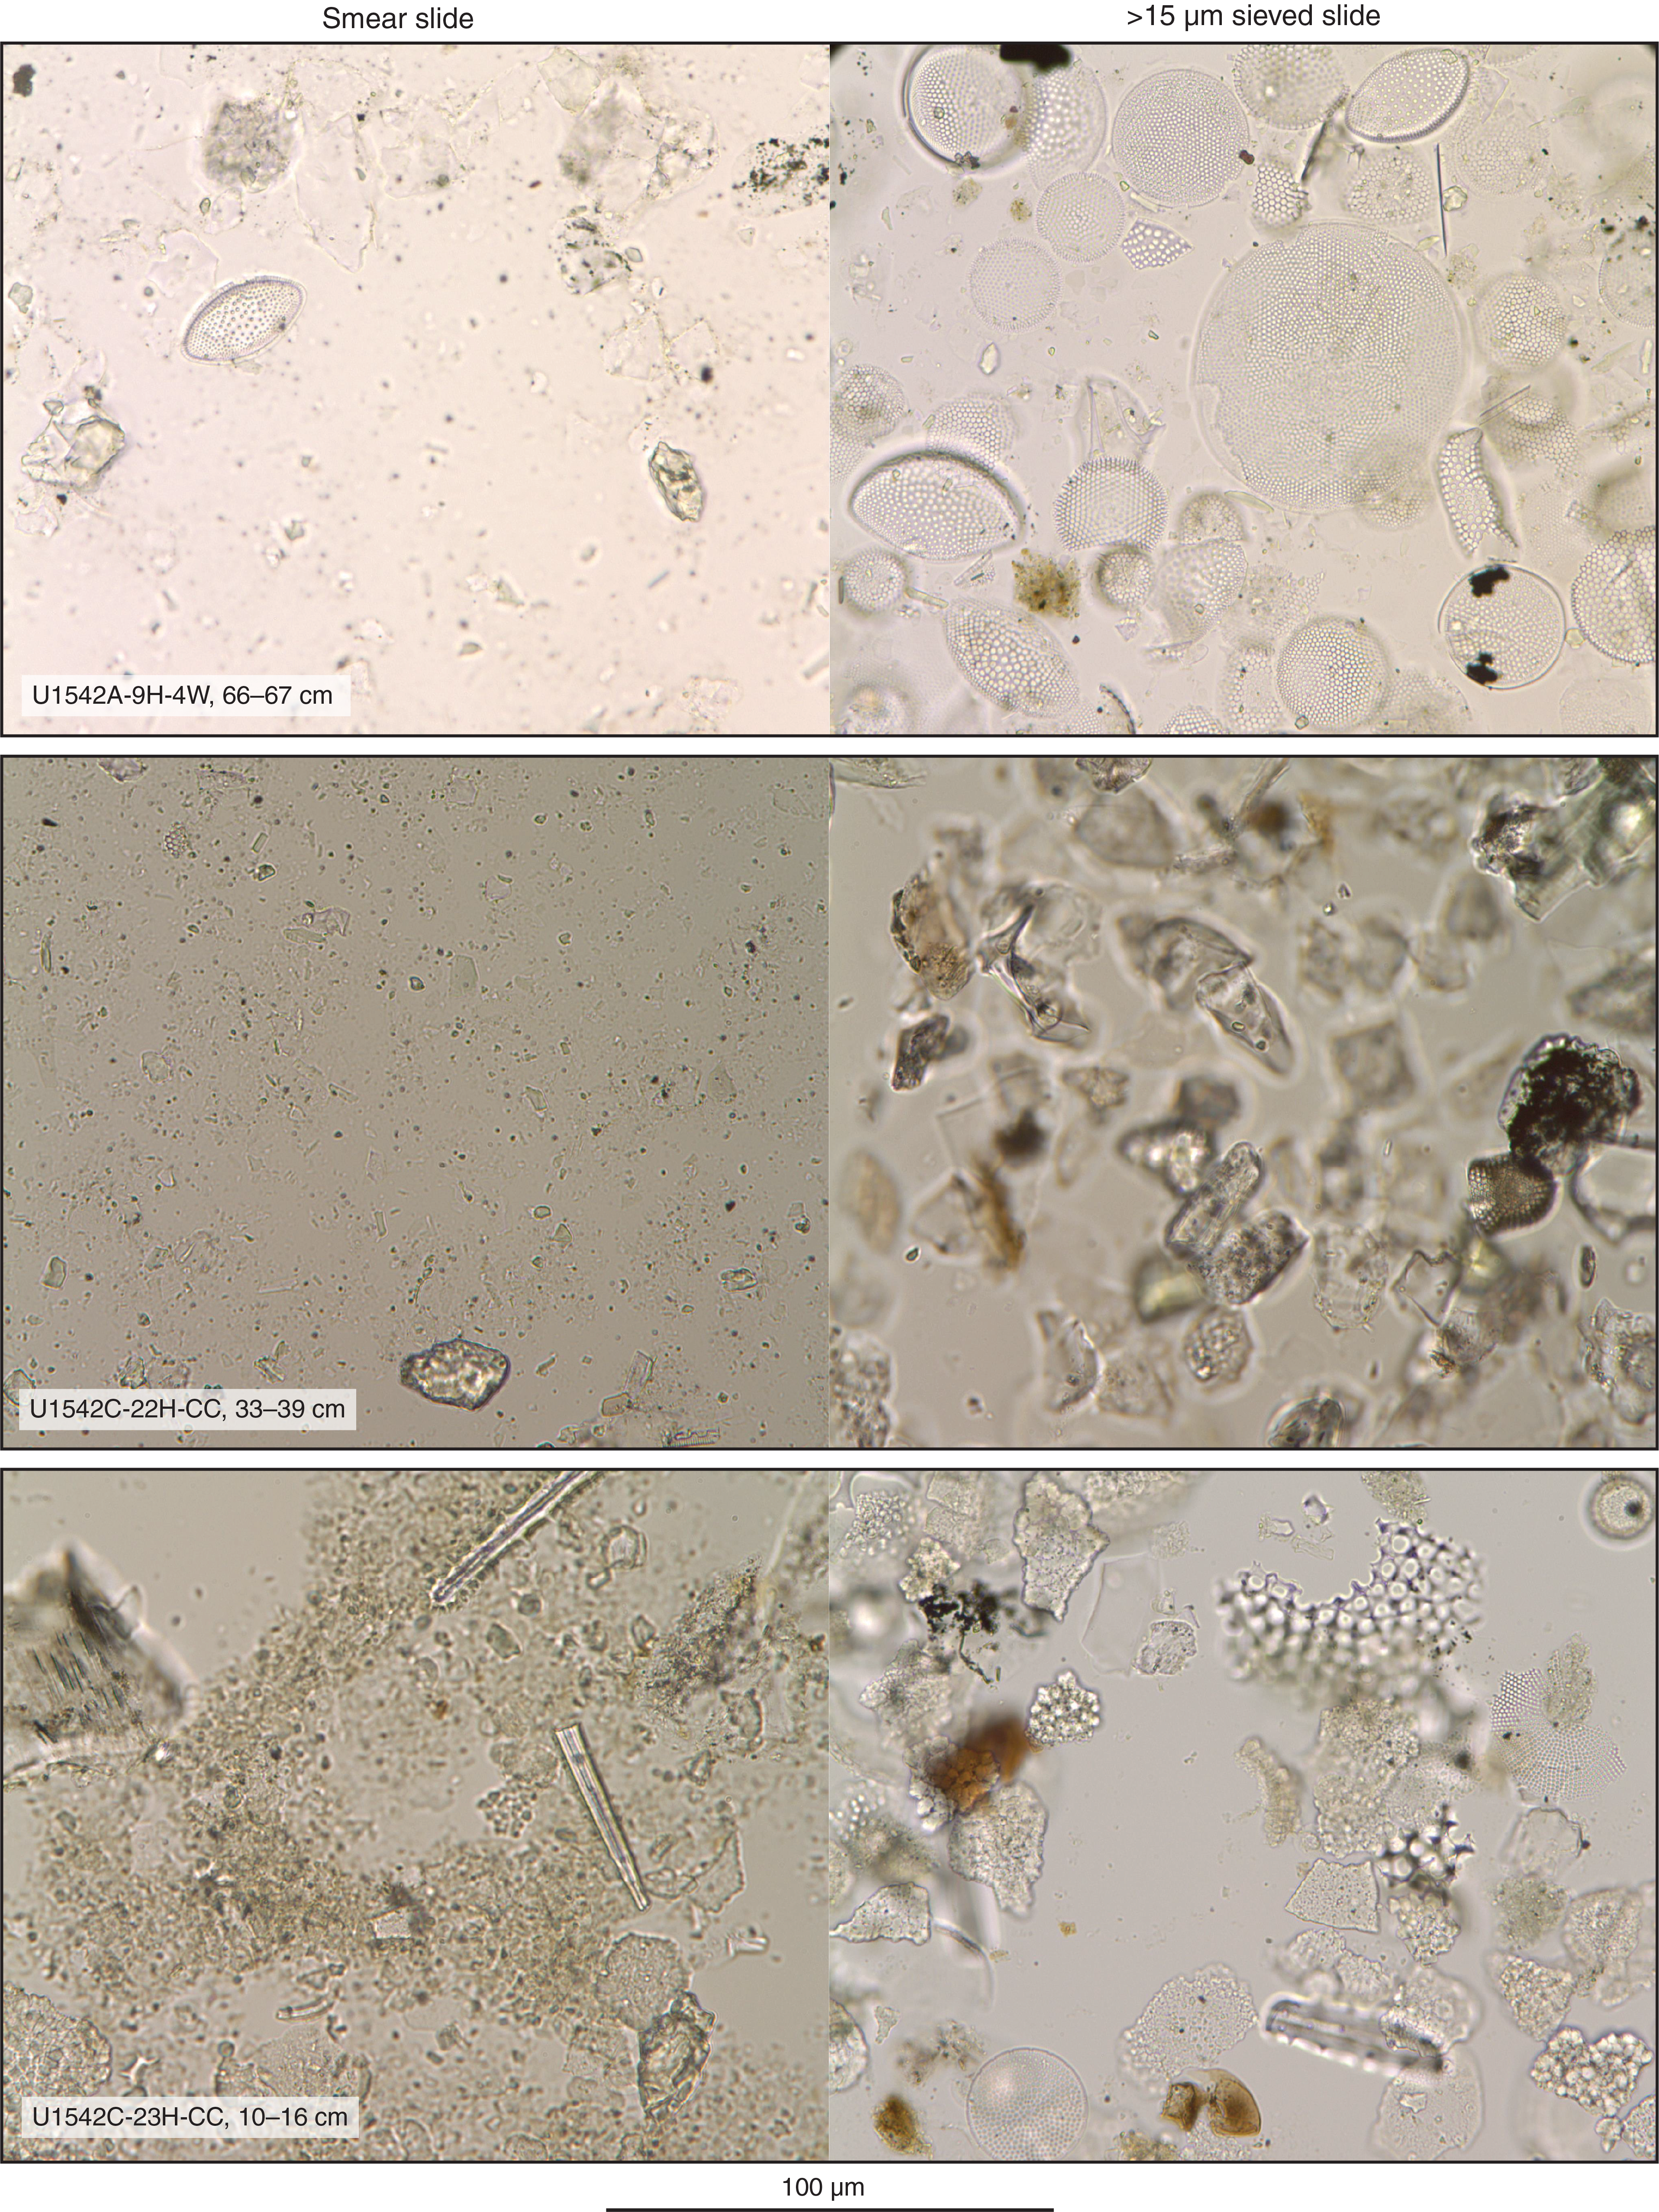
Figure F24. Diatom abundance and fragmentation.
Diatom biostratigraphy at Site U1542 is based on the analysis of 28 smear slides and 16 sieved sample slides from 1 mudline, 20 core catcher, and 7 working-half cylinder samples from Hole U1542A and 10 smear slides and 5 sieved sample slides from 10 core catcher samples from Hole U1542C. Diatom abundances vary from barren to common in smear slides and from barren to abundant in sieved sample slides (Figures F22, F23; Table T4). In total, 18 smear slides were barren of diatoms due to high dilution by terrigenous clay and silt. Dissolution is moderate, and most samples exhibit high to moderate fragmentation in smear slides. Sieved sample diatom preservation is moderate to good, and fragmentation is low because of the removal of fragments <15 µm.
The diatom assemblage compositions in both Site U1542 holes are internally consistent, and the datums agree well with the middle Pleistocene to recent sequence at Site U1539. The diatom succession appears to record continuous accumulation from the recent to the middle Pleistocene and follows the diatom zonation of Zielinski and Gersonde (2002). Bottom ages are younger than 0.64 Ma for Hole U1542A and older than 0.64 Ma for Hole U1542C (Table T4; Figure F20). Besides diatoms, few to common sponge spicules and organic-walled dinoflagellate cysts (dinocysts) were noted, especially in the sieved samples (Table T4). The dinocyst assemblages are composed of two distinct species only, Brigantedinium simplex and Selenopemphix antarctica, reported from high southern latitudes (Esper and Zonneveld, 2002; Esper and Zonneveld, 2007).
The diatom assemblages in Hole U1542A reflect most of the Thalassiosira lentiginosa Partial Range Zone and are characterized by the sporadic appearance of common to rare Azpeitia tabularis, Eucampia antarctica, and T. lentiginosa and few to rare Fragilariopsis kerguelensis. The boundary between Subzones C and B, marked by the last occurrence (LO) of Hemidiscus karstenii, was identified in Sample 383-U1542A-9H-3, 66–67 cm (77.27–77.28 m CSF-A). As discussed in Biostratigraphy in the Site U1540 chapter (Winckler et al., 2021c), Subzones B and A of the T. lentiginosa Zone, traditionally divided by the first Quaternary common occurrence of H. karstenii (Zielinski and Gersonde, 2002), are more clearly differentiated at Expedition 383 sites by the LO of Actinocyclus ingens at 0.42 Ma. In Hole U1542A, this event was identified in Sample 17H-3, 95–96 cm (149.27–149.28 m CSF-A). The boundary between the T. lentiginosa Zone and the A. ingens Partial Range Zone was placed at the last common occurrence of A. ingens at few or greater numbers, as noted in Sample 383-U1542C-25H-CC, 12–18 cm (208.05–208.11 m CSF-A).
Radiolarians
A total of 31 core catcher samples were processed and analyzed for radiolarian assemblages from Holes U1542A (Samples 1H-CC through 20F-CC; 6.99–169.45 m CSF-A) and U1542C (Samples 20H-CC through 30H-CC; 168.45–232.92 m CSF-A). Although most samples from Holes U1542A and U1542C were barren of radiolarians, Samples 383-U1542A-2H-CC (16.68–16.74 m CSF-A), 7H-CC (65.18–65.26 m CSF-A), 10H-CC (93.89–93.95 m CSF-A), 13H-CC (120.85–120.91 m CSF-A), 15H-CC through 17H-CC (135.98–155.77 m CSF-A), and 20F-CC (168.45–169.51 m CSF-A) and Samples 383-U1542C-21H-CC (172.81–172.87 m CSF-A), 23H-CC (191.46–191.52 m CSF-A), 25H-CC (208.05–208.11 m CSF-A), and 27H-CC (219.65–219.71 m CSF-A) contain rare radiolarian specimens. Fifteen species were identified, and their distribution is documented in Table T5.
Because of the scarcity of radiolarians and their poor preservation at Site U1542, it was difficult to determine stratigraphic ranges of zonal marker taxa or to confidently demarcate biozones. However, the occurrence of Stylatractus universus in Sample 383-U1542A-17H-CC (155.71–155.77 m CSF-A) suggests an age of 0.43 Ma or older for this sample. The presence of Antarctissa cylindrica in Sample 383-U1542C-25H-CC (208.05–208.11 m CSF-A) indicates that this sample falls within the Psi Zone. The last appearance datum of A. cylindrica is has been dated at 0.64 Ma, suggesting that the age of Sample 25H-CC should be older than 0.64 Ma, in good agreement with diatom biostratigraphy at this site.
Silicoflagellates
Silicoflagellates are absent throughout the sediment succession at Site U1542 except for one occurrence of Stephanocha speculum in Sample 383-U1542C-25H-CC.
Calcareous nannofossils
Calcareous nannofossil biostratigraphy is based on the analysis of 51 samples: 1 mudline, 20 core catcher, and 18 split-core samples from Hole U1542A (0–169.51 m CSF-A) and 12 core catcher samples from Hole U1542C (155.79–233.98 m CSF-A).
Nannofossils are present in low abundance, generally rare to few, throughout the sequence (Figures F22, F23). However, they are more abundant in the mudline sample and in specific intervals (i.e., Samples 383-U1542A-11H-2, 120 cm, to 11H-4, 75 cm [95.17–97.48 m CSF-A]; 12H-CC and 13H-CC [112.46–120.91 m CSF-A]; and 14H-4, 40 cm, to 14H-4, 130 cm [125.51–126.61 m CSF-A], which correspond to a nannofossil ooze dominated by Gephyrocapsa caribbeanica and small [<4 µm] Gephyrocapsa sp., and Sample 383-U1542C-23H-CC [191.46–191.52 m CSF-A]). Preservation of calcareous nannofossils at Site U1542 generally varies from moderate to good, and poor preservation is rare.
The nannofossil assemblage at Site U1542 consists of 15 groups/taxa (Figure F25): Emiliania huxleyi, Gephyrocapsa margerelii/muellerae, G. caribbeanica, Gephyrocapsa oceanica, Gephyrocapsa spp. (small <4 µm and medium 4–5.5 µm), Gephyrocapsa omega, Reticulofenestra (<3 and 3–5 µm), Coccolithus pelagicus, Calcidiscus leptoporus, Helicosphaera carteri, Helicosphaera wallichii, Syracosphaera spp. (including Syracosphaera pulchra), and Umbellosphaera spp. Reworked specimens of Reticulofenestra >7 µm were occasionally found throughout the cores (Table T6).
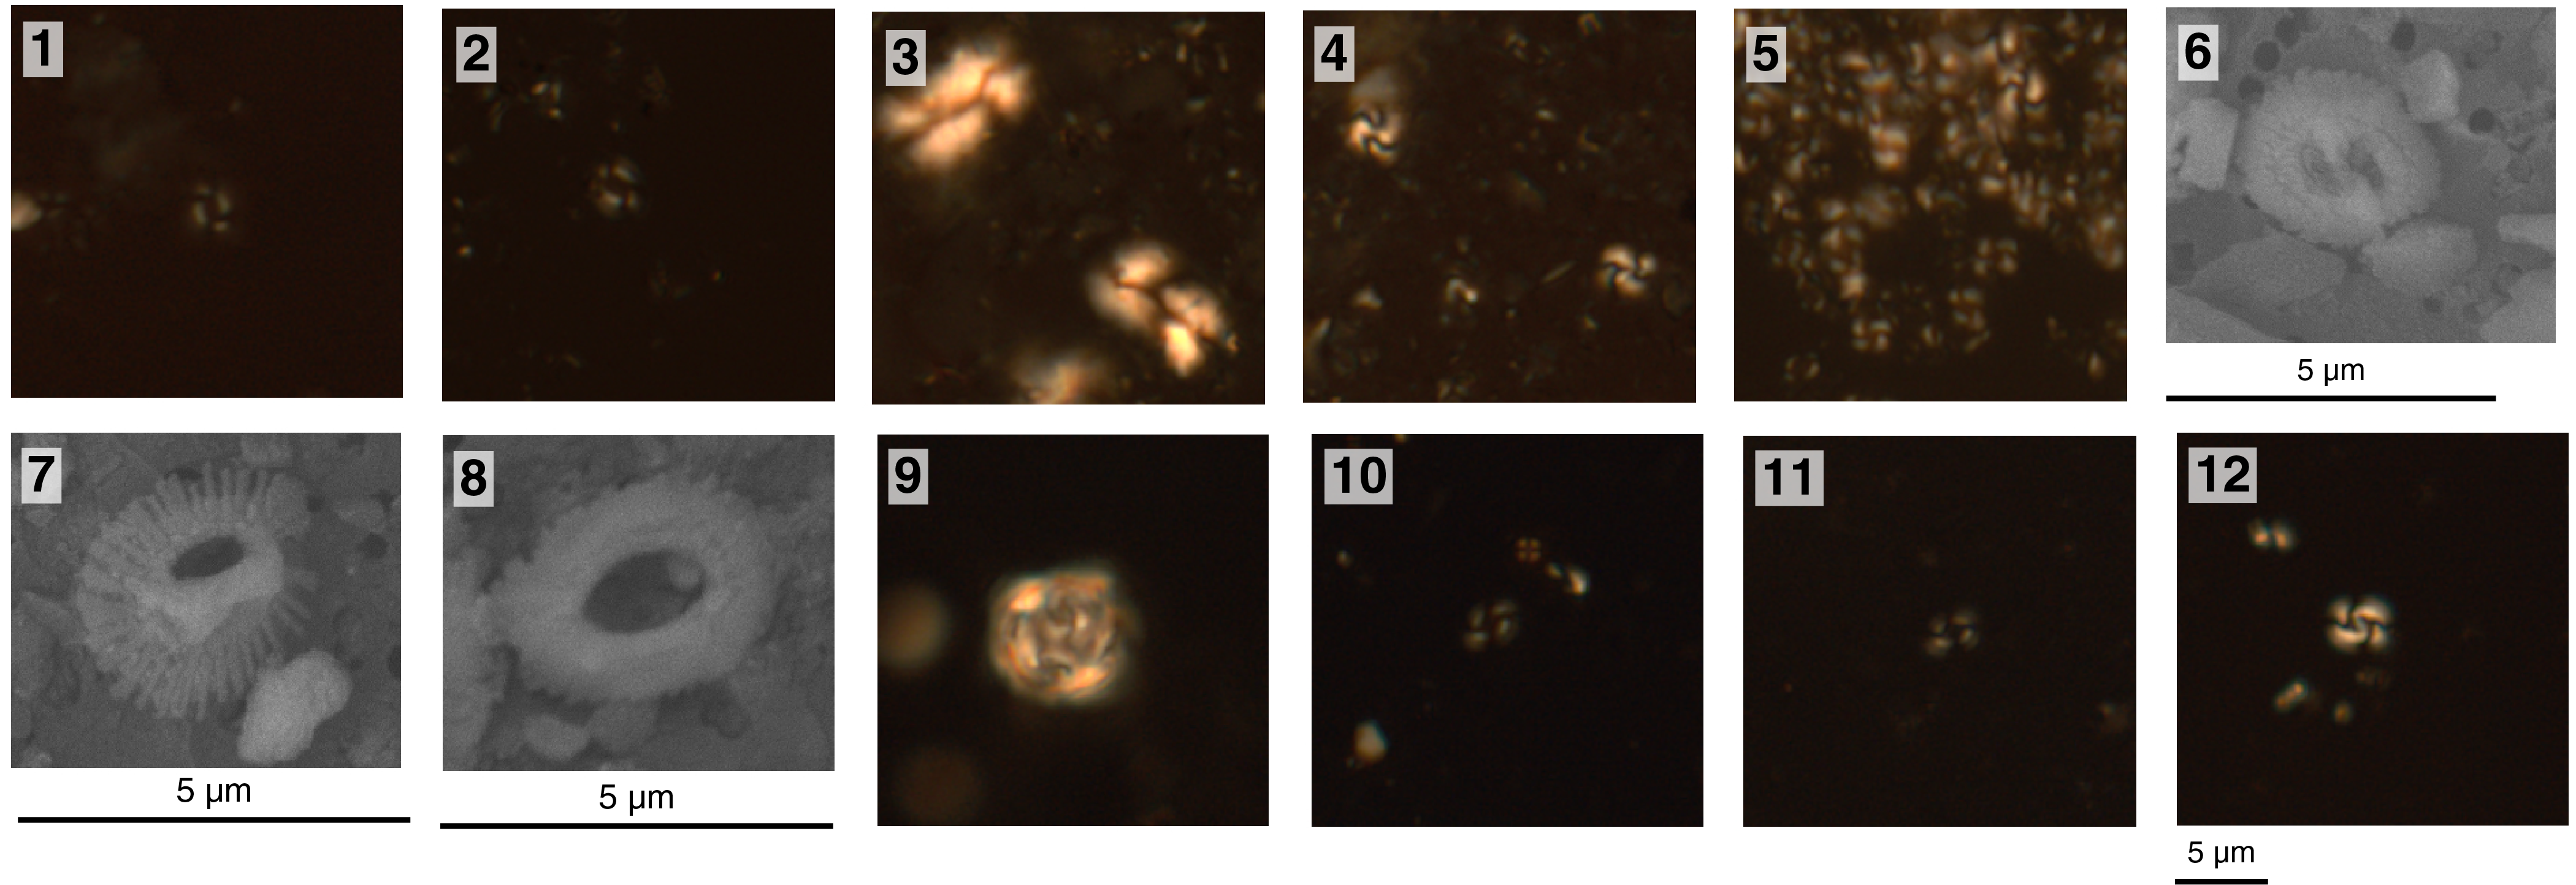
Figure F25. Calcareous nannofossils.
Only two biostratigraphic events were observed at Site U1542. Nannofossil Zone CN15/NN21 was recognized (Figure F20) based on the first occurrence of E. huxleyi (between Samples 383-U1542A-13H-CC [120.85–120.91 m CSF-A] and 9H-CC [84.11–84.17 m CSF-A]). Additionally, few specimens of G. omega (Figure F25) were found in Samples 383-U1542C-23H-CC and 24H-CC (191.46–201.44 m CSF-A), suggesting a minimum age of 0.61 Ma. This datum could be regarded as the LO of G. omega; however, it should be considered with caution because those specimens could alternatively be classified as G. oceanica. Surprisingly, not a single specimen of Pseudoemiliania lacunosa was observed at Site U1542, possibly due to ecological forcing.
Foraminifers
Planktonic foraminifers
All 20 core catcher samples from Hole U1542A and 12 core catcher samples from Hole U1542C were analyzed for planktonic foraminifers (Table T7). One additional working-half sample (Sample 383-U1542A-14H-44, 34–36 cm) was collected from Hole U1542A to compare assemblages across a suspected glacial–interglacial transition. The mudline sample from Hole U1542D was also examined, although no systematic assemblage data were collected. The abundance of planktonic foraminifers is variable throughout Holes U1542A and U1542C and particularly low (<5%) in Samples 383-U1542A-10H-CC, 18H-CC, 19H-CC, and 20H-CC and 383-U1542C-24H-CC and 25H-CC (Figures F22, F23). Preservation is generally moderate to good in both holes (Table T7). Several encrusted forms of Globoconella inflata, Globoconella puncticulata puncticuloides, and Truncorotalia crassaformis were found, which may influence stable isotope or trace element analyses (Jonkers et al., 2012, Steinhardt et al., 2015).
Assemblages are characterized mainly by high-latitude and temperate species. Neogloboquadrina pachyderma (sinistral) dominates the assemblage in samples from Holes U1542A and U1542C but not the mudline sample of Hole U1542D, Sample U1542A-1H-CC (6.99–7.05 m CSF-A), or the sample from Section 14H-4 (125.55–125.57 m CSF-A). Globigerina bulloides is present throughout the sequence in Holes U1542A and U1542C, but its abundance is highly variable. Other species that occur in low abundances are T. crassaformis, Truncorotalia crassaformis hessi, G. puncticulata puncticuloides, G. inflata, Turborotalita quinqueloba, Globigerinita glutinata, Orbulina universa, Neogloboquadrina incompta, Neogloboquadrina dutertrei, Truncorotalia truncatulinoides, and Hirsutella scitula. Examples of major foraminiferal taxa found at Site U1542 are shown in Figure F26.

Figure F26. Planktonic foraminifers.
Several biomarkers species are present in Site U1542 planktonic foraminiferal assemblages: Globigerina calida, G. inflata, G. puncticulata puncticuloides, T. crassaformis hessi, and T. truncatulinoides. One specimen of G. calida was found in Sample 383-U1542A-1H-CC, tentatively dating this sample to younger than 0.22 Ma. T. truncatulinoides was found only in Samples 1H-CC and 2H-CC (1.99–7.05 and 16.68–16.74 m CSF-A, respectively), which indicates Zone SN14 of Jenkins (1993). G. inflata was observed in very low abundance in Samples 383-U1542C-23H-CC and 26H-CC (191.46–191.52 and 212.71–212.77 m CSF-A, respectively). G. puncticulata puncticuloides is present in Sample 30H-CC (233.92–133.98 m CSF-A), indicating that the bottom age of the sequence is approximately 0.7 Ma (Hornibrook, 1981; Hornibrook and Jenkins, 1994; Wei, 1994; Scott et al., 2007).
Benthic foraminifers
Benthic foraminifers were examined in 20 core catcher samples and 1 working-half sample from Hole U1542A and from 14 core catcher samples from Hole U1542C. Specimens were picked from both the >125 µm fraction and the 63–125 µm fraction to ensure that assemblages in the >125 µm fraction were representative and that small species such as phytodetritus feeders or small infaunal taxa were not overlooked. Mudline samples from Holes U1542A and U1542C were also examined, although systematic assemblage data were not collected.
The benthic foraminifers at this site are abundant, diverse, and very well preserved except in a few samples, such as Samples 383-U1542C-22H-CC, 24H-CC, and 29H-CC, where benthic foraminifers are rare (Figures F22, F23, F27; Table T8). Most samples except 23H-CC and 27H-CC have significant proportions of clay and silt. Hence, the residue after washing over 63 µm sieves was small.
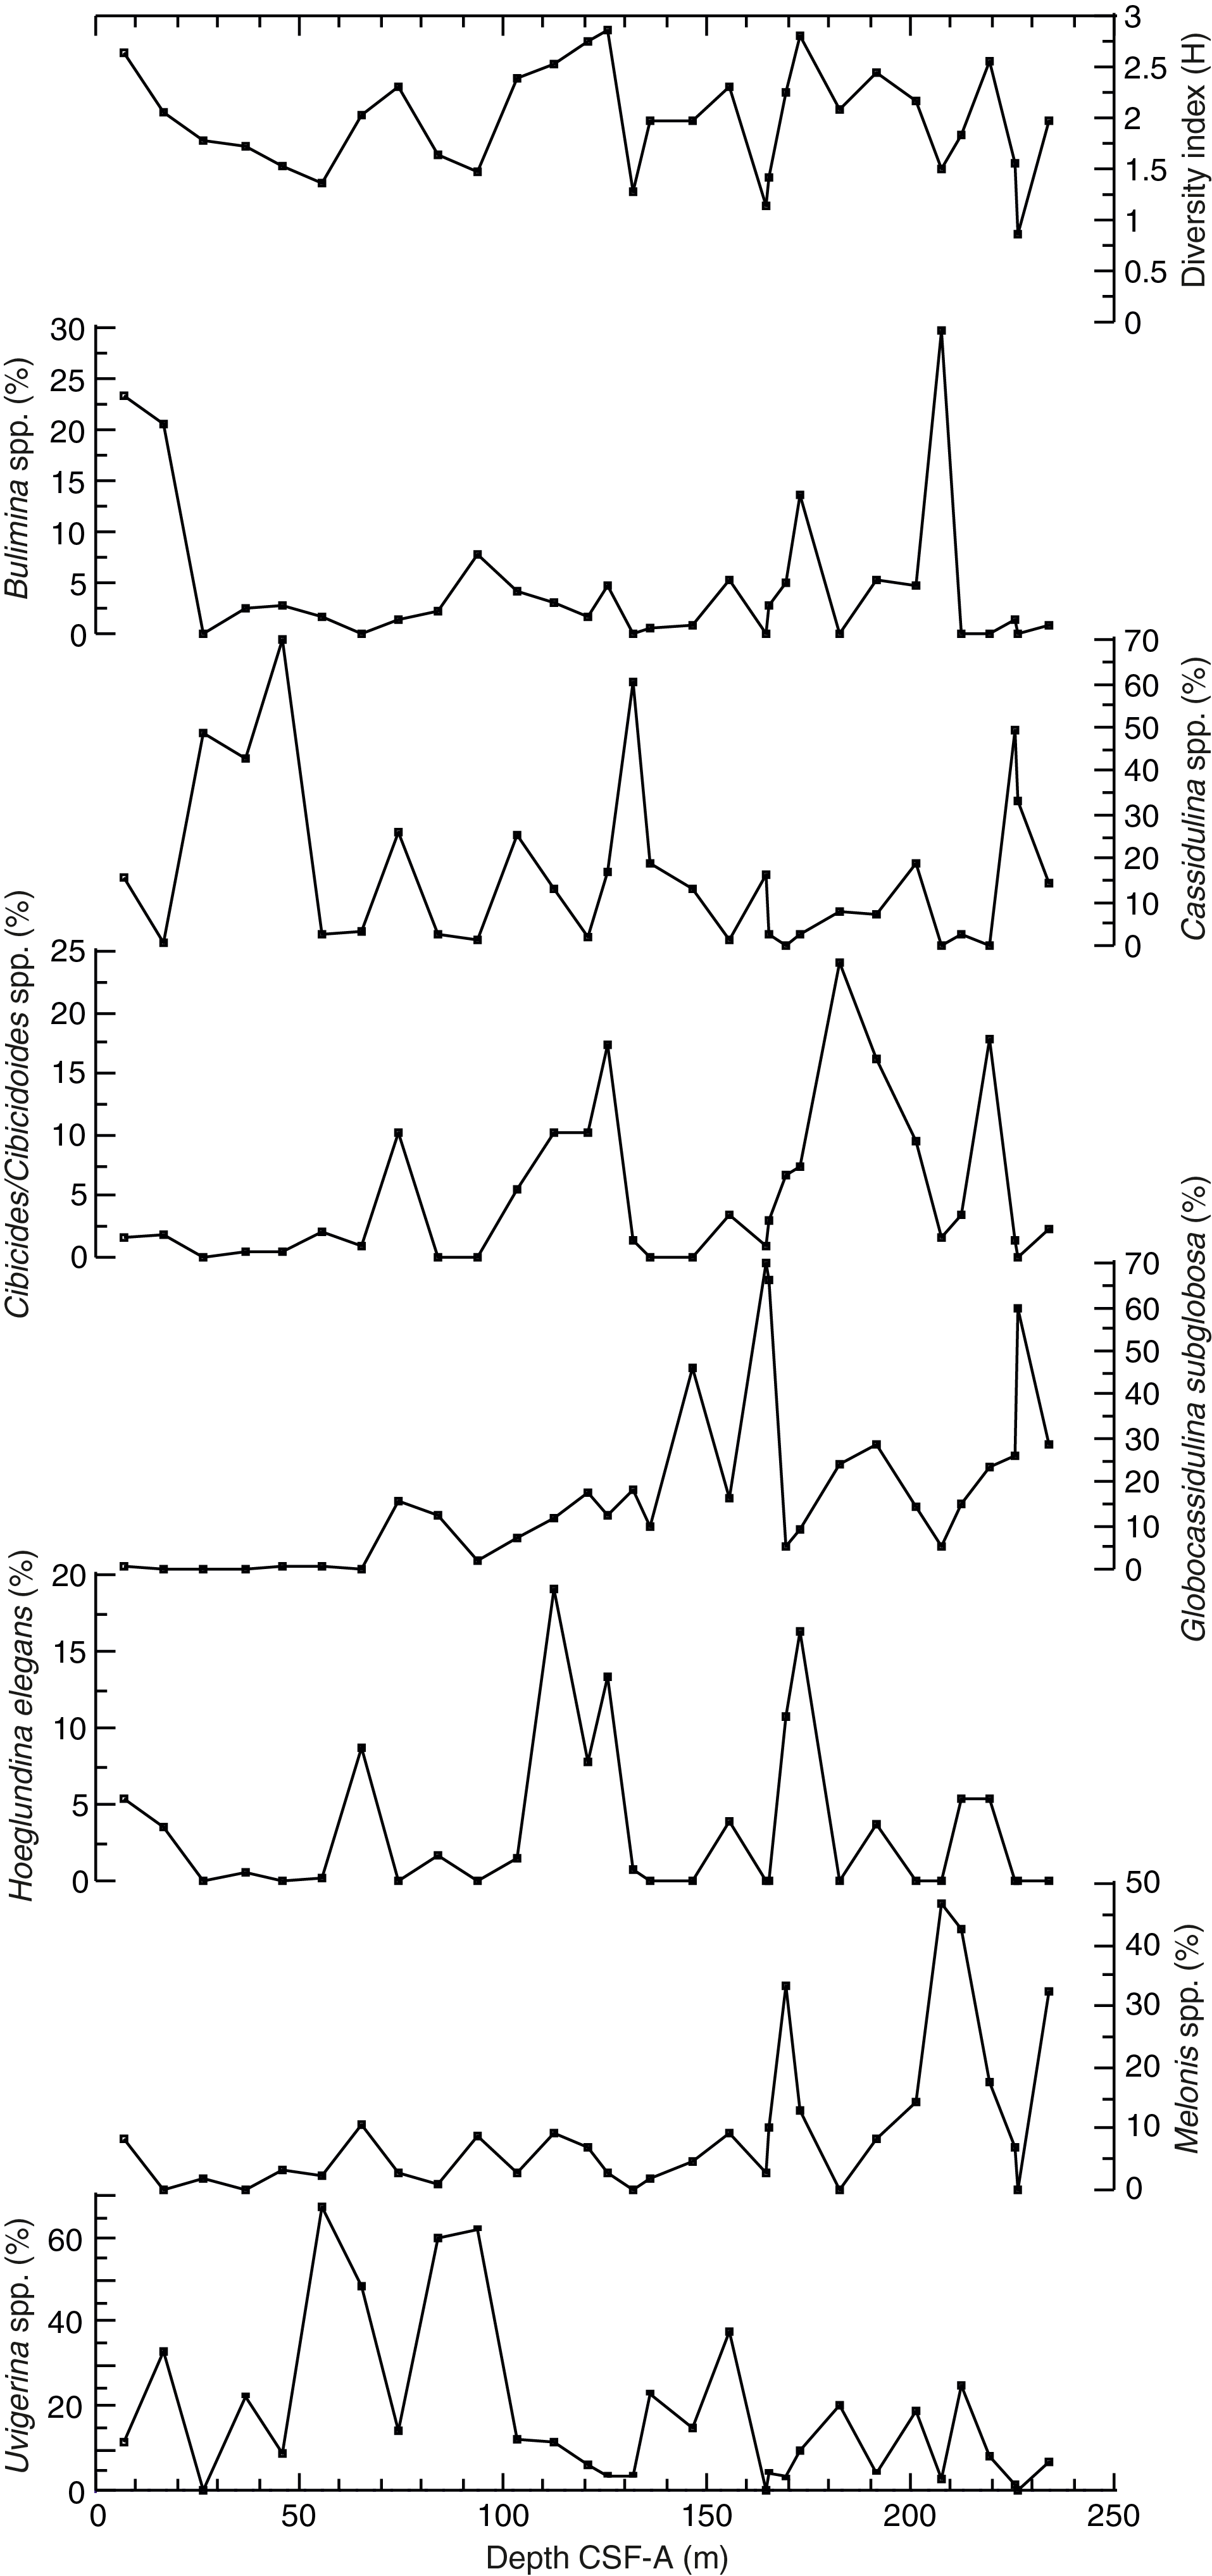
Figure F27. Species diversity index and abundance of dominant genus/species.
In total, 72 benthic foraminiferal taxa were identified at this site. Table T8 summarizes the downcore distribution of benthic foraminifers in core catcher samples from Holes U1542A and U1542C. Figure F27 illustrates down core distributions of key taxa, and Figure F28 illustrates some of the characteristic species found at this site along with taxa found at central South Pacific Sites U1539–U1541.
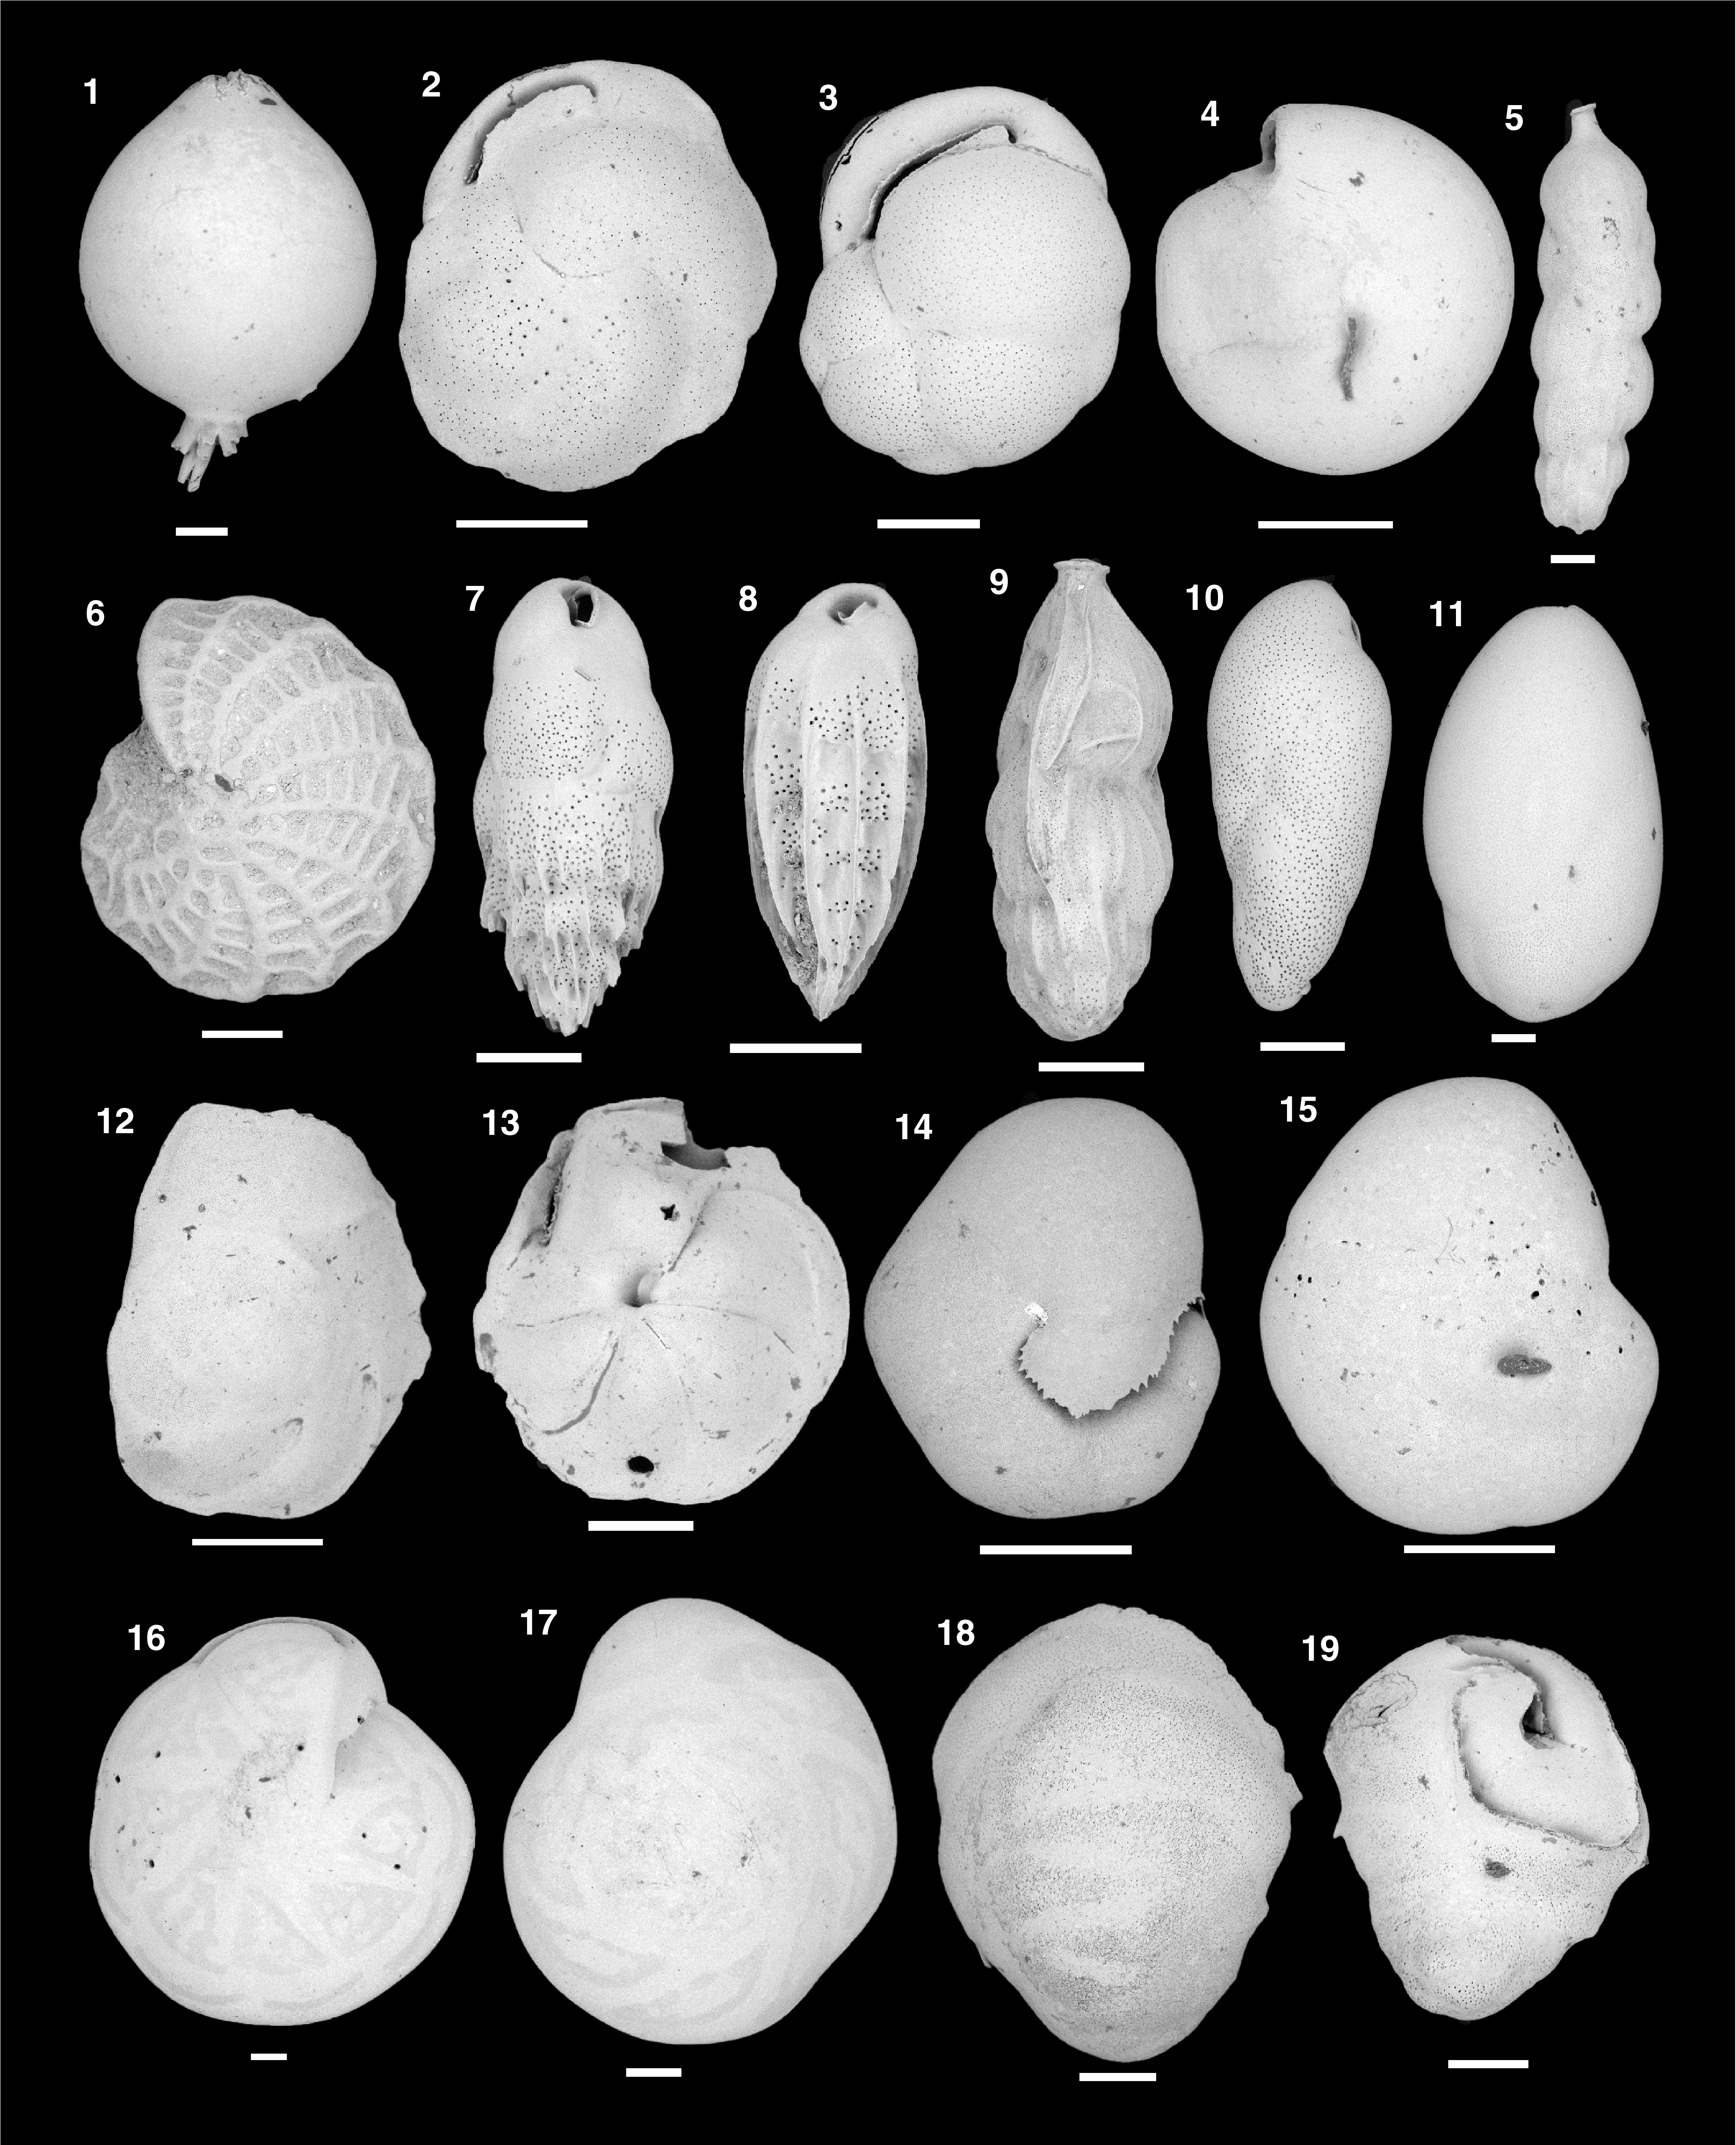
Figure F28. Benthic foraminifers.
The overall assemblage composition indicates shelf to bathyal paleodepths throughout the sequence. Species commonly recorded through the sequence include the calcareous species Bulimina alazanensis, Bulimina mexicana, Cassidulina laevigata, Cibicidoides/Cibicides species, Globocassidulina subglobosa, Hoeglundina elegans, Melonis barleeanum, and Uvigerina peregrina (Figure F28); the Uvigerina species is present in all samples except 383-U1542A-3H-CC, 18H-CC, and 383-U1542C-29H-CC. Cibicides/Cibicidoides species, mainly Cibicidoides mundulus and Cibicides wuellerstorfi, occur sparsely throughout the record. The abundance of G. subglobosa below ~140 m CSF-A suggests enhanced influence of CDW in this interval (Corliss, 1979; Singh and Gupta, 2004, 2010; Singh et al., 2012). C. laevigata is a species typical of shelf areas (Ubaldo and Otero, 1978; Murray, 1991) and has been correlated to relatively cold waters (Fontanier et al., 2003). This species is also abundant in regions of high seasonality (Loubere and Fariduddin, 1999; Schmiedl and Mackensen, 1997) and is abundant in the glacial intervals of the northeastern Atlantic (Schnitker, 1984). The peak of this species indicates the presence of cold glacial water and high seasonality in the region. The abundance of Uvigerina suggests higher surface productivity (Das et al., 2018; Schönfeld, 2006; Singh and Gupta, 2004), and its distribution has an inverse relationship with C. laevigata. H. elegans has both epifaunal and shallow infaunal microhabitats (Corliss, 1985) and has been identified as an oxygen minimum zone species (Hermelin and Shimmield, 1990; Rathburn and Corliss, 1994). It has also been associated with “young” well-oxygenated water like modern North Atlantic Deep Water (NADW) (Lohmann, 1978; Schnitker, 1980). In the South Atlantic, B. alazanensis, considered a “warm benthos fauna,” has been used as a proxy for NADW flux and is restricted to interglacial stages (Schmiedl and Mackensen, 1997). M. barleeanum has evenly distributed pores on the surface of its test, which suggests enhanced gas exchange in low-oxygen conditions (Corliss, 1985; Fontanier et al., 2003).
Downhole changes in assemblage composition and diversity at Site U1542 likely reflect changes in paleoenvironmental conditions, which may be linked to distinct glacial–interglacial cycling and major global paleoclimatic changes through future research. The overall assemblage suggests the influence of comparatively deeper water masses below ~140 m CSF-A. Above this depth, the assemblages contain shallower water indicators.
Ostracods
All 20 core catcher samples and the mudline sample from Hole U1542A, the mudline sample from Hole U1542B, and 14 core catcher samples from Hole U1542C were analyzed for ostracods. Sample volume averaged ~20 cm3, and all ostracods present were picked from the >125 µm sand fraction and counted to obtain quantitative estimates of their temporal distribution. Ostracods are absent from most samples, and when present, their abundance generally ranges from rare to few (Figures F22, F23; Table T9). They are most abundant in the uppermost two core catcher samples of each hole, the mudline samples, and at the base of Hole U1542C (Samples 26H-CC, 27H-CC, and 30H-CC). Preservation ranges from poor to good.
The ostracod assemblage is composed mainly of the lower bathyal genera Krithe, Bradleya, and Cytheropteron. The shallower water genera Munseyella, Kangarina, and Kuiperiana (Dingle and Majoran, 2001; Mazzini, 2005) are also present in some samples, suggesting sporadic downslope transport from shallower sediment sources. Common ostracod taxa at Site U1542 are shown in Figure F29.
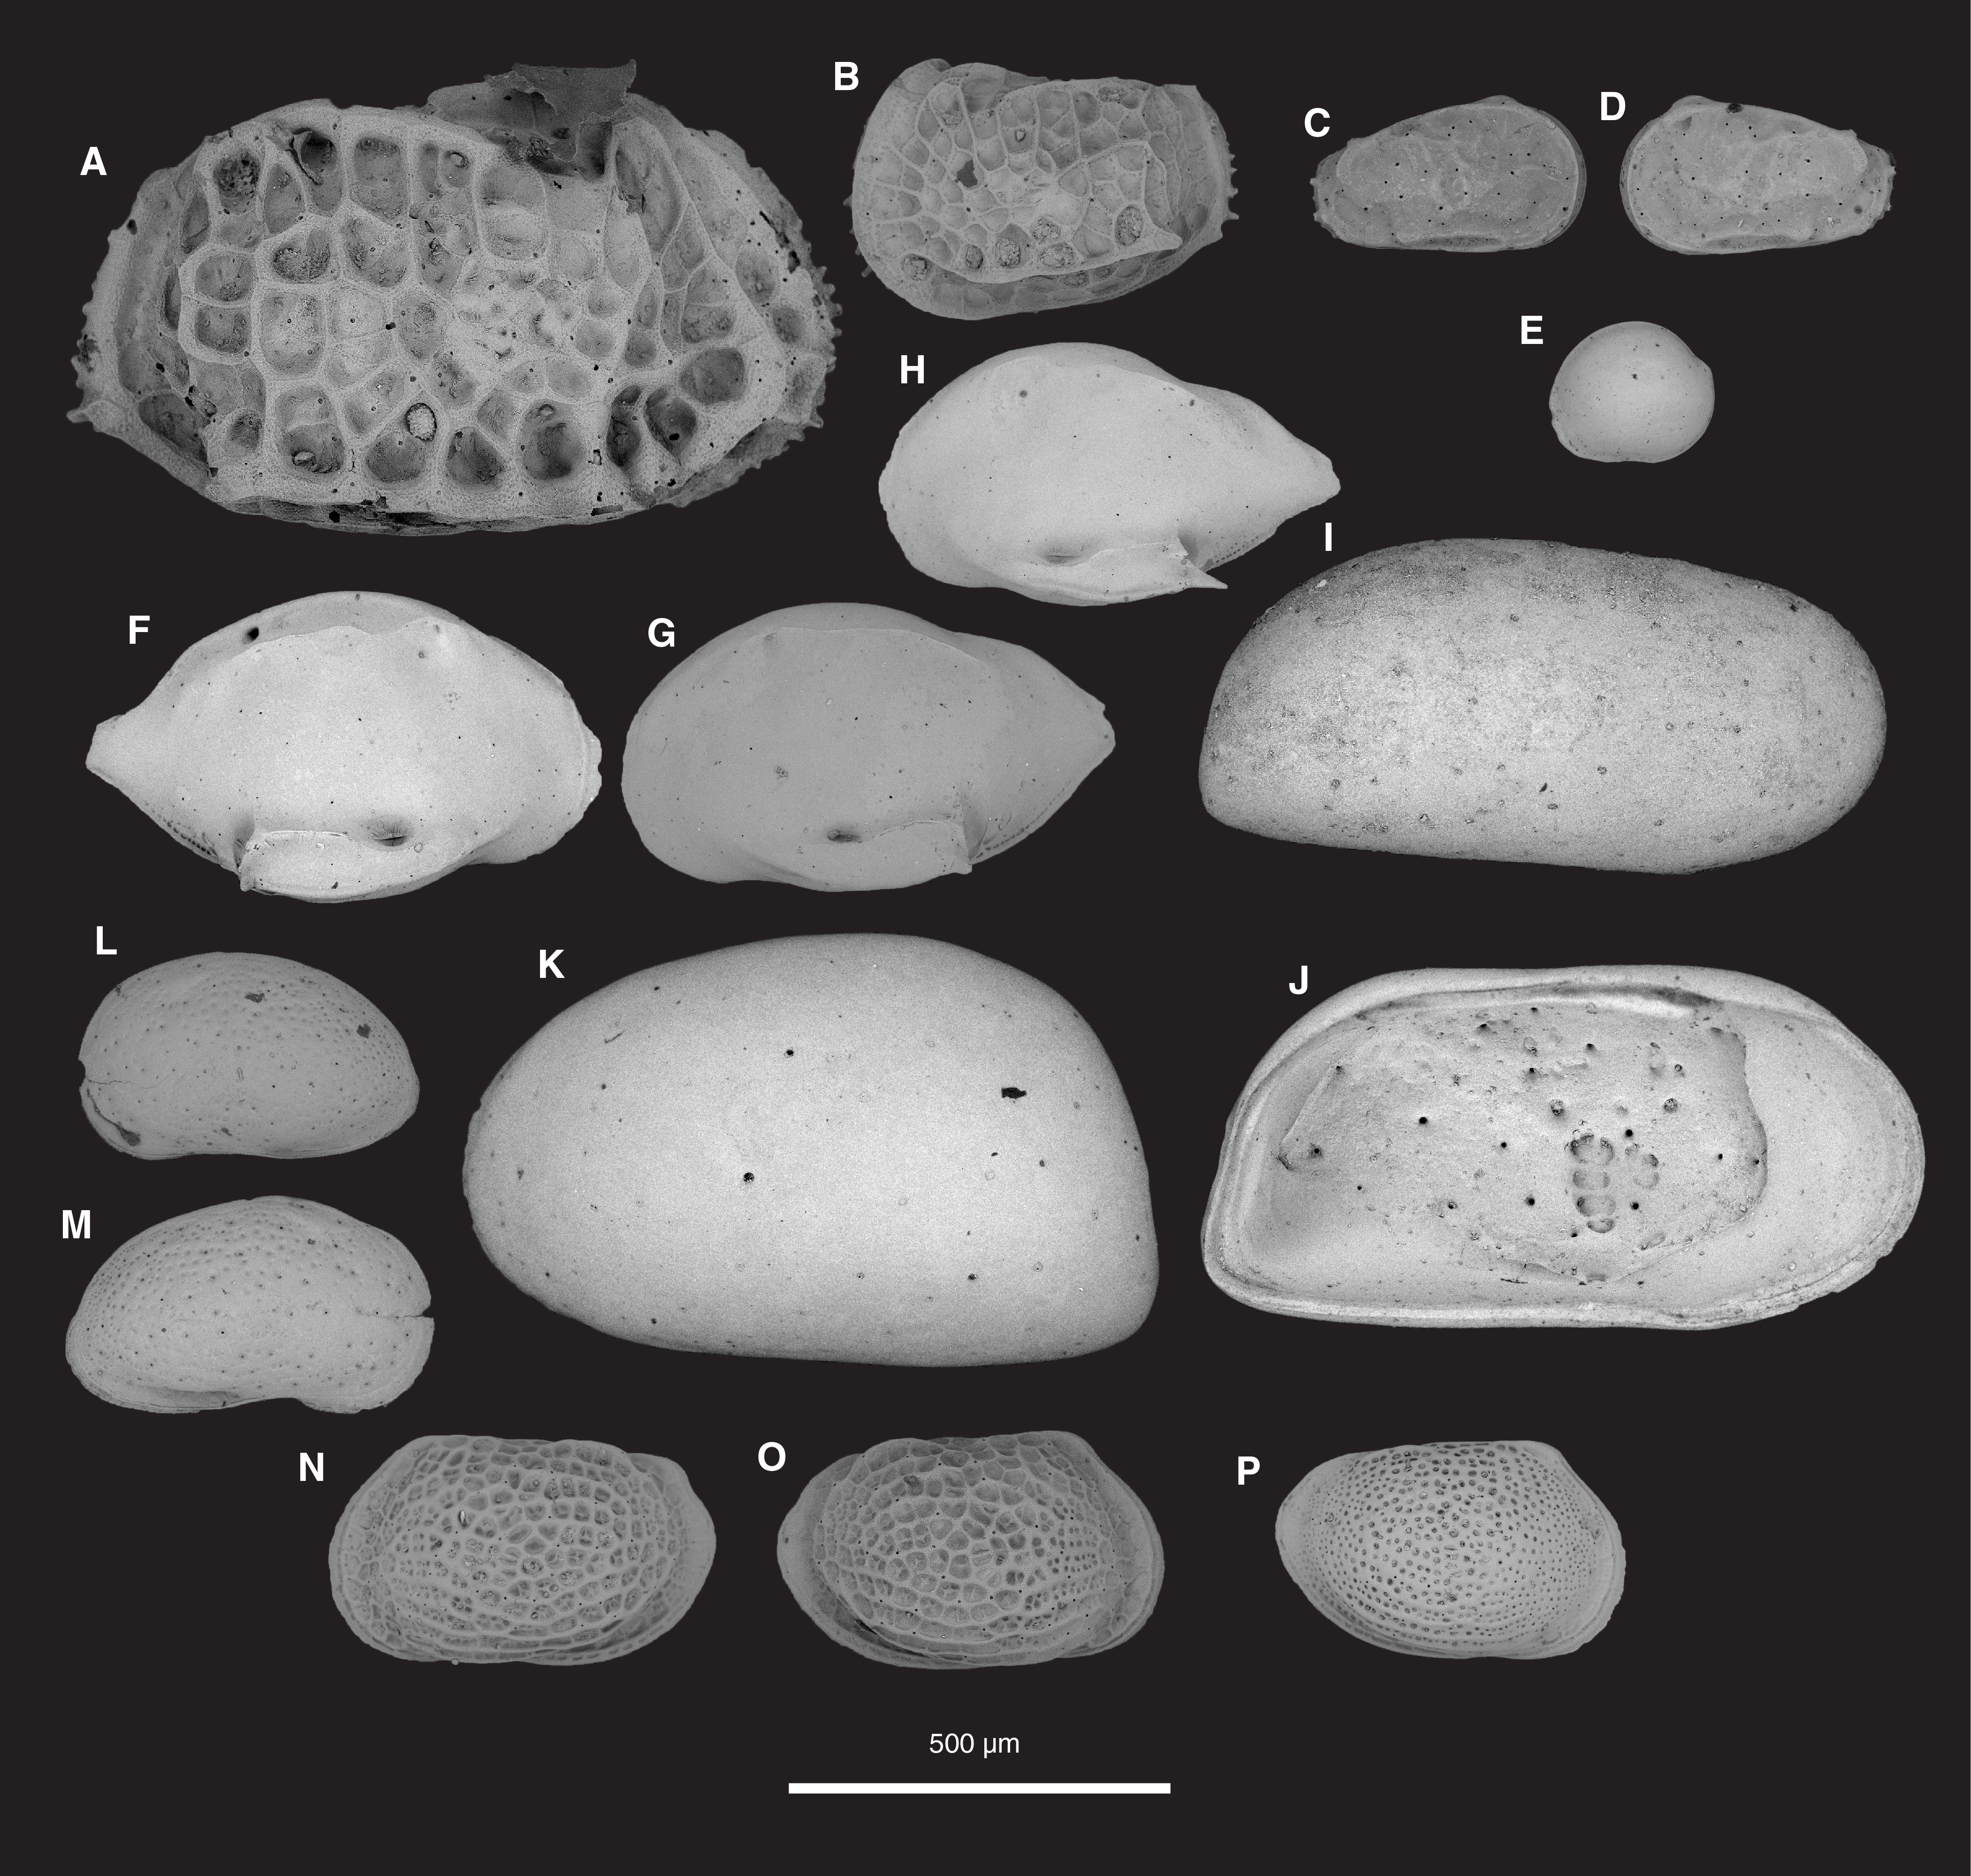
Figure F29. Common ostracod taxa.
Paleomagnetism
The natural remanent magnetization (NRM) of archive-half core sections from Site U1542 was measured and remeasured after alternating field (AF) demagnetization at 2 cm increments. In general, the number of demagnetization steps reflect the desire for more steps to study the magnetization(s), the severity of the drill string and natural overprints that hopefully can be removed to recover the natural remanence, the desire to use low peak fields to preserve the magnetization for future shore-based studies, and the need to maintain core flow through the laboratory. For Hole U1542A, three (5, 10, and 15 mT) AF demagnetization steps were performed for the upper 42 m (through Section 383-U1542A-5H-4) to examine the drill string overprint and our ability to remove it. To keep up with core flow, the 5 mT step was removed, and only the 10 and 15 mT steps were used for the rest of Hole U1542A and for Hole U1542B. Based on these results and to further speed up core processing, a single 15 mT peak AF demagnetization step was employed for the rest of the site (Holes U1542C and U1542D). Data associated with intervals affected by obvious drilling deformation or measurement error were culled prior to uploading or during data processing.
The intensities prior to demagnetization of cores recovered from Holes U1542A–U1542D (Figure F30) are generally quite strong, varying around 10–1 A/m, although intensities in the 10–2 to 10–3 A/m range are also observed in a few discrete intervals. These intervals are generally associated with low magnetic susceptibility (MS) values. After demagnetization at a peak AF of 15 mT, intensities drop into the 10–2 to 10–3 A/m range on average and are more variable (Figure F30). Intensities prior to demagnetization correlate well with MS; an example from Hole U1542C is shown in Figure F31. This relationship is consistent with an essentially constant drill string field giving rise to an overprint where the remanence before demagnetization scales with magnetic concentration as measured by MS. Postcruise studies using laboratory magnetization will allow exploration of these relationships and what they imply about lithologic variations. After demagnetization, the intensity correlates with neither MS (Figure F31B) nor intensity prior to demagnetization (Figure F31C), suggesting that the large drill string overprint has been successfully removed and a geomagnetic signal was recovered. Experiments on the upper 40 m in Hole U1542A show that the differences between NRM intensity after demagnetization at 5 mT and 10 mT are minimal, suggesting that the drill string overprint has a low coercivity, which is typical for siliciclastics of mixed grain sizes (see Sedimentology).
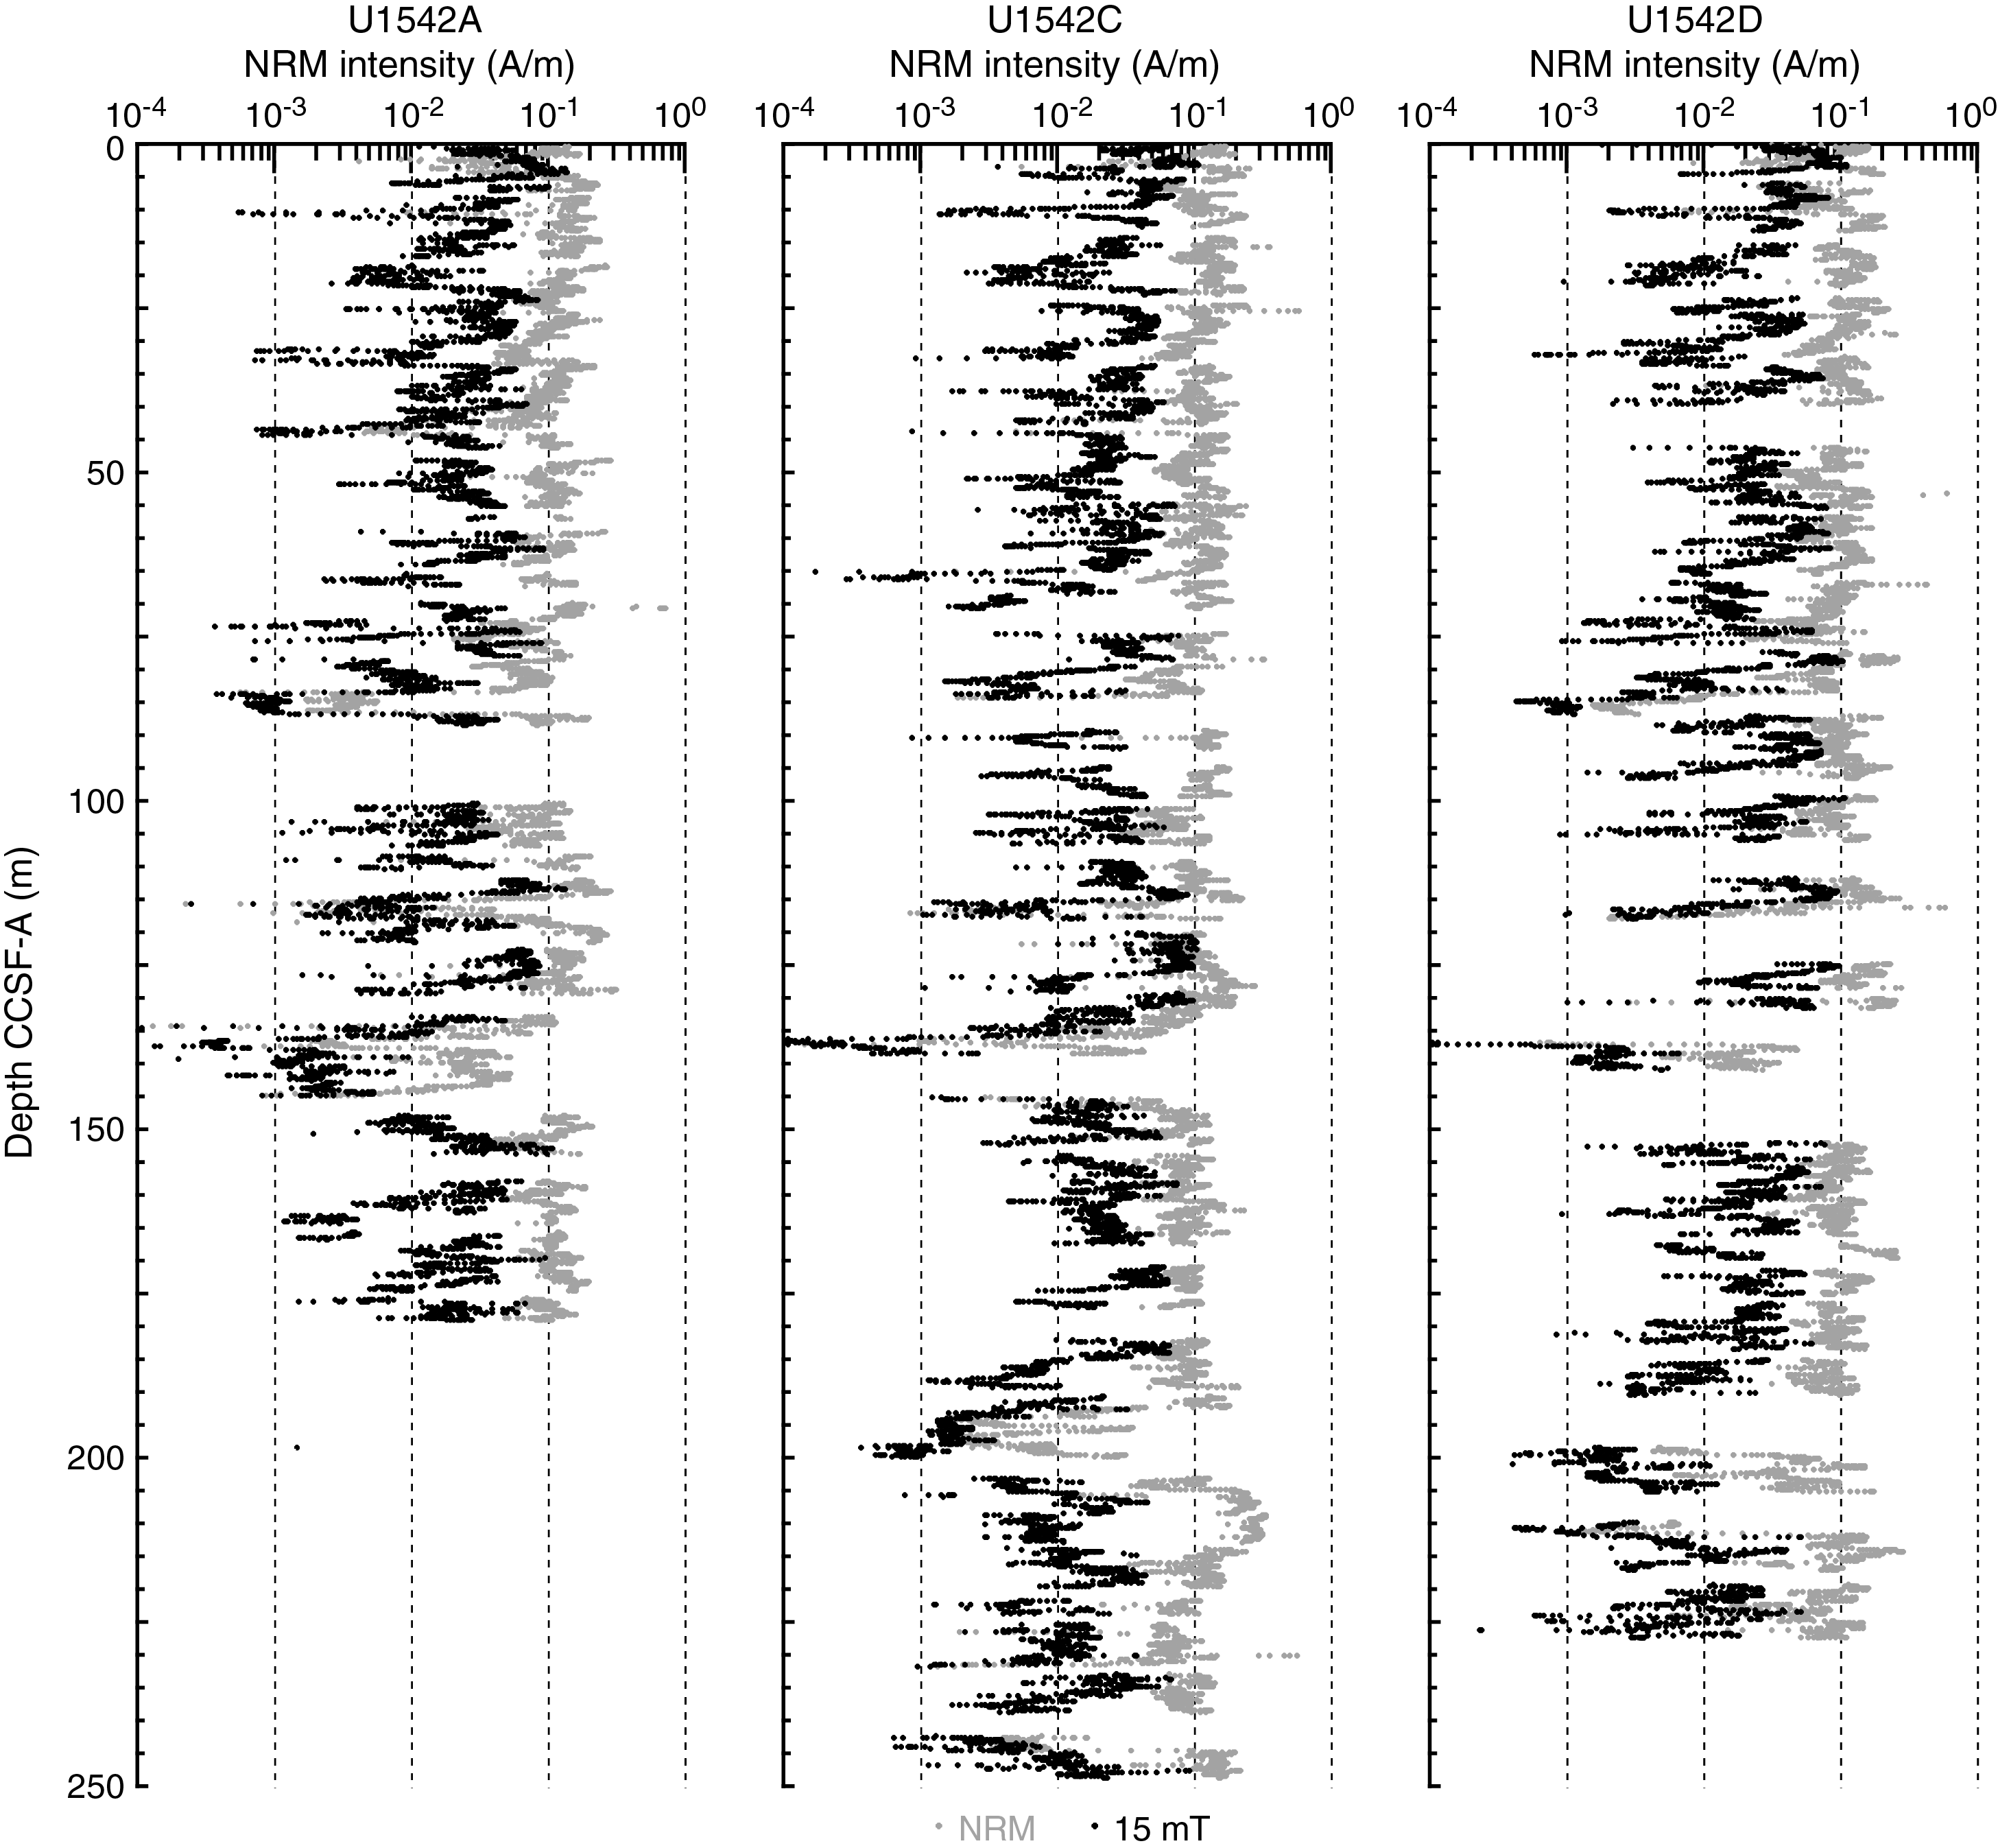
Figure F30. NRM intensity.
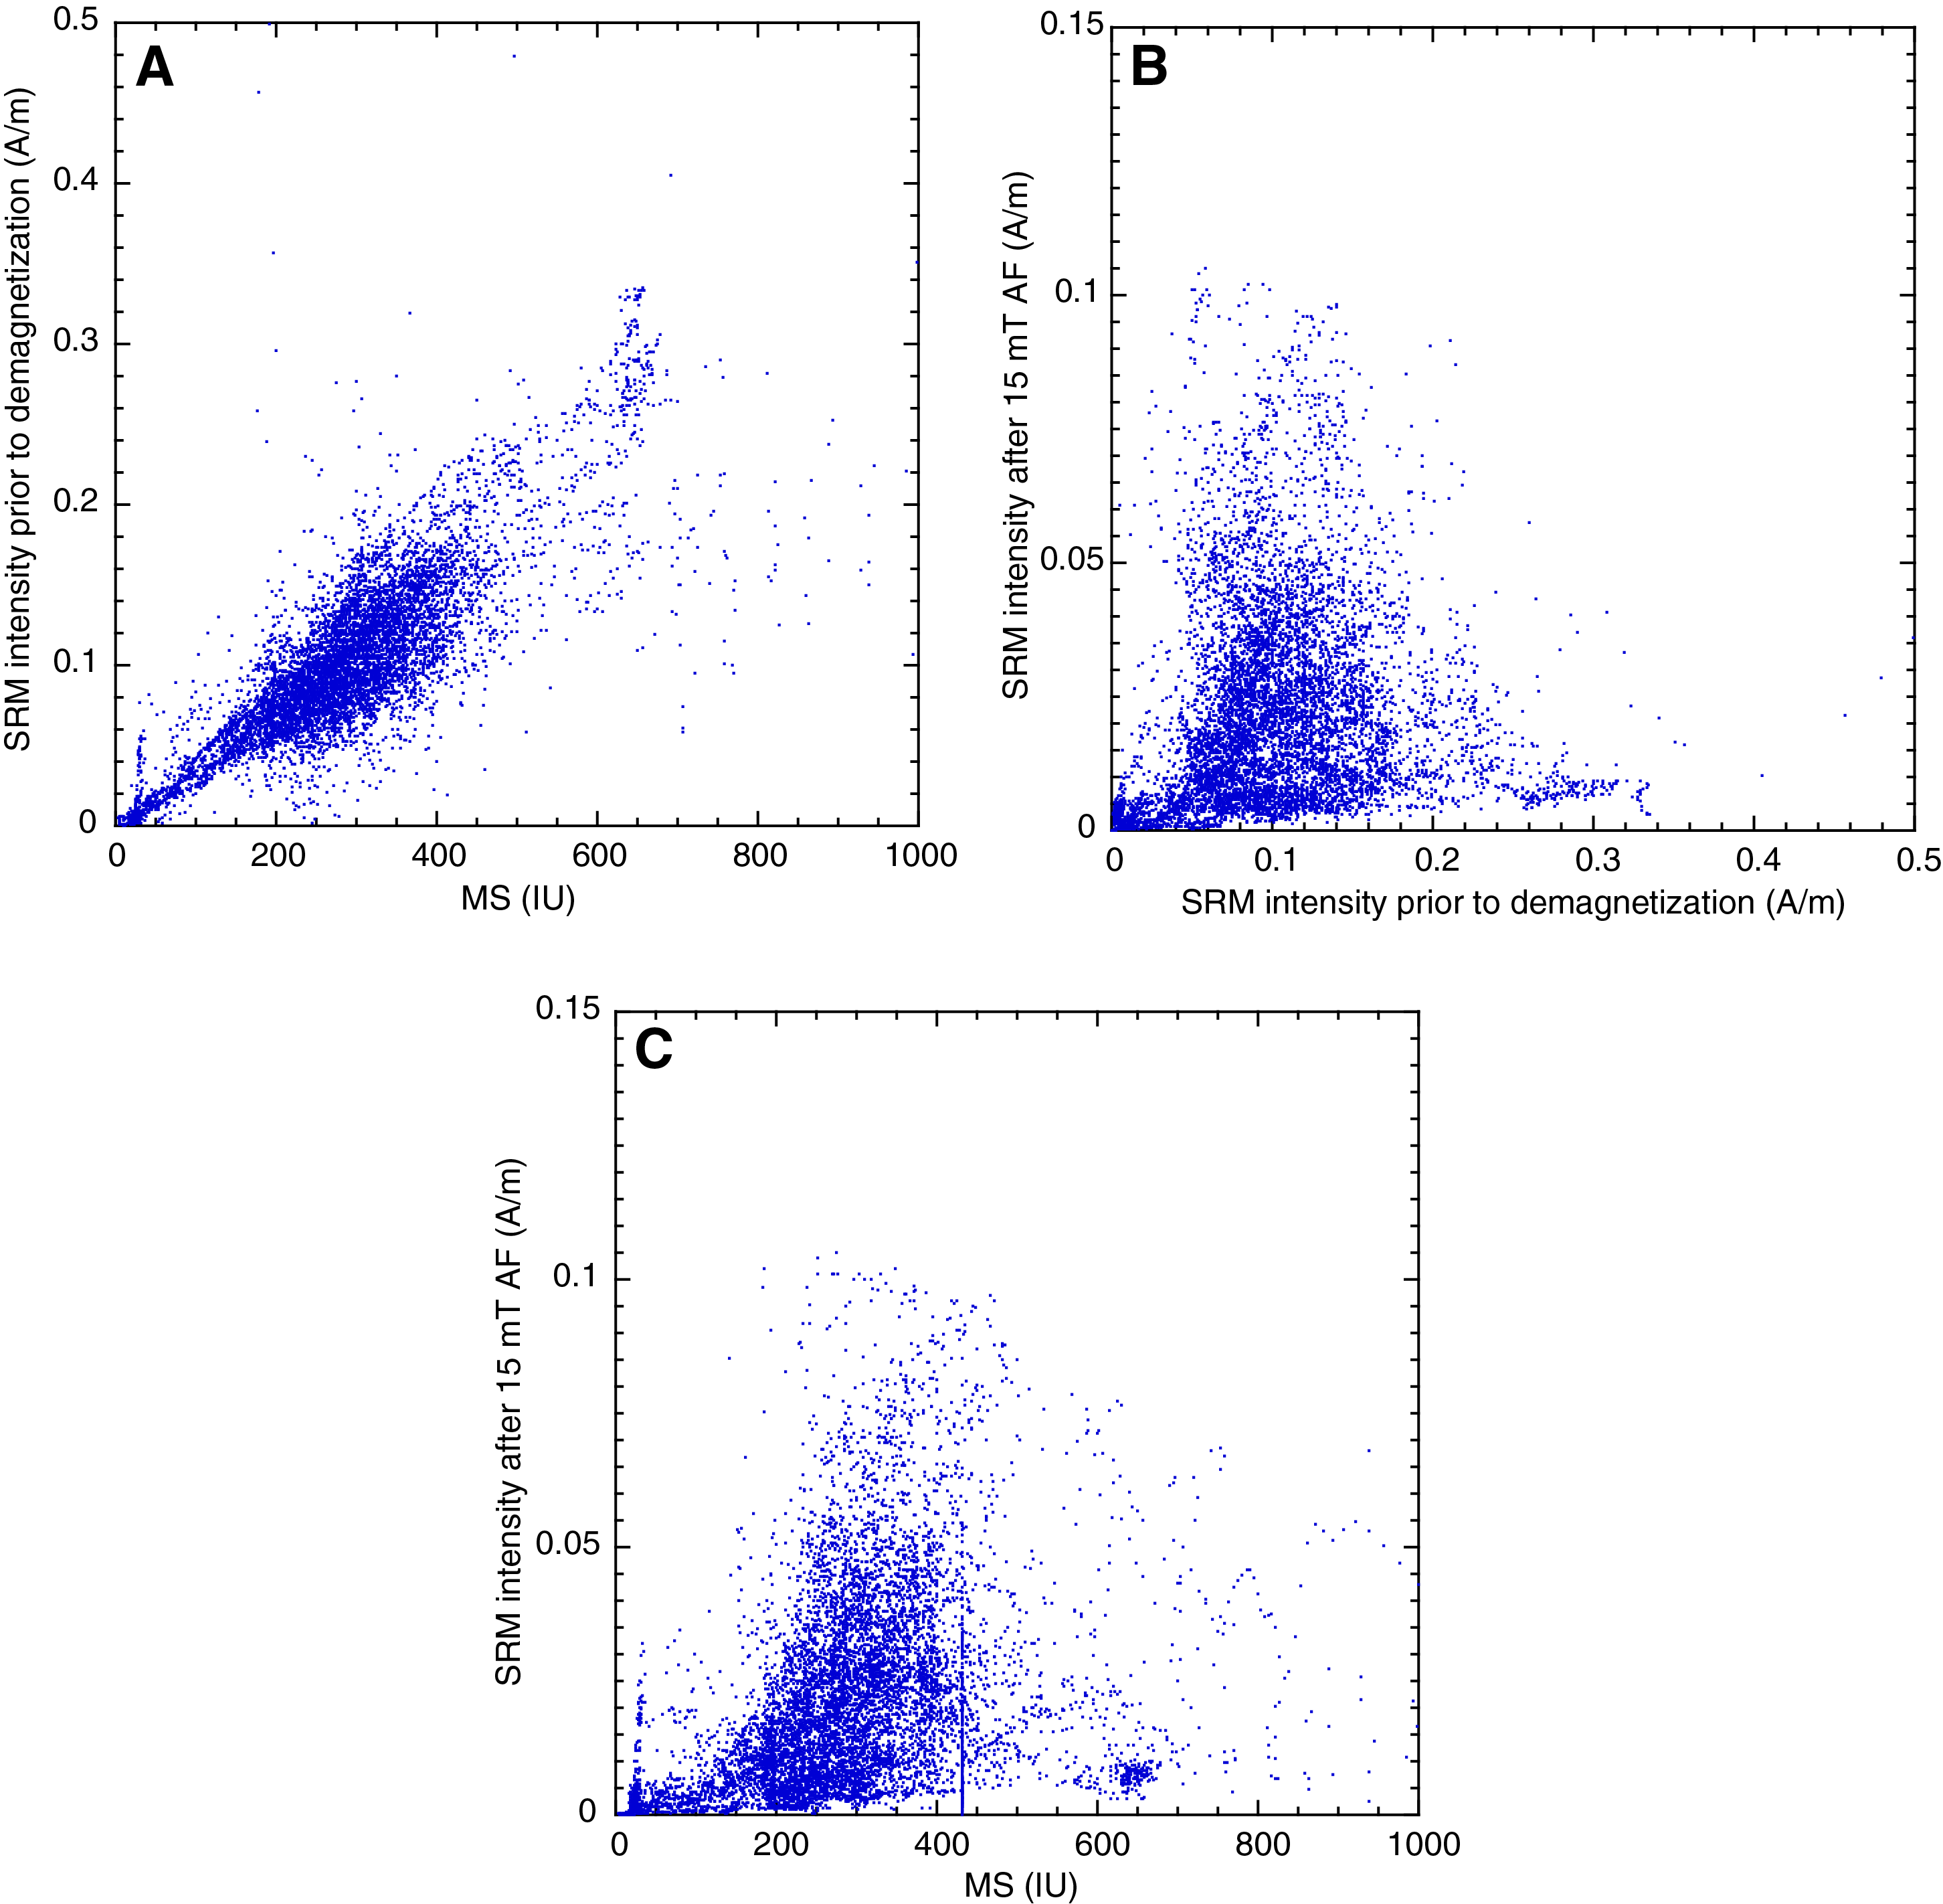
Figure F31. NRM intensity and MS.
Figure F32 shows inclination for Holes U1542A, U1542C, and U1542D before and after AF demagnetization at 15 mT. Inclinations are steep and positive prior to demagnetization and steep and negative after, suggesting, as with the intensity data, that a vertical (+z) drill string magnetic overprint is removed, giving way to a primary remanence that varies around expected directions (–69°) for the site latitude during normal polarity. The NRM after 15 mT shows no evidence for reversed polarity, suggesting that Site U1542 sediments are younger than 0.781 Ma (Hilgen et al., 2012). Shore-based studies will verify these interpretations and further develop these sediments as geomagnetic recorders, providing information on field intensity and directional variability and facilitating the next iteration in magnetic stratigraphy.
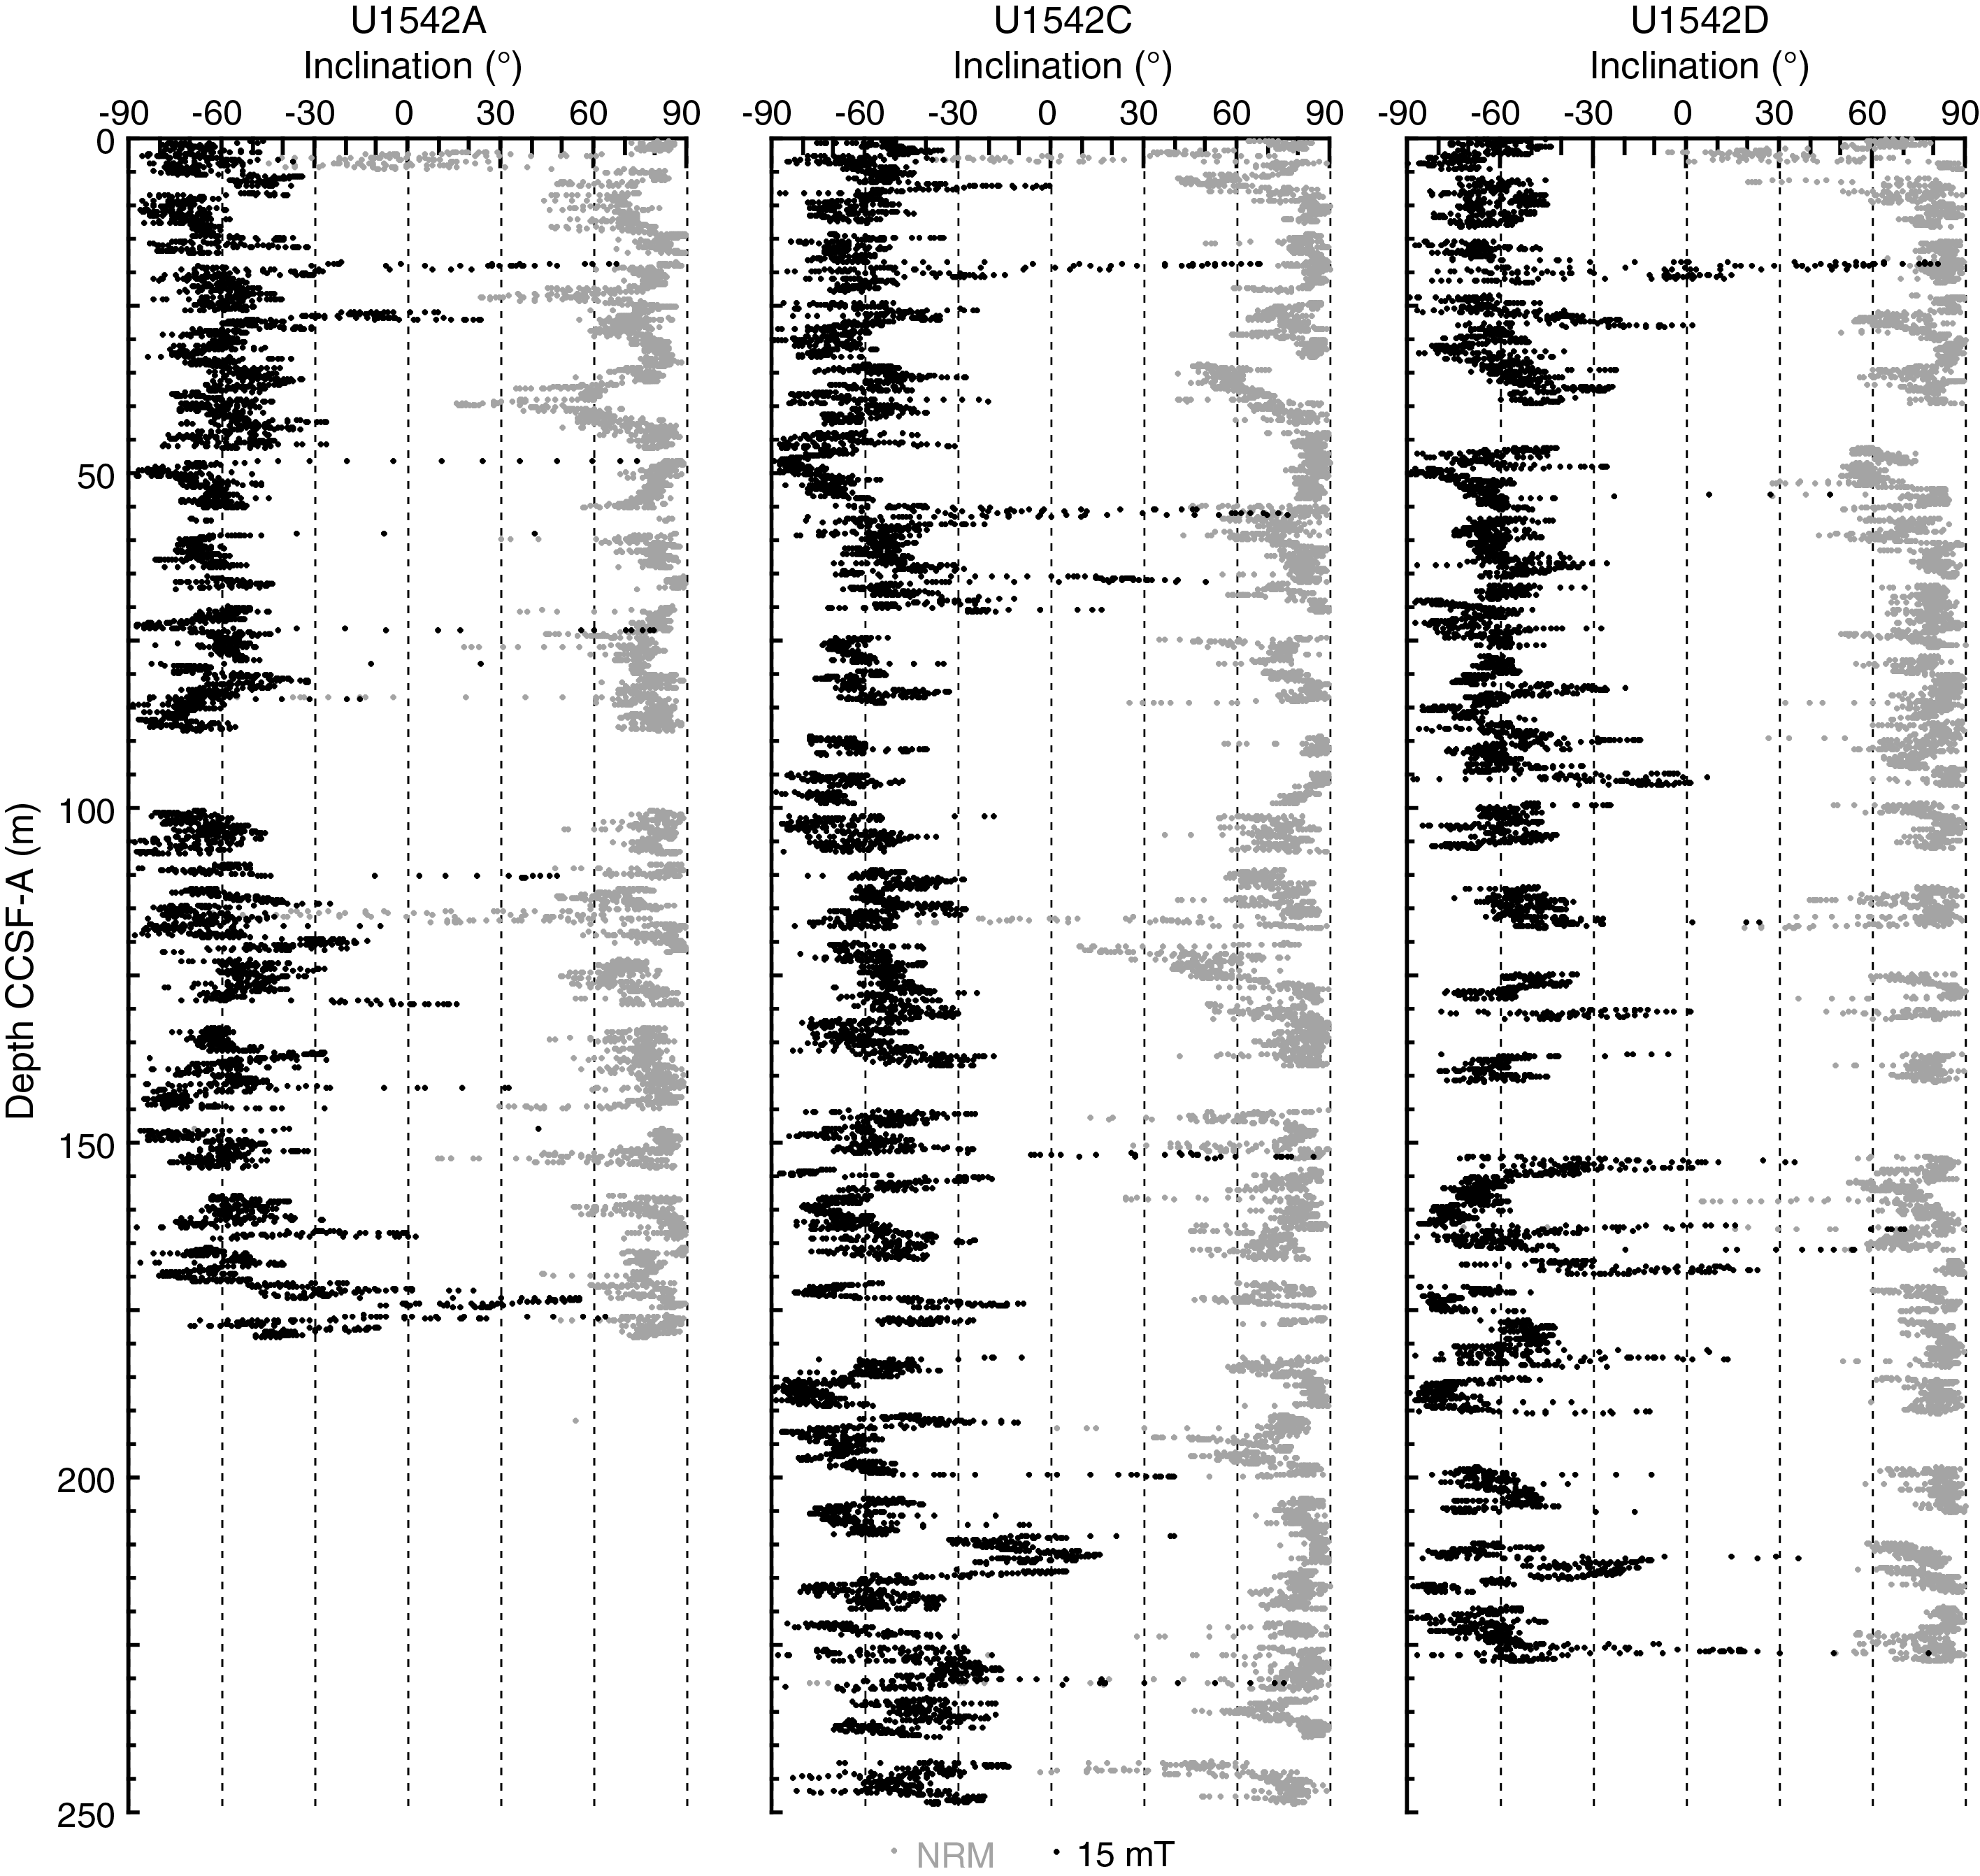
Figure F32. Inclination.
Geochemistry
Sediment gas sampling
Routine safety hydrocarbon measurements were collected at Site U1542 in headspace gastight vials at a resolution of approximately one 5 cm3 sample per core for Holes U1542A and U1542C (5.98–230.99 m CSF-A) (see Geochemistry in the Expedition 383 methods chapter [Winckler et al., 2021a]). Methane concentrations increase rapidly from 4.39 ppmv at 5.98 m CSF-A to 60,786 ppmv at 60.66 m CSF-A and decrease gradually to 5,667 ppmv at 230.99 m CSF-A (Figure F33; see U1542-T1.xls in GEOCHEM in Supplementary material). Ethane occurs from 60.66 to 100.77 m CSF-A and from 128.04 m CSF-A to the bottom of Hole U1542C. It has a mean concentration of 1.90 ± 0.79 ppmv (Figure F33). Propene occurs only at 118.7 m CSF-A at a concentration of 0.83 ppmv. The methane/ethane (C1/C2) ratio decreases from 55,498.91 at 60.66 m CSF-A to 2276.22 at the base of Hole U1542C at 230.99 m CSF-A (Figure F33). No C1/C2 ratio was calculated between 5.98 and 52.64 m CSF-A because ethane remained below detection limits in this interval. Methane concentrations are within safety limits (<200,000 ppmv) throughout the holes cored at Site U1542 according to the BBSCP Biogenic Methane Gas Safety Protocol. When plotted against downhole formation temperature, C1/C2 ratios remain in the range typically observed for normal biogenic methane production (Pimmel and Claypool, 2001).

Figure F33. Headspace hydrocarbon gas concentrations.
Interstitial water chemistry
At Site U1542, 64 whole rounds were collected for interstitial water (IW) samples from Holes U1542A and U1542C at a resolution of one per section for the first three cores, three per core to 120 m CSF-A, two per core from 120 to 150 m CSF-A, and one per core from 150 m CSF-A to the bottom of the hole. A mudline sample collected from Hole U1542A was allowed to settle for several hours and subsequently filtered through a 0.45 µm syringe-tip filter. Filtered mudline water was subjected to all standard shipboard chemistry analyses. We squeezed whole rounds and subsampled for IW according to the methods described above (see Geochemistry in the Expedition 383 methods chapter [Winckler et al., 2021a]).
Alkalinity and pH
Alkalinity increases dramatically from a mudline value of 2.4 mM to a maximum of 34.0 mM at 24.04 m CSF-A. Below this peak, alkalinity decreases to 14.5 mM at 133.16 m CSF-A and then averages ~17.2 ± 1.9 mM (Figure F34; see U1542-T2.xls in GEOCHEM in Supplementary material). Several values lower than ~10 mM between ~100 and 130 m CSF-A are likely due to issues with the instrument software and can safely be excluded as outliers. The high alkalinity is likely due to strong sulfate (SO42–) reduction and methanogenesis throughout the core because both of these anaerobic organic carbon remineralization pathways produce bicarbonate (Soetaert et al., 2007; Pierre and Fouquet, 2007). Similar to alkalinity, pH increases in the surface sediment, reaching a maximum value of 8.6 between 16.54 and 21.03 m CSF-A (Figure F34). From this depth to the bottom of the core, pH remains constant with an average of 8.4 ± 0.1. The pH increase and overall high values are likely caused by high alkalinity.
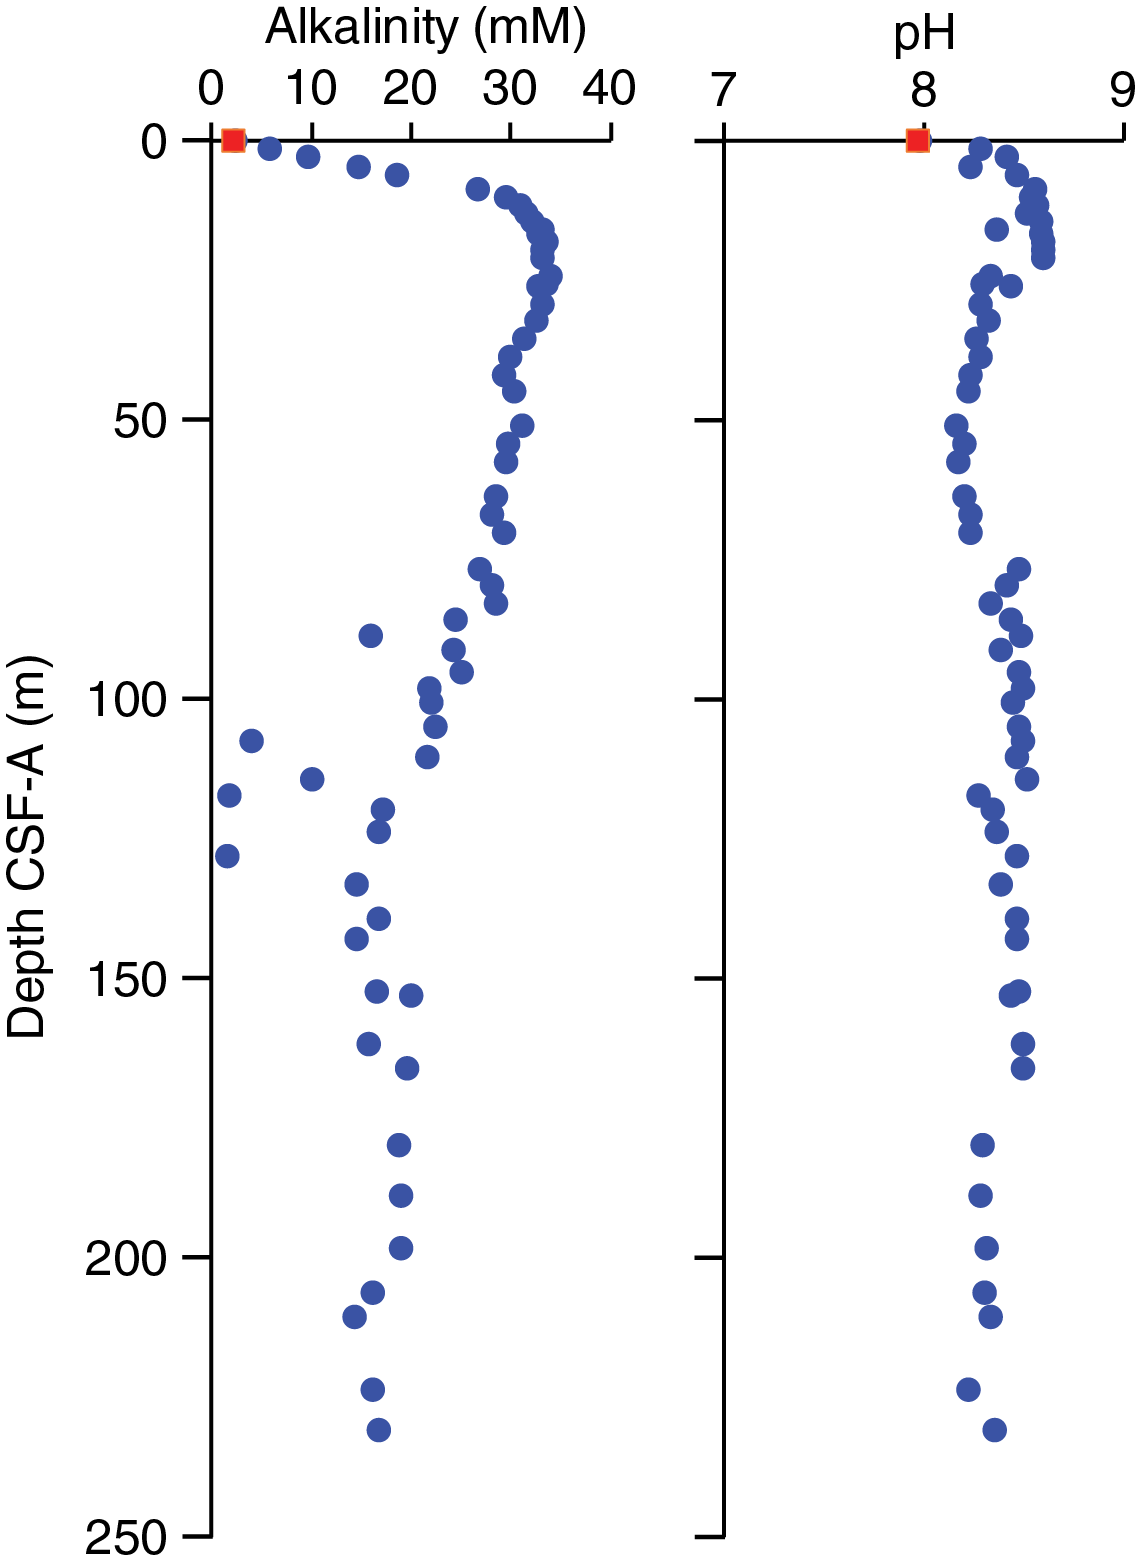
Figure F34. Interstitial water alkalinity and pH.
Salinity, chlorinity, and sodium
Salinity for all IW samples ranges between 33 and 35 throughout the core. The lower values relative to average seawater may be due to an artifact in the refractometer because the IW has a visible yellow tint and therefore refraction may have been affected by colloidal constituents. Chlorinity has an average value of 558.4 ± 37.1 mM with no prominent downhole trends except for a few high (16.54–35.21 m CSF-A) and low values (123.79 m CSF-A) (Figure F35). Similar to chlorinity, sodium (Na) concentrations show little variability downhole (Figure F35). The mean Na value is 458.7 ± 7.7 mM.
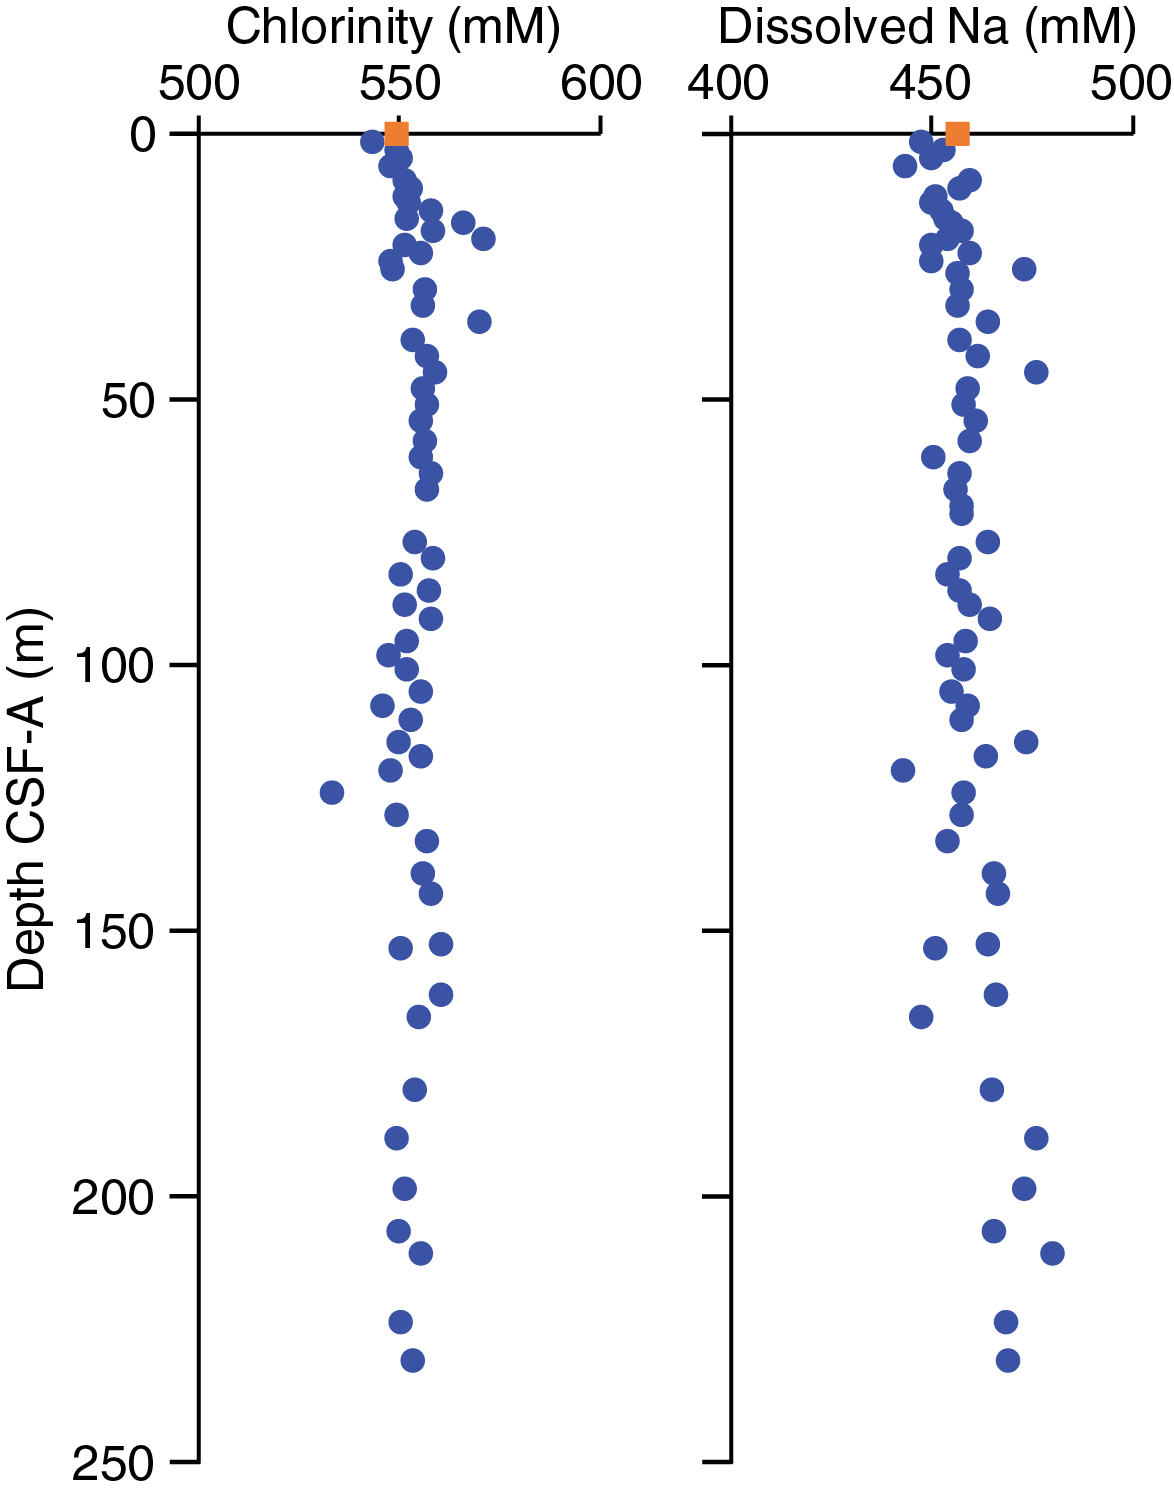
Figure F35. Interstitial water chloride and sodium.
Ammonium, phosphate, and sulfate
Ammonium (NH4+) concentrations increase with depth over the upper part of the core from below detection limit in the mudline sample to 3948 µM at 16.54 m CSF-A (Figure F36). Below this depth, NH4+ concentrations decrease slightly to 3712 µM at 29.07 m CSF-A before continuing to increase all the way to the bottom of the core and reaching 7745.9 µM at 230.94 m CSF-A. The general pattern of increasing NH4+ is caused by organic matter remineralization.
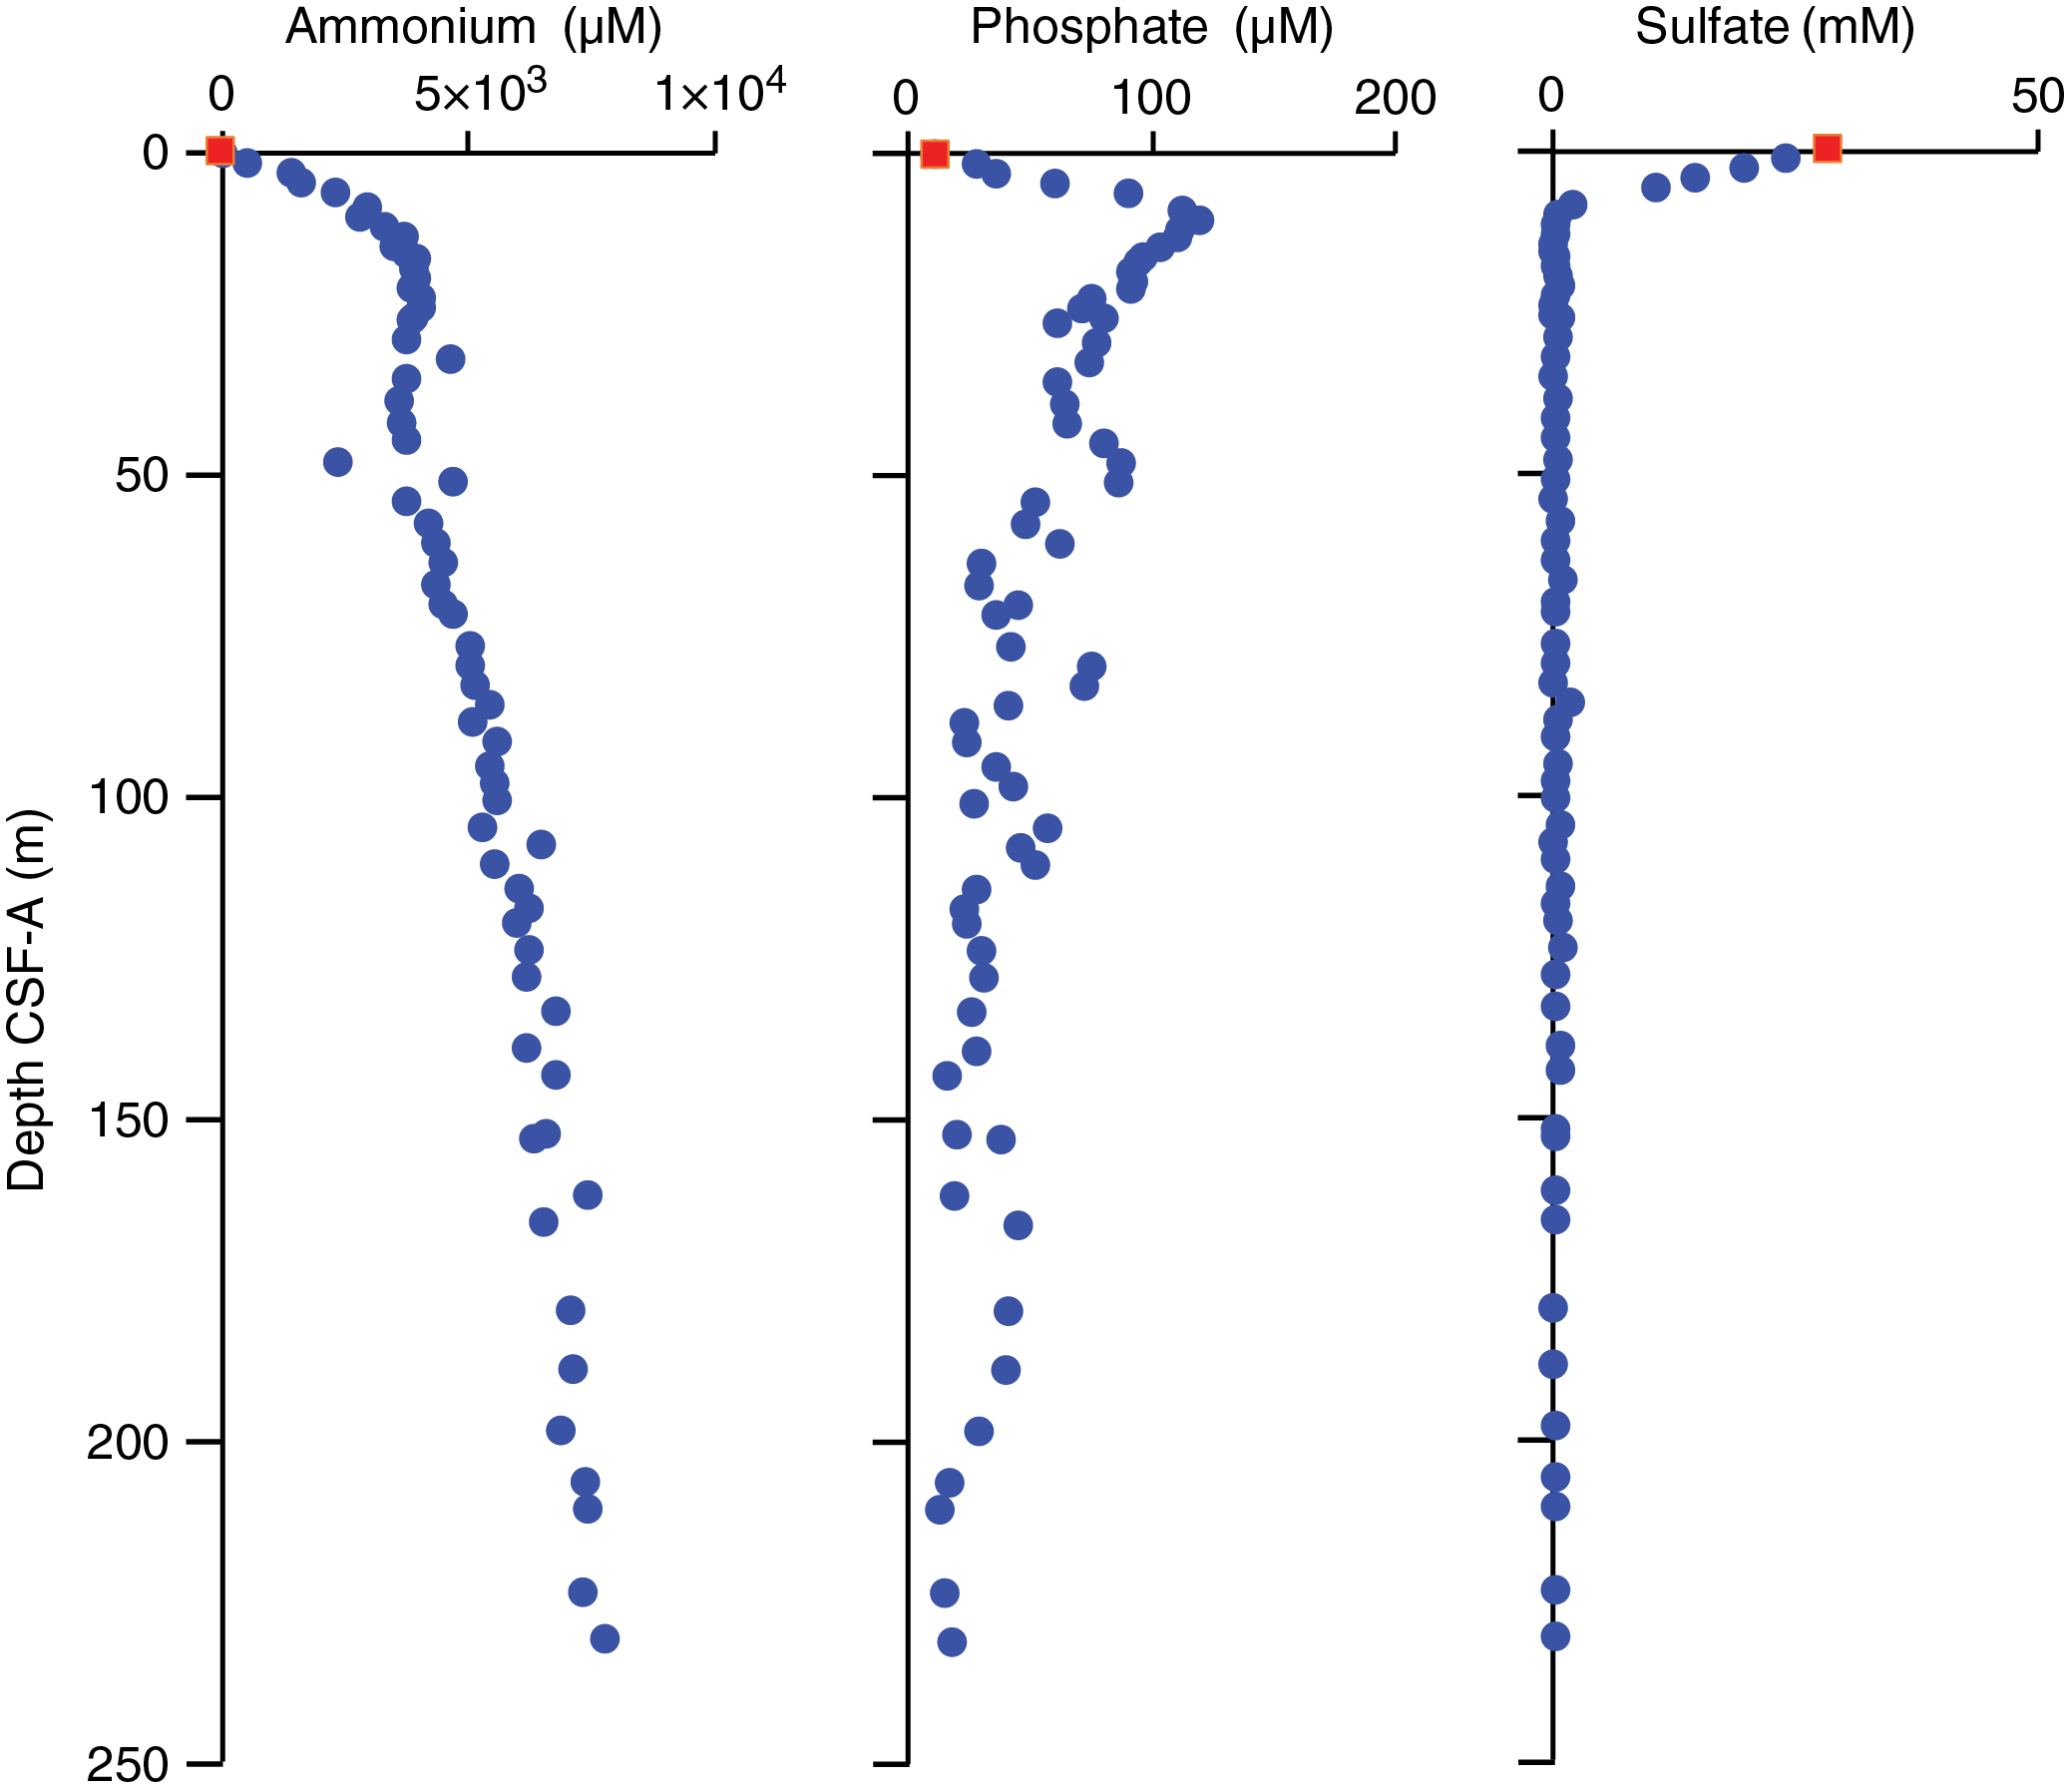
Figure F36. Interstitial water ammonium, phosphate, and sulfate.
Immediately below the sediment surface, phosphate (PO42–) concentrations increase from 11 µM at the mudline to 120 µM at 10.04 m CSF-A (Figure F36). This subsurface peak in PO42– might be related to organic matter degradation. Below this shallow peak, PO42– concentrations generally decrease. The bottom four samples reach values of 17–18 µM.
Sulfate concentrations show a rapid decrease from 28.4 mM at the mudline to 0.4 mM at 10.04 m CSF-A and remain low throughout the rest of the core (Figure F36). According to the SO42– and methane profiles, the region between ~9 and 11 m CSF-A is likely the sulfate–methane transition zone (SMTZ), where upward-diffusing methane is oxidized by downward-diffusing SO42– (Iversen et al., 1985). Above this zone, organic carbon remineralization is likely dominated by SO42– reduction, whereas methanogenesis dominates below this zone.
Calcium, strontium, and magnesium
Calcium (Ca) concentrations show a sharp decrease from ~10 to 2.6 mM at 8.55 m CSF-A downhole (Figure F37). Below this depth, Ca concentrations remain fairly constant with an average value of 2.3 ± 0.5 mM. Depletion of Ca from IW suggests precipitation of carbonate minerals in the solid phase, which has been observed in other sediments below the SMTZ and in regions of high methane production (Pierre and Fouquet, 2007).
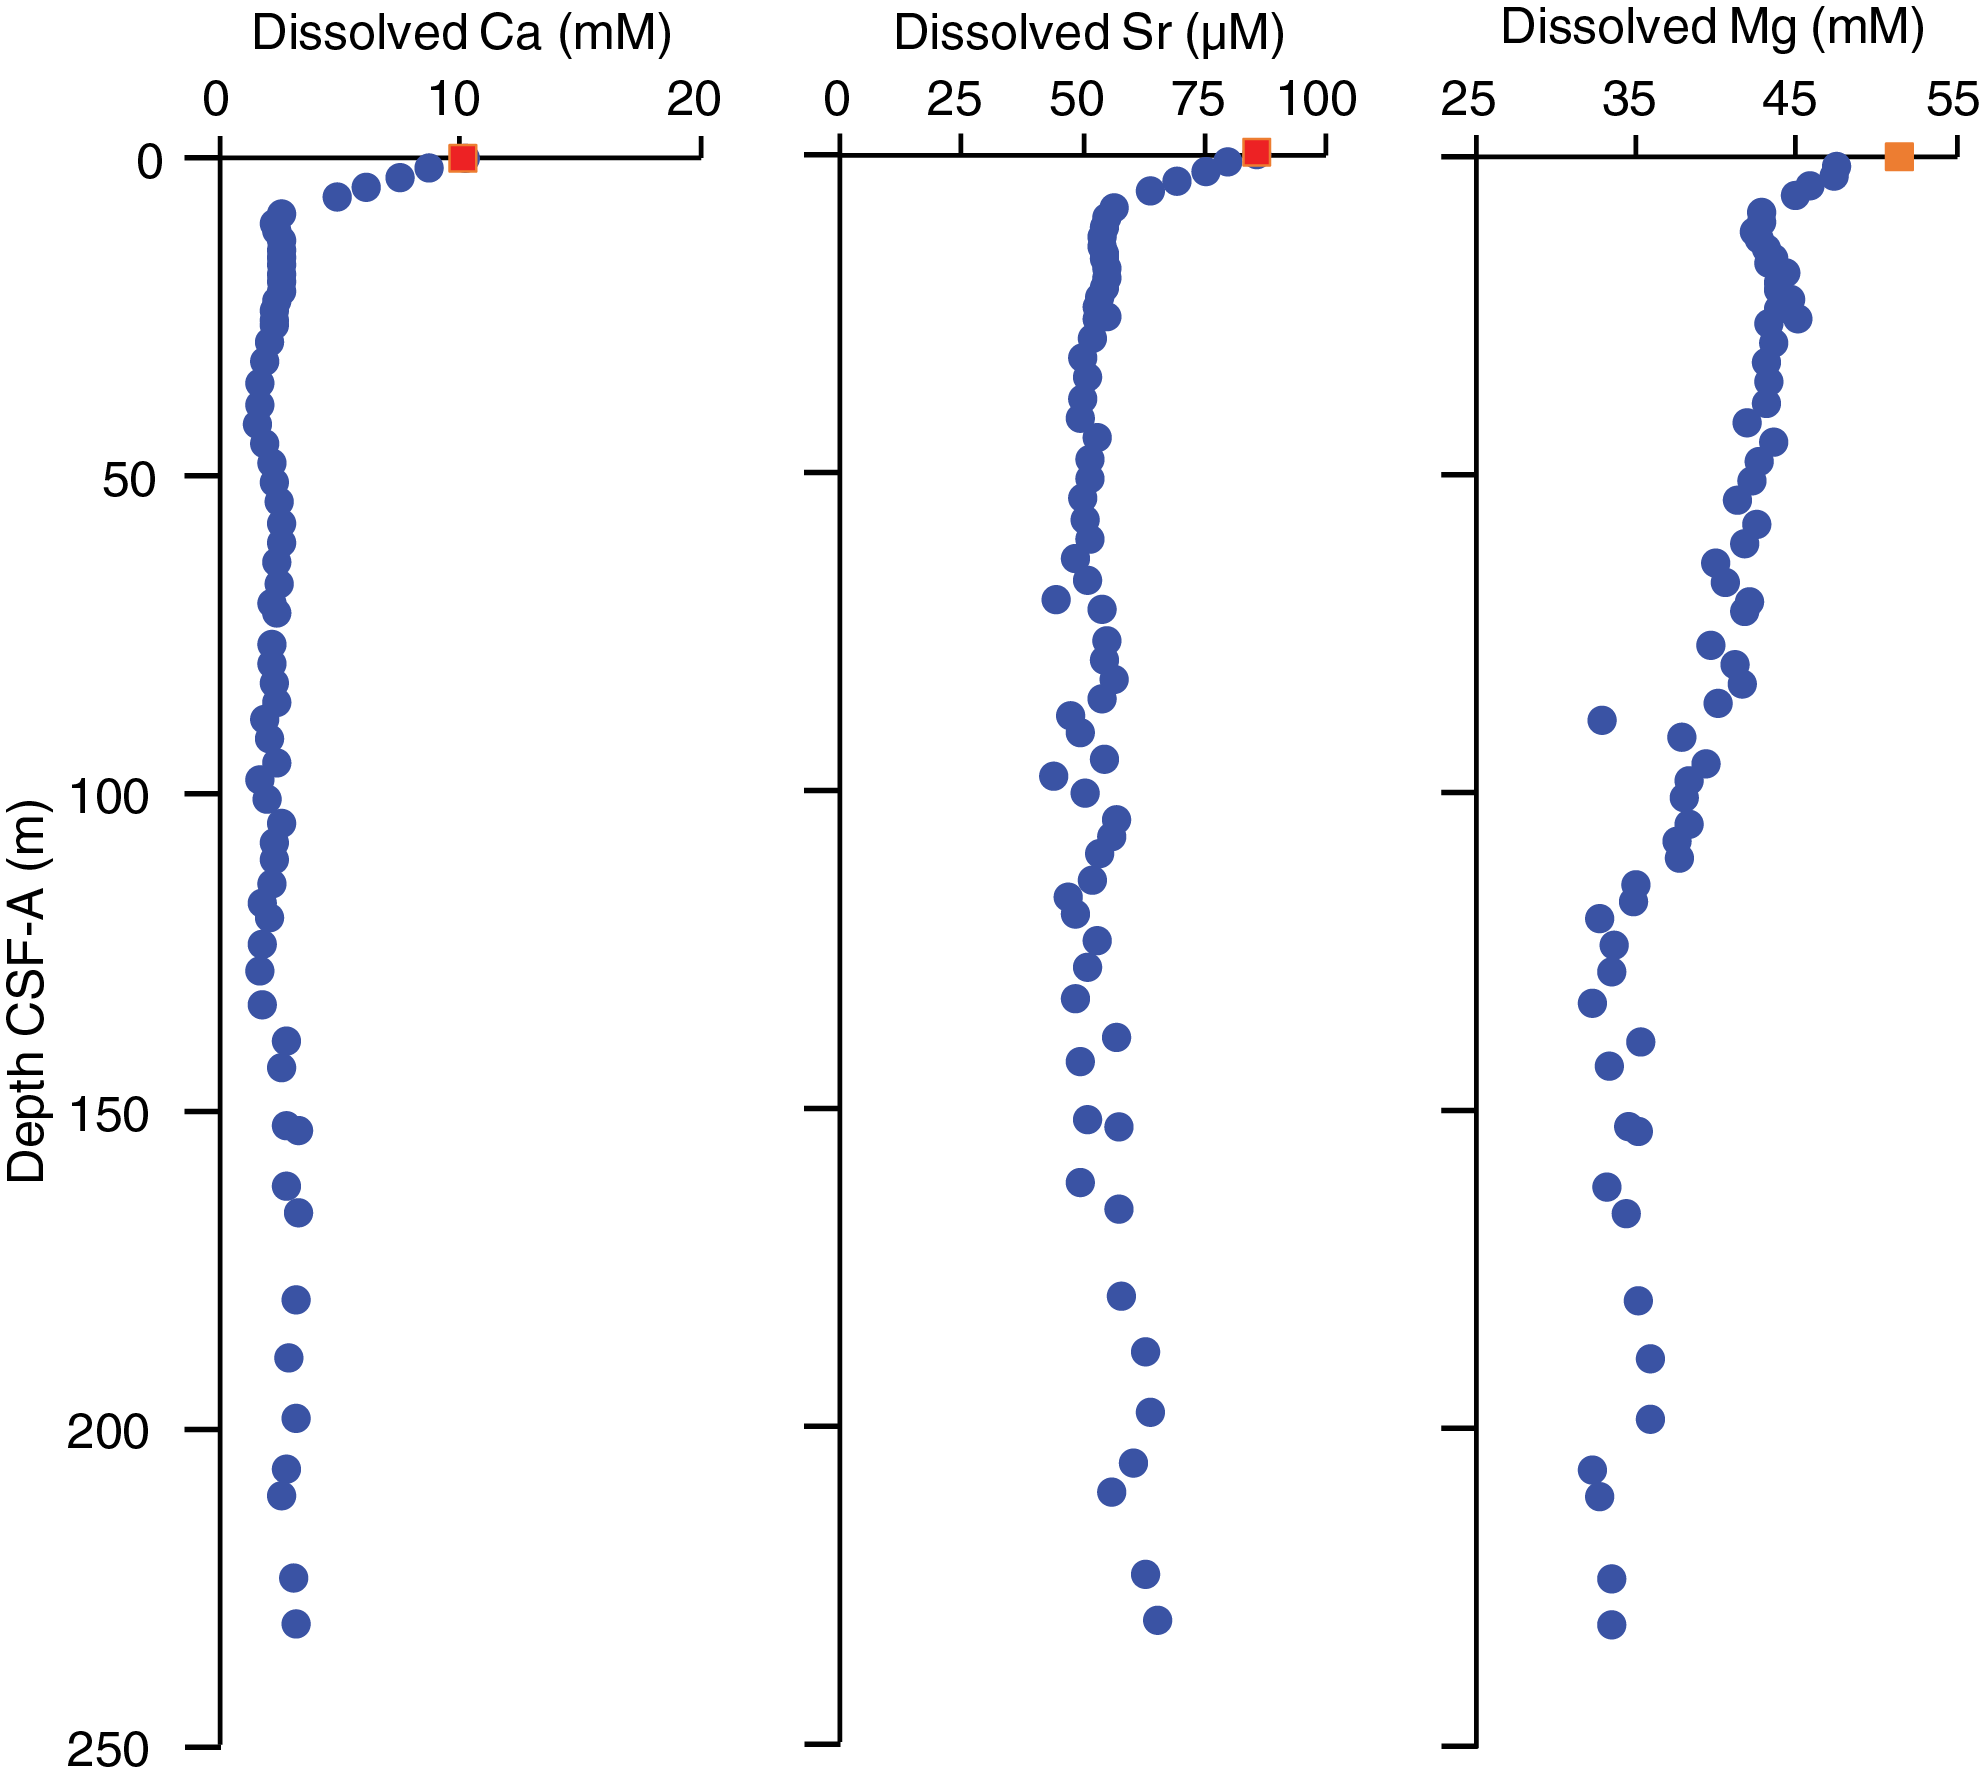
Figure F37. Interstitial water calcium, strontium, and magnesium.
Strontium (Sr) concentrations follow a pattern similar to Ca, with a linear decrease to 53.6 µM in the uppermost 13.03 m. Farther downhole, Sr concentrations remain fairly constant with an average value of 52.9 ± 4.4 mM (Figure F37).
Magnesium (Mg) concentrations decrease continuously from 51.5 mM at the mudline to 42.9 mM at 8.55 m CSF-A (Figure F37). Farther downhole, Mg concentrations show an overall decreasing trend to 107.56 m CSF-A. Below this depth, Mg concentrations are almost constant, averaging 34.3 ± 1.1 mM.
Right below the SMTZ, methane is generated via anaerobic oxidation (Iversen and Jorgensen, 1985). Methane tends to diffuse upward in the sediment column and enter zones right above the SMTZ where reaction between methane and SO42– produces bicarbonate ions. These bicarbonate ions facilitate the precipitation of authigenic minerals, mainly Mg-calcite, aragonite, and dolomite. This mechanism explains the observed removal of Ca and Mg from the IW. Sr can also be incorporated in carbonates; hence, precipitation of carbonate would also deplete Sr from the IW.
Iron, manganese, and lithium
Dissolved iron (Fe) concentrations peak immediately below the surface before aqueous Fe is rapidly removed and have a minimum value of 0.8 µM at 8.55 m CSF-A (Figure F38). Below this shallow subsurface minimum, Fe concentrations increase to 46.5 µM at 18.04 m CSF-A, the maximum value recorded for this site. Following this peak, Fe concentrations follow a decreasing trend with an observed minimum value of 2.2 µM at 41.73 m CSF-A and a peak of 13.3 µM at 48.03 m CSF-A.
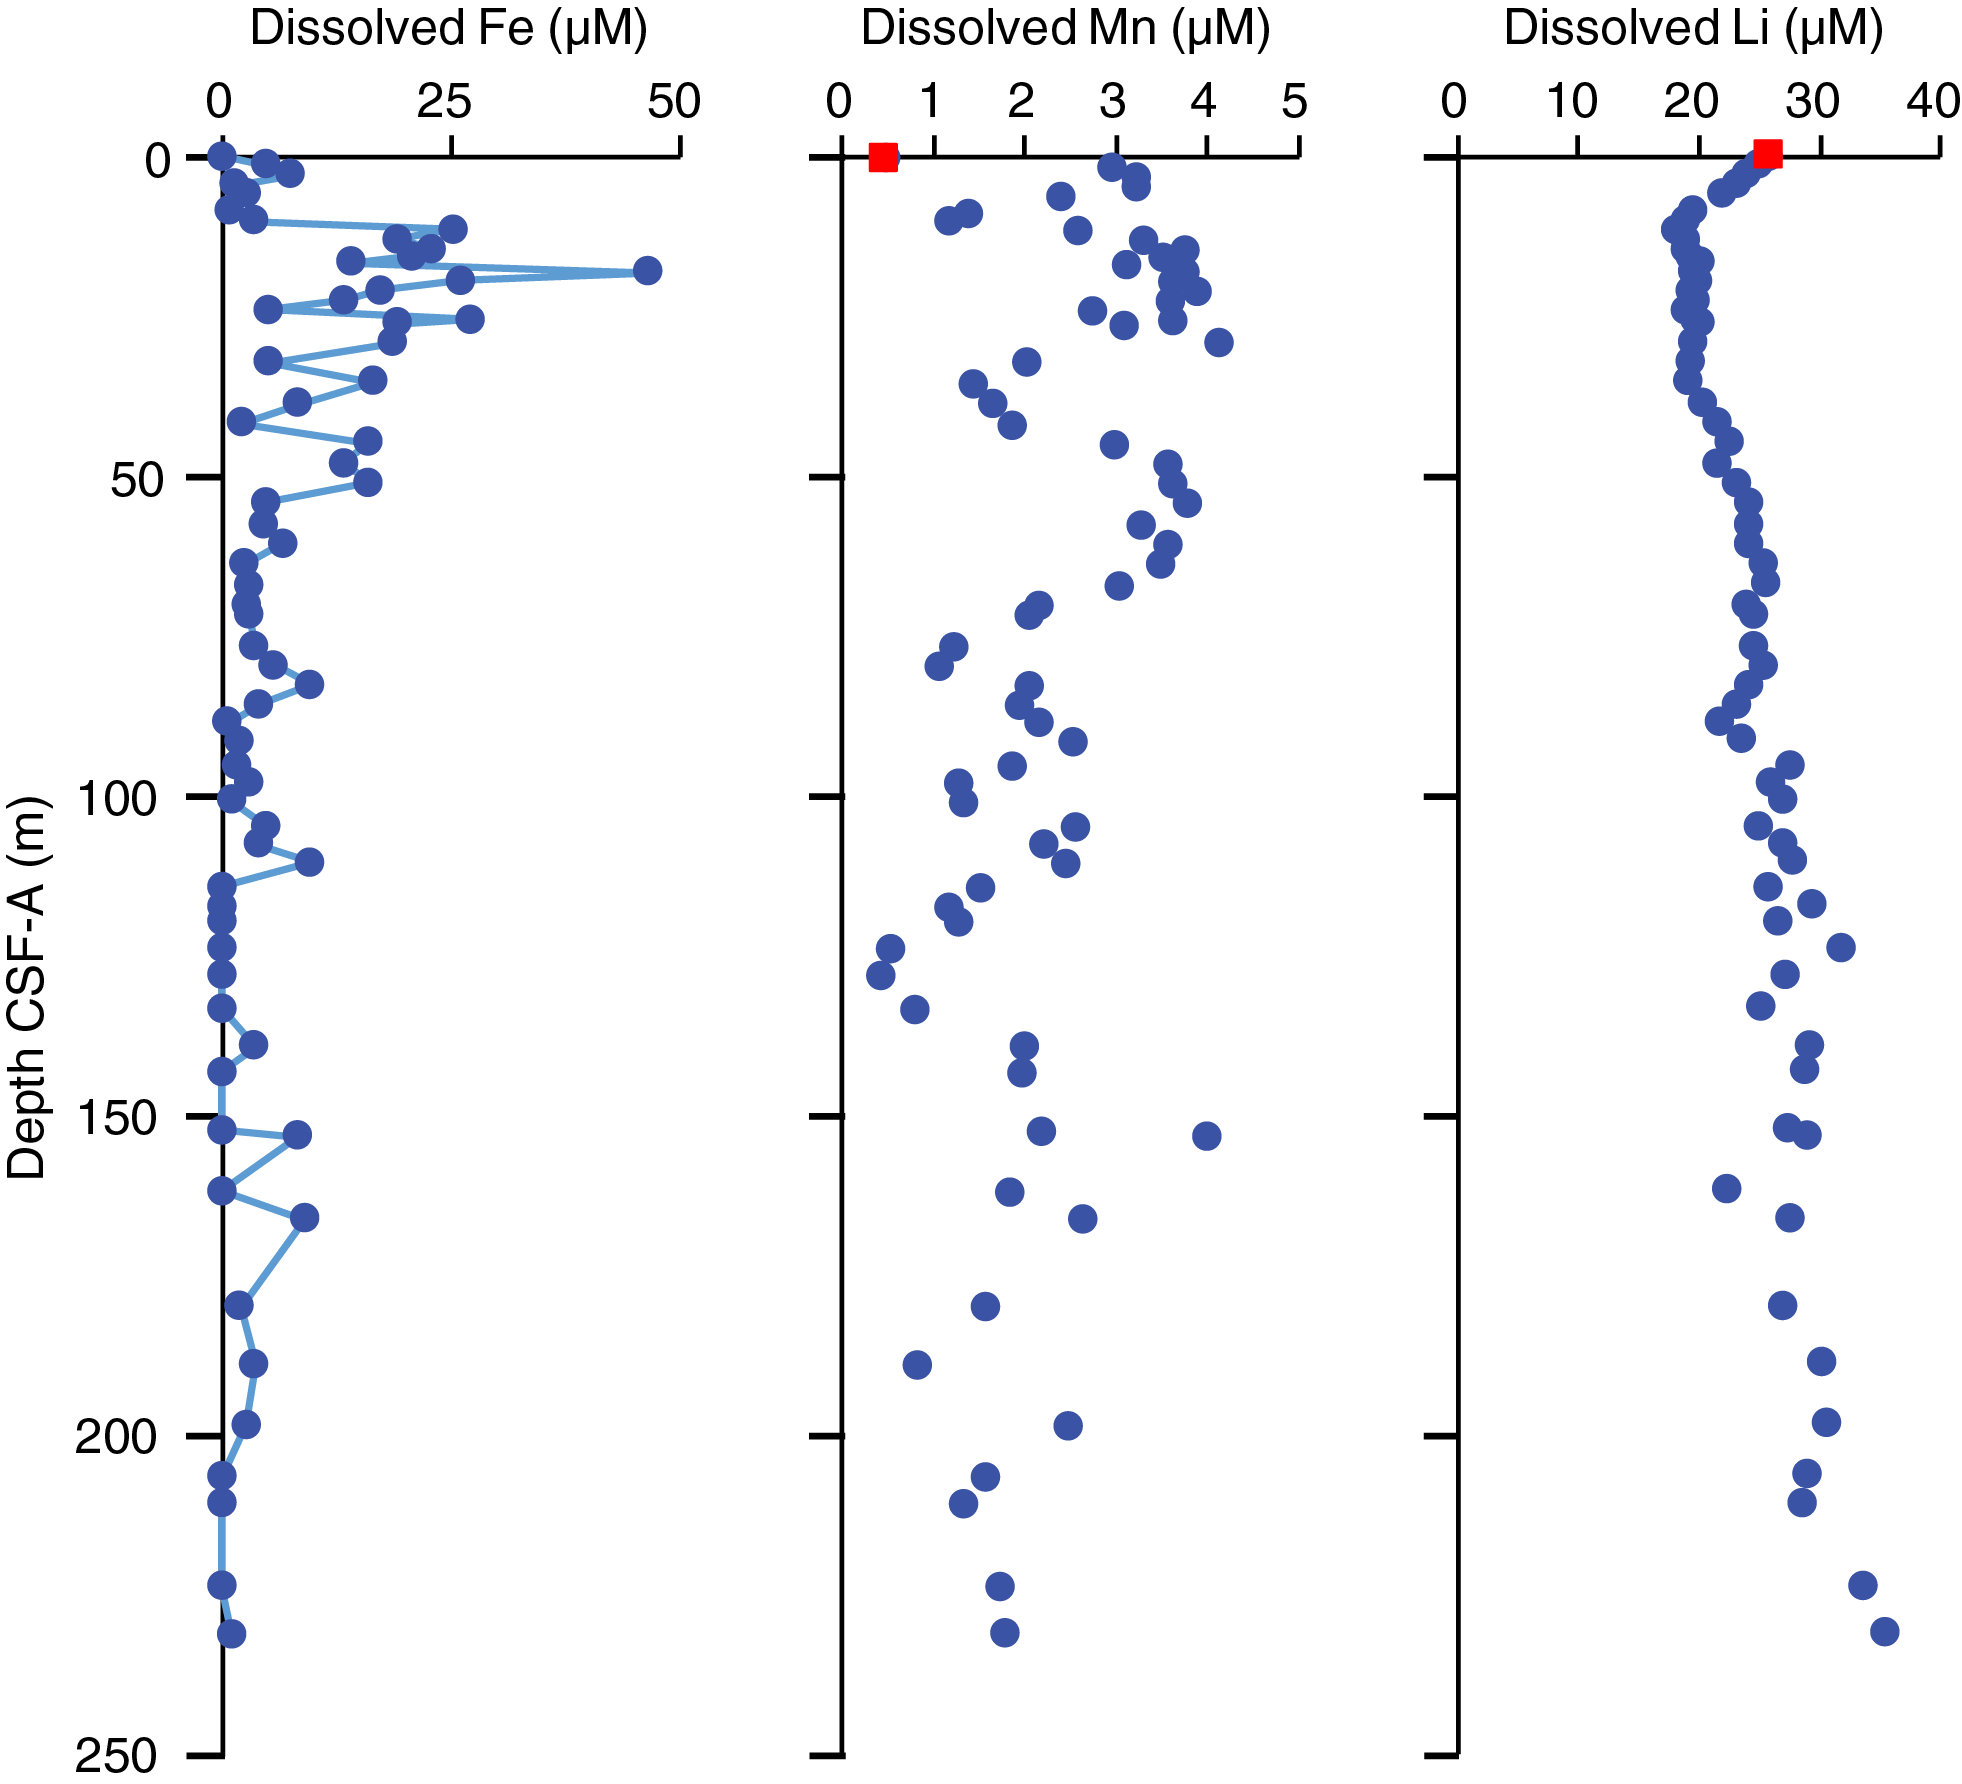
Figure F38. Interstitial water iron, manganese, and lithium.
Manganese (Mn) concentrations in the uppermost ~50 m show patterns that are broadly similar to Fe (Figure F38). Downhole, aqueous Mn varies significantly, reaching multiple peaks of 3.2–3.9 µM (e.g., at 4.4, 21.03, and 54.06 m CSF-A) and local minima of 0.5–1.4 µM (e.g., at 10.04, 35.21, and 123.79 m CSF-A).
Dissolved lithium (Li) displays a consistent decrease in concentrations below the mudline (25.7 µM) and reaches 17.8 µM at 11.54 m CSF-A (Figure F38). Farther downhole, Li concentrations show a gradual increase with depth.
Silicon, barium, and potassium
Silicon (Si) is low in the mudline water (77.3 µM) and relatively higher in the IW down to 41.73 m CSF-A with an average concentration of 503 ± 94 µM. From this depth to ~166 m CSF-A, Si concentrations show much scatter with a mean value around 953 ± 98 µM (Figure F39). Relatively high Si concentrations in IW with respect to bottom water can be attributed to silica undersaturation in IW resulting in dissolution of silica from solid phase.
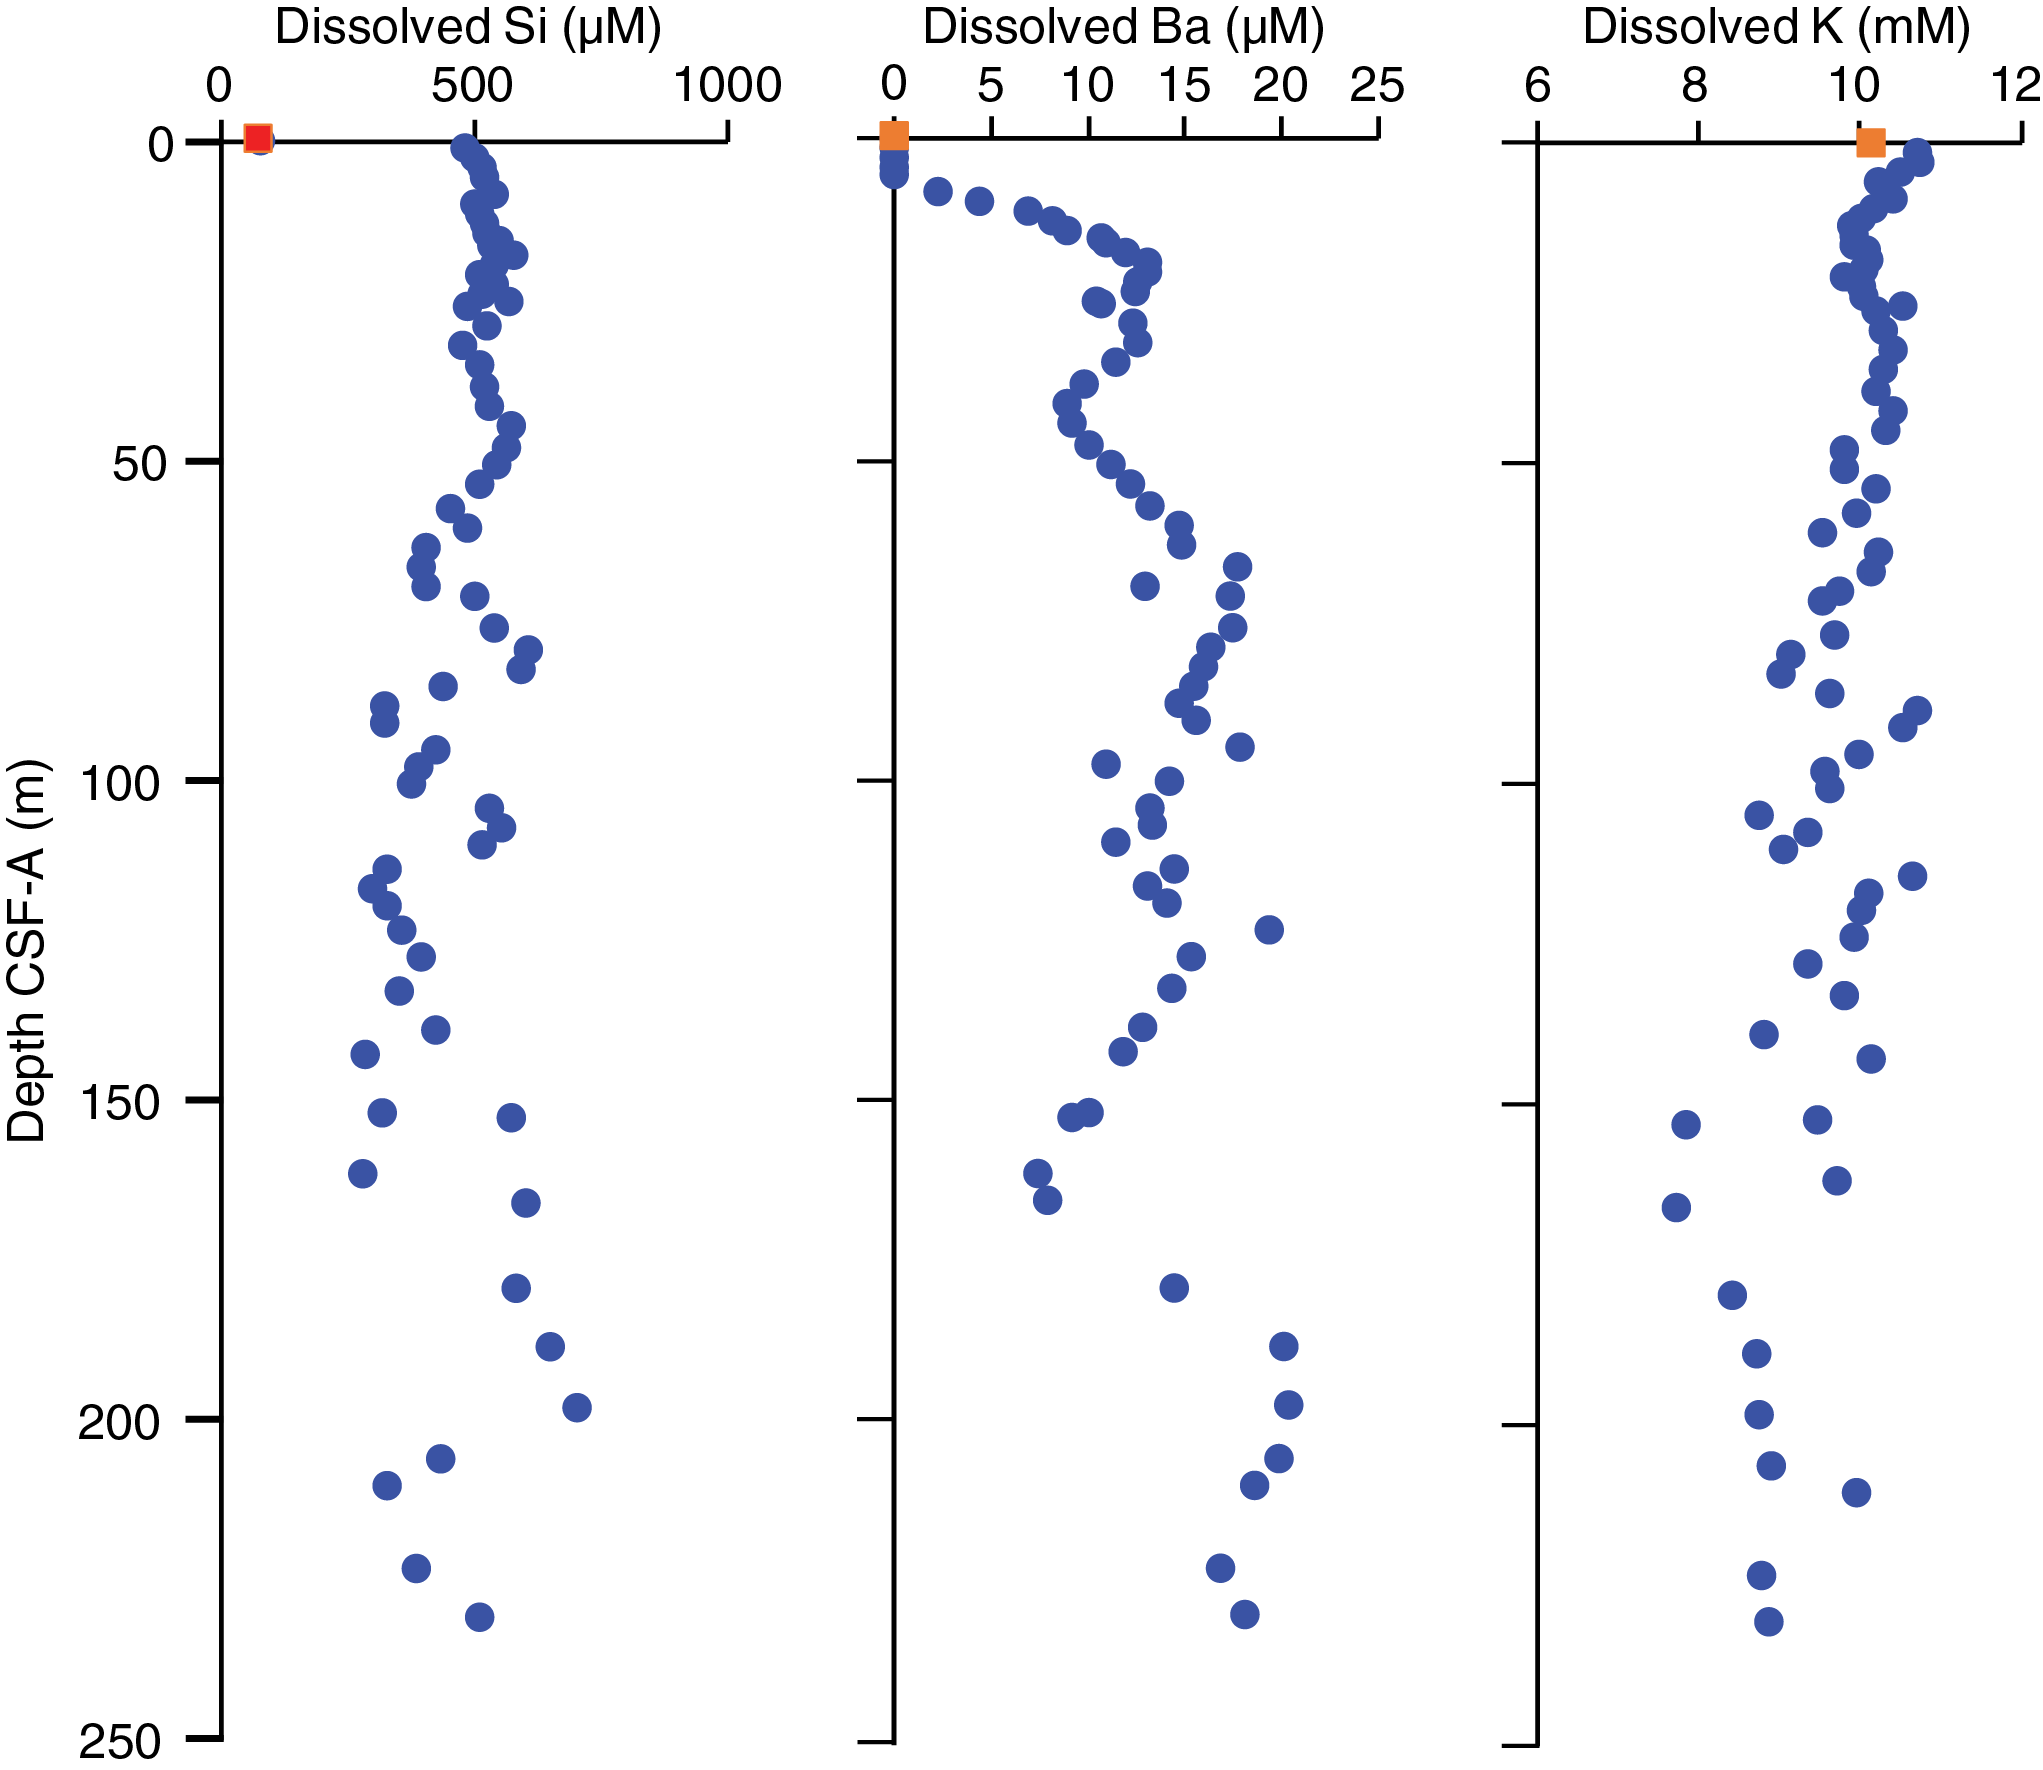
Figure F39. Interstitial water silicon, barium, and potassium.
Barium (Ba) concentrations remain below detection limit from the mudline sample to 5.93 m CSF-A. Below this depth, it increases to a maximum of 12.4 µM at 24.04 m CSF-A (Figure F39) and then remains high, with some variation, to the bottom of the core. In marine sediments, Ba is often present in the form of barium sulfate (barite; BaSO4), which is prone to dissolution as aqueous SO42– decreases. At this site, SO42– in the IW is consumed below ~9 m CSF-A, which suggests BaSO4 dissolution is the cause of the observed increases in aqueous Ba concentrations.
Dissolved potassium (K) decreases in the uppermost 8.55 m. Below this depth, it remains relatively constant to 44.02 m CSF-A, where it begins to show considerable scatter and an overall decreasing trend.
Bulk sediment
Calcium carbonate
Calcium carbonate (CaCO3) concentration measurements for Holes U1542A and U1542C were obtained with a resolution of generally two to three samples per core. At this site, CaCO3 content is low; the combined CaCO3 record of Holes U1542A and U1542C has an overall mean value of 5.2 wt%. Two distinct peaks of CaCO3 are present in Hole U1542A: 39.2 wt% at 97.22 m CSF-A and 80.0 wt% at 125.57 m CSF-A (Figure F40; see U1542-T3.xls in GEOCHEM in Supplementary material). With the exception of these two peaks, CaCO3 content never exceeds 10 wt% at this site, but it varies between 9.9 and 0.23 wt%. In contrast to the sites in the Central South Pacific, no correlation between CaCO3 concentration and RGB blue data is observed at Site U1542.
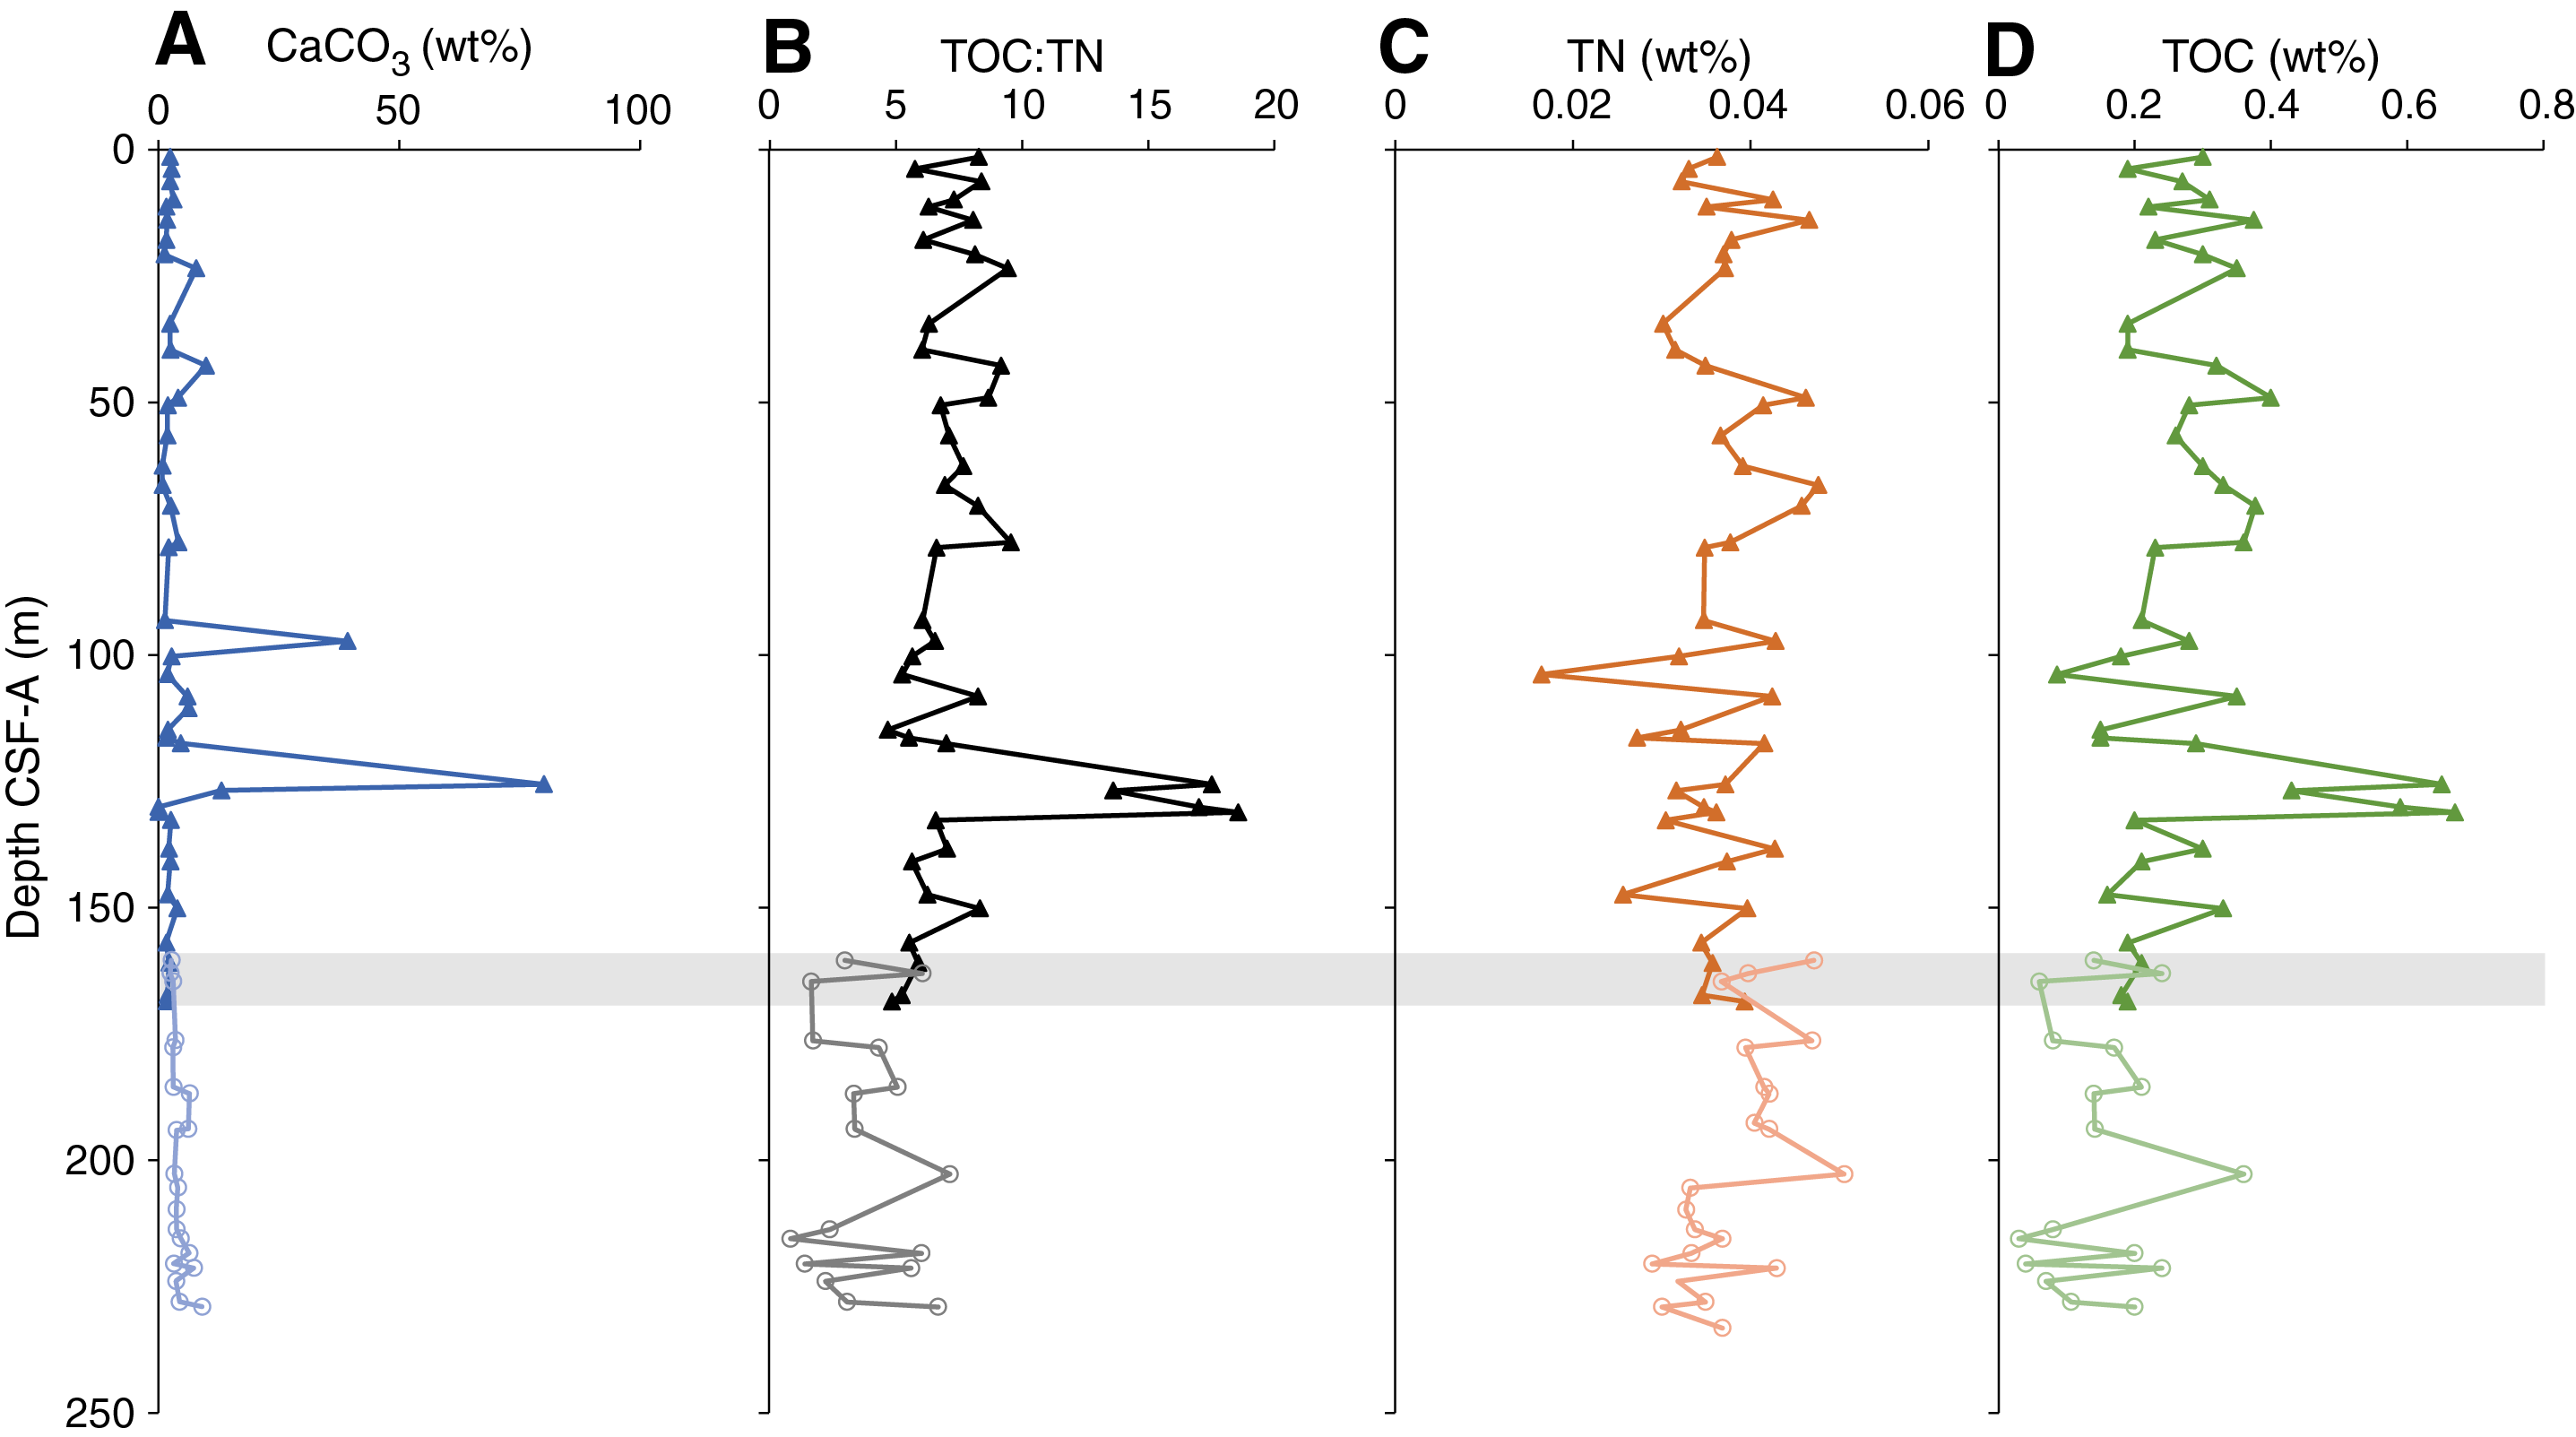
Figure F40. CaCO3, TOC:TN, TN, and TOC.
Major and trace elements
A total of 26 bulk sediment samples were taken from Holes U1542A and U1542C and analyzed for major and minor element concentrations using inductively coupled plasma–atomic emission spectroscopy (ICP-AES) (see U1542-T4.xls in GEOCHEM in Supplementary material). Elemental oxides (e.g., MgO, K2O, Fe2O3, MnO, and TiO2), when plotted against aluminum oxide (Al2O3), appear to exhibit a positive correlation; however, when two high value data points are excluded, the relationship breaks down (Figure F41). These high value samples are from 97.22 and 125.77 m CSF-A, depths which are also associated with anomalously high CaCO3 contents of ~39 and 80 wt%, respectively. Thus, we exclude these two samples in our discussion of major and trace element oxide data. The absence of any correlation between elemental oxides and Al2O3 possibly indicates the presence of a variety of terrigenous materials representing weathering products of different rock types.
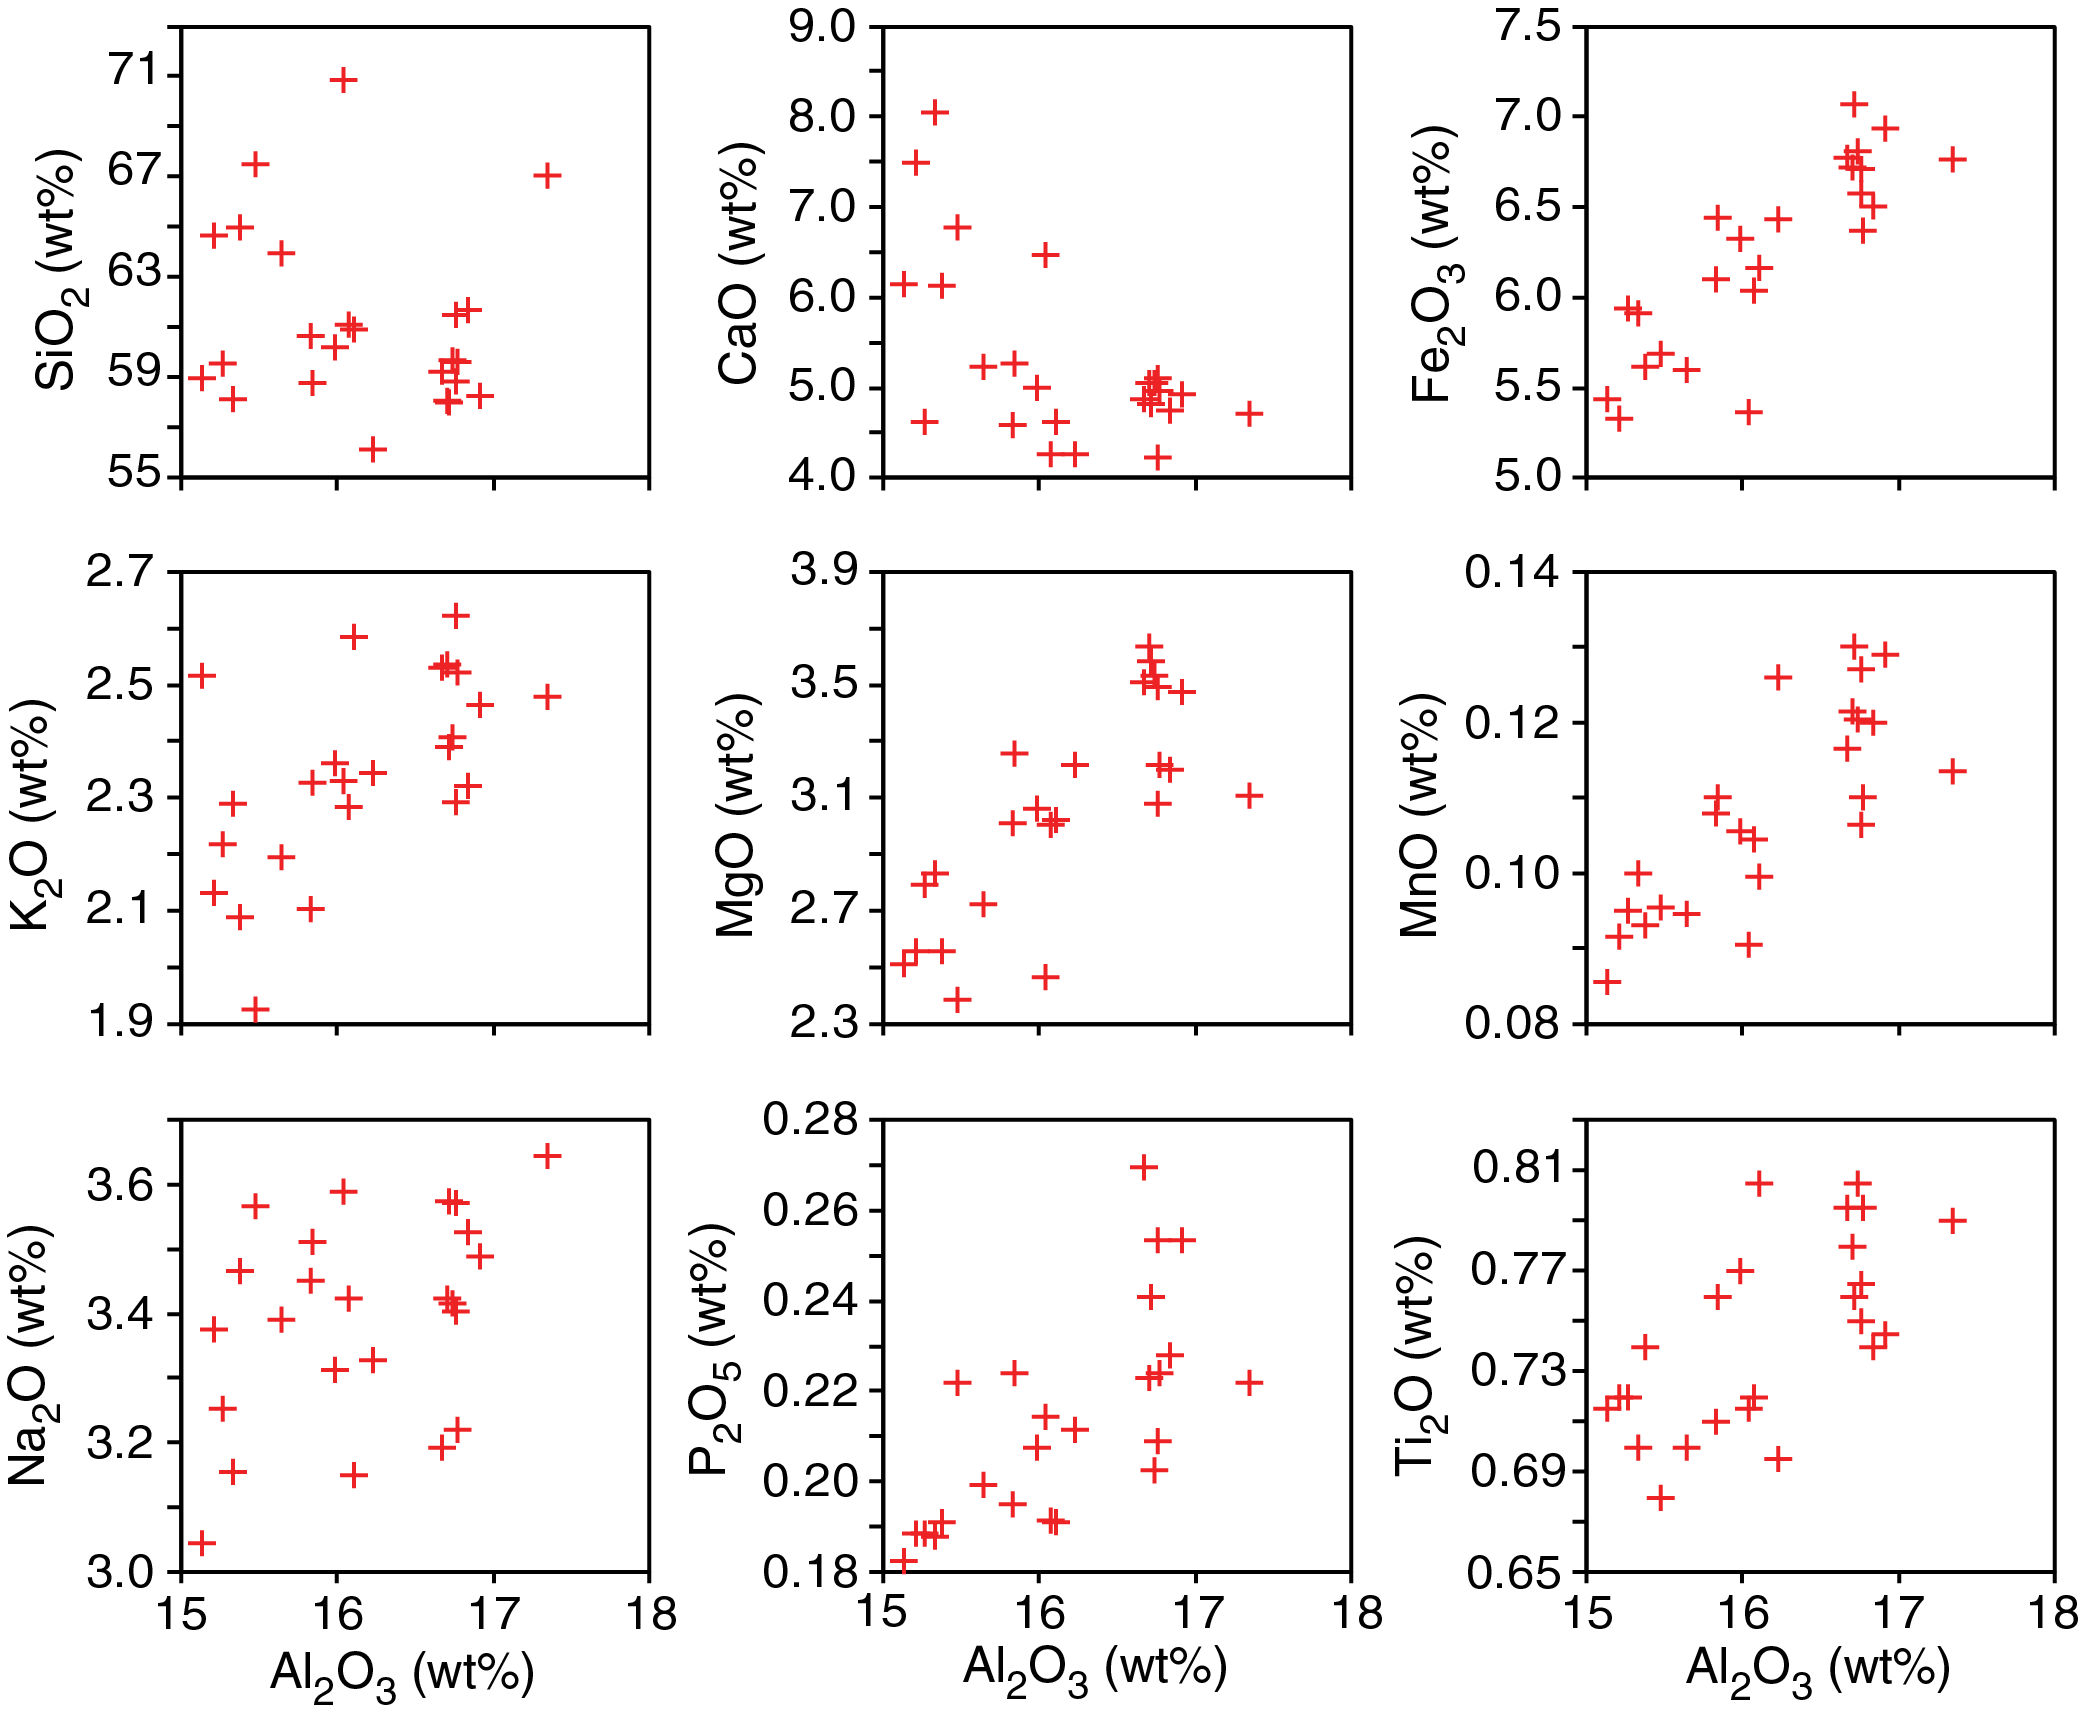
Figure F41. Bulk sediment elemental oxides vs. aluminum oxide.
The elemental composition of the bulk sediment shows lower variability in the uppermost ~80 m and higher variability at depth. Aluminum (Al), titanium (Ti), zinc (Zn), Mg, K, Ba, Fe, and Mn tend to co-vary, especially in the bottom half of the core where distinct regions of enrichment in all these elements are visible. In contrast, zircon (Zr), Ca, and Sr exhibit the opposite behavior, indicating that the regions enriched in Al, Mg, Ti, and so on are depleted in Zr, Ca, and Sr.
Downhole Sr and Ca concentrations show a strong similarity, with large peaks in CaCO3-rich layers (97.22 and 125.77 m CSF-A) (Figure F42). Bulk sediment Ca primarily represents biogenic CaCO3; hence, covariation of Sr and Ca can be attributed to incorporation of Sr in biogenic CaCO3.
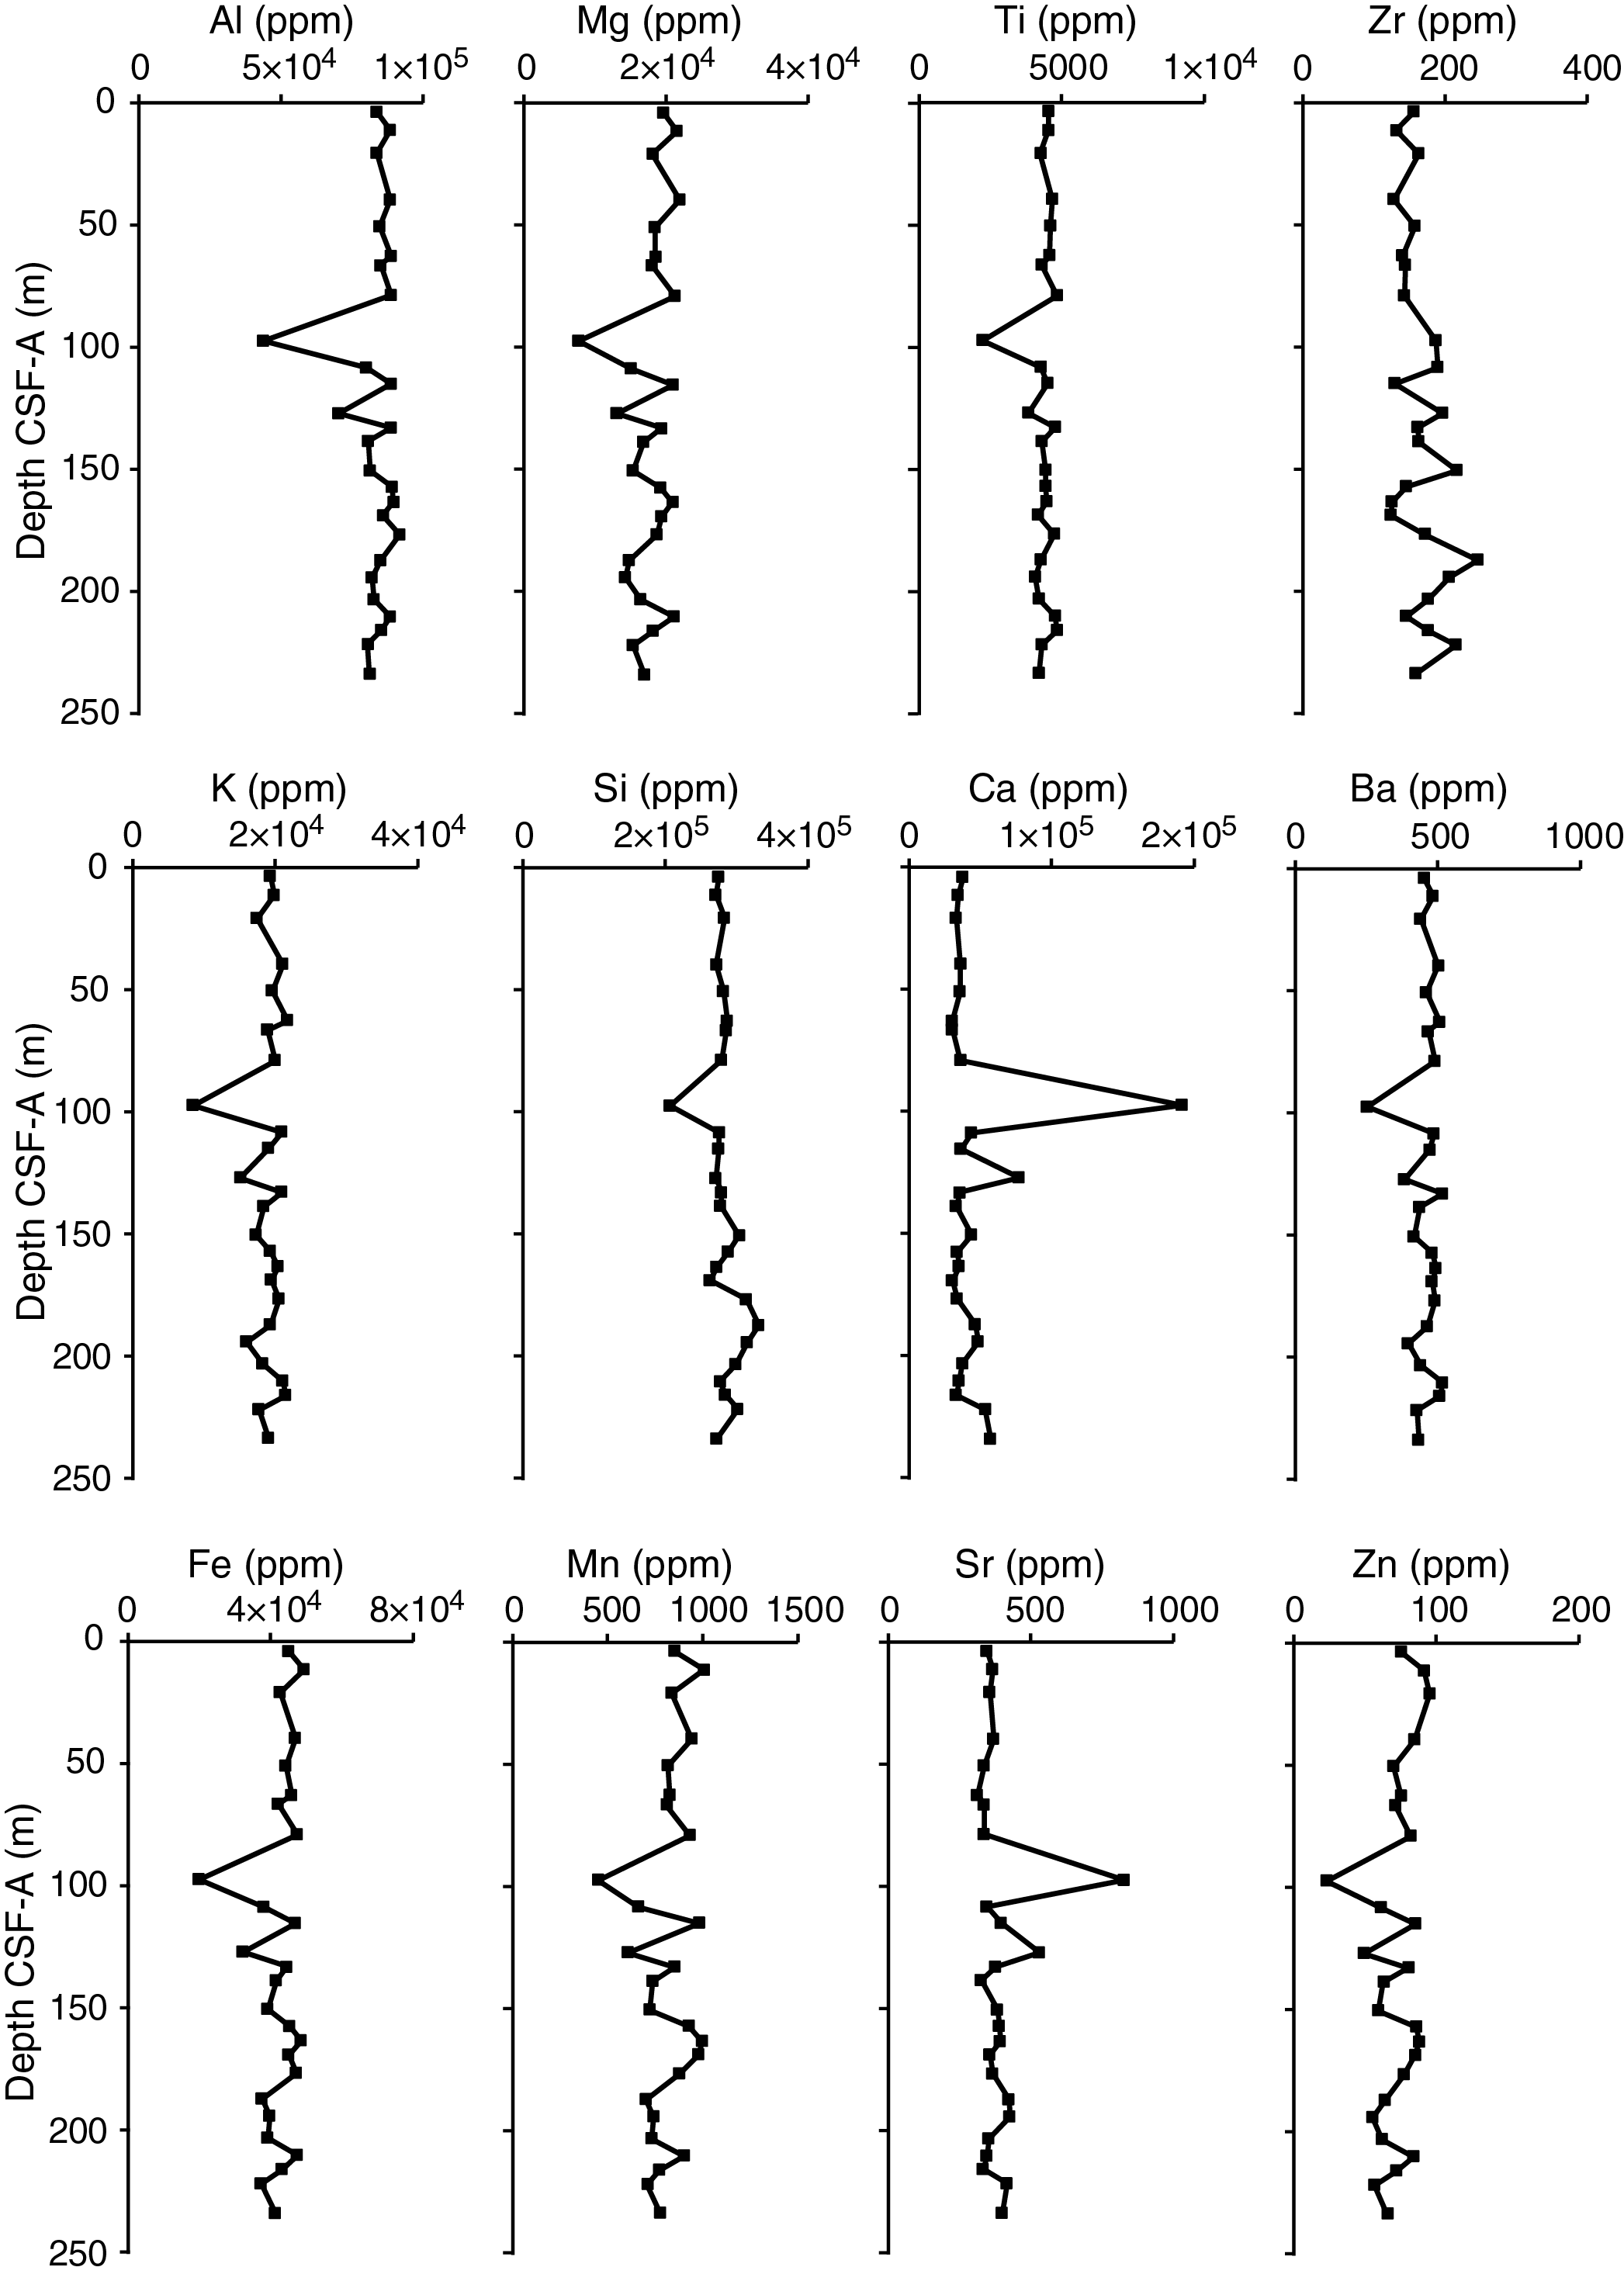
Figure F42. Bulk sediment major and minor element concentrations.
Organic carbon
All samples analyzed for CaCO3 were additionally subsampled for total carbon (TC) analysis. Total organic carbon (TOC) estimates were obtained by measuring the TC and subtracting the contribution of inorganic CaCO3 (see Geochemistry in the Expedition 383 methods chapter [Winckler et al., 2021a]). The combined TOC record of Holes U1542A and U1542C has a mean of 0.25 wt% and downhole variability ranging from a minimum of 0.03 wt% to a maximum of 0.67 wt% (Figure F40; see U1542-T3.xls in GEOCHEM in Supplementary material). Nine duplicate measurements were conducted to test reproducibility of analyses, and samples deviated from one another by up to 13% relative to their averaged value. Further analyses offshore are required to test shipboard findings. Generally, the TOC record shows little correlation to the CaCO3 record (r2 = 0.1401) downhole with the notable exception of a peak in TOC as high as 0.65 wt% observed between 125.57 and 131.1 m CSF-A that coincides with a peak in CaCO3 content at 125.57 m CSF-A (see Calcium carbonate), although this could be an effect of a small error associated to the TIC subtracted from a high TC value.
Total nitrogen
Samples were measured for total nitrogen (TN) simultaneously with TC. It was assumed that all the TN detected in the sediment was organic in origin. The composite TN record of Holes U1542A and U1542C has a mean of 0.04 wt% and downhole variability ranging from a minimum of 0.02 wt% at 103.82 m CSF-A in Hole U1542A to a maximum of 0.05 wt% at 202.69 m CSF-A in Hole U1542C (Figure F40; see U1542-T3.xls in GEOCHEM in Supplementary material). No clear trend can be observed in the TN data. These small values likely fall below the detection limit of the instrument and should therefore be interpreted with caution until shore-based analyses are completed. Nine duplicate measurements conducted to test for reproducibility of analyses indicate a difference between measurements as high as 36%. Therefore, the error associated with these low concentration measurements is too high for reasonable interpretation.
Organic carbon to organic nitrogen ratios
The ratio of TOC to TN from the composite record of Holes U1542A and U1542C has a mean value of 6.64 and ranges from a minimum ratio of 0.82 at 215.47 m CSF-A in Hole U1542C to a maximum ratio of 18.56 at 131.1 m CSF-A in Hole U1542A (Figure F40; see U1542-T3.xls in GEOCHEM in Supplementary material).
The peak in TOC:TN at 131.1 m CSF-A coincides with a peak in CaCO3 and TOC described in the previous sections of this chapter. A trend can be observed in the TOC:TN data; values slightly decrease progressively from the top to the bottom of the core. Despite its proximity to the continental margin, the overall TOC:TN ratio has a distinct signature of marine derived organic matter (Meyers et al., 1994). Evidence of terrestrially derived organic matter at Site U1542 might occur between 125.57 and 131.1 m CSF-A. However, these results should be interpreted with caution because of the low TN detected at Site U1542.
Summary
Organic matter remineralization in sediment is one of the primary controls of IW geochemistry. Close to the sediment–water interface, where oxygen is available, aerobic respiration is the primary mechanism of organic matter remineralization. As oxygen is depleted, nitrate, Mn, and Fe serve as terminal electron acceptors in organic carbon oxidation. SO42– reduction occurs as other electron acceptors become consumed/unavailable, and once SO42– is completely consumed, methanogenesis becomes the primary remineralization pathway. At this site, SO42– reduction predominates in the shallow sediment and the SMTZ likely occurs at ~9 m CSF-A. This is not unusual for continental margin sediments and is probably due to the fact that Site U1542 lies within a high productivity zone supported by abundant supply of nutrients from continental runoff.
CaCO3 content is very low at this site, with the exception of two distinct peaks of 39.2 and 80.0 wt% at 97.22 and 125.57 m CSF-A, respectively. The CaCO3 record shows no correlation with color reflectance L* and RGB blue data. The maximum TOC value measured is 0.67 wt%.
Similar to the other sites, TN is very low at this site, never exceeding 0.05 wt%. Low concentrations yield poor reproducibility of samples as a result of the detection limit of the instrument.
The ratio of TOC:TN ranges between 0.82 and 18.56, suggesting a predominance of marine derived organic matter. However, the very high values of the TOC:TN ratios are likely artifacts because of the extremely low values and poor reproducibility of TN measurements.
Bulk sediment major and trace element data suggest deposition of weathered material from varied terrigenous sources. Layers of enrichment in most analyzed elements (e.g., Al, Mg, Fe, and Mn) may represent time periods of increased delivery of terrigenous material.
Physical properties
Shipboard physical properties measured at Hole U1542A comprise nondestructive whole-round measurements of GRA bulk density, MS, and P-wave velocity using the Whole-Round Multisensor Logger (WRMSL) and NGR using the Natural Gamma Radiation Logger (NGRL). The methods were modified for Holes U1542B–U1542D because of rapid and significant expansion of cores (in some cases more than 10% of original liner length) in the core rack during the equilibration process. Specifically, the WRMSL data was collected at a 3 cm resolution (instead of the 2 cm resolution used for Hole U1542A), and the NGR data was collected at one position with 200 s integration time before core temperature equilibration to room temperature (see details below). Thermal conductivity measurements were taken on Hole U1542A whole-round sections.
After splitting the core sections, discrete samples were taken from the working halves, from representative lithologies, for moisture and density (MAD) measurements to determine porosity and bulk, dry, and grain density from Holes U1542A and U1542C. Discrete compressional wave velocity measurements were made on at least one working half from each core from the upper part of Hole U1542A using the P-wave caliper contact probe system on the Section Half Measurement Gantry (SHMG). However, those measurements were canceled below Section 383-U1542A-13H-4 (116.61 m CSF-A) (see below). Archive halves were measured with the Section Half Multisensor Logger (SHMSL) for MS and color reflectance (see Sedimentology).
Physical property data were used for hole-to-hole stratigraphic correlation and for defining the splice (see Stratigraphic correlation). Multiple physical property parameters display long-term cyclic changes and variability throughout the recovered stratigraphic sequence. However, these cyclic changes are much less pronounced than at previous Sites U1539–U1541. In contrast to the previous sites, the physical property data do not appear to correspond to visually defined alternating lithofacies at Site U1542, both over short (e.g., less than 1 m) and longer (e.g., several to tens of meters) intervals.
During coring operations in Hole U1542A, whole-round sections started to show significant sediment expansion due to degassing while waiting for temperature equilibration in the laboratory core racks before whole-round measurements. This rapid degassing over a period of less than 1 h led to the cracking of fixed liner end caps and extrusion and loss of sediment from the section ends. The drilling of small holes into the liners, at the end caps, and along the splitting lines did not mitigate the problem. Thus, abundant sediment cracks and voids developed in the whole-round sections, complicating, and in some instances preventing, the acquisition of high quality physical property data from whole-round sections. To reduce sediment expansion within the whole rounds, an alternate core flow plan was designed: cores were split before temperature equilibration to allow for a more uniform degassing of the cores over the entire sediment surface:
- The resolution of WRMSL MS and GRA measurements was changed from 2 to 3 cm for all cores from Holes U1542B–U1542D.
- P-wave measurements were skipped because no reliable data could be obtained due to the cracks in the sedimentary sequence.
- The NGRL was changed from the conventional two-position set up to a one-position set up (resulting in 20 cm resolution) and from the conventional 300 s acquisition time to a 200 s acquisition time.
This strategy resulted in a fast core flow, which allowed us to split the sections more quickly and to keep pace with the rate of cores recovered at shallow-water Site U1542, which was about one core per 30 min on average.
Magnetic susceptibility
Both whole-round measurements on the WRMSL and discrete point measurements on the SHMSL were used to characterize MS at Site U1542 (Figure F43). Both methods yielded a similar range of values and similar downhole variability; however, because of the pervasive gas expansion that continued after splitting (see Physical properties in the Expedition 383 methods chapter [Winckler et al., 2021a]), WRMSL measurements on whole round sections sometimes displayed depth offsets relative to SHMSL measurements on section halves. These features are explained by (1) parts of sediment moving because of ongoing gas expansion within individual sections after whole-round logging, either before or during splitting, and (2) closing of large voids after splitting of whole rounds and before SHMSL measurements by pushing sediment back together according to International Ocean Discovery Program (IODP) curatorial guidelines. Because MS measurements at previous sites have shown excellent reproducibility between both MS methods (WRMSL and SHMSL), comparison of the two MS datasets at U1542 can potentially be used to assess and reconcile offsets created by gas expansion and core handling (Figure F43).
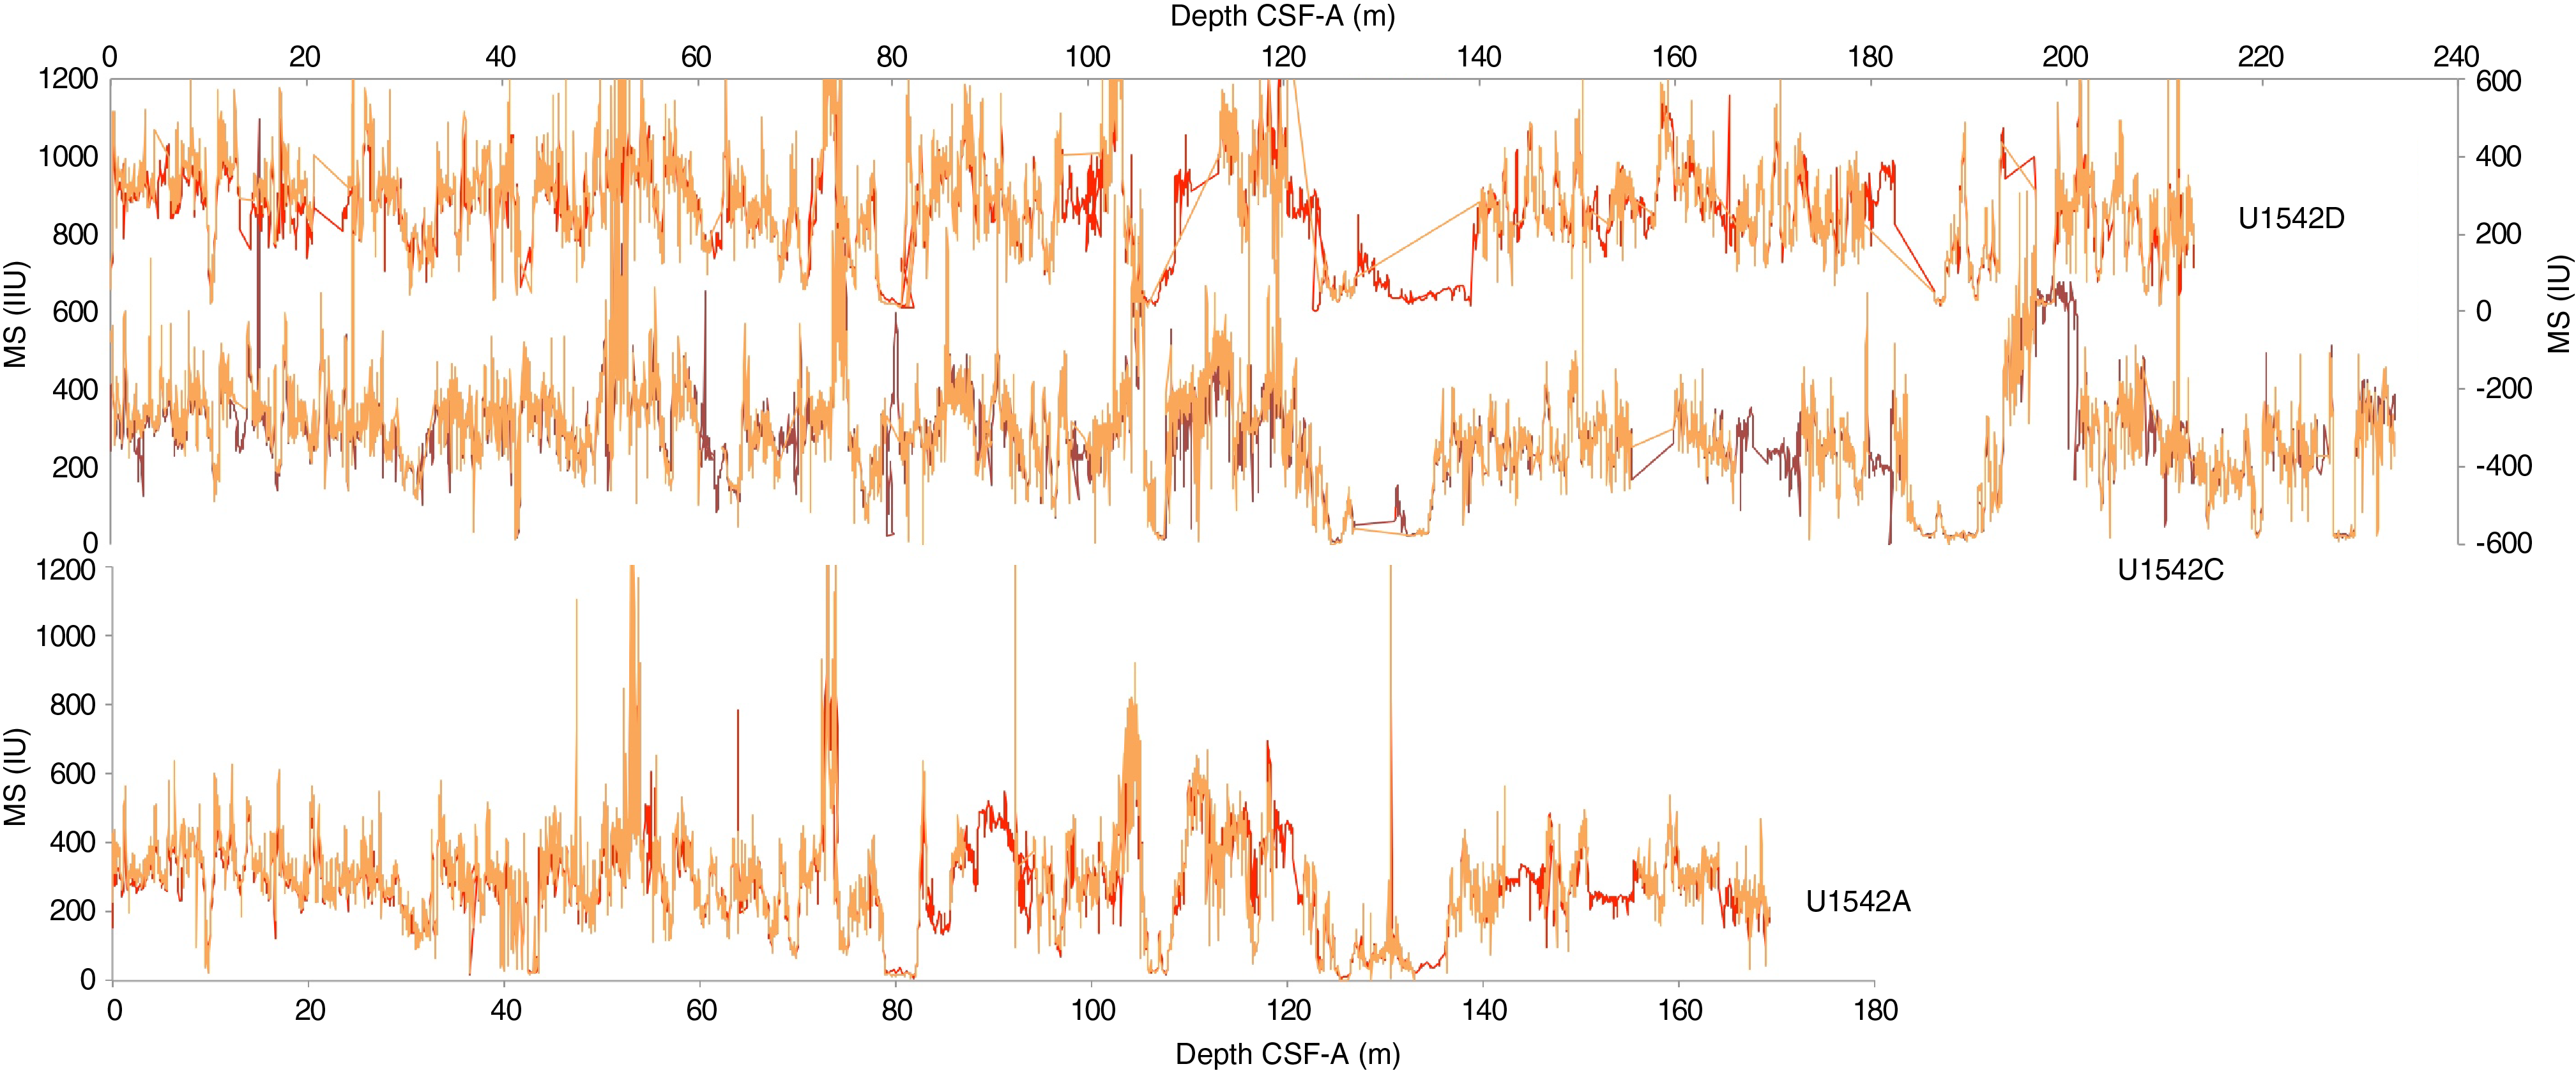
Figure F43. MS and MSP.
Overall, most MS values range from ~10 to ~500 instrument units (IU) for the WRMSL and SHMSL. A number of maxima with multiple data points exceeded this range, reaching 700 to >1000 IU, whereas average values range around ~200–300 IU. Several isolated values of >1200 IU are caused by individual oversized clasts or dropstones (Figure F44). WRMSL MS measurements in Holes U1542C and U1542D, made at a resolution of 3 cm, were essentially similar in terms of range and number of outliers to the MS measurements in Hole U1542A made at a resolution of 2 cm.
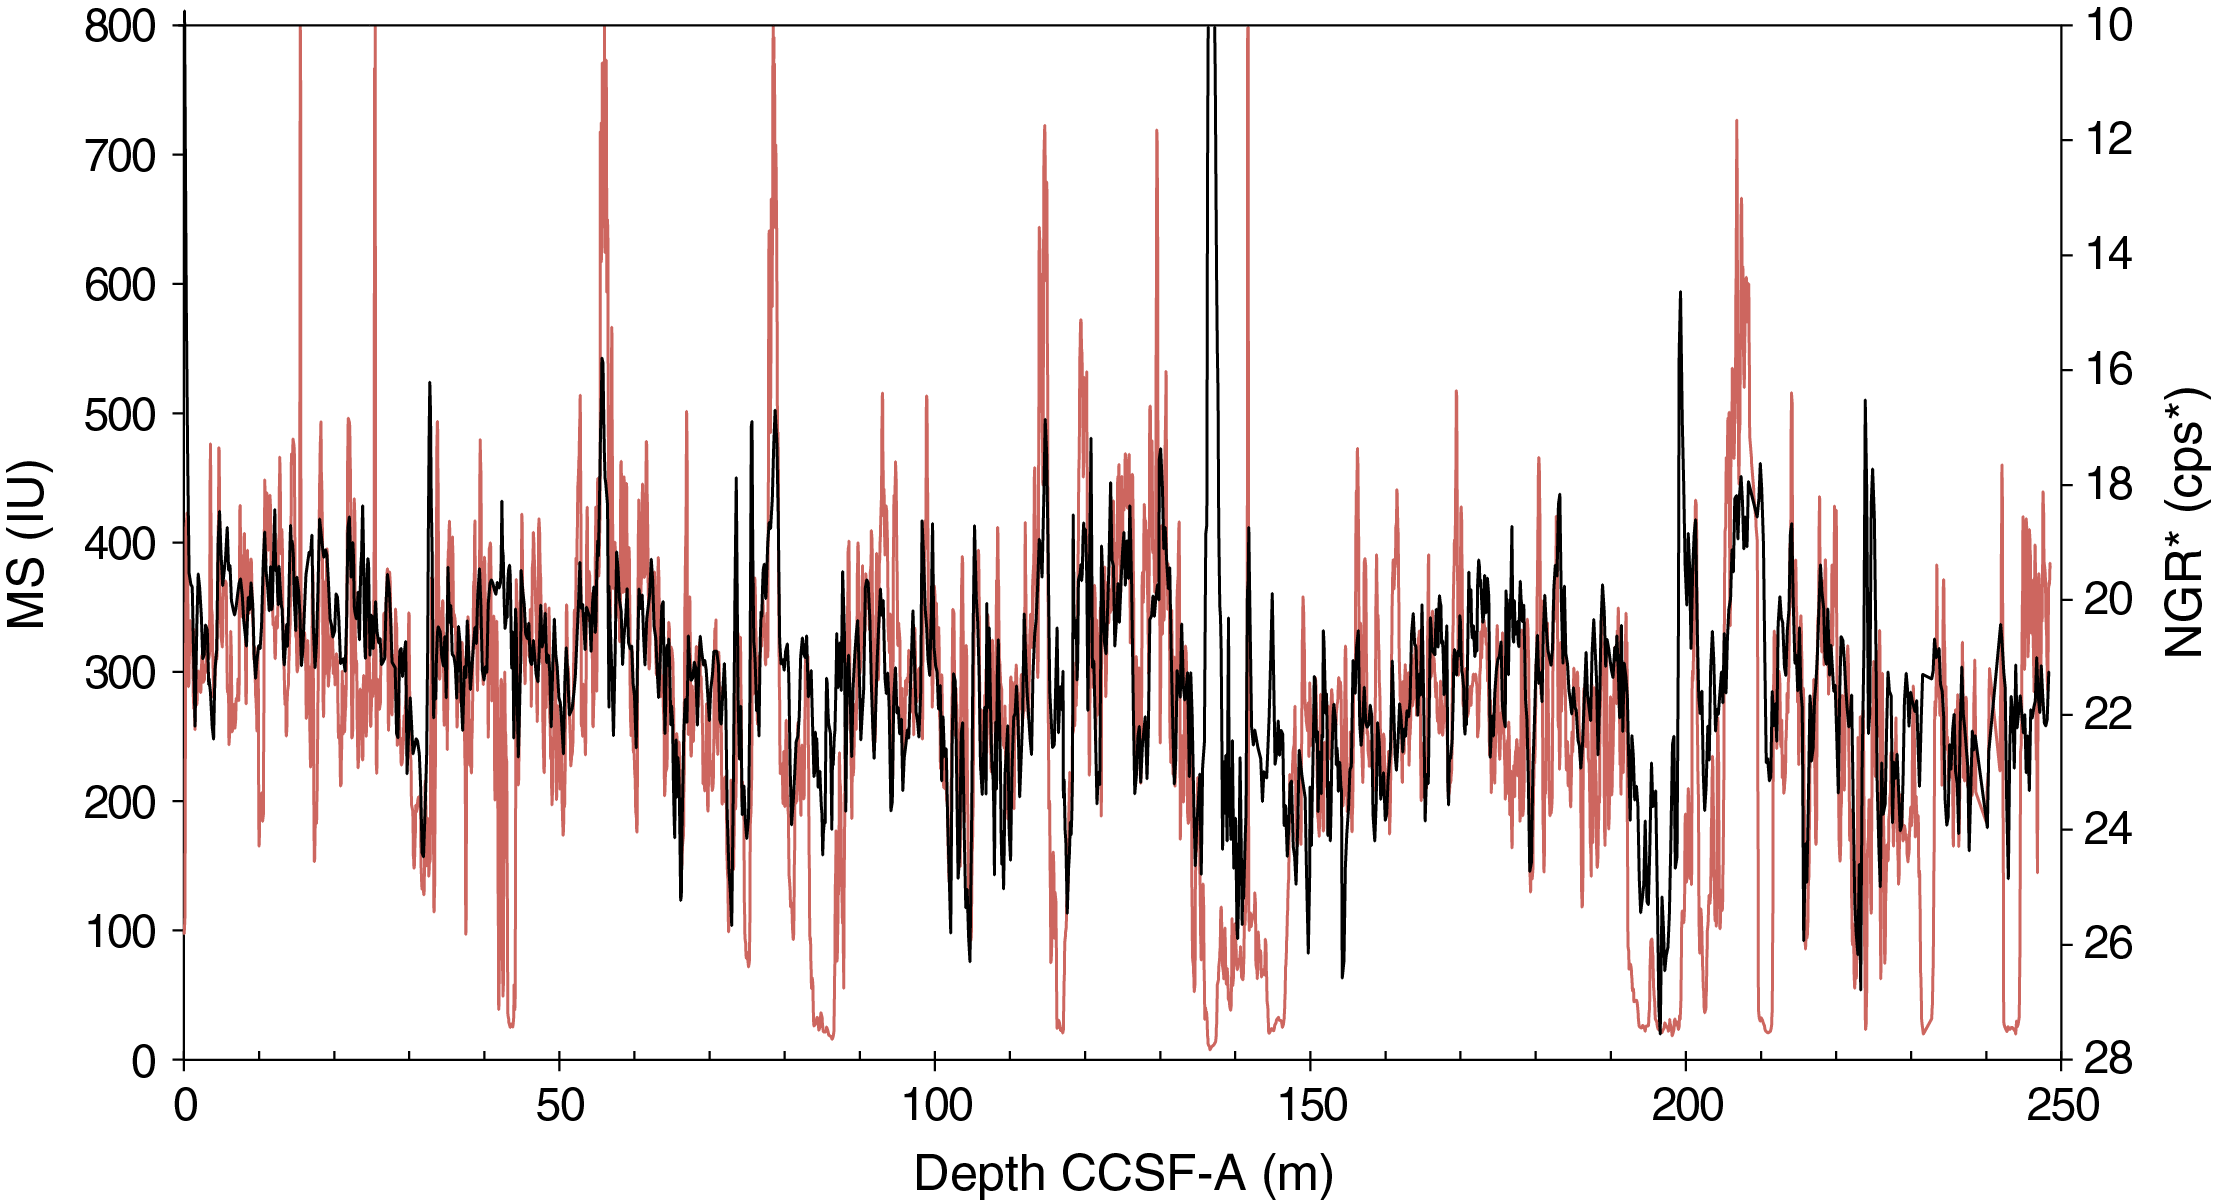
Figure F44. Splice data: MS and NGR*.
Natural gamma radiation
Unlike previous Central South Pacific sites, variability in the GRA density-normalized NGR (NGR*) data are mainly anticorrelated with variability in the MS data at Site U1542, although there are a few intervals that contain high abundances of calcareous nannofossils that yielded both low MS and NGR data (e.g., 41.4–42.4, 136–138, and 135–148 m core composite depth below seafloor [CCSF-A]) (Figure F44).
We deconvolved the U1542 NGR* into (semi)quantitative concentrations for the elements K, (Figure F45) Th, and U following the methods of Dunlea et al. (2013) and De Vleeschouwer et al. (2017). The three elements display differing patterns on a detailed scale, although possibly coherent cycles can be visually identified in the smoothed data (Figures F45, F46). The K content (a common proxy for the bulk terrigenous sediment fraction) variability anticorrelates with MS data (Figure F45), although small-scale offsets and differences are visible in the expression of minima and maxima (e.g., at 60–70 and 80–90 m CCSF-A). The principal anticorrelated pattern might reflect changes in the differential recording of changing terrestrial input sources and/or transport processes.
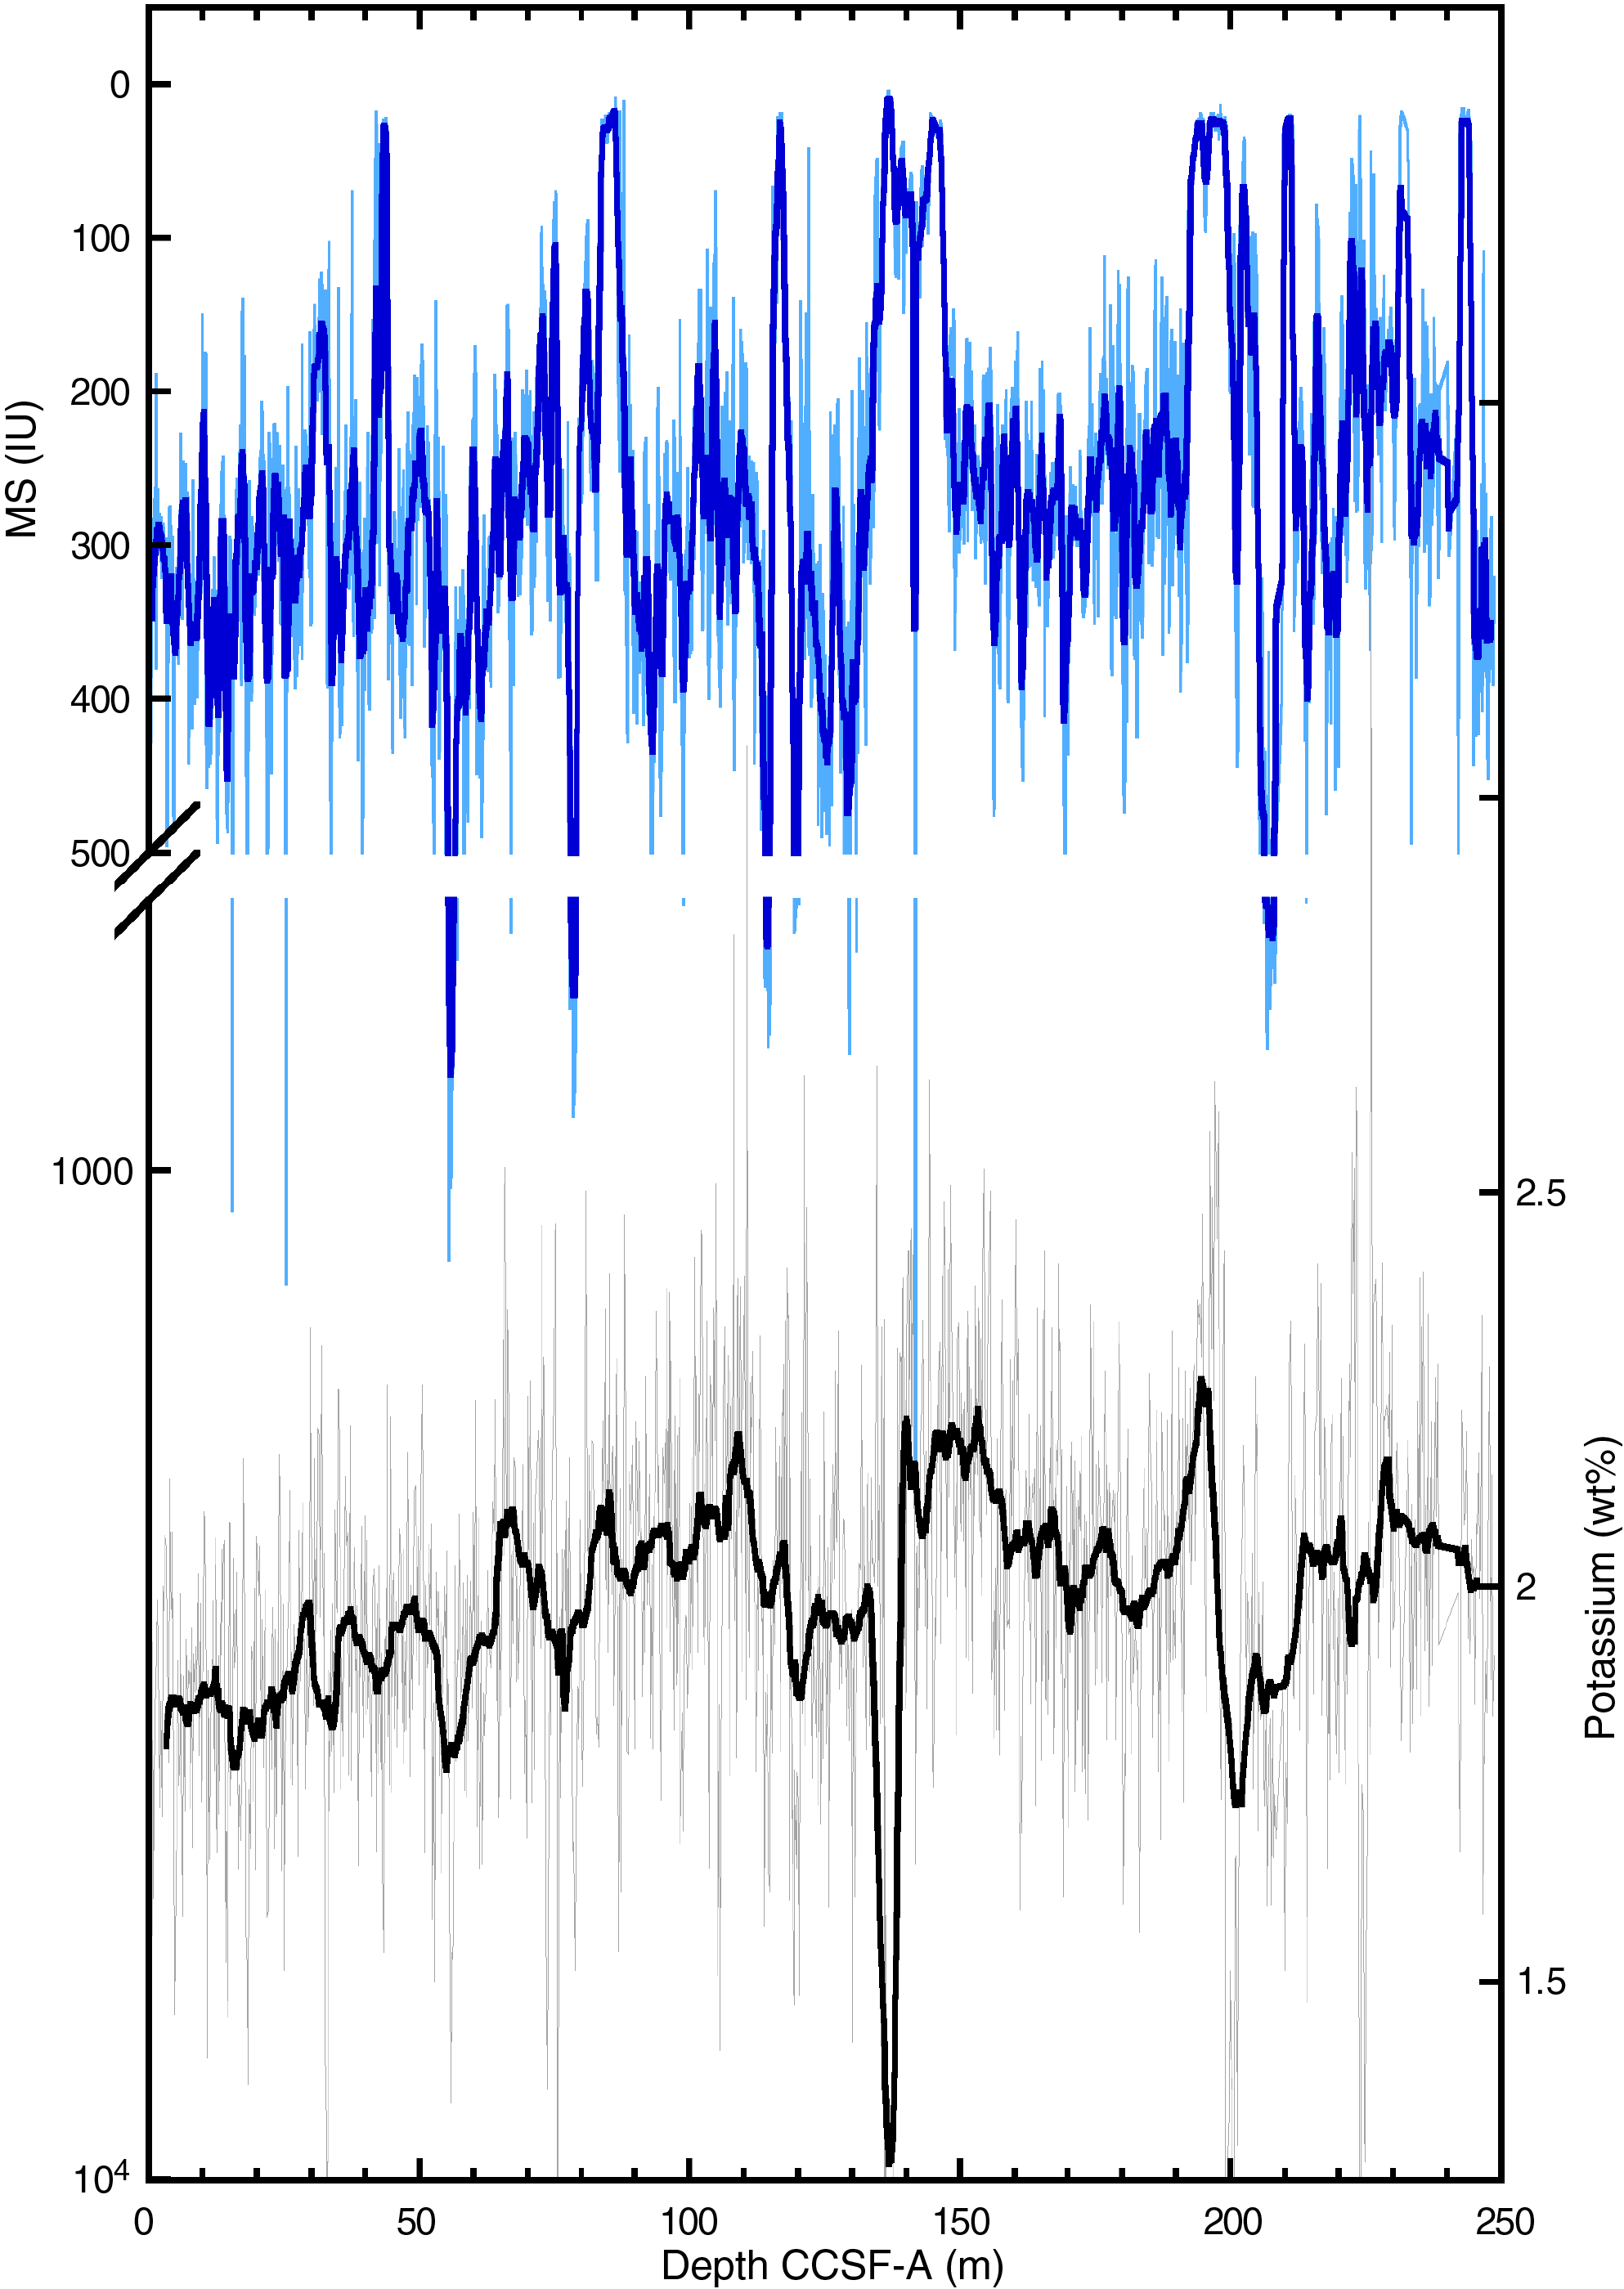
Figure F45. Spliced logging-derived proxy data.
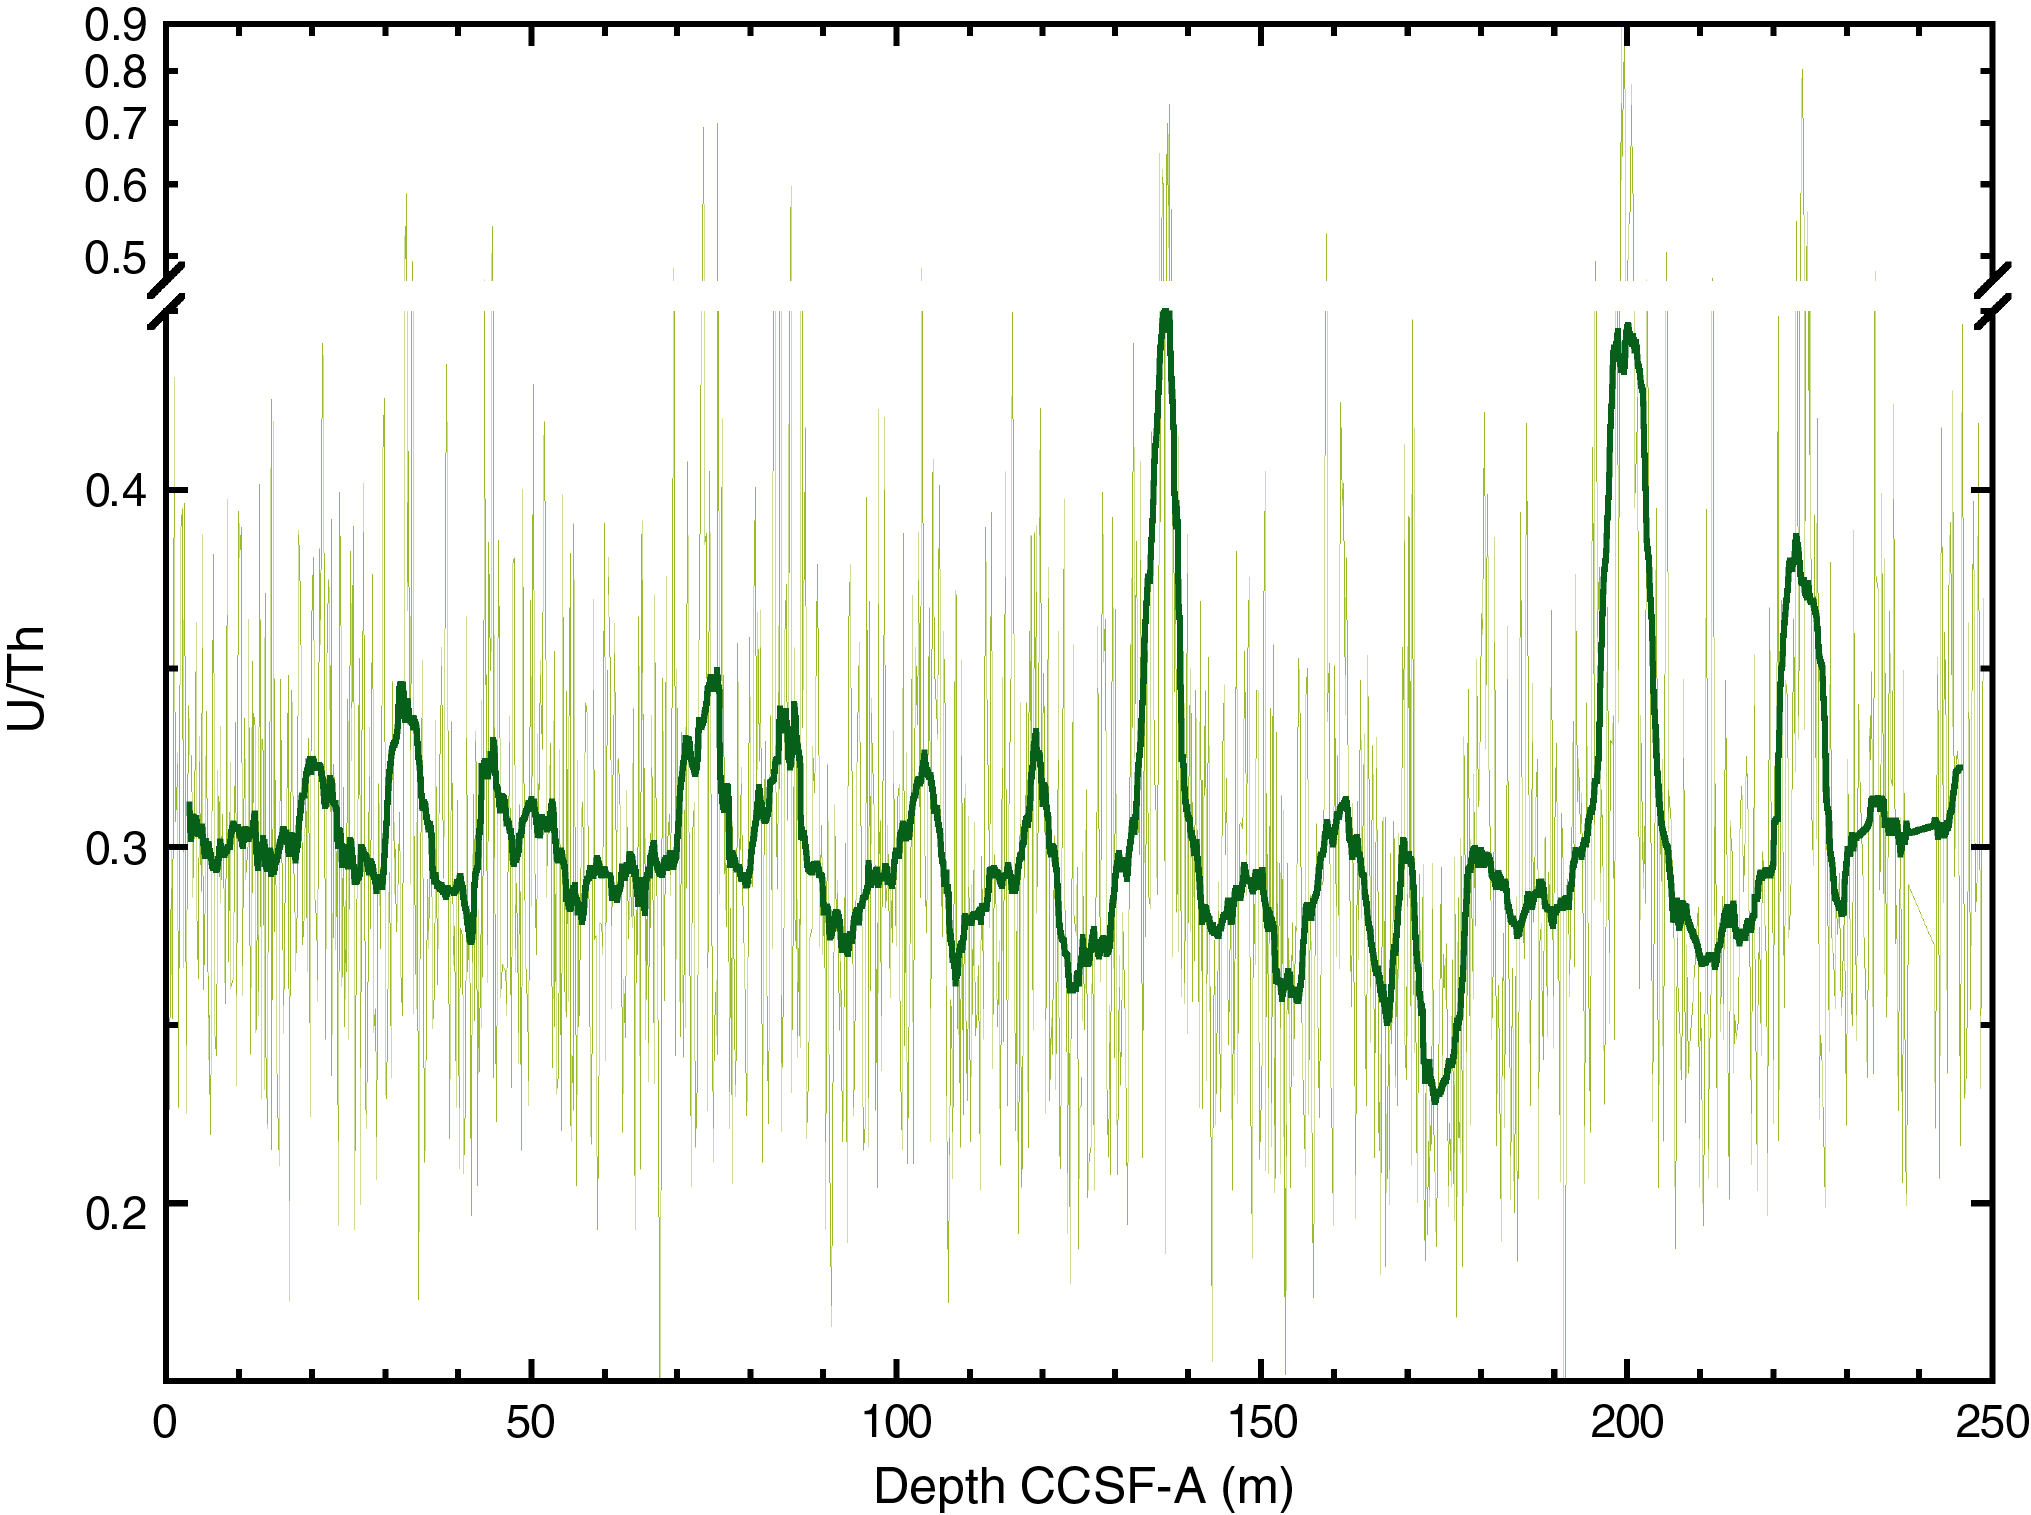
Figure F46. Spliced record U/Th ratio.
Deconvolved elemental U content, when normalized to Th content to partially account for dilution effects and smoothed, shows distinct downcore variation (Figure F46). Values range between ~0.25 and ~0.45 in the 30-point smoothed record, whereas individual data exhibit considerably wider ranges between ~0.2 and ~0.7. The smoothed data show maxima that reoccur every ~13–15 m; the most prominent maxima around 130–150, 192–205, and 220–225 m CCSF-A are between ~0.38 and ~0.45 and are potentially indicative of authigenic U enrichment.
Bulk density, grain density, and porosity
At Site U1542, we made WRMSL GRA measurements at 2 cm spacing for Hole U1542A and at 3 cm spacing for Holes U1542B–U1542D and made discrete MAD density measurements (76 samples). In contrast to the previous pelagic sites, there are large numbers of outliers in the whole-round WRMSL data due to degassing and core expansion. After processing cores from Hole U1542A according to typical protocol, we decided to minimize the impact of degassing on data quality by changing the core flow strategy and WRMSL settings for Holes U1542B–U1542D. An assessment of the impact of these changes on data quality will be presented later in a dedicated data report about the implementation of the fast workflow at Site U1542.
Overall, GRA bulk density values from Holes U1542A, U1542C, and U1542D vary mostly from ~1.6 to ~2.25 g/cm3 and discrete MAD values range from 1.68 to 2.2 g/cm3 (Figure F47). The highest GRA values, which reach ~2.2 g/cm3, reoccur about every 16–20 m downcore in Holes U1542A, U1542C, and U1542D. The lowest bulk density values (~1.38 g/cm3 in Hole U1542C; ~1.55 g/cm3 in Hole U1542A) correspond to the nannofossil facies identified at ~136 m CCSF-A.
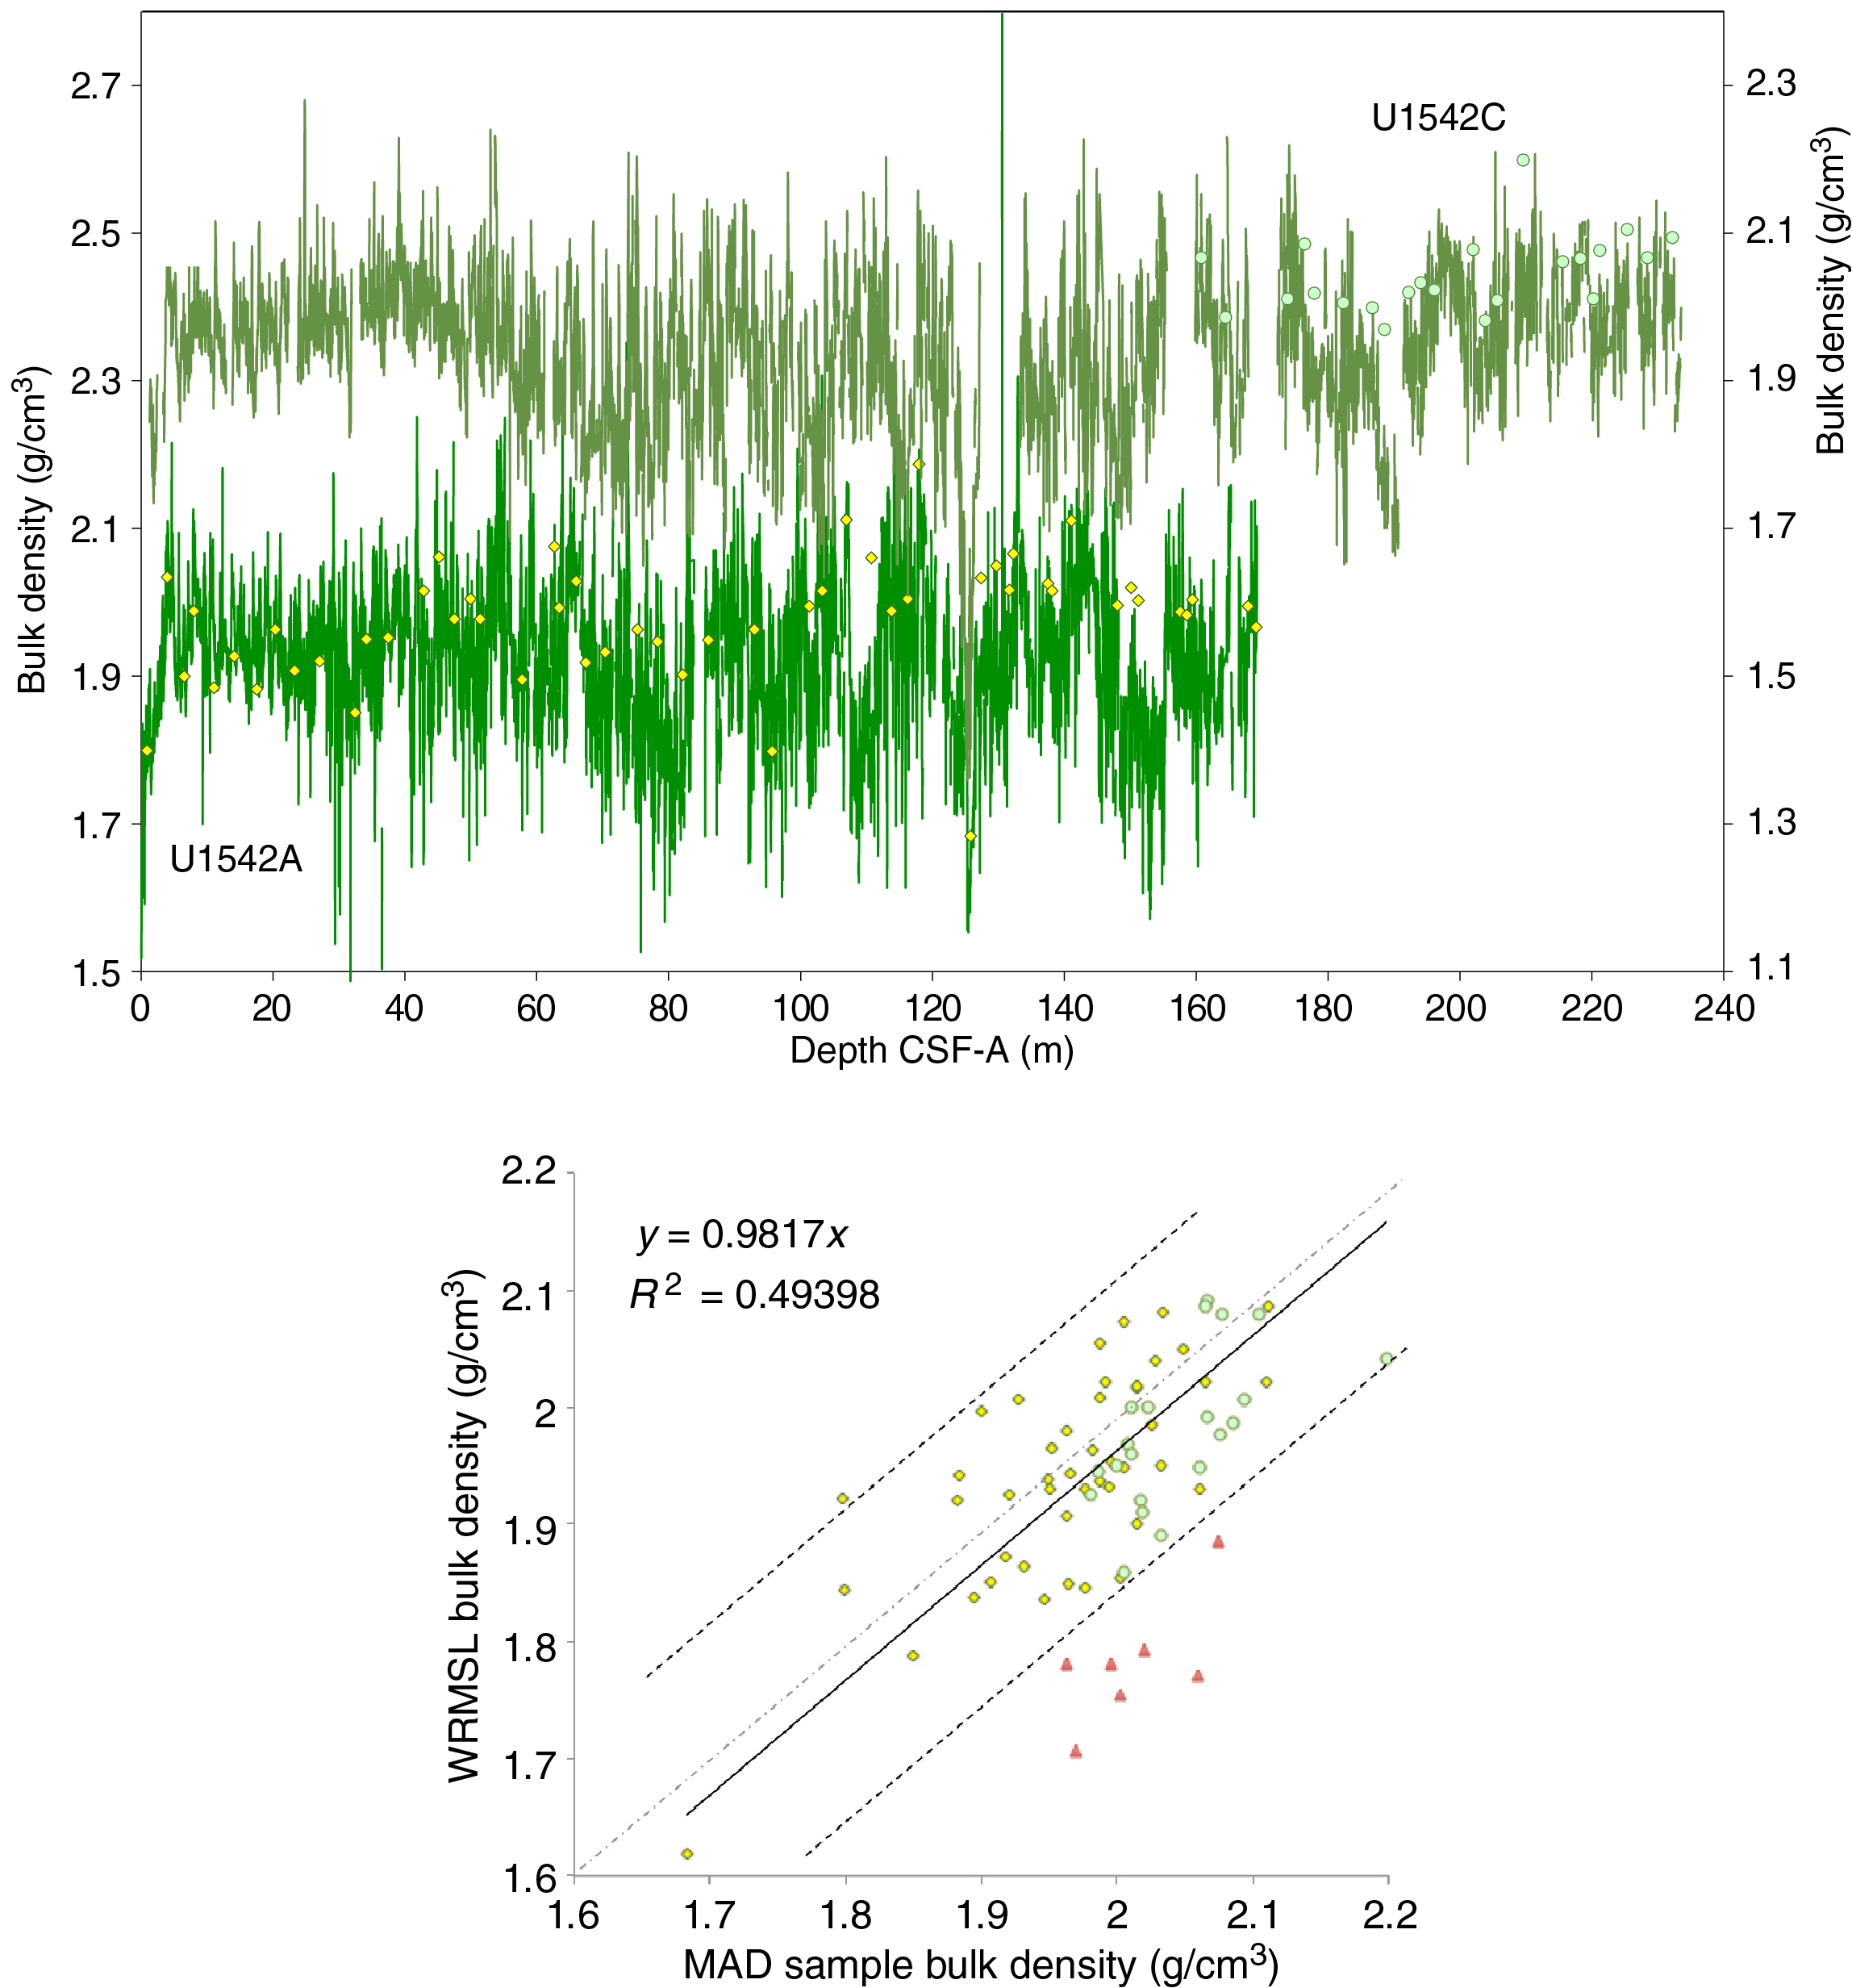
Figure F47. GRA bulk density and MAD.
To calibrate the GRA densities, 54 MAD samples were taken from Hole U1542A and 22 samples were taken from Sections 383-U1542C-20H-1 (160.80 m CSF-A) through 30H-4 (232.25 m CSF-A; bottom of the hole). Bulk densities calculated from discrete MAD samples match the range of GRA-derived estimates and display comparable downhole trends in Holes U1542A and U1542C (Figure F47). To quantify the correlation between MAD sample density and WRMSL GRA measurements, the depth of individual GRA data points was adjusted for instances of clearly identifiable offsets between the WRMSL and the split-core MAD samples due to core expansion and core handling. The correlation between MAD data from both holes and WRMSL GRA measurements (after correcting data offsets, along with thorough data processing and outlier identification) (Figure F47) has a correlation coefficient of 0.49; this value is low compared to previous Central South Pacific sites, which yielded values of r2 ≥ 0.94.
In addition to bulk density, the MAD measurements provide estimates of dry density, grain density, porosity, water content, void ratio, and several other properties, which co-vary downhole. Water content is 19% to 28% at most depths, exceeding 30% only in nannofossil-rich intervals and ranging as high as 37% in the nannofossil facies of Section 383-U1542A-14H-3. Bulk density and porosity are anticorrelated. Intervals of high porosity and water content and low grain density correspond to sediments with higher biogenic carbonate/diatom content (see Sedimentology; Lithofacies 9, 4, and 10).
Compressional P-wave velocity
Because of the fractured texture of sediments at Site U1542A, whole-round P-wave velocity measurements yielded a very high amount of erroneous data that could not be used, and extensive manual data reduction was unlikely to rectify the problem (Figure F48). For this reason, we stopped taking WRMSL P-wave velocity measurements below Section 383-U1542A-20H-3. Because discrete P-wave measurements on the gantry also did not provide reliable results and induced additional cracking in core sections, we stopped measuring discrete P-wave velocity values below Section 383-U1542A-13H-4. As part of the strategy to speed up the core flow for Hole U1542C onward, combined with our assessment that the P-wave velocity data collected for Hole U1542A was of poor quality, no P-wave data was collected for Holes U1542C and U1542D.
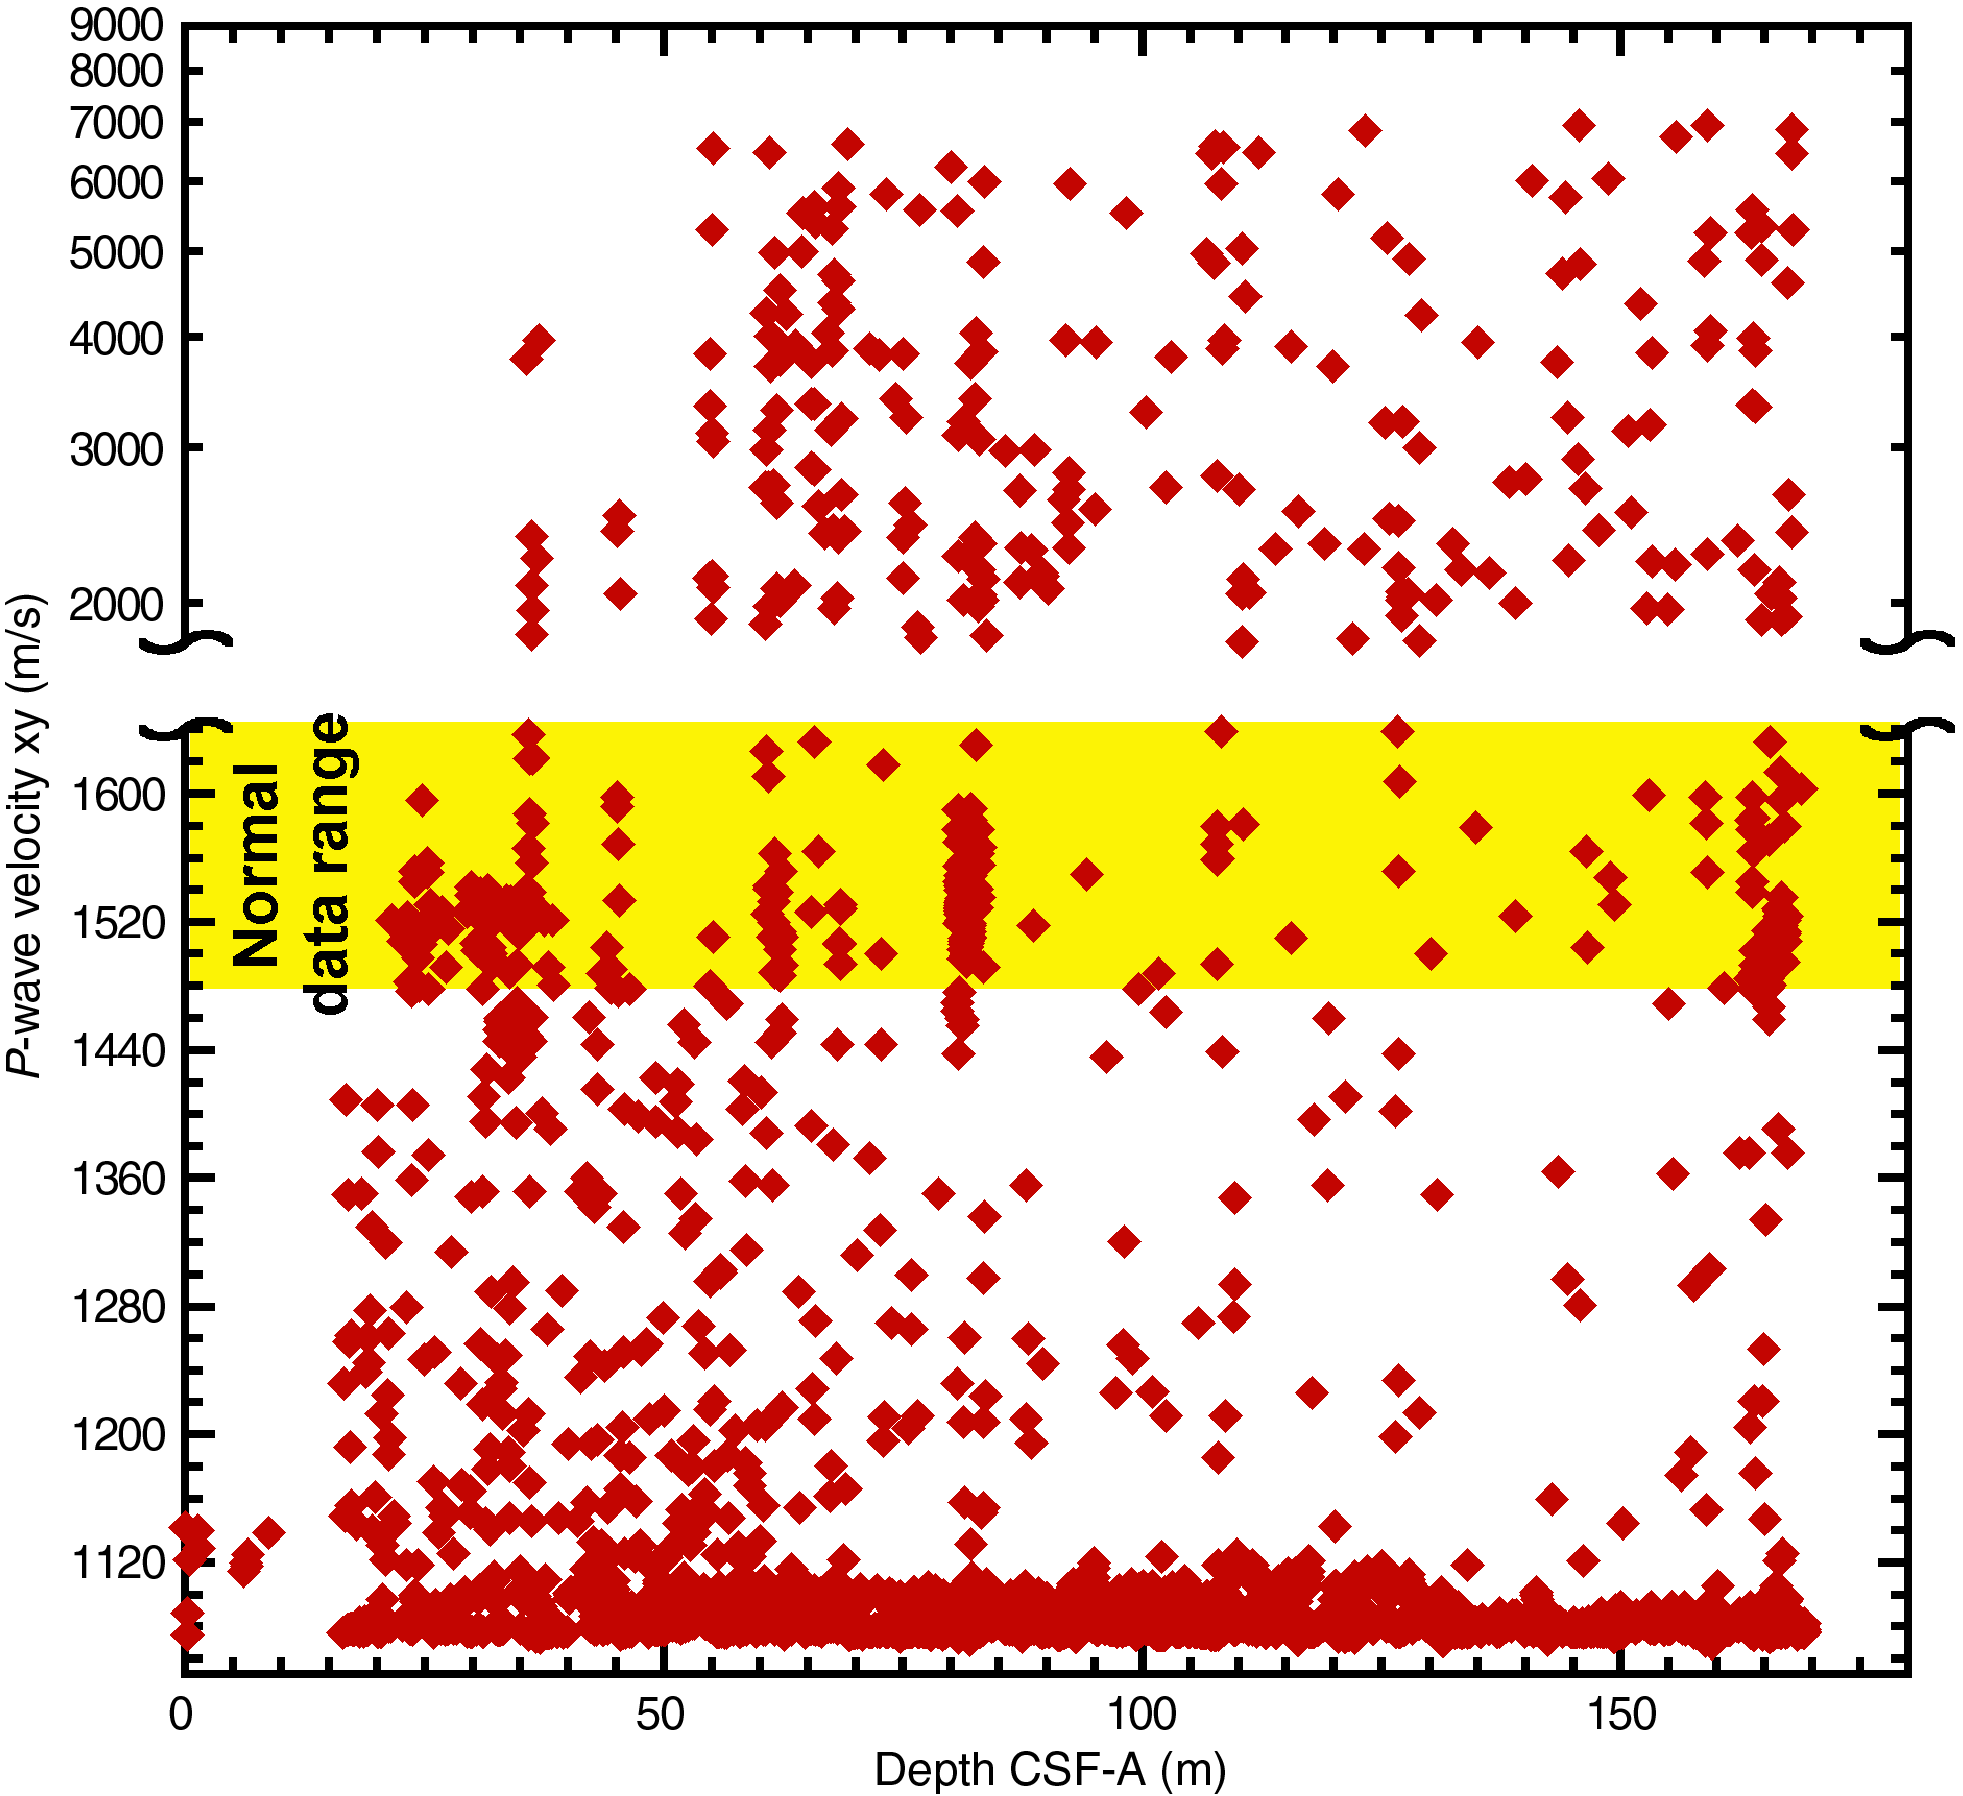
Figure F48. P-wave velocity.
Thermal conductivity
Because of our change to a faster core flow, we measured thermal conductivity only on Hole U1542A cores (one section per core) (Figure F49). We used a value of 0.7 W for the needle probe on the whole-round sections, with three replicate measurements taken at each depth. We encountered a few failed thermal conductivity calculations from the TK04 thermal conductivity meter setup because we had too few solutions, but two sets of measurements produced results from a low number of values well outside the range of standard errors, which classified those values as outliers. Thermal conductivity ranges from ~1.18 to ~1.64 W/(m·K) with a mean value of ~1.4 W/(m·K). These values are generally higher than those from previous pelagic sites, in all likelihood because of the lower water and higher terrigenous content of the sediments at Site U1542.
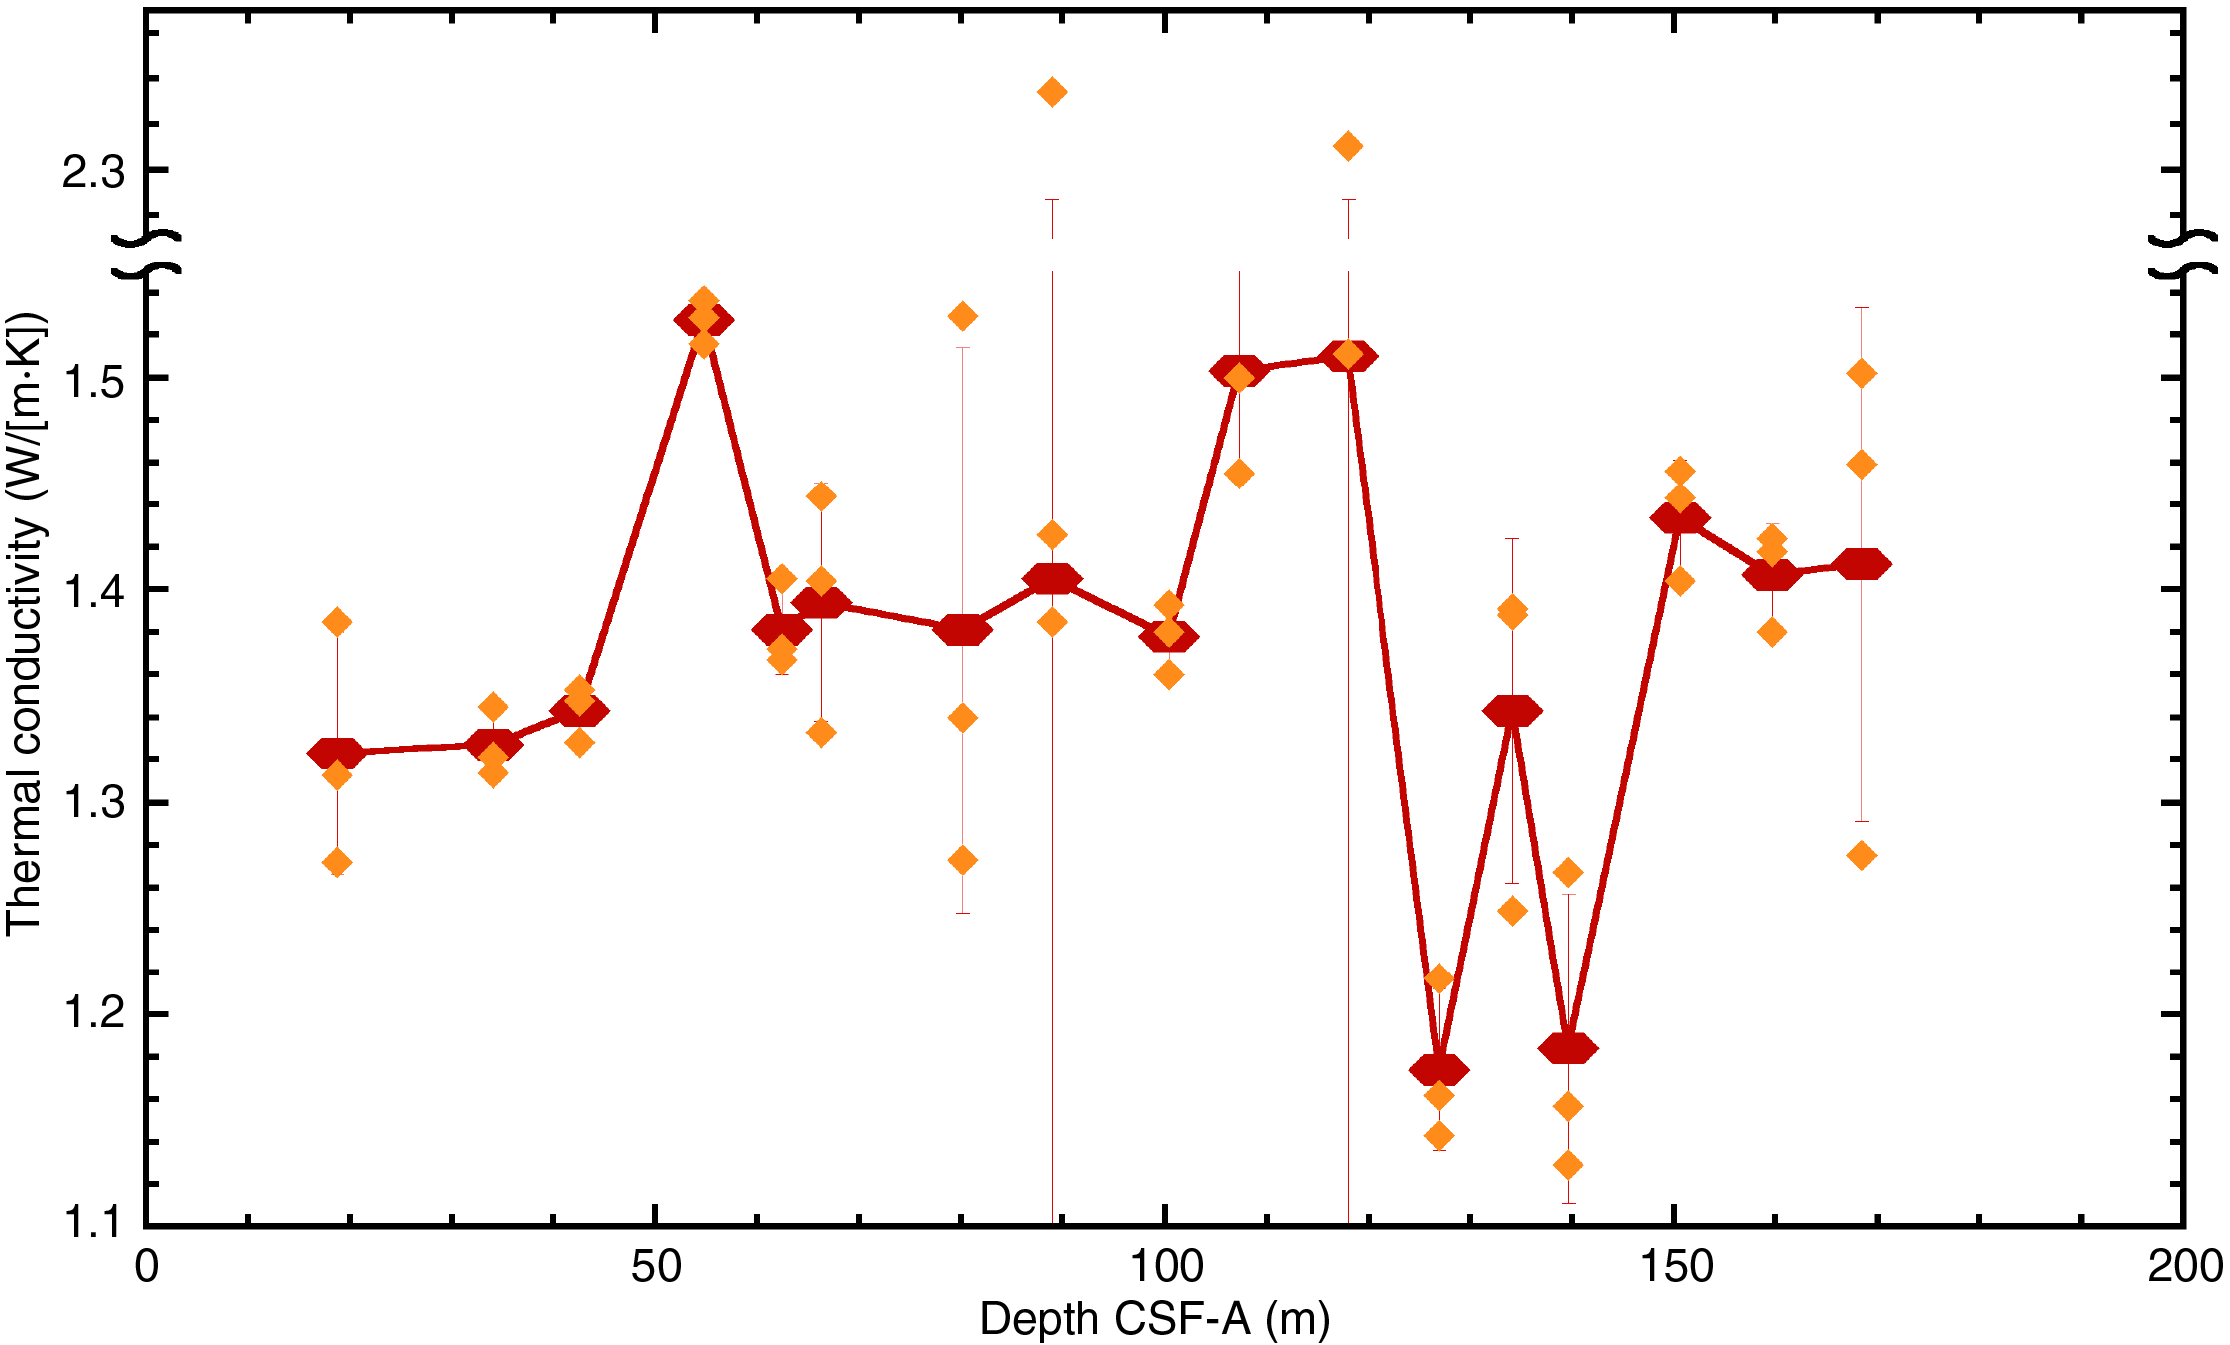
Figure F49. Thermal conductivity.
Summary
Data acquired from whole-round measurements for Site U1542 are generally in good agreement with those from split-core measurements. However, considerable offsets exist because of ongoing expansion of sediment between whole-round WRMSL measurements and SHMSL measurements and MAD sampling on the split cores. These differences will have to be corrected with further onshore work, including detailed inspection of MS data (Figure F43). For example, comparison of MS between whole-round and point sensor measurements may provide the means to correct whole-round core depths to split-core equivalents. The manual processing/cleaning of WRMSL and NGRL data based on the notes found on the whole-round WRMSL/STMSL log sheets provided sufficiently clean data for GRA, MS, and NGR but yielded data loss of about 8%–15% depending on hole and data category. P-wave velocity measurements largely failed at Site U1542 because of core expansion and related cracking of the sediment.
At this site, downhole changes in physical property characteristics are only in limited agreement with the defined lithofacies described in Sedimentology. The relatively high MS and GRA values, compared to those at pelagic Sites U1539–U1541, are likely related to the higher lithogenic content of Site U1542. The relationship between MS and GRA values at Site U1542 also differs from the relationships found at pelagic Sites U1539–U1541, suggesting a complex relationship between biogenic and terrigenous components and their grain size distribution at Site U1542. This complexity likely indicates that the terrigenous sediment components reflect multiple processes (e.g., ice and glacial meltwater transport as well as dust, current-induced lateral material transport, and sorting after deposition), all influenced by various forcing such as climate and glacier mass balance changes, associated sea level changes, and dynamic changes in bottom water circulation.
Downhole measurements
In situ temperature and heat flow
In Hole U1542A, we carried out five downhole formation temperature measurements using the APCT-3 tool (Table T10). We calculated in situ formation temperatures based on all five measurements and the three deployments that passed quality assurance/quality control (QA/QC) inspection. Cores 383-U1542A-4H and 7H yielded disturbed temperature dissipation profiles, and the measured temperatures did not fit the reference temperature model well (Figure F50). The two deepest temperature measurements on Cores 13H and 16H both show relatively good temperature dissipation profiles, although according to the log sheets, each deployment suffered from heave in excess of 4 m during deployment in the formation. Temperatures of these latter sets can be matched relatively well with the reference models and fulfill basic QC criteria. However, resulting temperatures in Cores 13H and 16H might be compromised because the shallower Core 13H yields a higher temperature (9.97°C) at 121.1 m CSF-A than the deeper Core 16H (9.11°C) at 140.8 mbsf. As a result, the overall downhole temperature profile, its fit, and the resulting heat flow remain insufficiently constrained.
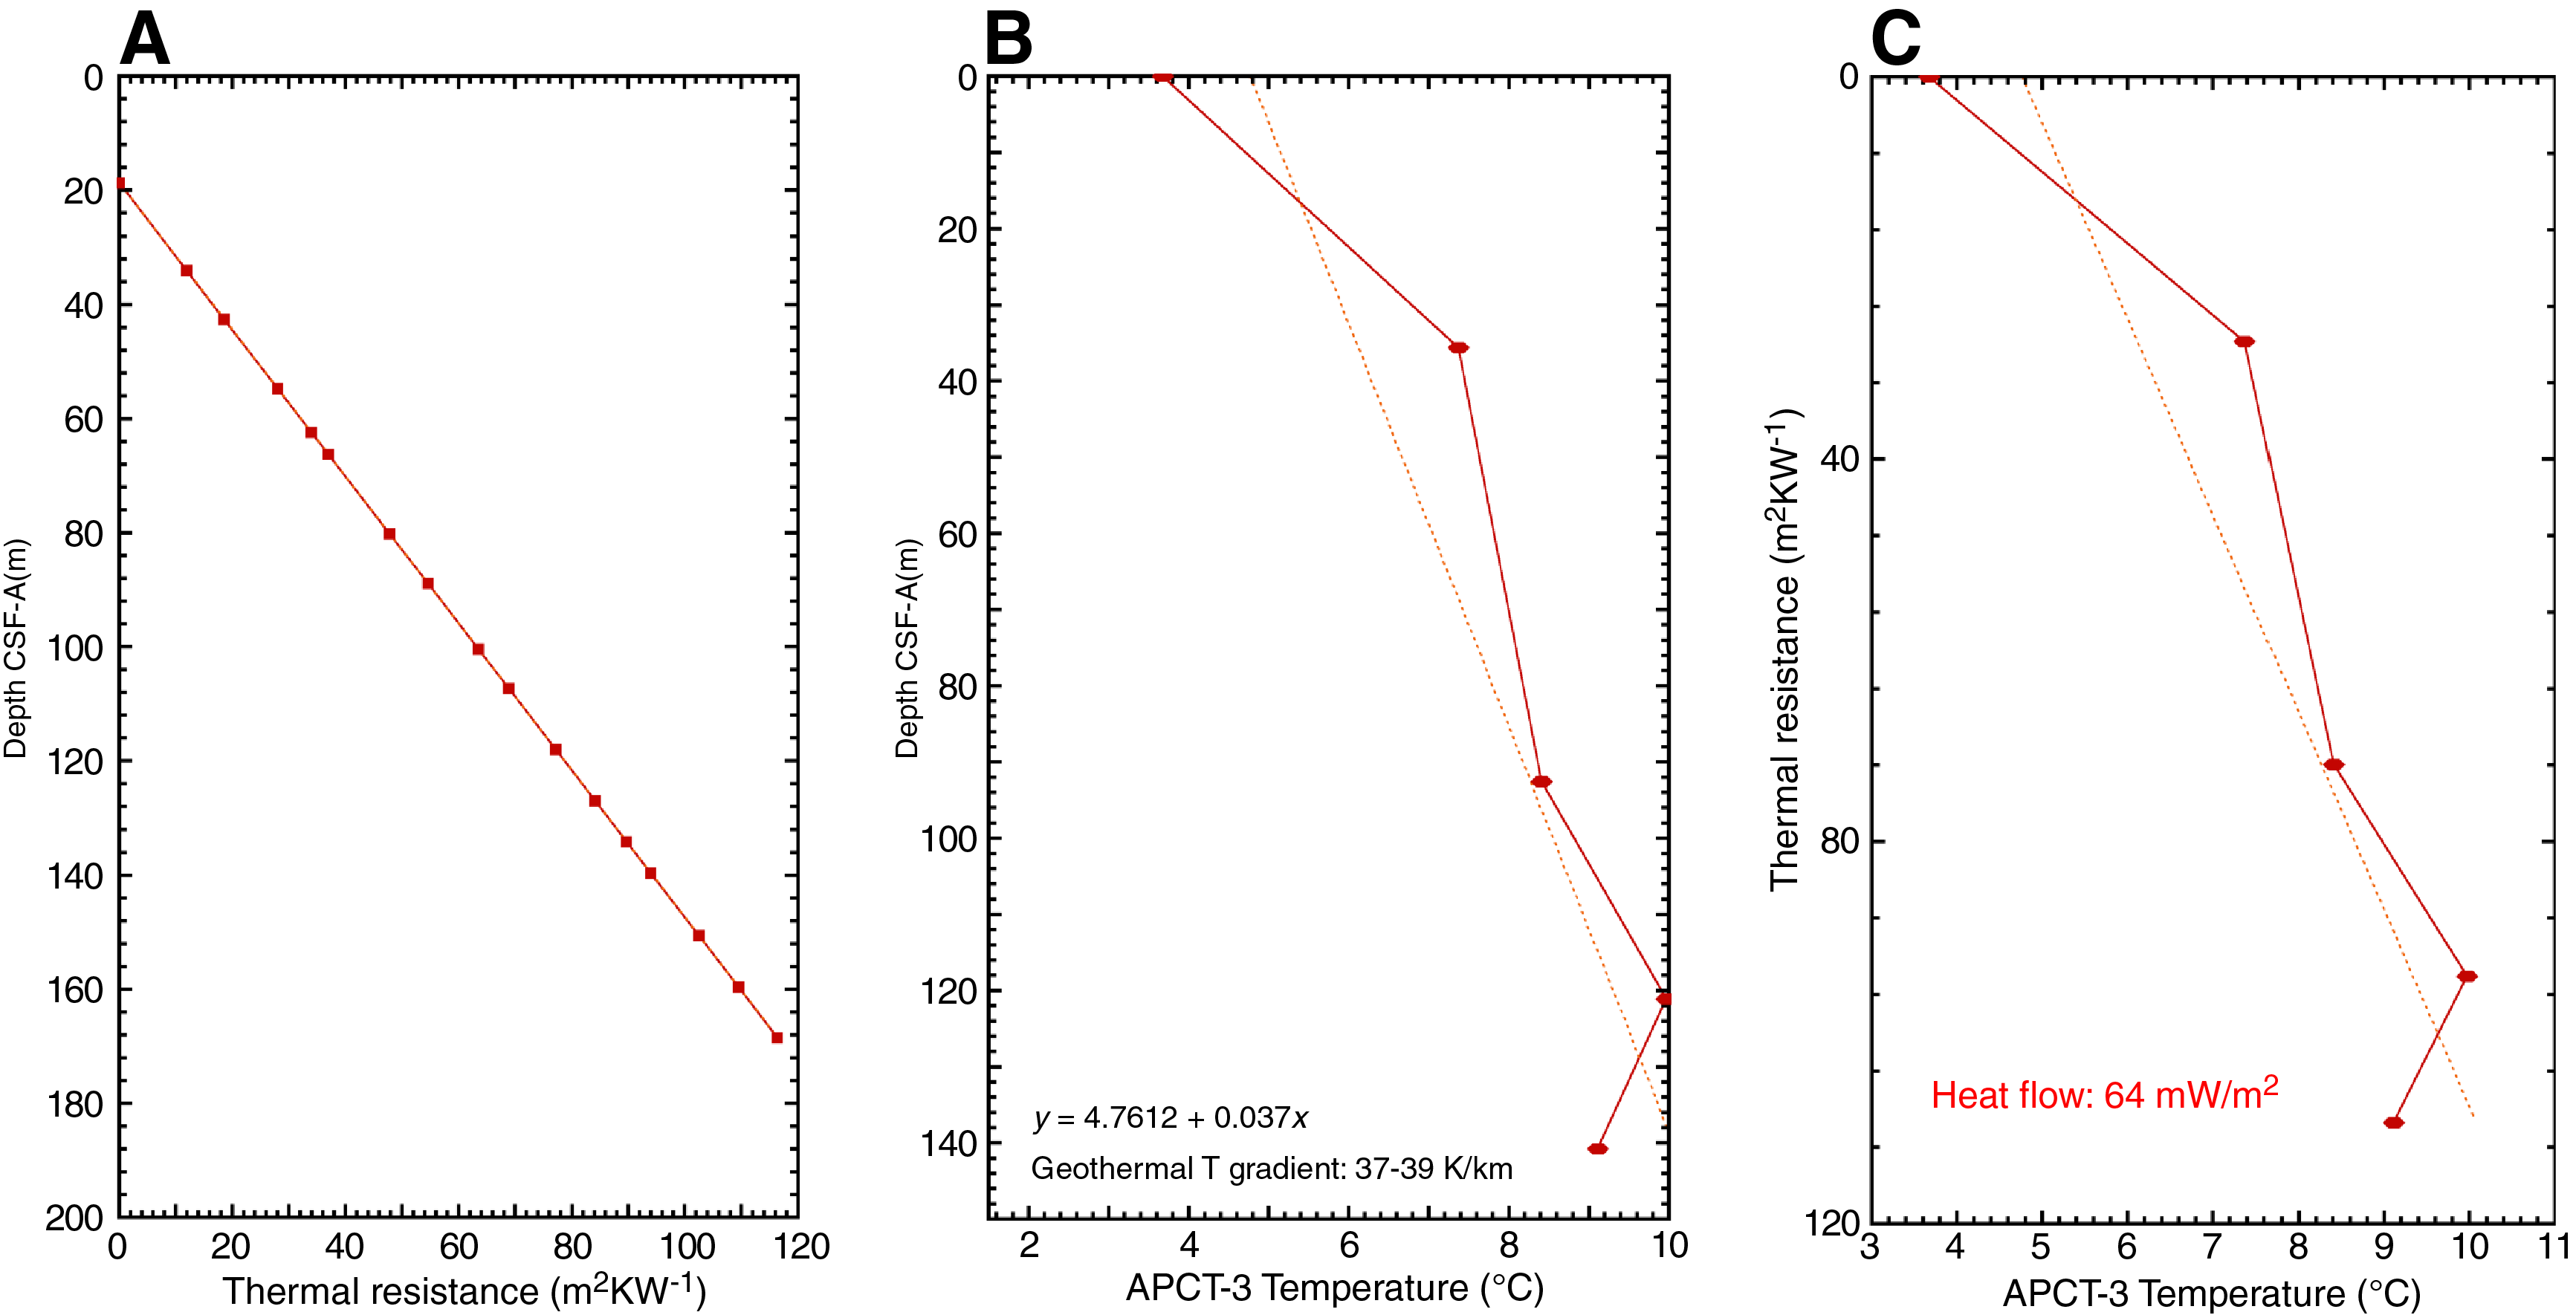
Figure F50. APCT-3 tool heat flow calculations.
Because of operational constraints, no additional formation temperature measurements were collected in Holes U1542C and U1542D to optimize drilling time and core recovery. We calculated the average bottom water temperature as 3.675°C from the APCT-3 logs, and the recorded minimum average of 3.534°C (Table T10) was taken from the temperature log while the cutting shoe was halted at the mudline for ~5 min with mud pumps switched off before lowering the tool to target depth.
Thermal conductivity under in situ conditions was estimated from laboratory-determined measurements using established methods (Pribnow et al., 2000; Hyndman et al., 1974) (see Physical properties in the Expedition 383 methods chapter [Winckler et al., 2021a]). Thermal resistance was calculated by cumulatively adding the inverse of the in situ thermal conductivity values over depth intervals downhole (Figure F50). We calculated the heat flow for the entire data set to be 66 mW/m2 from the slope of the linear fit between in situ temperature and thermal resistance (Figure F50). These values from the relatively shallow Site U1542 are significantly higher than those from the previous pelagic deepwater sites in the central South Pacific (U1539–U1541), which ranged between 11 and 21 mW/m2. However, existing heat flow data from the Chilean margin fall broadly within the range of Site U1542 values, between 30 and 60 mW/m2, although the lateral coverage of data in this region is fairly low (Hensen et al., 2019).
The geothermal gradient (gT) for Site U1542 is estimated to be 38 K/km within the total measured depth interval based on a linear fit of temperature versus depth. Reported results were calculated based on a mean thermal conductivity of 1.29 W/(m·K), a core water depth of 1111 m, a sediment density of 1.88 g/cm3 derived as the mean from our GRA density data, a bottom water temperature of 3.675°C, and a laboratory temperature of 18°C. Calculations for heat flow, resistivity, and geothermal gradient were checked for potential bias because of varying assumptions about the bottom water temperature, but reported results remain the same for various assumptions of bottom water temperature changes within a degree Celsius or less.
Stratigraphic correlation
Correlations between holes at Site U1542 were accomplished using Correlator software (version 3.0). Tie points were established mostly using MSP and reflectance b* data from the SHMSL (Figure F51), but in many cases a combination of measurements was used (Table T11). Because of gas expansion that created voids and cracks, the depths of features in the WRMSL MS data were often different than the depths of identical features resolved by measurements, made many hours later after the cores were split, on split sections using the SHMSL. For this reason, we used the SHMSL data to define tie points for the splice. We constructed a splice from 0 to 231.69 m CCSF-A using Holes U1542A, U1542C, and U1542D (Table T12; Figures F51, F52, F53); however, because some cores were disturbed and could not be used, the splice contains two gaps (Figures F51, F54), detailed below. Because Hole U1542C was drilled deeper than the other holes, the last two cores in Hole U1542C were appended to the bottom of the splice.
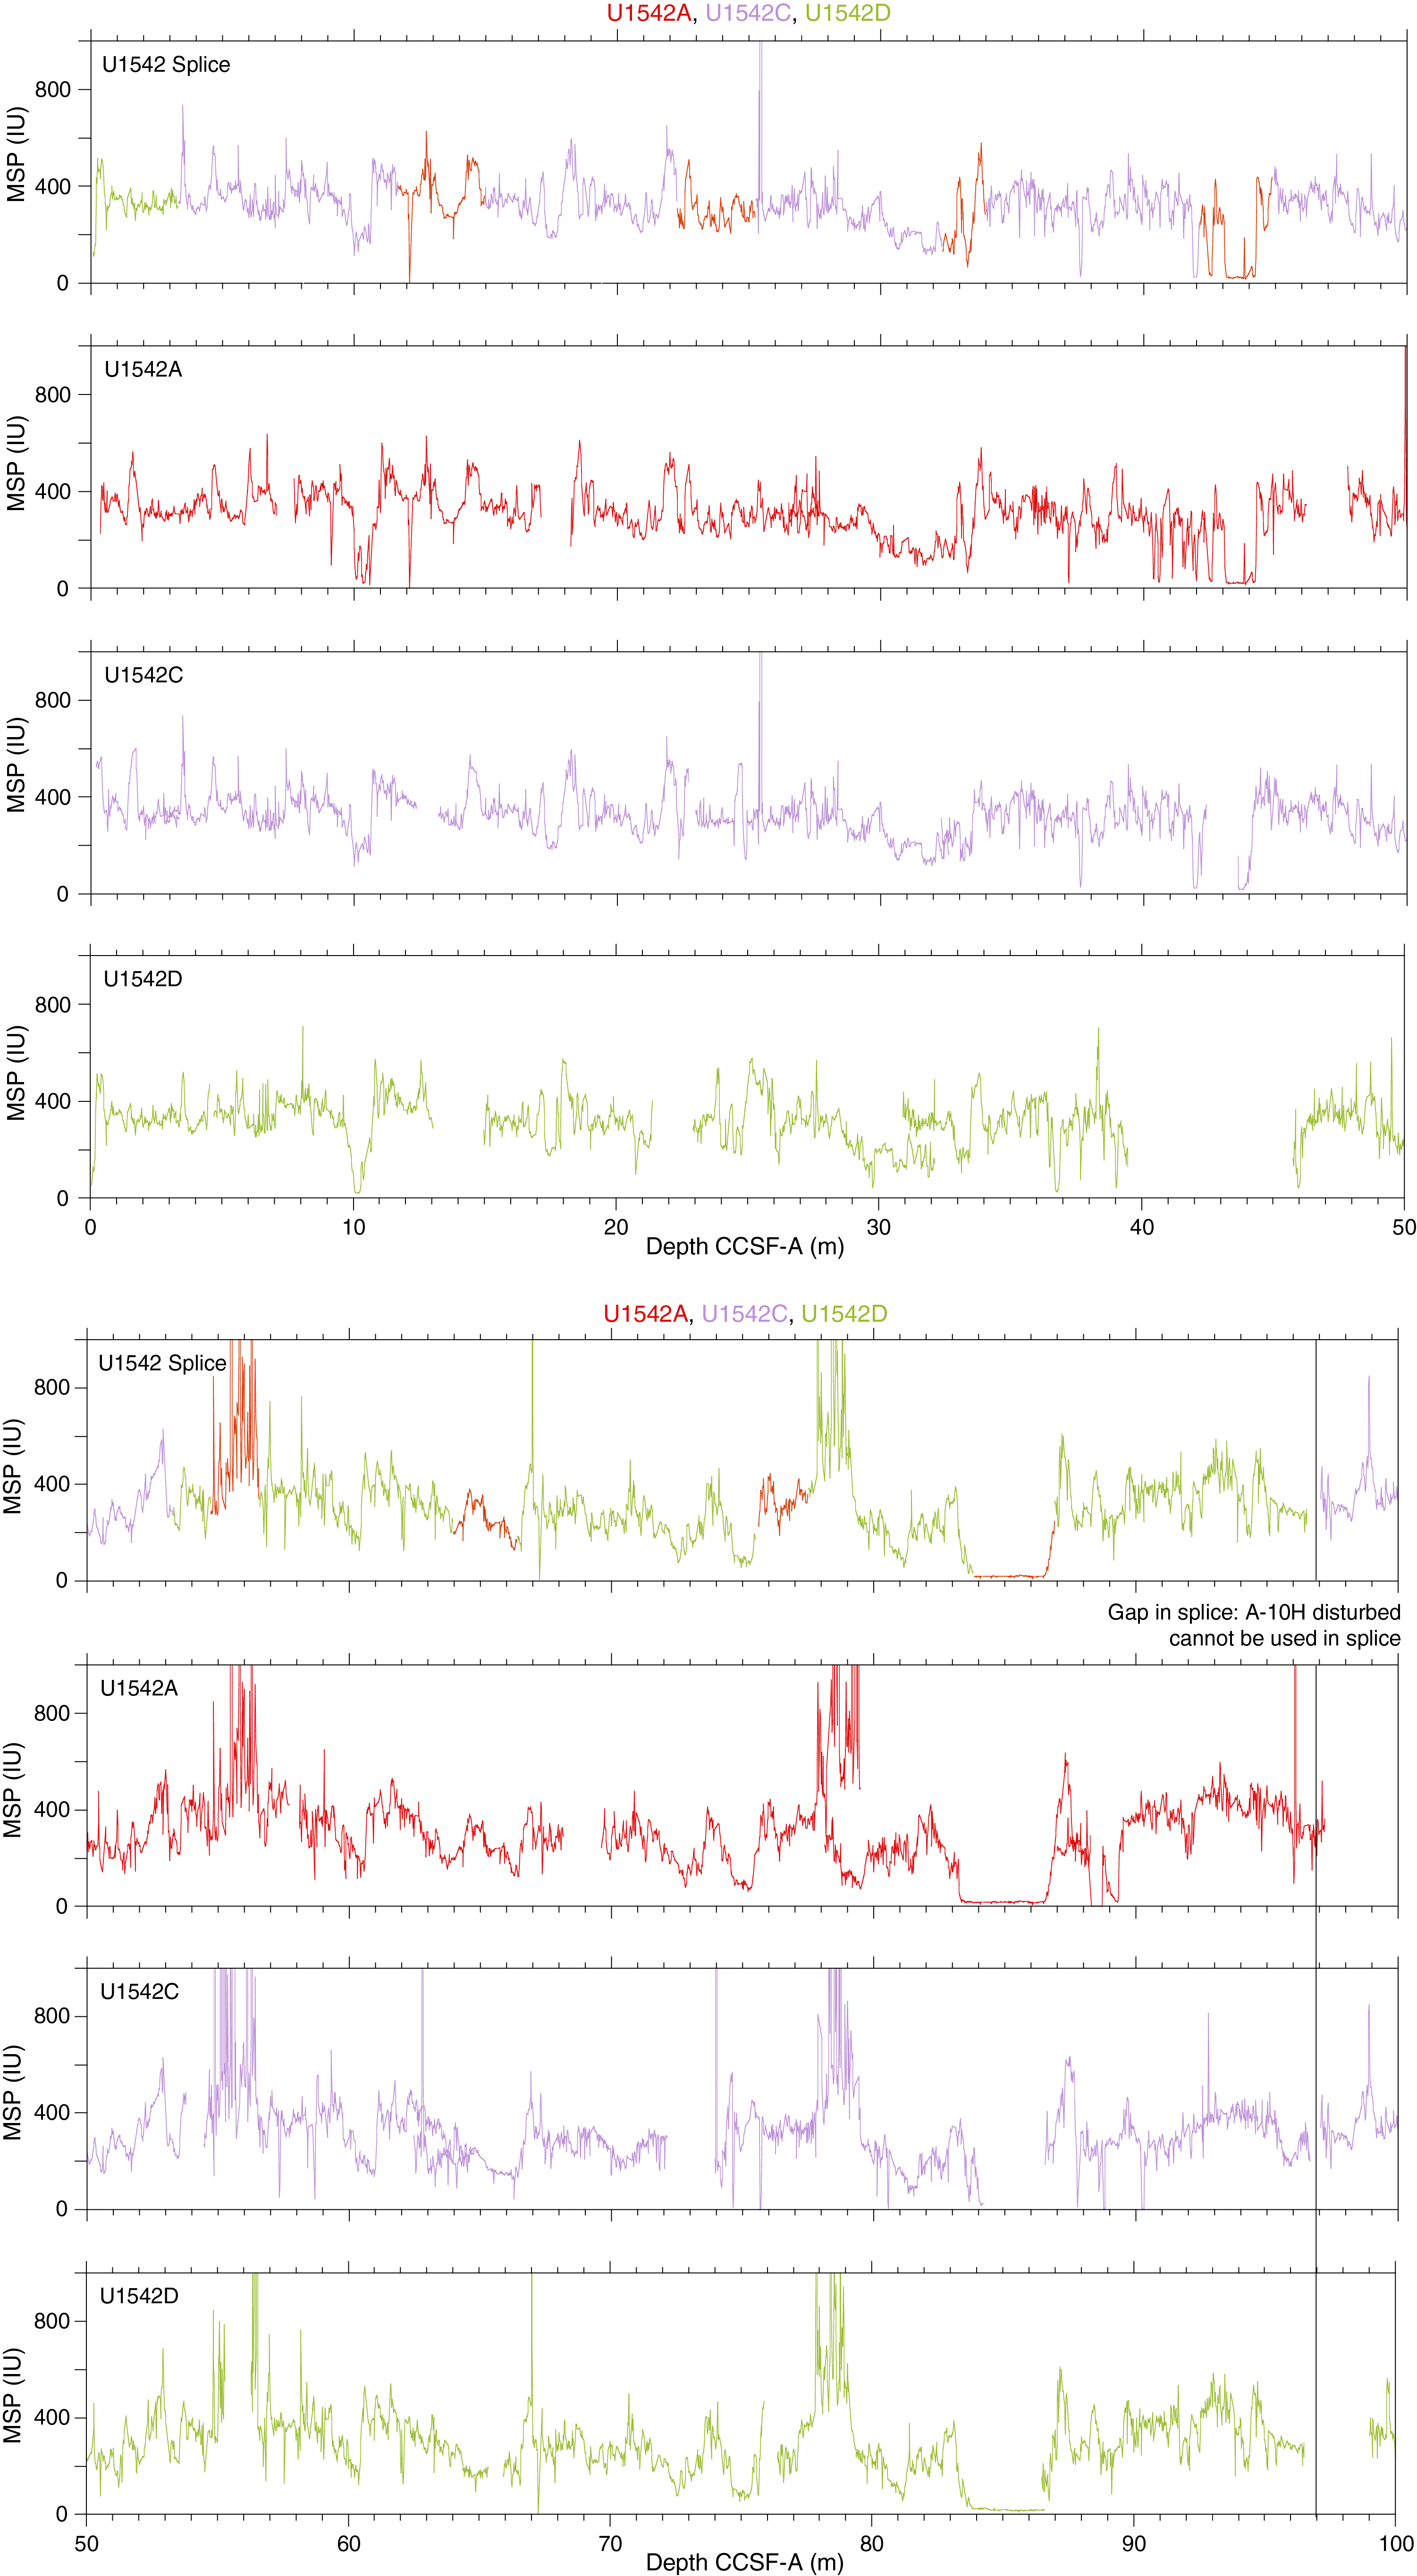
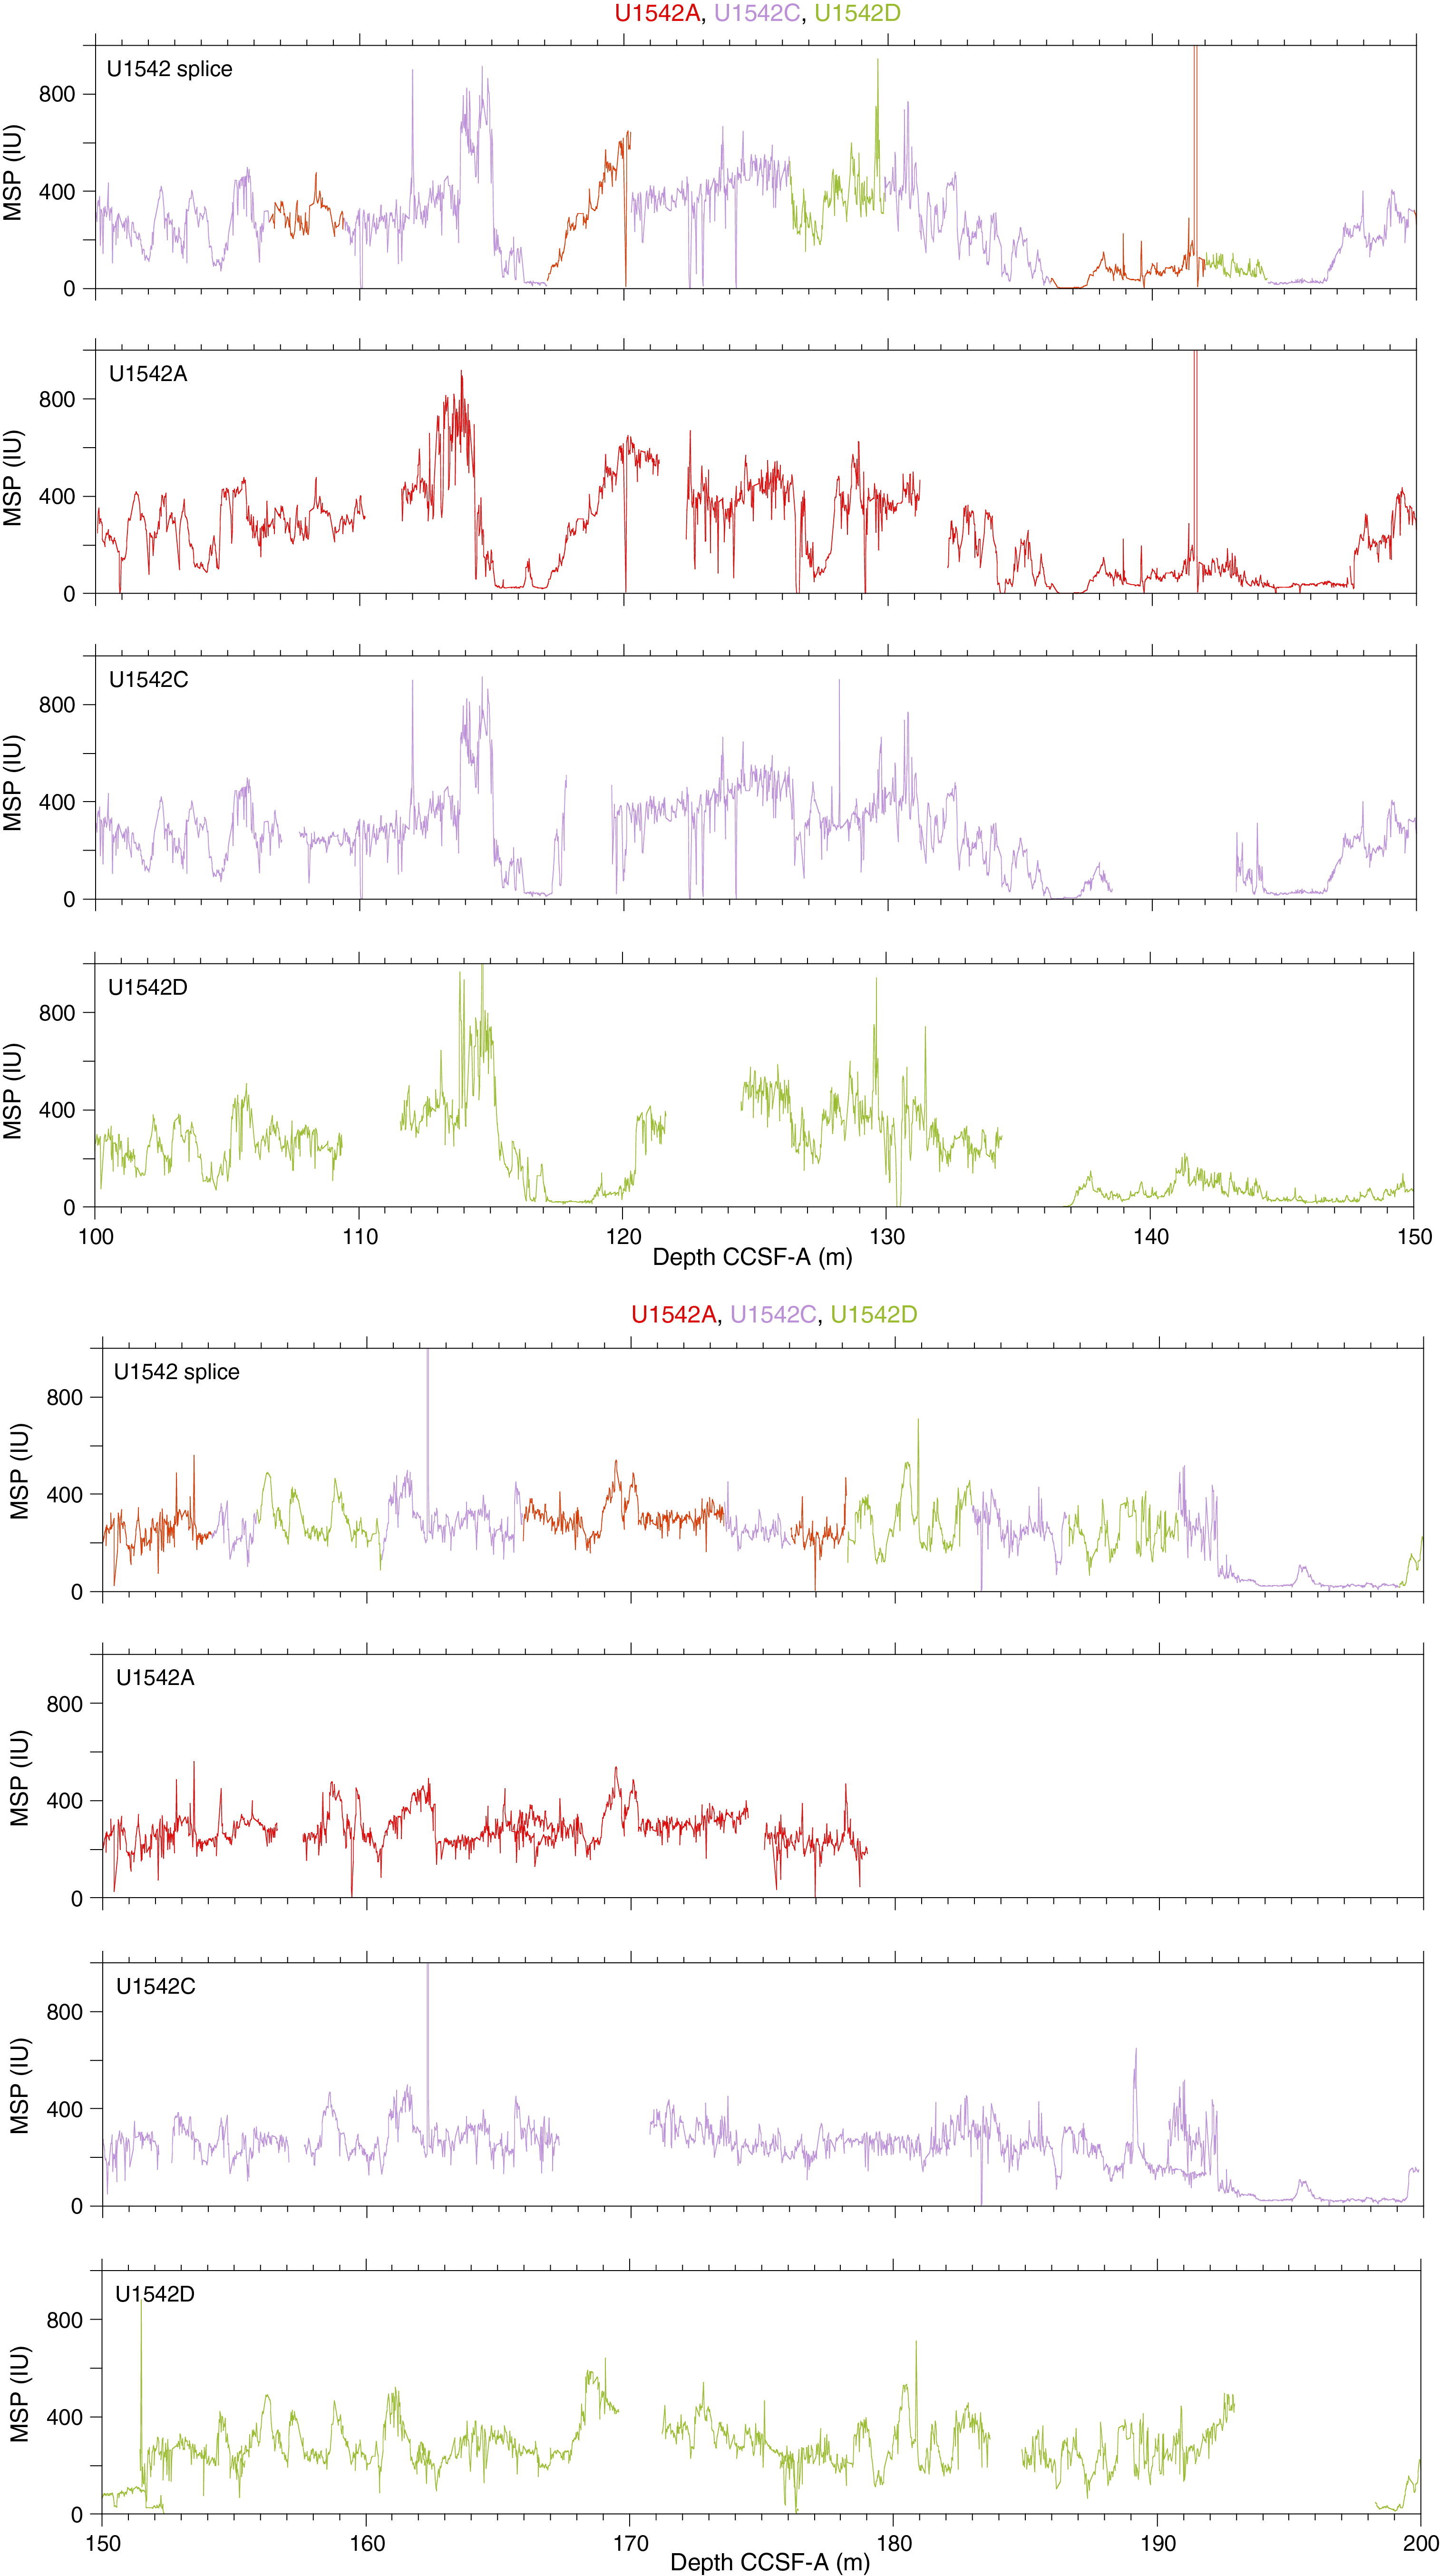
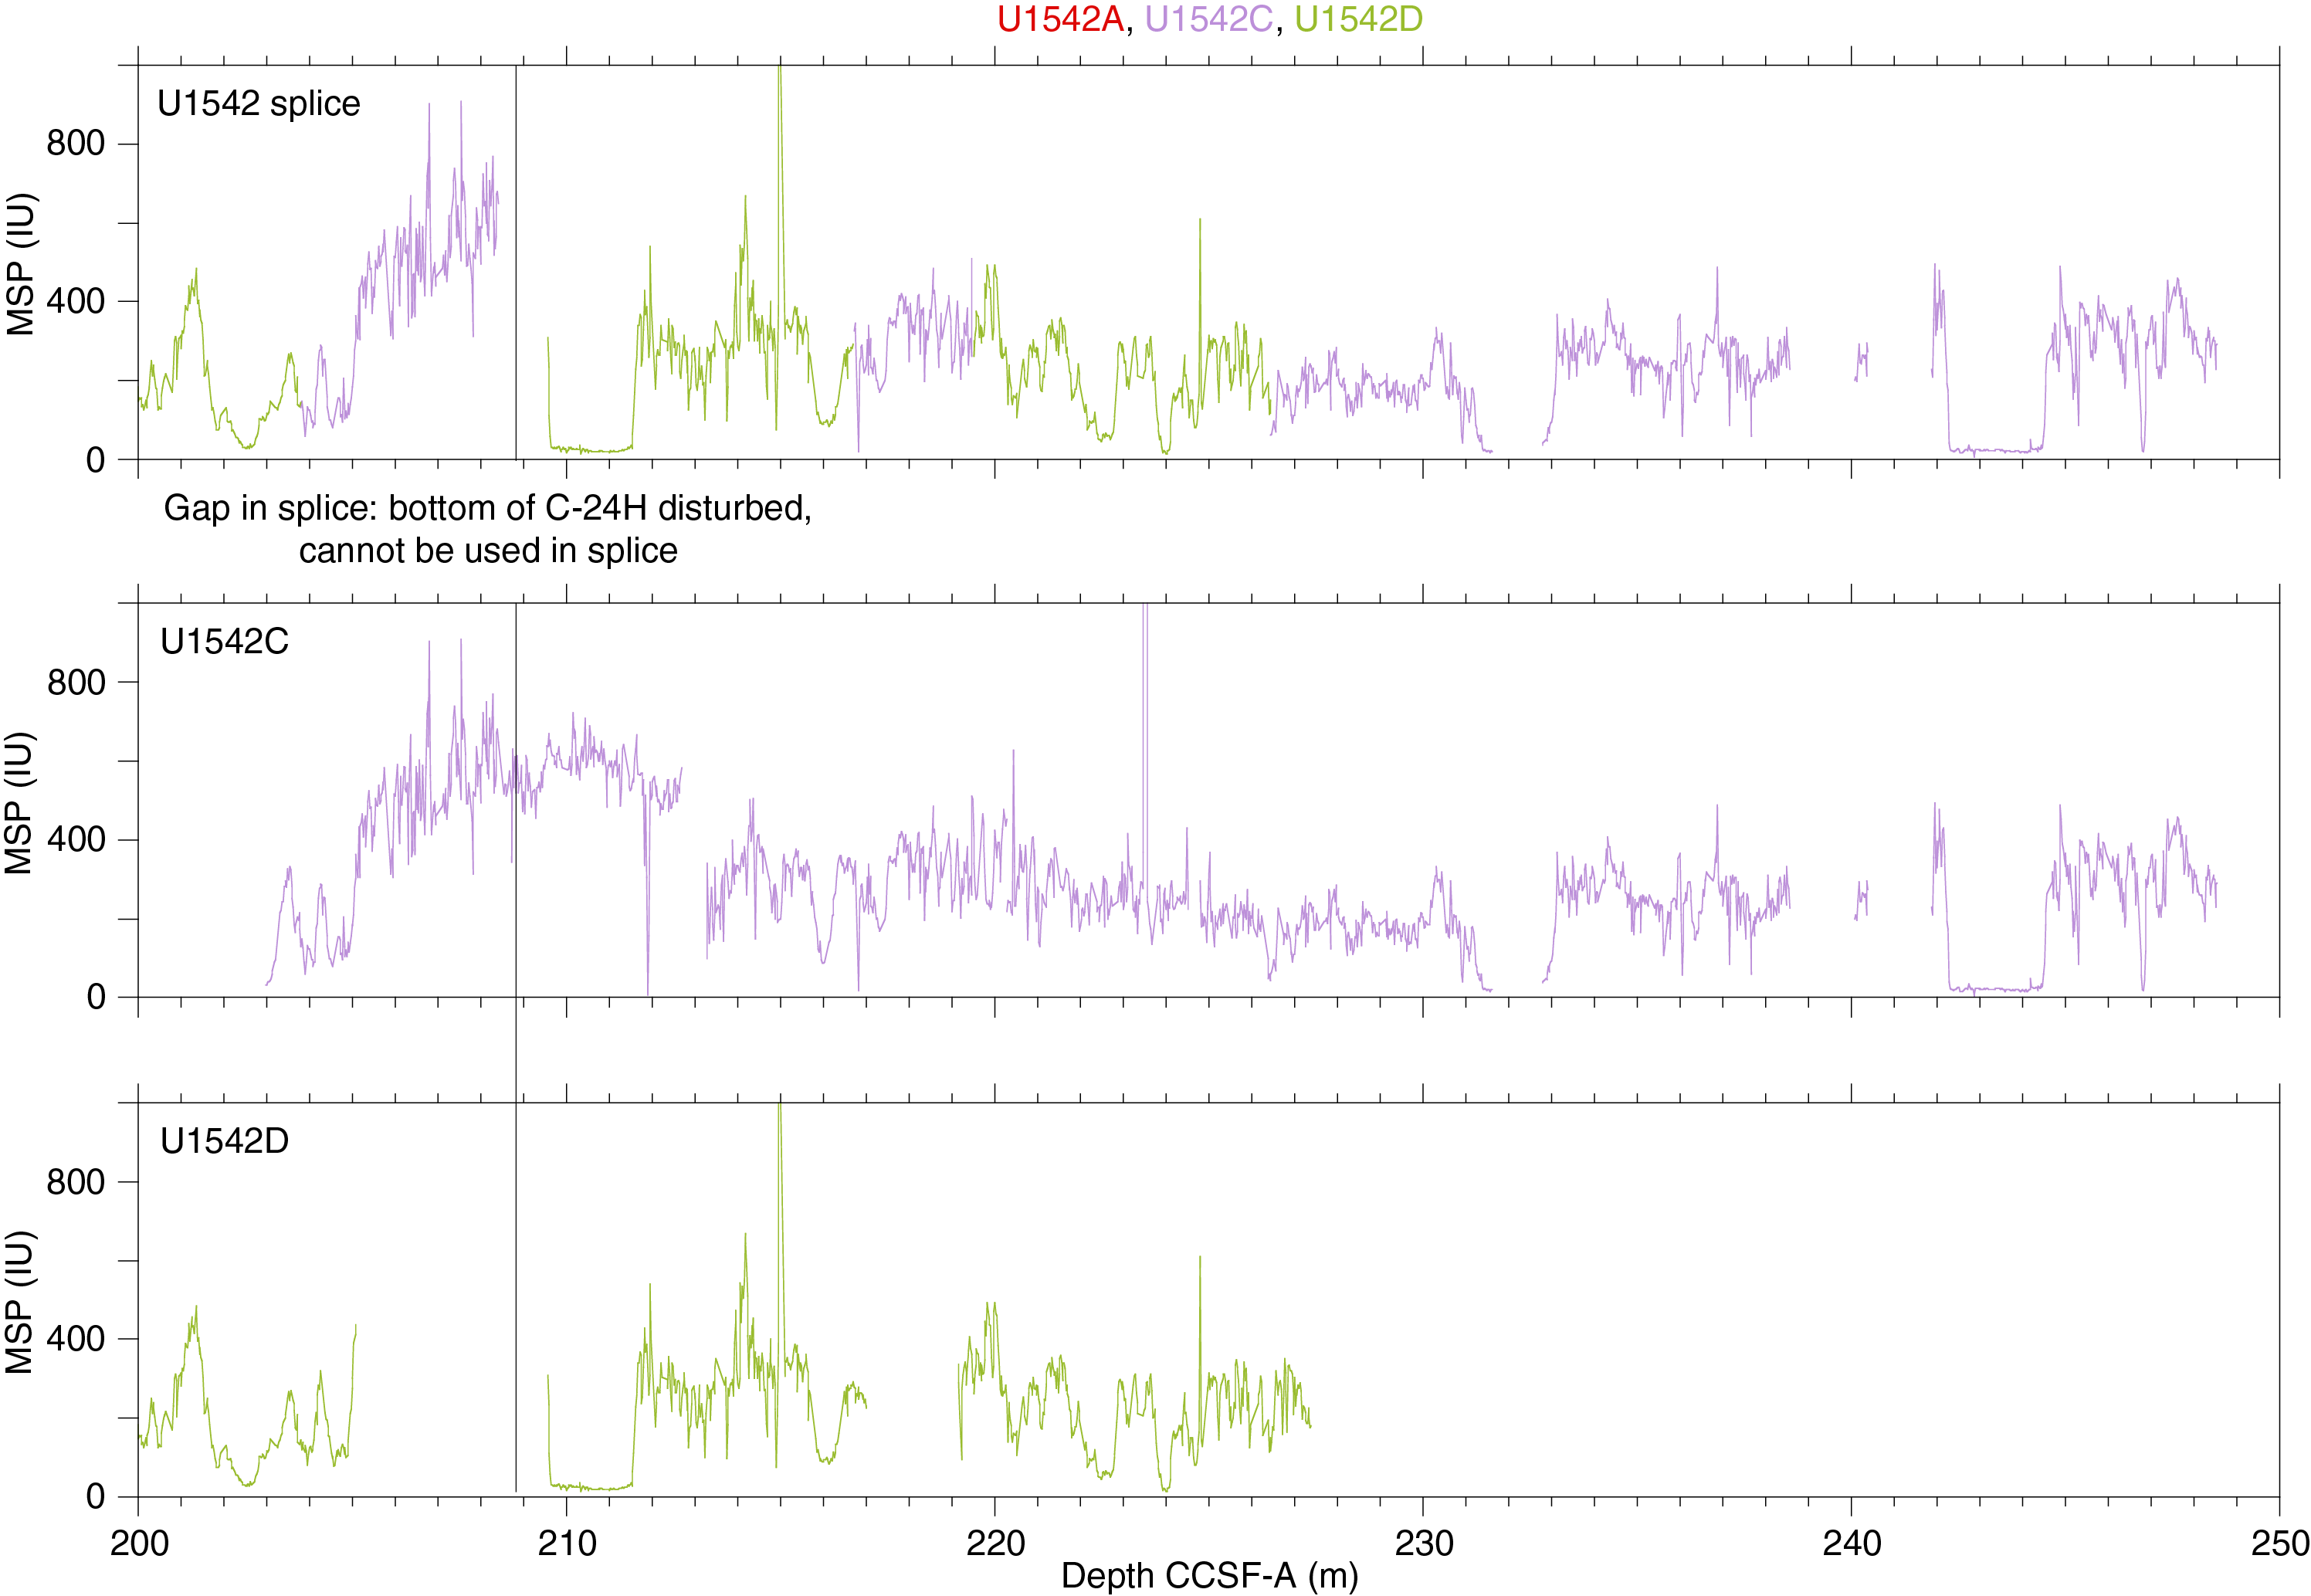
Figure F51. MSP splice.

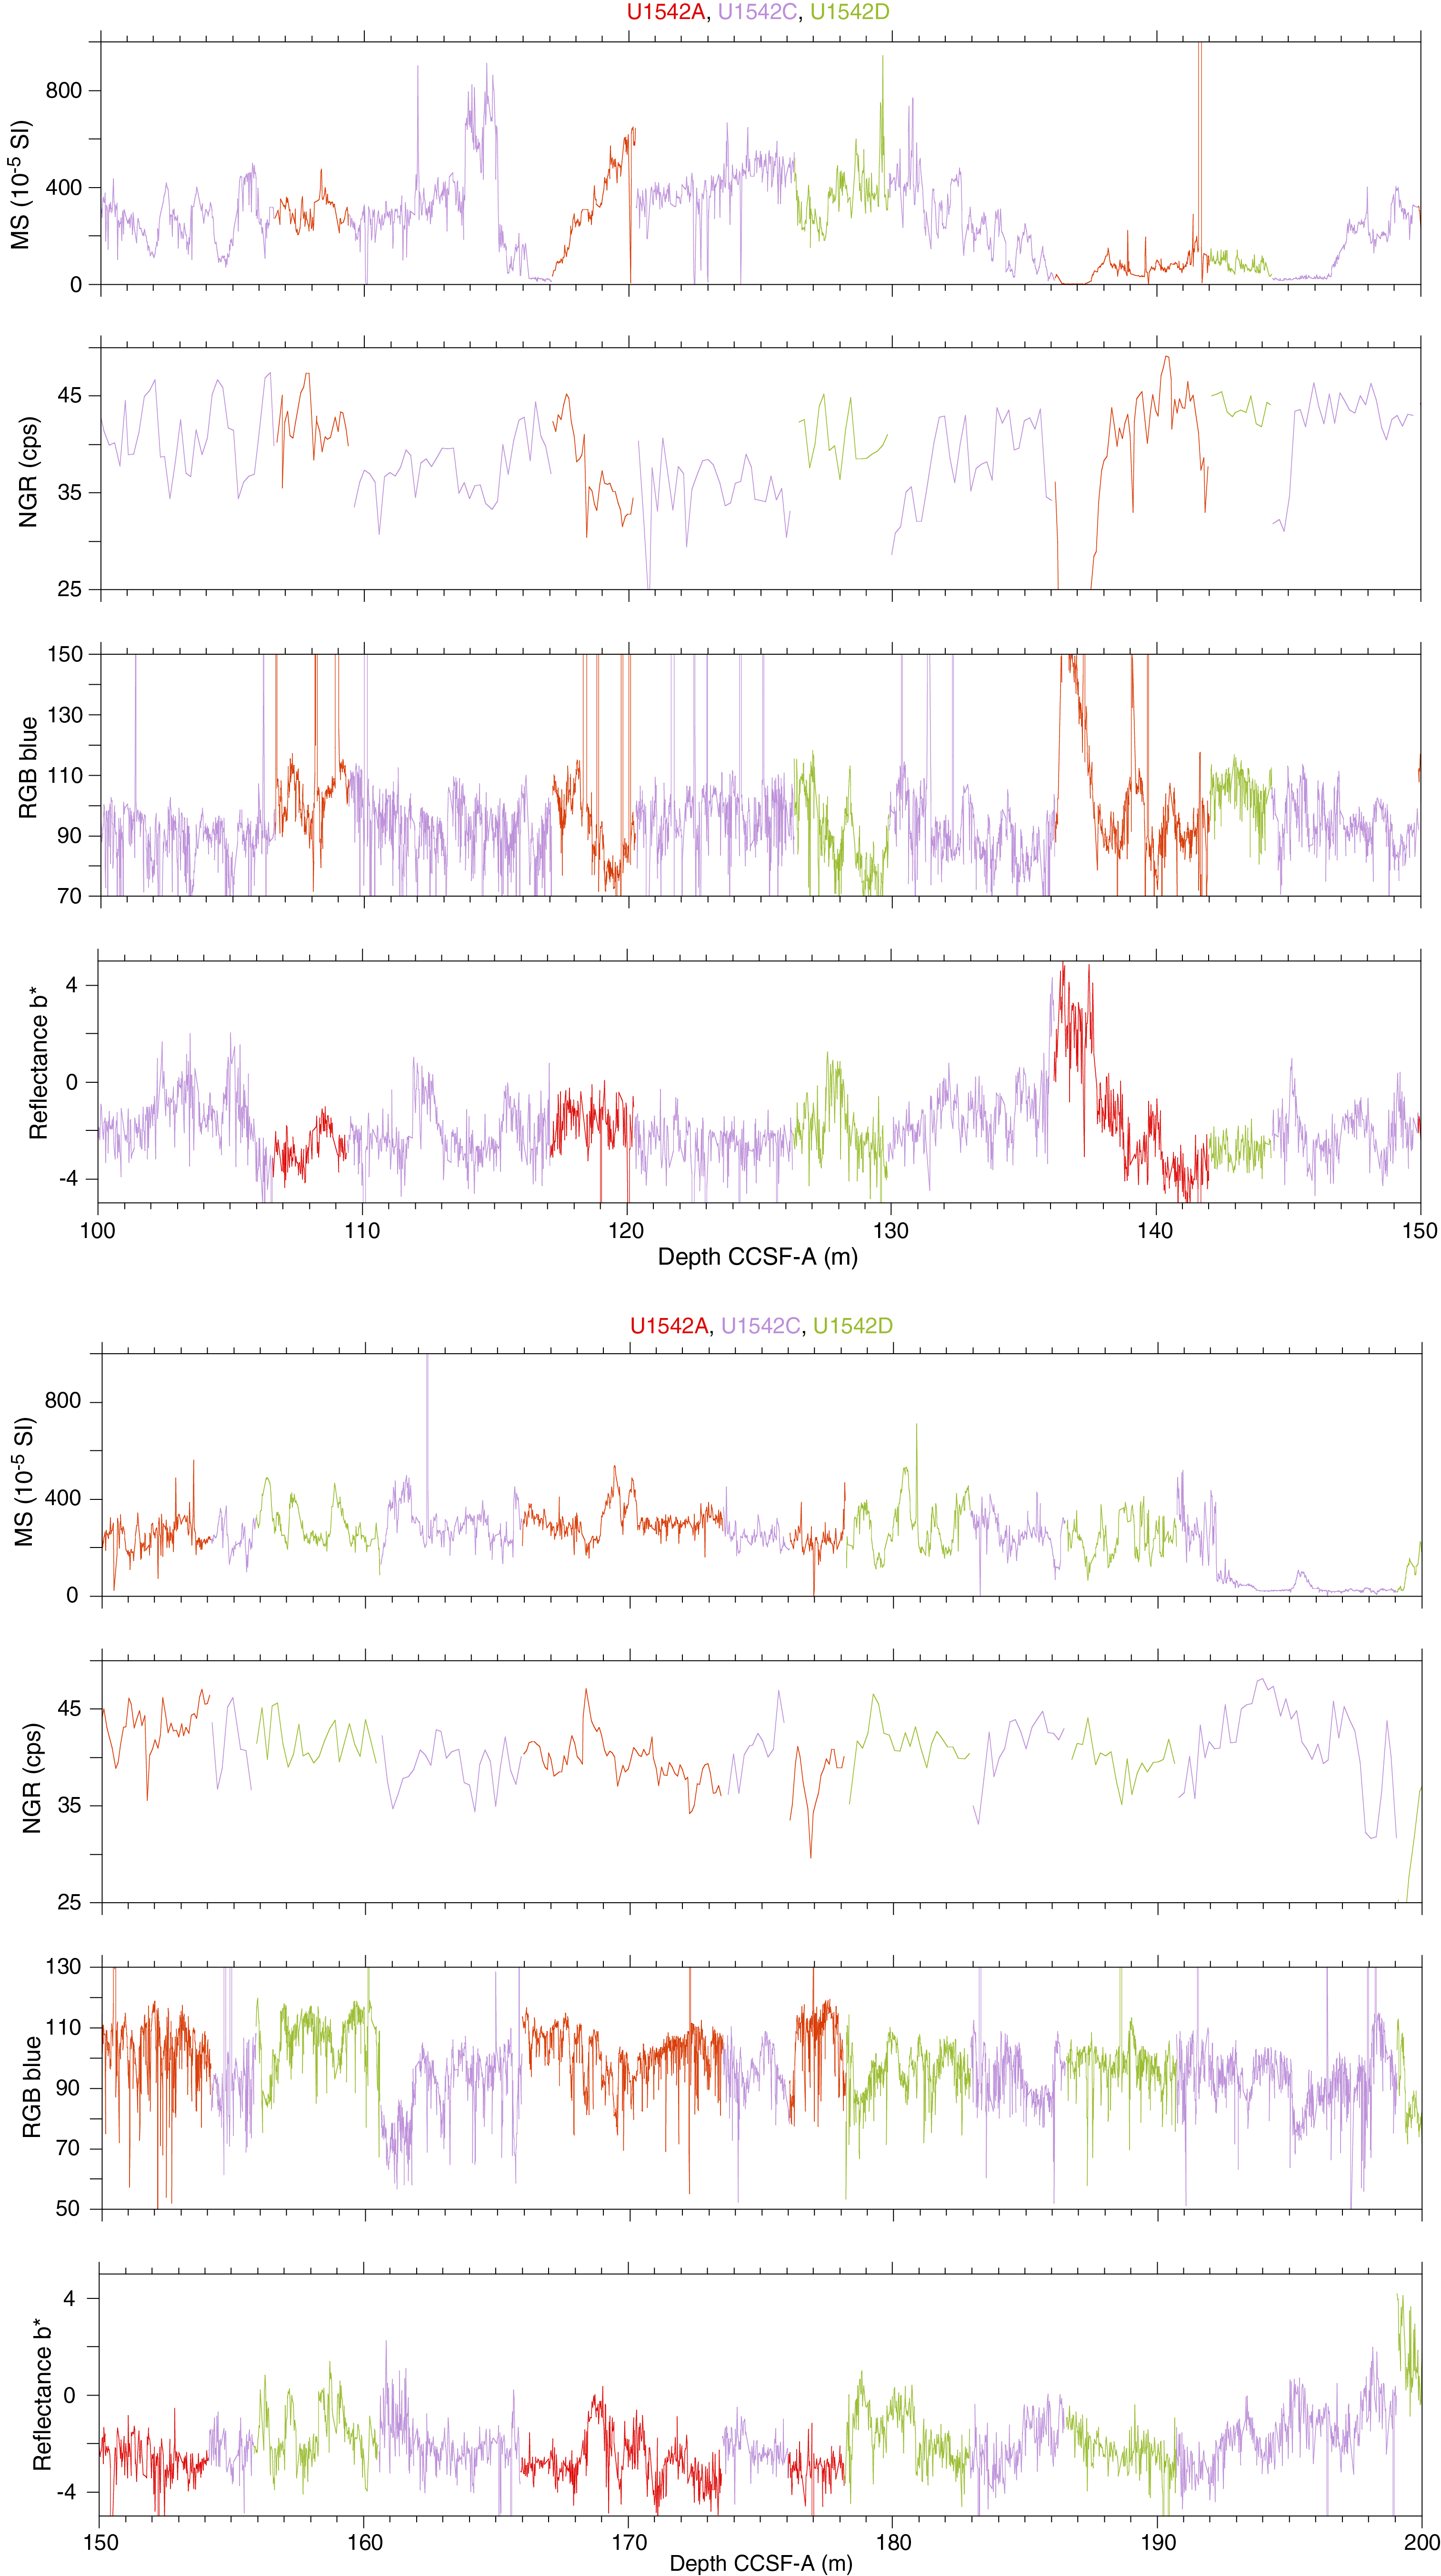
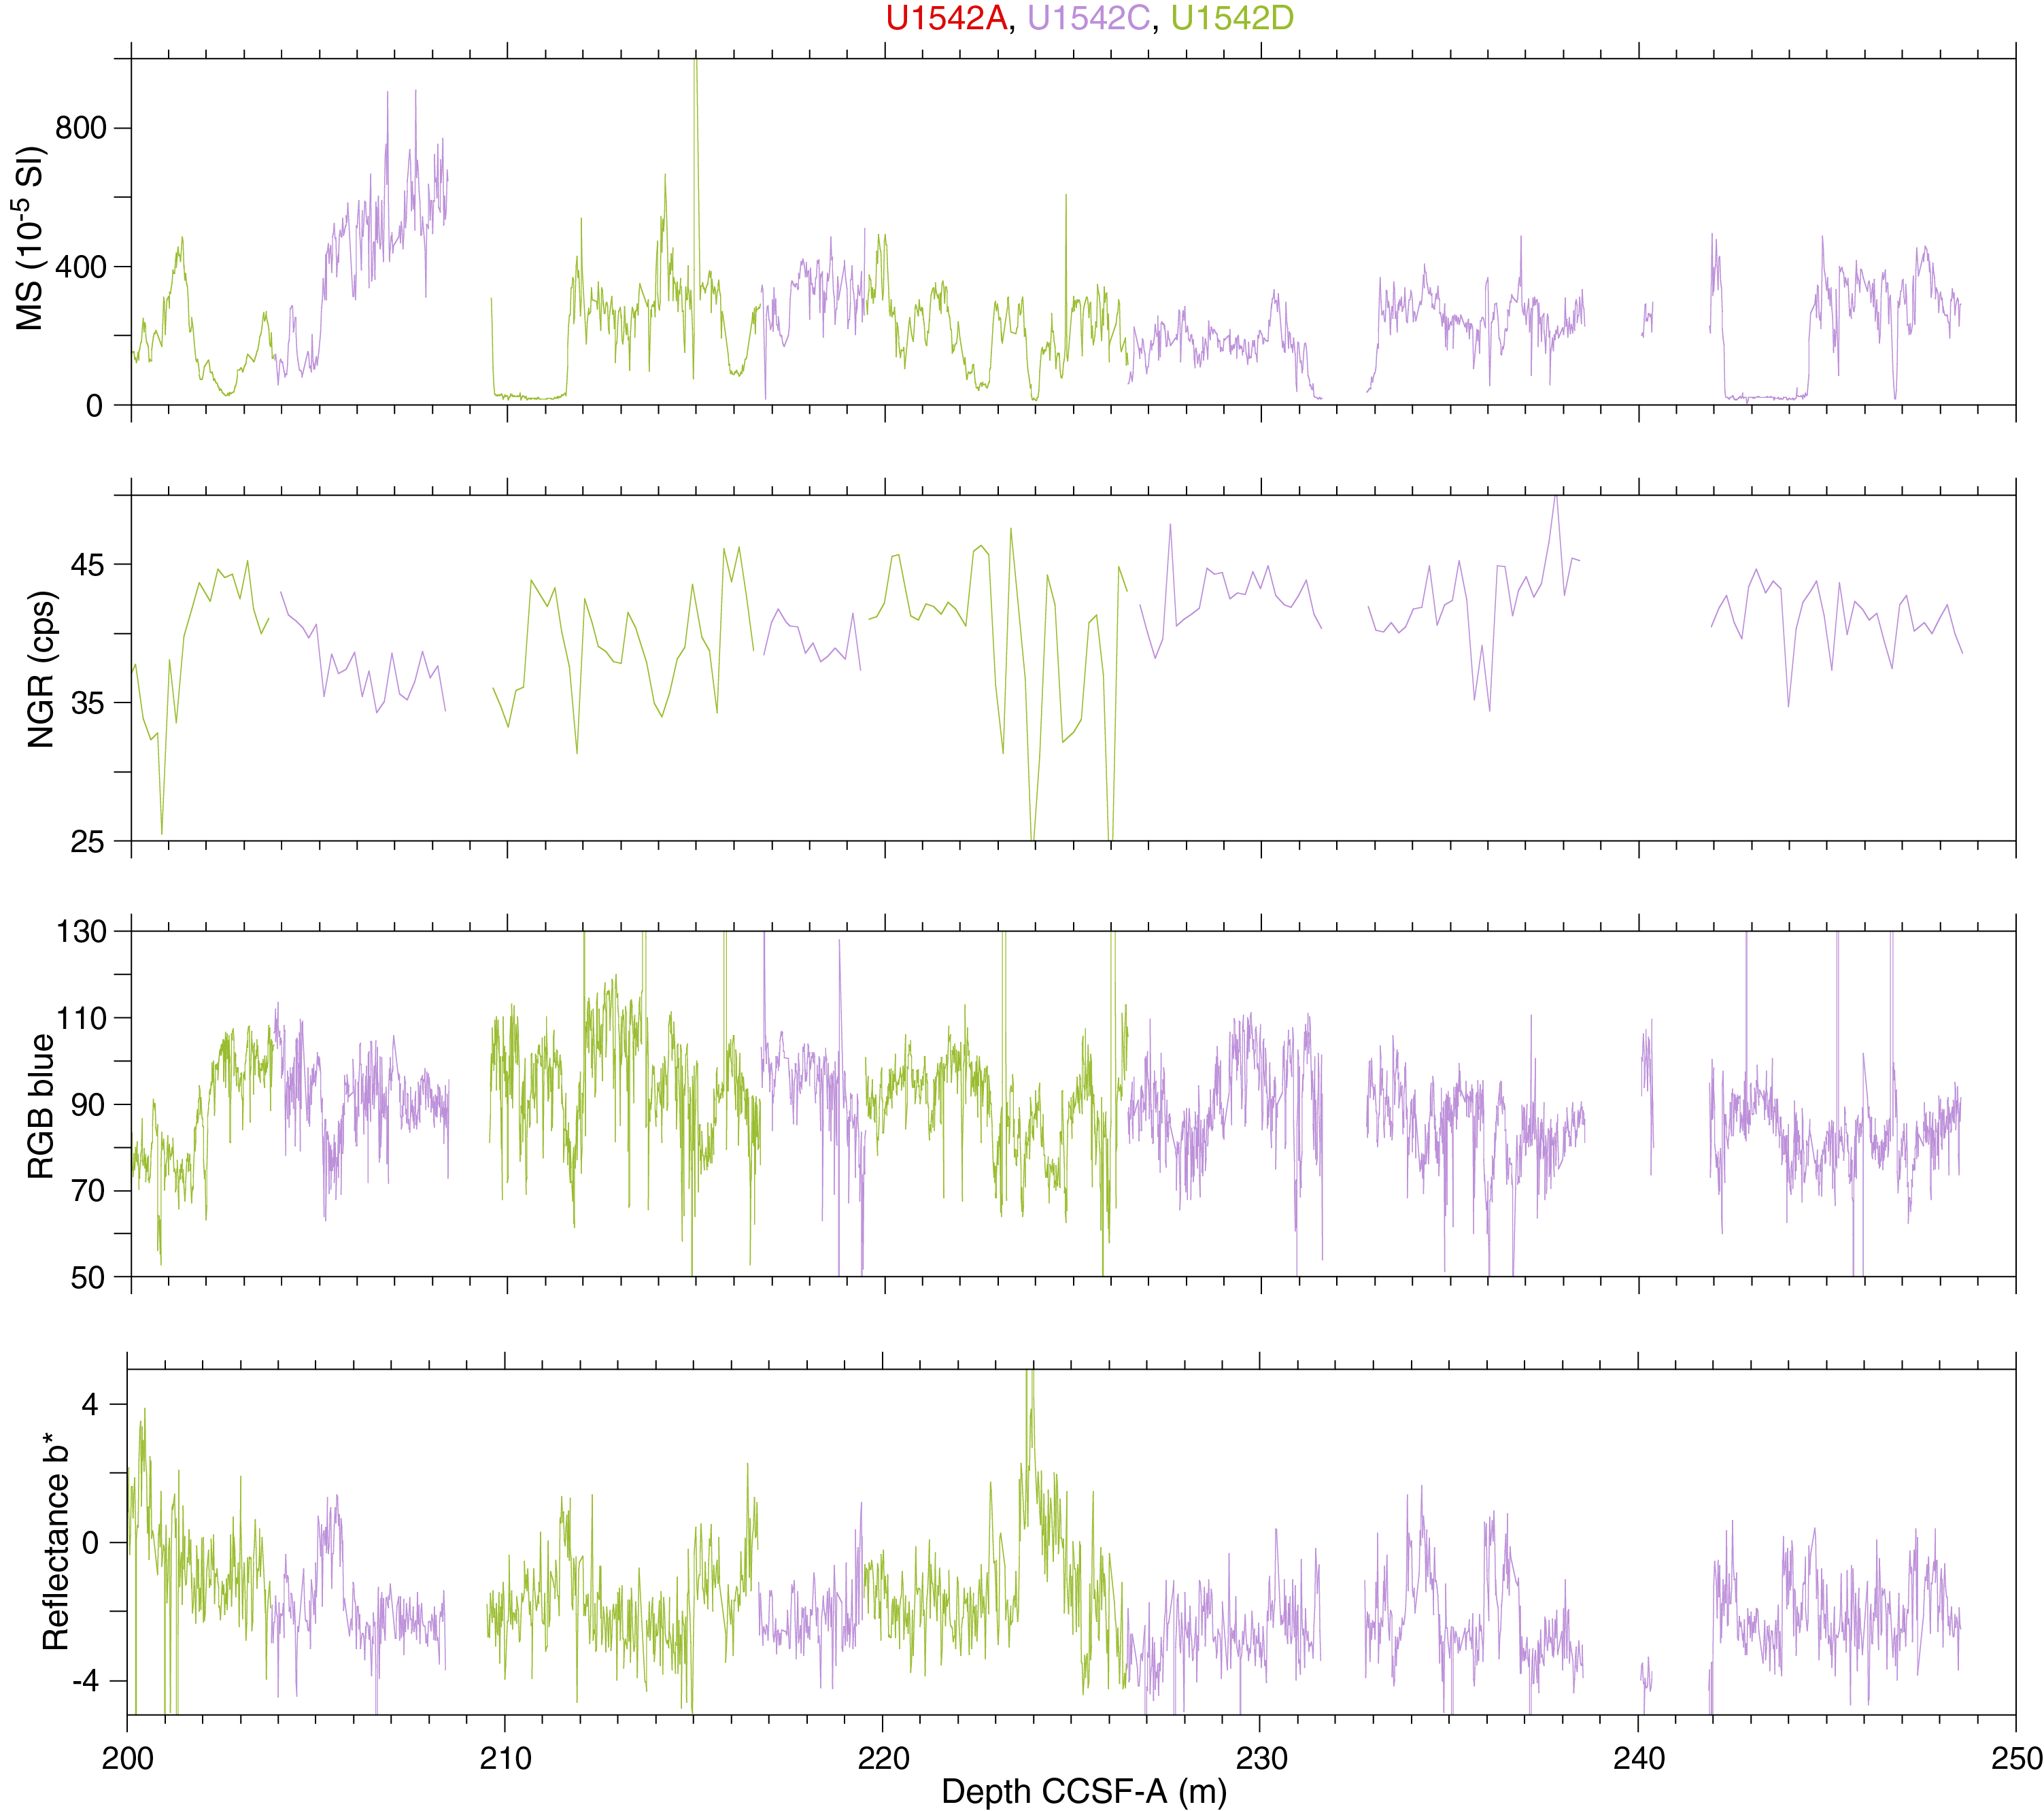
Figure F52. Splice data: MS, GRA bulk density, NGR, RGB blue, and b*.
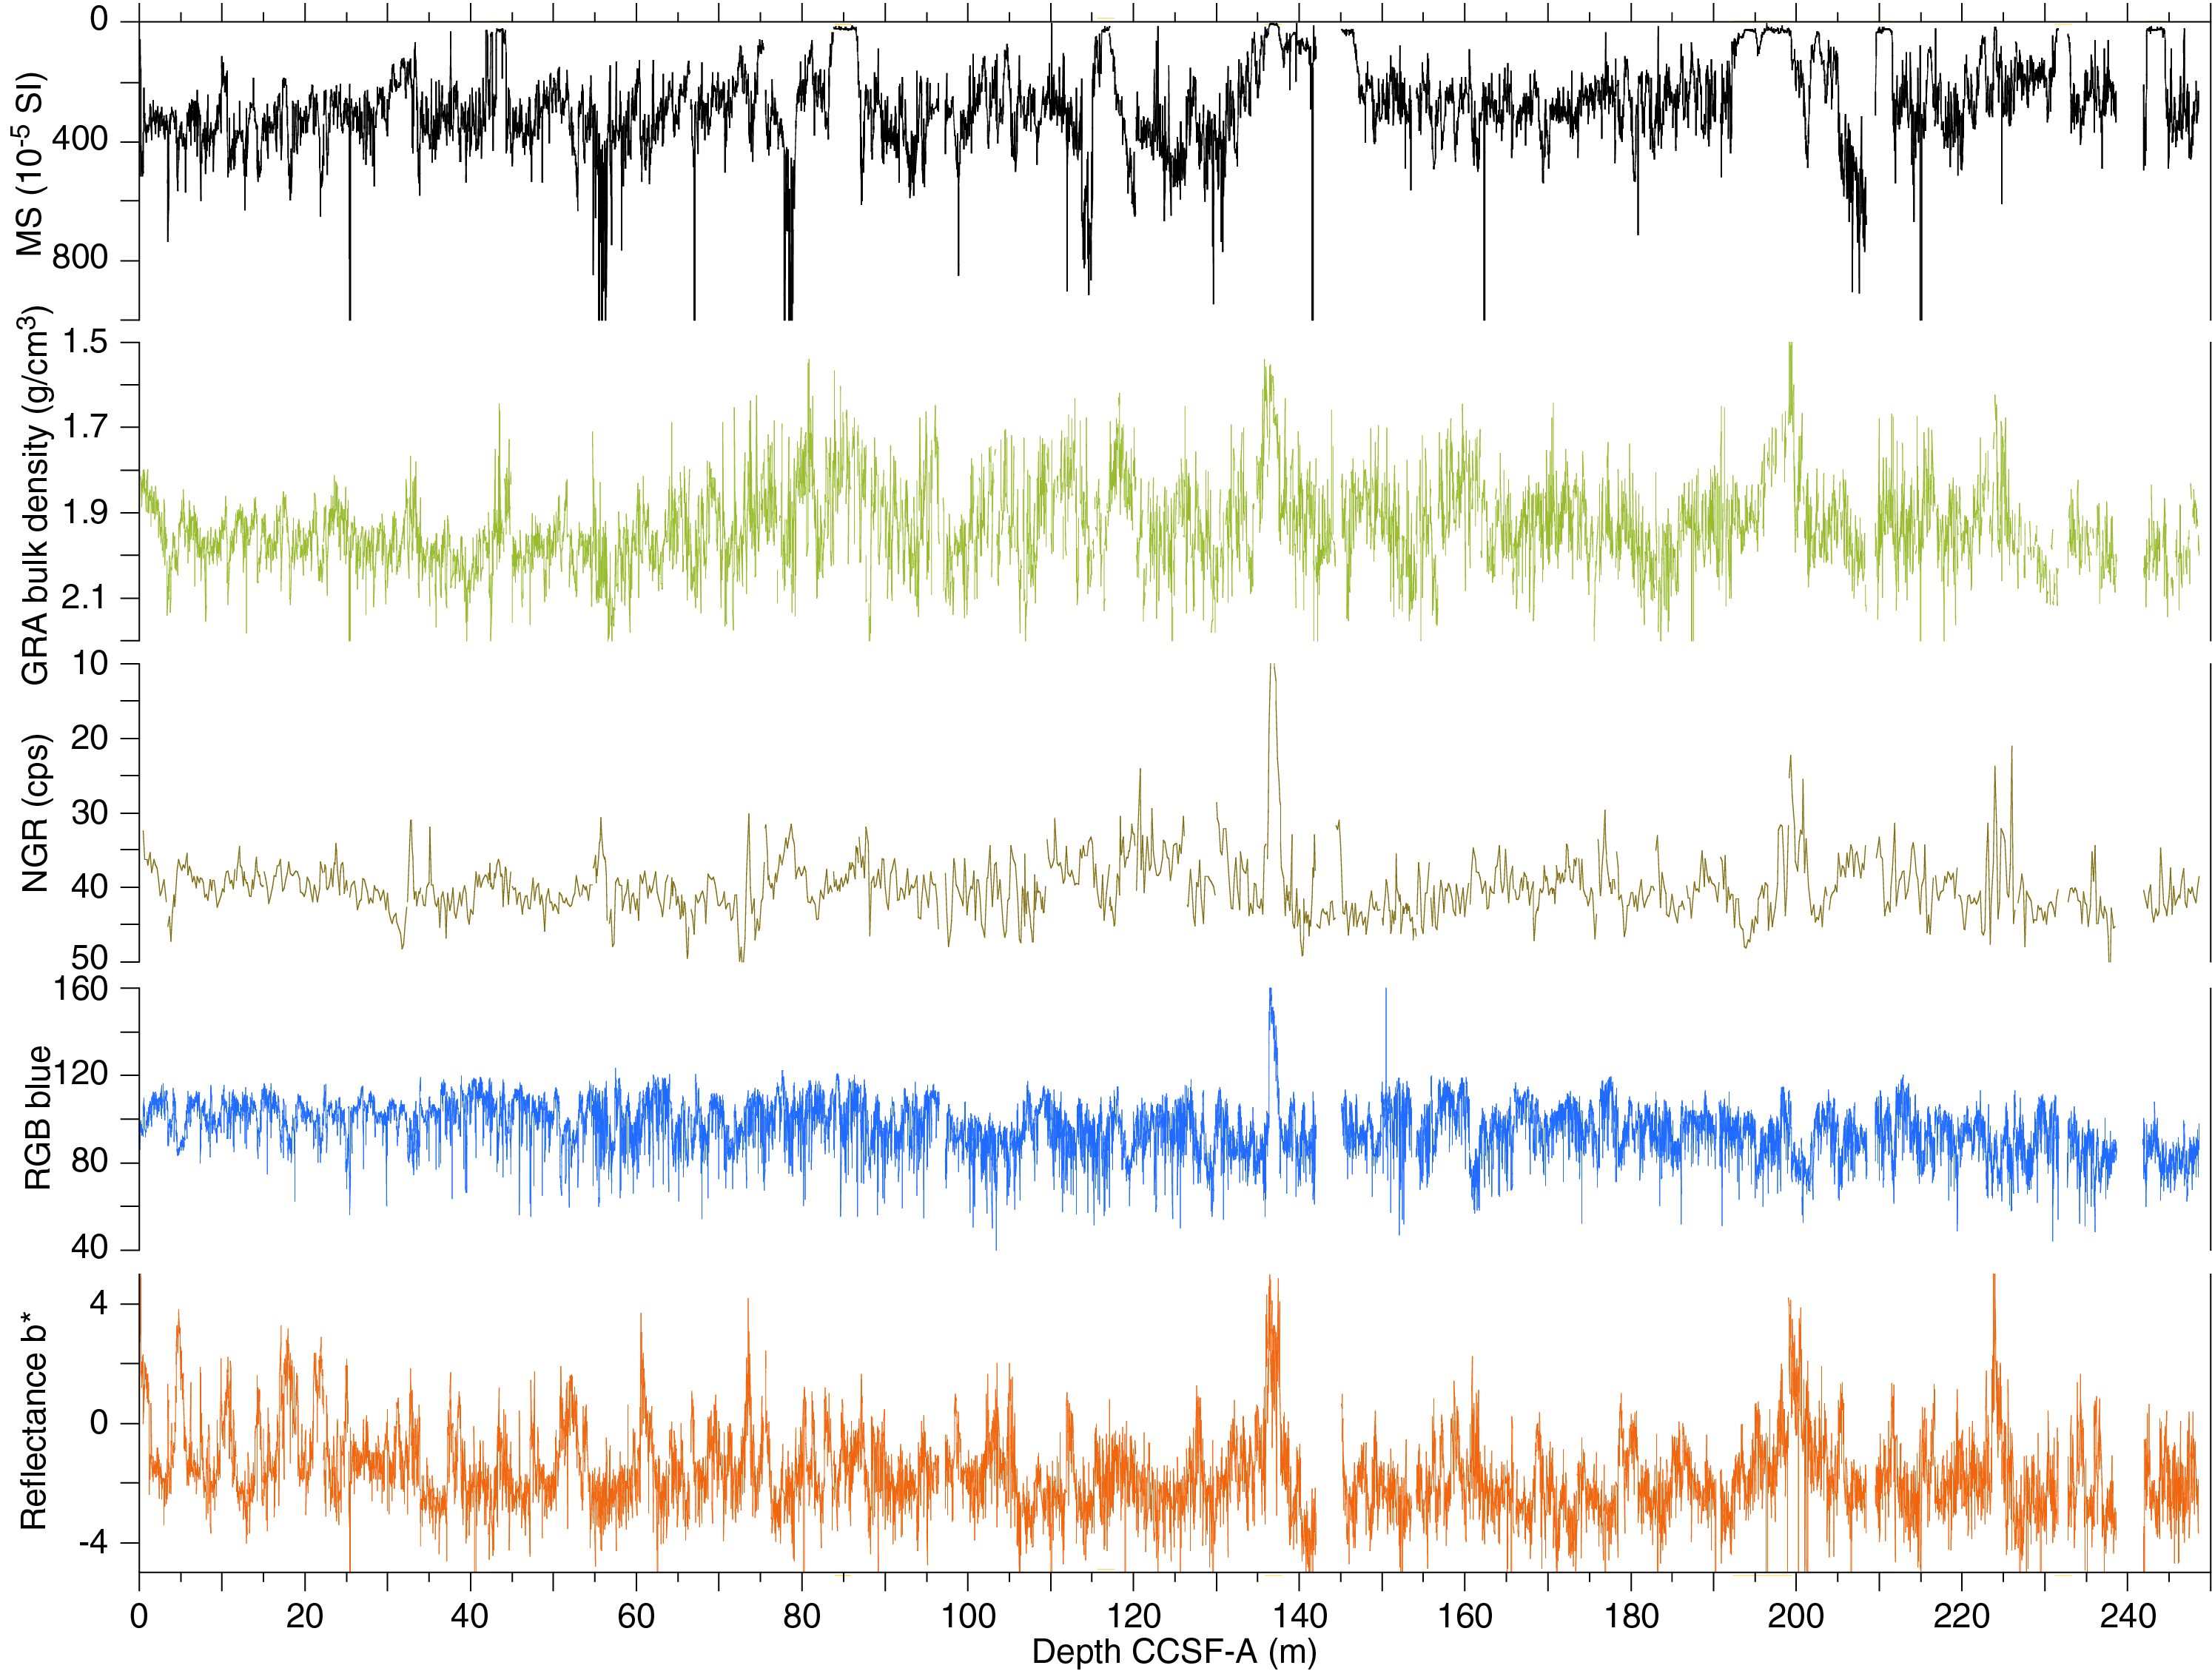
Figure F53. Cleaned splice data: MSP, GRA bulk density, NGR, RGB blue, and b*.
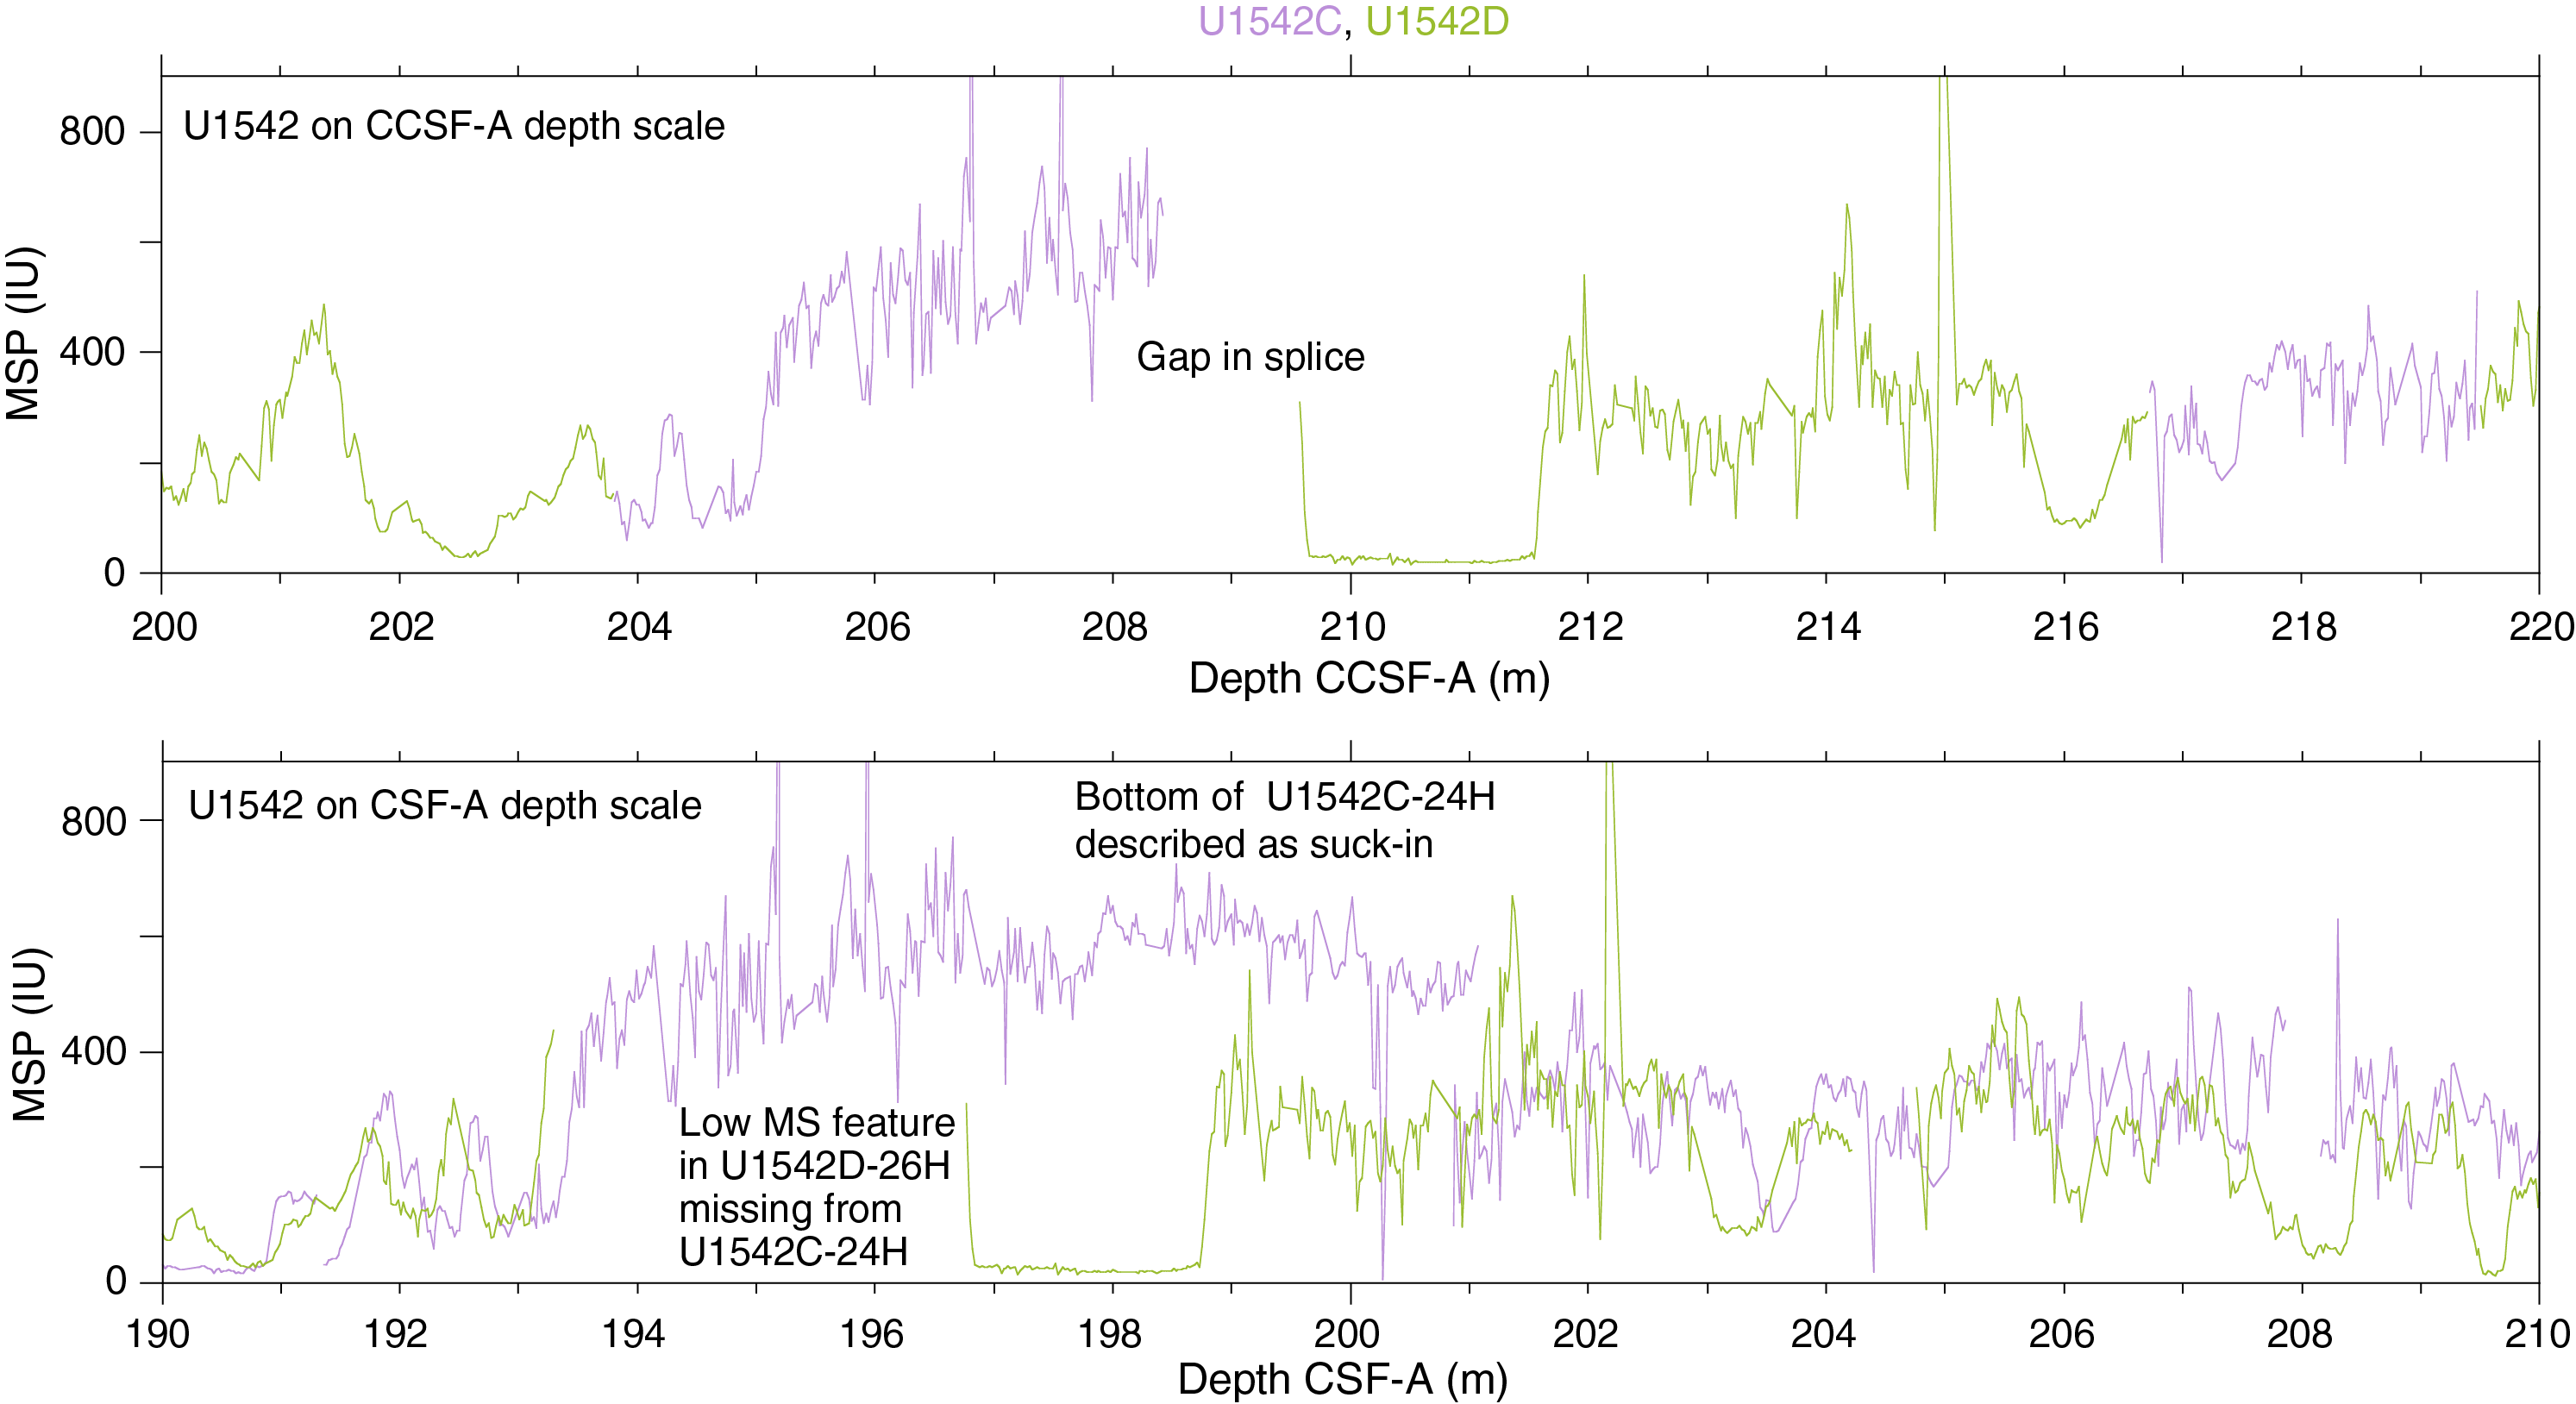
Figure F54. MSP data for second gap in splice.
The CCSF-A scale is anchored to the mudline of Core 383-U1542D-1H, which is assigned the depth of 0 m CCSF-A. From this anchor, we worked downhole using Correlator to establish a composite stratigraphy on a core-by-core basis. Because of poor recovery, coring disturbance, and disturbance due to gas expansion in a several intervals, we had to piece together the splice using all three holes, sometimes using cores that had been used for IW and other shipboard sampling.
In the upper portion of the splice, from 0 to 96.58 m CCSF-A, there are no splice intervals that include sediment with obvious drilling disturbance (suck-in, upward-arching structures, soupy texture, etc.). However, Core 383-U1542A-10H is mostly highly disturbed and therefore could not be used in the splice, which resulted in a gap at 96.58 m CCSF-A (Figure F51). At this depth, Core 383-U1542C-11H was appended to the splice by setting the affine offset using an offset consistent with an increasing cumulative affine offset of 1.0 m CCSF-A per core. Below this first gap, the splice is continuous to 208.49 m CCSF-A, which is the middle of Core 383-U1542C-24H. However, because of drilling disturbance (suck in), the lower sections of Core 24H were not included in the splice, which created a gap at 208.49 m CCSF-A (Figures F51, F54). At this point, Core 383-U1542D-26H was appended by setting the affine offset using an offset consistent with an increasing cumulative affine offset of 1.0 m CCSF-A per core. Below this second gap, the splice is continuous to 231.68 m CCSF-A, which is the bottom of Core 383-U1542C-27H. At this depth, Cores 28H–30H were appended to the splice using an increasing cumulative offset of 1.0 m CCSF-A per core. Although the splice is continuous from 0 to 96.58 m CCSF-A and from 96.99 to 231.69 m CCSF-A, a few of the splice intervals include sediment that has apparent drilling disturbance. Core 383-U1542C-11H has some uparching structures, and there is some suck-in and soupy sediment in small portions of the splice intervals from Cores 383-U1542D-15H, 383-U1542C-16H, 383-U1542A-16H, and 383-U1542C-22H. Despite these disturbances, distinctive features were correlated between cores, allowing for tie points to be defined. Tie points that are considered tentative can be found in Table T11 and should be confirmed during postcruise research.
Construction of the splice utilized distinctive features found across the drill holes. While selecting the tie points and building the splice, it was observed that there are many features that are not found across the drill holes, suggesting that there are many strata that might not be continuous over the short distance (tens of meters) between holes. These are noticeable when comparing the MSP data from each hole side by side (Figure F51). Although some of the apparent mismatch of features between holes may reflect discontinuous strata and/or changes in the thickness or character of strata between holes, other mismatched features could be explained by drilling disturbance. For example, at the depth of the second gap (208.49 m CCSF-A), the mismatch of MSP data between holes is striking (Figure F54). The fact that the distinctive low MSP data interval at the top of Core 383-U1542D-26H is not found in Core 383-U1542C-24H might be explained by severe drilling disturbance that resulted in the bottom portion of Core 24H being composed of suck-in, as noted by the lithostratigraphers (see Sedimentology). One possibility is that when the bit was advanced after Core 24H was retrieved, the low MSP interval was washed away. There was not enough time during the expedition to examine in detail each occurrence of mismatched features in the MSP data while building the composite depth scale and the splice; postcruise research of the Site U1542C sedimentary sequence should include, among other data collection, very close consideration of the impact of the drilling process on the physical properties data.
The cumulative offset between the CSF-A and CCSF-A depth scales is not linear for Holes U1542A, U1542C, and U1542D (Figures F55). The growth factor is different in the upper ~100 m of the sequence than it is below ~100 m CSF-A. In the upper 100 m of all holes, it averages about 10%, as expected from sediment that has gas expansion due to moderate concentrations of methane and other gases (see Geochemistry). This high growth factor reflects the fact that building the composite depth scale required adjusting each core downward by about 1 m on average. From about 100 to 200 m CSF-A, when APC coring resulted in many short cores, the growth rate averaged 0%, and some cores had to be adjusted upward. This could be a consequence of the fact that the CSF-A depth at the top of the core is the depth of the bottom of the hole prior to shooting that APC core; if a core is shorter than the amount the bit is advancing, then it often needs to be moved upward when correlating as the composite depth scale is constructed. Thus, the low growth factors from 100 to 200 m CSF-A may reflect the drilling process and are probably not a good indication of the amount of core expansion that occurred. The growth factor below about 200 CSF-A is hard to evaluate, but for full-length APC cores with minimal disturbance, the growth rate was close to 10%, comparable to the upper 0–100 m CSF-A growth rate. In sum, at Site U1542, the process of correlation and establishing the CCSF-A scale resulted from sediment compaction, expansion, and drilling disturbances. Calculation of mass accumulation rates based on the CCSF-A scale should account for these factors by dividing apparent depth intervals by the appropriate growth factor.
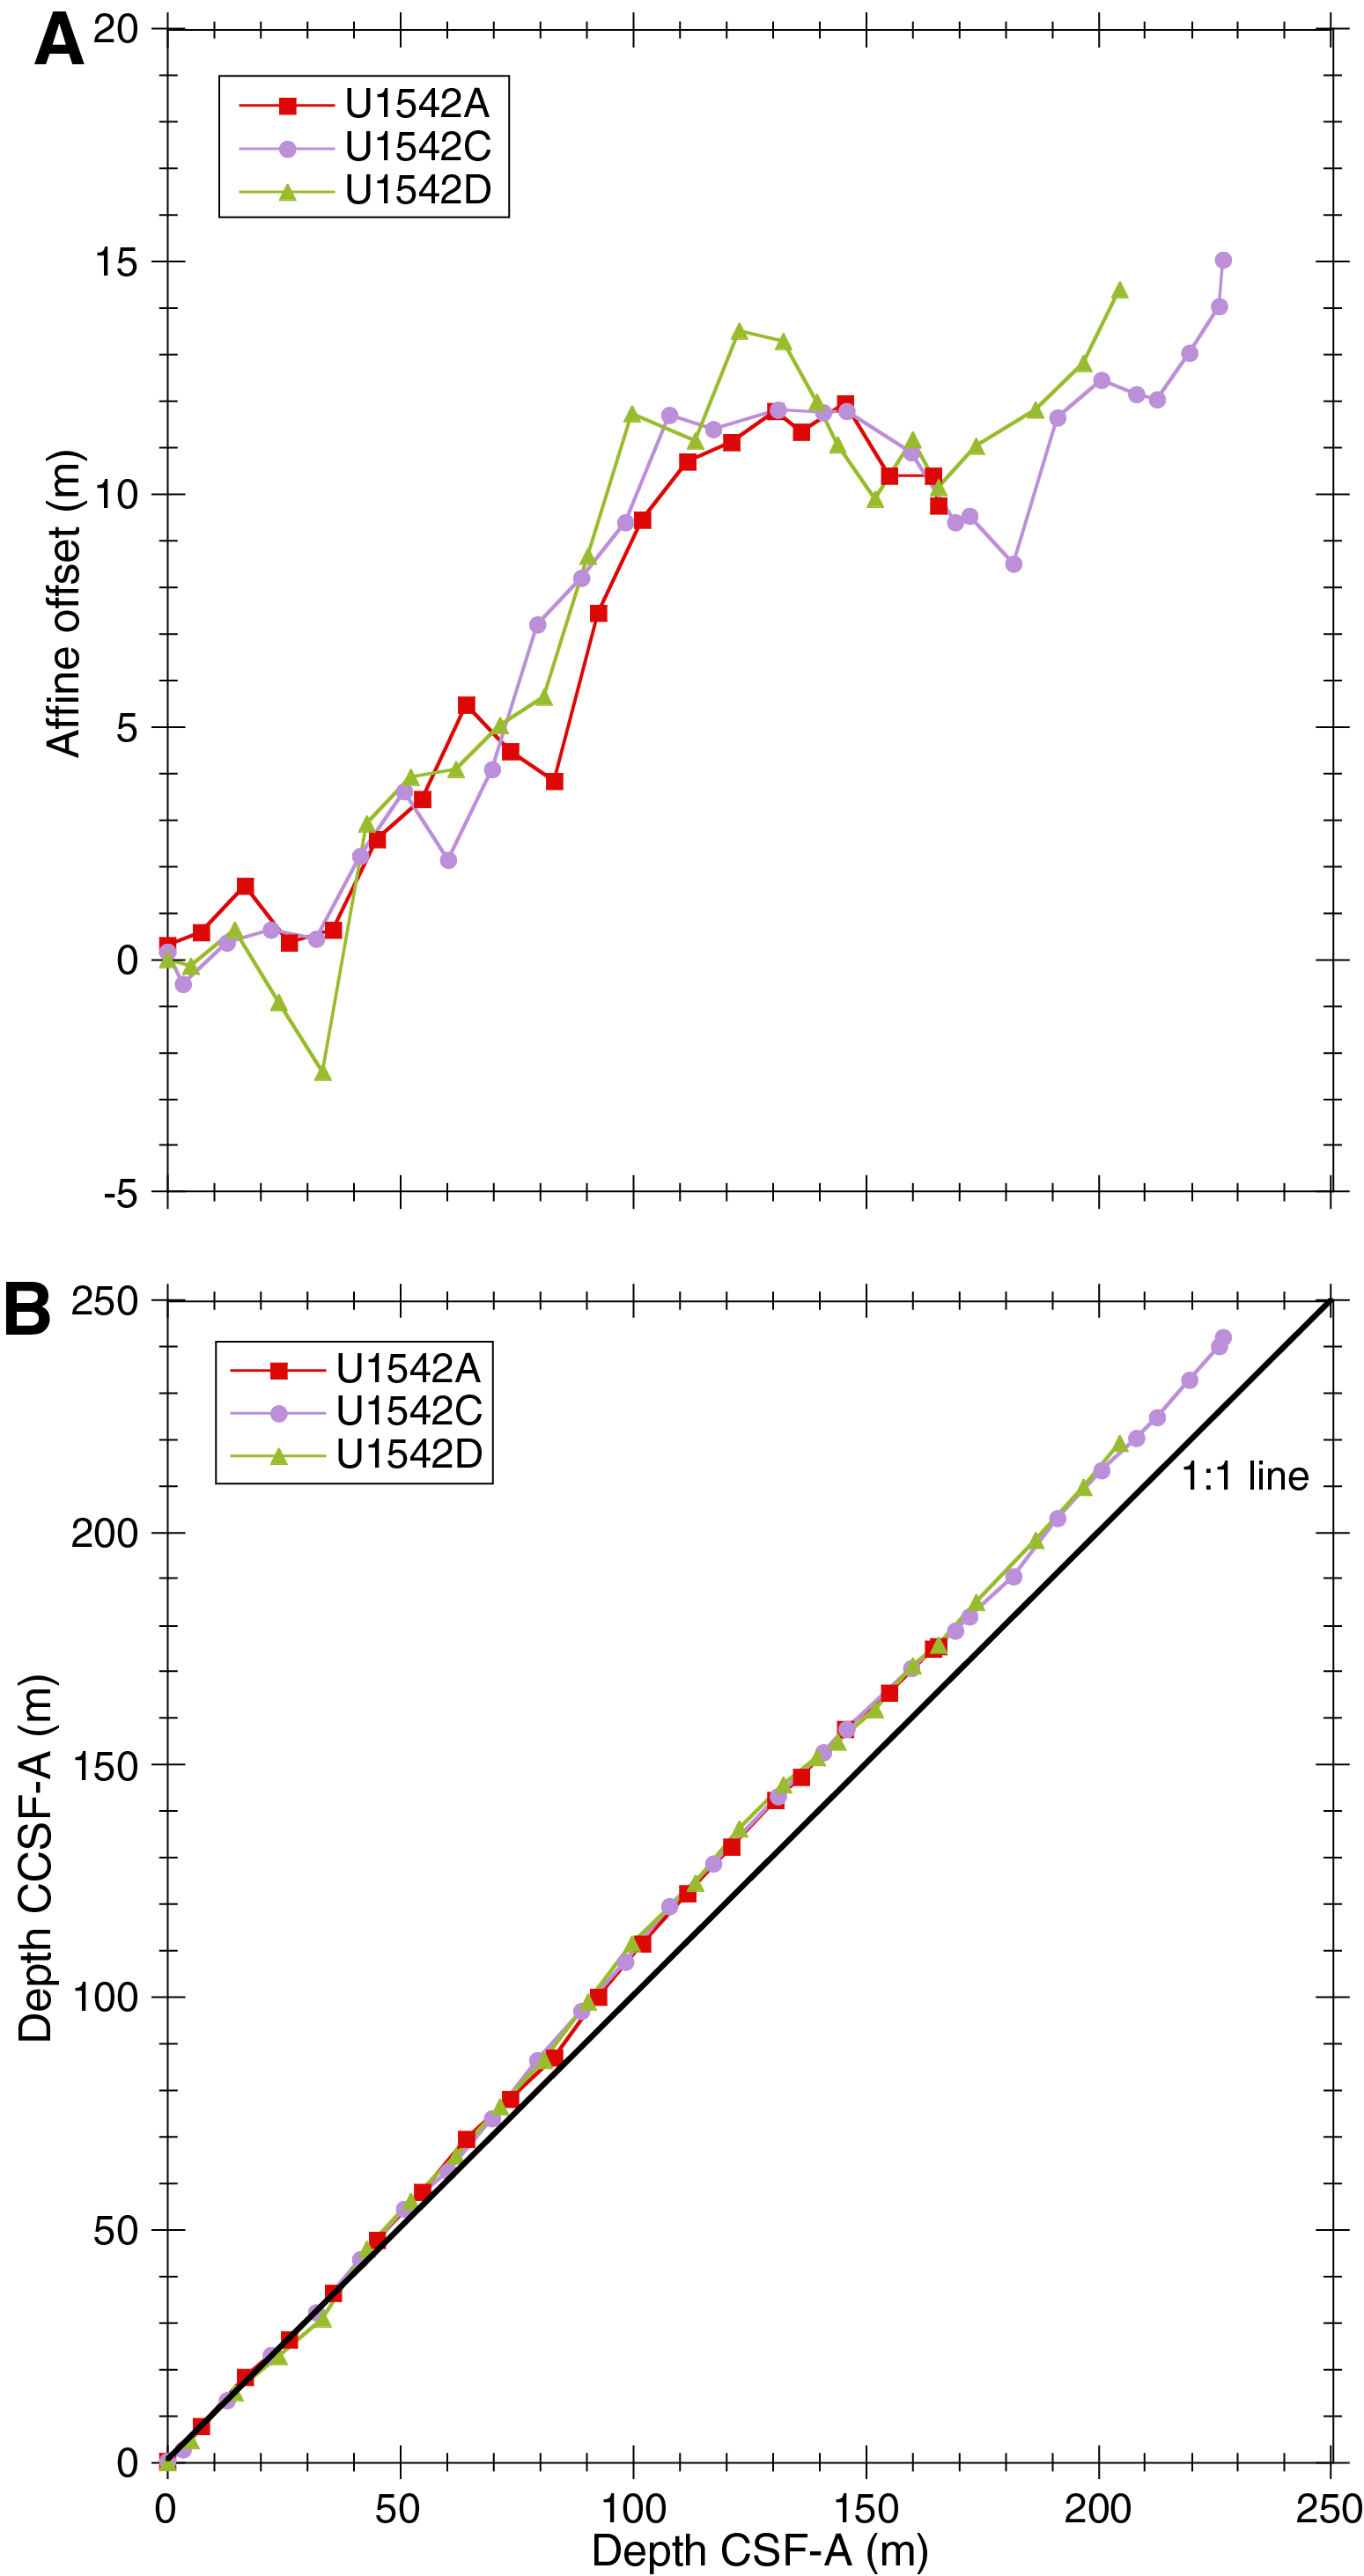
Figure F55. Core depth, composite depth scales, and the growth of cumulative depth offset.
References
Boisvert, W.E., 1969. Technical Report: Major Currents off the West Coasts of North and South America: Washington, D.C. (Naval Oceanographic Office). https://catalog.hathitrust.org/
Bostock, H.C., Sutton, P.J., Williams, M.J.M., and Opdyke, B.N., 2013. Reviewing the circulation and mixing of Antarctic Intermediate Water in the South Pacific using evidence from geochemical tracers and Argo float trajectories. Deep Sea Research, Part I: Oceanographic Research Papers, 73:84–98. https://doi.org/
Caniupán, M., Lamy, F., Lange, C.B., Kaiser, J., Arz, H., Kilian, R., Baeza Urrea, O., et al., 2011. Millennial‐scale sea surface temperature and Patagonian Ice Sheet changes off southernmost Chile (53°S) over the past ~60 kyr. Paleoceanography and Paleoclimatology, 26(3):PA3221. https://doi.org/
Chaigneau, A., and Pizarro, O., 2005. Surface circulation and fronts of the South Pacific Ocean, east of 120°W. Geophysical Research Letters, 32(8):L08605. https://doi.org/
Chamley, H., 1989. Clay Sedimentology: Berlin (Springer). https://doi.org/
Corliss, B.H., 1979. Quaternary Antarctic bottom-water history: deep-sea benthic foraminiferal evidence from the Southeast Indian Ocean. Quaternary Research, 12(2):271–289. https://doi.org/
Corliss, B.H., 1985. Microhabitats of benthic foraminifera within deep-sea sediments. Nature, 314(6010):435–438. https://doi.org/
Das, M., Singh, R.K., Vats, N., Holbourn, A., Mishra, S., Farooq, S.H., and Pandey, D.K., 2018. Changes in the distribution of Uvigernidae species over the past 775 kyr: implication for the paleoceanographic evolution of the Japan Sea. Palaeogeography, Palaeoclimatology, Palaeoecology, 507:201–213. https://doi.org/
De Vleeschouwer, D., Dunlea, A.G., Auer, G., Anderson, C.H., Brumsack, H., de Loach, A., Gurnis, M., et al., 2017. Quantifying K, U, and Th contents of marine sediments using shipboard natural gamma radiation spectra measured on DV JOIDES Resolution. Geochemistry, Geophysics, Geosystems, 18(3):1053–1064. https://doi.org/
Dingle, R.V., and Majoran, S., 2001. Palaeo-climatic and -biogeographical implications of Oligocene Ostracoda from CRP-2/2A and CRP-3 drillholes, Victoria Land Basin, Antarctica. Terra Antartica, 8(4):369–382. http://www.mna.unisi.it/
Dunlea, A.G., Murray, R.W., Harris, R.N., Vasiliev, M.A., Evans, H., Spivack, A.J., and D’Hondt, S., 2013. Assessment and use of NGR instrumentation on the JOIDES Resolution to quantify U, Th, and K concentrations in marine sediment. Scientific Drilling, 15:57–63. https://doi.org/
Esper, O., and Zonneveld, K.A.F., 2002. Distribution of organic-walled dinoflagellate cysts in surface sediments of the Southern Ocean (eastern Atlantic sector) between the Subtropical Front and the Weddell Gyre. Marine Micropaleontology, 46(1–2):177–208. https://doi.org/
Esper, O., and Zonneveld, K.A.F., 2007. The potential of organic-walled dinoflagellate cysts for the reconstruction of past sea-surface conditions in the Southern Ocean. Marine Micropaleontology, 65(3–4):185–212. https://doi.org/
Fontanier, C., Jorissen, F.J., Chaillou, G., David, C., Anschutz, P., and Lafon, V., 2003. Seasonal and interannual variability of benthic foraminiferal faunas at 550 m depth in the Bay of Biscay. Deep-Sea Research, Part I: Oceanographic Research Papers, 50(4):457–494. https://doi.org/
Hensen, C., Duarte, J.C., Vannucchi, P., Mazzini, A., Lever, M.A., Terrinha, P., Géli, L., et al., 2019. Marine transform faults and fracture zones: a joint perspective integrating seismicity, fluid flow and life. Frontiers in Earth Science, 7:39. https://doi.org/
Hermelin, J.O.R., and Shimmield, G.B., 1990. The importance of the oxygen minimum zone and sediment geochemistry on the distribution of recent benthic foraminifera from the NW Indian Ocean. Marine Geology, 91(1–2):1–29. https://doi.org/
Hilgen, F.J., Lourens, L.J., and Van Dam, J.A., 2012. The Neogene period. With contributions by A.G. Beu, A.F. Boyes, R.A. Cooper, W. Krijgsman, J.G. Ogg, W.E. Piller, and D.S. Wilson. In Gradstein, F.M., Ogg, J.G., Schmitz, M.D., and Ogg, G.M. (Eds.), The Geologic Time Scale: Oxford, United Kingdom (Elsevier), 923–978. https://doi.org/
Hillier, S., 1995. Erosion, sedimentation and sedimentary origin of clays. In Velde, B. (Ed.), Origin and Mineralogy of Clays: Berlin (Springer). https://doi.org/
Hornibrook, N.d.B., 1981. Globorotalia (planktic Foraminiferida) in the late Pliocene and early Pleistocene of New Zealand. New Zealand Journal of Geology and Geophysics, 24(2):263–292. https://doi.org/
Hornibrook, N.d.B., and Jenkins, D.G., 1994. DSDP 594, Chatham Rise, New Zealand—late Neogene planktonic foraminiferal biostratigraphy revisited. Journal of Micropalaeontology, 13(2):93–101. https://doi.org/
Hyndman, R.D., Erickson, A.J., and Von Herzen, R.P., 1974. Geothermal measurements on DSDP Leg 26. In Davies, T.A., Luyendyk, B.P., et al., Initial Reports of the Deep Sea Drilling Project, 26: Washington, DC (U.S. Government Printing Office), 451–463. https://doi.org/
Iversen, N., and Jorgensen, B.B., 1985. Anaerobic methane oxidation rates at the sulfate-methane transition in marine sediments from Kattegat and Skagerrak (Denmark). Limnology and Oceanography, 30(5):944–955. https://doi.org/
Jenkins, D.G., 1993. Cenozoic southern mid- and high-latitude biostratigraphy and chronostratigraphy based on planktonic foraminifera. In Kennett, J.P., and Warnke, D.A. (Eds.), The Antarctic Paleoenvironment: A Perspective on Global Change: Part Two. Antarctic Research Series, 60:125–144. https://agupubs.onlinelibrary.wiley.com/
Jonkers, L., De Nooijer, L.J., Reichart, G.-J., Zahn, R., and Brummer, G.-J.A., 2012. Encrustation and trace element composition of Neogloboquadrina dutertrei assessed from single chamber analyses - implications for paleotemperature estimates. Biogeosciences, 9(11):4851–4860. https://doi.org/
Jutzeler, M., White, J.D.L., Talling, P.J., McCanta, M., Morgan, S., Le Friant, A., and Ishizuka, O., 2014. Coring disturbances in IODP piston cores with implications for offshore record of volcanic events and the Missoula megafloods. Geochemistry, Geophysics, Geosystems, 15(9):3572–3590. https://doi.org/
Lamy, F., 2016. The Expedition PS97 of the Research Vessel POLARSTERN to the Drake Passage in 2016. Berichte zur Polar und Meeresforschung, 701. http://epic.awi.de/
Lamy, F., Arz, H.W., Kilian, R., Lange, C.B., Lembke-Jene, L., Wengler, M., Kaiser, J., et al., 2015. Glacial reduction and millennial-scale variations in Drake Passage throughflow. Proceedings of the National Academy of Sciences of the United States of America, 112(44):13496–13501. https://doi.org/
Lamy, F., Winckler, G., Alvarez Zarikian, C.A., and the Expedition 383 Scientists, 2021. Supplementary material, https://doi.org/
Lohmann, G.P., 1978. Abyssal benthic foraminifera as hydrographic indicators in the western South Atlantic Ocean. Journal of Foraminiferal Research, 8(1):6–34. https://doi.org/
Loubere, P., and Fariduddin, M., 1999. Benthic foraminifera and the flux of organic carbon to the seabed. In Sen Gupta, K. (Ed.), Modern Foraminifera: Dordrecht, Netherlands (Kluwer Academic Publishers), 181–199. https://doi.org/
Mazzini, I., 2005. Taxonomy, biogeography and ecology of Quaternary benthic Ostracoda (Crustacea) from circumpolar deep water of the Emerald Basin (Southern Ocean) and the S Tasman Rise (Tasman Sea). Senckenbergiana Maritima, 35(1):1–119. https://doi.org/
Meyers, P.A., 1994. Preservation of elemental and isotopic source identification of sedimentary organic matter. Chemical Geology, 114(3–4):289–302. https://doi.org/
Murray, J.W., 1991. Ecology and distribution. In Takayanagi, Y., and Saito, T., (Eds.), Studies in Benthic Foraminifera: Proceedings of the Fourth International Symposiyum on Benthic Foraminifera, Sendai, 1990: Sendai, Japan (Tokai University Press).
Pierre, C., and Fouquet, Y., 2007. Authigenic carbonates from methane seeps of the Congo deep-sea fan. Geo-Marine Letters, 27(2):249–257. https://doi.org/
Pimmel, A., and Claypool, G., 2001. Technical Note 30: Introduction to Shipboard Organic Geochemistry on the JOIDES Resolution. Ocean Drilling Program. https://doi.org/
Polonia, A., Torelli, L., Brancolini, G., and Loreto, M.-F., 2007. Tectonic accretion versus erosion along the southern Chile Trench: oblique subduction and margin segmentation. Tectonics, 26(3):TC1983. https://doi.org/
Pribnow, D., Kinoshita, M., and Stein, C., 2000. Thermal Data Collection and Heat Flow Recalculations for Ocean Drilling Program Legs 101–180: Hanover, Germany (Institute for Joint Geoscientific Research, Institut für Geowissenschaftliche Gemeinschaftsaufgaben [GGA]). http://www-odp.tamu.edu/
Rabassa, J., Coronato, A., and Martínez, O., 2011. Late Cenozoic glaciations in Patagonia and Tierra del Fuego: an updated review. Biological Journal of the Linnean Society, 103(2):316–335. https://doi.org/
Rathburn, A.E., and Corliss, B.H., 1994. The ecology of living (stained) deep-sea benthic foraminifera from the Sulu Sea. Paleoceanography, 9(1):87–150. https://doi.org/
Schmiedl, G., and Mackensen, A., 1997. Late Quaternary paleoproductivity and deep water circulation in the eastern South Atlantic Ocean: evidence from benthic foraminifera. Paleogeography, Paleoclimatology, Paleoecology, 130(1–4):43–80. https://doi.org/
Schnitker, D., 1980. Quaternary deep-sea benthic foraminifers and bottom water masses. Annual Review of Earth and Planetary Sciences, 8:343–370. https://doi.org/
Schnitker, D., 1984. High resolution records of benthic foraminifers in the late Neogene of the northeastern Atlantic. In Roberts, D.G., Schnitker, D., et al., Initial Reports of the Deep Sea Drilling Project, 81: Washington, DC (U.S. Government Printing Office), 611–622. https://doi.org/
Schönfeld, J., 2006. Taxonomy and distribution of the Uvigerina peregrina plexus in the tropical to northeastern Atlantic. Journal of Foraminiferal Research, 36(4):355–367. https://doi.org/
Scott, G.H., Kennett, J.P., Wilson, K.J., and Hayward, B.W., 2007. Globorotalia puncticulata: population divergence, dispersal and extinction related to Pliocene–Quaternary water masses. Marine Micropaleontology, 62(4):235–253. https://doi.org/
Singh, R.K., and Gupta, A.K., 2004. Late Oligocene–Miocene paleoceanographic evolution of the southeastern Indian Ocean: evidence from deep-sea benthic foraminifera (ODP Site 757). Marine Micropaleontology, 51(1–2):153–170. https://doi.org/
Singh, R.K., and Gupta, A.K., 2010. Deep-sea benthic foraminiferal changes in the eastern Indian Ocean (ODP Hole 757B): their links to deep Indonesian (Pacific) flow and high latitude glaciation during the Neogene. Episodes, 33(2):74–82. https://doi.org/
Singh, R.K., Gupta, A.K., and Das, M., 2012. Paleoceanographic significance of deep-sea benthic foraminiferal species diversity at southeastern Indian Ocean Hole 752A during the Neogene. Palaeogeography, Palaeoclimatology, Palaeoecology, 361–362:94–103. https://doi.org/
Soetaert, K., Hofmann, A.F., Middelburg, J.J., Meysman, F.J.R., and Greenwood, J., 2007. The effect of biogeochemical processes on pH. Marine Chemistry, 106(1–2):380–401. (Reprint) https://doi.org/
Steinhardt, J., de Nooijer, L.L., Brummer, G.-J., and Reichart, G.-J., 2015. Profiling planktonic foraminiferal crust formation. Geochemistry, Geophysics, Geosystems, 16(7):2409–2430. https://doi.org/
Ubaldo, M.L., and Otero, M.R.P., 1978. Foraminíferos da costa susudoeste de Portugal. Garcia de Orta. Série de Geologia, Lisboa, 2(2):77–130. http://geoprodig.cnrs.fr/
Weaver, C.E., 1989. Developments in Sedimentology (Volume 44): Clays, Muds, and Shales: New York (Elsevier Science).
Wei, K.-Y., 1994. Stratophenetic tracing of phylogeny using SIMCA pattern recognition technique: a case study of the late Neogene planktonic foraminifera Globoconella clade. Paleobiology, 20(1):52–65. https://doi.org/
Well, R., and Roether, W., 2003. Neon distribution in South Atlantic and South Pacific waters. Deep-Sea Research, Part I: Oceanographic Research Papers, 50(6):721–735. https://doi.org/
Winckler, G., Lamy, F., Alvarez Zarikian, C.A., Arz, H.W., Basak, C., Brombacher, A., Esper, O.M., Farmer, J.R., Gottschalk, J., Herbert, L.C., Iwasaki, S., Lawson, V.J., Lembke-Jene, L., Lo, L., Malinverno, E., Michel, E., Middleton, J.L., Moretti, S., Moy, C.M., Ravelo, A.C., Riesselman, C.R., Saavedra-Pellitero, M., Seo, I., Singh, R.K., Smith, R.A., Souza, A.L., Stoner, J.S., Venancio, I.M., Wan, S., Zhao, X., and Foucher McColl, N., 2021a. Expedition 383 methods. In Lamy, F., Winckler, G., Alvarez Zarikian, C.A., and the Expedition 383 Scientists, Dynamics of the Pacific Antarctic Circumpolar Current. Proceedings of the International Ocean Discovery Program, 383: College Station, TX (International Ocean Discovery Program). https://doi.org/
Winckler, G., Lamy, F., Alvarez Zarikian, C.A., Arz, H.W., Basak, C., Brombacher, A., Esper, O.M., Farmer, J.R., Gottschalk, J., Herbert, L.C., Iwasaki, S., Lawson, V.J., Lembke-Jene, L., Lo, L., Malinverno, E., Michel, E., Middleton, J.L., Moretti, S., Moy, C.M., Ravelo, A.C., Riesselman, C.R., Saavedra-Pellitero, M., Seo, I., Singh, R.K., Smith, R.A., Souza, A.L., Stoner, J.S., Venancio, I.M., Wan, S., Zhao, X., and Foucher McColl, N., 2021b. Site U1539. In Lamy, F., Winckler, G., Alvarez Zarikian, C.A., and the Expedition 383 Scientists, Dynamics of the Pacific Antarctic Circumpolar Current. Proceedings of the International Ocean Discovery Program, 383: College Station, TX (International Ocean Discovery Program). https://doi.org/
Winckler, G., Lamy, F., Alvarez Zarikian, C.A., Arz, H.W., Basak, C., Brombacher, A., Esper, O.M., Farmer, J.R., Gottschalk, J., Herbert, L.C., Iwasaki, S., Lawson, V.J., Lembke-Jene, L., Lo, L., Malinverno, E., Michel, E., Middleton, J.L., Moretti, S., Moy, C.M., Ravelo, A.C., Riesselman, C.R., Saavedra-Pellitero, M., Seo, I., Singh, R.K., Smith, R.A., Souza, A.L., Stoner, J.S., Venancio, I.M., Wan, S., Zhao, X., and Foucher McColl, N., 2021c. Site U1540. In Lamy, F., Winckler, G., Alvarez Zarikian, C.A., and the Expedition 383 Scientists, Dynamics of the Pacific Antarctic Circumpolar Current. Proceedings of the International Ocean Discovery Program, 383: College Station, TX (International Ocean Discovery Program). https://doi.org/
Winckler, G., Lamy, F., Alvarez Zarikian, C.A., Arz, H.W., Basak, C., Brombacher, A., Esper, O.M., Farmer, J.R., Gottschalk, J., Herbert, L.C., Iwasaki, S., Lawson, V.J., Lembke-Jene, L., Lo, L., Malinverno, E., Michel, E., Middleton, J.L., Moretti, S., Moy, C.M., Ravelo, A.C., Riesselman, C.R., Saavedra-Pellitero, M., Seo, I., Singh, R.K., Smith, R.A., Souza, A.L., Stoner, J.S., Venancio, I.M., Wan, S., Zhao, X., and Foucher McColl, N., 2021d. Site U1541. In Lamy, F., Winckler, G., Alvarez Zarikian, C.A., and the Expedition 383 Scientists, Dynamics of the Pacific Antarctic Circumpolar Current. Proceedings of the International Ocean Discovery Program, 383: College Station, TX (International Ocean Discovery Program). https://doi.org/
Zielinski, U., and Gersonde, R., 2002. Plio–Pleistocene diatom biostratigraphy from ODP Leg 177, Atlantic sector of the Southern Ocean. Marine Micropaleontology, 45(3–4):225–268.34 https://doi.org/
1 Lamy, F., Winckler, G., Alvarez Zarikian, C.A., Arz, H.W., Basak, C., Brombacher, A., Esper, O.M., Farmer, J.R., Gottschalk, J., Herbert, L.C., Iwasaki, S., Lawson, V.J., Lembke-Jene, L., Lo, L., Malinverno, E., Michel, E., Middleton, J.L., Moretti, S., Moy, C.M., Ravelo, A.C., Riesselman, C.R., Saavedra-Pellitero, M., Seo, I., Singh, R.K., Smith, R.A., Souza, A.L., Stoner, J.S., Venancio, I.M., Wan, S., Zhao, X., and Foucher McColl, N., 2021. Site U1542. In Lamy, F., Winckler, G., Alvarez Zarikian, C.A., and the Expedition 383 Scientists, Dynamics of the Pacific Antarctic Circumpolar Current. Proceedings of the International Ocean Discovery Program, 383: College Station, TX (International Ocean Discovery Program). https://doi.org/10.14379/iodp.proc.383.106.2021
2 Expedition 383 Scientists’ affiliations.
This work is distributed under the Creative Commons Attribution 4.0 International (CC BY 4.0) license. 