Teske, A., Lizarralde, D., Höfig, T.W., and the Expedition 385 Scientists
Proceedings of the International Ocean Discovery Program Volume 385
publications.iodp.org
https://doi.org/10.14379/iodp.proc.385.103.2021
Site U15451
![]() A. Teske,
A. Teske,
![]() D. Lizarralde,
D. Lizarralde,
![]() T.W. Höfig,
T.W. Höfig,
![]() I.W. Aiello,
I.W. Aiello,
![]() J.L. Ash,
J.L. Ash,
![]() D.P. Bojanova,
D.P. Bojanova,
![]() M.D. Buatier,
M.D. Buatier,
![]() V.P. Edgcomb,
V.P. Edgcomb,
![]() C.Y. Galerne,
C.Y. Galerne,
![]() S. Gontharet,
S. Gontharet,
![]() V.B. Heuer,
V.B. Heuer,
![]() S. Jiang,
S. Jiang,
![]() M.A.C. Kars,
M.A.C. Kars,
![]() S. Khogenkumar Singh,
S. Khogenkumar Singh,
![]() J.-H. Kim,
J.-H. Kim,
![]() L.M.T. Koornneef,
L.M.T. Koornneef,
![]() K.M. Marsaglia,
K.M. Marsaglia,
![]() N.R. Meyer,
N.R. Meyer,
![]() Y. Morono,
Y. Morono,
![]() R. Negrete-Aranda,
R. Negrete-Aranda,
![]() F. Neumann,
F. Neumann,
![]() L.C. Pastor,
L.C. Pastor,
![]() M.E. Peña-Salinas,
M.E. Peña-Salinas,
![]() L.L. Pérez-Cruz,
L.L. Pérez-Cruz,
![]() L. Ran,
L. Ran,
![]() A. Riboulleau,
A. Riboulleau,
![]() J.A. Sarao,
J.A. Sarao,
![]() F. Schubert,
F. Schubert,
![]() J.M. Stock,
J.M. Stock,
![]() L.M.A.A. Toffin,
L.M.A.A. Toffin,
![]() W. Xie,
W. Xie,
![]() T. Yamanaka,
T. Yamanaka,
![]() G. Zhuang
2
G. Zhuang
2
1 Teske, A., Lizarralde, D., Höfig, T.W., Aiello, I.W., Ash, J.L., Bojanova, D.P., Buatier, M.D., Edgcomb, V.P., Galerne, C.Y., Gontharet, S., Heuer, V.B., Jiang, S., Kars, M.A.C., Khogenkumar Singh, S., Kim, J.-H., Koornneef, L.M.T., Marsaglia, K.M., Meyer, N.R., Morono, Y., Negrete-Aranda, R., Neumann, F., Pastor, L.C., Peña-Salinas, M.E., Pérez Cruz, L.L., Ran, L., Riboulleau, A., Sarao, J.A., Schubert, F., Stock, J.M., Toffin, L.M.A.A., Xie, W., Yamanaka, T., and Zhuang, G., 2021. Site U1545. In Teske, A., Lizarralde, D., Höfig, T.W., and the Expedition 385 Scientists, Guaymas Basin Tectonics and Biosphere. Proceedings of the International Ocean Discovery Program, 385: College Station, TX (International Ocean Discovery Program). https://doi.org/
2 Expedition 385 Scientists’ affiliations.
1. Summary
1.1. Background and objectives
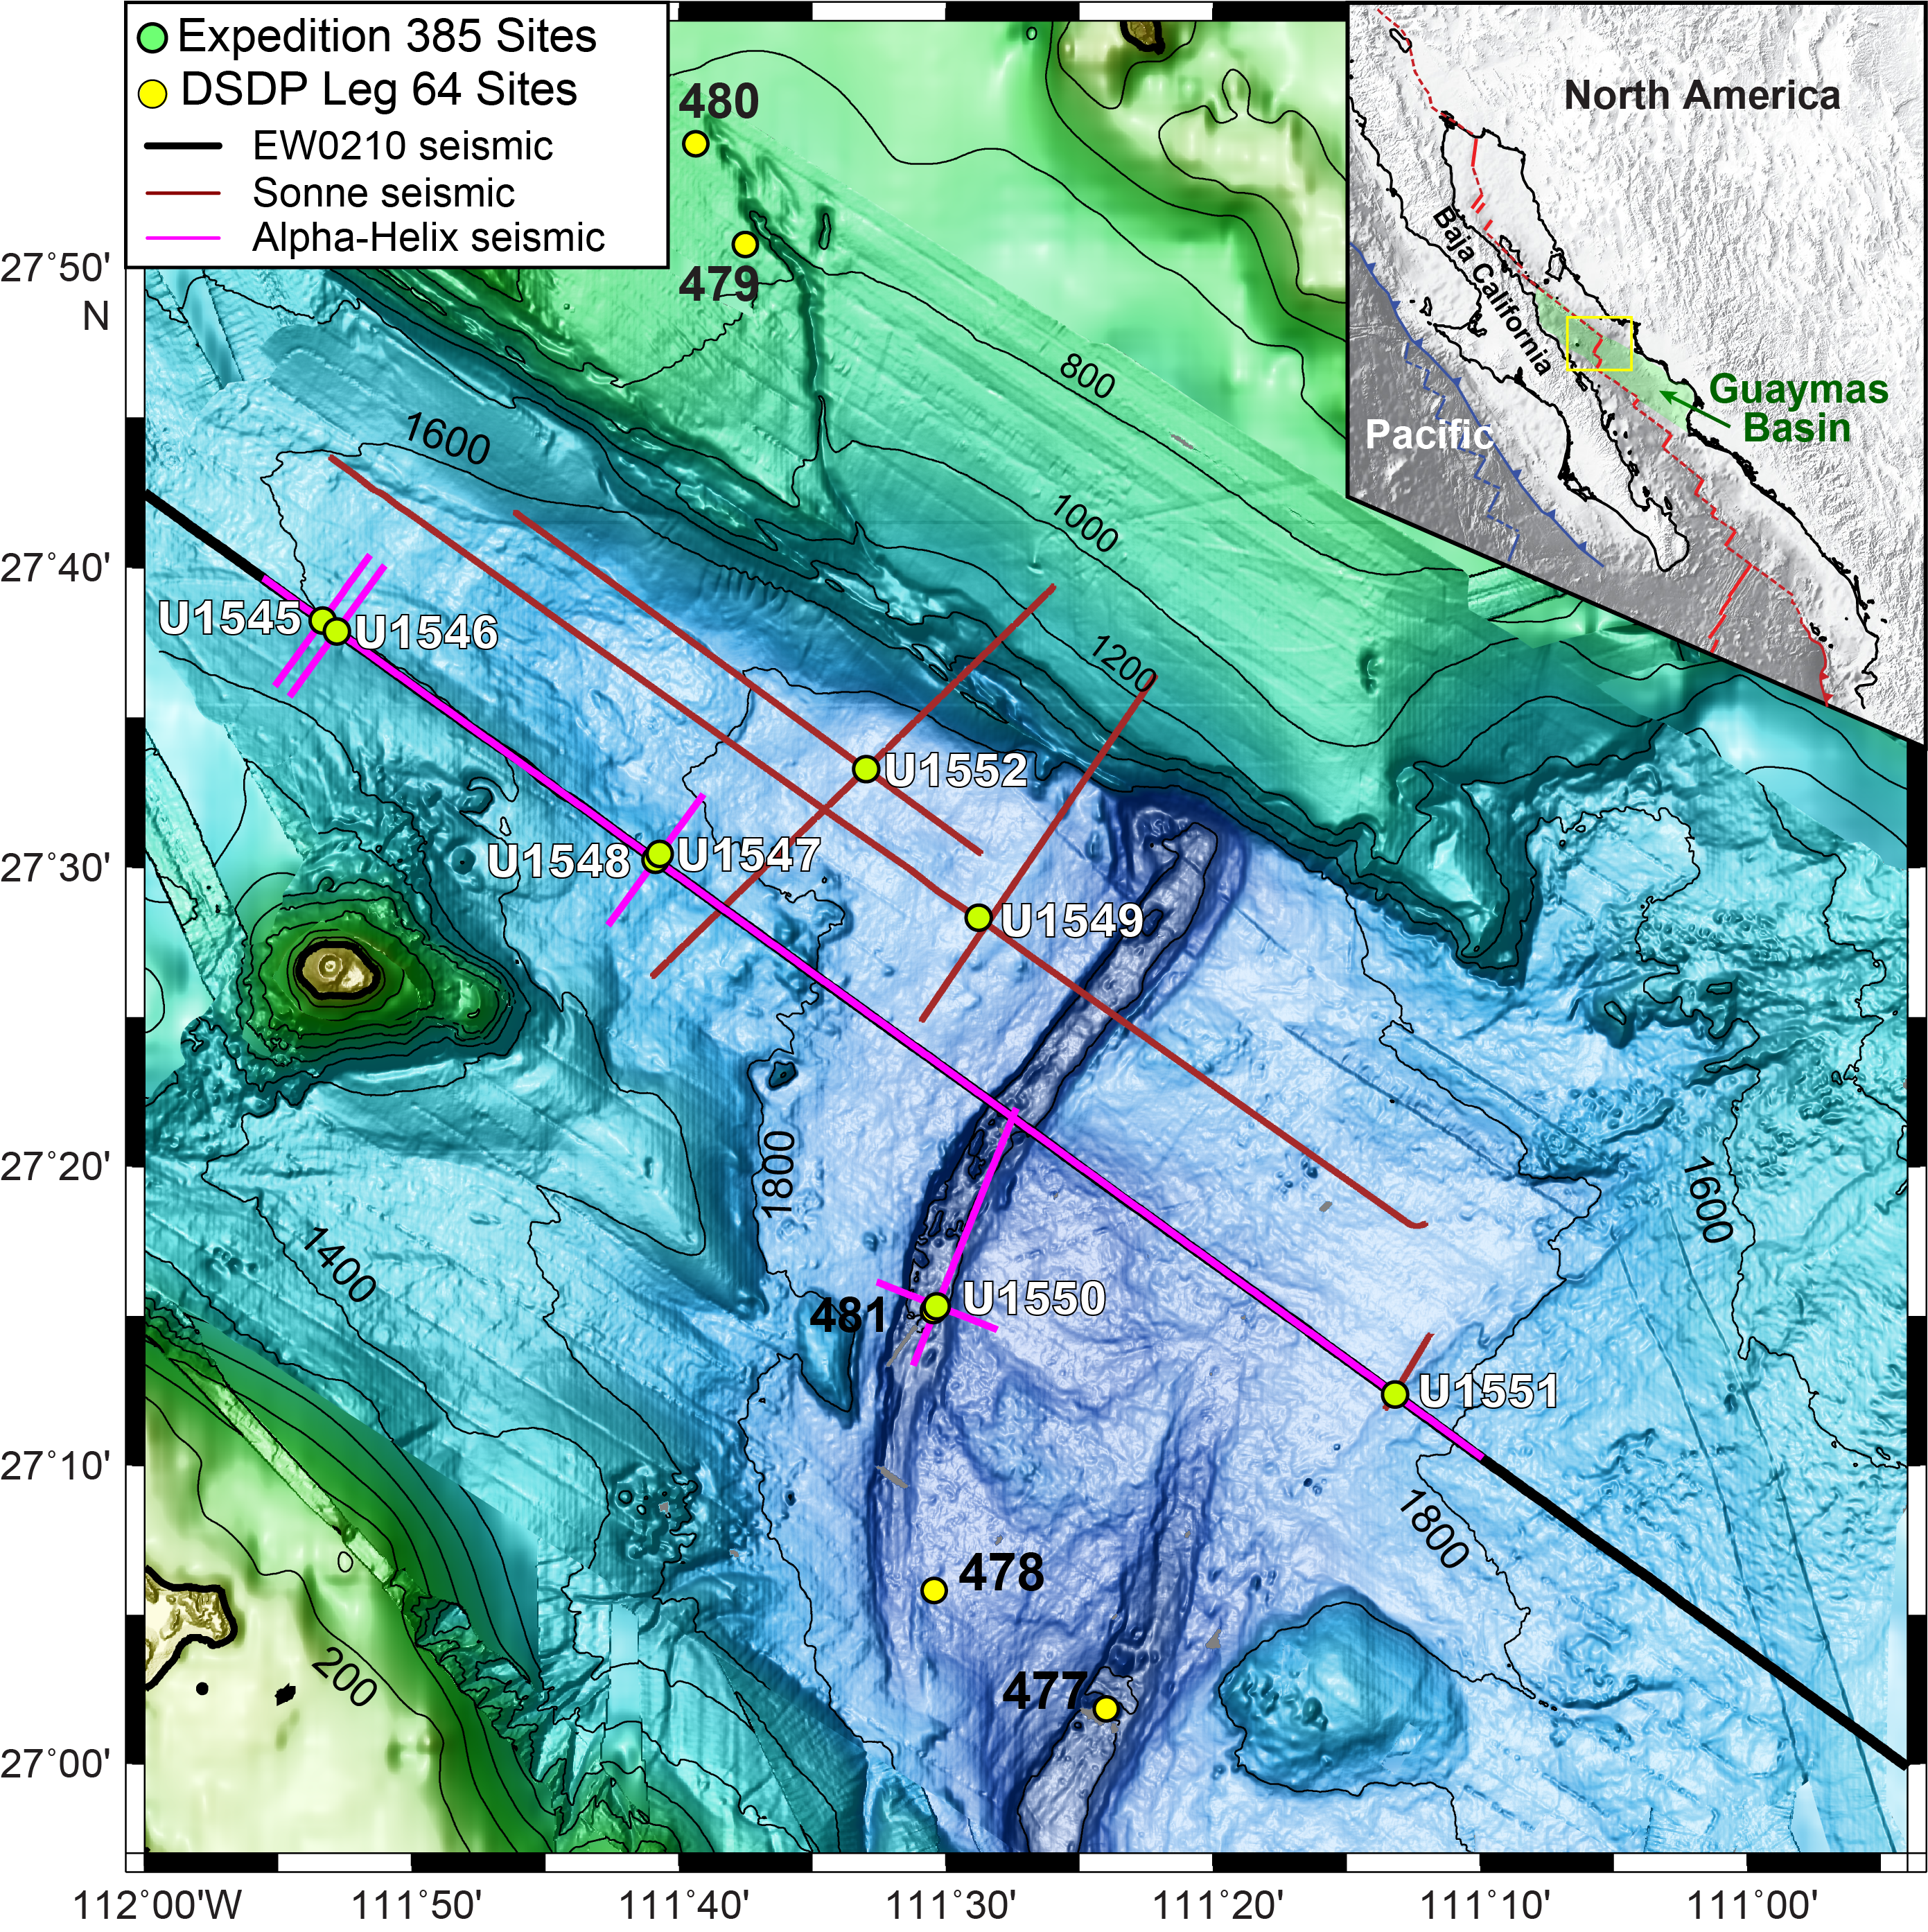
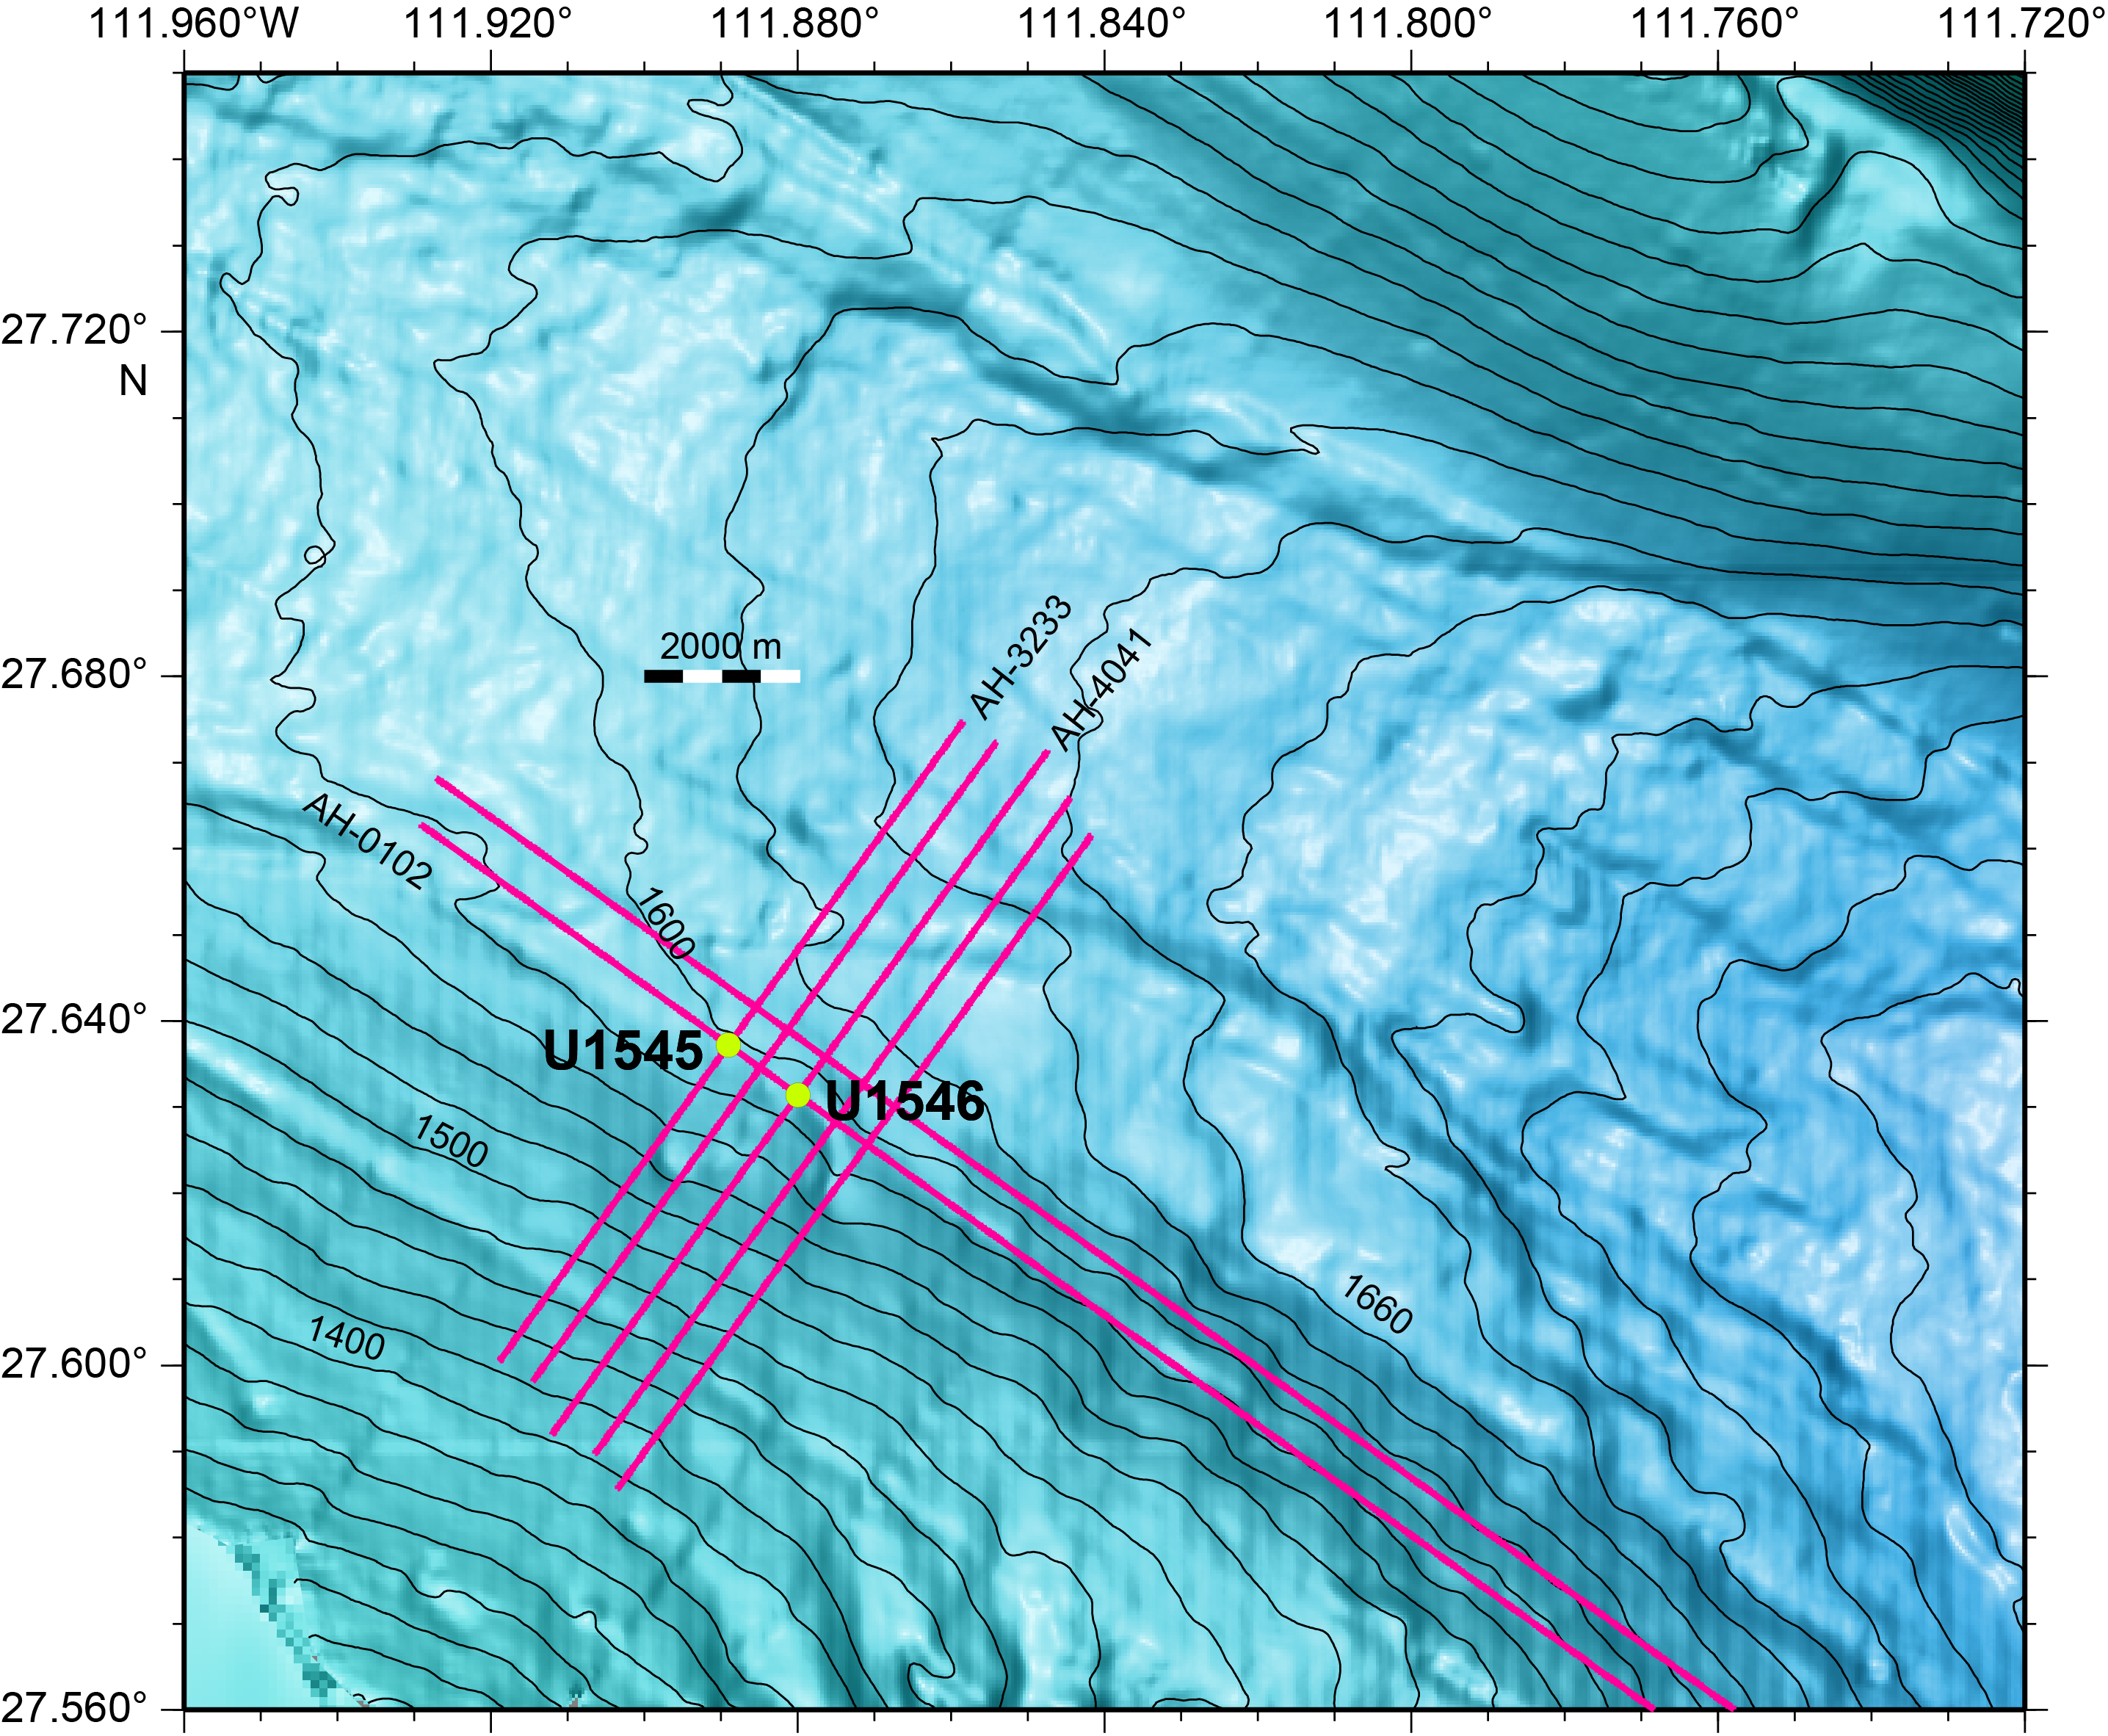
Site U1545 is located ~52 km northwest of the axial graben of the northern Guaymas Basin spreading segment (Figure F1). The primary objective for this site is shared with Site U1546, located just 1.1 km away (Figure F2). The expedition objective was to compare the sediments at two sites that are very close to each other but that have had, as seismic data suggest, very different degrees of alteration from intruding sills. Preexpedition seismic survey data indicate an undisturbed sedimentary succession at Site U1545 from the seafloor to ~2.8 s two-way traveltime (TWT) (~540 meters below seafloor [mbsf]), where an interpreted sill was observed. In contrast, seismic data show the same stratigraphic sequence at Site U1546 to be substantially disturbed between an apparent unconformity at ~2.3 s TWT and a bright reflector at ~2.6 s TWT (~350 mbsf), which was interpreted to be a sill intrusion. Sills deeper than 2.6 s TWT were also interpreted at Site U1546. Comparison of Sites U1545 and U1546 thus enables the quantification of thermal and hydrothermal alteration driven by sill intrusion at Site U1546.
1.2. Operations
We cored three holes at Site U1545. Hole U1545A is located at 27°38.2325′N, 111°53.3406′W in a water depth of 1593.5 m. In Hole U1545A, we used the advanced piston corer (APC), half-length APC (HLAPC), and extended core barrel (XCB) systems to advance from the seafloor to a final depth of 503.3 mbsf with a recovery of 389.0 m (77%). We made formation temperature measurements at several depths using the advanced piston corer temperature (APCT-3) tool and the Sediment Temperature 2 (SET2) tool. We terminated coring based on the safety monitoring protocol for hydrocarbon gases after measuring a low methane/ethane (C1/C2) value. We then conducted downhole measurements in Hole U1545A: (1) recovery of borehole fluid with the Kuster Flow Through Sampler (Kuster FTS) and (2) downhole logging with the triple combination (triple combo) and Formation MicroScanner (FMS)-sonic logging tool strings. In Hole U1545B, located at 27°38.2301′N, 111°53.3295′W in a water depth of 1594.2 m, we deployed the APC, HLAPC, and XCB systems. Cores penetrated from the seafloor to a final depth of 387.3 mbsf and recovered 340.1 m (88%). Formation temperature measurements were carried out at several depths with the APCT-3 and SET2 tools. In Hole U1545C, located at 27°38.2420′N, 111°53.3290′W in a water depth of 1595.0 m, we deployed the APC, HLAPC, and XCB systems to advance from the seafloor to a final depth of 329.0 mbsf with a recovery of 324.6 m (99%). Holes U1545B and U1545C were dedicated to extensive microbial and biogeochemical sampling that required the deployment of perfluorocarbon tracers (PFTs) downhole on all cores to monitor drilling fluid (seawater) contamination (House et al., 2003; Lever et al., 2006). During the first 2 days of coring in Hole U1545B, the pace of coring was adjusted to accommodate the complex microbial sampling program conducted on the core receiving platform. A total of 232.1 h, or 9.7 days, were spent at Site U1545. Cores, penetration depths, core recovery, and operations schedule for all holes at Site U1545 are listed in Table T1.
1.3. Principal results
1.3.1. Lithostratigraphy
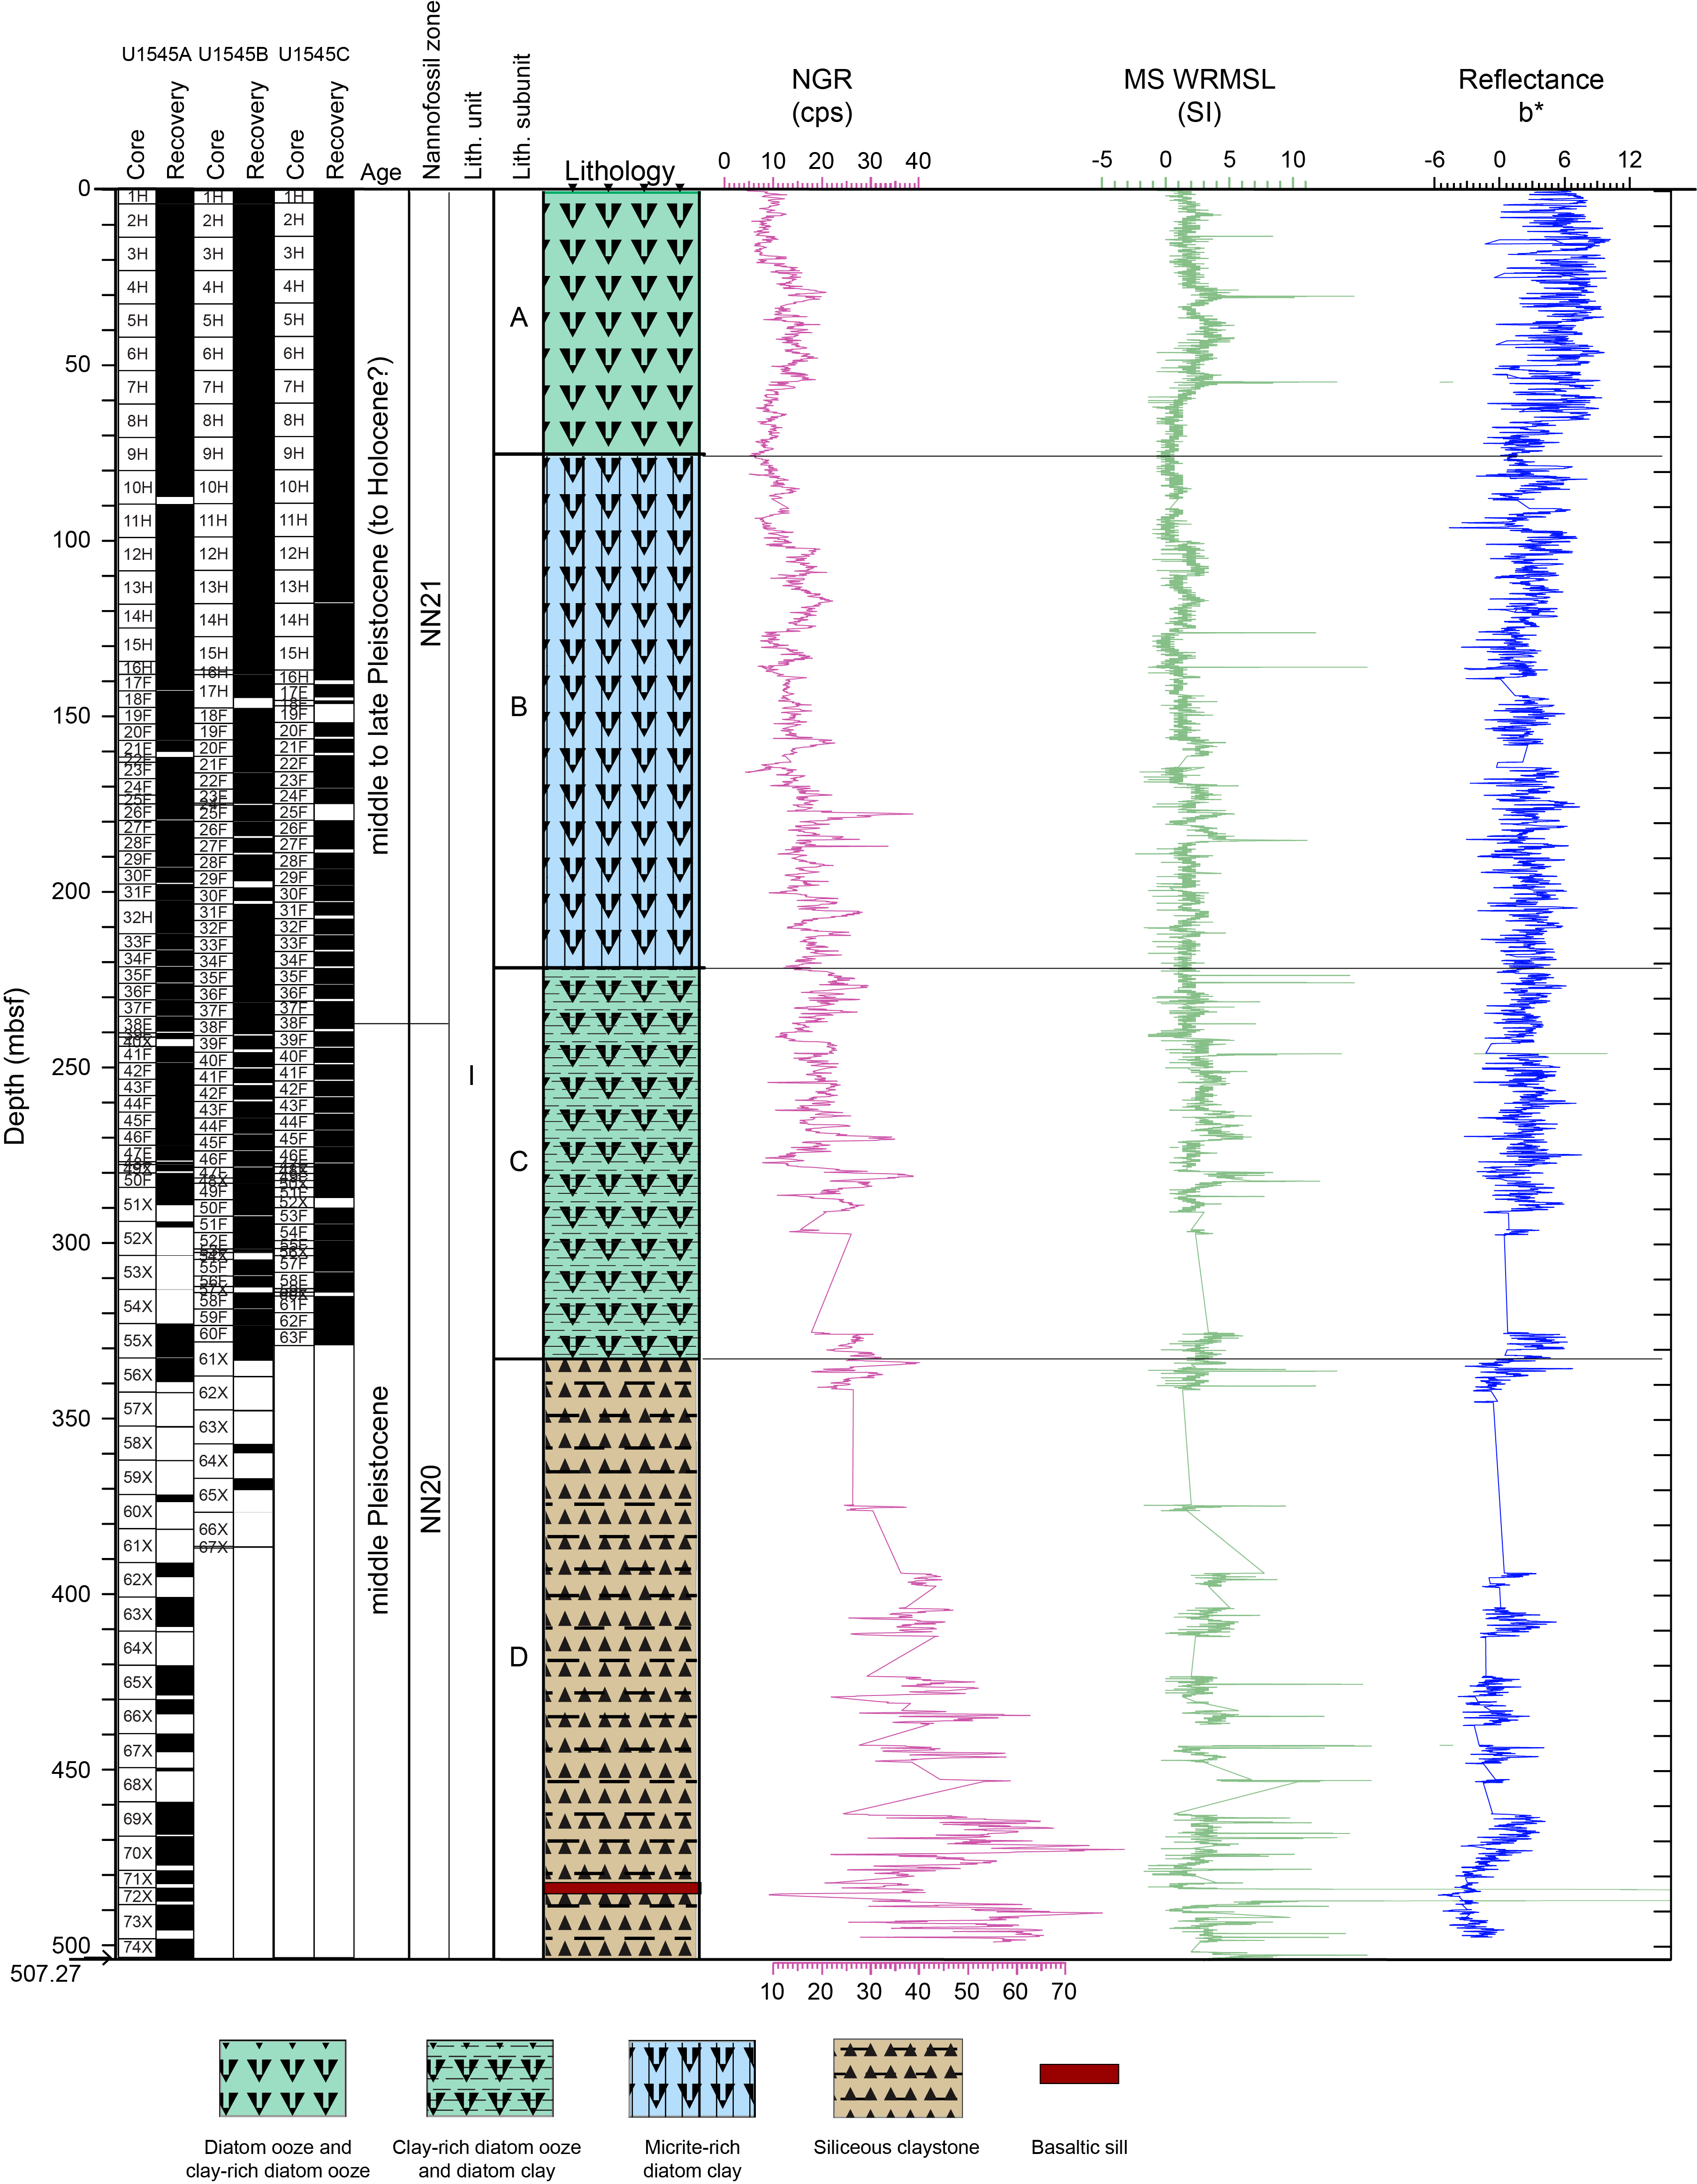
The deepest record of sediments and igneous rocks was recovered in Hole U1545A from a curated depth of 507.27 mbsf, and recovery reached 387.23 and 328.88 mbsf in Holes U1545B and U1545C, respectively. Site U1545 is composed of late to middle Pleistocene sediments that are primarily a mixture of laminated diatom ooze and clay minerals (Figure F4). Minor components encompass nannofossils and silt-sized siliciclastic particles and authigenic minerals. The latter include pyrite and clay- to silt-sized carbonate (micrite) particles (mainly dolomite) that occur both scattered in the sediment and concentrated in discrete nodules/concretions with different degrees of lithification. Downhole changes in lithology are not significant enough to require a division of the site into more than one lithostratigraphic unit (Unit I). However, the presence of minor yet significant downhole lithologic changes and/or changes in sediment induration and physical properties prompt the division of Unit I into four subunits (Subunits IA, IB, IC, and ID). These differences arise mainly from different degrees and types of diagenetic processes and overprinting that have resulted in the formation of authigenic minerals (e.g., micrite in Subunit IB) and/or the selective dissolution of sedimentary particles (e.g., dissolution of diatoms during opal-A to opal-CT phase transformation in Subunits IC and ID). The transitions between the subunits are gradual, occur over more than one core, and may be locally obscured in low-recovery zones. The mixed biogenic and siliciclastic nature of the sediments and the abundance of fine lamination in the sedimentary record suggest that the depositional environment at Site U1545 has remained essentially hemipelagic and suboxic to anoxic throughout the middle to late Pleistocene. Igneous rocks of subvolcanic texture and basaltic composition were encountered as an intrusive sheet in the sedimentary section near the bottom of Hole U1545A.
1.3.2. Igneous petrology and alteration
In Hole U1545A, we penetrated a mafic sill intrusion hosted by siliceous claystone and recovered a total core length of 86 cm from a top depth of 482.17 mbsf. This thin hypabyssal rock layer is identified as part of Subunit ID. It is dominantly composed of aphyric basalt. A ~3 cm thick baked layer of carbonate metasedimentary rock forms the upper contact with the sill. The dark gray aphyric basalt has an aphanitic texture with a micro- to cryptocrystalline inequigranular igneous mineral assemblage consisting of plagioclase, pyroxene, and accessory Fe-Ti oxides. Moderate to sparse vesicularity overall decreases with depth. Plagioclase phenocrysts are rarely present (<1 vol%). The entire cored length of the basaltic rock layer is texturally and mineralogically homogeneous except for a 1 cm thick, carbonate-rich vesicular interval in the middle of the section that has an overall coarser grain size and no microphenocrysts. The entire recovered section shows moderate alteration that is consistent with hydrothermal fluid-rock interaction. Plagioclase grains are slightly altered to sericite, whereas pyroxenes remain only as pseudomorphs that are totally replaced by secondary magnetite and clay minerals. Vesicles are mostly filled with secondary minerals. These precipitates are dominantly carbonates (e.g., calcite and dolomite) and clay minerals (e.g., smectite) with minor magnetite and pyrite. Observed veins are predominantly filled with carbonates, pyrite, and zeolites, giving them a white color with black and golden patches.
1.3.3. Structural geology
Tilted sedimentary beds and deformation structures are found in some depth intervals in Subunits IA–ID. The folds and tilted beds observed in two depth intervals above 109 mbsf are attributed to two slump events that caused soft-sediment deformation. At greater depth, some preexisting brittle fractures are found. Some of the layers in Subunit IC exhibit fractures with apparent dips of 60° relative to the core axis. The mafic sill (Subunit ID) has mineralized fractures that are subvertical in orientation.
1.3.4. Biostratigraphy
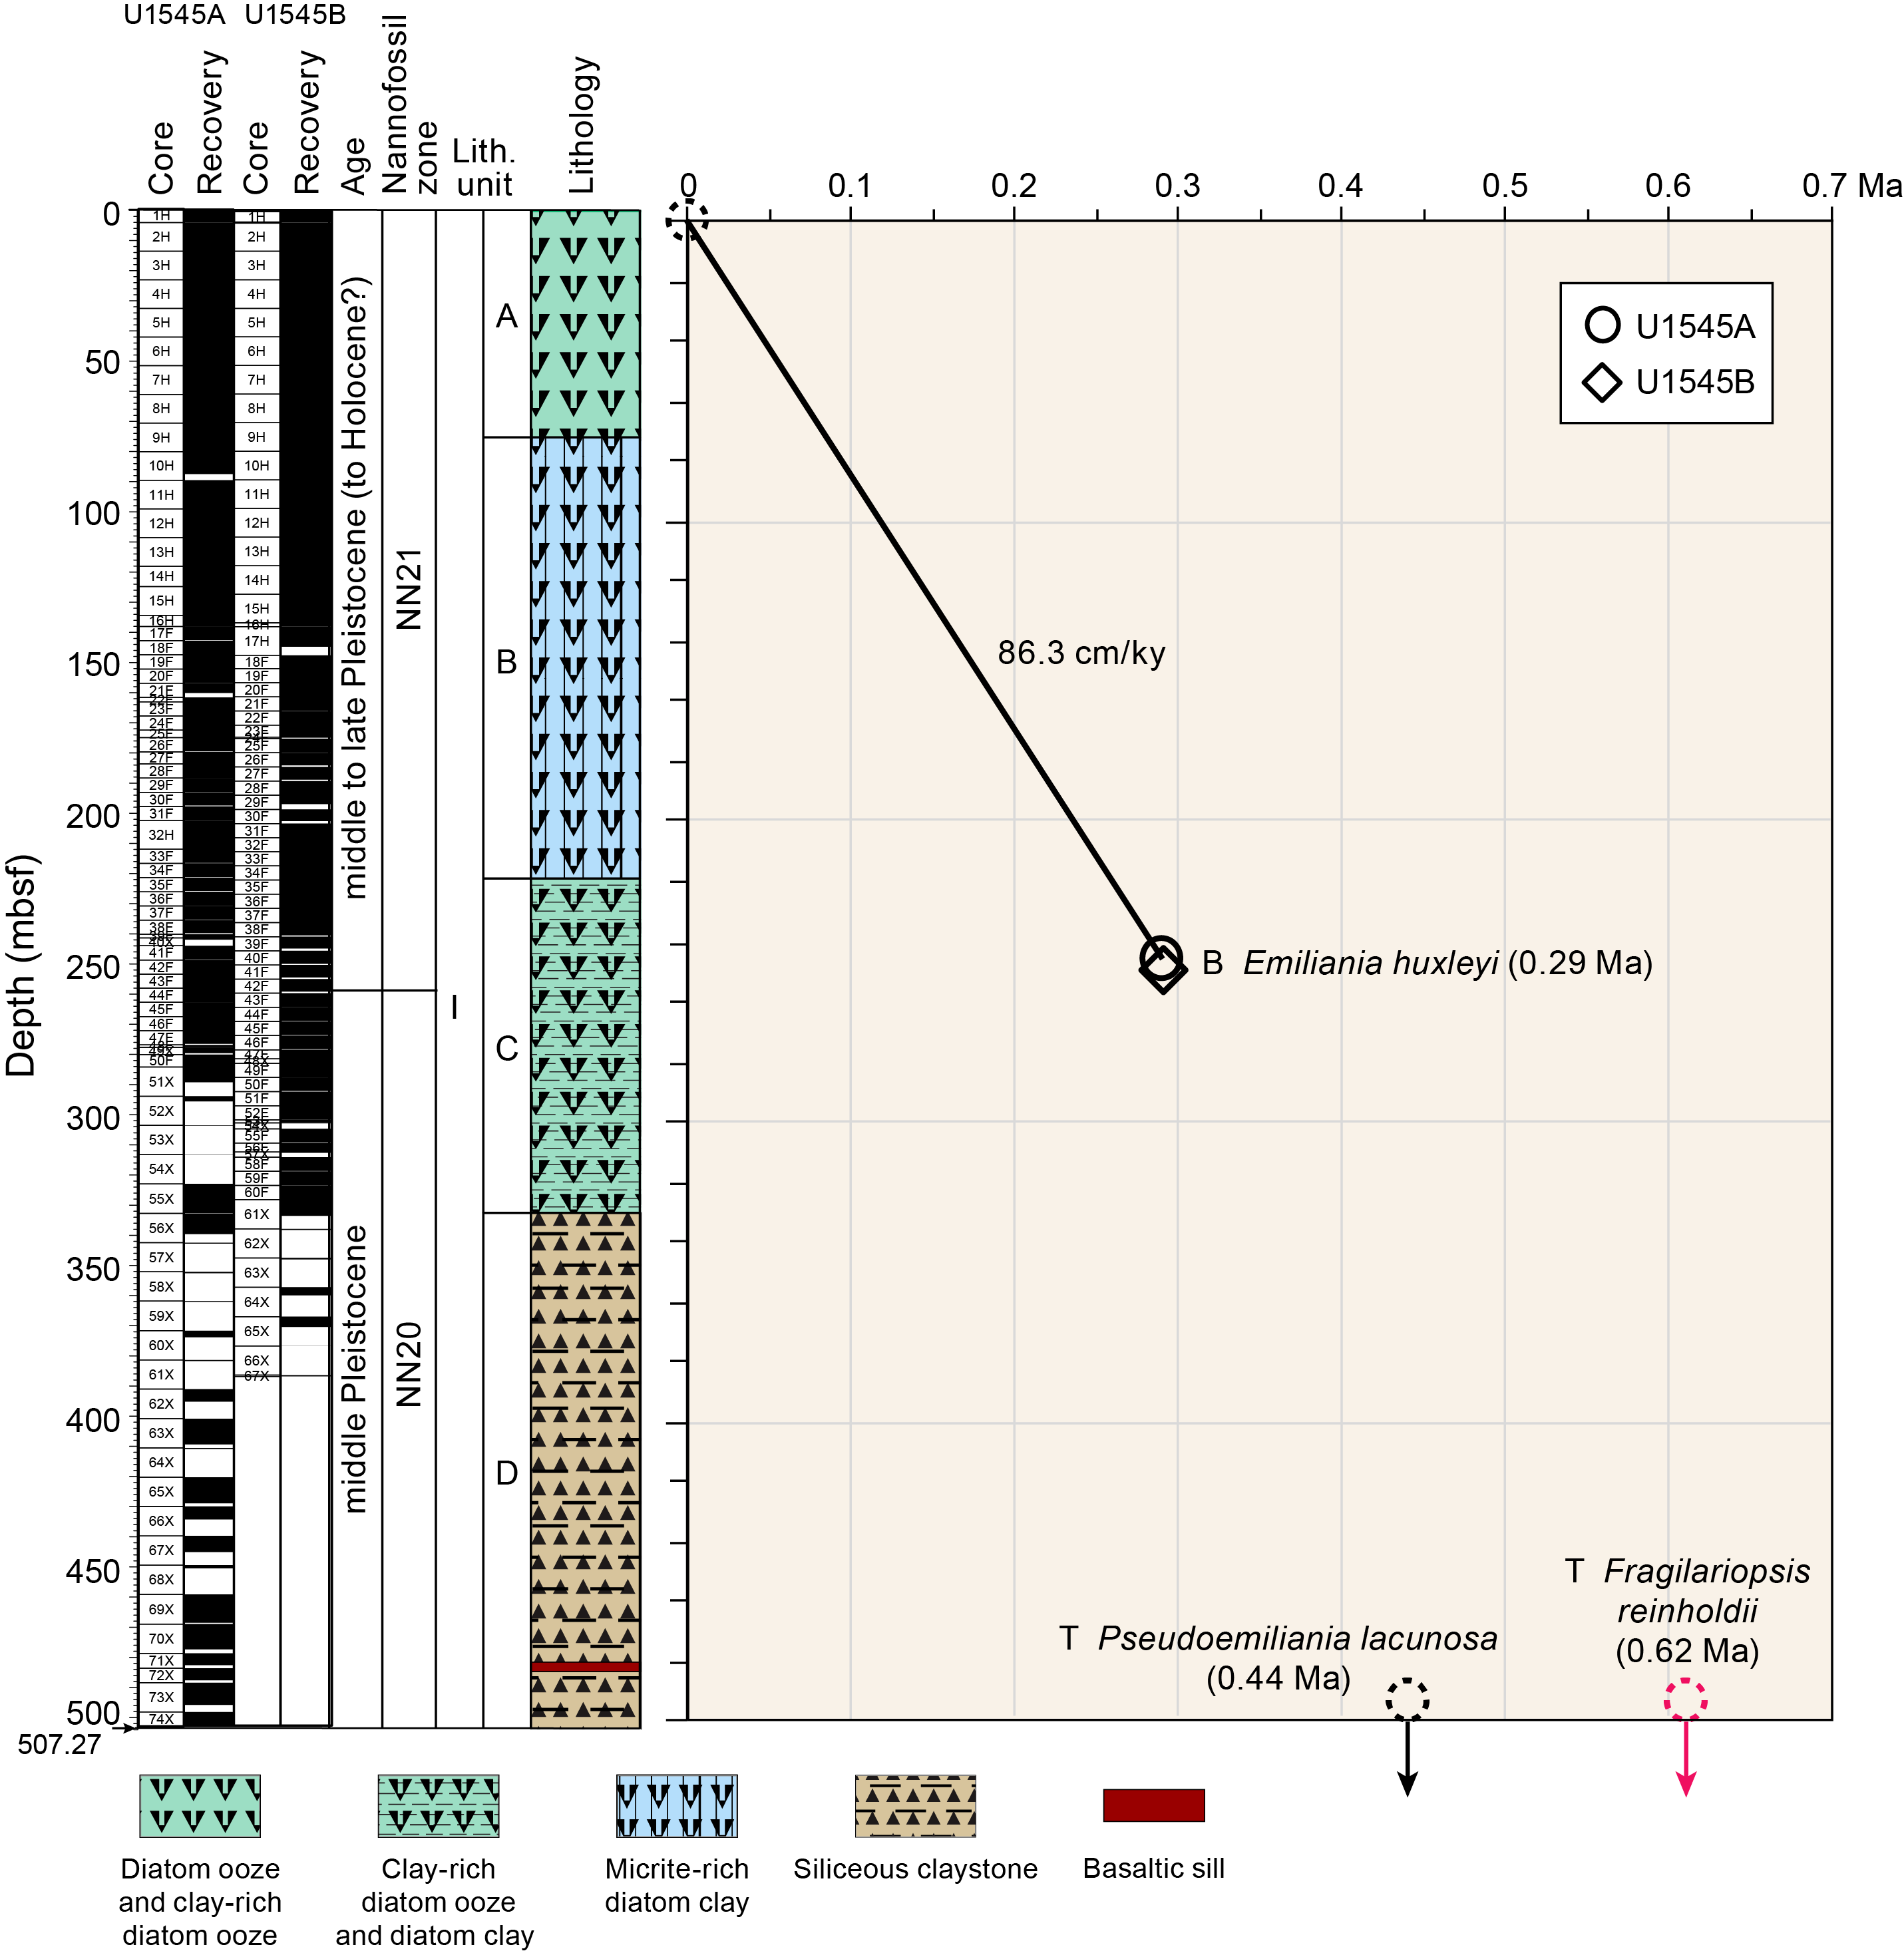
At Site U1545, preservation of calcareous nannofossils is good/moderate to poor throughout the entire sedimentary sequence. In general, preservation is good/moderate in samples with abundant or common nannofossils and poor in those with frequent or rare nannofossils. Preservation is better in samples taken from intervals above the core catcher than in core catcher samples. Overall, marine diatoms were observed to be dominant/abundant with good/moderate preservation to ~300 mbsf and barren to the bottom of Holes U1545A and U1545B as a result of silica diagenesis. One biostratigraphic datum was recognized, and two additional stratigraphically underlying datums were estimated based on the absence of the zonal markers in the generally continuous succession from the late to middle Pleistocene. The lowermost occurrence (i.e., first occurrence datum) of Emiliania huxleyi dates the upper part of the sediment sequence to (Holocene–)late–middle Pleistocene (younger than 0.29 Ma; Hole U1545A = 0–248.6 mbsf; Hole U1545B = 0–249.6 mbsf), whereas the absence of Pseudoemiliania lacunosa (calcareous nannofossil) and Fragilariopsis reinholdii (marine diatom) in samples examined from the underlying interval indicates a middle Pleistocene age (younger than 0.44 Ma) for the bottom of both holes. Hole U1545C was not sampled. The estimated average sedimentation rate is 863 m/My (86.3 cm/ky).
1.3.5. Paleomagnetism
Alternating field (AF) demagnetization up to 20 mT was conducted with the superconducting rock magnetometer (SRM) on all archive-half sections from Hole U1545A. The drilling-induced overprint was successfully removed from APC and HLAPC cores (from the seafloor to ~280 mbsf) upon demagnetization. Inclination values after demagnetization at 20 mT cluster around 46°, which is similar to the expected geocentric axial dipole (GAD) inclination at the latitude of the site (46.3°). This is supported by a detailed analysis of the remanence of discrete samples. The drilling-induced overprint is removed by 10 mT, and the characteristic remanent magnetization (ChRM) is consistent with the SRM measurements. Unfortunately, XCB cores were overprinted and too disturbed to yield reliable paleomagnetic data, and no discrete samples could be collected. Cores 385-U1545A-1H through 50F (to ~280 mbsf) were assigned to the normal Brunhes Chron C1n (younger than 0.78 Ma). The natural remanent magnetization (NRM) of archive-half sections decreases from ~50 to 80 mbsf in a depth interval that corresponds to the sulfate–methane transition zone (SMTZ). The magnetic mineral assemblage becomes coarser, and low-coercivity minerals, likely (titano)magnetite, are dominant. In addition, AF demagnetization up to 20 mT was carried out on archive-half sections from Hole U1545B (Cores 46F–60F) to increase the depth interval of paleomagnetic measurements on HLAPC cores. This enabled us to make a tentative correlation between Holes U1545A and U1545B based on the NRM and point magnetic susceptibility (MSP) that gives a possible offset of about 3 m between holes. Anisotropy of magnetic susceptibility shows a mixture of prolate and oblate behavior in the sediments. No paleomagnetic measurements were carried out in Hole U1545C.
1.3.6. Inorganic geochemistry
A total of 80 interstitial water (IW) samples were collected from the sedimentary successions in Holes U1545A–U1545C. Sulfate concentration decreases to almost zero and methane concentration sharply increases at around 50 mbsf. The depth interval over which these changes were observed is referred to as the SMTZ. Biogeochemical processes from the seafloor to 50 mbsf, including organoclastic sulfate reduction and anaerobic oxidation of methane (AOM), led to the accumulation of byproducts such as sulfide, ammonium, and phosphate; a corresponding sharp increase in alkalinity; and a continuous increase in bromide. The downward increase in ammonium concentration to a maximum of >30 mM at around 250 mbsf indicates ongoing microbial remineralization of organic matter. The significant decrease in calcium concentration toward the top of Subunit IB near 70–80 mbsf may correspond to the precipitation of authigenic carbonates. The drop in alkalinity and magnesium at ~70–80 mbsf could indicate the precipitation of authigenic dolomite, whereas the increase in calcium concentration could reflect the dissolution of carbonate phases other than dolomite. Chloride, silica, strontium, lithium, boron, and barium contents also continuously increase as a result of the dissolution of minerals such as silicates. Calcium, silica, strontium, lithium, boron, and barium concentrations continuously increase between 220 and 320 mbsf. The maximum concentration of dissolved silica is seen at ~290 mbsf, below which depth the profile starts to reverse. Around the same depth, bromide, lithium, boron, strontium, barium, and sodium sharply increase and potassium sharply decreases. Below ~320 mbsf, a number of significant variations (increase or decrease) were observed for many dissolved elements (K+, B, Sr2+, Li+, etc.) and are possibly related to a combination of diagenetic processes (opal diagenesis, smectite to illite transformation, or the dissolution/precipitation of other minerals) as well as thermal alteration during and after sill intrusion. Alternatively, data variability and some excursions may reflect erratic contamination of sediment derived from drilling-induced generation of core fragments that mix with drilling mud during XCB coring.
1.3.7. Organic geochemistry
At Site U1545, we performed analyses of gas and solid-phase samples. For Hole U1545A, one headspace gas sample was analyzed per 9.5 m of core for routine hydrocarbon safety monitoring. The carbon, nitrogen, and sulfur content of particulate sediment was characterized, and source rock analysis was performed on selected solid-phase samples. For Hole U1545B, hydrocarbons were analyzed for both headspace gas and void gas; the amount of void space was quantified; H2 and CO contents were measured; the carbon, nitrogen, and sulfur contents of sediment were characterized; and a comprehensive suite of gas and sediment samples was taken for postexpedition analyses. The SMTZ is at approximately 40–50 mbsf in the three holes, and C2–C6 hydrocarbons are detectable below 100 mbsf. In Hole U1545A, low C1/C2 values below the thin basaltic rock layer necessitated the termination of drilling. From elemental and source rock analysis, we infer that the primary source of organic matter is marine in origin and the thermal maturity of organic matter varies based on the proximity of the sill. In Holes U1545B and U1545C, H2 and CO are present in low concentrations, which suggests that biological cycling is the dominant control on these gases.
1.3.8. Microbiology
Sediment cores from below 480 mbsf in Hole U1545A and throughout Holes U1545B and U1545C span the temperature range from the cold seafloor to hot (~89°C) subsurface sediments that is potentially populated by psychrophilic, mesophilic, and thermophilic microorganisms. Thus, these cores were extensively sampled for microbiology and biogeochemistry, and those samples captured the entire spatial and thermal gradient in the penetrated sediment column at Site U1545. Syringe samples for cell counts, 3-D structural imaging, and RNA analyses were taken on the core receiving platform, preserved or frozen, and stored for further analyses. Whole-round core samples were either stored in a −80°C freezer or temporarily stored in a 4°–8°C cold room and processed further for shore-based analyses. Here and at all other sites, whole-round sample processing was conducted either inside a Coy Laboratory Products anaerobic chamber equipped with a Table KOACH air purification unit or on the bench with a KOACH open clean zone system to maintain conditions that were as sterile as possible. Samples for PFT measurements were taken using a syringe at 11 distinct sediment horizons on the core receiving platform. Shipboard cell counts showed that abundance gradually decreases with depth from 5.8 × 10⁸ cells/cm3 at the seawater/sediment interface to 8.2 × 10⁵ cells/cm3 at approximately 150 mbsf. Except for a local spike at 290 mbsf (Section 385-U1545B-50F-3) to a cell abundance of 3 × 10⁵ cells/cm3, cell numbers farther downhole drop below the detection limit of the protocol that we used for the shipboard cell counting program.
1.3.9. Petrophysics
Physical properties of whole-round and split cores were measured in the laboratory, and in situ measurements were made with downhole logging tools. Measurements on whole-round and working-half sections from Holes U1545A–U1545C were compared with each other and with downhole measurements from Hole U1545A for lithostratigraphic characterization and integration of core description, borehole data, and seismic profiles. These measurements included whole-round bulk density estimated from gamma ray attenuation (GRA) bulk density, magnetic susceptibility (MS), natural gamma radiation (NGR; sensitive to the abundance of minerals containing radioisotopes of K, U, and Th), P-wave velocity, and discrete measurements of moisture and density (MAD) (to estimate porosity), thermal conductivity, three-component P-wave velocity, and rheological properties (shear and compressional strength). Two types of changes were observed in the GRA bulk density. The first type was observed in the uppermost 100 m of sediment and the second type to ~280 mbsf. Density generally increases by 0.11 g/cm3 every 100 m. A steeper increase in density (0.14 g/cm3 every 100 m) was observed from ~280 mbsf to the final curated depth of Hole U1545A at 507.7 mbsf. This density increase is particularly well correlated with NGR values and corresponds to a change in lithology from diatom clay to siliceous claystone. MS values show peaks at 60, 170, and 482–483 mbsf that are also seen in the bulk density and NGR data. Two downhole logging tool strings were run in Hole U1545A: the triple combo (NGR, porosity, and density, including MS, resistivity, caliper, and logging head temperature) and FMS-sonic (resistivity images, caliper, acoustic velocity, and NGR) tool strings. Because of a malfunctioning caliper on the upward pass, only one pass was possible with the triple combo. In general, downhole measurements are consistent with results obtained from the whole-round and working-half cores. In addition to the logging tools, nine in situ formation temperature measurements were conducted with the APCT-3 and SET2 tools, indicating that temperature increases with depth along a linear geothermal gradient of 225°C/km that corresponds to a calculated heat flow of 161 mW/m2.
2. Background and objectives
Site U1545 (proposed Site GUAYM-01B) is located at 27°38.2315′N, 111°53.3396′W, ~52 km northwest of the axial graben of the northern Guaymas Basin spreading segment (see Figure F1 in the Expedition 385 summary chapter [Teske et al., 2021b]). The primary objective for this site is shared with Site U1546, located just 1.1 km away (Figure F3). These sites are located on lithosphere with the greatest lithospheric age (~2.1 Ma) of the Expedition 385 sites and at the foot of the slope to the southeast that marks the boundary between the southern and northern Guaymas Basin spreading segments. These sites thus have the greatest thickness of biogenic sediments of the Expedition 385 sites, with deposition directly from the water column and from minor downslope sediment transport.

The sedimentary section at Site U1545 is undisturbed by sills to ~500 mbsf, where a thin (<10 m) igneous sill is present. The same stratigraphic sequence is affected by igneous activity at nearby Site U1546, where the sediments between ~50 and ~358 mbsf were disrupted by an underlying massive sill intrusion. Thus, Site U1546 serves as reference for sediment modification due to alteration processes driven by sill intrusion (see the Site U1546 chapter [Teske et al., 2021c]). Comparing the composition, physical properties, geochemical gradients, and microbial communities of the sediments at Sites U1545 and U1546 provides a direct measurement of the effect of this alteration, namely its geochemical imprint and its consequences for carbon release from the sediments, microbial community composition, and activity of the sedimentary biome. In addition, the thin sill at ~500 mbsf at Site U1545 and the associated altered adjacent sediments provide a reference for the corresponding sediments at Site U1546, which also experienced alteration from a sill near this depth in addition to subsequent heating from the overlying massive sill. More generally, Site U1545 provides the Expedition 385 reference of undisturbed and continuous hemipelagic sedimentation in the absence of seepage, hydrothermal influence, and massive sill intrusion, whereas all other sites of this expedition exhibit some degree of alteration or disturbance that sets them apart.
3. Operations
3.1. San Diego port call
Expedition 385 started at 1500 h on 15 September 2019 when Expedition 385T ended with the first line ashore at the B-Street Pier Terminal in San Diego, California. After clearing US customs and immigration, port call activities immediately started with offloading freight.
At 0815 h on 16 September, the Co-Chief Scientists and JOIDES Resolution Science Operator (JRSO) staff boarded the vessel. JRSO staff conducted crossover activities with the off-going staff who departed in the late afternoon. Prior to that, all technical staff attended a radiation safety training course. Other port call activities included handling off-going and incoming freight, such as loading drill pipe (150 joints) and casing (20 joints). Also, third-party instruments and supplies shipped by the Expedition 385 science party were received. The Department of Energy van was loaded and placed on the core tech shop roof, enabling implementation of microbial stable isotope studies at sea.
On 17 September, the majority of the Expedition 385 science party boarded the vessel at 0830 h. At 1300 h, after another nine scientists boarded the vessel upon obtaining their Mexican cooperation visa documents, the science party was given a short introductory talk and presentation on information technology aboard the research vessel (R/V) JOIDES Resolution. The initial orientation talks were then concluded with presentations about life at sea and general safety. This was followed by a general ship safety tour. Port call activities included the arrival of the oncoming Siem Offshore crew that crossed over with their off-going counterparts. Loading and unloading of cargo continued throughout the day, including discharge of the Expedition 379 cores and staging casing and core winch line shipments for loading. By the end of the day, almost 1000 metric tons of fuel were bunkered. Routine port call activities continued on 18 September, including loading casing and food and starting a routine derrick inspection. Another science party member boarded the vessel at 1530 h. On 19 September, port call activities continued with loading hardware and supplies such as food and lube oil. In the afternoon, the Captain, Ship’s Doctor, Offshore Installation Manager, First and Second Mates, and Camp Boss met the science party and new JRSO technical staff and gave a presentation on the environment and safety of the vessel. The unloading of off-going shipments was completed on 20 September. The loading of freight, including all hazardous material shipments, proceeded. The routine inspection of the derrick concluded. Another ~1000 metric tons of fuel were bunkered by the end of the day. On 21 September, we completed loading freight, offloaded trash prior to sailing, and secured all equipment for our transit. Our departure was postponed 1 day to 22 September to avoid tropical storms and potentially high seas on our sea passage to Guaymas Basin in the Gulf of California.
3.2. Transit to Site U1545
The pilot boarded the vessel at 0642 h on 22 September 2019. JOIDES Resolution departed the B-Street Pier Terminal in San Diego at 0742 h, starting the 1152 nmi sea voyage to Site U1545. The passage began with a transit to Ensenada, Mexico, to clear customs and pick up the final member of the science party. During the transit, the Captain held the first weekly fire and life boat safety drill. The vessel arrived in Ensenada at 1442 h on 22 September and anchored at 1515 h, completing the 81 nmi transit in 7 h at an average speed of 11.6 kt. The port agent and final member of the science party boarded the ship at 1515 h, and all clearance formalities were completed by 1555 h. The anchor was secured at 1632 h, and we resumed our sea voyage to Site U1545 at 1636 h. We arrived at Site U1545 at 1342 h on 26 September, completing the entire 1152 nmi transit in 92.4 h at an average speed of 12.5 kt. All thrusters were lowered, and the vessel was switched to dynamic positioning (DP) mode.
3.3. Site U1545
Site U1545 consists of three holes. The original plan was for two holes to be cored by the APC and XCB systems to 600 mbsf (Hole U1545A) and 250 mbsf (Hole U1545B). The deeper hole was to be dedicated to lithologic description and pore water/solid-phase geochemistry as well as downhole wireline logging with the triple combo and FMS-sonic tool strings, and the shallower hole would be subject to microbial sampling. Actual operations differed from the plan. Hole U1545A focused on lithologic description and sampling, and Holes U1545B and U1545C were dedicated to microbial sampling. Hole U1545A was APC/HLAPC/XCB cored to 505.3 mbsf. Upon terminating coring in Hole U1545A, the 600 mL Kuster FTS was deployed to collect a borehole fluid sample from 490 mbsf, followed by downhole wireline logging with the triple combo and FMS-sonic tool strings running from the seafloor to approximately 490 mbsf. Hole U1545B was APC/HLAPC/XCB cored to 387.3 mbsf. Hole U1545C was APC/HLAPC/XCB cored to 329.0 mbsf. A total of 232.1 h, or 9.7 days, were spent at Site U1545.
3.3.1. Hole U1545A
Upon arrival at Site U1545, rig floor operations commenced at 1345 h on 26 September 2019. The APC/XCB bottom-hole assembly (BHA) was made up with an 11.44 inch (29.05 cm) C-3 drill bit. After the drill string was lowered to 1558.1 meters below sea level (mbsl), we pumped a “pig” (pipe cleaning device) through the drill string to remove some of the rust. By 2300 h, the drill bit was lowered to 1588.1 mbsl based on a precision depth recorder reading of the seafloor at 1593.5 mbsl. We then installed the sinker bars and the Icefield MI-5 core orientation tool, picked up the top drive, and positioned the bit to take the first core. Hole U1545A was spudded at 2322 h on 26 September. Mudline Core 385-U1545A-1H arrived on deck at 2335 h, recovering 4.4 m. This determined a seafloor depth of 1593.5 mbsl. Cores 1H–74X advanced from the seafloor to a total depth of 503.3 mbsf and recovered 389.0 m (77%) (Table T2). After encountering hard layers on Cores 14H–16H, we recorded partial strokes, and 50,000 lb (222.4 kN) overpull force was needed to retrieve these cores. To improve core quality, we switched to the HLAPC system for Cores 17F–31F (138.5–202.9 mbsf) until conditions indicated that the APC system might be viable again. Upon switching back to the APC system and recovering Core 32H, we encountered strong overpull of 100,000 lb (444.8 kN) and had to drill over the core barrel to retrieve it. We thus made the decision to resume HLAPC coring. The HLAPC system was deployed for Cores 33F–50F (217.1–284.6 mbsf). The XCB coring tool was used for Cores 40X and 49X to break through hard carbonate layers after partial strokes and damaged HLAPC cutting shoes. Following Core 50F, we decided to use XCB coring continuously because of the infrequent occurrence of hard carbonate interbeds. Nonmagnetic core barrels were used for all APC and HLAPC cores, and orientation measurements were taken on all full-length APC cores except Core 32H using the Icefield orientation tool. Formation temperature measurements were made with the APCT-3 tool on Cores 4H, 7H, 10H, 13H, 18H, 24F, 30F, 36F, 43F, and 47F. Additionally, we took formation temperature measurements with the SET2 tool after Cores 61X, 66X, 70X, and 74X. Prior to each SET2 deployment, we circulated 20 bbl (3179.8 L) of mud for hole cleaning. At 0345 h on 30 September, upon recovery of Core 74X and the subsequent SET2 tool deployment, coring was terminated in Hole U1545A based on the safety monitoring protocol as a result of a low C1/C2 value. After circulating high-viscosity mud in the hole, we ran the Kuster FTS and successfully recovered a borehole fluid sample from 490 mbsf at 0530 h. Following another sweep of high-viscosity mud, we started deploying the wireline logging tool strings. We raised the end of the drill string to a logging depth of 75 mbsf, made up the triple combo logging tool string, and lowered it into the hole at 1045 h on 30 September. It was made up with the following tools:
- High-Resolution Laterolog Array (HRLA),
- Hostile Environment Litho-Density Sonde (HLDS; with source),
- Hostile Environment Natural Gamma Ray Sonde (HNGS),
- Enhanced Digital Telemetry Cartridge (EDTC), and
- Logging equipment head-mud temperature (LEH-MT).
Once the tool string tagged fill at ~493 mbsf, we performed a short calibration pass followed by a full logging run up to the seafloor. The tool string returned to the rig floor at 1500 h. After disassembling the triple combo tool string, we rigged up the FMS-sonic (resistivity imaging) logging tool string, consisting of the following tools:
The FMS-sonic tool string was lowered in the hole until it reached a fill at ~476 mbsf, followed by two upward passes that together covered the entire depth range up to the seafloor. The string returned to the rig floor at 2300 h and was disassembled. While we were rigging down the logging tools, we deployed the subsea camera system to the seafloor to survey Hole U1545A and did not observe any gas release from the subseafloor through the drilled hole. The subsea camera system was recovered at 0200 h on 1 October. We then pulled the drill string out of the hole, and the bit cleared the seafloor at 0225 h, ending Hole U1545A. A total of 108.7 h, or 4.5 days, were spent on Hole U1545A.
3.3.2. Hole U1545B
After the drill string was raised to 1567.1 mbsl, we picked up the top drive, moved the vessel 20 m east, and lowered the bit to the seafloor to spud Hole U1545B. We then installed the sinker bars and started APC coring at 0410 h on 1 October 2019. This hole was dedicated to extensive collection of whole-round core samples for microbiology and biogeochemistry research. Hole U1545B started with mudline Core 1H recovering 3.7 m. This established a seafloor depth of 1594.2 mbsl. Cores 1H–67X penetrated from the seafloor to a total depth of 387.3 mbsf with a core recovery of 340.1 m (88%) (Table T2). We made formation temperature measurements (APCT-3) on every third core on Cores 4H–16H. A partial stroke was encountered on Core 16H. We switched from APC to HLAPC coring after recovering Core 17H. Cores 18F–39F penetrated from 147.6 to 245.8 mbsf. For formation temperature measurements, we deployed the APCT-3 tool on Cores 20F, 27F, 33F, and 39F and the SET2 tool following Cores 27F, 33F, and 39F. Partial strokes were recorded on Cores 18F, 23F, 24F, 26F, 27F, 35F, and 36F. On 3 October, operations required alternating between the HLAPC and XCB systems. Cores 40F–62X penetrated from 245.8 to 347.9 mbsf. We mainly used HLAPC coring to 328.5 mbsf (Core 60F) and switched to XCB coring for Cores 48X, 54X, and 57X after recording partial strokes caused by several hard carbonate layers. Starting with Core 61X, we deployed the XCB system permanently after we had to drill over the core barrel on Core 60F. For formation temperature measurements, we deployed the APCT-3 tool on Cores 45F and 49F and the SET2 tool following Cores 45F, 49F, and 60F. On 4 October, Cores 63X–67X penetrated from 347.9 to 387.3 mbsf. We made a formation temperature measurement following Core 63X with the SET2 tool. After the XCB bit was destroyed with Core 66X and we had advanced only 0.5 m in 45 min of coring Core 67X, we decided to terminate coring in Hole U1545B. At 0815 h, we started pulling the drill string out of the hole. The bit cleared the seafloor at 0945 h and was pulled to 1511 mbsl, ending Hole U1545B. We pumped PFTs downhole on all cores for monitoring drilling fluid (seawater) contamination. During the first 2 days of coring in Hole U1545B, the pacing of coring was adjusted to the complex microbial sampling program conducted on the core receiving platform on all cores.
3.3.3. Hole U1545C
Following completion of Site U1550 coring operations, we returned to Site U1545 26 days after we ended Hole U1545B to recover an additional set of samples for microbiology research. We arrived at the coordinates of Site U1545 at 0206 h on 30 October 2019. Upon lowering the thrusters over the coordinates of Hole U1545C (20 m north of Hole U1545B) and switching from cruise to DP mode at 0228 h, we made up an APC/XCB BHA and started lowering the drill string to the seafloor. At 0730 h, we picked up the top drive and positioned the bit at 1589.0 mbsl. The sinker bars and core barrel were installed, and Hole U1545C was spudded at 0745 h on 30 October. Mudline Core 385-U1545C-1H recovered 3.6 m and determined a seafloor depth of 1594.9 mbsl. Cores 1H–63F penetrated from the seafloor to a final depth of 329.0 mbsf and recovered 324.6 m (99%) (Table T2). After encountering a partial stroke on Core 16H, we switched to the HLAPC system at 140.6 mbsf. The pace of coring was adjusted on some cores to accommodate the complex microbiology sampling program on the core receiving platform. We deployed the XCB system whenever we had to core through hard carbonate layers (Cores 48X, 50X, 52X, 56X, and 60X). We pumped PFTs for drilling fluid contamination monitoring on all cores. Upon accomplishing our microbiology sampling objectives at Hole U1545C, we started to pull the drill string out of the hole. The bit cleared the seafloor at 2025 h, ending Hole U1545C and Site U1545. The total time spent on Hole U1545C amounted to 43.9 h, or 1.8 days.
4. Lithostratigraphy
Three holes were drilled at Site U1545 (Figure F4). Hole U1545A, the deepest hole, was drilled to 503.3 mbsf, which corresponds to a curated depth of 507.27 m core depth below seafloor, Method A (CSF-A). Hole U1545B penetrated to 387.3 mbsf, which corresponds to a curated depth of 387.23 m CSF-A. Hole U1545C, the shallowest hole, penetrated to 329.0 mbsf, which corresponds to a curated depth of 328.88 m CSF-A. Lithostratigraphic description and analysis were carried out based on the curated length of the cores (on the CSF-A depth scale), but all references to CSF-A depths in text, figures, and tables are given as meters below seafloor, unless otherwise noted. Lithologic description and interpretation are based on a combination of macroscopic core description, smear slide and thin section examination with a petrographic microscope, MS and NGR measurements, color reflectance analysis, and mineralogic analysis using X-ray diffraction (XRD) and carbonate analyses (see Lithostratigraphy and Petrophysics in the Expedition 385 methods chapter [Teske et al., 2021a]; see also Inorganic geochemistry and Organic geochemistry). Most of the observations and the depths used in this section refer to Hole U1545A because it was the deepest hole drilled. It also has the most complete recovered record because Hole U1545B, the next deepest hole, was heavily sampled and had numerous whole-round core sections collected for microbiology and geochemistry (see Microbiology, Inorganic geochemistry, and Organic geochemistry) prior to sediment description (Figure F4).
The sediments recovered at Site U1545, located on the lower slope off Baja California in the northwest part of the Guaymas Basin (Figure F2), are mostly laminated and primarily contain a mix of biogenic (mainly diatoms) and terrigenous (mainly clay minerals and minor silt-sized siliciclastic) particles, along with micrometer-sized authigenic carbonate particles (micrite) and millimeter- to centimeter-sized carbonate nodules as overall subordinate components. As discussed below, the depositional environment of Site U1545 remained essentially hemipelagic and suboxic to anoxic throughout the middle to late Pleistocene, as suggested by the mixed biogenic and siliciclastic nature of the sediments and the abundance of fine lamination. Igneous rocks of subvolcanic texture and basaltic composition were observed within the sedimentary section near the bottom of Hole U1545A. Different types and degrees of core disturbances were observed at this site, including mousse-like sediment, voids, fall-in debris, punctures, and brecciated and biscuited semilithified sediments to sedimentary rocks.
The sequence recovered at Site U1545 shows downhole changes in the lithologic characteristics of the sediment that, although distinctive, are not significant enough to require division of the site into more than one lithostratigraphic unit (Unit I). However, these downhole lithologic differences prompted the division of Unit I into four subunits (Figure F4; Table T3). The observed differences arise mainly from different degrees/types of diagenetic processes and overprinting that resulted in the formation of authigenic minerals (e.g., micrite in Subunit IB) and/or the selective dissolution of sedimentary particles (e.g., dissolution of diatoms as consequence of silica transformation from opal-A to opal-CT in Subunits IC and ID).
4.1. Unit descriptions
4.1.1. Unit I
- Intervals: 385-U1545A-1H-1, 0 cm, to 74X-CC, 39 cm; 385-U1545B-1H-1, 0 cm, to 67X-CC, 43 cm; 385-U1545C-1H-1, 0 cm, to 63F-CC, 34 cm
- Depths: Hole U1545A = 0–507.27 mbsf, Hole U1545B = 0–387.23 mbsf, Hole U1545C = 0–328.88 mbsf
- Thickness: Hole U1545A = 507.27 m, Hole U1545B = 387.23 m, Hole U1545C = 328.88 m
- Age: middle to late Pleistocene (existence of Holocene strata uncertain)
- Lithology: diatom ooze, clay-rich diatom ooze, diatom clay, clay, micrite-rich diatom ooze, limestone/dolostone, and basaltic rock
Lithostratigraphic Unit I is composed of 507.27 m of middle to late Pleistocene (and Holocene?) sediments that are primarily a mix of biogenic (mainly diatoms) and siliciclastic (mainly clay minerals and subordinate silt-sized siliciclastic) particles. Minor biogenic components include calcareous nannofossils, foraminifers, silicoflagellates, sponge spicules, and radiolarians. Clay- to silt-sized, largely authigenic carbonate particles (both dolomite and calcite) occur scattered in the diatom ooze and diatom clay sediments and/or concentrated in discrete layers with different degrees of lithification. The most lithified layers were described as limestone/dolostone. The local presence of dolomite is evident from XRD mineralogic data. Accessory authigenic sulfide precipitates (mostly framboidal pyrite) are also common. Fine-scale lamination is present throughout the unit. Discrete, millimeter- to centimeter-thick, black and gray, silt- to sand-sized layers composed of volcaniclastic (lapilli) and terrigenous particles were mainly observed in the upper ~250 m of the unit. Mollusk shell fragments (mainly fragmented during core cutting) appear from ~0–30 to ~250–300 mbsf. Sediment colors range from light olive-gray (5Y 5/2; Munsell Color Company, Inc., 1994) to olive-gray (5Y 3/2) toward the top of the unit to dark yellowish brown (10YR 4/2) and dusky yellowish brown (10YR 2/2) toward the bottom. A medium gray (N5) interval of vesicular subvolcanic basaltic rock with white calcite veins was recovered in Hole U1545A between 482.2 and 483.2 mbsf.
Unit I is divided into four subunits mainly based on the presence of minor yet significant lithologic changes occurring downhole and/or changes in sediment induration and physical properties such as NGR, MS, and color reflectance. The transitions between the subunits are gradual and occur over more than one core. The transitions between Subunits IC and ID were particularly difficult to locate and correlate between holes because of the low recovery at these depths. The subunit boundaries were selected based on the “first appearance” approach; the boundaries were located at the depths at which the new, diagenetically modified lithology was first encountered when describing the cores from top to bottom (Table T3).
4.1.1.1. Subunit IA
- Intervals: 385-U1545A-1H-1, 0 cm, to 9H-4, 143 cm; 385-U1545B-1H-1, 0 cm, to 9H-6, 138 cm; 385-U1545C-1H-1, 0 cm, to 12H-2, 31 cm
- Depths: Hole U1545A = 0–76.7 mbsf, Hole U1545B = 0–78.93 mbsf, Hole U1545C = 0–100.41 mbsf
- Thickness: Hole U1545A = 76.7 m, Hole U1545B = 78.93 m, Hole U1545C = 100.41 m
- Age: late to middle Pleistocene
- Lithology: diatom ooze, clay-rich diatom ooze, and diatom clay
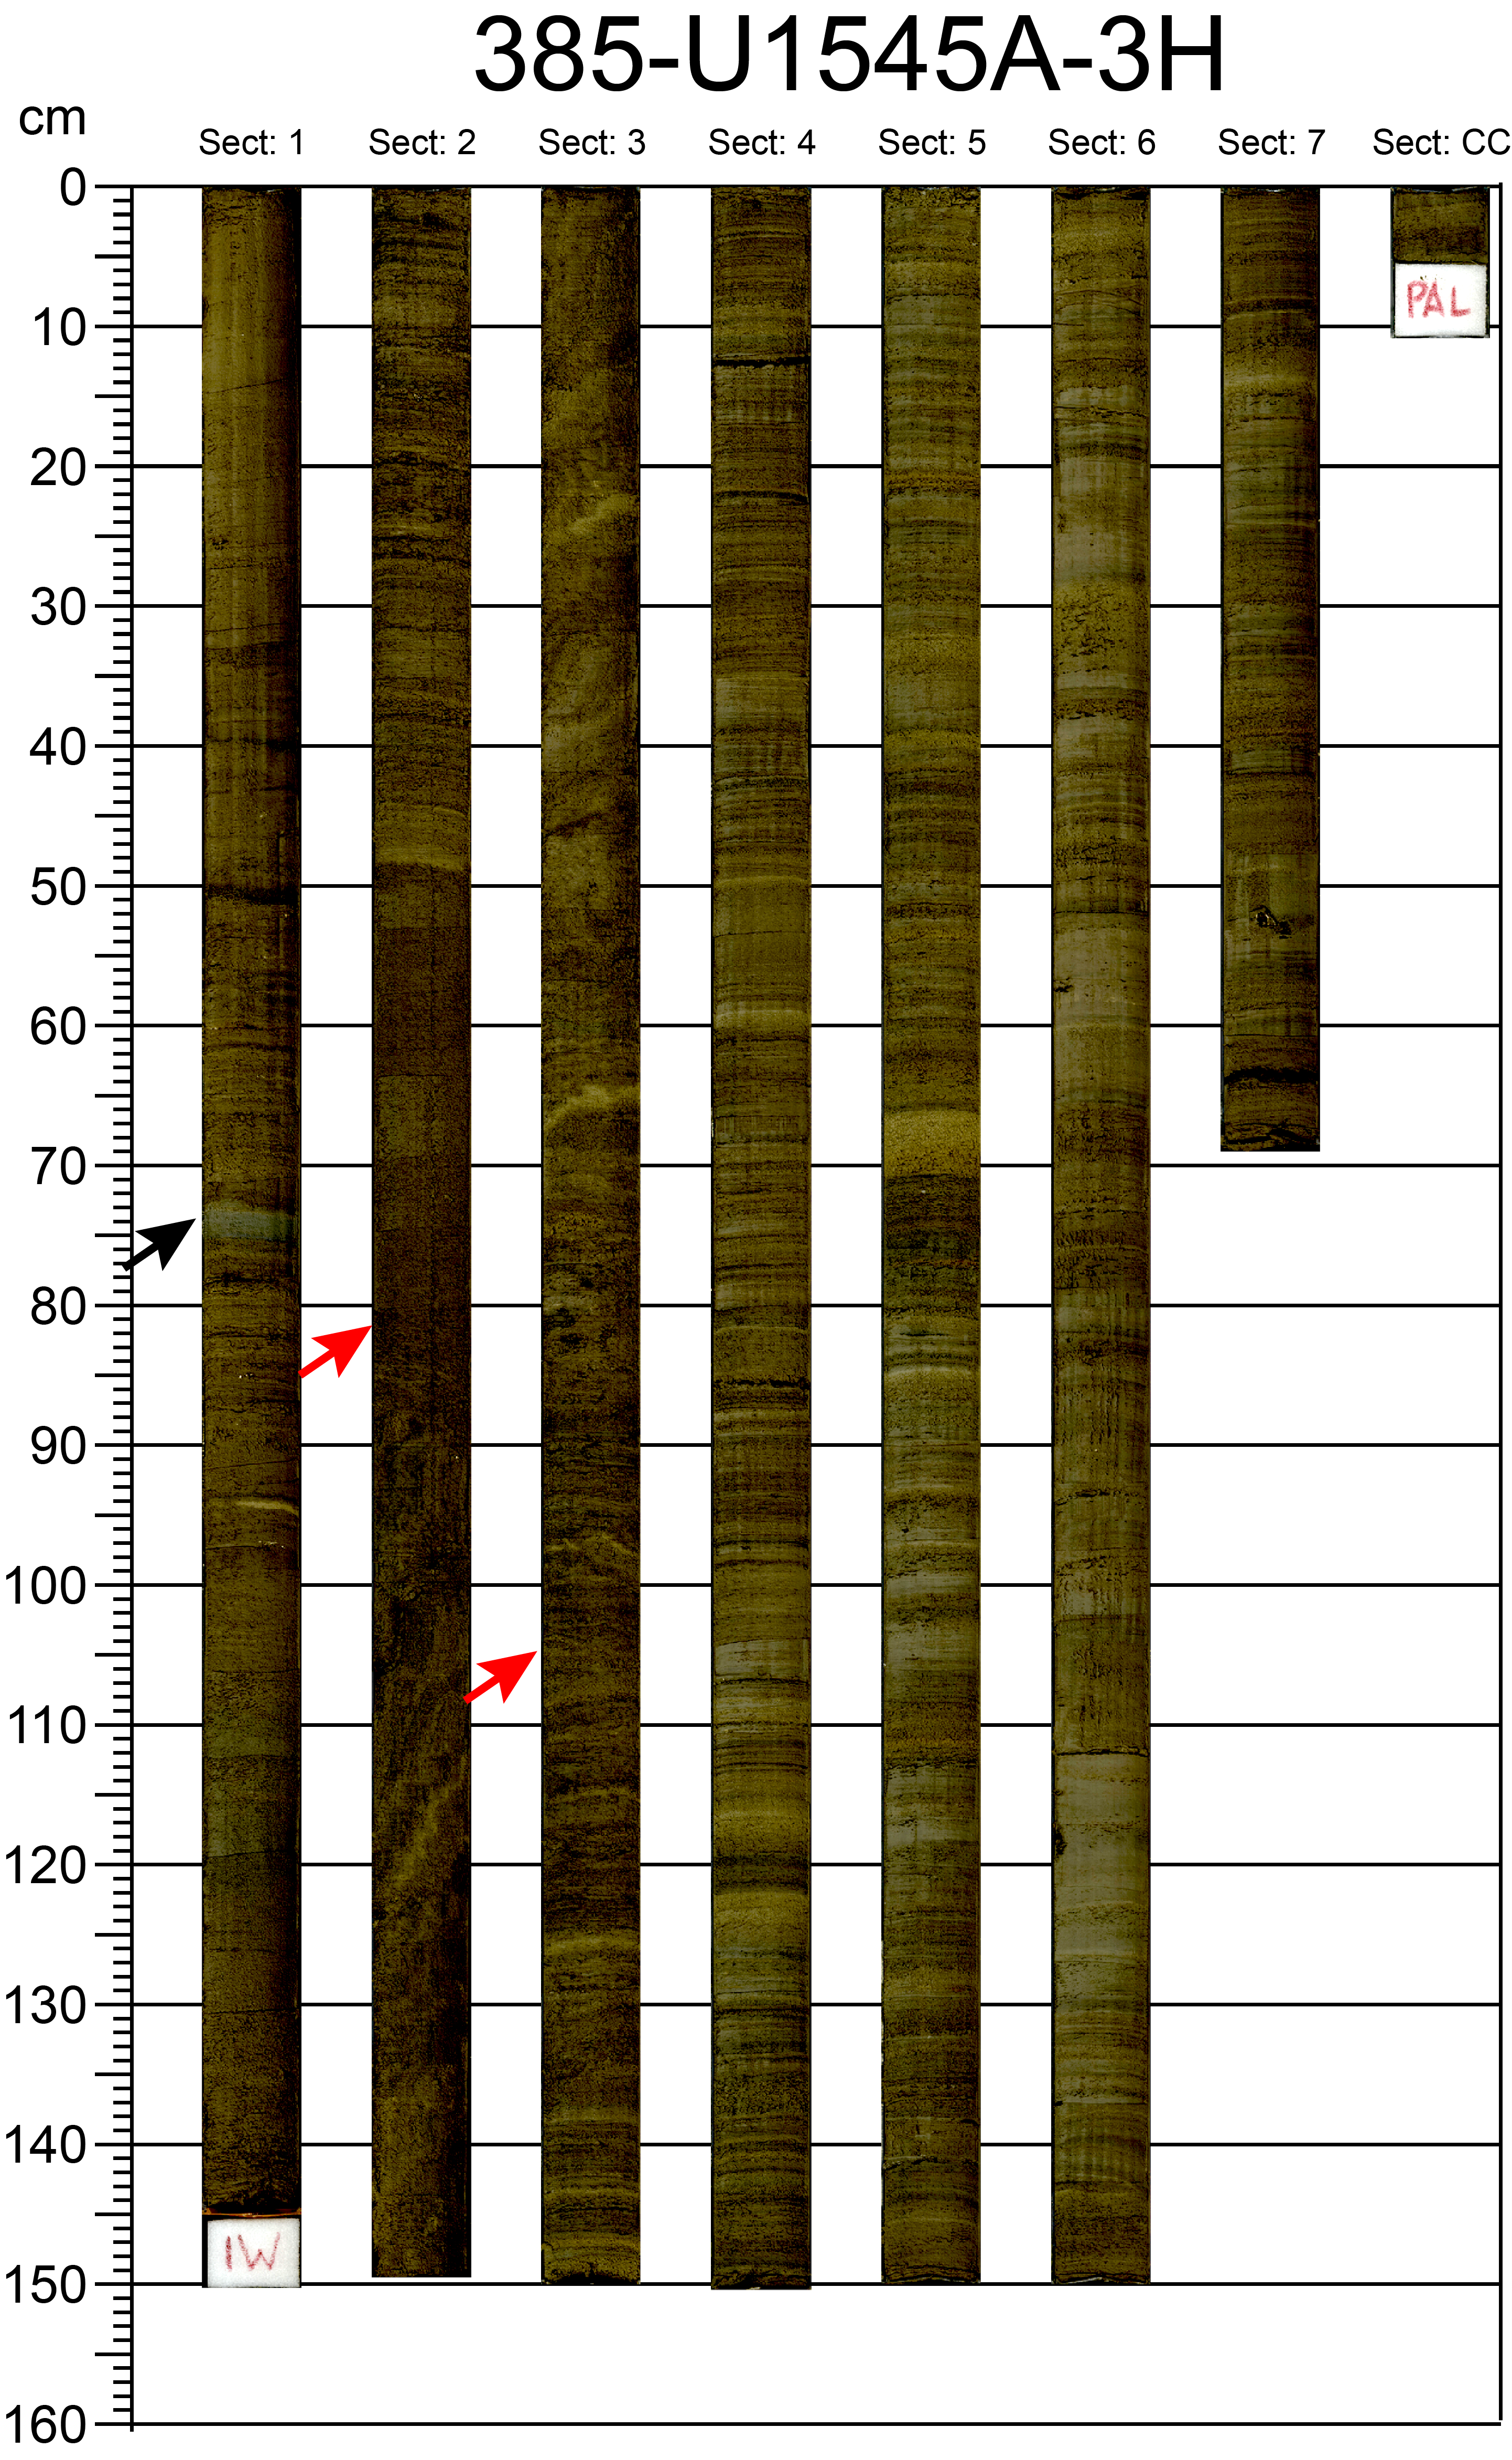
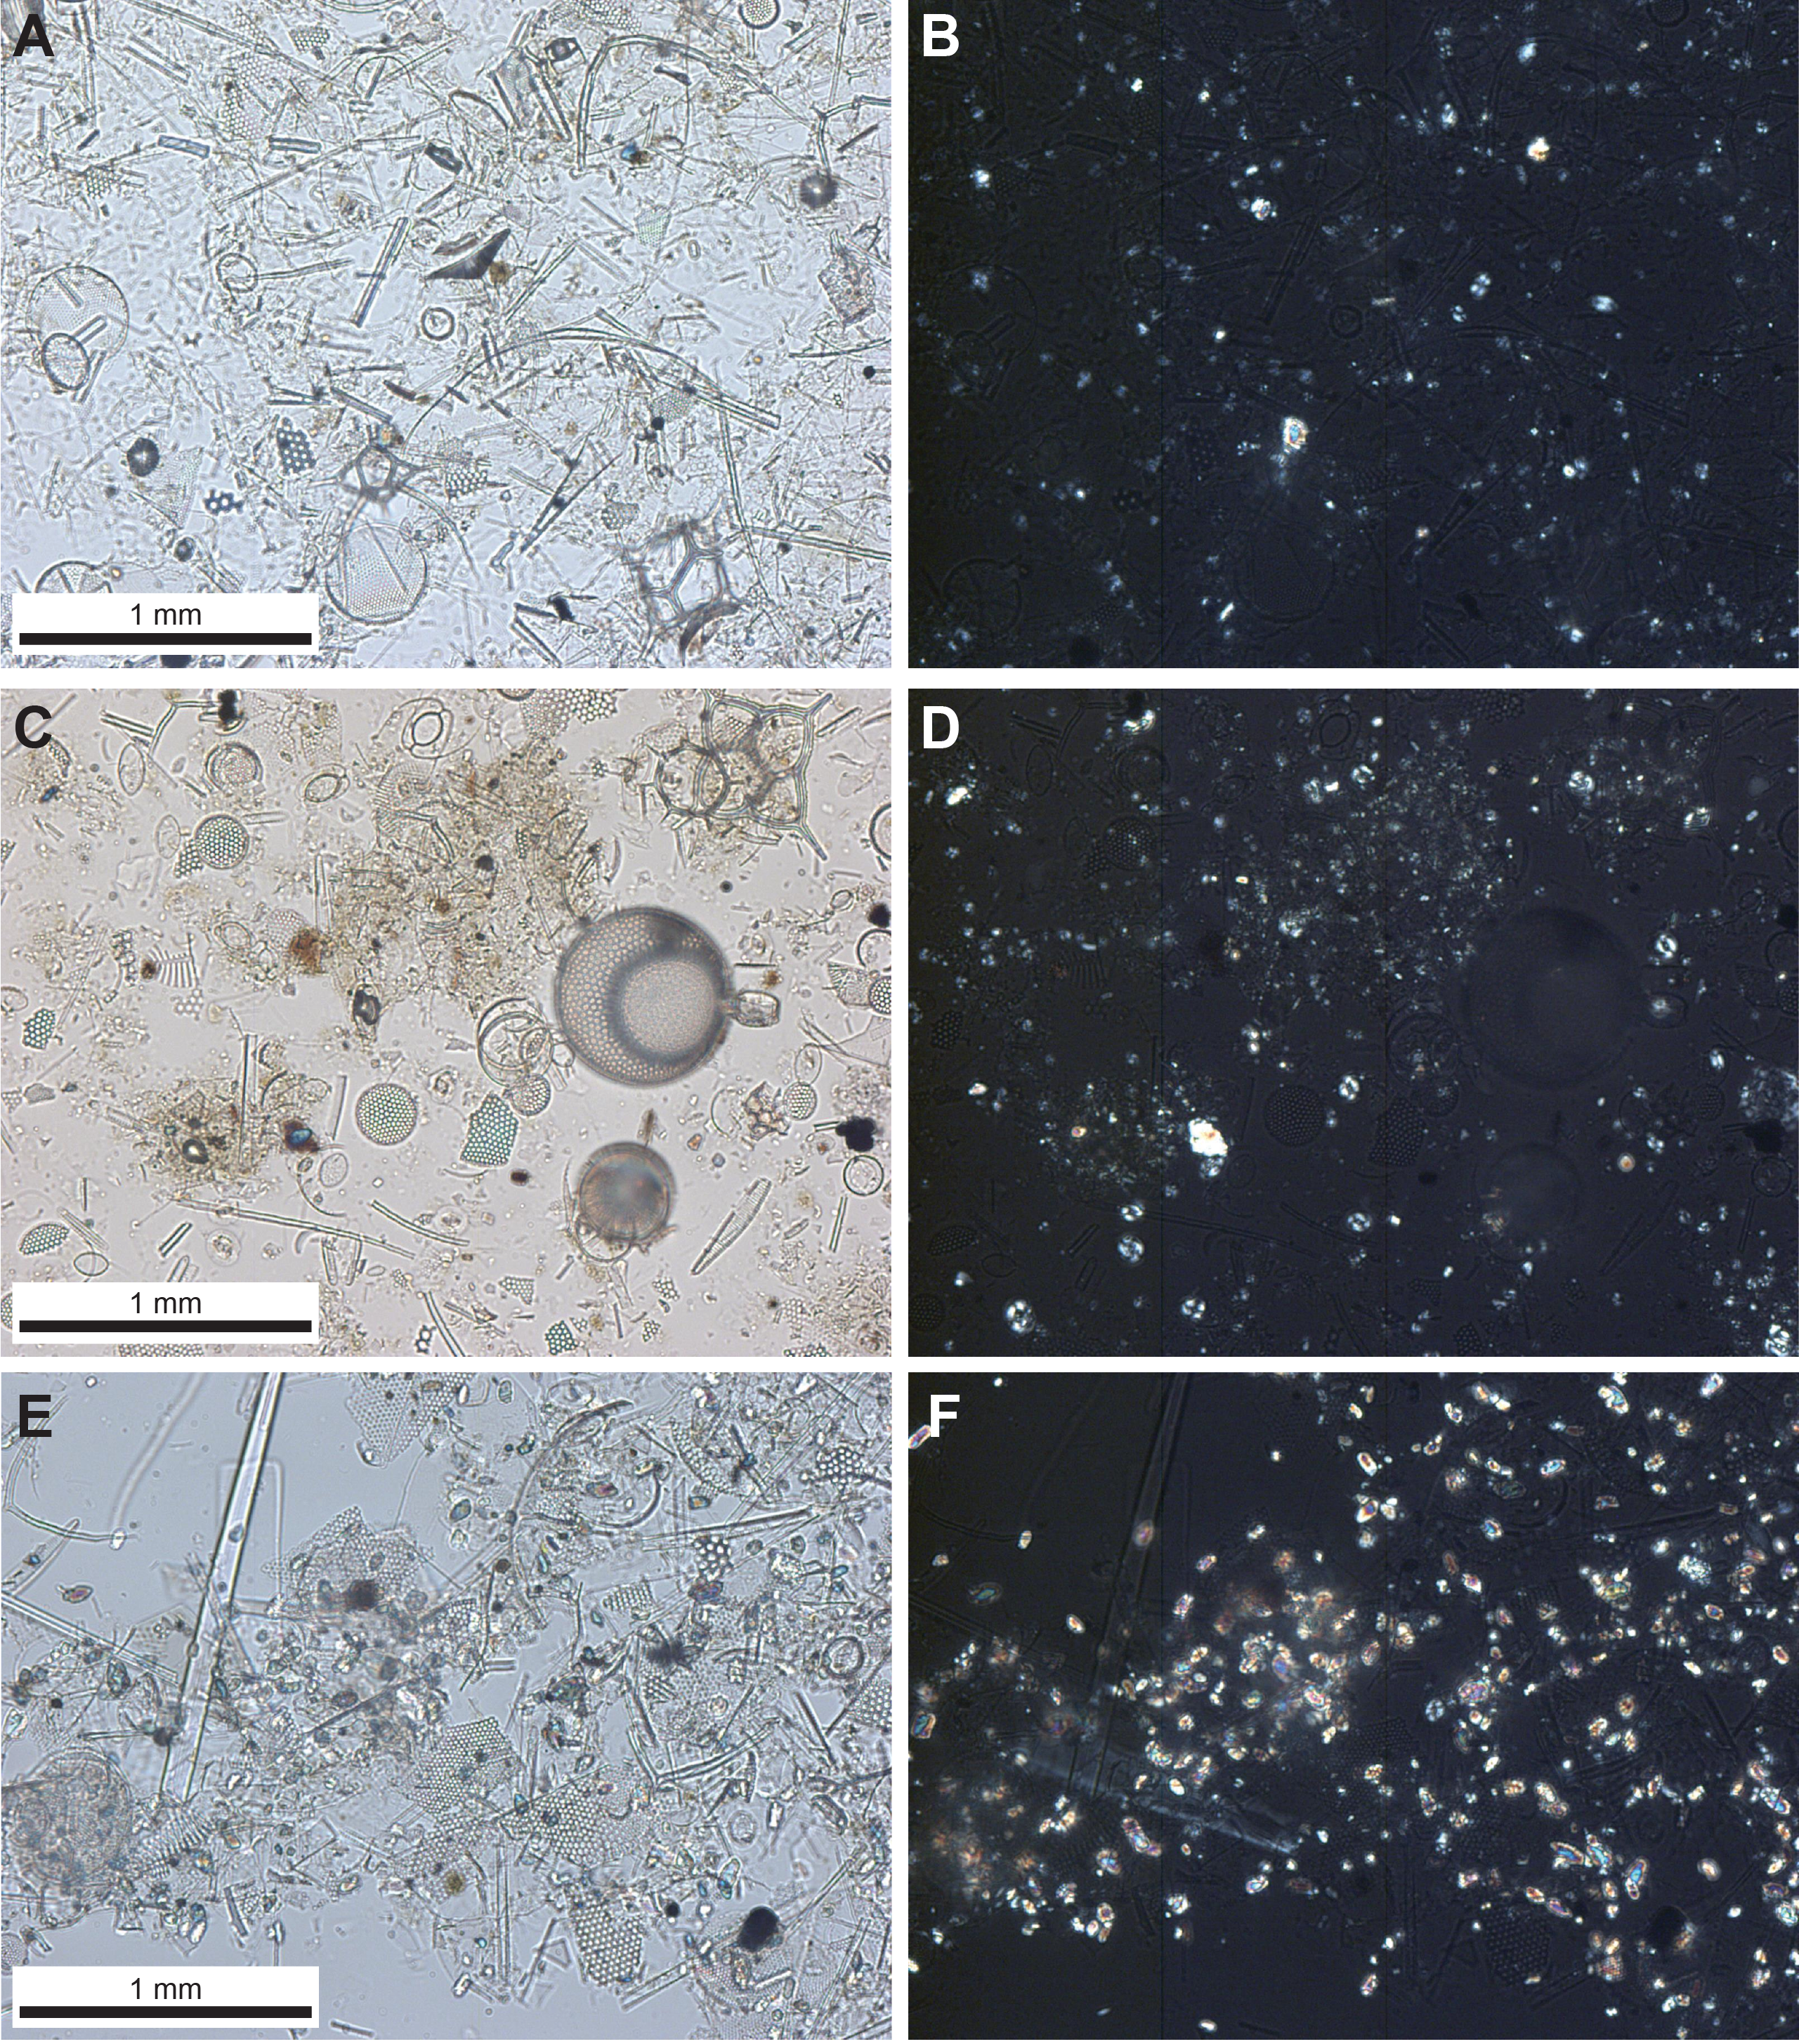
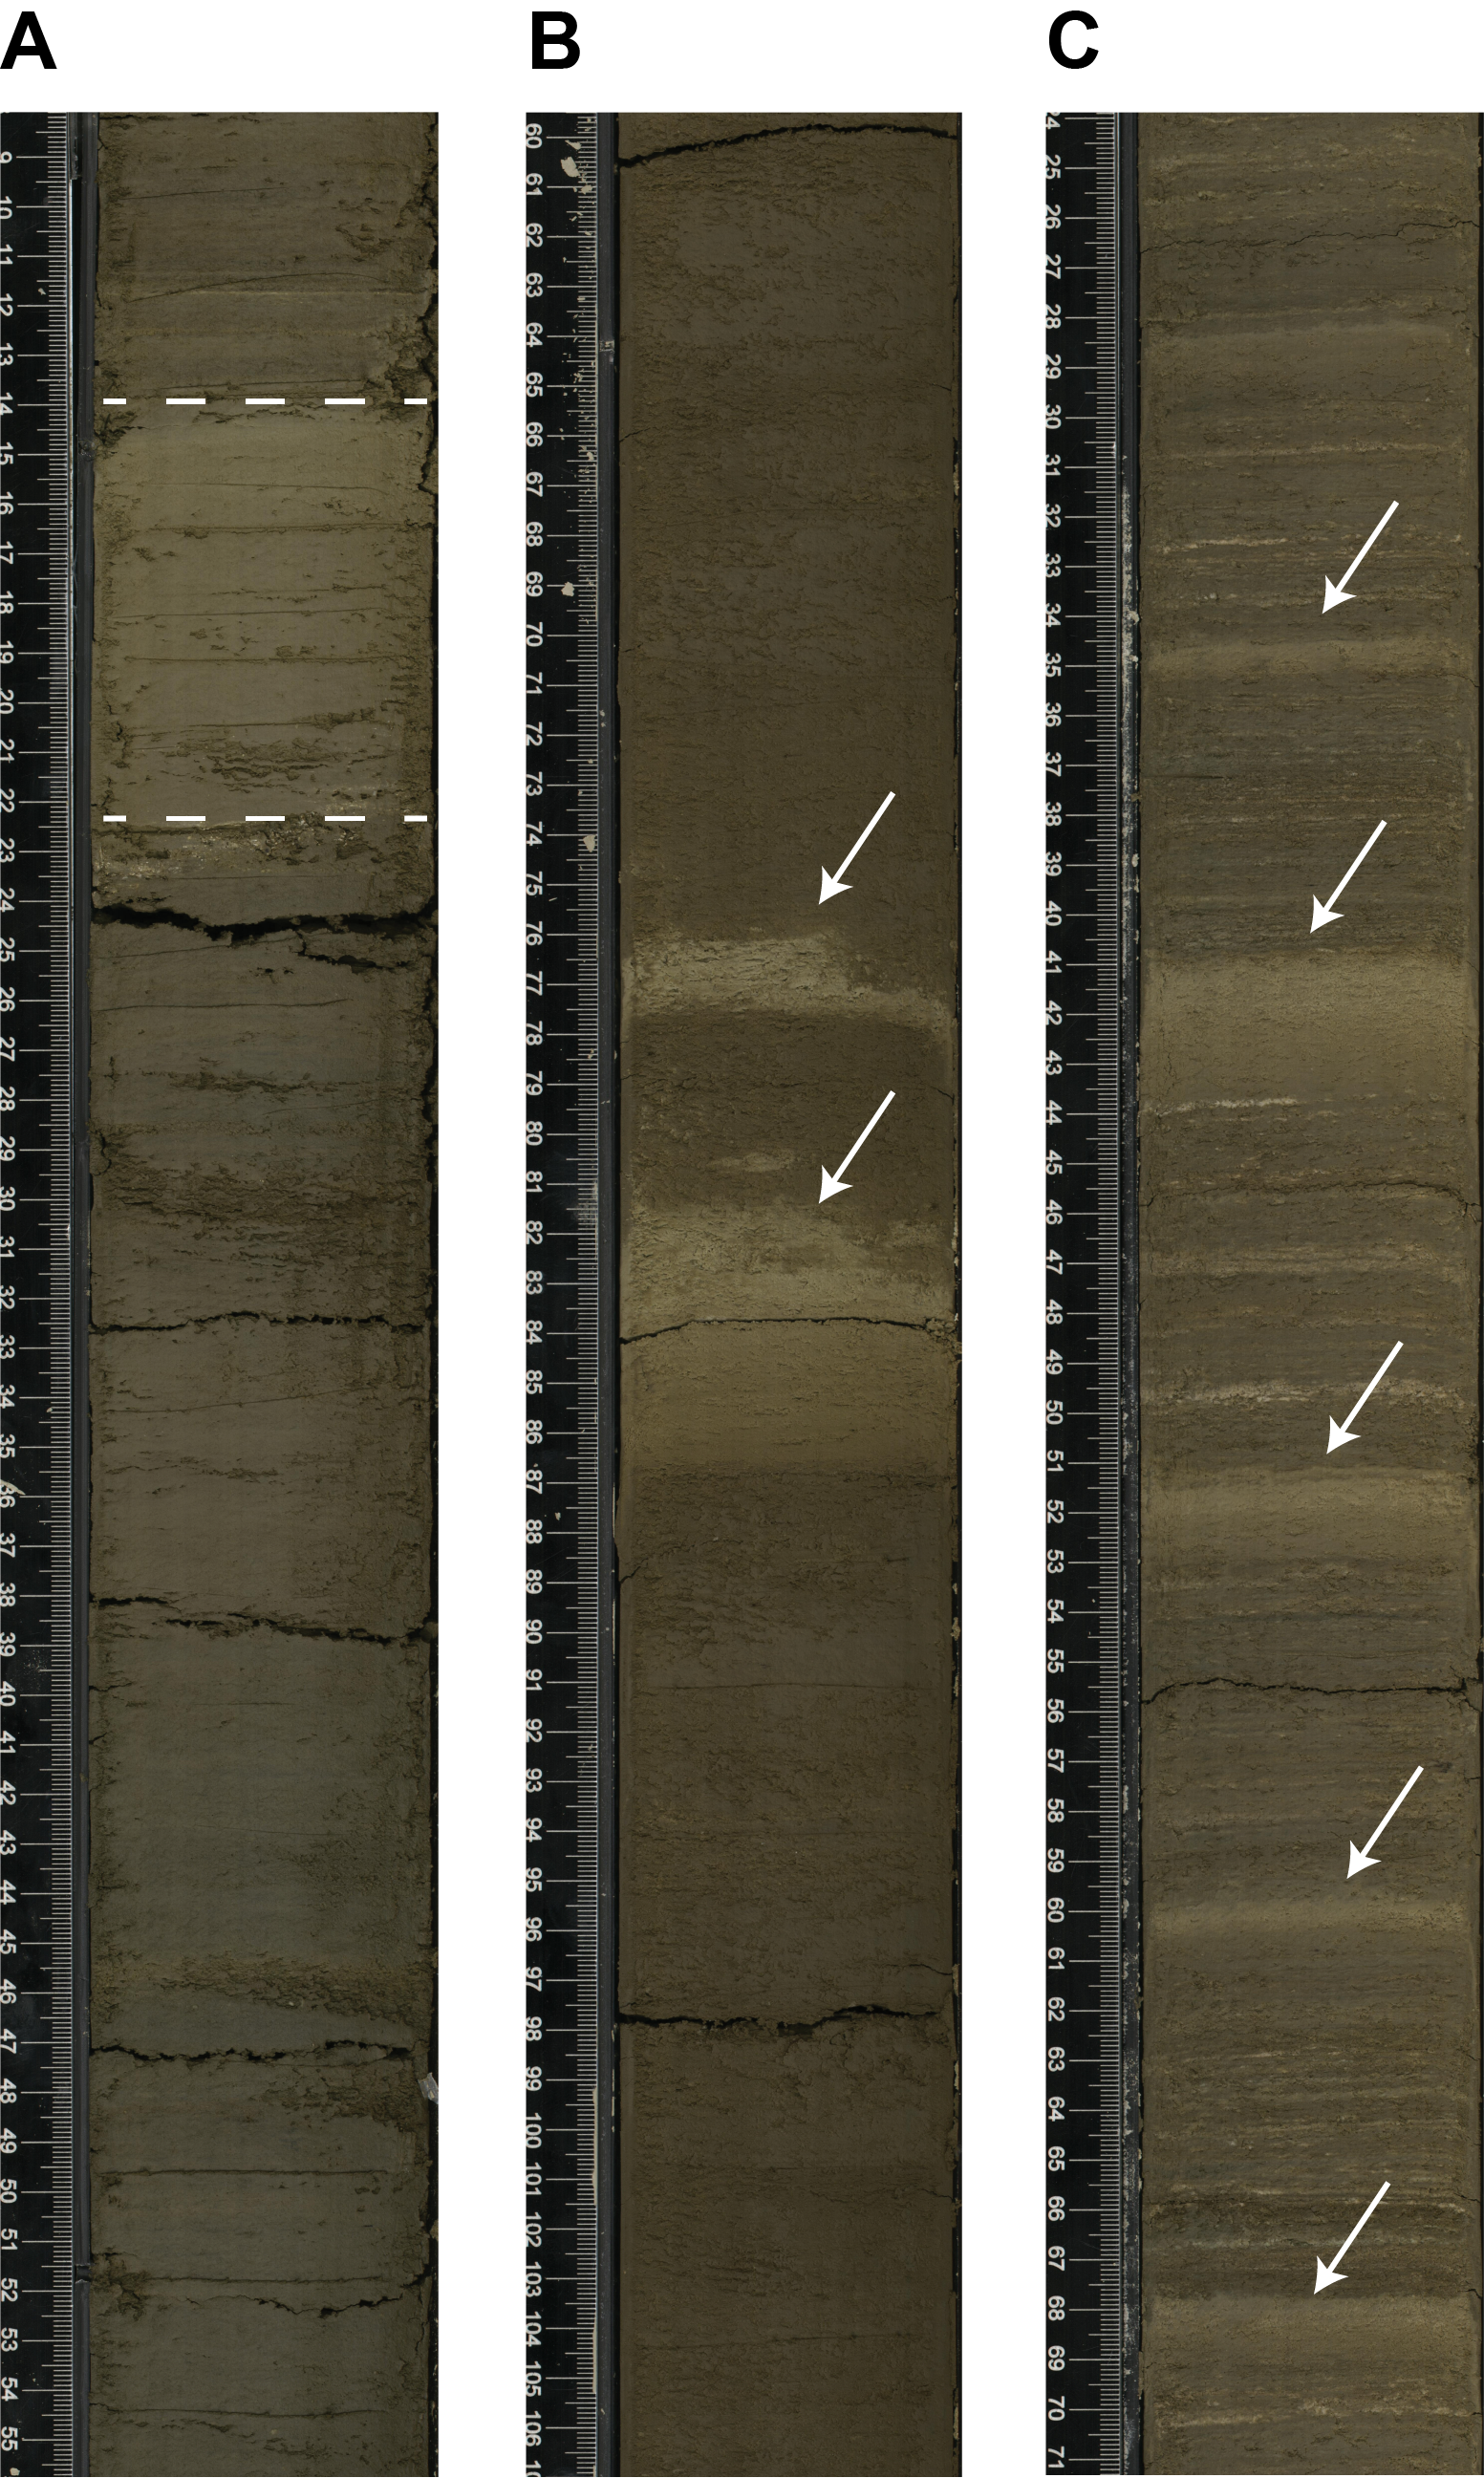
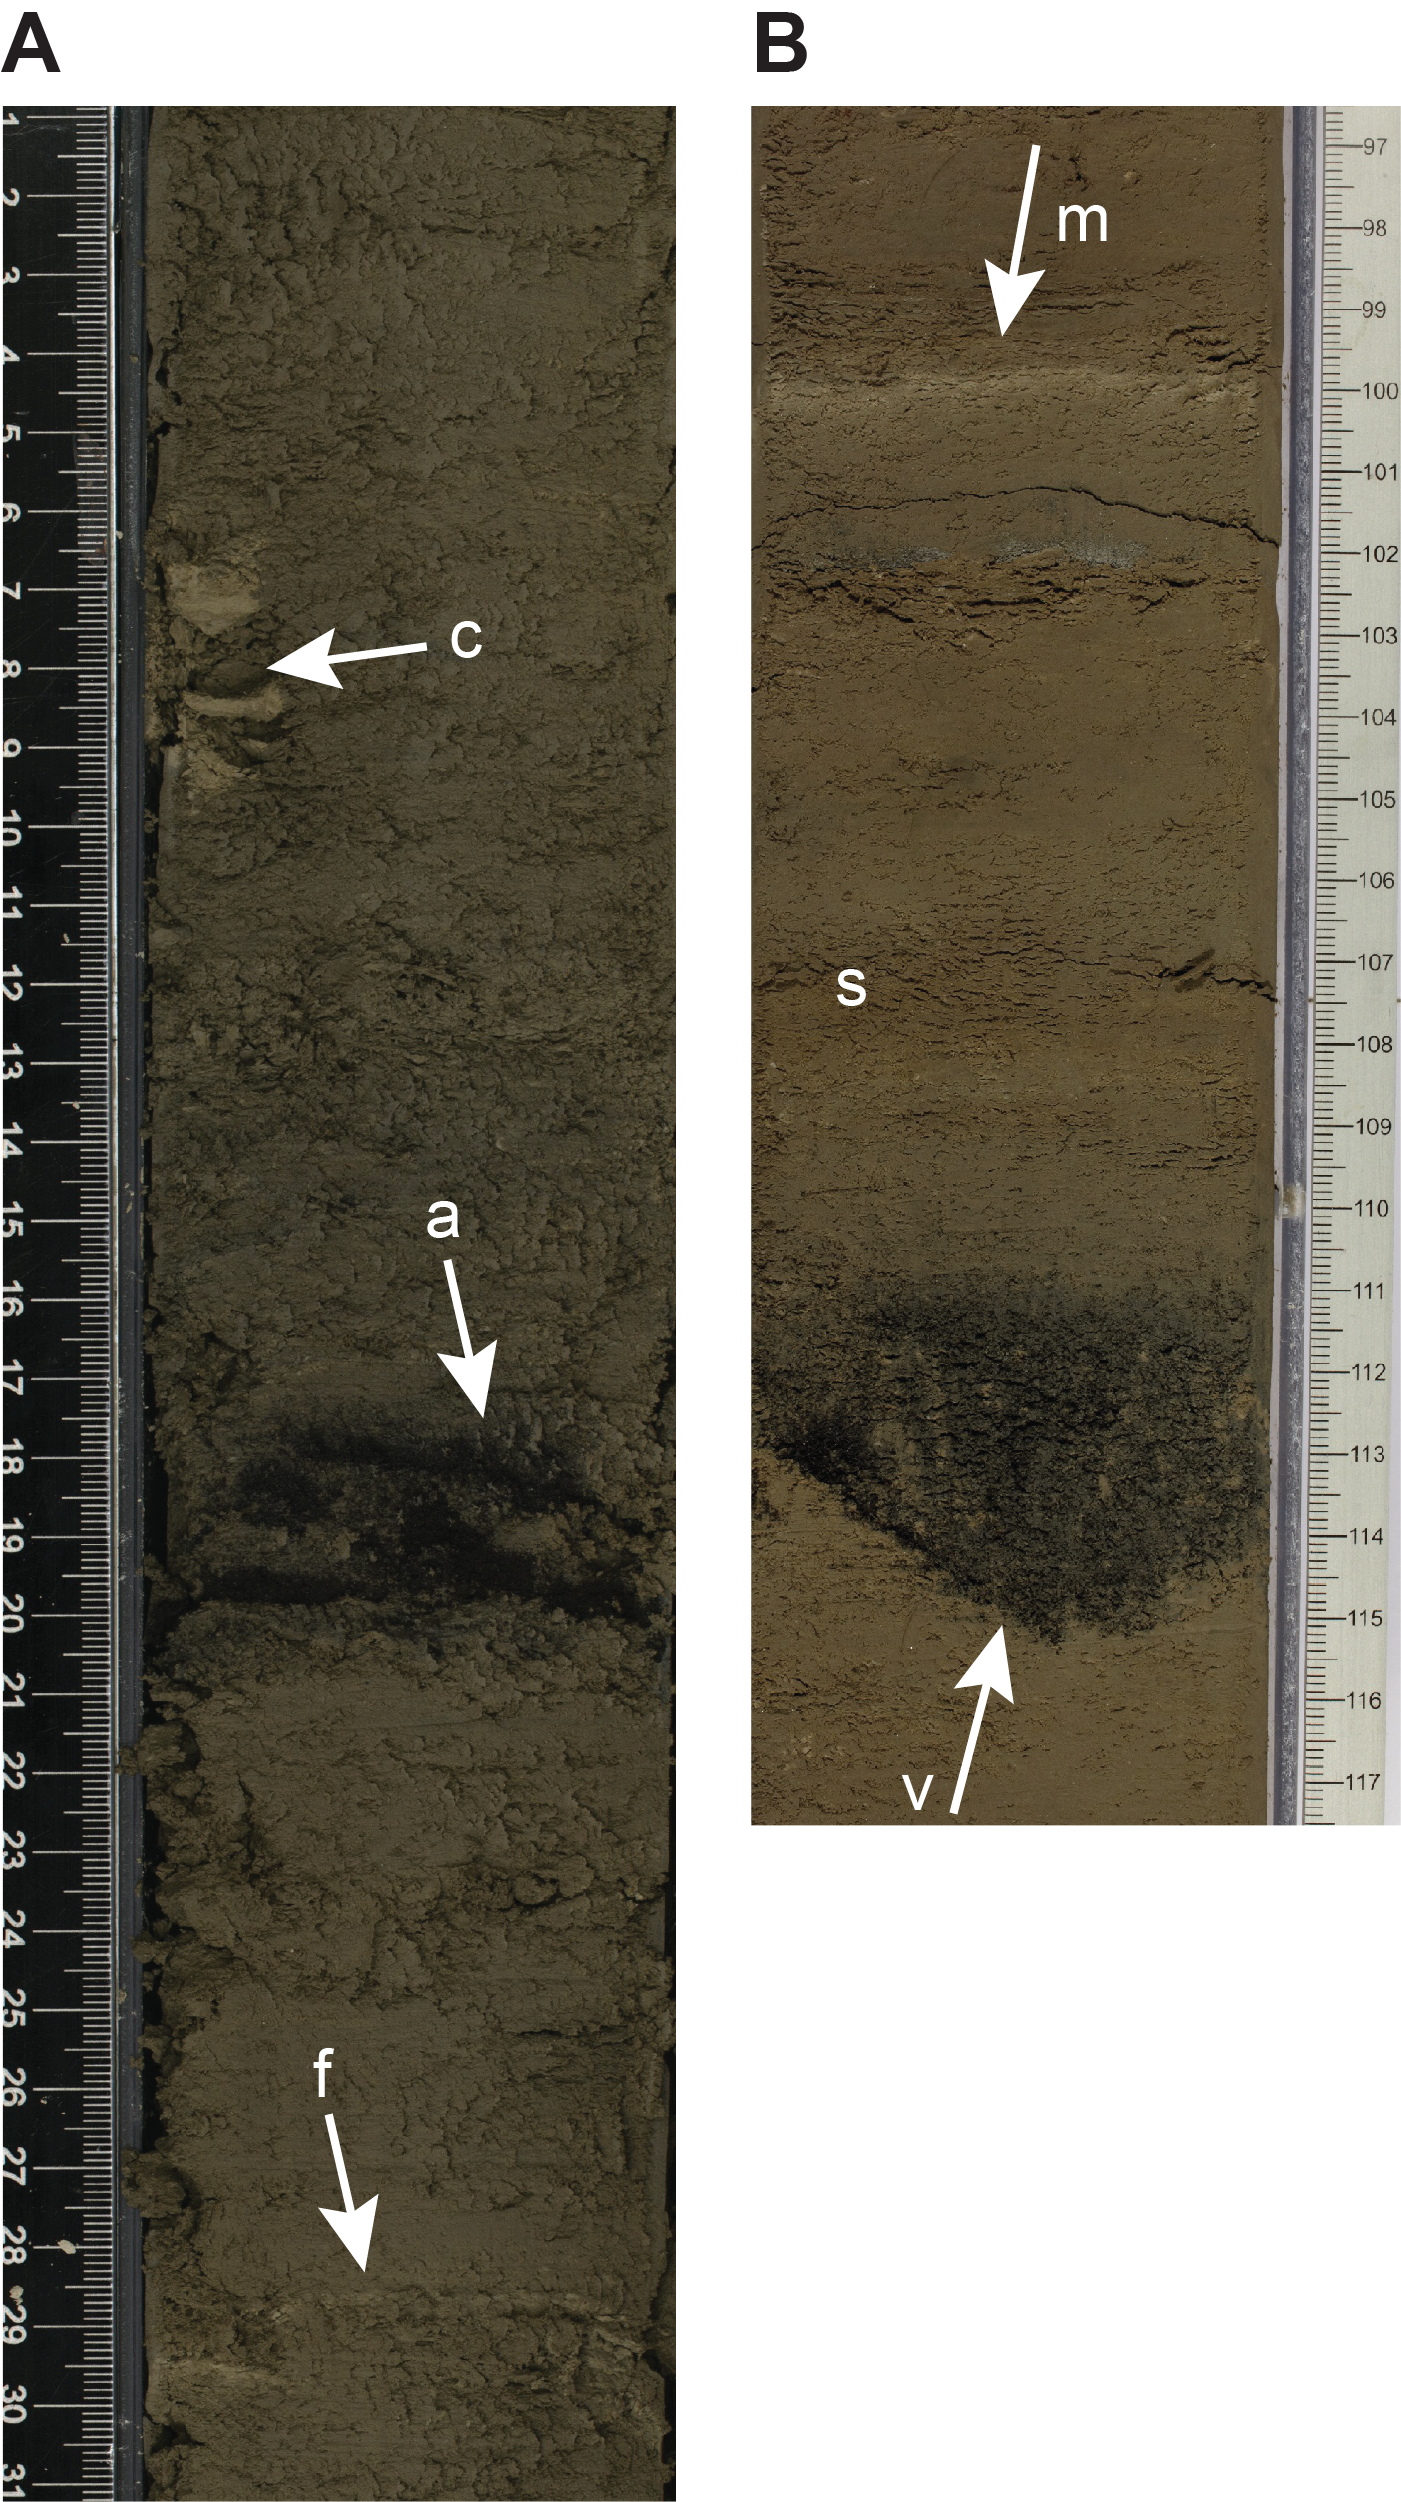
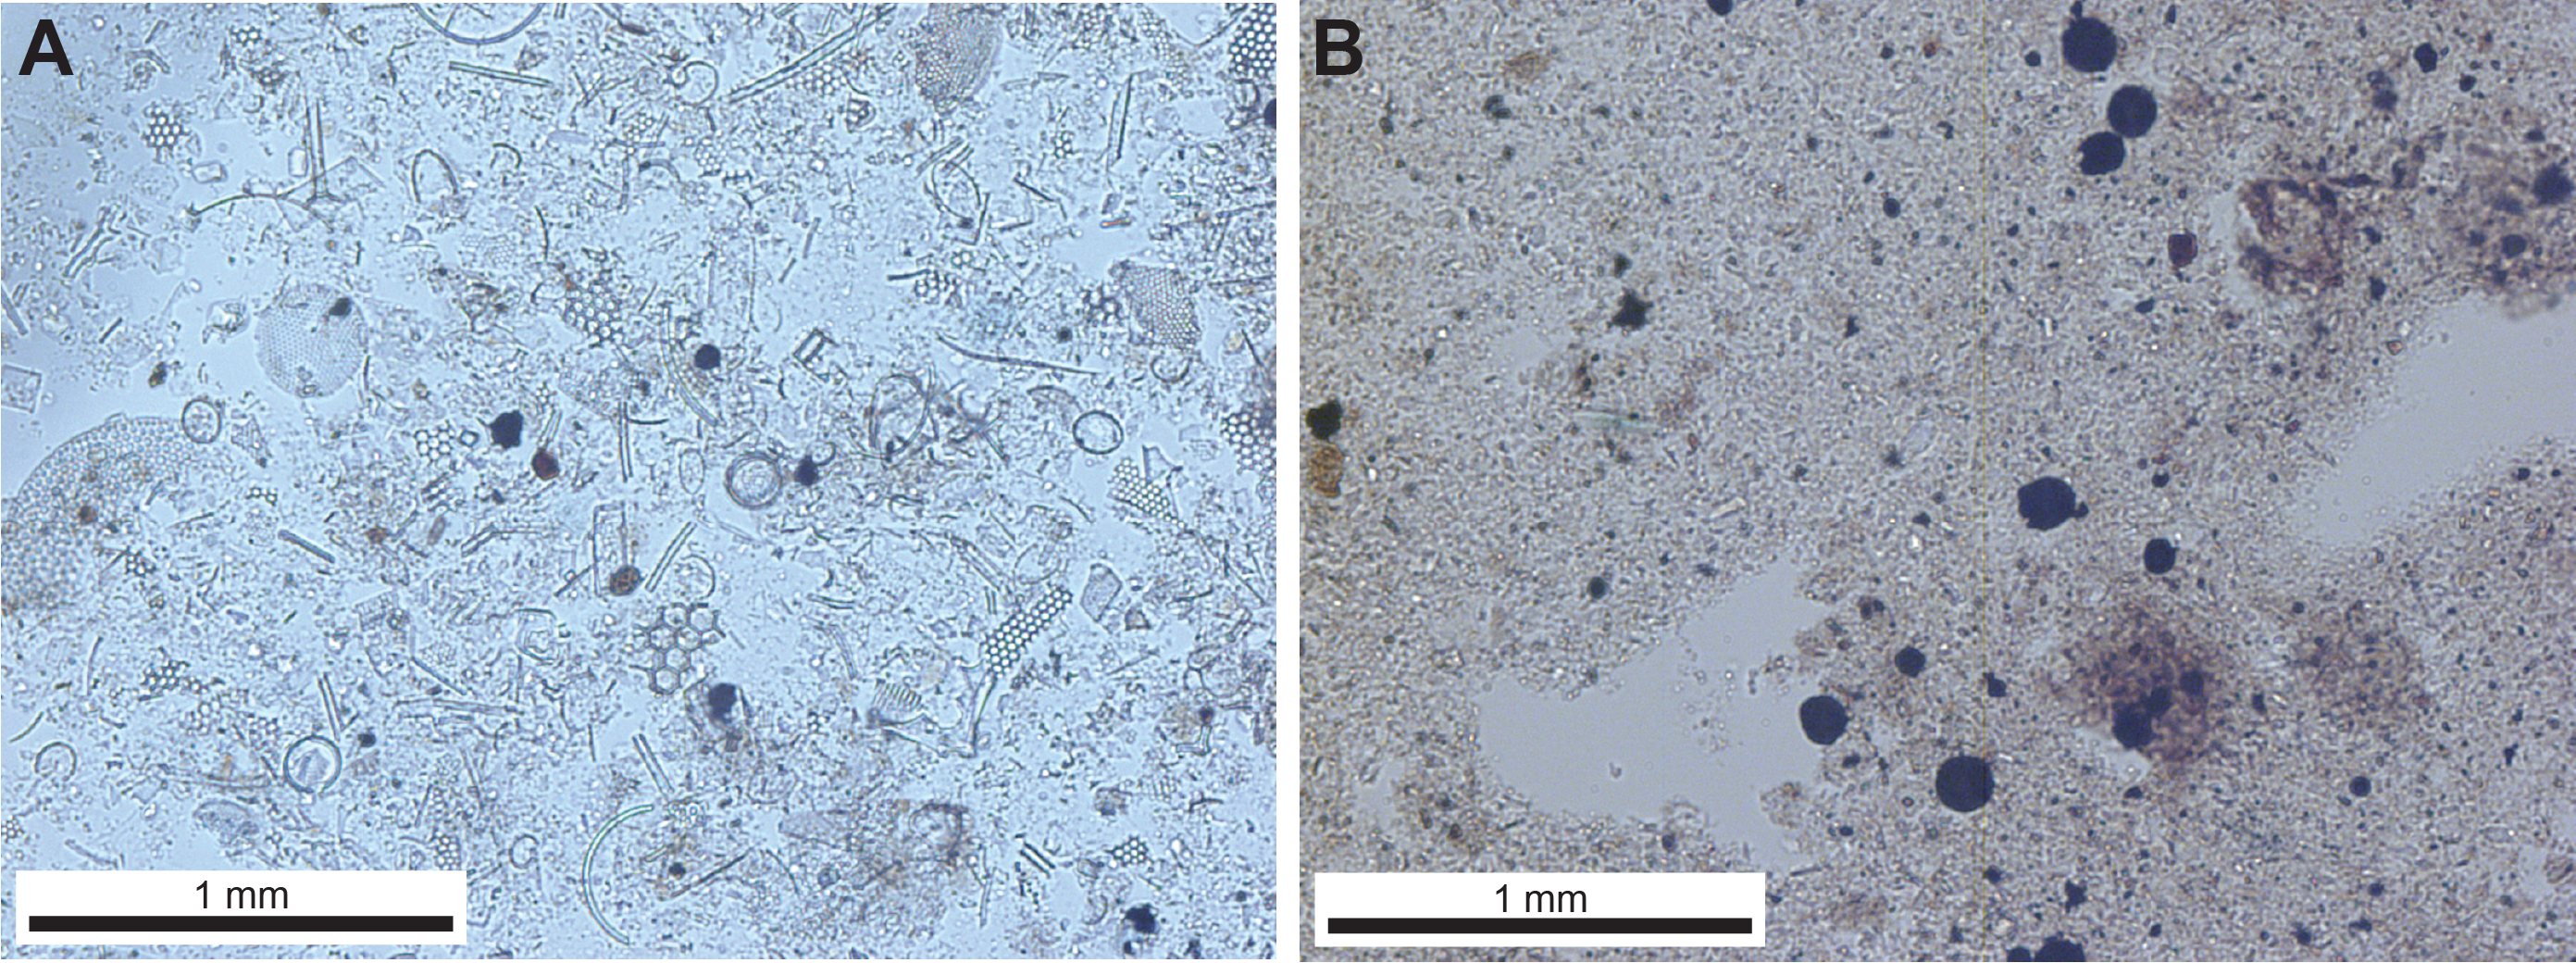
Lithostratigraphic Subunit IA is composed of mainly laminated diatom ooze with variable amounts of clay minerals (Figure F5). The clay content varies over multiple spatial scales, from micrometers (laminae) to meters (beds) to tens of meters, and the latter scale of variability is correlated with subtle changes in sediment color and NGR (Figure F4). Combined smear slide and macroscopic observations indicate that the intervals with higher diatom content are generally light olive-gray (5Y 5/2), whereas mixed lithologies (e.g., diatom and clay) tend to be darker (e.g., olive-gray; 5Y 3/2). These alternations correspond to changes in measured values of color reflectance parameter b*, which is higher in the diatom oozes (blue shading = positive values of b*, yellow shading = negative values; Figure F4). Diatom valves are well preserved in both clay-poor and clay-rich lithologies (Figure F6). Calcareous nannofossils are the second most important biogenic component. Some of the lighter colored laminae and bands are almost entirely composed of pennate diatoms (see Biostratigraphy). Toward the bottom of the subunit, the nannofossil content decreases and trace amounts of euhedral to subhedral, micrometer-sized, authigenic carbonate particles are visible in smear slides. The measured value of b* changes at the depth at which micrite becomes a common lithologic component in the sediment (see drop in color reflectance parameter b* at ~75 mbsf; Figure F4) and corresponds to the top of Subunit IB. An interval showing evidence of soft-sediment deformation (tilting and folding of laminae) was observed between ~16.3 and 18.1 mbsf (interval 385-U1545A-3H-2, 80 cm, to 3H-3, 105 cm; Figure F5; Table T3). Significant core disturbance due to cracks in the sediment generated by gas expansion was observed starting at ~61.5 mbsf (Core 8H).
4.1.1.2. Subunit IB
- Intervals: 385-U1545A-9H-4, 143 cm, to 34F-CC, 27 cm; 385-U1545B-9H-6, 138 cm, to 35F-4, 71 cm; 385-U1545C-12H-2, 31 cm, to 34F-3, 53 cm
- Depths: Hole U1545A = 76.7–221.58 mbsf, Hole U1545B = 78.93–226.10 mbsf, Hole U1545C = 100.41–220.03 mbsf
- Thickness: Hole U1545A = 144.88 m, Hole U1545B = 147.17 m, Hole U1545C = 119.626 m
- Age: middle Pleistocene
- Lithology: micrite-rich diatom ooze, clay-rich diatom ooze, clay and micrite-rich diatom ooze, micrite-rich diatom clay, and limestone/dolostone
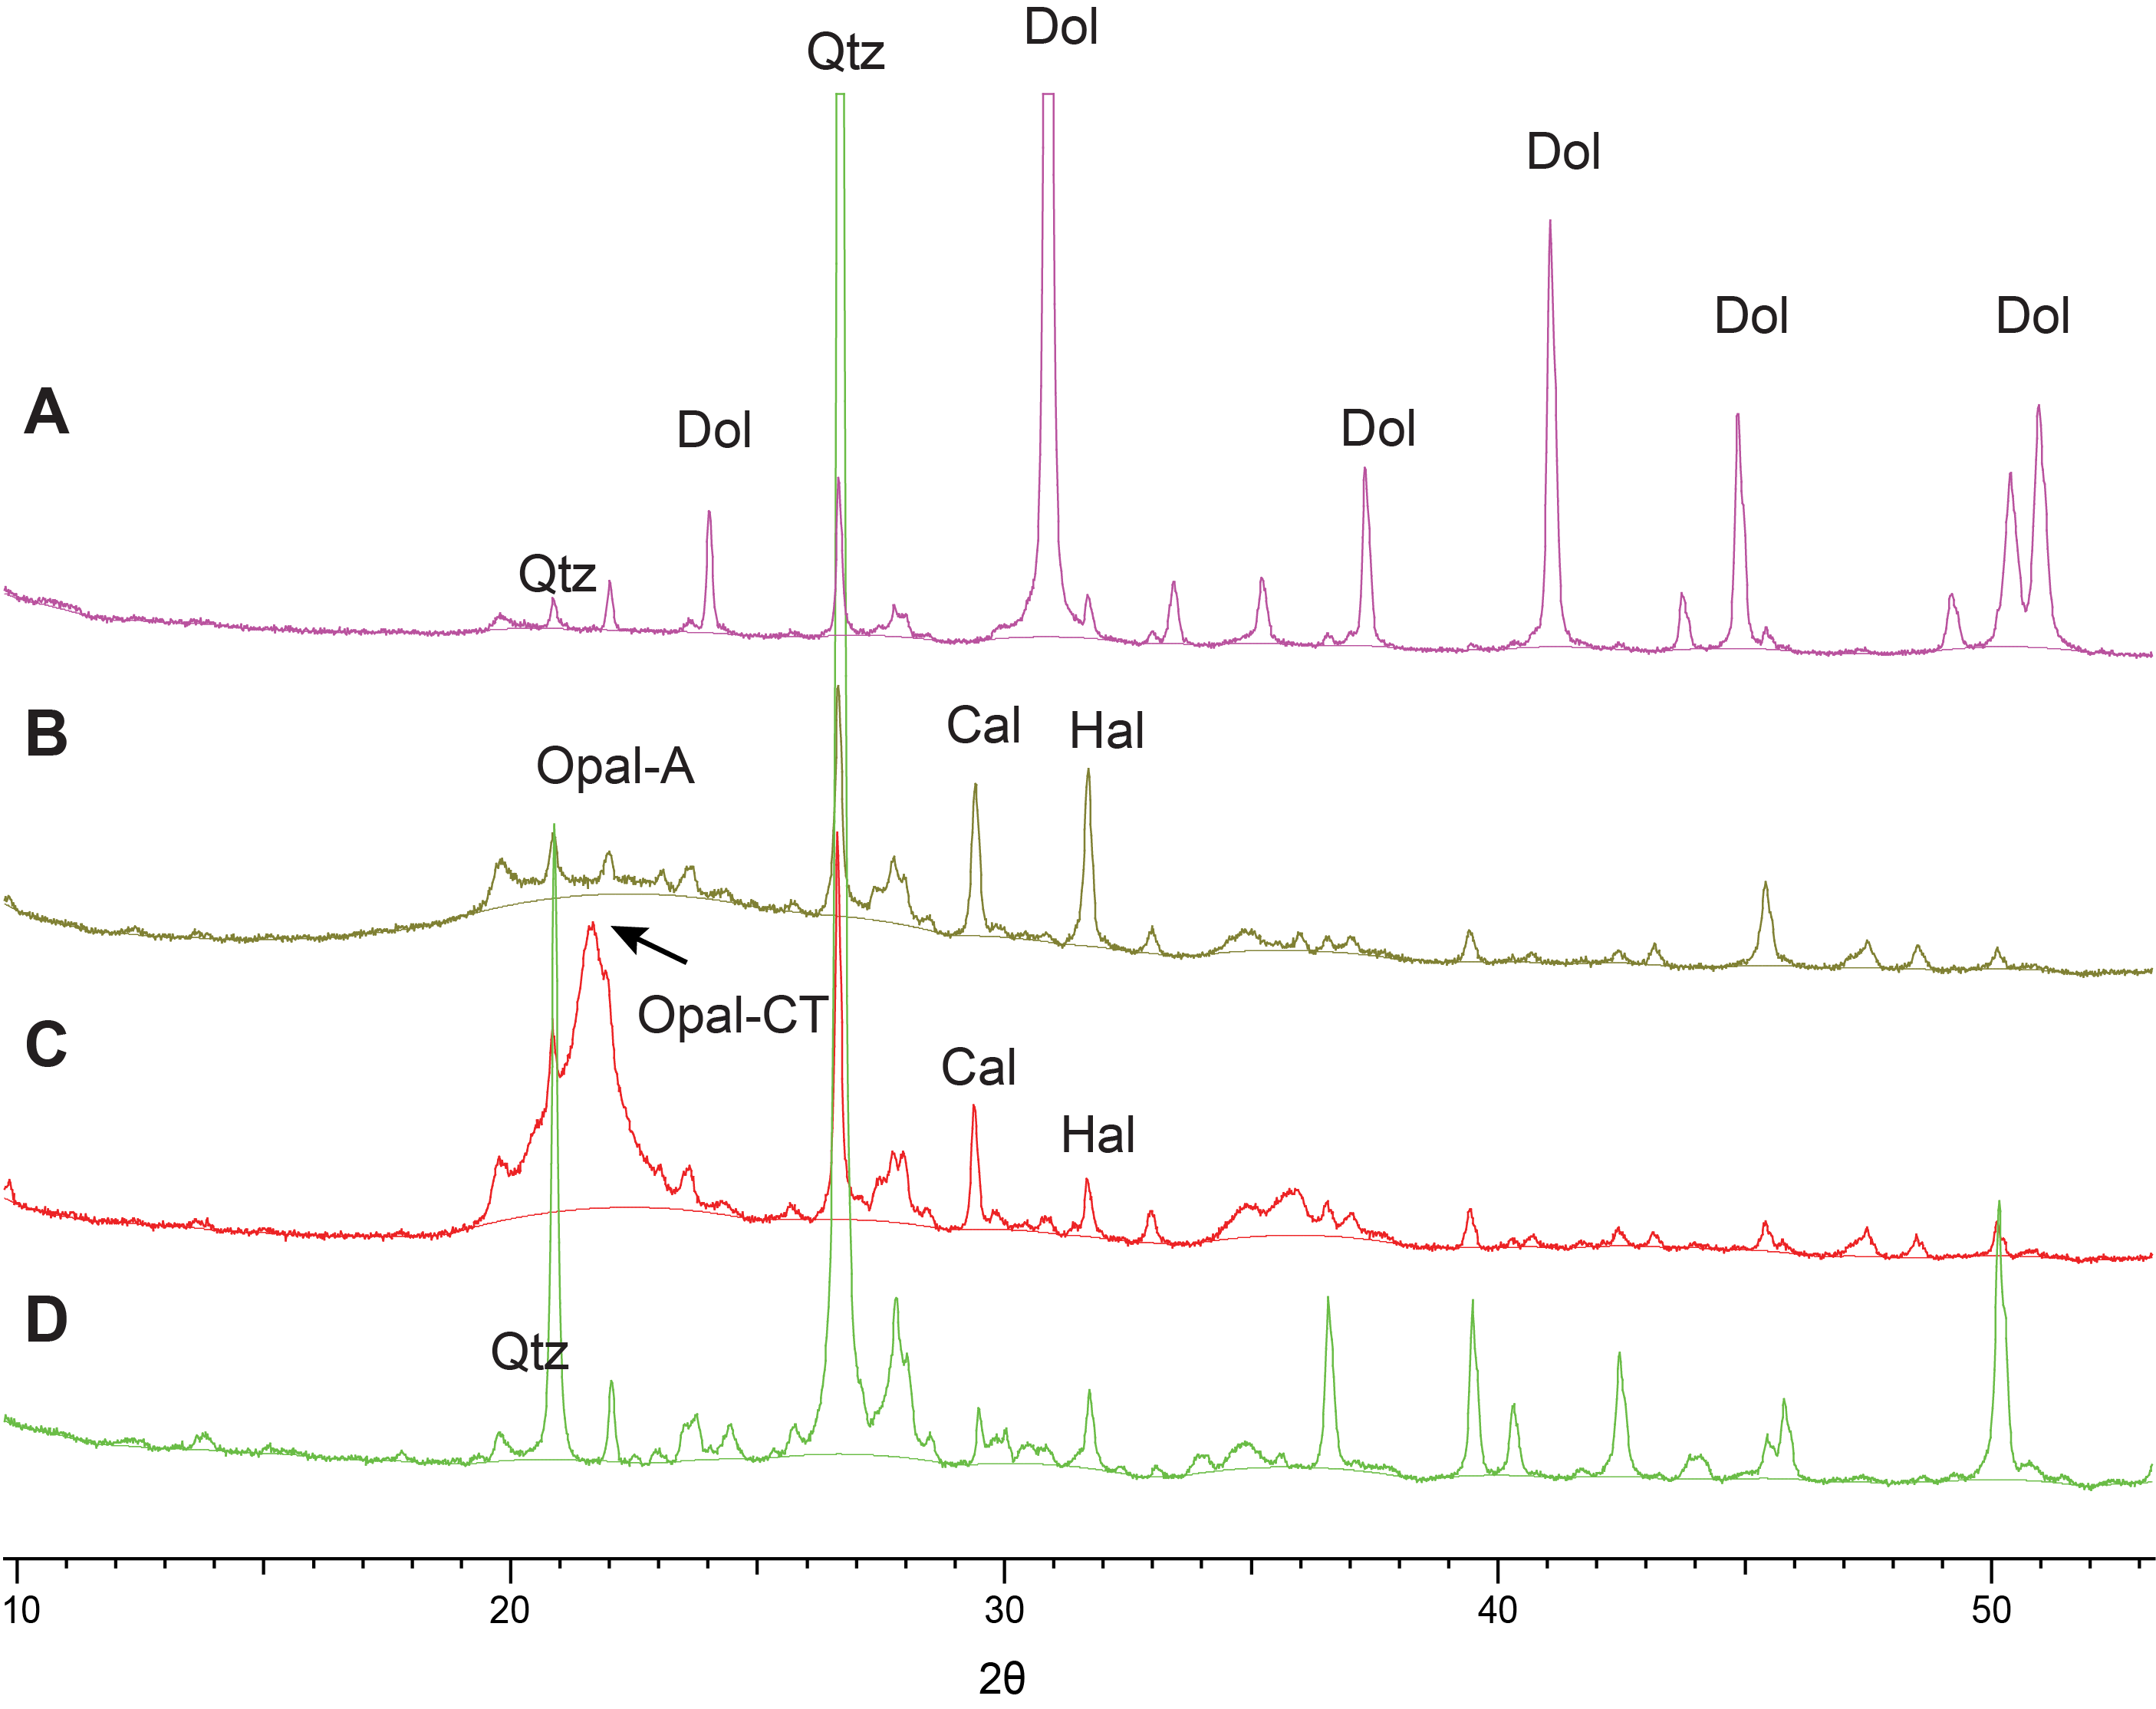
Lithostratigraphic Subunit IB is mainly composed of clay-rich diatom ooze and diatom clay with scattered micrite (Figure F7). The lithology of this subunit is characterized by the presence (>5%) of euhedral to subhedral, micrometer-sized, authigenic carbonate particles (micrite). Variations in the abundance of micrite, which constitutes as much as 50% or more of the sediment in some intervals (e.g., Figure F6E–F6F), correspond to similar variations in both the degree of induration (the more micrite the more induration) and changes in sediment color. Thus, darker, softer, olive-gray (5Y 3/2) intervals alternate with lighter (yellowish gray; 5Y 7/2) and more indurated intervals, and the latter contain more carbonate (Figure F7A) (see Organic geochemistry). The degree of induration and the strength of the yellow hue is highest at the depths at which micrite is very abundant, ultimately forming distinctive concretions or lithified beds, some of which are several centimeters thick (Figure F8A). Carbonate analyses show that the concretions contain as much as 84 wt% carbonate. XRD analysis reveals that the concretions and the clay- to silt-sized authigenic particles scattered in the sediment are mainly composed of dolomite (Figure F9). The micrite concentration, as defined by smear slide analyses, reaches a peak somewhere between Cores 385-U1545A-28F and 34F (between 184.94 and 221.58 mbsf) and rapidly decreases to trace amounts at the bottom of Core 34F. This rapid decline in micrite content defines the upper boundary of underlying Subunit IC, which is designated to be the base of Core 34F. Soft-sediment deformation–related structures, including tilting and folding, were observed between 95.26 and 102.24 mbsf (interval 11H-5, 80 cm, to 12H-3, 40 cm). Different types and degrees of core disturbances were observed in this subunit, including expansion cracks and voids. Severely brecciated cores were observed starting at ~138.5 mbsf (Core 17F) when drilling switched from full- to half-length hydraulic piston coring.
4.1.1.3. Subunit IC
- Intervals: 385-U1545A-34F-CC, 27 cm, to 56X-1, 0 cm; 385-U1545B-35F-4, 71 cm, to 60F-1, 0 cm; 385-U1545C-34F-3, 53 cm, to 63F-CC, 34 cm
- Depths: Hole U1545A = 221.58–333.2 mbsf, Hole U1545B = 226.10–323.8 mbsf, Hole U1545C = 220.03–328.88 mbsf (total depth)
- Thickness: Hole U1545A = 111.62 m, Hole U1545B = 97.7 m, Hole U1545C = 108.85 m
- Age: middle Pleistocene
- Lithology: diatom clay and clay-rich diatom ooze
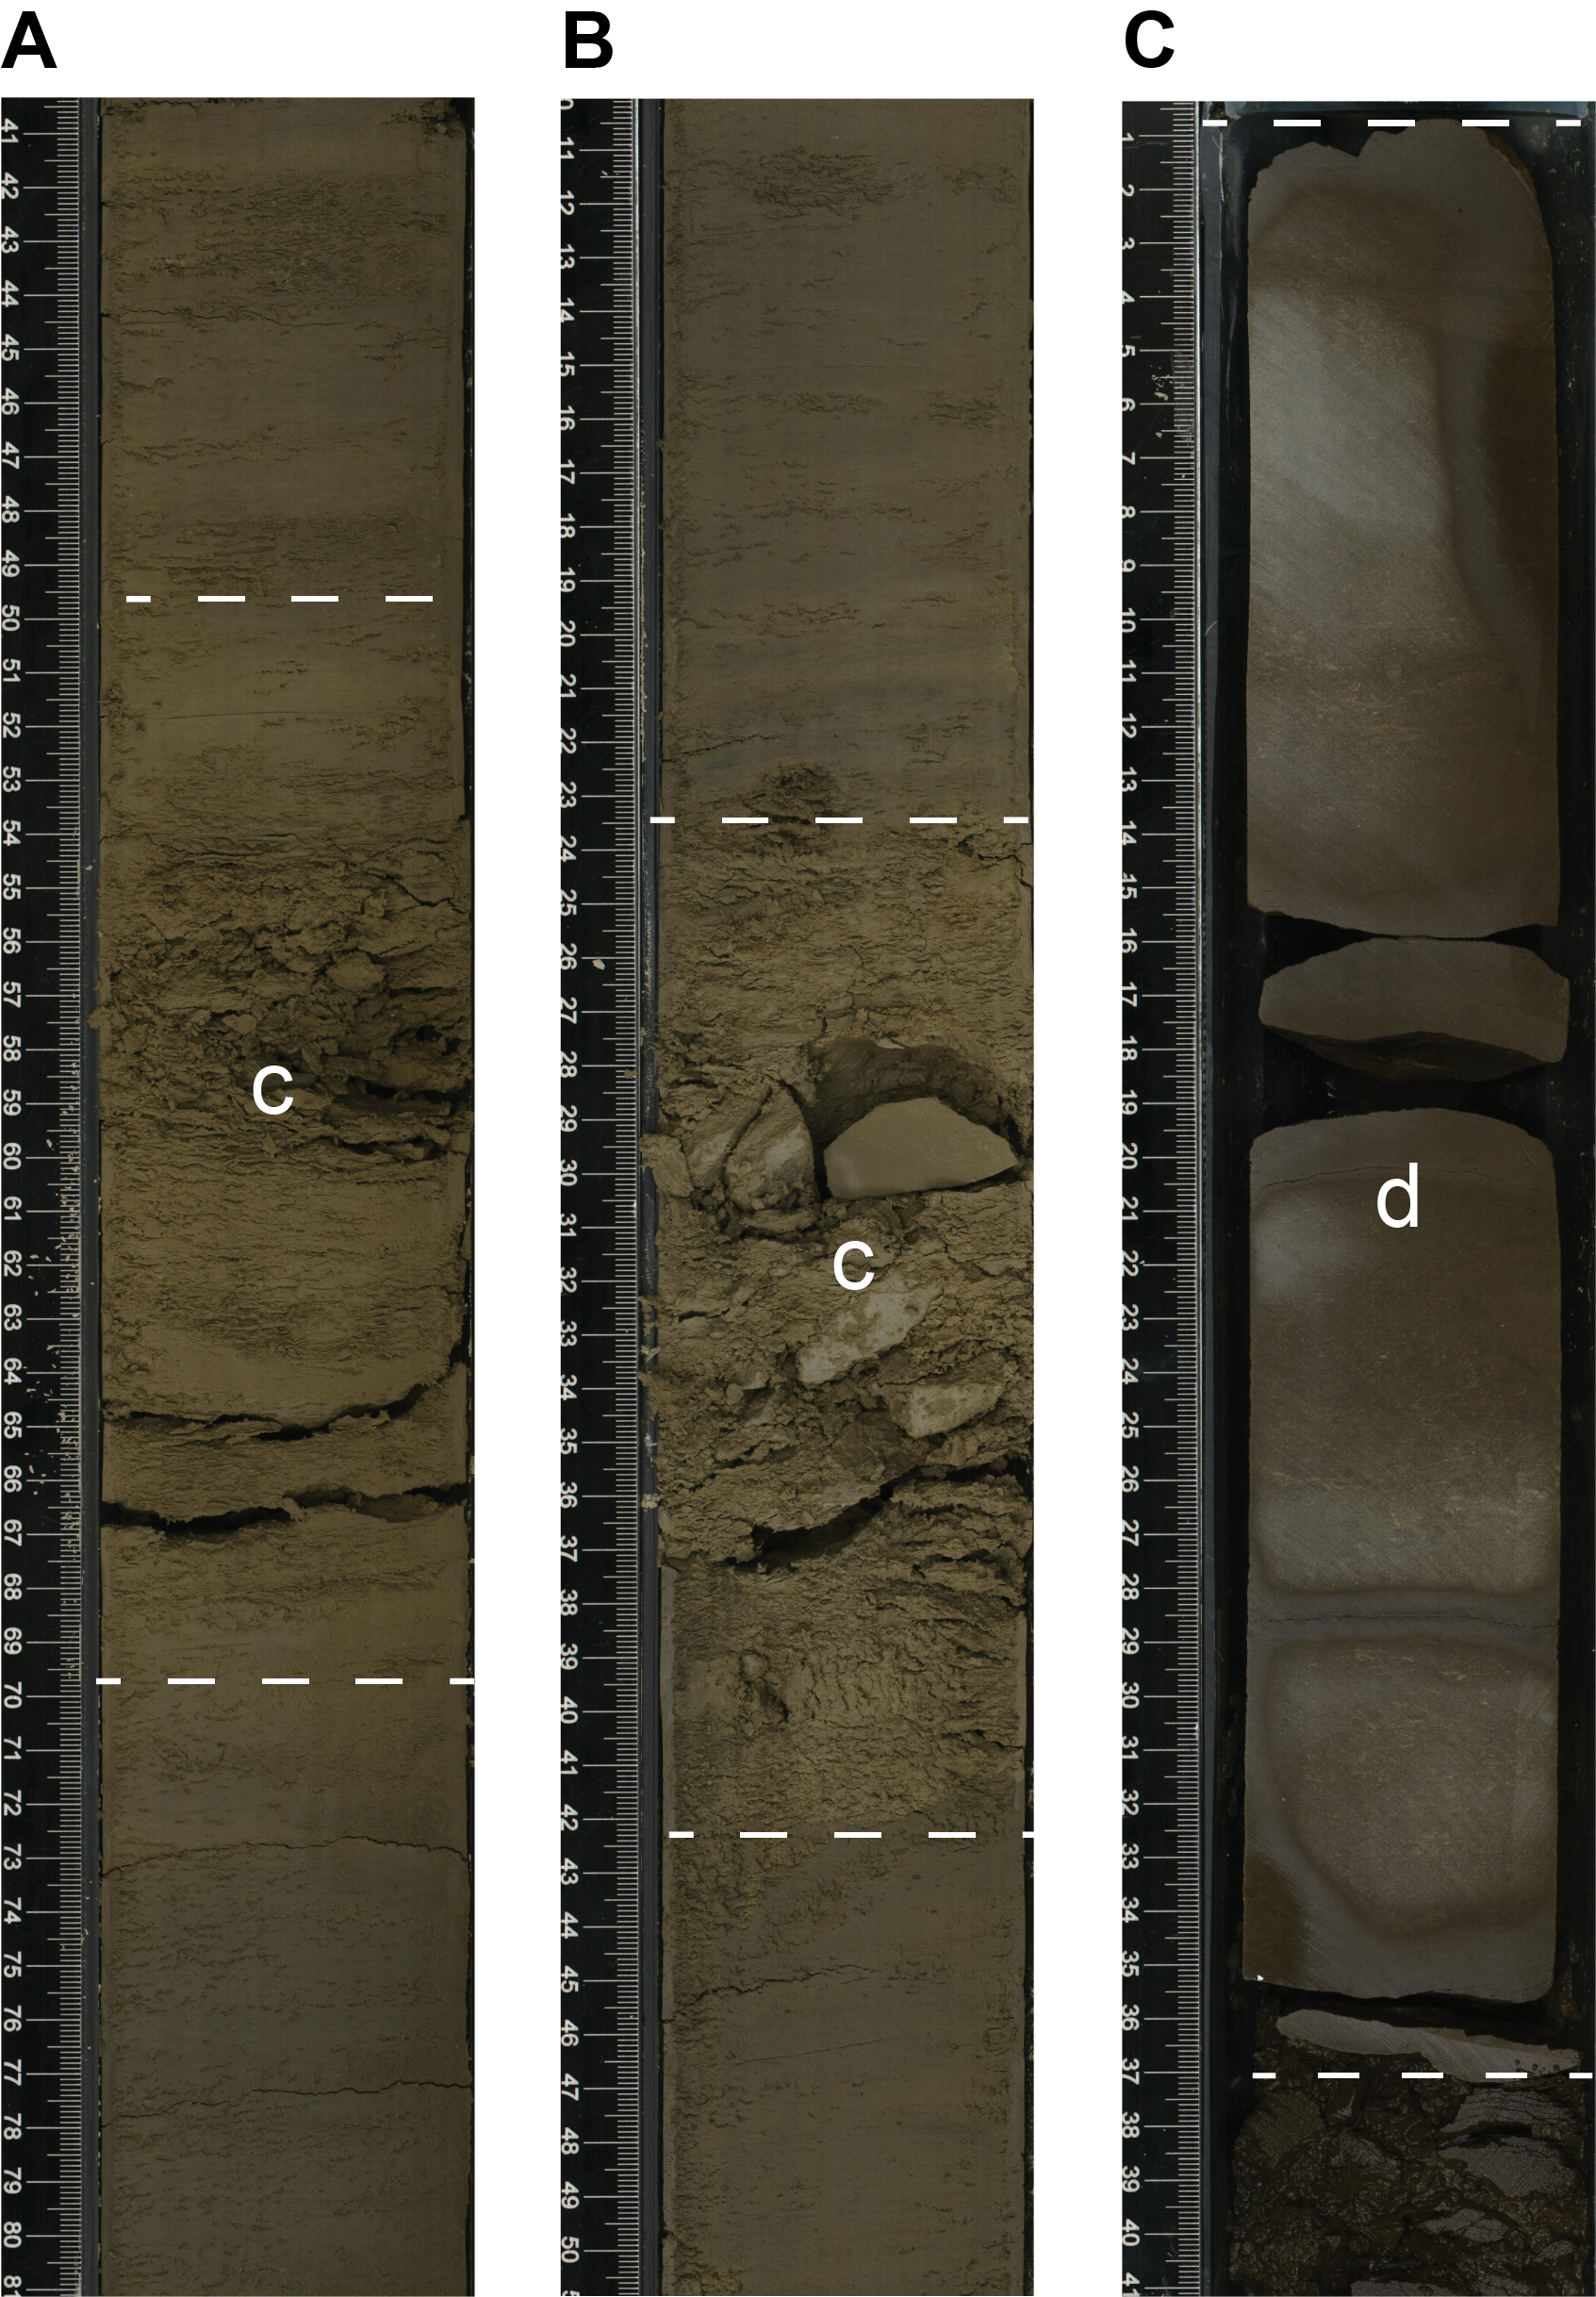
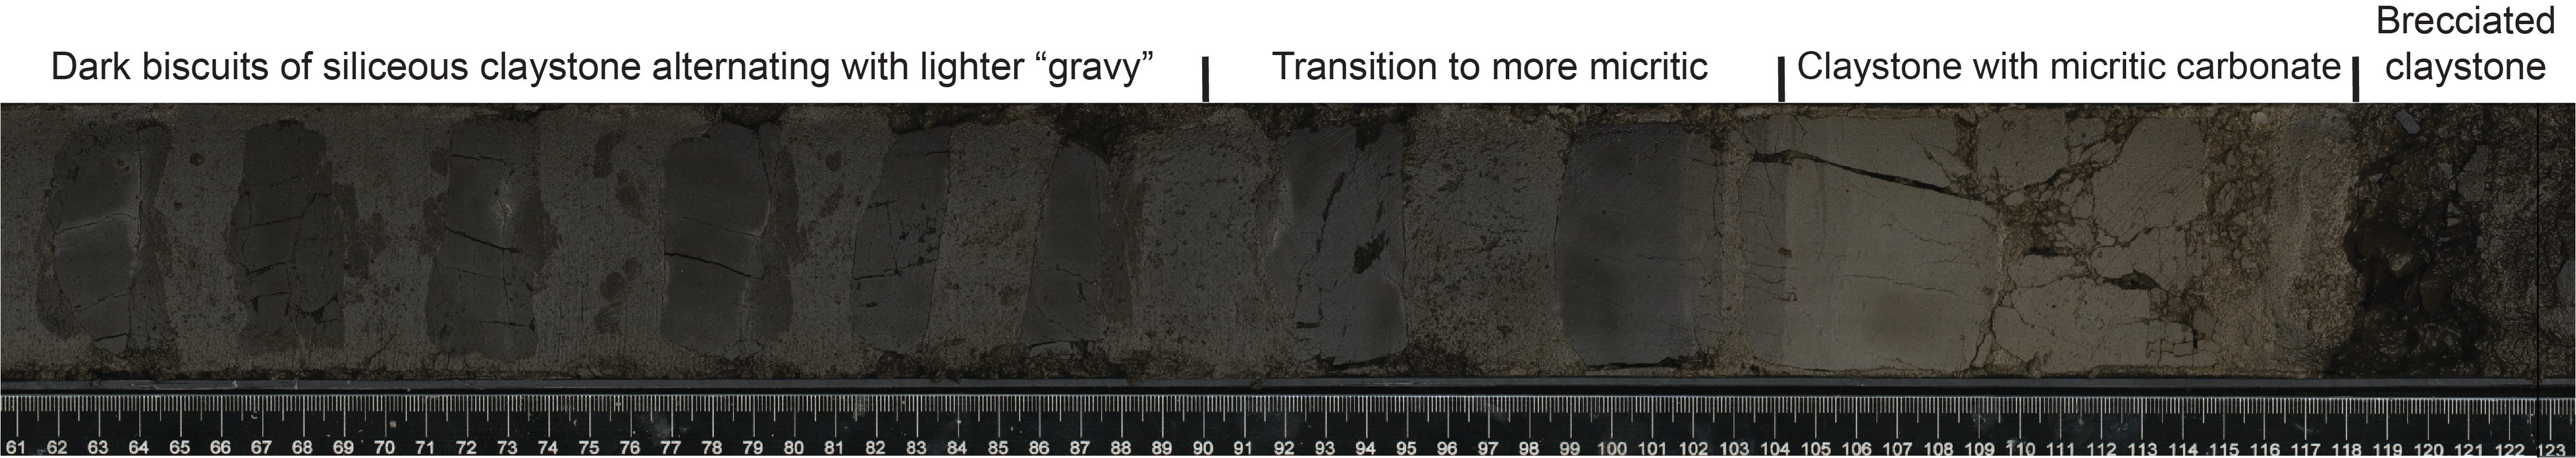
Below ~221 mbsf, the color of the sediment is dominated by darker hues (mainly olive-gray 5Y 3/2) that correspond to a significant decrease in the micrite component and an overall lower carbonate content in the sediment. The main lithology in Subunit IC is characterized by alternations between diatom ooze and clay-rich diatom ooze and transitions to diatom clay downhole. Major (e.g., clay-rich diatom ooze) and minor (e.g., ash, terrigenous silt, and micrite laminae) lithologies for Subunit IC are illustrated in Figure F10A. The abundance and degree of preservation of diatoms progressively decrease from Core 385-U1545A-50X through Core 59X. A few carbonate concretions are present, especially in the upper part of this subunit (Figure F8B–F8C), although their distribution in the lower part is equivocal because of the low recovery. The evidence of extensive dissolution of diatoms in smear slides (Figure F11A) and a shift in the color/luster of the sediment, which becomes more vitreous, correspond to the gradual diagenetic silica phase transition from opal-A to opal-CT and mark the bottom of this subunit and the top of Subunit ID (see Discussion). Biscuits surrounded by and alternating with ground-up, homogenized, softer interlayers, or “gravy,” started to appear when we switched from APC to XCB coring at ~277.8 mbsf.
4.1.1.4. Subunit ID
- Intervals: 385-U1545A-56X-1, 0 cm, to 74X-CC, 39 cm; 385-U1545B-60F-1, 0 cm, to 67X-CC, 43 cm
- Depths: Hole U1545A = 333.2–507.27 mbsf (total depth), Hole U1545B = 323.8–387.23 mbsf (total depth)
- Thickness: Hole U1545A = 174.07 m, Hole U1545B = 63.43 m
- Age: middle Pleistocene
- Lithology: siliceous claystone, limestone/dolostone, and basaltic rock
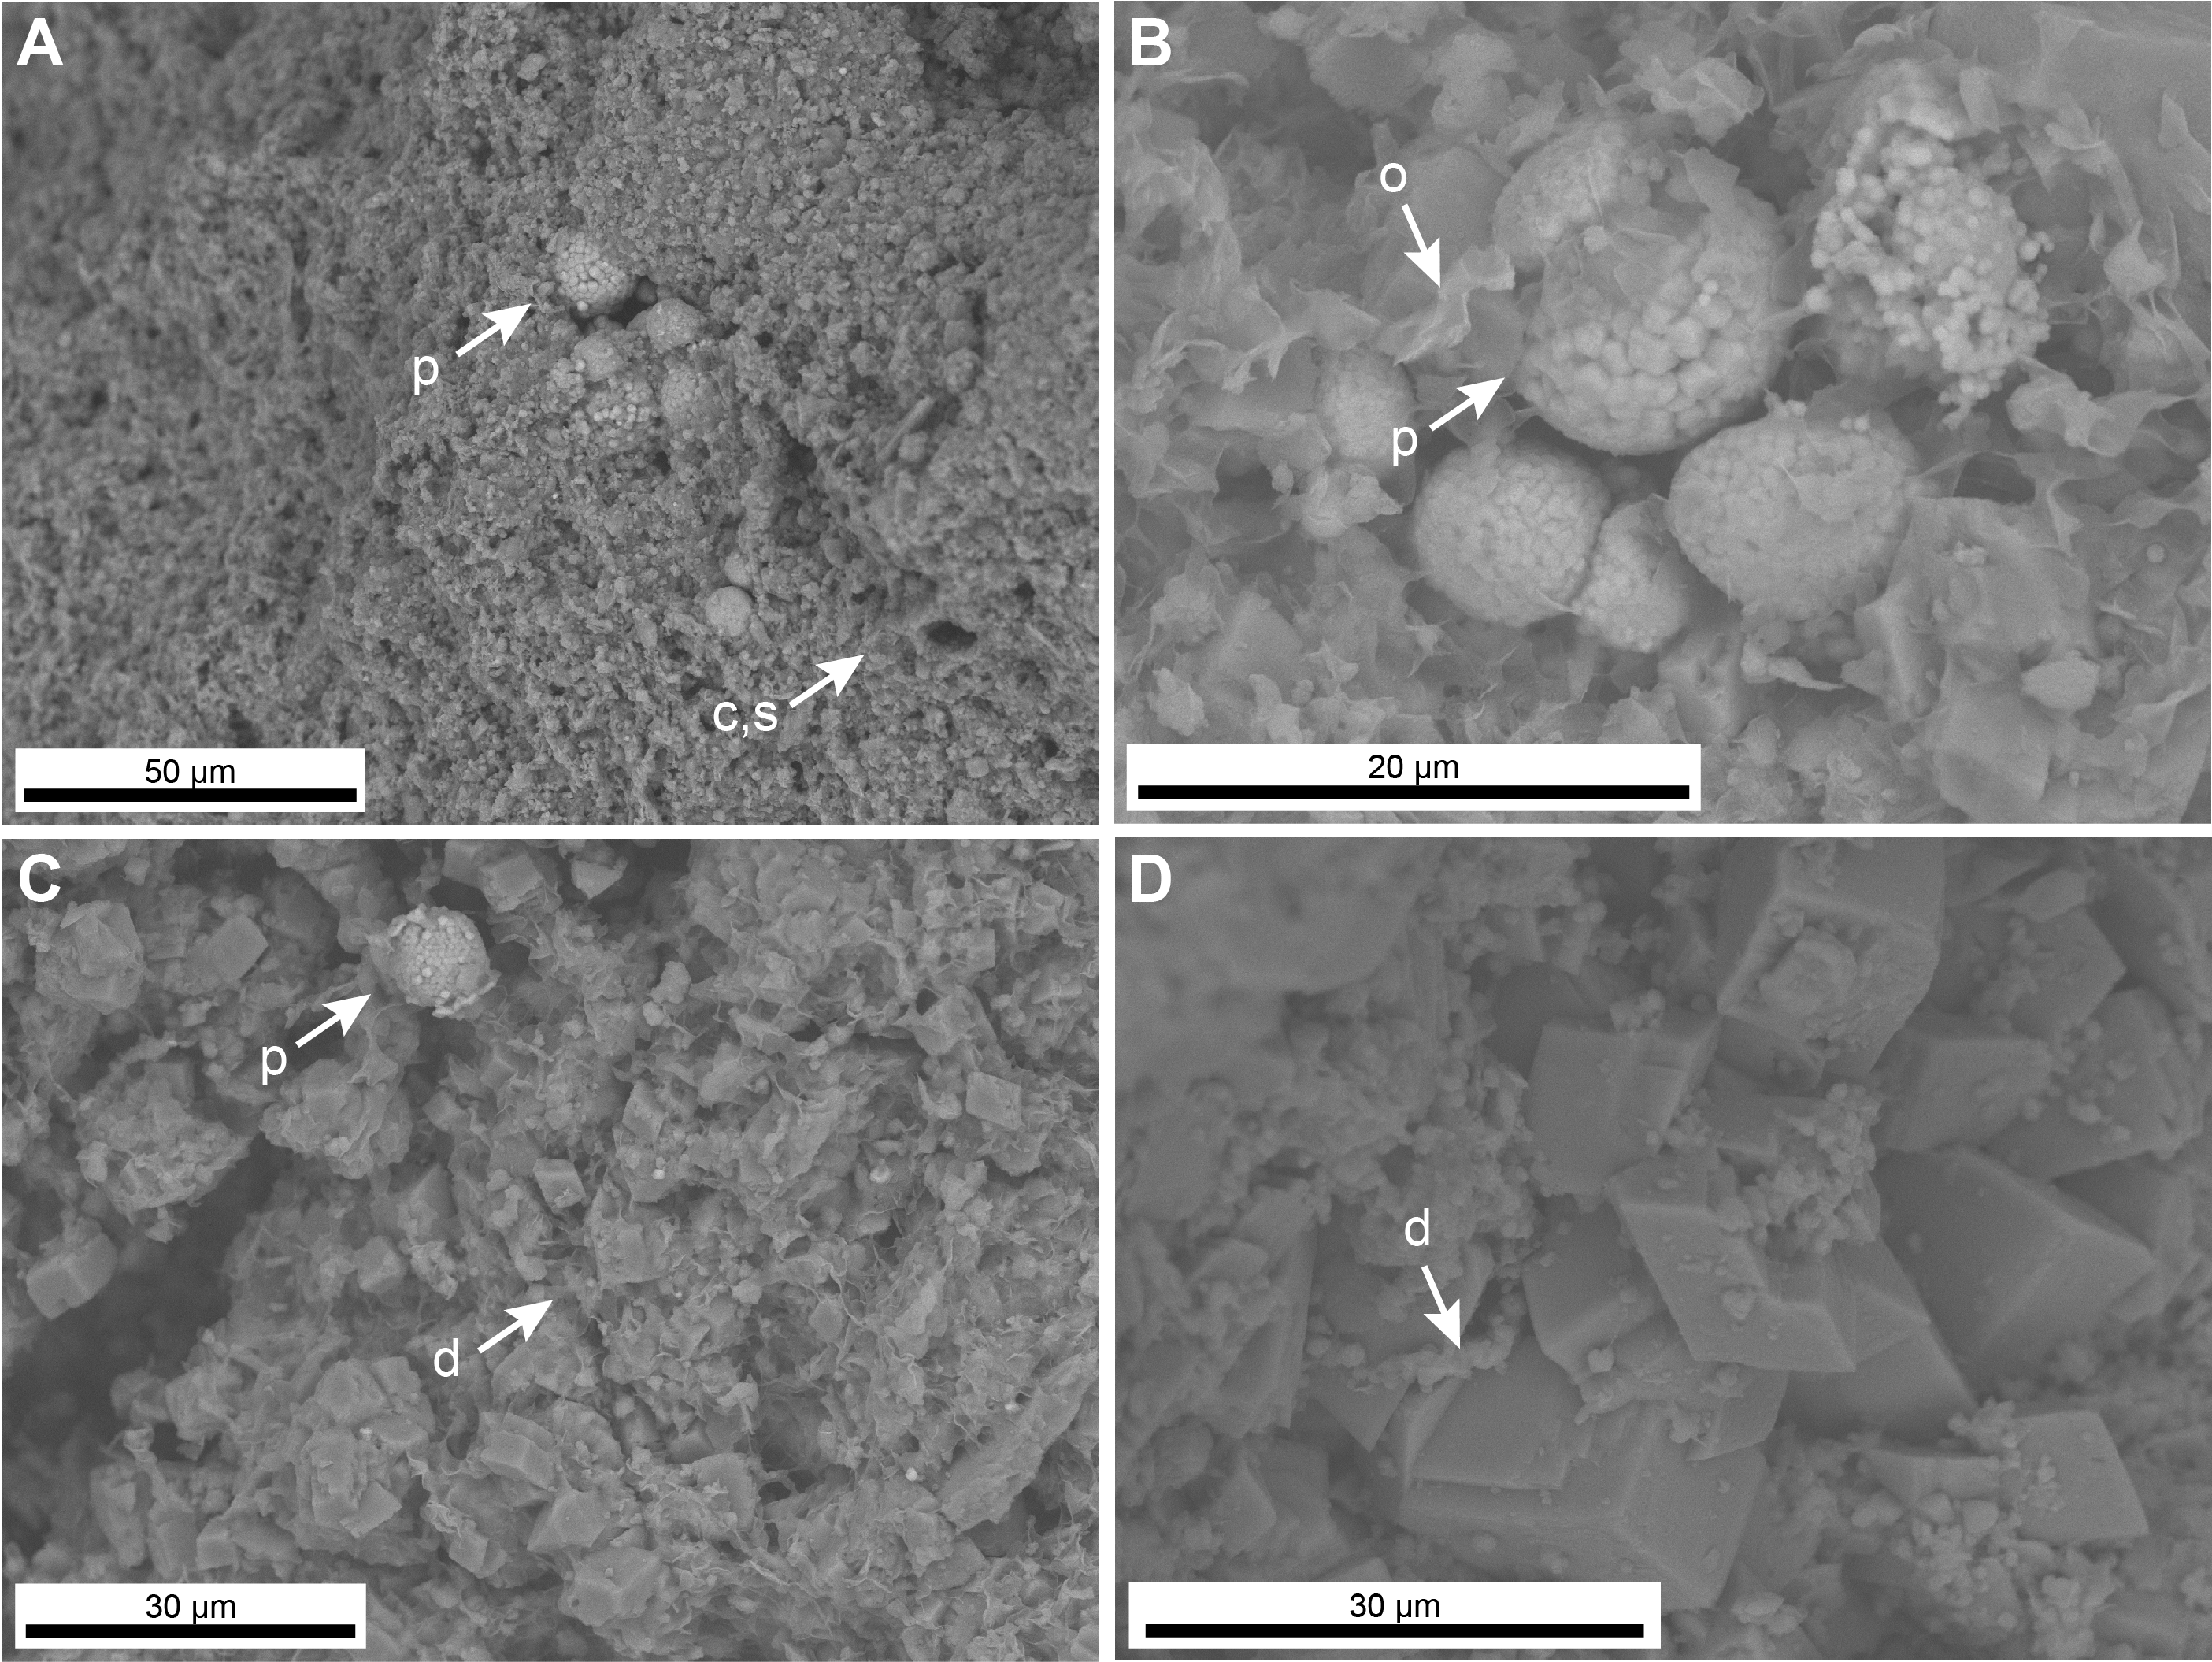
Subunit ID, the lowermost subunit, is characterized by a well-indurated to hard and finely laminated dark yellowish brown (10YR 4/2) and dusky yellowish brown (10YR 2/2) siliceous claystone to silty siliceous claystone (Figure F12). Smear slides and scanning electron microscope (SEM) imaging show that diatom valves are absent and the main components are clay and authigenic silica with subordinate silt and pyrite framboids (Figures F11B, F13A–F13B). Carbonate concretions/layers were recovered at intervals of about one per core (one every ~10 m; Figure F12). The main mineralogic phase in all carbonate concretions that were analyzed with XRD is dolomite (Figure F9B). Their thicknesses amount to 17 cm at most, and the layers exhibit mainly homogeneous textures with fewer laminations than the surrounding material. SEM observation of some of the carbonate precipitates shows a microtexture characterized by authigenic euhedral dolomite crystals associated with pyrite framboid structures (Figure F13C–F13D). The mineralogic analyses for this subunit indicate the absence of opal-A or opal-CT, which were common in Subunit IB (Figure F9B) and at the top of Subunit ID (Figure F9C), respectively. Although not directly observable in smear slide or thin section, XRD analyses from the indurated sediments of this subunit indicate the presence of quartz as a main mineralogic component (Figure F9D), suggesting that Subunit ID could be the diagenetic equivalent of the sediments recovered in the shallower subunits (see Discussion).
4.1.1.5. Subunit ID igneous rocks
An interval characterized by a ~85 cm thick interval of vesicular, partly fractured basaltic rock was recovered at 482.17–483.03 mbsf (interval 385-U1545A-71X-3, 18 cm, to 71X-CC, 41 cm), and given the small recovered thickness of the rock, the interval was assigned to Subunit ID. This interval is described in detail in Igneous petrology and alteration.
4.2. Correlation between Holes U1545A and U1545B
Holes U1545A and U1545B were drilled ~20 m apart, and overall their stratigraphy is roughly comparable. The intense whole-round sampling in Hole U1545B resulted in less certainty for correlation, which was amplified by the need to quickly turn around core description with minimal analyses. However, most of the subunit boundaries were delineated in both holes (Table T3). The Subunit IA/IB boundary was placed a few meters deeper in Hole U1545B than in Hole U1545A within a micrite-rich zone below gas expansion cracks in interval 385-U1545B-9H-6, 138 cm. The Subunit IB/IC boundary was also shifted a few meters deeper in Hole U1545B and placed below a thick carbonate concretion zone in Section 385-U1545B-35F-4 that was not observed in Hole U1545A. In Hole U1545B, the Subunit IC/ID boundary was placed below the last occurrence of sediments that contained diatom fragments in smear slides but above sedimentary rocks that appeared more vitreous on the flat surface of the slabbed core.
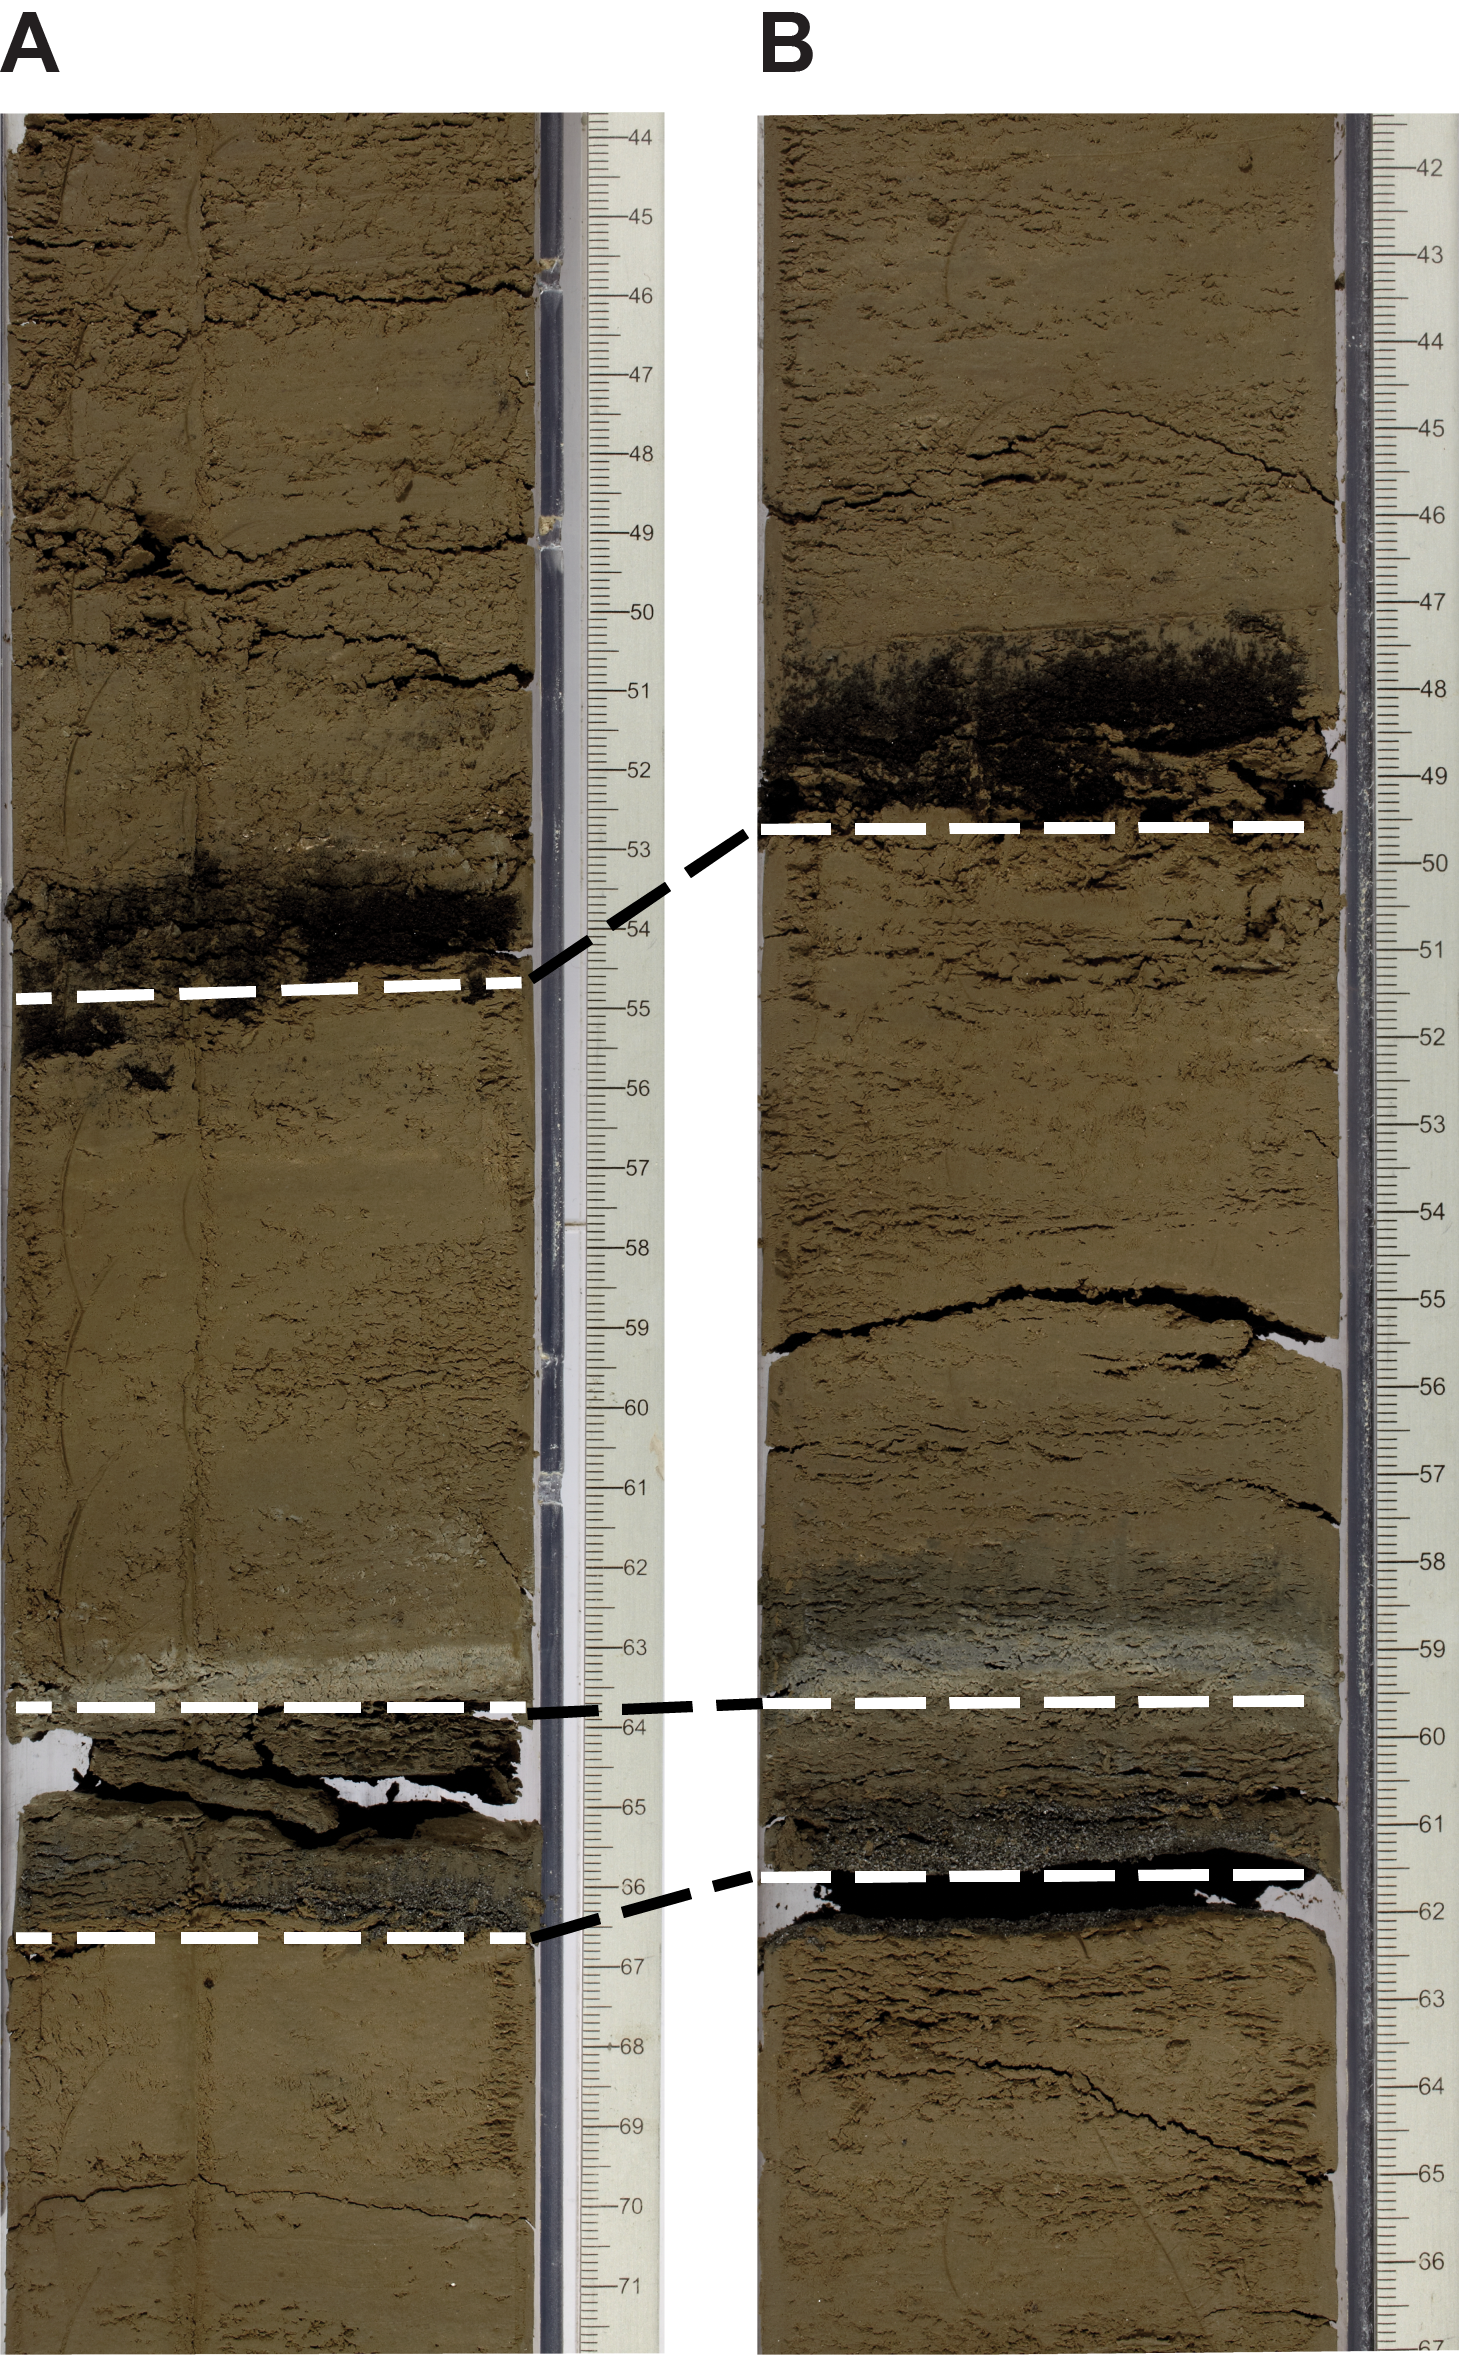
Visual observations, smear slides, and anomalies in MS were used to correlate the strata. Several volcanic ash and sand deposits are clearly correlated between Holes U1545A and U1545B (Table T4; Figure F14). They were found in the same numbered cores in Subunits IA–IC in both holes. Four layers are correlated in Subunit IA: two in Core 4H and a pair of basaltic sand layers in Core 7H. One layer is correlated in Subunit IB: a layer of mafic ash in Core 15H. Finally, in Subunit IC, a distinct package comprising an intermediate to mafic ash layer and a sand layer in clay-rich diatom ooze occurs at approximately the same depth interval (Core 36F) in both holes (Figure F14). The depth differences of the described strata between the two holes are 1 m or less in each case.
4.3. Discussion
4.3.1. Depositional processes
The sediments recovered at Site U1545 are a typical example of hemipelagic deposition in which biogenic particles derived from primary productivity in the surface ocean mix with terrigenous particles from terrestrial sources. At Site U1545, the biogenic particles are largely composed of whole or fragmented hard siliceous tests of diatoms, which in the Gulf of California typically “bloom” during high-productivity surface water conditions (e.g., Thunell, 1998). The texture of the terrigenous component is mainly clay sized, and it includes clay minerals that could have been transported to the drill site location mainly by sediment plumes from rivers or by wind. Site U1545 sediments also exhibit prominent lamination, which is produced by regular alternations between micron- to millimeter-thick dark and light layers; the dark layers have a higher abundance of clay, whereas the light ones are mainly composed of diatoms.
Classic core-based sediment studies in the Gulf of California have documented lamination in the region (e.g., Baumgartner et al., 1991) and shown that fine-grained terrigenous input comes from both eolian and riverine sources from the Sonora desert (Thunell, 1998). Sediment trap studies have shown that varve-like lamination reflects seasonal variability; the lighter laminations represent biogenic opal flux that peaks in November and December during increased upwelling (Thunell et al., 1993). Based on the preliminary age model for Site U1545 (sedimentation rate = ~0.8 mm/y) (see Biostratigraphy), we suggest that the lamination at this site could represent a record of past climatic and oceanographic variability at seasonal or longer, decadal timescales. The presence of laminae implies limited burrowing and reworking of the sediment after deposition, conditions that can only occur under bottom waters with low oxygen content. In turn, these conditions promote the preservation of organic matter leading to organic-rich biogenic sediments, and such conditions are supported by shipboard organic carbon analyses, which show organic carbon concentrations as high as 3.7 wt% (see Organic geochemistry). In modern Guaymas Basin, the bottom waters overlying the seafloor of the basin are low-oxygen, high-nutrient water masses derived from the Pacific Ocean (Pacific Intermediate Waters) (Thunell et al., 1993). The presence of lamination throughout the sedimentary sequence recovered at Site U1545 suggests that this mode of circulation has dominated since the middle Pleistocene, the age interval during which sedimentation occurred at Site U1545 (see Biostratigraphy). These conditions, however, have fluctuated over time. The occurrence of nonlaminated intervals and the presence of shelly macrofauna suggest that, at least temporarily, bottom water conditions were characterized by higher oxygen concentrations. Moreover, the abundance of clay minerals in the sediment and the preservation of diatoms varies at scales much larger than lamination, and these cycles are reflected by meter-scale variations in physical properties such as NGR and MS (Figure F4).
4.3.2. Diagenetic overprinting
As discussed above, the division of the sedimentary sequence recovered at Site U1545 into four subunits was mainly motivated by the different degrees/types of diagenetic overprinting and processes in Unit I sediments that resulted in the formation of authigenic minerals, the selective dissolution of sedimentary particles, and silica diagenesis. The recovery of a small basaltic sill close to the bottom of the drilled section also suggests that hydrothermalism and/or contact metamorphism may have altered and overprinted the oldest sediments recovered.
Subunit IA represents the most recent and diagenetically immature part of the sequence, which is characterized by the occurrence of opal-A as the main silica phase in the sediment (Figure F9B). The presence of folded and tilted intervals (also observed in underlying Subunit IB) suggests synsedimentary remobilization of partially lithified sediment owing to potentially seismically induced mass wasting along a relatively steep seafloor. Subunit IB, which is characterized by the occurrence of micrometer-sized crystals mainly composed of dolomite, corresponds to an interval in which analyzed pore waters show higher concentrations of methane (see Organic geochemistry). This suggests that authigenic carbonate precipitation is possibly associated with increased alkalinity during AOM, as demonstrated by Borowski et al. (1997) for sediments from the Blake Ridge. Subunit IC is distinguished from Subunit IB principally because of the dramatic decrease of micrite content in the sediment. The lower part of Subunit IC also shows a progressive decrease in the abundance of diatoms and a relative increase of the clay component together with an increase in fragmentation of diatom frustules. This trend corresponds to the depth at which the XRD data indicate the first precipitation of opal-CT at the expense of opal-A (Figure F9C). The main lithology of Subunit ID is characterized by opal-CT silica, indicating a complete recrystallization of the original amorphous silica (Figure F9D). Development and overgrowth of silica lepispheres within the pores of the opaline tests were also observed using an SEM during biostratigraphic analysis (see Biostratigraphy). The occurrence of opal-CT coincides with the virtual disappearance of diatoms in the sediments, which results in clay predominance. It cannot be excluded that the diagenetic boundary that forms the top of this subunit corresponds to a primary lithologic boundary that reflects a change in the depositional environment from less productive (more clay and fewer diatoms) to more productive conditions. For instance, it has been shown that silica diagenesis is affected not only by temperature but also composition of the sediment; the opal-A to opal-CT phase change occurs at shallower depths when diatoms are mixed with detrital components (Keller and Isaacs, 1985). Finally, only quartz was observed in the XRD results from cores below the small igneous body recovered ~20 m above the bottom of Hole U1545A, possibly indicating the further transformation of opal-CT into quartz. A similar transition from opal-CT/opal-A to quartz in the sediments above, below, and between sills has been observed in cores collected in Guaymas Basin during Deep Sea Drilling Project (DSDP) Leg 64 (Kastner and Siever, 1983).
5. Igneous petrology and alteration
In Hole U1545A, igneous rock was drilled from ~482.2 to ~483.0 mbsf using the XCB system. The total recovered core length of this interval amounts to 86 cm. The recovered hypabyssal mafic rock with basaltic texture represents an aphyric, microcrystalline, moderately to sparsely vesicular sill body that intruded the siliceous claystone of Lithostratigraphic Subunit ID. Thus, the intrusion has been stratigraphically assigned to Subunit ID and designated Igneous Lithologic Unit 1.
5.1. Igneous Lithologic Unit 1 (Lithostratigraphic Subunit ID)
- Interval: 385-U1545A-71X-3, 18 cm, to 71X-CC, 41 cm
- Depth: 482.17–483.03 mbsf
- Thickness: 0.86 m (cored) (bottom contact missing)
- Recovery: ≥45% (based on top depth of 484.1 mbsf of underlying Section 72X-1)
- Lithology: basaltic hypabyssal igneous rock
- Age: middle Pleistocene or younger (younger than 0.29 Ma)
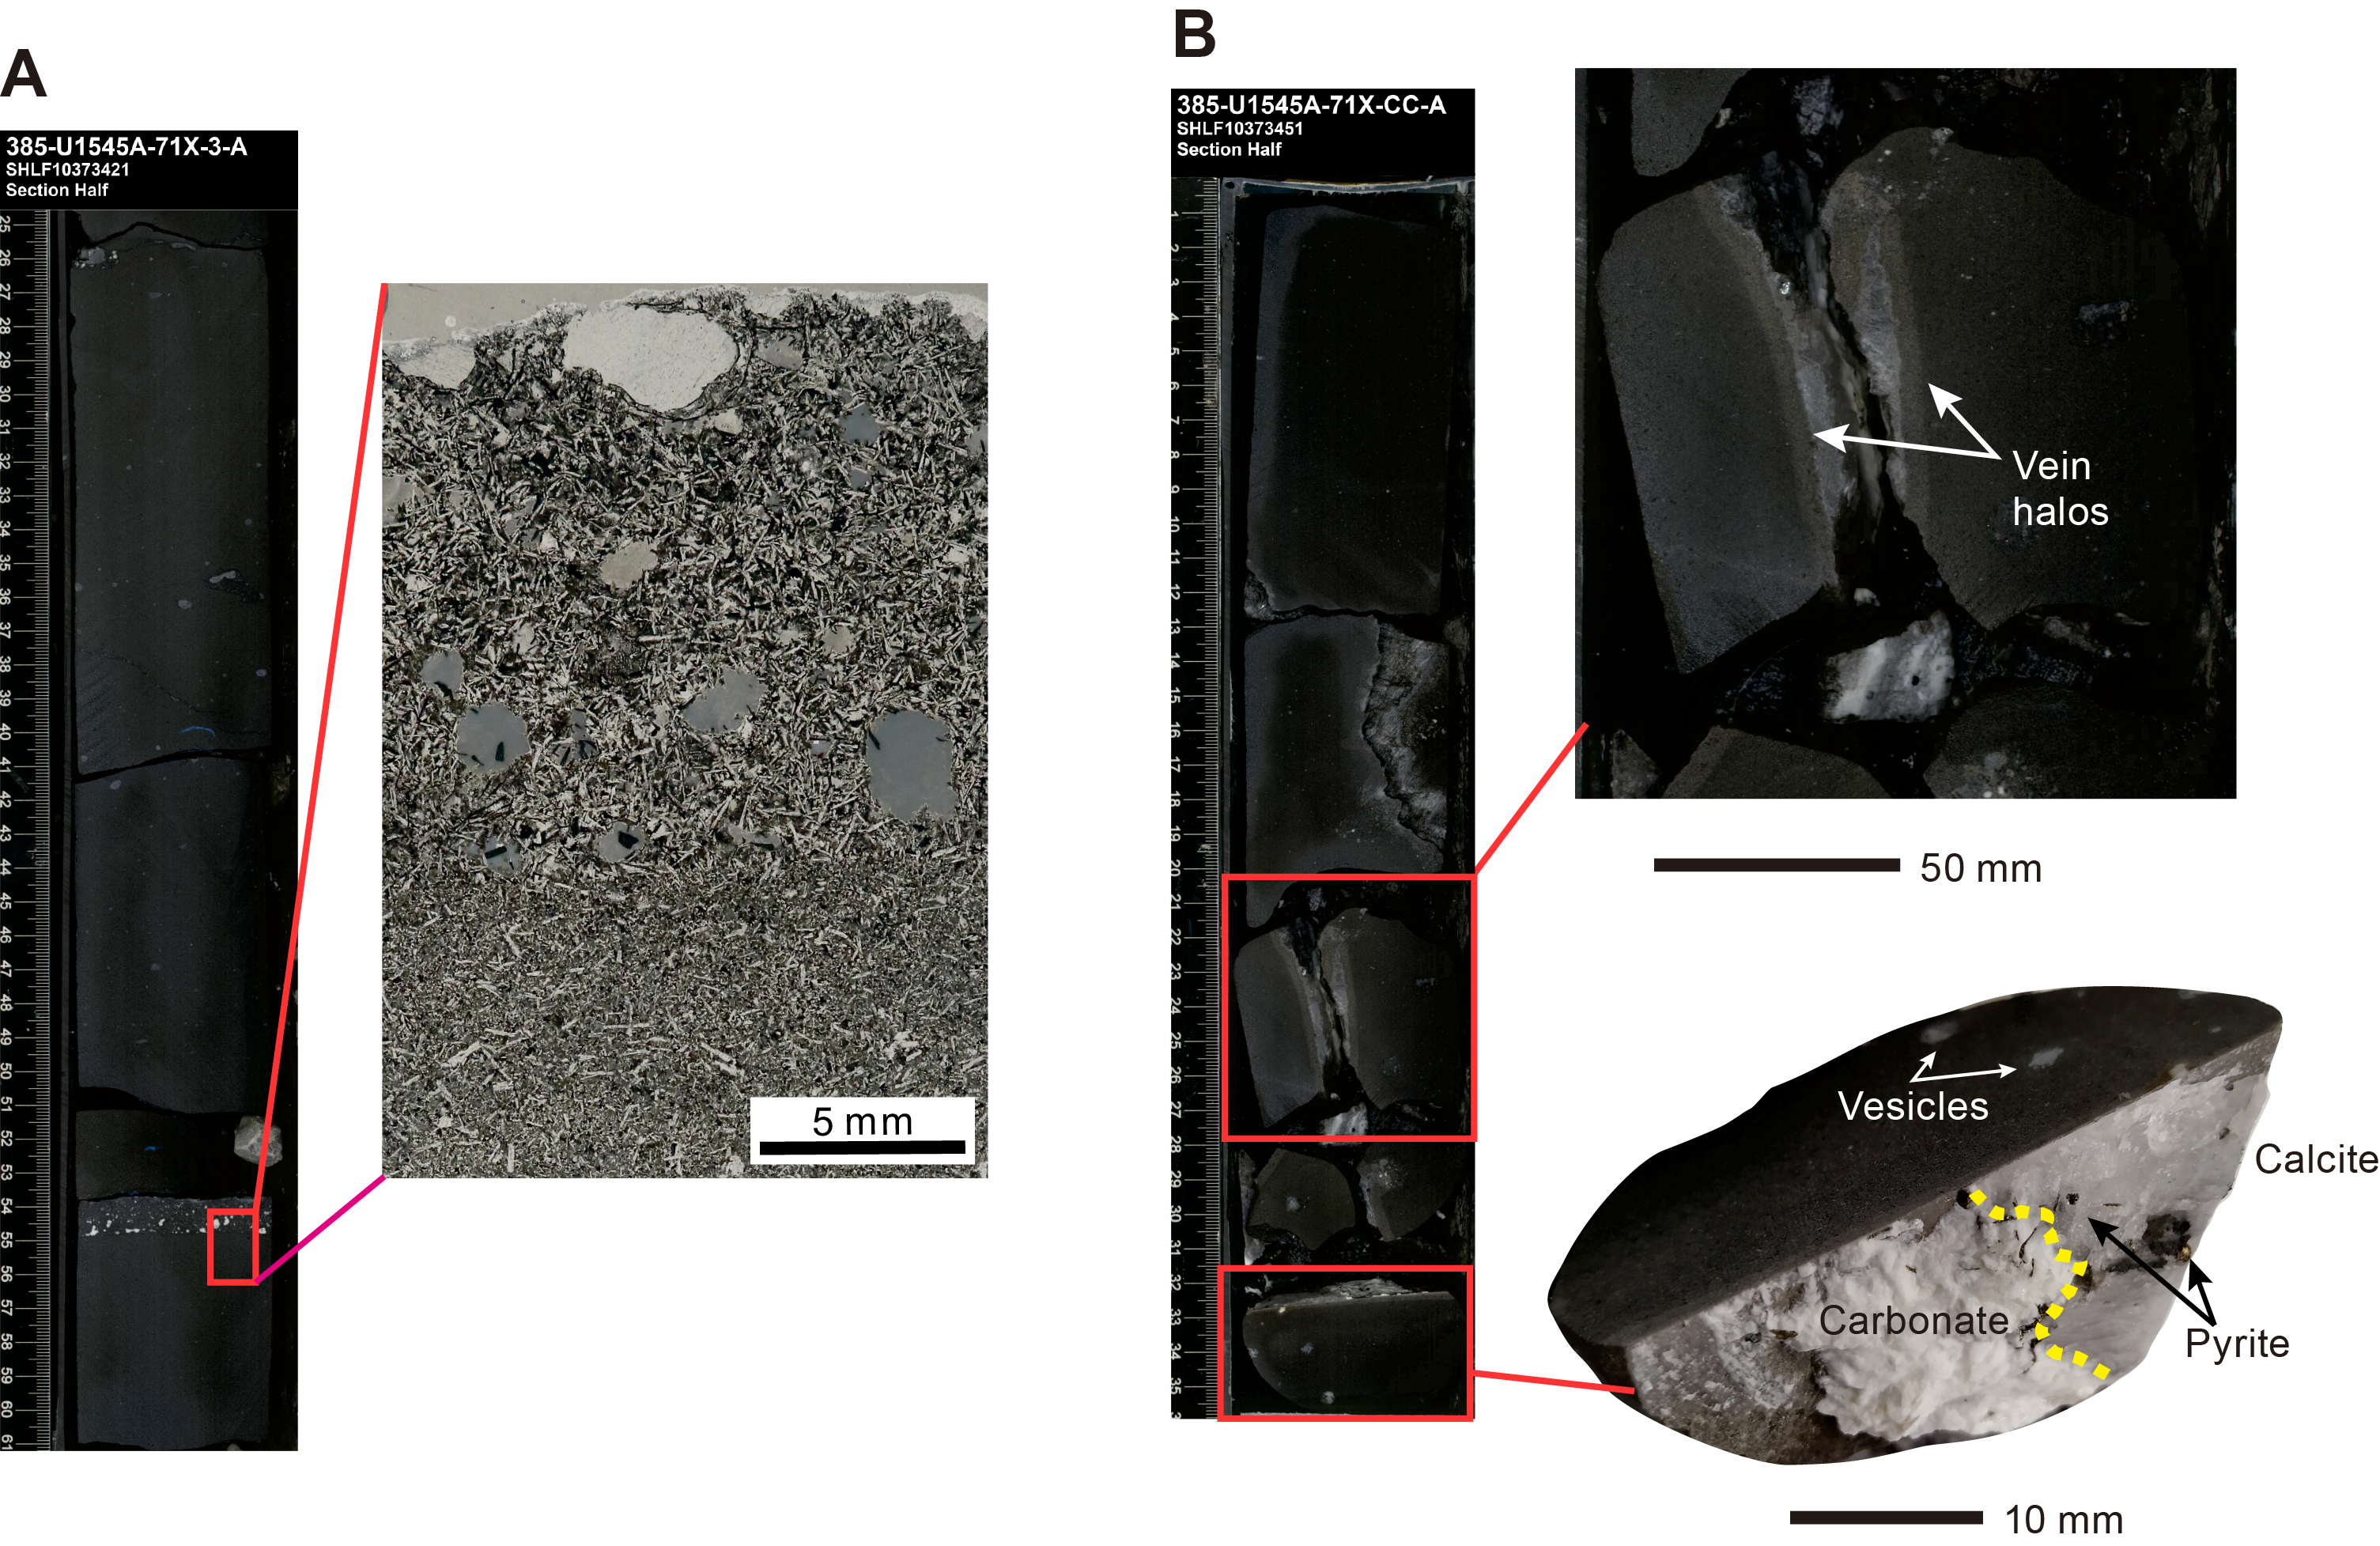
The top of the intersected sill is preserved and shows a chilled contact to the overlying sedimentary rock, but the bottom was not recovered. The top chilled contact (light green-gray; 0.3 cm thick) has a very fine grained texture with abundant small vesicles (<1 mm) but lacks volcanic glass. The top of the sill and the overlying siliceous claystone are sharply separated by a contact aureole that is represented by a baked contact horizon of 3 cm in thickness. The overlying contact sediment has been described as gray carbonate metasedimentary rock (see Lithostratigraphy). This contact zone contains thin and light gray baked boundaries (0.2–0.3 cm thick) at the top and bottom of the narrow aureole (Figure F15).

5.2. Petrographic description
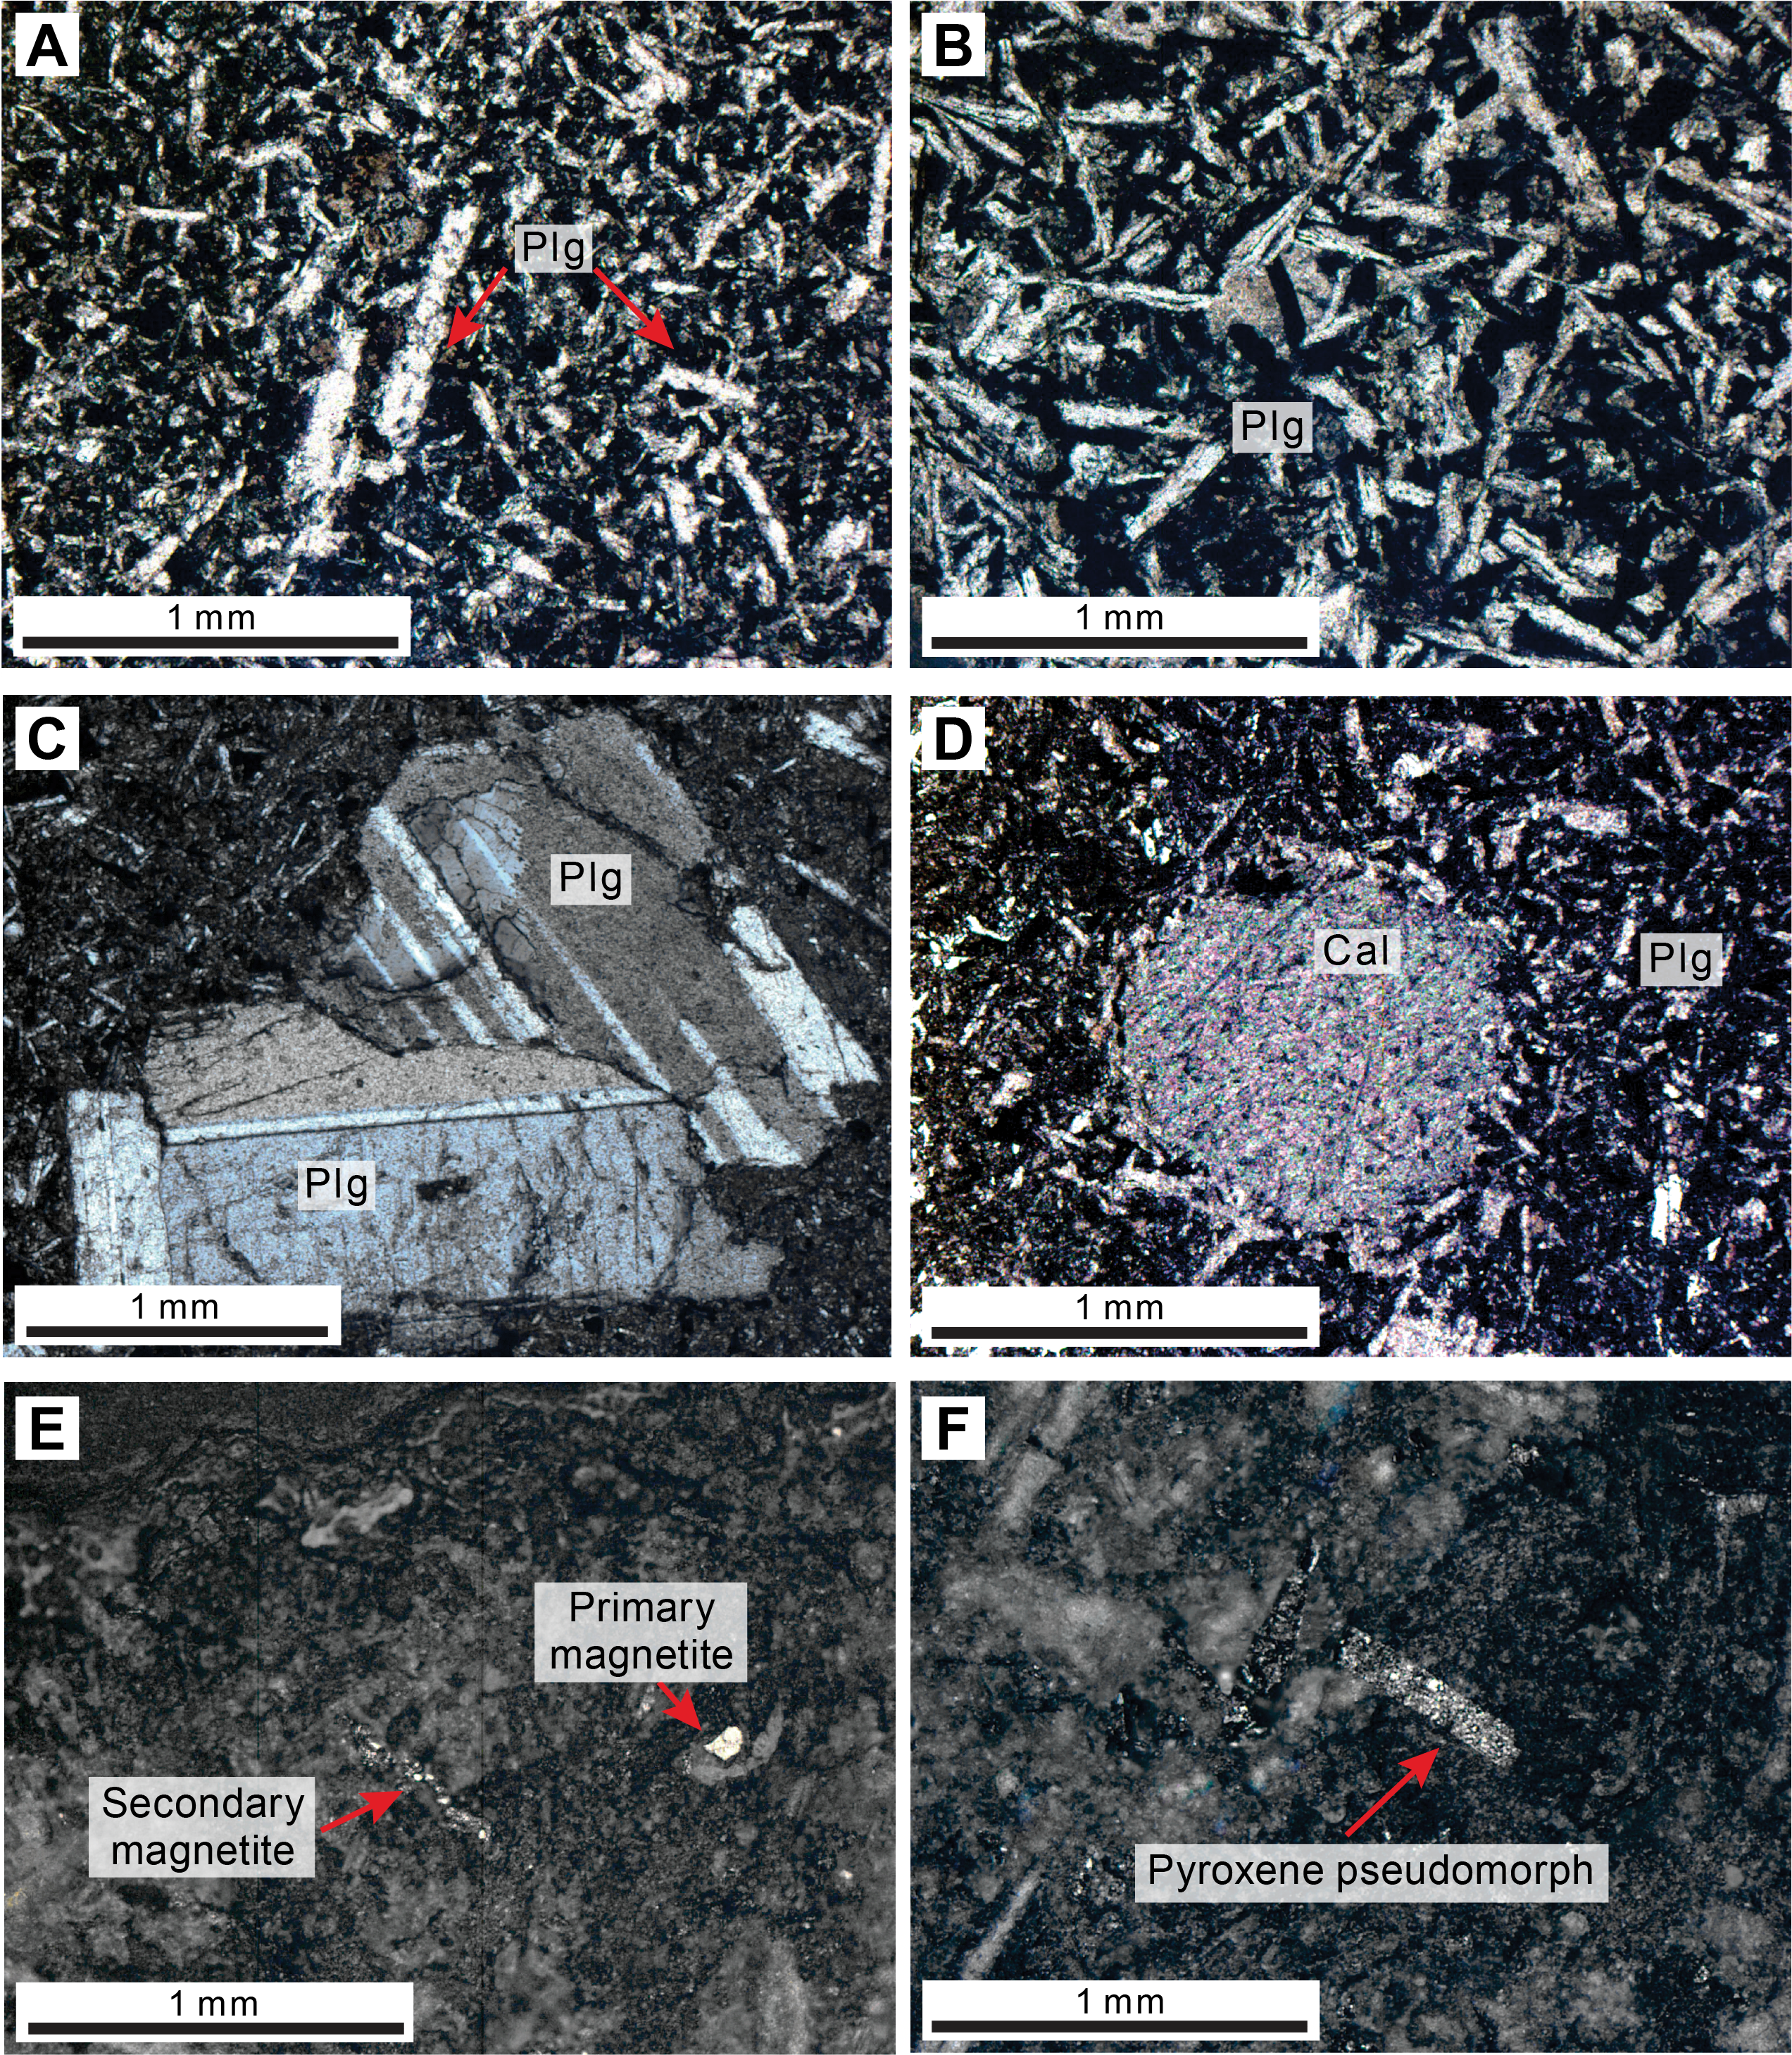
The dark gray aphyric basalt has an aphanitic texture with a micro- to cryptocrystalline inequigranular igneous mineral assemblage consisting of plagioclase, pyroxene, and accessory Fe-Ti oxides. Moderate to sparse vesicularity overall decreases with depth. The median size of the rounded to subrounded vesicles also generally decreases from 8 to 0.1 mm downcore. Rarely present (<1 vol%) euhedral, acicular plagioclase phenocrysts have a maximum length of 2 mm (Figure F16C) and a mode length of 1 mm (Figure F16A) and are more commonly found as lath-shaped microphenocrysts. The felty, equigranular matrix (groundmass) is very fine grained (≤0.2 mm) (Figure F16A) and consists of euhedral to subhedral acicular plagioclase (~50 vol%) and subhedral stubby pyroxene crystals (~40 vol%). Primary magnetite crystals less than 0.1 mm in size are also present in the groundmass as an accessory mineral phase (Figure F16E). Throughout the recovered sill interval, the basaltic rock remains texturally homogeneous, except for a 1 cm thick layer in the middle of the recovered basalt section in interval 385-U1545A-71X-3, 54–55 cm (Figures F15C, F17A). It shows subrounded to angular vesicles that are 1–3 mm in size and filled with secondary minerals. A high vesicularity is present throughout this narrow interval, which shows an overall coarser crystal size compared to the remainder of the drilled interval but lacks microphenocrysts. Its felty matrix mainly contains equigranular plagioclase and pyroxene as dominant mineral phases. Minor primary magnetite (<5 vol%; ~0.2 mm in size) is also present in this interval. The euhedral to subhedral lath-shaped plagioclase crystals are larger (0.5–1 mm long) than those contained in the other parts of the drilled section (Figure F16B). Euhedral to subhedral pyroxenes occur as pseudomorphs (0.5–1 mm long) due to complete replacement by secondary magnetite and clay minerals (Figure F16F). Both primary and secondary magnetite coexist in the aphyric and amygdaloidal mafic sill. Secondary magnetite is more abundant in the amygdule-rich layer than in the basaltic rock above and below.
5.3. Alteration and veins
The entire recovered section uniformly shows moderate alteration that is consistent with having resulted from hydrothermal fluid-rock interaction. Plagioclase crystals in both aphyric and amygdaloidal basaltic rocks are slightly altered to sericite, whereas pyroxenes remain only as pseudomorphs that are totally replaced by secondary minerals. In general, the groundmass is partially altered to clay minerals and carbonates. Vesicles are mostly filled with secondary minerals forming amygdules (Figure F16D). These secondary minerals are dominantly carbonates (e.g., calcite and dolomite) and clay minerals (e.g., smectite) with minor magnetite and sulfides (e.g., pyrite).
Observed veins are predominantly filled with carbonates, pyrite, and zeolites, which gives them a white color with black and golden patches. The alteration assemblages include minerals that are products of alteration of primary igneous minerals and those that directly precipitated from presumably hydrothermal fluids such as pyrite and carbonates in the identified polycrystalline veins. These show sharp contact with the host basaltic rock. The width of the veins varies from 1 to 2 mm, and they usually do not exceed a length of 5 cm, except for the largest vein (33 cm long and ~2 cm wide), which is in interval 385-U1545A-71X-CC, 3–36 cm. This polycrystalline vein consists of carbonates and pyrite (Figure F17B). The rock immediately surrounding this vein shows brown, ~0.2 cm thick alteration halos.
5.4. Discussion
Based on the biostratigraphic age (see Biostratigraphy) of the intruded Lithostratigraphic Subunit ID, the age of this sill can be estimated as being younger than 0.29 Ma. The presence of vesicles, a chilled contact associated with carbonate metasediment, and overlying claystone derived from diagenetic alteration of diatom ooze (see Lithostratigraphy) are clear evidence of shallow subseafloor basaltic magma intrusion into marine sediment. The 3 cm thick layer of carbonate metasediment found between the underlying mafic rock and overlying siliceous claystone is interpreted to be the zone baked by the heat of the magma when it intruded the sediment. The overall fine-grained texture of the 86 cm thick basalt indicates relatively fast magma solidification, which might be related to its comparatively small thickness of presumably a few meters and related low thermal mass compared to the ~75 m thick sill at adjacent Site U1546, which shows a basaltic texture at top and bottom contact only but transitions to much more coarse-grained doleritic and gabbroic textures in the interior of the intrusion (see Igneous petrology and alteration in the Site U1546 chapter [Teske et al., 2021c]). The thickness of the fine-grained basaltic sill (<1 m recovery) and its uniform modal composition and texture indicate that this sill probably represents a single magmatic event. Bulk rock inductively coupled plasma–atomic emission spectroscopy (ICP-AES) geochemical data obtained from this sill is not discussed here because the total sum of major element abundances was too low to reliably interpret the data.
6. Structural geology
Drilling at Site U1545 penetrated a sedimentary sequence of diatom ooze, diatom clay, and siliceous claystone intruded by a thin basaltic sill. Tilting of sedimentary bedding and deformation structures are observed intermittently in the cores from Site U1545.
Bedding and laminations were visible at some depths in Subunits IA–ID, but other depths were homogeneous or massive. The bedding is recognized by color changes in the core that may be due to grain size changes or variations in the amount of clay, authigenic minerals, detrital material, or biogenic components (see Lithostratigraphy). In this document, we refer to these features as “bedding” for the purposes of structural description. They are not reported in this section if they are oriented within 5° of horizontal.
Bedding surfaces sometimes comprise rheological breaks where fresh, drilling-induced fractures may be localized. These fractures were not usually measured separately, although the density of these fractures can vary within cores, presumably according to lithology.
Tilted bedding was found in parts of Sections 385-U1545A-3H-2 and 3H-3 and Cores 5H and 6H (Subunit IA) as well as in Sections 11H-5 through 11H-8 and Cores 12H and 15H (Subunit IB).
6.1. Folds
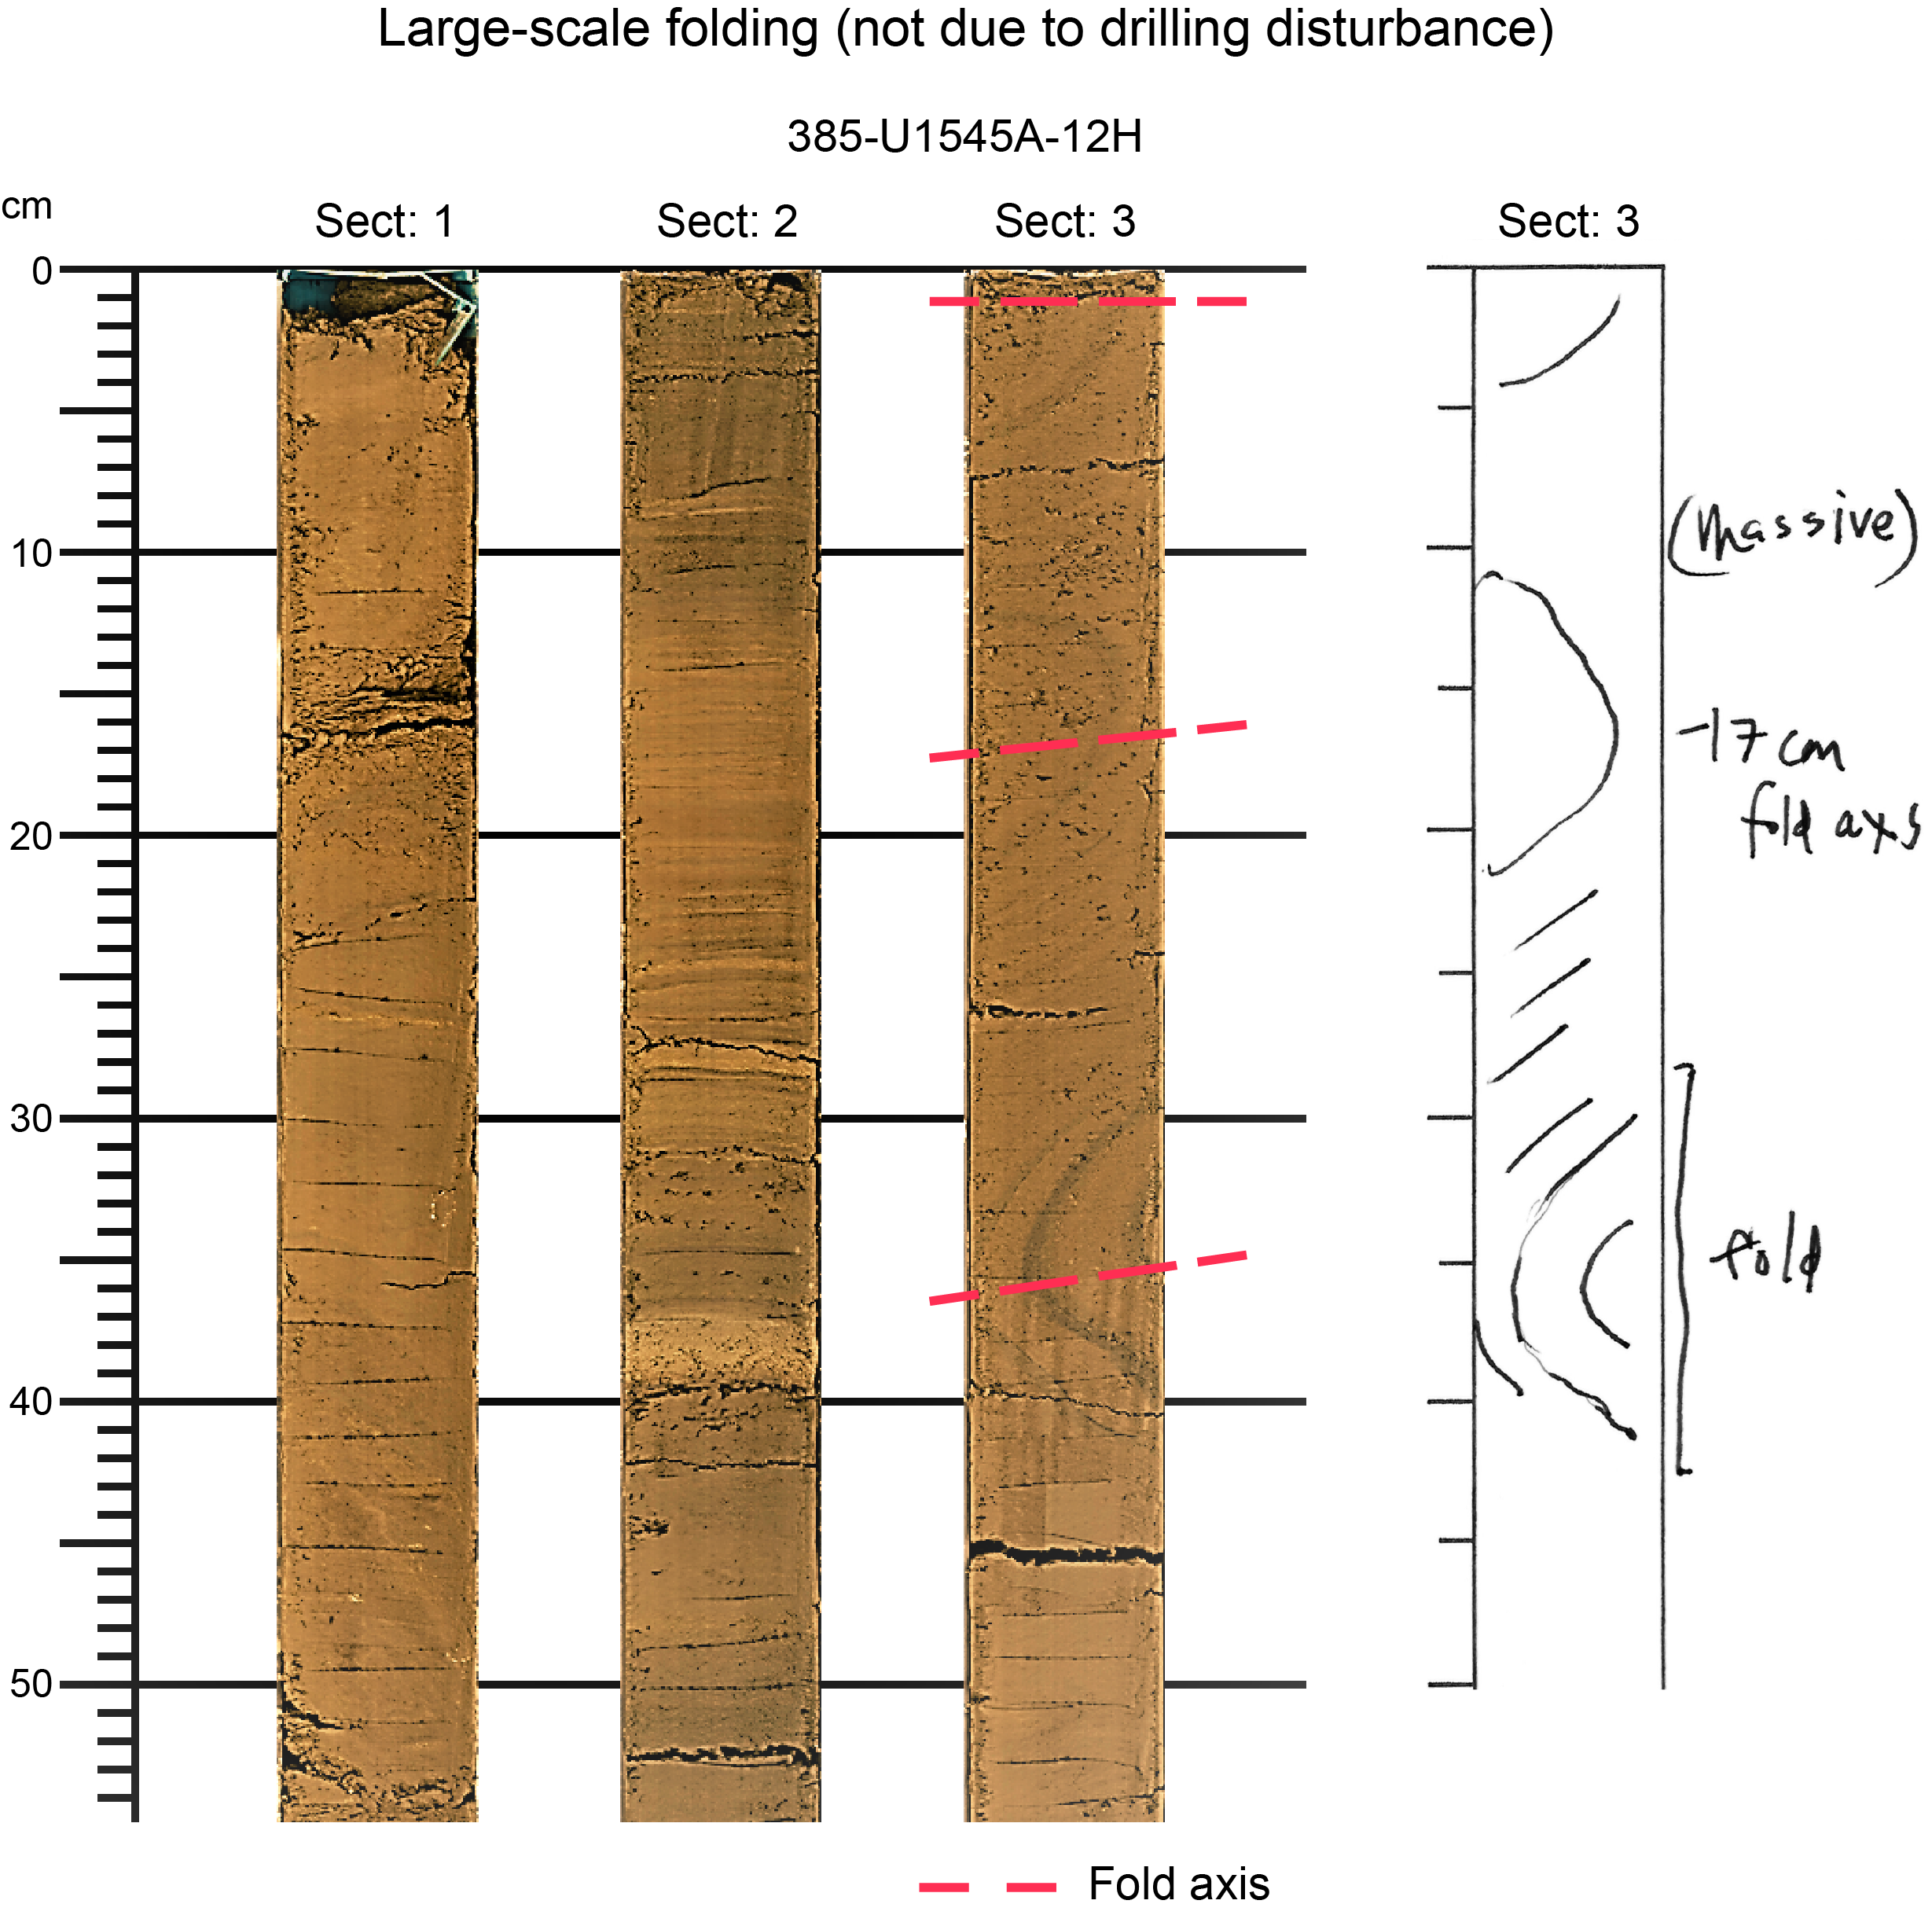
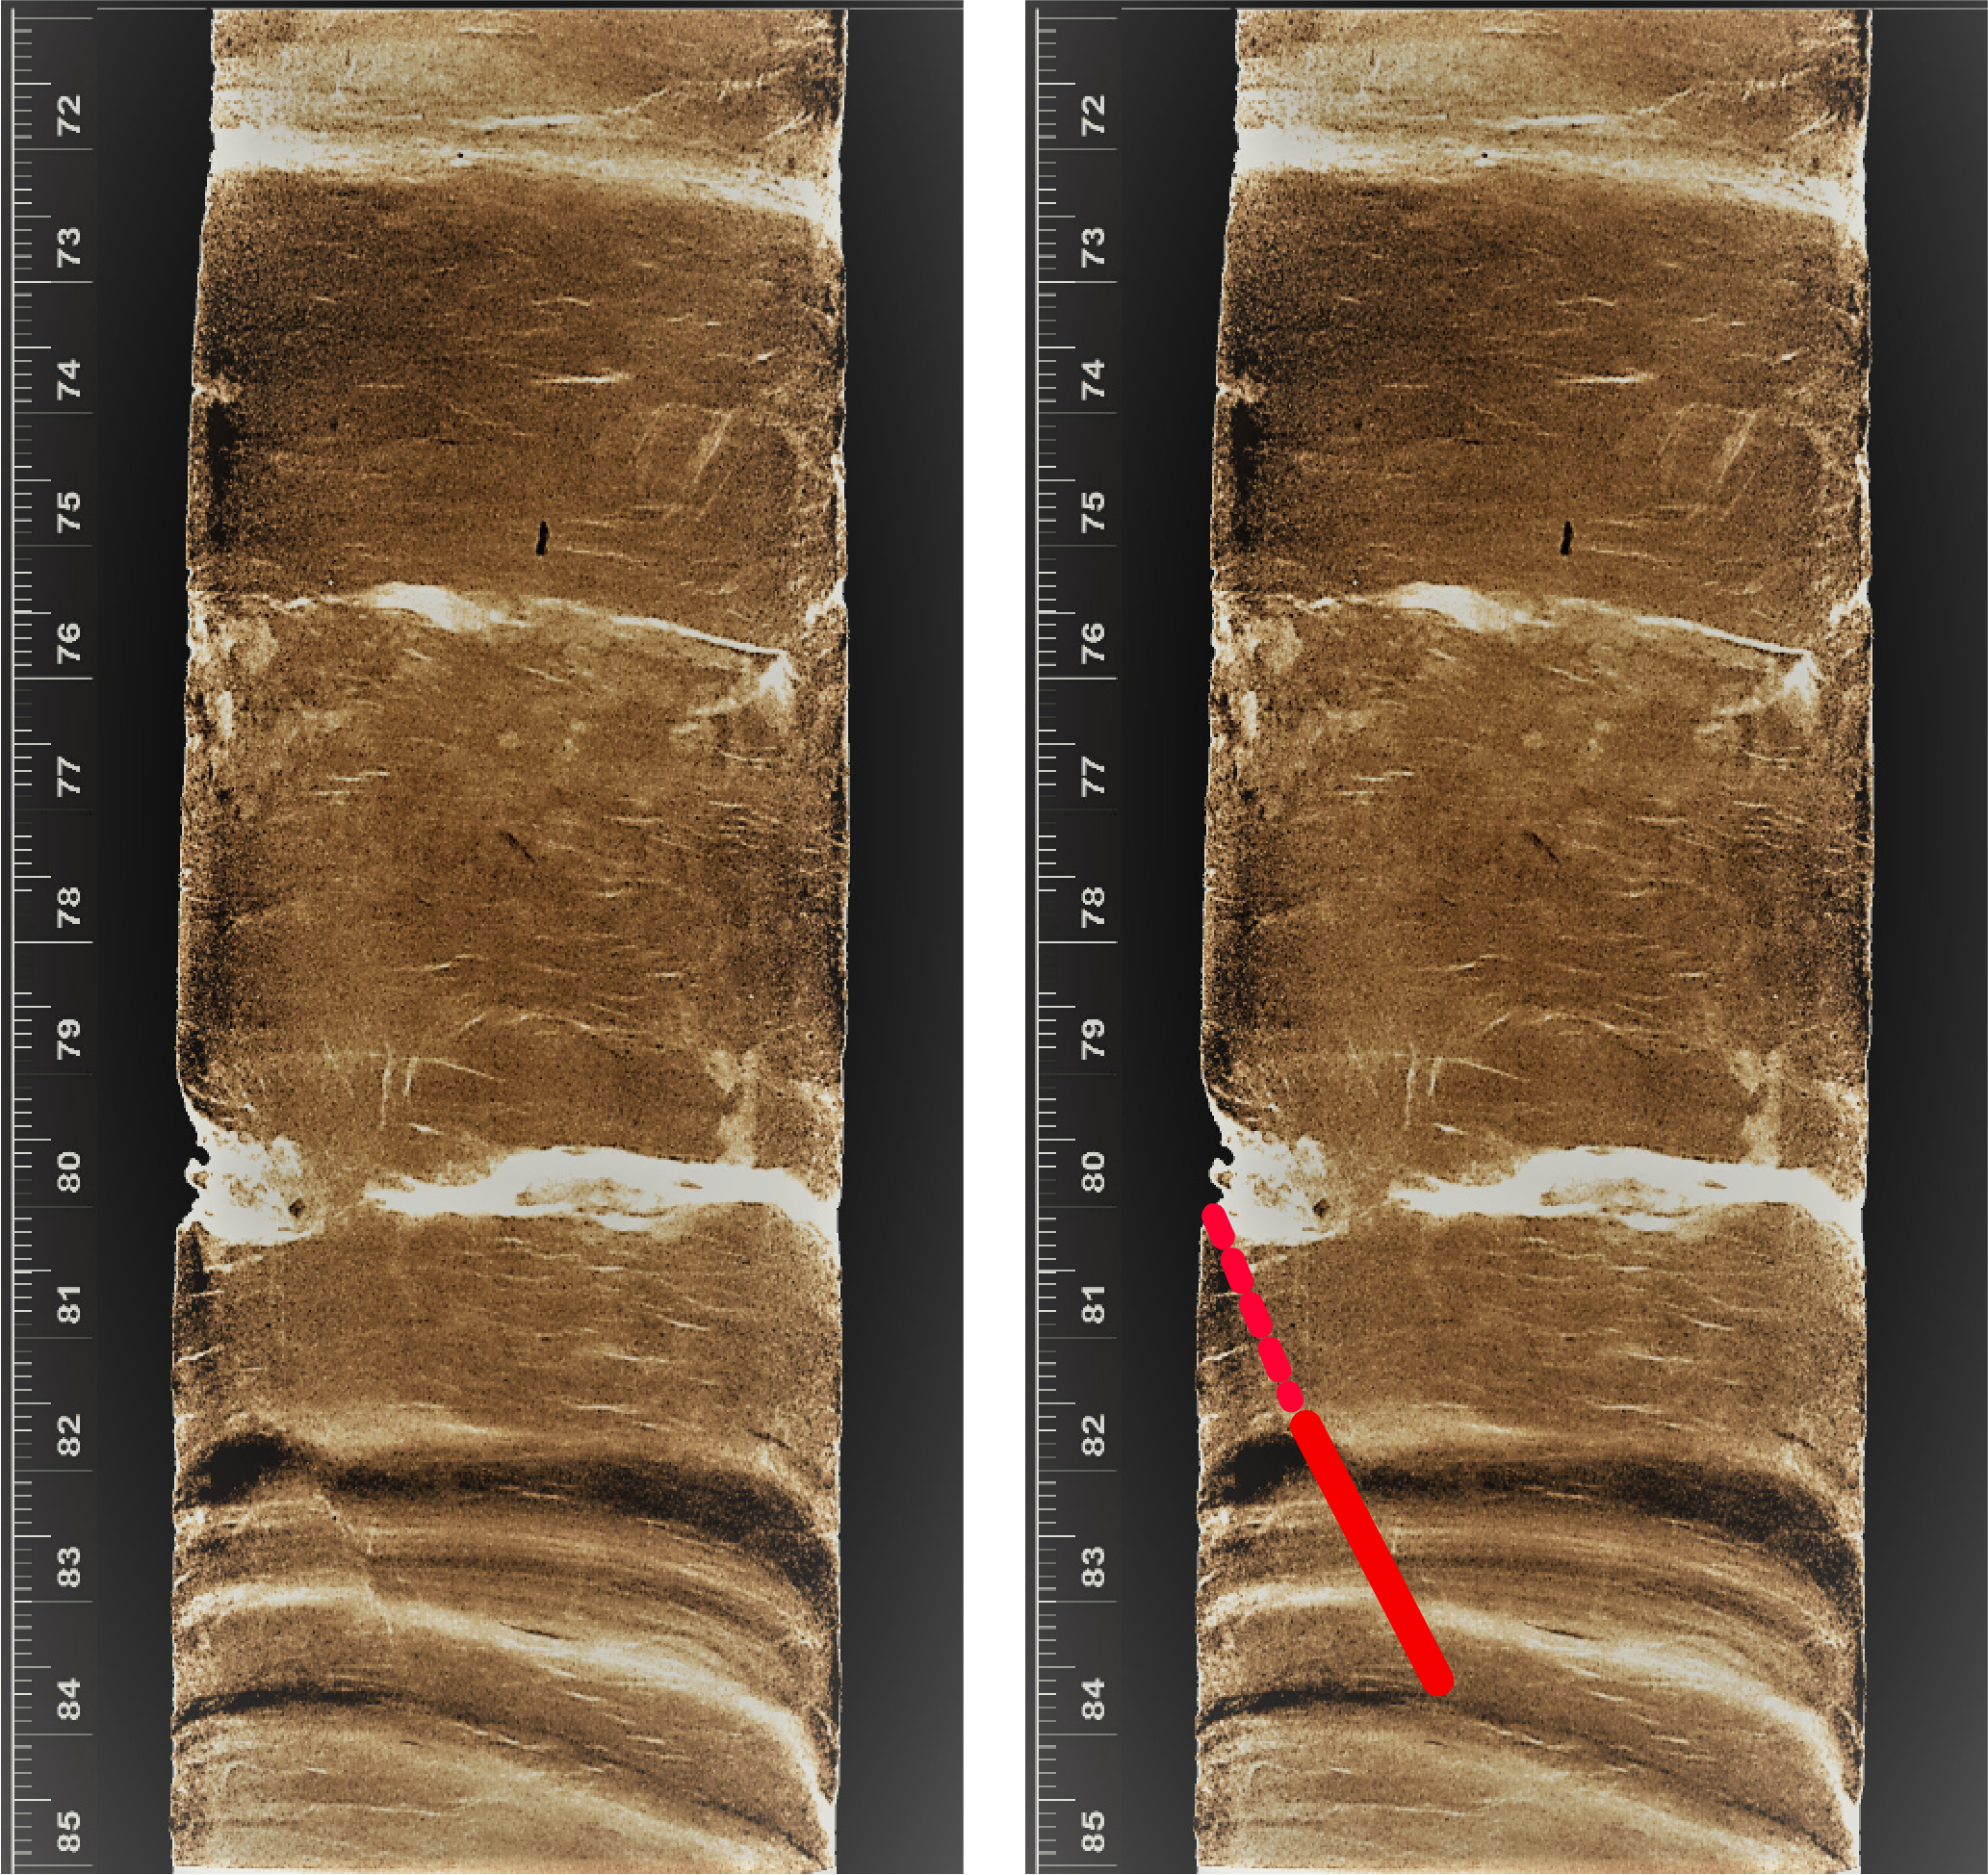
Large-scale folds due to soft-sediment deformation are found in Subunit IB in interval 385-U1545A-12H-3, 0–45 cm, at about 102 mbsf, where several nearly horizontal fold axes are identified (Figure F18). Some of these can be seen even more clearly on the X-ray images (Figure F19). Because the top two folds have the same facing direction (opening to the left in the reference frame of the photo), an additional fault or fold axis must exist between the two of them.

6.2. Vertical bedding
Vertical or steep bedding observed in Sections 385-U1545A-11H-7, 11H-8, and 12H-1 (between 97.1 and 100.5 mbsf) is interpreted to be soft-sediment deformation related to the same event that formed the large-scale folds. Some higher angle bedding is likely present elsewhere nearby, but it is difficult to observe because of the homogeneous nature of the sediment.
6.3. Fractures
The shallower cores from Site U1545 comprise soft sediment that is either undeformed or deformed by folding rather than brittle fracturing. In Subunits IB and IC, fractures generally are found shattering biscuits (i.e., fragmented pieces of core material) into smaller parts or affecting both biscuits and intervening mud, indicating that the fractures were associated with drilling. Some Subunit IC cores are more lithified and include occasional preexisting (i.e., unrelated to drilling) fractures. For instance, two small fractures dipping 60° occur in Section 385-U1545A-50F-1 (~280.5–281.9 mbsf). One of these, a small normal fault at 82–84 cm, displaces several sedimentary laminations by 2 mm (Figure F20).
6.4. Veins
Mineralized veins are found in the thin mafic sill in Subunit ID in Section 385-U1545A-71X-CC (~483 mbsf). These veins run vertically and contain localized growth of some minerals as large as 1 cm in diameter (see Igneous petrology and alteration). Some of these veins were fractured during drilling, but others are still intact.
7. Biostratigraphy
Smear slides prepared from core catcher samples from Hole U1545A and toothpick samples generally taken from the bottom part of working-half sections in Hole U1545B were analyzed for calcareous nannofossils (Table T5) and marine diatoms (Table T6). Additional toothpick samples were also obtained from intervals within the split cores when necessary to better constrain biostratigraphic events and refine associated ages. Preservation of calcareous nannofossils is good/moderate to poor throughout the entire sedimentary sequence. In general, preservation is good/moderate in samples with abundant or common nannofossils (except Sample 385-U1545A-72X-CC [488 mbsf]) and poor in those with frequent or rare abundances, and preservation is better in split-core samples than in core catchers (Table T5). In general, marine diatoms are dominant/abundant with good/moderate preservation to ~300 mbsf and barren to the bottom of Holes U1545A and U1545B as a result of diagenesis (Table T6).
One biostratigraphic datum was recognized and two additional stratigraphically underlying datums were estimated based on the absence of the zonal markers in the generally continuous succession from the late to the middle Pleistocene (Table T7). The bottom of E. huxleyi dates the upper part of the sediment sequence to Holocene or late to middle Pleistocene, or younger than 0.29 Ma (Hole U1545A = 0–248.6 mbsf; Hole U1545B = 0–249.6 mbsf), and the absence of P. lacunosa (calcareous nannofossil) and F. reinholdii (marine diatom) in the samples examined from the underlying interval indicates a middle Pleistocene age (younger than 0.44 Ma) for the bottom of both holes. The estimated average sedimentation rate is 863 m/My (86.3 cm/ky) (Figure F21).
7.1. Calcareous nannofossils
Calcareous nannofossils are abundant to common in the upper part of the sediment succession in both holes (Cores 385-U1545A-1H through 12H [0–109.67 mbsf] and 385-U1545B-1H through 13H [0–117.9 mbsf]). This interval is followed by one in which nannofossils are few or barren (Cores 385-U1545A-13H through 36F [119–231.1 mbsf] and 385-U1545B-14H through 32F [127.7–212.5 mbsf]) and then a sharp downhole increase in abundance (Cores 385-U1545A-38F through 47F [240.2–276.9 mbsf] and 385-U1545B-34F through 44F [222.3–268.8 mbsf]). The abundance in the lowermost part of the hole shows a high degree of variation, repeatedly alternating between barren and abundant (Cores 385-U1545A-49X through 74X [279.9–507.2 mbsf] and 385-U1545B-46F through 67X [277.5–387.1 mbsf]).
The downhole pattern of calcareous nannofossil preservation is similar in both holes, and higher (abundant or common) abundances generally correspond to moderate or good preservation (except Core 385-U1545A-72X [488 mbsf]), whereas few or rare abundances generally correspond to poor preservation. It is worth noting that the nannofossil assemblages are usually better preserved in samples from split core sections from Hole U1545B than in those from corresponding core catchers from Hole U1545A. Degraded preservation is usually associated with signs of dissolution and fragmentation.
Reworking of Cretaceous taxa is ubiquitous in all holes at this site. The origin of reworked nannofossils is uncertain, although possible sources may include the eroded Cretaceous outcrops in the Colorado River catchment and Cretaceous chalk deposits underlying the Sierra Madre Occidental mountain range (McDougall and Martínez, 2014). The source of reworking will be analyzed in detail during postexpedition research.
The upper parts of Holes U1545A and U1545B (Hole U1545A = 0–248.6 mbsf; Hole U1545B = 0–249.6 mbsf) were assigned to Nannofossil Zone NN21 based on the lowermost presence (i.e., bottom) of E. huxleyi in Samples 385-U1545A-41F-3, 124 cm (248.6 mbsf), and 385-U1545B-40F-4, 94 cm (249.6 mbsf). This interval is thus dated as Holocene or late to middle Pleistocene, corresponding to an age of 0–0.29 Ma (Table T7; Figure F21). The underlying interval is characterized as Nannofossil Zone NN20. It is defined as a “gap zone” bounded by the bottom of E. huxleyi (0.29 Ma) as the upper boundary and the top of P. lacunosa (0.44 Ma) as the lower boundary. The absence of P. lacunosa and other zonal markers (see Figure F20 in the Expedition 385 methods chapter [Teske et al., 2021a]) in Samples 385-U1545A-41F-CC to 74X-CC and 385-U1545B-42F-1, 50 cm, to 67X-CC, 28 cm, indicates that this interval falls above the top of P. lacunosa (0.44 Ma), suggesting a middle Pleistocene age (0.29–0.44 Ma) with the bottom of both holes younger than 0.44 Ma.
7.2. Diatoms
In Hole U1545A, diatoms are abundant to ~300 mbsf with good to moderate preservation. In Sections 385-U1545A-1H-CC (4.44 mbsf) through 16H-CC (138.52 mbsf), diatoms are well preserved with identification down to species level. In Sections 17F-CC (143.98 mbsf) through 52X-CC (296 mbsf), more fragments were found, indicating moderate preservation of diatoms.
Smear slides from Sections 385-U1545A-53X-CC (304 mbsf) and 55X-CC (333.05 mbsf) to 74X-CC (507.27 mbsf) are barren of diatoms observable by the light microscope, but tiny diatom fragments apparently altered by diagenesis were observed using a SEM in Section 53X-CC (304 mbsf). In Section 54X-CC (313.70 mbsf), diatoms are abundant; however, this is probably due to contamination from upper cores and is not considered an in situ feature (Table T6).
In Hole U1545B, diatoms are abundant from the top sample, 1H-3, 55 cm (3.55 mbsf), to Sample 58F-1, 26 cm (314.66 mbsf), with good to moderate preservation. In a transitional interval between Samples 58F-1, 59 cm (314.66 mbsf), and 60F-4, 59 cm (328.3 mbsf), diatoms are less abundant and poorly preserved and abundant diatom fragments were observed. In Samples 61X-4, 58 cm (333.35 mbsf), to 67X-CC, 28 cm (387.08 mbsf), no diatoms were identified.
In Section 385-U1545A-52X-CC (296 mbsf) and Sample 385-U1545B-60F-4, 59 cm (328.3 mbsf), no age-diagnostic diatom species were found, suggesting an age younger than 0.62 Ma, as indicated by the top/last appearance datum (LAD) of F. reinholdii (Table T6).
The absence of diatoms in the lowermost part of Holes U1545A and U1545B seems to be related to silica diagenesis promoted by high temperature at the site. The impact of diagenesis on diatom preservation described for Site U1545 is also evident at Site U1546. For both sites, a photomicrograph documentation of that process has been established (see photomicrograph Plate 9 in DIATOMS in Supplementary material). Photomicrograph Plates 1, 3–5, 7, and 8 of that figure compilation also illustrate a general overview of many diatom species found at Site U1545.
8. Paleomagnetism
Paleomagnetic shipboard measurements consisted of the analysis of the remanence on archive-half sections and discrete samples from Holes U1545A and U1545B to establish a magnetostratigraphy of the site. Representative discrete samples were collected from every APC and HLAPC core in Hole U1545A (two samples per APC core and one sample per HLAPC core). Sediments recovered using the XCB system were not analyzed because the substantial disruption due to XCB coring (see Lithostratigraphy) rendered those sediments unsuitable for paleomagnetic measurements. No discrete samples were collected from Hole U1545B. No paleomagnetic measurements were conducted in Hole U1545C.
8.1. Archive-half section analysis
The archive-half sections from Holes U1545A and U1545B were demagnetized at 5 cm intervals up to 20 mT. With the exception of highly disturbed archive-half sections, all sections from Hole U1545A were analyzed. Paleomagnetic measurements on archive-half sections from Hole U1545B were carried out on Cores 46F–60F (with the exception of Core 48X) to increase the depth interval for paleomagnetic measurements for HLAPC cores. Paleomagnetic measurements for Cores 1H–45F were not conducted because of (1) a discontinuous record of the archive-half sections due to complete sampling of whole-round sections (approximately a few meters per core) for microbiology and geochemistry (see Microbiology, Inorganic geochemistry, and Organic geochemistry in the Expedition 385 methods chapter [Teske et al., 2021a]) and (2) the absence of excursions and reversals in the paleomagnetic record (see Magnetostratigraphy).
8.1.1. Hole U1545A
In-line AF demagnetization of the archive-half sections of APC and HLAPC cores from Hole U1545A (Cores 1H–50F) indicate a drilling overprint that was removed by an AF demagnetization treatment of 10 mT. After demagnetization at 20 mT, inclination values cluster around an average value of 46°, which is similar to the expected GAD inclination value at the latitude of the site (i.e., ~46.3°) (Figure F22). The drilling overprint seems more important from ~80 mbsf (Core 10H) downhole, which is likely related to a coarser magnetic mineral assemblage. Nevertheless, it was successfully removed by AF demagnetization treatment for APC and HLAPC cores. For XCB cores, it was not possible to remove the overprint efficiently by 20 mT (i.e., maximum applied field with the SRM for sediments during this expedition). Detailed analysis of discrete samples with a prior liquid nitrogen treatment to remove the contribution of multidomain grains would have been useful in this case. Unfortunately, most of the XCB cores were highly disturbed by drilling (brecciated cores and fractured biscuits). Thus, we were not able to identify and collect discrete samples from XCB cores that were suitable for detailed analyses of the remanence.
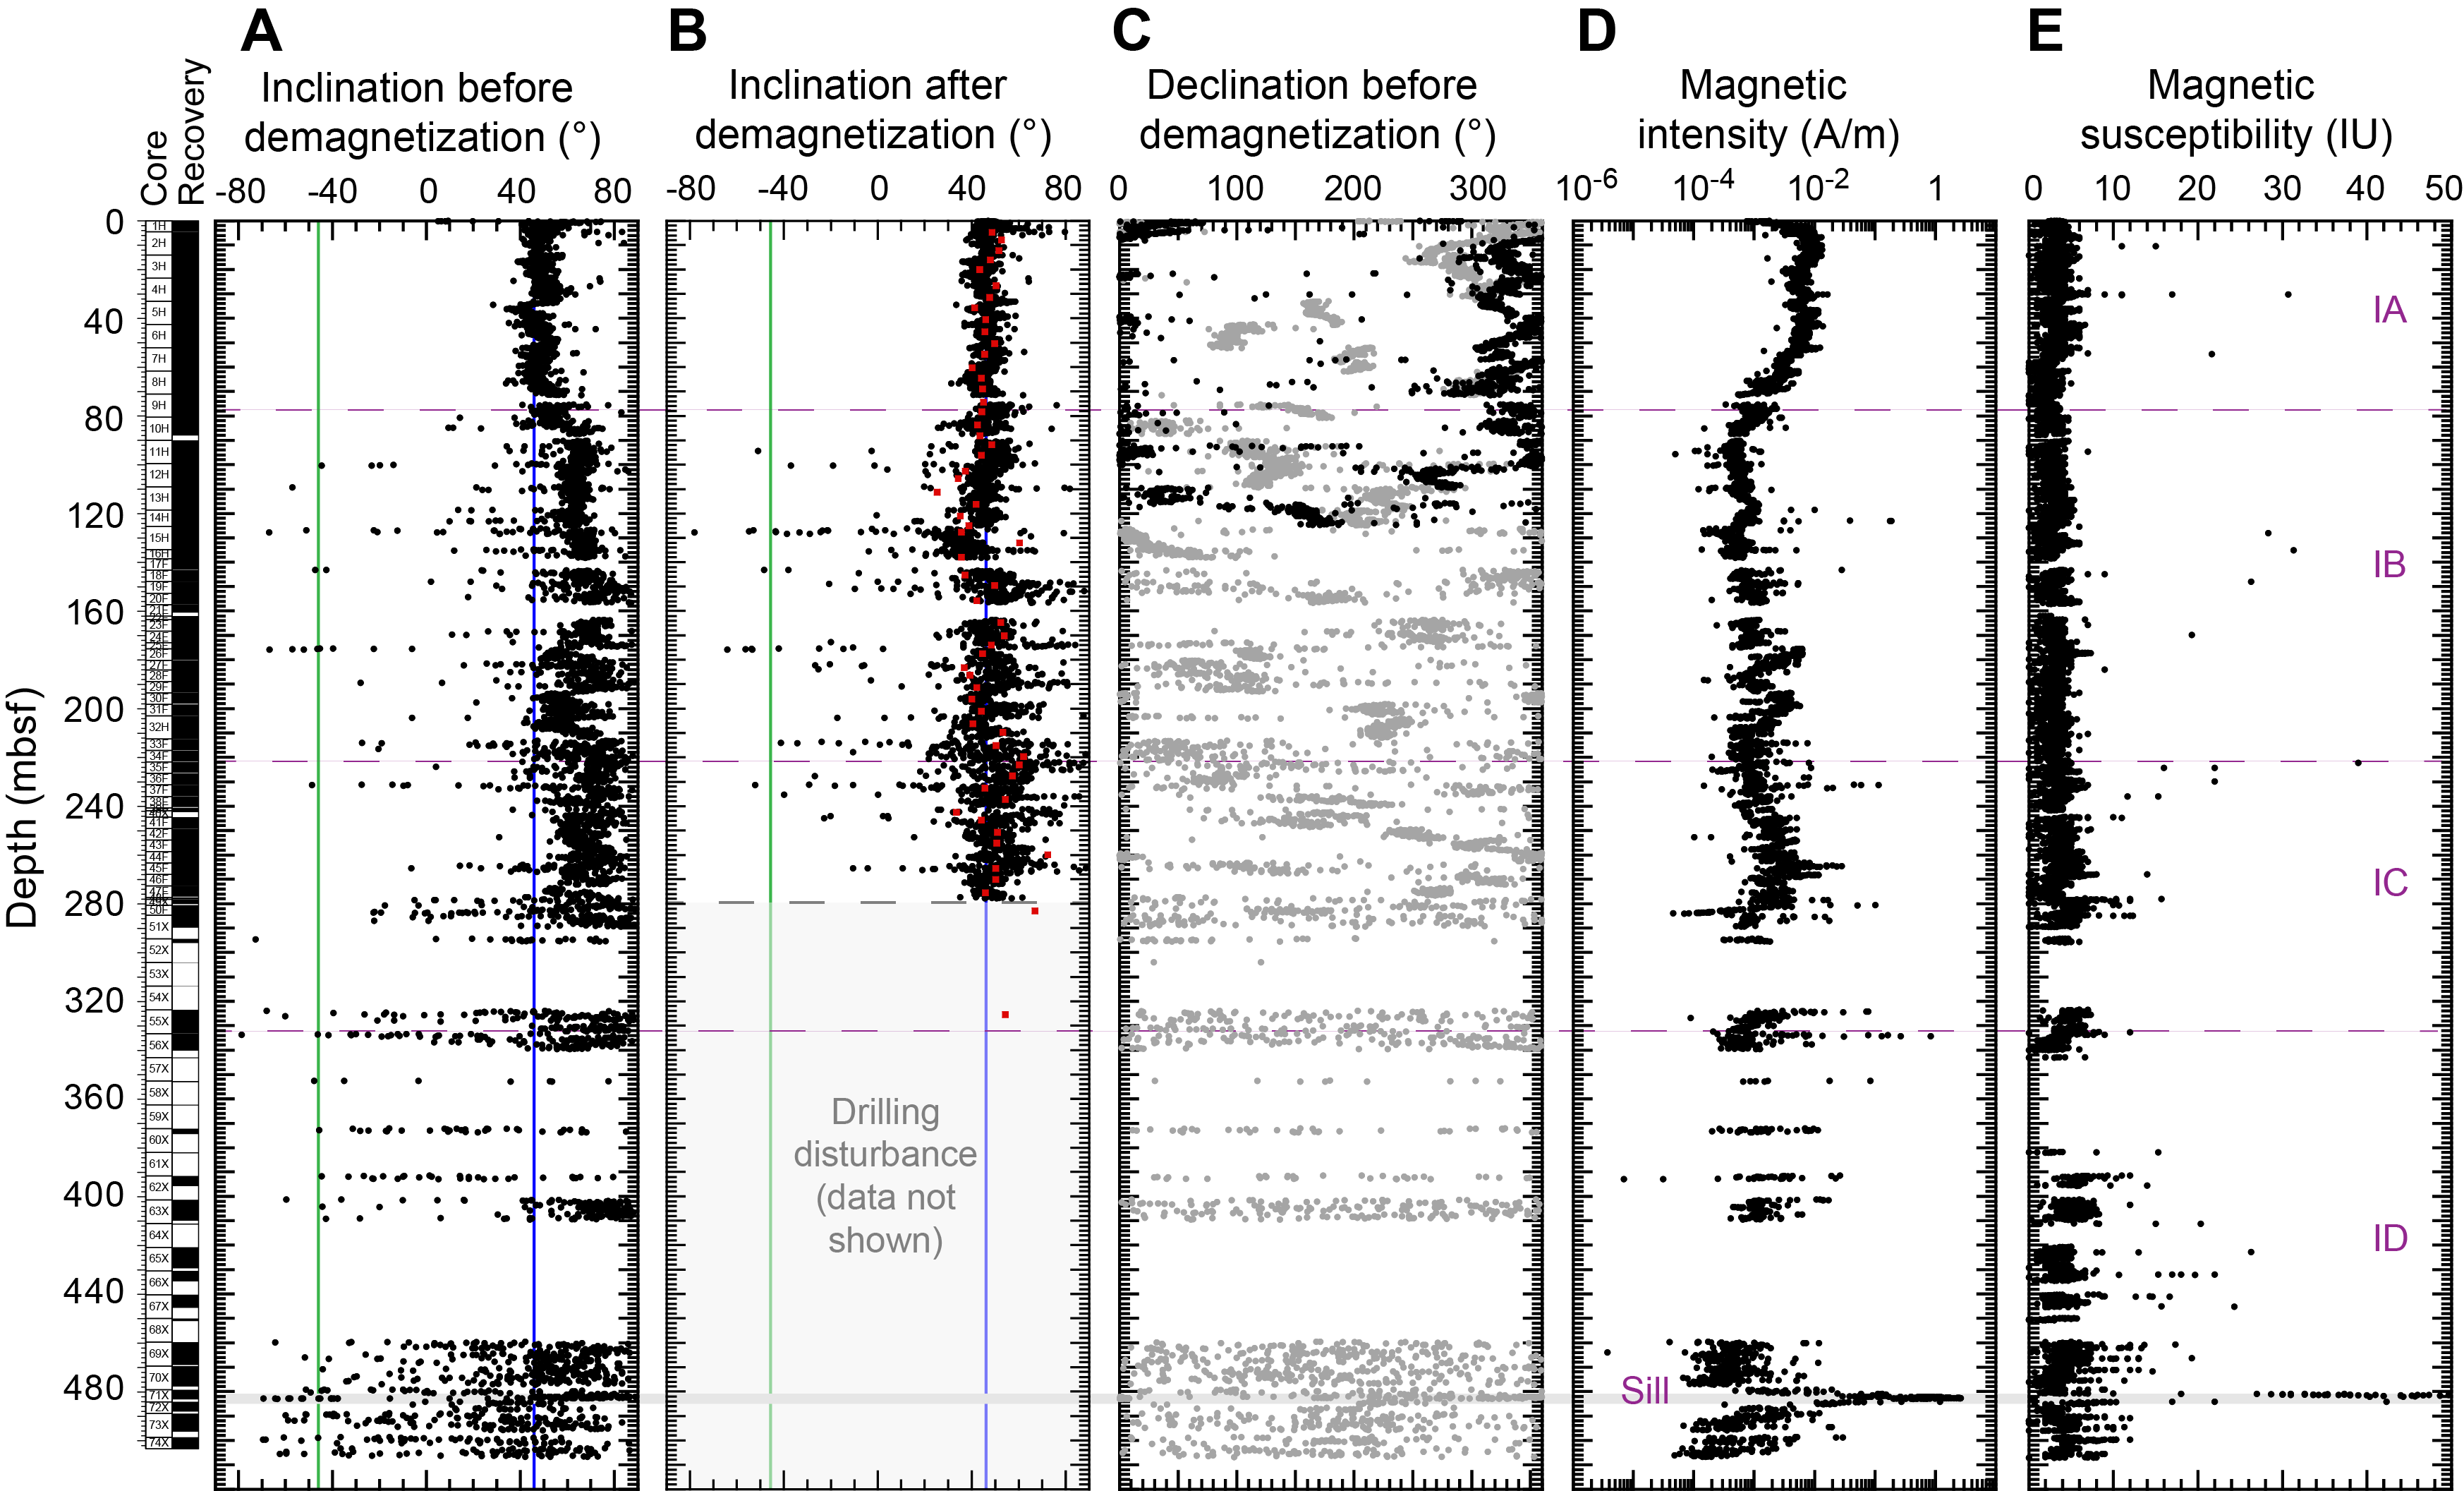
Magnetic intensity with depth does not seem to correlate with the lithostratigraphic subunits (Figure F22) except for the thin basaltic sill intersected in Subunit ID (see Igneous petrology and alteration). The basaltic sill sample is characterized by high values of magnetic intensity (as high as 2.63 A/m) and MS (as high as 1573 IU) that are several orders of magnitude higher than those of the surrounding sediment (<0.02 A/m and <10 IU for magnetic intensity and MS, respectively).
One remarkable feature of the site is the decrease of magnetic intensity from ~50 to 80 mbsf. This correlates with the SMTZ (see Inorganic geochemistry). In sulfidic environments, magnetic minerals (iron [oxyhydr]oxides) are reduced. At the SMTZ, dissolved iron reacts with dissolved hydrogen sulfide produced by organoclastic sulfate reduction (Berner, 1981) and sulfate-dependent AOM (Knittel and Boetius, 2009; Treude et al., 2005) to form iron sulfides. The formation of iron sulfides can impact the paleomagnetic record in sediment by either generating a secondary magnetization (if ferrimagnetic greigite is formed and preserved) or destroying the original paleomagnetic record (if pyritization is complete) (see review by Roberts, 2015). Generally, the latter case is characterized by a conspicuous decrease of both the NRM (Figure F22) and MS (e.g., Karlin, 1990) due to a preferential dissolution of the finest magnetic grains in sulfidic environments (e.g., Leslie et al., 1990). In Hole U1545A, however, in contrast to the magnetic intensity, MS does not drastically change at the SMTZ.
8.1.2. Hole U1545B
NRM and in-line AF demagnetization for Hole U1545B (Cores 46F–60F) were carried out primarily for correlation with Hole U1545A. The depth interval studied extends from ~275 to ~330 mbsf. Magnetic intensity (NRM) measured on archive-half sections and Section Half Multisensor Logger (SHMSL) MSP measurements were used for correlation. A reasonable hole-to-hole correlation in this interval was difficult because of poor core recovery in Hole U1545A (Figure F23). If our tentative correlation is correct, there would be a slight offset of about 3 m between Holes U1545A and U1545B.
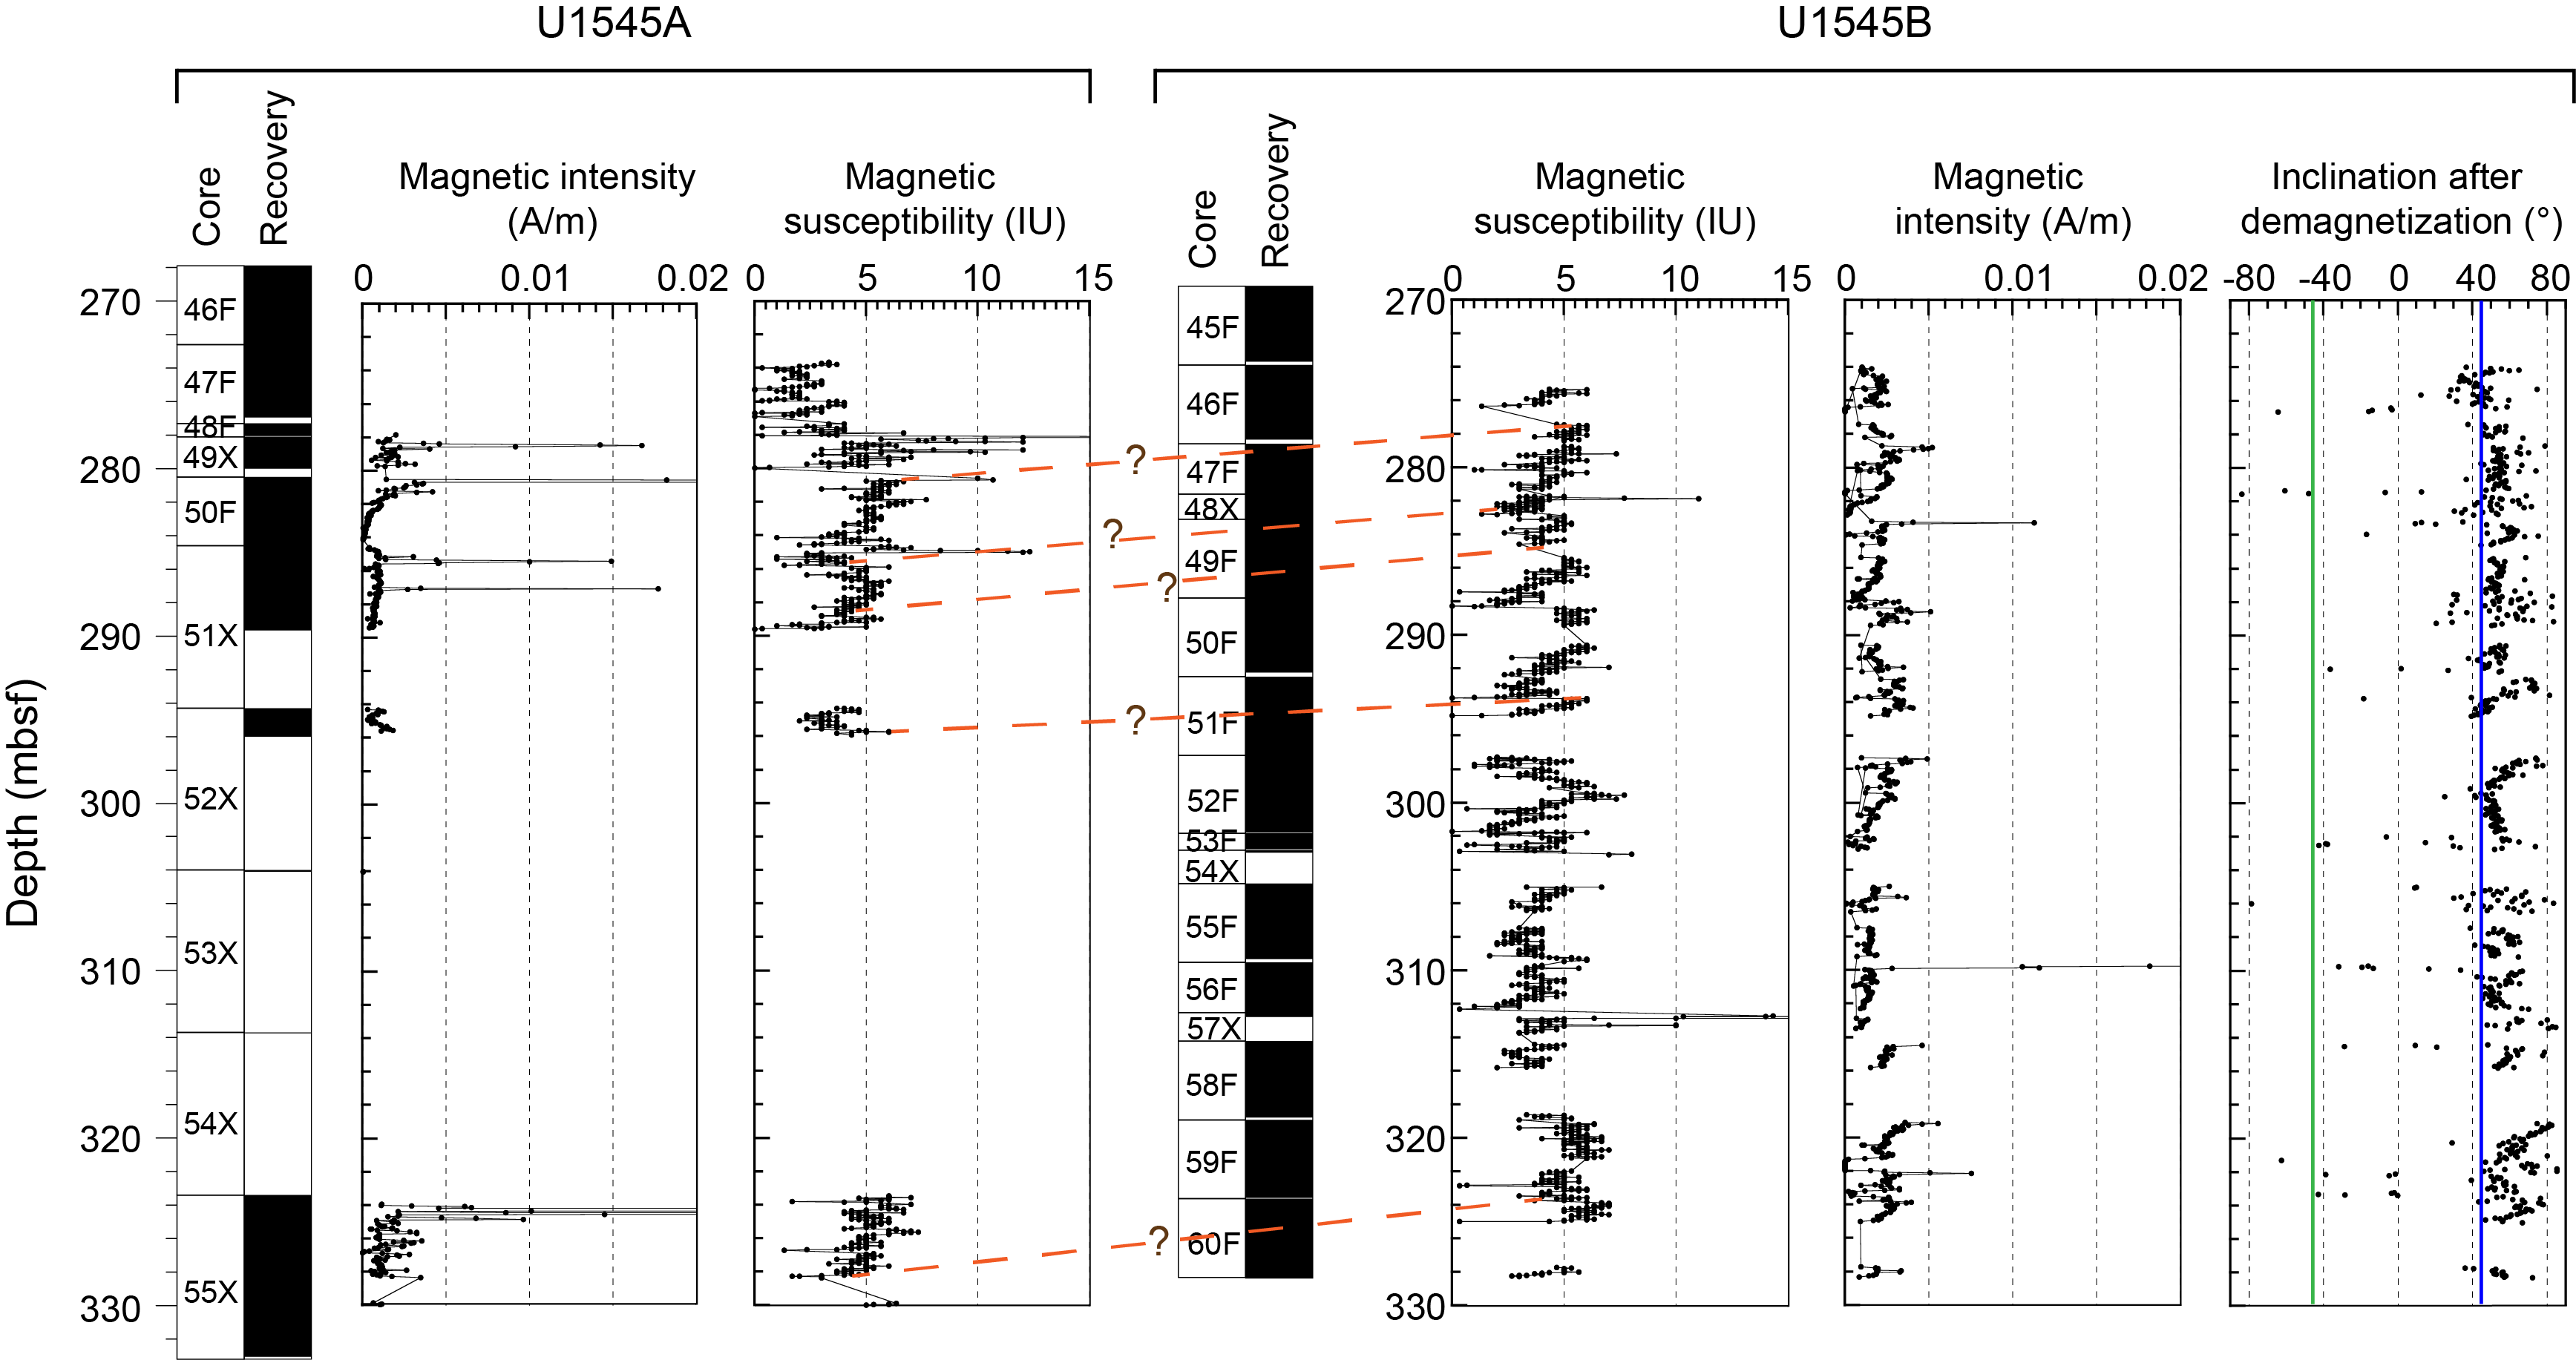
Overall, the paleomagnetic measurements on archive-half sections of Hole U1545B from Cores 46F–60F are consistent with the results obtained for Hole U1545A (Figure F23). Magnetic polarity is normal. Inclination values after AF demagnetization at 20 mT are steeper than the GAD inclination, suggesting the persistence of an overprint downhole.
8.2. Discrete sample analysis
For a more detailed study of the remanence in Hole U1545A, discrete samples were taken from the working-half sections of Cores 1H–50F at intervals of two discrete samples per APC core and one sample per HLAPC core. No discrete samples were taken from sediments of XCB cores because of intense drilling disturbance (fractured core biscuits).
Measurements of remanence were made using an AGICO JR-6A dual speed spinner magnetometer on a total of sixty 8 cm3 cube samples (see Figure F21 in the Expedition 385 methods chapter [Teske et al., 2021a]). All of these samples were demagnetized using a stepwise increasing AF to isolate the ChRM direction by means of principal component analysis (PCA) (Kirschvink, 1980). No samples were thermally demagnetized because all discrete samples were taken using plastic sampling boxes.
NRM intensities vary between 2.80 × 10⁻⁴ A/m for samples from the deepest sampled depth and 1.25 × 10⁻² A/m for samples taken from the top of the hole (Table T8). The mean intensity of all samples is 2.59 × 10⁻³ A/m. AF demagnetization was done up to 60 mT, at which point the samples had lost more than 90% of their total magnetization (Figure F24B). Representative demagnetization diagrams (Zijderveld, 1967) are shown in Figure F24A. All reported declination and inclination data are shown in the sample coordinate reference frame; however, because cores are free to rotate in the core barrel, only the inclination data are taken into account for interpretation. Two magnetic components were identified on the demagnetization diagrams for each discrete sample (Figure F24A). The first component is removed by an AF demagnetization treatment of 5–10 mT and corresponds to a drilling overprint. The second component is stable and points toward the origin. This component has a normal polarity for all analyzed discrete samples. The median destructive field (MDF) ranges from 5.7 to 26.5 mT with a mean MDF of 14.5 mT and is in agreement with the results of Levi and Karlin (1989) obtained during DSDP Leg 64 at Site 480. This suggests a magnetic mineral assemblage dominated by low-coercivity (titano)magnetite. In Hole U1545A, the MDF is generally found to be higher at the top of the hole, and a lower MDF is found at the bottom (Table T8). This downhole trend toward lower coercivity is likely related to a coarsening of the magnetic grain assemblage in the sediment below the SMTZ (e.g., Leslie et al., 1990). Coarser magnetic grains (especially multidomain grains) are more prone to overprinting (e.g., Dunlop et al., 1997). This likely is the explanation for the stronger overprint observed in archive-half sections from depths greater than ~80 mbsf.
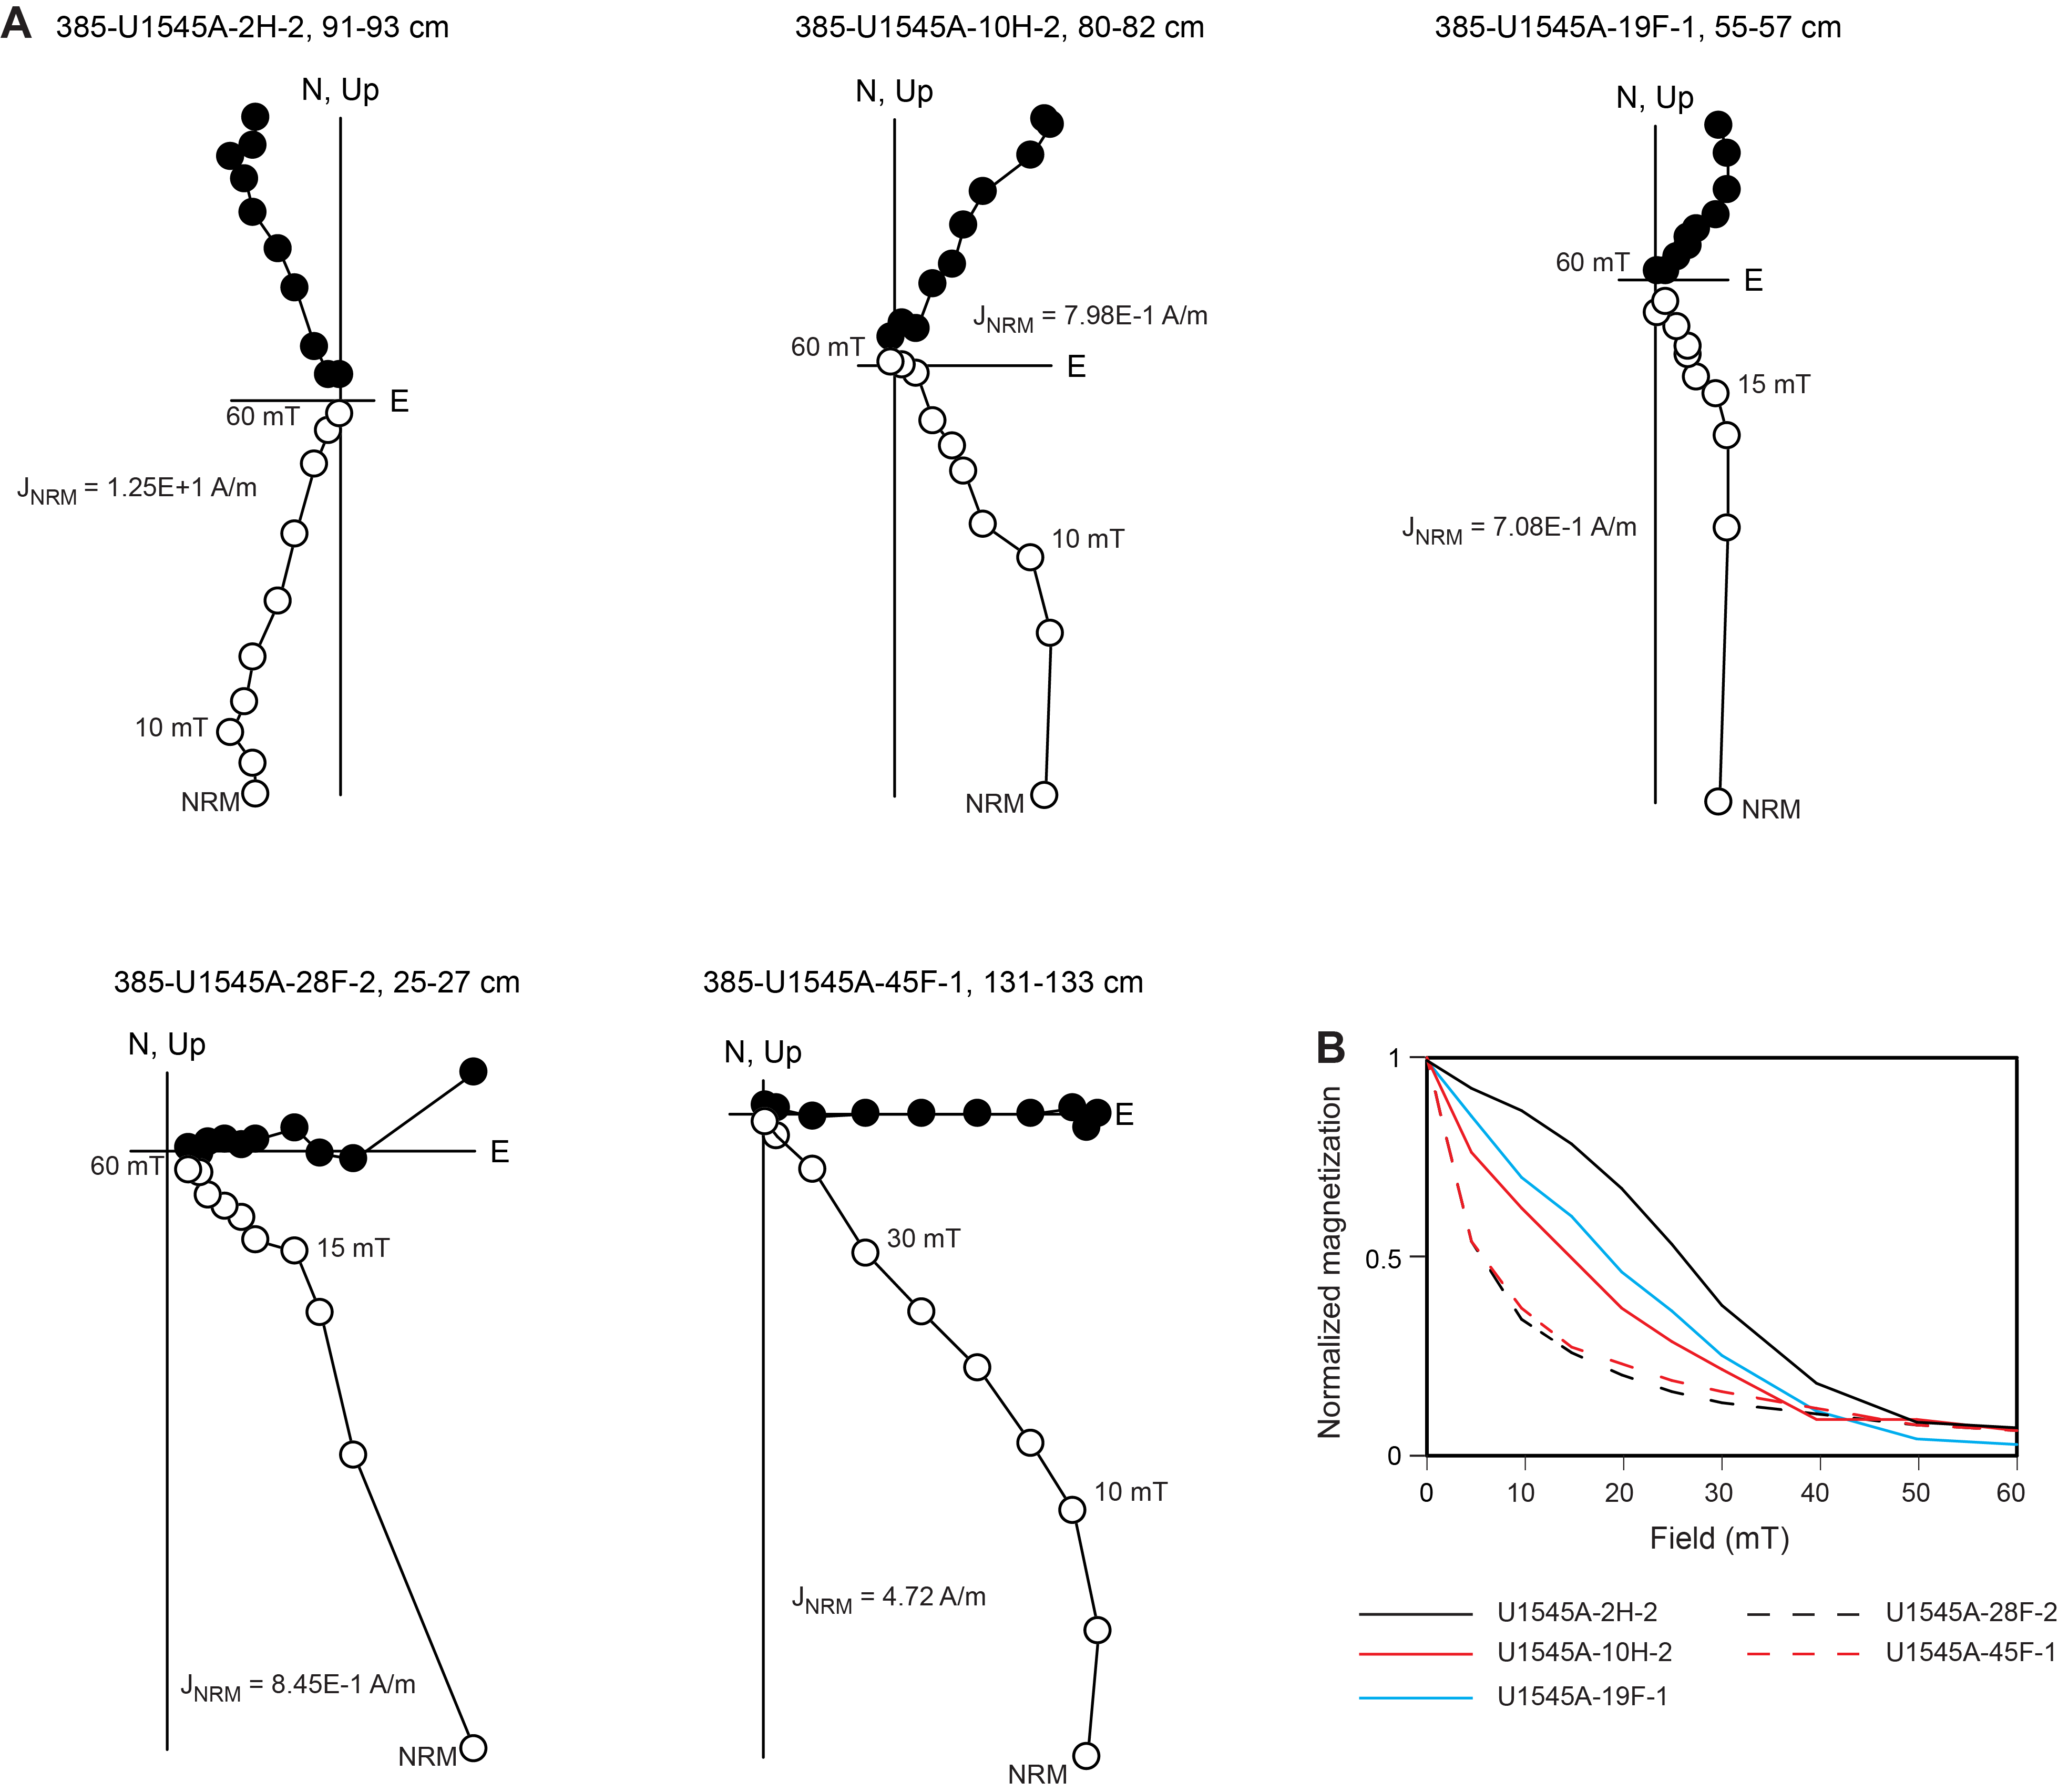
The distributions of the inclinations of the NRM after AF demagnetization at 20 mT and the ChRM of all discrete samples are shown in Figure F25. The majority of the NRM inclinations are steep, ranging from 35.9° to 80.8° with a mean inclination of 57.5°. AF demagnetization at 20 mT removes the overprint and results in a shallower and more consistent inclination of 44.0°, which is similar to the results obtained from archive-half section measurements (Figure F22). After PCA, mean inclinations for the ChRM were calculated using the maximum likelihood method of Arason and Levi (2010) (Table T9). The calculated mean inclination for the ChRM results in 47.05°, which is close to the GAD inclination expected at this location (~46.3°).
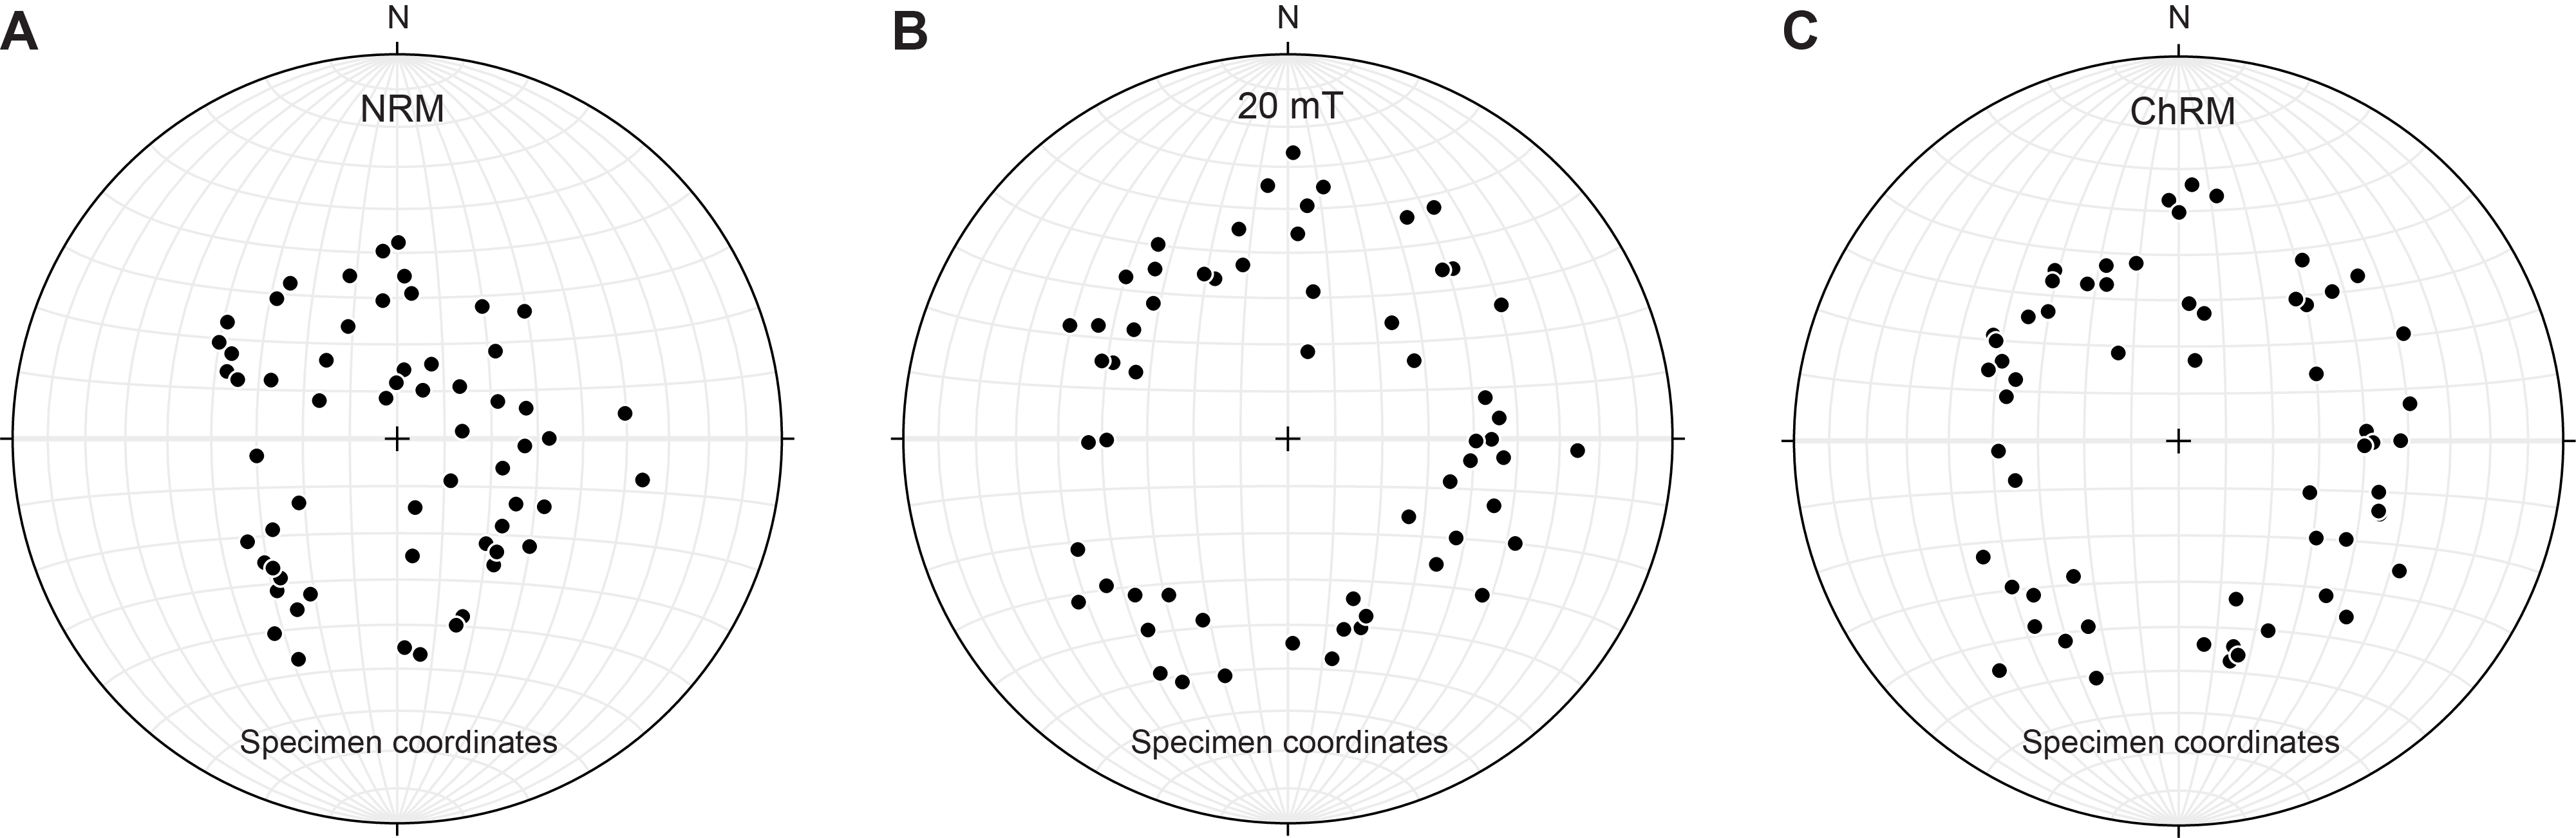
8.3. Anisotropy of magnetic susceptibility
Anisotropy of magnetic susceptibility was measured for all discrete samples from Site U1545 prior to demagnetization to characterize the magnetic fabrics present in the samples. Results for Hole U1545A sediments are shown in Figure F26 in the core reference frame. Because these results are not oriented, it is not possible to determine whether there is a preferred magnetic lineation in these rocks. Therefore, only the inclination of the anisotropy is taken into account. The results show a mixture of oblate and prolate behavior with kmax principal axes distributed predominantly in the horizontal plane and kmin principal axes oriented perpendicular to the sedimentary bedding (see Paleomagnetism in the Expedition 385 methods chapter [Teske et al., 2021a]).
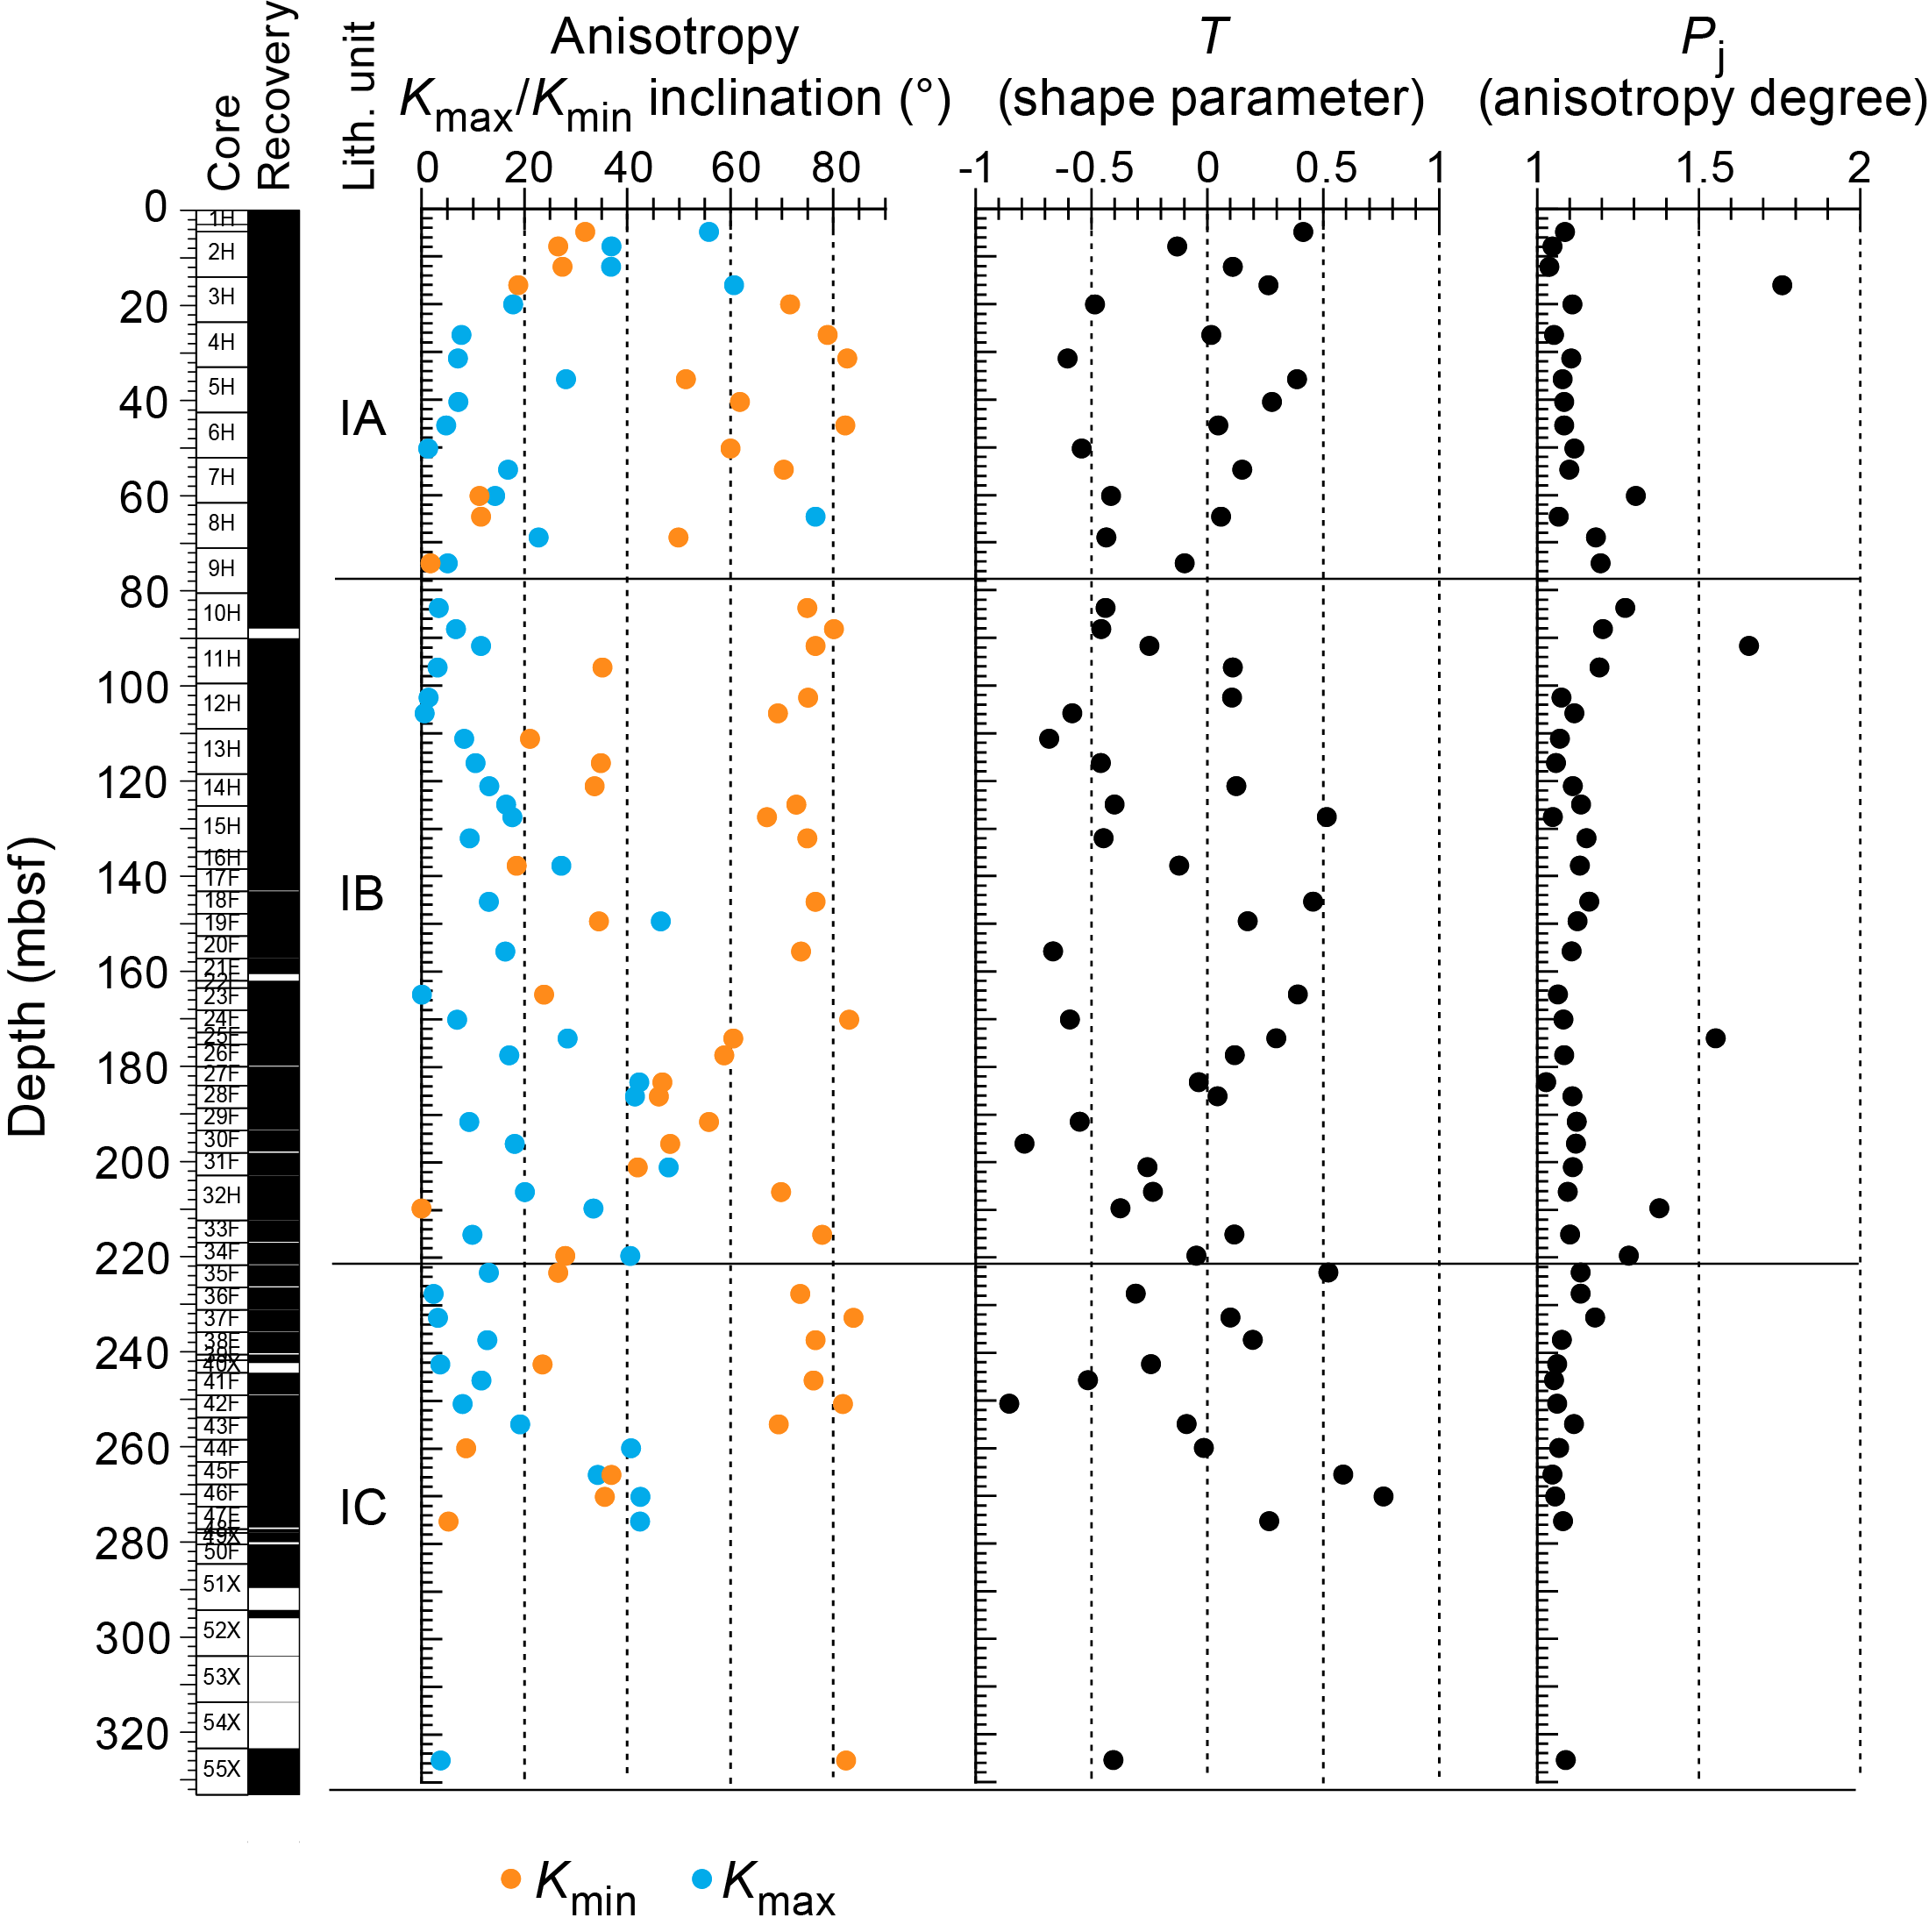
8.4. Magnetostratigraphy
We used the SRM measurements on archive-half sections to determine the polarity at Site U1545. We based our interpretation of the magnetic polarity on the sign of inclination at the maximum AF demagnetization step (20 mT) (Figure F22). Only data from APC and HLAPC cores were used for interpretation of polarity because XCB cores were too disturbed and overprinted to be considered reliable. All APC and HLAPC cores show a positive inclination of ~46°. This is supported by the detailed discrete sample analysis (Table T8). Therefore, we assigned the cores to the normal Brunhes Chron (C1n; younger than 0.78 Ma) in agreement with the biostratigraphic observations (see Biostratigraphy). No magnetic excursions during C1n were identified, despite a high sedimentation rate of about 0.86 m/ky as well as previously published paleomagnetic results from DSDP Site 480 that identified the Mono Lake and Laschamp magnetic polarity excursions at ~29–26 ky before present (BP) and ~51–49 ky BP, respectively (Levi and Karlin, 1989).
9. Inorganic geochemistry
9.1. Interstitial water sampling
Samples were prepared in a nitrogen-filled glove bag only for Hole U1545C; otherwise, they were prepared and squeezed under laboratory atmosphere. Mudline water was collected in Hole U1545A. The chemical composition of the IW and mudline water is listed in Table T10. All profiles are shown in Figure F27.
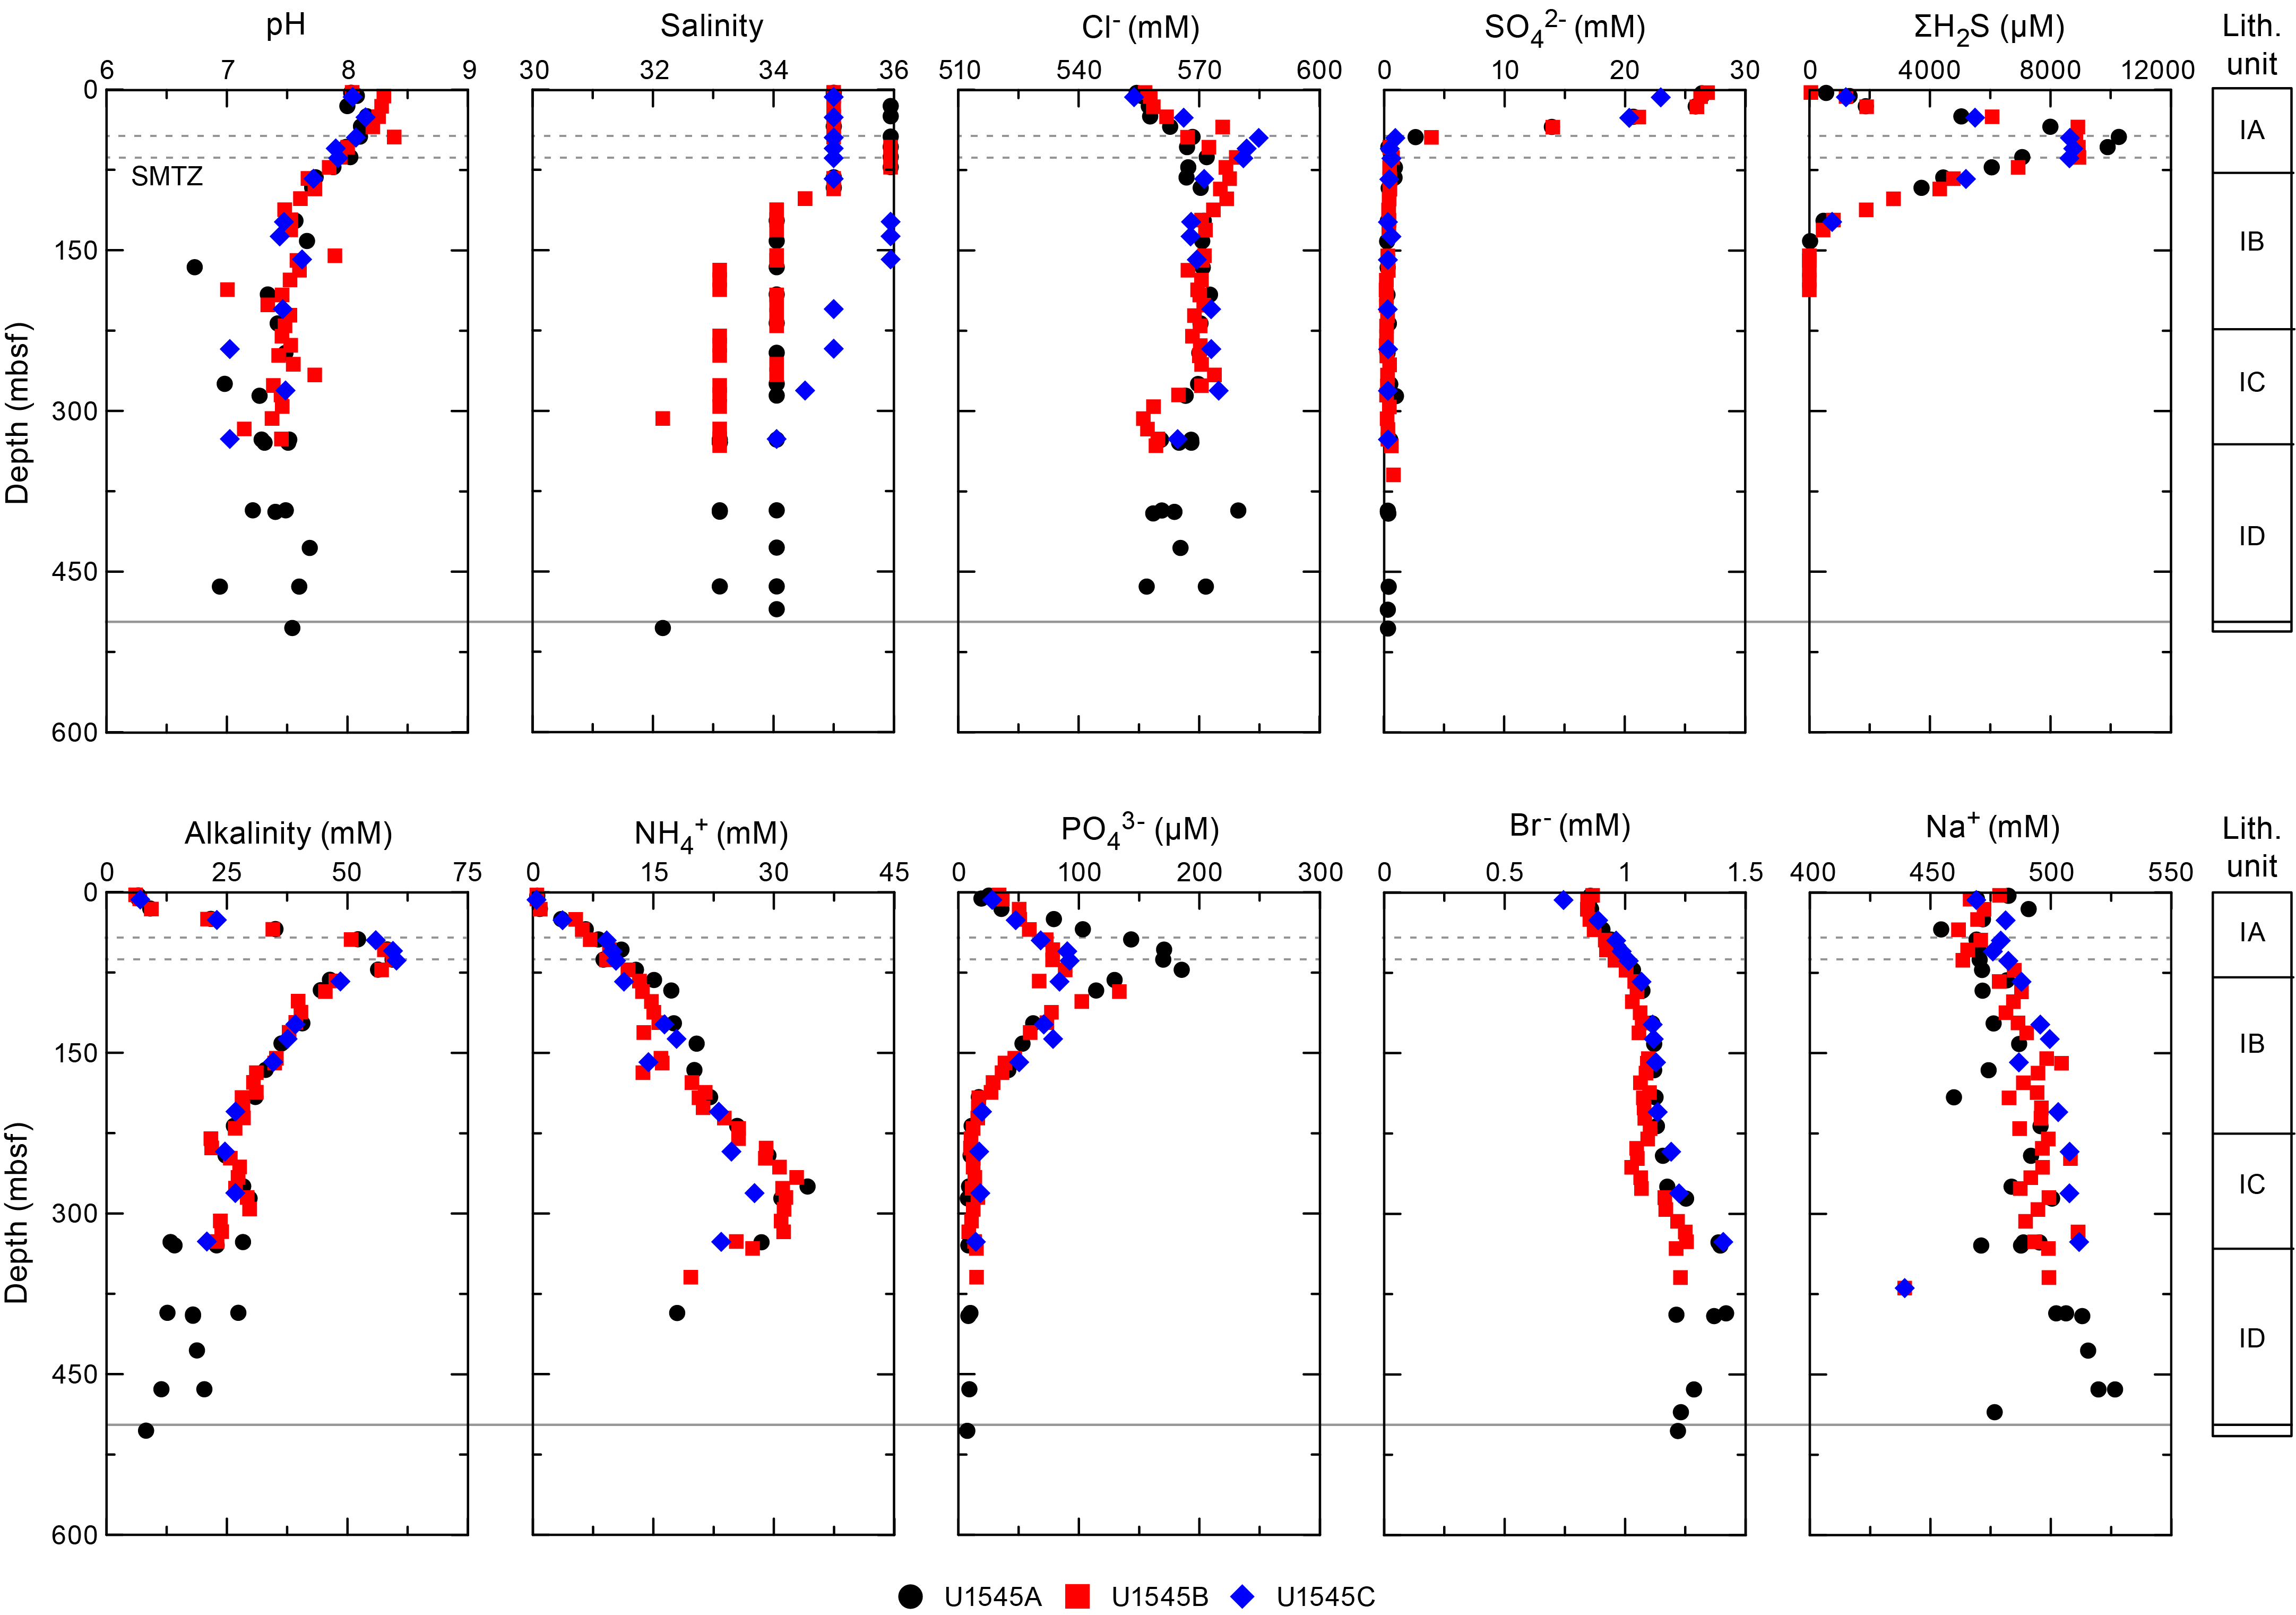

9.2. Interstitial water results
9.2.1. pH, salinity, chloride, and sodium
pH values reach a maximum of 8.2 between 0 and 50 mbsf, and they decrease to 7.2 at the bottom of Hole U1545A. Salinity at Site U1545 has a nearly constant value of 35–36 from the seafloor to ~80 mbsf, and then it decreases to 32–33 downhole.
Chloride (Cl−) concentration increases steadily from the seafloor to ~100 mbsf, from 545 to 573 mM, and then maintains a nearly constant value to ~300 mbsf. The increase of Cl− concentration in the upper 100 m (Figure F27) is probably caused by hydration reactions during clay formation (see Lithostratigraphy). Cl− concentration then decreases to <560 mM below 300 mbsf, and higher resolution sampling in Hole U1545B shows this decrease to be fairly abrupt. This could be caused by dehydration reactions commonly associated with deep fluid freshening in marine sediments, such as silica diagenesis (opal-A to opal-CT transition) (discussed below) and/or smectite to illite transformation (illitization). Sodium (Na+) concentration ranges between 470 and 527 mM throughout the holes and increases markedly between 50 and 100 mbsf. It generally shows an increasing trend downhole with a slight change in gradient at around 300 mbsf.
9.2.2. Sulfate, sulfide, alkalinity, ammonium, phosphate, and bromide
Sulfate (SO42−) concentration decreases from seawater value to <1 mM in the upper 50 m drilled and remains constantly low below this depth. Methane concentration increases markedly around this depth (>2 mM) (see Organic geochemistry). Sulfide concentration (ΣH2S = S2 + HS− + H2S) has a maximum value of ~10 mM at around 50 mbsf and gradually decreases with depth to <1 µM below 150 mbsf. Therefore, the SMTZ at Site U1545 is at around 50 mbsf (Figure F27). Around the SMTZ, alkalinity reaches a maximum value of ~60 mM and phosphate (PO43−) reaches a maximum value of ~200 µM. Alkalinity decreases with depth below 60 mbsf to a concentration of 8.2 mM at 500 mbsf. Phosphate also decreases with depth below 70 mbsf to a minimum of <10 µM below 250 mbsf. Ammonium (NH4+) behaves differently, increasing to a maximum value of 35 mM at 275 mbsf and then decreasing below 290 mbsf. Bromide (Br−) concentration ranges from 0.86 to 1.42 mM with two significant increases from 20 to 100 mbsf and from 300 to 400 mbsf. These profiles reflect organic matter degradation, mainly through sulfate reduction, resulting in increased alkalinity and the accumulation of sulfide, ammonium, bromide, and phosphate in the IW. The chemical composition of marine organic matter is characterized by an atomic C:N:P ratio of 106:16:1, commonly referred to as the Redfield ratio (e.g., Burdige, 2006). Ratios of alkalinity to ammonium (alkalinity/NH4+) range between 5.3 and 6.8, except for two samples closer to the surface, and are close to the Redfield ratio (C/N = 6.6), suggesting that the ammonium increase is strongly related to organic matter mineralization (Figure F28). On the other hand, the alkalinity/NH4+ values below the upper sediment layer (0–60 mbsf) decrease to 0.8 at 280 mbsf and suggest some other, possibly deeper, processes unrelated to microbially mediated organic matter degradation.
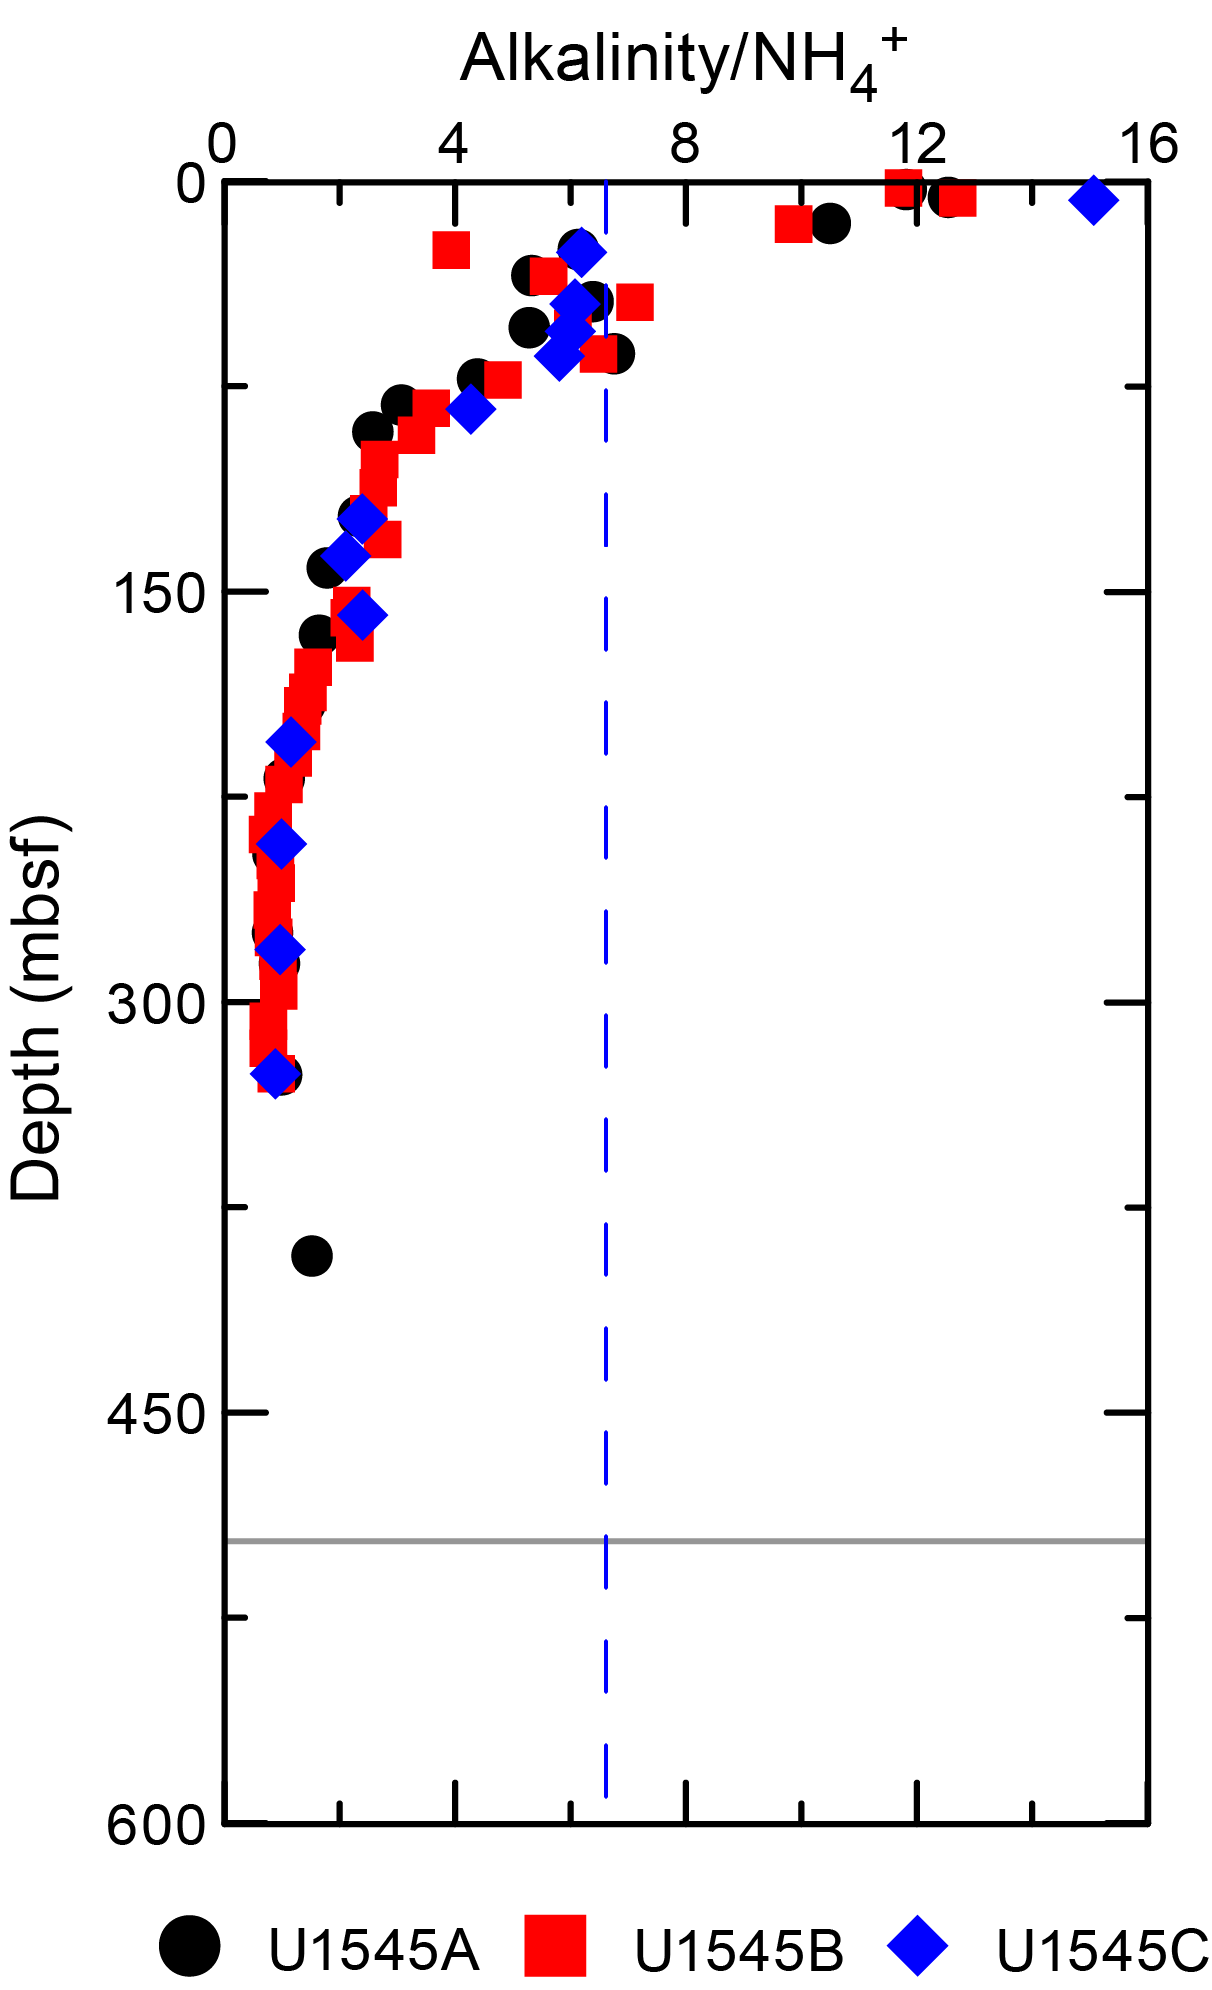
9.2.3. Silica, calcium, magnesium, and potassium
In the three holes, profiles of dissolved silica (expressed in solution as H4SiO4) effectively reflect the mineral phases described in Lithostratigraphy and the decreasing preservation state of diatoms with increasing temperature described in Biostratigraphy. Dissolved silica increases linearly to a maximum concentration of 2181 µM (Figure F27), likely at 300 mbsf, reflecting the successive dissolution of biogenic opal that is documented by decomposition of diatom valves and other siliceous microfossils as a function of increasing temperature (Kastner and Gieskes, 1976). At the bottom of Lithostratigraphic Subunit IC, the gradual transformation from opal-A into opal-CT occurs, leading to the precipitation of dissolved silica and thus a drop in dissolved silica content that starts around 300 mbsf (Figure F27).
Calcium (Ca2+) concentration decreases from 10.6 to 5–6 mM in Lithostratigraphic Subunit IA. This trend within the sulfate reduction zone is caused by carbonate precipitation coupled with sedimentary organic matter mineralization (2HCO3− + Ca2+ = CaCO3 + H2O + CO2). Authigenic carbonates were observed at ~70 mbsf at this site, which is consistent with the depth of maximum alkalinity (see Lithostratigraphy) and the observed decrease of dissolved calcium. Downhole, calcium concentration then increases to ~13–14 mM in Subunits IB and IC and peaks in Subunit ID, where it reaches 22 mM. This trend may reflect deeper sourced processes related to magmatic activity and/or calcium carbonate dissolution.
Magnesium (Mg2+) concentration has a relatively constant value (51–56 mM) in the upper part of the sediment column and then decreases with depth to around 15 mM. A maximum is observed at the boundary between Lithostratigraphic Subunits IC and ID.
Potassium (K+) has a fairly consistent range of 9–11 mM to 320 mbsf. It decreases sharply below this depth, probably as a result of the incorporation of K+ into clay minerals and/or the formation of K-feldspar (Kastner and Gieskes, 1976).
9.2.4. Iron and manganese
The concentrations of iron (Fe = Fe2+ + Fe3+) and manganese (Mn = Mn2+ + Mn4+) show scattered values throughout the cores from Hole U1545B, ranging from 2 to 82 µM (Fe) and 0 to 31 µM (Mn). Their release could be due to biologically mediated reactions such as organic matter mineralization using (oxy)hydroxides (Jørgensen, 2000), oxidation, and solubilization of metal sulfides (Jørgensen and Nelson, 2004) or even methane oxidation with metals as electron acceptors (Beal et al., 2009).
9.2.5. Boron, lithium, barium, and strontium
Boron (B; dissolved as borate; B(OH)4−), lithium (Li+), barium (Ba2+), and strontium (Sr2+) exhibit very similar trends throughout the sedimentary succession (Figure F27). Their concentrations slightly increase in the uppermost 100 m from 510 to 850 µM, 24 to 74 µM, 0 to 94 µM, and 85 to 126 µM, respectively. These concentrations continuously increase with a different slope between 100 and 300 mbsf, and they finally peak between 350 and 450 mbsf to maximum values of 1909 µM for boron, 841 µM for lithium, 225 µM for barium, and 602 µM for strontium. The variation of these elements might be closely related to precipitation/dissolution processes occurring throughout the sedimentary column.
9.3. Concluding remarks
Biogeochemical processes observed in the upper 100 m of the sedimentary succession are mainly related to organic matter degradation and methane oxidation/production around the SMTZ. As temperature increases with depth, precipitation/dissolution processes take place, including opal-A dissolution, authigenic carbonate precipitation, and dolomite formation. A number of significant increasing or decreasing excursions observed for many dissolved elements (K+, B, Sr2+, Li+) in IW below 300 mbsf (around 70°C) could be related to both opal-A to opal-CT and smectite to illite transformations (Figure F27). They could also be related to thermal sediment alteration during and after the intrusion of a sill of a few meters in thickness emplaced around 482 mbsf.
10. Organic geochemistry
At Site U1545, organic geochemists performed sampling and analysis of gas and solid-phase samples. For Hole U1545A, one headspace gas sample was analyzed per 9.5 m core for routine hydrocarbon safety monitoring. The carbon, nitrogen, and sulfur contents of particulate sediment were characterized, and source rock analysis was performed on solid-phase samples. For Hole U1545B, hydrocarbons were analyzed in headspace gas and void gas; the amount of void space was quantified; H2 and CO contents were analyzed from both headspace and void gas samples; the carbon, nitrogen, and sulfur contents of sediment were characterized; and a comprehensive suite of gas and sediment samples for postexpedition analyses was taken. In Hole U1545C, routine hydrocarbon safety monitoring was carried out and one stable isotope sample was taken concurrently for postexpedition analysis.
10.1. Solid-phase carbon, nitrogen, and sulfur contents
Solid-phase sediment samples were analyzed to determine the weight percent of CaCO3, total organic carbon (TOC), total nitrogen (TN), and total sulfur (TS). In Holes U1545A and U1545B, the sampling frequency was approximately 1 sample per 9.5 m core (Table T11). For Hole U1545A, the core description team selected samples from primary and secondary sedimentary components, and for Hole U1545B, material was subsampled from the community gas (COMGAS1) whole-round core for correlation to other biogeochemical data to be generated during shore-based analyses.
In Hole U1545A, CaCO3 content varies around 10 wt% in the primary lithology of diatom ooze (Figure F29). Subordinate carbonate nodules and indurated layers have much higher CaCO3 content that ranges from ~30 to ~90 wt%. TOC values rapidly decrease with depth from 3.7 to 2.1 wt% at 22.65 mbsf. At 22.65 mbsf, TOC values vary around 2.2 wt%. Between 105.29 and 440.61 mbsf, TOC values fluctuate around an average of ~1.7 wt%. Below 466.49 mbsf, the average TOC value is much lower than in the sediments above at ~0.6 wt%. In general, those sediment layers that are most carbonate-rich have TOC values lower than 1.5 wt%. The interval above 466.49 mbsf has an average atomic TOC/TN value of ~9, and there are only minor fluctuations in the studied interval. These values are indicative of algal matter as the primary source of organic matter (Meyers, 1994). Below 466.49 mbsf, TOC/TN values are much lower with an average value of ~5. This region is in close proximity to the sill described in Igneous petrology and alteration; these ratios may therefore be indicative of organic matter thermal evolution. TS content varies from 0 to 2.1 wt%. Average sulfur values are the highest above 105.29 mbsf at 1.34 wt%, and below this interval, the average value drops to 0.76 wt%. TS and TOC are positively correlated but show excess sulfur compared to the normal marine trend (Goldhaber and Kaplan, 1974; Berner, 1982), and the average TOC/TS value is 2.2.
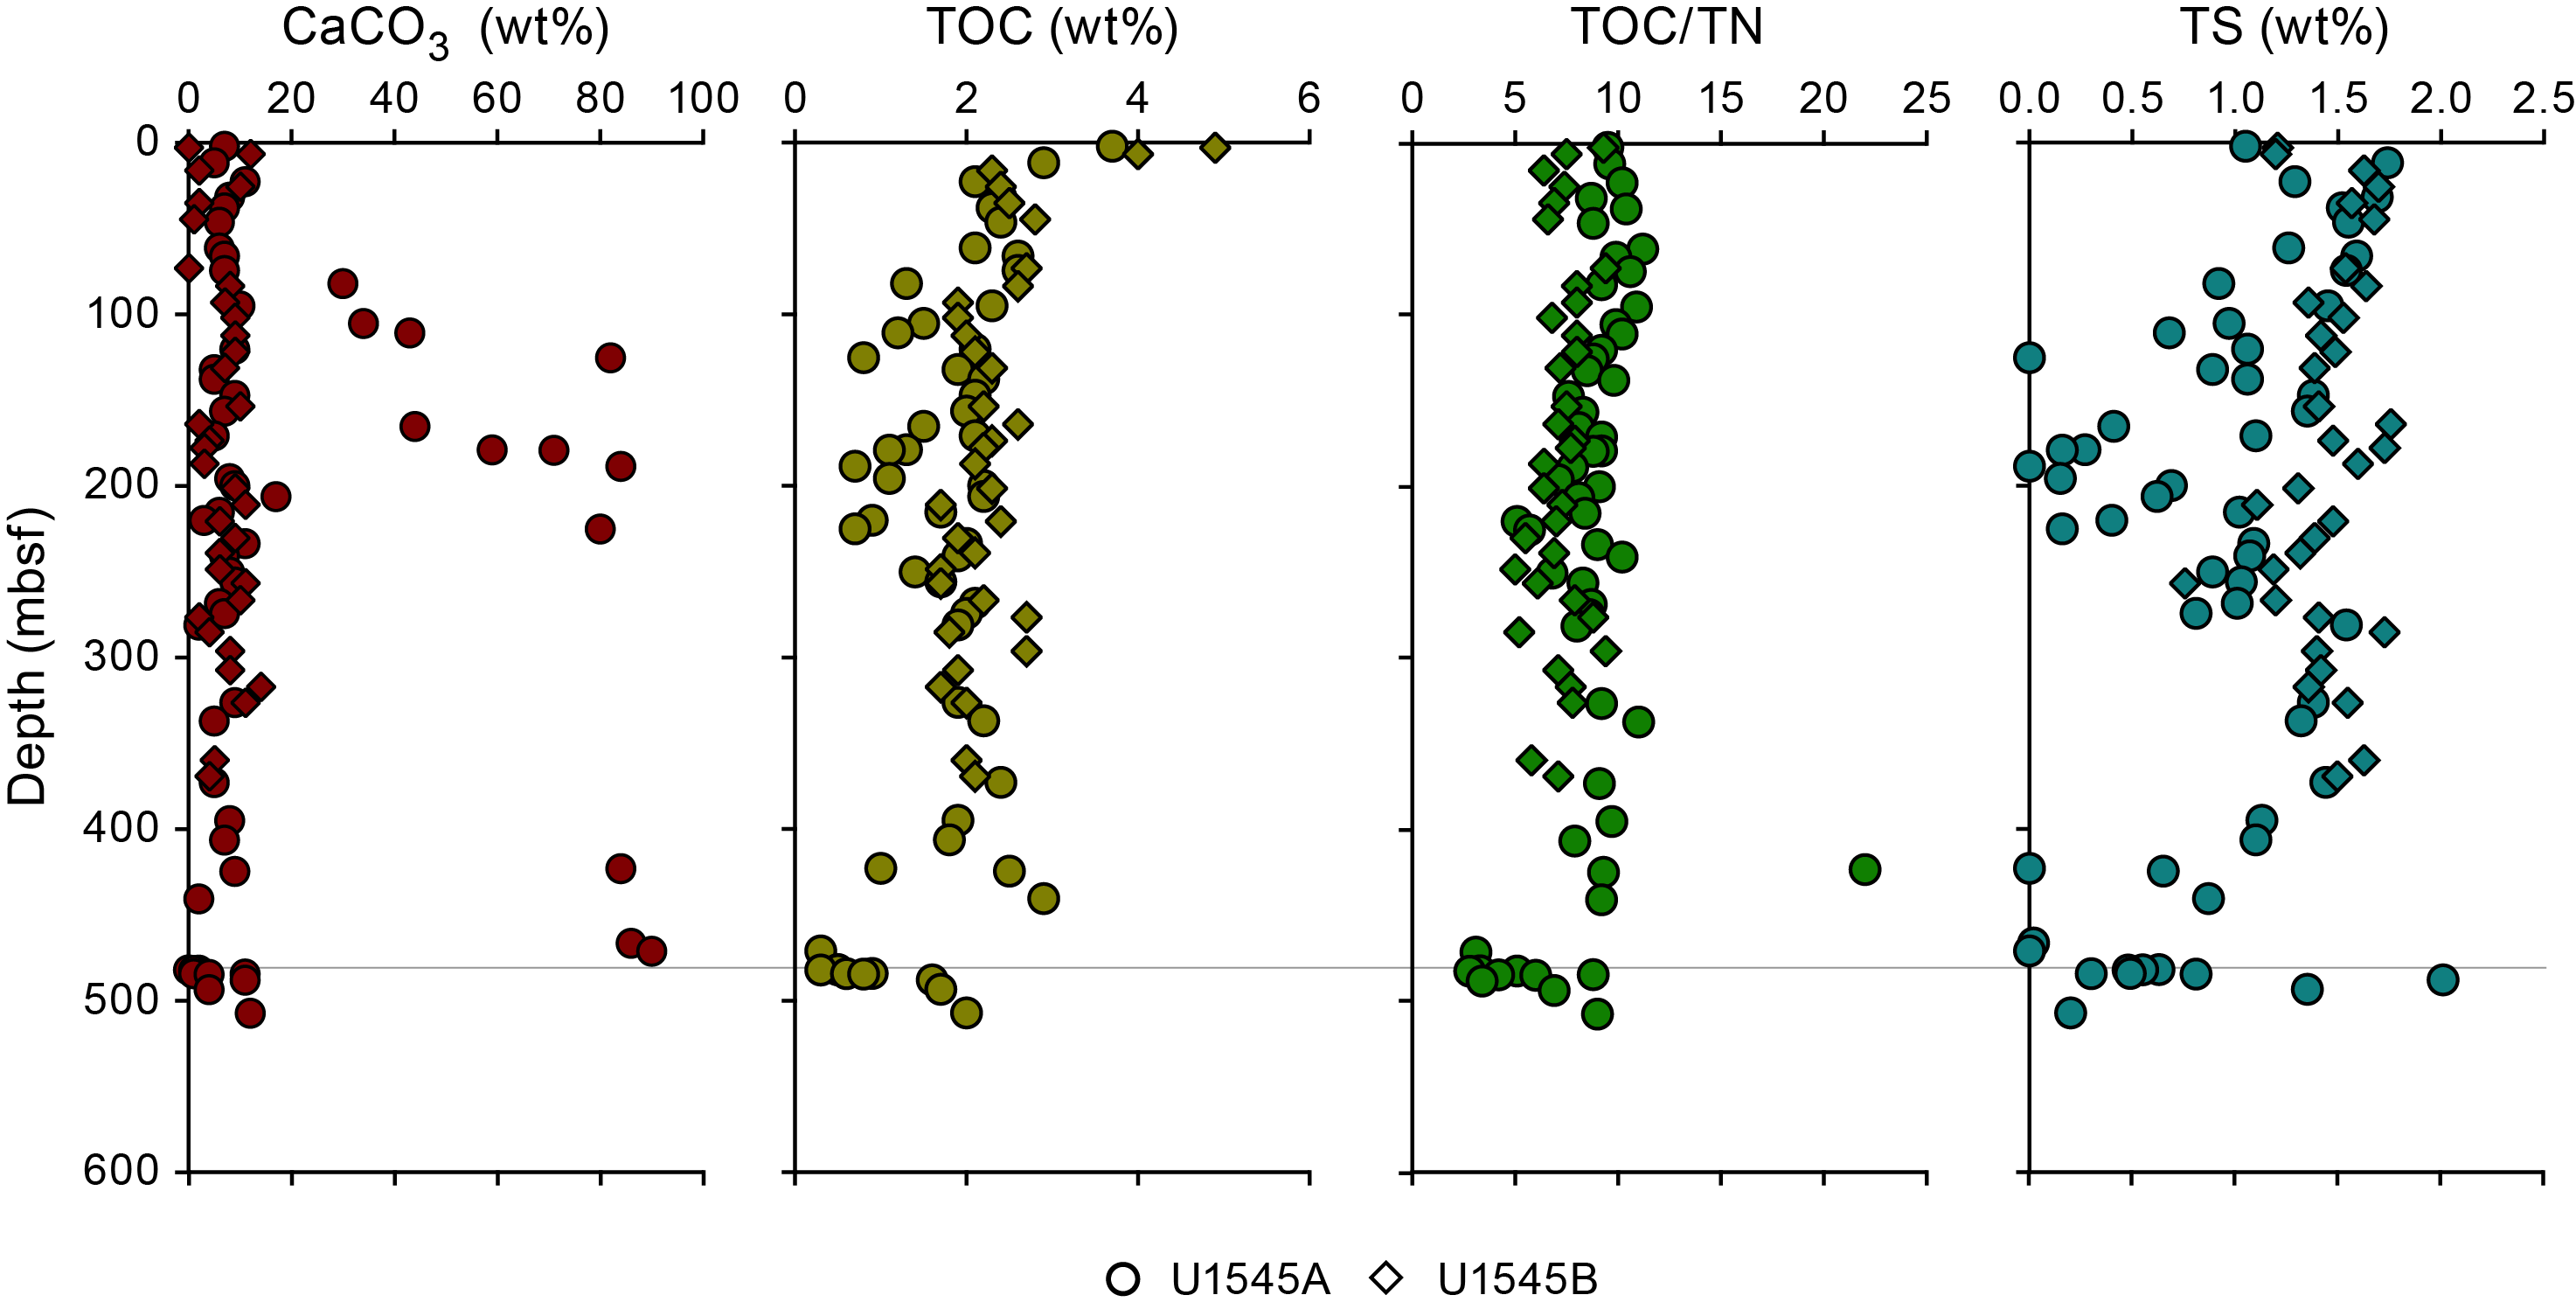
Hole U1545B sediment analyses revealed similar trends to those of Hole U1545A (Figure F29). CaCO3 content varies between <1 and 14 wt% with no discernible trend. The higher values observed in Hole U1545A are absent here because no carbonate nodules were intentionally sampled. TOC values rapidly decrease in the uppermost 15 m from 4.9 wt% to between 1.7 and 2.8 wt% for the remainder of the hole. TOC/TN values are 7.3 on average with minor fluctuations around this value. TS values are 1.44 wt% on average. In the upper 15 m, TS and TOC may be negatively correlated, but below this interval they are positively correlated and follow the same trend as in Hole U1545A.
In general, TOC values generated during source rock analysis are slightly higher than those generated during elemental analysis. This suggests that the TOC/TN values are slightly underestimated using the elemental analysis method.
10.2. Source rock analysis
Thirteen samples from Hole U1545A were selected for source rock analysis (Table T12). These samples were chosen based on their proximity or distance to the sill located in this hole (see Igneous petrology and alteration).
Six samples (385-U1545A-11H-5, 60–61 cm; 31F-2, 40–41 cm; 50F-1, 51–52 cm; 56X-3, 68–69 cm; 63X-4, 67–68 cm; and 67X-1, 41–42 cm) are located between ~390 and ~40 m above the sill. These samples have an average TOCSRA content of 2.5% (slightly higher than the value obtained using the coulometer method), average hydrogen index (HI) values of 275 mg HC/g TOC, and oxygen index (OI) values that decrease from 107 to 15 mg CO2/g TOC with depth. These values are in the range generally observed for recent marine sediments (e.g., Prell et al., 1989; Wefer, Berger, Richter, et al., 1998). Temperatures of maximum hydrocarbon release (Tmax) were similar for these samples and averaged ~416°C, indicating immature organic matter is dominant (Figure F30).
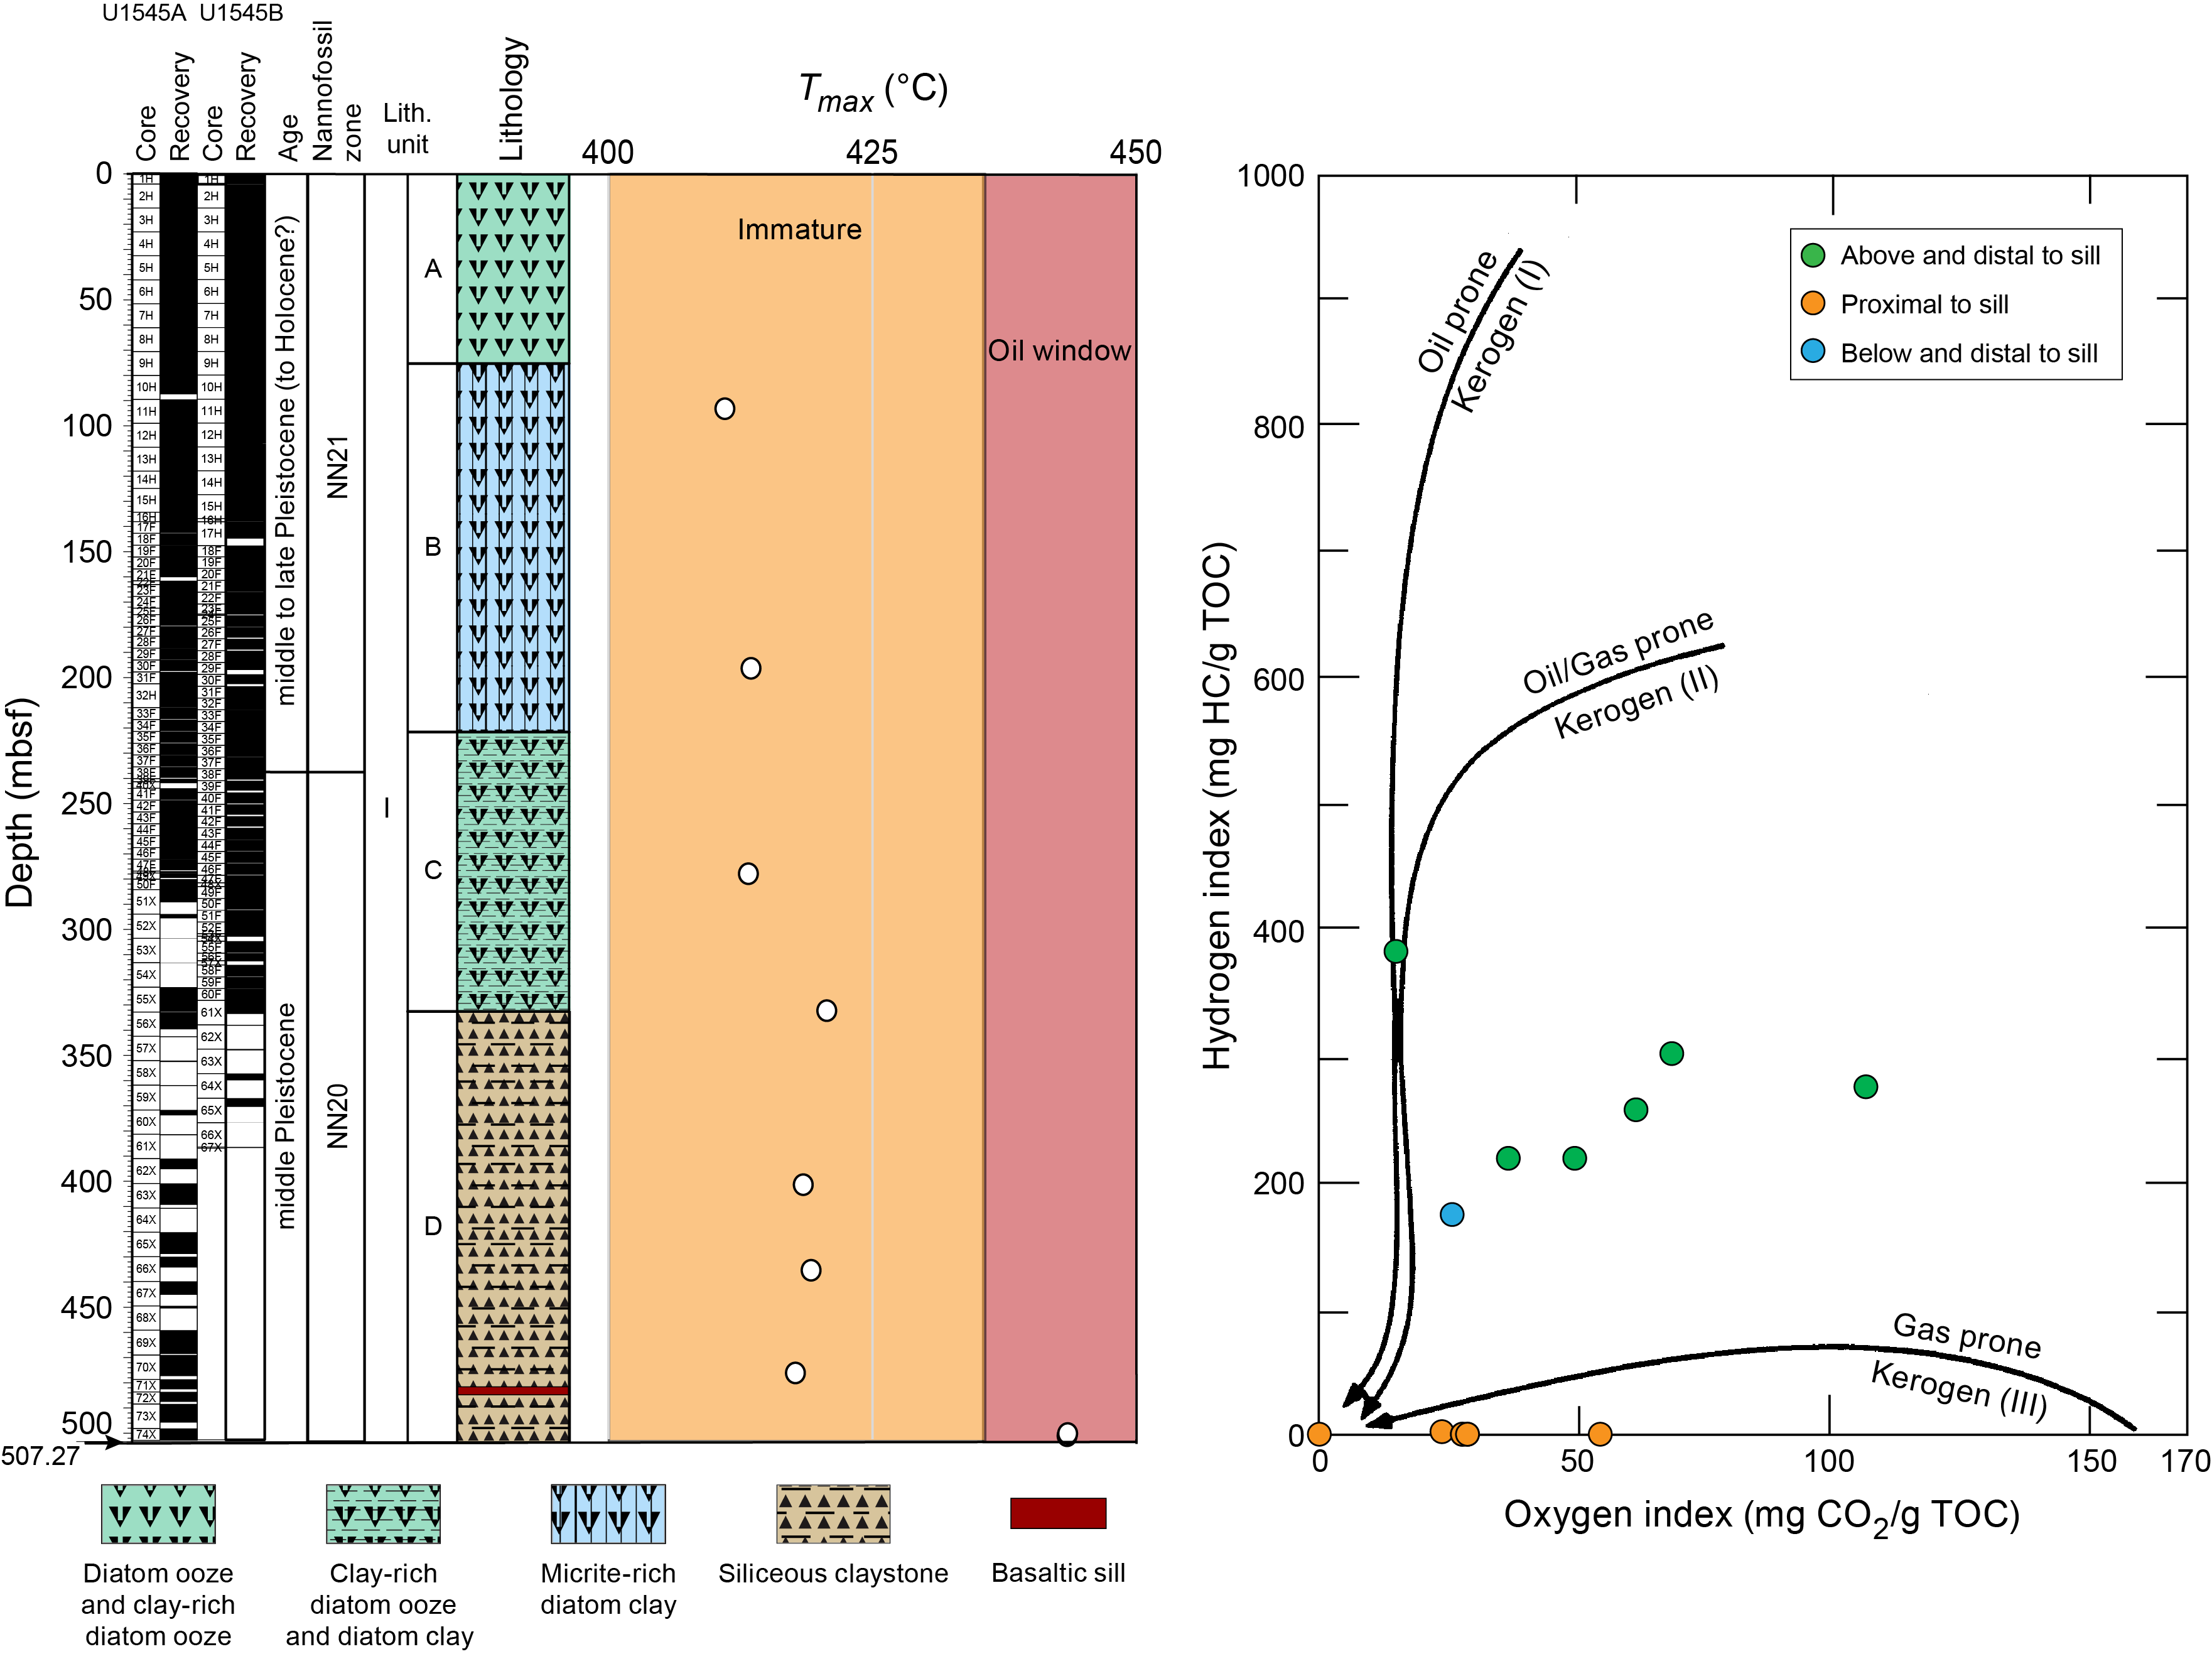
Six samples were collected in close proximity to the sill. Three samples were obtained from sediments just above the sill (offset = 1–27 cm) (Samples 385-U1545A-71X-2, 129–130 cm; 71X-3, 3–4 cm; and 71X-3, 16–17 cm), and three samples were obtained from sediments just below the sill (offset = 122–153 cm) (Samples 72X-1, 15–16 cm; 72X-1, 25–26 cm; and 72X-1, 45–46 cm). Samples above the sill have an average TOCSRA value of 0.9%, and samples below the sill have an average value of 1.3%. For all of these samples, the HI is ~0 mg HC/g TOC and the OI ranges between 0 and 55 mg CO2/g TOC. Because of the low amounts of generated hydrocarbons during pyrolysis (i.e., S2 values ≤ 0.02 mg HC/g), no meaningful Tmax values were obtained for these samples. This suggests the small amount of organic matter present is thermally highly mature. Despite the low organic content, notable S1 values (free hydrocarbon content) were obtained for these six samples (0.24–0.42 mg HC/g). This could indicate that oil is present in low amounts.
Finally, a sample from ~25 m below the sill was analyzed (Sample 385-U1545A-74X-CC, 29–30 cm). This sample has a TOCSRA value of 3.0 wt%, HI values of 174 mg HC/g TOC, and OI values of 26 mg CO2/g TOC. The Tmax value of 443°C indicates that the organic matter is in the oil-generating window (Figure F30). The S1 value of 2.26 mg HC/g indicates the presence of oil in significant proportion in this sample.
These trends are reflected in the relationship between HI and OI (Figure F30). Sill proximal samples cluster together near HI = 0 mg HC/g TOC because of the high thermal maturity of the organic matter in these samples, whereas those more distal to the sill are less thermally mature and are located between Type II and Type III kerogens.
10.3. Hydrocarbon gases
Headspace samples were taken from each core to monitor C1–C6 hydrocarbons per the standard safety protocol during drilling (Pimmel and Claypool, 2001). For Hole U1545A, 58 headspace samples were analyzed for their parts per million by volume (ppmv) concentration (Table T13) and then corrected by sample weight and porosity to determine the molar concentration of dissolved hydrocarbons (Table T14). In Hole U1545A, methane concentration increases with depth and reaches a maximum of ~7 mM at 62.9 mbsf; it then decreases to values ranging from <1 to ~2.4 mM to 393 mbsf (Figure F31). From 393 mbsf to the bottom of Hole U1545A, methane concentrations increase slightly, ranging from <1 to 5.5 mM. Contents of C2–C6 compounds are below detection limit from 0 to 100 mbsf, and then they are present at concentrations <300 µM with no discernible trend to 450 mbsf. From 450 to 503 mbsf, all C+ hydrocarbons increase, C3 and n-C4 notably so, to concentrations of ~3.9 and ~2.9 mM, respectively. These trends in methane and C+ are reflected in values of C1/C2 and C1/C+ (Figure F31). When hydrocarbons first appear, maximum C1/C2 values are in the 104 range. C1/C2 gradually decreases downcore to values in the 101–102 range at 402 mbsf. C+ continues to increase downcore, and the C1/C2 value decreases to <10. Although C1/C2 values may have an anomalous relationship with temperature, the high temperature gradients observed (see Petrophysics) in combination with the high concentrations of hydrocarbons at Site U1545 are beyond those defined by Pimmel and Claypool (2001) (Figure F32). These potentially anomalous C1/C2 values and the rapid increase in higher hydrocarbons below 485 mbsf led to the termination of coring in Hole U1545A.
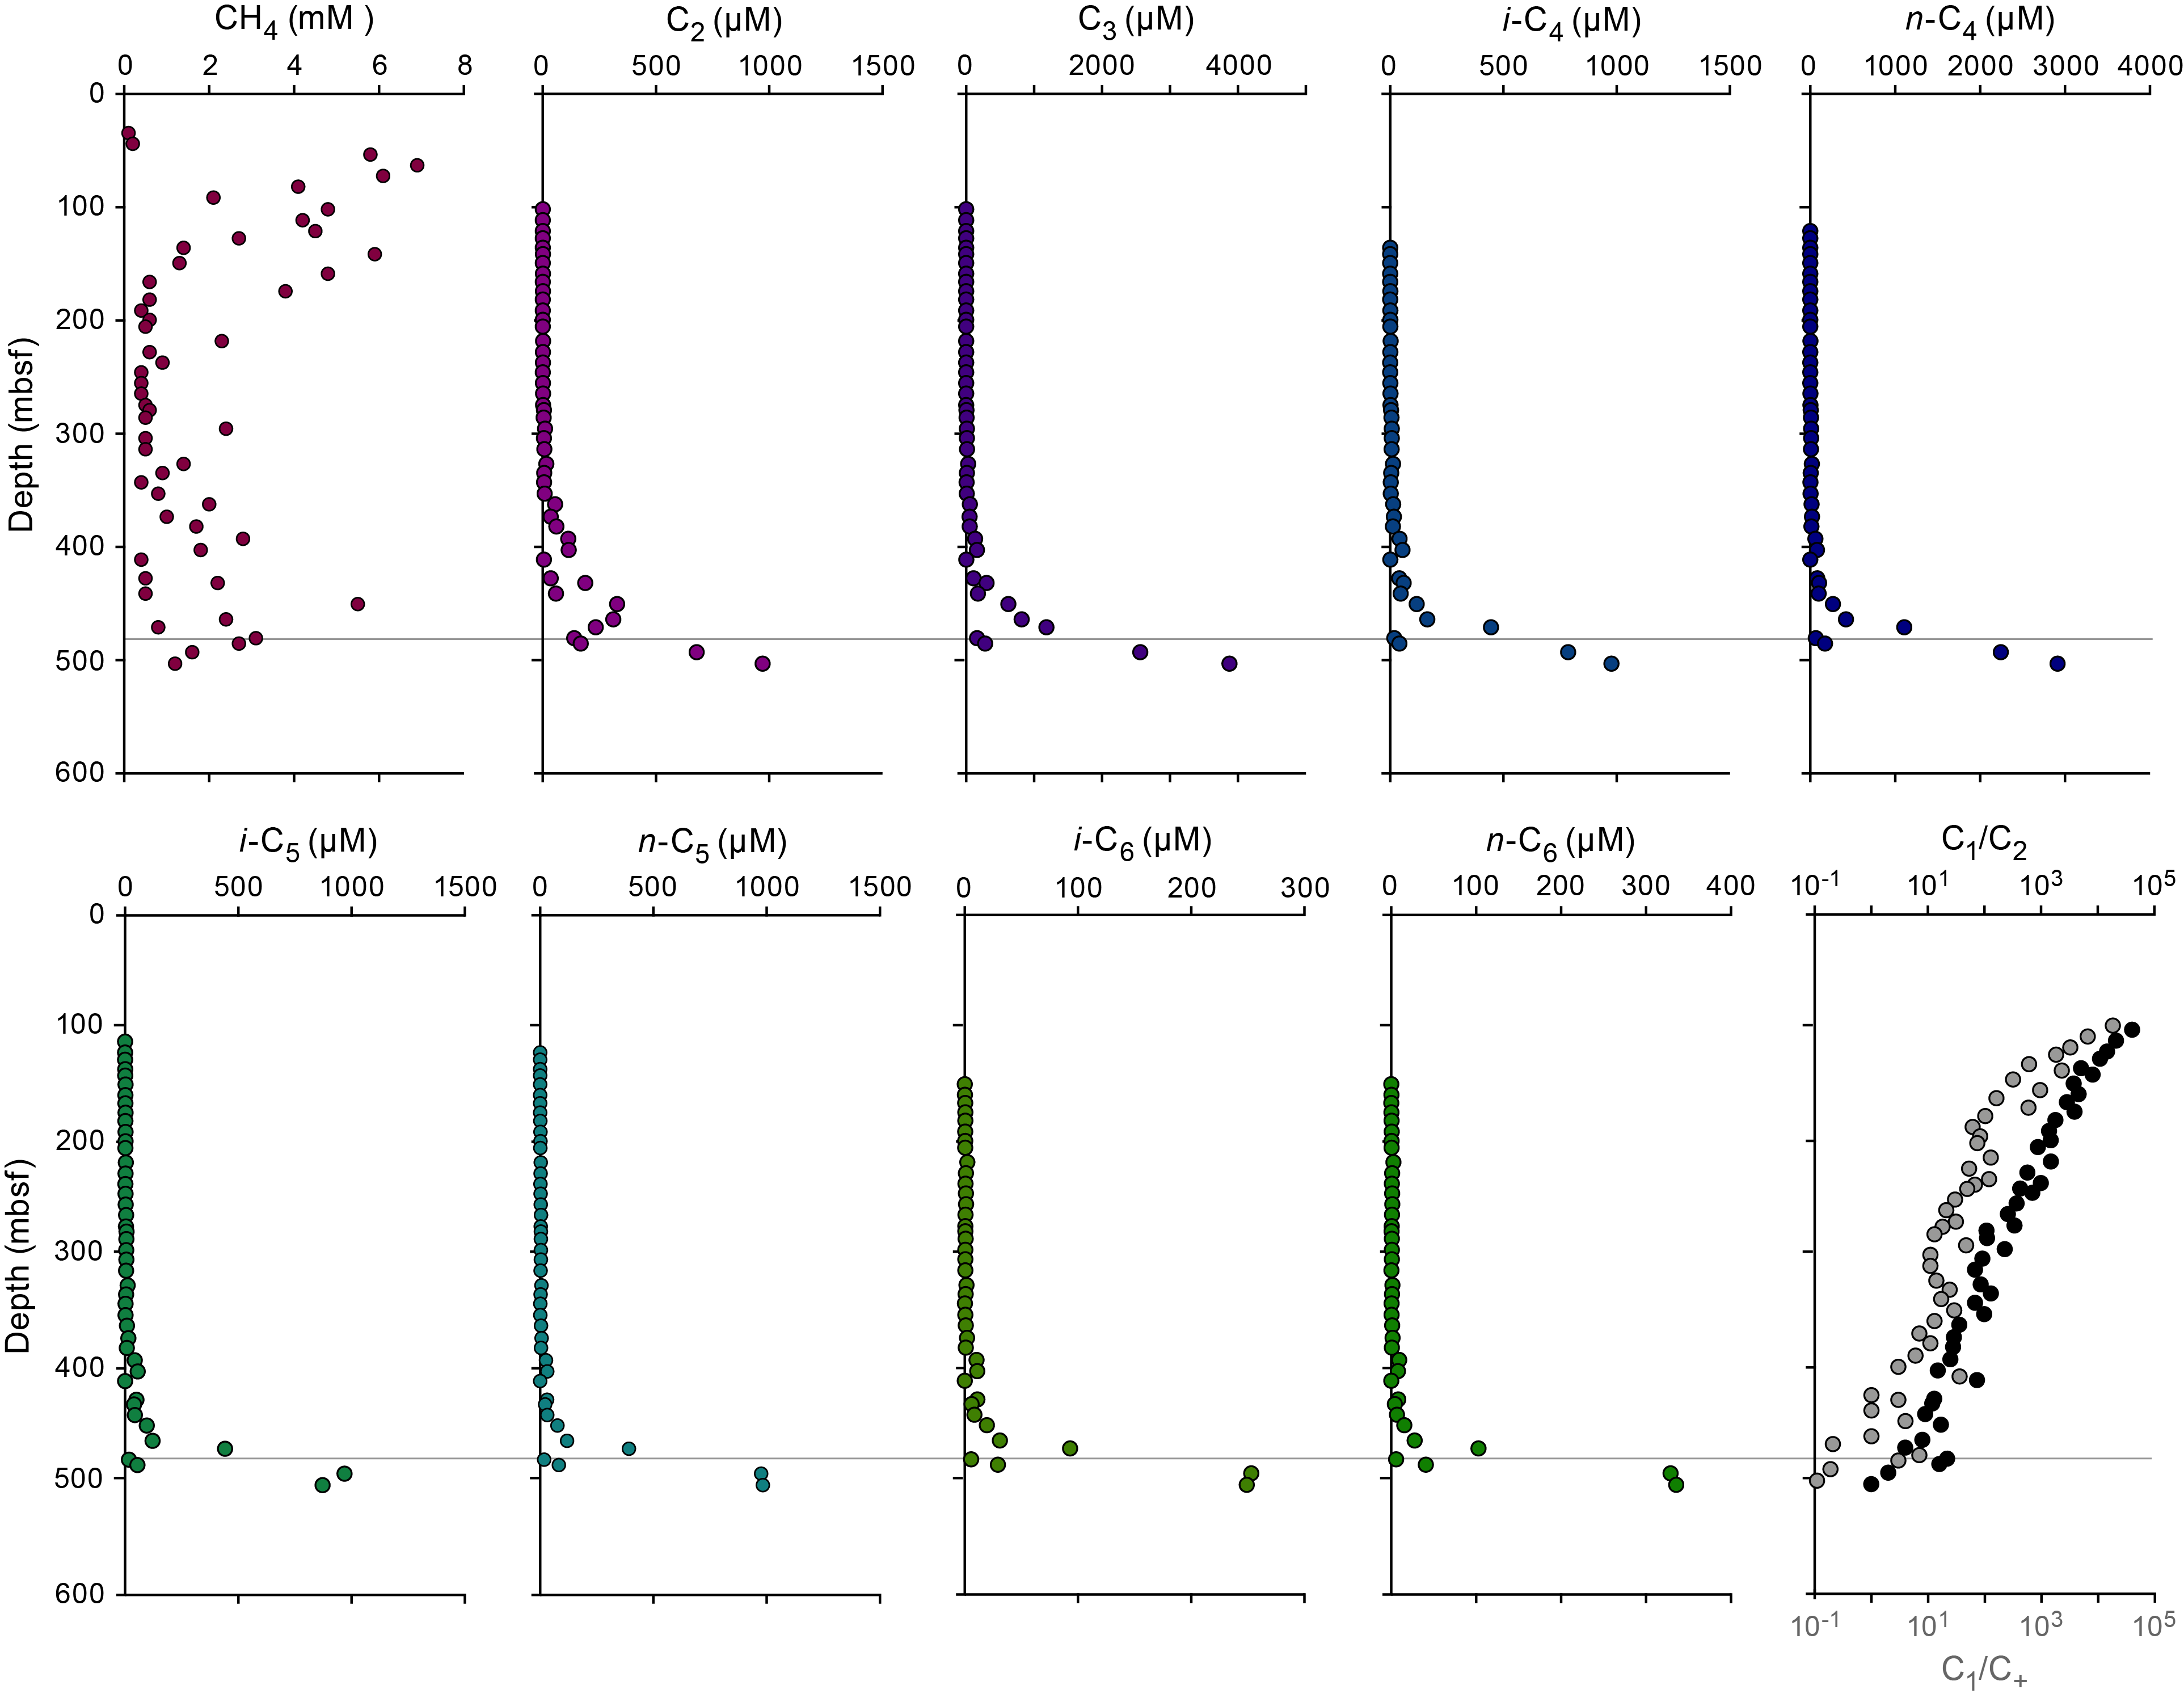
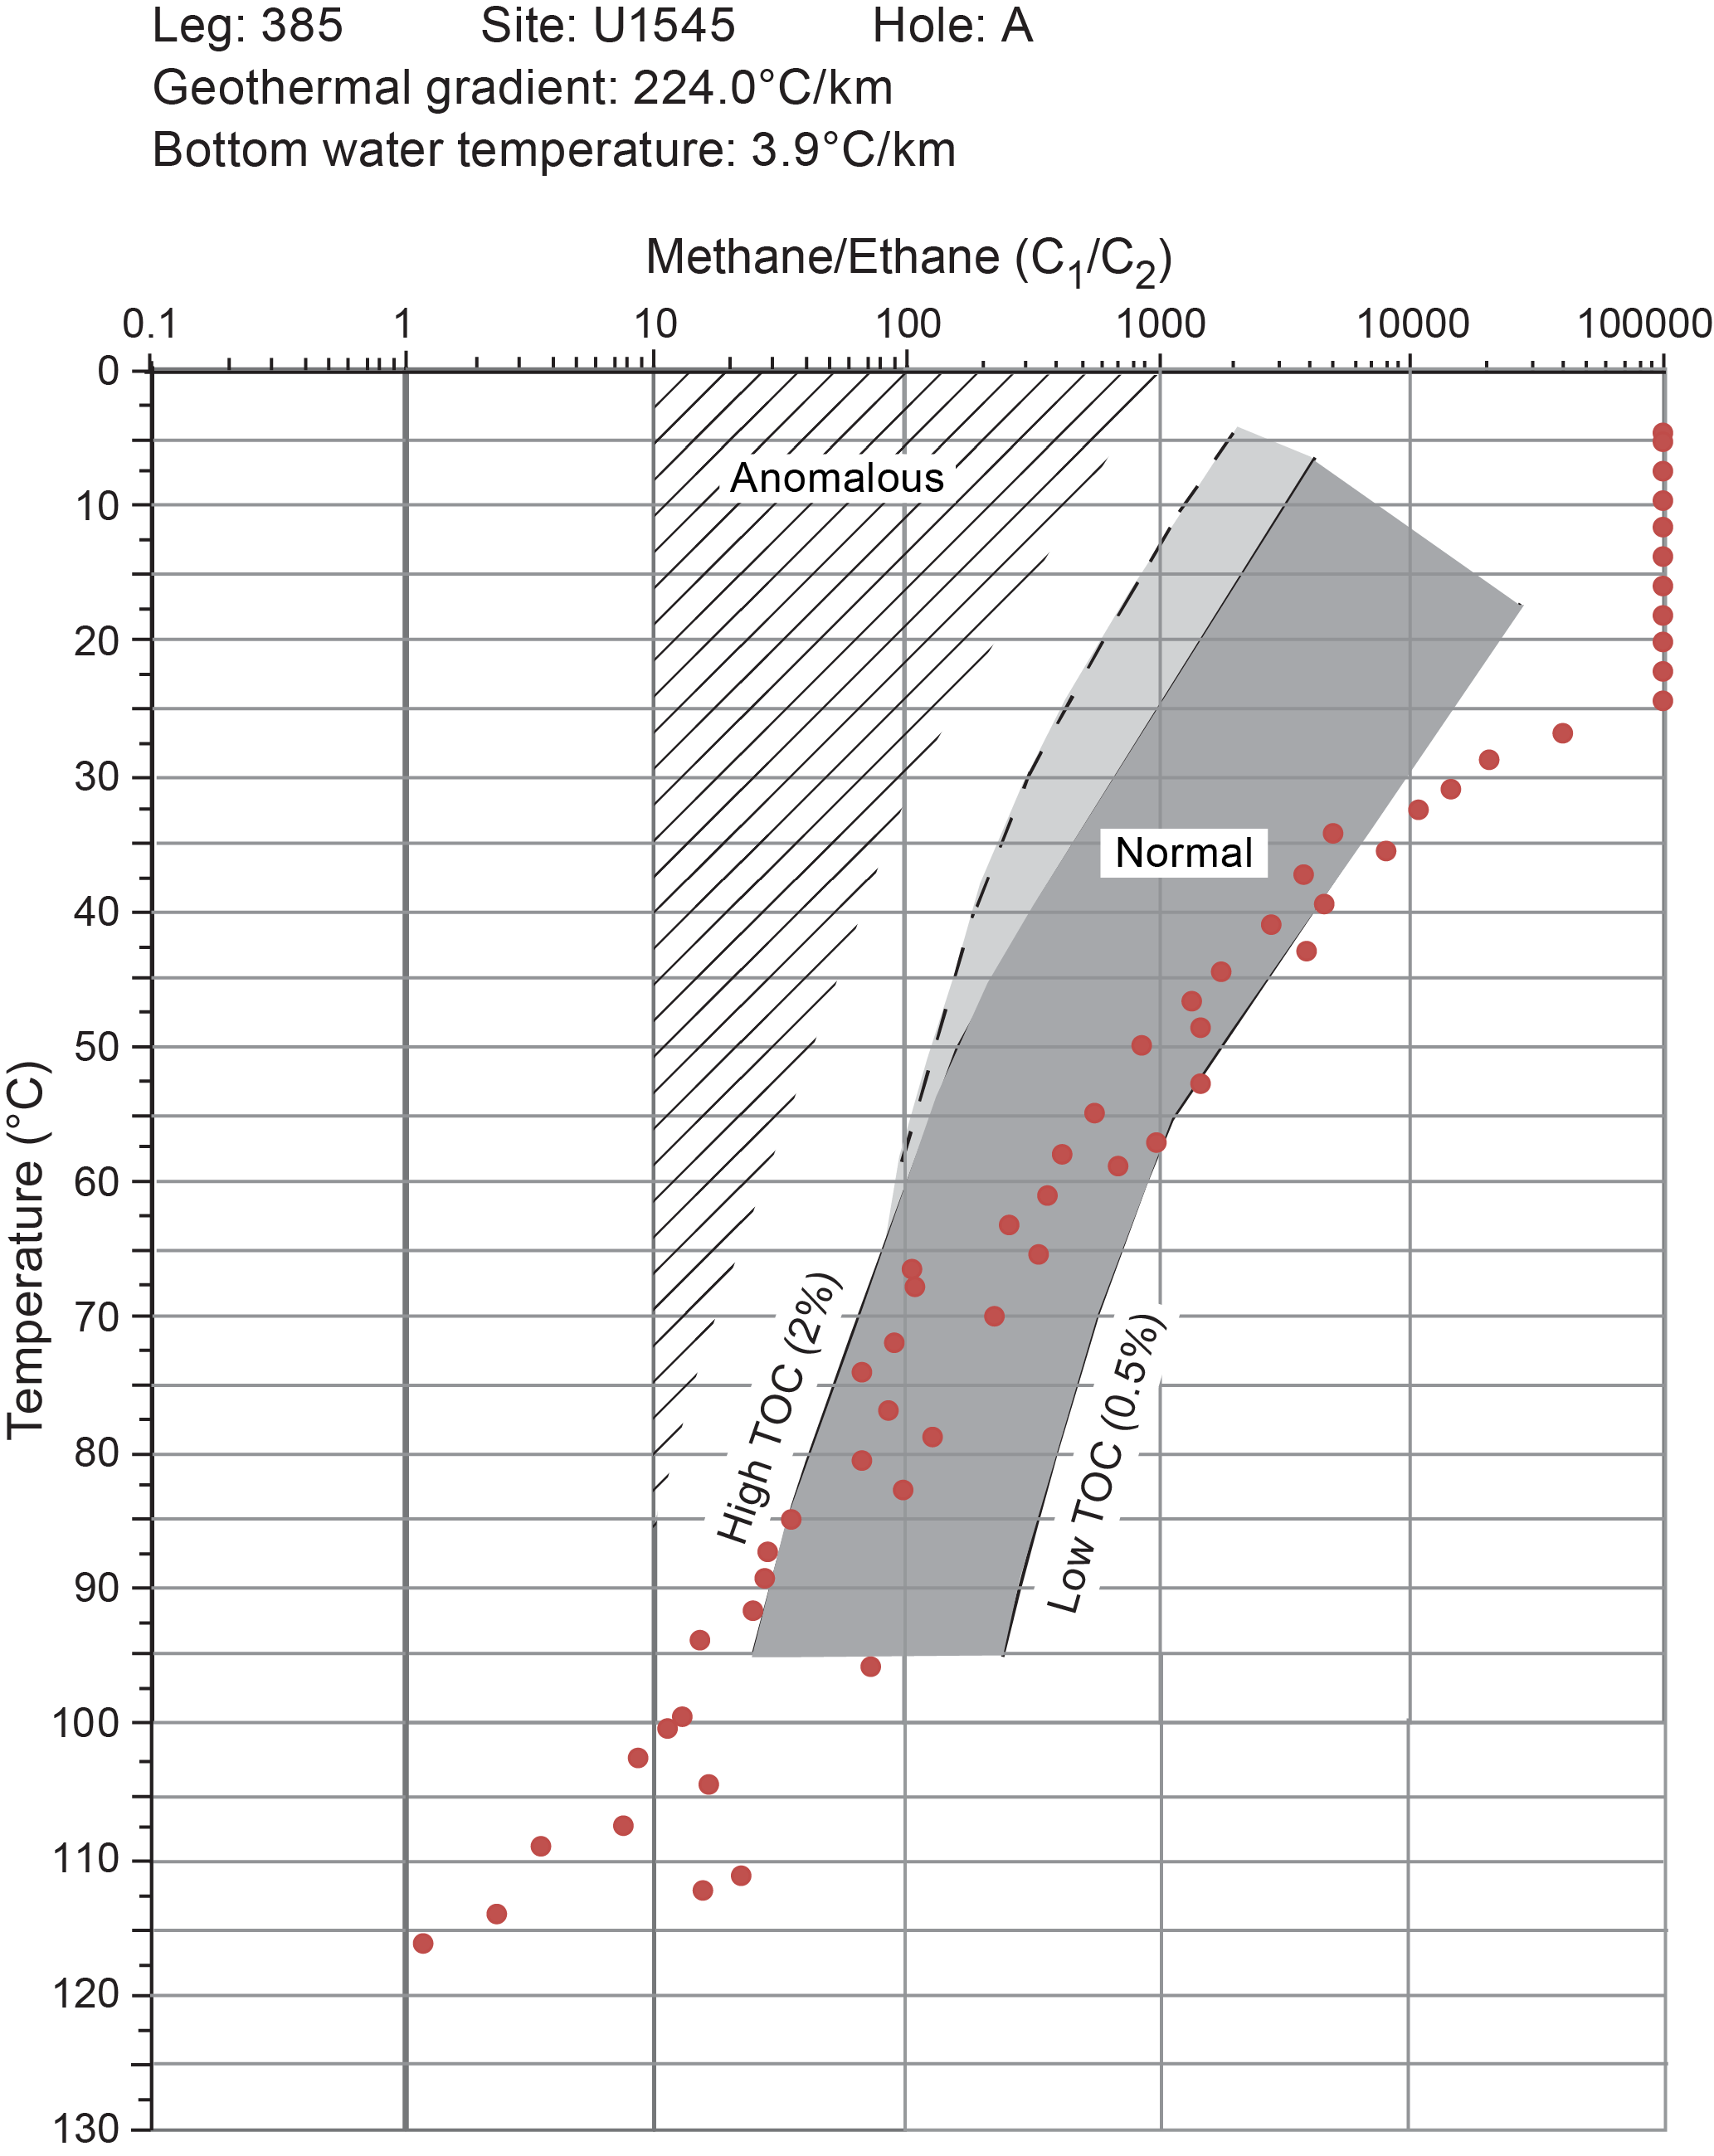
For Hole U1545B, 49 headspace samples were analyzed for their parts per million by volume concentration of gaseous hydrocarbons (Table T13) and then corrected by sample weight and porosity to determine the molar concentration of dissolved hydrocarbons (Table T14; Figure F33). Methane increases to a maximum of ~3 mM at 71.6 mbsf and then gradually decreases to values <0.6 mM at 200 mbsf. Methane seems to slightly increase at the bottom of Hole U1545B to 1.3 µM at 387 mbsf. In the uppermost section of Hole U1545B, C5 and C6 hydrocarbon compounds are present in low concentrations (i.e., <0.5 µM), and C2–C4 hydrocarbons appear below 100 mbsf. In general, all hydrocarbons increase with depth, but the depths of local maxima differ. For example, C2 and C3 have small maxima at 300 mbsf and C4 compounds have small maxima at 200 mbsf. Below 300 mbsf, all hydrocarbons increase to their maximum values in Hole U1545B. These trends in methane and C+ are reflected in changing values of C1/C2 and C1/C+. Because of the presence of C5 and C6 compounds in the uppermost sections of Hole U1545B, C1/C+ values are initially in the 100 range, but they increase to the 105 range at 52 mbsf. C1/C+ values then steadily increase downhole to the 101 range. Similarly, when C2 compounds initially appear at 100 mbsf, C1/C2 values are in the 105 range, and then they decrease downhole to the 101 range. Anomalous relationships of C1/C2 values with temperature as defined by Pimmel and Claypool (2001) were not observed in Hole U1545B.

For Hole U1545C, 51 headspace samples were analyzed for their volume concentration of gaseous hydrocarbons in parts per million (ppm) (Table T13). Those volumes were then corrected by sample weight and porosity to determine the molar concentration of dissolved hydrocarbons (Table T14; Figure F34). Methane increases to a maximum of 6.3 mM at 63 mbsf and then decreases downhole to values <1 mM at 190 mbsf. Unlike in Hole U1545B, C2 compounds are the first to appear at 43 mbsf in Hole U1545C. All hydrocarbon compounds remain below 15 µM throughout Hole U1545C, and differing depths of local maxima are noted. For instance, C3 and C4 compounds peak locally at 200 mbsf, n-C5 and C6 compounds peak at 185 mbsf, and i-C5 peaks at 161 mbsf. All C+ compounds increase downhole to their maximum values below ~280 mbsf. Trends in C1/C2 and C1/C+ values in Hole U1545C are similar to those observed in Hole U1545A in comparable depth intervals. Because Hole U1545C was terminated at a shallower depth than Hole U1545A, however, no anomalous relationships between C1/C2 and temperature as defined by Pimmel and Claypool (2001) were observed.
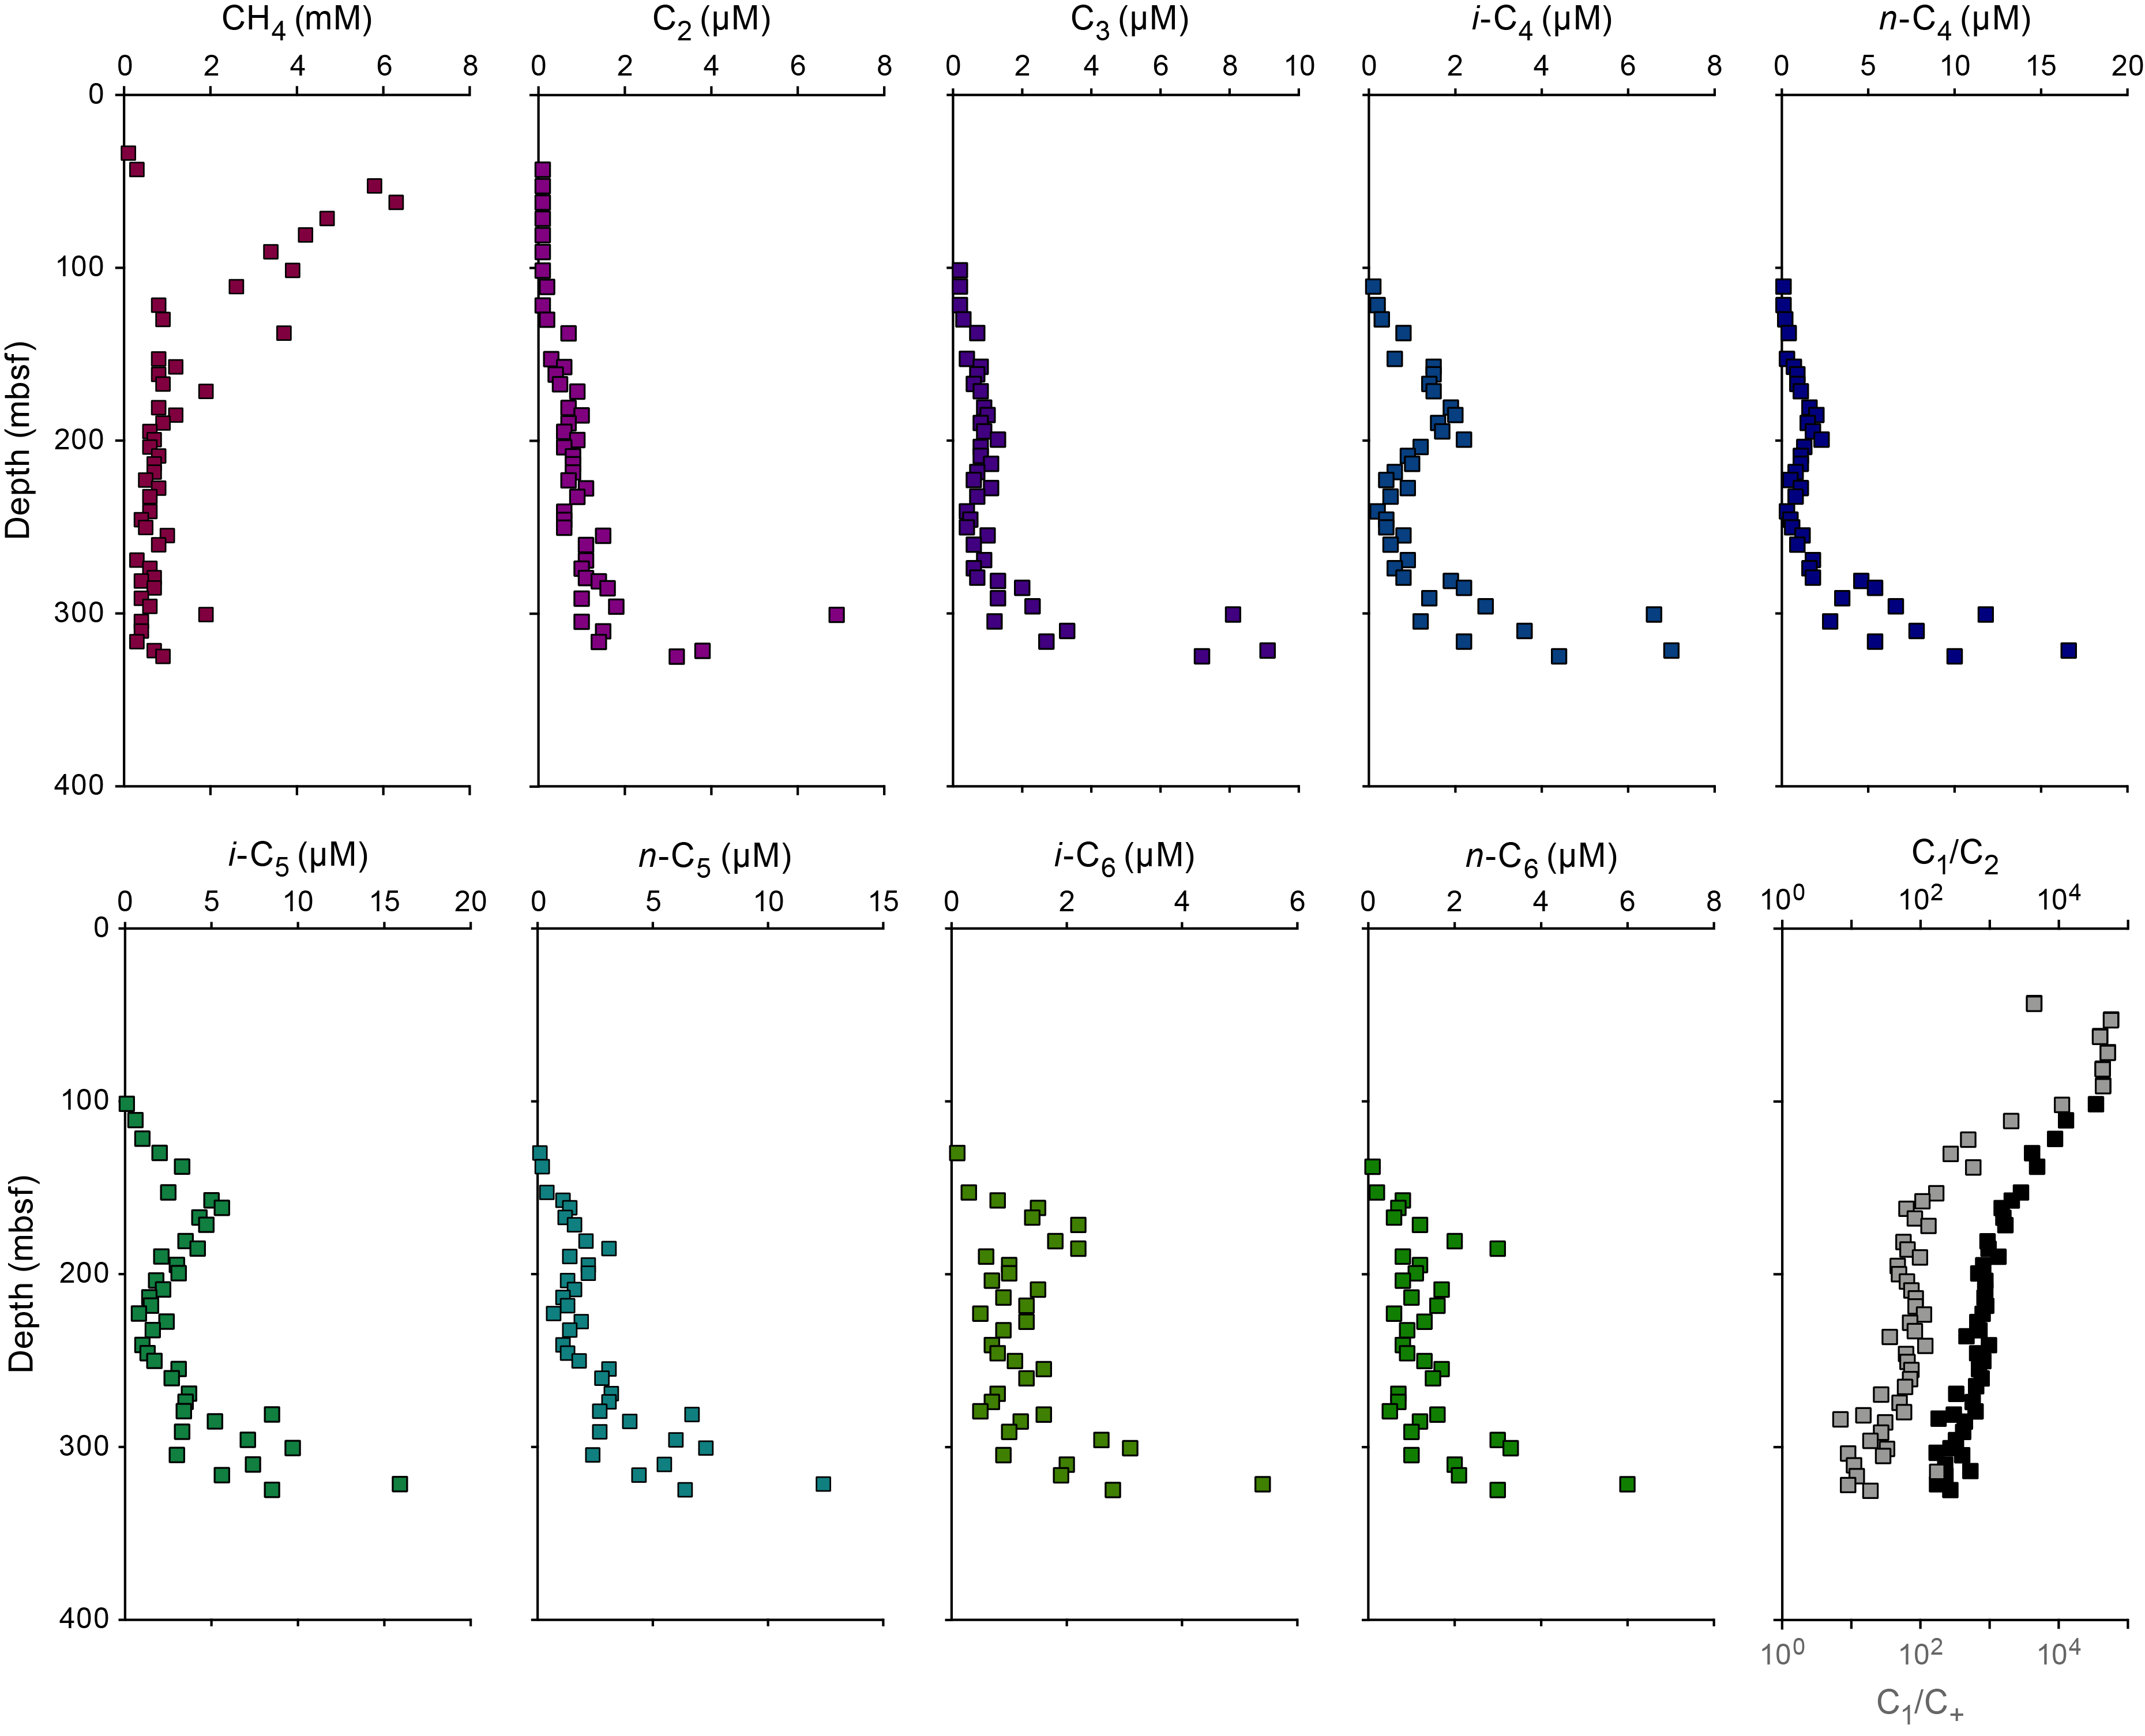
In addition to the headspace measurements described above, void gas samples were taken in Holes U1545A (n = 1) and U1545B (n = 45) when void spaces were observed on the core receiving platform (Table T15). These samples were analyzed to determine the parts per million by volume concentrations and values of C1/C+. The only sample taken in Hole U1545A (462.12 mbsf) contained 82.1% methane, and C2–C6 hydrocarbons were also present. In Hole U1545B, void samples are dominated by methane, which is present beginning at 42 mbsf (Figure F35). Methane concentrations increase downhole to a maximum of 77.9% at 101.6 mbsf and remain between 60% and 75% to 276 mbsf. Methane concentrations then decrease to the final measurement of 39.4% at 327 mbsf. C2–C6 hydrocarbons were also present in Hole U1545B, showing slightly different headspace profiles. Notably, C2 and C3 appear to steadily increase downhole, whereas i-C5, n-C5, and n-C4 display two local maxima, one at ~218 mbsf and a second near the deepest sampled depth of 327 mbsf. Meanwhile, the local maxima for i-C6 and n-C6 are spaced apart at ~242 mbsf and near 327 mbsf, respectively. The void gas C1/C2 and C1/C+ values are consistently higher than those observed in headspace samples because of the apparent preference of methane to be present in the gas phase rather than the dissolved phase (Stein et al., 1995).

For APC and HLAPC cores from Hole U1545B, the lengths of the void spaces in the core liner created by expanding gases were measured immediately after core recovery on the core receiving platform (Table T16; Figure F36). The percent of void space per meter of core ranges from 0% to 2% in the upper 80 m and then increases to a maximum value of ~45% at 245.8 mbsf (Figure F37). Below this maximum, void space values decrease to 3% at the final HLAPC measurement at 323.8 mbsf. No void spaces were present during deployment of the XCB system deeper in the hole.
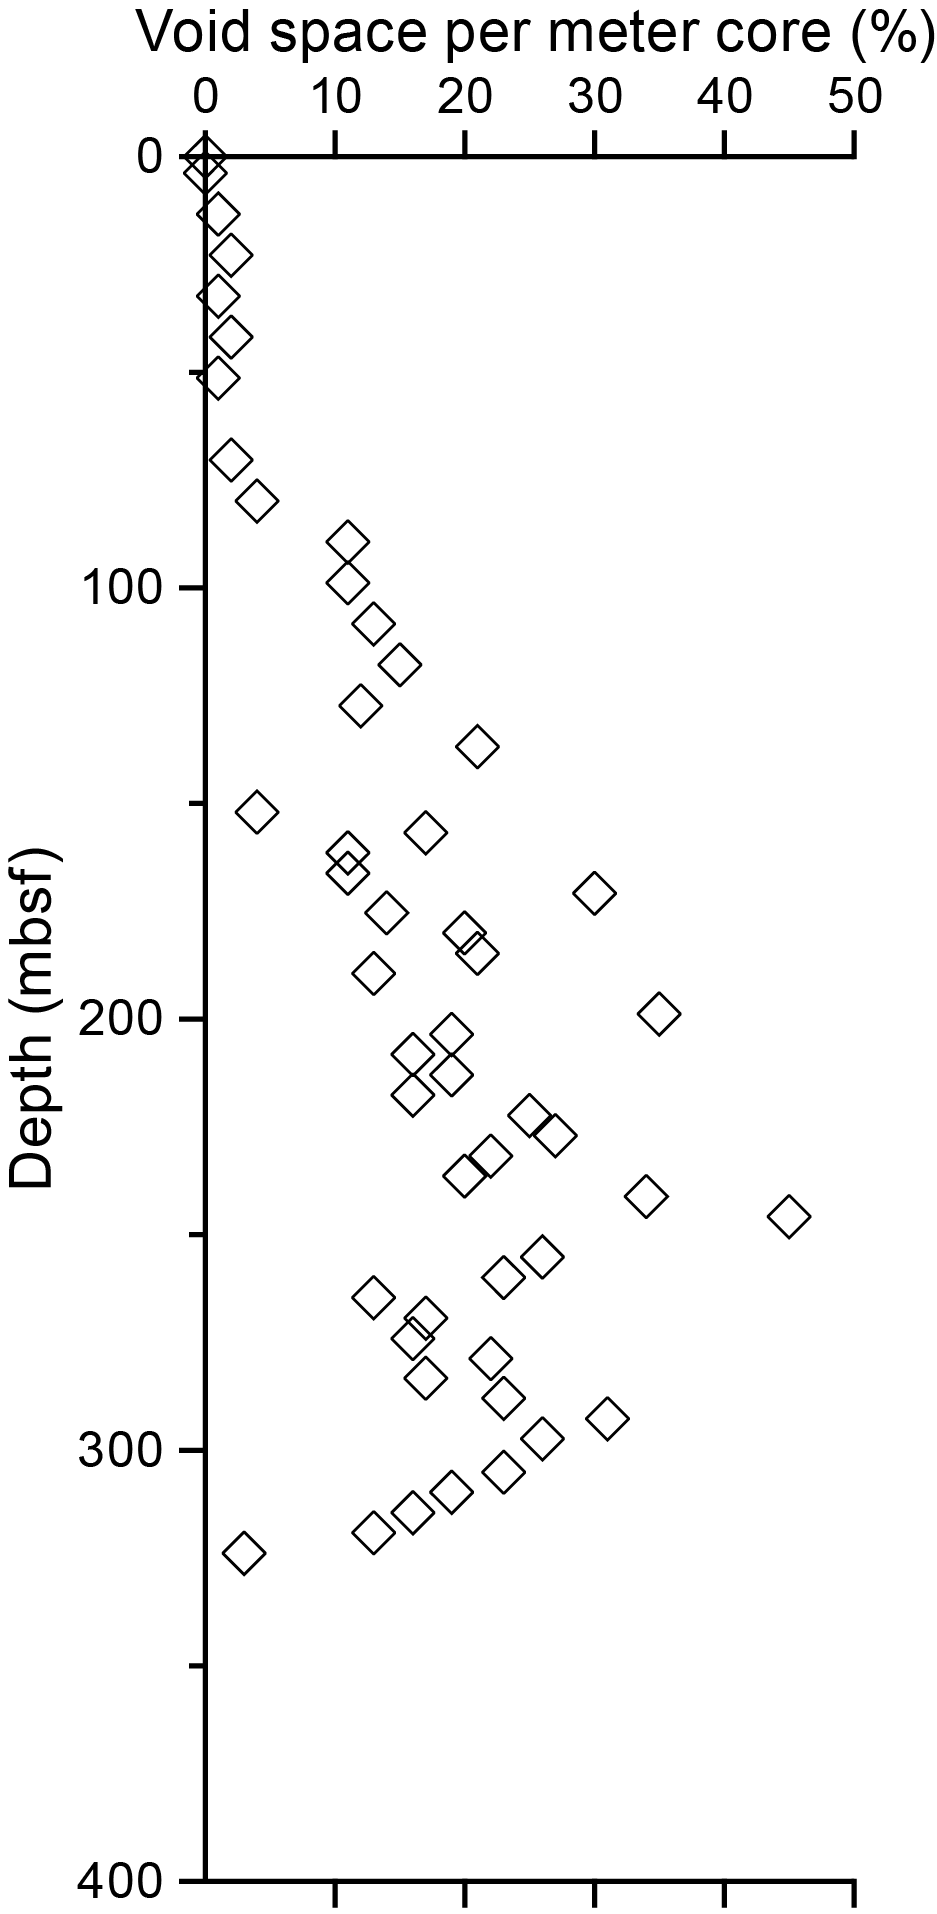
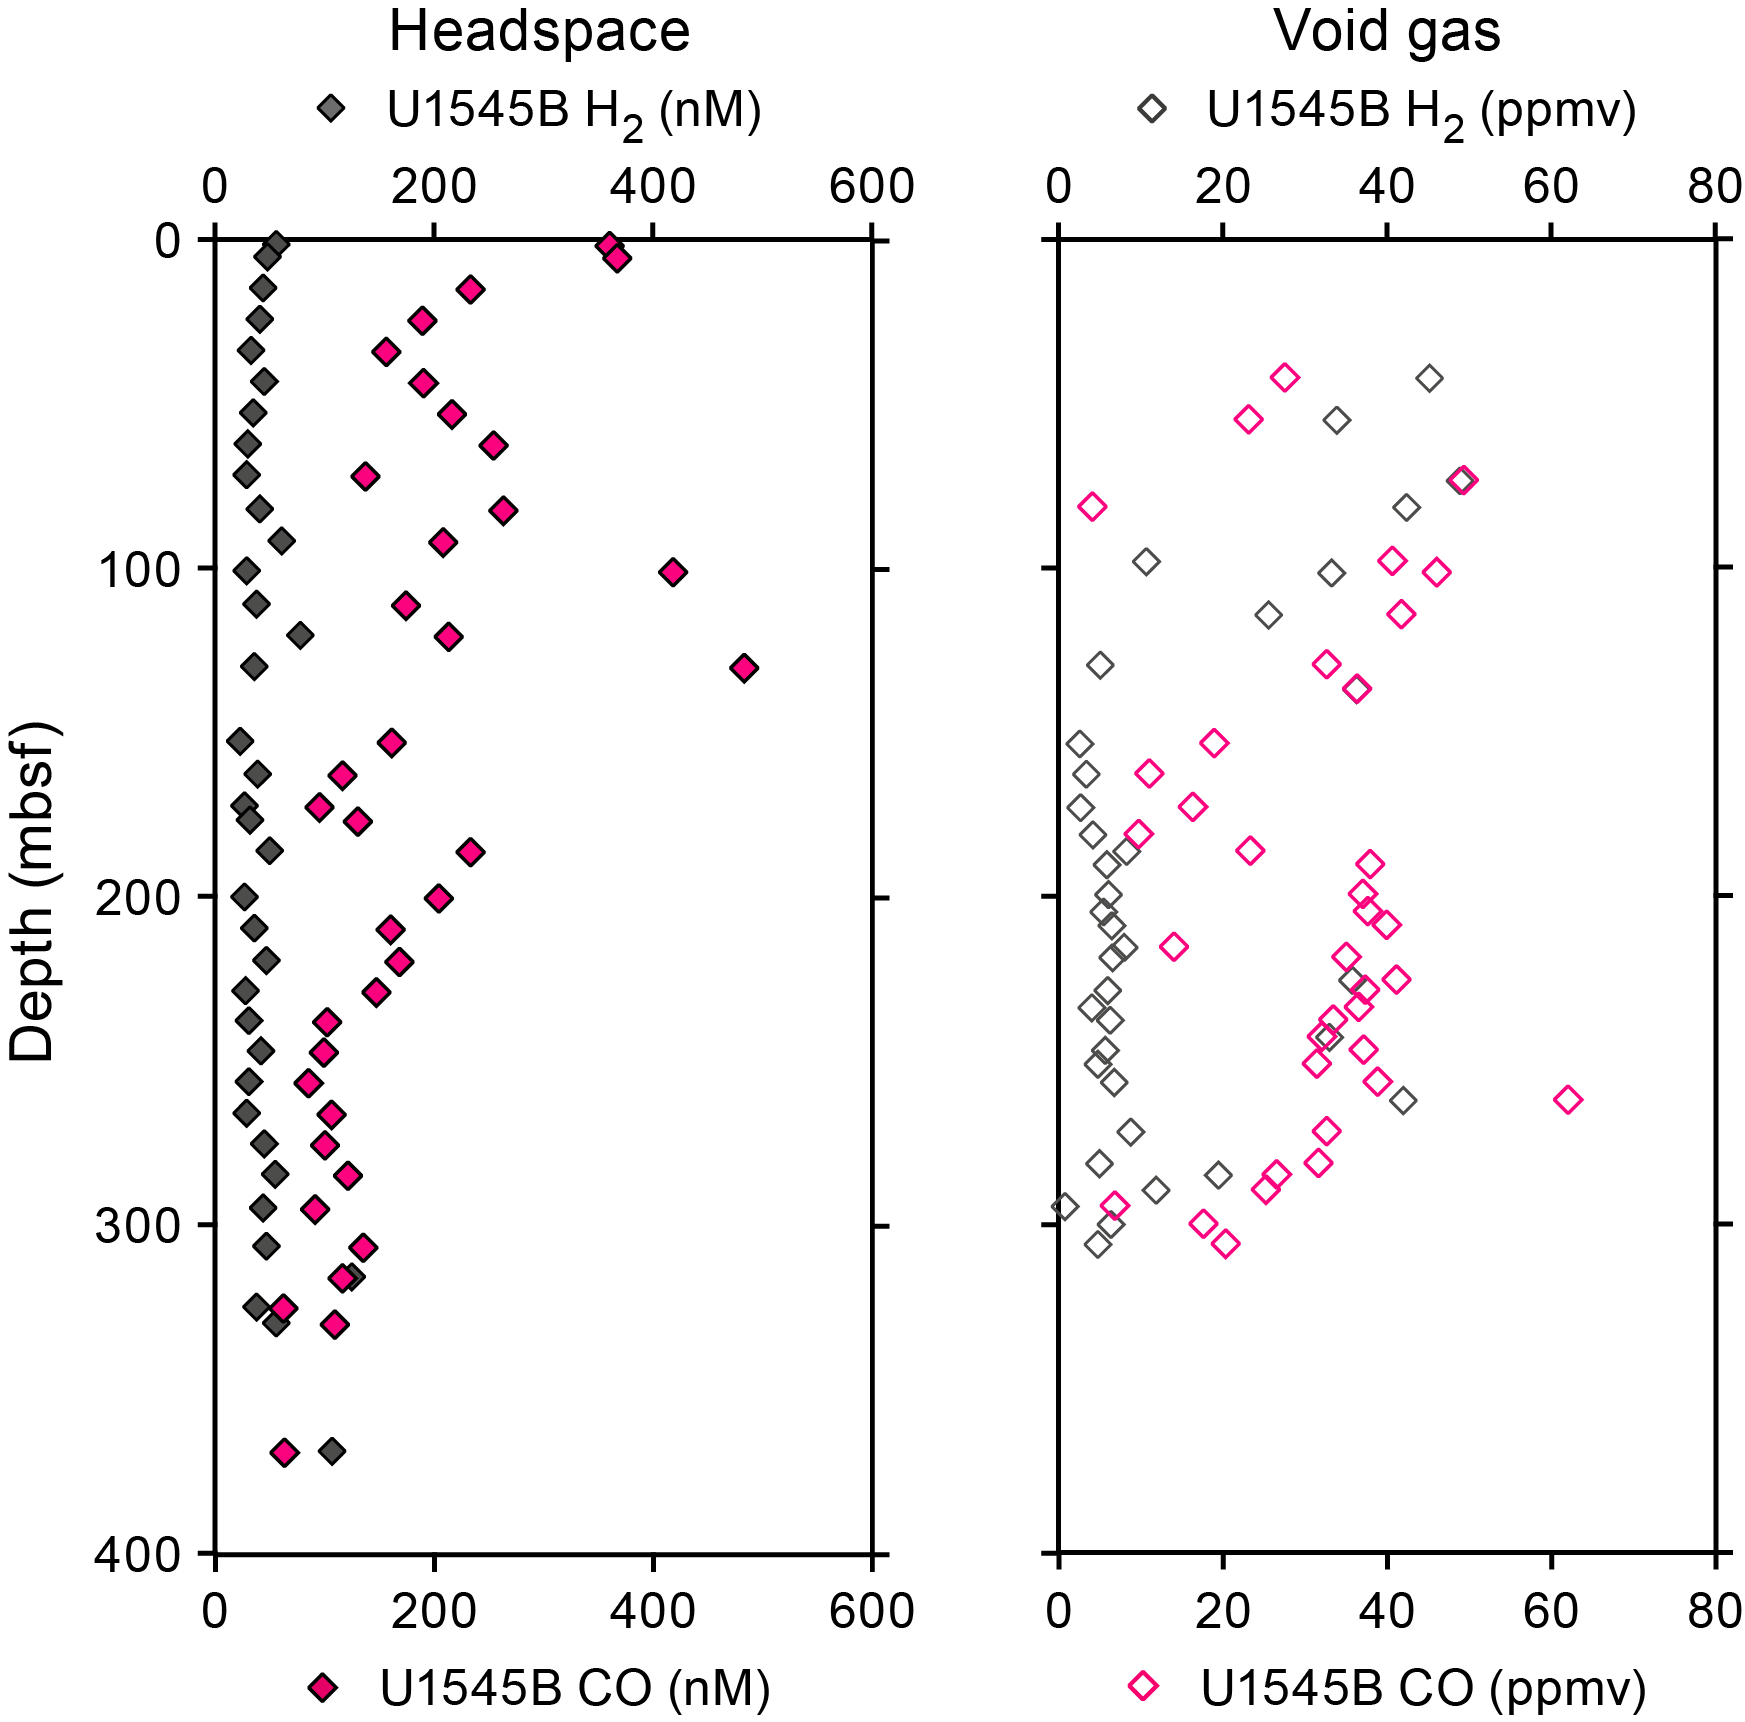
10.4. Hydrogen and carbon monoxide
Headspace samples were taken from each core to monitor molecular hydrogen (H2) and carbon monoxide (CO). In Hole U1545B, duplicate samples were collected from 36 depths next to samples taken for safety gas monitoring of hydrocarbon gases (Table T17). Dissolved H2 and CO were extracted into a defined headspace, the headspace gas was analyzed, and the molar concentrations of dissolved H2 and CO were determined (see Organic geochemistry in the Expedition 385 methods chapter [Teske et al., 2021a]). Because of the presence of H2 and CO in the analytical blank, the minimum quantification limits for in situ concentrations of dissolved H2 and CO were 40 and 150 nM, respectively. Concentrations of dissolved H2 vary slightly with depth from below the minimum quantification limit to a maximum of 125 nM at 315.79 mbsf (Figure F37). In contrast, CO generally decreases with increasing depth, and the concentrations range from 63 to 483 nM.
In addition to the headspace measurements described above, 40 void gas samples were collected using a gas-tight syringe and analyzed for H2 and CO contents (Table T18; Figure F37). H2 content ranges between 0.8 and 49 ppmv, decreases with depth in the upper 100 m, and generally remains constant below 100 mbsf with exceptions at 225, 243, and 262 mbsf. CO content varies between 4.1 and 62 ppmv; higher values of CO occur between 73 and 100 mbsf and between 186 and 289 mbsf.
11. Microbiology
11.1. Sampling
Sediment samples for microbiological studies were obtained from Holes U1545B and U1545C using the APC, HLAPC, and XCB coring systems. Hole U1545A was sampled along its deeper indurated sediment column below 480 mbsf when limited core recovery suggested that it might be prudent to use this sampling opportunity instead of relying on penetration in Hole U1545B for recovery of deep sediments. Using samples from the lower portion of Hole U1545A and the full depth range of Hole U1545B, complete or near-complete sections from cold (4°C) seafloor to hot (~89°C), deep sediments were obtained for extensive microbiology sampling. We thus successfully sampled sediments representing the entire spatial and thermal gradient in the sediment column of Site U1545. Sampling for cell counting, 3-D structural imaging, and RNA analyses was performed as described in Microbiology in the Expedition 385 methods chapter [Teske et al., 2021a]).
On 28 October 2019, it was discovered that the shipboard nitrogen gas contained oxygen in substantial concentration (~18%; determined by gas chromatography–thermal conductivity detector [GC-TCD] analysis). Upon this discovery, all the Hole U1545B sample bags were reflushed with oxygen-free nitrogen from gas cylinders. Additional microbiology samples for anaerobic incubation and cultivation experiments were collected from Hole U1545C (30 October–1 November 2019) and placed in gas-tight trilaminated foil bags after flushing three times with oxygen-free nitrogen.
Detailed curatorial information about all collected samples (e.g., core, section, interval, and absolute depths of samples) can be retrieved from the Curation and Samples Laboratory Information Management System Online Report (http://web.iodp.tamu.edu/LORE).
11.2. Microbial cell detection and enumeration
11.2.1. Prokaryotic cell counts
Cell abundance was determined by direct counting with an epifluorescence microscope. For shipboard analysis of sediment, samples (1 cm3) were aseptically taken from Hole U1545A and U1545B sections using tip-cut syringes, and selected samples (Sections 385-U1545B-1H-1, 1H-3, 2H-3, 3H-3, 4H-3, 5H-3, 6H-3, 8H-3, 10H-3, 15H-3, 19F-4, 25F-2, 30F-3, 36F-4, 46F-3, and 50F-3) were processed using the noncell extraction method described in Microbiology in the Expedition 385 methods chapter (Teske et al., 2021a). Cell abundance at the seawater/sediment surface was 5.8 × 10⁸ cells/cm3, and it gradually decreased downhole to 8.2 × 10⁵ cells/cm3 at ~150 mbsf (Figure F38). Below this depth, cells were not observed when counting 10 photomicrograph frames. However, at around 290 mbsf (Section 50F-3), cell abundance increased again to 3.0 × 10⁶ cells/cm3.
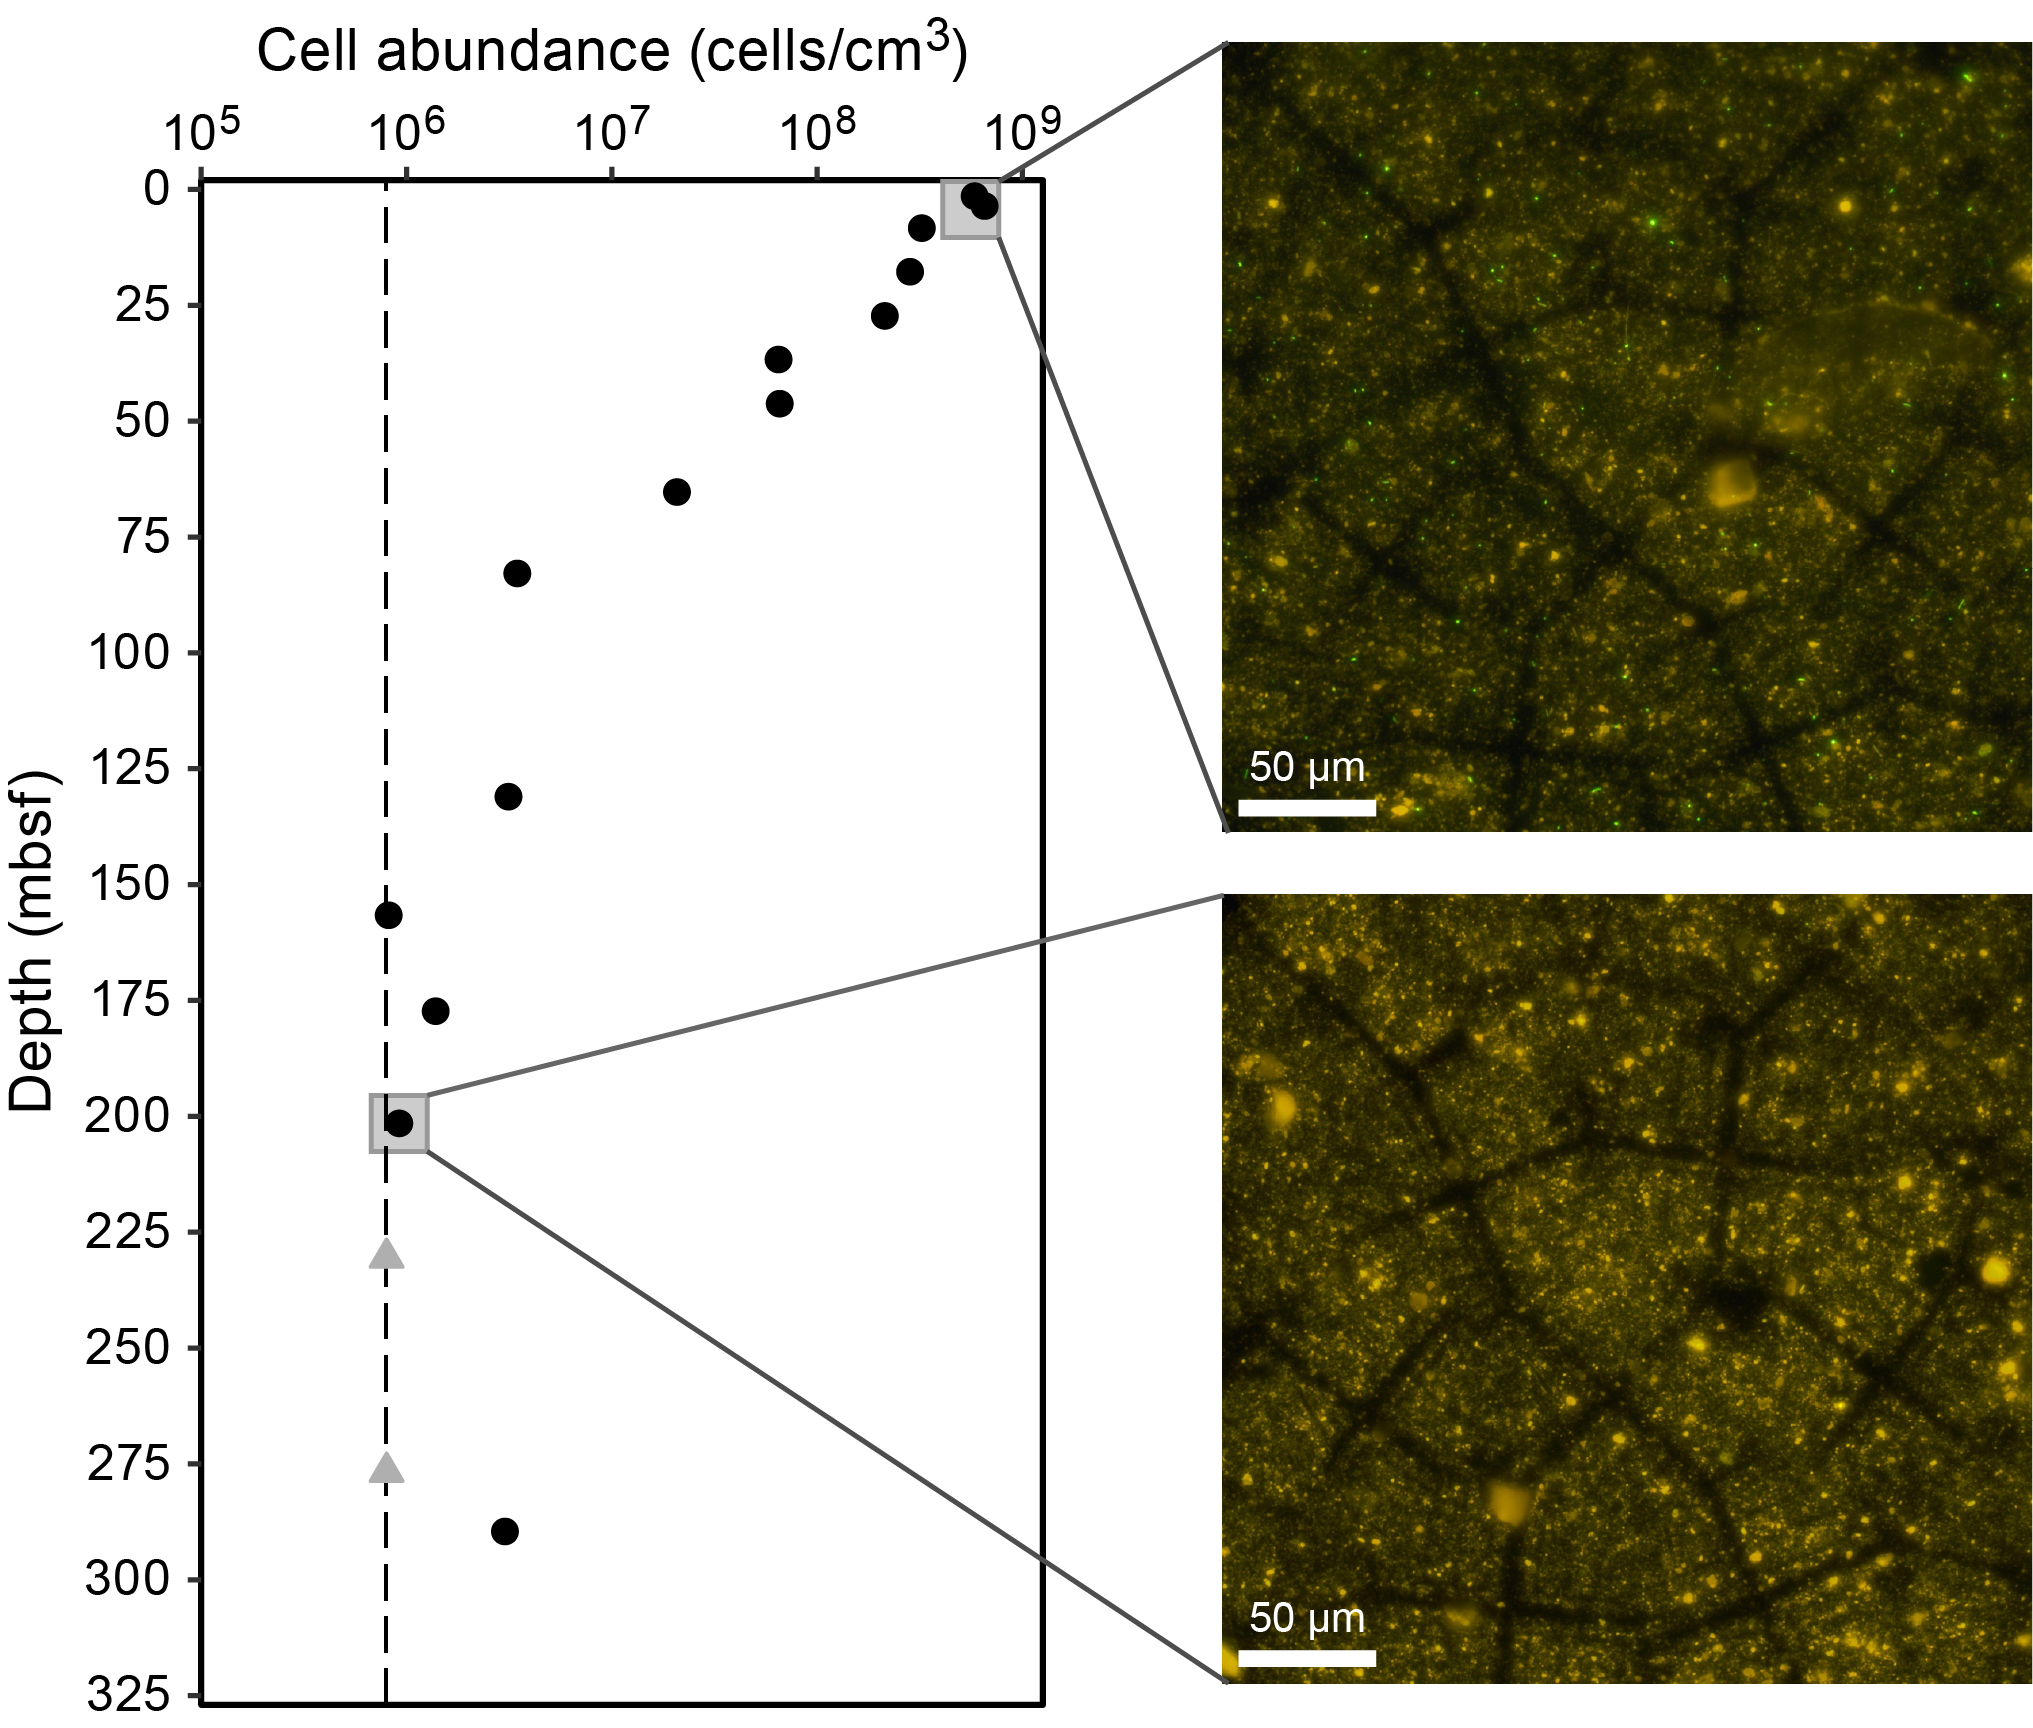
11.2.2. CARD-FISH cell counts of fungi
For catalyzed reporter deposition–fluorescence in situ hybridization (CARD-FISH) cell counts of fungi, ~10 cm3 sediment samples (Sections 385-U1545B-1H-2, 4H-2, 6H-2, 8H-2, 9H-2, 11H-3, 13H-3, 15H-3, 19F-3, 22F-3, 26F-2, 30F-2, 34F-3, and 38F-2 and Sections 385-U1545A-55X-5 and 65X-5) were fixed, washed, and stored as described in Microbiology in the Expedition 385 methods chapter (Teske et al., 2021a).
11.3. Microbial activity measurements
11.3.1. Single-cell stable isotope analysis
Sections 385-U1545B-2H-2, 8H-3, 19F-2, 34F-4, and 60F-3 were taken as whole-round cores and incubated on board for shore-based single-cell stable isotope analysis using nanoscale secondary ion mass spectrometry (NanoSIMS) (see Microbiology in the Expedition 385 methods chapter [Teske et al., 2021a]). Additional whole-round cores (Sections 385-U1545A-55X-5, 62X-2, 65X-5, 72X-2, and 74X-3; Sections 385-U1545B-1H-3, 4H-3, 13H-4, 22F-4, 44F-2, 50F-3, 51F-4, and 58F-3; and Sections 385-U1545C-1H3, 2H-3, 4H-3, 6H-3, 8H-3, 14H-5, 16H-1, 21F-3, 31F-3, 39F-3, 49F-3, and 63F-3) were taken and stored anaerobically at ~4°C for potential shore-based incubations.
11.3.2. Stable isotope bioassays of hydrocarbon degradation
A stable isotope probing experiment was initiated with material from Section 385-U1545A-1H-2 and 13C-labeled phenanthrene. Working within an anaerobic chamber, a 50.6 cm3 sediment sample was mixed with 455.6 mL of anaerobic artificial seawater. This slurry was transferred in 50 mL portions into nine 100 mL Hungate bottles, and 1.14 mL of phenanthrene (0.1 mg/mL) was added to each bottle. After they were filled with Biomix gas (5% H2:70% N2:25% CO2), the bottles were incubated at room temperature. When the bottles were sacrificed at timepoint zero (T0) and after 5, 12, and 24 days, half of the volume was frozen in a 50 mL Falcon tube at −80°C for lipid analyses and the other half was frozen in a second 50 mL Falcon tube at −80°C for RNA extraction to be carried out in a shore-based laboratory. A second stable isotope probing study was set up using material obtained from Section 385-U1545B-19H-3 and incubated in the dark at 30°C.
11.3.3. Rates of methanogenesis and anaerobic oxidation of methane
In Hole U1545B, whole-round samples from Sections 1H-3, 3H-3, 5H-3, 6H-3, 7H-3, 9H-3, 13H-4, 14H-4, 15H-4, 20F-4, 22F-4, 25F-2, 28F-3, 30F-3, 38F-3, 51F-4, and 60F-4 were collected to examine rates of methanogenesis and AOM from multiple depths along geochemical and temperature gradients. Sediment samples ~5 mL in volume were transferred to modified Hungate tubes in an anaerobic chamber in the microbiology cold room, and triplicate live samples and one killed control were collected for each substrate. These samples were then injected with 14C-labeled methane, bicarbonate, acetate, formate, methanol, and methylamine (see Microbiology in the Expedition 385 methods chapter [Teske et al., 2021a]) and incubated at different temperatures (20°, 30°, 40°, 50°, and 70°C) for 2 weeks. After incubation, microbial activity was terminated by injecting 3 mL of 2 M NaOH into each sample. Fixed samples were stored at room temperature and shipped to shore for further processing.
11.3.4. Sulfate reduction activity
Whole-round core samples for sulfate reduction rate measurements were resampled (Hole U1545C) from freshly drilled sediment after the discovery of oxygen contamination in the ship’s gas lines; prior compromised samples from Hole U1545B are not listed here because they were not processed further. Samples (Sections 385-U1545C-1H-3, 2H-3, 3H-3, 4H-2, 5H-3, 6H-2, 7H-3, 8H-2, 10H-3, 12H-4, 14H-4, 16H-2, 21F-2, 27F-2, 31F-2, 35F-2, 39F-2, 43F-3, 49F-2, 57F-2, and 63F-2) were chosen according to chemical and physical analyses of material recovered from Hole U1545A to capture geochemical and thermal changes at Site U1545. Selected 10 cm whole-round core samples from Hole U1545C, stored anaerobically at 4°C, were opened in the anaerobic chamber and chopped into small pieces with a sterile ceramic knife. Approximately 5 cm3 of sediment and 5 mL of bicarbonate-buffered sulfate reducer medium (see Microbiology in the Expedition 385 methods chapter [Teske et al., 2021a]) were added to a 20 mL headspace vial and tightly closed with nontoxic blue chlorobutyl rubber stoppers and aluminum crimp caps. For sediment obtained using the APC system, samples were taken with glass syringes (approximately 1 cm in diameter) and closed with a stopper. No medium was added to the glass syringe samples.
Injection of the 35S tracer and incubation were carried out in the dedicated radiation van aboard JOIDES Resolution. Incubation temperatures of 20°, 30°, 40°, 50°, and 70°C were chosen to reflect the approximate in situ temperature gradient of Site U1545 and to capture changes along the SMTZ and the transition between meso- and thermophiles. Incubations were terminated after 10 days as outlined in Microbiology in the Expedition 385 methods chapter (Teske et al., 2021a). Fixed samples were sent to shore for further analysis. All remaining whole-round samples taken for the purpose of sulfate-reduction activity measurements were also sent to shore for processing after the expedition.
11.4. Bioorthogonal noncanonical amino acid tagging analyses
A bioorthogonal noncanonical amino acid tagging (BONCAT) incubation study was set up using sediment material from Section 385-U1545B-1H-2 as described in Microbiology in the Expedition 385 methods chapter (Teske et al., 2021a). A second BONCAT study was set up with sediment from Section 19H-3 and incubated at 30°C. Volumes used for generation of the slurry and for individual incubation bottles were increased threefold for the deeper sample from Section 19H-3 relative to the shallow sample from Section 1H-2.
11.5. Cultivation experiments
11.5.1. Cultivation of mesophilic, thermophilic, and hyperthermophilic methanogenic subsurface microorganisms
Sediment samples from Holes U1545A and U1545B were selected according to in situ temperature ranges for analyses of potential mesophilic, thermophilic, and hyperthermophilic methanogenic populations (Table T19). Sediment slurries were prepared as described in Microbiology in the Expedition 385 methods chapter (Teske et al., 2021a), used as inoculum, and supplemented with one of the selected carbon substrates: bicarbonate; acetate; methanol; dimethylsulfide (10–20 mM); or hexadecane, dodecane, and hexane (final concentration = 1–5 vol%) with a H2/CO2 and N2/CO2 gas atmosphere (80/20 V/V; 200 kPa). Each treatment was performed in duplicate. In addition to an autoclaved control, one vial without substrate addition was used as the negative control. The sediment slurries were incubated close to the in situ temperatures (30°, 60°, and 80°C) in the dark and without shaking. Cultures and incubations were periodically checked (every month) for de novo methane production in the headspace using a gas chromatograph and compared with a negative control (uninoculated and autoclaved sediment). The presence of growing microbial populations from methane-producing enrichments was confirmed by light microscopy (Nikon Eclipse E400). Amended sediments were selected for further enrichments only when methane was detected in the headspace. As a starting point for enrichment and incubation monitoring, subsamples of around 50 cm3 were frozen at −80°C within a few hours after recovery for onshore metagenomic and metabarcoding analyses.
11.5.2. Methanogenic and sulfate-reducing microbial enrichments and DNA preservation for metagenomic analyses
To investigate how methanogenic and sulfate-reducing microbial community composition may vary with local geochemistry, anaerobic methanogenic and sulfate-reducing microbial enrichments were set up, in triplicate, from the center of two whole-round cores (Sections 385-U1545B-13H-3 [112 mbsf] and 34F-3 [220 mbsf]) at their in situ temperatures of 30°C and 50°C, respectively. Enrichment media and slurries were prepared as described in Microbiology in the Expedition 385 methods chapter (Teske et al., 2021a).
Subsamples for shore-based DNA extraction were taken from all whole-round core samples collected from Hole U1545A (Sections 55X-5, 65X-5, 72X-2, and 74X-3) and Hole U1545B (Sections 4H-2, 6H-2, 8H-2, 13H-3, 19H-4, 34H-3, 51F-3, 58F-2, and 60F-2) as described in Microbiology in the Expedition 385 methods chapter (Teske et al., 2021a). Before subsampling was performed, these whole-round core samples had unknowingly been exposed to atmospheric oxygen concentrations for three days. As potential replacements for these oxygenated samples, entire 10 cm whole-round core samples were frozen at −80°C in sterile Whirl-Pak bags from Hole U1545C (Sections 4H-2, 4H-3, 6H-2, 6H-3, 8H-2, 8H-3, 14H-4, 14H-5, 21F-2, 21F-3, 31F-2, 39F-2, 49F-2, 63F-2, and 63F-3) for shore-based processing and DNA extraction.
11.5.3. Cultivation experiments for fungi
For each sample (Sections 385-U1545B-1H-2, 4H-2, 6H-2, 8H-2, 9H-2, 11H-3, 13H-3, 15H-3, 19F-3, 22F-3, 26F-2, 30F-2, 34F-3, and 38F-2 and Sections 385-U1545A-55X-5 and 65X-5), two enrichment cultures were initiated by placing 5 mL of sediment each into two 30 mL Hungate bottles with 15 mL of filtered bottom water, gassing with Biomix gas, and capping and storing at ~4°C. Additional live sediment overlaid with filtered bottom water was stored anaerobically in 250 mL glass bottles filled with Biomix gas (see Microbiology in the Expedition 385 methods chapter [Teske et al., 2021a]) and stored at ~4°C. These samples will be used for fungal enrichment experiments in a shore-based laboratory.
12. Petrophysics
Physical properties of recovered cores were measured on whole-round as well as working- and (subordinate) archive-half sections in the core laboratory for Holes U1545A–U1545C, and the physical properties of the host formation were measured through downhole wireline logging using two different tool strings in Hole U1545A. Measurements on whole-round and working-half sections were compared between the three holes. Measured properties and measurement procedures are listed in Tables T17 and T18 in the Expedition 385 methods chapter (Teske et al., 2021a). Hole U1545C was dedicated to microbiology resampling; only whole-round measurements and compressive strength measurements on section halves were conducted for this hole.
Hole U1545A is the deepest of the three holes at Site U1545. Correlation between various measured physical properties revealed 12 to 13 specific depth horizons that are indicative of particular properties or processes, such as the diagenetic opal-A and opal-CT transitions (see Lithostratigraphy and Paleomagnetism), the presence of gas (see Organic geochemistry), and changes in lithology (see Lithostratigraphy). The most significant transition in terms of physical properties occurs at 280 mbsf. This transition correlates with lithologic changes; recovered sediments become darker in hue and have decreasing micrite and carbonate contents (see Lithostratigraphy).
One paleosurface horizon outlined in the expedition’s Scientific Prospectus (Teske et al., 2018) may be particularly well defined by petrophysical data at ~170 mbsf in Holes U1545A and U1545B. This horizon has a strong expression in NGR, with counts nearly twice that of the background values (NGR = 39 counts/s; background values = 20 counts/s). Values of GRA bulk density and MS are also distinct at this depth.
12.1. Data acquisition
Core laboratory measurements were conducted as explained in Petrophysics in the Expedition 385 methods chapter (Teske et al., 2021a) with no divergence from the standard sequence of measurements or measurement spacing for Holes U1545A and U1545B. For Hole U1545C, a subset of measurements were made on only a few section halves because the full suite of physical properties measurements had already been made for adjacent holes (see Table T17 in the Expedition 385 methods chapter [Teske et al., 2021a]).
Downhole wireline logging in Hole U1545A commenced after the final core was recovered at ~503 mbsf. The first logging run acquired data using the triple combo tool string, which includes the EDTC, HNGS, HLDS, and HRLA tools (Tables T20, T21) (see Petrophysics in the Expedition 385 methods chapter [Teske et al., 2021a]). Only one complete tool string pass, which includes measurements made on both a downward and an upward pass, was possible because of a caliper malfunction on the upward pass. The maximum depth reached by the bottom of the ~40 m long triple combo tool string was ~493 mbsf in Hole U1545A, with the bottom end of the string just above the bottom of the cored hole. Subsequently, the FMS-sonic tool string was deployed to acquire resistivity imaging data, measurements of compressional and shear seismic velocities and Stoneley wave dispersion (DSI), spectral gamma radiation (HNGS), and temperature measurements (LEH-MT tool). A total of two complete passes with the ~35.5 m long FMS-sonic tool string were made: two downward and two upward passes. Measurements reported here are from the upward pass. The maximum depths of the two complete passes were ~460 mbsf for the first pass and ~448 mbsf for the second. However, the first upward pass was stopped at ~74 mbsf, whereas the second upward pass measured continuously to the seafloor (for instruments such as the HNGS). We report here the second upward pass, which recorded data from ~434 mbsf to the seafloor.
The selection of data described here involved several factors, including potential instrument failure, the maximum depth range covered, and the fact that upward-pass measurements are typically of higher quality than downward-pass measurements. Table T21 summarizes reported measurements with comments on measurement quality.
12.2. Downhole temperature and thermal conductivity
12.2.1. Downhole temperature
A total of 30 in situ formation temperature measurements were made using the APCT-3 tool (Figure F39) and the SET2 tool (see Petrophysics in the Expedition 385 methods chapter [Teske et al., 2021a]). Measured temperature values range from 11.23°C at 33 mbsf (Core 385-U1545A-4H) to 65.27°C at 277.3 mbsf (Core 47F) in Hole U1545A and from 10.88°C at 33 mbsf (Core 385-U1545B-4H) to 85.22°C at 358.6 mbsf (Core 64X) in Hole U1545B (Table T22). SET2 measurements for Hole U1545A were not included in the analysis of temperature data presented in this report. The tool was calibrated after Hole U1545A was completed, resulting in more reliable results for Hole U1545B. The APCT-3 data can confidently be fit with a straight line and indicate a temperature increase with depth along a linear geothermal gradient of 225°C/km (Figure F40A). Heat flow is calculated according to the Bullard method (see Petrophysics in the Expedition 385 methods chapter [Teske et al., 2021a]). The slope of the linear fit between thermal resistance and formation temperature indicates a heat flow of 161 mW/m2 (Figure F40C).

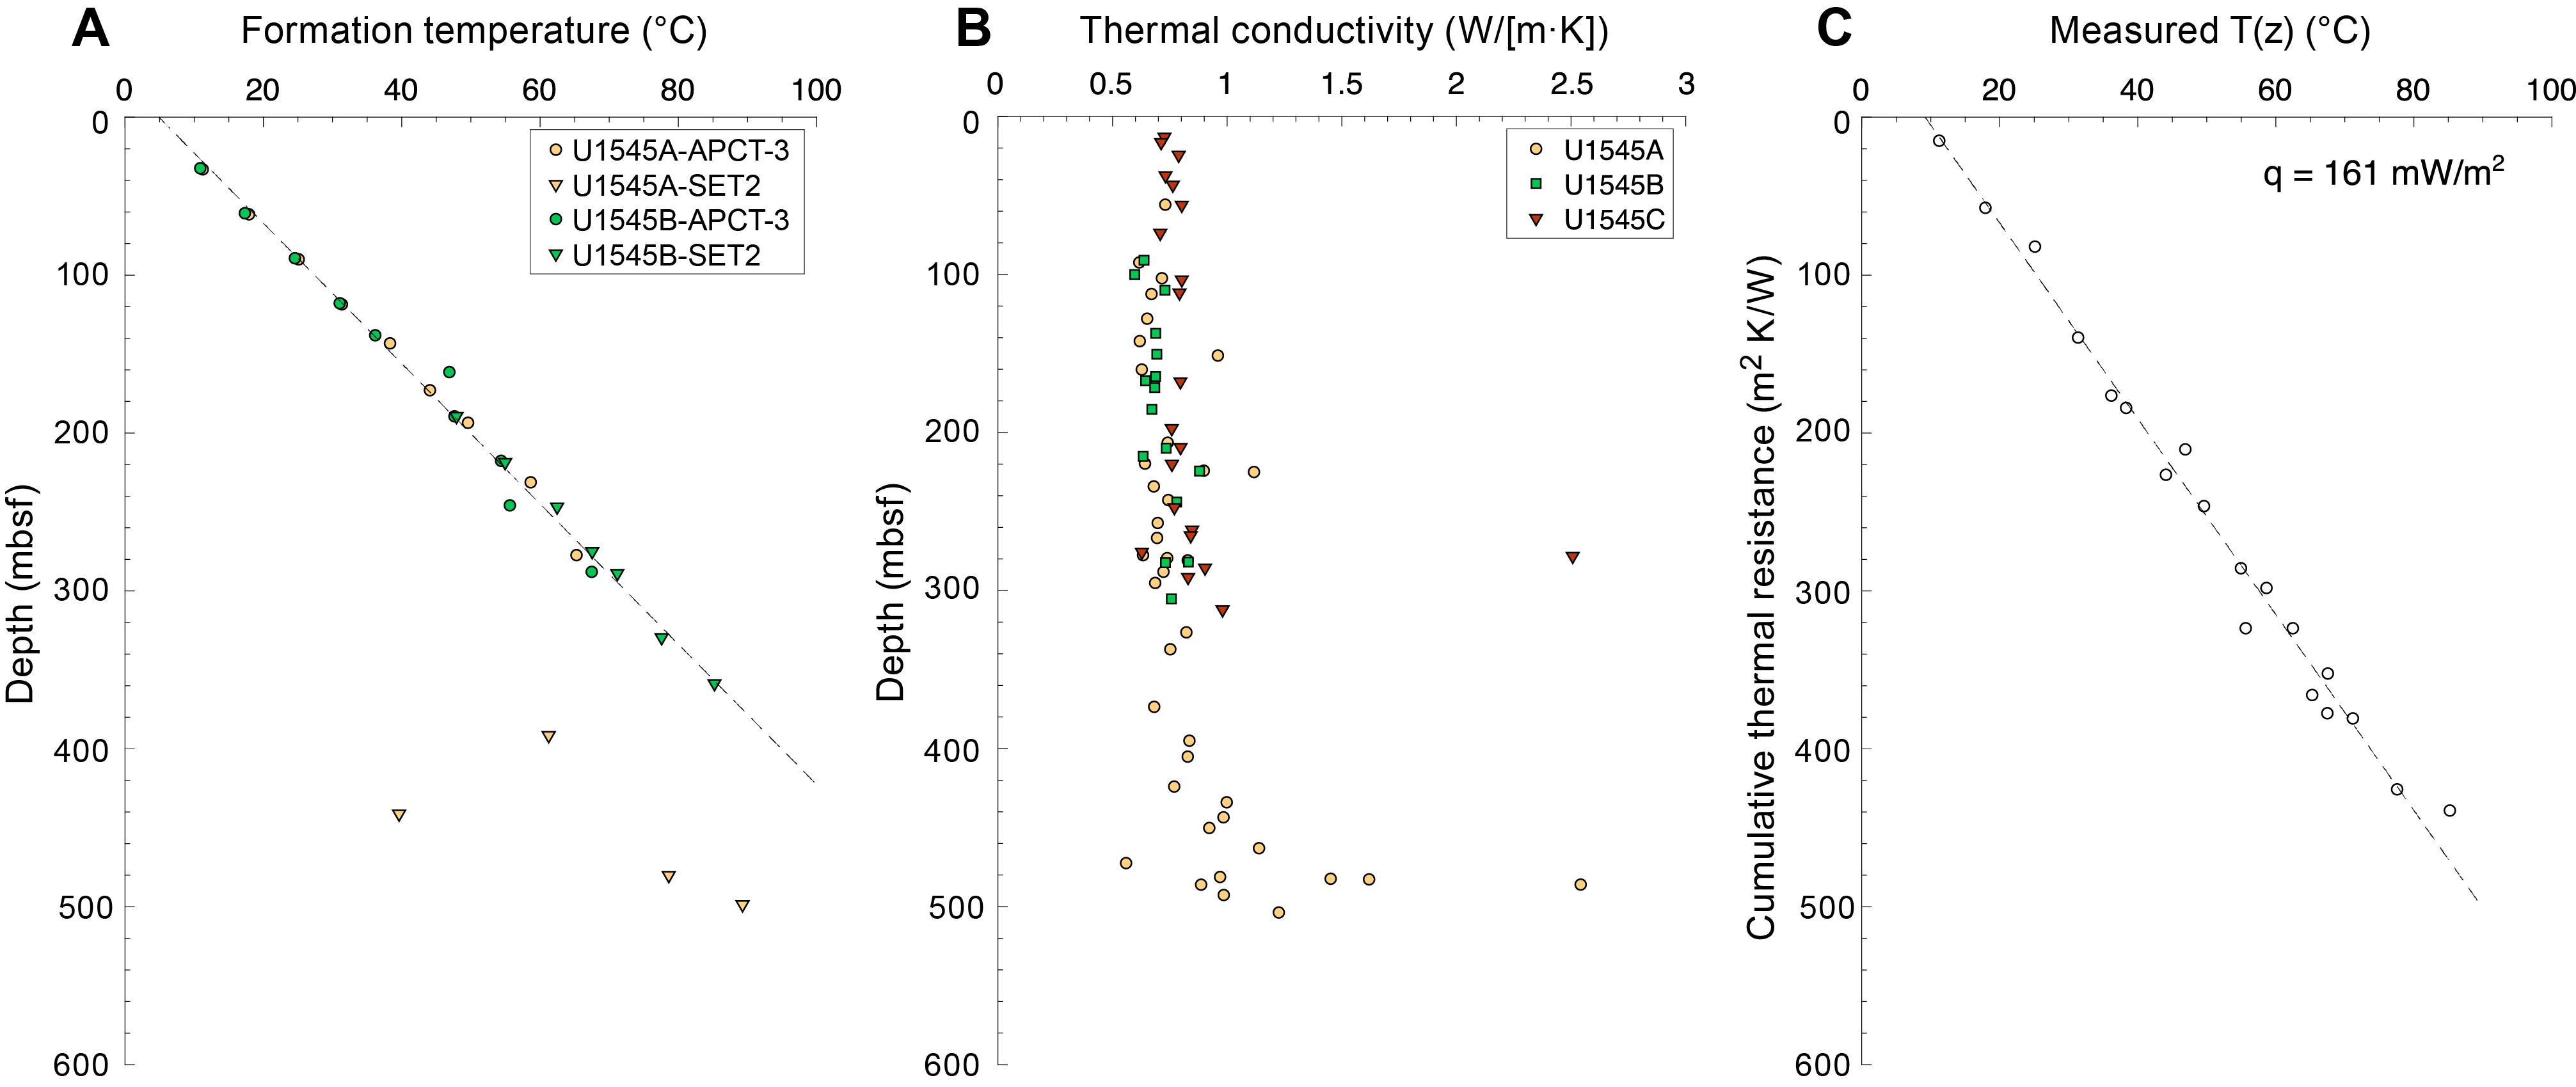
12.2.2. Thermal conductivity
Measured thermal conductivity values at Site U1545 vary between 0.56 and 2.54 W/(m·K) (Figure F40B). Two hard rock conductivity measurements made on a sill sample from Core 385-U1545C-71X yielded a mean thermal conductivity of ~1.62 W/(m·K) (Figure F40B), which resembles values reported for basalt (1.7 ± 0.6 W/[m·K]) (Raznjevic, 1976). Measurements in Holes U1545B and U1545C are consistent with values from Hole U1545A (Figure F40B), establishing a precision of ~0.3 W/(m·K) for the thermal conductivity measurement.
12.3. Density (formation/core and grain)
Bulk density was measured automatically every 2 cm on the Whole-Round Multisensor Logger (WRMSL) for Holes U1545A–U1545C. In addition, MAD was measured on 10 cm3 discrete core samples from Holes U1545A and U1545B. Usually, one sample per APC core or two samples per HLAPC core were measured. Both types of density measurements show similar variations (Figure F41B). Two patterns of changes are observed in the GRA bulk density. The first, in the upper 100 m of sediment, is characterized by a downhole increase and then a decrease in density with a maximum value at ~65 mbsf (1.305 g/cm3) and minimum values near the surface (1.146 g/cm3) and ~100 mbsf (1.260 g/cm3). The second pattern of density change is a relatively linear increase with depth. From 100 to about 280 mbsf, density generally increases by 0.111 g/cm3 every 100 m. A slightly steeper increase in density (0.136 g/cm3 every 100 m) is observed from ~280 mbsf to the bottom of Hole U1545A. This density increase correlates particularly well with NGR data and corresponds to a change in lithology identified as diatom clay and siliceous claystone (see Lithostratigraphy). Measurements of bulk density made during downhole logging with the triple combo tool string are consistent with core-based measurements (Figure F41B).

12.4. Magnetic susceptibility
MS and MSP values are in very good agreement along the entire profile of Site U1545 (Figure F41C). Notable changes in MS correlate with depth horizons identified by other physical properties measurements, including a decrease at 60 mbsf and peaks at 170 and 482–483 mbsf (density and NGR counts in Figure F41). In addition, a sudden increase in MS at 280 mbsf from 2.67 × 10⁻⁵ to 10 × 10−5 SI correlates with density, porosity, gamma ray, and resistivity data, and two distinct MS peaks in Sections 385-U1545A-35F-1 and 35F-2 (~210–227 mbsf) and one peak in Section 36F-3 (~226 mbsf) correspond to black, altered sediments containing an increased amount of magnetic minerals (see Paleomagnetism). The largest peak values, at ~485 mbsf (Section 69X-4) and 482–484 mbsf (Section 71X-3), correspond to the identified sill intrusion (see Igneous petrology and alteration).
12.5. Sonic velocities
P-wave velocities measured with the WRMSL and Section Half Measurement Gantry (SHMG) calipers for the uppermost sediment are close to the seawater velocity in the upper 50 to 60 m (mean value = 1499 m/s) (Figure F41D). WRMSL P-wave values and SHMG caliper values between the seafloor and 50 mbsf are of good quality with only a few deviant values. Noise in the P-wave data becomes problematic at depths greater than 50 mbsf because of the onset of degassing-induced sediment disruption and void space creation in the core sections. Between 50 and 60 mbsf, useful P-wave velocity data can still be extracted from the WRMSL. Manual first-arrival picking on the SHMG caliper is impossible after 60 mbsf.
Cracks and voids formed due to decompression are not observed below ~280 mbsf. However, biscuiting affects these deeper cores (Figure F41D) (see Lithostratigraphy). This disturbance coincides with the onset of the opal-A to opal-CT transformation (see Biostratigraphy and Lithostratigraphy), which results in a substantial change in lithology and associated physical properties. Finally, higher P-wave velocity (4300 m/s) was measured in the sill samples recovered from Core 385-U1545A-71X (Figure F41) (see Igneous petrology and alteration).
P-wave velocities of the borehole formation can be measured from first arrivals sourced and received by the FMS-sonic tool string, which was lowered below the BHA at about 84 mbsf. Thus, P-wave velocities could only be measured between the end of the BHA and the bottom of the hole.
Here we directly compare P-wave velocities measured in the core laboratory and during downhole logging (Figure F41D). The results indicate a good correlation between the P-wave measurements made in the core laboratory and the overall trend of the P-wave velocities determined from the Hole U1545A downhole logging data.
Seismic velocity measurements suggest a change in lithology at ~280–300 mbsf that correlates well with the opal-A to opal-CT transition identified by other petrophysical parameters. This change in lithology is particularly visible in the S-wave signal, which shows a velocity increase from 289 to 364 m/s between 300 and 340 mbsf (Figure F41D).
12.6. Formation natural gamma radiation
NGR values on core sections from Holes U1545A–U1545C exhibit an increase from 0 to 30 mbsf with a peak value of ~21 counts/s and a decrease from 30 to 75 mbsf with a minimum value of ~5 counts/s (Figure F41E). Below 75 mbsf, NGR values generally increase to ~21 counts/s at ~117 mbsf. NGR counts increase steadily from 14 to 25 counts/s between 135 and 270 mbsf, and a steeper increase is observed from 280 to ~506 mbsf with a maximum value of ~66 counts/s at 506 mbsf (Figure F41E). The large NGR count of 83 counts/s at ~470 mbsf corresponds to the sediment/sill contact at the top of the sill.
Both sets of HNGS measurements from the two tool strings show similar variation with depth as shown by the NGR measurements (Figure F41E). However, the data from the FMS-sonic tool record signal intensity that is closer to measurements made on core sections using the Natural Gamma Radiation Logger (NGRL) in the core laboratory. We use the data from the HNGS module of the FMS-sonic tool string to compare depth variation in potassium, uranium, and thorium with total NGR counts (Figure F42). Strong peaks in concentration relative to background are observed for K and U, and to a lesser degree Th, at ~280 mbsf. To 425 mbsf, the three concentration signals oscillate between high and low values and have an amplitude of ~1 wt% for K and 3–6 ppm for U and Th; all three elements reach a maximum value at ~390–400 mbsf (K = 1.41 wt%; U = 5 ppm; Th = 7 ppm). Other combined peak values in the three concentration signals are observed at ~300 and ~350 mbsf.
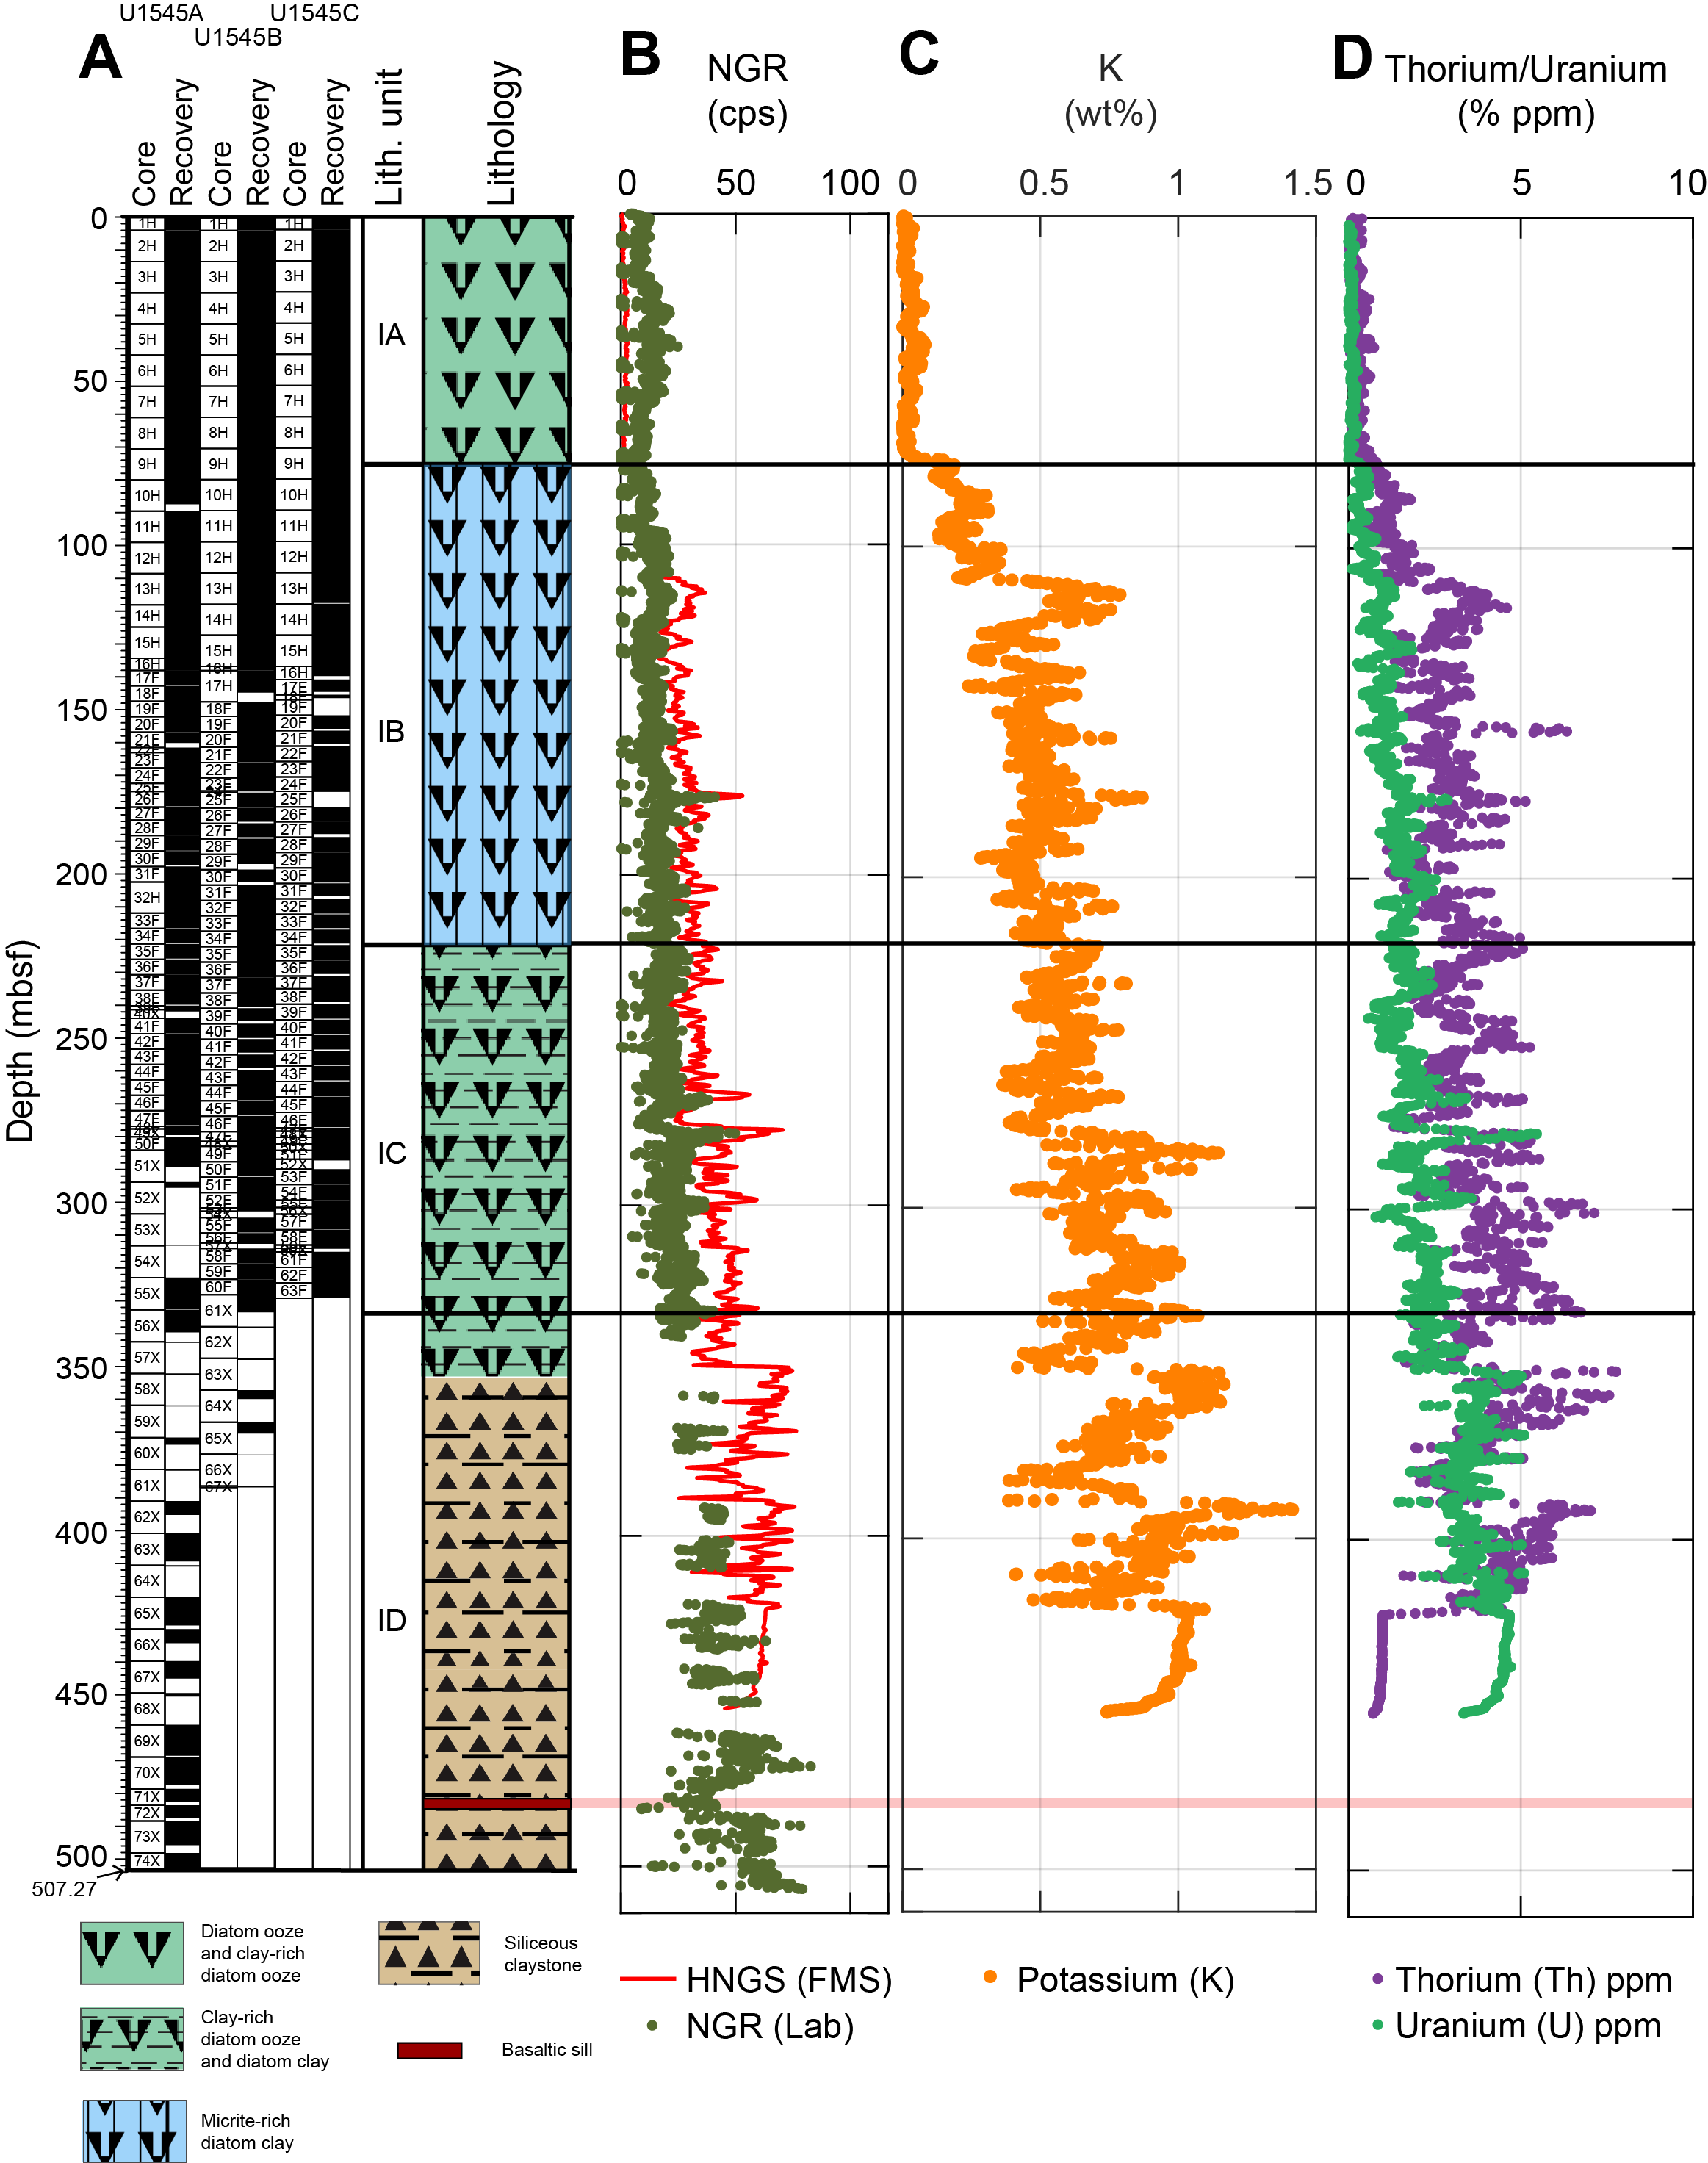
Three notable NGR anomalies are observed at Site U1545. A sharp peak of ~39 counts/s is observed at ~175–178 mbsf over a depth range of ~1 m, which correlates well with a trend in GRA bulk density and MS over the same depth range (Figure F41). A similar sharp increase in NGR counts at around 278 mbsf is also correlated with increases in GRA bulk density and MS. Finally, between 470 and 490 mbsf, a pronounced decrease in NGR counts is observed, with ~25 counts/s in this interval compared to the background trend of 50.1 counts/s (polynomial fit value). This anomaly coincides with an increase in MS and thermal conductivity, and it is consistent with the presence of the small sill identified in Section 385-U1545C-71X-3.
12.7. Borehole diameter (caliper)
Caliper data from the FMS-sonic tool string show diameters for both the C1 and C2 calipers at the maximum opening of the calipers between ~110 and ~275 mbsf (Figure F43), suggesting a relatively soft borehole wall over that interval. From 360 to 420 mbsf, differences in the opening distances of the C1 and C2 calipers are interpreted as indicators of borehole ellipticity. The azimuth of the long axis of ellipticity is taken as that of the caliper with the largest opening, in this case C1, which was fully extended between 400 and 410 mbsf, indicating a C1 to C2 caliper difference of at least ~20–50 cm. Values obtained from both passes yield similar results: ~47° C1 azimuth for the first pass and 42° C1 azimuth for the second pass. This suggests a slight hole ellipticity with a long axis in the northeast–southwest direction. This could be an indication of the present-day plain stress with a slight compression in the northwest–southeast direction.

12.8. Rheology
Shear strength measurements were made with the automated vane shear (AVS) on cores from Holes U1545A and U1545B, and those data were supplemented with high-density (i.e., short measurement spacing) compressive strength measurements (made using the pocket penetrometer [PEN]) on cores from Hole U1545C (Figure F41F). AVS shear strength measurements show a linear increase from the seafloor to ~246 mbsf from ~16 to ~84 kPa, respectively. In detail, variability around this linear trend starts to appear below 100 mbsf. PEN shear strength measurements show more variability but increase consistently with depth from 0.15 kPa at the seafloor to up to 220 kPa at 328 mbsf. A good agreement between the AVS and PEN measurements was obtained below 45–50 mbsf. Below 100 mbsf, the lithology shows a progressive increase in shear strength with a maximum at 150 mbsf corresponding to indurated carbonate (see Lithostratigraphy). After a drop in shear strength at ~160 mbsf (i.e., 37 kPa), both sets of measurements increase to a maximum value of 220 kPa at 215 mbsf. A decrease in values at ~235 mbsf (AVS = 54 kPa; PEN = 37 kPa) is followed by an increase in strength that is particularly well captured by PEN measurements and has a maximum of 225 kPa at 270 mbsf. Below 270–280 mbsf, only PEN measurements were possible, and those data show a general decrease in shear strength down to 19–90 kPa between 280 and 325 mbsf. Beyond 325 mbsf, PEN measurements reach the instrument maximum values of 225 kPa.
The rheology measurements are very precise at shallow depths and are congruent with the first depth interval characterized by density and derived porosity (Figure F41F). AVS shear strength measurements increase from the seafloor to 50–60 mbsf. After a small drop at about 50 mbsf, shear strength remains relatively constant at 35–50 kPa to 100 mbsf (Figure F41F). The interval from the seafloor to 60 mbsf is described as slump deposits (see Structural geology), which could explain the gradual increase of density with depth and the step increase in porosity at ~60 mbsf.
12.9. Porosity
Porosity derived from MAD measurements shows a decrease from 90% at the seafloor to 80% at 60 mbsf (Figure F41G). The same pattern is repeated from 60 to 100 mbsf. From 100 to 280 mbsf, porosity decreases linearly from 80% to 70%–75%. Finally, from 280 to 475 mbsf, porosity decreases quasilinearly from ~75% to ~50%. Density and porosity derived from MAD measurements for both Holes U1545A and U1545B are very consistent (Figure F41).
12.10. Resistivity
Resistivity measurements show large relative variations of 0.5–2.25 Ωm (Figure F43F) that typically correlate with variation in density and porosity. Several notable resistivity variations relative to the background value of ~0.5 Ωm are observed:
- 100 mbsf: relative variations range from 0.29 to 0.70 Ωm.
- 137 and 141 mbsf: moderate resistivity up to 0.9 Ωm.
- 224 and 242 mbsf: moderate resistivity up to 0.7 Ωm.
- 276 and 281 mbsf: high resistivity up to 2.3 Ωm.
- 301, 312, 332, 348, 359, 376, 372, 389, 400, 411, 419, 428, 432, 441, 446, 457, 462, 467, 472, 476, and 480 mbsf: resistivity values range from 0.63 to 2.15 Ωm.
Most of these more resistive layers are correlated with NGR peak values that coincide with a more clay-rich lithology from ~276 to at least ~450 mbsf.
12.11. Downhole Formation MicroScanner resistivity imaging
Many geological features are seen throughout the FMS resistivity imagery, although a quantitative geological interpretation of the images awaits further onshore processing and analyses. The reader may refer to the supplementary data, where we document the FMS images processed by Lamont-Doherty Earth Observatory Borehole Research Group (LDEO-BRG; Columbia University, US) (see 385-U1545A_FMS_Log_Summary.pdf in U1545A in FMS_IMAGE in Supplementary material). Despite the enlarged borehole to ~250 mbsf, good contact between the FMS pads and the surrounding formation was achieved, and the two repeated passes provide consistent images at similar azimuths.
12.12. Data integration and lithology correlation
We identified three main intervals that relate to specific lithostratigraphic units: 0–100, 100–280, and 280–507 mbsf (Figure F41E). The shallower interval corresponds to Lithostratigraphic Subunit IA, which is composed of loosely consolidated sediment with gradually increasing compaction with depth, as indicated by the general increase in density and decrease in porosity. This section was divided into two repeated intervals based on porosity derived from density measurements. From the seafloor to 60 mbsf, porosity progressively decreases from 90% to 80%; it then increases abruptly back to 90% just below 60 mbsf and again decreases with depth to ~80% at 100 mbsf. The depth interval of 60–80 mbsf corresponds to the SMTZ (see Paleomagnetism, Inorganic geochemistry, and Organic geochemistry). The increasing concentration of methane in pore fluids beyond this depth and the subsequent exsolution of methane upon decompression of the cores recovered from the seafloor explain the formation of voids in the cores and the resulting measurements of P-wave velocity that are very low and unrepresentative of in situ conditions.
The second main interval (100–280 mbsf) is defined by a gradual increase in density, NGR intensity, rheology (despite a few weak layers between 200 and 280 mbsf), and constant resistivity. This interval is associated with Lithostratigraphic Subunit IB (75–225 mbsf), which is dominated by clay-rich diatom ooze.
The third and final interval (280–507 mbsf) is characterized by a steeper increase in density and gamma ray and a transition to more radionuclide-rich thin layers that are correlated with higher resistivity thin beddings. This interval is associated with Lithostratigraphic Subunit ID (330–507 mbsf).
The onset of the opal-A to opal-CT transition, which is characterized by dissolution and reprecipitation of biogenic silica, begins around 280 mbsf. This transition marks the onset of the disappearance of diatoms observed at 289 mbsf (first sample below 280 mbsf for biostratigraphy). Diatoms are reported to fully disappear from the stratigraphy at 313 mbsf (see Biostratigraphy). A number of petrophysical properties change over this transition (e.g., density and P-wave velocity increase).
The sill cored at ~482–483 mbsf (see Igneous petrology and alteration) is highlighted by its physical properties; it has a major peak in MS, a significantly higher density (~2.4 g/cm3), thermal conductivity in the range of basaltic material (1.6 W/[m·K]), and a P-wave velocity of ~4300 m/s, which is also consistent with basaltic material.
References
Arason, P., and Levi, S., 2010. Maximum likelihood solution for inclination-only data in paleomagnetism. Geophysical Journal International, 182(2):753–771. https://doi.org/
Baumgartner, T.R., Ferreira-Bartrina, V., and Moreno-Hentz, P., 1991. Varve formation in the central Gulf of California: a reconsideration of the origin of the dark laminae from the 20th century varve record. In Dauphin, J.P., and Simoneit, B.R.T. (Eds.), Gulf and Peninsular Province of the Californias. AAPG Memoir, 47:617–635.
Beal, E.J., House, C.H., and Orphan, V.J., 2009. Manganese- and iron-dependent marine methane oxidation. Science, 325(5937):184–187. https://doi.org/
Berner, R.A., 1981. A new geochemical classification of sedimentary environments. Journal of Sedimentary Research, 51(2):359–365. https://doi.org/
Berner, R.A., and Raiswell, R., 1983. Burial of organic carbon and pyrite sulfur in sediments over phanerozoic time: a new theory. Geochimica et Cosmochimica Acta, 47(5):855–862. https://doi.org/
Borowski, W.S., Paull, C.K., and Ussler, W., III, 1997. Carbon cycling within the upper methanogenic zone of continental rise sediments: an example from the methane-rich sediments overlying the Blake Ridge gas hydrate deposits. Marine Chemistry, 57(3):299–311. https://doi.org/
Burdige, D.J., 2006. Geochemistry of Marine Sediments: Princeton, NJ (Princeton University Press). https://digitalcommons.odu.edu
Dunlop, D.J., Özdemir, Ö., and Schmidt, P.W., 1997. Paleomagnetism and paleothermometry of the Sydney Basin 2. Origin of anomalously high unblocking temperatures. Journal of Geophysical Research: Solid Earth, 102(B12):27285–27295. https://doi.org/
Goldhaber, M.B., and Kaplan, I.R., 1974. The sulfur cycle. In Goldberg, E.D. (Ed.), The Sea (Volume 5): Marine Chemistry: New York (Wiley), 569–655.
House, C.H., Cragg, B.A., Teske, A., and the Leg 201 Scientific Party, 2002. Drilling contamination tests during ODP Leg 201 using chemical and particulate tracers. In D’Hondt, S.L., Jørgensen, B.B., Miller, D.J., et al., Proceedings of the Ocean Drilling Program, Initial Reports, 201. College Station, TX (Ocean Drilling Program). https://doi.org/
Jørgensen, B.B., 2000. Pathways of organic matter degradation. In Schulz, H.D., and Zabel, M. (Eds.), Marine Geochemistry (2nd edition): Berlin (Springer-Verlag).
Jørgensen, B.B., Nelson, D.C., Amend, J.P., Edwards, K.J., and Lyons, T.W., 2004. Sulfide oxidation in marine sediments: geochemistry meets microbiology. In Amend, J.P., Edwards, K.J., and Lyons, T.W. (Eds.), Sulfur Biogeochemistry - Past and Present. Special Paper - Geological Society of America, 379. https://doi.org/
Karlin, R., 1990. Magnetite diagenesis in marine sediments from the Oregon continental margin. Journal of Geophysical Research: Solid Earth, 95(B4):4405–4419. https://doi.org/
Kastner, M., and Gieskes, J.M., 1976. Interstitial water profiles and sites of diagenetic reactions, Leg 35, DSDP, Bellingshausen abyssal plain. Earth and Planetary Science Letters, 33(1):11–20. https://doi.org/
Kastner, M., and Siever, R., 1983. Siliceous sediments of the Guaymas Basin: the effect of high thermal gradients on diagenesis. Journal of Geology, 91(6):629–641. https://doi.org/
Keller, M.A., and Isaacs, C.M., 1985. An evaluation of temperature scales for silica diagenesis in diatomaceous sequences including a new approach based on the Miocene Monterey Formation, California. Geo-Marine Letters, 5(1):31–35. https://doi.org/
Kirschvink, J.L., 1980. The least-squares line and plane and the analysis of palaeomagnetic data. Geophysical Journal International, 62(3):699–718. https://doi.org/
Knittel, K., and Boetius, A., 2009. Anaerobic oxidation of methane: progress with an unknown process. Annual Review of Microbiology, 63311–334. https://doi.org/
Leslie, B.W., Lund, S.P., and Hammond, D.E., 1990. Rock magnetic evidence for the dissolution and authigenic growth of magnetic minerals within anoxic marine sediments of the California continental borderland. Journal of Geophysical Research: Solid Earth, 95(B4):4437–4452. https://doi.org/
Lever, M.A., Alperin, M., Engelen, B., Inagaki, F., Nakagawa, S., Steinsbu, B.O., and Teske, A., 2006. Trends in basalt and sediment core contamination during IODP Expedition 301. Geomicrobiology Journal, 23(7):517–530. https://doi.org/
Levi, S., and Karlin, R., 1989. A sixty thousand year paleomagnetic record from Gulf of California sediments: secular variation, late Quaternary excursions and geomagnetic implications. Earth and Planetary Science Letters, 92(2):219–233. https://doi.org/
Martini, E., 1971. Standard Tertiary and Quaternary calcareous nannoplankton zonation. In McKee, E.D., and Weir, G.W. (Ed.), Trace Elements Investigations Report, 269: Washington, DC (US Department of the Interior). https://doi.org/
McDougall, K., and Martínez, A.Y.M., 2014. Evidence for a marine incursion along the lower Colorado River corridor. Geosphere, 10(5):842–869. https://doi.org/
Meyers, P.A., 1994. Preservation of elemental and isotopic source identification of sedimentary organic matter. Chemical Geology, 114(3–4):289–302. https://doi.org/
Munsell Color Company, 1994. Munsell Soil Color Charts (revised edition): Baltimore, MD (Munsell Color).
Pimmel, A., and Claypool, G., 2001. Introduction to shipboard organic geochemistry on the JOIDES Resolution. Ocean Drilling Program Technical Note, 30. https://doi.org/
Prell, W.L., Niitsuma, N., et al., 1989. Proceedings of the Ocean Drilling Program, Initial Reports, 117: College Station, TX (Ocean Drilling Program). https://doi.org/
Raznjevic, K., 1976. Handbook of Thermodynamic Tables and Charts: Washington, DC (Hemisphere Publishing Corporation).
Roberts, A.P., 2015. Magnetic mineral diagenesis. Earth-Science Reviews, 151:1–47. https://doi.org/
Stein, R., Brass, G.W., Graham, D., Pimmel, A., and the Shipboard Scientific Party, 1995. Hydrocarbon measurements at Arctic Gateways sites (ODP Leg 151). In Myhre, A.M., Thiede, J., Firth, J.V., et. al., Proceedings of the Ocean Drilling Program, Initial Reports, 151. College Station, TX (Ocean Drilling Program). 385–395. https://doi.org/
Teske, A., Lizarralde, D., and Höfig, T.W., 2018. Expedition 385 Scientific Prospectus: Guaymas Basin Tectonics and Biosphere. College Station, TX (International Ocean Discovery Program). https://doi.org/
Teske, A., Lizarralde, D., Höfig, T.W., Aiello, I.W., Ash, J.L., Bojanova, D.P., Buatier, M.D., Edgcomb, V.P., Galerne, C.Y., Gontharet, S., Heuer, V.B., Jiang, S., Kars, M.A.C., Khogenkumar Singh, S., Kim, J.-H., Koornneef, L.M.T., Marsaglia, K.M., Meyer, N.R., Morono, Y., Negrete-Aranda, R., Neumann, F., Pastor, L.C., Peña-Salinas, M.E., Pérez Cruz, L.L., Ran, L., Riboulleau, A., Sarao, J.A., Schubert, F., Stock, J.M., Toffin, L.M.A.A., Xie, W., Yamanaka, T., and Zhuang, G., 2021a. Expedition 385 methods. In Teske, A., Lizarralde, D., Höfig, T.W., and the Expedition 385 Scientists, Guaymas Basin Tectonics and Biosphere. Proceedings of the International Ocean Discovery Program, 385: College Station, TX (International Ocean Discovery Program). https://doi.org/
Teske, A., Lizarralde, D., Höfig, T.W., Aiello, I.W., Ash, J.L., Bojanova, D.P., Buatier, M.D., Edgcomb, V.P., Galerne, C.Y., Gontharet, S., Heuer, V.B., Jiang, S., Kars, M.A.C., Khogenkumar Singh, S., Kim, J.-H., Koornneef, L.M.T., Marsaglia, K.M., Meyer, N.R., Morono, Y., Negrete-Aranda, R., Neumann, F., Pastor, L.C., Peña-Salinas, M.E., Pérez Cruz, L.L., Ran, L., Riboulleau, A., Sarao, J.A., Schubert, F., Stock, J.M., Toffin, L.M.A.A., Xie, W., Yamanaka, T., and Zhuang, G., 2021b. Expedition 385 summary. In Teske, A., Lizarralde, D., Höfig, T.W., and the Expedition 385 Scientists, Guaymas Basin Tectonics and Biosphere. Proceedings of the International Ocean Discovery Program, 385: College Station, TX (International Ocean Discovery Program). https://doi.org/
Teske, A., Lizarralde, D., Höfig, T.W., Aiello, I.W., Ash, J.L., Bojanova, D.P., Buatier, M.D., Edgcomb, V.P., Galerne, C.Y., Gontharet, S., Heuer, V.B., Jiang, S., Kars, M.A.C., Khogenkumar Singh, S., Kim, J.-H., Koornneef, L.M.T., Marsaglia, K.M., Meyer, N.R., Morono, Y., Negrete-Aranda, R., Neumann, F., Pastor, L.C., Peña-Salinas, M.E., Pérez Cruz, L.L., Ran, L., Riboulleau, A., Sarao, J.A., Schubert, F., Stock, J.M., Toffin, L.M.A.A., Xie, W., Yamanaka, T., and Zhuang, G., 2021c. Site U1546. In Teske, A., Lizarralde, D., Höfig, T.W., and the Expedition 385 Scientists, Guaymas Basin Tectonics and Biosphere. Proceedings of the International Ocean Discovery Program, 385: College Station, TX (International Ocean Discovery Program). https://doi.org/
Teske, A., Lizarralde, D., Höfig, T.W., and the Expedition 385 Scientists, 2021d. Supplementary material, https://doi.org/
Thunell, R., Pride, C., Tappa, E., and Muller-Karger, F., 1993. Varve formation in the Gulf of California: insights from time series sediment trap sampling and remote sensing. Quaternary Science Reviews, 12(6):451–464. https://doi.org/
Thunell, R.C., 1998. Seasonal and annual variability in particle fluxes in the Gulf of California: a response to climate forcing. Deep Sea Research Part I: Oceanographic Research Papers, 45(12):2059–2083. https://doi.org/
Treude, T., Niggemann, J., Kallmeyer, J., Wintersteller, P., Schubert, C.J., Boetius, A., and Jørgensen, B.B., 2005. Anaerobic oxidation of methane and sulfate reduction along the Chilean continental margin. Geochimica et Cosmochimica Acta, 69(11):2767–2779. https://doi.org/
Wefer, G., Berger, W.H., Richter, C., et al., 1998. Proceedings of the Ocean Drilling Program, Initial Reports, 175: College Station, TX (Ocean Drilling Program). https://doi.org/
Zijderveld, J.D.A., 1967. AC demagnetization of rocks: analysis of results. In Runcorn, S.K.C., Creer, K.M., and Collinson, D.W. (Eds.), Methods in Palaeomagnetism: Amsterdam (Elsevier), 254–286.