Teske, A., Lizarralde, D., Höfig, T.W., and the Expedition 385 Scientists
Proceedings of the International Ocean Discovery Program Volume 385
publications.iodp.org
https://doi.org/10.14379/iodp.proc.385.104.2021
Site U15461
![]() A. Teske,
A. Teske,
![]() D. Lizarralde,
D. Lizarralde,
![]() T.W. Höfig,
T.W. Höfig,
![]() I.W. Aiello,
I.W. Aiello,
![]() J.L. Ash,
J.L. Ash,
![]() D.P. Bojanova,
D.P. Bojanova,
![]() M.D. Buatier,
M.D. Buatier,
![]() V.P. Edgcomb,
V.P. Edgcomb,
![]() C.Y. Galerne,
C.Y. Galerne,
![]() S. Gontharet,
S. Gontharet,
![]() V.B. Heuer,
V.B. Heuer,
![]() S. Jiang,
S. Jiang,
![]() M.A.C. Kars,
M.A.C. Kars,
![]() S. Khogenkumar Singh,
S. Khogenkumar Singh,
![]() J.-H. Kim,
J.-H. Kim,
![]() L.M.T. Koornneef,
L.M.T. Koornneef,
![]() K.M. Marsaglia,
K.M. Marsaglia,
![]() N.R. Meyer,
N.R. Meyer,
![]() Y. Morono,
Y. Morono,
![]() R. Negrete-Aranda,
R. Negrete-Aranda,
![]() F. Neumann,
F. Neumann,
![]() L.C. Pastor,
L.C. Pastor,
![]() M.E. Peña-Salinas,
M.E. Peña-Salinas,
![]() L.L. Pérez-Cruz,
L.L. Pérez-Cruz,
![]() L. Ran,
L. Ran,
![]() A. Riboulleau,
A. Riboulleau,
![]() J.A. Sarao,
J.A. Sarao,
![]() F. Schubert,
F. Schubert,
![]() J.M. Stock,
J.M. Stock,
![]() L.M.A.A. Toffin,
L.M.A.A. Toffin,
![]() W. Xie,
W. Xie,
![]() T. Yamanaka,
T. Yamanaka,
![]() G. Zhuang
2
G. Zhuang
2
1 Teske, A., Lizarralde, D., Höfig, T.W., Aiello, I.W., Ash, J.L., Bojanova, D.P., Buatier, M.D., Edgcomb, V.P., Galerne, C.Y., Gontharet, S., Heuer, V.B., Jiang, S., Kars, M.A.C., Khogenkumar Singh, S., Kim, J.-H., Koornneef, L.M.T., Marsaglia, K.M., Meyer, N.R., Morono, Y., Negrete-Aranda, R., Neumann, F., Pastor, L.C., Peña-Salinas, M.E., Pérez Cruz, L.L., Ran, L., Riboulleau, A., Sarao, J.A., Schubert, F., Stock, J.M., Toffin, L.M.A.A., Xie, W., Yamanaka, T., and Zhuang, G., 2021. Site U1546. In Teske, A., Lizarralde, D., Höfig, T.W., and the Expedition 385 Scientists, Guaymas Basin Tectonics and Biosphere. Proceedings of the International Ocean Discovery Program, 385: College Station, TX (International Ocean Discovery Program). https://doi.org/10.14379/iodp.proc.385.104.2021
2 Expedition 385 Scientists’ affiliations.
1. Summary
1.1. Background and objectives
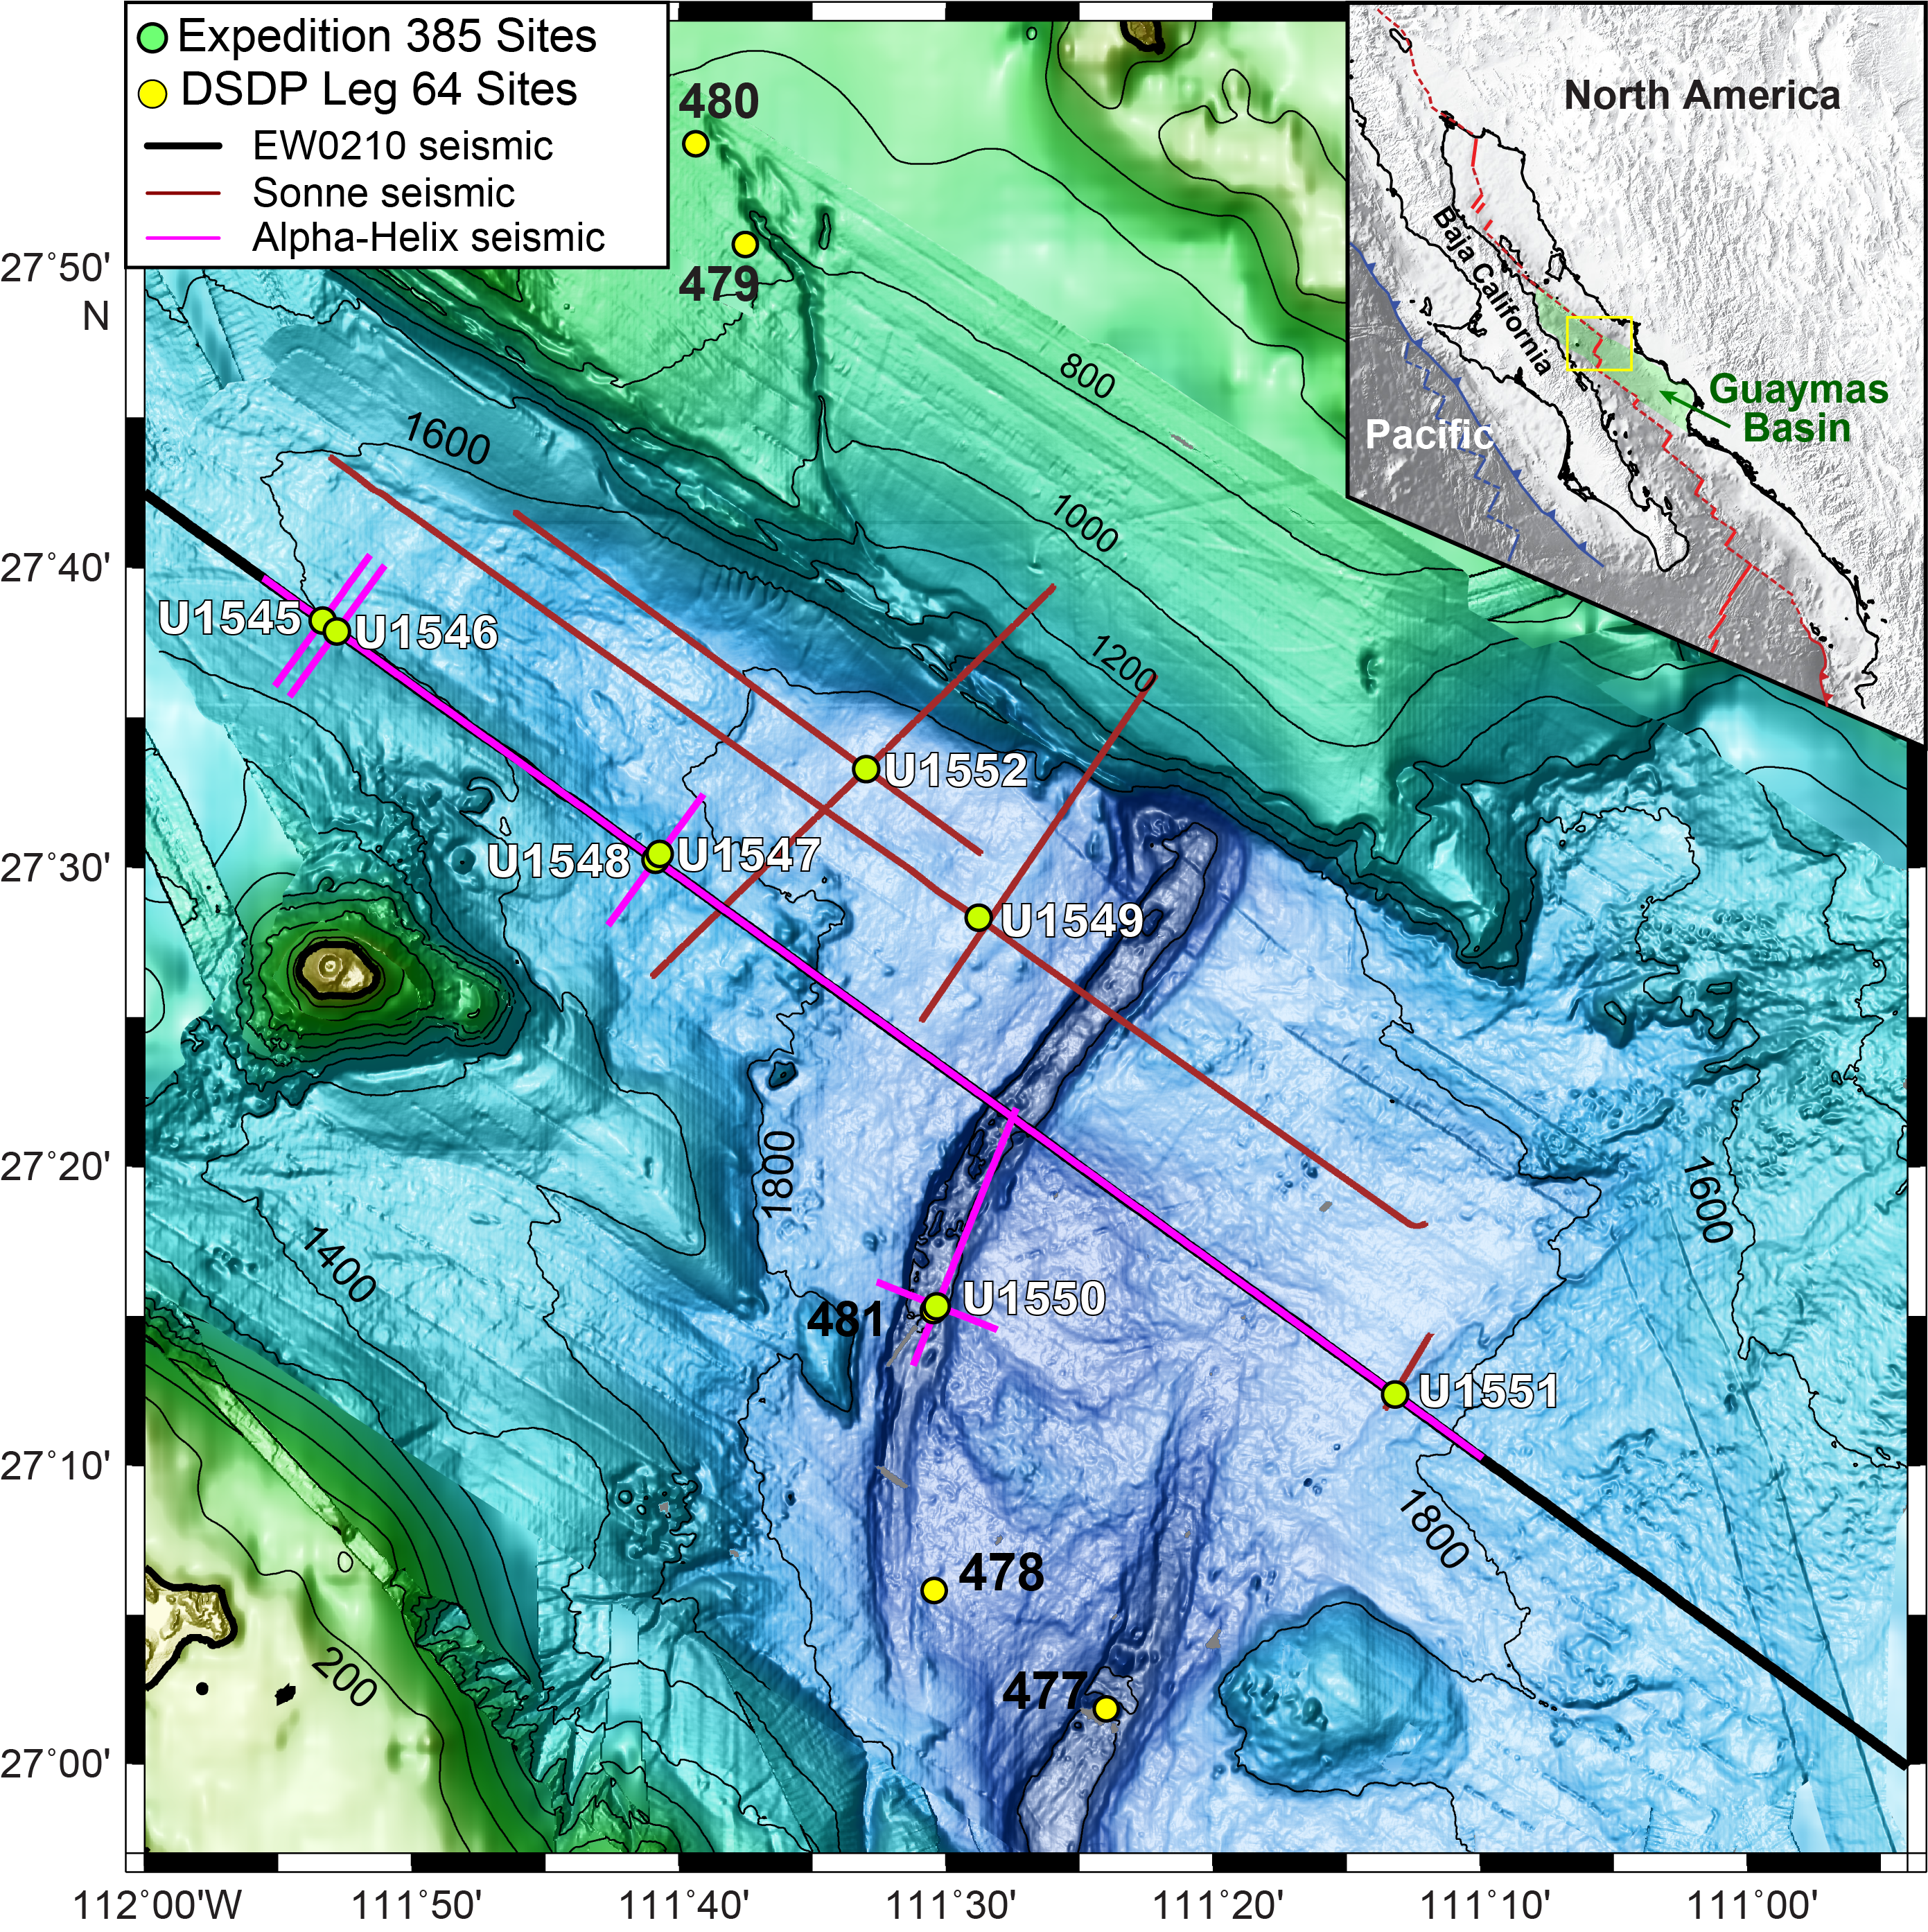
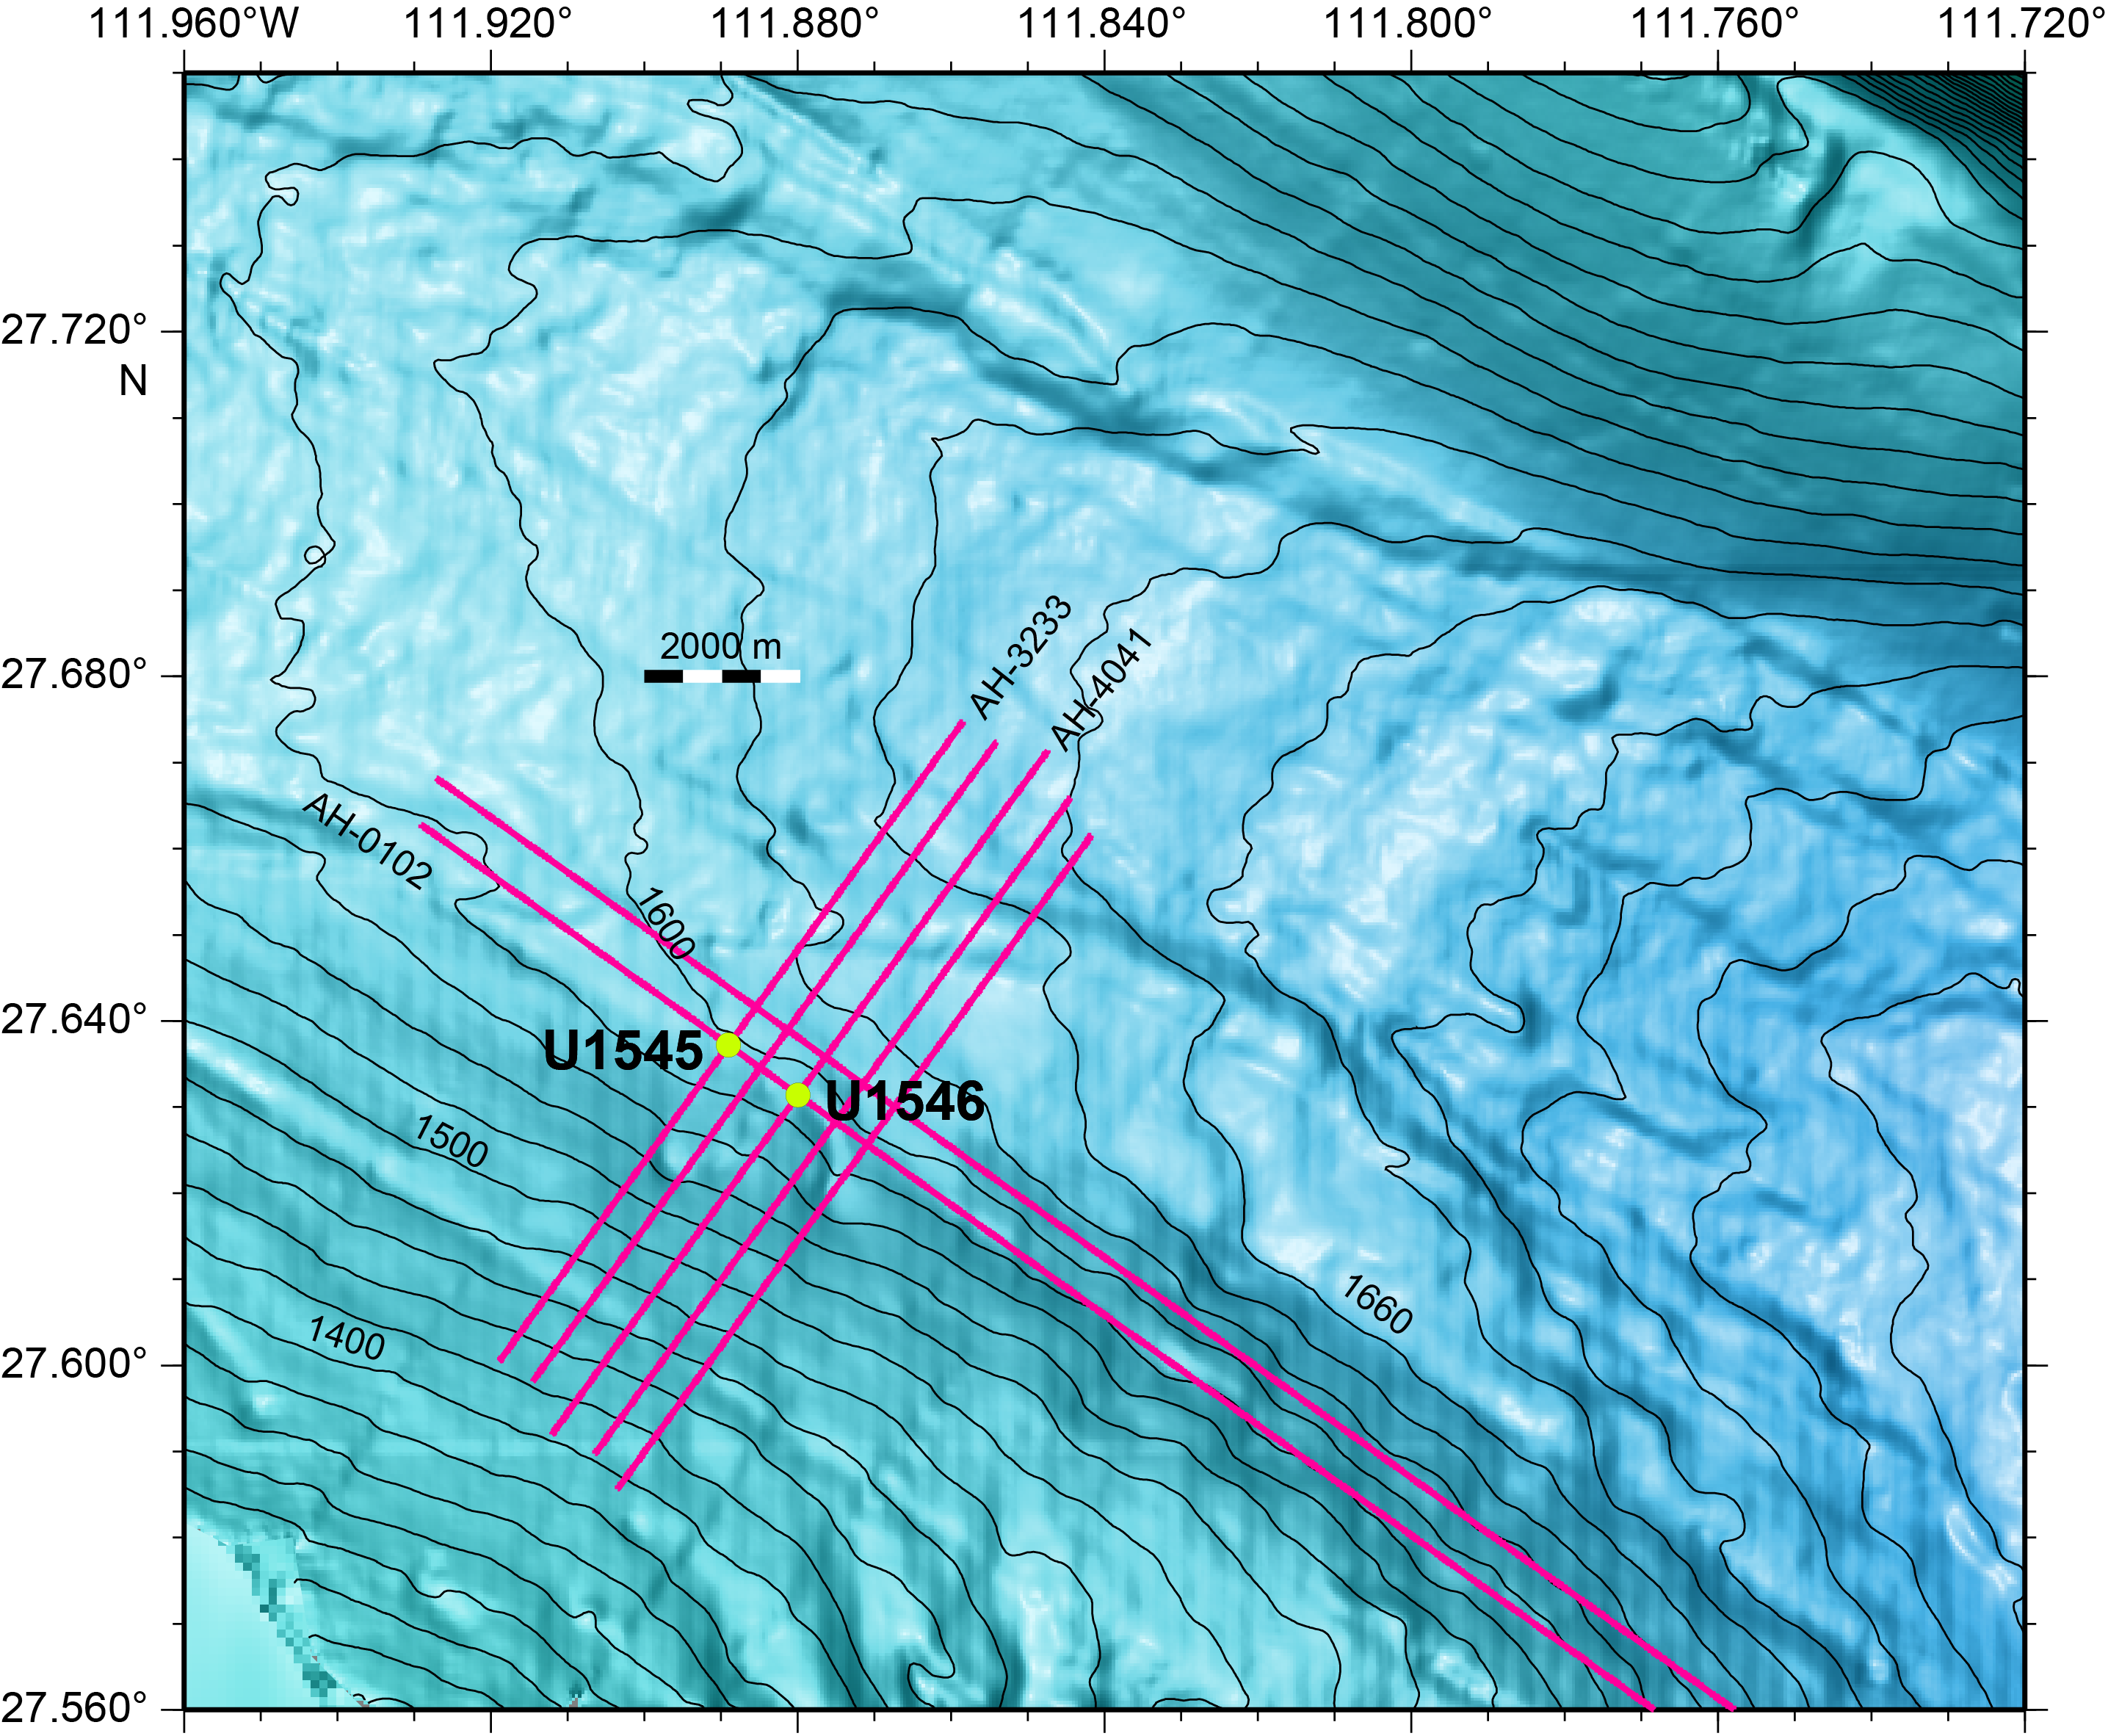
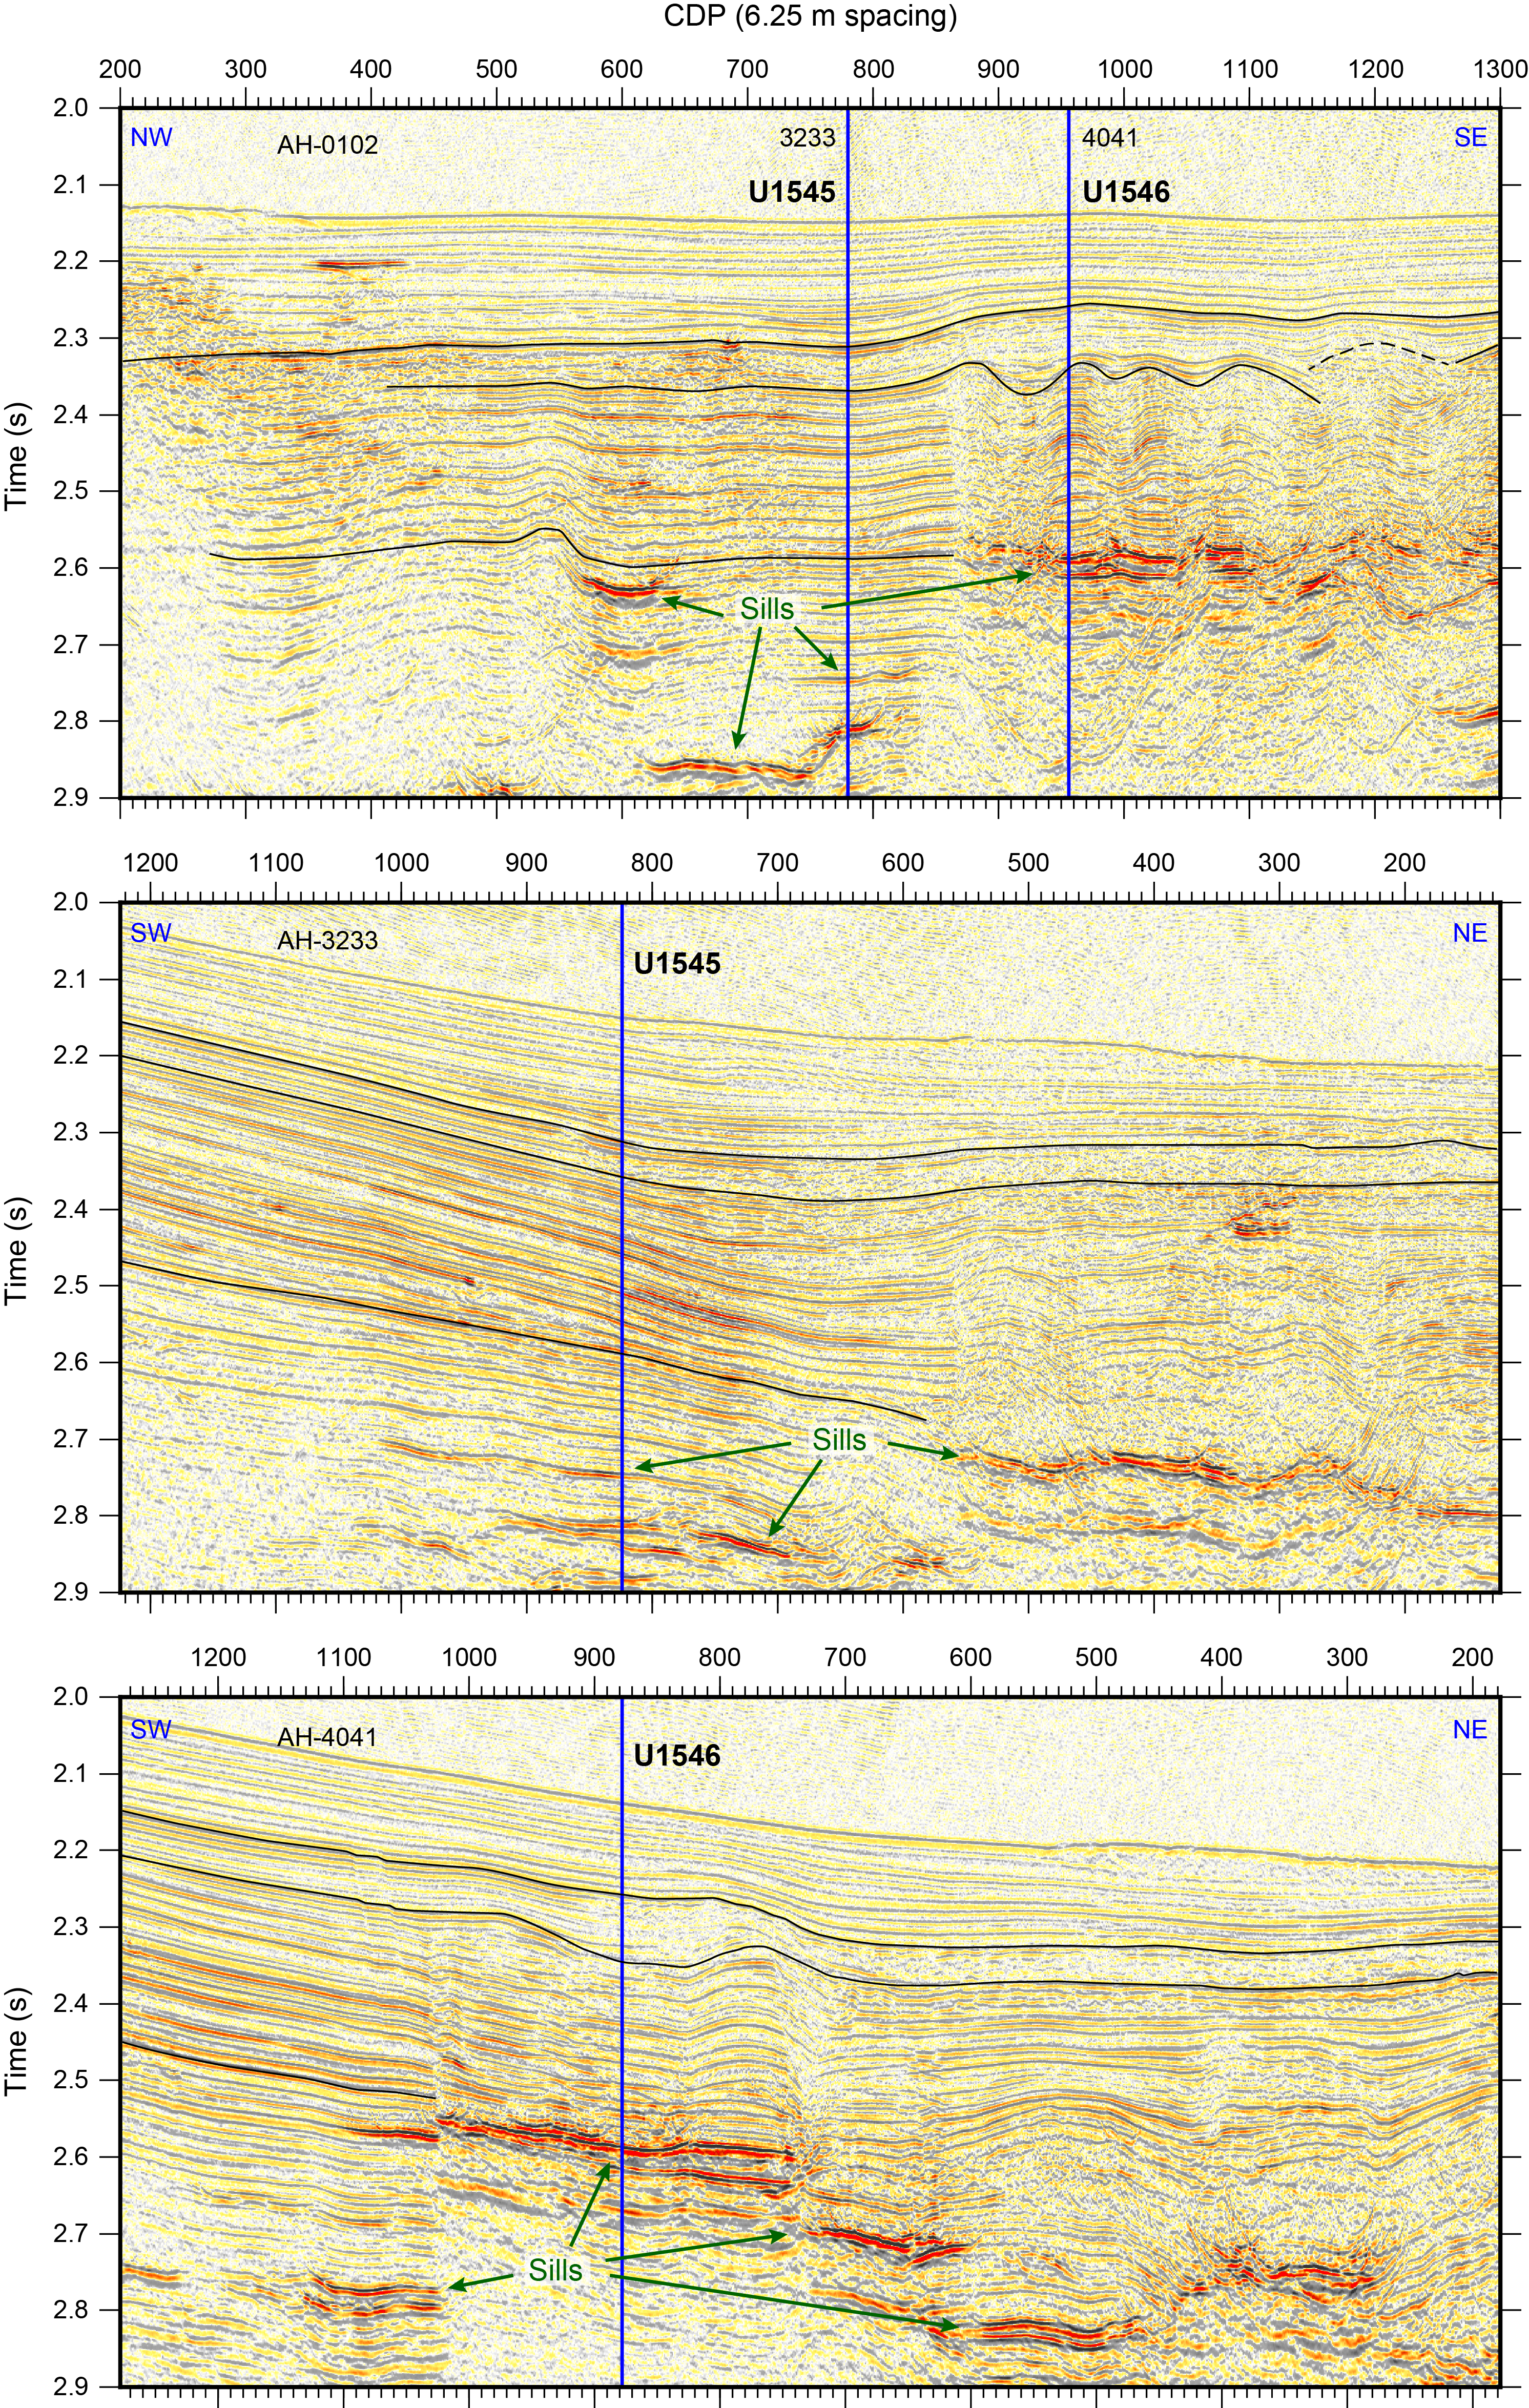
Site U1546 is located just 1.1 km away from Site U1545 and ~51 km northwest of the axial graben of the northern Guaymas Basin spreading segment (Figures F1, F2). The primary objective was to compare these two adjacent sites that have shared sedimentation history but very different degrees of alteration resulting from intruding sills. Preexpedition seismic survey data at Site U1546 revealed a bright reflector at ~2.6 s two-way traveltime (TWT) that was interpreted to be the contact with a sill intrusion. Disruption of the sedimentary strata above the interpreted sill (~2.3–2.6 s TWT) was supposed to have formed as a response to the sill emplacement. This feature abruptly terminates laterally toward Site U1545, coincident with the termination of the underlying sill. This same sedimentary sequence appears undisrupted at Site U1545 to ~2.8 s TWT, where another sill was observed in the seismic data. The shared objective for Sites U1545 and U1546 was to compare the composition, physical properties, geochemical gradients, and microbial communities at these sites. Thus, the major objective for Site U1546 was to provide a postintrusion sedimentary succession for comparison with reference Site U1545; this comparison will provide direct measurements of changes in response to sill intrusion.
1.2. Operations
We cored four holes at Site U1546. Hole U1546A is located at 27°37.8851′N, 111°52.7939′W in a water depth of 1586.1 m. In Hole U1546A, we used the advanced piston corer (APC), half-length APC (HLAPC), and extended core barrel (XCB) systems to advance from the seafloor to a final depth of 361.2 meters below seafloor (mbsf) with a recovery of 365.7 m (101%). We performed formation temperature measurements at several depths using the advanced piston corer temperature (APCT-3) tool and the Sediment Temperature 2 (SET2) tool. In Hole U1546B, located at 27°37.8840′N, 111°52.7809′W in a water depth of 1585.6 m, we deployed the APC, HLAPC, and XCB systems. Cores penetrated from the seafloor to a final depth of 333.8 mbsf and recovered 351.2 m (105%). In Hole U1546C, located at 27°37.8724′N, 111°52.7568′W in a water depth of 1596.6 m, we first drilled without core recovery from the seafloor to 308.2 mbsf. Then, the rotary core barrel (RCB) system was deployed to advance from 308.2 mbsf to a final depth of 540.2 mbsf with a recovery of 139.7 m (60%). Coring was terminated when the safety monitoring for hydrocarbon gases obtained an anomalously low C1/C2 value. We then conducted downhole wireline logging in Hole U1546C with the triple combination (triple combo) and Formation MicroScanner (FMS)-sonic logging tool strings. In Hole U1546D, located at 27°37.8943′N, 111°52.7812′W in a water depth of 1585.9 m, we deployed the APC, HLAPC, and XCB systems to advance from the seafloor to a final depth of 300.1 mbsf with a recovery of 314.7 m (105%). Holes U1546B and U1546D were dedicated to extensive microbial and biogeochemical sampling that required the deployment of perfluorocarbon tracers (PFTs) downhole on all cores to monitor drilling fluid (seawater) contamination. The pace of coring in Holes U1546B and U1546D was at times adjusted to accommodate the complex microbial sampling program conducted on the core receiving platform. A total of 270.7 h, or 11.3 days, were spent at Site U1546. Cores, penetration depths, core recovery, and operations schedule for all holes of Site U1546 are listed in Table T1.
1.3. Principal results
1.3.1. Lithostratigraphy
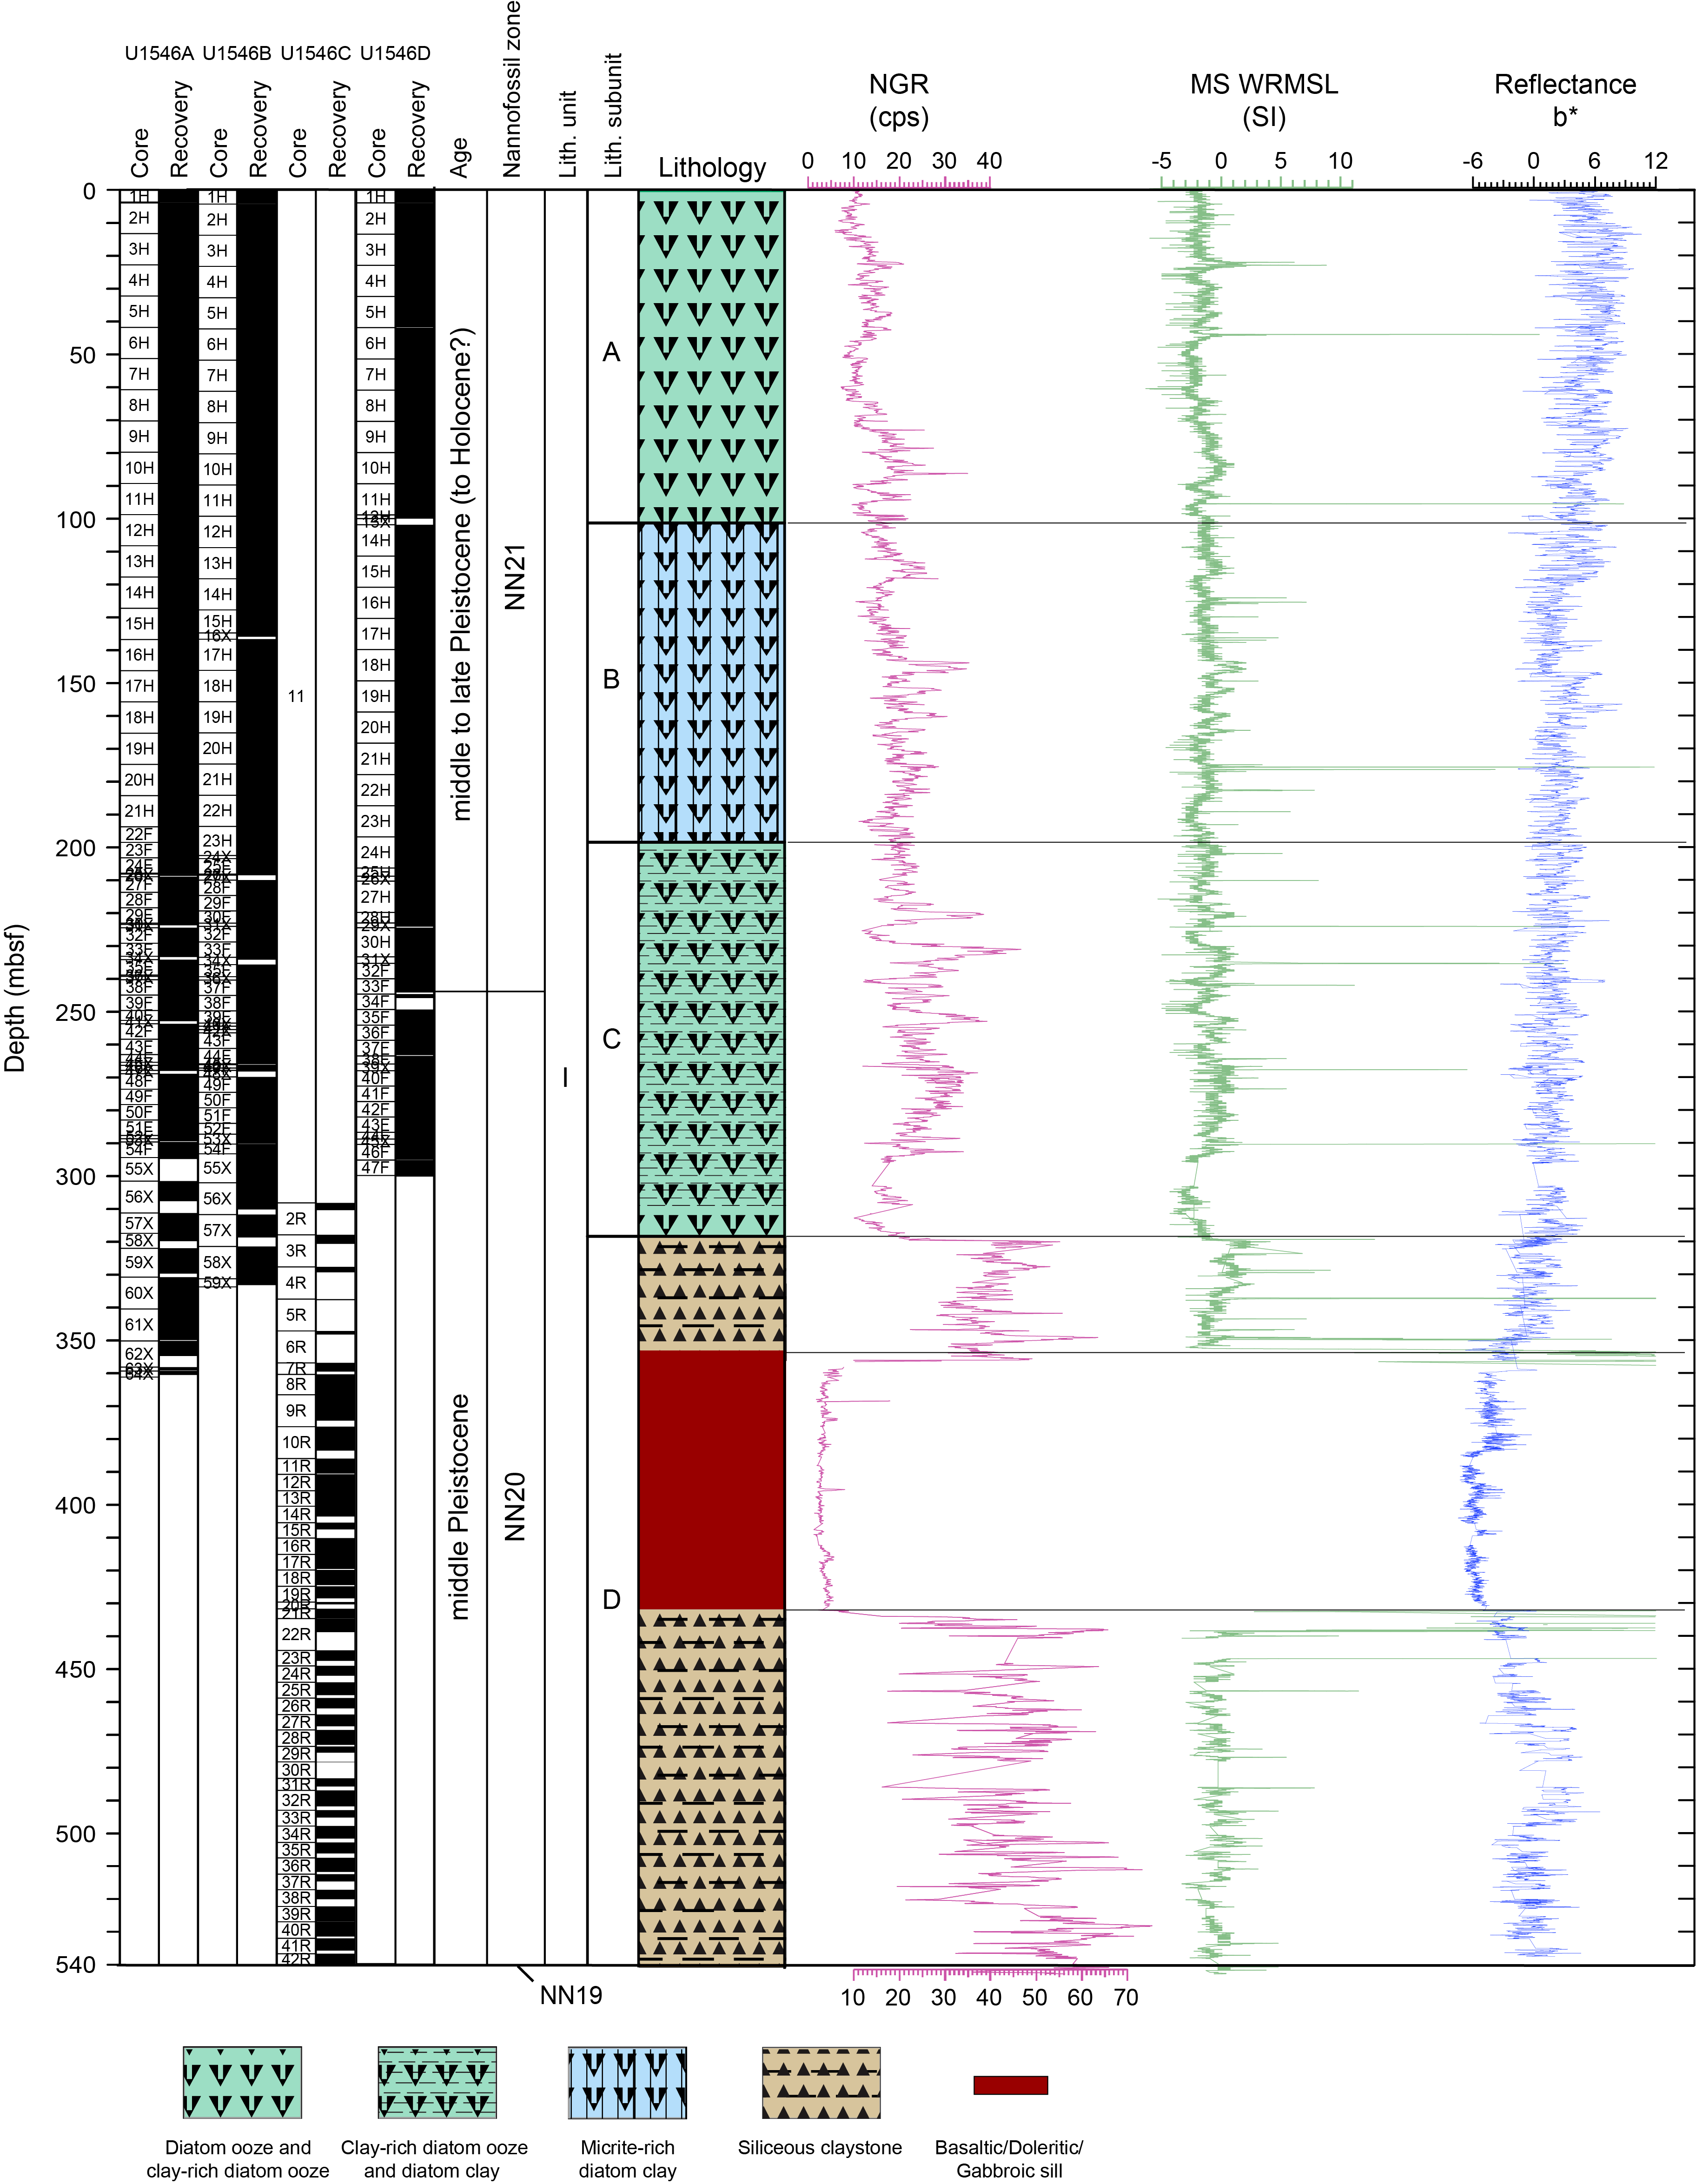
Of the four holes cored at Site U1546, the most complete and deepest record of soft and indurated sediments as well as igneous rocks is represented by the combination of results from Holes U1546A and U1546C. The sediments recovered are middle to late Pleistocene in age, mostly laminated to homogeneous diatom ooze to diatom clay forming a single lithostratigraphic unit (Unit I) (Figure F4). Subordinate lithologic components include nannofossils, silt-sized siliciclastic particles, and authigenic minerals such as pyrite and clay- to silt-sized carbonate (micrite). The latter is mainly dolomitic in composition and occurs as scattered crystals in the sediment. Carbonate also occurs as discrete concretions and ultimately as indurated limestone/dolomite intervals at depth. The distribution of authigenic carbonates and the biogenic (opal-A) to authigenic (opal-CT and quartz) silica phase transformations produce subtle yet distinct lithologic changes supporting the division of Unit I into four subunits (IA, IB, IC, and ID). The transitions between the subunits are generally gradual, occurring over intervals more than 10 m thick, and they can be difficult to define in low recovery or heavily sampled zones. The clay-rich diatom ooze of Subunit IA becomes more micritic in Subunit IB, which in turn is underlain by the less calcareous, largely micrite-free Subunit IC. The Subunit IC–ID transition is marked by diatom (opal-A) dissolution, the appearance of opal-CT, and ultimately authigenic quartz that heralds the formation of siliceous claystone in Subunit ID. Although the subunit divisions are similar to those at Site U1545, Subunit IB is thicker and shallower at Site U1546. There are also distinct zones of altered sediment above and below the thick mafic sill interval in Subunit ID that was fully penetrated in Hole U1546C. The mixed biogenic and siliciclastic sediments and their characteristic lamination are consistent with a middle to late Pleistocene, hemipelagic and suboxic to anoxic depositional environment.
1.3.2. Igneous petrology and alteration
Mafic sill material was encountered in Holes U1546A and U1546C at 354.6 and 348.2 mbsf, respectively. In Hole U1546A, the massive hypabyssal sill was penetrated over an interval of 6.0 m, whereas Hole U1546C was cored through the lower sill/sediment contact, resulting in a total sill thickness of 82.2 m based on drilling and ~75 m according to downhole logging data. The sill is made up of highly altered basaltic rock at the top followed by doleritic and gabbroic intervals. A doleritic texture resumes below the gabbroic interval and is followed by a short basaltic interval at the bottom contact. The upper- and lowermost basaltic rock intervals have chilled margin contacts with the adjacent sediments which are highly altered and vesicular with rounded to subrounded calcite amygdules. The cryptocrystalline groundmass hosts plagioclase phenocrysts. The doleritic intervals close to the basaltic layers are sparsely vesicular and gradually turn into nonvesicular doleritic rock toward the center of the sill. A ~12 m thick gabbroic interval is intercalated between the doleritic layers. The contacts between gabbroic and doleritic lithologies are both sharp and gradational. Plagioclase phenocrysts are present throughout the doleritic intervals, whereas pyroxene pseudomorphs occur as a minor phenocryst phase in the bottom doleritic layer below the gabbroic interval. No pyroxene phenocrysts were observed in the upper doleritic part of the sill intrusion. This sill shows a subalkaline, tholeiitic mafic rock chemistry that corresponds to an enriched mid-ocean-ridge basalt (MORB) composition.
1.3.3. Structural geology
A few intervals of tilted beds were seen in the sedimentary section of Lithostratigraphic Unit I. Hole U1546A has tilted bedding in the uppermost two subunits (IA and IB) from 98 to 117 mbsf. Tilted bedding also occurs in Subunit IB from 115 to 124 mbsf in Hole U1546B and from 112 to 120 mbsf and from 145 to 156 mbsf in Hole U1546D. Brittle fractures and faults were found in sedimentary cores below 200 mbsf in Hole U1546D and below 166 mbsf in Hole U1546B. They have intermediate apparent dips (30°–60°). Where displacements could be measured, they were ≤5 cm. Six vertical veins were measured in sedimentary rocks at 433 mbsf in Hole U1546C. In the recovered igneous rocks, fractures and veins were measured for true dip from whole-round cores before they were split. A total of 49 such structures were identified in Hole U1546C. No veins were seen in the igneous rocks at the bottom of Hole U1546A.
1.3.4. Biostratigraphy
At Site U1546, preservation of calcareous nannofossils is good/moderate to poor throughout the entire sedimentary sequence. In general, nannofossils are abundant and well preserved in the upper ~100 m of the sequence. Below ~100 mbsf, intervals with barren/few and common/abundant nannofossils alternate. Preservation is good/moderate in samples with common/abundant nannofossils and poor in those with few/rare abundances. In general, marine diatoms are dominant/abundant with good/moderate preservation to ~312 mbsf and barren to the bottom of Holes U1546A and U1546C. The lowermost appearance (first appearance datum) of the calcareous nannofossil Emiliania huxleyi dates the upper part of the sediment sequence to (Holocene–)late–middle Pleistocene (younger than 0.29 Ma; 0–249.28 mbsf in Hole U1546A). In contrast, the absence of calcareous nannofossil Pseudoemiliania lacunosa and marine diatom Fragilariopsis reinholdii in the underlying interval indicates a middle Pleistocene age (0.29–0.44 Ma) for the lower part of Hole U1546A. P. lacunosa was observed in the basal core catcher sample from Hole U1546C (539.84 mbsf), suggesting an age older than the uppermost appearance (last appearance datum) of P. lacunosa at 0.44 Ma. The estimated average sedimentation rate is 1020 m/My (102 cm/ky) at this site.
1.3.5. Paleomagnetism
Alternating field (AF) demagnetization was implemented with the superconducting rock magnetometer (SRM) on archive-half sections up to 20 mT on all cores from Holes U1546A and U1546C. The drilling-induced overprint was successfully removed from all APC and HLAPC cores (from the seafloor to ~270 mbsf) upon demagnetization. In Hole U1546A, inclination values after demagnetization at 20 mT cluster around 43°, which is slightly lower than the expected geocentric axial dipole (GAD) inclination at the latitude of the site (46.3°). A detailed analysis of the remanence of discrete samples from Hole U1546A showed that the drilling-induced overprint is removed by 10 mT and the characteristic remanent magnetization (ChRM) agrees with the SRM measurements. Unfortunately, the XCB and RCB cores were irreversibly overprinted. The natural remanent magnetization (NRM) of archive-half sections decreases at ~80–100 mbsf (Hole U1546A), a depth interval that corresponds to the sulfate–methane transition zone (SMTZ). The magnetic mineral assemblage becomes coarser, and low-coercivity minerals such as (titano)magnetite are dominant. The AF demagnetization protocol was not effective for the igneous rock sections of Hole U1546C. Therefore, we focused on thermal demagnetization of discrete samples. Two groups of samples distributed in the sill intrusion were identified: a first group in the upper 18 m of the sill contains fine-grained magnetite, and a second group is dominated by coarse-grained titanomagnetite in the bottom 57 m. Anisotropy of magnetic susceptibility shows a mixture of prolate and oblate behavior above the sill and a dominant prolate behavior below it. All cores in Holes U1546A and U1546C were assigned to the normal Brunhes Chron C1n (younger than 0.78 Ma). No paleomagnetic measurements were conducted in Holes U1546B and U1546D.
1.3.6. Inorganic geochemistry
A total of 94 interstitial water (IW) samples were collected from the sedimentary succession at Site U1546 (Holes U1546A–U1546D). Based on the sulfate and methane profiles, the SMTZ is estimated to be at ~110 mbsf, approximately twice as deep as it is at Site U1545. Around this depth, sulfide, alkalinity, and phosphate reach their maximum values and the barium concentration starts to increase. However, the depth of maximum concentrations of alkalinity and phosphate is slightly offset from the SMTZ. Ammonium gradually increases downhole to an alteration zone above the sediment/sill contact, where a drop is recorded between 300 and 330 mbsf; its maximal concentration of 12–14 mM, compared to more than 30 mM at Site U1545, indicates decreased biomineralization of organic matter. Biogeochemical processes observed from the seafloor to 120 mbsf are mainly related to anaerobic degradation of organic matter and sulfate-dependent anaerobic oxidation of methane (AOM). Just above and below the sill, a number of significant variations were observed for many IW dissolved elements (e.g., K+, B, Mg2+, Sr2+, Li+, and Ba2+), which could be related to changes in mineralogic composition derived from sill-induced alteration. Between the SMTZ and the sill intrusion, the IW chemical properties are likely to be influenced by combined biogeochemical processes and sediment-water interaction associated with the sill intrusion and by precipitation/dissolution processes including opal-A dissolution and authigenic carbonate precipitation.
1.3.7. Organic geochemistry
At Site U1546, we sampled and analyzed gas and solid-phase samples. In Holes U1546A–U1546D, one headspace gas sample was analyzed per 9.5 m advance for routine hydrocarbon safety monitoring. The carbon, nitrogen, and sulfur contents of particulate sediment were characterized, and source rock analysis was performed on selected solid-phase samples. For the sediments recovered in Holes U1546B and U1546C, both headspace and void gas were analyzed for their hydrocarbon contents; the amount of void space was quantified; H2 and CO contents were measured; and the carbon, nitrogen, and sulfur contents of sediment were characterized. During igneous rock recovery in Hole U1546C, whole-round core pieces of rock were incubated in sealed trilaminated foil barrier bags to examine degassing of hydrocarbons from freshly recovered whole-round sill cores. In general, methane increases with depth in each hole and reaches 1–2 local maxima. C2–C6 hydrocarbons are detectable below ~90 mbsf, and they all increase with depth. In Hole U1546C, low C1/C2 values eventually necessitated the termination of coring. From elemental and source rock analysis, we infer that the primary source of organic matter is marine in origin and the thermal maturity of organic matter varies based on the proximity of the sill. In Holes U1546B and U1546C, H2 and CO are present in nanomolar concentrations.
1.3.8. Microbiology
Sediment cores for microbiological studies were obtained from APC, HLAPC, and XCB cores in Holes U1546B and U1546D. After drilling to 308 mbsf without core recovery, Hole U1546C was also sampled along its deeper, hydrothermally heated sediment column above and below the penetrated sill. These Hole U1546C samples represent important horizons that will further our understanding of the impact sill emplacement has on geochemistry and extant microbial communities within the hyperthermophilic zone. Syringe samples for cell counts, 3-D structural imaging, and RNA analyses were taken on the core receiving platform, fixed or frozen, and stored for further analyses. Whole-round core samples were either stored in a −80°C freezer or temporarily stored in a cold room (4°C–8°C) and then processed for shore-based analyses, as for Site U1545. Samples for PFT measurements were taken on the core receiving platform by syringe at 17 horizons. Cell abundance for selected samples was determined by direct counting with an epifluorescence microscope. Cell abundance in seafloor sediment (1.0 × 10⁹ cells/cm3) was roughly 1000 times higher than the bottom seawater (1.1 × 10⁶ cells/cm3) and gradually decreased to 4.3 × 10⁶/cm3 at approximately 132 mbsf. In deeper intervals, cell abundance generally dropped below the detection limit of the protocol used for the shipboard cell counting program.
1.3.9. Petrophysics
Physical properties of the recovered cores were measured on whole-round and working-half sections. Downhole wireline logging was used to measure host formation physical properties. Measurements on whole-round and working-half sections from Holes U1546A–U1546D were compared with each other and with downhole measurements obtained from Hole U1546C for lithostratigraphic characterization and correlation between core description, logging data, and preexpedition seismic survey profiles. Our analysis identified the same two large-scale major petrophysical variations found at Site U1545 and a transition at ~280 mbsf. All physical properties highlight the presence of a ~74 m thick sill at ~355 mbsf. Twelve in situ formation temperature measurements were conducted using the APCT-3 and SET2 tools. Measured values indicate that temperatures increase with depth along a linear geothermal gradient of 221°C/km that corresponds to a calculated heat flow of 160 mW/m2. Thermal conductivity varies between ~0.66 and ~1.00 W/(m·K) in the uppermost ~345 mbsf, which marks the upper sill/sediment contact. Sixteen hard rock thermal conductivity measurements were made on sill samples from ~348 to ~432 mbsf, yielding a mean thermal conductivity of 1.72 ± 0.14 W/(m·K). Downhole logging caliper measurements clearly identify the sill–sediment transitions. Bulk density for sediments generally ranges from ~1.2 to ~1.5 g/cm3 and shows variations in trends at ~270 and ~310 mbsf. The average sill density of ~2.8 g/cm3 is typical for doleritic rock. Porosity shows a linear decrease from 90% at the seafloor to 73%–82% at ~309 mbsf. A significant decrease in sediment porosity was observed at the top and bottom contacts with the sill. Porosity inside the sill is relatively low (~3%) with some high values in the upper part of the sill. Compressive strength increases by 1.1 kPa/m, and shear strength increases by 0.6 kPa/m. Natural gamma radiation (NGR) values increase from ~10 to 25 counts/s to 270 mbsf in the host sediments; these values then drop inside the sill. Downhole NGR measurements inside the sill are consistent with whole-round core laboratory measurements. Resistivity measurements reveal large relative variations of 0.4 to ~200 Ωm that typically correlate with variations in density and porosity. Core-based magnetic susceptibility (MS) values are mainly constant to ~355 mbsf. P-wave velocity generally increases with depth and shows typical higher values for the sill.
2. Background and objectives
Site U1546 (proposed Site GUAYM-02B) is located at 27°37.8840′N, 111°52.7940′W, ~52 km northwest of the axial graben of the northern Guaymas Basin spreading segment (Figure F1). The primary objective for this site is shared with Site U1545, located just 1.1 km away. These sites are located on lithosphere with the greatest lithospheric age (~2.1 Ma) among the Expedition 385 sites and at the foot of the slope to the southeast that marks the boundary between the southern and northern Guaymas Basin spreading segments. These sites thus have the greatest thickness of biogenic sediments among the Expedition 385 sites, with deposition mainly directly from the water column and subordinate from downslope sediment transport.
Seismic data at Site U1546 show bright reflectors at ~2.6 s TWT (approximately 360 mbsf) that are interpreted as arising from a sill intrusion (Figure F3). The sedimentary strata above the interpreted sill are disrupted over a discrete interval from ~2.2 to 2.6 s TWT. This disruption is believed to be due to deformation in response to the sill intrusion event, with the top of the deformed interval possibly representing the paleosurface at the time of the intrusion. The seismic data show that this sediment disruption abruptly terminates laterally toward Site U1545, coincident with the termination of the underlying sill. This same sedimentary sequence appears basically undisrupted at Site U1545 to ~2.8 s TWT, where another, deeper sill is observed in the seismic data. Deeper sills are also interpreted at ~2.75 and 2.85 s TWT at Site U1546.
The shared objective of Sites U1545 and U1546 is to compare the composition, physical properties, geochemical gradients, and microbial communities of and within the sediments at these sites. This comparison will provide a direct measurement of sediment alteration and geochemical imprints in response to sill intrusion, providing insights into the consequences of sill intrusion for carbon release from biogenic sediments, microbial community composition, and activity of the sedimentary biome.
3. Operations
3.1. Site U1546
Site U1546 comprises four holes. The original plan for Site U1546 was for three holes: Hole U1546A would be APC/XCB cored to 350 mbsf, Hole U1546B would be APC/HLAPC cored with orientation to 250 mbsf, and Hole U1546C would be drilled to 250 mbsf and RCB cored to 600 mbsf, followed by wireline downhole logging with the triple combo and FMS-sonic tool strings. Hole U1546A was designated for pore water and solid-phase geochemistry as well as lithologic, mineralogic, structural, and micropaleontological analyses. Hole U1546B would be subject to microbial sampling. For the deeper parts of the sediment column and a seismically imaged massive sill, the deepest Hole U1546C had the same scientific purpose as Hole U1546A (see Background and objectives). Actual operations differed from the plan. Holes U1546A and U1546C focused on lithologic/
3.1.1. Hole U1546A
At 1005 h on 4 October 2019, we started moving the vessel to Site U1546 in dynamic positioning (DP) mode. The vessel completed the 0.6 nmi transit in 45 min, arriving at the site coordinates at 1045 h. Upon arrival, we started preparations for APC coring operations. We lowered the drill string to a water depth of 1558 meters below sea level (mbsl) and picked up the top drive. The bit was then positioned at 1581.4 mbsl (5 m above the seafloor depth obtained from the precision depth recorder) to take the first core. Hole U1546A was spudded at 1230 h. Mudline Core 385-U1546A-1H arrived on deck at 1250 h, recovering 3.8 m. This established a seafloor depth of 1586.1 mbsl. Cores 1H–64X penetrated from the seafloor to 361.2 mbsf and recovered 365.7 m (101%) (Table T2). After having to apply a strong overpull force of 80,000 lb (356 kN) to retrieve Core 21H, we switched to HLAPC coring. While using the HLAPC system, we occasionally switched to the XCB coring tool to penetrate through hard layers (Cores 26X, 31X, 34X, 37X, 41X, 45X, 47X, and 53X). After HLAPC Core 54F, we permanently deployed the XCB coring tool in stiffer sediment formations. Our goal was to deepen the hole to the top contact of a seismically imaged sill around 350 mbsf. We eventually intersected the sill contact on Core 63X at ~358.5 mbsf. Upon recovering another interval of the same sill in Core 64X at 2120 h, we started pulling the drill string out of Hole U1546A from a final depth of 361.2 mbsf. The bit cleared the seafloor at 2320 h on 6 October, ending Hole U1546A. Nonmagnetic core barrels were used on all APC/HLAPC cores, and orientation measurements were taken on all full length APC cores using the Icefield MI-5 core orientation tool. A total of eight temperature measurements were taken with the APCT-3 tool; the shallowest was on Core 4H at 32.3 mbsf, and the deepest was on Core 28F at 218.4 mbsf. Additionally, we made four formation temperature measurements using the SET2 tool; the shallowest was after Core 36F at 239.9 mbsf, and the deepest was after Core 59X at 323.0 mbsf. A 20 bbl (3179.8 L) mud sweep was circulated prior to each SET2 tool deployment. A total of 60.5 h, or 2.5 days, were spent on Hole U1546A.
3.1.2. Hole U1546B
We moved the vessel 20 m east to position the bit for starting Hole U1546B. After installing the sinker bars, we lowered the bit to the seafloor to begin APC coring in Hole U1546B. We spudded Hole U1546B at 0050 h on 7 October 2019. Mudline Core 385-U1546B-1H recovered 4.3 m and established a seafloor depth of 1585.6 mbsl. Cores 1H–59X penetrated from the seafloor to a final depth of 333.8 mbsf and recovered 351.2 m (105%) (Table T2). We pumped PFTs downhole on all cores for monitoring drilling fluid (seawater) contamination. Like Hole U1545A, Hole U1546B was dedicated to extensive collection of whole-round cores for microbiology and biogeochemistry research. For Cores 1H–23H, throughout 7 October, the pacing of coring was adjusted to the complex microbial sampling program conducted on the core receiving platform (one core arriving on deck every ~75 min). No temperature measurements were taken in Hole U1546B. We switched from the APC to the XCB system to core through a hard layer starting at 134.8 mbsf (Core 16X). Commencing with Core 24X (202.5 mbsf), we stopped using the APC coring tool. Instead, we mainly deployed the HLAPC system to 293.3 mbsf (Core 54F) and switched to the XCB system whenever we had to core through hard carbonate layers (Cores 24X, 27X, 31X, 34X, 36X, 40X, 42X, 46X, 48X, and 53X). Starting with Core 55X, we deployed the XCB system permanently. On 9 October, Core 59X penetrated from 331.3 to 333.8 mbsf. Upon its recovery, we terminated coring at 0045 h and pulled the drill string out of the hole to prepare for transit to Guaymas, Mexico, to conduct a medical repatriation of a crew member. The bit cleared the seafloor at 0215 h on 9 October, ending Hole U1546B. A total of 55.0 h, or 2.3 days, were spent on Hole U1546B. After the bit arrived on the rig floor at 0530 h, we secured the vessel for transit. At 0600 h, we began our transit to Guaymas. We arrived at the pilot station at 1215 h, and the patient disembarked the vessel at 1225 h. After the pilot boat left, we began the sea passage back to Site U1546 at 1227 h on 9 October.
3.1.3. Hole U1546C
We arrived on site at 1730 h and switched to DP mode. At 1813 h on 9 October 2019, we started preparations to spud Hole U1546C. We assembled the RCB system and made up the RCB bottom-hole assembly (BHA). We then began lowering the drill string to the seafloor. After the bit reached 1564 mbsl, we picked up the top drive, deployed the center bit, and positioned the end of the drill string for spudding Hole U1546C. At 0305 h on 10 October, we spudded Hole U1546C (40 m south and 20 m east of Hole U1546B). We then drilled without core recovery from the seafloor to 308.2 mbsf while pumping 20 bbl (3179.8 L) of high-viscosity mud. Upon recovering the center bit at 1330 h, we began RCB coring. Cores 385-U1546C-2R through 42R penetrated from 308.2 mbsf to a final depth of 540.2 mbsf and recovered 139.7 m (60%) (Table T2). The recovery increased substantially after a formation change from the sedimentary overburden (16%) to the underlying sill (69%) in Core 6R (recovered from 356.9 mbsf). Penetration rates slowed through the sill to approximately 2 m/h. This continued through Core 20R when the bit broke through the bottom of the sill and entered sediment again at 431.7 mbsf. The core barrel was pulled after a 2 m advance. Softer formation core catchers were installed before deploying again. Penetration rates increased after breaking through the sill and recovery remained excellent. To monitor drilling fluid (seawater) contamination, PFTs were pumped downhole on sediment Core 5R, sediment/sill contact Core 6R, and the first two entirely igneous cores (7R and 8R), which were critical for microbiology sampling. We then stopped PFT deployment at 366.6 mbsf. PFTs were again pumped on Cores 21R and 22R, the first two sediment cores below the sill. Coring was terminated for safety reasons at a final depth of 540.2 mbsf at 1530 h on 13 October when safety monitoring for hydrocarbon gases obtained an anomalously low C1/C2 value from Core 42R. No temperature measurements were taken in Hole U1546C. After circulating 50 bbl (7949.4 L) of high-viscosity mud for hole cleaning twice, we prepared to release the RCB bit in preparation for downhole wireline logging. At 1830 h, we deployed the rotary shifting tool (RST) to trigger the mechanical bit release (MBR). Upon dropping the bit at the bottom of the hole, we deployed the reverse RST to shift the MBR sleeve back into the circulation position. We then raised the end of the drill string to a logging depth of 80.9 mbsf. Upon making up the triple combo logging tool string on the rig floor, we lowered the tool string to the bottom of the hole (540.2 mbsf) at 0100 h on 14 October. The triple combo tool string was made up with the following tools:
- High-Resolution Laterolog Array (HRLA),
- Hostile Environment Litho-Density Sonde (HLDS) (with source),
- Hostile Environment Natural Gamma Ray Sonde (HNGS),
- Enhanced Digital Telemetry Cartridge (EDTC), and
- Logging equipment head-mud temperature (LEH-MT).
The Magnetic Susceptibility Sonde, version B (MSS-B), is usually part of the standard triple combo tool string, but neither of the two available MSS-B tools was able to connect with the Schlumberger logging software, which prevented us from recording downhole MS data. After a short calibration pass, we implemented a full logging pass from fill at 514.7 mbsf up to the seafloor at 0320 h on 14 October. The triple combo tool string returned to the rig floor at 0600 h. We then rigged up the FMS-sonic (resistivity imaging) logging tool string, consisting of the following tools:
The FMS-sonic tool string was deployed in the hole until we reached fill at 489.9 mbsf. After a single upward pass to the seafloor, the tool string returned to the rig floor at 1140 h and was disassembled by 1230 h on 14 October. Next, we deployed the subsea camera to the seafloor to survey Hole U1546C, and we did not observe any gas release. The subsea camera system was recovered and secured by 1445 h. We then pulled the drill string out of the hole. The drill string cleared the seafloor at 1500 h on 14 October and reached the rig floor at 1800 h, ending Hole U1546C. We secured the vessel for transit and started the 13 nmi sea passage to Site U1547 at 1822 h on 14 October. A total of 120.0 h, or 5.0 days, were spent on Hole U1546C.
3.1.4. Hole U1546D
After completing a second microbiology-dedicated operation at Site U1545, we returned to Site U1546 to establish another hole for microbiology sampling 17 days after we ended Hole U1546C. While cutting and reheading the core line after completing drilling Hole U1545C, we moved the vessel in DP mode to the coordinates of Hole U1546D to recover an additional set of microbial and biogeochemical samples from Site U1546. We began to move at 2041 h and arrived at the Hole U1546D coordinates at 2214 h on 31 October 2019. The sinker bars and APC core barrel were installed, and Hole U1546D was spudded at 2330 h. Mudline Core 385-U1546D-1H recovered 3.9 m and established a seafloor depth of 1585.9 mbsl. Cores 1H–47F penetrated from the seafloor to a final depth of 300.1 mbsf and recovered 314.7 m (105%) (Table T2). On Cores 1H–30H, we primarily deployed the APC system. After APC tool refusal, we predominantly used the HLAPC coring tool for Cores 32F–47F. The XCB system was deployed whenever we had to break through hard carbonate layers (Cores 13X, 26X, 29X, 31X, 39X, and 45X). All APC and HLAPC cores were taken with nonmagnetic core barrels. We did not implement temperature measurements in Hole U1546D. We pumped PFTs for drilling fluid contamination monitoring on all cores. Upon accomplishing our microbiology sampling objectives, we terminated coring at 0215 h on 2 November. The drill string was pulled out of the hole, and the bit cleared the rig floor at 0715 h. We then secured the ship for transit to Site U1551, located ~29 km southeast of the northern axial graben of Guaymas Basin. At 0742 h on 2 November, we switched from DP to cruise mode, which ended operations in Hole U1546D and at Site U1546. A total of 35.3 h, or 1.5 days, were spent on Hole U1546D.
4. Lithostratigraphy
The four holes drilled at Site U1546 define a stratigraphic succession that includes sediments, sedimentary rocks, and igneous rocks (Figure F4). Lithostratigraphic descriptions and analyses were carried out based on the curated length of the cores (core depth below seafloor, Method A [CSF-A]); all references to depths in the text, figures, and tables are expressed as CSF-A and use mbsf as the unit unless otherwise noted. Hole U1546A was drilled 361.2 m, corresponding to a total curated depth of 360.55 mbsf. Hole U1546B was drilled to a final depth of 333.8 mbsf and a total curated depth of 333.22 mbsf. Hole U1546C, the deepest hole, penetrated 540.2 m to a final curated depth of 540.05 mbsf. A fourth hole (U1546D) was added to ensure recovery of critical zones for microbiology studies. It penetrated 300.17 m to a final curated depth of 300.43 mbsf. The quality and quantity of recovered core in any hole was partly a function of the lithologies encountered and the coring methods used. The APC, HLAPC, and XCB systems were used in Holes U1546A, U1546B, and U1546D, and only the RCB system was used in Hole U1546C.
Lithology determinations and interpretations were based on a combination of visual core description, examination of smear slides and thin sections with a petrographic microscope, SEM, mineralogic analysis using X-ray diffraction (XRD) and carbonate analyses, and measurement of physical properties such as MS, NGR, and color reflectance (see Lithostratigraphy and Petrophysics in the Expedition 385 methods chapter [Teske et al., 2021a]; see also Geochemistry). Most of the lithologic observations and the depths of lithologic changes used in this report refer to Holes U1546A and U1546C; these two holes, correlated and combined, provide the most complete and deepest recovered record for this site (Figure F4). In contrast, Holes U1546B and U1546D were the shallowest and most heavily sampled holes prior to sediment description, with numerous whole-round core samples collected for microbiology and geochemistry analyses before they could be described by the sedimentology team (see Microbiology and Geochemistry). Different types and degrees of core disturbance were observed in sediments and rocks at this site, including the following textures: soupy, voids and gas expansion cracks, flow-in, fractures, breccia, and biscuiting. The latter two are more prevalent in the cores recovered using the XCB system. Punctures from core sampling on the core-receiving platform were also documented.
The sediments and sedimentary rocks recovered at Site U1546, located on the lower slope off Baja California in the northwestern part of the Guaymas Basin (Figure F1), are mostly laminated and primarily contain a mix of biogenic (mainly diatoms) and siliciclastic (mainly clay minerals and minor silt-sized siliciclastic) particles. Authigenic carbonates in the form of micrometer-sized particles (micrite), nodules, and layers are significant subordinate components. As discussed below, this site is lithologically akin to nearby Site U1545 and has a similar depositional environment, which is essentially hemipelagic and suboxic to anoxic throughout the middle to late Pleistocene (full recovery of Holocene strata is in question). As observed at Site U1545, the sequence recovered at Site U1546 shows downhole changes in the lithologic characteristics of the sediment mainly related to changes in the ratio of diatoms and clay minerals (the two main lithologic components), the presence of authigenic carbonate precipitates, and the diagenetic modification of biogenic silica. Although distinctive, these changes are not significant enough to require division of the sedimentary succession into more than one lithostratigraphic unit (Unit I), but they are important to understand the biogeochemical history of Sites U1545 and U1546. Hence, Unit I is divided into four subunits (Figure F4; Table T3). The subunit boundaries mark the depths at which the different degrees/types of diagenetic processes occur. For instance, the onset of micrite marks the top of the carbonate-rich Subunit IB, whereas the boundary between Subunits IC and ID is a diagenetic front in which the selective dissolution of biosiliceous tests (diatom shells) corresponds to the replacement of opal-A by opal-CT.
Sites U1545 and U1546 also have some important differences. The depths of the subunit boundaries are offset between the sites, and the subunit characterized by higher carbonate content (Subunit IB) is both shallower and thicker at Site U1545. Igneous rocks with a hypabyssal texture and basaltic composition were observed within the sedimentary section of Subunit ID in Hole U1546A (bottom of the hole) and in Hole U1546C, where altered sediments associated with both the upper and lower contact zones were recovered.
4.1. Unit descriptions
4.1.1. Unit I
- Intervals: 385-U1546A-1H-1, 0 cm, to 64X-1, 115 cm; 385-U1546B-1H-1, 0 cm, to 59X-CC, 36 cm; 385-U1546C-2R-1, 0 cm, to 42R-CC, 21 cm (385-U1546C-11 was a drilled interval with no core recovery); 385-U1546D-1H, 0 cm, to 47F-CC, 26 cm
- Depths: Hole U1546A = 0–360.55 mbsf, Hole U1546B = 0–333.21 mbsf, Hole U1546C = 308.2–540.05 mbsf (washed to 308.2 mbsf), Hole U1546D = 0–300.43 mbsf
- Thickness: Hole U1546A = 360.55 m, Hole U1546B = 333.21 m, Hole U1546C = 540.05 m, Hole U1546D = 300.43 m
- Age: late to middle Pleistocene (note that Holocene may not have been recovered)
- Lithology: diatom ooze, clay-rich diatom ooze, diatom clay, clay, diatom-rich clay, micrite-bearing to micrite-rich diatom clay, micrite-rich diatom ooze, limestone/dolostone, siliceous claystone, and mafic igneous rock
Lithostratigraphic Unit I is composed of a 540.5 m thick sequence of late to middle Pleistocene sediments as well as sedimentary and igneous rocks. The sediments are primarily a mixture of siliceous biogenic components (mainly made up of diatoms) and siliciclastic particles (mainly detrital clay minerals with lesser terrigenous silt and volcanic ash/sand). Minor biogenic components include calcareous nannofossils, foraminifers, silicoflagellates, sponge spicules, and radiolarians. The sedimentary rocks (limestone/dolostone/claystone) are authigenic products. Carbonate, the dominant authigenic phase, occurs as disseminated clay- to silt-sized particles in the sediments that ultimately coalesce to form harder and more lithified carbonate concretions and discrete nodules and layers. The carbonate minerals include calcite and dolomite based on analysis of XRD data. Other authigenic minerals include accessory sulfide minerals (e.g., framboidal pyrite) identified in smear slides throughout the unit and authigenic silica (opal-CT and quartz) identified in XRD data from lower in the section where siliceous claystones dominate. The authigenic silica is thought to have formed at the expense of the opaline biogenic components. Fine-scale lamination is present throughout the unit, but discrete, millimeter- to centimeter-thick, black and gray layers composed of silt- or sand-sized volcaniclastic and terrigenous particles or tephra (fine/coarse) are more common in Subunits IA and IB. Whole mollusk shells and fragments (with the breakup being mainly a product of core splitting) are also more prevalent in the upper part of the unit. The colors of the sediments and sedimentary rocks range from light olive-gray and olive-gray toward the top of the unit to dark yellowish brown and dusky yellowish brown toward the bottom. Igneous rocks were encountered at the base of Hole U1546A and then completely penetrated in nearby Hole U1546C, where a ~75 m thick interval of hypabyssal igneous rocks was cored along with associated contact zones of altered sedimentary rock (see Igneous petrology and alteration).
Unit I is divided into four subunits mainly based on the presence of minor yet significant lithologic changes occurring downhole and/or changes in sediment induration and physical properties such as NGR, MS, and color reflectance. The transitions between the subunits are not sharp but gradual and occur over more than one core. The unit boundaries were selected based on the “first appearance” approach; the boundaries were located at the depths at which the new, diagenetically modified lithology was first encountered when describing core from the top to bottom of the drilled interval (Table T3).
4.1.1.1. Subunit IA
- Intervals: 385-U1546A-1H-1, 0 cm, to 12H-2, 104 cm; 385-U1546B-1H-1, 0 cm, to 12H-2, 91 cm; 385-U1546D-1H-1, 0 cm, to 12H-1, 78 cm
- Depths: Hole U1546A = 0–101.34 mbsf, Hole U1546B = 0–101.71 mbsf, Hole U1546D = 0–99.78 mbsf
- Thickness: Hole U1546A = 101.34 m, Hole U1546B = 101.71 m, Hole U1546D = 99.78 m
- Age: late Pleistocene (to Holocene?)
- Lithology: clay-rich diatom ooze, diatom clay, and diatom ooze
Lithostratigraphic Subunit IA is composed of soft and mainly laminated diatom oozes with variable amounts of clay-sized nonbiogenic (i.e., terrigenous) debris made up of mainly clay minerals (Figure F5A). As in Subunit IA at Site U1545, the clay content varies over multiple scales of depth intervals from millimeters to meters. Visual observations at microscopic (smear slide) and macroscopic scales indicate that the intervals with higher diatom content (diatom ooze) are generally lighter colored (light olive-gray; 5Y 7/2), whereas mixed lithologies (e.g., diatom and clay) tend to be darker (e.g., olive-gray; 5Y 3/2). Diatoms are well preserved throughout the subunit, and calcareous nannofossils are the second most common biogenic component (Figure F6A–F6B). Smear slide analysis shows that nannofossils decrease in abundance at the bottom of the subunit just as micrite starts to appear, and the boundary with underlying Subunit IB is defined as the first occurrence of carbonate concretions or micrite-rich lithologies. Other minor lithologies include laminae of terrigenous silt/sand and tephra. Open burrows are present at the top of the subunit, and shells fragmented during core splitting are present in most cores. Intervals showing evidence of soft-sediment deformation (tilting and folding of laminae as well as intraformational breccia) are present near the top (Cores 385-U1546A-2H and 385-U1546B-2H and 3H) and bottom (Sections 385-U1546A-11H-7, 12H-1, 12H-2, and 385-U1546B-12H-1) of the subunit (Figure F7A, F7C). Drilling deformation in this subunit is virtually absent.


4.1.1.2. Subunit IB
- Intervals: 385-U1546A-12H-2, 104 cm, to 23F-1, 0 cm; 385-U1546B-12H-2, 91 cm, to 23H-5, 0 cm; 385-U1546D-12H-1, 28 cm, to 24H-1, 0 cm
- Depths: Hole U1546A =101.34–198.5 mbsf, Hole U1546B = 101.71–198.73 mbsf, Hole U1546D = 99.78–197.0 m
- Thickness: Hole U1546A = 97.16 m, Hole U1546B = 97.02 m, Hole U1546D = 97.22 m
- Age: late to middle Pleistocene
- Lithology: diatom clay, micrite-rich diatom ooze, micrite-bearing diatom clay, clay-rich diatom ooze, clay- and micrite-rich diatom ooze, diatom-rich micrite, and limestone/dolostone
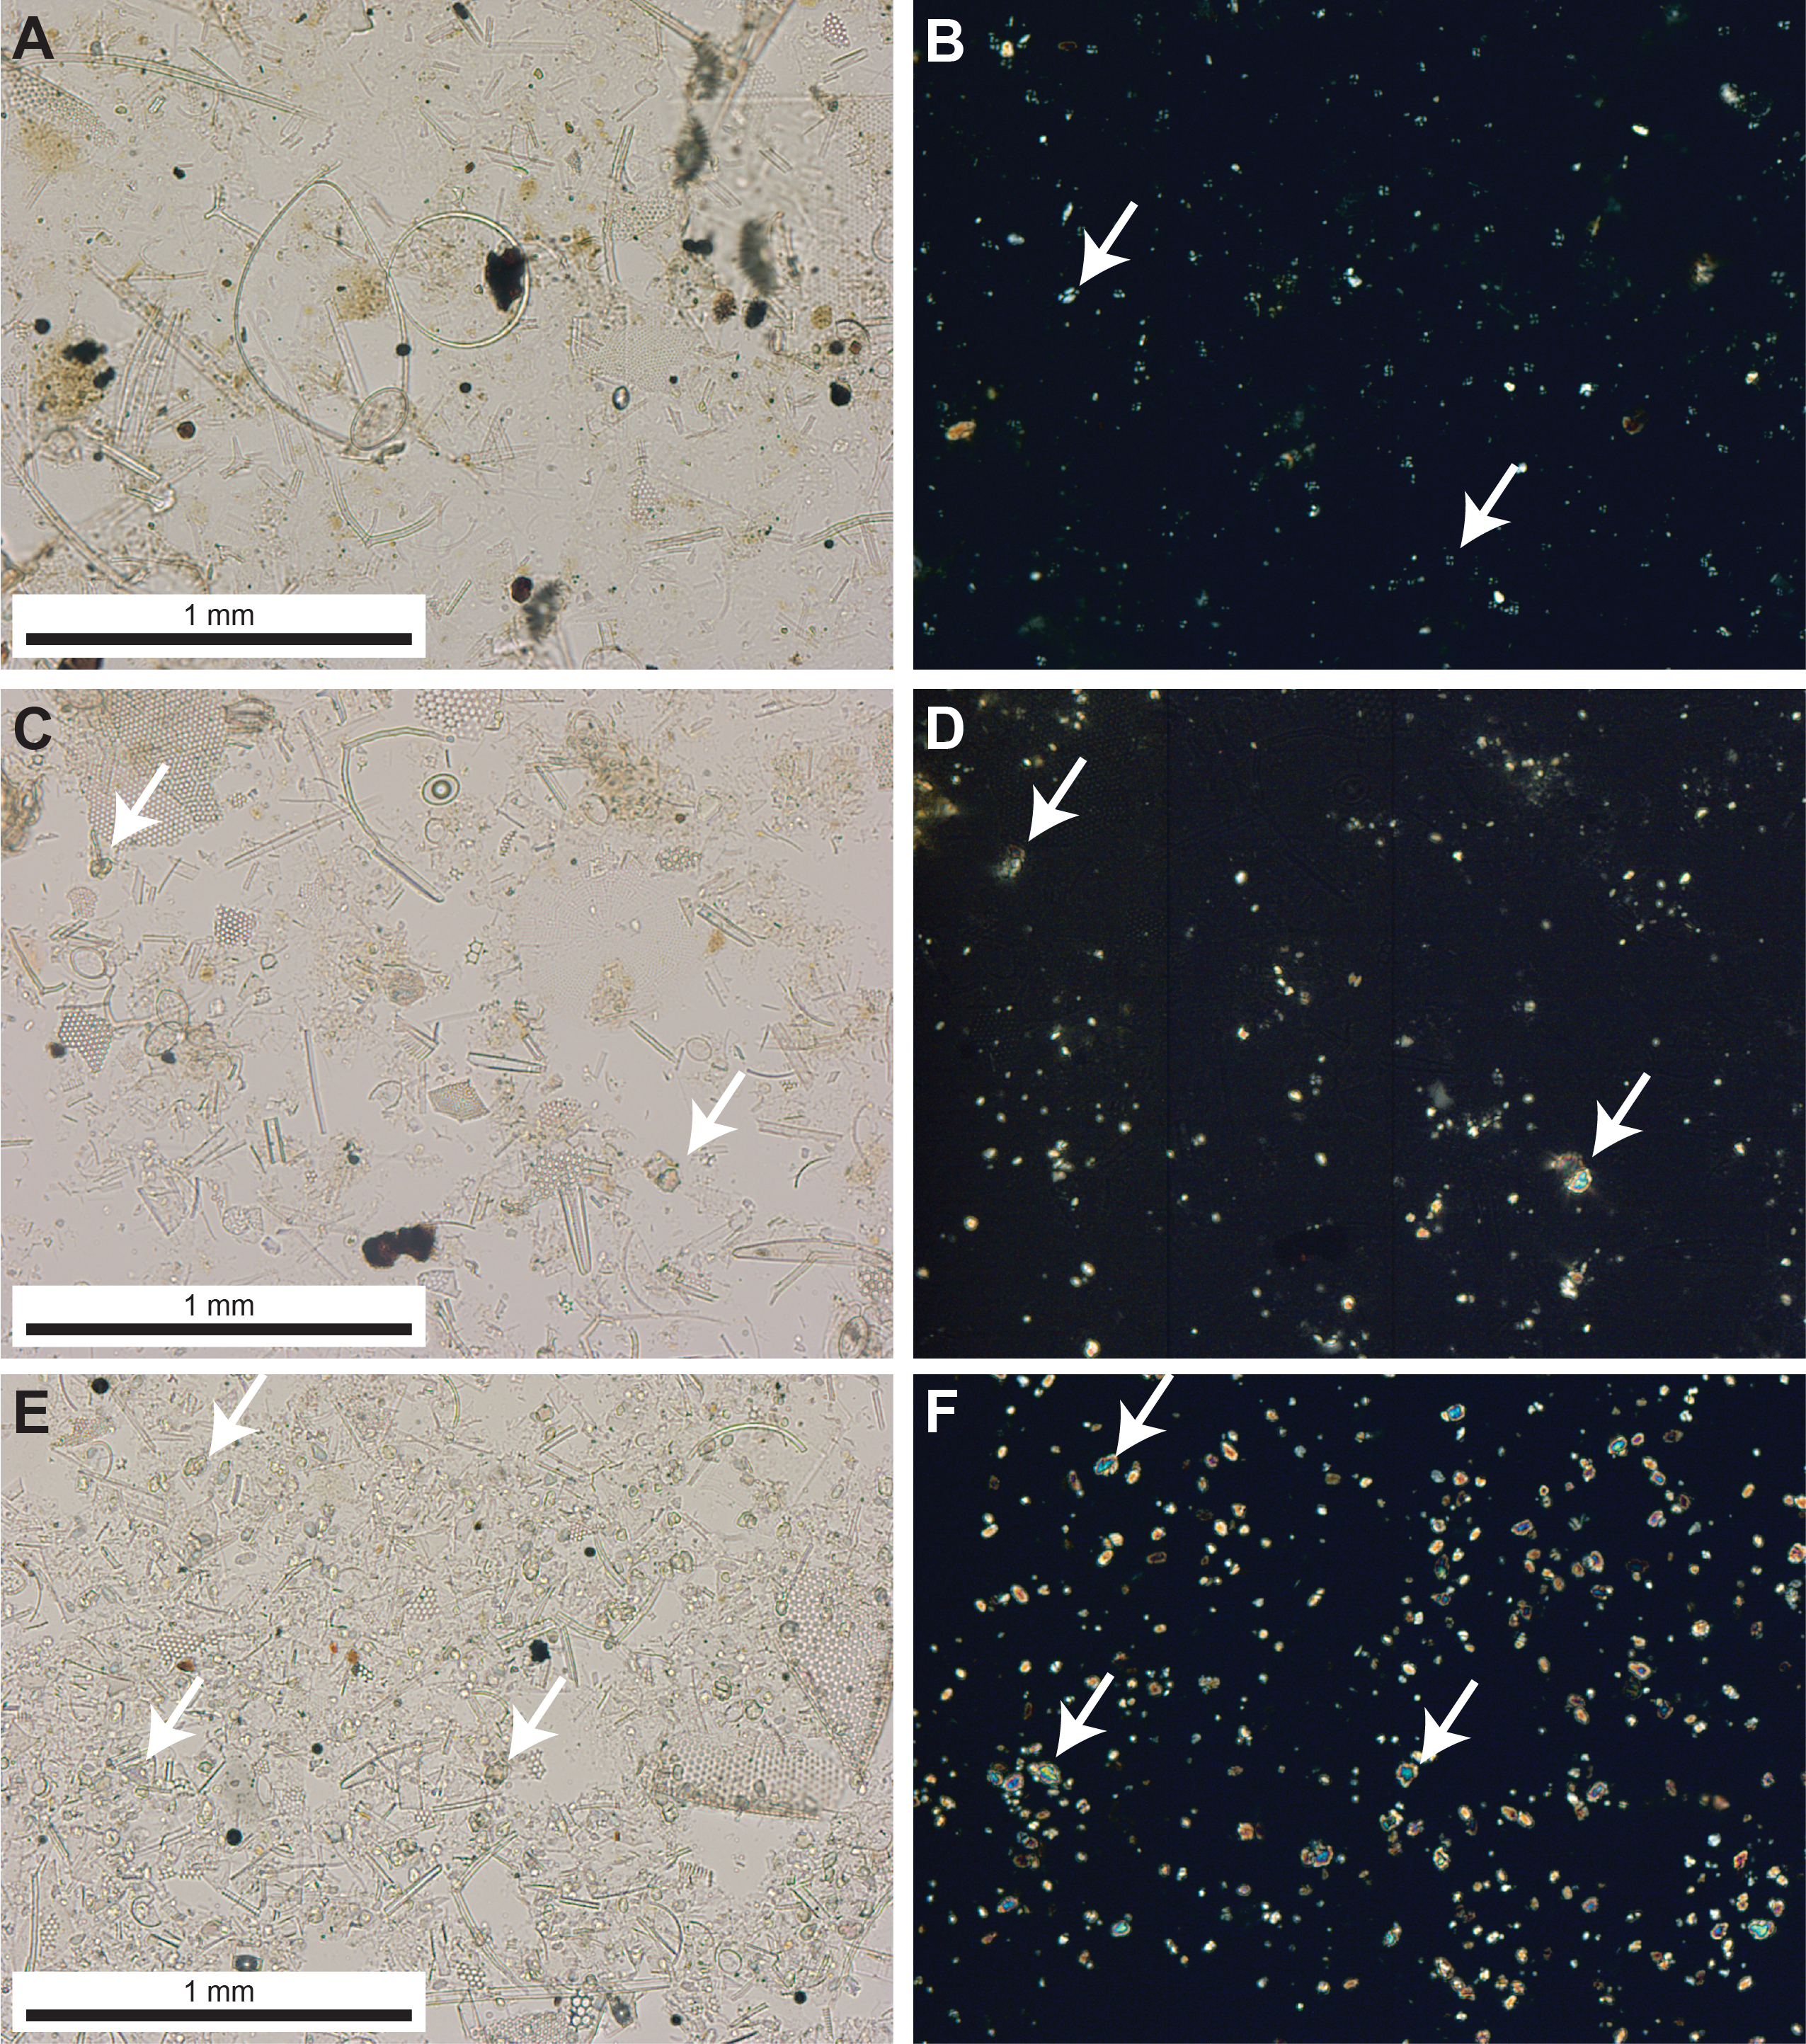
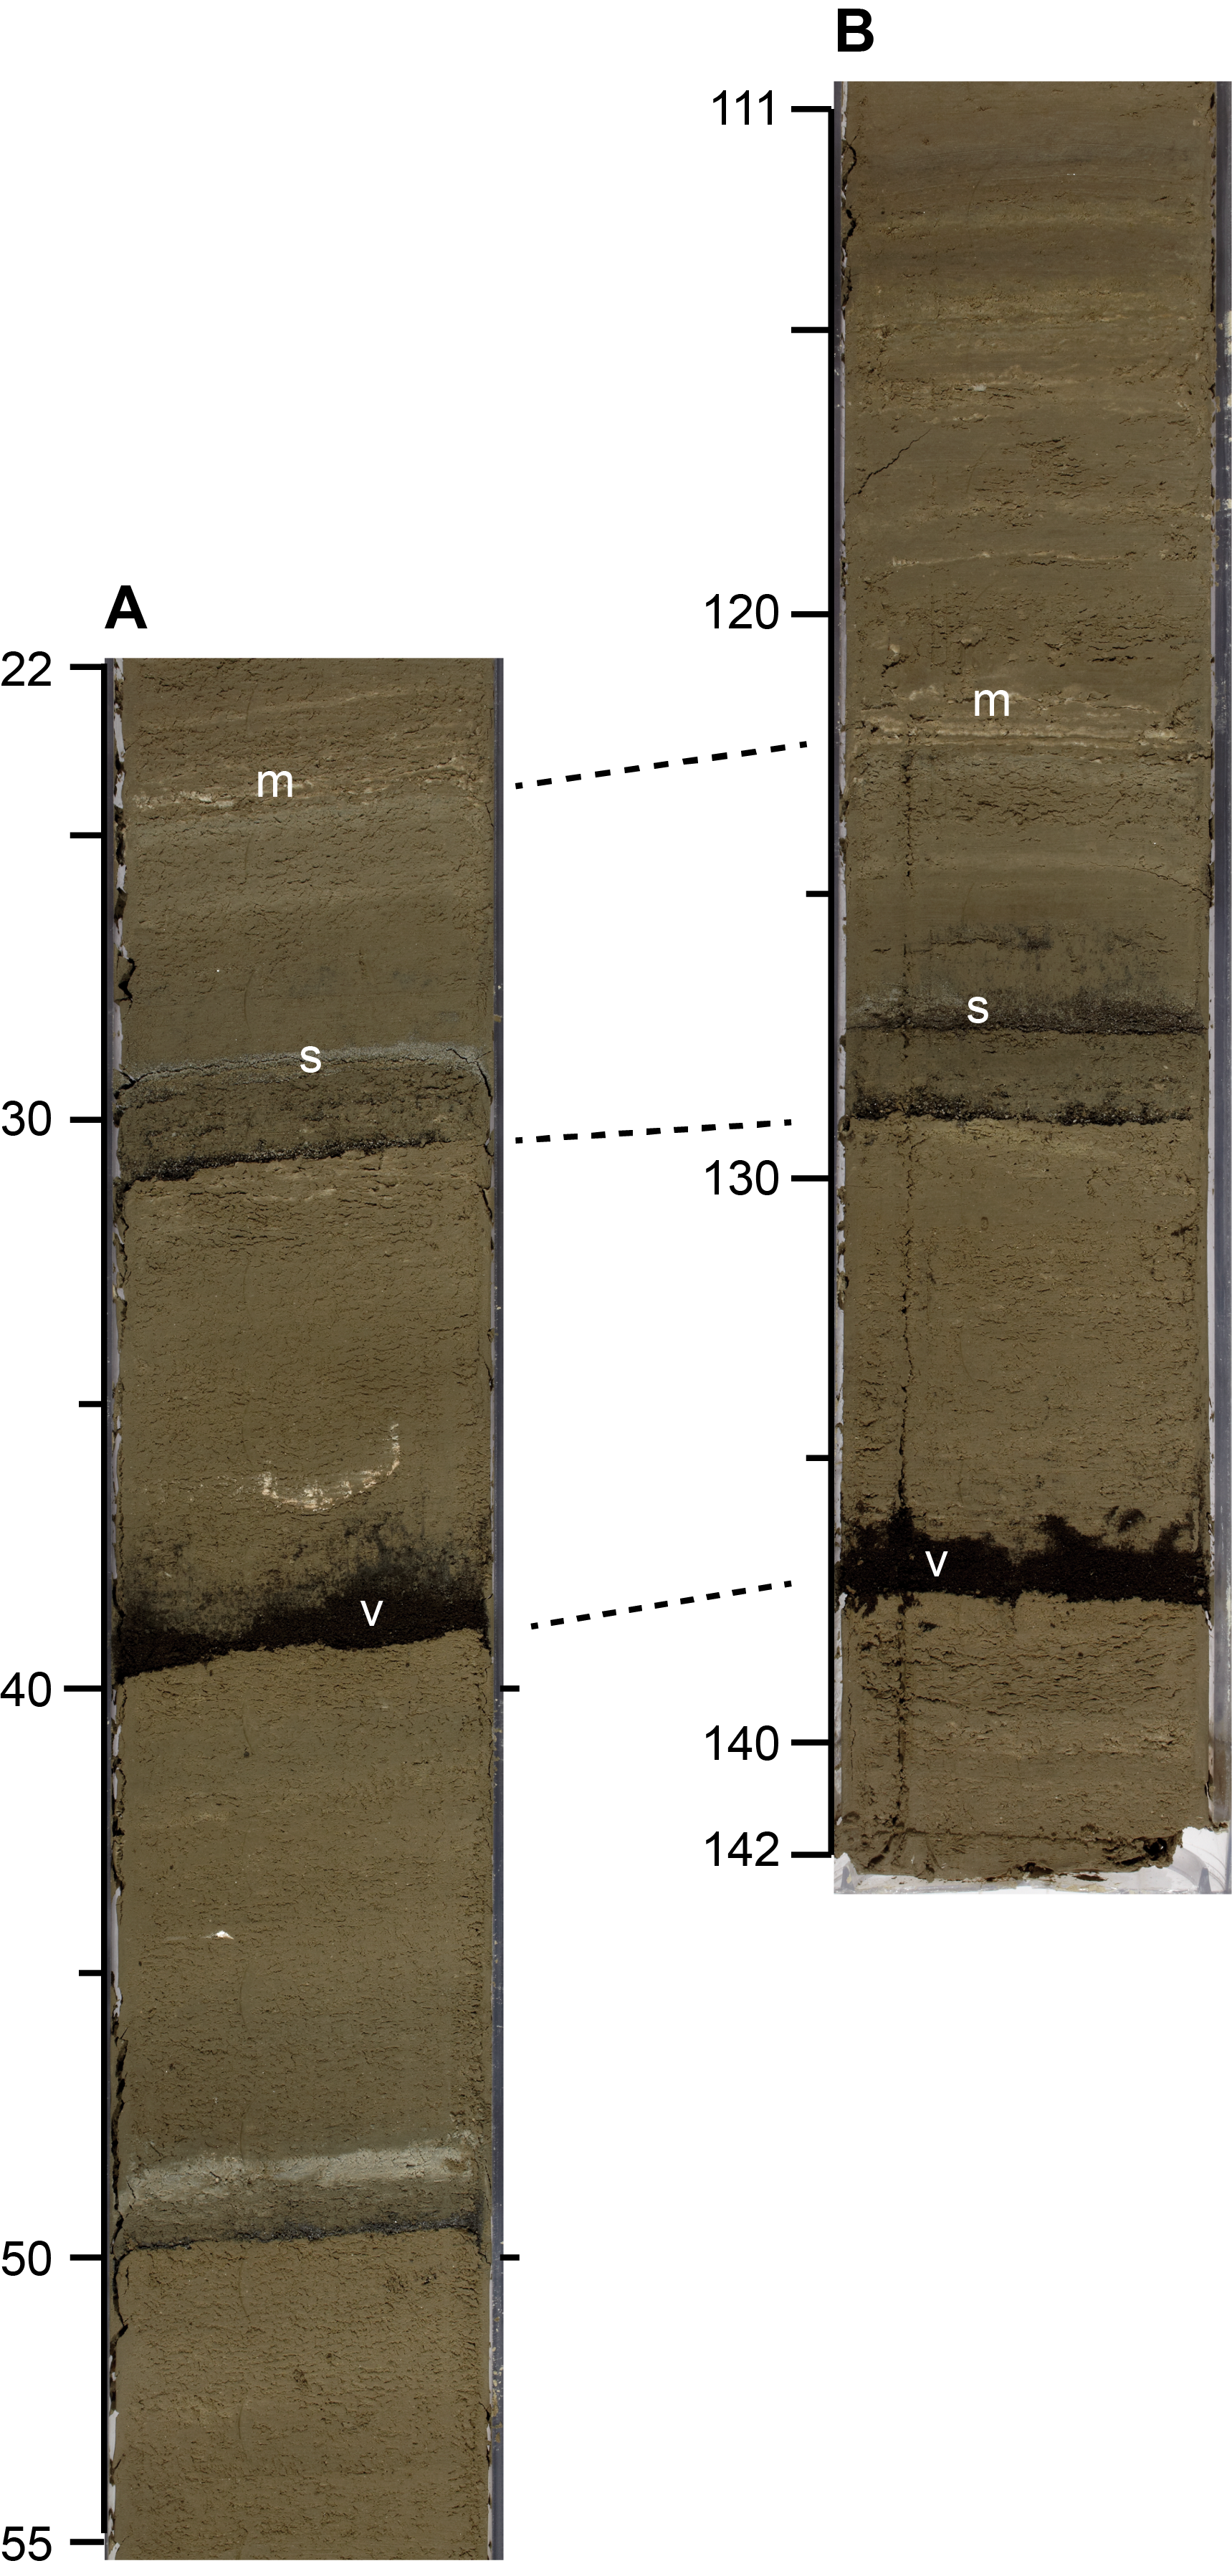
Lithostratigraphic Subunit IB is mainly composed of varying proportions of diatoms and clay, with the addition of significant (>5%) micrite (euhedral to subhedral, micrometer-sized, authigenic carbonate particles). The boundary between Subunits IA and IB is placed at the first occurrence of micrite-rich diatom ooze in Section 12H-2 of both Holes U1546A and U1546B and corresponds to the first occurrence of authigenic carbonate concretion in Hole U1546D. Laminae are faint in the upper part of the subunit but become more pronounced and distinct in the lower part (e.g., Figure F5B). The micrite content increases toward the middle of the subunit where the most common carbonate mineralogy transitions from calcite to dolomite (Figure F6C–F6F). The main lithologies are micrite-rich diatom ooze and micrite-rich diatom clay. Micrite content averages 10 vol% (Figure F6E–F6F) but ranges as high as ~80 vol% or more of the sediment in some intervals. Changes in carbonate content are linked to variations in the degree of induration (the more carbonate the more indurated) and in sediment color. For example, lighter colored (yellowish gray), more indurated intervals have higher carbonate content, whereas darker (olive-gray), softer intervals have less micrite. Other very minor lithologies include laminae of terrigenous silt/sand and ash (Figure F8), and sulfides, including pyrite, are commonly associated with diatom tests (Figure F9). Several intervals of tilted and deformed beds are attributed to soft-sediment deformation (Figure F7B). Mollusk shells are present in a few cores. Drilling disturbance is minimal.
4.1.1.3. Subunit IC
- Intervals: 385-U1546A-23F-1, 0 cm, to 58X-1, 0 cm; 385-U1546B-23H-5, 0 cm, to 58X-1, 0 cm; 385-U1546C-2R-1, 0 cm, to 3R-1, 0 cm; 385-U1546D-24H-1, 0 cm, to 47F-CC, 26 cm
- Depths: Hole U1546A = 198.5–317.5 mbsf, Hole U1546B = 198.73–321.5 mbsf, Hole U1546C = 308.2–317.9 mbsf, Hole U1546D = 197.0–300.43 mbsf
- Thickness: Hole U1546A = 119.0 m, Hole U1546B = 122.77 m, Hole U1546C = 9.7 m, Hole U1546D = 103.43 m
- Age: middle Pleistocene
- Lithology: diatom clay, clay-rich diatom ooze, and diatom ooze
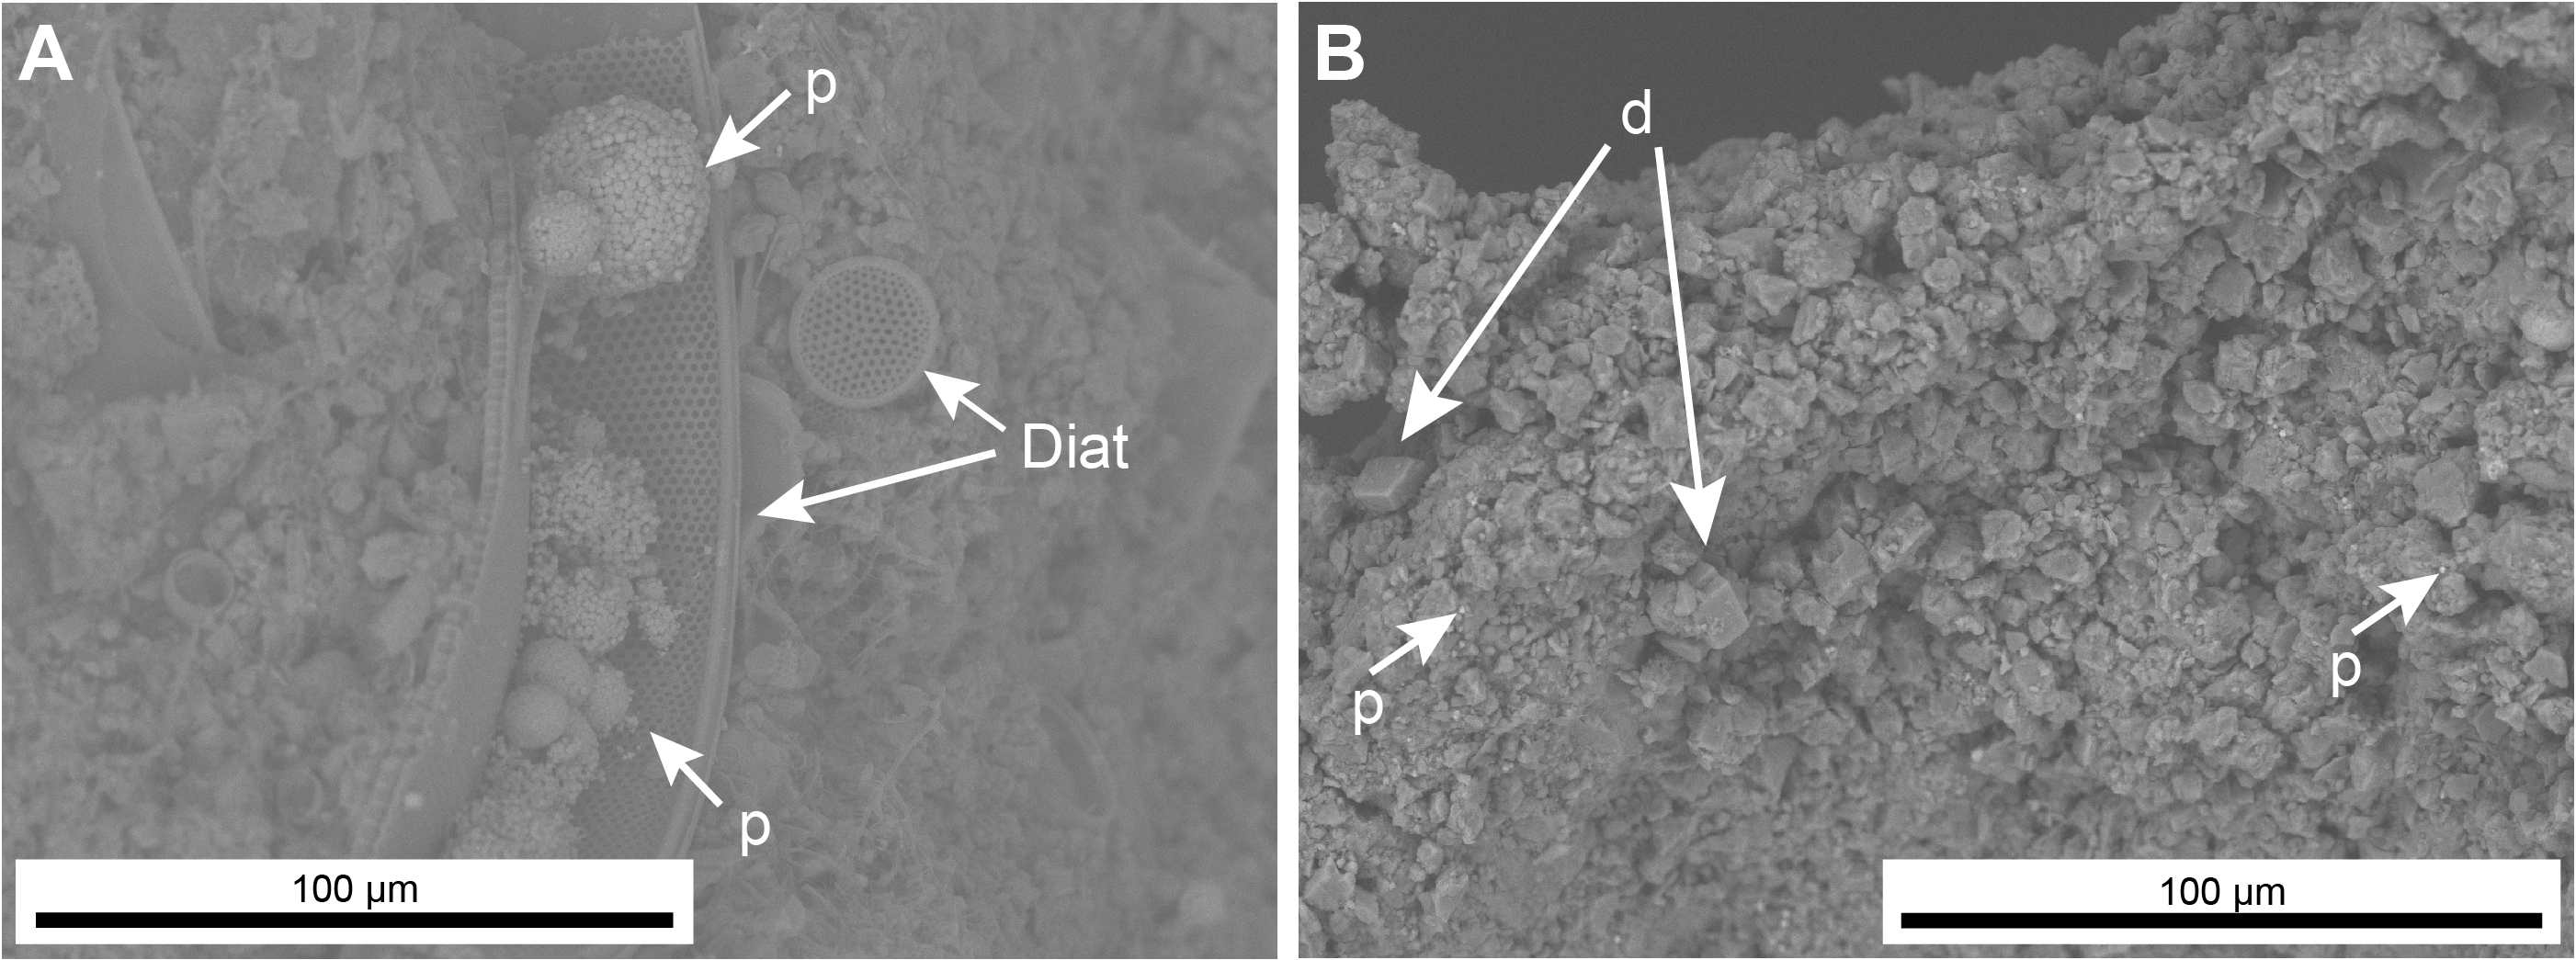
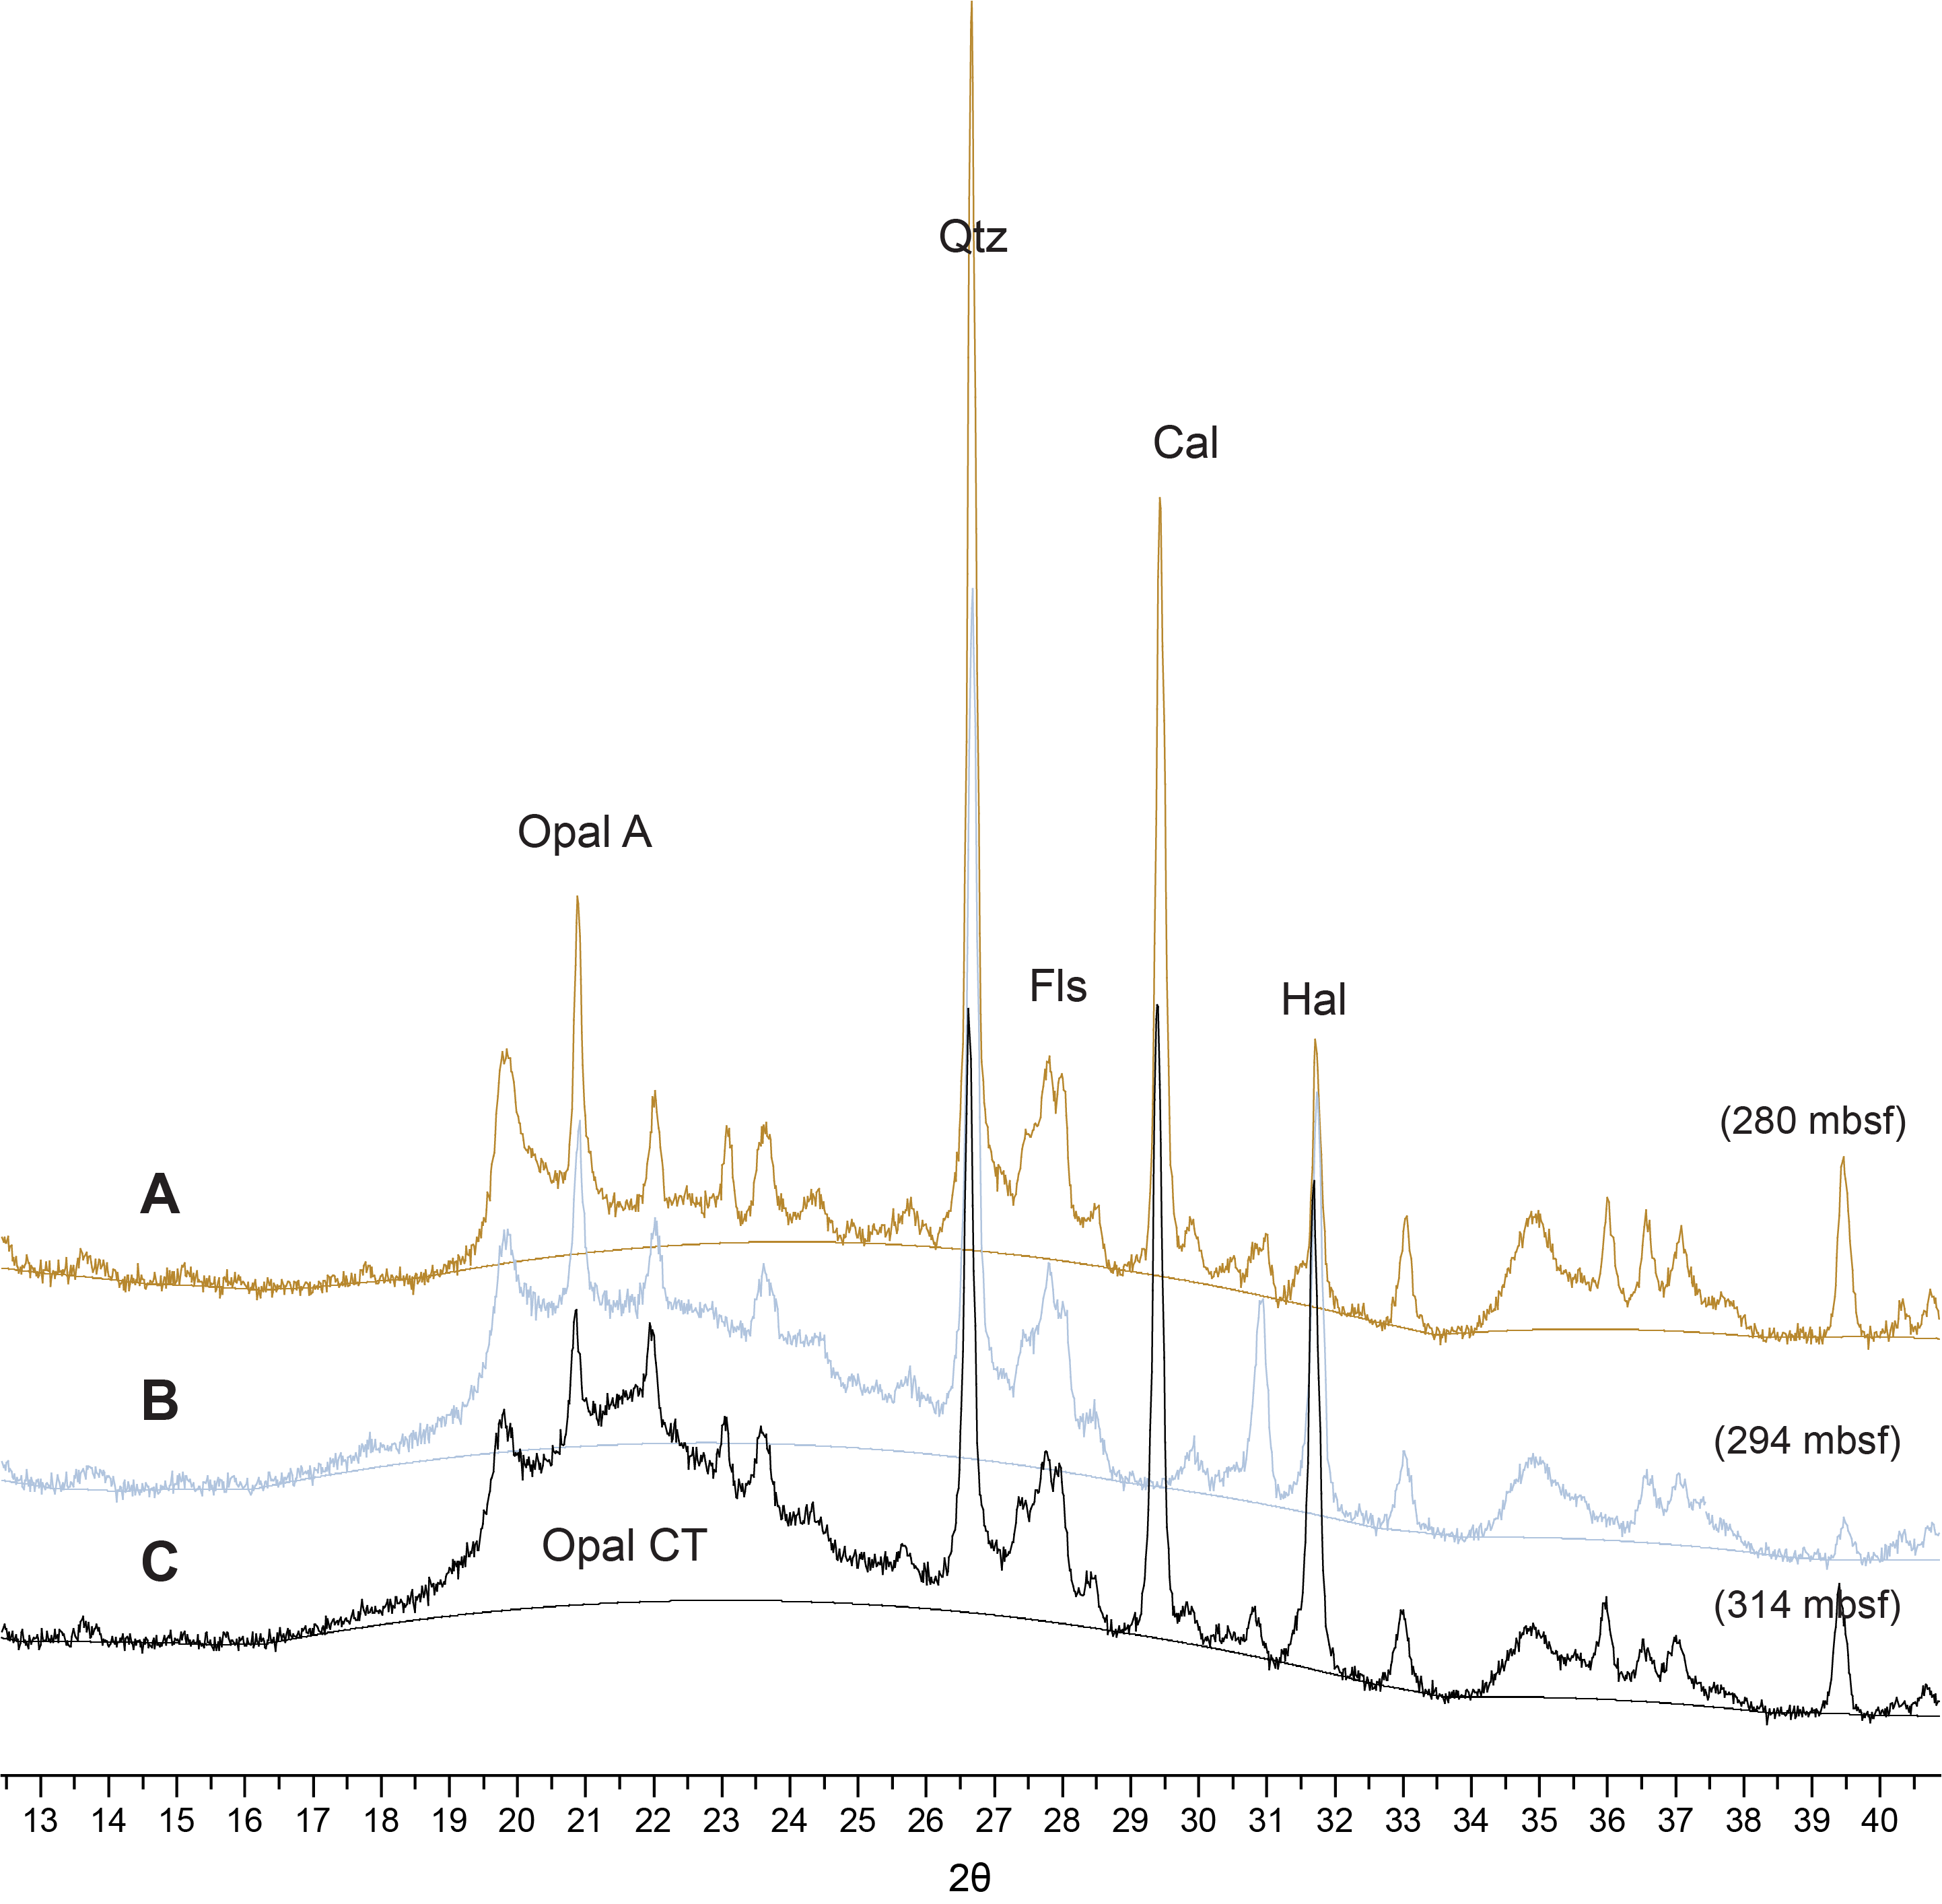
In Lithostratigraphic Subunit IC below ~198 mbsf, the color of the sediment is dominated by darker hues (mainly olive-gray) that correspond to a decrease in abundance of the micrite component relative to Subunit IB that is reflected by an overall lower carbonate content in the sediment. The main lithologies are diatom clay and clay-rich diatom ooze with laminae of diatom ooze (Figure F10A–F10B, F10E–F10F). Carbonate (limestone/dolostone) intervals and concretions are present locally throughout the subunit, including some intervals that have micrite-bearing to micrite-rich lithologies where carbonate is less concentrated. SEM observations confirm the presence of authigenic dolomite (Figure F9B). The abundance (and preservation) of diatoms rather abruptly decreases from Core 57X to Core 58X in both Holes U1546A and U1546B and from Core 385-U1546C-2R to Core 3R (Figure F10C–F10D, F10G–F10H). This corresponds to a color change from olive-gray to dusky yellowish gray and a change in silica phase from opal-A to opal-CT (Figure F11). Cores recovered using the XCB coring system displayed drilling-induced biscuiting and brecciation.
4.1.1.4. Subunit ID
- Intervals: 385-U1546A-58X-1, 0 cm, to 64X-1, 115 cm; 385-U1546B-58X-1, 0 cm, to 59X-CC, 36 cm; 385-U1546C-3R-1, 0 cm, to 42R-CC, 21 cm
- Depths: Hole U1546A = 317.5–360.55 mbsf (total depth), Hole U1546B = 321.5–333.22 mbsf (total depth), Hole U1546C = 317.9–540.05 mbsf (total depth)
- Thickness: Hole U1546A = 43.05 m, Hole U1546B = 11.72 m, Hole U1546C = 222.15 m
- Age: middle Pleistocene
- Lithology: siliceous claystone, silty clay, limestone, dolostone, and mafic igneous rock
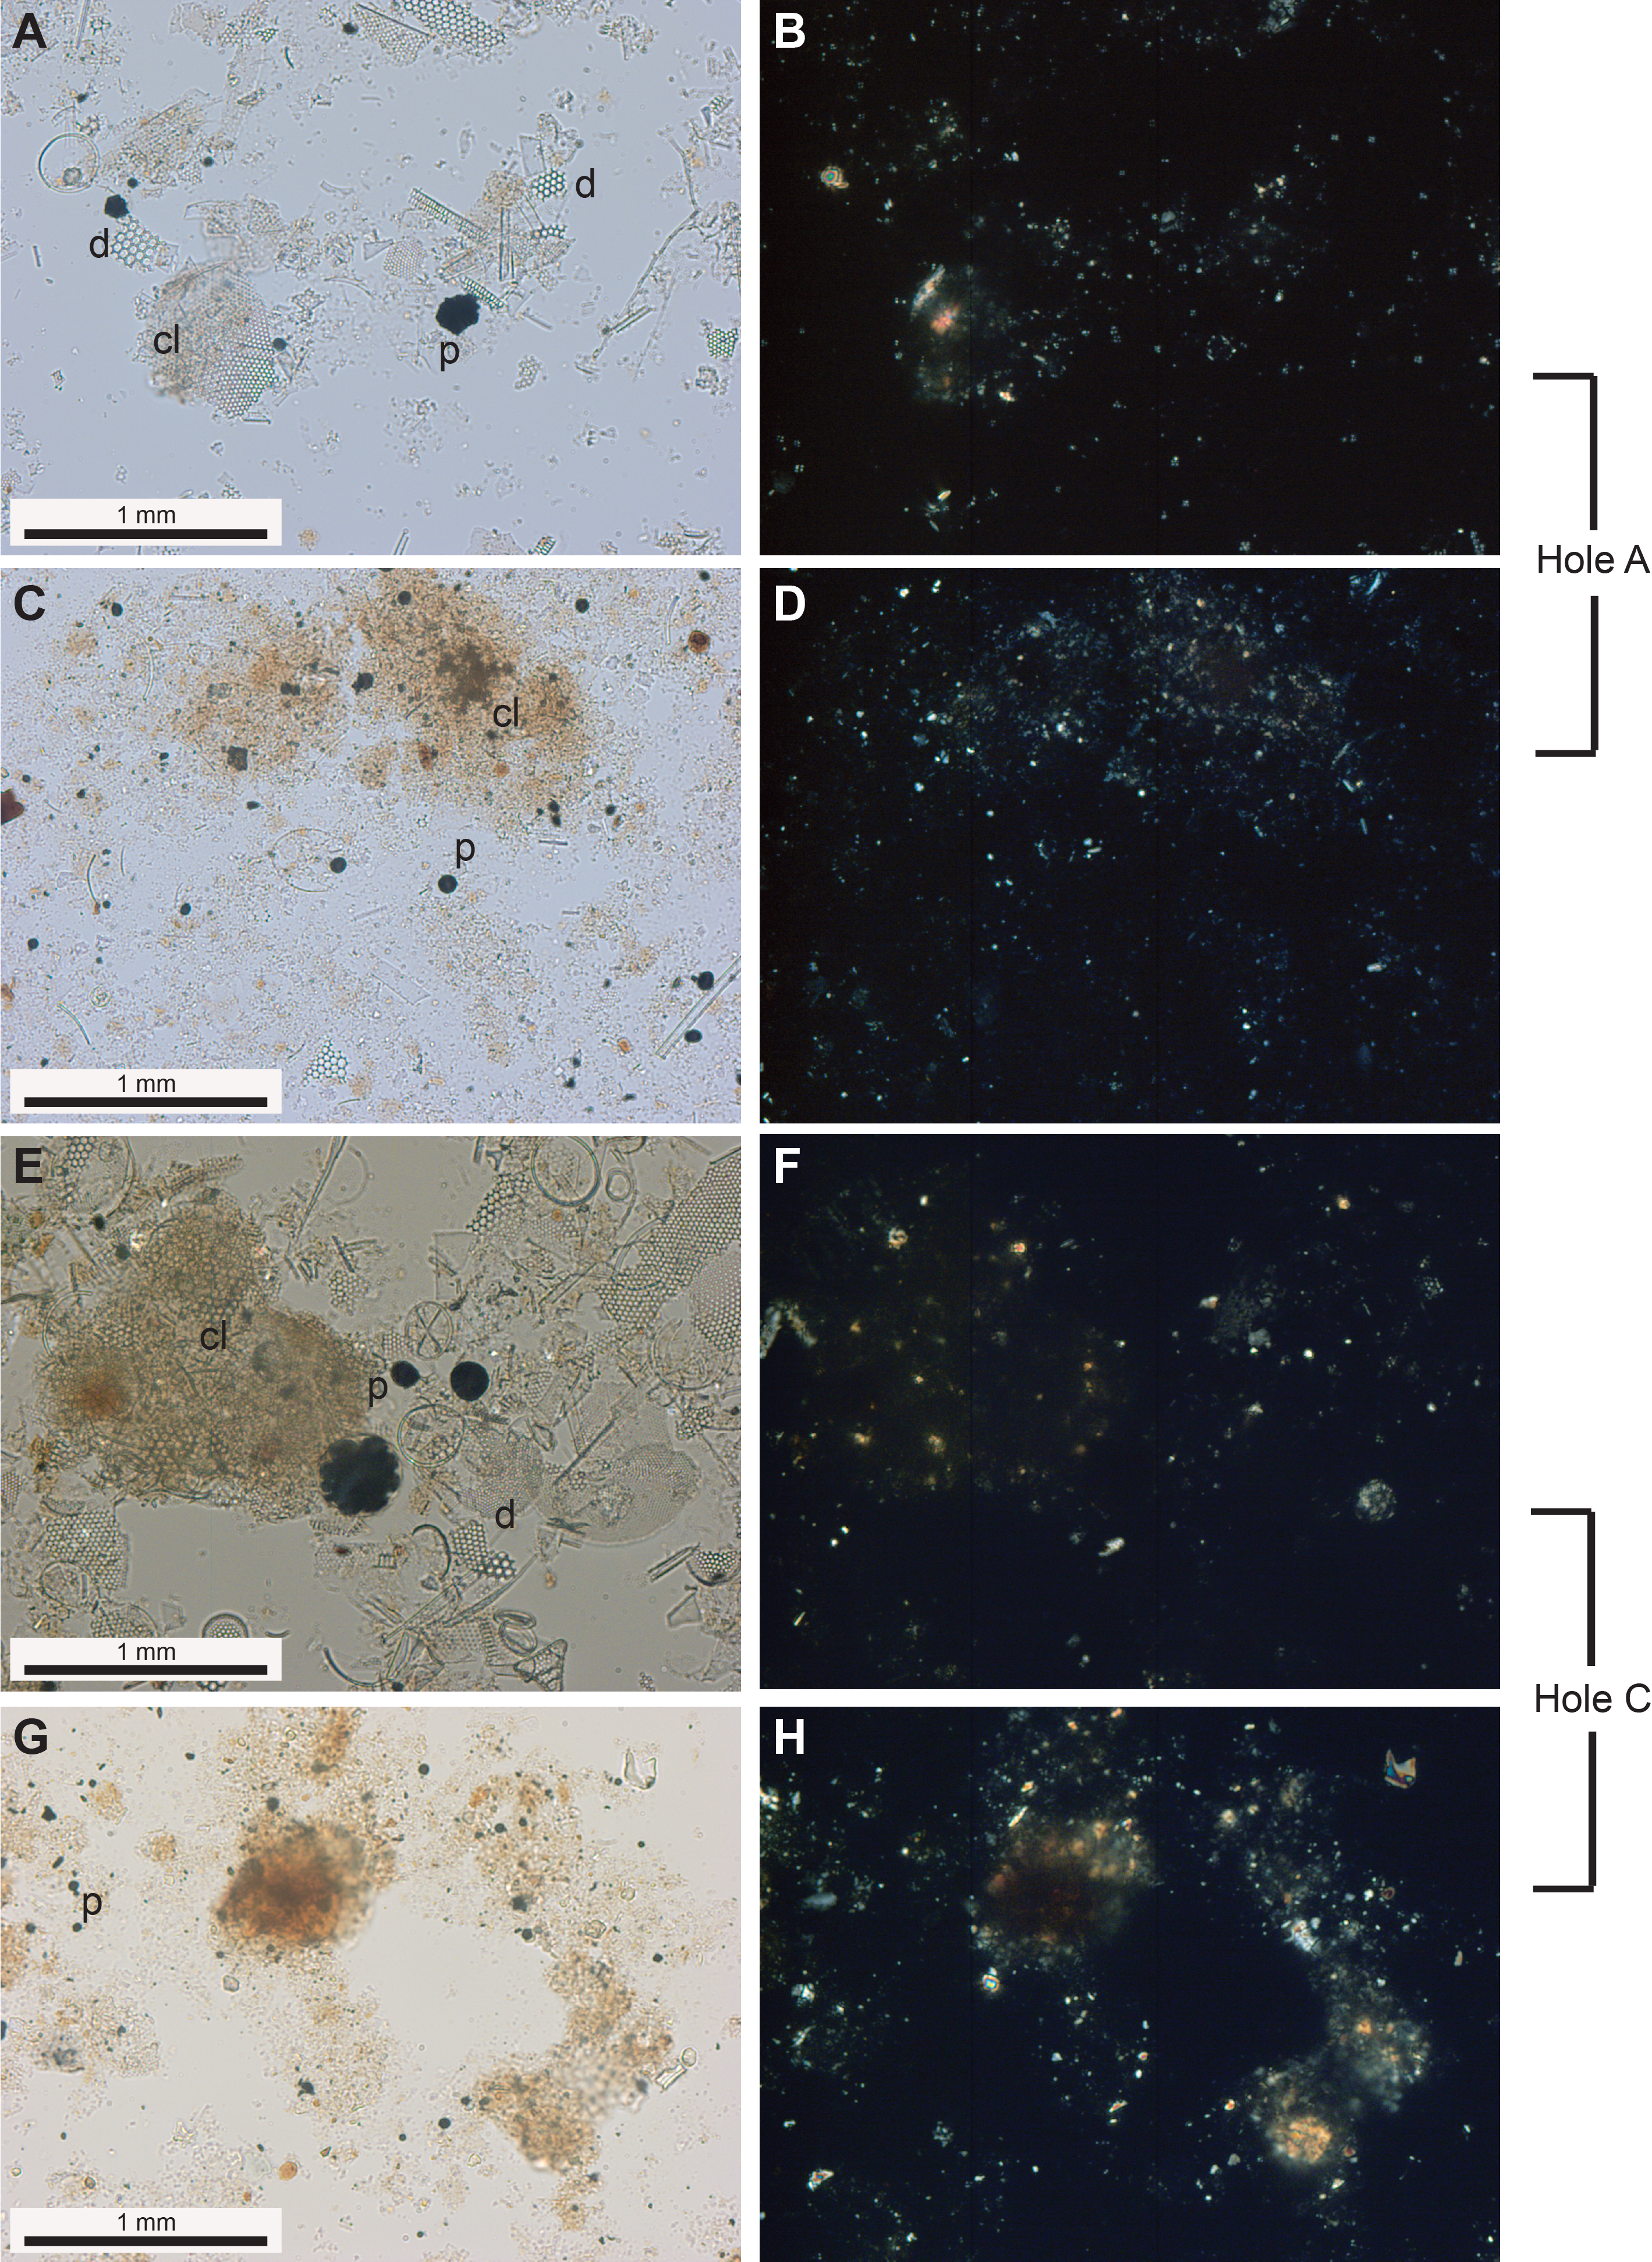
Lithostratigraphic Subunit ID is mainly represented by finely laminated siliceous claystone that varies in color from dusky yellowish brown (10YR 2/2) to dark yellowish brown (10YR 4/2) to olive-black (5Y 2/1) to brownish black. In Cores 385-U1546C-26R through 27R, Subunit ID is nannofossil bearing. Smear slides show that diatoms are absent and the main component is clay-sized material with minor detrital silt and pyrite framboids (Figure F10). This increased concentration of clay-sized material is mainly made up of clay minerals because it is associated with changes in NGR and MS, with both proxies shifting toward higher values (Figure F4). Pale yellowish brown (10YR 6/2) carbonate concretions/layers were recovered in most cores at the bottom of the subunit, approximately one every 10 m. Dolomite is likely the main carbonate mineral in these concretions based on their similarity to the concretions found in the correlative Subunit ID at Site U1545. The XRD analyses indicate the absence of opal-A or opal-CT and the presence of quartz in this subunit.
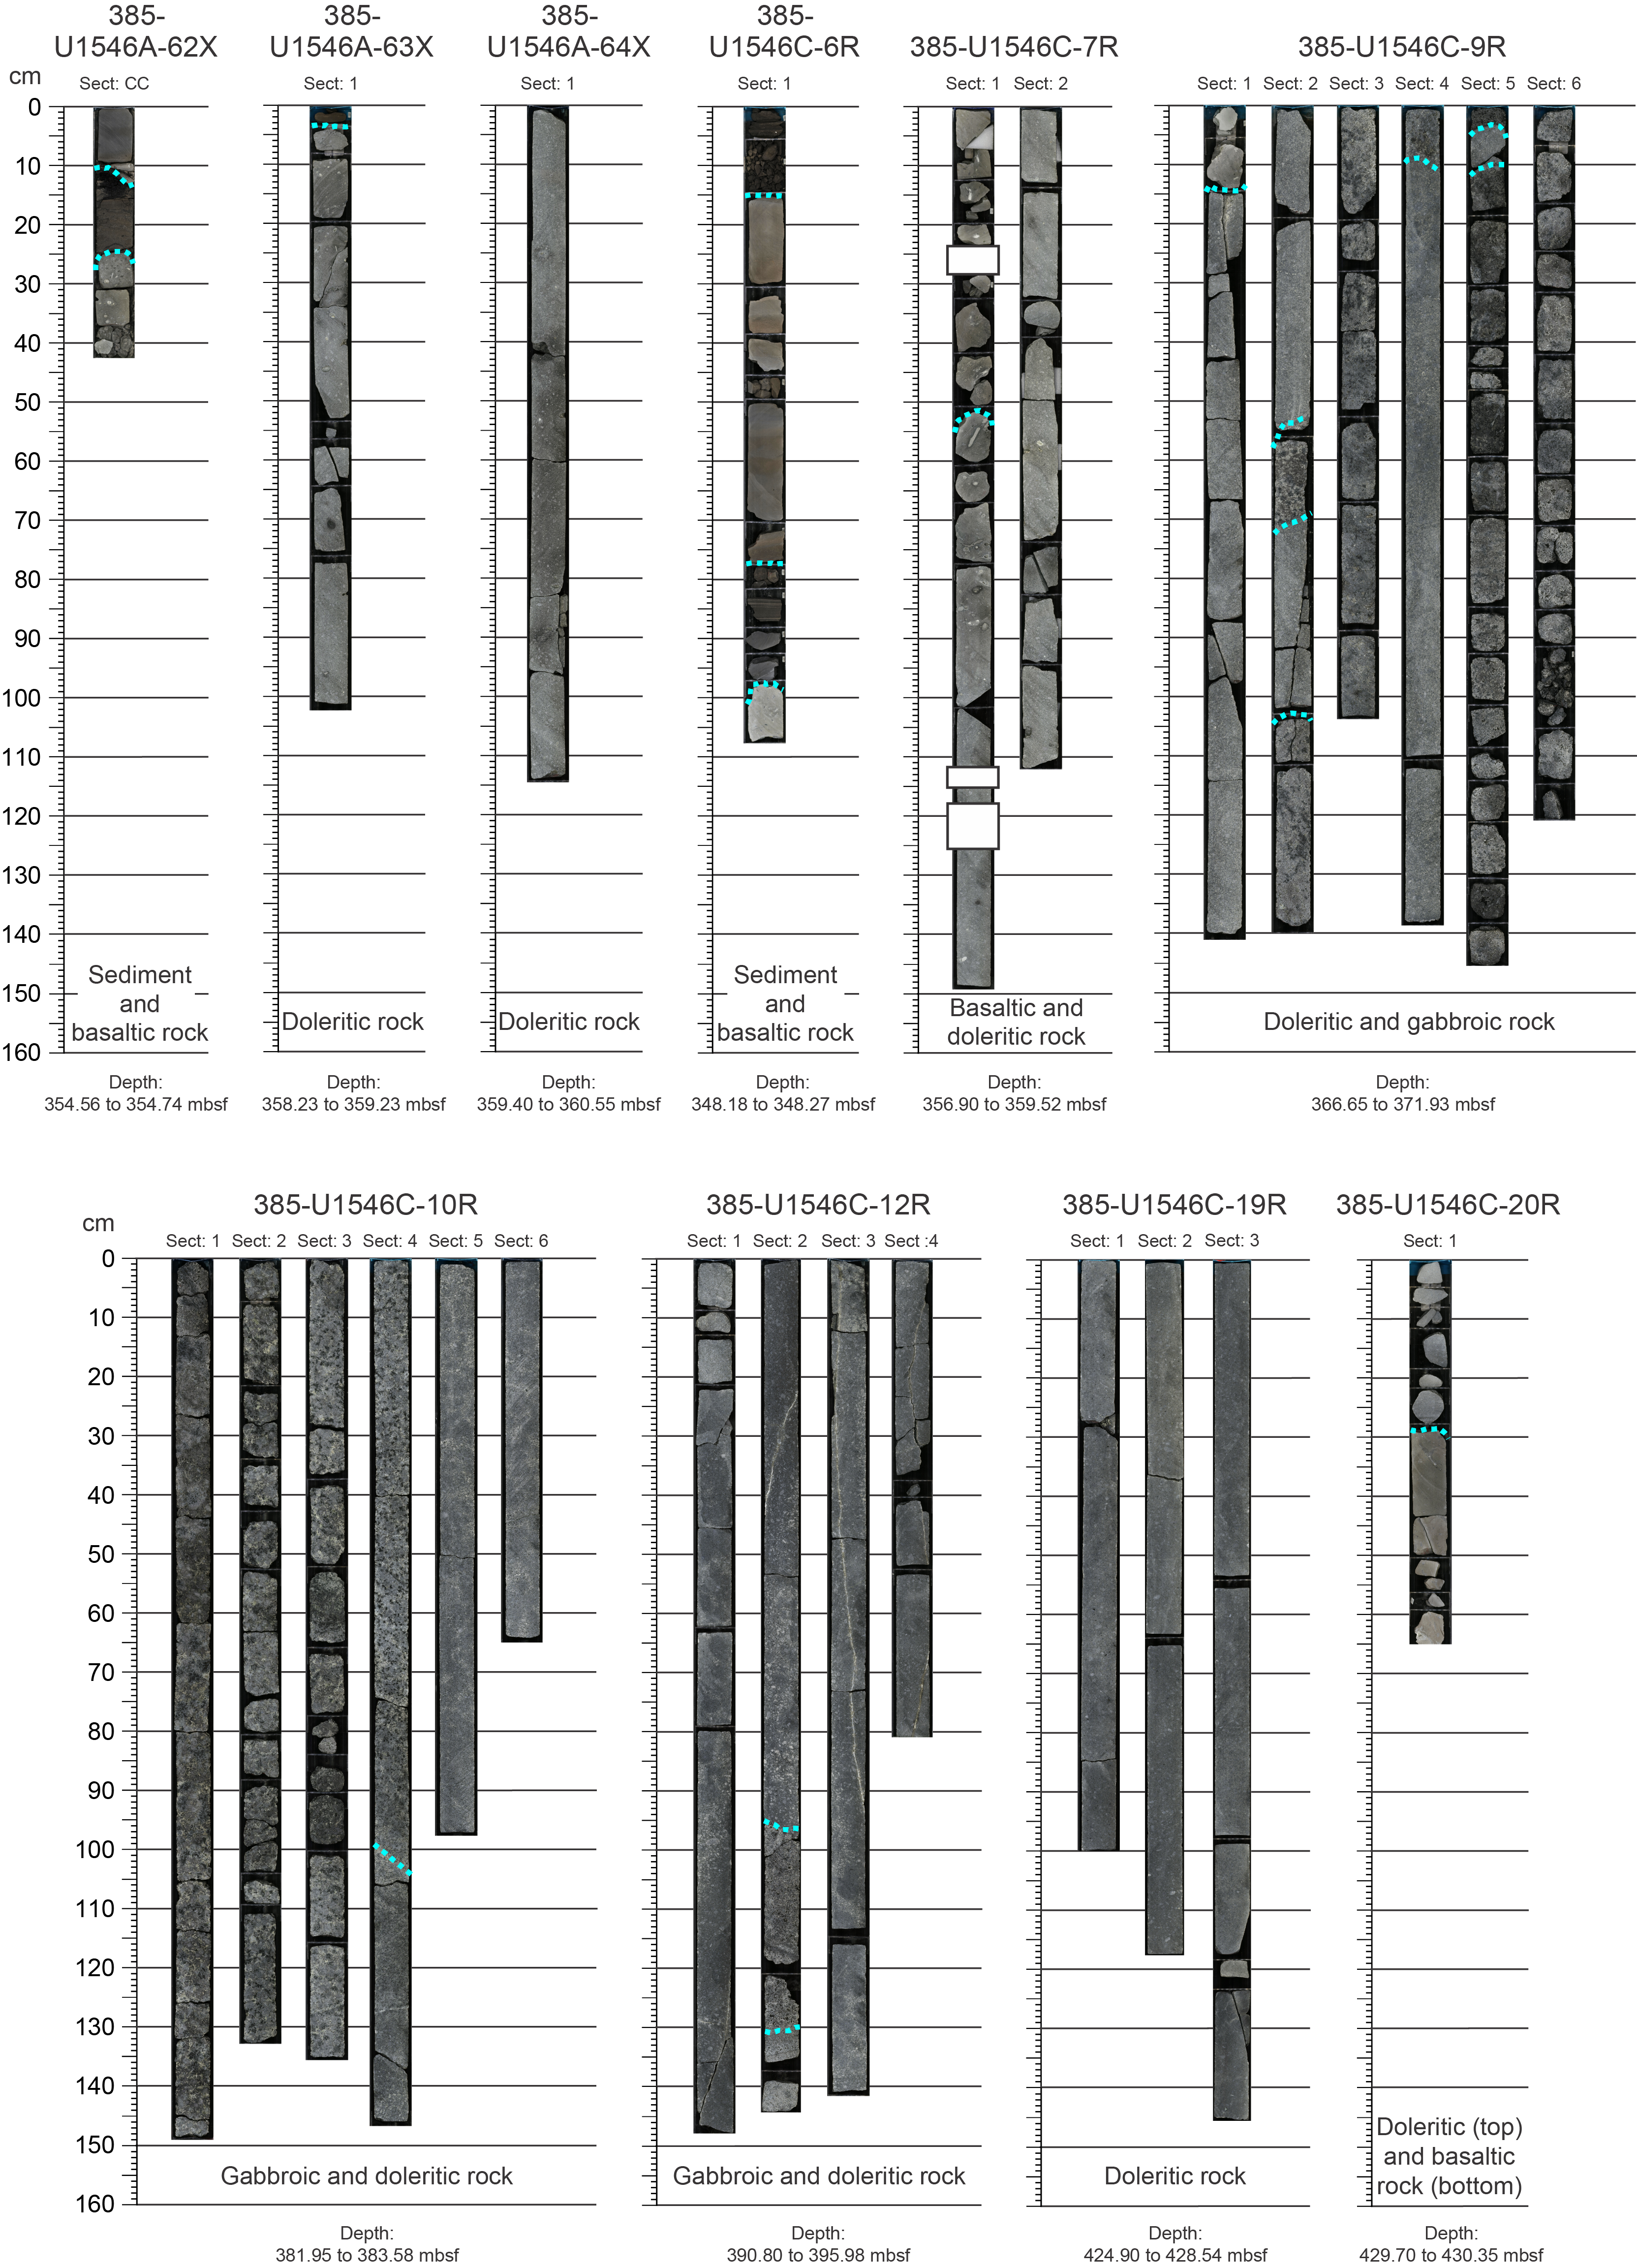
A sill characterized by hypabyssal mafic rocks with vesicular basaltic, doleritic, and gabbroic textures (Figure F4; Table T3) was recovered in Subunit ID in Holes U1546A and U1546C (5.99 m cored interval 385-U1546A-62X-CC, 25 cm, to 64X-1, 115 cm [354.56–360.55 mbsf] and 82.18 m cored interval 385-U1546C-6R-1, 97 cm, to 20R-1, 65 cm [348.17–430.35 mbsf]). These intervals are characterized in detail in Igneous petrology and alteration, and the surrounding altered sediments and sedimentary rocks are described below.
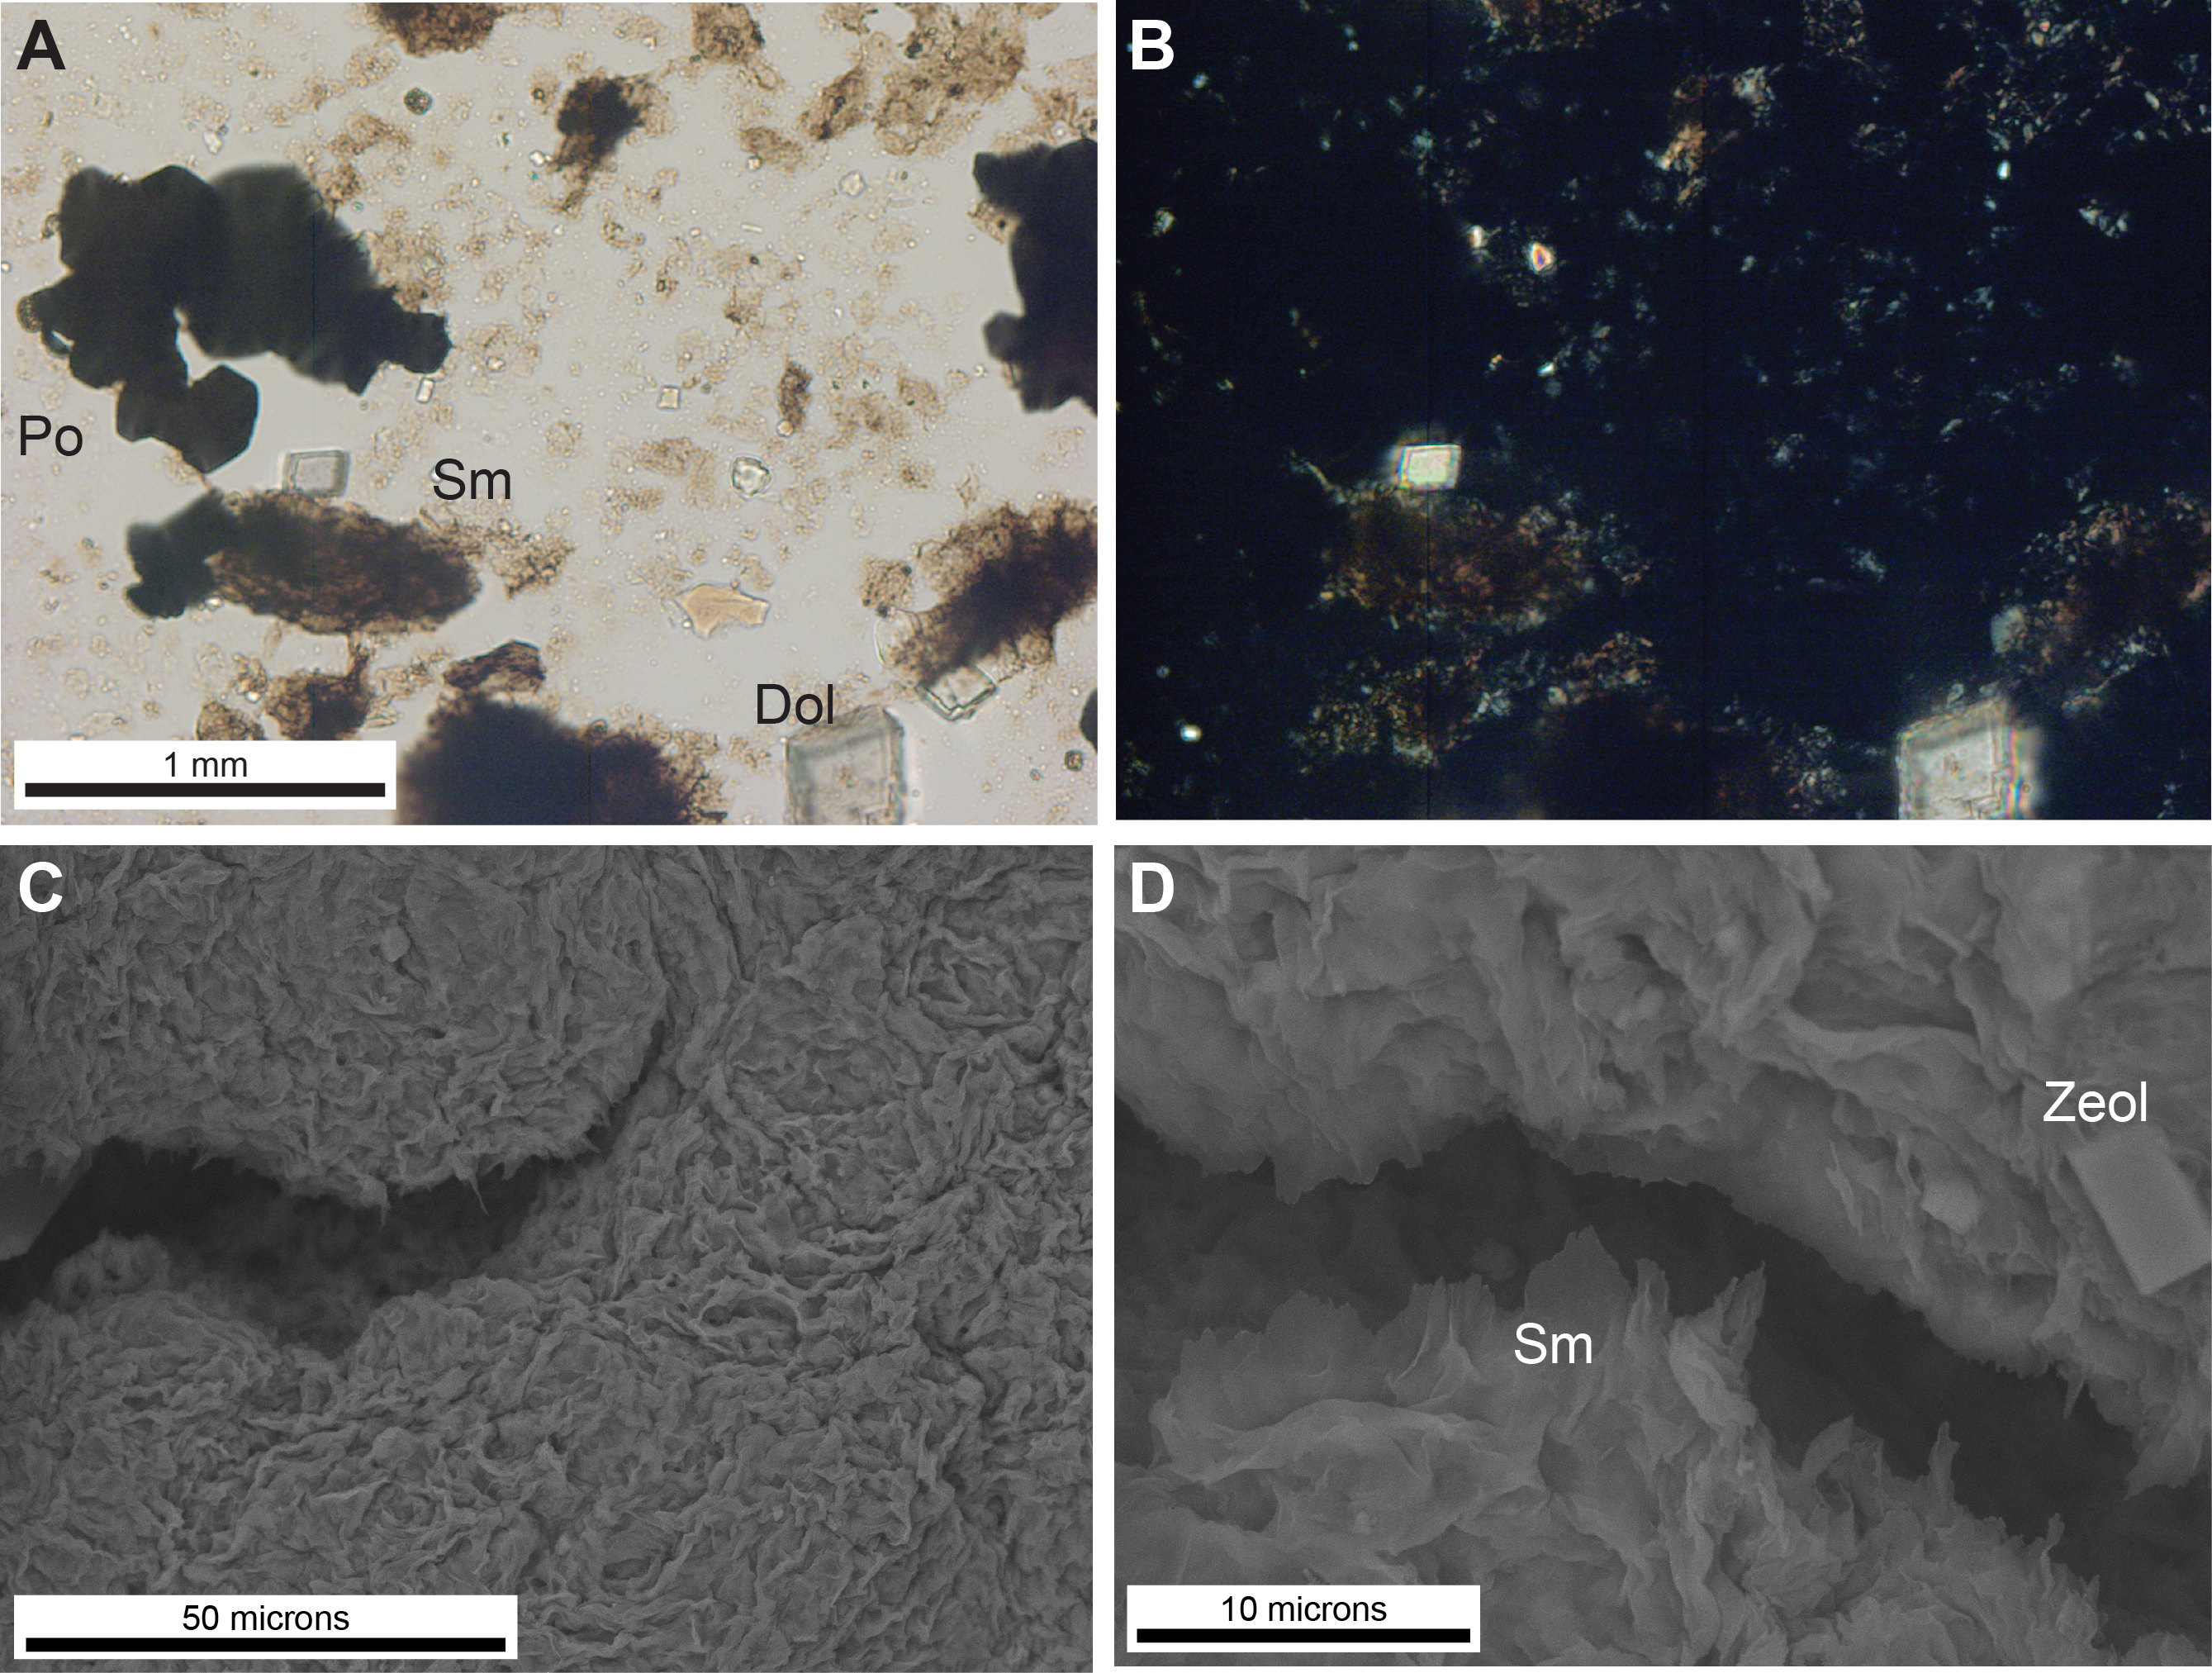
The upper contact zone between the sill and siliceous claystone of Subunit ID is characterized by the presence of altered sediment just above the sill in Sections 385-U1546A-62X-CC and 385-U1546C-6R-1. This altered sediment has very low NGR and very high MS values (Figure F4). In both holes, black siliceous claystone is present just above highly altered subvolcanic rocks. As suggested by XRD data, this black clay contains authigenic smectite and sulfide (pyrite or pyrrhotite) minerals (Figure F12). Below the sill, in Sections 385-U1546C-21R-1, 21R-2, and 22R-1, light gray silty clay with disseminated sulfide crystals (Figure F13A) becomes progressively darker in the bottom part of the core and is locally associated with harder porcellanite or chert intervals (Figure F13B). Some of the black silty clay and siliceous claystone is crosscut by calcite veins (Figure F13C).

4.2. Correlation between Site U1546 holes
Holes U1546A–U1546D were drilled at ~20 m offsets between succeeding holes. Overall, their stratigraphy is roughly comparable, but the thicknesses of Subunits IA and IB vary. The intense whole-round sampling in Holes U1546B and U1546D resulted in less certainty for correlation, which was amplified by the need to quickly turn around core description with minimal analyses. However, all subunit boundaries were delineated in Holes U1546A and U1546B, whereas only the Subunit IC/ID boundary was identified in Hole U1546C and only the Subunit IA/IB and IB/IC boundaries were identified in Hole U1546D (Table T3). The CSF-A data show that all the boundaries in Holes U1546A–U1546C are within ~50 cm of each other, except for the Subunit IC/ID boundary in Hole U1546B, which is ~4 m lower than in the other holes. The Subunit IA/IB and IB/IC boundaries in Hole U1546D are offset about 1.75 m from the other holes. Note that these differences may be a function of the lack of smear slide analyses in Holes U1546B and U1546D. Laminae of volcanic ash and terrigenous debris, especially where they occur in distinct packages, are correlated in the upper Subunits IA and IB (Figure F8; from base of Subunit IB).
4.3. Discussion
As at nearby Site U1545 (see Lithostratigraphy in the Site U1545 chapter [Teske et al., 2021b]), the sediments recovered at Site U1546 are largely a product of hemipelagic deposition in which biogenic particles associated with primary productivity in ocean surface waters are mixed during settling through the water column with terrigenous particles from terrestrial sources. At Site U1546, the biogenic particles are mainly composed of siliceous (opaline) tests of diatoms, a sediment produced today in the Gulf of California during high-productivity surface water events or “blooms” (e.g., Thunell, 1998). The terrigenous component, mainly clay-sized material including clay minerals, could have been supplied by marine or nonmarine processes as demonstrated by Thunell (1998). Fine-grained terrigenous input to the basin comes from eolian (e.g., wind-borne dust from the Sonora desert) and/or marine sediment plumes emanating from riverine sources (e.g., Sonoran rivers). Although Thunell (1998) emphasized Sonoran sources, a Baja California provenance is also plausible at Site U1546. The prominent micrometer- to millimeter-thick, dark and light laminae that characterize Site U1546 sediments are a product of alternating accumulation of dark, clay-rich laminae and light, diatom-rich laminae that, given the relatively high sedimentation rates, may reflect changes in seasonal productivity (see Lithostratigraphy in the Site U1545 chapter [Teske et al., 2021b]). The preservation of these laminae in the sedimentary record requires a lack of postdepositional bioturbation, and that in turn implies the presence of low-oxygen bottom waters like the Pacific Intermediate Water masses that today flow into the Gulf of California and northward to Guaymas Basin (Thunell et al., 1993). In contrast, homogeneous intervals lacking well-defined lamination imply periods of oxygenation to support infauna, including the sparse shelly macrofauna observed in the core (see Lithostratigraphy in the Site U1545 chapter [Teske et al., 2021b]).
The diagenetic processes that acted on the Site U1545 sedimentary succession to produce the changes in authigenic mineralogy that define the division of Lithostratigraphic Unit I into Subunits IA–ID (see Lithostratigraphy in the Site U1545 chapter [Teske et al., 2021b]) are also used to describe nearly identical subunit divisions at Site U1546 (Table T3). These were identified using formation of authigenic minerals, selective dissolution of biogenic sedimentary particles, and silica diagenesis. As summarized earlier, these boundaries are fairly uniform across Site U1546 holes but differ from those at Site U1545 in the following ways: (1) the depths at which the Subunit IA/IB and IB/IC boundaries (diagenetic transition zones) occur are slightly different between the sites, and (2) Subunit IC is not uniformly free of micrite below the Subunit IB/IC boundary. These differences likely reflect the distinctive thermal and burial conditions/histories at each site and the potential presence of “fossil” anaerobic methane oxidation fronts in Subunit IC at Site U1546 (see Inorganic geochemistry).
The thick (~75 m, based on downhole logging data) (see Petrophysics) mafic sill recovered at Site U1546 altered the surrounding sediments. Cursory examination and analysis of these altered sediments (sedimentary rocks) suggests interesting phenomena associated with intrusion of magma into porous biosiliceous sediments such as formation of hydrothermal mineral precipitates and temperature-induced transformation of silica phases.
5. Igneous petrology and alteration
A single, massive hypabyssal sill body was intersected in both Holes U1546A (top depth = ~355 mbsf) and U1546C (~348 mbsf). The former hole was drilled through the uppermost ~6 m of the emplaced igneous body using the XCB system, and the RCB system was used in the latter hole to fully penetrate the ~82 m thick (drilled thickness) intrusion. The mafic sill is interpreted to represent one single magmatic pulse made up of highly altered basaltic rock at the top and bottom chilled contacts with the surrounding host sediments. This basaltic (fine-grained) texture transitions to slightly to moderately altered doleritic (medium-grained) and gabbroic (coarse-grained) rocks toward the interior of the intrusion, as illustrated by gradual changes in grain size distribution. The ~10 m thick porous gabbroic zone occurs in the bottom part of the uppermost ~25 m interval of the intrusion, whereas the remaining ~50 m below is made up of mainly medium-grained mafic and minor fine-grained material. The magma intruded siliceous claystone of Lithostratigraphic Subunit ID. Thus, the intrusion has been stratigraphically assigned to Subunit ID and designated Igneous Lithologic Unit 1.
5.1. Igneous Lithologic Unit 1 (Lithostratigraphic Subunit ID)
- Interval: 385-U1546A-62X-CC, 25 cm, to 64X-1, 115 cm
- Depth: 354.56–360.55 mbsf
- Thickness: 5.99 m (cored)
- Recovery: 2.29 m (38%)
- Lithology: hypabyssal mafic rock with basaltic and doleritic textures
- Age: middle Pleistocene or younger (younger than 0.44 Ma)
- Interval: 385-U1546C-6R-1, 97 cm, to 20R-1, 65 cm
- Depth: 348.17–430.35 mbsf
- Thickness: 82.18 m (cored)
- Recovery: 60.06 m (73%)
- Lithology: hypabyssal mafic rock with basaltic, doleritic, and gabbroic textures
- Age: middle Pleistocene or younger (younger than 0.44 Ma)
In Holes U1546A and U1546C, the intersection of the hypabyssal mafic sill took place within Lithostratigraphic Subunit ID. The top sill/sediment contact zone was recovered from Sections 385-U1546A-62X-CC (Figure F14A) and 385-U1546C-6R-1 (Figure F15). The boundary layer immediately above the sill is lithologically similar in both holes and is identified as a black claystone layer. It represents a baked sediment interval that contains authigenic smectite and sulfide (pyrite and/or pyrrhotite) minerals (see Lithostratigraphy). In Hole U1546A, drilling stopped after Section 64X-1 was recovered from a bottom depth of 360.55 mbsf without intersecting the bottom contact of the sill. By contrast, the sill/sediment bottom contact was recovered in Hole U1546C at 430.35 mbsf (Section 20R-1). The uppermost interval of the bottom contact aureole consists of medium gray chert, which makes up a ~3 cm thick baked layer in the top of Section 21R-1 that does not directly adjoin the highly altered bottommost basaltic part of the sill preserved in overlying Core 20R. The latter showed a texture and alteration degree similar to the top basaltic contact. The baked chert changes to light gray, disseminated sulfide-bearing silty claystone that shades darker with increasing distance from the intrusion over an interval of ~2.4 m (to 434.11 mbsf) (see Lithostratigraphy). The sedimentary succession intruded by the sill has a middle to late Pleistocene age (younger than 0.44 Ma) based on nannofossil marker species (see Biostratigraphy). Therefore, we infer that the sill intruded less than 0.44 My ago.

In Hole U1546C, the sill was initially encountered at 348.17 mbsf in Section 6R-1 and was cored to 430.35 mbsf in Section 20R-1. This total drilled thickness of ~82 m is somewhat larger than the total measured thickness of ~74–76 m (between ~356 and 433 mbsf) that is revealed by downhole logging data (see Petrophysics). The former value is an overestimation because the top contact of the sill in Hole U1546C was obtained from a poor recovery core with a recovered length of 1.1 m over a 9.7 m long drilled interval in Core 6R (drilled depth = 347.2–356.9 mbsf). Considering that any core interval recovered within a core liner is pushed to the top of the liner on the core receiving platform, the cored depth of the upper contact of the sill in Hole U1546C is an apparent one; namely, it is placed somewhat too shallow. In fact, the curated core depth of the upper contact in Hole U1546A at 354.56 mbsf reflects the true depth of the sediment/sill interface because it is more congruent with the downhole logging data.
5.2. Petrographic description
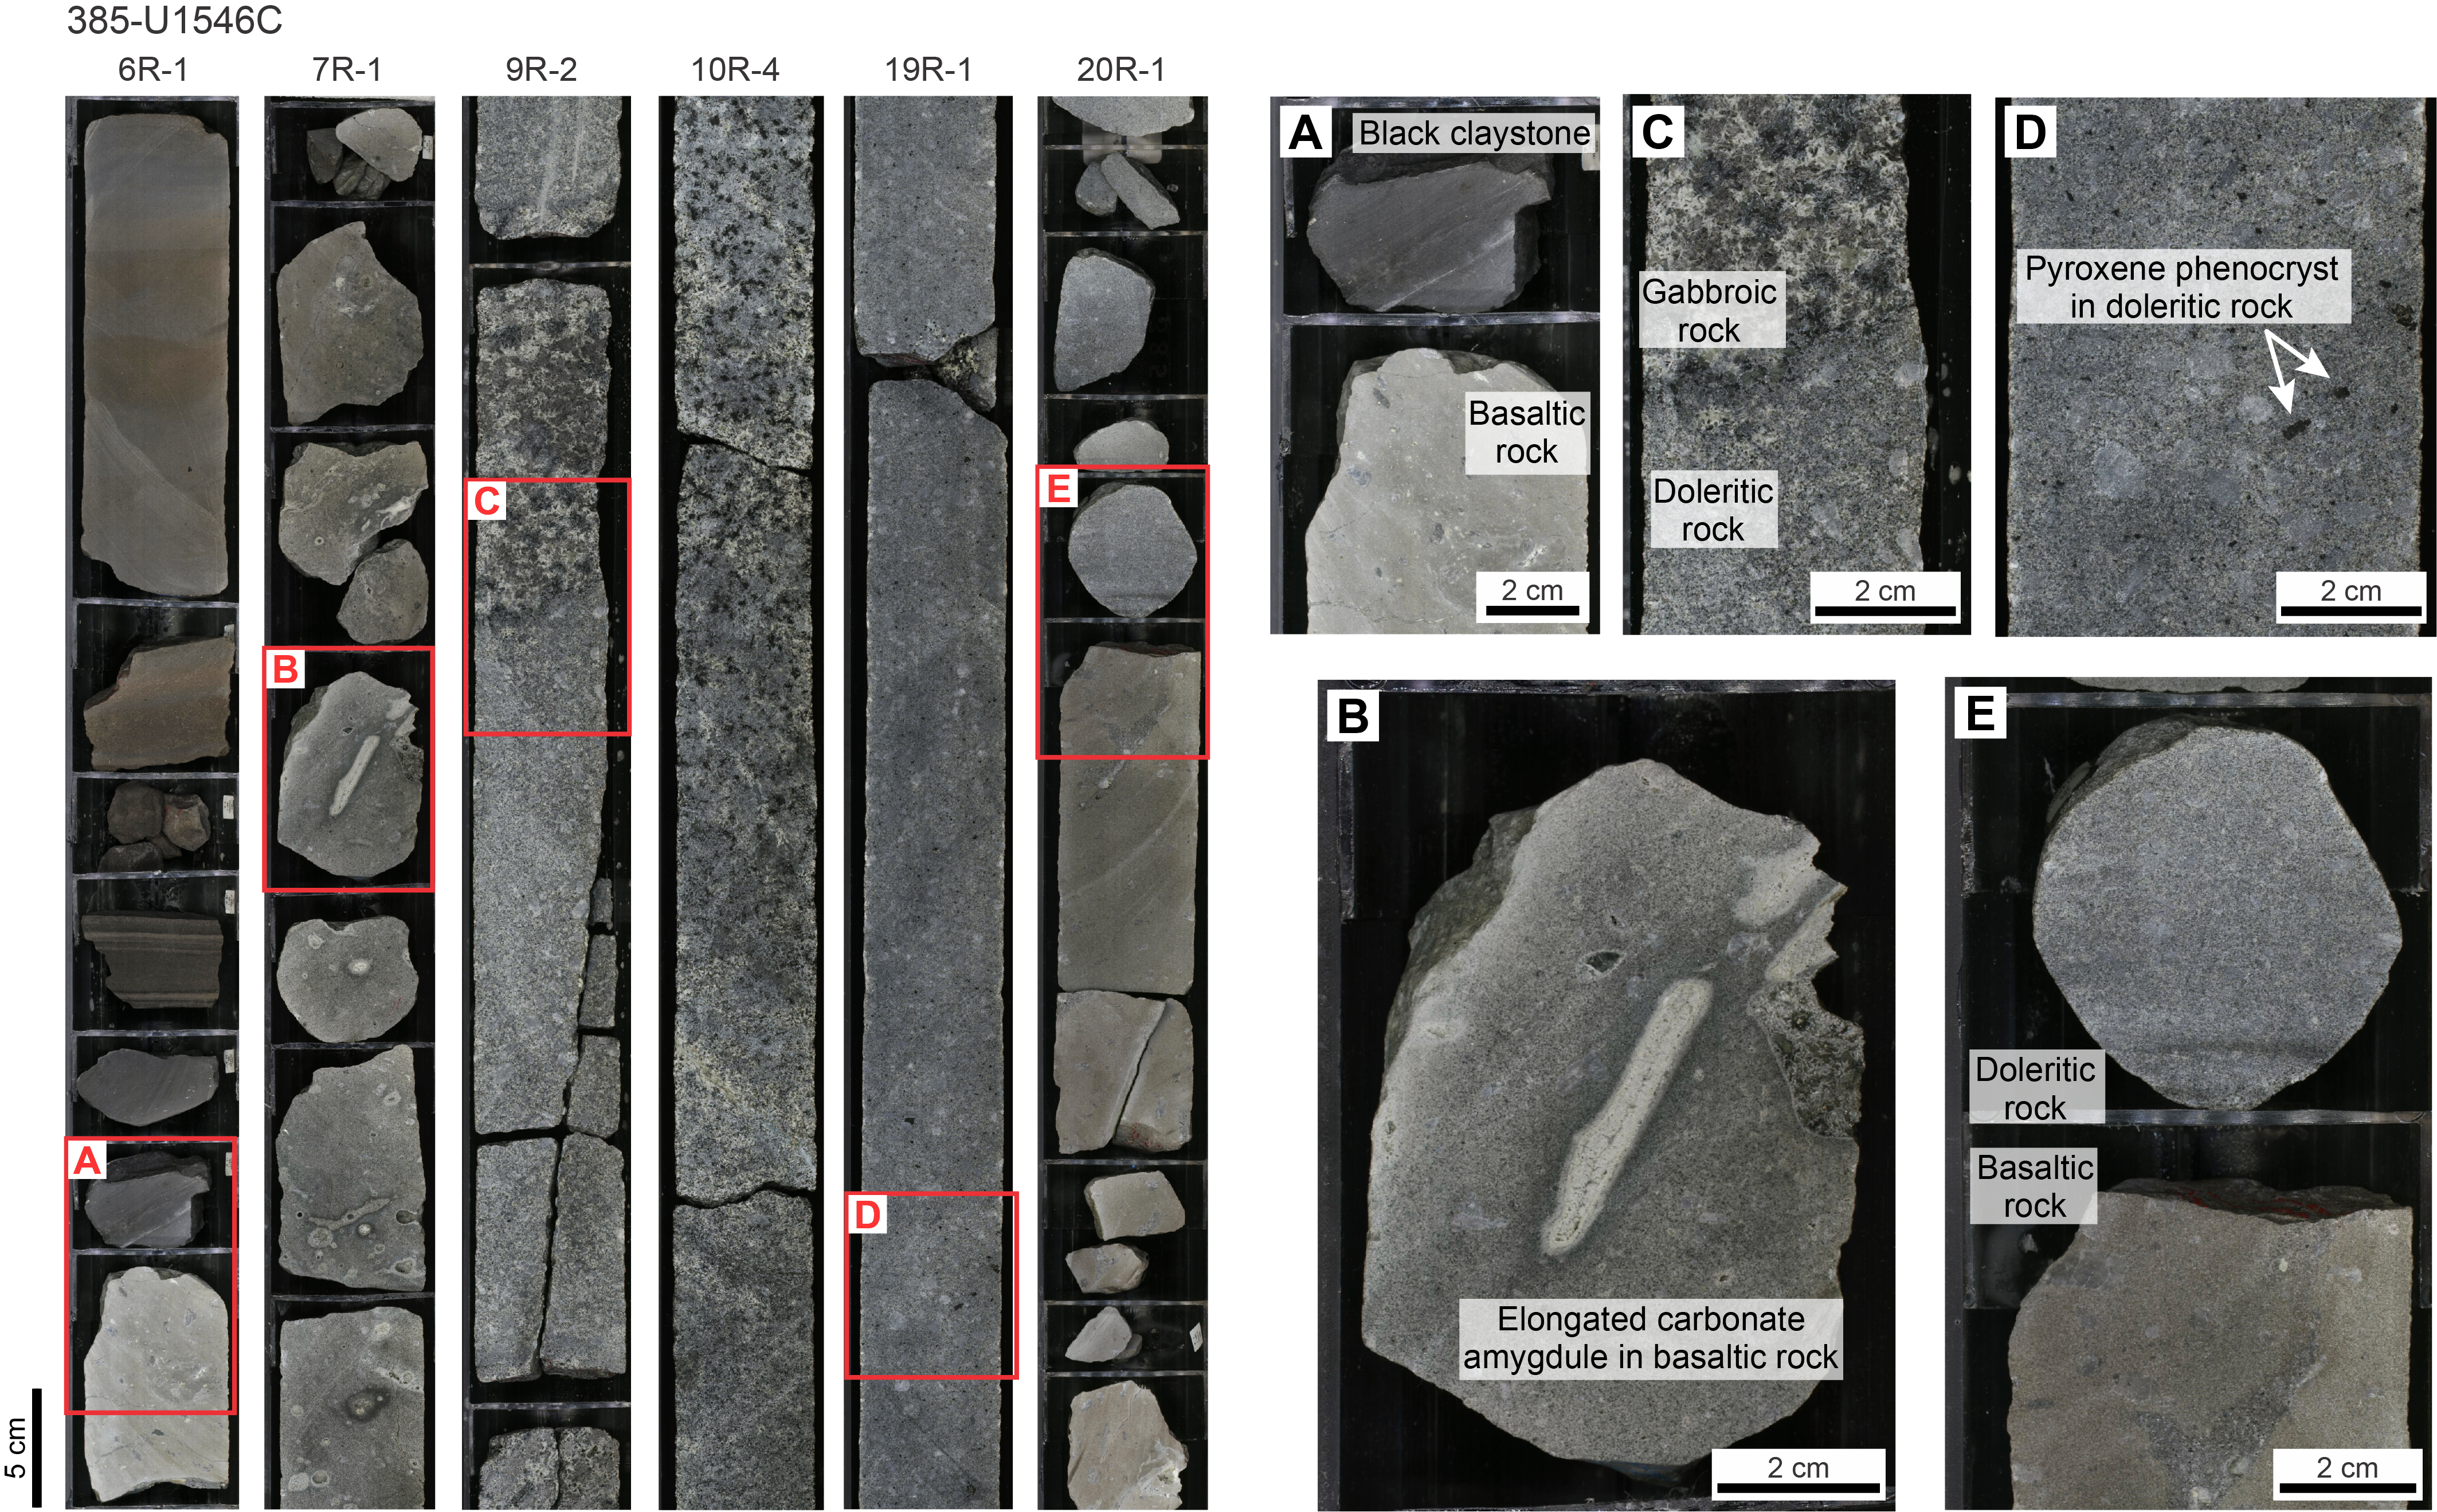
Of the four holes drilled at Site U1546, mafic sill material was recovered from two holes, U1546A and U1546C, with top contact depths of 354.56 and 348.17 mbsf, respectively (Figure F16). The total cored thickness of the sill is 5.99 m in Hole U1546A and 82.18 m in Hole U1546C; the latter hole fully penetrates the encountered sill. In Hole U1546A, highly altered hypabyssal mafic rock with basaltic and doleritic textures comprise the sill. The uppermost portion of the sill, adjacent to the overlying sedimentary layer, is defined by a top chilled contact. The basaltic margin has a recovered thickness of ~13 cm in Section 385-U1546A-62X-CC (354.56–354.69 mbsf) and is followed by doleritic rock from the bottom of Section 62X-CC through Section 64X-1 (354.69–360.55 mbsf) (Figure F16). Both the basaltic and doleritic intervals are sparsely to moderately vesicular with rounded to subrounded calcite amygdules. The basaltic texture is characterized by a microcrystalline groundmass that hosts plagioclase phenocrysts as long as ~3 mm. The sparsely vesicular, moderately altered doleritic rock is highly plagioclase phyric with variable sizes of phenocrysts (2–10 mm). Primary matrix pyroxene is altered to chlorite and clay minerals, presumably due to hydrothermal alteration, leaving patchy alteration marks on the cut surface as seen in Section 63X-1 (Figure F14C). The vesicles are rounded to subrounded and gradually decrease in size and abundance to the bottom of Hole U1546A at 360.55 mbsf.
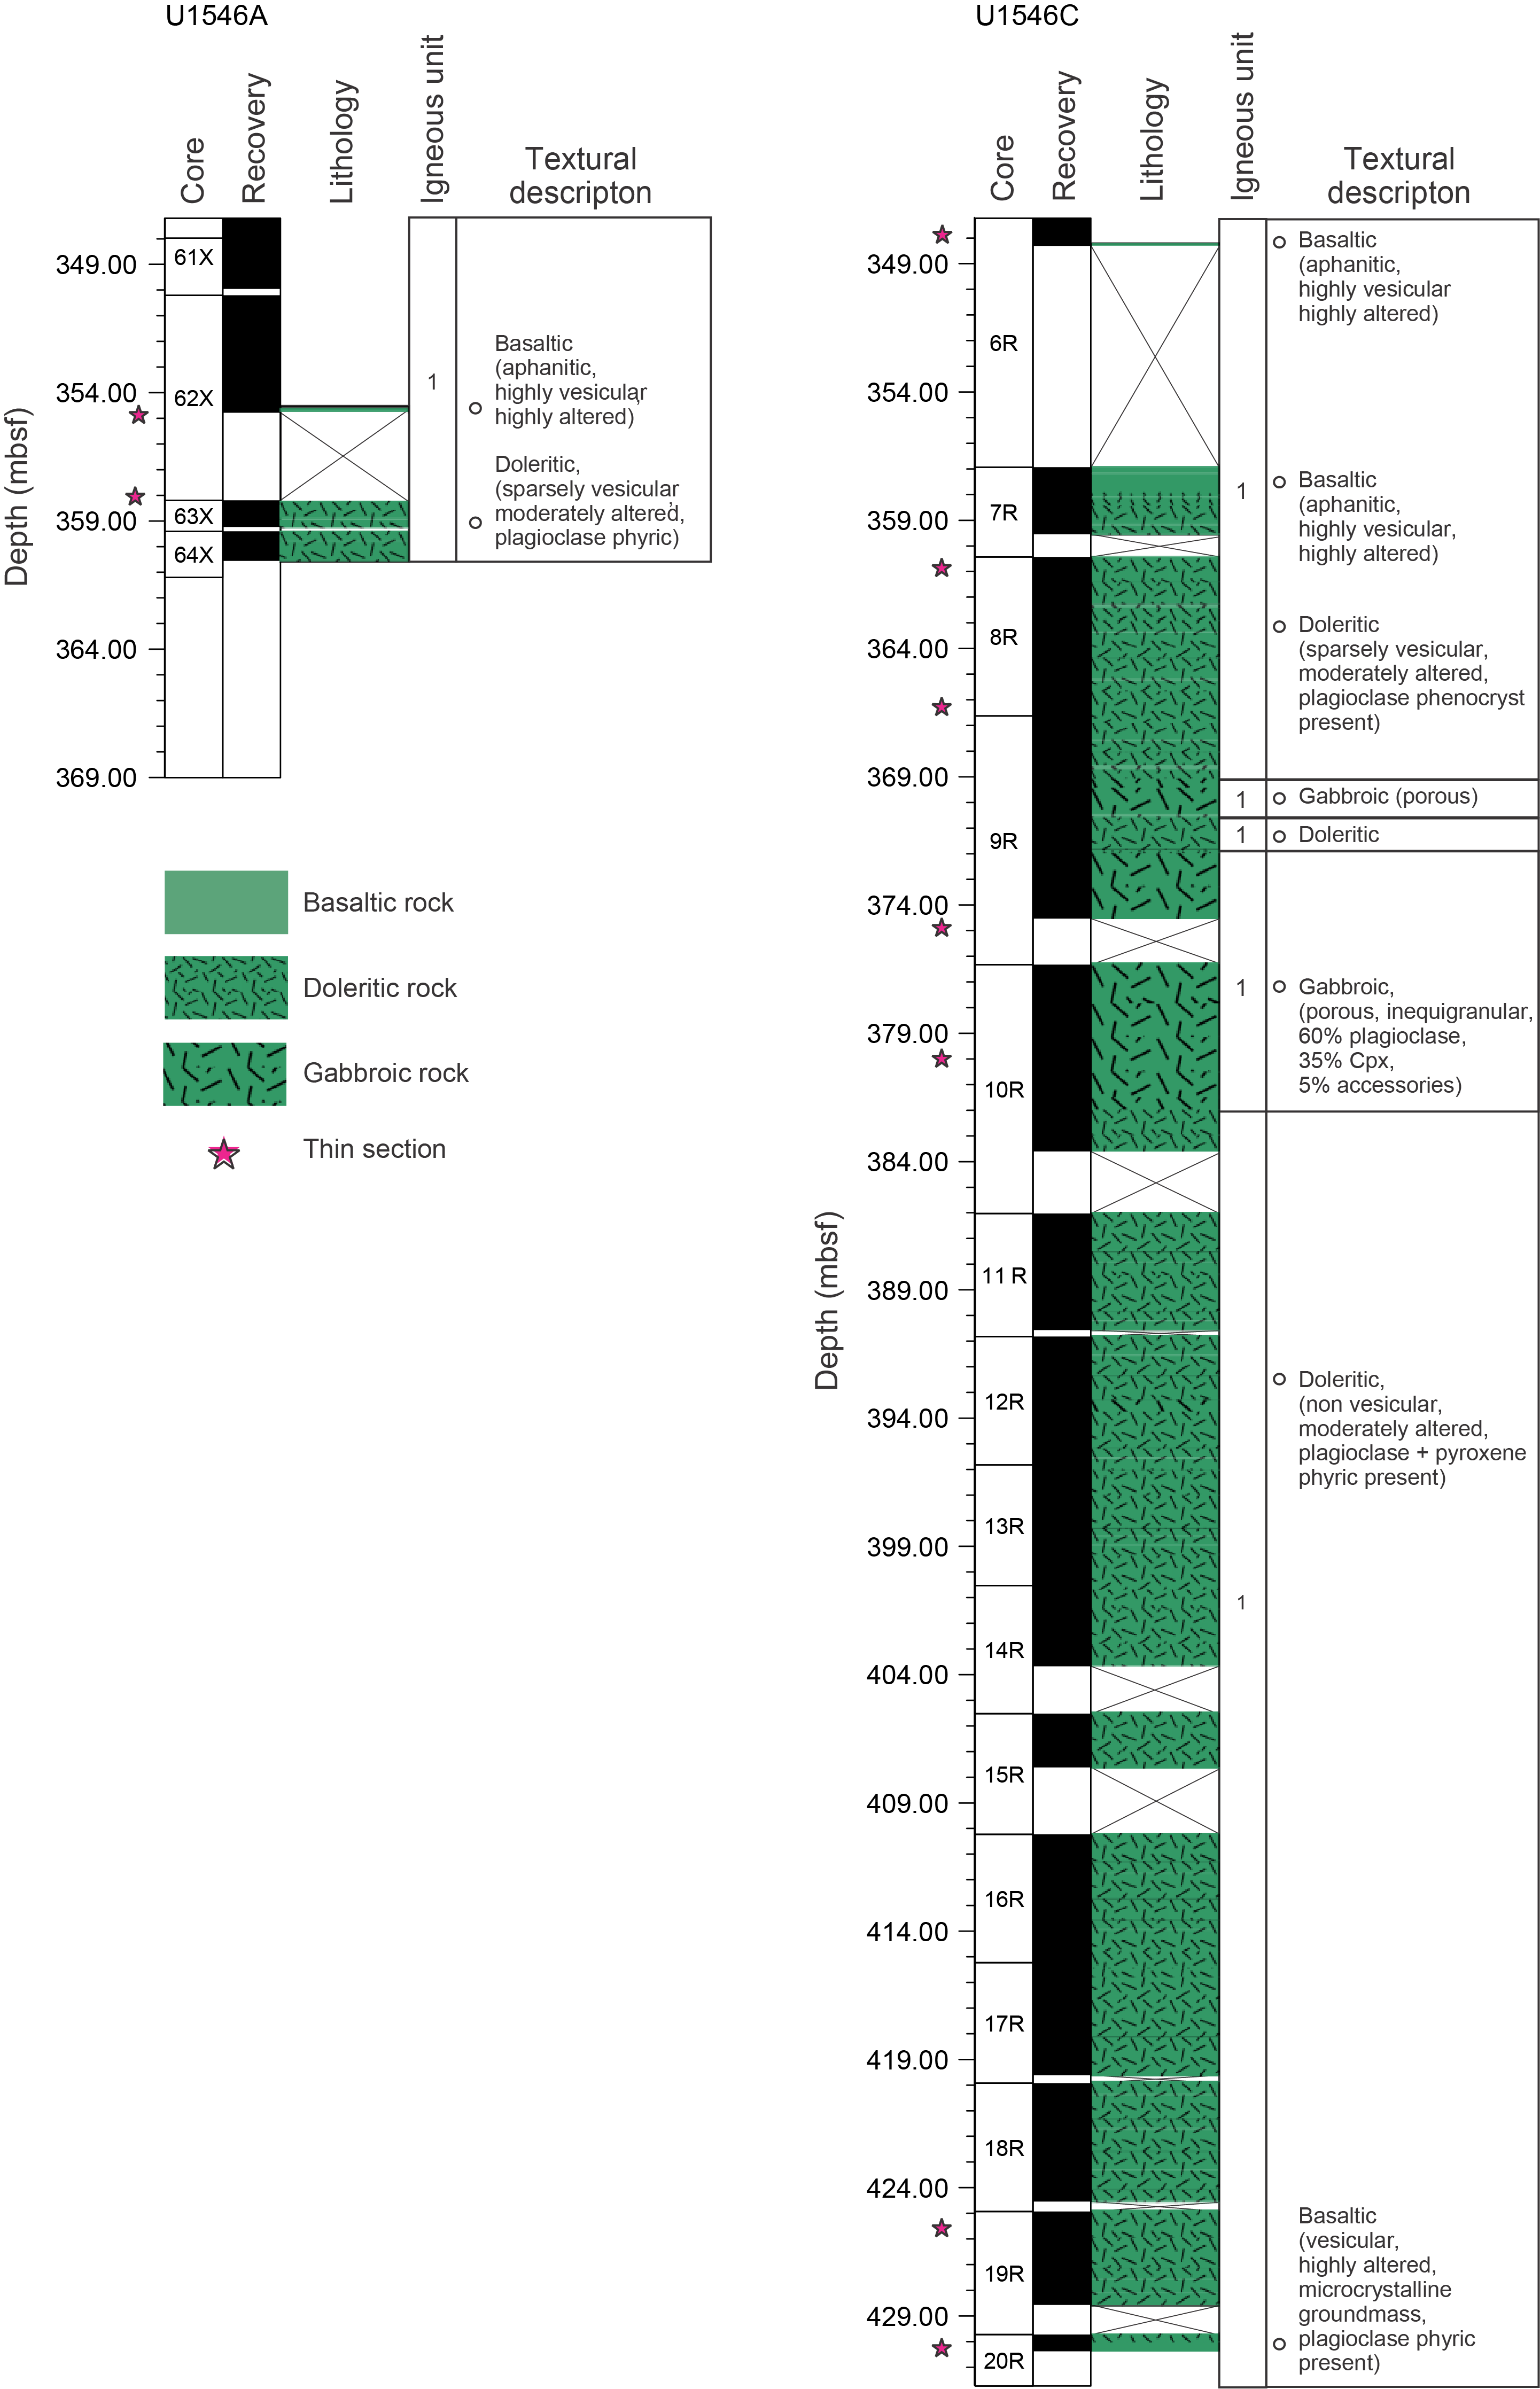
The igneous rocks recovered from Hole U1546C are composed of hypabyssal mafic rock with basaltic, doleritic, and gabbroic textures. Sections 6R-1 and 7R-1 contain an aphanitic basalt interval of 0.57 m thickness that is highly vesicular with elongated carbonate amygdules of >3 cm in diameter (Figure F15B). The rock texture gradually shifts to porphyritic aphanitic and phaneritic doleritic rock in Section 7R-1 (around 357.41 mbsf). This fine- to medium-grained texture is then continuously present over an ~11.2 m thick interval that starts transitioning to gabbroic texture in Section 9R-2 at 368.56 mbsf (Figure F15C). The part of the doleritic interval immediately underlying the basaltic layer (Core 7R) is sparsely to highly vesicular, sparsely to highly plagioclase phyric, and gradually turns into sparsely vesicular to nonvesicular, highly plagioclase phyric doleritic rock in Core 8R. Overall, the recovered doleritic material is slightly to moderately altered and occasionally shows veins filled with calcite and zeolite. Gabbroic texture fully supersedes the doleritic texture at the top of Section 9R-5 (371.83 mbsf). This moderately to highly vesicular gabbroic rock, showing up to 1 cm large subangular to very angular miarolitic cavities (usually 1–3 mm in size) of low to highly elongate sphericity, is then present over a ~9.7 m thick interval that ends close to the bottom of Section 10R-4 (around 381.48 mbsf) where doleritic texture resumes. Doleritic rock remains the predominant type through Section 20R-1. Plagioclase represents the major phenocryst phase throughout the slightly altered, moderately to highly phyric doleritic intervals, whereas pseudomorphic pyroxene occurs as minor phenocryst phase below the gabbroic layer (Figure F15D). The final cored ~0.4 m (429.98–430.35 mbsf) of the sill intrusion in Section 20R-1 consists of aphanitic basalt showing high alteration and sparse to moderate vesicularity comparable to the upper contact, suggesting this interval forms part of the bottom chilled contact of the sill. The succeeding Section 21R-1 commences with a baked sediment contact of the underlying strata.
At the microscopic scale, the hypabyssal mafic rocks with basaltic, doleritic, and gabbroic textures show a mainly well-preserved primary igneous mineral assemblage (plagioclase, clinopyroxene, and Fe-Ti oxides) and microstructures (mainly of glomeroporphyritic, subophitic, and intergranular nature) (Figure F17). The brownish gray aphanitic basalt contains a felty and equigranular groundmass that is micro- to cryptocrystalline (≤0.2 mm), showing euhedral to subhedral acicular plagioclase (~40 vol%) and subhedral stubby pyroxene crystals (~30 vol%). The light gray porphyritic basaltic rock has a similar groundmass modal composition but contains 2–5 vol% plagioclase phenocrysts and 1–2 vol% clinopyroxene phenocrysts. In the doleritic and basaltic intervals overall, euhedral tabular plagioclase is the dominant phenocryst mineral, ranging from 2 to 20 vol% in modal proportion and 1 to 10 mm in size. It displays well-defined oscillatory zoning and resorption textures. Clinopyroxene (≤3 vol%; 0.5–2 mm in size) is either fresh or identifiable by pseudomorphs made up of chlorite, carbonates, and mesh textures of clay minerals as well as fine-grained magnetite. The holocrystalline groundmass of the doleritic intervals is composed primarily of plagioclase, clinopyroxene, and Fe-Ti oxide and displays fine- to medium-grained crystals (0.5–2 mm). Plagioclase mostly occurs as narrow lath-shaped crystals in a subophitic relationship with subhedral clinopyroxene. The dark gray to greenish gray gabbroic interval is composed of 50–60 vol% euhedral plagioclase and 40–50 vol% euhedral to subhedral clinopyroxene as primary mineral assemblage with a grain size range from 2 to 10 mm. It has an ophitic texture that contains usually unfilled vesicles thinly coated with bluish gray clay and angular miarolitic cavities that are either open or filled with green clay material.

5.3. Alteration and veins
The basaltic intervals at or close to the top and bottom contacts with siliceous claystone are highly altered. In contrast, the gabbroic and doleritic intervals recovered at Site U1546 show a somewhat lower degree of alteration overall. They contain chlorite and patchy alteration marks that represent slight to moderate alteration. These patches, which seem to be made up of green clay material, mainly represent filled small (1 mm) to large (10 mm) miarolitic cavities. A majority of these highly abundant cavities are unfilled, leading to a porous appearance of the rock. In the upper doleritic part and underlying gabbroic interval, plagioclase crystals are fresh or partially transformed into sericite, whereas clinopyroxene is slightly or moderately altered to chlorite and secondary magnetite. In the lower doleritic interval, just below the gabbroic section, pyroxene phenocrysts of >1.5 mm are present. However, due to more profound alteration, they are almost completely replaced by secondary chlorite, magnetite, and clay minerals, so they remain solely as pseudomorphs. In addition to pyroxene, plagioclase phenocrysts and smaller plagioclase crystals present in the groundmass are also slightly altered. Microscopically visible decomposition of plagioclase is manifested by epidotization or clay mineral formation.
Veins are occasionally found throughout the upper and middle part of the sill, but they are absent in deeper Sections 385-U1546C-15R-3 through 20R-1. The veins usually have a sharp contact with the host rock and are mostly <0.2 cm wide, although some larger veins are 1–2 cm wide. They have an either vuggy, polycrystalline, or massive texture mineralogically represented by carbonate, chlorite, or zeolite precipitates. No halos were observed surrounding these veins.
5.4. Petrographic discussion
Considering the texturally seamless transition from top to bottom of the mineralogically homogeneous mafic intervals encountered, the sill at Site U1546 represents a single igneous cooling unit composed of basaltic intervals at the top and bottom of the intrusion body and doleritic and gabbroic intervals toward the center. The sill-intruded claystone is middle to late Pleistocene in age, as confirmed by the presence of age-diagnostic microfossil flora in the surrounding claystone (see Biostratigraphy). Compared to the overall thickness of the sill, the proportion of basaltic rock is limited: ~0.6 m thick at the top and ~0.4 m thick at the bottom. Doleritic rock is the predominant lithology of the sill and is present in upper (~11.2 m thick) and lower (~48.5 m thick) intervals separated by a gabbroic layer (~97 m thick). The changing grain sizes and associated textural evolution from top to bottom of the sill are summarized in Figure F18.
Overall, plagioclase phenocrysts are found throughout the doleritic and basaltic parts of the sill intrusion. Clinopyroxene is usually a sparse phenocryst mineral present only in the lower doleritic interval (Cores 385-U1546C-16R through 19R). The modal abundance of plagioclase phenocrysts is 5–15 vol% in the upper doleritic interval and increases downhole, reaching a peak of 20–25 vol% in the lower doleritic interval. The crystal sizes of plagioclase phenocrysts (average = 5 mm) in the lower interval are generally coarser than those in the upper interval (average = 2 mm). The lower doleritic interval possesses 2–3 vol% clinopyroxene phenocrysts. The presence of pyroxene and larger plagioclase phenocrysts limited to the lower doleritic interval suggests that the cooling process of the magma underwent a two-stage process in that part of the intrusion. The abundant small to large miarolitic cavities or vugs present in the gabbroic interval occur in interstitial patches that compose up to 20 vol% of the rock. They indicate that the gradual cooling process of the sill probably reached volatile saturation when the gabbroic interval solidified. This supports the interpretation of successive crystallization from the exterior toward the interior of the magma body, giving rise to steadily increasing volatile concentration with advancing solidification. This left the final melt pocket, allegedly represented by the gabbroic interval, with a high volatile concentration prior to degassing.
5.5. Geochemistry
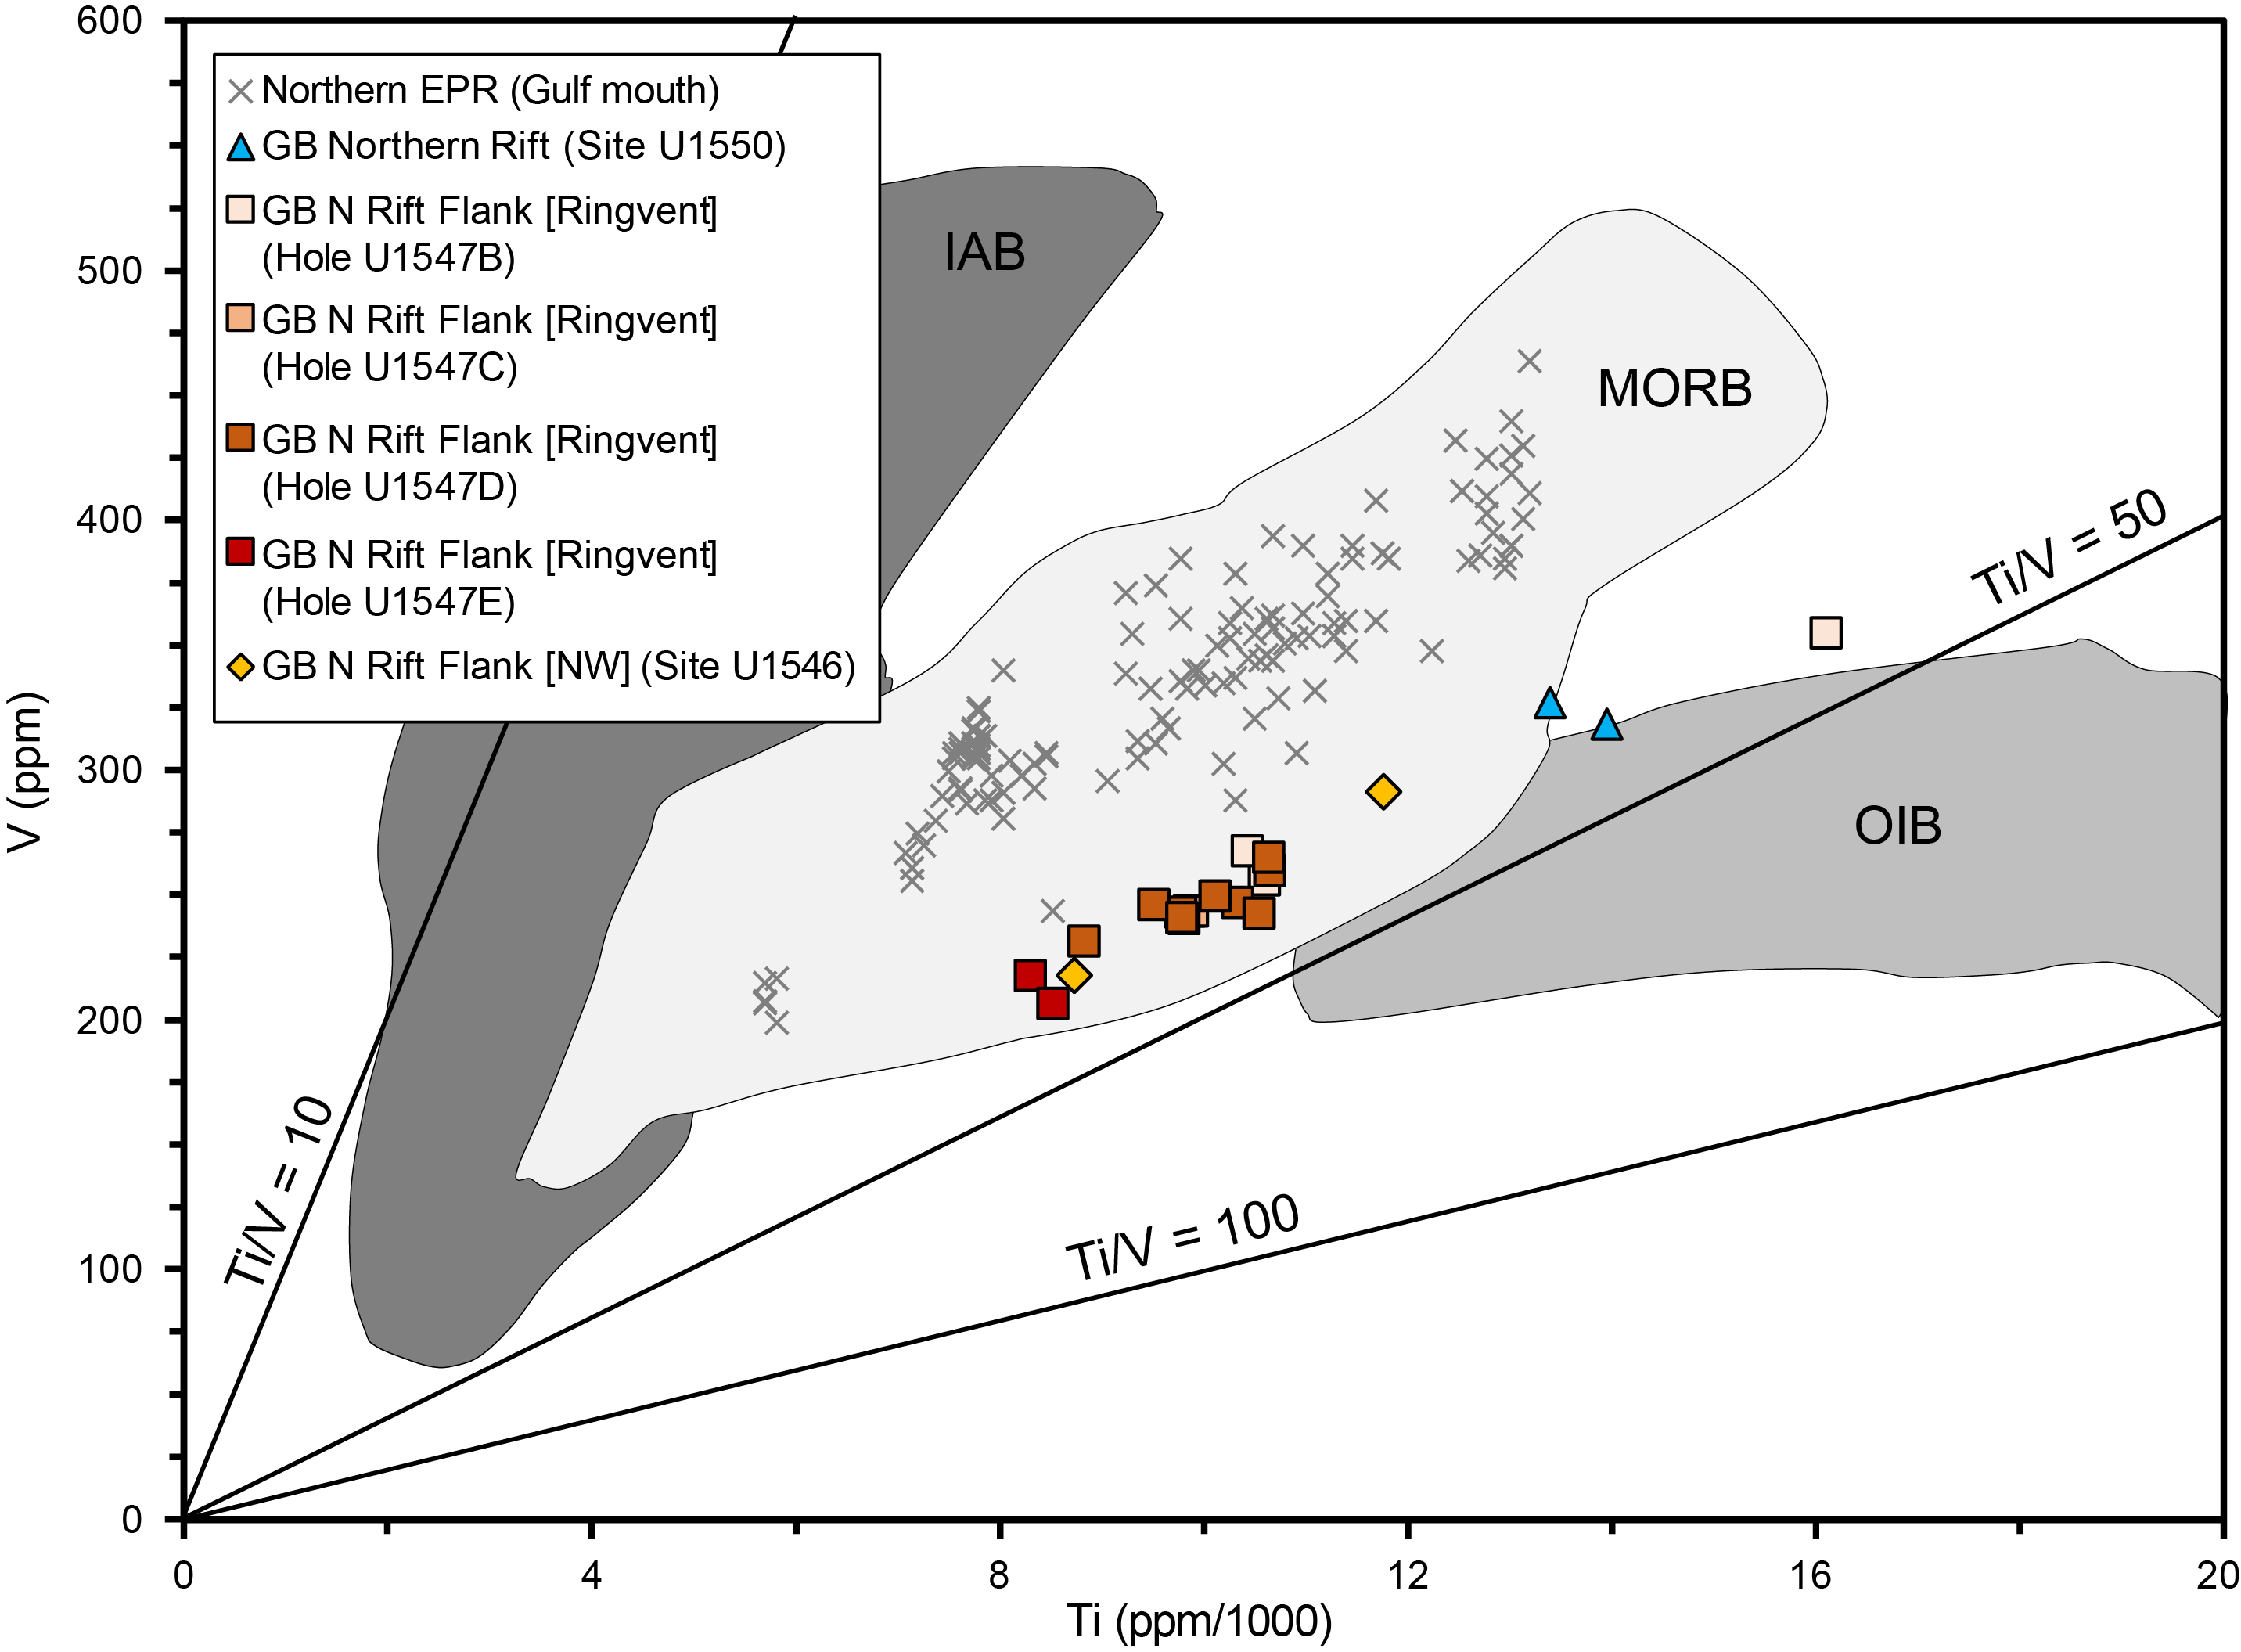
Two of five inductively coupled plasma–atomic emission spectroscopy (ICP-AES) analyses (see Inorganic geochemistry in the Expedition 385 methods chapter [Teske et al., 2021a]) from Site U1546 yielded reliable results. Both associated, slightly altered samples represent intervals in Hole U1546C, one from the gabbroic interval (9R-6, 97–99 cm; top depth = 374.25 mbsf) and one from the lower doleritic interval (19R-1, 24–27 cm; 425.14 mbsf) (Table T4). Their SiO2 and Na2O + K2O compositions range from 49.4 to 49.5 wt% and from 3.45 to 3.85 wt%, respectively, thus showing a subalkaline basalt chemistry (Figure F19; Table T4). These are low-K tholeiitic rocks (K2O contents of 0.17–0.31 wt%) (Table T4) whose Ti-V pattern points to a MORB composition (Figure F20). The doleritic sample solidified from a more primitive or less evolved (differentiated) melt (Mg# = 0.61) than the gabbroic one (Mg# = 0.51) (Figure F21; Table T4). The abundances of lithophile elements (e.g., Na, K, and Sr) (Figures F19, F21A) and high field strength elements (e.g., Ti and Zr) (Figures F20, F21B) are within the range of the other Guaymas Basin sites drilled during Expedition 385. The abundance of Sr is somewhat higher at off-axis Site U1546 (Figure F21A), and the content of highly incompatible trace element Zr is somewhat lower at a given Mg# (Figure F21B) compared to the similarly evolved magmas of the ~50 km distant northern rift segment (Site U1550). Strongly resembling the behavior of Zr, the highly incompatible trace element Y is also less enriched at the far off-axis location compared to the northern rift segment (Figure F22).
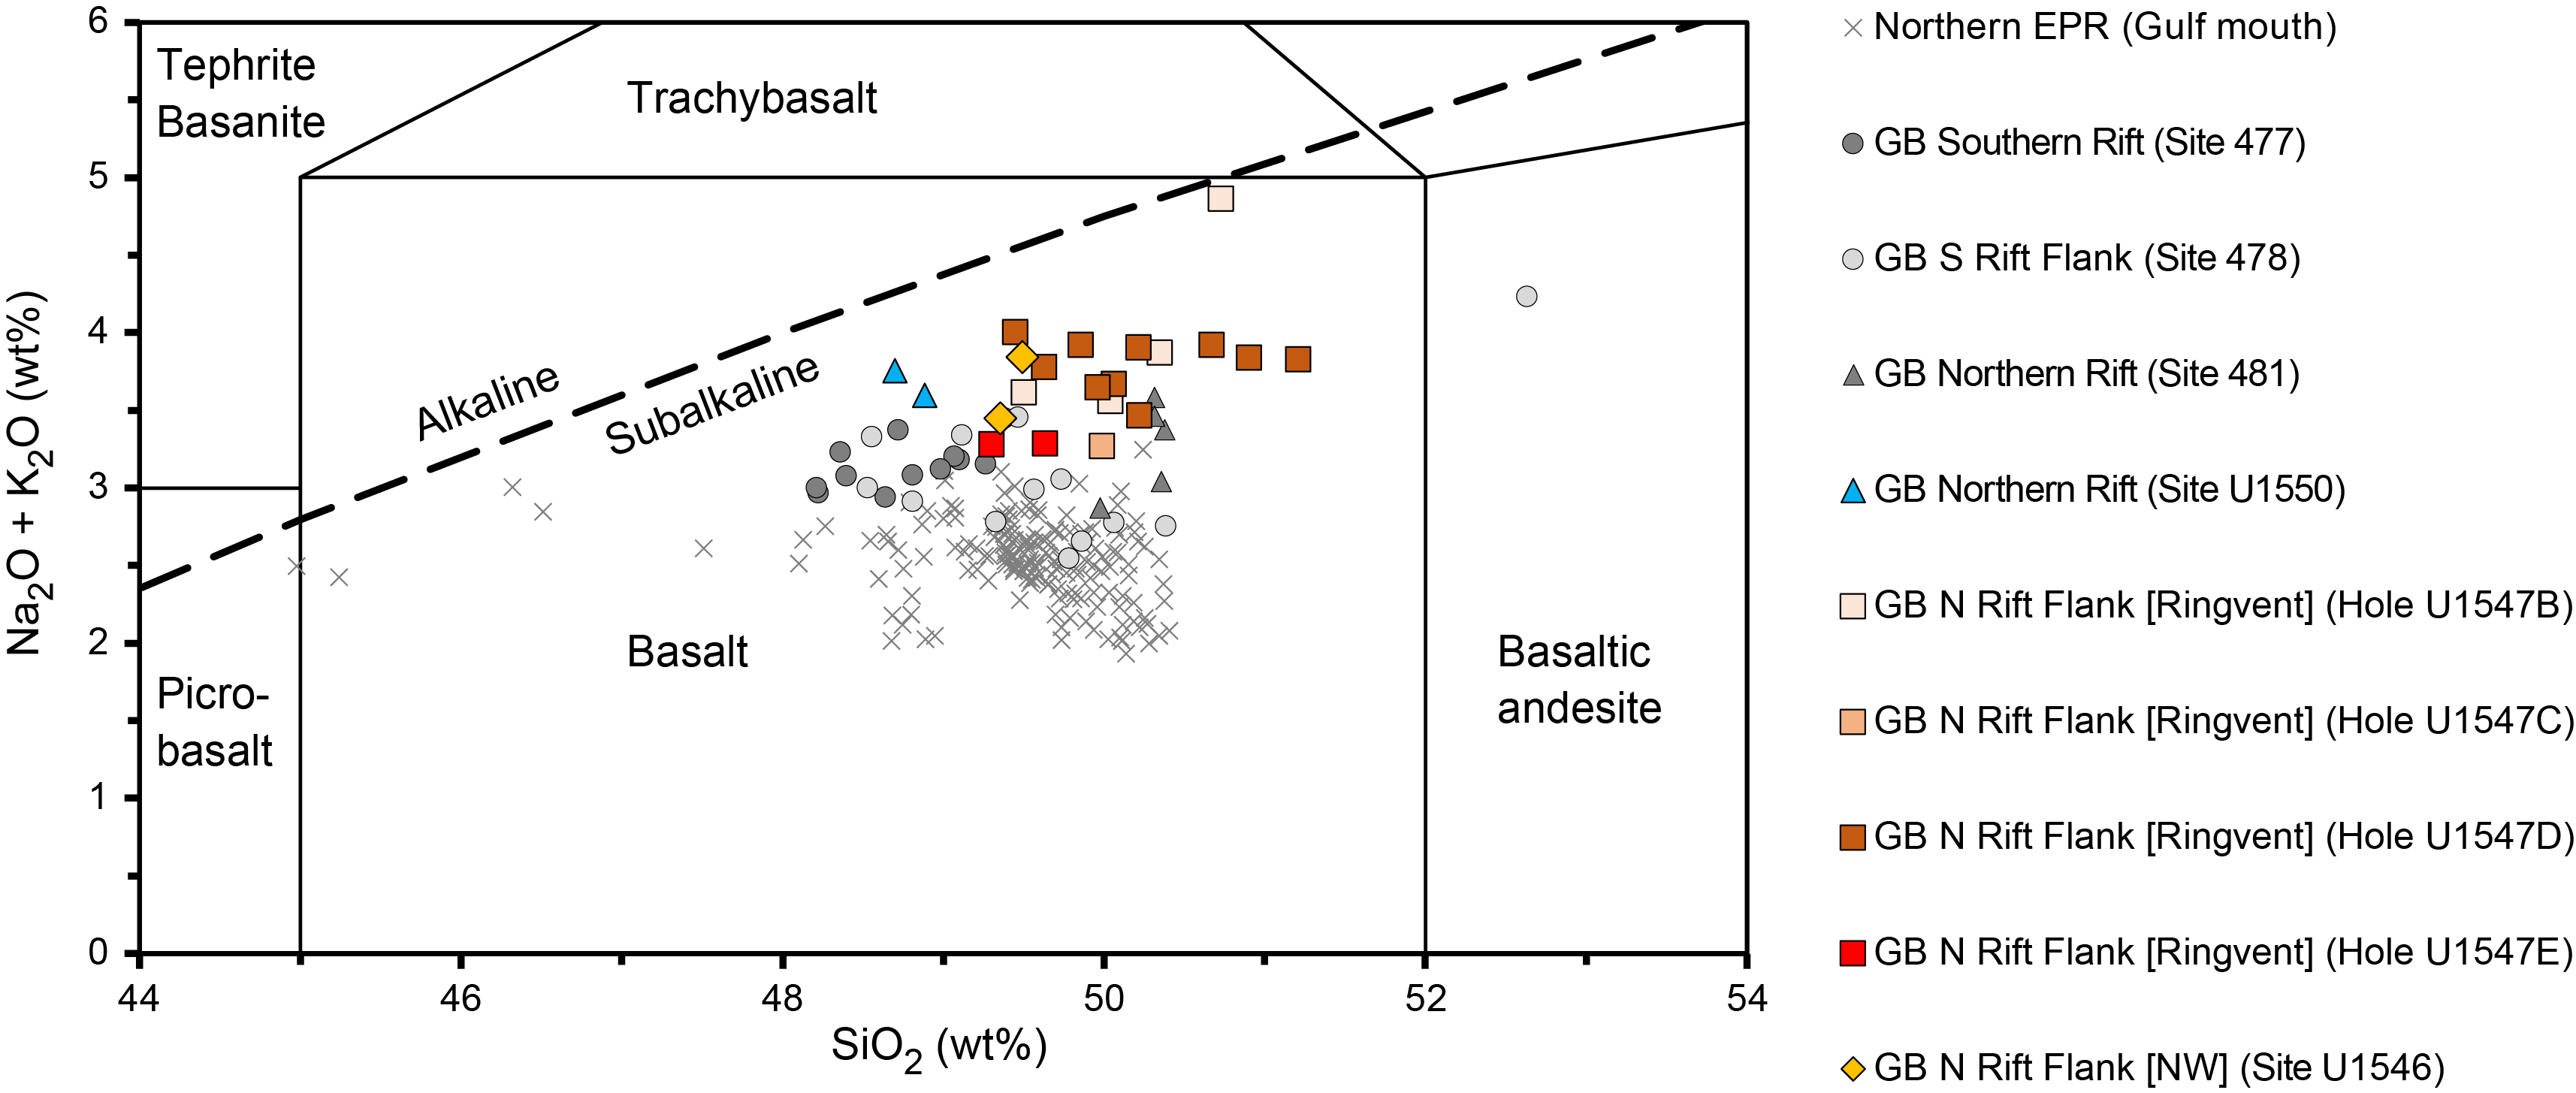
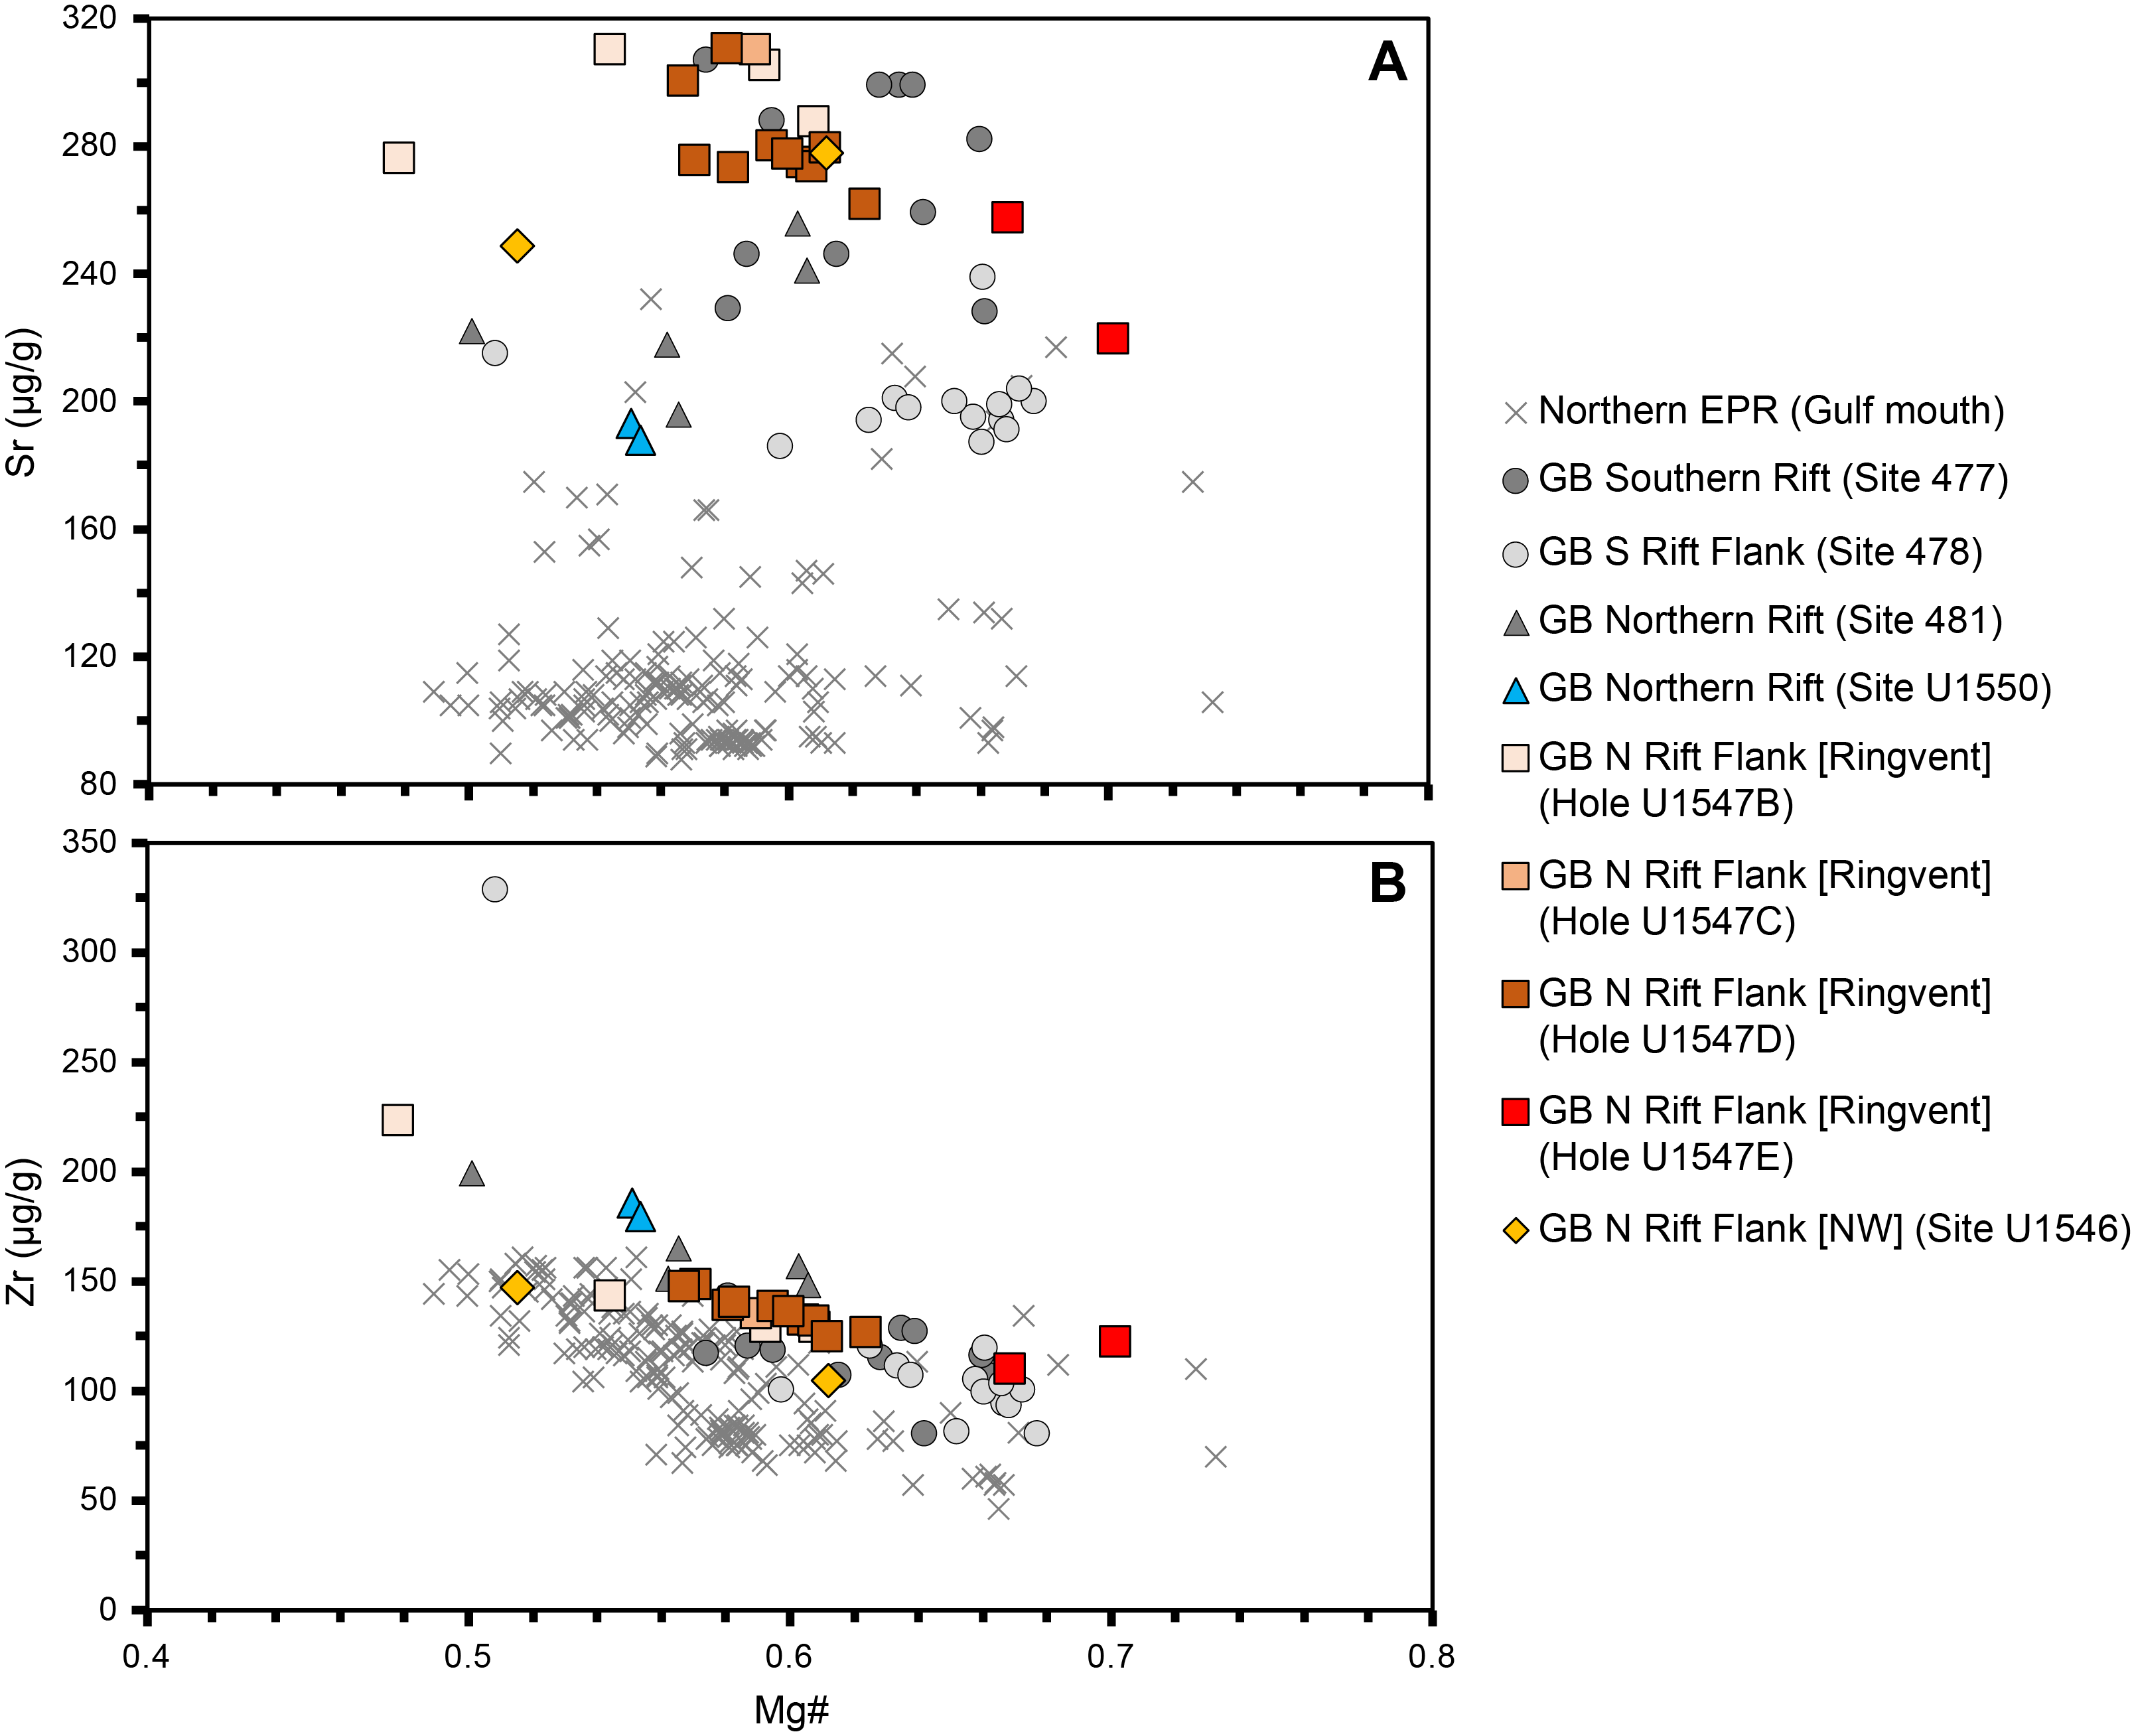
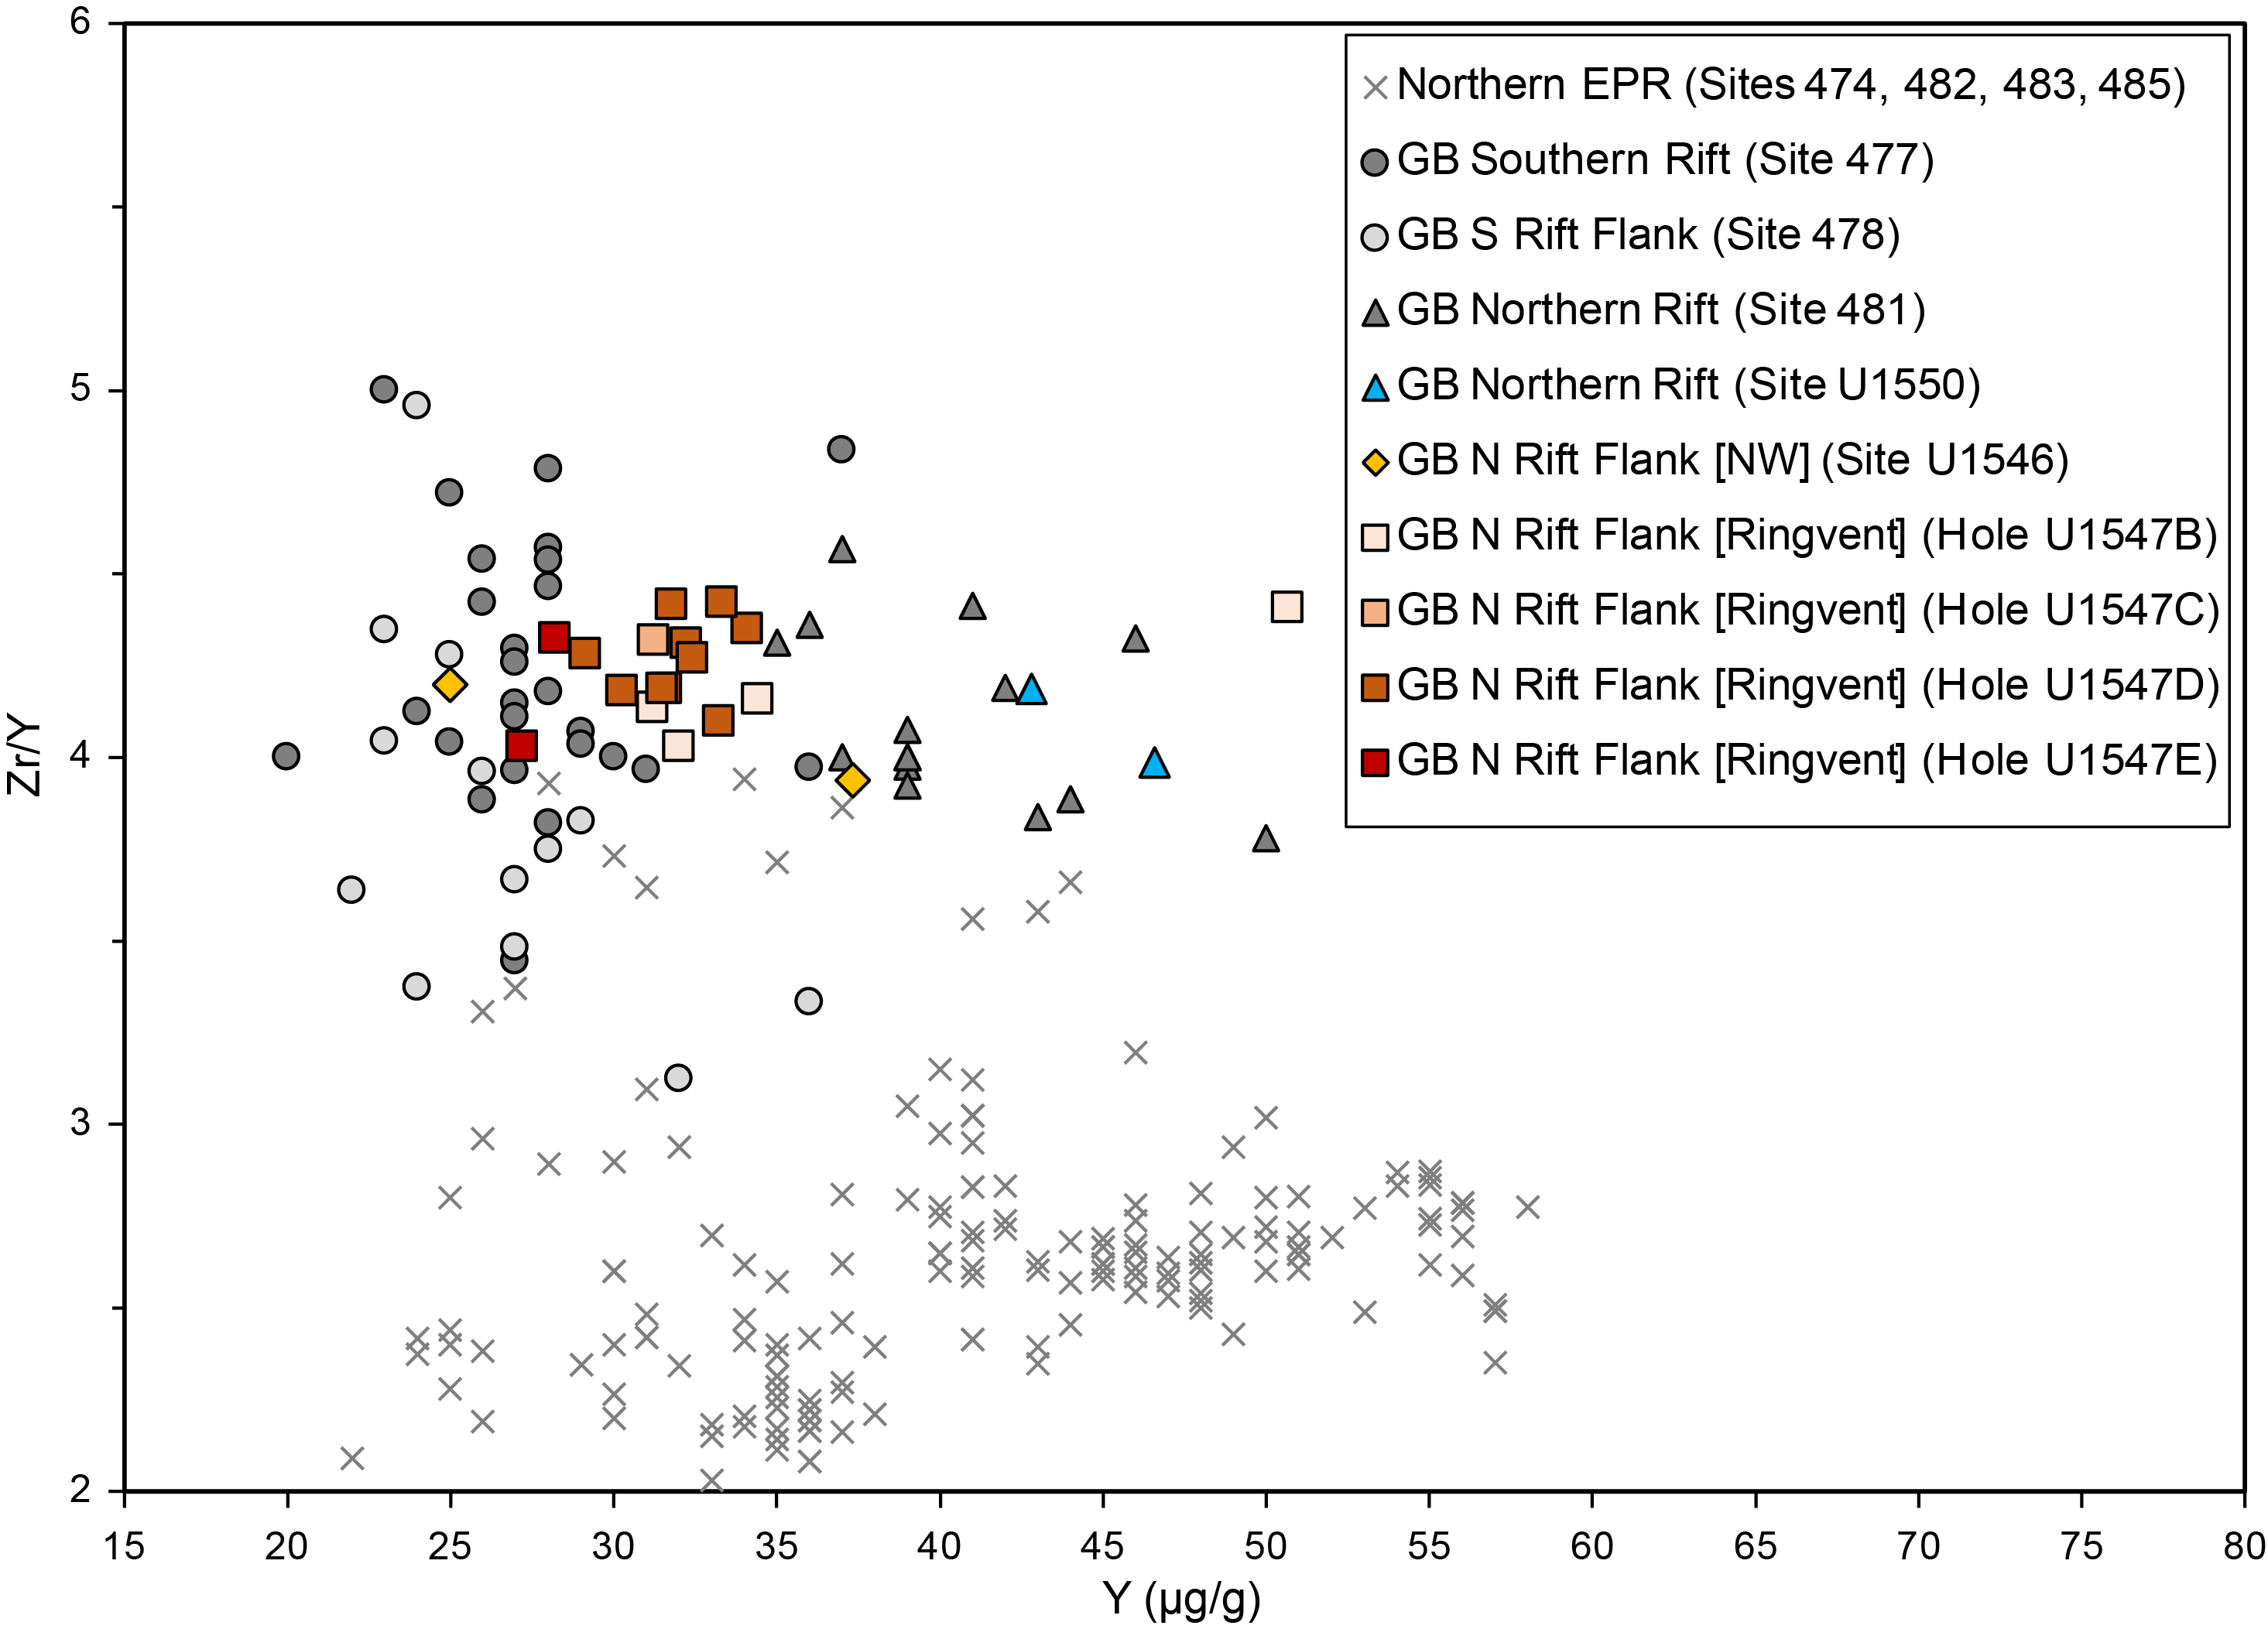
Samples from off-axis Site U1546 have a silica composition that is within the range of the northern rift segment (Deep Sea Drilling Project [DSDP] Site 481 and International Ocean Discovery Program [IODP] Site U1550), yet their content of alteration-insensitive, highly incompatible trace elements Zr and Y is lower than in the axial trough at a given Mg#. This suggests that at a similar differentiation degree, either the partial melting fraction is higher or the magma source is less enriched at Site U1546 compared to Sites 481 and U1550. In fact, the Site U1546 ratios of highly incompatible trace elements (e.g., Zr/Y) (Figure F22) are comparable among all Guaymas Basin sites but are significantly higher than in the northernmost East Pacific Rise spreading segment of the Gulf of California mouth. This indicates a significant heterogeneity in magma source compositions from the southern to the central part of the gulf because the same difference is indicated by the incompatible trace element Sr over the same range of Mg# (Figure F21A). Among the Guaymas Basin sites, higher Sr content at Site U1546 compared to Site U1550 may result in part from the formation of cumulate plagioclase at the former (off-axis) location in the gabbroic and highly plagioclase-phyric doleritic intervals. Overall, Sr variation is suggested to mainly represent primary features, that is, differences in magma source composition or extent of melting. In general, the lithophile element component (e.g., Na, K, and Sr) appears to be stronger at northern off-axis Site U1546 than at southern off-axis DSDP Site 478 and is overall more pronounced in Guaymas Basin than at the Gulf of California mouth spreading segment (Figures F19, F21A). This results in the presence of enriched MORB compositions in Guaymas Basin.
6. Structural geology
Drilling at Site U1546 penetrated Lithostratigraphic Subunits IA–ID; recovered a sedimentary sequence of diatom ooze, diatom clay, and siliceous claystone; and cored ~75 m of mafic hypabyssal rocks with basaltic, doleritic, and gabbroic textures. The strength of the cores differed considerably according to the lithology, so several methods were employed to measure the structures. For all cores, structures were measured and/or described, where present, from the archive halves of the cores. For igneous rock cores, structures were first observed and measured directly on the surface of the whole-round core pieces before they were split into section halves. These observations guided the placement of the cutting lines so that structures were split as evenly as possible between the working half and the archive half of a given core piece.
6.1. Sedimentary units
Structural information was obtained from sedimentary units in three of the four holes at this site (U1546A–U1546C). Hole U1546A was lithologically the most complete hole for sediments and sedimentary rocks and provided the most opportunity for structural observations of these lithologies. In Hole U1546B, some sections were removed for microbiological sampling immediately upon retrieval from the core liners and were therefore not available for structural study. Operations in Hole U1546C drilled without core recovery to 300 mbsf and did not sample Lithostratigraphic Subunits IA or IB. These three holes at Site U1546 are approximately 20 m distant from each other and generally have similar sedimentary stratigraphy. Structures such as tilted bedding may occur at the same depths in adjacent holes, but individual small faults do not.
The coring tool used also affected the preservation of structural information in the sedimentary material to different extents. For example, the XCB system resulted in pervasive drilling-induced fracturing of the indurated sediment in corresponding cores that prevented recognition of preexisting structures such as small faults or fractures (e.g., Cores 385-U1546B-55X through 58X; 293–331 mbsf).
Bedding and lamination in the sedimentary material were similar to those described for Site U1545.
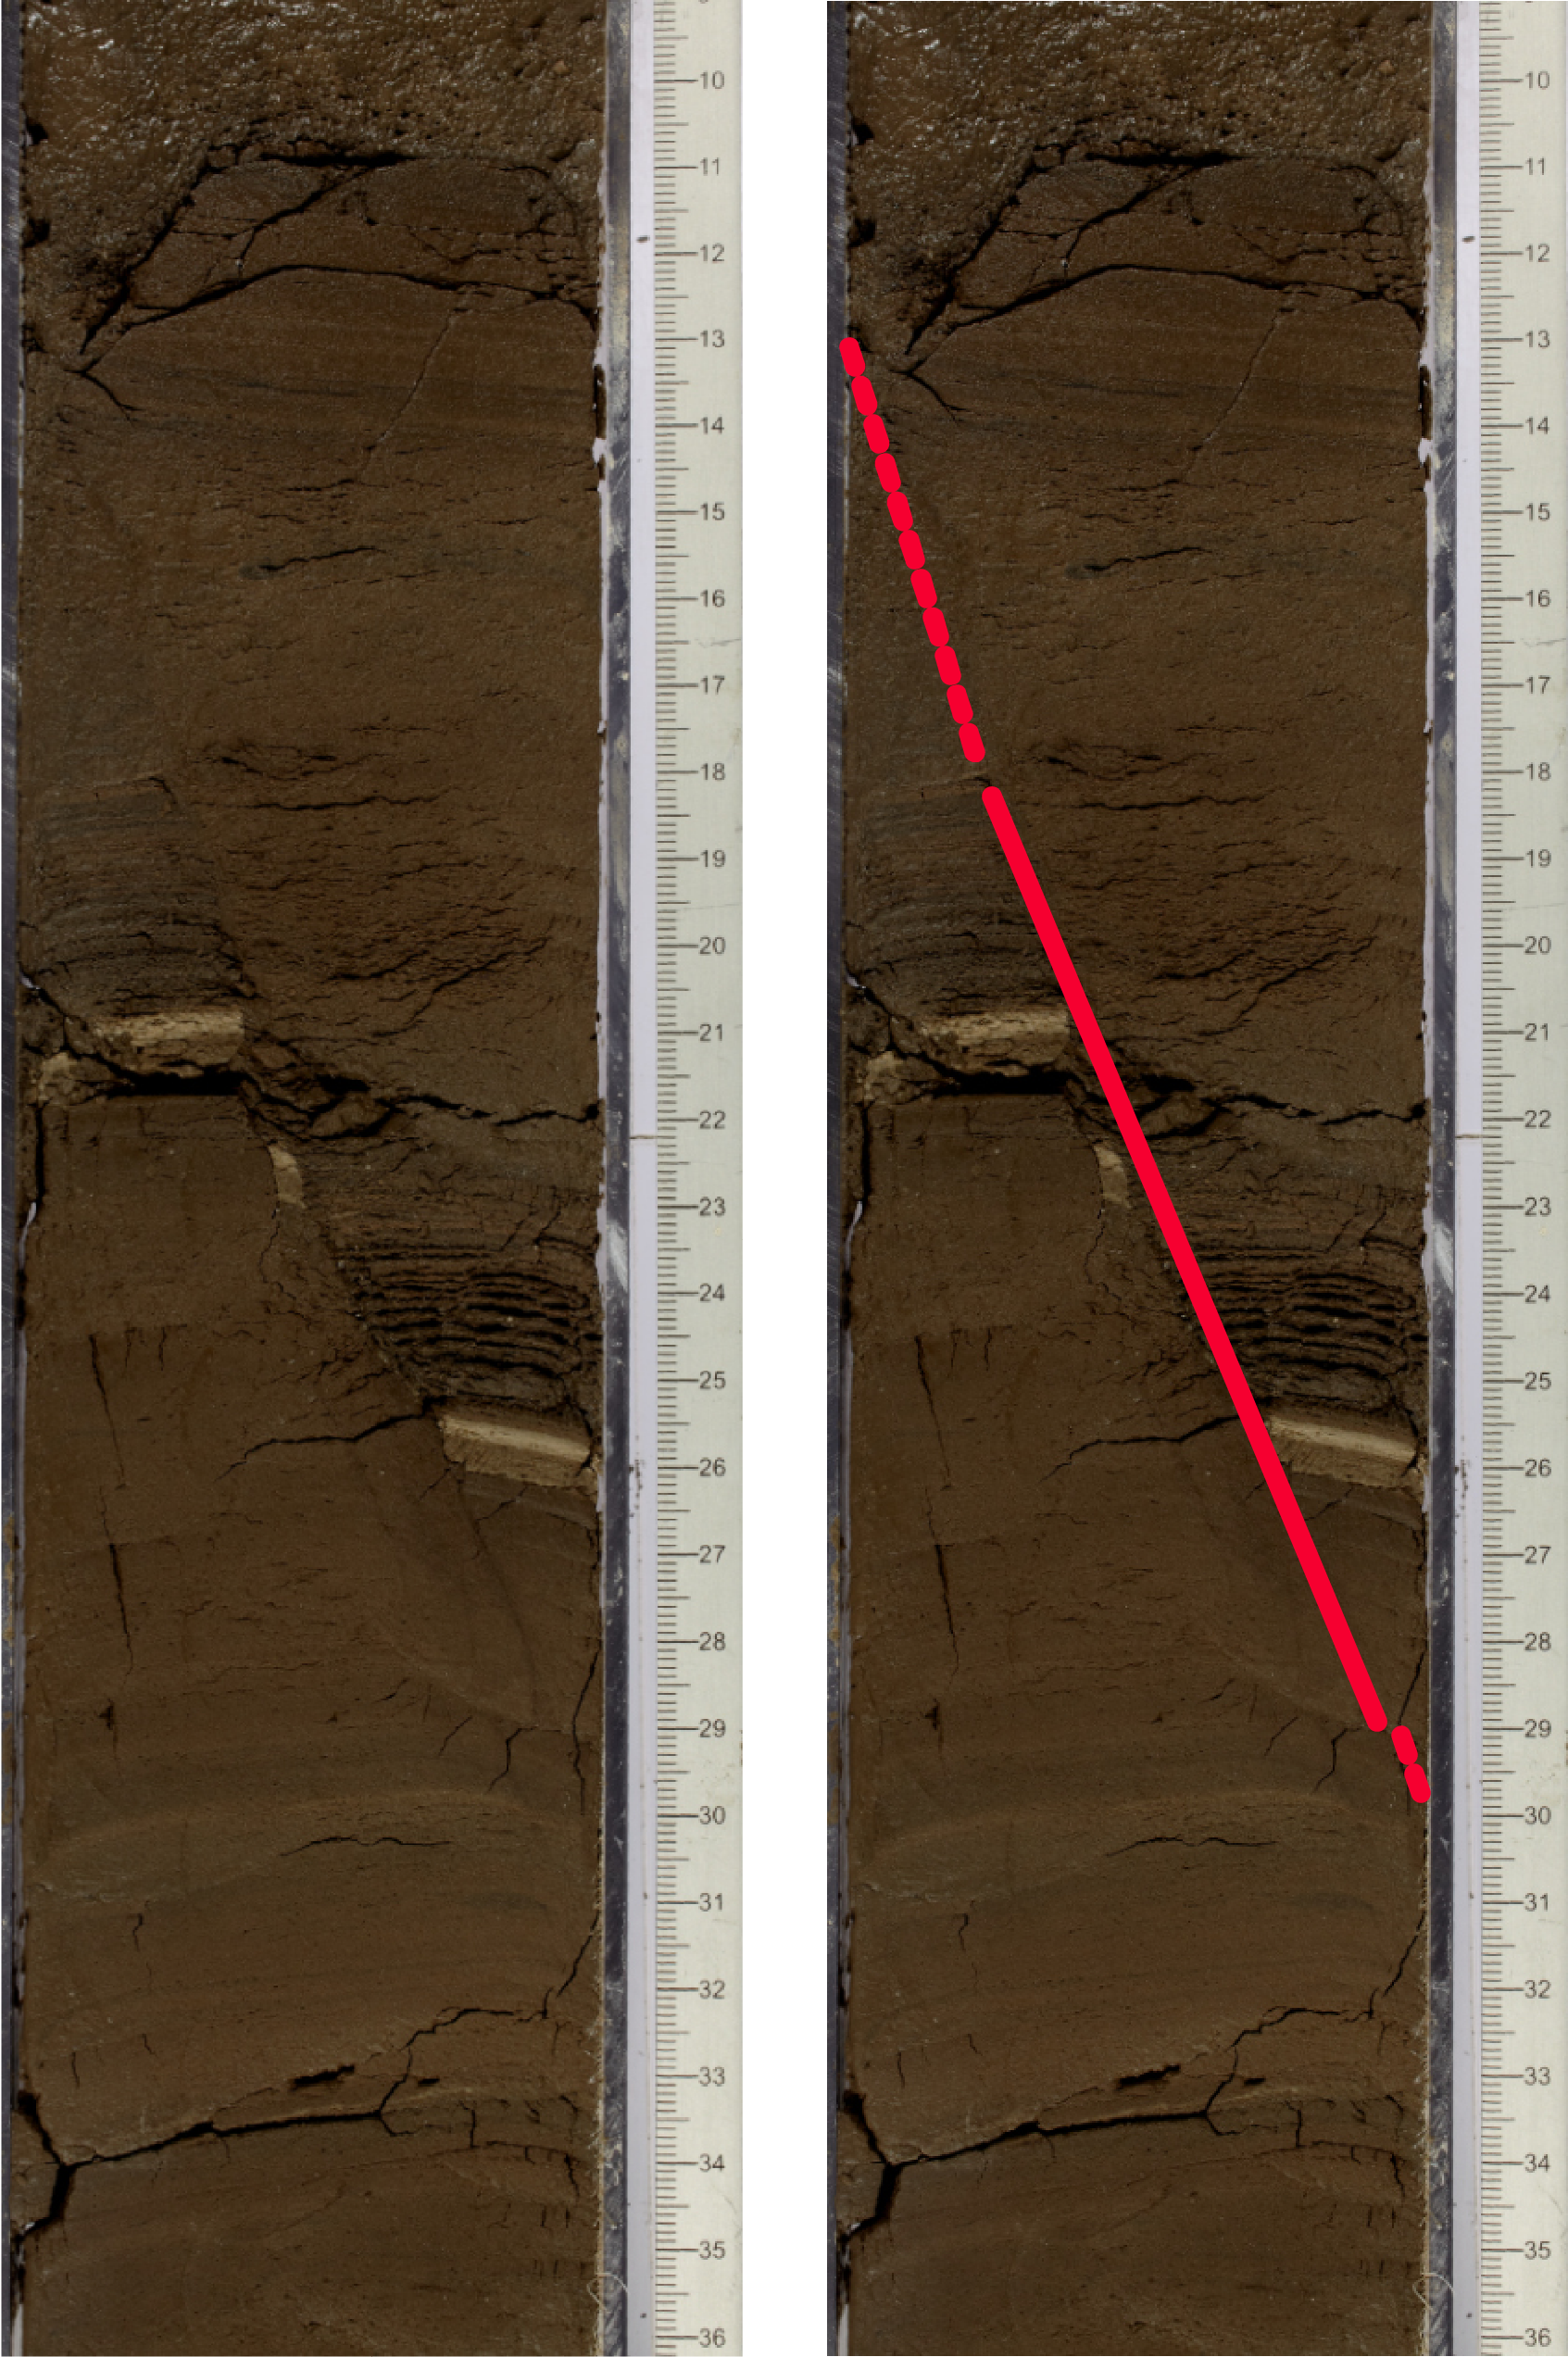
Folds were generally not observed, although slump folding is inferred to have caused steep dips in interval 385-U1546A-6H-2, 0–50 cm (30 mbsf). Brittle fractures and faults were identified in Hole U1546B starting with Core 44F (262 mbsf) and continuing through Core 56X (305 mbsf). One example of such a fault is shown in Figure F23. Fewer brittle fractures and faults were visible in Hole U1546A during visual inspection of the cores, although in some cases fractures were interpreted from the X-ray images when they were not visible on the cut surfaces of the cores. Orientations of calcite veins were measured in lithified sedimentary rocks at 433 mbsf in Section 385-U1546C-21R-2, which underlies a sill intrusion.
A set of about 10 subparallel fractures with apparent dips of 45° occurs at about 275 mbsf in interval 385-U1546B-50F-1, 70 cm, to 50F-2, 90 cm. These fractures break the core surface, but evidence in Hole U1546A suggests they may be preexisting rather than drilling induced. A similar set of subparallel fractures is seen in X-ray images of Section 385-U1546A-51F-1, but only one breaks the core surface.
6.2. Igneous units
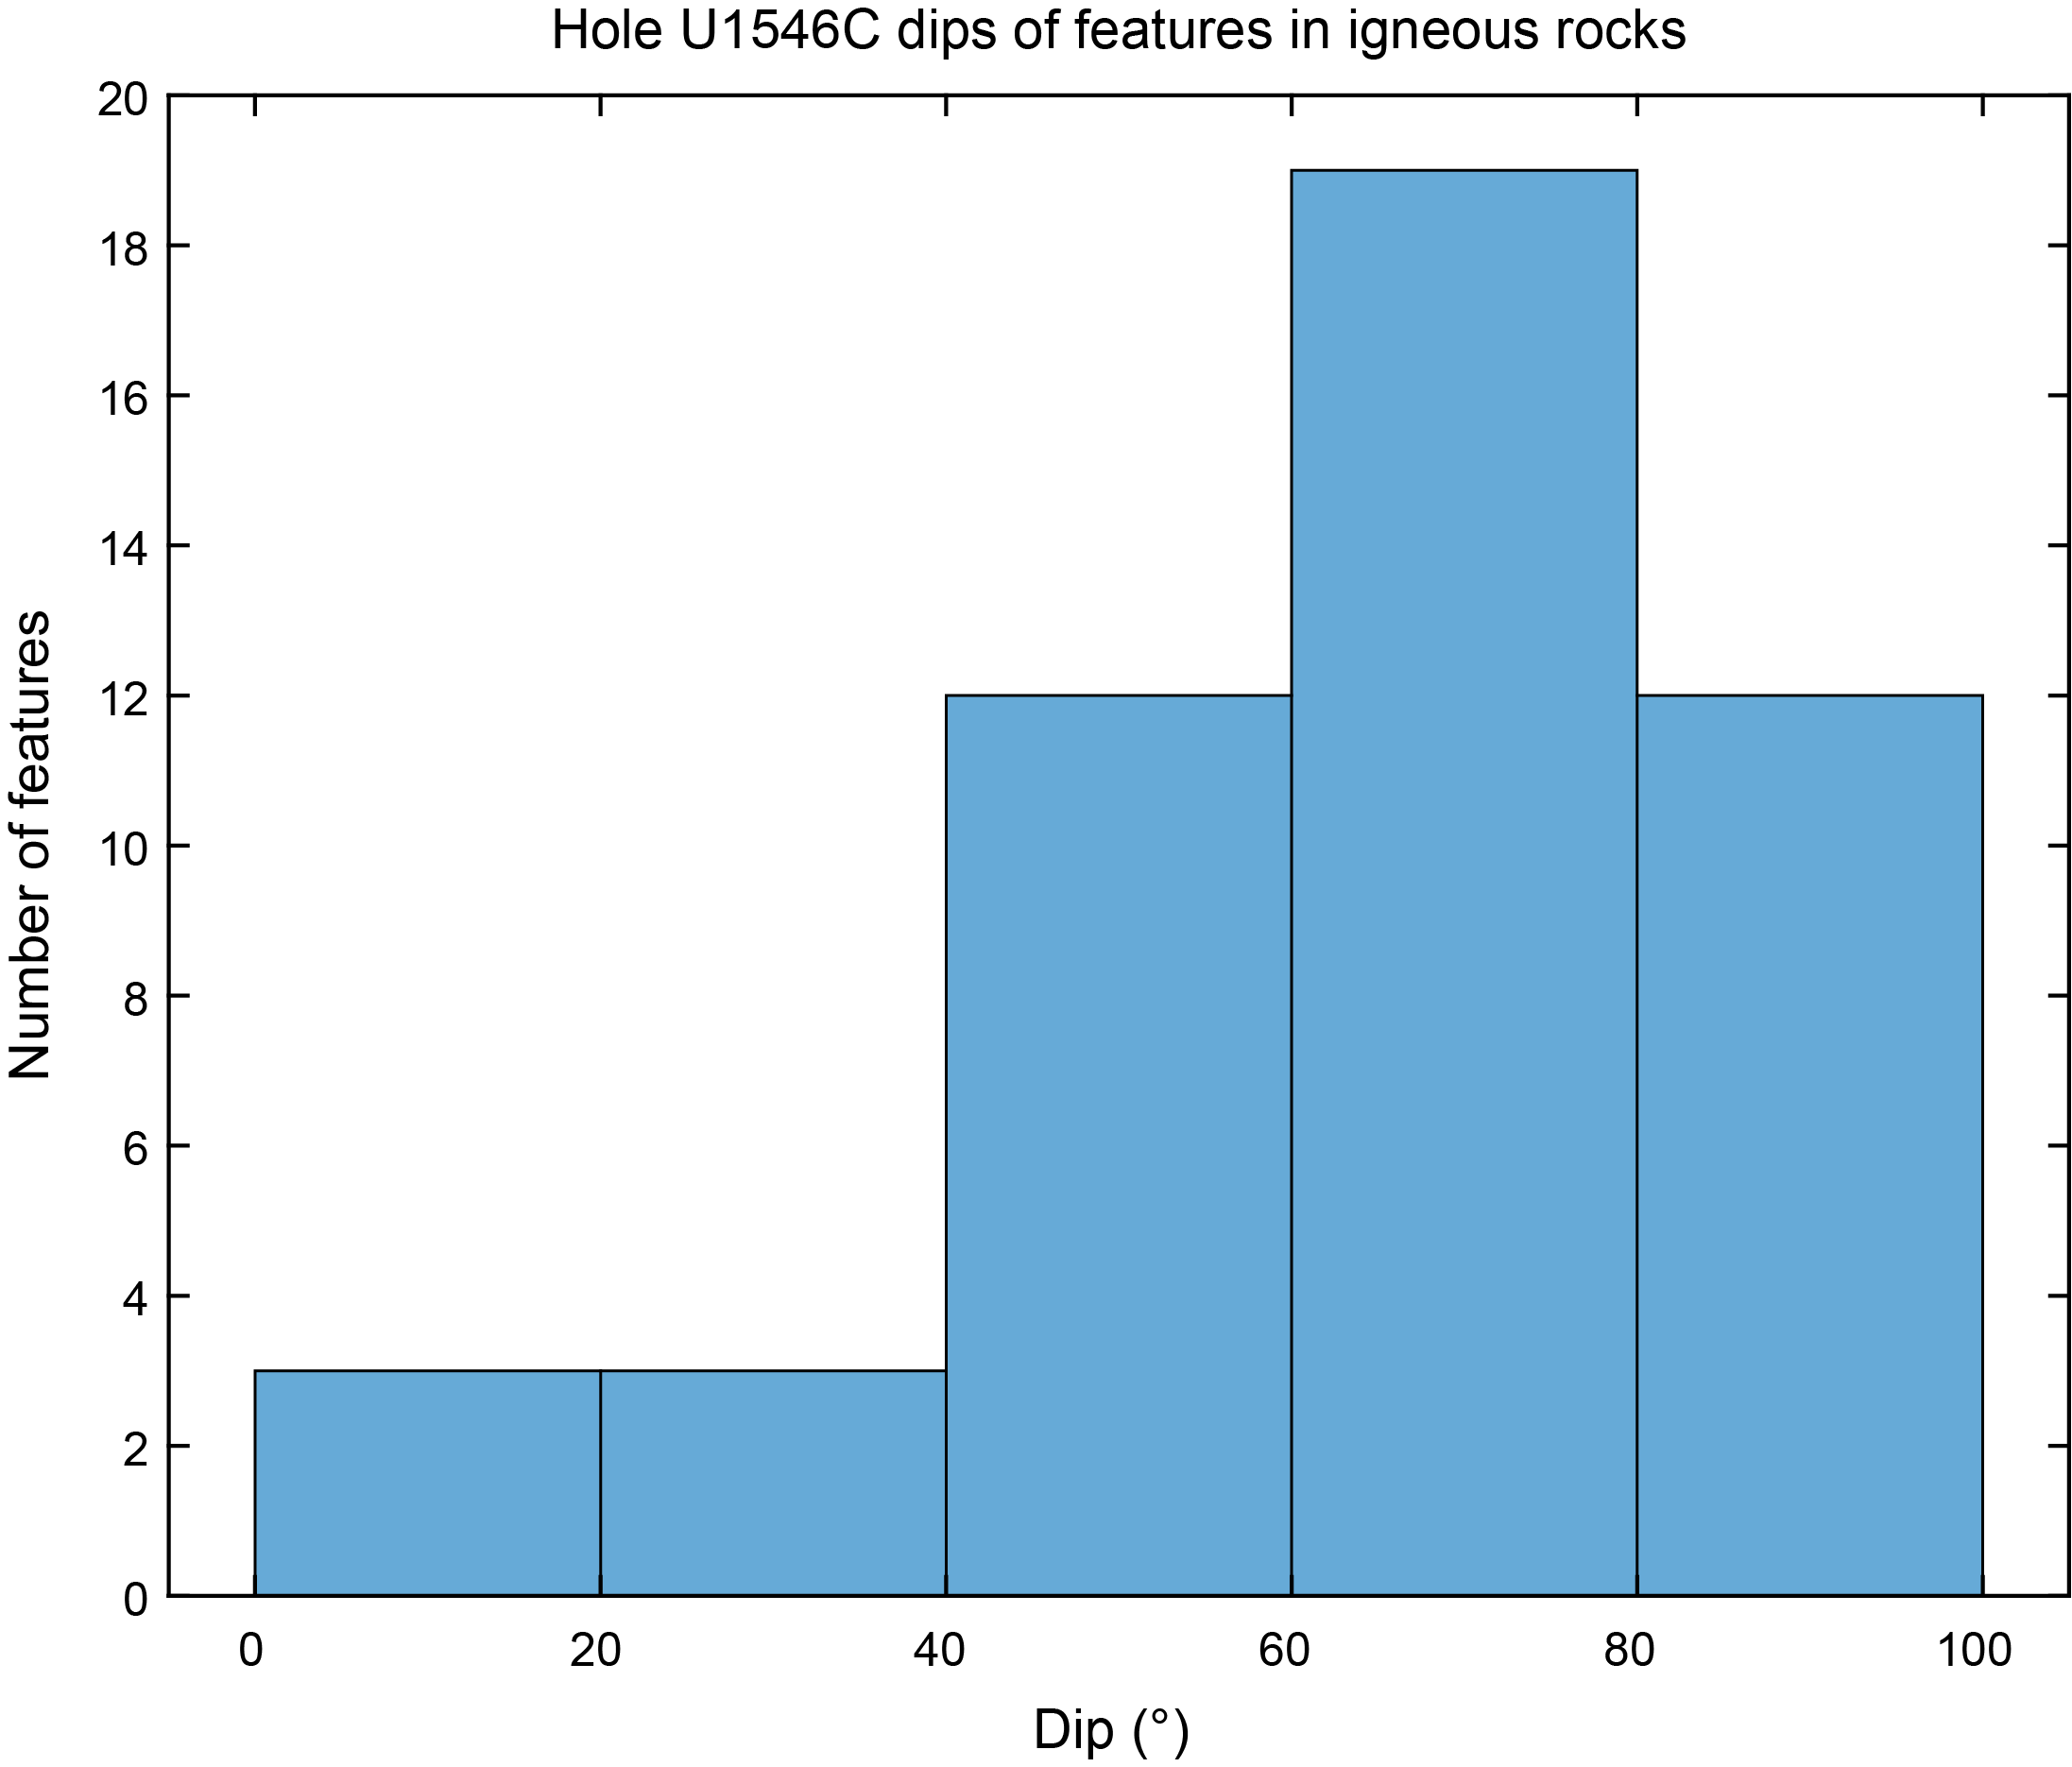
The basaltic, doleritic, and gabbroic rocks in Subunit ID of Hole U1546C have preexisting planar structures such as fractures, joints, chilled or glassy margins, and mineralized veins. Approximately 50 separate planar structures were measured on the whole-round sections from ~358 to ~430 mbsf (385-U1546C-7R-1 through 20R-1) before they were split. Because the geographic north direction of the cores is not known, only dip measurements of these structures are reported. Dips are generally steep; more than half of the dip measurements exceed 70° (Figure F24). Fresh fractures corresponding to planar tops or bottoms of core pieces were not measured unless it was clear that drilling had broken two adjacent pieces apart along a preexisting mineralized structure. The top and bottom depth of each feature was measured in the core piece, but in compiling the data for Figure F24, each feature was counted once without normalizing for its length or area. This means, for example, that a vertical vein encountered in each of four adjacent 10 cm long separate core pieces is counted as four observations, whereas a vertical vein encountered in a 40 cm long core piece is counted as one single observation.
After the cores were split, some additional thin (<1 mm thick) mineralized veins were seen on the flat surfaces of the split cores. These were measured, and their apparent dips were added to the database of structural observations.
7. Biostratigraphy
Toothpick samples from Hole U1546A and core catcher samples from Hole U1546C, along with additional spot samples of working- and archive-half sections from both holes, which were taken to better constrain biostratigraphic events, were taken and analyzed for calcareous nannofossils and marine diatoms. Preservation of calcareous nannofossils is good/moderate to poor throughout the entire sedimentary sequence. Overall, preservation is good/moderate in samples with abundant or common nannofossils and poor in those with few or rare abundances (Table T5). In general, marine diatoms are dominant/abundant with good/moderate preservation to ~312 mbsf and barren to the bottom of Holes U1546A and U1546C, due to diagenetic alteration (Table T6).
Two biostratigraphic datums were recognized and one additional stratigraphically underlying datum was estimated based on the absence of zonal markers in the generally continuous succession from the (Holocene to the) late to middle Pleistocene (Table T6). The bottom of E. huxleyi dates the upper part of the sediment sequence in Hole U1546A to Holocene(?)–late Pleistocene, or younger than 0.29 Ma (0–249.28 mbsf), and the absence of P. lacunosa (calcareous nannofossil) and F. reinholdii (marine diatom) in samples examined from the underlying interval indicates a middle Pleistocene age, specifically 0.29–0.44 Ma, for the bottom of Hole U1546A. P. lacunosa was observed in the basal core catcher sample from Hole U1546C (539.84 mbsf), suggesting an age older than the top (last occurrence) of P. lacunosa at 0.44 Ma. The estimated average sedimentation rate is 1020 m/My (102.0 cm/ky) (Figure F25).
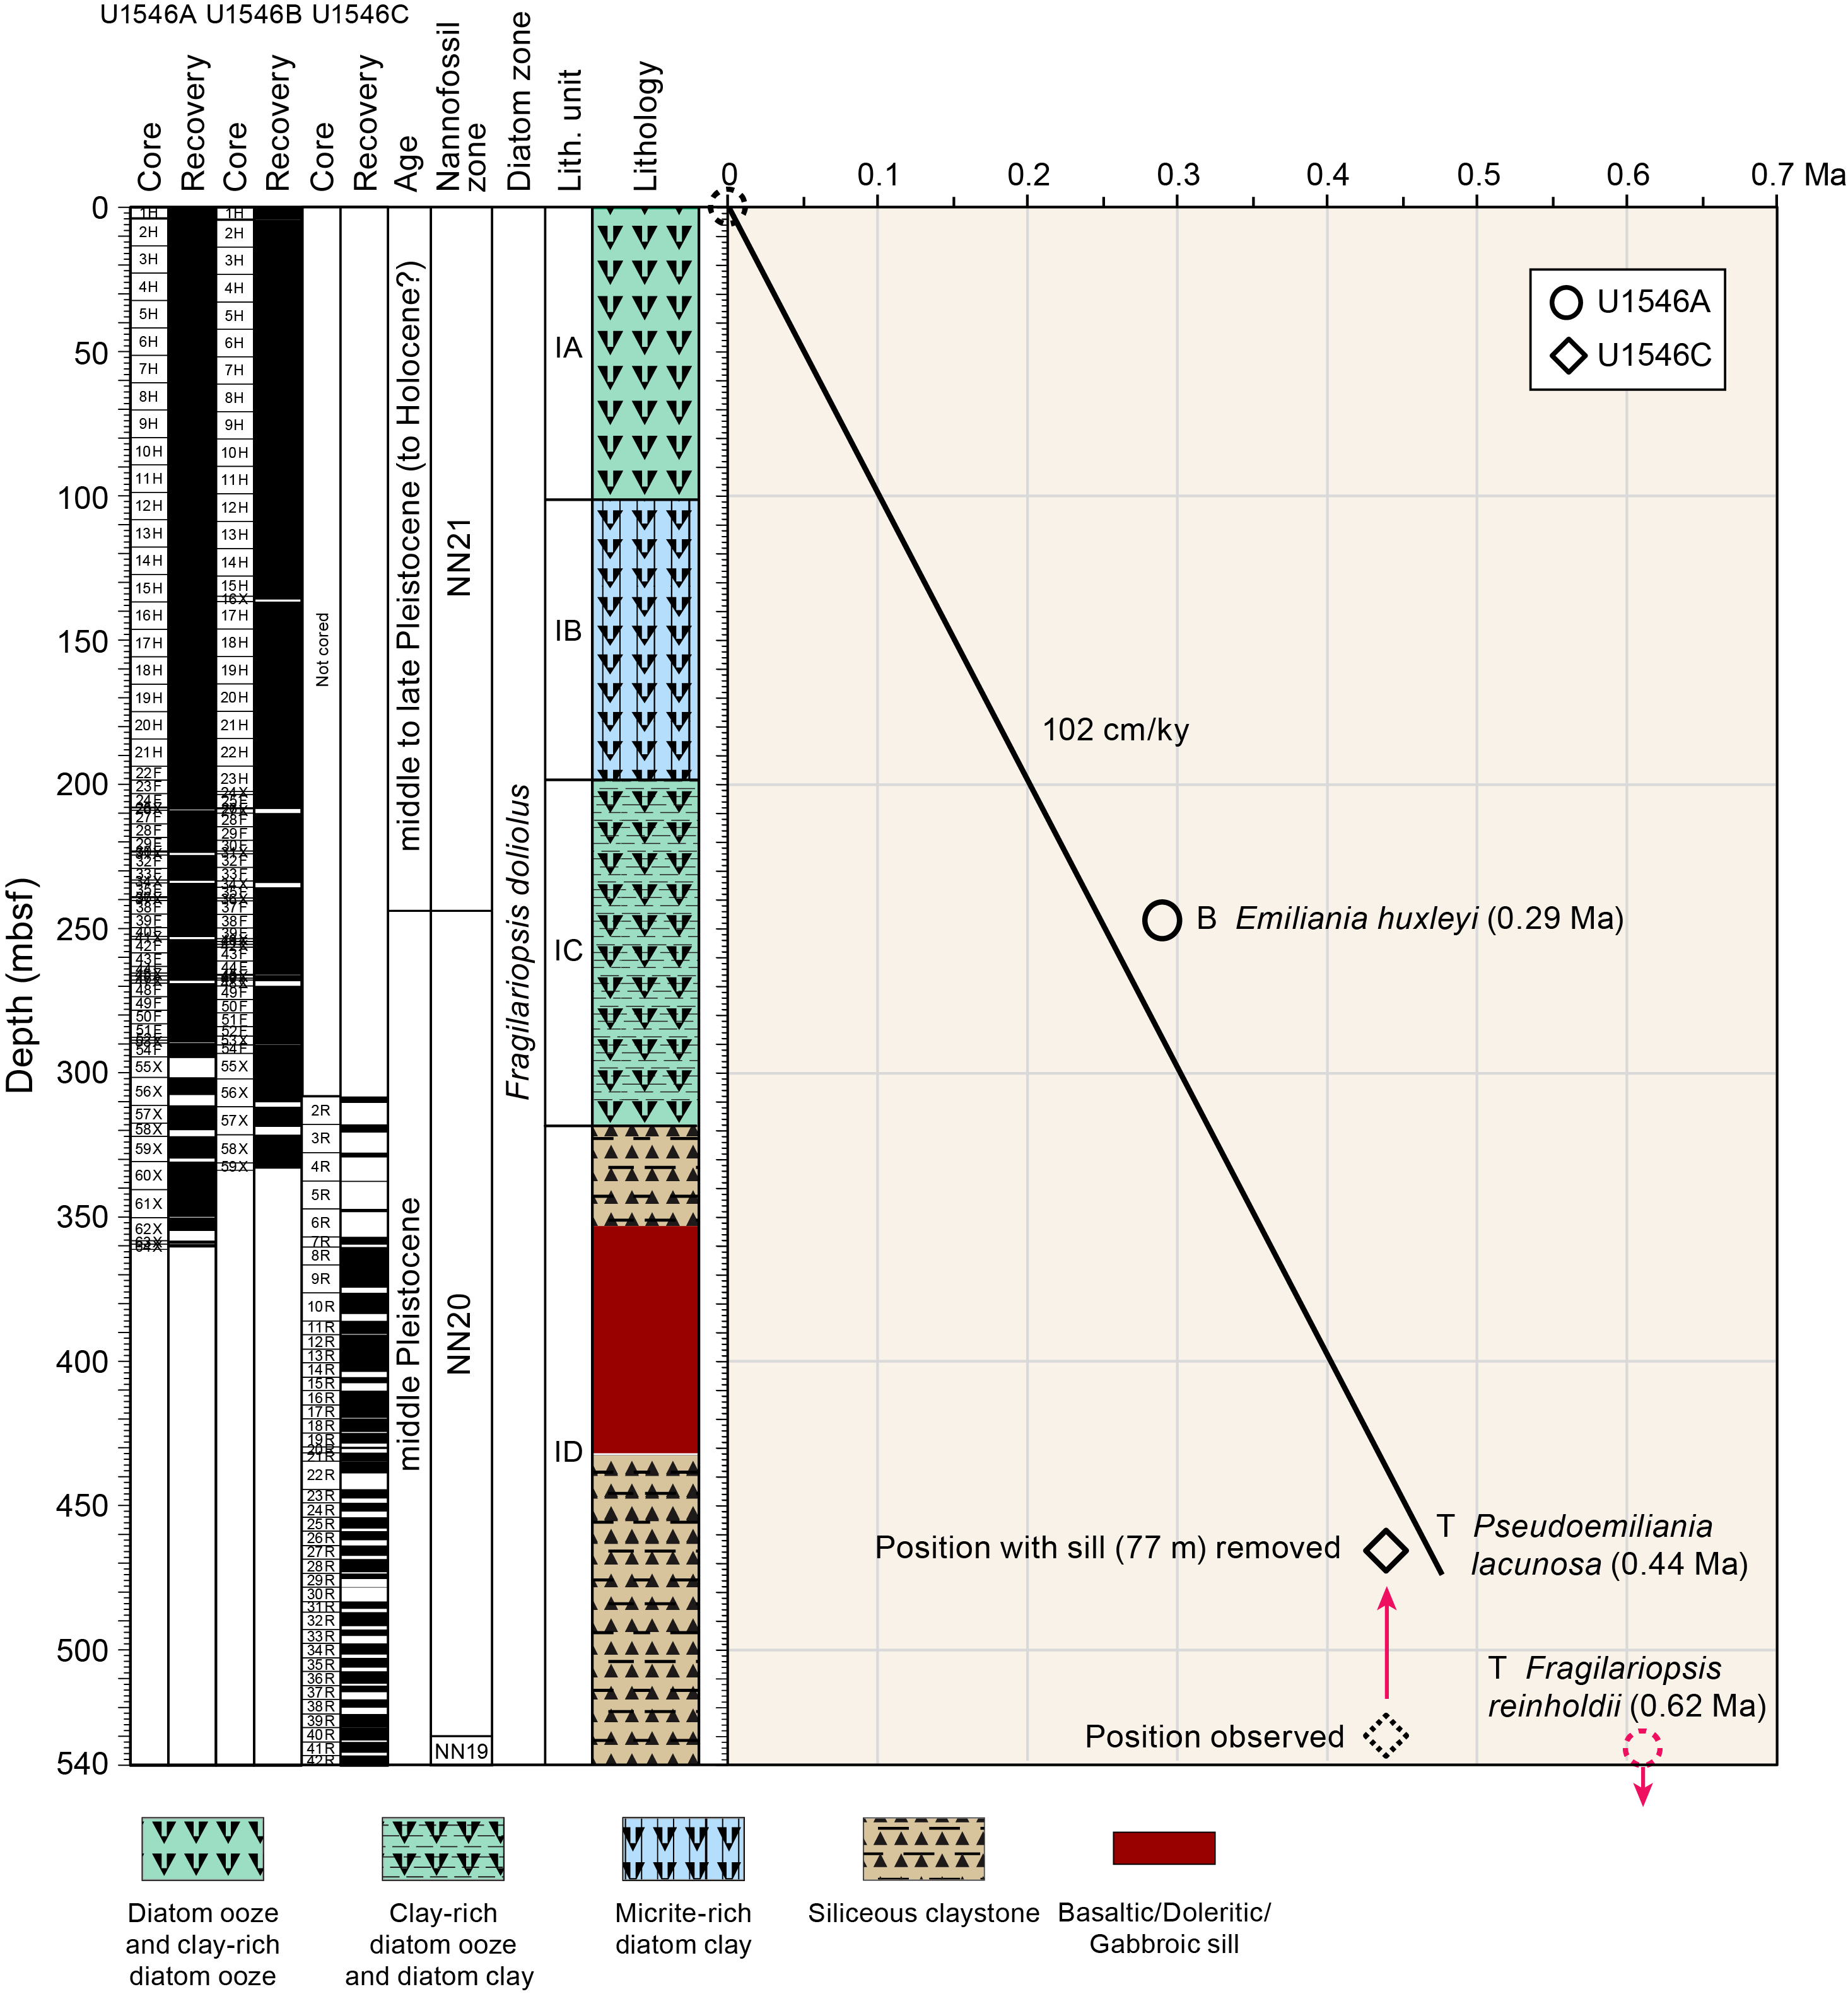
7.1. Calcareous nannofossils
Calcareous nannofossils are abundant to common in the upper part of the sediment succession in Hole U1546A (Cores 1H–11H; 0–98.81 mbsf). This interval is followed by one in which nannofossils are few or barren (Cores 12H–23F; 99–202.03 mbsf) and then by a sharp downhole increase in abundance (Cores 24F–51F; 203–286.58 mbsf). Nannofossil abundance in the lowermost part of the hole shows a large variation, and barren and abundant occurrences alternate repeatedly (Cores 54F–62X; 290.4–352.41 mbsf). Calcareous nannofossils alternate through intervals of abundant/common occurrences and few/barren occurrences throughout Hole U1546C (Cores 2R–42R; 309.99–540.05 mbsf).
The downhole pattern of calcareous nannofossil preservation is similar in both holes; higher (abundant and common) abundances generally correspond to moderate or good preservation (except Core 385-U1546A-61X; 348.72 mbsf), and few or rare abundances correspond to poor preservation. Degraded preservation is usually associated with signs of dissolution and fragmentation.
Reworking of Cretaceous taxa is ubiquitous in both holes. The origin of reworked nannofossils is uncertain, although possible sources may include the eroded Cretaceous outcrops in the Colorado River catchment and the Cretaceous chalk deposits underlying the Sierra Madre Occidental mountain range (McDougall and Martínez, 2014). The source of reworking will be analyzed in detail during postexpedition research.
The upper part of Hole U1546A (0–249.28 mbsf) was assigned to Nannofossil Zone NN21 based on the bottom presence of E. huxleyi in the lowermost Sample 39F-3, 50 cm (248.3 mbsf). This interval is thus dated as Holocene or late to middle Pleistocene with an age of 0–0.29 Ma. E. huxleyi was not observed in any samples from Hole U1546C. Its absence in the examined samples suggests that Hole U1546C lies below the bottom (first appearance datum) of E. huxleyi. Therefore, the entire sampled interval for Hole U1546C and the lower part of Hole U1546A were determined to be below Nannofossil Zone NN21 (older than 0.29 Ma). Nannofossil Zone NN20 is a so-called “gap zone” bounded by the bottom of E. huxleyi (0.29 Ma) as the upper boundary and the top of P. lacunosa (0.44 Ma) as the lower boundary. The bottom portion of Hole U1546A and the top of Hole U1546C are designated as Nannofossil Zone NN20 (Hole U1546A = 249–360.55 mbsf; Hole U1546C = 308.2–539.84 mbsf). The presence of P. lacunosa in Section 385-U1546C-62X-CC places the basal 21 cm of Hole U1546C within Nannofossil Zone NN19. Its upper boundary is defined by the top of P. lacunosa, indicating an age older than 0.44 Ma for the bottom of Hole U1546C. Thus, two nannofossil biostratigraphic datums, the bottom of E. huxleyi (0.29 Ma) and top of P. lacunosa, were recognized, pointing to a Holocene or late to middle Pleistocene sediment sequence at Site U1546 (Table T5).
7.2. Diatoms
In Hole U1546A, diatoms are abundant to Sample 57X-1, 70 cm (312 mbsf), with good to moderate preservation. Fragments were found in Samples 1H-3, 62 cm (3.61 mbsf), to 3H-7, 70 cm (23.04 mbsf), suggesting moderate preservation of diatoms. However, in most cases they were identified down to species level. In Samples 4H-7, 70 cm (32.02 mbsf), to 13H-7, 70 cm (117.8 mbsf), diatoms are well preserved, with identification down to species level. In Samples 14H-7, 70 cm (127.4 mbsf), to 57X-1, 70 cm (312 mbsf), more fragments were found, indicating moderate preservation of diatoms. Smear slides from Samples 58X-CC (319.7 mbsf) to 62X-2, 70 cm (352.4 mbsf), are barren of diatoms observable by the light microscope. No age-diagnostic diatom species were found, representing an age younger than 0.62 Ma, as indicated by the top/last appearance datum of F. reinholdii (Tables T6, T7).
The top of Hole U1546C penetrated a ~40 m thick sediment interval above the sill. Here, diatoms were observed to be abundant and with good preservation in Sample 2R-2, 32 cm (309.98 mbsf). In contrast, Samples 3R-1, 126 cm (319.16 mbsf), and 4R-1, 84 cm (328.54 mbsf), did not reveal any diatoms. In Sample 5R-CC, 11 cm (337.61 mbsf), small diatom fragments with poor preservation were found, and only a few were identified at species level as illustrated by the diatom preservation index in photomicrograph Plate 9 in DIATOMS in Supplementary material. Photomicrograph Plates 1–5, 7, and 8 of that figure compilation also provide a general overview of diatom taxa found at Site U1546. The decreasing degree of diatom preservation can be ascribed to the onset of silica diagenesis that increases with depth, specifically rising temperatures. Samples 21R-CC (433.78 mbsf) to 31R-CC (487 mbsf), which were recovered from below the sill, did not show any diatoms (Table T6). The absence of diatoms in the lowermost part of Hole U1546C seems to be related to complete replacement of opal-A (diatom tests) by opal-CT (siliceous claystone) as a consequence of the aforementioned silica diagenesis (see Lithostratigraphy).
8. Paleomagnetism
Paleomagnetic shipboard measurements consisted of analyzing the remanence on archive-half sections and discrete samples in Holes U1546A and U1546C to establish a continuous magnetostratigraphic record of the site and to characterize possible changes in magnetization related to sill emplacement. Representative discrete samples were collected from every APC and HLAPC core from Hole U1546A (two samples per APC core and one sample per HLAPC core). Sediments recovered using the XCB system were not analyzed because the substantial disruption due to XCB coring (see Lithostratigraphy) rendered those sediments unsuitable for paleomagnetic measurements. No paleomagnetic measurements were conducted on Hole U1546B and U1546D cores because of the absence of magnetic excursions and reversals in the sediment record (see Magnetostratigraphy). For Hole U1546C, only RCB cores containing sediments were subjected continuously to AF demagnetization up to 20 mT.
8.1. Archive-half section analysis
8.1.1. Hole U1546A
Archive-half sections from Hole U1546A were demagnetized at 5 cm intervals up to 20 mT. With the exception of highly disturbed archive-half sections, all sections from Hole U1546A were analyzed.
In-line AF demagnetization of archive-half sections (Cores 385-U1546A-1H through 54F) indicate a drilling overprint that was removed by an AF demagnetization treatment of 5–10 mT. The drilling-induced overprint in the NRM seems more important from ~110 mbsf (Core 13H) downhole and is even stronger from ~267 mbsf (Core 46F) downhole (Figure F26A). Nevertheless, it was successfully removed by AF demagnetization treatment for APC and HLAPC cores. For XCB cores, it was not possible to remove the overprint efficiently by 20 mT (i.e., maximum applied field with the SRM for sediments).
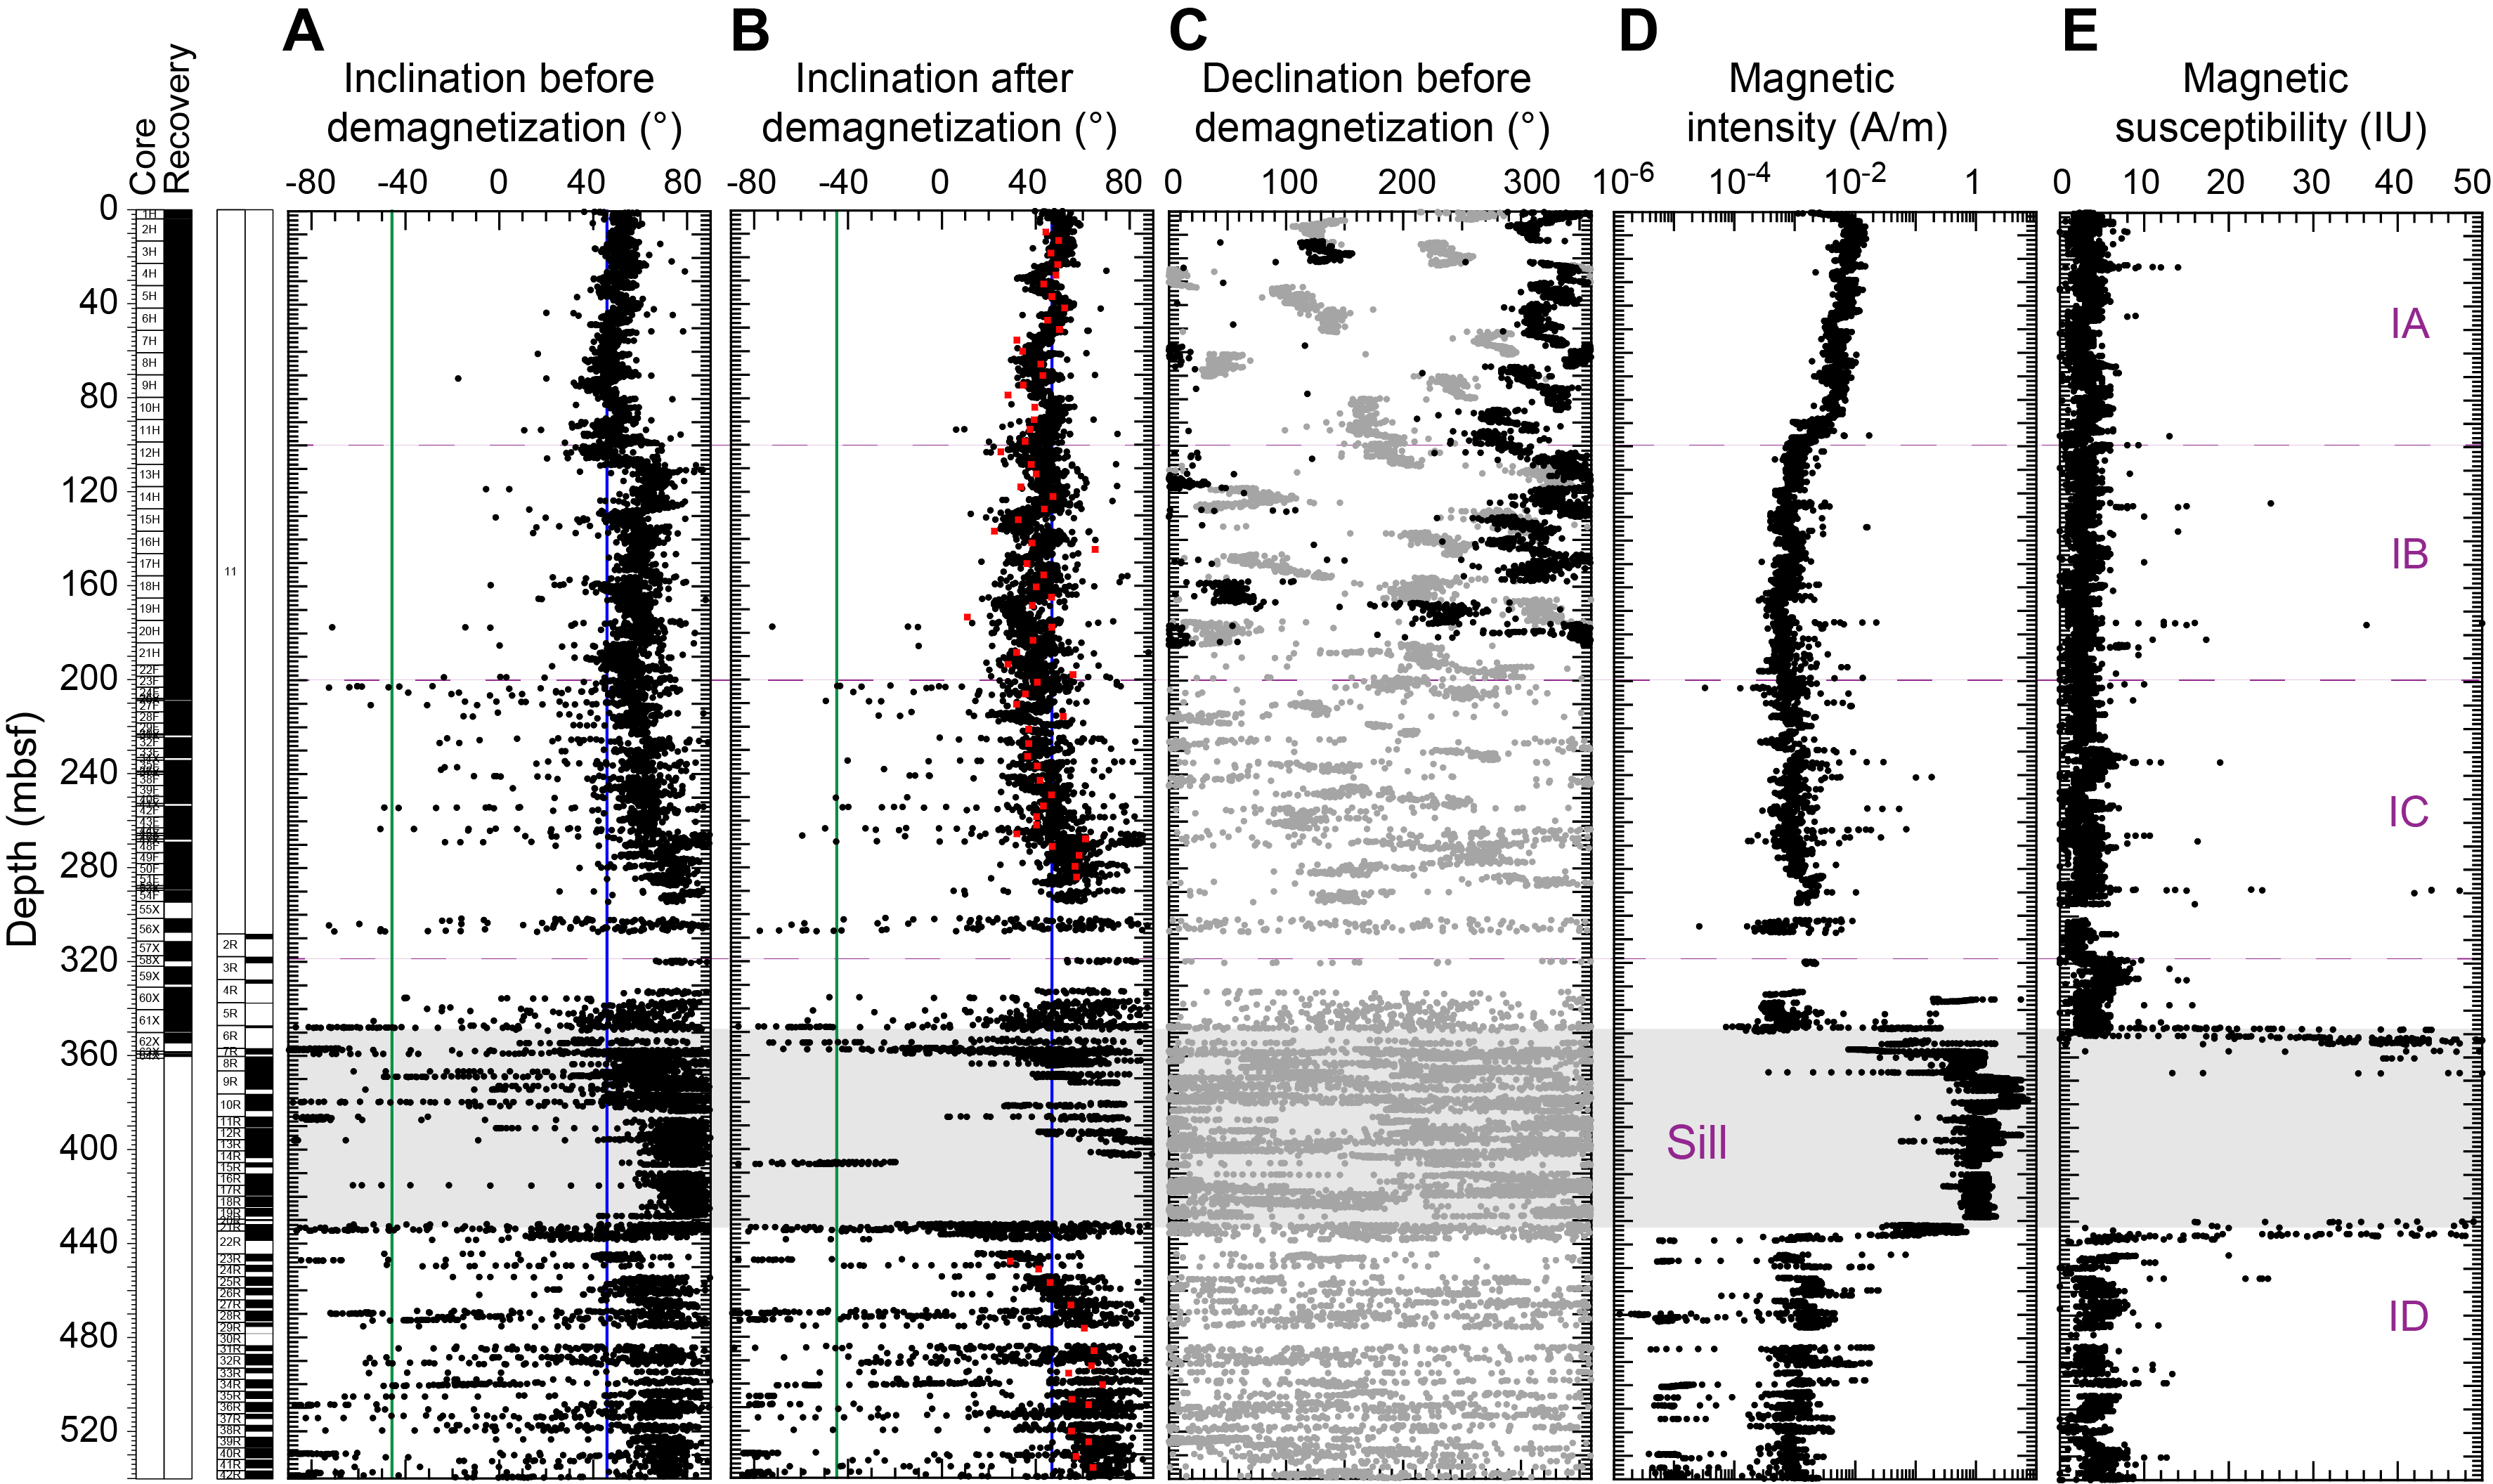
After AF demagnetization at 20 mT, inclination values for APC and HLAPC cores cluster around an average value of 43°, which is slightly lower than the expected GAD inclination value at the latitude of the site (~46.3°) (Figure F26B). Unfortunately, as at Site U1545, most of the XCB cores are highly disturbed by drilling (brecciated cores and fractured biscuits). We were therefore not able to collect discrete samples for further detailed analysis of the remanence.
Magnetic intensity (Figure F26D) decreases in the SMTZ at ~80–100 mbsf (see Inorganic geochemistry) by a factor of 10 compared to the shallowest cores. Magnetic intensity in the sediments remains low below the SMTZ (<0.005 A/m), and MS does not exceed 10 instrumental units (IU) (Figure F26E) (see Petrophysics). Sections 385-U1546A-56X-4 through 60X-2 (~310–330 mbsf) were not analyzed because they are highly disturbed. Sections 62X-CC through 64X-1 correspond to igneous lithologies with magnetic intensity and MS of as much as ~2 A/m and ~2000 IU, respectively, which is several orders of magnitude higher than the surrounding sediment (Figure F26) (see Petrophysics).
8.1.2. Hole U1546C
8.1.2.1. Sediments
The cored intervals of Holes U1546A (0–360.55 mbsf) and U1546C (308.20–540.05 mbsf) overlap, enabling us to obtain a continuous magnetic record to ~540 mbsf. SRM measurements on RCB cores show a stronger drilling-induced overprint (steeper inclination) compared to APC and HLAPC cores from Hole U1546A (Figure F26), where nonmagnetic core barrels were used (Richter et al., 2007). AF demagnetization treatment up to 20 mT partly removes this overprint, and inclination values after demagnetization are generally higher than those of the overlying sediments in Hole U1546A.
Magnetic intensity progressively increases toward the sill and decreases below it to low background values (<0.005 A/m). This pattern is mirrored in the MS values (see Petrophysics). Together, these patterns suggest authigenesis of magnetic minerals in the contact zone, likely triggered by the heat of the sill intrusion with possible hydrothermal fluid circulation (Katz et al., 1998).
8.1.2.2. Igneous lithologies
Sill sections (385-U1546A-62X-CC through 64X-1 and 385-U1546C-6R-1 through 21R-1) (see Igneous petrology and alteration) have very high magnetic intensity (as high as ~6 A/m) and very high MS of ~10,000 IU (Figure F26) (see Petrophysics), which is orders of magnitude higher than the surrounding sediments.
The AF demagnetization protocol with a maximum applied field of 20 mT appeared inappropriate for Hole U1546C cores with igneous rocks. SRM measurements on archive-half sections yield an inclination value after demagnetization at 20 mT that is higher than those of the overlying sediments, and corresponding demagnetization diagrams are not sufficient to identify the ChRM (Figure F27) (see Discrete sample analysis). Therefore, we conducted some tests on a few selected archive-half sections by using higher AF demagnetization steps (up to 80 mT and then 40 mT) (Table T8). AF demagnetization of up to 80 mT on Sections 385-U1546C-8R-1, 8R-2, and 8R-3 shows three magnetic components; the latest (from 40–50 to 80 mT) is possibly a ChRM (Figure F27). However, this AF treatment is destructive (no magnetic signal is left), and coil overheating inside the SRM is possible (as happened during IODP Expedition 367/368; B. Novak, pers. comm., 2019). Thus, an AF demagnetization treatment up to 40 mT was used instead for other sections. Further measurements on archive-half sections show different behavior upon AF demagnetization to 40 mT: persistent positive steep inclinations (Figure F27D–F27E) and reversed steep inclinations (Figure F27F). Consequently, we decided to stop AF demagnetization on archive-half sections for igneous rocks from Hole U1546C. Instead, more discrete samples were collected and thermally demagnetized (see Discrete sample analysis).

8.2. Discrete sample analysis
8.2.1. Hole U1546A
For a more detailed study of the remanence in Hole U1546A, discrete samples were taken from the working-half sections of Cores 2H–56X at a frequency of two discrete samples per APC core and one sample per HLAPC core.
A total of 60 discrete cube samples were analyzed. All of them were demagnetized using a stepwise increasing AF to isolate the ChRM direction using principal component analysis (PCA) (Kirschvink, 1980).
NRM intensities vary between 3.35 × 10⁻⁴ A/m for samples from the deepest sampled depth and 1.05 × 10⁻² A/m for samples taken at the top of the hole (Table T9). The mean intensity of all samples is 2.30 × 10⁻³ A/m. AF demagnetization was done up to 60 mT, at which point the samples had lost more than 90% of their total magnetization (Figure F28B). Representative demagnetization diagrams (Zijderveld, 1967) are shown in Figure F28A. All reported declination and inclination data are shown in the sample coordinate reference frame. However, only the inclination data are taken into account for interpretation because cores are free to rotate in the core barrel.
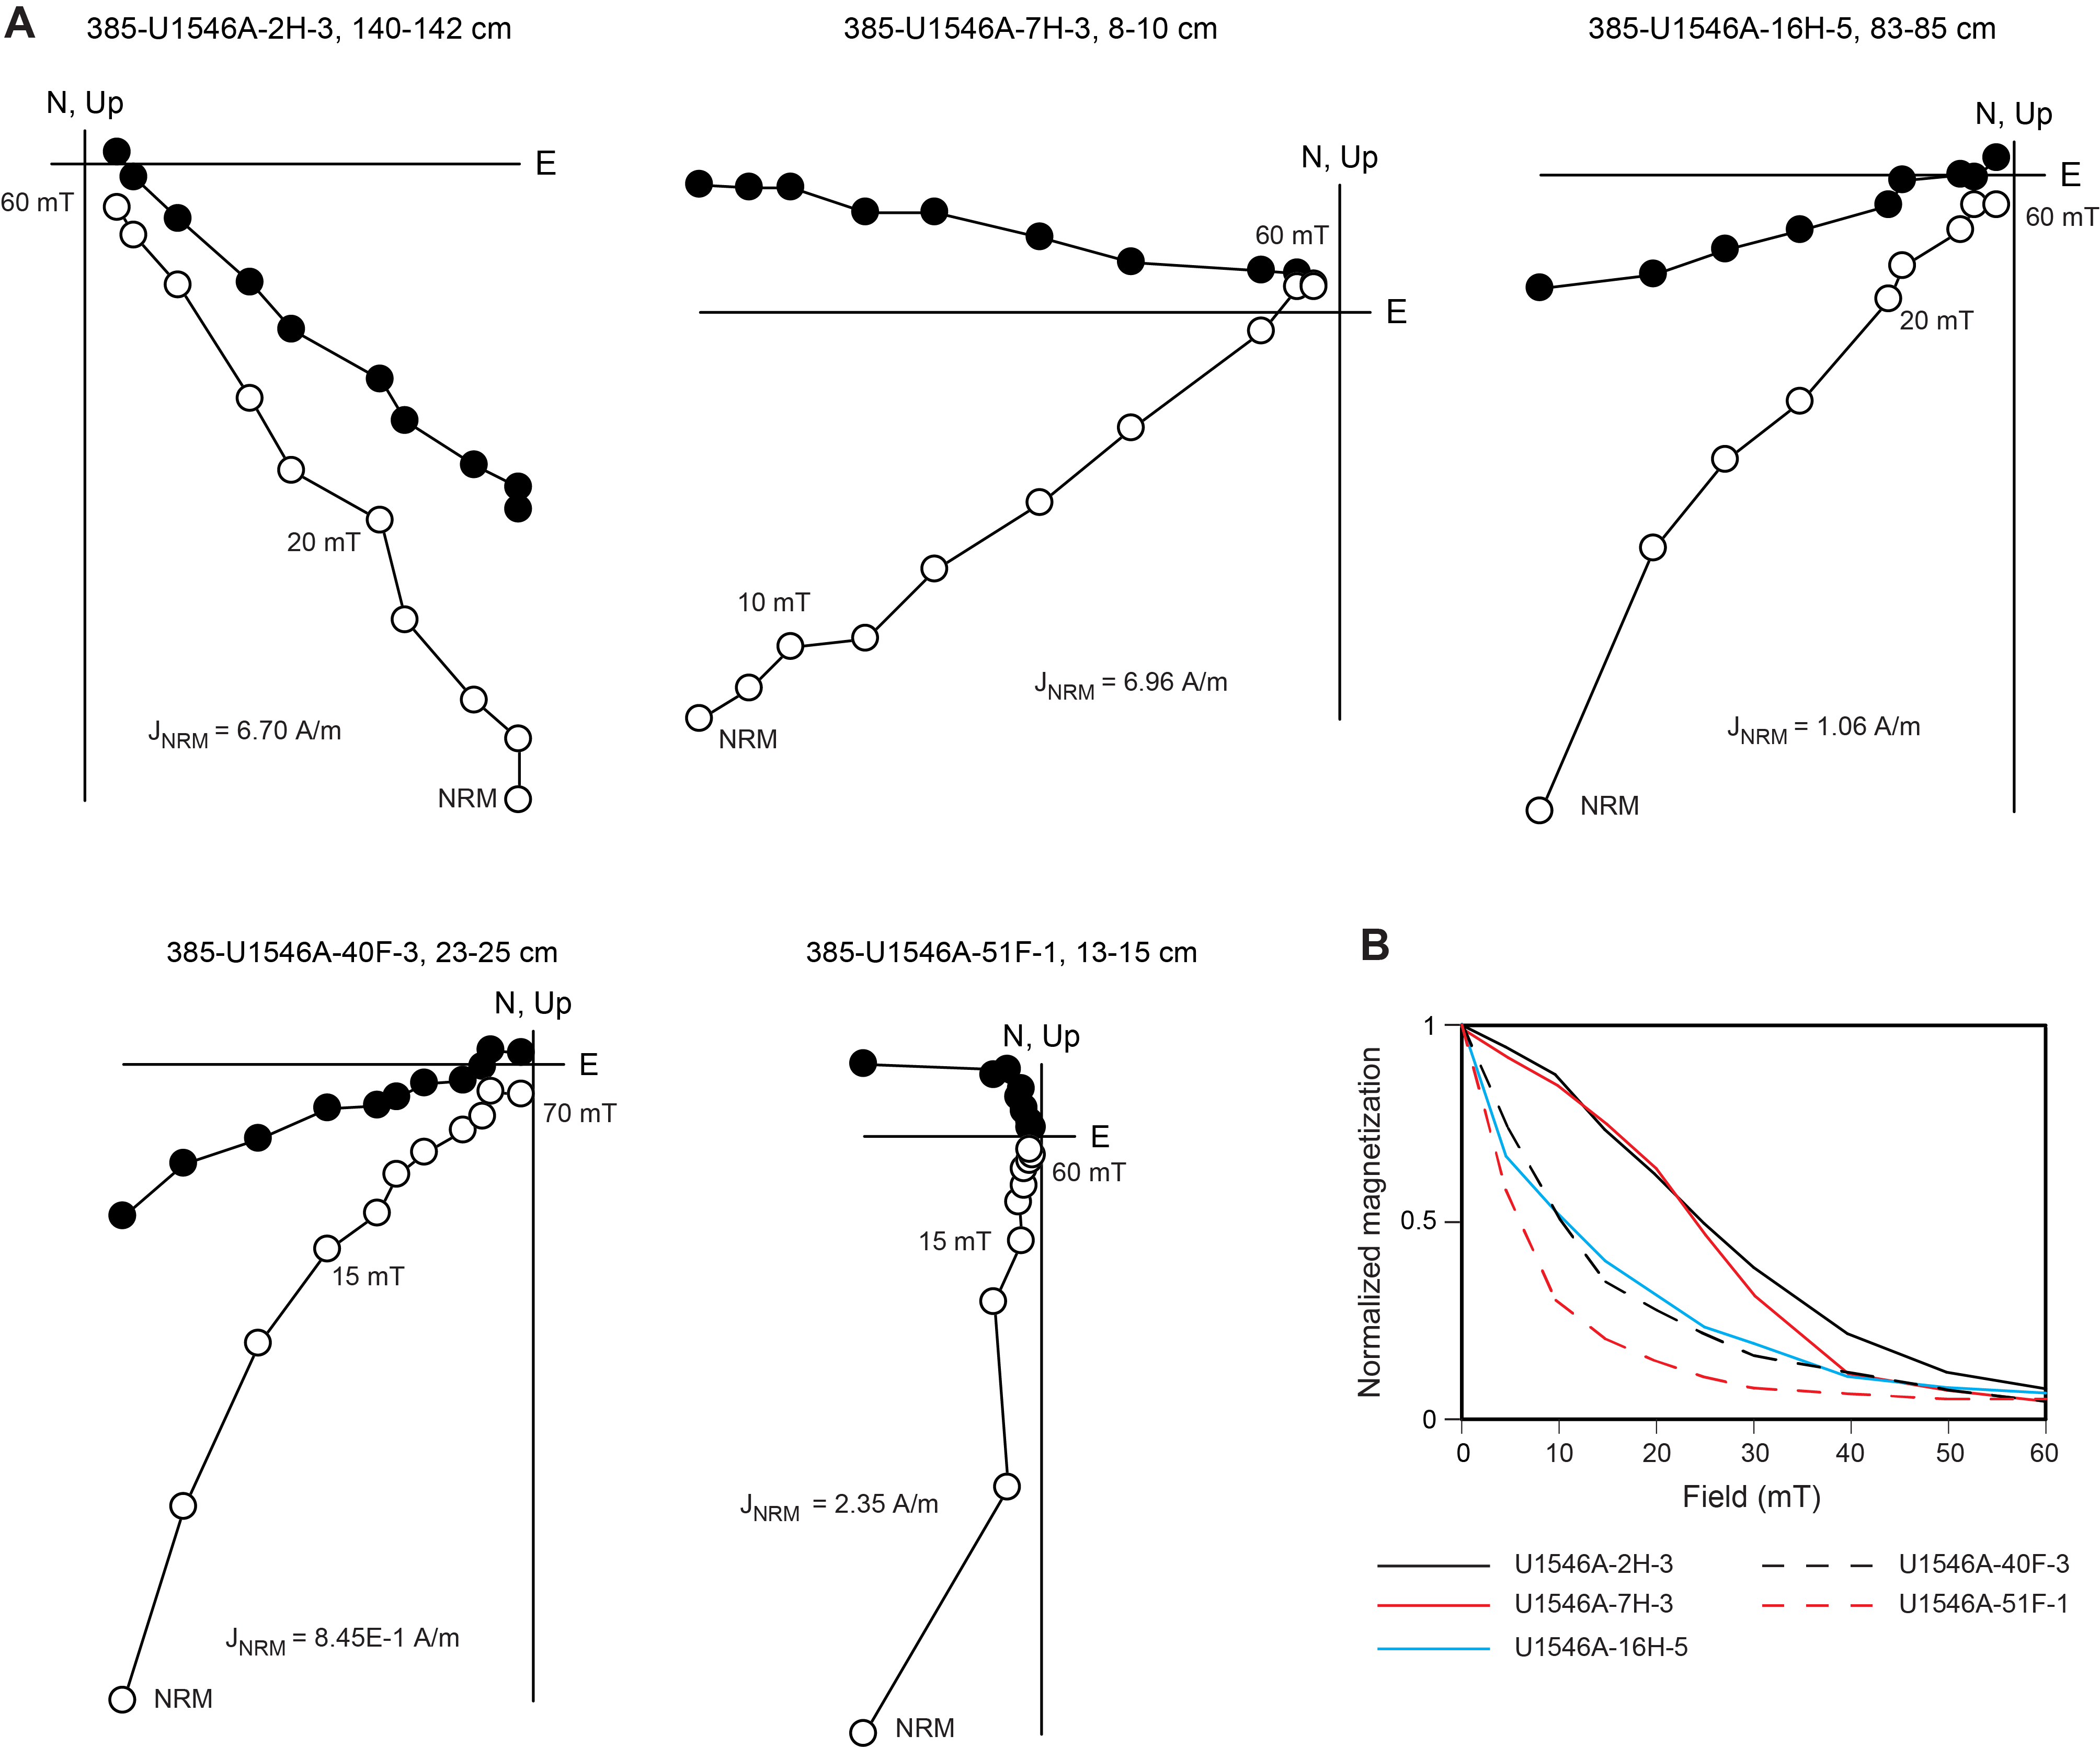
Two magnetic components were identified on the demagnetization diagrams in some discrete samples (Figure F28A). The first component is removed by an AF demagnetization treatment of 5–10 mT and corresponds to drilling overprint. A second, stable component is found in all samples and points toward the origin. This component is of normal polarity for all analyzed discrete samples. The median destructive field (MDF) ranges from 6.3 to 25.9 mT with a mean MDF of 15.3 mT and is similar to the findings at Site U1545. This suggests a magnetic mineral assemblage dominated by low-coercivity (titano)magnetite. As at Site U1545, the MDF is generally found to be higher at the top of the hole and lower MDF is found at the bottom (Table T9). This downhole trend toward lower coercivity is likely related to a coarsening of the magnetic grain assemblage in the sediment below the SMTZ (see Paleomagnetism in the Site U1545 chapter [Teske et al., 2021b]).
The distribution of NRM inclinations at 20 mT and the ChRM of all discrete samples are shown in Figure F29. The majority of the NRM inclinations are steep, ranging from 14.6° to 82.6° with a mean inclination of 52.2° (Figure F29A). AF demagnetization at 20 mT removed the overprint, resulting in a shallower and more consistent inclination of 41.6° (Figure F29B), similar to the results obtained from archive-half section measurements (Figure F26). After PCA, mean inclinations for the ChRM were calculated using the maximum likelihood method of Arason and Levi (2010) (Table T10). The calculated mean inclination for the ChRM results is 44.89°, which is close to the GAD inclination expected at this location (~46.3°) (Figure F29C).
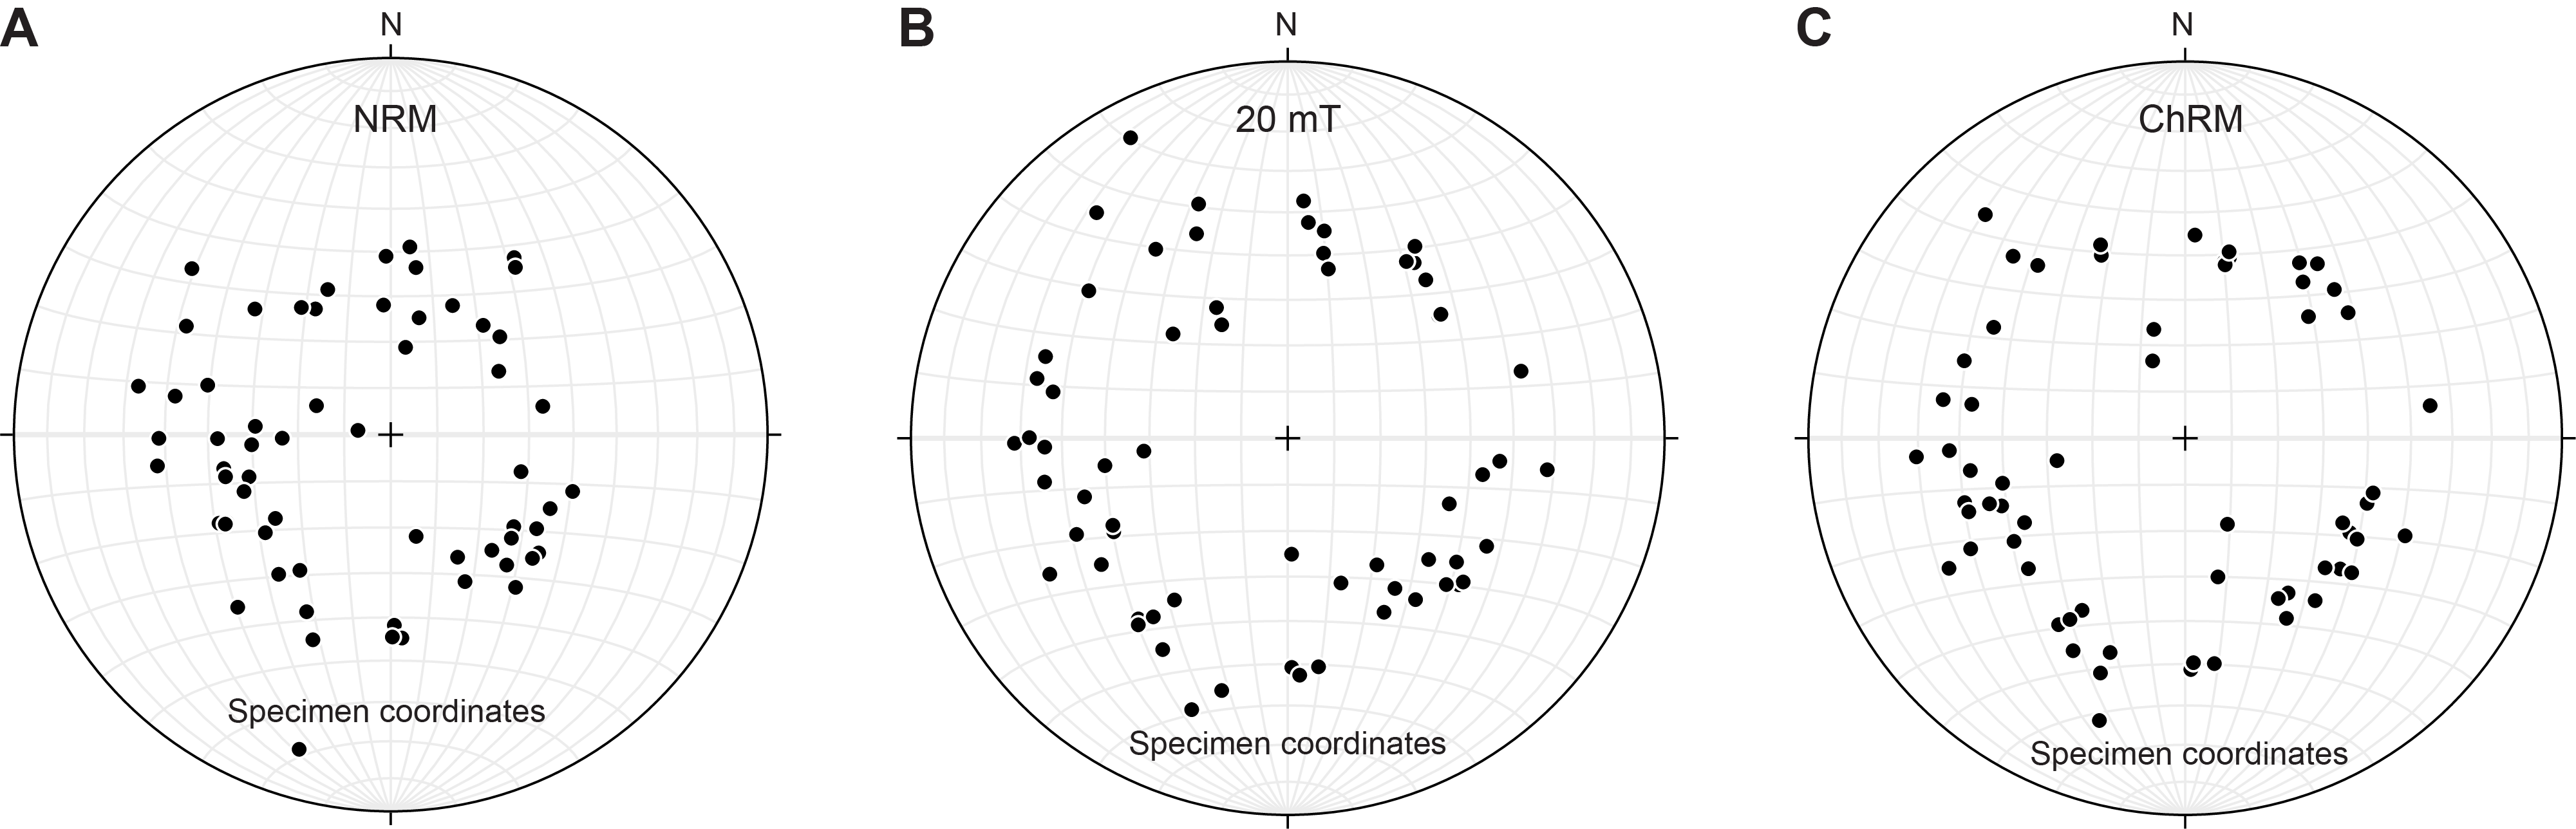
8.2.2. Hole U1546C
8.2.2.1. Igneous unit
Discrete samples were taken from the working halves of Sections 385-U1546C-7R-1 through 22R-1 at intervals of one discrete sample per RCB core. Two discrete samples from Hole U1546A, sampled from the top of the igneous unit, were added to the results presented here (Cores 62X-CC and 64X-1). This provided a total of twenty-four 8 cm3 cube samples that were first measured for moisture and density (MAD) by the physical properties team and then treated with liquid nitrogen (see Petrophysics and Paleomagnetism in the Expedition 385 methods chapter [Teske et al., 2021a]), after which they were demagnetized using stepwise increasing temperatures to isolate the ChRM direction.
Two distinct groups of data were identified from our results in this ~75 m thick sill unit: one defines the upper 19 m of the recovered sill (Cores 385-U1546A-62X-CC and 64X-1 and interval 385-U1546C-7R-1, 98 cm, through Section 9R-5), and the other defines the lower 56 m of the intrusion (Core 385-U1546C-10R-3 through Section 22R-1). The mean NRM intensity of all igneous samples is 1.57 A/m (Table T11). Because of their high intensity, all samples yielded erroneous results for the NRM measured with the AGICO JR-6A dual speed spinner magnetometer. Thermal demagnetization at 110°C, after being kept at 105°C for 24 h for MAD measurements, solved this issue and provided stable results. Most samples of the upper igneous unit lost 90% of their magnetization by 550°–600°C, whereas samples from the lower igneous unit had already lost all their magnetization at 450°C (Figure F30B). From most samples, a stable ChRM was obtained on the demagnetization diagrams in discrete samples (Figure F30A) with a median destructive temperature of 285°C for the upper unit and 234°C for the lower unit. This suggests a magnetic mineral assemblage dominated by single-domain magnetite (<0.1 µm) in the upper unit and multidomain (titano)magnetite (>10 µm) in the lower unit.
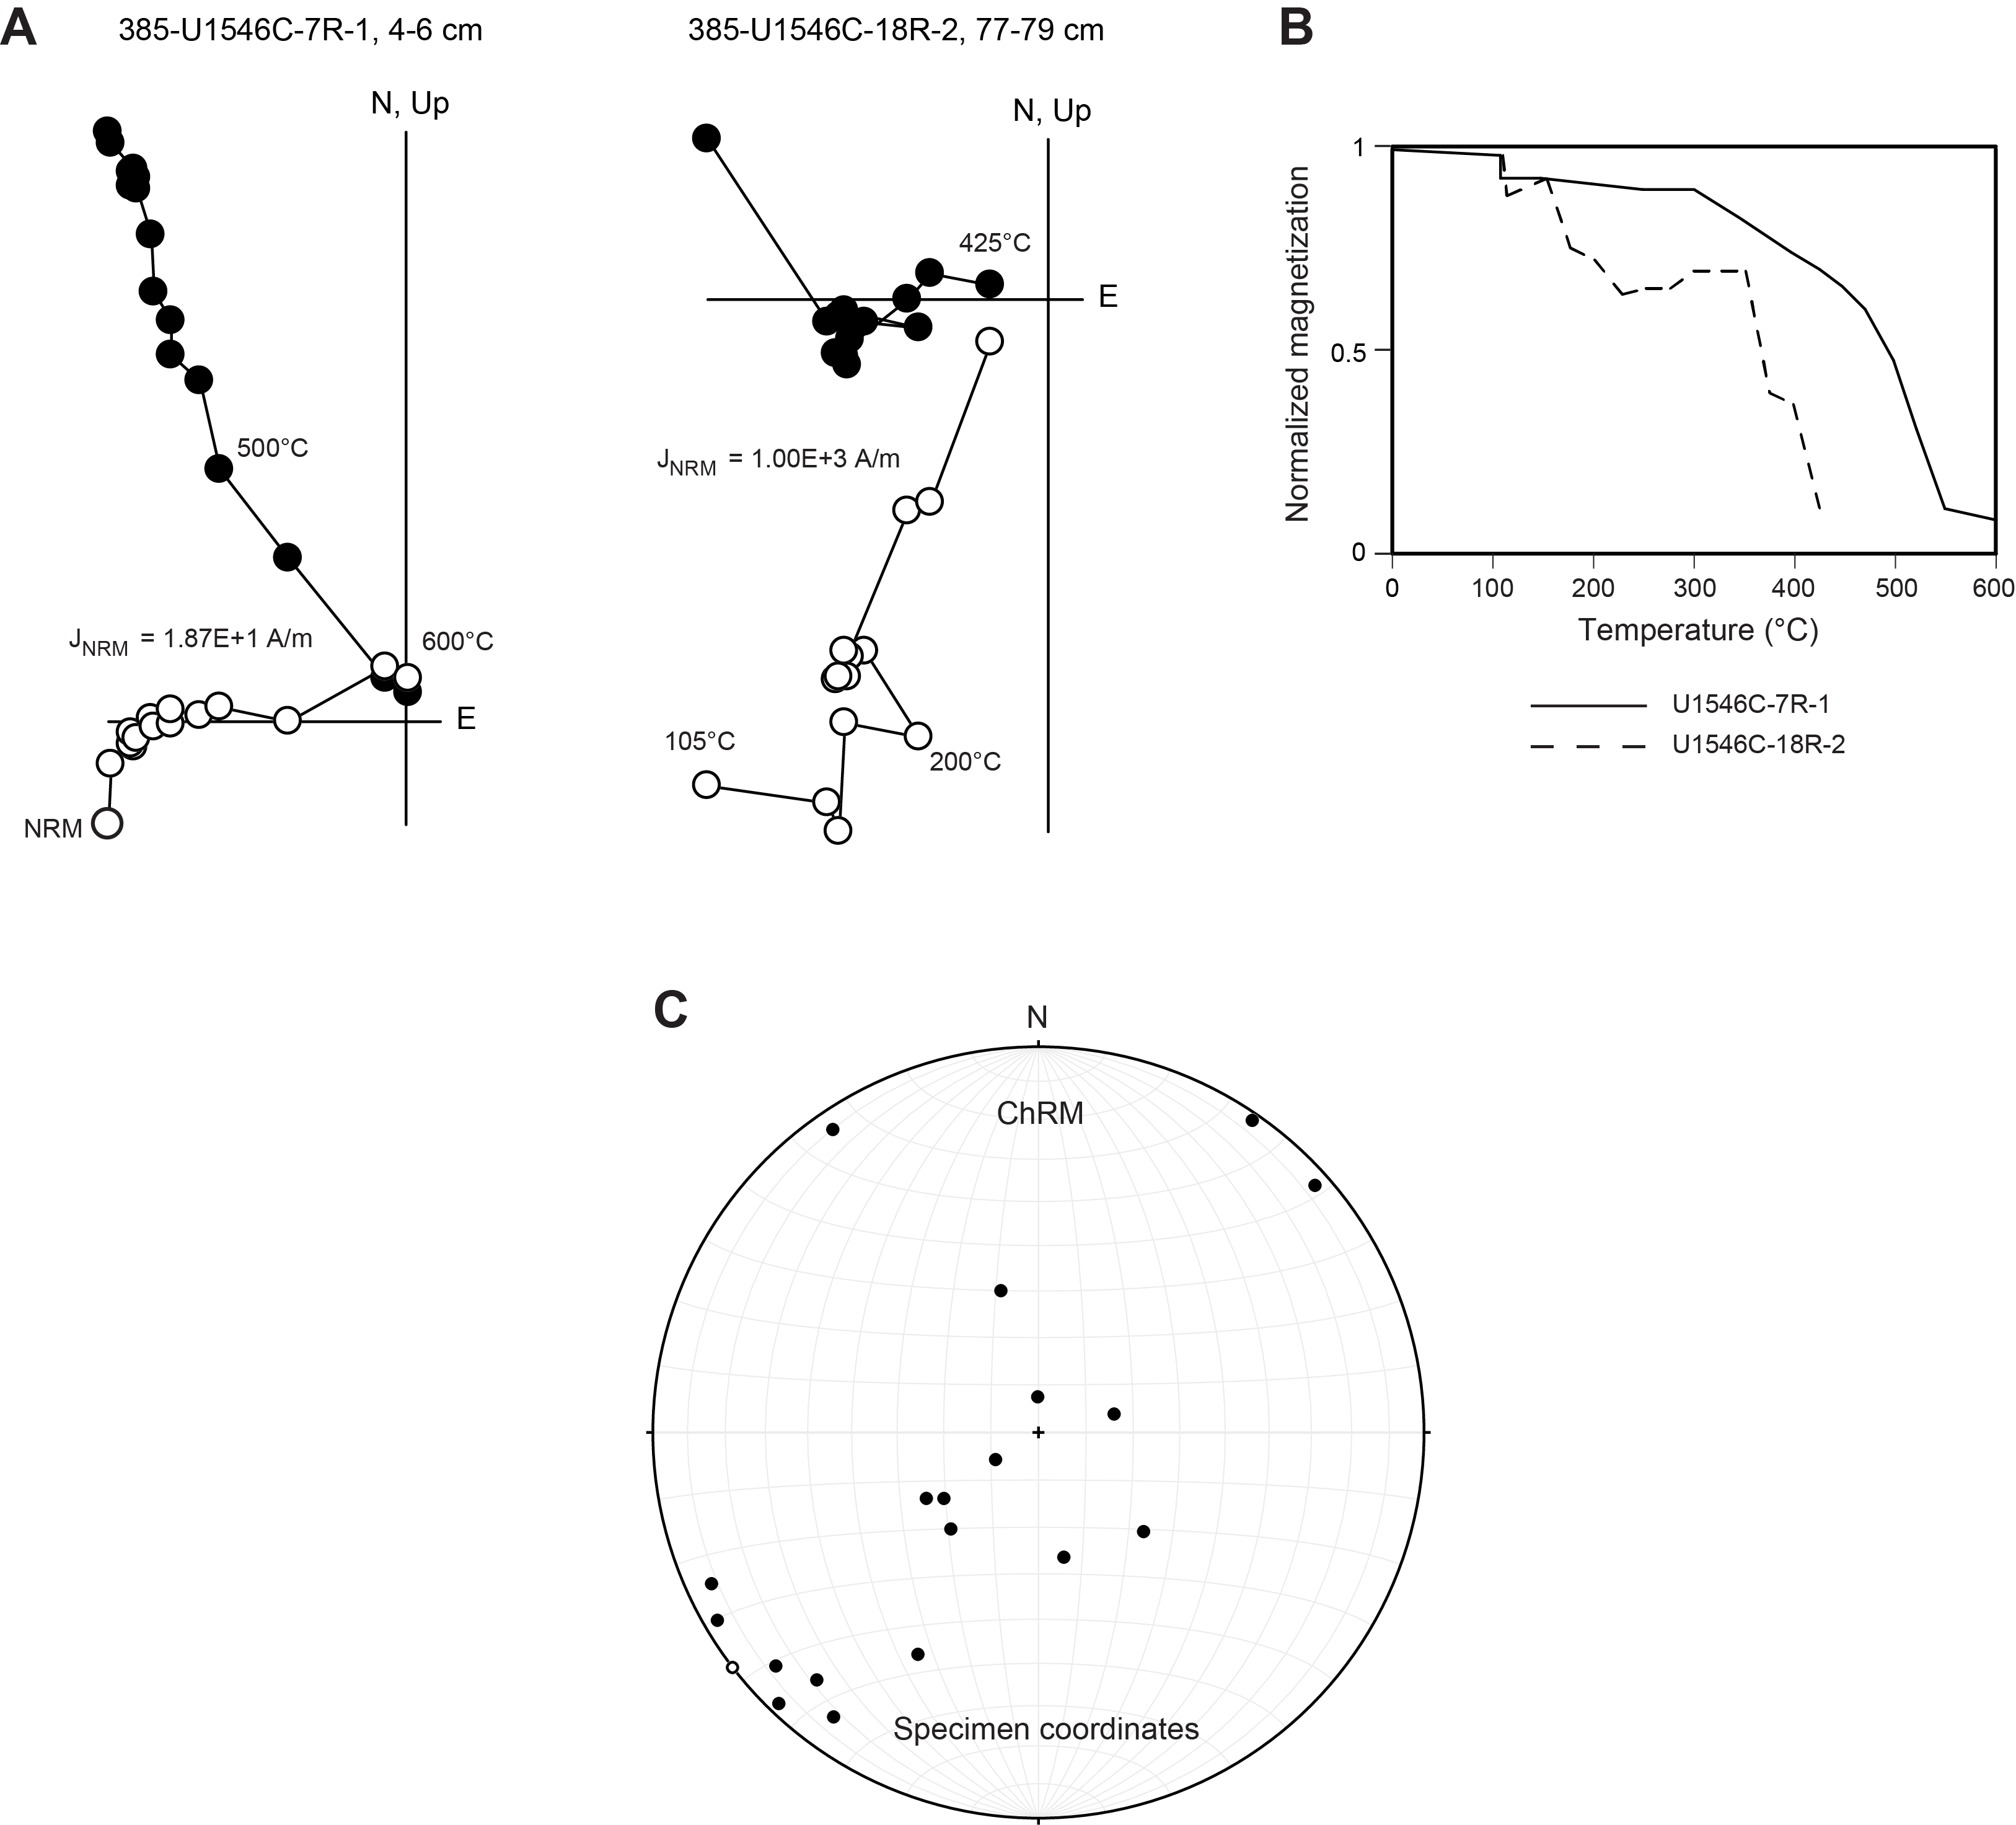
The distribution of the ChRM inclinations determined for all discrete samples is shown in Figure F30C. After PCA, mean inclinations for populations of the ChRMs were calculated using the maximum likelihood method of Arason and Levi (2010) (Table T10). The mean inclination calculated for the ChRMs found in the upper part of the sill is 6.43°, and a mean inclination of 90° is found for the lower unit ChRMs. This seems to strengthen the argument that the lower unit does not contain single-domain magnetite but rather consists of multidomain (titano)magnetite only, which is less stable in retaining a remanent magnetization than single-domain magnetite. The lower unit has thus acquired a complete RCB drilling overprint. The upper unit, in comparison, provides a more stable inclination of 6.43°; however, this inclination is much shallower than the expected GAD inclination of 46° at this location.
8.2.2.2. Sediments
Below the bottom sill/sediment contact, discrete samples were taken from the working-half sections of Cores 385-U1546C-23R through 42R at intervals of one discrete sample per RCB core. This provided a total of 16 discrete cube samples that were demagnetized using a stepwise increasing AF to isolate the ChRM direction following the same approach used for the sediments in Hole U1546A.
The mean NRM intensity of all samples is 1.88 × 10⁻³ A/m (Table T11). AF demagnetization removed more than 90% of the total magnetization at 60 mT (Figure F31B). Similar to the demagnetization results of Hole U1546A, two magnetic components were identified on the demagnetization diagrams in some discrete samples (Figure F31A); the first component (0–10 mT) corresponds to a drilling overprint, and the stable component (ChRM) points toward the origin. This component is of normal polarity for all analyzed discrete samples. A mean MDF of 11.3 mT suggests a magnetic mineral assemblage dominated by low-coercivity (titano)magnetite.
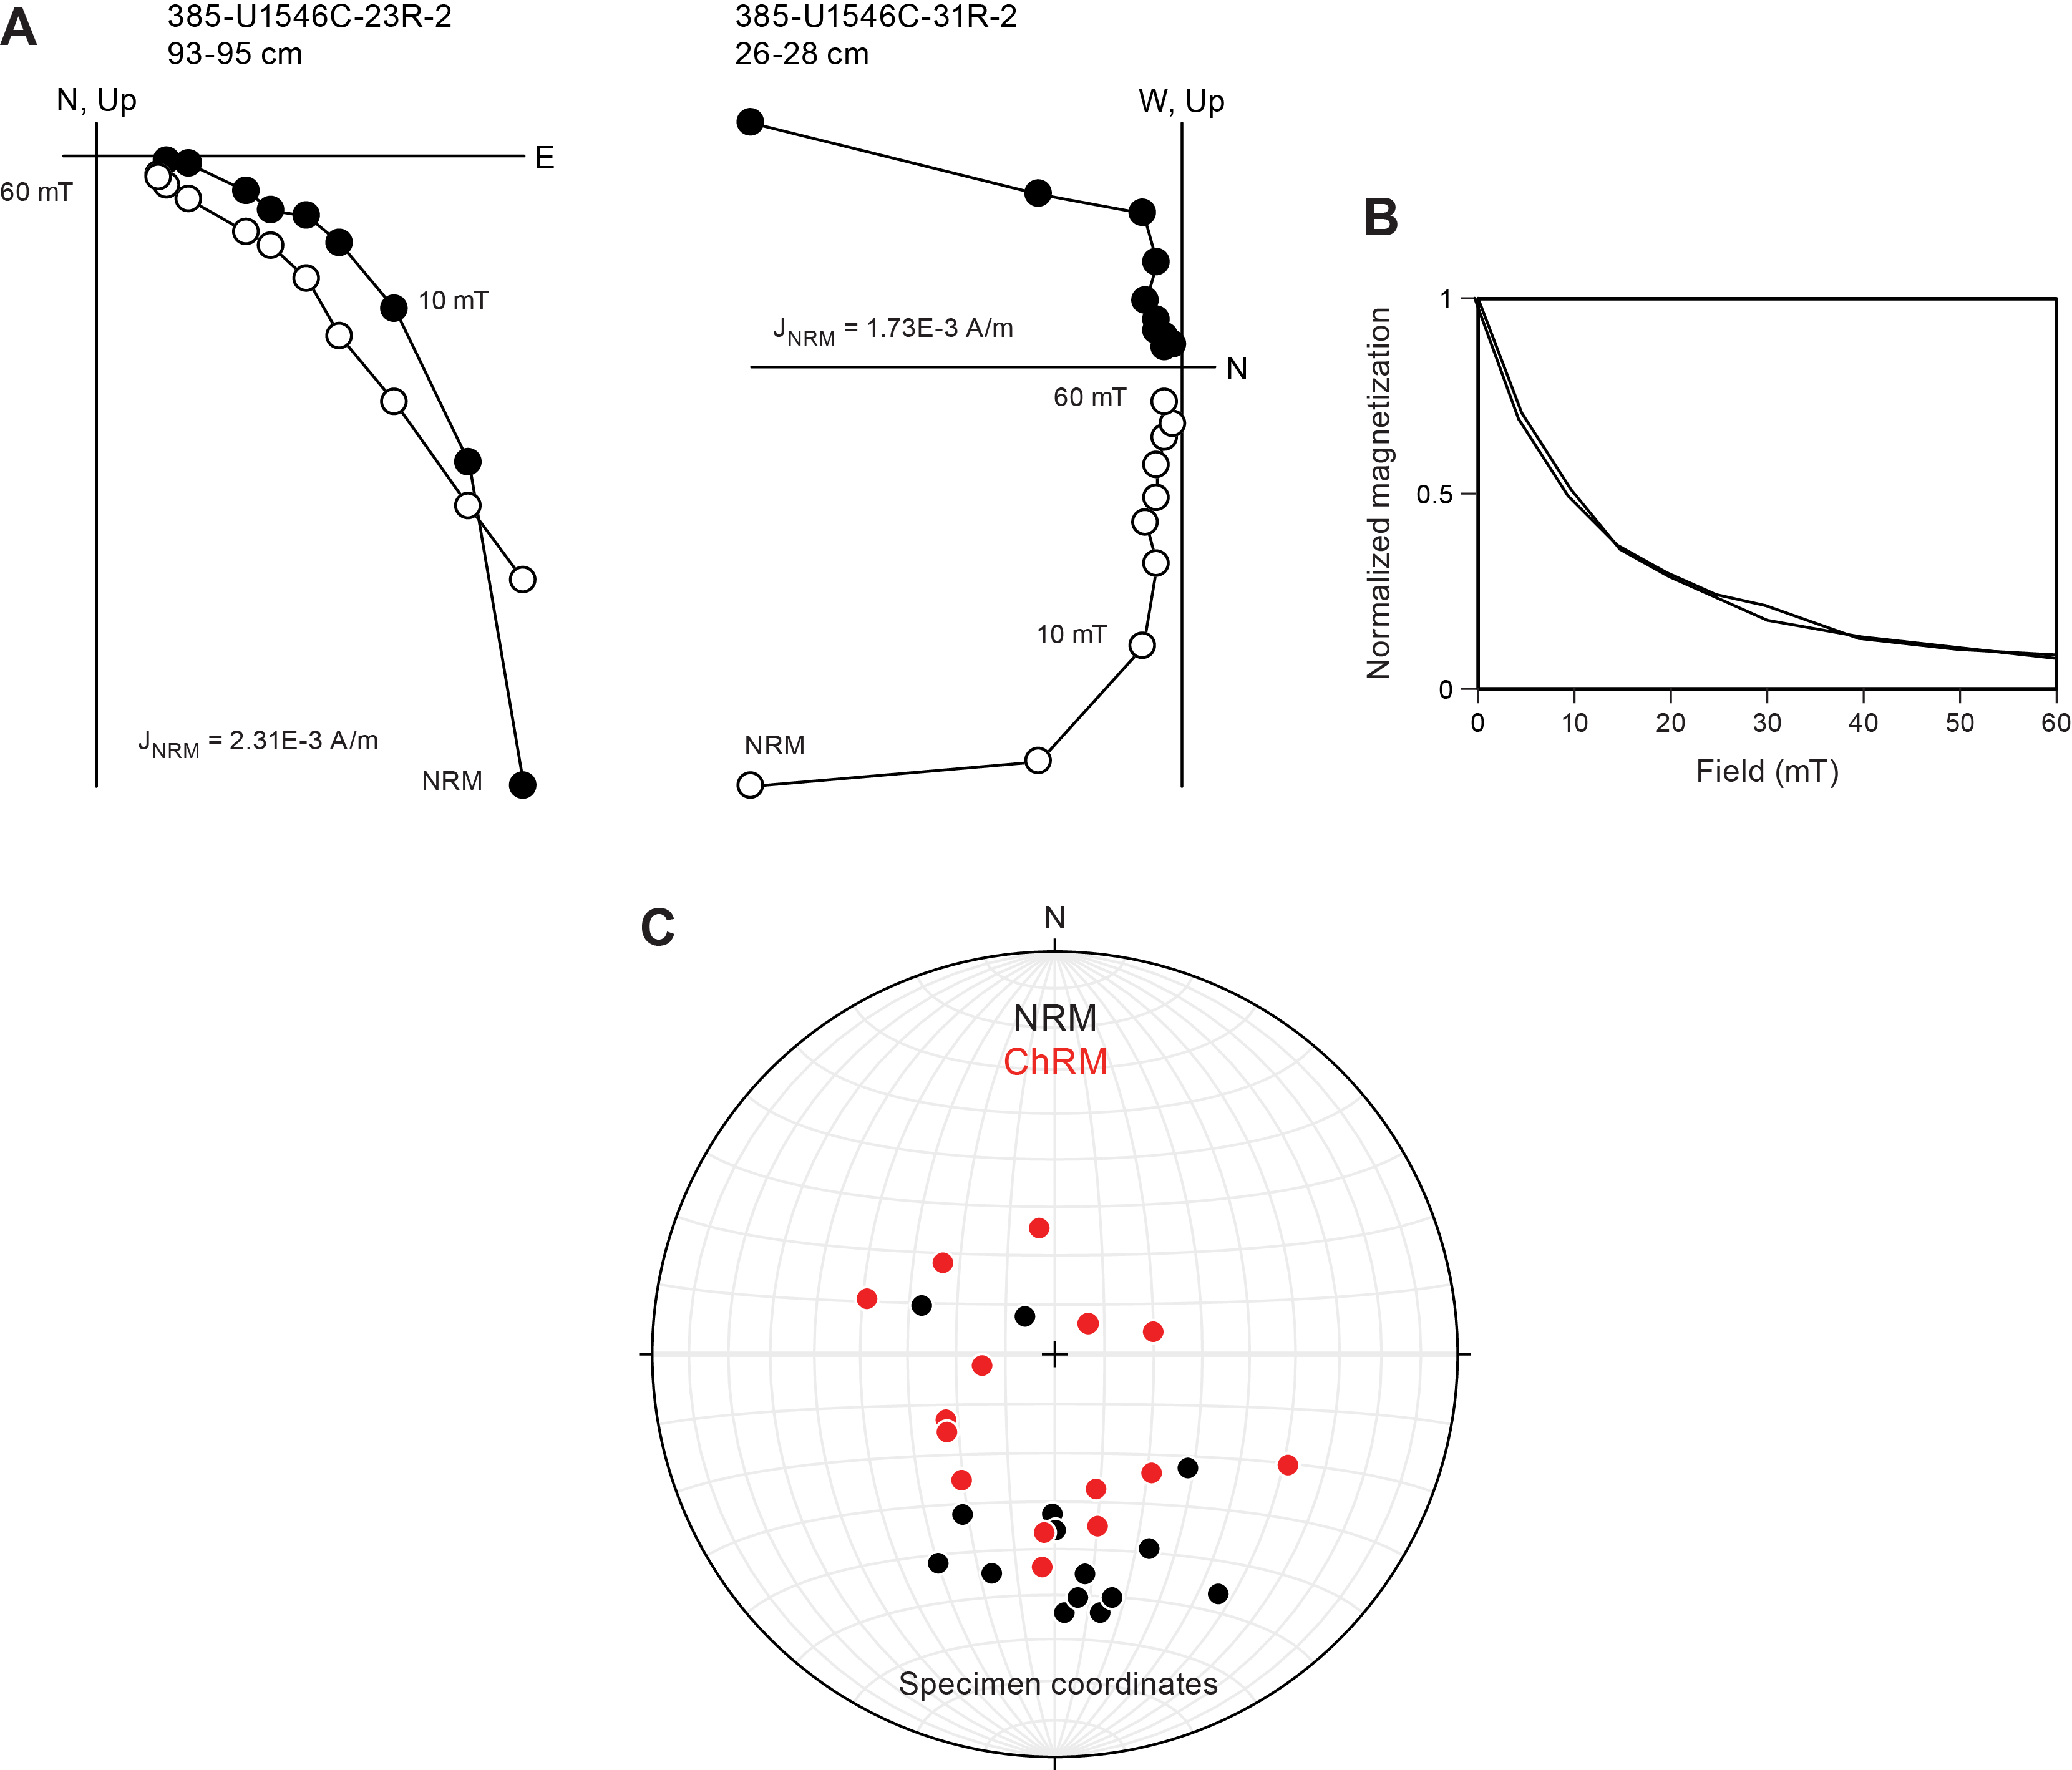
The distributions of the inclinations of the NRM and ChRM of all discrete samples are shown in Figure F31C. The NRM inclinations show a wide range from 29.2° to 79.9° with a mean inclination of 44.5° (Table T11). After PCA, the inclinations of the ChRM were analyzed using the maximum likelihood method of Arason and Levi (2010) (Table T10). The resulting mean inclination for the ChRM results is 62.12°, which is steeper than the expected GAD inclination at this location (~46.3°). This could indicate that we were not fully capable of removing the RCB drilling overprint in these samples by AF demagnetization.
8.3. Anisotropy of magnetic susceptibility
Anisotropy of magnetic susceptibility was measured for all discrete samples from Site U1546 prior to demagnetization to characterize the magnetic fabrics present in the samples. Results for the sediments of Holes U1546A and U1546C are shown in Figure F32 in the core reference frame. Because these results are not oriented, it is not possible to determine whether there is a preferred magnetic lineation in these rocks. Therefore, only the inclination of the anisotropy is taken into account. Sedimentary samples taken from above the igneous unit show a mixture of oblate and prolate behavior with kmax principal axes distributed in the horizontal plane and kmin principal axes oriented perpendicular to the sedimentary bedding. Discrete samples taken from below the sill predominantly show prolate behavior with the kmax principal axes defining a lineation distributed in the horizontal plane (see Paleomagnetism in the Expedition 385 methods chapter [Teske et al., 2021a]).
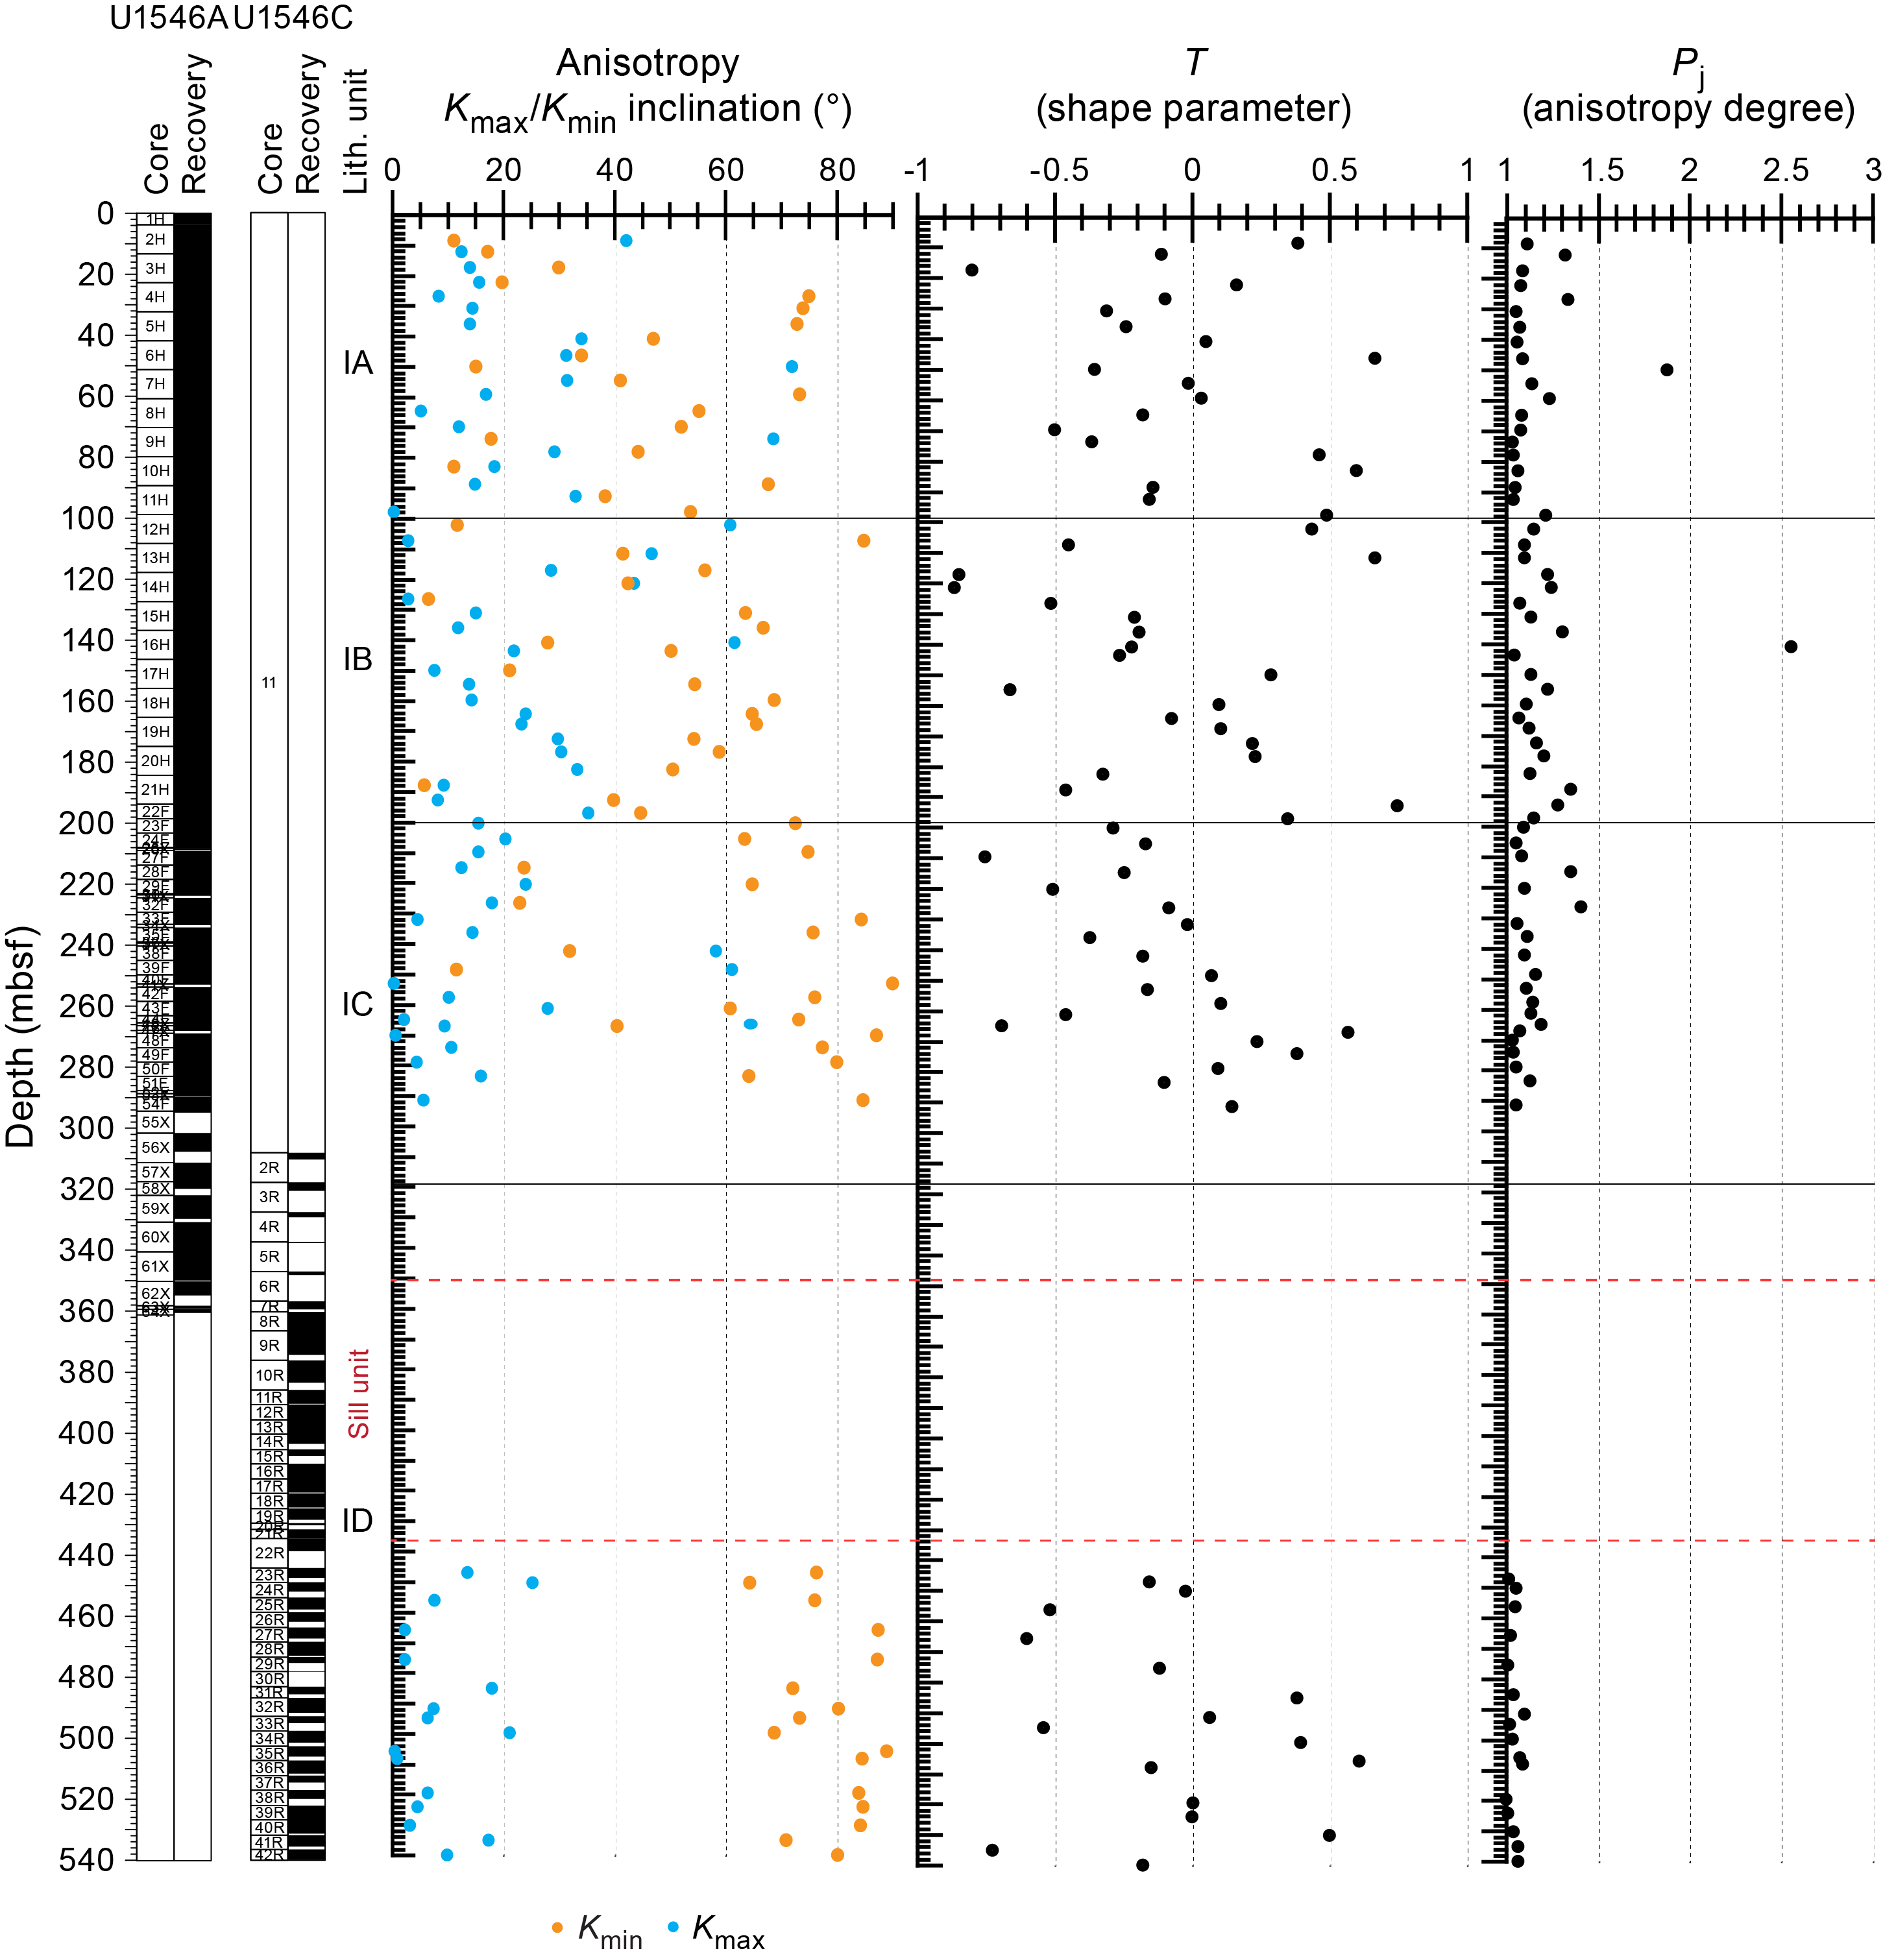
8.4. Magnetostratigraphy
We used the SRM measurements on archive-half sections from Holes U1546A and U1546C to determine the polarity at Site U1546. We based our interpretation of the magnetic polarity on the sign of inclination at the maximum AF demagnetization step (20 mT) (Figure F26). Data from APC and HLAPC cores (Hole U1546A) and RCB cores (Hole U1546C) were used to interpret polarity because XCB cores were too disturbed and overprinted to be considered reliable. APC and HLAPC cores show an average positive inclination of ~43°. RCB cores show a stronger variability in inclination, and therefore only the sign of inclination is considered. The detailed discrete sample analyses (Table T9) support the results obtained from archive-half sections. Therefore, we assigned the cores to the normal Brunhes Chron (C1n; younger than 0.78 Ma), which is congruent with the biostratigraphic observations (see Biostratigraphy). No magnetic excursions during C1n were identified despite a high sedimentation rate of about 1.02 m/ky (see Biostratigraphy) and previously published paleomagnetic results from DSDP Site 480 that identified the Mono Lake and Laschamp magnetic polarity excursions at ~29–26 ky before present (BP) and ~51–49 ky BP, respectively (Levi and Karlin, 1989).
9. Inorganic geochemistry
9.1. Interstitial water sampling
Samples were prepared in a nitrogen-filled glove bag for Hole U1546D; all other samples were prepared and squeezed under laboratory atmosphere. Mudline water was collected in Hole U1546A. The chemical composition of the IW and mudline water is listed in Table T12. All profiles are shown in Figure F33. Pore water profiles for Hole U1546C extend into indurated sediments below a major sill that was cored from ~354 to ~430 mbsf (see Igneous petrology and alteration).
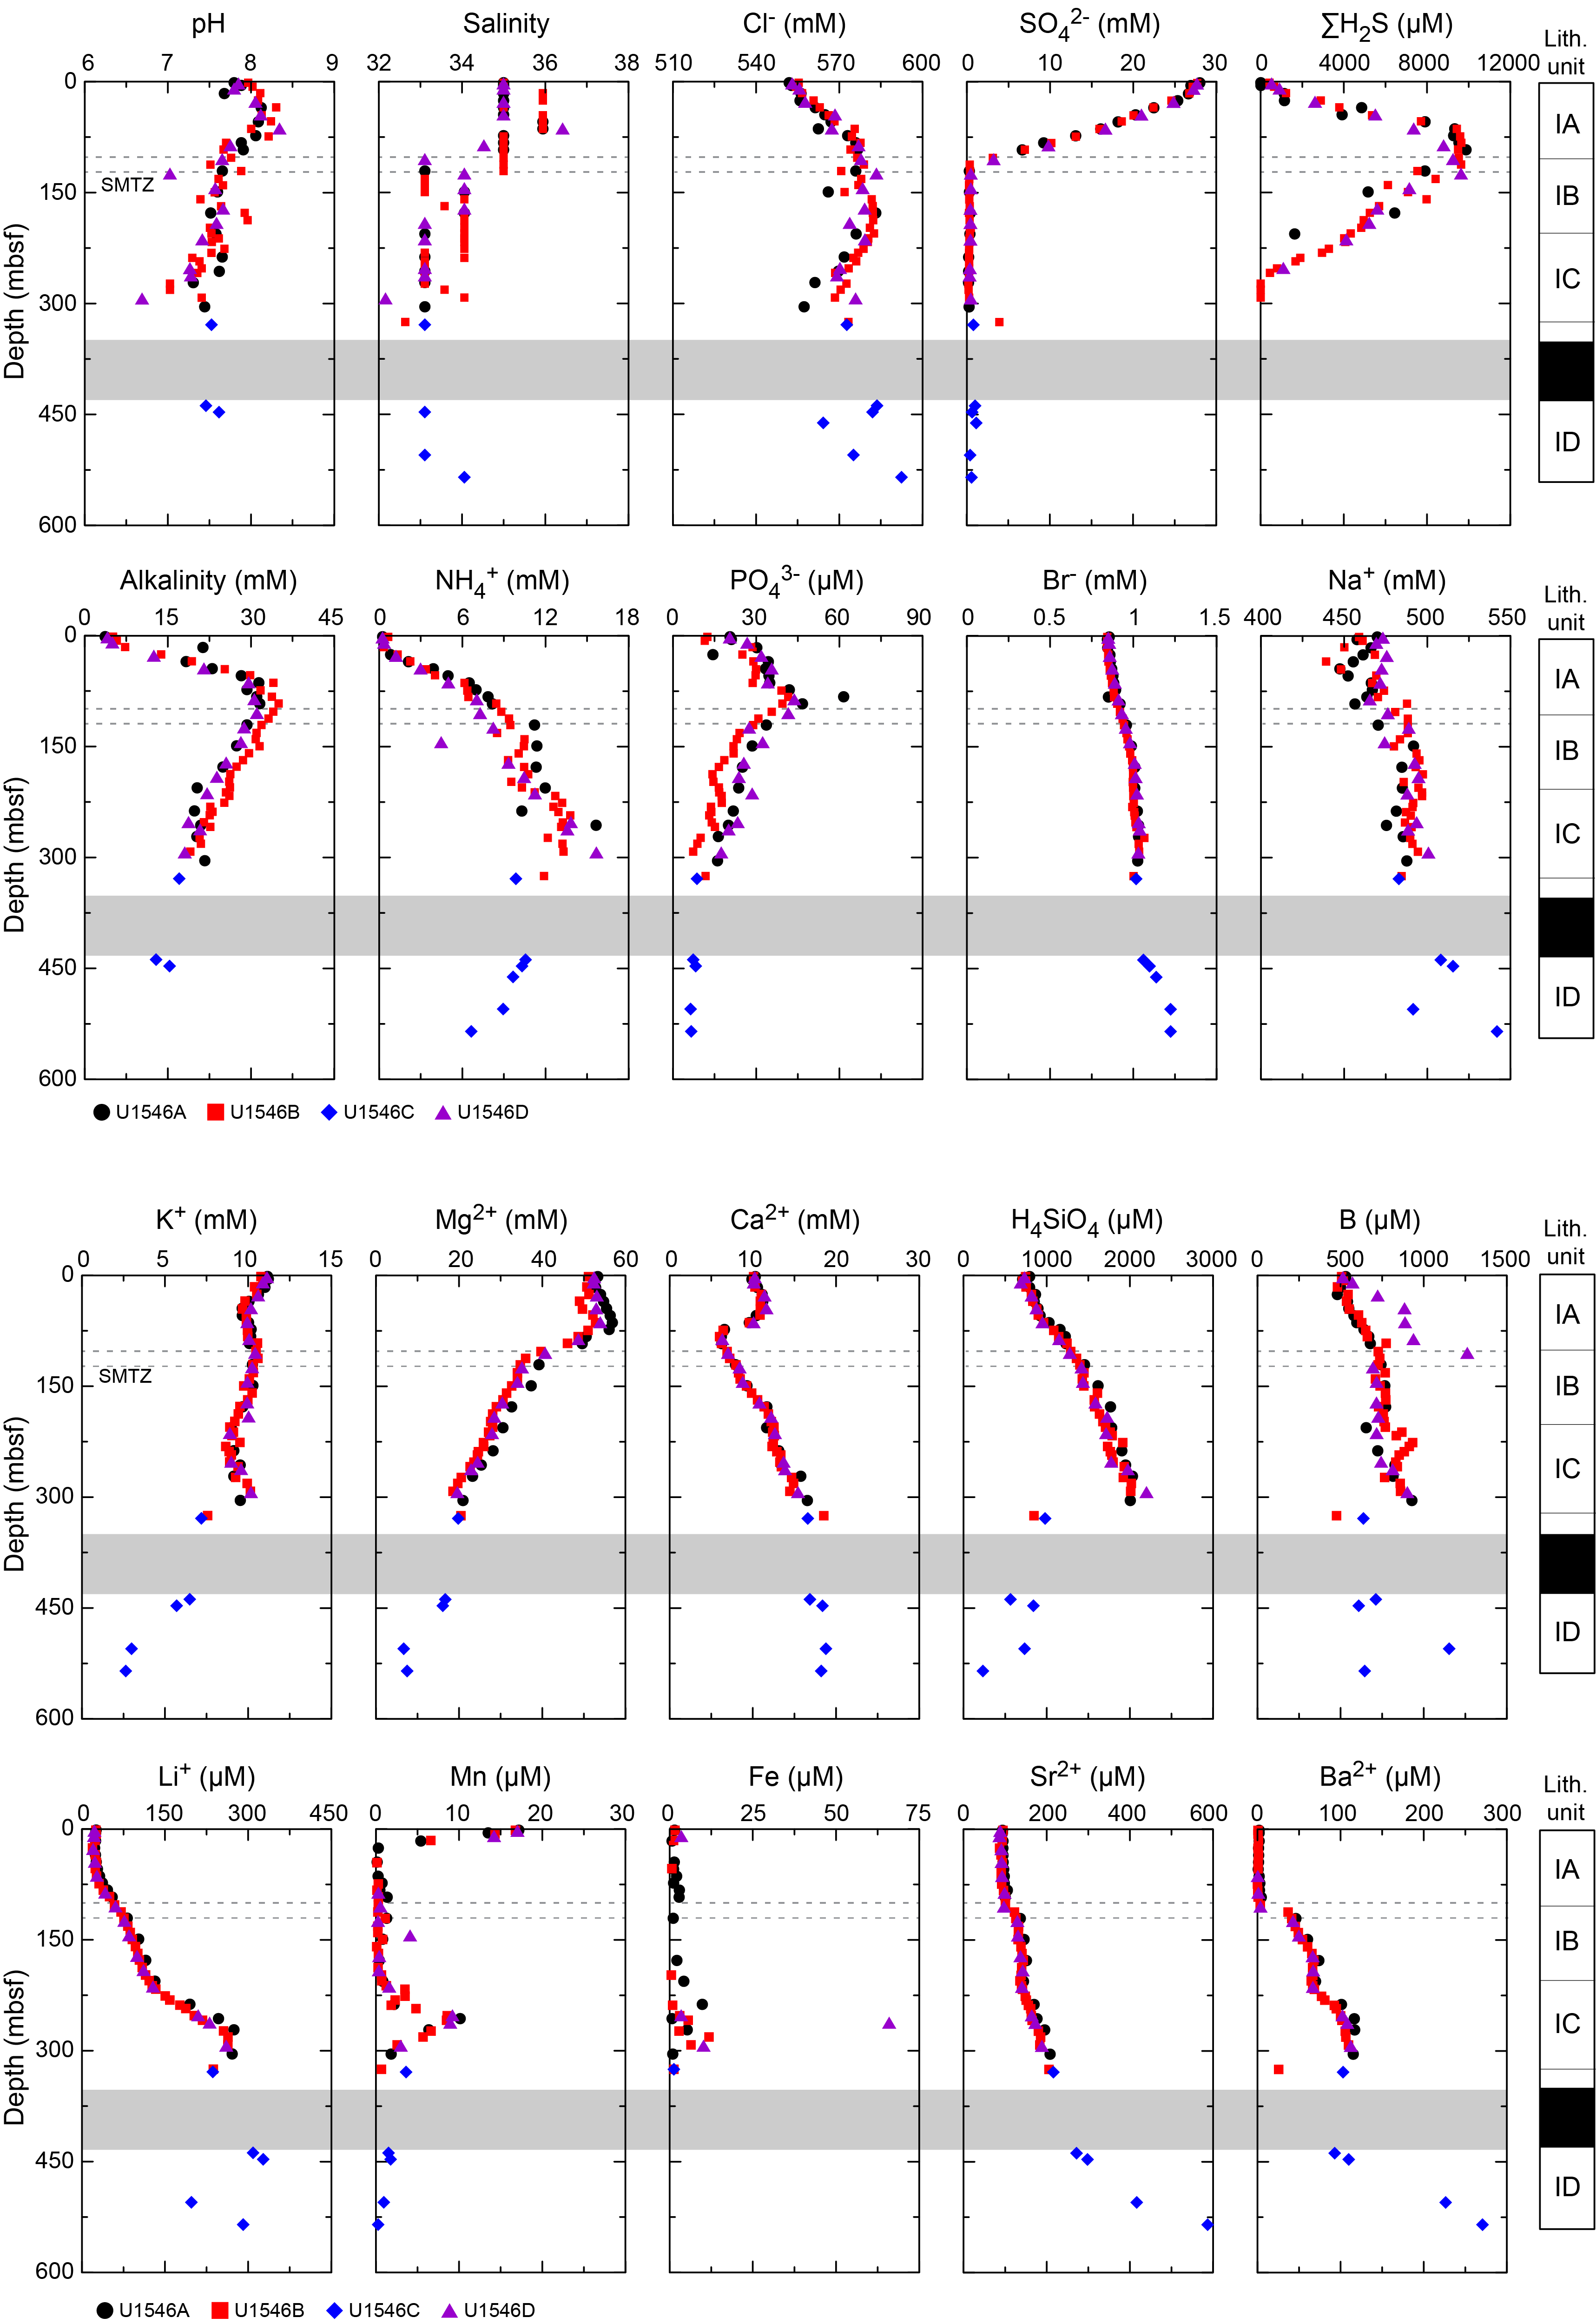
9.2. Interstitial water results
9.2.1. pH, salinity, chloride, and sodium
pH values reach a maximum of 8.3 between 0 and 35 mbsf, and they gradually decrease to 7.0 at the bottom of Hole U1546A. Salinity at Site U1546 has a nearly constant value of 35–36 from the seafloor to ~120 mbsf, and then it decreases to 33–34 farther downhole.
Chloride (Cl−) concentration increases steadily from the seafloor to ~70 mbsf, from 554 to 574 mM, and then maintains a nearly constant value to ~200 mbsf. The increase of Cl− concentration in the upper 70 m of Holes U1546A, U1546B, and U1546D (Figure F33) is probably caused by hydration reactions during clay formation. Cl− concentration decreases from 582 mM at 200 mbsf to 570 mM around 300 mbsf. In Hole U1546C, Cl− concentration has a minimum value of 564 mM below the sill, and then it increases with depth. The maximum Cl− concentration of 593 mM is observed at the bottom of Hole U1546C.
Sodium (Na+) concentration ranges between 435 and 515 mM throughout the hole with a marked increase between 50 and 100 mbsf. From 100 to 330 mbsf, it has a stable range of 480–497 mM. Below the sill interval, Na+ reaches its maximum concentration of 515 mM around 447 mbsf.
9.2.2. Sulfate, sulfide, alkalinity, ammonium, phosphate, and bromide
Sulfate (SO42−) concentration decreases from seawater level (28 mM) to <1 mM in the upper 110 m, and below this depth it remains at low concentrations <0.5 mM. At 325 mbsf in Hole U1546B, SO42− concentration reaches ~4 mM, which is likely due to contamination from seawater because this sample was taken from a working-half core sample that had been stored in the laboratory for days. Locally decreased boron and Ba2+ concentrations at this depth also indicate seawater-derived contamination of this IW sample because those elements have generally low concentrations in seawater (~0.4 mM and ~0.1 µM, respectively). SO42− concentration ranges from 0.4 to 1.1 mM in Hole U1546C, which is slightly enriched compared to the values below 120 mbsf in Hole U1546B (<0.5 mM), indicative of slight seawater contamination during XCB coring.
Sulfide concentration (ΣH2S = S2 + HS− + H2S) reaches a maximum of ~10 mM around 60–110 mbsf and gradually decreases with depth to <2 µM below 290 mbsf. Methane concentration increases markedly at 110 mbsf (0.7 mM) (see Organic geochemistry). Therefore, the SMTZ at Site U1546 is estimated to be around 110 mbsf (Figure F33). The SMTZ at Site U1546 is almost twice as deep compared to Site U1545. Furthermore, the depths of alkalinity and phosphate maxima are slightly offset from the SMTZ. Alkalinity and phosphate (PO43−) reach maximum values of ~35 mM and ~60 µM, respectively, around 80–90 mbsf. In Hole U1546B below 80 mbsf, alkalinity decreases linearly (r2 = 0.98) to a concentration of 19.1 mM at 290 mbsf. Below 90 mbsf, phosphate also decreases with depth to a minimum of <10 µM. Alkalinity and phosphate concentrations generally have lower values at Site U1546 than at Site U1545. Ammonium (NH4+) behaves differently at Site U1546; it occurs at lower concentrations from the seafloor to 20 mbsf (<0.6 mM) and then gradually increases with depth. A maximum NH4+ concentration of 15.6 mM is reached at 256 mbsf. Below the sill, NH4+ concentration starts to decrease but remains above 6.6 mM (Hole U1546C). Bromide (Br−) concentration ranges from 0.84 to 1.22 mM with a positive trend from the seafloor to the bottom of Hole U1546C. Generally, Br− is released from organic matter during diagenesis (Tomaru et al., 2007). However, Br− concentration continues to increase below the sill, whereas alkalinity and PO43− concentrations decrease with depth. These results may imply that another Br− source unrelated to organic matter degradation processes may influence IW chemistry below the sill.
9.2.3. Silica, calcium, magnesium, and potassium
Dissolved silica (expressed in solution as H4SiO4) increases linearly from the seafloor to the bottom of Holes U1546A, U1546B, and U1546D and has a maximum value around 2000 µM (Figure F33). Because the sediments at Site U1546 are rich in diatoms (see Lithostratigraphy and Biostratigraphy), the high H4SiO4 concentration likely reflects the successive dissolution of biogenic opal, represented by diatom valves and other siliceous microfossils, as the temperature increases (Kastner and Gieskes, 1976). The transition from opal-A to opal-CT takes place between ~300 and ~330 mbsf (see Lithostratigraphy), which corresponds to the drop in dissolved silica content observed (Figure F33). Also, the sill penetrated in Hole U1546C may have affected the dissolved silica concentration. Remarkably depleted values were observed above and below the sill in Hole U1546C compared to the bottom of Holes U1546A, U1546B, and U1546D, which do not reach the sill. The interaction between sediment and magmatically driven thermal and hydrothermal overprint (i.e., alteration processes accompanying sill emplacement or perhaps solely the presence of the silicate rock) may have caused this distinct pattern.
Calcium (Ca2+) concentration decreases from 10.6 to 5–6 mM in Lithostratigraphic Subunit IA. This trend within the sulfate reduction zone is caused by carbonate precipitation coupled with HCO3− produced during sedimentary organic matter decomposition (2HCO3− + Ca2+ = CaCO3 + H2O + CO2). Calcium concentration then increases with depth to ~19 mM just above the sill, and similar values continue to the bottom of Hole U1546C. This trend may reflect deeper alteration processes related to sill emplacement.
Magnesium (Mg2+) has a relatively narrow concentration range (51–56 mM) in the upper part of the sediment column, corresponding to Lithostratigraphic Subunit IA, and then it decreases downhole to values around 7 mM.
Potassium (K+) has a fairly consistent range of 9–11 mM from the seafloor to ~300 mbsf. Around the sill, K+ concentration decreases with depth and reaches a minimum value of 3 mM at 505 mbsf. This is a further indication that IW composition toward the bottom of the site is affected by the emplacement and/or presence of the sill.
9.2.4. Manganese and iron
Manganese (Mn = Mn2+ + Mn4+) exhibits a decreasing trend from 17 µM in the upper 10 m to values close to 0 at 25 mbsf. This profile could reflect the reduction of manganese oxides during organic matter mineralization in the upper part of the sediment column. A second peak is clearly defined between 210 and 325 mbsf with a maximum value of 8.6 µM at 252 mbsf. Values below the sill decrease from 4 to <0.5 µM. Concentrations of iron (Fe = Fe2+ + Fe3+) show more disparate values throughout Site U1546 and range from 0 to 66 µM. Its maximum value coincides with the manganese peak. Below the sill, no iron was detected in IW.
9.2.5. Boron, lithium, barium, and strontium
Boron (B; dissolved as borate; B(OH)4−) exhibits a steadily increasing trend from the seafloor to 210 mbsf, and then a slight excursion of boron (836–934 µM) is observed from 210 to 240 mbsf in Holes U1545A–U1546C. Below this interval and toward the bottom of Hole U1546B, boron concentration shows some scatter but mainly remains between 831 and 861 µM. The values are slightly lower just above and below the sill (610–710 µM) and reach their maximum value near the bottom of Hole U1546C (1153 µM). A slight difference is observed in Hole U1546D, where boron displays an increasing trend from the seafloor to 105 mbsf, ranging from 514 to 1262 µM. The maximum concentration is higher than in the other holes, whereas below 105 mbsf, boron exhibits values similar to those found in the other holes. Lithium (Li+) and strontium (Sr2+) have nearly constant concentrations from the seafloor to 75 mbsf, ranging from 22 to 31 µM and from 90 to 98 µM, respectively (Figure F33). These values are similar to those of mudline water (Li+ = 21 µM; Sr2+ = 87 µM) from Hole U1546A. Li+ concentration continuously increases with depth below 75 mbsf and reaches its maximum value below the sill (327 µM). Sr2+ concentration remains within a narrow range of 90–100 µM to 100 mbsf and then increases to 183 µM above the sill. A faster increase to a maximum value of 416 µM is observed below the sill at the bottom of Hole U1546C. Barium (Ba2+) concentration is low (4 µM) from the seafloor to 100 mbsf and sharply increases around the SMTZ (>37 µM). Where IW becomes depleted in SO42−, barite dissolution increases Ba2+ concentration by several orders of magnitude (von Breymann et al., 1990, 1992). Below the SMTZ, Ba2+ concentration continuously increases with depth to 180 mbsf; it then remains within a narrow range of 90–110 µM to 217 mbsf before increasing again to just above the sill. Ba2+ concentration is similar just below and above the sill; it then increases downhole to a maximum value at the bottom of Hole U1546C.
9.3. Concluding remarks
Biogeochemical processes observed from the seafloor to 120 mbsf at Site U1546 (Figure F33) are mainly related to anaerobic degradation of organic matter and sulfate-dependent AOM. Just above and below the sill, a number of significant excursions (increasing or decreasing) for many dissolved elements (e.g., potassium, magnesium, strontium, lithium, and barium) could be related to changes in mineralogy or other factors related to the sill intrusion. Between the SMTZ and sill interval, the chemical properties of IW are likely to be influenced by combined biogeochemical processes and sediment-water interaction associated with the sill intrusion as well as precipitation/dissolution processes including opal-A dissolution, opal-CT precipitation, authigenic carbonate precipitation, and dolomite formation.
10. Organic geochemistry
At Site U1546, organic geochemists performed sampling and analysis of gas and solid-phase samples. In Hole U1546A, one headspace gas sample was analyzed per 9.5 m advance for routine hydrocarbon safety monitoring. The carbon, nitrogen, and sulfur contents of particulate sediment were characterized, and source rock analysis was performed on solid-phase samples. During sediment recovery in Holes U1546B and U1546C, headspace and void gas were analyzed for their hydrocarbon content, the amount of void space was quantified, the H2 and CO contents were measured, and the carbon, nitrogen, and sulfur contents of sediment were characterized. During igneous rock recovery in Hole U1546C, whole-round pieces of rock were incubated in sealed trilaminated foil barrier bags to examine degassing of hydrocarbons.
10.1. Solid-phase carbon, nitrogen, and sulfur contents
Solid-phase sediment samples were analyzed to determine the weight percent of CaCO3, total organic carbon (TOC), total nitrogen (TN), and total sulfur (TS). For Hole U1546A, the core description team selected samples from major and minor sedimentary components and some high-resolution sampling occurred in proximity to sill/sediment contacts (Table T13; Figure F34). For Hole U1546B, material was subsampled from the community gas (COMGAS) whole-round core sample (see Organic geochemistry in the Expedition 385 methods chapter [Teske et al., 2021a]) taken once per 9.5 m advance for correlation to other biogeochemical data to be generated during shore-based analyses. In Hole U1546C, high-resolution sampling occurred in proximity to sill/sediment contacts, and material was also collected from the COMGAS sample at a frequency of approximately one sample per 9.5 m advance. Finally, carbonate and elemental analysis was also performed on igneous rock material. Data from Holes U1546A–U1546C are combined for discussion as a single profile below.
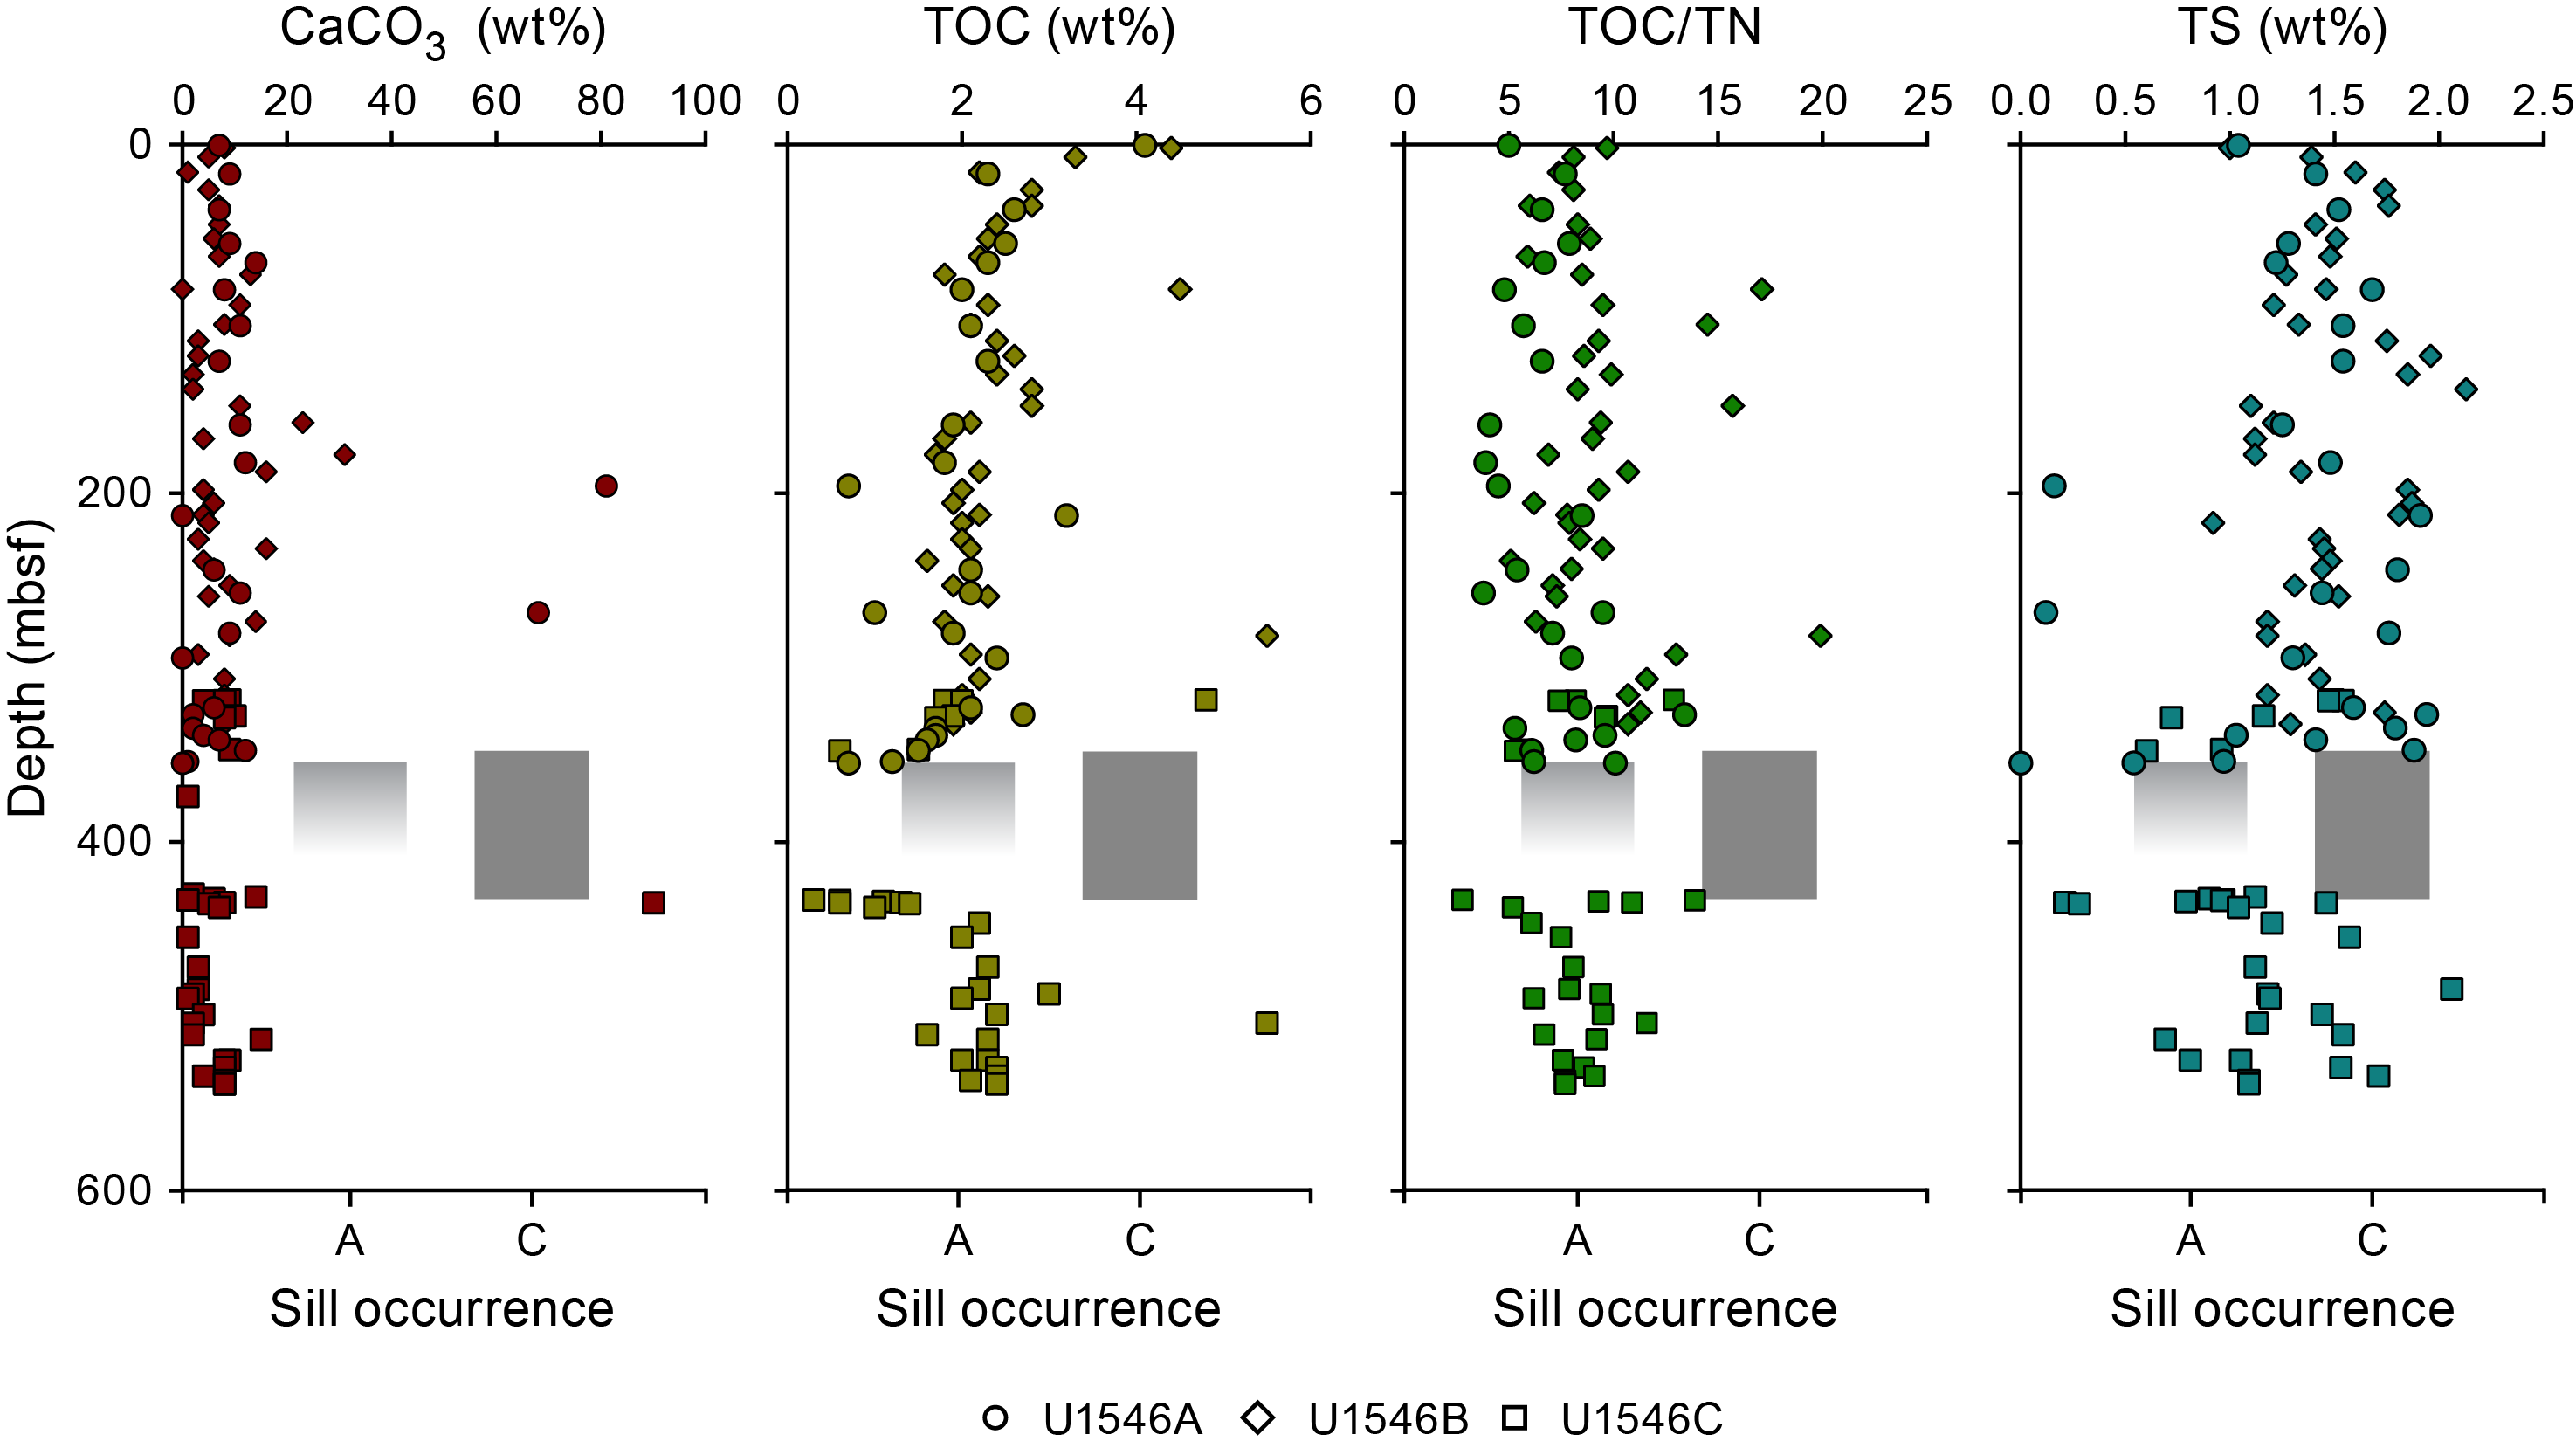
From 0 to 140 mbsf, CaCO3 content varies between <0 and ~13 wt% with no discernible trend. The interval between 140 and 274 mbsf is much more variable, with values ranging from ~3 to ~31 wt%. In general, these observations coincide with the presence of micrite-rich and micrite-bearing diatom oozes in Lithostratigraphic Subunit IC (see Lithostratigraphy). Subordinate carbonate nodules and indurated layers in this subunit have much higher CaCO3 content ranging from ~68 to ~81 wt%. Below 274 mbsf, CaCO3 values average ~5 wt% to the bottommost sample of Hole U1546C at 539.11 mbsf. One notable exception is at 435.23 mbsf, where ~90 wt% CaCO3 is measured in a sample from the sill/sediment contact zone (385-U1546C-22R-1, 53–54 cm). Within the sill, CaCO3 values range from below detection limit to ~2 wt%.
TOC values rapidly decrease from 4.4 to 1.8 wt% in the uppermost 75 m. Below 75 mbsf, values gradually increase to a local maximum of 2.8 wt% at 149.84 mbsf. In the underlying interval to 347.3 mbsf in Hole U1546C, TOC values average 2.1 wt% with only minor variations. The sill/sediment contact above the sill is marked by a progressive decrease to very low TOC values (<0.6 wt%). Within the sill, TOC is below the detection limit. High-resolution sampling on the lowermost sediment/sill contact shows an increase in TOC from below the detection limit to 2.2 wt% from 432.82 to 446.82 mbsf. TOC values then remain constant around 2.2 wt% to the bottom of the site except for one sample (385-U1546C-35R-1, 134–139 cm) that has a TOC value of 5.5 wt%. TOC/TN values vary from ~6 to ~10 above 75 mbsf and similarly from 197.93 to 273.61 mbsf. These values are indicative of algal matter as the primary source of organic matter (Meyers, 1994). Higher TOC/TN values vary from ~8 to ~17 from 82.99 to 187.71 mbsf, which may be indicative of a slight increase in terrestrial organic matter deposition at these times. Near the upper sill/sediment contact, TOC/TN values generally decrease from ~11 to ~5. Within the sill, TN is <0.3 wt%. The lower sill/sediment contact is marked by fluctuating TOC/TN values from 2.8 to 13.9 with no discernible trend. Below 455 mbsf, TOC/TN values are relatively constant around 9.
TS values vary from 1.00 to 2.13 wt%, and the variations observed indicate some cyclicity with local maxima at 35.01, 140.31, and 325.66 mbsf. In the upper 15 m of Hole U1546B, TS and TOC are negatively correlated, but below this interval and in Hole U1546A, they are positively correlated but show excess sulfur compared to the normal marine trend (Berner, 1982; Goldhaber and Kaplan, 1974). Near the upper and lower sill/sediment contacts, TS values are very low (0.60 wt% and below the detection limit, respectively). Within the sill, the TS concentration is below detection limit. High-resolution sampling on the lowermost sediment/sill contact shows an increase in TS from below the detection limit to 1.46 wt% from 432.82 to 435.68 mbsf. Below this interval, TS values slightly fluctuate between ~0.6 and ~1.6 wt% and have an average value of ~1.2 wt%.
10.2. Source rock analysis
A total of 14 samples from Hole U1546A and 9 samples from Hole U1546C were selected for source rock analysis (Table T14; Figure F35). These samples were chosen based on their proximity or distance to the sill located at these holes (see Igneous petrology and alteration).
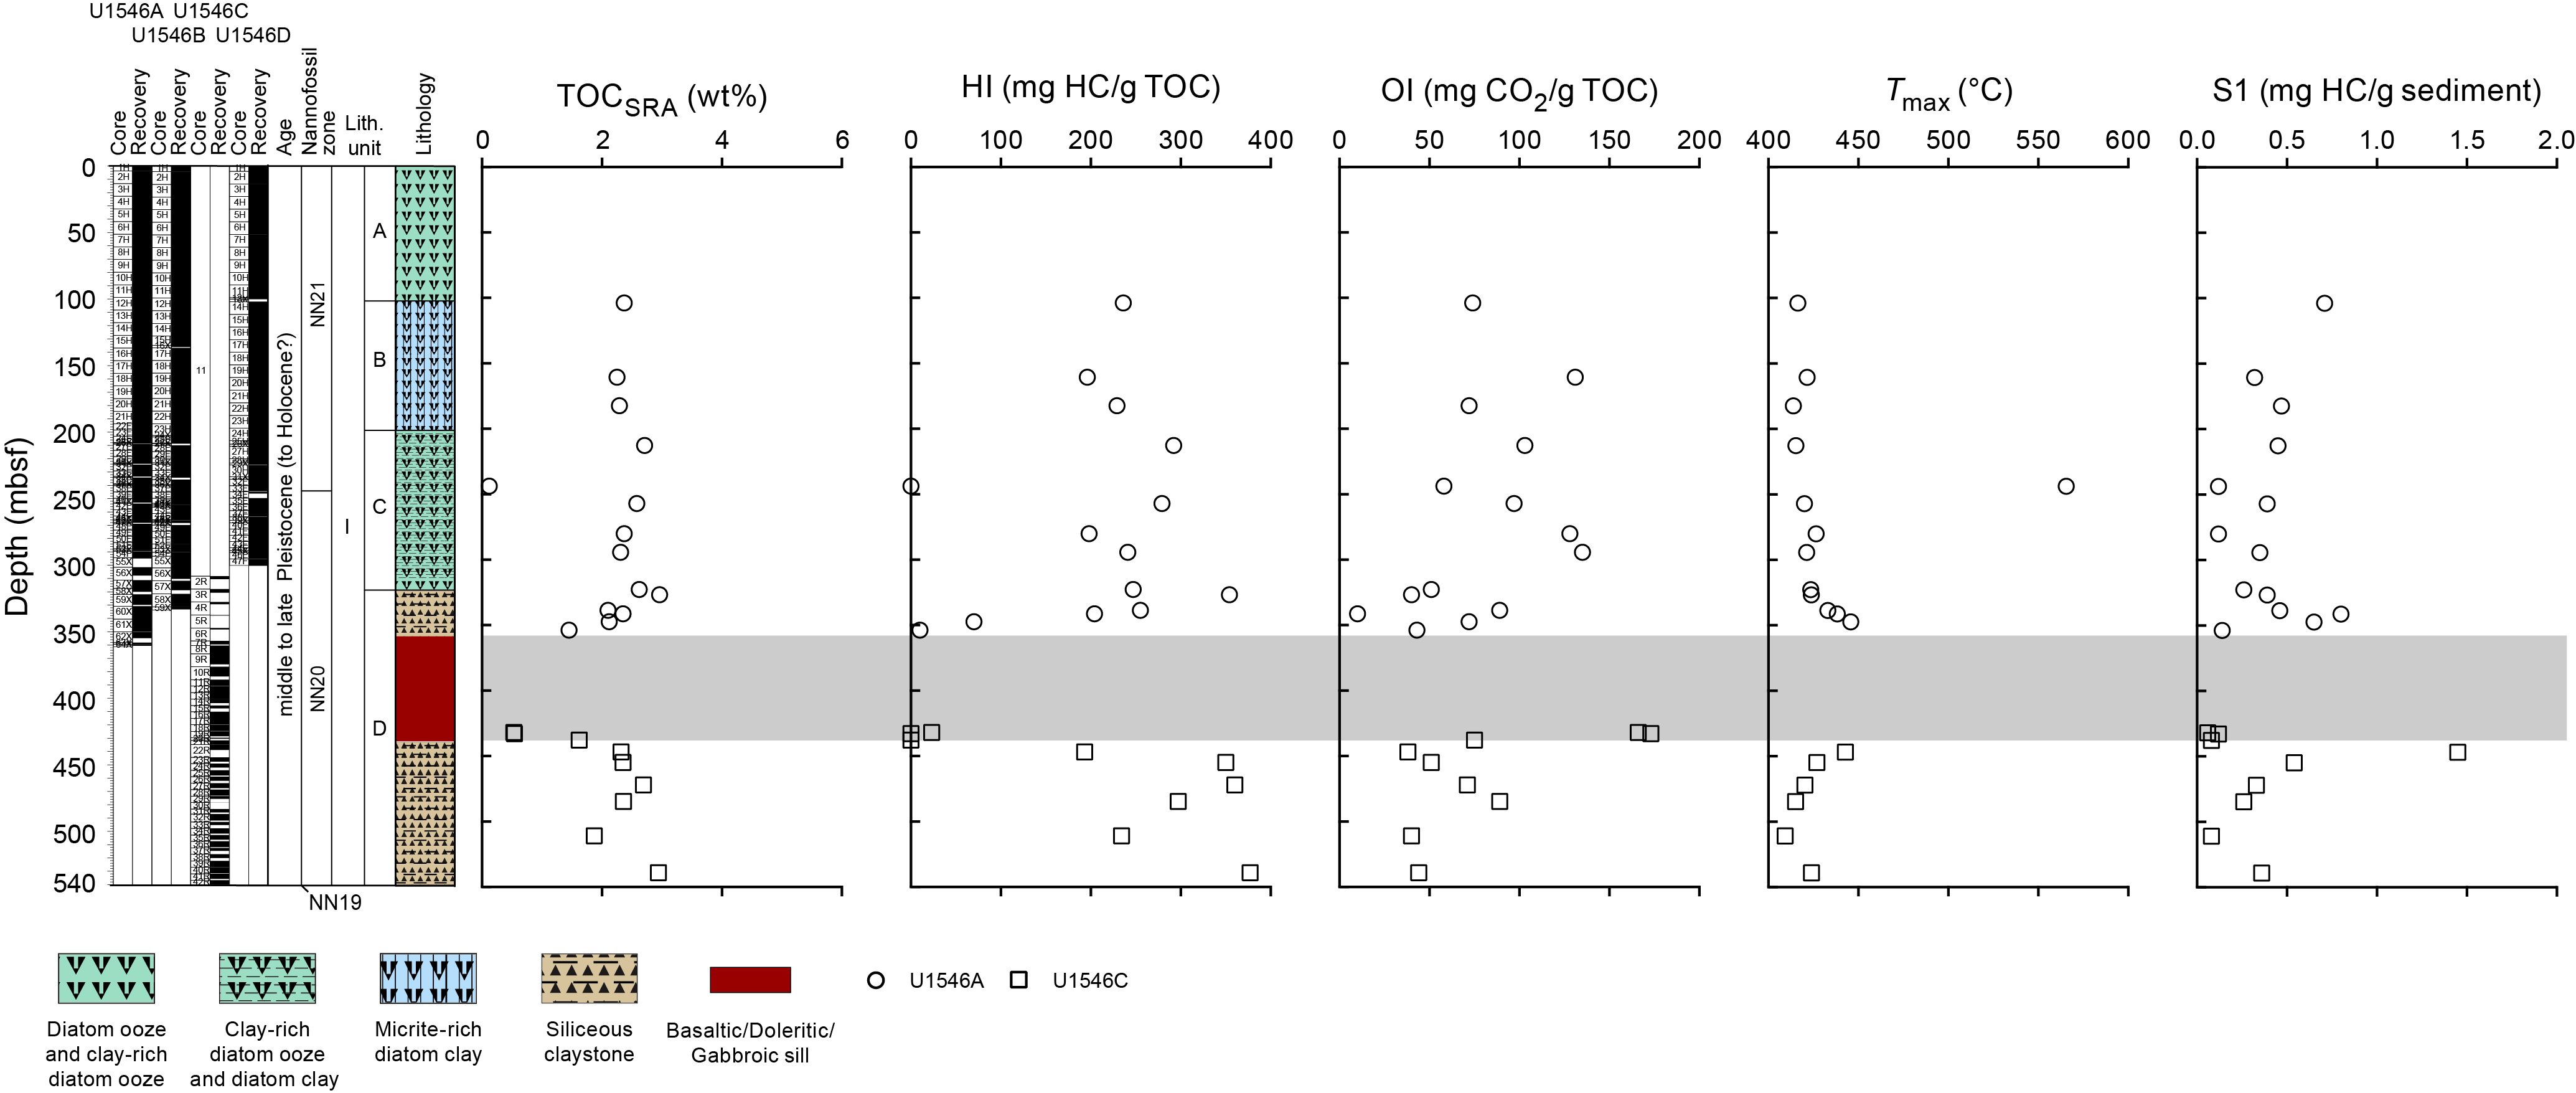
All 14 samples from Hole U1546A are located above the sill. The samples located between ~20 and 250 m from the sill have an average TOCSRA content of 2.5%, average hydrogen index (HI) values of 252 mg HC/g TOC, and oxygen index (OI) values that range between 40 and 135 mg CO2/g TOC. These values are in the range generally observed for recent marine sediments (e.g., Prell et al., 1989; Wefer, Berger, Richter, et al., 1998). Temperatures of maximum hydrocarbon release (Tmax) are comparable and have an average value of 420°C downhole. These values indicate that immature organic matter is dominant (Figure F35).
A total of four samples from Hole U1546A were located between 0.8 and 16.0 m above the sill. Their TOCSRA and HI values progressively decrease toward the sill to the minimum of 1.4% for TOCSRA and 10 mg HC/g TOC for HI in the sample closest to the sill (385-U1546A-62X-3, 69–70 cm). A parallel increase of Tmax values from 433° to 445°C is observed, indicating that these samples have reached the oil-generating window. Because of the very low S2 value, no meaningful Tmax value was obtained for the sample closest to the sill, which suggests that thermal maturity of this sample is in the gas-generating window.
A total of four samples from Hole U1546C were taken from an interval between 0.8 and 15.8 m below the sill. These samples show a progressive increase of TOCSRA and HI values with increasing distance from the sill, from 0.5% to 2.3% for TOCSRA and from 0 to 193 mg HC/g TOC for HI. No meaningful Tmax values were obtained for the three samples closest to the sill, which suggests that thermal maturity of these samples is in the gas-generating window. Sample 385-U1546C-23R-2, 93–94 cm, has a Tmax value of 443°C, which indicates that the organic matter has reached the oil-generating window. High OI values are observed for the two samples from Section 21R-1, suggesting that in addition to thermal maturation, the organic matter of these sediments was also oxidized.
Finally, five samples from Hole U1546C were collected from ~24 to 108 m below the sill. These samples have an average TOCSRA value of 2.4 wt%, which is comparable to TOCSRA values above the sill, and average HI values of 323 mg HC/g TOC and OI values of 59 mg CO2/g TOC, which are slightly higher and lower, respectively, than the values in the sediments above the sill. The average Tmax value of 419°C indicates that the organic matter is thermally immature (Figure F35).
These trends are reflected in the relationship between HI and OI (Figure F36). Samples distal to the sill are between Type II and Type III kerogens. Samples located between 10 and 20 m from the sill also plot in this interval but have decreased HI values reflecting thermal maturation. Sill-proximal samples cluster near HI = 0 mg HC/g TOC due to the high thermal maturity of the organic matter in these samples.

10.3. Hydrocarbon gases
Headspace samples were taken from each core to monitor C1–C6 hydrocarbons according to the standard safety protocol during drilling (Pimmel and Claypool, 2001). At Site U1546, 154 headspace samples were analyzed for their parts per million by volume concentrations (Table T15); the headspace samples were then corrected by sample mass and porosity to determine the molar concentrations of dissolved hydrocarbons (Table T16). Trends in Holes U1546A and U1546D are alike, and trends in Holes U1546B and U1546C are alike, so these two groups are discussed separately below.
In Holes U1546A and U1546D, methane content is below detection limit to ~43 mbsf and remains at the submillimolar level to ~100 mbsf (Figure F37). Methane then increases to a local maximum of ~7 mM at ~158 mbsf and decreases again to the submillimolar level by ~260 mbsf. Methane increases to its maximum value of ~14 mM at ~319 mbsf. Higher hydrocarbons appear at ~90 mbsf, beginning with ethane. All hydrocarbons increase with depth but not all within the same interval. For example, ethane remains at the submicromolar level to ~305 mbsf, where it begins to increase, but i-Cs begins to increase at 211 mbsf. These trends in methane and C+ are reflected in values of C1/C+. When hydrocarbons first appear at ~90 mbsf, C1/C2 values are generally in the 103 range; they remain in this range to ~189 mbsf. A slight increase to C1/C2 values in the 104 range occurs from ~198 to 208 mbsf, and then C1/C2 values decrease downhole to the 102 range. No anomalous C1/C2 values as defined by Pimmel and Claypool (2001) were observed in Holes U1546A or U1546D.
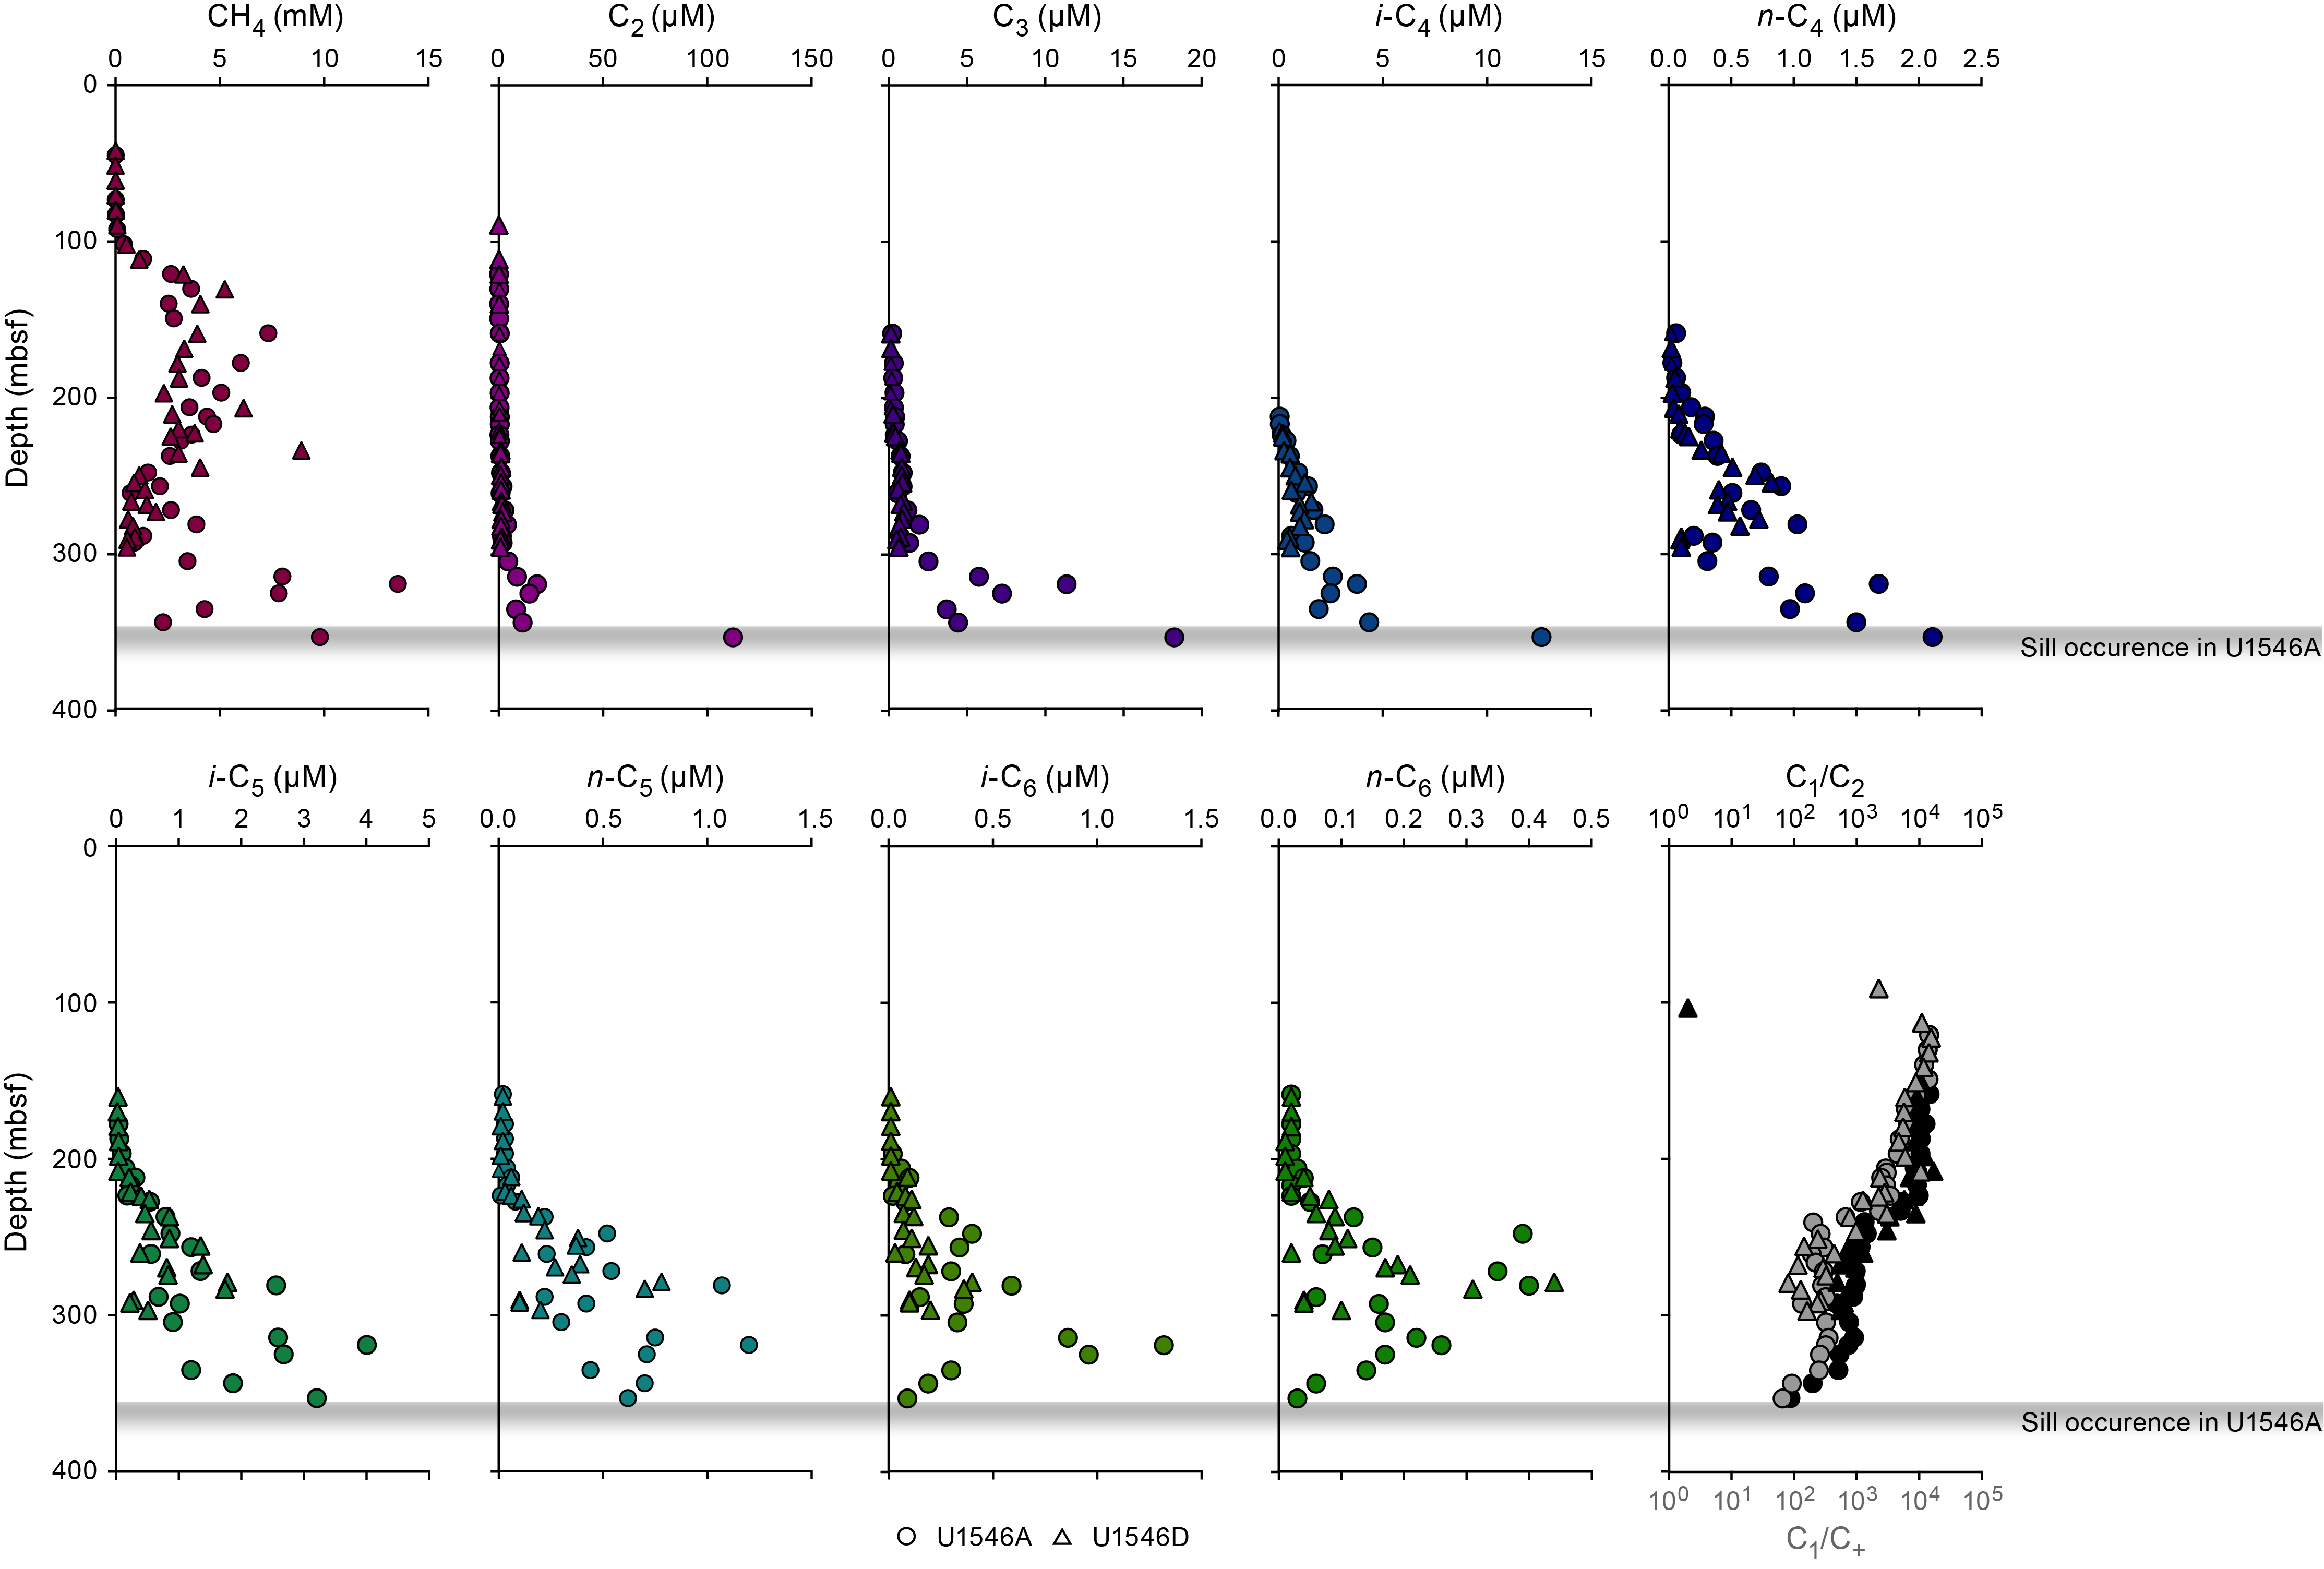
In Hole U1546B, methane increases to a local maximum of ~2 mM at ~120 mbsf and then gradually decreases to values below 0.1 mM by ~157 mbsf (Figure F38). A second maximum of ~6 mM is observed at ~237 mbsf; methane then decreases rapidly to 0.35 mM by 258 mbsf. Concentrations begin to increase below this depth, and at ~332 mbsf (approximately 16 m above the occurrence of the sill in Hole U1546C) the methane concentration is 5.44 mM. This trend exists in both Holes U1546B and U1546C. No headspace samples sensu stricto were taken within the sill, but hydrocarbon content from rock incubations in Hole U1546C will be discussed below (see Rock incubations). Headspace sampling resumed below the sill in Hole U1546C at ~434 mbsf (~4 m below the sill). Dissolved methane concentrations are ~9 mM at that depth, and they decrease with depth to ~1.5 mM at ~535 mbsf. C2–C6 hydrocarbons appear below ~120 mbsf and gradually increase to values as high as ~7 µM (observed in C2) at ~328 mbsf (~20 m above the cored top of the sill). Below the sill, C2–C6 appear at values similar to those above the sill but hydrocarbons increase with depth to values that exceed those observed above the sill by ~2 orders of magnitude. These trends in methane and C+ are reflected in values of C1/C2. When hydrocarbons appear at ~120 mbsf, C1/C2 values are in the 104 range; they decrease to the 103 range by ~157 mbsf. At ~225 mbsf, C1/C2 values begin to decrease to the 102 range, and just above the sill at ~337 mbsf, the C1/C2 value is ~261. Below the sill at ~435 mbsf, the C1/C2 value is 209, and it continues to decrease to a minimum of ~6 at ~539 mbsf. Anomalous C1/C2 relationships with temperature were observed in these headspace samples (Figure F39), and these observations led to the termination of coring in Hole U1546C.
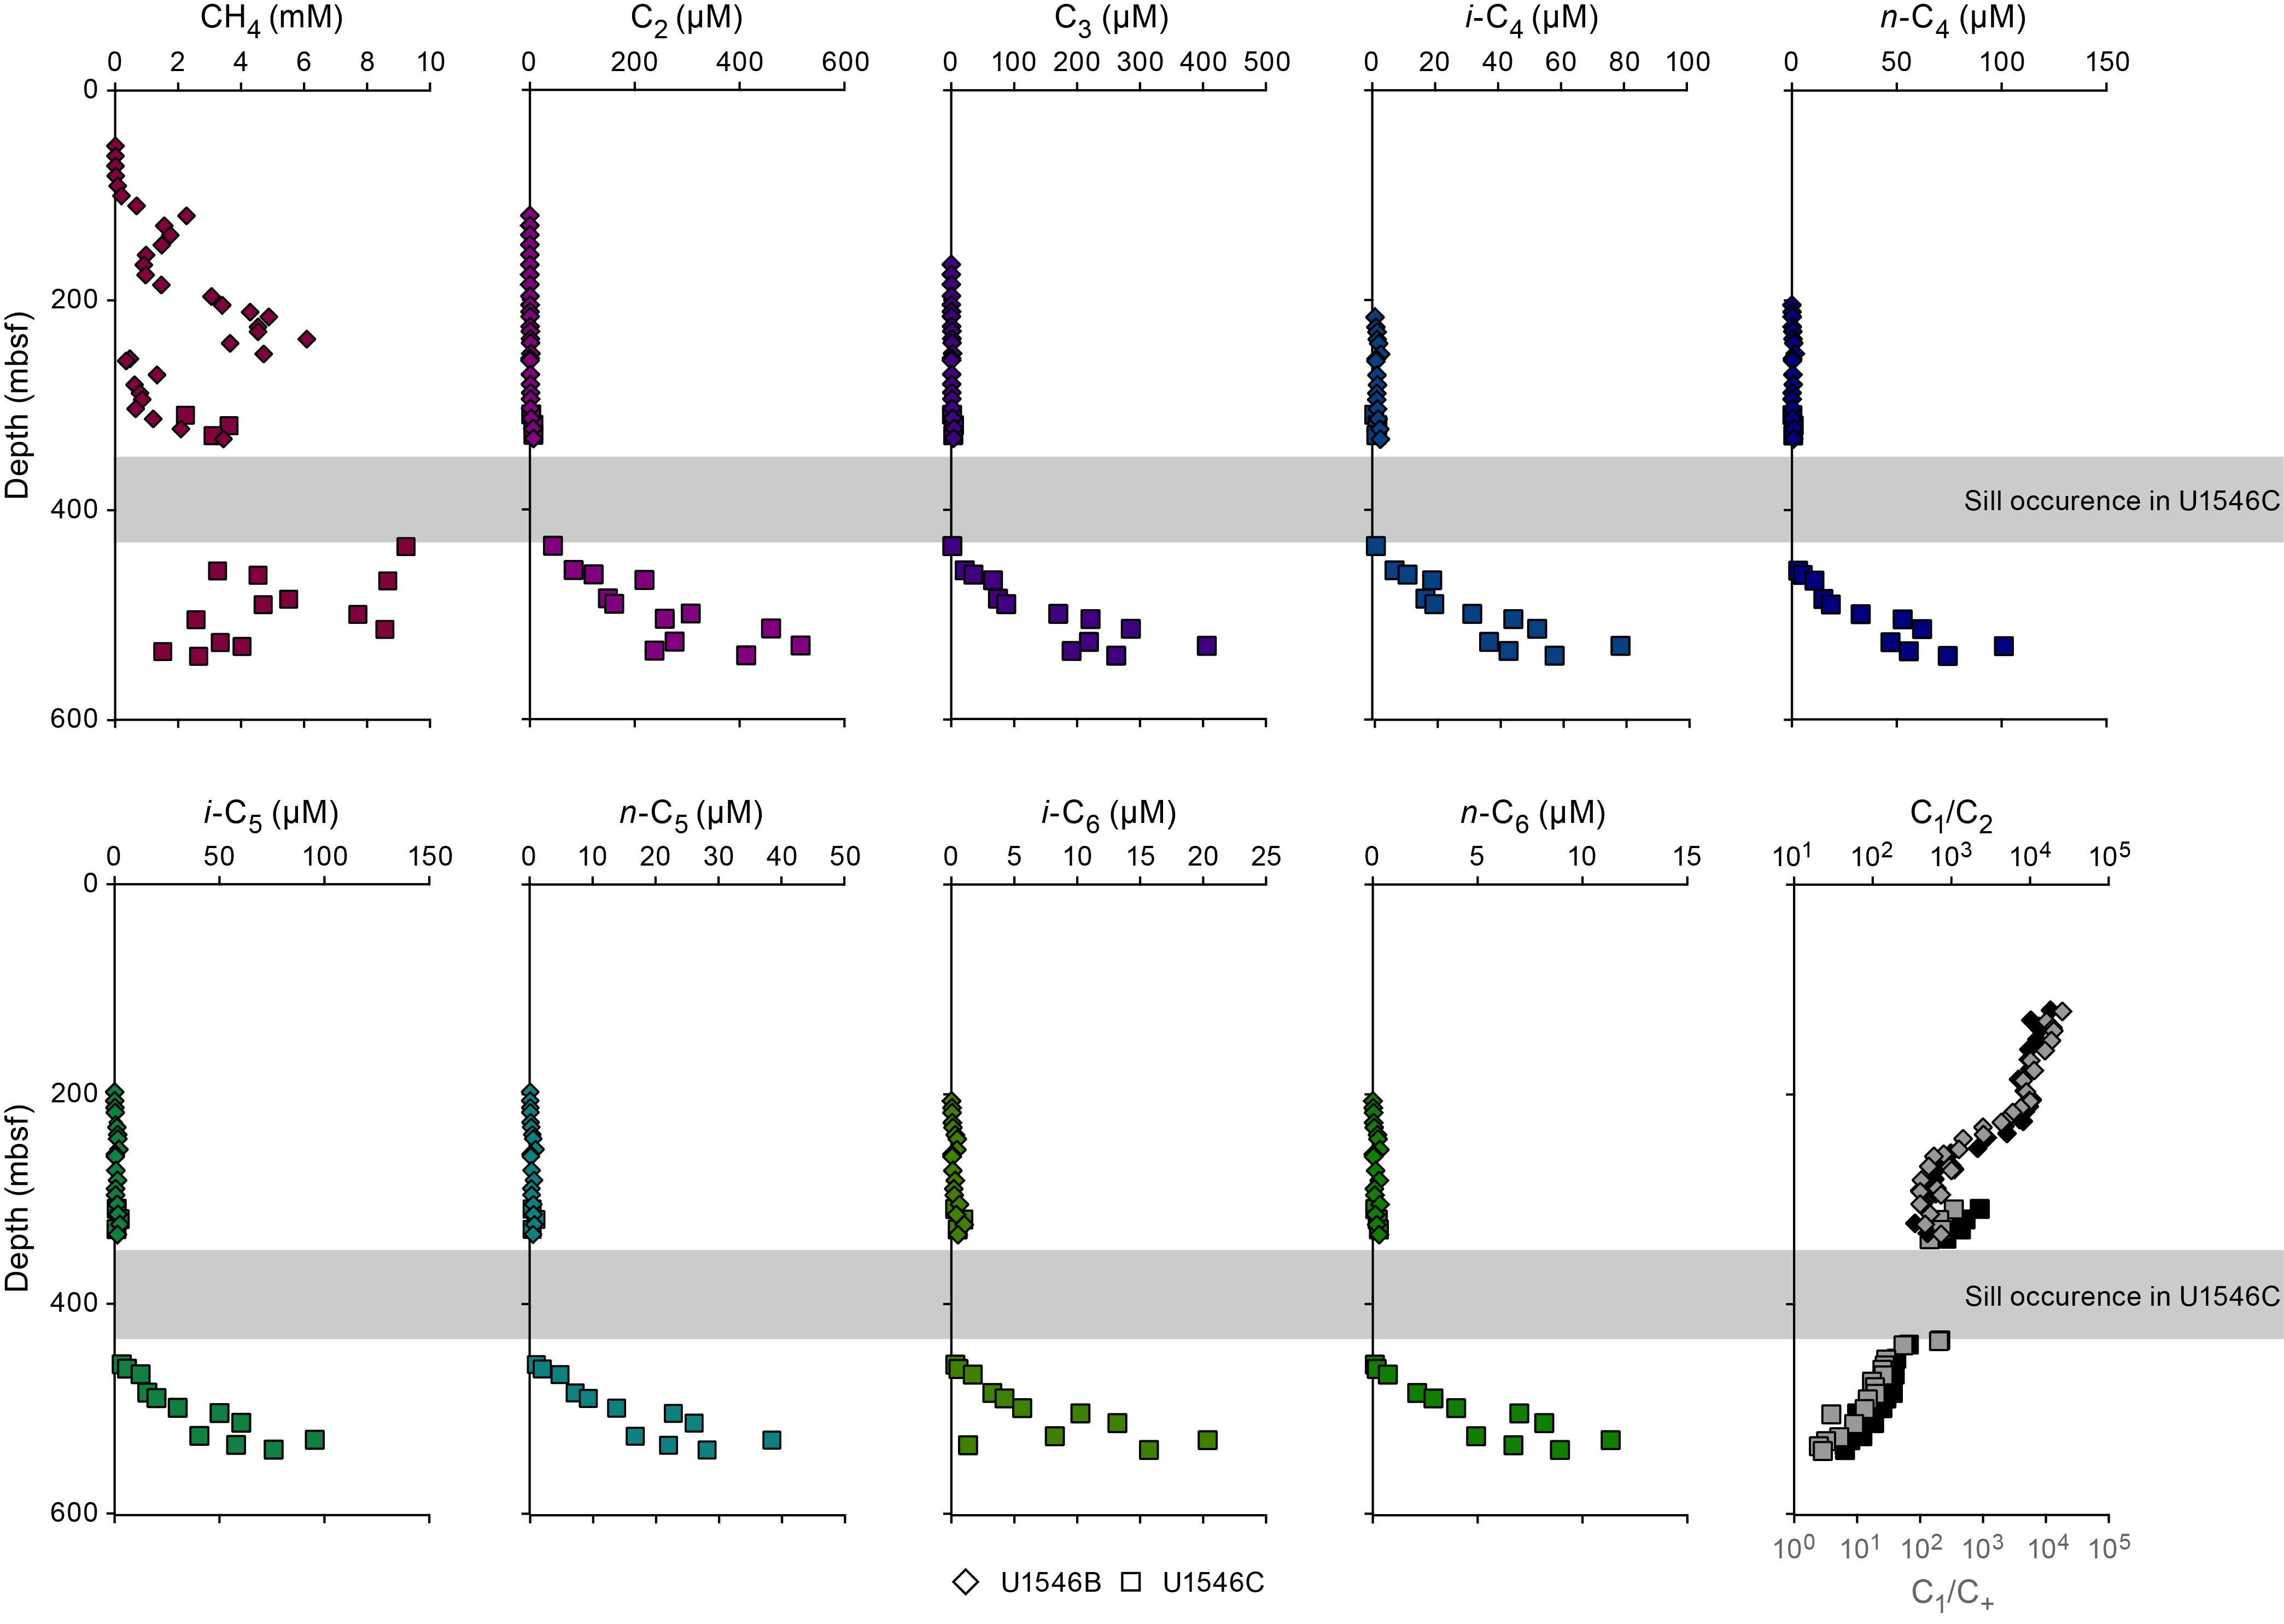
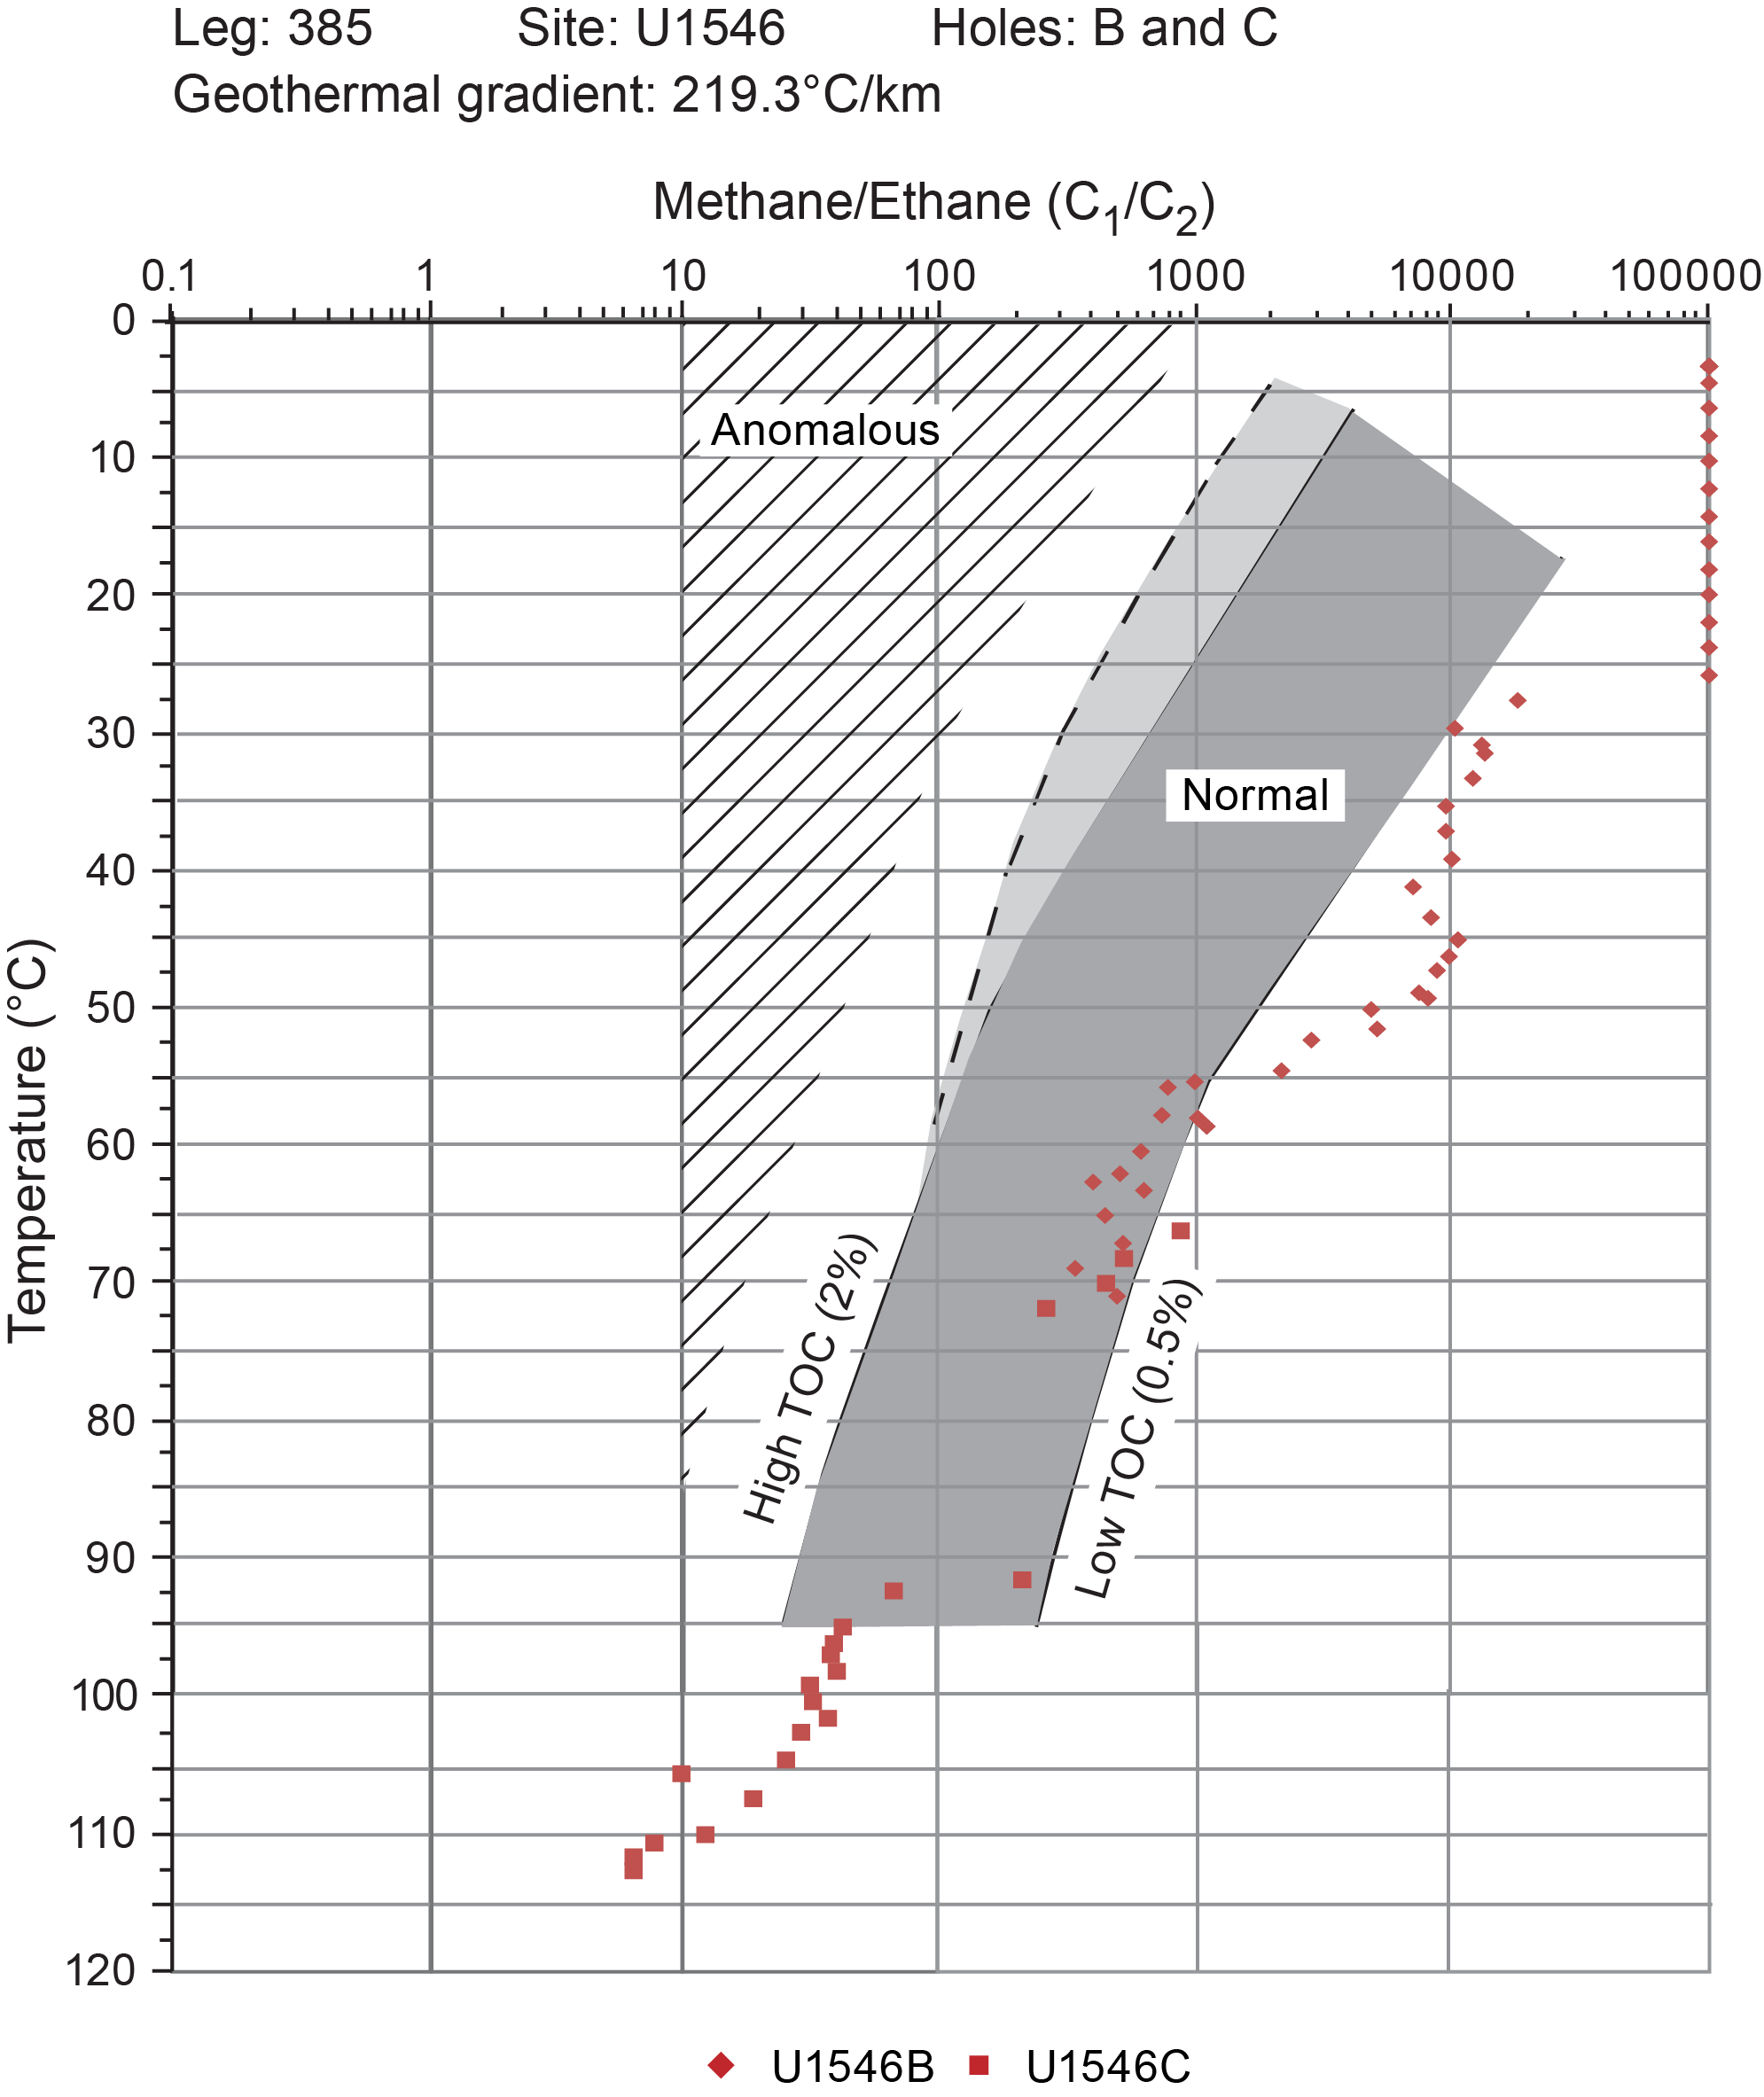
In addition to the headspace measurements described above, 55 void gas samples were taken in Holes U1546A–U1546C (Table T17). In Holes U1546A and U1546B, these samples were taken when void spaces due to gas expansion were observed on the core receiving platform. During Hole U1546C RCB coring, no gas expansion voids were recovered, so samples were taken during sill recovery from gaps in the core liner. Although these “core-gap” samples in the sill were of relatively low quality due to atmospheric contamination (compared to gas expansion voids within sedimentary sections), the detection of methane within the core gaps in spite of this contamination inspired the development of more appropriate methods to quantify sill hydrocarbons (see Rock incubations). These samples were analyzed to determine the parts per million by volume concentrations and values of C1/C2 and C1/C+ (Figure F40), and trends from each hole are combined for analysis in the following discussion. Void samples are dominated by methane. Above the sill, methane concentrations generally increase from ~58% at ~205 mbsf to ~86% at ~347 mbsf. Within the sill, methane concentrations drop to <1%; below the sill, they increase rapidly to a maximum of ~85% at ~534 mbsf. For higher hydrocarbons, ethane appears to steadily increase downhole, whereas C3, C4, and i-C5 compounds have a local maximum at ~260 mbsf and i-C5 and C6 compounds have their local maximum slightly deeper at ~280 mbsf. Within the sill, ethane is the only higher hydrocarbon detected, and it is present at concentrations of <5 ppmv throughout. Below the sill, all higher hydrocarbons increase with depth by 1–4 orders of magnitude.
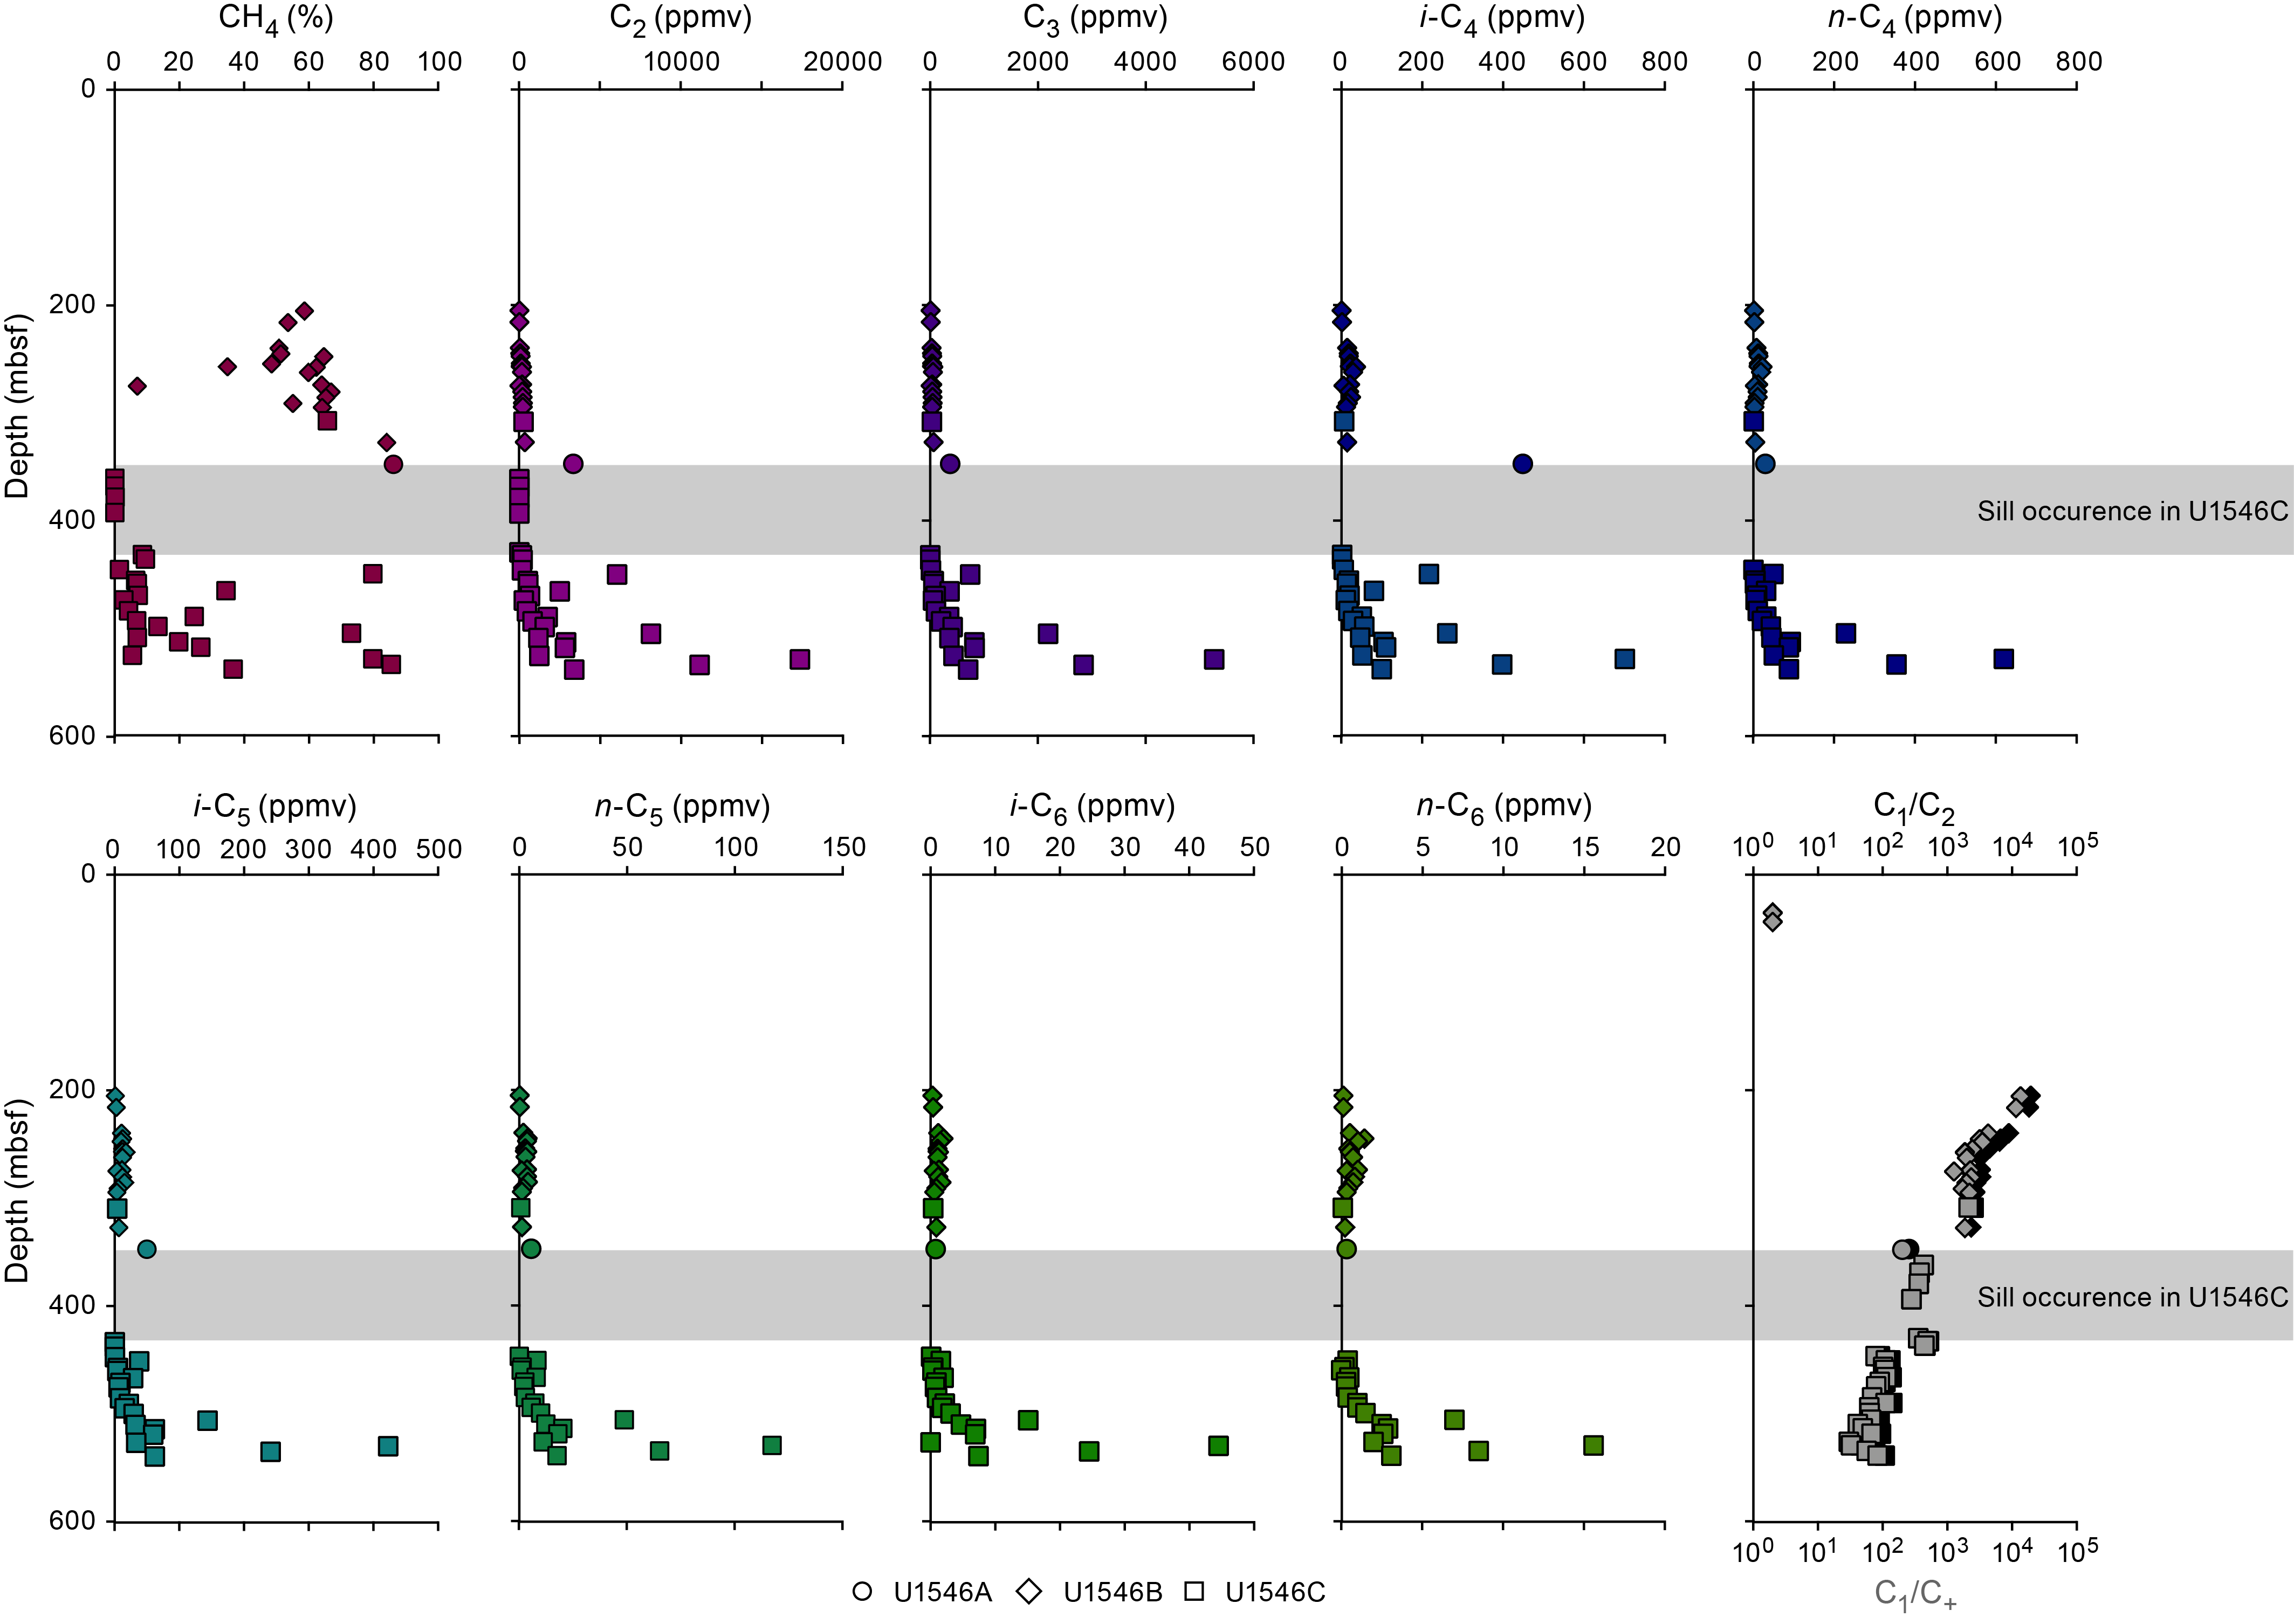
For APC and HLAPC cores from Hole U1546B, the lengths of the void spaces in the core liner created by expanding gases were measured immediately after core recovery on the core receiving platform (Table T18). The percent of void space per meter of core was ~0% to 193.7 mbsf and then increased to a maximum value of ~10% at 235.7 mbsf (Figure F41). Below this maximum, values decreased to 5% for the final HLAPC measurement at 290.3 mbsf. No void spaces were present during deployment of the XCB system deeper in the hole, and void spaces were not monitored in Holes U1546A, U1546C, or U1546D.
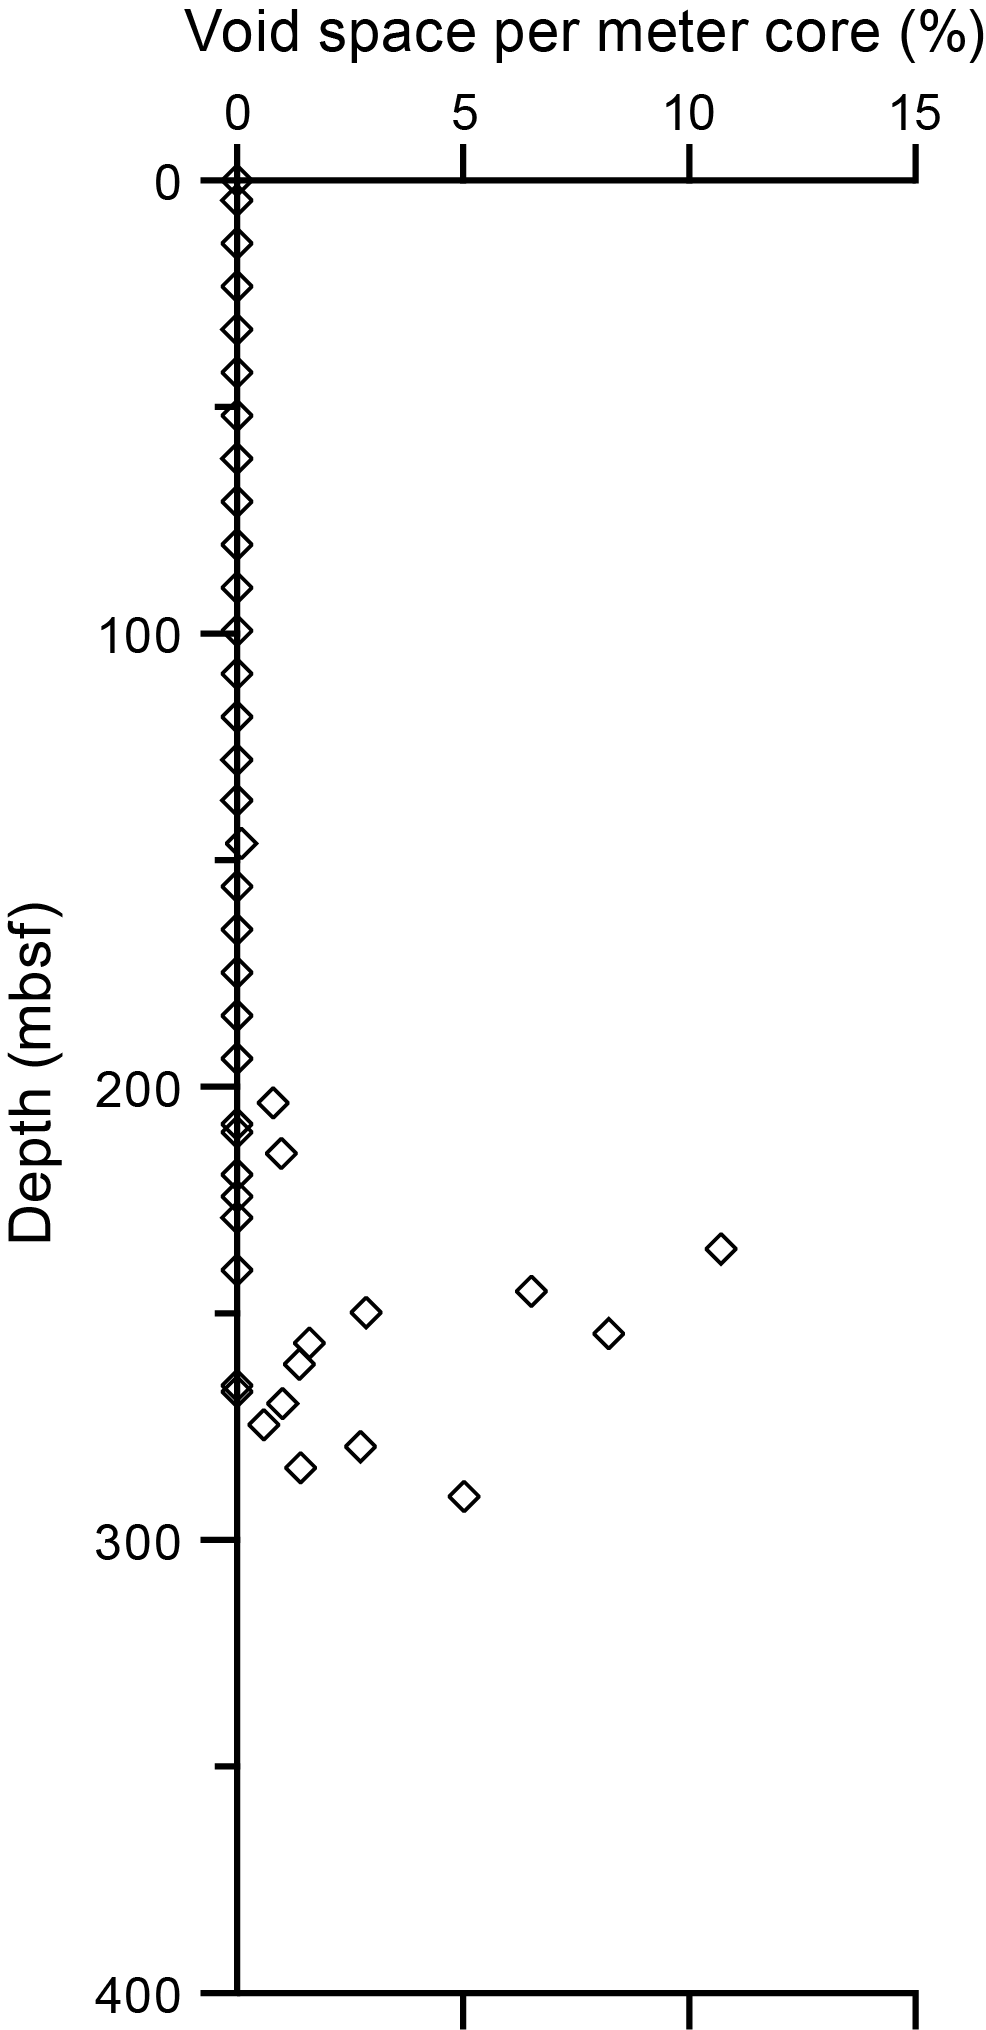
10.4. Rock incubations
During the recovery of igneous rocks at Site U1546, five igneous rocks were sampled for rock incubations (see Organic geochemistry in the Expedition 385 methods chapter [Teske et al., 2021a]) (Table T19). Rock incubations at Site U1546 were executed as a proof of concept study to demonstrate that this method would result in a volume of gas sufficient for shipboard analyses of hydrocarbons, H2, and CO as well as shore-based analyses of stable and clumped isotopes. Methane was present and ranged from <1% to 16.5%, ethane was present throughout and ranged from 9 to 1252 ppmv, and additional higher hydrocarbons were present at low levels. H2 and CO were present throughout at the parts per billion by volume level.
10.5. Hydrogen and carbon monoxide
Headspace samples were taken from each core from Holes U1546B and U1546C to monitor molecular hydrogen (H2) and carbon monoxide (CO). Duplicate samples were collected from 48 depths next to samples taken for safety gas monitoring of hydrocarbon gases (Table T20). Dissolved H2 and CO were extracted into a defined headspace, the headspace gas was analyzed, and molar concentrations of dissolved H2 and CO were determined (see Organic geochemistry in the Expedition 385 methods chapter [Teske et al., 2021a]). Because of the presence of H2 and CO in the analytical blank, the minimum quantification limit for in situ concentrations of dissolved H2 and CO was 40 and 150 nM, respectively. Concentrations of dissolved H2 gradually increased with depth from below the minimum quantification limit to a maximum of 354 nM at 539.11 mbsf (Figure F42). In contrast, a maximum CO value of 665 nM was observed in the uppermost sample at 0.71 mbsf, and values gradually declined with depth to below the minimum quantification limit at 291.68 mbsf.
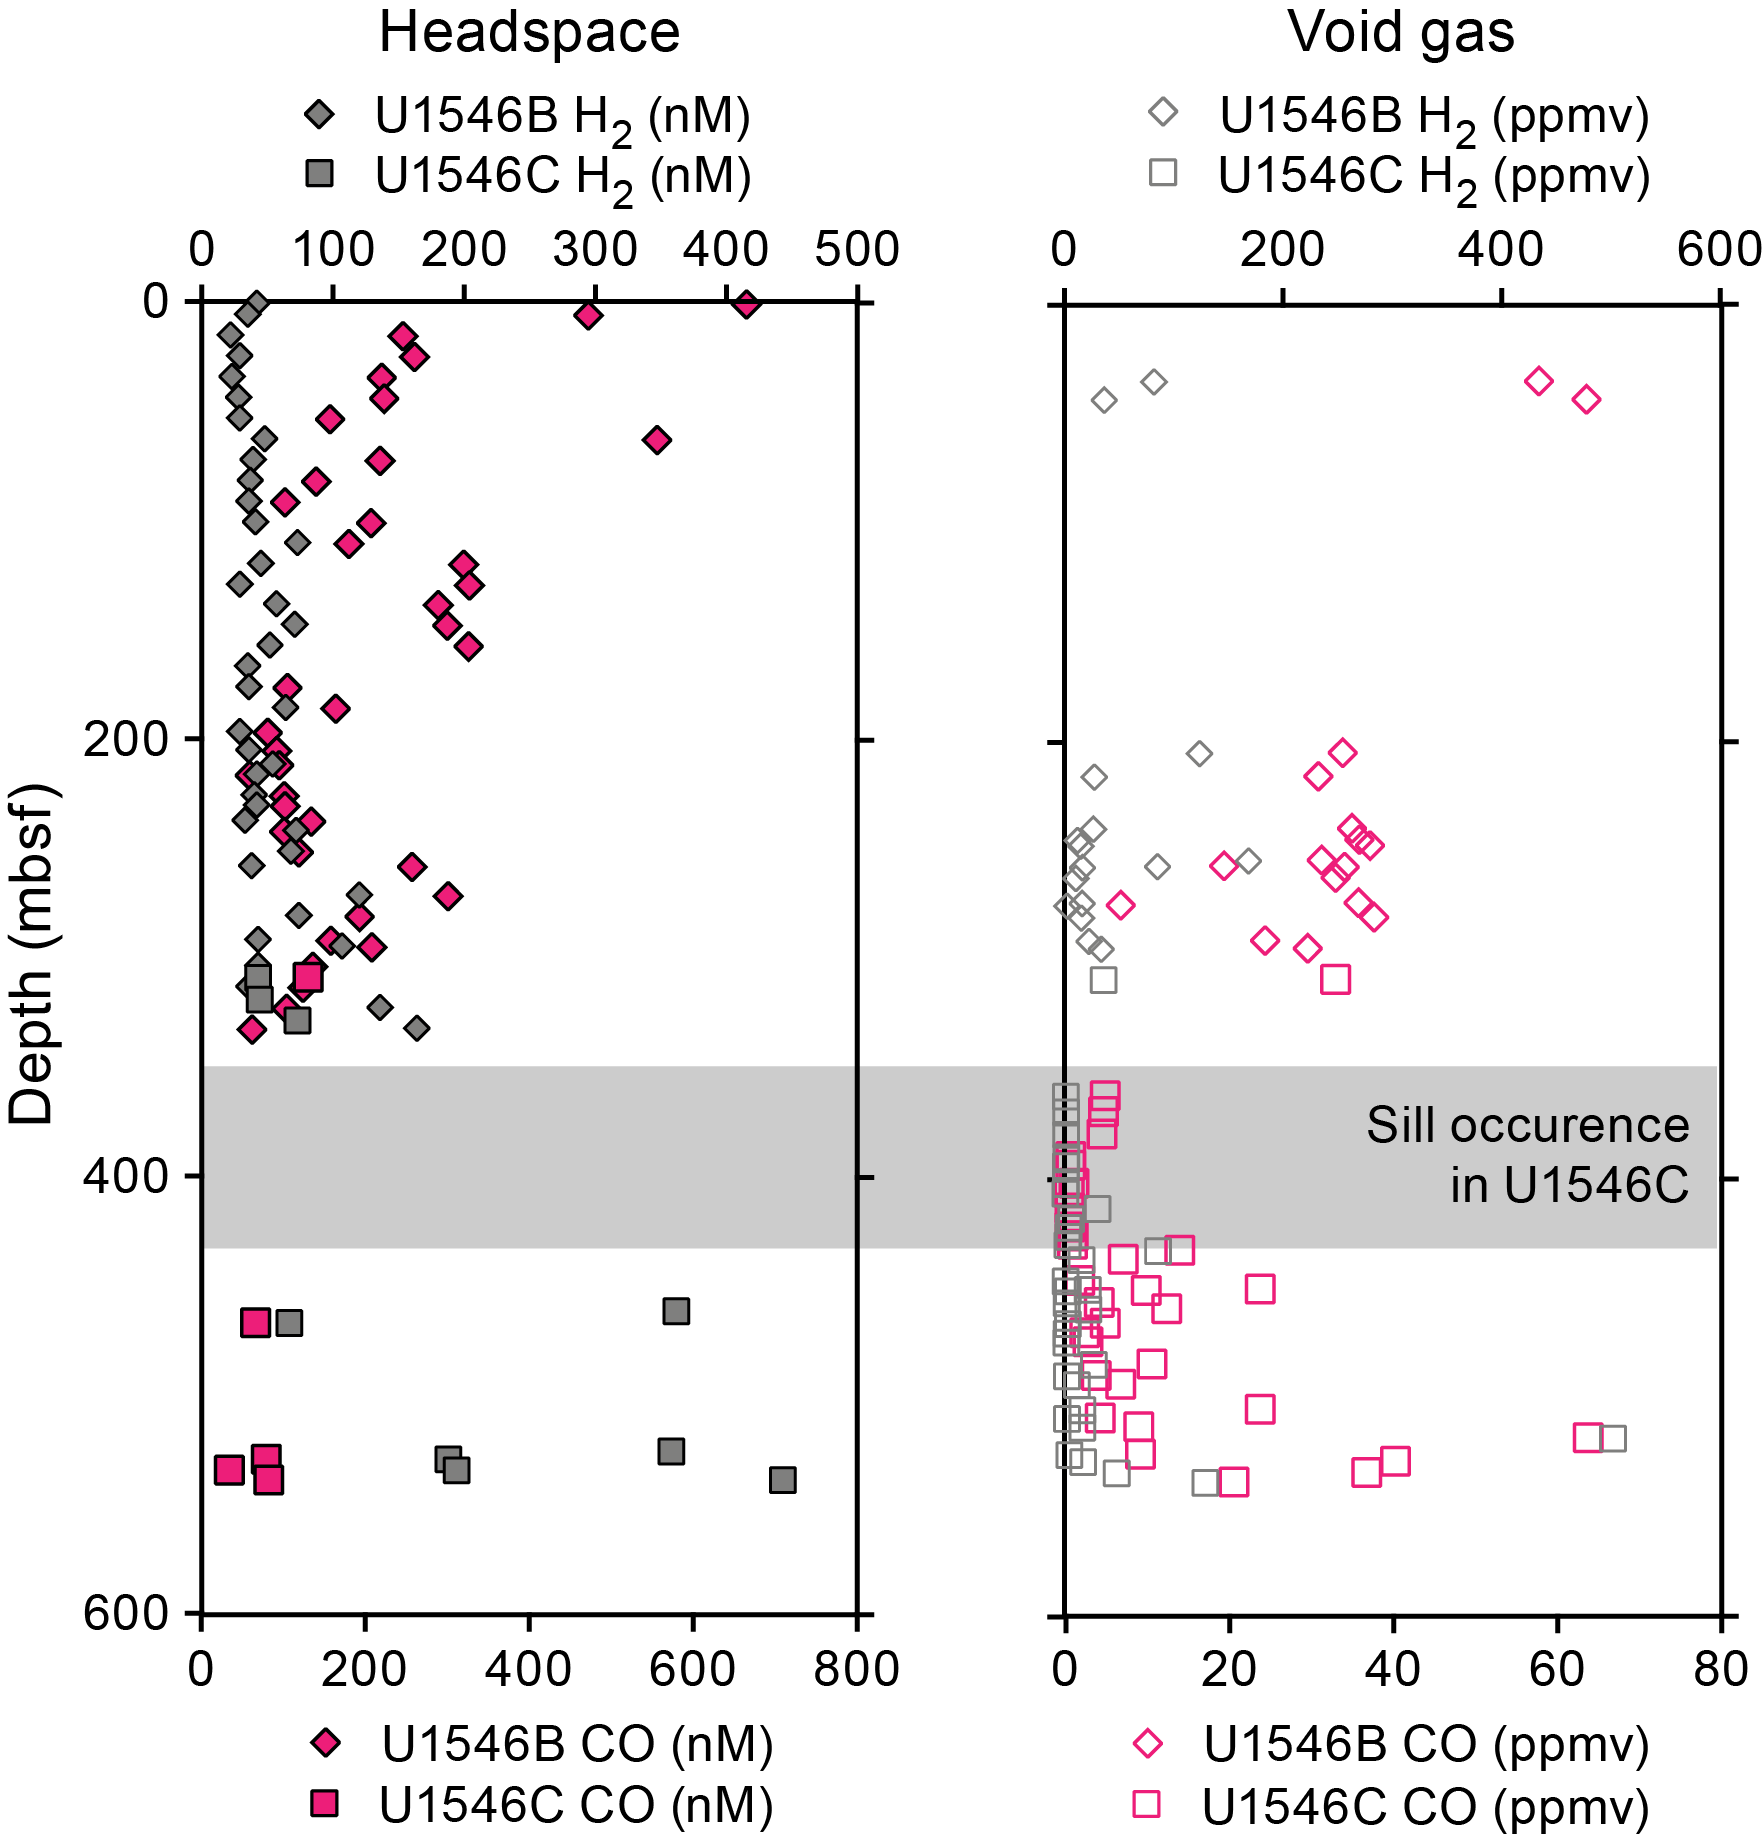
In addition to the headspace measurements described above, we also collected 50 void gas samples to analyze H2 and CO contents (Table T21; Figure F42). H2 contents ranged between 1 and 501.9 ppmv, with most values falling below 10 ppmv. No trend is discernible. The content of CO varies between 4.1 and 62 ppmv, and values seem to increase slightly from 362.02 to 518.44 mbsf.
11. Microbiology
11.1. Sampling
Sediment cores for microbiological studies were obtained from Holes U1546B and U1546D using the APC, HLAPC, and XCB systems. After drilling to 308 mbsf without core recovery, Hole U1546C was sampled along its deeper, hydrothermally heated, indurated sediment column above (Core 6R) and below (Cores 23R, 24R, 28R, 32R, 34R, 36R, 40R, and 42R) a penetrated sill. This sill was also subject to microbiology sampling (Cores 7R and 12R). The corresponding sedimentary and igneous rock cores were drilled using the RCB system. The Site U1546 samples represent important horizons that will inform our understanding of the impacts of sill emplacement on geochemistry and extant microbial communities in the hyperthermophilic zone. Sampling for cell counting (17 sediment horizons), 3-D structural imaging, RNA analyses, and contamination tracing was performed as described in Microbiology in the Expedition 385 methods chapter (Teske et al., 2021a).
On 28 October 2019, it was discovered that the shipboard nitrogen gas contained oxygen in substantial concentration (~18%, determined by gas chromatography–thermal conductivity detector [GC-TCD] analysis). Upon this discovery, all the Hole U1546B sample bags were reflushed with oxygen-free nitrogen from gas cylinders. Additional microbiology samples for anaerobic incubation and cultivation experiments were collected from Hole U1546D sediments above the sill (31 October–2 November) and placed in gas-tight trilaminated foil bags after flushing three times with oxygen-free nitrogen.
Detailed curatorial information about all collected samples (e.g., core, section, interval, and absolute depths of samples) can be retrieved from the Curation and Samples Laboratory Information Management System Online Report (http://web.iodp.tamu.edu/LORE).
11.2. Microbial cell detection and enumeration
11.2.1. Microbial cell counts
Cell abundance was determined by direct counting with an epifluorescence microscope. For shipboard analysis of sediment, samples (1 cm3) were aseptically taken from Hole U1546B and U1546C sections using tip-cut syringes (or shaved rock material from the interior of rock samples), and selected Hole U1546B samples (Sections 1H-1, 2H-1, 2H-3, 3H-3, 4H-3, 5H-2, 6H-4, 8H-3, 10H-3, 12H-4, 15H-3, 18H-3, 20H-3, 28F-2, 35F-3, 39F-2, 49F-3, and 54F-2) were processed using the noncell extraction method described in Microbiology in the Expedition 385 methods chapter (Teske et al., 2021a). Cell abundance was 1.1 × 10⁶ cells/cm3 in bottom seawater and 1.0 × 10⁹ cells/cm3 in seafloor sediments. Below the seafloor, cell abundance gradually decreases to 4.3 × 10⁶ cells/cm3 at approximately 132 mbsf (Figure F43). Cells could not be detected in the sample taken from Section 10H-3 (83.4 mbsf). Cell abundance returned to the detection range (>8.0 × 10⁵ cells/cm3) in Sections 20H-3 (168.9 mbsf) and 35F-3 (237.9 mbsf), but cells were not observed in deeper samples from Hole U1546B.
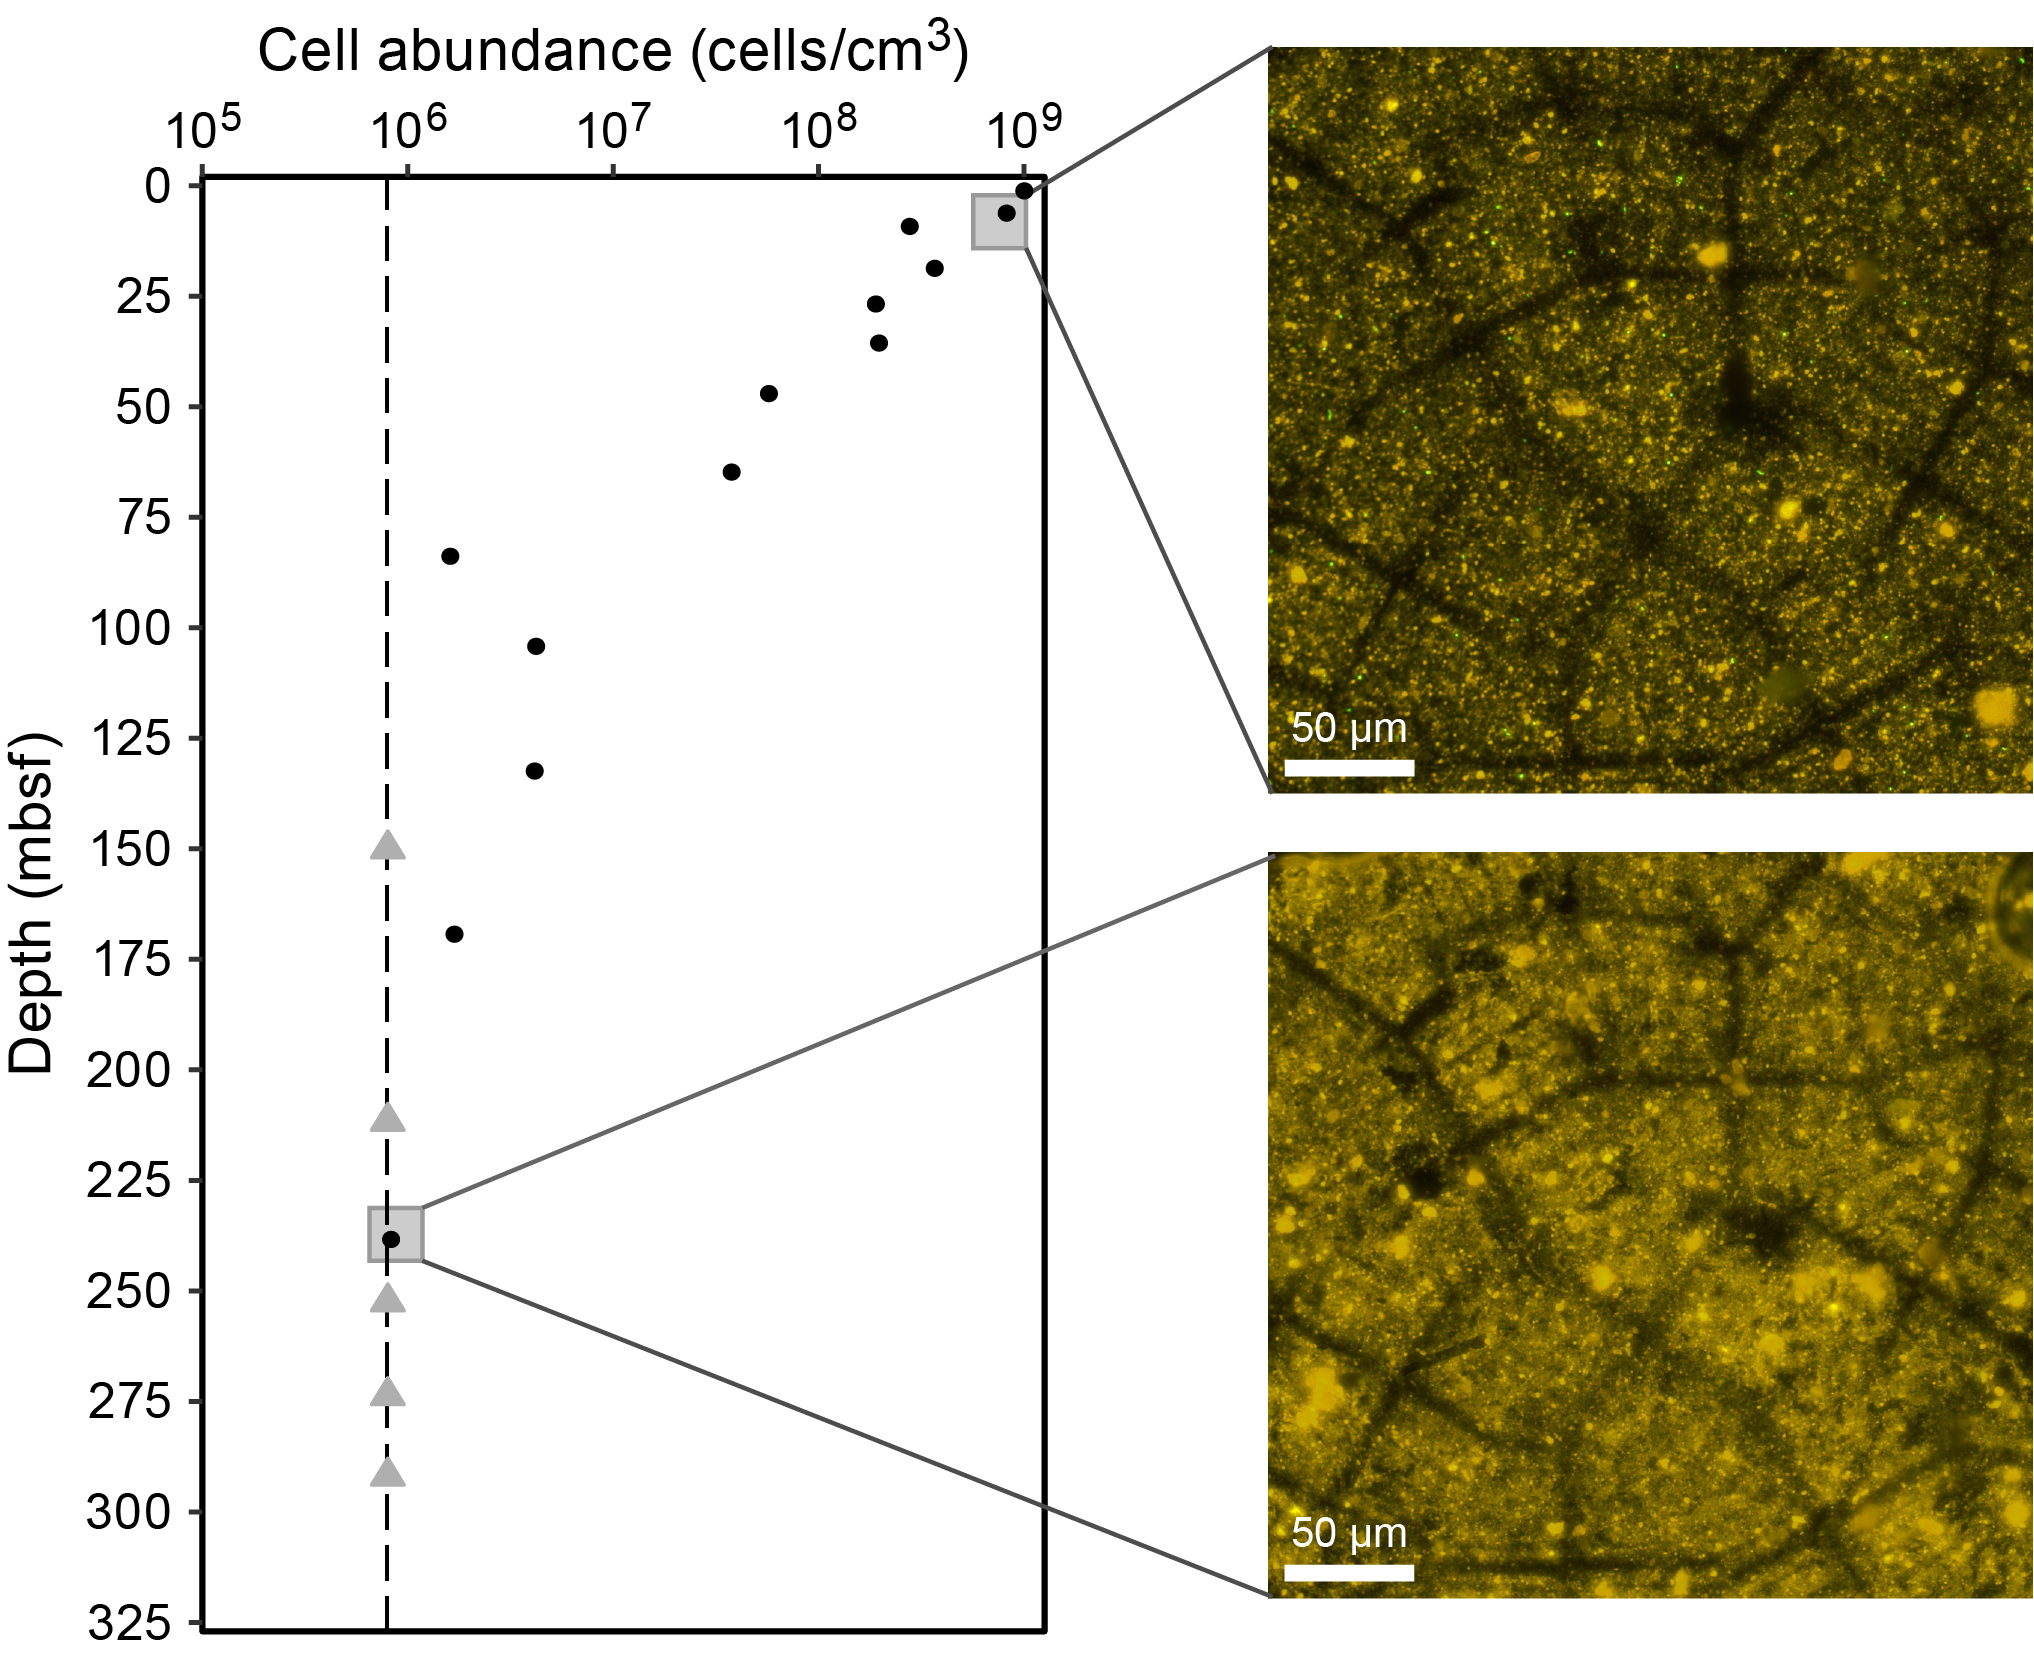
11.2.2. CARD-FISH cell counts of fungi
For catalyzed reporter deposition–fluorescence in situ hybridization (CARD-FISH) cell counts of fungi, ~10 cm3 sediment samples (Sections 385-U1546B-1H-2, 3H-2, 6H-2, 9H-2, 12H-2, and 21H-2) were fixed, washed, and stored as described in Microbiology in the Expedition 385 methods chapter (Teske et al., 2021a).
11.2.3. Visualization of fungal cells
For visualizing the 3-D positioning of fungal filaments and yeasts using antibodies to chitin, 5–15 cm3 syringe tubes of sediment were collected from Sections 385-U1546B-1H-2 and 3H-2 and preserved as described in Microbiology in the Expedition 385 methods chapter (Teske et al., 2021a).
11.3. Microbial activity measurements
11.3.1. Single-cell stable isotope analysis
Sections 385-U1546B-1H-3, 9H-3, 21H-3, and 49H-3 were taken as whole-round samples, immediately stored at ~4°C under anaerobic conditions, and incubated at sea for shore-based single-cell stable isotope analysis using nanoscale secondary ion mass spectrometry (NanoSIMS) (see Microbiology in the Expedition 385 methods chapter [Teske et al., 2021a]). Additional whole-round cores (Sections 385-U1546B-6H-3, 12H-3, and 54F-3; 385-U1545C-7R-1, 12R-4, 24R-2, 28R-2, 34R-2, 40R-3, and 42R-1; and 385-U1546D-1H-3, 2H-5, 4H-4, 6H-3, 8H-3, 10H-5, 14H-3, 15H-2, 16H-3, 21H-3, 27H-3, 37F-3, and 46F-3) were taken and stored anaerobically at ~4°C for potential shore-based incubations.
11.3.2. Stable isotope bioassays of hydrocarbon degradation
An initial stable isotope probing experiment was initiated with material from Section 385-U1546B-1H-2 and 13C-labeled phenanthrene as outlined in Microbiology in the Expedition 385 methods chapter (Teske et al., 2021a).
11.3.3. Methanogenesis and anaerobic oxidation of methane
In Hole U1546B, whole-round samples were collected to examine rates of methanogenesis and AOM along geochemical and temperature gradients in triplicate live samples and one killed control for Sections 1H-2, 7H-2, 12H-3, 13H-3, 14H-2, 20H-3, 22H-3, 28F-2, and 54F-3 as depicted in Microbiology in the Expedition 385 methods chapter (Teske et al., 2021a). These samples were then spiked with 14C-labeled methane, bicarbonate, acetate, and methanol and incubated at different temperatures (30°, 40°, 50°, and 70°C) for 2 weeks. After incubation, microbial activity was terminated by injecting 4 mL of 2 M NaOH into each sample. Fixed samples were stored at room temperature and shipped to shore for further processing.
11.3.4. Sulfate reduction activity
Whole-round core samples for sulfate reduction rate measurements were resampled (Hole U1546D) from freshly recovered sediment after the discovery of oxygen contamination in the ship’s gas lines; previously compromised samples from this site are not listed here because they were not processed further.
After core retrieval, 10 cm long whole-round samples (Sections 385-U1546D-1H-2, 2H-4, 4H-3, 6H-2, 8H-2, 10H-4, 11H-3, 14H-2, 15H-3, 16H-2, 18H-3, 21H-2, 23H-3, 27H-2, 30H-3, 37F-2, 41F-2, and 46F-2) were cut from a core section and stored at ~4°C under anaerobic conditions and then processed for measurements of sulfate reduction activity (see Microbiology in the Expedition 385 methods chapter [Teske et al., 2021a]). Samples were chosen to reflect the approximate in situ temperature gradient of Site U1546 and to capture the transition between meso- and thermophiles.
11.4. Bioorthogonal noncanonical amino acid tagging analyses
A bioorthogonal noncanonical amino acid tagging (BONCAT) incubation study was set up using sediment material from Section 385-U1546B-1H-2 (see Microbiology in the Expedition 385 methods chapter [Teske et al., 2021a]).
11.5. Cultivation experiments
11.5.1. Cultivation of mesophilic, thermophilic, and hyperthermophilic methanogenic subsurface microorganisms
Sediment samples from Holes U1546B and U1546C were selected according to in situ temperature ranges for analyses of potential mesophilic, thermophilic, and hyperthermophilic methanogenic populations (Table T22). Sediment slurries were prepared as described in Microbiology in the Expedition 385 methods chapter (Teske et al., 2021a), used as inoculum, and supplemented with one of the selected carbon substrates: bicarbonate; acetate; methanol; dimethylsulfide (10–20 mM); or hexadecane, dodecane, and hexane (final concentration = 1–5 vol%) under an H2/CO2 and N2/CO2 gas atmosphere (80/20 V/V each; 200 kPa). Each treatment was performed in duplicate. In addition to an autoclaved control, one vial without substrate addition was used as the negative control. The sediment slurries were incubated close to the in situ temperatures (30°, 60°, and 80°C) in the dark and without shaking. Cultures and incubations were periodically checked (every month) for de novo methane production in the headspace using a gas chromatograph and compared with a negative control (uninoculated and autoclaved sediment). The presence of growing microbial populations from methane-producing enrichments was confirmed by light microscopy (Nikon Eclipse E400). Amended sediments were selected for further enrichments only when methane was detected in the headspace. As a starting point for enrichment and incubation monitoring, subsamples of around 50 cm3 were frozen at −80°C within a few hours after recovery for onshore metagenomic and metabarcoding analyses.
11.5.2. Methanogenic and sulfate-reducing microbial enrichments and DNA preservation for metagenomic analyses
To investigate how methanogenic and sulfate-reducing microbial community composition may vary with local geochemistry, enrichments of methanogens and sulfate-reducing microorganisms were prepared, in triplicate, from the center of two whole-round cores (Sections 385-U1546B-13H-3 [112 mbsf] and 29F-2 [217 mbsf]) as described in Microbiology in the Expedition 385 methods chapter (Teske et al., 2021a). Enrichments from 112 mbsf were incubated at 30°C and those from 217 mbsf were incubated at 50°C; these temperatures were similar to in situ conditions.
Subsamples for shore-based DNA extraction were taken from all whole-round cores collected throughout Hole U1546B (Sections 4H-2, 6H-3, 9H-3, 13H-3, 19H-3, 21H-2, 29F-2, and 54F-2), as described in Microbiology in the Expedition 385 methods chapter (Teske et al., 2021a). Before subsampling was performed, these whole-round core samples had, unknowingly, been exposed to atmospheric oxygen concentrations for 3 days. As potential replacements for these oxygenated samples, entire 10 cm whole-round core samples from Hole U1546D (Sections 4H-3, 6H-2, 8H-2, 10H-4, 14H-2, 15H-2, 16H-2, 16H-3, 27H-2, 37F-2, 37-3, and 46F-2) were frozen at −80°C in sterile Whirl-Pak bags for shore-based processing and DNA extraction.
11.6. Cultivation experiments for fungi
Replicate enrichment cultures for fungi were initiated for Sections 385-U1546B-1H-2, 3H-2, 6H-2, 9H-2, 12H-2, and 21H-2 and 385-U1546D-1H-2, 2H-4, 3H-2, 4H-3, 6H-2, 8H-2, 10H-4, 11H-3, 14H-2, 15H-3, 16H-2, 21H-2, and 27H-2 following the protocol outlined in Microbiology in the Expedition 385 methods chapter (Teske et al., 2021a). These samples will be used for fungal enrichment experiments in a shore-based laboratory.
12. Petrophysics
Physical properties of the cores recovered from the four holes at Site U1546 (U1546A–U1546D) and host formation were measured in the core laboratory on whole-round and working- and archive-half sections, and the in situ physical properties of the formation were measured using downhole wireline logging tool strings. Measurements on whole-round and working-half sections were compared between holes (U1546A–U1546D) and with downhole measurements obtained from Hole U1546C for lithostratigraphic characterization and correlation of core descriptions, core laboratory measurements, borehole physical properties data, and seismic profiles. The list of measured properties and measurement procedures are in Tables T17 and T18 in the Expedition 385 methods chapter (Teske et al., 2021a).
A good correlation based on petrophysical measurements was obtained between Holes U1546A, U1546B, and U1546D, although some slight differences are visible. These holes were cored to ~360 mbsf (Hole U1546A), ~333 mbsf (Hole U1546B), and ~304 mbsf (Hole U1546D). Hole U1546C was drilled without core recovery to ~300 mbsf and has a notable average core recovery of 74% below ~356 mbsf (i.e., when coring the encountered massive sill intrusion).
At shallow depths, compaction marked by an increase in the density of the sediment was observed from the seafloor to 50 mbsf. After a small decrease, a steady increase in density was identified to ~270 mbsf. Below this depth, a significant decrease in density was recorded to ~315 mbsf. The interval between 320 and 355 mbsf marks the first interval that differs from Site U1545. This interval shows a combined increase in density and NGR that is significantly higher than at Site U1545. All petrophysical properties measured above and below the sill at Site U1546 (i.e., above and below ~355.5–432.90 mbsf) highlight the presence of a ~74–76 m thick sill. The 2 m variation in thickness is due to the fact that FMS imaging provides a thickness of 74 m, whereas other measurements combined provide an average thickness of 76 m (reported values are from the caliper measurements from the FMS-sonic tool string). Measurements of physical properties also clearly distinguish the top and bottom sill/sediment contact zones.
12.1. Data acquisition
Core laboratory measurements were conducted as explained in Petrophysics in the Expedition 385 methods chapter (Teske et al., 2021a), with no divergence from the standard sequence of measurements and measurement spacing for Holes U1546A–U1546C. Downhole wireline logging operations started in Hole U1546C after termination of coring at a final penetration depth of 540.3 mbsf. The first logging run acquired data using the triple combo tool string, which includes the EDTC, HNGS, HLDS, and HRLA (Table T23) (see Petrophysics in the Expedition 385 methods chapter [Teske et al., 2021a]). The MSS is part of the triple combo string, but neither of the two available MSS-B tools (provided by Lamont-Doherty Earth Observatory) was able to make contact with the Schlumberger logging software, preventing recording of MS data. Subsequently, the FMS-sonic tool string was deployed to acquire resistivity imaging data (FMS) of the borehole walls and measurements of compressional, shear, and Stoneley wave velocities (DSI), spectral gamma radiation (HNGS), and temperature (LEH-MT). Only one pass with the FMS-sonic tool string was run because of the instability of the hole. For all runs, upward-pass measurements are considered of higher quality, and downward-pass measurements provide backup in case upward measurements fail. The maximum depths of the triple combo tool string main pass and the FMS-sonic tool string pass were 514.7 and 489.9 mbsf, respectively.
Selection of downhole logging data to describe here involves several factors, including potential instrument failure, the maximum depth range covered, the condition and diameter of the borehole, and the fact that upward-pass measurements are typically higher quality than downward-pass measurements. Table T23 summarizes reported measurements and comments on measurements that we chose to not describe here.
12.2. Downhole temperature and thermal conductivity
12.2.1. Downhole temperature
Twelve in situ formation temperature measurements were made at Site U1546 using the APCT-3 and SET2 tools (see Petrophysics in the Expedition 385 methods chapter [Teske et al., 2021a]). In Hole U1546A, measured temperature values range from 10.05°C at 32.3 mbsf (Core 4H) to 67.18°C at 323 mbsf (Core 59X) (Table T24). The last measured value (Core 385-U1546C-59X) was not included in the analysis of the temperature data because this value showed a substantial offset from the linear trend that is well defined by the other data. The penetration of the SET2 tool into indurated sediments can generate small cracks that enable water inflow into the formation, introducing uncertainties in the SET2 measurement (typically decreasing the measured temperature), which seems to be the case for this particular value. The remaining data indicate that temperature increases with depth along a linear geothermal gradient of 221°C/km (Figure F44A). The slope of the linear fit between thermal resistance and formation temperature (Figure F44C) indicates a heat flow of 160 mW/m2.
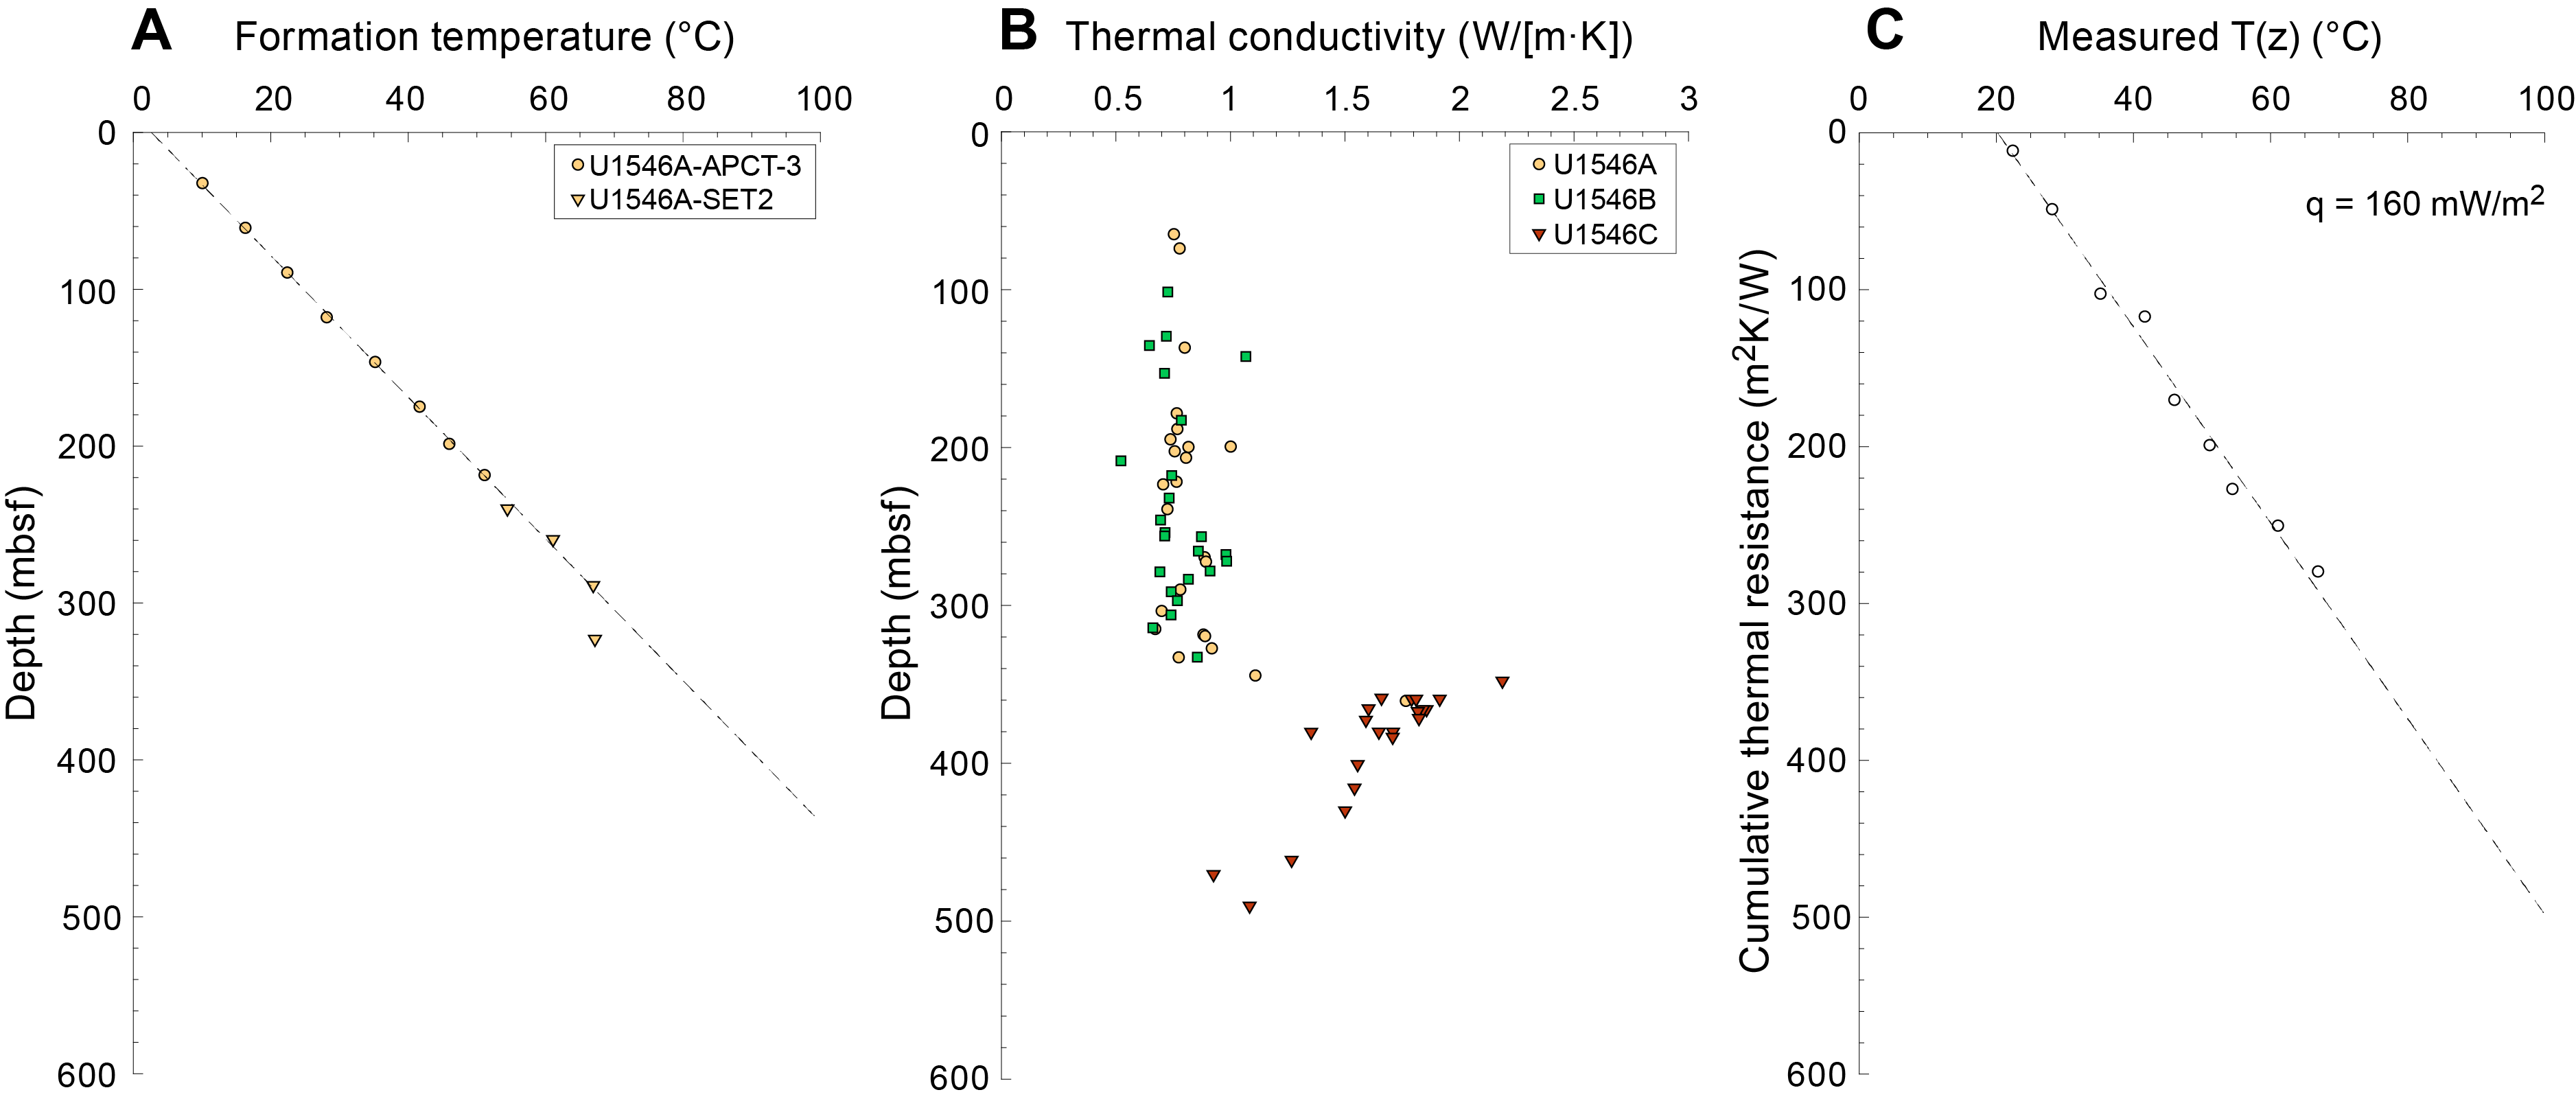
12.2.2. Thermal conductivity
Thermal conductivity varies between 0.52 and 1.00 W/(m·K) over the uppermost ~345 m of penetration, which includes the upper sill/sediment boundary (Figure F44B) (see Lithostratigraphy). An increase to a value of 2.19 W/(m·K) was observed from ~345 to ~400 mbsf. Sixteen hard rock thermal conductivity measurements were made on sill samples from ~348 to ~432 mbsf and yielded a mean thermal conductivity of 1.72 ± 0.14 W/(m·K) (Figure F44B), which closely matches conductivity values reported for basalt (1.7 ± 0.6 W/[m·K]) (Raznjevic, 1976). Only three measured conductivity values were obtained from below the lower sill–sediment transition because of irregularities and small cracks on the surface of indurated sediment cores. These features make it difficult to obtain accurate results with the TK04 system (see Petrophysics in the Expedition 385 methods chapter [Teske et al., 2021a]). Measurements in Hole U1546B revealed a trend similar to that found by measurements in Hole U1546A (Figure F44B).
12.3. Density (formation/core)
Gamma ray attenuation (GRA) bulk density was measured every 2 cm using the Whole-Round Multisensor Logger (WRMSL) for all three holes. MAD was also measured on discrete working-half section samples. For Hole U1546A, MAD samples were collected every other core. A higher resolution sampling scheme (one per core) was implemented in Hole U1546B in coordination with samples taken for safety monitoring of hydrocarbon gases (see Organic geochemistry). Discrete MAD measurements on sill material from Hole U1546C were performed on cubes sampled for shipboard paleomagnetic studies (see Paleomagnetism). After a demagnetization procedure to remove magnetization induced from coring, the cubes were saturated in water in a vacuum chamber for 24 h and processed normally for wet- and dry-mass measurements, followed by a volume measurement. At the end of this procedure, the cubes were returned to the paleomagnetism team for further analyses. Sediments collected above and below the sill were processed identically.
Density variations of the sediments above the sill are detailed below from core laboratory measurements on material recovered in Holes U1546A, U1546B, and U1546D as well as logging data from Hole U1546C. Shallow sediments to 50 mbsf (Holes U1546A, U1546B, and U1546D) show a rapid increase in density in the uppermost 5 m of the subseafloor to ~1.24 g/cm3. This is followed by a general increase in density from ~1.24 g/cm3 at ~53 mbsf to ~1.33 g/cm3 at ~100 mbsf observed in both holes (Figure F45A–F45B).
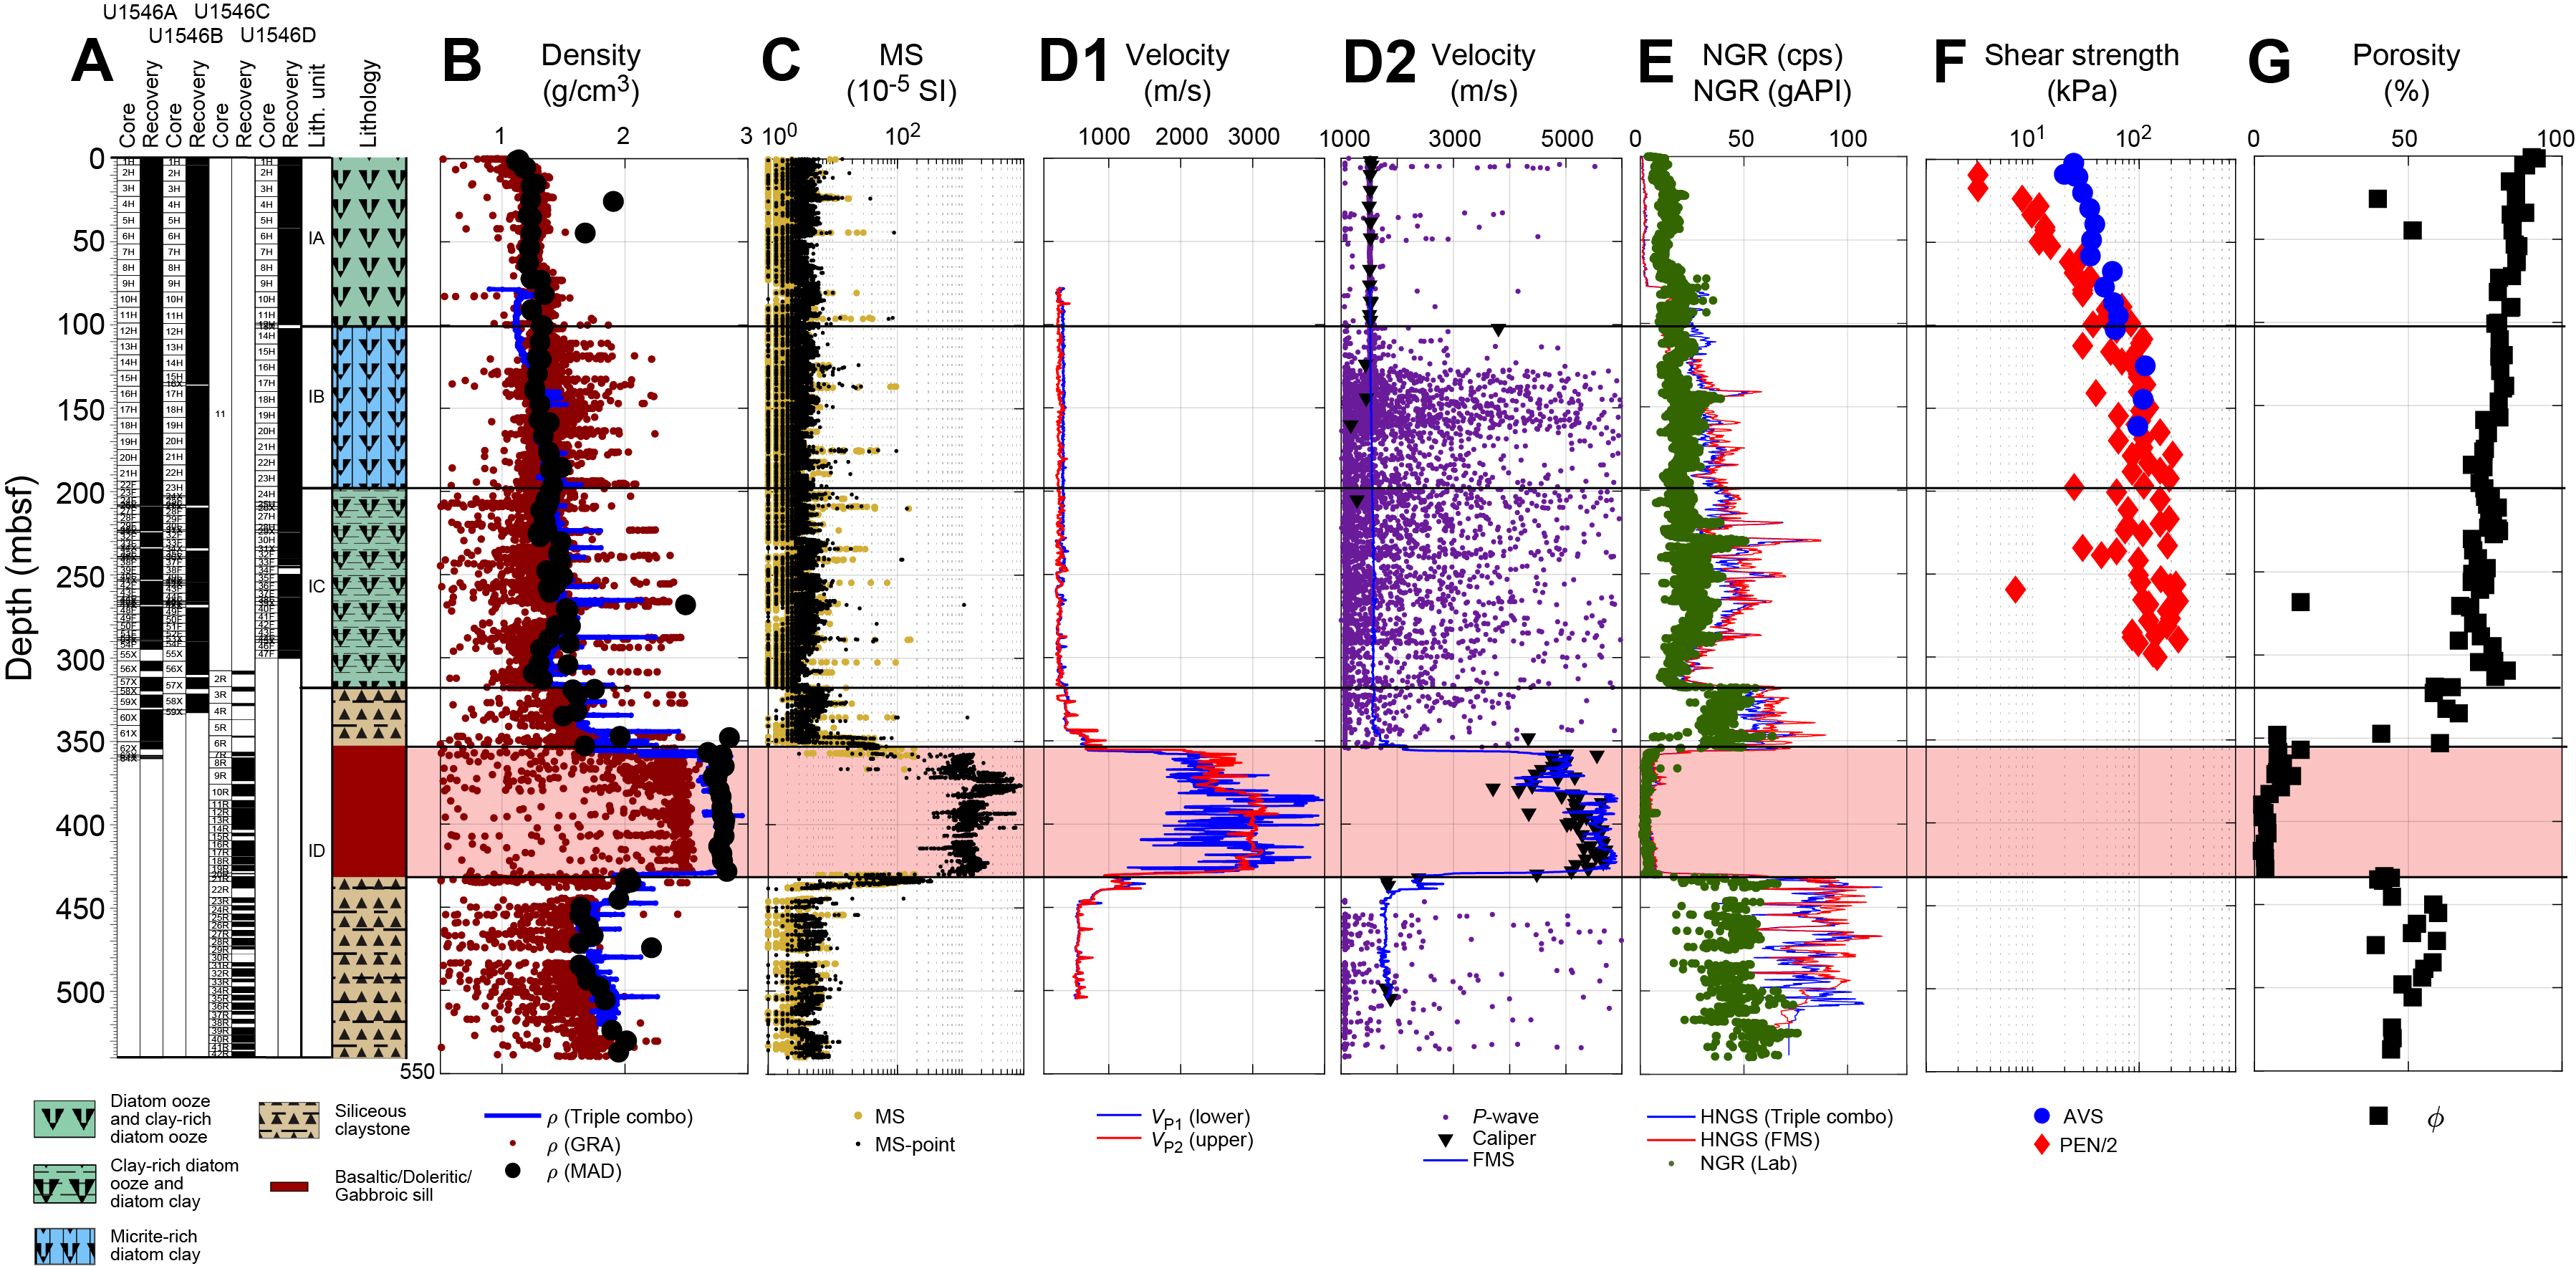
From 100 to ~250 mbsf (Holes U1546A, U1546B, and U1546D), density increases from 1.33 to 1.44 g/cm3 (Figure F45A–F45B). At 270 mbsf, density increases sharply to 2.49 g/ cm3. This value is consistent in the two types of data (GRA bulk density and MAD), characterizing a 4 m thick layer at 265–269 mbsf. Below 270 mbsf, density decreases from ~1.54 to ~1.30 g/cm3 at ~310 mbsf (Figure F45A–F45B). The amplitude of this signal is greater than the one from Site U1545 at a similar depth (see Petrophysics and Figure F41 in the Site U1545 chapter [Teske et al., 2021b]). It is followed by a sudden increase from 1.33 to 1.60 g/cm3 over a downhole interval of 6 m. From ~319 to ~337 mbsf, the density of the sediments directly above the sill remains relatively constant at ~1.60 g/cm3. Density of the sediments between ~337 and 346.5 mbsf progressively increases from ~1.60 to 1.86 g/cm3. The interval of 346.5–356 mbsf is marked by a relative plateau value at 1.83 g/cm3 obtained from the triple combo data, whereas MAD measurements on an indurated carbonate sample (see Lithostratigraphy) recovered within 1 m of the upper sill/sediment contact indicate a density of 2.85 g/cm3. Density in Hole U1546C decreases abruptly from ~2.00 g/cm3 at ~433 mbsf, followed by a much less abrupt decrease to 1.95 g/cm3 at 445.3 mbsf. This last depth interval is correlated with silty clay directly at the bottom contact of the sill that evolves toward siliceous claystone (see Lithostratigraphy). Finally, from ~448 to 472 mbsf, density in Hole U1546C remains relatively constant at ~1.63 g/cm3 before it slowly increases linearly to a value of ~2.0 g/cm3 at the bottom of the hole (Figure F45A–F45B). This latter trend mimics measurements at Site U1545 between ~450 and ~500 mbsf.
An alternation between doleritic and gabbroic textures is observed in the upper ~32 m of the cored sill (see Igneous petrology and alteration), and this pattern correlates with a significant density variation ranging from 2.72 to 2.80 g/cm3. The density of the sill in the lower ~45 m is slightly more consistent around ~2.80 g/cm3 (calculated from MAD samples). Downhole logging data collected from the HLDS (triple combo) are in good agreement with the density measurements made on discrete samples. Not surprisingly, GRA bulk density data collected from whole-round core measurements provide lower values due to space between the hard rock and the core liner.
12.4. Magnetic susceptibility
MS was measured on the WRMSL and the Section Half Multisensor Logger (SHMSL) (point MS). MS is sensitive to magnetic mineral content and the mineralogy of the formation. After Clark and Emerson (1991), MS varies between 0 and 2000 × 10−5 SI for sandstone and between 20 and 200 × 10−5 SI for clay materials. MS data and point MS data were collected every 2 cm for all three holes at Site U1546. MS values are in very good agreement along the entire profile of Holes U1546A and U1546B (Figure F45C). Values in both holes are mainly constant to ~355 mbsf. Data from Hole U1546C show that MS values increase strongly at the sill/sediment boundary and are constant within the sill (~620–850 SI) to the bottom sill/sediment boundary, where values decrease and show patterns similar to the upper sediment. The portion of the sill with gabbroic texture (~372–381 mbsf) shows some of the highest MS values of ~2100–3160 SI (Figure F45C). Finally, a large singular peak in MS observed at ~393 mbsf shows the highest observed MS value (3582 SI) at Site U1546.
12.5. Sonic velocities
P-wave velocities measured using the WRMSL and Section Half Measurement Gantry (SHMG) calipers for the uppermost sediment are close to seawater velocity at 50–80 mbsf (Figure F45D). WRMSL and SHMG caliper P-wave velocity values between the seafloor and 50 mbsf are of good quality with only a few deviant values. P-wave velocity data collected on recovered cores become problematic on material originating from depths greater than ~100 mbsf. Exsolution of gas from the pore fluid of recovered sediment creates fractures and gaps in the core sections. P-wave velocity measured on cores from 50 to 100 mbsf shows results consistent with the uppermost 50 m of sediments, where aberrant values can be easily detected (WRMSL data). Automatic and manual first-arrival picking on the SHMG caliper was impossible on cores from depths greater than ~100 mbsf because of cracks in the sediments.
P-wave velocities of the borehole formation can be measured from first arrivals sourced and received using the FMS-sonic tool string. The FMS-sonic tool string is lowered below the BHA at ~80 mbsf, so P-wave velocities can only be measured between the end of the BHA and the bottom of the hole.
Here we directly compare P-wave velocities measured in the core laboratory with those from downhole logging (Figure F45D). The results indicate that P-wave velocity measurements made in the core laboratory effectively extend the trend of the P-wave velocity data collected during logging in Hole U1546C to shallower levels.
Seismic velocities suggest a change in lithology at ~356.5 mbsf, which correlates well with the sill/sediment boundary that is strongly expressed in other petrophysical parameters. This change in lithology is particularly apparent in the P-wave velocity signal as an increase from ~1600 to ~5000 m/s between ~356.5 and 430 mbsf, which corresponds to the sill (Figure F45D). At the sill/sediment boundaries (~356.5 and ~430 mbsf), P-wave velocity values are intermediate between the sill and surrounding sediments. Throughout the sill, both P- and S-wave velocities measured with the sonic log tool have higher values that correspond to a doleritic texture. P-wave velocities vary from 5442 to 5870 m/s, and S-wave velocities vary from 2920 to 3140 m/s (Figure F45D). The gabbroic texture shows lower values for P- and S-waves than the doleritic texture (e.g., P-wave velocity = 4122–5065 m/s).
12.6. Formation natural gamma radiation
NGR varies with lithology, resulting in higher NGR counts in sediments rich in clay, silt, and diatom ooze (40–70 counts/s) and lower counts in sand or sandstone (0–25 counts/s) (Russell, 1944). Here we compare five sources of NGR data measured on cores from Holes U1546A–U1546D and downhole measurements collected using the HNGS tool mounted on both the FMS-sonic and triple combo tool strings.
NGR values on whole-round core sections from Holes U1546A–U1546D exhibit an increase from ~10 to 35 counts/s over the upper ~270 m and reach a peak value of ~46 counts/s at 230 mbsf. Below ~270 mbsf, NGR values linearly decrease to ~13 counts/s at ~315 mbsf (Figure F45E).
Over a short 4 m interval between ~315 and 319 mbsf, a large increase of 40 counts/s is observed; values then remain relatively constant at a mean of 45 counts/s over ~35 m between ~319 and 354 mbsf. Similar values ranging around 50 counts/s are observed below the sill between ~437 and 540 mbsf. NGR values inside the sill are very low, between 2 and 5.2 counts/s, compared to values of the sediments around the sill, which range from 40 to 60 counts/s.
The HNGS mounted on both the triple combo and FMS-sonic tool strings measures NGR in the formation. The HNGS detectors estimate concentrations of K (in weight percent), Th (in µg/g [parts per million]), and U (in µg/g) from the characteristic gamma ray energies. An additional NGR sensor was housed in the EDTC. That sensor measures the total NGR emission of the formation, which can be compared directly with measurements from the core laboratory (see Petrophysics in the Expedition 385 methods chapter [Teske et al., 2021a]). Measurements from both tool strings show variation with depth similar to the NGR measurements made on whole-round cores. We also report NGR measurements made using the FMS-sonic tool.
We used the HNGS from the FMS-sonic tool string to compare downhole variation in K, U, and Th with total NGR counts. The linear increase in total HNGS-collected values between 88.67 mbsf (first meaningful value without interference from the drill pipe) and 266 mbsf is well correlated with NGR data measured on whole-round cores (Figure F45E). Three large positive anomalies are observed in each of the NGR data sets at ~142, ~219, and ~229 mbsf. The anomaly at 142 mbsf correlates with concentration peaks in both K and Th, with values of 1 wt% and ~5 ppm, respectively (Figure F46C–F46D). The anomaly at 219 mbsf is characterized by peak values in K of up to ~1 wt% (Figure F46C). The anomaly at 230 mbsf is associated with particularly pronounced U content and shows a peak value of ~7 ppm (Figure F46D).

The overall decreasing trend in NGR counts between 251.7 and 312.1 mbsf is associated with three additional positive anomalies that are particularly well isolated on the U-corrected gamma radiation curve (i.e., U counts subtracted from the total counts), highlighting relatively clay-rich horizons at 251, 267, 286.9, and 306.8 mbsf (Figure F45E). The anomaly at 267 mbsf is primarily due to Th, which shows a peak value at ~10 ppm (highest concentration recorded at Site U1546). The anomaly at 386.9 mbsf is due to combined peak values in K (1 wt%) and Th (~7 ppm). K and U are particularly enriched in the vicinity of the bottom sill contact, and values rise from ~1 to 2.3 wt% K and from ~6 to 9 ppm U between ~432 and 437 mbsf (Figures F46F–F46G).
Gamma ray logging data are consistent with core laboratory measurements made on recovered igneous sill material and provide additional quantitative information on bulk rock composition that can be correlated with textural variations in the sill observed in the recovered cores. The following detailed variations are expressed as depth intervals (in meters) above the bottom contact of the sill, which is identified at ~433 mbsf using the caliper. We sometimes refer to distance from the top contact of the sill, which is inferred from the caliper measurements to be at ~355 mbsf.
An enlarged view of the sill is presented in Figure F46B with a depth indication for the top contact at ~356.5 mbsf and the bottom contact at 430 mbsf, based on FMS imaging data presented below. The data show very homogeneous values between ~3.6 and 6.0 American Petroleum Institute gamma radiation units (gAPI) over the lower ~50 m of the sill, from 50.4 m above the bottom contact (380 mbsf) to just above the bottom contact (430 mbsf). Similarly, near the top contact of the sill, homogeneous values of ~6.4–6.5 gAPI are observed between 360 mbsf (3.5 m inside the sill from the top contact) and 370 mbsf (13.5 m inside the sill from the top contact) (Figure F46B).
Gamma radiation within the sill shows large increases close to the top and bottom contacts. Gamma radiation values average around 5 gAPI within the sill and increase from ~7.2 to ~19 gAPI over the upper 3.5 m of the sill and from ~7.3 to ~42.4 gAPI over the bottom 2.5 m of the sill (Figure F46B). The steep increases in gAPI near the sill/sediment contacts correlate with increases in measured abundance of the elements K, U, and Th. Near the bottom contact, measured K abundance increases from 0.1 to 0.5 wt% over the 3.2 m interval from ~427 mbsf to the bottom sill contact, U increases from ~0.2 ppm at ~429 mbsf (~1 m inside the sill from the bottom contact) to ~3 ppm at the contact, and Th increases from ~0.4 to ~2 ppm over that same 1 m interval (Figure F46C–F46D). Similar increases are observed in the sill near its top contact.
In the interval with gabbroic texture (see Igneous petrology and alteration), between 50.4 and 63.6 m from the bottom contact (~382.5–396.3 mbsf), concentrations of K and U-Th generally increase to maximum values of ~0.4 wt% for K, ~0.4 ppm for U, and ~2 ppm for Th (Figure F46C–F46D). Finally, the peak anomaly in gamma radiation at ~393 mbsf correlates with increases in concentrations of both K (~0.3 wt%) and Th (~1 ppm).
12.7. Borehole diameter (caliper)
Borehole diameter measured using the calipers of the triple combo and FMS-sonic tools provides an indication of formation strength and its response to the artificial erosion associated with drilling operations. Additionally, orthogonal caliper measurements from the FMS-sonic tool provide information on borehole deformation that can be used to make inferences about the present-day stress field (see Petrophysics in the Expedition 385 methods chapter [Teske et al., 2021a]).
Two large portions of Hole U1546C, between ~78 and 207 mbsf and between ~264 and 341 mbsf, had a diameter greater than that of the RCB coring bit at the time of logging. The washed out condition of these intervals is indicated by caliper data from the triple combo tool string, which show no contact of the caliper arm (maximum extent = 40.6 cm) with the borehole wall (Figure F47).
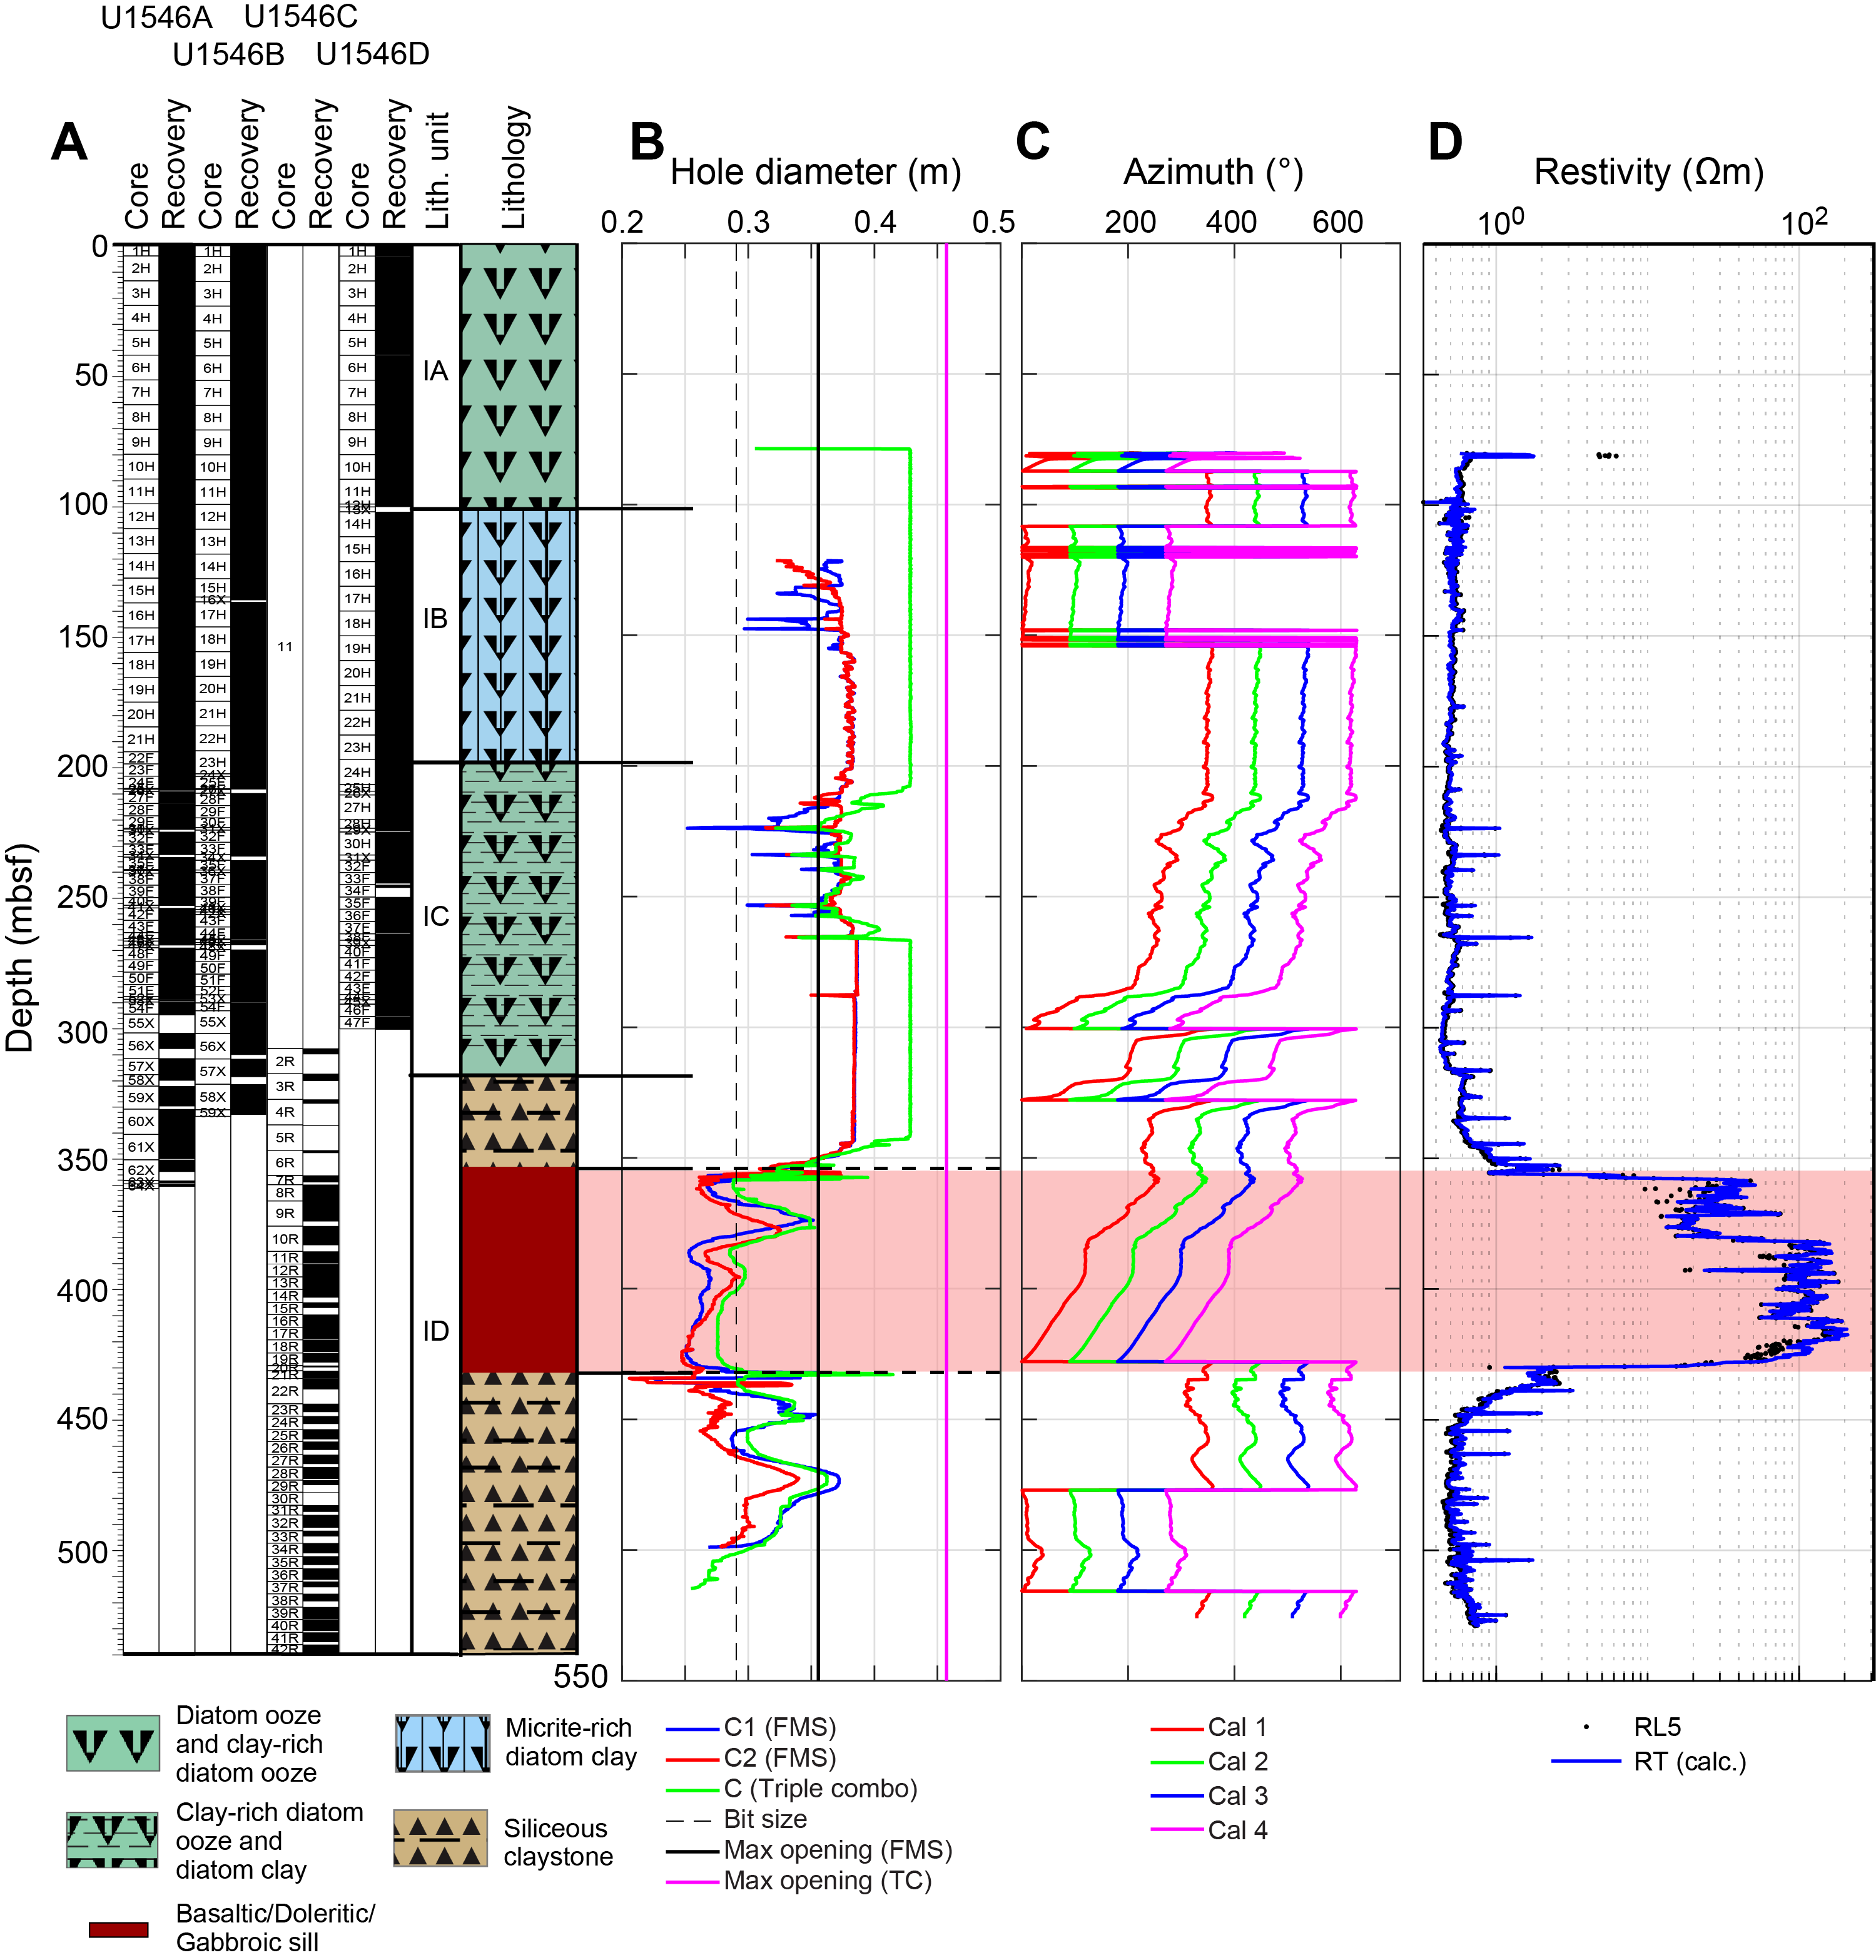
Caliper measurements through the sill show values close to the bit size and are consistent with the formation strength of the sill. The transitions between the indurated sediments found at the top contact (limestone; see Lithostratigraphy) and the sill are identified at 355.5 mbsf for the top contact and 430.8 mbsf for the bottom contact, providing a measurement of 75.3 m sill thickness.
To characterize the borehole geometry, we analyzed caliper data in depth intervals where the azimuths remained constant (Figure F47B). Diameter measurements from the two orthogonal calipers of the FMS-sonic tool indicate an elliptic shape of the borehole with a C2 calorimeter diameter measurement greater than C1 between ~380 and ~400 mbsf (i.e., ~30 m from the bottom of the sill). The fixed orientation of the calipers in this interval indicates a long-axis orientation at an azimuth of 30° (Figure F47A–F47B). A similar caliper decoupling is observed in the sediment below the sill at 439–455 mbsf, where the C1 axis shows a greater value than the bit size and the C2 axis remains below the bit size value.
12.8. Rheology
Reported shear strength measurements are from Hole U1546A, and reported data of compressive strength are from Holes U1546A and U1546D.
Shear strength measurements (Figure F45F) on working-half sections from Site U1546 show a linear increase from 24 kPa just below the seafloor (~2.3 mbsf) to ~97 kPa at ~161 mbsf.
Compressive strength (Figure F45F) measured by the pocket penetrometer shows a linear increase from ~1.8 kPa at the subseafloor to a maximum of ~100 kPa at ~58 mbsf. After a drop to 46 kPa at 67.5 mbsf, compressive strength increases to ~196 kPa at ~94 mbsf. Between ~100 and 200 mbsf, compressive strength increases linearly to a maximum value of 382.5 kPa. The interval 200–260 mbsf is marked by a general increase and decrease of the compressive strength with a maximum value of ~441 kPa measured at ~237 mbsf and minimum values of 225–245 kPa above 205 mbsf and below 250 mbsf (values are from Hole U1546A). Between ~266 and ~300 mbsf, compressive strength varies between 171 and 490 kPa. Note that all compressive strength values reported in the text have been converted into shear strength in the corresponding illustration, which is half of the compressive strength (see Petrophysics in the Expedition 385 methods chapter [Teske et al., 2021a]).
Compared to measurements from Site U1545 (see Figure F41F in the Site U1545 chapter [Teske et al., 2021b]), rheological values (notably compressive strength) are generally higher at Site U1546 (Figure F45F). The trend lines of shear and compressive strengths intersect at both sites at ~50 mbsf. This depth indicates the depth beyond which compressive strength measurements become reliable (see Petrophysics in the Expedition 385 methods chapter [Teske et al., 2021a]). Between 50 and 150 mbsf, compressive and shear strength have a greater increase with depth at Site U1546 than at Site U1545. Compressive strength increases at a rate of 1.1 kPa/m at Site U1546 and only increases by 1.0 kPa/m at Site U1545. Shear strength increases by 0.6 kPa/m at Site U1546 and only increases by 0.14 kPa/m at Site U1545.
12.9. Porosity
Porosity derived from MAD measurements on sediments from Hole U1546B shows a near-constant value of 90% over the upper 60 m and then a linear decrease with depth from 90% to 73% at ~309 mbsf (Figure F45G). This observation contrasts with the porosity variations observed in the uppermost 100 m at Site U1545. Two measurements with significantly lower porosity (and corresponding high density) at 25 and 44 mbsf stand out from the general trend observed in the upper 100 m in Hole U1546A. No obvious changes in the sediments are observed in the clay-rich diatom ooze deposited at these shallow depths (see Lithostratigraphy). A negative porosity anomaly of 15% found at ~268 mbsf stands out from the overall background porosity of 70%–75% at these depths (Figure F45G). In contrast to the previous shallow porosity anomalies, this anomaly corresponds to one of the first sampled occurrences of micrite at Site U1546. First occurrences of limestone are also observed at these depths, which might explain some of the higher density values measured using GRA and the triple combo tool string.
A significant decrease in sediment porosity is observed at the top and bottom contacts with the sill. Sediments at both contacts have a measured porosity of ~40% at ~347 and ~434 mbsf (Figure F45G). These measurements are only 2 and 3 m distant from the top and bottom contacts, respectively. Porosity below the sill between ~450 and ~537 mbsf (deepest part of Hole U1546C) evolves from 58% to 44%.
Porosity inside the sill is variable in the upper 32 m and constant in the lower 45 m. In the upper ~32 m of the sill, porosity generally correlates with the transition from doleritic to gabbroic textures (see Igneous petrology and alteration) and shows a maximum value of 12.2% at 372 mbsf (Figure F45G). Porosity in the lower 45 m of the sill is uniform at ~3.4%.
12.10. Resistivity
The resistivity log is composed of five resistivity measurements (RLT1–RLT5) at increasing depths of investigation into the borehole walls: 0.25, 0.51, 0.76, 1.52, and 2.29 m. Two curves are calculated from these values: a true resistivity (RT) curve of the hole, which is always the closest value to the deepest measurements, and resistivity of the borehole fluids (RM).
Because it is least affected by the borehole fluids infiltrating the formation, the deepest depth of investigation, RLT5, is used here to describe variations of resistivity with depth. Resistivity measurements show large relative variations of 0.4 to ~200 Ωm (Figure F47D) that typically correlate with variation in density and porosity. Several notable resistivity variations relative to the background value of ~0.5 Ωm are observed:
- ~100 to ~320 mbsf: relative variations range from 0.5 to 1.7 Ωm.
- ~320 to ~355 mbsf: resistivity increases up to 1.5 Ωm.
- ~355 to ~430 mbsf (sill): high resistivity up to 200 Ωm.
- ~430 mbsf downward: decrease in resistivity to 0.5 Ωm.
Resistive layers are correlated with NGR peak values that coincide with more clay-rich sediment. Within the sill, NGR values decrease and resistivity reaches its highest values.
Resistivity variations inside the sill are correlated with the main textural variations observed (doleritic and gabbroic) (Figure F47D). From the lower sill/sediment boundary to ~381 mbsf (52 m into the sill), resistivity ranges between 47 and 170 Ωm. The main gabbroic texture observed between ~372 and 381 mbsf shows a relative decrease in resistivity to values ranging from 13.5 to 25.8 Ωm. Finally, localized anomalously low resistivity down to 17.7 Ωm was observed at 393 mbsf.
12.11. Downhole Formation MicroScanner resistivity imaging
The FMS resistivity images acquired in Hole U1546C reveal many geological features (Figures F48, F49), most of which require further onshore processing and analysis before quantitative geological interpretations can be made. The enlarged borehole to ~208 mbsf and between ~267 and 340 mbsf resulted in poor contact between the FMS pads and the surrounding formation. Good contact was achieved between ~208 and 267 mbsf, and excellent contact was achieved between ~340 and 514 mbsf (Figure F45A). The results of the formation imaging using dynamic FMS scaling are illustrated in Figure F49. A visual inspection of the preliminarily processed images shows variability in the background rock mass that reflects variations in the host rock texture. The boundary between the sill and the sediment is clearly visible on the static FMS scaling, and a horizontal plane contrasts the high resistivity of the sill (white) with the conductive contact (dark), which places the contacts between 356.5 (top contact) and 430 mbsf (bottom contact) (Figure F48).
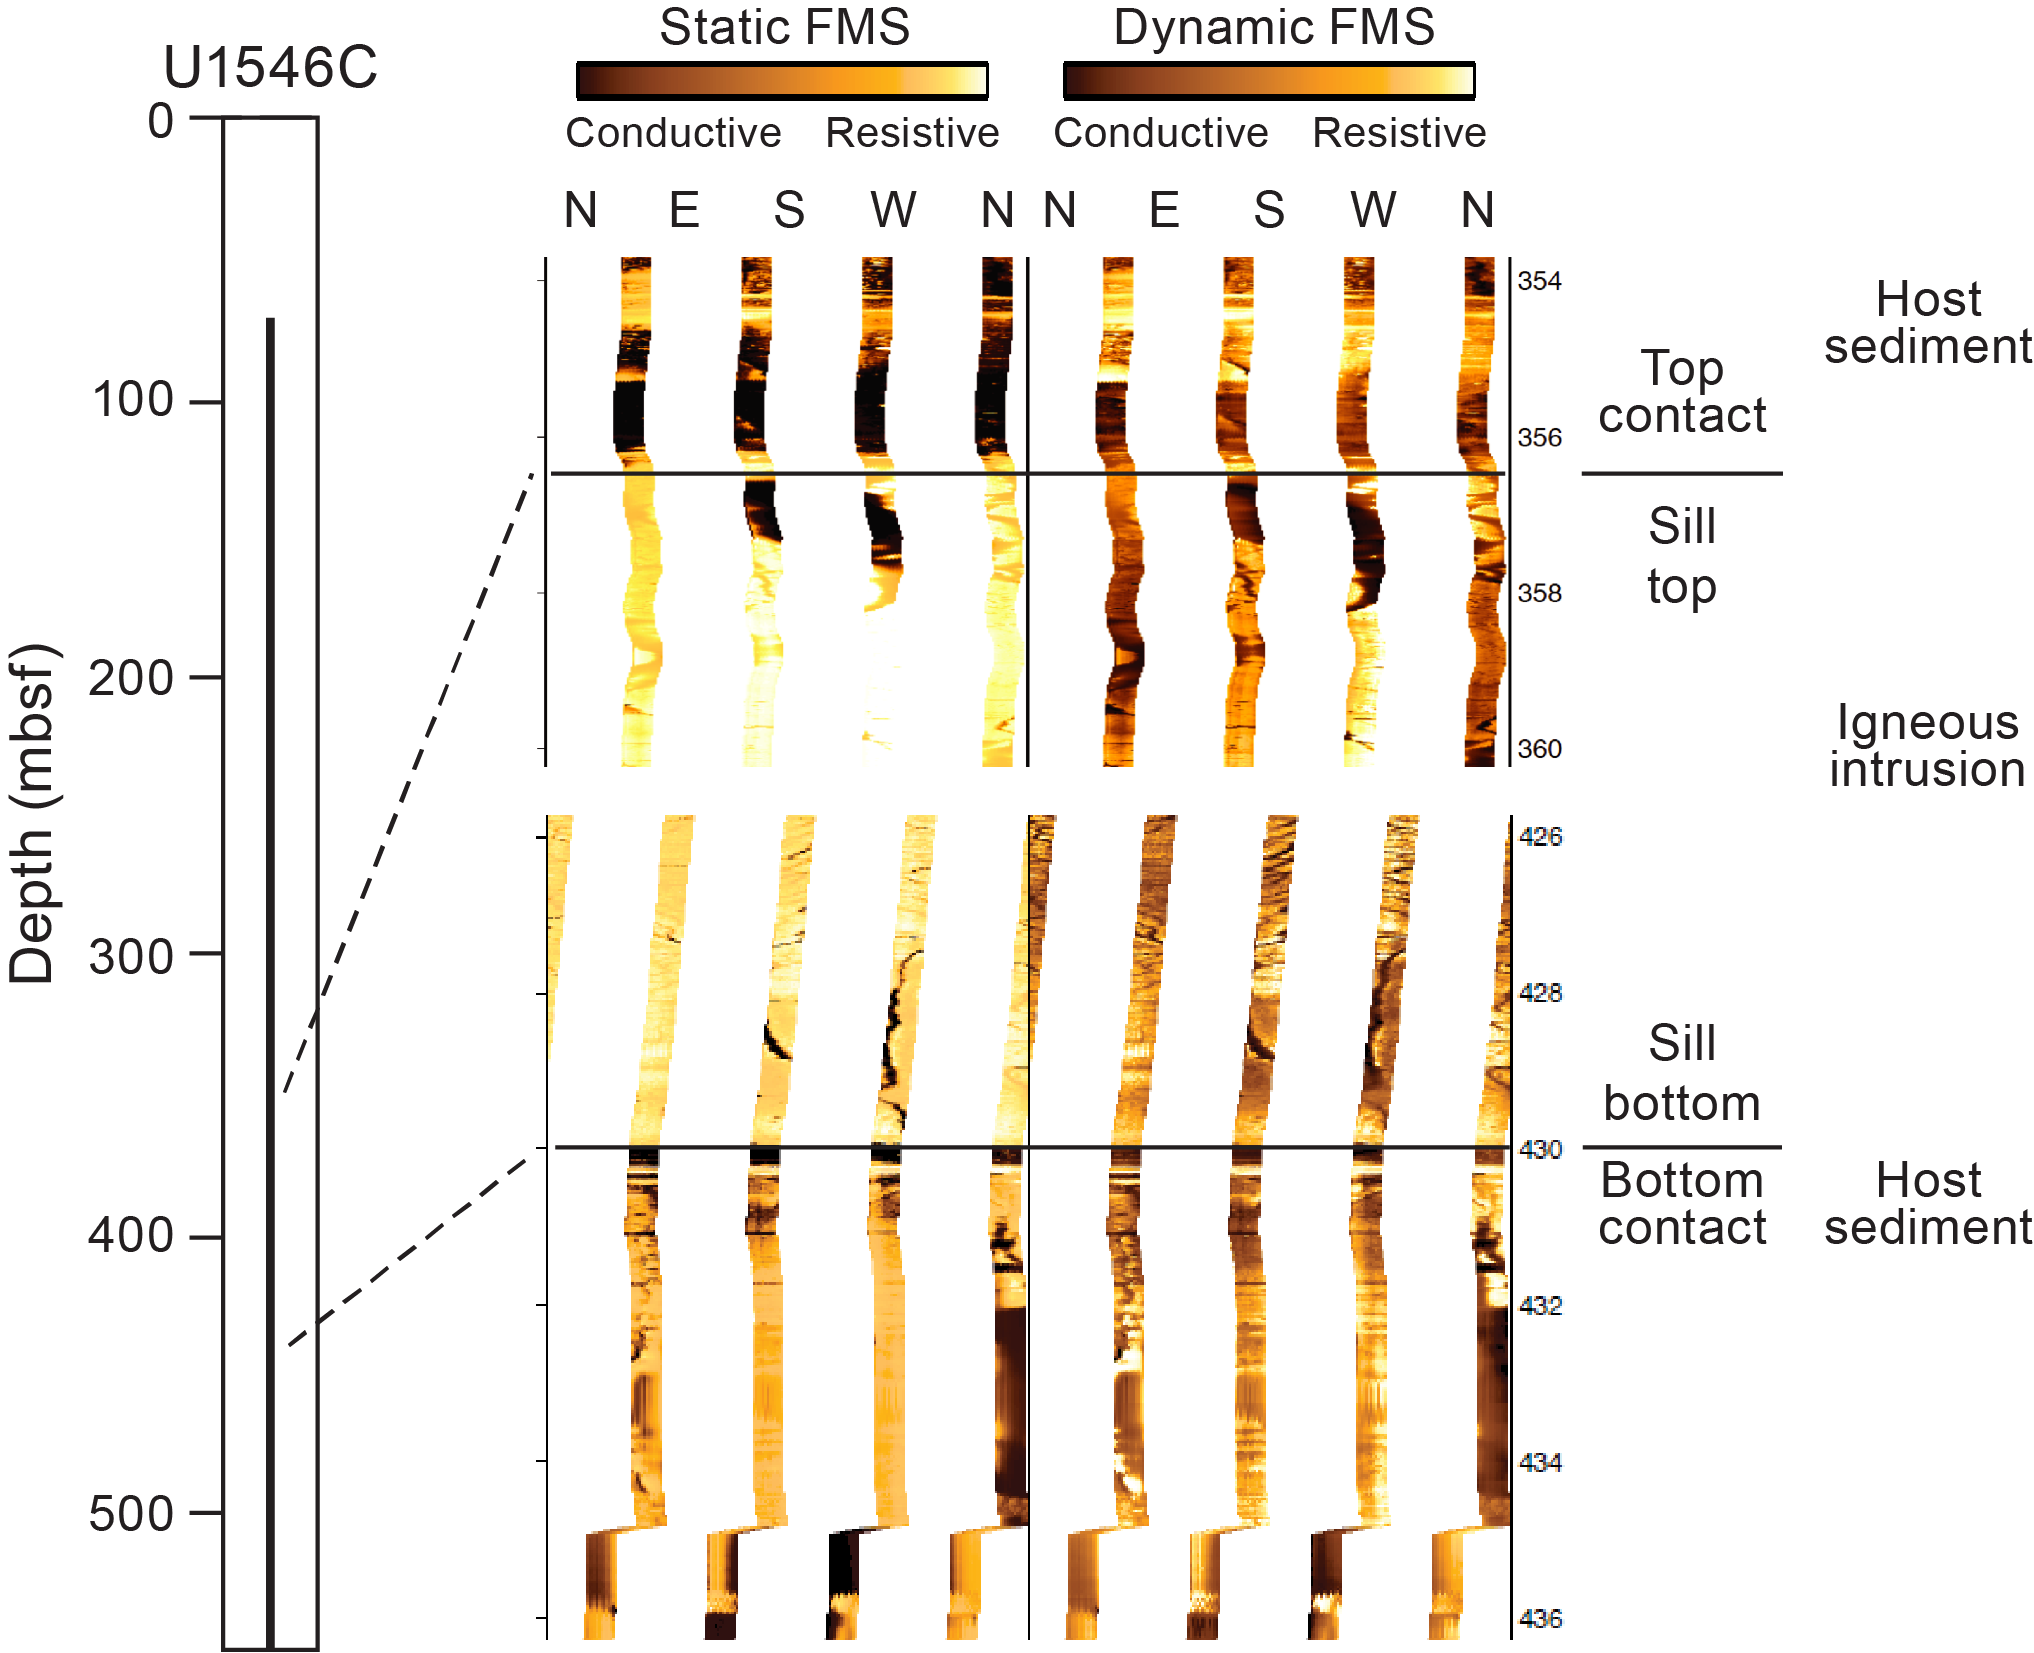

12.12. Data integration and lithology correlation
We identified four main depth intervals that relate to specific lithostratigraphic units: 0–320, ~320–355, ~355–430, and ~430–550 mbsf. The shallowest interval corresponds to Lithostratigraphic Subunits IA–IC, which consist of loosely consolidated sediment with gradually increasing compaction with depth, as indicated by the general increase in density and decrease in porosity. Within this interval, we observe increases in gamma radiation, density, rheology, thermal conductivity, and P-wave velocity and a decrease in porosity values.
The second depth interval (~320–355 mbsf) is defined by a steeper increase in density, higher plateau values in NGR and thermal conductivity, increasing resistivity and P-wave velocity, and a steeper decrease in porosity. Rheology measurements were obtained to ~300 mbsf. This interval is associated with the upper part of Lithostratigraphic Subunit ID, which is dominated by siliceous claystone.
The third interval (~355–430 mbsf) is characterized by large increases in density, thermal conductivity, P-wave velocity, MS, and resistivity. Gamma radiation counts and porosity have the lowest values. This interval corresponds to the sill within Lithostratigraphic Subunit ID, which shows varying magmatic textures from fine-grained basaltic and medium-grained doleritic to coarse-grained gabbroic (see Igneous petrology and alteration). The detailed petrophysical variations observed in the sill (Figure F45) show good correlations with the different textural units of this intrusion, clearly outlining those textural units. The final interval (~430–550 mbsf) shows an increase in gamma radiation counts and porosity values, and density, thermal conductivity, MS, P-wave velocity, and resistivity decrease. The lower part of Subunit ID is associated with this interval and is characterized by siliceous claystone.
References
Arason, P., and Levi, S., 2010. Maximum likelihood solution for inclination-only data in paleomagnetism. Geophysical Journal International, 182(2):753–771. https://doi.org/
Berner, R.A., 1982. Burial of organic carbon and pyrite sulfur in the modern ocean; its geochemical and environmental significance. American Journal of Science, 282(4):451–473. https://doi.org/
Clark, D.A., and Emerson, J.B., 1991. Notes on rock magnetization characteristics in applied geophysical studies. Exploration Geophysics, 22(3):547–555. https://doi.org/
Goldhaber, M.B., and Kaplan, I.R., 1974. The sulfur cycle. In Goldberg, E.D. (Ed.), The Sea (Volume 5): Marine Chemistry: New York (Wiley), 569–655.
Kastner, M., and Gieskes, J.M., 1976. Interstitial water profiles and sites of diagenetic reactions, Leg 35, DSDP, Bellingshausen Abyssal Plain. Earth and Planetary Science Letters, 33(1):11–20. https://doi.org/
Katz, B., Elmore, R.D., and Engel, M.H., 1998. Authigenesis of magnetite in organic-rich sediment next to a dike: implications for thermoviscous and chemical remagnetizations. Earth and Planetary Science Letters, 163(1):221–234. https://doi.org/
Kirschvink, J.L., 1980. The least-squares line and plane and the analysis of palaeomagnetic data. Geophysical Journal International, 62(3):699–718. https://doi.org/
Le Bas, M.J., Le Maitre, R.W., Streickeisen, A., and Zanettin, B., and the IUGS Subcommission on the Systematics of Igneous Rocks, 1986. A chemical classification of volcanic rocks based on the total alkali-silica diagram. Journal of Petrology, 27(3):745–750. https://doi.org/
Levi, S., and Karlin, R., 1989. A sixty thousand year paleomagnetic record from Gulf of California sediments: secular variation, late Quaternary excursions and geomagnetic implications. Earth and Planetary Science Letters, 92(2):219–233. https://doi.org/
Martini, E., 1971. Standard Tertiary and Quaternary calcareous nannoplankton zonation. In McKee, E.D. and Weir, G.W. (Ed.), Trace Elements Investigations Report, 269: Washington, DC (US Department of the Interior). https://doi.org/
McDougall, K., and Martínez, A.Y.M., 2014. Evidence for a marine incursion along the lower Colorado River corridor. Geosphere, 10(5):842–869. https://doi.org/
Meyers, P.A., 1994. Preservation of elemental and isotopic source identification of sedimentary organic matter. Chemical Geology, 114(3–4):289–302. https://doi.org/
Pimmel, A., and Claypool, G., 2001. Introduction to shipboard organic geochemistry on the JOIDES Resolution. Ocean Drilling Program Technical Note, 30. https://doi.org/
Prell, W.L., Niitsuma, N., et al., 1989. Proceedings of the Ocean Drilling Program, Initial Reports, 117: College Station, TX (Ocean Drilling Program). https://doi.org/
Raznjevic, K., 1976. Handbook of Thermodynamic Tables and Charts: Washington, DC (Hemisphere Publishing Corporation).
Richter, C., Acton, G., Endris, C., and Radsted, M., 2007. Handbook for shipboard paleomagnetists. Ocean Drilling Program Technical Note, 34. https://doi.org/
Russell, W.L., 1944. The total gamma ray activity of sedimentary rocks as indicated by Geiger counter determinations. Geophysics, 9(2):180–216. https://doi.org/
Shervais, J.W., 1982. Ti-V plots and the petrogenesis of modern and ophiolitic lavas. Earth and Planetary Science Letters, 59(1):101–118. https://doi.org/
Teske, A., Lizarralde, D., Höfig, T.W., Aiello, I.W., Ash, J.L., Bojanova, D.P., Buatier, M.D., Edgcomb, V.P., Galerne, C.Y., Gontharet, S., Heuer, V.B., Jiang, S., Kars, M.A.C., Khogenkumar Singh, S., Kim, J.-H., Koornneef, L.M.T., Marsaglia, K.M., Meyer, N.R., Morono, Y., Negrete-Aranda, R., Neumann, F., Pastor, L.C., Peña-Salinas, M.E., Pérez Cruz, L.L., Ran, L., Riboulleau, A., Sarao, J.A., Schubert, F., Stock, J.M., Toffin, L.M.A.A., Xie, W., Yamanaka, T., and Zhuang, G., 2021a. Expedition 385 methods. In Teske, A., Lizarralde, D., Höfig, T.W., and the Expedition 385 Scientists, Guaymas Basin Tectonics and Biosphere. Proceedings of the International Ocean Discovery Program, 385: College Station, TX (International Ocean Discovery Program).
https://doi.org/
Teske, A., Lizarralde, D., Höfig, T.W., Aiello, I.W., Ash, J.L., Bojanova, D.P., Buatier, M.D., Edgcomb, V.P., Galerne, C.Y., Gontharet, S., Heuer, V.B., Jiang, S., Kars, M.A.C., Khogenkumar Singh, S., Kim, J.-H., Koornneef, L.M.T., Marsaglia, K.M., Meyer, N.R., Morono, Y., Negrete-Aranda, R., Neumann, F., Pastor, L.C., Peña-Salinas, M.E., Pérez Cruz, L.L., Ran, L., Riboulleau, A., Sarao, J.A., Schubert, F., Stock, J.M., Toffin, L.M.A.A., Xie, W., Yamanaka, T., and Zhuang, G., 2021b. Site U1545. In Teske, A., Lizarralde, D., Höfig, T.W., and the Expedition 385 Scientists, Guaymas Basin Tectonics and Biosphere. Proceedings of the International Ocean Discovery Program, 385: College Station, TX (International Ocean Discovery Program). https://doi.org/
Teske, A., Lizarralde, D., Höfig, T.W., and the Expedition 385 Scientists, 2021c. Supplementary material,
https://doi.org/
Thunell, R., Pride, C., Tappa, E., and Muller-Karger, F., 1993. Varve formation in the Gulf of California: insights from time series sediment trap sampling and remote sensing. Quaternary Science Reviews, 12(6):451–464. https://doi.org/
Thunell, R.C., 1998. Seasonal and annual variability in particle fluxes in the Gulf of California: a response to climate forcing. Deep Sea Research Part I: Oceanographic Research Papers, 45(12):2059–2083. https://doi.org/
Tomaru, H., Lu, Z., Snyder, G.T., Fehn, U., Hiruta, A., and Matsumoto, R., 2007. Origin and age of pore waters in an actively venting gas hydrate field near Sado Island, Japan Sea: interpretation of halogen and 129I distributions. Chemical Geology, 236(3):350–366. https://doi.org/
von Breymann, M.T., Brumsack, H.-J., and Emeis, K.C., 1992. Depositional and diagenetic behavior of barium in the Japan Sea. In Pisciotto, K.A., Ingle, J.C., Jr., Von Breymann, M., Barron, J., et al., Proceedings of the Ocean Drilling Program, Scientific Results, 127/128, Pt. 1: College Station, TX (Ocean Drilling Program), 651–665. https/doi.org/
von Breymann, M.T., Emeis, K.-C., and Camerlenghi, A., 1990. Geochemistry of sediments from the Peru upwelling area: results from Sites 680, 682, 685, and 688. In Suess, E., von Huene, R., et al., Proceedings of the Ocean Drilling Program, Scientific Results,112: College Station, TX (Ocean Drilling Program), 491–503. https://doi.org/
Wefer, G., Berger, W.H., Richter, C., et al., 1998. Proceedings of the Ocean Drilling Program, Initial Reports, 175: College Station, TX (Ocean Drilling Program). https://doi.org/
Zijderveld, J.D.A., 1967. AC demagnetization of rocks: analysis of results. In Runcorn, S.K.C., Creer, K.M., and Collinson, D.W. (Eds.), Methods in Palaeomagnetism: Amsterdam (Elsevier), 254–286.