Strasser, M., Ikehara, K., Everest, J., and the Expedition 386 Scientists
Proceedings of the International Ocean Discovery Program Volume 386
publications.iodp.org
https://doi.org/10.14379/iodp.proc.386.104.2023
Sites M0092 and M0095 (Basin S2)1
![]() M. Strasser,
M. Strasser,
![]() K. Ikehara,
K. Ikehara,
![]() J. Everest,
J. Everest,
![]() L. Maeda,
L. Maeda,
![]() K. Hochmuth,
K. Hochmuth,
![]() H. Grant,
H. Grant,
![]() M. Stewart,
M. Stewart,
![]() N. Okutsu,
N. Okutsu,
![]() N. Sakurai,
N. Sakurai,
![]() T. Yokoyama,
T. Yokoyama,
![]() R. Bao,
R. Bao,
![]() P. Bellanova,
P. Bellanova,
![]() M. Brunet,
M. Brunet,
![]() Z. Cai,
Z. Cai,
![]() A. Cattaneo,
A. Cattaneo,
![]() K.-H. Hsiung,
K.-H. Hsiung,
![]() J.-J. Huang,
J.-J. Huang,
![]() T. Ishizawa,
T. Ishizawa,
![]() T. Itaki,
T. Itaki,
![]() K. Jitsuno,
K. Jitsuno,
![]() J.E. Johnson,
J.E. Johnson,
![]() T. Kanamatsu,
T. Kanamatsu,
![]() M. Keep,
M. Keep,
![]() A. Kioka,
M. Kölling,
A. Kioka,
M. Kölling,
![]() M. Luo,
M. Luo,
![]() C. März,
C. März,
![]() C. McHugh,
C. McHugh,
![]() A. Micallef,
A. Micallef,
![]() Y. Nagahashi,
Y. Nagahashi,
![]() D.K. Pandey,
D.K. Pandey,
![]() J.-N. Proust,
J.-N. Proust,
![]() E.T. Rasbury,
E.T. Rasbury,
![]() N. Riedinger,
N. Riedinger,
![]() Y. Satoguchi,
Y. Satoguchi,
![]() D.E. Sawyer,
D.E. Sawyer,
![]() C. Seibert,
C. Seibert,
![]() M. Silver,
M. Silver,
![]() S.M. Straub,
S.M. Straub,
![]() J. Virtasolo,
J. Virtasolo,
![]() Y. Wang,
Y. Wang,
![]() T.-W. Wu, and
T.-W. Wu, and
![]() S.D. Zellers2
S.D. Zellers2
1 Strasser, M., Ikehara, K., Everest, J., Maeda, L., Hochmuth, K., Grant, H., Stewart, M., Okutsu, N., Sakurai, N., Yokoyama, T., Bao, R., Bellanova, P., Brunet, M., Cai, Z., Cattaneo, A., Hsiung, K.-H., Huang, J.-J., Ishizawa, T., Itaki, T., Jitsuno, K., Johnson, J.E., Kanamatsu, T., Keep, M., Kioka, A., Kölling, M., Luo, M., März, C., McHugh, C., Micallef, A., Nagahashi, Y., Pandey, D.K., Proust, J.-N., Rasbury, E.T., Riedinger, N., Satoguchi, Y., Sawyer, D.E., Seibert, C., Silver, M., Straub, S.M., Virtasalo, J., Wang, Y., Wu, T.-W., and Zellers, S.D., 2023. Sites M0092 and M0095 (Basin S2). In Strasser, M., Ikehara, K., Everest, J., and the Expedition 386 Scientists, Japan Trench Paleoseismology. Proceedings of the International Ocean Discovery Program, 386: College Station, TX (International Ocean Discovery Program). https://doi.org/10.14379/iodp.proc.386.104.2023
2 Expedition 386 Scientists’ affiliations.
1. Operations
During Expedition 386, a total of three Giant Piston Corer (GPC) system deployments in Basin S2 in the central area of the southern Japan Trench (Figure F1) resulted in the recovery of cores from four holes at Site M0092 and two at Site M0095 (Figure F2). The water depth was between 7697 and 7702 meters below sea level (mbsl). A breakdown of operational time is reported weekly instead of daily (see OPS in Supplementary material) due to decisions to move between sites based on weather and current conditions. Holes at Sites M0092 and M0095 were acquired during Weeks 6 and 7 of the offshore phase. In total, 98 m of cores (Table T1) and 34 km of hydroacoustic profiles (see Hydroacoustics) were recovered and acquired, respectively, in this focus area. Further operations details, including winch log and inclinometer information, are found for all sites in Coring methodology in the Expedition 386 methods chapter (Strasser et al., 2023a) and associated files (see PALEOMAG and WINCHLOGS in Supplementary material).
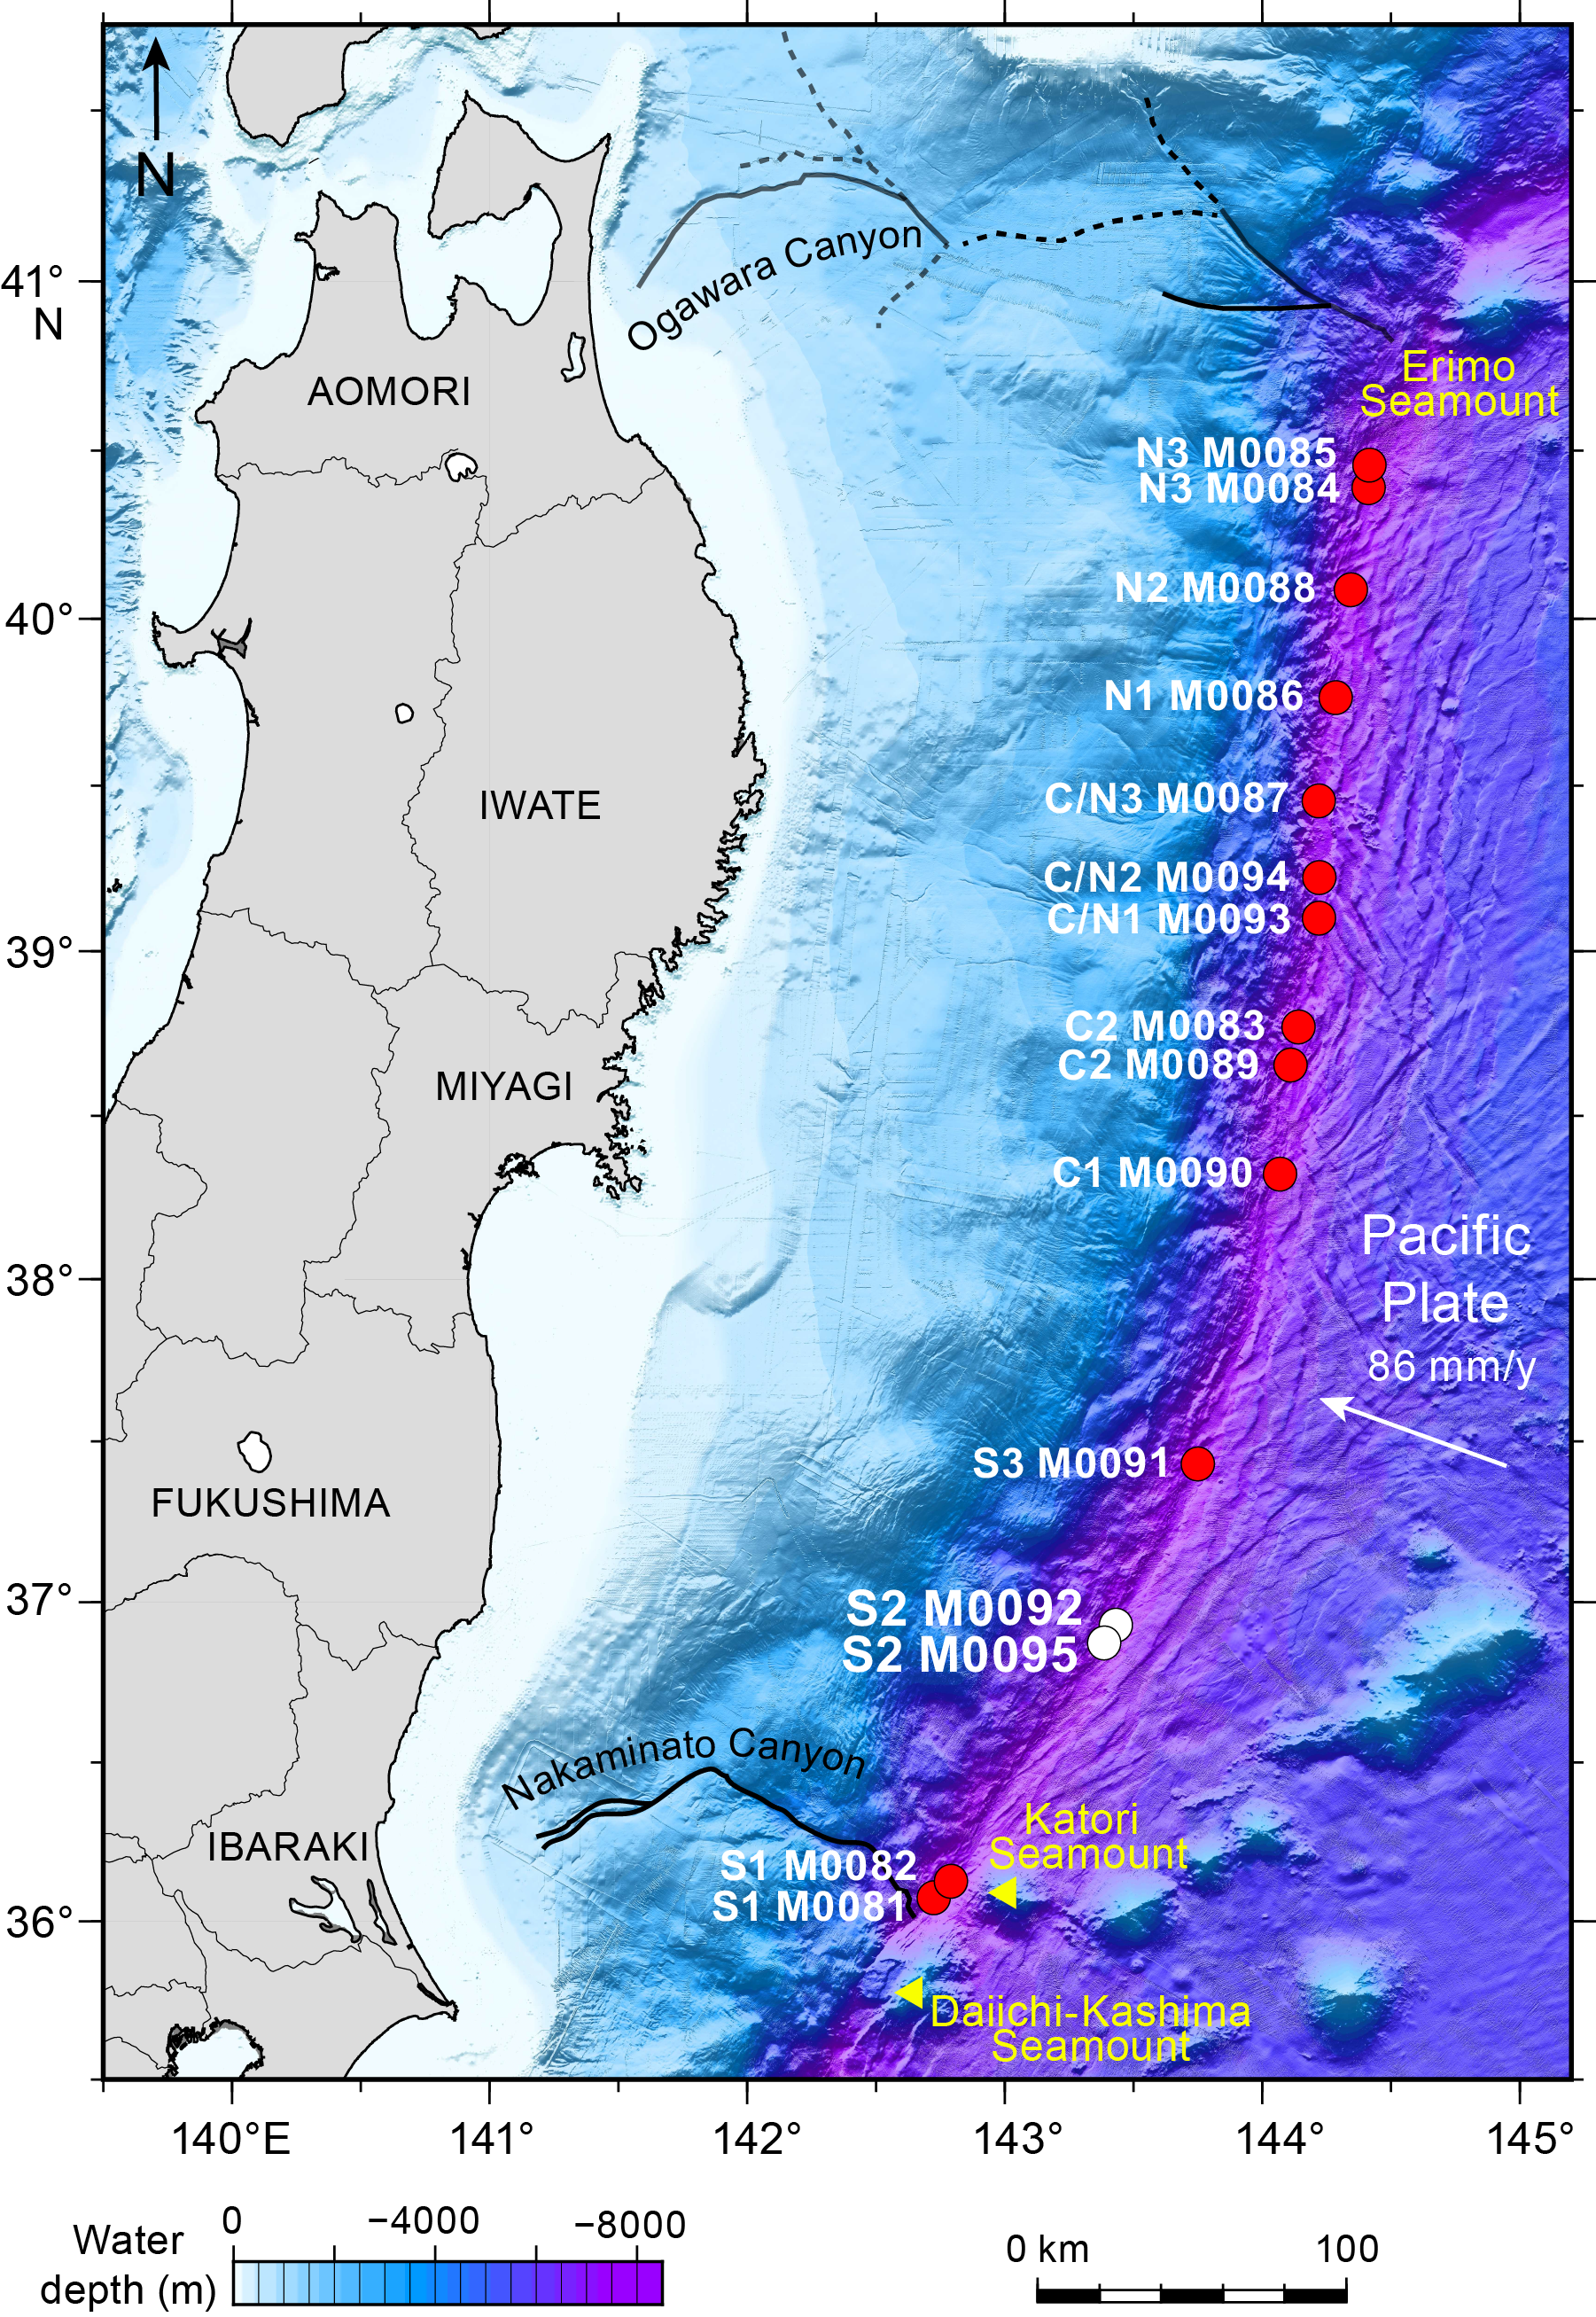
Figure F1. Site map.

Figure F2. Sites M0092 and M0095.
The main site-specific scientific objectives for Basin S2 were as follows:
- Recover two continuous Holocene stratigraphic successions from the coupled Sites M0092 and M0095, which previous subbottom profiling site survey data suggests have either relatively expanded or condensed sections in the upper part and more condensed or expanded sections in the lower part, respectively, comprising event deposits from an isolated trench basin in the central part of the southern Japan Trench (see Site selection and coring strategy in the Expedition 386 summary chapter [Strasser et al., 2023b]; Strasser et al., 2019).
- Analyze the stratigraphic pattern and event deposit characteristics of each site and integrate them with its coupled site to establish robust stratigraphic pattern recognition of proxy evidence for earthquakes.
- Generate results for comparison with those from all other Expedition 386 sites to explore spatiotemporal distribution of event deposits to eventually develop a long-term record for giant earthquakes.
1.1. Operations summary
The R/V Kaimei arrived at Site M0092 at 0515 h on 24 May 2021 with good conditions (wind <4 m/s, wave heights <1 m, and a <1.2 kt current). GPC operations started in Holes M0092A and M0092B with a 30 m GPC barrel string at 0800 h. The GPC system was recovered on deck at 1430 h. The deck crew and GPC operation team withdrew the core from the GPC assembly and cut it into 5 m segments. The Science Party cut the core into 1 m sections from 1500 to 1630 h. The 40 m GPC was assembled at 2015 h, when multibeam echo sounder/subbottom profiler (MBES/SBP) surveying also commenced. Surveying finished at 0145 h on 25 May.
Conditions on the morning of 25 May were warm with winds <8 m/s, wave height at 1.5 m, and a 1.2 kt current. GPC operations started in Holes M0092C and M0092D with a 40 m GPC barrel string at 0800 h. The GPC system was recovered on deck at 1415 h. The deck crew and GPC operation team withdrew the core from the GPC assembly and cut it into 5 m segments. The Science Party cut the core into 1 m sections from 1445 to 1630 h. At 1715 h, the ship set sail to Sendai for the medical evacuation of a scientist.
The ship arrived at Site M0095 at 0730 h on 30 May, and a short MBES/SBP survey was conducted. Conditions were warm, with winds around 6 m/s, wave height at 2 m, and a 2 kt current in the morning decreasing to 1 kt in the afternoon. GPC operations started in Holes M0095A and M0095B with a 30 m GPC barrel string at 0815 h. The GPC system was recovered on deck at 1415 h. The deck crew and GPC operation team withdrew the core from the GPC assembly and cut it into 5 m segments. The Science Party cut the core into 1 m sections from 1500 to 1645 h. The GPC barrel string was disconnected from the weighthead, washed, and secured at 1730 h, which marked the completion of coring operations for Expedition 386. The ship then set sail for Yokosuka Japan Agency for Marine-Earth Science and Technology (JAMSTEC) headquarters.
1.2. Site M0092
1.2.1. Holes M0092A and M0092B
Holes M0092A and M0092B were cored on 24 May 2021. Preparations for running the 30 m barrel string GPC were completed at 0800 h, and the GPC was run into the water at 0850 h. An inclinometer was set on the winch cable 20 m above the trigger arm of the GPC and on the GPC assembly (see Figure F4 in the Expedition 386 methods chapter [Strasser et al., 2023a]). Winch speed was set at 1.0 m/s. At 1110 h, running the GPC down was paused at a cable length of 7800 m for stabilization and monitoring the GPC position and resumed after 3 min at a winch speed of 0.3 m/s. Spud-in commenced at 11:25:39 h and ended at 11:25:42 h at a cable length of 7953 m. Recovery commenced, and the cable tension rose to 2870 kgf at 12:25:45 h before dropping to 1939 kgf and then rising again to a maximum of 8345 kgf at 12:26:49 h. It dropped to 7097 kgf at 12:26:45 h, indicating the corer was clear of the seabed (see WINCHLOGS in Supplementary material). Inclinometer data for Hole M0092B show the piston corer barrel was rotated clockwise by 139.8° at the estimated seabed, with an east–west dip of 0.99° and a north–south dip of 0.56° (see Figure F5 in the Expedition 386 methods chapter [Strasser et al., 2023a]). The GPC was run back to the surface at a winch speed of 1.0 m/s. The trigger corer and GPC were recovered to deck at 1405 and 1430 h, respectively. The trigger core and GPC core from Holes M0092A and M0092B have a total length of 1.1 m (2 sections) and 30.07 m (31 sections), respectively.
1.2.2. Holes M0092C and M0092D
Holes M0092C and M0092D were cored on 25 May 2021. Preparations for running the 40 m barrel string GPC were completed at 0800 h, and the GPC was run into the water at 0850 h. The inclinometer was set on the winch cable 20 m above the trigger arm of the GPC and on the GPC assembly (see Figure F4 in the Expedition 386 methods chapter [Strasser et al., 2023a]). Winch speed was set at 1.0 m/s. At 1105 h, running the GPC down was paused at a cable depth of 7800 m for stabilization and monitoring the GPC position and resumed after 3 min at a winch speed of 0.3 m/s. Spud-in commenced at 11:13:48 h and ended at 11:13:51 h at a cable length of 7932 m. Recovery commenced, and the cable tension rose to 1846 kgf at 11:13:56 h before dropping to 1660 kgf and then rising again to a maximum of 8345 kgf at 11:26:49 h. It dropped to 7097 kgf at 11:26:55 h, indicating the corer was clear of the seabed (see WINCHLOGS in Supplementary material). Inclinometer data for Hole M0092D show the piston corer barrel was rotated counterclockwise by 195.1° at the estimated seabed, with an east–west dip of 0.21° and a north–south dip of −1.69° (see Figure F5 in the Expedition 386 methods chapter [Strasser et al., 2023a]). The GPC was run back to the surface at a winch speed of 1.0 m/s. The trigger corer and GPC were recovered on deck at 1330 and 1415 h, respectively. The trigger core and GPC core from Holes M0092C and M009D have a total length of 0.785 m (2 sections) and 36.205 m (36 sections), respectively.
1.3. Site M0095
1.3.1. Holes M0095A and M0095B
Holes M0095A and M0095B were cored on 30 May 2021. Preparations for running the 30 m barrel string GPC were completed at 0815 h, and the GPC was run into the water at 0910 h. The inclinometer was set on the winch cable 20 m above the trigger arm of the GPC and on the GPC assembly (see Figure F4 in the Expedition 386 methods chapter [Strasser et al., 2023a]). Winch speed was set at 1 m/s. At 1120 h, running the GPC down was paused at a cable length of 7800 m for stabilization and monitoring the GPC position and resumed after 3 min at a winch speed of 0.3 m/s. Spud-in commenced at 11:31:55 h and ended at 11:31:57 h at a cable length of 7949 m. Recovery commenced, and the cable tension rose to 2367 kgf at 11:32:01 h before dropping to 1734 kgf and then rising again to a maximum of 8308 kgf at 11:32:53 h. It dropped to 6855 kgf at 11:33:03 h, indicating the corer was clear of the seabed (see WINCHLOGS in Supplementary material). Inclinometer data for Hole M0095B show the piston corer barrel was rotated counterclockwise by 317.7° at the estimated seabed, with an east–west dip of 0.55° and a north–south dip of −2.13° (see Figure F5 in the Expedition 386 methods chapter [Strasser et al., 2023a]). The GPC was run back to the surface at a winch speed of 1.2 m/s. The trigger corer and GPC were recovered on deck at 1335 and 1410 h, respectively. The trigger core and GPC core from Holes M0095A and M0095B have a total length of 0.895 m (2 sections) and 28.345 m (29 sections), respectively.
2. Hydroacoustics
Sites M0092 and M0095 lie in Basin S2 in the southern Japan Trench. The grid of eight acquired SBP lines includes four trench-perpendicular lines oriented east–west and four lines approximately trench-parallel that trend north-northeast or northeast (Figure F3). In total, over 34 km of survey lines were acquired. The acquisition parameters for all eight lines in Basin S2 are documented in Table T2. The area surveyed for bathymetry includes the basin floor and surrounding area, covering an area of approximately 460 km2. All depth conversions in this section are approximate and assume a seismic velocity of 1500 m/s.

Figure F3. Subbottom profiler lines.
2.1. Bathymetry
Seafloor depths in Basin S2 range 7967–7702 mbsl. Holes M0092A and M0092B are at 7702 mbsl, Holes M0092C and M0092D are at 7700 mbsl, and Holes M0095A and M0095B are at 7697 mbsl. The basin is wider to the north (~2580 m), narrows in the region of Site M0092 (~1450 m), and widens again at Site M0095 (1870 m), with widths measured across the flat basin floor to the first sudden change in bathymetry. The western basin margin forms a series of flat-topped terraces or steps that reduce the overall slope gradient near Sites M0092 and M0095 to roughly 16% or less on the western side. To the east, the topography changes more gradually, with a maximum slope gradient of approximately 13%, disrupted by northeast-trending ridges.
2.2. Basin characterization
A series of trench-perpendicular lines across the basin characterize the acoustic nature from north to south: Lines 386_Underway_100, 386_Underway_099, and 386_Underway_097. Common characteristics for all lines include a high-amplitude seafloor reflector overlying an acoustically transparent layer and a package of acoustically laminated basin fill, although the thicknesses of these units vary. The northernmost trench-perpendicular line (386_Underway_100) shows a generally flat-lying basin floor at ~10.077 s two-way traveltime (TWT) (Figure F4). A high-amplitude seafloor reflector overlies an acoustically transparent layer 1–2 m thick. An acoustically laminated package of basin fill underlies the transparent layer and is approximately 40 m thick in the center of the basin. The base of the laminated packages appears to extend beyond the base of the section at 10.130 s TWT. The contact between the acoustically laminated basal fill and the acoustic basement is not sharp.

Figure F4. Line 386-Underway_100.
Line 386_Underway_099 lies 1900 m south of Line 386_Underway_100, as measured perpendicular to the lines (Figure F5). In the center of the basin, the same acoustic facies occur, but the seafloor is slightly domed at this location, rather than flat, with a gentle westward dip. The high-amplitude seafloor reflector, acoustically transparent layer, and acoustically laminated package are all present in Line 386_Underway_100. The transparent package maintains a 1–2 m thickness, but the laminated package at this location extends to ~50 m thick and appears to extend beyond the base of the section at 10.13 s TWT. Again, the margins of the acoustically laminated basin fill are not clear, and some topographic disruptions occur toward the eastern end of the line (Shotpoint 3410), which disrupts interpretation.
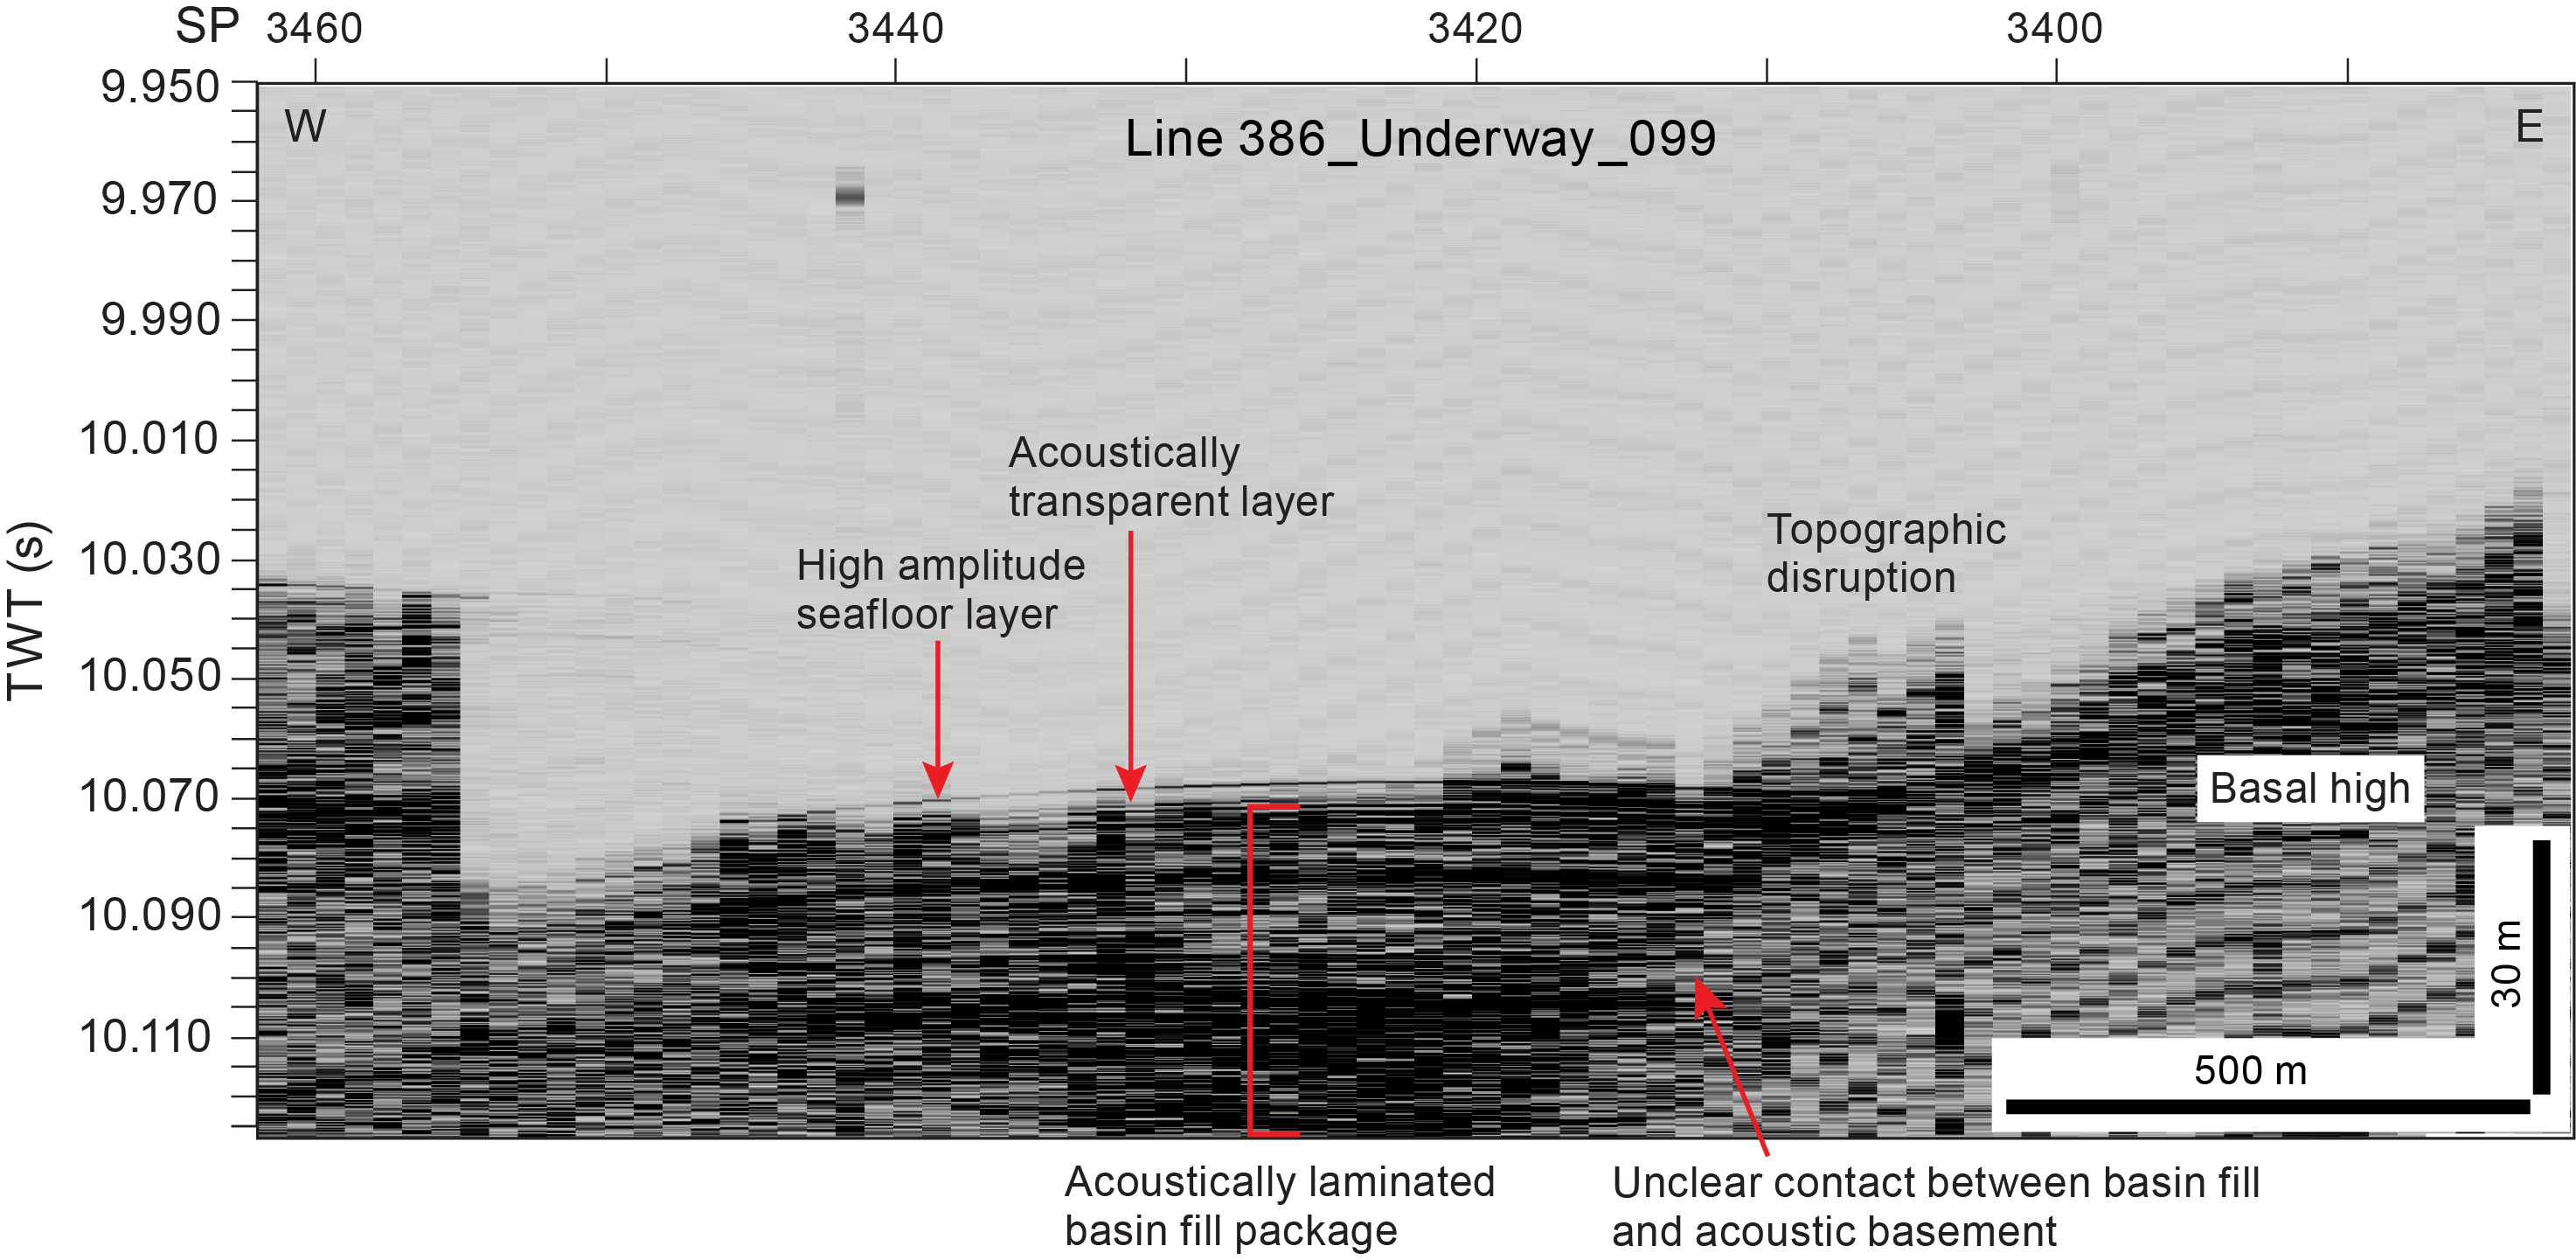
Figure F5. Line 386-Underway_099.
At the southernmost end of the basin, Line 386_Underway_097, which lies 2250 m south of Line 386_Underway_099, shows an apparently more complex basin with a central basal bathymetric high that disrupts the basin-fill packages (Figure F6). The same acoustic elements found in Lines 386_Underway_100 and 386_Underway_099 are present in the central and northern parts of Line 386_Underway_97 but are not as well imaged. The depocenter at the eastern end of the line shows slight doming (around Shotpoint 2990) and a gentle dip to the west, whereas the depocenter farther west (Shotpoints 3010–3025) is entirely flat-lying.
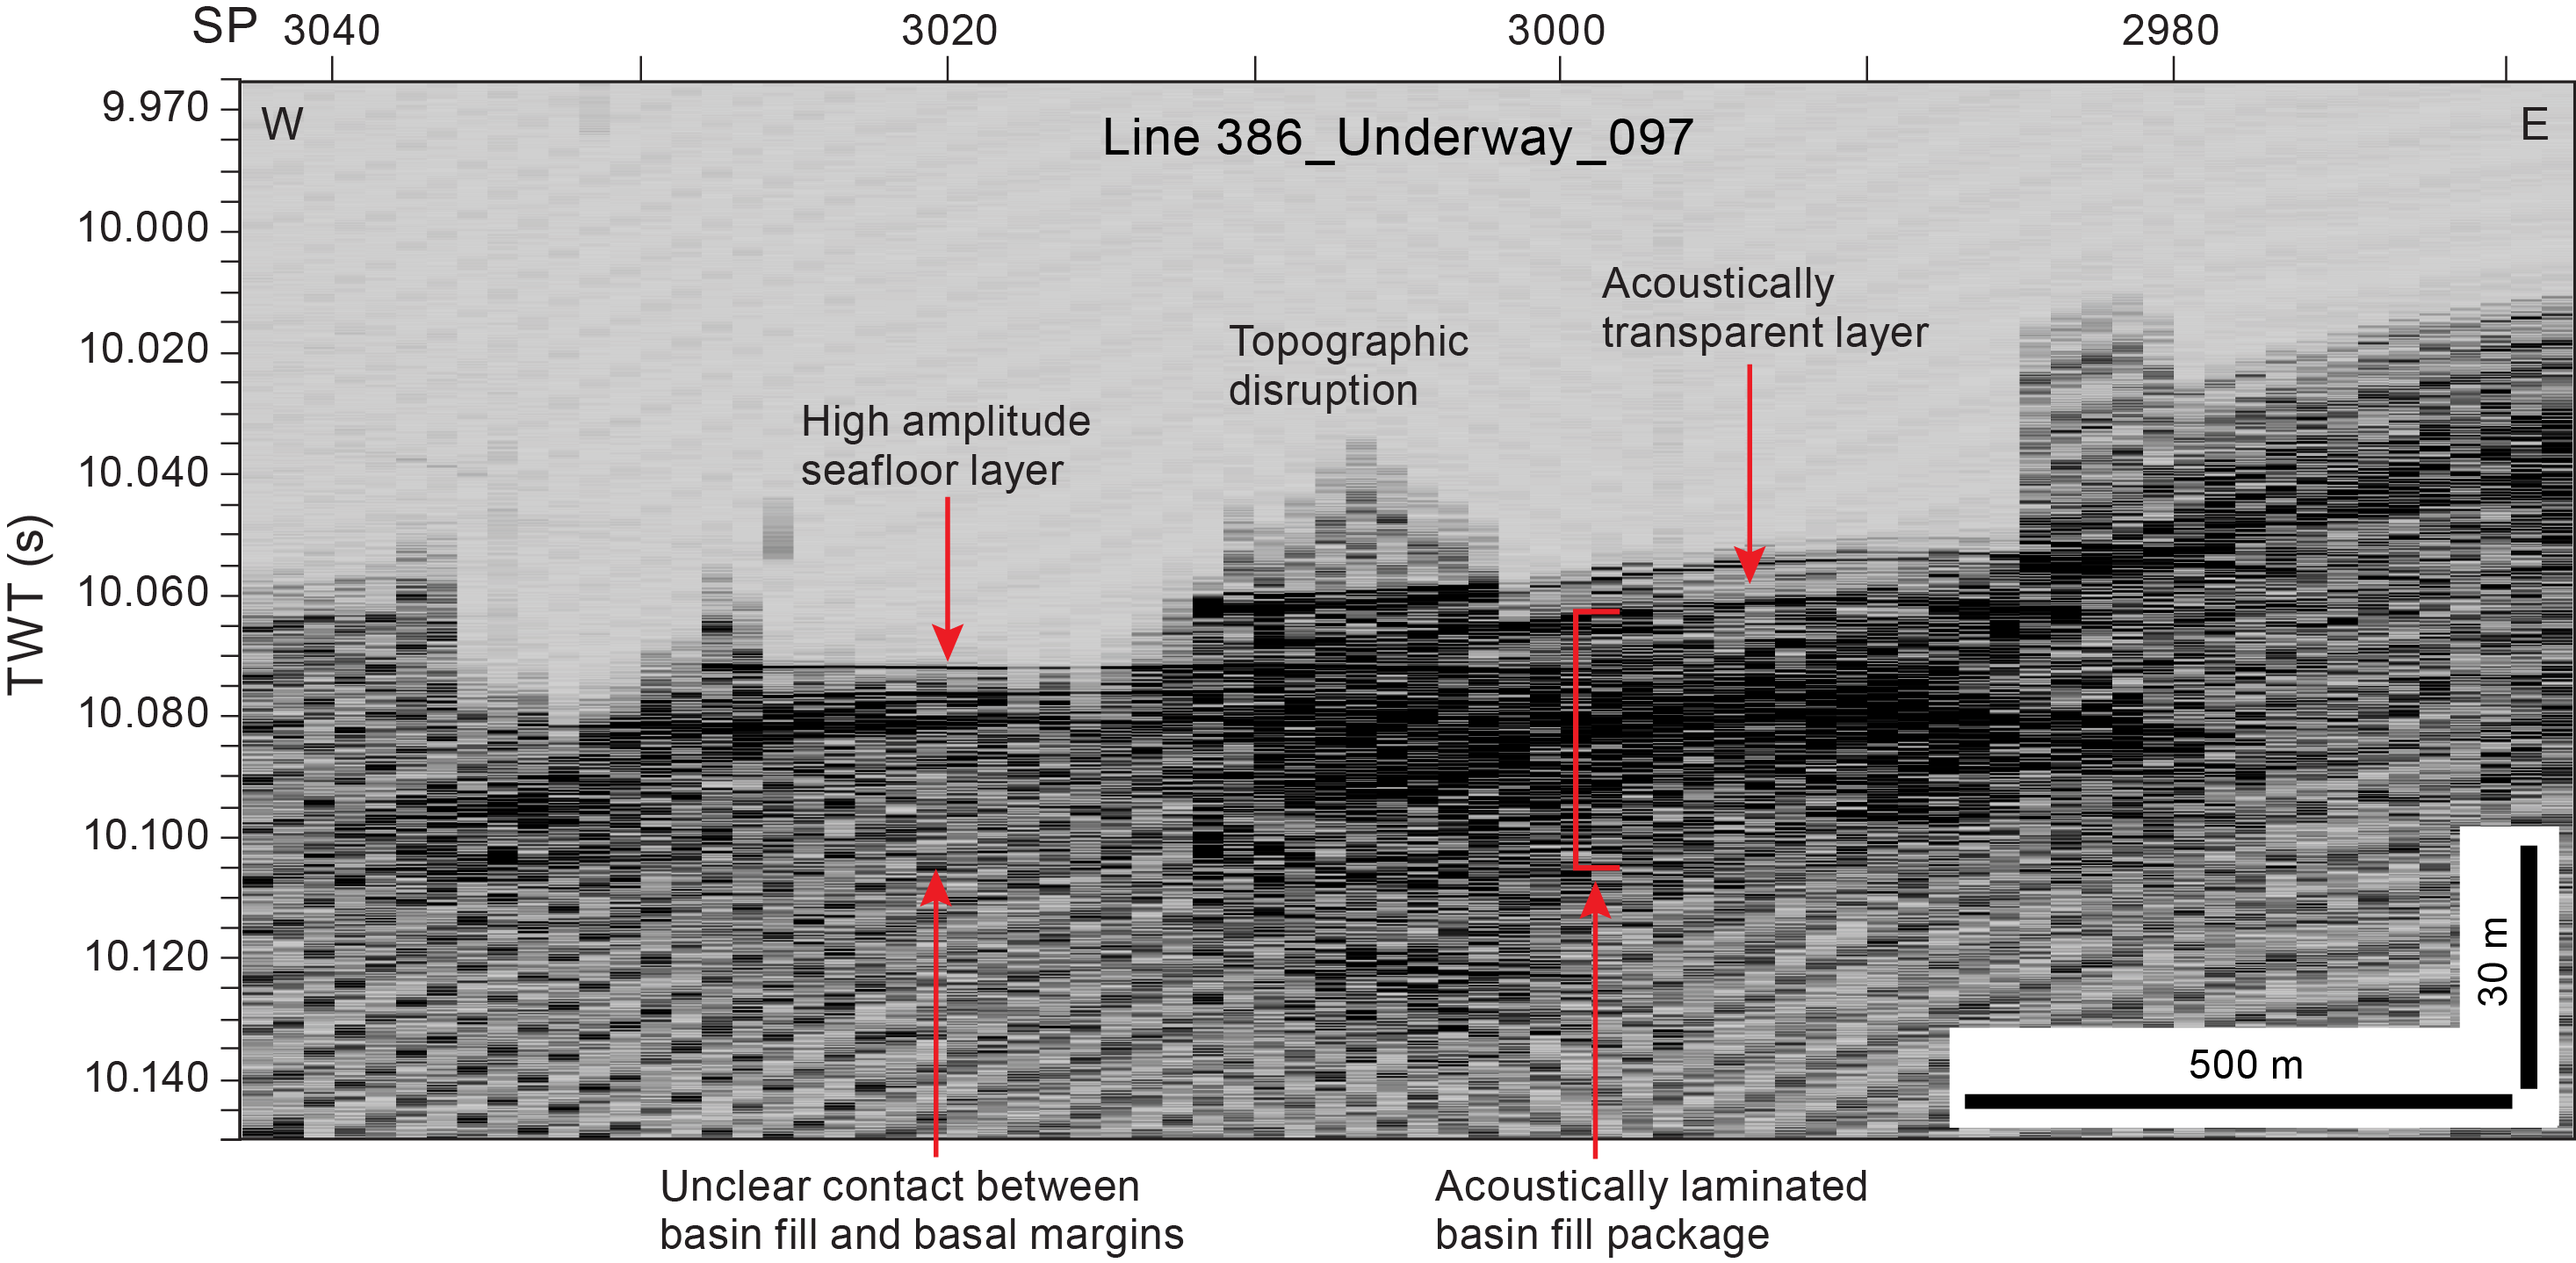
Figure F6. Line 386-Underway_097.
2.3. Site M0092
Holes M0092A–M0092D lie east of Line 386_Underway_096 (Figures F7, F8) at distances of 27 and 56 m, respectively (measured perpendicular to the line). Line 386_Underway_096 intersects Site M0092, and Site M0095 lies 600 m west (as measured perpendicular to the line), allowing for comparison of the acoustic character between the sites and along the strike of the basin. This line shows a complex arrangement of acoustic elements. At the seabed, a high-amplitude seabed reflector overlies an acoustically transparent layer that varies in thickness from 4 to 5 m near Site M0092 (beneath Shotpoint 2700) to approximately 2 m at Site M0095.
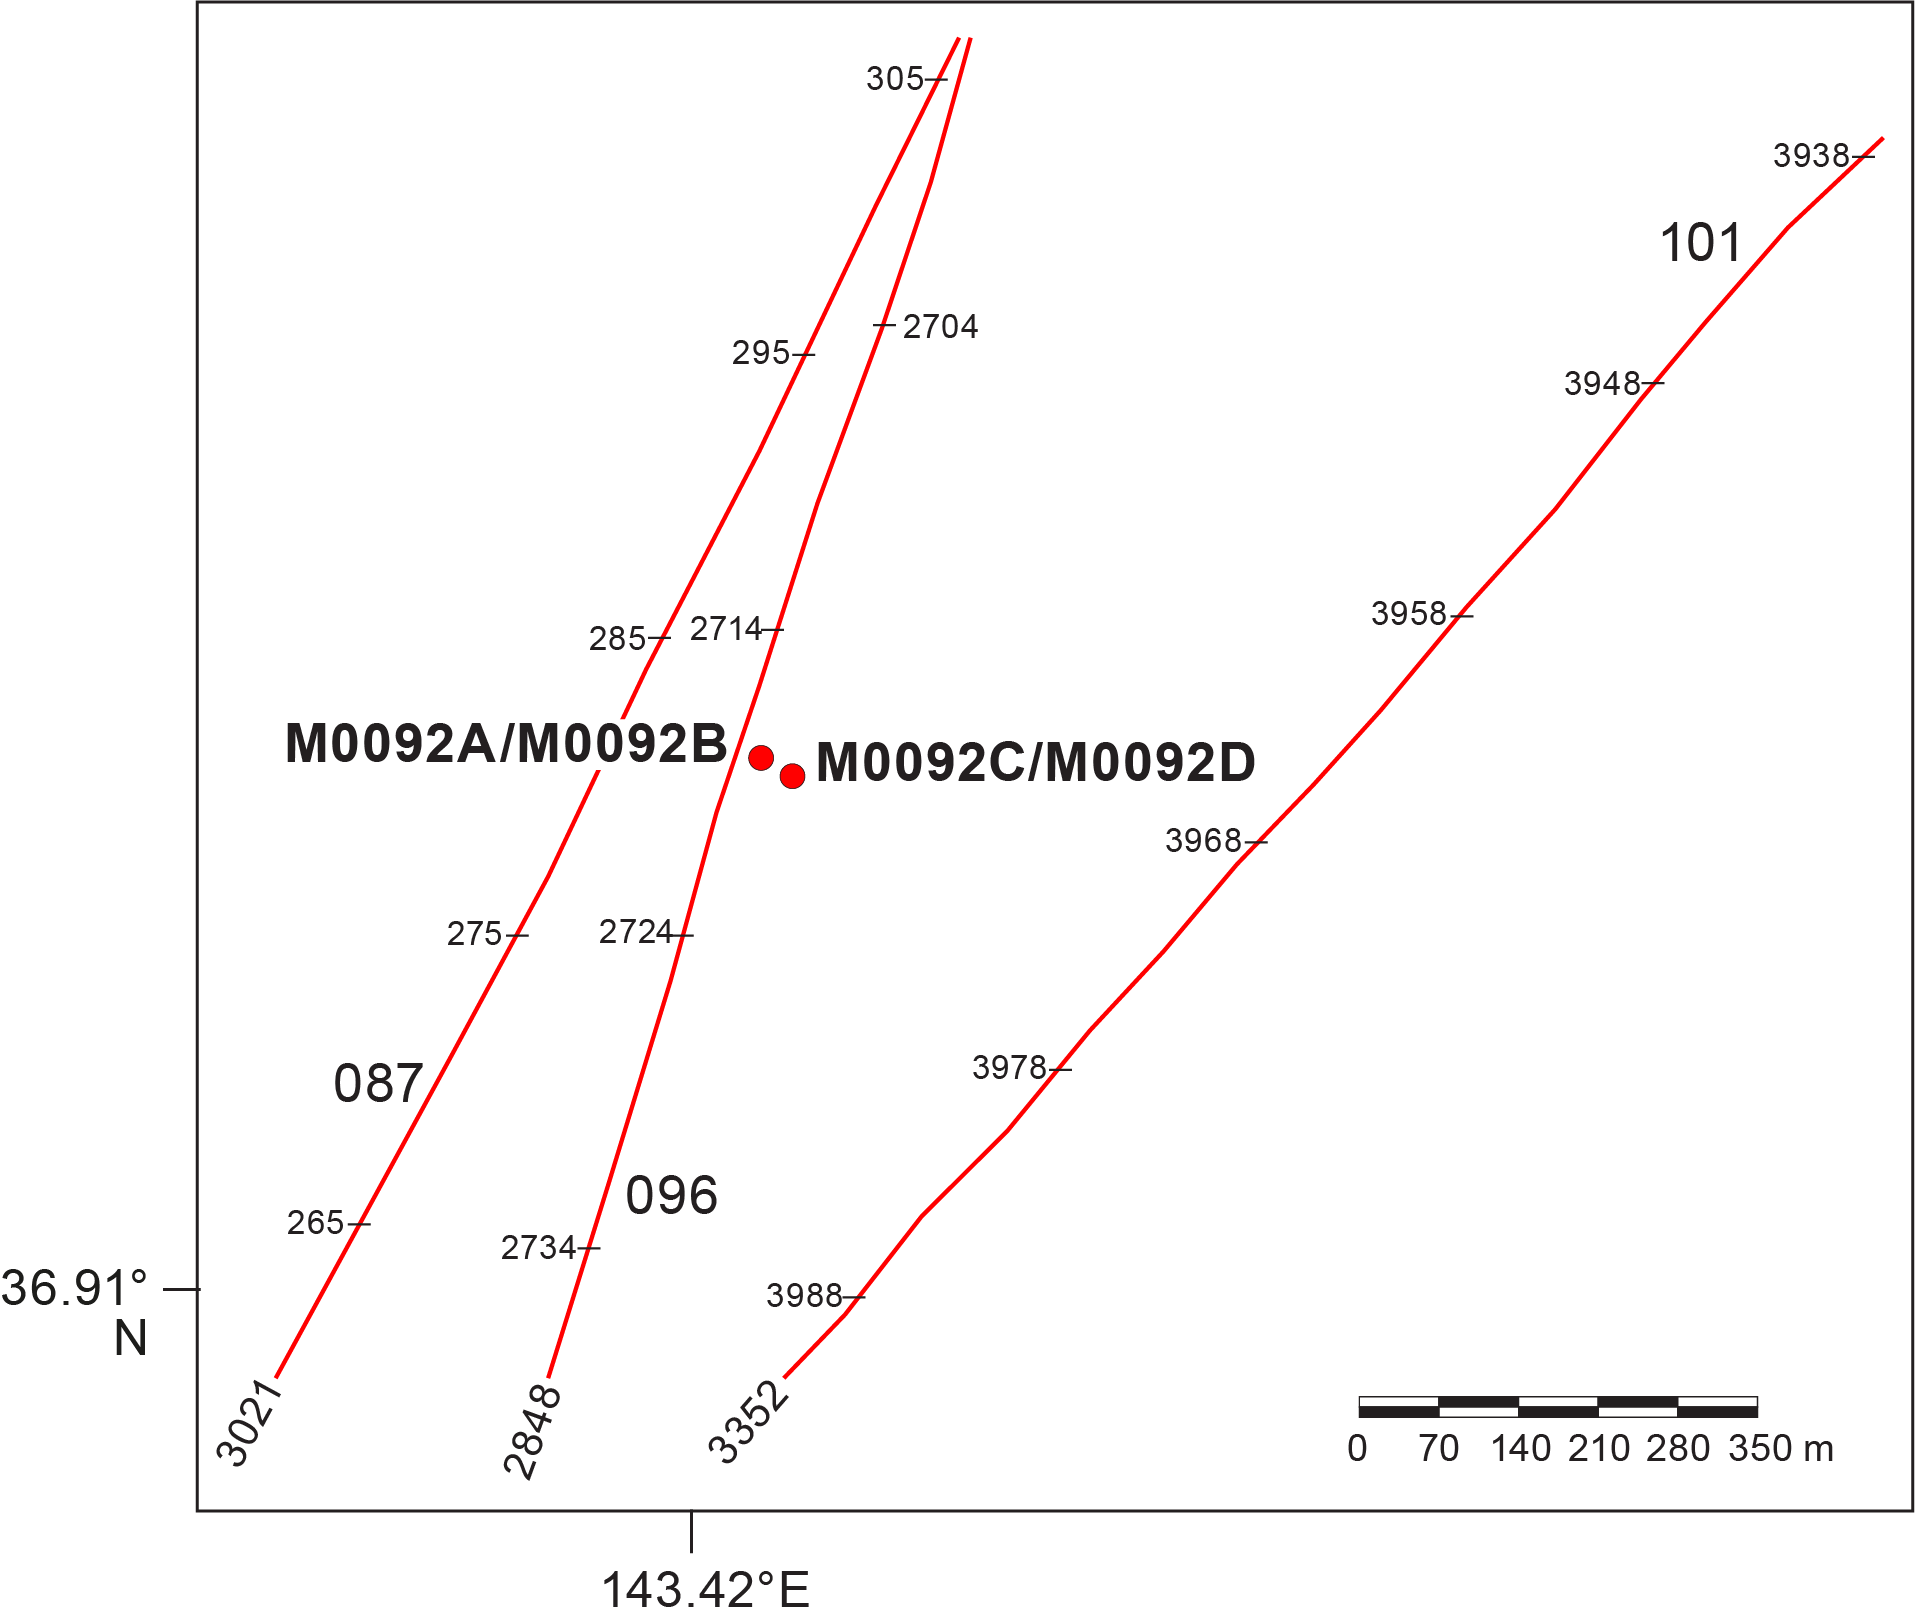
Figure F7. Subbottom profiles, Site M0092.

Figure F8. Line 386_Underway_096.
Site M0092 lies within a package of acoustically laminated basin infill that lies beneath the transparent layer, is approximately 20 m thick at its thickest point, and is relatively flat-lying. The acoustically laminated package appears to be infilling older topography based on the onlap relationship with an underlying package of high-amplitude materials.
In Line 386_Underway_096, the underlying topography comprises an older package of higher amplitude, acoustically laminated basin fill that has varying dip and gentle folding (green arrows on Figure F8). The exact thickness of this underlying package is difficult to determine because its contacts with acoustic basement are not clearly imaged. However, this package is at least 40 m thick. The lower part of this gently folded package displays a change in acoustic character, with higher amplitude reflections (green arrows on Figure F7). Immediately below Holes M0092C and M0092D, this package becomes very thick and extends to the base of the line, located between two highs in the acoustic basement, with possible fault control especially to the south. Beneath Shotpoint 2800, the entire package of laminated materials is over 55 m thick, and the deeper, higher amplitude portion is nearly 40 m thick. Contacts with the adjacent basal highs are sharp to the south (where a possible fault is interpreted; Figure F8) but more diffuse on the northern side (Shotpoints 2680–2690), and the entire relatively narrow structure presents as a graben. Overall, Line 386_Underway_096 appears to show structural control at the basal level, with at least two periods of infill.
2.4. Site M0095
Holes M0095A and M0095B sit 60 m southeast of the nearest trench-parallel line, Line 386_Underway_101, and 10 m north of trench-perpendicular Line 386_Underway_098, as measured perpendicular to the lines (Figure F9).
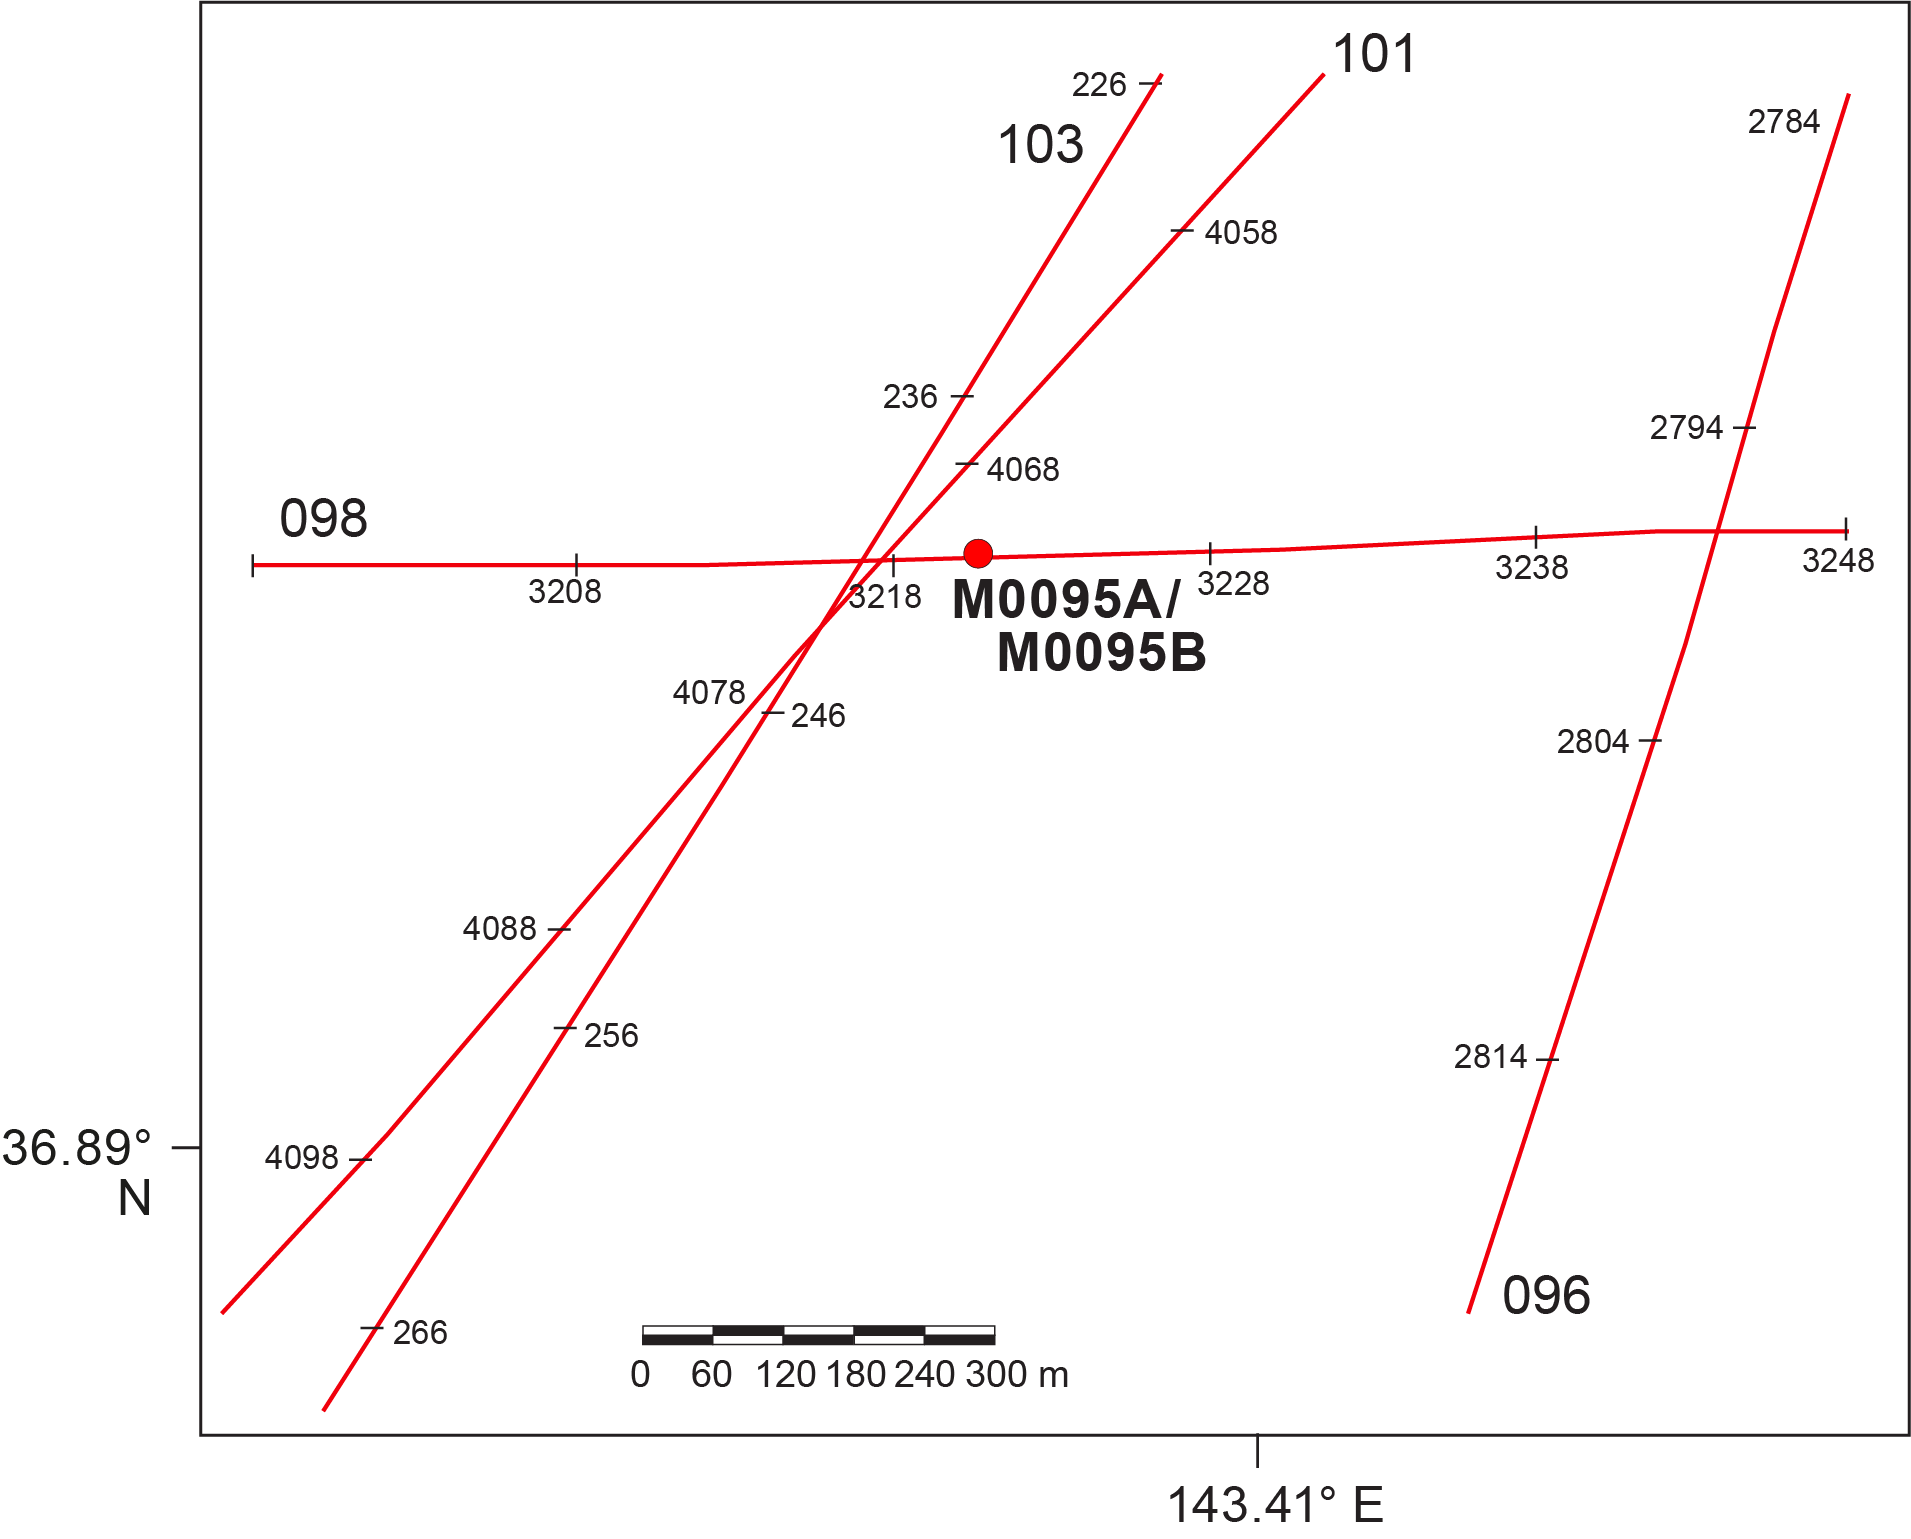
Figure F9. Subbottom profiles, Site M0095.
Trench-parallel Line 386_Underway_101 shows the location of Site M0095 and the projected location of Site M0092 and appears similar in seismic character to Line 386_Underway_096, which lies 600 m east of Site M0095 (Figure F10). In Line 386_Underway_101, the acoustic character at Site M0095 shows a high-amplitude seafloor reflector overlying a thin acoustically transparent layer that is approximately 3 m thick in Holes M0095A and M0095B. Beneath the transparent layer, a package of acoustically laminated materials up to 45 m thick dip gently to the south and appear to thicken in that direction, where they apparently extend beyond the bottom of the section at 10.14 s TWT.
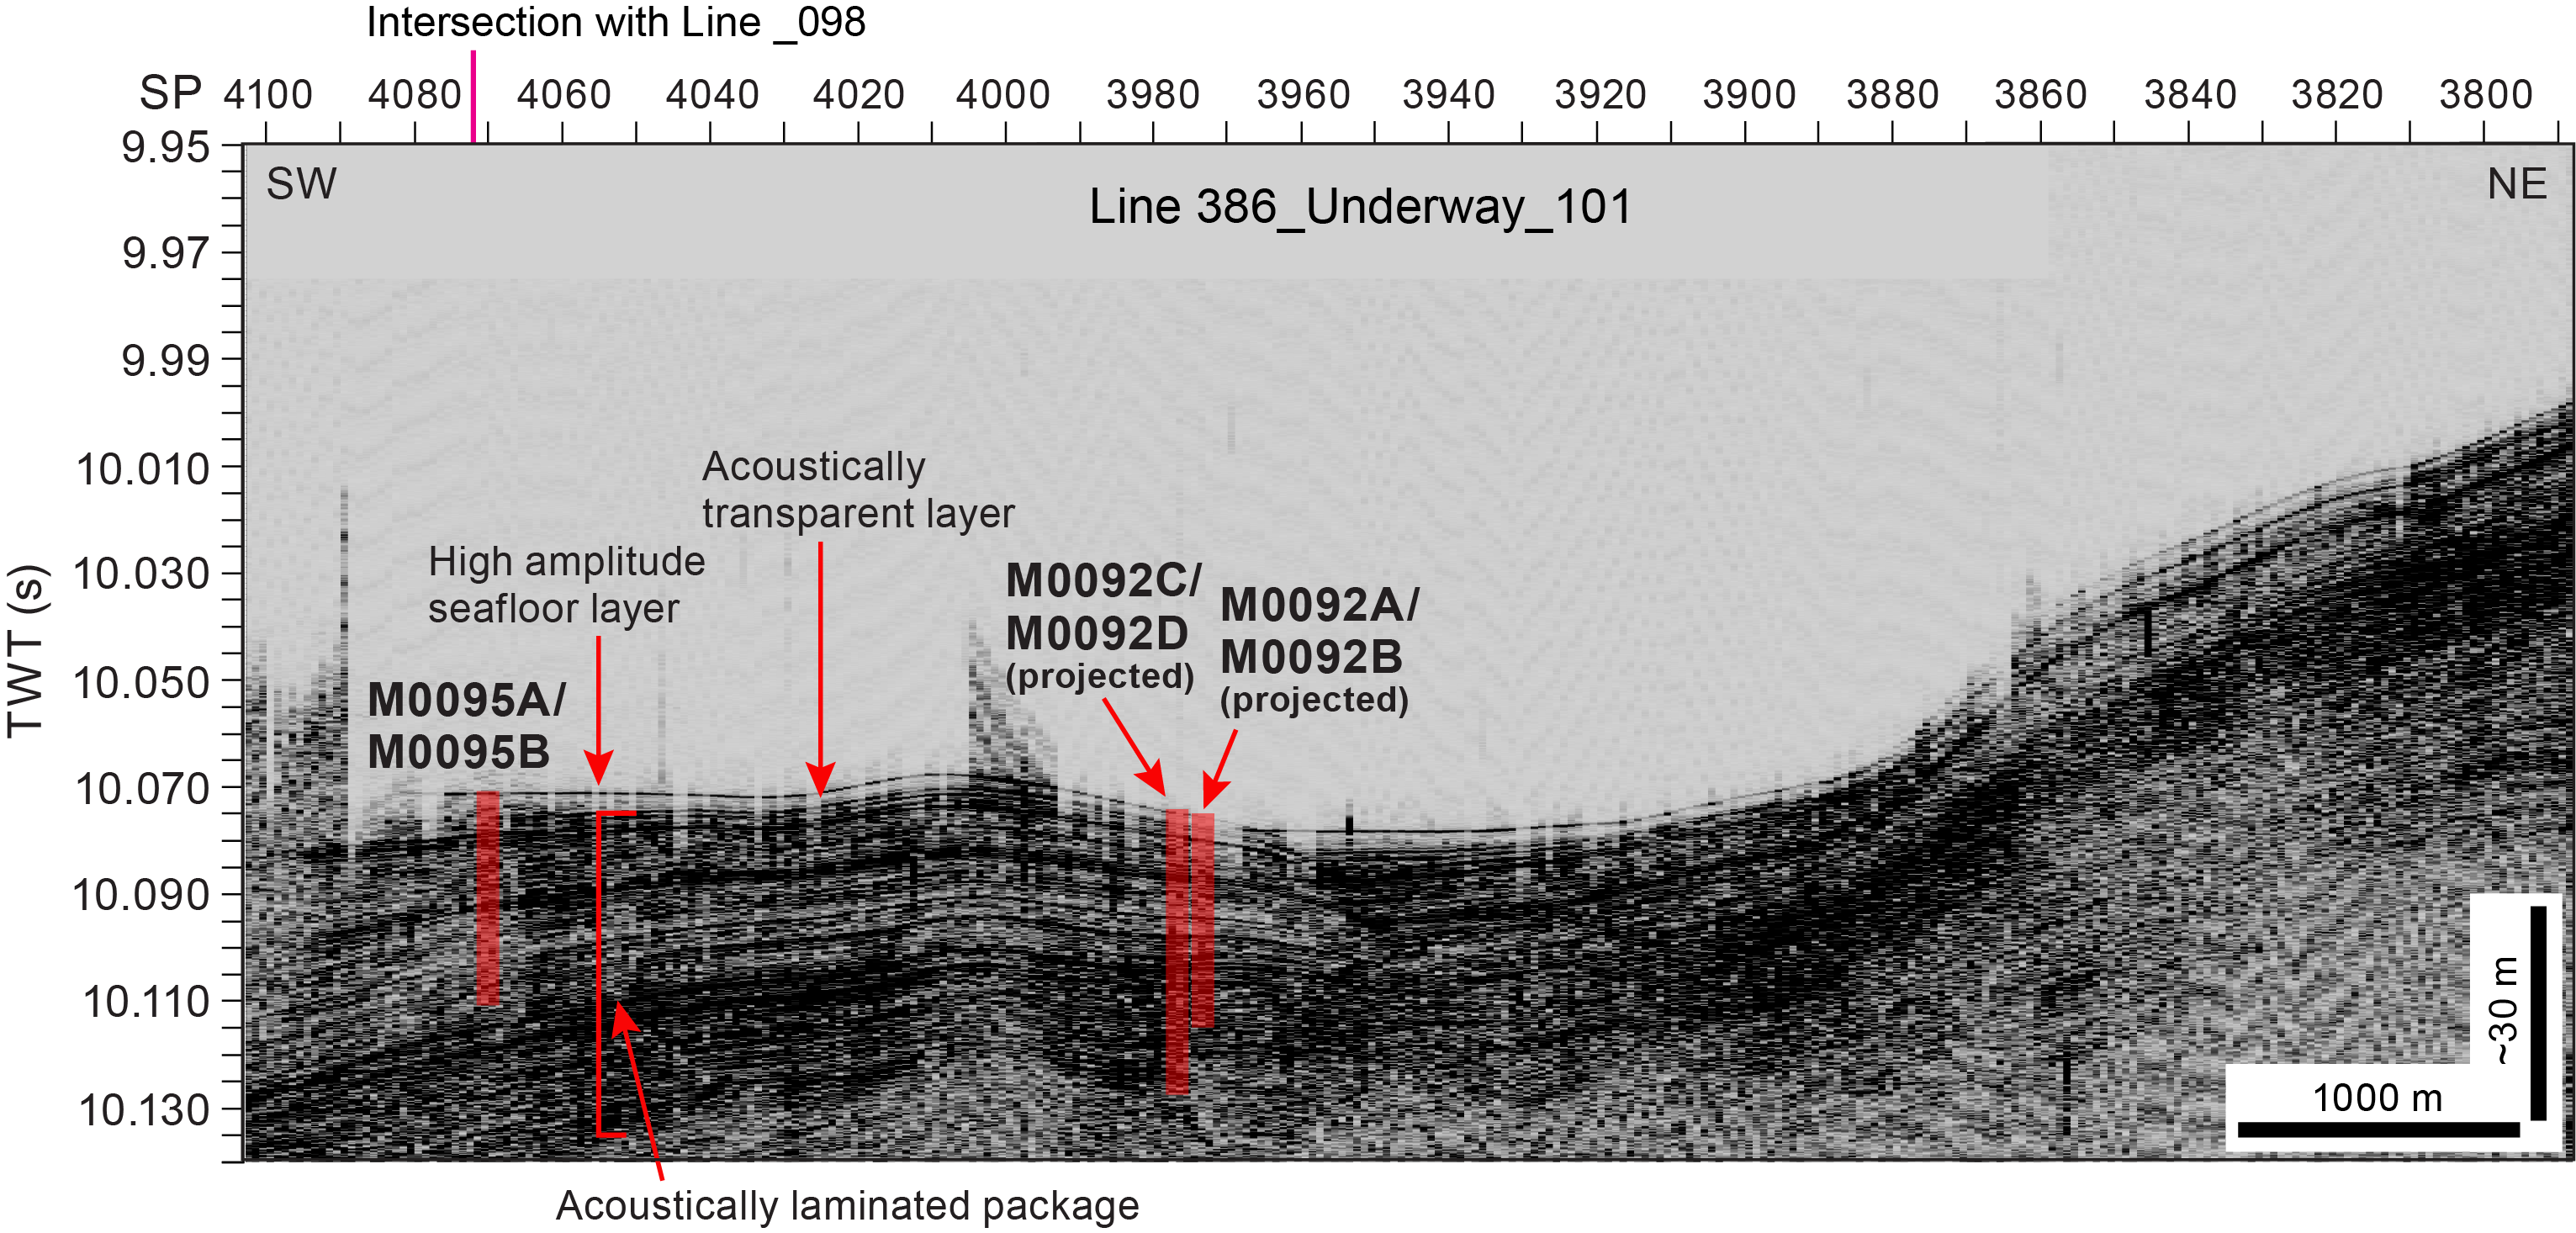
Figure F10. Line 386_Underway_101.
Trench-perpendicular Line 386_Underway_098 lies within 10 m of Site M0095 and shows acoustic elements similar to those observed in Lines 386_Underway_101 and 386_Underway_096, including a high-amplitude seafloor reflector overlying an acoustically transparent layer and a thick package of acoustically laminated materials beneath (Figure F11). The transparent layer in Line 386_Underway_098 thickens to the west, varying between 2 and 4 m at its thickest point near Site M0095. Similarly, the underlying acoustically laminated package dips gently to the west, with a thickness of up to 40 m at its thickest point, although the acoustically laminated package can be seen to thin over basal highs (e.g., at Shotpoint 3270). Contacts between the basin fill and basal layers are not well imaged in this line.
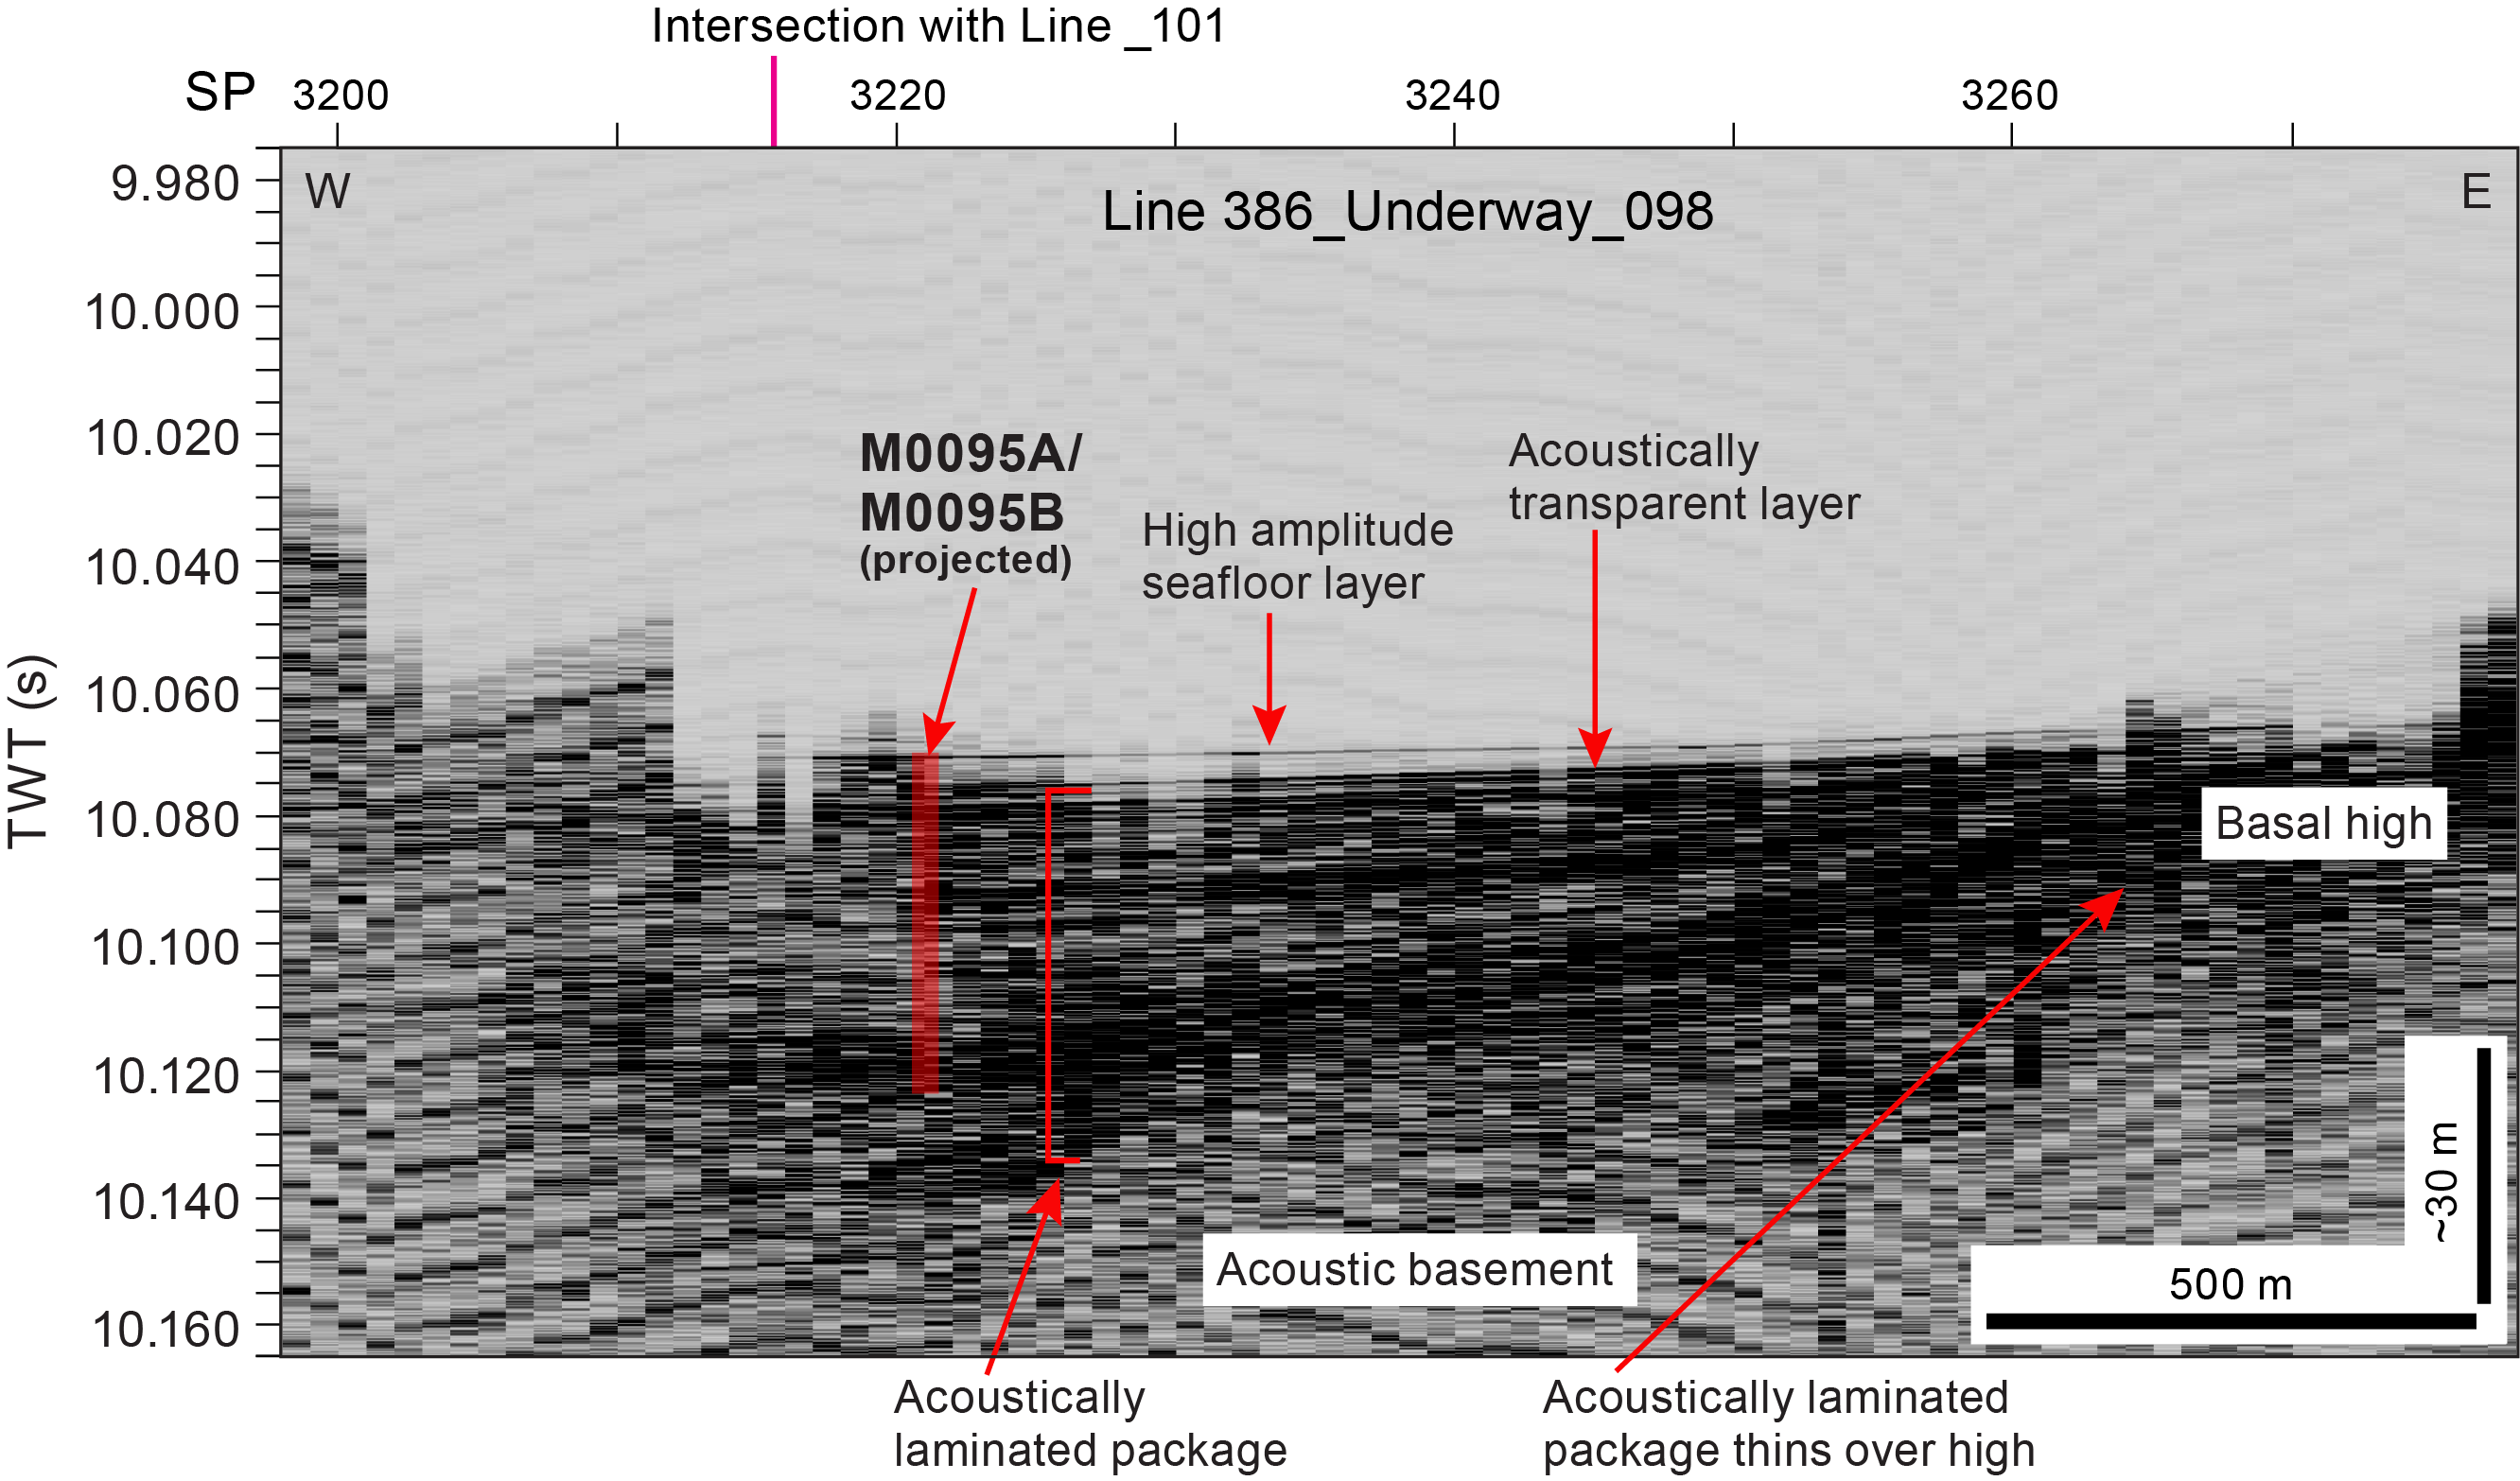
Figure F11. Line 386_Underway_098.
3. Lithostratigraphy
Sites M0092 and M0095 were cored in the Southern Japan Trench focus area in Basin S2. Site M0092 comprises four holes, including those of the accompanying trigger cores (Holes M0092A–M0092D), which were cored in the basin floor where the greatest sediment recovery was anticipated based on the subbottom profiles. Site M0095 comprises two holes and accompanying trigger cores (Holes M0095A and M0095B), which were cored at the basin edge where the thinnest (condensed) sediment recovery was anticipated based on the subbottom profiles (see Operations).
This section describes the grain size–based lithology of Sites M0092 and M0095 as originally logged during visual core description. The use of major and minor lithologies, contacts, sedimentary structures, bioturbation, iron monosulfides, and accessories are defined in Lithostratigraphy in the Expedition 386 methods chapter (Strasser et al., 2023a). The lithology, sedimentary structures, bioturbation, iron monosulfide abundances, physical properties, and linescan and X-ray computed tomography (CT) scan images are displayed on 20 m lithostratigraphic summaries (Figures F12, F17, F19). Smear slide descriptions are semiquantitative and include grain size: sand, silt, and clay (100%). Lithogenic, biogenic, and volcanic components are also described as percentages of 100% of the total slide (Tables T3, T4). Smear slides were observed every 2 m, and the results are displayed as color bars representing the lithogenic, biogenic, and volcanic components on the smear slide summaries (Figures F15, F18, F20). X-ray CT scan and linescan images, which were used to interpret the grain size–based lithology, and X-ray diffraction (XRD) results, used in summary XRD figures, are available in XRAYCT, LINESCAN, and XRD, respectively, in Supplementary material. Smear slide tables and 3 m barrel sheets are available in Core descriptions. Core close-up photos and smear slide photomicrographs are available in CORECLOSEUP and SMEARSLD in Supplementary material.
Visual descriptions of core sections from Site M0092 show the following in a downcore direction (Figures F12, F17): (1) a ~9 m thick, medium- to thick-bedded interval of fining-upward silt to bioturbated silty clay and clay; (2) a ~10 m thick bioturbated clay with scattered silty clay horizons and silt laminae; (3) a ~1 (Hole M0092B) to 3 m thick (Hole M0092D) sharp-base, fining-upward succession from very fine sand to silt and bioturbated silty clay with scattered silt and sand laminae; and (4) a ~10 (Hole M0092B) to ~15 m thick (Hole M0092D) medium- to thick-bedded silty clay and clay with gradational contacts that contain dispersed millimeter-scale pumiceous silt and sand patches and some silt and sand laminae.
Bioturbation is slight to heavy, and iron monosulfide occurrences are sparse to abundant and also widespread at Site M0092 except for the lower and upper parts of Interval 1, where they seem to be absent.
The texture of the sediment at Site M0092, as observed in smear slides, is mainly clayey silt, silty clay, and silt with 30%–70% lithic and biogenic components and less than 10% volcanic material (Table T3; Figures F13, F15, F18) except for two lithogenic-rich ash samples observed in smear slides (Samples 386-M0092D-1H-20, 60 cm, and 1H-28, 63 cm). The latter is sampled from a tephra layer (see Tephra). In addition to the ash samples, sediment composition ranges from siliceous-rich lithogenic clayey silt to silty clay and silt to lithogenic-rich siliceous ooze with pyrite.
The mineralogy of the smear slides is dominated, in decreasing abundance, by clay, quartz, feldspar, pyrite, and vitric grains. The biogenic elements are sponge spicules, diatoms, and rare radiolaria (Table T3).
The lithology at Site M0095 is dominated by clayey silt, silty clay, and clay with minor components of fine sand, very fine sand, and silt (Figures F14, F20). The most common sedimentary structures are thin beds (1–3 cm) and laminae sometimes forming parallel laminated intervals that contain fine sand, very fine sand, silt, and clayey silt. These deposits can have sharp, erosional, wavy, gradational, or bioturbated lower and upper contacts. The sediment above the basal contacts can fine or coarsen upward. Notable at Site M0095 is a very fine sand bed that fines upward to silt and silt laminae and a thin silt bed above. This sedimentary package extends from 4.5 to 6.5 meters below seafloor (mbsf) (Figures F19). This bed and the sediment above it lack bioturbation. A chaotic interval showing soft-sediment deformation such as recumbent and drag folds is present above a fine sand bed at 5.5–6.2 mbsf (Section 386-M0095B-1H-7). Bioturbation, except for the interval mentioned above, is common and classified from slight to heavy. The sediments have undergone extensive organoclastic sulfate reduction and/or anaerobic oxidation of methane that is manifested as iron monosulfides. Bioturbation and formation of iron monosulfides overprint the primary depositional bedding features and are seen filling burrows, as mottling, and filling porosity in laminae forming dark color bands. Core deformation is minor and characterized mainly by cracks. Cracks are more abundant with depth in the core. Most significant is the post–core recovery and splitting oxidation observed in many sections (see Lithostratigraphy in the Expedition 386 methods chapter [Strasser et al., 2023a]).
Detailed smear slide observations indicate that there is a large biogenic component that can dominate the lithology, and it contains, in decreasing abundance, diatoms, sponge spicules, and radiolaria (Figures F20). Radiolaria are a minor component in some intervals, and silicoflagellates are reported (Table T4). The mineral components of the smear slides are, in decreasing abundance, clay minerals, quartz, and feldspar. Micas are not reported for this site. A 3 cm large carbonate nodule is present at 10.45 mbsf (Figures F21). Vitric-bearing sediments are observed at 40 cm below seafloor and at 3, 17, and 19.20 mbsf. The most common lithology names derived from the smear slide observations include siliceous-rich lithogenic silty clay or clayey silt, lithogenic-rich siliceous ooze, and vitric-bearing siliceous-rich lithogenic clayey silt.
3.1. Site M0092
3.1.1. Holes M0092A and M0092B
3.1.1.1. Hole M0092A
Hole M0092A comprises a 1.10 m long trigger core, including a core catcher. The top of the core (interval 1P-1, 0–5 cm) is a void above a thick homogeneous dark olive-brown (2.5Y 3/3) to grayish olive (7.5Y 5/2) clay and silt (interval 1P-1, 5–99.5 cm) (Figure F12). In the upper part of the core, sediment is oxidized, indicating that the seafloor is probably recovered. Magnetic susceptibility and density show a bell shape aspect with a sharp decrease upward in intensity that might indicate a fining-upward trend, although the parallel evolution of natural gamma radiation (NGR) points to a diminution of the clay content (see Physical properties).

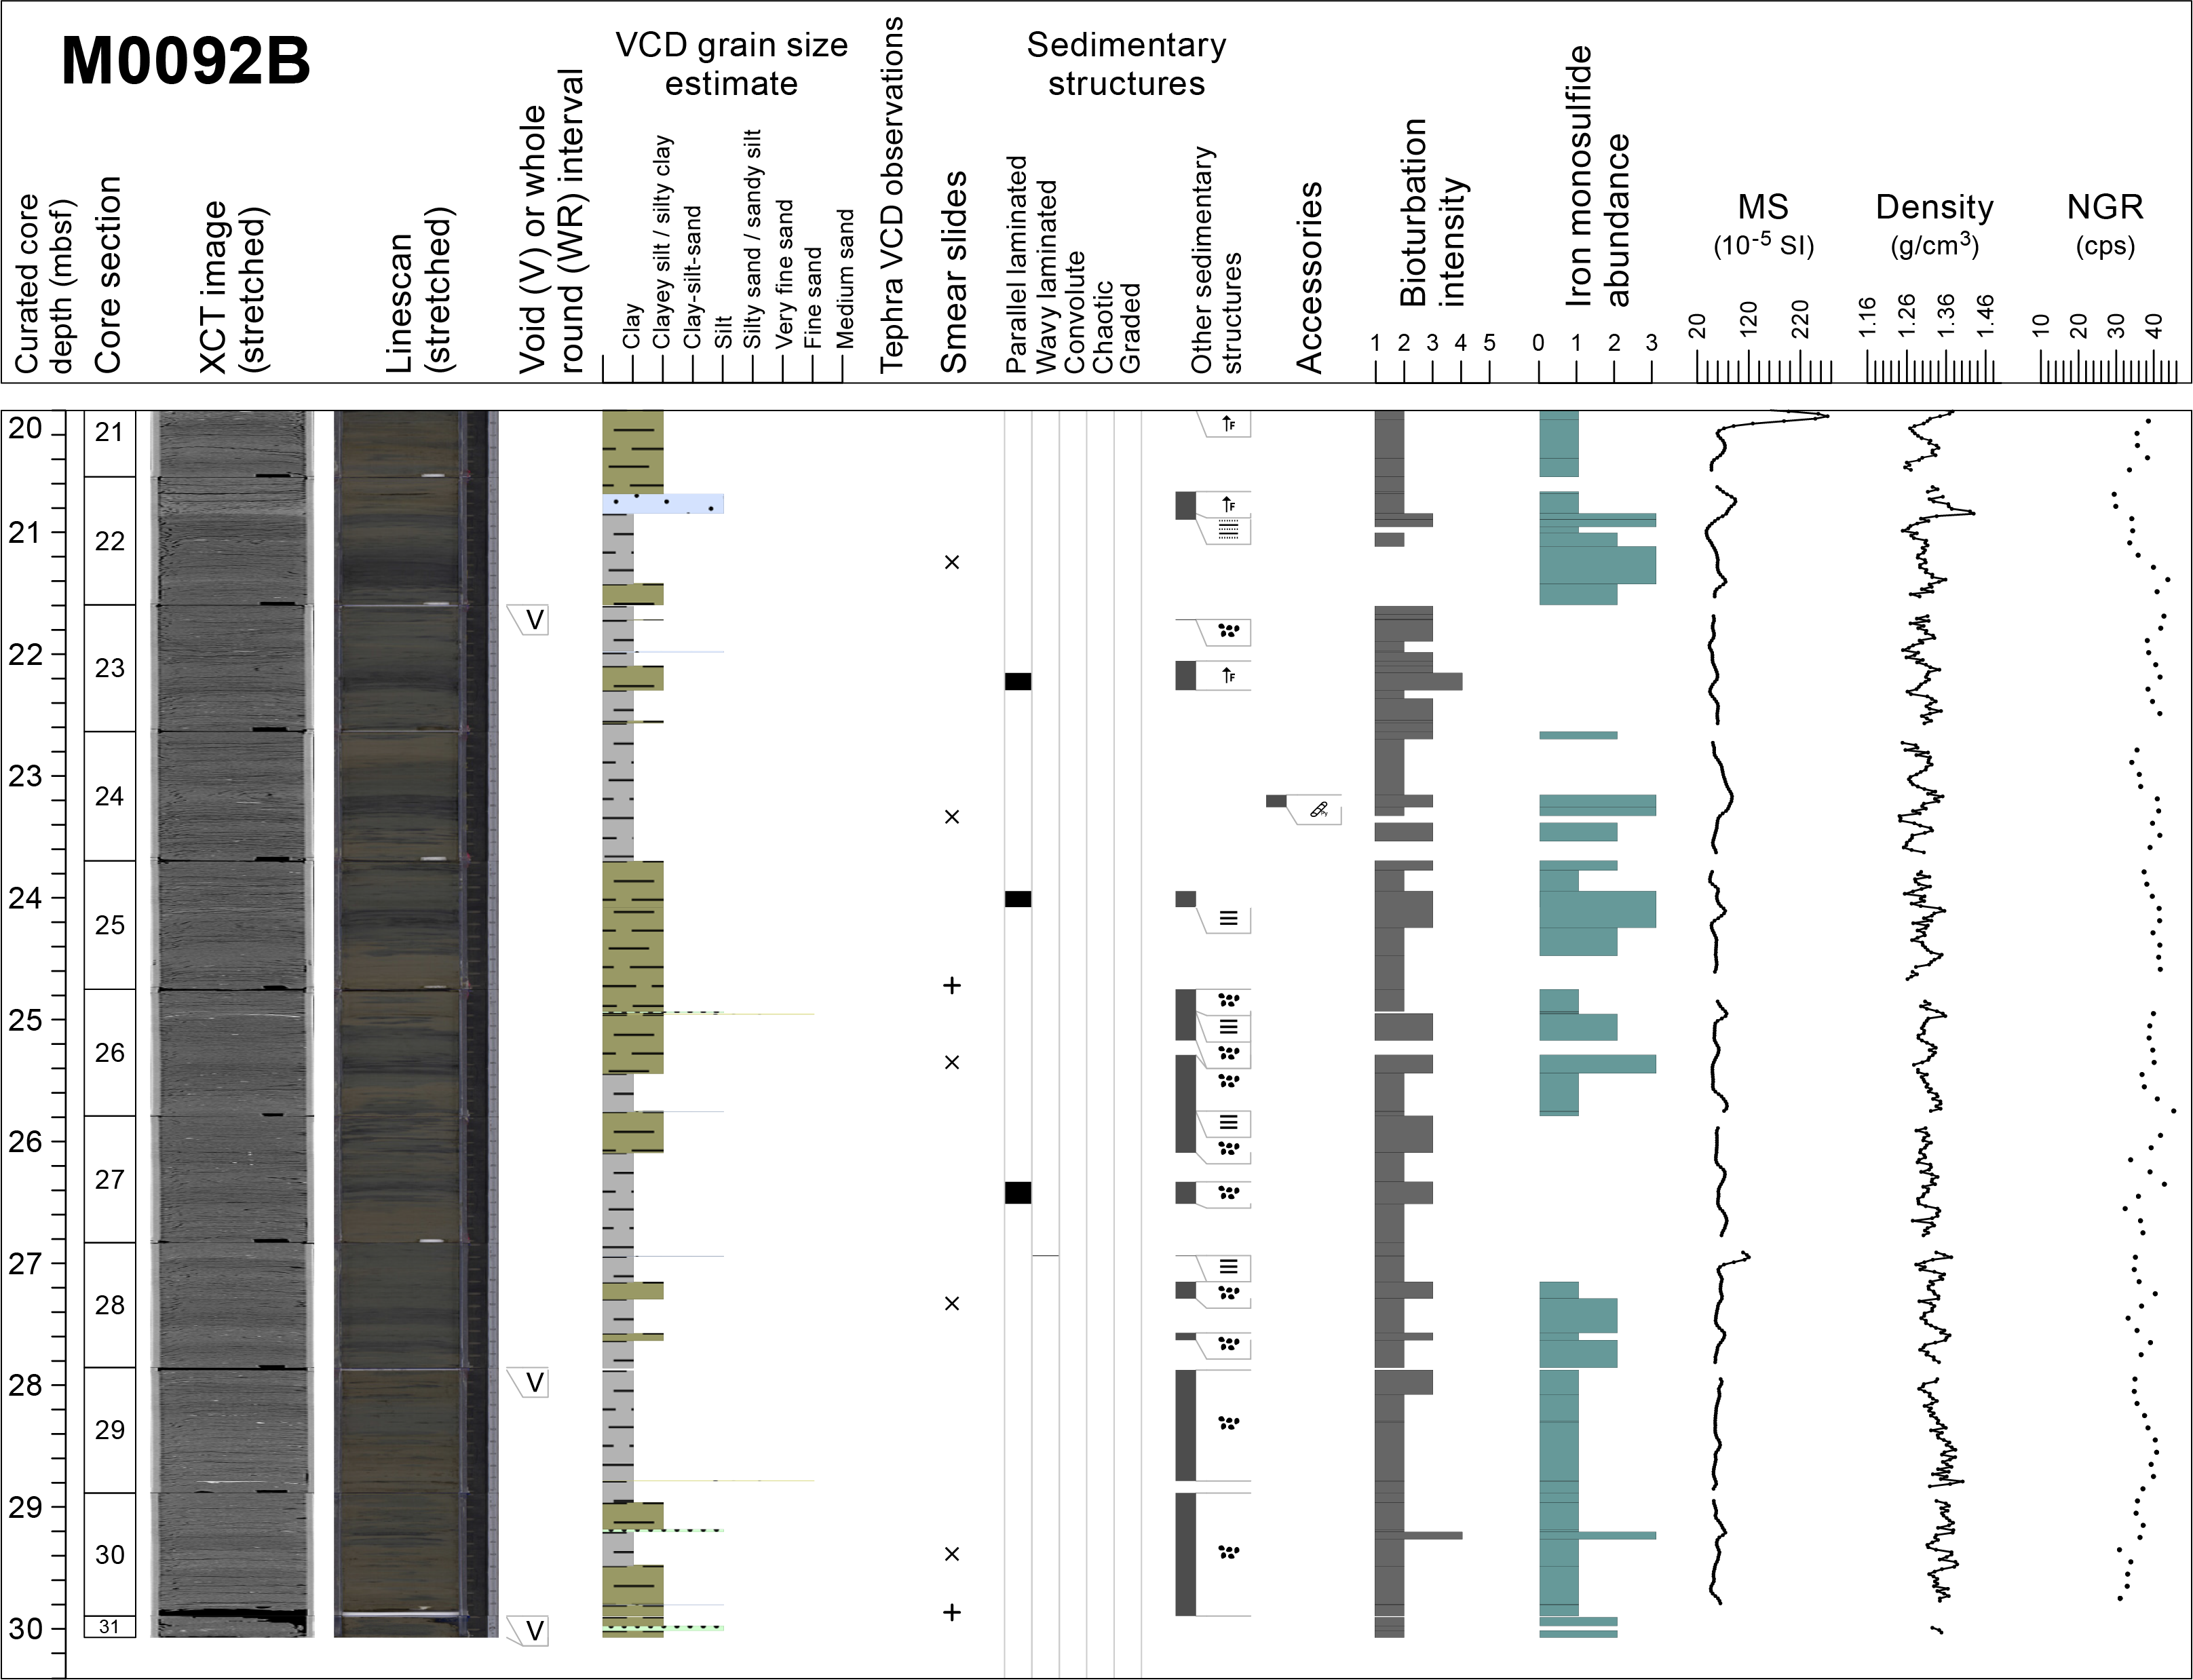
Figure F12. Lithostratigraphic summaries, Holes M0092A and M0092B.
One smear slide was collected for Hole M0092A (Table T3; Figures F13, F14, F15). The lithology is siliceous-rich lithogenic silt and clay. The dominant textures are clay (50%) and silt (50%). The latter is composed of a large biogenic fraction with 10% quartz, 15% sponge spicules, and 25% diatoms.

Figure F13. Texture.
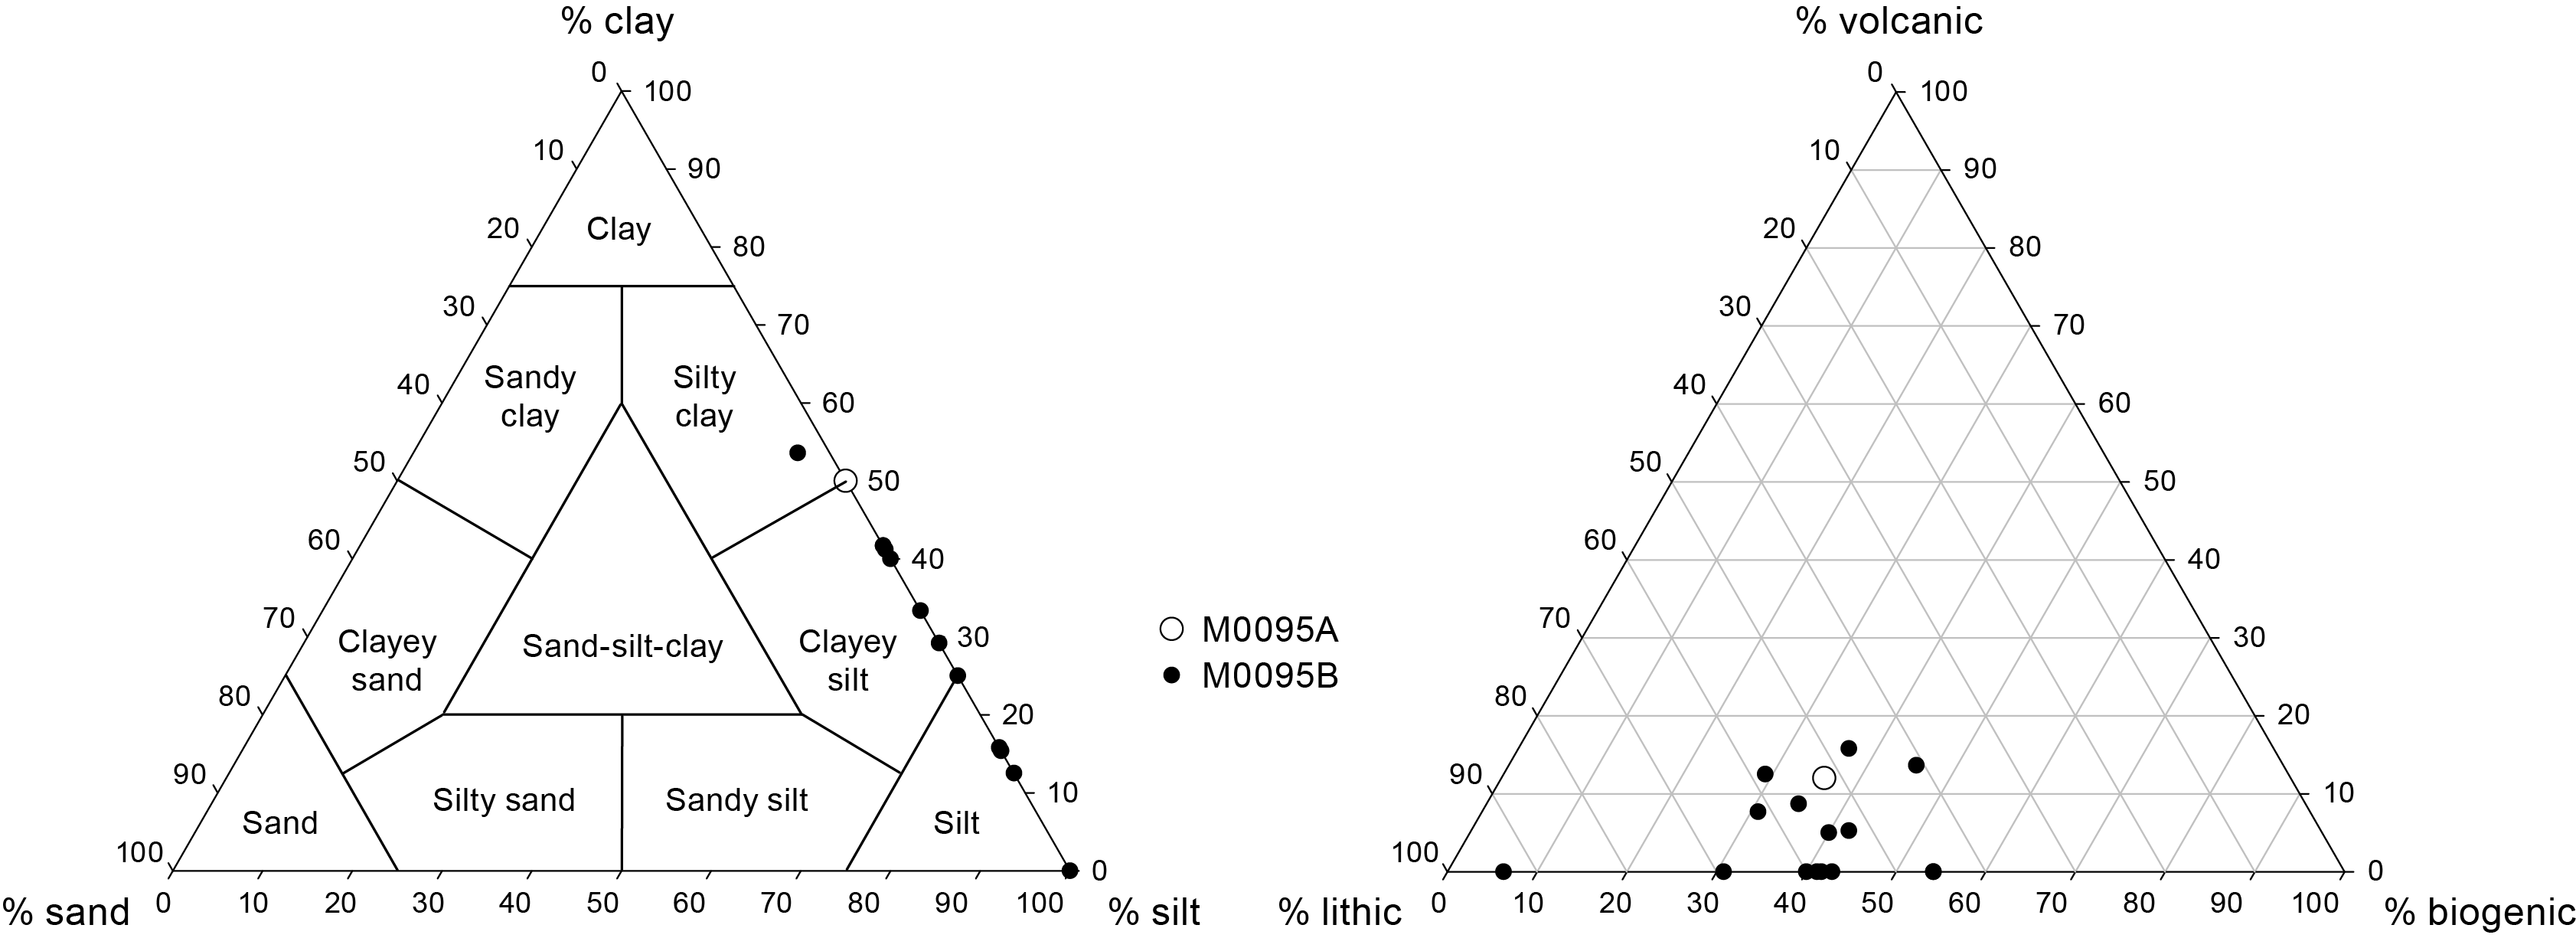
Figure F14. Major components.
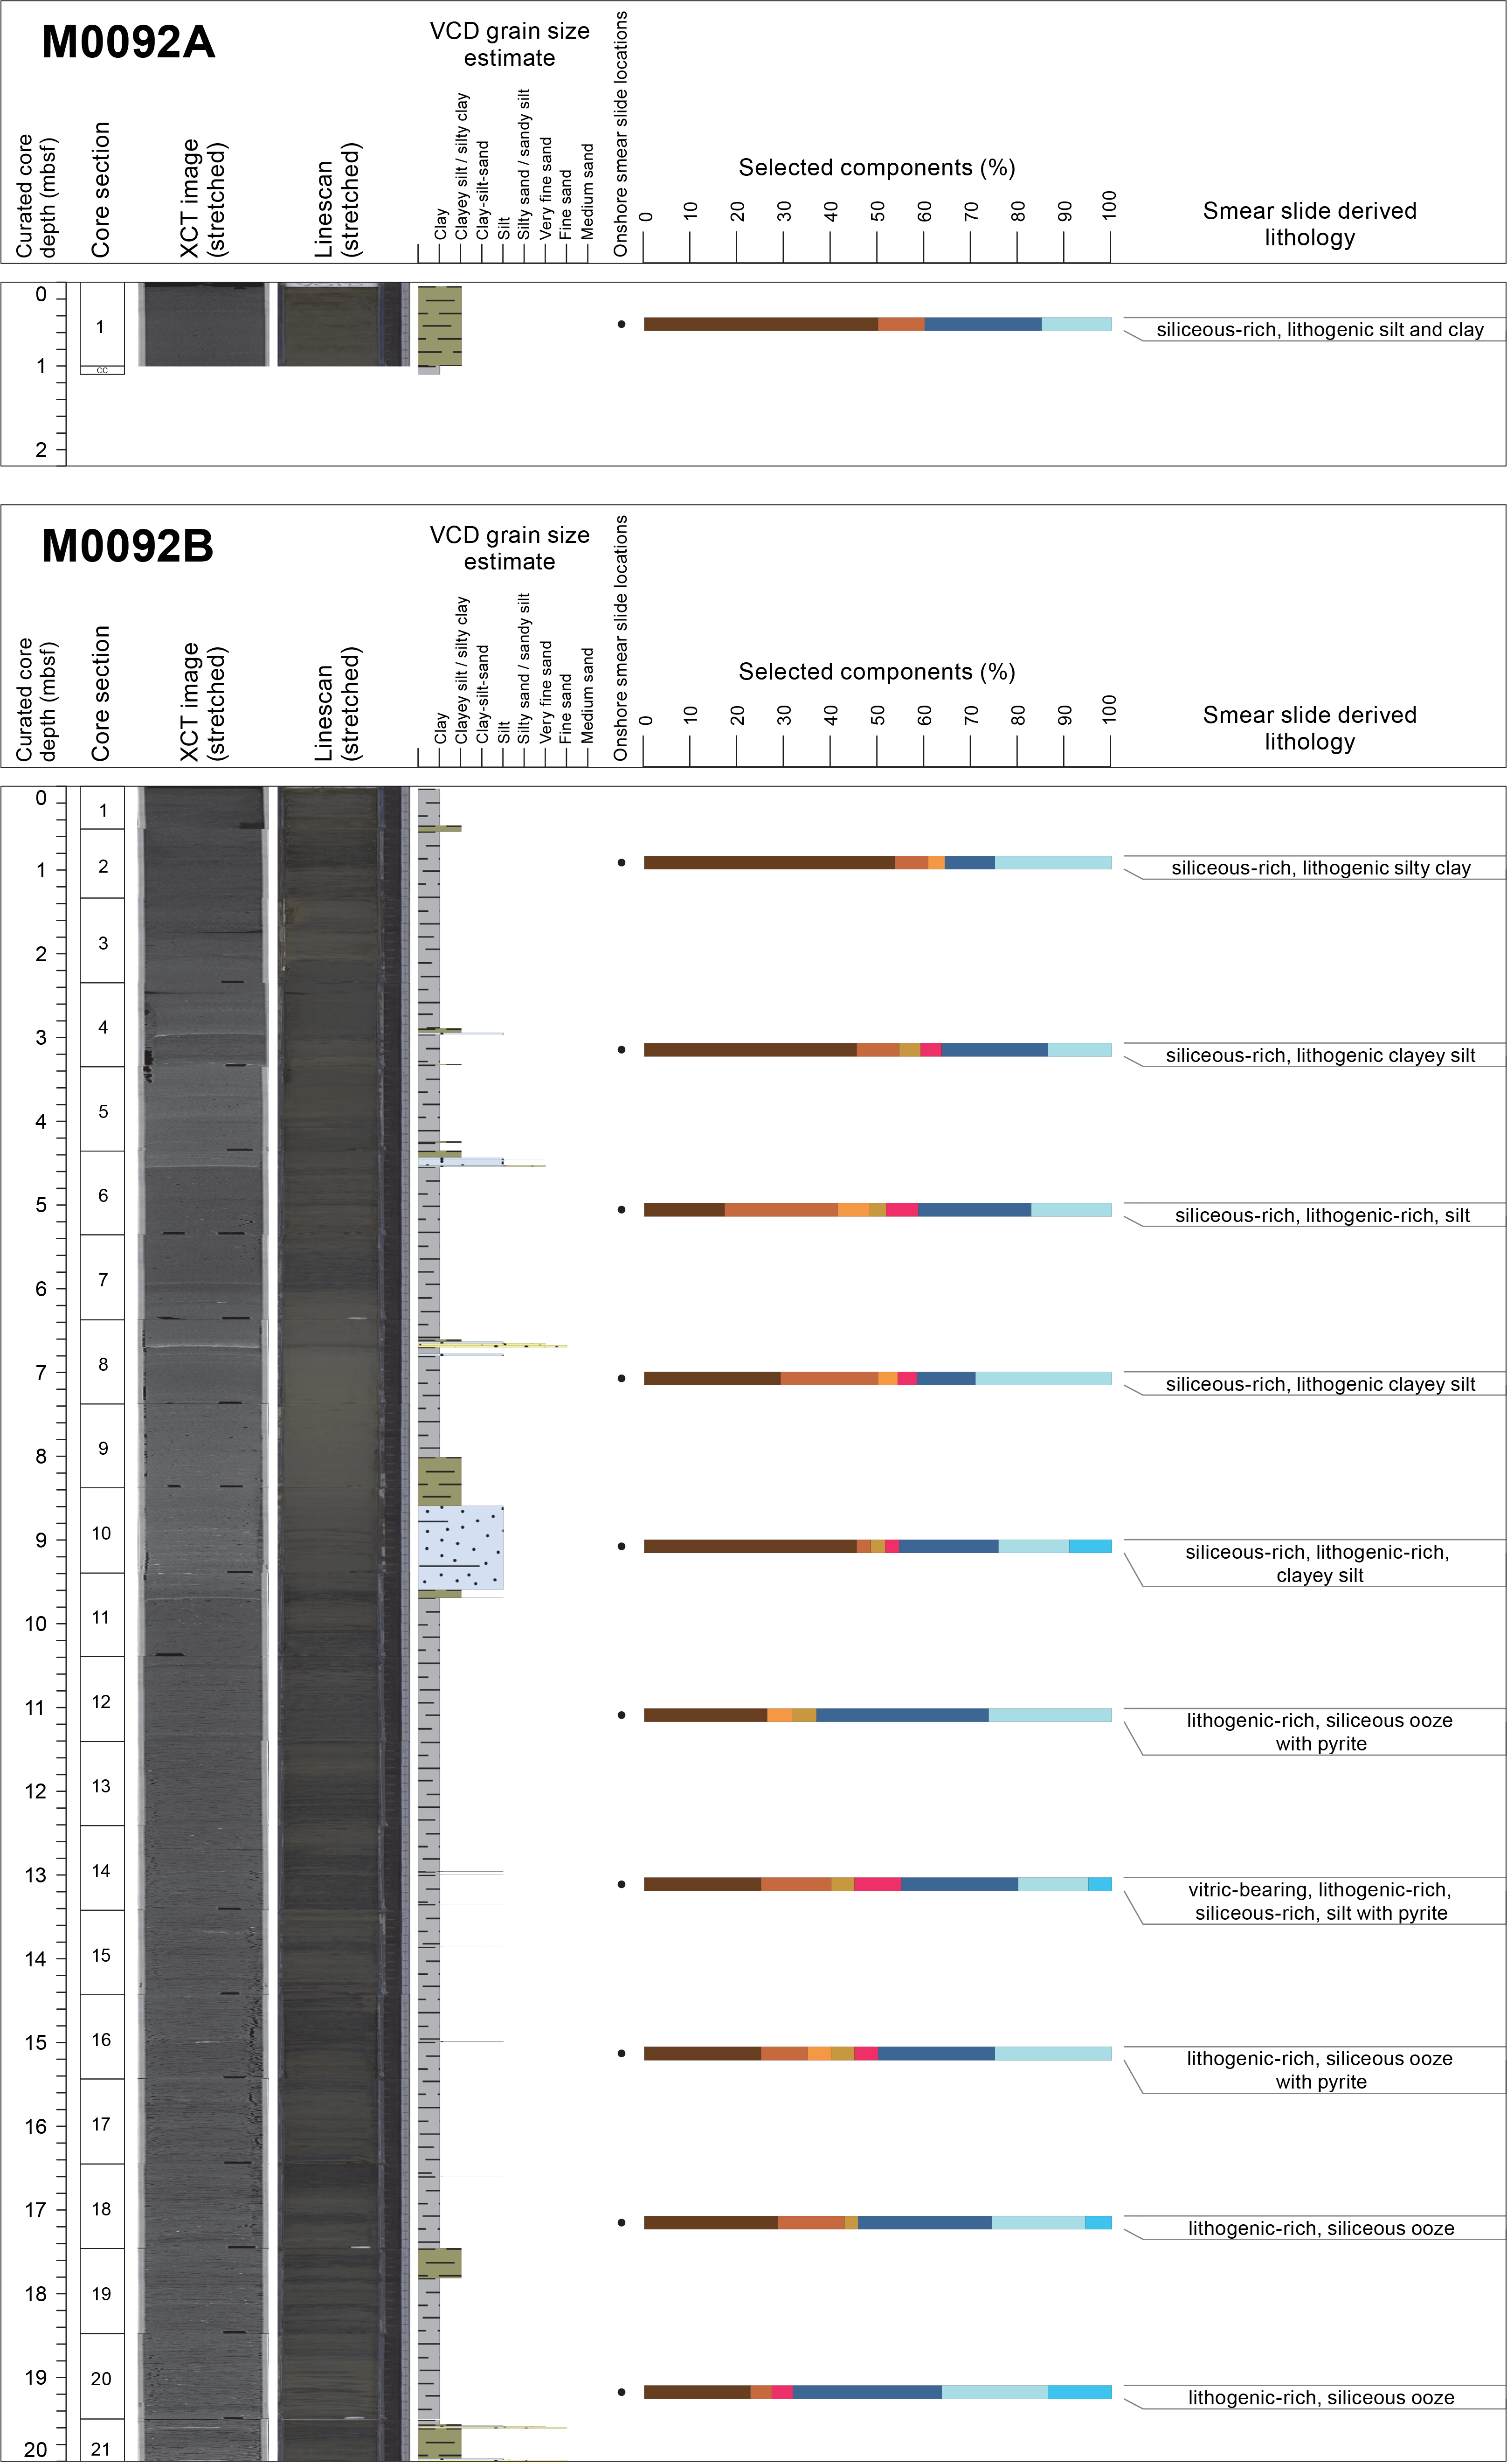

Figure F15. Smear slide summaries, Holes M0092A and M0092B.
3.1.1.2. Hole M0092B
Hole M0092B comprises a piston core with an overall length of 30.07 m in 31 core sections without a core catcher. The lithology is overall composed of silty clay/clayey silt with sparse clay, silt, or very fine sand layers distributed in four intervals with sharp contacts (Figure F12).
Interval 1 (0–9.5 mbsf; Sections 386-M0092B-1H-1, 3 cm, through 1H-11, 32 cm) comprises two parts. (1) An upper part (~0–6.5 mbsf; Sections 1H-1, 3 cm, through 1H-8, 33 cm) shows three fining-upward very thin bedded sand, silt, to silty clay intervals giving rise to thick-bedded clay with rare silty clay streaks. The base of each succession is characterized by a sharp surface over a heavily bioturbated clay (Figure F16). In the lower part of this interval (Sections 1H-6, 20 cm, through 1H-8, 33 cm), the sediment overlying the surface is a planar laminated sand over a few centimeters thick; in the middle of this interval (Sections 1H-4, 63 cm, through 1H-6, 20 cm), it is a few centimeters thick laminated silt; and in the upper part of the interval (Sections 1H-1, 0 cm, through 1H-4, 63 cm), it is centimeter-scale silty clay with minor silt laminae. The clay sediments in between the coarser layers are slightly to heavily bioturbated with some mottling in places. Bioturbation intensity is higher in the lower and upper parts of this interval than in the middle one. (2) A lower part (~6.5–9.5 mbsf; Sections 1H-8, 33 cm, through 1H-11, 32 cm) shows a fining-upward succession of silt, silty clay, and clay lying above a 10 cm thick silty clay horizon (interval 1H-11, 20–32 cm). The latter is underlined by a silt lamina, is heavily bioturbated, and shows sharp lower and upper boundaries. The overlying silt is poorly laminated with bioturbated clayey silt interbeds that produce a rough color banding aspect. The upward transition from silty clay to clay is gradational. The silty clay and clay comprise few silts and very fine sand patches and streaks that progressively fine upward and disappear. The clay at the top of the lower part (interval 1H-8, 42–47 cm) shows some scattered silt laminae. Bioturbation at the base of the lower part is slight to moderate but stops sharp from Section M0092B-1H-10, 49 cm, to the top. The physical properties display a bell shape with a stronger signal in the lower part and a decrease in the signal that parallels the fining-upward trend of the sediment. The upper part shows smooth curves in low values of magnetic susceptibility, density, and NGR (see Physical properties) with small peaks in the thin-bedded sand, silt, and silty clay. Density shows the strongest variations observed in the core in a laminated silt and silty clay (interval 1H-4, 65–70 cm).
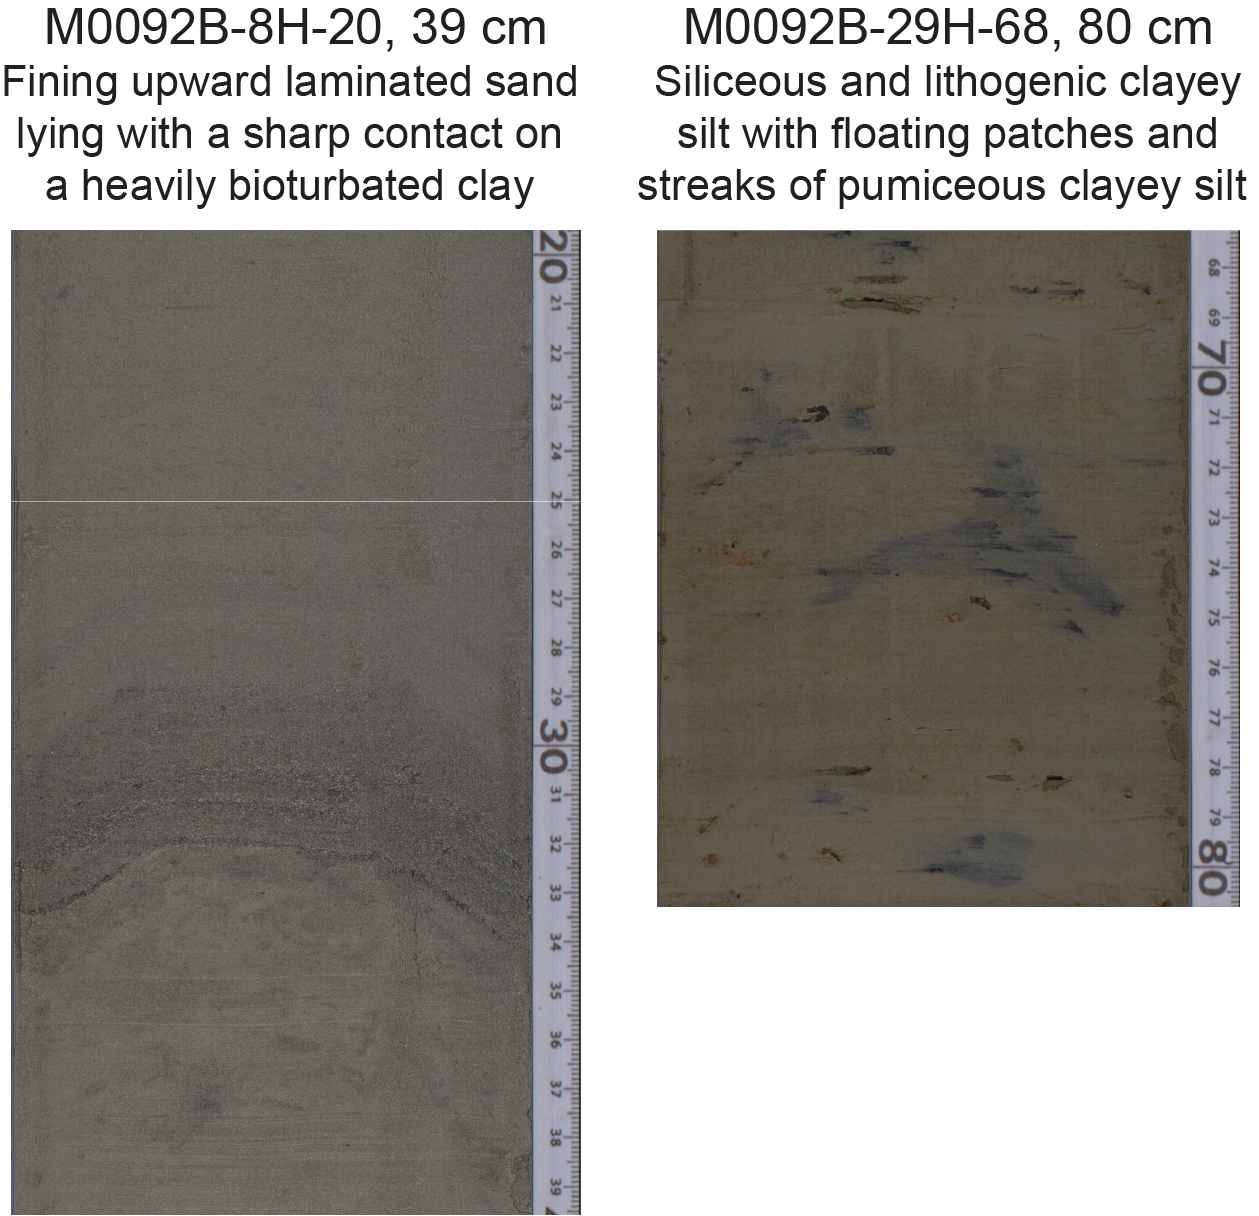
Figure F16. Sedimentary facies.
Interval 2 (~9.5–19.5 mbsf; Sections 386-M0092B-1H-11, 32 cm, through 1H-21, 7 cm) is a clay with no apparent primary sedimentary structures, few scattered silt laminae, and a silty clay horizon in interval 1H-19, 0–35 cm. Bioturbation is slight to moderate in the lower half of the interval, and iron monosulfide abundance is sparse to abundant; in the upper half, bioturbation is moderate to heavy. The magnetic susceptibility and density curves display monotonous, smooth curves and low intensity values that confirm the homogeneous nature of the sediment, whereas the higher and wavy values in NGR point to the high clay content with some silt laminae (see Physical properties).
Interval 3 (~19.5–20.60 mbsf; Sections 386-M0092B-1H-21, 7 cm, through 1H-22, 30 cm) is a fining-upward succession from a sharp base silt layer (interval 1H-22, 12–30 cm) overlain by a silty clay horizon (Sections 1H-21, 7 cm, through 1H-22, 12 cm). The silty clay comprises two centimeter-scale, fining-upward fine sand laminae to silt intervals (1H-21, 10–16 and 47–50 cm) with a sharp base. Interval 3 shows slight bioturbation. The three physical properties curves are smooth and show low intensity values except for a large peak in magnetic susceptibility and density in the lowermost fine sand laminae (interval 1H-21, 47–50 cm) (see Physical properties).
Interval 4 (~20.60–30.17 mbsf; Sections 386-M0092B-1H-22, 30 cm, through 1H-31, 17 cm) is an irregular alternation of medium- to thick-bedded silty clay and clay with gradational contacts. The silty clay and clay contains isolated and dispersed millimeter-scale pumiceous silt and sand patches and streaks (Figure F16) and scattered silt (Sections 1H-28, 10 cm; 1H-30, 92cm; and 1H-31, 11–14 cm), fine sand (Section 1H-29, 94 cm), and fine sand and silt (interval 1H-26, 21–19 cm) laminae. Bioturbation is slight to moderate but extends throughout most of the interval. Magnetic susceptibility is smooth in low values with some wiggles in silty clay horizons and is accompanied by a sawtooth density curve. The NGR curve is wavy and shows high values that are indicative of the substantial clay content (see Physical properties).
A total of 15 smear slides were collected for Hole M0092B. The texture of the sediment is a clayey silt with some silty clay and silt with 30%–70% of lithic and biogenic and less than 10% volcanic material (Figure F13, F14). In the stratigraphy, however, the sediment ranges from a siliceous-rich lithogenic clayey silt and silt in Interval 1 to a lithogenic-rich siliceous ooze with pyrite in parts of Interval 2 to a siliceous-rich lithogenic silty clay and minor clayey silt in Interval 4 (Figure F15). Interval 3 was not sampled. One sample (1H-14, 70 cm) is a vitric-bearing lithogenic- and siliceous-rich silt with pyrite. The main minerals are clay (17.2%–53.6%), quartz (0%–24%), feldspar (6.9%), pyrite (0%–5%), and vitric grains (0%–12.5%). The biogenic elements are sponge spicules (12.5%–26.3%), diatoms (10.7%–31.8%), and rare radiolaria. Radiolaria are present in only three samples with abundances of 9.1%, 5.7%, and 13.6% (Table T3).
3.1.1.3. Diagenesis
Iron monosulfide abundance in Holes M0092A and M0092B varies from sparse to abundant in large parts parallel to bioturbation intensity. Interval 2 is heavily impregnated with iron monosulfides, whereas Interval 3 is sparse, and Intervals 1 and 5 show meter-scale horizons with no iron monosulfide overprints.
3.1.2. Holes M0092C and M0092D
3.1.2.1. Hole M0092C
Hole M0092C comprises a 0.785 m long trigger core, including a core catcher. The top of the core (interval 1P-1, 0–5 cm) is a void above a thick homogeneous dark olive (7.5Y 4/3) to grayish olive (7.5Y 4/2) clay (Figure F17). In the upper part of the core, sediment is oxidized, indicating that the seafloor is probably recovered. Magnetic susceptibility, density, and NGR show a slightly increasing trend with depth indicative of an increase of grain size and radiogenic material (see Physical properties).


Figure F17. Lithostratigraphic summaries, Holes M0092C and M0092D.
One smear slide was collected for Hole M0092C (Table T3; Figures F13, F14, F18). The lithology is a siliceous-rich lithogenic clayey silt with a large biogenic fraction that includes sponge spicules (13%) and diatoms (30%).
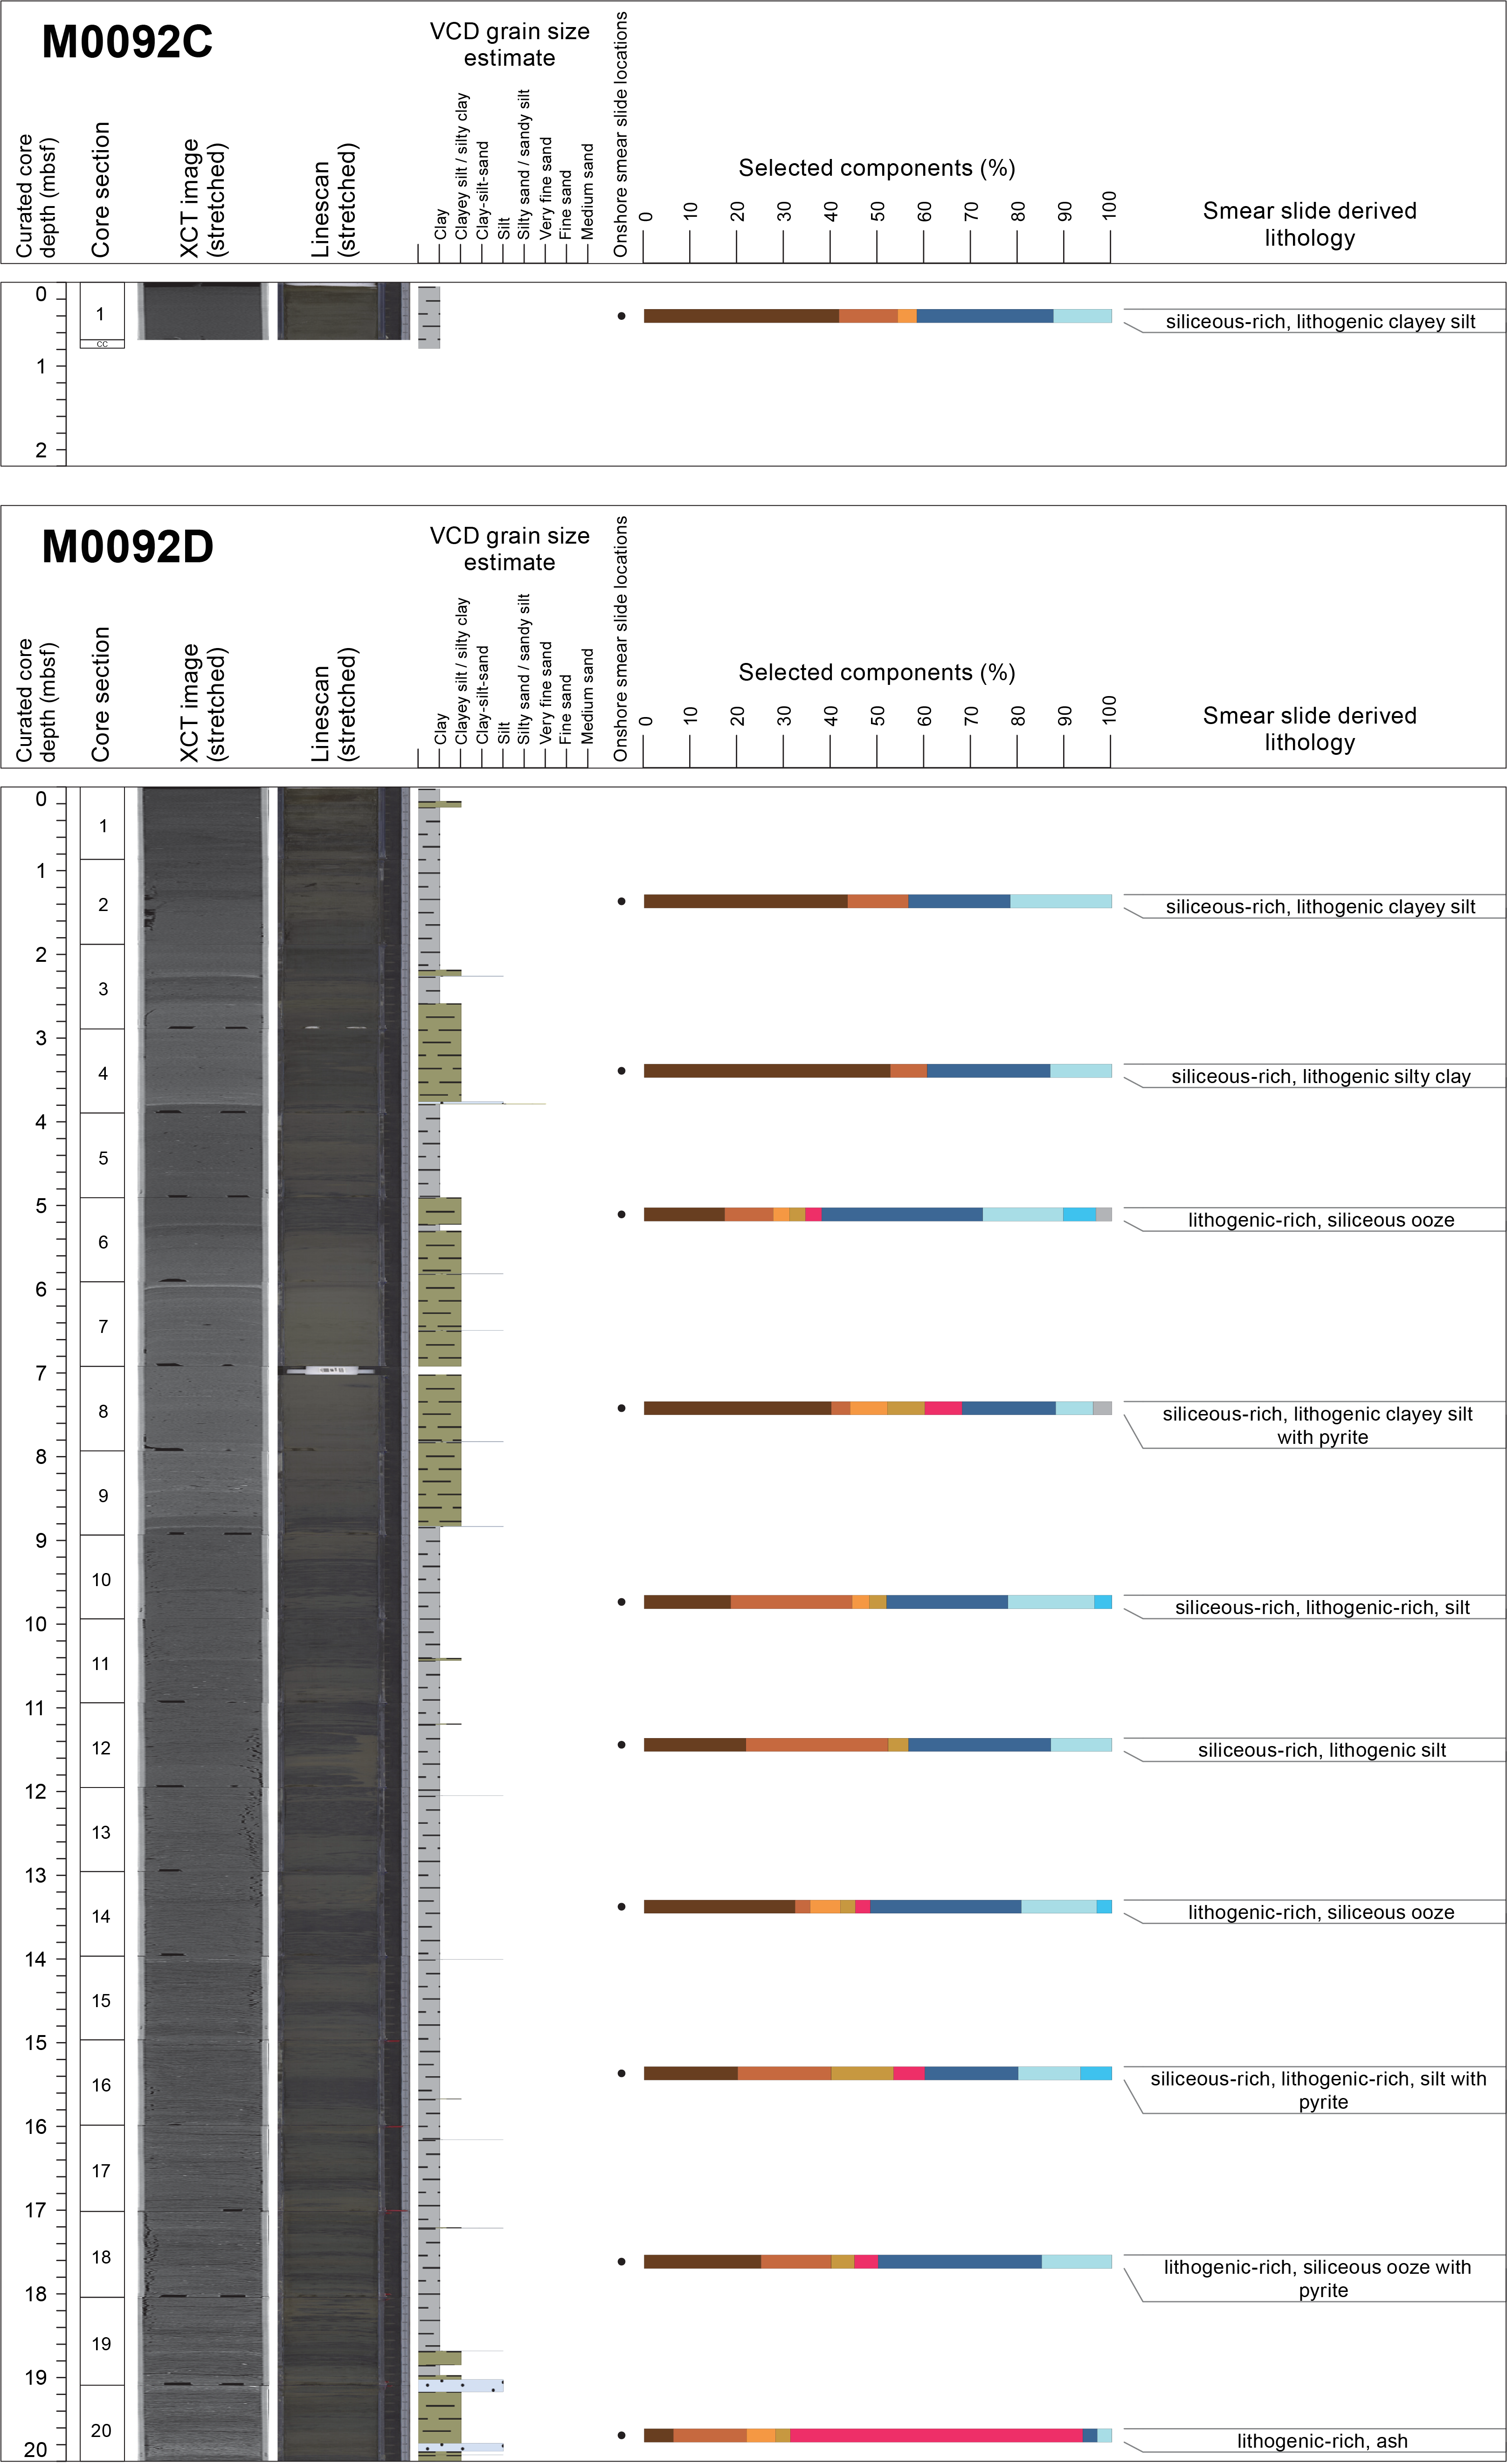
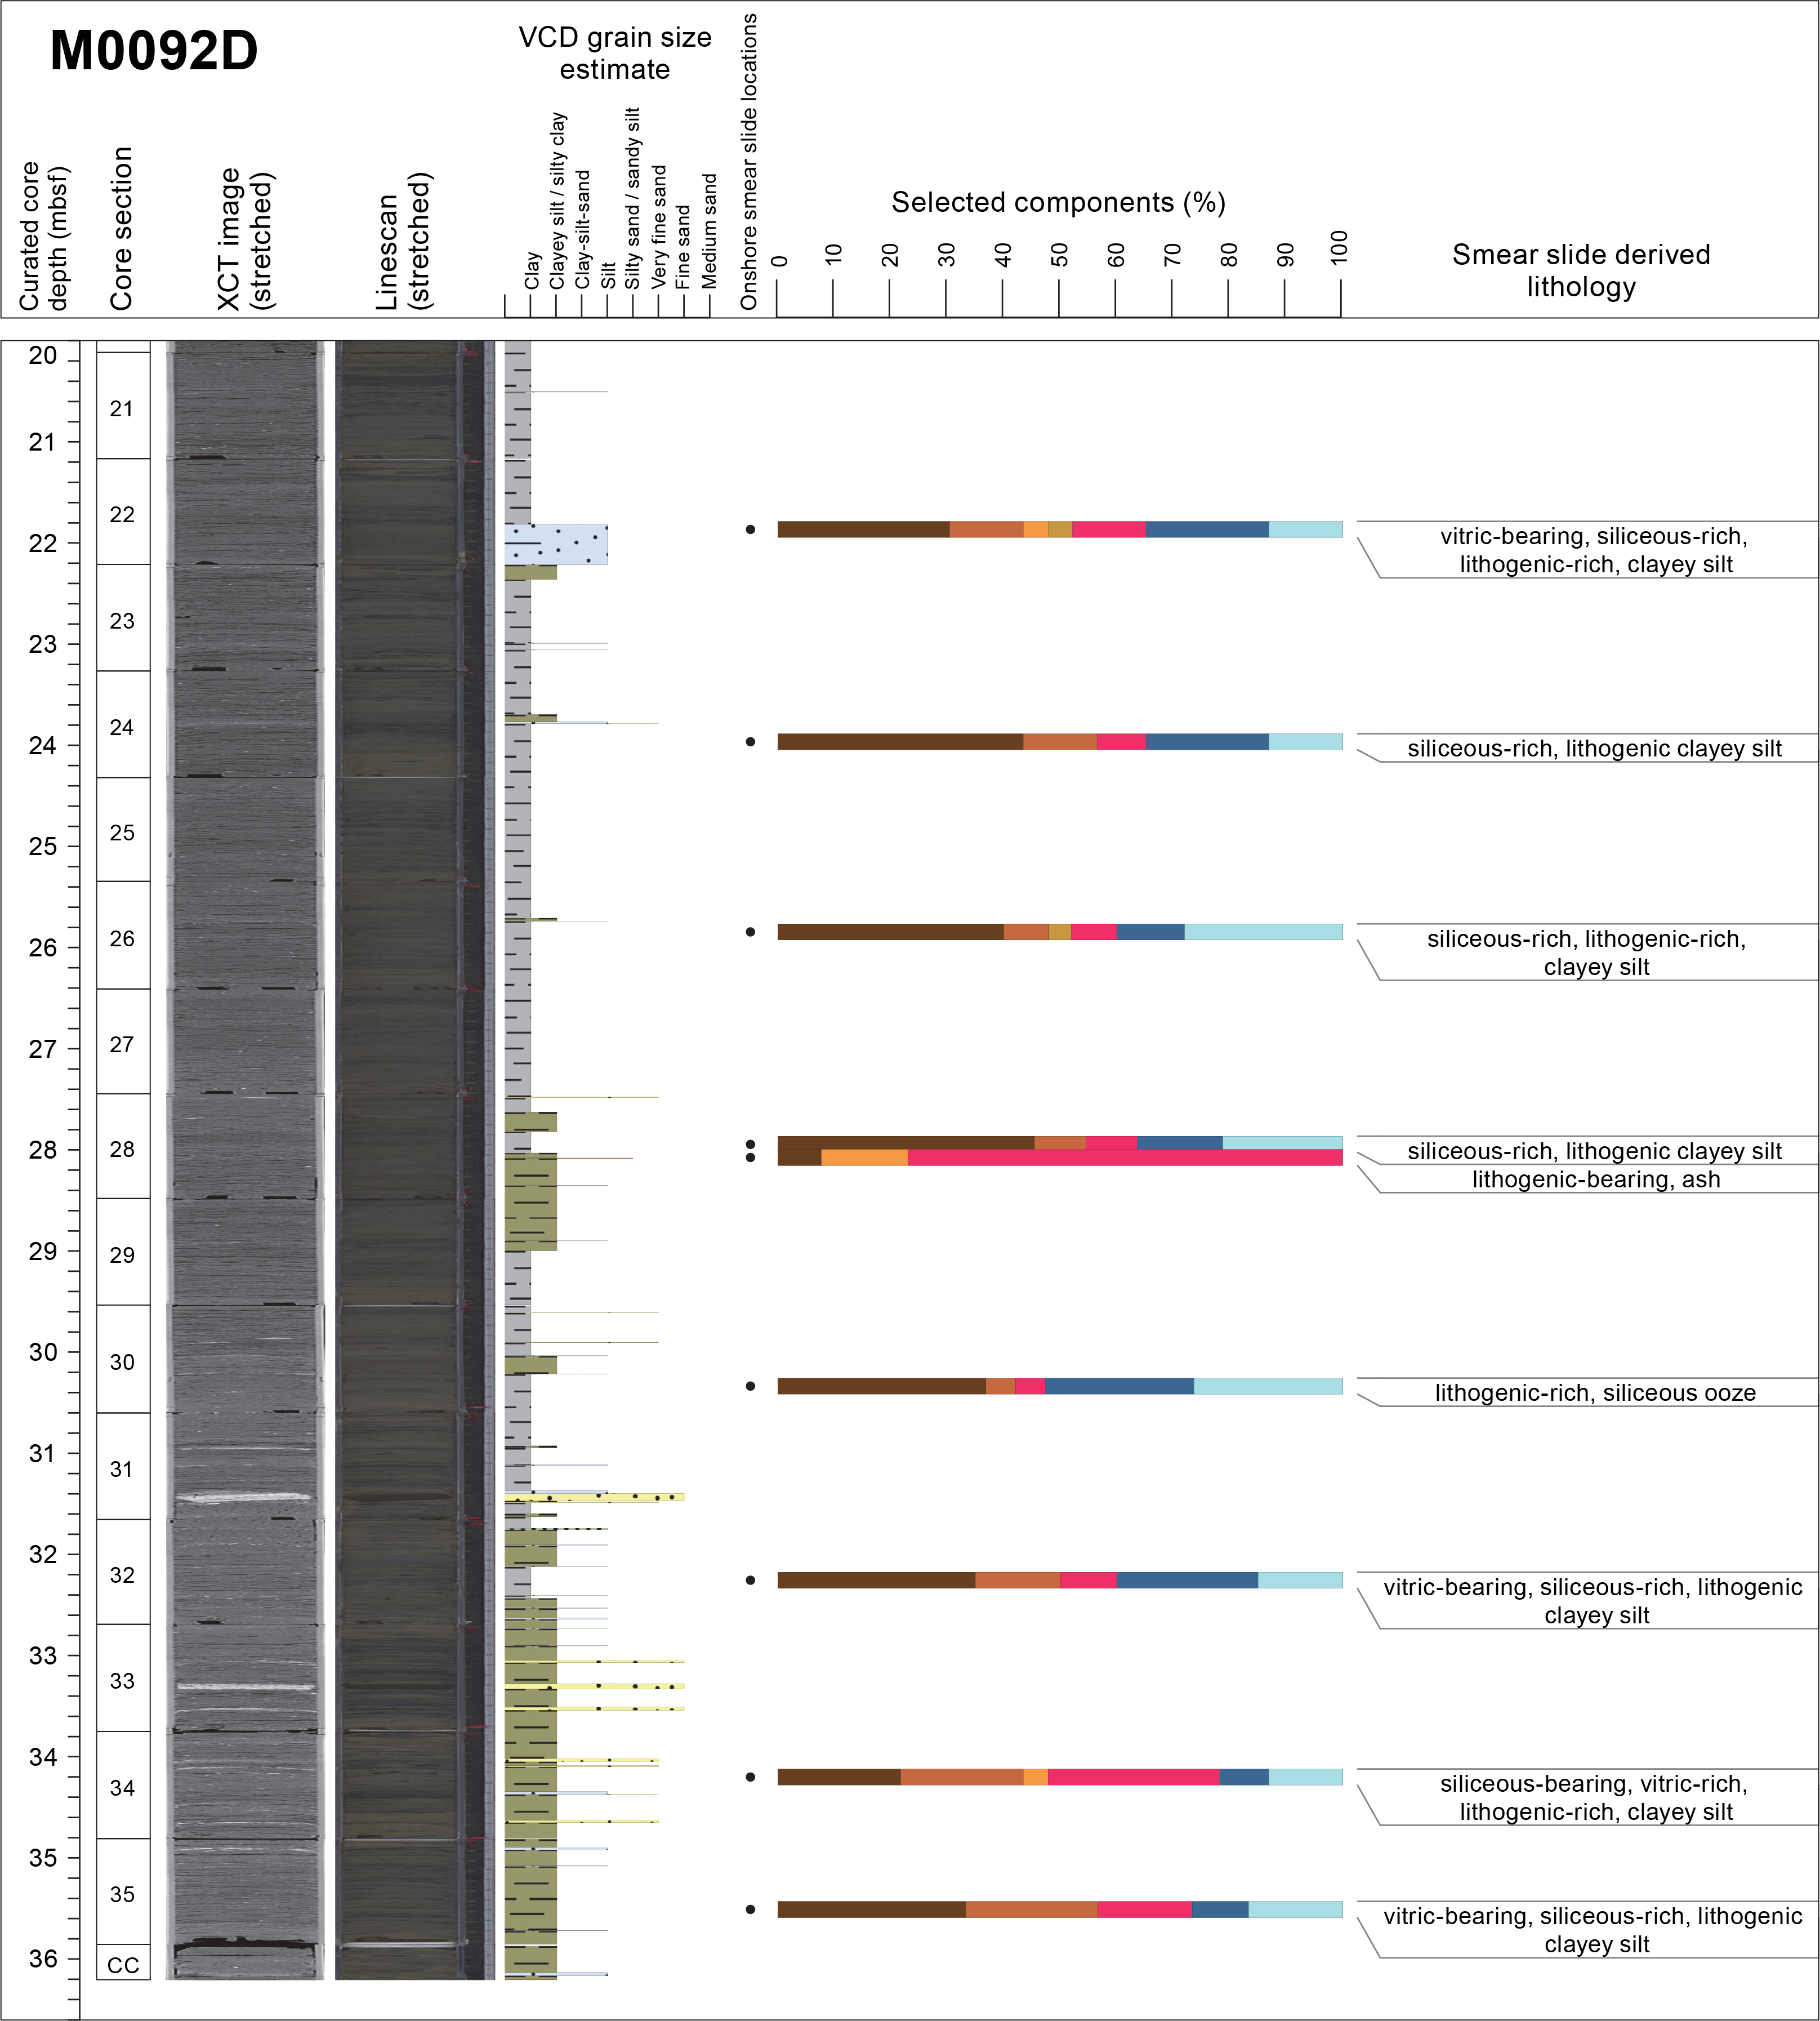
Figure F18. Smear slide summaries, Holes M0092C and M0092D.
3.1.2.2. Hole M0092D
Hole M0092D comprises a piston core with overall length of 36.21 m divided in 36 core sections. It is composed of silty clay/clayey silt with sparse clay, silt, or very fine sand layers distributed in four intervals with sharp contacts (Figure F17).
Interval 1 (~0–8.84 mbsf; Sections 386-M0092B-1H-1, 0 cm, through 1H-9, 91 cm) shows three major fining-upward, very thin-bedded, very fine sand and silt to silty clay and clay sequences (approximately at the base of Sections 1H-4, 1H-7, and 1H-9). The base of each succession is characterized by a sharp contact, and Sections 1H-4 and 1H-9 overlie a heavily bioturbated and iron monosulfide–rich clay. Zones of planar laminated sediments occur in thin intervals throughout and are visible on the core surface due to the iron monosulfides within them. Bioturbation intensity is higher in the upper part of the middle and upper succession than in the lower one, which is not bioturbated. Physical properties measurements are similar to those for Hole M0092B. They show a bell shape with stronger values in the lower part that decrease, paralleling the fining-upward trend of the sediment. The upper part shows very smooth curves with low values of magnetic susceptibility, density, and NGR and small peaks in the thin-bedded sand, silt, and silty clay. The magnetic susceptibility signature is thickest and highest in magnitude for the basal part of the lower fining-upward sequence in Section 1H-9. NGR shows a decreasing trend from Section 1H-9 to the core top (see Physical properties).
Interval 2 (~8.84–18.7 mbsf; Sections 386-M0092D-1H-9, 91 cm, through 1H-19, 66 cm) is a variably laminated clay with a few scattered silt laminae throughout. Bioturbation is slight to abundant throughout, and iron monosulfide abundance is sparse to abundant. Magnetic susceptibility and density display monotonous, smooth curves with low values of intensity and minor variations that correlate to the homogeneous nature of the sediment. The high NGR values point to the high clay content, whereas the lows in wiggles correlate to silt laminae (see Physical properties).
Interval 3 (~18.7–22.25 mbsf; Sections 386-M0092D-1H-19, 66 cm, through 1H-23, 3 cm) is characterized by three fining-upward successions from a sharp base, very fine sand to silt layer (interval 1H-23, 3–4 cm) overlain by a structureless silty clay interval up to Section 1H-21, 7 cm, to two stacked silt to silty clay events in Sections 1H-20, 84 cm, through 1H-19, 66 cm. Bioturbation is slight to heavy, and iron monosulfide abundance is sparse to heavy throughout. Physical properties display smooth curves that show low values of intensity and minor variation but with notable peaks in magnetic susceptibility and density in the three coarsest layers.
In Interval 4 (~22.25–36.21 mbsf; Section 386-M0092D-1H-23, 3 cm, through interval 1H-36, 17–35 cm), the sediments progressively contain more closely spaced sand and silt beds and laminae with depth. Below Section 1H-22, fine-grained intervals are silty clay and several fine sand beds and laminae; the coarsest sediments in this interval occur in Sections 1H-31 and 1H-33. Contacts are sharp at the base and overlain by sediment that grades upward. Laminar and mottled bedding occurs throughout the interval. A tephra in Section 1H-28, 63 cm, is present as a thin bed. Bioturbation is generally slight and locally abundant in Section 1H-25, and iron monosulfide abundance is sparse to abundant throughout. Physical properties display smooth curves that show low values of intensity and minor variation but with notable peaks in magnetic susceptibility and density in most of the coarse beds and laminae (see Physical properties).
A total of 20 smear slides were collected for Holes M0092C and M0092D. The texture of the sediment is a clayey silt with some silty clay and silt (Figures F13, F14, F18) with 30%–70% lithic and biogenic components and less than 10% volcanic material, except in the case of the lithogenic-rich ash in Section 386-M0092D-1H-20, 60 cm, and the lithogenic bearing ash in Section 1H-28, 63 cm (Table T3; see Tephra). In addition to the ash samples, sediment compositions from smear slides range from siliceous-rich lithogenic clayey silt and silt to lithogenic-rich siliceous ooze and a siliceous-rich lithogenic silty clay. Additionally, some samples contain pyrite in abundances high enough (>5%) to be added as an addendum to the sediment name. The mineralogy of the smear slides is dominated by clay (6.3%–52.6%), quartz (0%–30.4%), feldspar (0%–15.4%), pyrite (0%–13.3%), and vitric grains (0%–76.9%). The biogenic elements are sponge spicules (0%–28%), diatoms (0%–35%) and rare radiolaria (0%–6.9%).
3.1.2.3. Diagenesis
In sediments from Holes M0092C and M0092D, the intensity of iron monosulfides varies throughout the cores (Figure F17). This variation ranges from ~10–15 cm thick intervals in the cores to a nearly uniform presence in the sediments. In some cases, there are no iron monosulfides present (e.g., Sections 386-M0092D-1H-8, 1H-7, 1H-3, 1H-2, and 1H-1). Iron monosulfides are most easily observed during split core description and subsequent examination of the linescan camera images for each section. In addition, smear slide observations document framboidal occurrences of pyrite within microfossils. Relative to the host lithostratigraphy, there are three main patterns of iron monosulfide occurrence: (1) as mottles (1–10 mm in diameter) or patches (>1 cm in diameter) in fine-grained sediment intervals, (2) as mottling in bioturbated zones beneath coarse-grained sediments, and (3) as color bands in strata layers in both fine- and coarse-grained beds. Variations in iron monosulfide intensity from sparse to abundant throughout the cores is consistent with variable exposure time of the sediments to organoclastic sulfate reduction and/or the anaerobic oxidation of methane, the dominant diagenetic reactions that produce iron monosulfides and ultimately pyrite in marine sediments. Although bioturbation intensity is also variable throughout the cores, some bioturbated zones are most easily seen when amplified by iron monosulfide precipitates, particularly in lighter portions of the cores. After core splitting in February 2022, variable oxidation of the iron sulfide–rich sediments occurred. It is particularly visible in some sections along fractures, at core section ends, and as encroachment fronts from the core liner edges (e.g., Section 1H-12).
3.1.3. X-ray diffraction mineralogy
XRD mineralogy was conducted for one sample from every other section, and the most abundant mineral and/or mineral groups are summed and shown as a downcore cumulative abundance plot with depth for the longest hole in each basin, in this case Hole M0092D. Some of these mineral groupings will require additional processing to extract a signal for each mineral. For example, clays, carbonates, amphiboles, pyroxene, and heavy minerals are composed of several minerals in each grouping (see Lithostratigraphy in the Expedition 386 methods chapter [Strasser et al., 2023a]). The interpretation of the mineralogy is preliminary at this stage; however, some interpretations can be made when the data are compared with the smear slides and lithostratigraphic summary plots. For Hole M0092D, the most abundant minerals are quartz, feldspar, and clay followed by micas (muscovite and biotite). The data show correspondence between quartz, feldspar, clays, and micas, and the smear slide data also show them as the most abundant minerals (Table T3). Palygorskite, a clay associated with the weathering of glasses, occurs at 2–3 and at 12 mbsf, and in most instances it occurs where there are vitric grains or tephra. The amphibole group minerals, the heavy minerals, and pyroxene are present rarely throughout the core and seem to correlate with silty clay and clayey silt intervals. Carbonate is rare in most of the cores; however, the XRD data indicate it is present at 0–1 and 20–21 mbsf. Future studies will be required to fully extract the bulk mineralogy of the sediments in these two holes.
3.2. Site M0095
3.2.1. Holes M0095A and M0095B
3.2.1.1. Hole M0095A
Hole M0095A is 80 cm deep, is composed of homogeneous clay, and lacks bioturbation and iron monosulfide (Figure F19). A 2 cm thick interval at the top of the hole (2.5Y 3/3) is interpreted as oxygenated, indicating that the surface of the seafloor was recovered. A sharp contact in Section 1P-1, 12 cm, is marked by a color change. Otherwise, the lithology in this section is structureless and nonbioturbated. Magnetic susceptibility, density, and NGR increase toward the bottom of the hole (see Physical properties), indicating an overall fining-upward trend and a progressive increase in radiogenic material.
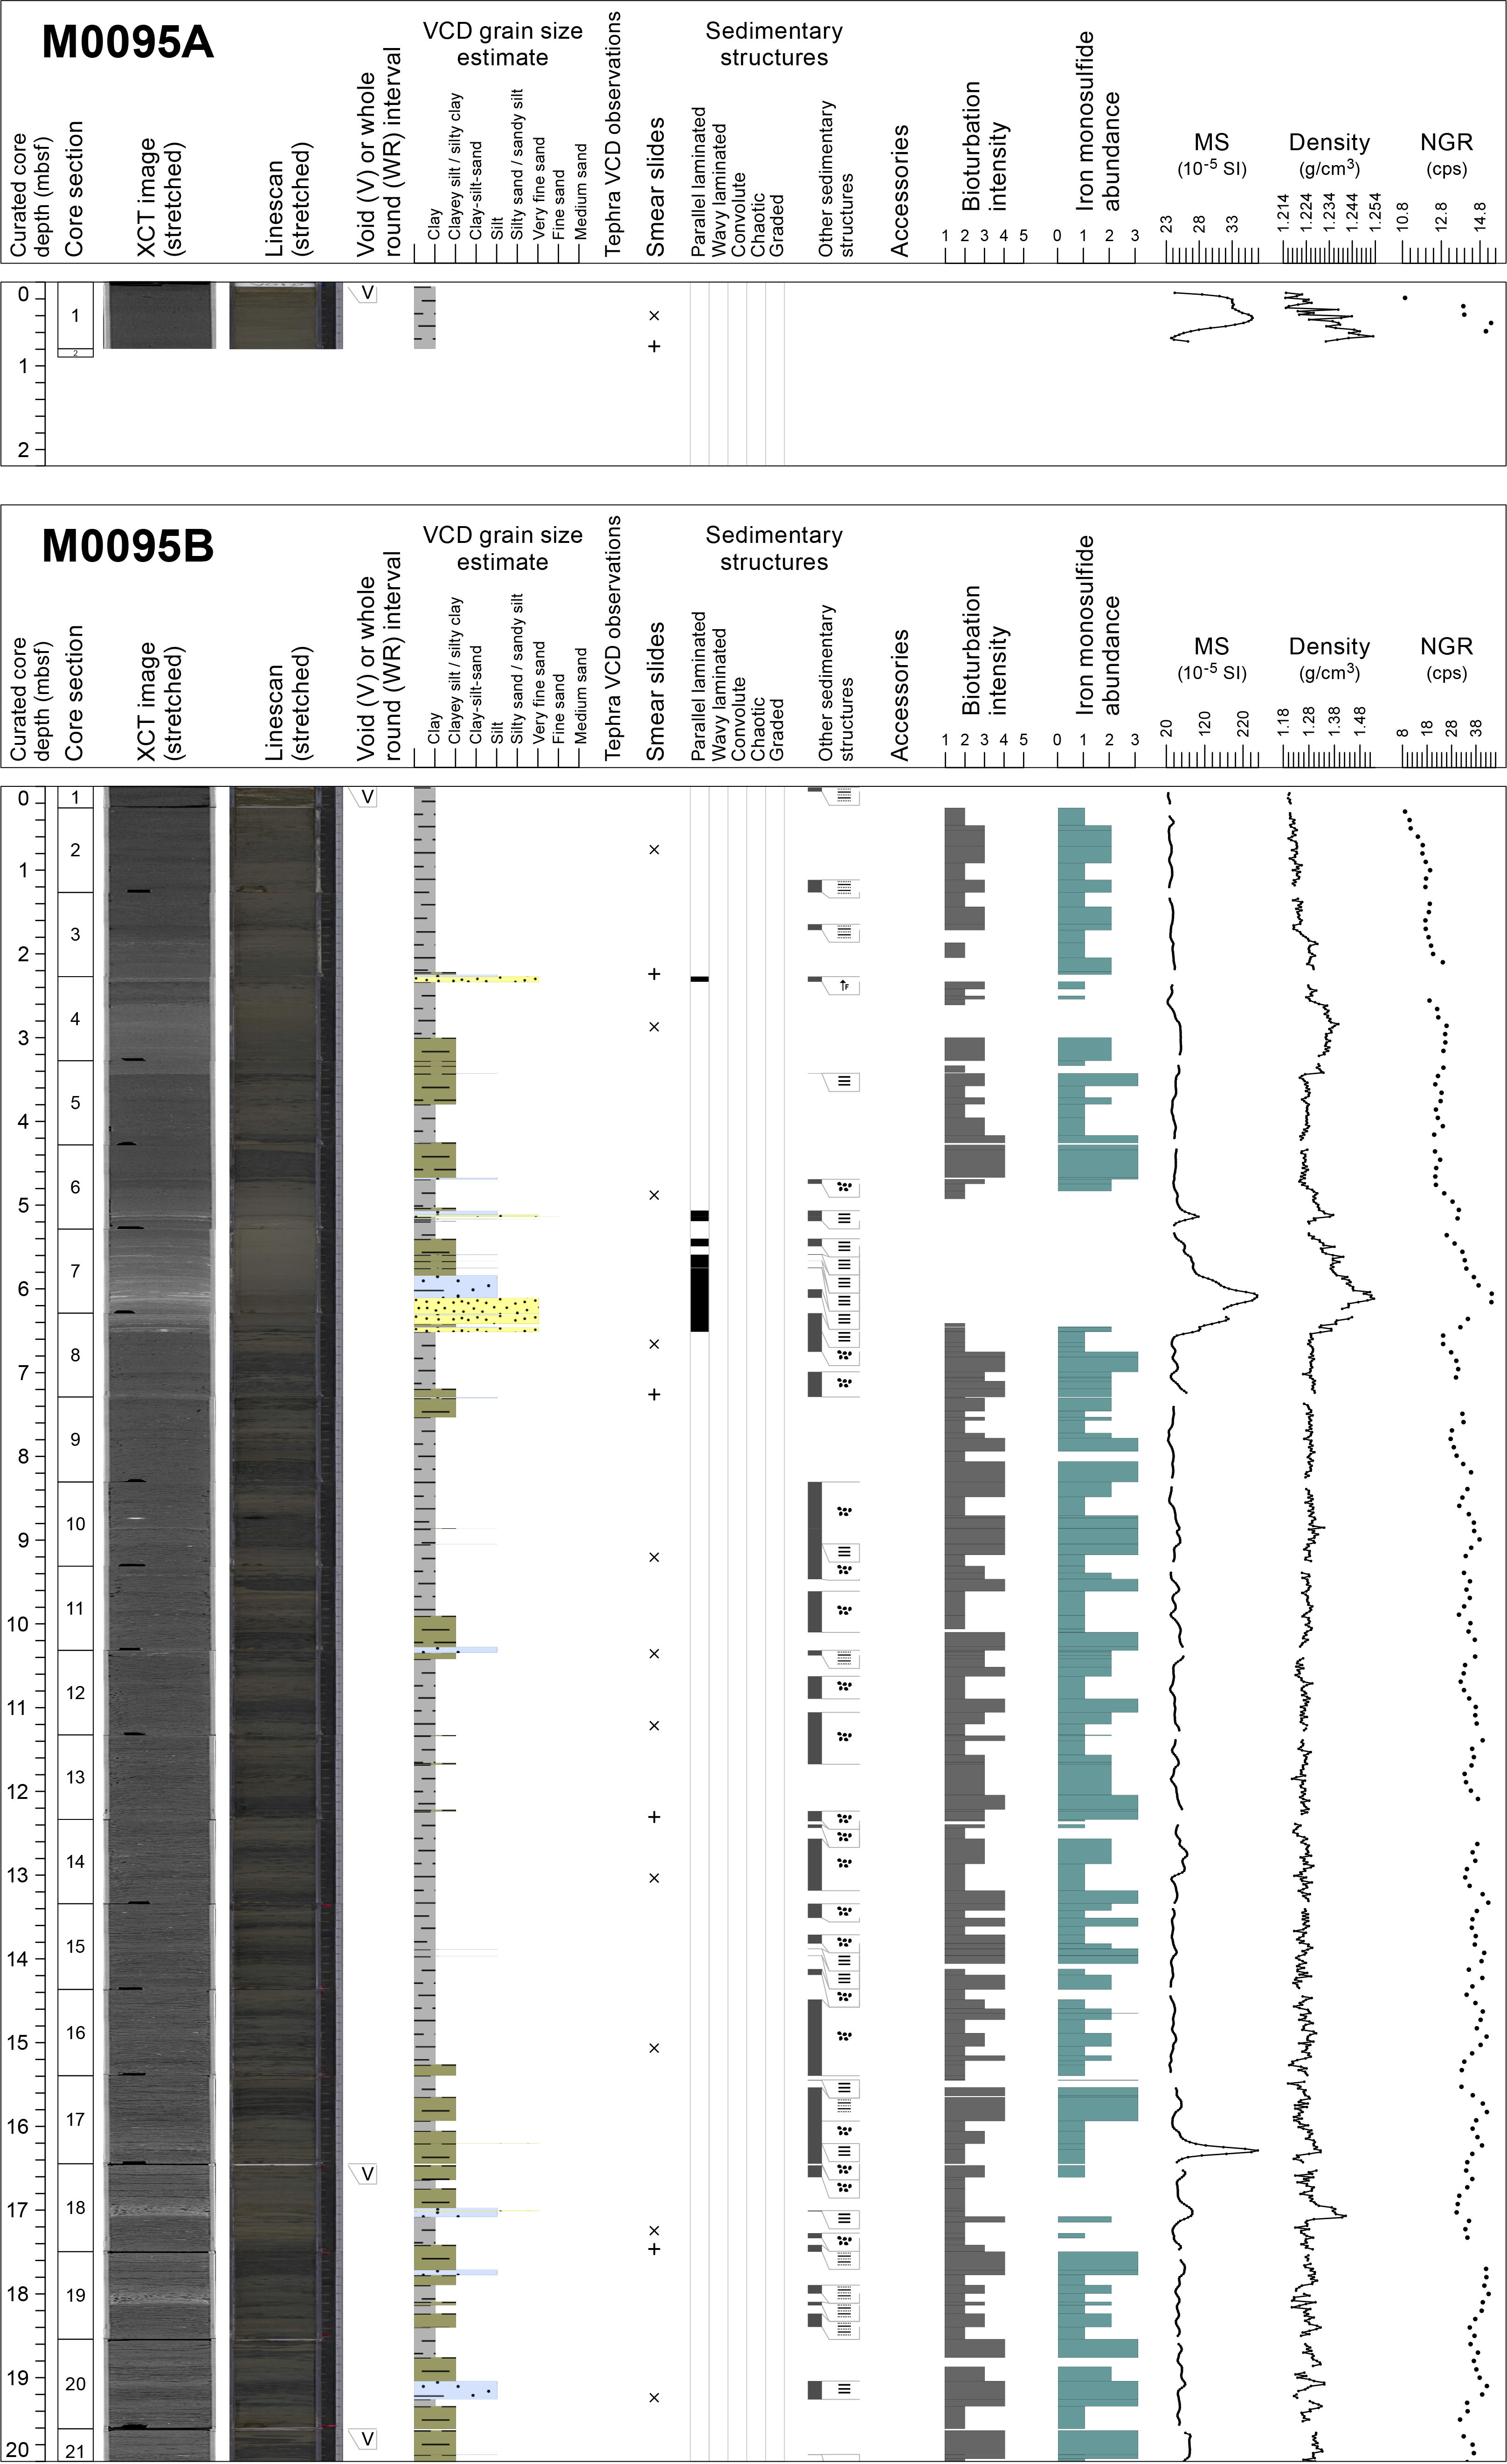
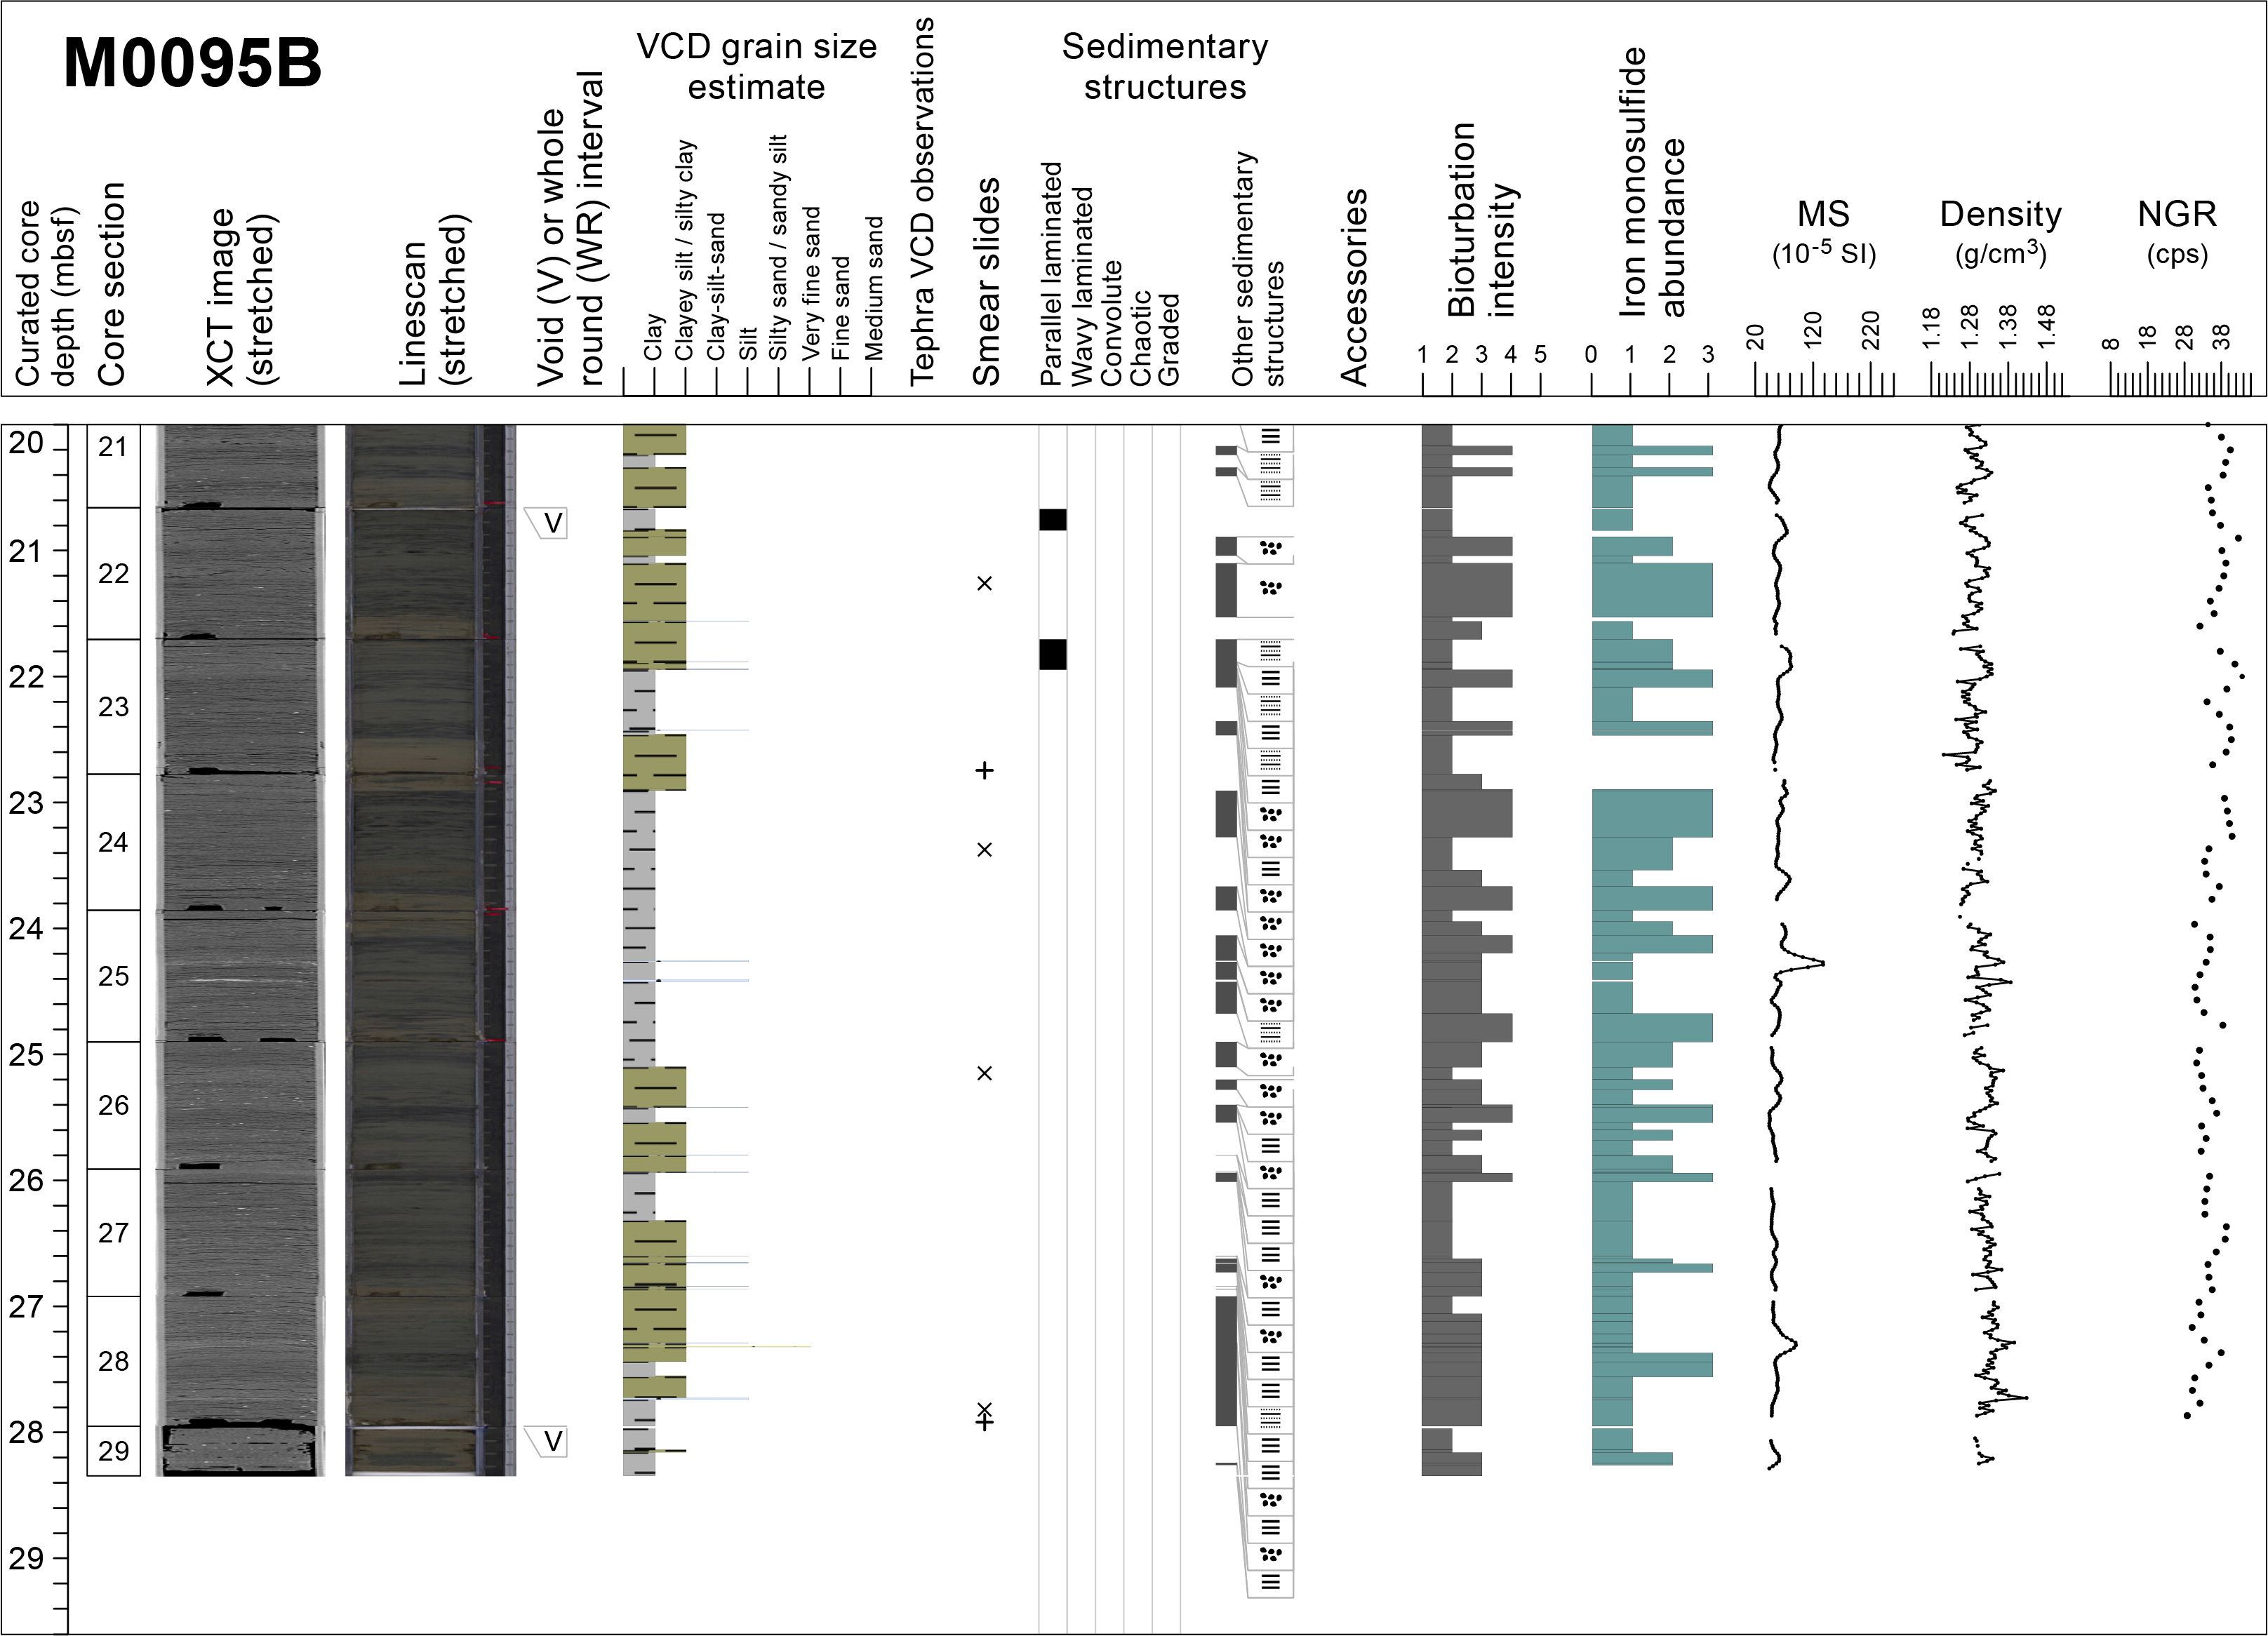
Figure F19. Lithostratigraphic summaries, Holes M0095A and M0095B.
One smear slide was observed, and the lithology is vitric-bearing siliceous-rich lithogenic clayey silt (Table T4; Figure F20). Silt is the most abundant component of the grains (60%), followed by clay (40%). The minerals are dominated by clay (40%) and to a lesser extent quartz (12%). The biogenic component forms 36% of the slide and is composed of diatoms (28%) and sponge spicules (8%). Vitric components constitute 12% of the total slide.


Figure F20. Smear slide summaries, Holes M0095A and M0095B.
3.2.1.2. Hole M0095B
In Hole M0095B, the grain size–based lithology is dominated by clayey silt and silty clay (Figure F19). Based on the grain size and bedding structures, Hole M0095B is divided into four intervals.
Interval 1 (0–2.2 mbsf; Sections 386-M0095-1H-1, 0 cm, through 1H-4, 6 cm) is composed of homogeneous clayey silt and silty clay. The base of this interval is marked by a 5 cm thick, fining-upward interbedded silt and very fine sand bed underlined by a sharp base sand laminae. Except for the very fine sand section, the interval is bioturbated. Bioturbation ranges in intensity from slight to moderate, and iron monosulfides follow similar patterns and intensities as those in the bioturbated interval. There is no variability in the magnetic susceptibility, bulk density, and NGR signals within this interval (see Physical properties), and the X-ray CT scan image highlights the density change related to the very fine sand laminae at 2.2 mbsf.
Interval 2 (2.2–6.45 mbsf; Sections 386-M0095D-1H-4, 6 cm, through 1H-8, 16 cm) has a sharp basal contact with a 40 cm thick very fine sand bed that fines upward into a 10 cm silt bed. Above, there is a 1.3 m homogeneous interval of clayey silt that comprises several very fine sand and silt laminae with sharp basal and upper contacts. This lower depositional package lacks bioturbation. Two clayey silt beds up to 80 cm thick and interbedded with clay occur above Section 1H-6, 93 cm, but the section with thin beds is heavily to moderately bioturbated. Iron monosulfide staining occurs in the bioturbated section. Magnetic susceptibility, bulk density, and NGR show a pronounced increase in their signals in the coarser grained horizons of this interval (see Physical properties).
Interval 3 (6.45–16.2 mbsf; Sections 386-M0095B-1H-8, 16 cm, through 1H-17, 84 cm) is finer grained than the interval above. The main lithology is clay interbedded with two clayey silt beds 4–6 cm thick and sparse silt laminae. Interval 3 is moderately to heavily bioturbated with sparse to abundant iron monosulfide staining. The magnetic susceptibility, bulk density and gamma signals show slight variability but no major increases or decreases because the lithology is homogeneous clay and silty clay (see Physical properties).
Interval 4 (16.2–28.33 mbsf; Sections 386-M0095-1H-17, 84 cm, through 1H-29, 33 cm) is thick bedded and comprises alternating clay and silty clay beds with silt laminae. Three silt beds 10–20 cm thick are present between 17 and 19.2 mbsf. Clayey silt and silty clay beds range in thickness from 20 cm to 1 m, and silt and very fine sand laminae are common throughout the interval. Moderate to abundant bioturbation with corresponding iron monosulfide staining is present throughout. The X-ray CT scan density contrasts highlight the silt and very fine sand beds and laminae, and the linescans highlight the bioturbated and iron monosulfide staining. The magnetic susceptibility signal increases correspond with the coarser grained intervals. In contrast, bulk density shows much more variability. Increases in NGR correspond with the clay intervals (see Physical properties).
A total of 15 smear slides were studied for Hole M0095B. The lithology is described as lithogenic-rich siliceous ooze, vitric-bearing siliceous-rich lithogenic clayey silt, lithogenic-rich siliceous ooze with carbonate grains, vitric-bearing siliceous- and lithogenic-rich silt with pyrite, siliceous-rich lithogenic clayey silt, and lithogenic-rich silt with carbonate grains (Table T4; Figure F20). The main components described in the smear slides are grain size, lithogenic, vitric, and biogenic grains (Figure F14). The grain size is dominated by clayey silt and, to a lesser extent, silty clay. Clay minerals are the most abundant lithogenic component, followed by quartz and feldspar. Pyrite and carbonate grains are reported in nine and three smear slides intervals, respectively. Diatoms are the most abundant biogenic component, with lesser occurrences of sponge spicules and radiolaria. Vitric grains are present near the top and bottom of the hole. Authigenic carbonate is reported from smear slides for Section 1H-12 (Figure F21).
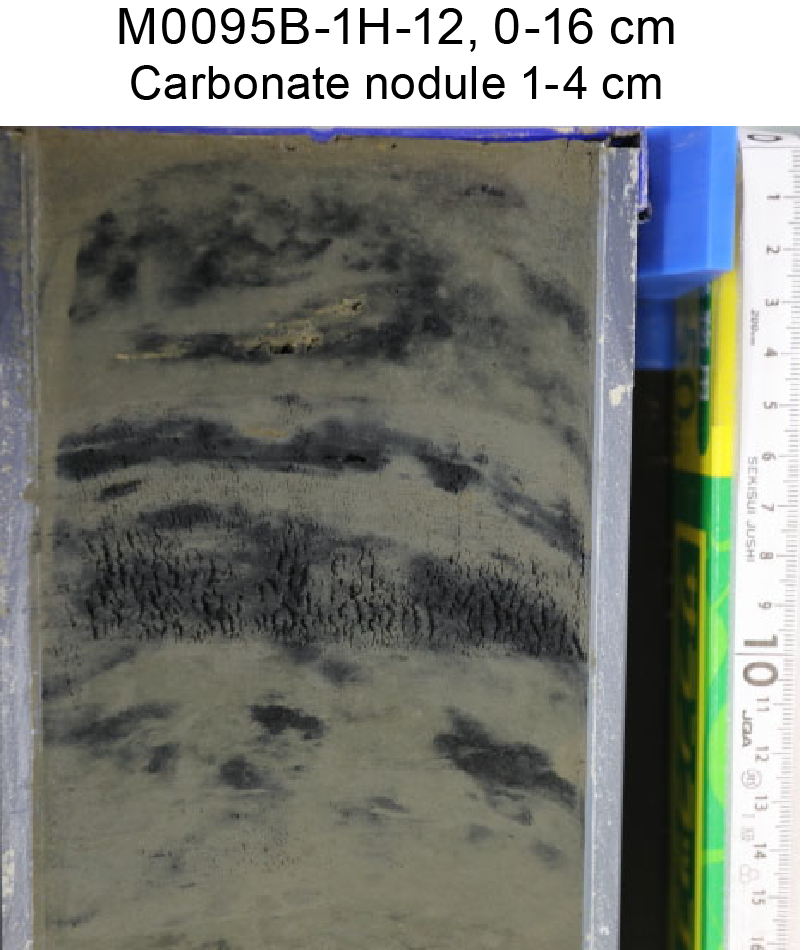
Figure F21. Carbonate nodule.
3.2.2. Diagenesis
In sediments from Holes M0095A and M0095B, variations in iron monosulfide intensity is seen throughout the cores. This variation ranges from ~10–15 cm thick intervals in the cores to a nearly uniform presence in the sediments. In some cases, no iron monosulfides are present (e.g., interval 386-M0095B-1H-7, 0–100 cm). Iron monosulfides are most easily observed during split core description and subsequent examination of the linescan camera images for each section. In addition, smear slide observations document framboidal occurrences of pyrite within microfossils. Relative to the host lithostratigraphy, there are three main patterns of iron monosulfide occurrence: (1) as mottles (1–10 mm in diameter) or patches (>1 cm in diameter) in fine-grained sediment intervals, (2) as mottling in bioturbated zones beneath coarse-grained sediments, and (3) as color bands in strata layers in both fine- and coarse-grained beds. Variations in iron monosulfide intensity from sparse to heavy throughout the cores is consistent with variable exposure time of the sediments to organoclastic sulfate reduction and/or the anaerobic oxidation of methane, the dominant diagenetic reactions that produce iron monosulfides and ultimately pyrite in marine sediments. Although bioturbation intensity is also variable throughout the cores, some bioturbated zones are most easily seen when amplified by iron monosulfide precipitates, particularly in lighter portions of the cores. After core splitting in February 2022, variable oxidation of the iron sulfide–rich sediments occurred. It is particularly visible in some sections along fractures, at core section ends, and as encroachment fronts from the core liner edges (e.g., interval 386-M0095B-1H-7, 0–100 cm).
3.2.3. X-ray diffraction mineralogy
XRD mineralogy was conducted for one sample every other section, and some minerals are grouped. These groupings will require additional processing to extract a signal for each mineral. For example, clays, carbonates, amphiboles, pyroxene, and heavy minerals are composed of several minerals in each grouping (see Lithostratigraphy in the Expedition 386 methods chapter [Strasser et al., 2023a]). The interpretation of the mineralogy is preliminary at this stage; however, some interpretations can be made when the data are compared with the smear slides and Strater plots. For Hole M0095B, the most abundant minerals are quartz, feldspar, and clays, followed by micas (muscovite and biotite). The interval containing very fine sand and silt beds and laminae correlates to a peak abundance of quartz, feldspar, and clay (3–6 mbsf). The amphibole group of minerals tends to correspond to silty clay intervals between 9 and 12 mbsf and 12 and 17 mbsf, but amphibole is not present toward the bottom of the hole (19–28 mbsf). Instead, pyroxene was measured from 19 to 28 mbsf. Palygorskite was detected at 0–5, 7–17, 20–22, and 25–28 mbsf, but it does not correlate with intervals of vitric components observed in the smear slides, likely due to differences in sampling locations. Future studies will be required to fully extract the mineralogy of the sediments in these two holes.
4. Tephra
One tephra layer was described in Basin S2 at Site M0092. No tephra layer was described at Site M0095.
This brownish white silt-sized tephra (M0092D-1H-28, 63.5 cm) occurs as patches in silty sediment in interval 386-M0092D-1H-28, 63–63.5 cm (Figure F22). It is composed of moderate vesicularity, fibrous, and bubble-wall types of volcanic glass shards (Table T5; Figure F23). Heavy minerals are rare, although hornblende, orthopyroxene, and biotite are observed.

Figure F22. Tephra core photo.
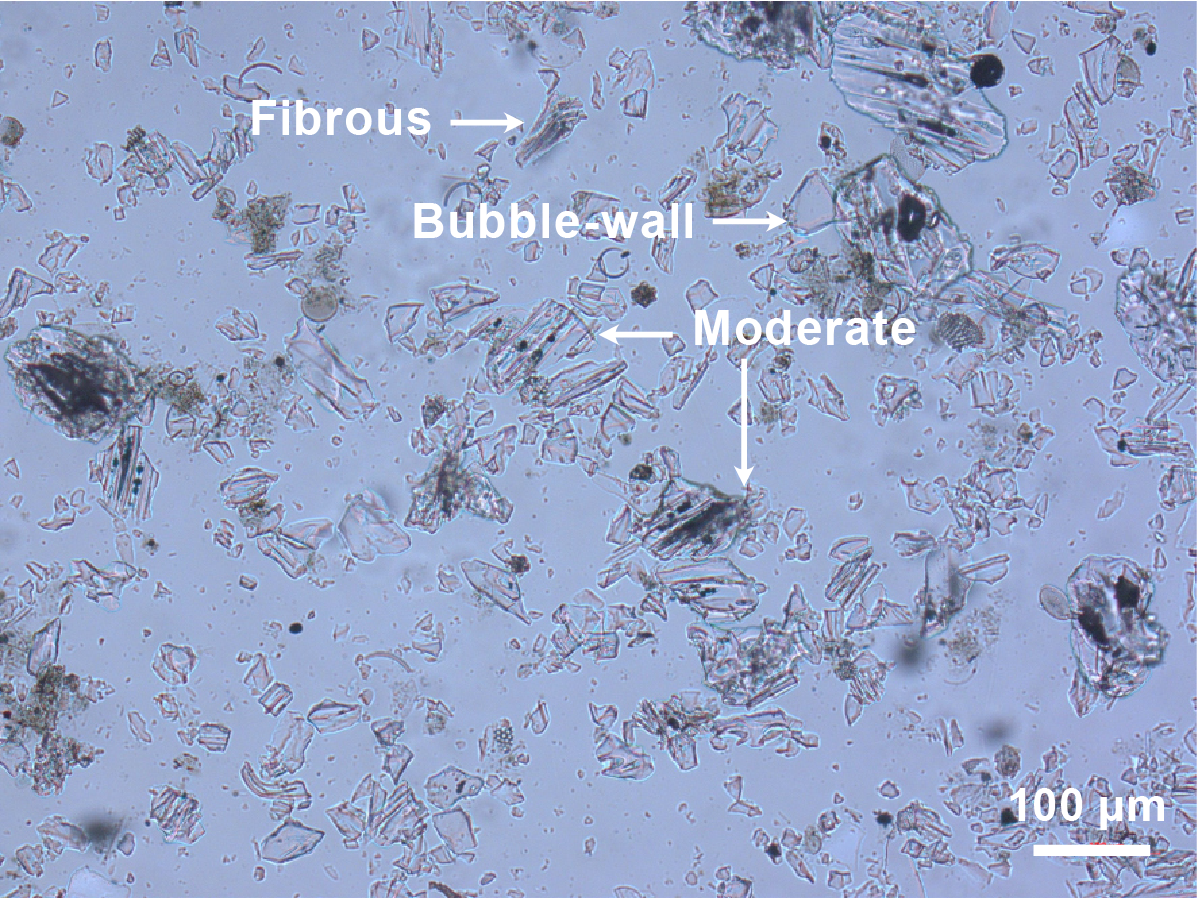
Figure F23. Tephra smear slide.
5. Micropaleontology
Four holes were cored at Site M0092 and two holes were cored at Site M0095 in Basin S2 in the central part of the southern Japan Trench. The biostratigraphy determined for Holes M0092D and M0095B was based on an examination of radiolaria collected during the offshore phase of Expedition 386. Foraminifera in samples collected during the offshore phase were examined to determine provenance of mass transport deposits.
5.1. Radiolaria
Relative abundance changes of Cycladophora davisiana, the Tetrapyle circularis/fruticosa group (hereafter Tetrapyle group), and Lithomelissa setosa in cores from Holes M0092D and M0095B are shown in Figure F24.
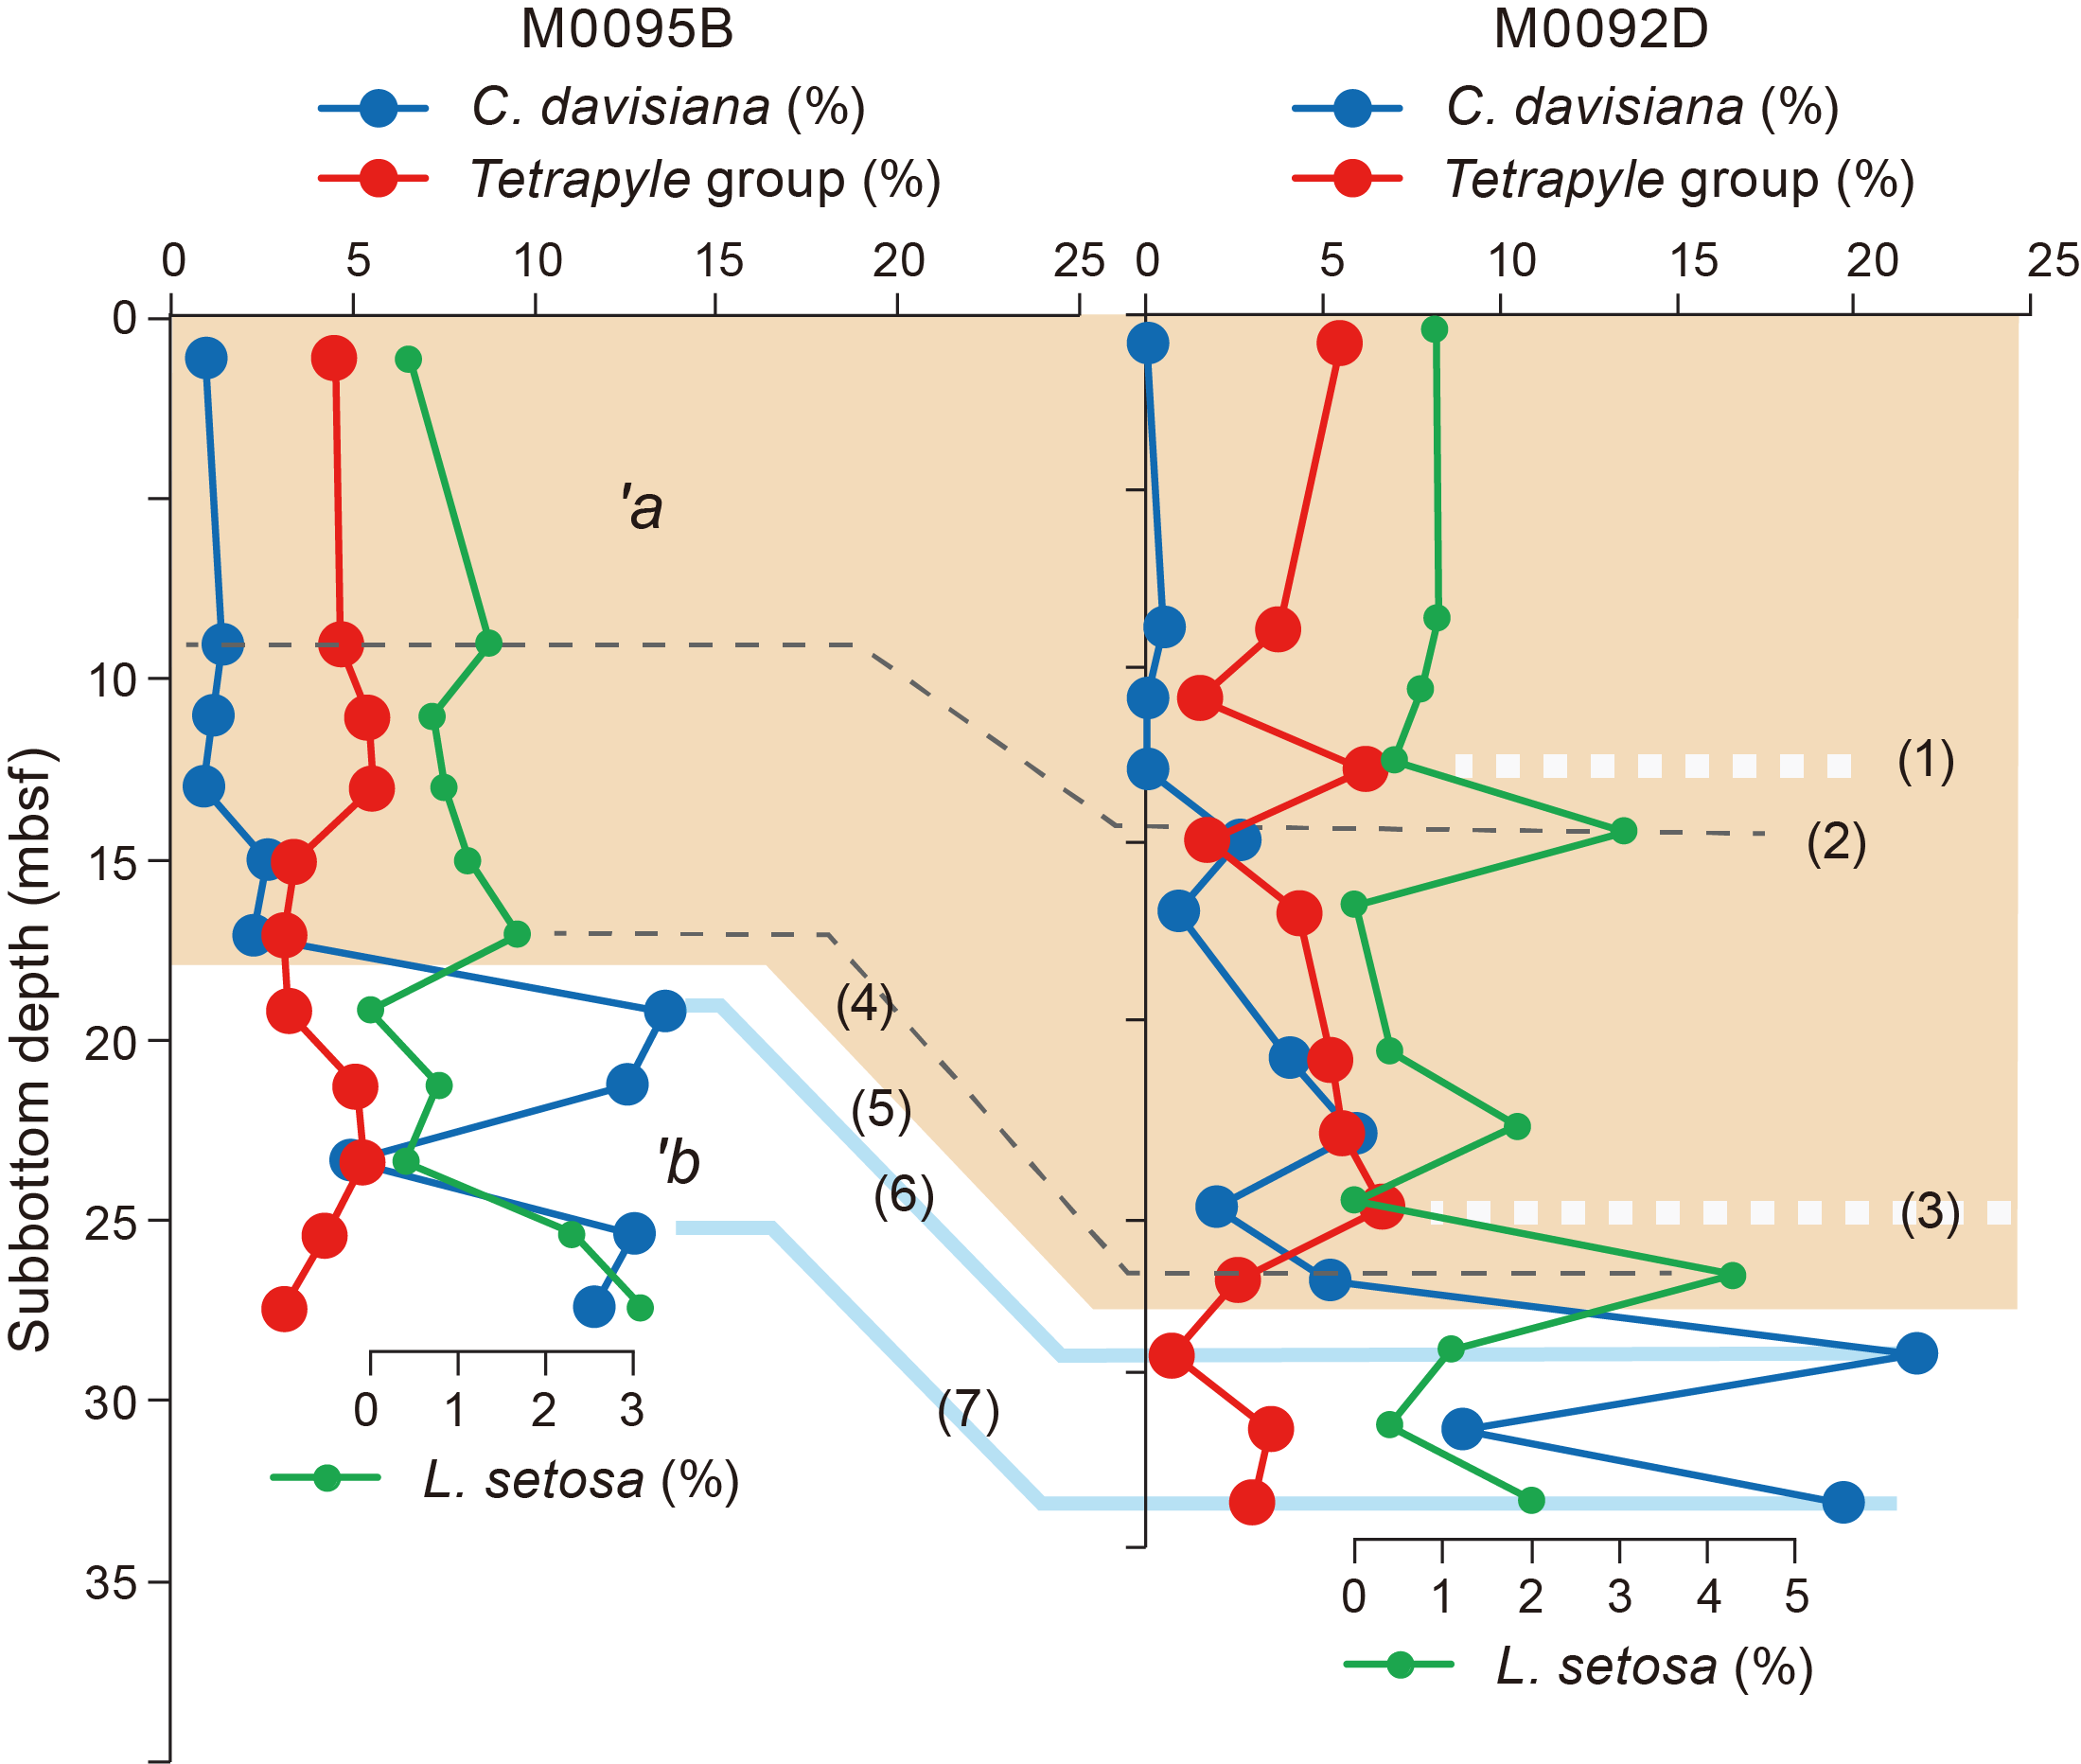
Figure F24. Radiolarian species abundance.
5.1.1. Site M0092
A total of 17 radiolarian samples were collected from Hole M0092D, and 13 samples were processed for analysis. The remaining 4 were found within possible event layers and were not processed (Table T6). Radiolarian fossils were abundant in all examined samples, with good preservation. The relative abundance of C. davisiana varies between 0% and 22% and tends to be high (>5%) below 27.4 mbsf. The sharp increase in the relative abundance of C. davisiana from <5% to >10% at this depth could be correlated to the boundary horizon of C. davisiana Zones ‘a and ‘b (Event 5, ~11 ka), corresponding to the Holocene/Pleistocene boundary (Morley et al., 1982; see Micropaleontology in the Expedition 386 methods chapter [Strasser et al., 2023a]). A primary peak in the relative abundance of C. davisiana at 29.5 mbsf likely correlates to Event 6, and the high value at the bottom might be correlated to Event 7, corresponding to Davisiana Event (DAE)-2 (~12 ka) and DAE-3 (~17 ka) of Matsuzaki et al. (2014), respectively. The relative abundance of the Tetrapyle group ranges 0%–7%, and higher values (>5%) tend to be recognized between 12.9 and 25.3 mbsf, probably corresponding to Events 1 (~6 ka) and 3 (~8 ka), respectively. Two peaks in the relative abundance of L. setosa at 14.9 and 27.4 mbsf likely correlate to Events 2 and 4, corresponding to approximately 7 and 11 ka, respectively (see Micropaleontology in the Expedition 386 methods chapter [Strasser et al., 2023a]).
5.1.2. Site M0095
A total of 14 radiolarian samples were collected from Hole M0095B, and 11 samples were processed for analysis. The remaining three were found within possible event layers and were not processed (Table T6). Radiolarian fossils were abundant in all samples examined, with good preservation. The relative abundance of C. davisiana fluctuates between 1% and 14% and tends to be high (>10%) below 19.6 mbsf. The sharp increase in the relative abundance of C. davisiana from <5% to >10% at this depth could be correlated to the boundary horizon of C. davisiana Zones ‘a and ‘b (Event 5, ~11 ka), corresponding to the Holocene/Pleistocene boundary (Morley et al., 1982; see Micropaleontology in the Expedition 386 methods chapter [Strasser et al., 2023a]). Two peaks of C. davisiana at 19.6 and 25.9 mbsf likely correlate to Events 6 and 7, corresponding to DAE-2 (~12 ka) and DAE-3 (~17 ka) of Matsuzaki et al. (2014). The Tetrapyle group ranges 3%–6%; however, it is difficult to define the interval between Events 1 and 3. Two minor peaks of L. setosa% at 9.3 and 17.5 mbsf likely correlate to Events 2 and 4, corresponding to approximately 7 and 11 ka, respectively (see Micropaleontology in the Expedition 386 methods chapter [Strasser et al., 2023a]).
According to above correlations from Sites M0092 and M0095, it is likely that the sedimentation rate is higher at Site M0092 than at Site M0095 (Figure F24).
5.2. Foraminifera
5.2.1. Site M0092
Samples were taken at 5 m intervals offshore, as described in Micropaleontology in the Expedition 386 methods chapter (Strasser et al., 2023a). With the exception of the agglutinated benthic foraminifera, which may be either in situ or reworked, all foraminifera at Site M0092 are considered to be allochthonous.
5.2.1.1. Hole M0092A
One sample from the base of Hole M0092A was examined for foraminifera (Table T7). Rare specimens of agglutinated foraminifera including Haplophragmoides spp., Trochammina spp., and Reophax spp., with moderate preservation, occur in this sample, along with abundant diatoms, radiolaria, and sponge spicules and some iron monosulfides.
No provenance interpretation can be made for this sample due to low foraminifera abundance.
5.2.1.2. Hole M0092B
Six samples from Hole M0092D were examined for foraminifera (Table T7). Benthic foraminifera with poor to good preservation are present to rare in all six samples. Planktonic foraminifera with moderate to good preservation are present or few in three samples; three are barren. All samples examined for foraminifera contain abundant diatoms, radiolaria, and sponge spicules, and some have glass shards and iron monosulfides.
Of note is Sample 386-M0092B-1H-10, 99–102 (9.4 mbsf), which contains few, moderately preserved, brownish orange stained planktonic foraminifera, several of which are indicative of warmer water conditions, including dextral Neogloboquadrina pachyderma, Globorotalia scitula, Pulleniatina obliquiloculata, and Globorotalia inflata. Several calcareous benthic foraminifera are present, but at a very low abundance. The sample also contains abundant clear and brown glass, some red brick colored fragments, iron monosulfides, heavy minerals, and chert fragments. There are some fragments with iron monosulfides on the inside and what appears to be broken chert on the outside.
No provenance interpretation can be made for these samples due to low foraminifera abundance.
5.2.1.3. Hole M0092C
One sample from the base of Hole M0092C was examined for foraminifera (Table T7). Two specimens of Bolivina pacifica with poor preservation occur in this sample, along with abundant diatoms, radiolaria, and sponge spicules.
No provenance interpretation can be made for this sample due to low foraminifera abundance.
5.2.1.4. Hole M0092D
Seven samples from Hole M0092D were examined for foraminifera (Table T7). Benthic foraminifera with poor to good preservation are present in five samples; two are barren. No planktonic foraminifera occur in these samples. All samples examined for foraminifera contain abundant diatoms, radiolaria, and sponge spicules, and several have burrows infilled with iron monosulfides.
No provenance interpretation can be made for these samples due to low foraminifera abundance.
5.2.2. Site M0095
Samples were taken at 5 m intervals offshore, as described in Micropaleontology in the Expedition 386 methods chapter (Strasser et al., 2023a). With the exception of the agglutinated benthic foraminifera, which may be either in situ or reworked, all foraminifera at Site M0095 are considered to be allochthonous.
5.2.2.1. Hole M0095A
One sample from the base of Hole M0095A was examined for foraminifera (Table T8). Only agglutinated foraminifera, including Textularia spp., with good preservation, occur in this sample, along with abundant diatoms, radiolaria, and sponge spicules.
No provenance interpretation can be made for this sample due to low foraminifera abundance.
5.2.2.2. Hole M0095B
Six samples from Hole M0095B were examined for foraminifera (Table T8). Benthic foraminifera with poor to good preservation are present or few in all samples. Planktonic foraminifera with moderate to good preservation are present in all but one of the samples. All samples examined for foraminifera contain abundant diatoms, radiolaria, and sponge spicules, and several have orange clumps of mud and burrows infilled with iron monosulfides.
No provenance interpretation can be made for these samples due to low foraminifera abundance.
6. Geochemistry
6.1. Interstitial water
At Site M0092, 2 bottom water (BW) samples and 54 interstitial water (IW) samples were collected using Rhizon samplers from two trigger cores (Holes M0092A and M0092C) and two GPC cores (Holes M0092B and M0092D). At Site M0095, 1 BW sample and 24 IW samples were collected from one trigger core (Hole M0095A) and one GPC core (Hole M0095B). Results of shipboard and shore-based analyses are described in this section. See Geochemistry in the Expedition 386 methods chapter (Strasser et al., 2023a) for details of the sampling, analytical methods, and data quality.
Overall, IW compositions at Sites M0092 and M0095 are influenced by organic matter degradation, including the release of metabolic products and consumption of electron acceptors, as well as dissolution/precipitation reactions within the sediment.
6.1.1. Shipboard analyses: salinity, alkalinity, and ammonium
Salinity at Site M0092 fluctuates nonsystematically, mostly between 33.48 and 35.43, with a drop to 30.62 at 2.73 mbsf in Hole M0092D (Table T9; Figure F25). Alkalinity is 2.56 mM in the BW. In Hole M0092A, concentrations rise from 7.64 mM at 0.35 mbsf to 8.32 mM at 0.85 mbsf. Similarly, in Hole M0092C, the BW value is 2.65 mM and the IW sample from 0.53 mbsf has a value of 9.04 mM. Hole M0092B shows an exponential alkalinity increase from 11.89 to 60 mM at ~16.3 mbsf and then stabilizes at the base of the core. Hole M0092D shows a similar exponential increase starting at lower values (7.07 mM) but also stabilizing at ~60 mM at 17.89 mbsf. Similarly, ammonium (NH4+) is low in the BW samples from Holes M0092A and M0092C at 0.03 and 0.02 mM, respectively. Ammonium values increase from 0.46 mM at 0.35 mbsf to 0.76 mM at 0.85 in Hole M0092A and are 0.67 mM in the one sample from 0.53 mbsf in Hole M0092C. In Hole M0092B, ammonium increases asymptotically from 0.62 to 4.84 mM. In Hole M0092D, ammonium increases asymptotically from 0.57 mM at 0.21 mbsf to 1.83 mM at 2.73 mbsf and then rises nearly linearly from 2.31 mM at 5.76 mbsf to 5.48 mM at 32.54 mbsf.

Figure F25. IW salinity, alkalinity, and ammonium, Site M0092.
The salinity of the BW sample from Hole M0095A is 34.45 (Table T10). The salinity of the IW samples from Hole M0095A is 34.18 at 0.15 mbsf and 34.72 at 0.65 mbsf (Figure F26). Salinity in Hole M0095B shows a gradual but nonlinear increase from 33.5 at the top to 35.86 at the bottom of the hole. Alkalinity at Site M0095 asymptotically increases from 17.69 to 69.06 mM at the bottom of Hole M0095B. Ammonium at Site M0095 generally increases linearly from 0.03 mM at the top of the trigger core to ~6 mM at the bottom of Hole M0095B.
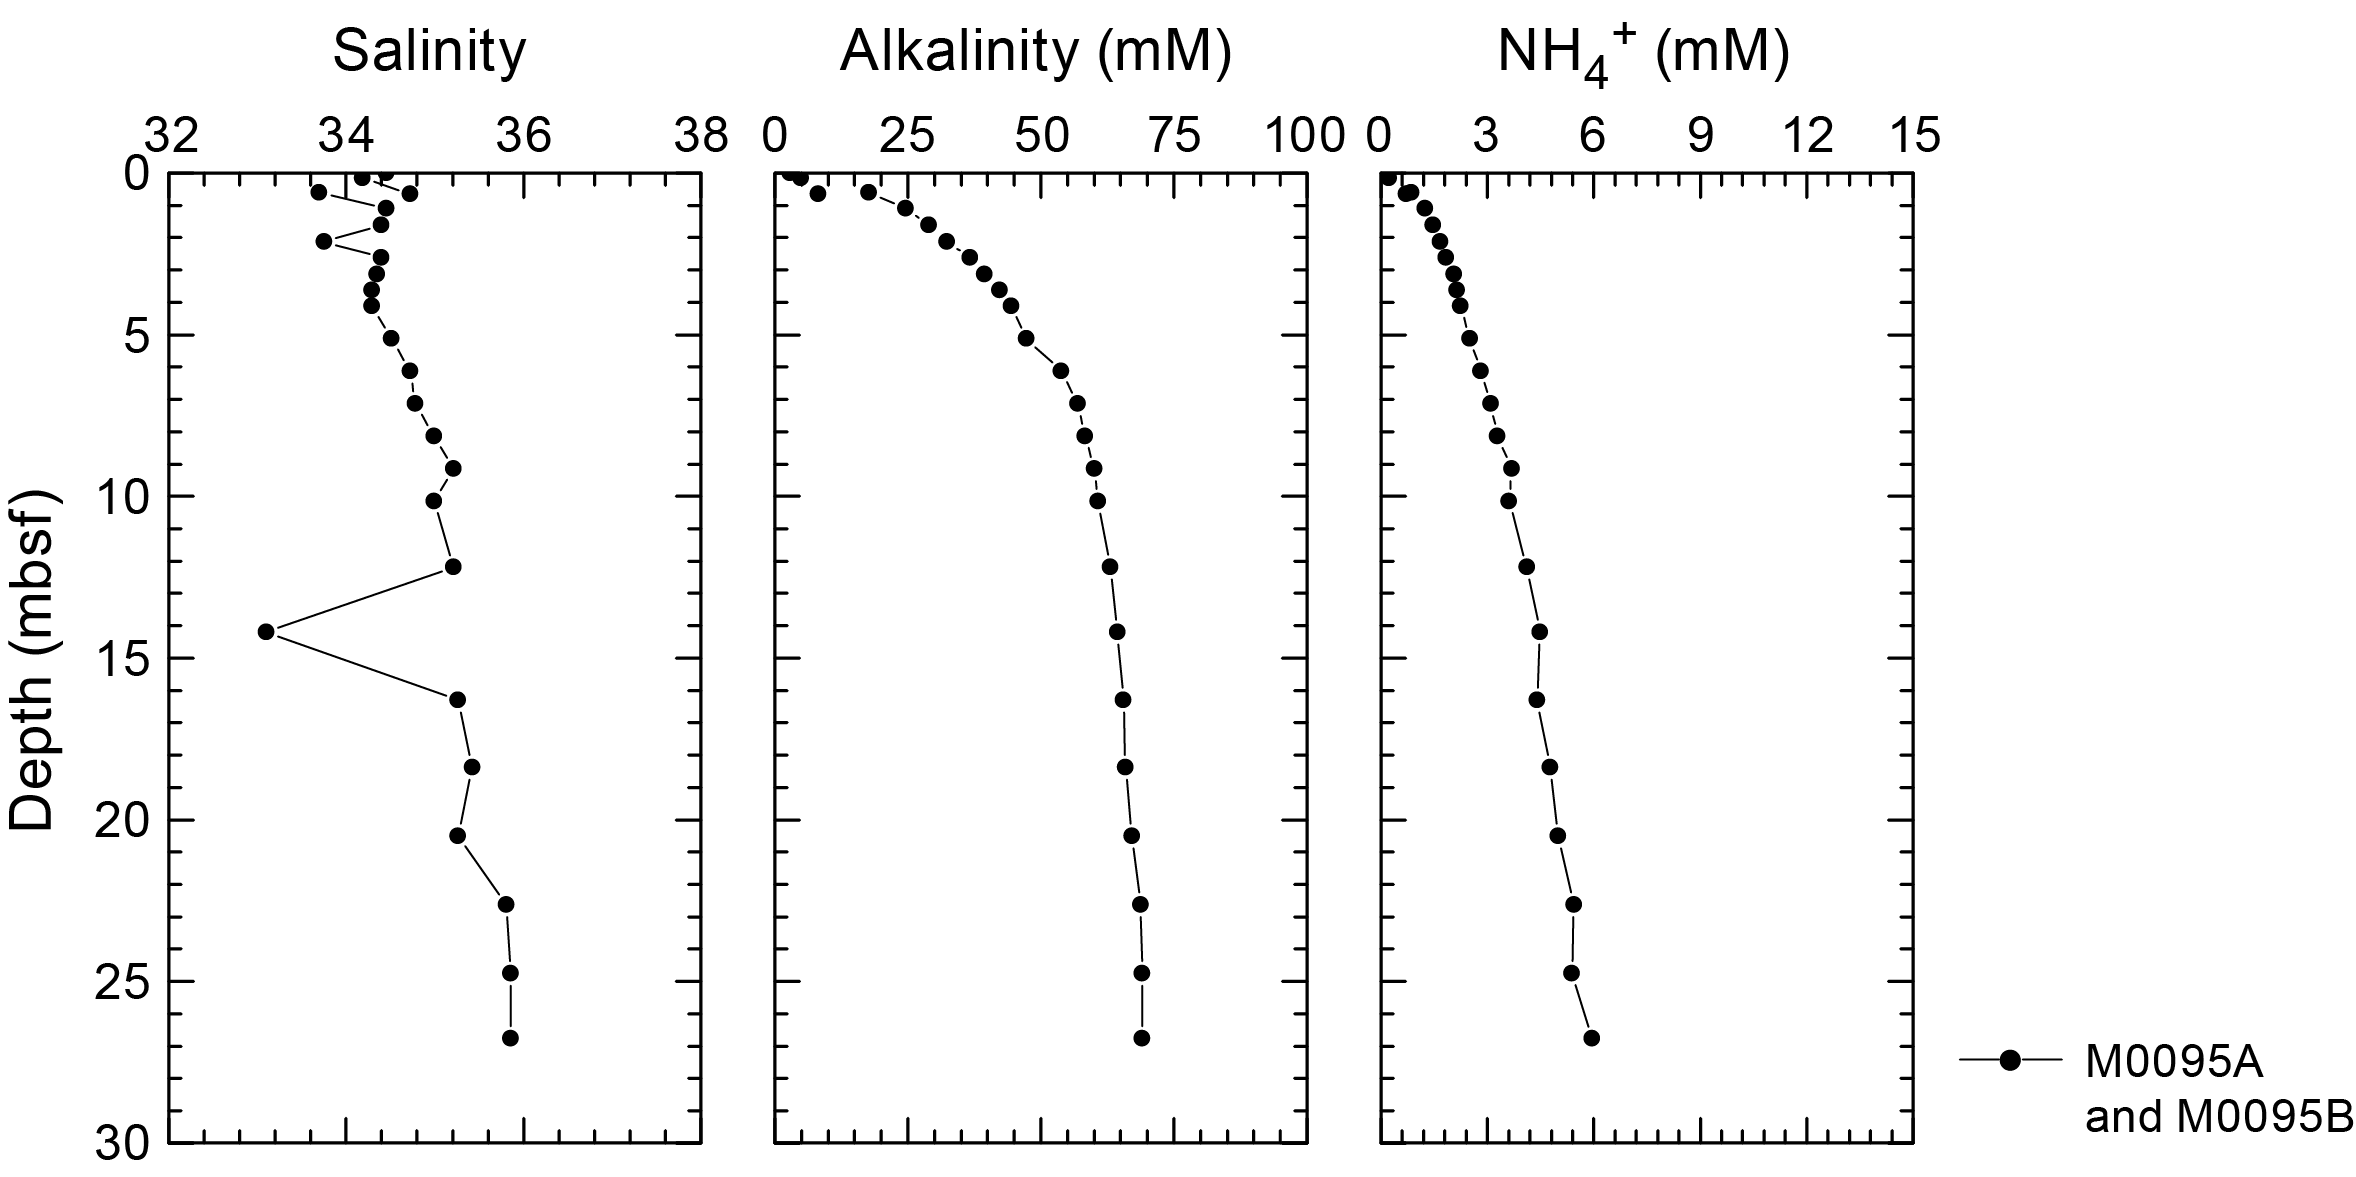
Figure F26. IW salinity, alkalinity, and ammonium, Site M0095.
6.1.2. Shore-based analysis
6.1.2.1. Dissolved vanadium, molybdenum, and uranium
In Hole M0092A, the BW vanadium (V) concentration is 68 nM, and in Hole M0092C the BW V concentration is 191.8 nM (Table T9). IW V concentrations from Holes M0092A and M0092C are similar, ranging 114.6 nM at 0.35 mbsf to 158.7 nM at 0.85 mbsf in Hole M0092A, whereas the one IW sample from 0.53 mbsf in Hole M0092C has a concentration of 166.2 nM (Figure F27). In Holes M0092B and M0092D, dissolved V concentration patterns are relatively consistent, except in the uppermost 5 m. In Hole M0092B, V concentrations decline from the surface to 3 mbsf and then rise to 10 mbsf. In Hole M0092D, V concentrations rise to 5 nM at 5 mbsf and then decline to 7 mbsf, where they match the values from Hole M0092B at about 150 nM. Below 7 mbsf, the curves are the same and V concentrations rise to about 200 nM at 10 mbsf and stay around 200 nM to the bottom of the holes, where they decline to 65.6 nM in Hole M0092D at 34.65 mbsf.
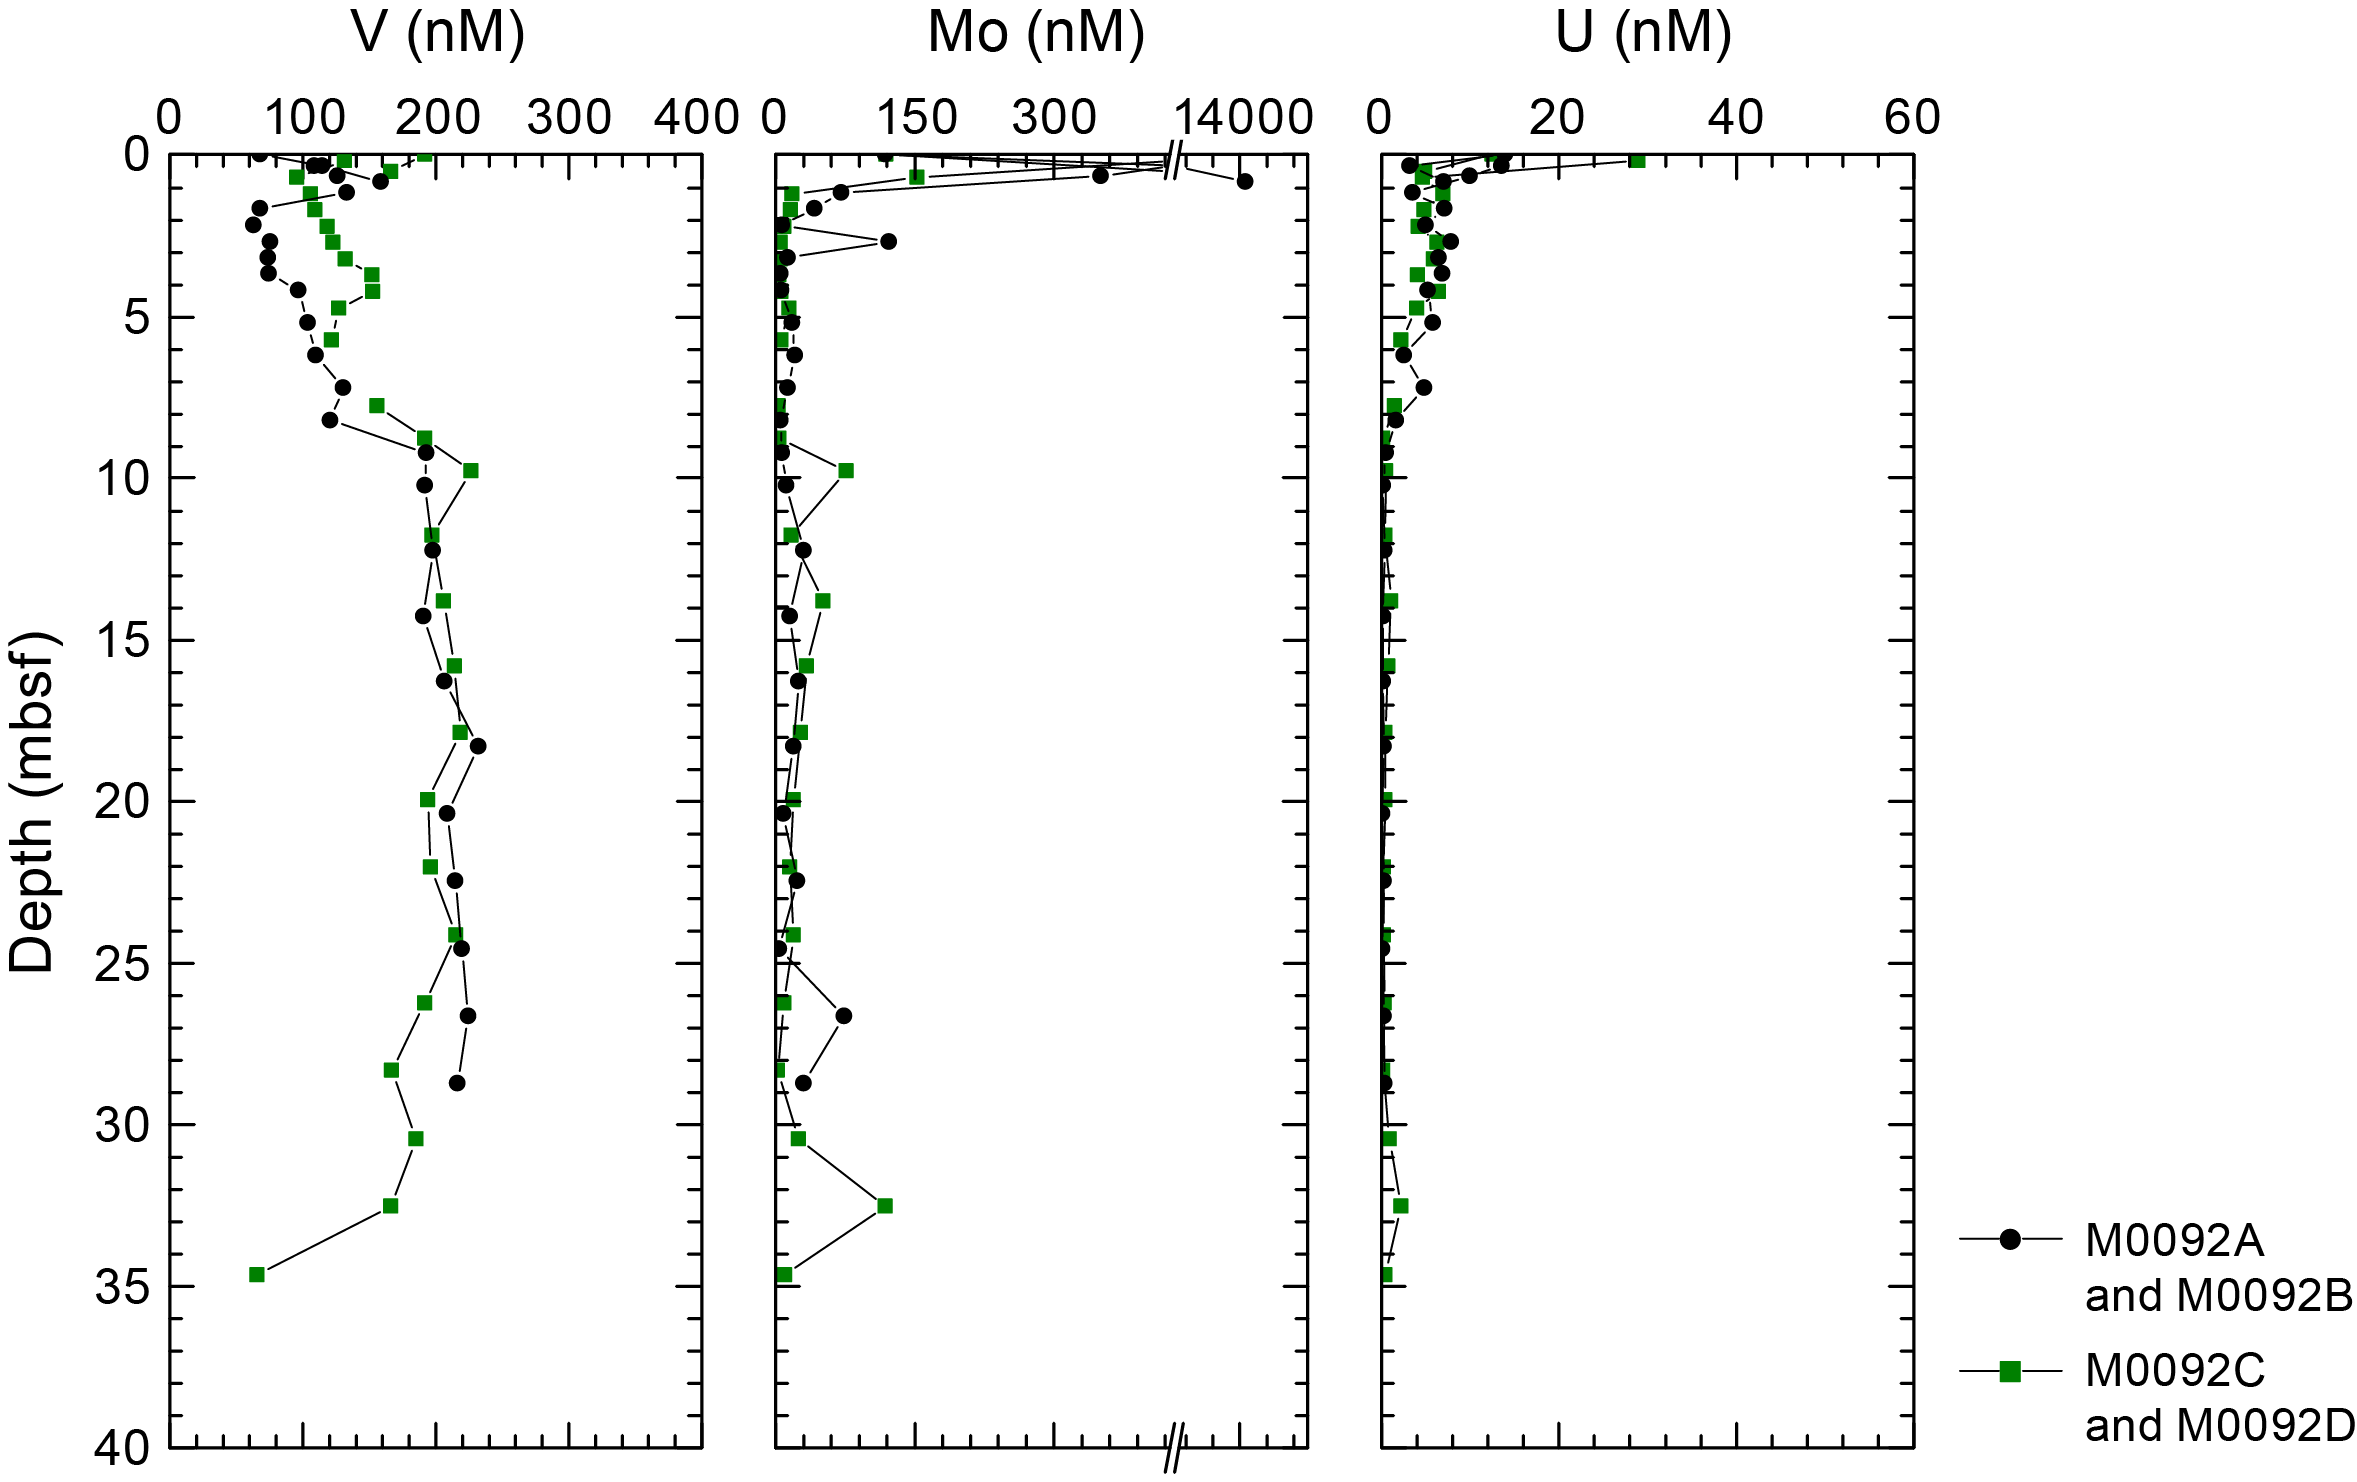
Figure F27. IW V, Mo, and U, Site M0092.
Dissolved molybdenum (Mo) concentrations in the BW are 118.3 nM in Hole M0092A and 119.4 nM in Hole M0092C (Table T9). In Hole M0092A, the IW sample from 0.35 mbsf has a Mo concentration of 2468.5 nM, whereas the sample from 0.85 mbsf has a concentration of 14,079.1 nM. The one IW sample from Hole M0092C is also quite elevated (6810 nM). The IW samples from Holes M0092B and M0092D show the highest Mo concentrations in the uppermost ~1 m. Extreme Mo enrichment is not observed in Hole M0092B, where values start at 997 nM and decline rapidly to less than 100 nM in the uppermost 1.18 m. Below this depth, values are mostly below 20 nM with a few spikes. Mo concentrations in Hole M0092D start at 5349 nM at 0.21 mbsf, decline to <20 nM in the uppermost 1 m, and stay low throughout the rest of the hole with a few small spikes (Figure F27).
Dissolved uranium (U) concentrations from the BW samples are 13.97 nM in Hole M0092A and 12.49 nM in Hole M0092C (Table T9). IW U concentrations in Hole M0092A are 3.20 nM at 0.35 mbsf and 6.98 nM at 0.85 mbsf. The IW sample from 0.53 mbsf in Hole M0092C has a concentration of 4.86 nM. In Holes M0092B and M0092D, the U profiles look like that of Mo, with the highest values in the uppermost ~1 m. In Hole M0092B, U concentrations show a high of 13.55 nM at the top and all other samples have lower values with a trend to 9.43 mbsf reaching 0.51 nM and falling under 0.33 from 10.25 mbsf to the base of the core (Figure F27). Hole M0092D starts with elevated U concentrations at 29 nM, and they decrease in a pattern similar to that of Hole M0092B, reaching minimum values at 8.78 mbsf with a notable increase to 2.21 nM at 32.54 mbsf.
At Site M0095, dissolved V concentrations in the BW sample are 0.03 nM (Table T10). V concentrations in Hole M0095A are 0.23 nM at 0.15 mbsf and 0.71 nM at 0.65 mbsf (Figure F28). IW samples from Hole M0095B have elevated V concentrations, starting at 114.6 nM at 0.695 mbsf, and increase with depth to 12.19 mbsf, where they flatten out at ~227 nM to the bottom of the hole.
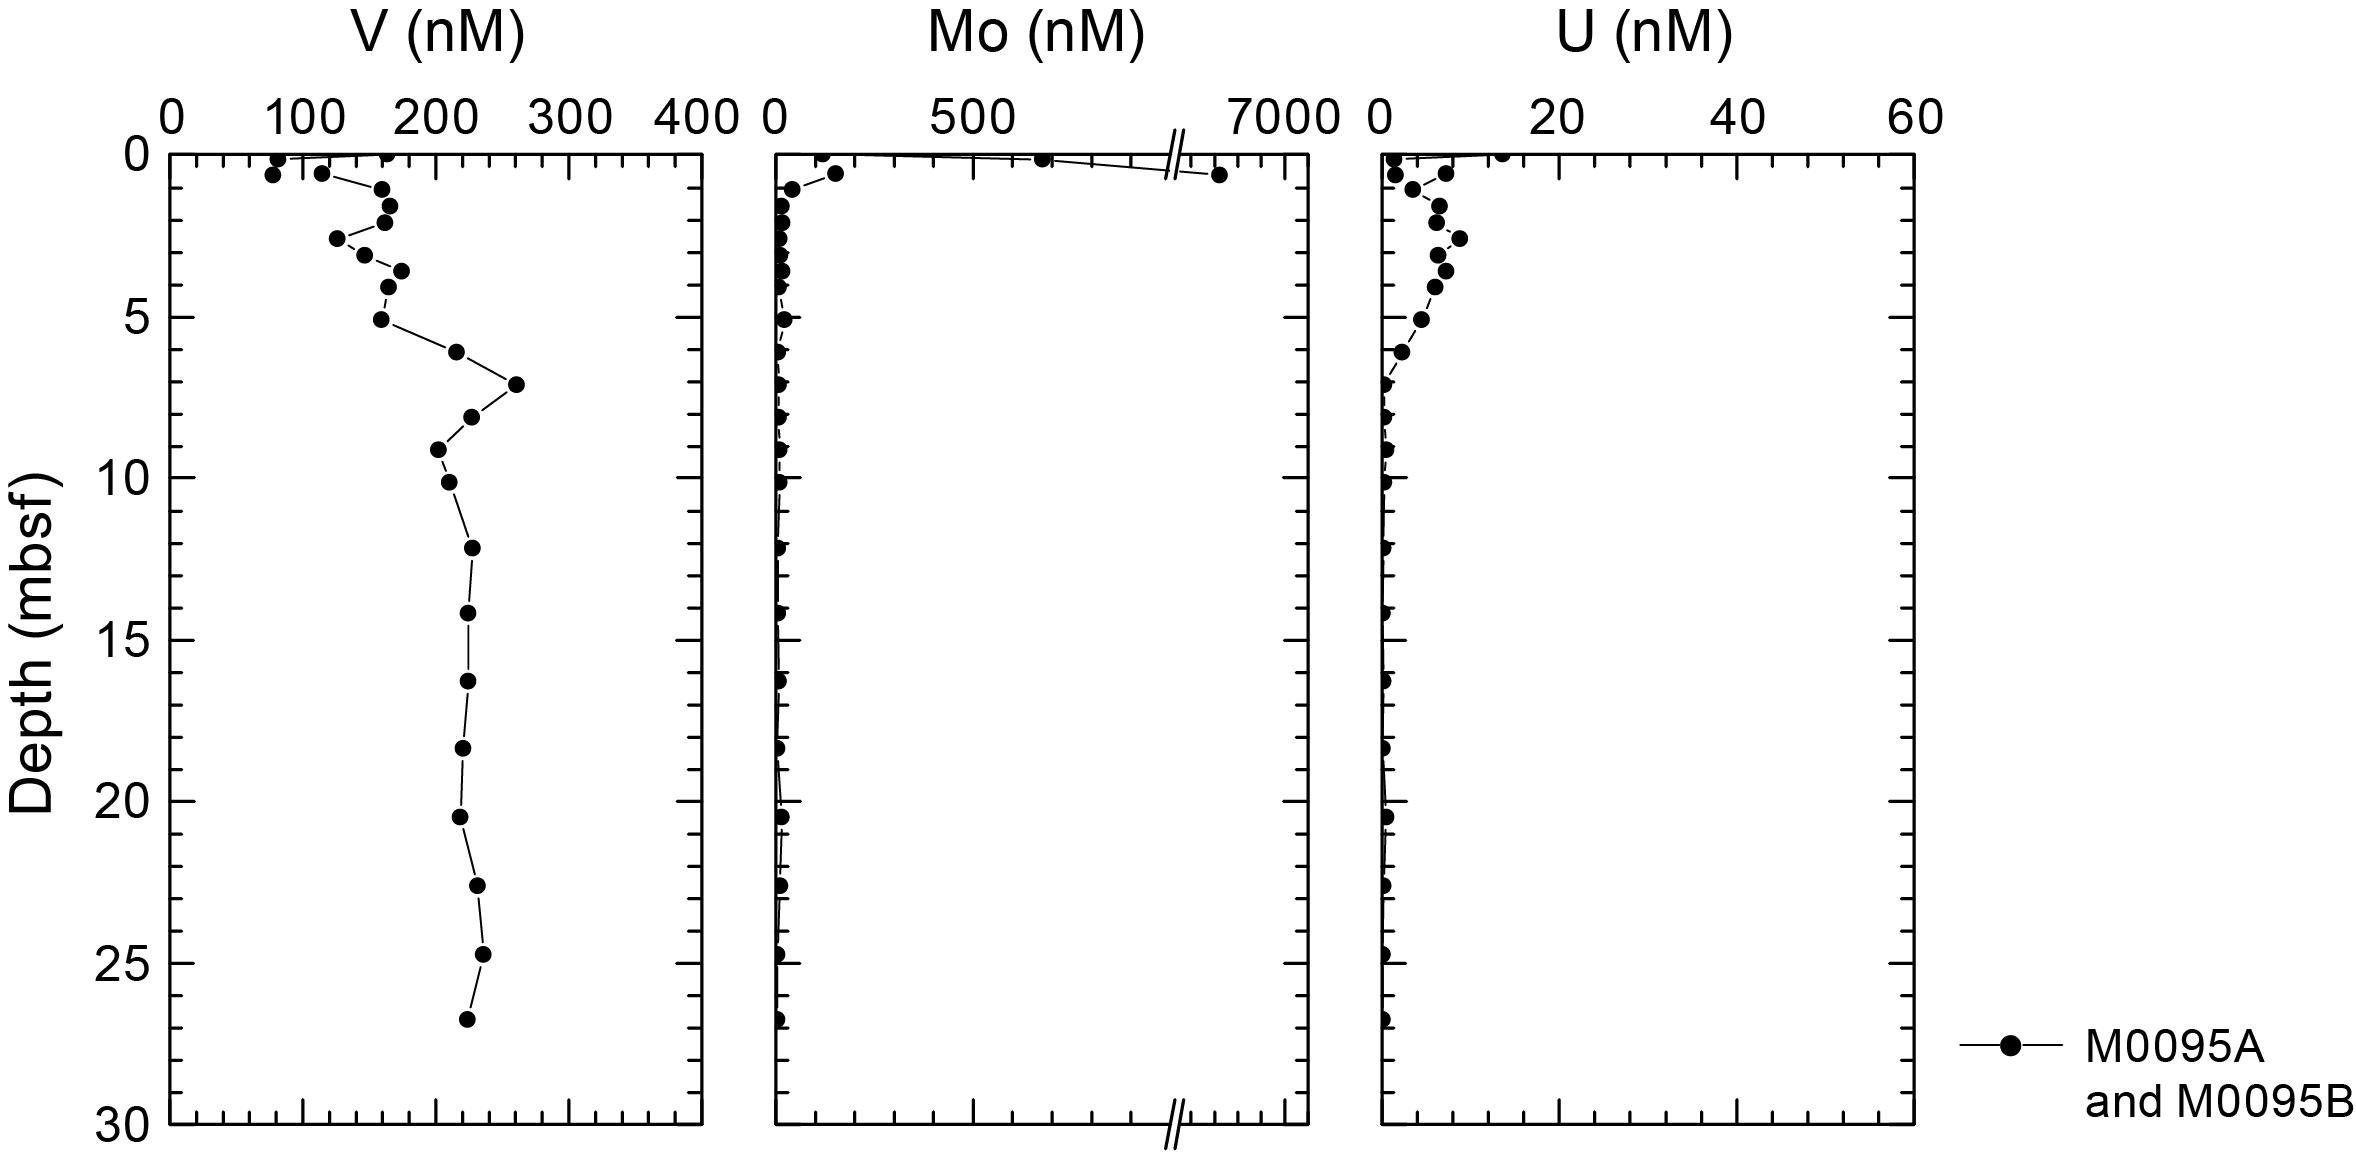
Figure F28. IW V, Mo, and U, Site M0095.
Dissolved Mo concentrations are 119.6 nM in the BW sample from Site M0095 (Table T10). Mo concentrations are highly elevated in IW samples from Hole M0095A (675 nM at 0.15 mbsf), followed by a sample from 0.65 mbsf with a concentration of 6444 nM (Figure F28). IW samples from Hole M0095B show variable but overall the highest Mo concentrations at the top (159 nM) and a nonlinear decline to 2 nM at the base of the core.
Dissolved U concentrations in the BW are 13.58 nM (Table T10). IW from Hole M0095A has U concentrations of 1.42 nM at 0.15 mbsf and 1.57 nM at 0.65 mbsf (Figure F28). In Hole M0095B, U concentrations vary between 3.5 and 8.79 nM to around 5.13 mbsf, decline to less than 1 nM at 7 mbsf, and are low for the remainder of the core.
6.1.2.2. Dissolved lithium, boron, silica, manganese, iron, strontium, and barium
At Site M0092, dissolved lithium (Li) in the BW is 26.46 and 27.18 µM (Table T9). Li concentrations in Hole M0092A are 24.37 µM at 0.35 mbsf and 43.63 µM at 0.85 mbsf (Figure F29). In Holes M0092B and M0092D, the highest Li concentrations are found in the uppermost 5 m, where both cores show a slow decline to about 20 µM. This is followed by an exponential decrease to ~13 µM at ~7 mbsf. Below 7 mbsf, Li is unchanging and ranges 13–15 µM to the base of the cores.
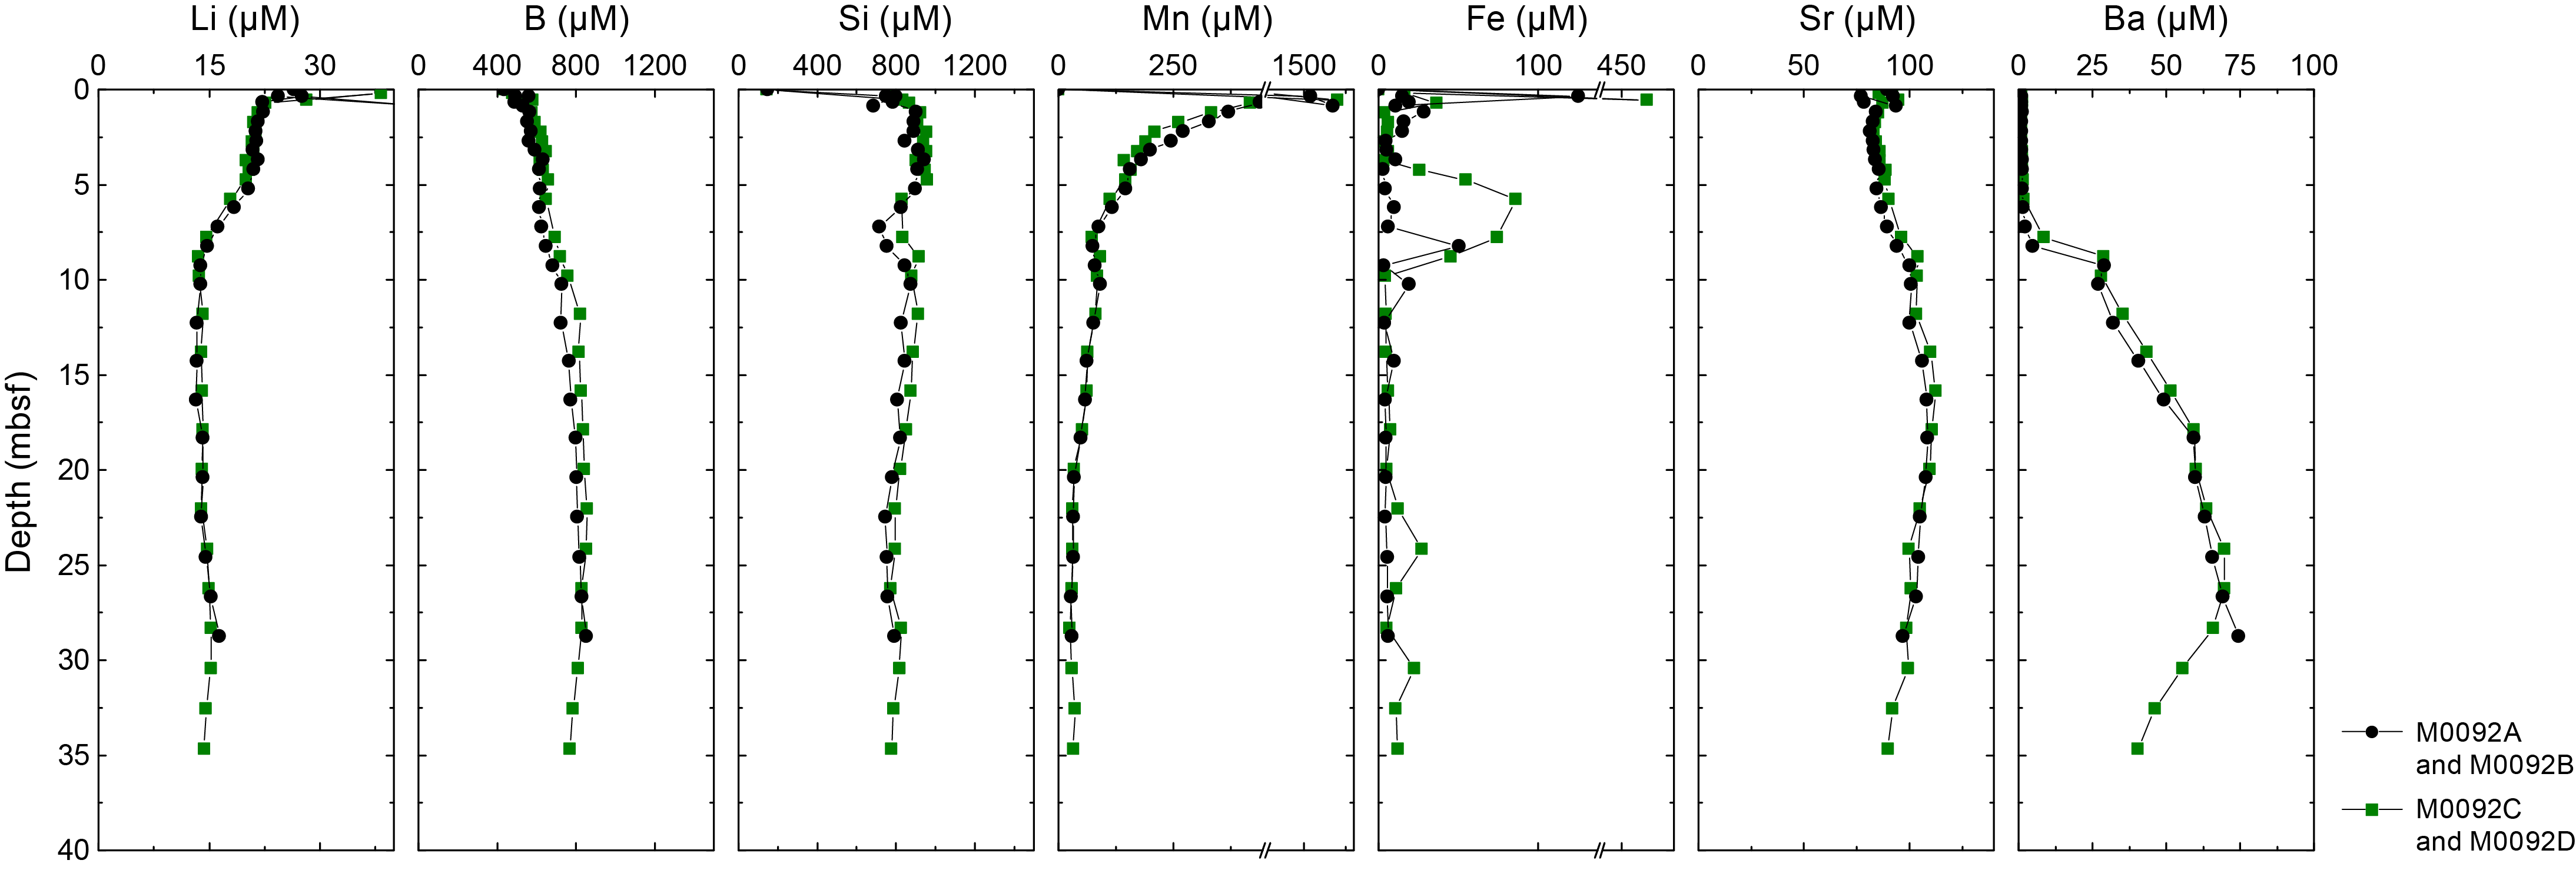
Figure F29. IW Li, B, Si, Mn, Fe, Sr, and Ba, Site M0092.
Dissolved boron (B) in the BW at Site M0092 is 434.8 and 436.4 µM (Table T9). B concentrations in IW from Holes M0092A and M0092C are much higher than in the BW. In Hole M0092A, the B concentration is 560.9 µM at 0.35 mbsf and 531.0 µM at 0.85 mbsf; in Hole M0092C it is 579.1 µM at 0.53 mbsf (Figure F29). In Hole M0092B, the B concentration at 0.355 mbsf is 491.3 µM, increases to ~613 µM at ~5 mbsf, followed by a steeper increase to ~800 µM at 18 mbsf, and then increases at a much lower rate to the base of the core and a maximum B concentration of 851.9 µM. The B concentration profile for Hole M0092D is similar to that of Hole M0092B, but at 24.15 mbsf values reach the highest concentrations of 854.0 followed by a drop to 770.2 µM at the base of the core (34.65 mbsf).
Dissolved silica (Si) in the BW samples is 148.6 and 144.1 µM (Table T9). Si concentrations in Holes M0092A and M0092C are much higher than those in the BW: 749.1 µM at 0.35 mbsf and 685.7 µM at 0.85 in Hole M0092A and 832.3 µM at 0.53 mbsf in Hole M0092C (Figure F29). In Hole M0092B, Si concentrations range 797.8–945.0 µM in the uppermost 5 m and decline to 714.7 µM at 7.22 mbsf, rising again to values of 876.5 µM by 10.245 mbsf and then declining gradually to a bottom core value of 789.9 µM. In Hole M0092D, Si concentrations show a pattern similar to that of Hole M0092B, with values in the uppermost 5 m ranging 787.4–956.3 µM and a notable drop at 5.76 mbsf to 830.8 µM followed by gentle rises and falls with an overall decreasing trend between 5.76 mbsf and the base of the core at 34.65 mbsf, where the concentration is 775.4 µM.
Dissolved manganese (Mn) in the BW samples from Site M0092 is 0.632 and 0.144 µM (Table T9). The IW samples from Hole M0092A show a dramatic increase over the BW, with concentrations of 1624 µM at 0.35 mbsf and 2021 µM at 0.85 mbsf. IW Mn concentrations in Hole M0092C are 2109 µM (Figure F29). In Holes M0092B and M0092D, the maximum Mn concentrations are in the top sample (0.355 mbsf): 495.9 µM in Hole M0092B and 799.4 µM at 0.21 mbsf in Hole M0092D. Both cores show a strong decrease in Mn to values below 100 µM at 7 mbsf. Below 7 mbsf, Mn concentrations decrease downcore to ~30 µM at the base of the cores.
Dissolved iron (Fe) values are below detection limit in the BW samples from Site M0092. The IW from Holes M0092A and M0092C has elevated Fe concentrations in the top sample and decreasing downward trends: 125.3 µM at 0.35 mbsf in Hole M0092A and 497.8 µM at 0.53 mbsf in Hole M0092C (Table T9; Figure F29). Hole M0092B has highly variable Fe concentrations to 14.28 mbsf with a spike of 50 µM at 8.225 mbsf. Hole M0092B shows a gentle increase in Fe concentrations from 4.415 µM at 16.295 mbsf to 6.116 µM at the base of the core at 28.74 mbsf. In Hole M0092D, concentrations are highly variable in the uppermost 9.79 m, and the highest concentration reaches 86.38 µM. Below 9.79 mbsf, Fe concentrations gently rise from 4.335 to 12.13 µM at the base of the core (34.65 mbsf) with several peaks to over 20 µM.
Strontium (Sr) concentrations in the BW samples from Site M0092 are 88.43 and 91.91 µM (Table T9). Sr concentrations in the IW from Holes M0092A and M0092C are ~90–100 µM (Figure F29). The top intervals of Holes M0092B and M0092D are characterized by relatively stable Sr concentrations of 80–90 µM down to ~5 mbsf. In both holes, this is followed by a relatively linear increase to ~100 µM at ~15 mbsf, stable values around ~110 µM to 26 mbsf, and a decline to 80–90 µM at the bottom of the holes.
Dissolved barium (Ba) values for BW samples from Site M0092 are 0.15 and 0.16 µM (Table T9). The IW samples have Ba concentrations of 0.81 µM at 0.35 mbsf and 1.10 µM at 0.85 mbsf in Hole M0092A and 1.24 µM at 0.53 mbsf in Hole M0092C (Figure F29). Hole M0092B has low concentrations (0.94–1.41 µM) at 0.355–6.215 mbsf, followed by a sharp increase to 74.47 µM at the base of the core (28.74 mbsf). Hole M0092D shows much more variability than Hole M0092B; low values trend from 1.04 to 1.88 µM to 5.76 mbsf, followed by a rapid increase to 69.80 µM at 24.15 mbsf and a decline from 69.64 µM at 26.26 mbsf to 40.29 µM at the end of the core (34.65 mbsf).
Dissolved Li in the BW sample from Site M0095 is 26.76 µM (Table T10). Dissolved Li is 24.91 µM at 0.15 mbsf in Hole M0095A and 35.81 µM at 0.65 mbsf (Figure F30). The IW samples from Hole M0095B show a decrease in Li from 22.28 µM at 0.605 mbsf to 13.43 µM at 10.16 mbsf. This is followed by a stable concentration of ~13–15 µM to the base of the core.

Figure F30. IW Li, B, Si, Mn, Fe, Sr, and Ba, Site M0095.
Dissolved B in the BW sample from Site M0095 is 431.9 µM (Table T10). The IW samples from Hole M0095A have concentrations of 516.7 µM at 0.15 mbsf and 543.0 µM at 0.65 mbsf (Figure F30). The IW samples from Hole M0095B have B concentrations that show a relatively steady and gradual increase from 545.0 µM at 0.605 mbsf to ~815 µM at ~15 mbsf and below, with reduction in the rate of increase to 937 µM by the end of the core at 26.76 mbsf.
Dissolved Si in the BW sample from Site M0095 is 147.8 µM (Table T10). The IW samples from Hole M0095A have Si concentrations of 854.2 µM at 0.15 mbsf and 903.0 µM at 0.65 mbsf (Figure F30). Hole M0095B shows a slight increase in dissolved Si concentrations from 872.0 µM at 0.605 mbsf to 951.7 µM at 3.12 mbsf. This is followed by a sharp drop to 776.8 µM at 5.13 mbsf, an increase to 902.9 at 7.14 mbsf, and a linear decrease to 760.3 µM at 22.63 mbsf. From 22.63 mbsf to the base of the core, dissolved Si concentrations rise to 796.2 µM.
Dissolved Mn in the BW sample from Hole M0095A is 0 µM (Table T10). The IW samples from Hole M0095A have elevated Mn concentrations of 837.863 µM at 0.15 mbsf and 1993.746 µM at 0.65 mbsf (Figure F30). In Hole M0095B, maximum concentrations are found in the shallowest sample (421.224 µM at 0.605 mbsf) and drop exponentially to 19.357 µM at the base of the core at 26.76 mbsf with a slight reversal at 7.14 mbsf.
Dissolved Fe is below detection limit in the BW sample from Site M0095 (Table T10). IW Fe concentrations are 224.6 µM at 0.15 mbsf and 321.9 at 0.65 mbsf (Figure F30). In Hole M0095B, this subseafloor maximum is not recorded. Instead, Fe values range 2.670–5.266 µM in the uppermost ~14.2 m. At 16.295 mbsf, Fe concentrations jump to 43.831 µM, and then they gradually decline to 5.807 µM at the base of the core (25 mbsf).
The Sr concentration in the BW sample at Site M0095 is 94.11 µM (Table T10). The IW samples have similar Sr concentrations: 91.79 µM at 0.15 mbsf and 92.77 µM at 0.65 mbsf (Figure F30). Sr concentrations in Hole M0095B are between 85.36 and 90.59 µM from 0.61 to 5.13 mbsf and then increase to 108.58 µM at 9.16 mbsf and stabilize through the remainder of the core with a small range of values between 103.68 and 111.98 µM.
The Ba concentration in the BW sample from Hole M0095A is 0.16 µM (Table T10). The IW Ba concentrations are 0.76 µM at 0.15 mbsf and 0.94 µM at 0.65 mbsf (Figure F30). The shallowest levels in Hole M0095B trend from 1.08 to 2.36 µM to 5.13 mbsf. Below this depth, concentrations increase rapidly to ~42.21 µM at 8.14 mbsf and then increase more gradually to 70.85 µM at the base of the core at 26.76 mbsf.
6.1.2.3. Chloride, bromide, and sulfate
All anions analyzed using ion chromatography (IC) are listed in Tables T9 and T10.
Dissolved chloride (Cl−) values in the BW samples from Site M0092 are indistinguishable from average seawater (Bruland et al., 2013): 542.0 mM in Hole M0092A and 541.6 mM in Hole M0092C (Table T9). Similarly, IW samples from Hole M0092A have Cl− concentrations of 543.8, 542.8, and 542.0 in Hole M0092C (Figure F31). The IW samples from Holes M0092B and M0092D are mostly similar to average seawater, with values ranging ~540–560 mM.
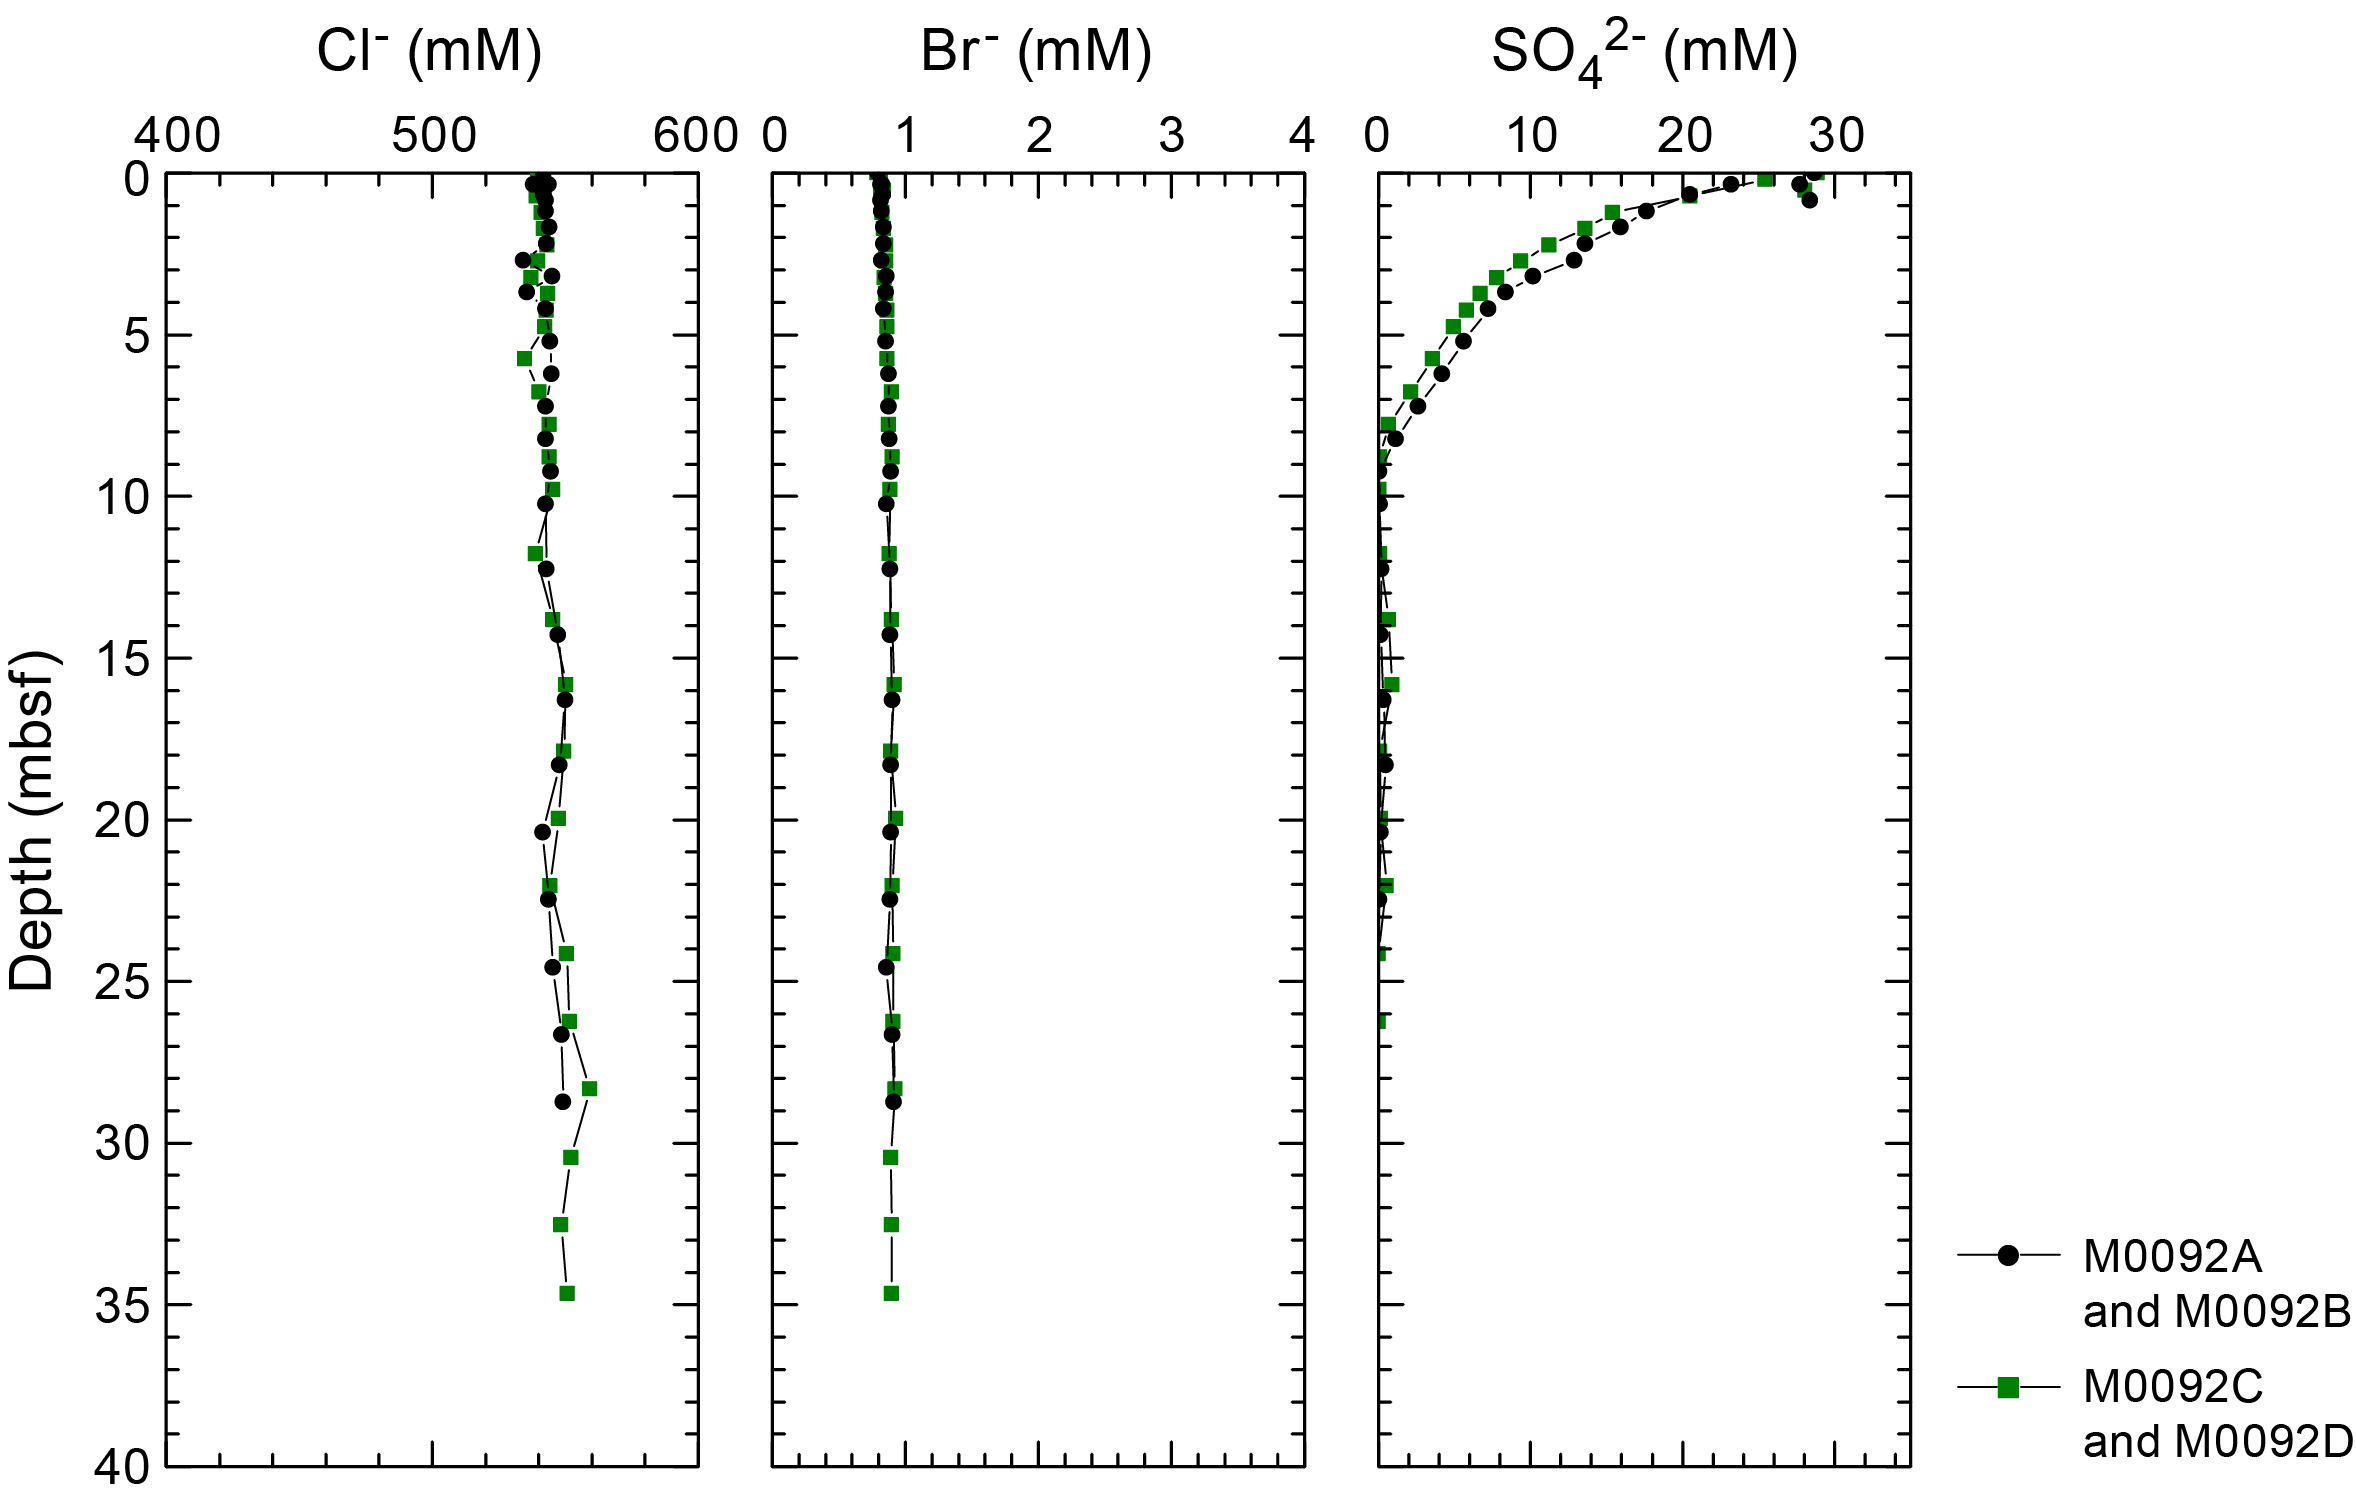
Figure F31. IW Cl−, Br−, and SO42−, Site M0092.
Dissolved bromide (Br−) concentrations in the BW samples from Site M0092 are similar to those of seawater (Bruland et al., 2013): 0.791 mM in Holes M0092A and M0092C (Table T9). The samples from Hole M0092A have concentrations of 0.828 mM at 0.35 mbsf and 0.816 mM at 0.85 mbsf; in Hole M0092C, the concentration is 0.836 mM at 0.53 mbsf (Figure F31). In Hole M0092B, a steady increase in Br concentrations reaches around 0.893 mM at 9.25 mbsf, where the slope flattens, and values fluctuate between 0.884 and 0.914 mM to the bottom of the hole, with one lower outlier of 0.856 mM at 24.57 mbsf. Hole M0092D has a pattern similar to that of Hole M0092B, with the lowest concentration (0.815 mM) at 0.21 mbsf, a steep increase to 0.919 mM at 15.84 mbsf, and fluctuations between 0.892 and 0.928 mM throughout the remainder of the core.
Dissolved sulfate (SO42−) concentrations in the BW samples from Holes M0092A and M0092C are 28.7 and 28.9 mM (Table T9). SO42− concentrations in IW samples from Holes M0092A and M0092C all have similar values (~28–29 mM) (Figure F31). Hole M0092B has SO42− concentrations of 23.1 mM at 0.36 mbsf, followed by a rapid decline to 1.1 mM at 8.26 mbsf and values of 0–0.5 mM between 9.25 mbsf and the bottom of the core at 28.74 mbsf. Hole M0092D has a near identical pattern to that of Hole M0092B, reaching values of less than 1 mM by 7.78 mbsf.
Dissolved Cl− values at Site M0095 are similar to seawater values throughout the cores (Bruland et al., 2013), ranging ~540–560 mM (Table T10; Figure F32). Dissolved Br− concentrations range 0.834–0.875 mM to 6.135 mbsf and then increase to between 0.904 and 0.936 mM from 7.14 mbsf to the base of the core at 26.76 mbsf. The dissolved SO42− concentration in the BW sample is 28.0 mM. The IW samples from Hole M0095A have similar concentrations: 27.3 and 26.8 mM. In Hole M0095B, the SO42− profile shows an exponential decrease with depth to values around the detection limit at 6.14 mbsf; values remain at such low levels to the bottom of the hole.
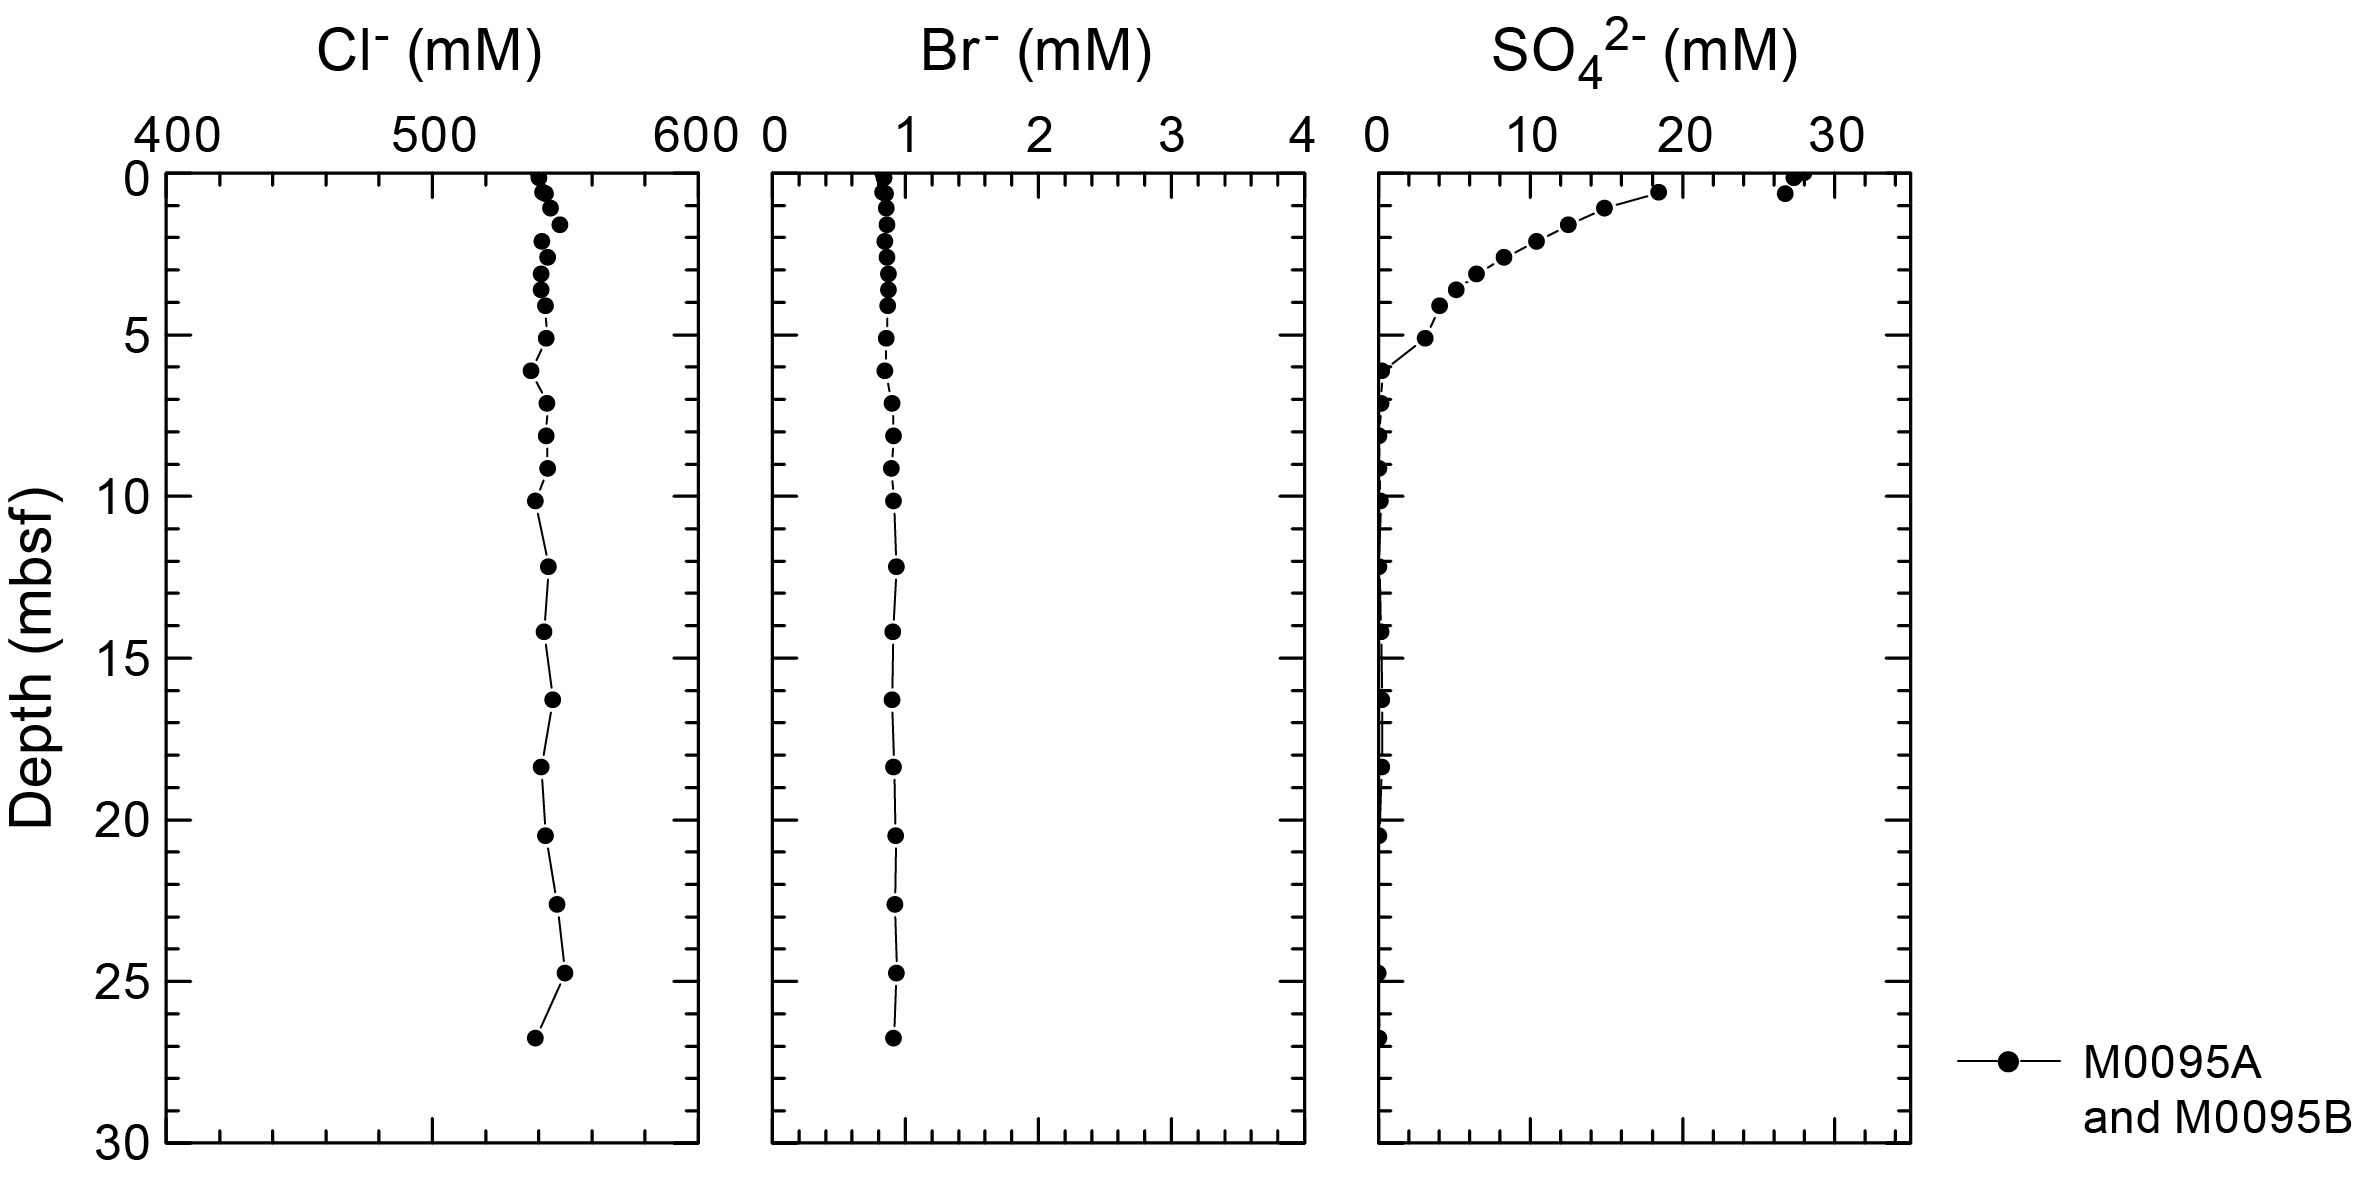
Figure F32. IW Cl−, Br−, and SO42−, Site M0095.
6.1.2.4. Sodium, magnesium, potassium, and calcium
Dissolved sodium (Na+) concentrations in the BW from Holes M0092A and M0092C are 562.41 and 538.74 mM. Dissolved Na+ concentrations are 535.68 and 516.24 mM in Hole M0092A and 475.24 mM at 0.53 mbsf in Hole M0092C. Dissolved Na+ concentrations in Holes M0092B and M0092D fluctuate unsystematically and are mostly above average seawater values (~470 mM; Bruland et al., 2013), ranging ~453–630 mM.
Dissolved potassium (K+) concentrations in the BW samples from Site M0092 are 12.31 and 11.71 mM. The IW samples from Hole M0092A have K+ concentrations that are lower than those in the BW (11.30 mM at 0.35 mbsf; 10.45 mM at 0.85 mbsf), and in Hole M0092C the K+ concentration is 9.71 mM at 0.53 mbsf. In Holes M0092B and M0092D, K+ concentrations fluctuate unsystematically and are mostly above seawater values (~10 mM; Bruland et al., 2013), ranging ~9.5–14.2 mM.
Dissolved calcium (Ca2+) concentrations in the BW samples from Site M0092 are 12.42 and 12.11 mM. The IW samples have Ca2+ concentrations that are lower in Hole M0092A (11.53 mM at 0.35 mbsf and 10.01 mM at 0.85 mbsf) than in Hole M0092C, where the Ca2+ concentration is 9.92 mM at 0.53 mbsf. Ca2+ concentrations in the IW from Holes M0092B and M0092D fluctuate unsystematically and are mostly around seawater values (~10 mM), ranging ~7–12 mM.
Dissolved magnesium (Mg2+) concentrations in the BW samples from Site M0092 are 62.65 and 60.75 mM. The IW Mg2+ concentrations in samples from Holes M0092A and M0092C are similar to each other; in Hole M0092A, concentrations are 62.08 mM at 0.35 mbsf and 57.23 mM at 0.85 mbsf, and in Hole M0092C, the concentration is 53.97 mM at 0.53 mbsf. In Holes M0092B and M0092D, Mg2+ concentrations fluctuate unsystematically and are mostly around seawater values (~53 mM), ranging ~48–73 mM.
The dissolved Na+ concentration in the BW sample from Site M0095 is 525.62 mM. The IW samples from Hole M0095A have Na+ concentrations that are slightly lower (483.58 mM at 0.15 mbsf and 499.20 mM at 0.65 mbsf). In Hole M0095B, Na+ concentrations fluctuate unsystematically and are consistently above average seawater values (~470 mM; Bruland et al., 2013), ranging 461.33–540.92 mM.
The dissolved K+ concentration in the BW sample from Site M0095 is 11.35 mM. IW K+ concentrations for Hole M0095A are 10.84 mM at 0.15 mbsf and 10.05 mM at 0.65 mbsf. The IW samples from Hole M0095B have K+ concentrations that fluctuate unsystematically and are consistently above seawater values (~10 mM), ranging ~10.7–12.3 mM.
The dissolved Ca2+ concentration in the BW sample from Site M0095 is 11.90 mM. Dissolved Ca2+ concentrations in the IW samples from Hole M0095A are 10.43 mM at 0.15 mbsf and 10.24 mM at 0.65 mbsf. Dissolved Ca2+ concentrations in the IW samples from Hole M0095B fluctuate unsystematically and are mostly less than seawater values (~10 mM), with a trend from near seawater values at the surface to 6.97 mM at 18.39 mbsf and an increase to 8.92 mM at the bottom of the core at 26.76 mbsf.
Dissolved Mg2+ concentrations in the BW sample from Site M0095 are 59.61 mM. IW Mg2+ concentrations for Hole M0095A are 54.28 mM at 0.15 mbsf and 56.31 mM at 0.65 mbsf. IW Mg2+ concentrations for Hole M0095B fluctuate unsystematically and are consistently above seawater values (~53 mM), ranging 53–65.45 mM.
The IC cation data is only presented in GEOCHEM in Supplementary material because the samples require postexpedition analysis for validation of absolute values (analytical accuracy).
6.2. Shore-based H2S analysis
At Sites M0092 and M0095, H2S concentrations were below detection limit in all samples (see GEOCHEM in Supplementary material).
6.3. Headspace gas analysis: methane, ethane, and C1/C2 ratio
Offshore headspace samples were taken following the standard methods (see Geochemistry in the Expedition 386 methods chapter [Strasser et al., 2023a]). A total of 36 headspace samples from Holes M0092C and M0092D and 28 headspace samples from Holes M0095A and M0095B were measured for hydrocarbon compositions.
At Site M0092, methane values are low to 7 mbsf, at which point they increase rapidly to a high value of 13,000 ppmv near 17 mbsf (Table T11; Figure F33). Methane values remain high with major fluctuations between 8,700 and 25,000 ppmv to the bottom of the core. Ethane (C2H4 and C2) increases nonlinearly from 0.32 to ~2.0 ppmv. Methane/ethane (C1/C2) ratios follow the methane profile pattern and are >5000 below ~10 mbsf.

Figure F33. Methane, ethane, and methane to ethane ratio, Site M0092.
In the uppermost 6 m at Site M0095, methane increases from 7 to 83.5 ppmv (Table T12; Figure F34). This is followed by a steep increase to >20,000 ppmv at 20 mbsf. Below this depth, concentrations remain relatively stable with fluctuations. Ethane (C2H4 and C2) increases from 0.1 to 0.25 ppmv from 0 to 20 mbsf, where it declines again to 0.15 ppmv. Methane/ethane (C1/C2) ratios follow the methane profile pattern and are consistently >20,000 below ~6 mbsf.

Figure F34. Methane, ethane, and methane to ethane ratio, Site M0095
Alongside C1 and C2, other hydrocarbon gases such as ethylene (C2=), ethane (C2), propene/propylene (C3=), propane (C3), and n-butane (n-C4) were detected and measured, but their concentrations are very low, generally less than 1 ppmv at all sites (see GEOCHEM in Supplementary material).
6.4. Shore-based solid-phase analysis
6.4.1. Aluminum, calcium, silica, iron, and manganese
Energy dispersive X-ray fluorescence (ED-XRF) was used to quantify elements from 15 ground solid sediment samples from Hole M0092B, 18 samples from Hole M0092D, and one sample each from Holes M0092A and M0092C. The solid-phase elements (including Al, Ca, Si, Fe, and Mn, briefly described below) are listed together with Ba, Br, Cr, Cu, K, Mg, Ni, P, Sr, Ti, V, Zn, and Zr in Table T13. Selected elements plotted in Figure F35 highlight the compositional differences in the sediments at Site M0092 (see Lithostratigraphy).

Figure F35. Al, Ca, Si, Fe, and Mn, Site M0092.
Aluminum (Al) contents at Site M0092 range ~4.1–6.1 wt% (40,843–61,062 mg/kg). In Holes M0092B and M0092D, there is a general trend of increasing concentrations from the top to the bottom of the cores (Table T13; Figure F35). Holes M0092A and M0092B have the lowest concentrations. Calcium (Ca) contents range ~0.8–1.5 wt% (8,491–15,137 mg/kg), and values fluctuate throughout the cores. Silicon (Si) contents range ~25–32 wt% (251,505–323,753 mg/kg) and do not show any trends with depth. Fe contents range ~3–4.1 wt% (30,105–41,013 mg/kg) without any obvious trends with depth. Mn contents range ~0.05–1.2 wt% (489–12,059 mg/kg) without any systematic trends with depth.
Contents of Al in Hole M0095B range ~4.6–5.9 wt% (46,397–58,592 mg/kg) and generally increase from the top to the bottom of the cores (Table T14; Figure F36). Hole M0095A has the lowest concentration of 4.0 wt% (40,457 mg/kg). Ca contents range ~0.92–1.8 wt% (9,215–17,732 mg/kg) in Hole M0095B and do not show a systematic trend with depth. Hole M0095A has the lowest concentration of 0.92 wt% (9208 mg/kg). Si concentrations in Hole M0095A are 33 wt% (331,764 mg/kg). Si contents for Hole M0095B range ~26–30 wt% (266,728–303,510 mg/kg) and do not show a systematic trend with depth. Hole M0095A has the lowest Fe concentration of 2.8 wt% (28,405 mg/kg). Fe contents in Hole M0095B range ~3.3–3.8 wt% (32,598–37,734 mg/kg) and show no trend with depth. Mn contents at Site M0095 range ~0.06–1.1 wt% (643–11,171 mg/kg), with increases at 12.225 and 24.775 mbsf.
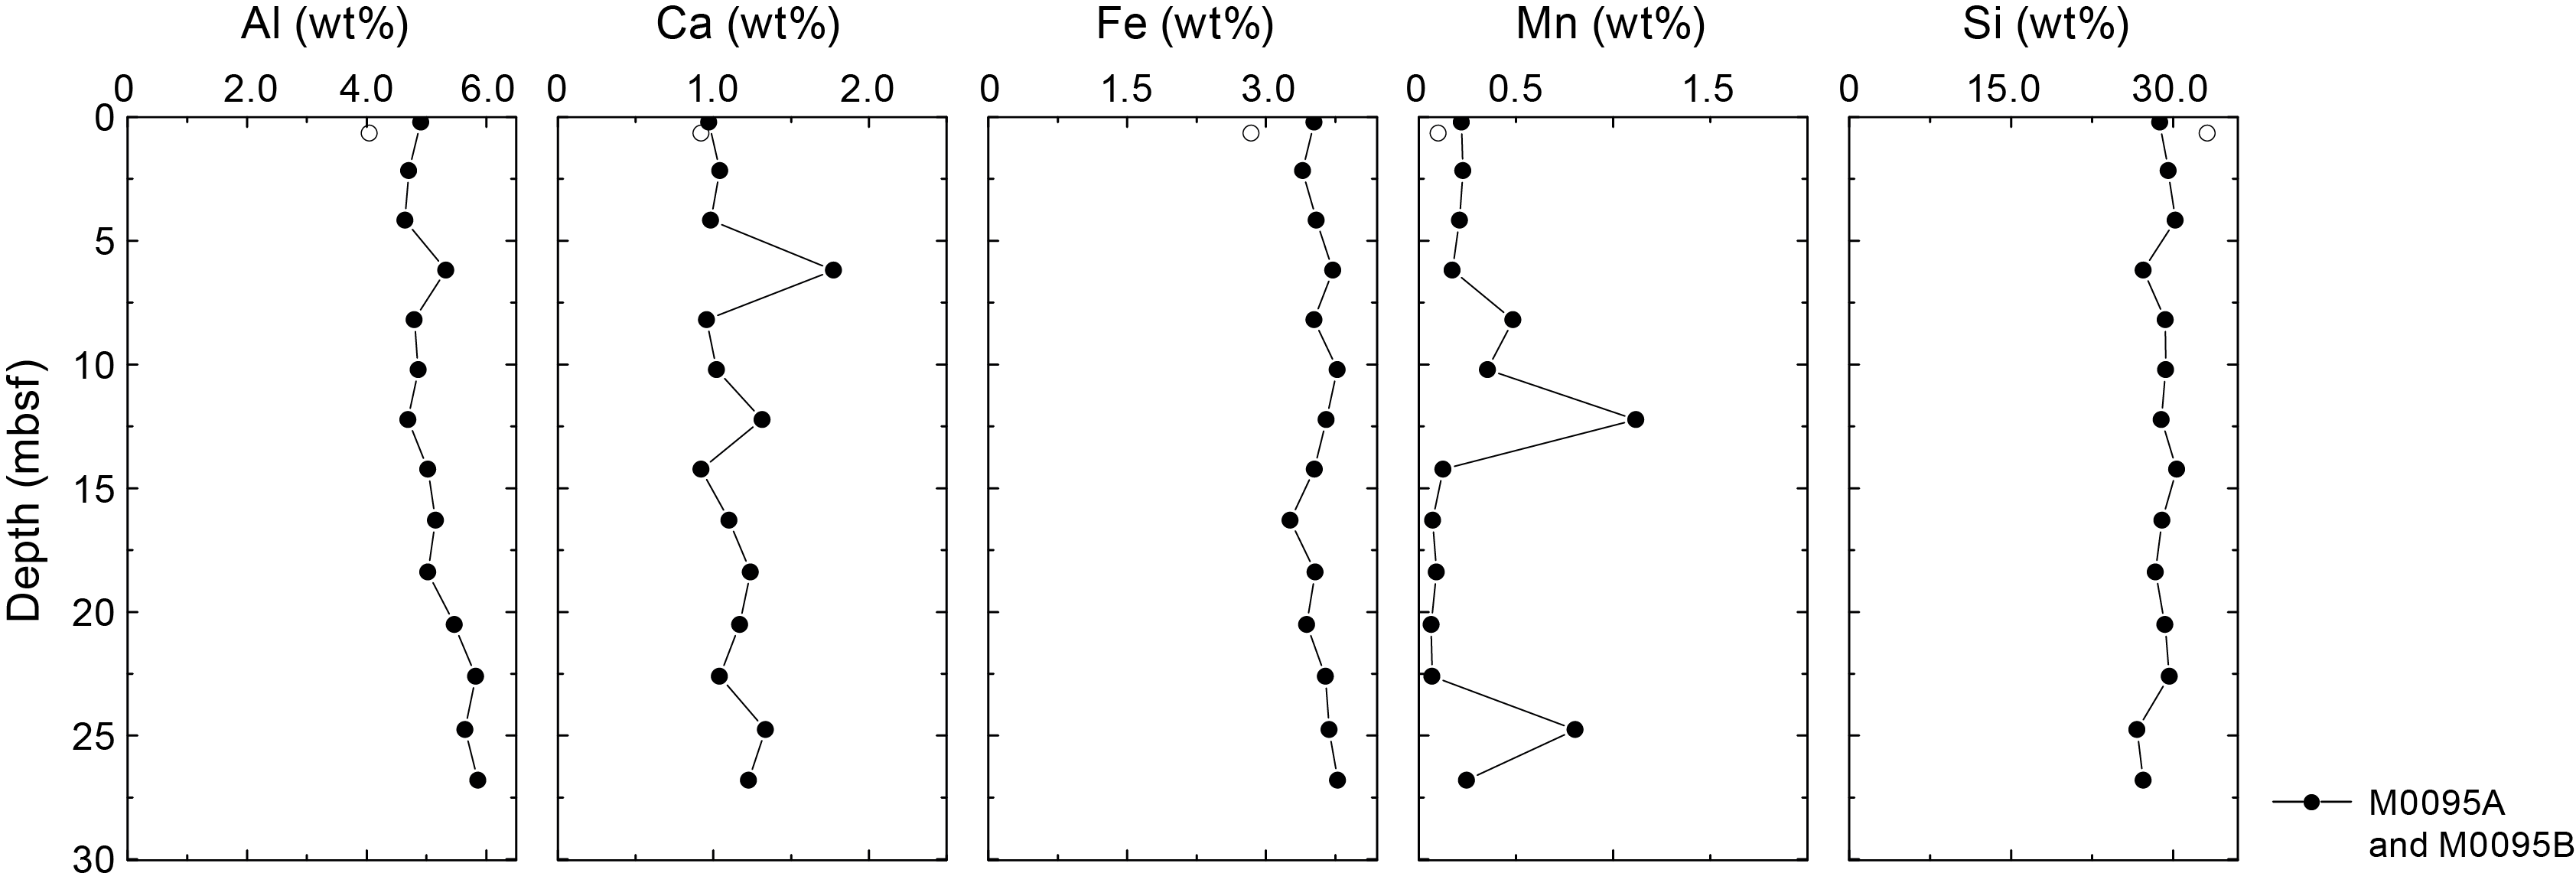
Figure F36. Al, Ca, Si, Fe, and Mn, Site M0095.
6.4.2. Carbon and sulfur
Overall concentrations of total carbon (TC) and total organic carbon (TOC) are similar throughout all cores from Sites M0092 and M0095 (Tables T13, T14; Figures F37, F38). TC contents in cores from Site M0092 range 0.77–1.80 wt%. TOC contents range 0.59–1.63 wt%. TC contents in cores from Site M0095 range 0.76–1.47 wt%. TOC contents range 0.63–1.41 wt%. Concentrations of total sulfur (TS) are low throughout all cores from Sites M0092 and M0095. At Site M0092, TS concentrations range 0.08–0.73 wt%. At Site M0095, TS concentrations range 0.09–0.56 wt%.

Figure F37. TC, TOC, TIC, and TS, Site M0092.

Figure F38. TC, TOC, TIC, and TS, Site M0095.
6.5. Discussion
The top of the cores from Sites M0092 and M0095 show elevations in redox sensitive elements (V, Mo, U, Fe, and Mn) and abrupt decreases in sulfate. Methane is low in the shallow parts of the cores and becomes important at a depth where sulfate is below detection (~8 mbsf at Site M0092 and ~6 mbsf at Site M0095), which defines the sulfate–methane transition (SMT). Combined, these observations are consistent with organic matter remineralization likely by intensive dissimilatory Fe and Mn reduction. Below the uppermost cored interval, organoclastic sulfate reduction becomes the dominant electron acceptor for organic matter remineralization, as evidenced by the loss of sulfate. Sulfate reduction and subsequent formation of diagenetic sulfide minerals is also evident from the abundance of most likely iron sulfides in the barrel sheets (see Core descriptions).
One significant difference between Sites M0092 and M0095 (based on IW and dissolved gas profiles) is the depth of the SMT. This could be explained by different sedimentation rates, organic matter reactivities, and/or organic matter delivery rates.
The abundance of amorphous silica (biogenic opal in diatom frustules and sponge spicules; volcanic ash) in the smear slide descriptions (see Core descriptions) can account for the very high dissolved Si concentrations immediately below the sediment surface. Interestingly, the diatom frustules are reported to be extremely well preserved (see Micropaleontology), suggesting that not a lot of dissolution has impacted them. Amorphous silica appears to reach an equilibrium value around 800–900 µM, some of the highest dissolved Si concentrations reported in marine sediments (e.g., Frings, 2017). Perhaps this approach to equilibrium values accounts for the diatom frustule preservation. The general downcore increase in B concentrations must have a source in addition to the amorphous silica phases because these values are stable throughout the cores. Organic matter remineralization may account for the increase. It is possible that desorption from clay could account for the B increase, although the Al content of the sediment is very low, suggesting that clay minerals are a minor constituent. In contrast, the dramatic decrease in Li with depth could reflect low-temperature silicate diagenesis, which adsorbs and/or incorporates Li into secondary minerals.
The solid phase at Sites M0092 and M0095 is dominated by siliceous material, indicated by high Si contents and corroborated by smear slide descriptions (see Lithostratigraphy). Fine-grained siliciclastic material, as approximated by Al contents, is quantitatively the second most important sediment component. Carbonate material, as shown by the IC and partly by the Ca contents, is very low but not zero. The Fe contents broadly parallel the Al records and, at first pass, do not indicate significant vertical redistribution by diagenetic dissolution-precipitation processes.
The coupled but marked variation of TC, TOC, total inorganic carbon (TIC), and TS may imply transport of material into the Japan Trench. The organic geochemical variation between Sites M0092 and M0095 provide a possible correlation tool for sediment stratigraphy in the trench sediments. In addition, although intensive remineralization occurs at the top part of the cored intervals at Sites M0092 and M0095, relatively higher TOC and TC contents (almost >1 wt%) were observed in the deeper sediments, suggesting that significant amounts of organic matter may persist in the trench sediments. The high methane concentrations and elevated C1/C2 values observed in the deeper sediments at the two sites show that remineralization by microbes is important in these hadal sediments.
7. Physical properties
This section summarizes the physical properties results from cores acquired at Sites M0092 and M0095 in the Southern Japan Trench (Basin S2). A total of six holes were cored: three pairs of trigger cores (Holes M0092A, M0092C, and M0095A) and corresponding GPC cores (Holes M0092B, M0092D, and M0095B) (see Operations). The physical properties data sets were collected with the techniques and sampling rates defined in Physical properties in the Expedition 386 methods chapter (Strasser et al., 2023a). During the offshore phase, whole cores were scanned through the Multi-Sensor Core Logger (MSCL). During the onshore phase, cores were split, scanned through the Tri-Sensor Core Logger (TSCL), and sampled for moisture and density (MAD), undrained shear strength, and P-wave velocity. Overall, the physical properties data sets are high quality and correlate well with lithology and hydroacoustics.
7.1. Bulk density
Offshore, density data (bulk density) were obtained using the gamma ray attenuation (GRA) technique on the MSCL. Onshore, bulk density, porosity, and grain density were obtained using the MAD analysis technique on discrete samples.
7.1.1. Site M0092
Bulk density values in Holes M0092A and M0092B increase from ~1.2 g/cm3 at the mudline (recovered only in Hole M0092A) to ~1.35 g/cm3 at the bottom of Hole M0092B (30 mbsf) (Figure F39). An approximately linear increase to 1.36 g/cm3 from 0 to 4 mbsf is observed in the MSCL and MAD data, including two pronounced peaks in MSCL bulk density of 1.38 g/cm3 at 2.5 mbsf and 1.49 g/cm3 at ~3 mbsf. Below this interval, bulk density sharply decreases to 1.32 g/cm3, increases to 1.36 g/cm3 at 4.4 mbsf, decreases sharply to 1.26 g/cm3, decreases gradually to 1.24 g/cm3 at 6 mbsf, and increases sharply to 1.29 g/cm3 and then gradually to ~1.35 g/cm3 at 9.2 mbsf, with a peak of 1.4 g/cm3 at 6.7 mbsf. There is another sharp decrease in bulk density to ~1.28 g/cm3 at the base of this interval. Below this depth, bulk density increases gradually via high frequency fluctuations to ~1.35 g/cm3 at the bottom of Hole M0092B.
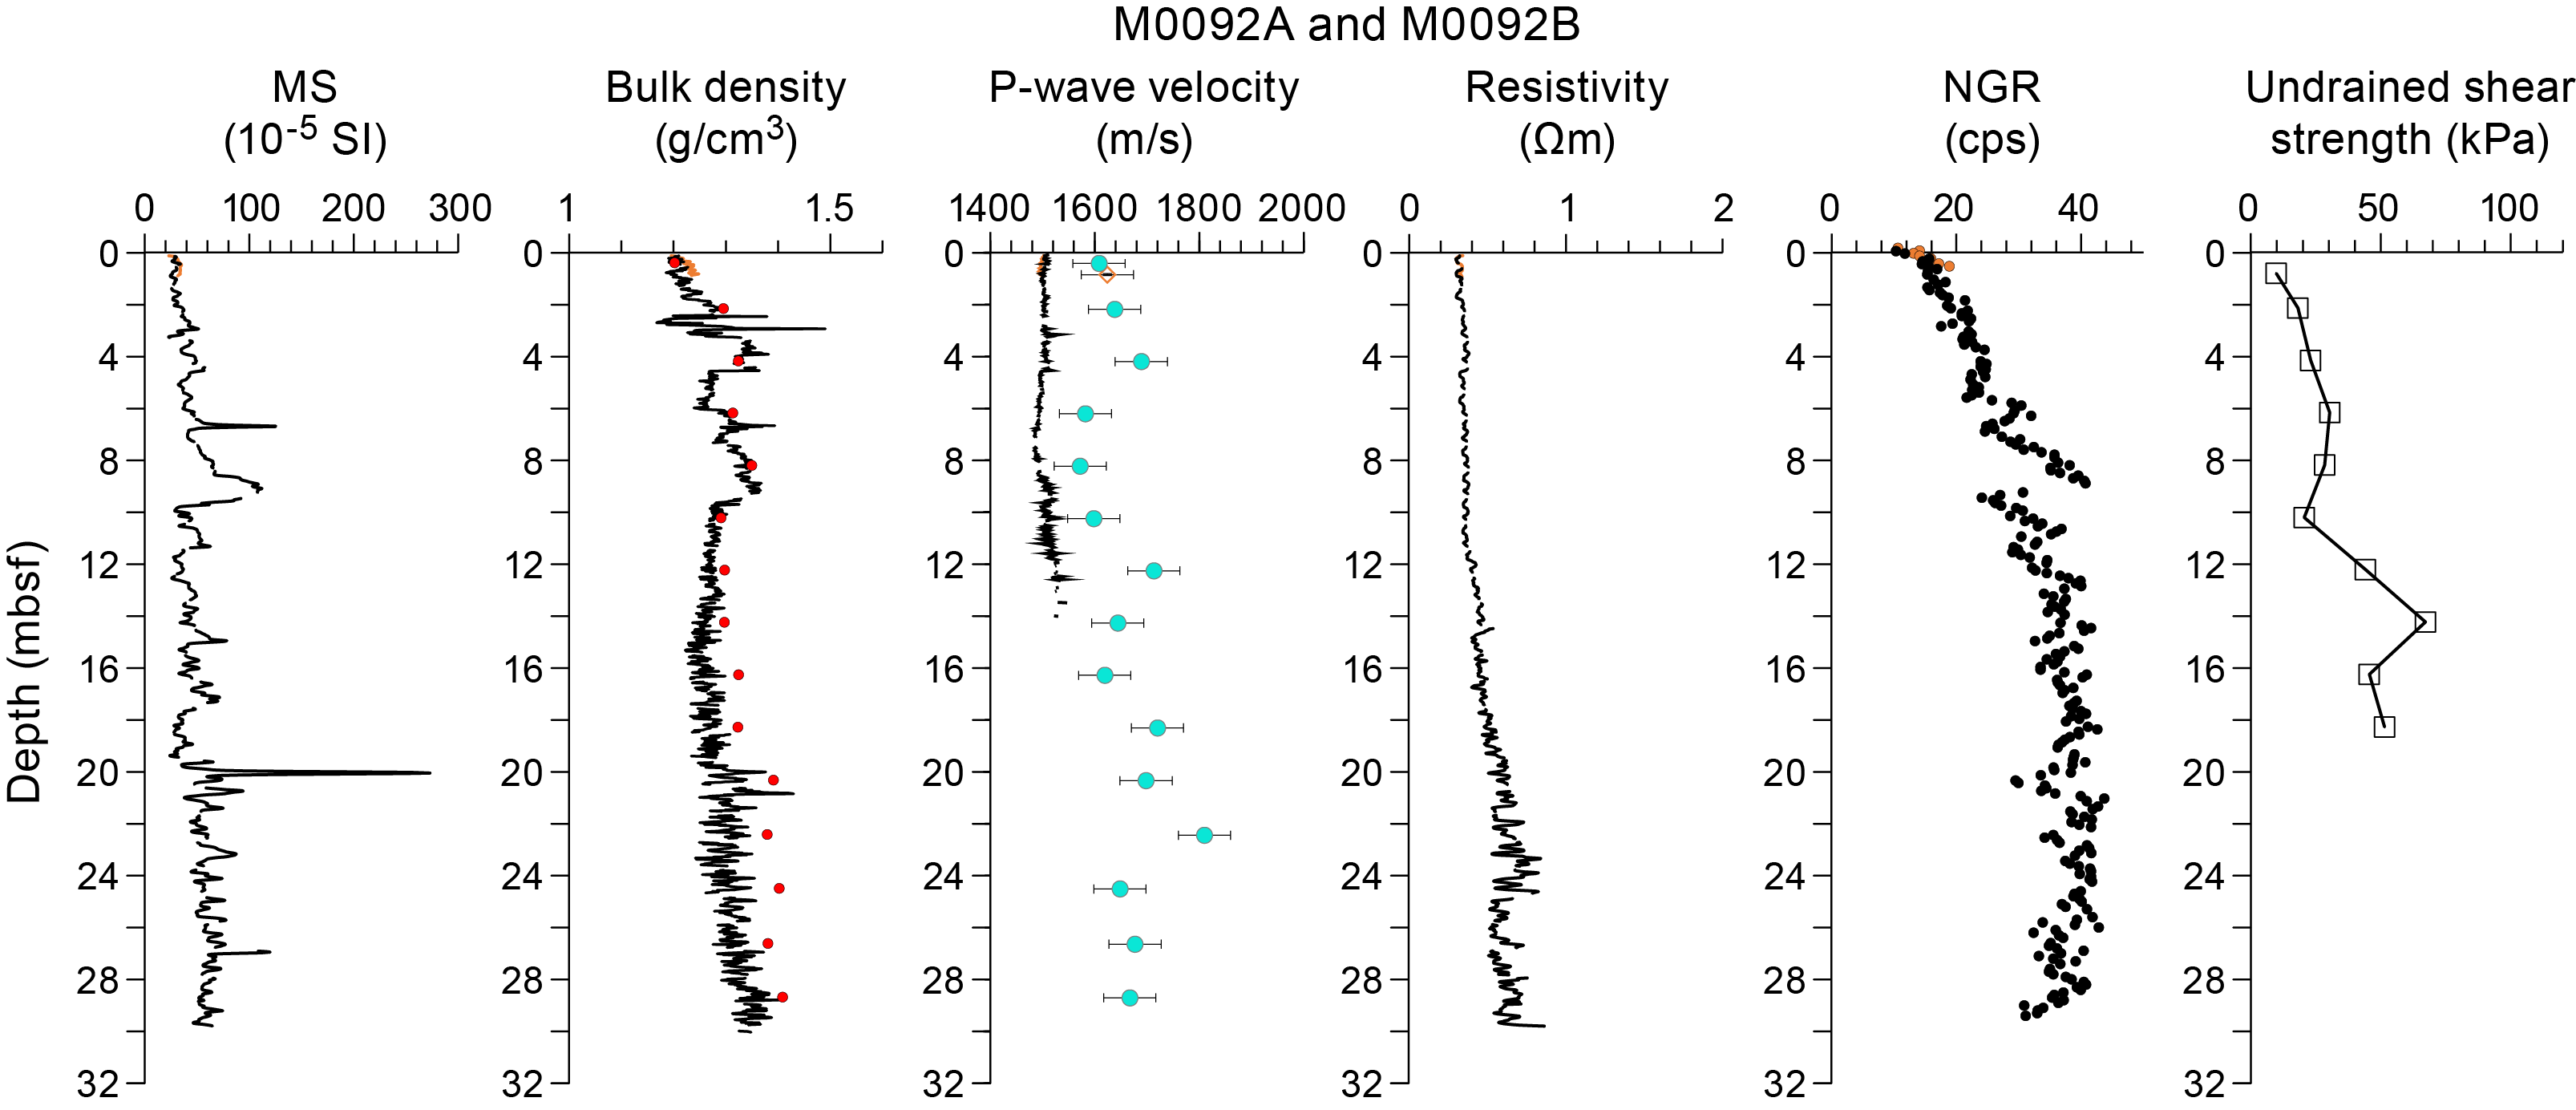
Figure F39. Physical properties summary, Holes M0092A and M0092B.
In Holes M0092C and M0092D, bulk density increases from ~1.17 g/cm3 at the mudline (only recovered in Hole M0092C) to ~1.34 g/cm3 at the bottom of Hole M0092D (36 mbsf) (Figure F40). An approximately linear increase to 1.34 g/cm3 from 0 to 3.6 mbsf is observed in the MSCL data, with a pronounced peak of 1.36 g/cm3 at ~2.5 mbsf. Below this interval, bulk density sharply decreases to ~1.26 g/cm3, increases sharply to 1.36 g/cm3, and then decreases gradually to 1.26 g/cm3 at 5.3 mbsf. Below this depth, bulk density increases gradually to ~1.36 g/cm3 at 8.6 mbsf, with a peak of 1.37 g/cm3 at 8.4 mbsf. There is another sharp decrease in bulk density to ~1.27 g/cm3 at the base of this interval. Below this depth, bulk density tends to increase with depth gradually but with high frequency fluctuations to ~1.34 g/cm3. Three local peaks occur in MSCL bulk density: 1.4 g/cm3 at 19.8 mbsf and >1.5 g/cm3 at 31.4 and 33.3 mbsf.

Figure F40. Physical properties summary, Holes M0092C and M0092D.
MAD-derived bulk density data have an overall good correspondence with the MSCL-derived bulk density data in the uppermost 8 m of Holes M0092B and M0092D (Figures F39, F40) but tend to be slightly higher than MSCL bulk density data downcore.
7.1.2. Site M0095
In Holes M0095A and M0095B, bulk density increases from 1.2 g/cm3 at the mudline (only recovered in M0095A) to ~1.35 g/cm3 at the bottom of Hole M0095B (~28 mbsf) (Figure F41). An approximately linear increase to 1.2 g/cm3 from 0 to 3.4 mbsf is observed in the MSCL data, including two local peaks of 1.31 and 1.4 g/cm3 at 1.9 and 2.8 mbsf, respectively. Bulk density values fluctuate around 1.27 g/cm3 between 3.45 and 4.75 mbsf and then increase rapidly to 1.54 g/cm3 at 6.1 mbsf. Below this peak, bulk density decreases to 1.29 g/cm3 at 6.6 mbsf and then gradually increases to the bottom of Hole M0095B to ~1.35 g/cm3. A local peak in bulk density of 1.42 g/cm3 occurs at 17.1 mbsf.
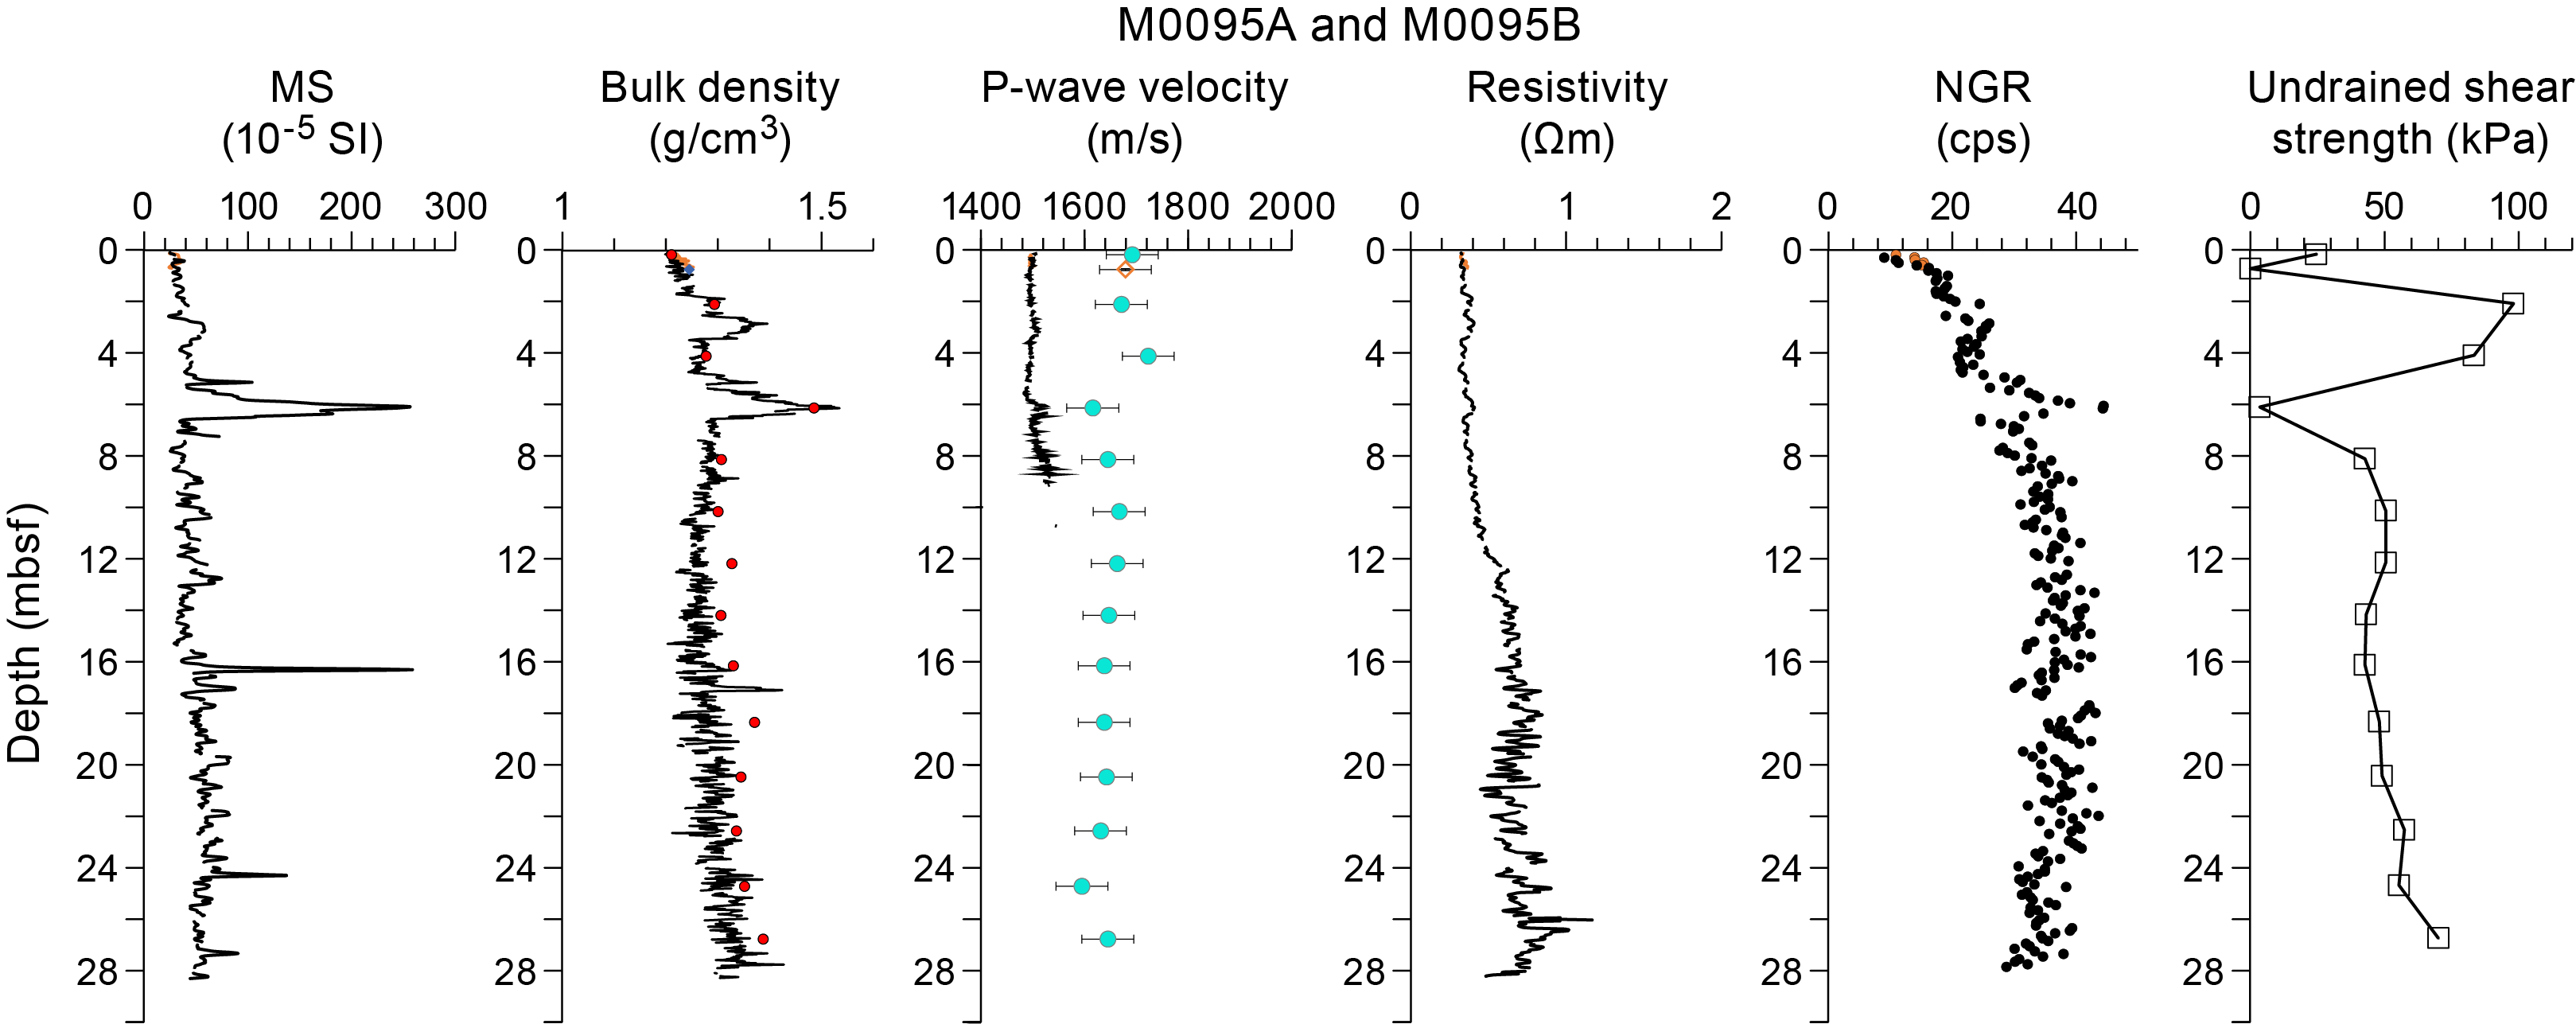
Figure F41. Physical properties summary, Holes M0095A and M0095B.
MAD-derived bulk density data have an overall good correspondence with the MSCL-derived bulk density data in the uppermost 6 m of Hole M0095B (Figure F41) but tend to be slightly higher than MSCL bulk density data downcore. A distinct high-density peak at 5 mbsf is captured well in both the MSCL and MAD data.
7.2. Magnetic susceptibility
Magnetic susceptibility data were obtained during the offshore phase using the MSCL.
7.2.1. Site M0092
Overall, magnetic susceptibility values in all cores at Site M0092 fluctuate around a baseline value of approximately 50 × 10−5 SI and generally increase throughout the cored depth (Figures F39, F40). Magnetic susceptibility values also show several pronounced peaks that exceed 100 × 10−5 SI, with the highest peak values typically occurring within short depth intervals of less than 90 cm. The peaks in Hole M0092B are located at 6.7 mbsf (125 × 10−5 SI), 9.1 mbsf (112 × 10−5 SI), 20 mbsf (272 × 10−5 SI), and 27 mbsf (120 × 10−5 SI). In Hole M0092D, peaks occur at 8.4 mbsf (121 × 10−5 SI), 19.2 mbsf (225 × 10−5 SI), 25.7 mbsf (115 × 10−5 SI), 31.4 mbsf (193 × 10−5 SI), and 33.3 mbsf (169 × 10−5 SI). The peaks at 9.1 mbsf (Hole M0092B) and 8.4 mbsf (Hole M0092D) are unusual in that they cover a broader depth range compared to the other peaks and are characterized by a decreasing trend that is sharper than the increasing trend.
7.2.2. Site M0095
Overall, magnetic susceptibility values in all cores at Site M0095 fluctuate around a baseline value of approximately 50 × 10−5 SI and generally increase throughout the cored depth. Magnetic susceptibility values also show several pronounced peaks that exceed 100 × 10−5 SI (Figure F41), with the highest peak values typically occurring within short depth intervals of less than 60 cm. The peaks are located at 5.1 mbsf (103 × 10−5 SI), 6.1 mbsf (256 × 10−5 SI), 16.3 mbsf (258 × 10−5 SI), and 24.3 mbsf (137 × 10−5 SI). The peak at 6.1 mbsf is unusual in that it covers a broader depth range compared to the other peaks and is characterized by a decreasing trend that is sharper than the increasing trend. Otherwise, magnetic susceptibility shows high-frequency variations typically with values of approximately 30 × 10−5 to 80 × 10−5 SI.
7.3. P-wave velocity
P-wave velocity was measured with the MSCL on whole cores during the offshore phase. During the onshore phase, P-wave velocity was measured on discrete samples approximately every 2 m. Much of the MSCL velocity data were of insufficient quality below ~5 mbsf and have been omitted.
Offshore P-wave velocities recorded with the MSCL at Site M0092 generally trend around 1500 m/s (the velocity of water). Shore-based discrete measurements are noticeably higher (closer to an average of 1700 m/s). The difference in velocity exceeds the uncertainty associated with the discrete velocity measurements (±50 m/s). The difference between the two datasets may be attributed to continued compaction or degassing of the sediments between offshore and onshore phase of the expedition. Postcruise research will be required to fully understand the discrepancy and, thus, the data should be used with a degree of caution.
7.3.1. Site M0092
In Holes M0092A and M0092B, MSCL-derived P-wave velocity measurements are available to 14 mbsf (Figure F39). In the uppermost 4.5 m, P-wave velocities are fairly constant, fluctuating around ~1500 m/s. A peak of 1530 m/s occurs at 3.2 mbsf. Below this interval, P-wave velocities drop abruptly to 1495 m/s and continue to decrease gradually to 1486 m/s at 7.1 mbsf. The values gradually increase to 1533 m/s at 13.5 mbsf, with a peak of 1517 m/s at 9.5 mbsf.
P-wave velocity measurements on discrete samples vary between 1572 and 1810 m/s, which are significantly higher (by up to 190 m/s) than values measured using the MSCL (Figures F39). These P-wave velocities vary between 1572 and 1810 m/s. Values tend to gradually increase between 0 and 4.2 mbsf, 8.2 and 12.3 mbsf, and 16.3 and 22.4 mbsf and gradually decrease between 4.2 and 8.2 mbsf and 12.3 and 16.3 mbsf, whereas values are fairly constant (~1650–1680 m/s) below 24.5 mbsf.
In Holes M0092C and M0092D, P-wave velocity measurements are available to 13.1 mbsf (Figures F40). In the uppermost 3.7 m, P-wave velocities are fairly constant, fluctuating around ~1500 m/s with subtle peaks of 1507 m/s at 1.84, 2.24, 2.7, and 3.7 mbsf. Below this depth, P-wave velocities decrease gradually to 1483 m/s at 6.1 mbsf and then gradually increase to 1554 m/s at 13.1 mbsf, with a subtle peak of 1524 m/s at 9.2 mbsf. This peak shows a gently increasing trend and an abruptly decreasing trend.
P-wave velocity measurements on discrete samples vary between 1647 and 1844 m/s (Figure F40), which are significantly higher (by up to 340 m/s) than the values measured using the MSCL. Velocity tends to gradually increase between 2.7 and 6.8 mbsf and 10.8 and 22.9 mbsf and gradually decrease between 0 and 2.7 mbsf, 6.8 and 10.8 mbsf, and 22.9 and 35.3 mbsf.
7.3.2. Site M0095
In Holes M0095A and M0095B, MSCL-derived P-wave velocity measurements are available to 10.7 mbsf (Figure F41). In the uppermost 3.2 m, P-wave velocities fluctuate around ~1500 m/s. A peak of 1510 m/s occurs at 3.2 mbsf. Below this interval, P-wave velocities drop abruptly to 1494 m/s and continue to decrease gradually to 1484 m/s at 4.1 mbsf. Values gradually increase to 1543 m/s at 8.7 mbsf, with a peak of 1520 m/s at 6.4 mbsf. This peak shows a gently increasing trend and an abruptly decreasing trend.
P-wave velocity measurements on discrete samples vary between 1595 and 1723 m/s, which are significantly higher (by up to 220 m/s) than the values measured using the MSCL. These P-wave velocities. Values tend to increase between 2.1 and 4.1 mbsf, 6.1 and 10.1 mbsf, and 24.7 and 26.8 mbsf and decrease between 4.1 and 6.1 mbsf and 10.1 and 24.7 mbsf.
7.4. Noncontact electrical resistivity
7.4.1. Site M0092
Noncontact electrical resistivity measured at Site M0092 using the MSCL is generally low, only exceeding 1 Ωm in very few intervals, and variability tends to increase downcore (Figures F39, F40). Resistivity values show fairly consistent profiles for all holes, especially in the uppermost 15 m, where resistivity ranges 0.4–0.5 Ωm. Below 15 mbsf, resistivity tends to increase downcore in both holes and exhibits more variability.
7.4.2. Site M0095
Noncontact electrical resistivity measured at Site M0095 using the MSCL is generally low, and variability tends to increase downcore, with an abrupt increase in values and variability at ~12 mbsf (Figure F41). The amplitude of the fluctuations tend to increase downcore, electrical resistivity overall decreases between 17.9 and 21 mbsf. Resistivity only exceeds 1 Ωm at 26 mbsf.
7.5. Natural gamma radiation
7.5.1. Site M0092
In all holes at Site M0092, NGR has similar profiles (Figures F39, F40) that fluctuate between 10 and 45 counts/s. Values increase from 10 to ~35 counts/s to ~10 mbsf (with peaks of 30 counts/s at 6.2 mbsf and 40 counts/s at 9.2 mbsf in Hole M0092B and 32 counts/s at 5.7 mbsf and 42 counts/s at 8.3 mbsf in Hole M0092D). The peaks tend to gradually increase over >1 m and have a sharper decreasing trend. NGR values fluctuate between 30 and 45 counts/s below the peaks to ~30 mbsf. In Hole M0092B, NGR values generally increase to ~20 mbsf and then maintain stable values. In Hole M0092D, NGR values generally increase to ~25 mbsf and then decrease to 30 mbsf. Below 30 mbsf, NGR values in Hole M0092D increase linearly from 30 to 40 counts/s.
7.5.2. Site M0095
At Site M0095, NGR fluctuates between 9 and 45 counts/s (Figure F41). Values tend to increase from 9 to ~30 counts/s to ~7.5 mbsf (with peaks of 26 counts/s at 2.9 mbsf and 45 counts/s at 6.2 mbsf). The peaks tend to exhibit gradually increasing trends over >1 m and have a sharper decreasing trend. Below 7.5 mbsf, NGR values fluctuate between 30 and 45 counts/s to the bottom of the hole. There is an overall increase in NGR values to 15 mbsf, stable values to 23 mbsf, and an overall decrease in values to the bottom of the hole.
7.6. Undrained shear strength
Undrained shear strength (Su) was measured on split cores with a handheld penetrometer, automated vane shear (AVS) apparatus, and fall cone penetrometer (see Physical properties in the Expedition 386 methods chapter [Strasser et al., 2023a]).
7.6.1. Site M0092
Su measured with a handheld penetrometer generally increases with depth in all holes at Site M0092 from near 0 kPa at the core top to maximum values of 72 kPa near the base of the deeper Hole M0092D (Figures F39, F40). Although the overall trend is increasing Su with depth, there are three intervals where strength decreases with depth: (1) 6–10 mbsf in Hole M0092B and 2.7–6.7 mbsf in Hole M0092D, (2) 14.2–16.3 mbsf in Hole M0092B and 14.8–20.9 mbsf in Hole M0092D, and (3) 32.9–35.3 mbsf in Hole M0092D.
Su measured during the personal sampling phase using a fall cone penetrometer was recorded once in each section in all holes at Site M0092 (Figure F42). Su values using the fall cone generally increase with depth, ranging 2.04–75.63 kPa. Fall cone Su measurements in Holes M0092B and M0092D range 2.21–75.63 and 2.04–60.16 kPa, respectively, and reveal similar downward trends.
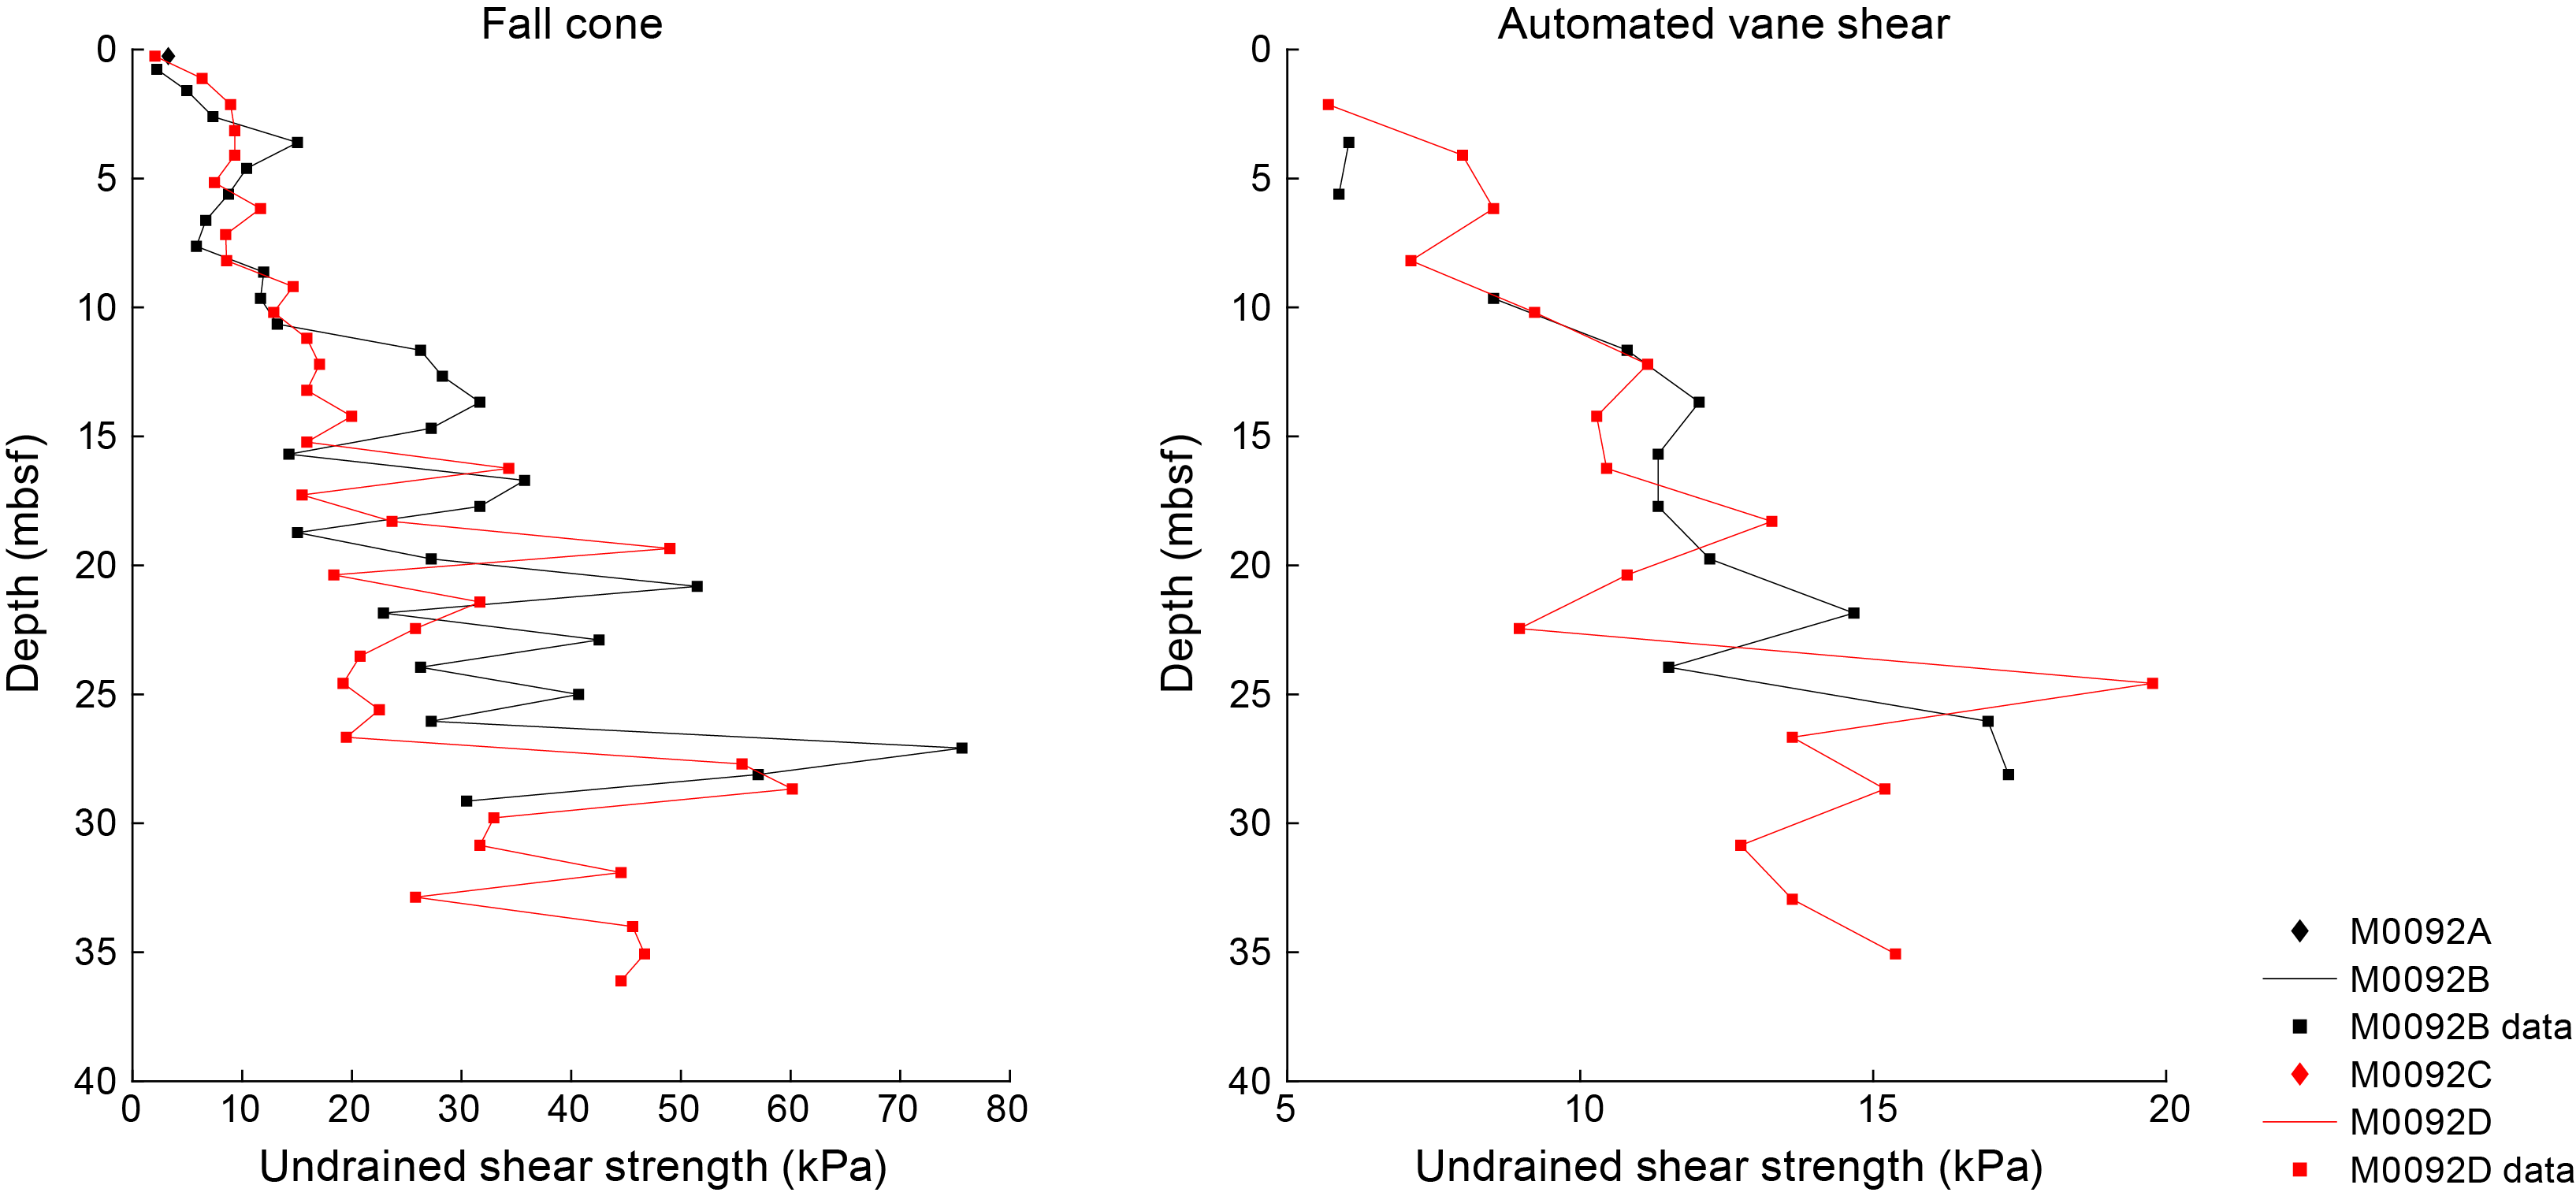
Figure F42. Undrained shear strength, Site M0092.
Su measured during the personal sampling phase using an AVS was recorded in alternating sections in Holes M0092B and M0092D (Figure F42). Su values measured using the AVS were generally lower than Su values measured using the fall cone penetrometer but generally match the overall trends. AVS-derived Su values generally increase with depth, ranging 5.70–19.77 kPa. AVS-derived Su in Holes M0092B and M0092D range 5.88–17.31 and 5.7–19.77, respectively. ASV-derived Su in Holes M0092B and M0092D average 11.55 ± 3.48 and 11.40 ± 3.43 kPa, respectively.
7.6.2. Site M0095
Su measured with a handheld penetrometer generally increases with depth at Site M0095 from near 0 kPa at the core top to 70 kPa near the base of Hole M0095B (Figure F41). There is a noteworthy interval (0.7–6.1 mbsf), however, where Su reaches very high values of 98 kPa.
Su measured during the personal sampling phase using a fall cone was recorded once in each section in all holes at Site M0095 (Figure F43). Su measured using the fall cone penetrometer generally increases with depth, ranging 3.30–50.21 kPa.
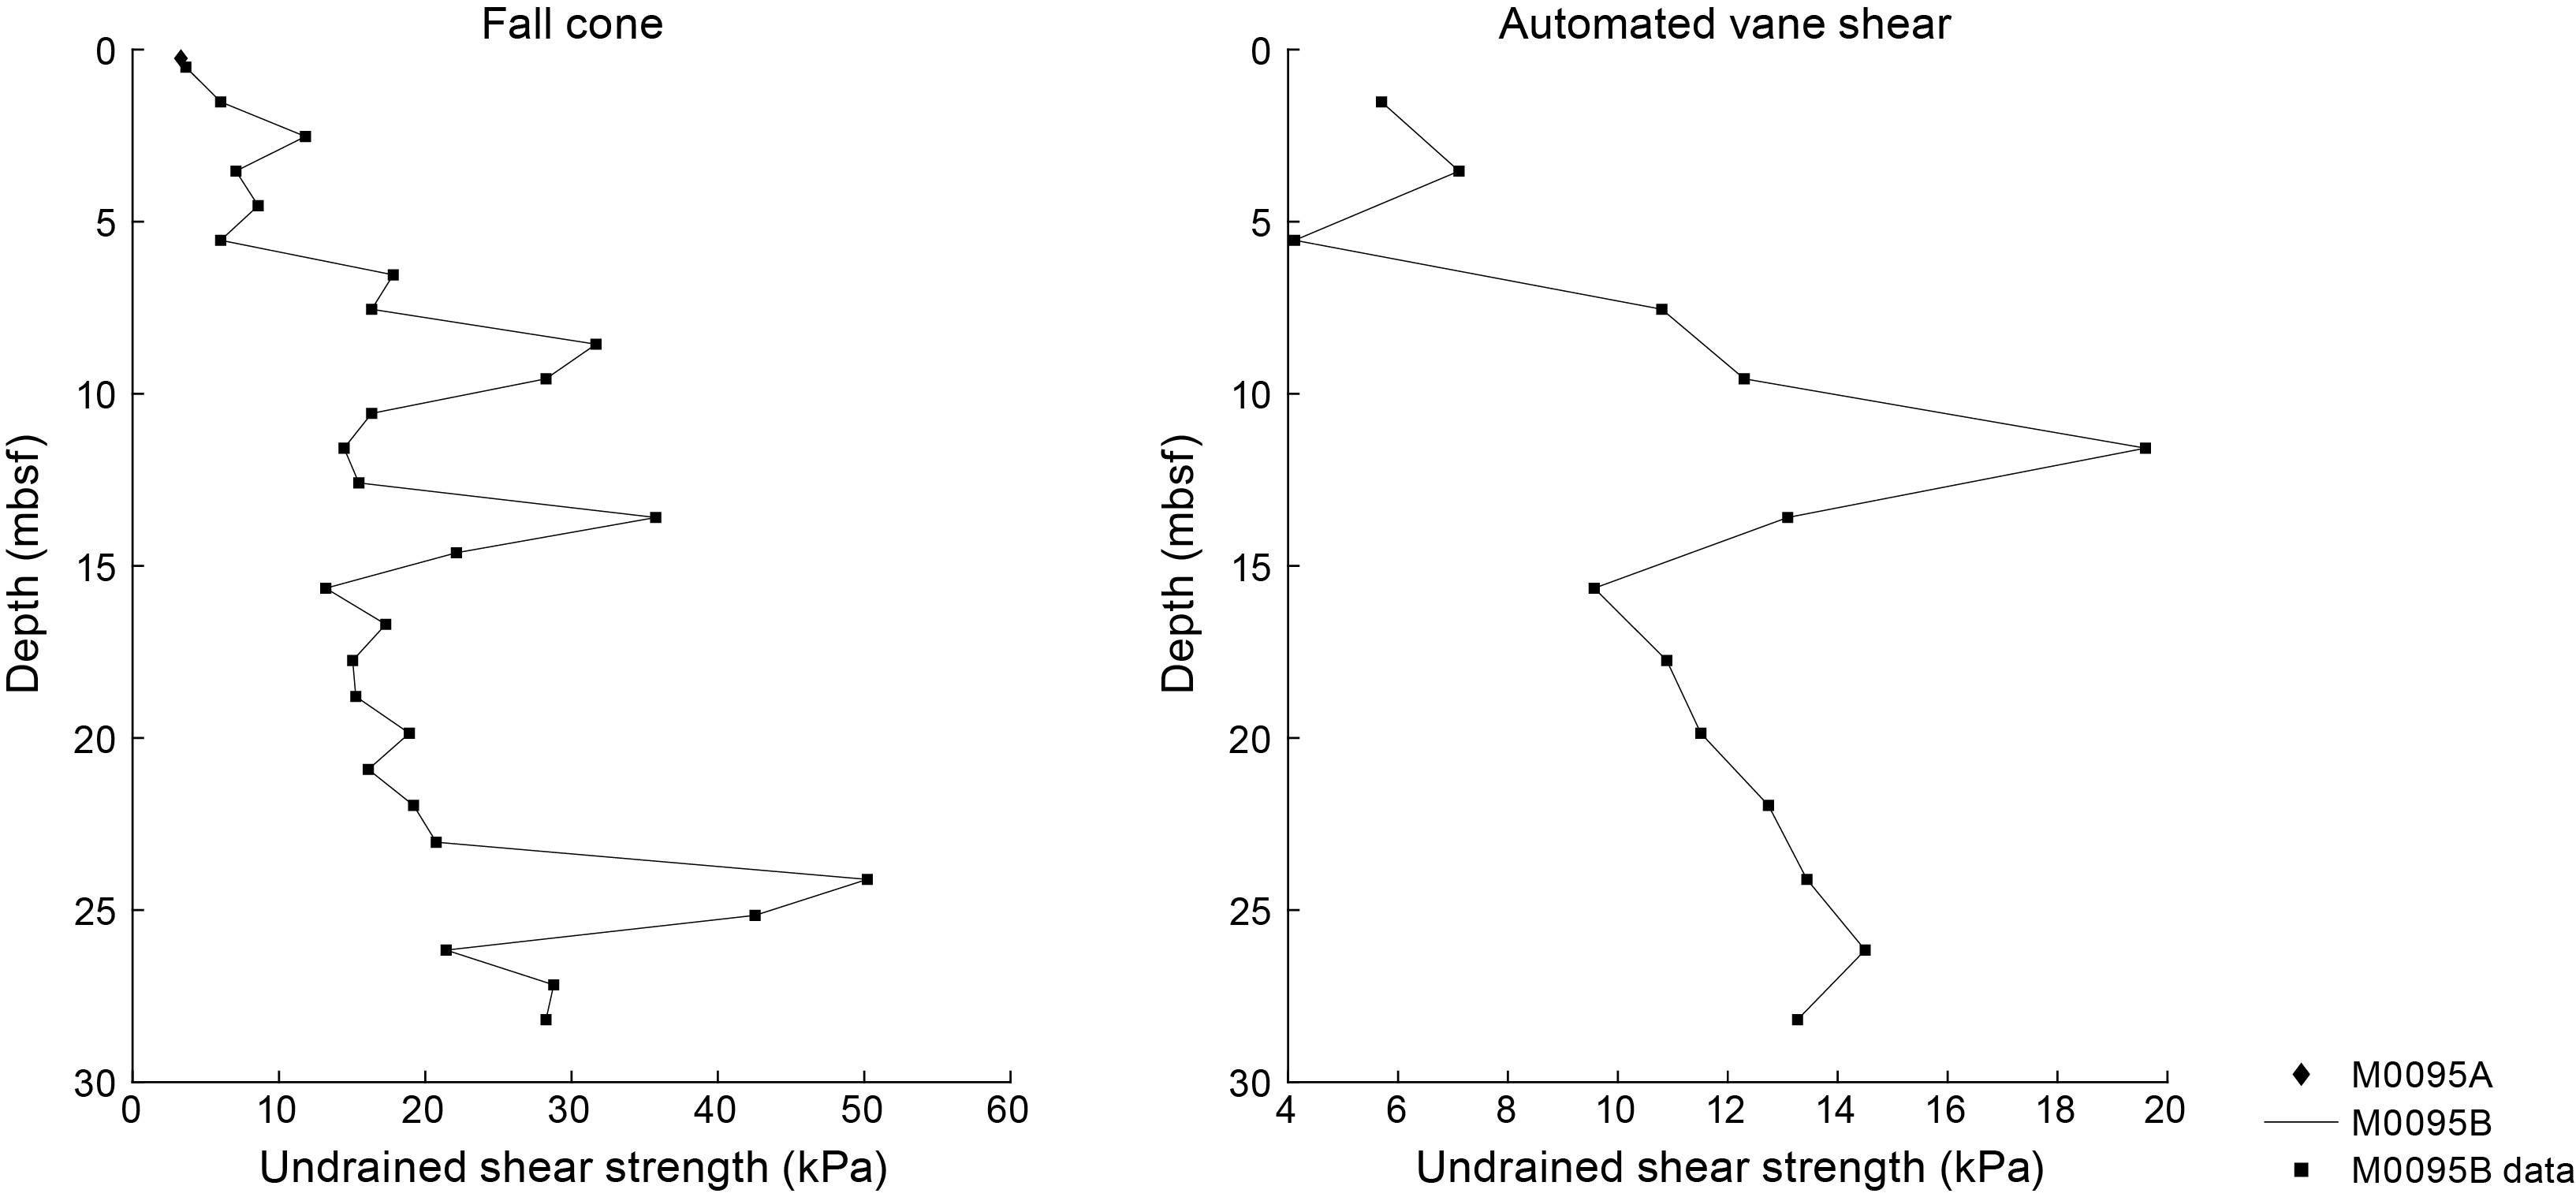
Figure F43. Undrained shear strength, Site M0095.
Su measured during the personal sampling phase using an AVS was recorded in alternating sections in Hole M0095B (Figure F43). Su measured using the AVS were generally lower than Su values measured using the fall cone. AVS Su values generally increase with depth, ranging 4.12–19.6 kPa.
It should be noted that Su values vary according to the device used to obtain them (Figures F41, F44). For example, fall cone strengths are higher than those obtained with the AVS and handheld penetrometer. The influence of the U-channel along the center of the core could result in lower strengths than the fall cone penetrometer. The fall cone only impacts a small region of the core (~2–5 mm), whereas the AVS impacts a larger region of the core (~20–50 mm). Both measurements ideally should be obtained from the center of the core away from the core sidewall. However, samples could not be taken at the center because of the U-channel recovered during the Onshore Science Party (OSP). As a result, strength sampling points had to be placed halfway between the central U-channel and the sidewall of the core. During AVS measurements, the fractures that opened often propagated toward both the central U-channel and the sidewall, perhaps resulting in lower strength values. Fall cone measurements were not seen to be affected by the U-channel or the sidewall.
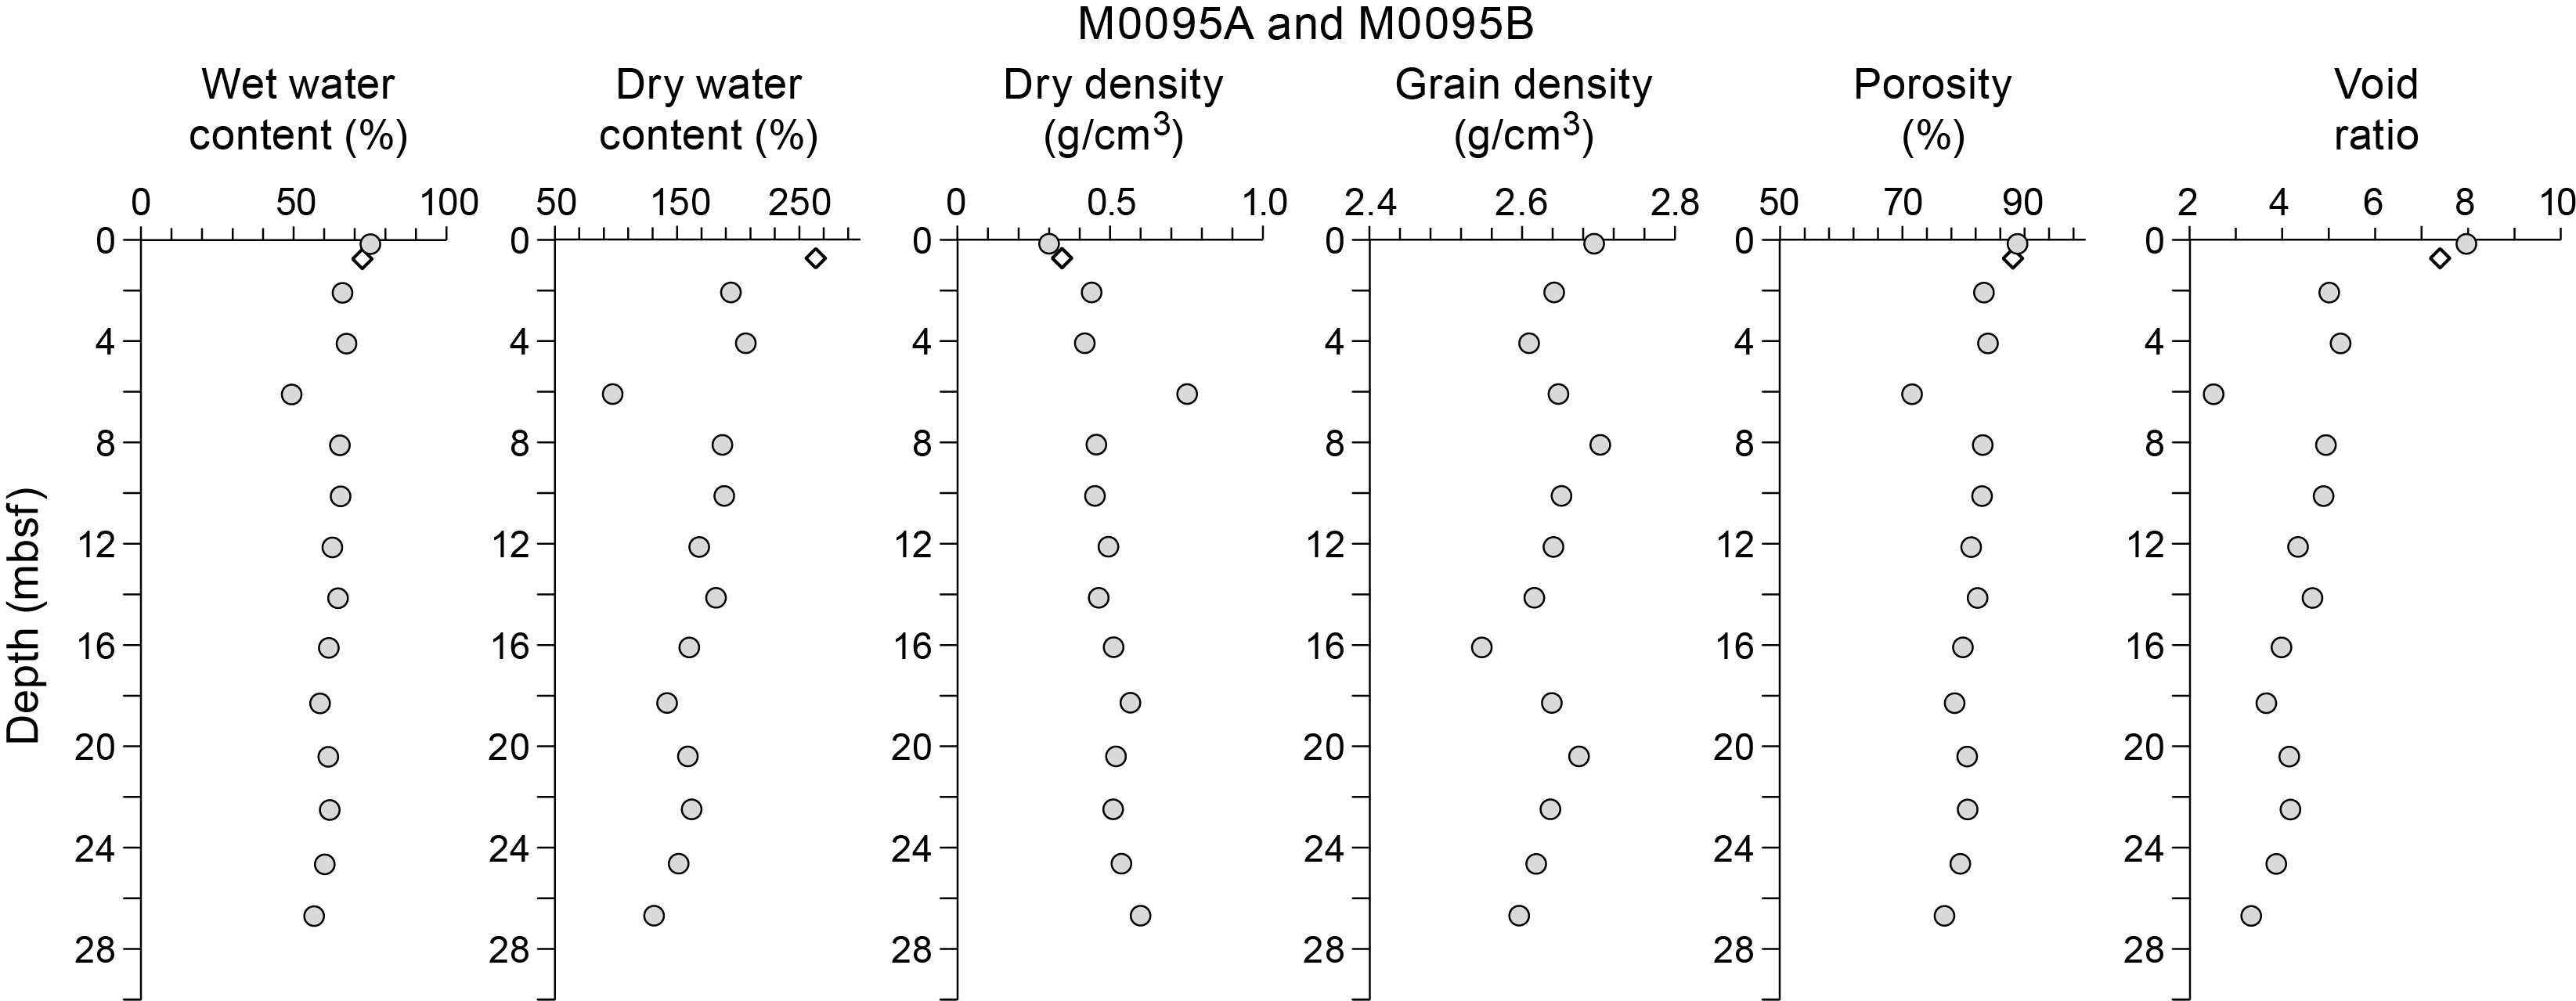
Figure F44. MAD data, Holes M0095A and M0095B.
7.7. Moisture and density
7.7.1. Site M0092
In all holes at Site M0092, water content and porosity have relatively high values throughout the recovered cores (Figures F45, F46). They vary between 75.9% and 56.2% (wet water content), 245.6% and 128.4% (dry water content), and 89.1% and 77.4% (porosity) for Holes M0092A and M0092B and between 72.1% and 53.5% (wet water content), 265.2% and 115% (dry water content), and 88.9% and 74.5% for Holes M0092C and M0092D. Void ratios at Site M0092 vary between 8.2 and 2.9, whereas grain density varies mostly between 2.5 and 2.75 g/cm3. Some of the grain densities are lower than expected, considering grain densities for the common mineral quartz (2.65 g/cm3) and clay minerals (>2.65 g/cm3). The reason(s) for the low densities is not well understood at this time.
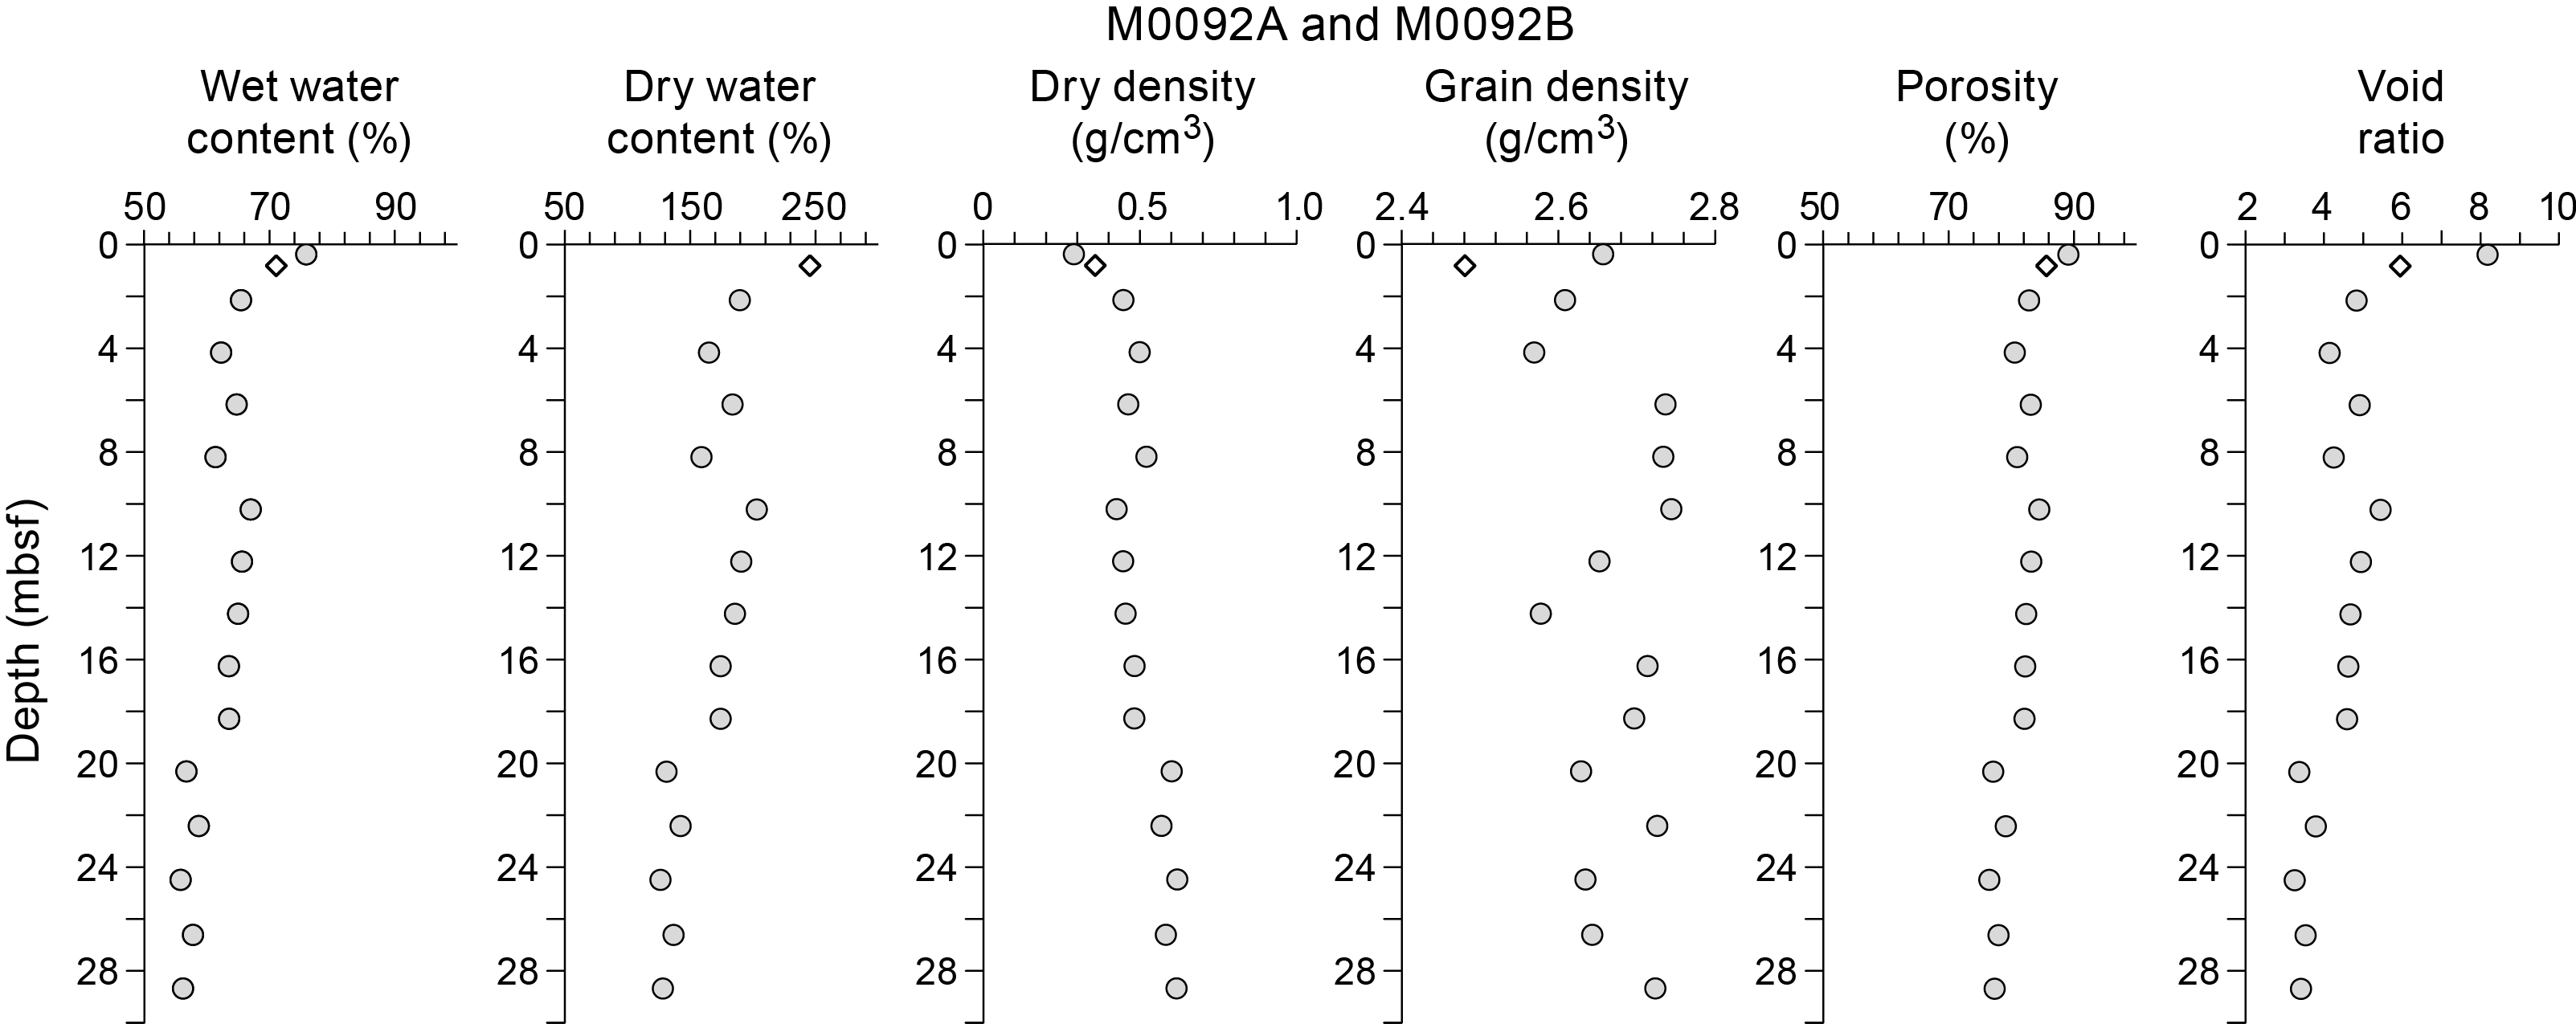
Figure F45. MAD data, Holes M0092A and M0092B.
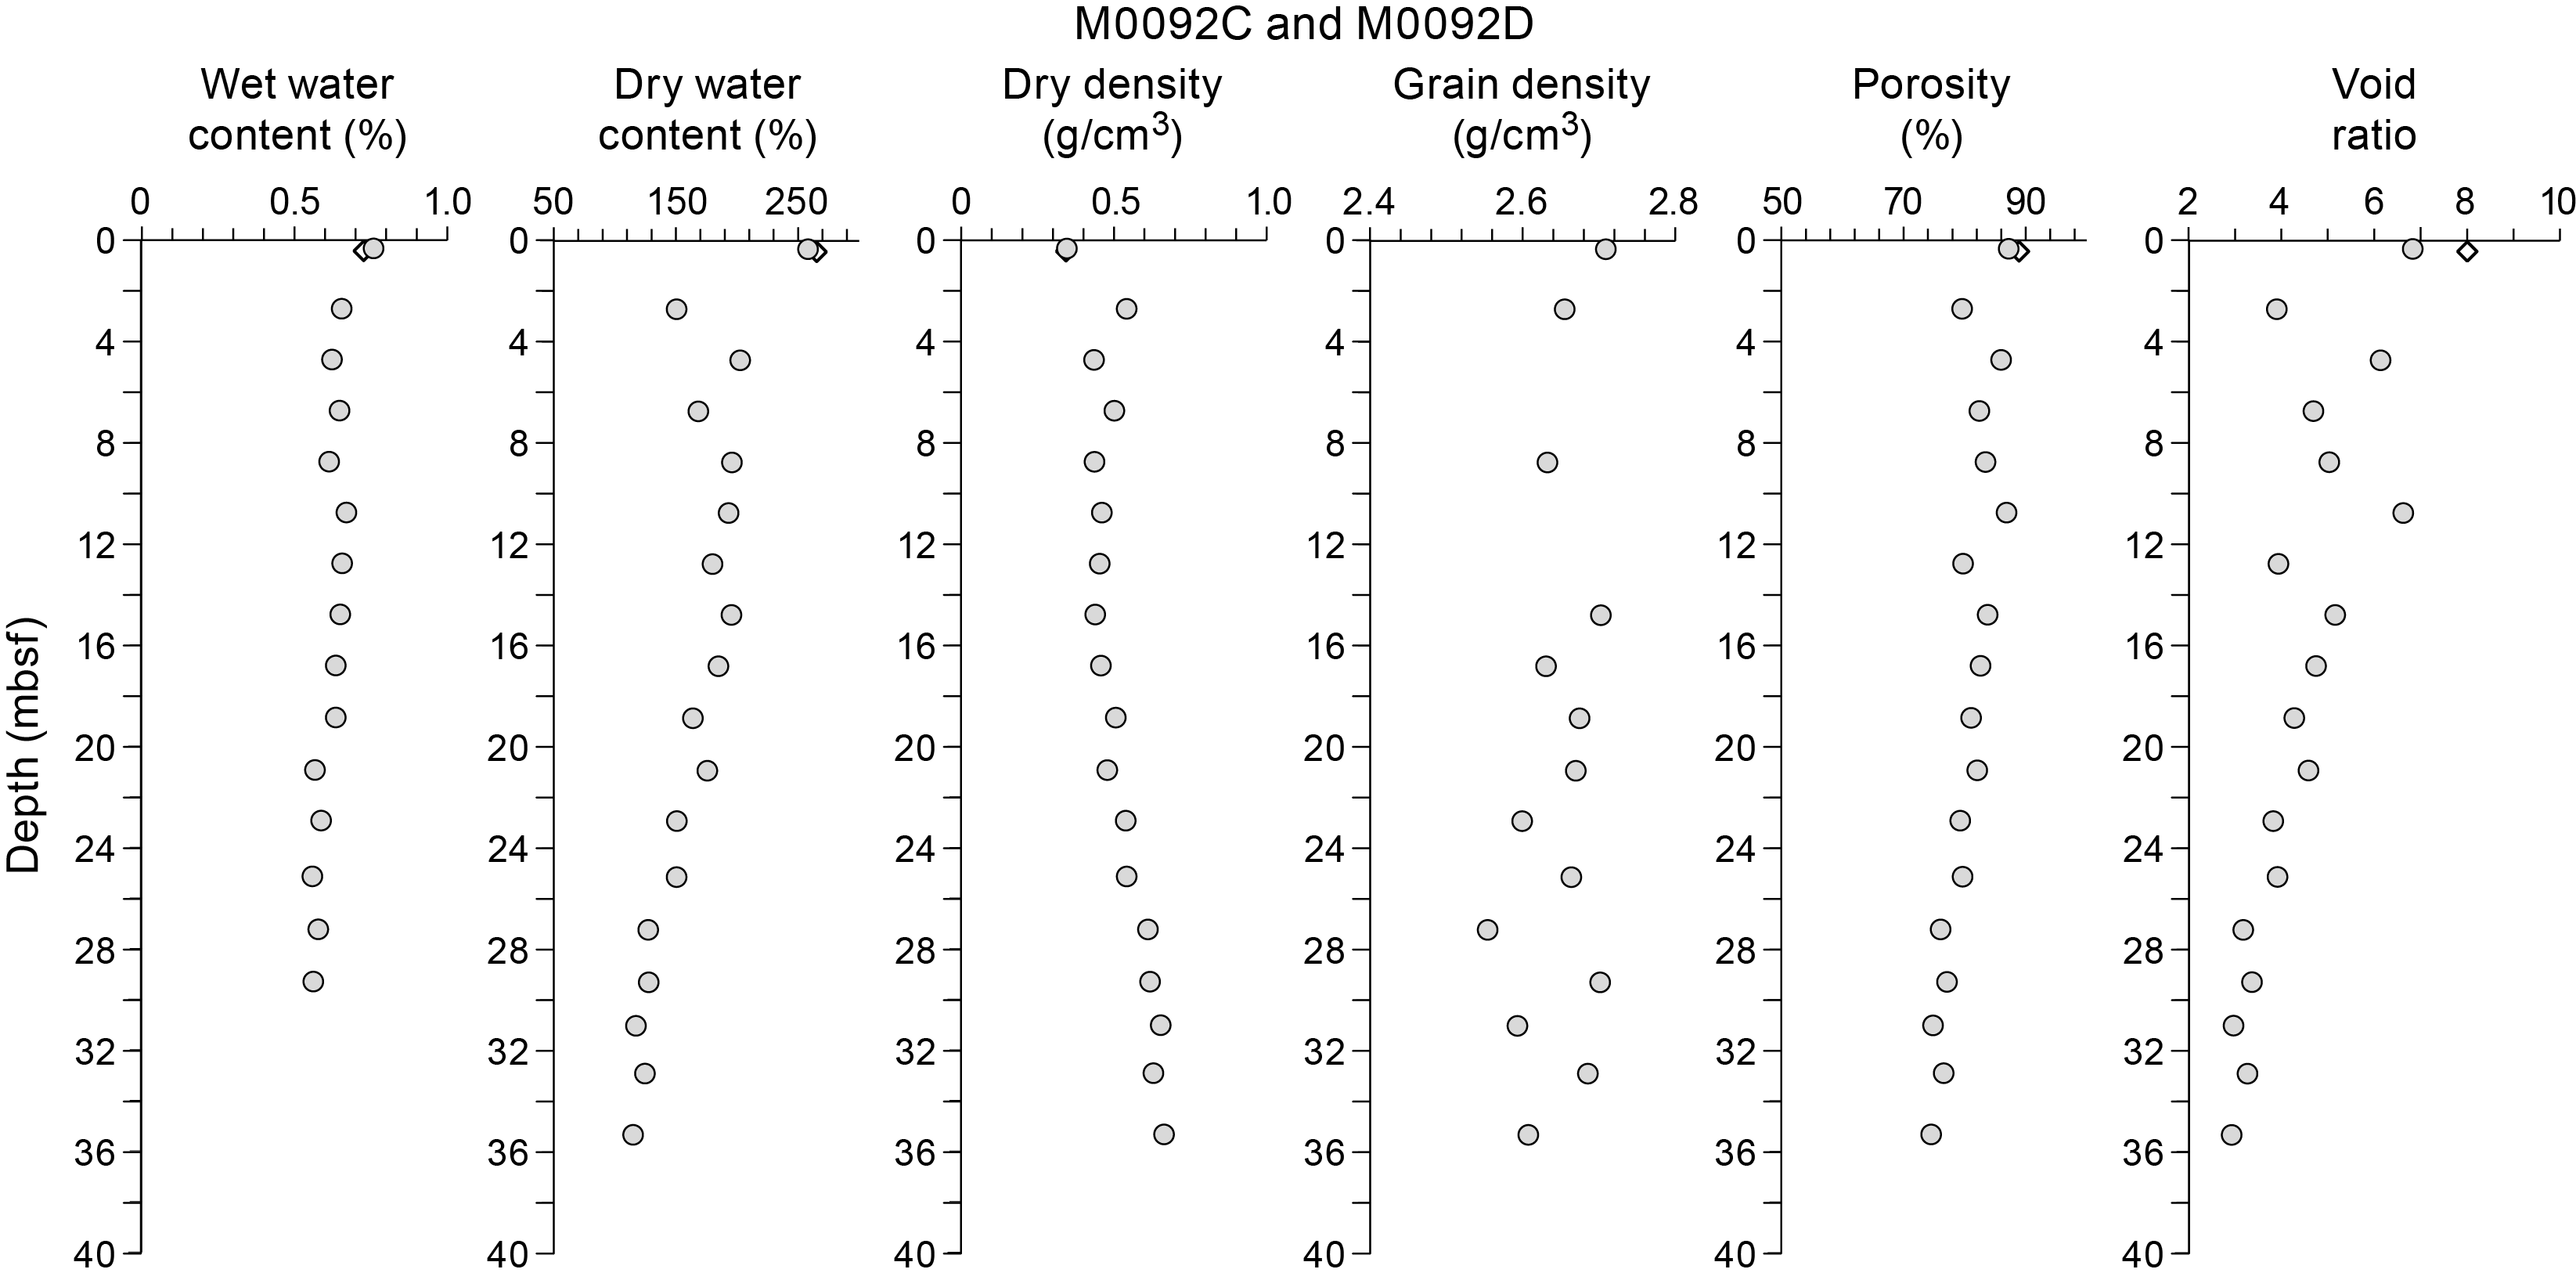
Figure F46. MAD data, Holes M0092C and M0092D.
7.7.2. Site M0095
In all holes at Site M0095, water content and porosity have relatively high values throughout the recovered cores (Figure F44). They vary between 75.2% and 56.8% (wet water content), 263.5% and 131.3% (dry water content), and 89.1% and 77.3% (porosity). Void ratios vary between 8 and 3.3 from the top to the bottom of the hole, whereas grain density varies mostly between 2.55 and 2.7 g/cm3.
7.8. Color reflectance and RGB values
7.8.1. Site M0092
At Site M0092, L*a*b* color spectrometry values generally range 15–35, −2–0, and 0–10, respectively (Figures F47, F48). RGB values in all holes vary with depth in concert with the spectrometry parameters. A main extended peak in color reflectance and RGB values occurs between 5 and 10 mbsf (L* = 40%, a* = −0.4, b* = 10, and RGB = ~85). This peak has a rapidly increasing trend and a gradually decreasing trend, and it corresponds to peaks in magnetic susceptibility, bulk density, and NGR.

Figure F47. Color data, Holes M0092A and M0092B.
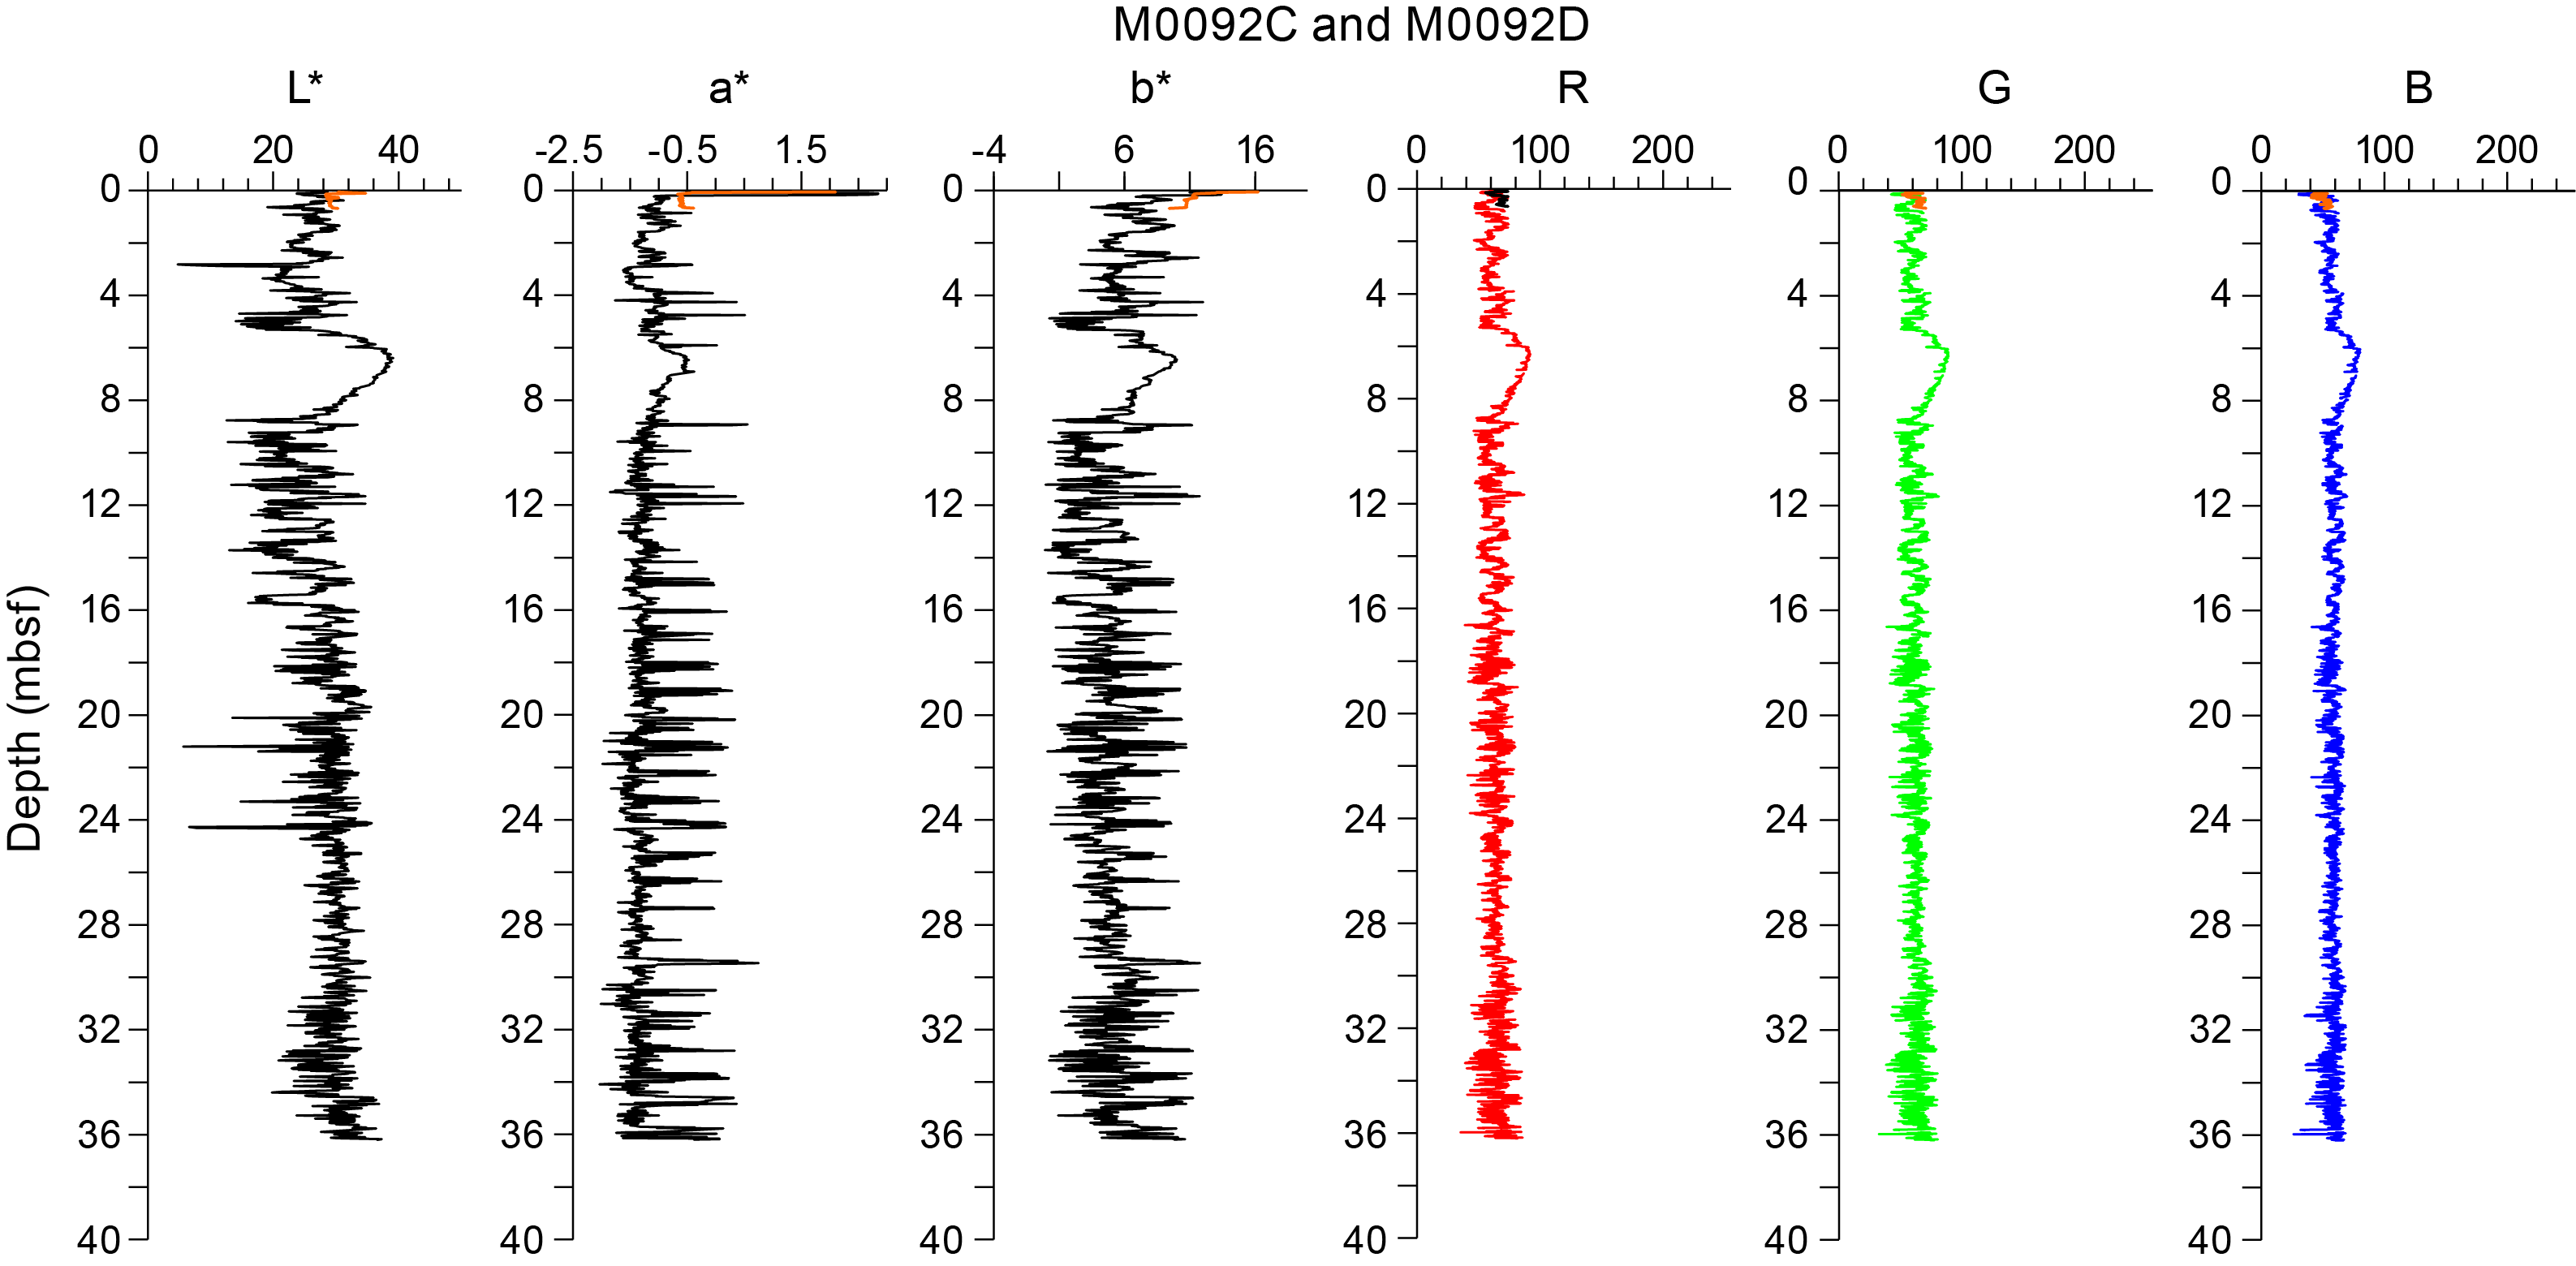
Figure F48. Color data, Holes M0092C and M0092D.
7.8.2. Site M0095
At Site M0095, L*a*b* color spectrometry values generally range 15–35, −2–0, and 0–10, respectively (Figure F49). RGB values in all holes vary with depth in concert with the spectrometry parameters. A main extended peak in color reflectance and RGB values occurs between 4.7 and 6.5 mbsf (L* = 40%, a* = −0.6, b* = 9, and RGB = ~85). This peak has a rapidly increasing trend and a gradually decreasing trend, and it corresponds to peaks in magnetic susceptibility, bulk density, and NGR.

Figure F49. Color data, Holes M0095A and M0095B.
8. Paleomagnetism
This section reports the measurement of natural remanent magnetization (NRM) in Holes M0092A–M0092D, M0095A, and M0095B, which were cored in the central part of the southern Japan Trench (Basin S2) roughly centrally located between the southern Japan Trench focus areas (Sites M0081 and M0082 in Basin S1 to the south and Site M0091 in Basin S3 to the north).
Remanent magnetization of U-channel samples was measured on sections of the working halves at 2 cm intervals. NRM measurements were only conducted at 0 and 5 mT peak fields due to the time constraints of the hybrid OSP.
Profiles of intensity, inclination, and declination after demagnetization at 5 mT are displayed in the figures in this section. The profiles of Holes M0092A, M0092C, and M0095A are shown separately from their GPC counterparts due to the limited length of the trigger cores (Figure F50). Holes M0092A, M0092C, and M0095A show higher intensity (5 × 10⁻⁵ to ~8 × 10⁻⁵ A/m) around 0.4 and 0.8 mbsf in Hole M0092A, 0.2 mbsf in Hole M0092C, and 0.5 mbsf in Hole M0095A. Below these intervals, intensity decreases with depth in all holes. No remarkable variations in declination and inclinations were observed in Holes M0092A, M0092C, and M0095A.

Figure F50. Intensity, inclination, and declination.
In Holes M0092B, M0092D, and M0095B, intensities are characterized by large fluctuations (Figure F51). An intensity low is recognized around 5 mbsf in Hole M0092B, 3.50 mbsf in Hole M0092D, and 3.50 mbsf in Hole M0095B. A strong reduction in intensity is recognized in all profiles at around 19 mbsf in Hole M0092B, 18 mbsf in Hole M0092D, and 15 mbsf in Hole M0095B. A longer low-intensity interval is recognized below 30 mbsf in Hole M0092D. The intensity low at the bottom of Holes M0092B and M0095B correlates to the intensity around 30 mbsf in Hole M0092D.
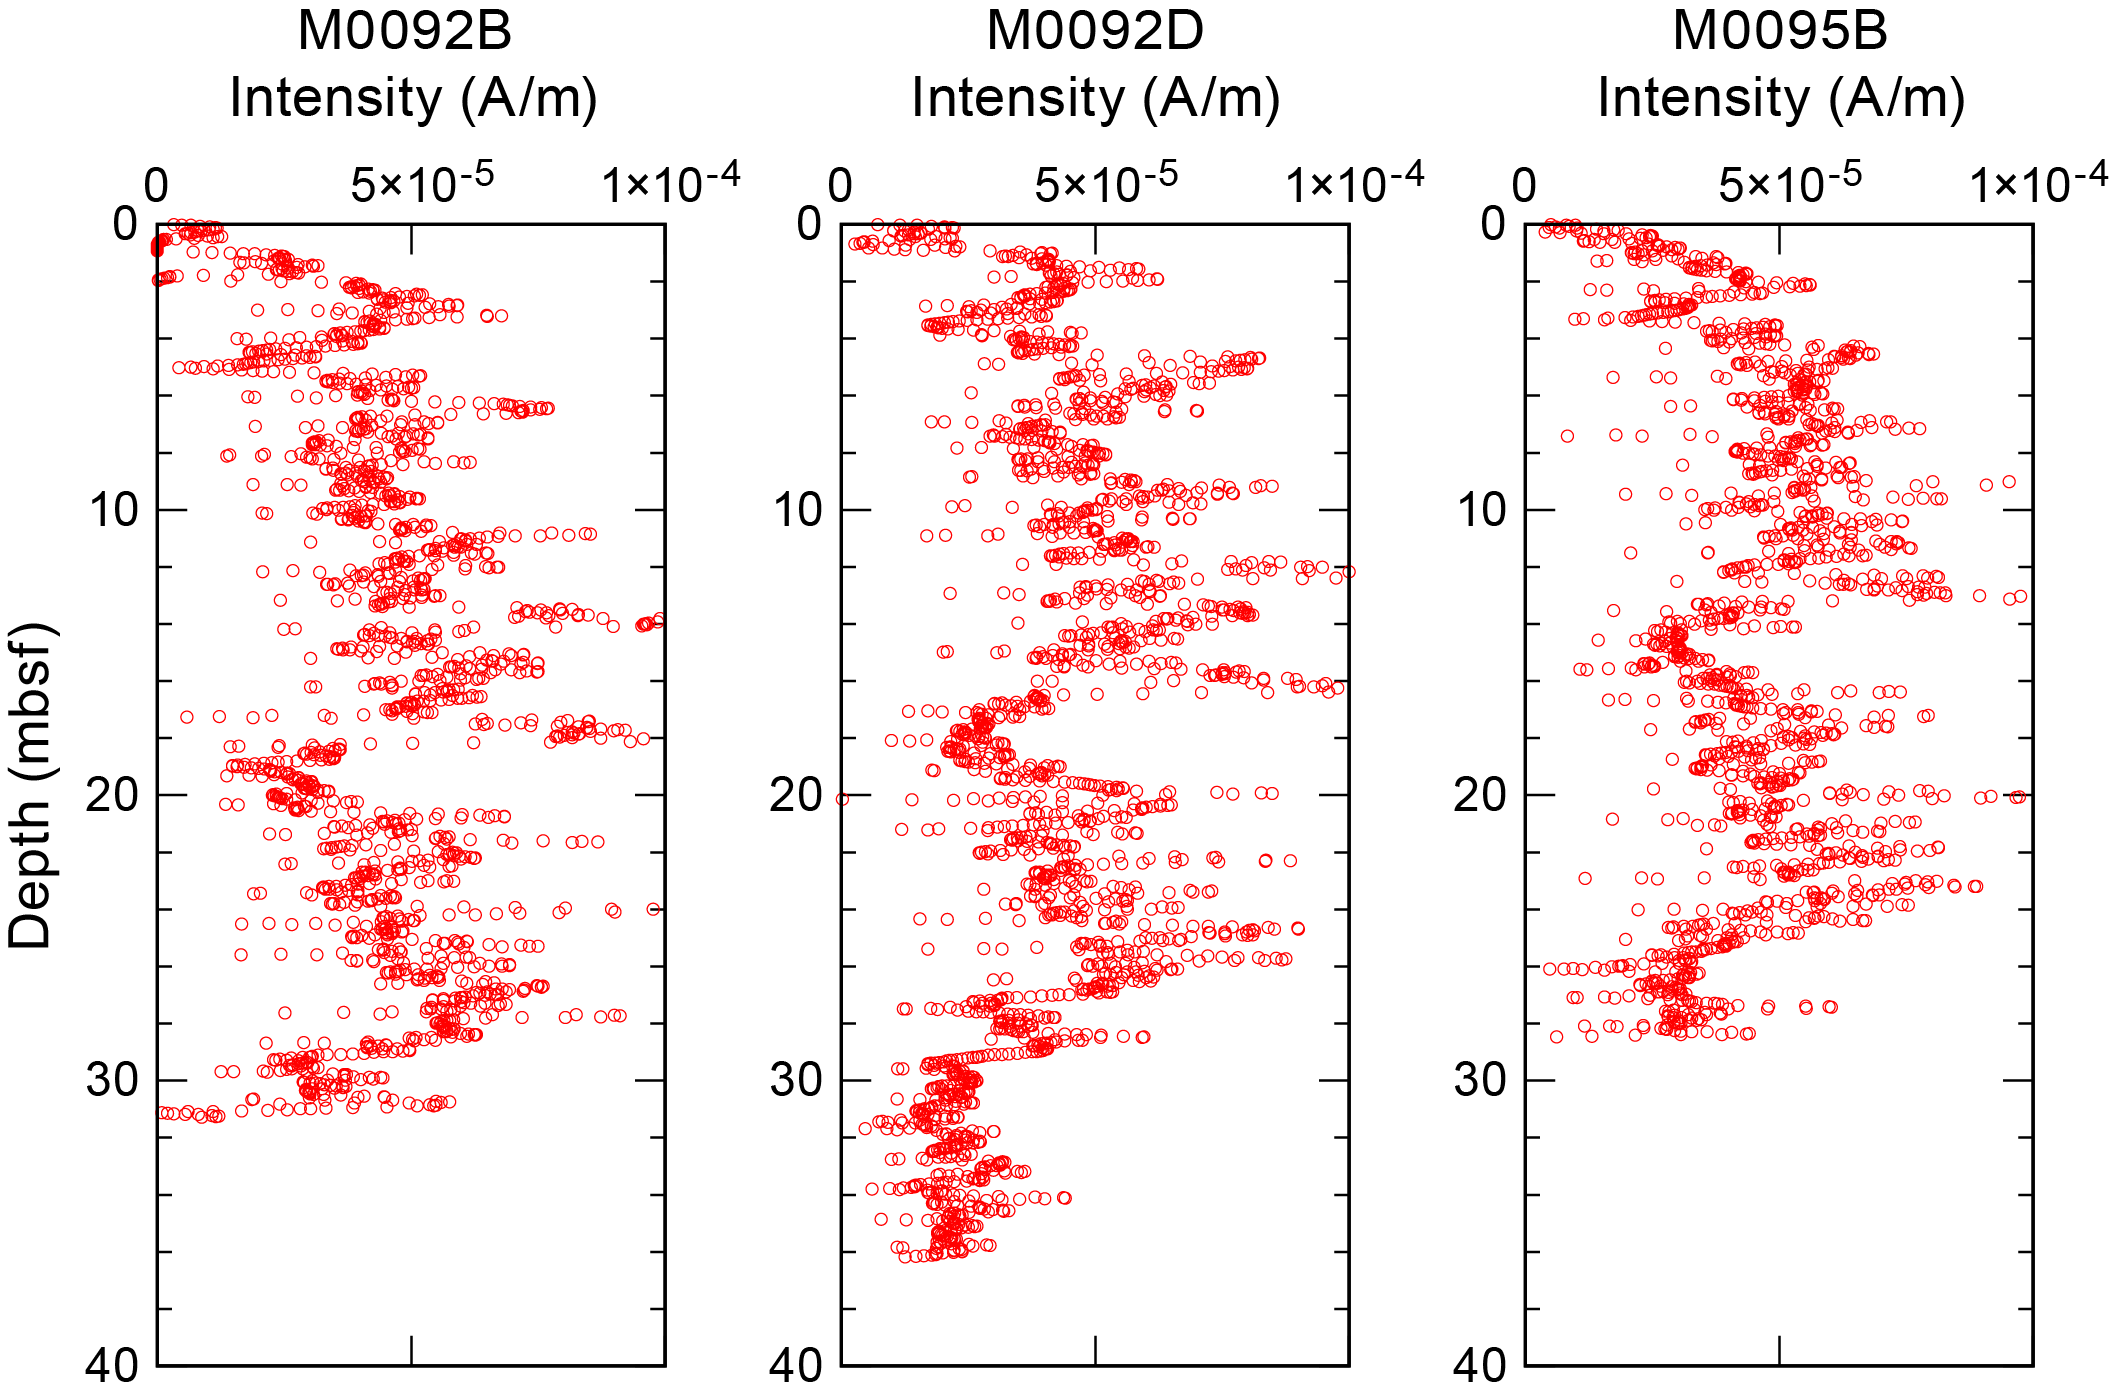
Figure F51. Intensity.
Declination trends are shown in Figure F52. Declination undergoes a clockwise gradual shift downward in Holes M0092B and M0092D. Some inflection points are recognized in the middle and lower intervals in Holes M0092B, M0092D, and M0095B at 14, 12, and 9 mbsf, respectively. Between 8 and 11 mbsf in Hole M0092B and between 7 and 9 mbsf in Hole M0092D, there are short fluctuations in the declination profiles. We applied a simple linear correction with depth function to remove clockwise linear trends produced by rotation of the GPC during penetration (see Figure F5 in the Expedition 386 methods chapter [Strasser et al., 2023a]). The corrected declination profiles of Holes M0092B, M0092D, and M0095B show generally similar trends (Figure F53).
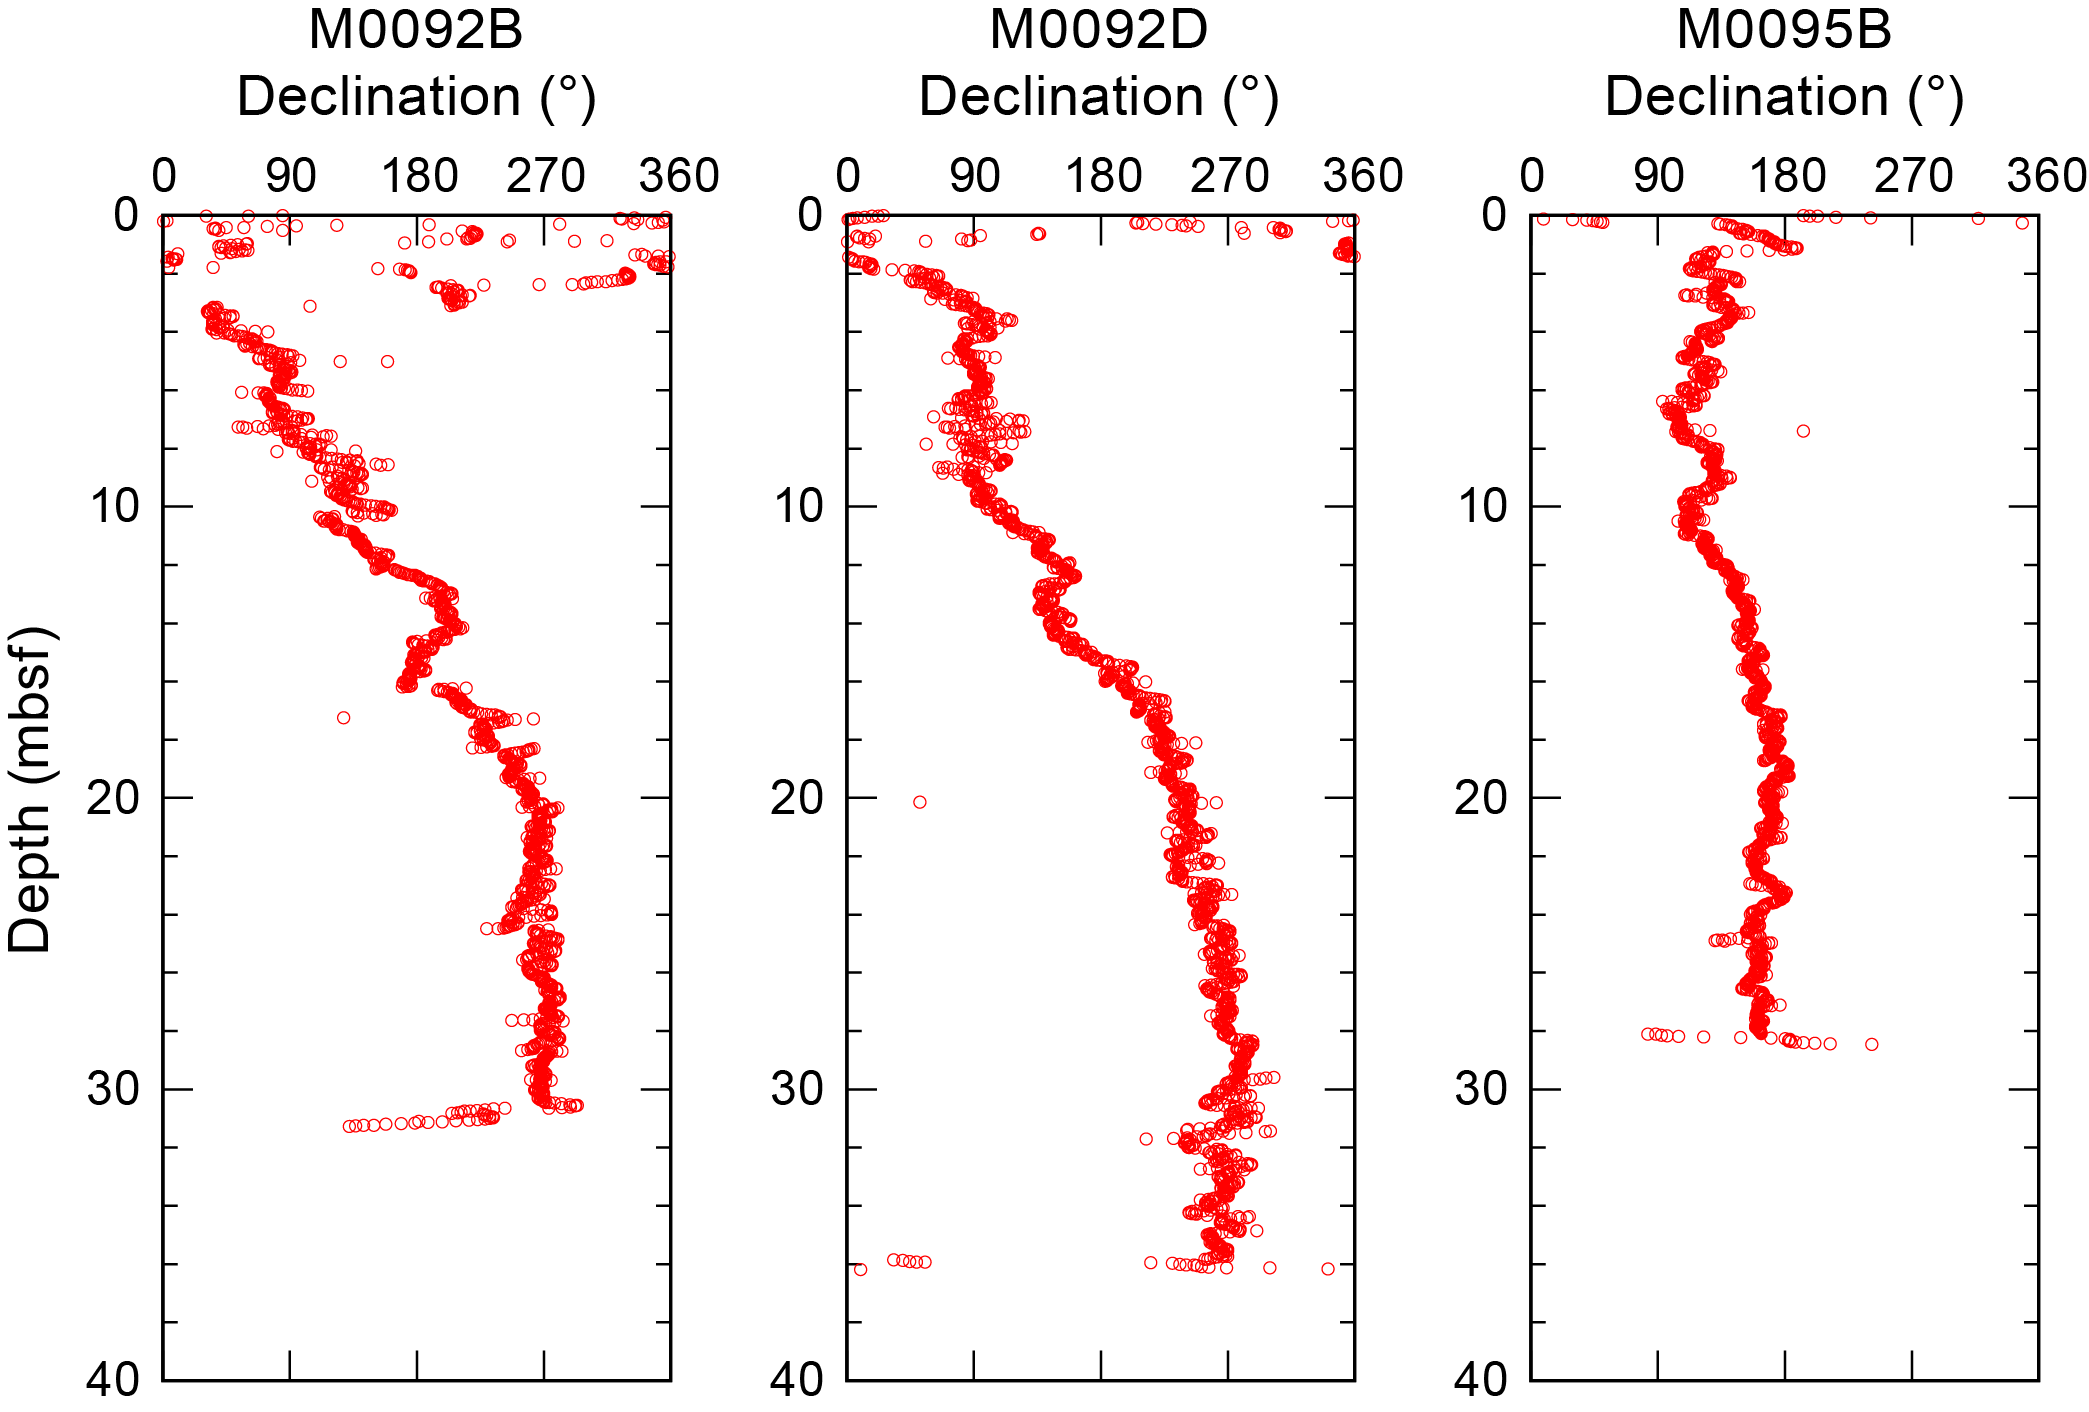
Figure F52. Declination.
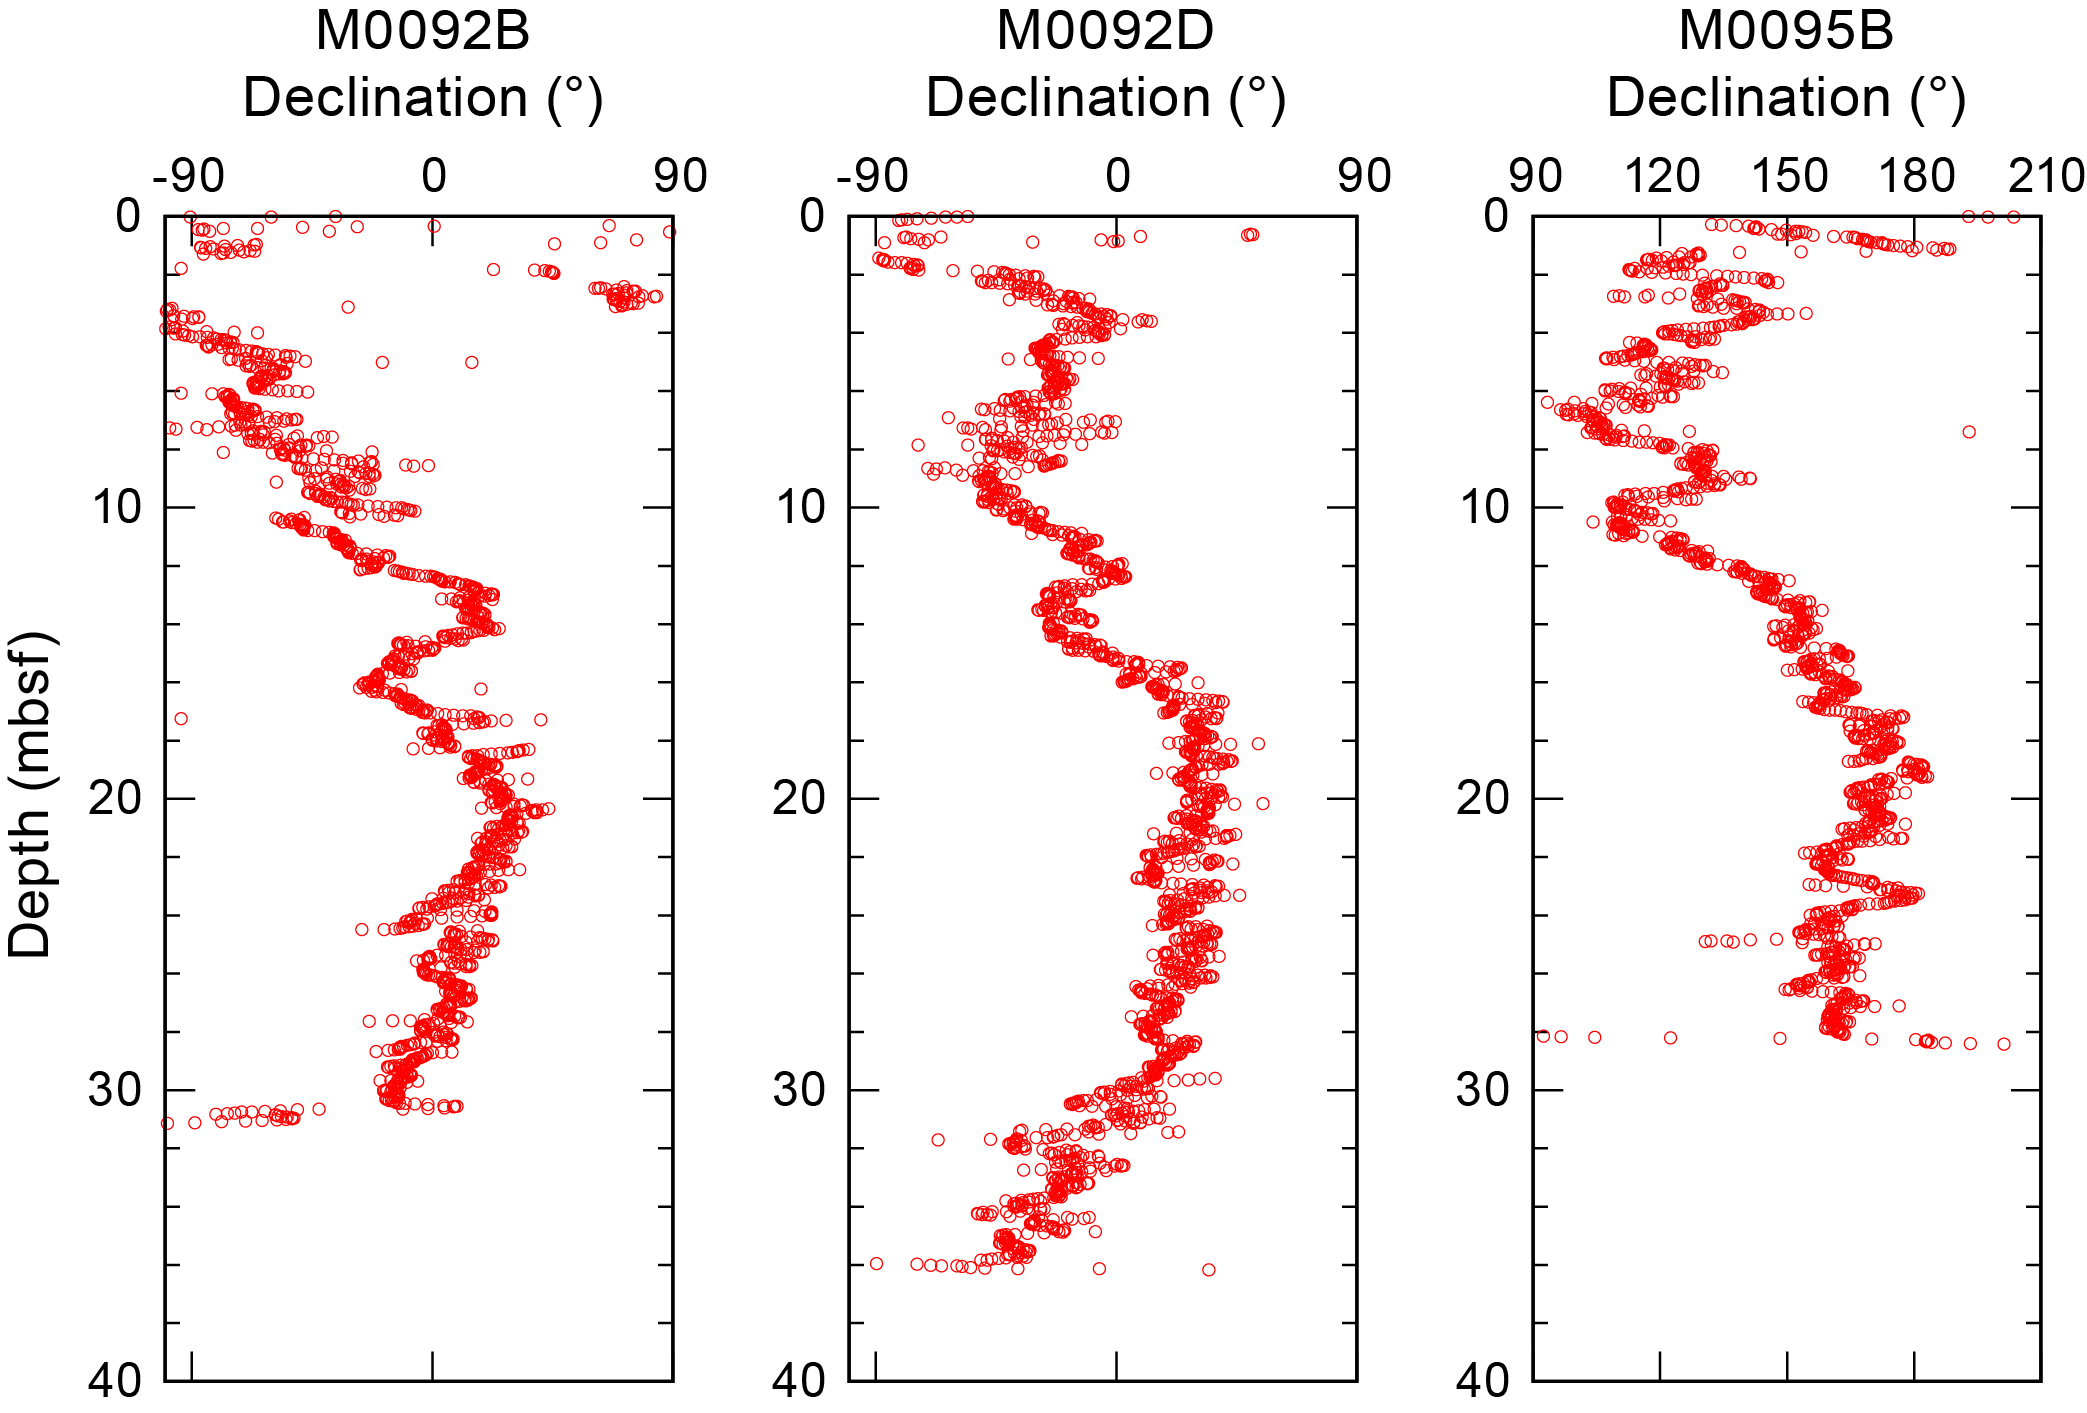
Figure F53. Corrected declination.
The upper interval, which shows higher frequency fluctuations, is punctuated by a scattered declination interval around 8–10 mbsf in Hole M0092B, 7–8 mbsf in Hole M0092D, and 5–6 mbsf in Hole M0095B. The positive excursions that occur at ~13–15, 11.5–12.5, and 8–9 mbsf in Holes M0092B, M0092D, and M0095B, respectively, become clearer after correction, as do the general pattern of lower values around 16, 14, and 10 mbsf, respectively, and the overall shape of the declination profile below this depth.
The inclination profile of Holes M0092B, M0092D, and M0095B fluctuates between 30° and 60° (Figure F54). Inclination drops are identified at 6–6.5, 14, and 30 mbsf in Hole M0092D and at 6 and 12 mbsf in Hole M0095B. An inclination high at around 8.5 mbsf in Hole M0092D and 7.0 mbsf in Hole M0095B cannot be clearly identified in Hole M0092B.
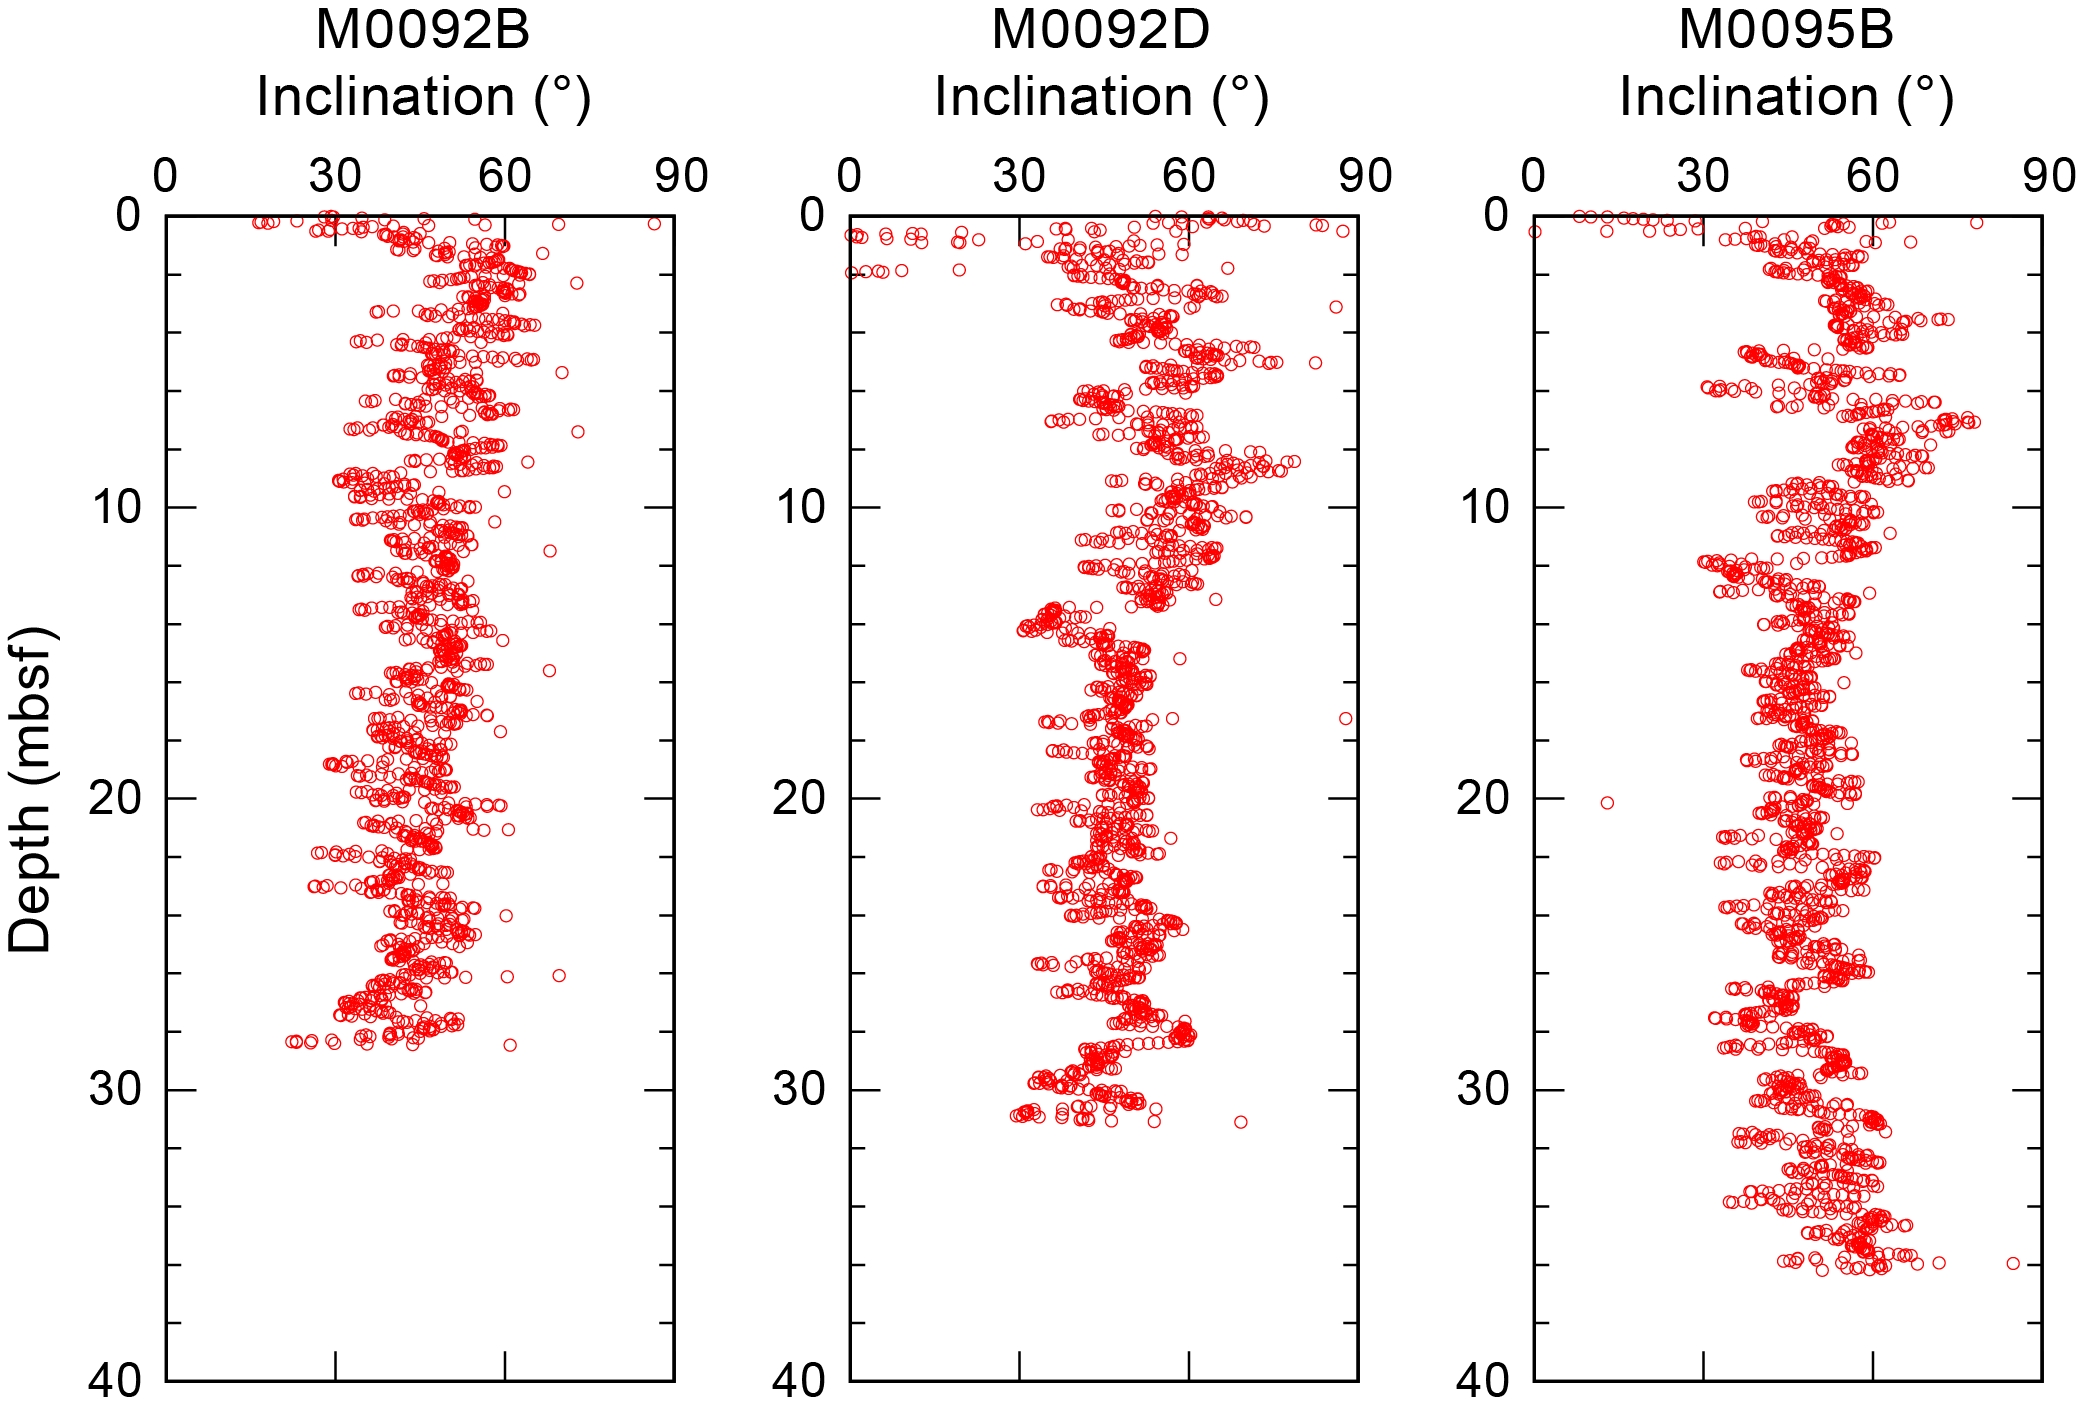
Figure F54. Inclination.
Preliminary paleomagnetic data for Holes M0092B, M0092D, and M0095B display similar trends in intensity, declination, and inclination, suggesting that the data reflect paleomagnetic secular variation. The scattered declination intervals in the upper portion indicate an unstable sediment magnetization record, which is interpreted to mean that the magnetization process of the interval is different from other intervals.
9. Stratigraphic correlation
A core composite depth scale and first-order splice (see Stratigraphic correlation in the Expedition 386 methods chapter [Strasser et al., 2023a]) were constructed for Site M0092 to establish a first-order continuous sediment succession recovered from two GPC deployments (Holes M0092A–M0092D). The GPC was only deployed once at Site M0095, and a core composite depth scale was established.
First-order splicing between the four holes at Site M0092 enabled construction of a continuous stratigraphic succession from the seafloor to the bottom the hole in Section 386-M0092D-1H-36, 35 cm (38.405 meters composite depth [mcd]-splice), with the exception of one currently unresolved gap between the base of Trigger Core 386-M0090A-1P and the top of GPC Core 386-M0092B-1H. Therefore, the Site M0092 composite depth below seafloor scale (mcd) and meters composite depth in splice (mcd-splice) for depths >0.945 mcd and mcd-splice is currently referred to as a floating depth, assuming the coring gap to be zero. Similarly, the Site M0095 composite depth below seafloor scale (mcd) for depths >0.74 mcd to the bottom of Section 386-M0095B-1H-29, 33 cm (28.895 mcd), is currently referred to as a floating depth because no clear tie point to correlate the top of GPC Core 386-M0095B-1H to Trigger Core 386-M0095A-1P could be identified.
9.1. Site M0092
9.1.1. Construction of core composite depth scale
9.1.1.1. Definition of top and selection of seafloor anchor core
Visual core description reveals the presence of a thin oxidized top in trigger core Holes M0092A and M0092C, documenting that an undisturbed mudline was recovered in both holes (Sections 386-M0092A-1P-1, 5.5 cm, and 386-M0092C-1P-1, 5.5 cm). Hence, the top (0 mcd) is defined at the mudline and a vertical shift of −0.055 m is applied to both trigger cores (Tables T15, T16, T17). The longer trigger core (386-M0092A-1P) is selected as the anchor core.
9.1.1.2. Compositing cores
Before compositing holes, artificial and/or natural voids were measured at ends of sections (see Stratigraphic correlation in the Expedition 386 methods chapter [Strasser et al., 2023a]) and the void length was subtracted from the curated section length to obtain the sediment length in each section (neglecting core catchers that were sampled in bags). Corrected section lengths and section top and bottom depths for Site M0092 are listed in Table T15.
The first-order core composite scale for Site M0092 is based on visual correlation of marker horizons on X-ray CT images and visual core description during the OSP, guided by visual inspection of trends and spikes in magnetic susceptibility and density data from the MSCL, linescan images and color reflectance data, and, where present, visible tephra layers. At this stage, thin but clear marker beds visible on X-ray CT and/or linescan images were used, in places verified by visual core description, instead of large (coarse and thick) event beds that may have eroded the underlying sediments. Primary air fall tephra beds, which are generated by a single volcanic eruption and fell through the water column, represent some of the best tie points between holes. There was only one tephra bed observed (Section 386-M0092D-1H-28, 63.5 cm; see Tephra), and no correlated tephra bed was observed during visual core description in the other hole.
First-order correlation does not allow for correlation between either of the trigger cores (386-M0092A-1P and 386-M0092C-1P) to the upper part of the GPC cores (386-M0092B-1H and 386-M0092D-1H), and no correlation tie point could be identified to tie the GPC cores to the mudline-anchored trigger core. This suggests that the coring gap on top of the GPC cores is larger than the total length of the trigger cores, and the composite depth scale of the GPC cores remains floating. Following the methodology explained in Stratigraphic correlation in the Expedition 386 methods chapter (Strasser et al., 2023a), the base of the longest trigger core (Section 386-M0092A-1P-1, 100 cm; 0.945 m corrected core depth) and the top of the GPC core (Section 386-M0092B-1H), which has more recovery at the core top than Core 386-M0092B-1H, are aligned, assuming the gap to be zero. With a 2.5 cm thick artificial void at the top of Section 386-M0092B-1H-1 (Table T15), a depth shift of 0.92 m is calculated for the top of Core 386-M0092B-1H (Table T16).
The uppermost clear tie point connecting the two GPC holes is defined as a horizon characterized by a sharp change in bioturbation intensity and color hue within a ~30 cm thick correlative facies association below a potentially slightly erosive fine sand bed in Sections 386-M0092B-1H-4 and 386-M0092D-1H-3. Horizontal alignment of this tie point (TP2: Sections 386-M0092B-1H-4, 90 cm, and 386-M0092D-1H-3, 62 cm; 4.165 mcd) allows calculation of the vertical offset for Core 386-M0090D-1H to be 1.665 m (Tables T16, T17). The vertical offsets of the top depth of each core used to create the first-order core composite depth scale at Site M0092 are given in the affine table (Table T15).
9.1.1.3. Construction of splice
With the exception of the unknown coring gap between the base of the longest trigger cores (386-M0092A-1P) and the top of the GPC core with the highest recovery at the core top (386-M0092B-1H), a combination of Cores 386-M0092A-1P (mudline anchor core), 386-M0092B-1H, and 386-M0092D-1H reveals the longest, most complete, and least disturbed stratigraphy interval at Site M0092.
At 0.945 mcd-splice, the top of the sedimentary successions recovered in Section 386-M0090B-1H-1 (0.02 mbsf) is appended to the base of the first splice segment at the base of the anchor core (386-M0092A-1P; Append Point AP1; Table T17). Below AP1, Hole M0092B is included in the splice because the cores recovered from the 20 or 30 m long GPC barrel deployment are generally less disturbed than from 40 m long GPC barrel deployments. Tie Point T3 (Section 386-M0092B-1H-30, 60 cm; 30.345 mcd-splice), which is characterized by a higher radiodensity lamina within a slightly denser interval, correlative to the silty interval containing visible tephra patches between 63 and 63.5 cm in Section 386-M0092D-1H-28) is then used to connect to the lowermost splice interval from the longer GPC core (from Section 386-M0092D-1H-28, 63.5 cm [30.345 mcd-splice]) to the bottom of the hole (38.405 mcd-splice = bottom of splice). All splice tie points used to construct a complete first-order splice along with the calculated core composite depth within the splice are given in T17.
9.2. Site M0095
9.2.1. Construction of core composite depth scale
9.2.1.1. Definition of top and selection of seafloor anchor core
Visual core description reveals the presence of a thin oxidized top in the trigger core from Hole M0095A, documenting that an undisturbed mudline was recovered in Section 386-M0095A-1P-1, 5.5 cm. Hence, the top (0 mcd) is defined at the mudline and a vertical shift of −0.055 m is applied to both trigger cores (Tables T18, T19, T20).
9.2.1.2. Compositing cores
Before compositing holes, artificial and/or natural voids were measured at ends of sections (see Stratigraphic correlation in the Expedition 386 methods chapter [Strasser et al., 2023a]) and the void lengths were subtracted from the curated section length to obtain the sediment length in each section. Corrected section lengths and section top and bottom depths of Site M0095 are listed in Table T18.
First-order correlation does not allow for correlation between the trigger core (386-M0095A-1P) and the upper part of the GPC core (386-M0095B-1H) because no correlation tie point could be identified to tie the GPC cores to the mudline-anchored trigger core. This suggests that the coring gap at the top of the GPC core is larger than the total length of the trigger core, and the composite depth scale of the GPC core remains floating. Following the methodology explained in Stratigraphic correlation in the Expedition 386 methods chapter (Strasser et al., 2023a), the base of the trigger core (Section 386-M0095A-1P-1, 79.5 cm; 0.74 m corrected core depth) and the top of GPC Core 386-M0095B-1H are aligned, assuming the gap to be zero. With a 1.5 cm thick artificial void at the top of Section 386-M0095B-1H-1 (Table T18), a depth shift of 0.725 m is calculated for the top of Core 386-M0092B-1H (Table T19).
9.2.1.3. Construction of CCSF-D scale
With only one GPC deployment at this site, no splice was constructed.
References
Bruland, K.W., Middag, R., and Lohan, M.C., 2014. Controls of trace metals in seawater. In Holland, H.D., and Turekian, K.K. (Eds.), Treatise on Geochemistry (Second Edition). Oxford (Elsevier), 19–51. https://doi.org/
Frings, P., 2017. Revisiting the dissolution of biogenic Si in marine sediments: a key term in the ocean Si budget. Acta Geochimica, 36(3):429-432. https://doi.org/
Kioka, A., Schwestermann, T., Moernaut, J., Ikehara, K., Kanamatsu, T., Eglinton, T.I., and Strasser, M., 2019. Event stratigraphy in a hadal oceanic trench: the Japan Trench as sedimentary archive recording recurrent giant subduction zone earthquakes and their role in organic carbon export to the deep sea. Frontiers in Earth Science, 7:319. https://doi.org/
Matsuzaki, K.M., Nishi, H., Suzuki, N., Kawate, Y., Takashima, R., and Sakai, T., 2014. Cycladophora davisiana abundances as a paleoceanographic and stratigraphic tool in high latitude siliciceous sediments. Marine Micropaleontology, 106:1–9. https://doi.org/
Morley, J.J., Hays, J.D., and Robertson, J.H., 1982. Stratigraphic framework for the late Pleistocene in the northwest Pacific Ocean. Deep Sea Research, Part A: Oceanographic Research Papers, 29(12):1485–1499. https://doi.org/
Strasser, M., Ikehara, K., and Cotterill, C., 2019. Expedition 386 Scientific Prospectus: Japan Trench Paleoseismology. International Ocean Discovery Program. https://doi.org/
Strasser, M., Ikehara, K., Everest, J., Maeda, L., Hochmuth, K., Grant, H., Stewart, M., Okutsu, N., Sakurai, N., Yokoyama, T., Bao, R., Bellanova, P., Brunet, M., Cai, Z., Cattaneo, A., Hsiung, K.-H., Huang, J.-J., Ishizawa, T., Itaki, T., Jitsuno, K., Johnson, J.E., Kanamatsu, T., Keep, M., Kioka, A., Kölling, M., Luo, M., März, C., McHugh, C., Micallef, A., Nagahashi, Y., Pandey, D.K., Proust, J.-N., Rasbury, E.T., Riedinger, N., Satoguchi, Y., Sawyer, D.E., Seibert, C., Silver, M., Straub, S.M., Virtasalo, J., Wang, Y., Wu, T.-W., and Zellers, S.D., 2023a. Expedition 386 methods. In Strasser, M., Ikehara, K., Everest, J., and the Expedition 386 Scientists, Japan Trench Paleoseismology. Proceedings of the International Ocean Discovery Program, 386: College Station, TX (International Ocean Discovery Program). https://doi.org/
Strasser, M., Ikehara, K., Everest, J., Maeda, L., Hochmuth, K., Grant, H., Stewart, M., Okutsu, N., Sakurai, N., Yokoyama, T., Bao, R., Bellanova, P., Brunet, M., Cai, Z., Cattaneo, A., Hsiung, K.-H., Huang, J.-J., Ishizawa, T., Itaki, T., Jitsuno, K., Johnson, J.E., Kanamatsu, T., Keep, M., Kioka, A., Kölling, M., Luo, M., März, C., McHugh, C., Micallef, A., Nagahashi, Y., Pandey, D.K., Proust, J.-N., Rasbury, E.T., Riedinger, N., Satoguchi, Y., Sawyer, D.E., Seibert, C., Silver, M., Straub, S.M., Virtasalo, J., Wang, Y., Wu, T.-W., and Zellers, S.D., 2023b. Expedition 386 summary. In Strasser, M., Ikehara, K., Everest, J., and the Expedition 386 Scientists, Japan Trench Paleoseismology. Proceedings of the International Ocean Discovery Program, 386: College Station, TX (International Ocean Discovery Program). https://doi.org/
Strasser, M., Ikehara, K., Everest, J., and the Expedition 386 Scientists, 2023c. Supplementary material, https://doi.org/10.14379/iodp.proc.386supp.2023. In Strasser, M., Ikehara, K., Everest, J., and the Expedition 386 Scientists, Japan Trench Paleoseismology. Proceedings of the International Ocean Discovery Program, 386: College Station, TX (International Ocean Discovery Program).