Strasser, M., Ikehara, K., Everest, J., and the Expedition 386 Scientists
Proceedings of the International Ocean Discovery Program Volume 386
publications.iodp.org
https://doi.org/10.14379/iodp.proc.386.106.2023
Site M0090 (Basin C1)1
![]() M. Strasser,
M. Strasser,
![]() K. Ikehara,
K. Ikehara,
![]() J. Everest,
J. Everest,
![]() L. Maeda,
L. Maeda,
![]() K. Hochmuth,
K. Hochmuth,
![]() H. Grant,
H. Grant,
![]() M. Stewart,
M. Stewart,
![]() N. Okutsu,
N. Okutsu,
![]() N. Sakurai,
N. Sakurai,
![]() T. Yokoyama,
T. Yokoyama,
![]() R. Bao,
R. Bao,
![]() P. Bellanova,
P. Bellanova,
![]() M. Brunet,
M. Brunet,
![]() Z. Cai,
Z. Cai,
![]() A. Cattaneo,
A. Cattaneo,
![]() K.-H. Hsiung,
K.-H. Hsiung,
![]() J.-J. Huang,
J.-J. Huang,
![]() T. Ishizawa,
T. Ishizawa,
![]() T. Itaki,
T. Itaki,
![]() K. Jitsuno,
K. Jitsuno,
![]() J.E. Johnson,
J.E. Johnson,
![]() T. Kanamatsu,
T. Kanamatsu,
![]() M. Keep,
M. Keep,
![]() A. Kioka,
M. Kölling,
A. Kioka,
M. Kölling,
![]() M. Luo,
M. Luo,
![]() C. März,
C. März,
![]() C. McHugh,
C. McHugh,
![]() A. Micallef,
A. Micallef,
![]() Y. Nagahashi,
Y. Nagahashi,
![]() D.K. Pandey,
D.K. Pandey,
![]() J.-N. Proust,
J.-N. Proust,
![]() E.T. Rasbury,
E.T. Rasbury,
![]() N. Riedinger,
N. Riedinger,
![]() Y. Satoguchi,
Y. Satoguchi,
![]() D.E. Sawyer,
D.E. Sawyer,
![]() C. Seibert,
C. Seibert,
![]() M. Silver,
M. Silver,
![]() S.M. Straub,
S.M. Straub,
![]() J. Virtasolo,
J. Virtasolo,
![]() Y. Wang,
Y. Wang,
![]() T.-W. Wu, and
T.-W. Wu, and
![]() S.D. Zellers2
S.D. Zellers2
1 Strasser, M., Ikehara, K., Everest, J., Maeda, L., Hochmuth, K., Grant, H., Stewart, M., Okutsu, N., Sakurai, N., Yokoyama, T., Bao, R., Bellanova, P., Brunet, M., Cai, Z., Cattaneo, A., Hsiung, K.-H., Huang, J.-J., Ishizawa, T., Itaki, T., Jitsuno, K., Johnson, J.E., Kanamatsu, T., Keep, M., Kioka, A., Kölling, M., Luo, M., März, C., McHugh, C., Micallef, A., Nagahashi, Y., Pandey, D.K., Proust, J.-N., Rasbury, E.T., Riedinger, N., Satoguchi, Y., Sawyer, D.E., Seibert, C., Silver, M., Straub, S.M., Virtasalo, J., Wang, Y., Wu, T.-W., and Zellers, S.D., 2023. Site M0090 (Basin C1). In Strasser, M., Ikehara, K., Everest, J., and the Expedition 386 Scientists, Japan Trench Paleoseismology. Proceedings of the International Ocean Discovery Program, 386: College Station, TX (International Ocean Discovery Program). https://doi.org/10.14379/iodp.proc.386.106.2023
2 Expedition 386 Scientists’ affiliations.
1. Operations
During Expedition 386, two Giant Piston Corer (GPC) system deployments in central Japan Trench Basin C1 (Figure F1) resulted in the recovery of cores from four holes at Site M0090 (Figure F2). The water depth was between 7445 and 7450 meters below sea level (mbsl). A breakdown of operational time is reported weekly instead of daily (see OPS in Supplementary material) due to decisions to move between sites based on weather and current conditions. Holes at Site M0090 were cored during Weeks 6 and 7 of the offshore phase. In total, 55.764 m of cores (Table T1) and 6.8 km of hydroacoustic profiles (see Hydroacoustics) were recovered and acquired, respectively, in this focus area. Further operations details, including winch log and inclinometer information, are found for all sites in Coring methodology in the Expedition 386 methods chapter (Strasser et al., 2023a) and associated files (see PALEOMAG and WINCHLOGS in Supplementary material).
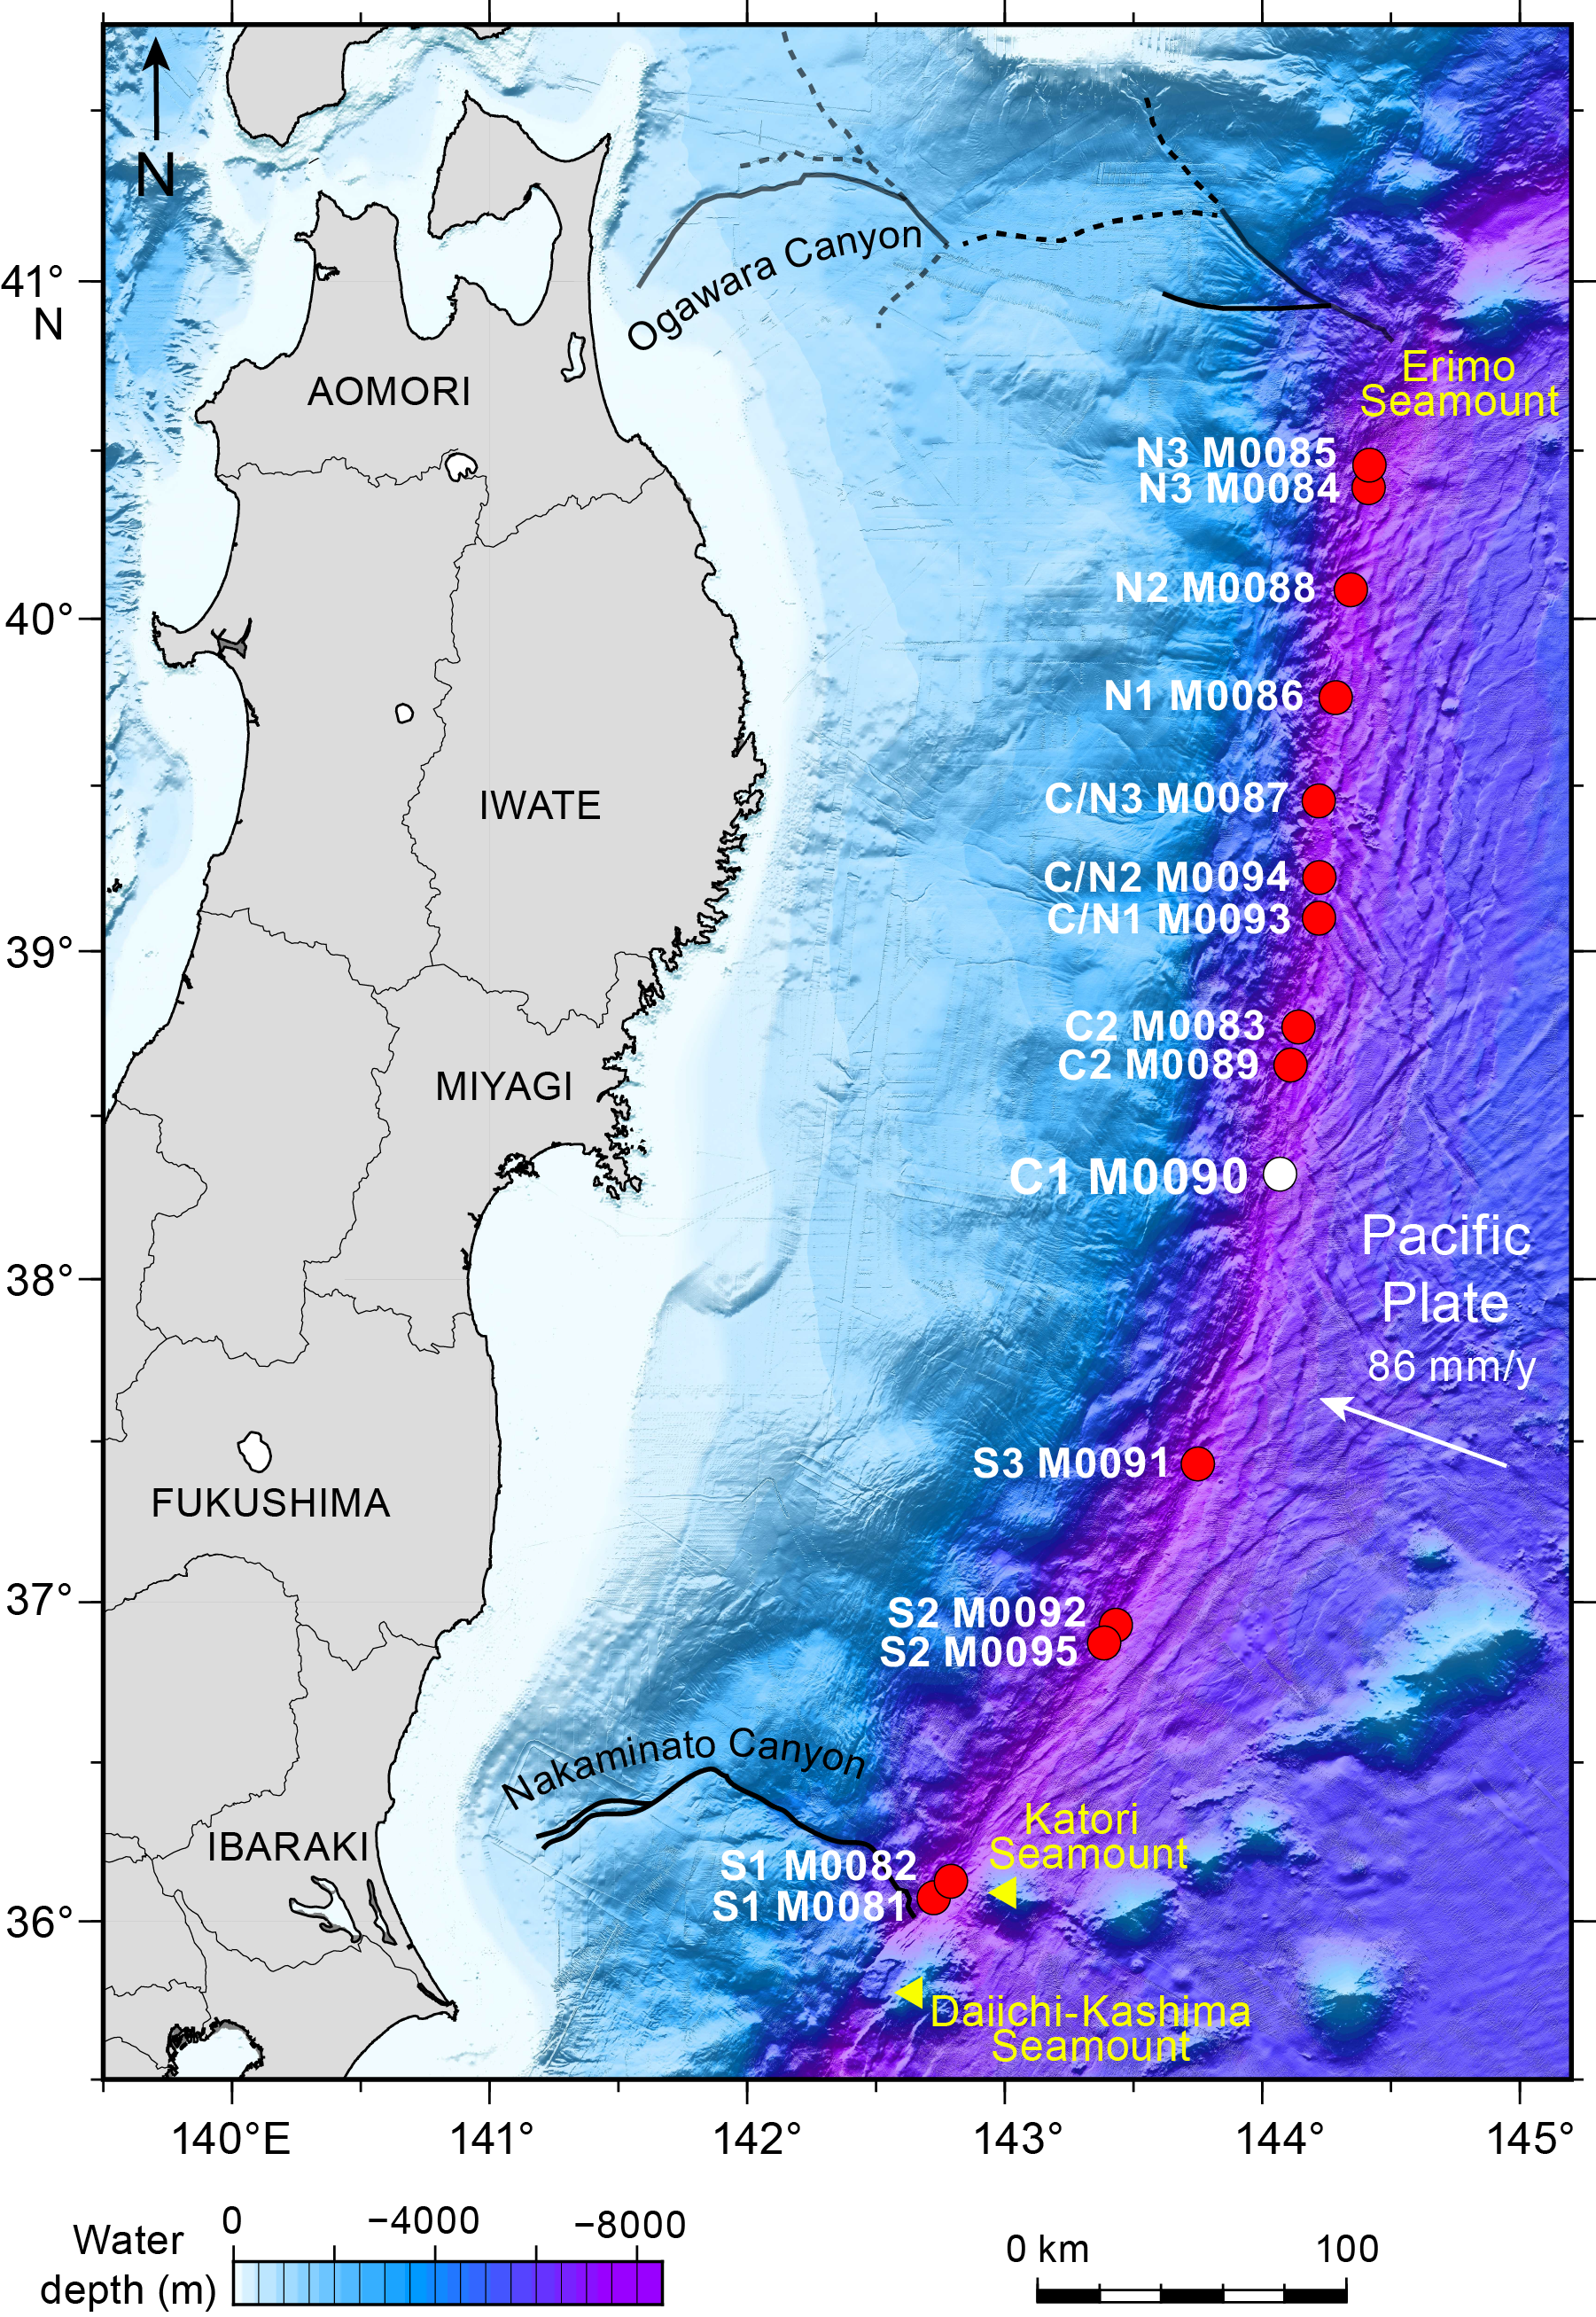
Figure F1. Site map.
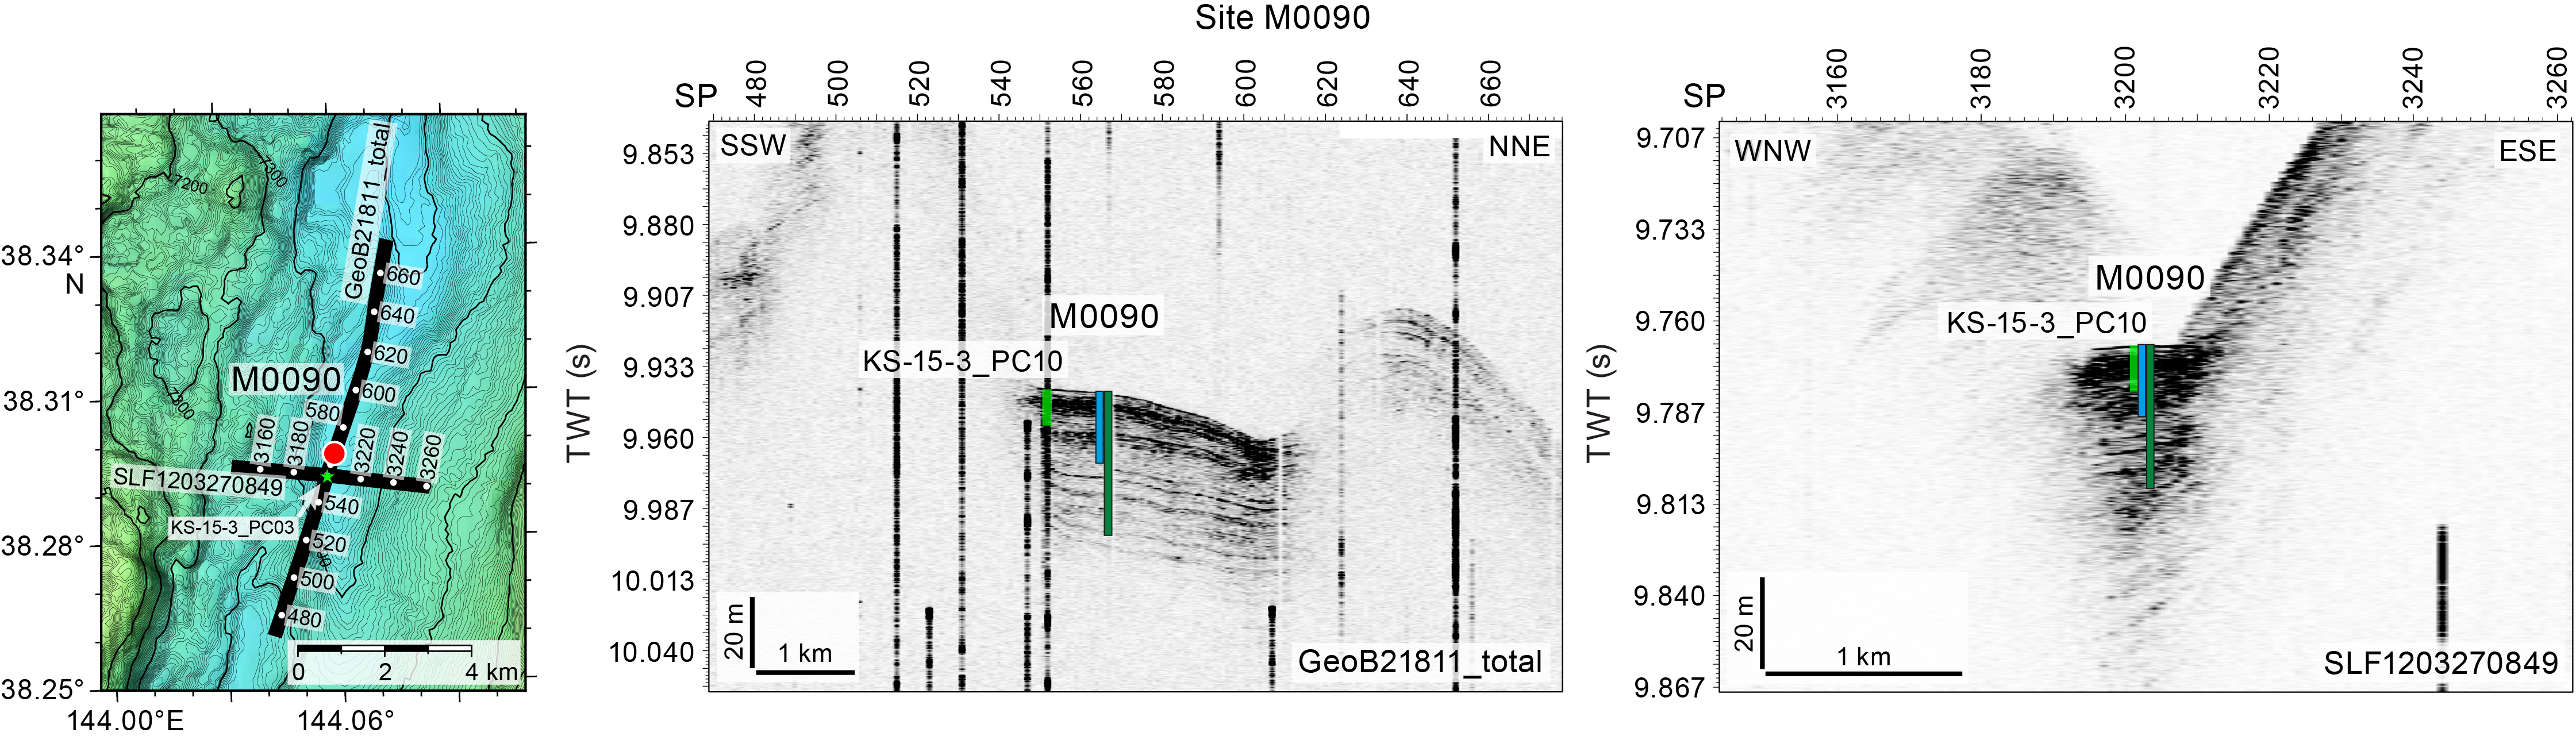
Figure F2. Site M0090.
The main site-specific scientific objectives for Site M0090 were as follows:
- Recover a continuous Pleistocene to Holocene stratigraphic succession comprising event deposits from the isolated trench basin within the relatively elevated trench floor segment in the southern part of the central Japan Trench.
- Analyze the stratigraphic pattern and event deposit characteristics and compare with integrated results from Sites M0083 and M0089 (~36 km north) to establish robust stratigraphic pattern recognition of proxy evidence for earthquakes.
- Generate results for comparison with those from all other Expedition 386 sites to explore spatiotemporal distribution of event deposits to eventually develop a long-term record for giant earthquakes.
1.1. Site M0090
The R/V Kaimei arrived at Site M0090 at 0645 h on 18 May 2021. An expendable bathythermograph (XBT) probe was deployed at 0645 h, and one multibeam echo sounder/subbottom profiler (MBES/SBP) survey was undertaken between 0700 and 0830 h. Conditions were overcast with a moderate wind (<8 m/s), relatively large wave heights (2.5 m), and a ~0.7 kt current. GPC operations started in Holes M0090A and M0090B with a 20 m GPC barrel string at 0830 h and were completed when the GPC system was recovered on deck at 1500 h. The Science Party completed cutting core into 1 m sections at 1700 h. The 20 m GPC assembly was prepared for the next run at 1930 h, and the ship set sail for Site M0091.
Kaimei returned to Site M0090 at 0730 h on 28 May. Conditions were warm with winds of 12 m/s decreasing to <8 m/s, wave heights of 2.5 m, and surface currents at 1.7–2.2 kt. GPC operations started in Holes M0090C and M0090D with a 40 m GPC barrel string at 0930 h and were completed when the GPC system was recovered on deck at 1515 h. The Science Party completed cutting core into 1 m sections at 1915 h. The 30 m GPC assembly was prepared for the next run at 2130 h, and Kaimei set sail to the next site.
1.1.1. Holes M0090A and M0090B
Holes M0090A and M0090B were cored on 18 May 2021. Preparations for running the 20 m GPC began at 0830 h, and the GPC was run into the water at 0915 h with an inclinometer attached to the winch cable 20 m above the GPC trigger arm and on the GPC assembly (see Figure F4 in the Expedition 386 methods chapter [Strasser et al., 2023a]). Winch speed was set at 1.0 m/s. At 1150 h, running the GPC down was paused at a cable length of 7550 m for stabilization and monitoring the GPC position and resumed after 3 min at a winch speed of 0.3 m/s. Spud-in commenced at 12:04:05 h and ended at 12:04:08 h at a cable length of 7694 m. Recovery commenced, and the cable tension rose to 1883 kgf at 12:04:12 h before dropping to 1287 kgf and then rising again to a maximum of 6762 kgf at 12:04:55 h. It dropped to 5365 kgf at 12:05:00 h, indicating the corer was clear of the seabed (see WINCHLOGS in Supplementary material). Inclinometer data for Hole M0090B show the piston corer barrel was rotated counterclockwise by 163° at the estimated seabed, with an east–west dip of 2.63° and a north–south dip of −3.75° (see Figure F5 in the Expedition 386 methods chapter [Strasser et al., 2023a]). The GPC was run back to the surface at a winch speed of 1.0 m/s. The trigger corer and GPC were recovered on deck at 1410 and 1500 h, respectively. The trigger core and GPC core from Holes M0090A and M0090B have a total length of 1.154 m (2 sections) and 19.6 m (20 sections), respectively. Note that, due to the transponder malfunctioning, the position of this hole is based on the ship’s position (Table T1).
1.1.2. Holes M0090C and M0090D
Holes M0090C and M0090D were cored on 28 May 2021. Preparations for running the 40 m GPC began at 0930 h, and the GPC was run into the water at 1020 h with an inclinometer attached to the winch cable 20 m above the GPC trigger arm and on the GPC assembly (see Figure F4 in the Expedition 386 methods chapter [Strasser et al., 2023a]). Winch speed was set at 1.1 m/s. At 1250 h, running the GPC down was paused at a cable length of 7600 m for stabilization and monitoring the GPC position and resumed after 3 min at a winch speed of 0.3 m/s. Spud-in commenced at 12:33:22 h and ended at 12:33:25 h at a cable length of 7684 m. Recovery commenced, and the cable tension rose to 1120 kgf at 12:04:12 h before dropping to 784 kgf and then rising again to a maximum of 10598 kgf at 12:34:57 h. It dropped to 8494 kgf at 12:35:10 h, indicating the corer was clear of the seabed (see WINCHLOGS in Supplementary material). Inclinometer data for Hole M0090B show the piston corer barrel was rotated counterclockwise by 295.20° at the estimated seabed, with an east–west dip of 1.33° and a north–south dip of −3.31° (see Figure F5 in the Expedition 386 methods chapter [Strasser et al., 2023a]). The GPC was run back to the surface at a winch speed of 1.1 m/s. The trigger corer and GPC were recovered on deck at 1440 and 1515 h, respectively. The trigger core and GPC core from Holes M0090C and M0090D have a total length of 1.075 m (2 sections) and 33.935 m (34 sections), respectively. Note that, due to the transponder malfunctioning, the position of this hole is based on the ship’s position (Table T1).
2. Hydroacoustics
Site M0090 lies within Basin C1 in the central Japan Trench survey area. The grid of acquired SBP data comprises two trench-parallel lines oriented northeast–southwest through the basin (Figure F3). These lines are continuous with each other, with Line 386_Underway_089 along strike from Line 386_Underway_088. In total, over 6.8 km of survey lines were acquired. The acquisition parameters for the two lines in Basin C1 are documented in Table T2. The area surveyed for bathymetry includes the basin floor and surrounding area, covering an area of approximately 126 km2. Depth estimates in this section are approximate and assume a seismic velocity of 1500 m/s.
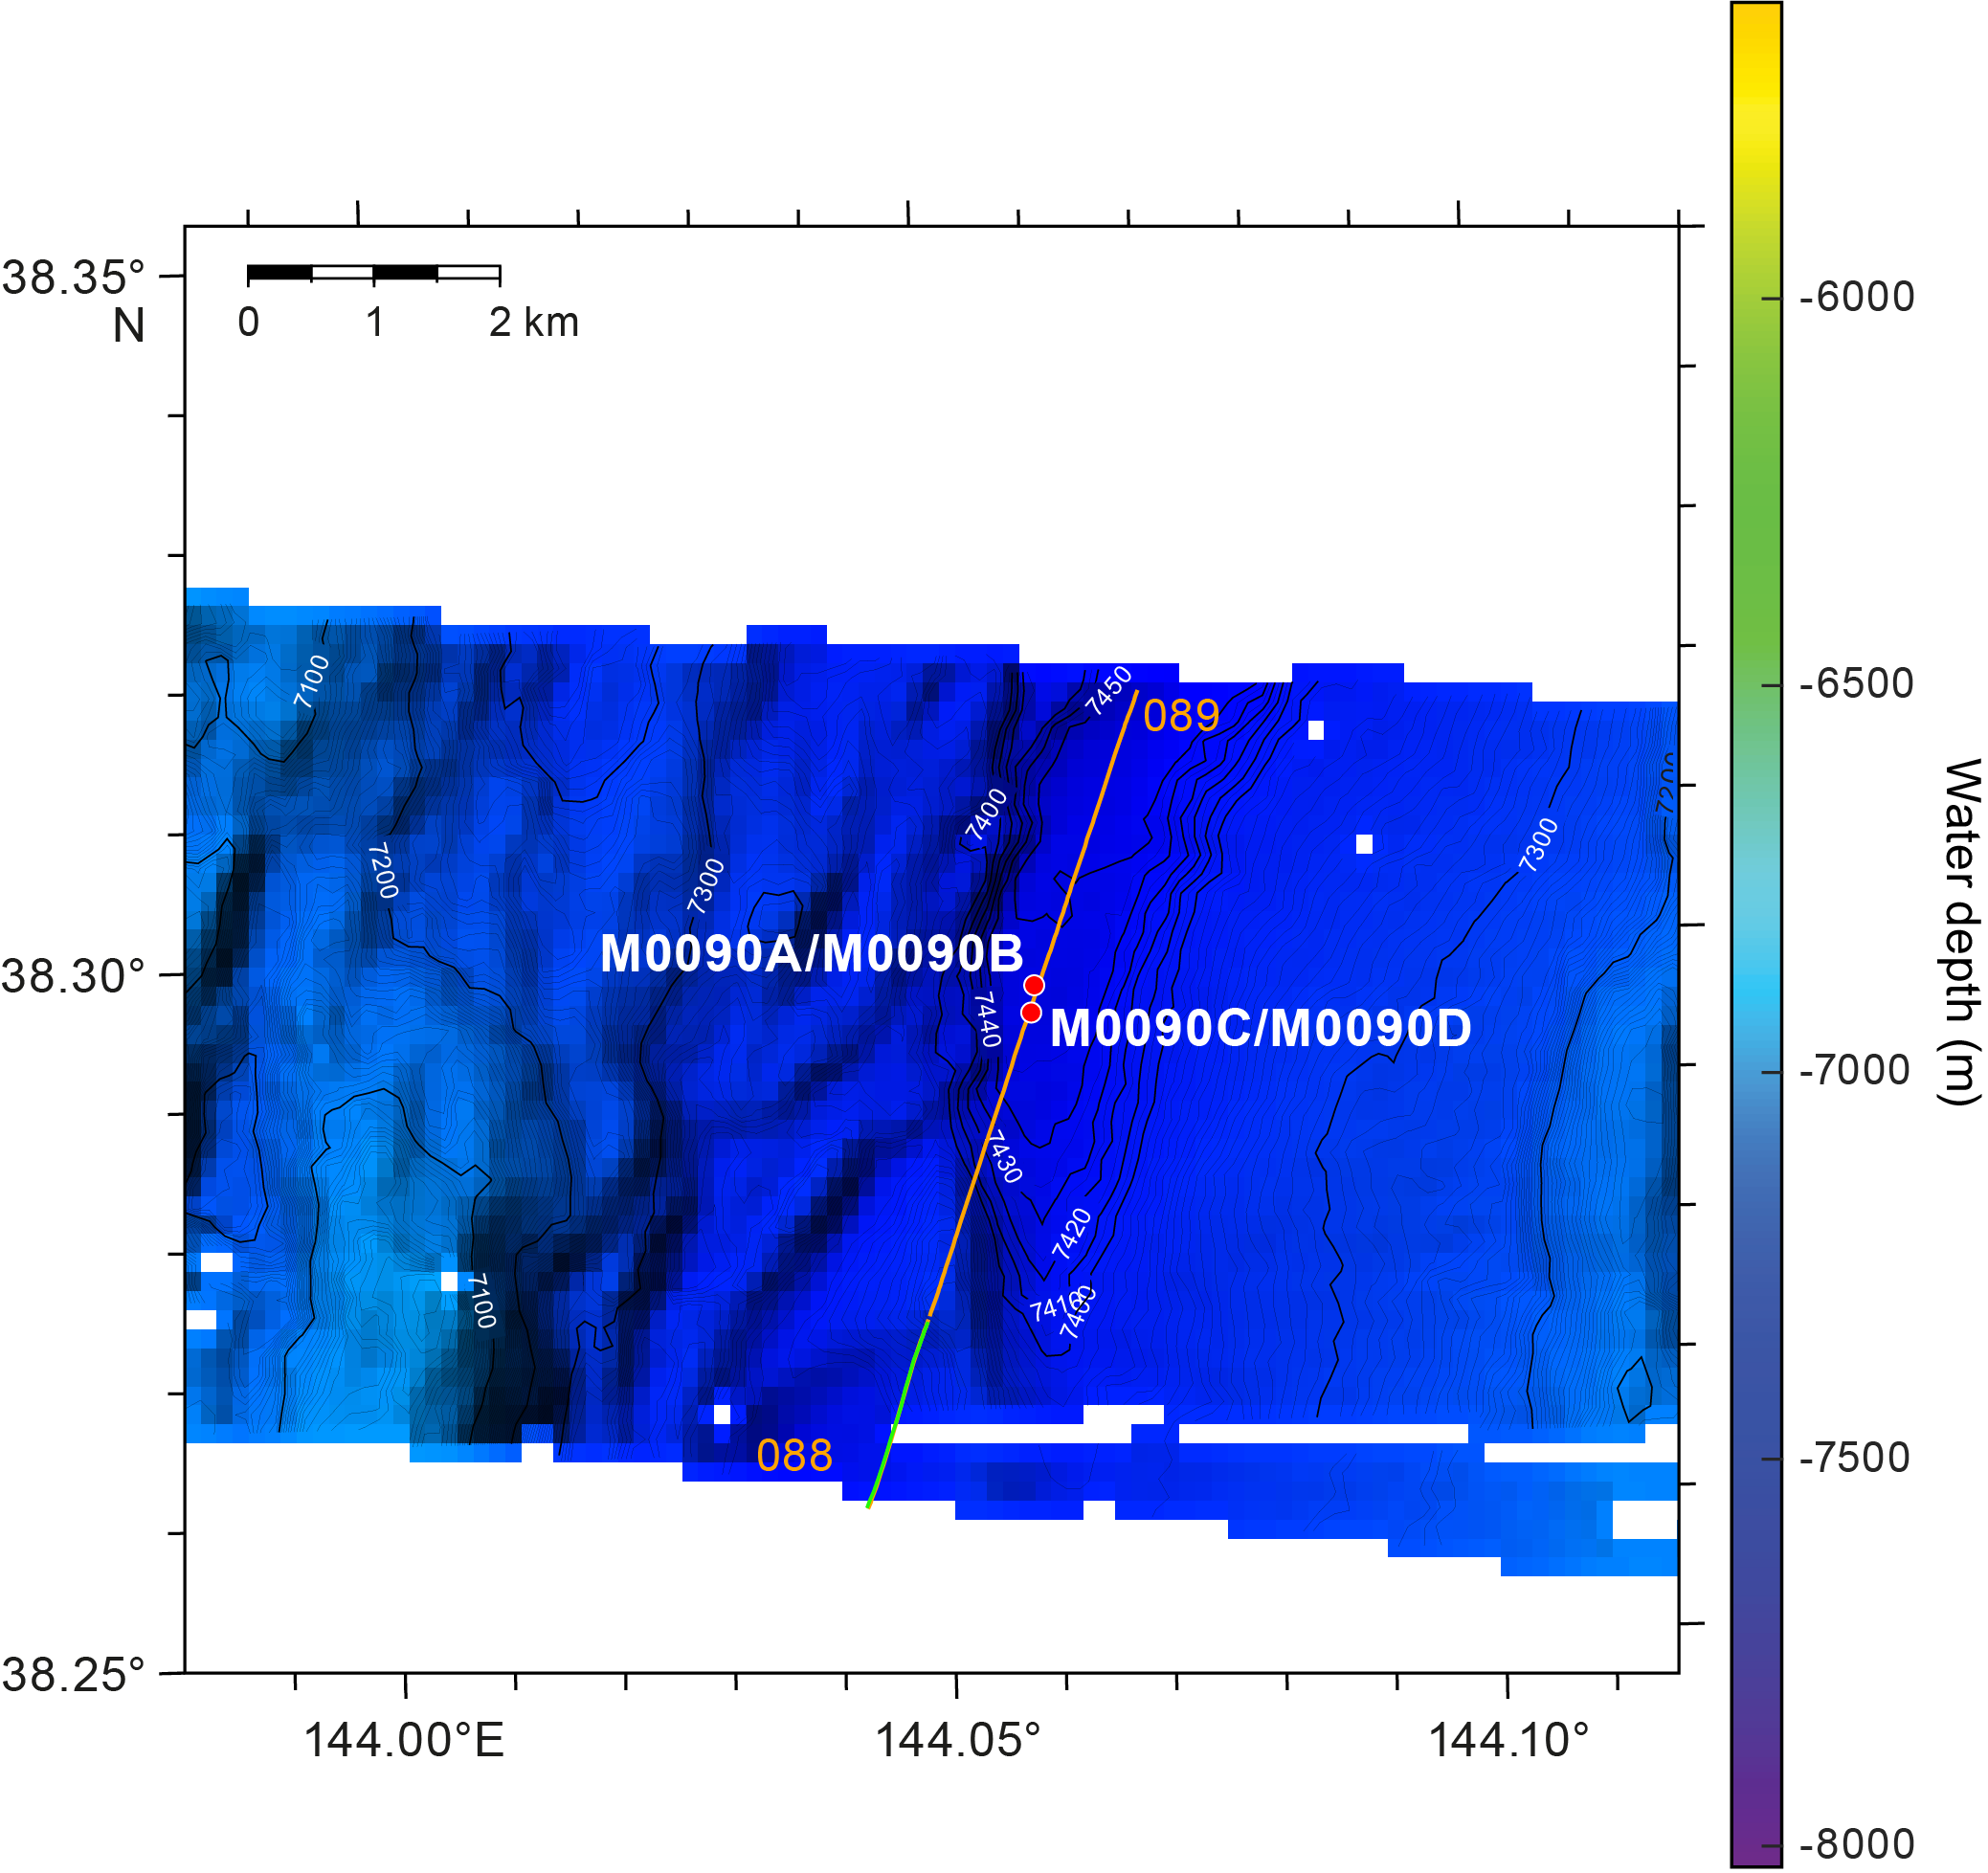
Figure F3. Subbottom profiler lines.
2.1. Bathymetry
The bathymetry data acquired for Basin C1 does not cover the entire areal extent of the basin and is instead limited to a smaller footprint that captures the combined length of the lines (6.8 km) but extends in an east–west direction for approximately 18 km (Figure F3). The lack of closure of topographic contours in the northern part of the survey area indicates that the basin floor continues north outside of the bathymetric survey area. Given the lack of a trench-perpendicular line, the width of the basin is difficult to determine with accuracy but appears to be approximately 1000 m wide near Site M0090 (as measured across the flat basin floor to the first points of rising topography to the east and west). Holes M0090A and M0090B were cored at a water depth of 7445 mbsl, and Holes M0090C and M0090D were cored at a water depth of 7450 mbsl.
The steepest part of the western basin margin has a slope gradient of approximately 20%, but this quickly decreases as a series of northeast-trending topographic ridges diffuse the gradient eastward toward Site M0090. Immediately east of Site M0090, a slope gradient of approximately 10% decreases within 50 m of the basin floor to a more gentle slope gradient of 6%.
2.2. Basin characterization and Site M0090
Of the two lines in the basin, only Line 386_Underway_089 (Figure F4) shows the acoustic character near Site M0090. Line 386_Underway_088 lies more than 2500 m southeast of Site M0090.
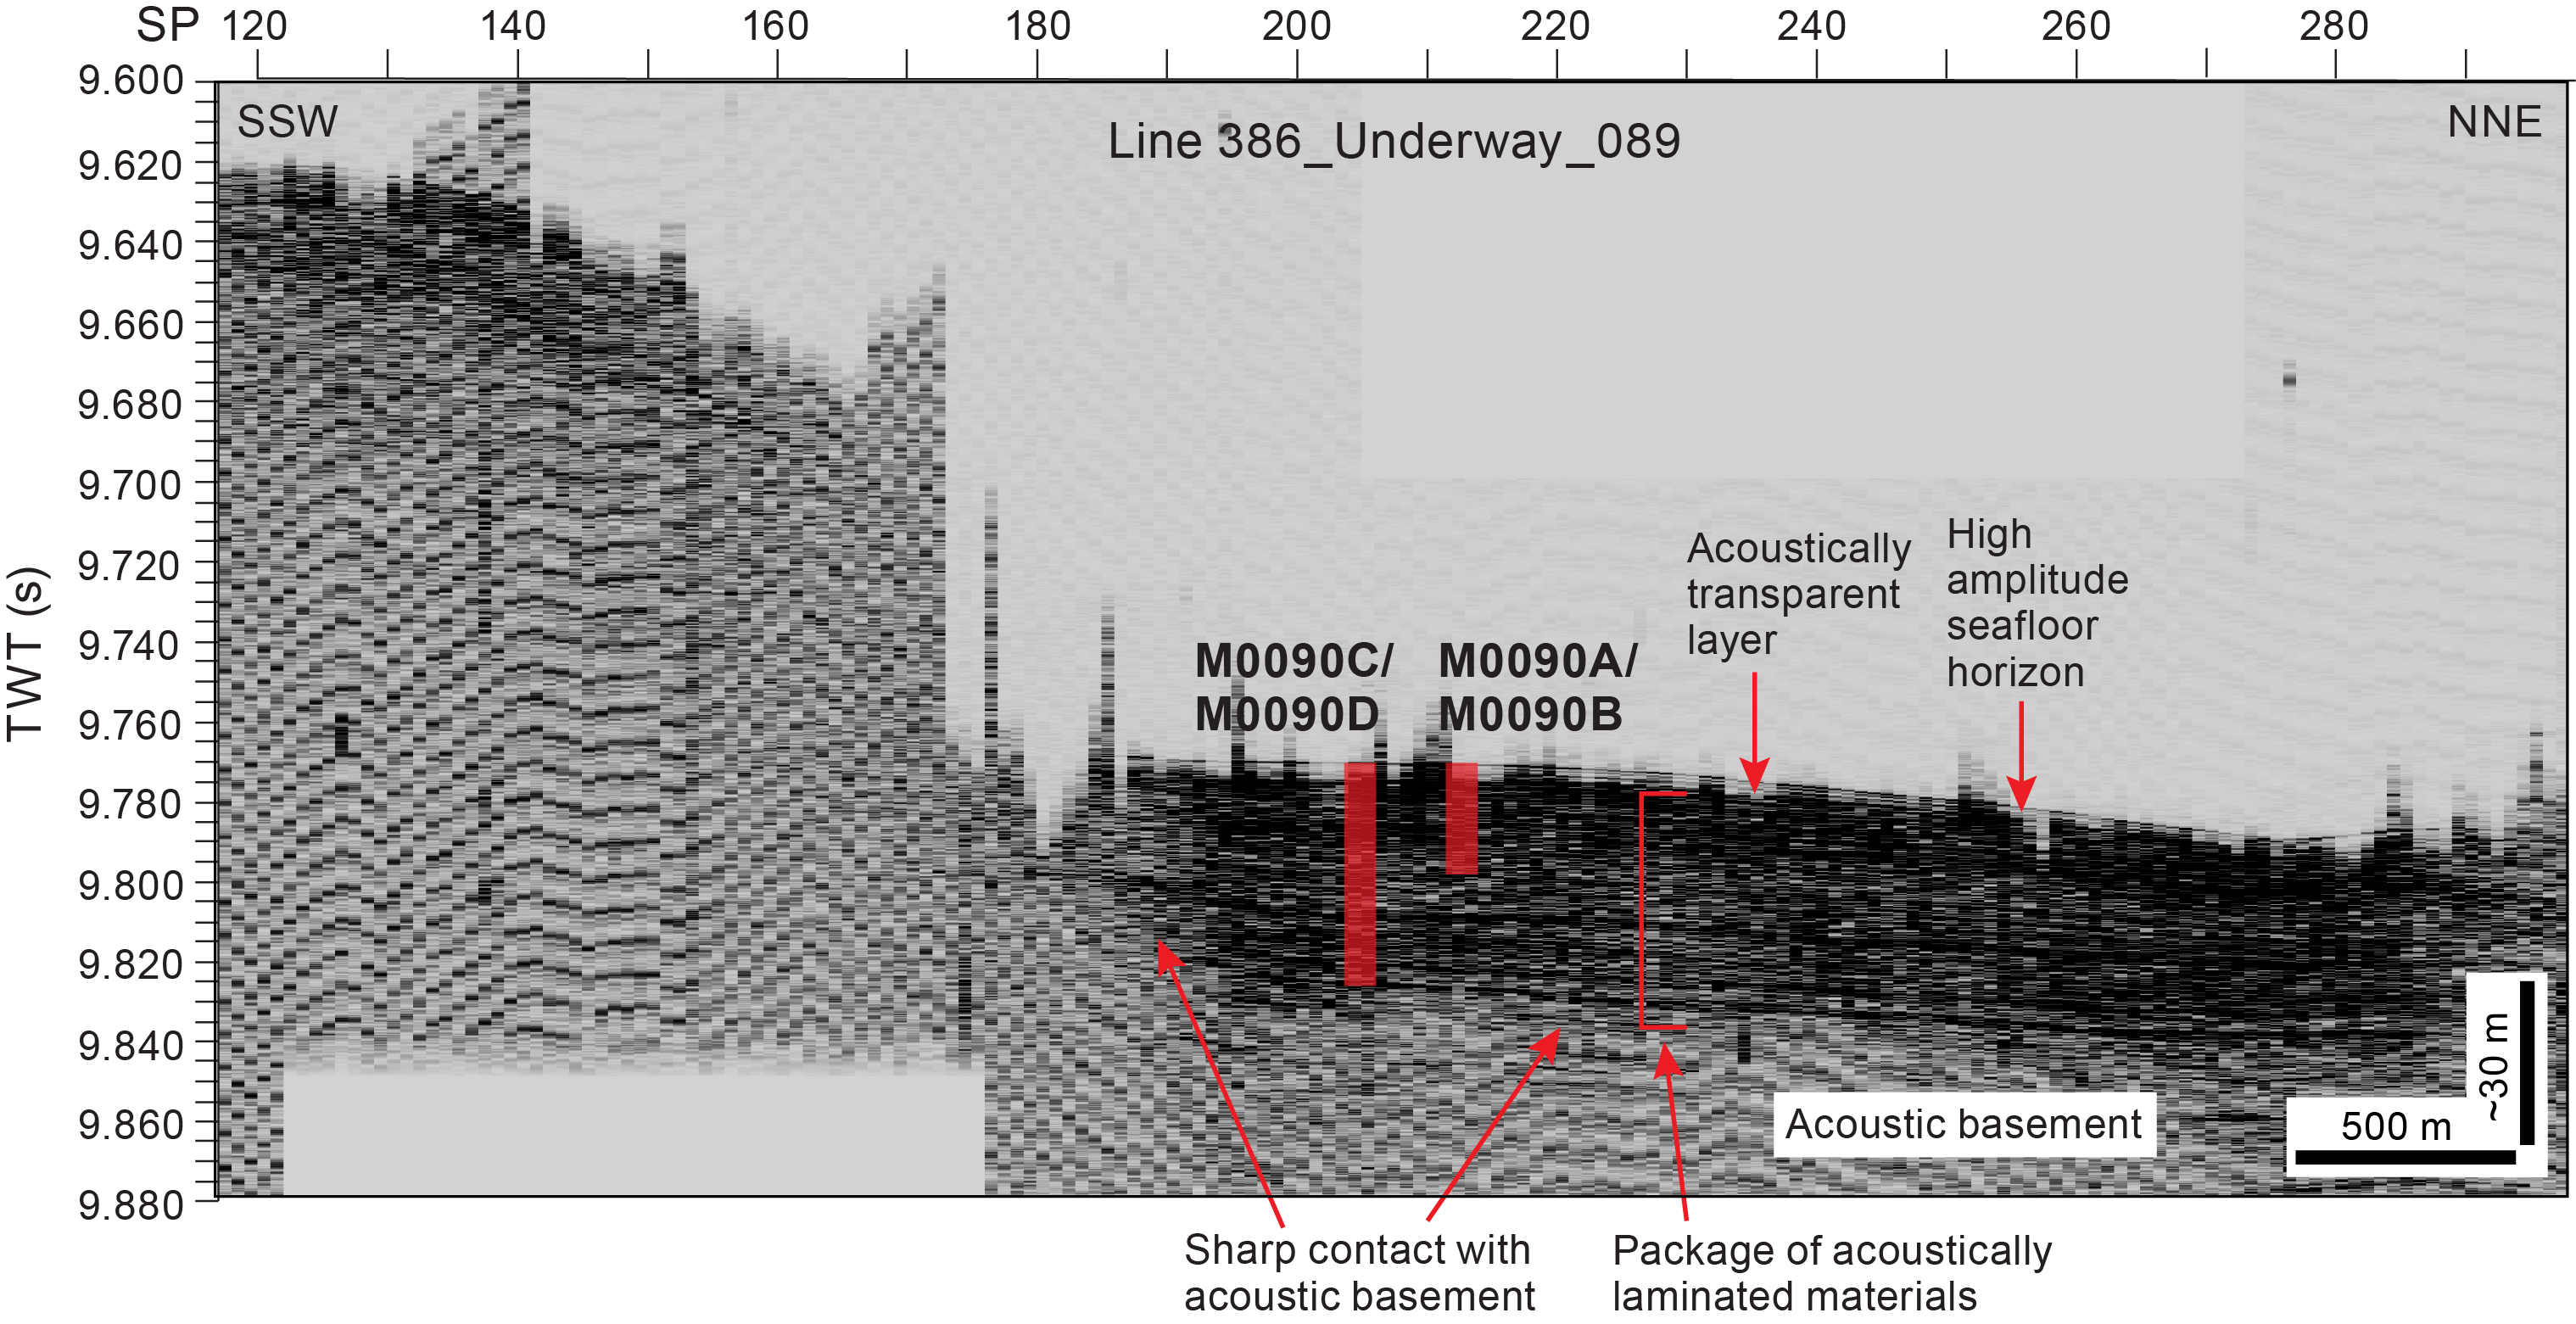
Figure F4. Line 396_Underway_089.
Holes M0090A and M0090B lie 30 m west of Line 386_Underway_089, and Holes M0090C and M0090D lie 15 m east of the line. In Line 386_Underway_089, a high-amplitude seafloor reflector overlies a thin acoustically transparent layer that is <2 m thick. Beneath this transparent layer, an acoustically laminated package, up to 40 m thick, extends to around 9.82 s two-way traveltime (TWT) and displays a relatively sharp contact with the surrounding basal layers. The laminated package remains coherent across the basin floor and displays largely flat-lying layers with few disruptions.
The contact between the basin fill and acoustic basement south of Holes M0090C and M0090D (at around Shotpoint 190) appears to be relatively sharp, and might potentially be fault-related. The sharp change in bathymetry (from Shotpoint 120 to Shotpoint 185) at the southern end of the line coincides with a north–south topographic ridge in the bathymetry data.
3. Lithostratigraphy
Site M0090 was cored in the central Japan Trench southern area in Basin C1. Site M0090 has four holes, including two accompanying trigger cores (Holes M0090A–M0090D). They were cored to recover a continuous upper Pleistocene to Holocene stratigraphic succession comprising event deposits from the trench basin floor (Holes M0090A and M0090B) and the relatively elevated basin wall (Holes M0090C and M0090D) within the central Japan Trench (see Operations). Full-length lithostratigraphic summary illustrations of the core sections, including X-ray computed tomography (CT) scan and linescan images, visual grain-size estimates, and core descriptions are shown in Figures F6 and F11 X-ray CT scans and linescan composite plots are included in XRAYCT in Supplementary material and in Core descriptions, respectively. The use of major and minor lithologies, primary sedimentary structures, accessories, and secondary structures (bioturbation and iron monosulfides) are defined in Lithostratigraphy in the Expedition 386 methods chapter (Strasser et al., 2023a).
The sediment texture and composition determined from smear slide analysis performed during the offshore phase of the expedition are semiquantitative (see Core descriptions). A total of 36 smear slides were obtained from sediment at Site M0090, with the following distribution among Holes: 1 in Hole M0090A, 13 in Hole M0090B, 1 in Hole M0090C, and 25 in Hole M0090D. Smear slide data are presented in tables (Table T3) and photos (see SMEARSLD in Supplementary material) and on two ternary diagrams for grain size and composition in Figure F7. Color bars represent the lithogenic, biogenic, and vitric components of smear slides in 20 m scale lithostratigraphic summaries (Figures F8, F12). Illustrations of the lithologies include photomicrographs of smear slides taken in the most representative facies (Figure F9) and in some tephra layers (Figure F10), as well as some close-up core photos of tephra layers (Figure F13) (see more close-up photos in CORECLOSEUP in Supplementary material), iron monosulfide occurrences (Figure F14), and event beds together with X-ray CT scan images (Figure F5). Mineralogy from XRD analysis is shown in Figure F15. Complete linescan and X-ray CT scan images of core sections and XRD data can be found in LINESCAN, XRAYCT, and XRD in Supplementary material. High-resolution 3 m scale barrel sheets and smear slide tables can be found in Core descriptions.
The lithology of Site M0090 is dominated by silty clay/clayey silt interbedded with alternating very fine sand to silt and silty clay layers (Figures F6, F11). The texture of the dominant lithology derived from smear slide observation is clayey silt and occasional sand, silt, and silty clay (Figures F7, F8, F12). In some cases, what was labeled as silty clay during visual core description was found to be clayey silt during smear slide observation. In terms of composition, the available smear slides show that there is a biogenic component almost as relevant as the lithogenic component containing, in decreasing abundance, diatoms, sponge spicules, and radiolaria. The main lithology is biosiliceous-rich silty clay with additional lithogenic components such as quartz, feldspar, pyrite, and vitric grains. Tephras are present in 0.5 to 4.1 cm thick patches, laminae, or layers identified in smear slides and core sections (Figures F10, F13) (see Tephra). The most common structures at Site M0090 are laminae, sometimes forming parallel laminated intervals that contain fine sand, very fine sand, and silt interbedded with clay. These deposits have sharp, gradational, or bioturbated contacts and sometimes display a fining-upward trend.
Iron monosulfides are present at variable intensities, mostly sparsely distributed but also at moderate to abundant intensity indicative of sulfate reduction and/or methane oxidation during early diagenesis (Figure F14) (see Geochemistry). Bioturbation is common and ranges from slight to heavy. Core deformation is minor and characterized by the presence of cracks and some voids, especially in the lower part of Holes M0090B and M0090D. When laminae are present, they are sometimes bowed. Post–core recovery oxidation is observed in some sections. Figure F5 shows some examples of normally graded sand/silt layers in photos and X-ray CT images. XRD analyses reveal that the most abundant minerals are quartz, feldspar, and clays, followed by micas (muscovite and biotite) with hints of palygorskite, pyrite, pyroxene, and heavy minerals but no carbonates or amphibole group minerals (Figure F15).
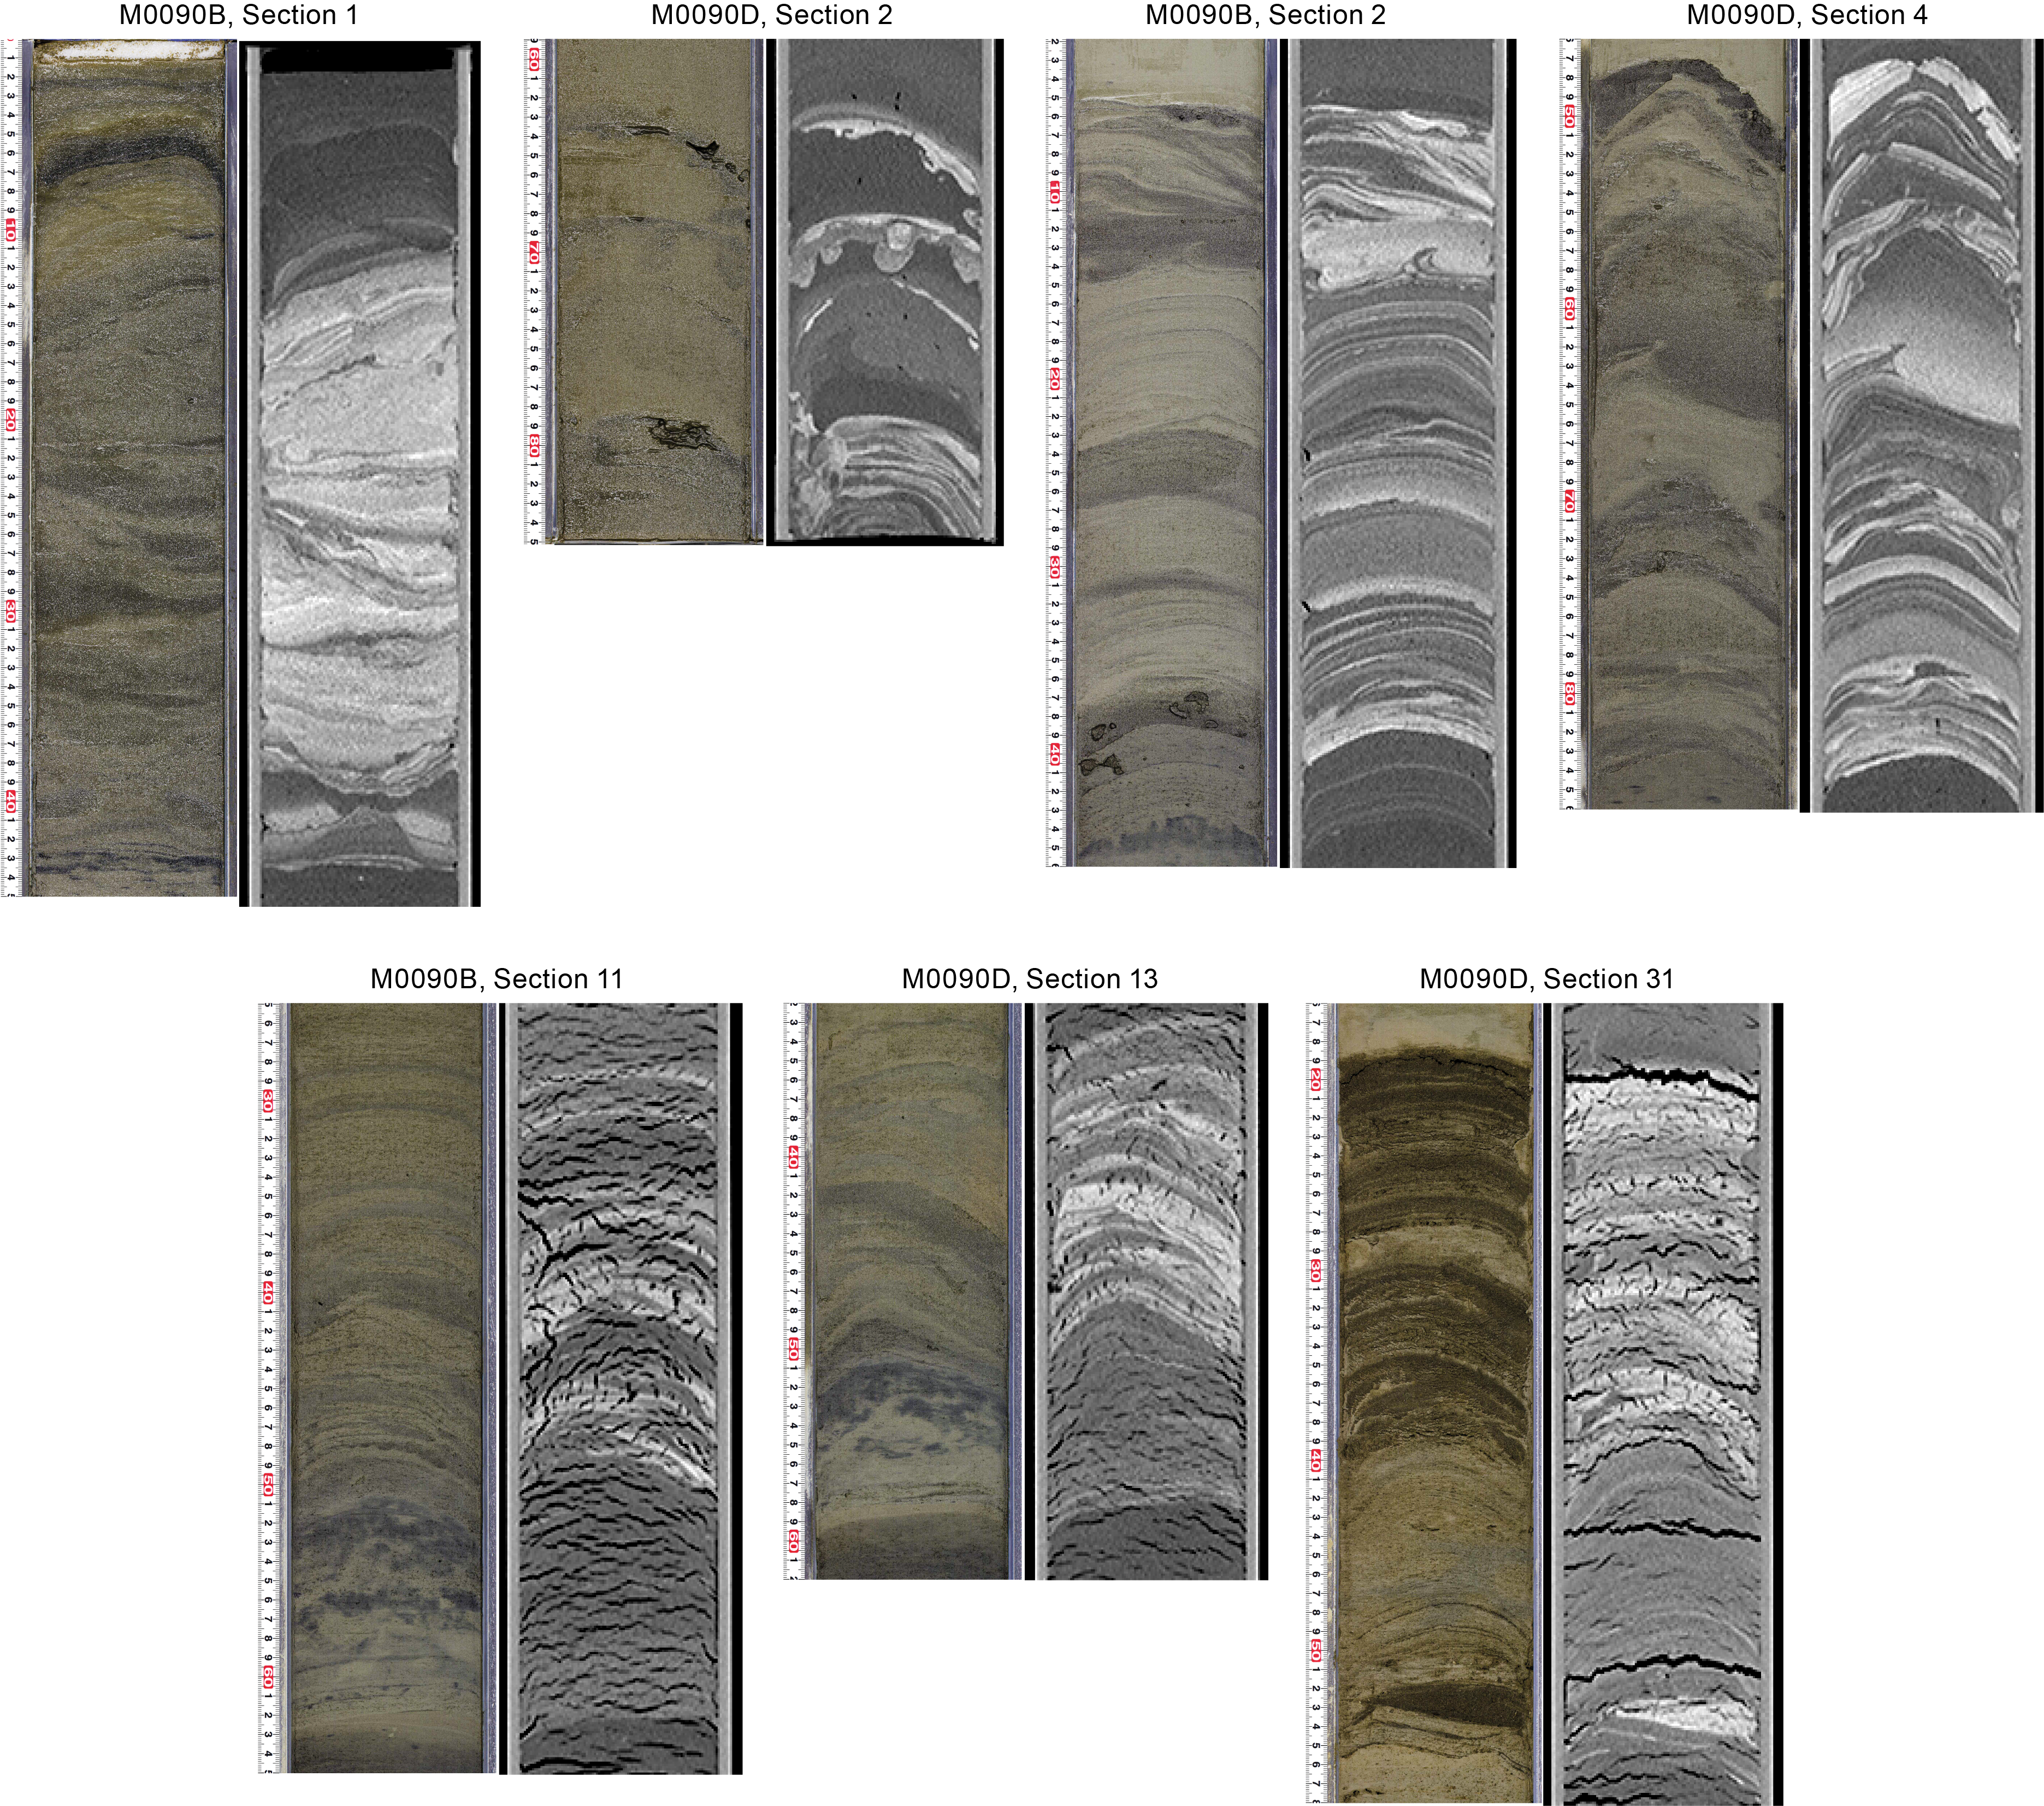
Figure F5. Normally graded sand/silt layers.
3.1. Holes M0090A and M0090B
3.1.1. Hole M0090A
Hole M0090A comprises a 1.145 m long trigger core mainly composed of silty clay showing 0.5–1 mm thick silt laminae occurring at intervals of a few to about 20–30 cm. The only sedimentary structures in the single section of Hole M0090A are the silt laminae mentioned above with generally sharp to irregular contact surfaces. The section is slightly bioturbated and displays a grayish olive color with dark olive-brown in the uppermost 7.5 cm, suggesting that the seabed sediments have been preserved. Physical properties (magnetic susceptibility, density, and natural gamma radiation [NGR]) show an overall increase in values downcore (Figure F6) (see Physical properties). The Multi-Sensor Core Logger (MSCL) logs show increases of magnetic susceptibility and density at laminated silt horizons, but the poor resolution of NGR cannot lead to any sound conclusion (see Physical properties).
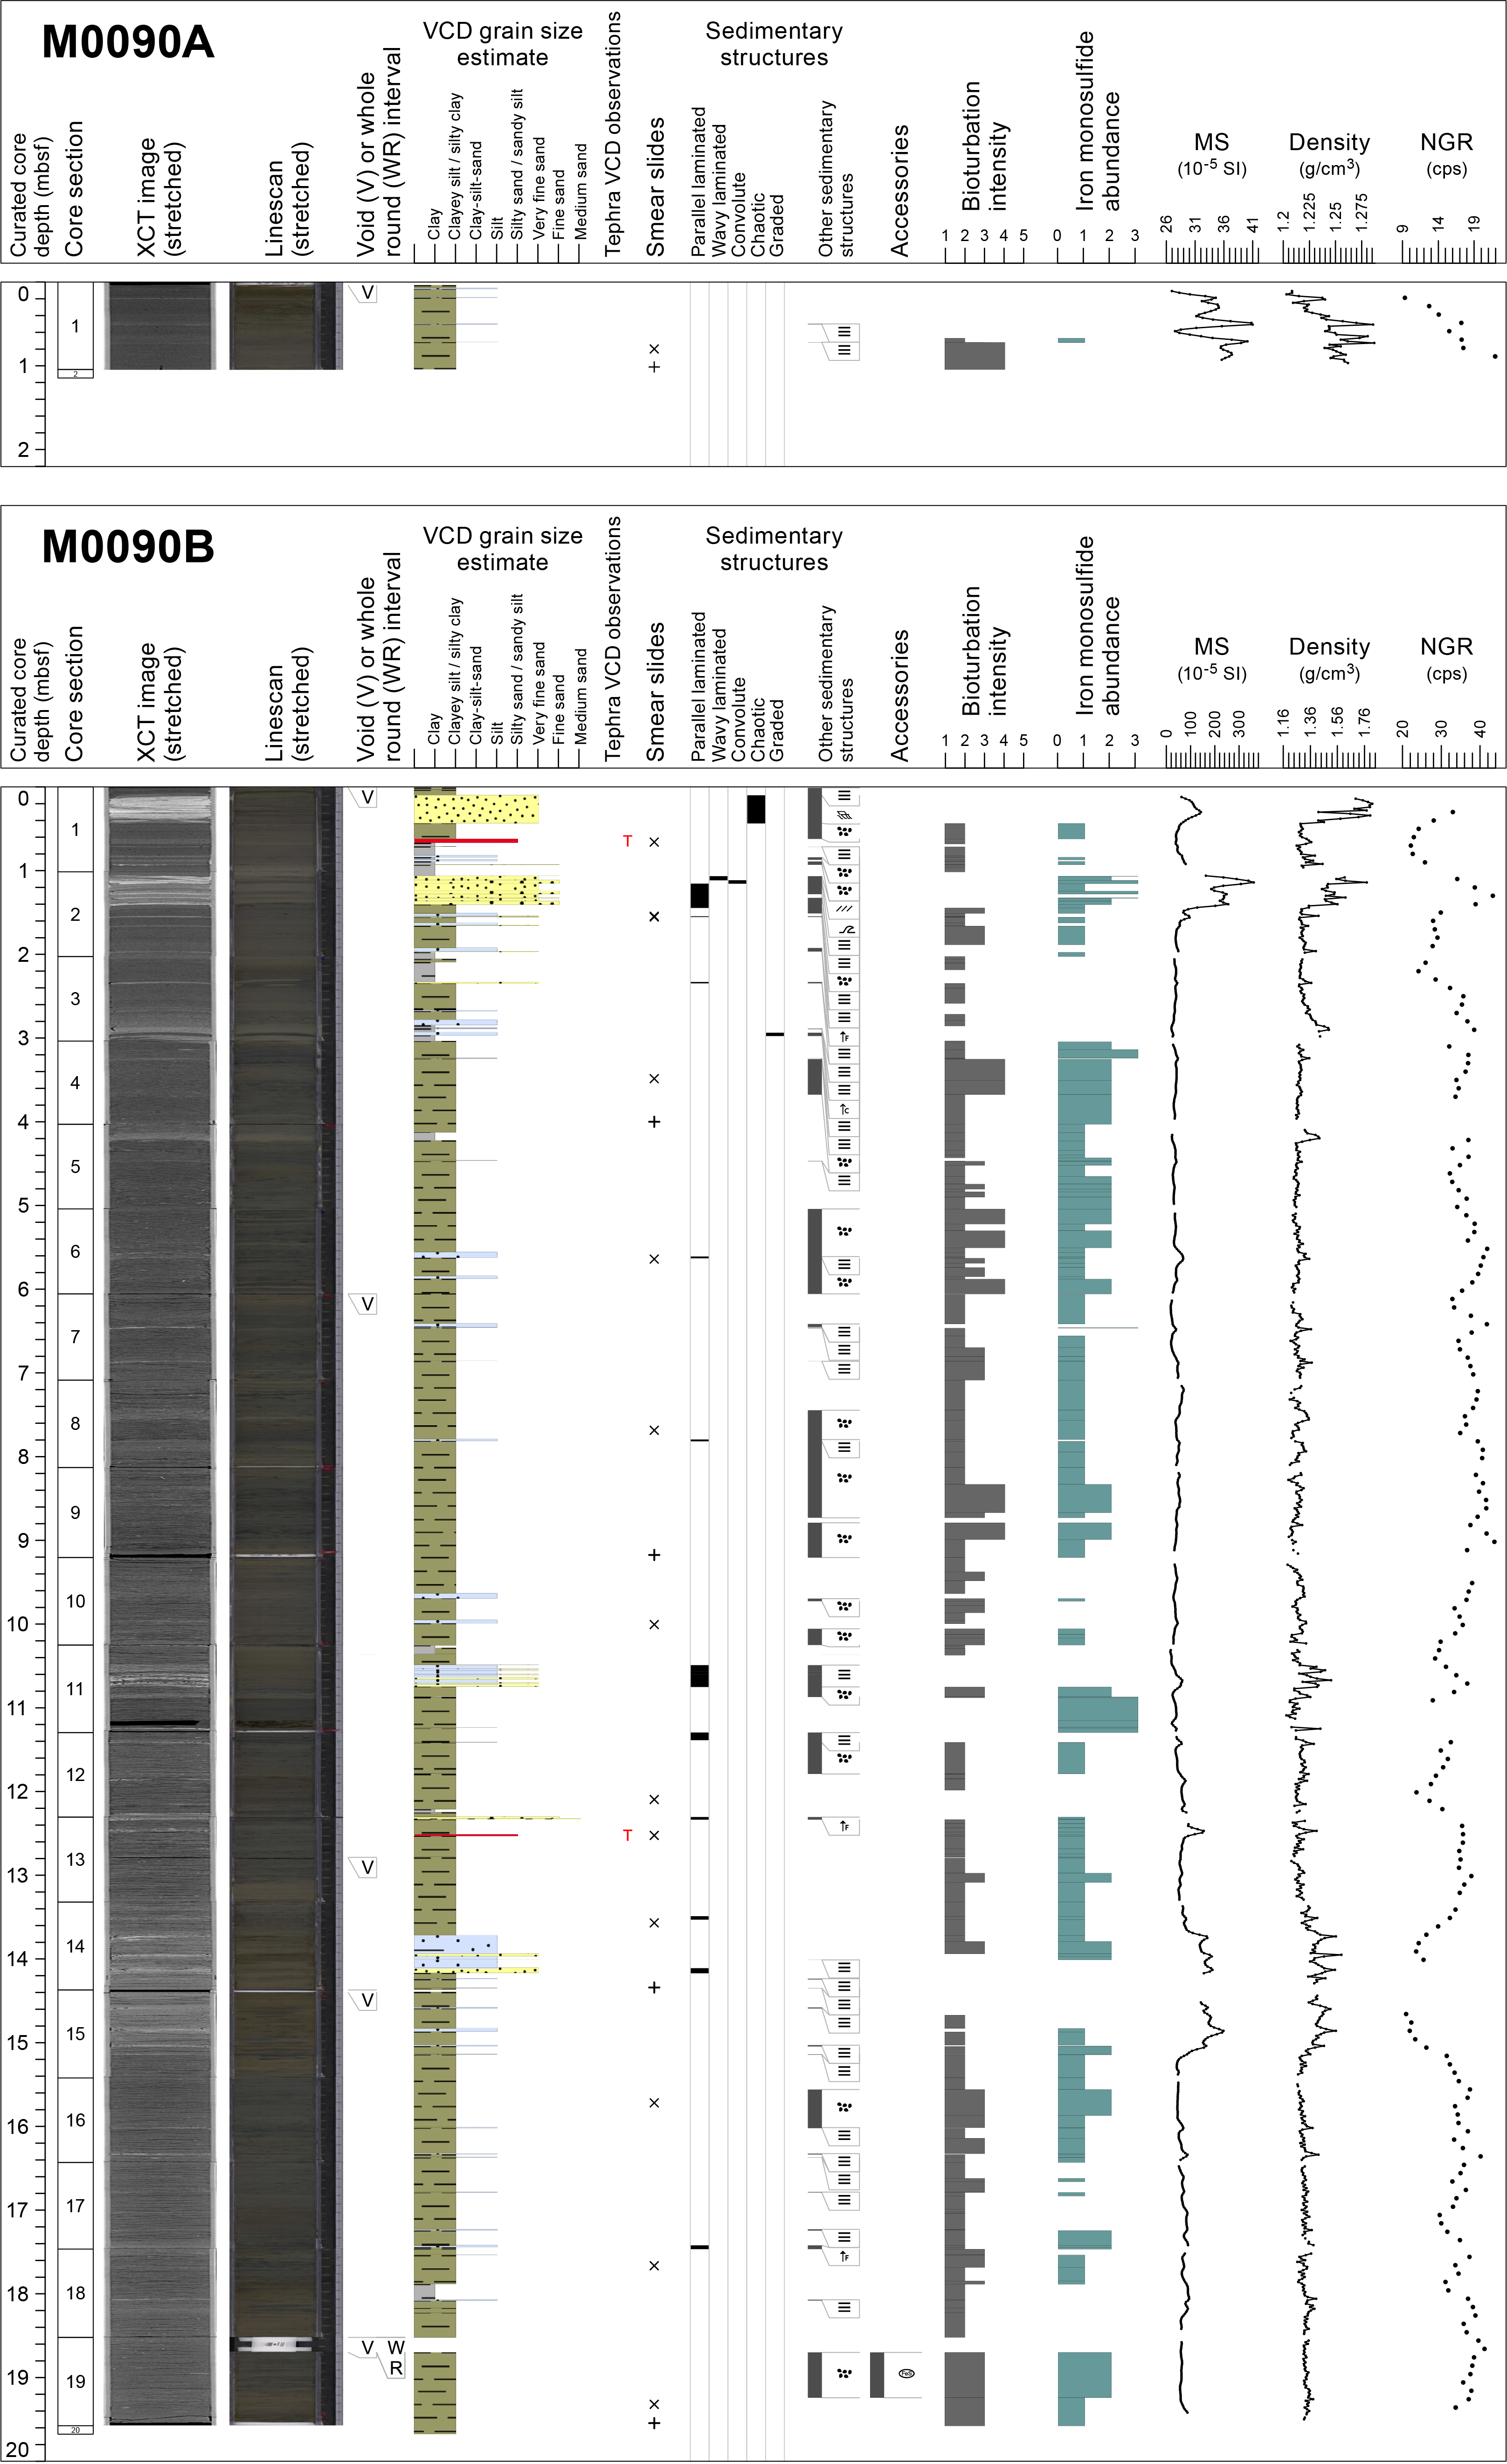
Figure F6. Lithostratigraphic summary, Holes M0090A and M0090B.
From one smear slide data point in Sample 386-M0090A-1P-1, 80–81 cm, the lithology is described as siliceous-rich lithogenic silty clay (see smear slide table in Core Descriptions; Figures F7, F8, F9). Clay is the most abundant mineral component (47.6%). Diatoms (14%) and sponge spicules (14%) form the dominant biogenic component of the smear slide.

Figure F7. Ternary diagrams of major components and grain size.
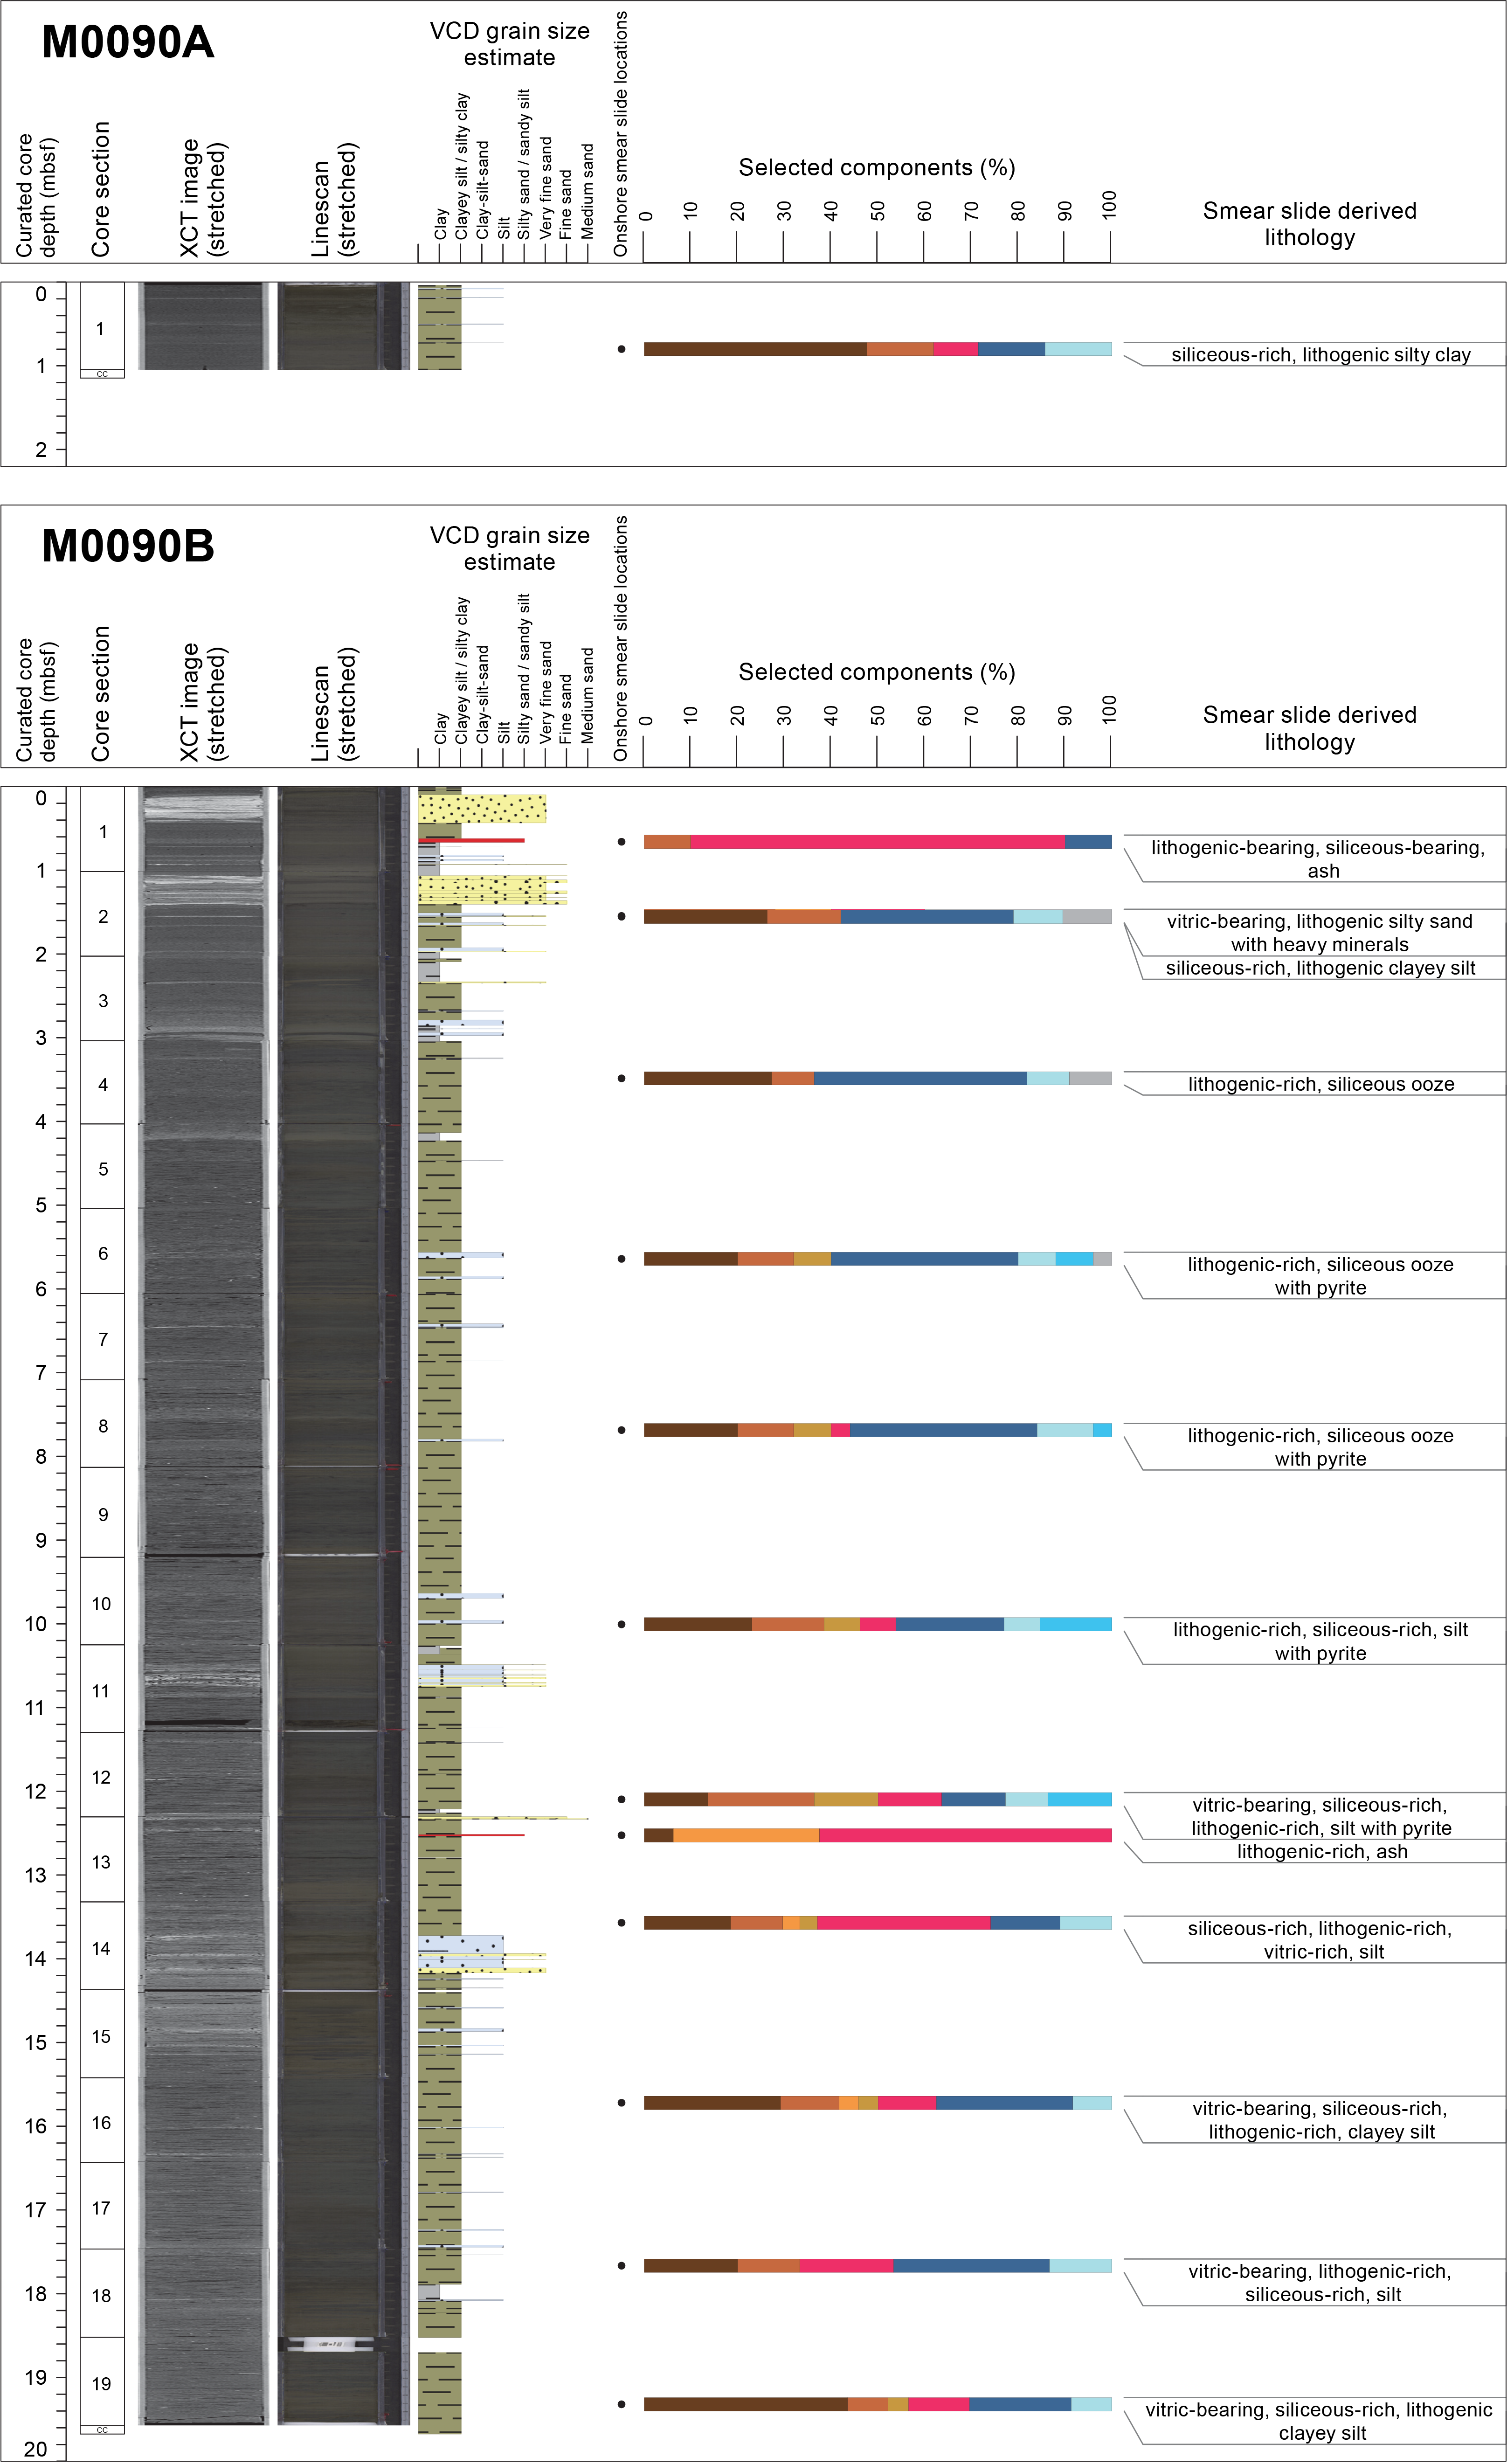
Figure F8. Smear slide summary, Holes M0090A and M0090B.
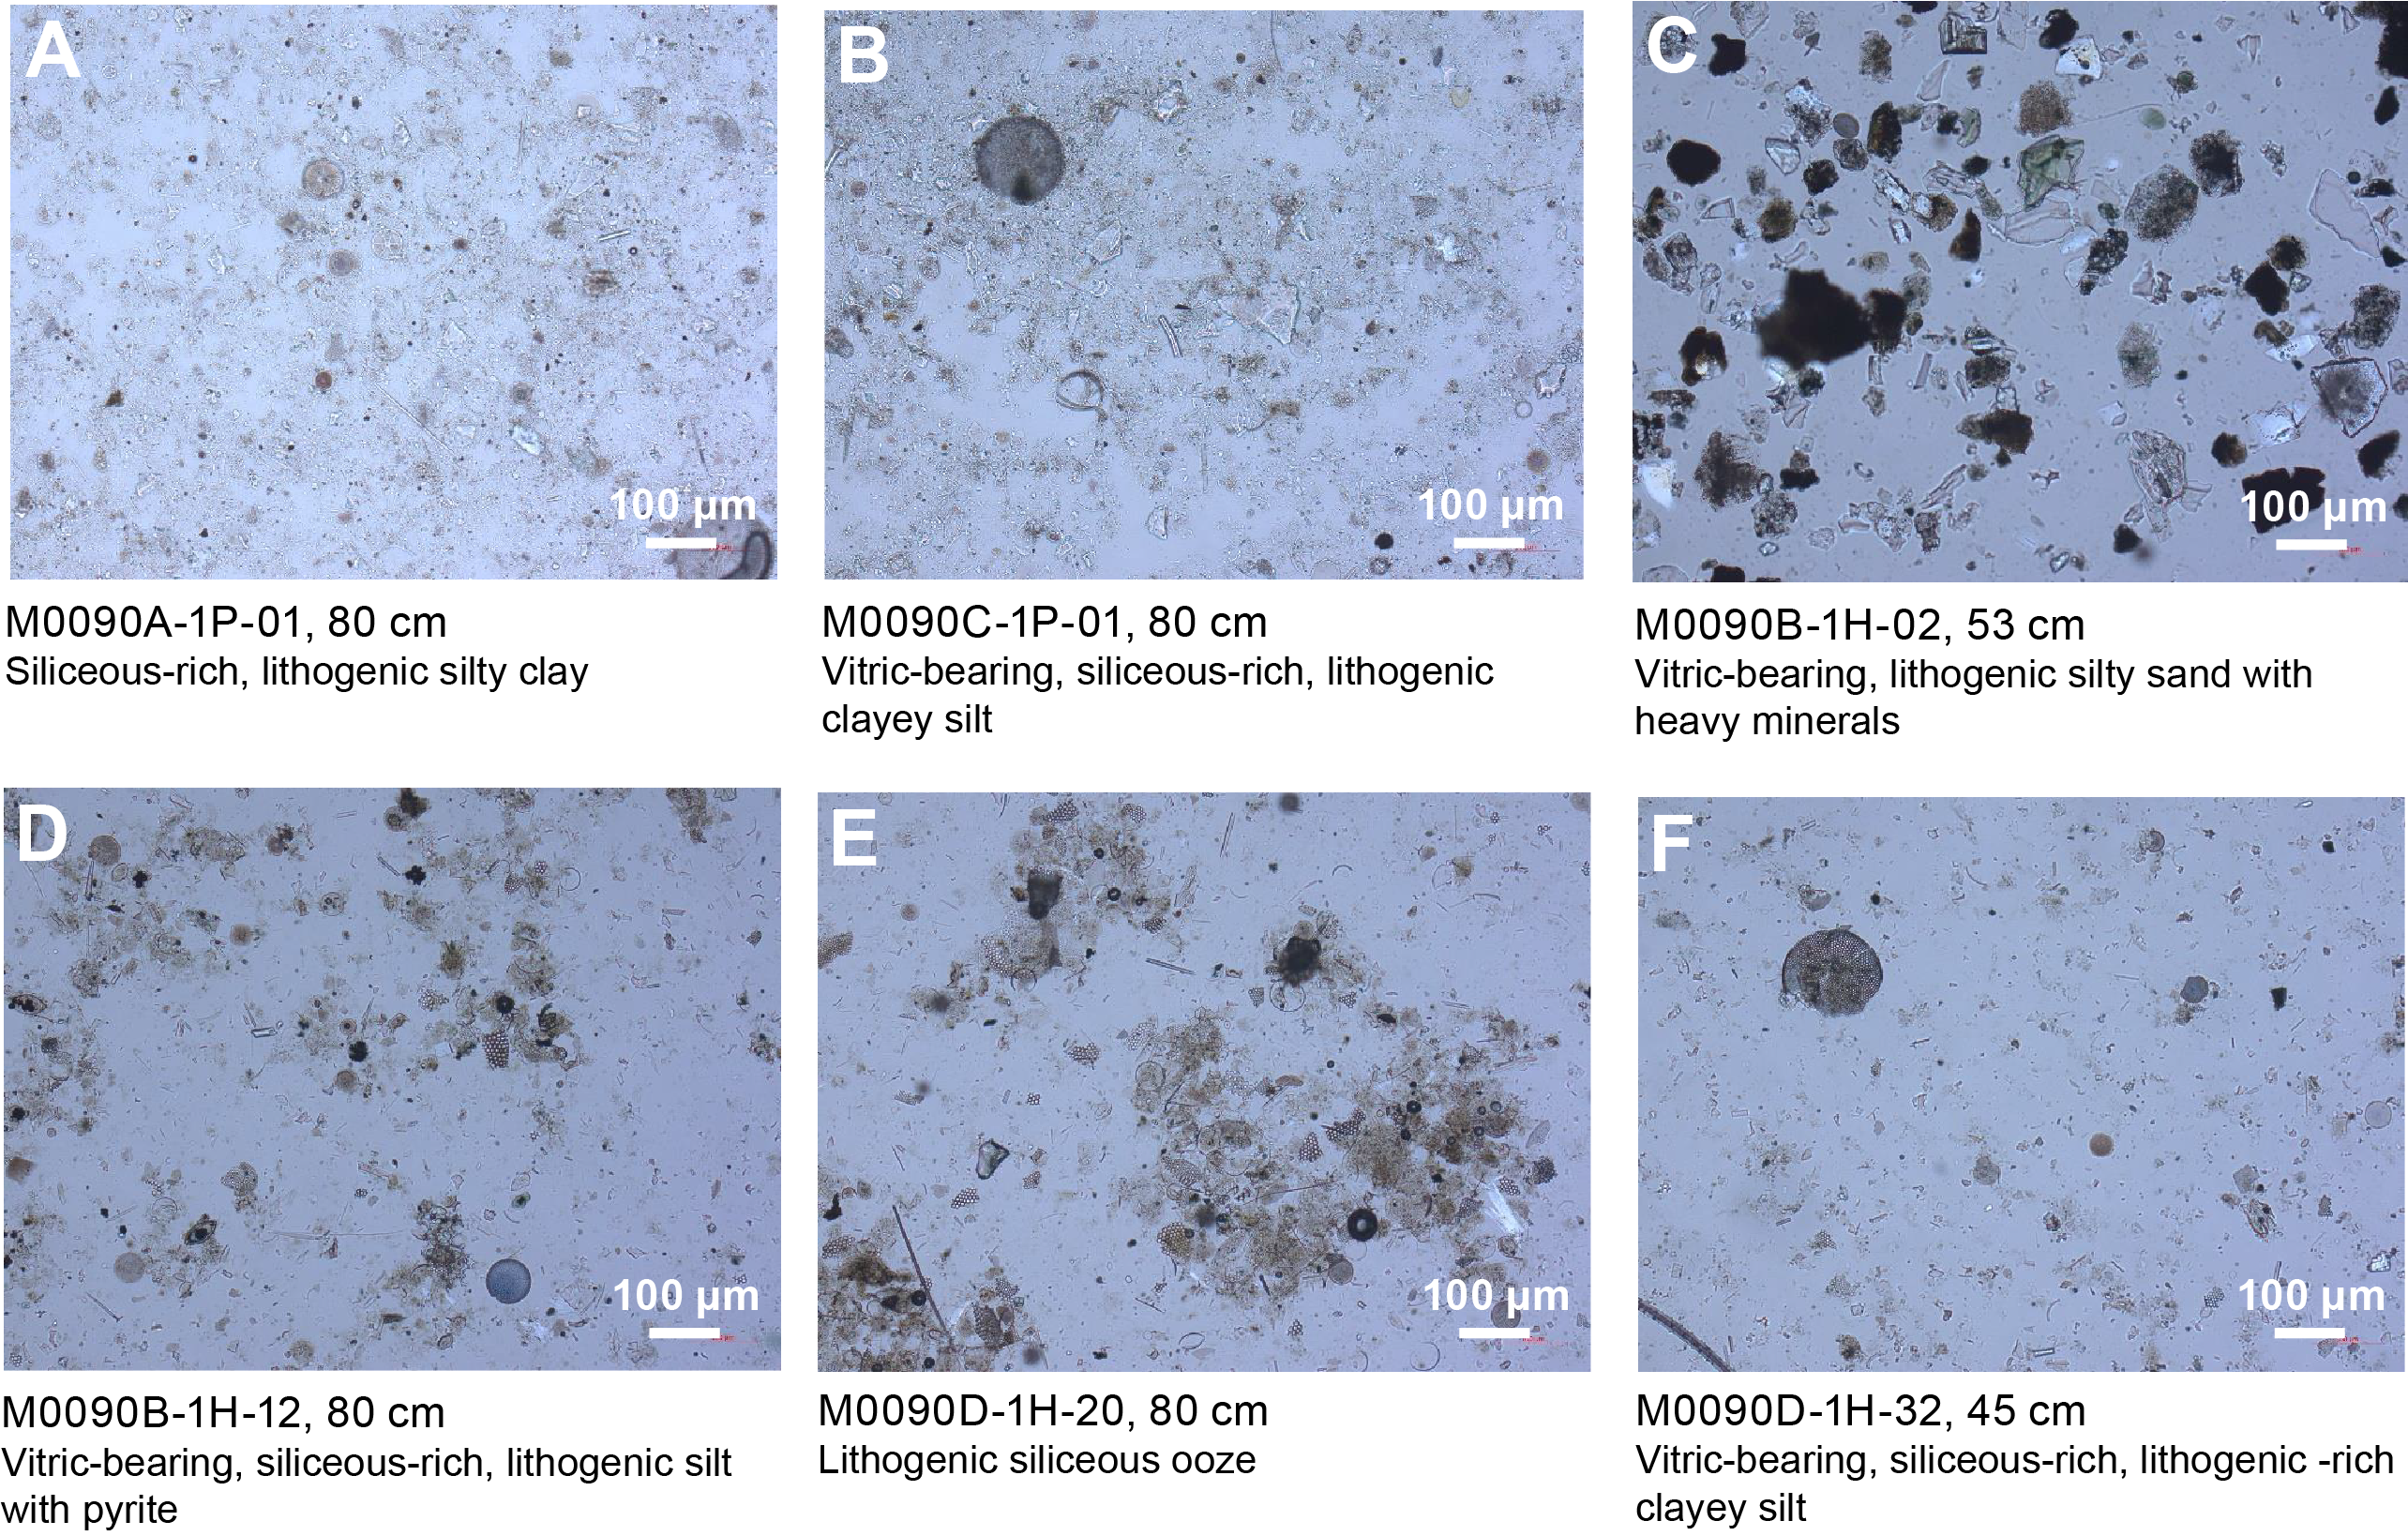
Figure F9. Lithologic and biogenic components.
3.1.2. Hole M0090B
Hole M0090B comprises a piston core with an overall length of 19.675 m in 20 core sections (Figure F6). It is primarily composed of silty clay/clayey silt with silt and sand layers distributed in four intervals.
Interval 1 (0–1.40 meters below seafloor [mbsf]; Sections 386-M0090B-1H-1, 0 cm, to 1H-2, 39 cm) presents decimeter-thick fine to very fine sand layers alternating with clayey silt, sandy silt, and thin silt laminae. Two prominent sand layers are present in intervals 1H-1, 10–43.5 cm, and 1H-2, 5–39 cm. Both layers have a sharp base, internal lamination, and a certain degree of soft-sediment deformation. The upper layer presents an overall chaotic aspect, whereas the lower layer shows some distinct sets of convolute laminations with flame structures in an overall laminated horizon. Sedimentary structures are very apparent in the X-ray CT scan images but are less appreciable in photos. Apart from the two sand layers, the rest of this interval is characterized by a relatively constant spacing of about 10 cm of silt laminae alternating with the dominant clayey silt. No alteration is notable in this interval. Slight bioturbation is present only in the lower part of Section 1H-1. Possible coring disturbance artifacts are present in the form of sediment deformation in the upper sand layer and bowed laminae in the lower sand layer. The three physical property logs show parallel variations of high amplitude with peaks in the sand and silt horizons. The sand beds show high values of NGR, which indicate the presence of radiogenic grains (see Physical properties).
Interval 2 (1.40–10.45 mbsf; Sections 386-M0090B-1H-2, 39 cm, to 1H-11, 24 cm) is dominated by silty clay presenting silt laminae with sharp contacts repeated approximately every 20–30 cm. Sediment color varies in decimeter-thick bands from olive-gray to grayish olive. Physical properties show overall low values, smooth curves for magnetic susceptibility and density, and relatively high NGR in a wavy shaped curve, pointing to a monotonous series of clayey sediment with some silt laminae (see Physical properties). Some levels of moderate to abundant bioturbation and mottling are present, for example in interval 1H-4, 21.6–99.5 cm (the base of Section 1H-4), and in more limited bands in Sections 1H-6 (intervals 1H-6, 26–46.5 cm, and 1H-6, 84–101 cm) and 1H-9 (intervals 1H-9, 20–54 cm, and 1H-9, 66–86 cm).
Interval 3 (10.45–15.20 mbsf; Sections 386-M0090B-1H-11, 24 cm, to 1H-15, 77.3 cm) presents dominant clayey silt to silty clay with alternating silt or very fine sand laminae with irregular spacing ranging from a few to 30 cm. The nature of the contacts are sharp, irregular, or gradational, and bioturbation is overall slight to absent. The sediment color is a relatively uniform grayish olive masked by sparse to moderate iron monosulfide oxidation in centimeter-thick bands or more irregular patches (e.g., intervals 1H-11, 50–100 cm; 1H-13, 0–101 cm; and 1H-14, 0–62 cm). Parallel lamination is the most common sedimentary structure in this interval, occurring in significant thicknesses (e.g., intervals 1H-11, 24–50 cm; 1H-12, 0–9 cm; 1H-13, 0–3 cm; 1H-14, 17–21 cm; and 1H-14, 79–89 cm). Sediment oxidation and cracks are the most common coring disturbance features, together with some bowed laminae. Overall, variations in the physical properties in Interval 3 are of higher magnitude than those in Intervals 2 and 4, with decreasing values from the base of Interval 3 to the top. Magnetic susceptibility and density signals increase and decrease, showing a sawtooth pattern in the sandy/silty horizons and a smooth one in the clayey part of the interval where the signal is consistently lower. NGR values are anticorrelated with the magnetic and density curves, with low values in the sandy silty horizons and high values in the clayey parts. A tephra bed shows a high magnetic susceptibility (see Physical properties).
Interval 4 (15.20 mbsf to base of the core at 19.675 mbsf; Sections 386-M0090B-1H-15, 77.3 cm, to 1H-19, 102 cm) is a dominantly fine-grained lithology with grayish olive clayey silt/silty clay alternating with sporadic silt laminae with sharp but most commonly irregular contacts. Bioturbation is rather pervasive and moderate to slight in intensity. Magnetic susceptibility and density have an almost constant and low value with a slight increase toward the base of the interval, whereas NGR are relatively high and variable, indicative of an homogeneous poorly bedded clayey horizon with some silt laminae (see Physical properties).
A total of 13 smear slides were studied for Hole M0090B (Table T3; Figure F8; see smear slide photos in SMEARSLD in Supplementary material). The lithology is described as silty sand, sandy silt, silt, clayey silt, and siliceous ooze with a variable lithogenic/siliceous/vitric component (Figure F7). The coarsest grain sizes are limited mainly to Interval 1, and to a much lesser extent Interval 3, whereas in the other intervals the dominant grain size component is clayey silt. Vitric components were observed in sandy silt (Section 1H-1, 66 cm), silty sand (Section 1H-2, 53 cm), silt (Sections 1H-12, 80 cm; 1H-13, 22 cm; 1H-14, 25 cm; and 1H-18, 20 cm) and clayey silt (Sections 1H-16, 30 cm, and 1H-19, 80 cm) (Figures F9, F10). Diatoms are the most abundant biogenic component with abundance values up to 40%; sponge spicules and radiolaria at times reach up to 15%.
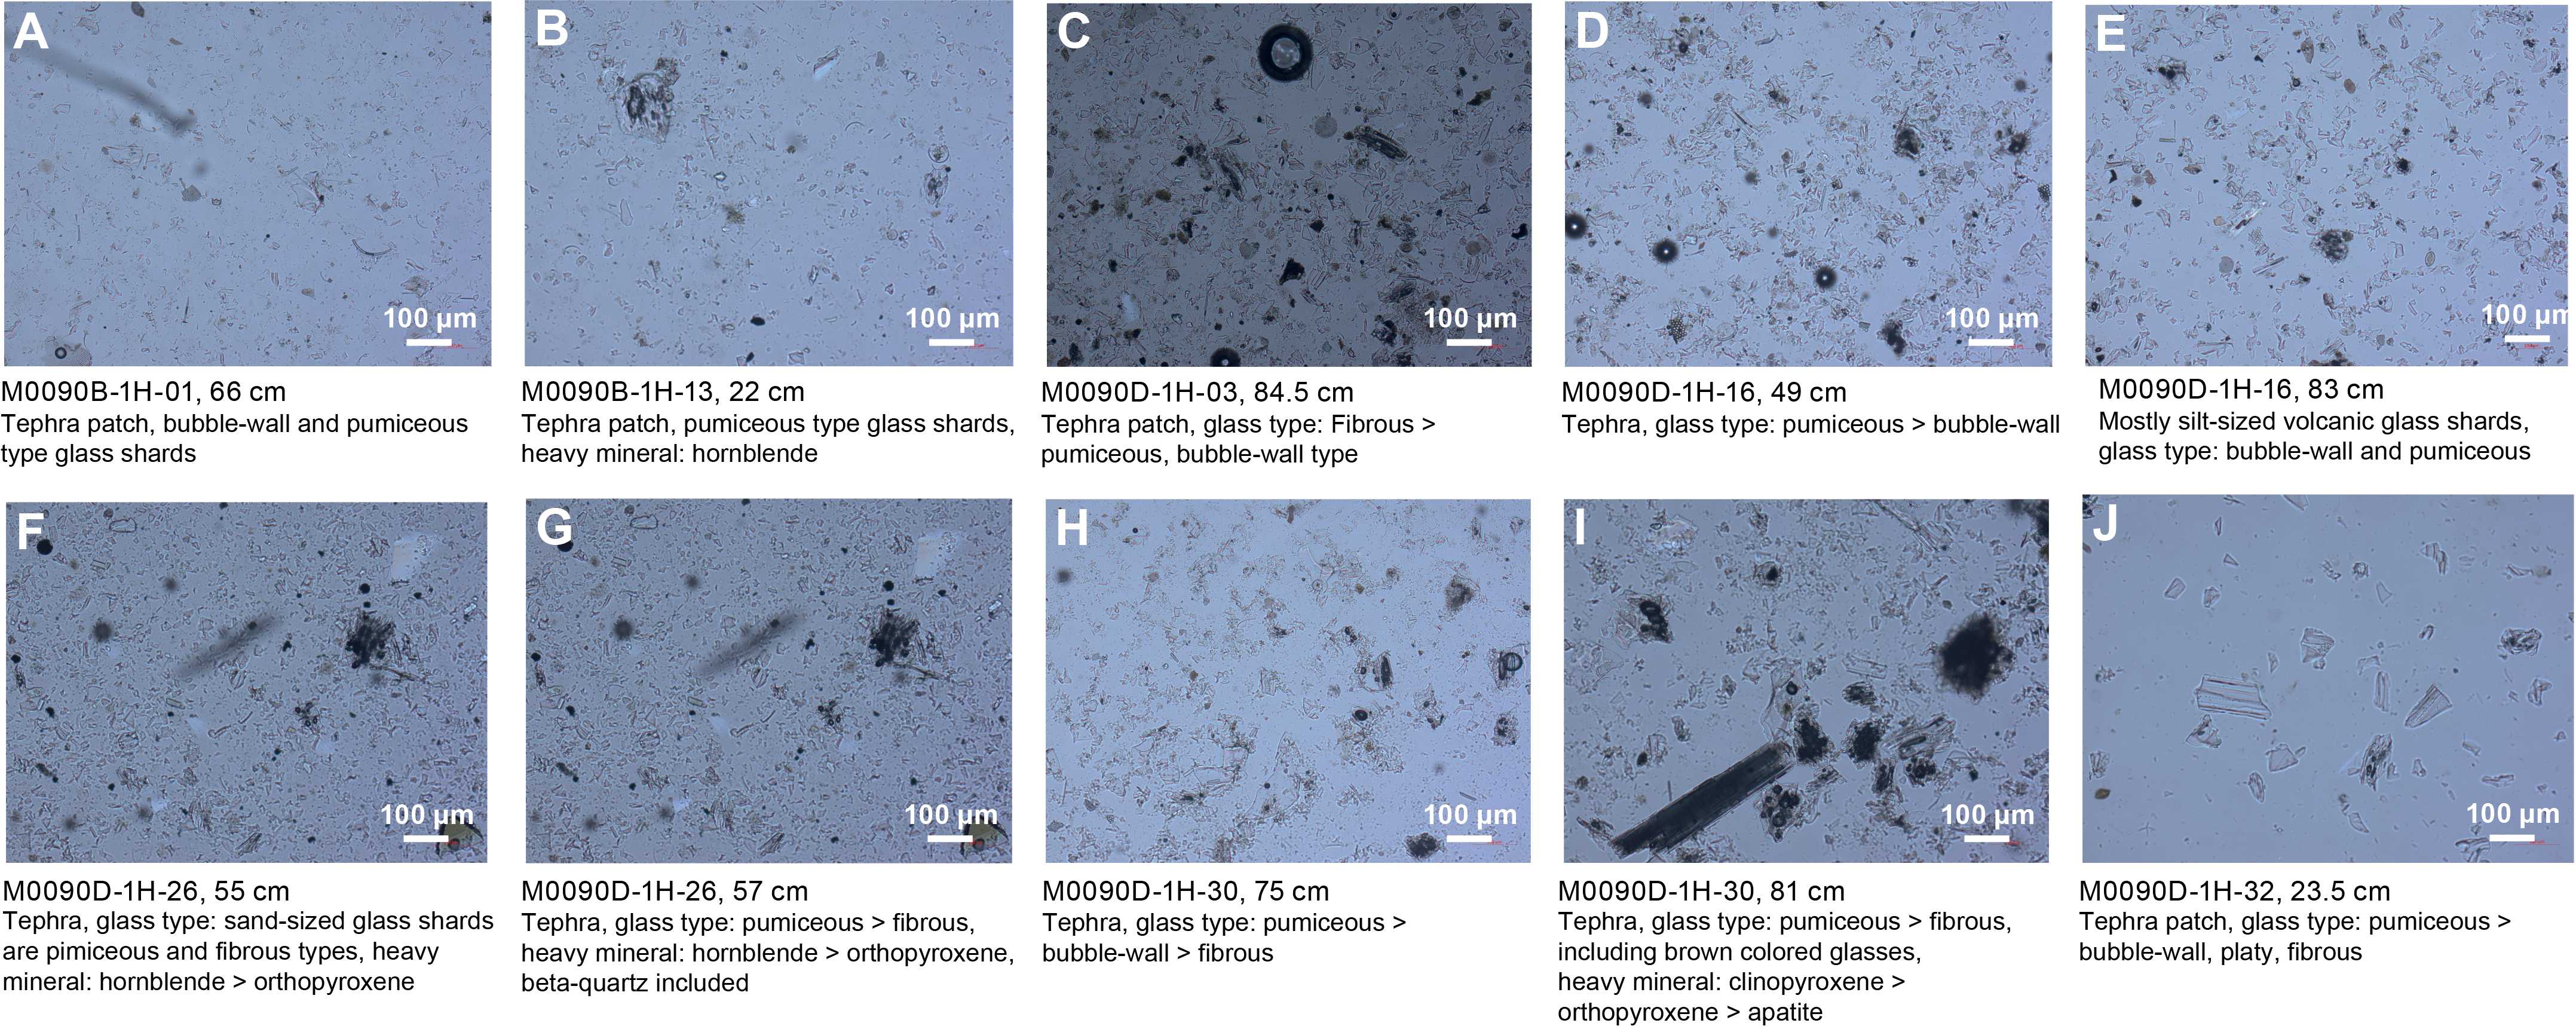
Figure F10. Main tephra lithologies.
3.2. Holes M0090C and M009CD
3.2.1. Hole M0090C
Hole M0090C comprises a 1.075 m long single section trigger core plus a core catcher. It is mainly composed of clayey silt displaying 0.5–1 mm thick silt laminae occurring at intervals of a few to about 20–30 cm (Figure F11). The only sedimentary structures are the silt laminae mentioned above with generally sharp contact surfaces. Bioturbation is sparse and concentrated in the lower half of Section 386-M0090C-1P-1. Color bands of grayish olive with dark olive-brown observed in the uppermost 8 cm suggest that the seabed sediments have been preserved. Physical properties (magnetic susceptibility, density, and NGR) are very similar to Hole M0090A. They show an overall increase in values downcore. The MSCL logs show peaks of magnetic susceptibility and density at laminated silt horizons, but the poor resolution of NGR cannot lead to any sound conclusion (see Physical properties).
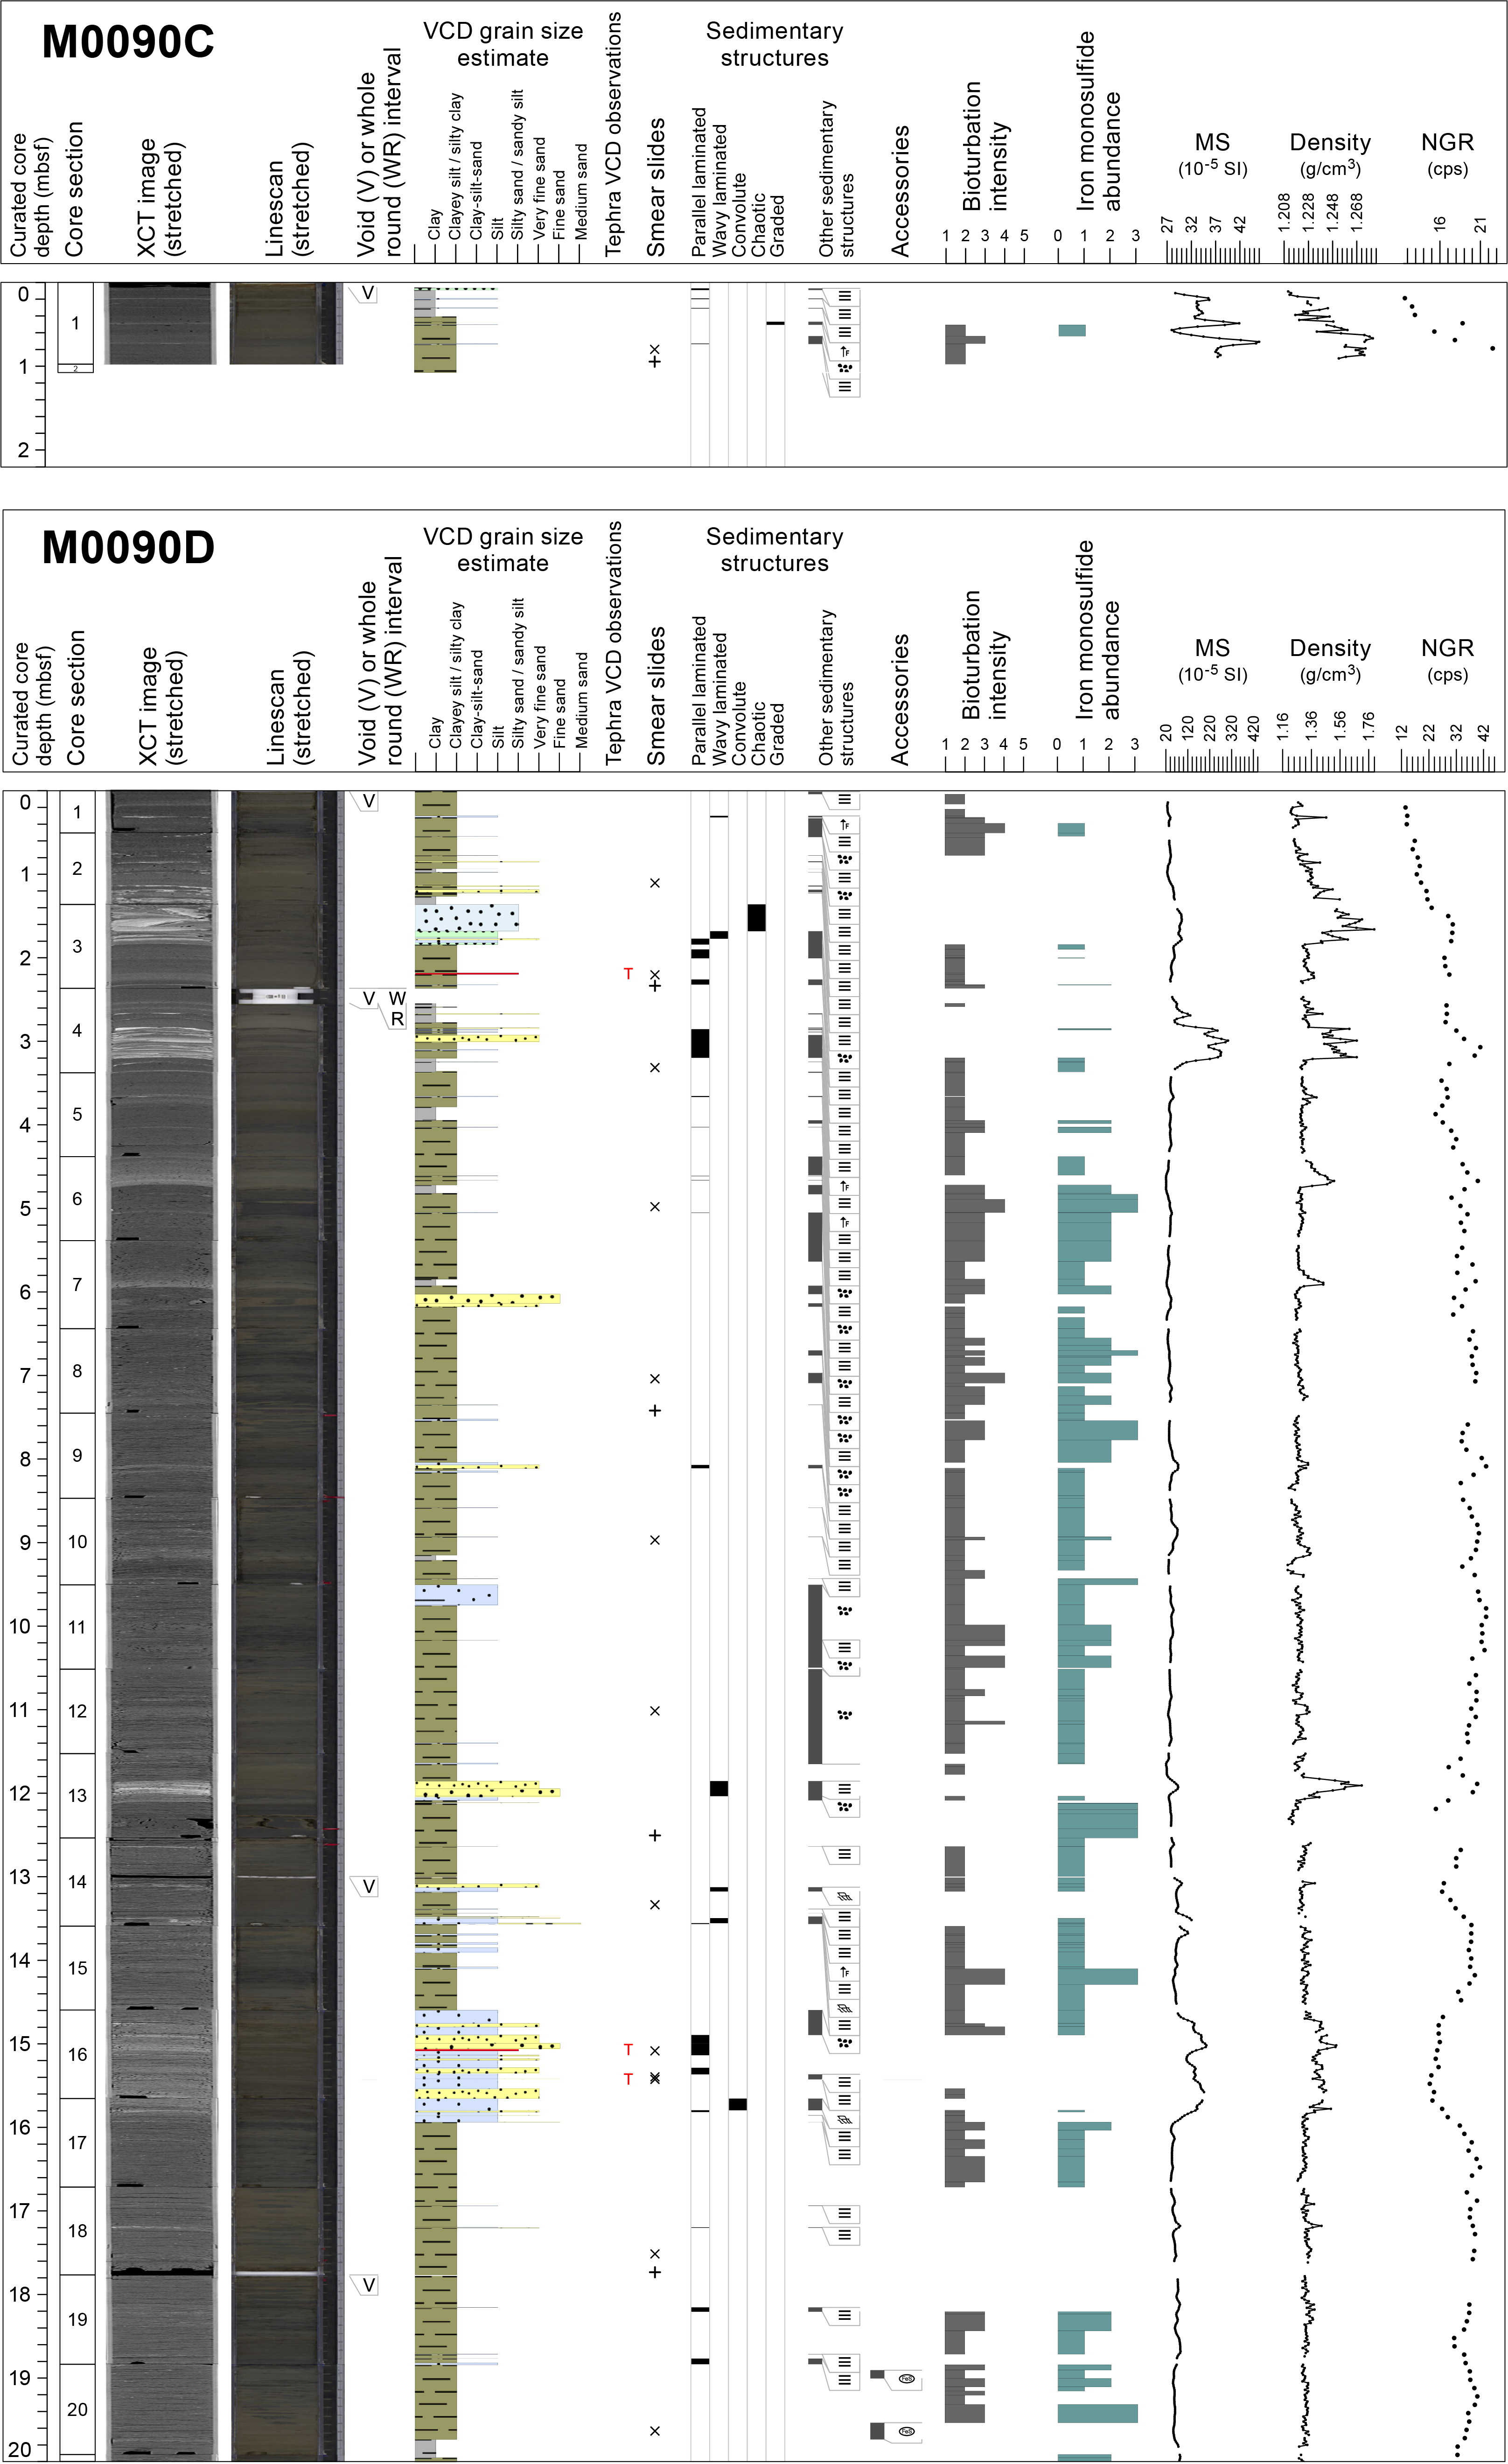

Figure F11. Lithostratigraphic summary, Holes M0090C and M0090D.
From one smear slide data point in Sample 386-M0090C-1P-1, 80–81 cm, the lithology is described as vitric-bearing siliceous-rich lithogenic clayey silt (Table T3; Figures F9, F12). The lithics are the most abundant mineral component (54.2%), and the clay component is 41.7%. Diatoms (20.8%) and sponge spicules (12.5%) form the biogenic component (total = 33%). Vitric grains (glass) represent 12.5%.
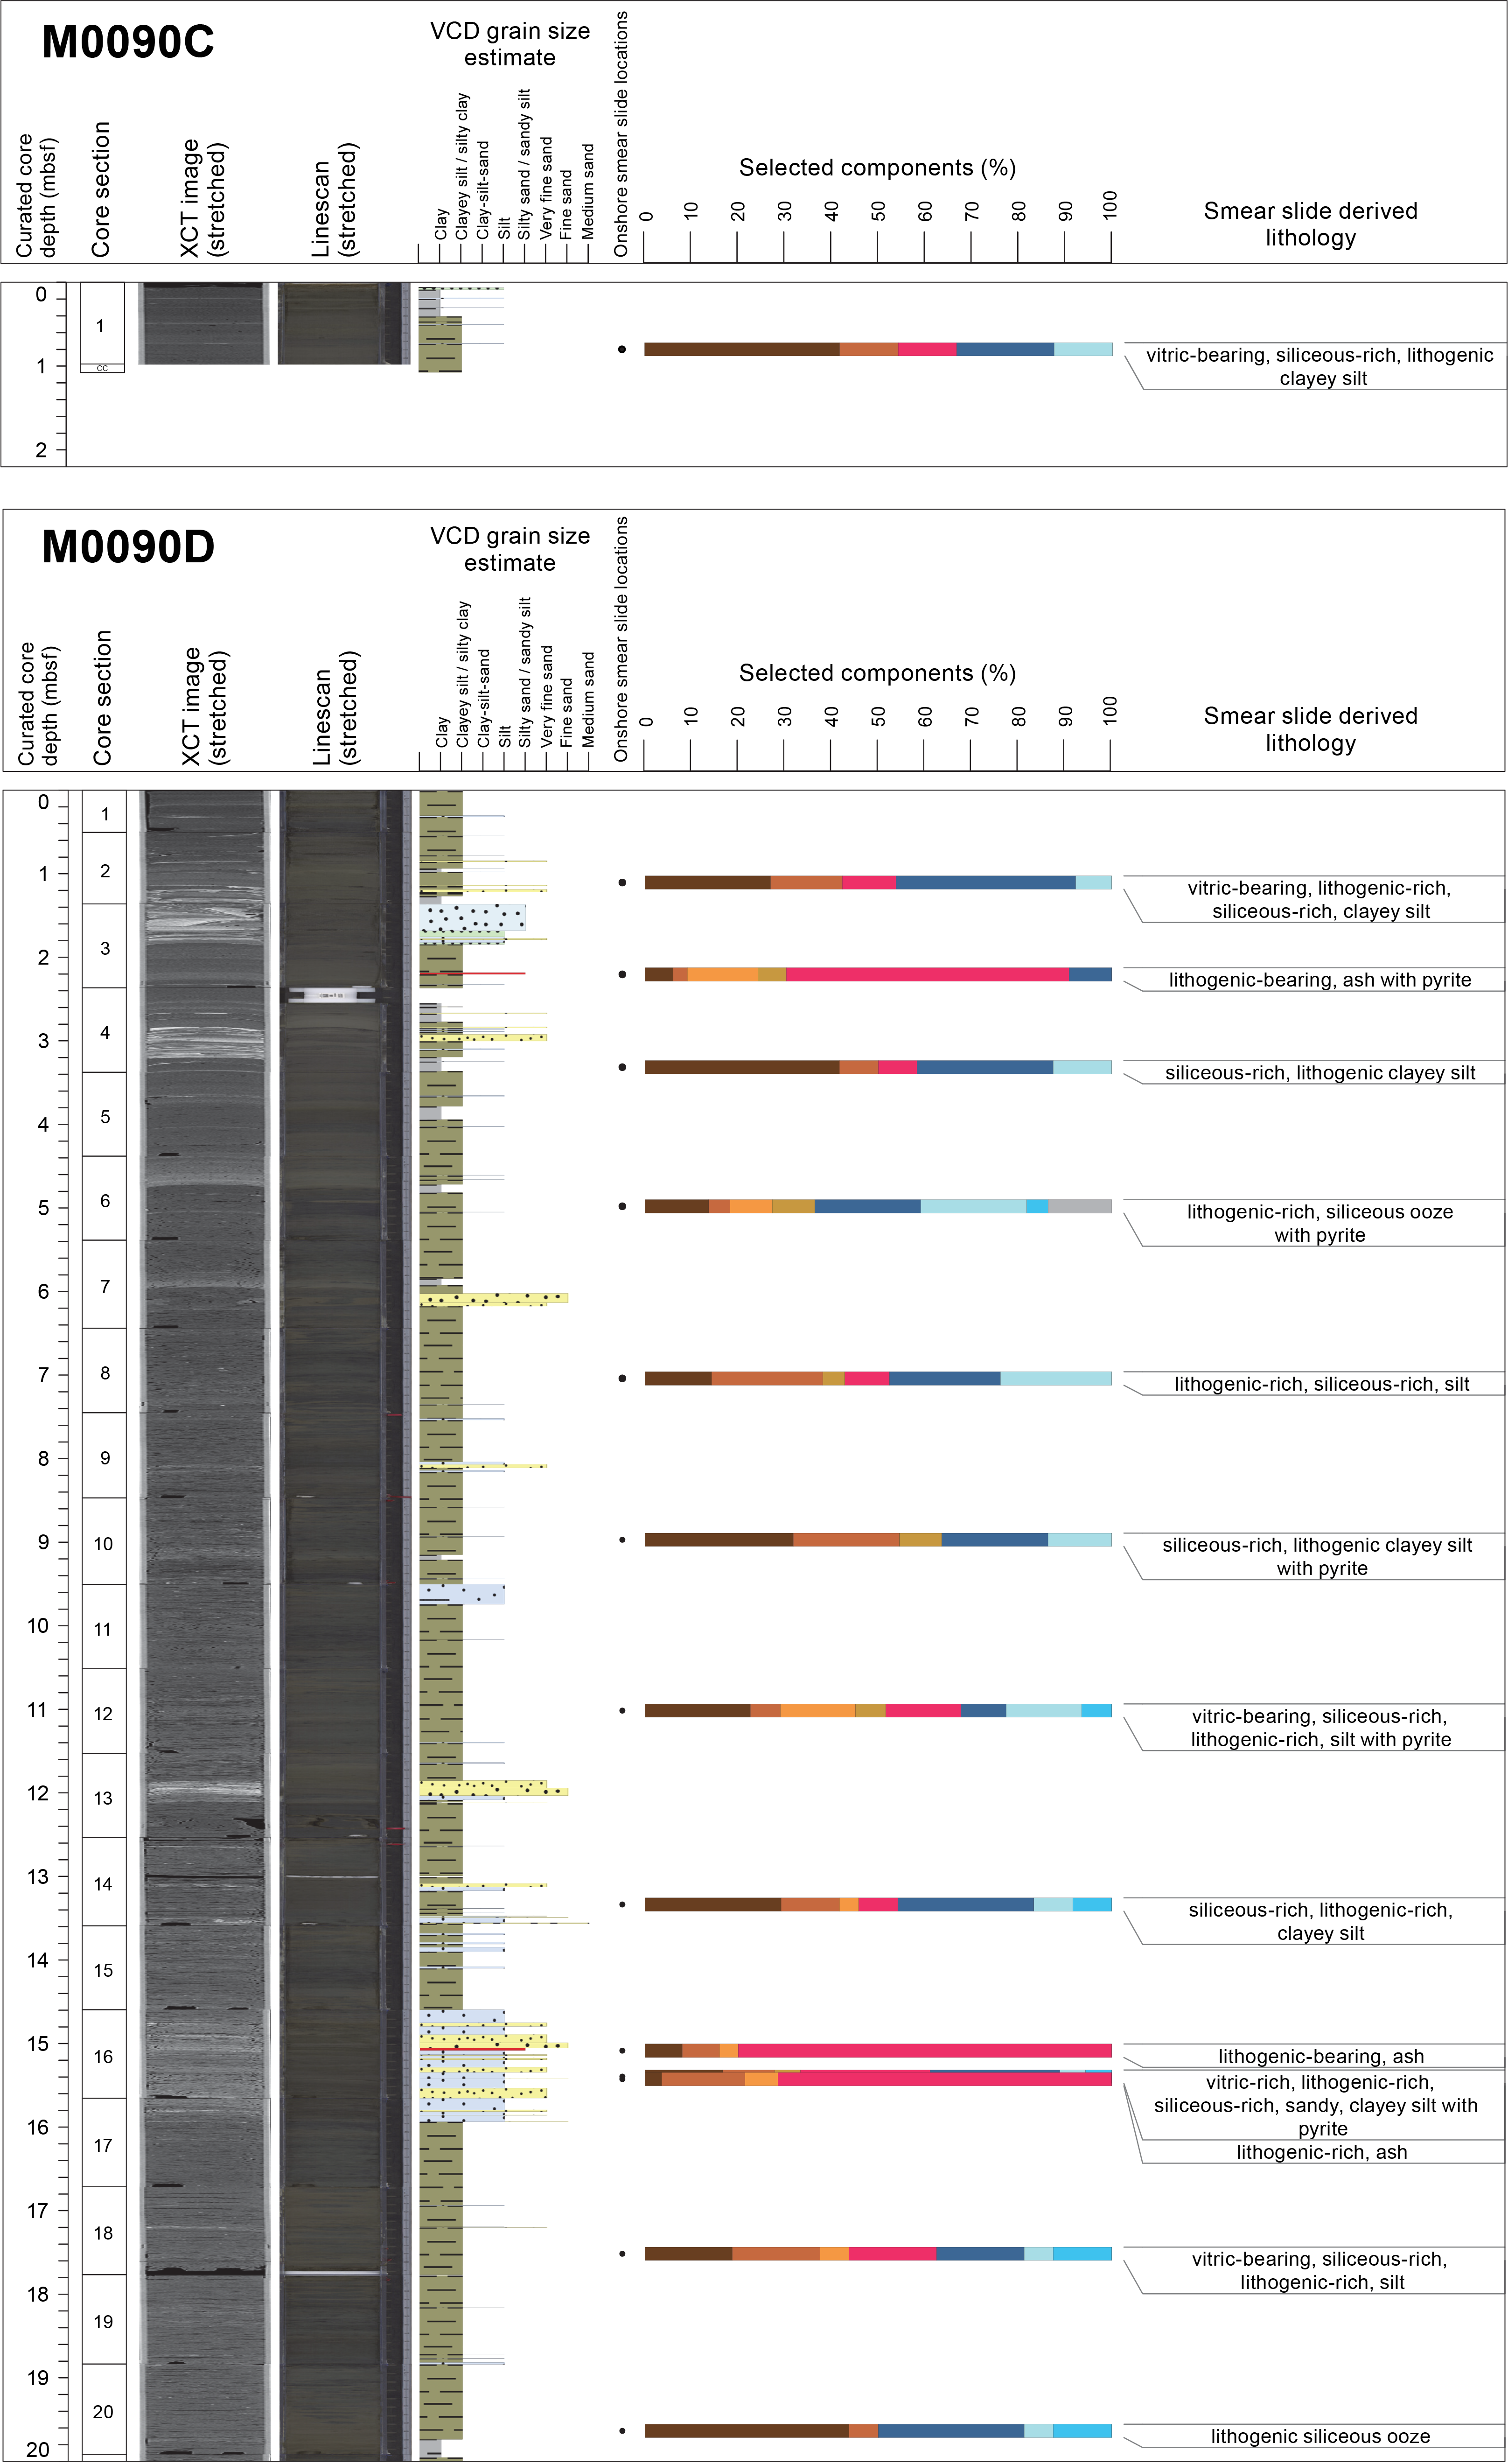
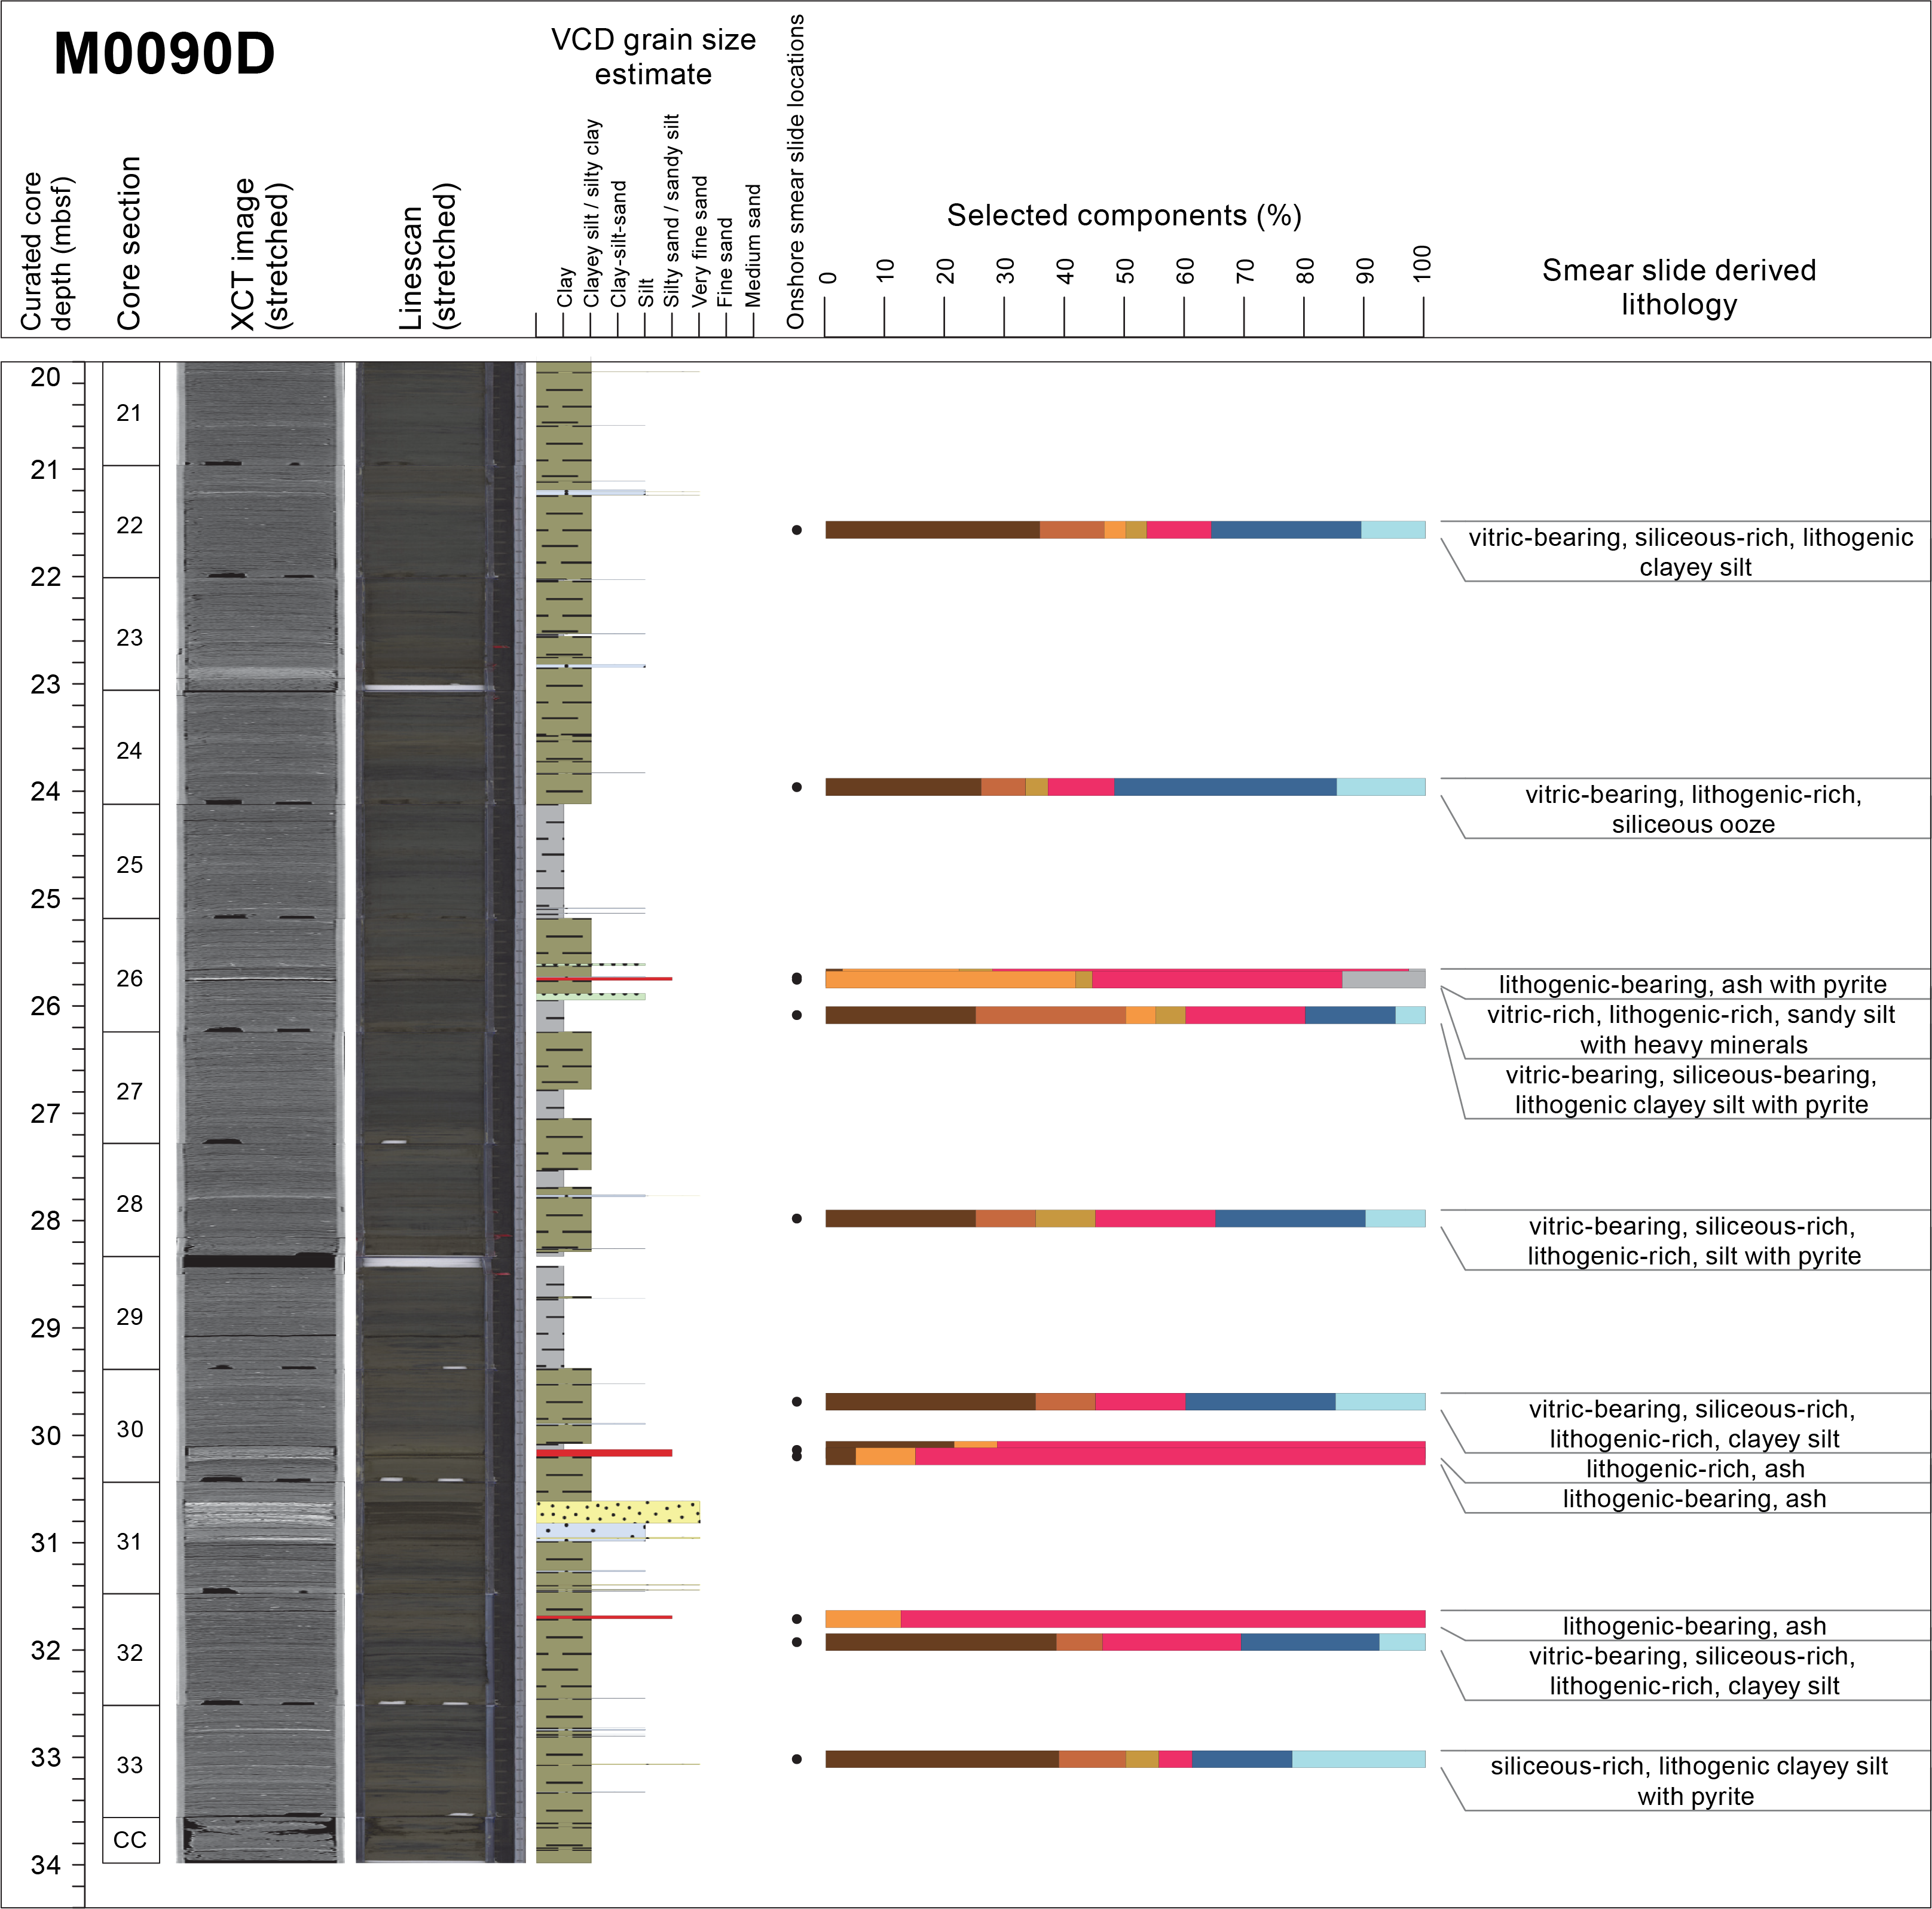
Figure F12. Smear slide summary, Holes M0090C and M0090D.
3.2.2. Hole M0090D
Hole M0090D is 33.935 m deep and comprises 33 core sections plus a core catcher (Figure F11). Its overall composition is silty clay/clayey silt with silt and very fine sand layers distributed in six intervals.
Interval 1 (0–3.195 mbsf; Sections 386-M0090D-1H-1, 0 cm, to 1H-4, 83 cm) is characterized by alternating millimeter- to centimeter- thick, sharp-based silt layers with clay intervals of 10–30 cm. Two bedsets are dominated by silt and/or very fine sand with parallel/wavy laminations, at times with sediment deformation. These two bedsets lie in Sections 1H-2, 68 cm, to 1H-3, 46 cm, and 1H-4, 49 cm, to 1H-4, 83 cm. Both bedsets have a sharp base and spectacular lamination in the X-ray CT scan images, albeit affected by possible coring artifacts (bowing and maybe also soft-sediment deformation). As in Hole M0090B, the upper bedset presents an overall chaotic aspect and the lower one shows some distinct sets of convolute laminations with flame structures in overall laminated sedimentary facies. Bioturbation is sparse in interval 1H-3, 48–100.5 cm, and moderate at the top of the core (0–0.70 mbsf). Magnetic susceptibility and density show marked higher values with a sharp increase at the base and decreasing values upward, in correspondence with the two sand/silt dominated bedsets (see Physical properties).
Interval 2 (3.195–11.80 mbsf; Sections 386-M0090D-1H-4, 83 cm, to 1H-13, 33 cm) is dominated by silty clay alternating with very thin silt laminae or thin sand beds with sharp contacts, repeated roughly every 10 cm but more frequently every 30 cm or more. Sediment color is a rather constant grayish olive. Some levels of moderate to abundant bioturbation and mottling are present (e.g., interval 1H-5, 57–72 cm) in bands of alternating moderate/sparse bioturbation in Sections 1H-6, 44 cm, to 1H-8, 91 cm, and 1H-11, 48 cm, to 1H-12, 62 cm. Magnetic susceptibility and density display overall constant values with isolated spikes at the location of thin silt/sand beds (see Physical properties).
Interval 3 (11.80–16.00 mbsf; Sections 386-M0090D-1H-13, 33 cm, to 1H-17, 28 cm) is composed of clayey silt with alternating laminae of silt or very fine to fine sand with irregular spacing ranging from a few to 30 cm. Contacts are sharp, irregular, or gradational, and bioturbation overall is slight to absent. The sediment color is a relatively uniform grayish olive. Crude parallel lamination is sometimes apparent, especially in Section 1H-16 (e.g., interval 1H-16, 30–77 cm). Sediment oxidation and cracks are the most common coring disturbance features, together with some bowed laminae. Magnetic susceptibility and density are variable and higher than in Intervals 2 and 4, with peaks corresponding to the coarsest beds (e.g., interval 1H-13, 33–51 cm, and Sections 1H-16, 16 cm, to 1H-17, 28 cm) (Figure F4) and display an overall trend characterized by a decreasing signal from the base of Interval 3 to the top as the sediment fines upward (see Physical properties).
Interval 4 (16.00–30.20 mbsf; Sections 386-M0090D-1H-17, 28 cm, to 1H-30, 82 cm) is a succession dominated by clayey silt/silty clay/clay with irregularly spaced thin (millimeter-thick) silt or very fine sand laminae, mostly with a sharp base. Bioturbation is sparse to moderate in alternating bands. Parallel lamination is clearly apparent, corresponding to the occurrence of silt/sand laminae. Sediment oxidation and the presence of cracks are the most common evidence of coring disturbance. Magnetic susceptibility and density signals are generally constant, with sporadic increases forming peaks likely associated with the occurrence of silt/sand layers. The increases in the signal at times correspond with interpreted tephra layers, for example, the fine sand layer in interval 1H-26, 55–58 cm, and the medium- to fine-grained fining-upward sand in interval 1H-30, 79–82 cm (Figure F13) (see Tephra).

Figure F13. Volcanic ash.
Interval 5 (30.20–33.935 mbsf, base of the core; Sections 386-M0090D-1H-30, 82 cm, to 1H-34, 40 cm) is characterized by the presence of very fine sand laminae, especially a very fine sand bed in interval 1H-31, 18.5–39 cm. Sand beds and laminae display sharp/wavy bottom contacts and internal wavy lamination. The remainder of the interval is dominated by the presence of clayey silt/silty clay with alternating silt laminae occurring roughly every 10 cm. Bioturbation is moderate to heavy. The physical properties present the highest values at the depth of the thickest sand layer (interval 1H-31, 18.5–39 cm). Otherwise, values generally decrease from the base to the top of the unit (see Physical properties).
A total of 25 smear slides were studied for Hole M0090D. The lithology is described as clayey silt, silt, sandy silt, siliceous ooze, and ash with variable amounts of lithogenic/siliceous/vitric components (Table T3; Figures F7, F12; see smear slide photos in SMEARSLD in Supplementary material). Vitric components (volcanic glass) are identified up to 60.6%–80% in layers interpreted as tephra, for example Sections 386-M0090D-1H-26, 55 cm; 1H-26, 57 cm; 1H-30, 75 cm; 1H-30, 81 cm; and 1H-32, 23.5 cm (Figure F10) (see Tephra). Diatoms are the most abundant biogenic component (37%–38%); sponge spicules reach up to 22%.
3.3. Diagenesis
At Site M0090, iron monosulfides occur in three main patterns: (1) small dots (1–10 mm in diameter) or patches (>1 cm in diameter) in fine-grained sediment intervals with slight bioturbation; (2) moderate intensity of iron monosulfide in mottled sediment in bioturbated zones, and (3) abundant iron monosulfide intensity in alternating silt and silty clay with slight bioturbation forming color bands (Figures F11, F14).
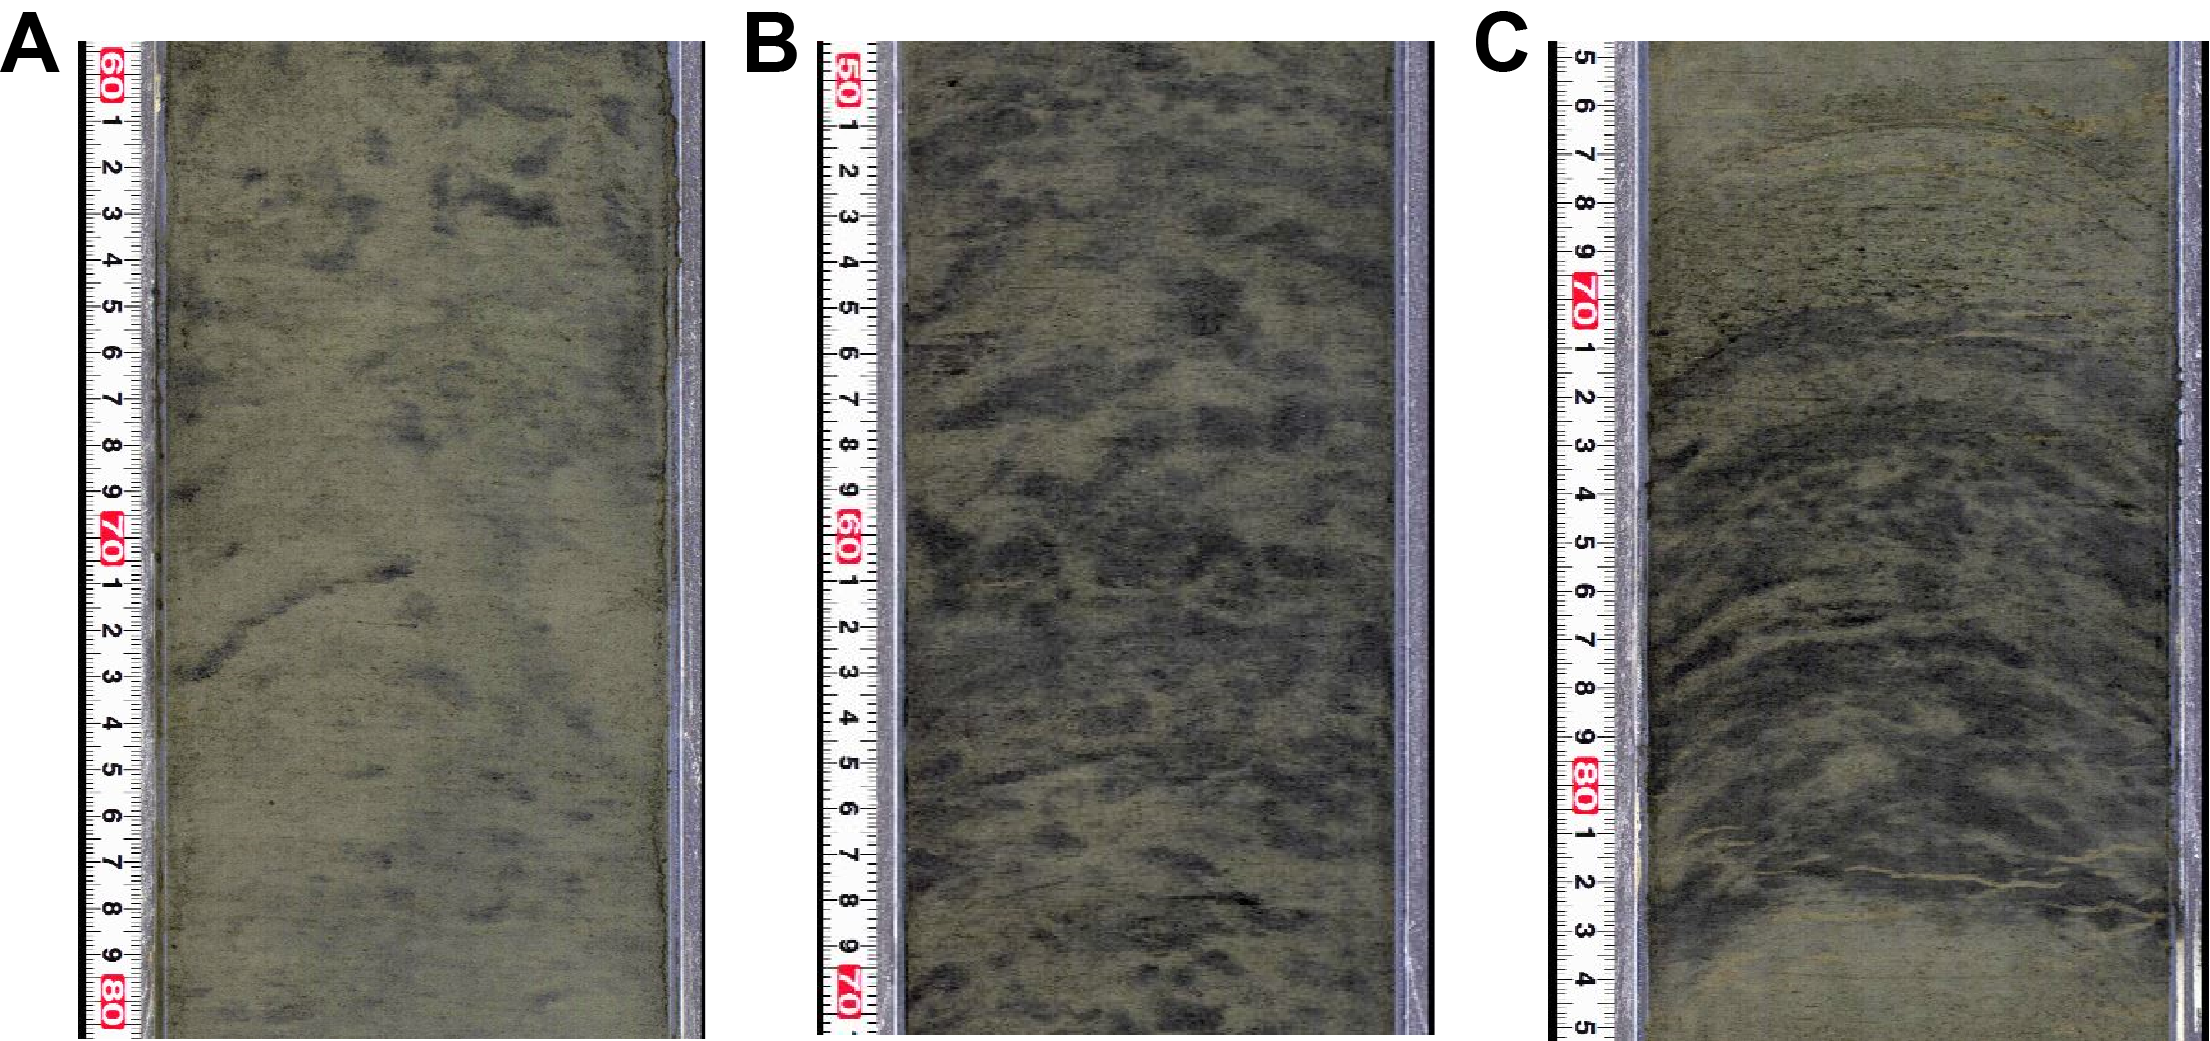
Figure F14. Iron monosulfide occurrence.
3.4. X-ray diffraction mineralogy
X-ray diffraction mineralogy was conducted for one sample every 2 m, and some minerals are grouped. These groupings will require additional processing to extract a signal for each mineral. For example, quartz has not been separated from opal-A, and clays, carbonates, amphiboles, pyroxenes, and heavy minerals are composed of several minerals in each grouping (see Lithostratigraphy in the Expedition 386 methods chapter [Strasser et al., 2023a]). The interpretation of the mineralogy is an approximation at this stage. However, some interpretations can be made when the data are contrasted with the lithostratigraphic summary plots.
For Hole M0090D, the most abundant minerals are quartz, feldspar, and clays, followed by micas (muscovite and biotite) but no carbonates (Figure F15). The data show correspondence between quartz, feldspar, clays, and micas, and the smear slide data also show they are the most abundant minerals, particularly where sand and silt beds are the thickest (e.g., ~10, 16, 25, and 31 mbsf) (Table T3; Figure F12; see XRD in Supplementary material). Palygorskite, a clay associated with the weathering of glasses, occurs at 0–12 and 21–31 mbsf. These levels do not specifically correspond to places where vitric grains and ashes are abundant in Hole M0090D, as observed in smear slides (Figures F12, F15). Heavy minerals are present in limited amounts at 11, 19, 25, and 31.5 mbsf. Pyrite is rare but present at 4 and 18.5 mbsf. Pyroxene is present at 0–12 and 33 mbsf but particularly abundant in a decimeter-thick sand layer at 12 mbsf. No mineral from the amphibole group was observed. The overall very smooth curves of mineral abundances in Hole M0090D are indicative of a relative homogeneity of the mineral composition along the hole.
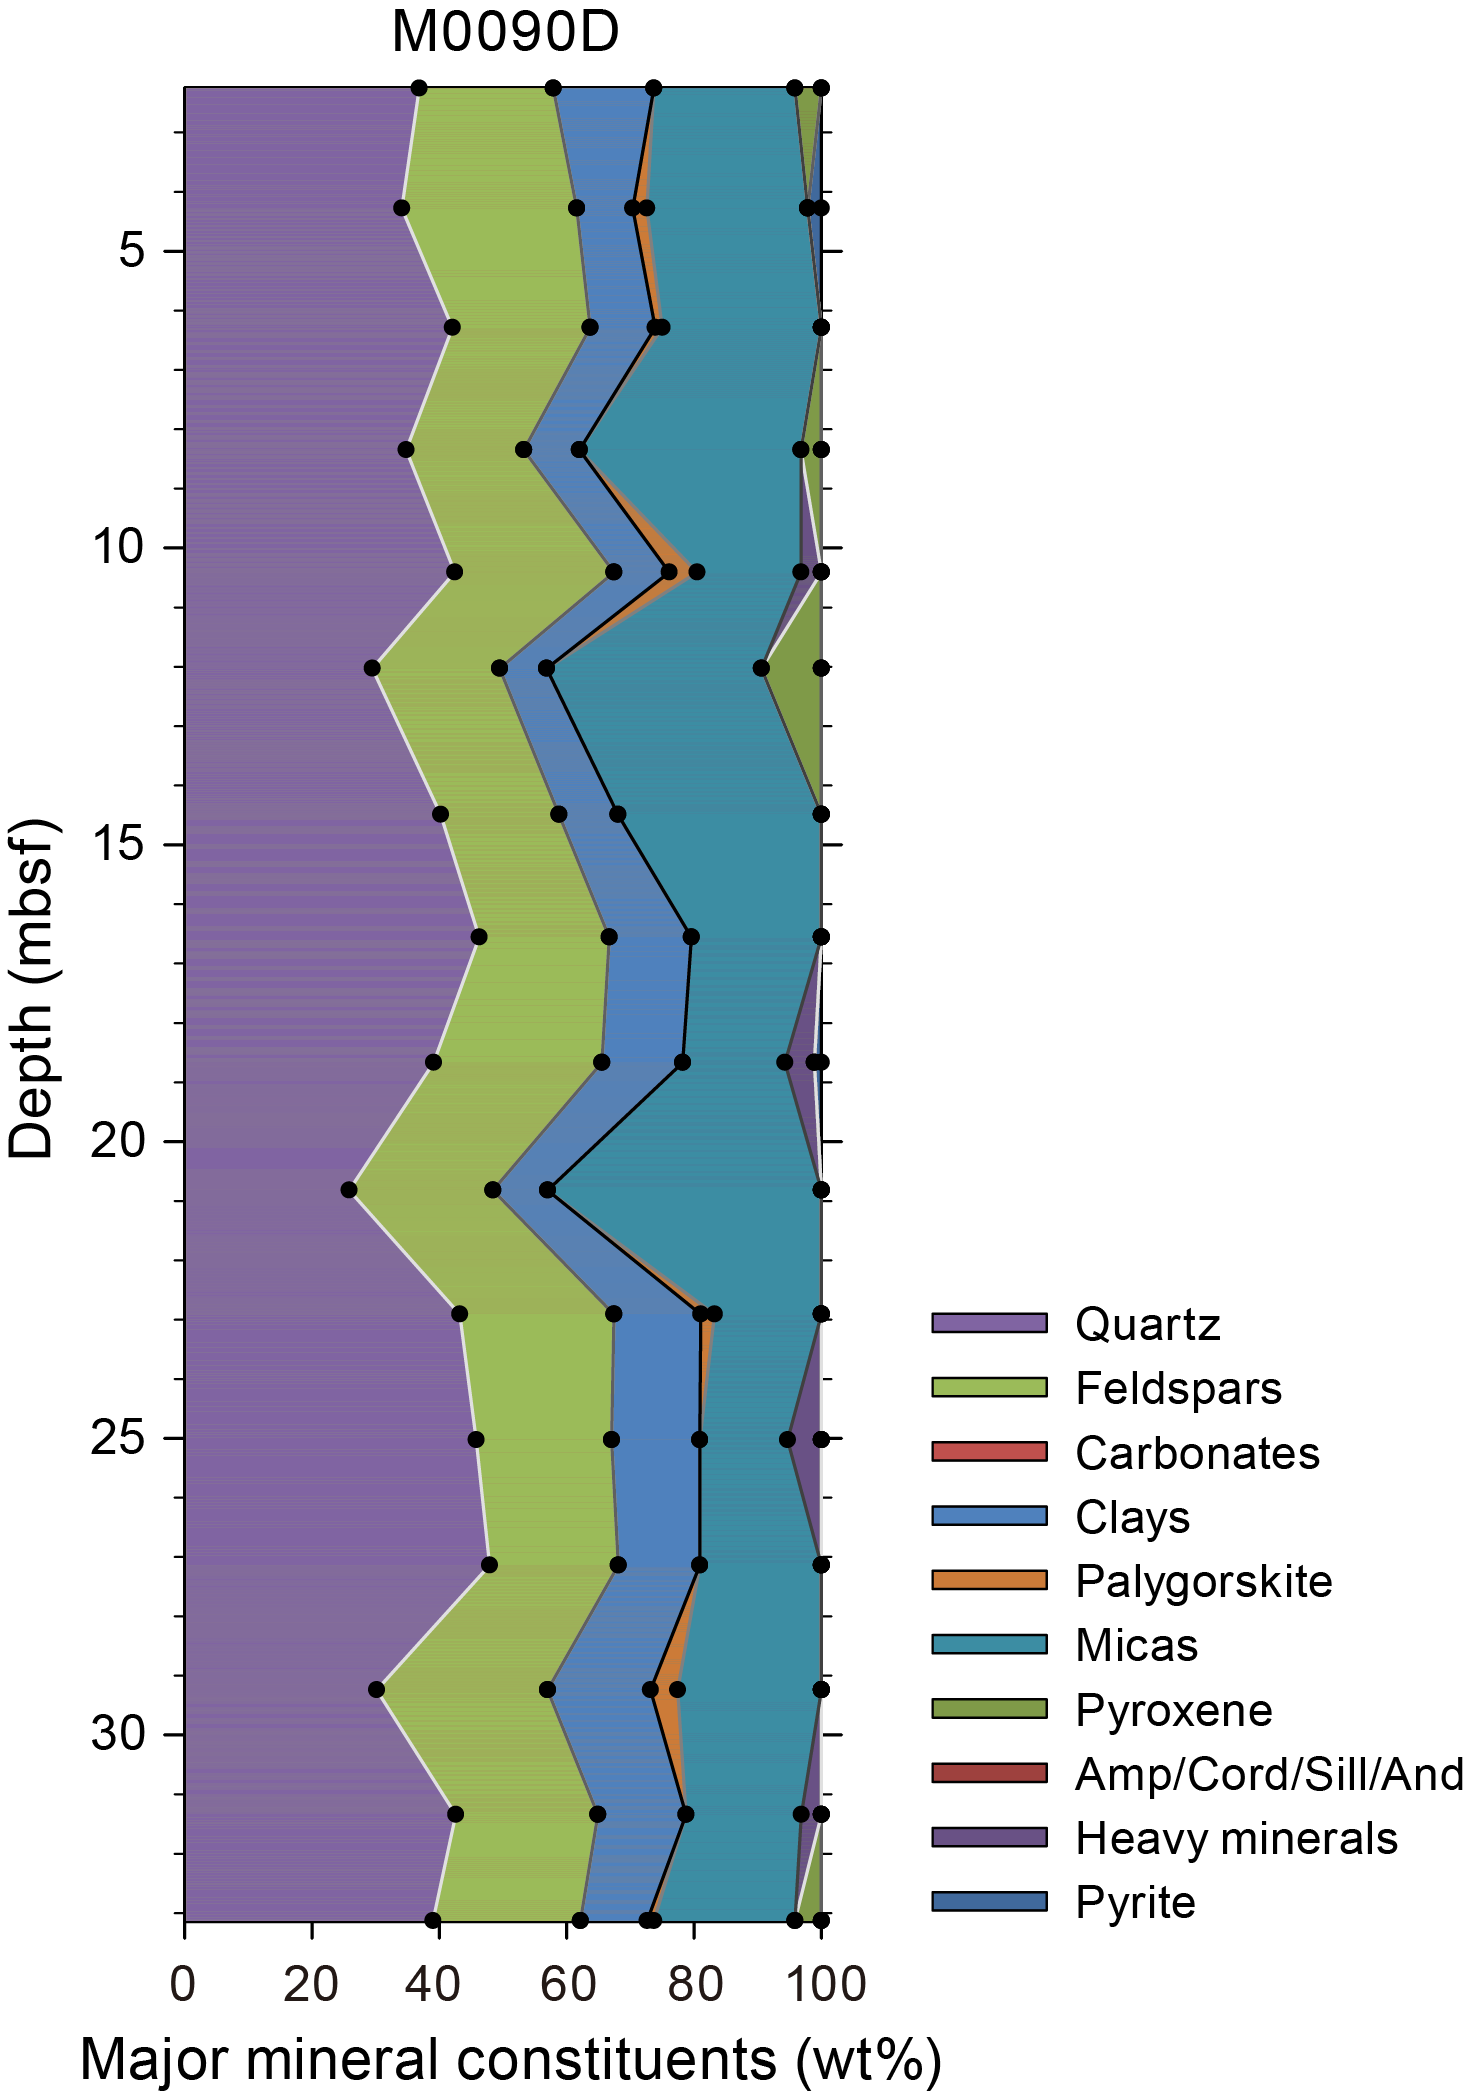
Figure F15. XRD mineralogy.
4. Tephra
Eight tephra layers were described in Basin C1, more than observed at other basins cored during Expedition 386 (Table T4). Most of the tephra layers occur in Hole M0090D and are described as beds or lenticular beds.
A reddish brown silt-sized tephra (M0090B-1H-1, 67 cm) is intercalated as patches in silty sediment interval 386-M0090B-1H-1, 63–67 cm (Figure F16A). It is composed of multiple types of volcanic glass shards such as pumiceous, moderate vesicularity, fibrous, and bubble-wall (Figure F17A). Heavy minerals were not observed, except for weathered biotite.
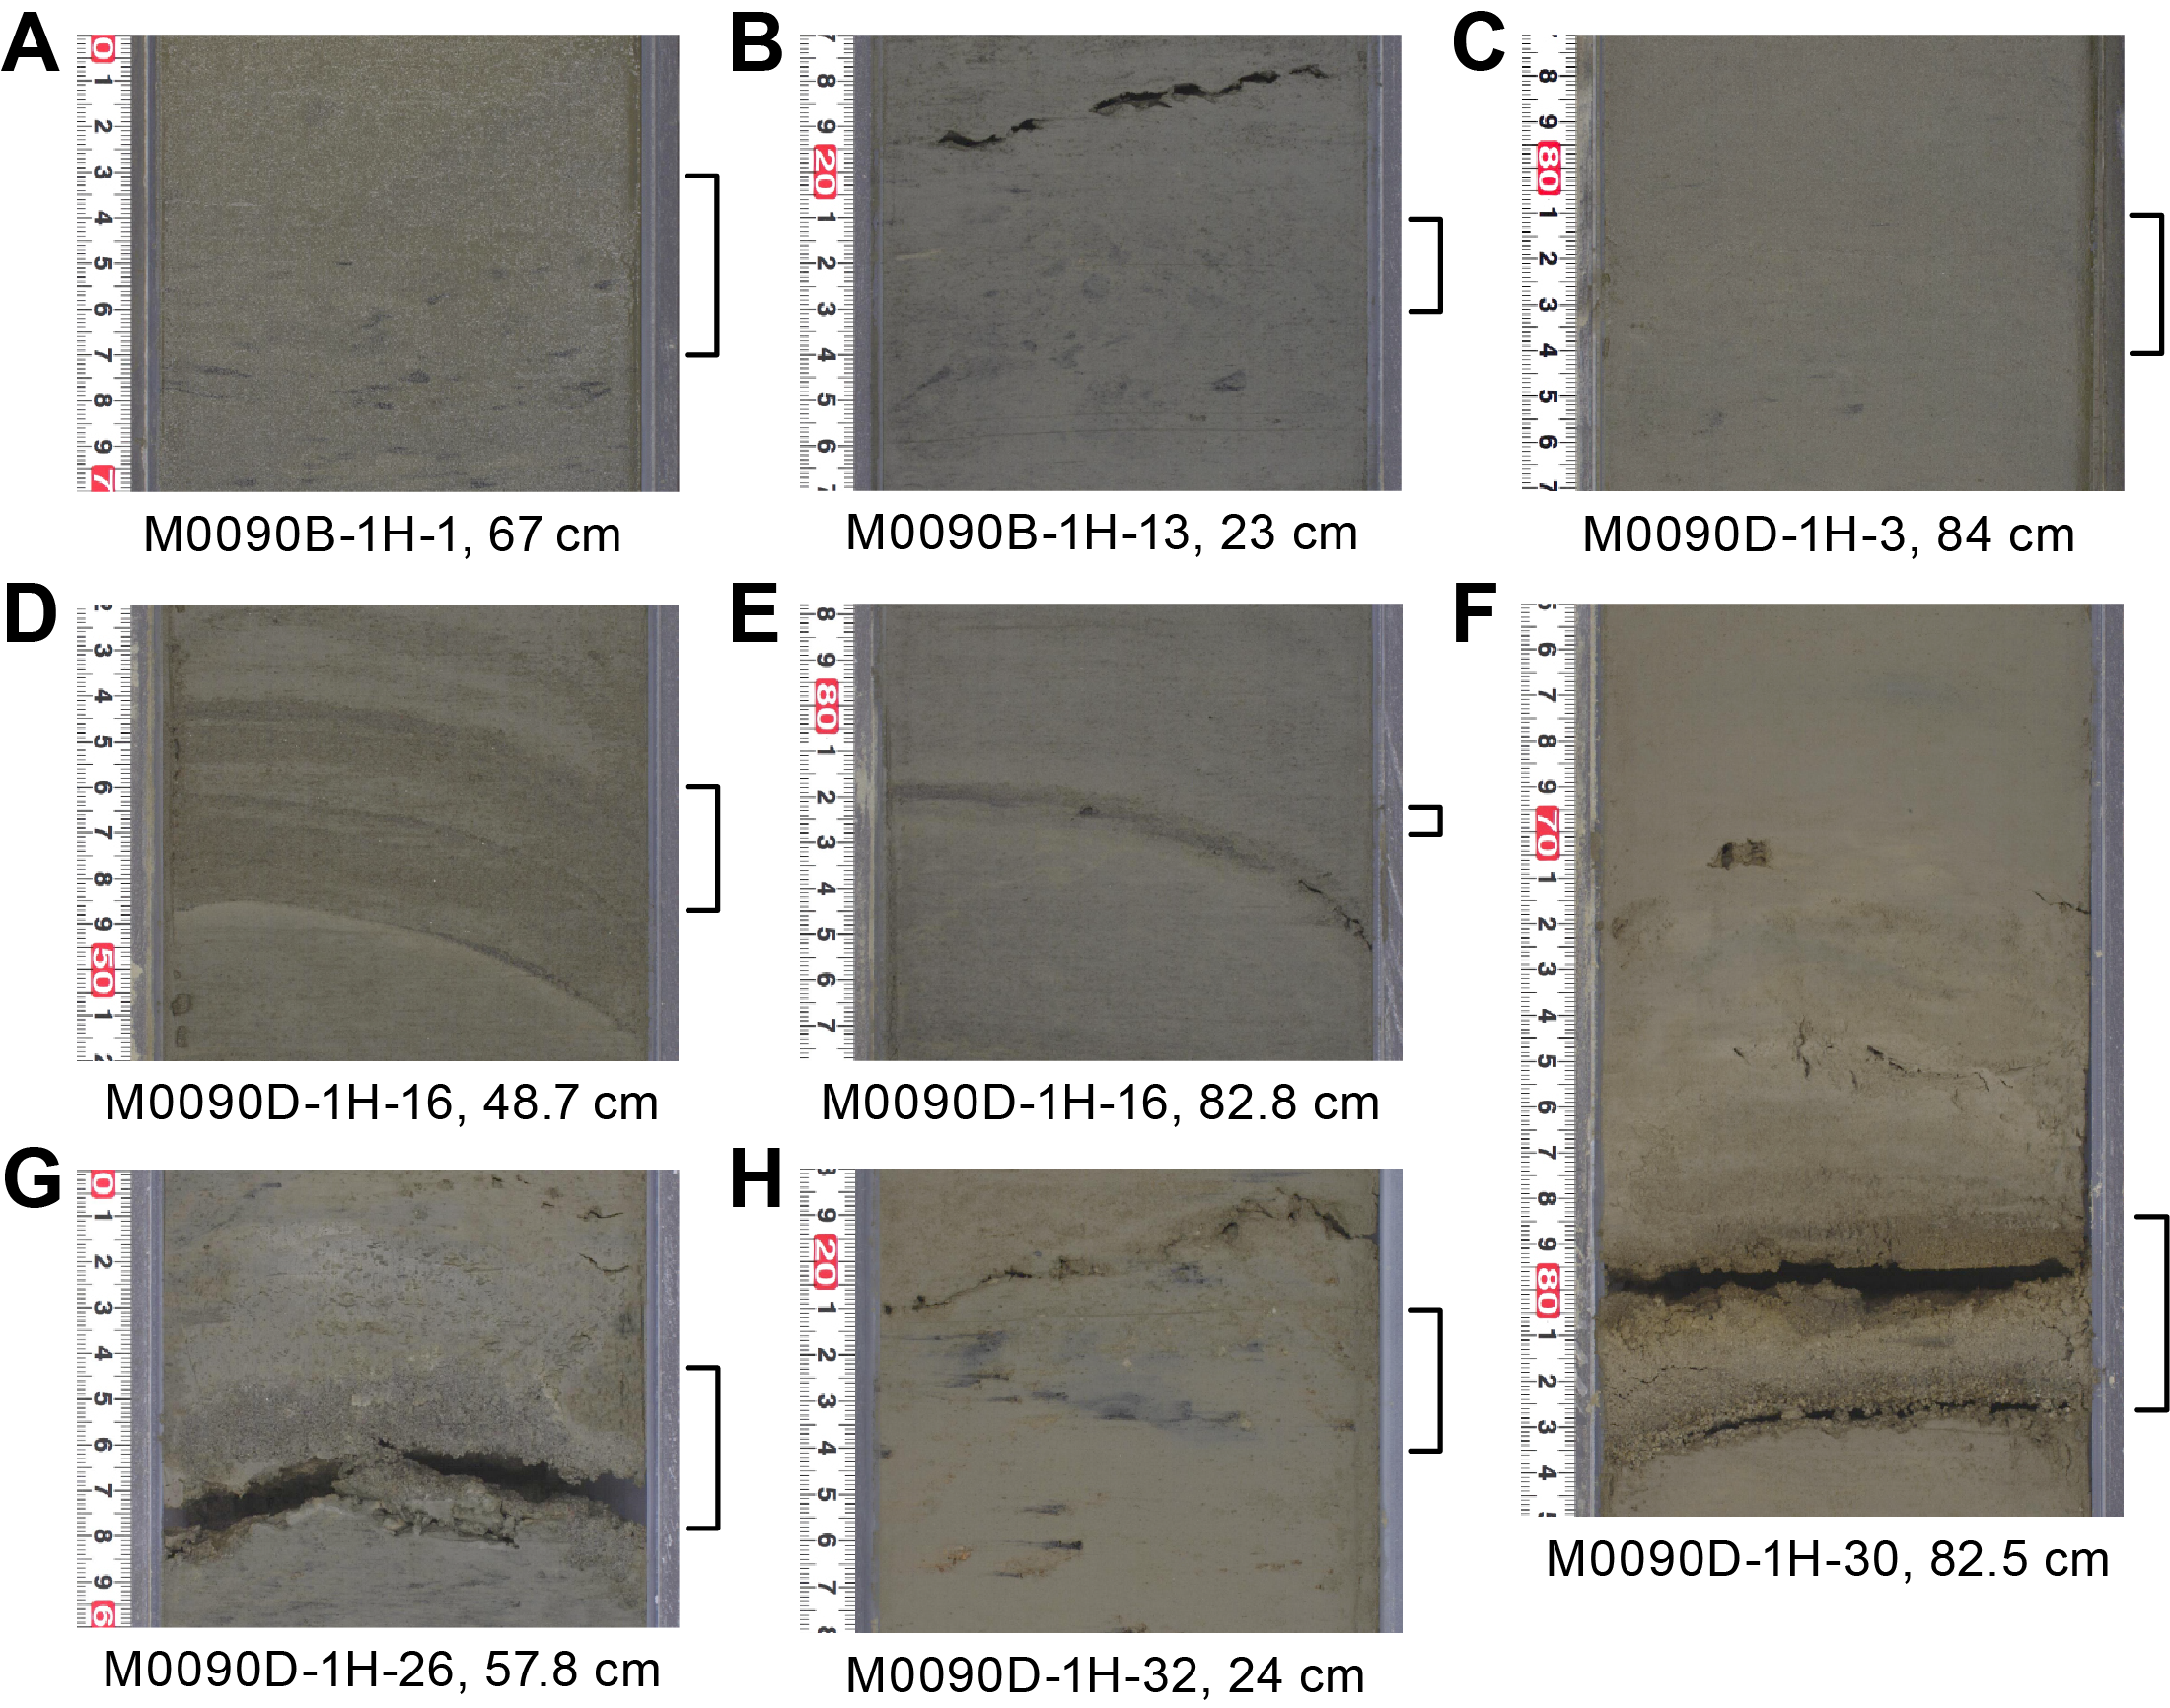
Figure F16. Tephras.
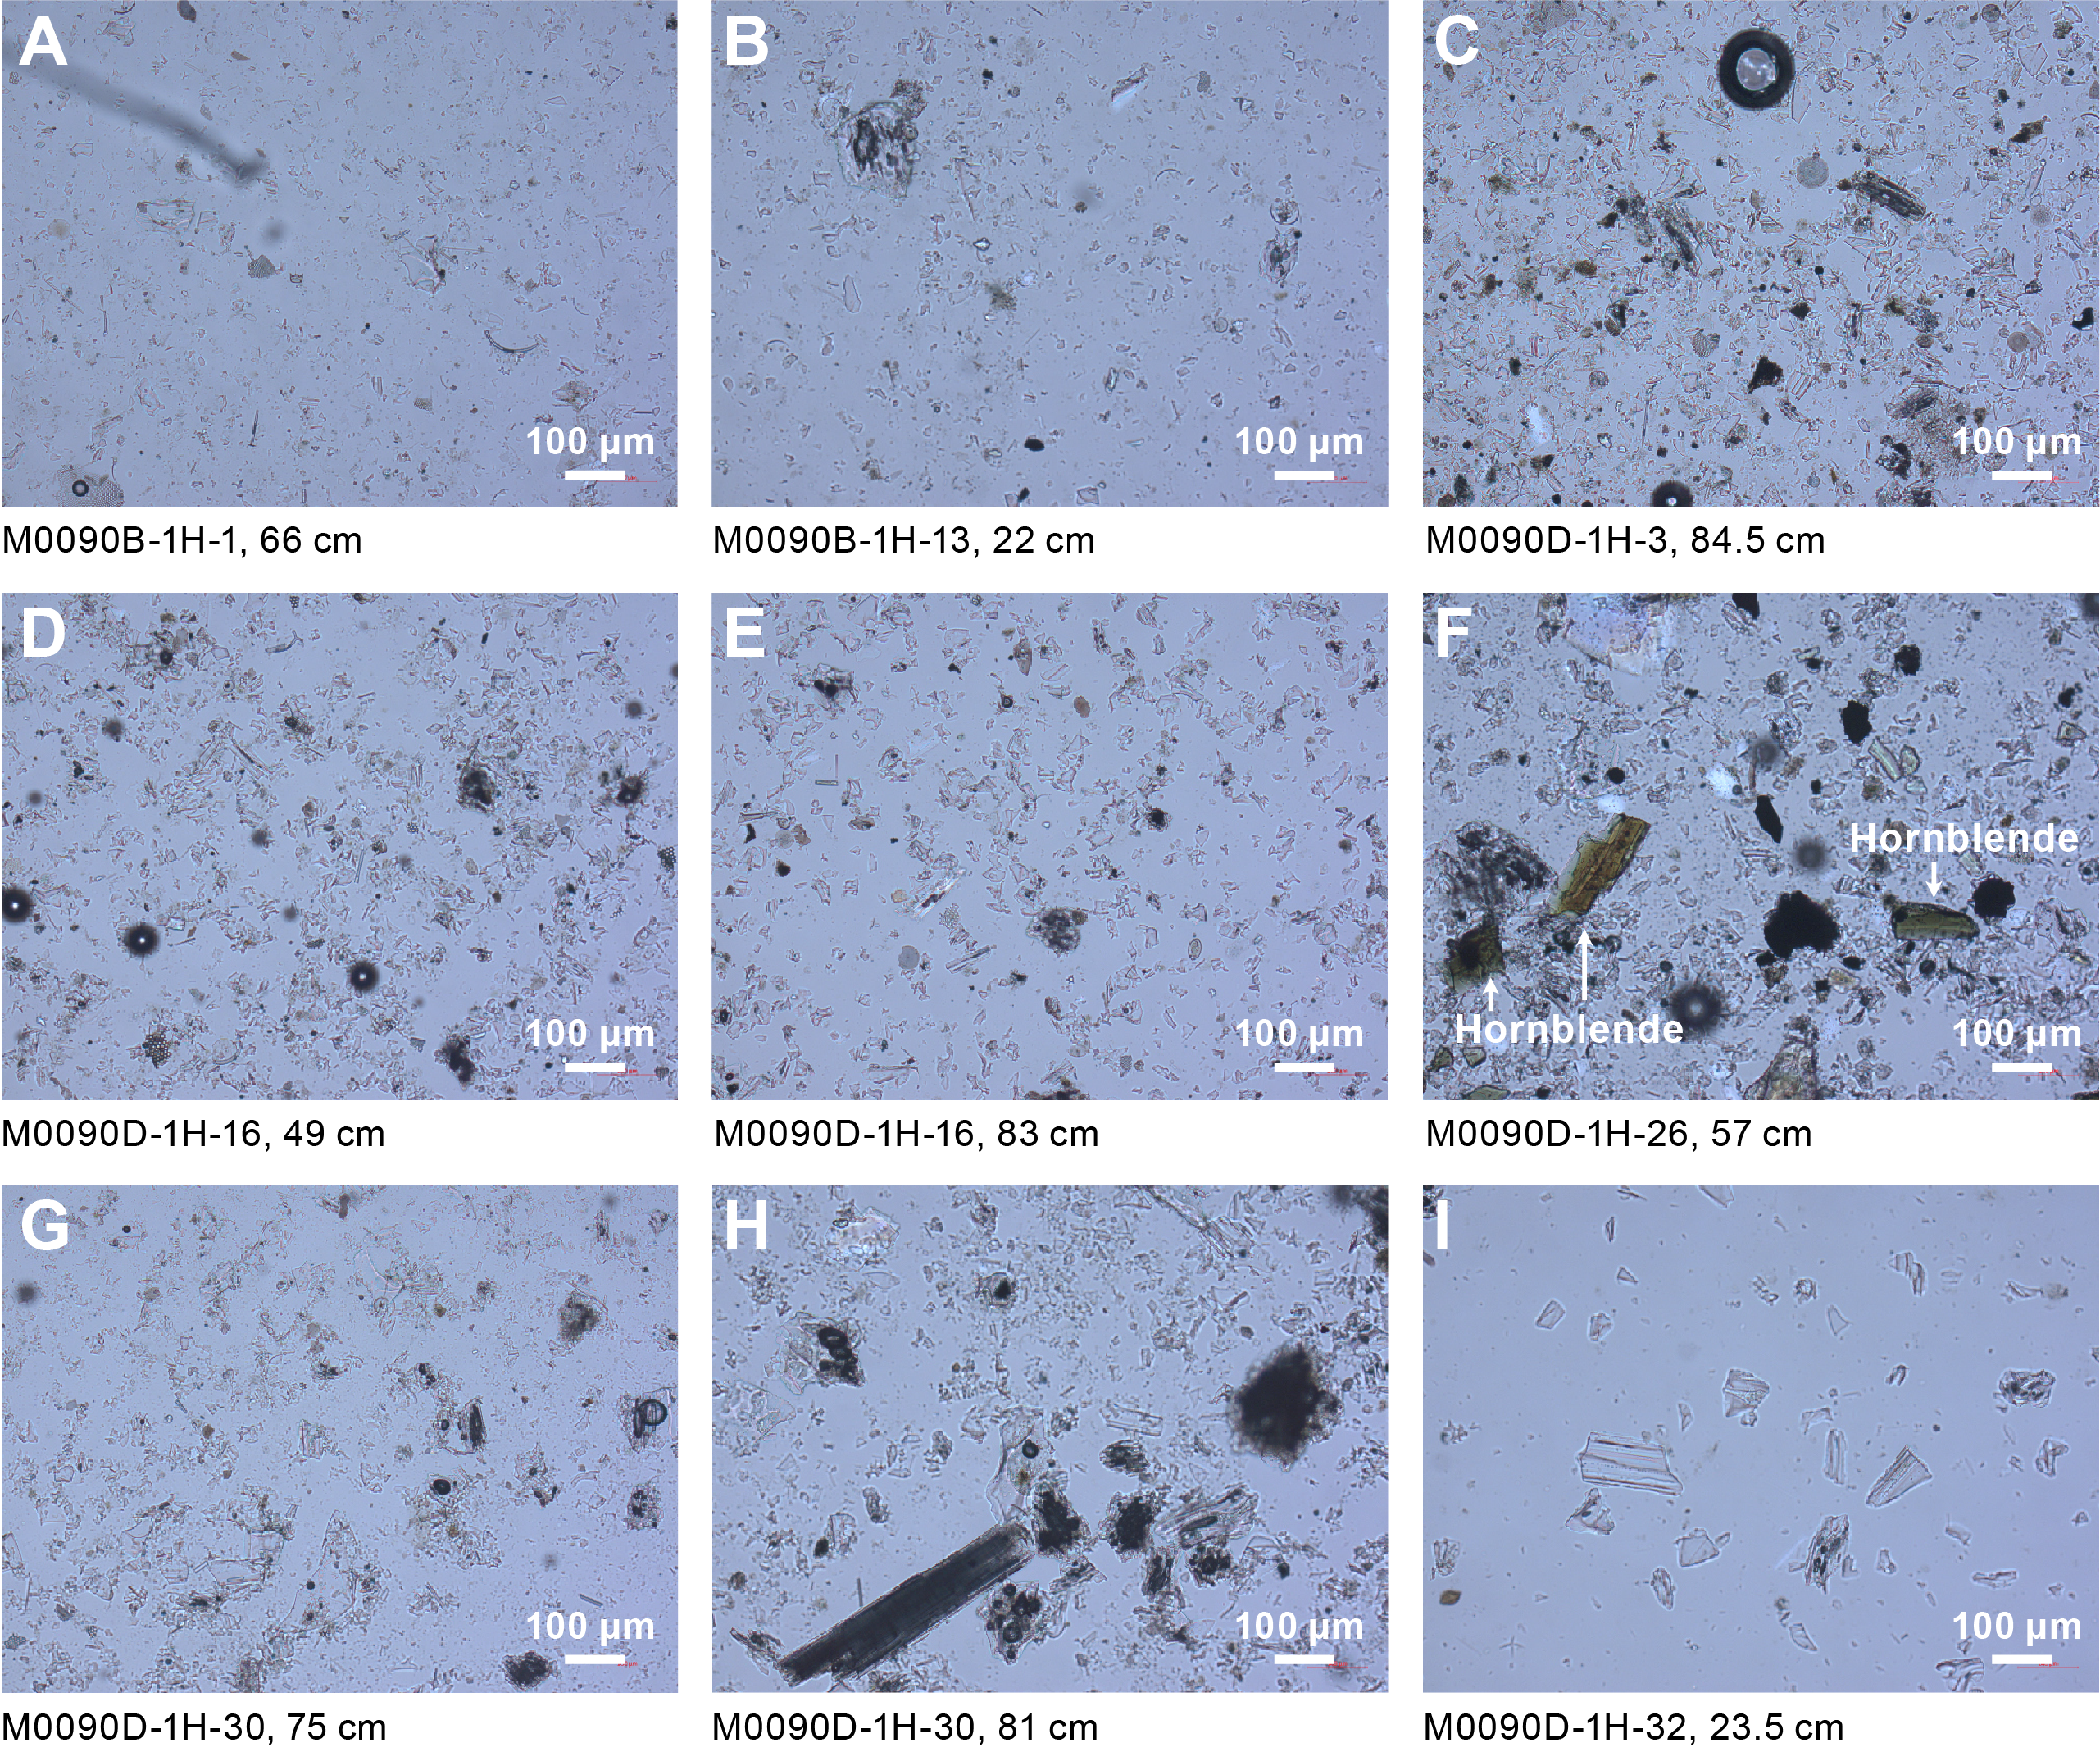
Figure F17. Smear slides representing tephras.
A white silt-sized tephra (M0090B-1H-13, 23 cm) is intercalated as patches in silty sediment interval 386-M0090B-1H-13, 21–23 cm (Figure F16B). It is composed of multiple types of volcanic glass shards such as bubble-wall and moderate vesicularity (Figure F17B). The heavy mineral composition is made up of abundant hornblende with a smaller orthopyroxene component.
A reddish brown silt-sized tephra (M0090D-1H-3, 84 cm) is intercalated as patches in silty sediment interval 386-M0090D-1H-3, 81–84 cm (Figure F16C). It is composed of pumiceous and fibrous types of volcanic glass shards (Figure F17C). Heavy minerals are rare, although hornblende and weathered biotite were observed.
A light reddish brown silt-sized tephra layer (M0090D-1H-16, 48.7 cm) is intercalated as a lenticular bed in interval 386-M0090D-1H-16, 45.8–48.7 cm (Figure F16D). It is composed of abundant pumiceous type volcanic glass shards with fibrous and bubble-wall types (Figure F17D). Heavy minerals are rare, although hornblende was observed.
A light reddish brown silt-sized tephra layer (M0090D-1H-16, 82.8 cm) is intercalated as a lenticular bed in interval 386-M0090D-1H-16, 82.3–82.8 cm (Figure F16E). It is composed of abundant pumiceous type volcanic glass shards with fibrous and bubble-wall types present (Figure F17E). It also contains brown volcanic glass shards. Heavy minerals are rare, although clinopyroxene, apatite, and orthopyroxene were observed.
A tephra layer (M0090D-1H-26, 57.8 cm) consisting of dark reddish brown to white silt- to fine sand–sized tephra is intercalated in silty sediment interval 386-M0090D-1H-26, 54.4–57.8 cm (Figure F16F). This layer comprises two lithologic facies: a dark reddish brown graded bed of silt to fine sand overlain by a white silt-sized tephra. These beds are 3.1 and 0.3 cm thick, respectively. Observations from the smear slide of Sample 386-M0090D-1H-26, 57 cm, show that this tephra is predominantly composed of the pumiceous type volcanic glass shape with a few examples of the fibrous type (Figure F17F). The heavy mineral composition is abundant hornblende and a lesser amount of orthopyroxene and opaque minerals. Apatite is very rare. The deposit contains hornblende similar to cummingtonite along with characteristic ß-quartz.
This tephra layer is probably correlated with tephra layer M0089D-1H-23, 58 cm, based on similarities in lithofacies, volcanic glass type, and heavy mineral composition and the presence of ß-quartz (see Smear slides in Lithostratigraphy in the Sites M0083 and M0089 (Basin 2) chapter [Strasser et al., 2023b]). More detailed analysis, such as determining chemical composition, is needed to explore this possible correlation.
A light brown tephra layer (M0090D-1H-30, 82.5 cm) is intercalated in silty sediment interval 386-M0090D-1H-30, 78.4–82.5 cm (Figure F16G). The grain size of the tephra is a graded bed of silt- to fine sand–sized light pink medium to coarse sand–sized pumice grains in the basal part of the layer. A 1 cm thick pink silt-sized reworked tephra with the same characteristics is found in the upper 3 cm of this layer. It is composed of dominant pumiceous type volcanic glass shape with fibrous and bubble-wall types (Figure F17G). It also contains brown volcanic glass shards. Heavy minerals are rare, and observed minerals are clinopyroxene, orthopyroxene, apatite, and opaque minerals.
A brownish white silt-sized tephra (M0090D-1H-32, 24 cm) occurs as patches in silty sediment interval 386-M0090D-1H-32, 21–24 cm (Figure F16H). It is composed of multiple types of volcanic glass shards such as pumiceous, bubble-wall, platy, moderate vesicularity, and fibrous (Figure F17I). Opaque minerals are the only observed heavy minerals types.
5. Micropaleontology
Four holes were cored at Site M0090 in Basin C1 in the southern part of the central Japan Trench. The biostratigraphy determined for Hole M0090D was based on an examination of radiolaria collected during the offshore phase of Expedition 386. Foraminifera in samples collected during the offshore phase were examined to determine provenance of mass transport deposits.
5.1. Radiolaria
Relative abundance changes of Cycladophora davisiana, the Tetrapyle circularis/fruticosa group (hereafter Tetrapyle group), and Lithomelissa setosa in Hole M0090D are shown in Figure F18. Results of radiolarian analysis for this hole are described below.
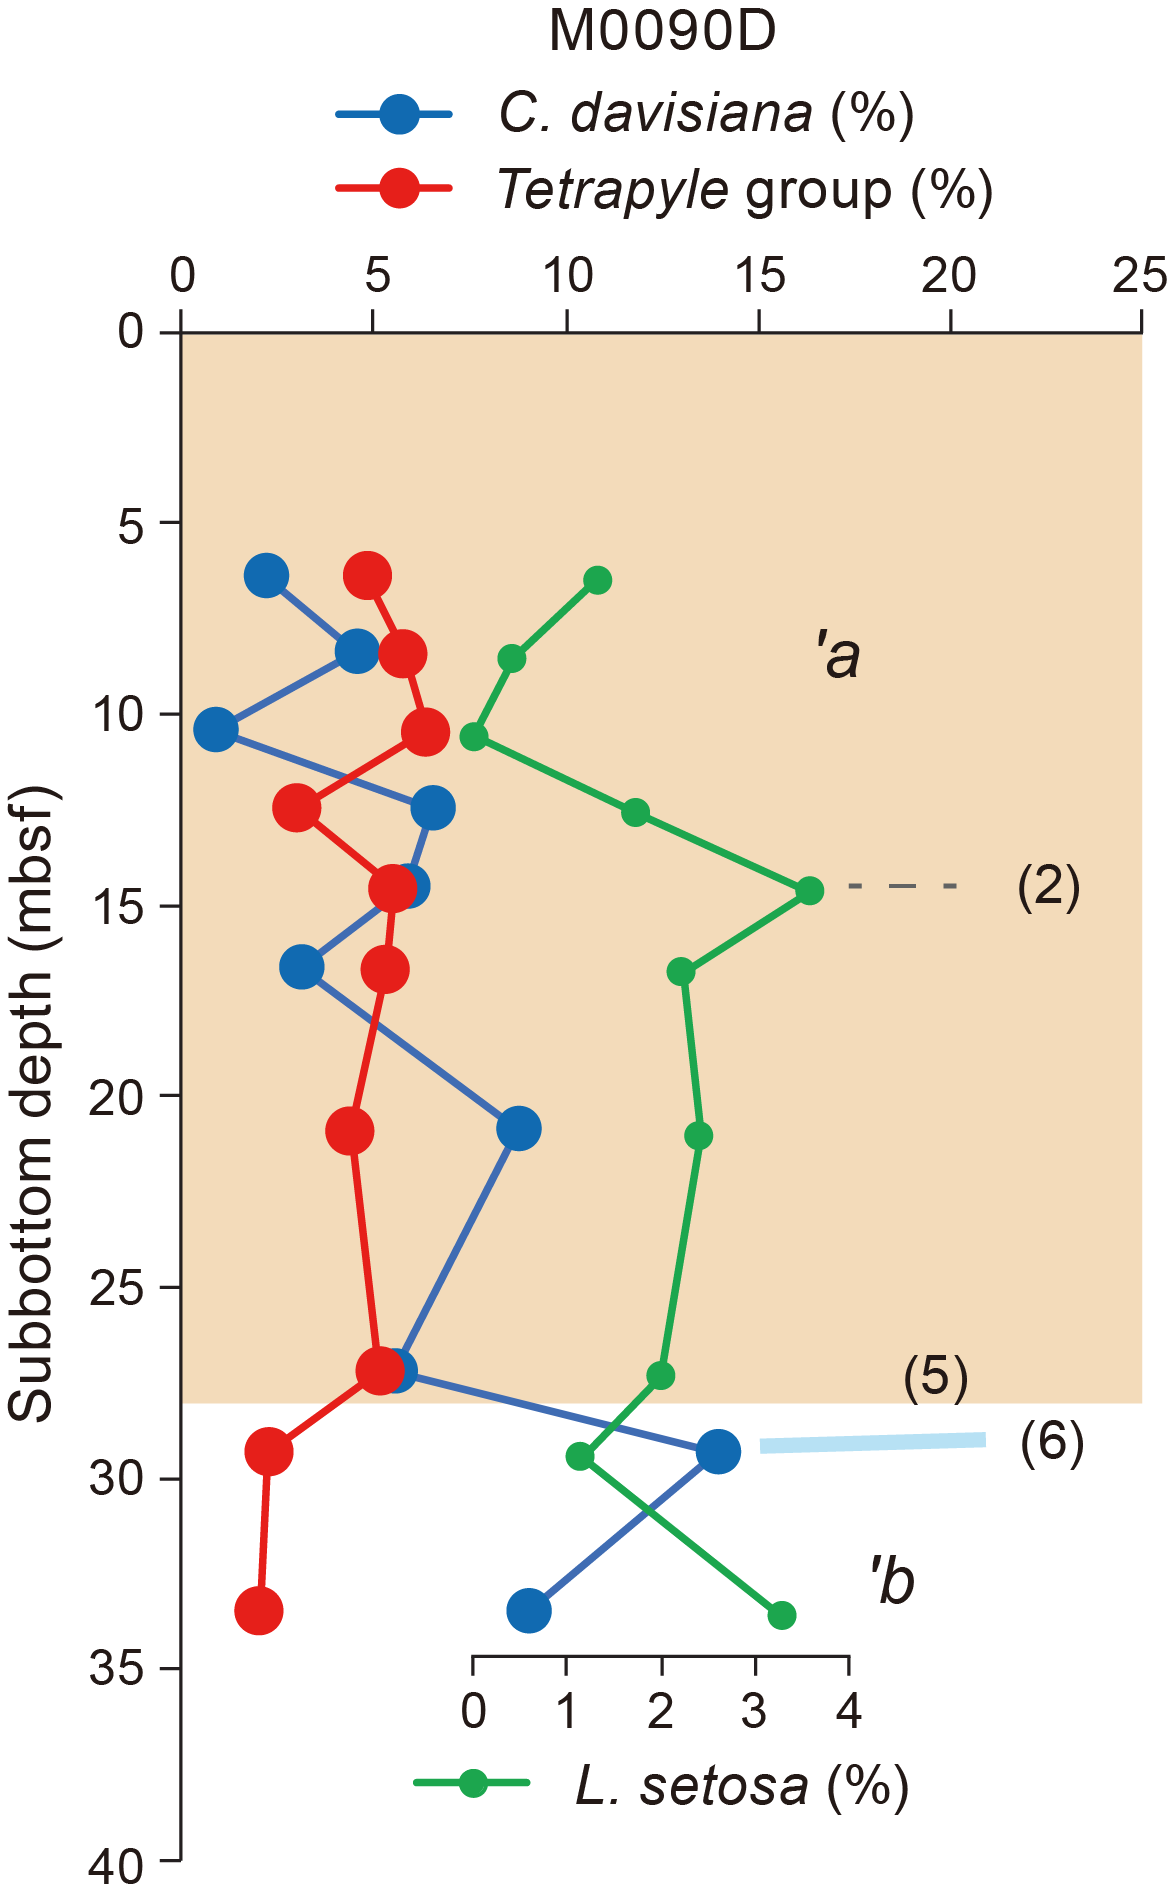
Figure F18. Radiolarian species abundance.
A total of 17 radiolarian samples were collected from Hole M0090D, and 10 were processed for analysis (Table T5). An additional 7 samples were recovered from possible event layers and were not processed. Radiolarian fossils were abundant in all examined samples, with good preservation. C. davisiana ranges 1%–14% and tends to be high (9%–14%) below 29.3 mbsf. The increase of C. davisiana from 27.2 to 29.3 mbsf could be correlated with the boundary horizon between C. davisiana Zones ‘a and ‘b (Event 5), corresponding to the Holocene/Pleistocene boundary (Morley et al., 1982; see Micropaleontology in the Expedition 386 methods chapter [Strasser et al., 2023a]). A primary peak of C. davisiana at 29.3 mbsf is likely correlated with Event 6, corresponding to Davisiana Event (DAE)-2 (~12 ka) of Matsuzaki et al. (2014). The Tetrapyle group ranges 2%–6%; however, it is difficult to define the interval between Events 1 and 3 (see Micropaleontology in the Expedition 386 methods chapter [Strasser et al., 2023a]). A peak of L. setosa% at 14.5 mbsf may correlate with Event 2, corresponding to approximately 7 ka (see Micropaleontology in the Expedition 386 methods chapter [Strasser et al., 2023a]).
5.2. Foraminifera
Samples were taken at 5 m intervals offshore, as described in Micropaleontology in the Expedition 386 methods chapter (Strasser et al., 2023a). With the exception of the agglutinated foraminifera, which may be either in situ or reworked, all foraminifera at Site M0090 are considered to be allochthonous.
5.2.1. Hole M0090A
One sample taken from the base of Hole M0090A was examined for foraminifera (Table T6). Specimens of Trochammina spp., Reophax spp., and Lagenammina spp. with good preservation and broken specimens of Ammodiscus sp. and Bathysiphon spp. are present. These agglutinated specimens may represent an in situ hadal fauna. The sample contains abundant diatoms, radiolaria, sponge spicules, and glass shards, with some plastic present.
5.2.2. Hole M0090B
Four samples from Hole M0090B were examined for foraminifera (Table T6). Benthic foraminifera with poor to good preservation are common in one sample and present in three samples. Planktonic foraminifera with poor to good preservation are rare in two samples and present in two samples. All samples examined for foraminifera contain abundant diatoms, radiolaria, and sponge spicules, and two contain glass shards.
A paleobathymetric interpretation cannot be made for most samples due to low foraminifera abundance, with the exception of Sample 386-M0090B-1H-14, 102–105 cm (14.34 mbsf).
Sample 386-M0090B-1H-14, 102–105 cm, contains a common assemblage of calcareous benthic foraminifera dominated by Epistominella naraensis, Cassidulina reniforme, Stainforthia fusiformis, Globocassidulina subglobosa, and Nonionella globosa. Preservation of these and other thin-walled taxa is good. The provenance of the displaced calcareous assemblage in this sample is likely to be from an outer neritic environment based on the paleobathymetric zonation of Usami et al. (2017) after Matoba (1976). This sample also contains brownish orange specimens of planktonic foraminifera, including Neogloboquadrina dutertrei and sinistral Neogloboquadrina pachyderma.
5.2.3. Hole M0090C
One sample from the base of Hole M0090C was examined for foraminifera (Table T6). Seven specimens of Trochammina spp. and two specimens of Oridorsalis umbonatus with good preservation are present, along with abundant diatoms, radiolaria, and sponge spicules.
No provenance interpretation can be made for this sample due to low foraminifera abundance.
5.2.4. Hole M0090D
Seven samples from Hole M0090D were examined for foraminifera (Table T6). Benthic foraminifera with moderate to very good preservation are present to common. Planktonic foraminifera with poor to good preservation are present in four of the seven samples. All samples examined for foraminifera contain abundant diatoms, radiolaria, and sponge spicules; several contain stained foraminifera along with orange mud clumps.
A paleobathymetric interpretation cannot be made for most samples due to low foraminifer abundance, with the exception of Sample 386-M0090D-1H-13, 98–101 cm (12.51 mbsf), and possibly Sample 1H-33, 101.5–104.5 cm (33.53 mbsf).
Sample 386-M0090D-1H-13, 98–101 cm, contains a common assemblage of calcareous benthic foraminifera dominated by C. reniforme, S. fusiformis, E. naraensis, G. subglobosa, and N. globosa. Preservation of these and other thin-walled taxa is good. The provenance of the displaced calcareous assemblage in this sample is likely to be from an outer neritic environment based on the paleobathymetric zonation of Usami et al. (2017) after Matoba (1976). This sample also contains brownish orange specimens of orange clumps, brownish orange stained Globobulimina pacifica, and N. globosa.
Although Sample 386-M0090D-1H-33, 101.5–104.5 cm (33.53 mbsf), contains common benthic foraminifera, the assemblage is dominated by just two taxa: rare Trochammina spp. and common O. umbonatus, a cosmopolitan species whose paleoenvironmental preferences are not well known (Ohkushi et al., 1999) and vary with location. According to Katz et al. (2013), O. umbonatus indicates outer neritic paleodepths (100–200 m) off the New Jersey margin, whereas Hayward (2004) estimated depths of 1000–2100 m for assemblages dominated by this species off New Zealand. In an analysis of Japan Trench foraminifera, Thompson (1980) stated that the genus Oridorsalis is a lower middle bathyal form. It is possible that this sample contains displaced faunas from outer neritic to middle bathyal environments.
6. Geochemistry
6.1. Interstitial water
At Site M0090, a total of 49 interstitial water (IW) samples were collected using Rhizon samplers from two trigger cores (Holes M0090A and M0090C) and two GPC cores (Holes M0090B and M0090D). In addition, one bottom water (BW) sample was taken from each of the trigger cores (2 samples). See Geochemistry in the Expedition 386 methods chapter (Strasser et al., 2023a) for details of the sampling, analytical methods, and data quality.
The IW geochemical results from all Site M0090 holes closely match for all analytes and are discussed together except where noted. In general, the IW composition at Site M0090 is mainly influenced by organic matter degradation, including the release of metabolic products and consumption of electron acceptors, as well as dissolution/precipitation reactions within sediment.
6.1.1. Shipboard IW analyses: salinity, alkalinity, and ammonium
Salinity at Site M0090 varies between 33.6 and 36 (Table T7;. Figure F19). Values of ~34.0–34.4 are found in the BW samples. In Hole M0090C, salinity is much lower at 30.4 and 32.7 at approximately ~0.33 and ~0.38 mbsf, respectively. These low values are not found in Hole M0090D at a similar core depth. Salinity remains low (~34.1) in the uppermost ~4 m, followed by a gradual nonlinear increase with depth to stable values (36) from ~23 mbsf to the bottom of the cores. Alkalinity at Site M0090 is near the detection limit in the BW. In the GPC cores, there is an asymptotic increase from ~0.4 to ~15 mbsf and values stabilize at ~70 mM from ~23 mbsf to the bottom of the cores (Figure F19). Ammonium at Site M0090 is at the detection limit in the BW and increases with depth. Compared to the GPC cores, ammonium is low in both trigger cores (<0.68 mM). The ammonium values of the two uppermost samples from Holes M0090B and M0090D abruptly increase to 2 and 1 mM, respectively. However, the abrupt increase may be the consequence of lost sediment due to overshooting the GPC cores. In the GPC cores, ammonium increases more or less linearly with depth from ~0.4 mbsf downhole and reaches maximum values of ~5 mM (Hole M0090B at ~19.4 mbsf) and ~6.5 mM (Hole M0090B at ~32.3 mbsf, except for one outlier of ~7.8 mM at ~30.3 mbsf) (Figure F19).

Figure F19. IW salinity, alkalinity, and ammonium.
6.1.2. Shore-based analysis
6.1.2.1. Dissolved vanadium, molybdenum, and uranium
A suite of trace metals was analyzed using inductively coupled plasma–mass spectroscopy (ICP-MS) (including V, Mo, and U, briefly described below, as well as Cu and Rb). Data are listed in Table T7, and downcore variations are shown in Figure F20. Dissolved vanadium (V) concentrations in the BW (92.5 and 177.3 nM) and trigger cores (63.3–127.1 nM) from Holes M0090A and M0090C overlap but are lower in Hole M0090A (~83 nM on average) than in Hole M0090C (~127 nM on average). In the GPC cores, V concentration patterns are relatively consistent between Holes M0090B and M0090D. At first, V concentrations increase rapidly to ~200–240 nM in the uppermost ~5 m, and then they decrease slightly. In Hole M0090B, V concentrations decrease to ~200 nM throughout the remainder of the core, whereas V concentrations in Hole M0090D fluctuate between ~150 and ~200 nM from 5 to ~28 mbsf before decreasing again to ~63 nM at ~32 mbsf.
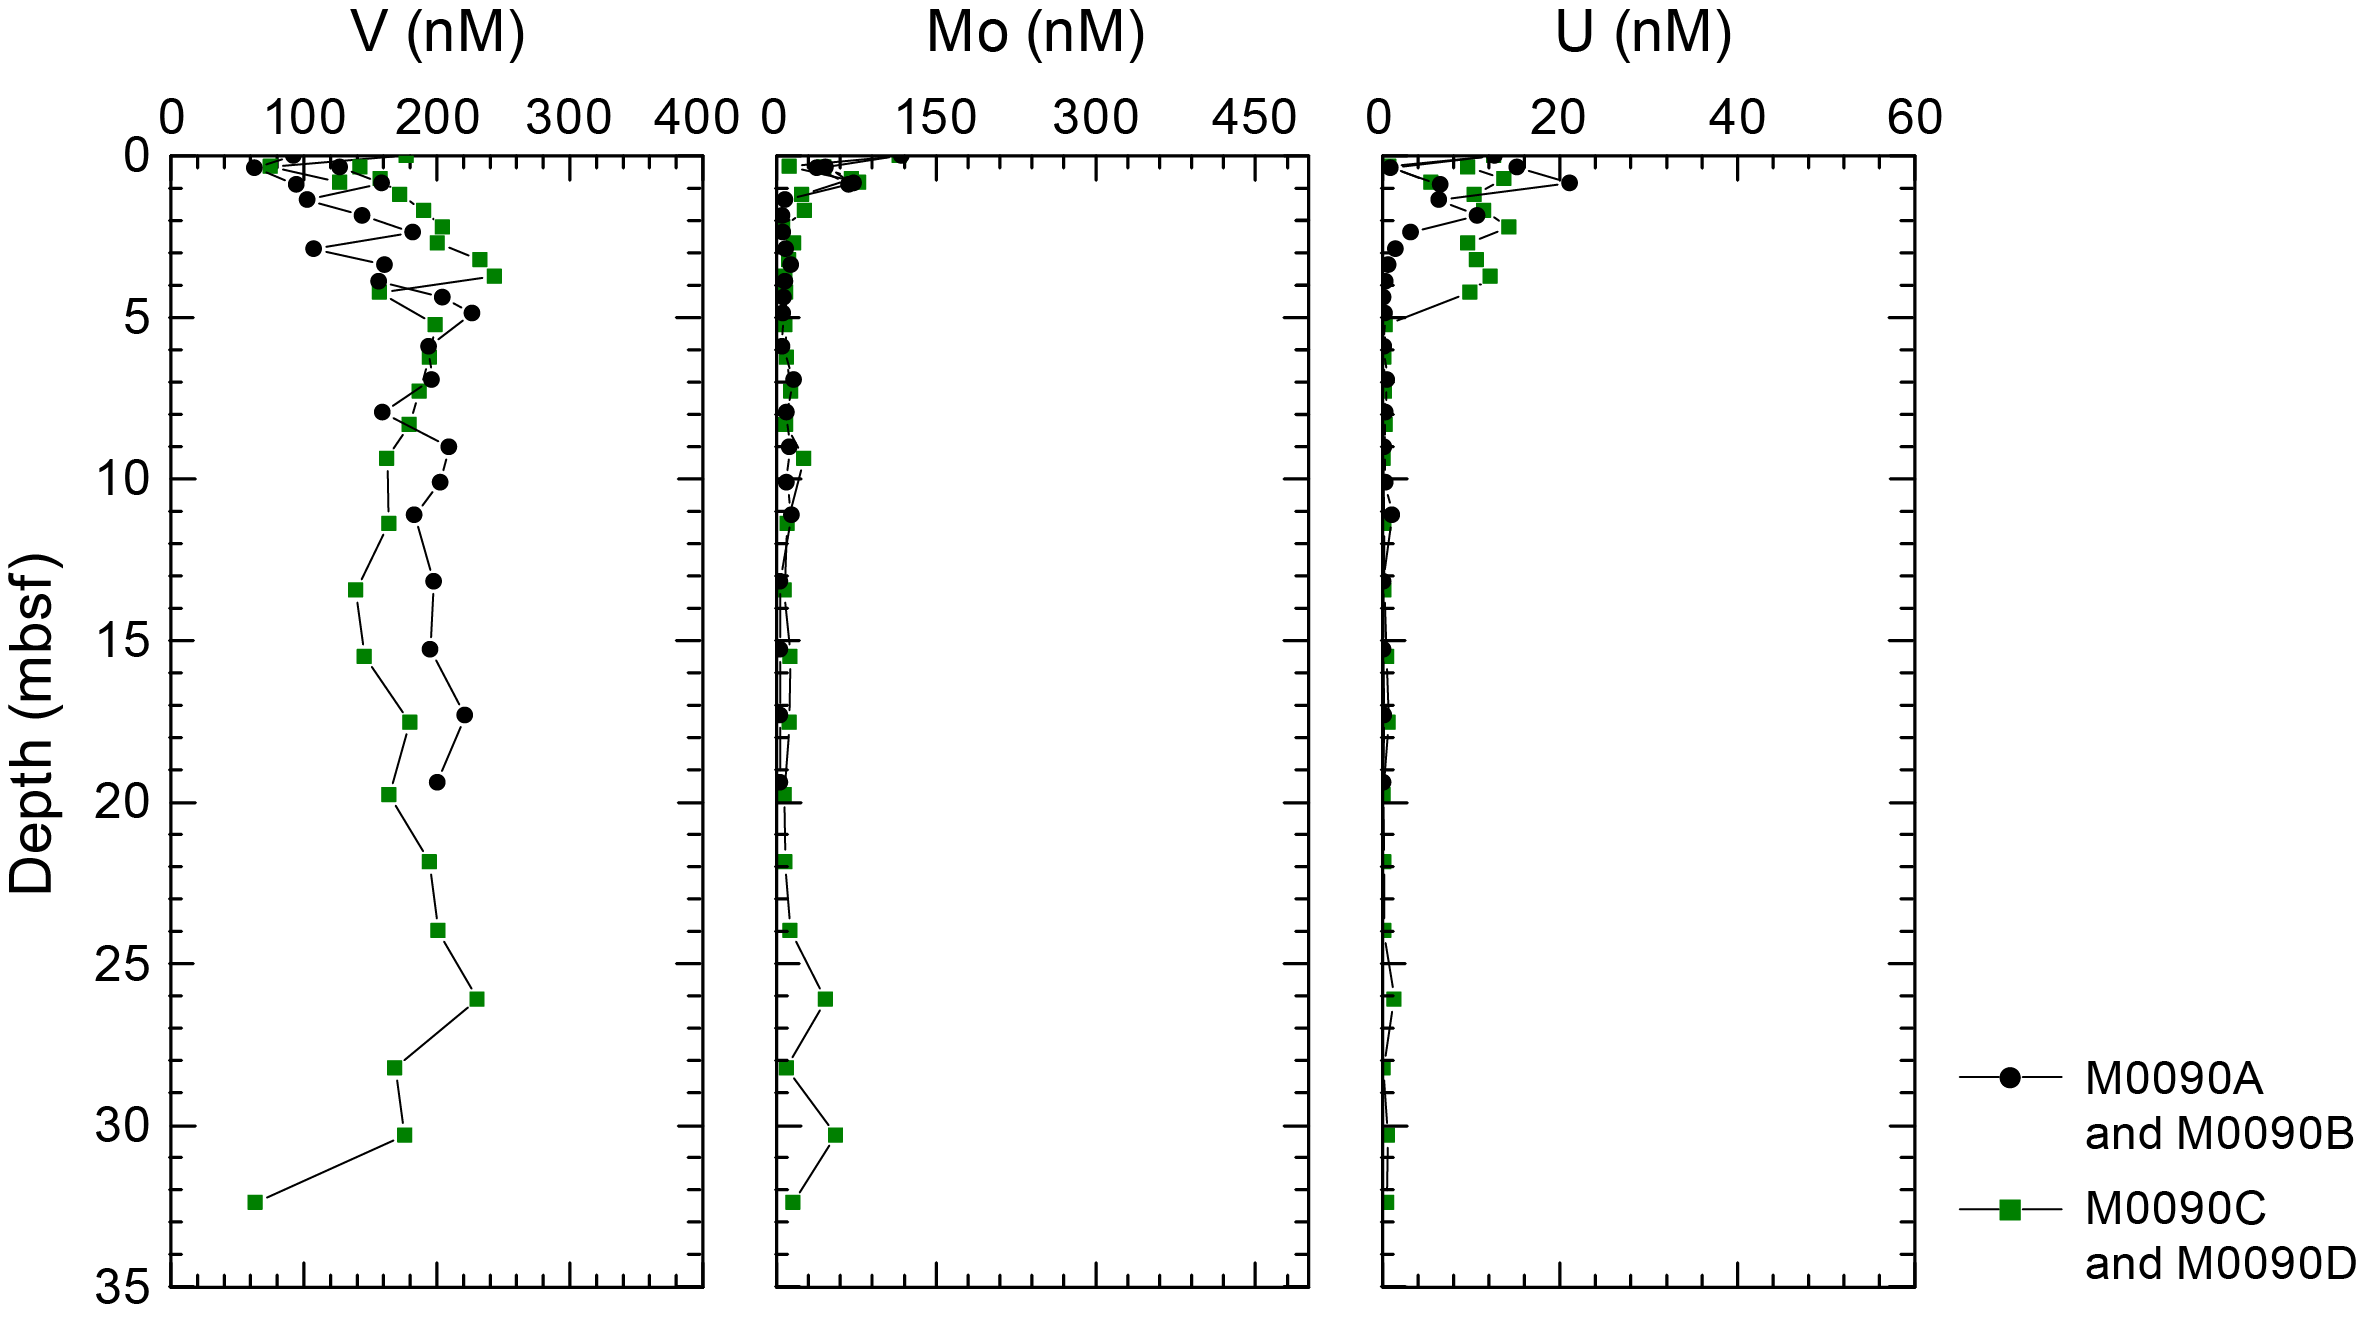
Figure F20. IW V, Mo, and U.
Dissolved molybdenum (Mo) concentrations are highest in the BW (117 nM in Hole M0090B and 115 nM in Hole M0090D). In the trigger cores (Holes M0090A and M0090C), dissolved Mo is much lower (<78 nM) and reaches a minimum of 12 nM at 0.3 mbsf in Hole M0090C. The GPC samples show variable but overall the highest Mo concentrations in the uppermost ~1 m (~40–70 nM). Below 1 mbsf, Mo concentrations are less than ~30 nM, and they mostly fluctuate around 10 nM over the lower parts of the cores, apart from two isolated samples from Hole M0090D with Mo concentrations of ~45 and ~55 nM at ~25 and 35 mbsf, respectively.
Dissolved U concentrations are ~13 nM in the BW and much lower in the trigger cores (Holes M0090A and M0090C) with values <7 nM and a minimum of 0.7 nM at 0.3 mbsf in Hole M0090C. In the GPC cores, like the Mo profiles, the U concentrations are highest at the top (~0.3 nM), but the high values extend to ~3 mbsf (Hole M0090B) and ~4 mbsf (Hole M0090D), respectively. Although an overall and rapid U decrease is observed in the uppermost 3 m in Hole M0090B, U values vary mostly between 10 and 15 nM in Hole M0090D before abruptly dropping to <1 nM at ~4 mbsf. Below 3–4 mbsf, U concentrations are mostly less than 1 nM for the remainder of the cores.
6.1.2.2. Dissolved lithium, boron, silica, manganese, iron, strontium, and barium
All minor elements analyzed using inductively coupled plasma–optical emission spectroscopy (ICP-OES) are listed in Table T7. Downcore variations are shown in Figure F21.
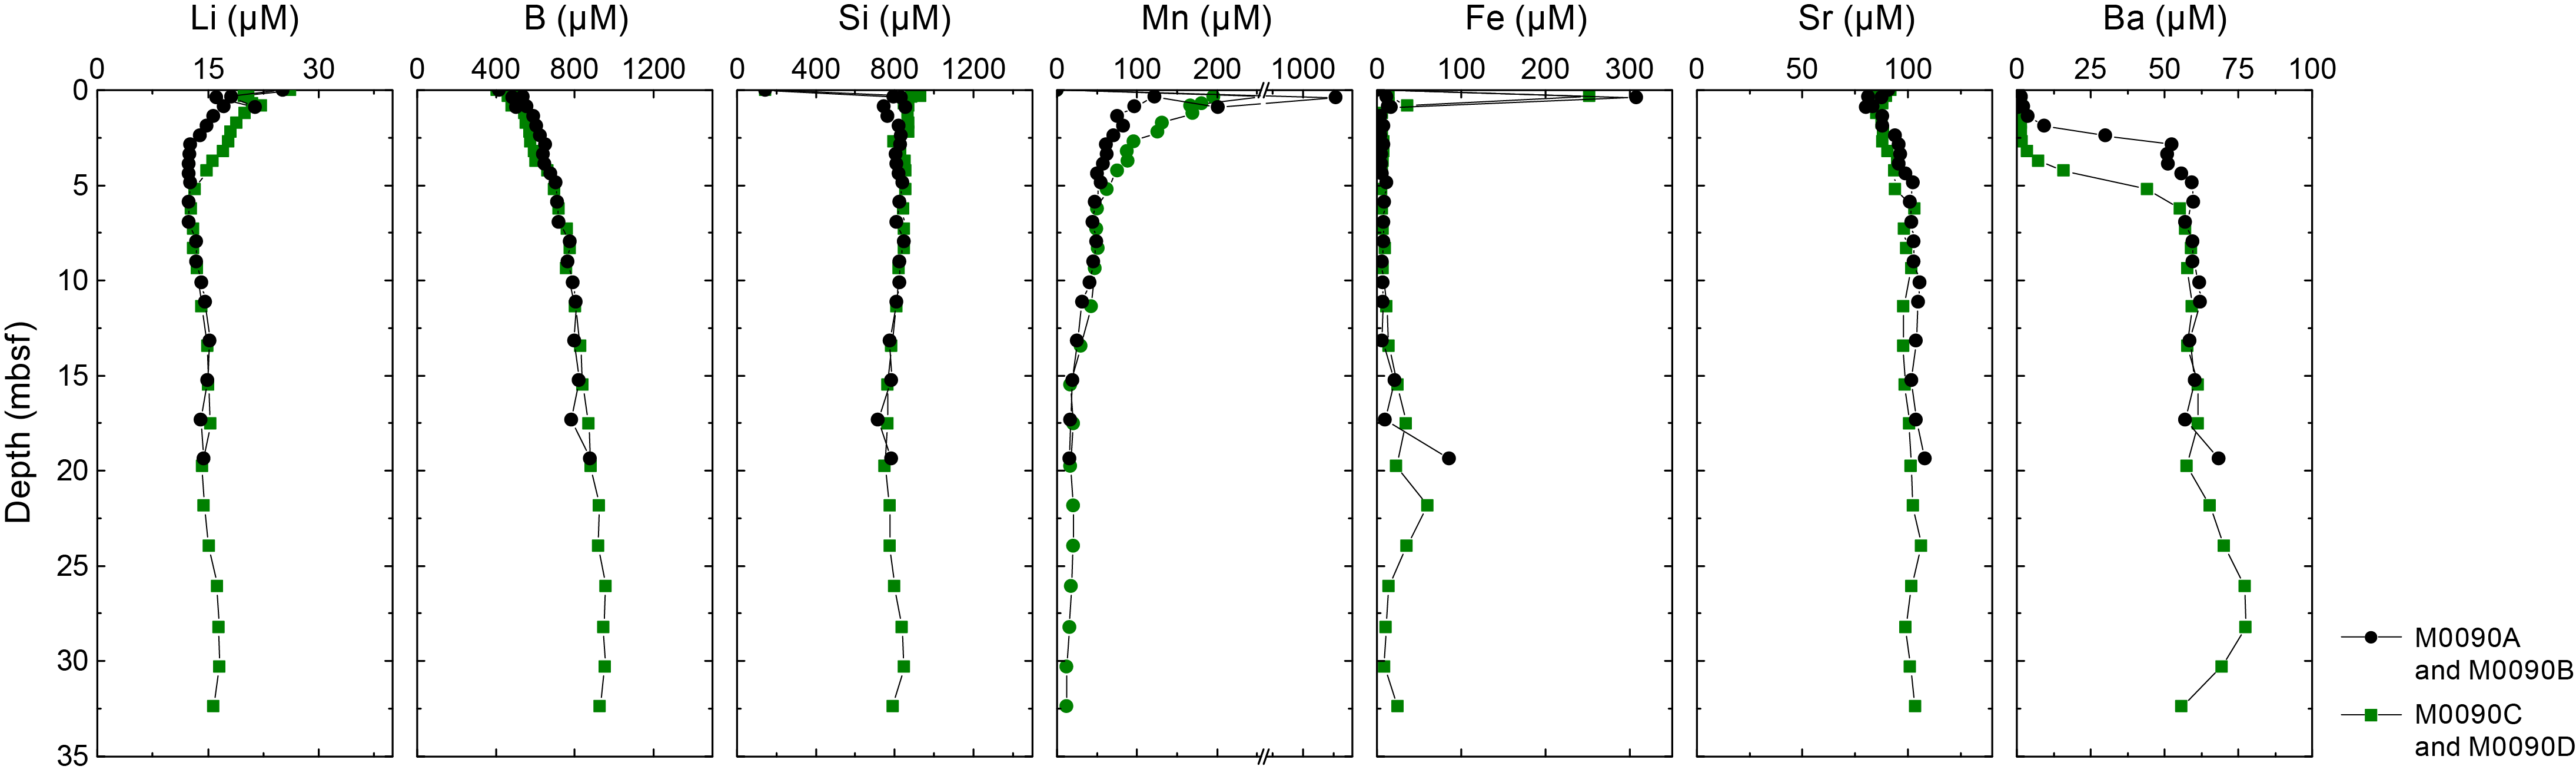
Figure F21. IW Li, B, Si, Mn, Fe, Sr, and Ba.
Dissolved lithium (Li) values are highest in the BW (~25–26 µM), whereas Li concentrations in the trigger cores are comparable to the top part of the GPC cores at depths <1 mbsf. In the GPC cores, the Li value is at a maximum (~20 µM) at the top (~1 mbsf) and then decreases nearly linearly to ~12–13 µM at ~3–5 mbsf, which are the lowest Li concentrations observed. Below ~3–5 mbsf, Li concentrations rise slightly again to 15–17 nM with increasing depth to the base of the hole.
Dissolved boron (B) concentrations at Site M0090 are lowest in the BW (~404–418 µM). In the trigger cores and GPC cores from Holes M0090B and M0090D, dissolved B increases from ~500 to ~950 µM at ~25 mbsf. Below 25 mbsf, dissolved B values are approximately 950 µM and do not show a trend through this interval.
Dissolved silica (Si) values are lowest in the BW (~144 µM). In the trigger cores, dissolved Si values are much higher (~800–900 µM) between ~0.3 and 0.8 mbsf. At the same depth, silica concentrations in the GPC cores have a similar concentration (~800–900 µM) before decreasing slightly to ~765 µM at about 17 mbsf in both holes. Below 17 mbsf, Si concentrations rise slightly and fluctuate around ~800 µM to the base of the hole.
Dissolved manganese (Mn) is lowest in the BW (~0.1 µM). In the uppermost samples from the trigger cores (~0.3–0.4 mbsf), dissolved Mn values are at a maximum of ~570–1130 µM, but they decrease rapidly to ~200 µM at ~0.8–0.9 mbsf. In the GPC cores, maximum Mn values of ~200 and ~100 µM are found at the top of Holes M0090B and M0090D (<1 mbsf), respectively. Downcore, Mn first decreases nearly exponentially in each hole to ~60 µM at ~5 mbsf and remains at this level to ~10 mbsf. Below 10 mbsf, Mn continues to decrease at a lower rate to level out again around ~20 µM between ~15 and 25 mbsf. Below ~25 mbsf, concentrations fall below ~20 µM in Hole M0090D.
Dissolved iron (Fe) follows the downcore pattern of Mn in the trigger cores. Unlike Mn, however, dissolved Fe is below the detection limit in the BW. In the uppermost samples from the trigger cores (~0.3–0.4 mbsf), dissolved Fe values are at a maximum of ~251 and 307 µM, which is followed by a decrease to ~36 and 17 µM at ~0.8–0.9 mbsf. In the GPC cores, comparable subseafloor maxima are not recorded, and dissolved Fe values are ~11–14 µM at the top of the GPC cores (<1 mbsf). Below ~1 mbsf, dissolved Fe reaches minimum values around or less than 10 µM, which remain at this level to ~11 mbsf. Below this depth, dissolved Fe begins to irregularly increase again and reaches peak values of ~86 and ~61 µM at ~19 and ~22 mbsf in Holes M0090B and M0090D, respectively. In Hole M0090D, dissolved Fe decreases again to ~10 µM between ~26 and 30 mbsf before increasing again to ~25 µM at the bottom of the hole (~32 mbsf).
Dissolved strontium (Sr) concentrations are highest in the BW (~91–92 µM). In the trigger cores, dissolved Sr decreases from ~91 to ~82 µM between 0.3 and 0.9 mbsf. In contrast, dissolved Sr increases downcore in the GPC cores. In the uppermost meter of the GPC cores, dissolved Sr fluctuates between 81 and 88 µM and then increases to about ~100 µM at ~5–6 mbsf. Below this depth, dissolved Sr remains more or less stable around ~100–105 µM.
Dissolved barium (Ba) values are lowest in the BW (~0.13–0.16 µM). In the trigger cores, dissolved Ba is slightly higher (~0.5–0.8 µM) between 0.3 and 0.9 mbsf. Dissolved Ba is also low (~1 µM) at the top of the GPC cores (<1 mbsf) but increases first slowly and then abruptly at 2 and 4 mbsf in Holes M0090B and M0090D to rapidly reach ~60 µM at ~4 and ~6 mbsf, respectively. Farther downcore, Ba concentrations remain more or less stable around ~60 µM to about ~18–21 mbsf, where dissolved Ba increases to ~77 µM between 26 and 28 mbsf before decreasing again to ~56 µM at the maximum core depth of ~33 mbsf.
6.1.2.3. Chloride, bromide, and sulfate
All anions analyzed using ion chromatography (IC) are listed in Table T7.
Dissolved chloride (Cl−), bromine (Br−) and sulfate (SO42−) concentrations are listed in Table T7. Dissolved Cl− concentrations are similar to seawater (546 mM; Bruland et al., 2014), ranging ~531 to ~555 mM. The lowest concentrations of ~531 and ~532 mM are found in GPC Hole M0090B at ~4 and ~17 to ~19 mbsf, respectively. Dissolved Cl− concentrations are highest in the lower part of Hole M0090D and reach a maximum of ~555 mM at 24 mbsf (Figure F22).

Figure F22. IW Cl−, Br−, and SO42−.
Dissolved Br− concentrations show an overall asymptotic increase with core depth in all holes, starting near seawater values (0.65–0.80 mM) in BW of ~0.84 mM at the top of the trigger cores and reaching values around 0.99 mM below ~24 mbsf that then remain stable to the bottom of Hole M0090D at ~32 mbsf.
Dissolved SO42− concentrations are highest in the BW with values (~28–29 mM) that are close to average seawater (28.5 mM; Bruland et al., 2014). Dissolved SO42− exponentially decreases from ~26 to 20 mM in the trigger cores between 0.3 and 0.9 mbsf. Dissolved SO42− concentrations also decrease exponentially in GPC Holes M0090B and M0090D. Dissolved SO42− reaches the detection limit at ~4–5 mbsf in both GPC cores and remains at comparable low levels to the bottom of Holes M0090B and M0090D, except for one outlying value of ~3 mM at ~9 mbsf in Hole M0090D.
6.1.2.4. Sodium, magnesium, potassium, and calcium
Dissolved concentrations of sodium (Na+), potassium (K+), calcium (Ca2+), and magnesium (Mg2+) downcore profiles at Site M0090 show overall very similar patterns with little variations. Dissolved Na+ concentrations fluctuate unsystematically and are mostly above average seawater values (~470 mM) in all holes (Bruland et al., 2014), ranging ~453–615 mM. Dissolved K+ concentrations fluctuate unsystematically and are mostly above seawater values (~10 mM) in all holes, ranging ~10.0–14.3 mM. Dissolved Ca2+ concentrations fluctuate around seawater values (~10 mM). Dissolved Ca2+ is ~10 to ~12 mM in the BW of both trigger cores and in Hole M0090D to ~4 mbsf. Downcore, dissolved Ca2+ is consistently lower than seawater values and fluctuates between ~6.1 and 9.3 mM in the deeper sections of Hole M0090D and throughout Hole M0090B. Dissolved Mg2+ concentrations fluctuate unsystematically and are mostly around or slightly above seawater values (~53 mM) in all holes, ranging ~50.6–76.8 mM.
The IC cation data is only presented in GEOCHEM in Supplementary material because the samples require postexpedition analysis for validation of absolute values (analytical accuracy).
6.2. Shore-based H2S analysis
At Site M0090, H2S concentrations were below the detection limit in all samples (see GEOCHEM in Supplementary material).
6.3. Headspace gas analysis: methane, ethane, and C1/C2 ratio
A total of 34 headspace samples were measured from Holes M0090C (trigger cores) and M0090D (GPC cores) for hydrocarbon compositions. The data are listed in Table T8. Downcore variations of selected variables are shown in Figure F23.
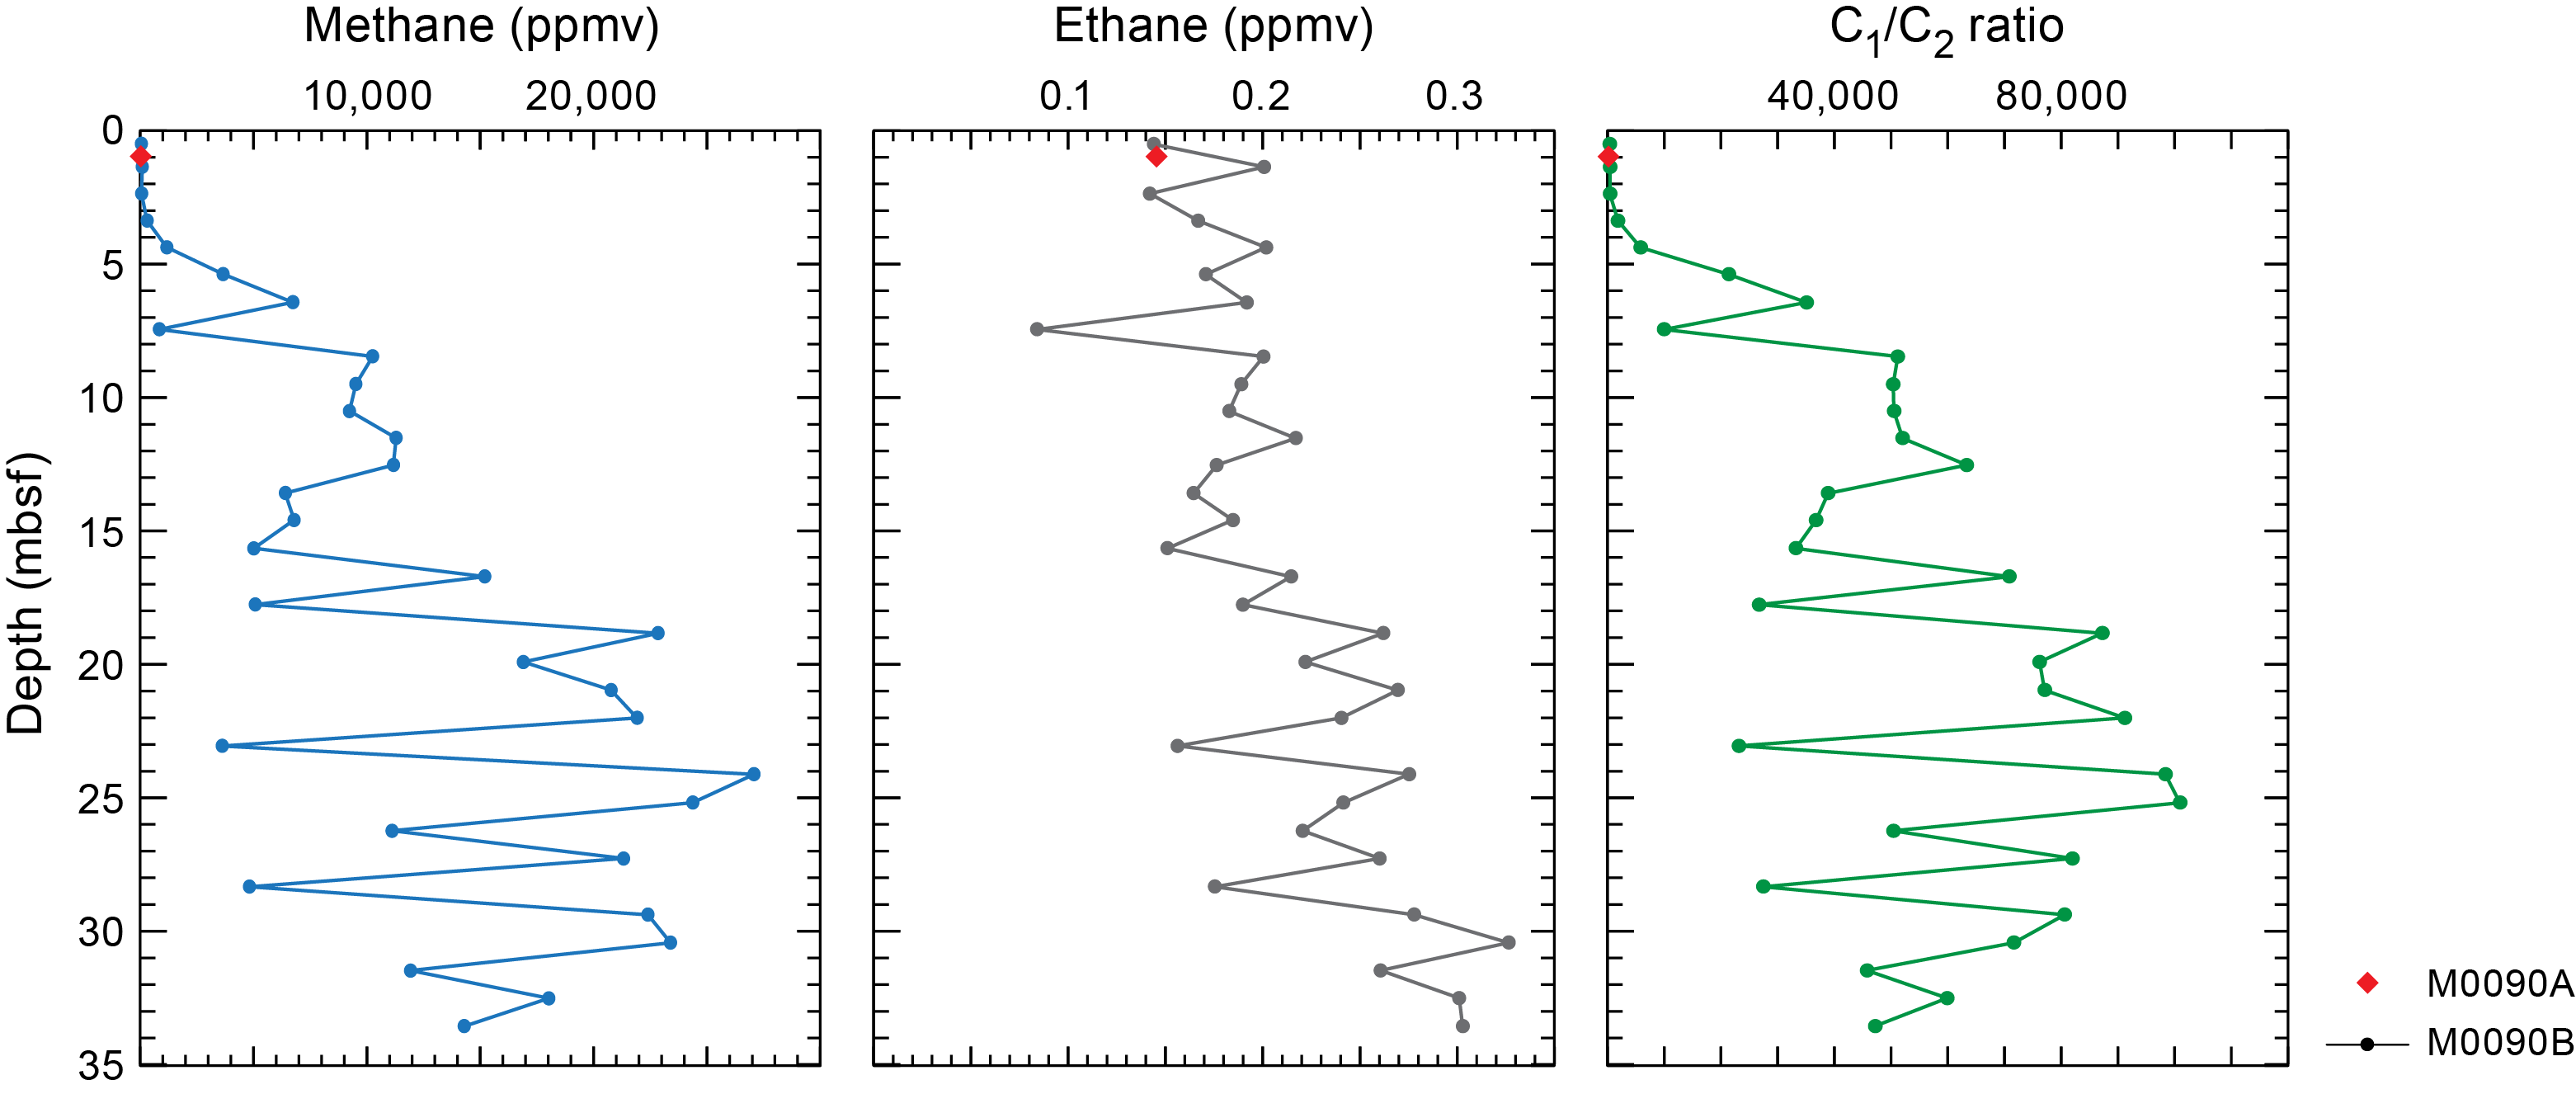
Figure F23. Methane, ethane, and C1/C2 ratios.
The offshore headspace gas analysis was mainly performed on the longest GPC core. The hydrocarbons methane, ethylene, ethane, propylene, and butane were identified at each site, and methane (CH4 and C1) is a major component of the headspace samples.
Methane concentrations vary between 53 and 306 ppmv at 0–3.38 mbsf. Below 3.38 mbsf, methane concentrations increase rapidly to 10,254 ppmv at 8.47 mbsf and stabilize with values fluctuating between ~3,600 and 27,000 ppmv to the bottom of the core. At ~24.12 mbsf, methane concentrations are at a maximum (27,079 ppmv). Ethane (C2H4 and C2) concentrations slowly increase downcore (0.08–0.33 ppmv). The methane/ethane (C1/C2) ratios follow the methane profile pattern and fluctuate between 23,151 and 100,936 below 8.47 mbsf.
Alongside C1 and C2, other hydrocarbon gases such as ethylene (C2=), ethane (C2), propene/propylene (C3=), propane (C3), and n-butane (n-C4) were detected and measured, but their concentrations are very low, generally less than 1 ppmv at all sites (see GEOCHEM in Supplementary material).
6.4. Shore-based solid-phase analysis
6.4.1. Aluminum, calcium, silica, iron, and manganese
Energy dispersive X-ray fluorescence (ED-XRF) was used to quantify elements from 10 ground solid sediment samples from Hole M0090B, 16 samples from Hole M0090D, and 1 sample from each of the trigger cores (Holes M0090A and M0090C). The solid-phase elements (including Al, Ca, Si, Fe, and Mn, briefly described below) are listed together with Ba, Br, Cr, Cu, K, Mg, Ni, P, Sr, Ti, V, Zn, and Zr in Table T9. Selected elements plotted in Figure F24 highlight the compositional differences between the sediments at Site M0090 (see Lithostratigraphy).
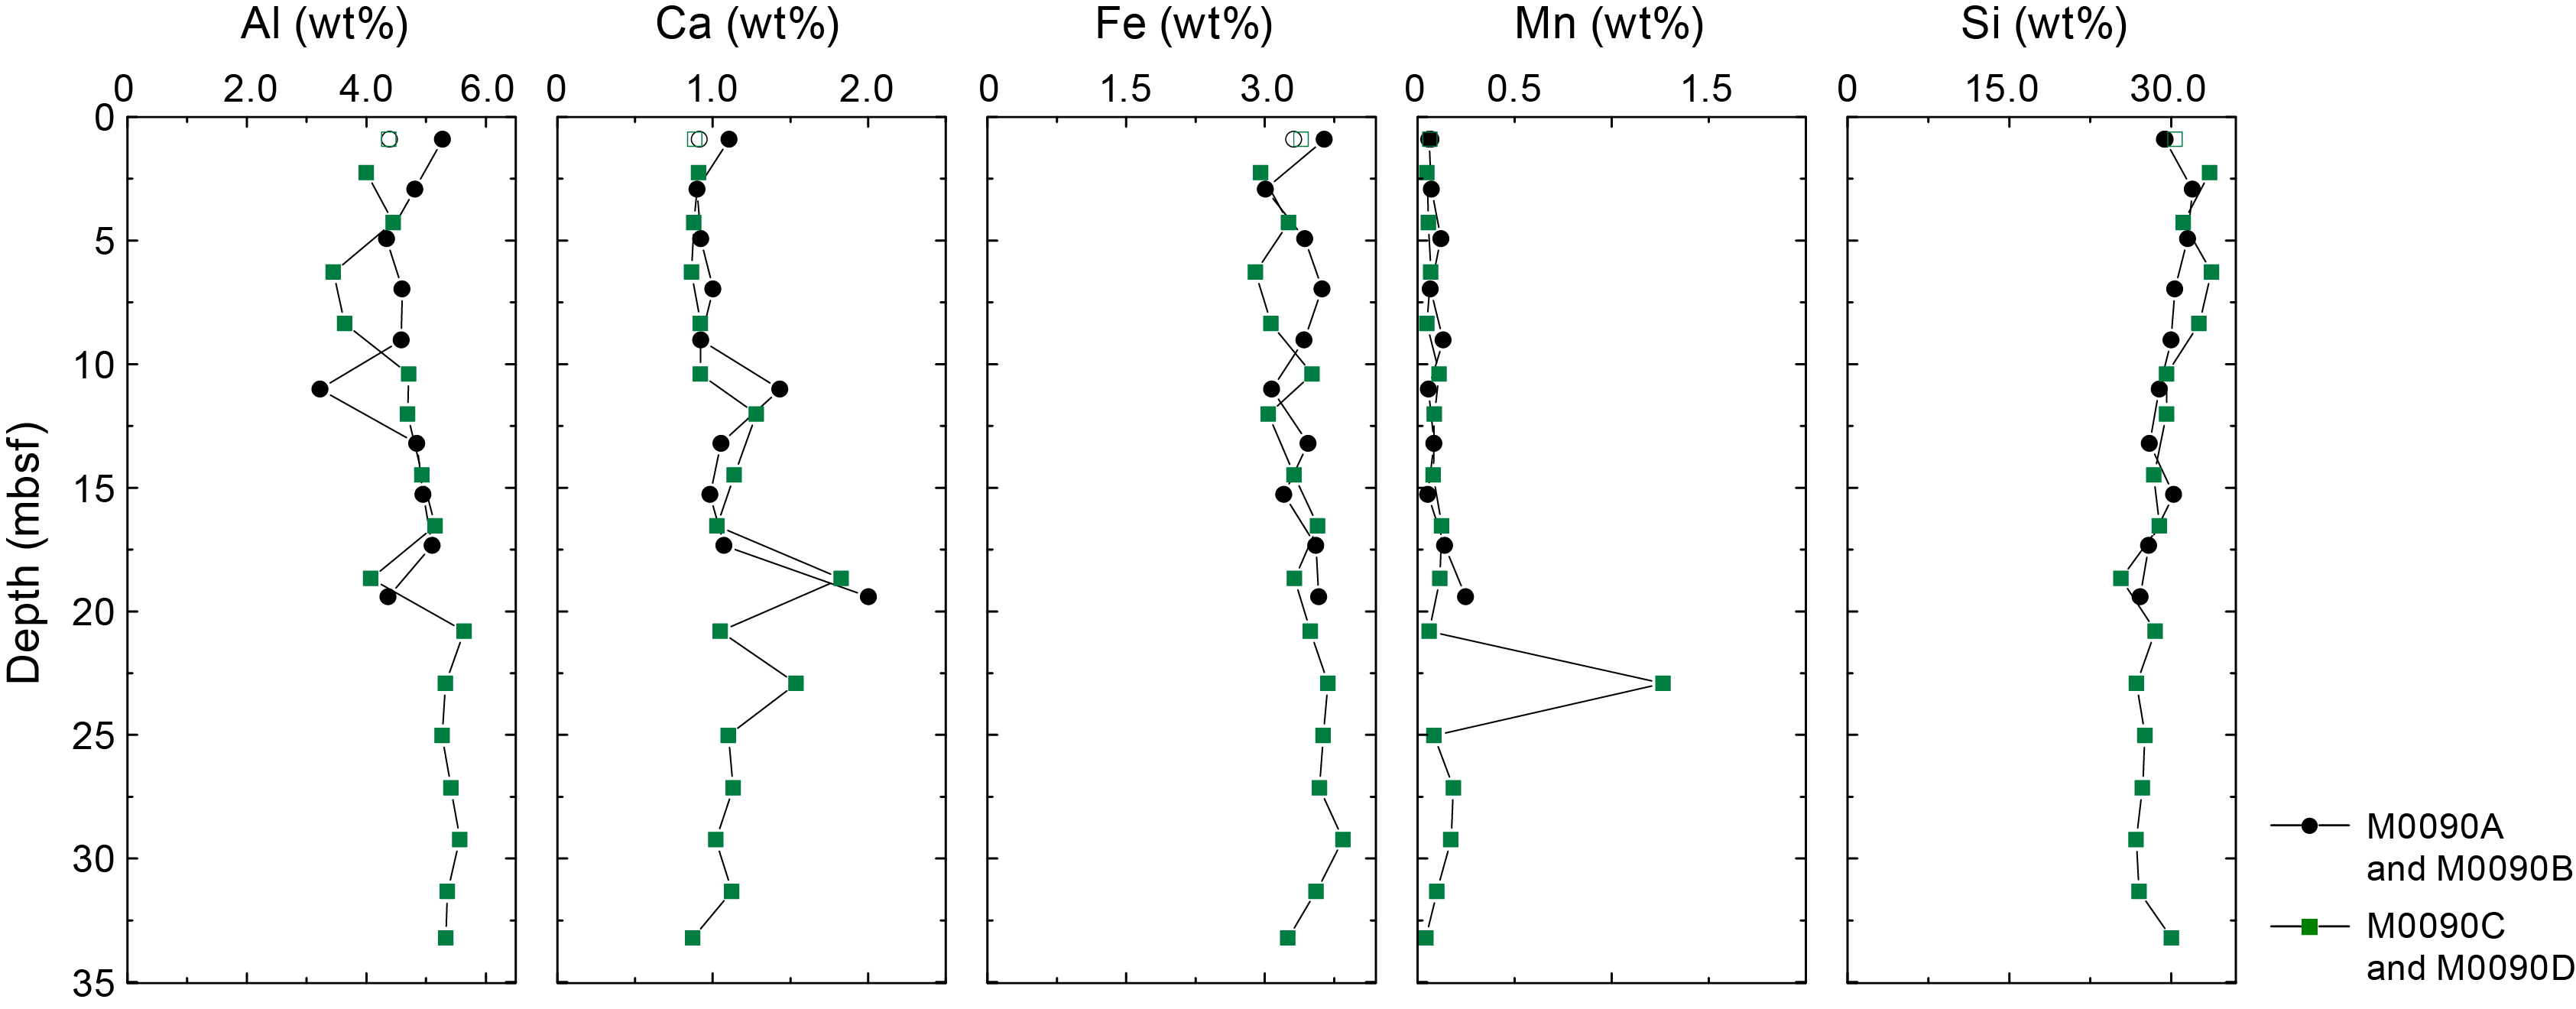
Figure F24. Solid-phase major elements.
Aluminum (Al) contents range ~3–6 wt% (32,233–56,410 mg/kg). From 0 and 21 mbsf, the Al content fluctuates downcore with different patterns in Hole M0090D. The lowest Al concentration (~3.2 wt%) is at ~11 mbsf in Hole M0090B. In Hole M0090D, the lowest Al concentration (~3.5–3.6 wt%) is located between ~6 and 8 mbsf. Al contents reach the highest values of ~5.3–5.6 wt% in Hole M0090D only.
Calcium (Ca) contents range ~1–2 wt% (8,635–20,020 mg/kg). In all holes, Ca is at or slightly below ~1–1.5 wt% to ~10 mbsf. Below this depth, Ca fluctuates rapidly to the bottom of the holes with maxima of ~1.3–1.4, ~1.8–2, and ~1.5 wt% at ~11–12, ~18–19, and ~23 mbsf, respectively.
Silica (Si) contents range ~25–34 wt% (253,756–335,723 mg/kg). In all holes, Si generally decreases downcore from ~32 to 27 wt% with superimposed fluctuations to ~22 mbsf. Below 22 mbsf, Si levels out at ~27 wt%, except for the deepest sample from Hole M0090D, in which Si reaches ~30 wt%.
Iron (Fe) contents range ~2.9–3.9 wt% (28,984–38,469 mg/kg). Downcore, Fe values fluctuate without an overall increase or decrease, and they are most constant at ~3.5 wt% between ~20 and 27 mbsf.
Manganese (Mn) contents are very low (~0.05–0.25 wt%; 429–2477 mg/kg), except for a single outlying value of ~1.3 wt% (12,650 mg/kg) Mn at ~23 mbsf in Hole M0090D. Downcore Mn variations resemble those of Fe and fluctuate without an overall increase or decrease.
6.4.2. Carbon and sulfur
Total carbon (TC), total organic carbon (TOC), and total inorganic carbon (TIC) are listed in Table T9. Downcore variations are shown in Figure F25.
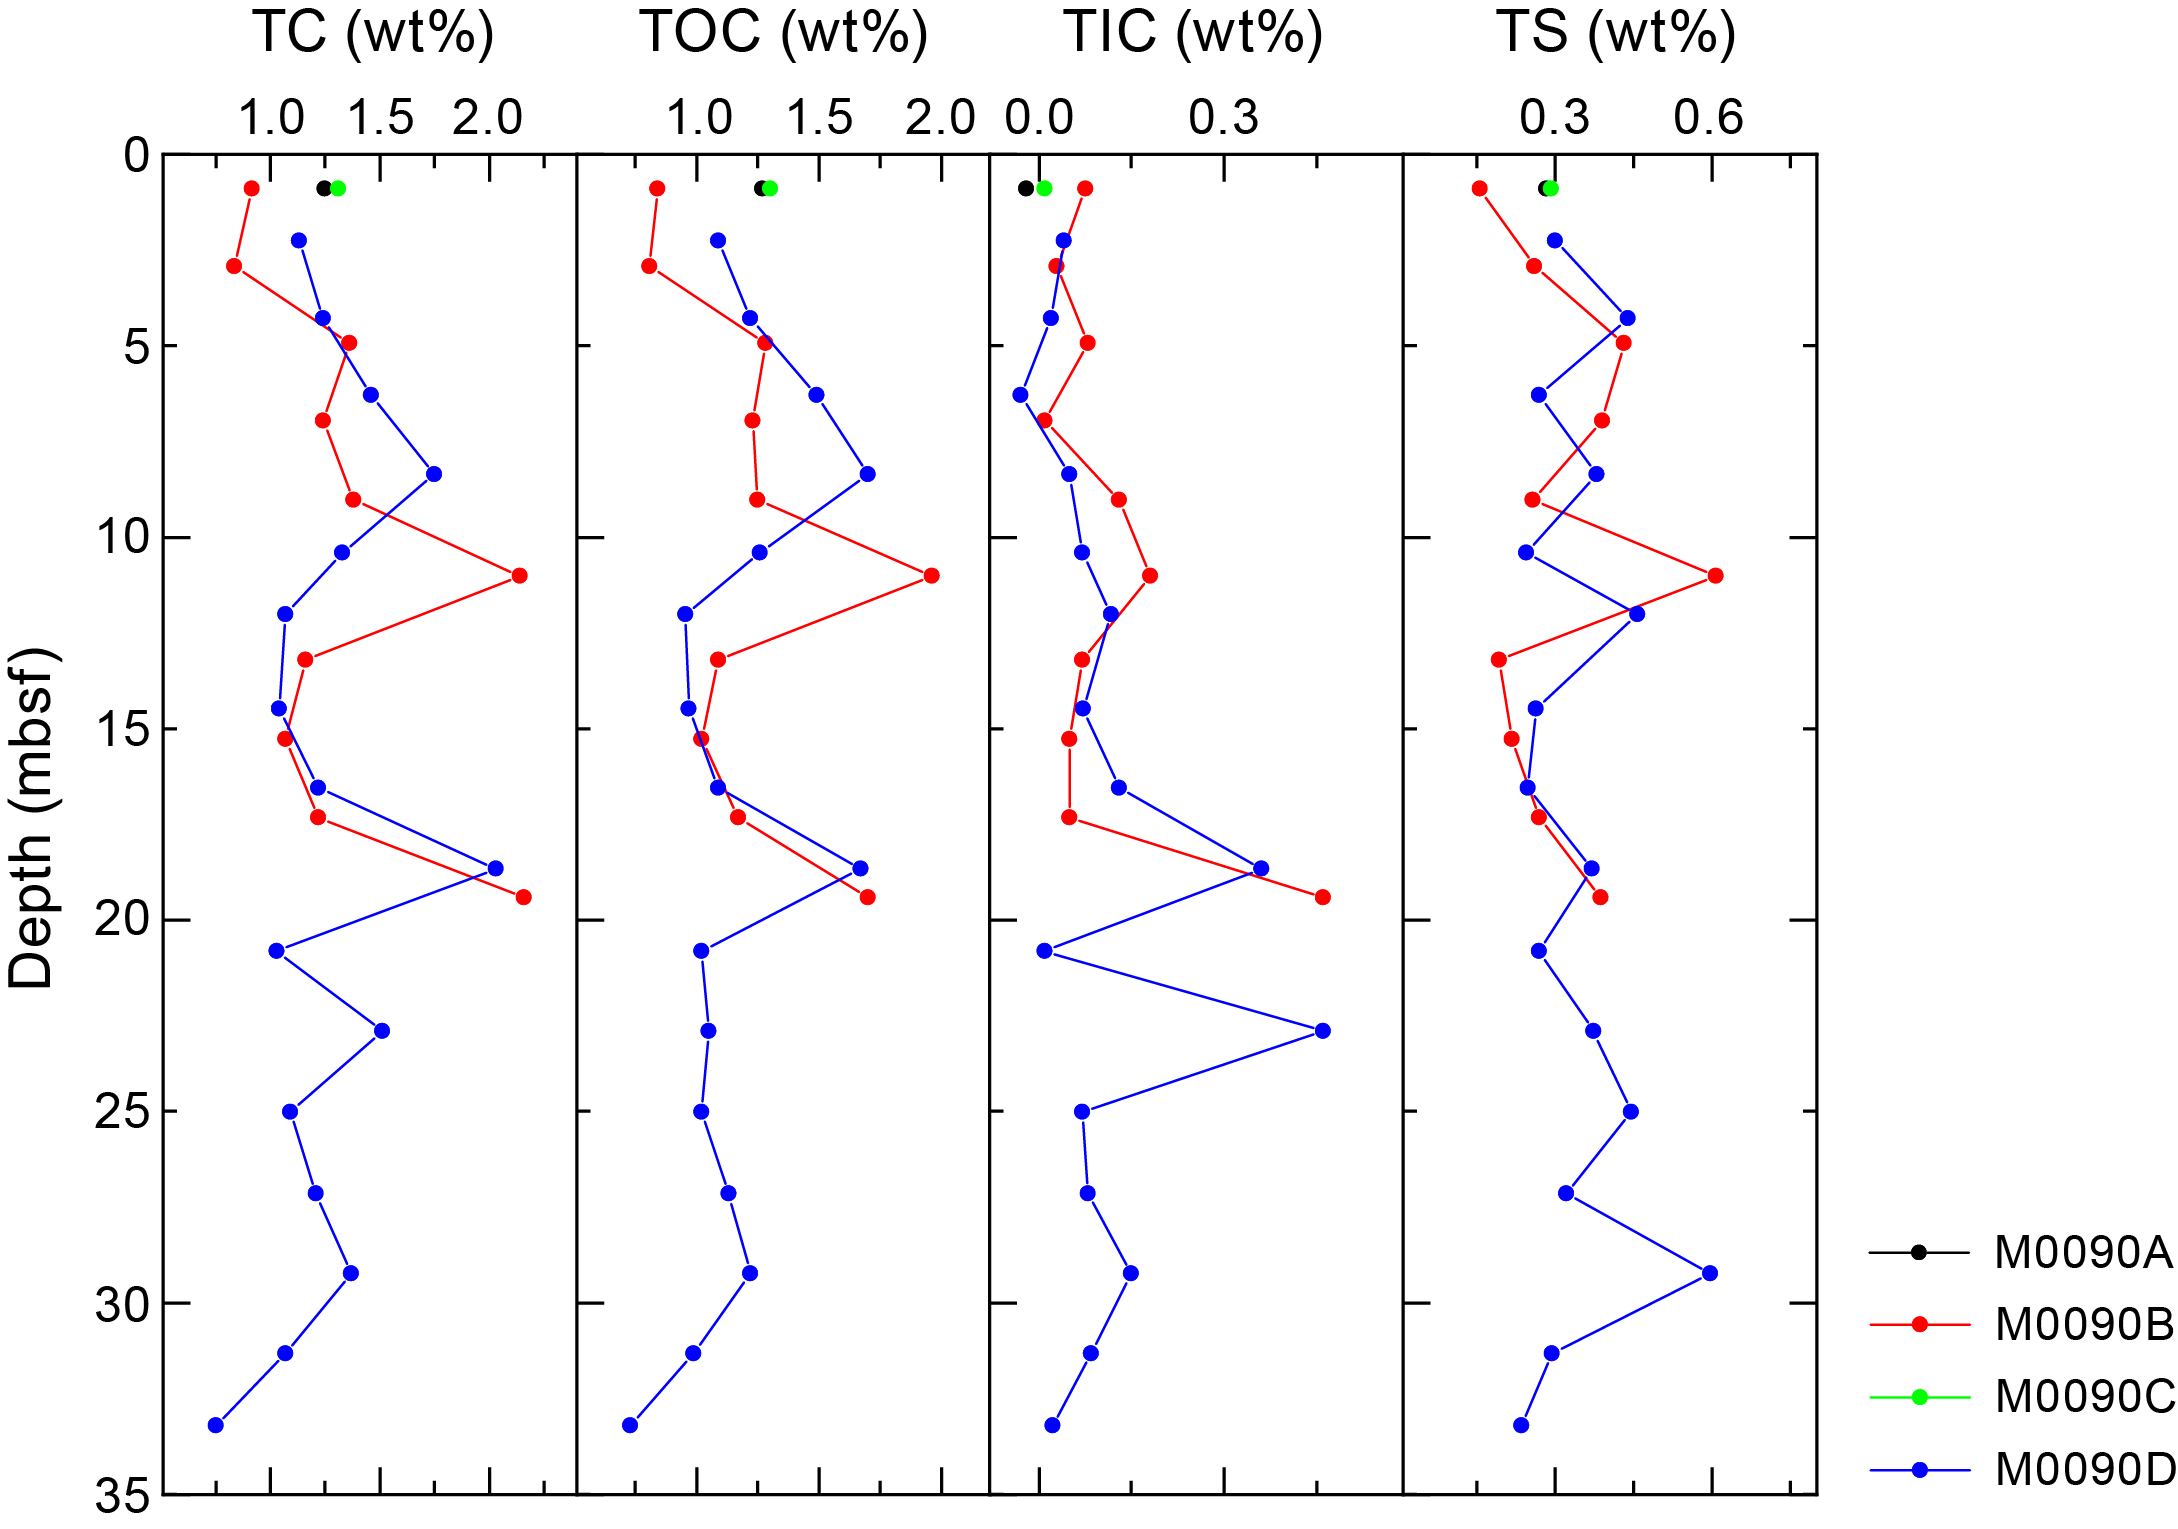
Figure F25. TC, TOC, TIC, and TS.
TC (~1.25–1.31 wt%) and TOC (~1.27–1.30 wt%) were measured for one sample from each trigger core (Holes M0090A and M0090C).
TC and TOC range ~0.83–2.16 wt% in GPC Holes M0090B and M0090D. Downcore, they fluctuate without a trend. TC reaches maxima (>2.1 wt%) at ~10 and ~18–19 mbsf in Holes M0090B and M0090D, respectively, and is matched by TOC maxima of 1.9 and 1.7 wt% in Holes M0090B and M0090D, respectively.
TIC contents are near zero in the sediments from both trigger cores (Holes M0090A and M0090C). Downcore, TIC contents fluctuate but remain low (<0.2 wt%) in Holes M0090B and M0090D, except for three samples from ~18–22 mbsf where TIC reaches maxima of ~0.4 wt%.
Total sulfur (TS) contents in sediments from Holes M0090A and M0090C are very similar (~0.28–0.29 wt%). Downcore, TS values fluctuate between 0.19 and 0.61 wt% without an overall increase or decrease. There is no obvious correlation with TC or TOC, although TS also shows a maximum at ~10 mbsf.
6.5. Discussion
The IW concentration profiles of ammonium and alkalinity at Site M0090 indicate high rates of organic matter remineralization. Additionally, the methane concentration profiles, with the highest methanogenesis rates in the uppermost 3–5 m, point to a shallow sulfate–methane transition (SMT) at about 2.5 mbsf (Hole M0090B) and 4.5 mbsf (Hole M0090D). Dissolved Fe and Mn concentrations are very high in the uppermost meter of the sediment column, indicating organic matter remineralization by intensive dissimilatory Mn and Fe reduction (Froelich et al., 1979). Exponentially decreasing sulfate values suggest organoclastic sulfate reduction in the deeper sediments. Dissolved Ba increases below the SMT, reaching high values compared to the other sites. This suggests potential input of marine barite at this site that is dissolved below the SMT with the consequential release of Ba to the IW (e.g., Torres et al., 1996). Furthermore, the release of dissolved Fe around 22.5 mbsf could potentially signal postdepositional alteration of volcanic glass shards (see Lithostratigraphy and Tephra).
The high contents (>1.0%) of TC and TOC in the upper part of Site M0090 suggest large amounts of carbon burial in the central Japan Trench. The high methane concentrations and C1/C2 values and low concentrations of SO42− observed in the deeper sediments suggest significant roles of microbes in the fate of sedimentary organic carbon in the hadal.
The solid-phase data show that the sediments at Site M0090 are dominated by siliceous material. Solid-phase Fe and Mn mainly follow the content profile of Al, suggesting detrital and/or volcanic sources for these elements. One exception is a strong increase in Mn at around 23 mbsf that is likely related to a vitric silt, as observed in smear slide Sample 386-M0090D-1H-23, 102–105 cm (see SMEARSLD in Supplementary material; see Lithostratigraphy and Tephra), which is in good agreement with the observed changes in the IW iron profile as a potential result of diagenetic ash alteration.
7. Physical properties
This section summarizes the preliminary physical properties results from cores acquired at Site M0090 at a water depth of around 7445 mbsl in Basin C1 in the Central Japan Trench. A total of four holes were cored: two pairs of trigger cores (Holes M0090A and M0090C) and corresponding GPC cores (Holes M0090B and M0090D) (see Operations). The physical properties data sets were collected with the techniques and sampling rates defined in Physical properties in the Expedition 386 methods chapter (Strasser et al., 2023a). During the offshore phase, whole cores were scanned through the MSCL. During the onshore phase, cores were split, scanned through the Tri-Sensor Core Logger (TSCL), and sampled for moisture and density (MAD), undrained shear strength, and P-wave velocity. Overall, the physical properties data sets are high quality and correlate well with lithology and hydroacoustic data.
A synthesis of MSCL and shear strength properties is presented in Figure F26 for Holes M0090A and M0090B and in Figure F27 for Holes M0090C and M0090D.

Figure F26. Physical properties summary, Holes M0090A and M0090B.

Figure F27. Physical properties summary, Holes M0090C and M0090D.
7.1. Bulk density
Bulk density data were obtained using the gamma ray attenuation (GRA) technique on the MSCL. Density values show a slight increasing trend with depth from 1.27 g/cm3 near the top to 1.35 g/cm3 at the bottom of Hole M0090D (Figure F27) . The top of Hole M0090B shows high bulk density (1.69 g/cm3), which does not match the density obtained from the top of Hole M0090A (1.21 g/cm3) (Figure F26). This indicates that the GPC core (Hole M0090B) lost a few meters of material from the top during coring, which is also evident from the geochemistry data (see Geochemistry).
Holes M0090A and M0090B are generally denser than Holes M0090C and M0090D at the same depth. However, a number of localized zones of variation are superimposed on this overall trend. The shallowest 0–3 m show the highest MSCL bulk density fluctuations, including pronounced peaks reaching 1.8 g/cm3 at 0.2 and 1.1 mbsf in Hole M0090B and 1.7 mbsf in Hole M0090D. Below this depth, bulk density decreases downcore to near-mudline values at about 11 mbsf. There is a local high-density zone between 11 and 15 mbsf in Hole M0090B (reaching 1.6 g/cm3 near the base of this zone) and between 12 and 16 mbsf in Hole M0090D (with a sharp peak of 1.7 g/cm3 at ~12 mbsf and values up to 1.5 g/cm3 near the base of this zone). Below this depth, bulk density gradually increases downcore to the bottom of the both holes. In Hole M0090D, the deepest density peak (1.7 g/cm3) occurs at 30.6 mbsf (Figure F27).
Bulk density values obtained from discrete samples from trigger cores and GPC cores are shown as blue and red dots, respectively, in Figures F26 and F27. MAD-derived bulk density data have an overall good correspondence with MSCL-derived bulk density data but tend to be slightly higher. The MSCL density data show higher frequency fluctuations, especially in the uppermost 3 m of Holes M0090B and M0090D and between 13 and 15 mbsf in Hole M0090B.
7.2. Magnetic susceptibility
Magnetic susceptibility in all Site M0090 holes varies over short, centimeter-scale intervals around an average value of approximately 60 × 10−5 SI throughout the cored depth but also shows several pronounced peaks that exceed 300 × 10−5 SI at 1–3 mbsf (Figures F26, F27). Between 11 and 15 mbsf in Hole M0090B and 12 and 16 mbsf in Hole M0090D, magnetic susceptibility increases downcore from the above described average value to peak values of ~202 × 10−5 to 236 × 10−5 SI at the base of this interval, followed by a very sharp drop back to average values immediately below this interval. Peak magnetic susceptibility values usually correlate with peak bulk density values. The highest peak magnetic susceptibility value at this site (423 × 10−5 SI) occurs at 25.7 mbsf in Hole M0090D.
As with MSCL bulk density, the magnetic susceptibility values obtained from the top of Hole M0090B (62 × 10−5 SI) do not match the values in Hole M0090A (27 × 10−5 SI), possibly indicating a loss of material from Hole M0090B during coring.
7.3. P-wave velocity
P-wave velocity was measured on whole cores using the MSCL during the offshore phase. During the onshore phase, P-wave velocity was measured on discrete samples approximately every 2 m. Many of the MSCL velocity data were of insufficient quality below ~5 mbsf and have been omitted.
Offshore P-wave velocities recorded with the MSCL at Site M0090 generally trend around 1500 m/s (the velocity of water). Shore-based discrete measurements are noticeably higher (closer to an average of 1700 m/s). The difference in velocity exceeds the uncertainty associated with the discrete velocity measurements (±50 m/s). The difference between the two data sets may be attributed to continued compaction or degassing of the sediments between the offshore and onshore phases of the expedition. Postcruise research will be required to fully understand the discrepancy; thus, the data should be used with a degree of caution.
MSCL and laboratory-measured P-wave data are plotted in Figures F26 and F27 for Site M0090. The maximum MSCL P-velocity values observed in Holes M0090B and M0090D are 1639 m/s at 0.2 mbsf and 1655 m/s at 1.7 mbsf, respectively.
Hole M0090B laboratory-measured P-wave velocities vary between 1791 m/s at 0.9 mbsf and 1578 m/s at 19.4 mbsf. There is a slight increasing trend in P-wave velocity downcore to 11 mbsf, followed by a slight decreasing trend to the bottom of the hole.
For Holes M0090C and M0090D, the average P-wave velocity measured on discrete samples is 1739 m/s. There is no obvious trend of increasing P-wave velocity with depth despite a local highest value of 2060 m/s at 16.5 mbsf in Hole M0090D.
7.4. Noncontact electrical resistivity
Noncontact electrical resistivity measured using the MSCL shows a gentle increasing profile in Hole M0090D and in the uppermost 7 m of Hole M0090B. The deeper part of Hole M0090B shows a peak value of ~1.1 Ωm at 7.3 mbsf followed by a gradual decrease to the bottom of the hole (Figure F26). In deeper GPC Hole M0090D, relatively consistent resistivity values around 0.6 Ωm from ~14 to 24 mbsf are followed by increasing resistivity values toward the bottom of the hole. This bottom zone shows the greatest amount of variability and the highest readings, with a maximum of ~1.4 Ωm at 33.6 mbsf in Hole M0090D (Figure F27). As with MSCL bulk density, there is not a good match between the values obtained from the top of Hole M0090B (0.4 Ωm) and Hole M0090A (0.3 Ωm), indicating a loss of material from Hole M0090B during coring.
7.5. Natural gamma radiation
In all holes at Site M0090, NGR has similar profiles (Figures F26, F27) that generally fluctuate between 20 and 40 counts/s. A relatively low NGR zone is observed in the two GPC holes (M0090B and M0090D), with readings as low as 15 counts/s. This zone occurs between 12 and 15 mbsf in both Holes M0090B and M0090D and correlates with high bulk density and magnetic susceptibility values. Below this zone, NGR values taper back to background levels (about 35 counts/s). As with MSCL bulk density, there is not a good match between the values obtained from the top of Hole M0090B (33 counts/s) and Hole M0090A (9 counts/s), indicating a loss of material from Hole M0090B during coring.
7.6. Undrained shear strength
Undrained shear strength (Su) was measured on split cores with a handheld penetrometer, automated vane shear (AVS) apparatus, and fall cone penetrometer (see Physical properties in the Expedition 386 methods chapter [Strasser et al., 2023a]). Su generally increases with depth in all holes at Site M0090 (Figures F26, F27, F28). Holes M0090A and M0090B show a stronger shear strength profile, with handheld penetrometer data with an average Su increase rate of 5.7 kPa/m, whereas Holes M0090C and M0090D have an average Su increase rate of 2.3 kPa/m. As with MSCL bulk density, the Su obtained from the top of Hole M0090B (33 kPa) is higher than that from the top of Hole M0090A (15 kPa), suggesting a loss of material from Hole M0090B during coring. The AVS and fall cone data profile for Hole M0090B are higher than those for Hole M0090D. It is not obvious why this might be, but it could be due to lithologic effects.
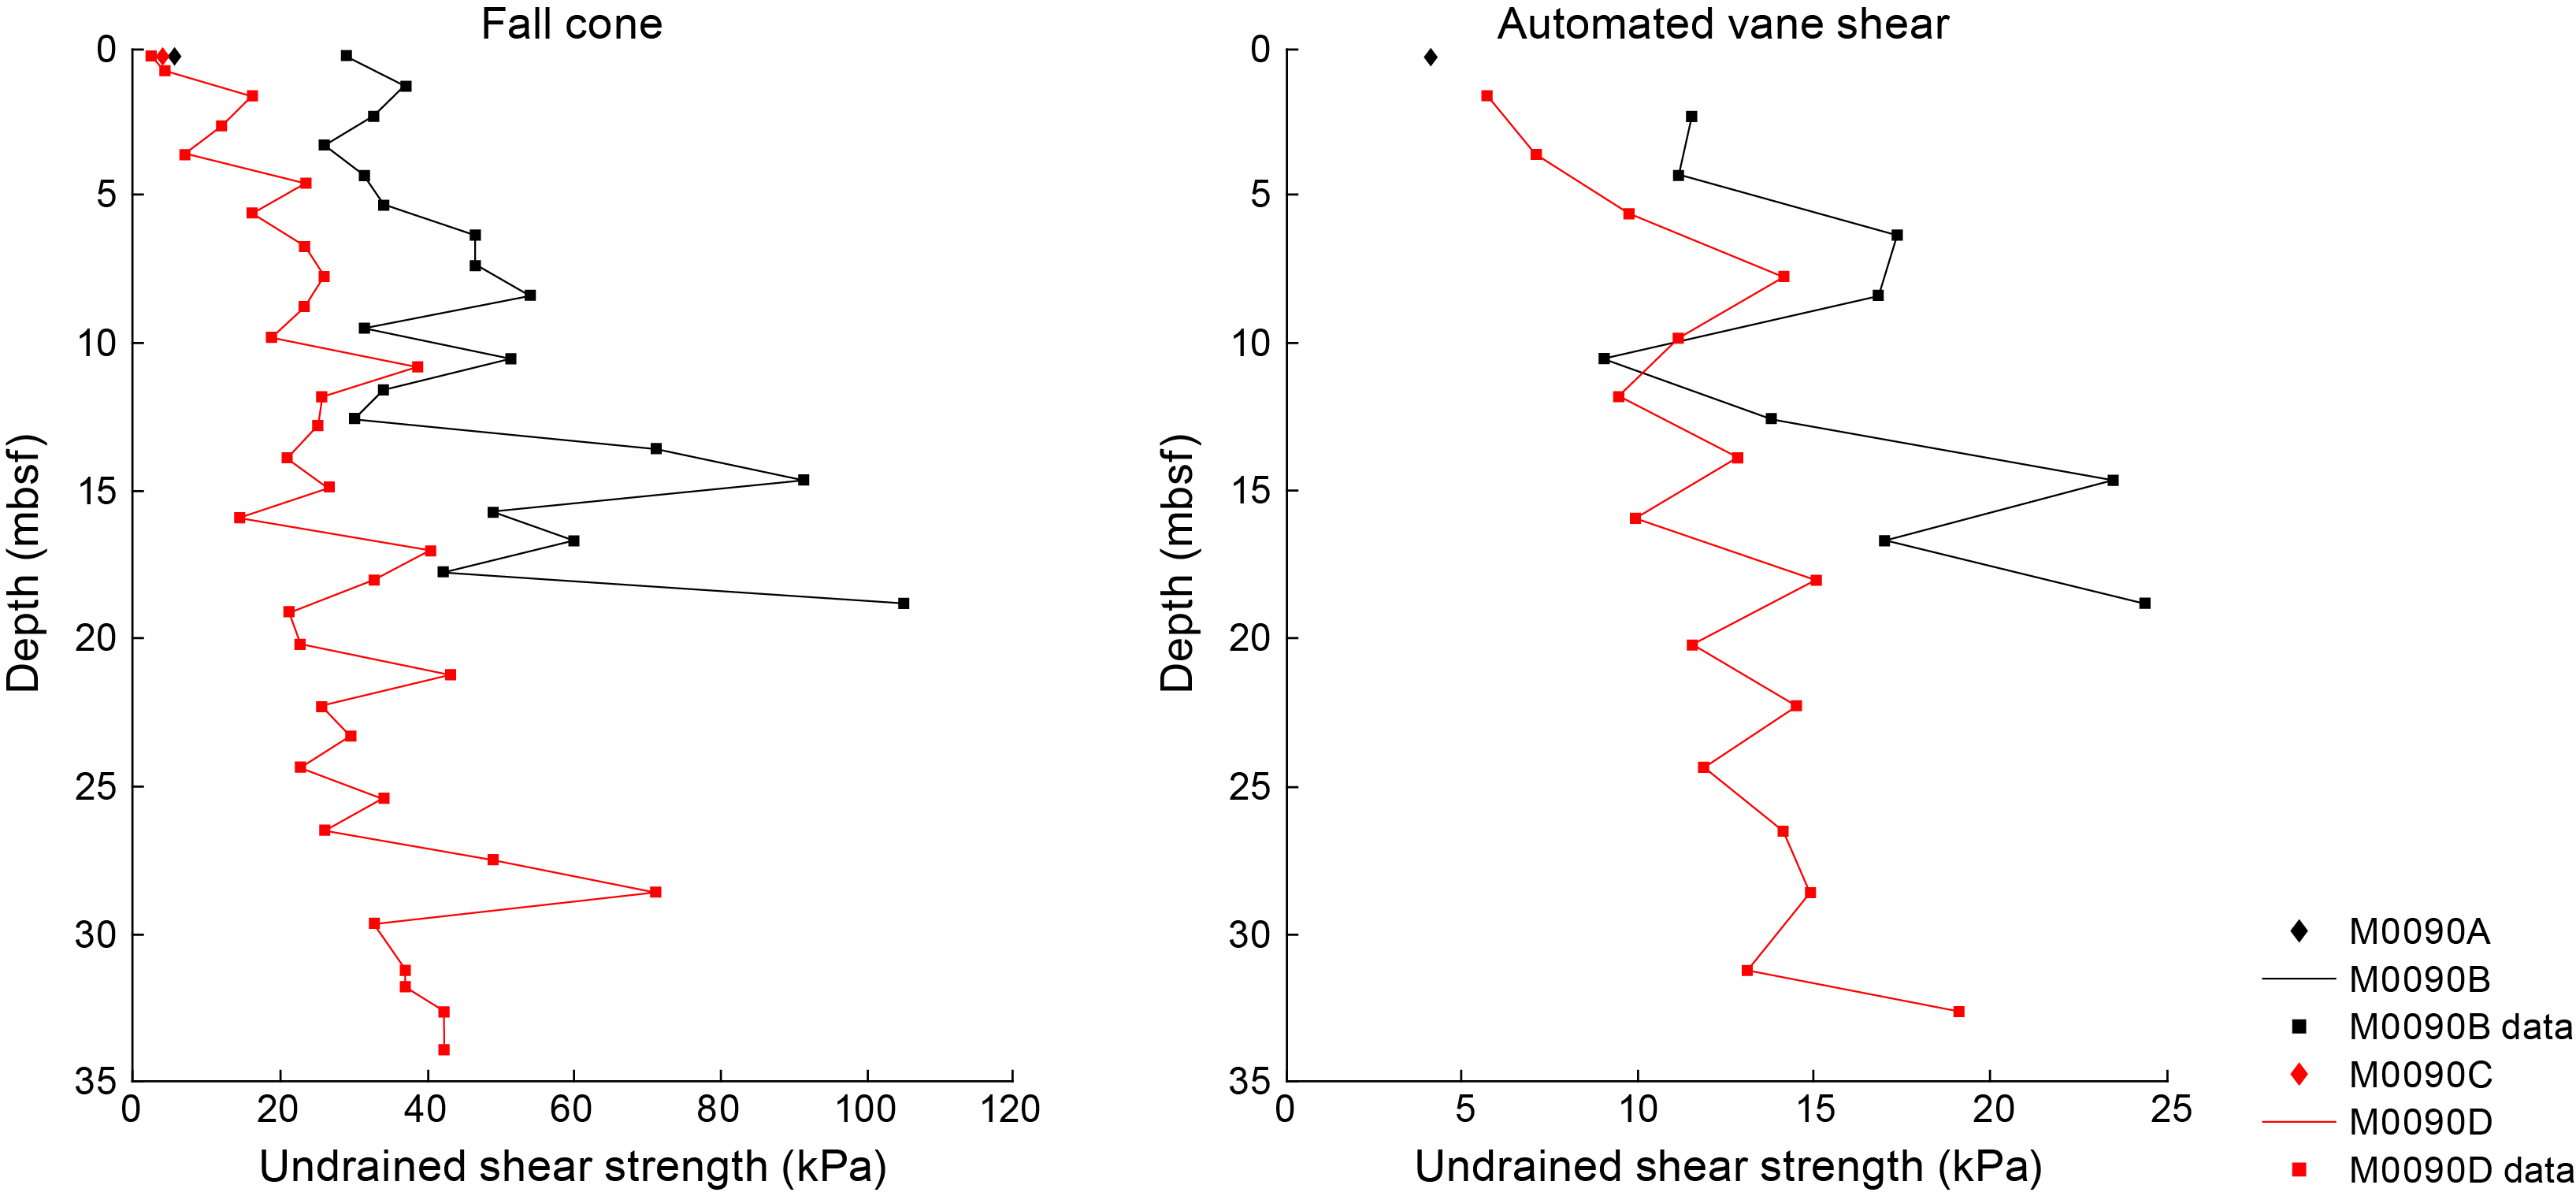
Figure F28. Undrained shear strength.
It should also be noted that values of Su vary according to the device used to obtain them (Figure F28). For example, fall cone penetrometer strengths are higher than those obtained with the AVS and handheld penetrometer. The influence of the U-channel along the center of the core could result in lower strengths than those measured with the fall cone. The fall cone only impacts a small region of the core (~2–5 mm), whereas the AVS impacts a larger region of the core (~20–50 mm). Both measurements ideally should be obtained from the center of the core away from the core sidewall. However, samples could not be taken at the center because of the U-channel (see Physical properties in the Expedition 386 methods chapter [Strasser et al., 2023a]). As a result, strength sampling points had to be placed halfway between the central U-channel and the sidewall of the core. During AVS measurements, the fractures that opened often propagated toward both the central U-channel and the sidewall, perhaps resulting in lower strength values. Fall cone measurements were not seen to be affected by the U-channel or the sidewall. Postcruise analysis will more closely examine the strength data to try to reconcile the differences.
7.7. Moisture and density
Using the MAD technique on discrete samples onshore, wet and dry water contents, bulk density, dry density, grain density, porosity, and void ratio were obtained (Figures F29, F30). Trigger core data are plotted in red, and piston core data are plotted in black.

Figure F29. MAD data, Holes M0090A and M0090B.
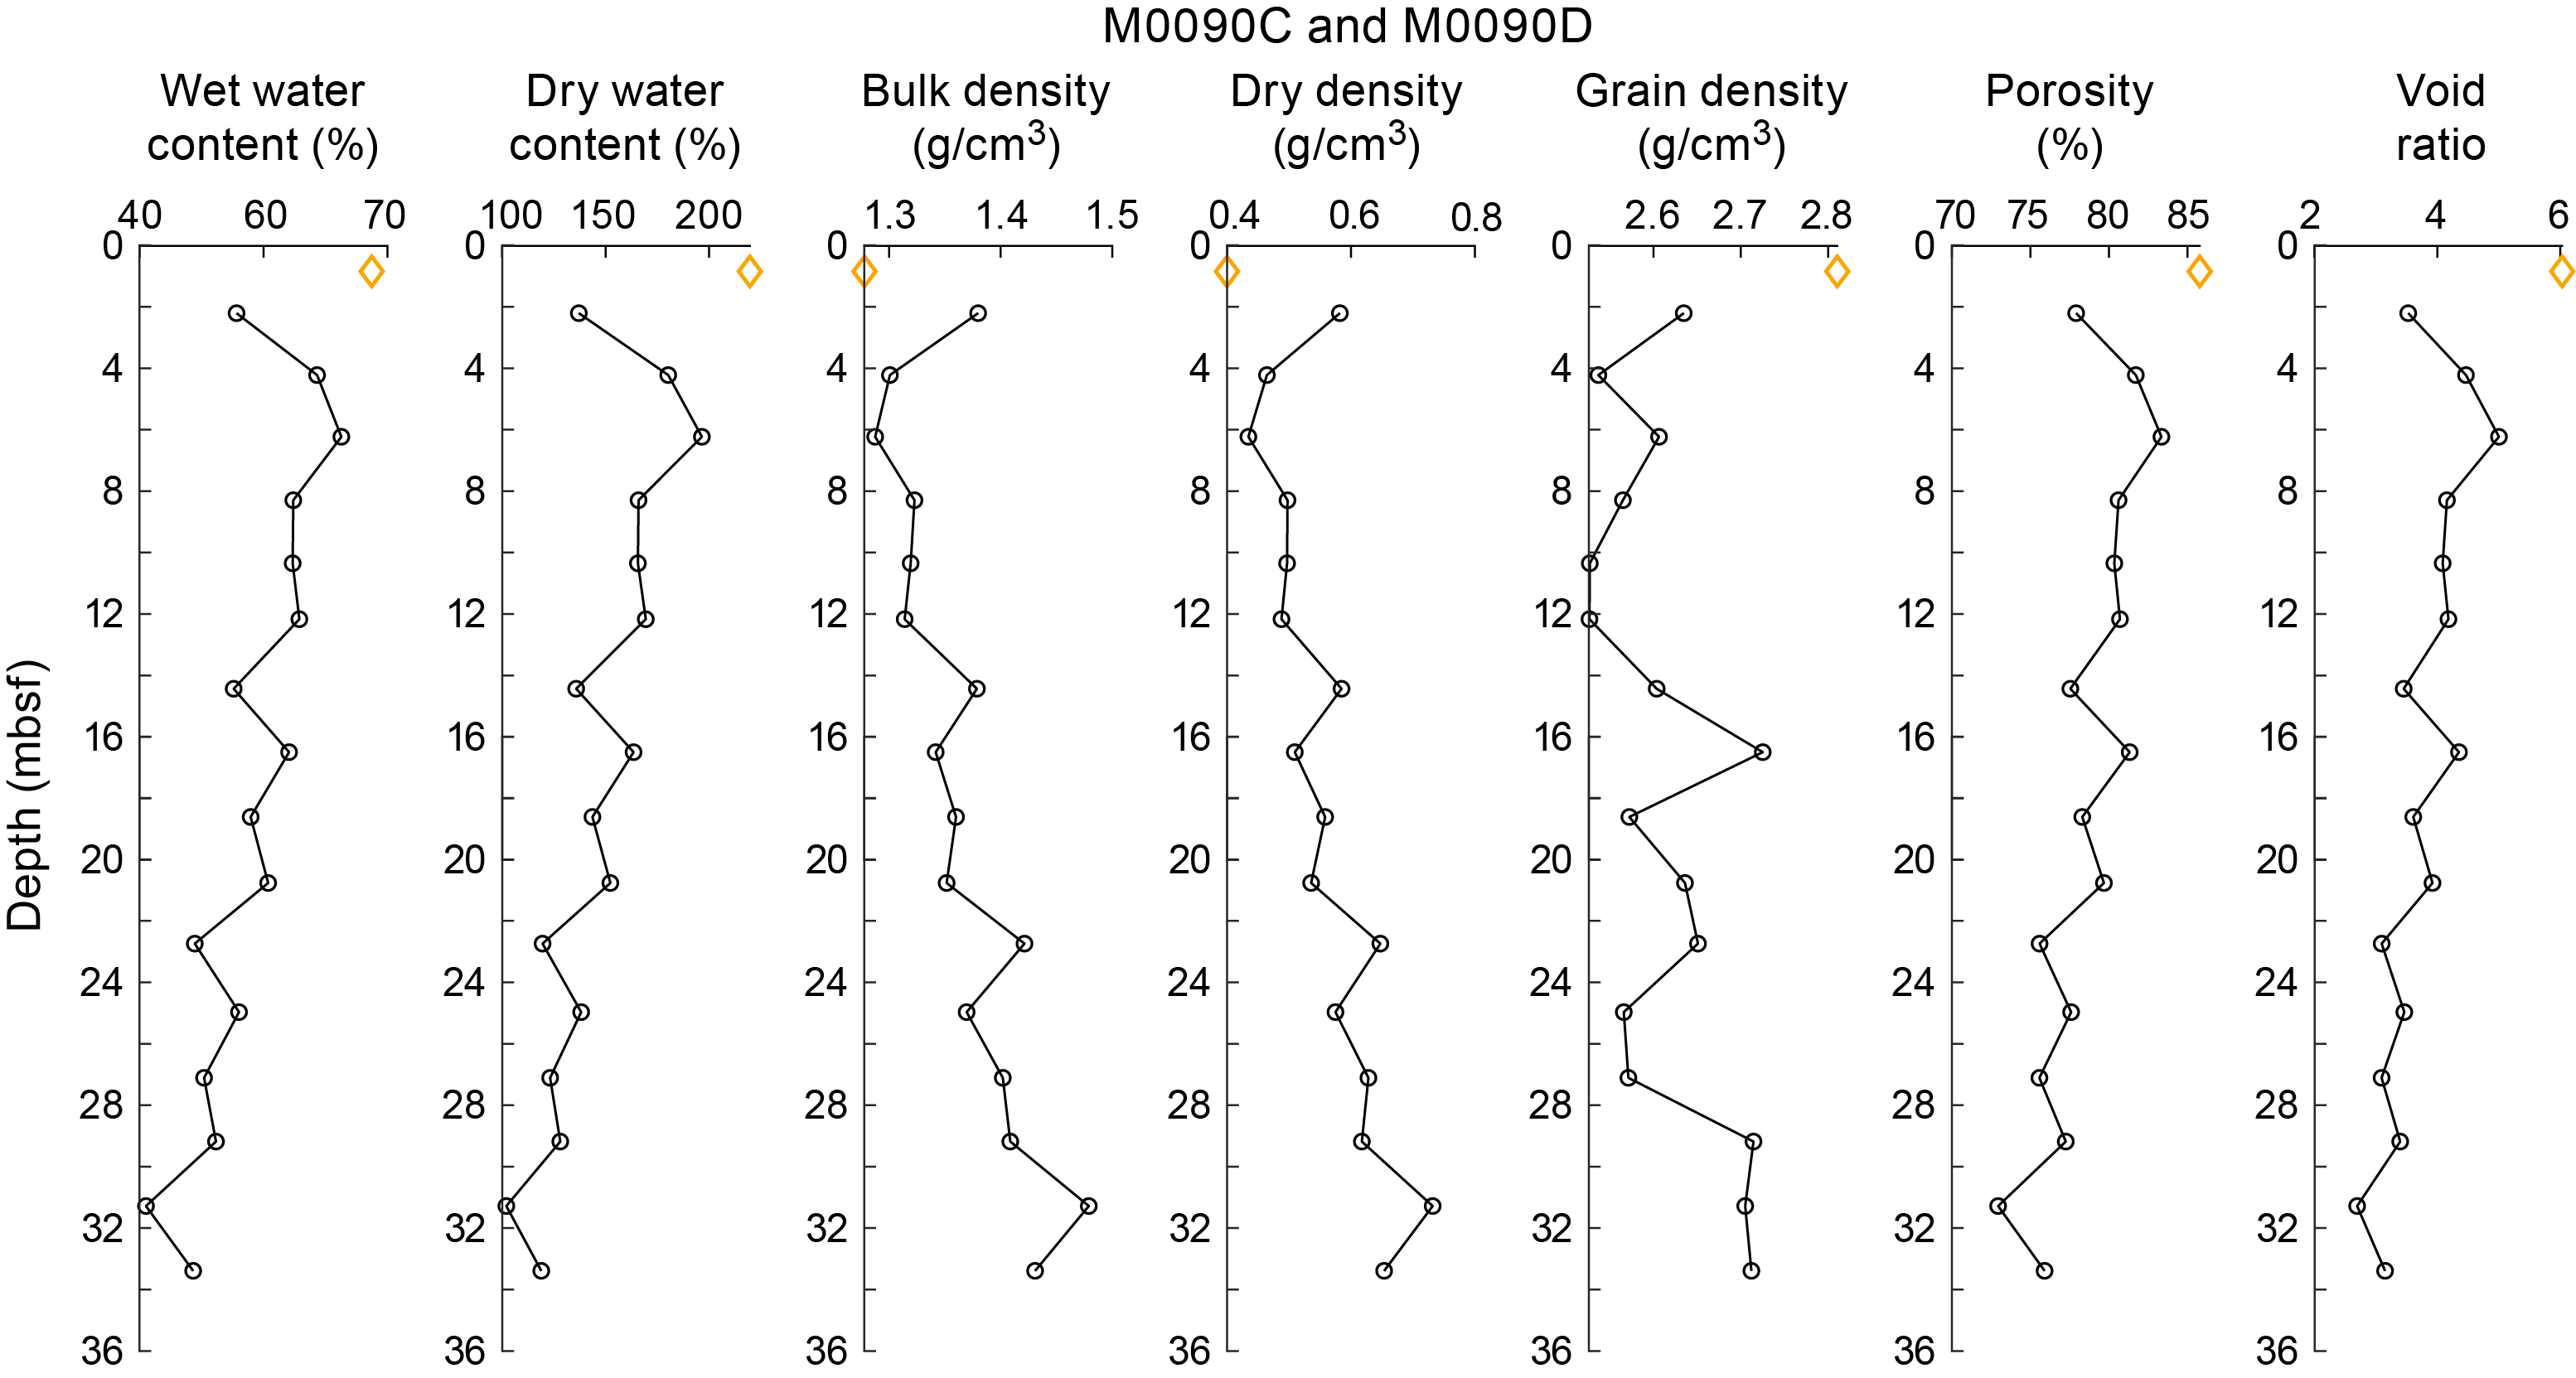
Figure F30. MAD data, Holes M0090C and M0090D.
Wet water contents and dry water contents gradually decrease with depth except for a local drop to 41% wet water and 103% dry water at about 2.9 mbsf in Hole M0090B.
Bulk density values for Holes M0090A and M0090B increase downcore from ~1.25 g/cm3 at the mudline to ~1.38 g/cm3 at the bottom of Hole M0090B (19.4 mbsf). These correspond to porosity values of 86.5% and 77.2%, respectively. The increasing trend in bulk density is almost linear except for a local high value of 1.47 g/cm3 at 2.9 mbsf. Grain density shows a decreasing trend with depth, which varies from 2.83 g/cm3 at 0.8 mbsf to 2.52 g/cm3 at 15.2 mbsf.
In Holes M0090C and M0090D, bulk density increases from ~1.28 g/cm3 at the mudline to ~1.43 g/cm3 at the bottom of Hole M0090D (33.4 mbsf). These values correspond to porosity values of 85.8% and 75.9%, respectively. However, the increasing density trend shows more variation than in Holes M0090A and M0090B. Several local high density values occur at 2.2, 14.4, 22.7, and 31.3 mbsf. Grain density shows a slight increasing trend with depth. The minimum grain density value in Hole M0090D is 2.53 g/cm3 at 12.2 mbsf, and the maximum value is 2.73 g/cm3 at 16.5 mbsf.
7.8. Color reflectance and RGB values
For Holes M0090B and M0090D, color spectrometry L* values range between approximately 20 and 40 with several localized spikes below 20. a* values range approximately −2–0. b* ranges approximately 0–10. Calculated red-green-blue (RGB) values in all holes vary with depth in concert with the spectrometry parameters. In Figures F31 and F32, the farthest right column represents merged color from RGB values. White bars indicate intervals that contain no data.
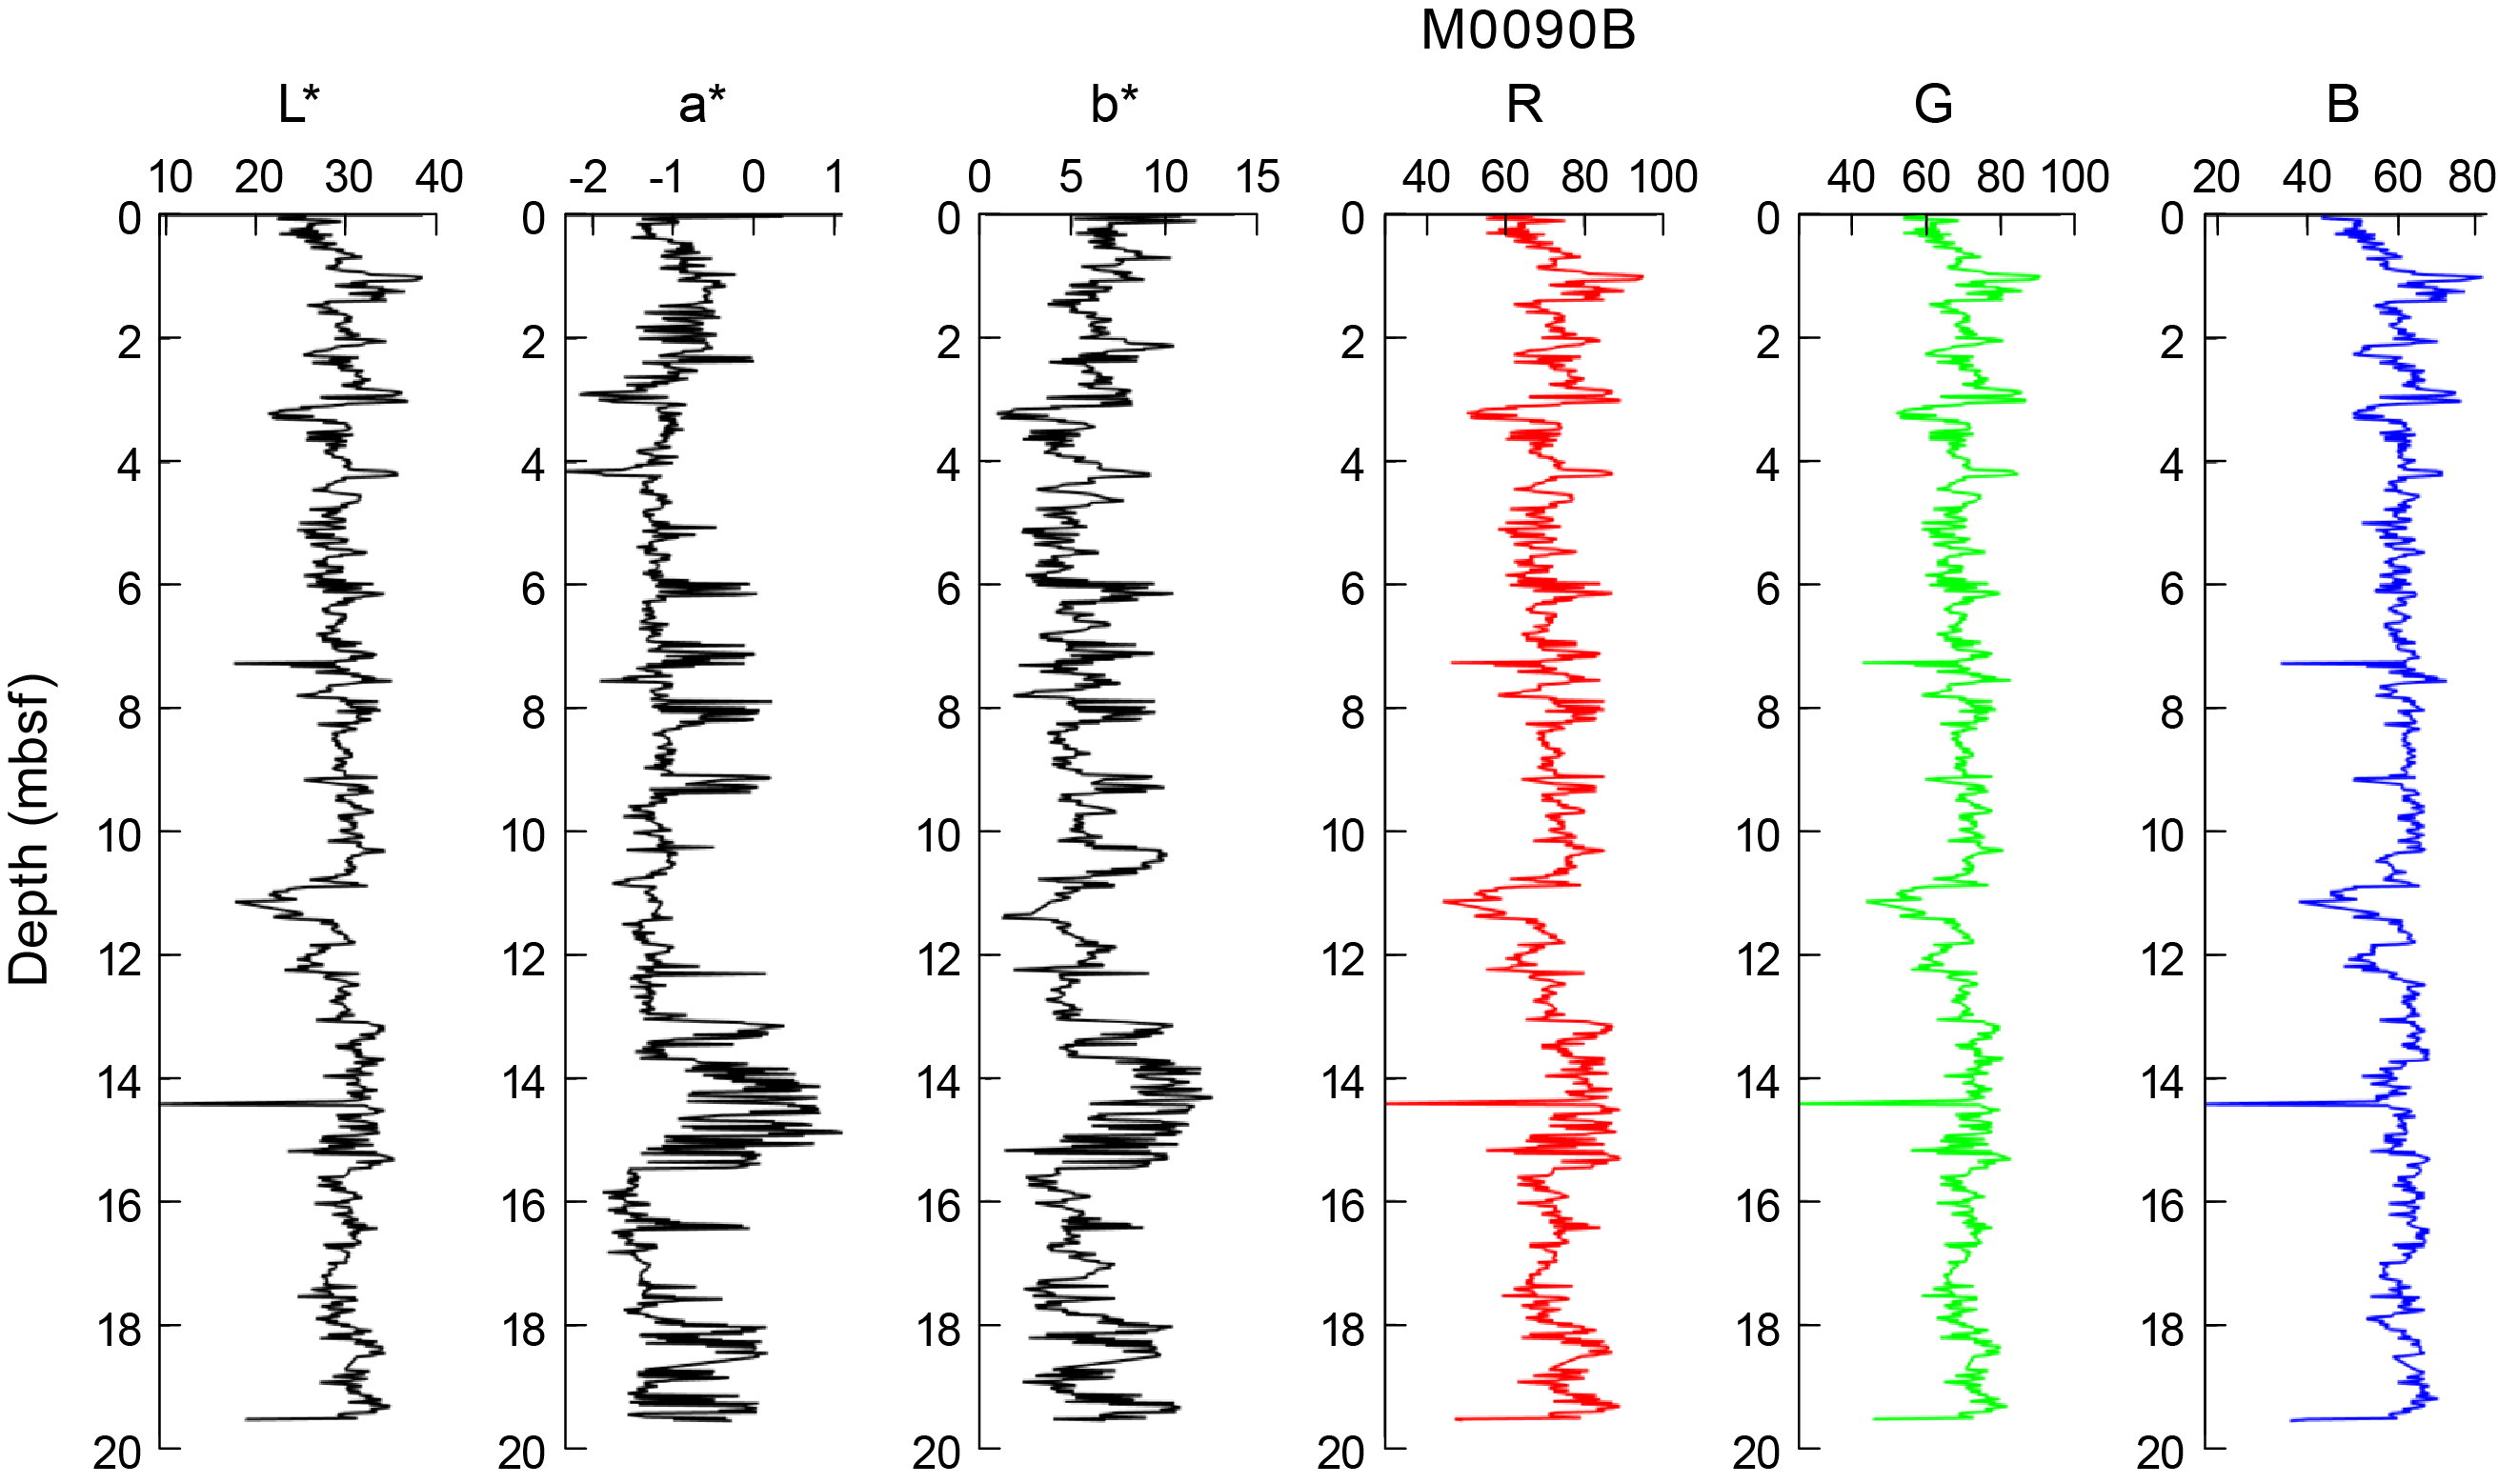
Figure F31. Color data, Hole M0090B.
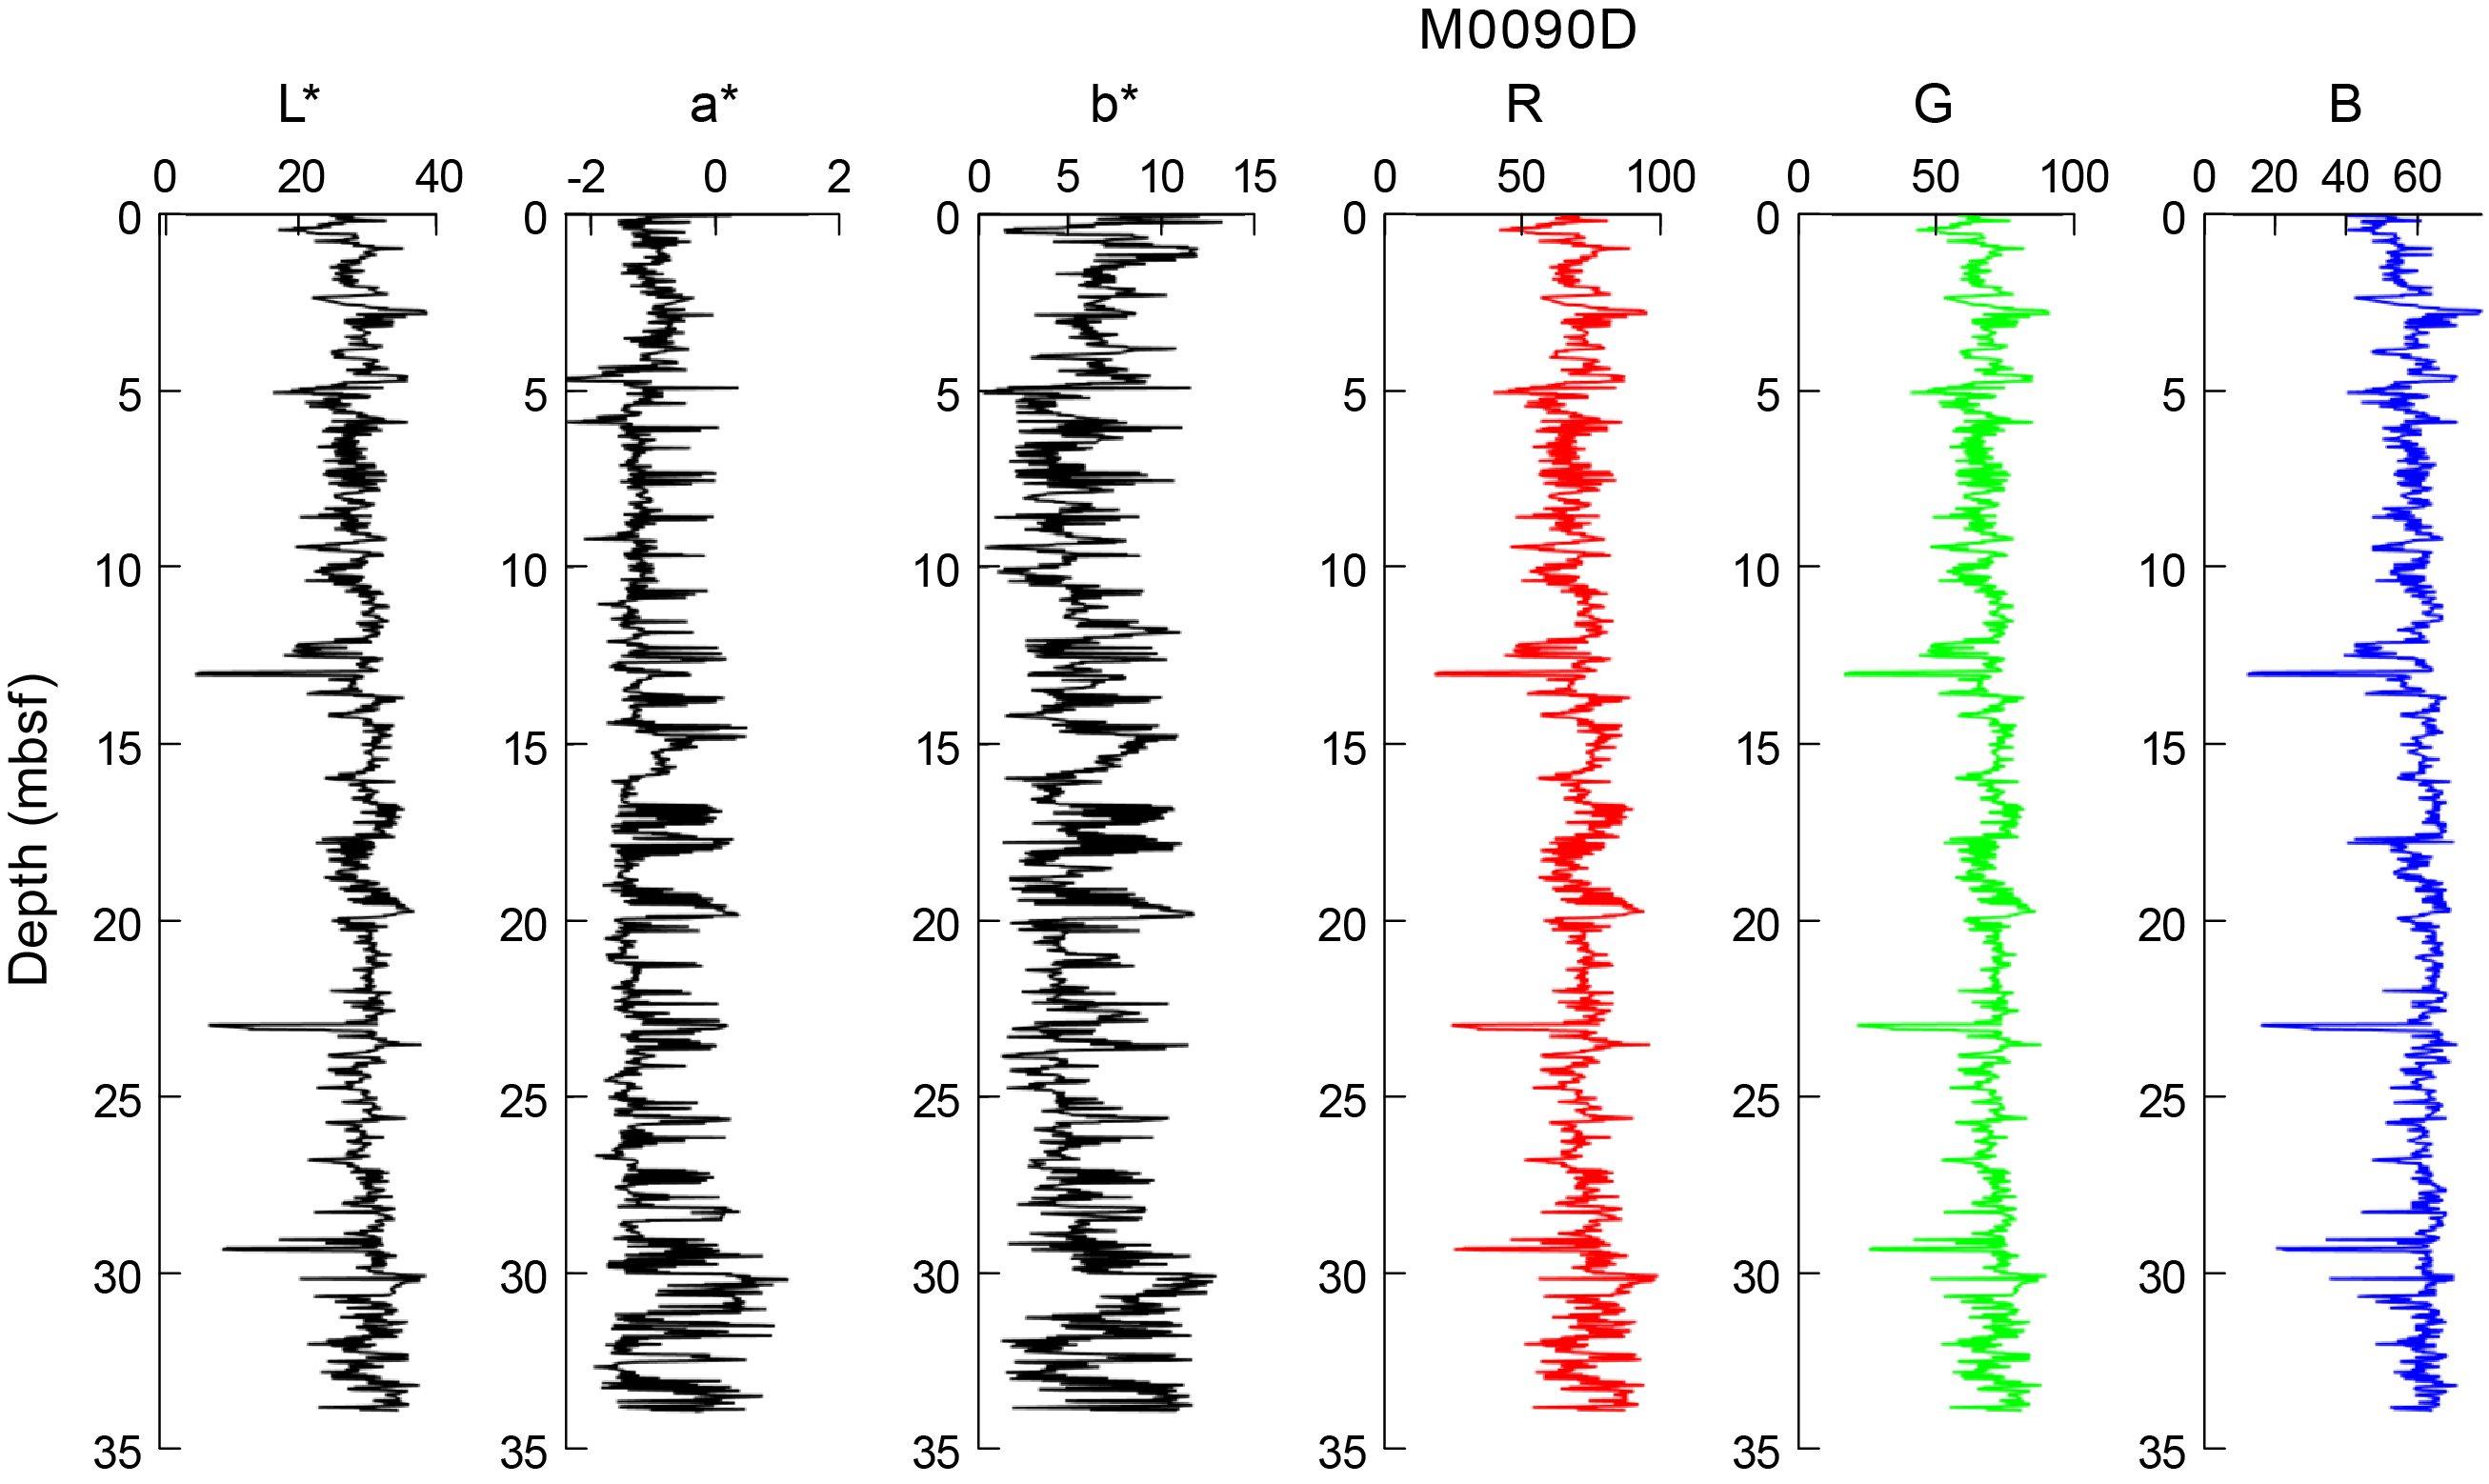
Figure F32. Color data, Hole M0090D.
In Hole M0090B, dark tones can be seen at approximately 3.2, 7.3, 11.1, 12.2, and 19.5 mbsf and in a very thin interval at 14.4 mbsf (Figure F31). These intervals are characterized by a sudden drop to low RGB values. The dark intervals at 11.1, 14.4, and 19.5 mbsf are in fact not real sedimentary properties but instead represent void spaces which can be seen from X-ray CT scans and linescan images (see Lithostratigraphy). A pale interval at 1.0 mbsf corresponds to high RGB values.
In Hole M0090D, local dark intervals can be seen at approximately 5.1, 12.5, and 23.0 mbsf and in thin intervals at 13.0 and 29.4 mbsf (Figure F32). The dark intervals at 12.5, 13.0, 23.0, and 29.4 mbsf are not real sedimentary properties but instead represent void spaces that can be seen from X-ray CT scans and linescan images.
8. Paleomagnetism
This section reports the measurement of remanent magnetization in Holes M0090A–M0090D, which were cored in the southern part of the central Japan Trench (Basin C1).
Remanent magnetization of U-channel samples was measured on sections of the working halves at 2 cm intervals. Natural remanent magnetization (NRM) measurements were only conducted at 0 and 5 mT peak fields due to the time constraints of the hybrid Onshore Science Party (OSP).
Profiles of intensity, inclination, and declination after demagnetization at 5 mT are displayed in figures in this section. The profiles of Holes M0090A and M0090C are shown separately from their GPC counterparts due to the limited length of the trigger cores (Figure F33). The intensities and inclinations in Holes M0090A and M0090C show cyclic fluctuations throughout the cores; in contrast, declinations show more constant values.

Figure F33. Intensity, inclination, and declination.
The intensities observed in Holes M0090B and M0090D are characterized by large fluctuations (Figure F34). Both holes show a similar trend in the intensity profiles: intensities increase from the core top to 1 mbsf in Hole M0090B and from the core top to 3 mbsf in Hole M0090D. They then decrease to 6 mbsf in both holes. Short intervals around 1 m in length with low intensities are observed at 6–7 mbsf in both holes. High peaks of about 5.0 × 10⁻⁵ to 6.0 × 10⁻⁵ A/m are observed at around 8 mbsf in both holes. Values decrease from 8 to 11 mbsf in Hole M0090B and from 8 to 12 mbsf in Hole M0090D. Short intervals with low intensities are again observed at 10–11 mbsf in Hole M0090B and 12 mbsf in Hole M0090D. They gradually increase downward, reaching peaks of 13 × 10−5 and 8 × 10⁻⁵ A/m at 15 mbsf in Holes M0090B and M0090D, respectively, followed by a sharp drop in intensity in both holes. In Hole M0090D, values gradually increase, peaking at 22 mbsf and then decreasing to the core bottom.
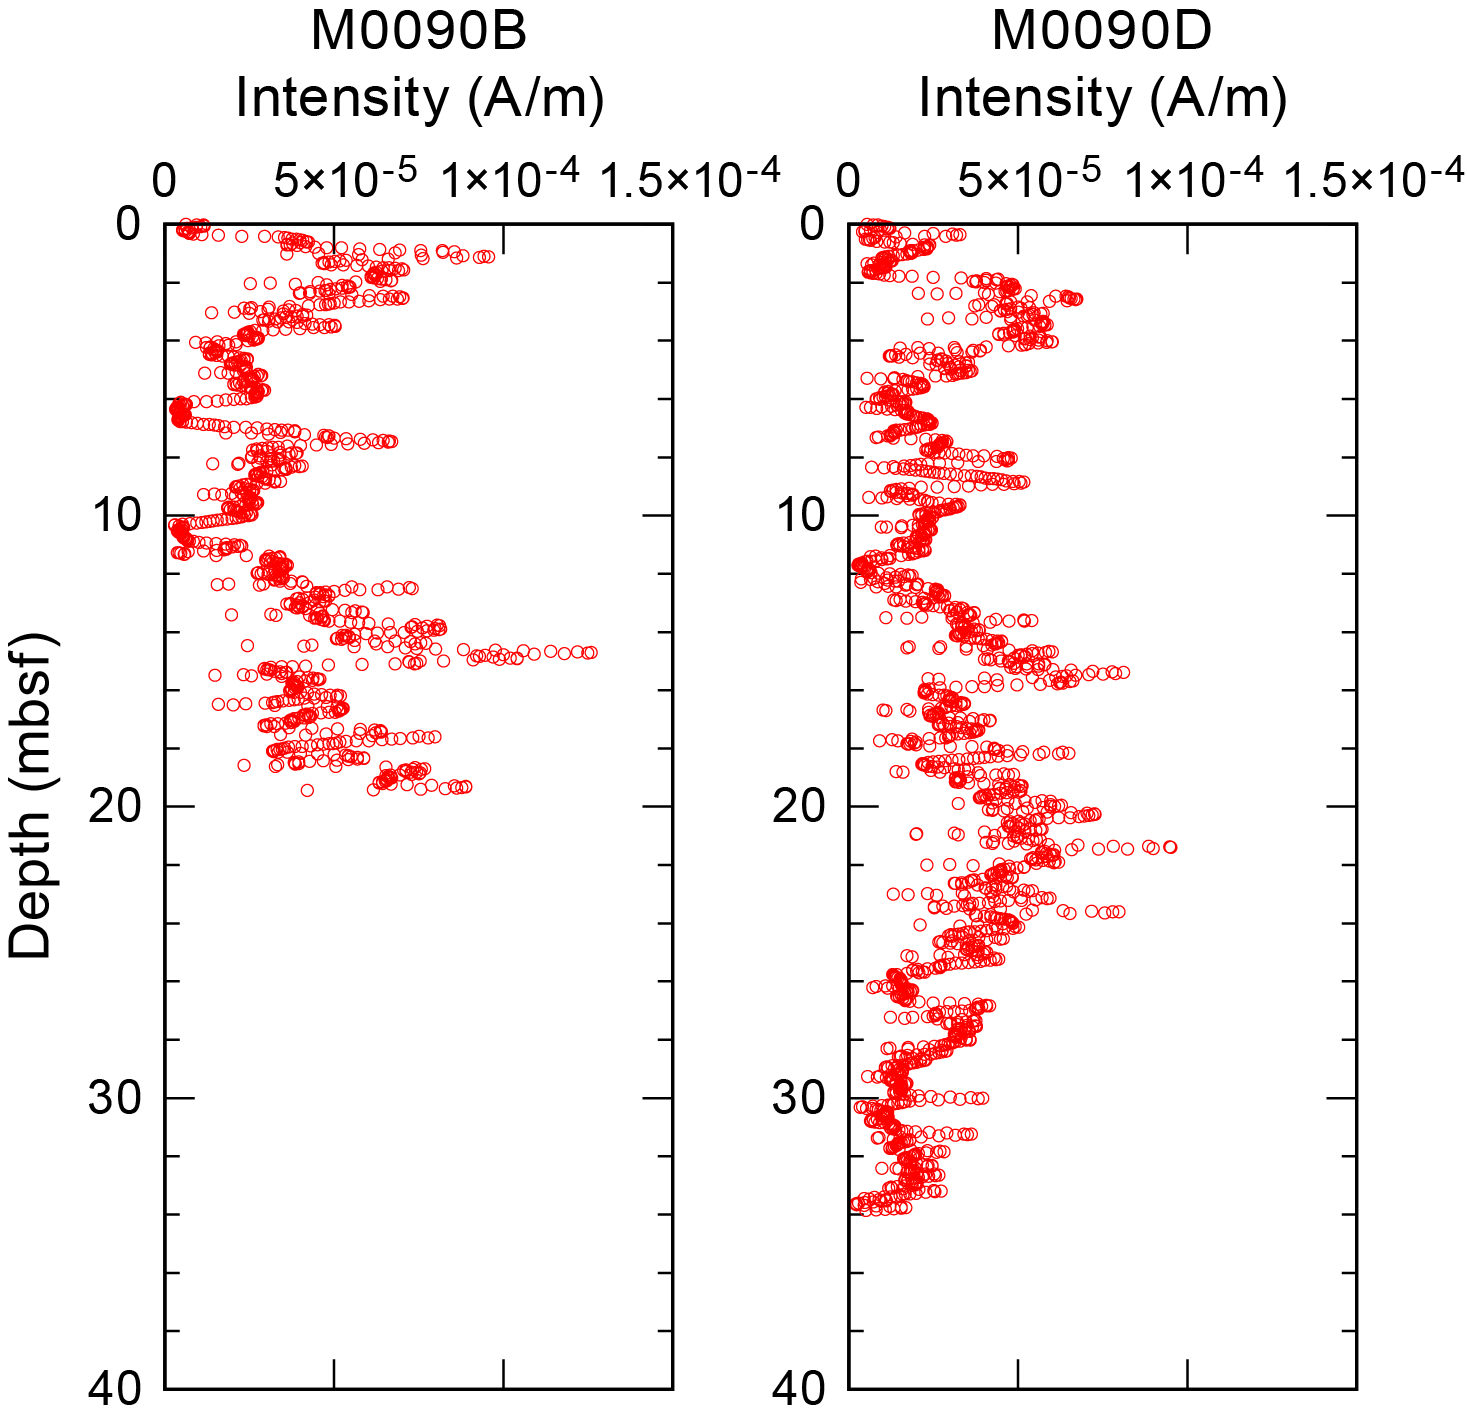
Figure F34. Intensity.
Declination trends are shown in Figure F35. The discontinuities of the declination trend at 4, 5, 6, and 12 mbsf in Hole M0090D were corrected by shifting to compensate for directional gaps. The declination variations in Hole M0090B and the corrected declination in Hole M0090D are similar (Figure F36). The following distinct peaks recognized in both profiles can be compared: negative peaks at 1 mbsf in Hole M0090B and 3 mbsf in Hole M0090D, positive peaks at 3 mbsf in Hole M0090B and 4.5 mbsf in Hole M0090D, positive small peaks at 10 mbsf in Hole M0090B and 11 mbsf in Hole M0090D, and negative peaks at 18 mbsf in both holes. However, there is no complete agreement regarding depth between the holes. Hole M0090D has a sudden offset at 30 mbsf with some scattered distribution in declination.
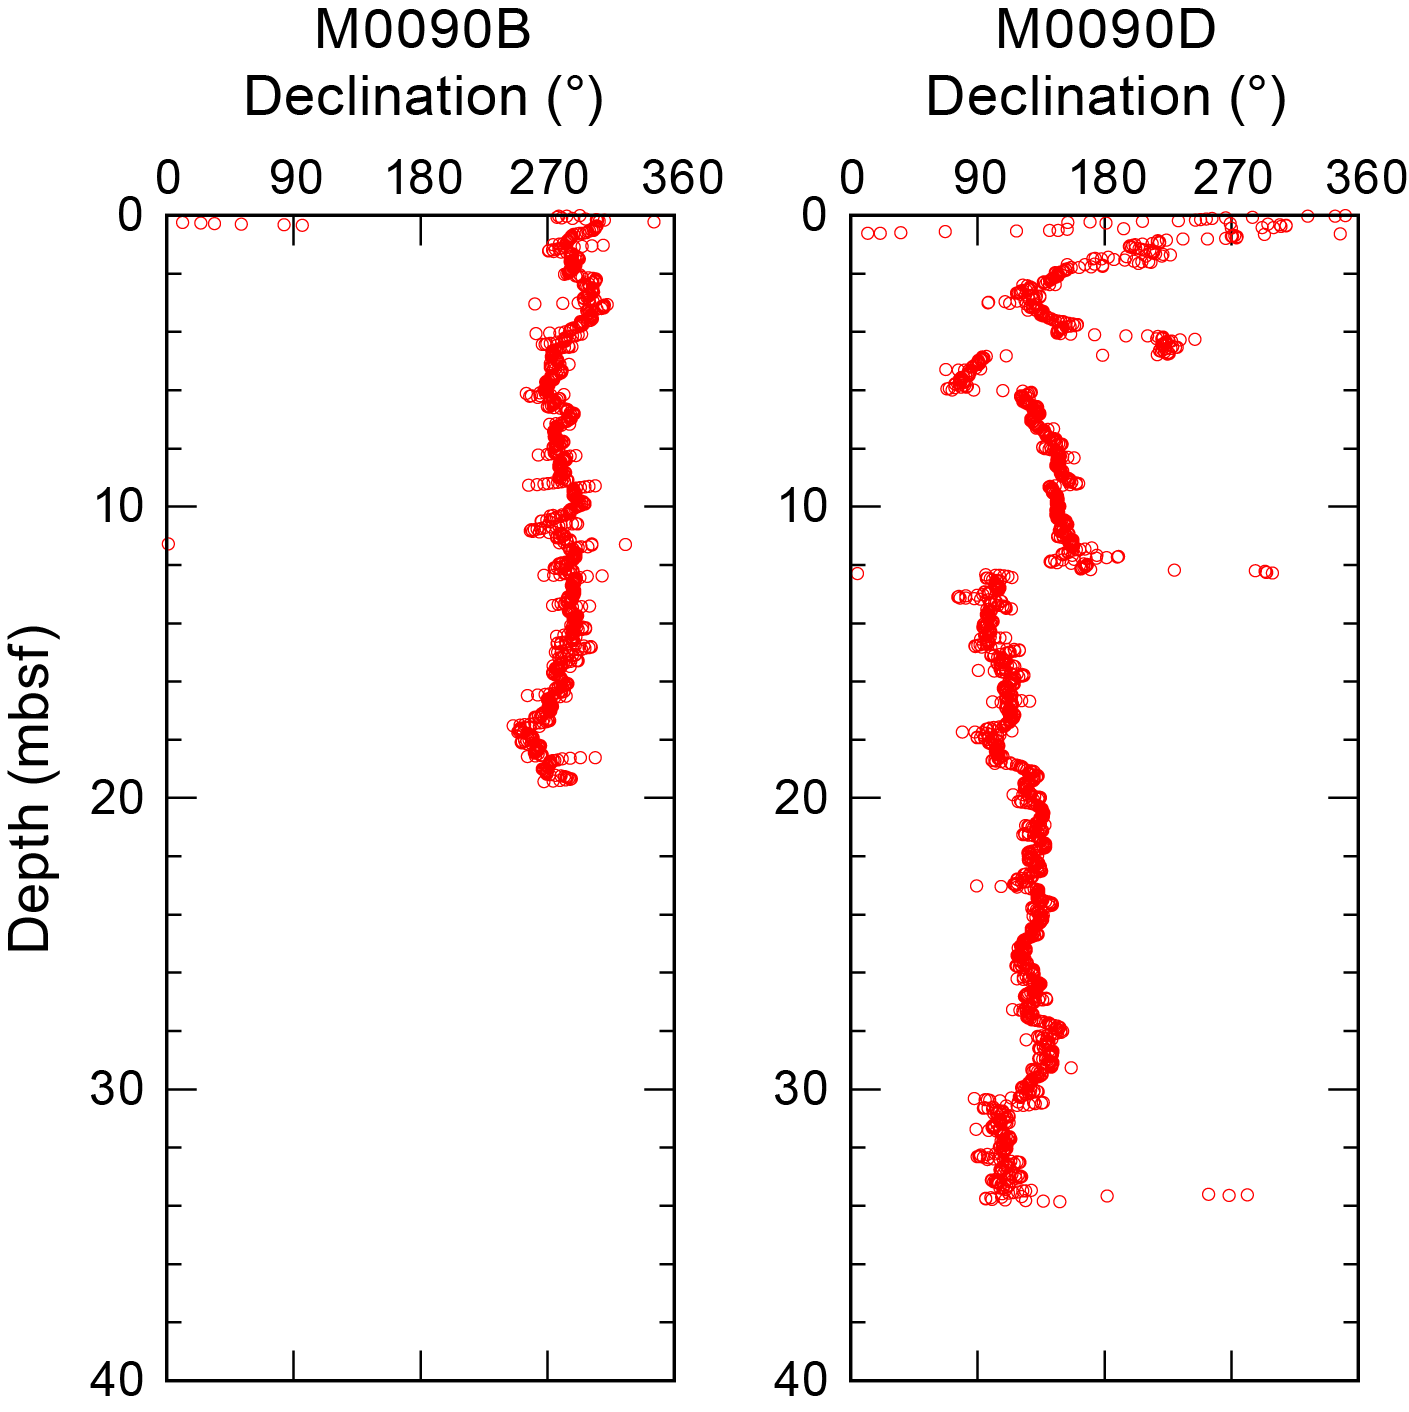
Figure F35. Declination.
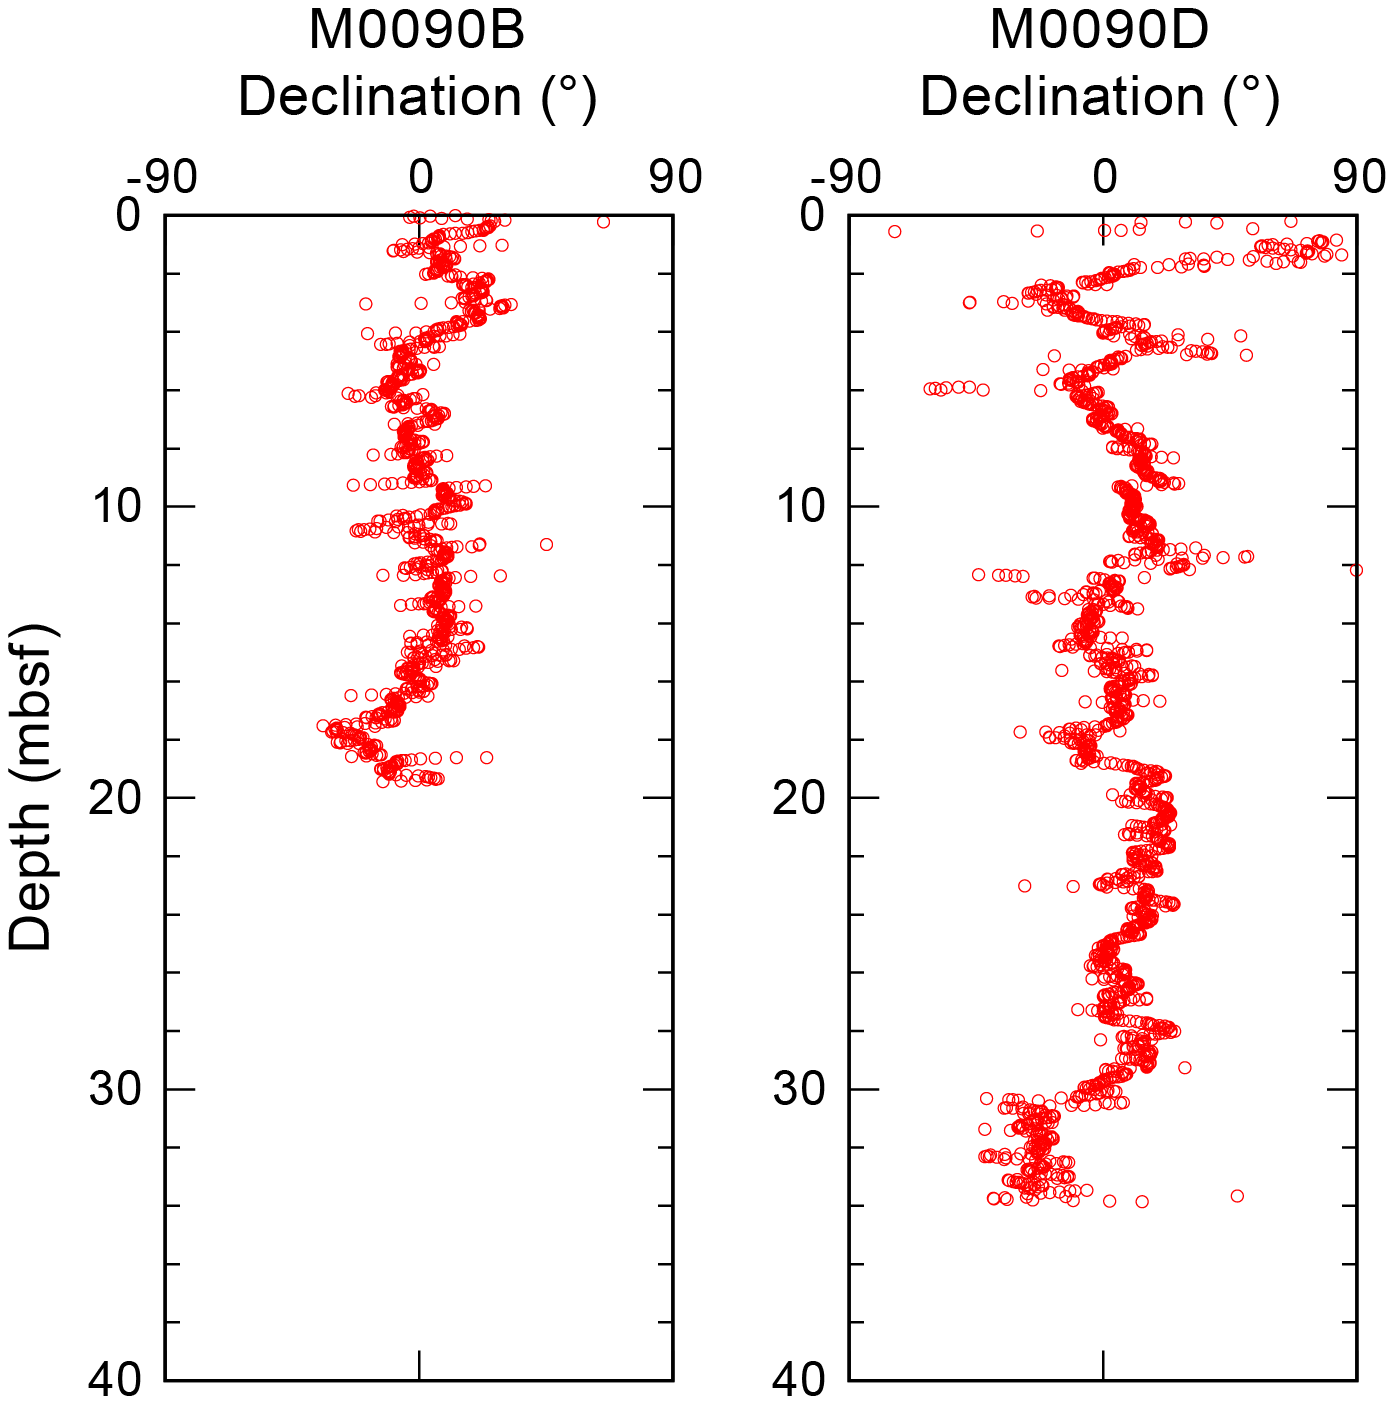
Figure F36. Rescaled and corrected declination.
The inclination profile of Holes M0090B and M0090D generally fluctuates between 30° and 60° (Figure F37). Inclination drops from 70° to 30° at 5 mbsf in Hole M0090D. Notably, inclination rises from ~30° to ~60° between 27 and 30 mbsf in Hole M0090D. Generally, no characteristic signature is observed in Hole M0090B.
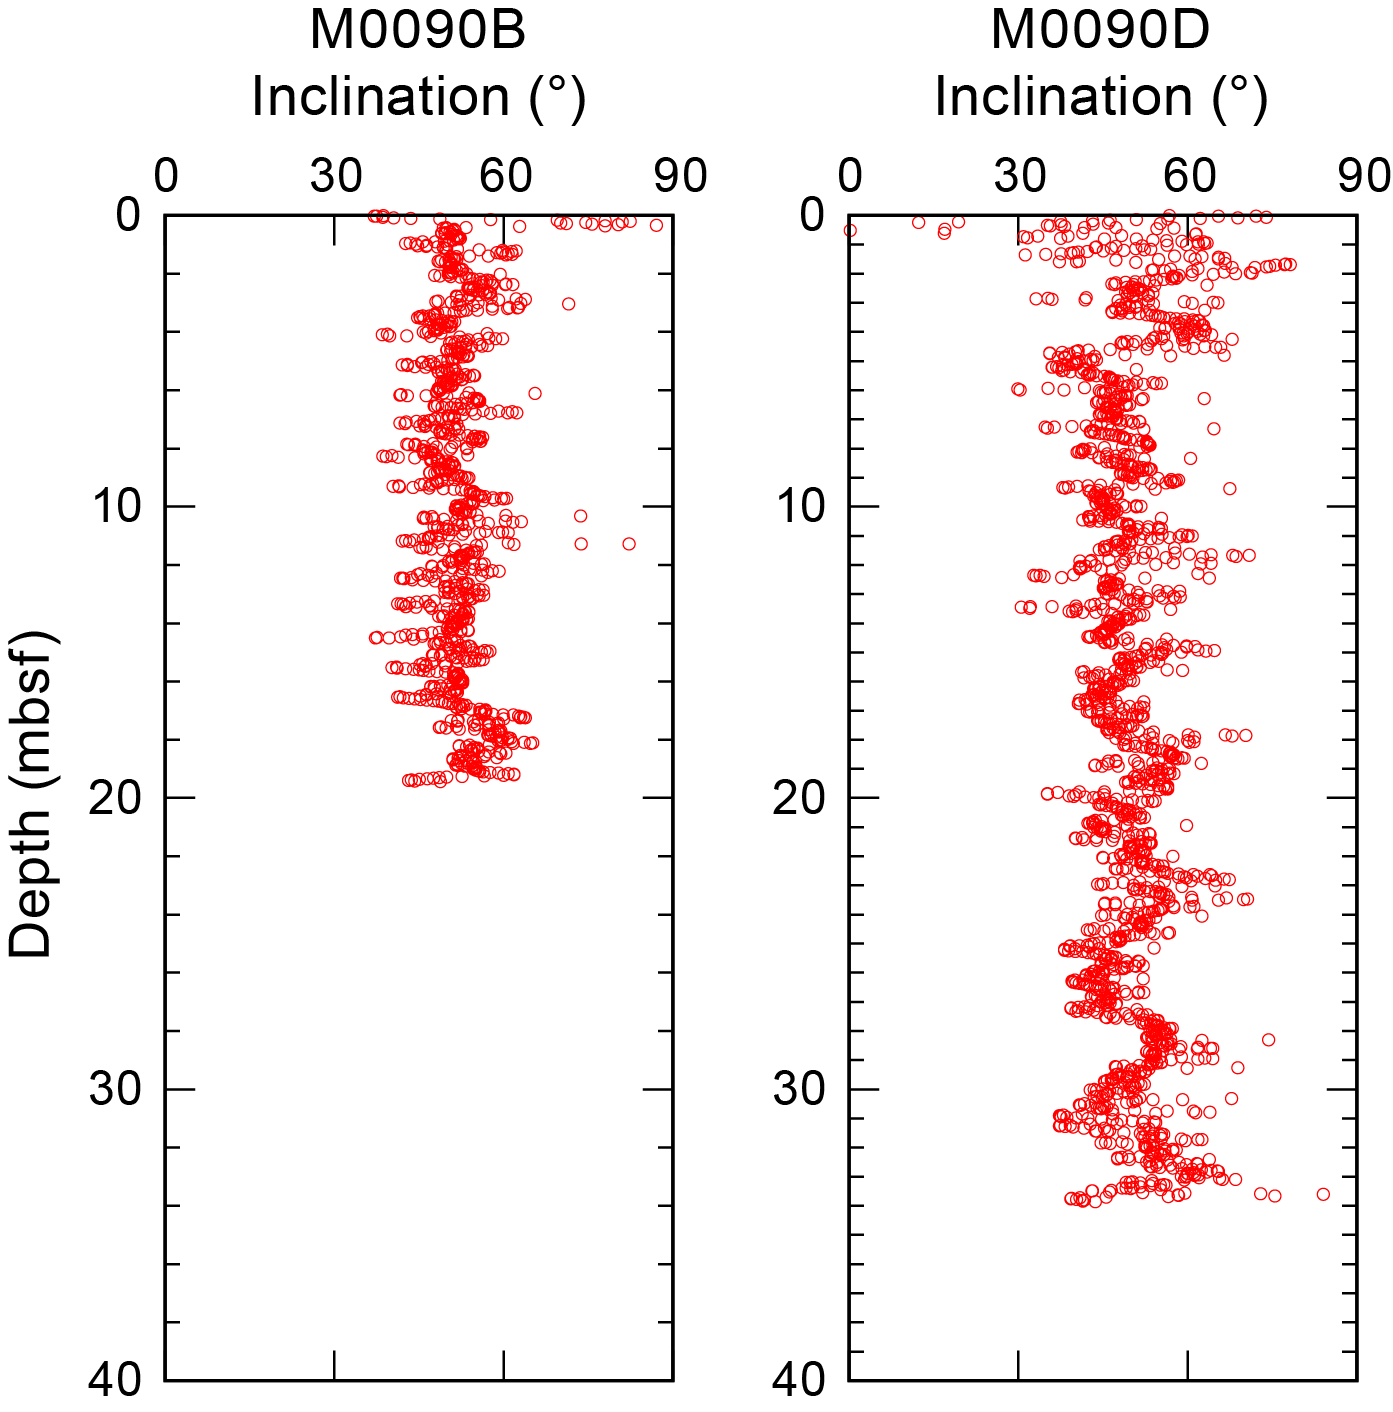
Figure F37. Inclination.
Preliminary paleomagnetic data for Holes M0090B and M0090D display similar trends in intensity and declination. Declination variation may be paleomagnetic secular variation because several unique peaks are observed that could be potential tie points. There are no distinct common characteristic signatures observed between the inclination profiles of each hole.
9. Stratigraphic correlation
A core composite depth scale and first-order splice (see Stratigraphic correlation in the Expedition 386 methods chapter [Strasser et al., 2023a]) were constructed for Basin C1 (Site M0090) to establish a first-order continuous sediment succession. Cores were recovered from four holes during two GPC deployments (Holes M0090A–M0090D).
First-order splicing between the four holes at Site M0090 enabled construction of a continuous stratigraphic succession from the seafloor to the bottom of Hole M0090D (35.36 meters composite depth in splice [mcd-splice]), with the exception of one currently unresolved gap between the base of Trigger Core 386-M0090A-1P and the top of GPC Core 386-M0090D-1H. Therefore, the Site M0090 composite depth below seafloor scale (mcd and mcd-splice]) for depths >1.01 mcd and mcd-splice is currently referred to as a floating depth, assuming the coring gap to be zero (see Stratigraphic correlation in the Expedition 386 methods chapter [Strasser et al., 2023a]).
9.1. Construction of core composite depth scale
9.1.1. Definition of top and selection of seafloor anchor core
The visual core descriptions (VCDs) show a thin oxidized top in the trigger cores (Holes M0090A and M0090C), demonstrating that an undisturbed mudline was recovered in both holes (Sections 386-M0090A-1P-1, 3.5 cm, and 386-M0090C-1P-1, 6.5 cm). Hence, the top (0 mcd) is defined at the mudline and a vertical shift of −0.035 m to Core 386-M0090A-1P and −0.065 m to Core 386-M0090C-1P is applied (Tables T10, T11, T12).
Several stratigraphic horizons define a characteristic succession that can be correlated across both trigger cores, revealing nearly constant thickness of the stratigraphic succession recovered in Holes M0090A and M0090C. Thus, the longer trigger core (386-M0090A-1P) was selected as the anchor core and Section 386-M0090A-1P-1, 3.5 cm, is designated as 0 mcd.
9.1.2. Compositing cores
Before compositing holes, artificial and/or natural voids were measured at the ends of sections (see Stratigraphic correlation in the Expedition 386 methods chapter [Strasser et al., 2023a]) and the void length was subtracted from the curated section length to obtain the sediment length for each section (neglecting core catchers that were sampled in bags). Corrected section lengths and section top and bottom depths for Site M0090 are listed in Table T10.
The first-order core composite scale for Site M0090 is based on the visual correlation of marker horizons on X-ray CT images and VCDs created during the OSP, guided by visual inspection of trends and spikes in magnetic susceptibility and density data from the MSCL, linescan images and color reflectance data, and, where present, visible tephra layers. At this stage, thin but clear marker beds visible on X-ray CT and/or linescan images are used, in places verified by hand drawn VCDs, instead of large (coarse and thick) event beds that may have eroded the underlying sediments. Primary air fall tephra beds, which were generated by a single volcanic eruption and fell through the water column, represent some of the best tie points between holes. Several tephra beds were observed in Holes M0090B and M0090D (see Tephra). Tephra layers M0090B-1H-1, 67 cm, and M0090D-1H-3, 84 cm, are likely correlated to each other; therefore, postexpedition geochemical analyses will test this correlation for robust tie-point confirmation.
First-order correlation does not allow for correlation between any of the trigger cores (386-M0090A-1P and 386-M0090C-1P) and the upper part of the GPC cores (386-M0090B-1H and 386-M0090D-1H) because no correlation tie point could be identified to tie the GPC cores to the mudline-anchored trigger core. This suggests that the coring gap at the top of the GPC core is larger than the total length of the trigger cores, and the composite depth scale of the GPC cores remains floating. Following the methodology in Stratigraphic correlation in the Expedition 386 methods chapter (Strasser et al., 2023a), the base of the longest trigger core (Section 386-M0090A-1P-1, 104.5 cm; 1.01 mbsf [corrected core depth scale; Table T10]; 1.01 mcd) and the top of GPC Core 386-M0090D-1H (which has more recovery at the core top than Core 386-M0090B-1H) are aligned, assuming the gap to be zero. With an artificial void (1 cm) at the top of Section 386-M0090D-1H-1 (Table T10), a vertical depth shift of 1 m is calculated for the top of Core 1H (Table T11).
Horizontal alignment at the bases of a 4 cm interval and a 3 cm thick interval with tephra patches observed during visual core description in Sections 386-M0090B-1H-1, 67 cm, and 386-M0090D-1H-3, 84 cm (see Tephra), which occur within a correlative facies association succession, likely allows Core 386-M0090B-1H to be tied to Core 386-M0090D-1H using tie point TP2 (3.195 mcd-splice) (Table T12), with a resulting vertical offset for Core 386-M0090B-1H of 2.525 m (Table T11). The vertical offsets of the top depth of each core used to create the first-order core composite depth scales at Site M0090 are given in the affine table (Table T11). Note that these linear bulk shifts are only correct for the uppermost few meters shallower than the first occurrence of artificial voids added to the bottom or tops of a section during core cutting due to sediment expansion during core recovery (Table T10).
9.1.3. Construction of splice
With the exception of the unknown coring gap between the base of the longest trigger core (386-M0090A-1P; 1.045 mbsf; 1.01 mcd-splice) and top of the GPC core with the highest recovery at the core top (386-M0090D-1H), a combination of Cores 386-M0090A-1P (mudline-anchored core), 386-M0090B-1H, and 386-M0090D-1H reveals the longest, most complete, and least disturbed stratigraphic interval at Site M0090.
At 1.01 mcd-splice, the top of the sedimentary succession recovered in Core 386-M0090D-1H is appended to the base of anchor Core 386-M0090A-1P (append point AP1; Table T12). The top interval in Hole M0090B down to TP2 at 3.195 mcd-splice was selected for the splice. Below this depth (3.195 mcd-splice), the respective interval in Hole M0090B was selected for the splice because cores recovered from the 20 m long GPC barrel deployment are generally less disturbed. Sequentially aligning tie points between the two GPC cores reveals differences in the thickness of the stratigraphic successions recovered from the two holes that are possibly due to hiatuses below the erosive bases of event beds (e.g., base of Section 386-M0090B-1H-3). To avoid potential stratigraphic loss by such occurrences, TP3 was used (0.5–1 cm thick silt to very fine sand layer within a succession, the stratigraphic pattern of which correlates between the two holes) with TP4 (two superimposed thin silt lamina and thin silt beds) to define a short splice interval in Core 386-M0090D-1H that appears to contain the more complete stratigraphic succession compared to Core 386-M0090B-1H. Below TP4, the splice is defined in Core 386-M0090B-1H to TP5, which is used to tie the lowermost splice interval from the longer GPC core (from Section 386-M0090D-1H-18, 51 cm [18.88 mcd-splice] to the bottom of the hole [35.36 mcd-splice = bottom of the splice]). All splice tie points used to construct a complete first-order splice along with the calculated core composite depth within the splice are given in Table T12.
References
Bruland, K.W., Middag, R., and Lohan, M.C., 2014. Controls of trace metals in seawater. In Holland, H.D., and Turekian, K.K. (Eds.), Treatise on Geochemistry (Second Edition). Oxford (Elsevier), 19–51.
https://doi.org/
Froelich, P.N., Klinkhammer, G.P., Bender, M.L., Luedtke, N.A., Heath, G.R., Cullen, D., Dauphin, P., Hammond, D., Hartman, B., and Maynard, V., 1979. Early oxidation of organic matter in pelagic sediments of the eastern equatorial Atlantic: suboxic diagenesis. Geochimica et Cosmochimica Acta, 43(7):1075–1090. https://doi.org/
Hayward, B.W., 2004. Foraminifera‐based estimates of paleobathymetry using Modern Analogue Technique, and the subsidence history of the early Miocene Waitemata Basin. New Zealand Journal of Geology and Geophysics, 47(4):749–767. https://doi.org/
Katz, M.E., Browning, J.V., Miller, K.G., Monteverde, D.H., Mountain, G.S., and Williams, R.H., 2013. Paleobathymetry and sequence stratigraphic interpretations from benthic Foraminifera; insights on New Jersey shelf architecture, IODP Expedition 313. Geosphere, 9(6):1488–1513. https://doi.org/
Kioka, A., Schwestermann, T., Moernaut, J., Ikehara, K., Kanamatsu, T., Eglinton, T.I., and Strasser, M., 2019. Event stratigraphy in a hadal oceanic trench: the Japan Trench as sedimentary archive recording recurrent giant subduction zone earthquakes and their role in organic carbon export to the deep sea. Frontiers in Earth Science, 7:319. https://doi.org/
Matoba, Y., 1976. Recent foraminiferal assemblages off Sendai, northeast Japan. Maritime Sediments, Spec. Pub. A:205–220. https://cir.nii.ac.jp/
Matsuzaki, K.M., Nishi, H., Suzuki, N., Kawate, Y., Takashima, R., and Sakai, T., 2014. Cycladophora davisiana abundances as a paleoceanographic and stratigraphic tool in high latitude siliciceous sediments. Marine Micropaleontology, 106:1–9. https://doi.org/
Morley, J.J., Hays, J.D., and Robertson, J.H., 1982. Stratigraphic framework for the late Pleistocene in the northwest Pacific Ocean. Deep Sea Research, Part A: Oceanographic Research Papers, 29(12):1485–1499. https://doi.org/
Ohkushi, K.i., Thomas, E., and Kawahata, H., 1999. Abyssal benthic foraminifera from the northwestern Pacific (Shatsky Rise) during the last 298 kyr. Marine Micropaleontology, 38(2):119–147. https://doi.org/
Strasser, M., Ikehara, K., and Cotterill, C., 2019. Expedition 386 Scientific Prospectus: Japan Trench Paleoseismology. International Ocean Discovery Program. https://doi.org/
Strasser, M., Ikehara, K., Everest, J., Maeda, L., Hochmuth, K., Grant, H., Stewart, M., Okutsu, N., Sakurai, N., Yokoyama, T., Bao, R., Bellanova, P., Brunet, M., Cai, Z., Cattaneo, A., Hsiung, K.-H., Huang, J.-J., Ishizawa, T., Itaki, T., Jitsuno, K., Johnson, J.E., Kanamatsu, T., Keep, M., Kioka, A., Kölling, M., Luo, M., März, C., McHugh, C., Micallef, A., Nagahashi, Y., Pandey, D.K., Proust, J.-N., Rasbury, E.T., Riedinger, N., Satoguchi, Y., Sawyer, D.E., Seibert, C., Silver, M., Straub, S.M., Virtasalo, J., Wang, Y., Wu, T.-W., and Zellers, S.D., 2023a. Expedition 386 methods. In Strasser, M., Ikehara, K., Everest, J., and the Expedition 386 Scientists, Japan Trench Paleoseismology. Proceedings of the International Ocean Discovery Program, 386: College Station, TX (International Ocean Discovery Program). https://doi.org/
Strasser, M., Ikehara, K., Everest, J., Maeda, L., Hochmuth, K., Grant, H., Stewart, M., Okutsu, N., Sakurai, N., Yokoyama, T., Bao, R., Bellanova, P., Brunet, M., Cai, Z., Cattaneo, A., Hsiung, K.-H., Huang, J.-J., Ishizawa, T., Itaki, T., Jitsuno, K., Johnson, J.E., Kanamatsu, T., Keep, M., Kioka, A., Kölling, M., Luo, M., März, C., McHugh, C., Micallef, A., Nagahashi, Y., Pandey, D.K., Proust, J.-N., Rasbury, E.T., Riedinger, N., Satoguchi, Y., Sawyer, D.E., Seibert, C., Silver, M., Straub, S.M., Virtasalo, J., Wang, Y., Wu, T.-W., and Zellers, S.D., 2023b. Sites M0083 and M0089 (Basin C2). In Strasser, M., Ikehara, K., Everest, J., and the Expedition 386 Scientists, Japan Trench Paleoseismology. Proceedings of the International Ocean Discovery Program, 386: College Station, TX (International Ocean Discovery Program). https://doi.org/
Strasser, M., Ikehara, K., Everest, J., and the Expedition 386 Scientists, 2023c. Supplementary material, https://doi.org/10.14379/iodp.proc.386supp.2023. In Strasser, M., Ikehara, K., Everest, J., and the Expedition 386 Scientists, Japan Trench Paleoseismology. Proceedings of the International Ocean Discovery Program, 386: College Station, TX (International Ocean Discovery Program).
Thompson, P.R., 1980. Foraminifers from Deep Sea Drilling Project Sites 434, 435, and 436, Japan Trench. In Party, S., Initial Reports of the Deep Sea Drilling Project. 56, 57 Pt. 1: Washington, DC (US Government Printing Office), 775–807. https://doi.org/
Torres, M.E., Brumsack, H.J., Bohrmann, G., and Emeis, K.C., 1996. Barite fronts in continental margin sediments: a new look at barium remobilization in the zone of sulfate reduction and formation of heavy barites in diagenetic fronts. Chemical Geology, 127(1):125–139. https://doi.org/
Usami, K., Ikehara, K., Jenkins, R.G., and Ashi, J., 2017. Benthic foraminiferal evidence of deep-sea sediment transport by the 2011 Tohoku-Oki earthquake and tsunami. Marine Geology, 384:214–224. https://doi.org/