Strasser, M., Ikehara, K., Everest, J., and the Expedition 386 Scientists
Proceedings of the International Ocean Discovery Program Volume 386
publications.iodp.org
https://doi.org/10.14379/iodp.proc.386.107.2023
Sites M0083 and M0089 (Basin C2)1
![]() M. Strasser,
M. Strasser,
![]() K. Ikehara,
K. Ikehara,
![]() J. Everest,
J. Everest,
![]() L. Maeda,
L. Maeda,
![]() K. Hochmuth,
K. Hochmuth,
![]() H. Grant,
H. Grant,
![]() M. Stewart,
M. Stewart,
![]() N. Okutsu,
N. Okutsu,
![]() N. Sakurai,
N. Sakurai,
![]() T. Yokoyama,
T. Yokoyama,
![]() R. Bao,
R. Bao,
![]() P. Bellanova,
P. Bellanova,
![]() M. Brunet,
M. Brunet,
![]() Z. Cai,
Z. Cai,
![]() A. Cattaneo,
A. Cattaneo,
![]() K.-H. Hsiung,
K.-H. Hsiung,
![]() J.-J. Huang,
J.-J. Huang,
![]() T. Ishizawa,
T. Ishizawa,
![]() T. Itaki,
T. Itaki,
![]() K. Jitsuno,
K. Jitsuno,
![]() J.E. Johnson,
J.E. Johnson,
![]() T. Kanamatsu,
T. Kanamatsu,
![]() M. Keep,
M. Keep,
![]() A. Kioka,
M. Kölling,
A. Kioka,
M. Kölling,
![]() M. Luo,
M. Luo,
![]() C. März,
C. März,
![]() C. McHugh,
C. McHugh,
![]() A. Micallef,
A. Micallef,
![]() Y. Nagahashi,
Y. Nagahashi,
![]() D.K. Pandey,
D.K. Pandey,
![]() J.-N. Proust,
J.-N. Proust,
![]() E.T. Rasbury,
E.T. Rasbury,
![]() N. Riedinger,
N. Riedinger,
![]() Y. Satoguchi,
Y. Satoguchi,
![]() D.E. Sawyer,
D.E. Sawyer,
![]() C. Seibert,
C. Seibert,
![]() M. Silver,
M. Silver,
![]() S.M. Straub,
S.M. Straub,
![]() J. Virtasolo,
J. Virtasolo,
![]() Y. Wang,
Y. Wang,
![]() T.-W. Wu, and
T.-W. Wu, and
![]() S.D. Zellers2
S.D. Zellers2
1 Strasser, M., Ikehara, K., Everest, J., Maeda, L., Hochmuth, K., Grant, H., Stewart, M., Okutsu, N., Sakurai, N., Yokoyama, T., Bao, R., Bellanova, P., Brunet, M., Cai, Z., Cattaneo, A., Hsiung, K.-H., Huang, J.-J., Ishizawa, T., Itaki, T., Jitsuno, K., Johnson, J.E., Kanamatsu, T., Keep, M., Kioka, A., Kölling, M., Luo, M., März, C., McHugh, C., Micallef, A., Nagahashi, Y., Pandey, D.K., Proust, J.-N., Rasbury, E.T., Riedinger, N., Satoguchi, Y., Sawyer, D.E., Seibert, C., Silver, M., Straub, S.M., Virtasalo, J., Wang, Y., Wu, T.-W., and Zellers, S.D., 2023. Sites M0083 and M0089 (Basin C2). In Strasser, M., Ikehara, K., Everest, J., and the Expedition 386 Scientists, Japan Trench Paleoseismology. Proceedings of the International Ocean Discovery Program, 386: College Station, TX (International Ocean Discovery Program). https://doi.org/10.14379/iodp.proc.386.107.2023
2 Expedition 386 Scientists’ affiliations.
1. Operations
During Expedition 386, a total of five Giant Piston Corer (GPC) system deployments in the central Japan Trench (Basin C2; Figure F1) resulted in the recovery of cores from six holes at Site M0083 and four at Site M0089 (Figure F2). The water depth ranged 7602–7626 meters below sea level (mbsl). A breakdown of operational time is reported weekly instead of daily (see OPS in Supplementary material) due to decisions to move between sites based on weather and current conditions. Sites M0083 and M0089 were cored during Weeks 2–4 of the offshore phase. In this focus area, a total of 154 m of cores (Table T1) were recovered. In addition, 121 km of hydroacoustic profiles (see Hydroacoustics) were acquired. Further operations details, including winch log and inclinometer information for all sites, are found in Coring methodology in the Expedition 386 methods chapter (Strasser, 2023a) and associated files (see PALEOMAG and WINCHLOGS in Supplementary material).
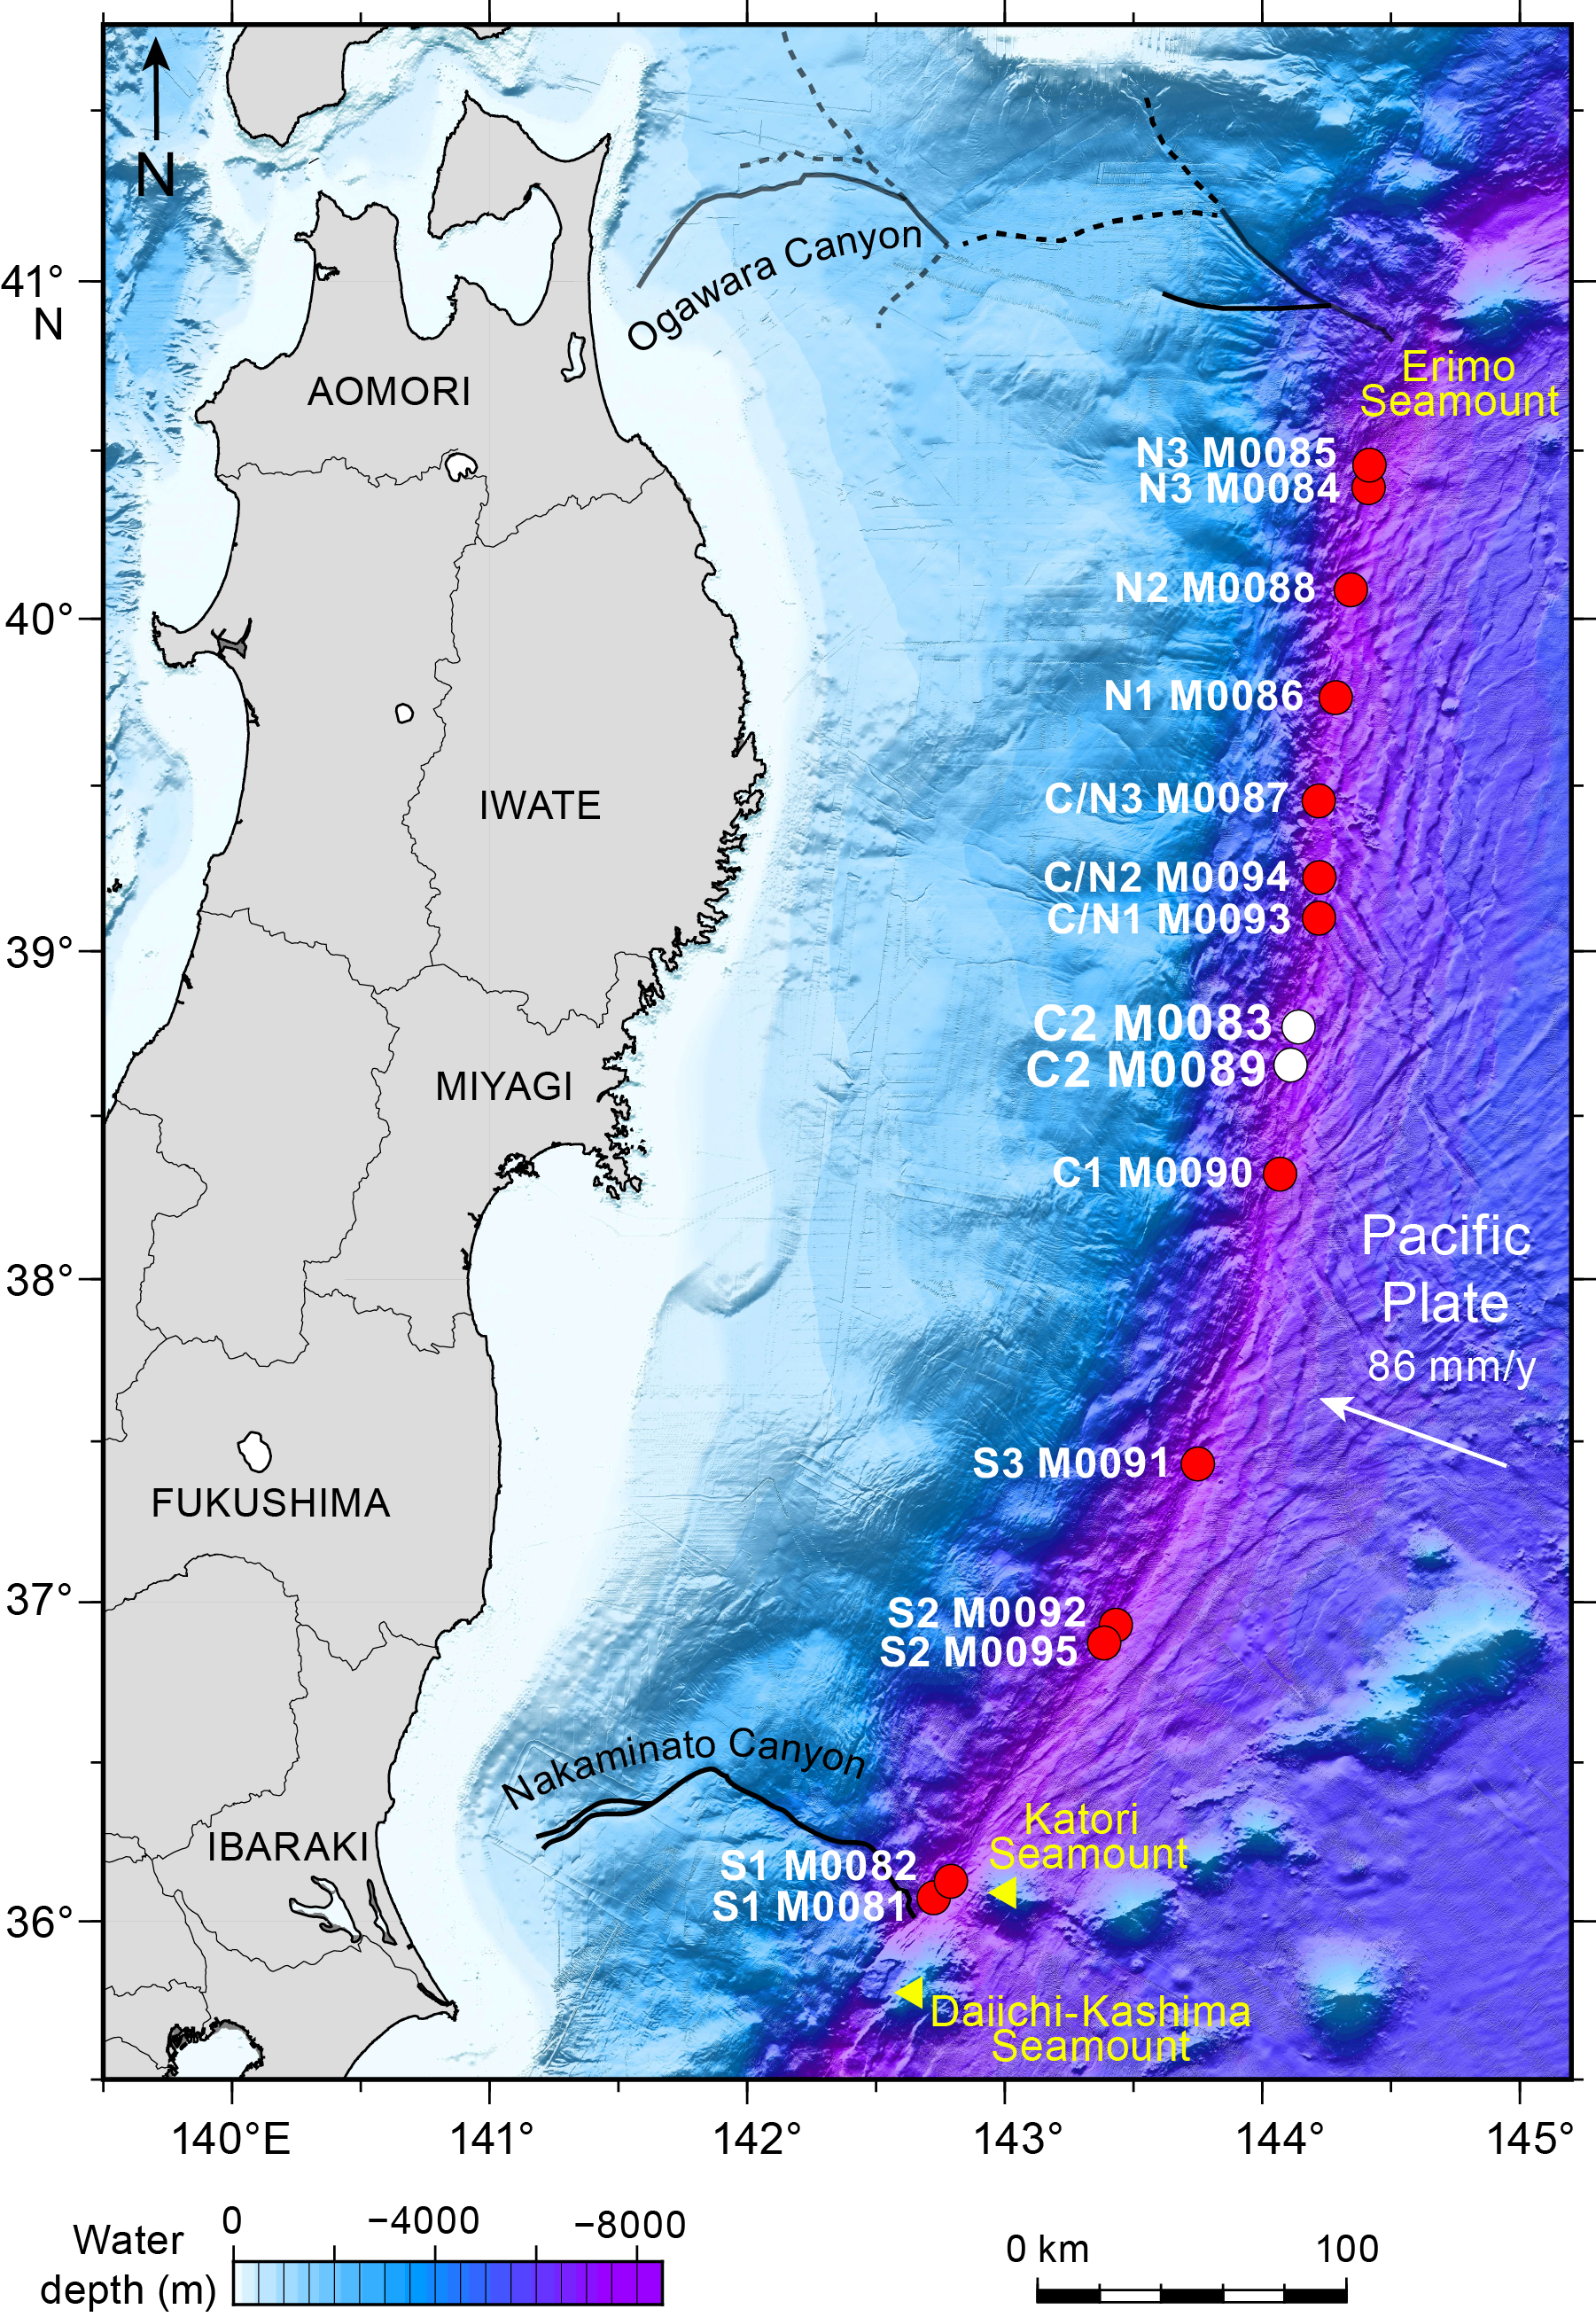
Figure F1. Site map.

Figure F2. Sites M0083 and M0089.
The main site-specific scientific objectives for Sites M0083 and M0089 were as follows:
- Recover an expanded and condensed (relative to coupled-stratigraphy Sites M0083 and M0089, respectively) continuous Holocene stratigraphic succession comprising event deposits from the depocenter of a trench basin in the central Japan Trench (see Site selection and coring strategy in the Expedition 386 summary chapter [Strasser, 2023b]; Strasser et al., 2019).
- Analyze the stratigraphic pattern and event deposit characteristics of each site and integrate them with its coupled site to establish robust stratigraphic pattern recognition of proxy evidence for earthquakes.
- Generate results for comparison with those from all other Expedition 386 sites to explore spatiotemporal distribution of event deposits to eventually develop a long-term record for giant earthquakes.
1.1. Operations summary
The R/V Kaimei arrived 1 mile upstream of Site M0083 at 0500 h (local time) on 24 April 2021. An expendable bathythermograph (XBT) probe was deployed at 0530 h, and a single multibeam echo sounder/subbottom profiler (MBES/SBP) survey was conducted from 0600 to 0745 h. GPC operations started in Holes M0083A and M0083B with a 20 m GPC barrel string at 0800 h and were completed when the trigger corer was recovered on deck at 1350 h and the GPC system was recovered at 1430 h. Preparation of the 20 m GPC barrel for the next run was completed at 1945 h, when MBES/SBP surveys began. Nine more MBES/SBP surveys around Sites M0083 and M0089 were completed at 0315 h on 25 April. The planned deployment of the next 20 m GPC barrel at Site M0089 on 25 April was abandoned at 0600 h due to strong winds (>15 m/s) and surface currents (~2 kt). Because wave height was forecast to increase in this area, at 0620 h on 25 April the decision was made to move to Site M0084 in the northern Japan Trench focus area (see Operations in the Sites M0084 and M0085 (Basin N3) chapter [Strasser, 2023c]).
Kaimei returned to the central Japan Trench focus area on 1 May and arrived back at Site M0083 at 0800 h. At 0855 h, the trigger was set on the GPC assembly, and GPC operations started in Holes M0083C and M0083D at 0930 h with a 40 m GPC barrel string. The trigger corer was recovered on deck at 1420 h, and the GPC assembly was recovered at 1515 h. Preparation of the 20 m GPC assembly for the next deployment was completed at 2030 h, when the ship departed for Site M0086 in the northern Japan Trench working area to avoid a low pressure system (see Operations in the Site M0086 (Basin N1) chapter [Strasser, 2023d]).
Kaimei returned to the central Japan focus area on 9 May and arrived at Site M0089 at 0345 h. Preparations for running a 20 m GPC assembly in Holes M0089A and M0089B were completed at 0800 h, and the GPC was run into the water at 0900 h. The trigger corer was recovered on deck at 1345 h, and the GPC assembly was recovered on deck at 1415 h. Preparation of the 40 m GPC assembly for the next run was completed at 2000 h. Beginning at 2015 h, six MBES/SBP surveys around Site M0089 were undertaken, ending at 0345 h on 10 May to prepare for coring Holes M0089C and M0089D.
At 0800 h on 10 May, preparations began for running the 40 m GPC assembly. The assembly was deployed into the water at 0855 h in Holes M0089C and M0089D. The trigger corer was recovered on deck at 1335 h, and the GPC was recovered at 1415 h. Making up the 40 m GPC assembly for the next run was completed at 2115 h. At 2130 h, the last 4 of the 28 MBES/SBP surveys around Sites M0083 and M0089 were completed. At 0145 h on 11 May, the ship went on standby at Site M0083 for the second 40 m GPC operation.
At 0800 h on 11 May, preparations began for running the second 40 m GPC assembly in Holes M0083E and M0083F. The 40 m GPC assembly was deployed into the water at 0855 h. The trigger corer was recovered on deck at 1340 h, and the GPC assembly was recovered on deck at 1415 h. Making up the 40 m GPC assembly for the next run was completed at 2045 h, and the ship began the transit to Site M0084 in the northern Japan Trench focus area (see Operations in the Sites M0084 and M0085 (Basin N3) chapter [Strasser, 2023c]).
1.2. Site M0083
1.2.1. Holes M0083A and M0083B
Holes M0083A and M0083B were cored on 24 April 2021. Preparations for running a 20 m GPC assembly were completed at 0800 h, and the GPC was run into the water at 0900 h. After attaching the inclinometer and transponder on the winch cable 20 and 50 m above the GPC trigger arm, respectively (see Figure F4 in the Expedition 386 methods chapter [Strasser, 2023a]), the winch speed was set at 0.5–1 m/s to a cable length of 100 m and then increased to 1.2–1.5 m/s to a cable length of 7750 m. Running the GPC down was paused at a cable length of 7750 m for stabilization and monitoring the GPC position and resumed after 3 min at a winch speed of 0.3 m/s. Spud-in commenced at 11:32:58 h and ended at 11:33:00 h at a cable length of 7876 m. Recovery commenced, and the cable tension rose to 2125 kgf at 11:33:06 h before dropping to 1287 kgf and then rising again to a maximum of 6855 kgf at 11:33:49 h. It dropped to 4825 kgf at 11:33:56 h, indicating the corer was clear of the seabed (see WINCHLOGS in Supplementary material). Inclinometer data for Hole M0083B show the piston corer barrel was rotated counterclockwise by 127.90° at the estimated seabed, with an east–west dip of 0.02° and a north–south dip of −2.48° (see Figure F5 in the Expedition 386 methods chapter [Strasser, 2023a]). The GPC was run back to the surface at a winch speed of 1.2–1.5 m/s. The trigger corer and GPC were recovered on deck at 1350 and 1430 h, respectively. The GPC assembly was secured and the trigger corer dismantled while the collection of bottom water and trigger core cutting commenced. The trigger core and GPC core from Holes M0083A and M0083B have a total length of 1.615 m (3 sections) and 19.52 m (20 sections), respectively (Table T1). Meanwhile, the deck crew and GPC operation team started withdrawing the core from the GPC assembly and cutting it into 5 m segments. The Science Party cut core into 1 m sections while collecting sediment samples from section bottom ends from 1530 to 1600 h.
1.2.2. Holes M0083C and M0083D
Holes M0083C and M0083D were cored on 1 May. The ship arrived at Site M0083 at 0800 h, and soon after arrival, preparations for 40 m GPC operations started. The 40 m GPC assembly was run into the water at 0930 h, the inclinometer and transponder were attached to the winch cable 20 and 50 m above the GPC trigger arm, respectively, and on the GPC assembly (see Figure F4 in the Expedition 386 methods chapter [Strasser, 2023a]), and the GPC was run down to a cable length of 7700 m at winch speeds of 0.5–1.0 m/s (cable length = 0–100 m) and 1.2–1.5 m/s (cable length = 100–7700 m). Running the GPC was suspended for 3 min at 1155 h to stabilize the assembly and monitor the GPC position. It resumed with a winch speed of 0.3 m/s. Spud-in commenced at 12:08:14 h and ended at 12:08:16 h. Recovery commenced, and the cable tension rose to 1865 kgf at 12:08:26 h before dropping to 1678 kgf and then rising again to a maximum of 10542 kgf at 12:09:36 h. It dropped to 9257 kgf at 12:09:39 h, indicating the corer was clear of the seabed (see WINCHLOGS in Supplementary material). Inclinometer data for Hole M0083D show the piston corer barrel was rotated counterclockwise by 182.1° at the estimated seabed, with an east–west dip of 0.31° and a north–south dip of 0.22° (see Figure F5 in the Expedition 386 methods chapter [Strasser, 2023a]). The GPC was run back to the surface at a winch speed of 1.0–1.5 m/s. The trigger corer was recovered on deck at 1420 h, and the GPC assembly was recovered on deck at 1515 h. The trigger core and GPC core from Holes M0083C and M0083D have a total length of 1.4 m (3 sections) and 36.255 m (except for the core catcher; 37 sections), respectively (Table T1). The deck crew and GPC operation team started withdrawing the core from the GPC assembly and cutting core into 5 m segments. Withdrawing and cutting core was slowed due to severe gas expansion. The Science Party began cutting the segments into 1 m sections at 1600 h. Section cutting was completed at 1910 h, and sediment sampling at the base of sections was completed at 2100 h. Removal of the core catcher sample was postponed due to ship motion.
1.3. Site M0089
1.3.1. Holes M0089A and M0089B
Holes M0089A and M0089B were cored on 9 May 2021. The ship arrived at Site M0089 at 0400 h, and the sea condition was checked. Preparations for running the 20 m GPC assembly began at 0800 h, and the trigger was set on the GPC assembly at 0830 h. The 20 m GPC assembly was deployed at 0845 h, the inclinometer and transponder were set on the winch cable 20 and 50 m above the GPC trigger arm, respectively, and on the GPC assembly (see Figure F4 in the Expedition 386 methods chapter [Strasser, 2023a]), and the GPC was run down to a cable length of 7750 m at winch speeds of 0.5–1.0 m/s (cable length = 0–100 m) and 1.2–1.5 m/s (cable length = 100–7750 m) and then held 3 min for stabilization and monitoring the GPC position. Running the GPC assembly down resumed at a winch speed of 0.3 m/s. Spud-in commenced at 11:11:57 h and ended at 11:12:01 h at a cable length of 7858 m. Recovery commenced, and the cable tension rose to 2442 kgf at 11:12:10 h before dropping to 2069 kgf and then rising again to a maximum of 6669 kgf at 11:12:45 h. It dropped to 5347 kgf at 11:12:56 h, indicating the corer was clear of the seabed (see WINCHLOGS in Supplementary material). Inclinometer data for Hole M0089B show the piston corer barrel was rotated clockwise by 164.70° at the estimated seabed, with an east–west dip of 0.6° and a north–south dip of −3.21° (see Figure F5 in the Expedition 386 methods chapter [Strasser, 2023a]). The GPC assembly was run back to the surface at a winch speed of 1.2–1.5 m/s. The trigger corer was recovered on deck at 1345 h, and the GPC assembly was recovered on deck at 1415 h. The trigger core and GPC core from Holes M0089A and M0089B have a total length of 1.43 m (3 sections) and 18.1 m (19 sections), respectively (Table T1). Soon after recovery, the trigger corer was dismantled, and then bottom water and sediment at the bottom were sampled. Meanwhile, the deck crew and the GPC operation team started withdrawing and cutting the GPC core into 5 m segments. At 1445 h, the Science Party began cutting 5 m segments into 1 m sections while sampling from section bottom ends. Cutting and sampling were completed at 1615 h.
1.3.2. Holes M0089C and M0089D
Holes M0089C and M0089D were cored on 10 May 2021. At 0800 h, preparations began for running the 40 m GPC assembly. The inclinometer and transponder were set on a winch cable 20 and 50 m above the GPC trigger arm, respectively, and on the GPC assembly (see Figure F4 in the Expedition 386 methods chapter [Strasser, 2023a]). The 40 m GPC assembly was deployed into the water at 0855 h and run down at a winch speed of 1.0 m/s. Running the GPC assembly was held for 3 min at a cable length of 7700 m for stabilization and monitoring the GPC position and then resumed at 0.3 m/s winch speed. Spud-in commenced at 11:22:50 h and ended at 11:22:52 h. Recovery commenced, and the cable tension rose to 1473 kgf at 11:22:57 h before dropping to 1269 kgf and then rising again to a maximum of 10337 kgf at 11:24:13 h. It dropped to 8792 kgf at 11:24:23 h, indicating the corer was clear of the seabed (see WINCHLOGS in Supplementary material). Inclinometer data for Hole M0089D show the piston corer barrel was rotated clockwise by 314.6° at the estimated seabed, with an east–west dip of 1.42° and a north–south dip of 0.9° (see Figure F5 in the Expedition 386 methods chapter [Strasser, 2023a]). The GPC assembly was run back to the deck at a winch speed of 1.3 m/s. The trigger corer was recovered on deck at 1335 h, and the GPC was recovered at 1415 h. The trigger core and GPC core from Holes M0089C and M0089D have a total length of 0.705 m (2 sections) and 36.9 m (36 sections), respectively (Table T1). Soon after recovery, the trigger corer was dismantled, and then bottom water and sediment at the core bottom were sampled. Meanwhile, the deck crew and GPC operation team began withdrawing and cutting core into 5 m segments. The Science Party cut 5 m segments into 1 m sections while sampling from section bottom ends from 1430 to 1800 h. Gas expansion was observed in many sections, and extended liner patches were attached to almost all sections.
1.4. Return to Site M0083
1.4.1. Holes M0083E and M0083F
Holes M0083E and M0083F were cored on 11 May 2021. Preparations began for running the 40 m GPC assembly at 0800 h on 11 May. The trigger was set on the GPC assembly at 0830 h. After the inclinometer and transponder were set on the winch cable 20 and 50 m above the GPC trigger arm, respectively, and on the GPC assembly (see Figure F4 in the Expedition 386 methods chapter [Strasser, 2023a]), the 40 m GPC assembly was deployed into the water at 0855 h and run down at a winch speed of 1.0 m/s to a cable length of 7750 m. Running down was held for stabilization and monitoring the GPC position at a cable length of 7750 m and resumed after 3 min. Spud-in commenced at 11:21:53 h and ended at 11:21:57 h. Recovery commenced, and the cable tension rose to 1678 kgf at 11:21:59 h before dropping to 1269 kgf and then rising again to a maximum of 10561 kgf at 11:23:23 h. It dropped to 8326 kgf at 11:23:33 h, indicating the corer was clear of the seabed (see WINCHLOGS in Supplementary material). Inclinometer data for Hole M0083F show the piston corer barrel was rotated counterclockwise by 262.6° at the estimated seabed, with an east–west dip of 0.5° and a north–south dip of −2.92° (see Figure F5 in the Expedition 386 methods chapter [Strasser, 2023a]). The GPC was run back to the surface at a winch speed of 1.2 m/s. The trigger corer was recovered on deck at 1340 h, and the GPC assembly was recovered on deck at 1415 h. The trigger core and GPC core from Holes M0089C and M0089D have a total length of 0.92 m (2 sections) and 36.605 m (36 sections), respectively (Table T1). Soon after recovery, the trigger corer was dismantled and sampled from the top and bottom ends while the deck crew and GPC operation team began withdrawing and cutting the core into 5 m segments. At 1430 h, the Science Party began cutting the 5 m segments into 1 m sections while sampling from section bottom ends. Cutting was completed at 1700 h, and sampling was completed at 1900 h.
2. Hydroacoustics
Sites M0083 and M0089 lie in Basin C2 in the Central Japan Trench survey area. The grid area of acquired SBP data, restricted to the flat basin floor, includes 121 km of profiles. The subbottom profiles include 20 lines perpendicular to the trench axis and 9 parallel to the trench axis (Figure F3). Trench axis–perpendicular lines all trend WNW–ESE, whereas trench axis–parallel lines trend NNE–SSW. The acquisition parameters for all subbottom profiles in this basin are documented in Table T2. The area surveyed for bathymetry includes both the basin floor and surrounding areas, covering approximately 770 km2. Approximate depth conversions in this section use a seismic velocity of 1500 m/s.

Figure F3. Bathymetry and subbottom profile lines.
2.1. Bathymetry
Seafloor depths in Basin C2 are between 7614 and 7629 mbsl for Site M0083 and between 7602 and 7607 mbsl for Site M0089 (Figure F3). The width of the basin, defined as the change from flat basin floor to the first point of rapidly changing bathymetry on either side of the basin, varies from approximately 2460 m at the narrowest point in the north, near Site M0083, to approximately 3060 m in the south, near Site M0089, roughly defined by the 7500 m contour.
Topography rises more steeply on the western side of the basin, where it shallows 100 m vertically over a horizontal distance of 300 m (~30% slope gradient) in the south, near Site M0089, and 100 m over 400 m (25% slope gradient) near Site M0083. The eastern margin shallows more gently, with a slope angle of approximately 15%–20%.
2.2. Basin characterization
The basin character changes markedly from north to south, as shown in a series of trench-perpendicular lines (386_Underway_076, 386_Underway_073, 386_Underway_071, 386_Underway_068, 386_Underway_028, and 386_Underway_064). At the northern end of the basin, in Line 386_Underway_076 (Figure F4), the seafloor reflector is poorly imaged. Transparent layers cannot be readily identified, although the relatively high amplitude of the layers near the surface indicate the laminated basin fill. The thickness of the basin fill is unclear because the contact between the basin fill and the underlying basal layers is not clear, but the main part of the package varies between approximately 20 and 25 m in thickness.

Figure F4. Line 386-Underway_076.
In Line 386_Underway_073 (Figure F5, 2500 m south of Line 368_Underway_076, the imaging of the basin floor is coherent. The general basin fill is better imaged and appears largely flat-lying and approximately 15–18 m thick, although both dip and thickness change over topographic highs with disrupted basal layers. The seafloor reflector is marked by a high-amplitude reflector at 9.98 s two-way traveltime (TWT) in the flat part of the basin. A semitransparent acoustic layer occurs immediately beneath the seafloor horizon and is approximately 2 m thick.
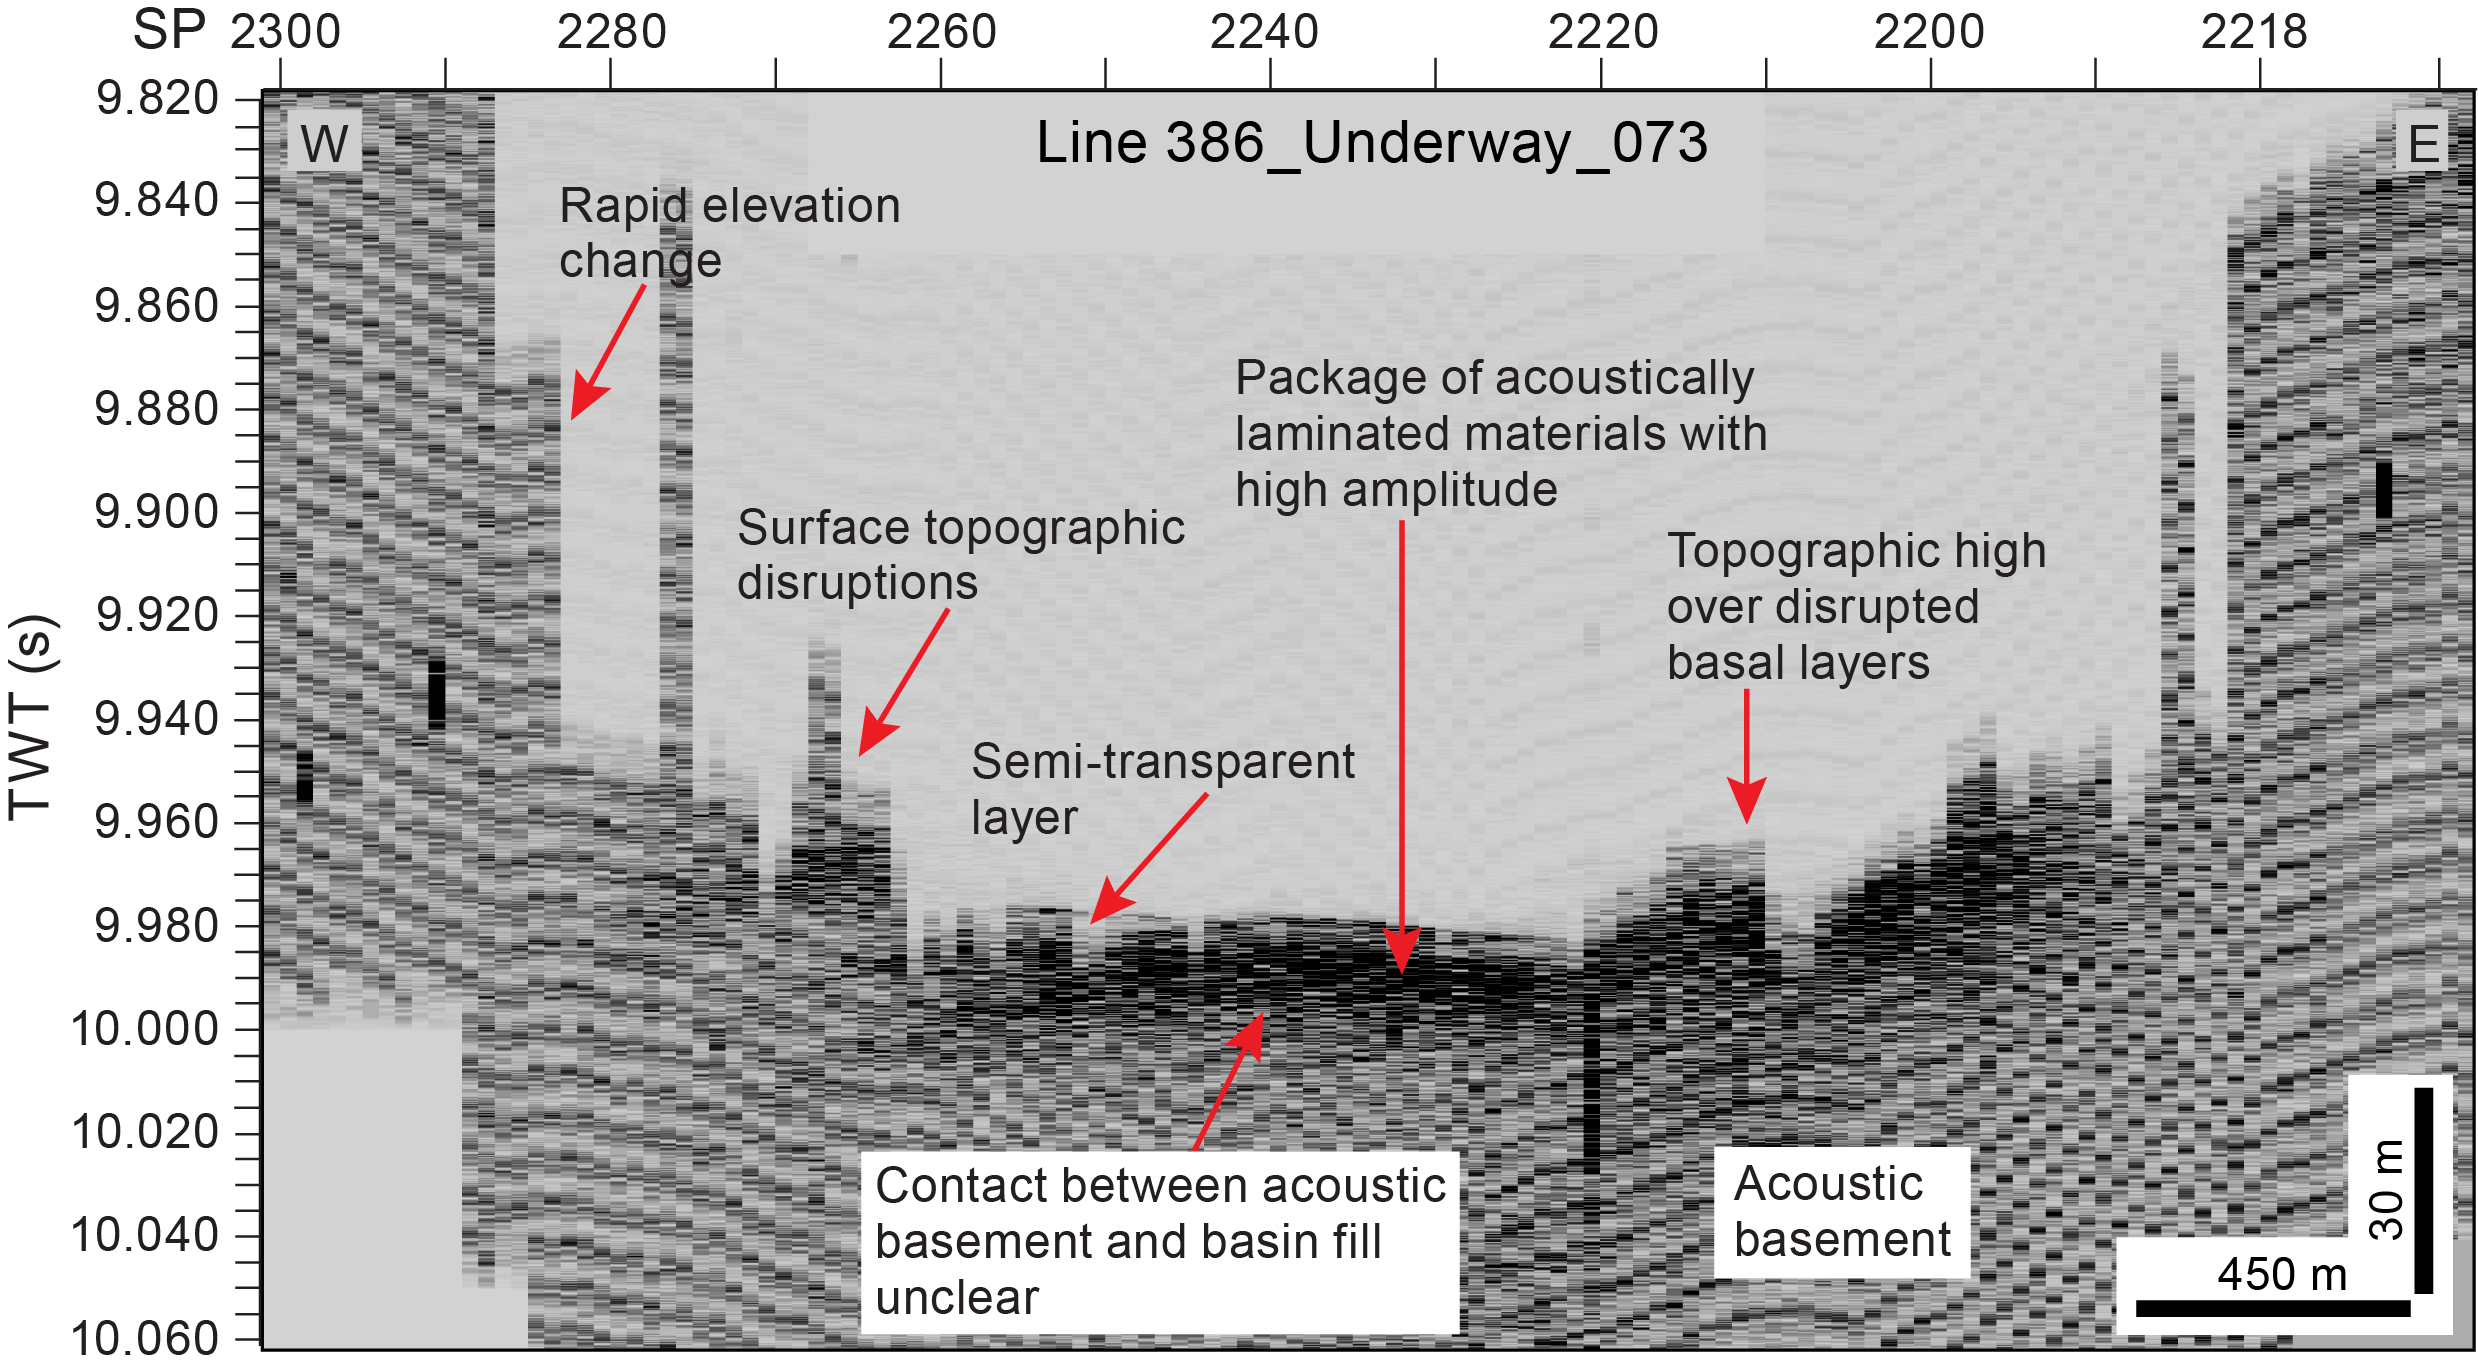
Figure F5. Line 386-Underway_073.
Lines 386_Underway_071 and 386_Underway 068 (Figures F6, F7), lie 2200 and 5100 m south of Line 386_Underway_073, respectively (Figure F3). Line 386_Underway_071 shows Site M0083, and Line 386_Underway_068 is 2900 m south of Line 386_underway_071.
The nature of the seafloor reflector is not clear on all parts of Line 386_Underway_071 because there are distortions in the acoustic response (e.g., at Shotpoint 1880), whereas on Line 386_Underway_068, a high-amplitude seafloor reflector is present at 9.97 s TWT (Figures F6, F7). On Line 386_Underway_071, acoustically transparent layers beneath the seafloor reflector are not clear (between Shotpoints 1880–1840), whereas on Line 386_Underway_068, they resolve into two clear acoustically transparent or semitransparent layers, both approximately 5 m thick, separated by a high-amplitude layer at 10 s TWT.
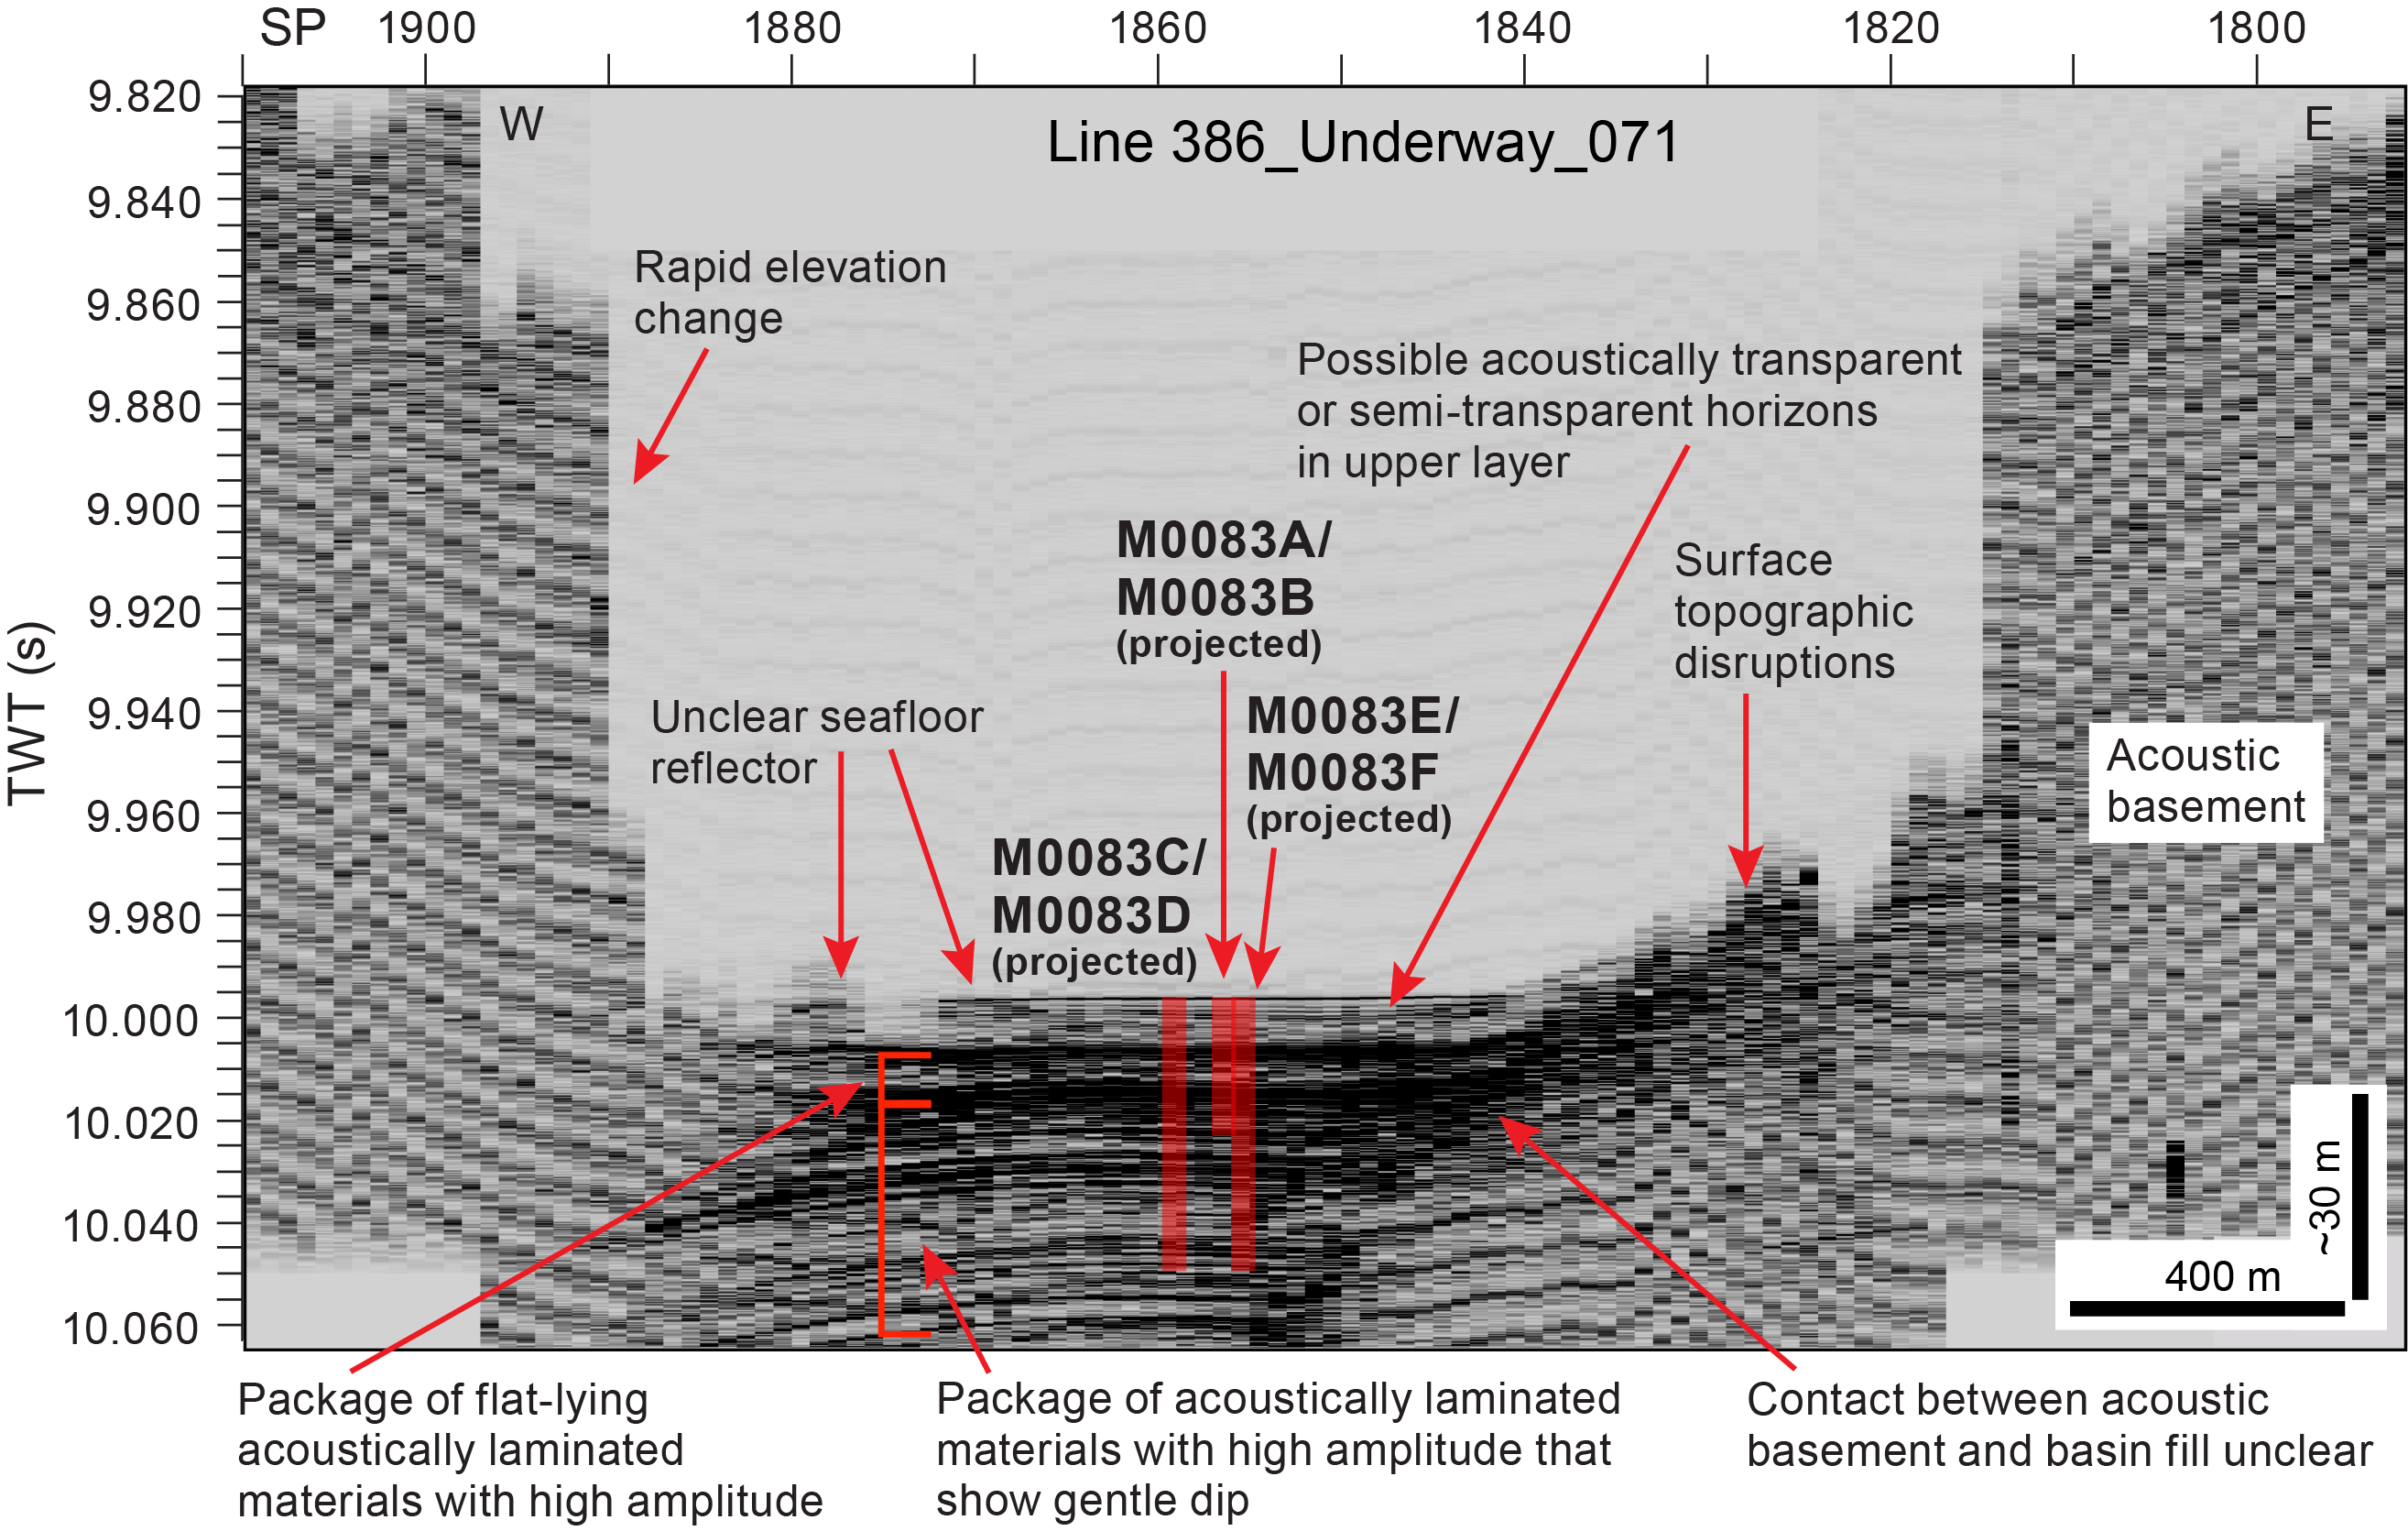
Figure F6. Line 386-Underway_071.
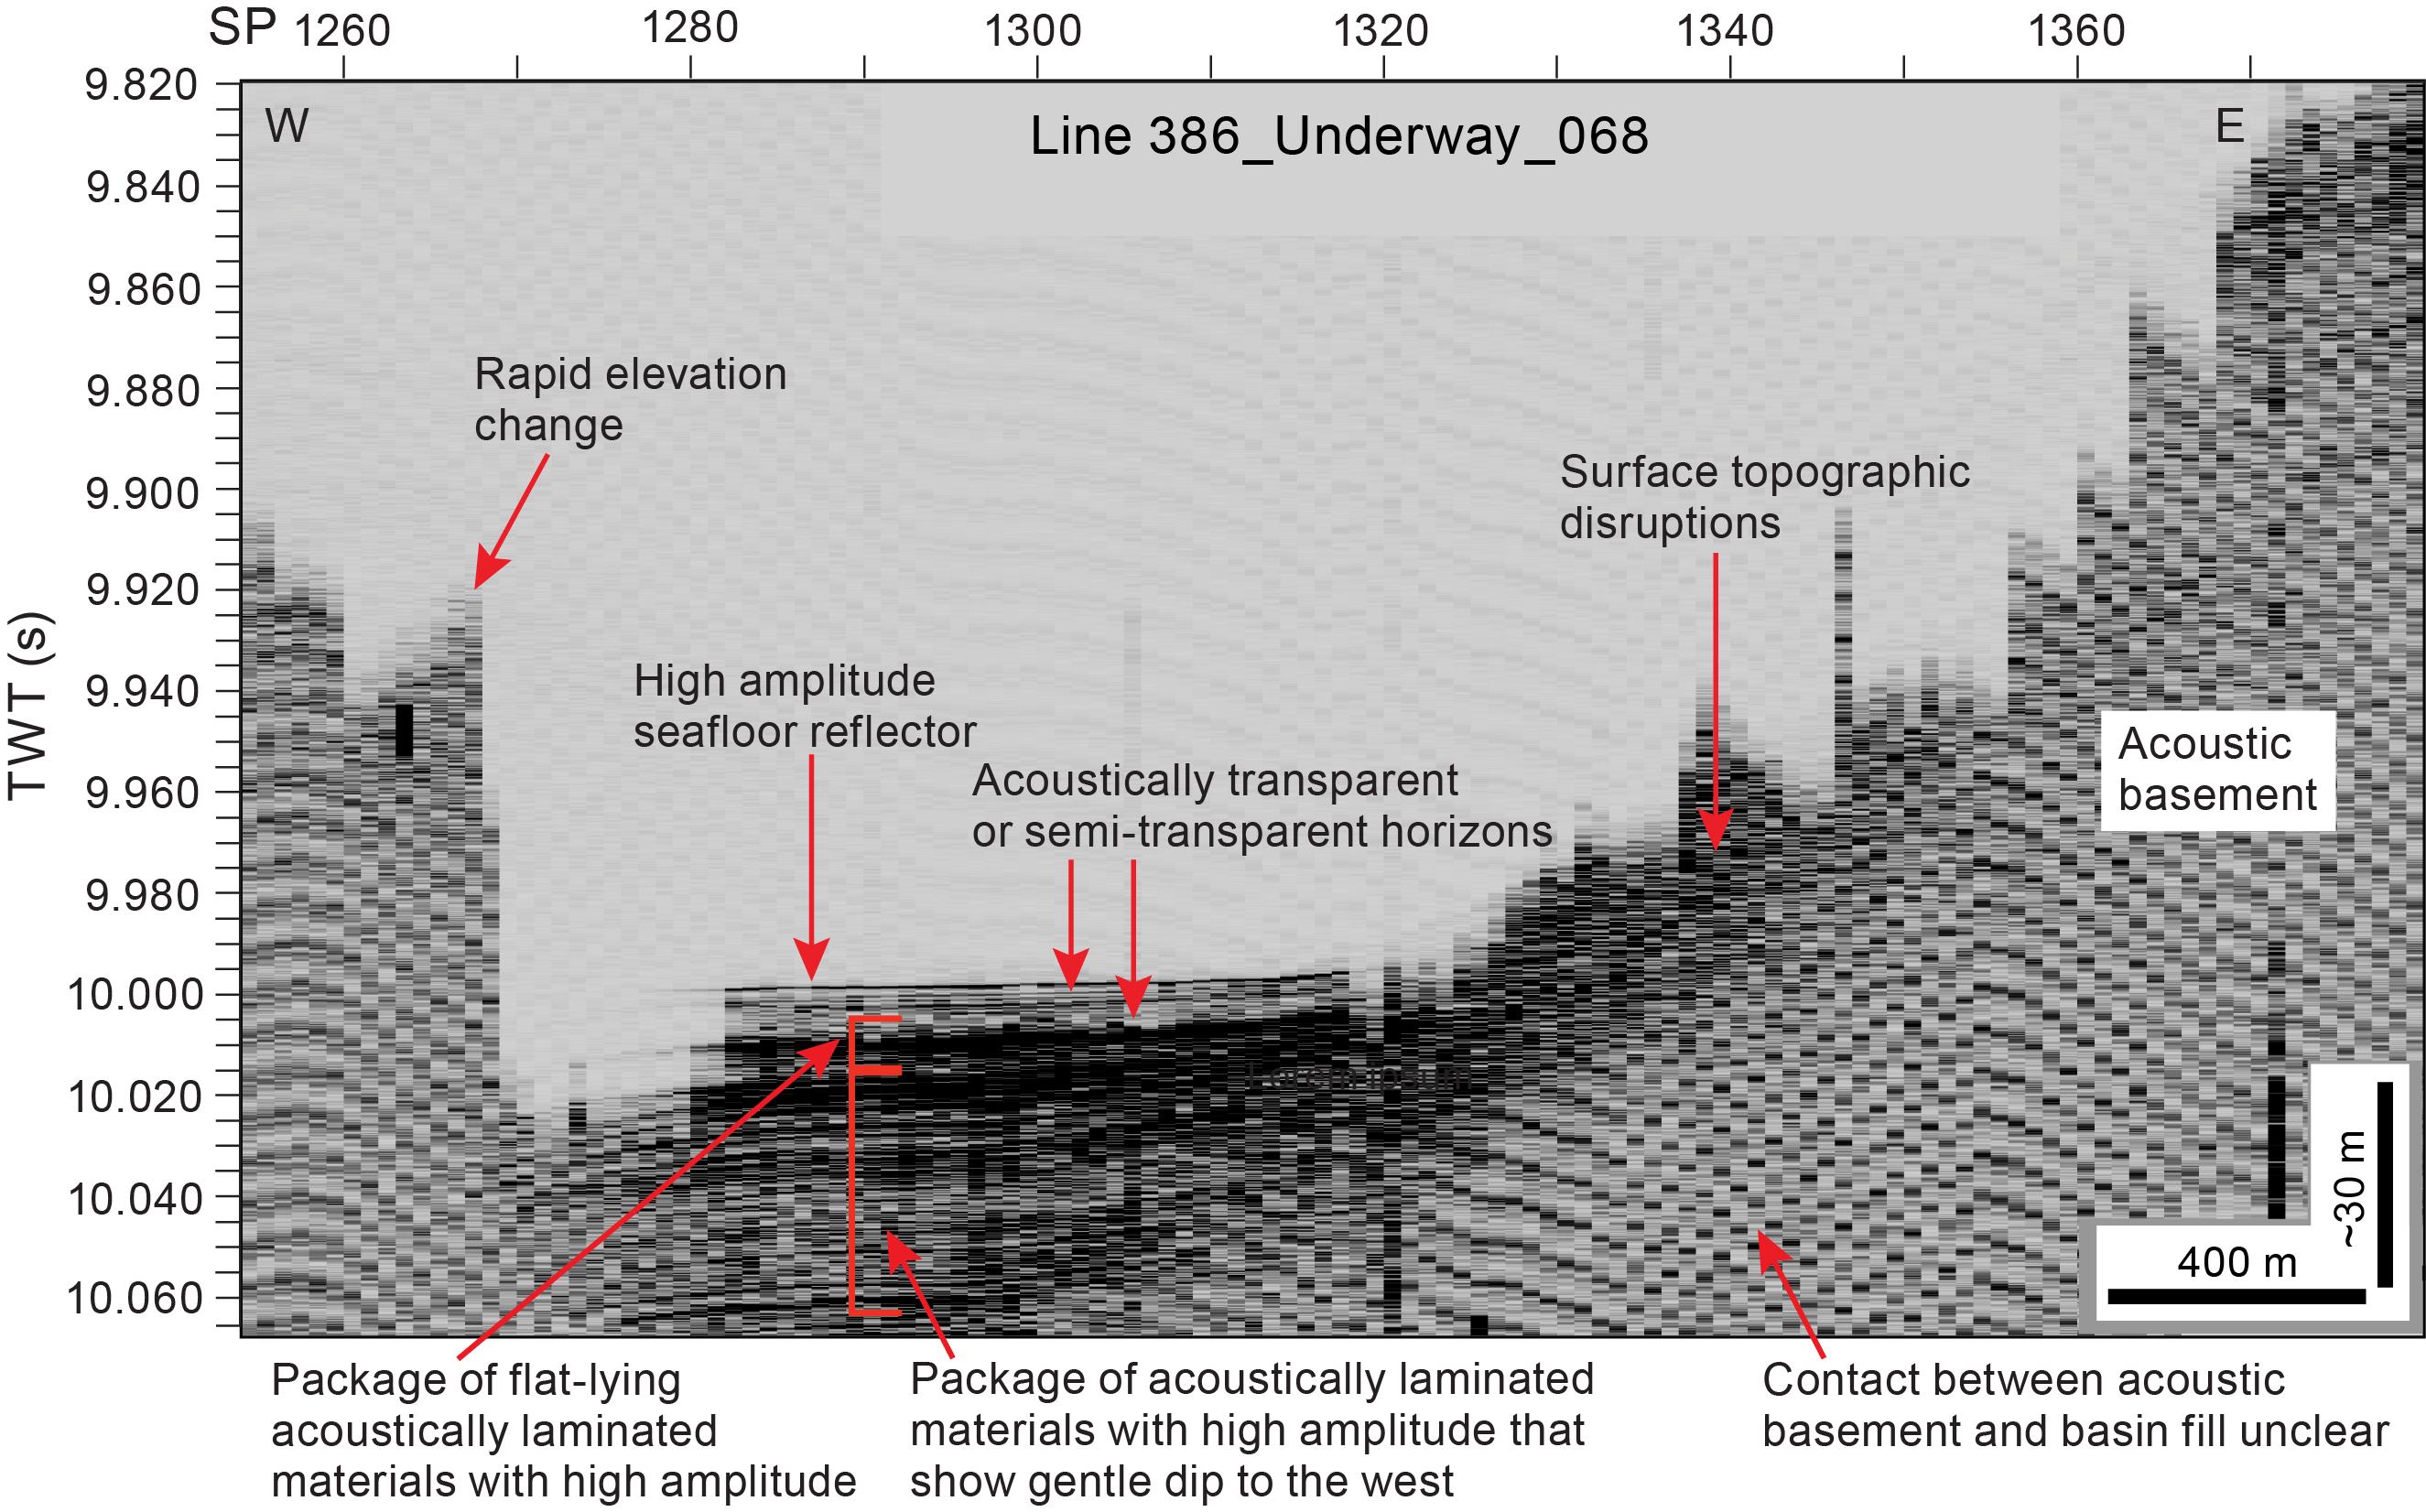
Figure F7. Line 386-Underway_068.
On both lines, a thick package of acoustically laminated materials fills the basin and is approximately 50 m thick, although it could extend beyond the extent of the collected lines. This laminated package is bound on Line 386_Underway_071 by the basal layers to the east and by a sharp topographic change to the west. The lower half of the package displays a gentle dip to the west, whereas the upper part is flat-lying. The contact between the basin fill and basal layers is not resolved in Figures F6 and F7.
At the southern end of Basin C2, Lines 386_Underway_028 and 386_Underway_064 (Figures F8, F9), which lie 2250 m apart, show a gentle dip of all basinal layers to the west. The seafloor reflector is unclear on both lines. A package of acoustically laminated high-amplitude reflections varies in thickness from approximately 15 to 20 m on both lines and thickens to the west, but it is shown more clearly on Line 386_Underway_064.
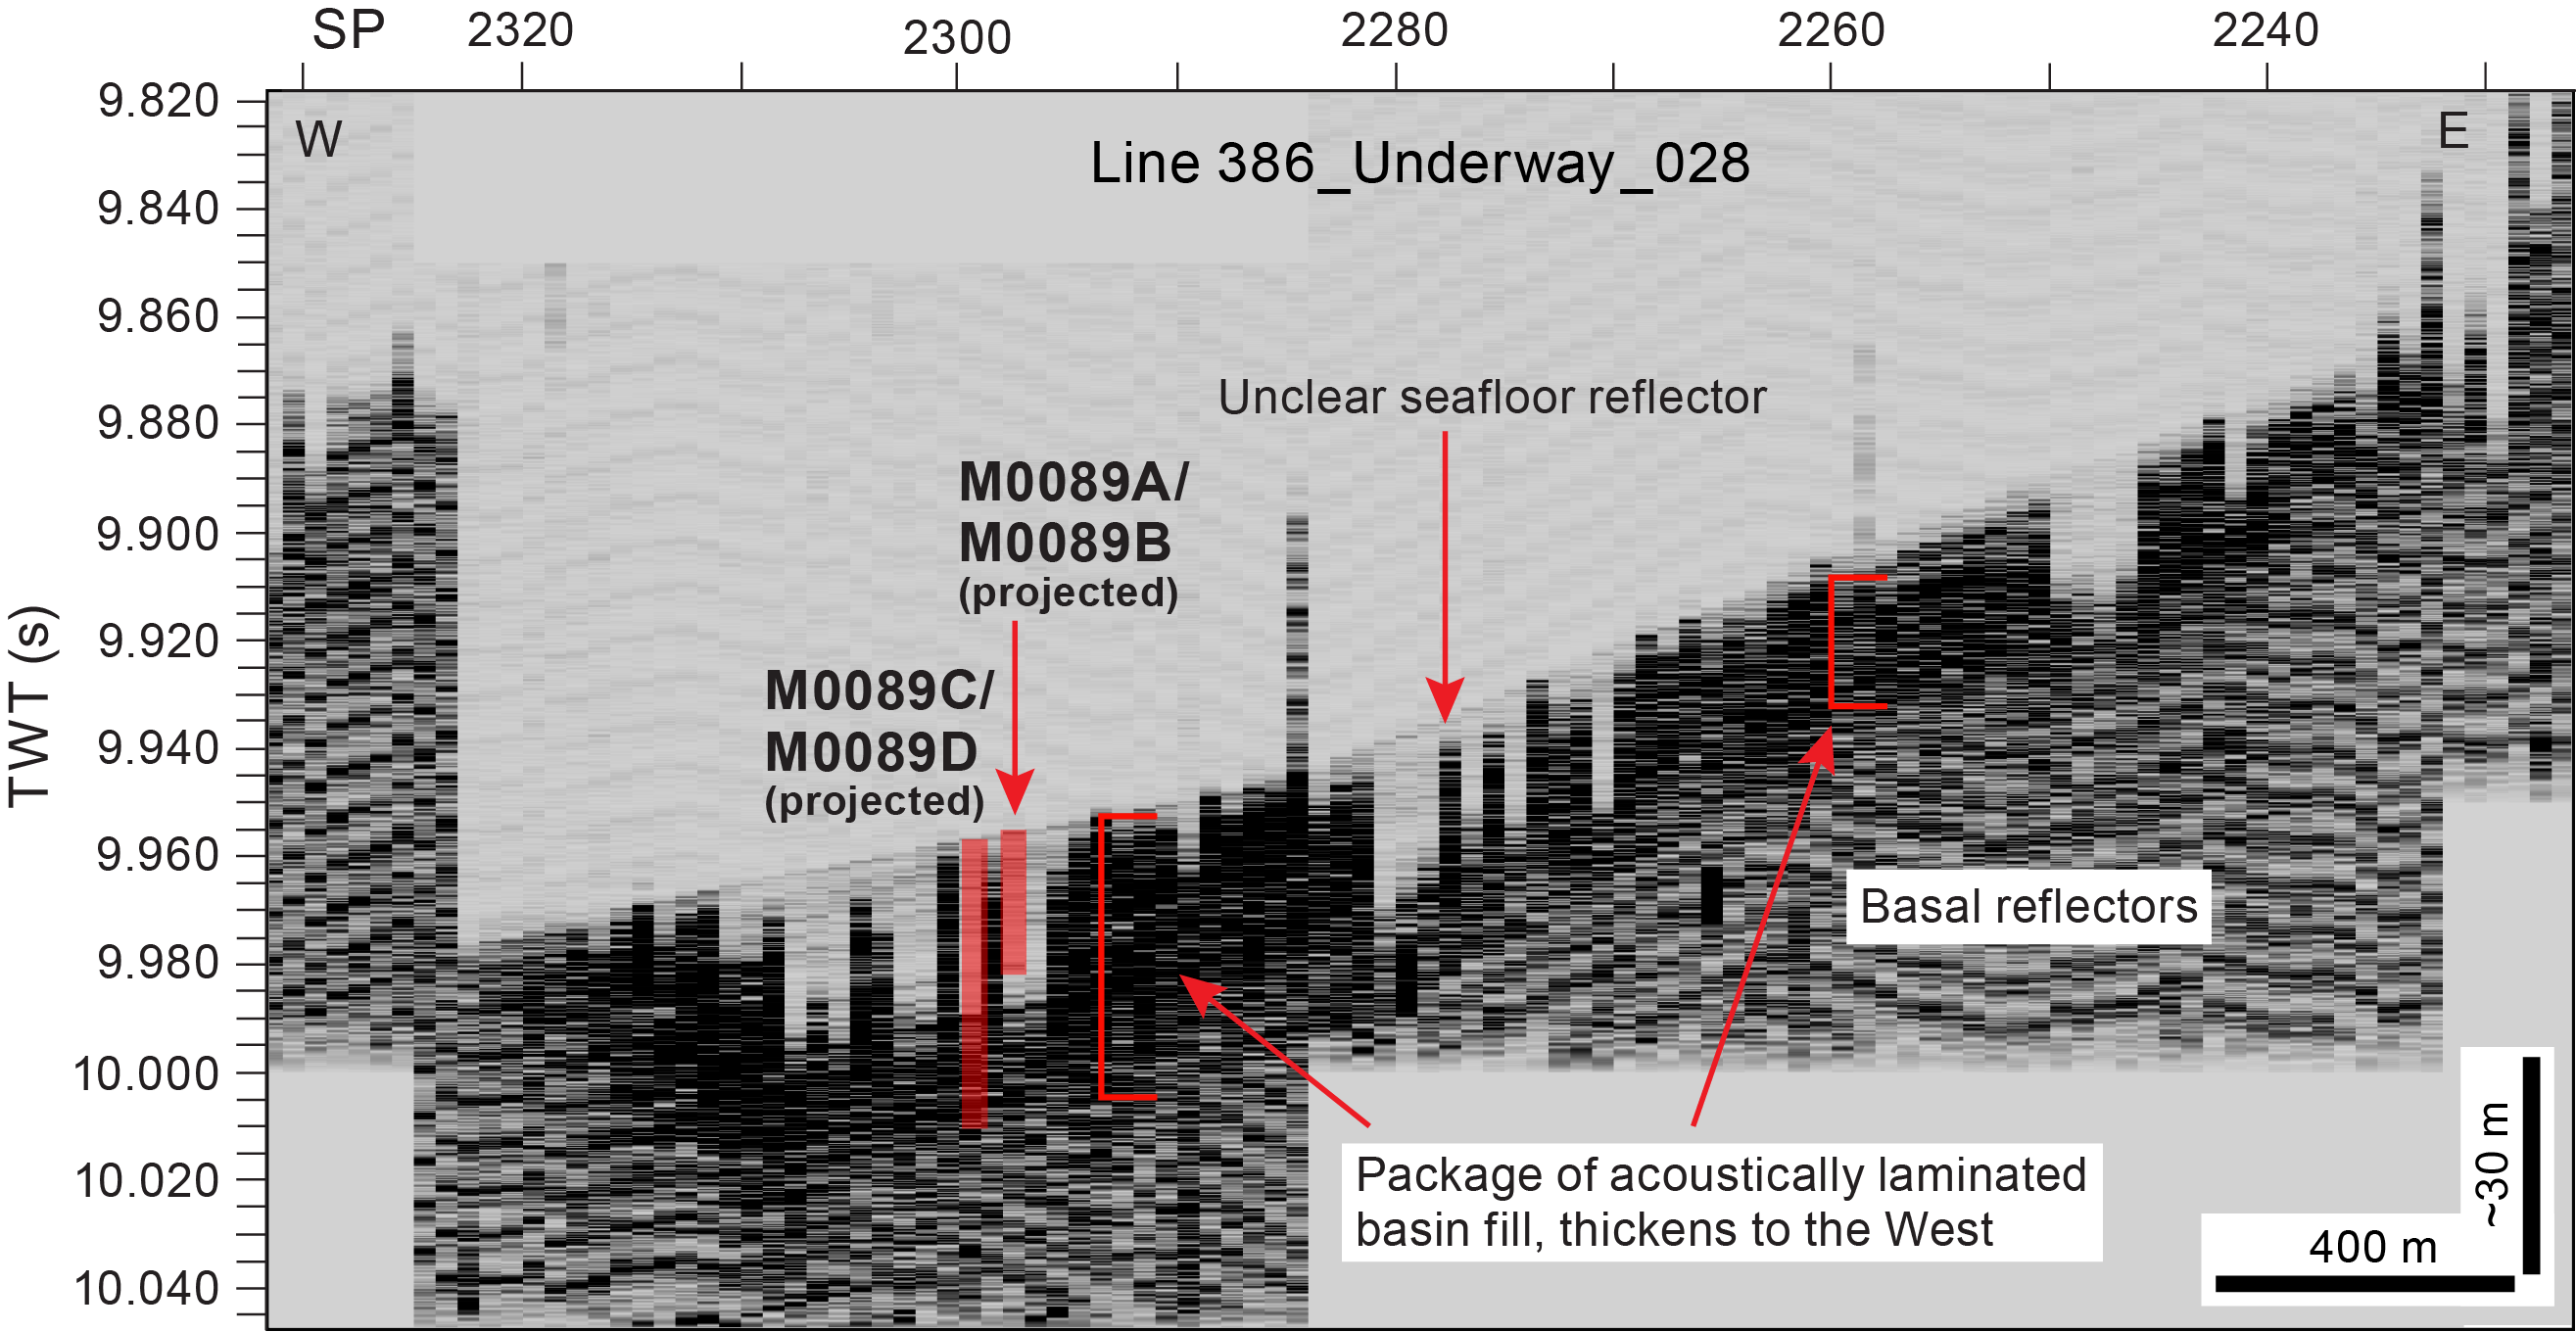
Figure F8. Line 386-Underway_028.
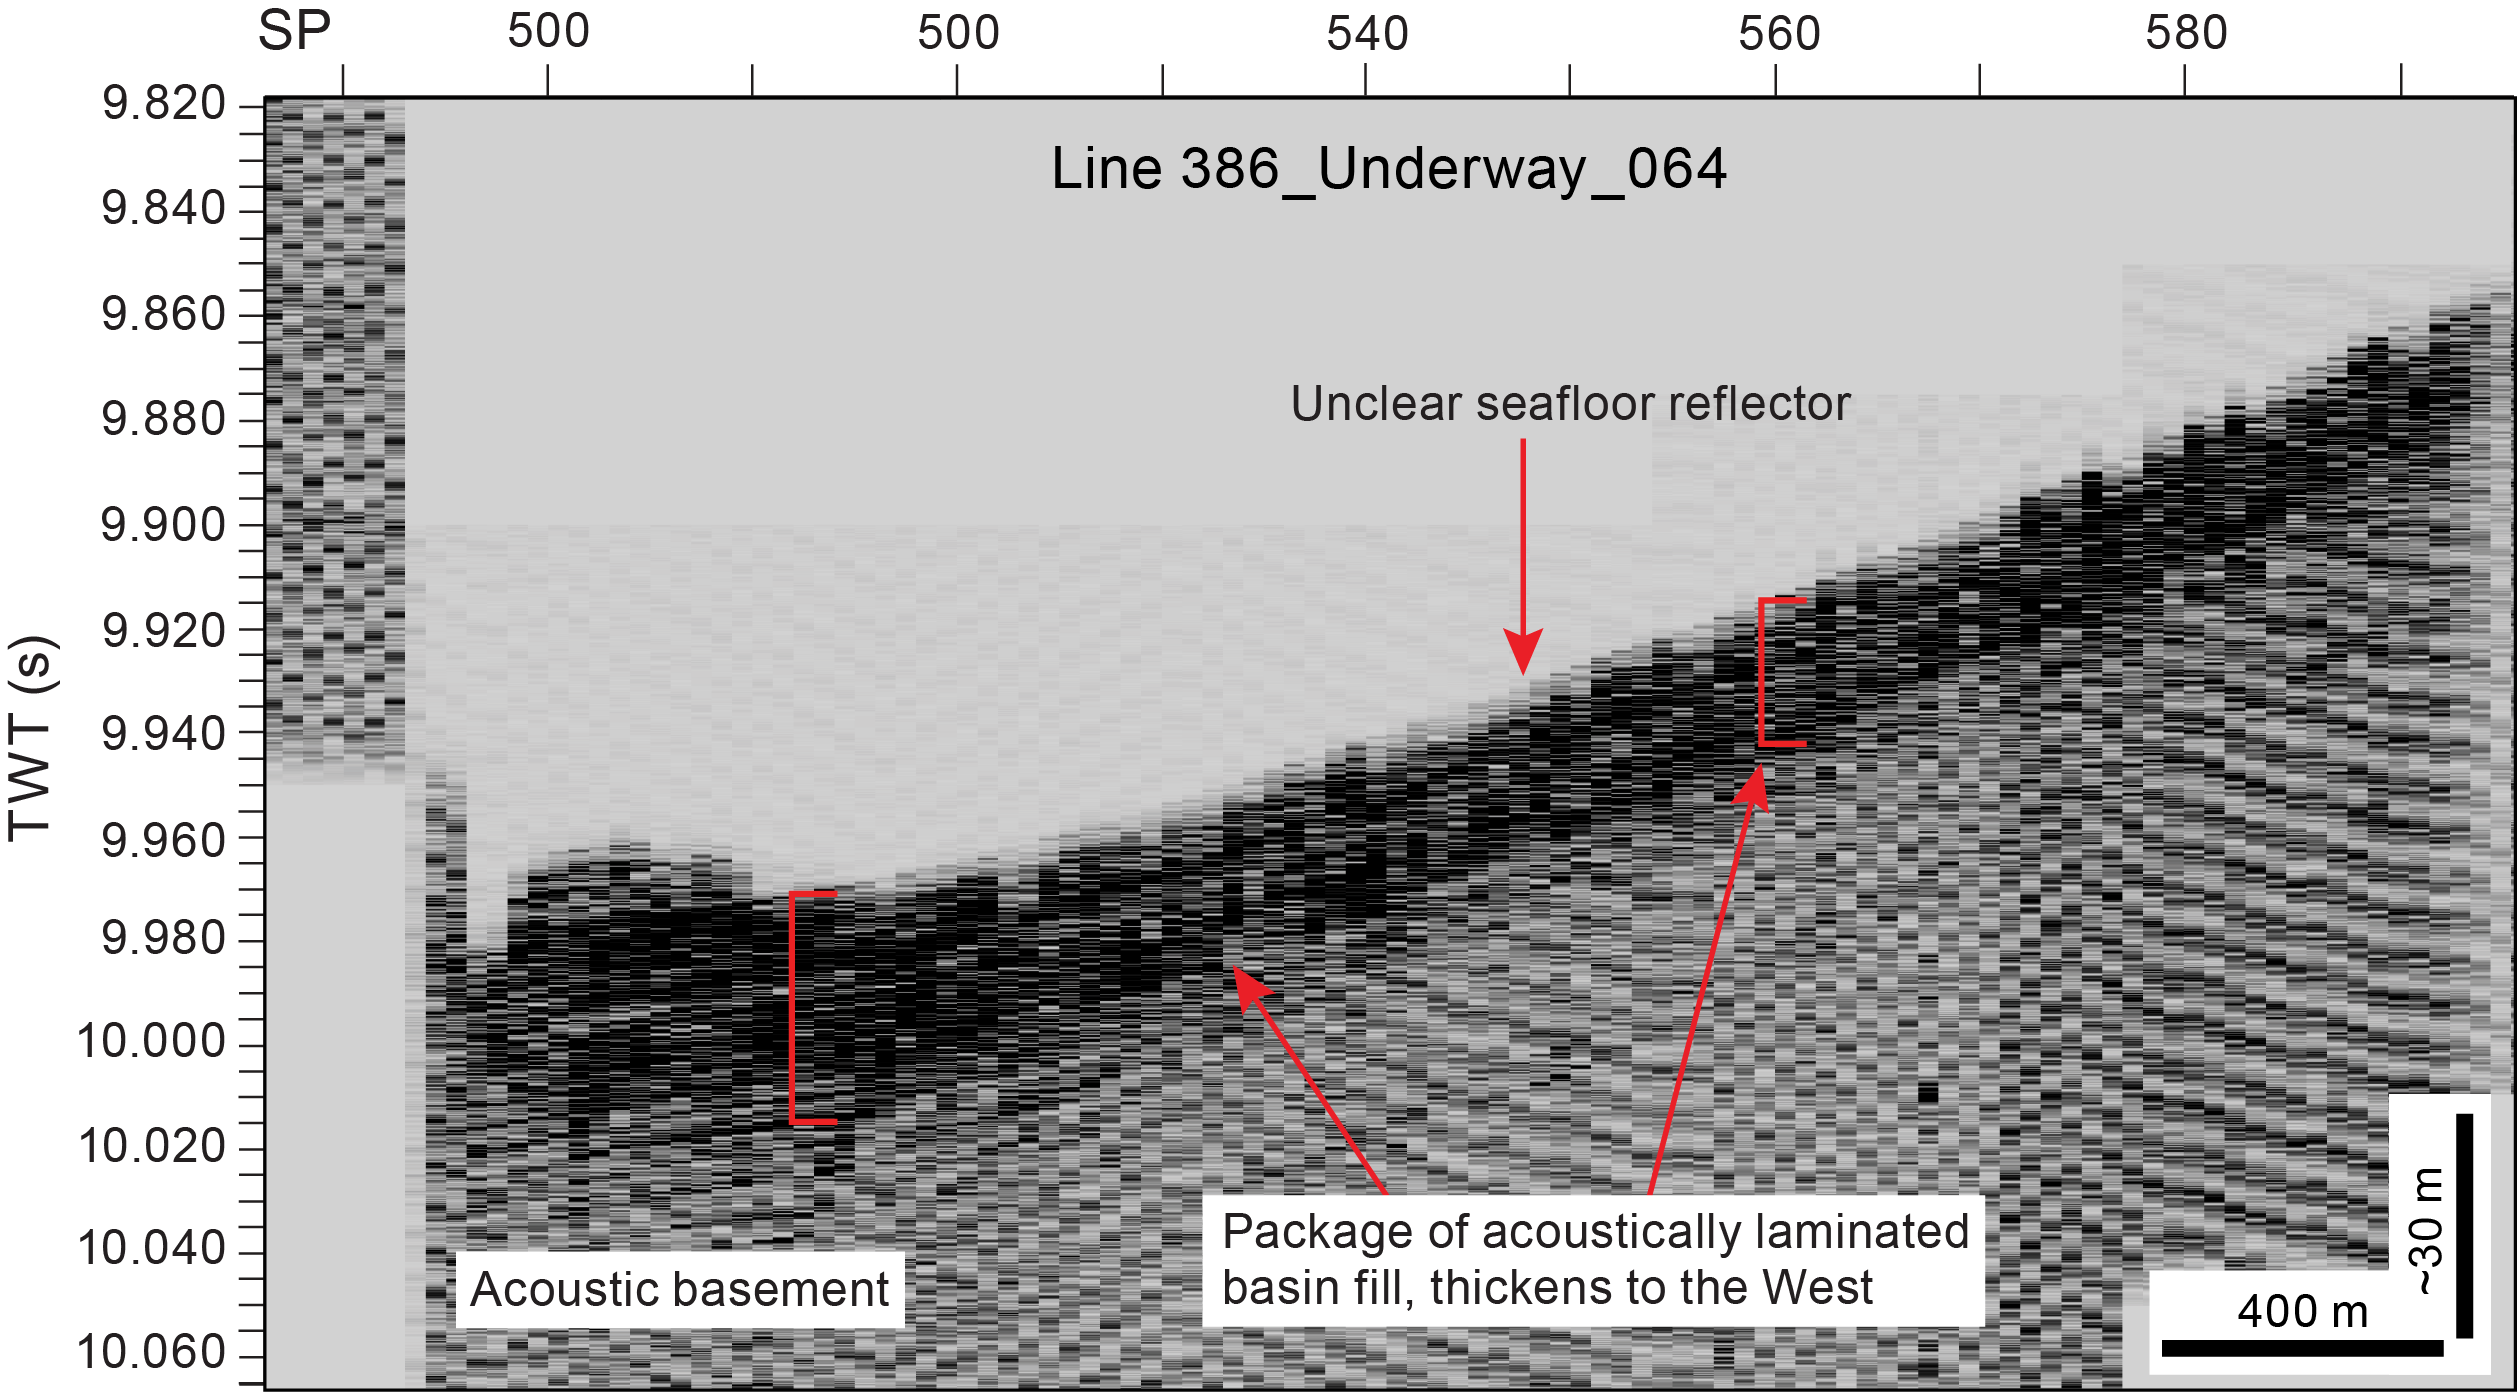
Figure F9. Line 386-Underway_064.
2.3. Site M0083
All Site M0083 holes lie adjacent to trench-parallel Line 386_Underway_021 (Figures F10, F11). A sharp, high-amplitude seafloor reflector visible on Line 386_Underway_021 overlies a series of three acoustically transparent or semitransparent layers that vary in thickness from approximately 2 m (shallowest) to 6 m (middle layer). Beneath the transparent layers is a package of high-amplitude, acoustically laminated materials, which are flat-lying and apparently onlap the basal high to the south. Beneath the laminated package, a high-amplitude basal fill is observed in the deeper part of the basin. This older package, although flat-lying, is not continuous; a basal high separates apparent compartments of deposition.

Figure F10. Subbottom profile lines around Site M0083.
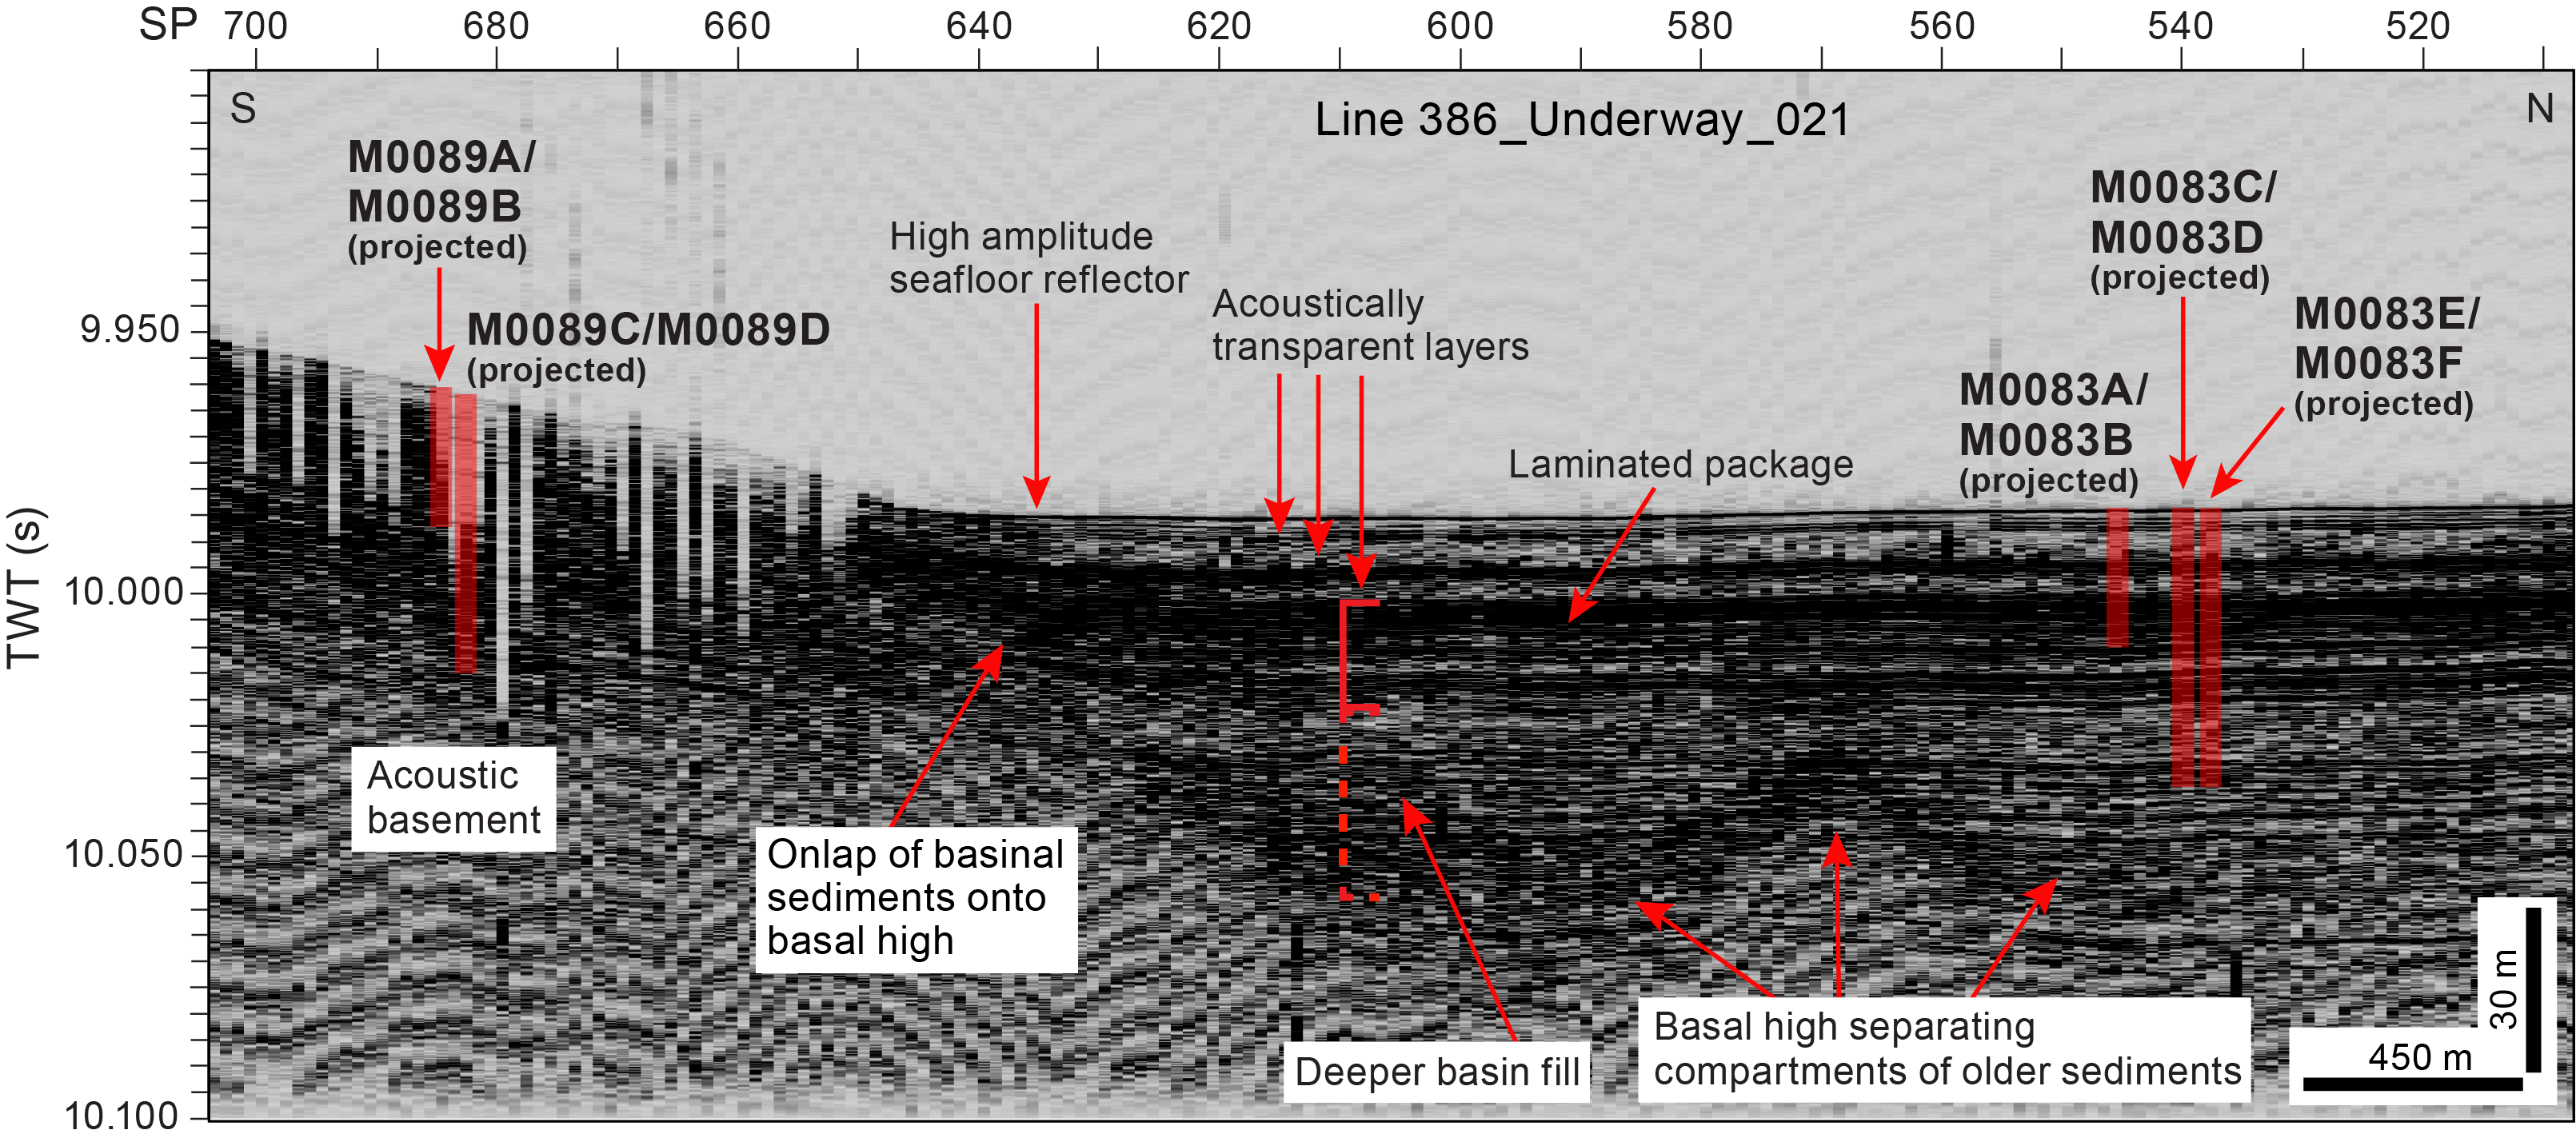
Figure F11. Line 386-Underway_021.
Trench-parallel Line 386_Underway_019 lies west of Line 386_Underway_021 and shows a faulted contact that juxtaposes the deeper basin fill against the basal high (Figure F12). This line shows disruption from seabed to the bottom of the section (10.1 s TWT) at Shotpoint 480, where basin fill layers are disrupted, and near-seabed basin fill appears to show drag at the seabed with acoustic shadow at seafloor. Together, these features may be indicative of fault activity with fluid involvement at this location.

Figure F12. Line 386_Underway_019.
2.4. Site M0089
Site M0089 lies near the intersection of Lines 386_Underway_028 (trench-perpendicular line) and 386_Underway_019 (trench-parallel line) (Figures F12, F13). In Line 386_Underway_019, Site M0089 can be seen on the northern side of a topographic high. An acoustically transparent layer occurs at the seafloor. The seismic reflectors on the high include a high-amplitude package of acoustically layered materials that is around 35 m thick in Holes M0089A and M0089B and up to 40 m thick in Holes M0089C and M0089D.

Figure F13. Subbottom profile lines around Site M0089.
3. Lithostratigraphy
Sites M0083 and M0089 were cored in Basin C2 in the central Japan Trench. Site M0083 has six holes, including those of the accompanying trigger cores. These were cored in the basin floor where the greatest sediment recovery was anticipated based on the subbottom profiles. Site M0089 has four holes, including those of the accompanying trigger cores. These were recovered from a topographic high in the basin flank where a condensed interval was anticipated.
This section describes the grain size–based lithology as originally logged during visual core description. The lithology and full lithostratigraphic description is illustrated on the lithostratigraphic summaries (Figures F15, F19, F23, F26, F28) and in close-up photos (Figure F21). The use of major and minor lithologies, bedding, sedimentary structures, accessories, bioturbation, and iron monosulfides are defined in Lithostratigraphy in the Expedition 386 methods chapter (Strasser, 2023a). The descriptions of smear slides taken during the offshore party are semiquantitative and include sand, silt, and clay grain size estimates and grain compositions described as percentages of the total slide (100%). Smear slide textural (sand, silt, and clay) and compositional data (lithogenic, biogenic, and volcanic components) are illustrated in ternary diagrams and photomicrographs (Figures F16, F17, F25) and smear slide tables (Tables T3, T4). Smear slides were observed every 2 m, and the results are displayed as color bars representing the lithogenic, biogenic, and volcanic components on smear slide summaries for Sites M0083 (Figures F18, F20, F22) and M0089 (Figures F24, F27) (see SMEARSLD in Supplementary material). The XRD bulk sediment mineralogy is summarized in Figure F29 for Holes M0083D and M0089D, and the data is available in XRD in Supplementary material.
The X-ray computed tomography (CT) scan, linescan images, core close-up photos, handwritten VCDs (see XRAYCT, LINESCAN, CORECLOSEUP, and HANDRAWNVCD in Supplementary material), and linescan composite plots (see Core descriptions) were used during the lithostratigraphic core description and summation and appear on the lithostratigraphic summaries. Higher resolution core descriptions produced at 3 m intervals and the smear slide data tables can be found in Core descriptions.
The lithology at Sites M0083 and M0089 is similar and dominated by clayey silt, silty clay, and clay with minor components of medium sand, fine sand, very fine sand, and silt (Figures F15, F19, F23, F26, F28). Detailed smear slide observations indicate that a large biogenic component containing, in decreasing abundance, diatoms, sponge spicules, silicoflagellates, and radiolaria can dominate the lithology. Foraminifera and calcareous nannofossils are rare (see Core descriptions). The lithologic names are derived from the smear slide observations following a scheme from Mazzulo et al. (1988) (see Lithostratigraphy in the Expedition 386 methods chapter [Strasser, 2023a]). Common examples include siliceous-rich lithogenic clayey silt, vitric-bearing siliceous- and lithogenic-rich clayey silt, lithogenic-rich ash, vitric-rich lithogenic silty clay, and others (Figures F18, F20, F22, F24, F27; see Core descriptions).
The most common primary bedding structures at both sites are thin beds (1–3 cm) and laminae sometimes forming parallel laminated or wavy laminated intervals that contain fine sand, very fine sand, silt, and clayey silt. These deposits can have sharp, erosional, wavy, gradational, or bioturbated lower and upper contacts (Figure F21). The sediment above the basal contacts can fine or coarsen upward. Convolute and chaotic bedding structures with folded and dipping beds, drag folds, and floating silt and very fine sand clasts are present at Sites M0083 and M0089. Tephras are observed in the cores and verified by smear slide petrography in the following sections: 386-M0083B-1H-16, 27 cm, and 1H-17, 22 cm; 386-M0083D-1H-21, 12.5 cm; and 386-M0089D-1H-23, 40 cm, 1H-23, 58 cm, 1H-26, 102.6 cm, 1H-26, 104 cm, 1H-26, 105.7 cm, and 1H-31, 63 cm (see Tephra).
Intervals of homogeneous sediment that lack structures are also present at Sites M0083 and M0089. These intervals range in thickness from 1 cm to 4 m. Their grain size composition is generally clay dominated, but silty clay and clayey silt are also present (Figures F15, F19, F23, F26, F28). These homogeneous intervals are interbedded with parallel or wavy laminated intervals that commonly contain silt and very fine to medium sand. Smear slide ternary diagrams suggest Site M0089 has finer grained sediment with less silt than Site M0083 (Figures F16, F25), but more rigorous analyses are required to better evaluate this. Site M0083 and M0089 biogenic and lithic components seem to have similar compositions that average 50% plus or minus 20% lithogenic and/or biogenic components. Volcanic material is the least abundant at both sites.
X-ray CT scan images in grayscale show density contrasts and offer a detailed image of the sedimentary structures. The X-ray CT scan images for Sites M0083 and M0089 correlate well with the bedding in the lithology, for example in Hole M0083D (12.5–20 mbsf) (Figure F19). Linescan images also highlight changes in lithology as well as sedimentary structures and the degree of bioturbation and iron monosulfides. Where the lithology is homogeneous, magnetic susceptibility, density, and natural gamma radiation (NGR) for the most part have profiles that show little variability. Where the lithology exhibits variability, such as thinly bedded and/or closely spaced laminae, the physical properties exhibit sharp increases and decreases (see Physical properties).
The sediments have undergone secondary depositional processes: bioturbation and the formation of iron monosulfides. These processes overprint the primary depositional bedding features. Bioturbation is common and has been classified on a scale ranging from slight to abundant and homogenized (see Lithostratigraphy in the Expedition 386 methods chapter [Strasser, 2023a]). Bioturbation is noted by color variability ranging from brown (7.5 YR 4/3) to grayish olive (5Y 4/2) to dark olive (7.5Y 4/3). Extensive organoclastic sulfate reduction and/or anaerobic oxidation of methane is manifested as iron monosulfides. Iron monosulfides are classified as sparse, moderate, or abundant, and they are observed as infill in burrows, as mottling, and filling porosity in laminae producing color bands (Figures F15, F19, F23, F26, F28).
Core deformation is minor and characterized by voids, slurry, and cracks. Cracks are more abundant with depth. Most significant is the post–core recovery and splitting oxidation observed in many sections.
Core close-up photos can be found in CORECLOSEUP in Supplementary material.
3.1. Sites M0083 and M0089
Sites M0083 and M0089 are composed of intervals that represent sedimentary units containing similar physical characteristics: bedding (lithology grain size and bed thickness), primary structures (frequency and type of sedimentary structures), and secondary structures (bioturbation and iron monosulfides). The X-ray CT scan and linescan images and physical properties record the observed changes (see XRAYCT and LINESCAN in Supplementary material). We identified four main sediment types at Sites M0083 and M0089, and they are described using the criteria defined in Lithostratigraphy in the Expedition 386 methods chapter (Strasser, 2023a) (Figure F14). The framework of these sedimentary type descriptions can be applied to other sites in the Japan Trench basins in the future.

Figure F14. Sedimentary facies Types 1–4.
Type 1 is composed of sections of structureless (homogeneous) clay, silty clay, or clayey silt ~0.5 to 1 m thick that contains a few scattered laminae of clayey silt, silt, and very fine to medium sand. Bioturbation in this interval is slight to abundant. The X-ray CT scan images show some density variability, but it is not as pronounced as in Types 2 and 3. The linescan images highlight the bioturbated intervals. Magnetic susceptibility, bulk density, and NGR show variability that generally correlates with the laminae but is not as pronounced as in Types 2 and 3.
Type 2 tends to have sharp basal contacts. The sediment above these contacts is ~0.5–2 m thick, tends to be coarser grained, can have parallel and wavy bedding and/or laminae, and tends to fine upward from medium sand to clayey silt or silty clay. This sediment type can also show evidence of plastic deformation, such as contorted bedding. The basal contacts tend to be sharp, wavy, and erosional. The linescan and X-ray CT scan images reveal sedimentary structures and high-density changes, respectively. A ~1 to 6 m thick bed of clay and silty clay that lacks bioturbation overlies an interval of contorted bedding. The clay can be chaotic, with silt and very fine sand clasts floating in the matrix. The clasts have polygonal to subrounded shapes ranging from millimeters to centimeters in diameter but can also be vertically elongated with diffuse margins. Rare laminae and sparse bioturbation occur near the top of the clay interval (upper 0.5–1 m), as revealed in the linescan images. The X-ray CT scan images show variability or density changes corresponding with silt and very fine sand patches. Magnetic susceptibility and bulk density show slight variability that corresponds to the siltier intervals within the clayey section (see Physical properties). In contrast, when there are laminae or beds, magnetic susceptibility and bulk density show more pronounced changes in their signals. Abundant bioturbation is commonly observed below the basal contact and above the top of this interval.
The main difference between Type 2 and Type 3 lithologies is that in Type 3, the 1–6 m thick bed of clay is structureless and does not contain the floating clasts, silt, and very fine patches or any other evidence of chaotic soft-sediment deformation seen in Type 2. The X-ray CT scans show no variability or density changes in the clayey section, suggesting sediment homogeneity. In contrast, Type 2 shows bright reflections due to density changes in the sand and silt patches. Type 3 does not show deformation features within the thick clay bed (1–6 m).
Type 4 is composed of <50 cm thick homogeneous and/or structureless clay, silty clay, and clayey silt that is thickly interbedded with laminae and beds of clayey silt, silty clay, silt, and very fine to medium sand. The laminae and thin beds are millimeter to centimeter scale and can occur as parallel and wavy sets or as a single lamina and beds. Their basal contacts can be sharp, wavy, or gradual, and the top contacts tend to be gradational. This sediment type is generally sparsely to heavily bioturbated, except where the bedding is very closely spaced and sandier, in which case bioturbation is absent. The details of these primary and secondary features are further revealed by the linescan images. The X-ray CT scan images show a high degree of variability, such as enhanced brightness and contrast, that highlight the bedding structures. Magnetic susceptibility, density, and NGR can show great variability (see Physical properties) that generally but not always corresponds to variations in lithology in association with laminae that range in grain size from very fine sand to silt to clayey silt.
3.1.1. Holes M0083A and M0083B
3.1.1.1. Hole M0083A
Hole M0083A is 1.65 m deep and mainly composed of clay. The upper 7 cm is a void space. The clay contains three silty clay laminae in intervals 1H-1, 20–22, 40–42, and 80–90 cm (Figure F15). A 1 cm thick dark olive-brown layer (2.5Y 3/3) near the top of the hole 7 cm below seafloor is interpreted as oxygenated, indicating that recovery included the intact seabed surface. The lithology, except for the three laminae, is structureless and sparsely bioturbated toward the bottom of the hole. Two color bands of dark olive-brown (2.5Y 3/3) are recognized at 26–32 and 45–46 cm below seafloor. The X-ray CT scan images show little variability, but the linescan images highlight the color bands (see XRAYCT and LINESCAN in Supplementary material). The three physical properties measured (magnetic susceptibility, density, and NGR) increase in correlation with clayey silt laminae (see Physical properties). The lithology of Hole M0083A has similar characteristics to those described for Type 1.

Figure F15. Lithostratigraphic summary, Holes M0083A and M0083B.
Smear slide observations at 20 and 30 cm below seafloor describe this lithology as lithogenic-rich siliceous ooze and siliceous-rich lithogenic silt with pyrite and carbonate grains. The grain size is clayey silt and silt (see smear slide tables in Core descriptions). Clay is the most abundant component of the minerals (38.5%), and calcite (15%) is also present. Diatoms (38.5%) are the main biogenic component. In the ternary diagram, minerals (including clay minerals) are considered part of the lithics (Figure F16).
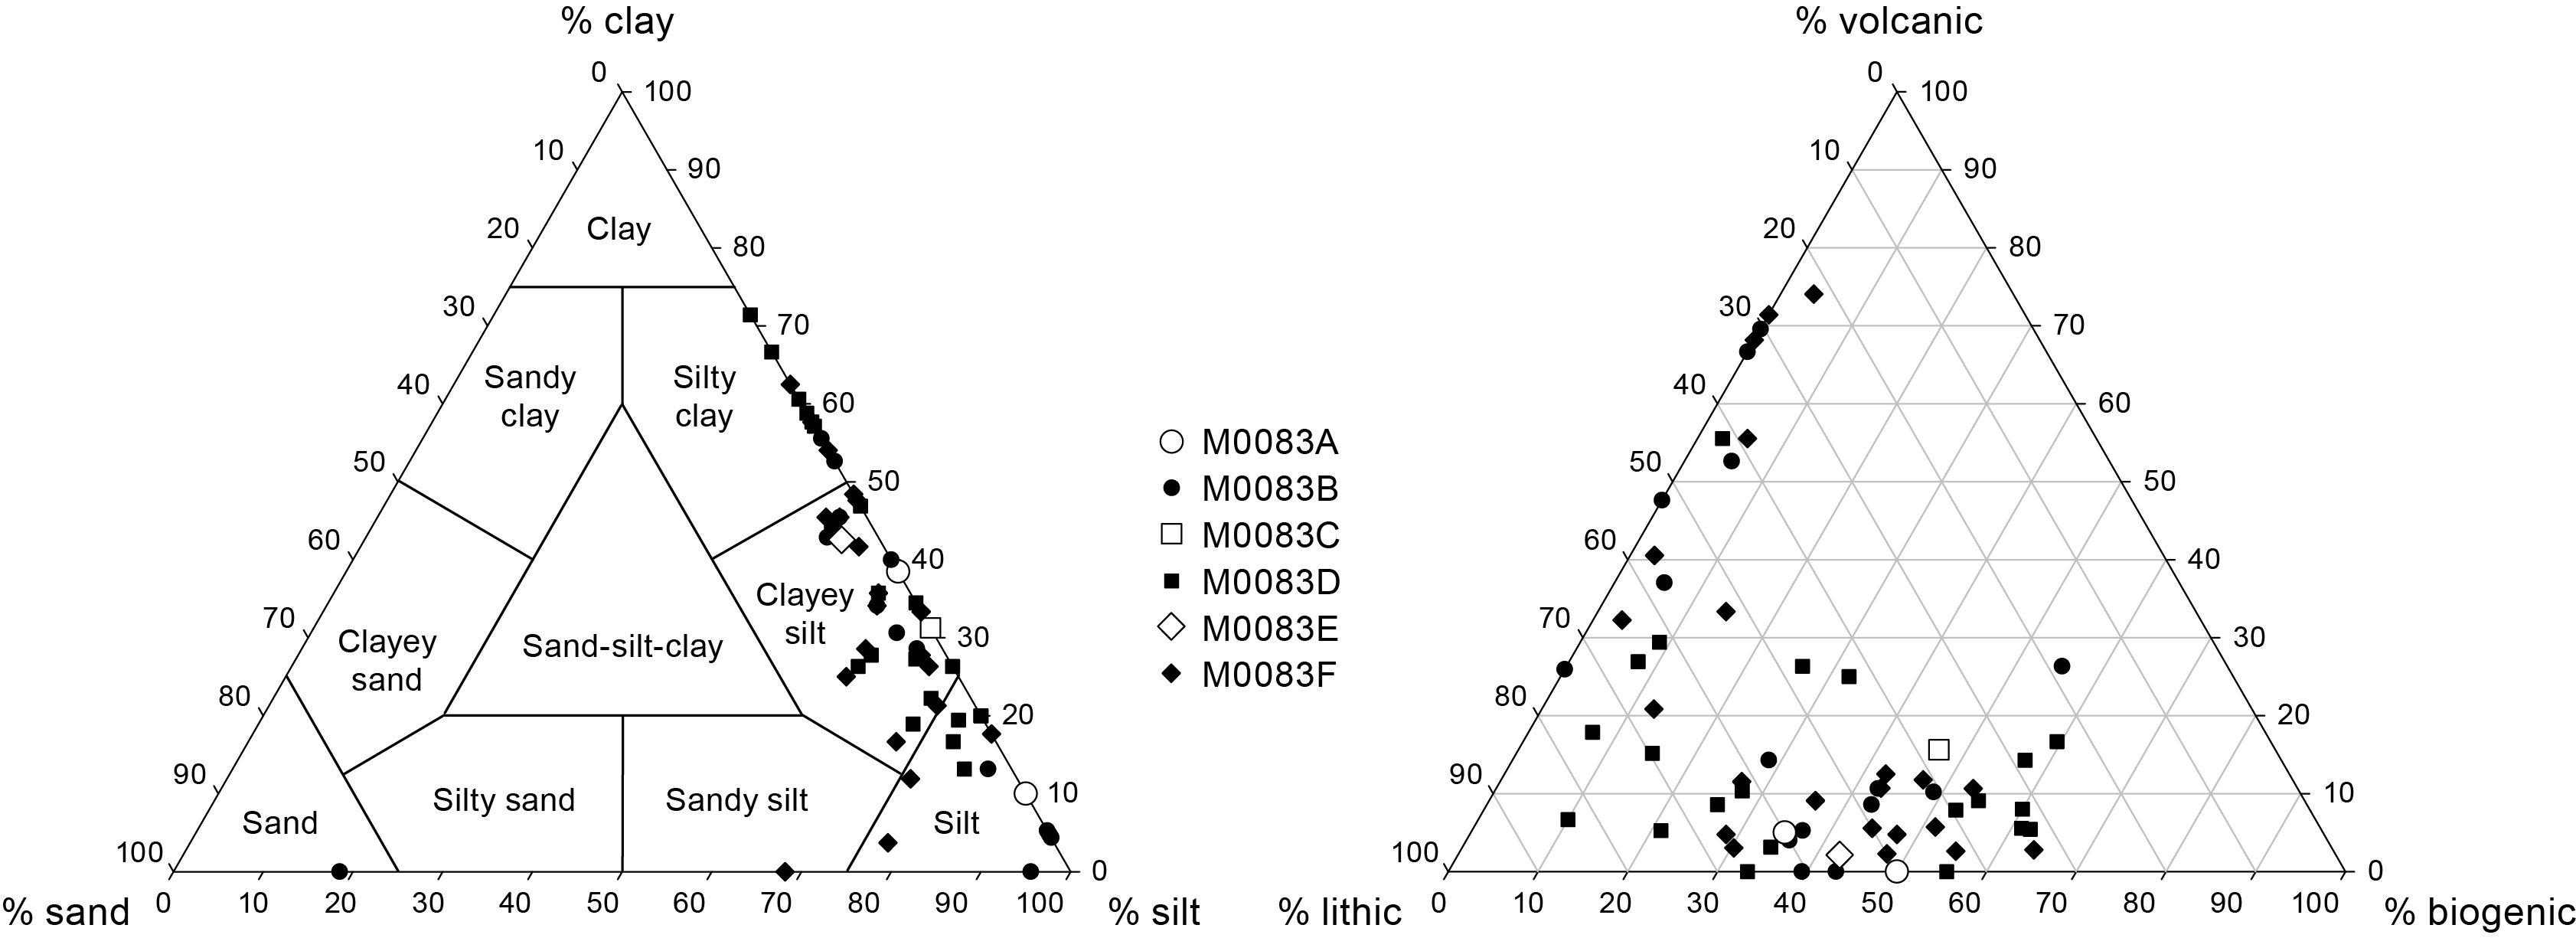
Figure F16. Ternary diagrams of major components and grain size, Site M0083.
3.1.1.2. Hole M0083B
The grain size–based lithology for the 19.52 m deep Hole M0083B is dominated by clay, silty clay, and clayey silt (Figures F15, F16, F17).
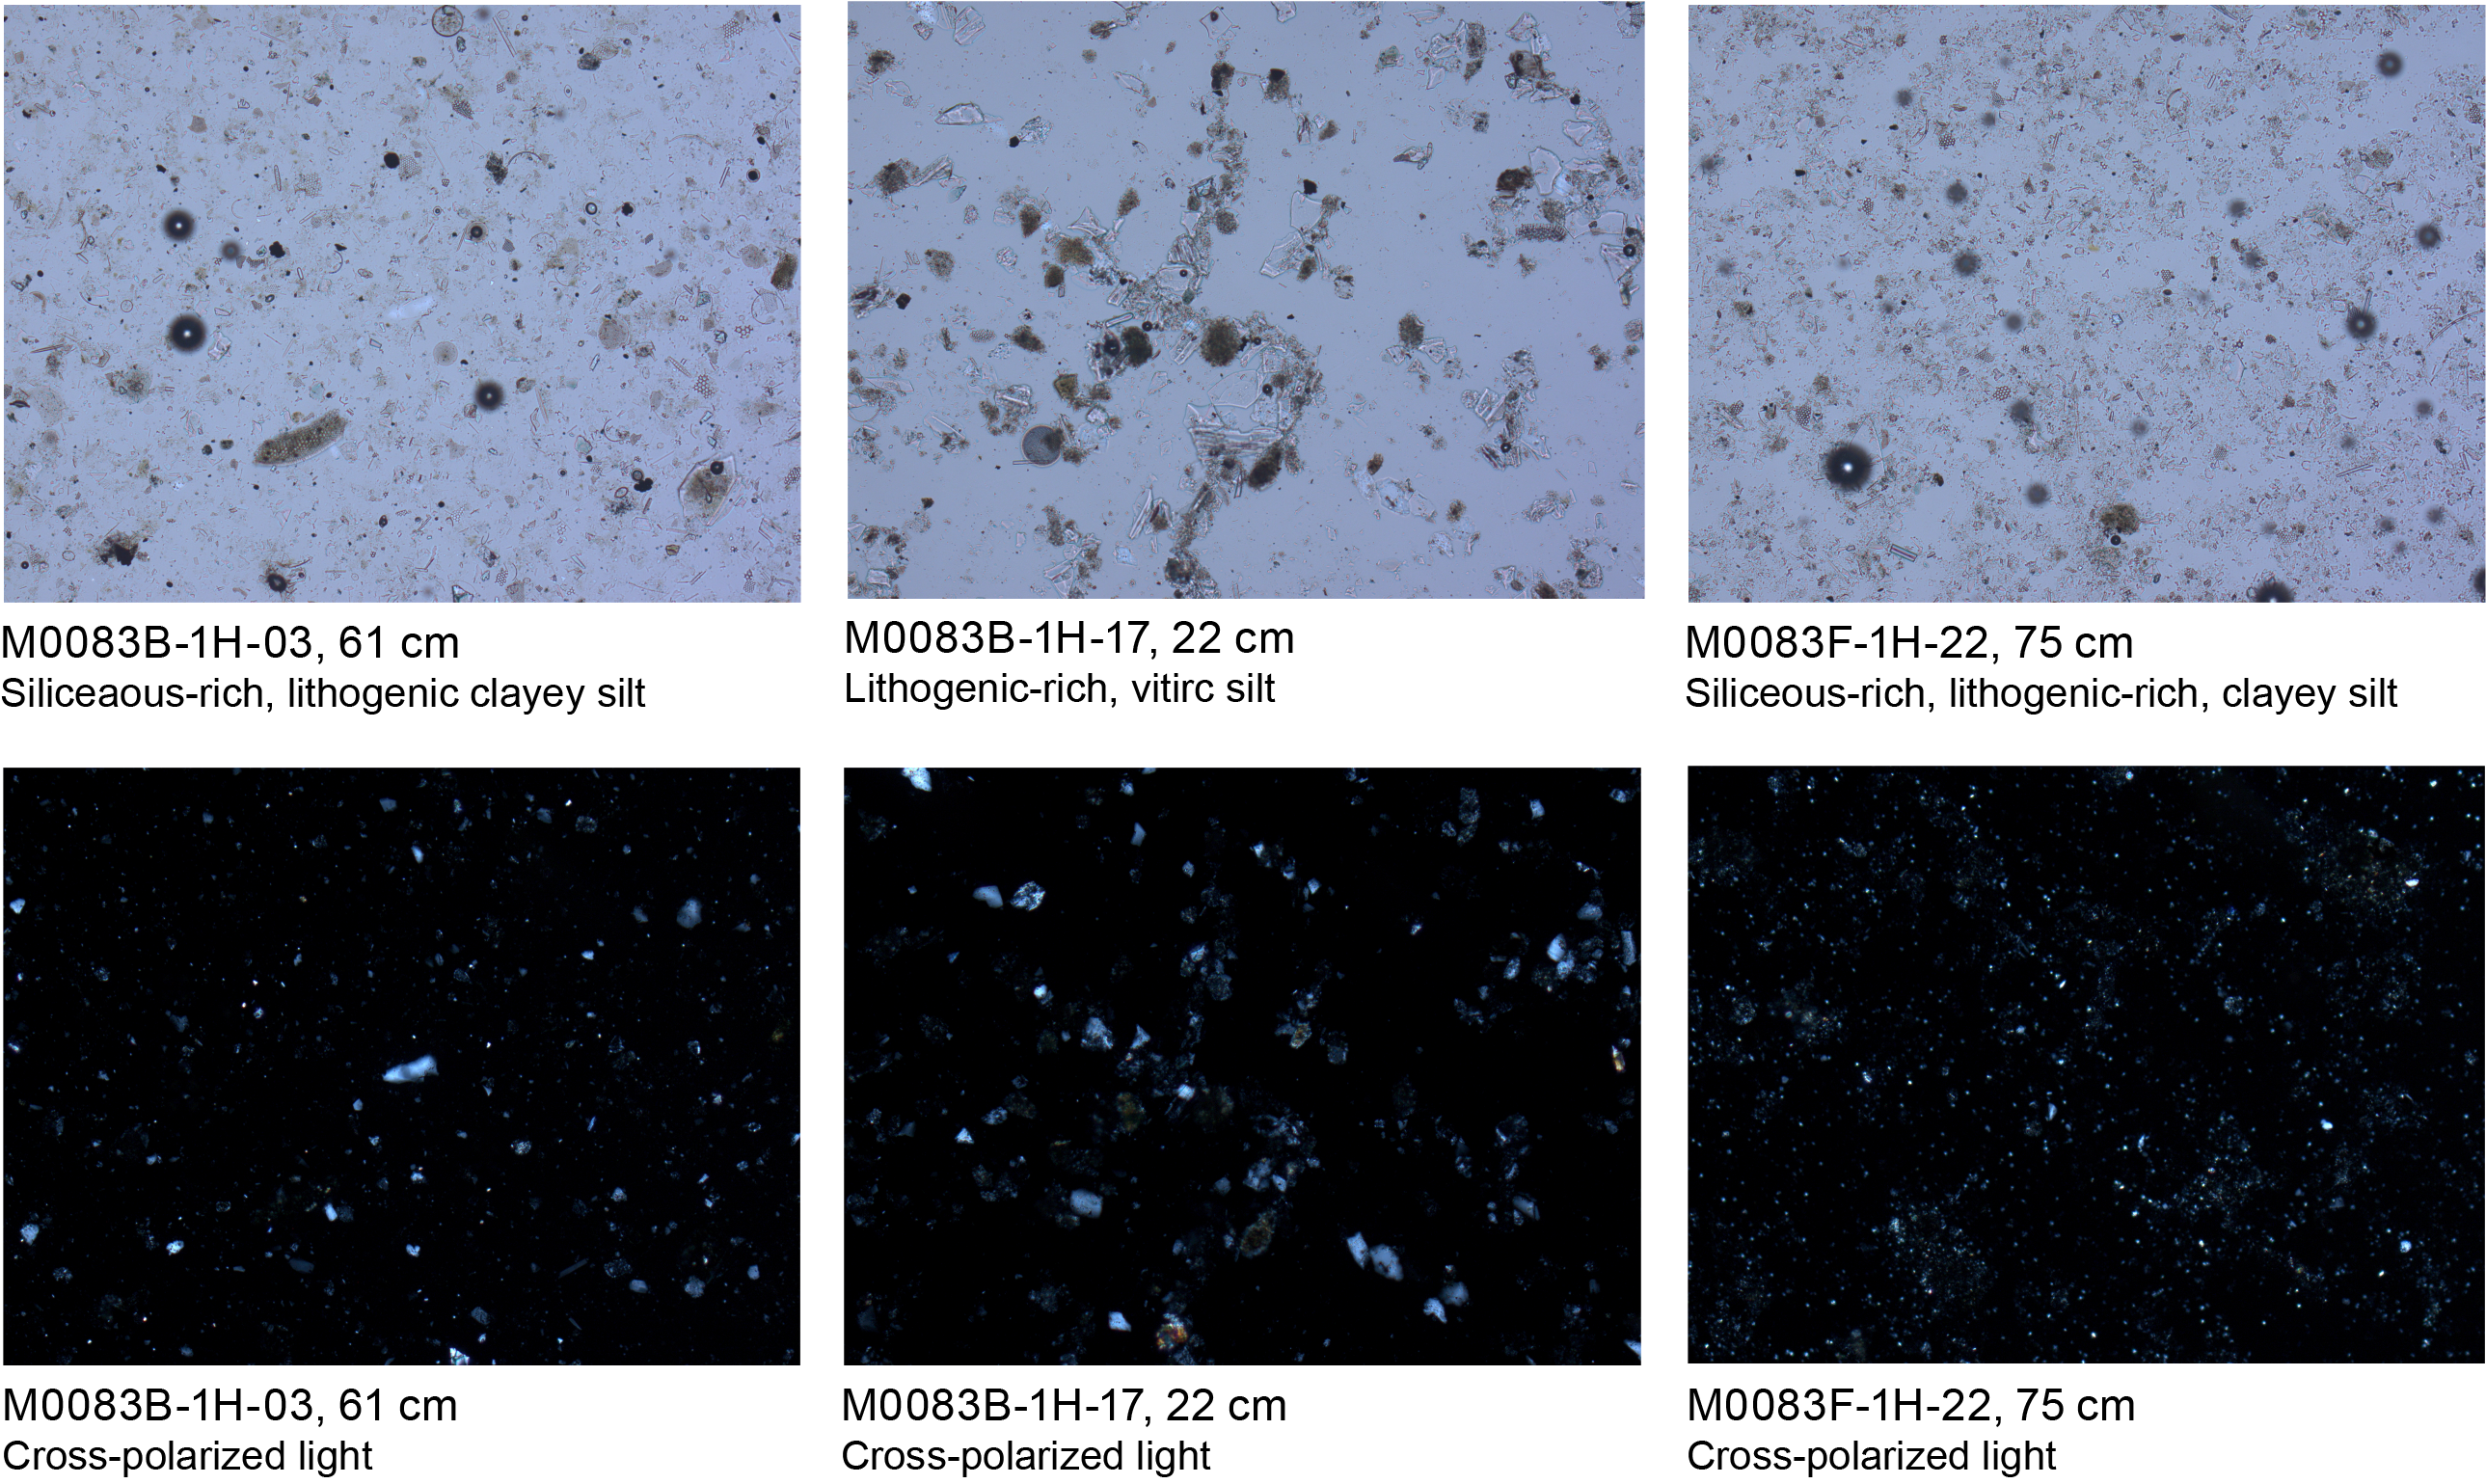
Figure F17. Smear slide photomicrographs, Site M0083.
The lithology of Interval 1 (0–0.65 mbsf) is characterized as Type 1. It is composed of clay and silty clay. The clay layer is in the upper 0.5 m, and the silty clay is found between 0.5 and 0.65 mbsf. It is sparsely to moderately bioturbated, and the X-ray CT scan images and physical properties show little variability (see Physical properties).
Interval 2 (0.65–7.6 mbsf) has similar characteristics to lithology Type 2. It is composed of medium, fine, and very fine sand; silt; clayey silt; or silty clay and clay. This interval has a sharp basal contact. The sediment above the contact is 20 cm thick and composed of fining-upward medium to very fine sand. The X-ray CT scan images show marked changes in density, and the physical properties display increases in magnetic susceptibility, density, and NGR within this 20 cm thick interval that corresponds to the very fine sand fining-upward sequence (see Physical properties). The sediment above this interval is 6.75 m thick and composed of a 2.25 m interval of clayey silt and silty clay that grades upward into a 4.5 m thick clay bed. This interval is chaotic in that it contains silt clasts and silt patches floating in the matrix. The silt clasts have polygonal and subrounded shapes. A lamina is present near the top. The X-ray CT scan images show variability or density changes corresponding to the silt patches. Bulk density and magnetic susceptibility show some variability corresponding to the siltier parts of the interval. The coarse- and fine-grained intervals from 0.65 to 7.6 mbsf lack bioturbation. Heavy bioturbation is observed below the basal contact and above the top of this interval.
Interval 3 (7.6–9.5 mbsf) has characteristics similar to Type 1. It is composed of clay with a few silt laminae at ~8.5, 9, and 9.5 mbsf. This interval is sparsely to moderately bioturbated. The X-ray CT scan images show some density contrast, and all the physical properties (magnetic susceptibility, bulk density, and NGR) display moderate variability (see Physical properties).
Interval 4 (9.5–13.7 mbsf) has characteristics of Type 3. From the base upward, this interval has a sharp contact at 13.7 mbsf and an ~10 cm thick laminated interval above. Slight bioturbation occurs above the contact and in the 70 cm above. This subsection is composed of very fine sand fining upward to silt. The section then fines upward, forming a ~4 m thick structureless and homogeneous silty clay and clay. The X-ray CT scan images and physical properties show no variability (see Physical properties). Sparse bioturbation was observed near the base (lower 70 cm) and top (above 13.7 mbsf) of the interval.
Interval 5 (13.7–19.2 mbsf) has characteristics similar to Type 4. It is composed of clay and silty clay–clayey silt densely interbedded with laminae and parallel laminated intervals composed of silt and sandy silt. The X-ray CT scan images show pronounced density contrasts, and bulk density and NGR show pronounced increases and decreases (see Physical properties) that correlate with the very fine sand, silt, and clayey silt laminated and thin bedded intervals. In contrast, magnetic susceptibility shows little variability. There are intervals of sparse to heavy bioturbation. Tephras are present in intervals 386-M0083B-1H-16, 26.5–27 cm, and 1H-17, 21.2–22 cm (see Tephra).
A total of 13 smear slides were studied for Hole M0083B (Figures F16, F17, F18; see smear slide tables in Core descriptions). The lithology is described as siliceous-rich lithogenic clayey silt, vitric-bearing siliceous-rich lithogenic clayey silt, vitric-rich lithogenic silt, and lithogenic-rich ash. The grain size is dominated by clayey silt and silty clay with minor silt and sand. The main mineral components, in decreasing abundance, are clay, quartz, feldspar, heavy minerals, and pyrite. Diatoms are the most abundant biogenic component with an abundance of up to 30% of the total smear slide components, followed in decreasing abundance by sponge spicules, radiolaria, and silicoflagellates.

Figure F18. Smear slide summary, Holes M0083A and M0083B.
3.1.2. Holes M0083C and M0083D
3.1.2.1. Hole M0083C
Hole M0083C is 1.4 m deep, and the sediments comprise clayey silt–silty clay and clay (Figure F19). The sediment characteristics are associated with Type 1. The clayey silt–silty clay and clay are interbedded with rare silt, very fine sand, and fine sand laminae, and they are sparsely to moderately bioturbated. The X-ray CT scan images show few changes in density, and magnetic susceptibility, density, and NGR show moderate variability (see Physical properties) corresponding to clayey silt and very fine sand laminae.
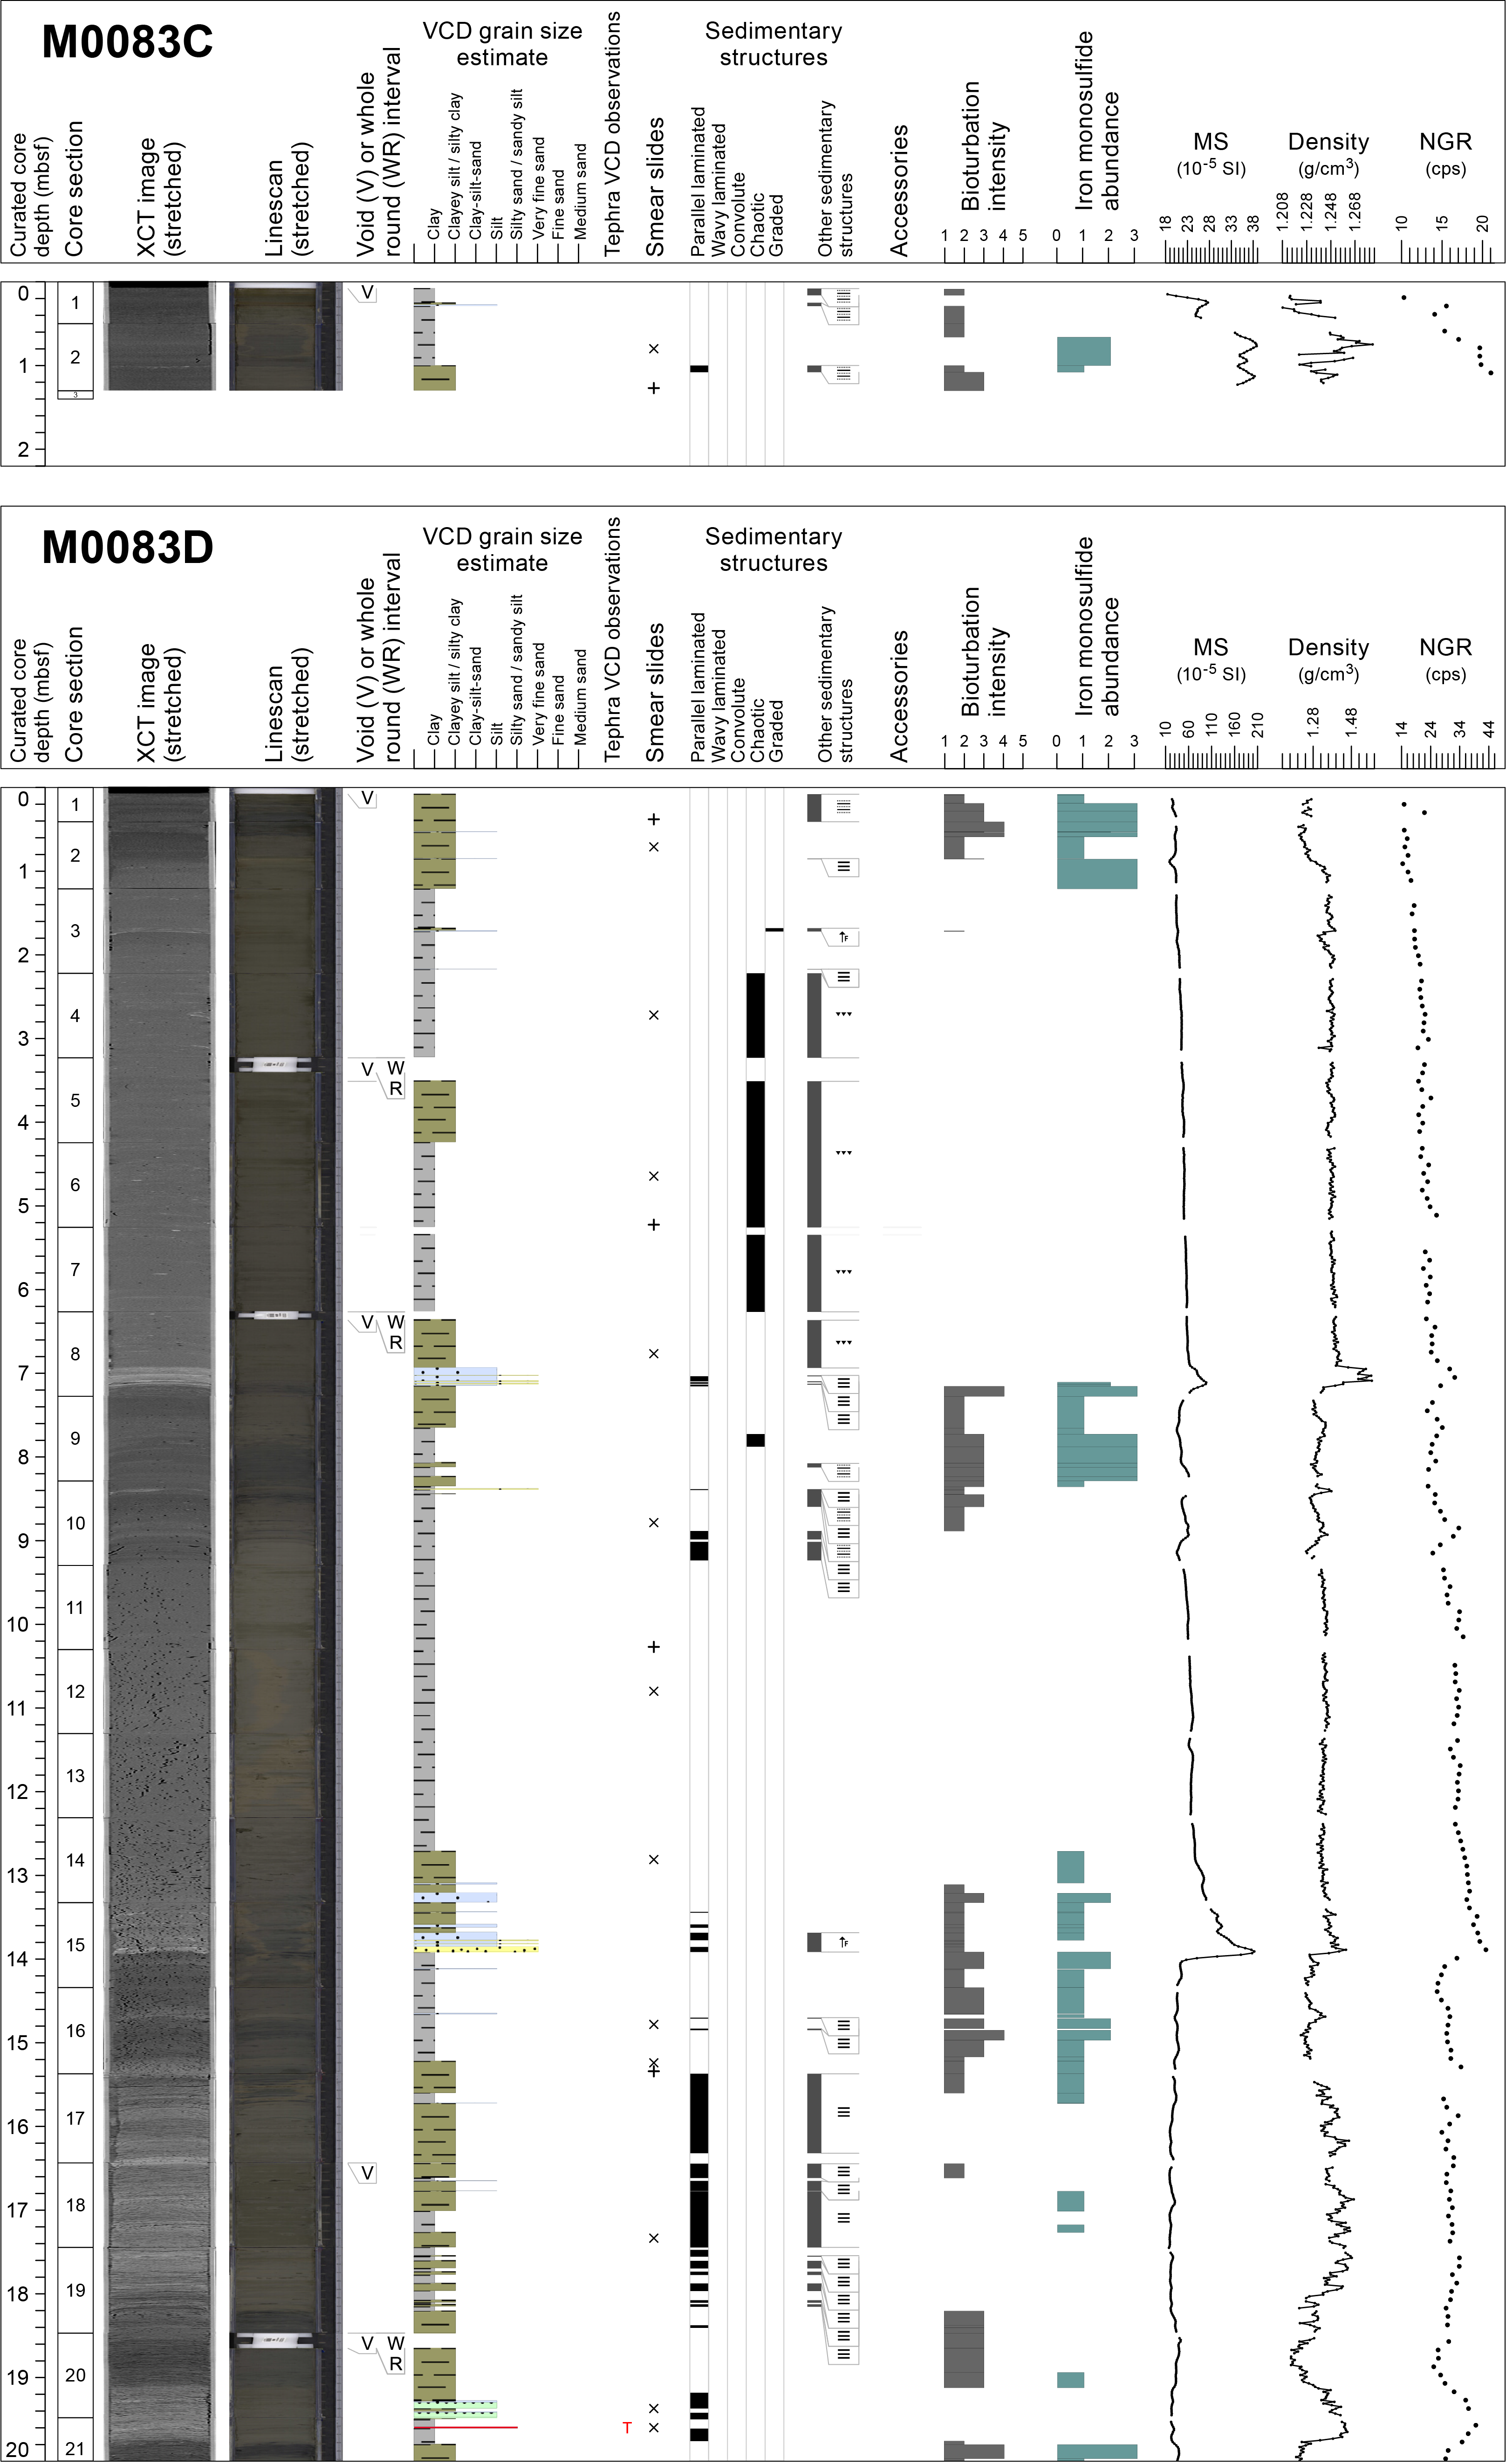
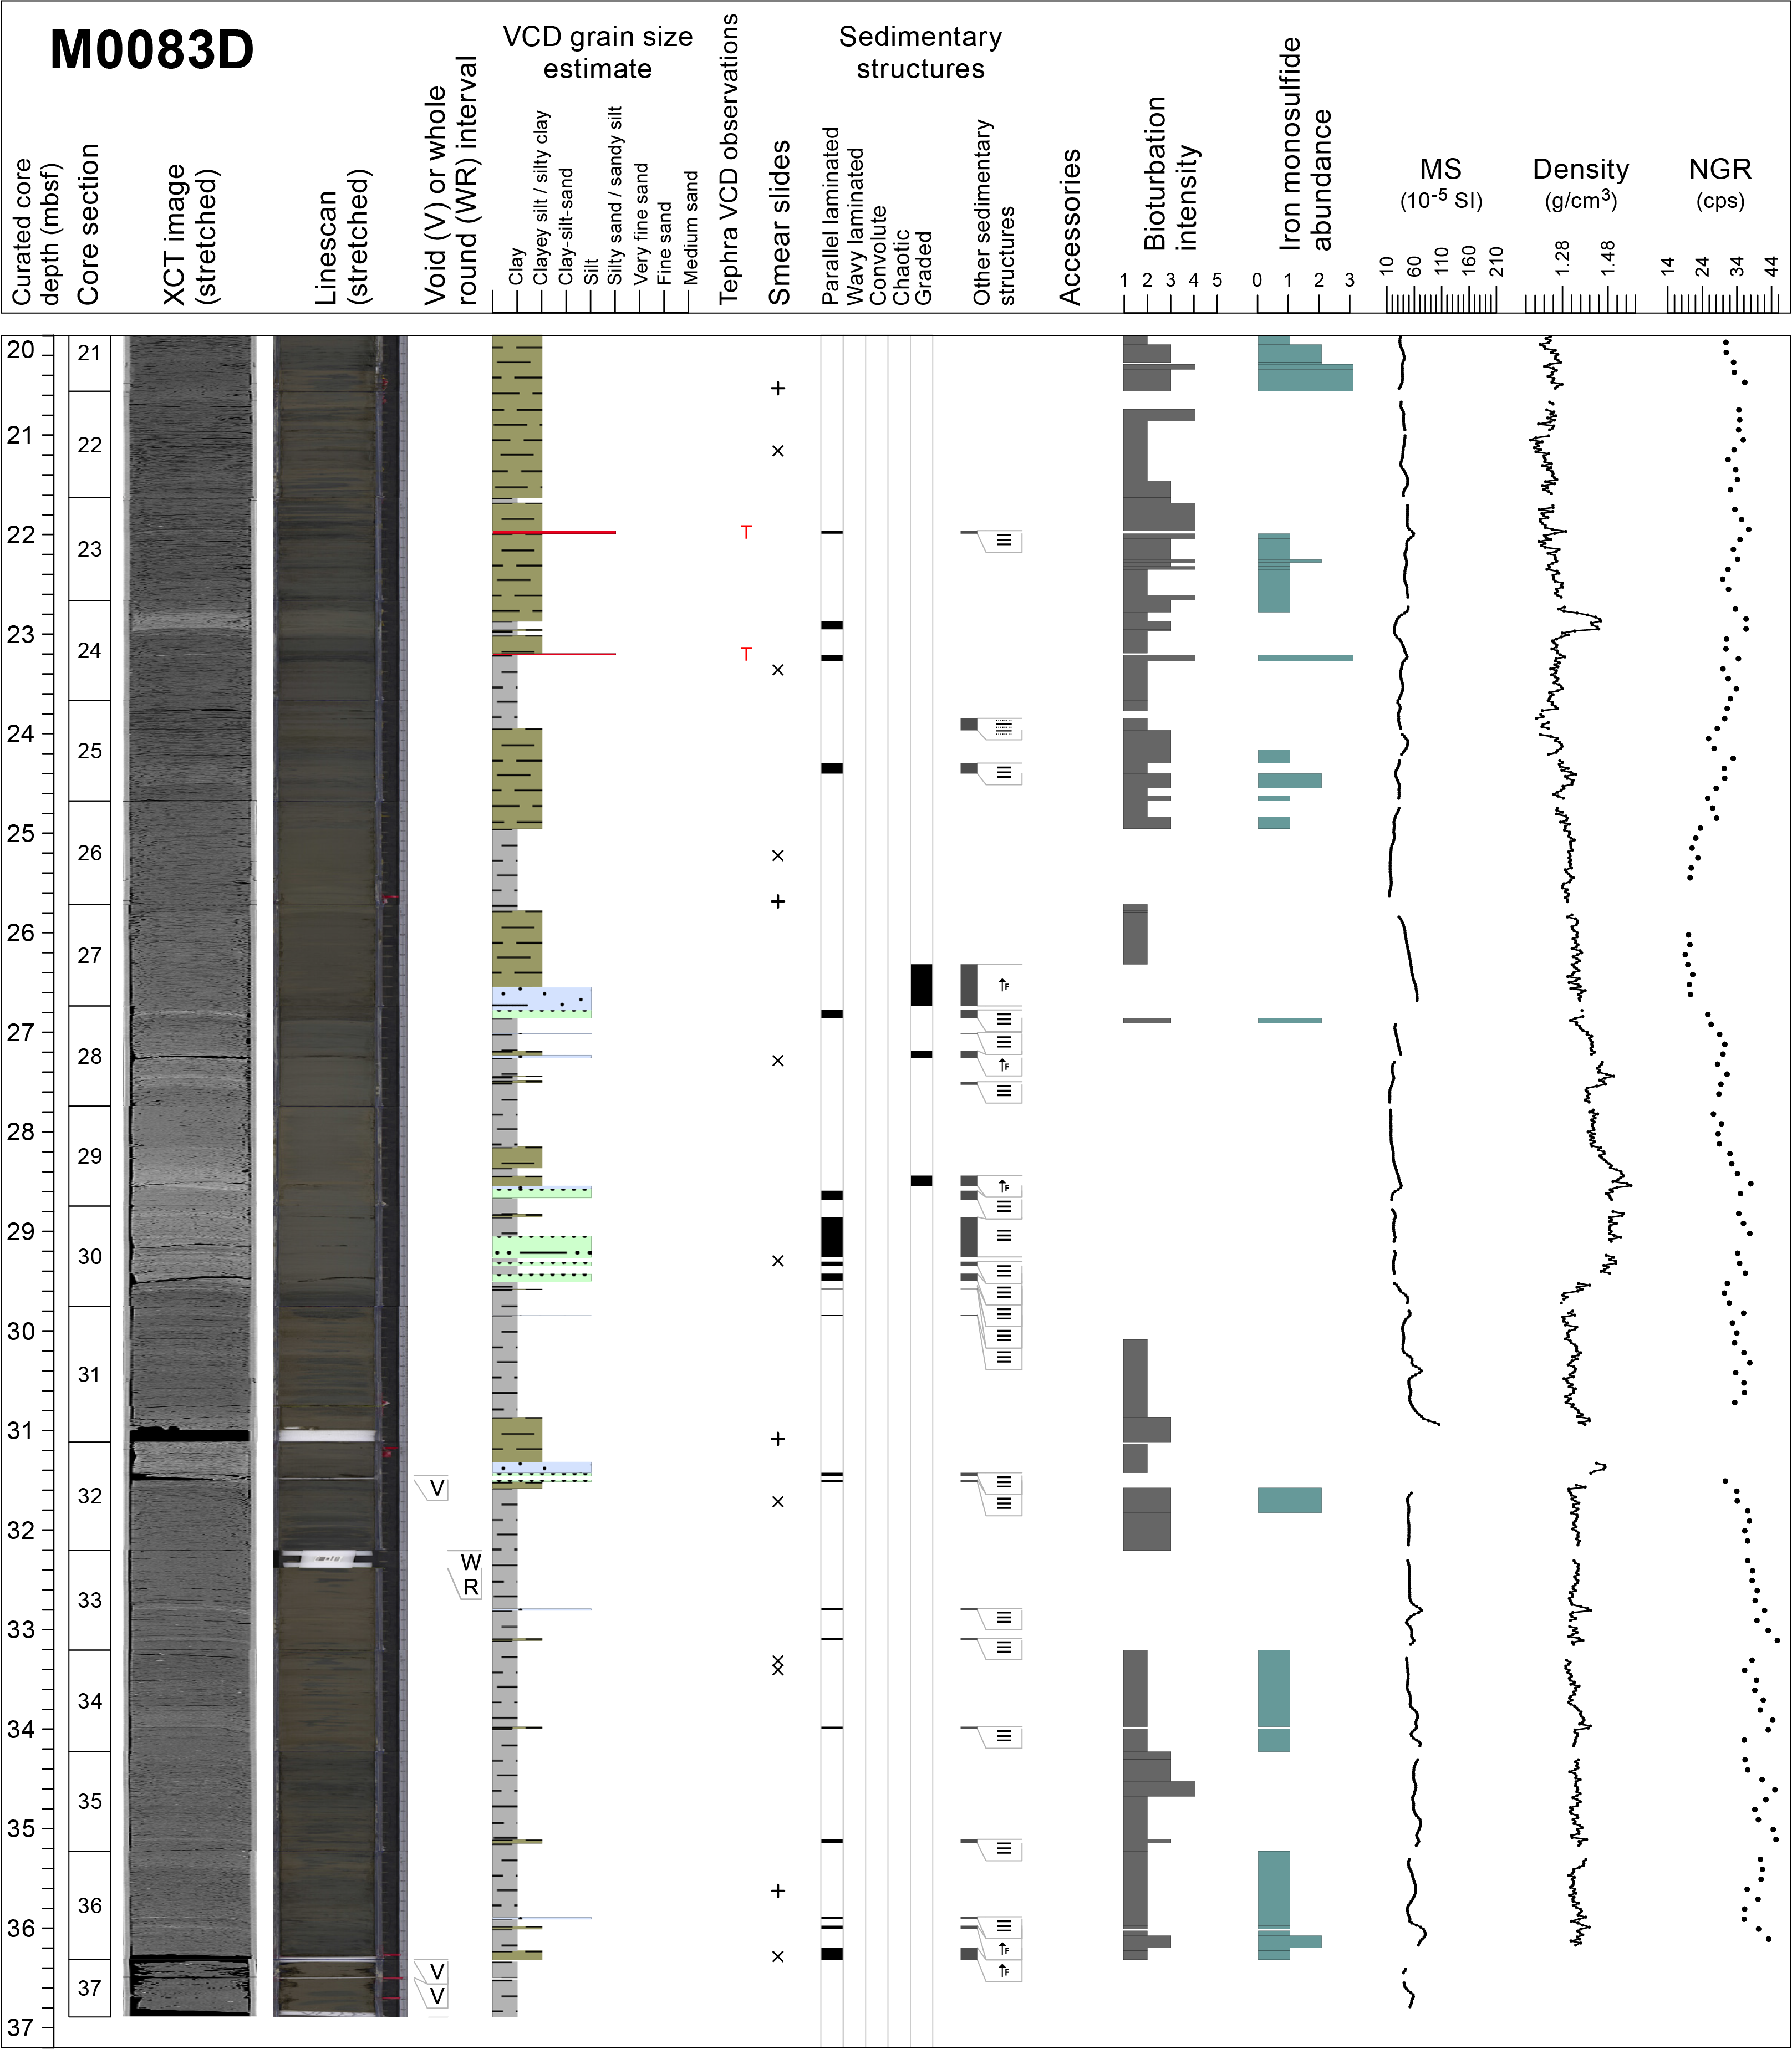
Figure F19. Lithostratigraphic summary, Holes M0083C and M0083D.
One smear slide describes the lithology as vitric-bearing lithogenic- and siliceous-rich silt (see Core descriptions; Figures F16, F20). Silt (68.8%) and clay (31.3%) are the major grain sizes. The main mineral components are clays with vitric grains and minor quartz. Diatoms dominate the biogenic component (31.3% of the total slide), and sponge spicules (15.6%) are present to a lesser extent.
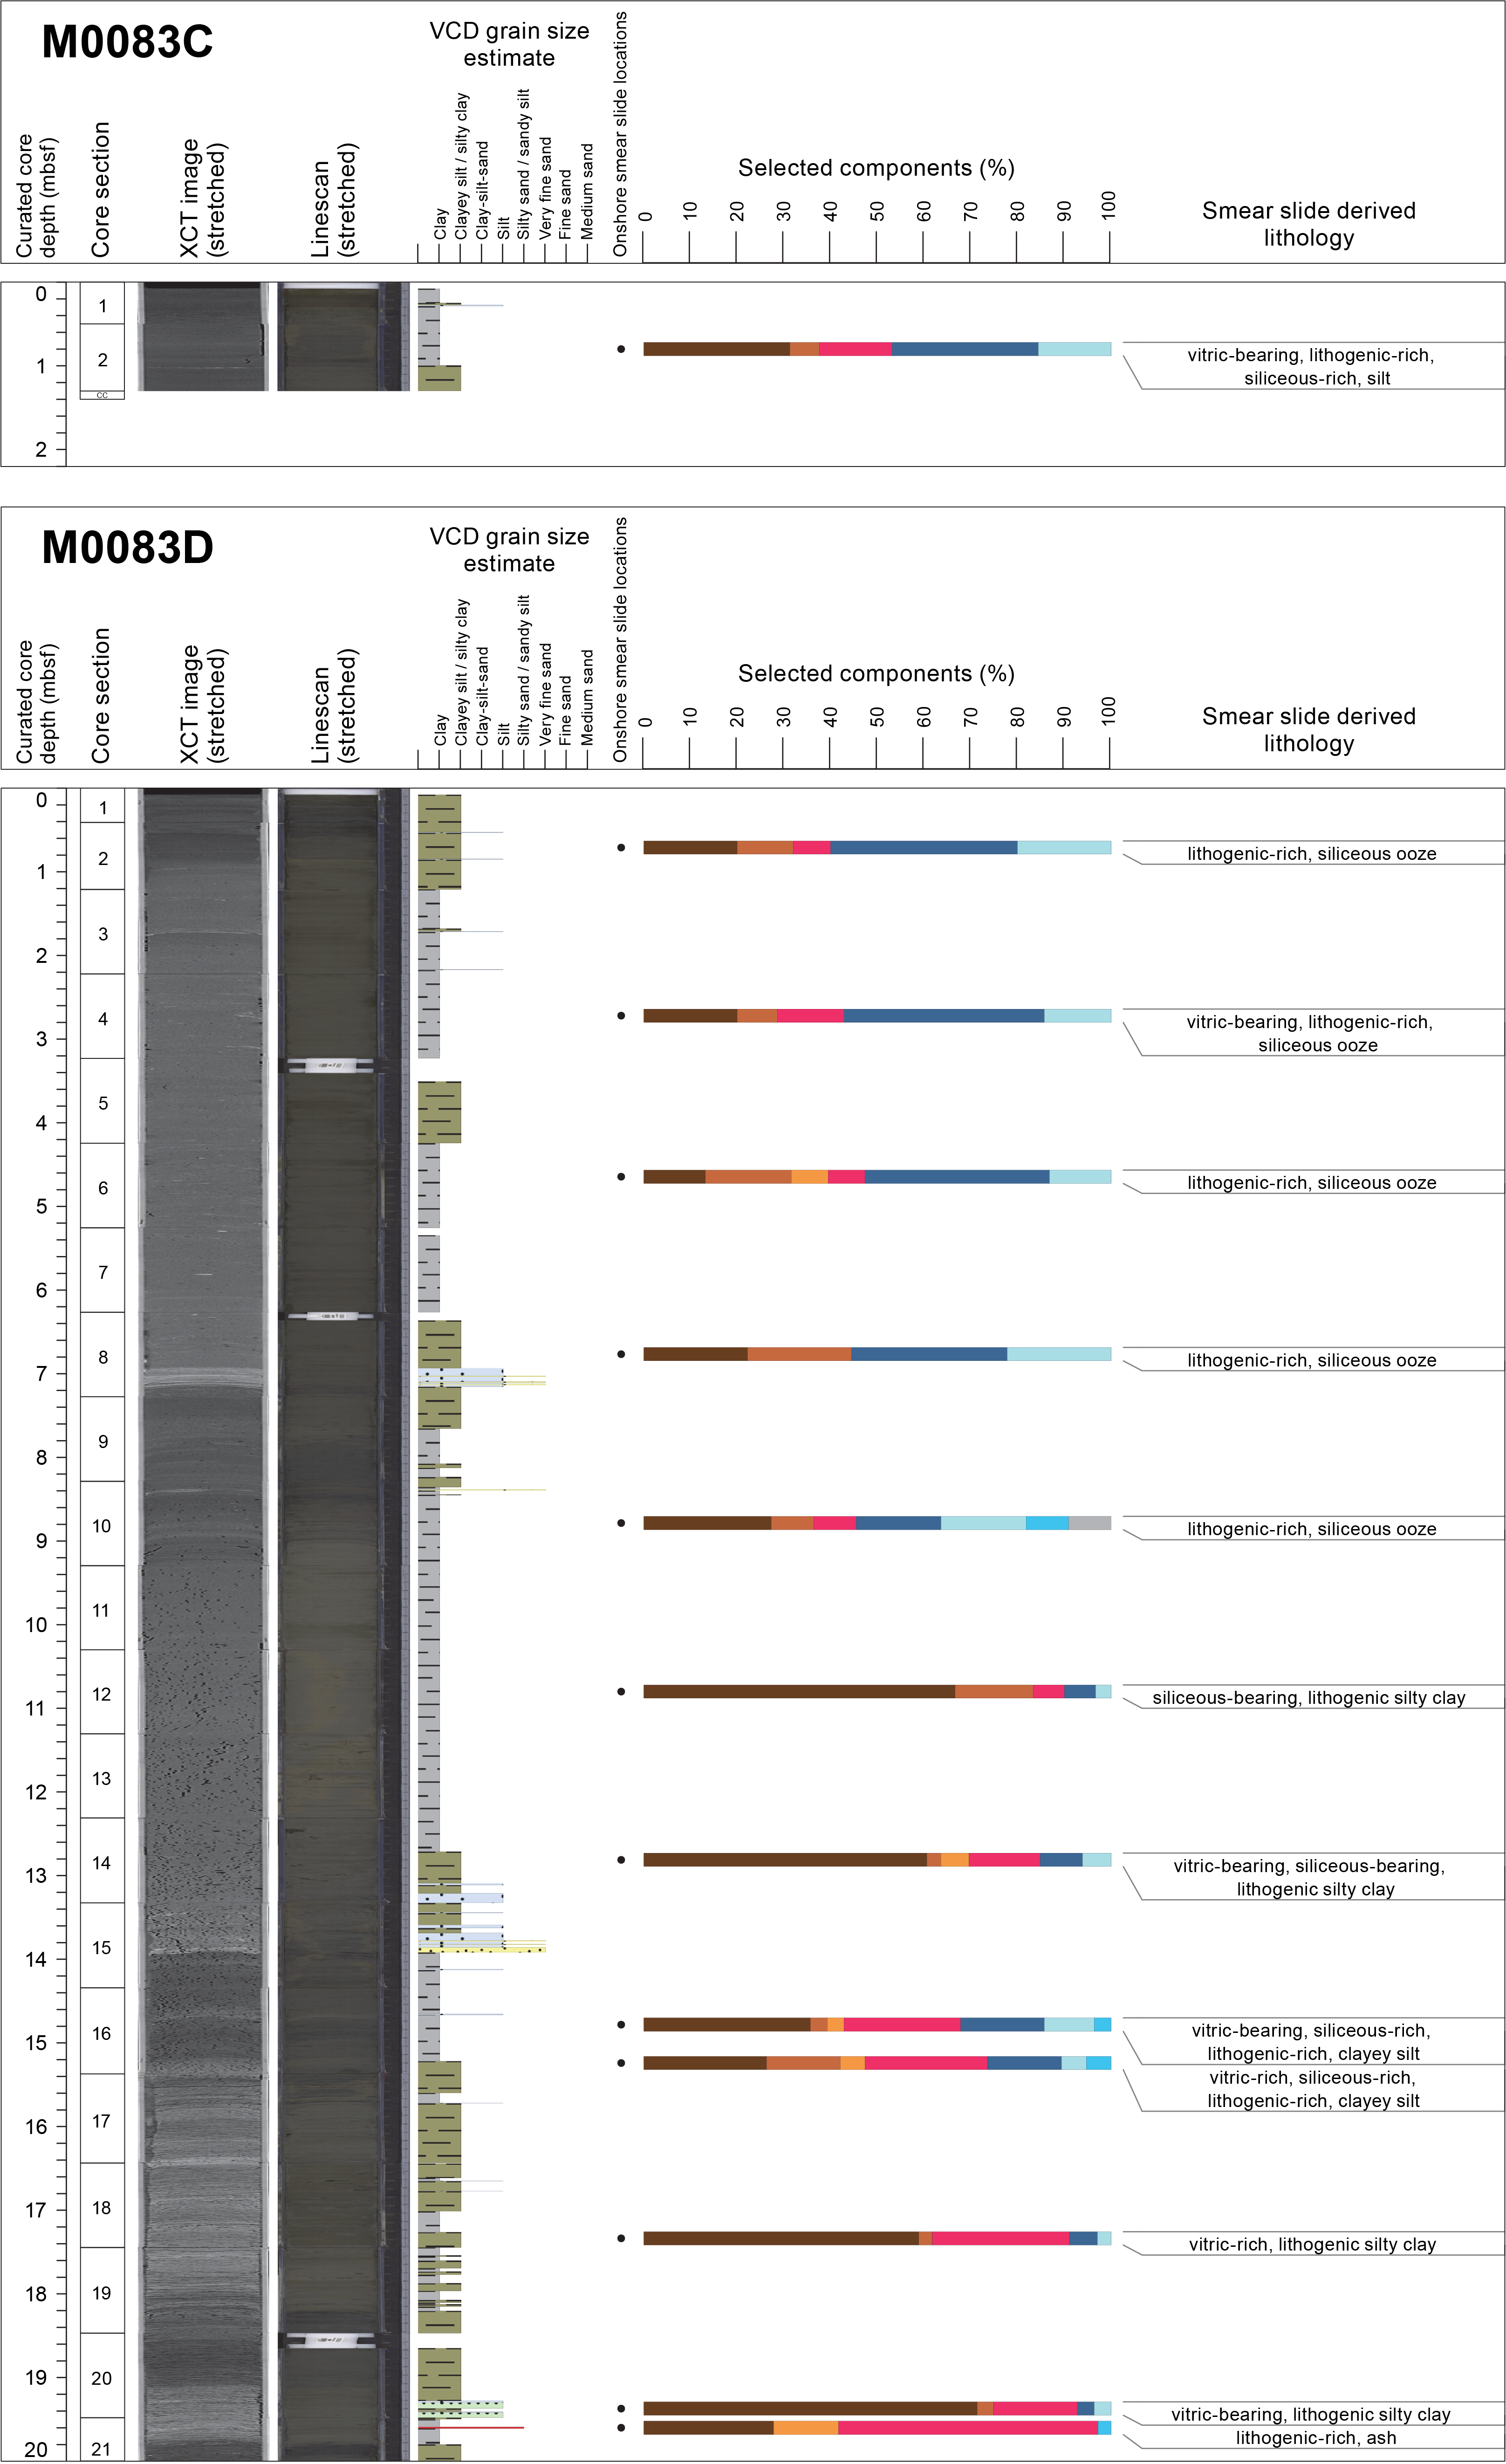

Figure F20. Smear slide summary, Holes M0083C and M0083D.
3.1.2.2. Hole M0083D
Hole M0083D is 36.89 m deep, and the lithology is dominated by clay, clayey silt, and silty clay with minor components of silt and very fine, fine, and medium sand (Figures F16, F19, F21).

Figure F21. Sedimentary structures and tephras.
Interval 1 (0–1.2 mbsf) has Type 1 features. It is composed of interbedded silty clay and clayey silt with several silt, sandy silt, and very fine sand laminae. Sparse to moderate bioturbation occurs in the upper 1 m. The X-ray CT scan images show little variability in density. Density and NGR show minor changes in variability, and magnetic susceptibility forms a nearly vertical profile with no apparent variability (see Physical properties), corresponding to the silty clay and clayey silt interval.
Interval 2 (1.2–7.2 mbsf) has Type 2 characteristics. It has a sharp basal contact with a 30 cm thick interval containing parallel laminated fine sand to silt laminae and a thin silt bed above that exhibits soft-sediment deformation. The sediment grades upward into a ~50 cm thick clayey silt or silty clay thin bed and a 4 m thick chaotic clay with dipping layers and floating silt clasts and patches. The upper part of the interval (1.2–2.3 mbsf) is structureless. Rare silt laminae occur near the top. The X-ray CT scan images show a marked density contrast associated with the coarser grained layer at the base of the interval that highlights the floating silt clasts and patches. Magnetic susceptibility, density, and NGR show little to no variation in the structureless interval (see Physical properties). This interval also lacks bioturbation.
Interval 3 (7.2–8.9 mbsf) is associated with the Type 1 lithology. It is composed of interbedded silty clay or clayey silt and clay. Bioturbation is sparse to moderate throughout the interval. The X-ray CT scan images and physical properties show minor variability.
Interval 4 (8.9–13.9 mbsf) exhibits characteristics similar to those described for Type 3. A sharp basal contact with fining-upward laminae composed of fine and very fine sand, silt, and clayey silt that grade upward into a structureless 4.5 m thick clay bed. The clay bed has slight bioturbation and mottling associated with the basal 1 m of the deposit but lacks bioturbation in the upper 3.5 m. A moderate to high density contrast is revealed by the X-ray CT scan images in association with the coarser grained interval, and bulk density, magnetic susceptibility, and NGR also increase in association with this interval. In the clay interval, the X-ray CT scan images and physical properties show little to no variability (see Physical properties).
Interval 5 (13.9–19.8 mbsf) is a good example of Type 4 lithology. The dominant lithology is silty clay and clayey silt interbedded with clay. Both lithologies contain laminae and parallel laminated intervals of very fine sand, sandy silt, and silt. Bioturbation is sparse to moderate and occurs near the top and bottom of the interval. Intervals without bioturbation at 15.6–16.5, 16.6–18.2, and 19.1–19.7 mbsf correspond to intervals of thin beds and laminae. The X-ray CT scan images show much variability in density, and bulk density and NGR also show pronounced increases and decreases corresponding to thickly laminated intervals (see Physical properties). The X-ray CT scan images show greater increases in density, bulk density, and NGR near the base (19.0–19.8 mbsf) that can be correlated with very fine sand and silt laminae and thin beds. This interval also contains a tephra layer, which likely also contributes to the gamma-density signal. In contrast, the magnetic susceptibility signal has a nearly vertical profile with little variability. A tephra interval is present near the base (386-M0083D-1H-21, 11.2–12.5 cm) (see Tephra).
Interval 6 (19.8–26.8 mbsf) exhibits characteristics similar to other Type 1 intervals previously described. The main lithology is clayey silt–silty clay interbedded with clay. It is sparsely to heavily bioturbated but contains a few intervals without primary structures that correspond to the silty clay and are sparsely bioturbated. The X-ray CT scans and physical properties show moderate variability except for an increase in their signal related to a tephra layer at ~23–23.2 mbsf.
Interval 7 (26.8–31.6 mbsf) is associated with Type 4. It contains a wide range of lithologies and primary structures (clay, silty clay and clayey silt, silt, sandy silt, and very fine sand) that are interbedded, forming laminae, parallel laminae sets, and beds <50 cm thick. Where the interbedding is thicker and coarser grained (mostly silt) near the top (26.8–30 mbsf), this interval lacks bioturbation. It is only sparsely bioturbated in the lower 1.4 m. The X-ray CT scan images show great variability due to high-density contrasts within the heavily laminated intervals, and the physical properties show pronounced increases and decreases.
Interval 8 (31.6–36.8 mbsf) is associated with Type 1. It is composed of clay interbedded with rare laminae of very fine sand, silt, and clayey silt and is sparsely bioturbated. The X-ray CT scan images show moderate variability, as do the density and NGR signals. Magnetic susceptibility shows less variability because the lithology is composed of clay that contains several very fine sand, silt, and clayey silt laminae.
A total of 21 smear slides were studied for Hole M0083D (see Core descriptions; Figures F16, F20). The main lithologies are lithogenic-rich siliceous ooze, vitric-bearing lithogenic-rich siliceous ooze, siliceous-bearing lithogenic silty clay, vitric-bearing lithogenic silty clay, vitric-rich lithogenic silty clay, and lithogenic-rich ash. The grain size, in decreasing abundance, is clayey silt, silty clay, and silt with minor sand. Clays (up to 71.4%) are the most abundant mineral component, followed by quartz (up to 57.7%) and minor feldspars and pyrite. Vitric grains are quite abundant and are present in most studied smear slides (up to 56.6% in some slides). Diatoms are the most abundant biogenic component (up to 41.7%), and sponge spicules (up to 21.8%) are present to a lesser extent. Radiolaria form a minor component, and most other microfossil groups studied were not present in smear slides from Hole M0083D.
3.1.3. Holes M0083E and M0083F
3.1.3.1. Hole M0083E
Hole M0083E is 0.92 m deep. The upper 10 cm are void space. The upper 30 cm of sediment is composed of structureless, homogeneous clay lacking bioturbation, with a thin silty clay bed at 32–34 cm below seafloor. Heavy bioturbation is apparent in the lower 40 cm. The X-ray CT scan shows no apparent density changes. Magnetic susceptibility and bulk density increase in correlation with a silty clay bed at 32–34 cm below seafloor. The general trend of these two physical properties is an increase with depth. All of Hole M0083E has characteristics similar to those described for Type 1.
One smear slide was described for Hole M0083E. The sediment is composed of siliceous-rich lithogenic clayey silt. Silt (53.2%) is the most abundant grain size, followed by clay (42.6%) and sand (4.3%). The most abundant lithogenic components are clay (42.6%) minerals, quartz (10.6%), and feldspar (2.1%). Vitric grains are a small component (2.1%). The biogenic components, in decreasing abundance, are diatoms (21.3%), sponge spicules (10.6%), and silicoflagellates (10.6%) (Figure F16, F22; see smear slide table in Core descriptions).
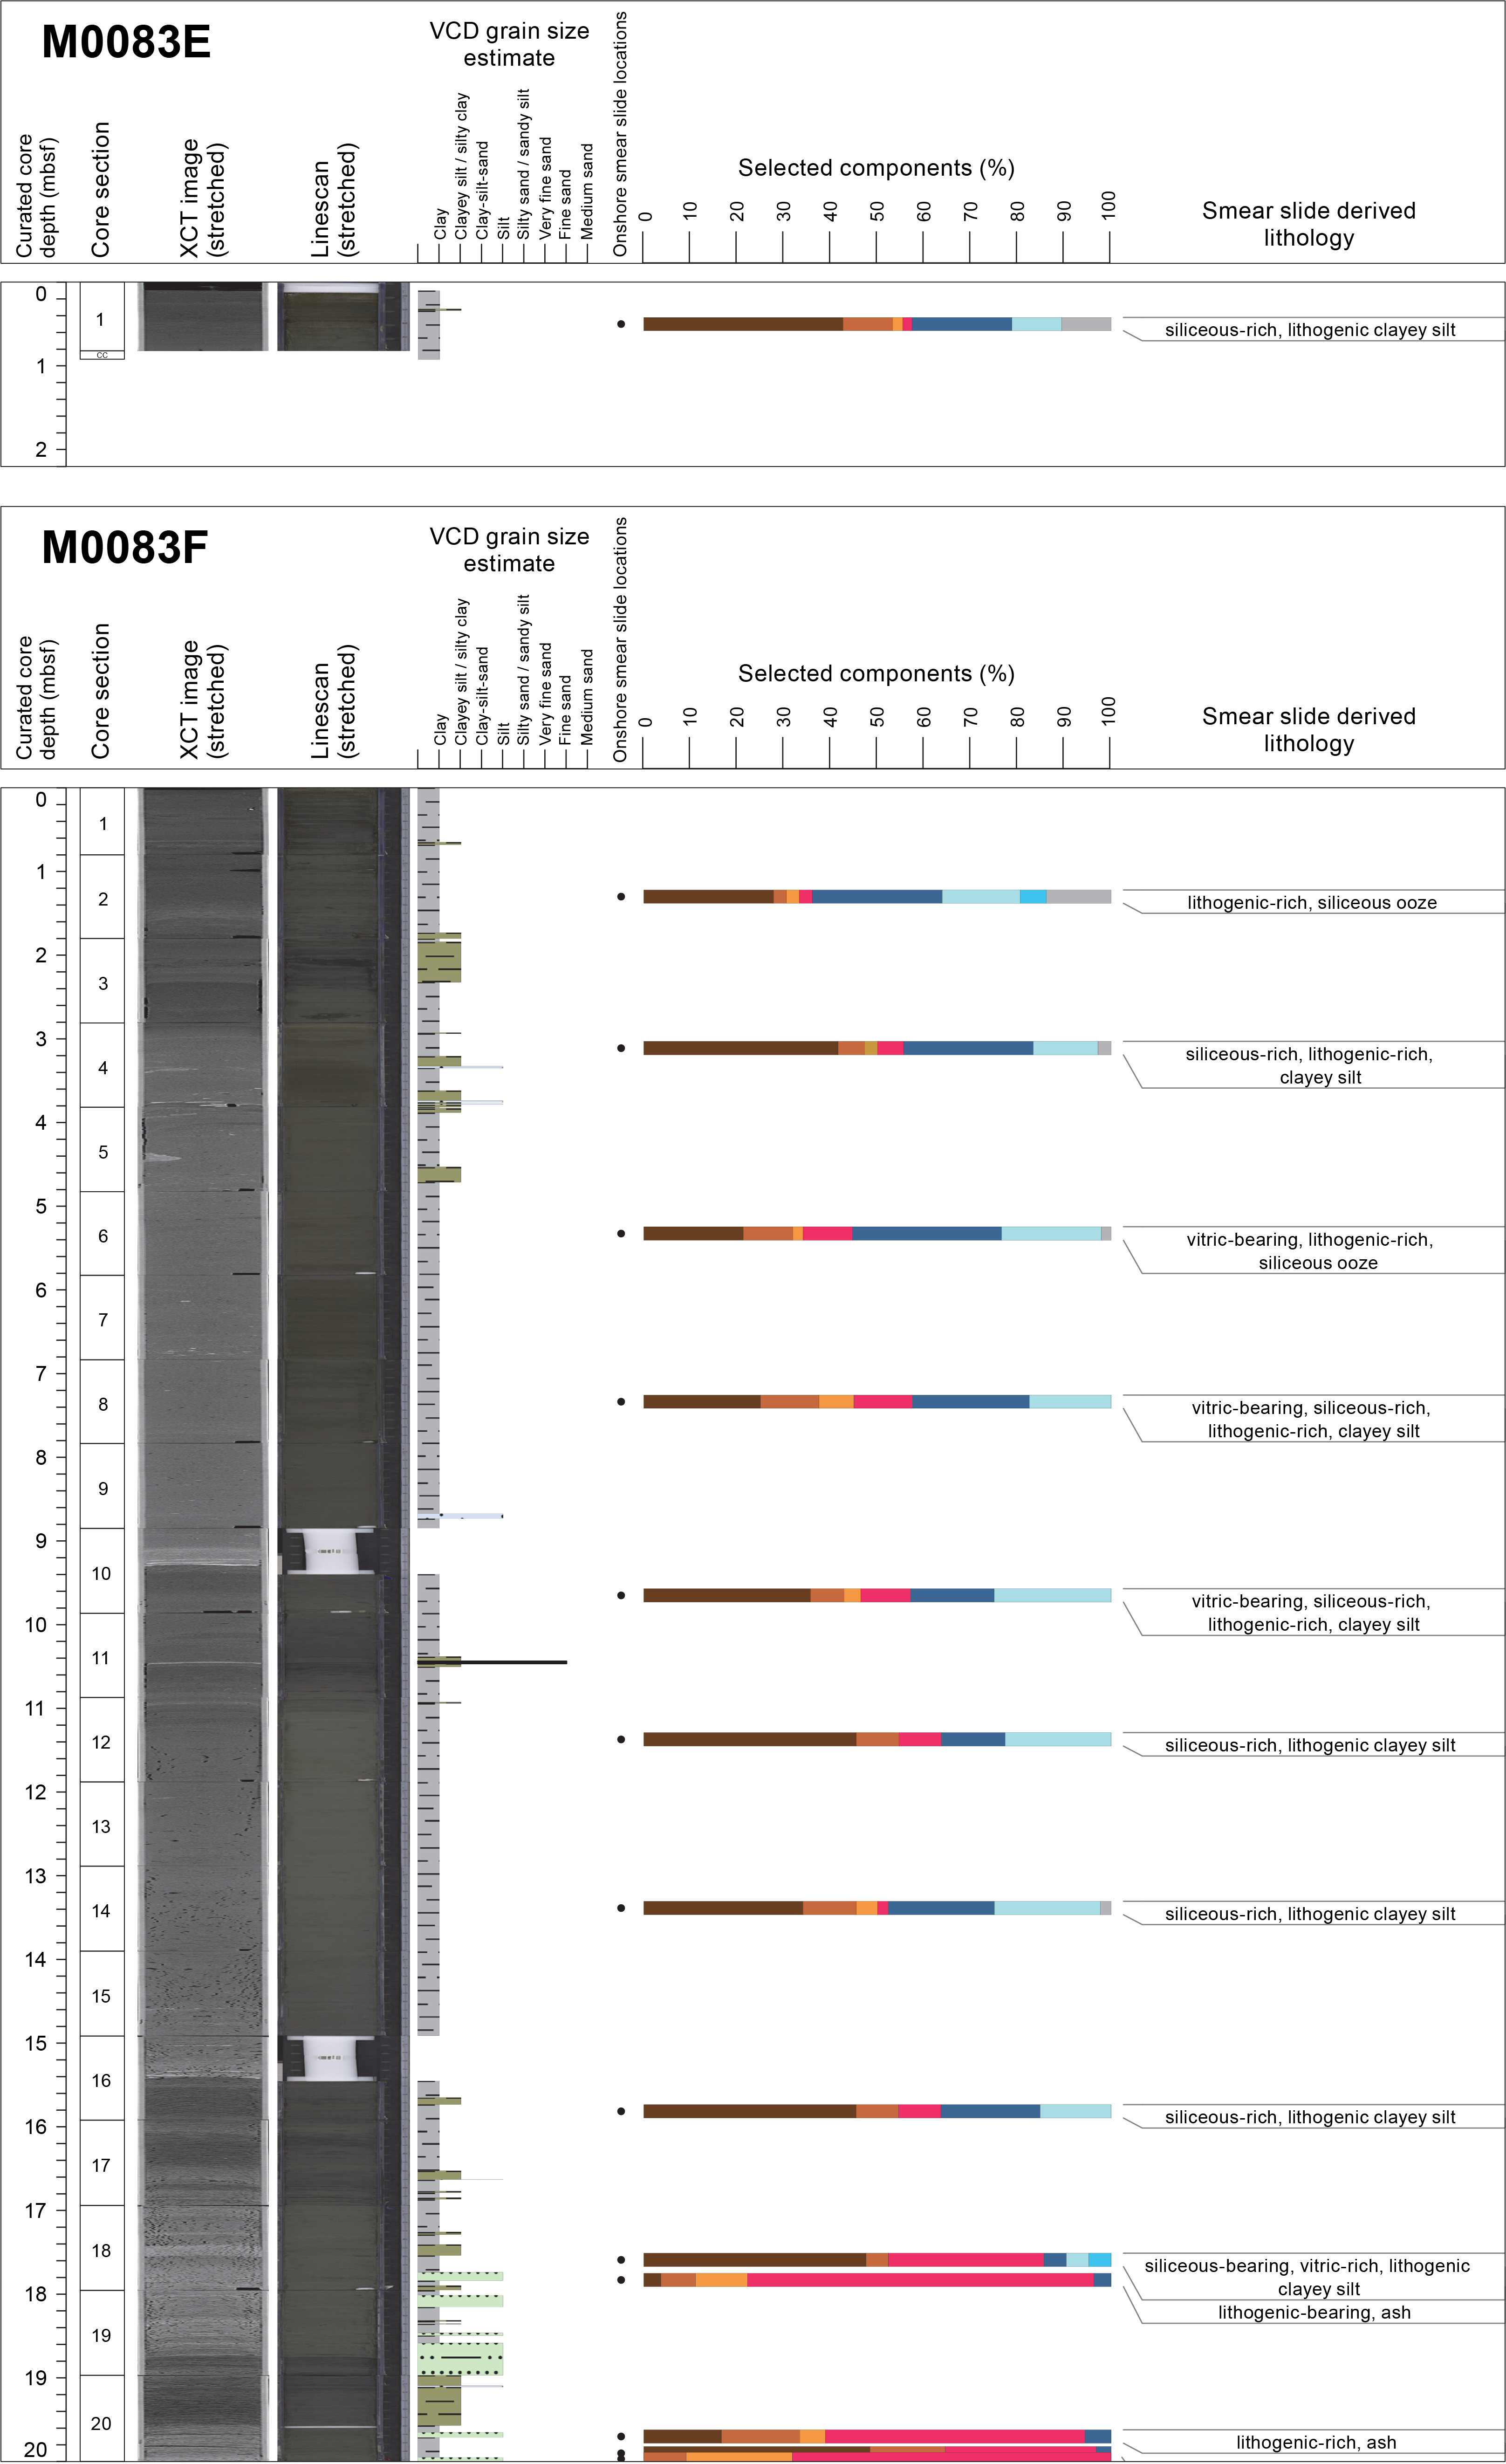
Figure F22. Smear slide summary, Holes M0083E and M0083F.
3.1.3.2. Hole M0083F
Hole M0083F is 36.6 m deep, and the lithology is dominated by clay and silty clay–clayey silt with minor components of silt and very fine, fine, and medium sand. The lithology of Hole M0083F has characteristics of Types 1–4. The order of the intervals defined in Hole M0083F corresponds with Holes M0083B and M0083D.
Interval 1 (0–2.4 mbsf) is composed of interbedded clay and clayey silt–silty clay intervals up to 50 cm thick. Sparse clayey silt laminae are present. It is typical of Type 1 lithology. From 0 to 2.40 cm below seafloor, the sediment is sparsely to moderately bioturbated. The X-ray CT scan images show density contrasts that highlight parallel laminated intervals and what appears to be floating clay clasts associated with these intervals, but more studies are needed to evaluate this. The physical properties show slight increases and decreases, especially density and NGR, whereas the magnetic susceptibility profile is nearly vertical (see Physical properties). This lack of increase or decrease in the signal corresponds to the clay and clayey silt lithologies.
Interval 2 (2.4–9.40 mbsf) is associated with Type 2 lithology. From the base upward, this interval has a sharp erosional basal contact. The section between 7.80 and 9.40 mbsf is not present because it was removed as a whole-round sample, but information was obtained from the X-ray CT scan images and physical properties. The X-ray CT scan images reveal a very high density contrast above the basal contact. The contrast variability between high and low reveals three beds ~1 cm thick. The sediment above is composed of chaotic clay with horizontally elongated and subrounded floating silt clasts. Dipping beds, recumbent and drag folds, and centimeter-long silt patches are present between 3 and 5 mbsf. All are evidence of soft-sediment deformation. Interval 2 also lacks bioturbation. All three physical properties show increases correlating with the high-density X-ray CT signal (see Physical properties). There is no variability (nearly vertical, smooth profiles) in their signals within the clay interval.
Interval 3 (9.40–11 mbsf) has the characteristics of Type 1 lithology. The main lithology is composed of clay that contains a thin bed of silty clay ~10 cm thick and a medium sand lamina. It is sparsely bioturbated. The X-ray CT scan shows moderate contrast associated with the sand and silty clay layers, and magnetic susceptibility and density show a corresponding increase in this interval.
Interval 4 (11–15.40 mbsf) is typical of Type 3. The lithology for the lower part (14.90–15.40 mbsf) is not present (removed as a whole-round sample). Nevertheless, the X-ray CT scan images reveal an interval of very high to low density contrast with two laminae above a sharp basal contact and two thin beds above. The laminae above the base show the highest density contrast. The beds above are ~2 cm thick and display high density contrast, although it is a lower contrast than the laminae. The clay interval above (14.90–14.0 mbsf) shows millimeter-sized mottling. The remaining 3 m are structureless and lack bioturbation. Magnetic susceptibility, bulk density, and NGR from 14.90 to 15.40 mbsf show pronounced increases (see Physical properties), suggesting that sand and possibly silt, silty clay, or clayey silt are present. For the clay interval above, magnetic susceptibility, density, and NGR signals have nearly vertical profiles without apparent increases or decreases.
Interval 5 (15.40–20.10 mbsf) is associated with Type 4 lithology with thickly interbedded thin beds and laminae of clay, silty clay–clayey silt, silt, and sandy silt. The closely spaced stacking of the layers is also revealed by the very high to low density contrasts of the X-ray CT scan images. Bioturbation is absent where the stacking is closely spaced (16.80–18.7 mbsf). The sections above and below are sparsely to moderately bioturbated. The beds and laminae form sets of parallel structures. The most pronounced physical property is density, which shows a marked decrease in a silty clay interval and a high increase where the bed stacking is closely spaced. NGR and magnetic susceptibility show little and no variability in their signals, respectively (see Physical properties).
Interval 6 (20.10–25.40 mbsf) sediments are mainly composed of clayey silt and silty clay with rare thin beds of clay and silt, sandy silt, and fine sand laminae. The interval displays sparse to abundant bioturbation. The X-ray CT scan image shows high density contrast in association with the silt, sandy silt, and sand laminae. The gamma-density and NGR signals show great variability that can be related to the thin beds and laminae, but magnetic susceptibility commonly correlates with sandy lithologies that are not present in this interval. This interval is typical of Type 1 lithology.
Interval 7 (25.40–30.40 mbsf) is composed of closely spaced interbeds of silt; silty clay; clayey silt; clay; and medium, fine, very fine sand and silt and clayey silt. It is typical of a Type 4 lithology. The bioturbation is sparse to moderate from 28.7 to 29.7 mbsf, where the density of the bedding and laminae is lower. In contrast, where the beds and laminae are closely spaced (25.43–28.7 mbsf), bioturbation is lacking. The high to low density contrasts of the X-ray CT scan images are also typical of Type 4. The magnetic susceptibility signal is high in association with the sandy laminae near the base of the interval. In contrast, density and NGR exhibit strong variability (see Physical properties).
Interval 8 (30.40–36.6 mbsf) is composed of silty clay and clayey silt interbedded with clay beds (<1 m thick) and laminae. The laminae are of fine sand, sandy silt, and silt, and they are sparse. The interval displays sparse to abundant bioturbation. The X-ray CT scan shows a moderate density contrast between high and low, and the physical properties show slight increases and decreases in their signals. The interval is composed of silty clay and clayey silt, but they are only sparsely laminated, which could be the reason for the moderate variability in the physical properties signal. This section is typical of Type 1 lithology.
A total of 22 smear slides were studied for Hole M0083F. The main lithologies are lithologic-rich siliceous ooze, siliceous-rich lithogenic clayey silt, vitric-bearing lithogenic-rich siliceous ooze, vitric-bearing siliceous- and lithogenic-rich clayey silt, siliceous-bearing vitric-rich lithogenic clayey silt, lithogenic-rich ash, vitric-bearing siliceous-rich clayey silt, and lithogenic-bearing ash (see smear slide table in Core descriptions). Clayey silt followed by silty clay and silt are the most abundant components (Figures F16, F17, F22). From the mineral components, clay minerals, quartz, and feldspar occur in decreasing concentrations. Vitric grains are quite common. Diatoms and sponge spicules are important components, and radiolaria and silicoflagellates are minor components.
3.1.4. Holes M0089A and M0089B
3.1.4.1. Hole M0089A
Hole M0089A is 1.43 m deep and composed of clay with silty clay beds in the upper and lower 2 cm of the hole. A sandy silt lamina is also present at 1.43 mbsf. The sediment is sparsely and heavily bioturbated except for at 0.6–1.1 mbsf, as highlighted on the linescan images (see Core descriptions; see LINESCAN in Supplementary material). The X-ray CT scan images show moderate density changes, and magnetic susceptibility and density show pronounced increases and decreases that do not correspond with each other (see Physical properties). The peaks in magnetic susceptibility in the upper 30 and lower 10 cm of the core correlate with a silty clay bed and sandy silt laminae, respectively. The interval in between is bioturbated clay. It is not clear why magnetic susceptibility changes in this interval. The decrease in the density signal below 30 cm below seafloor is related to a muddy and bioturbated interval. The sediments in Hole M0089A are similar to those described for the Type 1 lithology (Figure F23).

Figure F23. Lithostratigraphic summary, Holes M0089A and M0089B.
Smear slides show that the sediment in Hole M0089A is composed of lithogenic-rich siliceous ooze (Table T4; Figure F24). Silt is the most abundant component (67%), followed by clay (28.3%) and sand (3.8%) (Figure F25). Clay minerals (28.3%) are the most abundant mineral component, followed by quartz (3.4%) and feldspar (1.9%). Vitric grains form 9.4% of the slide. The biogenic sediment is composed of diatoms (28.3%), sponge spicules (18.9%), and silicoflagellates (3.8%).

Figure F24. Smear slide summary, Holes M0089A and M0089B.
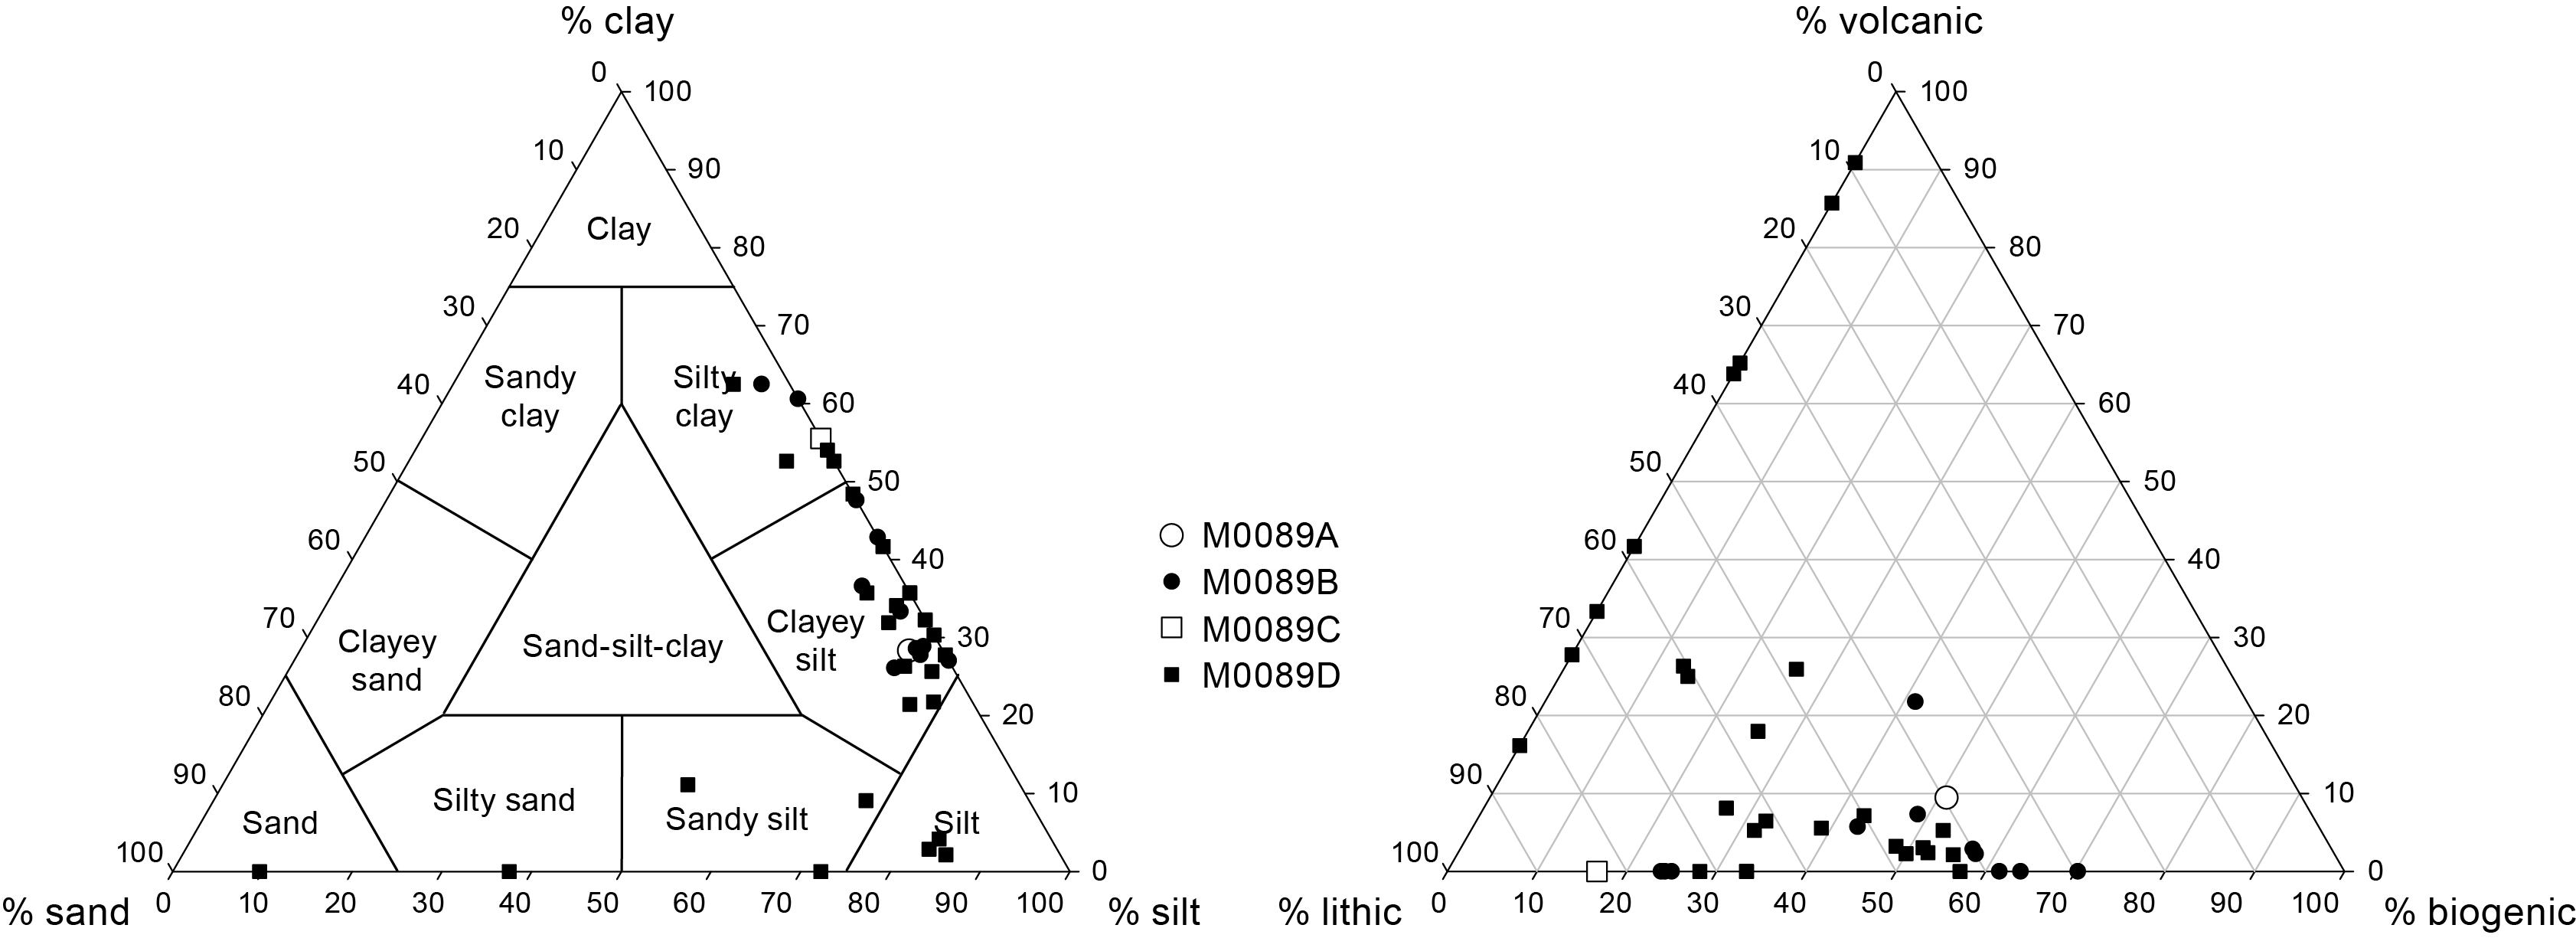
Figure F25. Ternary diagrams of major components and grain size, Site M0089.
3.1.4.2. Hole M0089B
Hole M0089B is 18 m deep and, like Site M0083, is divided into intervals with characteristics similar to Lithology Types 1, 2, and 4. The Type 3 structureless thick clay intervals without bioturbation do not appear to be present (Figures F21, F23).
Interval 1 (0–4.5 mbsf) is composed of clay interbedded with silty clay and silty clay, clayey silt, and silt laminae. The beds and laminae are closely spaced, as shown on the high density contrast of the X-ray CT scan images. Bioturbation intensity ranges from sparse to heavy. The density signal has a pronounced increase in between 3.5 and 4.5 mbsf that corresponds to a thickly laminated interval. In contrast, the magnetic susceptibility signal is not strong in this interval, likely because of the silty clay and clayey silt laminae and the absence of sand. This interval is associated with lithology Type 4.
Interval 2 (4.5–10.9 mbsf) is composed of clay with four thin beds of clayey silt and a few laminae of sandy silt and very fine sand laminae. The beds and laminae display spacing of 1 m or more. Except for three locations with high density contrasts at ~5.5, 8.5, and 10.25 mbsf, the X-ray CT scan images show low contrast. This interval is bioturbated throughout, ranging from sparse to abundant. Pronounced increases in density correlate to intervals where thin beds and laminae are present. NGR shows a pronounced increase consistent with density and the X-ray CT scan image at 5.5 mbsf, but elsewhere shows little variability. The magnetic susceptibility profile shows little variability throughout. The lithology and its stacking shows characteristics of Type 1 lithology.
Interval 3 (10.9–14.0 mbsf) comprises closely spaced interbedded clay, silty clay, silt beds (~0.5 to 0.75 m thick), and laminae. Laminae are abundant and composed of silty clay, clayey silt, silt, and very fine sand. Bioturbation is sparse to moderate except from 10.9 to 11 mbsf, where there is none. High density variability is noted in the X-ray CT scan images at 11–12 and 13.5–14 mbsf. These high density contrasts correspond closely with increases in the bulk density signal. NGR increases from 11 to 12 mbsf where the sediment is finer grained, but not in between 13.5 and 14 mbsf where the interval is sandier. In contrast, the magnetic susceptibility signal is more pronounced in the sand interval from 13.5 to 14 mbsf. The pronounced signals in the X-ray CT scan images and for the physical properties (see Physical properties), as well as the thick interbedding of lithologies, suggests that this interval is associated with Type 4 lithology.
Interval 4 (14.0–18.0 mbsf) is composed of silty clay with a silt and clayey silt laminae near the top and base of the interval. The silty clay is sparsely to moderately bioturbated. Neither the X-ray CT scan images nor the physical properties show density contrasts or variability. This section fits closely with attributes of Type 1 lithology.
A total of 11 smear slides were described for Hole M0089B (Figure F24). The lithology was classified as lithogenic-rich siliceous ooze, vitric-bearing lithogenic- and siliceous-rich clayey silt, lithogenic-rich siliceous ooze with calcareous nannofossils, lithogenic- and siliceous-rich clayey silt, siliceous-rich lithogenic clayey silt, and siliceous-bearing lithogenic silty clay or silty clay (Table T4). The sediments are dominated by clayey silt followed by silty clay (Figure F25). Volcanics (21.7%) are present in Sample 386-M0089B-1H-3, 6 cm. The biogenic components are dominated by diatoms, followed by sponge spicules and to a minor extent radiolaria, silicoflagellates, and calcareous nannofossils.
3.1.5. Holes M0089C and M0089D
3.1.5.1. Hole M0089C
The trigger core from Hole M0089C is 0.70 mbsf long, but the upper 10 cm are void space. The lithology is composed of clay (upper 15 cm) and clayey silt or silty clay. Bioturbation is sparse to abundant. Magnetic susceptibility and density show increases corresponding with depth in the core and a more competent lithology. The X-ray CT scan shows no change in density or variability. This section is consistent with lithology Type 1 (Figure F26).
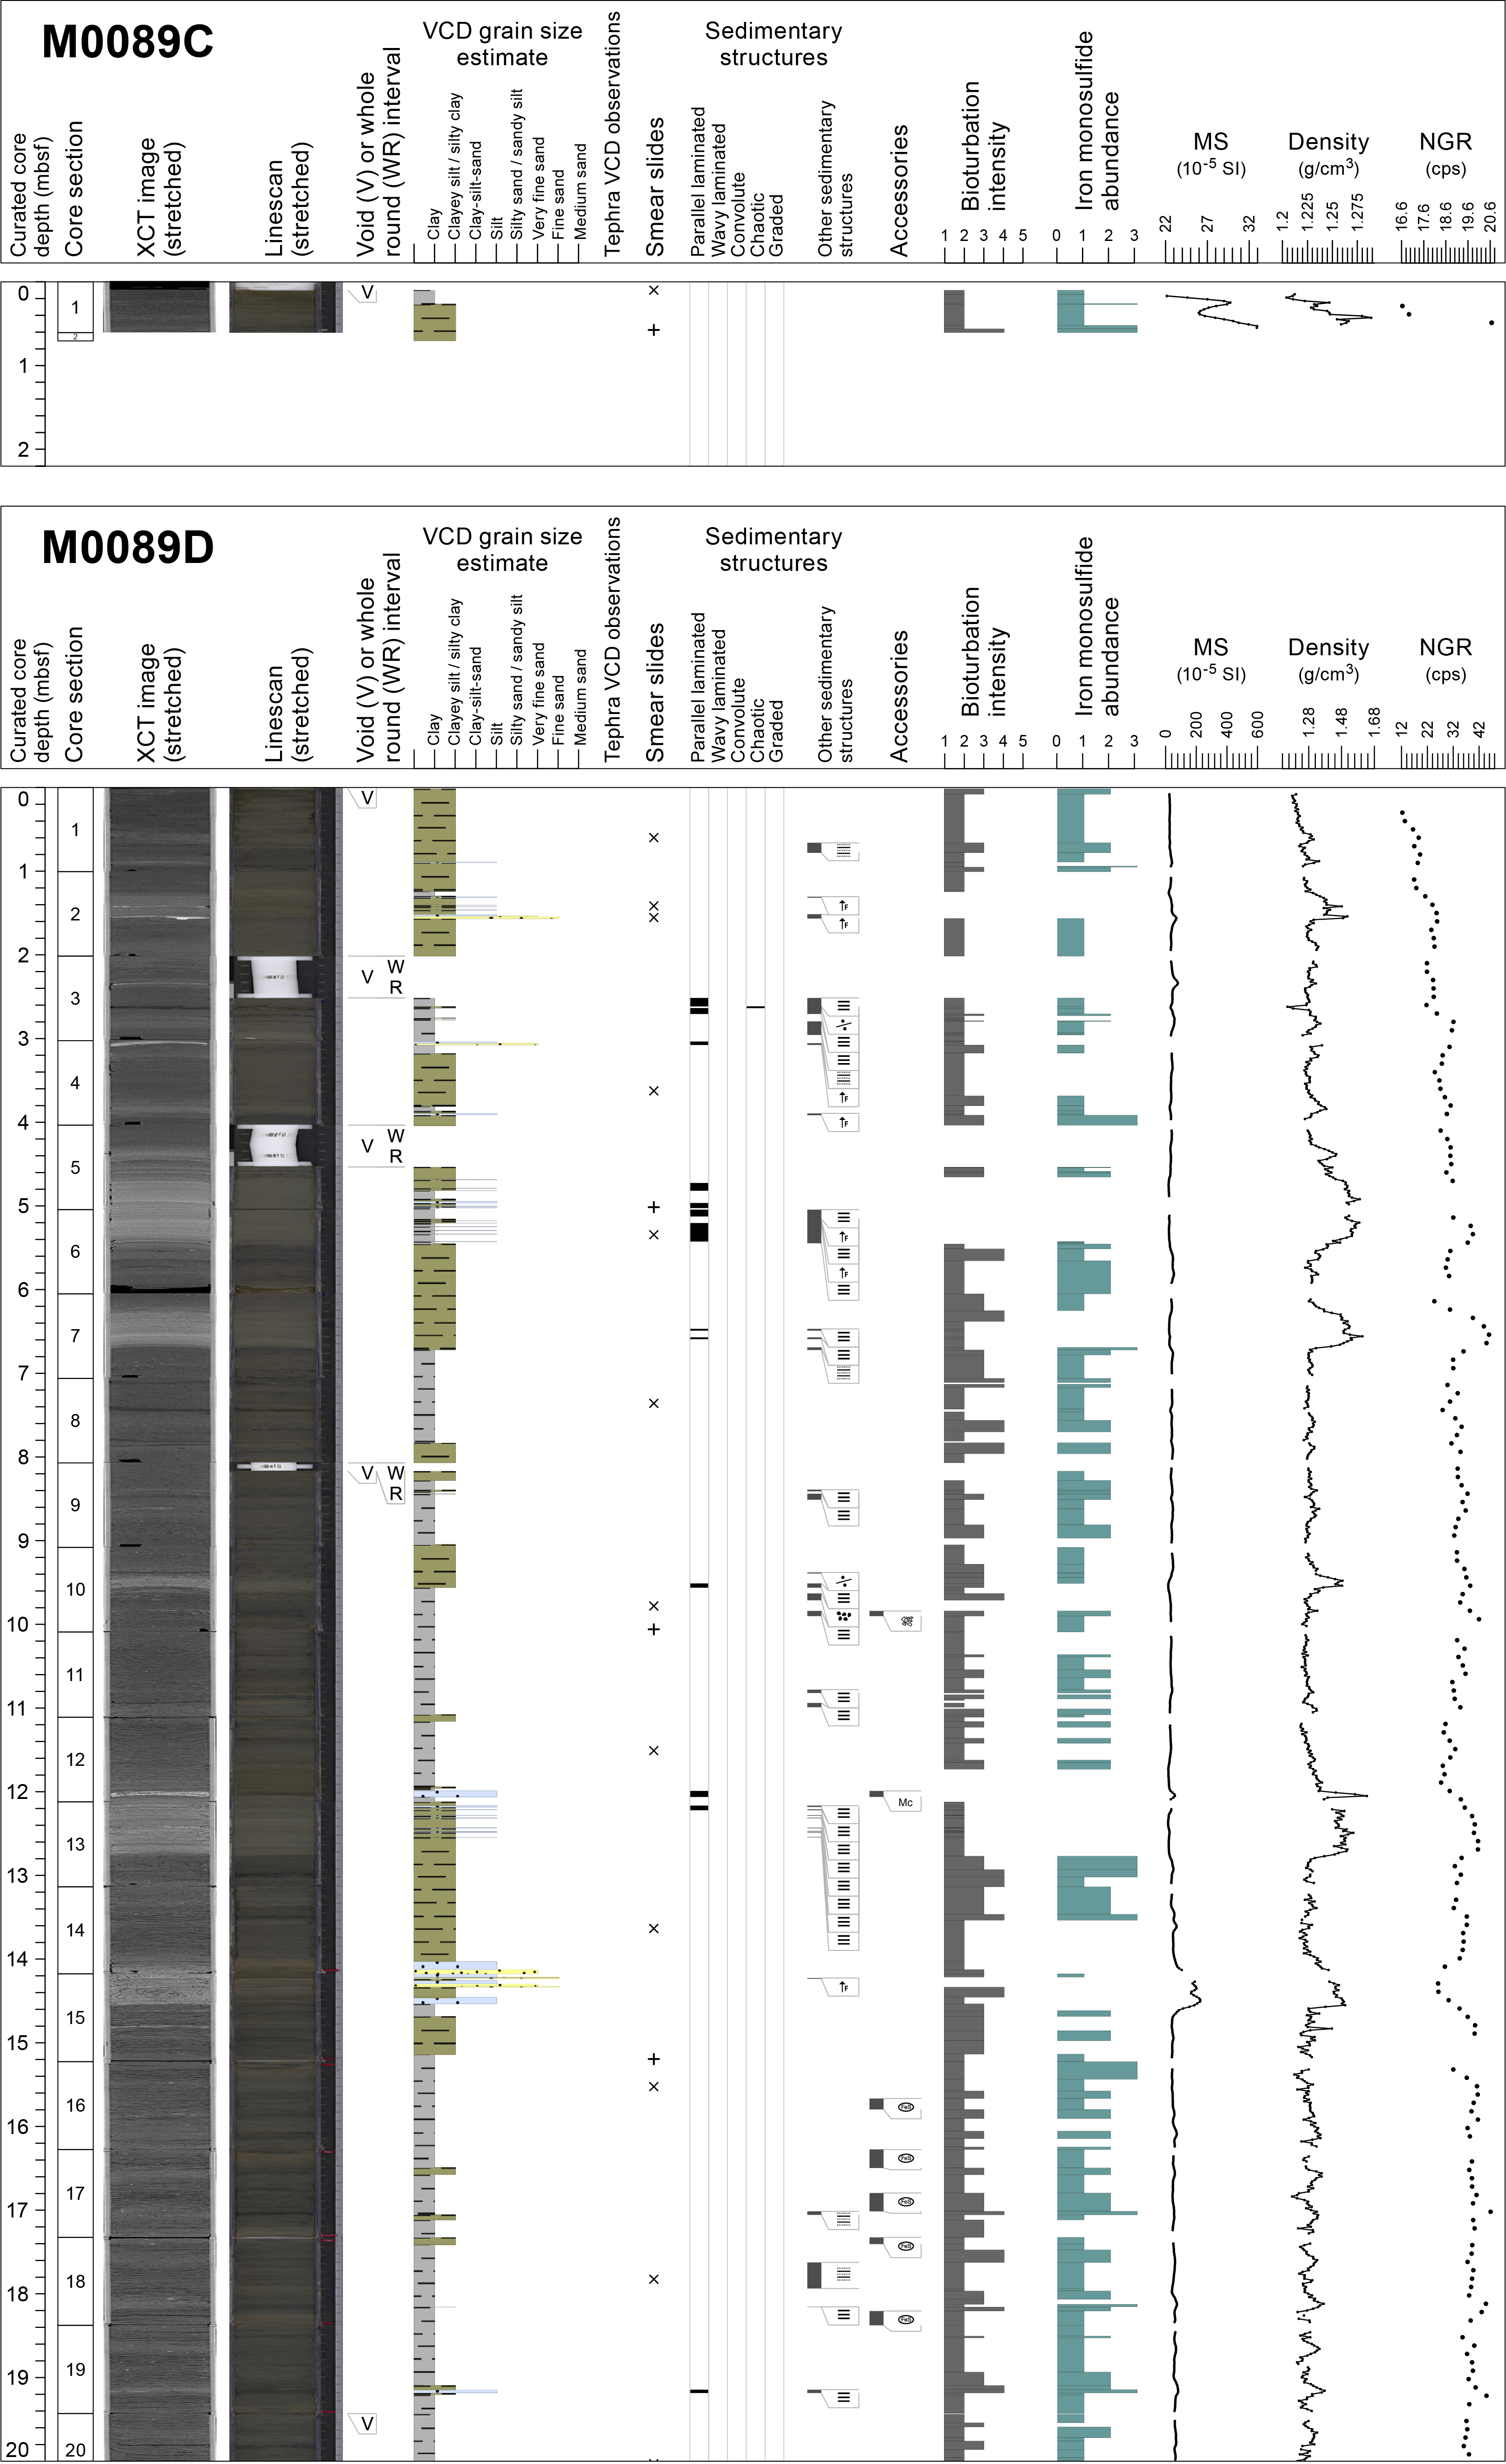
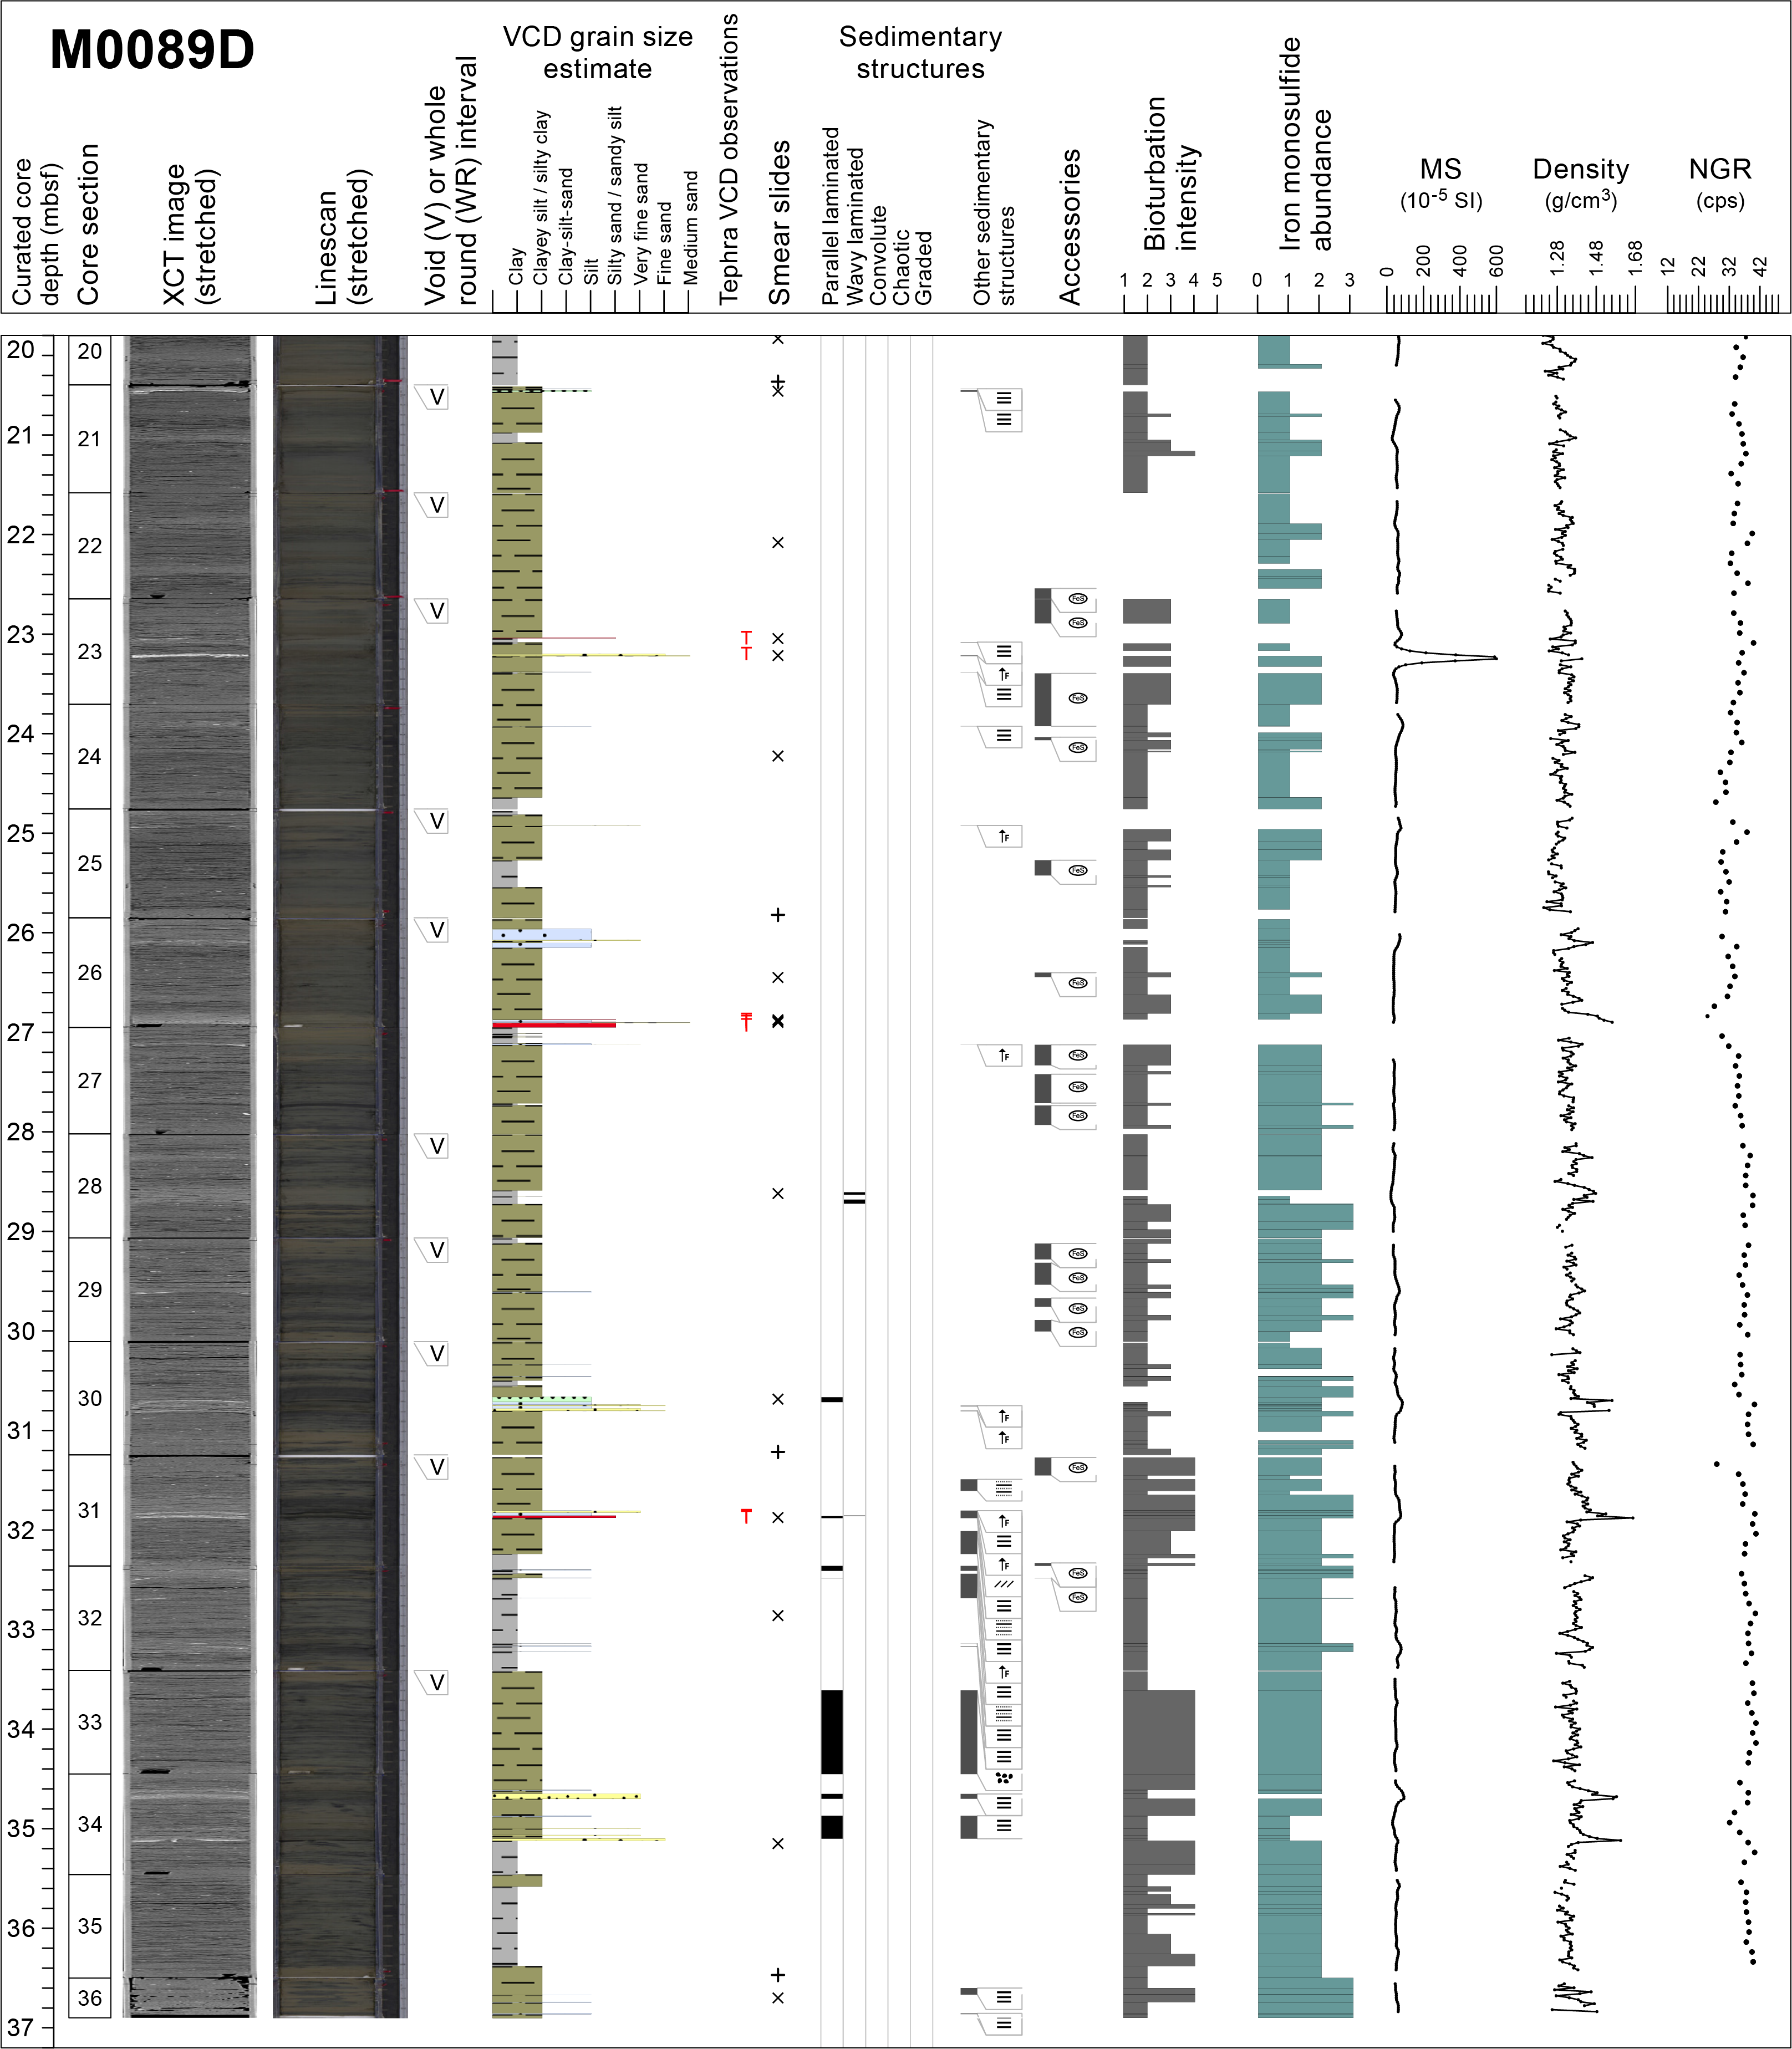
Figure F26. Lithostratigraphic summary, Holes M0089C and M0089D.
One smear slide was studied for Hole M0089C. It classifies the lithology as siliceous-bearing lithogenic silty clay. Clay (55.6%) and silt (44.4%) are the dominant grain sizes. Clay minerals are dominant at 55.6%. The biogenic components are diatoms (11.1%) and sponge spicules (5.6%) (Table T4; Figures F25, F27).
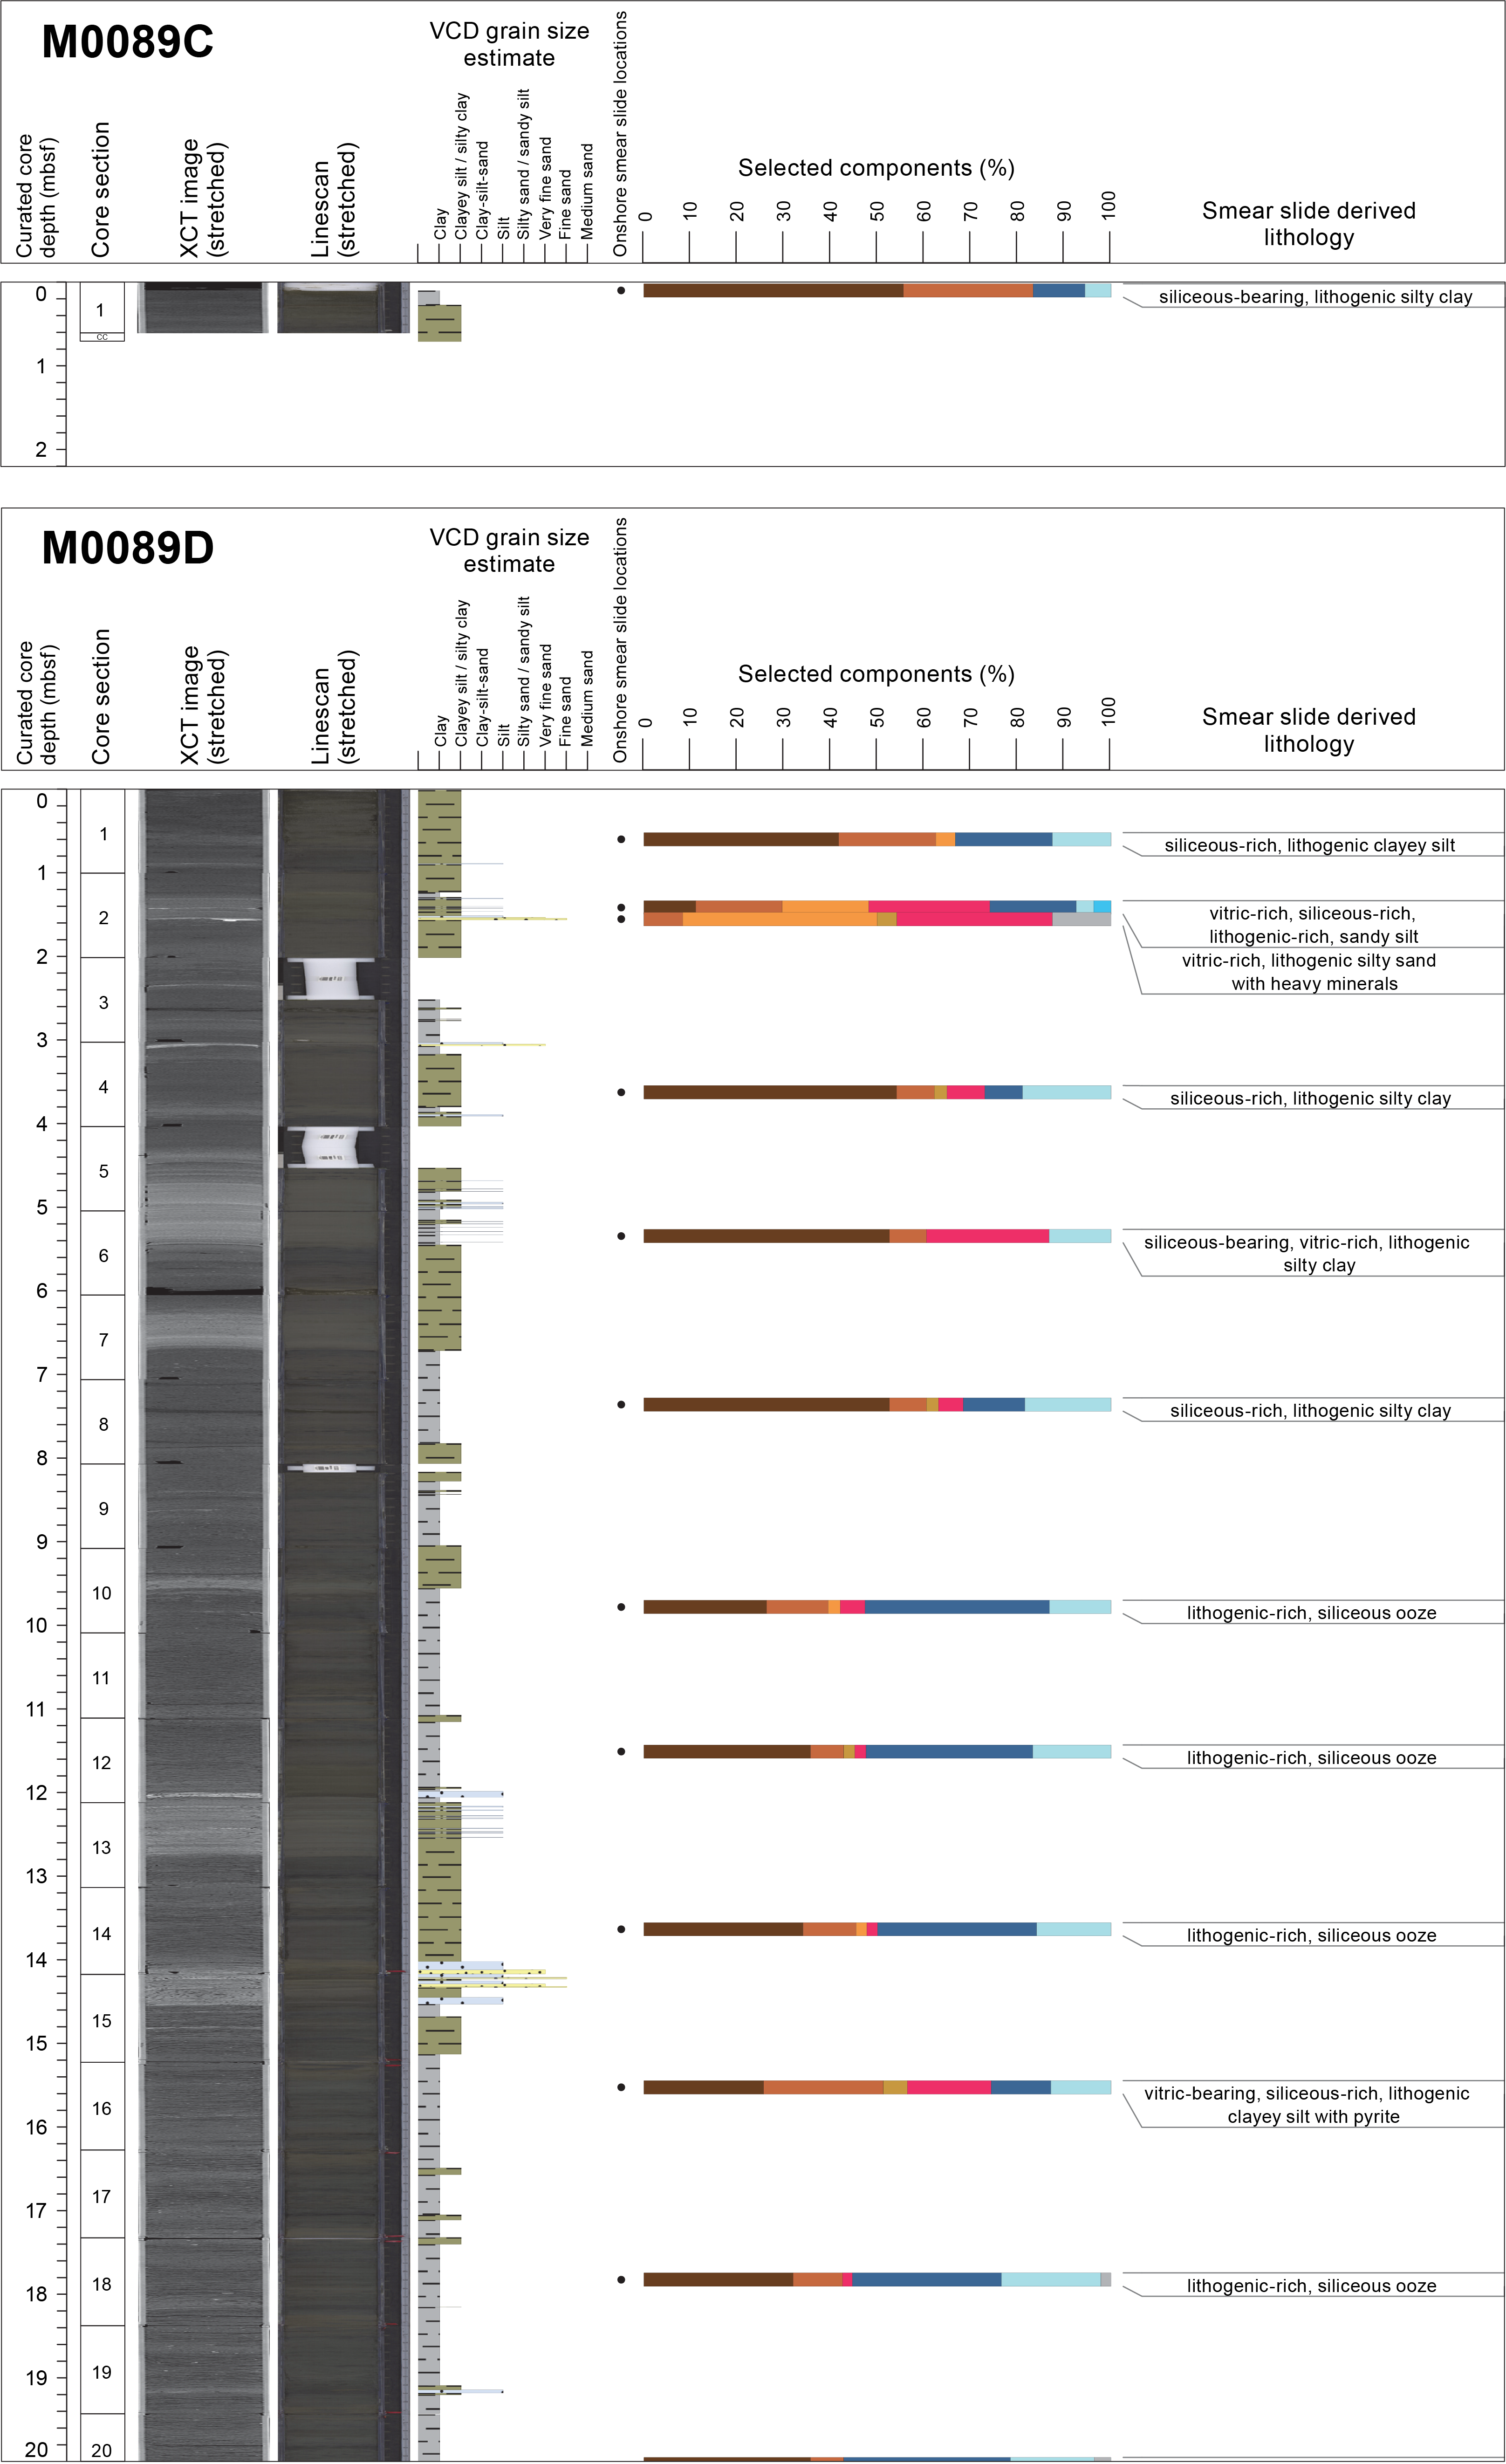
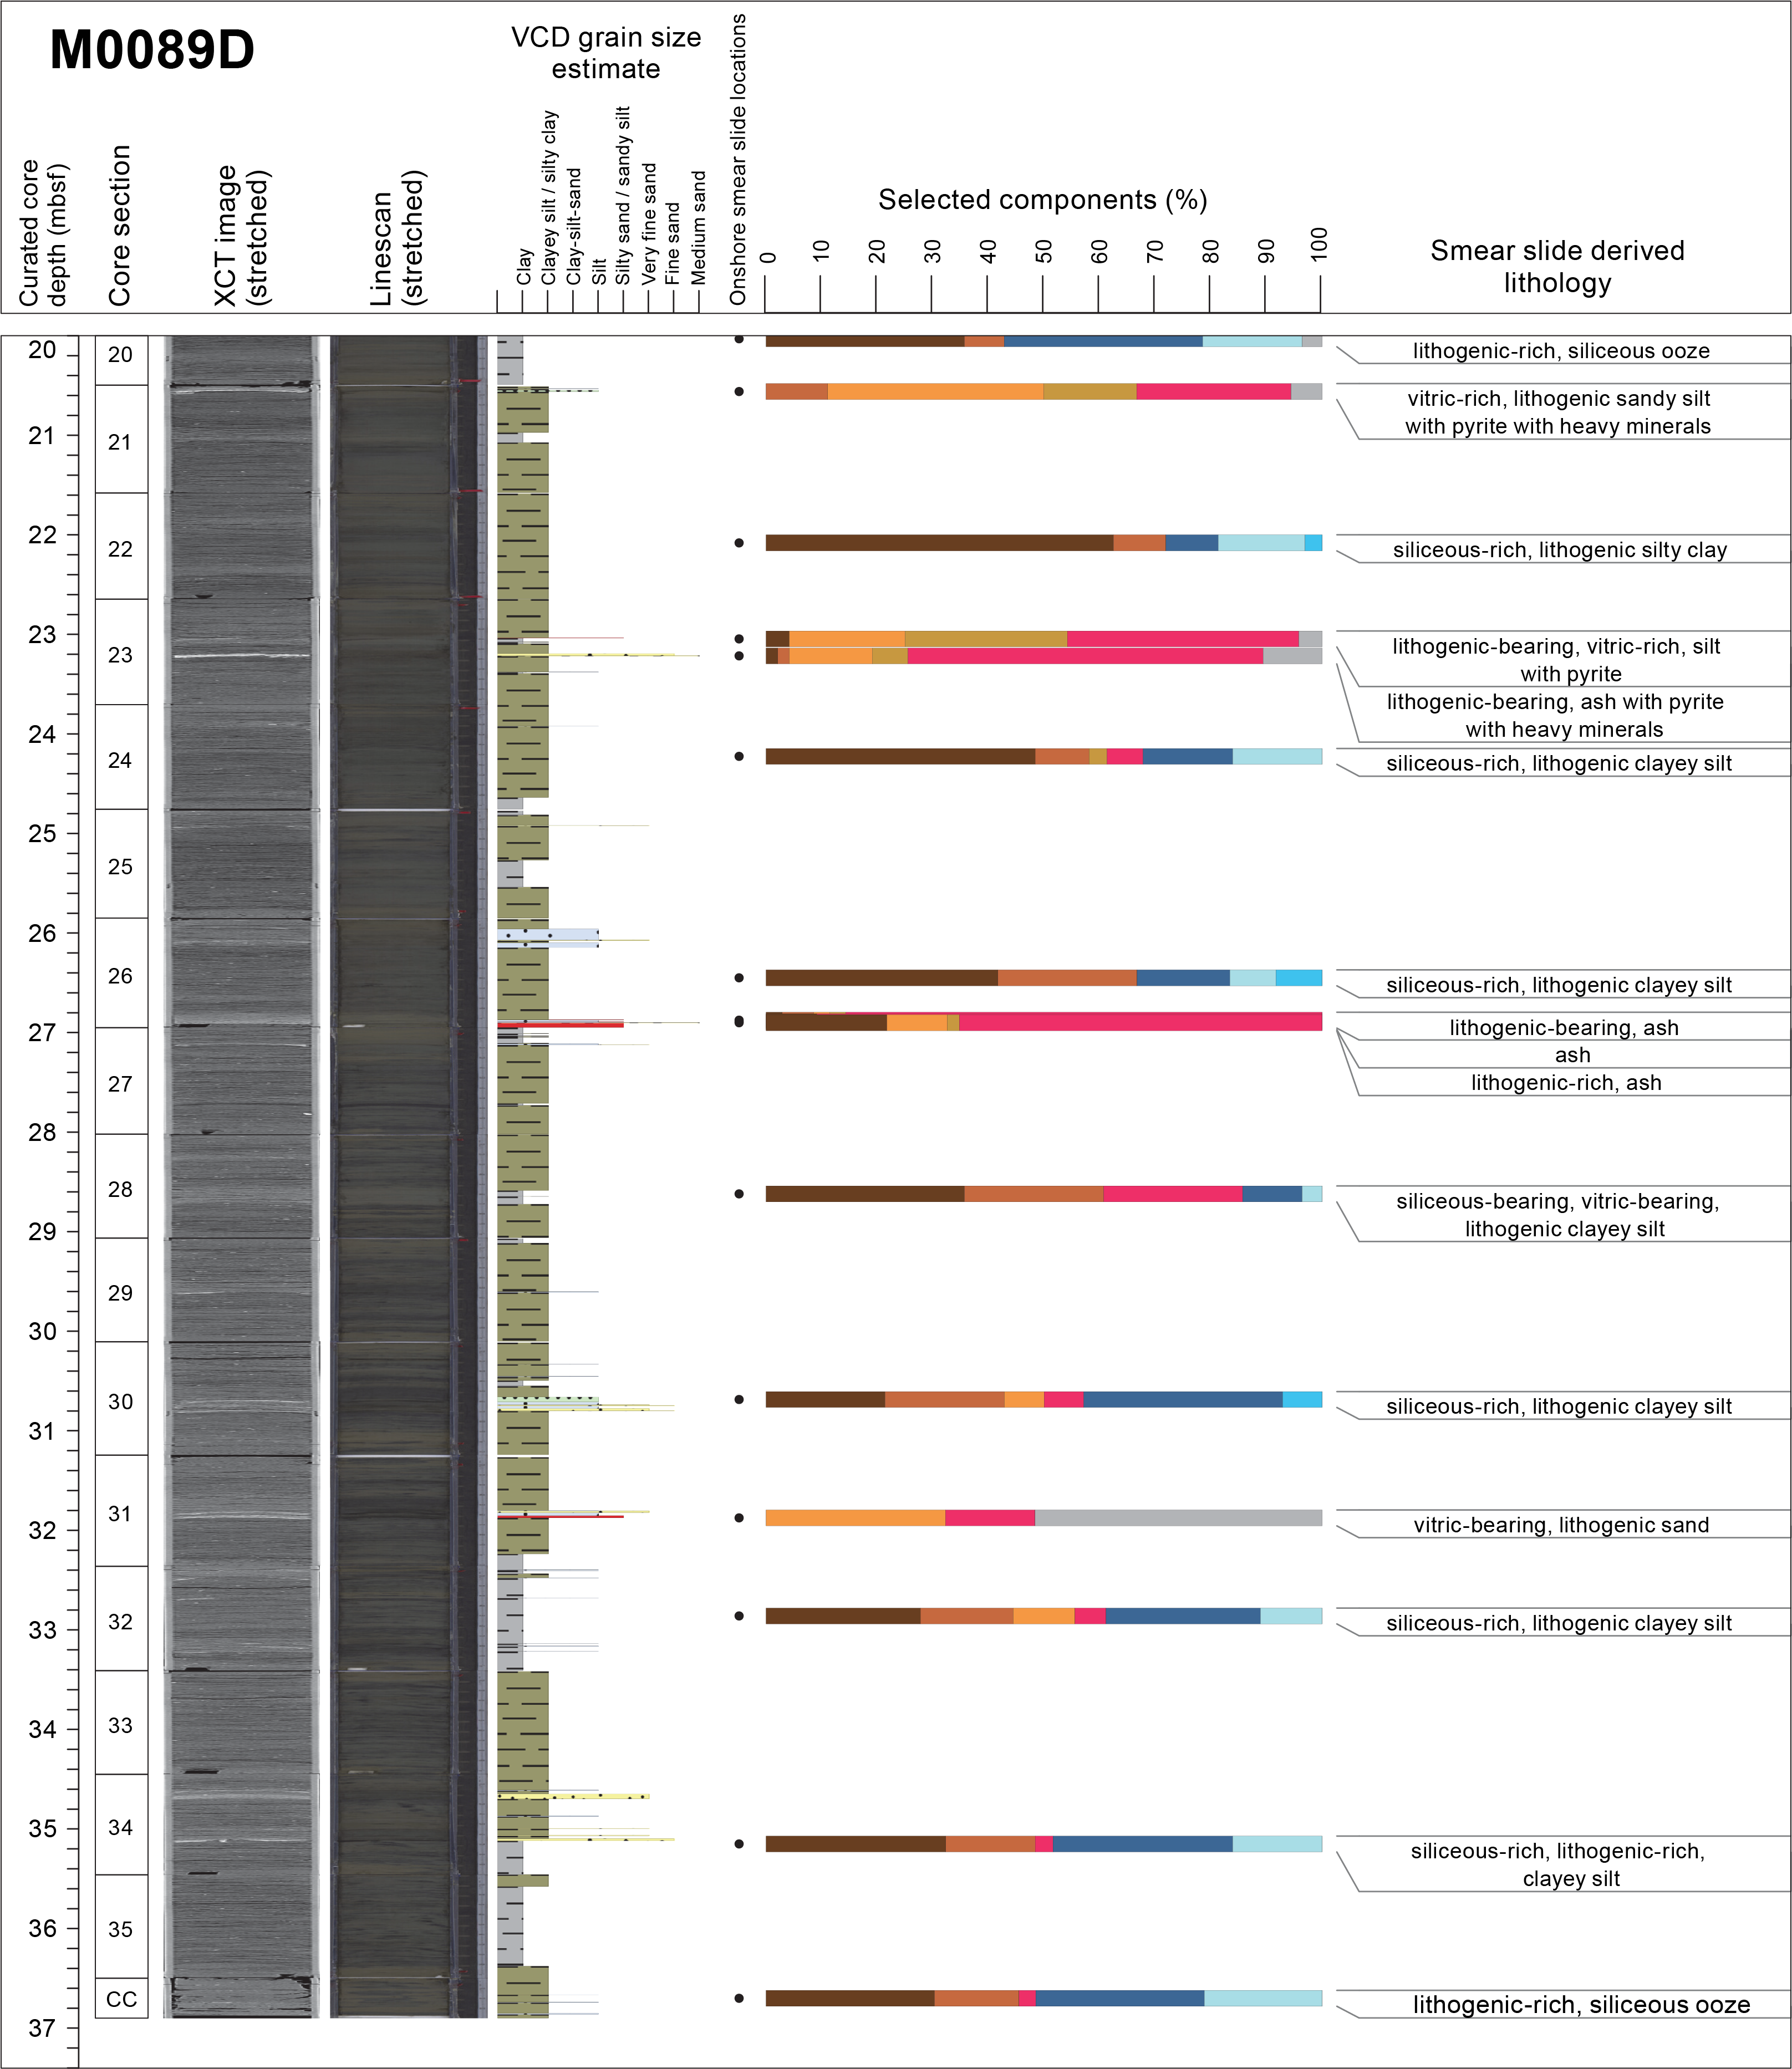
Figure F27. Smear slide summary, Holes M0089C and M0089D.
3.1.5.2. Hole M0089D
Hole M0089D extends from 0 to 36.9 mbsf. The sediment characteristics are similar to those of Hole M0089B in that they contain Type 1 and 4 lithologies. The sediments are divided into intervals that correlate with Hole M0089B (Figures F26, F21). Tephra occurrences are documented for Hole M0089D in the lithostratigraphic summary (Figure F26) and described in Tephra.
Interval 1 (0–5.40 mbsf) is composed of thickly bedded silty clay–clayey silt, clay, and laminae ranging in grain size from silt to fine sand. The sequence is sparsely to moderately bioturbated with several intervals that lack bioturbation. These sections correlate with the intervals in which the laminae are most closely spaced (Figure F26; see 3 m barrel sheets in Core descriptions). The X-ray CT scan images also show very high density contrasts (1–1.5, 2–25, and 4.5–5.40 mbsf). Density and NGR show increases and decreases correlated with laminated sections, but magnetic susceptibility lacks variability, possibly due to the muddy composition of the interval. The sediment characteristics in this interval are those of Type 4.
Interval 2 (5.40–11.80 mbsf) is interbedded clay and silty clay or clayey silt. The beds range in thickness from ~0.25 to 1 m. Laminae are rare. The X-ray CT scan images show moderate variability in density; however, the lithology in this interval shows sparse to abundant bioturbation, possibly suggesting slow sediment deposition. An increase in density and NGR correlates with a section of high density contrast in the X-ray CT scan at ~6–6.5 mbsf that marks the transition from clay to silt. Magnetic susceptibility shows no variability in this muddy interval. This interval is associated with Type 1 lithology.
Interval 3 (11.80–14.60 mbsf) is composed of clayey silt–silty clay and closely spaced laminae of silt, sandy silt, and very fine, fine, and medium sand. The densely packed laminae are present at 11.80–12.40 and 14–14.60 mbsf. These two sections correspond with bands of high density contrast in the X-ray CT scan images and pronounced peaks in gamma-density and NGR related to thickly laminated intervals. Magnetic susceptibility has a pronounced peak in the deeper interval in which the laminae contain sand. Bioturbation in these sections is sparse. In contrast, bioturbation is moderate in the silty clay–clayey silt that lacks laminae. This interval is associated with lithology Type 4.
Interval 4 (14.60–20 mbsf) comprises clay with a few thin beds of clayey silt and silty clay (<50 cm thick) and rare laminae toward the base. This interval is sparsely to moderately bioturbated throughout. The X-ray CT scan image shows moderate changes in density, as do the density and NGR signals. These changes can be correlated with thin clayey silt beds and laminae. Magnetic susceptibility shows no variability in this muddy interval. This interval has affinities with lithology Type 1.
Interval 5 (20–36.9 mbsf) is composed of silty clay with a few clay beds (35.40–36.40 mbsf). Otherwise, laminae of silt to medium sand occur throughout and tend to be closely spaced, similar to those described in lithology Type 4. Interval 5 is sparsely to heavily bioturbated except for a section between 21.45 and 22.9 mbsf. The X-ray CT scan images show high density contrasts, and density and NGR show moderate increases and decreases that correspond to laminated intervals. Magnetic susceptibility shows one peak that corresponds with two reported tephras in intervals 386-M0089D-1H-23, 39.5–40 cm, and 1H-23, 55–58 cm. Other reported tephras occur in intervals 1H-26, 102.2–102.6, 103.5–104, and 104.5–105.7 cm, and 1H-31, 61–63 cm (see Tephra).
A total of 26 smear slides were examined for Hole M0089D (Table T4; Figure F27). The lithology comprises siliceous-rich lithogenic clayey silt, vitric- and lithogenic-rich sandy silt, vitric- and lithogenic-rich sand with heavy minerals, siliceous-rich lithogenic silty clay, siliceous-bearing vitric-rich lithogenic silty clay, lithogenic-rich siliceous ooze, vitric-bearing siliceous-rich lithogenic clayey silt with pyrite, and vitric-rich lithogenic sandy silt with pyrite with heavy minerals. The grain size is composed of clayey silt, silty clay, silt, and to a minor extent sandy silt, silty sand, and sand (Figure F25). The biogenic components are dominated by diatoms, silicoflagellates, sponge spicules, and radiolaria.
3.2. Diagenesis
Sediments at Sites M0083 and M0089 show variations in the abundance of iron monosulfides throughout the cores (Figures F15, F19, F23, F26, F28). This variation ranges from ~10–15 cm thick intervals up to a nearly uniform presence in the sediment. Iron monosulfides are most easily observed during split core description and subsequent examination of the linescan images for each section (see composite plots in Core descriptions and individual linescan images in LINESCAN in Supplementary material). In addition, smear slide observations document framboidal occurrences of pyrite within microfossils. Relative to the host lithostratigraphy, there are three main patterns in the occurrence of iron monosulfides: (1) as small dots (1–10 mm in diameter) or patches (>1 cm in diameter) in fine-grained sediment intervals, (2) mottled in bioturbated zones beneath coarse-grained sediments, and (3) nearly uniform in strata bound layers in both fine- and coarse-grained beds. Generally, iron monosulfides correlate with bioturbation, first filling burrows, and are seen as mottling on core surfaces. They also fill pore spaces created by laminae or beds forming black-stained color bands. The intensity of the iron monosulfide generally increases from sparse to heavy with increased depth, consistent with exposure time of the sediments to organoclastic sulfate reduction and/or the anaerobic oxidation of methane, the dominant diagenetic reactions that produce iron monosulfides and ultimately pyrite in marine sediments. Although bioturbation intensity is also variable throughout the cores, some bioturbated zones are most easily seen when amplified by iron monosulfide precipitates, particularly in lighter portions of the cores.


Figure F28. Lithostratigraphic summary, Holes M0083E and M0083F.
3.3. X-ray diffraction mineralogy
X-ray diffraction mineralogy was conducted on two samples per section, and some minerals are grouped. These groupings will require additional processing to extract a signal for each mineral. For example, quartz has not been separated from opal-A, and clays, carbonates, amphiboles, pyroxenes, and heavy minerals are composed of several minerals in each grouping (see Lithostratigraphy in the Expedition 386 methods chapter [Strasser, 2023a]). The interpretation of the mineralogy at this stage is an approximation. However, some interpretations can be made when the data is compared with the lithostratigraphic summaries (Figures F15, F19, F23, F26, F28). For Hole M0083D (Figure F29), the most abundant minerals are quartz, feldspar, and clay. The data show correspondence between quartz, feldspar, clays, and micas, and the smear slide data also show them as the most abundant minerals (see Supplementary material). There is some correlation between thickly bedded intervals at 13–14, 18.5–19.5, and 23–25 mbsf and peaks of quartz and feldspar. From 8 to 33 mbsf, there are occurrences of palygorskite, a clay associated with the weathering of glasses. Pyrite is rare except at the top of the hole, and the amphibole group correlates with silty clay and clayey silt intervals at 10–15, 28, and 30–35 mbsf. As in Hole M0083D, quartz, feldspar, clays, and micas are the most abundant minerals in Hole M0089D (Figure F29). These mineral abundances also correspond with smear slide observations (see Core descriptions). At 19 and 23 mbsf, the signals of quartz and feldspar increase. Palygorskite corresponds to the occurrence of tephras between 23 and 27 mbsf and at 32 mbsf. As in Hole M0083D, the amphibole group appears to correspond to the silty clay and clayey silt intervals. However, this group of minerals is more abundant in this hole than in Hole M0083D. Future studies will be required to fully extract the mineralogy of the sediments in these two holes.
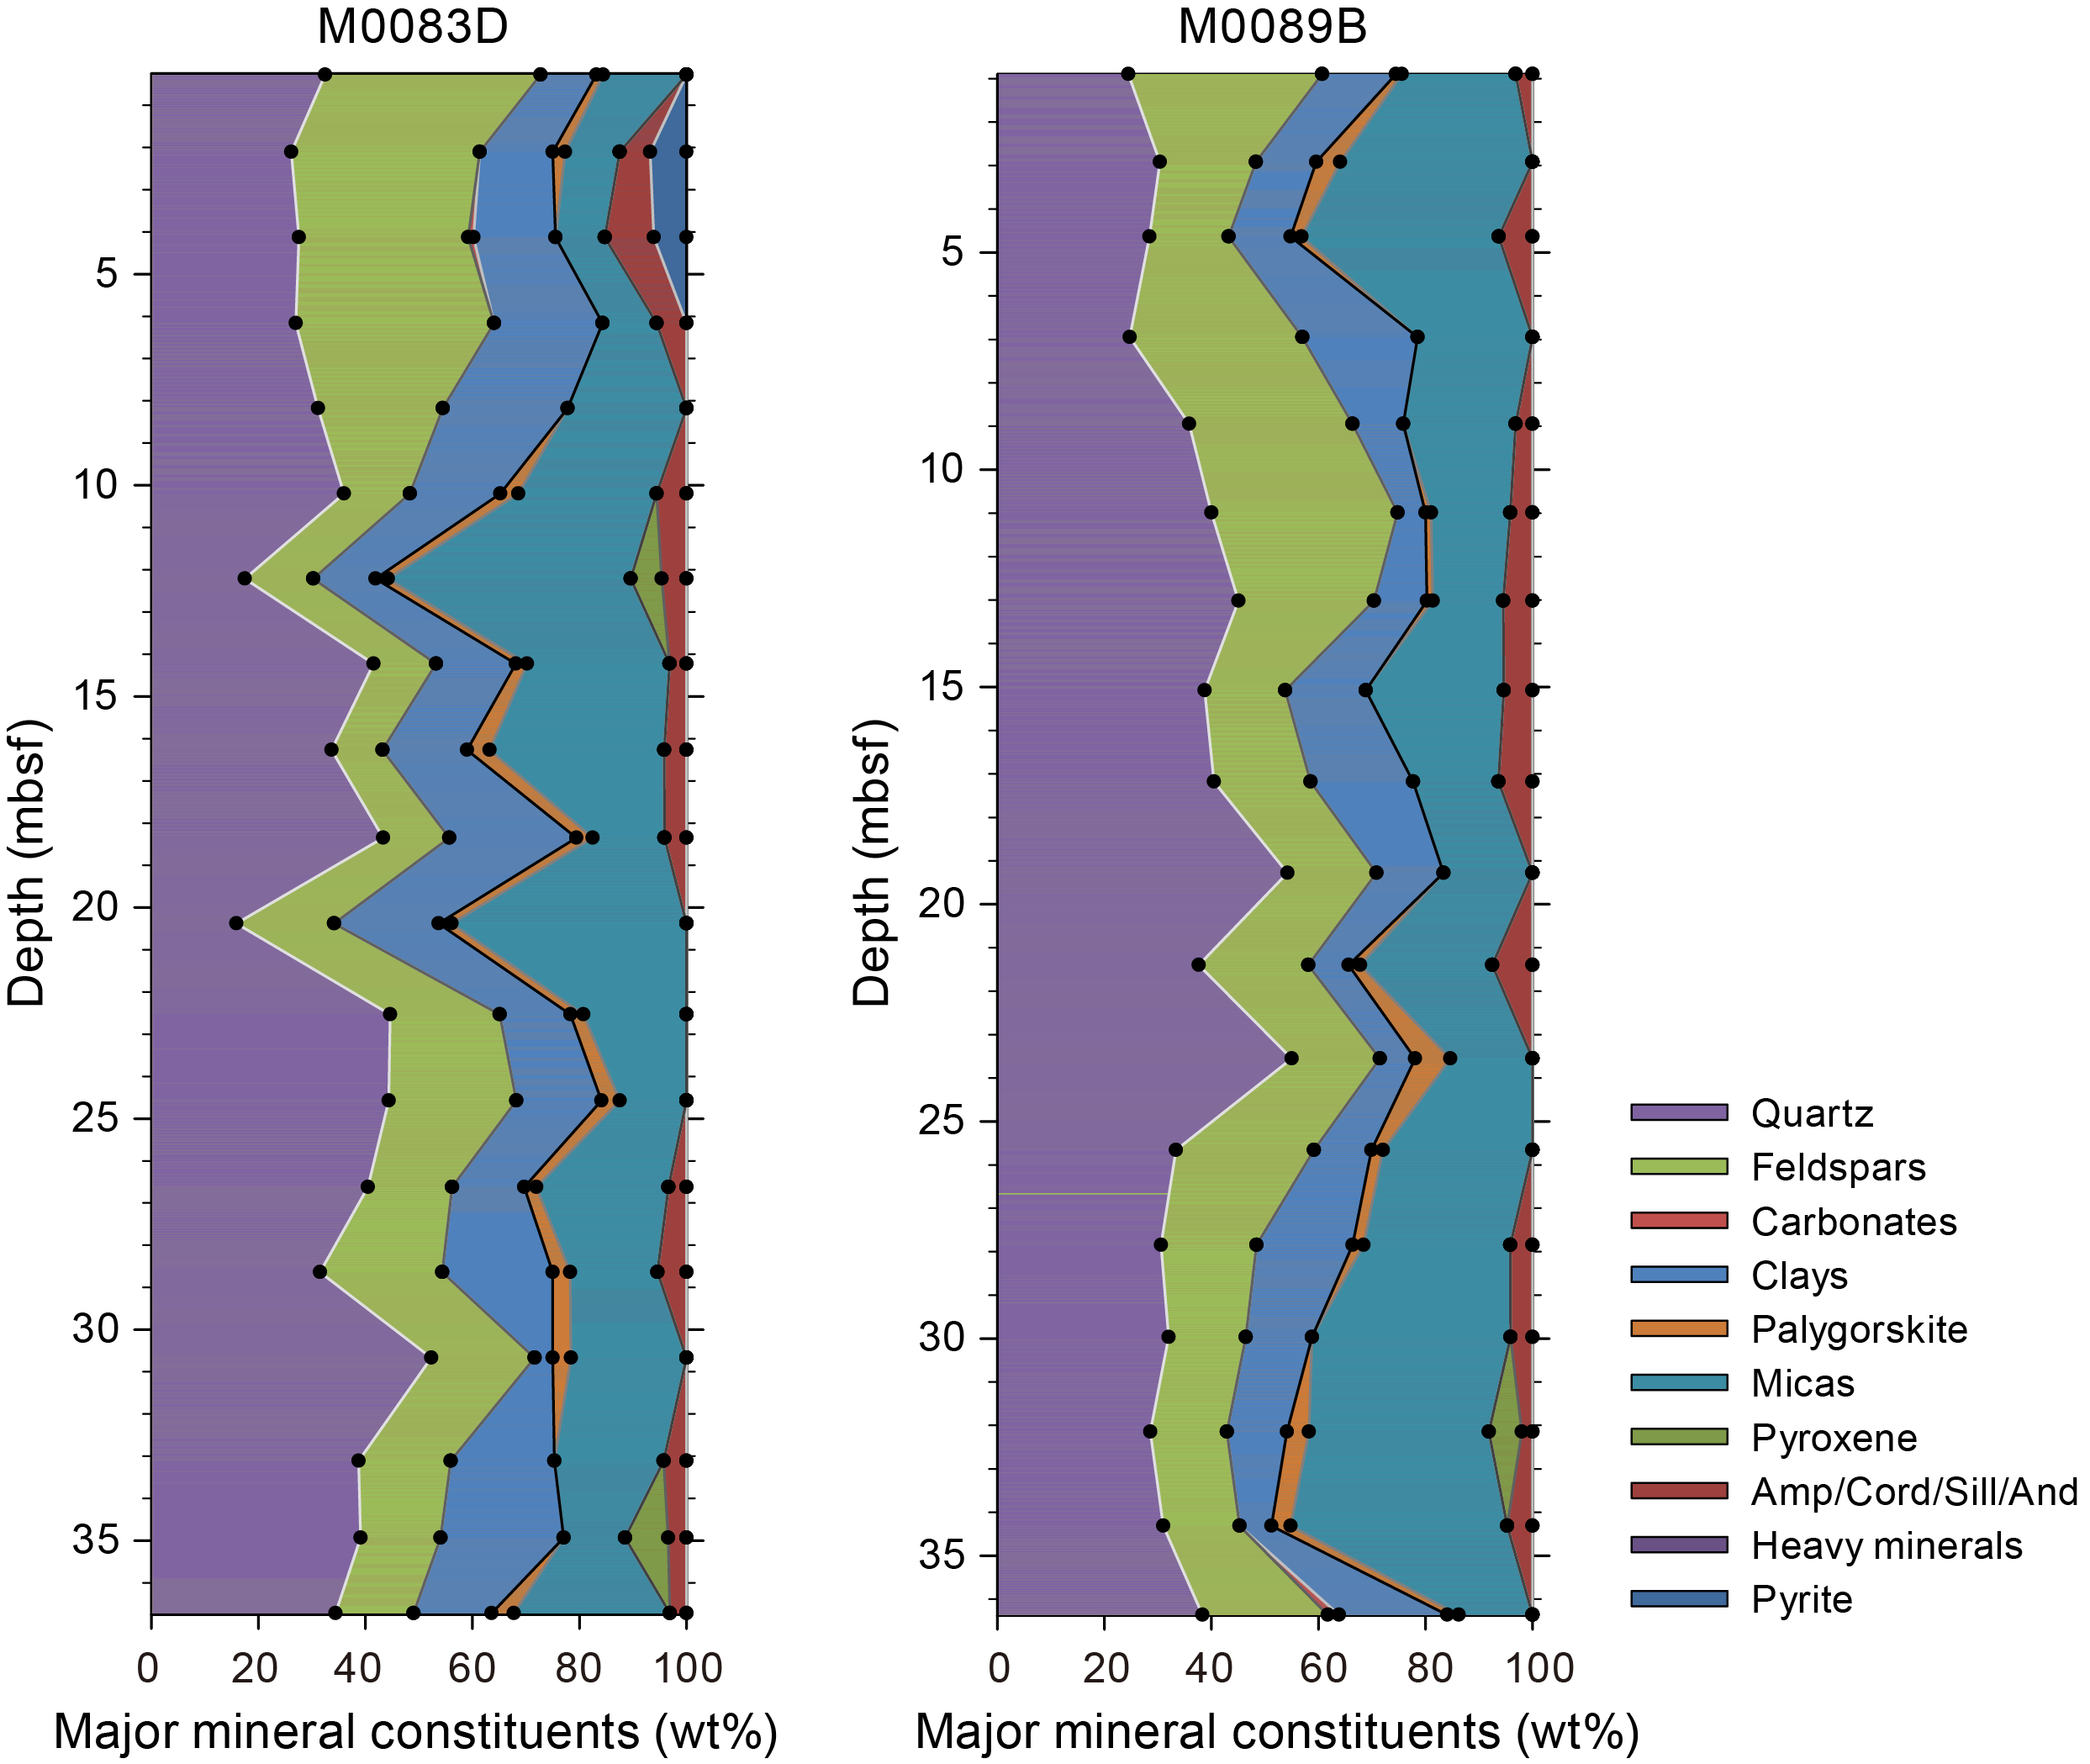
Figure F29. X-ray mineralogy, Holes M0083D and M0089D.
4. Tephra
Nine pyroclastic grain-rich sediments are described in Basin C2 (Figure F30); however, most of them are reworked tephra layers. The three layers described at Site M0083 were recognized as reworked tephra layers because of their rounded volcanic glass shards (M0083B-1H-16, 27 cm; M0083B-1H-17, 22 cm; M0083B-1H-21, 12.5 cm). At Site M0089, two of six pyroclastic grain–rich sediments were recognized as reworked tephra layers (M0089B-1H-23, 40 cm; M0089-1H-31, 63 cm). Among the in situ tephra layers, the several centimeter thick tephra layer M0089-1H-23, 58 cm, displays characteristic facies, shape of volcanic glass shards, and mineral composition, which make it a suitable candidate for intersite correlation. In contrast, based on the data collected during the Onshore Science Party (OSP) alone, it was not possible to correlate the other three thin in situ tephra layers identified in Section M0089-1H-26, 102.6, 104.0, and 105.7 cm.
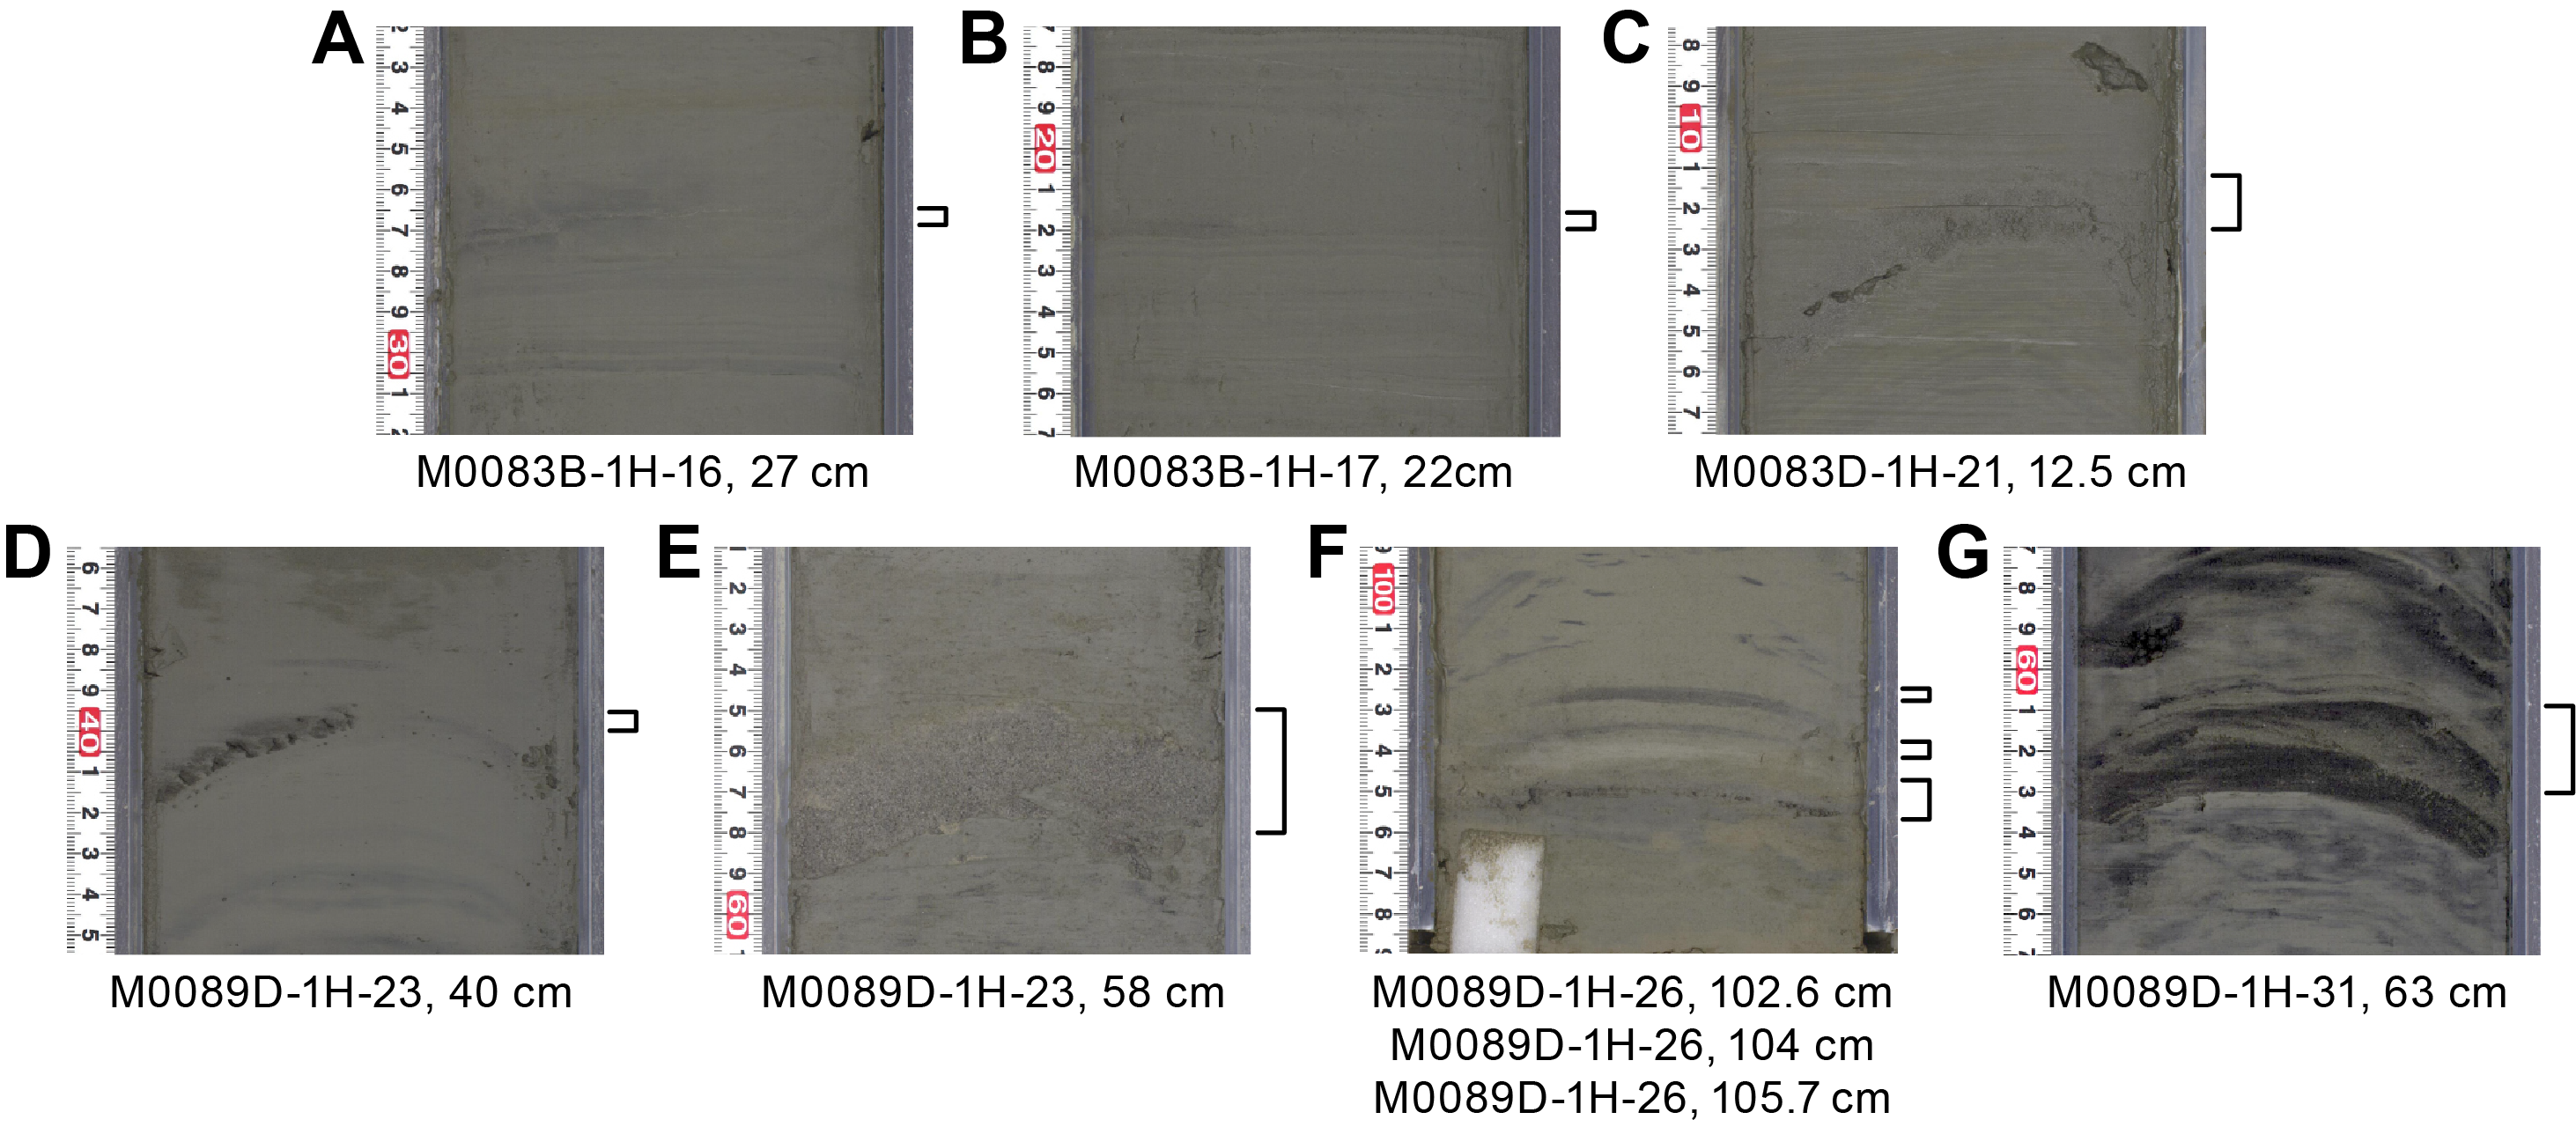
Figure F30. Tephras (brackets) in Basin C2, Sites M0083 and M0089.
A dark gray vitric silt layer (M0083B-1H-16, 27 cm) is intercalated as a lenticular bed in sediment interval 386-M0083B-1H-16, 26.5–27 cm (Figure F30A). The volcanic glass shards are rounded (Figure F31), with a few altered volcanic glasses, leading to the interpretation that these pyroclastic sediments are reworked tephra (Table T5). Platy and bubble-wall type glass shards are abundant. Heavy minerals are rare, and hornblende, cummingtonite, orthopyroxene, and biotite were observed.
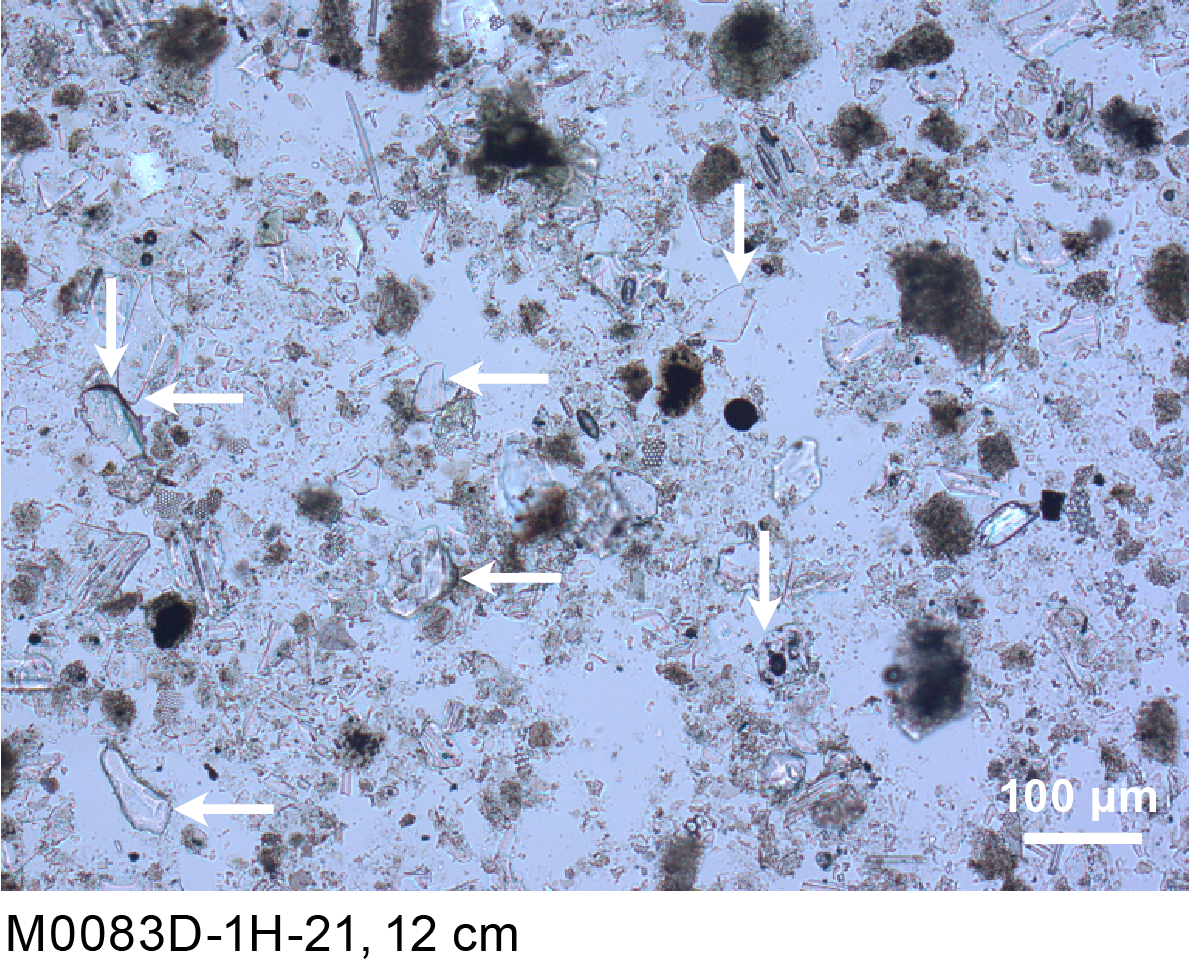
Figure F31. Tephra layer M0083D-1H-21, 12.5 cm.
A dark gray vitric silt layer (M0083B-1H-17, 22 cm) is intercalated as the lenticular bed in sediment interval 386-M0083B-1H-17, 21.2–22 cm (Figure F30B). The volcanic glass shards are fresh rounded glass, leading to the interpretation that these pyroclastic sediments are reworked tephra (Table T5). Platy and bubble-wall type glass shards are abundant. Only hornblende was observed as the heavy mineral component.
A black layer (M0083D-1H-21, 12.5 cm) with a silt to very fine sand grain size is intercalated in interval 386-M0083D-1H-21, 11.2–12.5 cm (Figure F30C). The volcanic glass shards are fresh rounded glass, so these pyroclastic sediments are interpreted as reworked tephra (Table T5). Platy and bubble-wall type volcanic glass shards are abundant. Heavy minerals are rare, and hornblende and orthopyroxene were observed.
A black very fine sand layer (M0089D-1H-23, 40 cm) is intercalated as a lenticular bed in interval 386-M0089D-1H-23, 39.5–40 cm (Figure F30D). Bubble-wall and platy types of volcanic glass shards are abundant and rounded, so these pyroclastic sediments are interpreted as reworked tephra (Table T5). Heavy minerals are present, with dominant hornblende and a few orthopyroxene and clinopyroxene observed.
A light gray and white silt- to fine sand–sized tephra layer (M0089D-1H-23, 58 cm) is intercalated in silty sediment interval 386-M0089D-1H-23, 55–58 cm (Figure F30E). This layer is composed of two lithologic facies; the lowermost is light gray silt to fine sand crystal-rich tephra with graded bedding, and the other is a white silt-sized tephra forming the upper component. These layers are 2.5 and 0.5 cm thick, respectively. From smear slide observations, this tephra layer is composed of equal amounts of volcanic glass shards and minerals, namely quartz, feldspar, and heavy minerals (Table T5). The pumiceous volcanic glass shape type is dominant with significantly lower amounts of moderate vesicularity and fibrous types. The heavy mineral composition shows abundant hornblende and smaller amounts of orthopyroxene and opaque minerals. Apatite is very rare. The tephra contains hornblende similar to cummingtonite and contains characteristic ß-quartz. This tephra layer (M0089D-1H-23, 58 cm) likely correlates with tephra layer M0090D-1H-26, 57.8 cm, based on similarities in lithofacies, volcanic glass type, heavy mineral composition, and inclusion of ß-quartz (Figure F32; see Tephra in the Site M0090 (Basin C1) chapter [Strasser, 2023e]). More detailed analysis is needed to determine chemical composition and further explore this possible correlation.
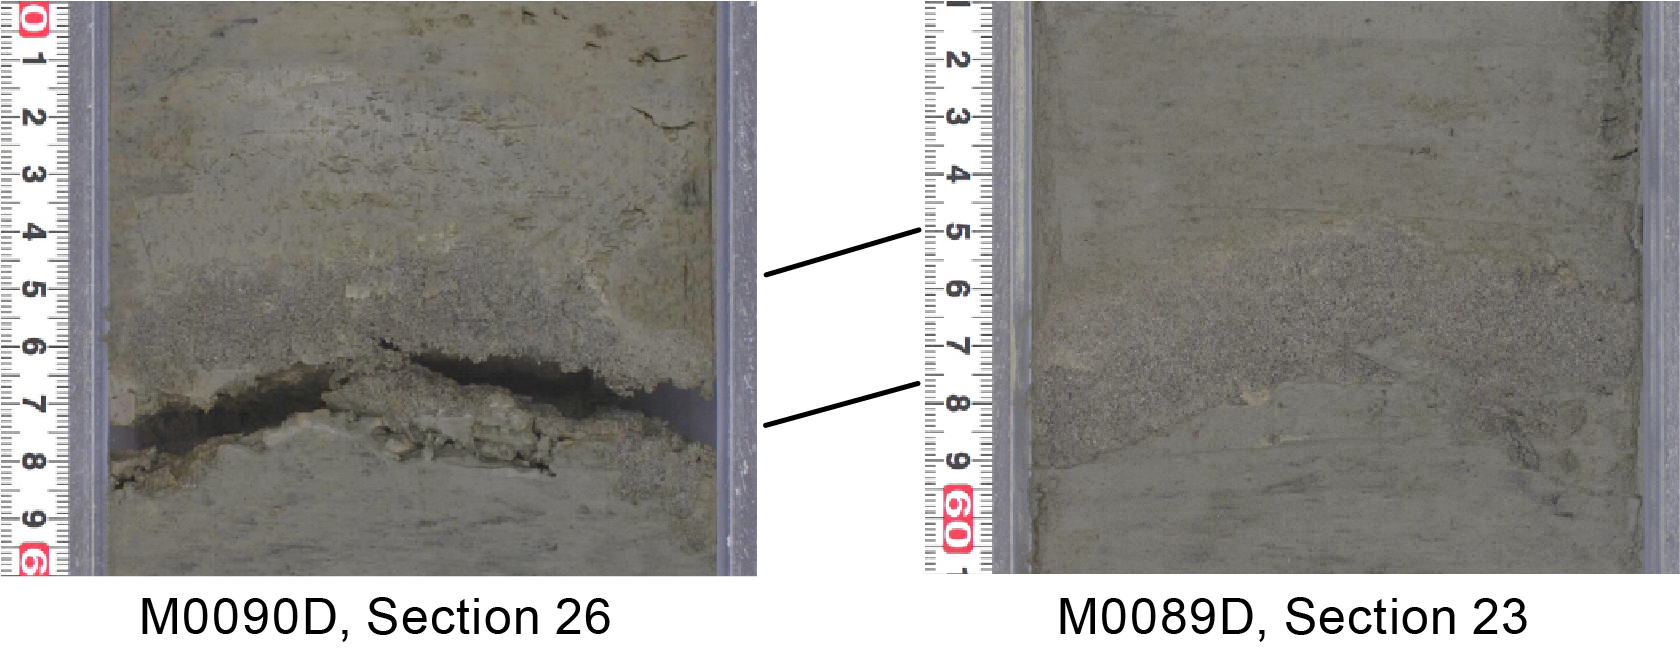
Figure F32. Tephra layer potentially enabling intersite correlation.
A black silt- to very fine sand–sized tephra layer (M0089D-1H-26, 102.6 cm) is intercalated as a lenticular bed in silty sediment interval 386-M0089D-1H-26, 102.2–102.6 cm (Figure F30F). It is composed of abundant fibrous types of volcanic glass shards with a lower concentration of pumiceous and bubble-wall types (Table T5). Heavy minerals are rare, and those observed are orthopyroxene, hornblende, and cummingtonite.
A white silt-sized tephra layer (M0089D-1H-26, 104 cm) is intercalated as a lenticular bed in silty sediment interval 386-M0089D-1H-26, 103.5–104 cm (Figure F30F). It is composed of abundant fibrous types of volcanic glass shards and a smaller component of bubble-wall type (Table T5). Heavy minerals are rare, with only clinopyroxene observed.
A black very fine sand–sized tephra layer (M0089D-1H-26, 105.7 cm) is intercalated as patches in silty sediment interval 386-M0089D-1H-26, 104.5–105.7 cm (Figure F30F). It is composed of abundant pumiceous and fibrous types of volcanic glass shards with a smaller component of bubble-wall type (Table T5). Heavy minerals are rare, with only orthopyroxene observed.
A dark gray silt to very fine sand layer (M0089D-1H-31, 63 cm) is intercalated in interval 386- M0089D-1H-31, 61–63 cm (Figure F30G). Cross-lamination was observed. Fibrous and bubble-wall types of volcanic glass shards are abundant and rounded; therefore, this pyroclastic sediment is interpreted as reworked tephra (Table T5). Orthopyroxene is the dominant heavy mineral, and hornblende and zircon are also observed.
5. Micropaleontology
Six holes at Site M0083 and four holes at Site M0089 were cored in Basin C2 in the central part of the Japan Trench. The biostratigraphy determined for Holes M0083D and M0089D was based on an examination of radiolaria collected during the offshore phase of Expedition 386. For Hole M0089D, additional samples were taken during the OSP to identify more detailed changes. Foraminifera in samples collected during the offshore phase were examined to determine the provenance of mass transport deposits.
5.1. Radiolaria
Relative abundance changes of Cycladophora davisiana, the Tetrapyle circularis/fruticosa group (hereafter Tetrapyle group), and Lithomelissa setosa in cores from Holes M0083D and M0089D are shown in Figure F33. Results of radiolarian analysis for these cores are described below.
Figure F33. Radiolarian species abundance.
5.1.1. Site M0083
A total of 18 radiolarian samples were collected from Hole M0083D, and 4 samples were processed for analysis. The remaining 14 were found within possible event layers and were not processed (Table T6). Radiolarian fossils were abundant in all examined samples, with good preservation. The relative abundance of C. davisiana was less than 6% throughout the core; therefore, it is likely that this entire section of the hole lies within C. davisiana Zone ‘a, corresponding to the Holocene (Morley et al., 1982; see Micropaleontology in the Expedition 386 methods chapter [Strasser, 2023a]). In addition, abundances tend to be high (>5%) in the lower part of the core (33.2 mbsf). The relative abundance of L. setosa in the same horizon was higher than those of others (>2%); therefore, this could be correlated to Events 2 or 4 (see Micropaleontology in the Expedition 386 methods chapter [Strasser, 2023a]). Because of the scarcity of samples in other horizons, the possibility of more detailed correlation to biostratigraphic events is limited.
5.1.2. Site M0089
A total of 42 radiolarian samples were collected from Hole M0089D, and 39 samples were processed for analysis. The remaining 3 were found within possible event layers and were not processed (Table T6). Radiolarian fossils are abundant throughout the core, with good preservation. The relative abundance of C. davisiana varies between 1% and 23% and tends to be significantly higher (>10%) below 24.6 mbsf. This could correlate with the boundary horizon of C. davisiana Zones ‘a and ‘b (Event 5), corresponding to the Holocene/Pleistocene boundary (Morley et al., 1982; see Micropaleontology in the Expedition 386 methods chapter [Strasser, 2023a]). Two significant peaks in the relative abundance of C. davisiana at 24.6–25.8 and 29.6 mbsf are likely to correlate to Events 6 and 7 corresponding to Davisiana Event (DAE)-2 (~12 ka) and DAE-3 (~17 ka) of Matsuzaki et al. (2014), respectively. The low abundance of C. davisiana between 36.0 and 36.5 mbsf below Event 7 possibly corresponds to the minimum C. davisiana abundance between Zones ‘b1 and ‘b2 (approximately 24 ka) of Morley et al. (1982) and Itaki et al. (2009). The relative abundance of the Tetrapyle group ranges 0%–10%, and higher values (>5%) tend to be recognized between 7.9 and 19.4 mbsf, probably corresponding to Events 1 and 3, respectively, and ranging approximately between 6 and 8 ka (see Micropaleontology in the Expedition 386 methods chapter [Strasser, 2023a]). Two minor peaks in the relative abundance of L. setosa in C. davisiana Zone ‘a at 14.6 and 23.7 mbsf are likely correlated to Events 2 and 4, respectively.
According to the above correlations from Sites M0083 and M0089, it is likely that the sedimentation rate is significantly higher at Site M0083 than at Site M0089.
5.2. Foraminifera
5.2.1. Site M0083
Samples were taken at 5 m intervals offshore, as described in Micropaleontology in the Expedition 386 methods chapter (Strasser, 2023a). With the exception of the agglutinated benthic foraminifera, which may be either in situ or reworked, all foraminifera at Site M0083 are considered to be allochthonous.
5.2.1.1. Hole M0083B
Four samples from Hole M0083B were examined for foraminifera (Table T7). Benthic foraminifera with good preservation are present to rare in two samples; two samples are barren. One planktonic foraminifer with good preservation is present in only one of the four samples. All samples examined for foraminifera contain abundant diatoms, radiolaria, and sponge spicules, and some have glass shards and iron monosulfides.
No provenance interpretation can be made for these samples due to low foraminifera abundance.
5.2.1.2. Hole M0083C
One sample from the base of Hole M0083C was examined for foraminifera (Table T7). Only one specimen of agglutinated Haplophragmoides spp. with good preservation is present. The sample contains abundant diatoms, radiolaria, and sponge spicules.
No provenance interpretation can be made for this sample due to low foraminifera abundance.
5.2.1.3. Hole M0083D
Eight samples from Hole M0083D were examined for foraminifera (Table T7). Benthic foraminifera with poor to very good preservation are present or common in six samples; two are barren. Planktonic foraminifera with poor or good preservation are present or common in four samples; four are barren. All samples examined for foraminifera contain abundant diatoms, radiolaria, and sponge spicules, and some have glass shards and iron monosulfides.
No provenance interpretation can be made for these samples due to low foraminifera abundance, with the exception of Sample 386-M0083D-1H-31, 133–136 cm (31.1 mbsf).
Sample 386-M0083D-1H-31, 133–136 cm, contains a common and relatively diverse assemblage of calcareous benthic foraminifera dominated by Cassidulina reniforme, Globocassidulina subglobosa, Nonionella globosa, Epistominella naraensis, Nonionellina labradorica, Elphidium excavatum, and Uvigerina spp. Planktonic foraminifera are common, and most of these, along with many of the benthic foraminifera, have a brownish orange stain. The presence of E. excavatum, Cibicides sp., and Triloculina spp. suggest a neritic source; however, common planktonic foraminifera suggest no shallower than outer neritic. Some benthic foraminifera present, such as N. labradorica, have been found living within the oxygen minimum zone off Hachinohe, Japan (Fontanier et al., 2014). Using the paleobathymetric zonation of Usami et al. (2017) after Matoba (1976), the provenance of some of the displaced calcareous assemblage in this sample is interpreted to be from an outer neritic to upper bathyal environment within the oxygen minimum zone (~200–600 mbsl).
5.2.1.4. Hole M0083E
One sample from the base of Hole M0083E was examined for foraminifera (Table T7). One specimen of the agglutinated species Haplophragmoides spp. and one planktonic specimen occur in this sample, along with abundant diatoms, radiolaria, sponge spicules, glass shards, and iron monosulfides.
No provenance interpretation can be made for this sample due to low foraminifera abundance.
5.2.1.5. Hole M0083F
Seven samples from Hole M0083F were examined for foraminifera (Table T7). Benthic foraminifera with poor to good preservation are present or few in five samples; two are barren. Planktonic foraminifera with good preservation are rare in just one of the samples. All samples examined for foraminifera contain abundant diatoms, radiolaria, and sponge spicules, and most have glass shards and iron monosulfides.
No provenance interpretation can be made for these samples due to low foraminifera abundance.
5.2.2. Site M0089
Samples were taken at 5 m intervals offshore, as described in Micropaleontology in the Expedition 386 methods chapter (Strasser, 2023a). With the exception of the agglutinated benthic foraminifera, which may be either in situ or reworked, all foraminifera at Site M0089 are considered to be allochthonous.
5.2.2.1. Hole M0089A
One sample from the base of Hole M0089A was examined for foraminifera (Table T8). Agglutinated benthic foraminifera with good preservation are present, and calcareous benthic foraminifera are rare. There are abundant diatoms, radiolaria, sponge spicules, glass shards, and plant material of unknown origin.
5.2.2.2. Hole M0089B
Four samples from Hole M0089B were examined for foraminifera (Table T8). Benthic foraminifera with moderate to good preservation are present in three samples; one sample is barren. Planktonic foraminifera are absent. All samples examined for foraminifera contain abundant diatoms, radiolaria, and sponge spicules, and some have varying amounts of glass shards.
No provenance interpretation can be made for these samples due to low foraminifera abundance.
5.2.2.3. Hole M0089C
One sample from the base of Hole M0089C was examined for foraminifera (Table T8). Seventeen specimens of Trochammina spp., considered to be autochthonous, dominate the sample. This sample also contains abundant diatoms, radiolaria, sponge spicules, and glass shards.
5.2.2.4. Hole M0089D
Seven samples from Hole M0089D were examined for foraminifera (Table T8). Benthic foraminifera with poor to good preservation are present to abundant in five samples; two are barren. Planktonic foraminifera with moderate to good preservation are present or few in two of the five samples. All samples examined for foraminifera contain abundant diatoms, radiolaria, and sponge spicules, and many have iron monosulfides and varying amounts of glass shards. Possible crustacean parts also occur in several samples.
No provenance interpretation can be made for these samples due to low foraminifer abundance, with the exception of Samples 386-M0089D-1H-20, 103.5–106.5 cm (20.5 mbsf), and 1H-25, 106.5–109.5 cm (25.8 mbsf).
Sample 386-M0089D-1H-20, 103.5–106.5 cm, contains abundant benthic foraminifera dominated by abundant Stainforthia fusiformis, common Stainforthia apertura and N. globosa, and Bolivina pacifica and Fursenkoina complanata. Preservation of these thin-shelled taxa is good. Using the paleobathymetric zonation of Usami et al. (2017) after Matoba (1976), the provenance of the displaced calcareous assemblage in this sample is interpreted to be from an upper bathyal environment (200–600 m).
Sample 386-M0089D-1H-25, 106.5–109.5 cm, contains common benthic foraminifera dominated by S. fusiformis and S. apertura. This sample is also interpreted to be from an upper bathyal environment.
6. Geochemistry
6.1. Interstitial water
At Site M0083, 3 bottom water (BW) and a total of 79 interstitial water (IW) samples were collected using Rhizon samplers from three trigger cores (Holes M0083A, M0083C, and M0083E) and three GPC cores (Holes M0083B, M0083D, and M0083F). At Site M0089, 2 BW and 50 IW samples were collected from two trigger cores (Holes M0089A and M0089C) and two GPC cores (Holes M0089B and M0089D). See Geochemistry in the Expedition 386 methods chapter (Strasser, 2023a) for details of the sampling and analytical methods used. Overall, the IW geochemical results from all holes at both sites closely match for all analytes and are generally discussed together except where noted. In general, IW composition at Sites M0083 and M0089 is influenced by organic matter degradation, including the release of metabolic products and consumption of electron acceptors, as well as dissolution/precipitation reactions with sediment.
6.1.1. Shipboard analyses: salinity, alkalinity, and ammonium
Salinity at Site M0083 generally varies between 34.02 and 36.18. The lowest value (34.02) is found in the trigger cores at ~17 mbsf. The IW from the GPC cores has values of 34.45 at the surface, followed by a gradual and overall linear increase with depth to ~36 at the base of the cores (~35 mbsf) (Table T9; Figure F34). Alkalinity at Site M0083 is greater than BW values and shows a steep rise in the trigger cores. In the GPC cores, values for the top samples are greater than 20 mM and the alkalinity asymptotically increases with depth, stabilizing around 50 mM at ~7 mbsf. Further linear alkalinity increases occur between ~10 and 20 mbsf and below 20 mbsf, reaching ~65 mM at 20 mbsf and ~70 mM at the base of the cores (~35 mbsf). Ammonium (NH4+) at Site M0083 is low in the BW and increases with depth in the trigger cores. In the GPC cores, an initial asymptotic increase with depth to ~3 mM at ~5 mbsf is followed by a minor, smooth downcore decrease to ~2 mM at ~12 mbsf and a second linear increase with depth to ~6 mM at ~35 mbsf.
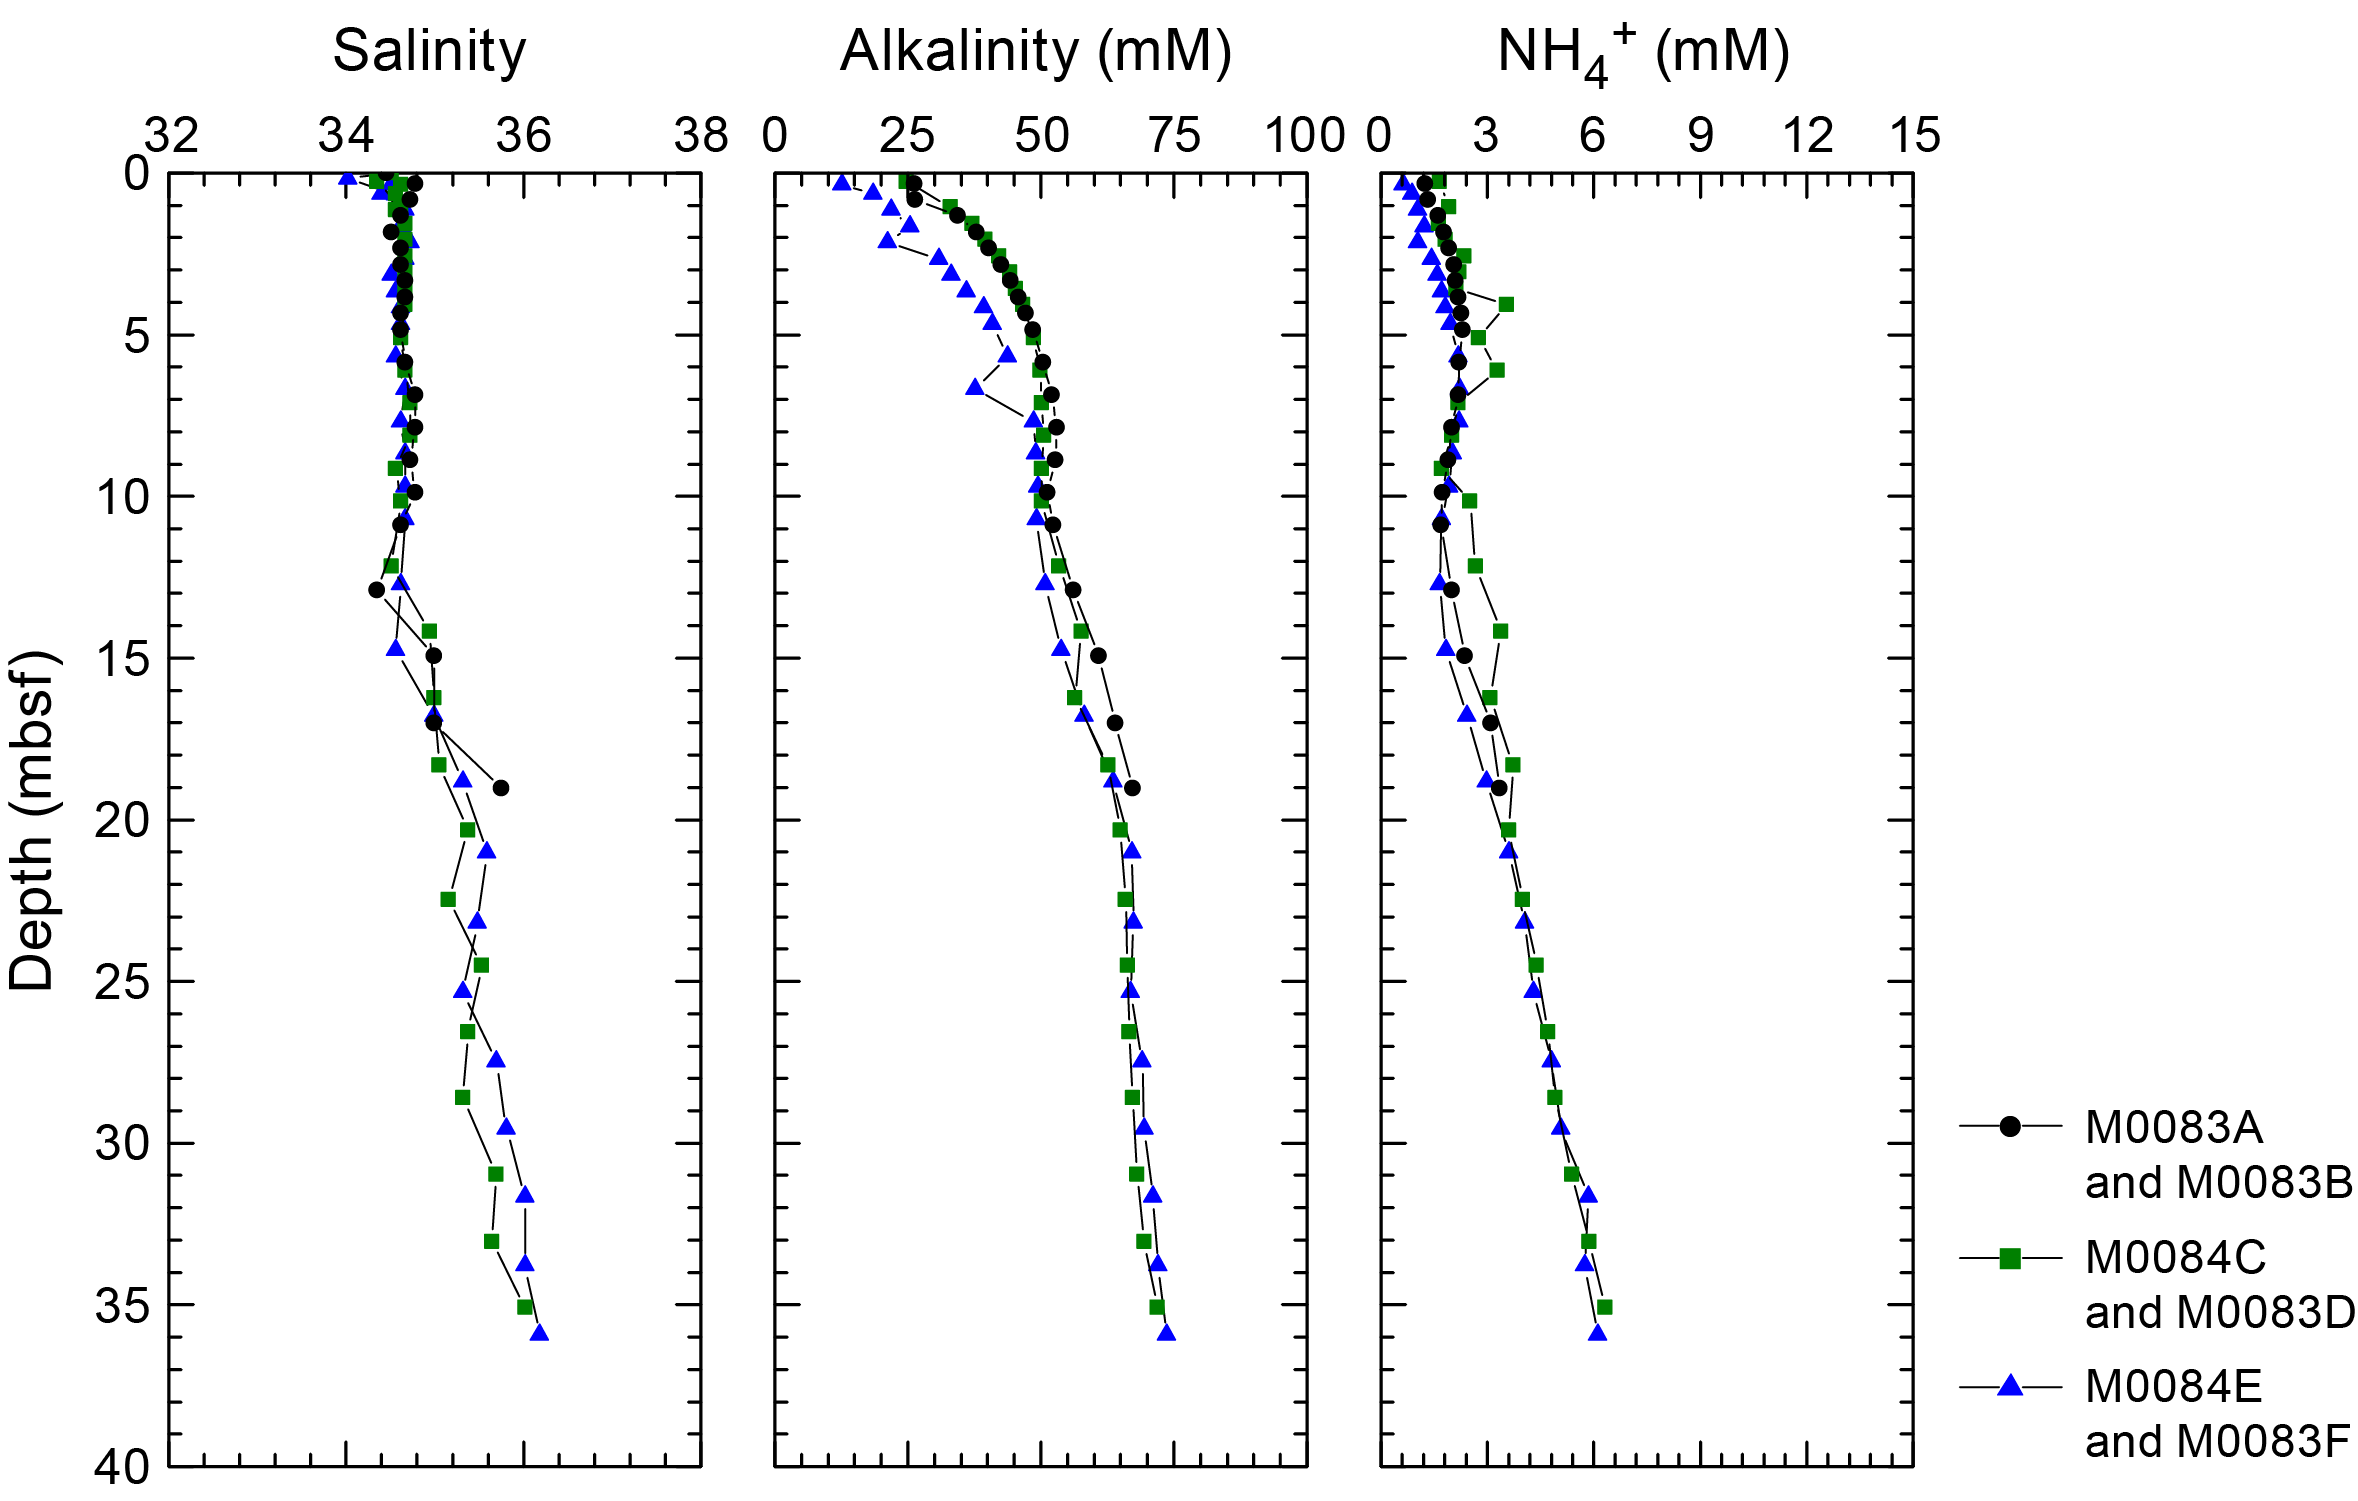
Figure F34. IW salinity, total alkalinity, and ammonium concentrations, Site M0083.
Salinity at Site M0089 generally varies between 34 and 36. Values of 34.5 are found in the trigger cores (Table T10; Figure F35). At the top of the GPC cores, salinity is ~35, and it decreases to values approaching 34 between ~3 and 6 mbsf. This is followed by a gradual and mostly linear increase in salinity with depth until values stabilize at 36 from ~26 mbsf to the bottom of the cores. Alkalinity at Site M0089 is greater than BW values and increases steeply from the seabed in the trigger cores. In the GPC cores, values are elevated (21 and 11 mM) in the top part of the core, and there is an asymptotic increase with depth to ~58 mM at 18 mbsf in Hole M0089B and ~70 mM at ~35 mbsf in Hole M0089D. Ammonium at Site M0089 shows a steep increase in the trigger cores, with all IW values greater than BW values. In the GPC cores, values at the surface are elevated (~2 mM in Hole M0089B and ~1 mM in Hole M0089D) and increase with depth, reaching ~6 mM at the base of Hole M0089D (~35 mbsf).
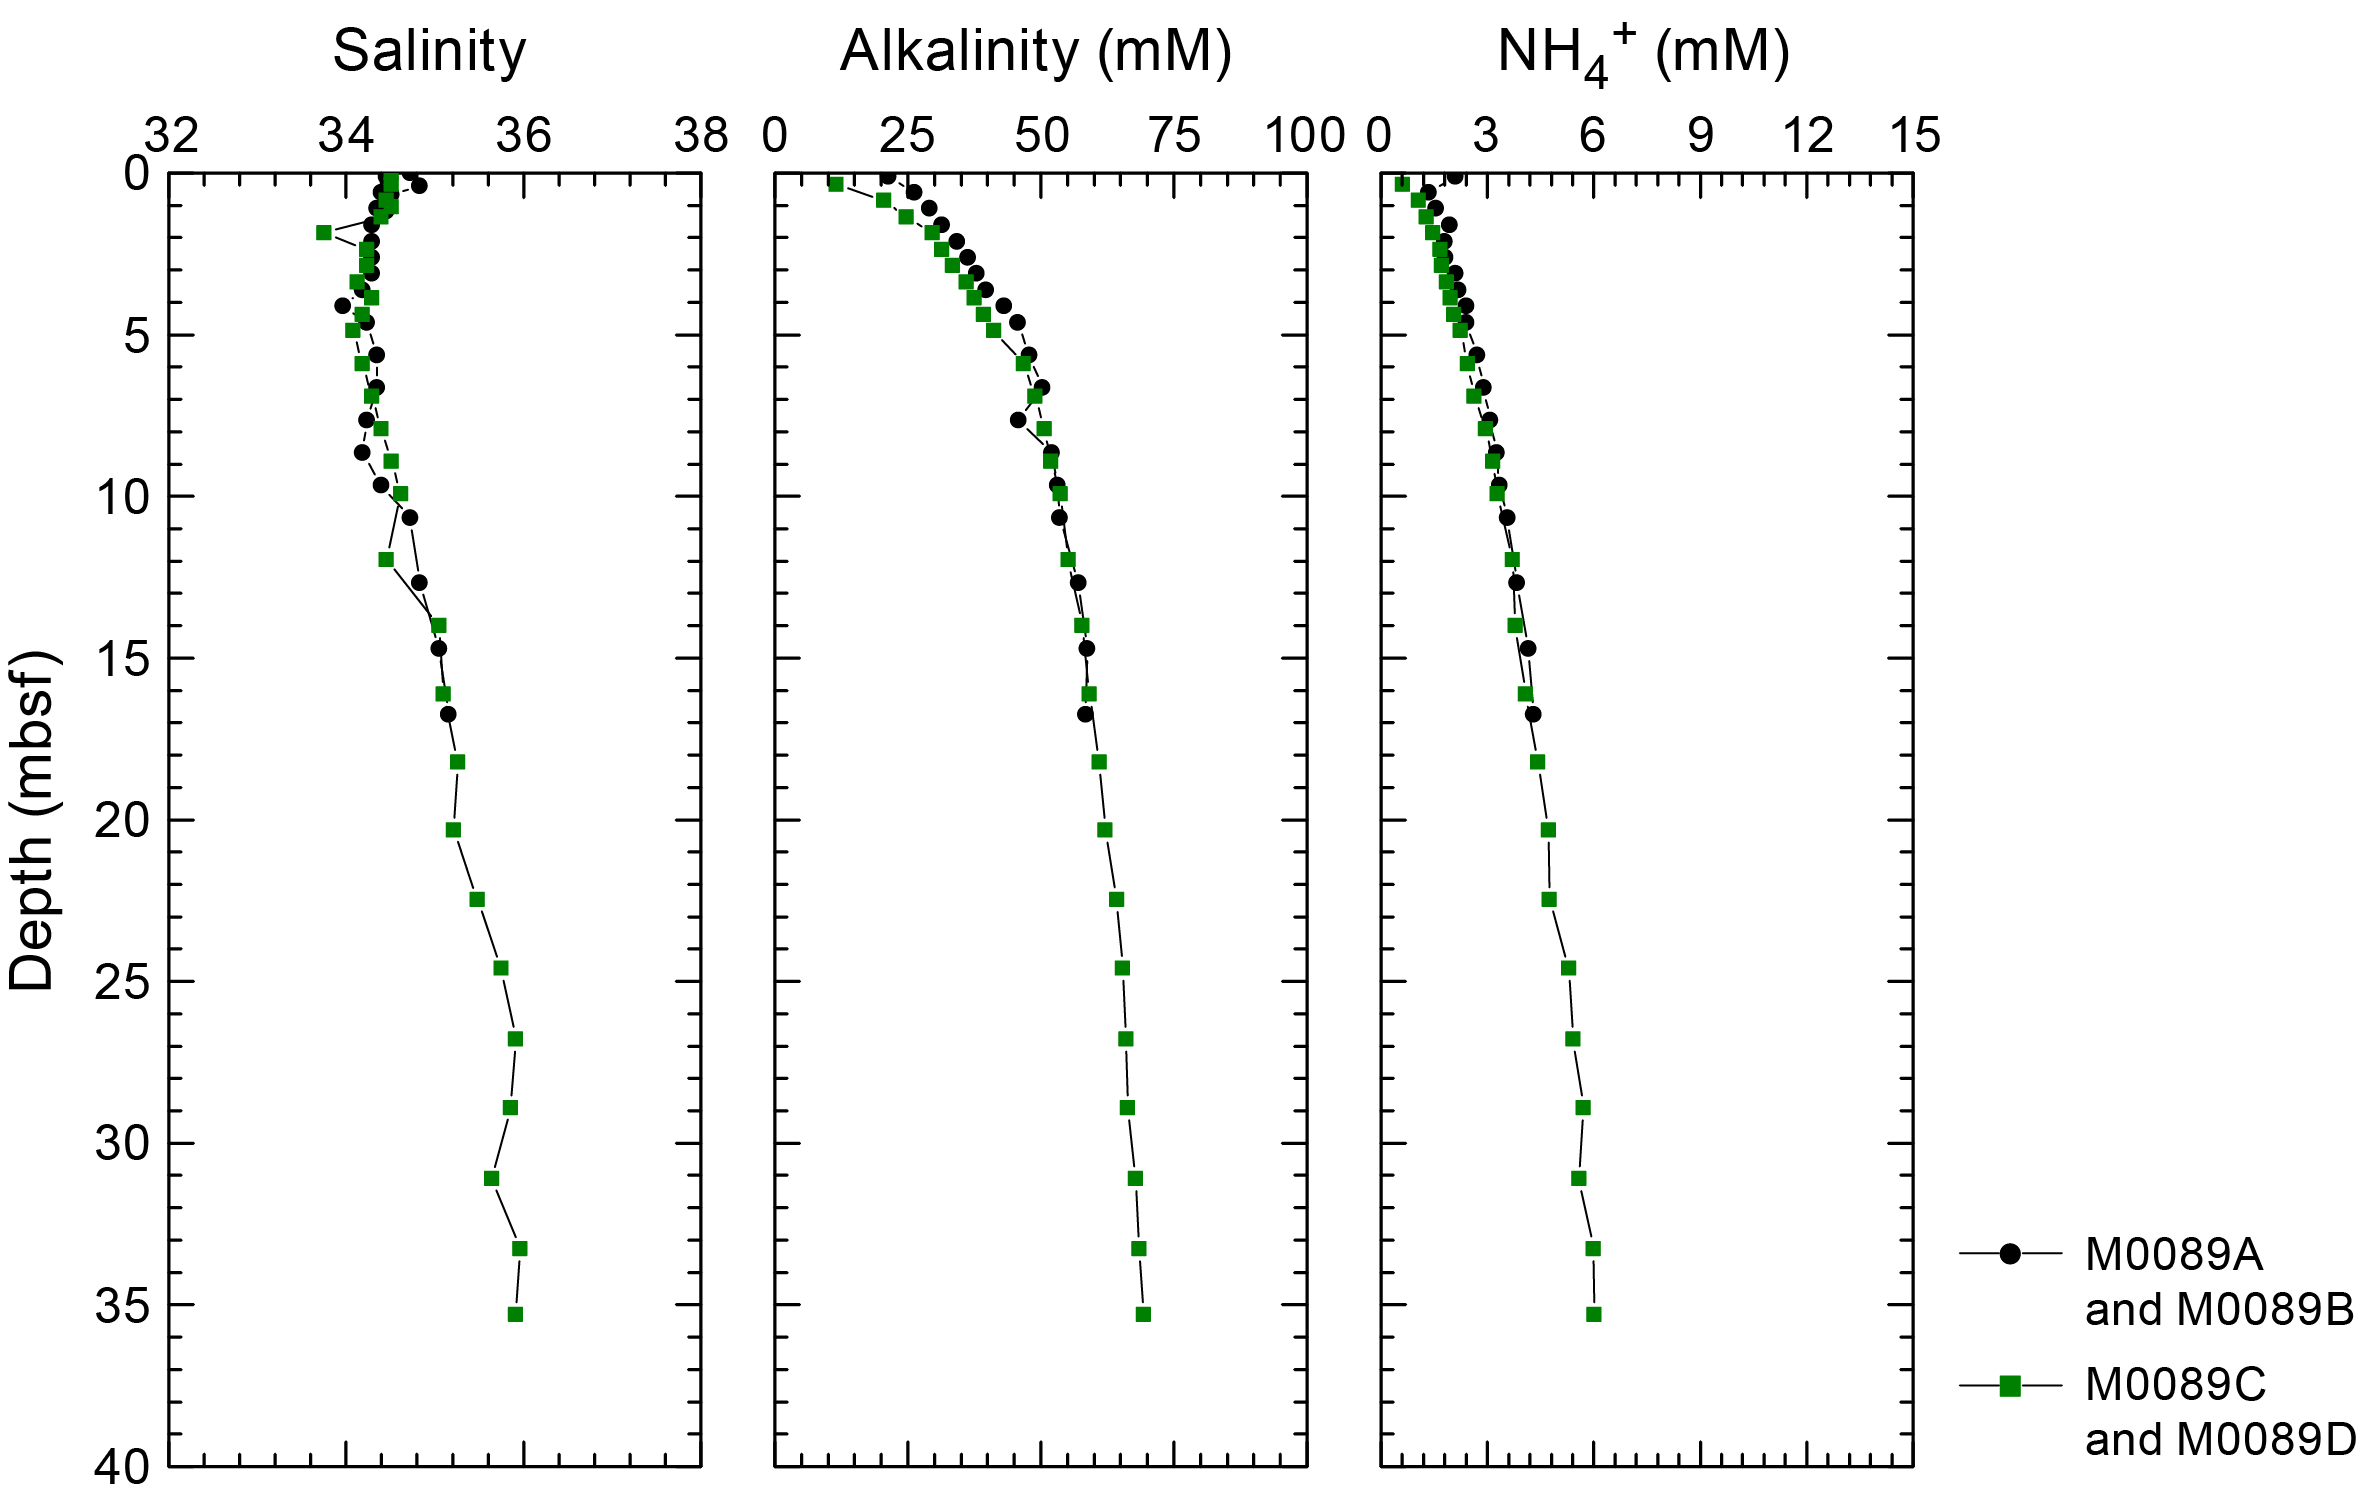
Figure F35. IW salinity, total alkalinity, and ammonium concentrations, Site M0089.
6.1.2. Shore-based analysis
6.1.2.1. Dissolved vanadium, molybdenum, and uranium
A suite of trace metals were analyzed using inductively coupled plasma-mass spectroscopy (ICP-MS) (including vanadium [V], molybdenum [Mo], and uranium [U], briefly described below, as well as copper [Cu] and rubidium [Rb]) (Tables T9, T10).
At Site M0083, dissolved V concentrations in the trigger cores are between ~65 and 95 nM, with no systematic patterns of increase or decrease (Figure F36). In the GPC cores, V concentration patterns are similar between Holes M0083B and M0083D, with V concentrations mostly between ~70 and 100 nM in the uppermost ~8–10 m and ~40–50 nM at ~17 mbsf. Below this depth, a gradual increase brings V concentrations to ~160 nM at the bottom of Hole M0083D (~35 mbsf). In Hole M0083F, however, a linear V decrease from the top GPC sample reaches zero from ~3 to 6 mbsf. This is followed by a downcore increase to ~260 nM at the bottom of Hole M0083F (~35 mbsf).
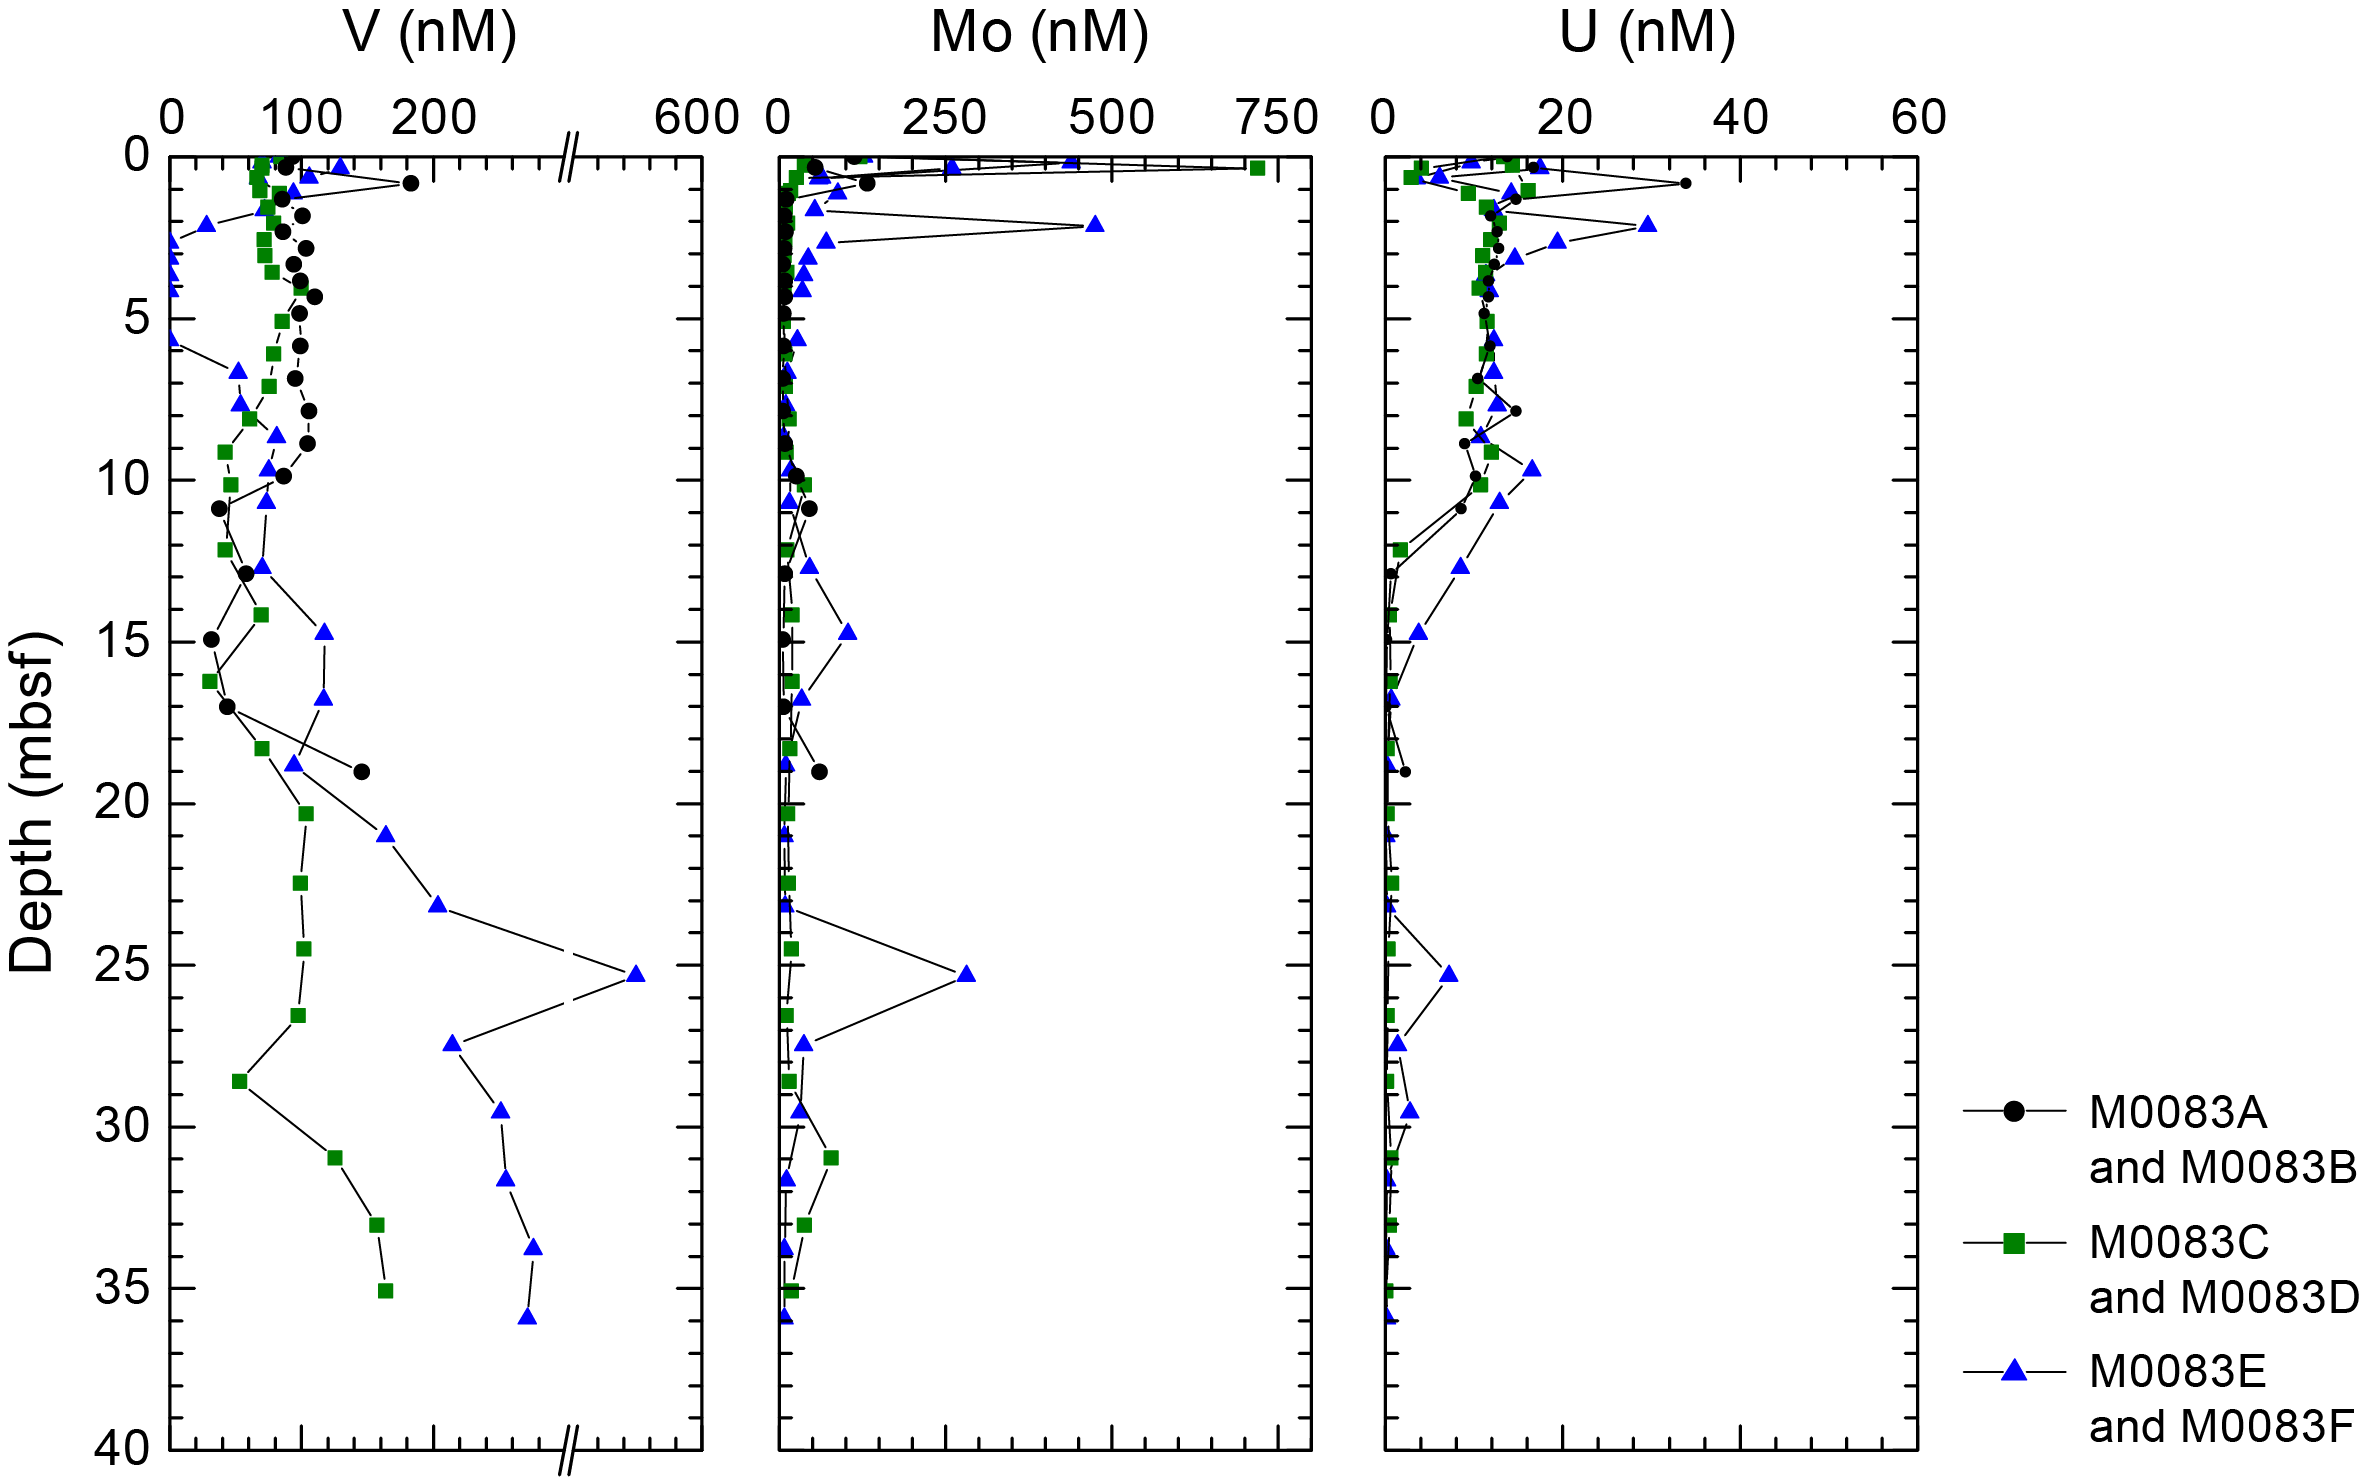
Figure F36. IW V, Mo, and U concentrations, Site M0083.
Dissolved Mo concentrations are ~110–120 nM in the BW, followed by rapid increases to ~400–700 nM between ~0.15 and 0.35 mbsf in the trigger cores (Figure F36). Below these maxima, Mo drops to much lower values, reaching ~15–60 nM at the bottom of the trigger cores. The GPC samples from Holes M0083B and M0083D show similar patterns overall, but similar to V, Mo differs in Hole M0083F. In Holes M0083B and M0083D, the highest values (~35–135 nM) at the top of the GPC cores are followed by a downcore decrease, and values below 10 nM persist to ~9 mbsf. Between ~9 and 13 mbsf, there is a local increase to ~45 nM. Below ~13 mbsf, Mo concentrations remain mostly below 20 nM to the bottom of the holes. In Hole M0083F, isolated maxima up to ~480 nM occur in the uppermost ~3 m, followed by a decrease to less than 10 nM between ~7 and 11 mbsf, a local maximum of ~100 nM between ~11 and 17 mbsf, and values mostly below 20 nM to the bottom of the hole.
Dissolved U concentrations at the top of the trigger cores are ~13–14 nM, and values decrease to ~1 nM toward the deeper parts of the cores (Figure F36). In the GPC cores, U profiles exhibit the highest values in the uppermost ~10 m, with peaks reaching ~30 nM in the uppermost ~3 m, followed by a decrease in concentration below ~10 mbsf and values of less than 1 nM at ~13 mbsf in Holes M0083B and M0083D and at ~17 mbsf in Hole M0083F. Values remain at comparable low levels to the base of the cores.
In Hole M0089A, values range ~110–200 nM, whereas values in Hole M0089C are ~70 nM or less (Table T10). In Hole M0089B, V concentrations are mostly ~150–200 nM to ~5 mbsf and then drop rapidly to ~100 nM and remain at this level to the bottom of the hole (Figure F37). In Hole M0089D, V concentrations show some minor variability but overall remain stable, mostly between ~100 and 140 nM to the base of the core.
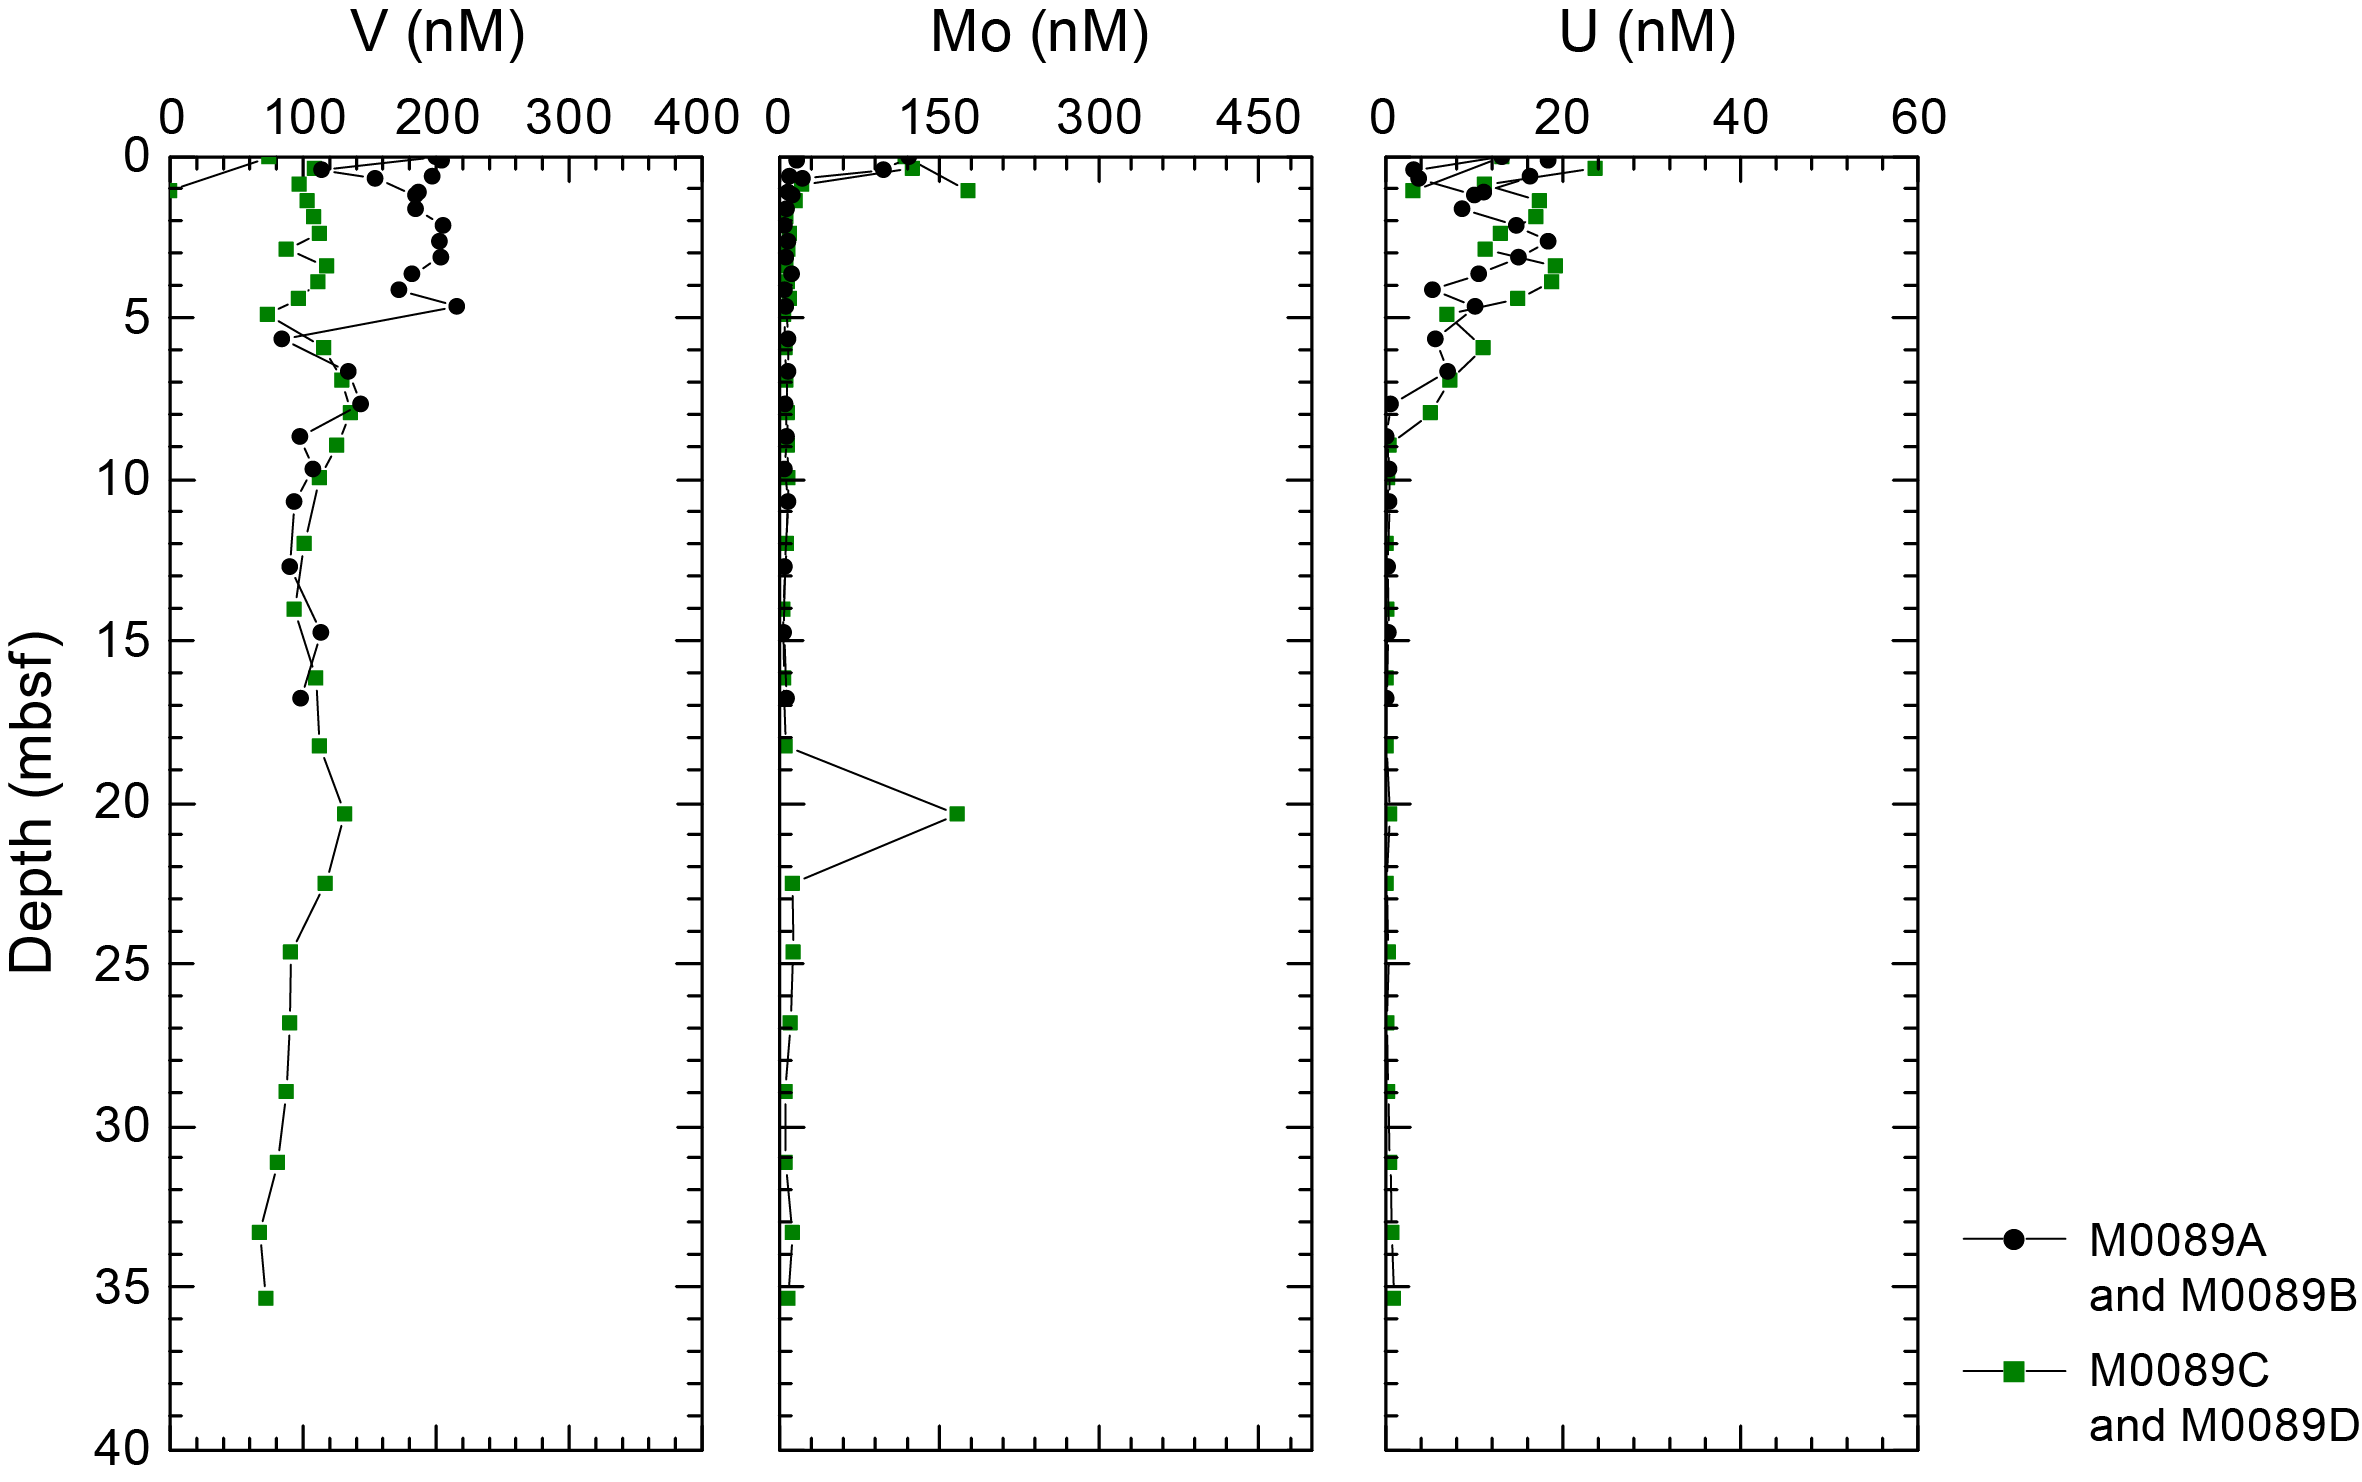
Figure F37. IW V, Mo, and U concentrations, Site M0089.
The highest dissolved Mo concentrations (~120 nM in Hole M0089A and ~180 nM in Hole M0089C) are found in the trigger cores (Figure F37). These maxima are followed by a rapid decrease. Below the uppermost ~1 m, Mo rarely rises above 10 nM in the GPC cores.
Dissolved U concentrations at the top of the trigger core are ~13–14 nM, and values decrease to ~3–4 nM in the deeper parts of the core (Figure F37). In the GPC cores, U profiles exhibit maximum values in the uppermost ~4 m and peaks reach ~20 nM, followed by a decrease to ~8 mbsf and low values, mostly below 1 nM, to the base of the cores.
6.1.2.2. Dissolved lithium, boron, silica, manganese, iron, strontium, and barium
All minor elements analyzed using inductively coupled plasma–optical emission spectroscopy (ICP-OES) are listed in Tables T9 and T10.
At Site M0083, the highest values of dissolved lithium (Li) (~28 µM) are at the top of the trigger core from Hole M0083E (0.17 mbsf) (Figure F38). All other IW samples are lower than BW values (~27 µM), mostly lower than ~21 µM. Li decreases to minimum values of ~15 µM at ~17 mbsf. This is followed by a downcore increase to ~18 µM at ~26 mbsf and another gradual downcore decrease to ~15 µM at ~36 mbsf.
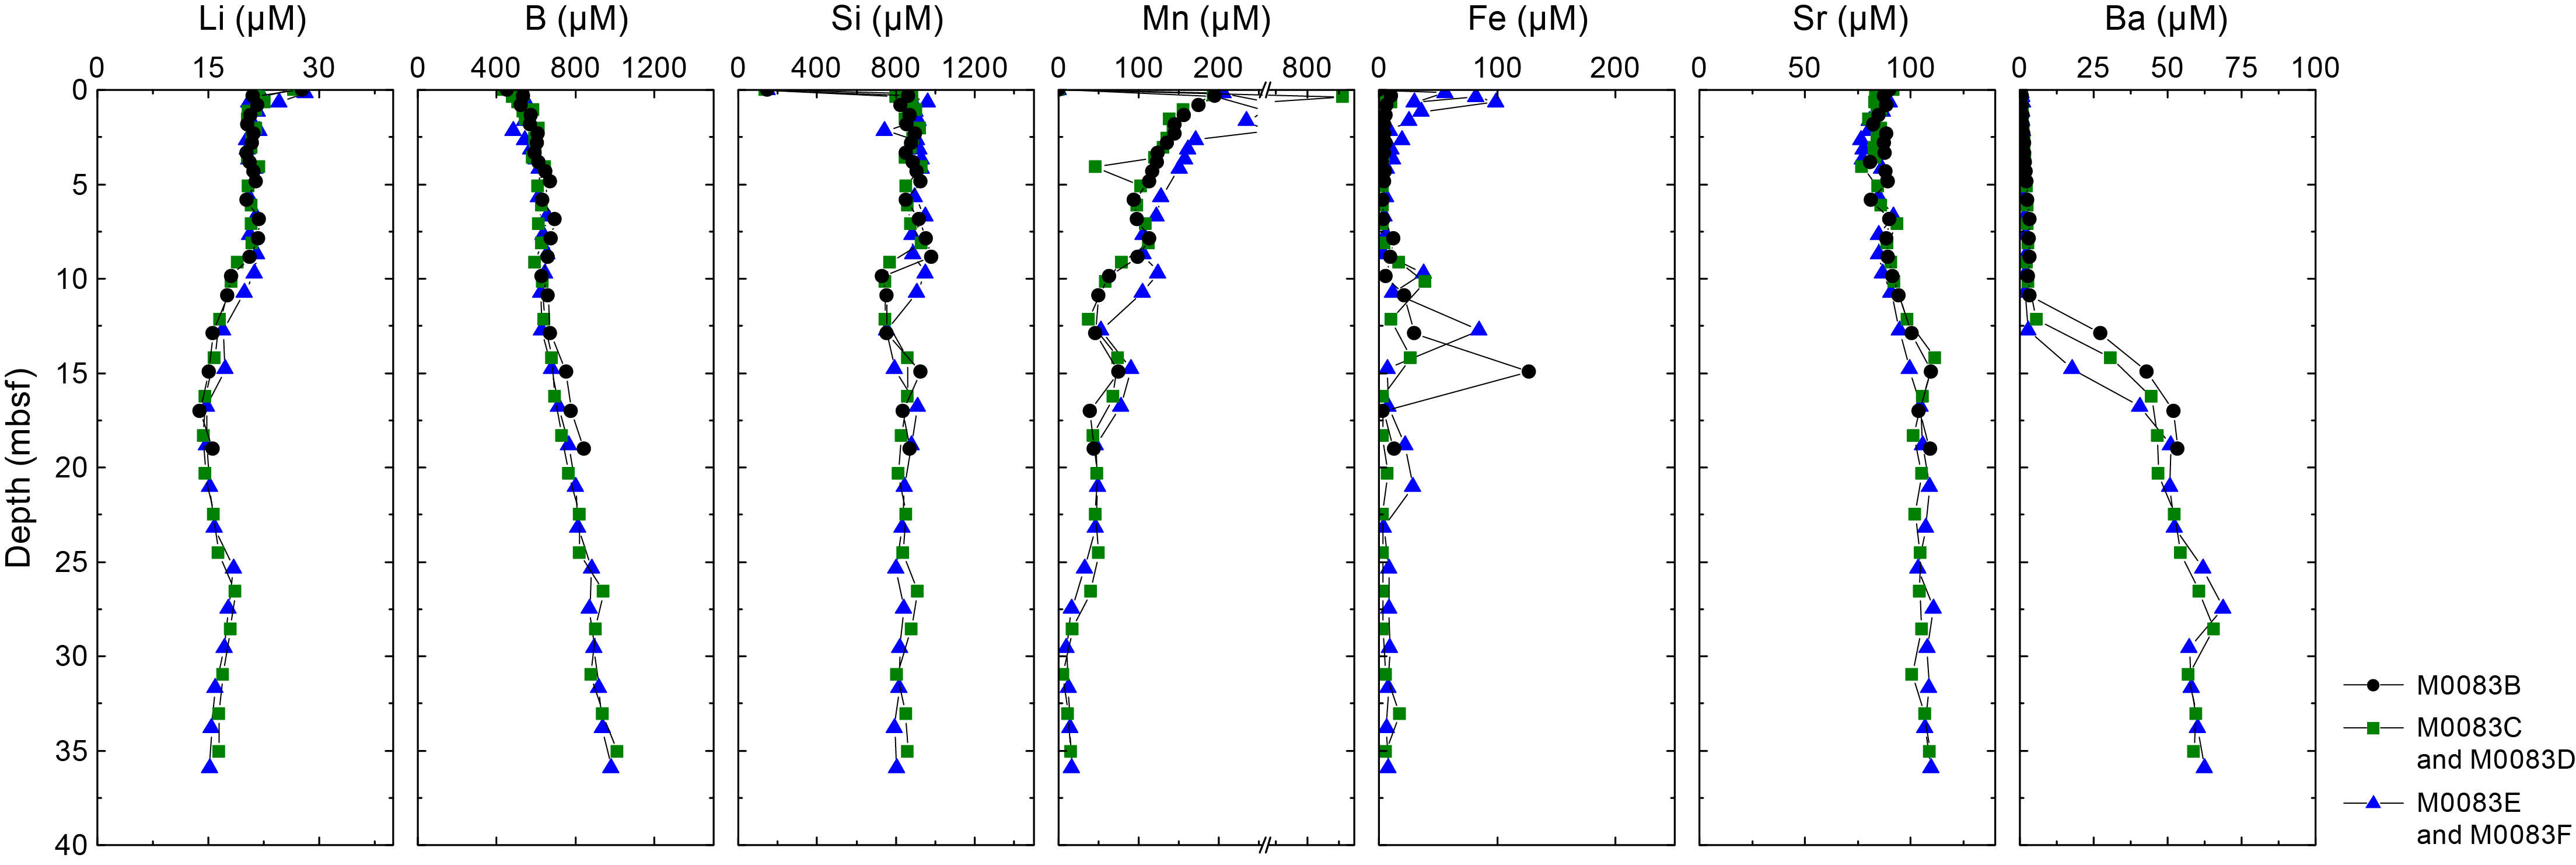
Figure F38. IW Li, B, Si, Mn, Fe, Sr, and Ba concentrations, Site M0083.
Dissolved boron (B) shows minimum values of ~450 µM in the BW. Values rise from ~480 to 560 µM through the top meter represented by the trigger cores (Figure F38). The GPC cores all have values over 500 µM followed by a gradual increase downcore to ~1000 µM at ~36 mbsf and below.
BW samples have the lowest values of dissolved silica (Si) (~140 µM), which is around 800 µM at top of the trigger cores (Figure F38). Silica concentrations remain above 800 µM over the entire length of the GPC cores, with one minor dip centered around ~12 mbsf, where values decrease to a minimum of ~750 µM.
Dissolved manganese (Mn) shows low values (~0.1 µM) in the BW. Trigger cores show a rapid increase from ~200 µM at ~0.2 mbsf to ~1000 µM at ~0.4 mbsf (Figure F38). In the GPC cores, this subseafloor maximum is recorded to different extents (~190 µM in Holes M0083B and M0083D; ~450 µM in Hole M0083F). Common to all holes, below the maximum values there is a more or less exponential stepped Mn decrease, with a first minimum of ~100–120 µM at ~5–7 mbsf, a minor recovery at ~8 mbsf, a second minimum of ~40 µM at ~12 mbsf, another minor recovery at ~15 mbsf, and a third minimum of ~30 µM at ~17 mbsf. Values are then relatively stable between ~30 and 35 µM to ~25 mbsf, below which depth they decrease to less than ~20 µM.
Dissolved iron (Fe) concentrations are below or at the quantification limit in the BW. Fe concentrations at the top of the trigger cores are variable but greater than 10 µM and as high as 59 µM (Figure F38). In the GPC cores, the Fe subseafloor maximum of ~100 µM is only recorded in the uppermost ~1–2 m of Hole M0083F and is not found in Holes M0083B and M0083D. Below ~10 mbsf in Holes M0083B and M0083D and ~2 mbsf in Hole M0083F, Fe concentrations are less than 5 µM to ~10 mbsf. Between ~10 and 15 mbsf, Fe concentrations increase to ~80–120 µM. Farther downcore, Fe mostly returns to concentrations below 10 µM.
Dissolved strontium (Sr) concentrations in the BW are between ~87 and 90 µM. Values in the trigger cores are mostly lower and around 85 µM (Figure F38). The tops of the GPC cores are as low as ~80 µM, and these low values persist through the uppermost ~10 m of the GPC cores. This is followed by an increase to ~105–110 µM at ~15 mbsf, and stable values remain at this level to the bottom of the holes.
Dissolved barium (Ba) values are lowest (~0.2 µM) in the BW and are greater than 0.5 µM in the IW of the trigger cores (Figure F38). In the GPC cores, concentrations increase gradually to ~5 µM at ~11–12 mbsf and then increase more rapidly to ~55 µM at ~17 mbsf. Farther downcore, Ba concentrations remain more or less stable around 55–65 µM, with a minor increase to ~70 µM centered around ~27 mbsf.
At Site M0089, The highest values of dissolved Li (~27 µM) are found in the BW. Values lower than 24 µM are found in the trigger cores (Figure F39). The GPC cores have Li concentrations less than 24 µM, followed by a mostly linear decrease to ~14 µM at ~5 mbsf, an initially steep and then more gradual downcore decrease ~13 µM at ~10 mbsf, and a return to ~15 µM at ~20 mbsf and below.

Figure F39. IW Li, B, Si, Mn, Fe, Sr, and Ba concentrations, Site M0089.
Dissolved B shows the lowest values (~440 µM) in the BW. The trigger core from Hole M0089A has a similar value at 0.4 mbsf, but all other values in the trigger cores are greater than 500 µM (Figure F39). In the GPC core, concentrations as low as 500 µM are followed by a relatively steady and gradual increase to ~850 µM at ~25 mbsf and below for all cores at this site.
Dissolved Si shows the lowest values (~140 µM) in the BW. Values of ~800 µM are seen at the top of the trigger cores, increasing rapidly to 900 µM (Figure F39). Si concentrations are ~900 µM at the top of the GPC cores, and then dissolved Si decreases gradually downcore to ~780 µM at ~35 mbsf.
Dissolved Mn is low (~0.2 µM) in the BW. The highest IW Mn concentrations are found at the top of the trigger cores, with values of ~520–610 µM at ~0.4 mbsf (Figure F39). In the GPC cores, Mn concentrations are highest at the top and ~150 µM in the uppermost ~3–4 m. This is followed by an exponential Mn decrease that reaches ~10 µM at the bottom of Hole M0089D.
Dissolved Fe is below the minimum quantification limit in the BW. Iron concentrations in the trigger cores are ~60–90 µM at ~0.4 mbsf (Figure F39). Throughout all GPC cores from Site M0089, dissolved Fe concentrations remain mostly below 10 µM, with the most elevated values near the top.
Dissolved Sr concentrations in the BW and trigger cores are ~90 µM (Figure F39). The top intervals of the GPC cores are characterized by slightly fluctuating Sr concentrations (80–85 µM) to ~5 mbsf. This is followed by a relatively linear increase to ~95–100 µM at ~10 mbsf and more or less stable values (~100 µM) below that depth.
Dissolved Ba values are lowest (~0.2 µM) in the BW. Ba concentrations are <50 µM at the top of the trigger cores (Figure F39). In the GPC cores, concentrations fluctuate between ~4 and 6 µM to ~5 mbsf and then increase more rapidly, reaching ~50–60 µM at ~8–10 mbsf. Farther downcore, Ba concentrations remain more or less stable around ~60–70 µM to ~26 mbsf, and then concentrations of Ba decrease to reach ~40 µM at ~36 mbsf.
6.1.2.3. Chloride, bromide, and sulfate
All anions analyzed using ion chromatography (IC) are listed in Tables T9 and T10. Dissolved Cl− values are similar to seawater values (Bruland et al., 2014) throughout the cores, ranging ~540–560 mM at Site M0083 (Figure F40).
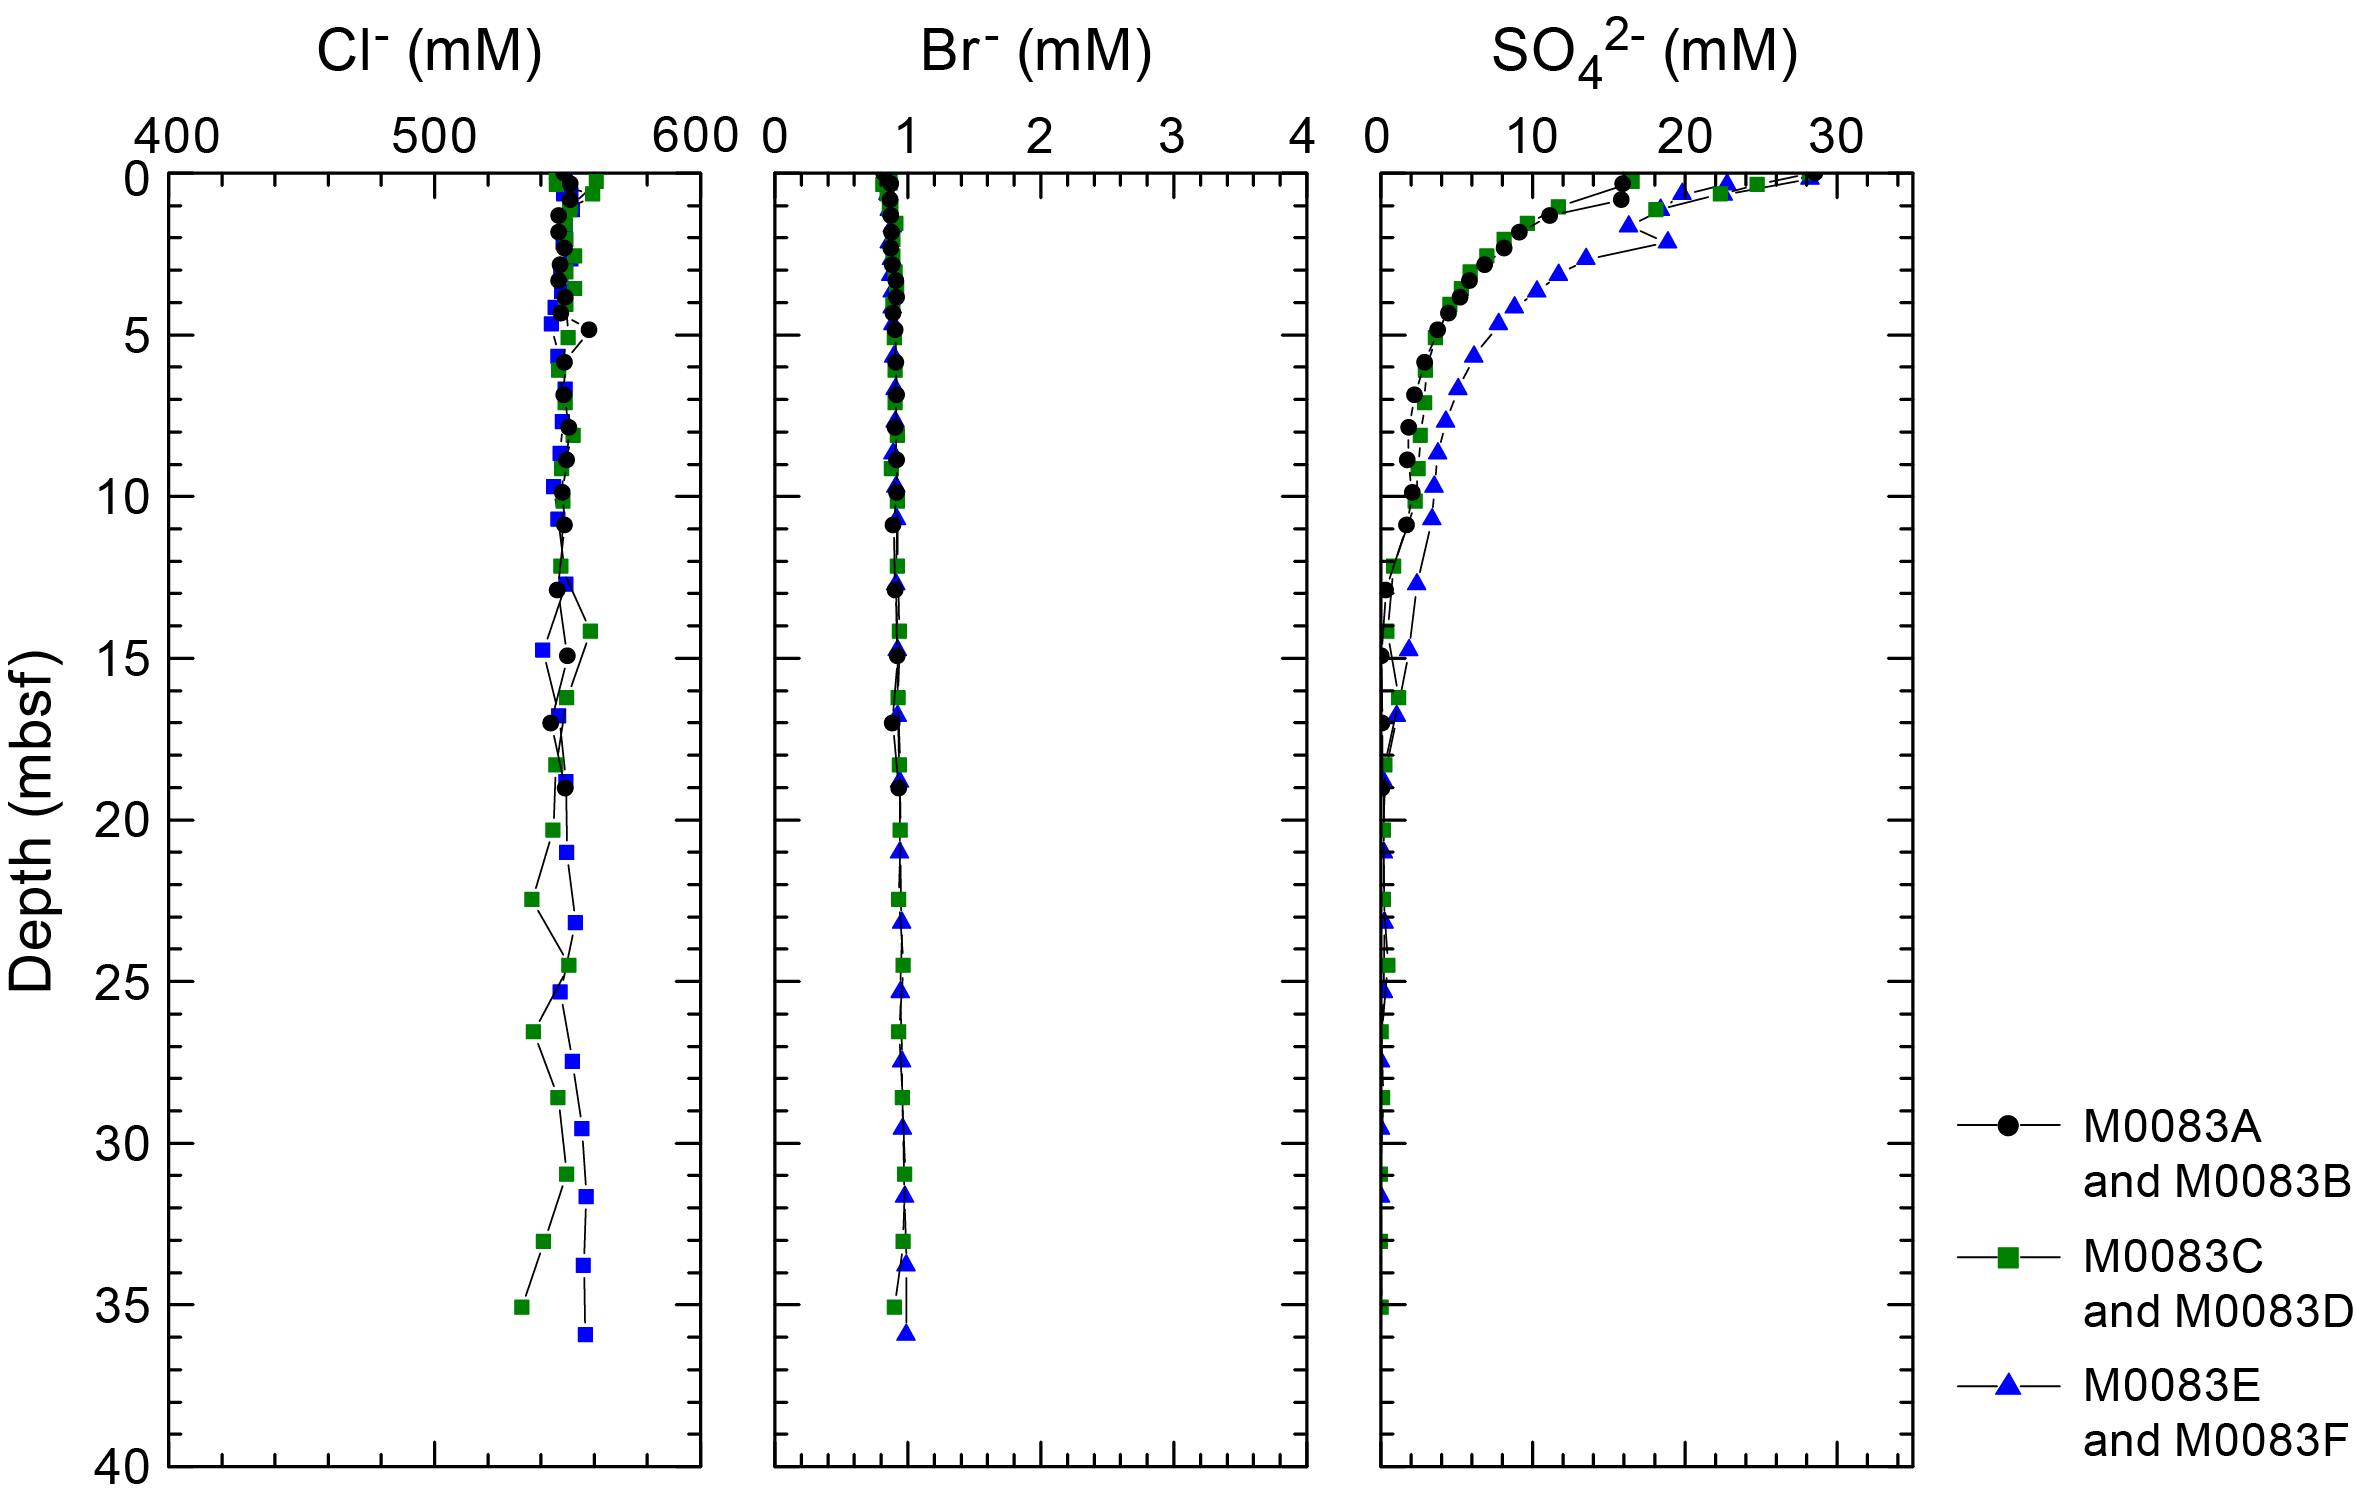
Figure F40. IW Cl−, Br−, and SO42− concentrations, Site M0083.
Dissolved Br− concentrations show continuous and quasilinear increases with depth for all holes, starting at seawater values of ~0.820 mM (Bruland et al., 2014) at the top of the trigger cores and reaching values of around 1 mM at ~36 mbsf (Figure F40).
Dissolved SO42− concentrations in all holes show seawater values (Bruland et al., 2014) of ~28–29 mM at the top of the trigger cores and then exhibit an exponential decrease with depth to a minimum of about 0.1 mM at ~15 mbsf in Holes M0083B and M0083D (Figure F40). In Hole M0083F, the sulfate gradient has the same shape but is shifted downward, reaching the minimum at ~18 mbsf.
Dissolved Cl− values in Hole M0089B display two maxima of ~570–580 mM (Bruland et al., 2014) at ~3 and ~8 mbsf. In Hole M0089D, Cl− concentrations are similar to seawater values throughout, ranging ~540–560 mM (Figure F41).

Figure F41. IW Cl−, Br−, and SO42− concentrations, Site M0089.
Dissolved Br− concentrations show continuous and linear increases with depth in all holes, starting at seawater values (~0.820 mM; Bruland et al., 2014) in the BW and trigger cores and reaching values around 1 mM from ~17 mbsf in the GPC cores to the bottom of Hole M0089D (~35 mbsf) (Figure F41).
Dissolved SO42− concentrations show seawater values (~28–29 mM; Bruland et al., 2014) in the BW. The IW from the trigger cores show a trend of higher dissolved SO42− concentrations at the top (lower than seawater values) (Figure F41). All dissolved SO42− concentrations of IW from the tops of the GPC core have lower than seawater concentrations of ~21–23 mM. In Holes M0089B and M0089D, SO42− profiles then show an exponential decrease from the shallowest sample to values near 0 mM at ~3–4 mbsf. Values are stable to the bottom of the holes, where values are below the detection limit.
6.1.2.4. Sodium, potassium, calcium, and magnesium
Dissolved Na+ concentrations at Site M0083 fluctuate unsystematically and are mostly above average seawater values (~470 mM; Bruland et al., 2014) in all holes, ranging ~435–573 mM. Dissolved K+ concentrations are highest in the trigger cores and at the top of the GPC cores in all holes, up to ~12 mM, which is slightly higher than average seawater values (~10 mM). A linear decrease from the top reaches the lowest values (~9 mM) at ~3 mbsf in all holes, and values remain at 9–10 mM to ~15 mbsf. Below this depth, values increase again to ~11–12 mM below 25 mbsf.
Dissolved Ca2+ concentrations are around seawater values (~10 mM; Bruland et al., 2014) in the trigger cores and at the top of the GPC cores in all holes, followed by a more or less linear decrease with depth to ~6 mM at the bottom of the holes.
Dissolved Mg2+ concentrations are around average seawater values (~53 mM; Bruland et al., 2014) in the trigger cores and at the top of the GPC cores in all holes and then gradually increase with depth to ~65–70 mM at the bottom of the holes.
At Site M0089, dissolved Na+ concentrations fluctuate and are almost always above average seawater values (~470 mM; Bruland et al., 2014) in both holes, ranging ~465–624 mM.
Dissolved K+ concentrations in both holes are consistently above seawater values (~10 mM; Bruland et al., 2014), ranging ~10.5–14.0 mM with a slight trend to higher values (~11–12 mM) in the trigger cores and near the tops of the GPC cores, slightly lower values (~10–11 mM) between ~5 and 13 mbsf, and slightly higher values (~11–13 mM) from ~13 mbsf to the bottom of Hole M0089D.
Dissolved Ca2+ concentrations are around average seawater values (~10 mM; Bruland et al., 2014) in the trigger cores and at the tops of the GPC cores, ranging ~9–19 mM. From the shallowest samples, there is a gradual, near-exponential decrease in concentrations to ~6 mM at ~13 mbsf. Values remain at this low level (6–7 mM) to ~22 mbsf in Hole M0089D, and below this depth they increase downcore to ~10 mM at ~33 mbsf.
Dissolved Mg2+ concentrations are mostly above seawater values (~53 mM; Bruland et al., 2014) in both holes, ranging ~48–75 mM with a slight overall trend to higher values with increasing core depth.
The IC cation data is only presented in GEOCHEM in Supplementary material because the samples require postexpedition analysis for validation of absolute values (analytical accuracy).
6.2. Shore-based H2S analysis
At Sites M0083 and M0089, H2S concentrations were below the detection limit in all samples (see GEOCHEM in Supplementary material).
6.3. Headspace gas analysis: methane, ethane, and C1/C2 ratio
The offshore headspace gas analysis was mainly performed on the longest GPC core recovered. A total of 38 headspace samples were measured from Holes M0083C (trigger core) and M0083D (GPC core) for hydrocarbon compositions, and a total of 36 headspace samples were measured from Holes M0089C (trigger core) and M0089D (GPC core) (Tables T11, T12).
At Site M0083 between 0 and 8.285 mbsf, methane concentrations are low but constant, ranging ~260–515 ppmv (Figure F42). Between 8.285 and 14.34 mbsf in Hole M0083D, methane concentrations increase rapidly to 9989 ppmv. Methane concentrations fluctuate between 5183 and 9989 ppmv from 14.34 to 20.56 mbsf before increasing to 10,244–21,933 ppmv downcore to the base of Hole M0083D at 36.315 mbsf. The methane/ethane (C1/C2) ratios mostly follow the methane profile pattern and are consistently >5000 below ~8 mbsf.

Figure F42. Methane, ethane, and methane to ethane ratio, Holes M0083C and M0083D.
From 0 to 6.05 mbsf at Site M0089, methane remains at a low concentration (107–2,766 ppmv) (Figure F43). Between 6.05 and 16.275 mbsf in Hole M0089D, methane concentrations increase rapidly to 16,855 ppmv. Below this depth, concentrations remain relatively stagnant with fluctuations. At 28.02 mbsf, the methane concentration reaches the maximum (29,085 ppmv).
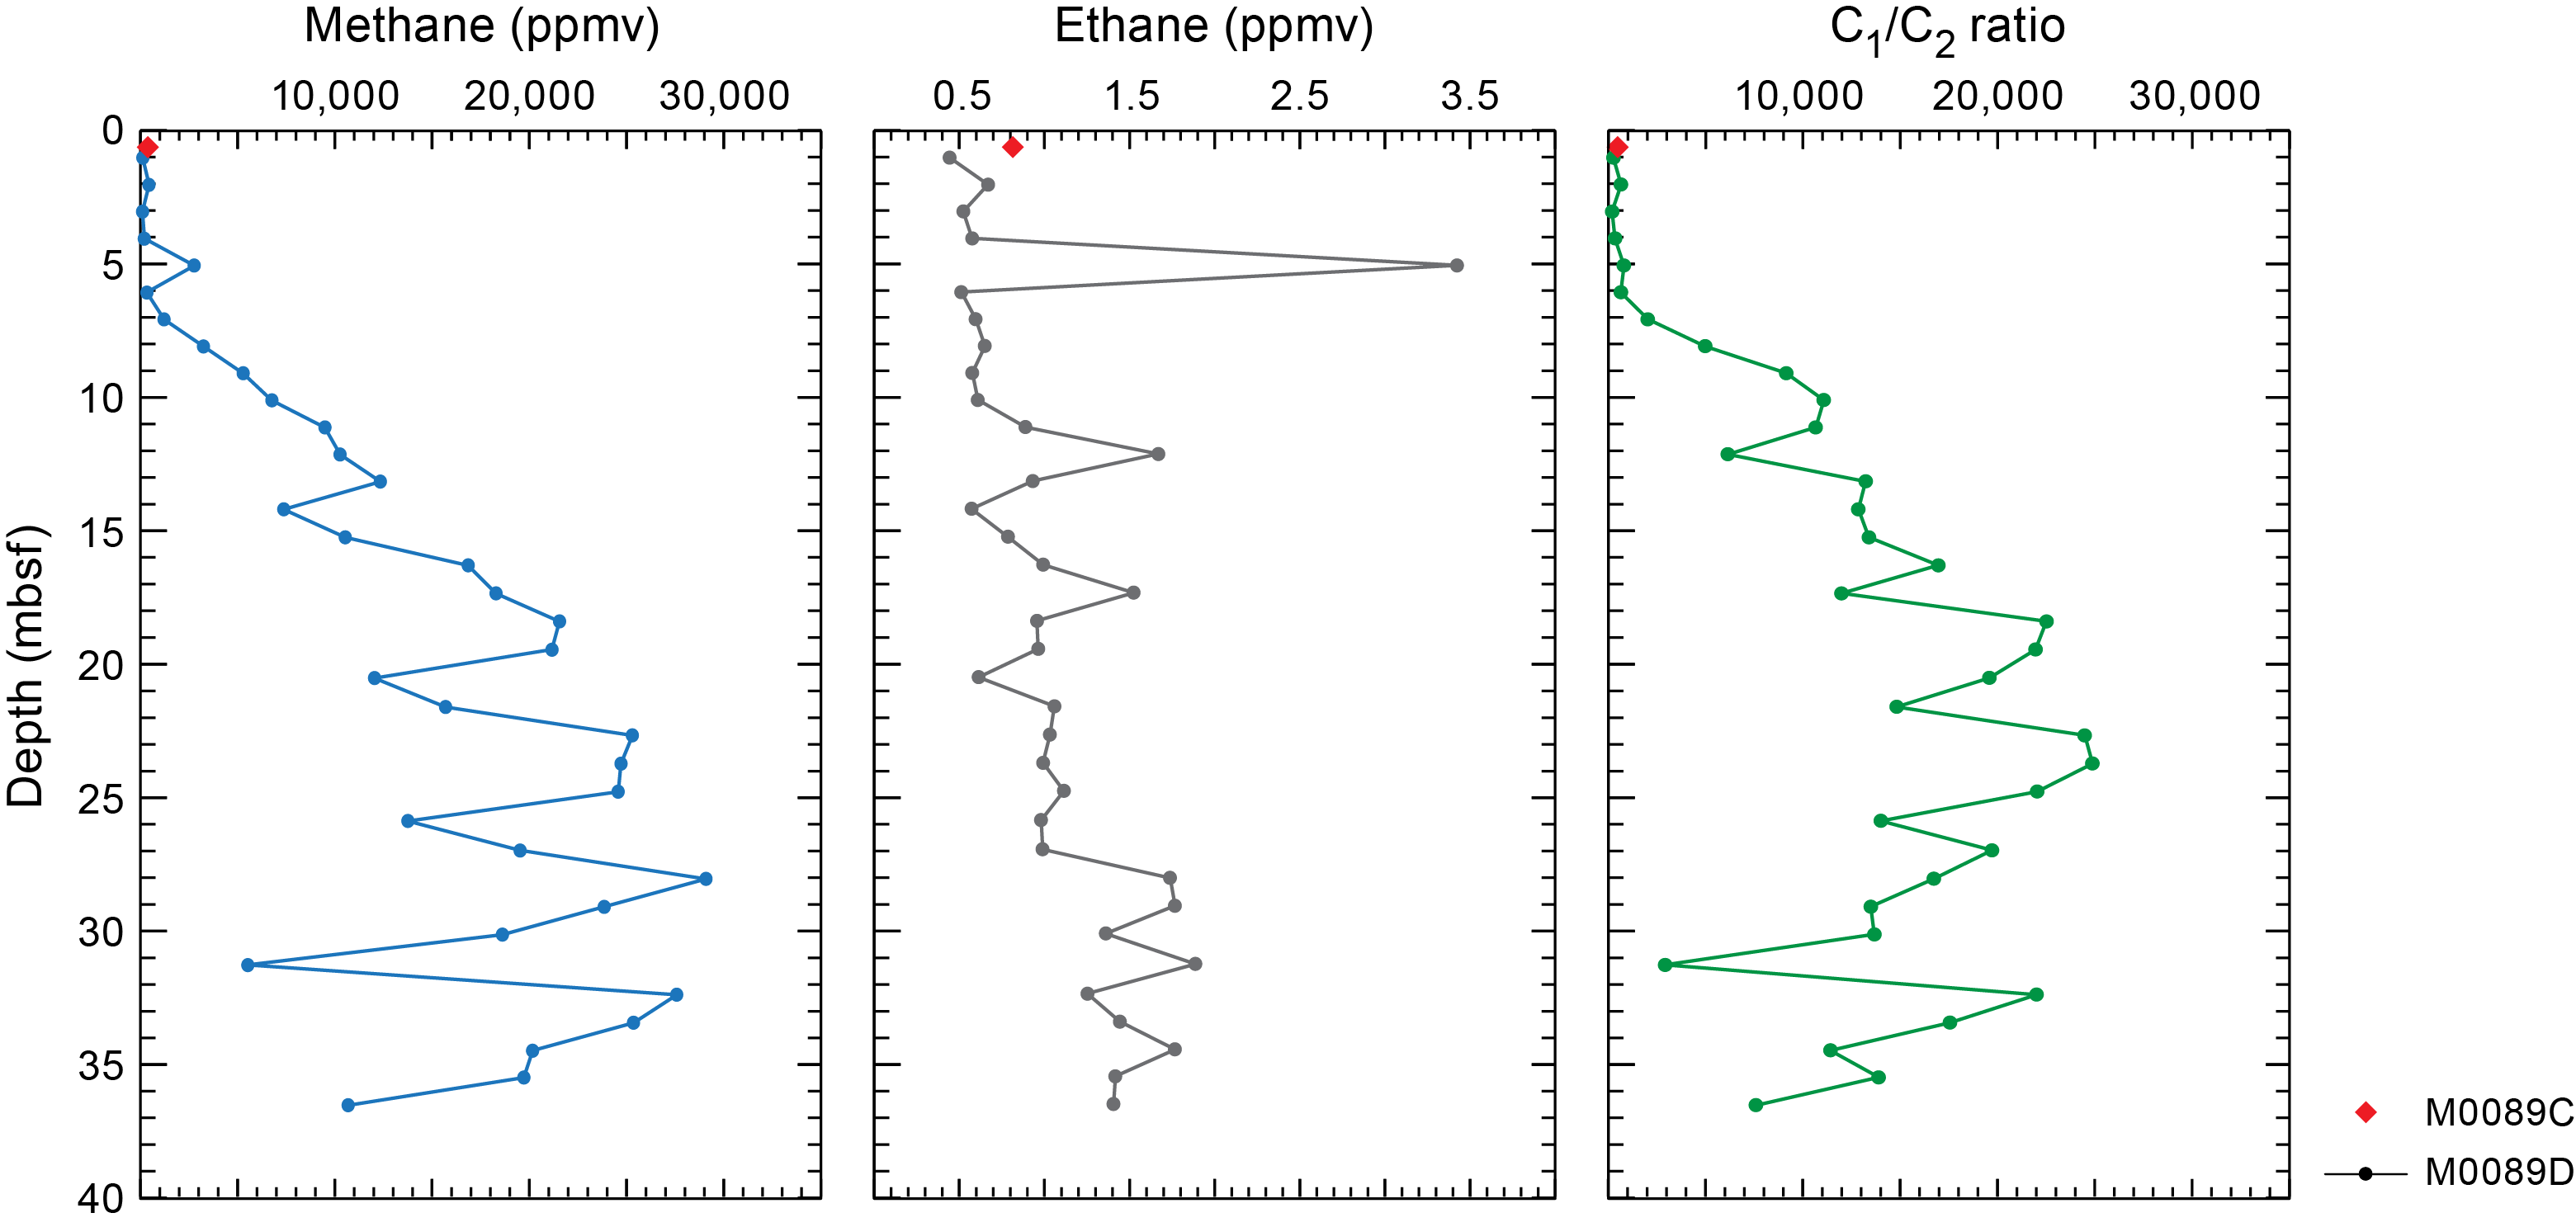
Figure F43. Methane, ethane, and methane to ethane ratio, Holes M0089C and M0089D.
Ethane (C2H4 and C2) at Site M0089 was detected in relatively constant but low concentrations (0.44–1.88 ppmv) in all headspace samples (Figure F43). One outlier with a concentration of 3.42 ppmv is found at 5.045 mbsf. Methane/ethane (C1/C2) ratios follow the methane profile pattern and are consistently >5000 below ~9 mbsf. A methane/ethane outlier at 31.245 mbsf shows a ratio decline to 2926.
Alongside C1 and C2, other hydrocarbon gases such as ethylene (C2=), ethane (C2), propene/propylene (C3=), propane (C3), and n-butane (n-C4) were detected and measured, but their concentrations are very low, generally less than 1 ppmv at all sites (see GEOCHEM in Supplementary material).
6.4. Shore-based solid-phase analysis
6.4.1. Aluminum, calcium, silica, iron, and manganese
The solid-phase elements measured by XRF, including aluminum (Al), calcium (Ca), silica (Si), Iron (Fe), and manganese (Mn), briefly described below, in addition to Ba, Br, Cr, Cu, K, Mg, Ni, P, Sr, Ti, V, Zn, and Zr, are listed in Tables T13 and T14.
Solid-phase Al contents at Site M0083 range ~3–6 wt% (28,874–59,230 mg/kg; Figure F44). In all holes, a common downcore pattern is observed: relatively low contents (~2–3 wt%) in the uppermost 0–9 m are followed by an interval of higher contents (~4–6 wt% in Holes M0083D and M0083F; ~4 wt% in Hole M0081B) between ~9 and 20 mbsf and a drop to lower and stable values (around 4 wt%) between ~20 and 27 mbsf. Below ~27 mbsf, Al increases again to ~5.5 wt% at ~36 mbsf.

Figure F44. Al, Ca, Fe, Mn, and Si, Site M0083.
Ca contents range ~0.7–1.7 wt% (7,422–17,579 mg/kg; Figure F44). Intervals with higher Ca contents are common to all holes and occur between ~2 and 7 mbsf (up to ~1.2 wt%), between ~10 and 15 mbsf (up to ~1.7 wt%), around 26 mbsf (up to ~1.4 wt%), and around 34 mbsf (up to ~1.3 wt%).
Si contents range ~17–30 wt% (172,352–303,362 mg/kg; Figure F44). In Hole M0083B, high values in the trigger core and at the top of the GPC core are followed by a stepped downcore decrease, reaching ~17 wt% at ~13 mbsf. Values then recover abruptly to reach ~25–28 wt% between 15 and 20 mbsf. In Holes M0083D and M0083F, Si contents are more stable, mostly ranging ~25–30 wt% throughout the holes.
Fe contents range ~2.6–4.1 wt% (26,403–40,502 mg/kg; Figure F44). In all holes, a common downcore pattern is expressed, resembling that of Al: relatively low contents (~2.8–3.1 wt%) in the uppermost 0–10 m are followed by an interval of higher contents (~3.5–4.0 wt%) between ~10 and 15 mbsf and a drop to lower values (around 2.6 wt%) around 17–18 mbsf. Around 20–22 mbsf, there is another high Fe interval (~2.4–2.8 wt%) followed by a trough-shaped decrease downcore and another high of ~3.5 wt% below ~30 mbsf to the bottom of the holes (~37 mbsf).
Solid-phase Mn contents range ~0.04–0.9 wt% (431–8808 mg/kg; Figure F44). In all holes, a common downcore pattern is expressed: relatively low values between ~0.04 and 0.07 wt% characterize the uppermost ~7 m. Higher values (~0.10–0.14 wt%) are reached between ~7 and 14 mbsf, followed by a drop to lower values (~0.05–0.06 wt%) between ~14 and 18 mbsf. The deeper half of the record in Holes M0083D and M0083F is characterized by a low baseline Mn content (~0.05–0.06 wt%), but several isolated peaks at ~21 mbsf (~0.6 wt%; Hole M0083F only) and ~34 mbsf (~0.7–0.9 wt%; Holes M0083D and M0083F).
Solid-phase Al contents at Site M0089 range ~2.6–6.3 wt% (25,867–63,288 mg/kg; Figure F45). The records are characterized by small fluctuations superimposed on a clear and continuous downcore increase that reaches ~6.3 wt% around 35 mbsf.
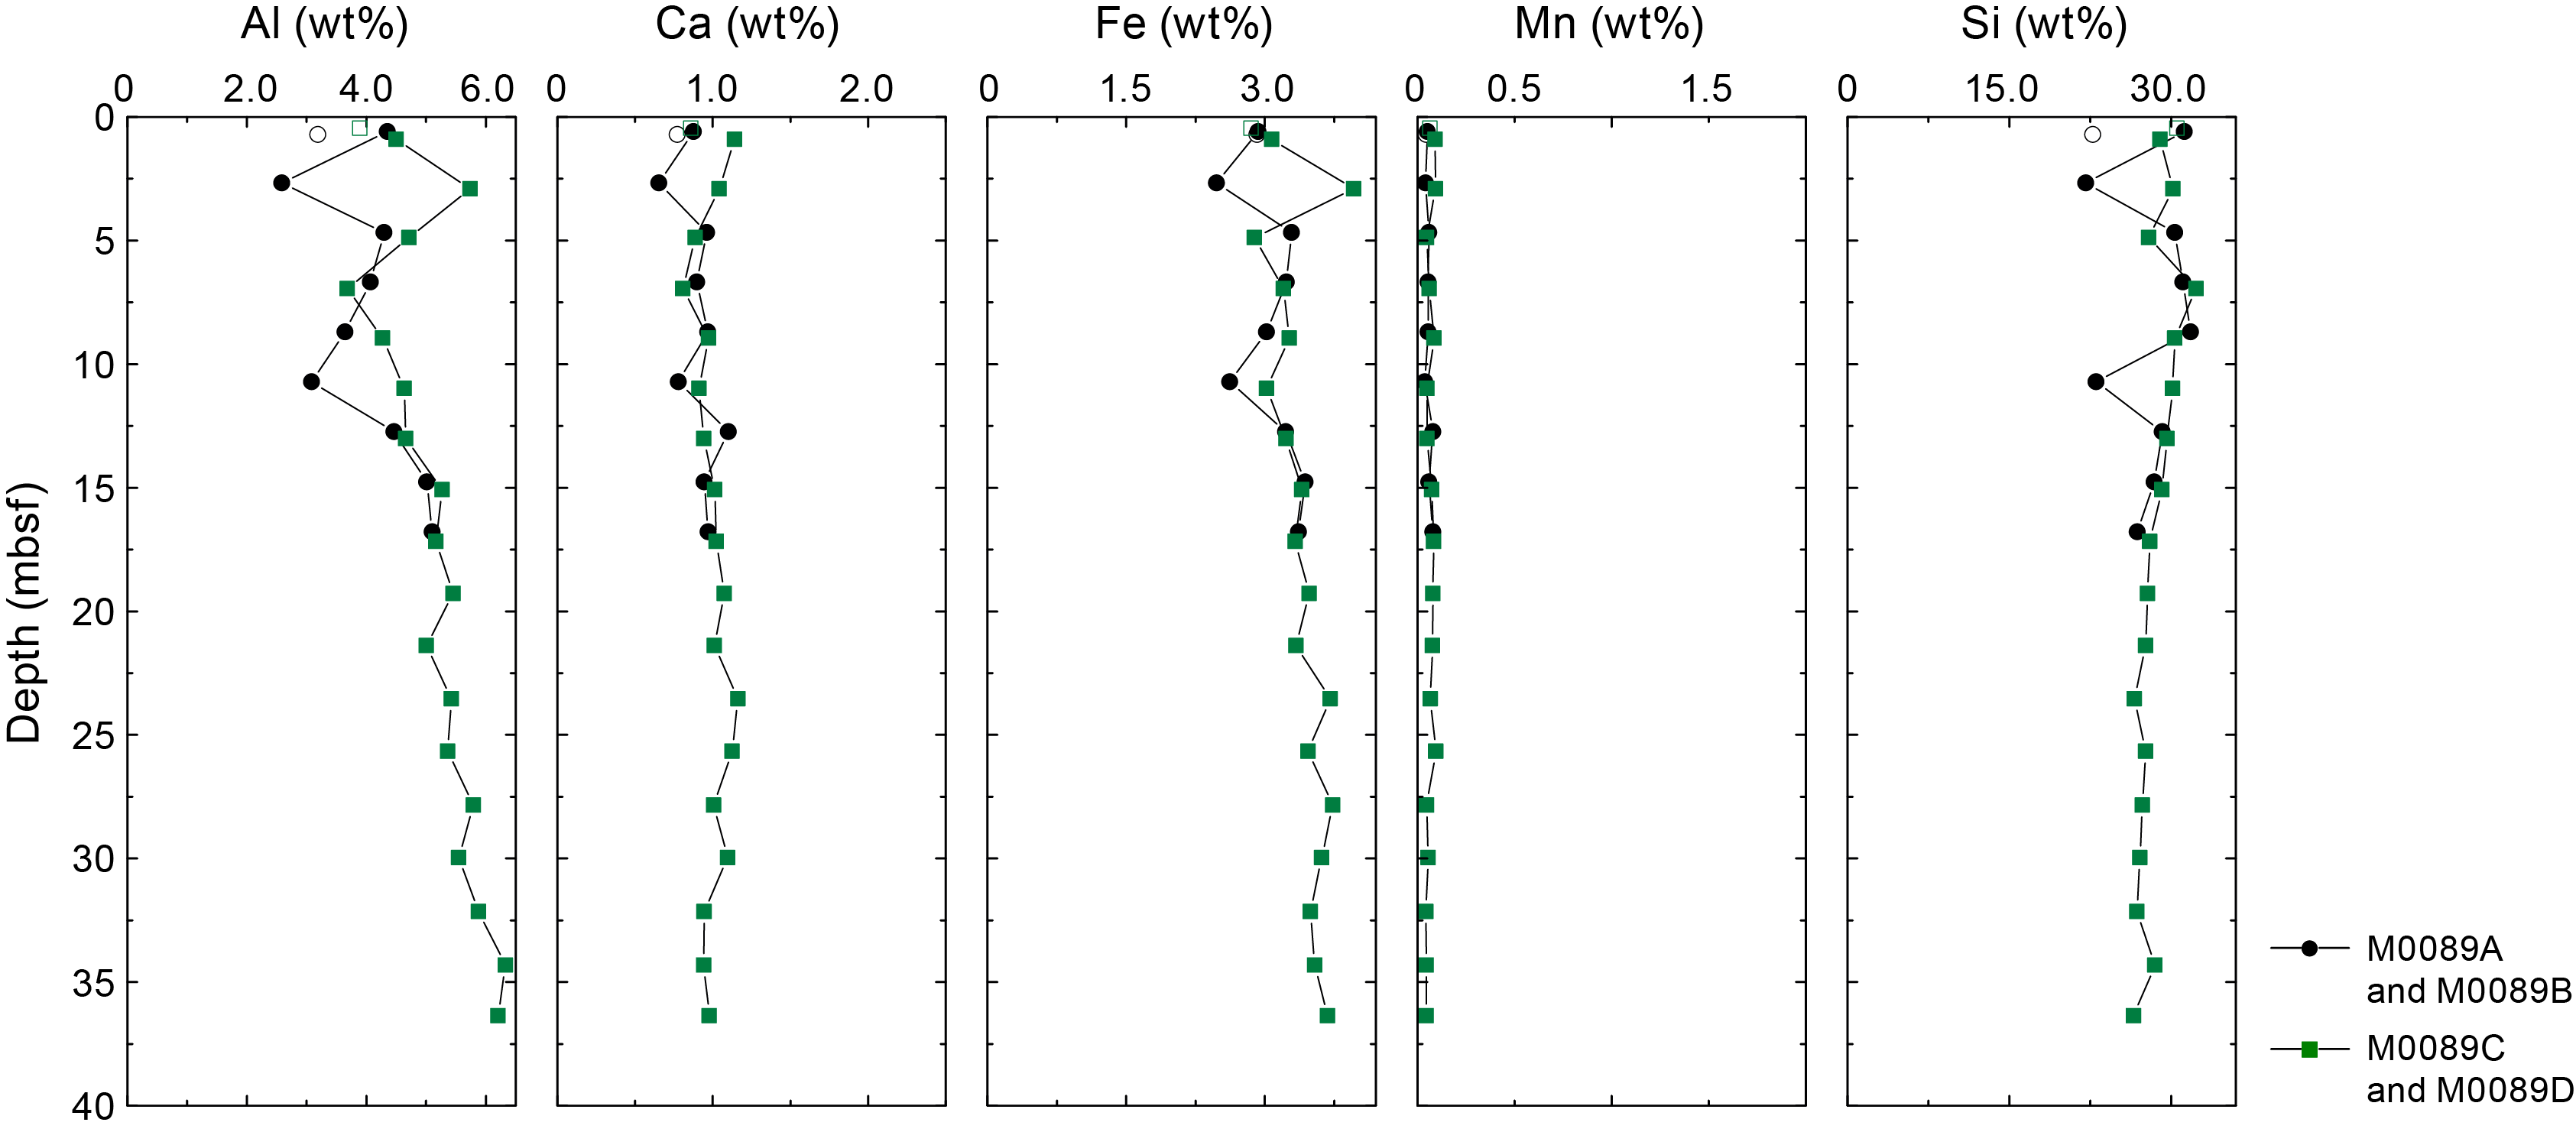
Figure F45. Al, Ca, Fe, Mn, and Si, Site M0089.
Ca contents range ~0.7–1.2 wt% (6,541–11,619 mg/kg; Figure F45). In Hole M0089B, there is a stepped increase overall, with the lowest values (around 0.7 wt%) at ~3 mbsf and the highest values (~1.2 wt%) at ~13 mbsf. In Hole M0089D, a downcore decrease from ~1.2 to 0.8 wt% characterizes the uppermost ~7 m. This is followed by a gradual increase back to ~1.2 wt% around 25 mbsf and another minor decrease to ~0.9 wt% at ~37 mbsf.
Si contents range ~22–32 wt% (227,267–317,971; Figure F45). In Hole M0089B, this entire range of values occurs without a clear pattern to ~17 mbsf. Hole M0089D is characterized by a more gradual decrease from ~30 wt% near the top of the GPC core to ~27 wt% at ~35 mbsf.
Fe contents range ~2.4–4.05 wt% (24,787–39,610 mg/kg; Figure F45), and besides some variability without clear pattern, there is an overall downhole increase that reaches 3.5–3.8 wt% between ~23 and 37 mbsf.
Solid-phase Mn contents range ~0.04–0.09 wt% (410–940 mg/kg; Figure F45), and values fluctuate without a clear pattern between these values throughout both holes.
6.4.2. Carbon, sulfur, and nitrogen
Solid-phase total carbon (TC), total inorganic carbon (TIC), total organic carbon (TOC), total nitrogen (TN), and total sulfur (TS) are listed in Tables T13 and T14.
Three samples from the trigger cores (Holes M0083A, M0083C, and M0083E) were measured for TC and TOC contents, and the mean contents are 1.25 and 1.11 wt%, respectively (Figure F46). In Hole M0083B, TC contents range 0.61–1.37 wt% and TOC contents range 0.54–1.18 wt%. For Holes M0083D and M0083F, TC and TOC have similar trends. For Hole M0083D, TC contents range 0.64–1.64 wt% and TOC contents range 0.60–1.39 wt%. For Hole M0083F, TC contents range 0.56–1.75 wt% and TOC contents range 0.51–1.49 wt%. The highest TC and TOC values at Site M0083 (1.75 and 1.49 wt%, respectively) are observed at ~25 mbsf, and the lowest TC and TOC values at Site M0083 (0.56 and 0.51 wt%, respectively) are found at ~27 mbsf.

Figure F46. TC, TOC, TIC, TN, and TS, Site M0083.
Two samples from the trigger cores (Holes M0089A and M0089C) were measured, and the mean values of TC and TOC are ~1.24 and 1.14 wt%, respectively (Figure F46). For Hole M0089B, TC contents range 0.84–1.65 wt% and TOC contents range 0.78–1.42 wt%. For Hole M0089D, TC contents range 0.57–1.45 wt% and TOC contents range 0.53–1.32 wt%. The lowest TC and TOC values at Site M0082 are observed in Hole M0082D at ~5 mbsf (0.57 and 0.53 wt%, respectively), and the highest TC and TOC values are found in Hole M0089B at ~9 mbsf (1.65 and 1.42 wt%, respectively).
Three samples from the trigger cores (Holes M0083A, M0083C, and M0083E) were calculated for TIC contents, which are 0.15, 0.17, and 0.09 wt%, respectively (Figure F46). At Site M0089, two samples from the trigger cores (Holes M0083A and M0083C) were calculated for TIC contents, which are 0.11 and 0.09 wt%, respectively. For the GPC samples from Sites M0083 and M0089, TIC contents vary from 0 to 0.46 wt% (Figure F47). The lowest TIC value at Site M0089 (0.03 wt%) is observed at ~17 mbsf, and the highest TIC content (0.46 wt%) is found at ~34 mbsf. The lowest TIC value at Site M0089 (0 wt%) is at ~36 mbsf, and the highest TIC content (0.23 wt%) is found at ~9 mbsf.
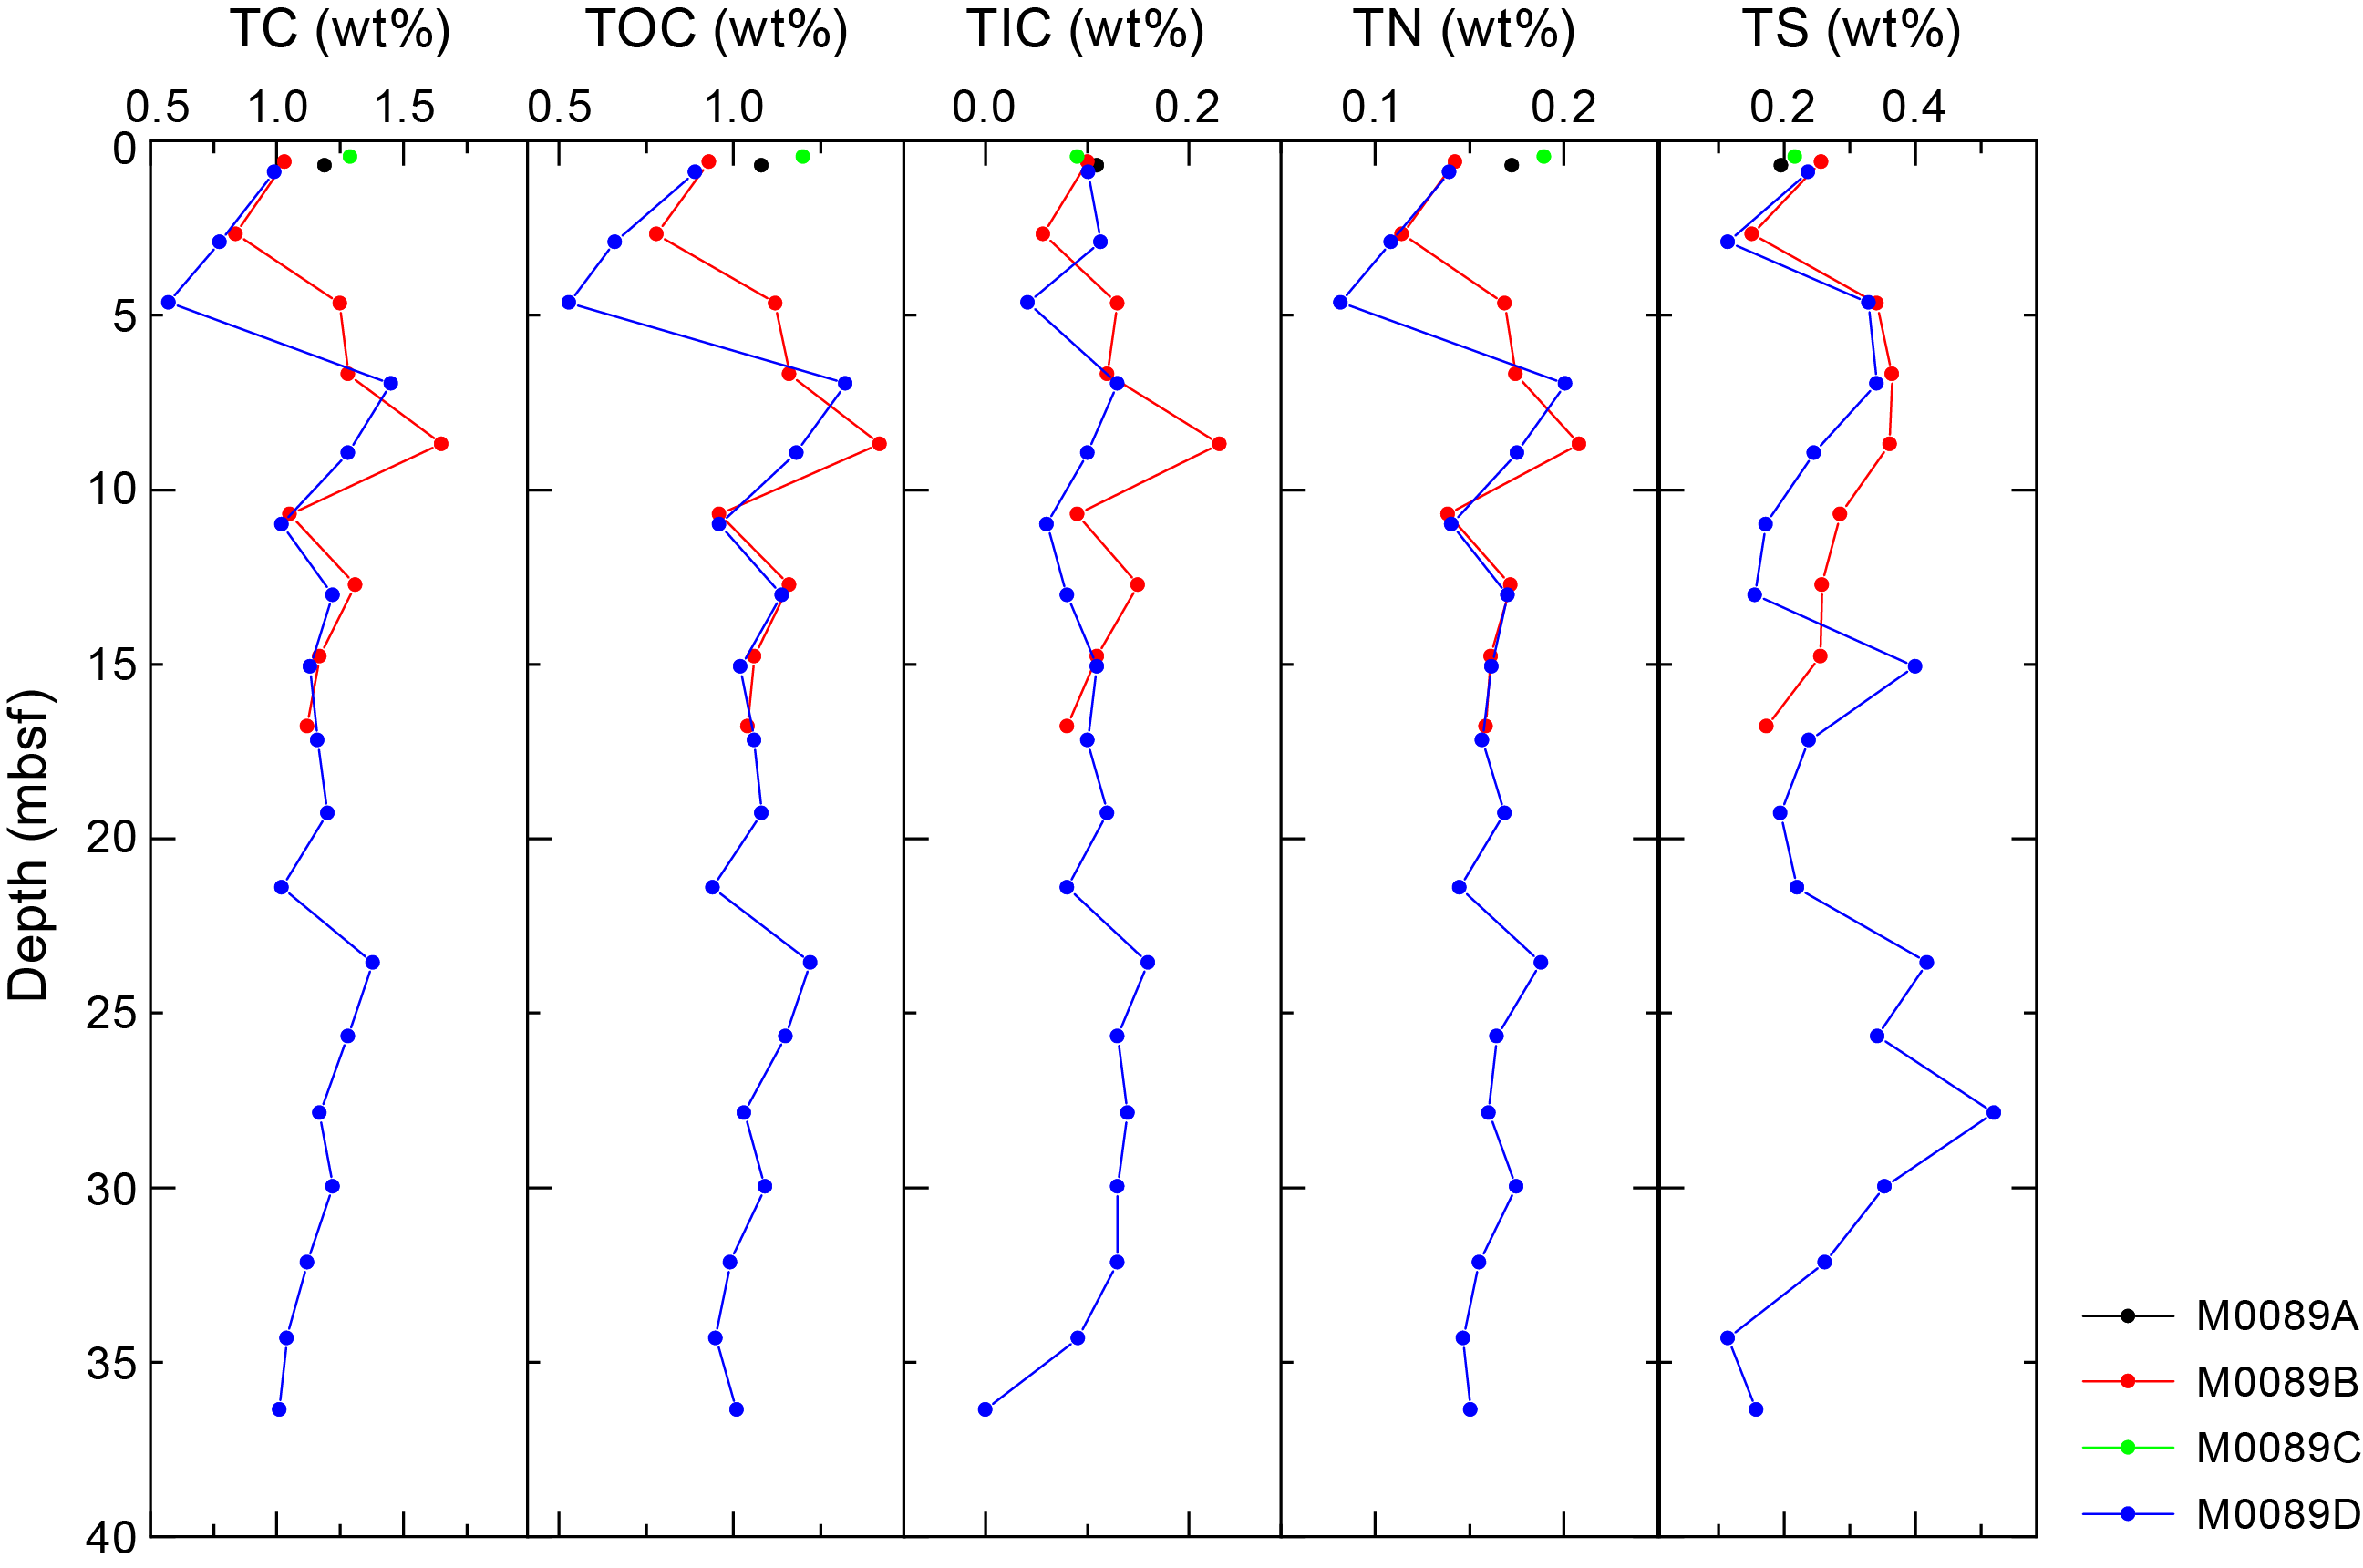
Figure F47. TC, TOC, TIC, TN, and TS, Site M0089.
Overall, trends in TN are similar to those in TOC and TC. The TN contents of Holes M0083B, M0083D, and M0083E are low and vary from 0.09 to 0.24 wt% (Figure F46). The TN contents of Holes M0089B and M0089D are 0.08–0.23 wt% (Figure F47).
Overall, trends in TS are similar to those in TOC and TC. The TS contents of Holes M0083B, M0083D, and M0083E are low and vary from 0.03 and 0.69 wt% throughout the entire record and without any intervals of particularly high or low values (Figure F46). Three samples from the trigger cores (Holes M0083A, M0083C, and M0083E) were measured for TS contents, which are 0.17, 0.17, and 0.19 wt%, respectively. At Site M0089, trends in TS trends in Holes M0089B and M0089D are also similar to those in TOC and TC. TS contents are 0.11–0.52 wt% (Figure F47). In addition, two samples from the trigger cores (Holes M0089A and M0089C) were measured for TS contents, which are 0.20 and 0.22 wt%, respectively.
6.5. Discussion
Indicators of organic matter degradation in the IW and headspace samples (ammonium, alkalinity, bromide, and methane concentrations) suggest that intensive remineralization occurs at both Sites M0083 and M0089, most actively in the uppermost ~3–5 m, and gradually diminishes farther downcore, occurring at comparable rates at both sites. Notably, the ammonium and alkalinity profiles at Site M0083 are less linear and more variable than those at Site M0089, potentially indicating more pronounced and/or more clearly preserved nonsteady-state diagenesis at Site M0083. The different holes at each site show similar IW and gas chemistry patterns, implying that each site is characterized by only minor spatial heterogeneity. Patterns and concentrations of most other IW parameters are also similar between Sites M0083 and M0089, indicating that overall similar depositional and diagenetic processes affected both sites.
The coupled but marked variation of TC, TOC, and TIC in all holes may imply episodic material input into the Japan Trench. The organic geochemical variation between the holes could thus provide another dimension for deciphering event stratigraphy in the trench sediments. Although intensive remineralization occurs in the top part of the sediments, high TOC and TC contents found in the deeper sediments suggest rapid burial and/or elevated organic contents. The high methane concentrations and elevated C1/C2 values observed in the deeper sediments highlights the role of microbes in the fate of sedimentary organic carbon in the hadal sediments (Claypool and Kvenvolden, 1983).
At Site M0083, dissolved Fe and Mn are very high in the top meter of the sediment column, indicating organic matter remineralization by intensive dissimilatory Mn and Fe reduction. The nonlinear, wavy decrease in Mn concentrations below the top meter may indicate repeated periods of nonsteady-state diagenesis preserved in the IW record. At Site M0089, Mn and especially Fe concentrations are much lower, and Mn remains elevated to around 5 mbsf, potentially a sign of less intense and/or deeper dissimilatory Mn and Fe reduction. Below the uppermost few meters of the cores, organoclastic sulfate reduction becomes the dominant electron acceptor for organic matter remineralization, as evidenced by the loss of sulfate within the top 10 mbsf, followed by methanogenesis, as shown by the rise in methane and C1/C2 below the sulfate–methane transition (SMT) to the base of the cores. Sulfate reduction and subsequent formation of diagenetic sulfide minerals is also evident from the abundance of likely iron sulfides in the visual core descriptions (VCDs; see Lithostratigraphy).
One significant difference between Sites M0083 and M0089 (based on IW and dissolved gas profiles) is the depth of the SMT, which is located at ~10–12 mbsf at Site M0083 and ~4–5 mbsf at Site M0089. This could be explained by different depositional histories at these sites because Site M0089 has a much higher rate of sedimentation (see Lithostratigraphy). The SMT is also clearly visible in the Ba profiles, which show low values above the SMT and the highest concentrations below the SMT. The abundance of amorphous silica (biogenic opal in diatom frustules and sponge spicules; volcanic ash) in the smear slide descriptions (see Core descriptions; see Lithostratigraphy) is consistent with the very high dissolved Si concentrations throughout the IW samples and suggests that 900 µM is the equilibrium value in this system. In contrast, subdued changes in dissolved Sr and Ca suggest limited dissolution of carbonate material in the sediment, consistent with limited recognized carbonate components.
The solid phase at Sites M0083 and M0089 is dominated by siliceous material, indicated by high Si contents and corroborated by smear slide descriptions (see Lithostratigraphy). Fine-grained siliciclastic material, as approximated by Al contents, is quantitatively the second most important sediment component. Carbonate material, as shown by the TIC contents and partly by the Ca contents, is very low but not zero. The Fe contents broadly parallel the Al records and, at first pass, do not indicate significant vertical redistribution by diagenetic dissolution-precipitation processes. This is different for Mn, which exhibits several dramatic peaks at Site M0083 (but not Site M0089), suggesting diagenetic precipitation of a Mn mineral.
7. Physical properties
This section presents a summary of the preliminary physical properties results from sediment cores acquired at Sites M0083 and M0089 in Basin C2 of the central Japan Trench (see Figure F1 in the Expedition 386 methods chapter [Strasser et al., 2023a]). At Site M0083, a total of six holes were cored: three trigger cores (Holes M0083A, M0083C, and M0083E) and corresponding GPC cores (Holes M0083B, M0083D, and M0083F) (see Operations). At Site M0089, a total of four holes were cored: two trigger cores (Holes M0089A and M0089C) and corresponding GPC cores (Holes M0089B and M0089D). The physical properties data sets were collected with the techniques and sampling rates defined in Physical properties in the Expedition 386 methods chapter (Strasser, 2023a). During the offshore phase, whole cores were scanned through the Multi-Sensor Core Logger (MSCL). During the onshore phase, cores were split, scanned through the Tri-Sensor Core Logger (TSCL), and sampled for moisture and density (MAD), undrained shear strength, and P-wave velocity. Overall, the physical properties data sets are high quality and correlate well with lithology, hydroacoustics, and other data sets. Note that the MSCL data for Holes M0083E and M0083F are potentially adversely affected due to cores being wrapped and gas charging associated with protocols for microbiological sampling (see Operations). The following text and figures summarize the overall quantitative and qualitative aspects of the physical properties data acquired at Sites M0083 and M0089.
7.1. Bulk density
During the offshore phase, density data (bulk density) were obtained using the gamma ray attenuation (GRA) technique on the MSCL. During the onshore phase, bulk density, porosity, water content, void ratio, and grain density were obtained using MAD analysis on discrete samples. Overall, MSCL-derived and MAD-derived densities are in good agreement with each other.
7.1.1. Site M0083
Bulk density values in Holes M0083A–M0083D increase downcore from ~1.23 g/cm3 in the uppermost MAD samples to ~1.3 g/cm3 at the bottom of Holes M0083B (19.0 mbsf) (Figure F48) and M0083D (37.1 mbsf) (Figure F49). The depth intervals that deviate from this overall trend are similar in both holes. A sharp increase from the uppermost samples to ~1.37 g/cm3 at 1 mbsf is seen in MSCL bulk density data from both holes, and then values stay at a comparably high level to 7.4 and 6.9 mbsf in Holes M0083B and M0083D, respectively. Below this interval, pronounced peaks in MSCL bulk density of 1.56 and 1.59 g/cm3 are seen at 7.5 and 7.1 mbsf in Holes M0083B and M0083D, respectively. Below these peaks, MAD density ranges 1.27–1.37 g/cm3 until peaks in MSCL bulk density of 1.48 and 1.42 g/cm3 are seen at 13.8 and 13.9 mbsf in Holes M0083B and M0083D, respectively. Below these depths, MSCL density drops to values similar to those at the core tops; however, this drop is not captured in the MAD data (measured every 2 m), which show an increase to high values of 1.51 and 1.48 g/cm3 at 17.0 and 16.2 mbsf in Holes M0083B and M0083D, respectively. Below these depths, bulk density drops to 1.30 g/cm3 at the bottom of Hole M0083B (19.0 mbsf) and 1.28 g/cm3 at 20.3 mbsf in Hole M0083D. Asymmetric peaks in MSCL density, with an upper ~1 m thick interval of downward increasing values to 1.56 and 1.46 g/cm3 at 18.6 and 19.5 mbsf, followed by a sharp drop of more than 0.25 g/cm3 within a few centimeters, are seen in Holes M0083B and M0083D, respectively, but are not captured in the MAD data. Below 20 mbsf, bulk density increases continuously to the maximum value of 1.53 g/cm3 at 28.6 mbsf in Hole M0083D. Below this depth, bulk density values range 1.31–1.45 g/cm3 to the bottom of the hole.

Figure F48. Physical properties summary, Holes M0083A and M0083B.
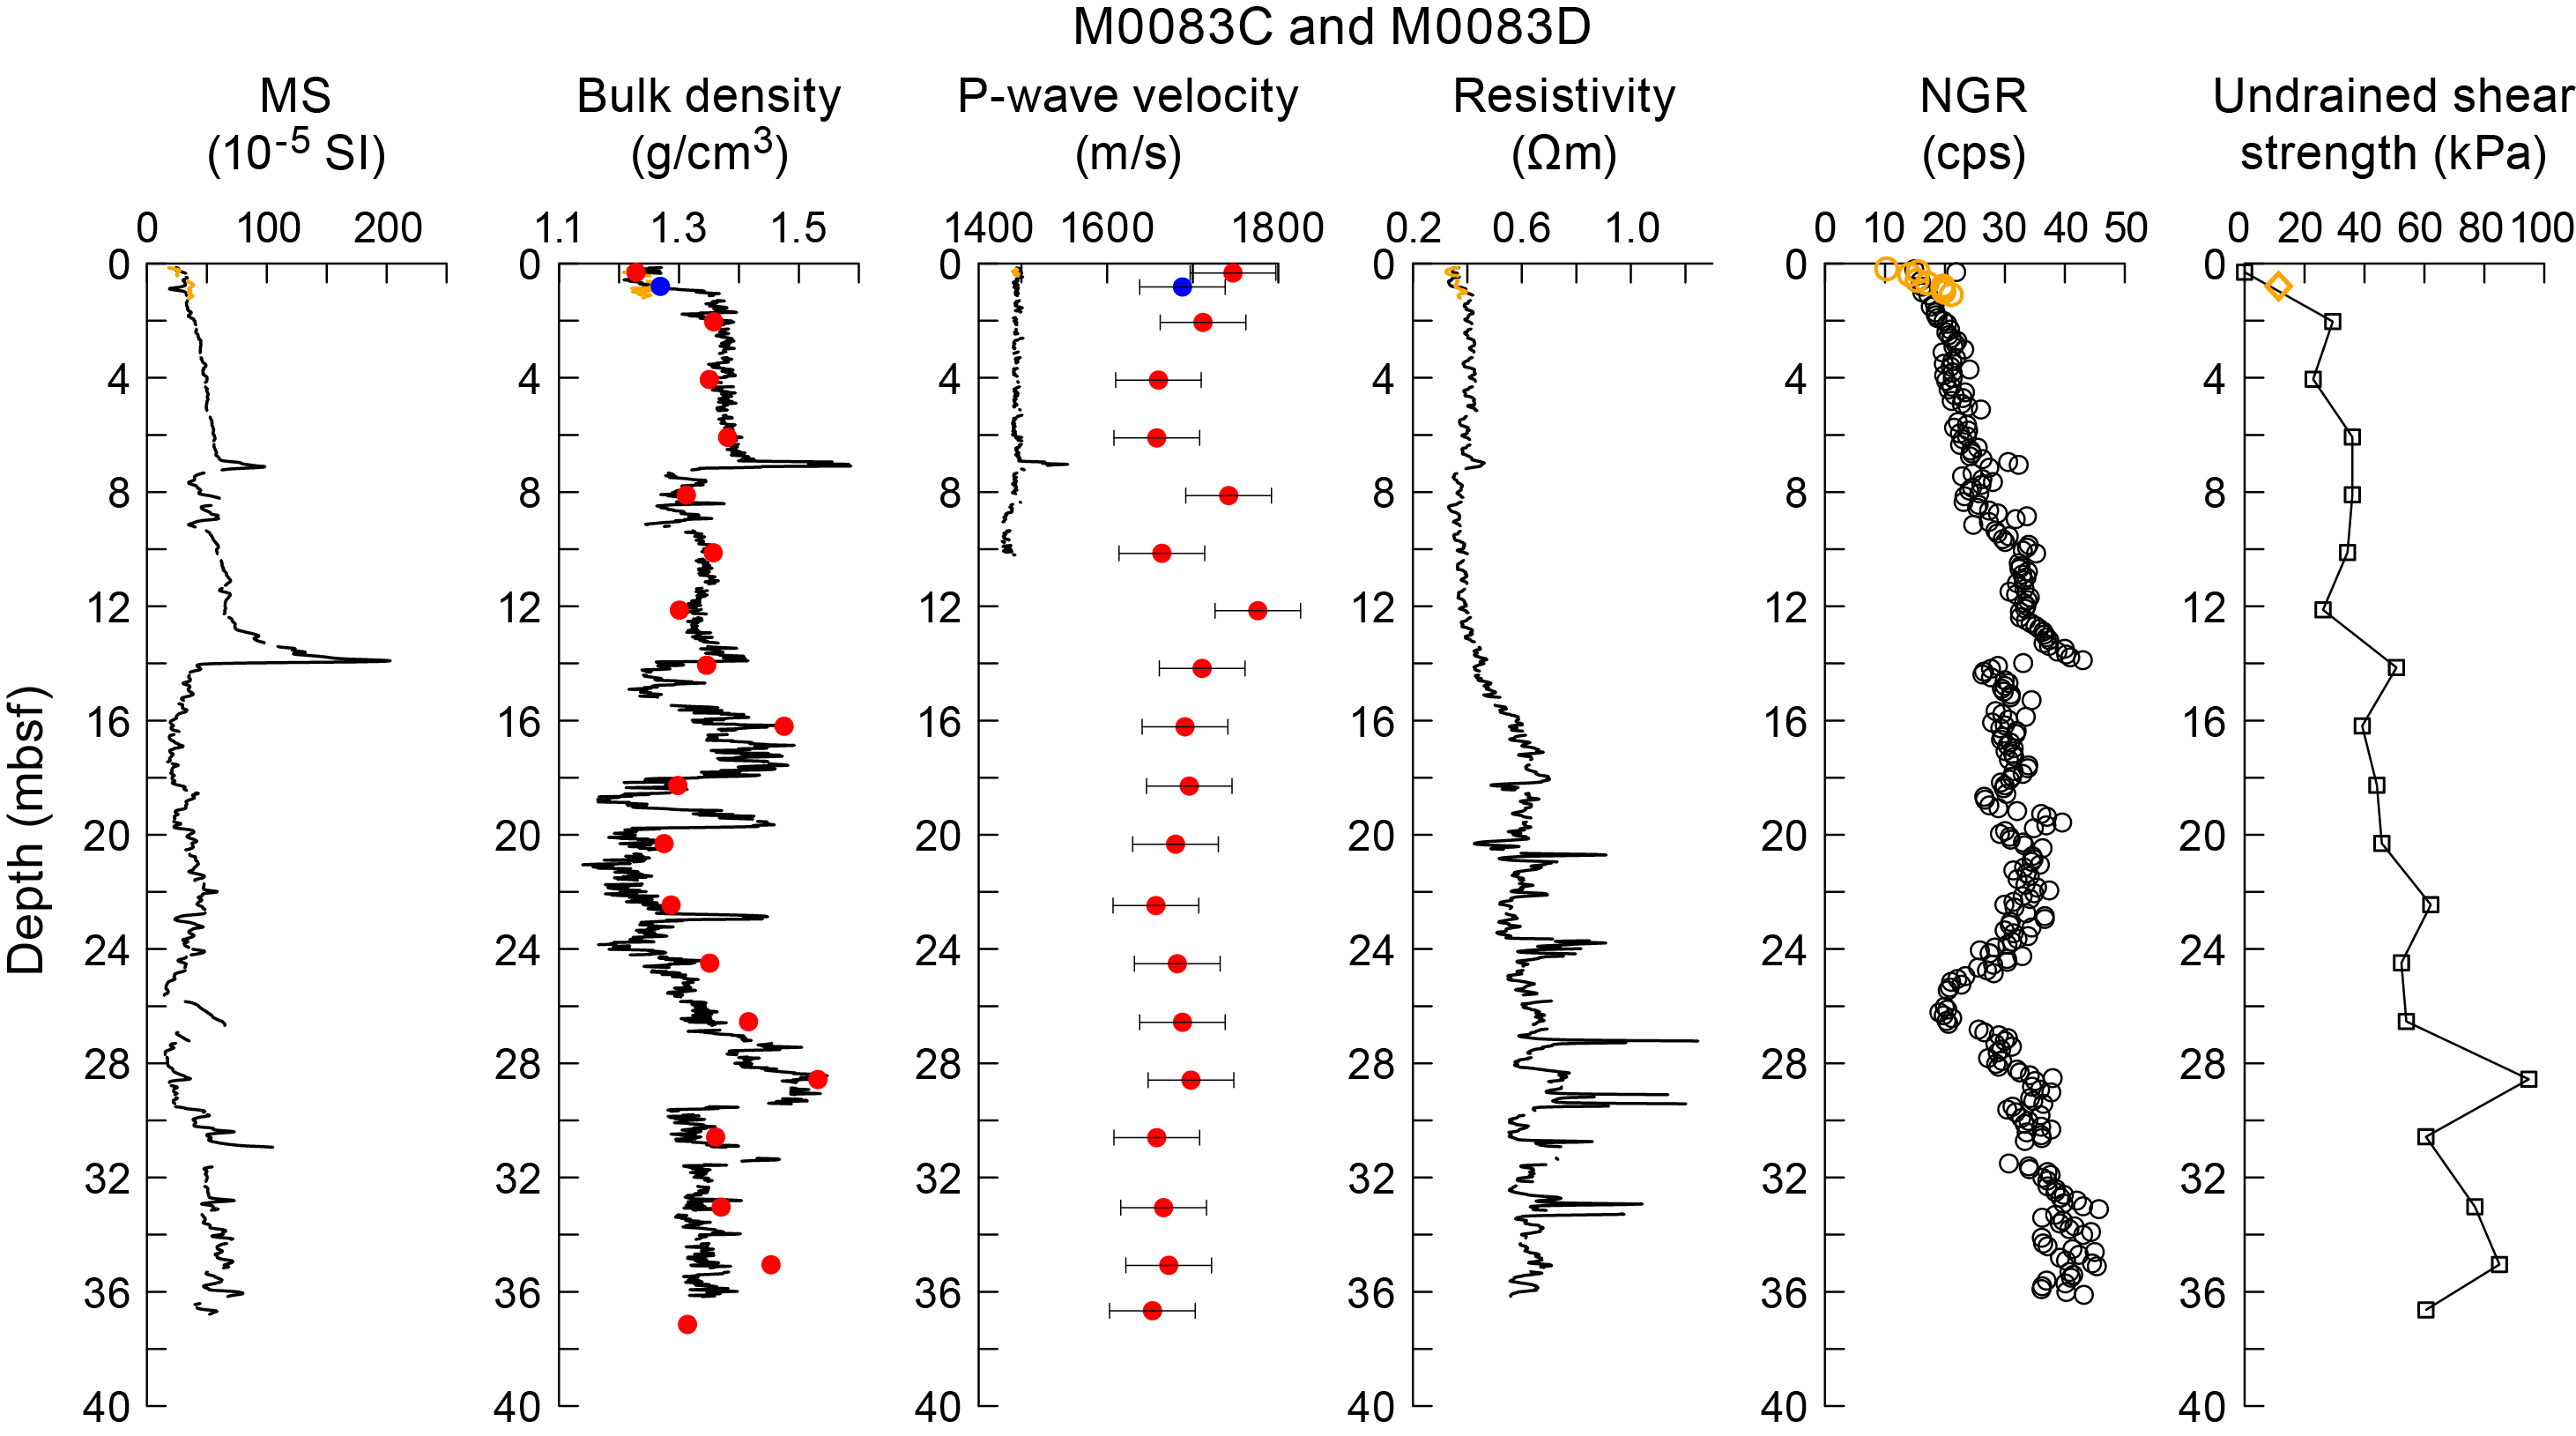
Figure F49. Physical properties summary, Holes M0083C and M0083D.
Bulk density values in Holes M0083E and M0083F increase downcore from ~1.25 g/cm3 in the uppermost MAD samples to 1.37 g/cm3 at the bottom of Hole M0083F (36.9 mbsf) (Figure F50). In Hole M0083F, a sharp increase in MSCL bulk density to ~1.37 g/cm3 is observed at ~3 mbsf, similar to the increase to ~1.37 g/cm3 at 1 mbsf in Holes M0083B and M0083D, which suggests that the uppermost part of the sediment column above the increase is better captured in Hole M0083F. Below this depth, the vertical pattern of density values in Hole M0083F is similar to that in Holes M0083B and M0083D, except the pattern features seem to be shifted downward by ~2 m in Hole M0083F (Figures F48, F49, F50); for example, the peaks in MSCL density at 7.1 and 13.9 mbsf in Hole M0083D seem to correspond to peaks at 9.1 and 15.4 mbsf in Hole M0083F (1.55 and 1.50 g/cm3, respectively). Below ~20 mbsf, the vertical patterns of density values continue to be similar between Holes M0083D and M0083F, but Hole M0083F seems vertically compressed compared to Hole M0083D, with the maximum MAD density value of 1.53 g/cm3 at 28.6 mbsf in Hole M0083D seemingly corresponding to a high value of 1.48 g/cm3 at 27.4 mbsf in Hole M0083F.
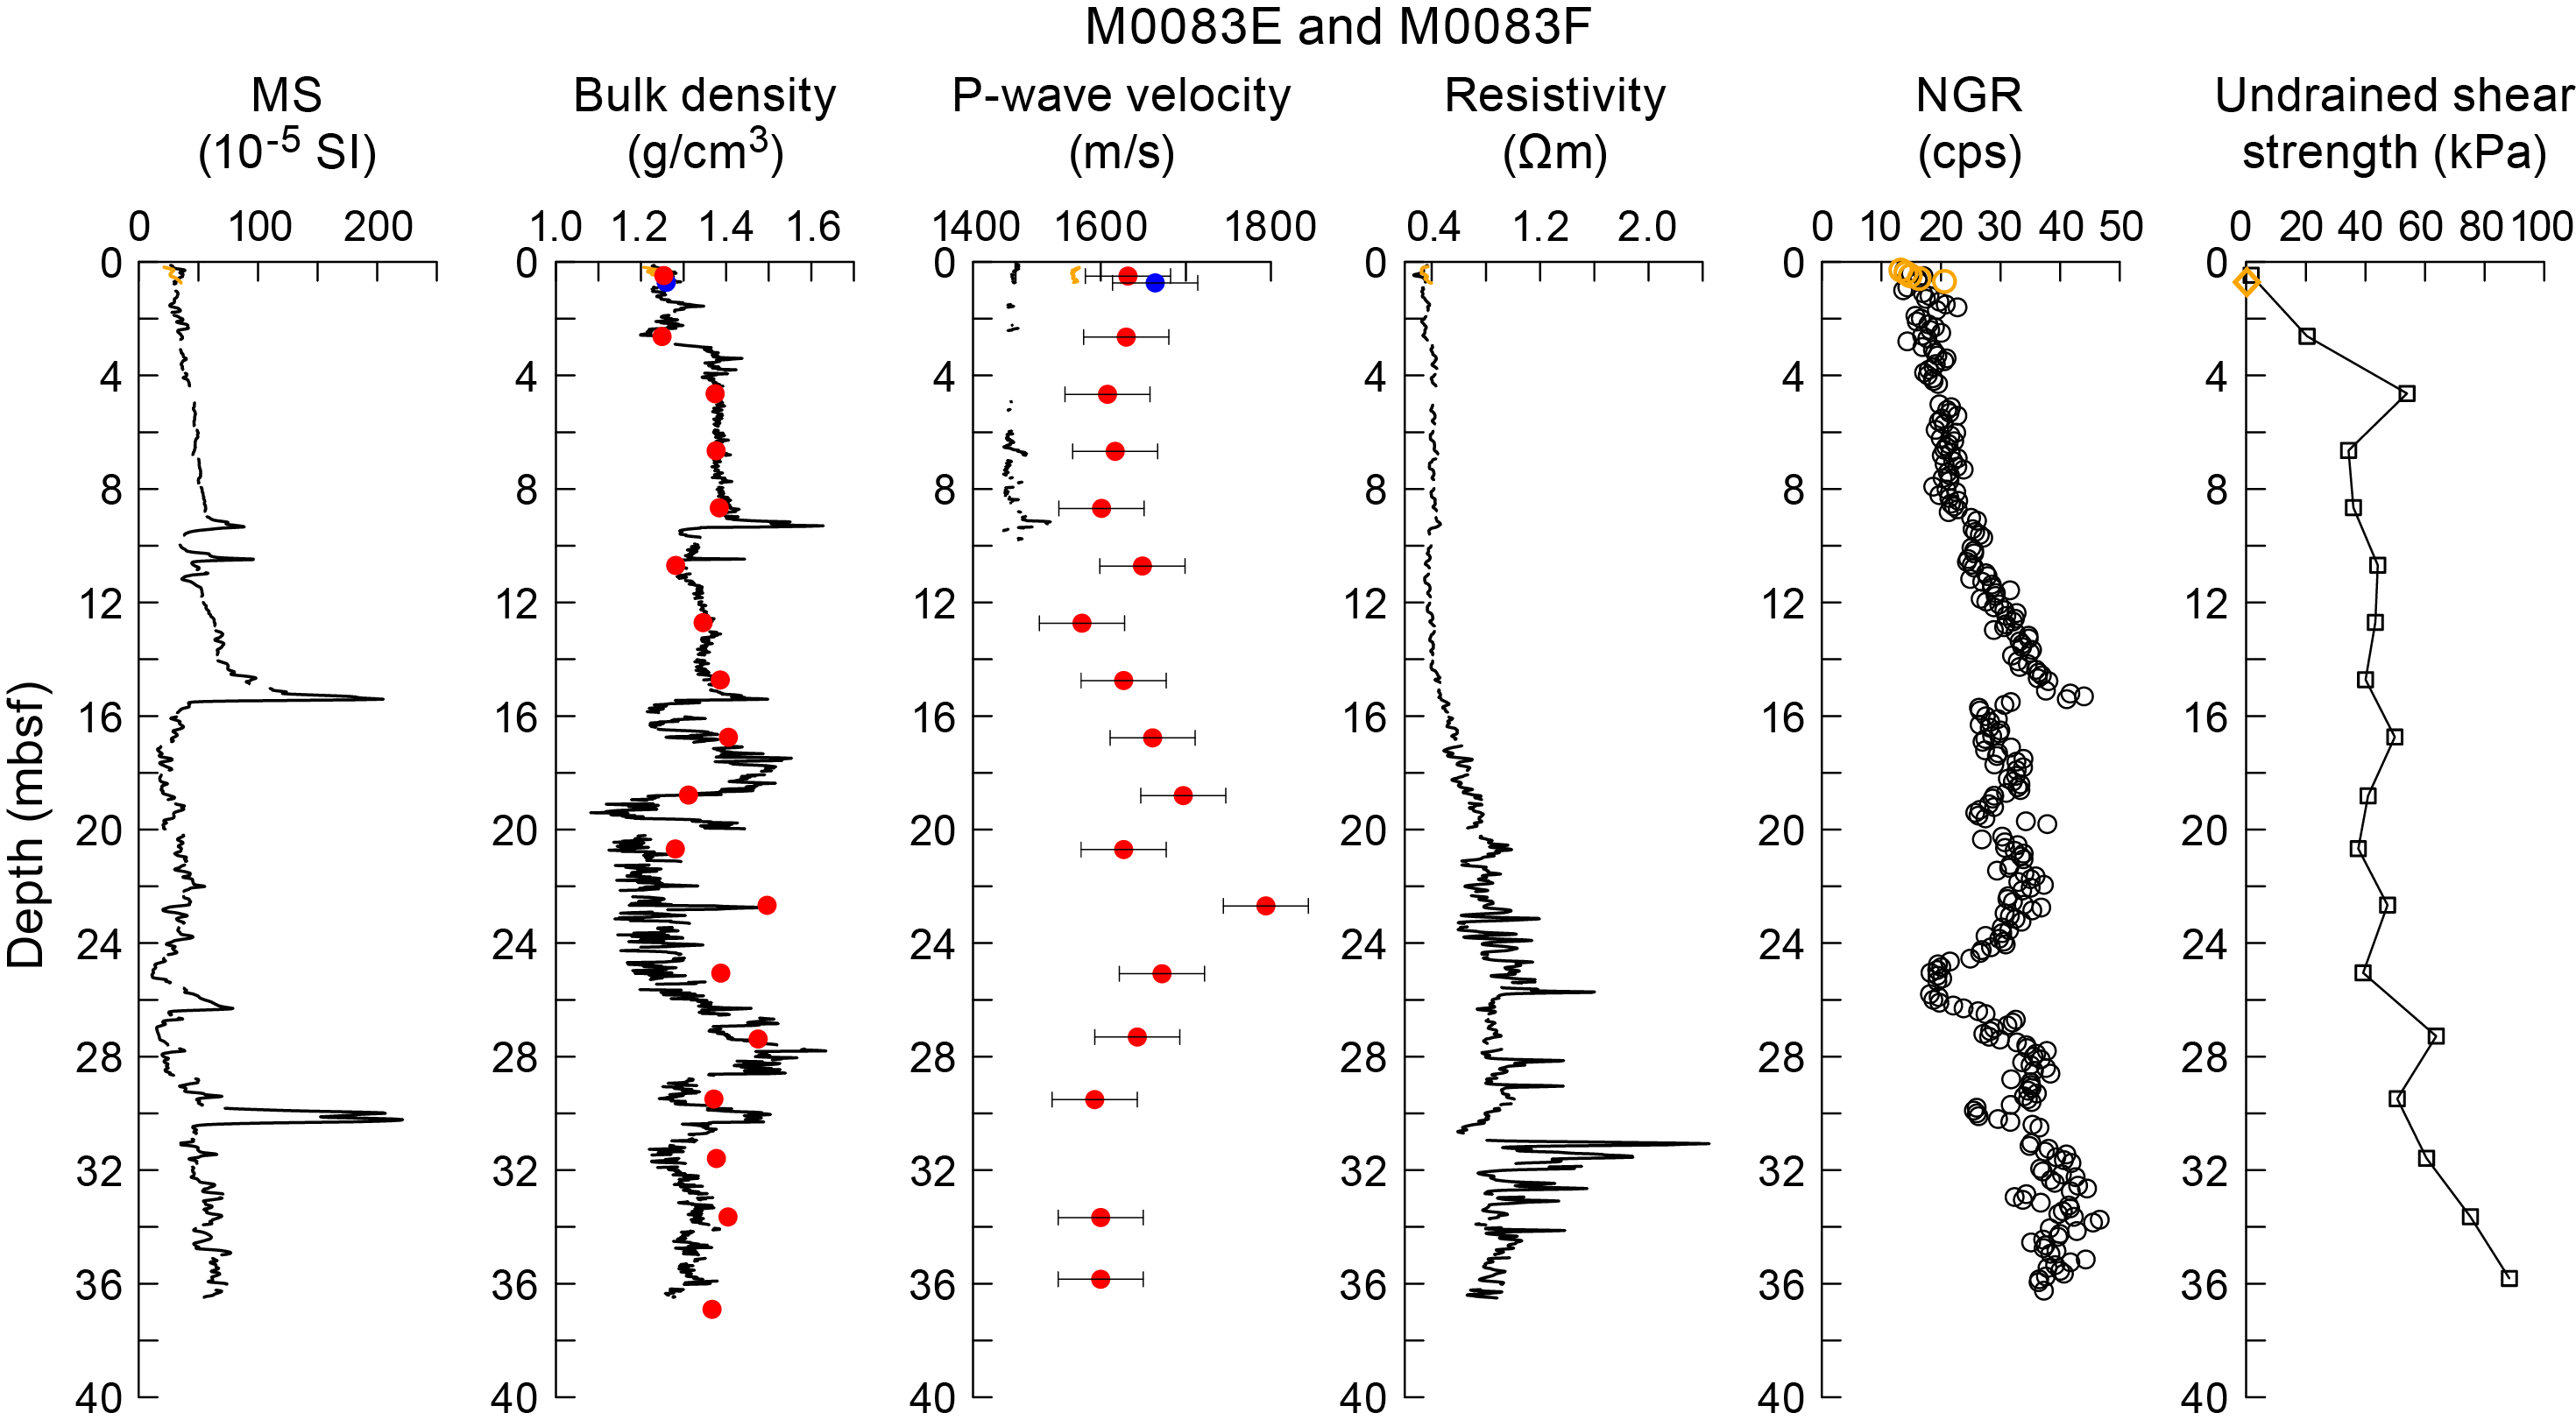
Figure F50. Physical properties summary, Holes M0083E and M0083F.
MAD and MSCL bulk density values correspond well to each other to ~15 mbsf. Below this depth, however, MAD density is often shifted toward higher values in Holes M0083B, M0083D, and M0083F.
7.1.2. Site M0089
The single MAD bulk density value of 1.19 g/cm3 in Hole M0089A is substantially less than the uppermost MAD density values in Holes M0089B–M0089D, which range 1.25–1.30 g/cm3 (Figures F51, F52). Bulk density values increase downcore to 1.34 g/cm3 at the bottom of Hole M0089B (16.7 mbsf) and to 1.45 g/cm3 at the bottom of Hole M0089D (36.3 mbsf). Two MAD density values in Hole M0089B (1.26 and 1.28 g/cm3 at 4.6 and 6.6 mbsf, respectively) are lower than the uppermost sample in that core. MSCL density data sets show pronounced peaks that are not captured by MAD sampling in Holes M0089B and M0089D; peaks at 3.9, 5.4, 8.5, 11.8, and 13.8 mbsf in Hole M0089B seem to correspond to similar peaks at 4.9, 6.6, 9.5, 12.5, and 14.5 mbsf in Hole M0089D. Below ~15 mbsf, Hole M0089D is characterized by large fluctuations in MSCL bulk density.
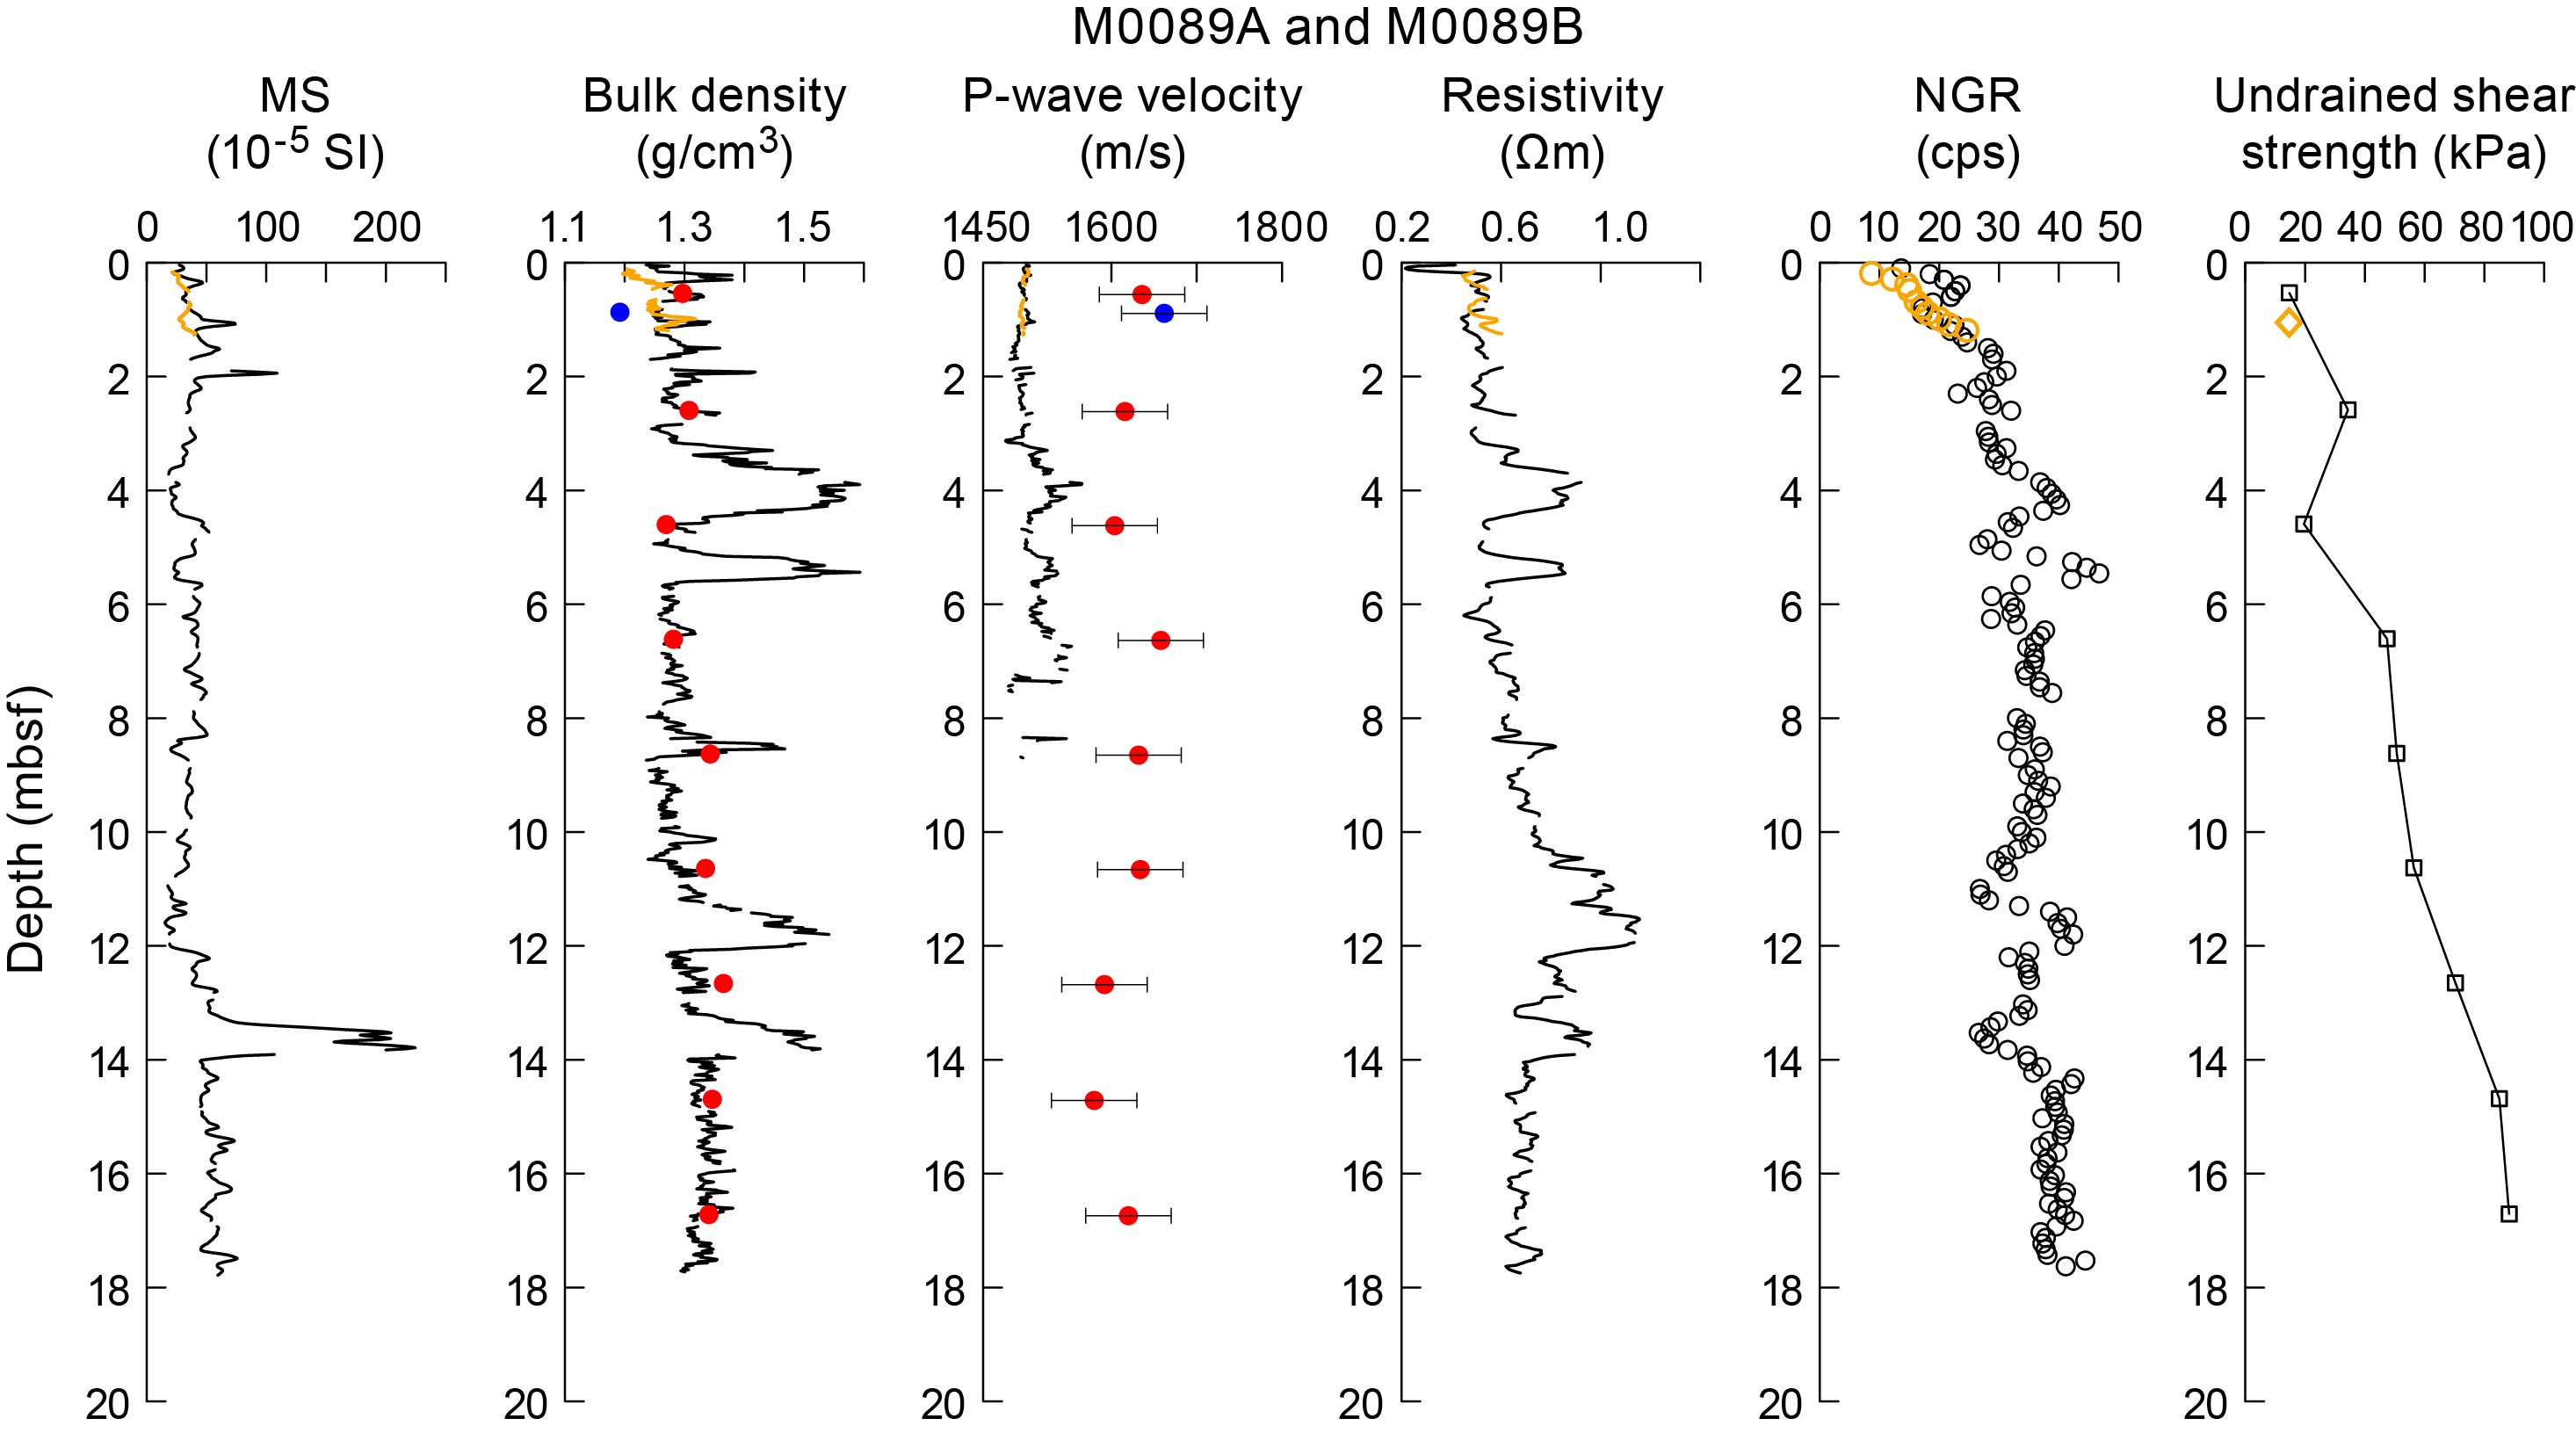
Figure F51. Physical properties summary, Holes M0089A and M0089B.

Figure F52. Physical properties summary, Holes M0089C and M0089D.
Similar to Site M0083, MAD and MSCL bulk density values correspond well to each other to ~15 mbsf in Holes M0089B and M0089D. Below this depth, MAD density seems to be systematically shifted toward higher values in Hole M0089D.
7.2. Magnetic susceptibility
Magnetic susceptibility data were obtained during the offshore phase using the MSCL.
7.2.1. Site M0083
In Holes M0083A–M0083F, magnetic susceptibility increases steadily from ~20 × 10−5 SI at the core tops to 13.8, 13.9, and 15.4 mbsf in Holes M0083B, M0083D, and M0083F, respectively. Below these depths, pronounced peaks of more than 200 × 10−5 SI are observed (Figures F48, F49, F50). These peaks are notably asymmetric; values increase downhole in the uppermost ~1 m and then sharply drop more than 150 × 10−5 SI within a few centimeters. Comparable steady increases downcore are also visible in NGR values, which show similar asymmetric peaks at the corresponding depths in Holes M0083B, M0083D, and M0083F. Also, there are broadly correlative bulk density peaks at these depths in these holes. The steady downcore increases are interrupted by characteristic triple-peak patterns, with the uppermost peaks at 7.6, 7.1, and 9.3 mbsf, the middle peaks at 8.8, 8.2, and 10.5 mbsf, and the small lowermost peaks at 9.3, 8.9, and 11.0 mbsf in Holes M0083B, M0083D, and M0083F, respectively. The uppermost peaks correspond to peaks in bulk density and NGR for all three holes and correspond to resistivity in Holes M0083B and M0083D. Below the pronounced peaks to the core bases, magnetic susceptibility shows high-frequency fluctuations, typically with values of approximately 20 × 10−5 to 70 × 10−5 SI. Modest asymmetric peaks of downcore increasing values and sharp drops are observed at 25.8–26.7 mbsf (with some data points missing) in Hole M0083D and 25.3–26.3 mbsf in Hole M0083F. These peaks correspond to troughs in NGR. In addition, strong peaks at 30.9 and 30.0 mbsf in Holes M0083D and M0083F, respectively, correspond to peaks in bulk density and troughs in NGR.
7.2.2. Site M0089
Magnetic susceptibility in Holes M0089A–M0089D generally fluctuates between 20 × 10−5 and 70 × 10−5 SI (Figures F51, F52). The upper parts of Holes M0089B and M0089D show characteristic modest double-peak patterns with the uppermost peaks at 1.1 and 1.6 mbsf and the lowermost peaks at 1.9 and 2.4 mbsf, respectively. Pronounced peaks of more than 200 × 10−5 SI are observed at 13.8 and 14.5 mbsf in Holes M0089B and M0089D, respectively. There is another pronounced peak of 600 × 10−5 SI at ~23.2 mbsf in Hole M0089D.
7.3. P-wave velocity
P-wave velocity was measured using the MSCL on whole cores during the offshore phase. During the onshore phase, P-wave velocity was measured on discrete samples approximately every 2 m. Many of the MSCL velocity data were of insufficient quality below ~5 mbsf and have been omitted.
Offshore P-wave velocities recorded with the MSCL at both sites generally trend around 1500 m/s (the velocity of water). Shore-based discrete measurements are noticeably higher (closer to an average of 1700 m/s). The difference in velocity exceeds the uncertainty associated with the discrete velocity measurements (±50 m/s). The difference between the two datasets may be attributed to continued compaction or degassing of the sediments between offshore and onshore phase of the expedition. Postcruise research will be required to fully understand the discrepancy, and the data should thus be used with a degree of caution.
MSCL and laboratory-measured P-wave data are plotted in Figures F48, F49, and F50 for Site M0083 and Figures F51 and F52 for Site M0089. Despite the offset between MSCL and discrete sample P-wave data, the downcore trends tend to follow trends observed in other physical properties datasets, for example, zones of higher bulk density tend to correspond to higher P-wave velocity. Pronounced peaks in MSCL velocity are observed at 7.5, 7.1, and 9.1 mbsf in Holes M0083B, M0083D, and M0083F, respectively, and correspond to peaks in MSCL bulk density and magnetic susceptibility.
7.4. Noncontact electrical resistivity
7.4.1. Site M0083
Noncontact electrical resistivity, measured using the MSCL, increases from ~0.35 Ωm at the core top for Holes M0083A–M0083F to ~0.4 Ωm at 1 mbsf (Figures F48, F49, F50). Values remain at this level downcore and then begin to increase gently at 9, 11, and 14 mbsf in Holes M0083B, M0083D, and M0083F, respectively. The increase levels off at 17 and 21 mbsf at values of 0.7 and 0.9 Ωm in Holes M0083D and M0083F, respectively. Below these depths, resistivity generally fluctuates between 0.5 and 1 Ωm to the base of both holes, with a few peaks exceeding 1.2 Ωm. A pronounced peak of 2.4 Ωm is observed at 31 mbsf in Hole M0083F, which also corresponds to peaks in magnetic susceptibility and bulk density.
7.4.2. Site M0089
Resistivity in Holes M0089A and M0089B generally increases from ~0.35 Ωm at the core top to 0.67 Ωm at ~12 mbsf in Hole M0089B (Figure F51). Below this depth, resistivity generally decreases to ~0.43 Ωm at the base of Hole M0089B. In Holes M0089C and M0089D, resistivity increases from ~0.35 Ωm at the top to ~0.4 Ωm at 1 mbsf (Figure F52). Values remain at this level to ~7 mbsf in Hole M0089D. Below this depth, resistivity generally increases with relatively rapid fluctuations to ~1.2 Ωm near the base of Hole M0089D. Pronounced resistivity peaks with the maximum exceeding 2 Ωm are seen between 28 and 36 mbsf in Hole M0089D.
7.5. Natural gamma radiation
NGR data were obtained at a 10 cm resolution during the offshore phase.
7.5.1. Site M0083
In Holes M0083A–M0083F, NGR increases from ~15 counts/s at the core tops to 13.7, 13.9, and 15.3 mbsf in Holes M0083B, M0083D, and M0083F, respectively, where pronounced peaks of more than 40 counts/s are observed (Figures F48, F49, F50). These peaks correspond to asymmetric peaks in density and magnetic susceptibility at the same depths. Below these peaks, NGR sharply drops to ~30 counts/s and then increases to ~40 counts/s at the bases of Holes M0083D and M0083F. Pronounced troughs of ~20 counts/s at ~26 mbsf in Holes M0083D and M0083F correspond to small asymmetric peaks in magnetic susceptibility.
7.5.2. Site M0089
NGR values in Holes M0089A–M0089D generally increase from ~10 counts/s at the core top to more than 30 counts/s at ~2 mbsf in Hole M0089B and ~4 mbsf in Hole M0089D (Figures F51, F52). Below these depths, NGR values generally fluctuate between 30 and 40 counts/s to the base of Holes M0089B and M0089D. The maximum peak NGR values of 46.8 and 45.9 counts/s are observed at 5.5 and 6.5 mbsf in Holes M0089B and M0089D, respectively. These peaks correspond to asymmetric peaks in density at the same depths. In addition, characteristic patterns are observed at 11–13.5 and 11.5–14.5 mbsf in Holes M0089B and M0089D, respectively, where troughs in NGR are followed first by strong increases to peak values and then by two-step drops to the next troughs. The peaks correspond to peaks in density, and the lower troughs correspond to asymmetric peaks in both density and magnetic susceptibility.
7.6. Undrained shear strength
Undrained shear strength (Su) was measured on split cores with a handheld penetrometer during the onshore phase and with an automated vane shear (AVS) apparatus and a fall cone penetrometer during the Personal Sampling Party (see Physical properties in the Expedition 386 methods chapter [Strasser, 2023a]).
7.6.1. Site M0083
Su, measured with a handheld penetrometer generally increases downcore from near 0 kPa at the top of Holes M0083A–M0083F (Figures F48, F49, F50, F53). In Hole M0083B, Su is 83.4 kPa at the core base with a maximum value of 96.5 kPa at 14.9 mbsf. In Hole M0083D, Su exceeds 80 kPa only below 28.6 mbsf with a maximum value of 94.8 kPa. In Hole M0083F, the maximum value of 88.3 kPa is measured at the bottom of the hole.
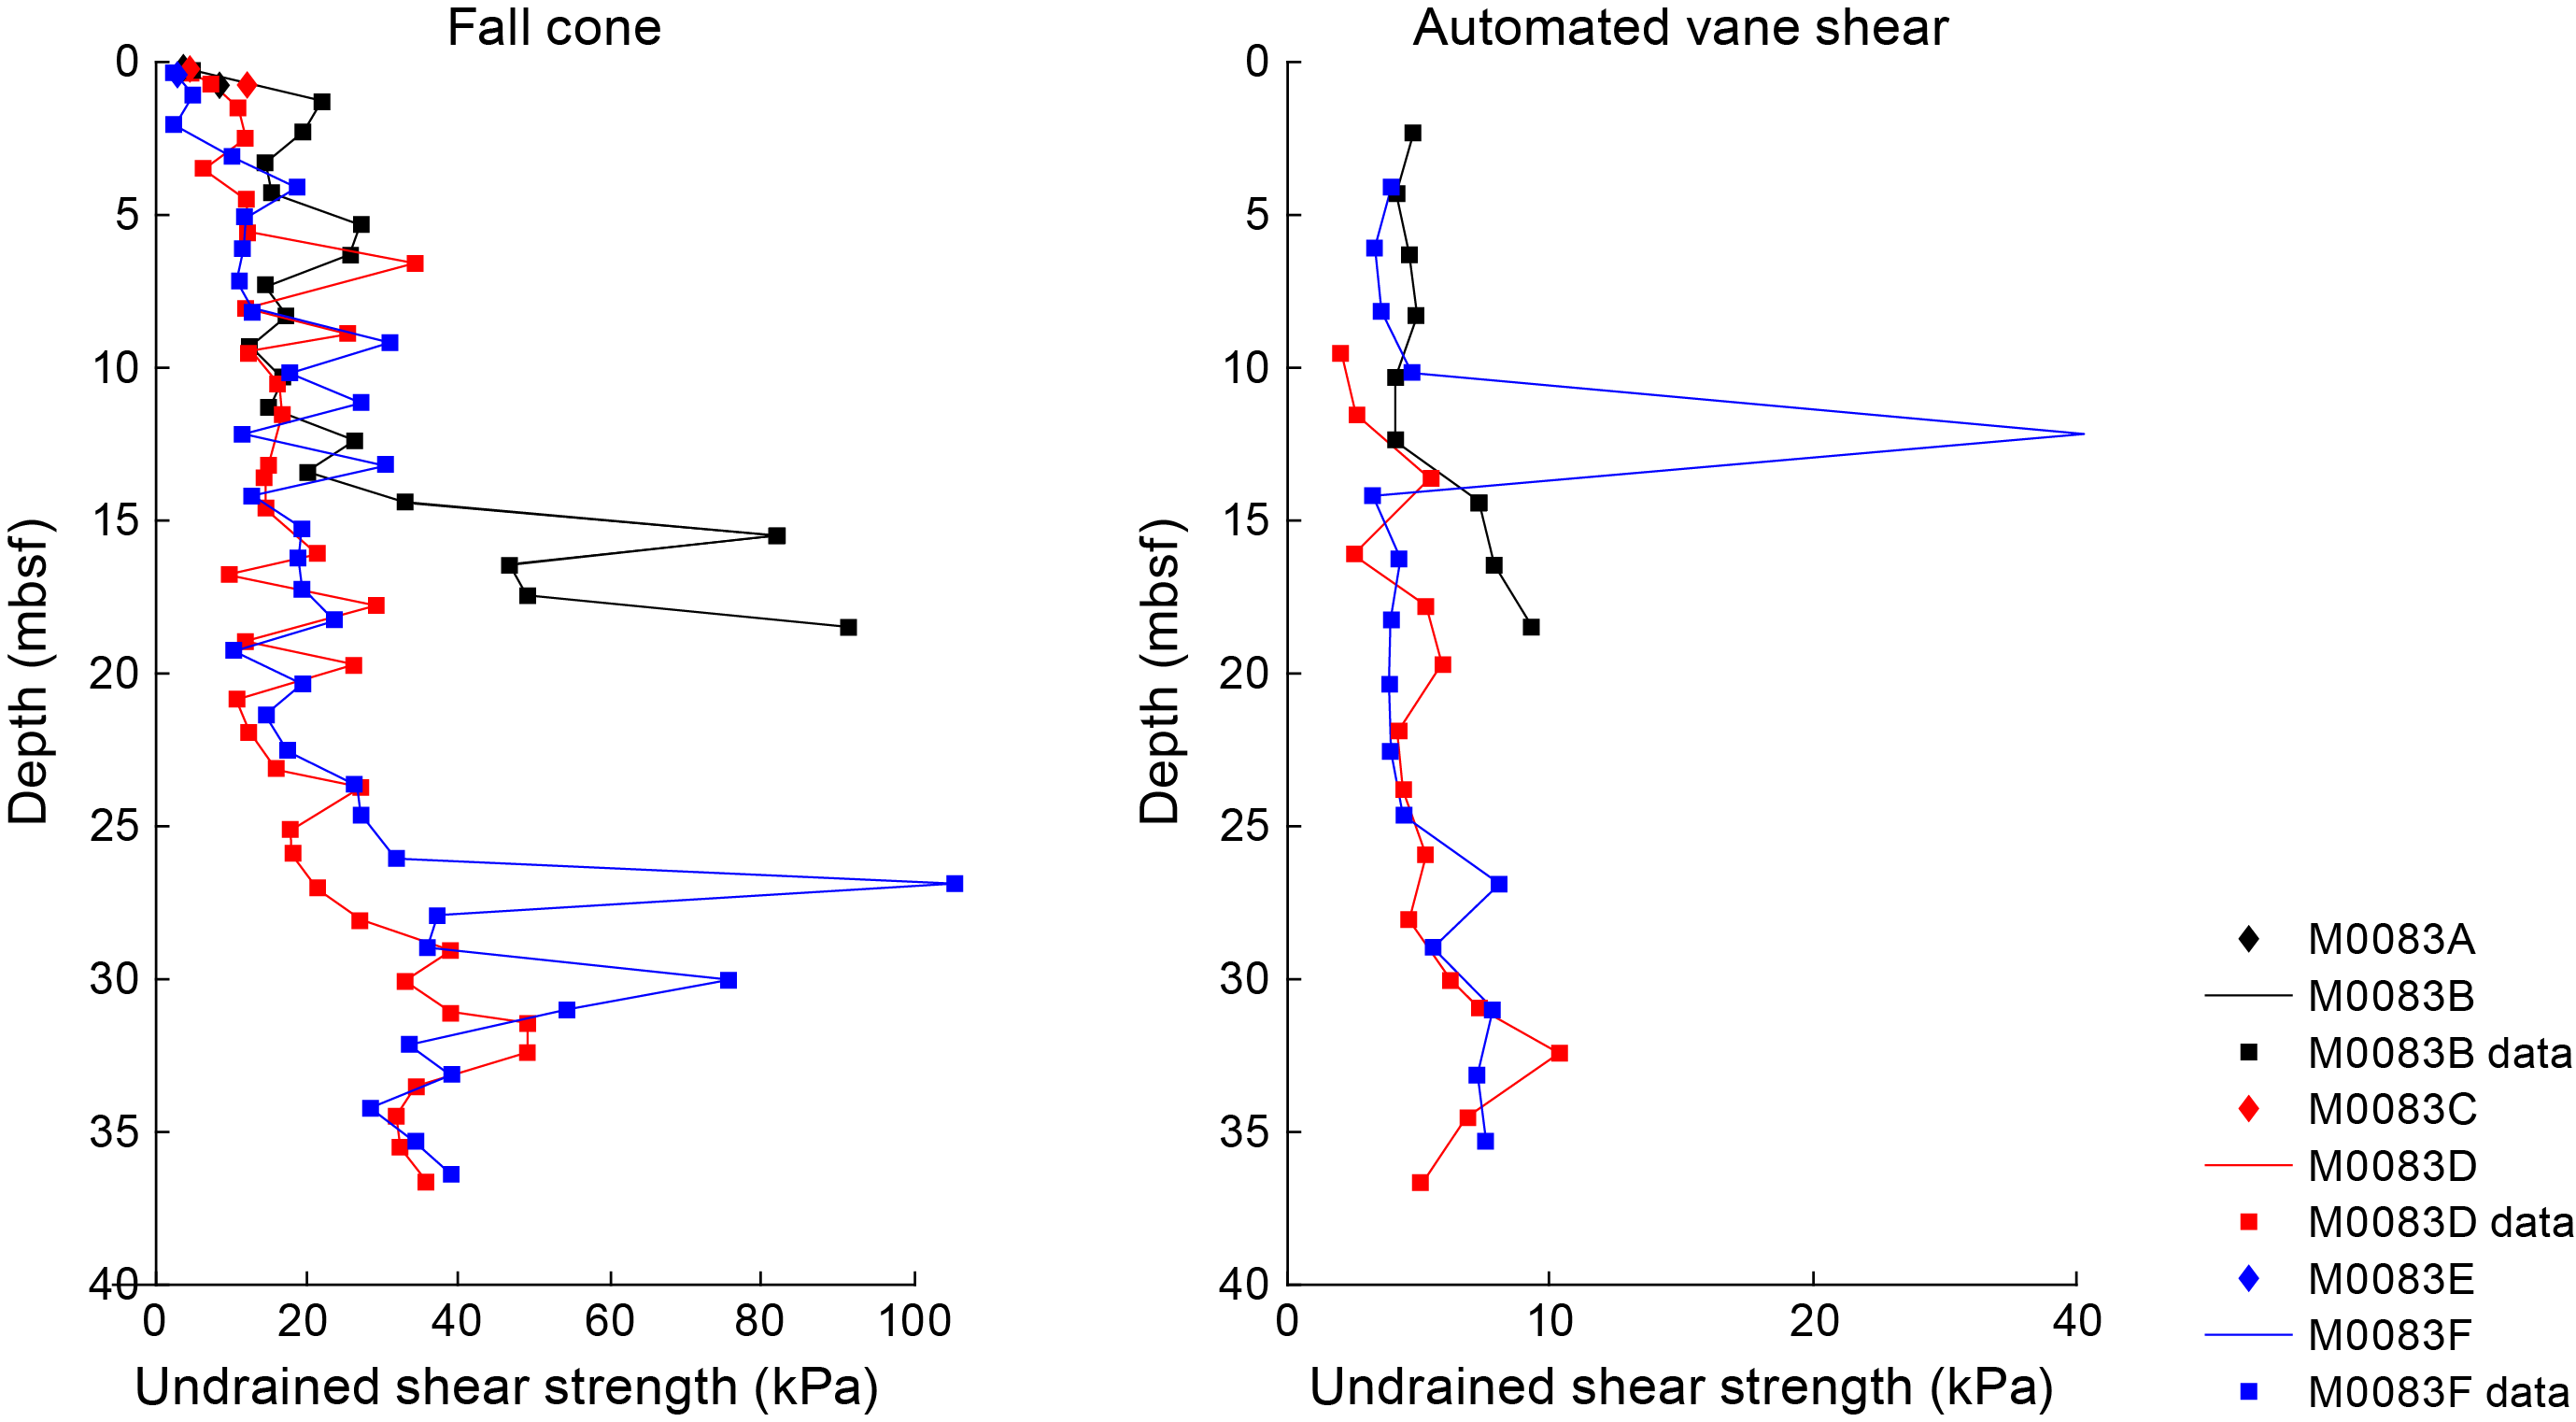
Figure F53. Undrained shear strength, Site M0083.
7.6.2. Site M0089
Su increases from 14.7 kPa at the top of Holes M0089A and M0089B to 88.3 kPa at the base of Hole M0089B (Figure F51). In Holes M0089C and M0089D, Su increases from 8.2 kPa at the top to 50.7 kPa at 6.9 mbsf in Hole M0089D (Figure F52). Below this depth, Su ranges ~50 to ~60 kPa to the core base.
It should be noted that Su values vary according to the device used to obtain them (e.g., handheld penetrometer versus fall cone penetrometer; compare Figures F51, F54). For example, fall cone strengths are higher than those obtained with the AVS and handheld penetrometer. The influence of the U-channel along the center of the core could result in lower strengths in handheld penetrometer and AVS data. The fall cone only impacts a small region of the core (~2–5 mm), whereas the AVS impacts a larger region (~20–50 mm). Both measurements ideally should be obtained from the center of the core away from the core sidewall. However, samples could not be taken at the center because of the U-channel recovered during the OSP. As a result, strength sampling points had to be placed halfway between the central U-channel and the sidewall of the core. During AVS measurements, fractures that opened often propagated toward both the central U-channel and the sidewall, perhaps resulting in lower strength values. Fall cone measurements were not seen to be affected by the U-channel or the sidewall. Postcruise analysis will more closely examine the strength data to try to reconcile the differences.
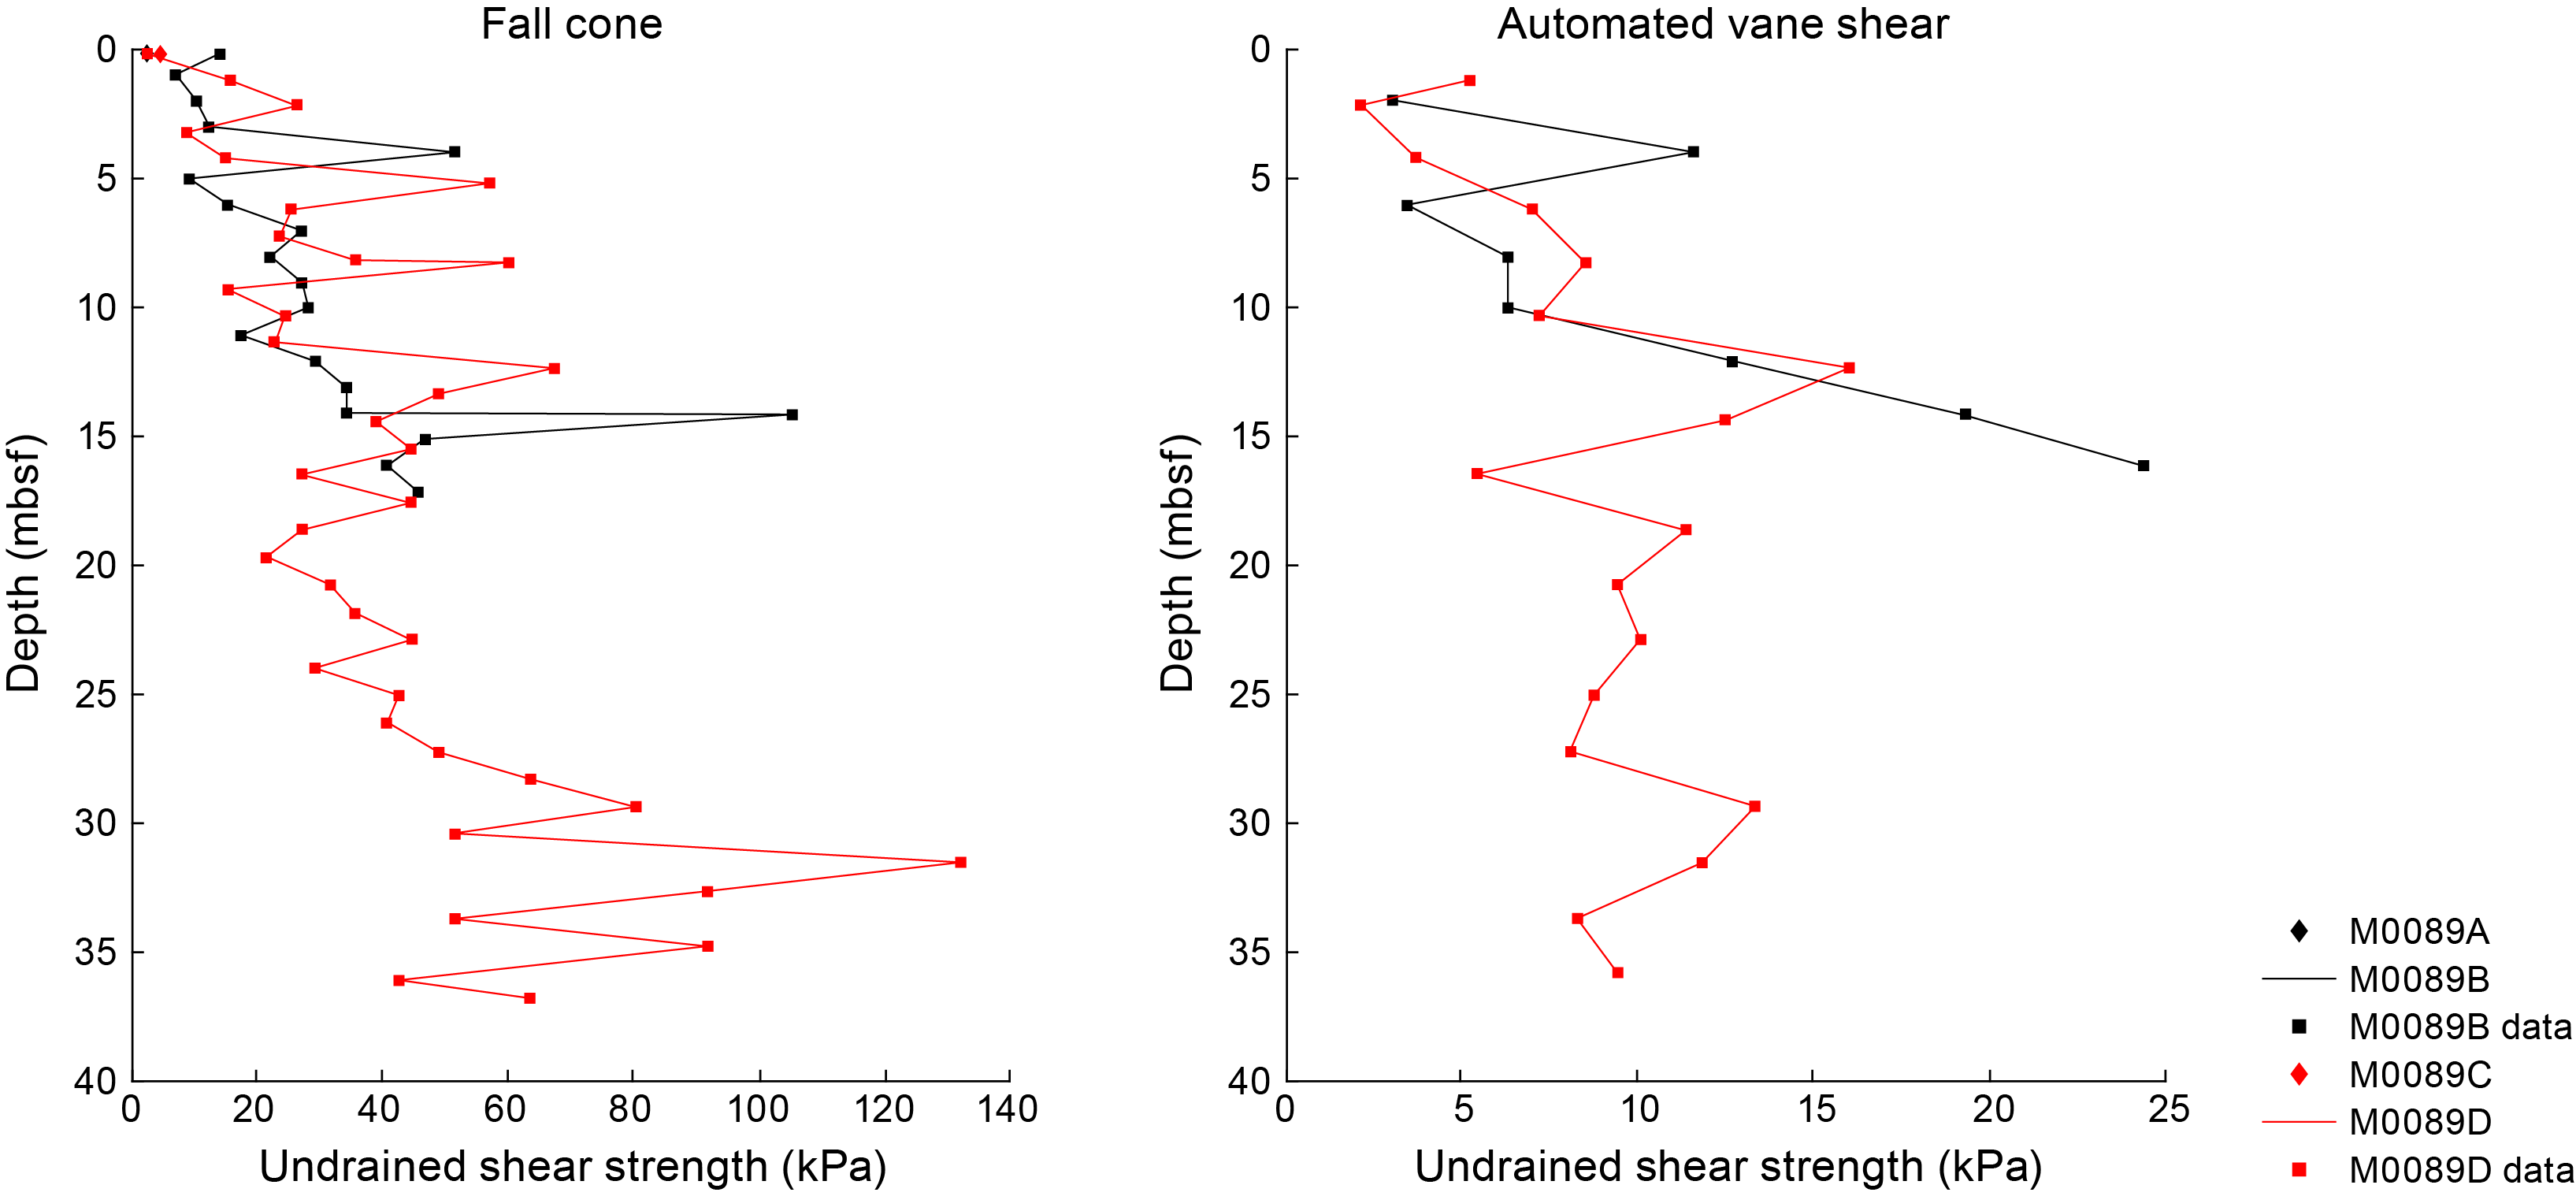
Figure F54. Undrained shear strength, Site M0089
7.7. Moisture and density
MAD measurements were carried out on discrete samples at a frequency of approximately 1 measurement every 2 m. Plots of water content (wet and dry), porosity, void ratio, grain density, and dry density and plots of bulk density MAD data with MSCL bulk density data are presented in the figures in this section.
7.7.1. Site M0083
In all holes at Site M0083, water content, porosity, and void ratio decrease from the core tops to 6.8, 6.1, and 8.7 mbsf in Holes M0083B, M0083D, and M0083F, respectively, followed by an increase (Figures F55, F56, F57). This increase is followed by a downcore decreasing trend to 17.0, 16.2, and 16.8 mbsf in Holes M0083B, M0083D, and M0083F, respectively, followed by another increase. Below 20.3 and 20.7 mbsf in Holes M0083D and M0083F, respectively, values decrease to the core bases, with notable troughs at 28.6 mbsf in Hole M0083D and at 22.7 and 27.4 mbsf in Hole M0083F. Dry density and grain density values behave opposite to water content, porosity, and void ratio values. Grain density varies mostly between 2.45 and 2.60 g/cm3, which is relatively low considering the grain densities of quartz (2.65 g/cm3) and common clay minerals (~2.7 g/cm3). Notably, Hole M0083D shows an interval of grain density values as low as 2.14 g/cm3 at 18.3–22.5 mbsf, and the lowest grain density values in Holes M0083D and M0083F (2.13 and 2.18 g/cm3, respectively) are at the core bases. The highest grain density value of 2.61 g/cm3 in Hole M0083D is observed at 33.7 mbsf.
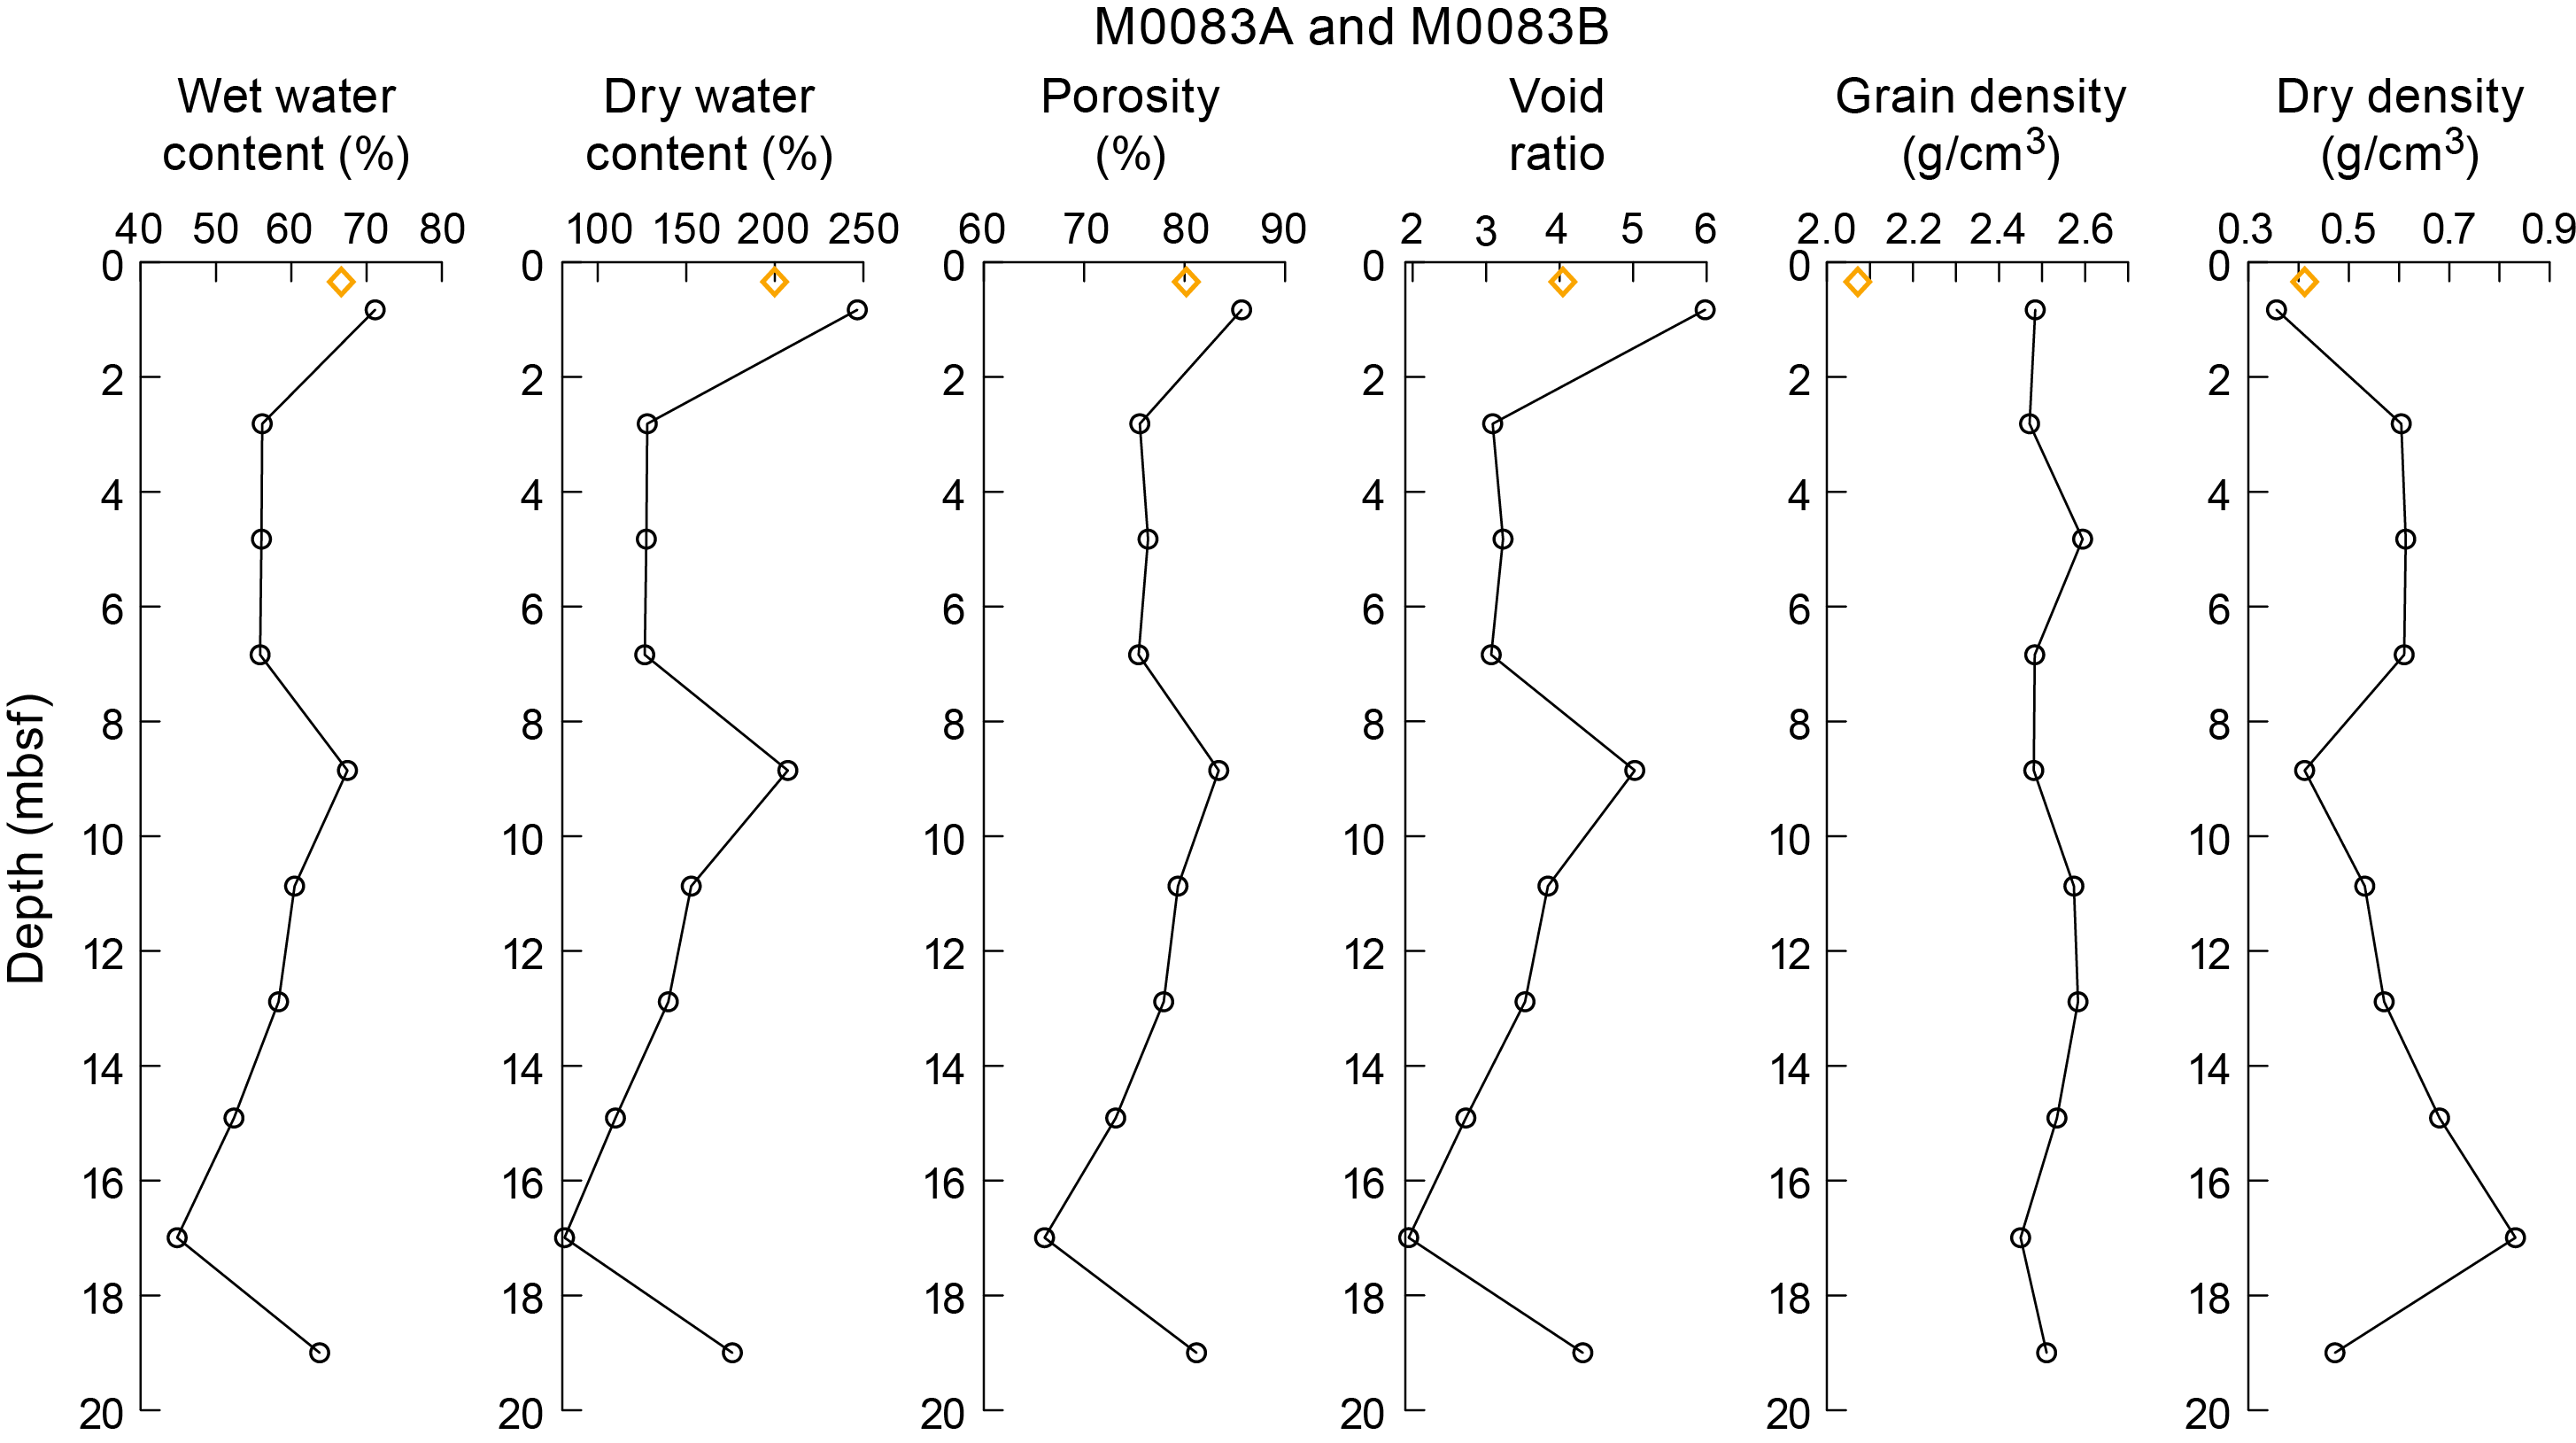
Figure F55. MAD data, Holes M0083A and M0083B.
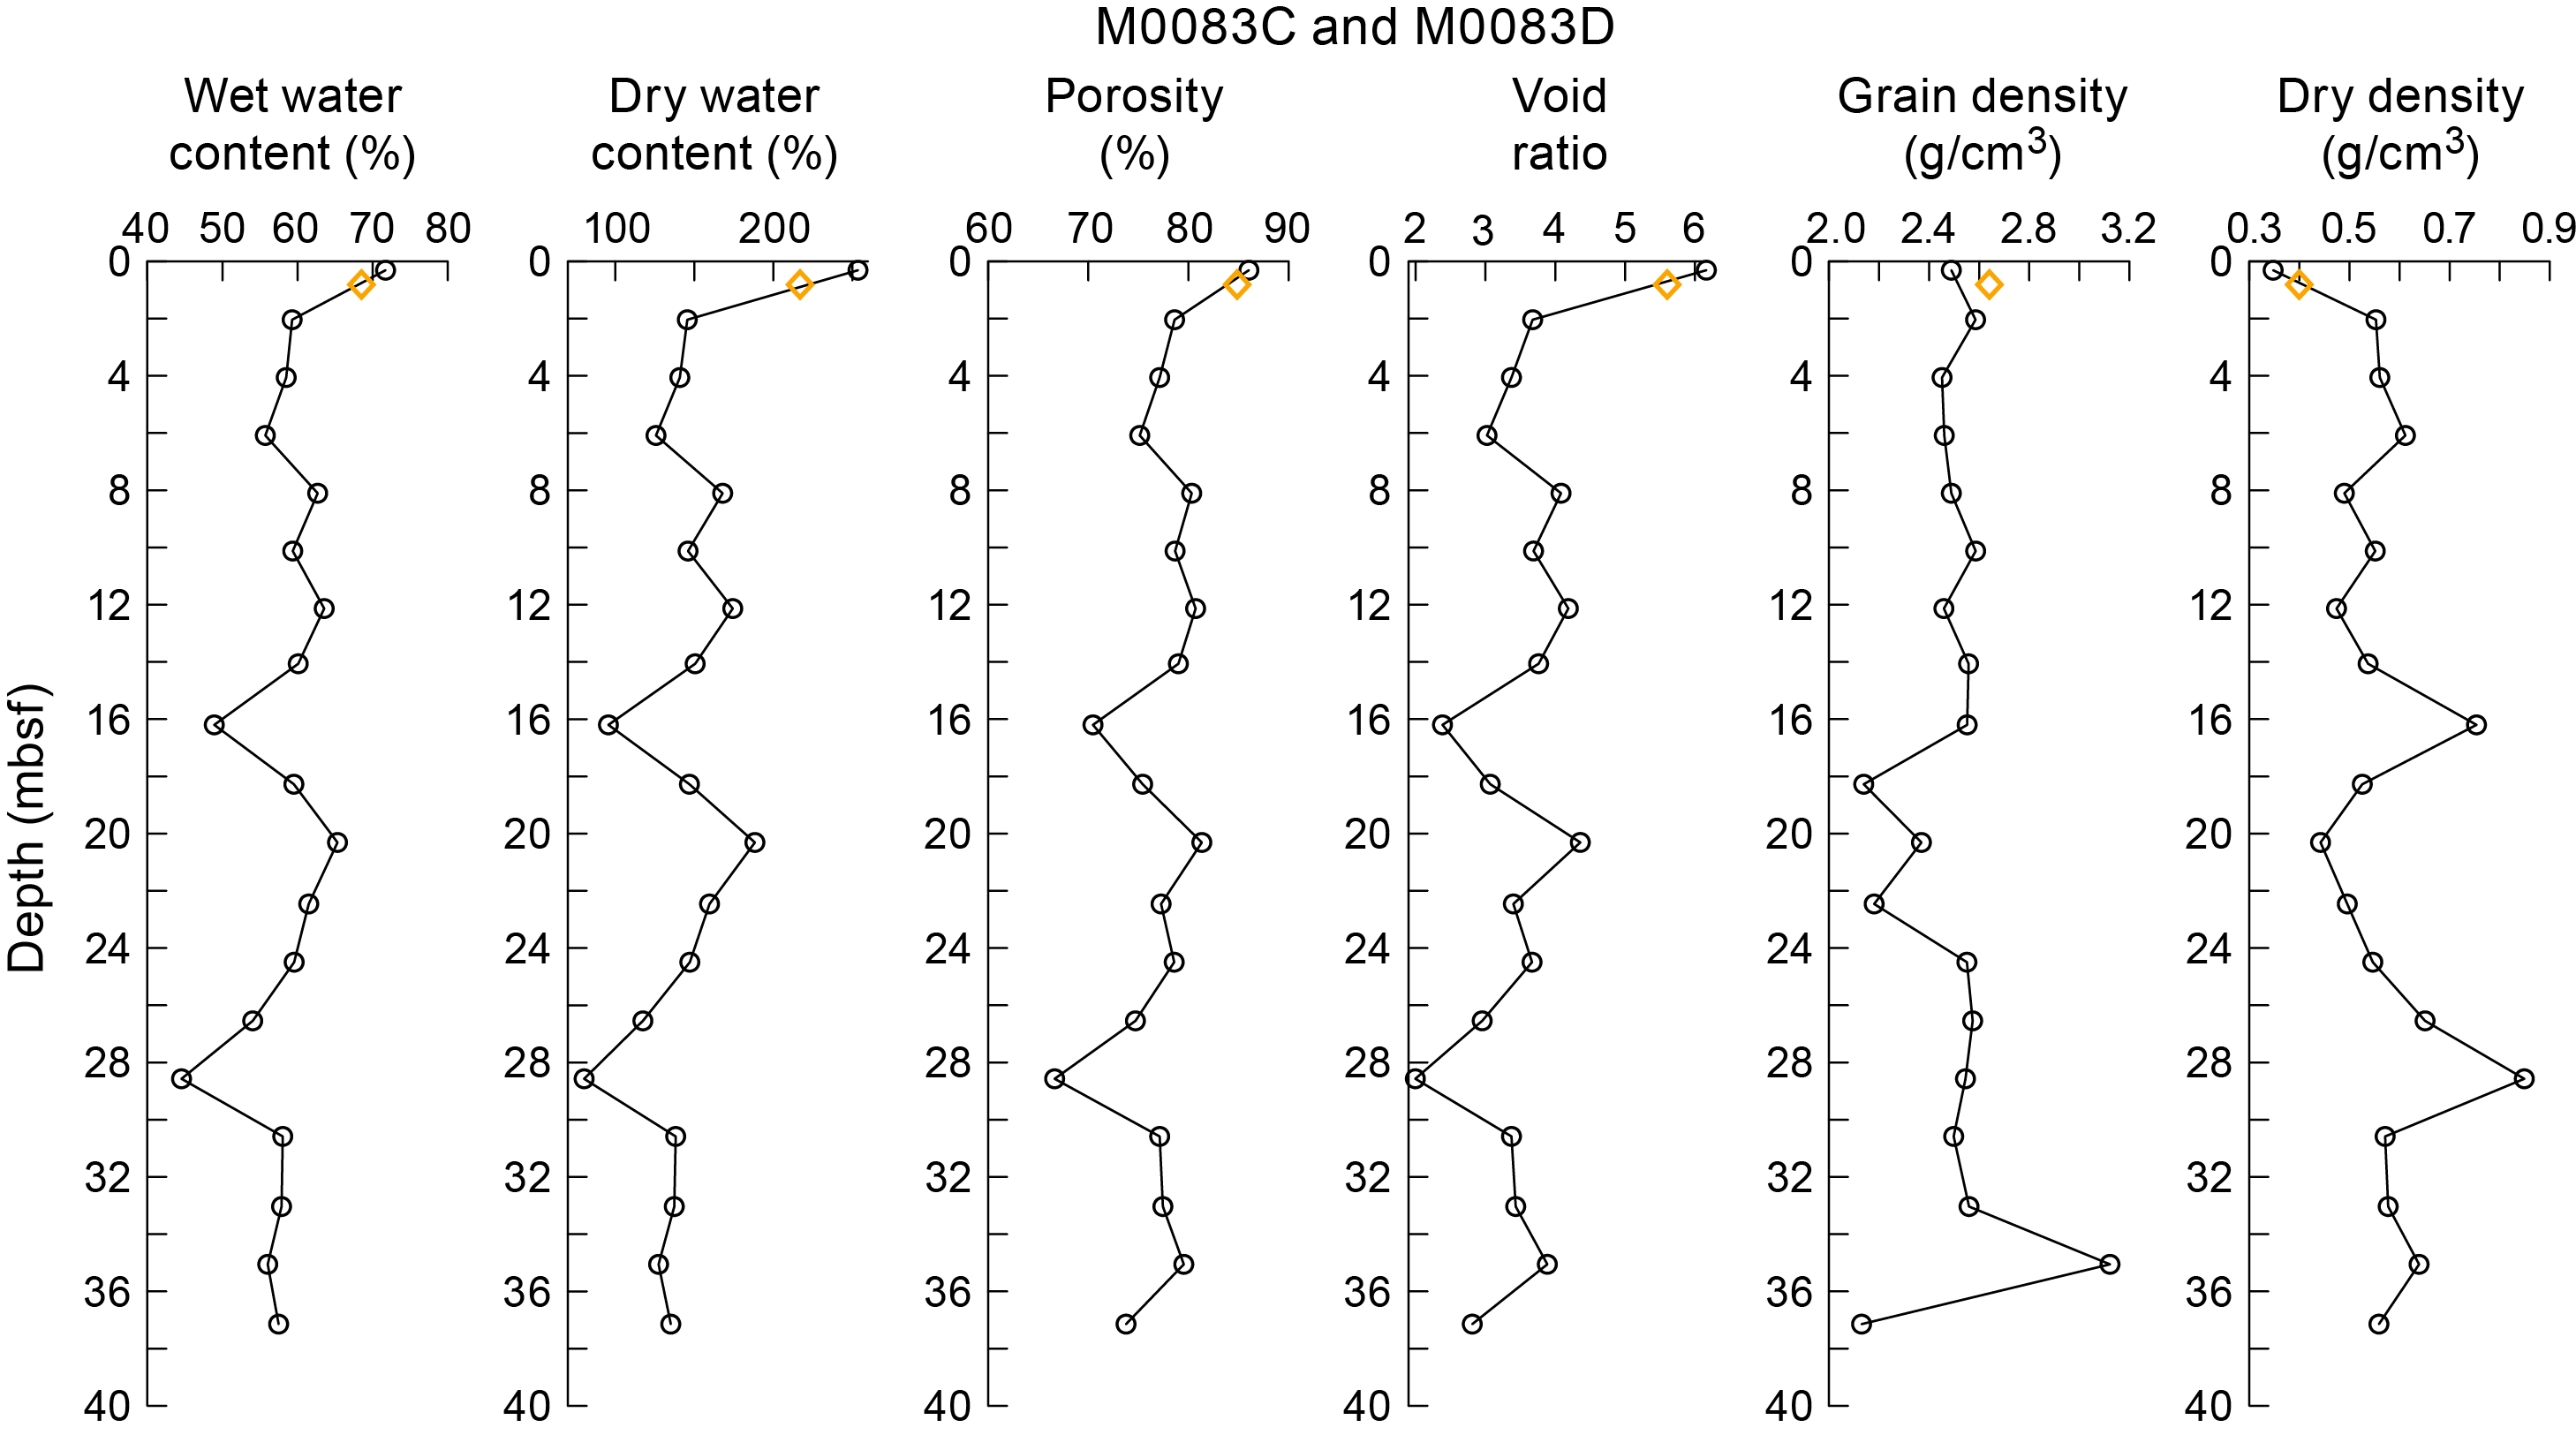
Figure F56. MAD data, Holes M0083C and M0083D.

Figure F57. MAD data, Holes M0083E and M0083F.
7.7.2. Site M0089
In Hole M0089B, water content, porosity, and void ratio show little variation in the uppermost 6.6 m (Figure F58). Values decrease at 8.6 mbsf and then show little variation downcore to the core base. In Hole M0089D, water content, porosity, and void ratio decrease from the core tops to 4.9 mbsf, below which depth an increase is observed (Figure F59). Below 8.9 mbsf in Hole M0089D, values decrease to the core base. Dry density and grain density values behave opposite to water content, porosity, and void ratio values: the former property values systematically decrease when the latter property values increase. Grain density varies mostly between 2.45 and 2.60 g/cm3, which are relatively low values considering the grain densities of quartz (2.65 g/cm3) and common clay minerals (~2.7 g/cm3).
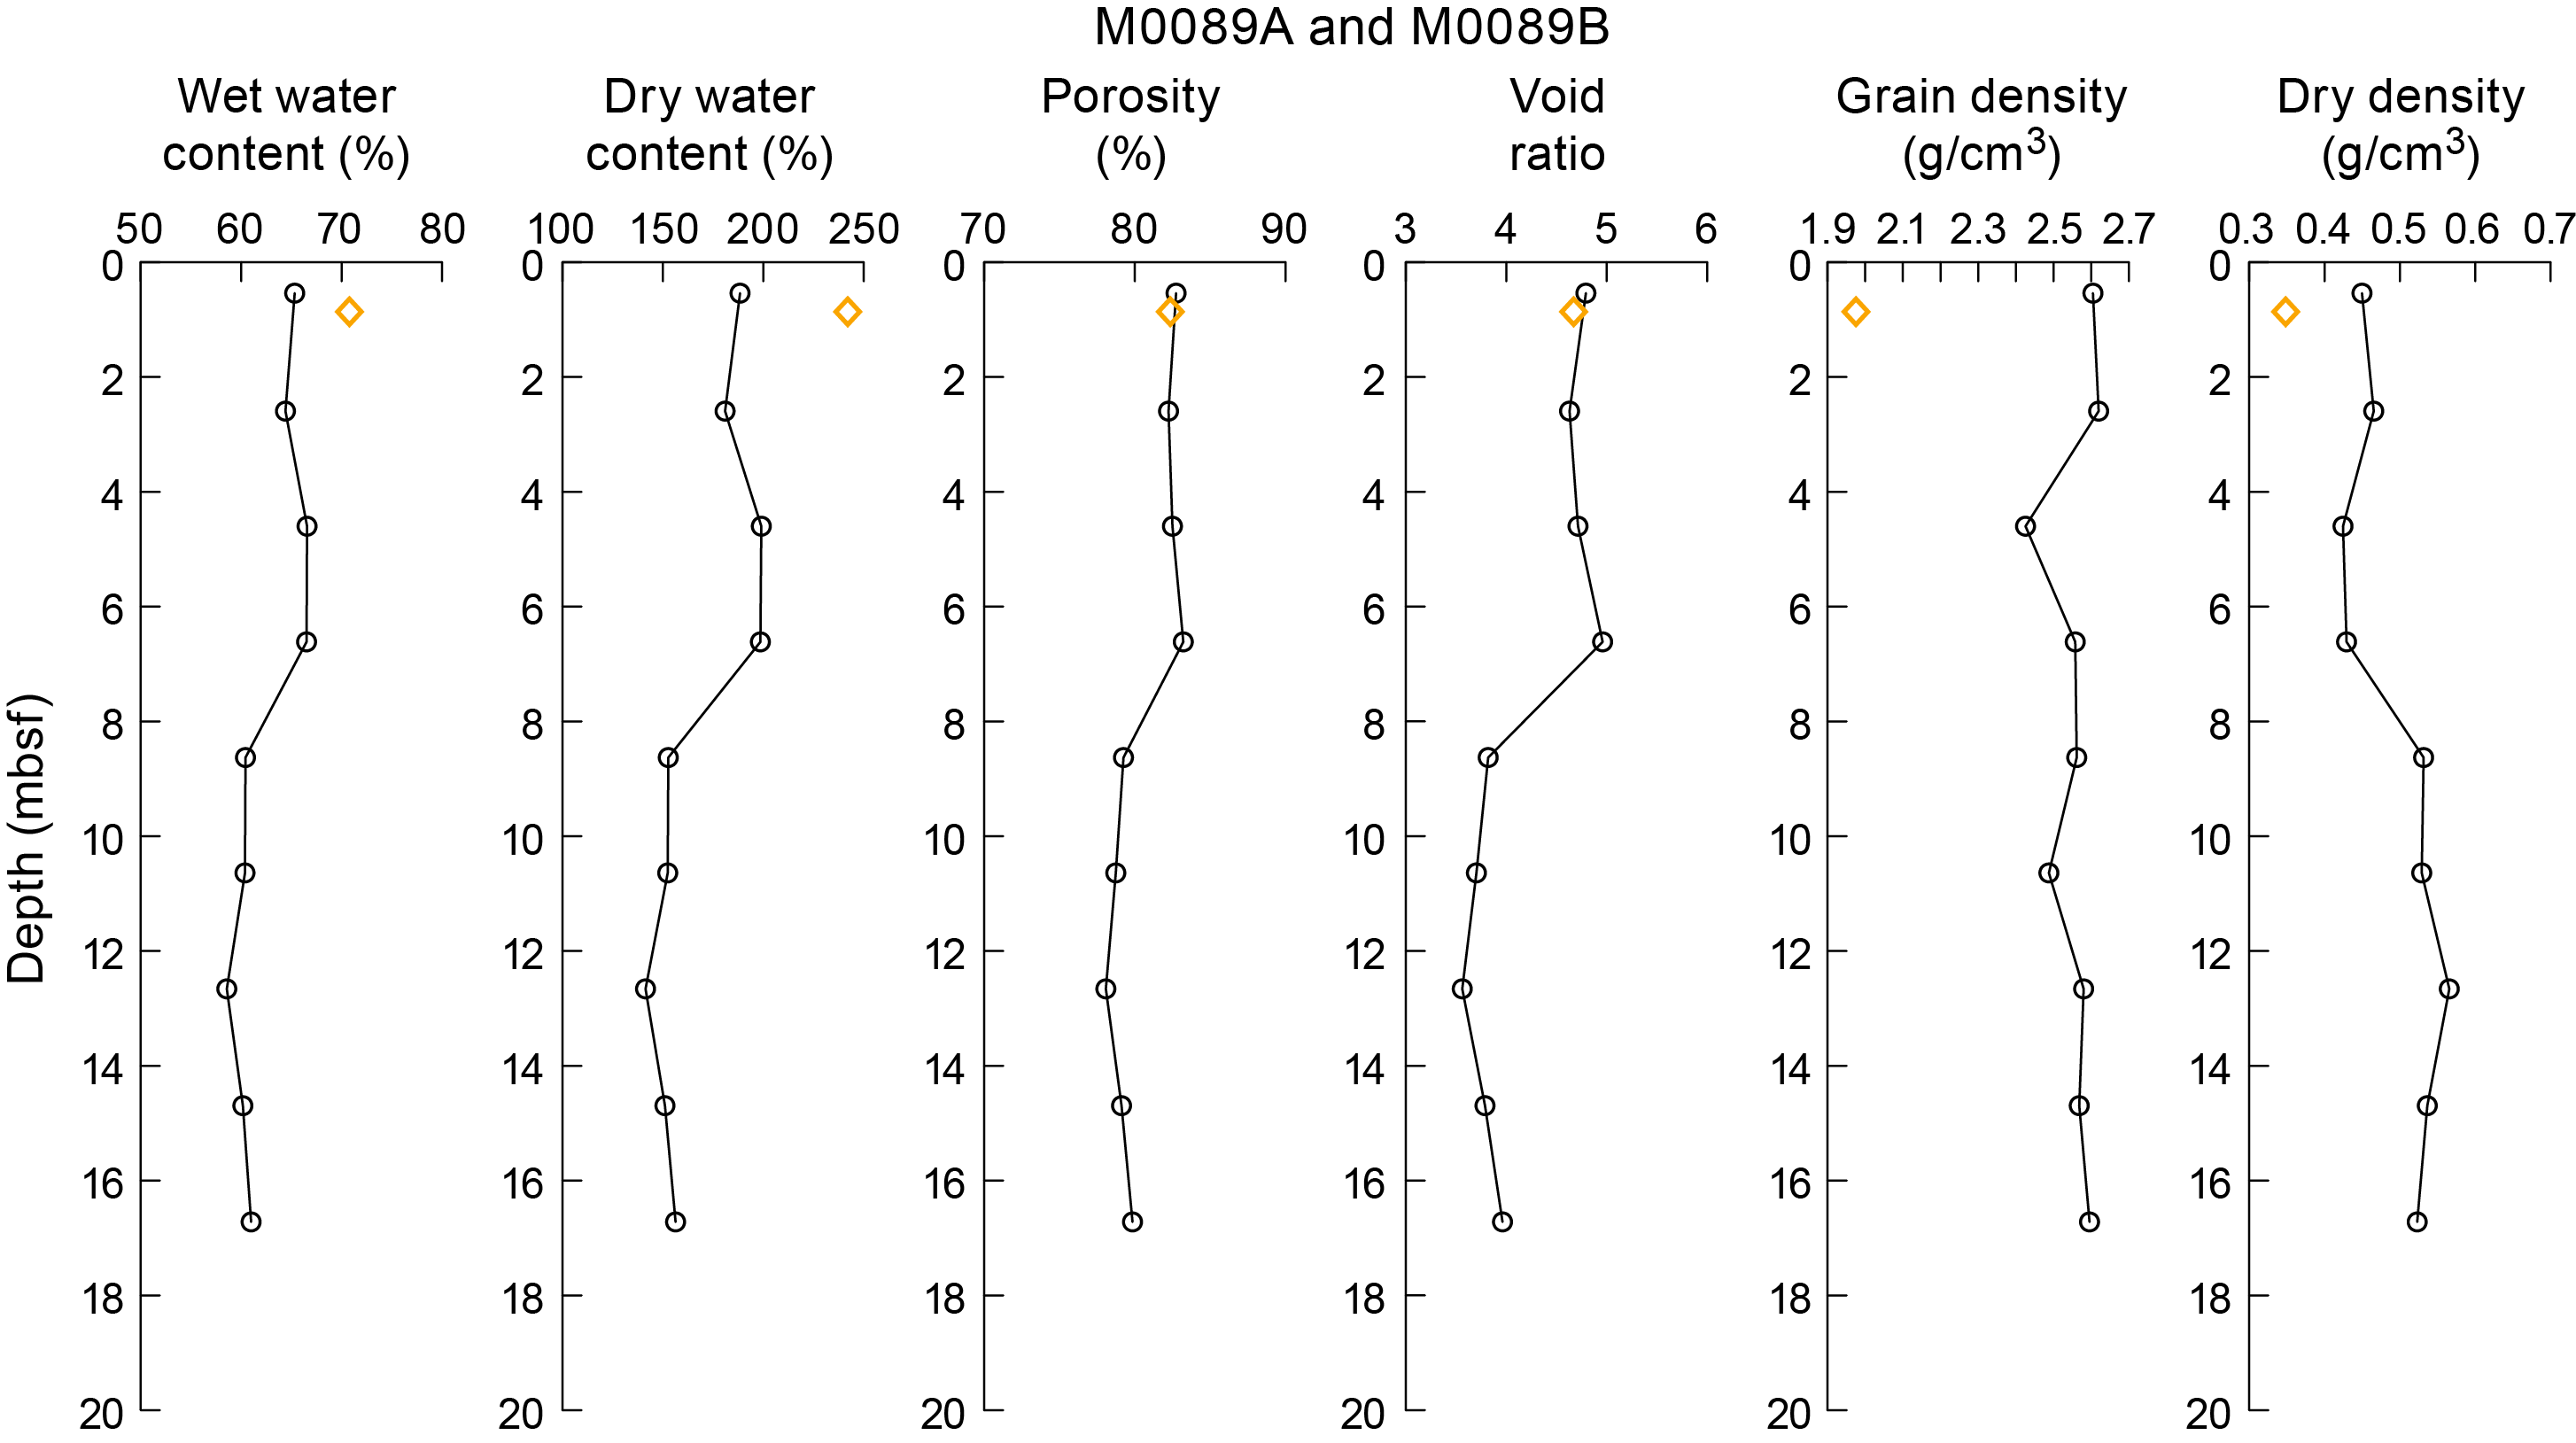
Figure F58. MAD data, Holes M0089A and M0089B.

Figure F59. MAD data, Holes M0089C and M0089D.
7.8. Color reflectance and RGB values
L*a*b* color values were measured using the spectrophotometer, whereas RGB values were extracted from linescan images (see Physical properties in the Expedition 386 methods chapter [Strasser, 2023a]).
7.8.1. Site M0083
In all holes at Site M0083, L* color values range approximately 20–40 (Figures F60, F61, F62). Values of a* range approximately −2 to +1, and b* values range approximately 0–15. R and G values range 40–90, and B values range 30–80. The vertical pattern of RGB values closely follows that of L*.
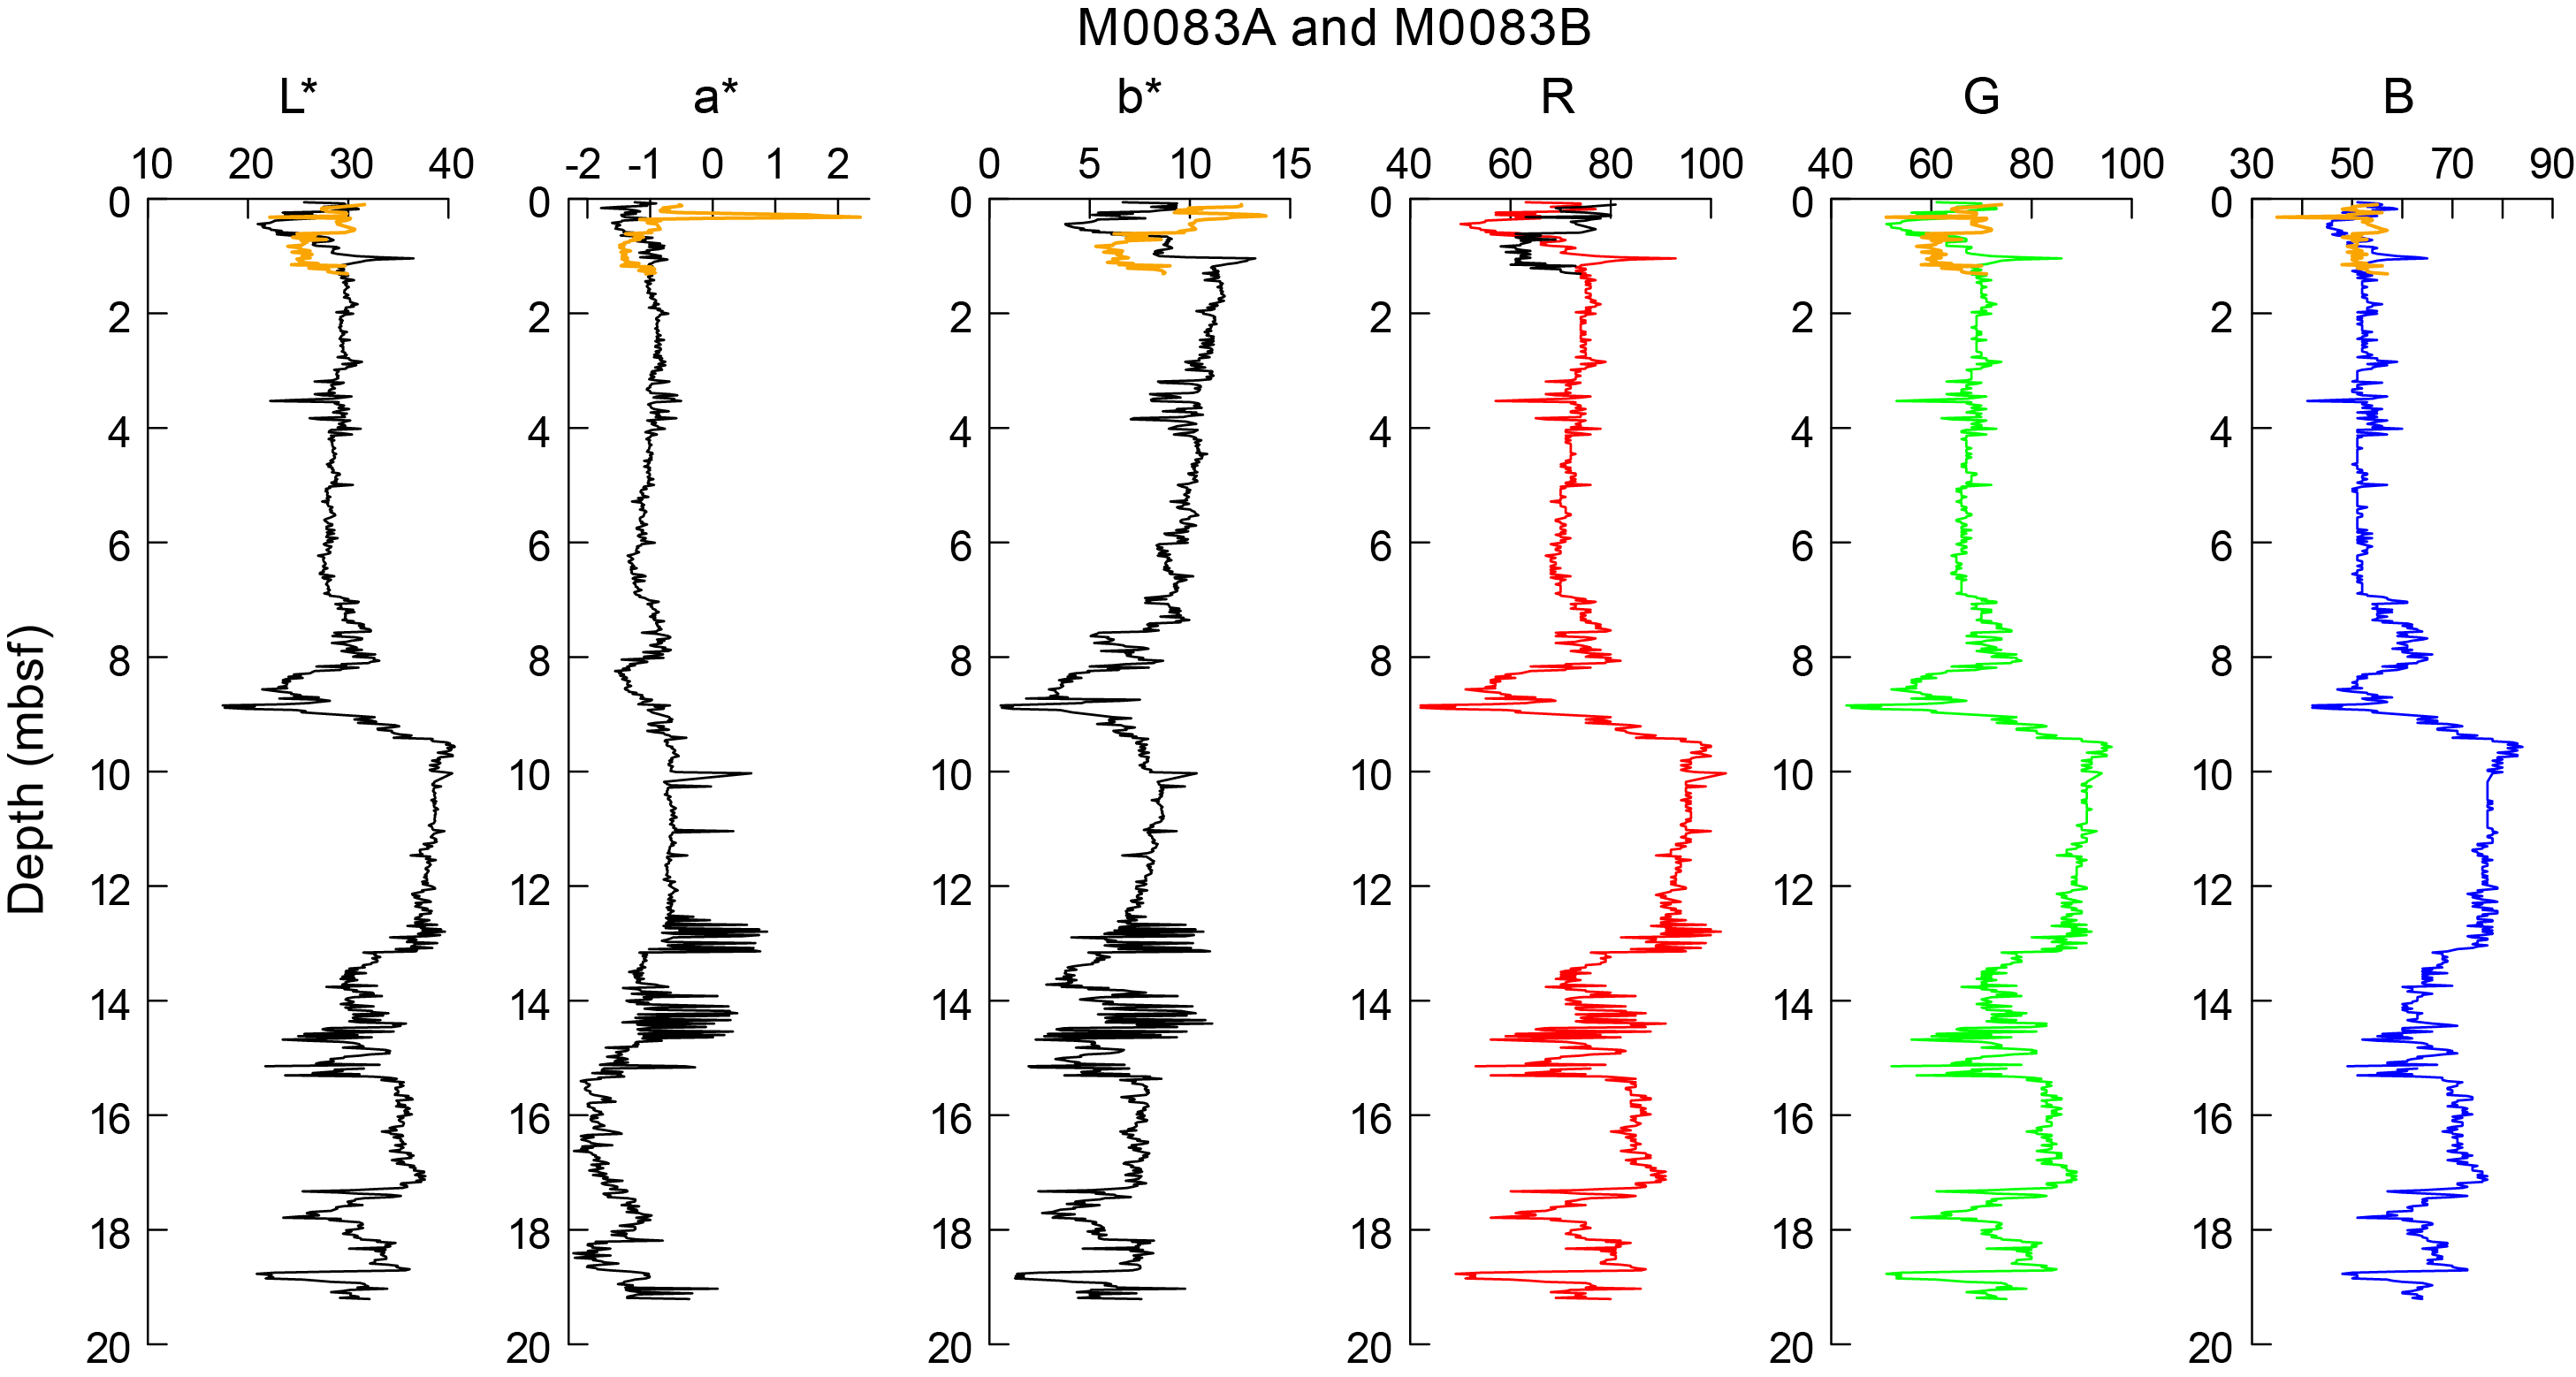
Figure F60. Color data, Holes M0083A and M0083B.
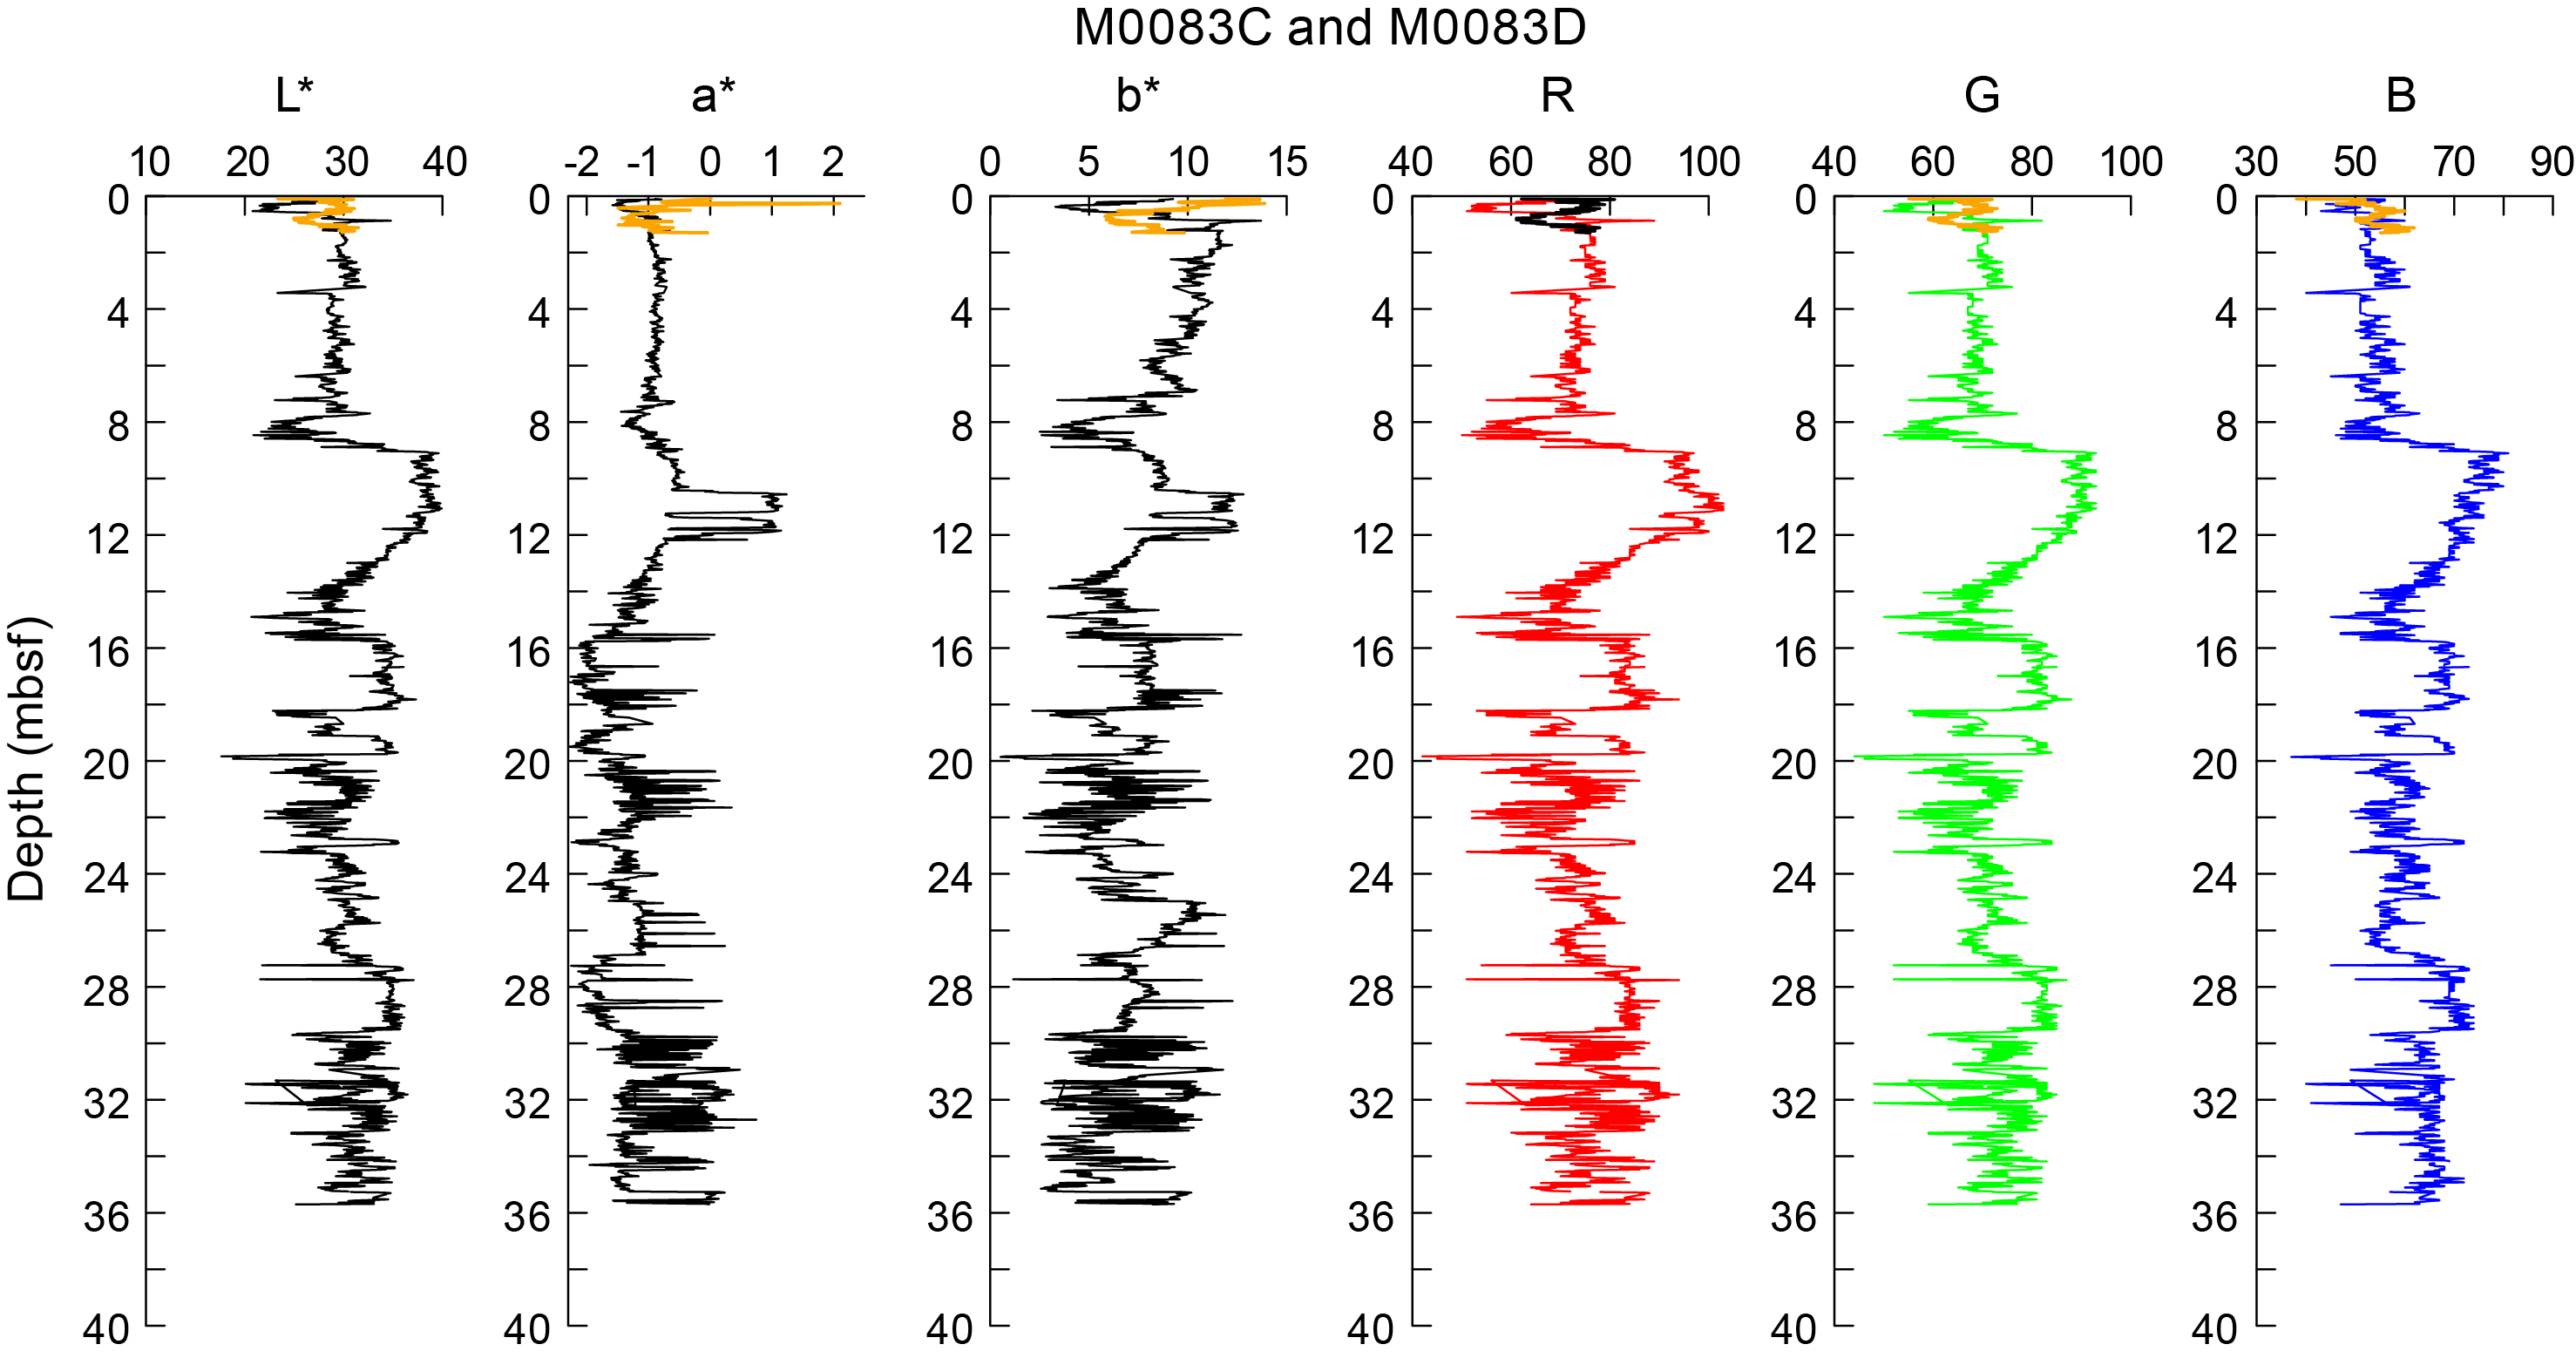
Figure F61. Color data, Holes M0083C and M0083D.

Figure F62. Color data, Holes M0083E and M0083F.
Characteristic patterns in L* and b* are observed at 9–13.5 mbsf in Holes M0083B and M0083D (10.5–15.5 mbsf in Hole M0083F), where values first drop sharply and then increase strongly. L* reaches the maximum value at 9.5 mbsf in Hole M0083B, and b* reaches the maximum value at 10 mbsf (9.0 and 10.5 mbsf in Hole M0083D and 11.0 and 11.5 mbsf in Hole M0083F, respectively). Values then decline gently to the next trough at 13.5 mbsf in Hole M0083B (14.0 and 15.5 mbsf in M0083D and M0083F, respectively). Another characteristic feature are plateaus of elevated L* and b* values at 15.1–17.2 mbsf in Hole M0083B, 15.5–18.2 and 27.2–29.7 mbsf in Hole M0083D, and 16.8–18.6 and 26.5–28.5 mbsf in Hole M0083F.
7.8.2. Site M0089
L* color values range approximately 20–40 in all holes at Site M0089 (Figures F63, F64). Values of a* range approximately −2 to +1, and b* values range approximately 0–15. R and G values range 40–100, and B values range 30–80. The vertical pattern of the RGB values strongly follow that of L*.
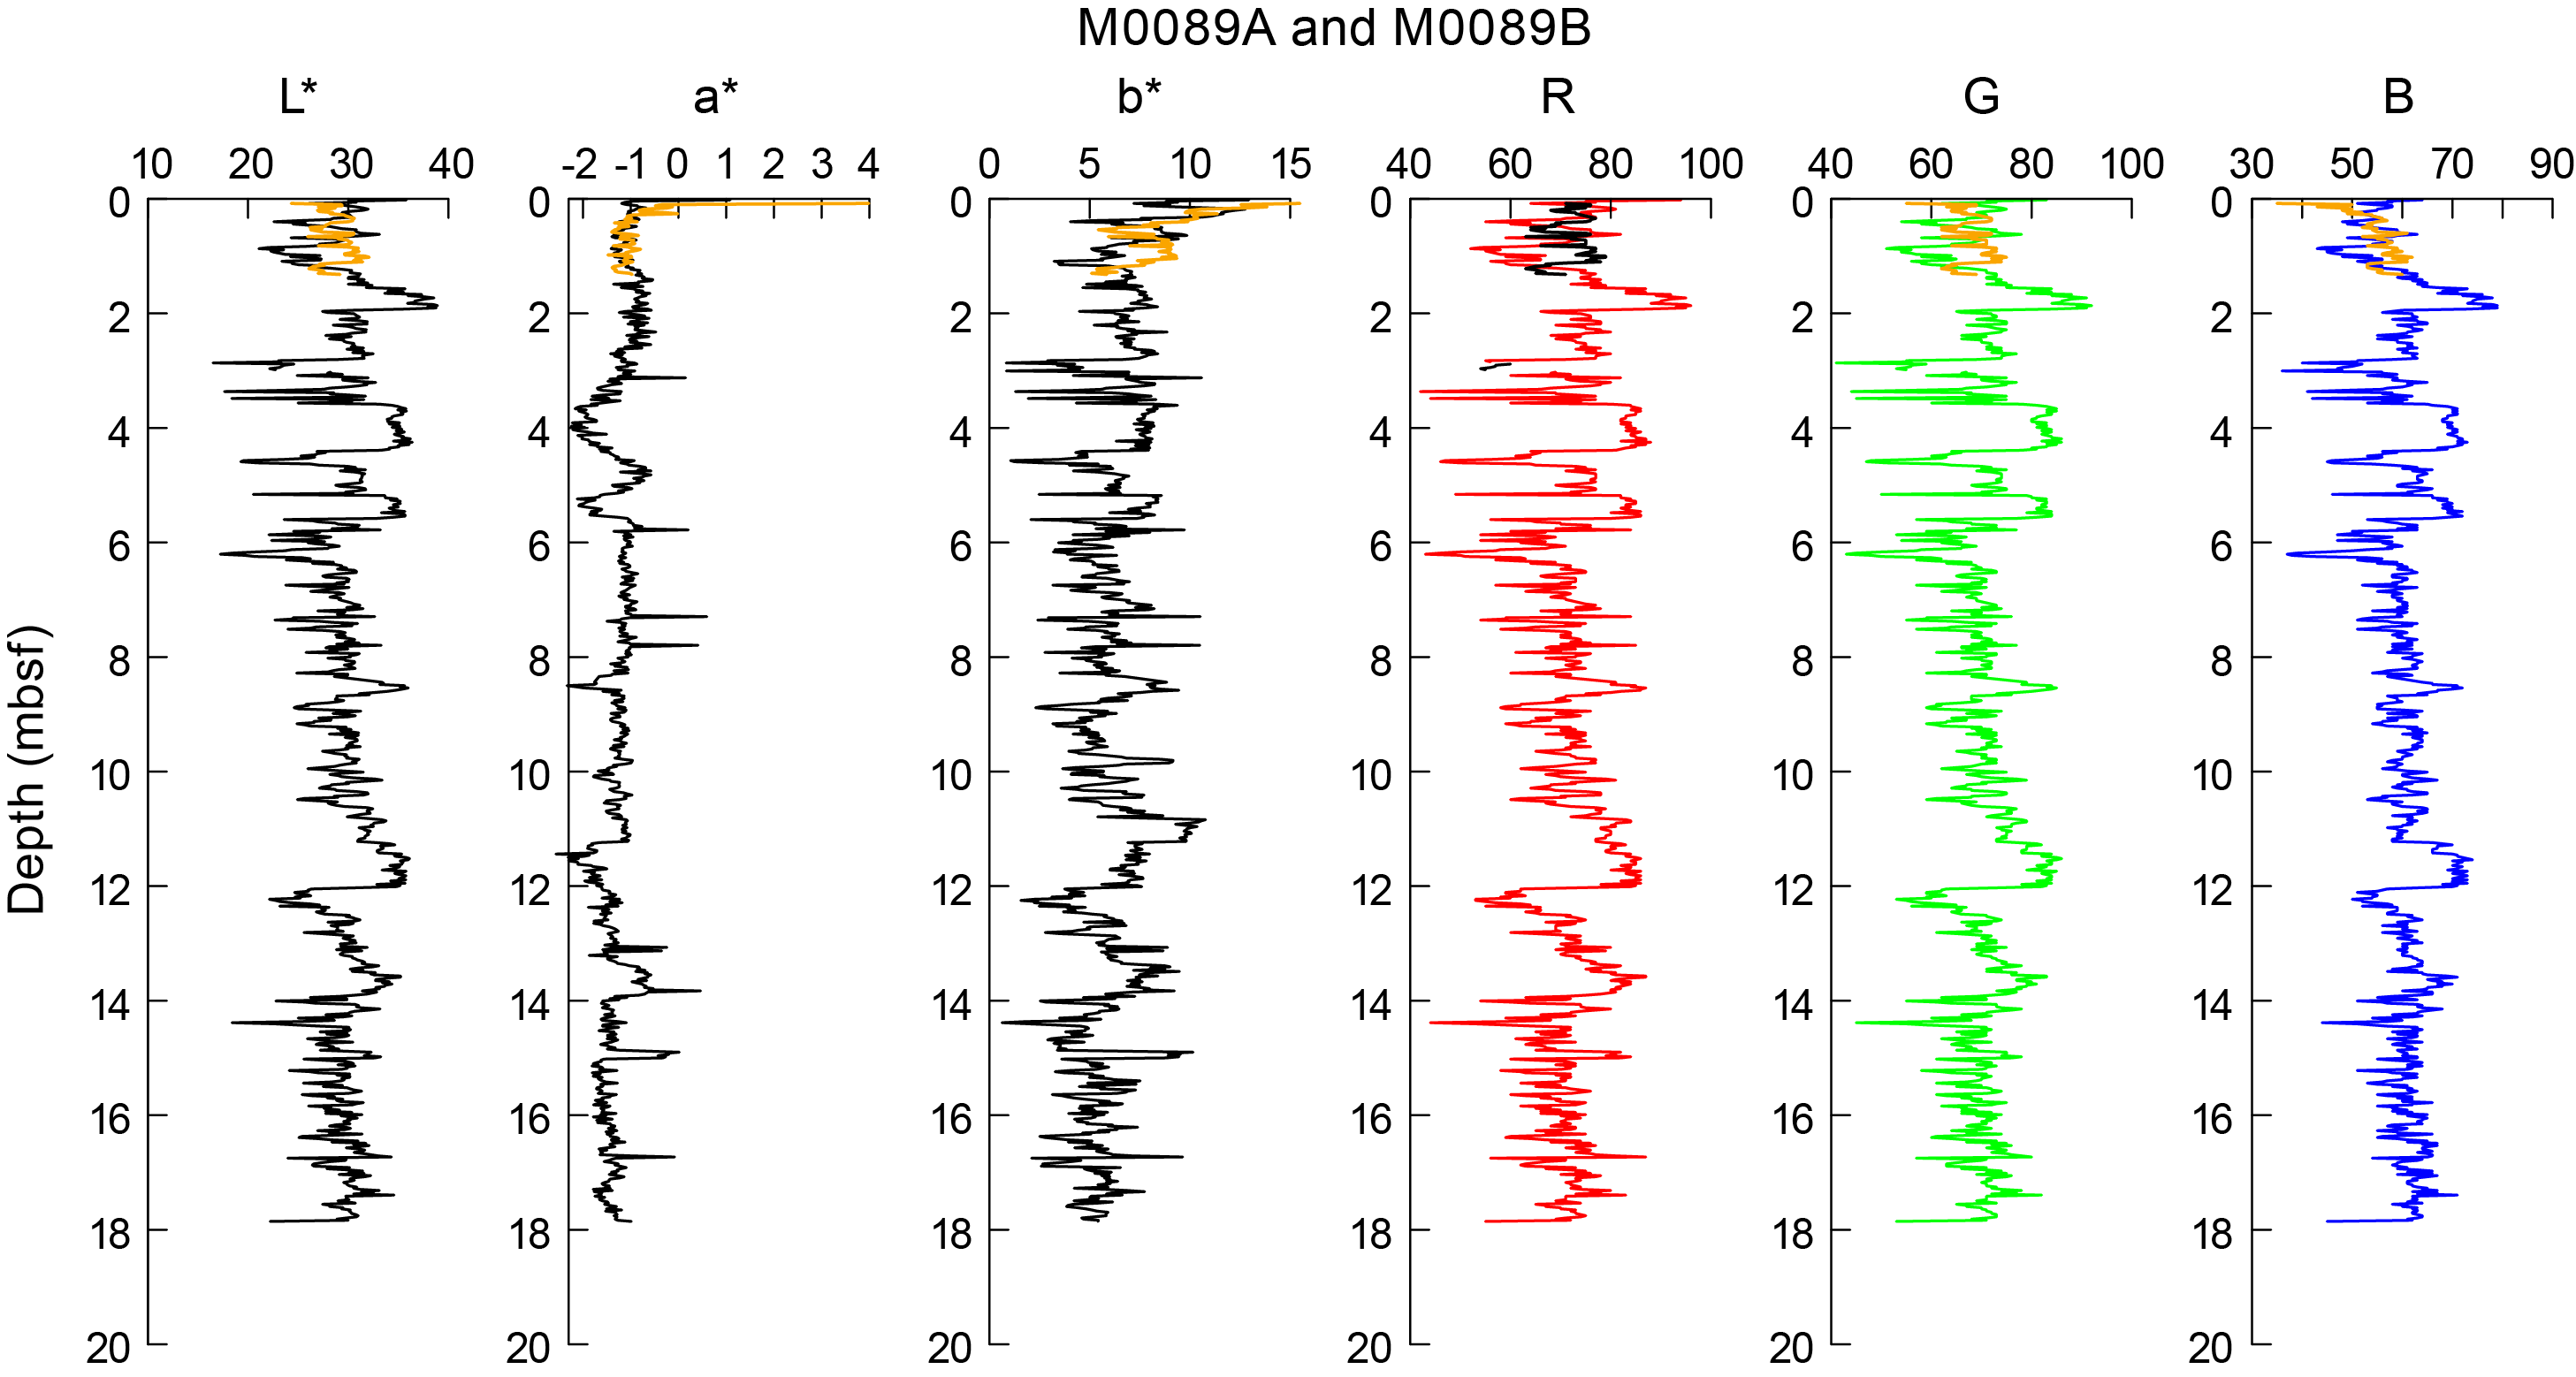
Figure F63. Color data, Holes M0089A and M0089B.

Figure F64. Color data, Holes M0089C and M0089D.
8. Paleomagnetism
Remanent magnetization was measured for Holes M0083A–M0083F, sampled in the center of Basin C2, and Holes M0089A–M0089D as the condensed sections for Basin C2. Remanent magnetization of U-channel samples taken from each working half were measured at 2 cm intervals. Natural remanent magnetization (NRM) measurements were performed at 0 and 5 mT peak fields. Intensity, inclination, and declination after 5 mT demagnetization are reported here.
Intensity profiles for the trigger cores of Holes M0083A, M0083C, M0083E, M0089A, and M0089C are shown separately from the profiles for the GPC cores because of the short lengths of the trigger cores (Figure F65). Intensity in these holes is characterized by one or two peaks (2.5 × 10⁻⁵ to 10 × 10−5 A/m) in the middle and/or lower intervals. Variations of declination and inclination of the holes remain relatively constant except for the large change in inclinations of about 90° in the uppermost part (0–0.3 mbsf) of Holes M0083A and M0083C.

Figure F65. Intensity, inclination, and declination.
Intensity in Holes M0083B, M0083D, M0083F, M0089B, and M0089D is characterized by two patterns (Figure F66). One is an interval containing spiky peaks (e.g., 7–15 mbsf in Hole M0083B), and the other is characterized by less variability with an overall lower intensity value (e.g., 2–7 mbsf in Hole M0083B). The cause of the low variation is unknown currently, but it is probably useful for interhole correlation because it is a clear visual marker. Other than those intervals with less variability, a low intensity interval is observed between 25 and 34 mbsf in Hole M0089D.
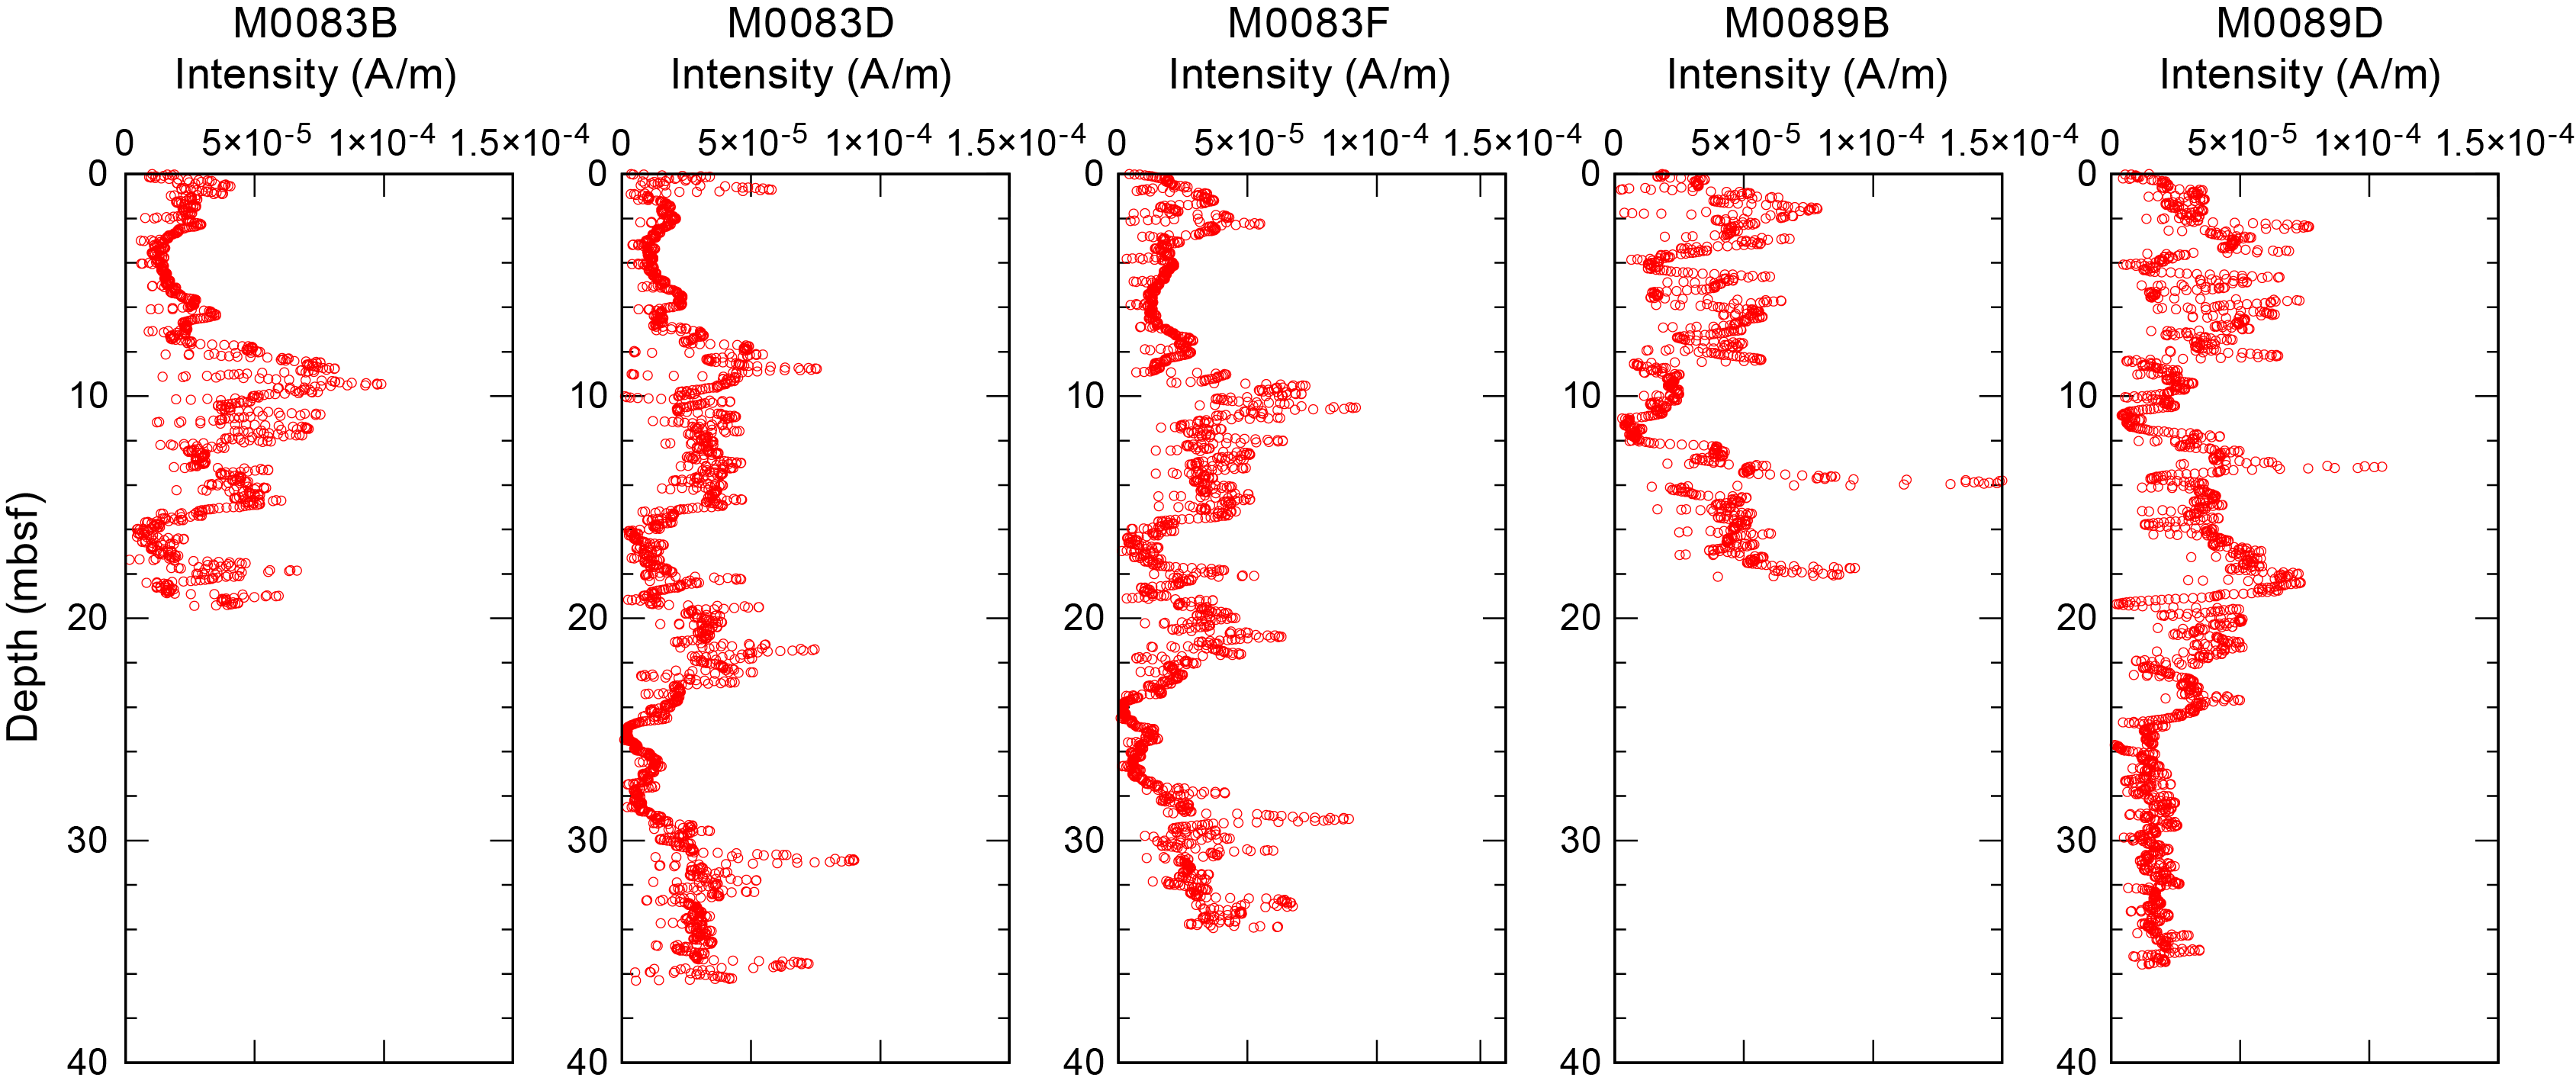
Figure F66. Intensity.
Declinations reveal clockwise linear trends downhole (Figure F67). Discontinuities of declination are observed in the upper intervals of Holes M0089B and M0089D at 6 and 12 mbsf, respectively. Supposing the linear trend formed due to twisting along the vertical axis during GPC penetration of the seabed, the correction on declination is applied as described in Coring methodology and Paleomagnetism in the Expedition 386 methods chapter (Strasser, 2023a). Also, the discontinuities in declination observed in Holes M0089B and M0089D were shifted to cancel gaps of declination. After correction, the declination profiles for Holes M0083B, M0083D, and M0083F show two large right side convex shapes (e.g., 1–14 and 19–38 mbsf in Hole M0083D) and one small convex shape (e.g., 14–19 mbsf in Hole M0083D) (Figure F68). Another feature is scattered declination intervals around 12–14 mbsf in Holes M0089B and M0089D. More frequent fluctuations of declination than those found at Site M0083 are recognized in the upper interval of Holes M0089B (0–8 mbsf) and M0089D (0–9 mbsf).

Figure F67. Declination.

Figure F68. Rescaled declination.
The inclination of all the holes oscillates between 30° and 60° (Figure F69). Remarkable inclinations of less than 30° are clearly observed between 16 and 18 mbsf in Holes M0083B, M0083D, and M0083F. Inclination lows of about 30° in Holes M0089B and M0089D occur around 4 mbsf, and the interval of the inclination low seems to be narrower (~1 m thick) but shows a similar shape to that of Hole M0083. If this inclination feature is proved to represent a geomagnetic signal, this inclination low value could be a robust chronological tie to be correlated across the cores from this expedition.
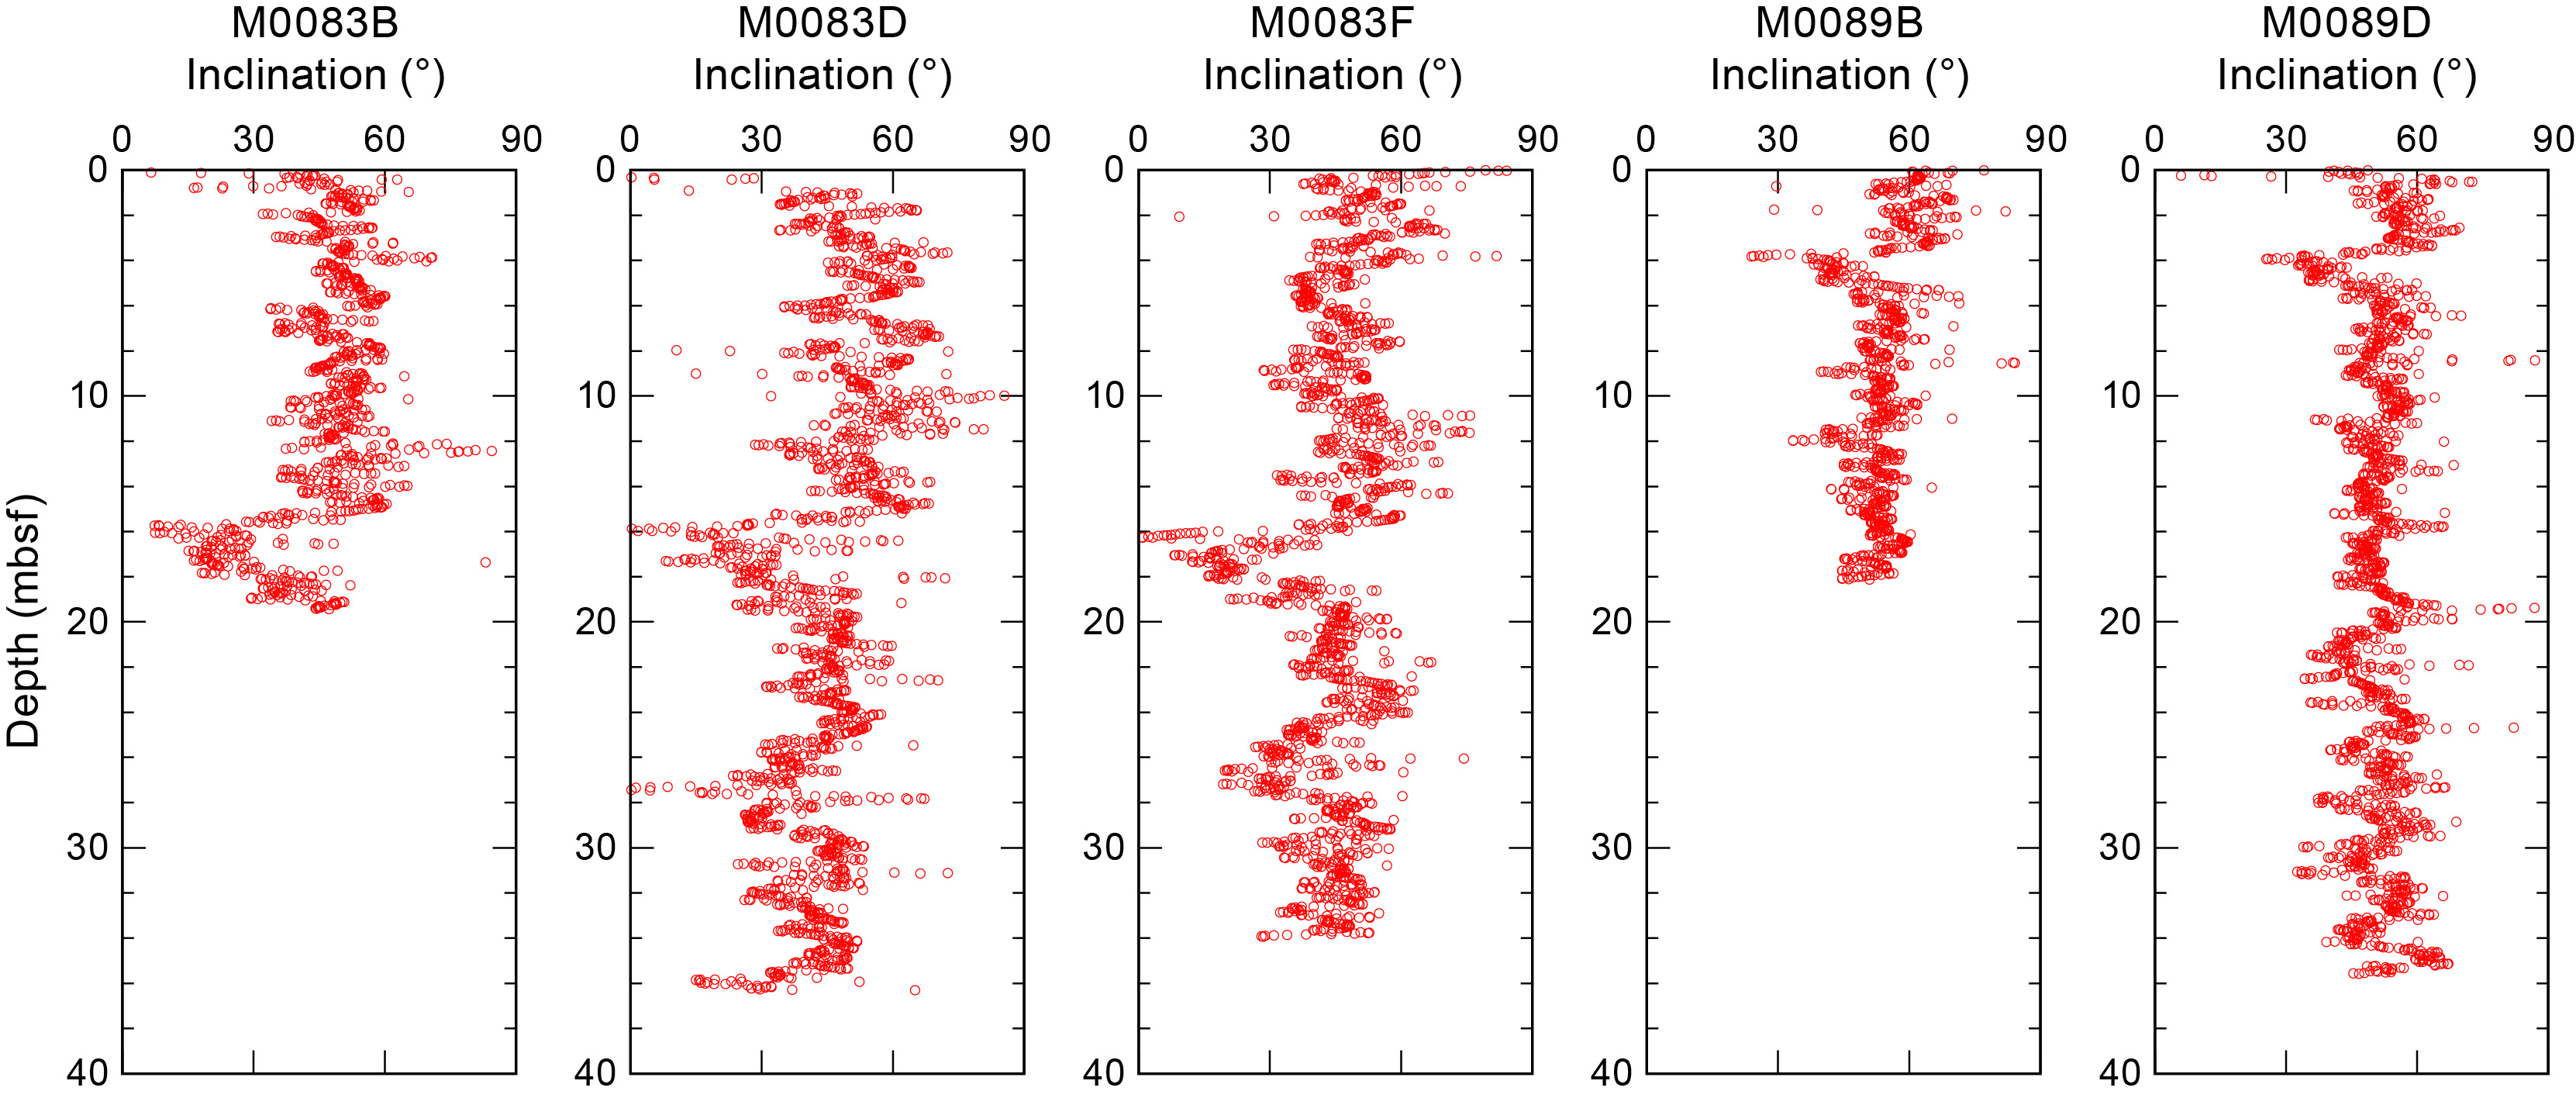
Figure F69. Inclination.
Preliminary paleomagnetic data for Sites M0083 and M0089 display declination profiles that are characterized by long periodic changes. Inclination is characterized by a low around 16 mbsf at Site M0083 and around 4 mbsf at Site M0089. These features may be confirmed as remarkable paleomagnetic signals in detailed postcruise research.
9. Stratigraphic correlation
A core composite depth scale and first-order splice (see Stratigraphic correlation in the Expedition 386 methods chapter [Strasser, 2023a]) were constructed separately for Sites M0083 and M0089 to establish a first-order continuous sediment succession at each site. Three GPC cores from Holes M0083A–M0083F and two GPC cores from Holes M0089A–M0089D were recovered.
First-order splicing between holes at Sites M0083 and M0089 enabled construction of continuous stratigraphic successions from the seafloor to the bottom of Cores 386-M0083F-1H-36 (37.11 meters composite depth [mcd]-splice) and 386-M0089D-1H-36 (37.47 mcd-splice).
9.1. Construction of Site M0083 core composite depth scale
9.1.1. Definition of top
The presence of a thin (~1 cm thick) oxidized top at the top of Trigger Cores 386-M0083A-1P, 386-M0083C-1P, and 386-M0083E-1P (see Lithostratigraphy) suggests that an undisturbed mudline was recovered in all three holes. Thus, the vertical offset was determined as −0.07 m for Hole M0083A, −0.08 m for Hole M0083C, and −0.105 m for Hole M0083E (Tables T15, T16). Based on visual core description and linescan images, a clear boundary between the upper interval with no bioturbation or slightly bioturbated silt to clay and the lower heavily bioturbated clay observed in Sections 386-M0083A-1P-1, 32 cm (0.25 mbsf); 386-M0083C-1P-1, 29 cm (0.21 mbsf); and 386-M0083E-1P-1, 34 cm (0.235 mbsf) was recognized as the first stratigraphic tie point (TP1). Because sediment thickness between the mudline and TP1 is largest in Hole M0083A, the core from this hole was selected as the anchor core and Section 1P-1, 7 cm, was defined as 0 mbsf.
9.1.2. Compositing cores
Before compositing holes, artificial and/or natural voids were measured at the ends of sections and void lengths were subtracted from the curated section length to obtain the sediment length for each section (Table T15).
The core composite scale for Site M0083 is currently tentatively based on visual correlation of marker horizons on X-ray CT images. VCDs and linescan images were used during the OSP, and spikes in magnetic susceptibility and GRA data from the MSCL, measured at 2 cm intervals (see Physical properties in the Expedition 386 methods chapter [Strasser, 2023a]), were also used for interhole correlation. At this stage, thin but clear marker beds visible on X-ray CT and/or linescan images were tentatively used, in places verified by visual core description, instead of the large (coarse and thick) event beds that may have eroded the underlying sediments.
Initially, four tie points were determined: one tie point was observed in each trigger core (Holes M0083A, M0083C, and M0083E), one was identified between the trigger core (Hole M0083A) and GPC core (Hole M0083F), and two were identified in the three GPC cores (Holes M0083B, M0083D, and M0083E). The uppermost tie point in each core was used to calculate the vertical offsets of the top depth of each core used to create the first-order core composite depth scales at Site M0083 (Table T16). Note that these linear bulk shifts are only correct for the uppermost few meters shallower than the first occurrence of artificial voids added to the bottom or tops of each section during core cutting due to sediment expansion during core recovery (Table T15). All tie points were evaluated for robustness of correlation and suitability for composing the splice, and out of these, four were selected (Table T17). Most of these are described as subtle radiodensity/bioturbation degree/sediment color changes, but one tie point (TP4) occurs at the base of a relatively thick sand layer. The accuracy of correlation depends on how clearly the tie point can be recognized in X-ray CT and linescan images. The depth of each tie point was determined by visual core description; however, some tie points were not described visually and thus were based on X-ray CT images.
First-order correlation identifies a 1–2 cm thick clay bed between a sharp high-radiodensity silty clay lamina above and a 4–6 cm thick bioturbated higher radiodensity silty clay interval below. This clay bed (Section 386-M0083A-1P-2, 61–63 cm) is very similar to interval 386-M0083C-1P-3, 49–50 cm, and occurs at the top of Section 386-M0083F-1H-1, 64–65 cm. The base of this clay bed is tentatively used as a tie point to correlate Core 386-M0083F-1H to mudline-anchored Core 386-M0083A-1P (TP2 at 1.05 mcd-splice; Table T17), and the vertical offset for Hole M0083F was calculated as 0.4 m. The uppermost tie point between the three GPC holes is a surface of subtle radiodensity change (TP3) that forms a boundary between the upper weakly bioturbated silty clay and the lower moderately bioturbated clay to silty clay located in Sections 386-M0083F-1H-3, 52 cm (2.295 mbsf); 386-M0083D-1H-2, 19 cm (0.455 mbsf); and 386-M0083B-1H-1, 60 cm (0.585 mbsf). Based on the vertical depth shift of Hole M0083F and the two corrected core depths and artificial voids (1.5 cm for Hole M0083B and 8 cm for Hole M0083D), the vertical offset was calculated as 2.12 m for Hole M0083B and 2.17 m for Hole M0083D (Table T16).
Overall, the general stratigraphic succession and several distinct marker horizons, as observed in X-ray CT images, can be correlated across the GPC cores (Table T17). However, sequential horizontal alignment of marker beds from the top to bottom of the cores reveals that the stratigraphic succession is slightly more expanded in Holes M0083D and M0083F than in the stratigraphically equivalent succession in Hole M0083B, likely due to more gas expansion and elastic rebound during core recovery. This is noted below ~17–18 mbsf and becomes more significant below ~20 mbsf in Hole M0083D.
9.1.3. Construction of splice
A combination of Holes M0083A, M0083B, and M0083F reveals the longest complete and least disturbed stratigraphic interval at Site M0083. As described above, TP2 connects the uppermost splice interval in mudline-anchored Hole M0083A (1.05 mcd-splice) to the longest recovered interval in the top part of the three GPC holes above TP3, which is correlative among the three GPC holes at 2.72 mcd-splice (see Stratigraphic correlation in the Expedition 386 methods chapter [Strasser, 2023a]; Table T17).
Below TP3 at 2.72 mcd-splice, the Hole M0083B interval was selected to be included in the splice because cores recovered from the 20 m long GPC barrel deployment are generally less disturbed. The splice moves to Hole M0083F at TP4 (Sections 386-M0084B-1H-19, 56 cm; 386-M0083D-1H-21, 28 cm; and 386-M0084F-1H-21, 6 cm), which is the base of a relatively thick sand layer. Below this level, the splice continues to the base of Hole M0083F (37.11 mcd-splice) to construct a first-order splice. The tentatively defined tie points and splice intervals with calculated splice composite depth are given in Table T17.
9.2. Construction of Site M0089 core composite depth scale
9.2.1. Definition of top
The presence of a thin (<1 cm) oxidized top was described at the top of the trigger core from Hole M0089A (see Lithostratigraphy). Although no description was made of the oxidized layer at the top of Hole M0089C, a very thin film of oxidized layer was observed in the linescan image. These observations suggest that an undisturbed mudline was recovered in both holes. Thus, the vertical offset was determined as −0.07 m for Hole M0089A and −0.105 m for Hole M0089C. Based on the VCDs and X-ray CT images, no clear tie point was observed. Therefore, the longest trigger core (Hole M0089A) was selected as the anchor core, and Section 386-M0089A-1P-1, 7 cm, was defined as 0 mbsf (Tables T18, T19).
9.2.2. Compositing cores
Before compositing holes, artificial and/or natural voids were measured at the ends of sections and void lengths were subtracted from the curated section length to obtain the sediment length of each section. Corrected section lengths and section top and bottom depths for Site M0089 are listed in Table T18.
Initially, three tie points were determined: one between the trigger core (Hole M0089A) and GPC core (Hole M0089D) and two in the GPC cores (Holes M0089B and M0089D). The uppermost tie point in each core was used to calculate the vertical offsets of the top depth of each core used to create the first-order core composite depth scales at Site M0089 (Table T19). Note that these linear bulk shifts are only correct for the uppermost few meters shallower than the first occurrence of artificial voids added to the bottom or tops of sections during core cutting due to sediment expansion during core recovery (Table T18). All tie points were evaluated for robustness of correlation and suitability for composing the splice, for which three were selected (Table T20). Most of these are described as thin silt laminae with slightly higher radiodensity than the surrounding clayey sediments. The accuracy of correlation depends on how clearly the tie point can be recognized in X-ray CT and linescan images. The depth of each tie point was determined by visual core description; however, some were not described and thus were based on X-ray CT images.
First-order correlation reveals a characteristic facies association succession in the lower part of interval 386-M0089A-1P-2, 30–75 cm (characterized from bottom to top by a 5–7 cm thick fining upward succession with a basal fine sand lamina below a 2–3 cm thick silt bed with elevated radiodensity values and an overlying 20 cm thick bioturbated clay interval with slightly higher radiodensity in X-ray CT images), which is comparable to a very similar succession in interval 386-M0089D-1H-1, 50–95 cm (with a slight difference in the thickness of the potentially correlative beds likely due to the different coring techniques between push corer and piston corer system). The silt lamina at the base of this comparable succession is tentatively used as a tie point to tie Core 386-M0089D-1H to mudline-anchored Core 386-M0089A-1P (TP1 at 1.19 mcd-splice; Table T20), and a vertical offset of Hole 386-M0083D was calculated as 0.29 m (Table T19). Identification of a possible correlation in the uppermost part of Holes M0089B and M0089D remains challenging at this stage of first-order correlation, and the uppermost clear tie point between the two GPC holes (TP2) can only tentatively be defined by a high-radiodensity silt lamina within a characteristically comparable succession in Sections 386-M0089D-1H-5, 44 cm (4.46 mbsf), and 386-M0089B-1H-4, 60 cm (3.35 mbsf). Based on the vertical depth shift of Hole M0089D to achieve horizontal alignment of this tie point, and considering an artificial void (1.5 cm) at the top of Section 386-M0089B-1H-1, the vertical offset of Hole M0089B was calculated as 1.4 m.
Overall, the general stratigraphic succession and several distinct marker horizons, as observed in X-ray CT images, can be correlated across GPC cores (Table T20). Below TP2, the sequential horizontal alignment of marker beds from the top to bottom of the cores reveals that the stratigraphic succession covered in the two holes is broadly similar, suggesting no significant difference based on gas expansion and elastic rebound during core recovery.
9.2.3. Construction of splice
A combination of Holes M0089A, M0089B, and M0089D reveals the longest complete and least disturbed stratigraphic interval at Site M0089. As described above, TP1 connects the uppermost splice interval in mudline-anchored Hole M0089A (1.19 mcd-splice) to the longest recovered interval in the top part of the two GPC holes above TP2, which is correlative at 4.765 mcd-splice (see Stratigraphic correlation in the Expedition 386 methods chapter [Strasser, 2023a]; Table T20).
Below TP2 at 4.765 mcd-splice, the interval from Hole M0089B was selected to be included in the splice because cores recovered from the 20 m long GPC barrel deployment are generally less disturbed. The splice moves to Hole M0089D at TP3, which is defined by a silt lamina with high radiodensity in Sections 386-M0089B-1H-18, 69 cm, and 386-M0089D-1H-18, 84 cm. Below this level, the splice continues to the base of Hole M0089D (37.47 mcd-splice). The tentatively defined tie points and splice intervals with calculated splice composite depth are given in Table T20.
References
Bruland, K.W., Middag, R., and Lohan, M.C., 2014. Controls of trace metals in seawater. In Holland, H.D., and Turekian, K.K. (Eds.), Treatise on Geochemistry (Second Edition). Oxford (Elsevier), 19–51.
https://doi.org/
Claypool, G.E., and Kvenvolden, K.A., 1983. Methane and other hydrocarbon gases in marine sediment. Annual Review of Earth and Planetary Sciences, 11(1):299–327. https://doi.org/
Fontanier, C., Duros, P., Toyofuku, T., Oguri, K., Koho, K.A., Buscail, R., Grémare, A., Radakovitch, O., Deflandre, B., De Nooijer, L.J., Bichon, S., Goubet, S., Ivanovsky, A., Chabaud, G., Menniti, C., Reichart, G.-J., and Kitazato, H., 2014. Living (stained) deep-sea foraminifera off Hachinohe (NE Japan, Western Pacific): environmental interplay in oxygen-depleted ecosystems. Journal of Foraminiferal Research, 44(3):281–299. https://doi.org/
Itaki, T., Uchida, M., Kim, S., Shin, H.-S., Tada, R., and Khim, B.-K., 2009. Late Pleistocene stratigraphy and palaeoceanographic implications in northern Bering Sea slope sediments: evidence from the radiolarian species Cycladophora davisiana. Journal of Quaternary Science, 24(8):856–865. https://doi.org/
Kioka, A., Schwestermann, T., Moernaut, J., Ikehara, K., Kanamatsu, T., Eglinton, T.I., and Strasser, M., 2019. Event stratigraphy in a hadal oceanic trench: the Japan Trench as sedimentary archive recording recurrent giant subduction zone earthquakes and their role in organic carbon export to the deep sea. Frontiers in Earth Science, 7:319. https://doi.org/
Matoba, Y., 1976. Recent foraminiferal assemblages off Sendai, northeast Japan. Maritime Sediments, Spec. Pub. A:205–220. https://cir.nii.ac.jp/
Matsuzaki, K.M., Nishi, H., Suzuki, N., Kawate, Y., Takashima, R., and Sakai, T., 2014. Cycladophora davisiana abundances as a paleoceanographic and stratigraphic tool in high latitude siliciceous sediments. Marine Micropaleontology, 106:1–9. https://doi.org/
Mazzullo, J., Meyer, A., and Kidd, R., 1988. Appendix I: New sediment classification scheme for the Ocean Drilling Program. In Mazzullo, J., and Graham, A.G. , Handbook for shipboard sedimentologists. Ocean Drilling Program Technical Note. 8: 44–67. https://doi.org/
Morley, J.J., Hays, J.D., and Robertson, J.H., 1982. Stratigraphic framework for the late Pleistocene in the northwest Pacific Ocean. Deep Sea Research, Part A: Oceanographic Research Papers, 29(12):1485–1499.
https://doi.org/
Strasser, M., Ikehara, K., and Cotterill, C., 2019. Expedition 386 Scientific Prospectus: Japan Trench Paleoseismology. International Ocean Discovery Program. https://doi.org/
Strasser, M., Ikehara, K., Everest, J., Maeda, L., Hochmuth, K., Grant, H., Stewart, M., Okutsu, N., Sakurai, N., Yokoyama, T., Bao, R., Bellanova, P., Brunet, M., Cai, Z., Cattaneo, A., Hsiung, K.-H., Huang, J.-J., Ishizawa, T., Itaki, T., Jitsuno, K., Johnson, J.E., Kanamatsu, T., Keep, M., Kioka, A., Kölling, M., Luo, M., März, C., McHugh, C., Micallef, A., Nagahashi, Y., Pandey, D.K., Proust, J.-N., Rasbury, E.T., Riedinger, N., Satoguchi, Y., Sawyer, D.E., Seibert, C., Silver, M., Straub, S.M., Virtasalo, J., Wang, Y., Wu, T.-W., and Zellers, S.D., 2023a. Expedition 386 methods. In Strasser, M., Ikehara, K., Everest, J., and the Expedition 386 Scientists, Japan Trench Paleoseismology. Proceedings of the International Ocean Discovery Program, 386: College Station, TX (International Ocean Discovery Program). https://doi.org/
Strasser, M., Ikehara, K., Everest, J., Maeda, L., Hochmuth, K., Grant, H., Stewart, M., Okutsu, N., Sakurai, N., Yokoyama, T., Bao, R., Bellanova, P., Brunet, M., Cai, Z., Cattaneo, A., Hsiung, K.-H., Huang, J.-J., Ishizawa, T., Itaki, T., Jitsuno, K., Johnson, J.E., Kanamatsu, T., Keep, M., Kioka, A., Kölling, M., Luo, M., März, C., McHugh, C., Micallef, A., Nagahashi, Y., Pandey, D.K., Proust, J.-N., Rasbury, E.T., Riedinger, N., Satoguchi, Y., Sawyer, D.E., Seibert, C., Silver, M., Straub, S.M., Virtasalo, J., Wang, Y., Wu, T.-W., and Zellers, S.D., 2023b. Expedition 386 summary. In Strasser, M., Ikehara, K., Everest, J., and the Expedition 386 Scientists, Japan Trench Paleoseismology. Proceedings of the International Ocean Discovery Program, 386: College Station, TX (International Ocean Discovery Program). https://doi.org/
Strasser, M., Ikehara, K., Everest, J., Maeda, L., Hochmuth, K., Grant, H., Stewart, M., Okutsu, N., Sakurai, N., Yokoyama, T., Bao, R., Bellanova, P., Brunet, M., Cai, Z., Cattaneo, A., Hsiung, K.-H., Huang, J.-J., Ishizawa, T., Itaki, T., Jitsuno, K., Johnson, J.E., Kanamatsu, T., Keep, M., Kioka, A., Kölling, M., Luo, M., März, C., McHugh, C., Micallef, A., Nagahashi, Y., Pandey, D.K., Proust, J.-N., Rasbury, E.T., Riedinger, N., Satoguchi, Y., Sawyer, D.E., Seibert, C., Silver, M., Straub, S.M., Virtasalo, J., Wang, Y., Wu, T.-W., and Zellers, S.D., 2023c. Sites M0084 and M0085 (Basin N3). In Strasser, M., Ikehara, K., Everest, J., and the Expedition 386 Scientists, Japan Trench Paleoseismology. Proceedings of the International Ocean Discovery Program, 386: College Station, TX (International Ocean Discovery Program). https://doi.org/
Strasser, M., Ikehara, K., Everest, J., Maeda, L., Hochmuth, K., Grant, H., Stewart, M., Okutsu, N., Sakurai, N., Yokoyama, T., Bao, R., Bellanova, P., Brunet, M., Cai, Z., Cattaneo, A., Hsiung, K.-H., Huang, J.-J., Ishizawa, T., Itaki, T., Jitsuno, K., Johnson, J.E., Kanamatsu, T., Keep, M., Kioka, A., Kölling, M., Luo, M., März, C., McHugh, C., Micallef, A., Nagahashi, Y., Pandey, D.K., Proust, J.-N., Rasbury, E.T., Riedinger, N., Satoguchi, Y., Sawyer, D.E., Seibert, C., Silver, M., Straub, S.M., Virtasalo, J., Wang, Y., Wu, T.-W., and Zellers, S.D., 2023d. Site M0086 (Basin N1). In Strasser, M., Ikehara, K., Everest, J., and the Expedition 386 Scientists, Japan Trench Paleoseismology. Proceedings of the International Ocean Discovery Program, 386: College Station, TX (International Ocean Discovery Program). https://doi.org/
Strasser, M., Ikehara, K., Everest, J., Maeda, L., Hochmuth, K., Grant, H., Stewart, M., Okutsu, N., Sakurai, N., Yokoyama, T., Bao, R., Bellanova, P., Brunet, M., Cai, Z., Cattaneo, A., Hsiung, K.-H., Huang, J.-J., Ishizawa, T., Itaki, T., Jitsuno, K., Johnson, J.E., Kanamatsu, T., Keep, M., Kioka, A., Kölling, M., Luo, M., März, C., McHugh, C., Micallef, A., Nagahashi, Y., Pandey, D.K., Proust, J.-N., Rasbury, E.T., Riedinger, N., Satoguchi, Y., Sawyer, D.E., Seibert, C., Silver, M., Straub, S.M., Virtasalo, J., Wang, Y., Wu, T.-W., and Zellers, S.D., 2023e. Site M0090 (Basin C1). In Strasser, M., Ikehara, K., Everest, J., and the Expedition 386 Scientists, Japan Trench Paleoseismology. Proceedings of the International Ocean Discovery Program, 386: College Station, TX (International Ocean Discovery Program). https://doi.org/
Strasser, M., Ikehara, K., Everest, J., and the Expedition 386 Scientists, 2023f. Supplementary material, https://doi.org/10.14379/iodp.proc.386supp.2023. In Strasser, M., Ikehara, K., Everest, J., and the Expedition 386 Scientists, Japan Trench Paleoseismology. Proceedings of the International Ocean Discovery Program, 386: College Station, TX (International Ocean Discovery Program).
Usami, K., Ikehara, K., Jenkins, R.G., and Ashi, J., 2017. Benthic foraminiferal evidence of deep-sea sediment transport by the 2011 Tohoku-Oki earthquake and tsunami. Marine Geology, 384:214–224.
https://doi.org/