Strasser, M., Ikehara, K., Everest, J., and the Expedition 386 Scientists
Proceedings of the International Ocean Discovery Program Volume 386
publications.iodp.org
https://doi.org/10.14379/iodp.proc.386.113.2023
Sites M0084 and M0085 (Basin N3)1
![]() M. Strasser,
M. Strasser,
![]() K. Ikehara,
K. Ikehara,
![]() J. Everest,
J. Everest,
![]() L. Maeda,
L. Maeda,
![]() K. Hochmuth,
K. Hochmuth,
![]() H. Grant,
H. Grant,
![]() M. Stewart,
M. Stewart,
![]() N. Okutsu,
N. Okutsu,
![]() N. Sakurai,
N. Sakurai,
![]() T. Yokoyama,
T. Yokoyama,
![]() R. Bao,
R. Bao,
![]() P. Bellanova,
P. Bellanova,
![]() M. Brunet,
M. Brunet,
![]() Z. Cai,
Z. Cai,
![]() A. Cattaneo,
A. Cattaneo,
![]() K.-H. Hsiung,
K.-H. Hsiung,
![]() J.-J. Huang,
J.-J. Huang,
![]() T. Ishizawa,
T. Ishizawa,
![]() T. Itaki,
T. Itaki,
![]() K. Jitsuno,
K. Jitsuno,
![]() J.E. Johnson,
J.E. Johnson,
![]() T. Kanamatsu,
T. Kanamatsu,
![]() M. Keep,
M. Keep,
![]() A. Kioka,
M. Kölling,
A. Kioka,
M. Kölling,
![]() M. Luo,
M. Luo,
![]() C. März,
C. März,
![]() C. McHugh,
C. McHugh,
![]() A. Micallef,
A. Micallef,
![]() Y. Nagahashi,
Y. Nagahashi,
![]() D.K. Pandey,
D.K. Pandey,
![]() J.-N. Proust,
J.-N. Proust,
![]() E.T. Rasbury,
E.T. Rasbury,
![]() N. Riedinger,
N. Riedinger,
![]() Y. Satoguchi,
Y. Satoguchi,
![]() D.E. Sawyer,
D.E. Sawyer,
![]() C. Seibert,
C. Seibert,
![]() M. Silver,
M. Silver,
![]() S.M. Straub,
S.M. Straub,
![]() J. Virtasolo,
J. Virtasolo,
![]() Y. Wang,
Y. Wang,
![]() T.-W. Wu, and
T.-W. Wu, and
![]() S.D. Zellers2
S.D. Zellers2
1 Strasser, M., Ikehara, K., Everest, J., Maeda, L., Hochmuth, K., Grant, H., Stewart, M., Okutsu, N., Sakurai, N., Yokoyama, T., Bao, R., Bellanova, P., Brunet, M., Cai, Z., Cattaneo, A., Hsiung, K.-H., Huang, J.-J., Ishizawa, T., Itaki, T., Jitsuno, K., Johnson, J.E., Kanamatsu, T., Keep, M., Kioka, A., Kölling, M., Luo, M., März, C., McHugh, C., Micallef, A., Nagahashi, Y., Pandey, D.K., Proust, J.-N., Rasbury, E.T., Riedinger, N., Satoguchi, Y., Sawyer, D.E., Seibert, C., Silver, M., Straub, S.M., Virtasalo, J., Wang, Y., Wu, T.-W., and Zellers, S.D., 2023. Sites M0084 and M0085 (Basin N3). In Strasser, M., Ikehara, K., Everest, J., and the Expedition 386 Scientists, Japan Trench Paleoseismology. Proceedings of the International Ocean Discovery Program, 386: College Station, TX (International Ocean Discovery Program). https://doi.org/10.14379/iodp.proc.386.113.2023
2 Expedition 386 Scientists’ affiliations.
1. Operations
During Expedition 386, a total of five Giant Piston Corer (GPC) system deployments in the northern Japan Trench (Basin N3; Figure F1) resulted in the recovery of cores from six holes at Site M0084 and four at Site M0085 (Figure F2). The water depth was between 7590 and 7603 meters below sea level (mbsl). A breakdown of operational time is reported weekly instead of daily (see OPS in Supplementary material) due to decisions to move between sites based on weather and current conditions. Cores from Sites M0084 and M0085 were acquired during Weeks 2, 3, and 5 of the offshore phase. In total, 149.2 m of cores (Table T1) and 133 km of hydroacoustic profiles (see Hydroacoustics) were recovered and acquired, respectively, in this focus area. Further operations details, including winch log and inclinometer information, are found for all sites in Coring methodology in the Expedition 386 methods chapter (Strasser et al., 2023a) and in the associated files (see PALEOMAG and WINCHLOGS in Supplementary material).

Figure F1. Site map.
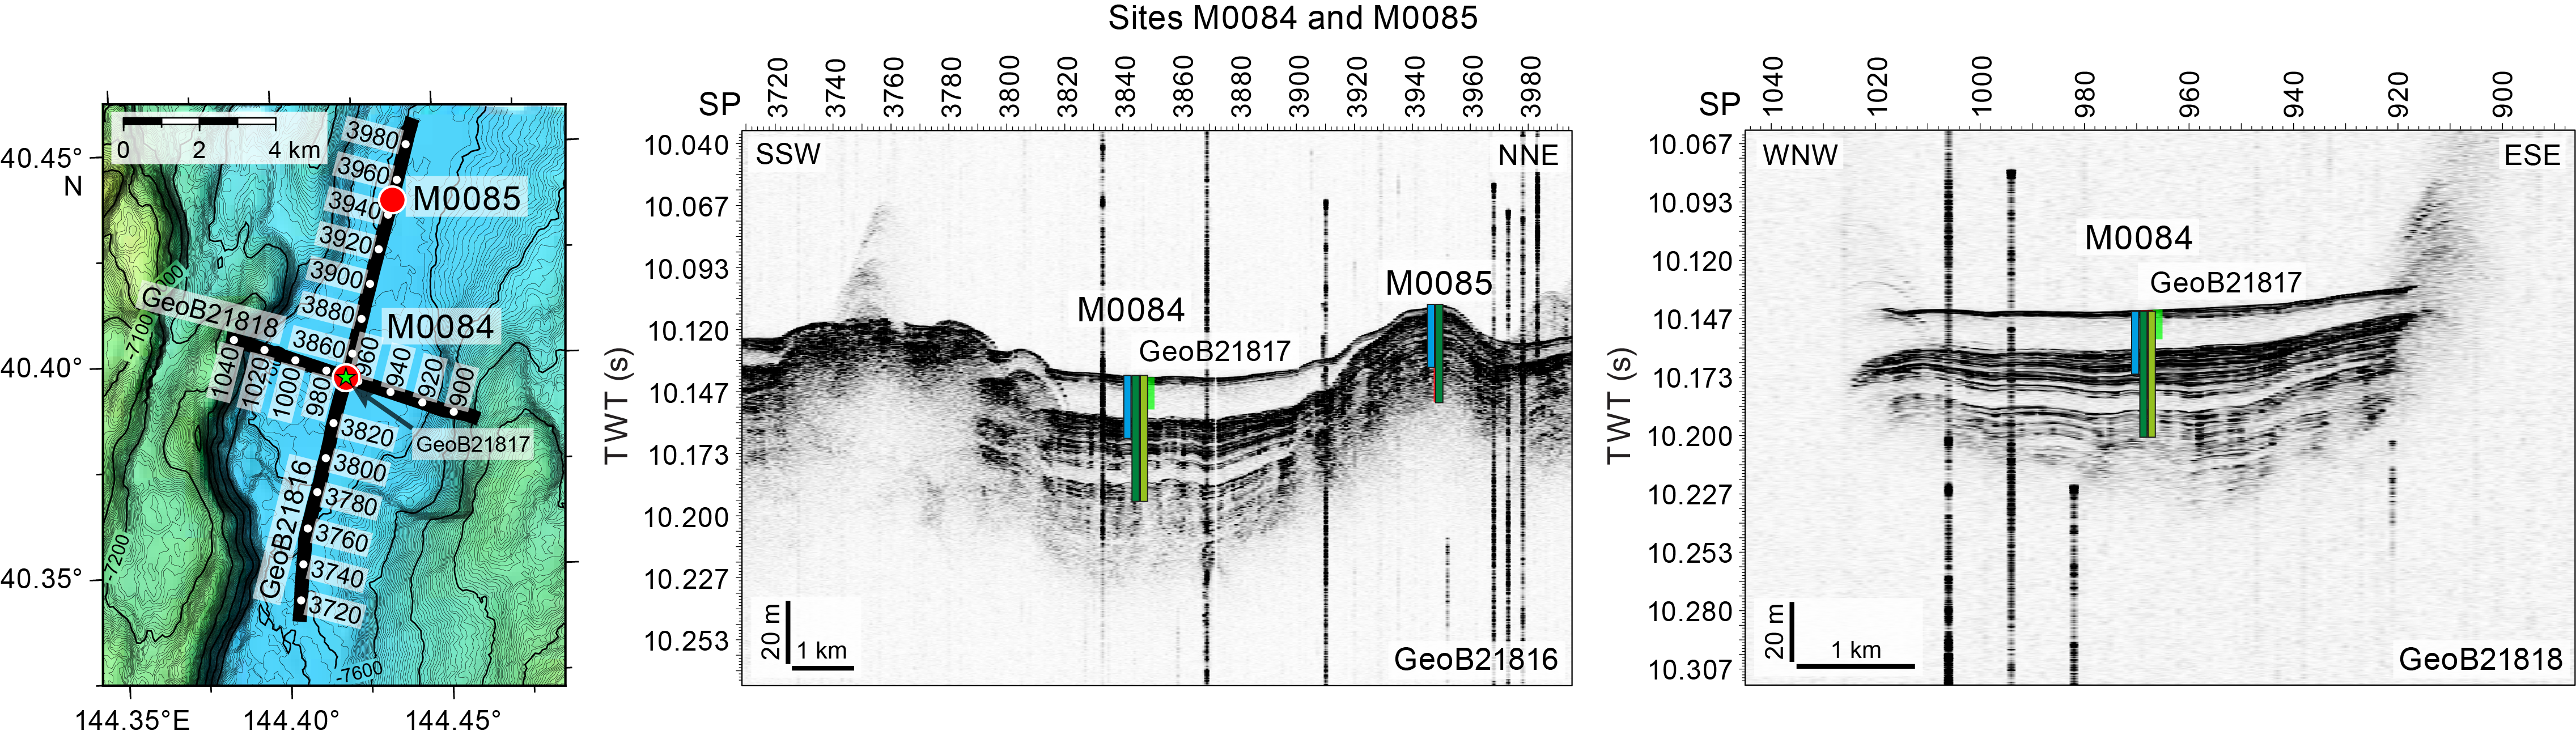
Figure F2. Sites M0084 and M0085.
The main site-specific scientific objectives for Sites M0084 and M0085 were as follows:
- Recover an expanded and condensed (relative to coupled-stratigraphy Sites M0084 and M0085, respectively) continuous upper Pleistocene to Holocene stratigraphic succession comprising event deposits from the depocenter (Site M0084) and from a nearby trench floor high (Site M0085) in the deepest trench basin of the northernmost part of the Japan Trench (see Site selection and coring strategy in the Expedition 386 summary chapter [Strasser et al., 2023b]; Strasser et al., 2019).
- Analyze the stratigraphic pattern and event deposit characteristics of each site and integrate them with its coupled site to establish robust stratigraphic pattern recognition of proxy evidence for earthquakes.
- Generate results for comparison with those from all other Expedition 386 sites to explore spatiotemporal distribution of event deposits and the southern extent of sediment transport routed through the Ogawara submarine canyon to eventually develop a long-term record for giant earthquakes.
1.1. Operations summary
Because of very strong winds (>15 m/s) on 25 April 2021 at Site M0089, the decision was made to move the R/V Kaimei to Site M0084 in the northern Japan Trench focus area (Sites M0084 and M0085). Kaimei reached the site at 1430 h and multibeam echo sounder/subbottom profiler (MBES/SBP) surveys were carried out at Site M0084 from 1530 to 1645 h. Winds remained strong (>18 m/s) on the morning of 26 April, with wave heights of 3 m and 1.3 kt currents; the decision was made to delay GPC deployment until the winds dropped to <15 m/s. At 1200 h, the captain confirmed it was possible to maintain position under manual mode, and the go ahead was given to deploy the GPC. GPC operations started in Holes M0084A and M0084B with a 20 m GPC barrel string at 1230 h and were completed when the GPC system was recovered on deck at 1840 h. The deck crew and GPC operation team withdrew the core from the GPC assembly and cut it into 5 m segments. The Science Party cut the core into 1 m sections from 1900 to 2100 h. The GPC assembly was prepared for the next run at 2300 h.
At 0000 h on 27 April, Kaimei began drifting to Site M0085, standing by at the site at 0200 h. Conditions were cold but calm (winds 8 m/s; wave height 1 m; <1.5 kt current). GPC preparations for Holes M0085A and M0085B with a 20 m barrel string began at 0600 h, and the GPC was recovered on deck at 1500 h. The deck crew and GPC operation team withdrew the core from the GPC assembly and cut it into 5 m segments. The Science Party cut the core into 1 m sections. Cutting was completed at 1610 h, and the GPC was made up for the next run at 2115 h.
An MBES/SBP survey around Sites M0084 and M0085 commenced at 2115 h on 27 April and continued until 0700 h on 28 April. Conditions were warmer and calm (winds <3 m/s; <1.3 kt current; wave height <1 m). GPC operations started in Holes M0084C and M0084D with a 40 m GPC barrel string at 0700 h, and the GPC system was recovered on deck at 1500 h. The deck crew and GPC operation team withdrew core from the liner, and the Science Party sampled from section bottoms and cut core into 1 m sections from 1600 to 1930 h. GPC make up and preparation with a 40 m barrel was complete at 2130 h on 28 April, and MBES/SBP surveying around Sites M0084 and M0085 resumed at this time.
MBES/SBP surveying around Sites M0084 and M0085 continued until 0445 h on 29 April and was suspended for 40 m GPC operations in Holes M0085C and M0085D. Conditions were overcast but calm (winds <5 m/s; <1.2 kt current; wave height <1 m). GPC operations started in Holes M0085C and M0085D with a 40 m core barrel string at 0600 h, and the GPC was recovered on deck at 1315 h. The GPC core bit was removed at 1400 h and the GPC was secured, but a rough weather forecast meant that withdrawing core was delayed. The ship began transit to a standby point off Miyako at 1400 h and arrived at 2300 h. Core from Holes M0085C and M0085D was withdrawn, and cores were cut into 5 and 1 m sections from 1130 to 1600 h on 30 April. The 40 m GPC assembly was made up at 2300 h, when the ship started the transit to Site M0083 (see Operations in the Sites M0083 and M0089 (Basin C2) chapter [Strasser et al., 2023d]).
Kaimei returned to Site M0084 on 12 May at 0445 h. GPC operations started in Holes M0084E and M0084F using the 40 m core barrel string at 0800 h, and the GPC was recovered on deck at 1415 h. Conditions were calm (winds <4 m/s; wave height ~0.2 m) with a relatively strong current (~1.8 kt). The deck crew and GPC operation team withdrew the core from the liner, and the Science Party sampled from the section bottoms and cut the core into 1 m sections from 1430 to 1900 h. GPC make up and preparation with the 40 m barrel was complete at 2100 h on 12 May, and MBES/SBP surveying around Site M0084 commenced at 2100 h and continued until 0215 h on 13 May.
1.2. Site M0084
1.2.1. Holes M0084A and M0084B
Holes M0084A and M0084B were cored on 26 April 2021. Preparations for running the 20 m GPC were complete at 1230 h, and the GPC was run into the water at 1320 h. The inclinometer and transponder were set on the winch cable at 20 and 50 m above the weight head of the GPC, respectively, and on the GPC casing (see Figure F4 in the Expedition 386 methods chapter [Strasser et al., 2023a]). Winch speed was set at 0.5–1 m/s to a cable length of 100 m and then increased to 1.2–1.5 m/s to a cable length of 100–7750 m. Running the GPC down was paused at a cable length of 7750 m for stabilization and monitoring the GPC position and resumed after 3 min at a winch speed of 0.3 m/s. Spud-in commenced at 16:02:05 h and ended at 16:02:06 h. Recovery commenced, and the cable tension rose to 1511 kgf at 16:02:10 h before dropping to 1008 kgf and then rising again to a maximum of 7190 kgf at 16:02:54 h. It dropped to 5049 kgf at 16:02:59 h, indicating the corer was clear of the seabed (see WINCHLOGS in Supplementary material). Inclinometer data for Hole M0084B show the piston corer barrel was rotated clockwise at 139.5° at the estimated seabed, with an east–west dip of 0.02° and a north–south dip of −0.91° (see Figure F5 in the Expedition 386 methods chapter [Strasser et al., 2023a]). The GPC was run back to the surface at a winch speed of 1.2–01.5 m/s. The trigger corer and GPC were recovered on deck at 1815 and 1840 h, respectively. The trigger core and GPC core from Holes M0084A and M0084B have a total length of 0.95 m (2 sections) and 19.94 m (21 sections), respectively.
1.2.2. Holes M0084C and M0084D
Holes M0084C and M0084D were cored on 28 April 2021. Preparations for running the 40 m GPC began at 0700 h, and the GPC was run into the water at 0900 h with the inclinometer and transponder attached to the winch cable at 20 and 50 m above GPC weight head, respectively, and on the GPC casing (see Figure F4 in the Expedition 386 methods chapter [Strasser et al., 2023a]). Winch speed was set at 0.5–1 m/s to a cable length of 100 m and then increased to 1.2–1.5 m/s to a cable length of 7750 m. Running the GPC down was paused at a cable length of 7750 m for stabilization and monitoring the GPC position and resumed after 3 min at a winch speed of 0.3 m/s. Spud-in commenced at 11:44:31 h and ended at 11:44:33 h. Recovery commenced, and the cable tension rose to 1567 kgf at 11:44:37 h before dropping to 1306 kgf and then rising again to a maximum of 11120 kgf at 11:46:10 h. It dropped to 7861 kgf at 11:46:26 h, indicating the corer was clear of the seabed (see WINCHLOGS in Supplementary material). Inclinometer data for Hole M0084D show the piston corer barrel was rotated clockwise by 94.5° at the estimated seabed, with an east–west dip of 0.46° and a north–south dip of 1.19° (see Figure F5 in the Expedition 386 methods chapter [Strasser et al., 2023a]). The GPC was run back to the surface at a winch speed of 1.0–1.5 m/s. The trigger corer and GPC were recovered on deck at 1410 and 1440 h, respectively. The trigger core and GPC core from Holes M0084C and M0084D have a total length of 0.46 m (2 sections) and 35.17 m (37 sections), respectively. Preparations for the next 40 m GPC deployment were completed at 2130 h, and MBES/SBP surveying resumed at the same time.
1.2.3. Holes M0084E and M0084F
Holes M0084E and M0084F were cored on 12 May 2021. Preparations for running the 40 m GPC were complete at 0800 h, and the GPC was run into the water at 0850 h. The inclinometer and transponder were set on the winch cable 20 and 50 m above the weight head of the GPC, respectively, and on the GPC casing (see Figure F4 in the Expedition 386 methods chapter [Strasser et al., 2023a]). Winch speed was set at 1 m/s to 7750 mbsl. Running was suspended at 7750 m cable depth at 1110 h for stabilization and monitoring the GPC position and resumed after 3 min at a winch speed of 0.3 m/s. Spud-in commenced at 11:19:24 h and ended at 11:19:27 h. Recovery commenced, and the cable tension rose to 2423 kgf at 11:19:24 h before dropping to 1511 kgf and then rising again to a maximum of 11287 kgf at 11:20:54 h. It dropped to 7377 kgf at 11:21:26 h, indicating the corer was clear of the seabed (see WINCHLOGS in Supplementary material). Inclinometer data for Hole M0084F show the piston corer barrel was rotated counterclockwise at 309.1° at the estimated seabed, with an east–west dip of 1.13° and a north–south dip of −1.35° (see Figure F5 in the Expedition 386 methods chapter [Strasser et al., 2023a]). The GPC was run back to the surface at a winch speed of 1.1 m/s. The trigger corer and GPC were recovered on deck at 1330 and 1415 h, respectively. The trigger core and GPC core from Holes M0084E and M0084F have a total length of 0.5 m (2 sections) and 38.771 m (39 sections), respectively. The 40 m GPC was made up and ready for the next run at 2100 h when MBES/SBP surveying also commenced.
1.3. Site M0085
1.3.1. Holes M0085A and M0085B
Holes M0085A and M0085B were cored on 27 April 2021. Preparations for running the 20 m barrel string GPC were complete at 0600 h, and the GPC was run into the water at 0850 h. The inclinometer and transponder were set on the winch cable 20 and 50 m above the weight head of the GPC, respectively, and on the GPC casing (see Figure F4 in the Expedition 386 methods chapter [Strasser et al., 2023a]). Winch speed was set at 0.5–1 m/s to a cable length of 100 m and then increased to 1.2–1.5 m/s to a cable length of 100–7750 m. Running the GPC down was paused at a cable length of 7750 m for stabilization and monitoring the GPC position and resumed after 3 min at a winch speed of 0.3 m/s. Spud-in commenced at 11:30:12 h and ended at 11:30:15 h. Recovery commenced, and the cable tension rose to 2386 kgf at 11:30:16 h before dropping to 1027 kgf and then rising again to a maximum of 6129 kgf at 11:31:08 h. It dropped to 4956 kgf at 11:31:12 h, indicating the corer was clear of the seabed (see WINCHLOGS in Supplementary material). Inclinometer data for Hole M0085B shows the piston corer barrel was rotated clockwise at 78.5° at the estimated seabed, with an east–west dip of 0.07° and a north–south dip of −2.08° (see Figure F5 in the Expedition 386 methods chapter [Strasser et al., 2023a]). The GPC was run back to the surface at a winch speed of 1.0–1.5 m/s. The trigger corer and GPC were recovered on deck at 1405 and 1500 h, respectively. The trigger core and GPC core from Holes M0085A and M0085B have a total length of 0.72 m (2 sections) and 18.31 m (19 sections), respectively. The 20 m GPC was made up and ready for the next run at 2115 h.
1.3.2. Holes M0085C and M0085D
Holes M0085C and M0085D were cored on 29 April 2021. Preparations for running the 40 m GPC were complete at 0600 h, and the GPC was run into the water at 0730 h. The inclinometer and transponder were set on the winch cable 20 and 50 m above the weight head of the GPC, respectively, and on the GPC casing (see Figure F4 in the Expedition 386 methods chapter [Strasser et al., 2023a]). Winch speed was set at 0.5–1 m/s to a cable length of 100 m and then increased to 1.2–1.5 m/s to a cable length of 7700 m. Running the GPC down was paused at a cable length of 7700 m at 1000 h for stabilization and monitoring the GPC position and resumed after 3 min at a winch speed of 0.3 m/s. Spud-in commenced at 10:10:53 h and ended at 10:10:59 h. Recovery commenced, and the cable tension rose to 1101 kgf at 10:11:00 h before dropping to 878 kgf and then rising again to a maximum of 12665 kgf at 10:12:54 h. It dropped to 7470 kgf at 10:13:01 h, indicating the corer was clear of the seabed (see WINCHLOGS in Supplementary material). Inclinometer data for Hole M0085D show the piston corer barrel was rotated clockwise by 145° at the estimated seabed, with an east–west dip of 0.84° and a north–south dip of −0.91° (see Figure F5 in the Expedition 386 methods chapter [Strasser et al., 2023a]). The GPC was run back to the surface at a winch speed of 1.0–1.5 m/s. The trigger corer and GPC were recovered on deck at 1235 and 1315 h, respectively. The trigger core and GPC core from Holes M0085C and M0085D have a total length of 0.33 m (2 sections) and 33.69 m (34 sections), respectively. Because of a poor weather forecast, the 40 m GPC was secured for transit at 1400 h.
2. Hydroacoustics
Sites M0084 and M0085 lie within Basin N3 in the most northerly part of the Japan Trench survey area. The grid of acquired SBP data, restricted to the flat basin floor, comprises 133 km of profiles. In total, the survey is made up of 24 lines, of which 7 are trench parallel (SSE–NNE) and 17 are trench perpendicular (WNW–ESE) (Figure F3). The acquisition parameters for all lines in Basin N3 are documented in Table T2. The area surveyed for bathymetry includes both the basin floor and surrounding areas, covering an area of approximately 825 km2. Conversions to depth in this section are approximate and assume a seismic velocity of 1500 m/s.
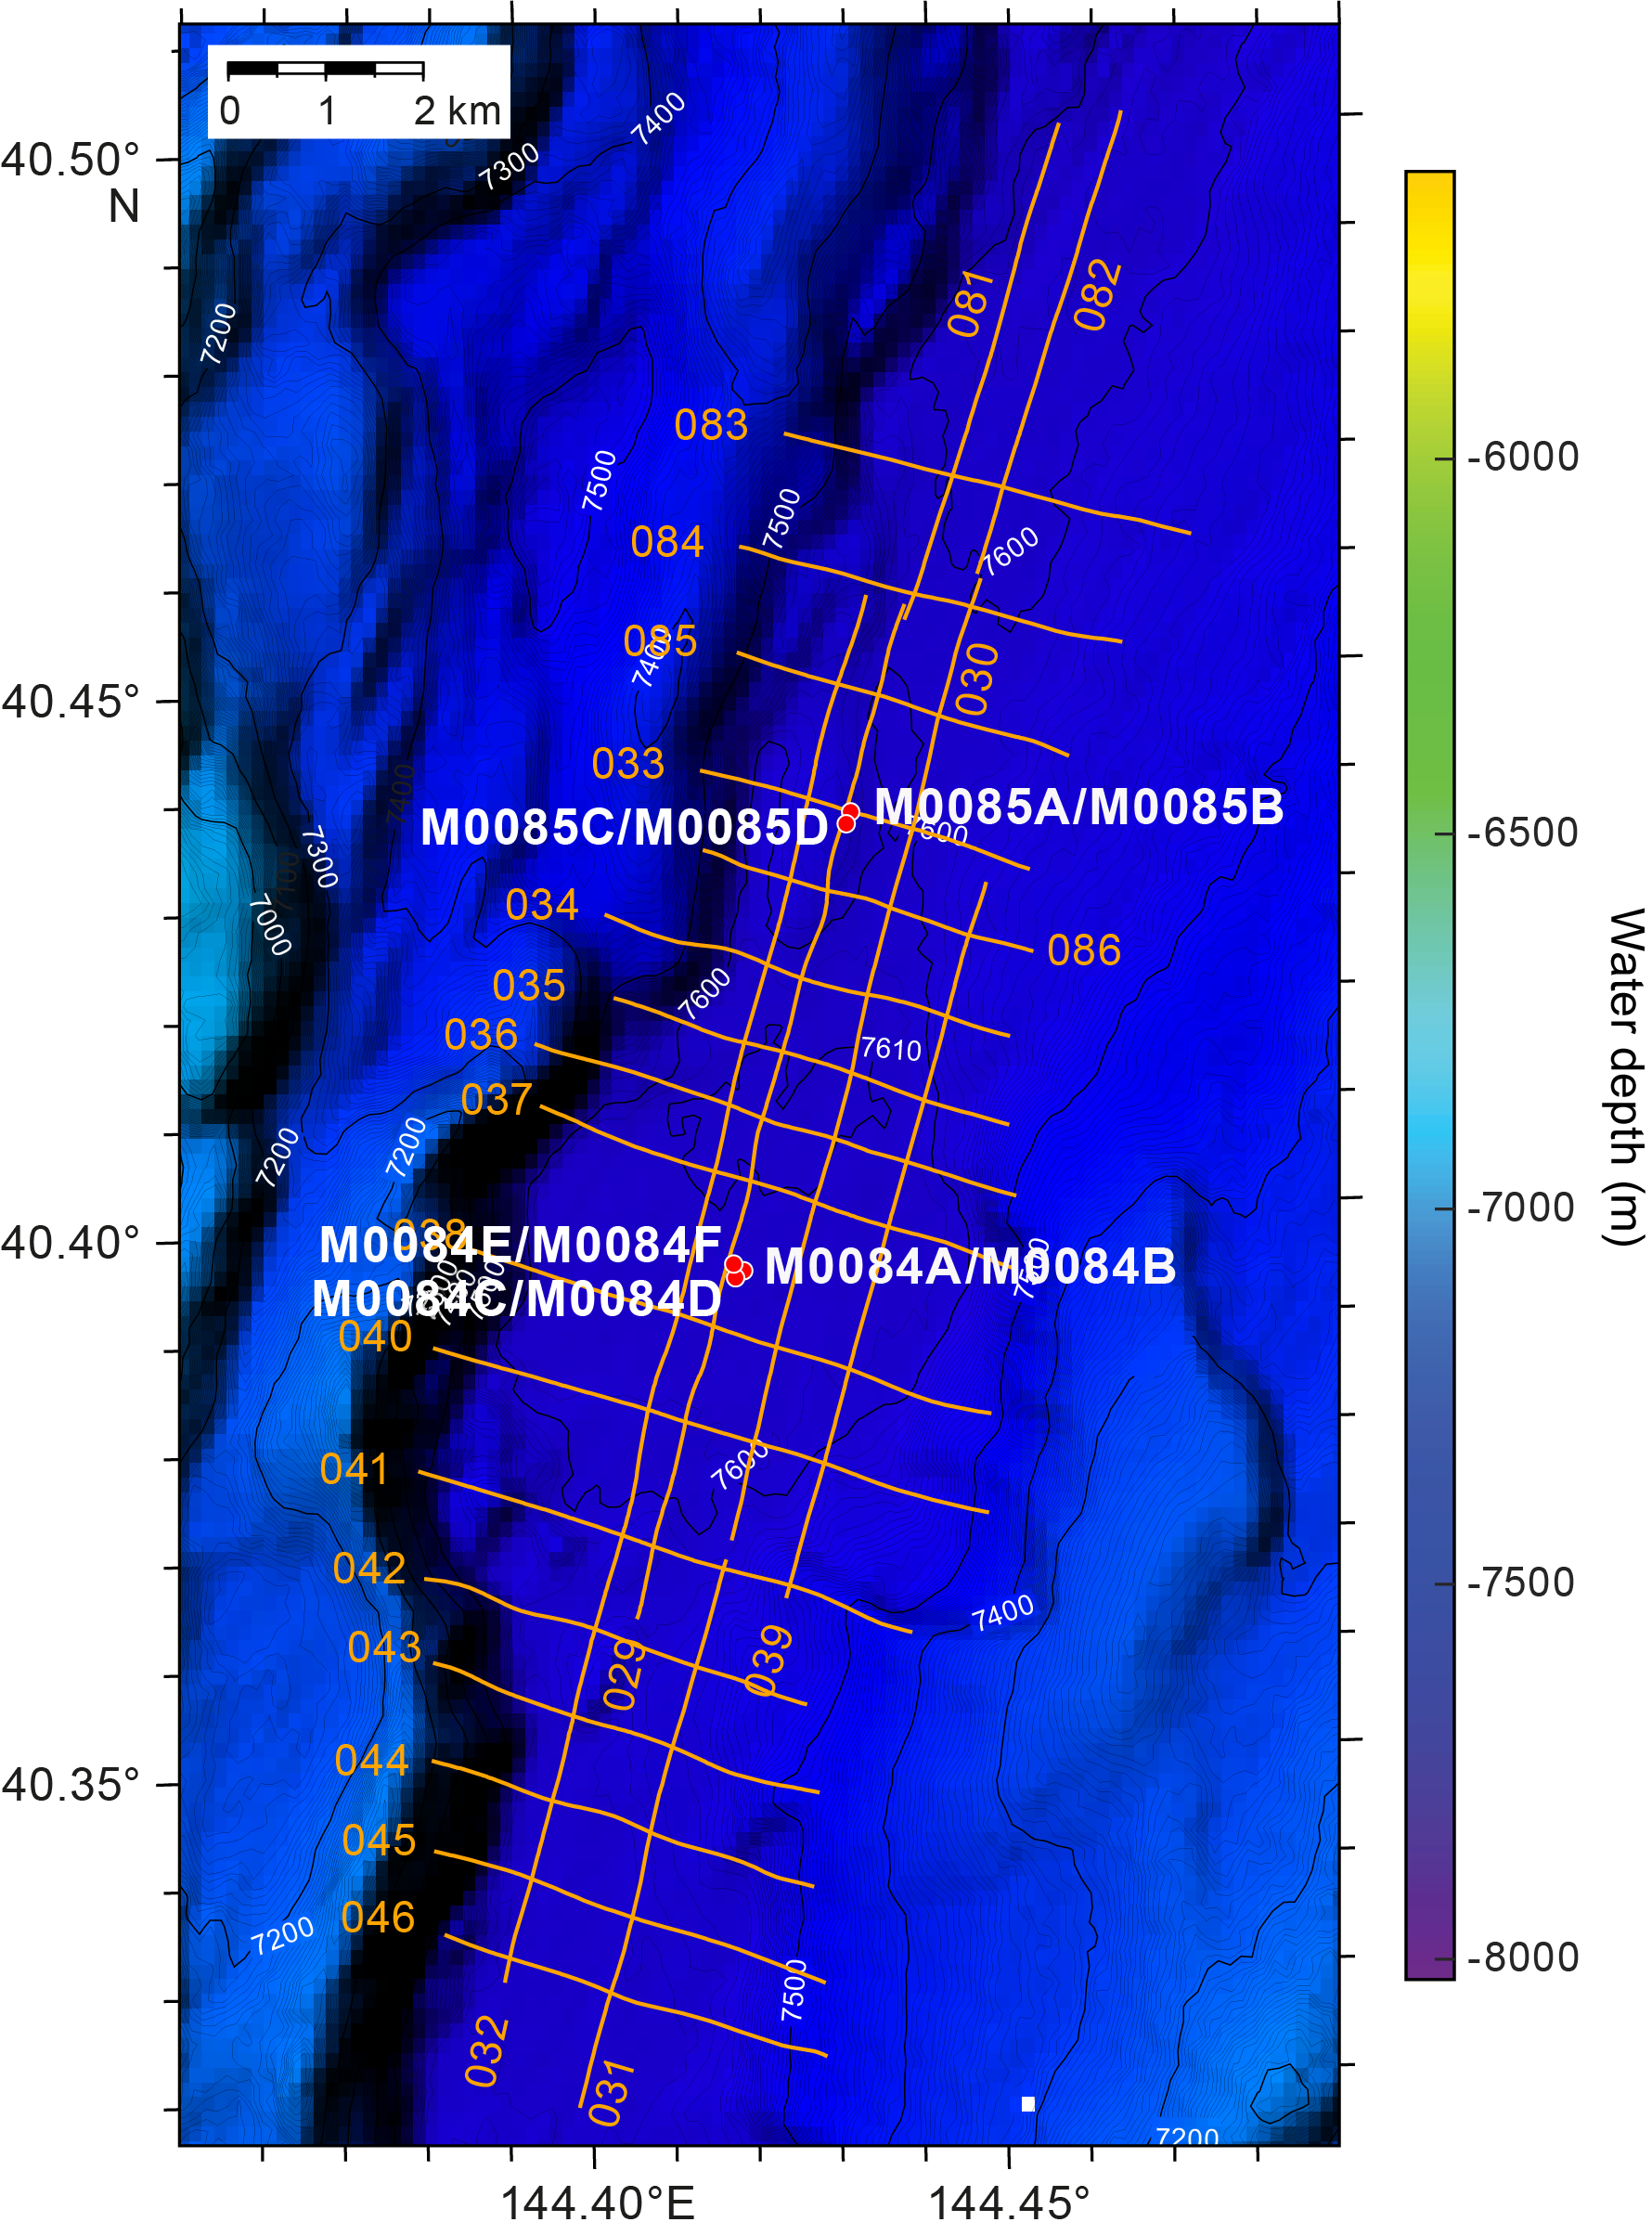
Figure F3. Subbottom profiler lines.
2.1. Bathymetry
Seafloor depths in Basin N3 are between 7600 and 7613 mbsl at Site M0084 and between 7590 and 7606 mbsl at Site M0085 (Figure F3). The width of the basin, defined as the change from flat basin floor to the first point of rapidly changing topography on either side, varies from approximately 3554 m at its narrowest point in the north, near Site M0085, to approximately 4945 m in the south, in the vicinity of Site M0084.
Bathymetry rises more steeply on the western side of the basin, where it shallows 100 m vertically over a horizontal distance of 300 m (~30% slope gradient) west of Site M0084 and 100 m over 500 m (20% slope gradient) east of Site M0084.
2.2. Basin characterization
Changes in basin character from north to south are shown on a series of trench-perpendicular lines (386_Underway_083, 386_Underway_037, 386_Underway_041, and 386_Underway_046). Line 386_Underway_083 (Figure F4), at the northern end of the basin, displays a somewhat discontinuous high-amplitude seafloor horizon overlying a thick, acoustically transparent package approximately 10 m thick at its thickest point. The near-seabed transparent package thins to the east onto a bounding basal and bathymetric high, where it appears to be only 1–2 m thick. Beneath the transparent layer, there is a thick package of acoustically laminated materials with high amplitudes. This package is approximately 30 m thick throughout the basin but thins to 25 m at the eastern end of the line. The western end of the line shows changes west of Shotpoint 1160 where all reflectors dip significantly to the west, with some layers appearing to display drag.
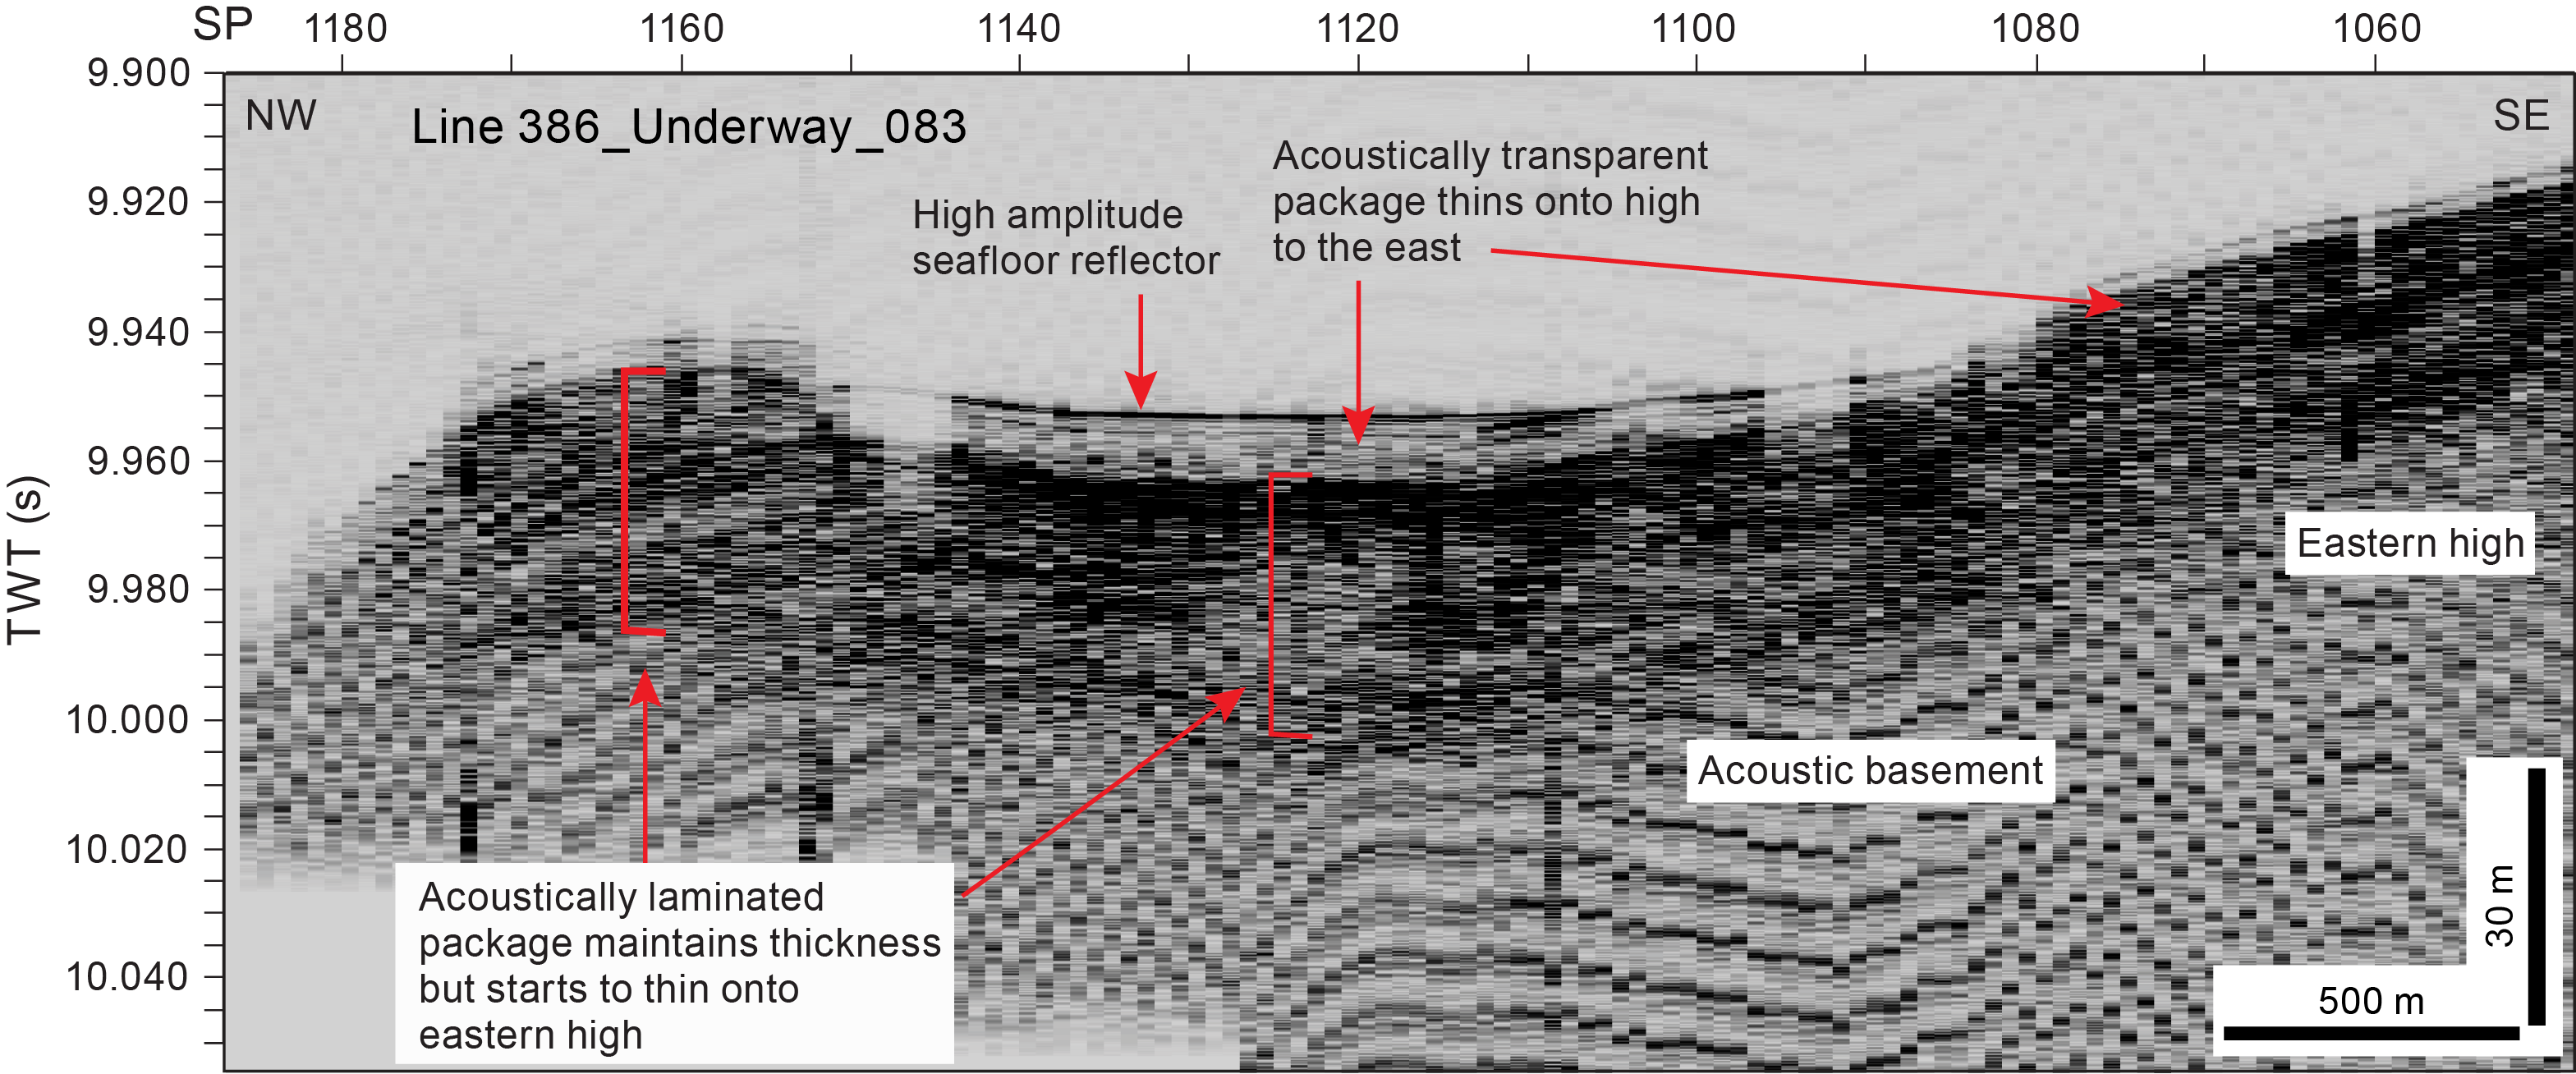
Figure F4. Line 386-Underway_083.
Line 386_Underway_037 (Figure F5) lies 7600 m south of Line 386_Underway_083 (as measured perpendicular to the lines). A high-amplitude continuous reflector is present at the seabed, overlying a continuous 10–12 m thick acoustically transparent layer that thins slightly onto the bounding eastern high. Some dipping reflectors are apparent within the overall acoustically transparent package. Beneath the transparent package lies an acoustically laminated package up to 50 m thick, although its base is not fully imaged in Line 386_Underway_037. Within the laminated package, another potentially acoustically transparent layer occurs at 10.01 s two-way traveltime (TWT).
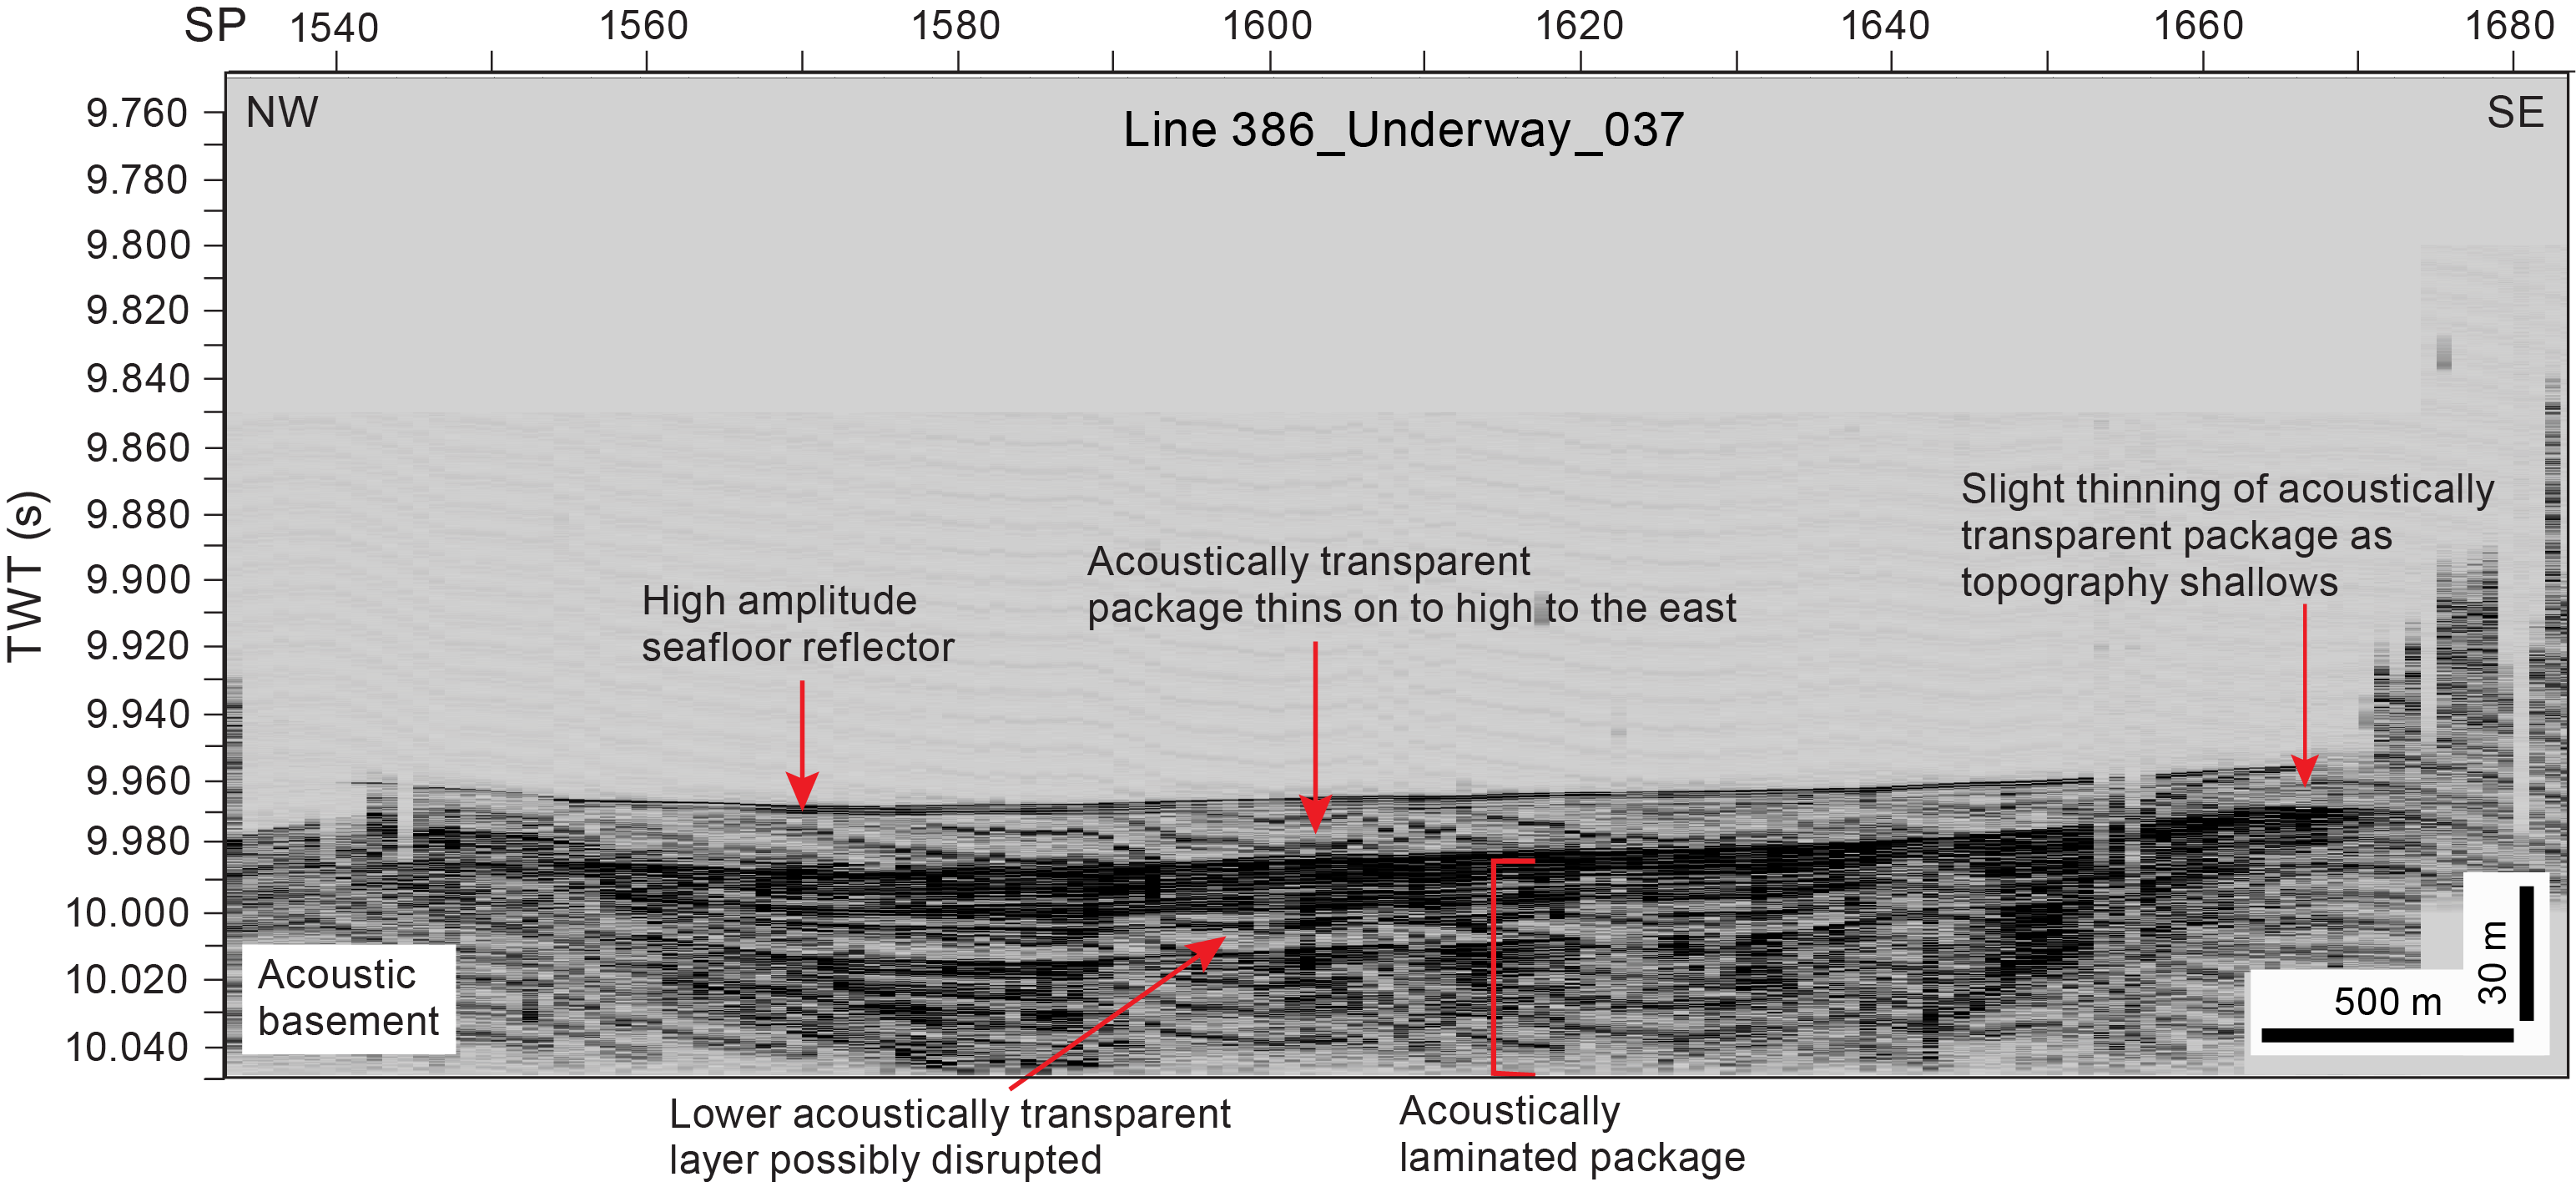
Figure F5. Line 386-Underway_037.
The character of Basin N3 changes toward the south, as shown in Line 386_Underway_041 (Figure F6), which lies 3890 m south of Line 386_Underway_037. In Line 386_Underway_041, the seafloor reflector is unclear because the seabed is affected by disrupted reflectors. A near-seabed acoustically transparent layer appears to be present but is relatively poorly imaged. This narrow part of the basin is bounded to the east and west by sharp bathymetric changes. An acoustically laminated package appears to be present, but it is also less well imaged.
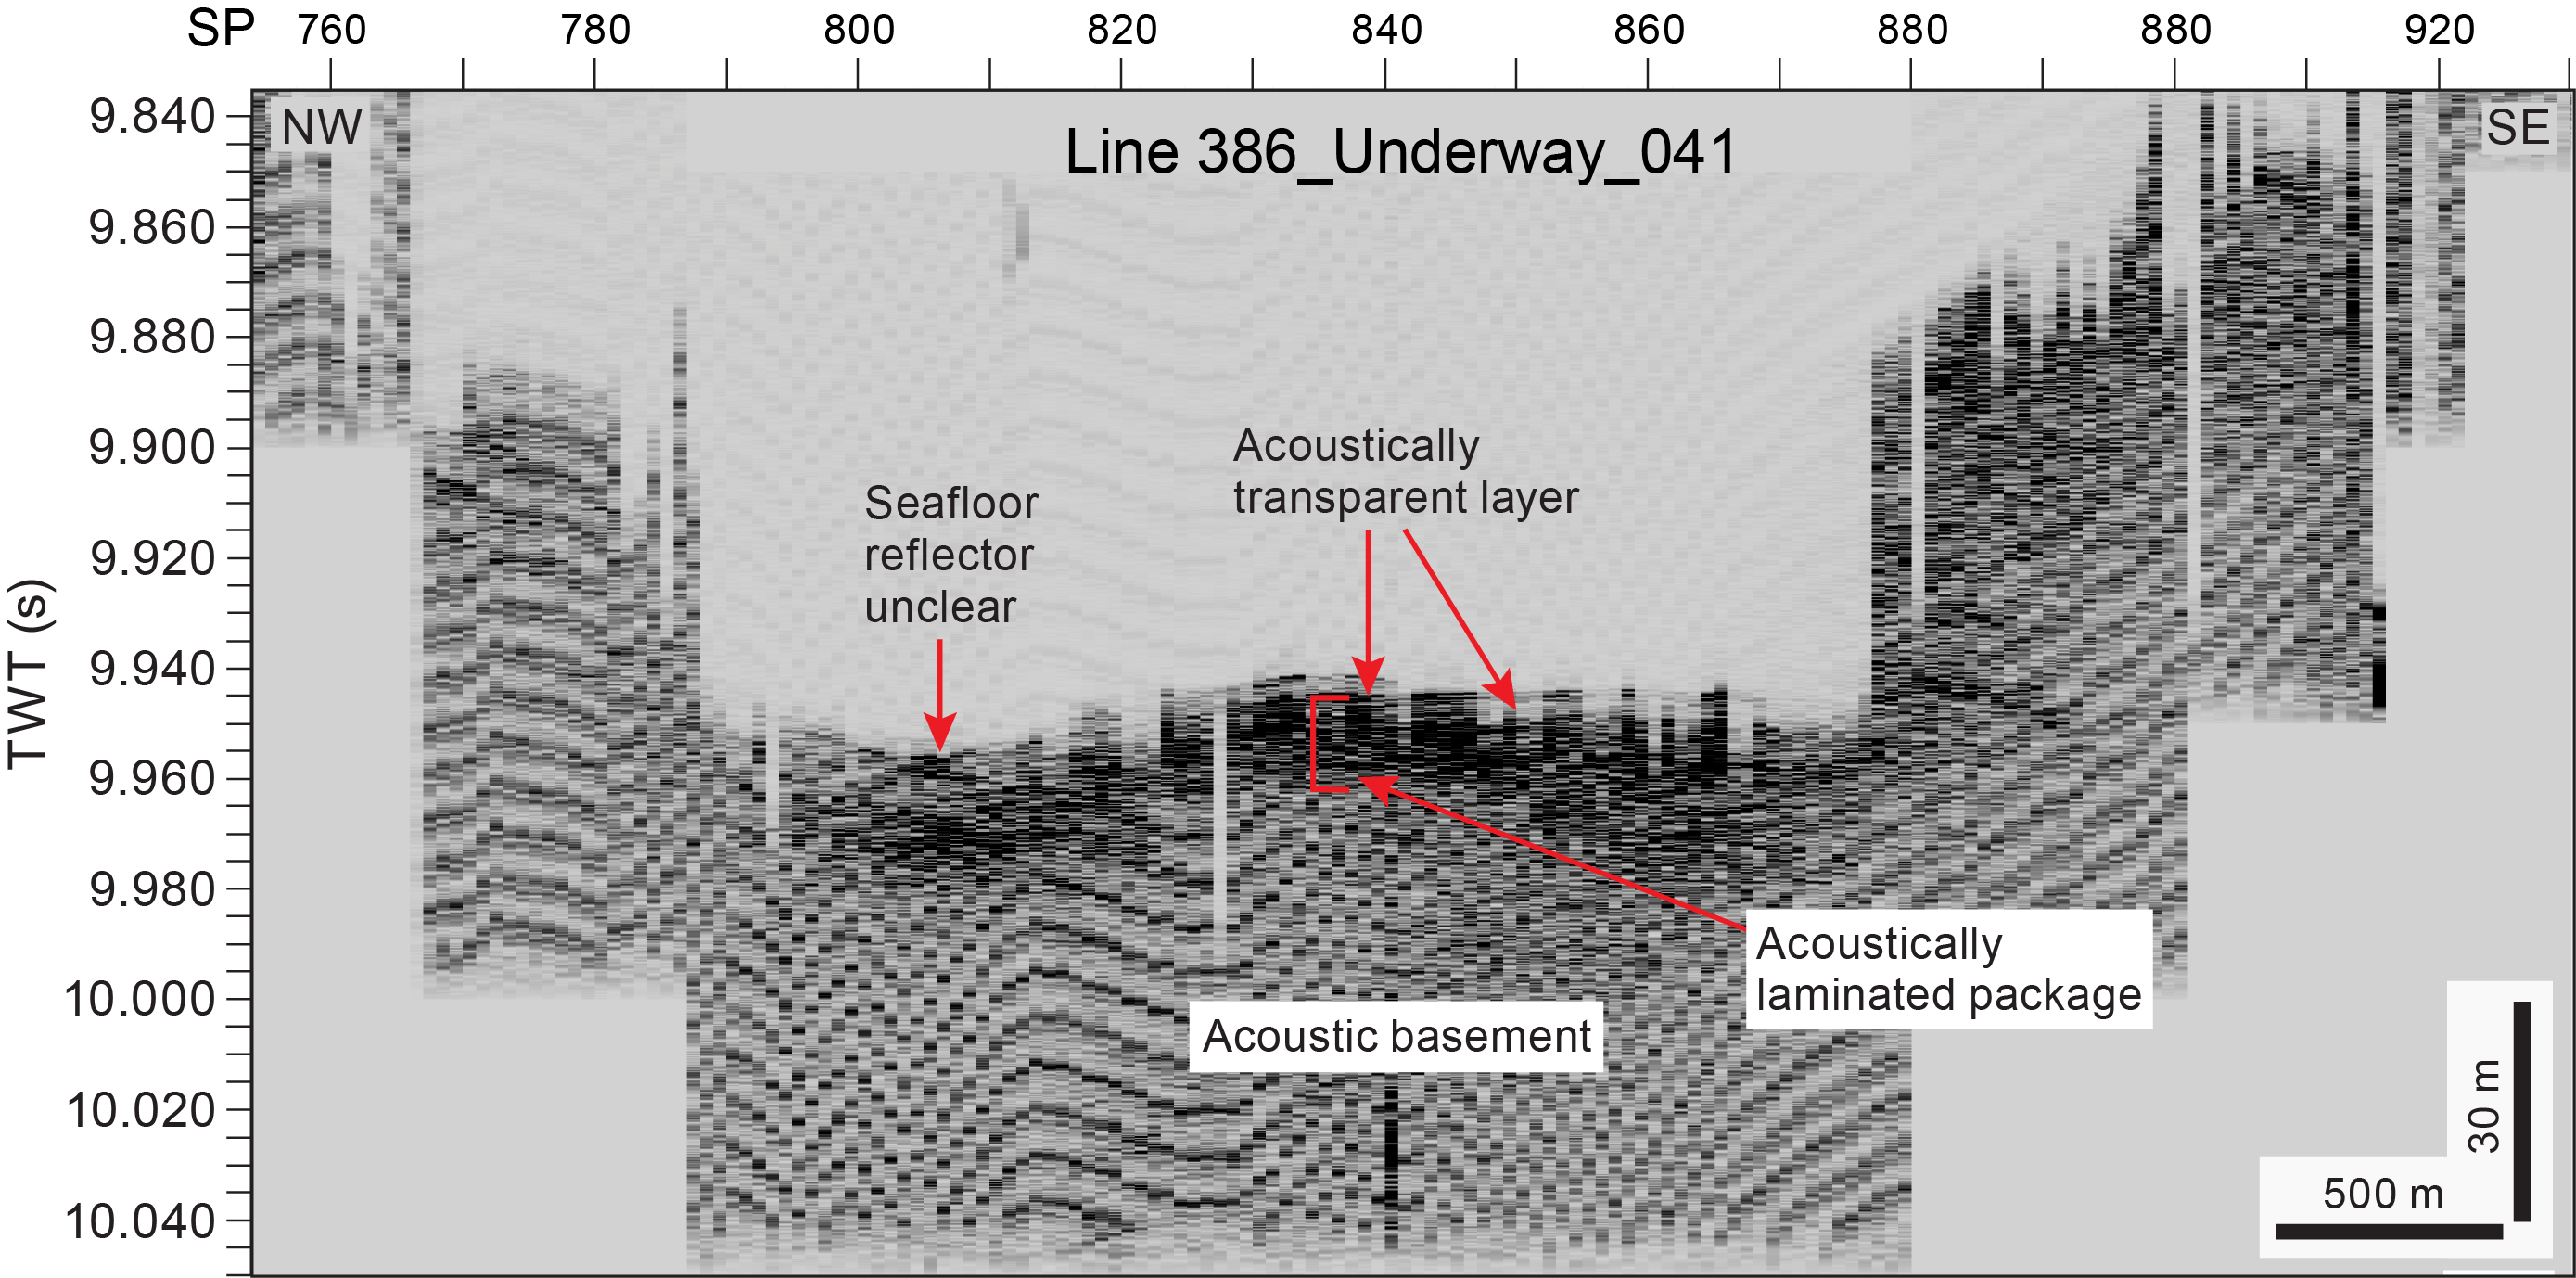
Figure F6. Line 386-Underway_041.
The southernmost line of the basin, Line 386_Underway_046 (Figure F7), lies 4500 m south of Line 386_Underway_041. The character in this part of the basin is similar to Line 386_Underway_037 to the north, with a high-amplitude seafloor horizon, a thick (10–12 m) acoustically transparent layer that thins to the east onto a basal high, and a thicker package (30–40 m) of acoustically laminated materials. A central basal high divides the lower part of the laminated package into two distinct depocenters to the west and east, and the western part is slightly thicker than the eastern part.
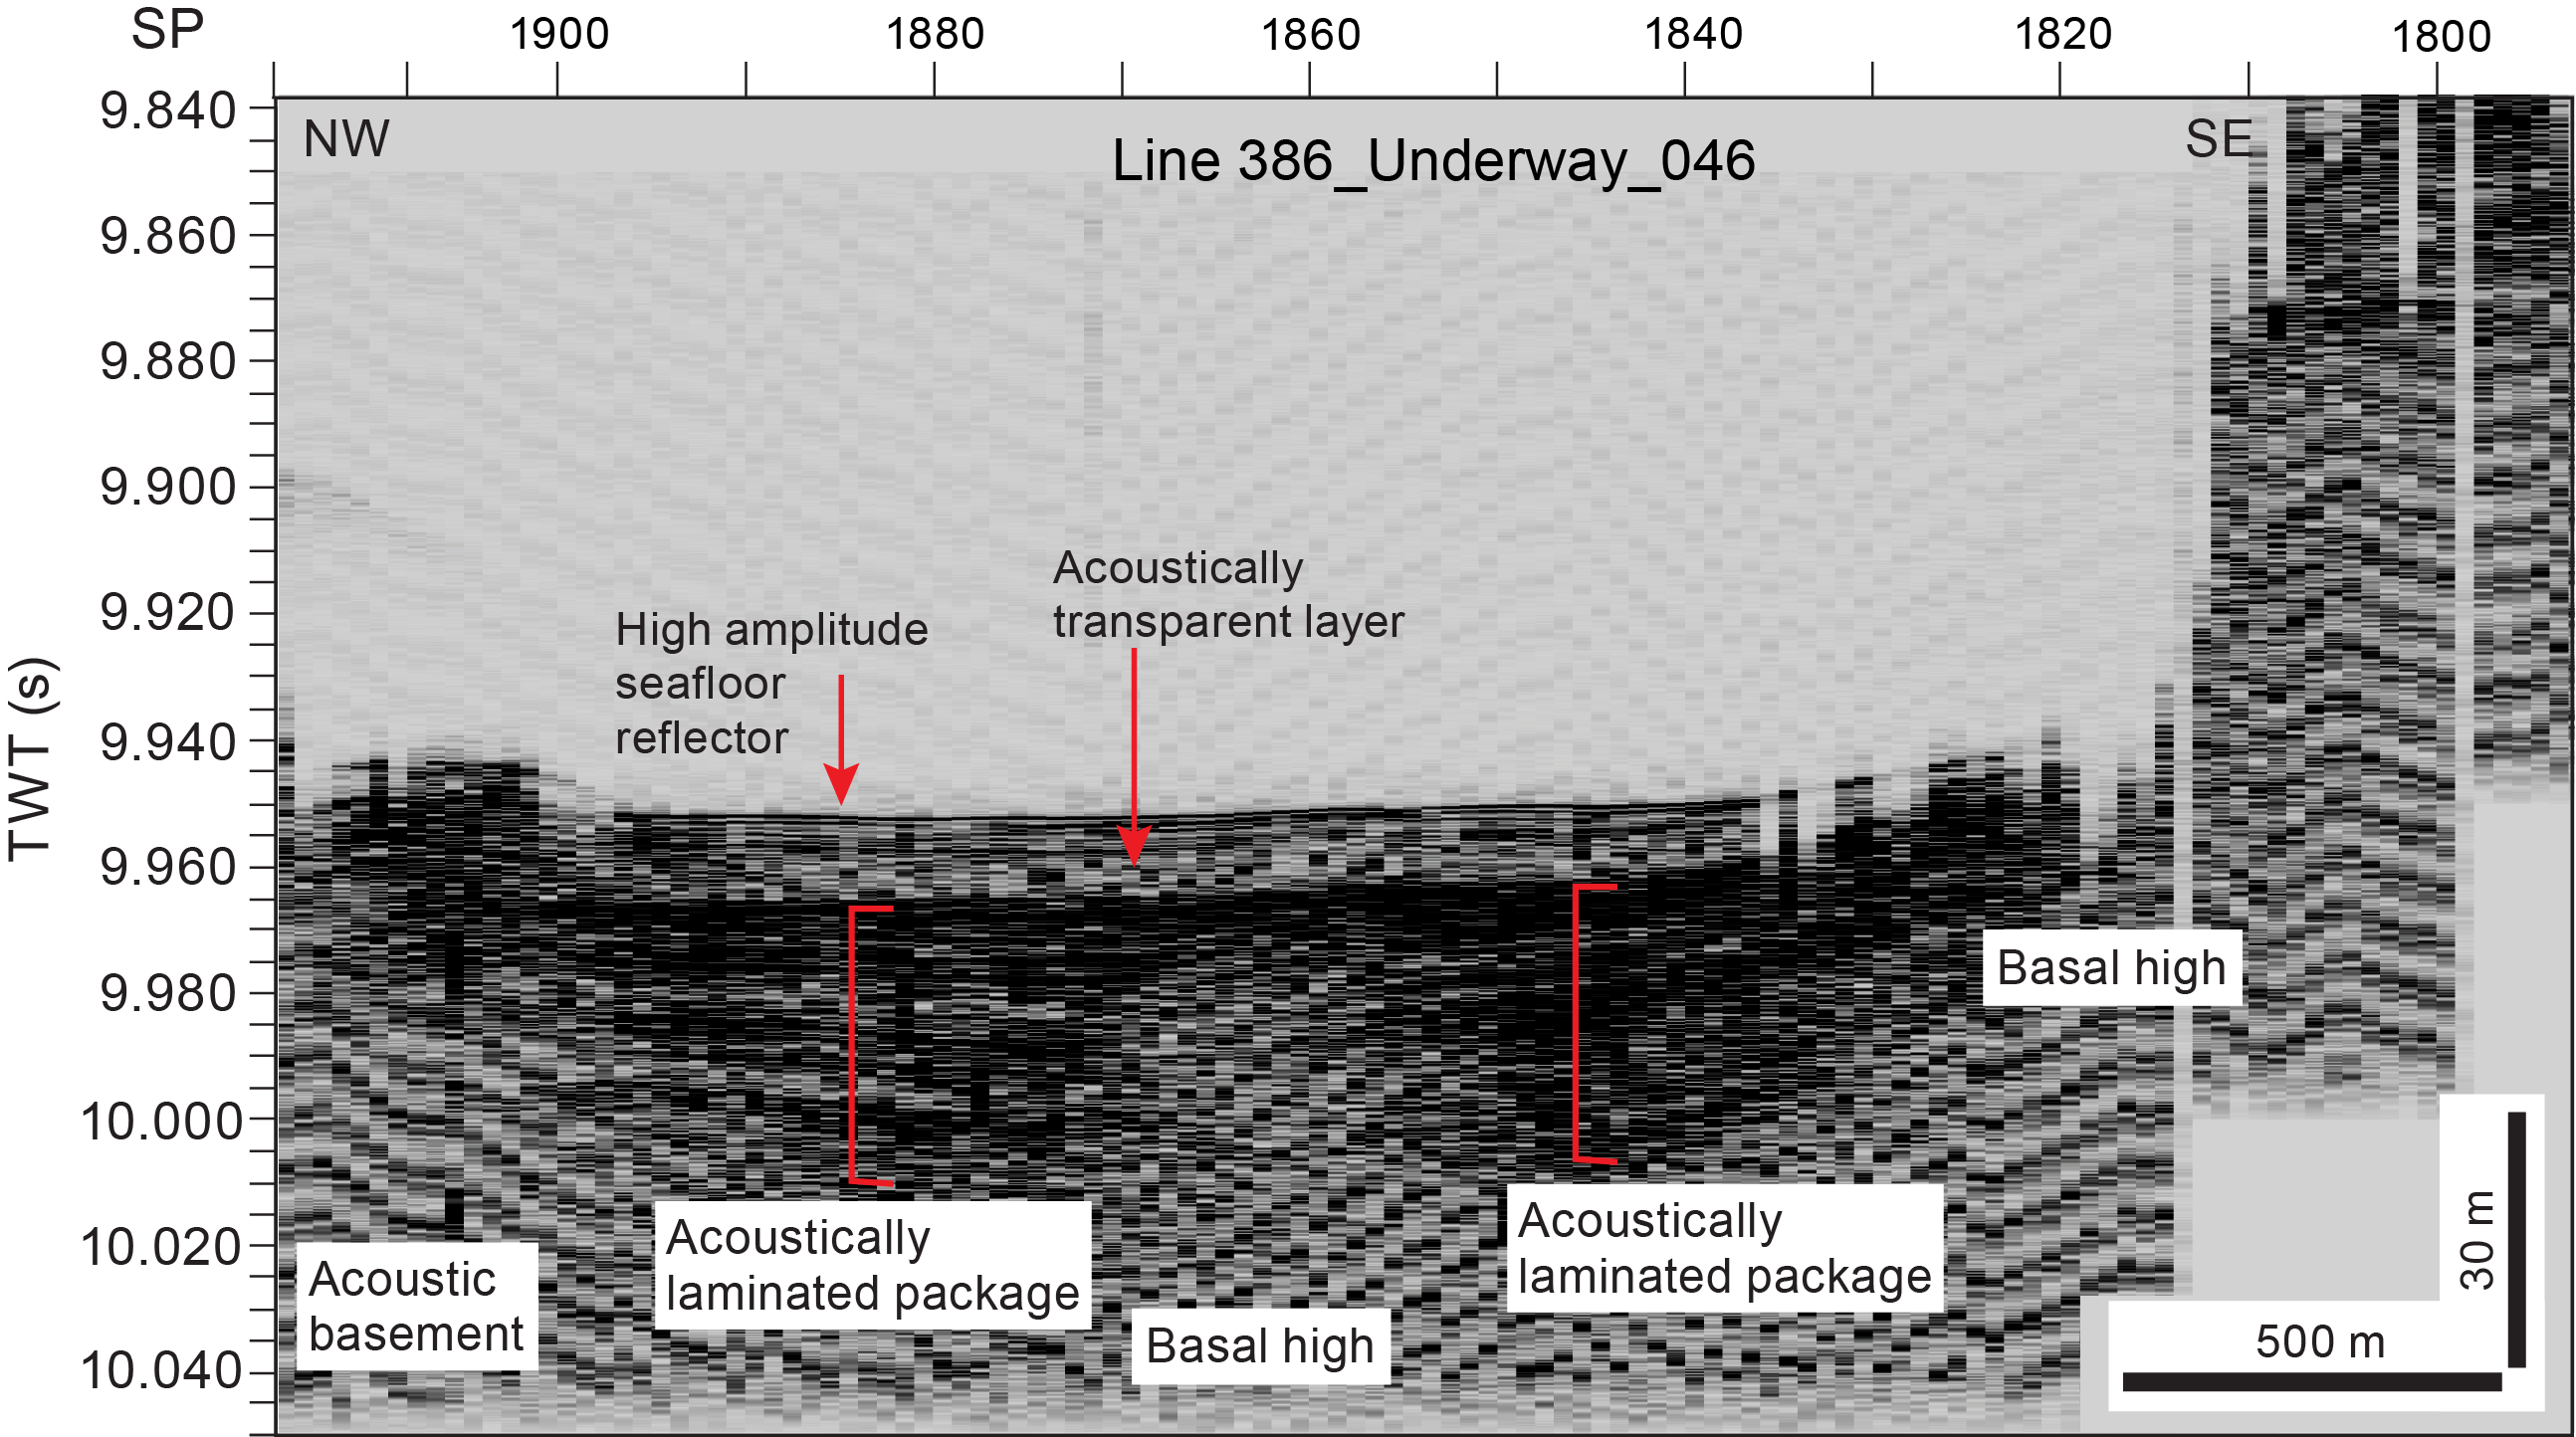
Figure F7. Line 386-Underway_046.
2.3. Site M0084
Site M0084 is bound by two trench-perpendicular lines to the north and south (Lines 386_Underway_037 and 386_Underway_038, respectively), and is intersected by one trench parallel line, 386_Underway_081 (Figure F8). Line 386_Underway_037 shows an acoustically transparent layer around 15 m thick (Figure F5), similar to that seen on Line 386_Underway_038 (Figure F9). Line 386_Underway_038 shows a relatively continuous high-amplitude seafloor layer overlying an acoustically transparent layer that thins onto a basal high in the east and a deeper package of acoustically laminated materials. In addition, Line 386_Underway_038 better images a deeper transparent layer within the laminated sequence at around 10.01 s TWT. Some disturbance to this transparent package is apparent at the intersection with Holes M0084C–M0084F, which may relate to underlying disruption of the acoustic basement.
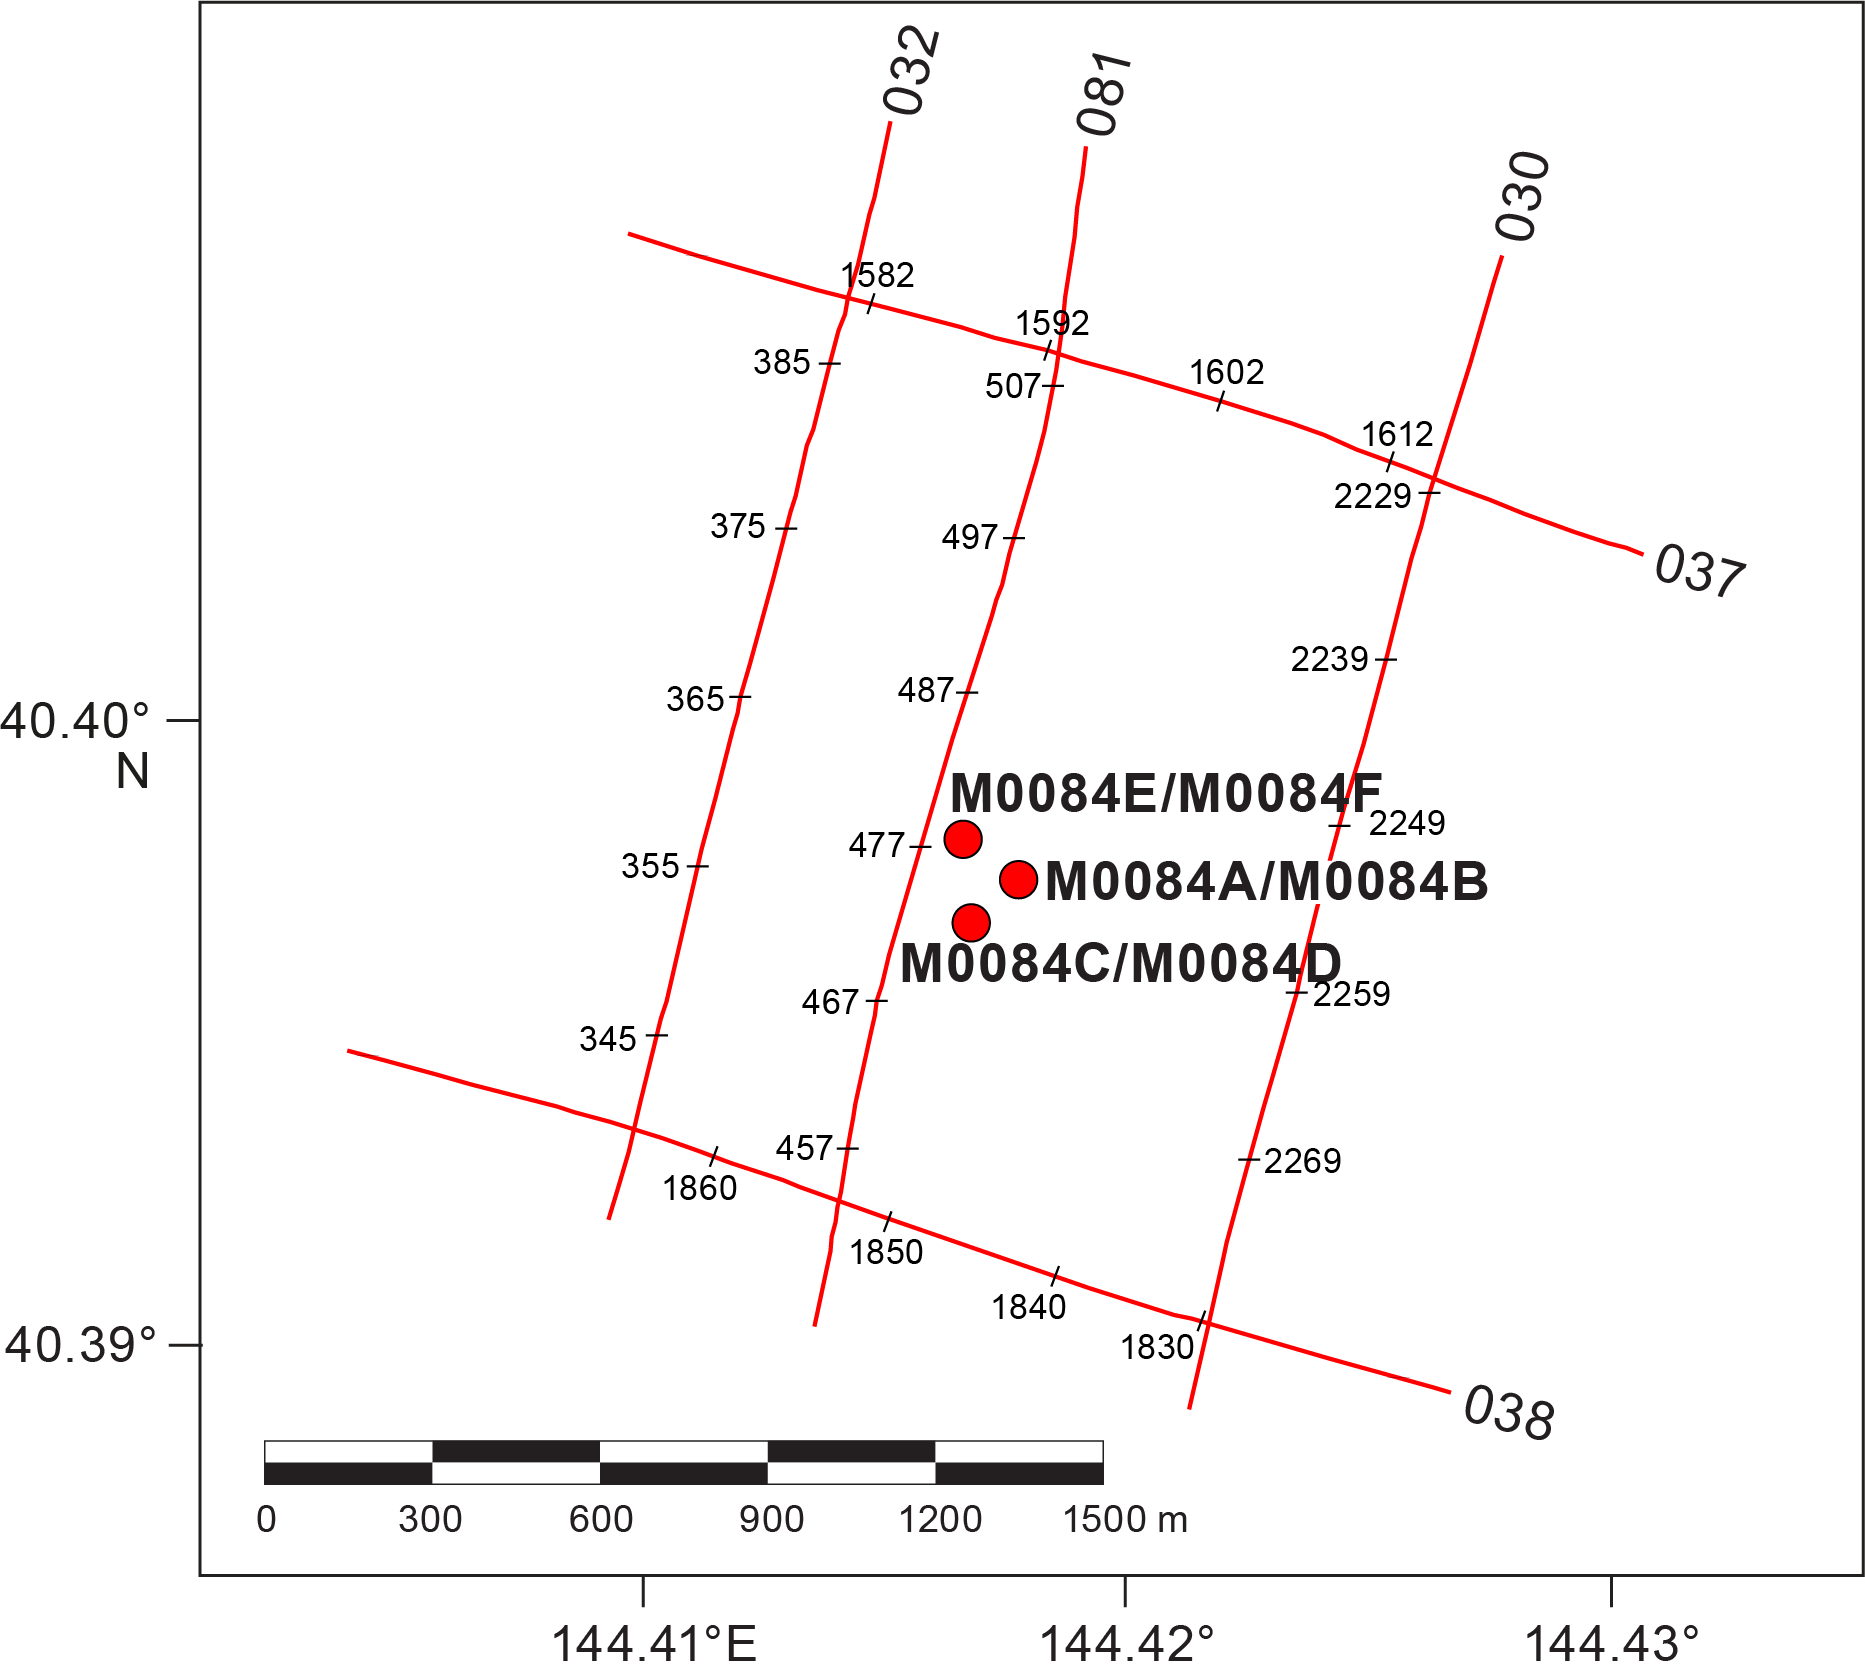
Figure F8. Subbottom profiles around Site M0084.
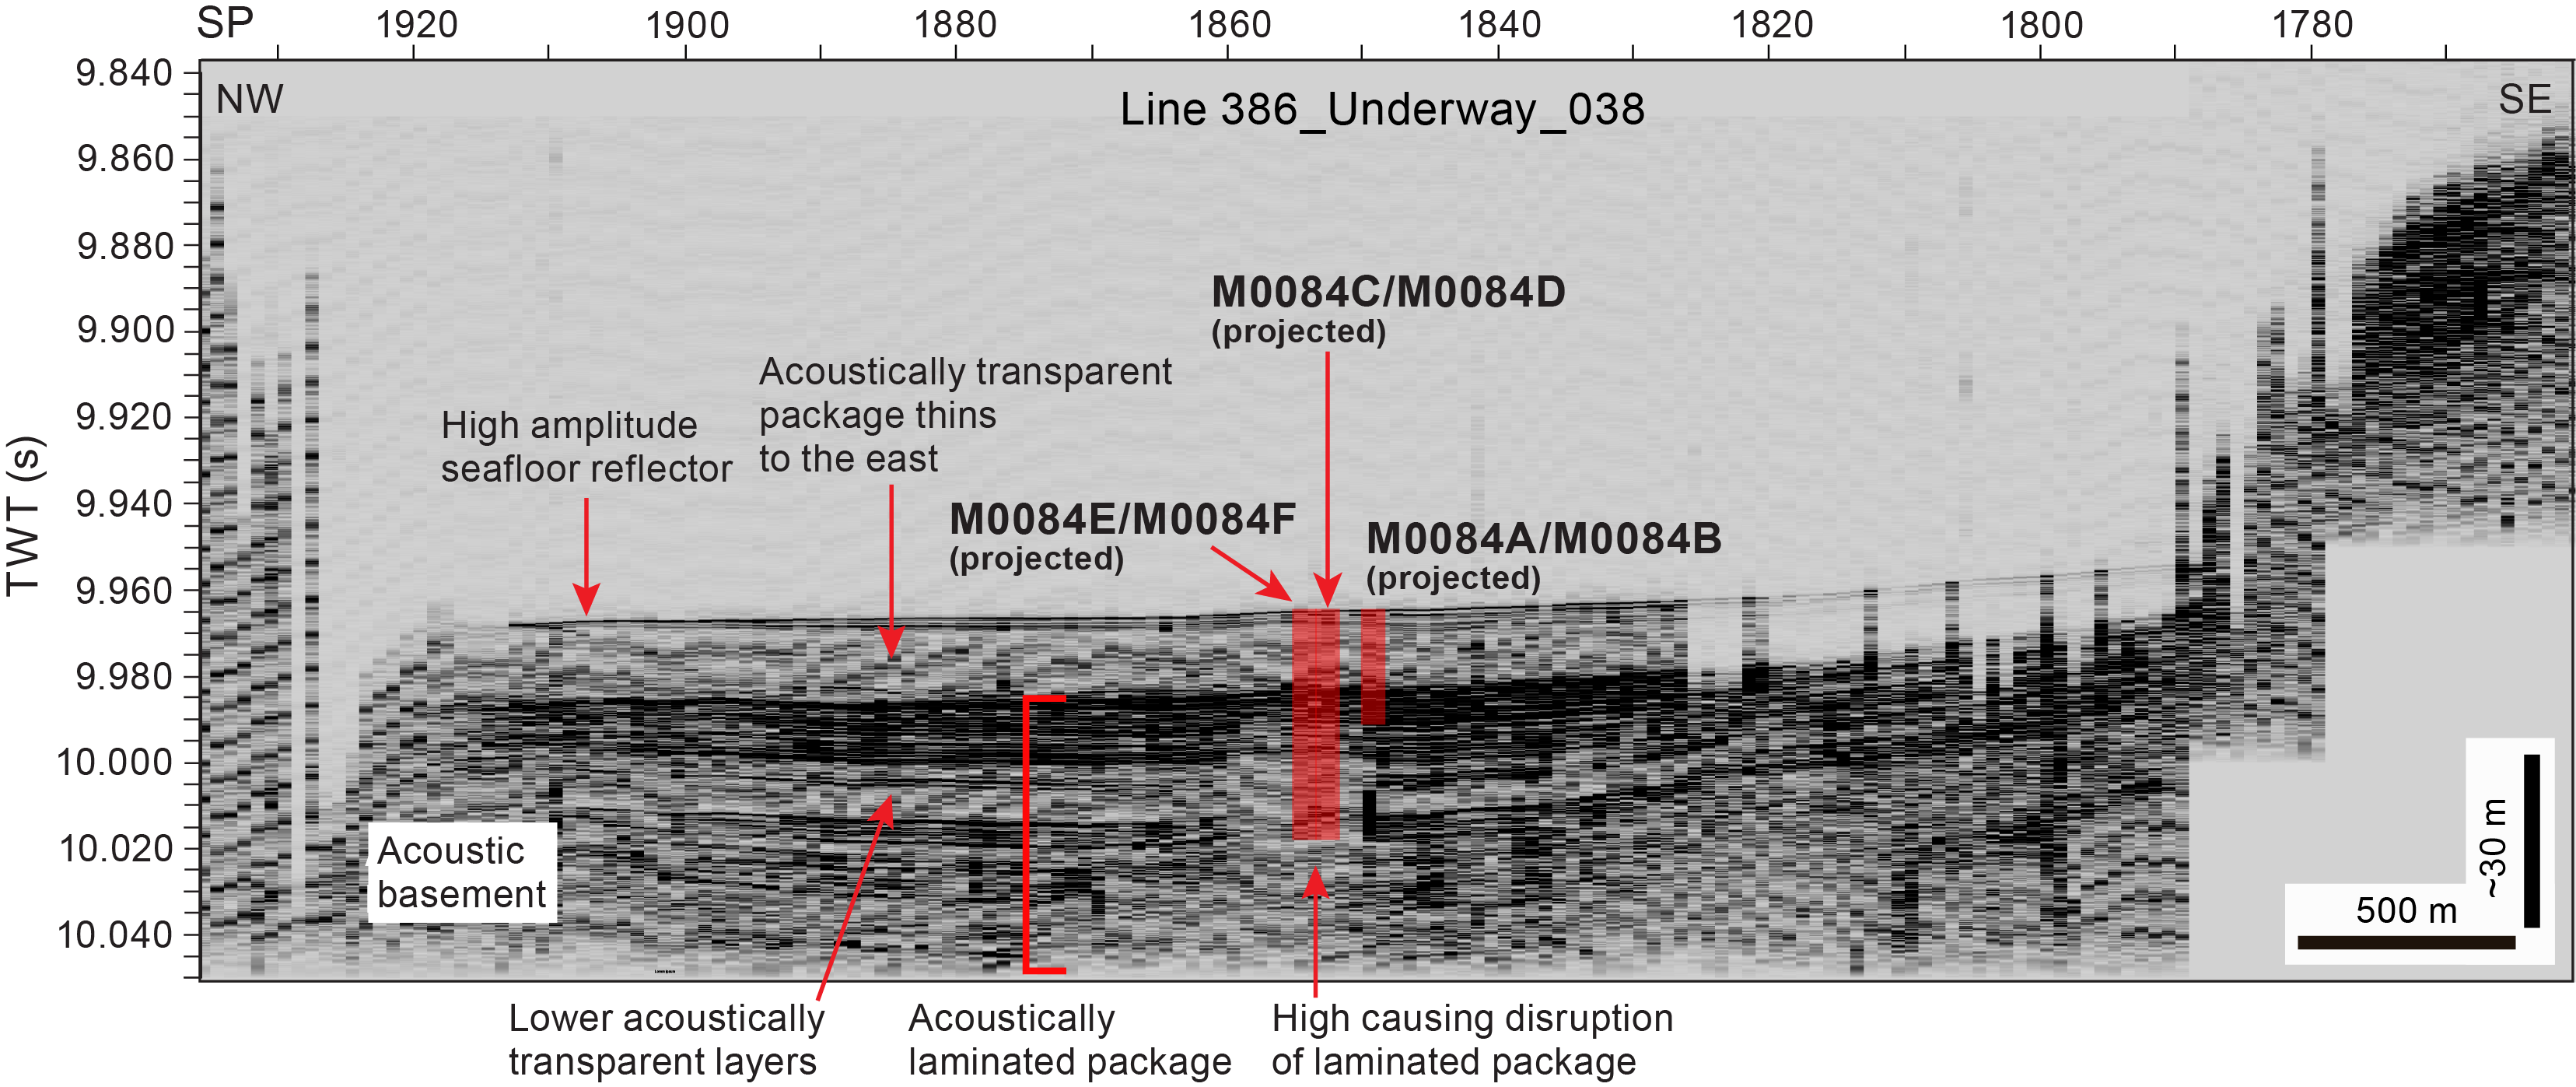
Figure F9. Line 386-Underway_038.
Trench-parallel Line 386_Underway_029 intersects Sites M0084 and M0085, enabling direct comparison of the acoustic character between these two sites (Figure F10). At Site M0084, the line shows a series of high-amplitude reflectors at and just below the seafloor and overlying a thick (~15 m) acoustically transparent layer. The transparent package thins notably to the north onto a basal high, where the thickness in Holes M0085A–M0085D is approximately 3 m. Beneath the acoustically transparent layer, an acoustically laminated basin fill package extends in parts to the base of the section, where it is approximately 50 m thick at its maximum, and thins onto basal highs to the west and east. Within the laminated package, several other acoustically transparent layers are present in Holes M0084C and M0084D: a thin layer (1–2 m) occurs at around 9.992 s TWT, and there are two thicker layers at 10.000 s TWT (2–3 m thick) and 10.005 s TWT (5–6 m thick).
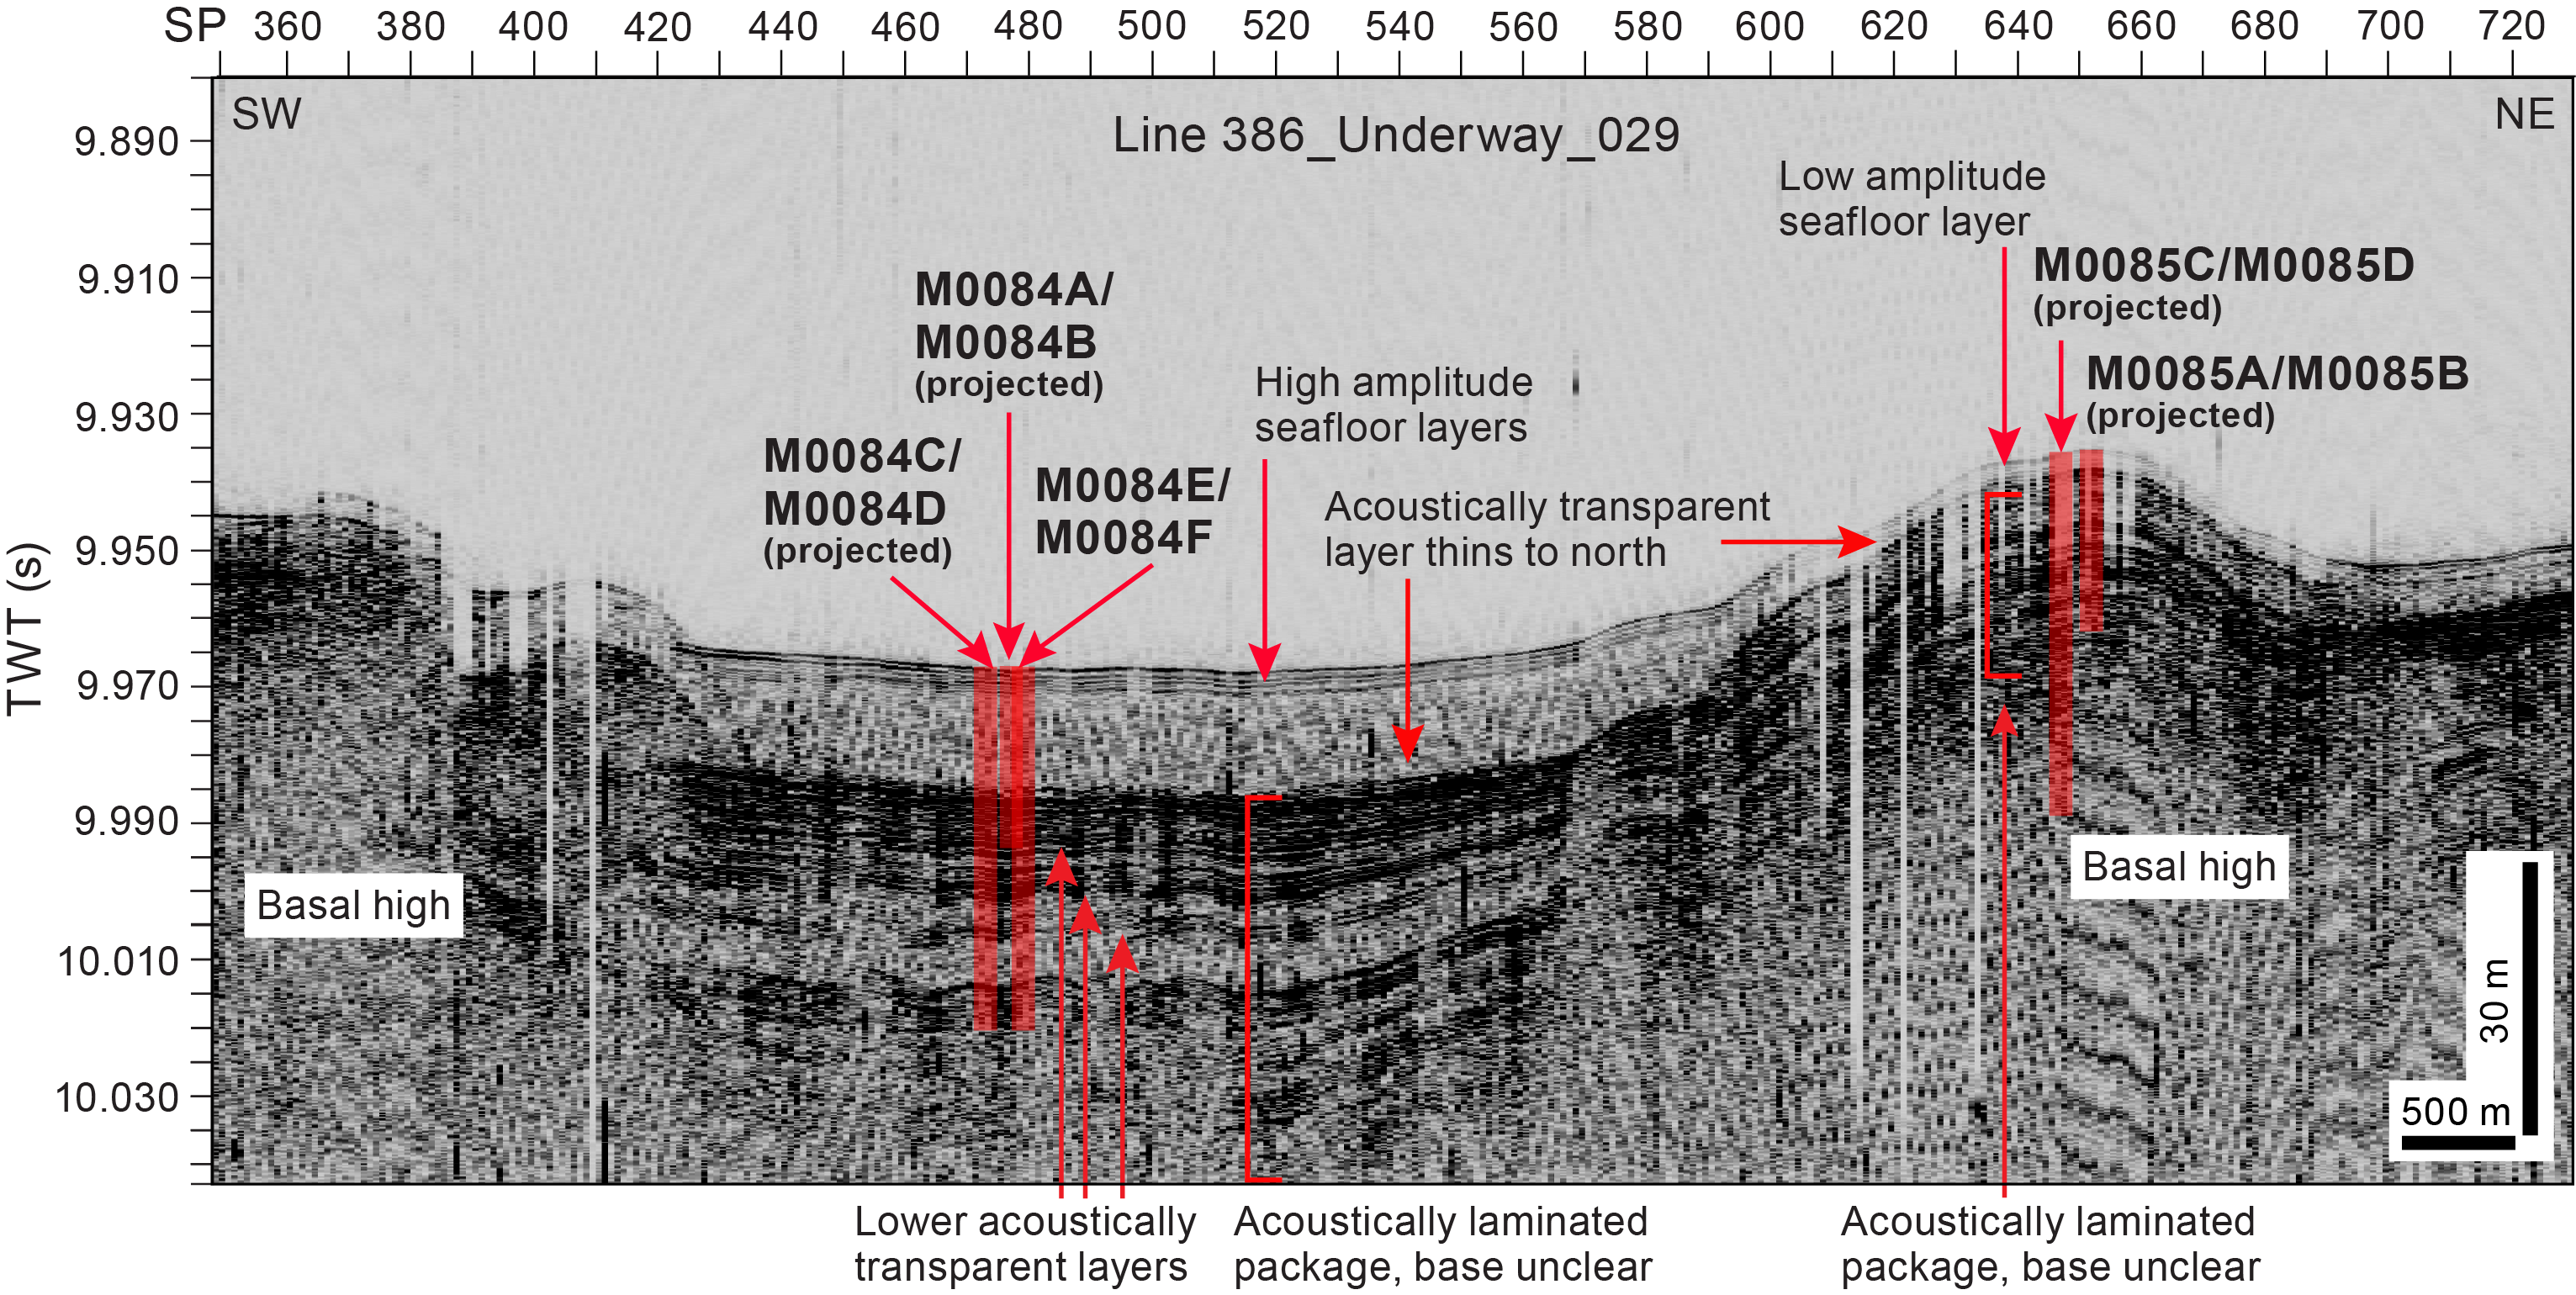
Figure F10. Line 386-Underway_029.
2.4. Site M0085
Site M0085 lies at the intersection of trench-parallel Line 386_Underway_029 and trench-perpendicular Line 386_Underway_033 (Figures F10, F11). Line 386_Underway_029 shows Site M0085 located on a basal high. The seafloor at this location is imaged as a low-amplitude reflector, and an underlying acoustically transparent layer thins onto the basal high from 10–12 m at Site M0084 to approximately 3 m at Site M0085, which is consistent with deposition over a preexisting structure. The entire laminated package, which is more than 50 m thick at Site M0084, thins to approximately 30 m at Site M0085, although internal transparent layers are not visible in Line 386_Underway_029. Line 386_Underway_033 shows the trench-perpendicular view at Site M0085 (Figure F12). Although lower resolution, the line shows the laminated package following the structure of the basal high and potentially onlapped by the overlying acoustically transparent layers, overall suggesting that the laminated package predates the formation of the high. The acoustically transparent layer can be seen clearly in the basin east of Site M0085.
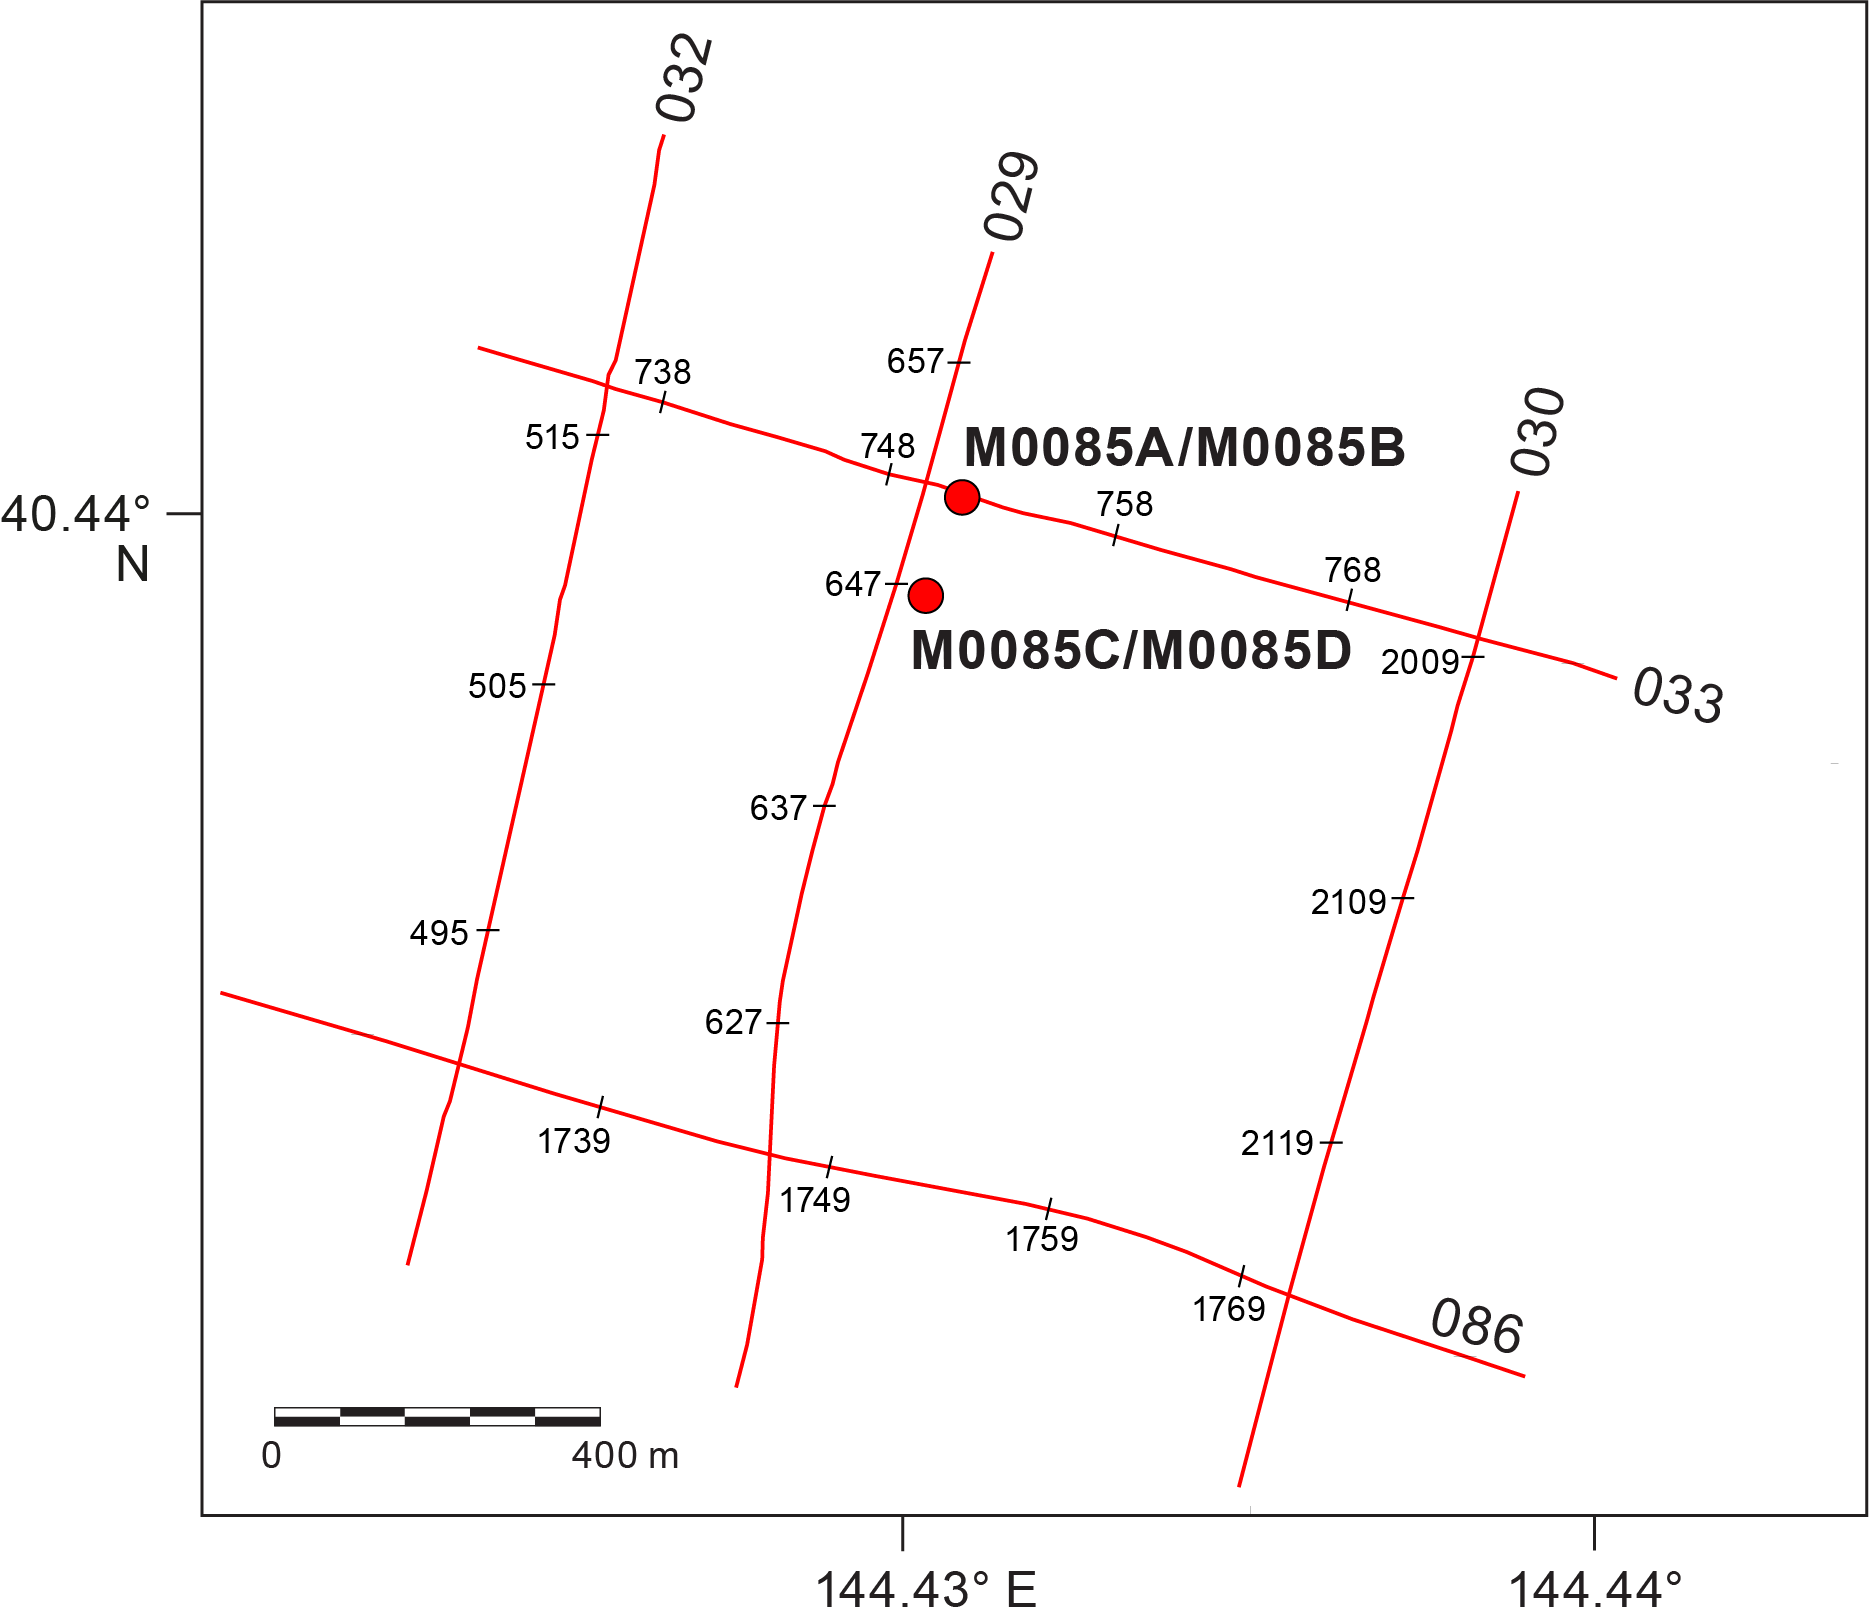
Figure F11. Subbottom profiles around Site M0085.

Figure F12. Line 386-Underway_033.
3. Lithostratigraphy
Sites M0084 and M0085 were cored in Basin N3 in the northern Japan Trench. Site M0084 has six holes, with accompanying trigger cores. Site M0084 was cored in the basin floor where the greatest sediment recovery was anticipated based on subbottom profile analyses. Site M0085 has two GPC holes (M0085B and M0085D) and the accompanying trigger cores (Holes M0085A and M0085C). Site M0085 was cored in a basin high where the thinnest (condensed) sediment recovery was anticipated based on the subbottom profiles (see Operations).
The lithostratigraphic summaries of core sections, including line scan, X-ray computed tomography (CT) scan images, and visual core descriptions (VCDs) are shown on Figures F13, F17, F20, F22, and F25. The sediment texture and composition determined from smear slide analysis is presented in ternary diagrams (Figures F14, F23) and smear slide summaries (Figures F15, F18, F21, F24, F26) and illustrated with selected photomicrographs (Figures F16) and close-up photos (Figure F19) (see SMEARSLD and CORECLOSEUP in Supplementary material for additional images). The bulk sediment mineralogy is documented in X-ray diffraction (XRD) plots (Figure F27).
Complete linescan and X-ray CT scan images of core sections for Sites M0084 and M0085 can be found in LINESCAN and XRAYCT, respectively, in Supplementary material. XRD results used in summary XRD figures for Sites M0084 and M0085 can be found in XRD in Supplementary material. Smear slide analysis data tables and 3 m barrel sheets for Sites M0084 and M0085 can be found in Core descriptions.
VCDs of core sections from Site M0084 show the following intervals downcore (Figures F13, F17, F20): (1) a 1–3 m thick medium- to thick-bedded unit of bioturbated silty clay and clay; (2) a 12–15 m thick, very thick bedded silty clay with centimeter-scale, contorted silt layers and patches above (3) a 1–2 m thick, fining-upward sand to silt with well-defined planar and ripple laminations (foraminifera and mica are present); and (4) a ~20 m thick medium- to thick-bedded, fining-upward succession of very fine sand grading to bioturbated clay that can be found across all the holes. Bioturbation is absent from Intervals 2 and 3. Iron monosulfides are characteristically absent as well in Intervals 2 and 3 but present in Interval 1 and 4.
Lithostratigraphic summaries from Site M0085 (Figures F22, F25) show less lithologic variability and differ from those for Site M0084. From the seafloor downhole, a composite section comprises the following intervals: (1) a 5 m thick silty clay with either a fining-upward succession of very fine sand, silt, silty clay, and clay or sand and silt laminae or patches; (2) a ~10 m thick clay-rich segment with minor laminated sand and silt layers, some of which contain shell fragments; (3) a ~16 m thick bioturbated clay and silty clay with fining-upward very fine sand and silt laminae above a decimeter-scale, laminated, fining-upward coarse to very fine sand horizon with a sharp base; and (4) a ~10 m thick thick-bedded, fining-upward succession of sand, silt, and bioturbated clay on top of a 2 m thick layer of mud-supported pebble and cobble clasts. Iron monosulfides are sparse to moderate and bioturbation is slight to moderate at Site M0085 except at the top of Intervals 1 and 5 where the sediment is sandy and in mud-supported clast horizons.
The smear slides show that the textures observed at Site M0084 are dominated by clayey silt but also consist of silty clay and silt. There is only one occurrence of silty sand (Figure F14; see Core descriptions). The sediment composition is clearly lithogenic (50%–80%) and/or biogenic (20%–70%). In contrast, textures at Site M0085 are mostly clayey silts with minor sandy silts (Figure F23; see Core descriptions). The abundance of volcanic material is less than 50% at both sites except for four samples at Site M0085 (three of those samples contain up to 90% volcanic material) and one sample at Site M0084. Foraminifera, micas, and shell fragments are observed in the samples, as well as volcaniclastic materials and tephra (see Tephra).
3.1. Site M0084
3.1.1. Holes M0084A and M0084B
3.1.1.1. Hole M0084A
Hole M0084A is 85 cm deep and composed of clay (Figure F13). The top of the liner (interval 1P-1, 0–9 cm) is a void, but a thin brown oxidized layer is noted at 9–10 cm below seafloor below the foam, indicating that the surface of the seafloor was recovered. The clay contains a 9 cm thick silty clay interval (1P, 36–45 cm) underlain by a 1 cm thick interval containing millimeter-scale fine sand laminae. The silty clay interval (1P-1, 36–45 cm) and the upper part of the underlying clay (interval 1P-1, 44.5–50 cm) are highly bioturbated, but the other parts of the core show no bioturbation. The silty clay and the underlying silt laminae with a sharp basal contact exhibit high magnetic susceptibility and high density that contrasts with the enclosing clay.

Figure F13. Lithostratigraphic summary, Holes M0084A and M0084B.
One smear slide was collected in Hole M0084A (Table T3; Figures F14, F15). The lithology is siliceous-rich lithogenic clayey silt. Silt and clay are the dominant textures (51.1% and 42.6%, respectively), with mineral components quartz (6.4%), feldspar (2.3%), and vitric shards (6.4%); diatoms (31.9%) and sponge spicules (10.6%) dominate the biogenic fraction.

Figure F14. Ternary diagrams of major components and grain size, Site M0084.

Figure F15. Smear slide summaries, Holes M0084A and M0084B.
3.1.1.2. Hole M0084B
The lithology for the ~20 m deep Hole M0084B (Figure F13) comprises four main intervals with gradational contacts, except for the contact between Intervals 3 and 4, which is sharp and erosional (interval 1H-18, 42–54 cm).
Interval 1 (0 to ~1.05 meters below seafloor [mbsf]) has a thick-bedded alternation of silty clay and clay (Sections 386-M0084B-1H-1, 0 cm, to 1H-2, 48 cm). The silty clay is moderately bioturbated in the upper part of the interval (1H-2, 20–48 cm). Iron monosulfides are variable and concentrated in the bioturbated silty clay.
Interval 2 (~1.05–15.4 mbsf; Sections 386-M0084B-1H-2, 48 cm, to 1H-16, 84 cm) is a very thick bedded silty clay interbedded with three decimeter-scale clay layers (Sections 1H-2, 48 cm, to 1H-3, 43 cm; interval 1H-4, 0–62 cm; Sections 1H-11, 86 cm, to 1H-12, 8 cm). The silty clay comprises centimeter-scale, contorted silt layers and patches isolated in a silty clay matrix. In the lower part, from 13 to 15.5 mbsf (Sections 1H-14, 40 cm, to 1H-17, 3 cm), the silt clasts are larger (8–10 cm) and angular (interval 1H-14, 66–100 cm). Interval 2 shows no iron monosulfides or bioturbation.
Interval 3 (~15.4–17 mbsf; Sections 386-M0084B-1H-16, 84 cm, to 1H-18, 48 cm) has a sharp base, above which there is a fining-upward succession from medium sand to silt and silty clay. The medium sand (interval 1H-18, 14.5–48 cm) has parallel lamination (interval 1H-18, 30–48 cm) that changes upsection to ripple cross-lamination (interval 1H-18, 14.5–30 cm). The fine to very fine sand (Sections 1H-17, 84 cm, to 1H-18, 14.5 cm) contains some foraminifera and mica grains and has millimeter-scale fine parallel laminations. The silt (interval 1H-17, 54–84 cm) includes sparse and very fine sand patches. Interval 3 shows no iron monosulfide staining or bioturbation.
Interval 4 (~17–19.80 mbsf; Sections 386-M0084B-1H-18, 48 cm, to 1H-20, 93 cm) has medium- to thick-bedded, fining-upward successions of very fine sand or silt, bioturbated silty clay, and clay that contains sparsely distributed mica. The base of each succession is sharp and overlain by thinly parallel laminated very fine sand, silt, and silty clay (Sections 1H-19, 88 cm, and 1H-20, 91 cm) or silt and silty clay (Sections 1H-18, 88 cm, to 1H-19, 54.5 cm). Iron monosulfide traces have overprinted bioturbation and are sparse to abundant. Core disturbance, as numerous cracks, is abundant.
The magnetic susceptibility, density, and natural gamma radiation (NGR) logs (see Physical properties) have similar variations (Figure F13), with (1) slightly variable values that are low in Interval 1 in alternating medium-bedded clay and silty clay lithologies, (2) a very smooth trend, with lack of variability in its values, in the monotonous silty clay of Interval 2, and (3) a sharp increase in values at the top of Interval 3. These values increase downcore in parallel to the grain size that coarsens from silt to sand. Interval 3 terminates on a sharp, erosional surface at its base, and (4) a sawtooth shape in low values in the thin-bedded clay, silty clay, silt, and very fine sand of Interval 4.
A total of 11 smear slides were studied for Hole M0084B (Table T3; Figures F14, F15B). The observed lithologies vary from lithogenic-rich siliceous ooze to siliceous-rich lithogenic clayey silt. Vitric particles are more abundant from Section 386-M0084B-1H-18, 50 cm, to the bottom of the hole (Interval 4), with vitric-rich or vitric-bearing sediment. One smear slide collected above the erosion surface at the base of Interval 3 (Sample 1H-18, 45 cm) is a vitric-, lithogenic-, and siliceous-rich silty sand with one large foraminifer (Figure F16A).

Figure F16. Lithologic and biogenic components.
3.1.2. Holes M0084C and M0084D
3.1.2.1. Hole M0084C
Hole M0084C is 35.5 cm deep and composed of moderately bioturbated clay (interval 386-M0084C-1P-1, 7.5–35.5 cm) (Figures F17, F18). The top of the liner from 0 to 7.5 cm below seafloor is a void space. The top of the core (interval 1P-1, 7.5–8.5 cm) is slightly oxidized, indicating that the surface of the seafloor was recovered. Iron monosulfides are sparsely distributed.
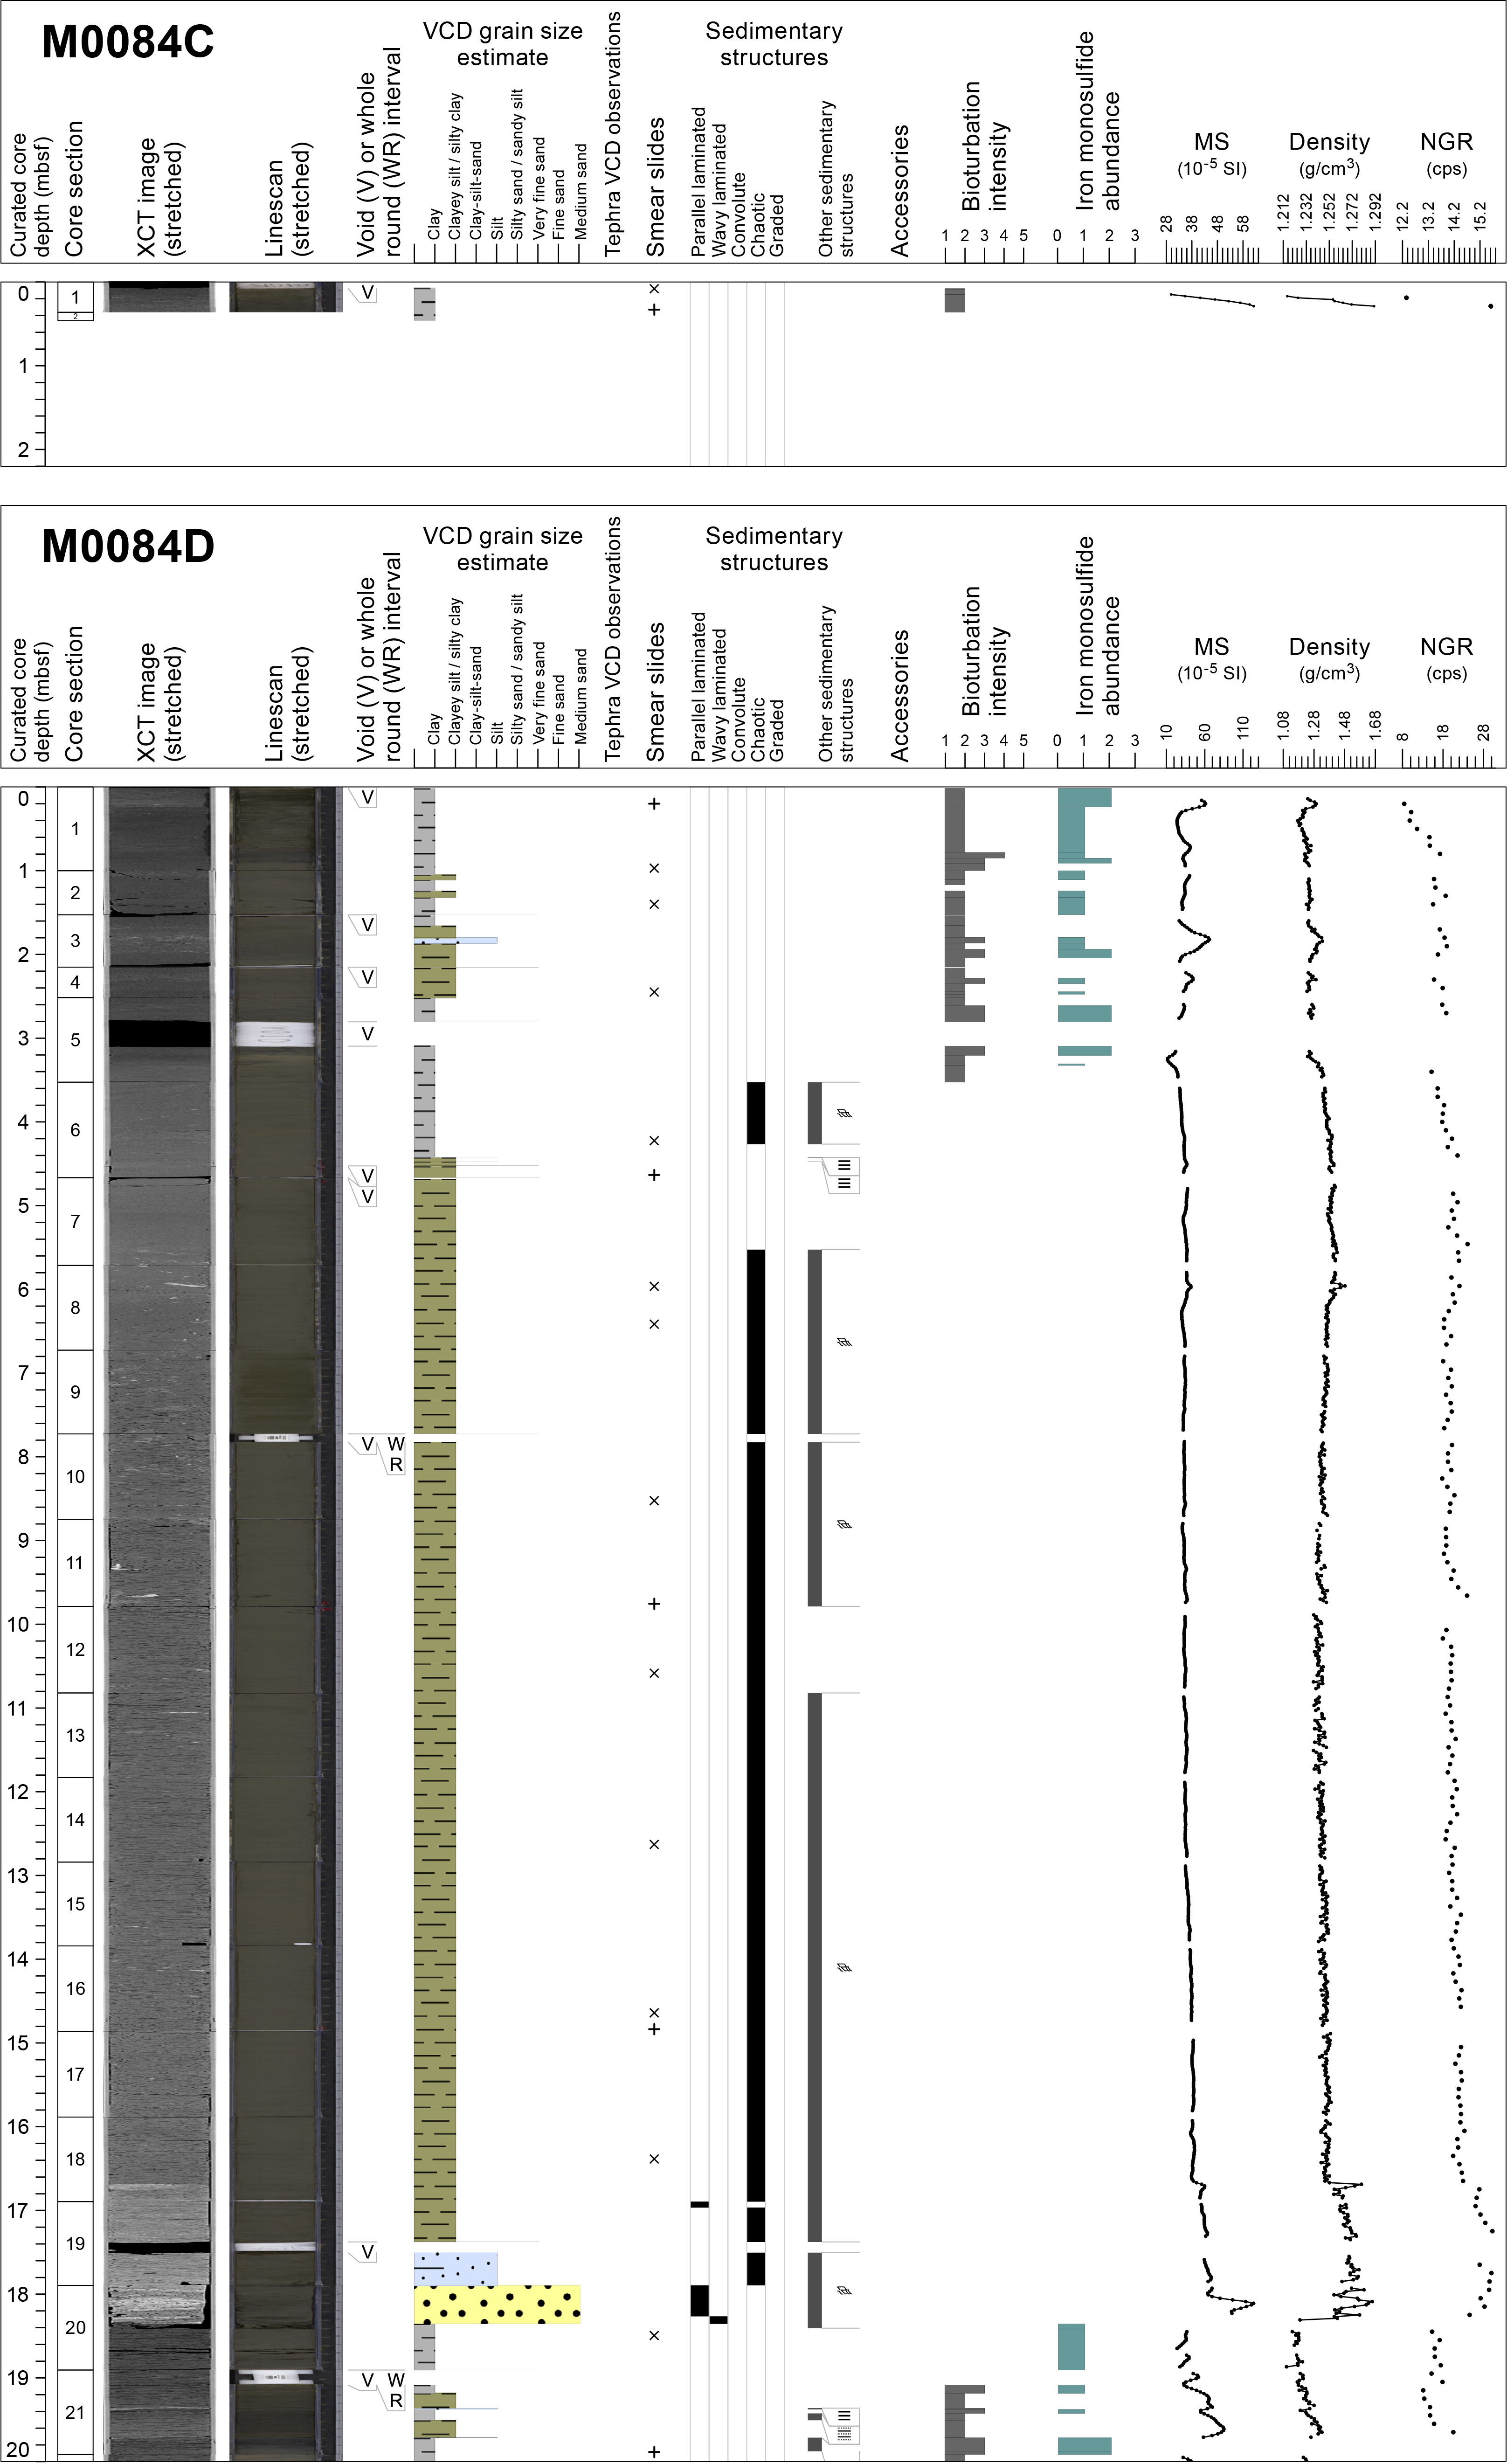

Figure F17. Lithostratigraphic summary, Holes M0084C and M0084D.

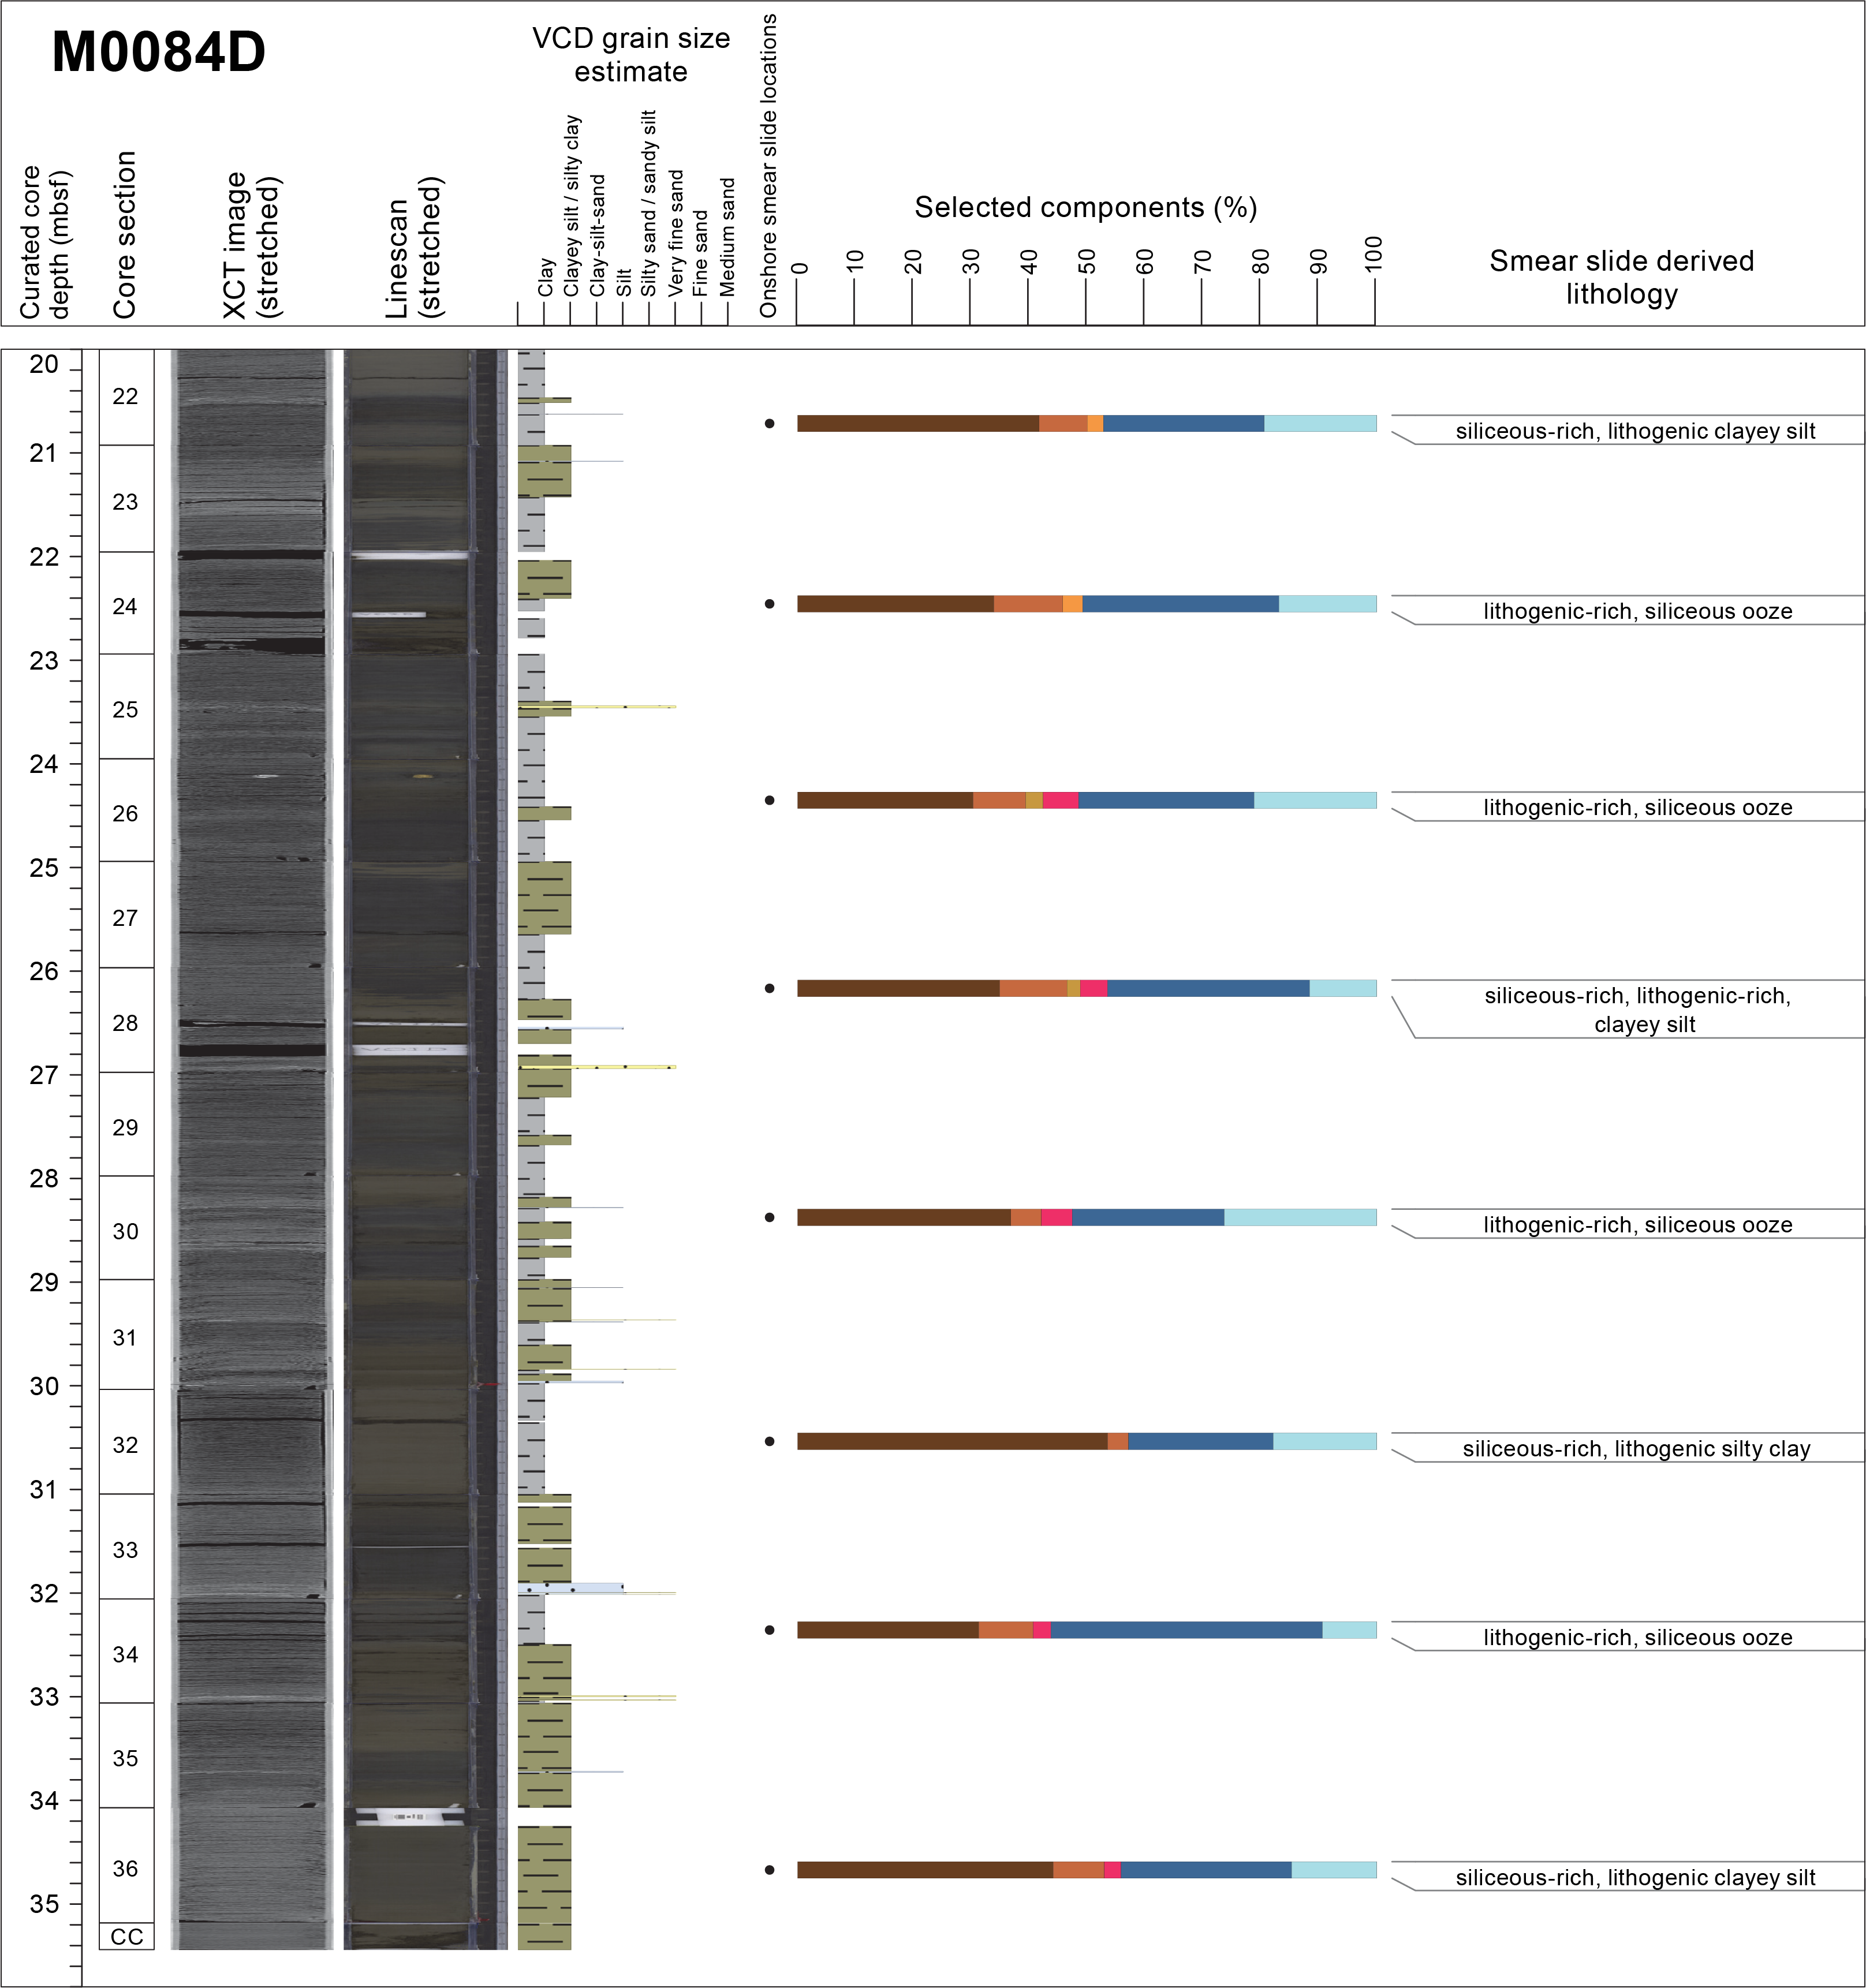
Figure F18. Smear slide summaries, Holes M0084C and M0084D.
One smear slide was collected in Hole M0084C (Table T3; Figures F14, F18). The sediment lithology is siliceous-bearing lithogenic-rich silty clay. Clay minerals are the most abundant component of the lithogenic fraction (55.6% of the total slide), with additional quartz (13.9%) and vitric shards (8.3%); diatoms (13.9%) and sponge spicules (8.3%) dominate the biogenic fraction.
3.1.2.2. Hole M0084D
The lithology for the ~35.5 m deep Hole M0084D comprises four main intervals with gradational lower contacts, except for the contact between Intervals 3 and 4, which is sharp and erosional (Figures F17, F18).
Interval 1 (0 to ~3.1 mbsf; Sections 386-M0084D-1H-1, 0 cm, to 1H-5, 70 cm) is a thick-bedded alternation of bioturbated silty clay and clay that includes a void in interval 1H-5, 29–58 cm. The alternations of silty clay and clay show clear bioturbated upper and basal contacts. Iron monosulfides are abundant in the bioturbated horizons. Interval 1 shows a bioturbated silt bed in interval 1H-3, 27–34 cm, and a sharp color change in Section 1H-1, 24 cm, from 5Y 5/2 below to 7.5Y 4/2 above to the top of the hole (Figure F19A).

Figure F19. Sedimentary structures.
Interval 2 (~3.1–16.8 mbsf; Sections 386-M0084D-1H-5, 70 cm, to 1H-18, 80 cm) is thick-bedded silty clay with centimeter-scale silt layers and patches showing soft-sediment deformation and fluid escape structures (interval 1H-8, 17–30 cm) but no bioturbation and no trace of iron monosulfides. However, the top boundary of the interval is bioturbated and color banded (Figure F19B). Two sharp-based silt laminae in Section 1H-6, 90 and 95 cm, mark the upper part of the interval, and scattered, deformed, 8 cm large laminated silt blocks occur in its lower part (interval 1H-18, 80–90 cm).
Interval 3 (~16.8–18.5 mbsf; Sections 386-M0084D-1H-18, 80 cm, to 1H-20, 46 cm) has a fining-upward succession from sand to silt and silty clay (Figure F19C, F19D). The boundary with the underlying clay is sharp and probably erosional, but it is not visible due to a 5 cm thick partly filled void space (interval 1H-20, 46–51 cm). The medium sand with parallel to wavy laminae (interval 1H-20, 35–46 cm) changes upsection to fine sand with wavy laminations (interval 1H-20, 6–37 cm). The upper part of this interval (Sections 1H-18, 80 cm, to 1H-20, 6 cm) is composed of silt and silty clay with very fine sand patches with soft-sediment deformation. Interval 3 shows no significant bioturbation or iron monosulfides.
Interval 4 (~18.5–35.5 mbsf; Sections 386-M0084D-1H-20, 46 cm, to 1H-37, 35 cm) is composed of medium- to thick-bedded (decimeter- to meter-scale), fining-upward successions of very fine sand or silt, silty clay, and clay. In places, the very fine sand or silt layers are absent and the interval is solely composed of alternating silty clay and clay. The base of the individual successions is sharp, and the top of the succession has abundant bioturbation (interval 1H-21, 65–97 cm). The very fine sand and silt are either displayed as individual laminae or more rarely as centimeter-scale horizons with thin parallel laminae of silty clay. Bioturbation and iron monosulfide staining are abundant to moderate; they largely vary together, but they are unevenly distributed in this cored interval, with parts showing no bioturbation (e.g., clay in Section 1H-32 or silty clay in Section 1H-28). Coring disturbance is significant and manifested as cracks in Sections 1H-22, 24 cm, and 1H-26 through 1H-34. Soft silt, pebble-sized clasts occur in Sections 1H-31, 101 cm, and 1H-25, 47 cm, and a 3 cm large yellowish (5Y 7/6) silty carbonate patch (Ikaïte?) occurs in Section 1H-26, 16–18 cm (Figure F19E).
Hole M0084D is similar to Hole M0084B, with similar lithologies and similar variations in the magnetic susceptibility, density, and NGR logs (Figure F17; see Physical properties): (1) low to medium values that form a slight wavy shape in Interval 1, (2) low values that form a very smooth monotonous trend in Interval 2, (3) an interval with high values that increase downcore in Interval 3 and end sharply at the erosion surface at the base of the interval, and (4) variable low to medium values that form a sawtooth shape in Interval 4. In the latter, most high magnetic susceptibility values form peaks that correlate to the very fine sand and silt layers, whereas low values form a very smooth trend in magnetic susceptibility that correlates to the thick clayey horizon from 21.5 to 26 mbsf.
A total of 20 smear slides were studied for Hole M0084D (Figures F14, F18; see Core descriptions). In Intervals 1 and 2, the sampled lithologies have vitric material in vitric-bearing siliceous-rich clayey silts (Samples 1H-2, 40 cm; 1H-6, 70 cm; 1H-8, 25 cm; 1H-10, 80 cm; 1H-14, 80 cm; and 1H-16, 80 cm) (Figure F16B). Vitric material is insignificant in Interval 4, which contains lithogenic-rich siliceous ooze (Figure F16C) and lithogenic- and siliceous-rich clayey silt. Interval 3 was not sampled. Diatoms (maximum = 46%) and sponge spicules (maximum = 27.8%) are the most abundant components of the biogenic silica.
3.1.3. Holes M0084E and M0084F
3.1.3.1. Hole M0084E
Hole M0084E is 40 cm thick and composed of slightly bioturbated clay (interval 386-M0084E-1P-1, 7–40 cm) (Figure F20). The sediment is missing from the top of the liner (interval 1P-1, 0–7 cm), but the sediment on top of the core (interval 1P-1, 7–9 cm) is slightly oxidized, indicating that the surface of the seafloor was recovered. Iron monosulfides and bioturbation are sparsely distributed.
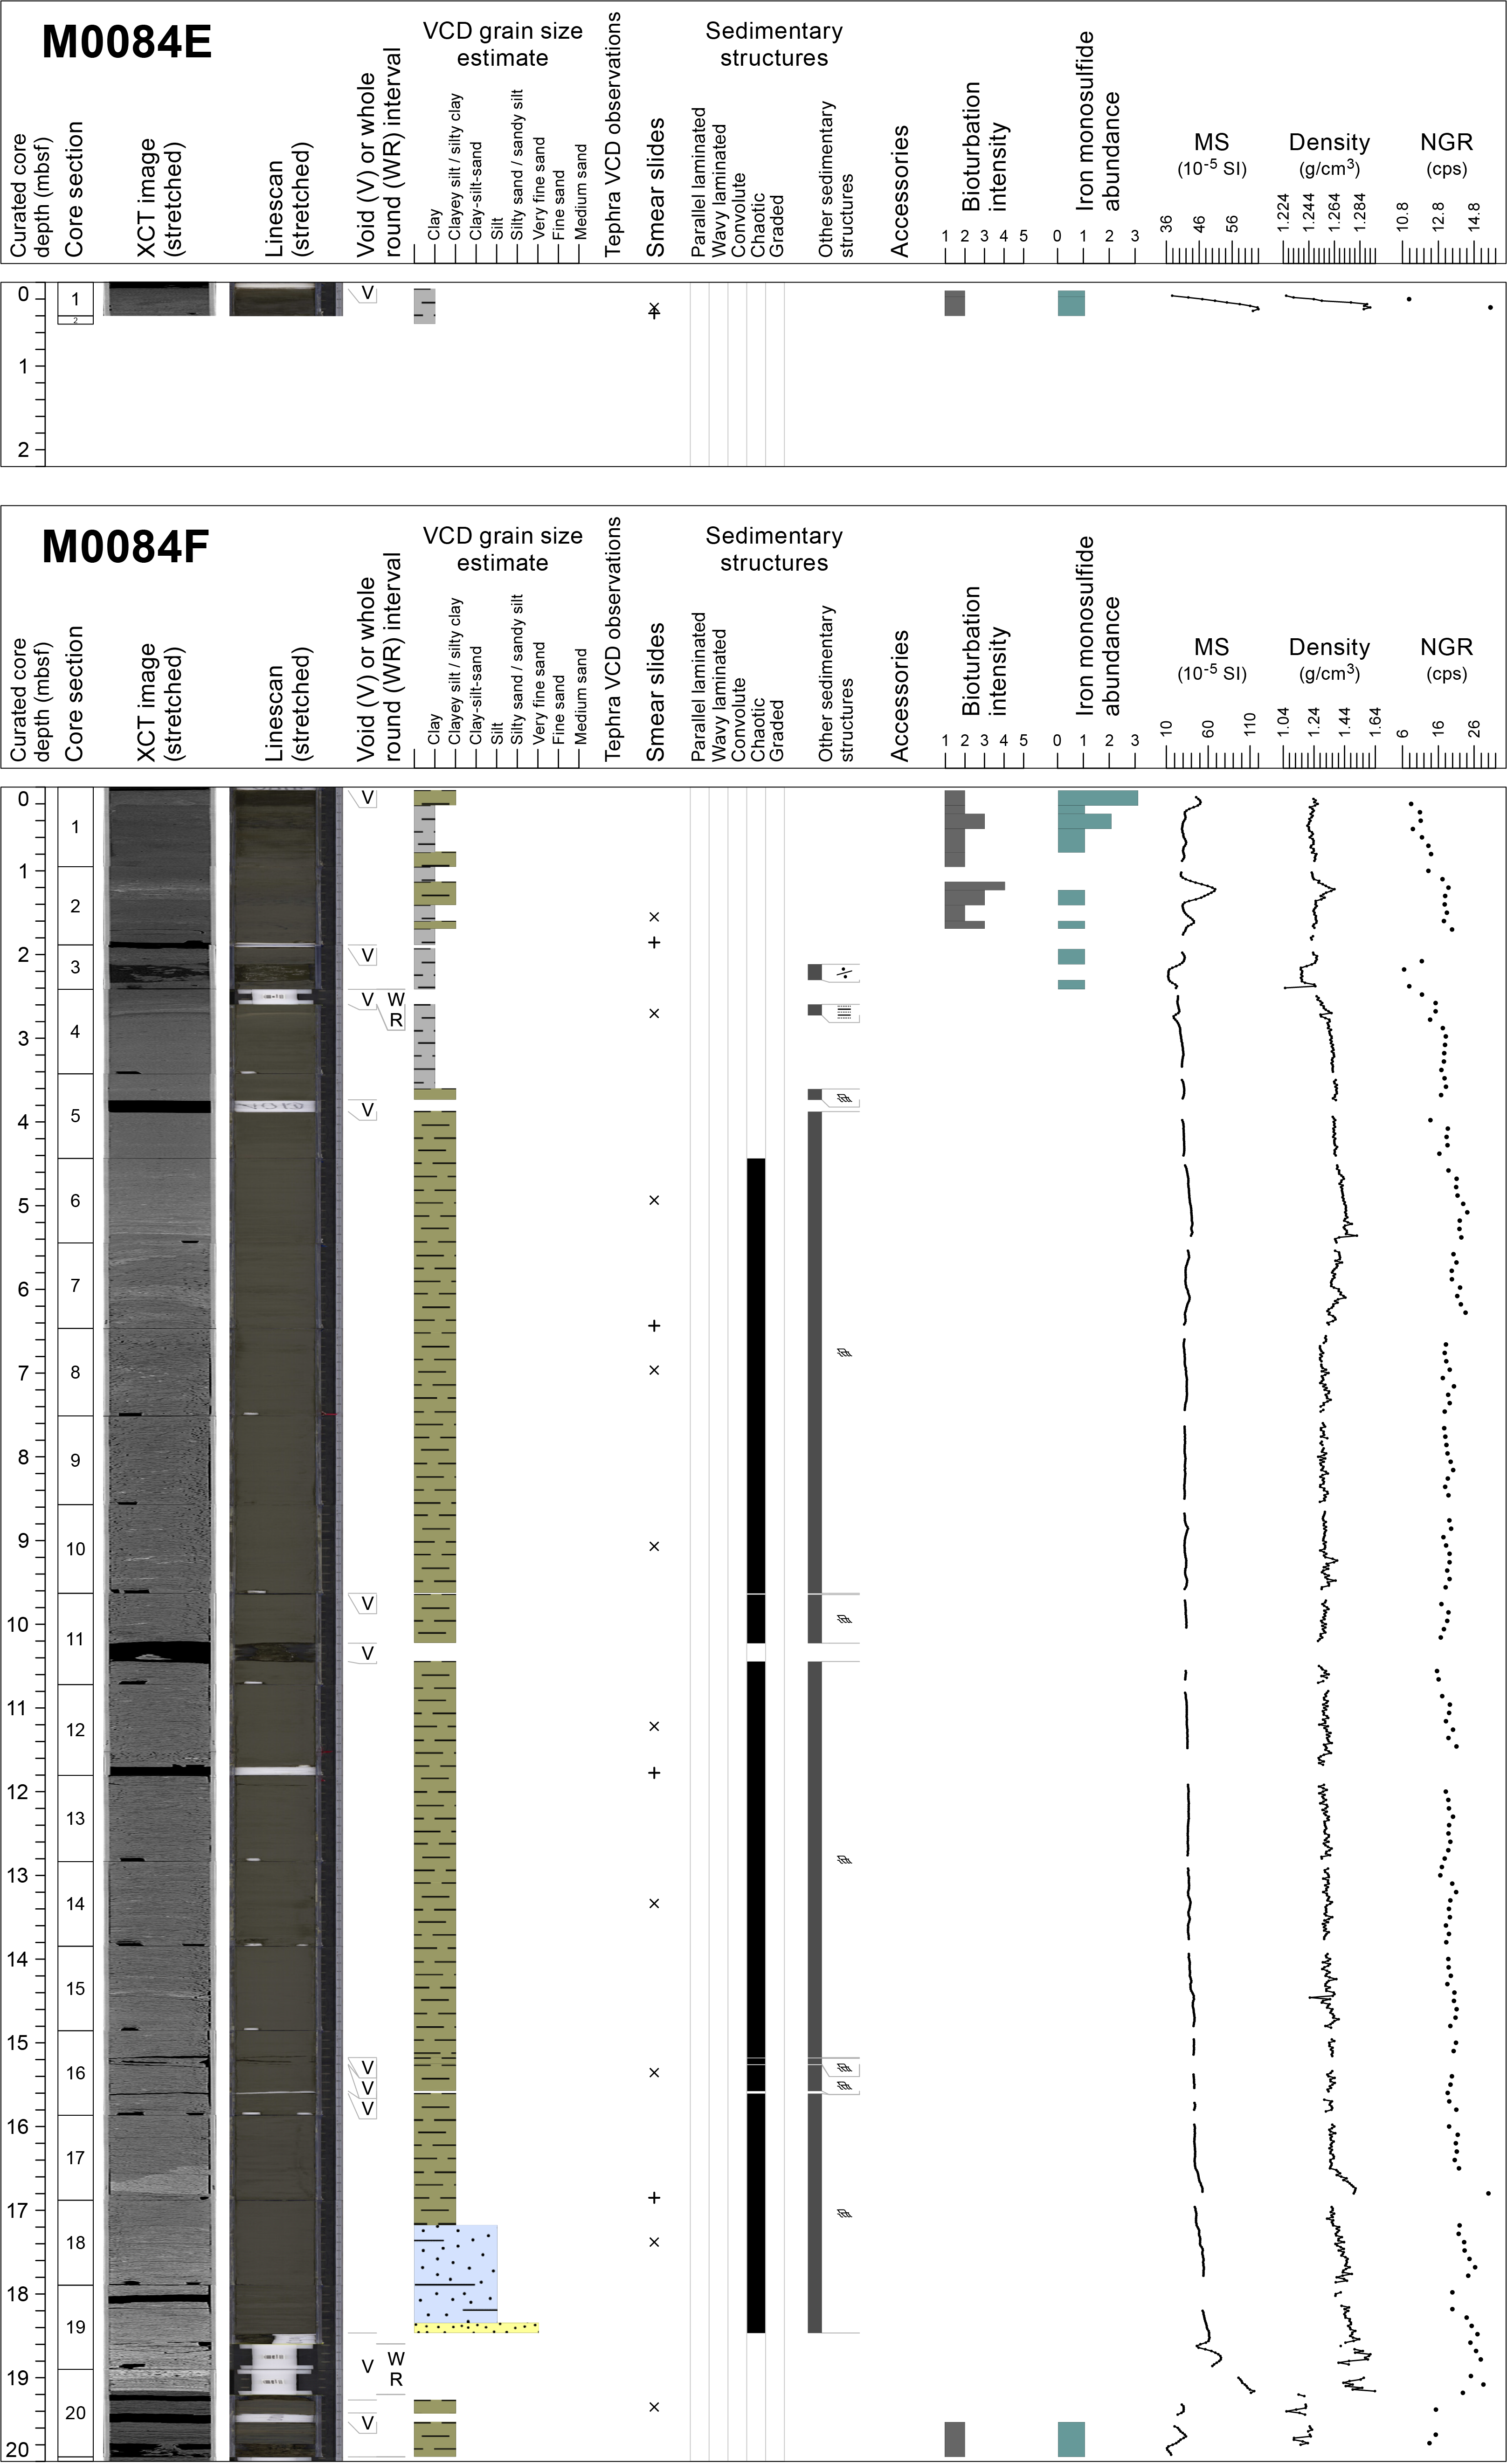
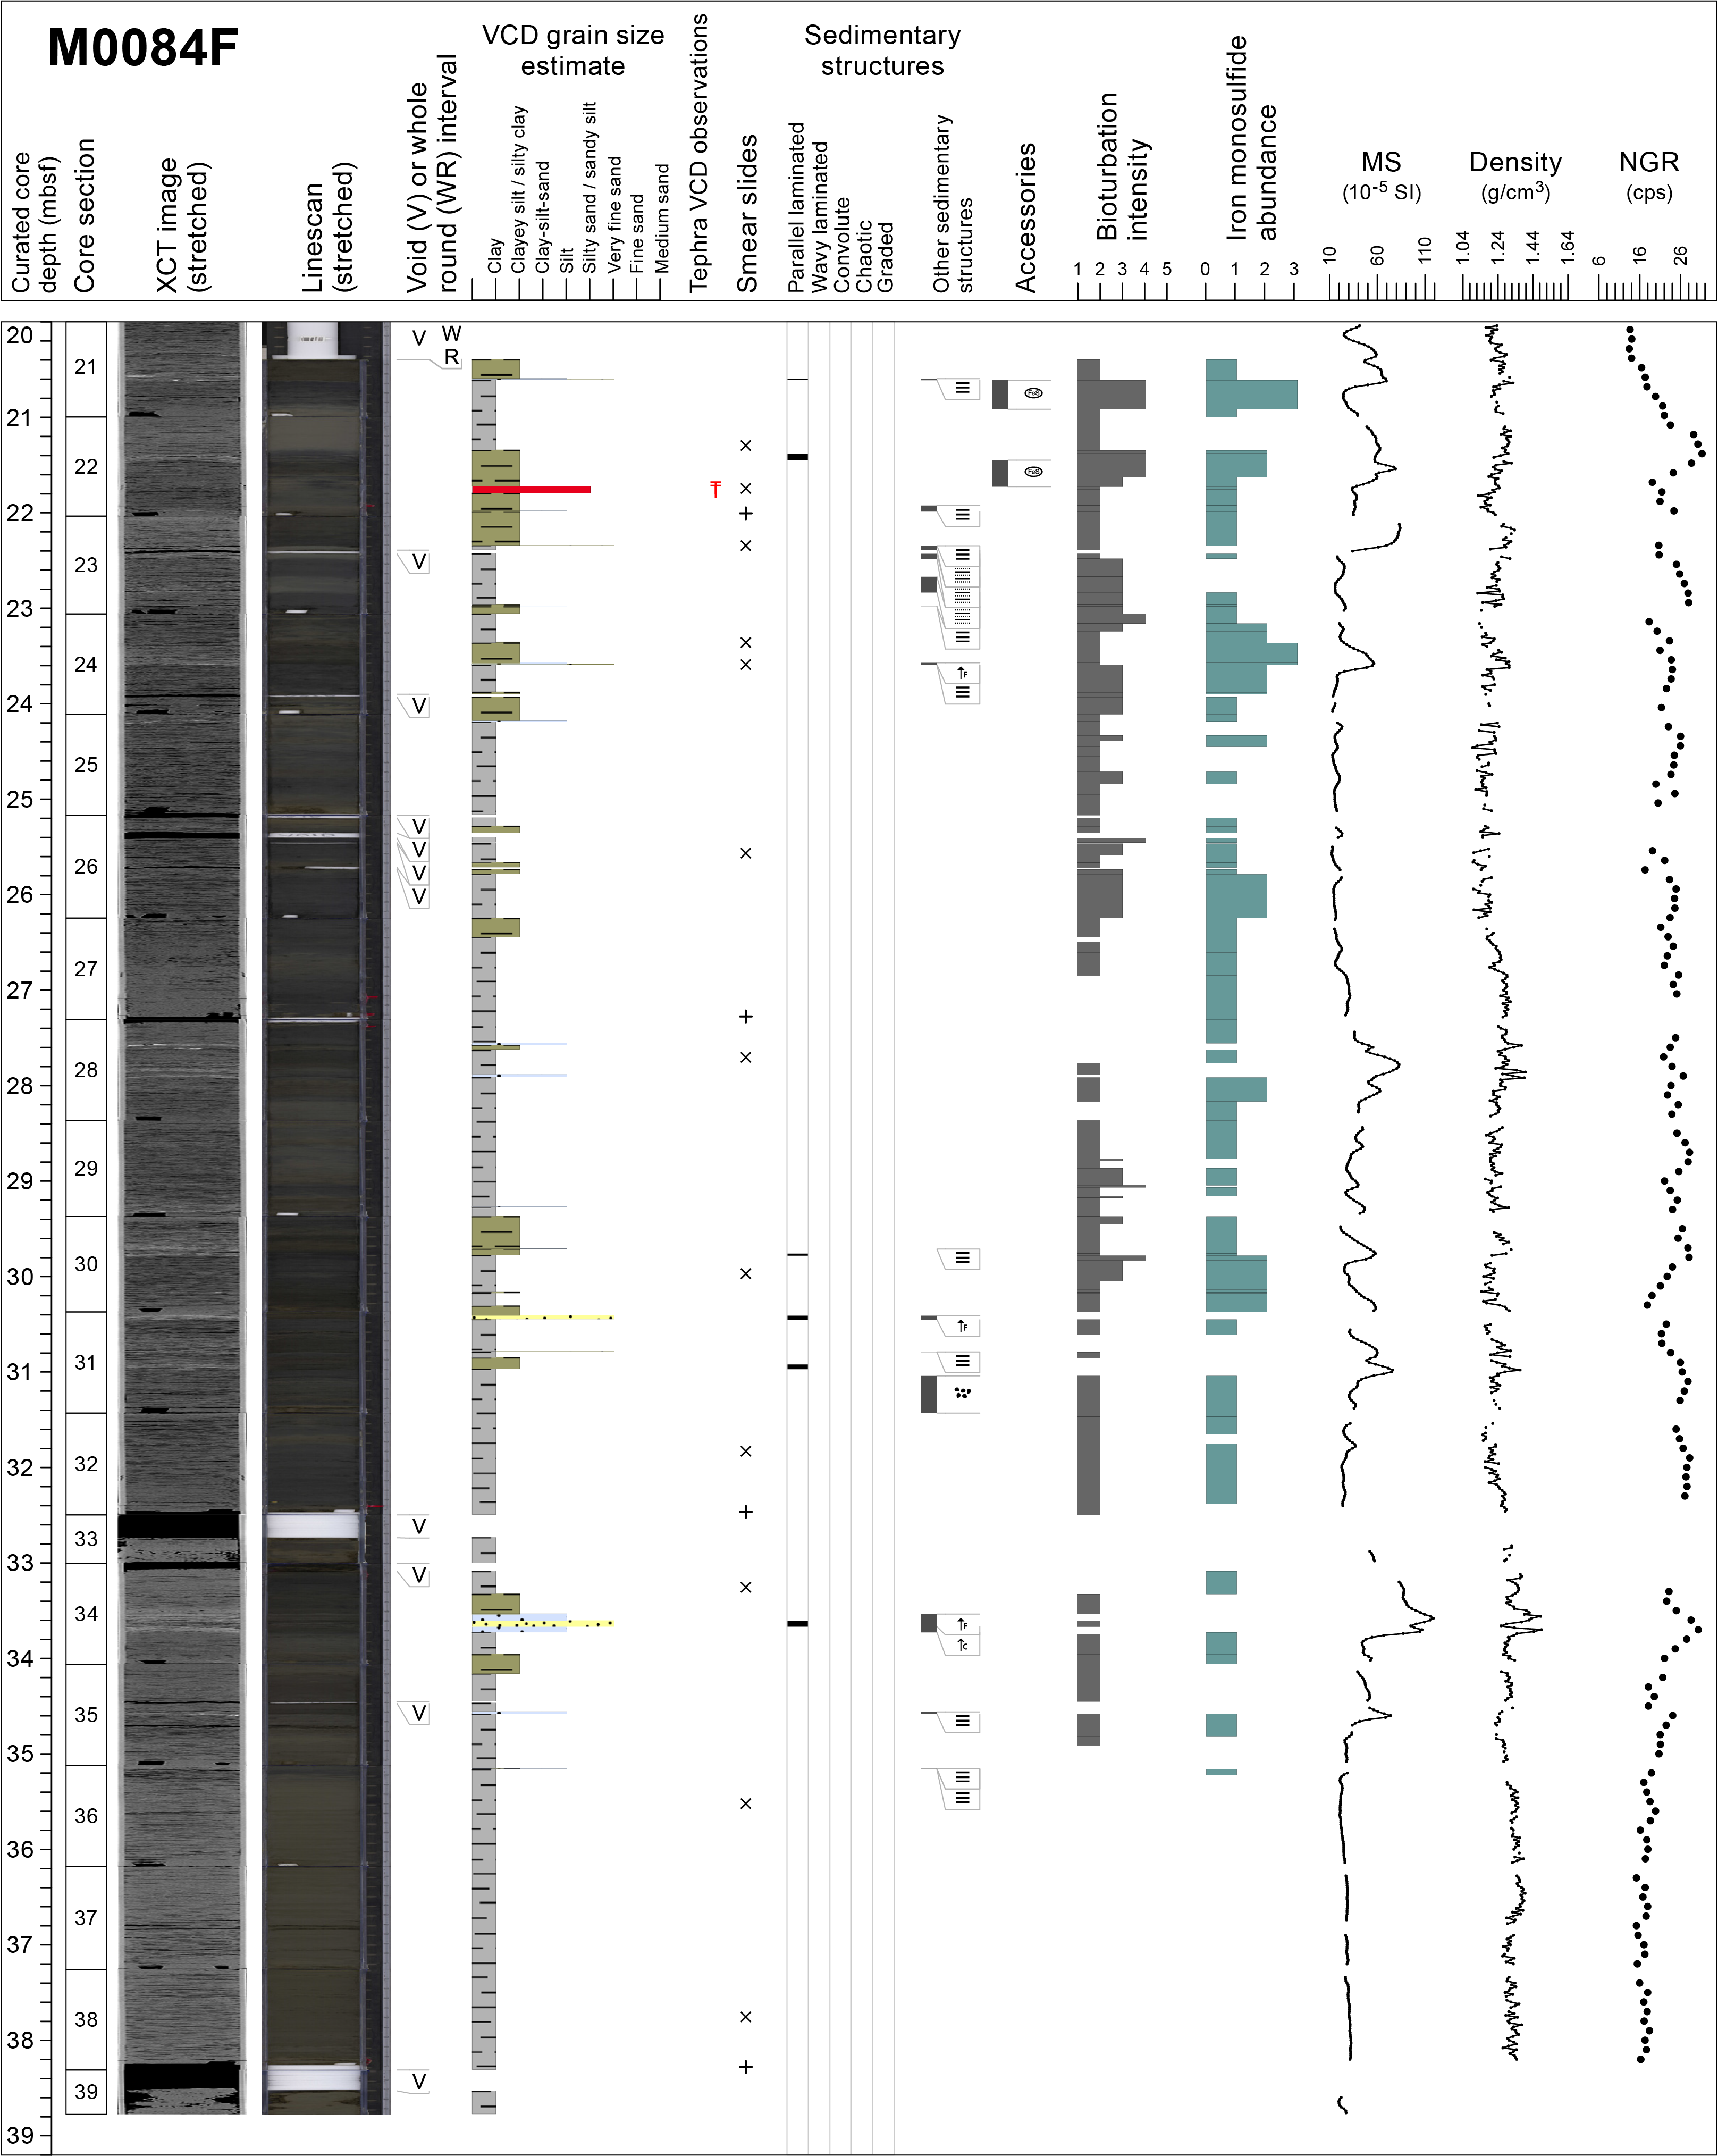
Figure F20. Lithostratigraphic summary, Holes M0084E and M0084F.
One smear slide was collected in Hole M0084E (Sample 1P-1, 30 cm) (Table T3; Figures F14, F21). The sediment lithology is lithogenic-rich siliceous ooze. The lithogenic fraction is abundant in the sediment (45% of the total slide) including clay (25%), quartz (15%), feldspar (5%), and vitric shards (5%). Diatoms (35%) and sponge spicules (15%) dominate the biogenic fraction.
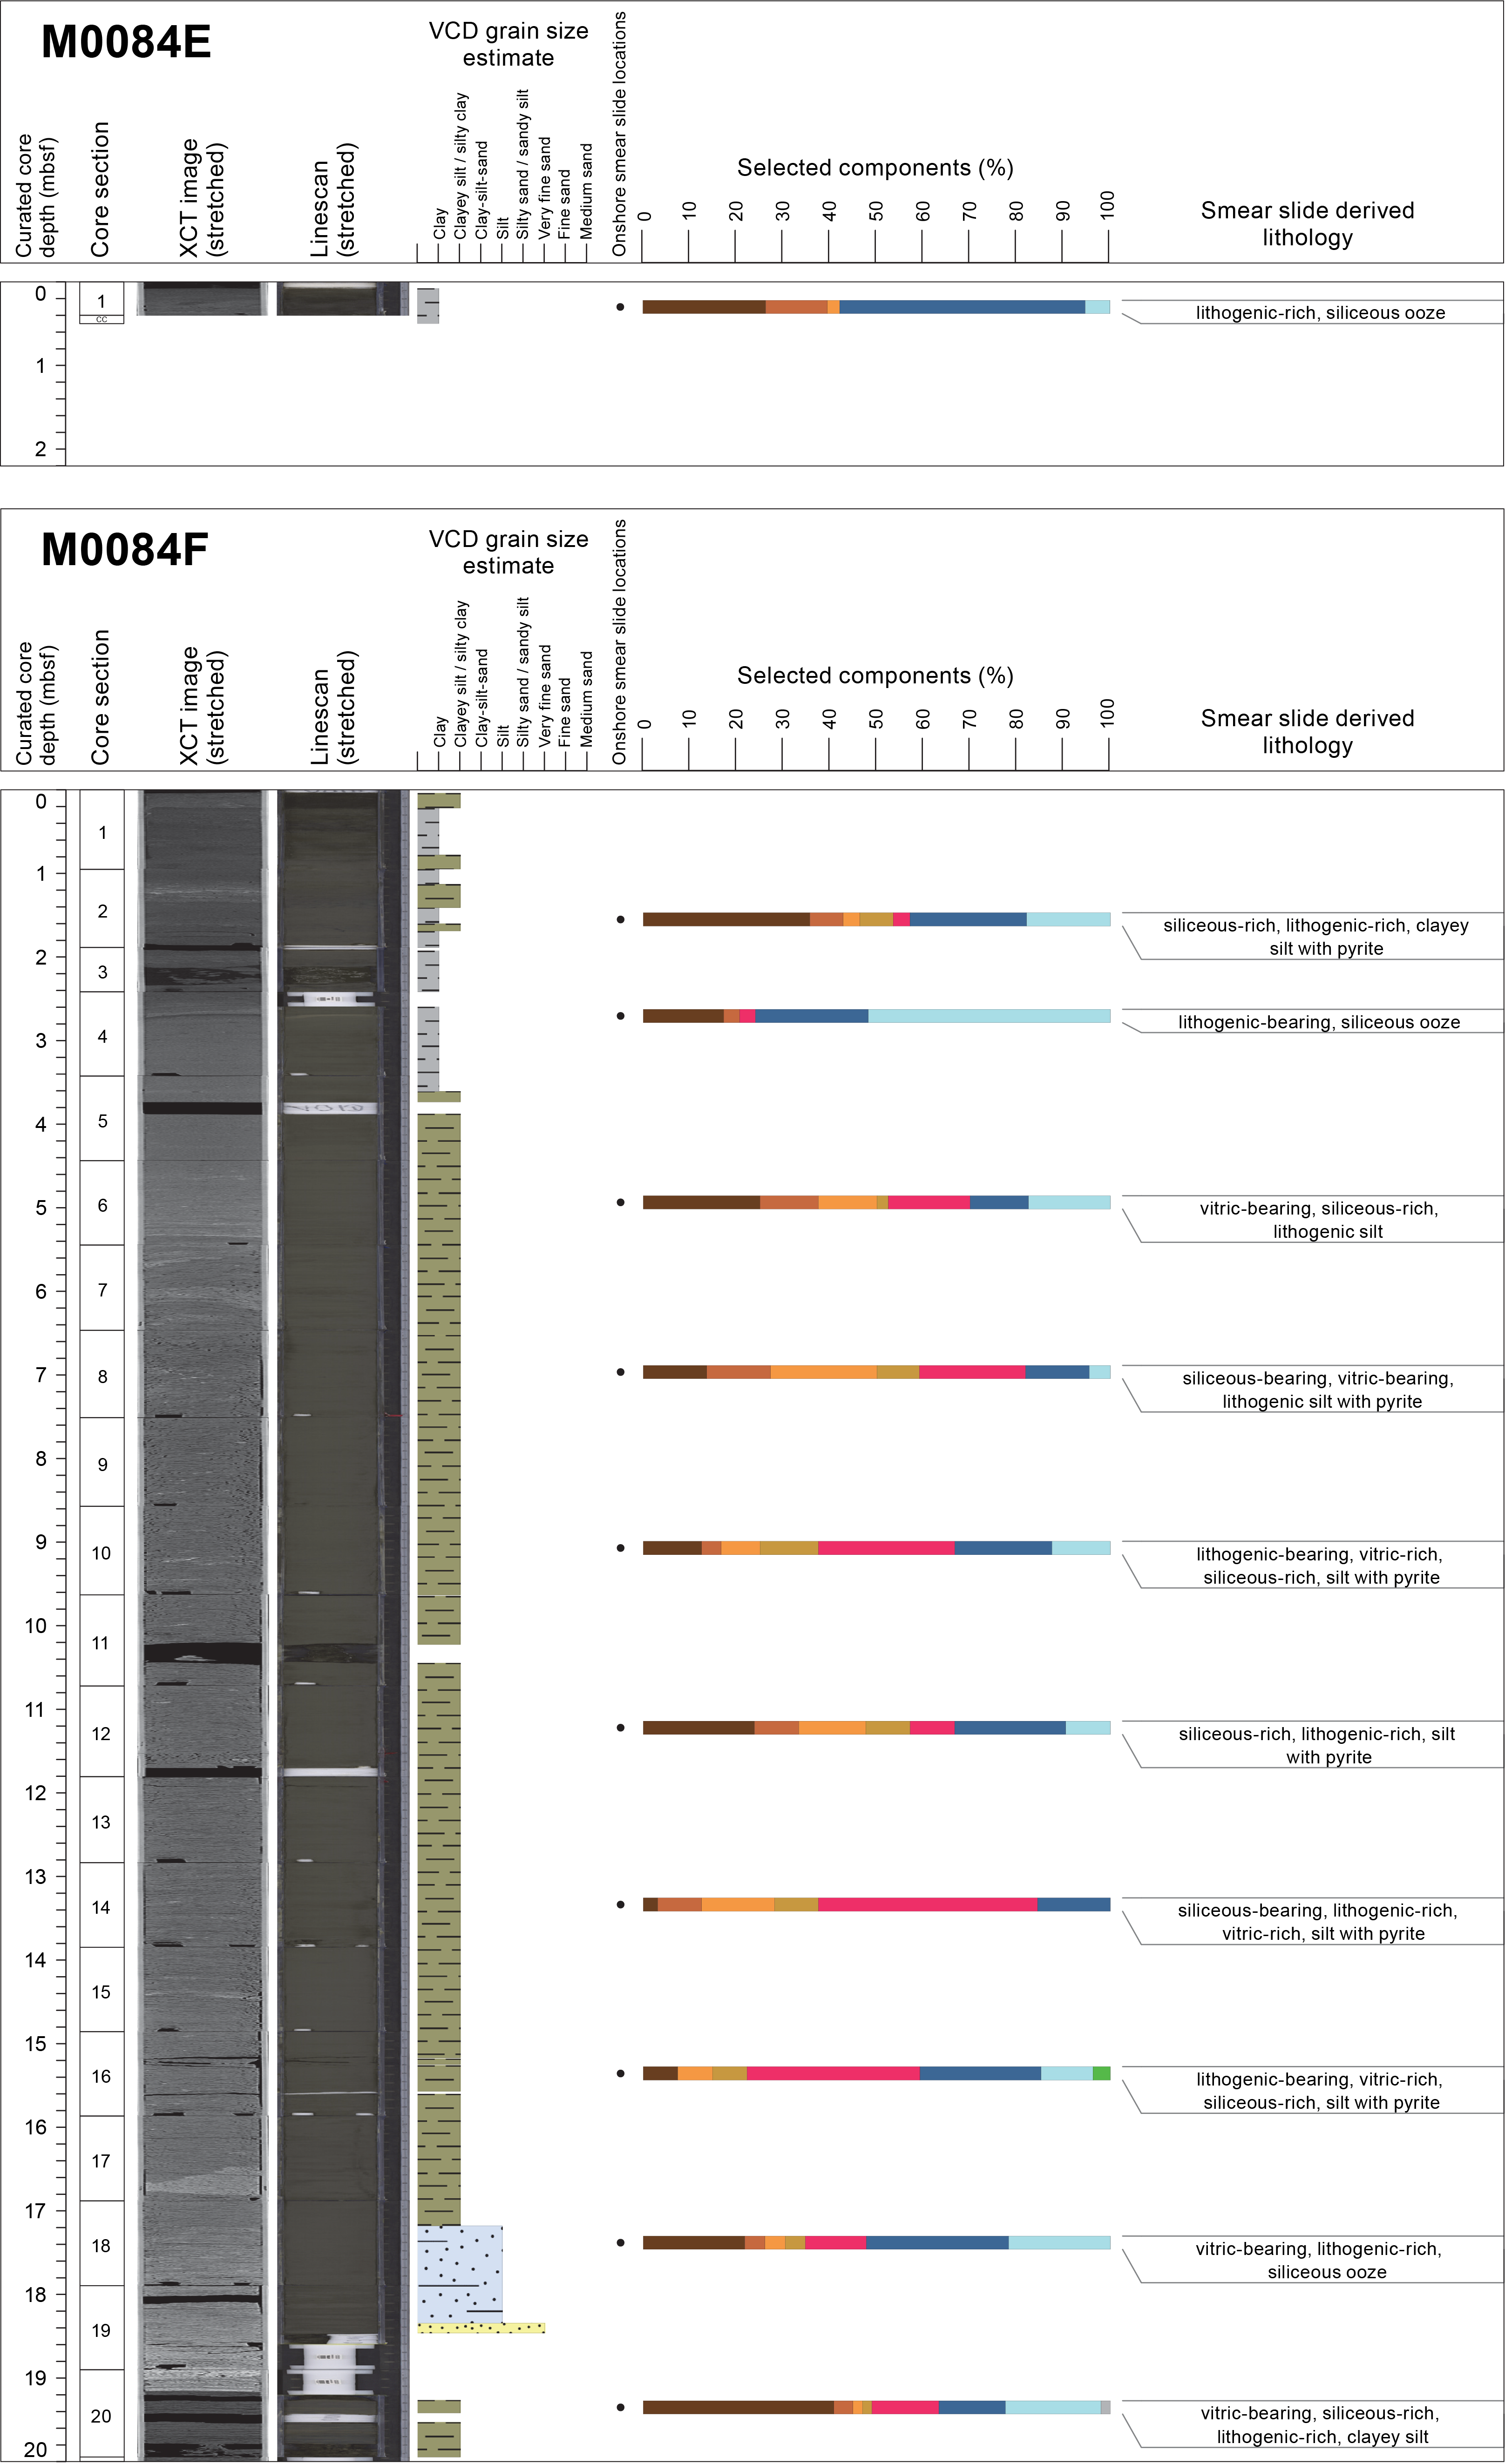
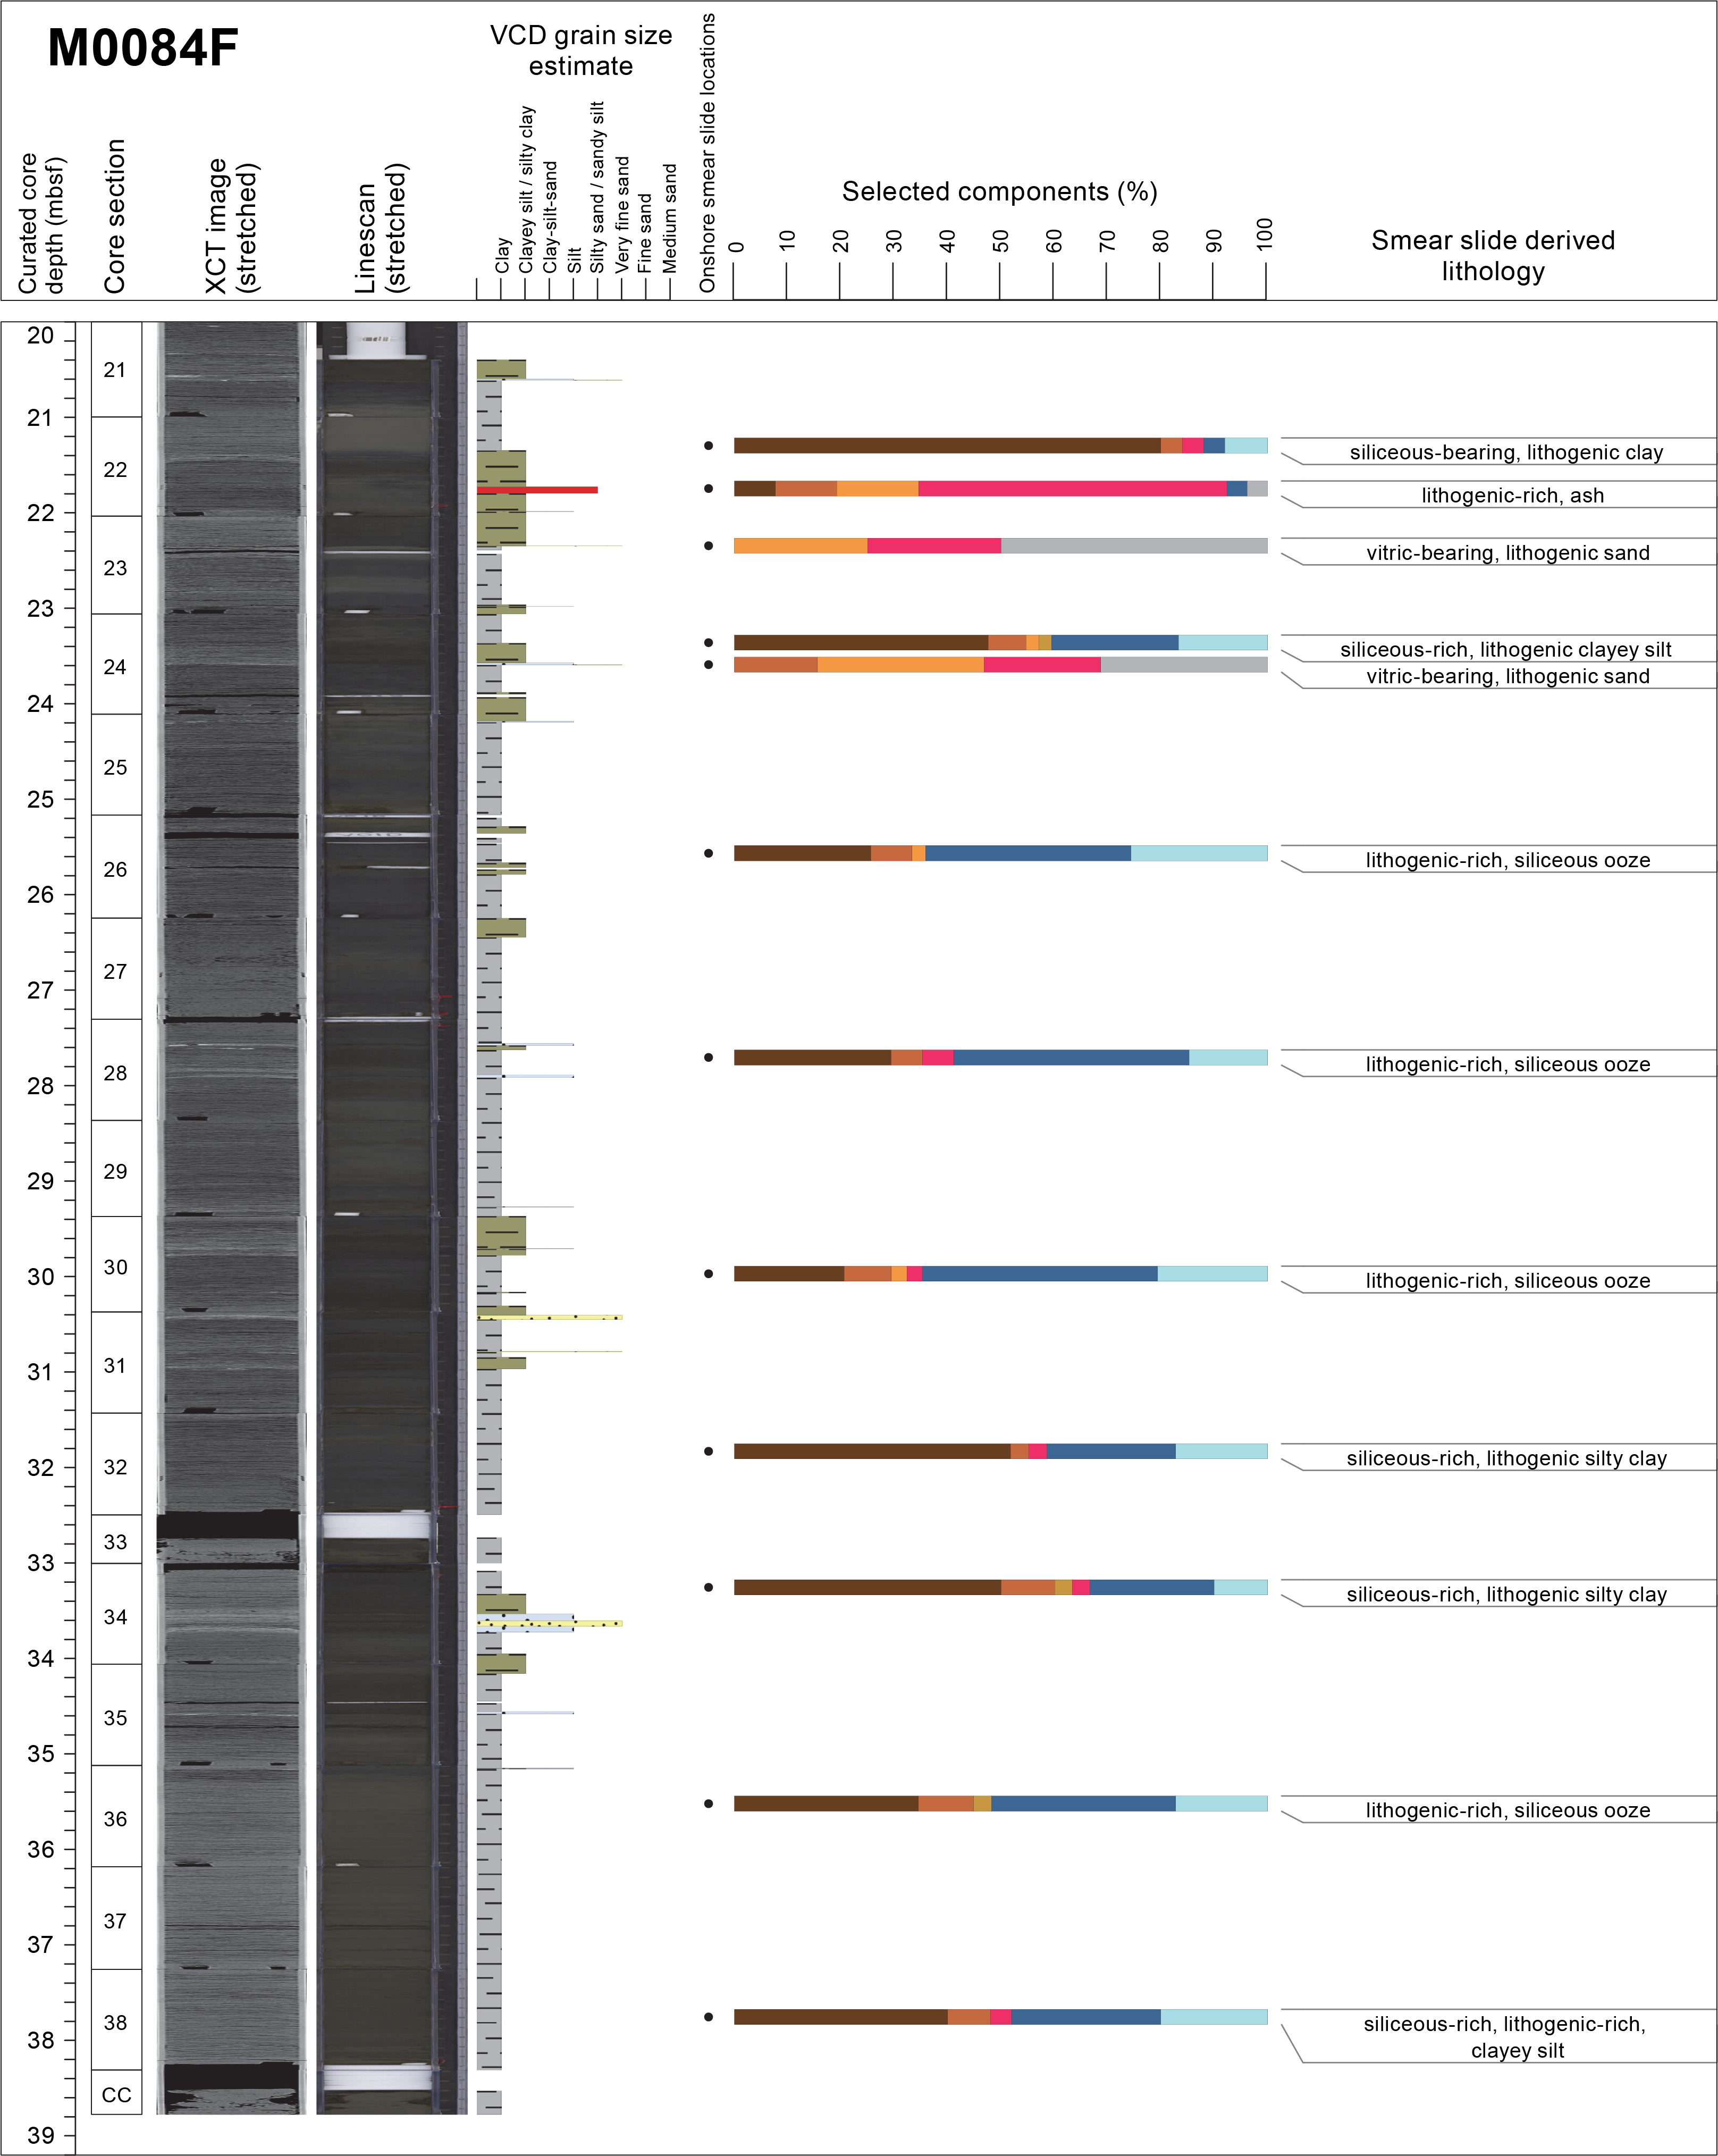
Figure F21. Smear slide summaries, Holes M0084E and M0084F.
3.1.3.2. Hole M0084F
The lithology for the ~38.8 m deep Hole M0084F (Figure F20) comprises five main intervals with gradational contacts, except for the contact between Intervals 3 and 4, which is sharp and erosional.
Interval 1 (~0–2.35 mbsf; Sections 386-M0084F-1H-1, 0 cm, to 1H-3, 50 cm) consists of medium-bedded alternations of slightly bioturbated clay and moderately to highly bioturbated silty clay with gradational upper and lower contacts. The lower part (Sections 1H-2, 74 cm, to 1H-3, 50 cm) has structureless clay without any bioturbation. Party empty portions of this interval contain soupy sediment (interval 1H-3, 23–42 cm).
Interval 2 (~2.35–17.2 mbsf; Sections 386-M0084F-1H-3, 50 cm, to 1H-18, 30 cm) is composed of a silty clay with centimeter-scale silt laminae, patches of soft-sediment deformation, and fluid escape structures but no bioturbation or staining by iron monosulfides. The upper part of the interval (Sections 1H-3, 50 cm, to 1H-5, 18 cm) is a structureless clay with a top characterized by a whitish, color-banded layer (interval 1H-4, 18–31 cm) (Figure F19F). The base of the interval has a 35 cm large, angular, soft-sediment, coarse-silt clast enclosed in the silty clay matrix (interval 1H-17, 60–96 cm). Core disturbance includes voids in intervals 1H-5, 31–45 cm; 1H-11, 59.5–81.5 cm; and 1H-16, 72–75 cm, and cracks in Sections 1H-13 and 1H-16.
Interval 3 (17.2–19.2 mbsf; Sections 386-M0084F-1H-18, 30 cm, to 1H-20, 25 cm) has a fining-upward succession from sand to silt with a sharp, erosional base on the underlying silty clay. The sand has parallel to wavy laminations (interval 1H-20, 8–25 cm) that change upsection to fine to very fine sand with wavy to parallel lamination (interval 1H-19, 100–57 cm, to Section 1H-20, 80 cm). The upper part (Sections 1H-18, 30 cm, to 1H-19, 57 cm) that was not sampled is a silt with 3–5 mm large, very fine sand patches with soft-sediment deformation. This interval shows no significant bioturbation or iron monosulfides. Interval 3 contains a void between Sections 1H-19, 57 cm, and 1H-20, 30 cm, due to whole-round sampling for micro-CT scan analysis.
Interval 4 (~19.2–35.15 mbsf; Sections 386-M0084F-1H-20, 25 cm, to 1H-36, 4 cm) is composed of medium- to thick-bedded, fining-upward successions of very fine sand or silt laminae, grading upward to bioturbated silty clay and bioturbated or nonbioturbated clay (e.g., Sections 1H-34, 72 cm, to 1H-31, 8 cm) (Figure F19H). At some locations, the very fine sand or silt layers are absent in the silty clay and clay. Laminated intervals appear sporadically in the silty clay and clay. A few structureless clay beds with no bioturbation and sparse iron monosulfides occur in Sections 1H-32, 93 cm, to 1H-34, 32 cm, and Sections 1H-27, 0 cm, to 1H-28, 25 cm. Other features include a tephra occurring in patches in the horizon (interval 1H-22, 73–76 cm), very fine sand pebbles in silt layers in intervals 1H-28, 29–32 cm, and 1H-35, 51–52 cm, and a yellowish (5Y 7/6) sandy carbonate nodule (ikaïte?) in interval 1H-32, 92–93 cm (Figure F19G).
Interval 5 (~35.15–38.8 mbsf; Sections 386-M0084F-1H-36, 4 cm, to 1H-39, 46 cm) is a clay bed with no primary sedimentary structures, no bioturbation, and no iron monosulfides, similar to the upper part of Interval 2.
The magnetic susceptibility, density, and NGR logs of Hole M0084F show variability in their signals similar to those of Holes M0084B and M0084D (see Physical properties; Figure F20): (1) low to medium values showing a wavy shape in Interval 1, (2) a very low signal with a smooth and monotonous trend in Interval 2, (3) a sharp increase at the top of Interval 3 that ends up sharply at the erosional surface at the base of the interval, (4) a sawtooth shape in low values in Interval 4, and (5) a quasilinear smooth trend with a very low magnetic susceptibility in the basal clay of Interval 5. In Interval 4, most magnetic susceptibility peaks correlate to the very fine sand and silt layers. The very smooth magnetic susceptibility, density, and NGR curves in Interval 5 are the signature of the thick clay interval at 35.1–38.7 mbsf.
A total of 22 smear slides were studied for Hole M0084F (Table T3; Figures F14, F21). The two smear slides sampled for Interval 1 have siliceous-rich lithogenic clayey silt with pyrite, and the core has a particular whitish, color-banded interval (1H-4, 18–31 cm) that corresponds to a lithogenic-bearing siliceous ooze. Six smear slides were analyzed for Interval 2; in contrast with Interval 1, they are siltier and enriched with vitric material. The main lithologies observed in smear slides are vitric-rich/bearing, lithogenic-rich/bearing, and siliceous-rich/bearing silt with pyrite in sediment that corresponds macroscopically to the mixing of silt streaks in silty clay. The one smear slide collected in the uppermost, finest grain size part of Interval 3 is a vitric-bearing lithogenic-rich siliceous ooze. A total of 13 smear slides were collected from Interval 4. They are generally composed of clayey silt and are either lithogenic-rich, siliceous-rich, or siliceous ooze. In the upper part of the interval, Samples 1H-20, 45 cm, to 1H-24, 53 cm, contain more vitric material with frequent occurrence of vitric-rich lithologies. The volcaniclastic layer in interval 1H-22, 73–76 cm is a vitric- and lithogenic-rich sand (Sample 1H-22, 75 cm) (Figure F16D; see Tephra).
3.2. Site M0085
3.2.1. Holes M0085A and M0085B
3.2.1.1. Hole M0085A
Hole M0085A is 62 cm deep and composed of clay (Figure F22) with a 5 cm thick bioturbated silty clay interval (1P-1, 16–21 cm) that includes a patchy, very fine sand interval (1P-1, 6–31 cm). The latter correlates to a peak of magnetic susceptibility and density. The uppermost 1 cm of the core is oxidized (interval 1P-1, 7–8 cm), showing that the seafloor sediment was probably preserved.

Figure F22. Lithostratigraphic summary, Holes M0085A and M0085B.
One smear slide was collected in Hole M0085A (Table T4; Figures F23, F24). The lithology is a siliceous-rich lithogenic silty clay. Silt and clay are the dominant textures (48.2% and 48.4%, respectively); mineral components consist of clay (48.2%), quartz (3.2%), and vitric shards (3.2%); and diatoms (22.6%) and sponge spicules (22.6%) dominate the biogenic fractions.

Figure F23. Ternary diagrams of major components and grain size, Site M0085.

Figure F24. Smear slide summaries, Holes M0085A and M0085B.
3.2.1.2. Hole M0085B
The lithology for the ~18.3 m deep Hole M0085B is divided into three main intervals with bed thickness variability and slight differences in lithologies. Basal contacts are sharp (Figure F22).
Interval 1 (0–3.05 mbsf; Sections 386-M0085B-1H-1, 0 cm, to 1H-3, 100 cm) has a thick-bedded (30 cm to 1 m) sharp-based, fining-upward succession of very fine sand, silt, silty clay, and clay. The very fine sand, when present, has well-defined planar lamination (Figure F19I), and the silt has laminae, whereas the silty clay and clay contain variable bioturbation ranging from heavy to light or no bioturbation. The silty clay contains some visible shell fragments in Section 1H-3, 60.5 cm, and silt pebble-sized clasts in interval 1H-3, 70–80 cm. In the uppermost 1 cm of the core, sediments show no trace of oxidation. Iron monosulfides are generally sparse.
Interval 2 (~3.05–12 mbsf; Sections 386-M0085B-1H-4, 0 cm, to 1H-13, 2.5 cm) has two main alternations of fining-upward, thin-bedded sand and silt with thick- to very thick–bedded silty clay and clay (Sections 1H-4 through 1H-8 and 1H-9 through 1H-12). The medium to very fine sand layers exhibit a sharp erosional base with parallel, low angle to ripple cross-lamination (e.g., interval 1H-12, 79–93 cm). The silt laminae are generally well preserved (interval 1H-7, 12–45 cm) but can be disrupted by bioturbation (interval 1H-9, 26–38 cm) and mixed with the silty clay. The clays are slightly to moderately bioturbated with heavy to moderate iron monosulfide concentrations.
Interval 3 (~12–18.30 mbsf; Sections 386-M0085B-1H-13, 2.5 cm, to 1H-18, 103.5 cm) is a thick-bedded silty clay alternating with thin silt layers grading upward to medium-bedded silt and silty clay. The silts are moderately to heavily bioturbated. The laminae are most often deformed, and the silt is mixed into the silty clay. Where preserved, the silt laminae have a sharp erosional base and a gradational top. Two very fine sand layers occur in Section 1H-14, 90 cm, and interval 1H-17, 26–28 cm. A few millimeter-scale tephra lenses are present in interval 1H-15, 85–86 cm. Iron monosulfides are manifested as mottling (3–10 mm in diameter), and color bands are abundant in the upper part of the interval and sparse in the lower part.
The magnetic susceptibility, density, and NGR logs (see Physical properties) show variability manifested as peaks (Figure F22) that align with most of the silt and sand beds and a low signal that manifests as smooth sections corresponding to the clay and silty clay horizons. In Intervals 2 and 3, however, NGR shows light values and a smooth log. The other logs have a variable (low and intermediate signal) manifested as a sawtooth shape, indicating that the sediment contains a low amount of radiogenic material.
A total of 13 smear slides were analyzed for Hole M0085B (Table T4; Figure F24). The lithologies are similar and have a grain size that is slightly coarser than the clay to silty clay interpreted in the VCDs. In smear slides, lithologies vary between lithogenic-rich siliceous ooze and siliceous-rich lithogenic silt or clayey silt. The tephra in Sample 1H-15, 85 cm (see Tephra), is lithogenic-rich ash with 62% vitric material. Some vitric minerals are also reported in Samples 1H-10, 60 cm; 1H-12, 96 cm; and 1H-16, 60 cm. Sample 1H-12, 96 cm, is composed of sandy silt with 8% foraminifera (Figure F16E).
3.2.2. Holes M0085C and M0085D
3.2.2.1. Hole M0085C
Hole M0085C is 32.5 cm deep and composed of clay, which includes a 7 cm thick bioturbated silty clay interval (1P-1, 9–16 cm) with patchy silt streaks (Figure F25). The latter correlates to a peak of magnetic susceptibility (see Physical properties). The top of the core liner (interval 1P-1, 0–8 cm) is a void, and the sediments do not show any traces of oxidation.
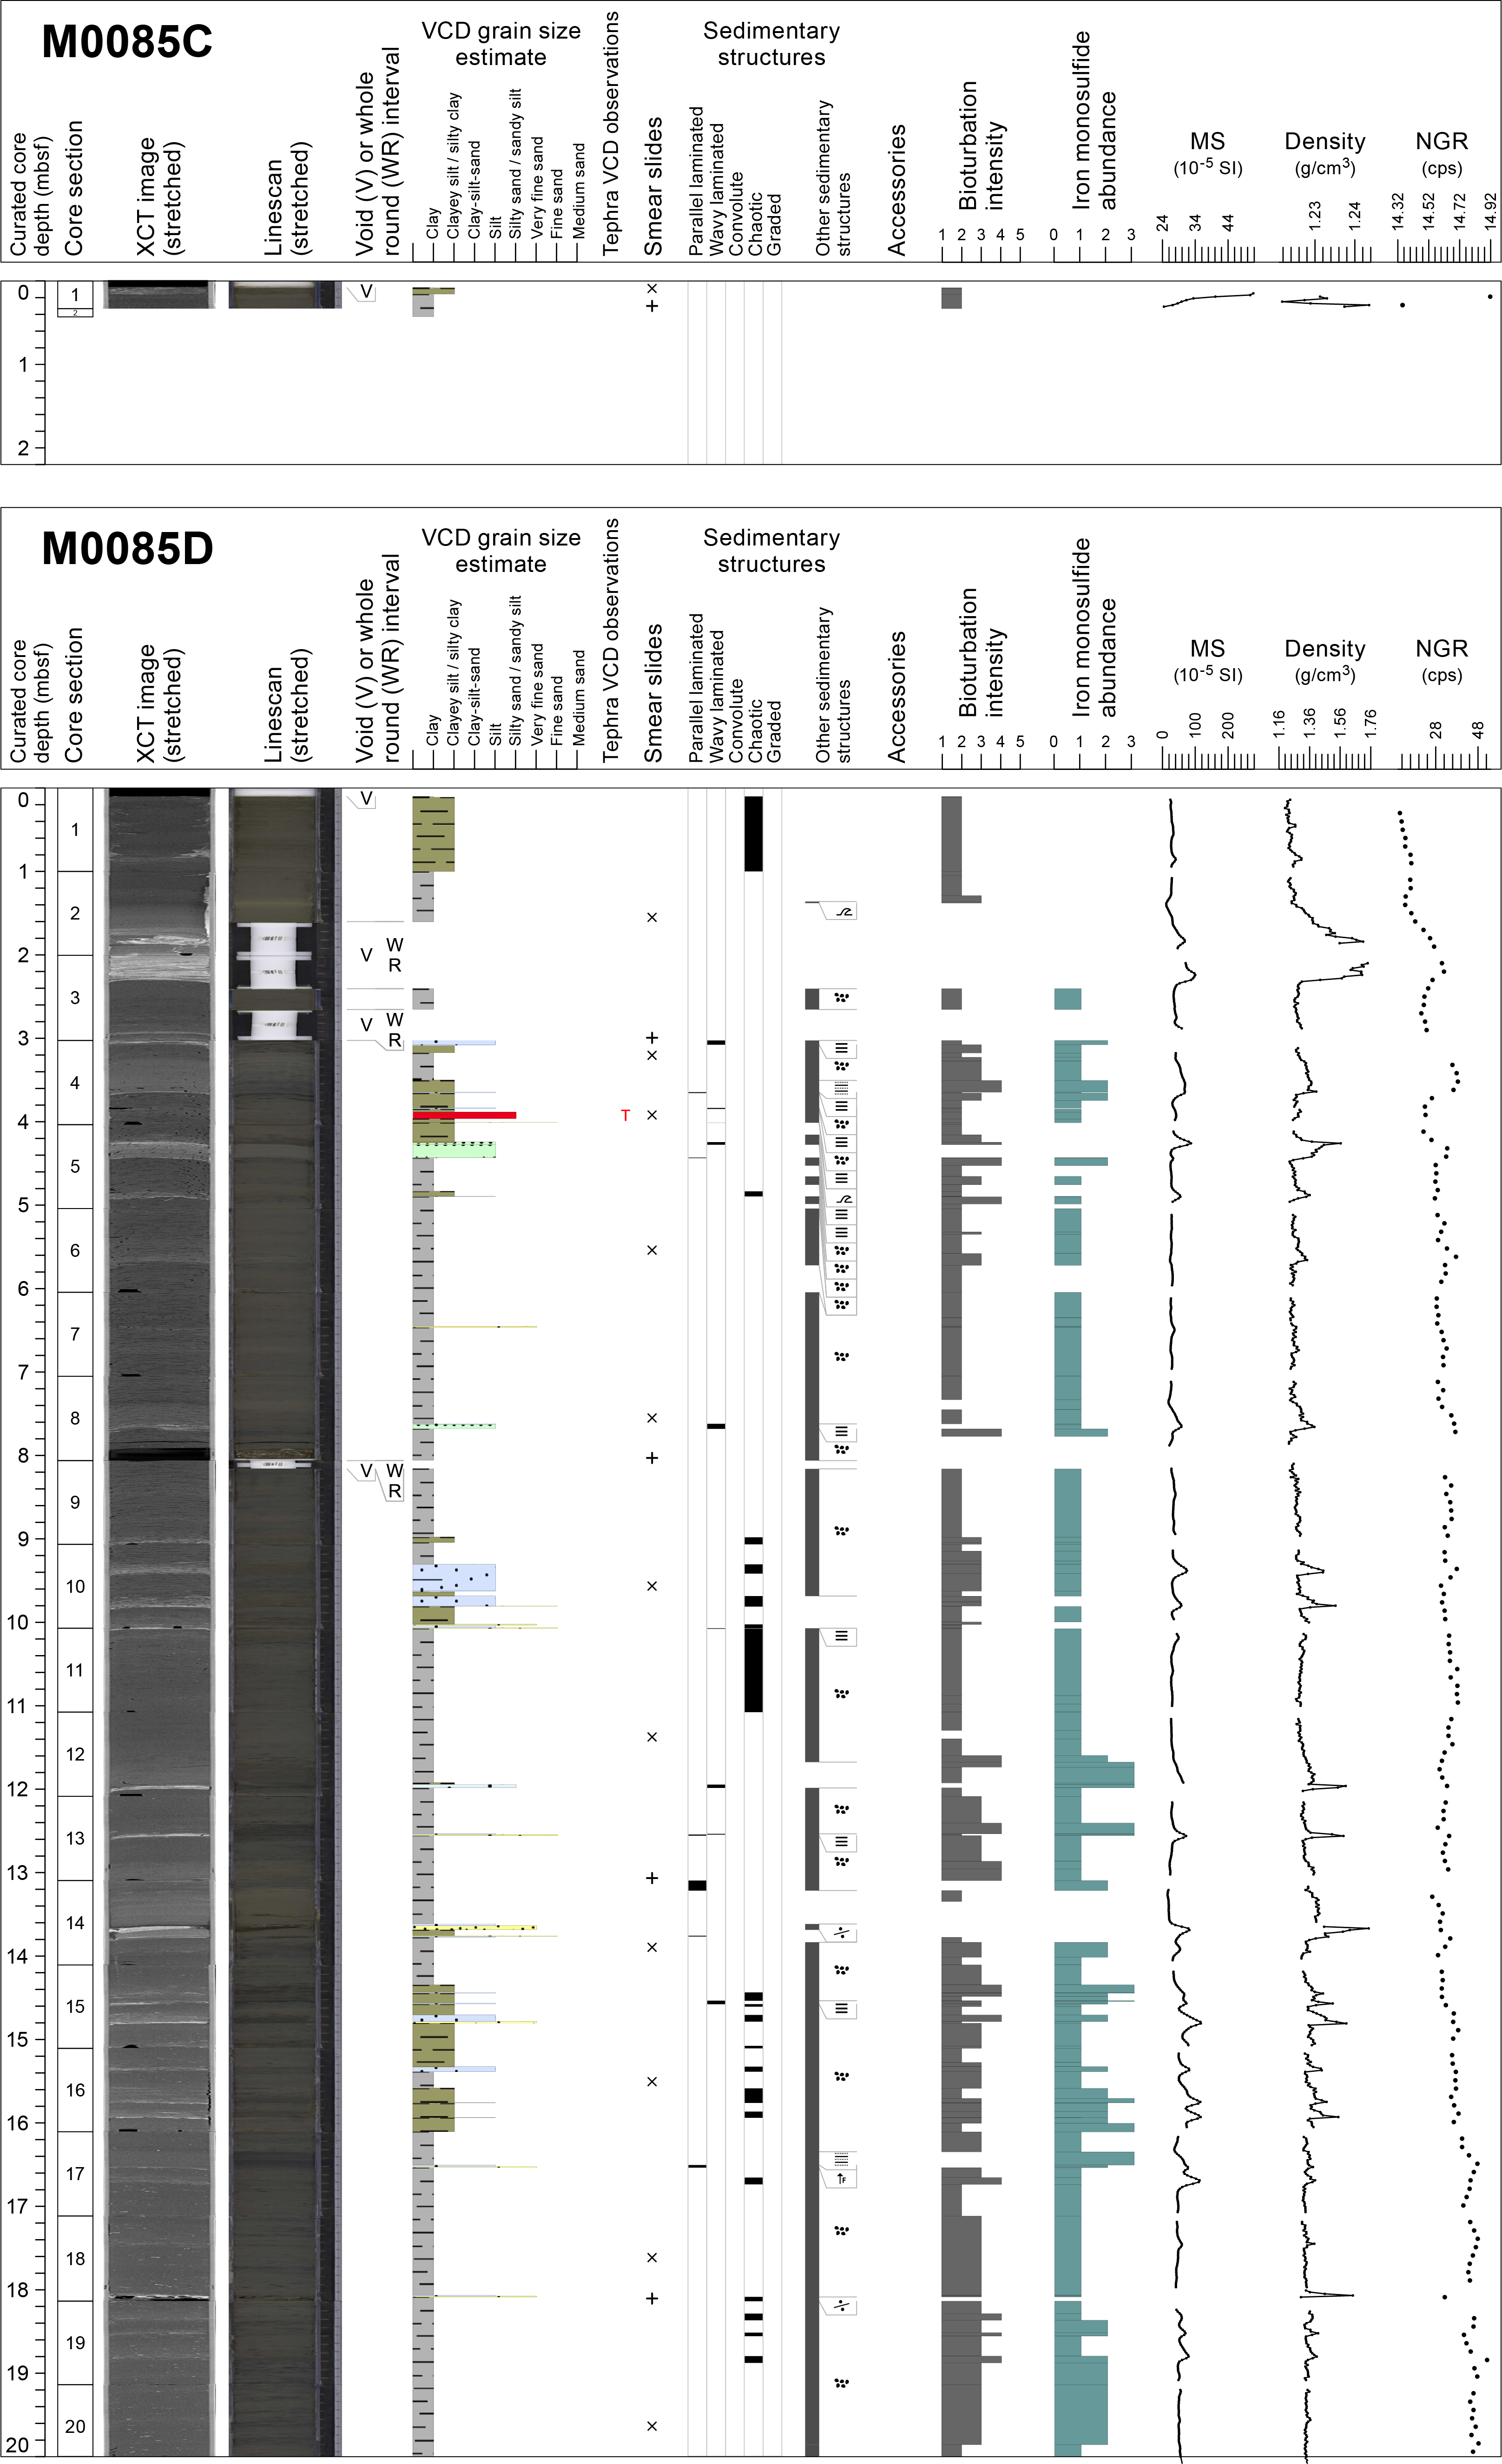
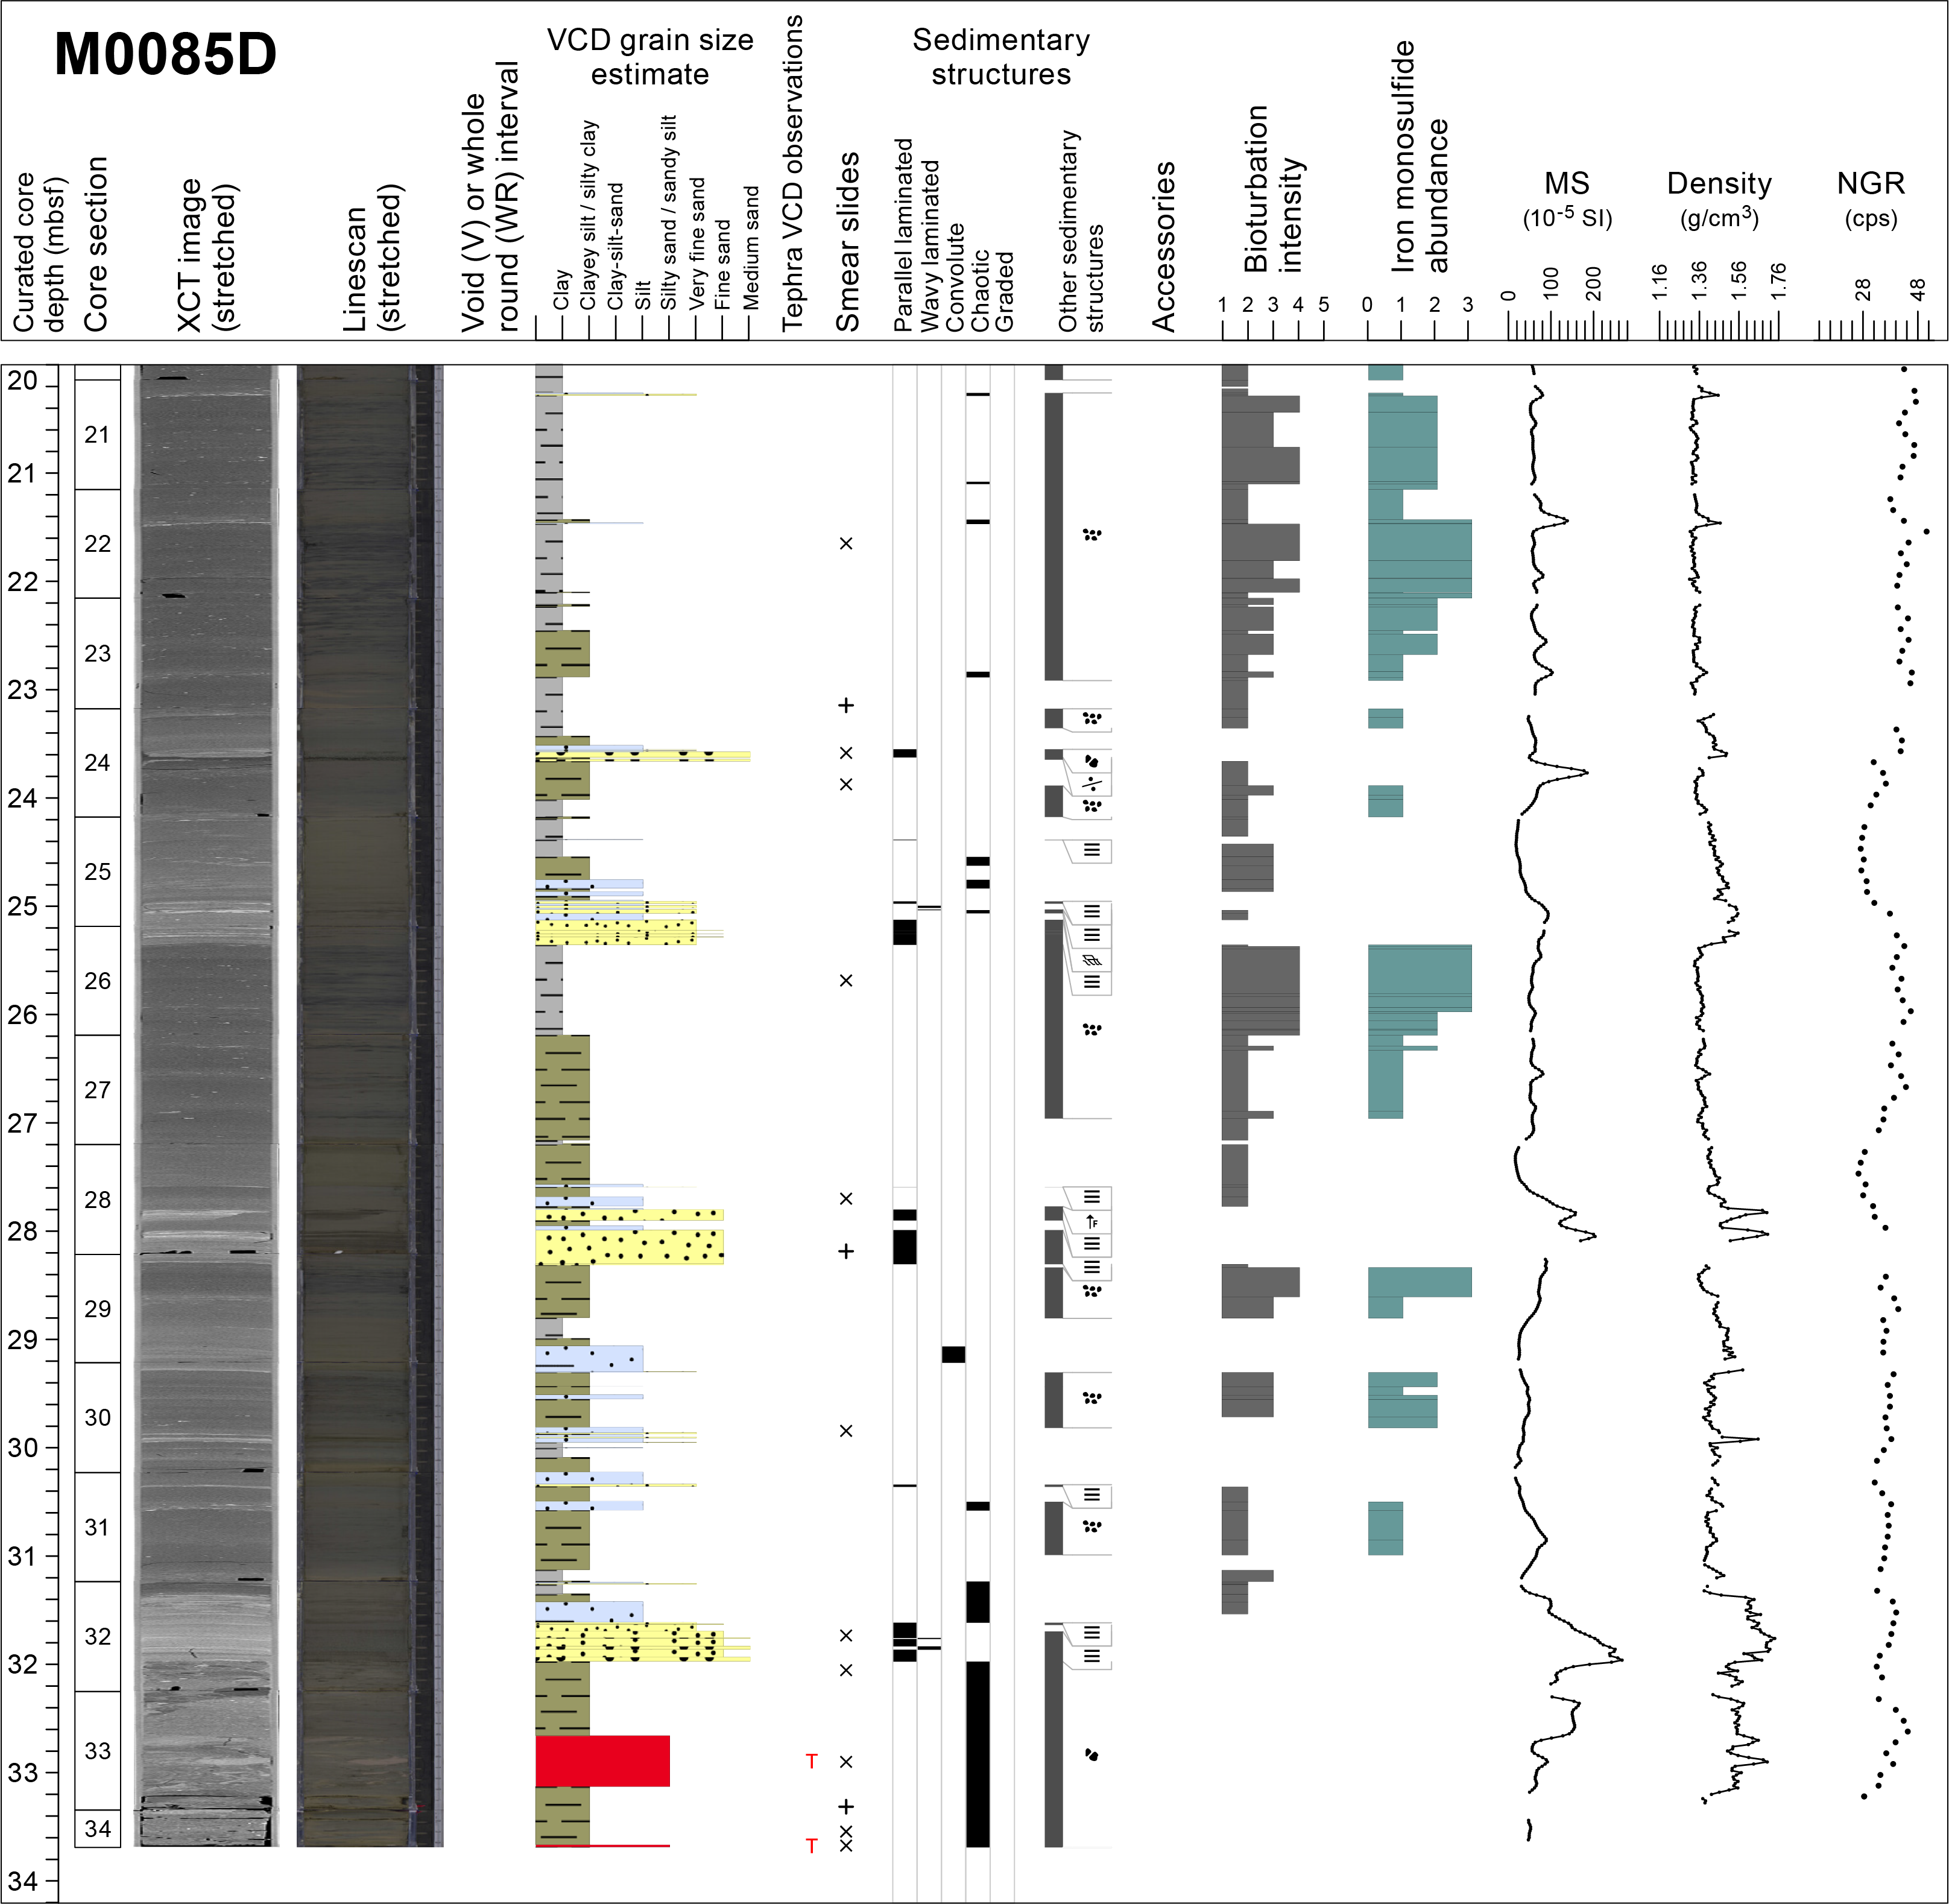
Figure F25. Lithostratigraphic summary, Holes M0085C and M0085D.
The smear slide sample collected for Hole M0085C (1P-1, 9 cm) (Table T4; Figure F26) is characterized as a siliceous- and lithogenic-rich silt that includes abundant feldspars (29.17%) and other fractions of 12.5% clay, 12.5% quartz, 4.2% pyrite, 4.2% vitric, 29.2% diatoms, and 8.3% sponge spicules.

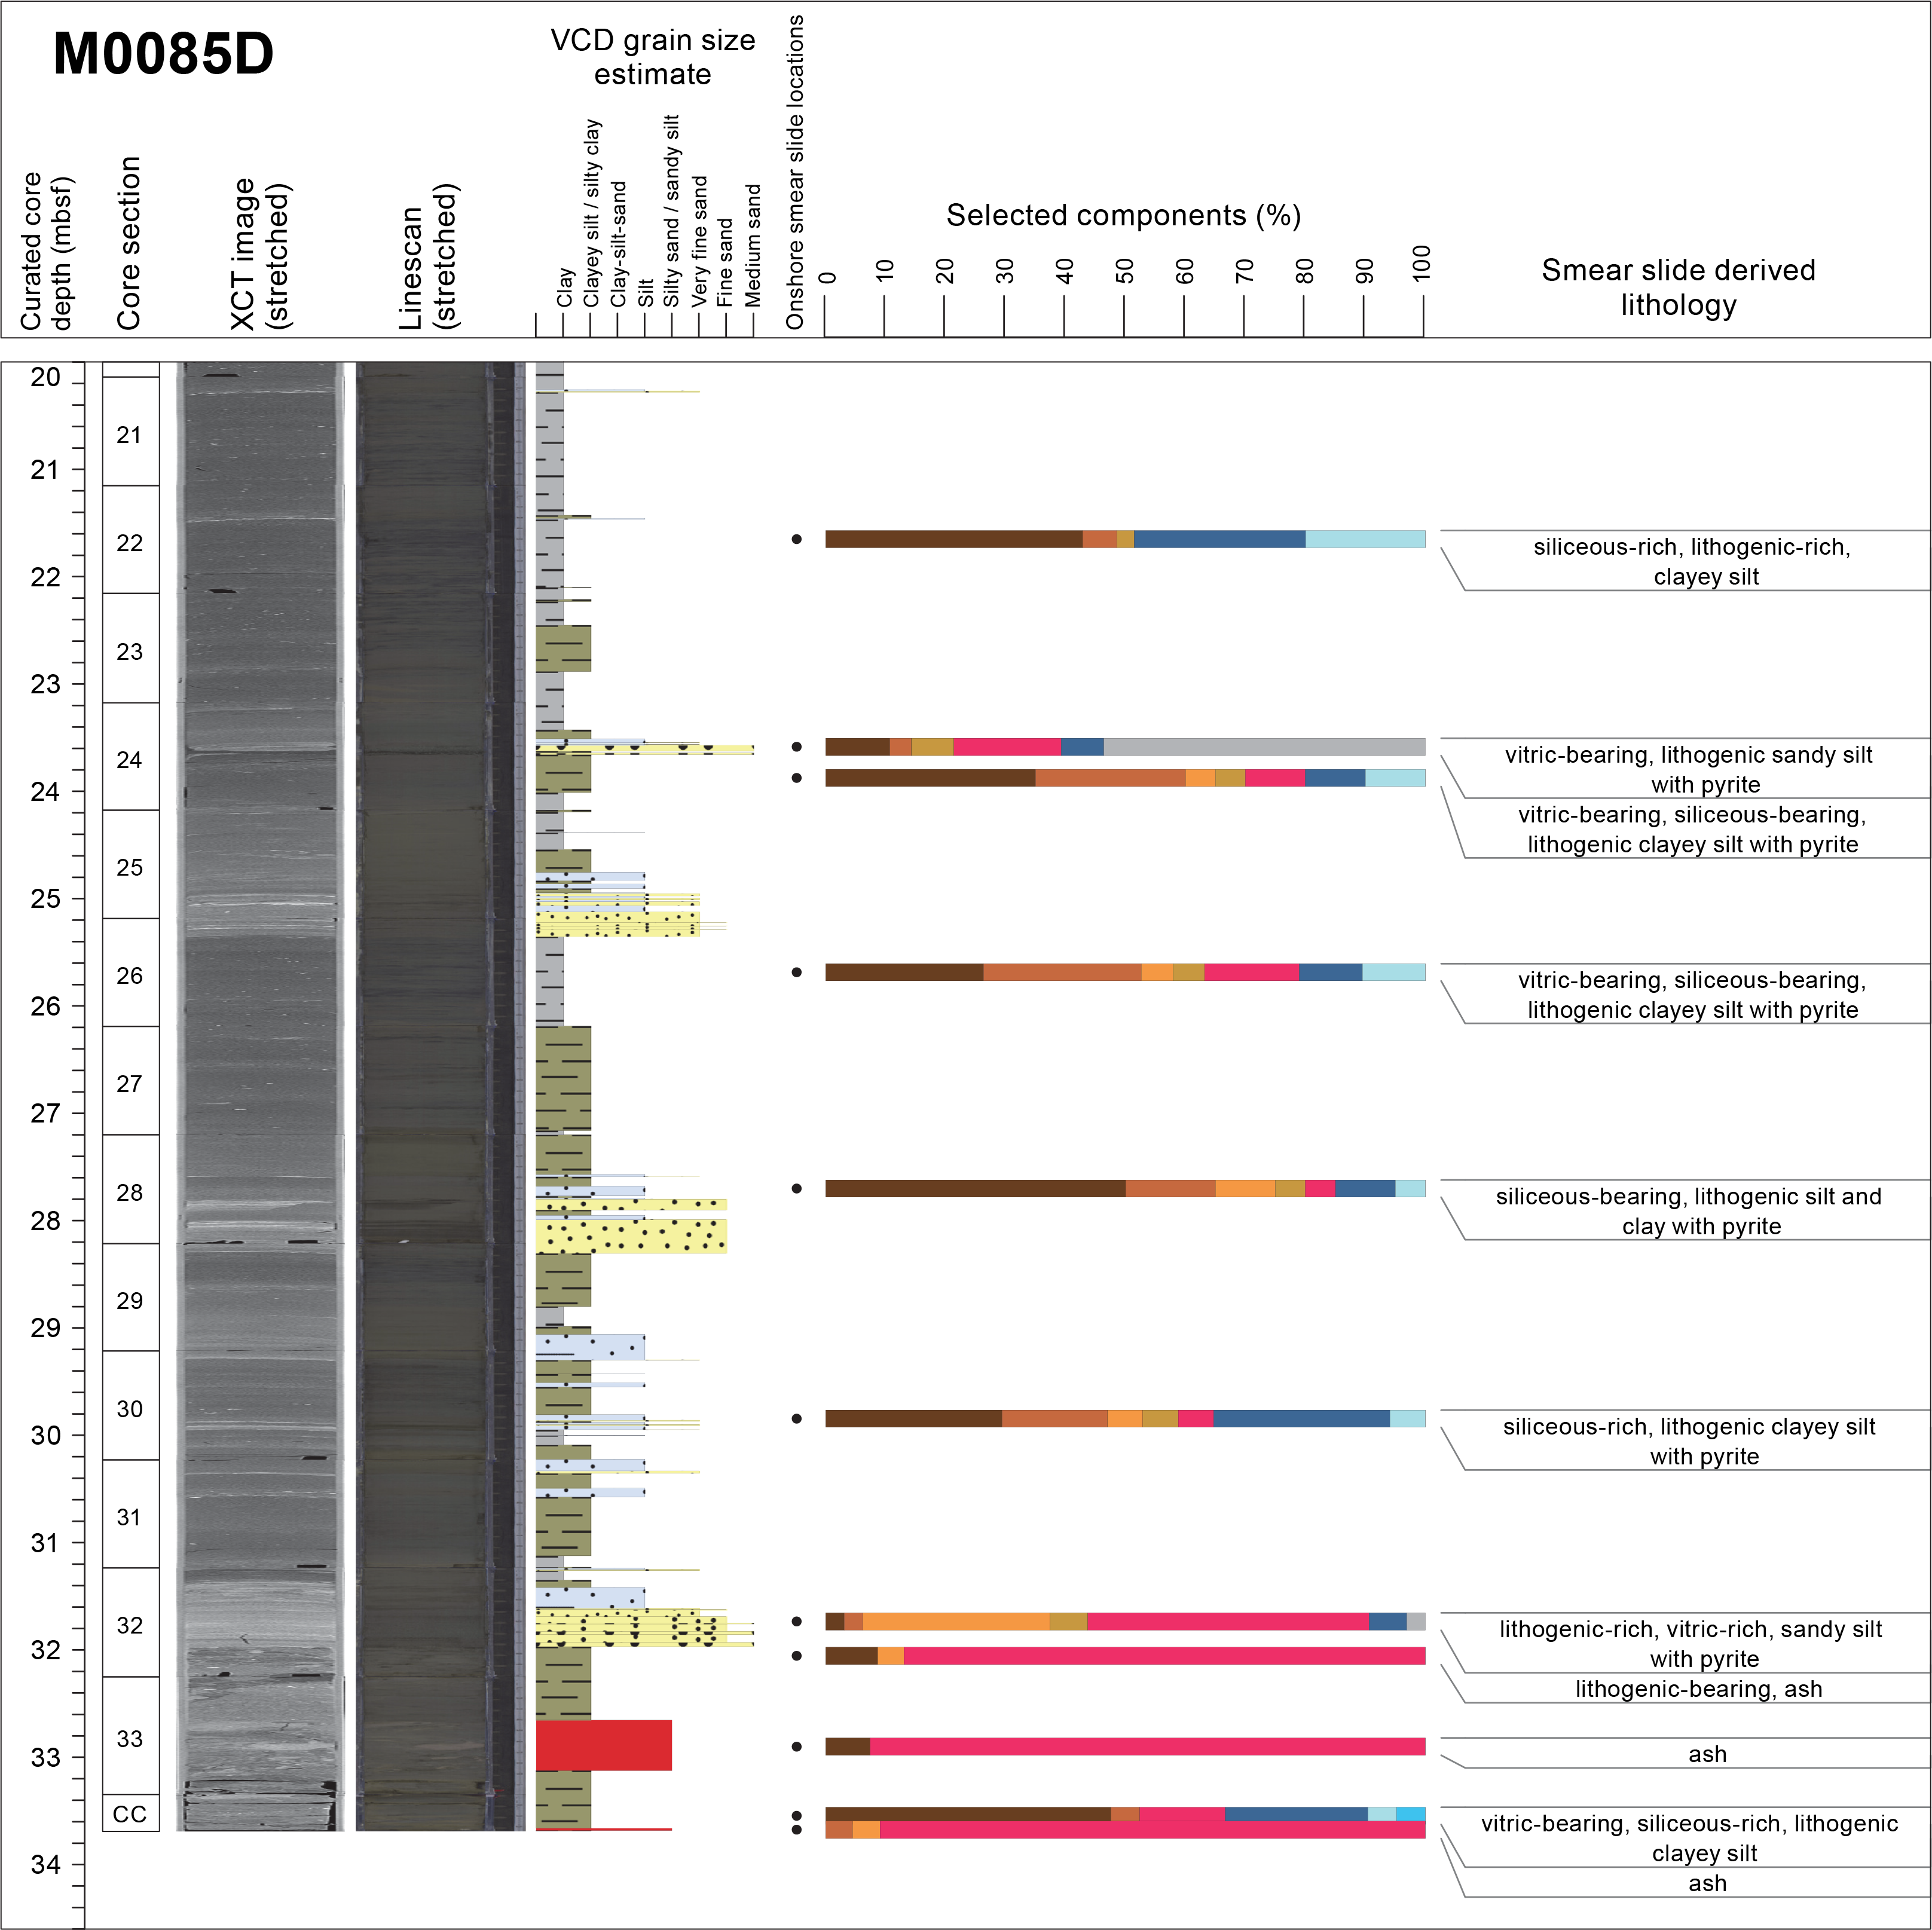
Figure F26. Smear slide summaries, Holes M0085C and M0085D.
3.2.2.2. Hole M0085D
The lithology for the ~33.75 m deep Hole M0085D comprises five main intervals separated by sharp contacts (Figure F25B).
Interval 1 (0–4.30 mbsf; Sections 386-M0085D-1H-1, 10 cm, to 1H-5, 42 cm) is composed of silty clay with two bioturbated clay portions in intervals 1H-3, 40–65 cm, and 1H-4, 20–48 cm. The silty clay includes very fine sand and silt laminae (interval 1H-5, 7–40 cm) and deformed medium sand streaks (interval 1H-4, 81–82 cm). These were deposited above silty clay with lenses of reworked volcaniclastic material (interval 1H-4, 86–94 cm). In the upper part of Interval 1, the silty clay contains patches of medium and very fine sand (interval 1H-1, 10–70 cm). Bioturbation and iron monosulfides are moderate to abundant in the lower part of Interval 1. Large parts of Interval 1 are whole-round samples (1H-2, 60 cm, to 1H-3, 40 cm, and 1H-3, 65–102 cm) and could not be observed in the initial visual core description process.
Interval 2 (~4.30–13.70 mbsf; Sections 386-M0085D-1H-5, 42 cm, to 1H-14, 72 cm) is composed of clay. The base of the interval is sharp with planar and cross-laminated sand with inclined bedding (interval 1H-14, 47–75 cm). The clay is slightly bioturbated and interbedded with few 10–50 cm thick, fining-upward very fine sand to silt laminae (intervals 1H-8, 46–77 cm; 1H-12, 76–100 cm; and 1H-13, 35–63 cm) and silty clay horizons. The laminae are frequently deformed by bioturbation that ranges from sparse to moderate. Some visible shell fragments are present in interval 1H-11, 81–91 cm. Iron monosulfide patches are sparsely distributed.
Interval 3 (~13.70–23.5 mbsf; Sections 386-M0085D-1H-14, 72 cm, to 1H-24, 48 cm) is composed of thick clay and silty clay. The base of the interval is sharp. Above, there is fining-upward coarse sand to very fine sand with planar laminations with low angle truncation. These change upsection to ripple cross-lamination (interval 1H-24, 37–50 cm). The remaining part of the interval is composed of medium- to thick-bedded, bioturbated silty clay and clay. It is interbedded with sharp-based, fining-upward very fine sand laminae (interval 1H-15, 54–84 cm) and silt laminae (interval 1H-15, 22–55 cm), which are disrupted by bioturbation. Iron monosulfide patches are moderate to abundant.
Interval 4 (23.5–32 mbsf; Sections 386-M0085D-1H-24, 48 cm, to 1H-32, 75 cm) is composed of three main thick-bedded, fining-upward successions of sand, silt, and clay (Sections 1H-24, 48 cm, to 1H-26, 18 cm; 1H-26, 18 cm, to 1H-29, 12 cm; and 1H-29, 12 cm, to 1H-32, 76 cm) (Figure F25):
- The sand is fining-upward from a medium to a very fine grain size. It has planar laminations with low-angle truncation at the base and ripple cross-bedding at the top. The base of the sand is sharp and erosional at its contact with Interval 5, as shown by an 8 cm deep erosional surface onlapped by planar lamination (Figure F19J).
- The silts contain some very fine sand laminae, either well preserved or disrupted (interval 1H-28, 32–46 cm), and structureless intervals with soft-sediment deformation (e.g., interval 1H-29, 85–100.5 cm).
- The silty clay and clay contain multiple dispersed silt patches and streaks with evidence of soft--sediment deformation (interval 1H-25, 34–45 cm). Bioturbation is usually slight but can be locally abundant at the top of a fining-upward succession (e.g., interval 1H-26, 22–80 cm). Iron monosulfide patches are moderate to abundant.
Interval 5 (32–33.75 mbsf; Sections 386-M0085D-1H-32, 75 cm, to 1H-34, 32 cm) is mud-supported sediment with large and angular clasts. It contains pebbles and cobbles of whitish to pinkish tephra in a silty clay matrix with soft-sediment deformation structures (Figure F19K) (intervals 1H-32, 79–91 cm; 1H-33, 39–54 cm; and 1H-CC, 21–34 cm). A 1 cm thick scoria layer caps the mud-supported clast deposits. There is no bioturbation and no iron monosulfide observed in this interval.
The magnetic susceptibility and density logs show similar signals that subparallel each other (see Physical properties) with most of the higher values forming peaks that correlate with the sandier horizons (Figure F25). The NGR log is smoother and generally anticorrelated with the other two (low NGR values in the sandy parts and high values in the clayey parts). Interval 4 has large variations from high to low magnetic susceptibility and density values that correlate to the 2–5 m thick sand and alternating silty clay and clay. The silty clay and clay in Intervals 1 and 3 show intermediate magnetic susceptibility, density, and NGR values with some peaks at the sand/silt beds, whereas the clay in Interval 2 shows very low values and amplitude variations, except in the unique well-bedded sandy silt horizon between 9 and 10 mbsf.
A total of 21 smear slides were analyzed for Hole M0085D (Table T4; Figures F23, F26). Intervals 1–3 show lithogenic-rich siliceous ooze and siliceous-rich lithogenic silty clay or clayey silt. Mineral content varies between 51.7% and 23.3% for clay, 0% and 17% for quartz, 0% and 3.6% for feldspars, and 0% and 3.6% for pyrite. The biogenic content varies between 7.1% and 50% for diatoms and 0 and 23.8% for sponge spicules, with 3.2% of radiolaria in Sample 1H-20, 50 cm. Interval 4 has vitric- and siliceous-bearing lithogenic clayey silt or silt with some pyrite. Two layers contain 92.6% (Sample 1H-33, 65 cm) (Figure F16F) and 87% (Sample 1H-32, 82 cm) vitric materials in ash and lithogenic-bearing ash. A third tephra bed is observed with 71.4% vitric material in Interval 1, in a lithogenic-bearing ash (Sample 1H-4, 18 cm).
3.3. Diagenesis
Iron monosulfides are observed at Sites M0084 and M0085, as shown by the linescan images on split cores (see LINESCAN in Supplementary material). The pattern of iron monosulfide occurrence ranges from less than 1 cm black spots and mottling to centimeter-scale patches or color bands parallel to the stratification to full inundation of the sediments throughout the core section in clay, silty clay, clayey silt, silt, or sandy silt. At both sites, iron monosulfides are closely associated with bioturbation, and the intensity of iron sulfide occurrence is often proportional to the intensity of bioturbation (Figures F13, F17, F20, F22, F25).
The distribution of iron monosulfides, however, is very different between the two sites. At Site M0084, bioturbation and iron monosulfides are totally absent from Intervals 2, 3, and 5 (only in Hole M0084F for the latter), whereas they are abundant in Intervals 1 and 4. At Site M0085, they are rare (Hole M0085B) or absent (Hole M0085D) in the upper part of Interval 1 where bioturbation is scarce and in Interval 5 of Hole M0085D where bioturbation is totally absent. The lack of iron monosulfide indicates depositional processes that probably limited the time of sediment exposure to organoclastic sulfate reduction and/or anaerobic methane oxidation.
Traces of sediment oxidation can be seen at section ends, along cracks, and at contacts with the liner. These diagenetic changes occurred after the splitting of the cores and during core storage. They particularly affect the zones rich in iron monosulfides (e.g., Section 386-M0084B-1H-20).
3.4. X-ray diffraction mineralogy
XRD mineralogy was conducted on samples taken every 2 m, and some minerals have been grouped. These groupings will require additional processing to extract a signal for each mineral. For example, quartz has not been separated from opal-A, and clays, carbonates, amphiboles, pyroxenes, and heavy minerals are composed of several minerals in each grouping (see Lithostratigraphy in the Expedition 386 methods chapter [Strasser et al., 2023a]). The interpretation of the mineralogy is an approximation at this stage. However, some interpretations can be made when the data are contrasted with the lithostratigraphic and smear slide summaries.
For Hole M0084F (Figure F27; see XRD in Supplementary material), the most abundant minerals are quartz, feldspar, and clay, followed by micas (muscovite and biotite). The data show correspondence between quartz, feldspar, clays, and micas, and the smear slide data also show they are the most abundant minerals (Table T3). There are consistent low occurrences of palygorskite, a clay associated with the weathering of glasses, at 0.78–6.35, 12.71–24.98, and 29.17 mbsf. In Hole M0084F, palygorskite occurs where vitric grains or tephra are abundant, as observed in smear slides but also, remarkably, in sediment with a limited amount of volcaniclastic material (Figure F21). Pyroxene is observed in two samples at 6.35 and 29.17 mbsf. The amphibole group and pyrite are constantly present in low amounts, except at 20.85 and 2.09 mbsf for the amphibole group and at 20.85–29.17 and 0.78 mbsf for pyrite and others. Pyrite correlates with peak abundances of quartz, feldspar, and clays. The very smooth curves of mineral abundances in Hole M0084F are indicative of a relative homogeneity of the mineral composition downhole.

Figure F27. XRD mineralogy summary plots.
As in Hole M0084F, quartz, feldspar, clays, and micas are the most abundant minerals in Hole M0085D (Figure F27; see XRD in Supplementary material). Pyrite, amphibole group minerals, heavy minerals, and pyroxene are present together almost everywhere in estimated low quantities. Palygorskite is only present in trace amounts at 0.9, 12.99, 21.04, 25.08, 29.12, and 33.5 mbsf, although the vitric material is abundant in most smear slide, especially at ~4 mbsf and between 23.5 mbsf and the bottom of the hole (Figure F26; Table T4). Future studies will be required to fully extract the mineralogy of the sediments in these two holes.
4. Tephra
The tephra layers described at Sites M0084 and M0085 are intercalated in silty sediments as patches and/or blocks, although the volume of each tephra in the cores is low, with a single tephra layer at Site M0084 and four at Site M0085. In the lower part of Hole M0085D, two tephra layers were observed as blocks within mass transport deposits (MTDs; see Lithostratigraphy). Therefore, the locations of these tephra layers in the core might not indicate their original tephrostratigraphic positions.
A white silt-sized tephra layer (M0084F-1H-22, 80 cm) is intercalated as patches in silty sediment interval 386-M0084F-1H-22, 74–80 cm (Figure F28A). Composition is dominated by pumiceous type volcanic glass shards (Table T5; Figure F29A). Hornblende is the dominant heavy mineral, and orthopyroxene and biotite are also observed.

Figure F28. Tephras in Basin N3.
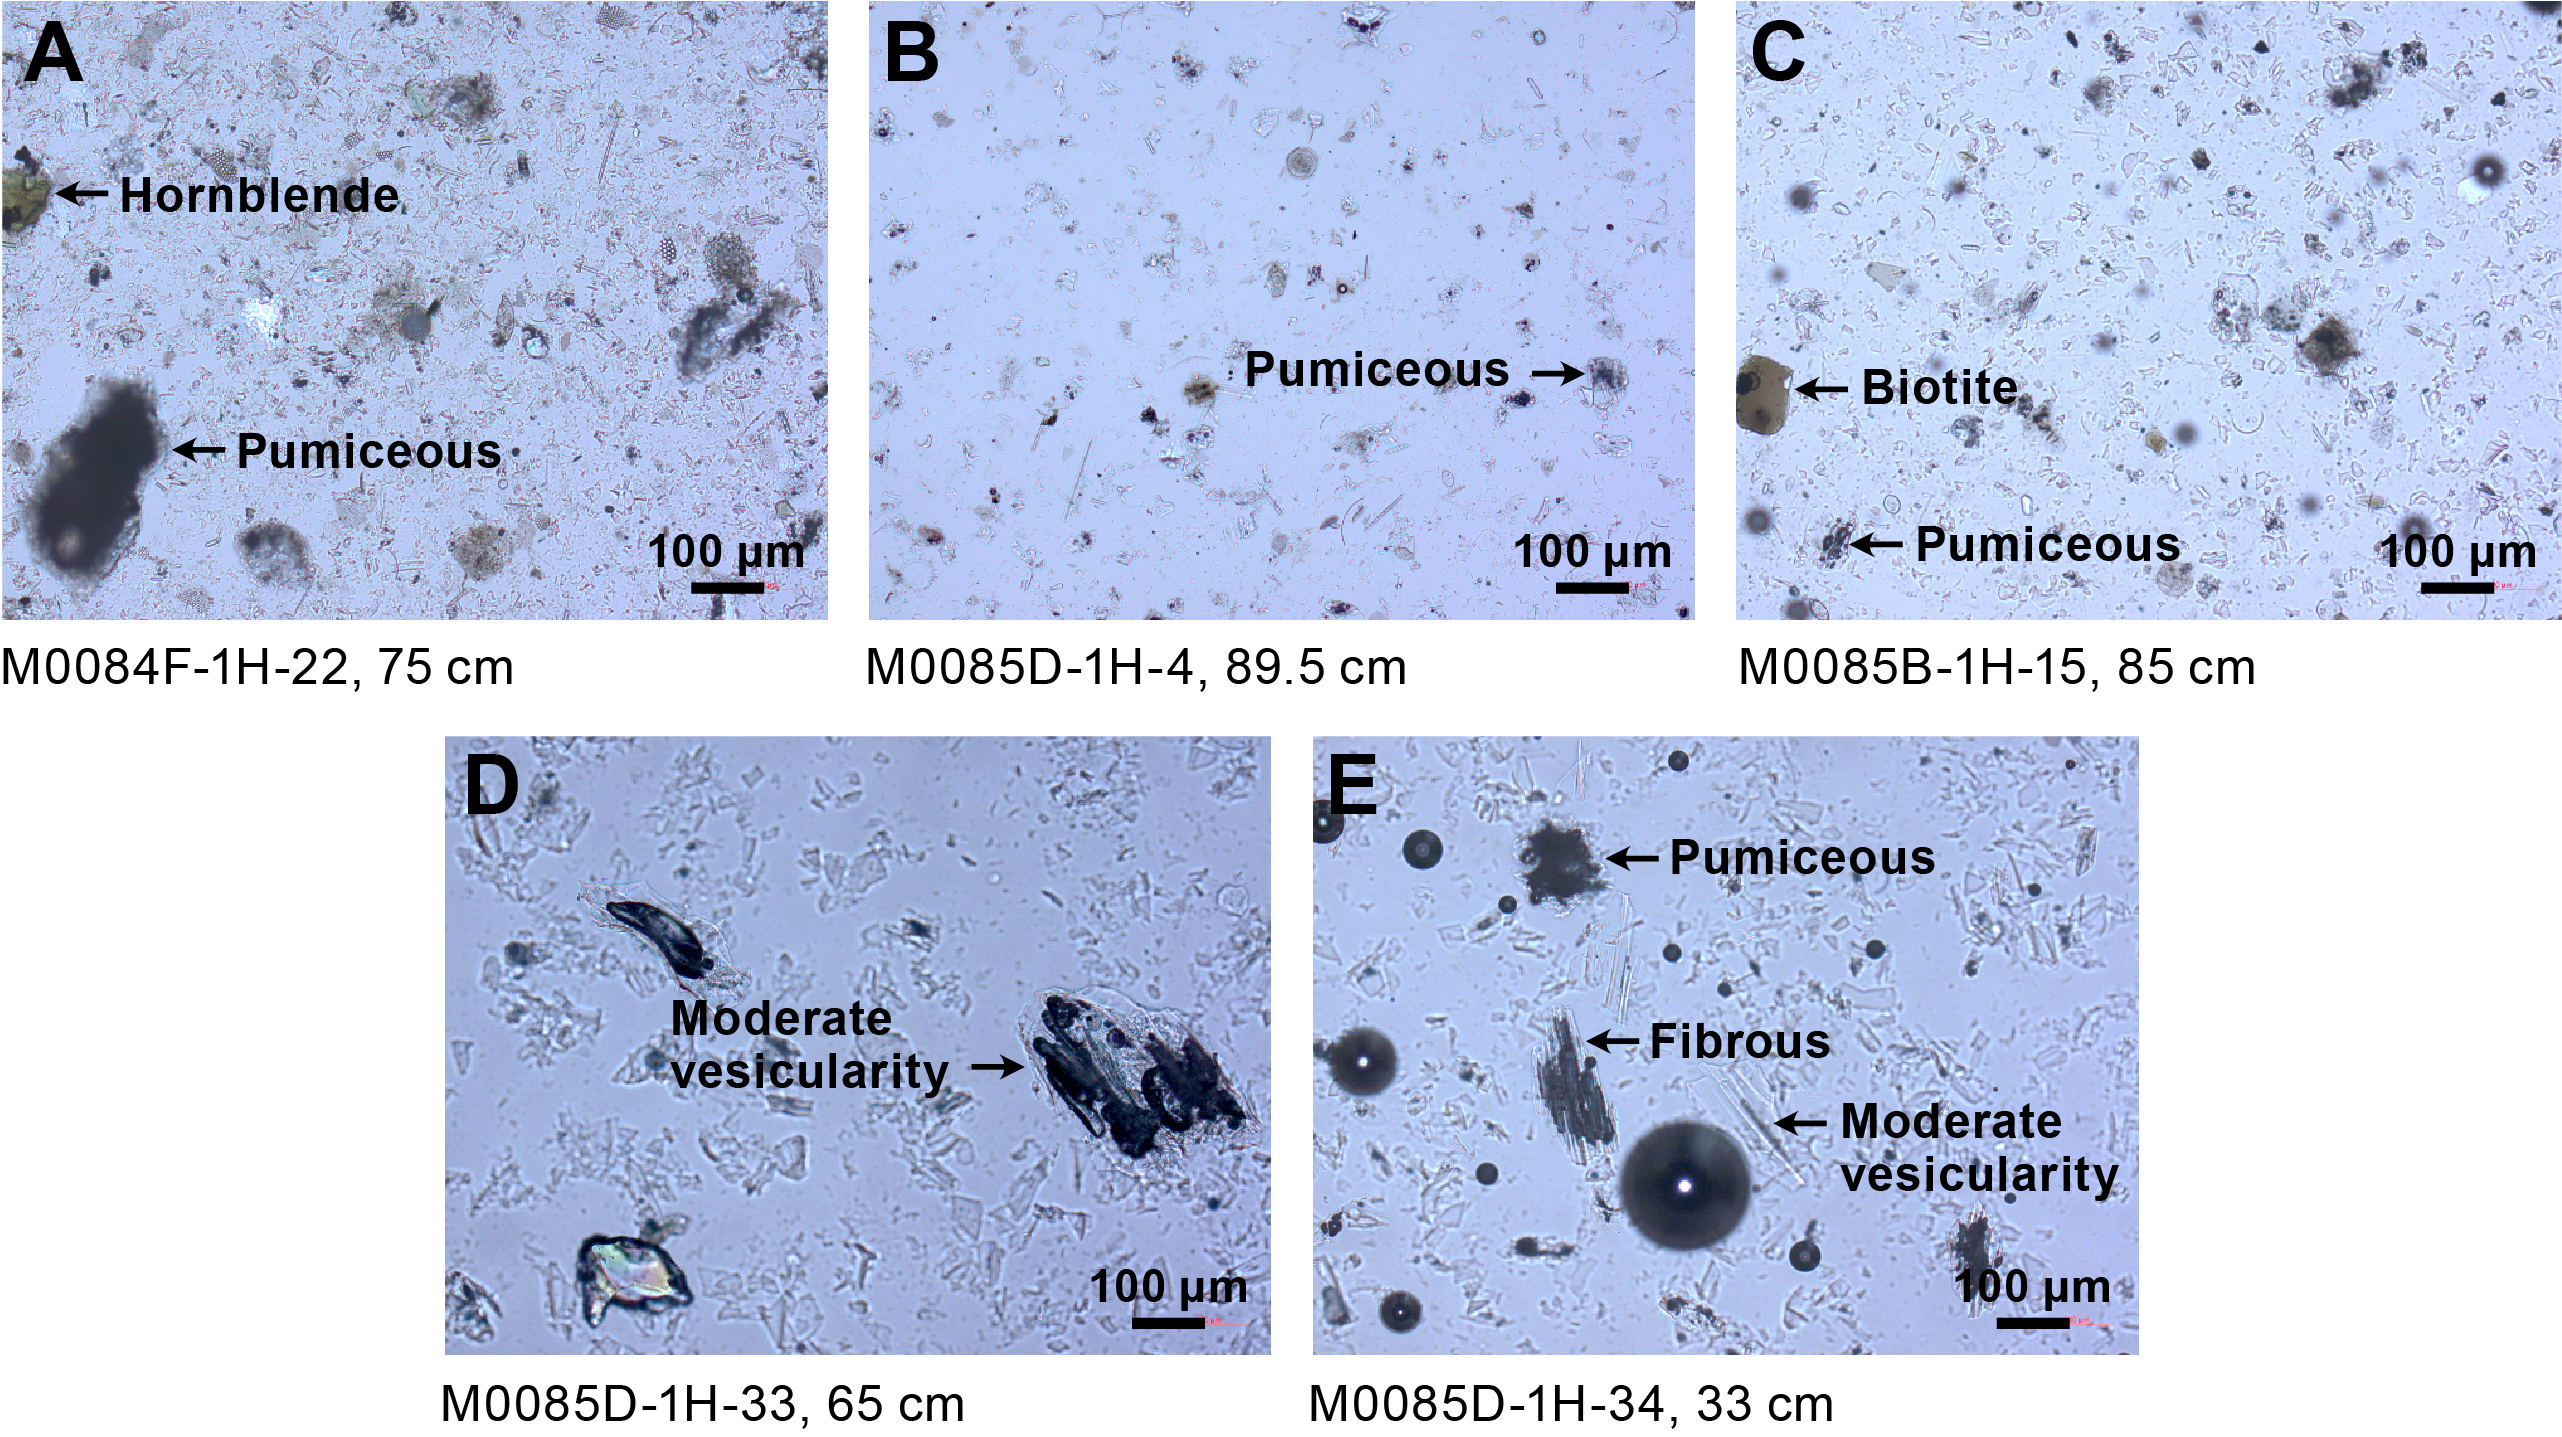
Figure F29. Tephras.
A white silt-sized tephra layer (M0085D-1H-4, 94 cm; Figure F28B) is intercalated as patches in silty sediment interval 386-M0085D-1H-4, 89–94 cm. Composition is dominated by pumiceous type volcanic glass shards (Table T5; Figure F29B). Hornblende is the dominant heavy mineral.
A white silt-sized tephra layer (M0085B-1H-15, 88.5 cm; Figure F28C) is intercalated as patches in silty sediment interval 386-M0085B-1H-15, 84.5–88.5 cm. Composition is dominated by pumiceous type volcanic glass shards (Table T5; Figure F29C). Heavy minerals are rare, with observed minerals being hornblende, orthopyroxene, apatite, and biotite.
A reddish brown silt-sized tephra (M0085D-1H-33, 87 cm; Figure F28D) is intercalated as blocks and patches in interval 386-M0085D-1H-32, 81.5 cm, through 1H-33, 87 cm. The blocks or patches of this tephra are scattered within MTDs, so this tephra does not represent a true tephrostratigraphic horizon. It is composed of multiple types of volcanic glass shards including bubble-wall, pumiceous, and moderate vesicularity types (Table T5; Figure F29D). Heavy mineral content includes abundant orthopyroxene, with clinopyroxene, hornblende, and cummingtonite all present. Characteristic ß-quartz minerals are also observed.
Pyroclastic sediments were sampled at the bottom of Section 386-M0085D-1H-33, 108.5 cm, during the offshore phase for chemical composition analysis of volcanic glass. This sample is likely to be the same as the MTD described above. Most volcanic glasses present are rhyolitic (SiO2 > 73 wt%), except for one grain. The Na2O and K2O contents are largely dispersed (Table T6). According to a K2O–SiO2 diagram (Figure F30), these glass shards are divided into three compositional groups.

Figure F30. SiO2 versus oxides.
A white silt-sized tephra (M0085D-1H-34, 34.3 cm; Figure F28E) is intercalated as a block in interval 386- M0085D-1H-34, 32.3–34.3 cm. It is composed of abundant fibrous type shards and others, including pumiceous and bubble-wall types (Table T5; Figure F30E). Heavy minerals are rare, and hornblende and apatite are also observed. Although this tephra occurs as blocks in chaotic MTDs like the M0085D-1H-33, 87 cm, tephra, the tephra observed in interval 386-M0085D-1H-34, 32.3–34.3 cm, is interpreted as separate due to differences in lithofacies color and the shape of the volcanic glass shards. This tephra also does not represent a true tephrostratigraphic horizon.
5. Micropaleontology
Six holes were cored at Site M0084 and four holes were cored at Site M0085 in Basin N3 in the northern part of the Japan Trench. The biostratigraphy determined for Holes M0084D and M0085D was based on an examination of radiolaria collected during the offshore phase of Expedition 386. For Hole M0085D, additional samples were taken during the Onshore Science Party (OSP) phase to detect more detailed changes. Foraminifera in samples collected during the offshore phase were examined to determine provenance of MTDs.
5.1. Radiolaria
Relative abundance changes of Cycladophora davisiana, the Tetrapyle circularis/fruticosa group (hereafter Tetrapyle group), and Lithomelissa setosa in cores from Holes M0084D and M0085D from Basin N3 of the Japan Trench are shown in Figure F31. Results of radiolarian analysis for these holes are described below.
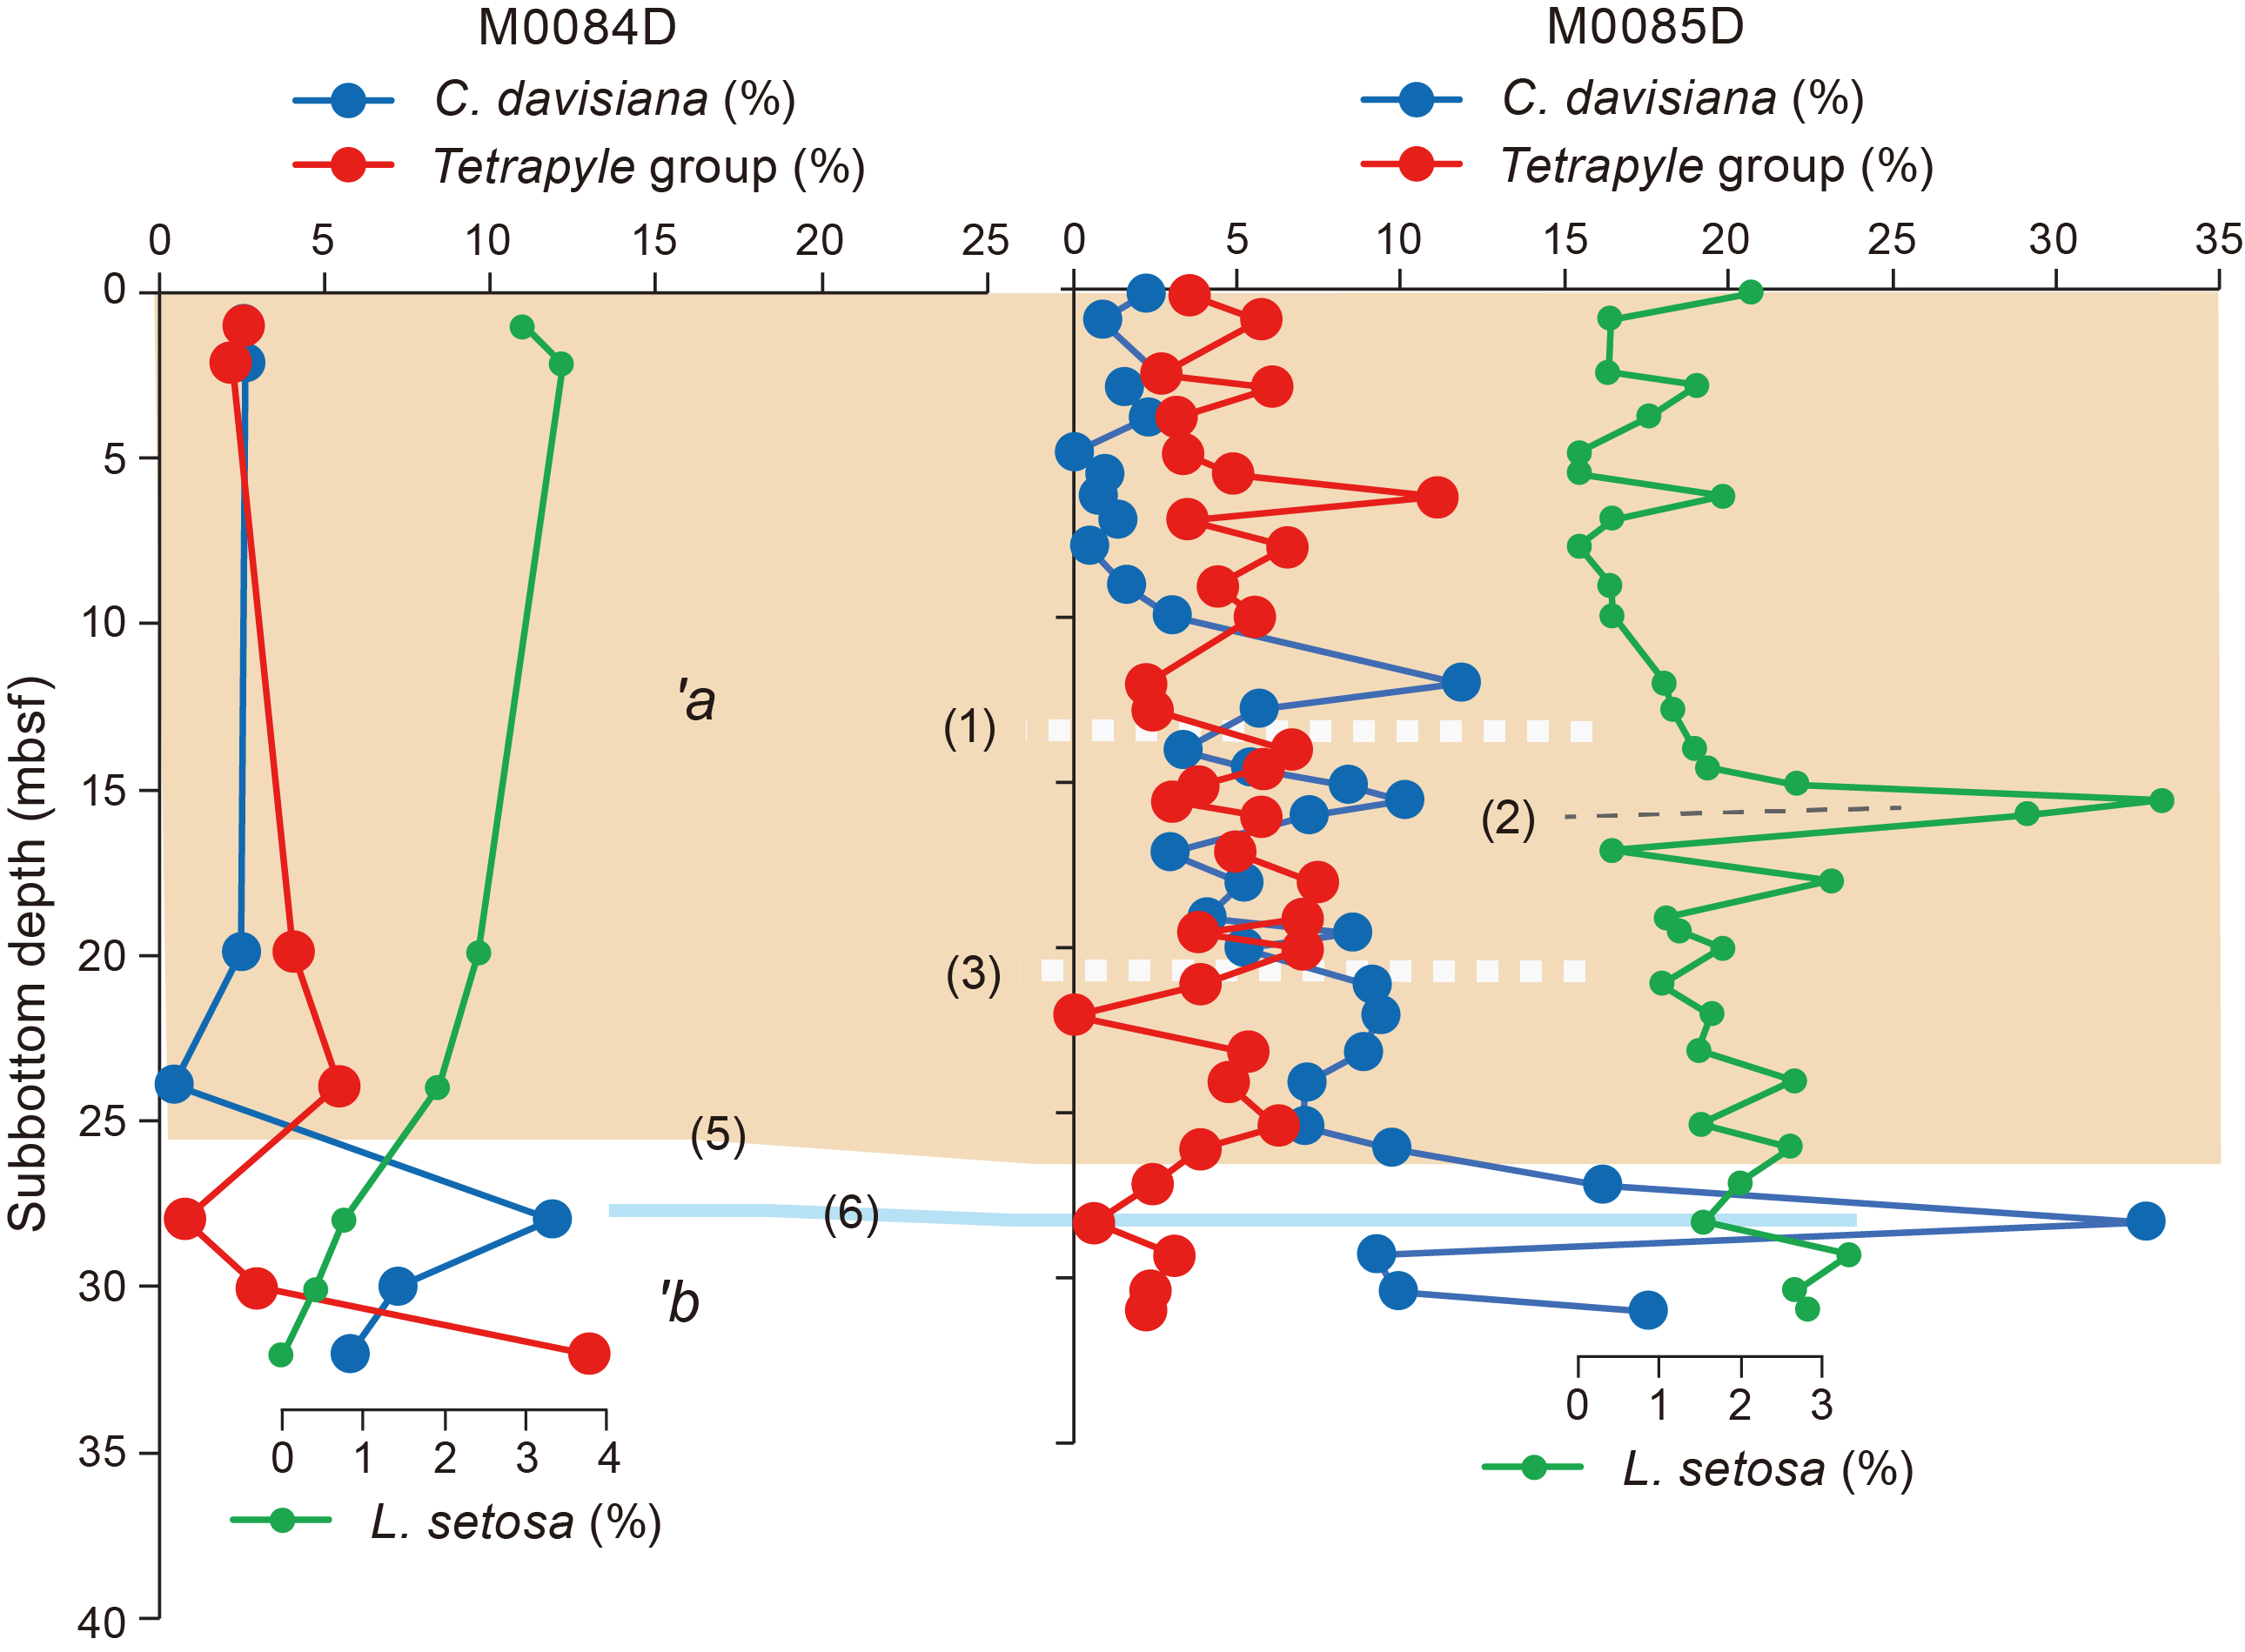
Figure F31. Radiolarian species abundance.
5.1.1. Site M0084
A total of 18 radiolarian samples were collected from Hole M0084D, and 7 were processed for analysis (Table T7). A further 11 samples were recovered from possible event layers and were not processed. Radiolarian fossils were abundant in all examined samples, with good preservation. The relative abundance of C. davisiana ranged 0%–12% and tended to be high (>5%) below 28.0 mbsf. It is possible that the increase in relative abundance of C. davisiana below 28 mbsf can be correlated to the boundary horizon of C. davisiana Zones ‘a and ‘b (Event 5), corresponding to the Holocene/Pleistocene boundary (Morley et al., 1982; see Micropaleontology in the Expedition 386 methods chapter [Strasser et al., 2023a]). A primary peak of the abundance of C. davisiana at 28.0 mbsf is likely correlated to Event 6 corresponding to Davisiana Event (DAE)-2 (~12 ka) of Matsuzaki et al. (2014). Because of the scarcity of samples within C. davisiana Zone ‘a, further detailed correlation is difficult, based solely on the Tetrapyle group and L. setosa abundance changes.
5.1.2. Site M0085
A total of 42 radiolarian samples were collected from Hole M0085D, and 37 samples were processed for analysis (Table T7). A further five samples were recovered from possible event layers and were not processed. Although two samples from near the bottom of the core (32.2 and 33.2 mbsf) were also from event layers, radiolarian fossils were examined for comparison with those in hemipelagic deposits. Radiolarian fossils were abundant in all the examined samples with good preservation. The relative abundance of C. davisiana fluctuated between 0% and 33% and tended to be high (>10%) below 26.1 mbsf. The increase in relative abundance of C. davisiana to above 10% at this depth could be correlated with the boundary horizon of C. davisiana Zones ‘a and ‘b of Morley et al. (1982) (Event 5; see Micropaleontology in the Expedition 386 methods chapter [Strasser et al., 2023a]), corresponding to the Holocene/Pleistocene boundary. A primary peak in the abundance of C. davisiana at 28.3 mbsf is likely correlated to Event 6, corresponding to DAE-2 (~12 ka) of Matsuzaki et al. (2014). The relative abundance of the Tetrapyle group ranges 0%–10%, and higher values (>5%) tend to be recognized between 14.6 and 20.0 mbsf, most likely corresponding to Events 1 and 3, respectively (Figure F31). This interval likely ranges between approximately 6 and 8 ka (see Micropaleontology in the Expedition 386 methods chapter [Strasser et al., 2023a]). A primary peak in the abundance of L. setosa at 15.6 mbsf is likely to correlate with Event 2, but it was not possible to identify the peak of Event 4 from this core. From event deposits near the bottom of the core (32.2 and 33.2 mbsf), ancient radiolaria were recovered, such as Lamprocyrtis heteroporos (Hays) and Cycladophora sphaeris (Popova). Significantly, these species disappeared in the early Pleistocene.
According to the correlations described above from Sites M0084 and M0085, it is likely that the sedimentation rate is similar between these sites.
5.2. Foraminifera
5.2.1. Site M0084
Samples were taken at 5 m intervals offshore, as described in Micropaleontology in the Expedition 386 methods chapter (Strasser et al., 2023a). With the exception of the agglutinated foraminifera, which may be either in situ or reworked, all foraminifera at Site M0084 are considered to be allochthonous.
5.2.1.1. Hole M0084B
Four samples from Hole M0084B were examined for foraminifera (Table T8). Benthic foraminifera with moderate to good preservation are present in all samples. Planktonic foraminifera with good to very good preservation are present in two samples. All samples examined for foraminifera contain abundant diatoms, radiolaria, and sponge spicules, and many have glass shards.
No provenance interpretation can be made for these samples due to low foraminifera abundance.
5.2.1.2. Hole M0084C
One sample from the base of Hole M0084C was examined for foraminifera (Table T8). Benthic foraminifera with moderate to good preservation are present. Planktonic foraminifera with good preservation are present. This sample contains abundant diatoms, radiolaria, sponge spicules, and glass shards.
No provenance interpretation can be made for this sample due to low foraminifera abundance.
5.2.1.3. Hole M0084D
Eight samples from Hole M0084D were examined for foraminifera (Table T8). Benthic foraminifera with moderate to very good preservation are present to common in all but one of the samples. Planktonic foraminifera with good to very good preservation are present in two samples. All samples examined for foraminifera contain abundant diatoms, radiolaria, and sponge spicules, and many have glass shards.
A provenance interpretation cannot be made for most samples due to low foraminifera abundance, with the exception of Sample 386-M0084D-1H-21, 98–101 cm (19.88 mbsf).
Sample 386-M0084D-1H-21, 98–101 cm, contains a common yet low diversity assemblage of calcareous benthic foraminifera dominated by Stainforthia fusiformis, Stainforthia apertura, and Bolivina pacifica. Preservation of these and other thin-walled taxa is very good. The provenance of the displaced calcareous assemblage in this sample is likely to be from an upper bathyal environment based on the paleobathymetric zonation of Usami et al. (2017) after Matoba (1976).
5.2.1.4. Hole M0084E
One sample from the base of Hole M0084E was examined for foraminifera (Table T8). Benthic foraminifera are rare with moderate preservation. One planktonic specimen with moderate preservation occurs in this sample, along with abundant diatoms, radiolaria, sponge spicules, and glass shards.
No provenance interpretation can be made for this sample due to low foraminifera abundance.
5.2.1.5. Hole M0084F
Eight samples from Hole M0084F were examined for foraminifera (Table T9). Benthic foraminifera with moderate to good preservation are present to rare in all samples. Planktonic foraminifera with moderate to very good preservation are present in three samples. All samples examined for foraminifera contain abundant diatoms, radiolaria, and sponge spicules, and many have glass shards.
No provenance interpretation can be made for these samples due to low foraminifera abundance.
5.2.2. Site M0085
Samples were taken at 5 m intervals offshore, as described in Micropaleontology in the Expedition 386 methods chapter (Strasser et al., 2023a). With the exception of the agglutinated foraminifera, which may be either in situ or reworked, all foraminifera at Site M0085 are considered to be allochthonous.
5.2.2.1. Hole M0085B
Four samples from Hole M0085B were examined for foraminifera (Table T9). Benthic foraminifera with good preservation are present in two samples; two samples are barren. All samples examined for foraminifera contain abundant diatoms, radiolaria, and sponge spicules, and many have glass shards.
No provenance interpretation can be made for these samples due to low foraminifera abundance.
5.2.2.2. Hole M0085C
One sample from the base of Hole M0085C was examined for foraminifera (Table T9). Only two agglutinated specimens of Trochammina spp., considered to be in situ, are present in the sample. This sample contains abundant diatoms, radiolaria, sponge spicules, and glass shards.
5.2.2.3. Hole M0085D
Seven samples from Hole M0085D were examined for foraminifera (Table T9). Benthic foraminifera with moderate to good preservation are present to common in all but one sample. Planktonic foraminifera with good to very good preservation are present to abundant in five samples. All samples examined for foraminifera contain abundant diatoms, radiolaria, and sponge spicules, and some have glass shards.
A provenance interpretation cannot be made for most samples due to low foraminifera abundance, with the exception of Samples 386-M0085D-1H-18, 99–102 cm (18.11 mbsf), and 1H-28, 98.5–101.5 cm (28.19 mbsf).
Sample 386-M0085D-1H-18, 99–102 cm, contains few benthic foraminifera dominated by moderately preserved Elphidium batialis and Nonionellina labradorica, along with Uvigerina akitaensis, Eubuliminella exilis, and Cassidulina carinata. Planktonic foraminifera are few and are dominated by sinistrally coiled Neogloboquadrina pachyderma with rare Globigerina bulloides. Using the paleobathymetric zonation of Usami et al. (2017) after Matoba (1976), the provenance of the displaced calcareous assemblage in this sample is interpreted to be from a middle to lower bathyal environment.
Sample 386-M0085D-1H-28, 98.5–101.5 cm, contains common benthic and abundant planktonic foraminifera (>500 specimens) with a bimodal preservation (either good or poor with brownish-orange stain). The benthic assemblage with good preservation is dominated by E. exilis, N. labradorica, Chilostomellina fimbriata, Chilostomella ovoidea, Epistominella pacifica, Globobulimina pacifica, and Elphidium spp. Some benthic foraminifera present, such as N. labradorica, C. fimbriata, G. pacifica, have been found living within the oxygen minimum zone off Hachinohe, Japan (Fontanier et al., 2014). Using the paleobathymetric zonation of Usami et al. (2017) after Matoba (1976), the provenance of some of the displaced calcareous assemblage in this sample is interpreted to be from an upper bathyal environment within the oxygen minimum zone (200–600 mbsl).
The more poorly preserved, stained specimens include Cassidulina reniforme and Quinqueloculina sp., along with broken specimens of Elphidium spp. infilled with iron monosulfides, which may indicate multiple reworking of neritic taxa. About one third of the planktonic specimens, mainly sinistrally coiled N. pachyderma, also have the brownish orange stain to their tests. A different provenance, no shallower than outer neritic based on the abundant planktonic foraminifera, is suggested for this stained assemblage.
This interpretation of several sources is supported by the laminated nature of the fine sand from which Sample 386-M0085D-1H-28, 98.5–101.5 cm, was taken (Figure F32).
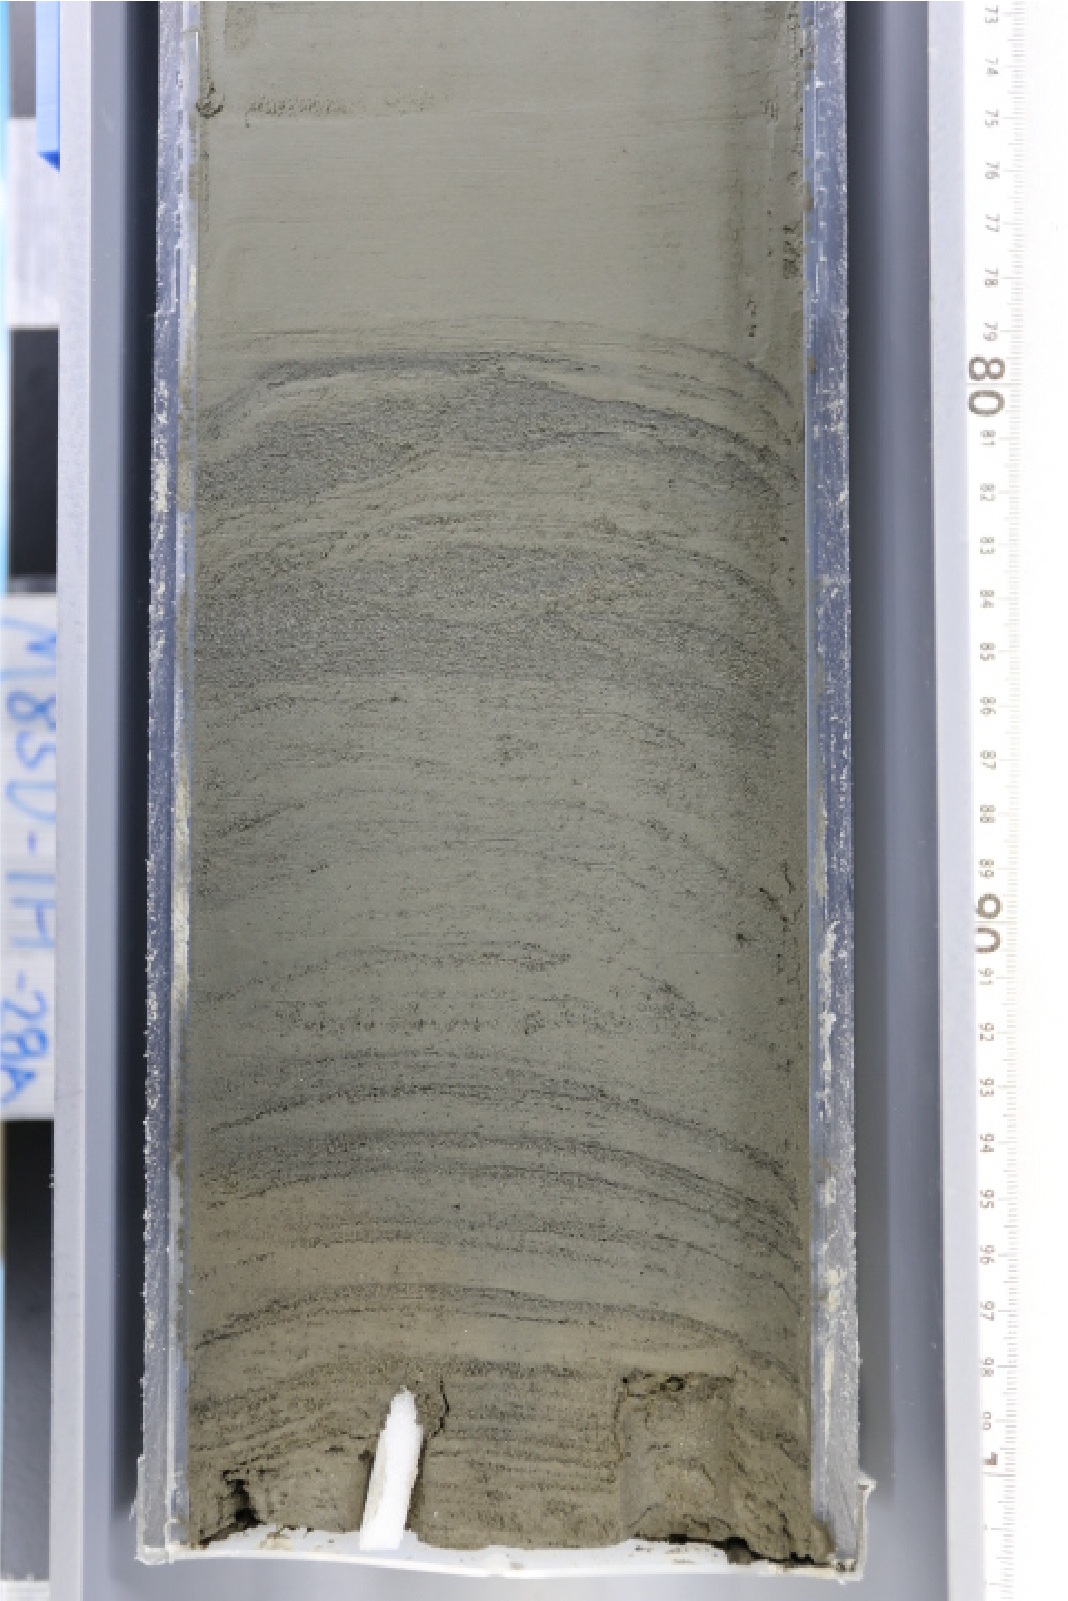
Figure F32. Parallel laminations.
6. Geochemistry
6.1. Interstitial water
At Site M0084, a total of 3 bottom water (BW) and 74 interstitial water (IW) samples were collected using Rhizon samplers from two trigger cores (Holes M0084C and M0084E) and three GPC cores (Holes M0084B, M0084D, and M0084F). At Site M0085, a total of 49 IW samples were collected from one trigger core (Hole M0085C) and two GPC cores (Holes M0085B and M0085D). In addition, one BW sample was taken from each of the trigger cores. See Geochemistry in the Expedition 386 methods chapter (Strasser et al., 2023a) for details of the sampling, analytical methods, and data quality.
In general, IW compositions at Sites M0084 and M0085 reflect the combined effects of organic matter degradation, including the release of metabolic products and consumption of electron acceptors, and mineral dissolution/precipitation reactions within sediments. Notably, concentrations of some pore water species (e.g., sulfate, alkalinity, ammonium, and barium) at Site M0085 exhibit reversal trends toward seawater values below ~11–12 mbsf (Bruland et al., 2014).
6.1.1. Shipboard analyses: salinity, alkalinity, and ammonium
Salinity in Site M0084 BW and in the trigger cores is about seawater value (~34.5; Bruland et al., 2014). The GPC cores have seawater values at the top, which increase to a peak value of 37.4 at ~24 mbsf, followed by a decrease to ~35 at the bottom of the GPC cores. Alkalinity concentrations of BW samples are like seawater (2.5 mM; Bruland et al., 2014). The alkalinity of the trigger core IW samples is substantially elevated over seawater (5.7 mM). The alkalinity of the top GPC core samples is over 10 mM and increases with depth to peak values (97.9 mM at ~24 mbsf in Hole M0084D; 85.9 mM at ~19 mbsf in Hole M0084F) and then decreases to 80 mM and 59 mM at the bottom of Holes M0084D and M0084F, respectively. Ammonium (NH4+) concentrations are similar to seawater in the BW samples (0.03 mM; Bruland et al., 2014). NH4+ values from the trigger core IW samples are ~0.2 mM. The GPC cores have substantially elevated NH4+ in the top samples (>0.5 mM), which generally increase to 12.2 mM at the bottom of the GPC cores. The downcore increasing trend of NH4+ shows different gradients with a more rapid increase from ~10.5 mbsf (Figure F33; Table T10).
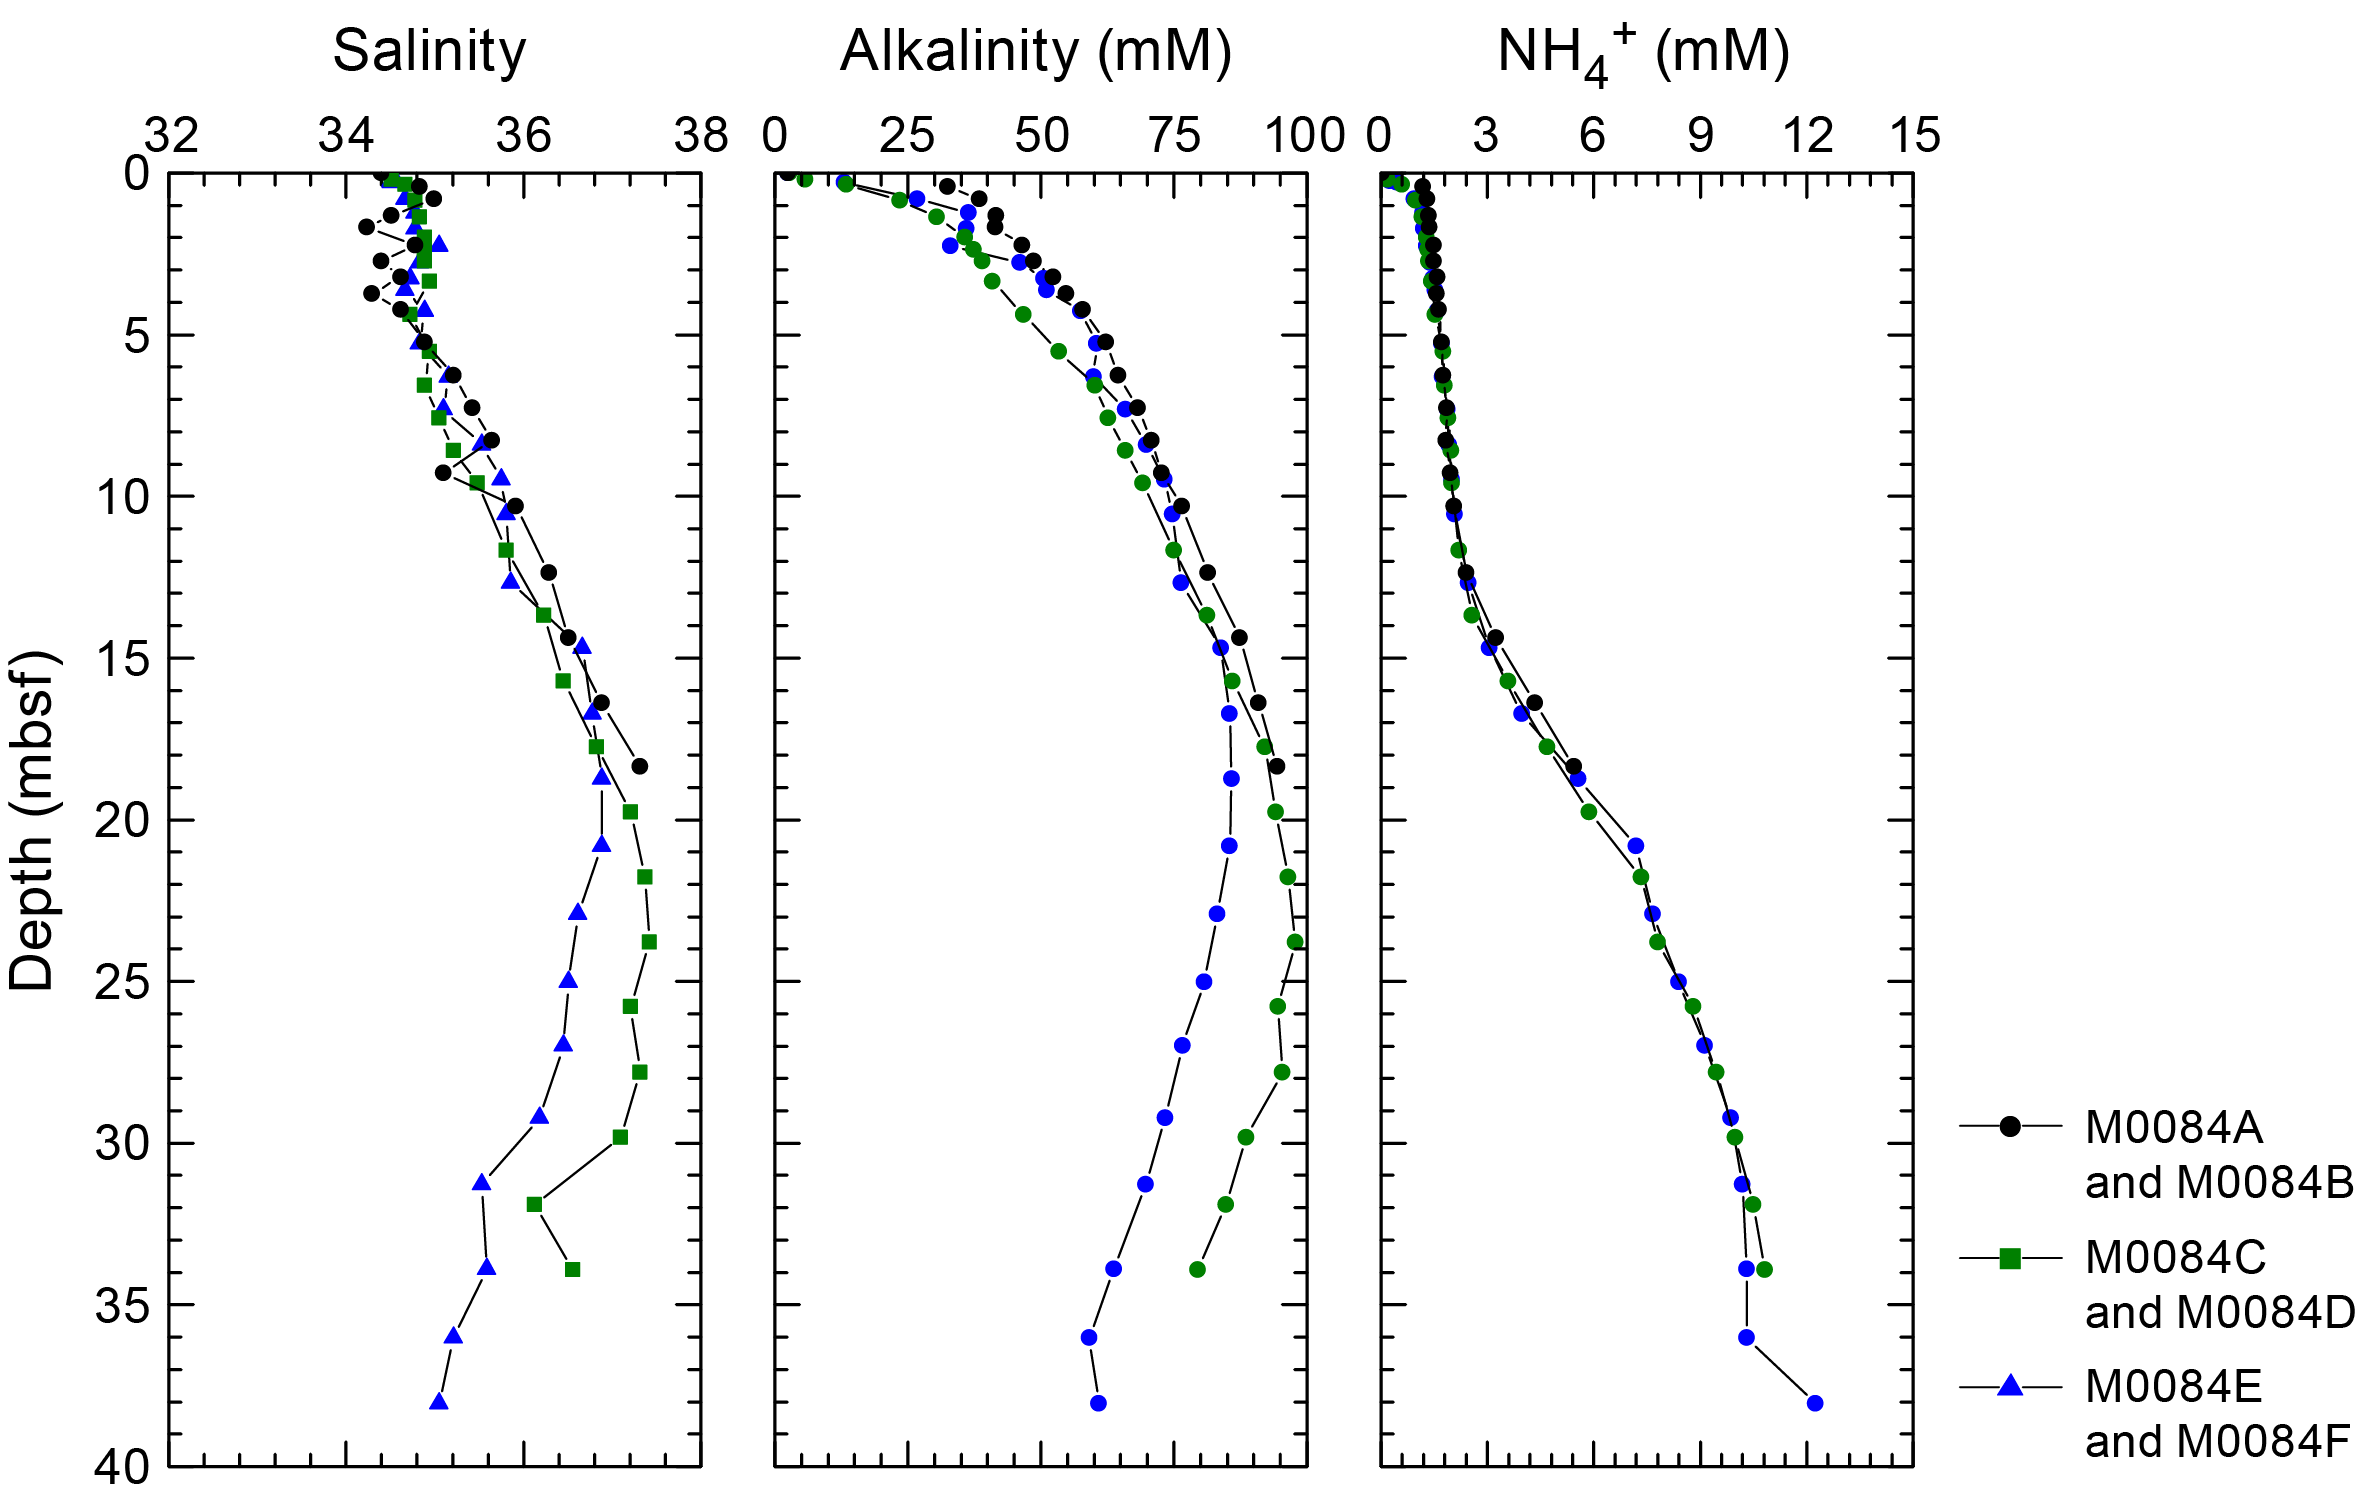
Figure F33. IW salinity, total alkalinity, and ammonium concentrations, Site M0084.
Salinity at Site M0085 generally shows relatively stable downcore trends with values ranging ~34–35.2. Alkalinity concentrations in the BW are similar to seawater (~2.5 mM; Bruland et al., 2014). Alkalinity at the top of the trigger core is elevated (7.2 mM). Alkalinity values in the GPC cores start above 11 mM and rise to peak values (50–51 mM) at ~6 mbsf, followed by gradual decreases to 19 mM at the bottom of Hole M0085D (~32 mbsf). Similar to the general downcore trends of alkalinity profiles, ammonium (NH4+) concentrations exhibit a significant increase relative to BW (0.03 mM) to 5–6 mM at 9–10 mbsf and then gradually decrease to 2.9 mM at the bottom of Hole M0085D (~32 mbsf) (Figure F34; Table T11).
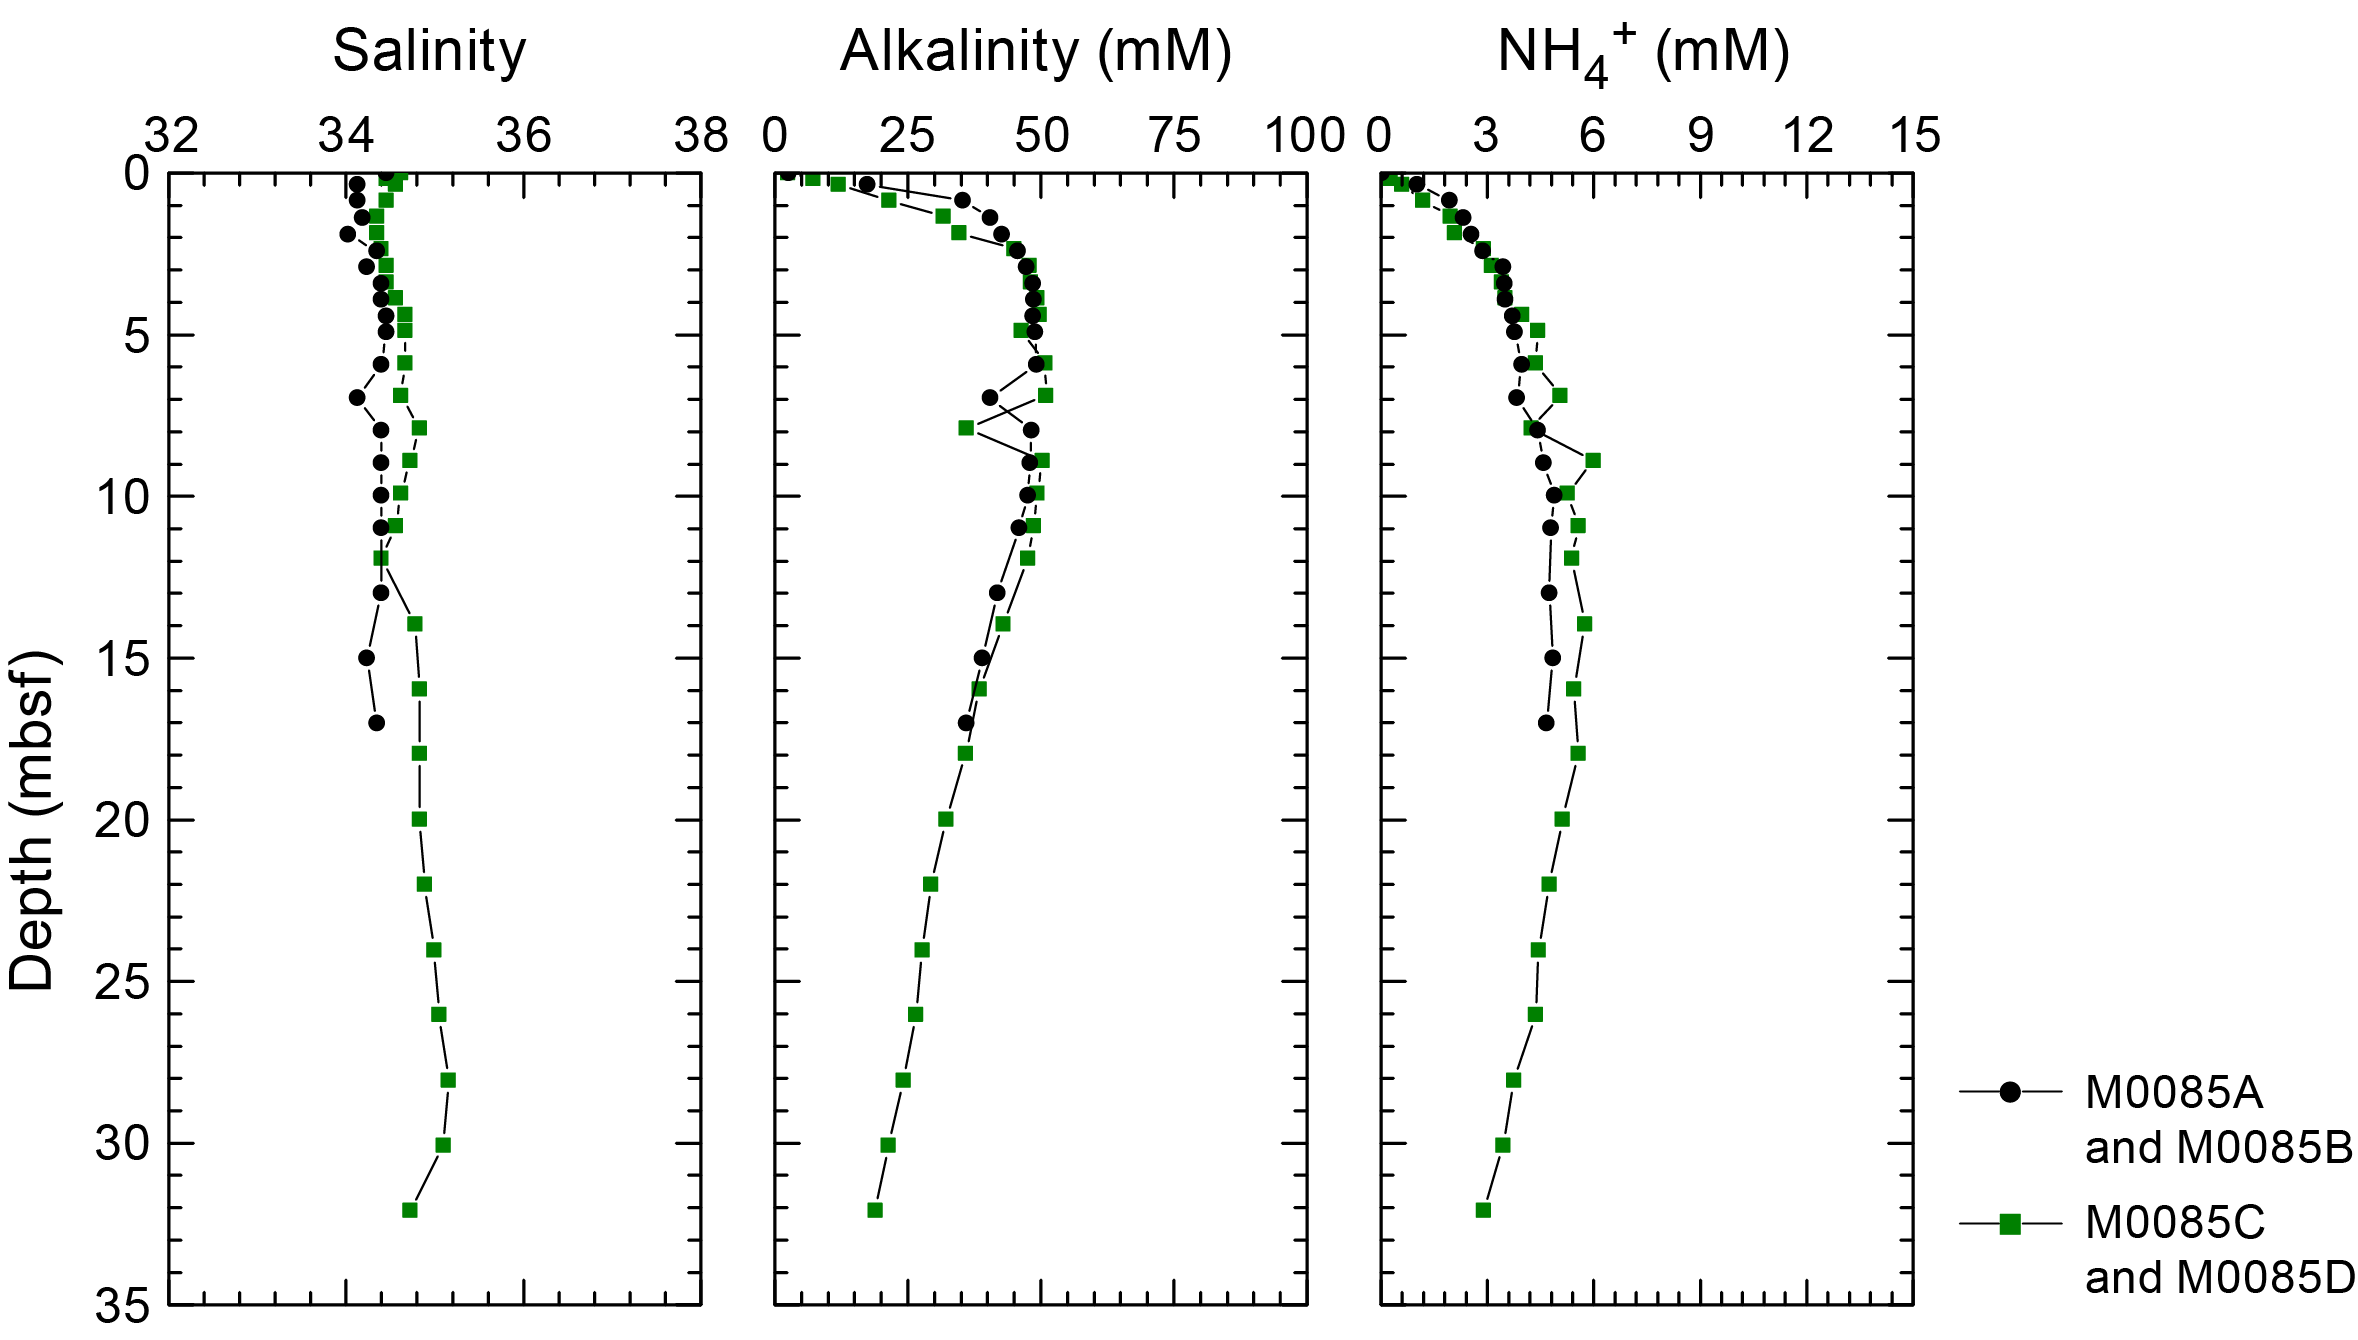
Figure F34. IW salinity, total alkalinity, and ammonium concentrations, Site M0085.
6.1.2. Shore-based analysis
6.1.2.1. Dissolved vanadium, molybdenum, and uranium
Dissolved vanadium (V) concentrations in Site M0084 trigger cores range 65–101 nM. In the GPC cores, V shows comparable downcore patterns, with concentrations first decreasing from ~200 nM at the core top to less than 60 nM at 8–10 mbsf and then increasing to ~269 nM at 25–26 mbsf, followed by an increase to ~600 nM and a decrease to 94 nM in the deepest part of Holes M0084D and M0084F, respectively. Dissolved molybdenum (Mo) concentrations generally decrease rapidly from ~160 nM at the uppermost GPC sample to less than 10 nM downhole, apart from occasional spikes and elevated concentrations throughout the holes. Dissolved uranium (U) concentrations decrease with depth from ~13–14 in BW to 2 nM in the trigger core. In the GPC cores, U profiles exhibit a rapid decrease from the highest concentrations of 30–40 nM in the uppermost samples to less than 1 nM throughout the cores, except for several elevated values in isolated intervals and slight increases at ~15–35 mbsf in Holes M0084D and M0084F (Figure F35; Table T10).

Figure F35. IW V, Mo, and U concentrations, Site M0084.
Dissolved V in Hole M0085B does not show a clear downcore trend; concentrations range 112–243 nM. In Hole M0085D, V concentrations generally increase from ~200 nM in the uppermost sample to 269 nM at ~14 mbsf, followed by a slight decrease to 229 nM at the bottom. Dissolved Mo concentrations range ~50–120 nM in the trigger cores. In the GPC cores, Mo concentrations decrease rapidly from ~200 nM in the uppermost sample to less than 20 nM at ~1.5 mbsf and remain at a low level downcore, except for some outliers with high concentrations, before increasing to ~150 nM at the bottom of Hole M0085D. Similar to Mo profiles, dissolved U concentrations also decrease with depth from ~43 nM in the uppermost sample of the GPC cores to mostly less than 2 nM for the remainder of the core except for several elevated values in isolated intervals (Figure F36; Table T11).
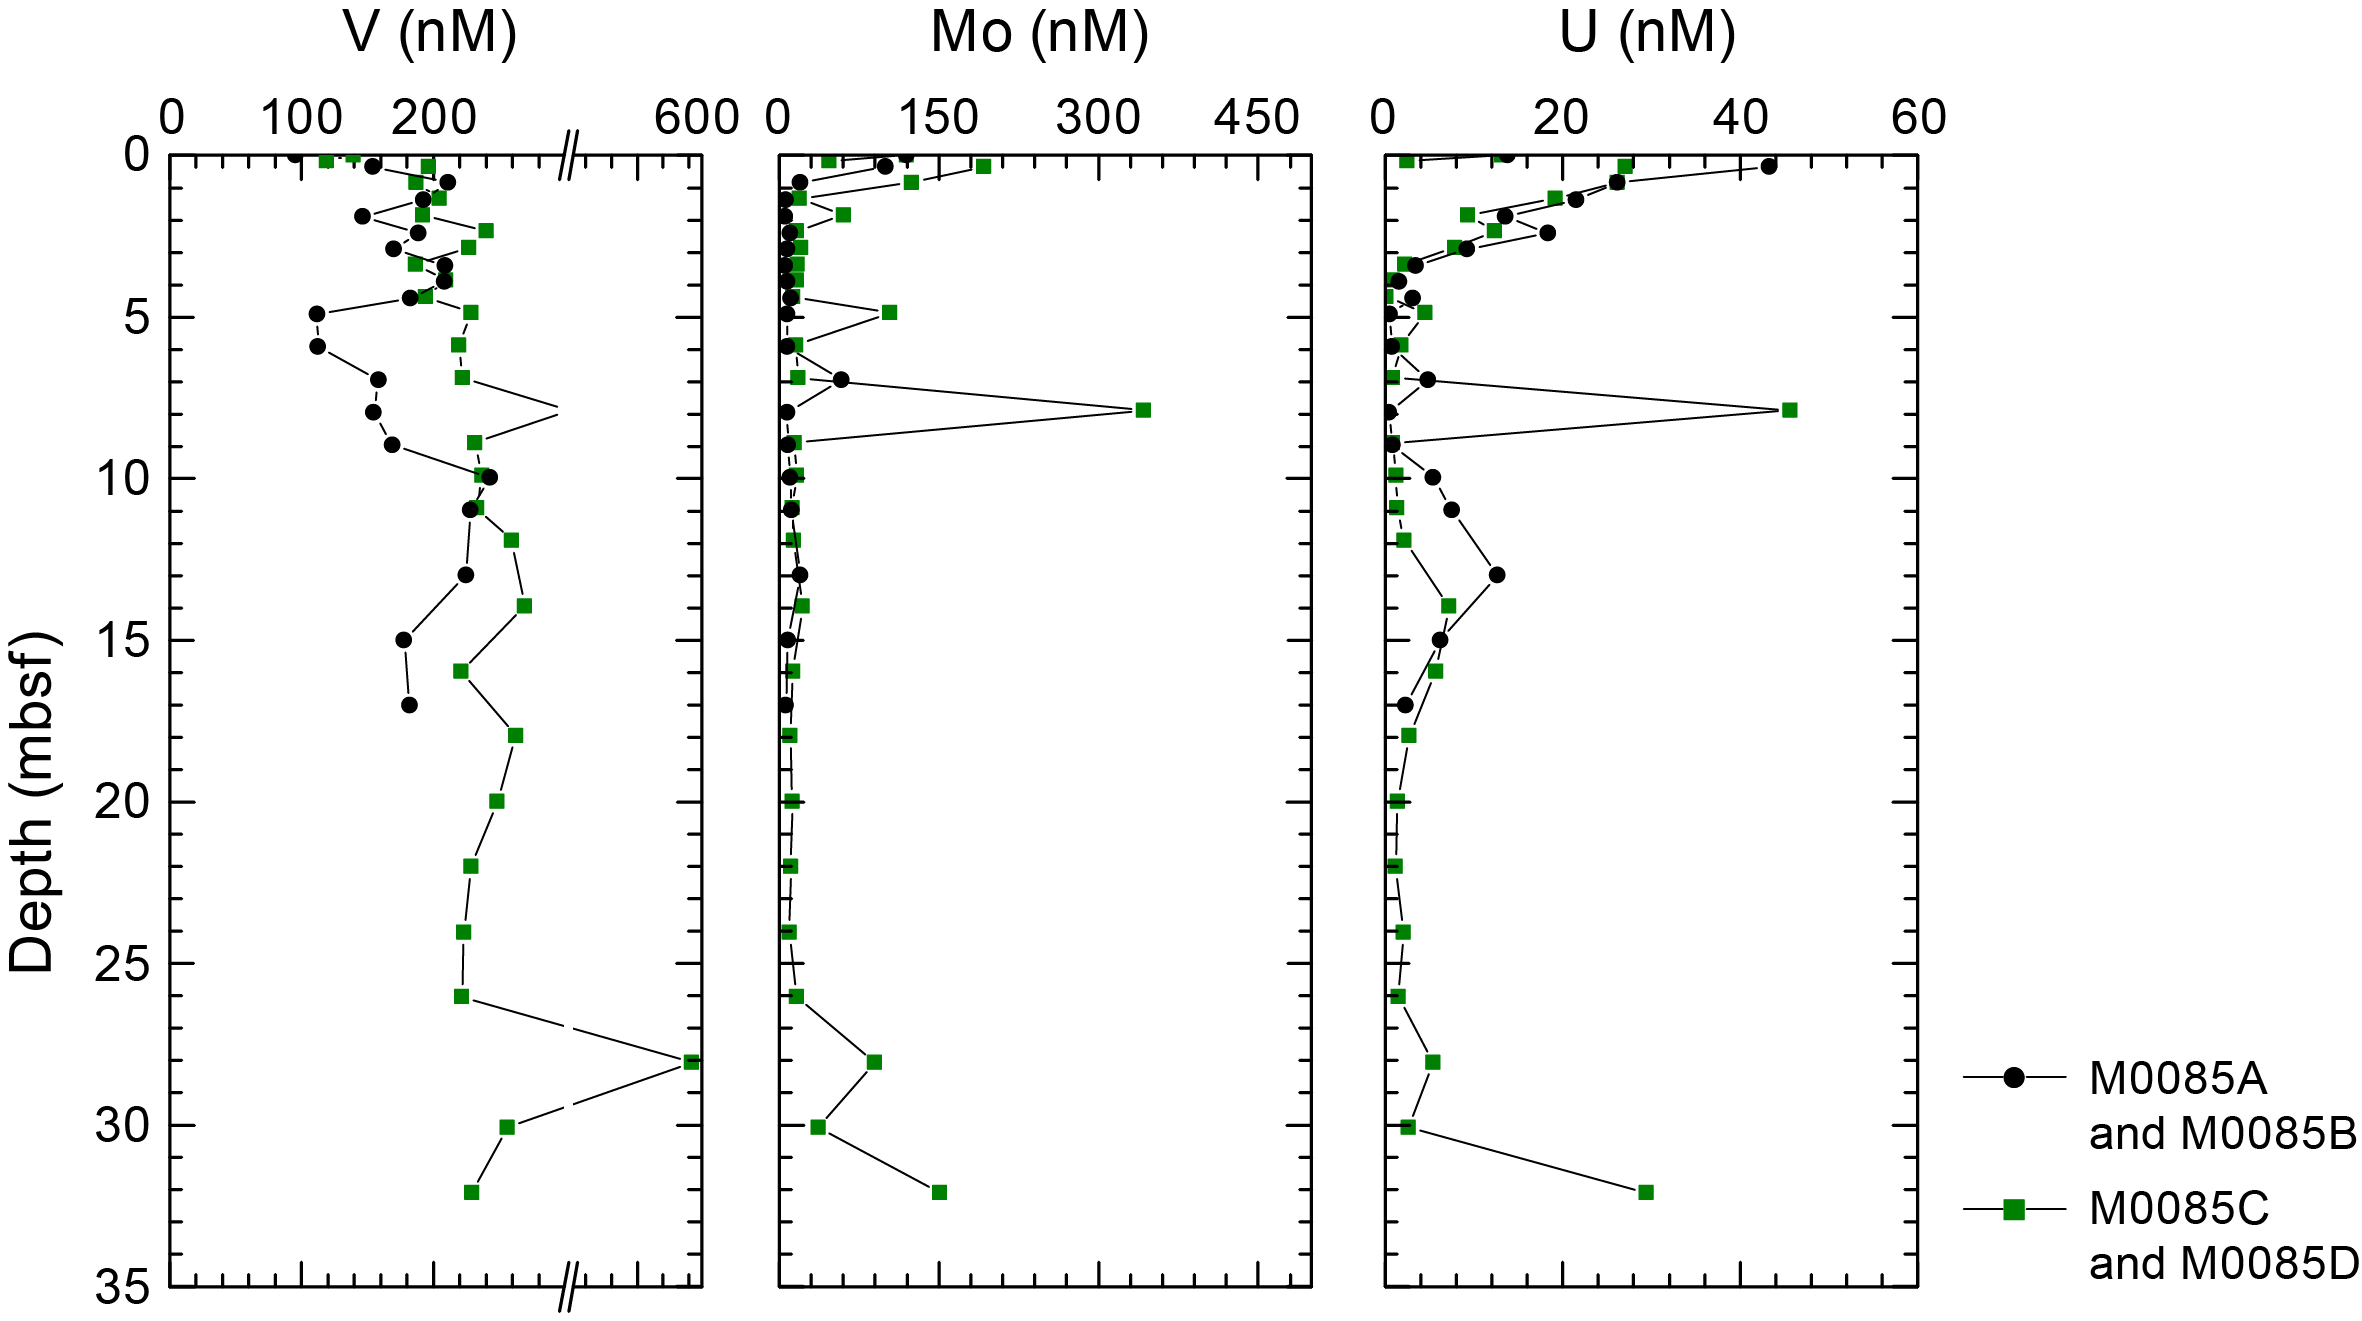
Figure F36. IW V, Mo, and U concentrations, Site M0085.
6.1.2.2. Dissolved lithium, boron, silica, manganese, iron, strontium, and barium
Dissolved lithium (Li) concentrations at Site M0084 decrease from ~26.5 µM in the BW to 15–17 µM at ~7–8 mbsf in the GPC cores. Below 8 mbsf, Li concentrations increase slightly to ~20 µM at ~12–15 mbsf. Subsequently, Li concentrations decrease again to ~16 µM at 18–21 mbsf, followed by an increase to ~24 µM at the core bottoms (~38 mbsf). Dissolved boron (B) concentrations generally increase monotonically from ~450 µM in the BW to ~1200 µM at the base of Hole M0084D (~34 mbsf). In the lowermost 10 m of Hole M0084F, B concentrations show a slight decrease toward the core bottom at ~38 mbsf. Dissolved silica (Si) concentrations increase rapidly from ~140 µM in the BW to ~800 µM at ~0.2–0.3 mbsf in the trigger cores. Si concentrations remain high (~770–960 µM) throughout the GPC cores at Site M0084 (Figure F37; Table T10).
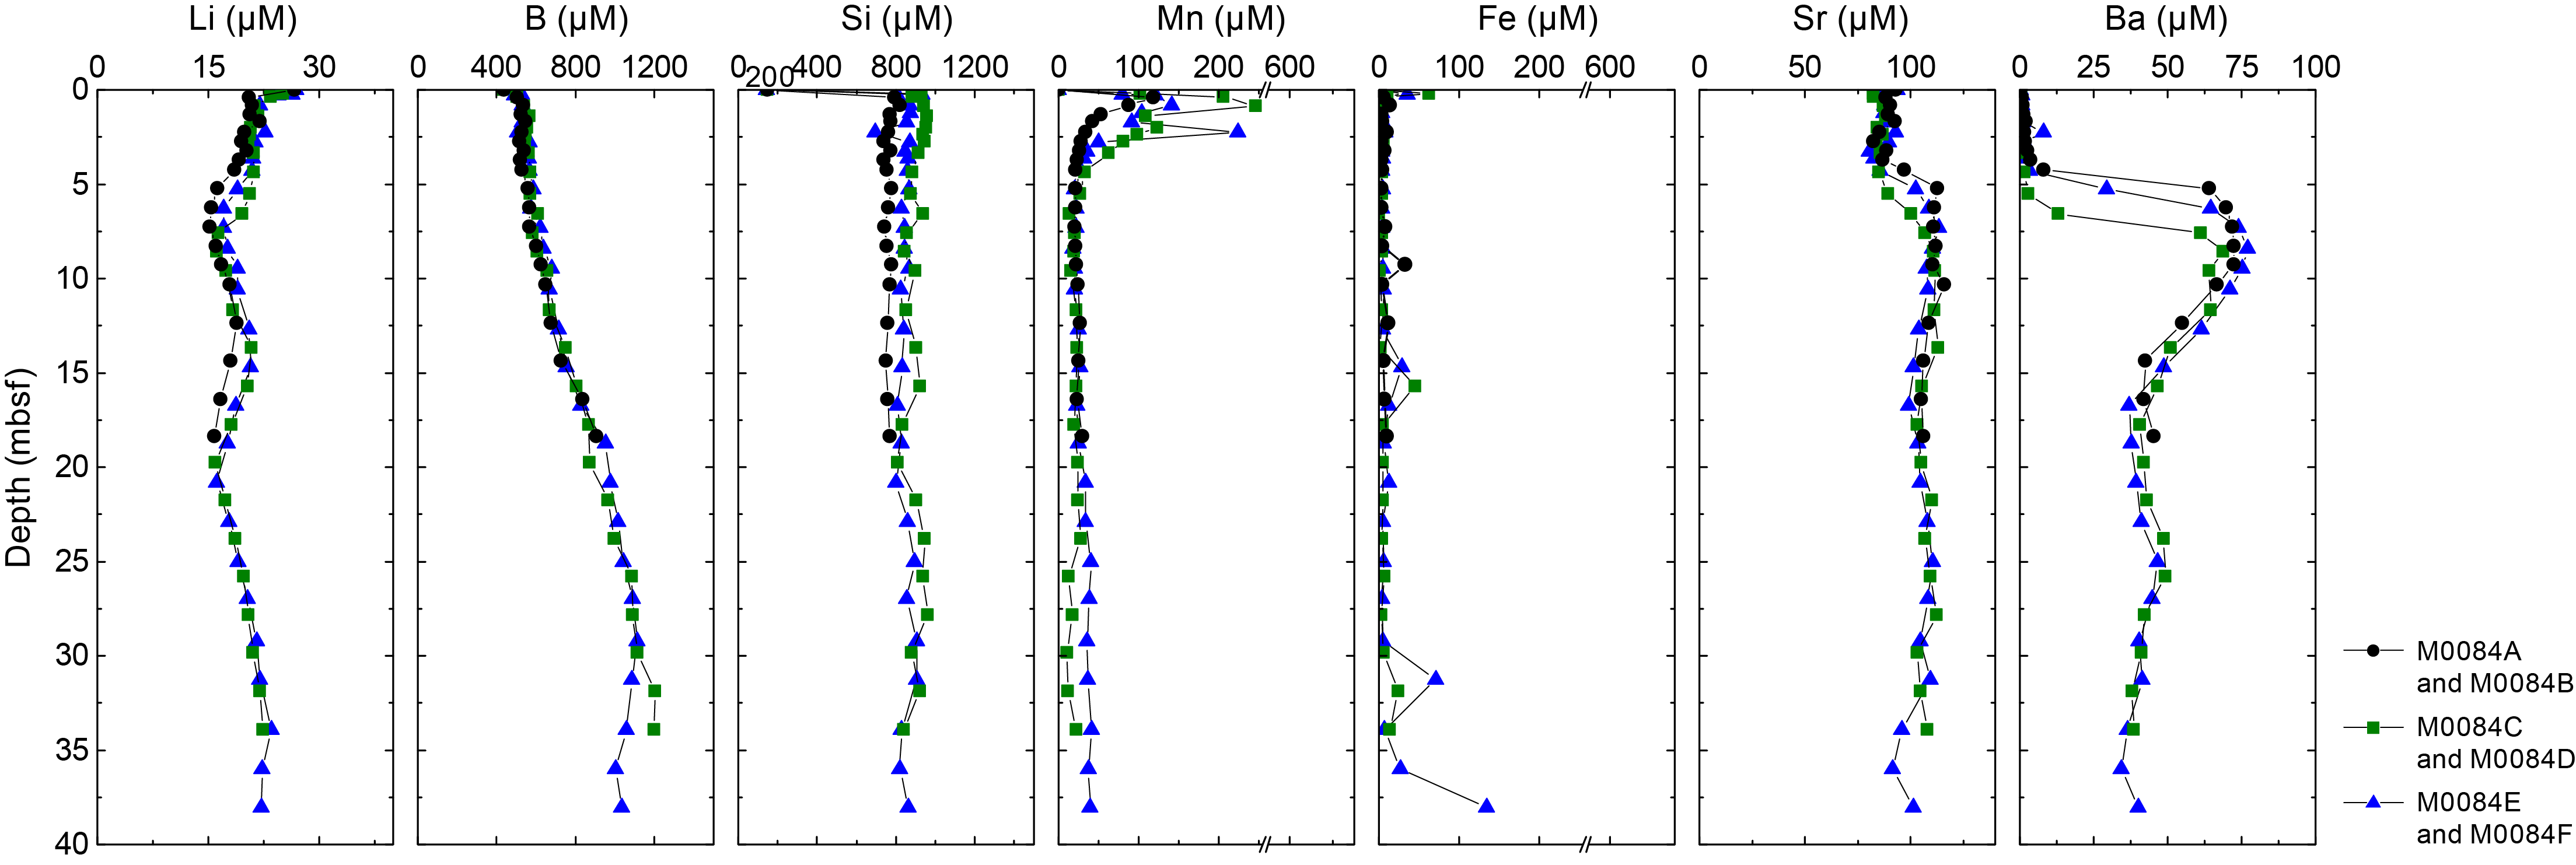
Figure F37. IW Li, B, Si, Mn, Fe, Sr, and Ba concentrations, Site M0084.
Dissolved manganese (Mn) profiles show high values (100–250 µM) in the uppermost samples of the trigger cores and GPC cores, followed by a quasiexponential decline that is punctuated by several spikes in the upper 5 m. Dissolved iron (Fe) generally shows low concentrations less than 10 µM, except for several prominent spikes at ~9, ~16, ~31, and ~38 mbsf (Figure F37).
Dissolved strontium (Sr) concentrations show generally constant values of ~80 µM in the uppermost ~4–5 m, followed by an increase to ~110 µM at ~6–9 mbsf. Subsequently, Sr concentrations decrease slightly to 100 µM at 17–18 mbsf and then increase again to ~110 µM at ~25–28 mbsf, followed by a gradual decrease to ~100 µM toward the bottom of Holes M0084D and M0084F (~38 mbsf). Dissolved barium (Ba) profiles exhibit downcore patterns mostly similar to Sr, with low values (less than 1 µM) in the trigger cores and a slight increase to 3–4 µM in the upper ~4 m of the GPC cores. A sharp increase in Ba concentrations to ~80 µM at 8–9 mbsf is observed. Below that depth, Ba concentrations decrease to ~40 µM at 14–17 mbsf and then remain generally stable, ranging 34–49 µM to the base of the cores (~38 mbsf) (Figure F37).
Dissolved Li concentrations at Site M0085 decrease from 25–26 µM in the BW to 12–14 µM at ~4 mbsf. Below this depth, Li concentrations generally remain constant to ~25 mbsf, where a sharp increase in Li concentrations to ~39 µM at the bottom of Hole M0085D (~32 mbsf) was observed. Dissolved B concentrations increase from ~450 µM in the BW to ~750 µM at ~4–5 mbsf, followed by a gradual decrease with depth to 494 µM at the bottom of Hole M0085D. Dissolved Si concentrations increase rapidly from ~140 µM in BW to 773 µM at 0.2 mbsf. In the GPC cores, Si concentrations remain at constant high levels in Hole M0085B and show a slight decreasing trend from ~950 to ~850 µM downcore in Hole M0085D (Figure F38; Table T11).

Figure F38. IW Li, B, Si, Mn, Fe, Sr, and Ba concentrations, Site M0085.
Dissolved Mn concentrations in the BW is below detection limit at Site M0085. Concentrations show a slight increase from 45 µM in the trigger core to 80–90 µM at ~5 mbsf in the GPC cores and then a decrease to ~30 µM at ~11 mbsf. The remainder of the core shows a relatively constant low level. Dissolved Fe concentrations mostly exhibit low values (<10 µM) throughout the cores, except in the trigger core and uppermost part of Hole M0085D (~2 mbsf), which show elevated concentrations of 25–57 µM (Figure F38).
Dissolved Sr concentrations increase from 88 µM in the trigger core to 96–99 µM at 4–6 mbsf in the GPC cores before concentrations start gradually declining to 81 µM at the bottom of Hole M0085D (~32 mbsf). Dissolved Ba concentrations show a rapid increase from 0.4 µM in the BW and trigger core to 35–37 µM at 4–6 mbsf in the GPC cores. Subsequently, Ba concentrations show gentle increases to 40 µM at ~11–12 mbsf, where a sharp decline to low concentrations (<1 µM) at the bottom of Hole M0085D (~32 mbsf) is observed (Figure F38).
6.1.2.3. Chloride, bromide, and sulfate
All anions analyzed using ion chromatography (IC) are listed in Tables T10 and T11.
Dissolved chloride (Cl−) concentrations are generally stable throughout Site M0084, ranging ~540–560 mM, except for one outlier at 9.6 mbsf with a much lower concentration of 513 mM. Dissolved bromide (Br−) concentrations show asymptotic increases with depth from ~0.82 mM in the BW to ~1 mM at ~20 mbsf in the GPC cores and then remain relatively stable to the bottom of Holes M0084D and M0084F (~38 mbsf). Dissolved sulfate (SO42−) concentrations in all holes decrease almost linearly from seawater values in the BW (~28–29 mM) to less than 0.5 mM at ~5–6 mbsf and remain at these low levels to the bottom of Holes M0084D and M0084F (Figure F39; Table T10).

Figure F39. IW Cl−, Br−, and SO42− concentrations, Site M0084.
Dissolved Cl− concentrations are relatively constant throughout Holes M0085B and M0085D, mostly ranging ~540–560 mM. Dissolved Br− concentrations increase slightly from ~820 µM in the BW to ~920 µM at 8–10 mbsf in the GPC cores and then remain relatively constant to the bottom of Hole M0085D (~32 mbsf). Dissolved SO42− concentrations exhibit a linear decrease from ~28 to 29 mM in the BW to less than 0.5 mM at ~3–4 mbsf in the GPC cores. Below this depth, SO42− concentrations remain at a very low level to 6–7 mbsf, where concentrations start to increase linearly to the bottom of the cores at ~32 mbsf in Hole M0085D (Figure F40; Table T11).
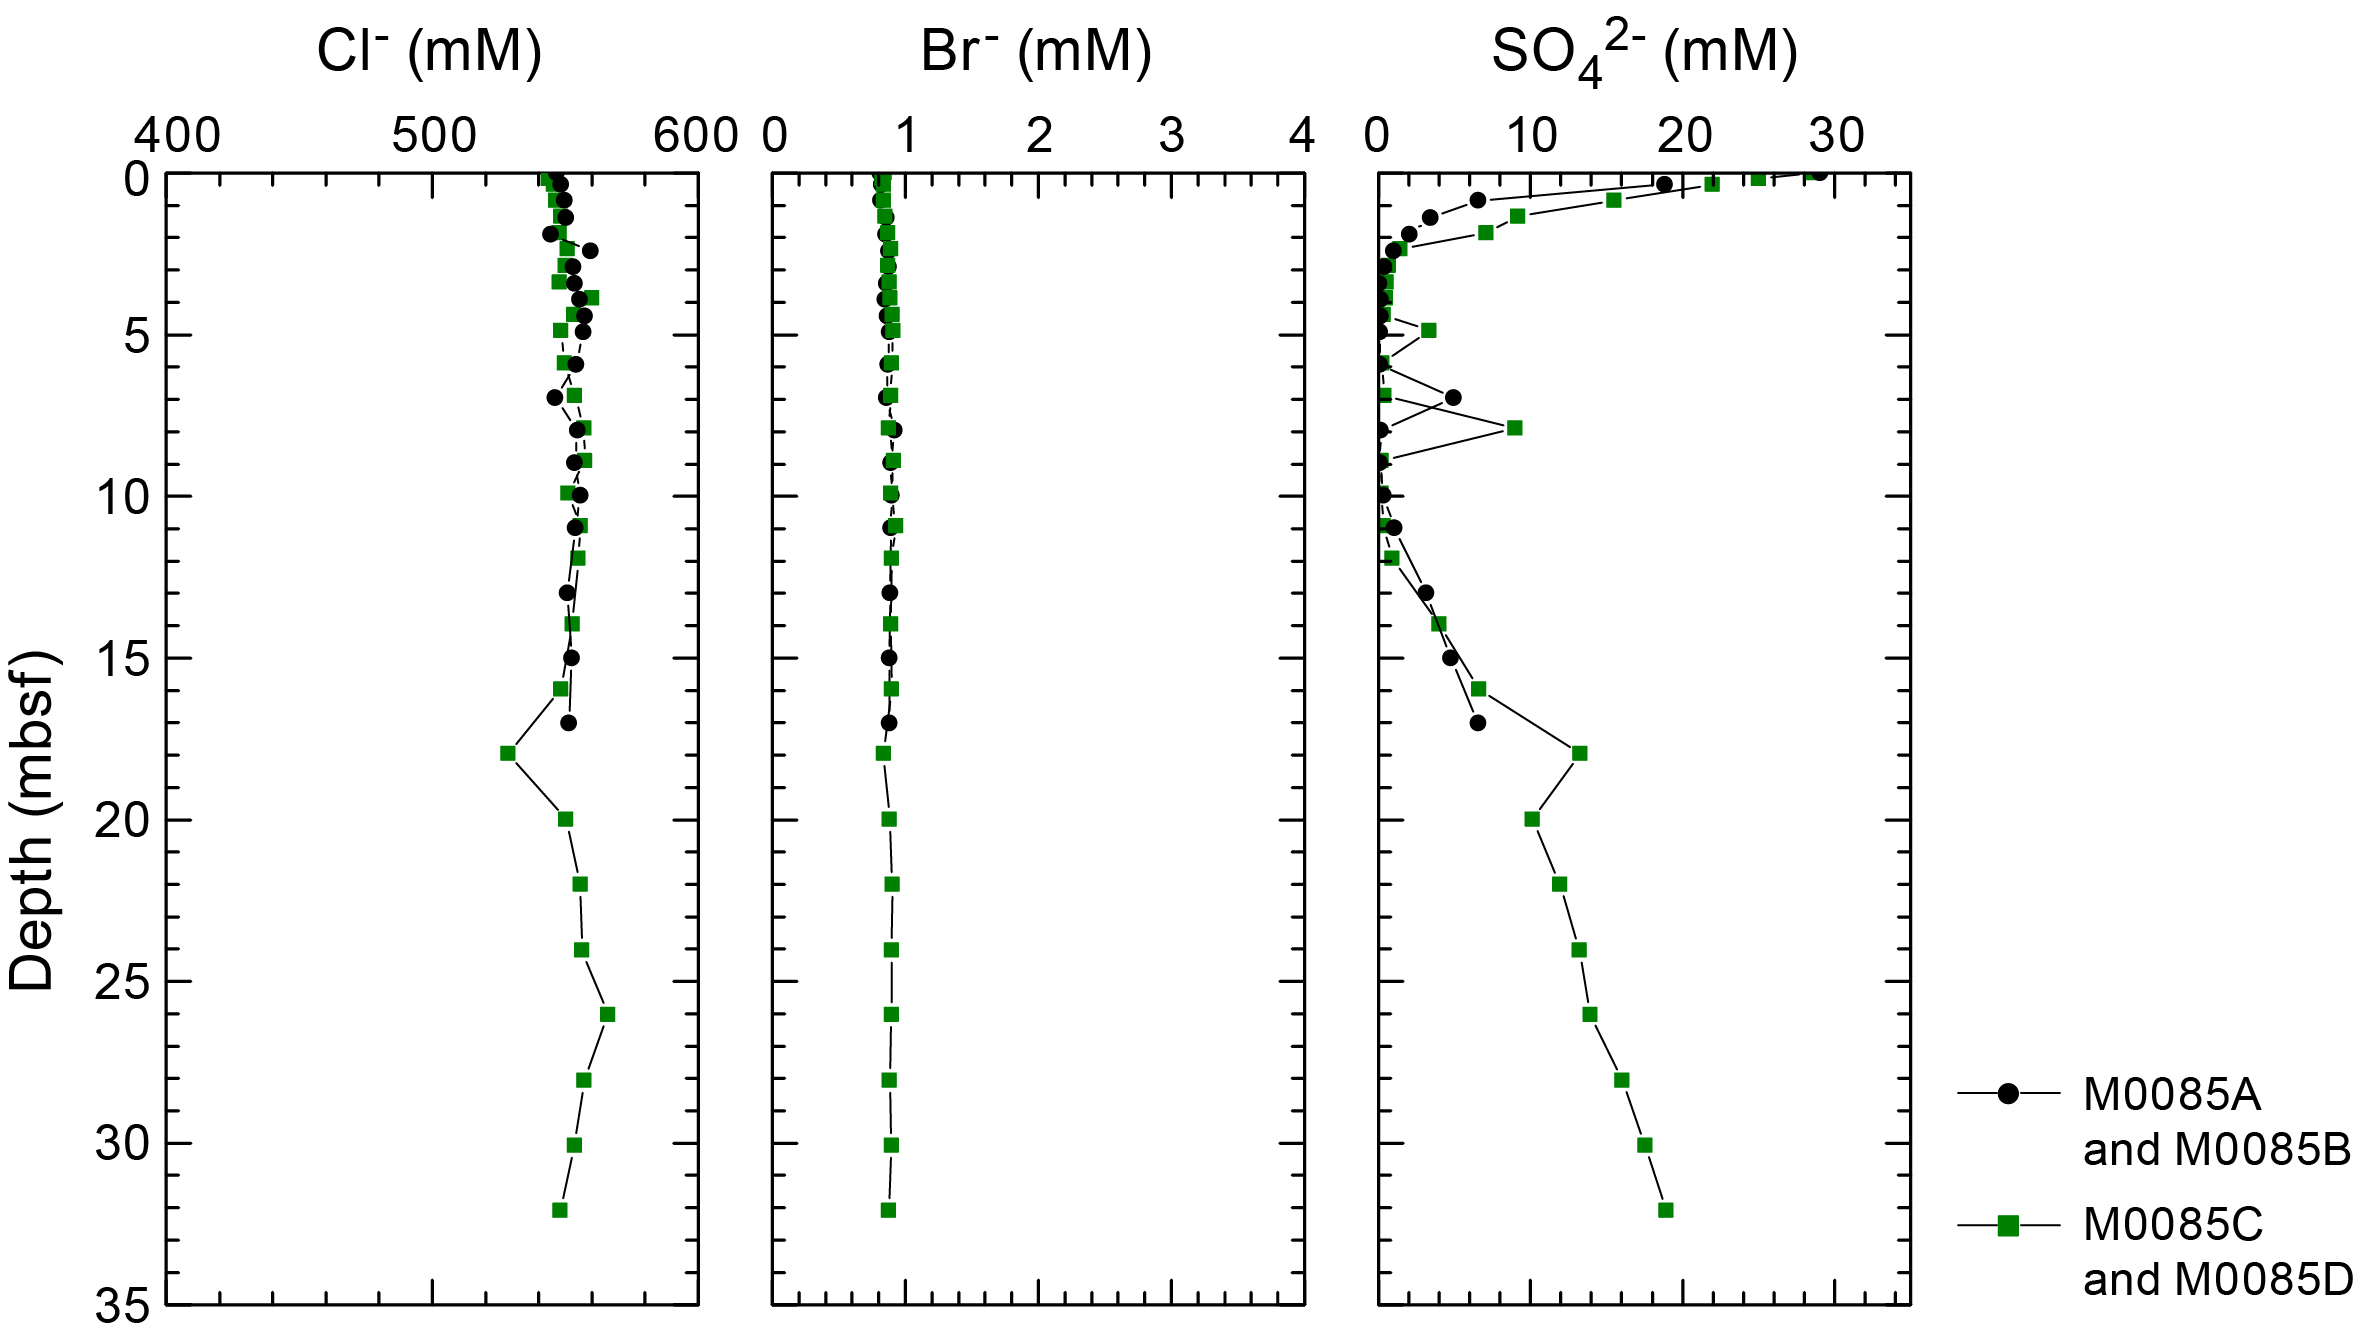
Figure F40. IW Cl−, Br−, and SO42− concentrations, Site M0085.
6.1.2.4. Sodium, magnesium, potassium, and calcium
Dissolved sodium (Na+) concentrations at Site M0084 do not exhibit clear downcore trends and are generally highly scattered, ranging ~280–616 mM.
Dissolved potassium (K+) concentrations at Site M0084 generally show a downcore decrease from ~10–11 mM in the uppermost samples from the GPC cores to ~9 mM at ~10 mbsf, followed by a gradual increase to ~13 mM at the bottom of Hole M0084D (~34 mbsf).
Dissolved calcium (Ca2+) concentrations at Site M0084 generally decrease with depth from ~11 mM in the uppermost samples from the trigger cores and GPC cores to ~5–6 mM at ~20 mbsf in the GPC cores, followed by an increase to ~10 mM at the bottom of Holes M0084D and M0084F.
Dissolved magnesium (Mg2+) concentrations at Site M0084 generally decrease with depth from ~55 mM in the uppermost samples of GPC cores to ~52 mM at ~3–4 mbsf, followed by an increase to high values (~65–76 mM) at ~12 mbsf in Hole M0084B, ~28 mbsf in Hole M0084D, and 18 mbsf in Hole M0084F. Farther downcore, Mg2+ concentrations decrease to ~52–70 mM at the bottom of all holes.
Dissolved Na+ concentrations at Site M0085 do not exhibit clear downcore trends and are generally highly scattered, ranging ~350–731 mM.
Dissolved K+ concentrations at Site M0085 generally remain stable downcore, mostly ranging ~10–12 mM with outliers at ~8 mbsf in Hole M0085B and ~18 mbsf in Hole M0085D.
Dissolved Ca2+ concentrations in Hole M0085B generally show a gentle decrease from ~9.3 mM in the uppermost sample to ~8 mM at the bottom of the hole. In Hole M0085D, Ca2+ concentrations decrease from ~9.7 mM in the uppermost sample to ~7 mM at ~14 mbsf, followed by an increase to 11 mM at the bottom of the hole (~32 mbsf).
Dissolved Mg2+ concentrations at Site M0085 fluctuate unsystematically in all holes, ranging ~32–74 mM.
The IC cation data is only presented in GEOCHEM in Supplementary material because the samples require further post expedition analysis for validation of absolute values (analytical accuracy).
6.2. Shore-based H2S analysis
At Sites M0084 and M0085, H2S concentrations were below the detection limit in all samples (see GEOCHEM in Supplementary material).
6.3. Headspace gas analysis: methane, ethane, and C1/C2 ratio
The offshore headspace gas analysis was mainly performed on the longest GPC core. A total of 38 headspace samples were measured from Holes M0084E (trigger core) and M0084F (GPC core) for hydrocarbon compositions (Figure F41; Table T12), and a total of 34 headspace samples were measured from Holes M0085C (trigger core) and M0085D (GPC core) (Figure F42; Table T13).
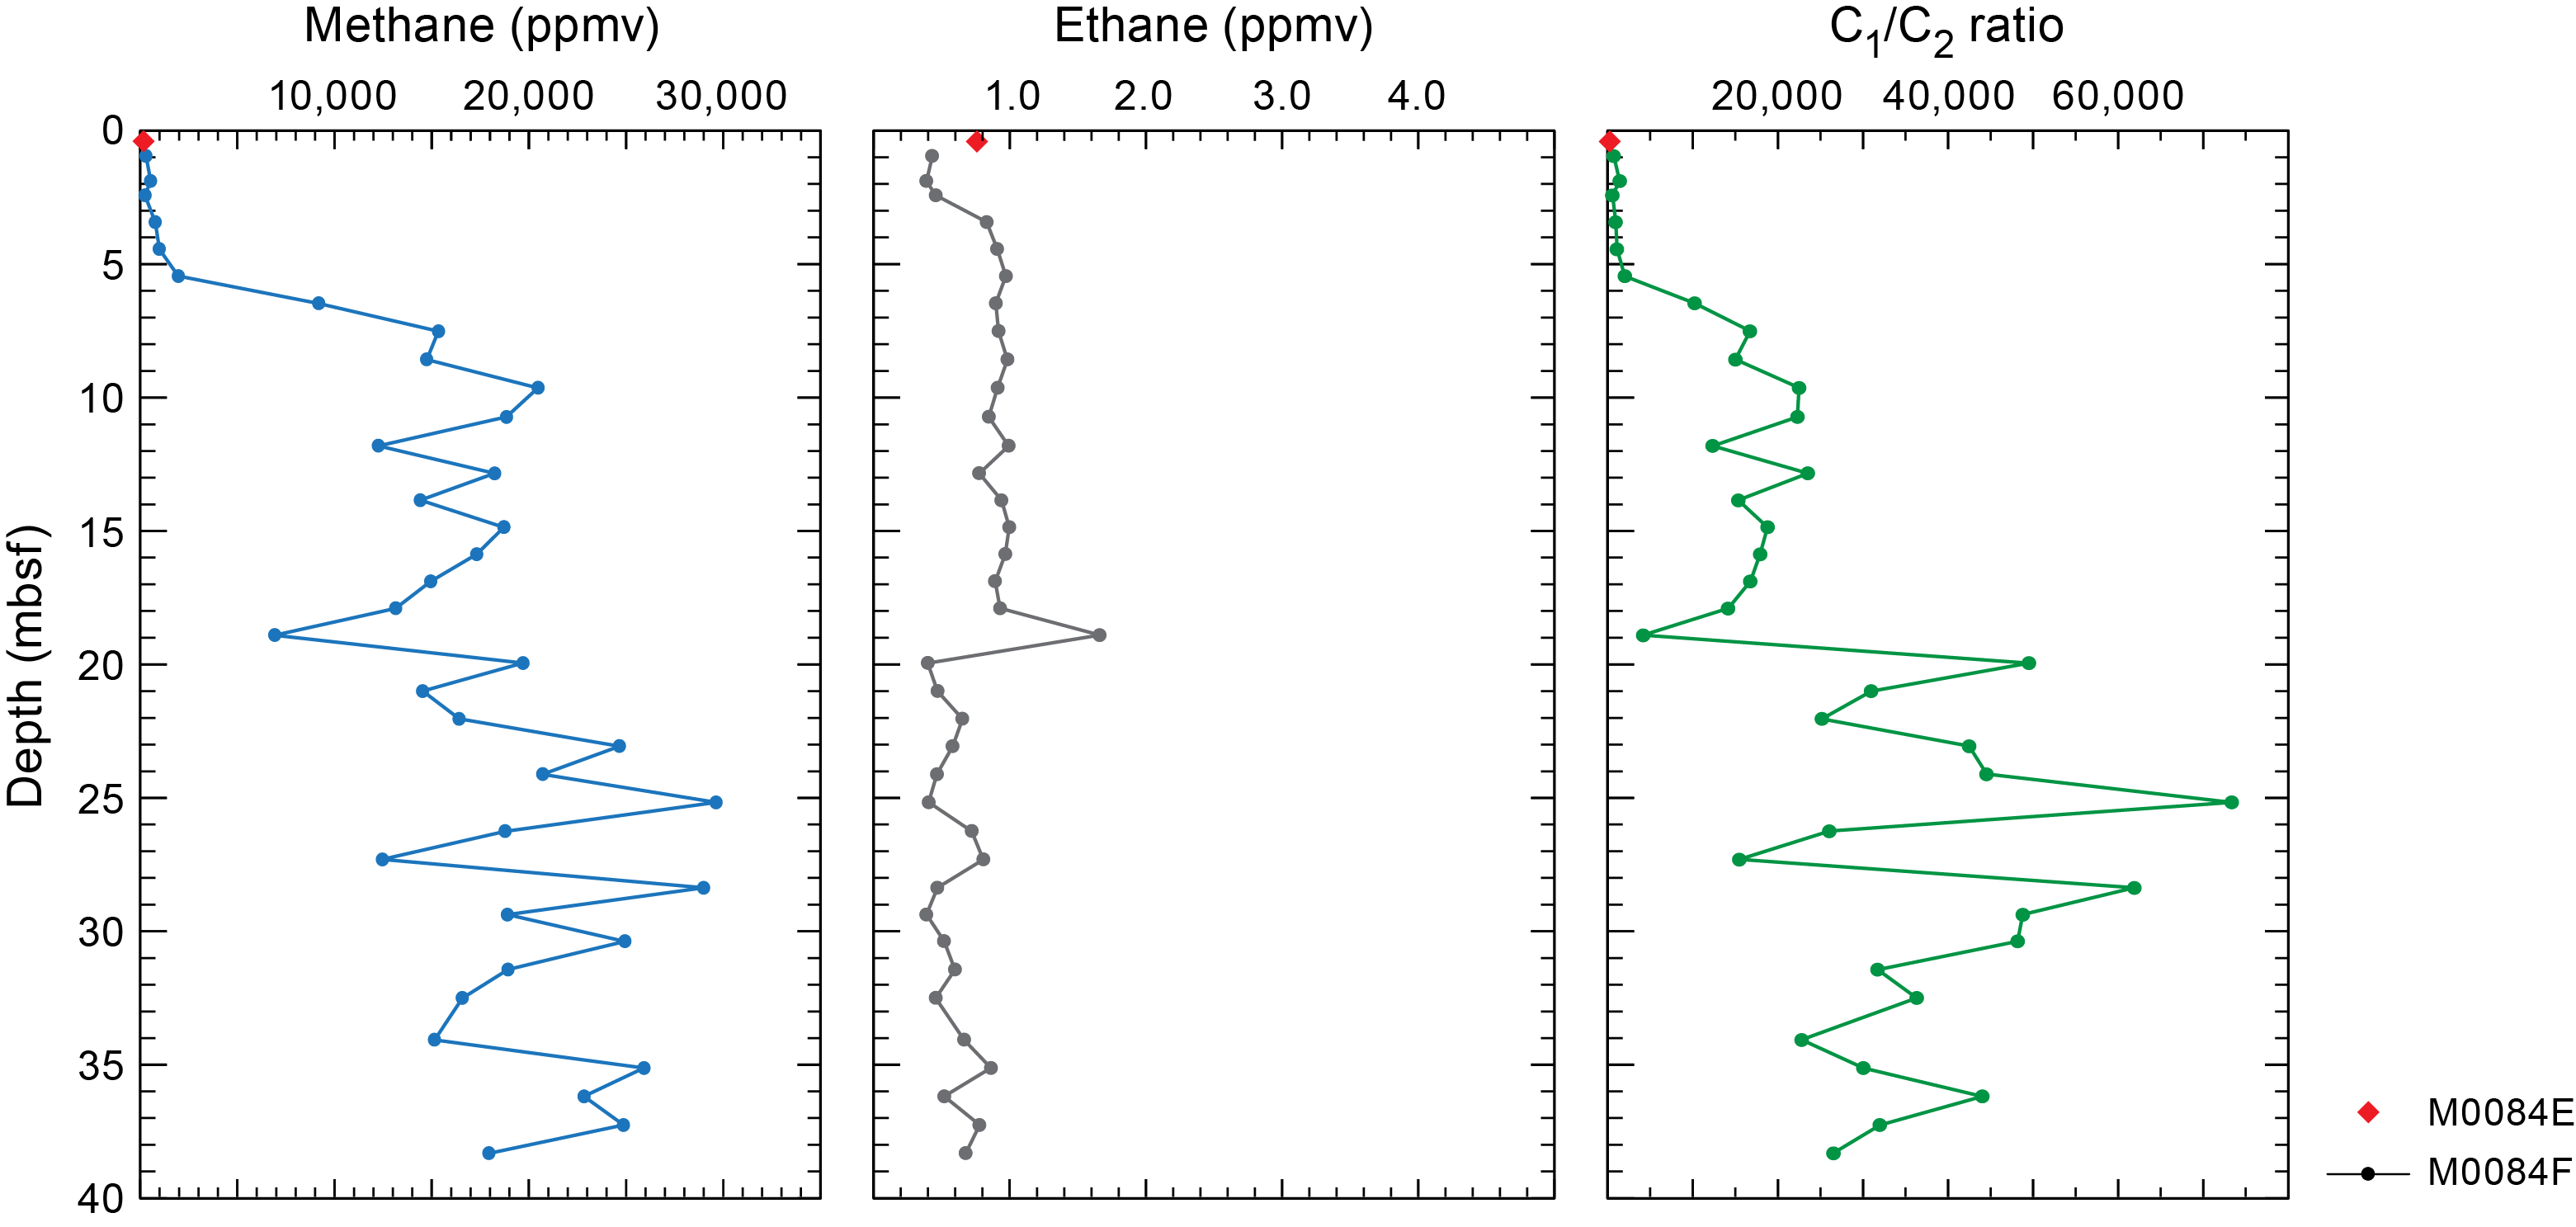
Figure F41. Methane, ethane, and methane to ethane ratio, Holes M0084F and M0084E.

Figure F42. Methane, ethane, and methane to ethane ratio, Holes M0085D and M0085C.
At Site M0084, from 0 to 5.445 mbsf, methane (CH4 and C1) concentrations are low but constant concentrations, ranging ~256–1963 ppmv. Between 5.445 and 7.51 mbsf, methane concentrations increase rapidly to 15,351 ppmv. Methane concentrations fluctuate between 6,924 and 29,633 ppmv with an overall increasing trend from 7.51 mbsf to the bottom of Hole M0084F (~38.3 mbsf).
Ethane (C2H4 and C2) was detected in relatively constant but low concentrations (0.38–99 ppmv) in all headspace samples from Holes M0084E and M0084F. At 18.9 mbsf, an outlier is observed with a maximum measured concentration of 1.66 ppmv. The methane/ethane (C1/C2) ratios follow the methane profile pattern; however, two stabilization ranges are observed, one between 7.51 and 18.9 mbsf, with average ratios of ~15,000, and the other between 19.945 and 38.31 mbsf, with average ratios of 20,000–40,000.
Hydrocarbon concentration patterns at Site M0085 are peculiar, but for several samples the leak tests failed (5.04, 7.05, 17.115, 20.14, 25,185, 30.23, 31.235, and 33.3445 mbsf in Hole M0085D). In the uppermost ~5 m of Hole M0085D, the methane concentration rapidly increases from 87 to 8,766 ppmv. This concentration is stable between ~5 and 9 mbsf. From ~9 to 12 mbsf, methane concentrations decline to 691 ppmv and then remain on a stable low level (215–1690 ppmv) to the bottom of Hole M0085D (~33.3 mbsf).
Ethane (C2H4 and C2) was detected in relatively constant but low concentrations (0.28–0.75 ppmv) from ~1 to 23.175 mbsf in Hole M0085D. Below this depth, ethane concentrations slowly increase overall (with fluctuations) and reach a maximum concentration of 4.29 ppmv at 32.25 mbsf. The methane/ethane (C1/C2) ratios follow the same pattern as the methane profile. Ratio values reach a maximum of >25,000 between ~5 and 9 mbsf and are on a constant low level (<1000) from 14.1 mbsf to the bottom of Hole M0085D.
Alongside C1 and C2, other hydrocarbon gases such as ethylene (C2=), ethane (C2), propene/propylene (C3=), propane (C3), and n-butane (n-C4) were detected and measured, but their concentrations are very low, generally less than 1 ppmv at all sites (see GEOCHEM in Supplementary material).
6.4. Shore-based solid-phase analysis
6.4.1. Aluminum, calcium, silica, iron and manganese
The solid-phase elements analyzed using energy dispersive X-ray fluorescence (ED-XRF), including aluminum (Al), calcium (Ca), silica (Si), iron (Fe), and manganese (Mn), which are briefly described below and listed in Tables T14 and T15, in addition to Ba, Br, Cr, Cu, K, Mg, Ni, P, Sr, Ti, V, Zn, and Zr.
Solid-phase Al contents at Site M0084 range ~2.6–5.4 wt% (25,703–53,625 mg/kg). In all holes, a common downcore pattern is shown: a gentle increase in Al contents from ~3.2 wt% in the uppermost samples to ~5.4 wt% at ~18–21 mbsf is followed by a slight decrease to ~4 wt% at the base of Hole M0084F (~37 mbsf) (Figure F43).

Figure F43. Solid-phase X-ray fluorescence contents of Al, Ca, Fe, Mn, and Si, Site M0084.
Solid-phase Ca contents range ~0.8–1.8 wt% (7,387–17,757 mg/kg). In all holes, Ca contents generally increase with depth from ~0.8 to 1.8 wt% at ~18 mbsf. Below this depth, Ca contents fluctuate between ~0.9 and 1.8 wt% to the bottom of Holes M0084D and M0084F.
Solid-phase Si contents show high values ranging ~22–32 wt% (218,761–332,100 mg/kg). In all holes, Si contents generally show downcore decrease trends at ~14–18 mbsf in Hole M0084B, ~20–28 mbsf in Hole M0084D, and ~18–31 mbsf in Hole M0084F and exhibit a slightly increasing trend downcore.
Solid-phase Fe contents range ~2.7–3.7 wt% (27,448–37,296 mg/kg). In all holes, a slightly decreasing downcore trend is observed.
Solid-phase Mn contents range ~0.04–0.23 wt% (398–4,646 mg/kg). In all holes, a common slightly decreasing downcore trend is observed, except for discrete intervals at 18 mbsf in Hole M0084B, 30 mbsf in Hole M0084D, and ~23 mbsf in Hole M0084F, which show elevated Mn contents.
Solid-phase Al contents at Site M0085 range ~3.4–5.4 wt% (33,632–53,855 mg/kg). In Holes M0085B and M0085D, Al contents decrease from ~4 wt% in the uppermost samples to ~3.4 at ~7 mbsf, followed by increases to 5.1 wt% at ~15 mbsf in Hole M0085B and 5.4 wt% at ~27 mbsf in Hole M0085D. Below ~27 mbsf in Hole M0085D, Al contents decrease to ~4 wt% at the base of the core (Figure F44).

Figure F44. Solid-phase X-ray fluorescence contents of Al, Ca, Fe, Mn, and Si, Site M0085.
Solid-phase Ca contents range ~0.7–2.4 wt% (7,444–23,560 mg/kg). In Hole M0085B, Ca contents show a high value of ~1.6 wt% at ~1 mbsf followed by a downcore increase from ~0.7 wt% at ~3 mbsf to ~1.2 wt% at ~17 mbsf. In Hole M0086D, Ca contents remain relatively constant with depth except for two high values (2.2–2.4 wt%) at ~25 and 29 mbsf.
Solid-phase Si contents range ~24–33 wt% (240,464–330,239 mg/kg). In Hole M0085B, Si contents are relatively low (~24 wt%) in the uppermost ~3 m, followed by a decrease from ~33 wt% at ~5 mbsf to 27.5 wt% at ~17 mbsf. In Hole M0085D, Si contents generally decrease from ~32 wt% at ~1 mbsf to ~25 wt% at the bottom of the hole (~33 mbsf).
Solid-phase Fe contents range ~2.6–3.6 wt% (25,980–36,414 mg/kg) with a general increase from ~2.6 wt% at ~1 mbsf to ~3.6 wt% at ~27 mbsf followed by a decrease to 2.6 wt% at the bottom of Hole M0085D (~33 mbsf).
Solid-phase Mn contents generally remain at low levels, ranging ~0.04–0.1 wt% (410–956 mg/kg), except at ~19–21 mbsf in Hole M0085D, where Mn contents are elevated to ~0.2 wt% (1,693 mg/kg).
6.4.2. Carbon, sulfur, and nitrogen
At Site M0084, total carbon (TC) contents vary between 0.69 and 1.59 wt% in Holes M0084A and M0084B, between 0.7 and 2.05 wt% in Holes M0084C and M0084D, and between 0.88 and 1.97 wt% in Holes M0084E and M0084F (Table T14). Total organic carbon (TOC) contents are generally constant with limited variations (~1.1–1.3 wt%) in the uppermost ~15 m in all holes, followed by a decrease to minima of ~0.6–0.8 wt% at ~16–18 mbsf. Below these depths, TOC contents increase with depth to ~1.7–1.8 wt% at the bottom of Holes M0084D and M0084F. Total inorganic carbon (TIC) contents are generally low, ranging 0.05–0.33 wt% in Holes M0084A and M0084B, 0–0.55 wt% in Holes M0084C and M0084D, and 0.07–0.46 wt% in Holes M0084E and M0084F. Total nitrogen (TN) contents vary between 0.09 and 0.2 wt% in Holes M0084A and M0084B, between 0.09 and 0.26 wt% in Holes M0084C and M0084D, and between 0.11 and 0.26 wt% in Holes M0084E and M0084F. Total sulfur (TS) contents first increase from ~0.3 to ~0.8 wt% at ~8–12 mbsf and then decrease to ~0.2–0.4 wt% at ~19–20 mbsf in all holes. Below these depths, TS contents are scattered, ranging 0.3–1 wt% (Figure F45).

Figure F45. Solid-phase contents of TC, TOC, TIC, and TS, Site M0084.
At Site M0085, TC contents vary between 0.59 and 1.61 wt% in Holes M0085A and M0085B and between 0.40 and 1.57 wt% in Holes M0085C and M0085D (Tables T15). TOC contents increase from ~0.45 wt% to a maximum value of ~1.5 wt% at ~7 mbsf in Holes M0085A and M0085B, followed by a decrease to ~1.1 wt% at the bottom of Hole M0085B. In Holes M0085C and M0085D, TOC shows a slight downcore decreasing trend ranging 0.83–1.49 wt% in the uppermost ~30 m, followed by a sharp decrease to ~0.3 wt% at the bottom of the core. TN contents vary between 0.07 and 0.19 wt% in Holes M0085A–M0085D. TS values generally do not exhibit clear downcore trends and are scattered, ranging 0.3–0.9 wt% in Holes M0085A and M0085B and 0.24–1.07 wt% in Holes M0085C and M0085D (Figure F46).

Figure F46. Solid-phase contents of TC, TOC, TIC, and TS, Site M0085.
6.5. Discussion
The downcore pore water profiles of sulfate, alkalinity, ammonium, and bromide at Sites M0084 and M0085 show characteristic changes related to organic matter degradation. Elevated Fe and Mn concentrations in the uppermost meter of sediments, especially at Site M0084, reflect dissimilatory Fe and Mn reduction coupled by organic matter oxidation. The rapid linear decrease in sulfate concentrations due to organoclastic sulfate reduction and exponential rise of methane marks the sulfate–methane transition (SMT) at ~5–7.5 mbsf at Site M0084 and ~3–4 mbsf at Site M0085. Such shallow SMTs are comparable with those in continental margin sediments (Egger et al., 2018). Together with very high alkalinity and ammonium concentrations in the cores, this suggests that intensive organic matter remineralization is taking place, which is also supported by the observed high TOC contents. High Si concentrations at both sites are probably sustained by biogenic opal dissolution, as evidenced by smear slide observations that show a substantial amount of diatom frustules and sponge spicules in the sediments (see Lithostratigraphy). Tephra alteration could also contribute to the high Si concentrations, as reflected by the downcore increase in Sr concentrations and the occurrence of discrete tephra layers (see Tephra). In contrast, the downcore Li profiles at Site M0084 could reflect low-temperature silicate diagenesis, which adsorbs and/or incorporates Li in the secondary minerals (You et al., 1995). The downcore Li increase in the lowermost 5 m at the bottom of Hole M0085D potentially reflects a supply of Li from beneath.
7. Physical properties
This section summarizes the preliminary physical properties results from cores acquired at Sites M0084 and M0085 in the northern Japan Trench (Basin N3) at water depths of 7781 and 7754 mbsl, respectively. At Site M0084, three trigger cores (Holes M0084A, M0084C, and M0084E) and corresponding GPC cores (Holes M0084B, M0084D, and M0084F) were collected, and at Site M0085, two trigger cores (Holes M0085A and M0085C) and corresponding GPC cores (Holes M0085B and M0085D) were collected (see Operations). The physical properties data sets were collected with the techniques and sampling rates defined in Physical properties in the Expedition 386 methods chapter (Strasser et al., 2023a). During the offshore phase, whole cores were scanned through the Multi-Sensor Core Logger (MSCL). During the onshore phase, cores were split, scanned through the Tri-Sensor Core Logger (TSCL), and sampled for moisture and density (MAD), undrained shear strength, and P-wave velocity. Overall, the physical properties data sets are high quality and correlate well with lithology and hydroacoustics.
7.1. Bulk density
Offshore, bulk density data were obtained using the gamma ray attenuation (GRA) technique on the MSCL. Onshore, bulk density, porosity, water content, void ratio, and grain density were obtained using the MAD technique on discrete samples.
7.1.1. Site M0084
Bulk densities at Site M0084 trend around 1.3–1.4 g/cm3 and increase with depth to a maximum of ~1.6 g/cm3 at ~18 mbsf. Below this peak, bulk density decreases to ~1.2 g/cm3 in all holes (Figures F47, F48, F49). This interval with a peak in bulk density is also observed in all other physical properties data, especially in Hole M0084B. Below this depth, values trend around 1.2–1.4 g/cm3 and increase with depth.
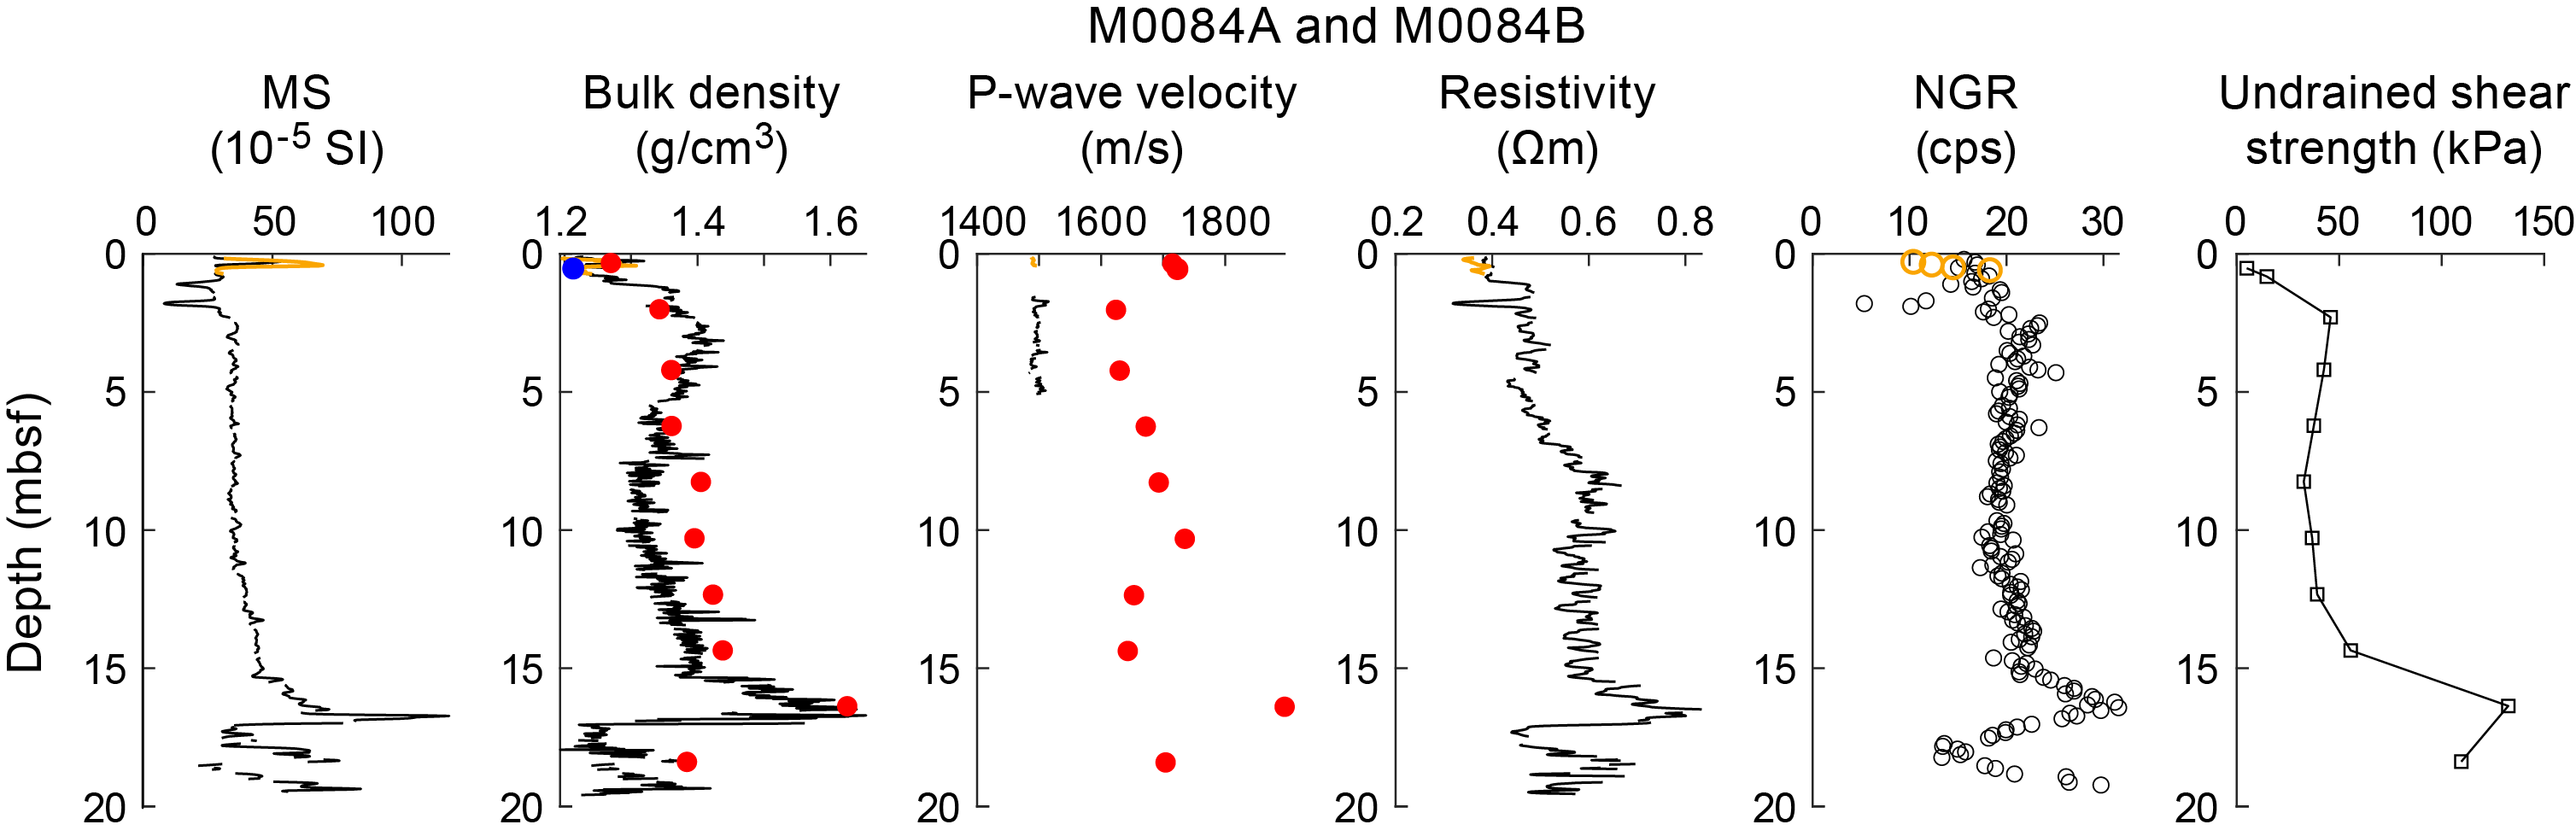
Figure F47. Physical properties summary, Holes M0084A and M0084B.

Figure F48. Physical properties summary, Holes M0084C and M0084D.
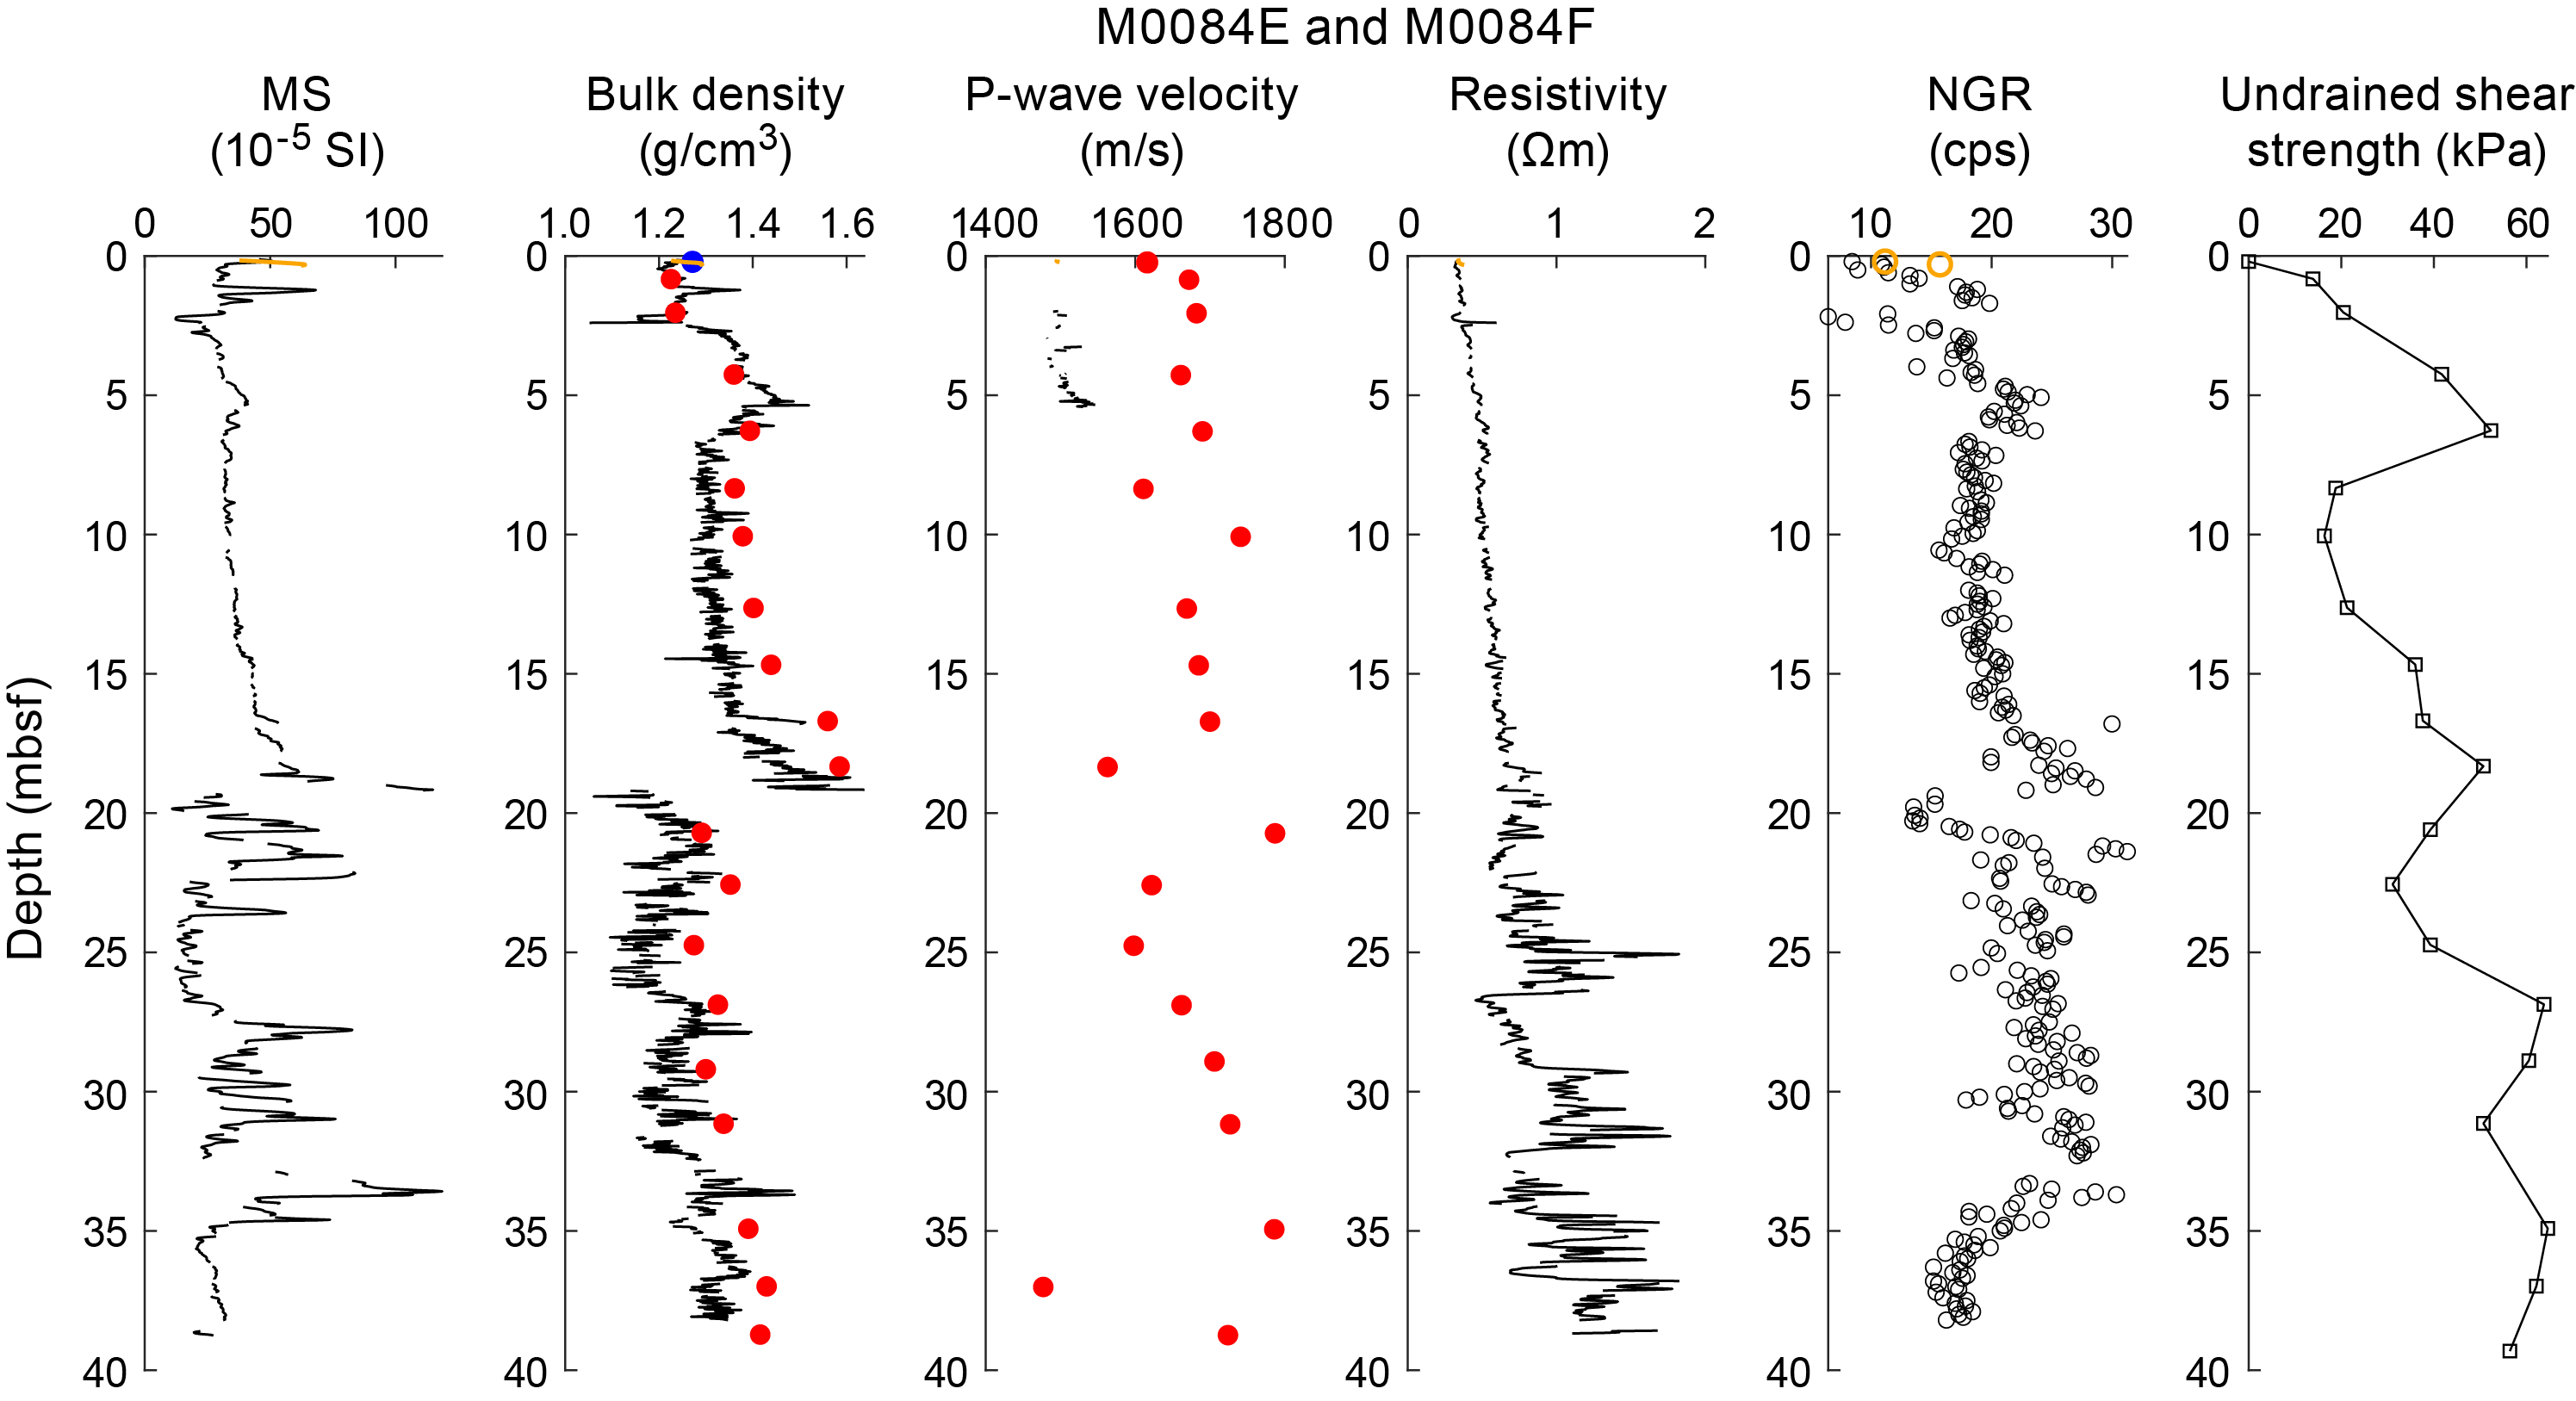
Figure F49. Physical properties summary, Holes M0084E and M0084F.
MSCL bulk density values measured offshore for trigger core Holes M0084A, M0084C, and M0084E average 1.24 ± 0.03, 1.25 ± 0.02, and 1.27 ± 0.02 g/cm3, respectively (Figures F47, F48, F49). Bulk densities range 1.20–1.31, 1.22–1.29, and 1.23–1.29 g/cm3 in Holes M0084A, M0084C, and M0084E, respectively.
Bulk densities measured offshore for GPC Holes M0084B, M0084D, and M0084F average 1.36 ± 0.07, 1.30 ± 0.09, and 1.30 ± 0.08 g/cm3, respectively (Figures F47, F48, F49). Bulk densities range 1.19–1.65, 1.08–1.66, and 1.05–1.64 g/cm3 in Holes M0084B, M0084D, and M0084F, respectively.
Bulk density was also measured onshore at a single depth for each trigger core and for every odd-numbered core section of the GPC cores. MAD-derived bulk density data have an overall good correspondence with the MSCL-derived bulk density data in the uppermost 6 m of the core but tend to be slightly higher than MSCL bulk density data downcore. A distinct high-density peak at ~17 mbsf is captured well in both the MSCL and MAD data. Onshore measurements for trigger core Holes M0084A, M0084C, and M0084E are 1.21, 1.28, and 1.27 g/cm3, respectively.
Onshore bulk density measurements for GPC Holes M0084B, M0084D, and M0084F average 1.40 ± 0.09, 1.37 ± 0.08, and 1.37 ± 0.09 g/cm3, respectively (Figures F47, F48, F49). Values range 1.27–1.63, 1.21–1.61, and 1.23–1.59 g/cm3 for Holes M0084B, M0084D, and M0084F, respectively.
7.1.2. Site M0085
Bulk densities at Site M0085 increase with depth from ~1.2 to ~1.7 g/cm3 (Figures F50, F51). Fluctuations in bulk density values are larger at Site M0085 than Site M0084. Unlike Site M0084, Site M0085 does not display any peak in magnetic susceptibility or correlating drop in bulk density around 17 mbsf.
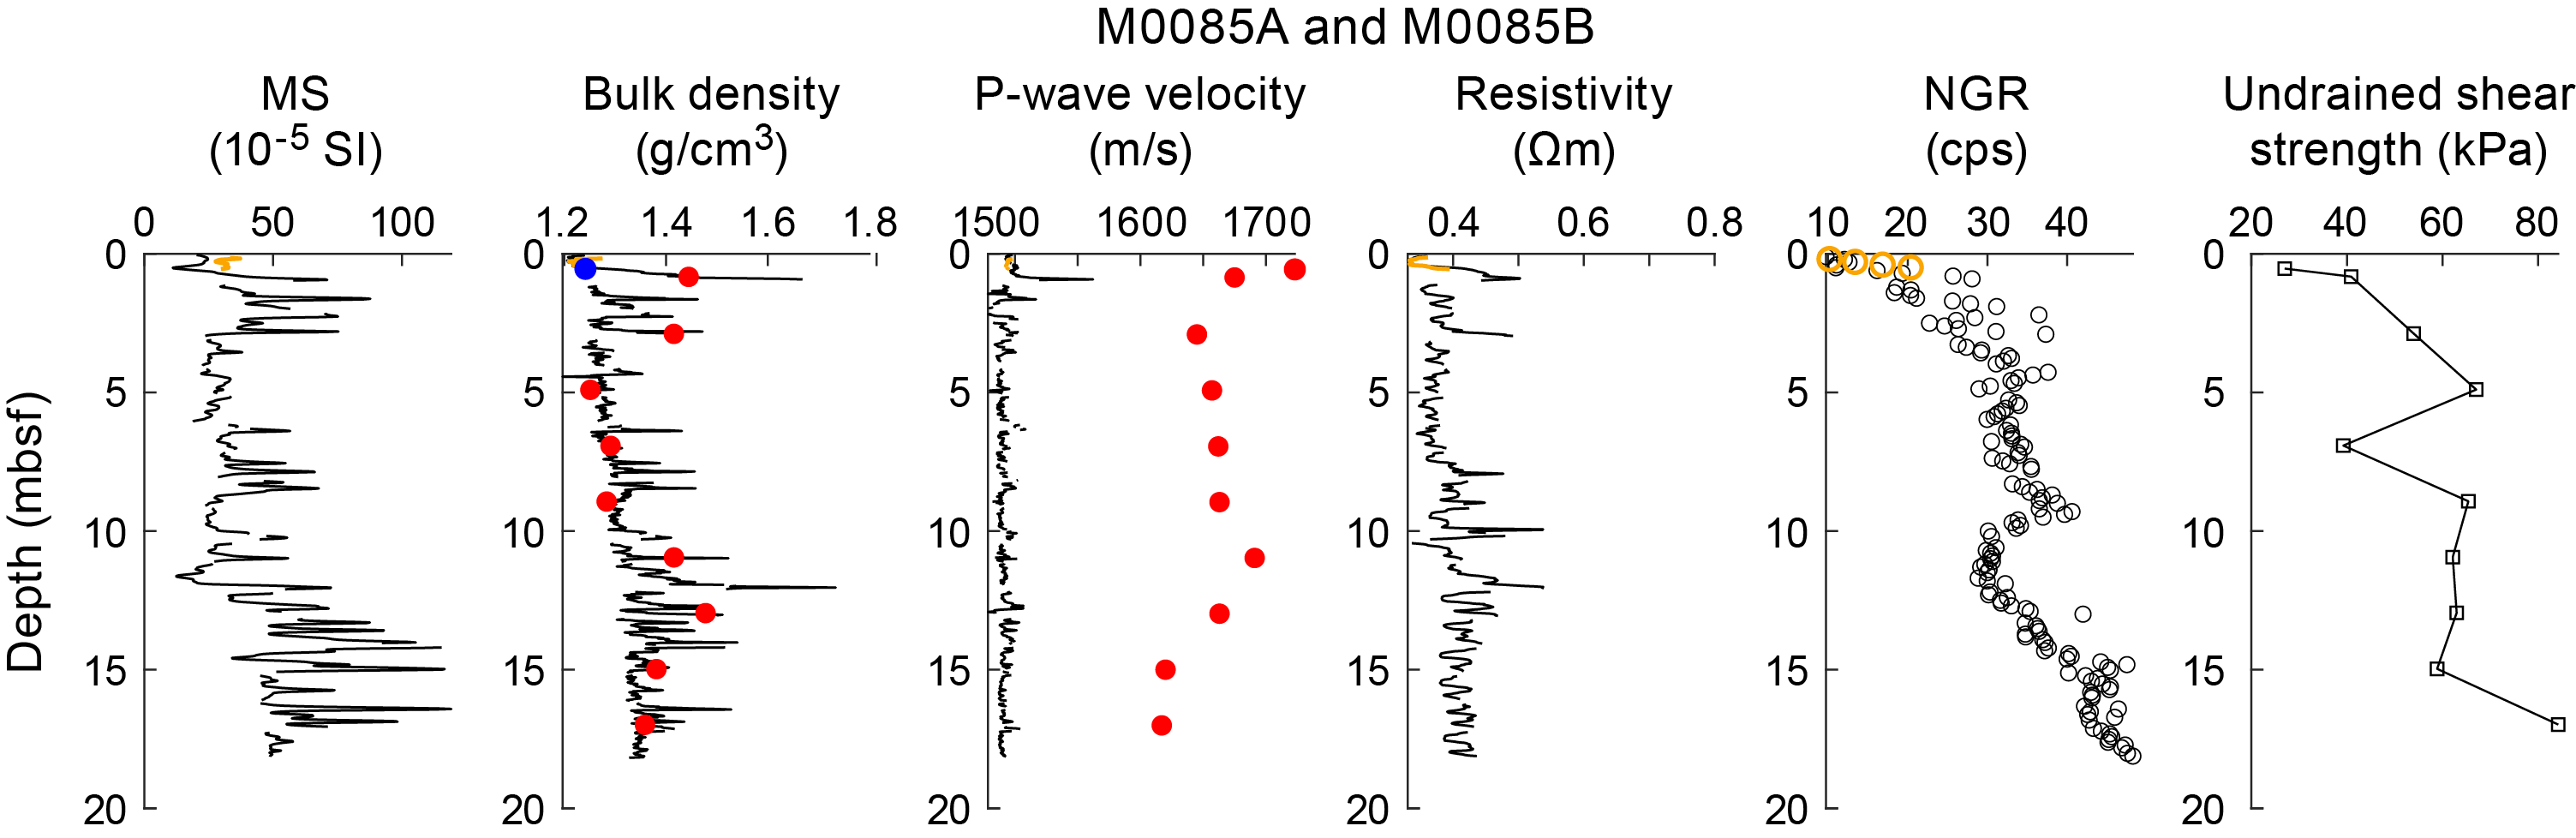
Figure F50. Physical properties summary, Holes M0085A and M0085B.
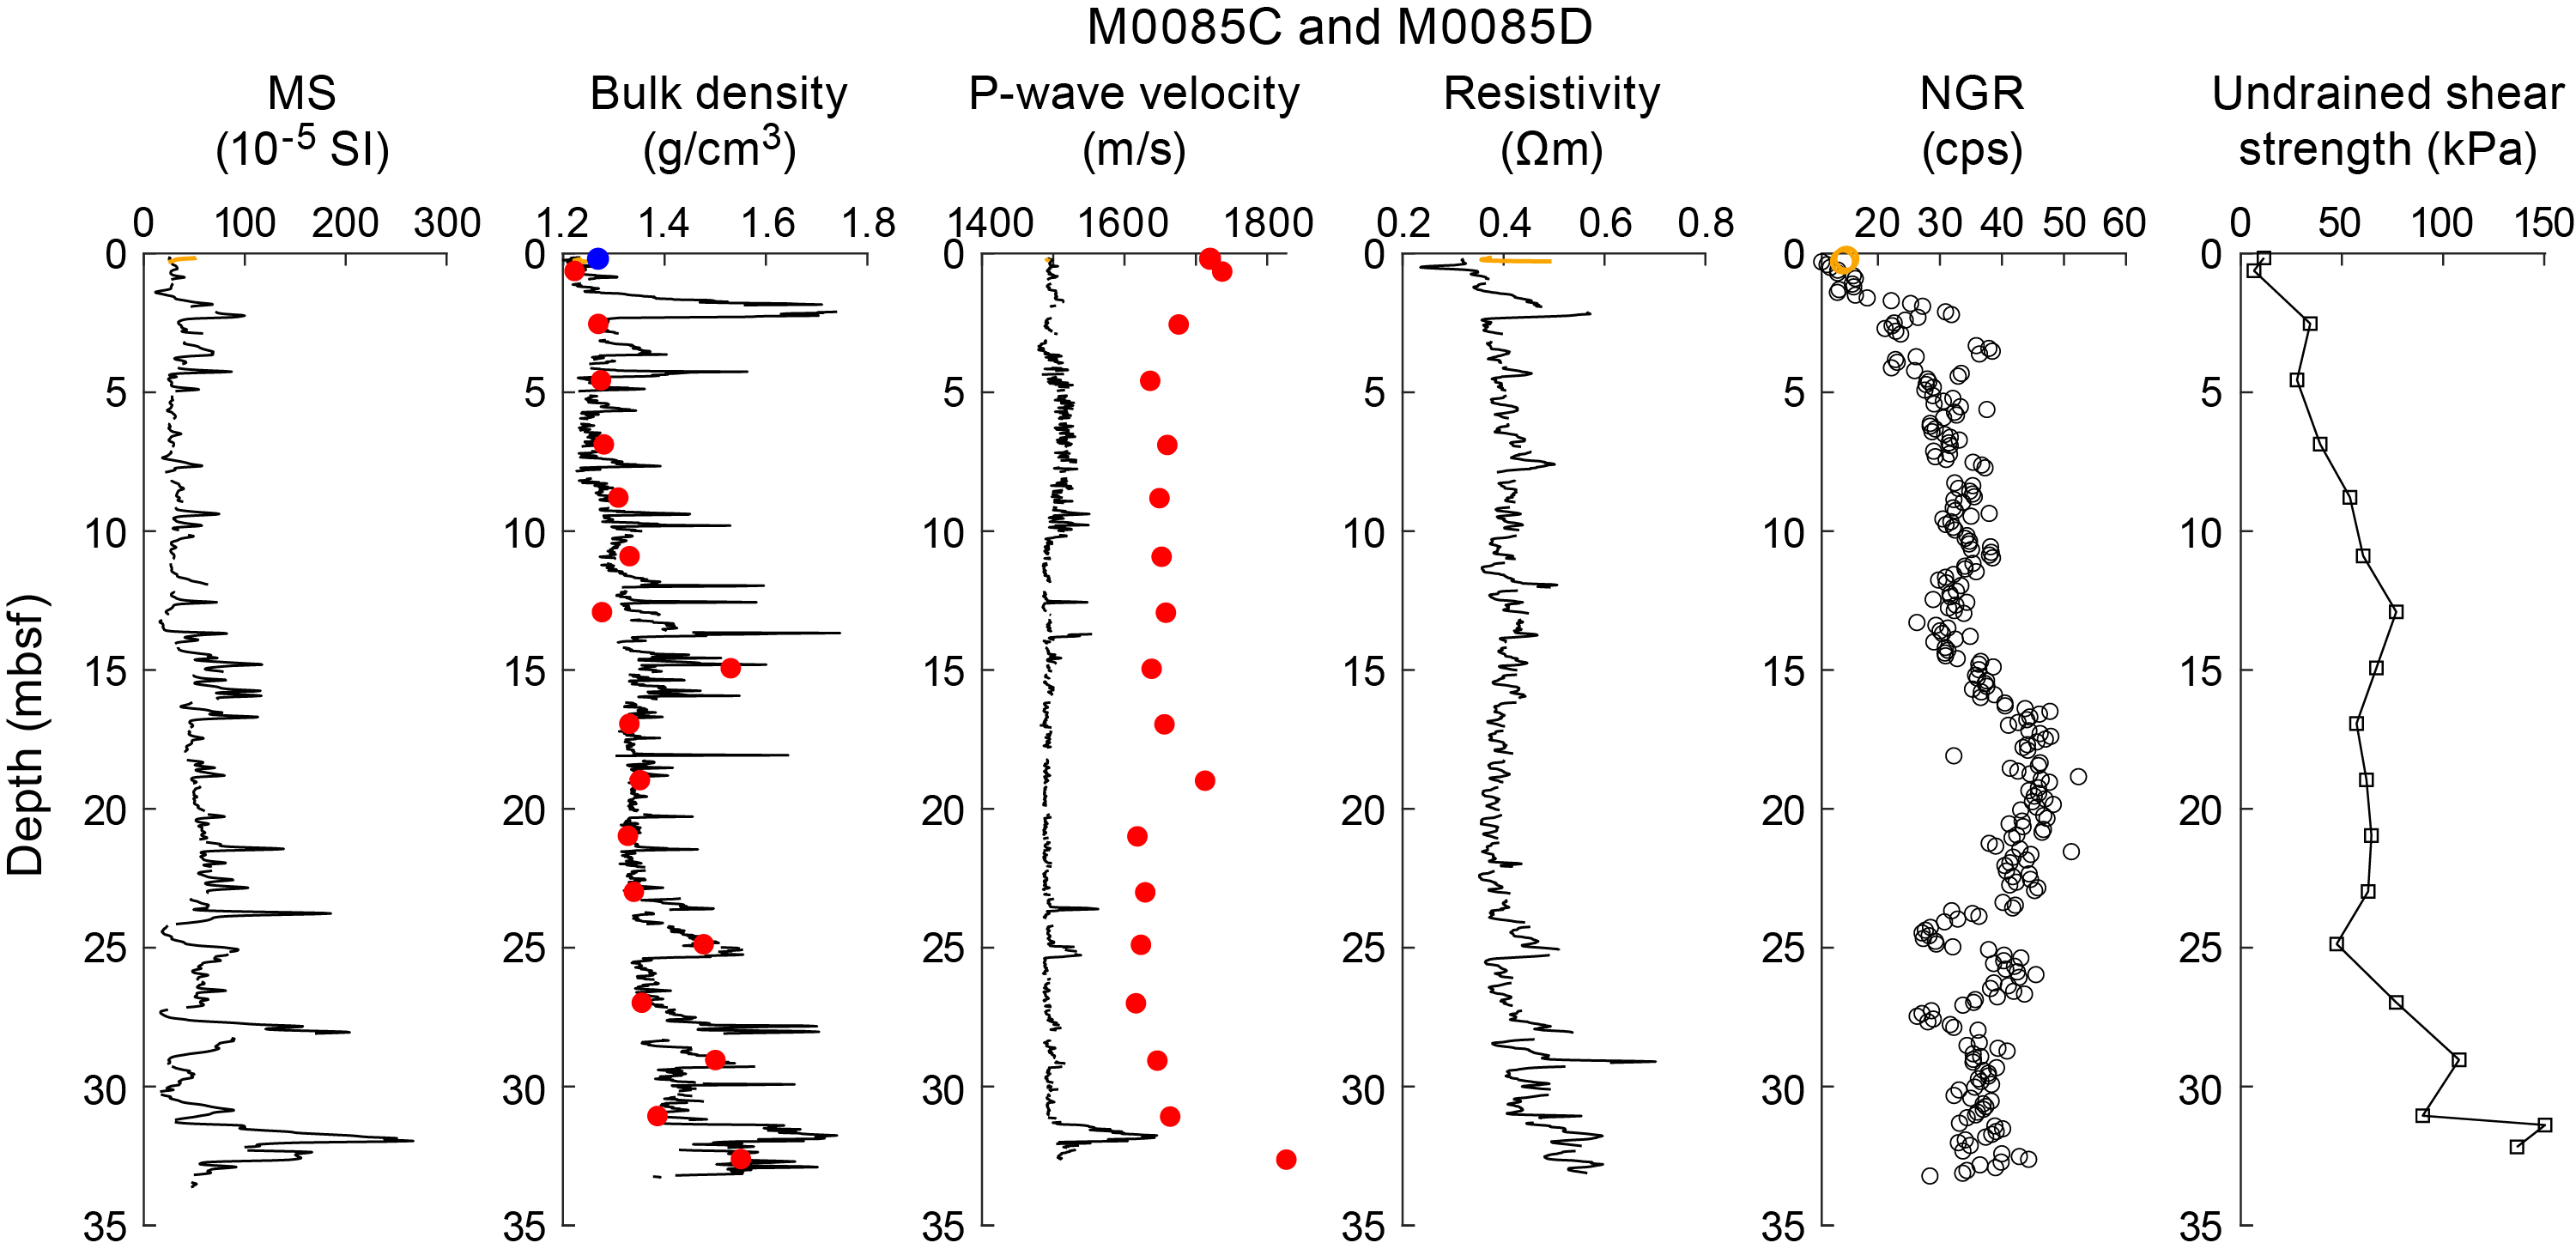
Figure F51. Physical properties summary, Holes M0085C and M0085D.
Bulk densities measured offshore for trigger core Holes M0085A and M0085C average 1.23 ± 0.01 and 1.23 ± 0.01 g/cm3, respectively (Figures F50, F51). Bulk densities range 1.21–1.27 and 1.22–1.24 g/cm3 in Holes M0085A and M0085C, respectively.
Bulk densities measured offshore for GPC Holes M0085B and M0085D average 1.33 ± 0.06 and 1.36 ± 0.09 g/cm3, respectively (Figures F50, F51). Values range 1.21–1.67 and 1.20–1.74 g/cm3 in Holes M0085B and M0085D, respectively.
Bulk density was also measured onshore at a single depth for each trigger core and for every odd-numbered core section of the GPC cores. MAD-derived bulk density data have an overall good correspondence with the MSCL-derived bulk density data. Onshore measurements for trigger core Holes M0085A and M0085C are 1.24 and 1.27 g/cm3, respectively.
Onshore bulk density measurements for GPC Holes M0085B and M0085D average 1.37 ± 0.07 and 1.36 ± 0.9 g/cm3, respectively (Figures F50, F51). Values range 1.25–1.48 and 1.22–1.55 g/cm3 in Holes M0085B and M0085D, respectively.
7.2. Magnetic susceptibility
Magnetic susceptibility data were obtained during the offshore phase using the MSCL.
7.2.1. Site M0084
Magnetic susceptibilities fluctuate between ~11 × 10−5 and 50 × 10−5 SI to 3 mbsf, where values stabilize around 40 × 10−5 SI before increasing with depth (Figures F47, F48, F49). At 16.73 mbsf (Hole M0084B), magnetic susceptibility peaks and begins to fluctuate between ~20 × 10−5 and ~70 × 10−5 SI for the remaining measurements. Similar trends are seen at all Site M0084 holes, and magnetic susceptibility fluctuates below ~16 mbsf.
Magnetic susceptibilities in trigger core Holes M0084A, M0084C, and M0084E average (43.91 ± 15.70) × 10−5, (48.18 ± 11.12) × 10−5, and (54.25 ± 8.88) × 10−5 SI, respectively (Figures F47, F48, F49). Magnetic susceptibilities range 28.27 × 10⁻⁵ to 69.42 × 10⁻⁵; 29.85 × 10⁻⁵ to 62.18 × 10⁻⁵; and 37.78 × 10⁻⁵ to 63.98 × 10⁻⁵ SI in Holes M0084A, M0084C, and M0084E, respectively.
Magnetic susceptibilities in GPC Holes M0084B, M0084D, and M0084F average 39.53 ± 9.94 × 10⁻⁵, 37.47 ± 14.46 × 10⁻⁵, and 37.29 ± 16.30 × 10⁻⁵ SI, respectively (Figures F47, F48, F49). Magnetic susceptibilities range 21.29 × 10⁻⁵ to 118.30 × 10⁻⁵, 11.26 × 10⁻⁵ to 105.13 × 10⁻⁵, and 10.90 × 10⁻⁵ to 118.64 × 10⁻⁵ SI in Holes M0084B, M0084D, and M0084F, respectively.
7.2.2. Site M0085
Magnetic susceptibilities at Site M0085 are less consistent than at Site M0084 (Figures F50, F51). Values fluctuate between 11 × 10−5 and 119 × 10−5 SI in Holes M0085A and M0085B along the entire sampled length (18.2 m). In Holes M0085C and M0085D, magnetic susceptibilities trend ~45 × 10−5 SI with small fluctuations and increase with depth to ~23 mbsf. Below 23 mbsf, magnetic susceptibilities in Hole M0085D fluctuate between ~17 × 10−5 and 260 × 10−5 SI.
Magnetic susceptibilities in trigger core Holes M0085A and M0085C average 31.16 ± 2.23 × 10⁻⁵ and 35.26 ± 9.48 × 10⁻⁵ SI, respectively (Figures F50, F51). Values range 27.66 × 10⁻⁵ to 37.16 SI × 10−5 and 24.46 × 10⁻⁵ to 51.70 × 10⁻⁵ SI in Holes M0085A and M0085C, respectively.
Magnetic susceptibilities in GPC Holes M0085B and M0085D average 41.90 ± 18.89 × 10⁻⁵ and 53.87 ± 33.26 × 10⁻⁵ SI, respectively (Figures F50, F51). These values range 1.05 × 10⁻⁵ to 119.16 × 10⁻⁵ and 11.45 × 10⁻⁵ to 267.02 × 10⁻⁵ SI, respectively.
7.3. P-wave velocity
P-wave velocity was measured using the MSCL on whole cores during the offshore phase. During the onshore phase, P-wave velocity was measured on discrete samples approximately every 2 m. Many of the MSCL velocity data were of insufficient quality below ~5 mbsf and have been omitted.
Offshore P-wave velocities recorded using the MSCL at both sites generally trend around 1500 m/s (the velocity of water). Shore-based discrete measurements are noticeably higher (closer to an average of 1700 m/s). The difference in velocity exceeds the uncertainty associated with the discrete velocity measurements (±50 m/s). The difference between the two datasets may be attributed to continued compaction or degassing of the sediments between the offshore and onshore phases of the expedition. Further investigation will be required to fully understand the discrepancy, and the data should thus be used with a degree of caution.
MSCL and laboratory-measured P-wave data are plotted in figures in this section. MSCL P-wave velocities recorded at both sites trend around 1500 m/s (the velocity of water) for the entire length of measured cores, but shore-based discrete measurements are higher (closer to 1700 m/s). Given the large porosity of samples (80%), it is reasonable to conclude that the 1500 m/s MSCL P-wave velocity trend accurately represents in situ P-wave velocities in the shallow subsurface samples.
7.3.1. Site M0084
MSCL P-wave velocities in trigger core Holes M0084A, M0084C, and M0084E average 1490.38 ± 1.82, 1515.13 ± 2.56, and 1497.61 ± 3.19 m/s, respectively (Figures F47, F48, F49). MSCL P-wave velocities range 1487.83–1496.26, 1511.51–1520.09, and 1494.65–1503.40 m/s in Holes M0084A, M0084C, and M0084E, respectively.
MSCL P-wave velocities in GPC Holes M0084B, M0084D, and M0084F average 1496.76 ± 6.39, 1503.11 ± 8.13, and 1507.20 ± 15.61 m/s, respectively (Figures F47, F48, F49). Values range 1483.56–1515.20, 1493.39–1534.49, and 1479.63–1546.96 m/s in Holes M0084B, M0084D, and M0084F, respectively.
7.3.2. Site M0085
MSCL P-wave velocities in trigger core Holes M0085A and M0085C average 1494.30 ± 1.13 and 1491.65 ± 1.66 m/s, respectively (Figures F50, F51). Values range 1492.94–1498.16 m/s in Hole M0085A and 1489.45–1493.66 m/s in Hole M0085C.
MSCL P-wave velocities in GPC Holes M0085B and M0085D average 1491.65 ± 5.98 and 1500.32 ± 18.92 m/s, respectively (Figures F50, F51). Values range 1478.59–1562.28 m/s in Hole M0085B and 1479.19–1645.69 m/s in Hole M0085D.
7.4. Noncontact resistivity
7.4.1. Site M0084
Noncontact electrical resistivities at Site M0084 increase with depth from ~0.4 to ~1.5 Ωm with mild fluctuations to ~20 mbsf, at which depth fluctuations increase in intensity (Figures F47, F48, F49). The intensity of fluctuations increases with depth below ~20 mbsf.
Electrical resistivities in trigger core Holes M0084A, M0084C, and M0084E average 0.37 ± 0.02, 0.35 ± 0.02, and 0.35 ± 0.01 Ωm, respectively (Figures F47, F48, F49). Electrical resistivities range 0.34–0.40, 0.33–0.39, and 0.34–0.38 Ωm in Holes M0084A, M0084C, and M0084E, respectively.
Electrical resistivities in GPC Holes M0084B, M0084D, and M0084F average 0.55 ± 0.08, 0.68 ± 0.28, and 0.73 ± 0.29 Ωm, respectively (Figures F47, F48, F49). Values range 0.38–0.83, 0.30–2.35, and 0.30–1.83 Ωm in Holes M0084B, M0084D, and M0084F, respectively.
7.4.2. Site M0085
Electrical resistivity measurements at Site M0085 are more consistent than at Site M0084, trending around 0.4 Ωm in Holes M0085A and M0085B and ~0.4 Ωm, increasing to ~0.55 Ωm with depth, in Holes M0085C and M0085D (Figures F50, F51). Fluctuations in resistivity values are also less intense at Site M0085 than Site M0084.
Electrical resistivities in trigger core Holes M0085A and M0085C average 0.35 ± 0.02 and 0.39 ± 0.04 Ωm, respectively (Figures F50, F51). Values range 0.33–0.39 Ωm in Hole M0085A and 0.36–0.50 Ωm in Hole M0085C.
Electrical resistivities in GPC Holes M0085B and M0085D average 0.40 ± 0.04 and 0.41 ± 0.05 Ωm, respectively (Figures F50, F51). Values range 0.33–0.75 Ωm in Hole M0085B and 0.24–0.70 Ωm in Hole M0085D.
7.5. Natural gamma radiation
7.5.1. Site M0084
At Site M0084, NGR increases with depth to ~5 mbsf (Figures F47, F48, F49). From ~5 to ~15 mbsf, NGR trends around 20 counts/s. Below ~17–20 mbsf, NGR values continue to trend around 20 counts/s, but variability increases. Below ~35 mbsf, NGR values decrease with depth to ~12 counts/s.
The number of NGR measurements (n) in trigger core Holes M0084A, M0084C, and M0084E were limited: n = 4, n = 2, and n = 2, respectively. NGR ranges 10.38–18.28 counts/s in Hole M0084A, 12.35–15.62 counts/s in Hole M0084C, and 11.17–15.72 counts/s in Hole M0084E (Figures F47, F48, F49).
NGR measurements GPC Holes M0084B, M0084D, and M0084F were more robust, averaging 20.95 ± 3.00 counts/s in Hole M0084B, 21.22 ± 3.58 counts/s in Hole M0084D, and 20.58 ± 4.17 counts/s in Hole M0084F (Figures F47, F48, F49). NGR ranges 14.25–31.57 counts/s in Hole M0084B, 8.43–30.20 counts/s in Hole M0084D, and 6.45–31.25 counts/s in Hole M0084F.
7.5.2. Site M0085
NGR readings at Site M0085 increase with depth to ~10 mbsf, at which depth they trend around 30 counts/s (Figures F50, F51). In Hole M0085B, NGR values continue to increase with depth, reaching ~50 counts/s at ~17 mbsf. In Holes M0085C and M0085D, NGR trends around 30 counts/s at 10–15 and 25–33 mbsf. Between 15 and ~23 mbsf, NGR values in Hole M0085D increase, trending around 45 counts/s.
The number of NGR measurements (n) in trigger core Holes M0085A and M0085C were limited: n = 4 and n = 2, respectively. NGR ranges 10.20–20.37 counts/s in Hole M0085A and 14.35–14.92 counts/s in Hole M0085C (Figures F50, F51).
Measurements of NGR in GPC Holes M0085B and M0085D were more robust. These values average 33.88 ± 7.95 and 34.90 ± 7.49 counts/s in Holes M0085B and M0085D, respectively (Figures F50, F51). NGR ranges 9.75–48.23 counts/s in Hole M0085B and 10.93–48.27 counts/s in Hole M0085D.
7.6. Undrained shear strength
Undrained shear strength (Su) was measured with a handheld penetrometer, automated vane shear (AVS) apparatus, and fall cone penetrometer on split cores. The handheld penetrometer was used during the OSP, and the AVS and fall cone were used during the Personal Sampling Party (PSP).
Generally, Su increased with depth at Sites M0084 and M0085, with higher average values at Site M0085.
7.6.1. Site M0084
Su measured during the onshore phase using the handheld penetrometer was recorded and reported as couplets of respective trigger core holes (M0084A, M0084C, and M0084E) and GPC holes (M0084B, M0084D, and M0084F). Penetrometer Su averages 50.16 ± 37.90 kPa in Holes M0084A and M0084B, 49.52 ± 23.74 kPa in Holes M0084C and M0084D, and 38.83 ± 19.20 kPa in Holes M0084E and M0084F (Figures F47, F48, F49). These values range approximately 5–150 kPa in Holes M0084A and M0084B, 0–90 kPa in Holes M0084C and M0084D, and 0–60 kPa in Holes M0084E and M0084F and show a general increasing trend from lower values at the top to higher values at the bottom of the hole. At all three sites, shear strengths increase rapidly with depth in the uppermost ~5–7 m. In addition to these overall trends with depth, some zones with relatively high strengths occur at each site. In Hole M0084B, a high strength zone occurs at ~16–17 mbsf. This zone is associated with the high bulk density (low porosity) zone at the same depth. In Hole M0084D, relatively high values occur at ~5 and 30 mbsf. In Hole M0084F, relatively high strength points occur at 7, 17, and 27 mbsf. In general, high strength zones correspond to high bulk density (low porosity).
Su measured during the PSP using a fall cone was recorded once in each section in all holes at Site M0084 (Figure F52). Su measured across all holes with the fall cone generally increases with depth, ranging 1.75–186.76 kPa. Fall cone Su measurements in Holes M0084B, M0084D, and M0084F range 10.17–57.04, 2.17–91.51, and 1.75–186.76 kPa, respectively, and values generally increase with depth.
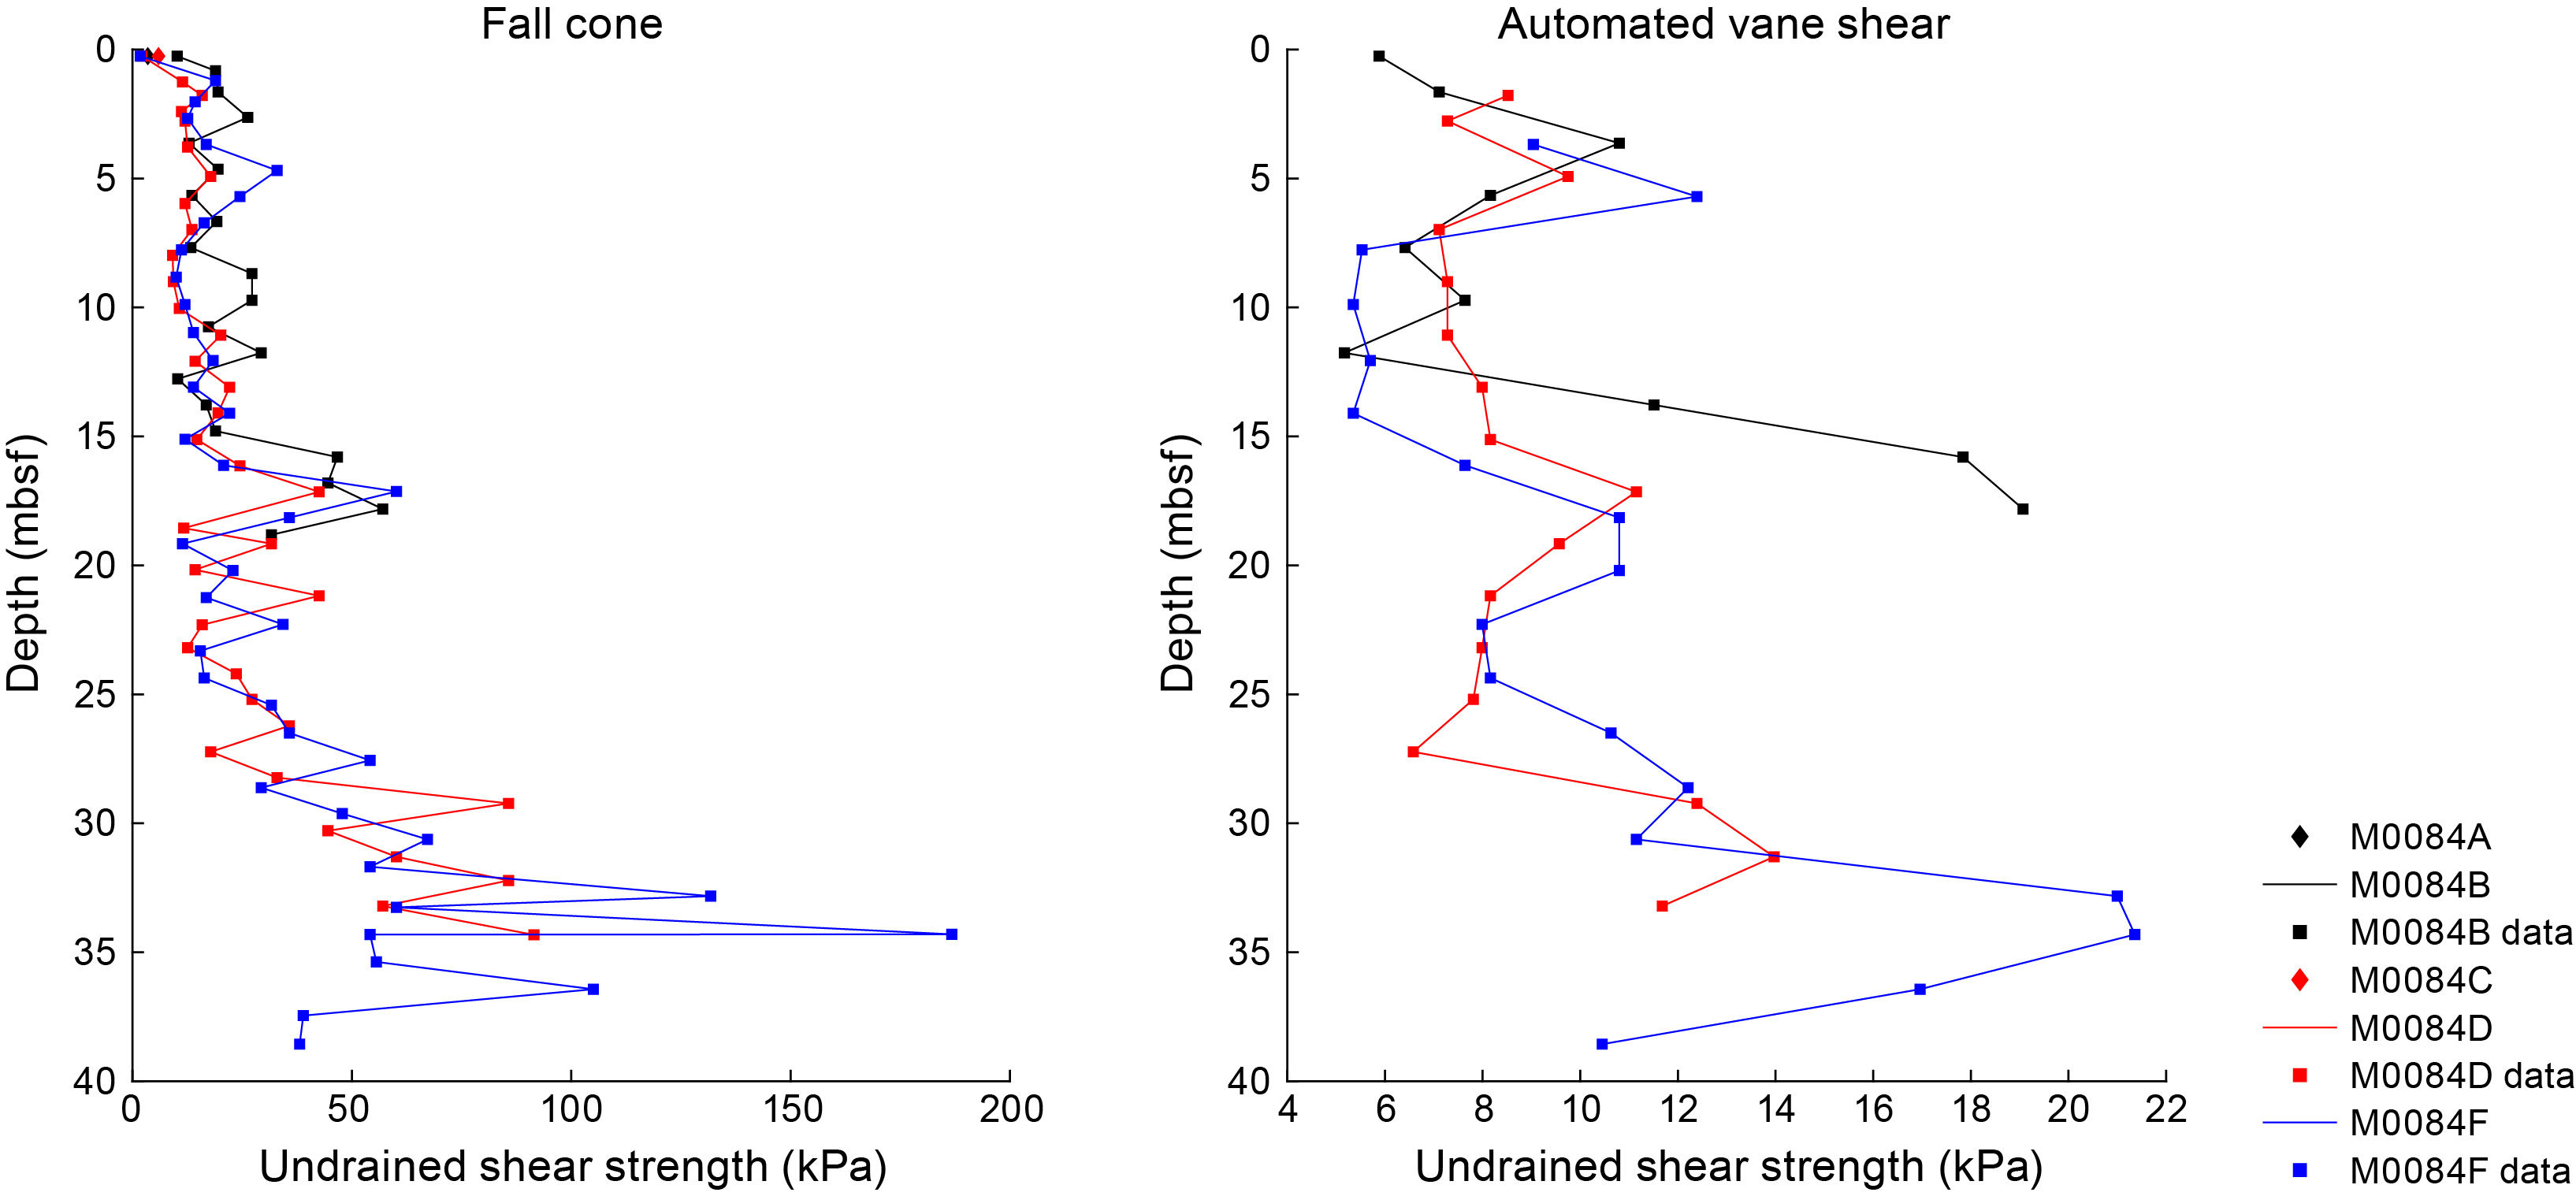
Figure F52. Undrained shear strength from fall cone and AVS, Site M0084.
Su measured during the PSP using an AVS was recorded in alternating sections in Holes M0084B, M0084D, and M0084F (Figure F52). Su measured across these holes using the AVS are generally lower than Su values measured using the fall cone. AVS Su values generally increase with depth, ranging 5.17–21.36 kPa. AVS Su in Holes M0084B, M0084D, and M0084F ranges 5.17–19.07, 6.58–13.97, and 5.35–21.36 kPa, respectively.
7.6.2. Site M0085
The Su of sediments measured during the onshore phase using the handheld penetrometer were recorded and reported as couplets of respective trigger core holes (M0085A and M0085C) and GPC holes (M0085B and M0085D). In Holes M0085A–M0085D, Su averages 56.16 ± 19.04 and 64.93 ± 36.75 kPa, respectively (Figures F50, F51). Values range approximately 24.53–80 kPa in Holes M0085A and M0085B and 0 to ~150 kPa in Holes M0085C and M0085D.
Su measured during the PSP using a fall cone was recorded once in each section in all holes at Site M0085 (Figure F53). Su measured across all holes at Site M0085 using the fall cone generally increase with depth, ranging 2.78–170.17 kPa and averaging 28.34 ± 27.15 kPa. Fall cone Su measurements in Holes M0085B and M0085D range 6.34–54.15 and 2.78–170.17 kPa, respectively. Fall cone Su in Holes M0085B and M0085D averages 27.13 ± 13.17 and 30.33 ± 32.30 kPa, respectively.

Figure F53. Undrained shear strength from fall cone and AVS, Site M0085.
Su measured during the PSP using an AVS was recorded in alternating sections in Holes M0085B and M0085D (Figure F53). Su measured across these holes using the AVS were generally lower than Su values measured using the fall cone. AVS-derived Su values generally increase with depth, ranging 5.17–45.63 kPa and averaging 15.26 ± 7.39 kPa. AVS Su in Holes M0085B and M0085D ranges 5.17–18.37 and 8.52–45.63 kPa, respectively. AVS Su in Holes M0085B and M0085D averages 12.25 ± 4.52 and 16.95 ± 8.11 kPa, respectively.
It should be noted that the values of Su vary according to the device used to obtain them (Figures F52, F53). For example, fall cone strengths are higher than those obtained with the AVS and handheld penetrometer. The influence of the U-channel along the center of the core could result in lower strength readings when using the AVS or handheld penetrometer compared to the fall cone. The fall cone only impacts a small region of the core (~2–5 mm), whereas the AVS impacts a larger region of the core (~20–50 mm). Both measurements ideally should be obtained from the center of the core away from the core sidewall. However, the sampling locations could not be taken at the center because of the U-channel sampled during the OSP (see Physical properties in the Expedition 386 methods chapter [Strasser et al., 2023a]). As a result, strength sampling points had to be placed halfway between the central U-channel and the sidewall of the core. During AVS measurements, the fractures that opened often propagated toward both the central U-channel and the sidewall. This perhaps resulted in lower strength values. The fall cone measurements were not seen to be affected by the U-channel or the sidewall. Postcruise analysis will more closely examine the strength data to try to reconcile the differences.
7.7. Moisture and density
7.7.1. Site M0084
Water contents of sediments were recorded at a single depth in each trigger core and for every odd-numbered GPC core section (Figures F54, F55, F56). In trigger core Holes M0084A, M0084C, and M0084E, wet water contents are 74%, 66%, and 67%, respectively. In GPC Holes M0084B, M0084D, and M0084F, average wet water contents are 55% ± 7%, 58% ± 7%, and 58% ± 8%, respectively. In Holes M0084B, M0084D, and M0084F, values range 38%–68%, 41%–74%, and 43%–72%, respectively.
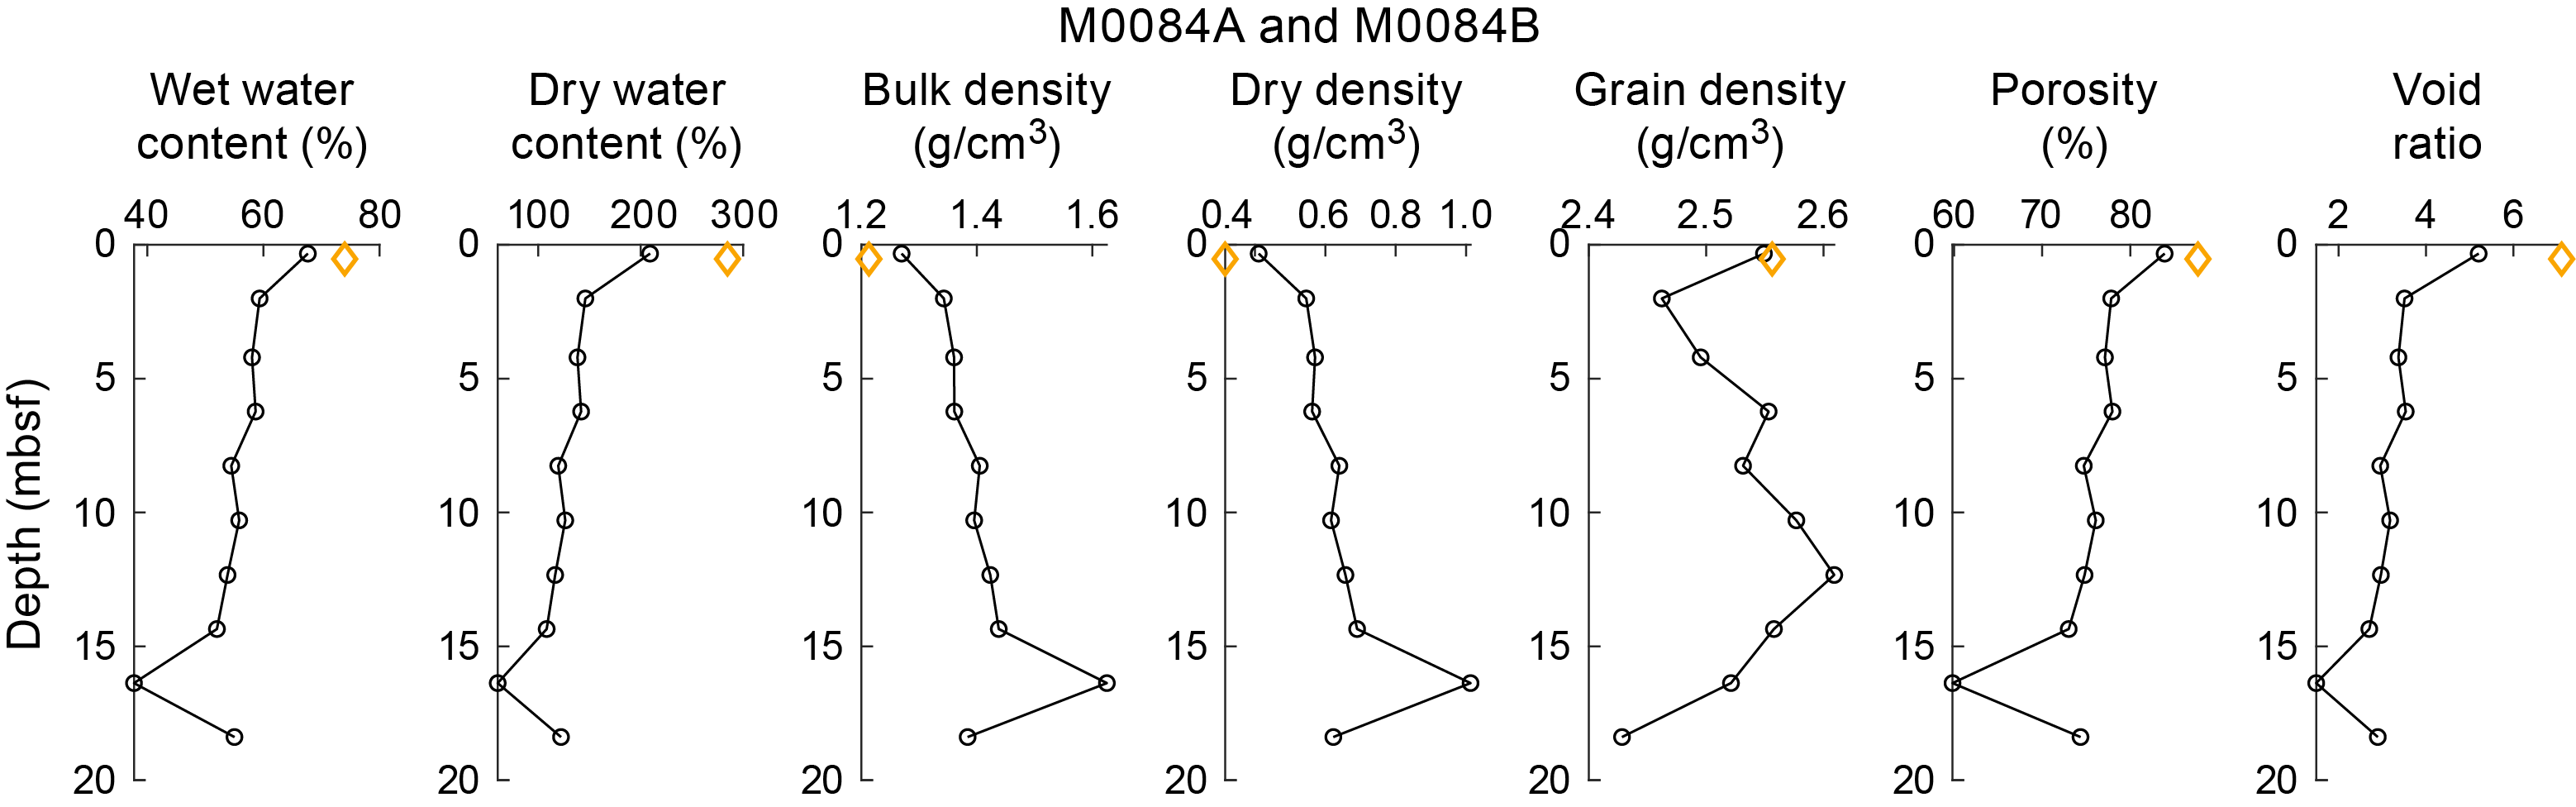
Figure F54. MAD summary, Holes M0084A and M0084B.
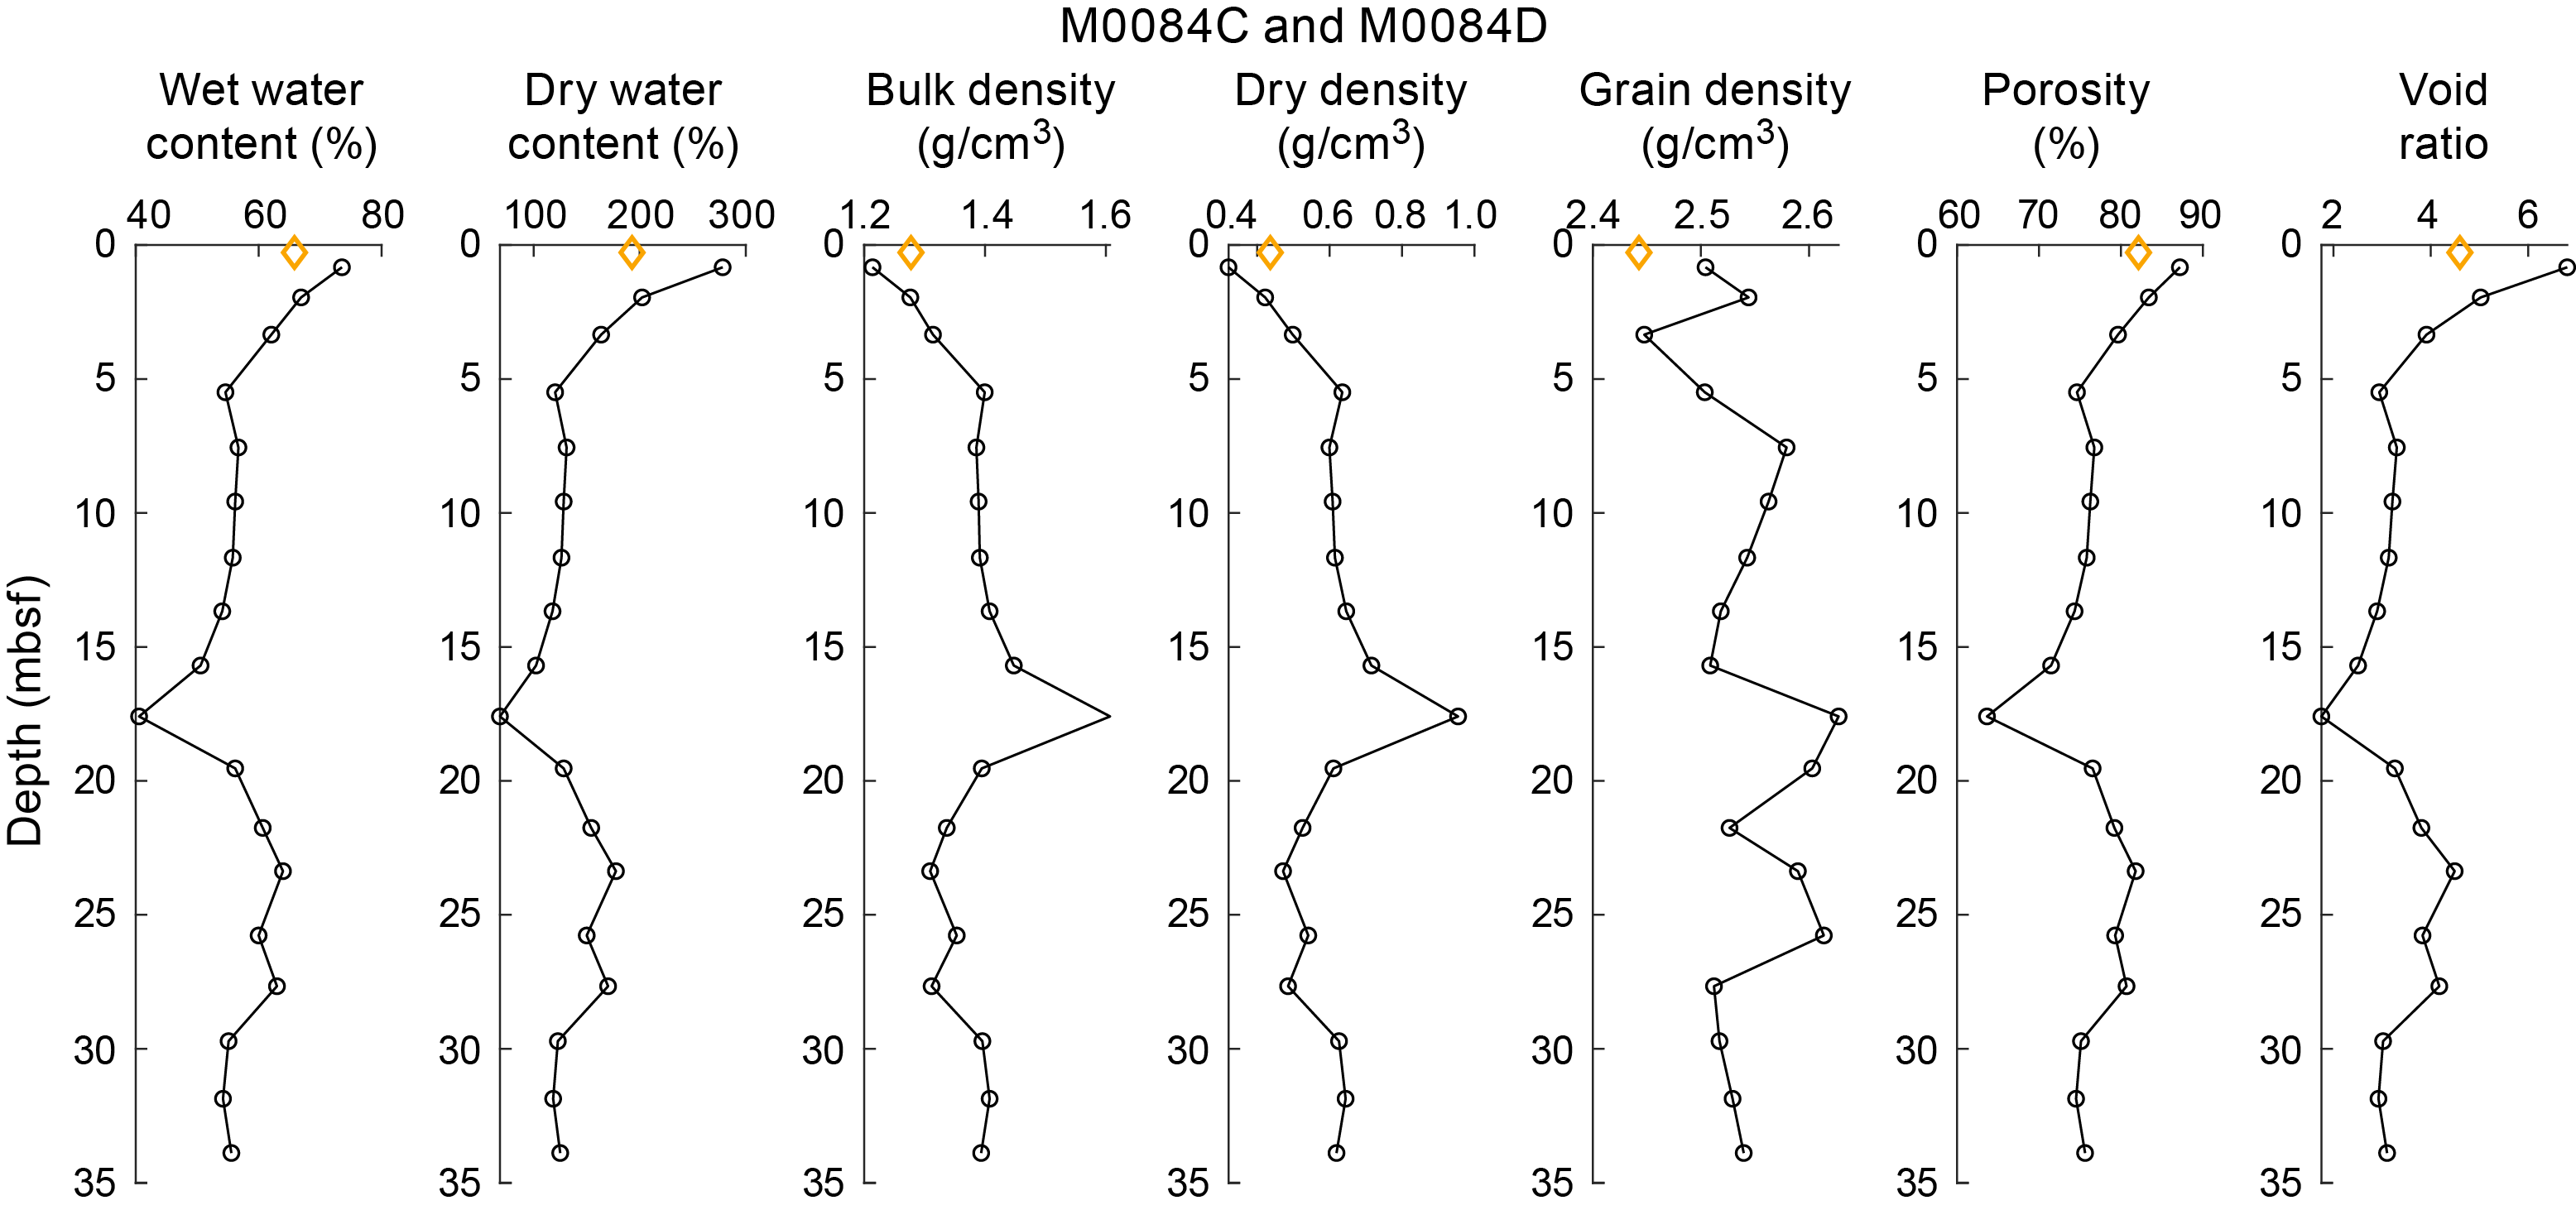
Figure F55. MAD summary, Holes M0084C and M0084D.

Figure F56. MAD summary, Holes M0084E and M0084F.
Porosities of sediments were recorded at a single depth in each trigger core and for every odd-numbered GPC core section (Figures F54, F55, F56). In Holes M0084A, M0084C, and M0084E, porosities are 88%, 82%, and 83%, respectively. In GPC Holes M0084B, M0084D, and M0084F, average porosities are 75% ± 0.06%, 77% ± 0.05%, and 78% ± 0.05%, respectively. Porosities in Holes M0084B, M0084D, and M0084F range 60%–84%, 64%–87%, and 65%–86%, respectively.
Void ratios of sediments were recorded at a single depth in each trigger core and for every odd-numbered GPC core section (Figures F54, F55, F56). In Holes M0084A, M0084C, and M0084E, void ratios are 7.11, 4.60, and 4.87, respectively. In GPC Holes M0084B, M0084D, and M0084F, average void ratios are 3.18 ± 0.92, 3.56 ± 1.07, and 3.72 ± 1.13, respectively. Values range 1.49–5.21, 1.75–6.80, and 1.90–6.24 for Holes M0084B, M0084D, and M0084F, respectively.
Grain densities were measured onshore at a single depth in each trigger core and for every odd-numbered GPC core section (Figures F54, F55, F56). In Holes M0084A, M0084C, and M0084E, grain densities are 2.56, 2.44, and 2.48 g/cm3, respectively. In GPC Holes M0084B, M0084D, and M0084F, average grain densities are 2.53 ± 0.05, 2.54 ± 0.04, and 2.57 ± 0.09 g/cm3, respectively. Values range 2.43–2.61, 2.45–2.63, and 2.36–2.74 g/cm3 for Holes M0084B, M0084D, and M0084F, respectively.
7.7.2. Site M0085
Water contents of sediments were recorded at a single depth in each trigger core and for every odd-numbered GPC core section (Figures F57, F58). In trigger core Holes M0085A and M0085C, wet water contents are 71% and 69%, respectively. In GPC Holes M0085B and M0085D, average wet water contents are 59% ± 7% and 61% ± 8%, respectively. Values range 49%–69% and 45%–72% in Holes M0085B and M0085D, respectively.

Figure F57. MAD summary, Holes M0085A and M0085B.
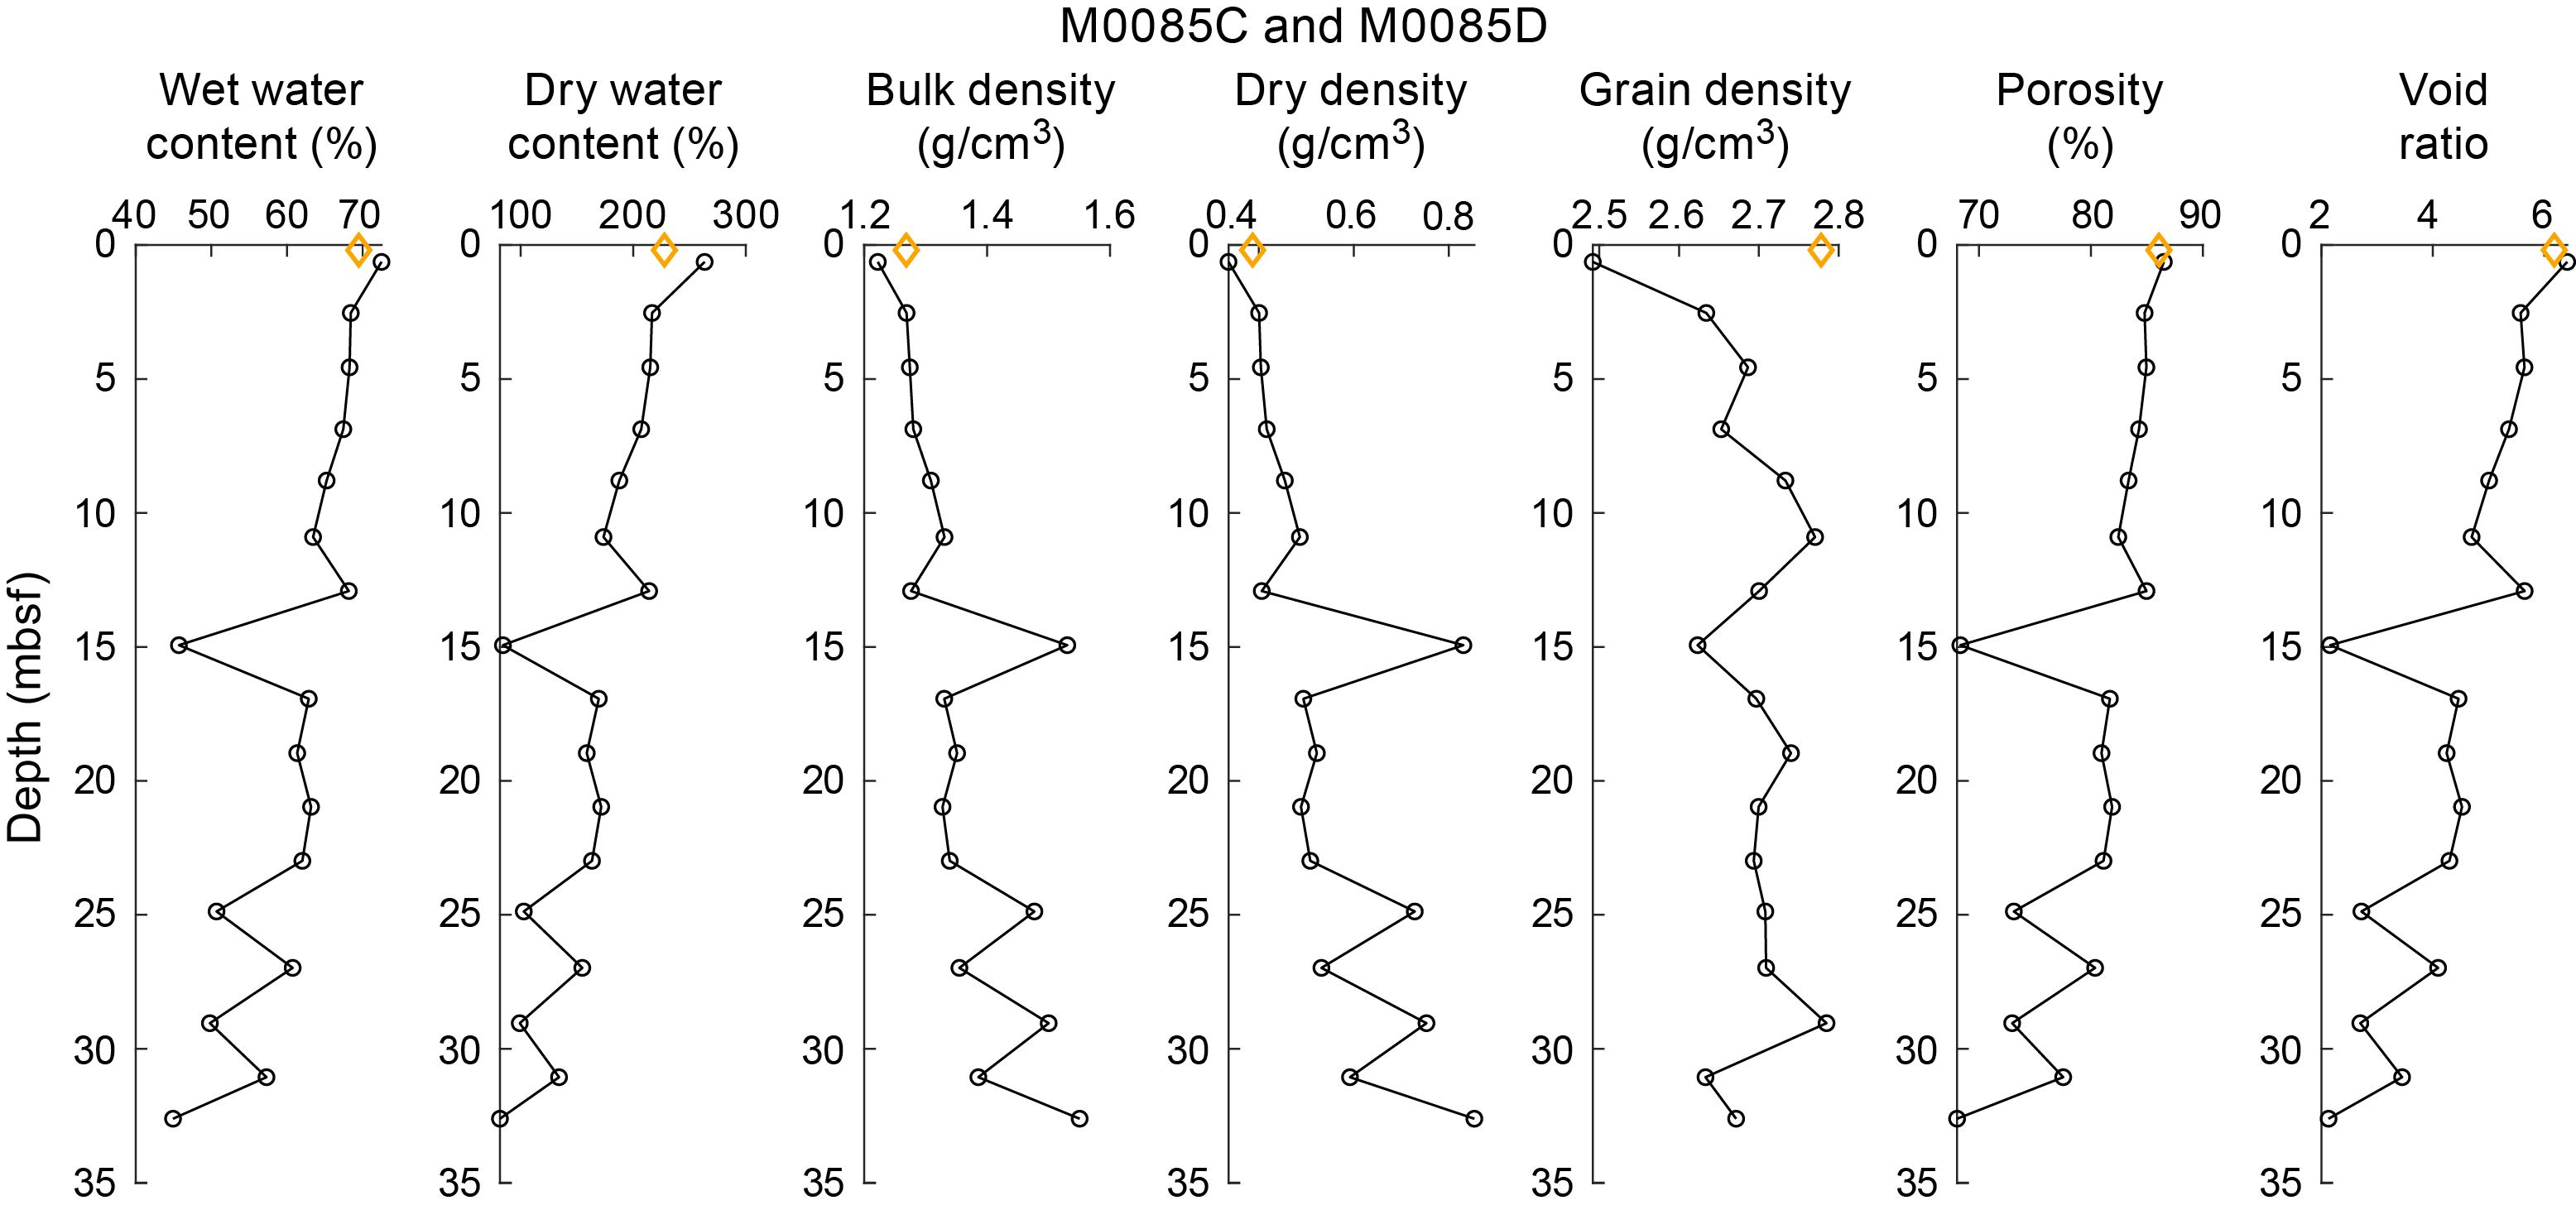
Figure F58. MAD summary, Holes M0085C and M0085D.
Porosities of sediments were recorded at a single depth in each trigger core and for every odd-numbered GPC core section (Figures F57, F58). In Holes M0085A and M0085C, porosities are 0.86 and 0.86, respectively. In Holes M0085B and M0085D, average porosities are 78% ± 5% and 80% ± 6%, respectively. Porosities in Holes M0085B and M0085D range 71%–84% and 68%–87%, respectively.
Void ratios of sediments were recorded at a single depth in each trigger core and for every odd-numbered GPC core section (Figures F57, F58). In Holes M0085A and M0085C, void ratios are 6.40 and 6.18, respectively. In Holes M0085B and M0085D, average void ratios are 3.86 ± 1.05 and 4.30 ± 1.25, respectively. Values range 2.48–5.42 and 2.13–6.41 for Holes M0085B and M0085D, respectively.
Grain densities were measured onshore at a single depth in each trigger core and for every odd-numbered GPC core section (Figures F57, F58). In Holes M0085A and M0085C, grain densities are 2.63 and 2.78 g/cm3, respectively. In Holes M0085B and M0085D, average grain densities are 2.62 ± 0.06 and 2.68 ± 0.07 g/cm3, respectively. Values range 2.48–2.70 and 2.49–2.78 g/cm3 for Holes M0085B and M0085D, respectively.
7.8. Color reflectance and RGB values
7.8.1. Site M0084
Color spectrometry was measured onshore and reported as L*a*b* values for each core.
In Hole M0084A, L*a*b* values average 25.31 ± 3.61, −1.01 ± 0.33, and 9.01 ± 1.86, respectively (Figure F59). Values range 17.46–30.09, −1.46–0.46, and 6.01–13.68, respectively.
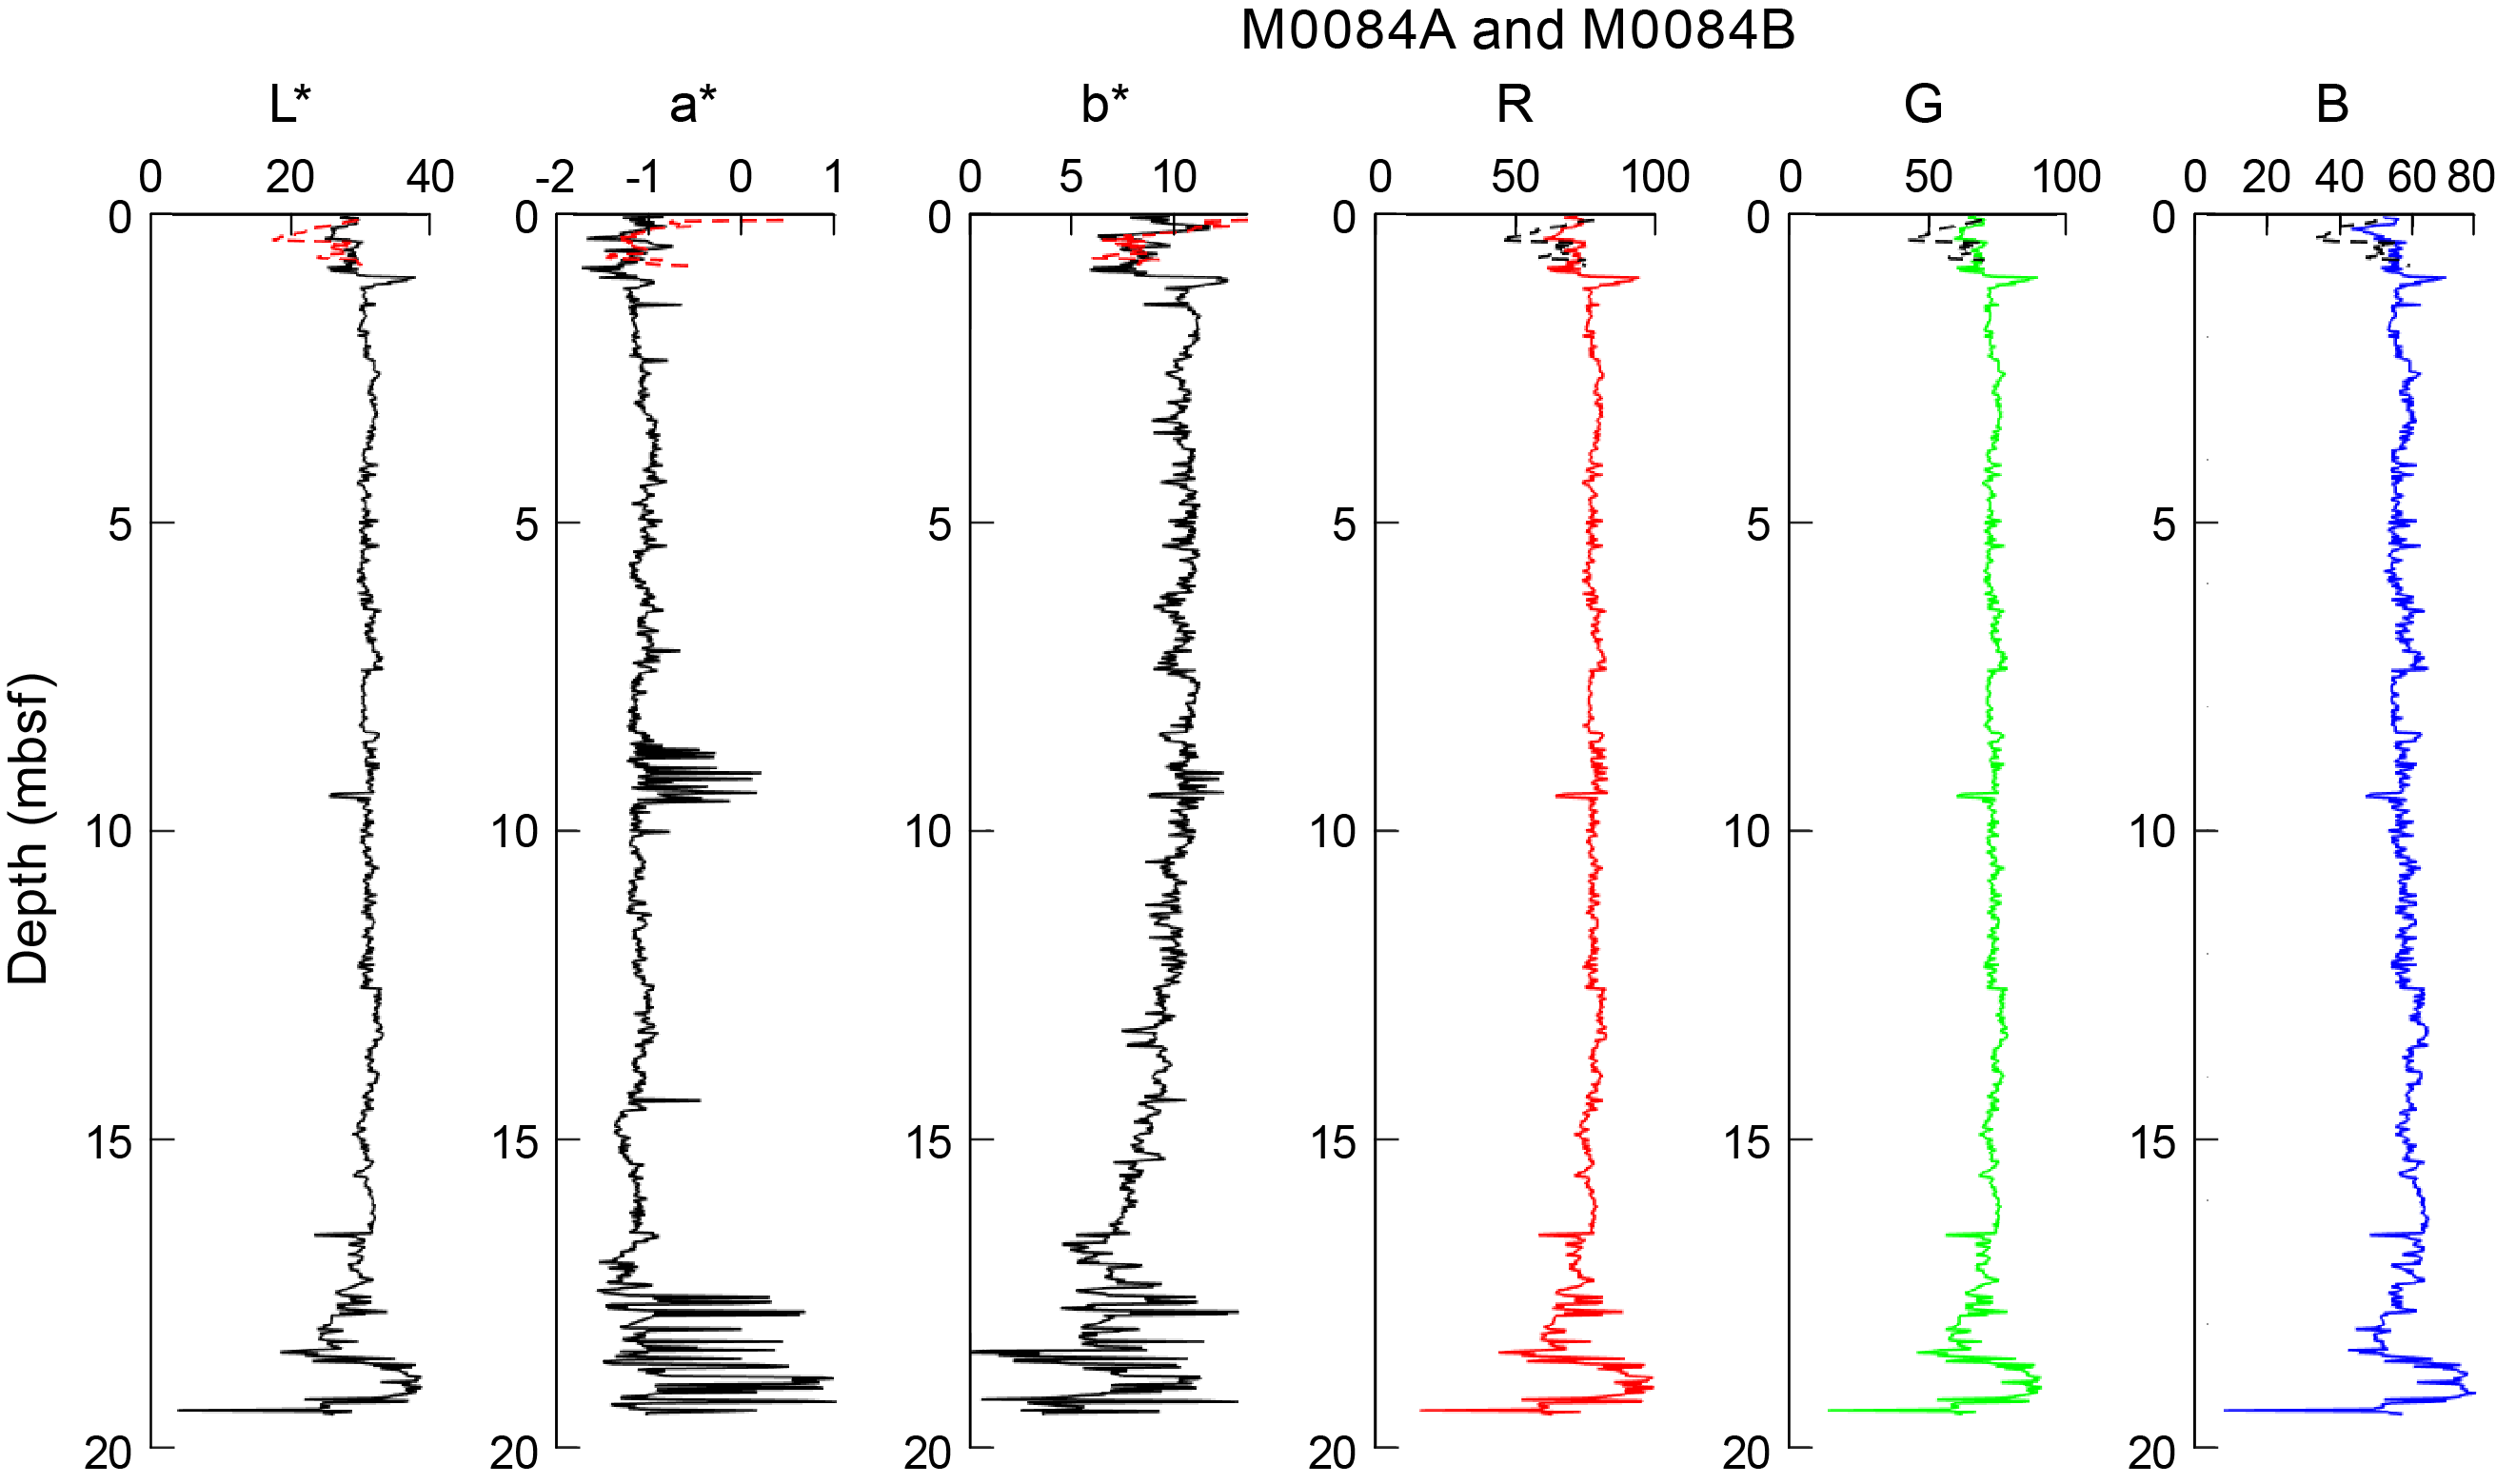
Figure F59. Color data summary, Holes M0084A and M0084B.
In Hole M0084B, L*a*b* values average 30.72 ± 2.26, −1.05 ± 0.30, and 9.44 ± 1.76, respectively (Figure F59). Values range 3.95–38.60, −1.72–1.03, and −0.10–13.22, respectively.
In Hole M0084C, L*a*b* values average 23.48 ± 5.95, −0.65 ± 0.56, and 9.78 ± 2.73, respectively (Figure F60). Values range 4.76–29.20, −1.34–0.68, and 3.74–12.98, respectively.
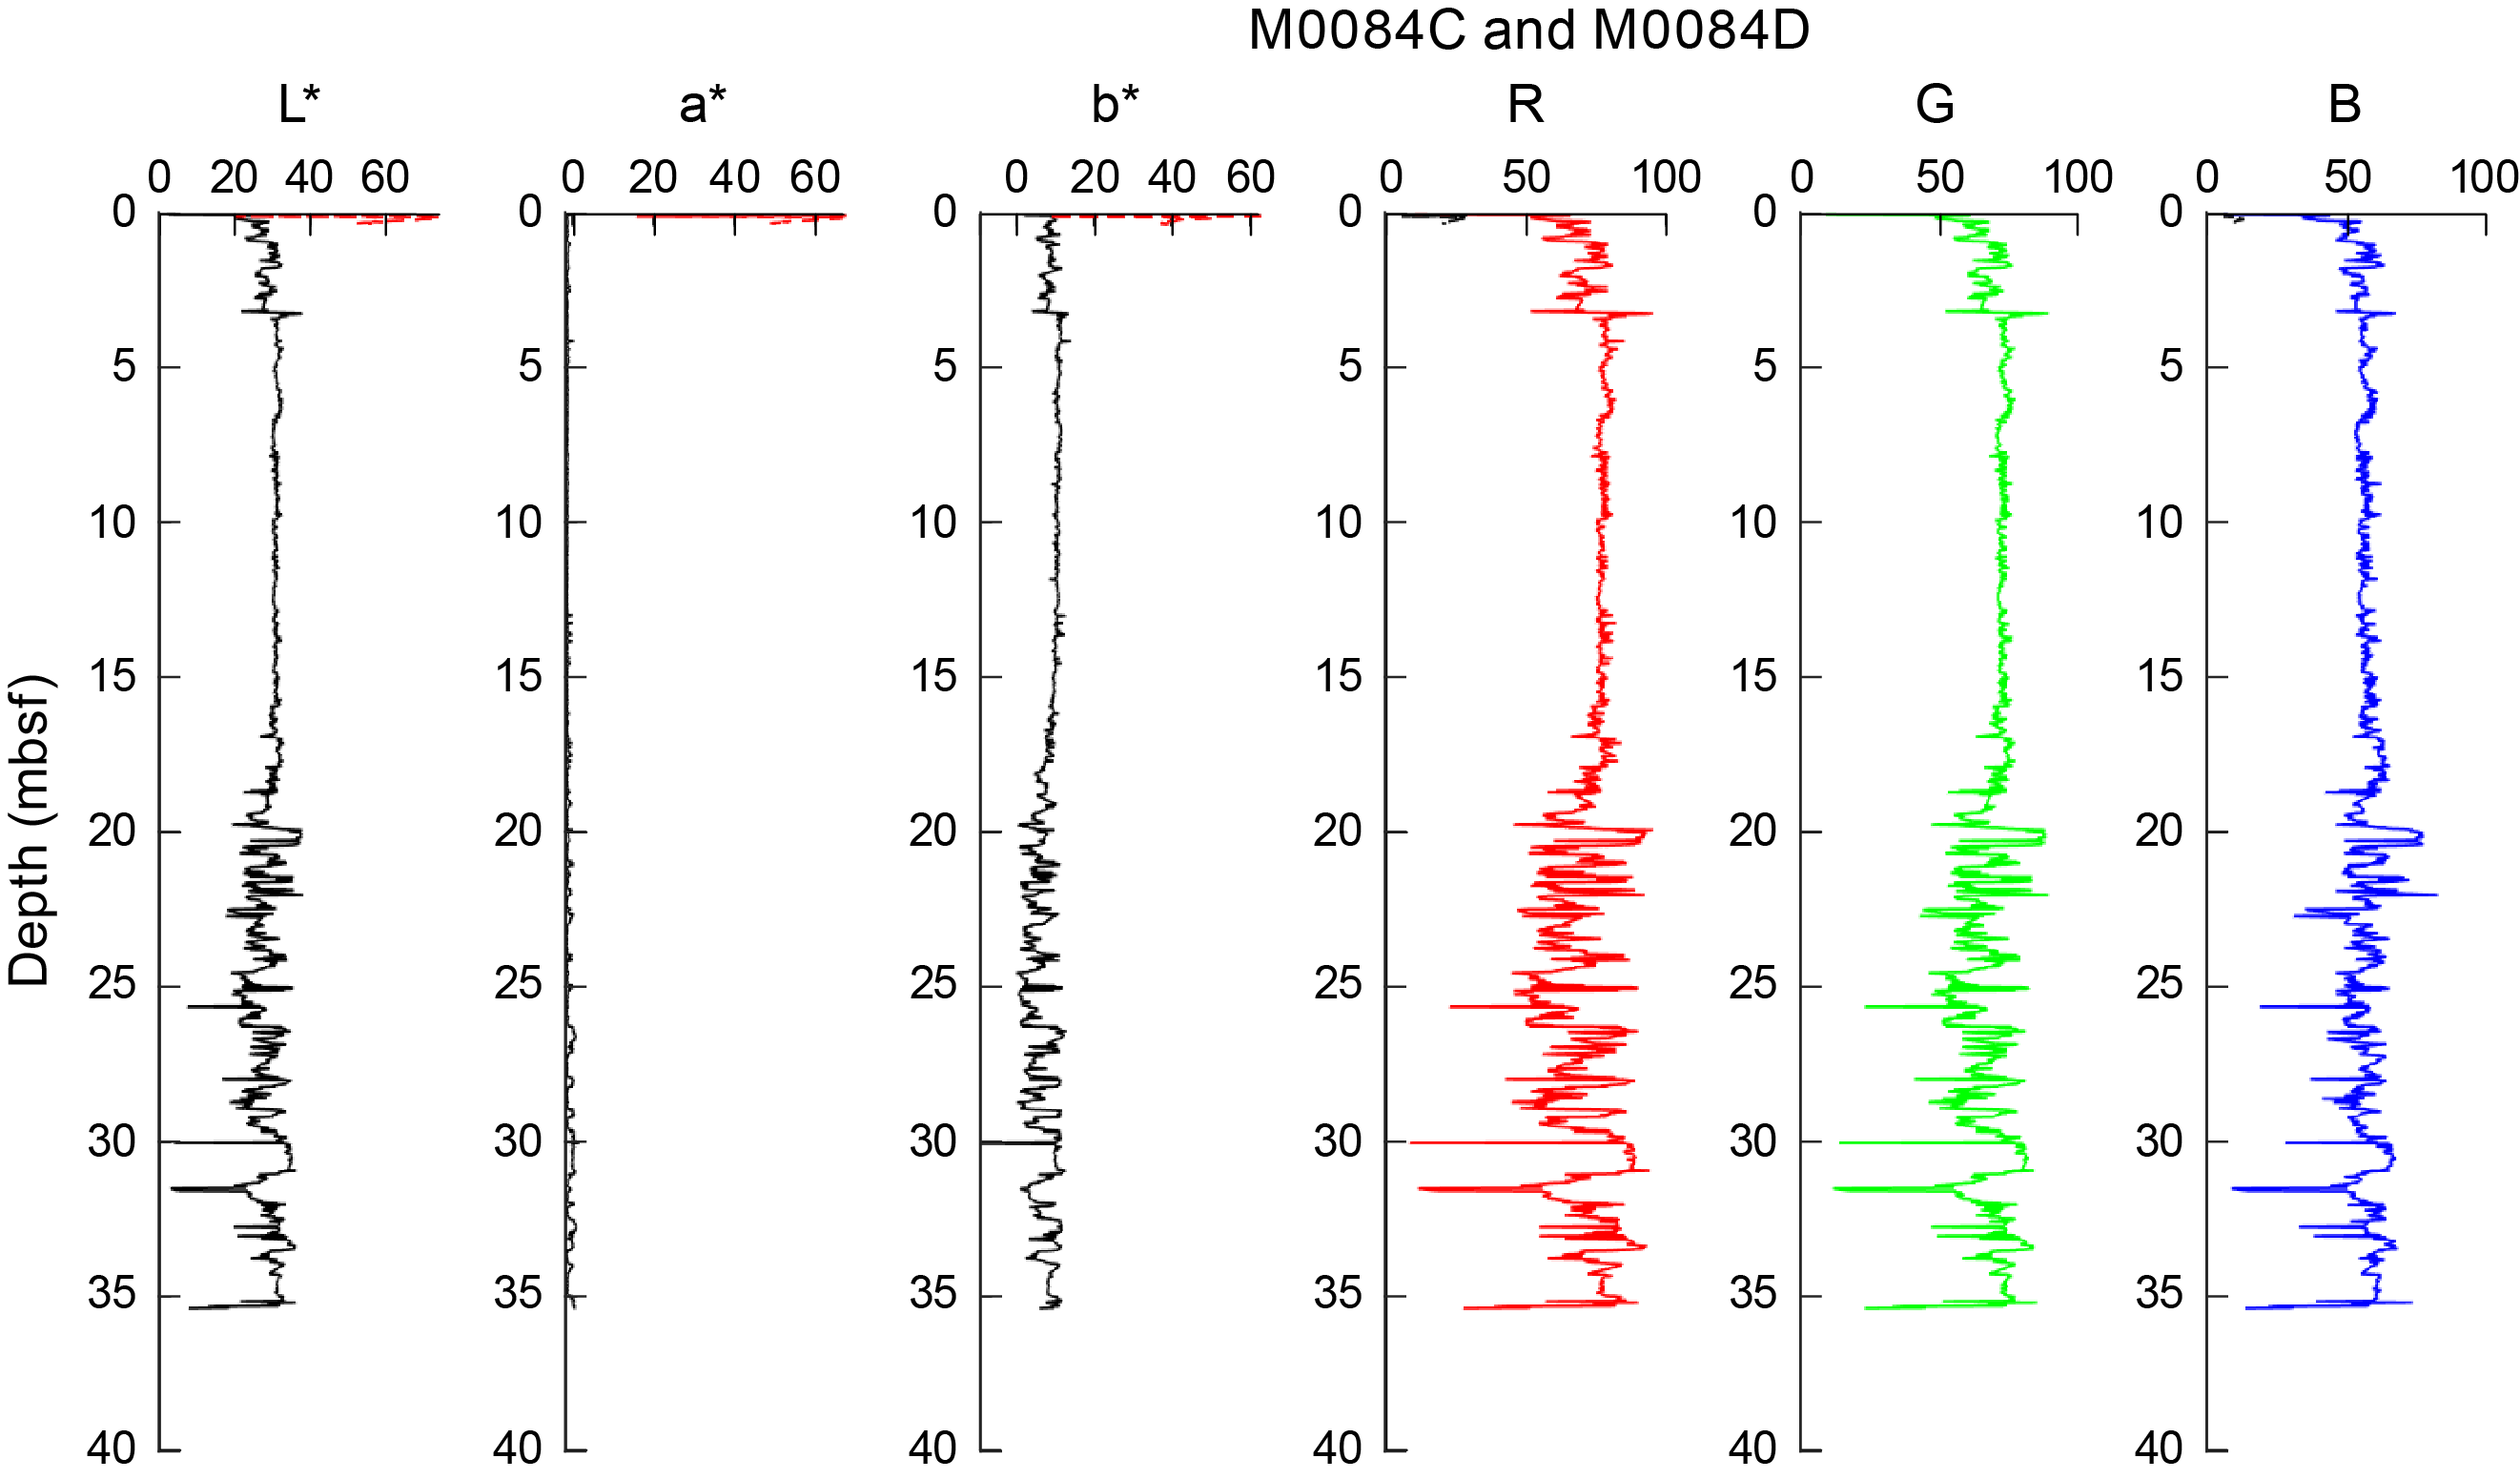
Figure F60. Color data summary, Holes M0084C and M0084D.
In Hole M0084D, L*a*b* values average 29.33 ± 3.78, −0.89 ± 0.53, and 8.21 ± 3.13, respectively (Figure F60). Values range 2.56–37.97, −1.83–1.96, and −9.52–14.08, respectively.
In Hole M0084E, L*a*b* values average 21.84 ± 3.17, −0.87 ± 0.61, and 9.32 ± 1.65, respectively (Figure F61). Values range 18.00–28.74, −1.41–1.10, and 6.41–12.63, respectively.
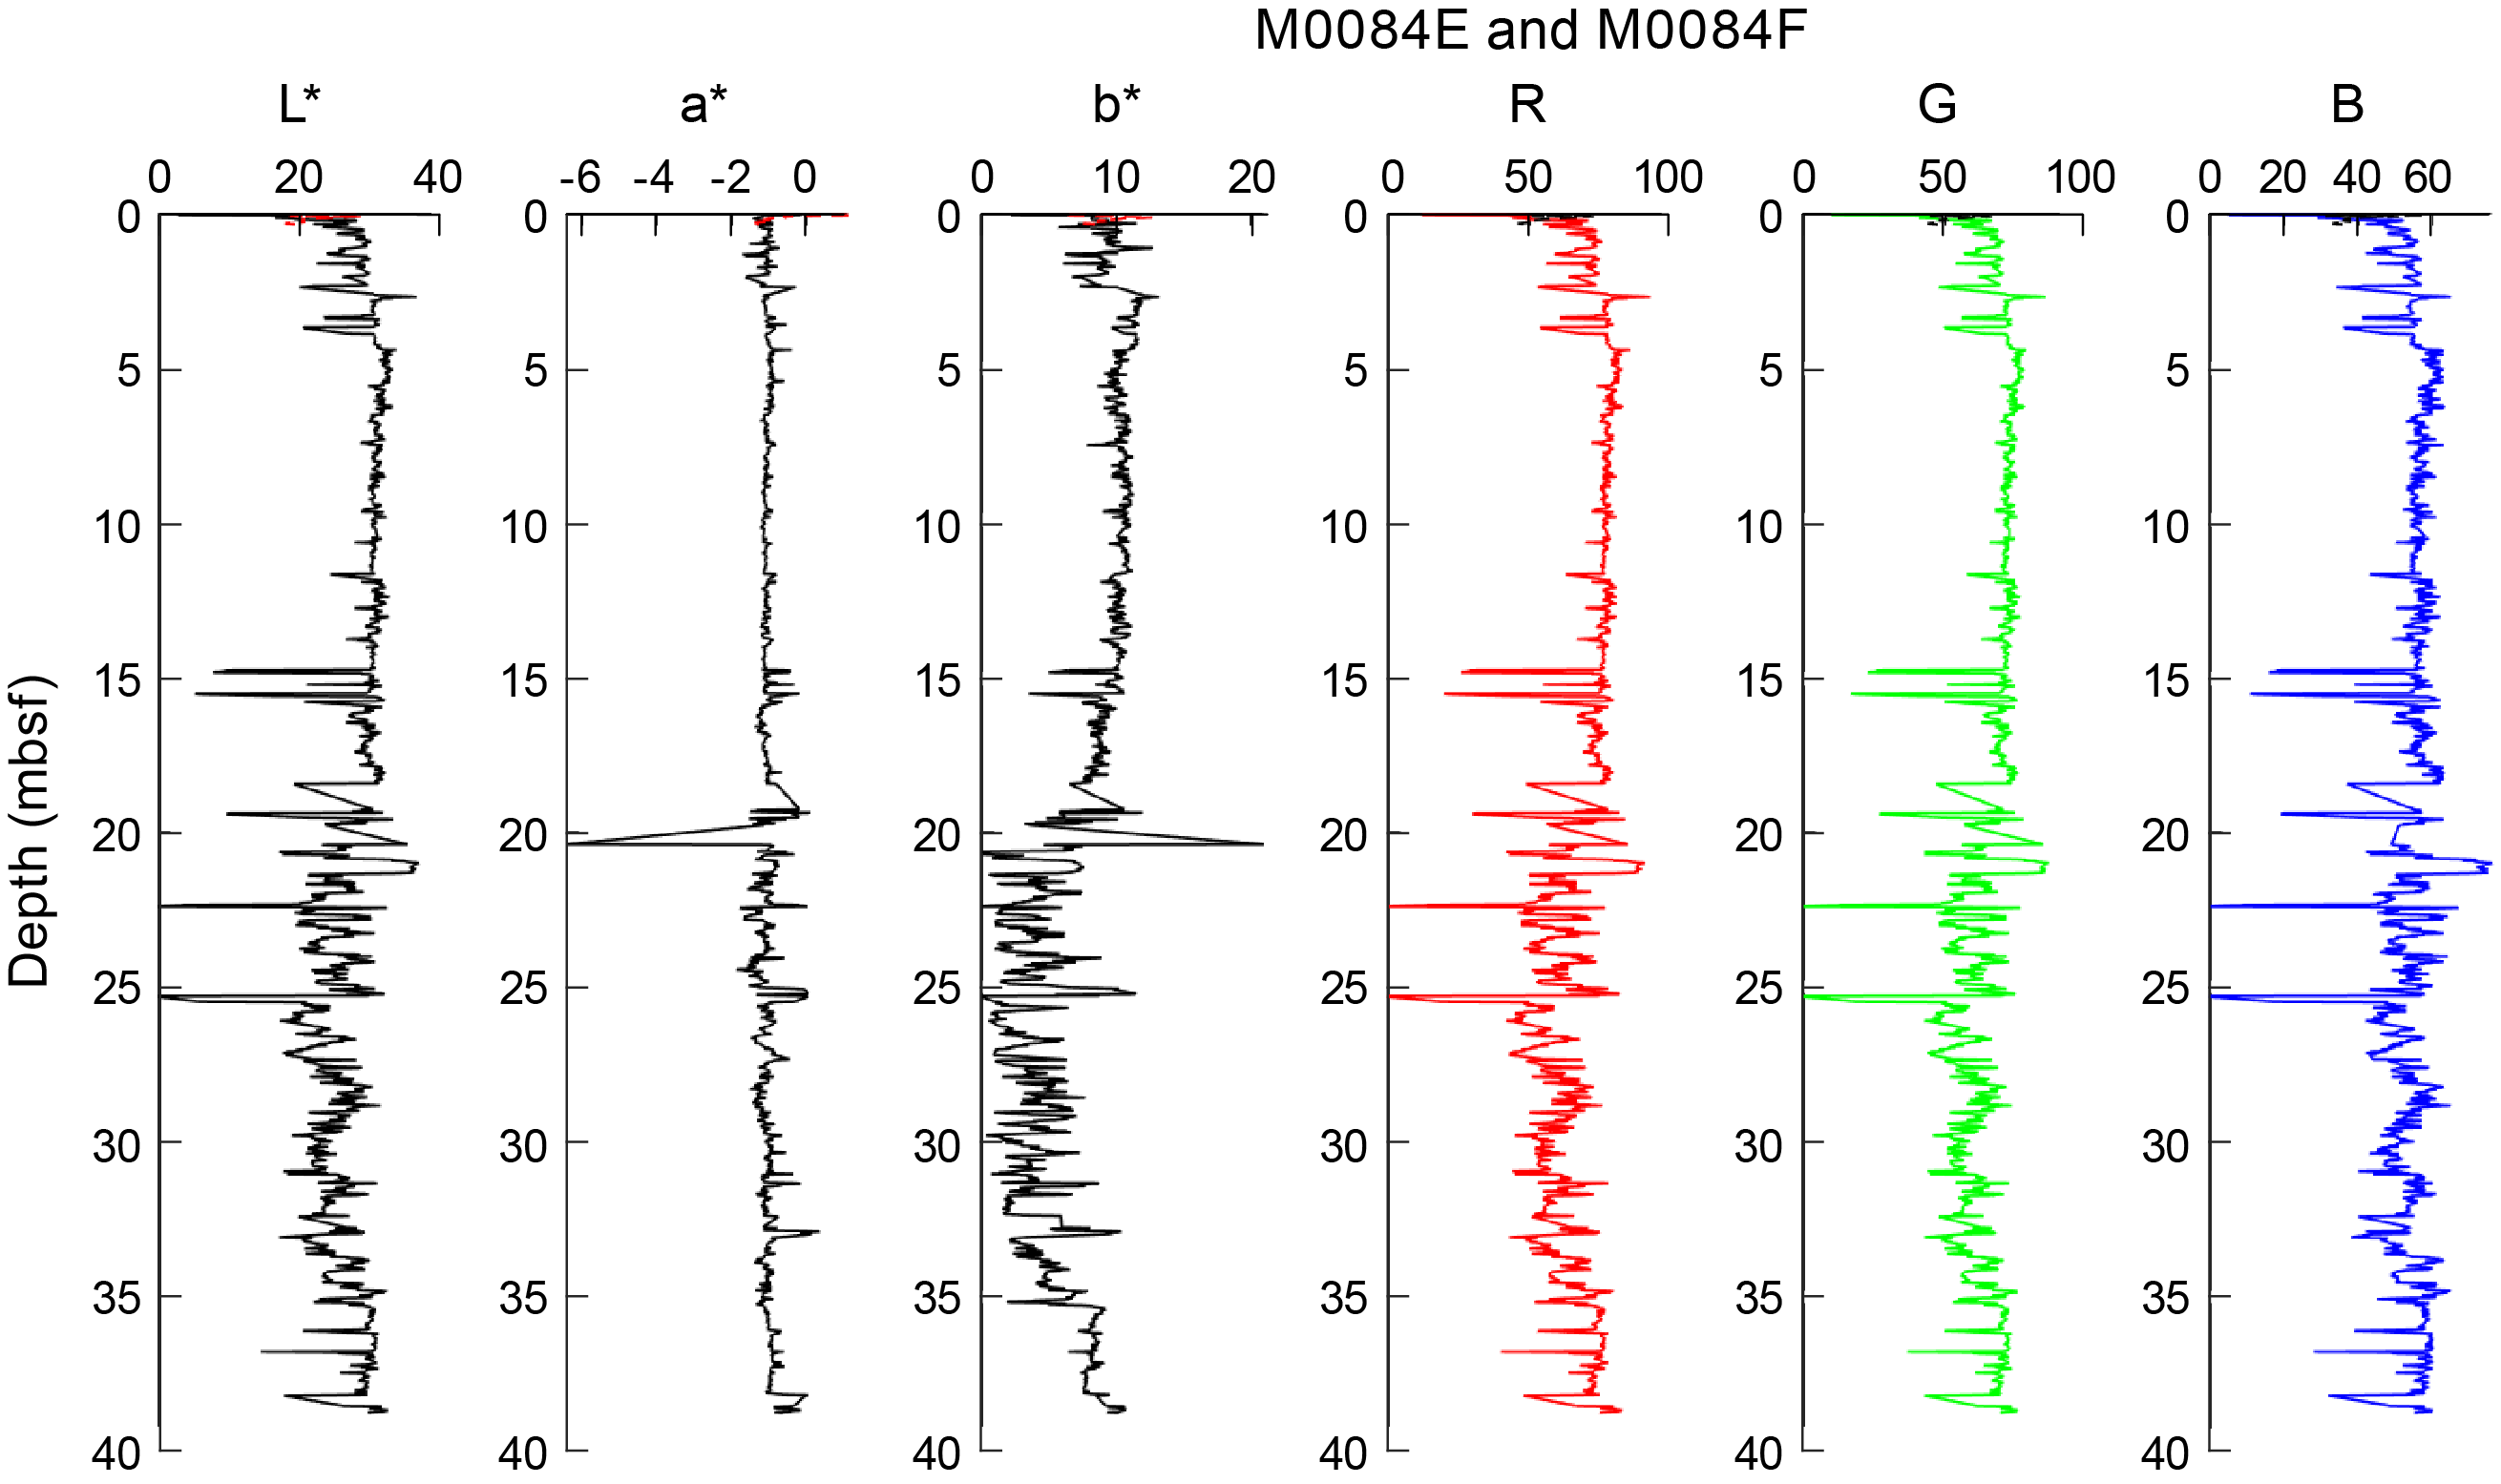
Figure F61. Color data summary. Holes M0084E and M0084F.
In Hole M0084F, L*a*b* values average 27.83 ± 4.36, −1.07 ± 0.25, and 7.31 ± 3.29, respectively (Figure F61). Values range 0–37.07, −6.42–0.34, and −0.04–20.91, respectively.
7.8.2. Site M0085
Color spectrometry was measured onshore and reported as L*a*b* values for each core.
In Hole M0085A, L*a*b* values average 28.92 ± 4.93, −0.75 ± 0.34, and 9.49 ± 1.34, respectively (Figure F62). Values range 4.27–33.75, −1.29–0.31, and 3.77–11.12, respectively.

Figure F62. Color data summary, Holes M0085A and M0085B.
In Hole M0085B, L*a*b* values average 29.32 ± 2.39, −1.31 ± 0.27, and 6.28 ± 1.90, respectively (Figure F62). Values range 12.21–36.98, −2.32–0.63, and 1.22–14.06, respectively.
In Hole M0085C, L*a*b* values average 29.82 ± 1.23, −0.75 ± 0.29, and 9.97 ± 1.46, respectively (Figure F63). Values range 27.30–31.46, −1.11–0.09, and 8.25–12.41, respectively.

Figure F63. Color data summary, Holes M0085C and M0085D.
In Hole M0085D, L*a*b* values average 29.15 ± 3.39, −1.18 ± 0.34, and 6.33 ± 2.01, respectively (Figure F63). Values range 5.24–48.51, −2.11–2.82, and 0.72–13.82, respectively.
8. Paleomagnetism
Remanent magnetization was measured for Holes M0084A–M0084F, which were cored in the main depocenter of Basin N3 in the northern Japan Trench focus area. The condensed sections of Holes M0085A–M0085D, located on a relative bathymetric high in this basin, were also measured for remnant magnetization. Thick MTD intercalations were documented at Site M0084 (see Hydroacoustics). Careful evaluations were made on the magnetic direction and intensity to distinguish the magnetic properties of thick MTDs from those of background sediment before extracting true paleomagnetic signals for processing during postcruise research.
Remanent magnetization of U-channel samples taken from each working half were measured at 2 cm intervals. Natural remanent magnetization (NRM) measurements were only made at 0 and 5 mT peak fields due to the time constraints of the hybrid OSP.
Profiles of intensity, inclination, and declination after demagnetization at 5 mT are displayed in the figures in this section. Profiles of trigger core Holes M0084A, M0084C, M0084E, M0085A, and M0085C are shown separately from their associated GPC holes because of their short core lengths (Figure F64). Intensities in Holes M0084A, M0084E, M0085A, and M0085C increase downward (from 1.0 × 10⁻⁵ to between 2.5 × 10⁻⁵ and 5.0 × 10⁻⁵ A/m). This may be due to less volume in the U-channel sample or low density soupy mud in the upper part of the cores. Declination and inclination in Holes M0084A and M0085A reveal constant values. The other holes are difficult to describe because of their short intervals.
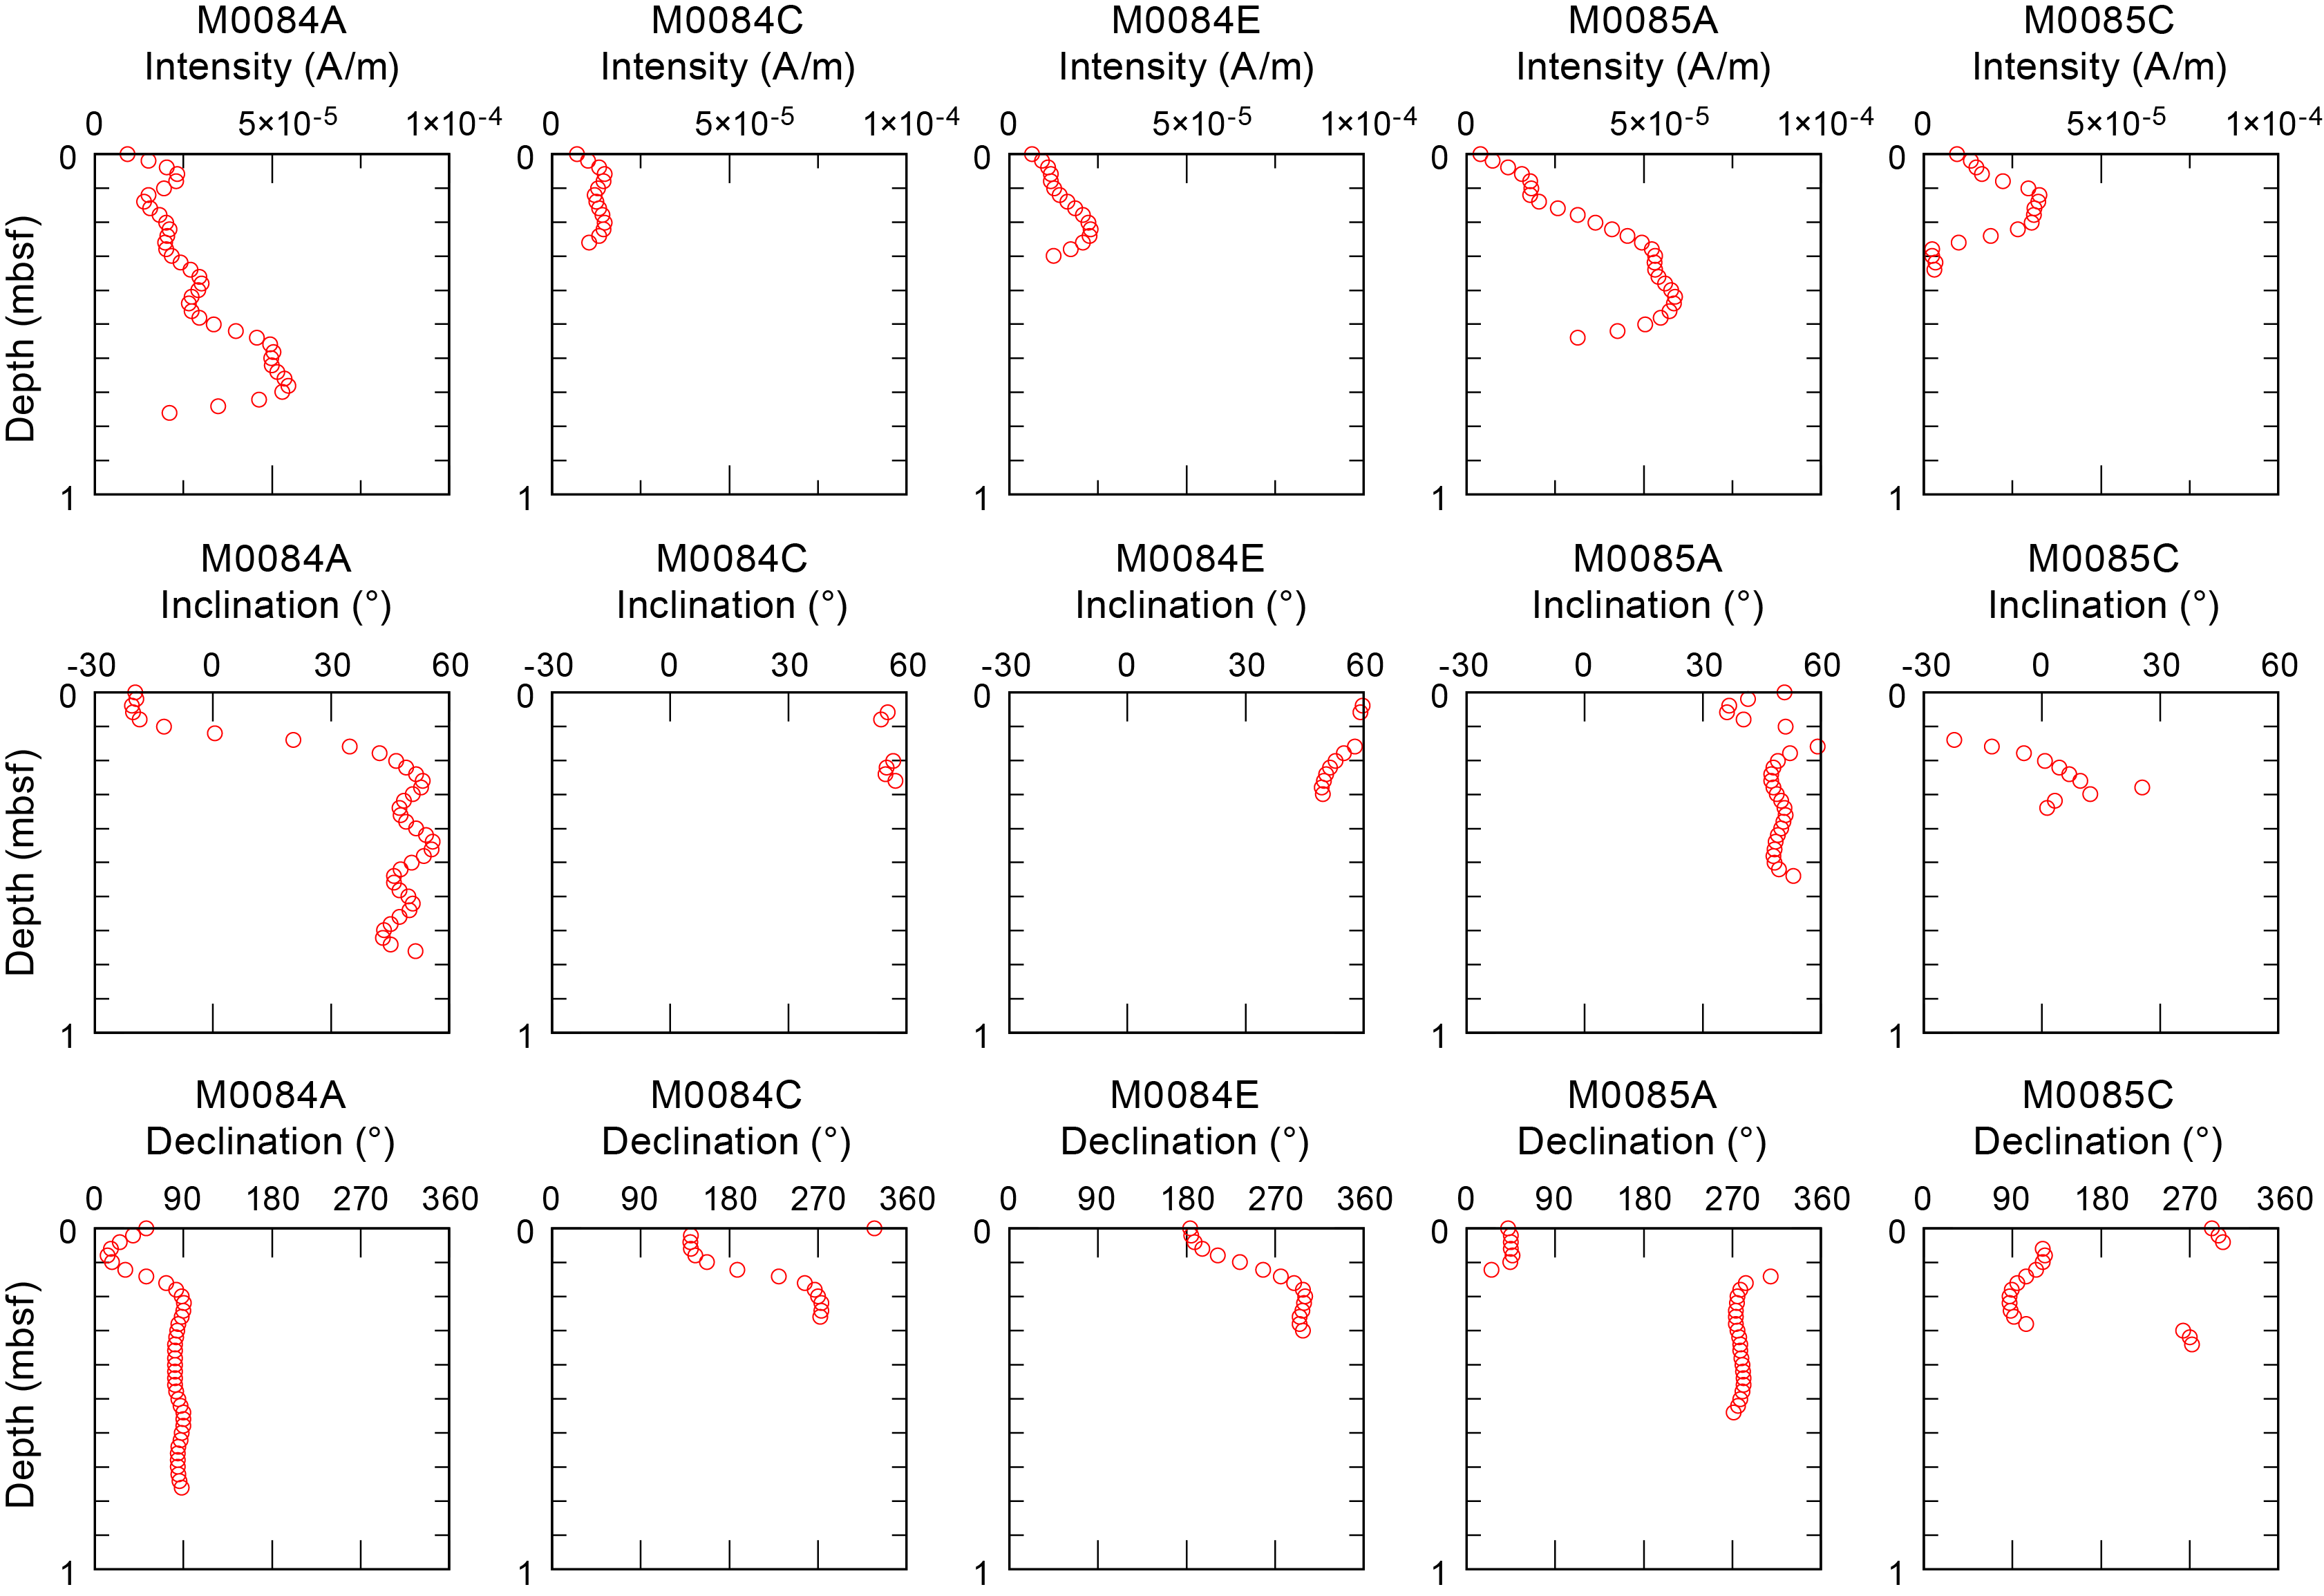
Figure F64. Intensity, inclination, and declination.
The intensity of GPC cores from Holes M0084B, M0084D, and M0084F is characterized by thick, low intensity intervals (1 × 10⁻⁵ A/m) between ~4 and 18 mbsf in Holes M0084B, M0084D, and M0084F; between 23 and 25 mbsf in Holes M0084D and M0084F; and between 34 and 37 mbsf in Hole M0084F (Figure F65). Intensity decreases (from ~6 × 10⁻⁵ to less than 1 × 10⁻⁵ A/m) from 2 to 12 mbsf in Holes M0085B and M0085D and then increases from 12 mbsf to the bottom of the core in Hole M0085B and to 22 mbsf in Hole M0085D (~6 × 10⁻⁵ A/m). Noticeable fluctuations in intensity between ~8 × 10⁻⁵ and less than 1 × 10⁻⁵ A/m from 22 mbsf to the core bottom in Hole M0085D are observed.
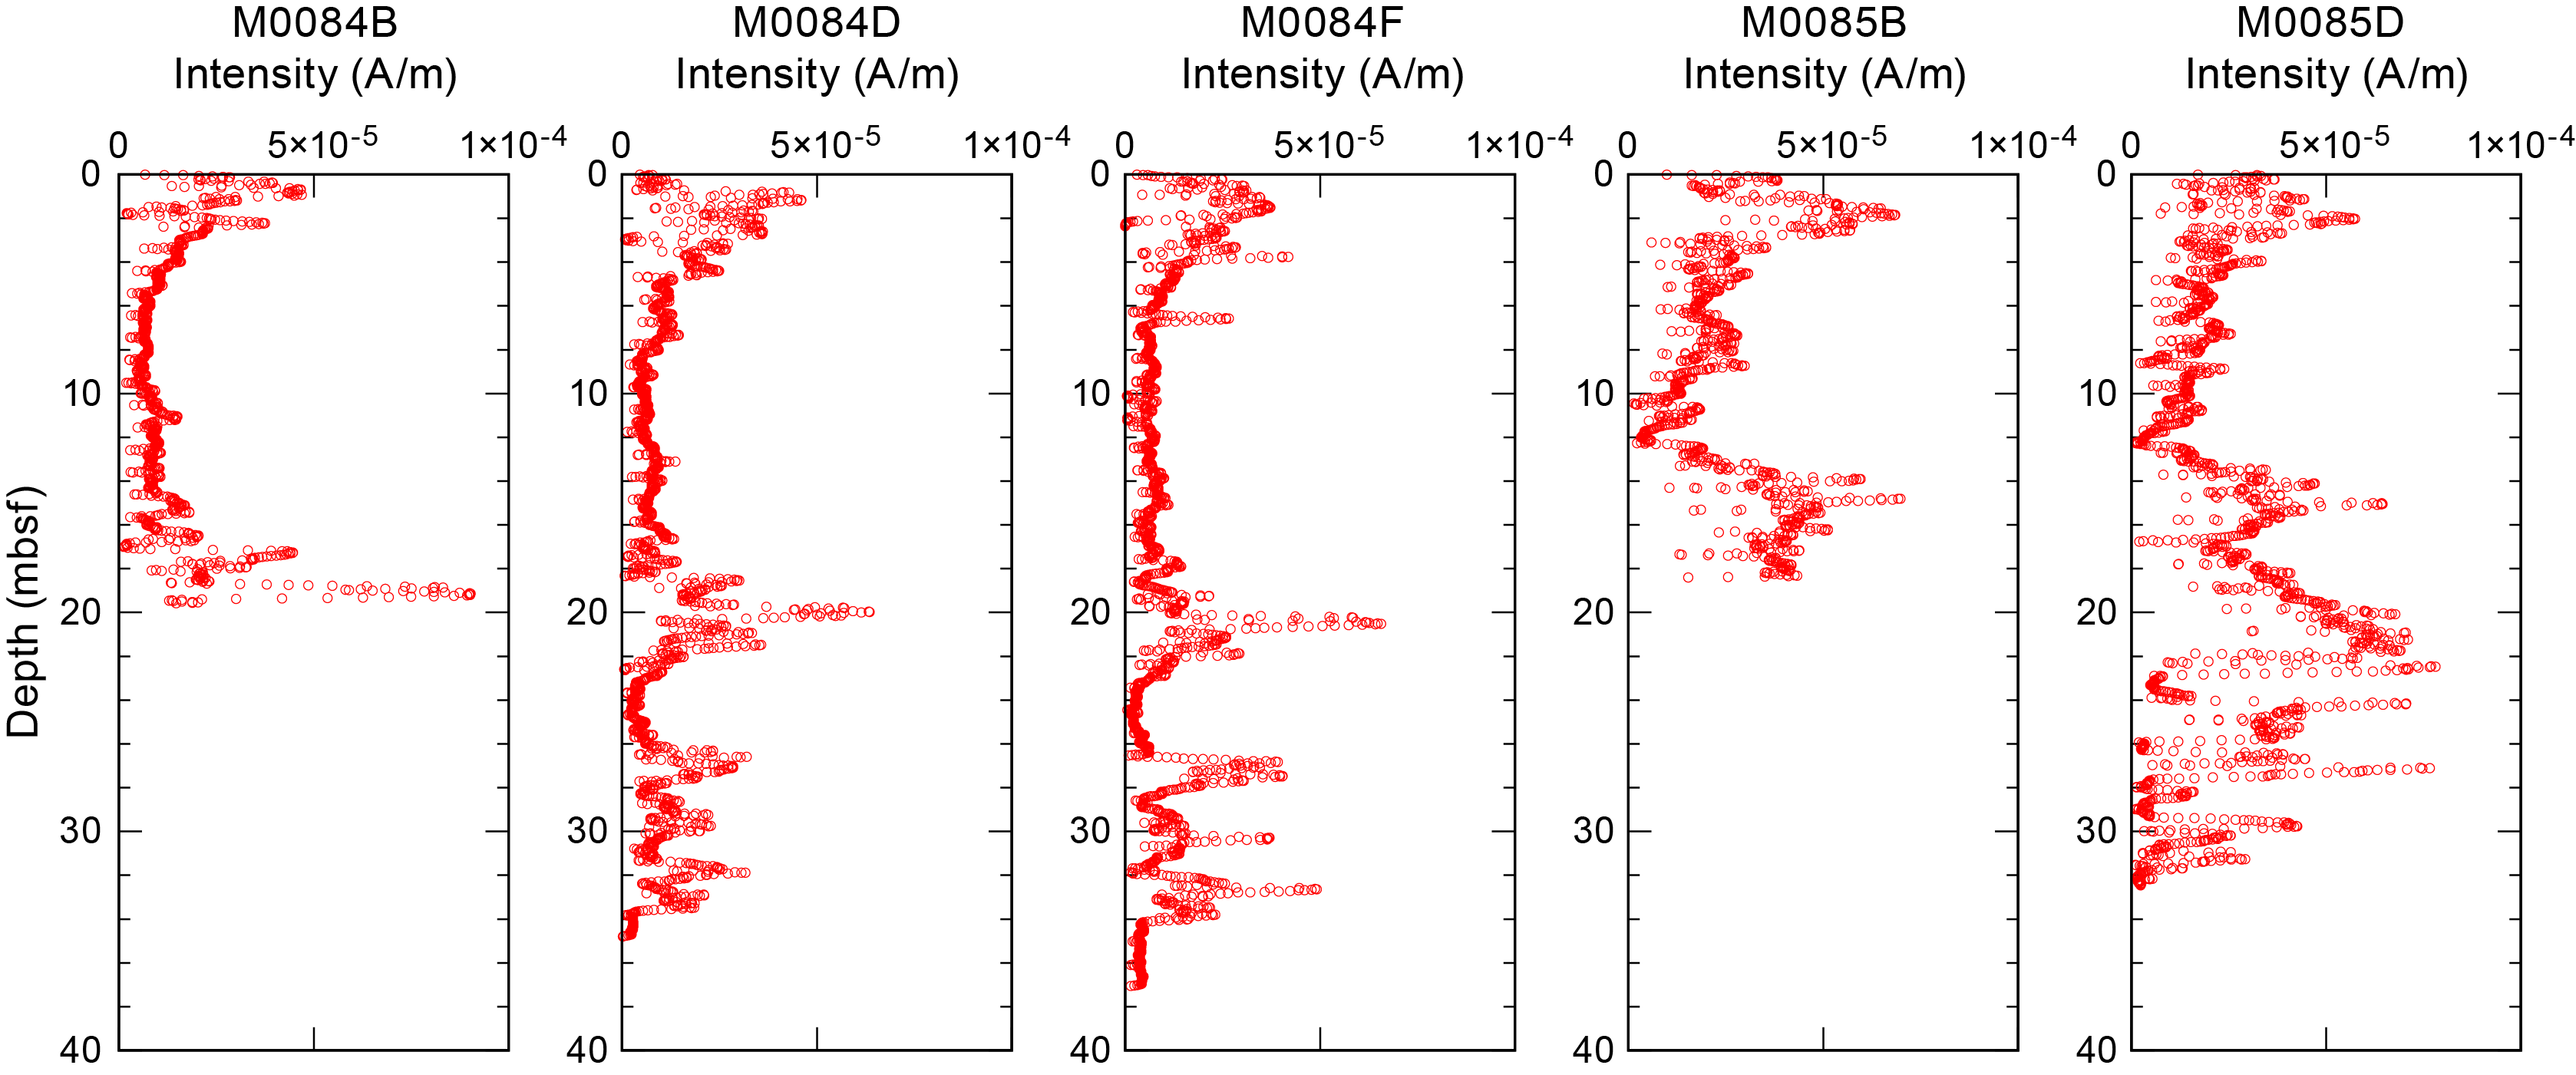
Figure F65. Intensity.
Various declination trends at Sites M0084 and M0085 can be observed in Figure F66. Clockwise gradual shifts downward are recognized for Holes M0084B, M0084D, M0084F, and M0085B, whereas an anticlockwise trend is observed in Hole M0085D. Discontinuities are observed in Holes M0085B and M0085D at 10 and 16.5 mbsf, respectively. It is presumed that these trends were caused during GPC penetration to the subbottom (see Figure F5 in the Expedition 386 methods chapter [Strasser et al., 2023a). A simple linear correction with depth was applied to reconstruct the original declination trend. Discontinuities were corrected by shifting to compensate for directional gaps. The corrected declination profiles for Site M0084 show large discrepancies in trends between 4 and 19 mbsf (Figure F67). Between 0 and 7 mbsf in Holes M0085B and M0085D there is a similar trend, which is a cyclic declination change. The declination profile of Hole M0085B seems to reveal good paleomagnetic record preservation. Conversely, the declination trend in Hole M0085D, which shows a large hump between 6 and 16 mbsf, is not likely to represent a natural trend.

Figure F66. Declination.
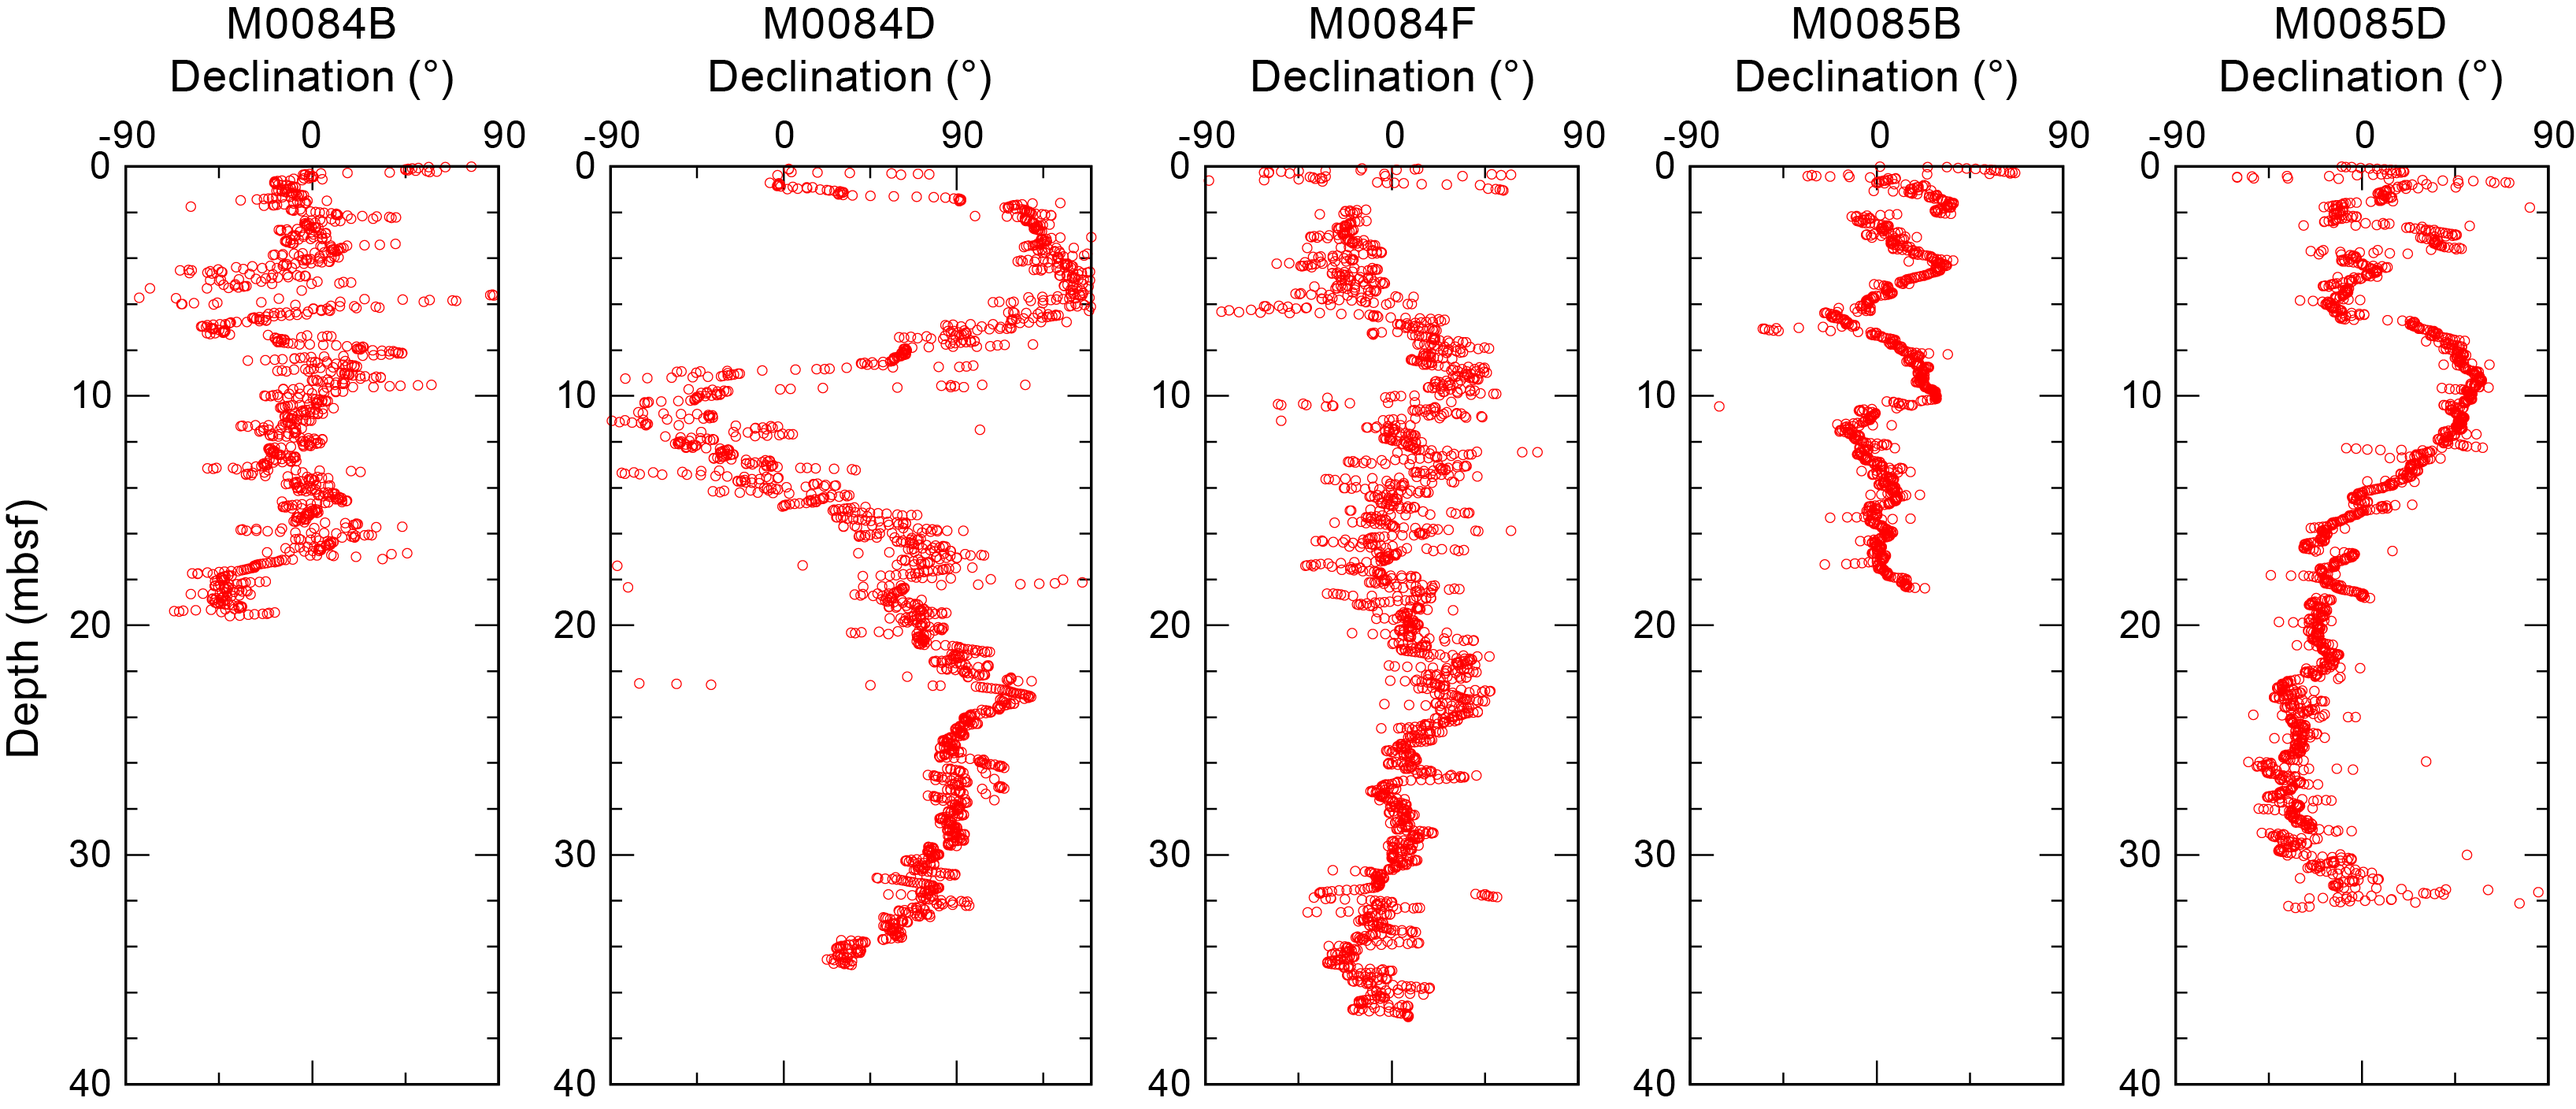
Figure F67. Corrected declination.
The inclination profiles of Holes M0084B, M0084D, and M0084F generally fluctuate between 30° and 60° (Figure F68). At Sites M0081–M0083 (see Paleomagnetism in the Sites M0081 and M0082 (Basin S1) chapter [Strasser et al., 2023c] and Paleomagnetism in the Sites M0083 and M0089 (Basin C2) chapter [Strasser et al., 2023d]) and Site M0085, interhole comparison of inclinations shows good agreement between holes at a single site. Because inclination values are not affected by the horizontal rotation of GPC penetration, the trend of inclination profiles should be comparable between the holes at Site M0084. However, inclination profiles of Holes M0084B, M0084D, and M0084F between 4 and 19 mbsf reveal different patterns. Above 18 mbsf, the depths of maxima and minima in inclination are different in Holes M0084D and M0084F. This observation, together with the declination discrepancies, suggests that the magnetic direction between 4 and 19 mbsf is not homogeneous, which could be related to the lithology of these intervals.

Figure F68. Inclination.
In Holes M0085B and M0085D, inclination drops from 70° to 40° are observed at around 5 mbsf. If this feature is a record of paleomagnetic secular variation, it is possibly correlated between holes and is a potential chronological tie point (e.g., Kanamatsu et al., 2017).
Preliminary paleomagnetic data for Sites M0084 and M0085 display various patterns of declination and inclination. Declination and inclination profiles are inconsistent between 4 and 19 mbsf in Holes M0084B, M0084D, and M0084F. The declination profiles of Holes M0085B and M0085D reveal good agreement with the cyclic pattern between 0 and 6 mbsf. Inclination profiles reveal remarkable lows at 5 mbsf. These signatures suggest Holes M0085B and M0085D possess good paleomagnetic records.
9. Stratigraphic correlation
A core composite depth scale and first-order splice (see Stratigraphic correlation in the Expedition 386 methods chapter [Strasser et al., 2023a]) was constructed separately for Sites M0084 and M0085 to establish a first-order continuous sediment succession at each site. Three GPC cores from Holes M0084A–M0084F and two from Holes M0085A–M0085D were recovered.
First-order splicing between the holes at Sites M0084 and M0085 enabled construction of continuous stratigraphic successions from the seafloor to the bottom of Holes M0084F (37.06 meters composite depth in splice [mcd-splice]) and M0085D (33.845 mcd-splice). For Site M0085, there is an exception of one currently unresolved gap between the base of Trigger Core 386-M0085A-1P and the top of GPC Core 386-M0085D-1H. Therefore, the Site M0085 composite depth below seafloor scale (mcd) and depth scale of the splice is mcd-splice for depths >0.545 mcd and >0.555 mcd-splice, respectively, are currently referred to as floating depths, assuming the coring gap to be zero (see Stratigraphic correlation in the Expedition 386 methods chapter [Strasser et al., 2023a]). The accuracy of correlation depends on how clearly the tie point can be recognized in X-ray CT and linescan images. The depth of each tie point was determined by visual core description; however, some were not described and thus were based on X-ray CT images.
9.1. Construction of Site M0084 core composite depth scale
9.1.1. Definition of top
The presence of a thin (~1 cm thick) oxidized top in Sections 386-M0084A-1P-1, 386-M0084C-1P-1, and 386-M0084E-1P-1 (see Lithostratigraphy) suggests that an undisturbed mudline was recovered in these three holes. Thus, the vertical offset was determined as −0.08 m for Hole M0084A, −0.08 m for Hole M0084C, and −0.075 m for Hole M0084E (Tables T16, T17). Based on X-ray CT images, ~1 cm thick high-radiodensity layers were observed in Sections 386-M0084A-1P-1, 43.5–44.5 cm, and 386-M0084E-1P-1, 36–37 cm. These consist of silty clay–very fine sand and are recognized as the stratigraphically first tie point (TP1). Because sediment thickness between the mudline and TP1 is larger in Hole M0084A, this hole was selected as the anchor core and Section 1P-1, 8 cm, was defined as 0 mbsf (Tables T16, T17).
9.1.2. Compositing of cores
Before compositing holes, artificial and/or natural voids were measured at the ends of sections and void lengths were subtracted from the curated section length to obtain the sediment length of each section. Corrected section lengths and section top and bottom depths for Site M0084 are listed in Table T16.
The core composite scale for Site M0084 is currently tentatively based on the visual correlation marker horizons on X-ray CT images. VCDs and linescan images were used during the OSP, and spikes in magnetic susceptibility and GRA data from the MSCL (see Physical properties in the Expedition 386 methods chapter [Strasser et al., 2023a]) were also used for interhole correlation. At this stage, thin but clear marker beds visible on X-ray CT and/or linescan images were tentatively used, in places verified by visual core description, instead of large (coarse and thick) event beds that may have eroded the underlying sediments.
Primary air fall tephra beds, which were generated by a single volcanic eruption and fell through the water column, are regarded as one of the best tie points between holes. Although a tephra bed was observed in Section 386-M0084F-1H-22, 80 cm (see Tephra), there was no correlative tephra bed in the other holes.
Initially, seven tie points were determined; no tie points were observed in all three trigger cores (Holes M0084A, M0084C, and M0084E), one was identified between the trigger cores (Holes M0084A and M0084E) and the GPC cores (Holes M0084D and M0084F), and the others were identified in the three GPC cores (Holes M0084B, M0084D and M0084E). The uppermost tie points in each core were used to calculate the vertical offsets of the top depth used to create the first-order core composite depth scales at Site M0084 (Table T17). Note that these linear bulk shifts are only correct for the uppermost few meters shallower than the first occurrence of artificial voids added to the bottom or top of a section during core cutting due to sediment expansion during core recovery (Table T16). All tie points were evaluated for robustness of correlation and suitability for composing the splice, and out of these, seven were selected (Table T18). Most of these are described as thin laminae or bioturbated silt, which is slightly coarser in grain size and higher in radiodensity than the surrounding fine-grained sediments.
First-order correlation suggests that TP1 exists in the anchor core (Section 386-M0084A-1P-1, 44.5 cm; 0.365 mbsf [corrected core depth scale]) and GPC Section 386-M0084D-1H-1, 24 cm (0.225 mbsf). Thus, the vertical offset of Hole M0084D was calculated as 0.125 m. Furthermore, the uppermost clear tie point among the three GPC holes is the bioturbated silt with high radiodensity (TP2; Sections 386-M0084B-1H-1, 27 cm [0.25 mbsf], 386-M0084D-1H-3, 30 cm [1.81 mbsf], and 386-M0084F-1H-2, 28 cm [0.195 mbsf]). Based on the vertical offset of Hole M0084D and the corrected core depths of TP2 in the three holes, the vertical depth shift was calculated as 1.68 m for Hole M0084B and 0.72 m for Hole M0084F (Table T17).
Overall, the general stratigraphic succession and several distinct marker horizons observed in X-ray CT images can be correlated across GPC cores (Table T18). However, sequential horizontal alignment of marker beds from the top to the bottom of the cores reveals that the stratigraphic succession is slightly more expanded in Holes M0084D and M0084F than in the stratigraphically equivalent succession in Hole M0084B, likely due to more gas expansion and elastic rebound during core recovery. This is noted below ~17–18 mbsf.
9.1.3. Construction of splice
A combination of Holes M0084A–M0084F reveals the longest complete and least disturbed stratigraphic interval at Site M0084. A high-radiodensity bed in the X-ray CT image of Section 386-M0084D-1H-1, 20–24 cm, consists of weakly laminated and bioturbated clay and is likely correlative with TP1 in trigger core Holes M0084A and M0084D (Table T18).
Below 0.365 mcd-splice, TP2 was defined by the bioturbated silt with a slightly higher radiodensity than the surrounding sediment (Sections 386-M0084D-1H-3, 30 cm, and 386-M0084B-1H-1, 27 cm), and the Hole M0084B interval was selected to be included in the splice because cores recovered from the 20 m long GPC barrel deployment are generally less disturbed. The splice moves to Hole M0084E at TP3 (Sections 386-M0084B-1H-20, 86 cm; 386-M0084D-1H-22, 60 cm; and 386-M0084F-1H-22, 45.5 cm). Below this level, the splice moves between Holes M0084E and M0084D at TP4–TP7 to avoid major voids and continues to the base of Hole M0084F (37.06 mcd-splice) to construct a first-order splice. The tentatively defined tie points and splice intervals with a calculated splice composite depth are given in Table T18.
9.2. Construction of Site M0085 core composite depth scale
9.2.1. Definition of top
The presence of a thin (1–2 cm) oxidized top of the trigger cores from Holes M0085A and M0085C (see Lithostratigraphy) suggests that an undisturbed mudline was recovered in both holes. Thus, the vertical offset was determined as −0.065 m for Hole M0085A and −0.085 m for Hole M0085C. Based on visual core description and X-ray CT images, patches of very fine sand or silt streaks with high radiodensity were observed at roughly 9–16 cm curated core depth in Section 1P-1 in both holes. These are heavily bioturbated but high-radiodensity intervals, which suggests coarse grains are concentrated in the lowest part. Therefore, the lowest horizons (16 cm curated core depth in both trigger cores) were tentatively correlated as the stratigraphically first tie point (TP1) of this site. Sediment thickness between the mudline and the TP1 in Hole M0085A is larger than that in Hole M0085C. Thus, Hole M0085A was selected as the anchor core and Section 1P-1, 7 cm, was defined as 0 mbsf (Tables T19, T20).
9.2.2. Compositing cores
Before compositing holes, artificial and/or natural voids were measured at the ends of sections and void lengths were subtracted from the curated section length to obtain the sediment length for each section. Corrected section lengths and section top and bottom depths for Site 386-M0085 are listed in Table T19.
Initially, five tie points of different types were determined; one between the trigger core (Hole M0085A) and GPC core (Hole M0085D) and the others in the two GPC cores (Holes M0085B and M0085D). The uppermost tie points in each core were used to calculate the vertical offsets of the top depth of each core used to create the first-order core composite depth scales at Site M0085 (Table T20). Note that these linear bulk shifts are only correct for the uppermost few meters shallower than the first occurrence of artificial voids added to the bottom or tops of sections during core cutting due to sediment expansion during core recovery (Table T19). All tie points were evaluated for robustness of correlation and suitability for constructing the splice, for which five were selected (Table T21). Most of these are described as thin coarse-grained layers a few centimeters thick composed of bioturbated silt and clay with slightly higher radiodensity than the surrounding fine-grained sediments. First-order correlation does not allow for correlation between any of the trigger cores (Holes M0085A and M0085C) to the upper part of the GPC cores (Holes M0085B and M0085D), and no correlation tie points could be identified to tie the GPC cores to the mudline-anchored trigger core. This suggests that the coring gap on top of the GPC cores is larger than the total length of the trigger cores, and the composite depth scale of the GPC cores remains floating. Following the methodology in Stratigraphic correlation in the Expedition 386 methods chapter (Strasser et al., 2023a), the base of the longest trigger core (Section 386-M0085A-1P-1, 62 cm, corrected core depth scale; Table T19; 0.555 mcd) and the top of GPC Core 386-M0085D-1H (which has more recovery at the core top than Core 386-M0085B-1H) were aligned, assuming the gap to be zero (append point AP1). With an artificial void (1 cm) at the top of Section 386-M0085D-1H-1 (Table T19), a vertical depth shift of 0.545 m is calculated for the top of Core 1H (Table T20). The uppermost clear tie point between the two GPC holes is the sharp and basal surface of a thick sand bed in Sections 386-M0085D-1H-3, 30 cm (2.205 mbsf), and 386-M0085B-1H-1, 93.5 cm (0.92 mbsf). Based on the vertical depth shift for Hole M0085D and the two corrected core depths, the vertical offset of Hole M0085B was calculated as 1.83 m.
Overall, the general stratigraphic succession and several distinct marker horizons observed in X-ray CT images can be correlated across GPC cores (Table T21). However, sequential horizontal alignment of marker beds from the top to the bottom of cores reveals that the stratigraphic succession covered by both holes is more expanded in Hole M0085D than the stratigraphically equivalent succession in Hole M0085B, likely due to more gas expansion and elastic rebound during core recovery. This is noted below ~10 mbsf.
9.2.3. Construction of the splice
A combination of Holes M0085A, M0085B, and M0085D reveals the longest complete and least disturbed stratigraphic interval at Site M0085. Because of the lack of tie points connecting trigger core Hole M0085A and GPC Holes M0085B and M0085D, the bottom of Hole M0085A (0.555 mcd-splice) and top of Hole M0085D were connected as the longest recovered interval in the top part of the two GPC holes above TP2 (see Stratigraphic correlation in the Expedition 386 methods chapter [Strasser et al., 2023a]; Table T21).
Below 0.555 mcd-splice, TP2 was defined by the sharp contact at the base of >3.5 cm thick coarse-grained bed with high radiodensity (Sections 386-M0085D-1H-3, 30 cm, and 386-M0085B-1H-1, 93.5 cm). The interval from Hole M0085B was selected to be included in the splice because cores recovered from the 20 m long GPC barrel deployment are generally less disturbed. The base of a >3.5 cm thick, high-radiodensity bed that consists of very fine sand to silt (verified by visual core description in Sections 386-M0089B-1H-9, 36 cm, and 386-M0085D-1H-11, 0.5 cm) was tentatively selected as TP3 to avoid a significant void in Section 386-M0085B-1H-11. The splice moves to Hole M0085B, connecting the two holes by a ~1–2 cm thick, high-radiodensity bed (TP4) consisting of bioturbated very fine to fine sand in Sections 386-M0085D-1H-13, 47 cm, and 386-M0085B-1H-11, 86 cm. Below these sections, interval 386-M0085B-1H-11, 86 cm, to 1H-18, 4 cm, is defined as the first-order splice. The splice moves to Hole M0085D at TP5 (Sections 386-M0085B-1H-18, 4 cm, and 386-M0085D-1H-19, 68 cm), a bed consisting of bioturbated silt to clay with slightly high radiodensity. This continues to the base of Hole M0085D to construct a first-order splice. The tentatively defined tie points and splice intervals with the calculated splice composite depth are given in Table T21.
References
Bruland, K.W., Middag, R., and Lohan, M.C., 2014. Controls of trace metals in seawater. In Holland, H.D., and Turekian, K.K. (Eds.), Treatise on Geochemistry (Second Edition). Oxford (Elsevier), 19–51. https://doi.org/
Egger, M., Riedinger, N., Mogollón, J.M., and Jørgensen, B.B., 2018. Global diffusive fluxes of methane in marine sediments. Nature Geoscience, 11(6):421–425. https://doi.org/10.1038/s41561-018-0122-8
Fontanier, C., Duros, P., Toyofuku, T., Oguri, K., Koho, K.A., Buscail, R., Grémare, A., Radakovitch, O., Deflandre, B., De Nooijer, L.J., Bichon, S., Goubet, S., Ivanovsky, A., Chabaud, G., Menniti, C., Reichart, G.-J., and Kitazato, H., 2014. Living (stained) deep-sea foraminifera off Hachinohe (NE Japan, Western Pacific): environmental interplay in oxygen-depleted ecosystems. Journal of Foraminiferal Research, 44(3):281–299. https://doi.org/
Kanamatsu, T., Usami, K., McHugh, C.M.G., and Ikehara, K., 2017. High-resolution chronology of sediment below CCD based on Holocene paleomagnetic secular variations in the Tohoku-oki earthquake rupture zone. Geochemistry, Geophysics, Geosystems, 18(8):2990–3002. https://doi.org/
Kioka, A., Schwestermann, T., Moernaut, J., Ikehara, K., Kanamatsu, T., Eglinton, T.I., and Strasser, M., 2019. Event stratigraphy in a hadal oceanic trench: the Japan Trench as sedimentary archive recording recurrent giant subduction zone earthquakes and their role in organic carbon export to the deep sea. Frontiers in Earth Science, 7:319. https://doi.org/
Matoba, Y., 1976. Recent foraminiferal assemblages off Sendai, northeast Japan. Maritime Sediments, Spec. Pub. A:205–220. https://cir.nii.ac.jp/
Matsuzaki, K.M., Nishi, H., Suzuki, N., Kawate, Y., Takashima, R., and Sakai, T., 2014. Cycladophora davisiana abundances as a paleoceanographic and stratigraphic tool in high latitude siliciceous sediments. Marine Micropaleontology, 106:1–9. https://doi.org/
Morley, J.J., Hays, J.D., and Robertson, J.H., 1982. Stratigraphic framework for the late Pleistocene in the northwest Pacific Ocean. Deep Sea Research, Part A: Oceanographic Research Papers, 29(12):1485–1499. https://doi.org/
Strasser, M., Ikehara, K., and Cotterill, C., 2019. Expedition 386 Scientific Prospectus: Japan Trench Paleoseismology. International Ocean Discovery Program. https://doi.org/
Strasser, M., Ikehara, K., Everest, J., Maeda, L., Hochmuth, K., Grant, H., Stewart, M., Okutsu, N., Sakurai, N., Yokoyama, T., Bao, R., Bellanova, P., Brunet, M., Cai, Z., Cattaneo, A., Hsiung, K.-H., Huang, J.-J., Ishizawa, T., Itaki, T., Jitsuno, K., Johnson, J.E., Kanamatsu, T., Keep, M., Kioka, A., Kölling, M., Luo, M., März, C., McHugh, C., Micallef, A., Nagahashi, Y., Pandey, D.K., Proust, J.-N., Rasbury, E.T., Riedinger, N., Satoguchi, Y., Sawyer, D.E., Seibert, C., Silver, M., Straub, S.M., Virtasalo, J., Wang, Y., Wu, T.-W., and Zellers, S.D., 2023a. Expedition 386 methods. In Strasser, M., Ikehara, K., Everest, J., and the Expedition 386 Scientists, Japan Trench Paleoseismology. Proceedings of the International Ocean Discovery Program, 386: College Station, TX (International Ocean Discovery Program). https://doi.org/
Strasser, M., Ikehara, K., Everest, J., Maeda, L., Hochmuth, K., Grant, H., Stewart, M., Okutsu, N., Sakurai, N., Yokoyama, T., Bao, R., Bellanova, P., Brunet, M., Cai, Z., Cattaneo, A., Hsiung, K.-H., Huang, J.-J., Ishizawa, T., Itaki, T., Jitsuno, K., Johnson, J.E., Kanamatsu, T., Keep, M., Kioka, A., Kölling, M., Luo, M., März, C., McHugh, C., Micallef, A., Nagahashi, Y., Pandey, D.K., Proust, J.-N., Rasbury, E.T., Riedinger, N., Satoguchi, Y., Sawyer, D.E., Seibert, C., Silver, M., Straub, S.M., Virtasalo, J., Wang, Y., Wu, T.-W., and Zellers, S.D., 2023b. Expedition 386 summary. In Strasser, M., Ikehara, K., Everest, J., and the Expedition 386 Scientists, Japan Trench Paleoseismology. Proceedings of the International Ocean Discovery Program, 386: College Station, TX (International Ocean Discovery Program). https://doi.org/
Strasser, M., Ikehara, K., Everest, J., Maeda, L., Hochmuth, K., Grant, H., Stewart, M., Okutsu, N., Sakurai, N., Yokoyama, T., Bao, R., Bellanova, P., Brunet, M., Cai, Z., Cattaneo, A., Hsiung, K.-H., Huang, J.-J., Ishizawa, T., Itaki, T., Jitsuno, K., Johnson, J.E., Kanamatsu, T., Keep, M., Kioka, A., Kölling, M., Luo, M., März, C., McHugh, C., Micallef, A., Nagahashi, Y., Pandey, D.K., Proust, J.-N., Rasbury, E.T., Riedinger, N., Satoguchi, Y., Sawyer, D.E., Seibert, C., Silver, M., Straub, S.M., Virtasalo, J., Wang, Y., Wu, T.-W., and Zellers, S.D., 2023c. Sites M0081 and M0082 (Basin S1). In Strasser, M., Ikehara, K., Everest, J., and the Expedition 386 Scientists, Japan Trench Paleoseismology. Proceedings of the International Ocean Discovery Program, 386: College Station, TX (International Ocean Discovery Program). https://doi.org/
Strasser, M., Ikehara, K., Everest, J., Maeda, L., Hochmuth, K., Grant, H., Stewart, M., Okutsu, N., Sakurai, N., Yokoyama, T., Bao, R., Bellanova, P., Brunet, M., Cai, Z., Cattaneo, A., Hsiung, K.-H., Huang, J.-J., Ishizawa, T., Itaki, T., Jitsuno, K., Johnson, J.E., Kanamatsu, T., Keep, M., Kioka, A., Kölling, M., Luo, M., März, C., McHugh, C., Micallef, A., Nagahashi, Y., Pandey, D.K., Proust, J.-N., Rasbury, E.T., Riedinger, N., Satoguchi, Y., Sawyer, D.E., Seibert, C., Silver, M., Straub, S.M., Virtasalo, J., Wang, Y., Wu, T.-W., and Zellers, S.D., 2023d. Sites M0083 and M0089 (Basin C2). In Strasser, M., Ikehara, K., Everest, J., and the Expedition 386 Scientists, Japan Trench Paleoseismology. Proceedings of the International Ocean Discovery Program, 386: College Station, TX (International Ocean Discovery Program). https://doi.org/
Strasser, M., Ikehara, K., Everest, J., and the Expedition 386 Scientists, 2023e. Supplementary material, https://doi.org/10.14379/iodp.proc.386supp.2023. In Strasser, M., Ikehara, K., Everest, J., and the Expedition 386 Scientists, Japan Trench Paleoseismology. Proceedings of the International Ocean Discovery Program, 386: College Station, TX (International Ocean Discovery Program).
Usami, K., Ikehara, K., Jenkins, R.G., and Ashi, J., 2017. Benthic foraminiferal evidence of deep-sea sediment transport by the 2011 Tohoku-Oki earthquake and tsunami. Marine Geology, 384:214–224. https://doi.org/
You, C.F., Chan, L.H., Spivack, A.J., and Gieskes, J.M., 1995. Lithium, boron, and their isotopes in sediments and pore waters of Ocean Drilling Program Site 808, Nankai Trough: implications for fluid expulsion in accretionary prisms. Geology, 23(1):37–40. https://doi.org/