Strasser, M., Ikehara, K., Everest, J., and the Expedition 386 Scientists
Proceedings of the International Ocean Discovery Program Volume 386
publications.iodp.org
https://doi.org/10.14379/iodp.proc.386.103.2023
Sites M0081 and M0082 (Basin S1)1
![]() M. Strasser,
M. Strasser,
![]() K. Ikehara,
K. Ikehara,
![]() J. Everest,
J. Everest,
![]() L. Maeda,
L. Maeda,
![]() K. Hochmuth,
K. Hochmuth,
![]() H. Grant,
H. Grant,
![]() M. Stewart,
M. Stewart,
![]() N. Okutsu,
N. Okutsu,
![]() N. Sakurai,
N. Sakurai,
![]() T. Yokoyama,
T. Yokoyama,
![]() R. Bao,
R. Bao,
![]() P. Bellanova,
P. Bellanova,
![]() M. Brunet,
M. Brunet,
![]() Z. Cai,
Z. Cai,
![]() A. Cattaneo,
A. Cattaneo,
![]() K.-H. Hsiung,
K.-H. Hsiung,
![]() J.-J. Huang,
J.-J. Huang,
![]() T. Ishizawa,
T. Ishizawa,
![]() T. Itaki,
T. Itaki,
![]() K. Jitsuno,
K. Jitsuno,
![]() J.E. Johnson,
J.E. Johnson,
![]() T. Kanamatsu,
T. Kanamatsu,
![]() M. Keep,
M. Keep,
![]() A. Kioka,
M. Kölling,
A. Kioka,
M. Kölling,
![]() M. Luo,
M. Luo,
![]() C. März,
C. März,
![]() C. McHugh,
C. McHugh,
![]() A. Micallef,
A. Micallef,
![]() Y. Nagahashi,
Y. Nagahashi,
![]() D.K. Pandey,
D.K. Pandey,
![]() J.-N. Proust,
J.-N. Proust,
![]() E.T. Rasbury,
E.T. Rasbury,
![]() N. Riedinger,
N. Riedinger,
![]() Y. Satoguchi,
Y. Satoguchi,
![]() D.E. Sawyer,
D.E. Sawyer,
![]() C. Seibert,
C. Seibert,
![]() M. Silver,
M. Silver,
![]() S.M. Straub,
S.M. Straub,
![]() J. Virtasolo,
J. Virtasolo,
![]() Y. Wang,
Y. Wang,
![]() T.-W. Wu, and
T.-W. Wu, and
![]() S.D. Zellers2
S.D. Zellers2
1 Strasser, M., Ikehara, K., Everest, J., Maeda, L., Hochmuth, K., Grant, H., Stewart, M., Okutsu, N., Sakurai, N., Yokoyama, T., Bao, R., Bellanova, P., Brunet, M., Cai, Z., Cattaneo, A., Hsiung, K.-H., Huang, J.-J., Ishizawa, T., Itaki, T., Jitsuno, K., Johnson, J.E., Kanamatsu, T., Keep, M., Kioka, A., Kölling, M., Luo, M., März, C., McHugh, C., Micallef, A., Nagahashi, Y., Pandey, D.K., Proust, J.-N., Rasbury, E.T., Riedinger, N., Satoguchi, Y., Sawyer, D.E., Seibert, C., Silver, M., Straub, S.M., Virtasalo, J., Wang, Y., Wu, T.-W., and Zellers, S.D., 2023. Sites M0081 and M0082 (Basin S1). In Strasser, M., Ikehara, K., Everest, J., and the Expedition 386 Scientists, Japan Trench Paleoseismology. Proceedings of the International Ocean Discovery Program, 386: College Station, TX (International Ocean Discovery Program). https://doi.org/10.14379/iodp.proc.386.103.2023
2 Expedition 386 Scientists’ affiliations.
1. Operations
During Expedition 386, a total of five Giant Piston Corer (GPC) system deployments in the southern Japan Trench focus area (Figure F1) resulted in the recovery of cores from six holes at Site M0081 and four at Site M0082 (Basin S1) (Figure F2). The water depth was between 7989 and 8023 meters below sea level (mbsl). A breakdown of operational time is reported weekly (see OPS in Supplementary material) due to decisions to move between sites based on weather and current conditions. Sites M0081 and M0082 were cored during Weeks 2 and 5 of the offshore phase. In total, 154.455 m of cores (Table T1) and 90 km of hydroacoustic profiles (see Hydroacoustics) were recovered and acquired, respectively, in this focus area. Further operations details, including winch log and inclinometer information, are found in Coring methodology in the Expedition 386 methods chapter (Strasser et al., 2023a) and associated files (see PALEOMAG and WINCH LOGS in Supplementary material).
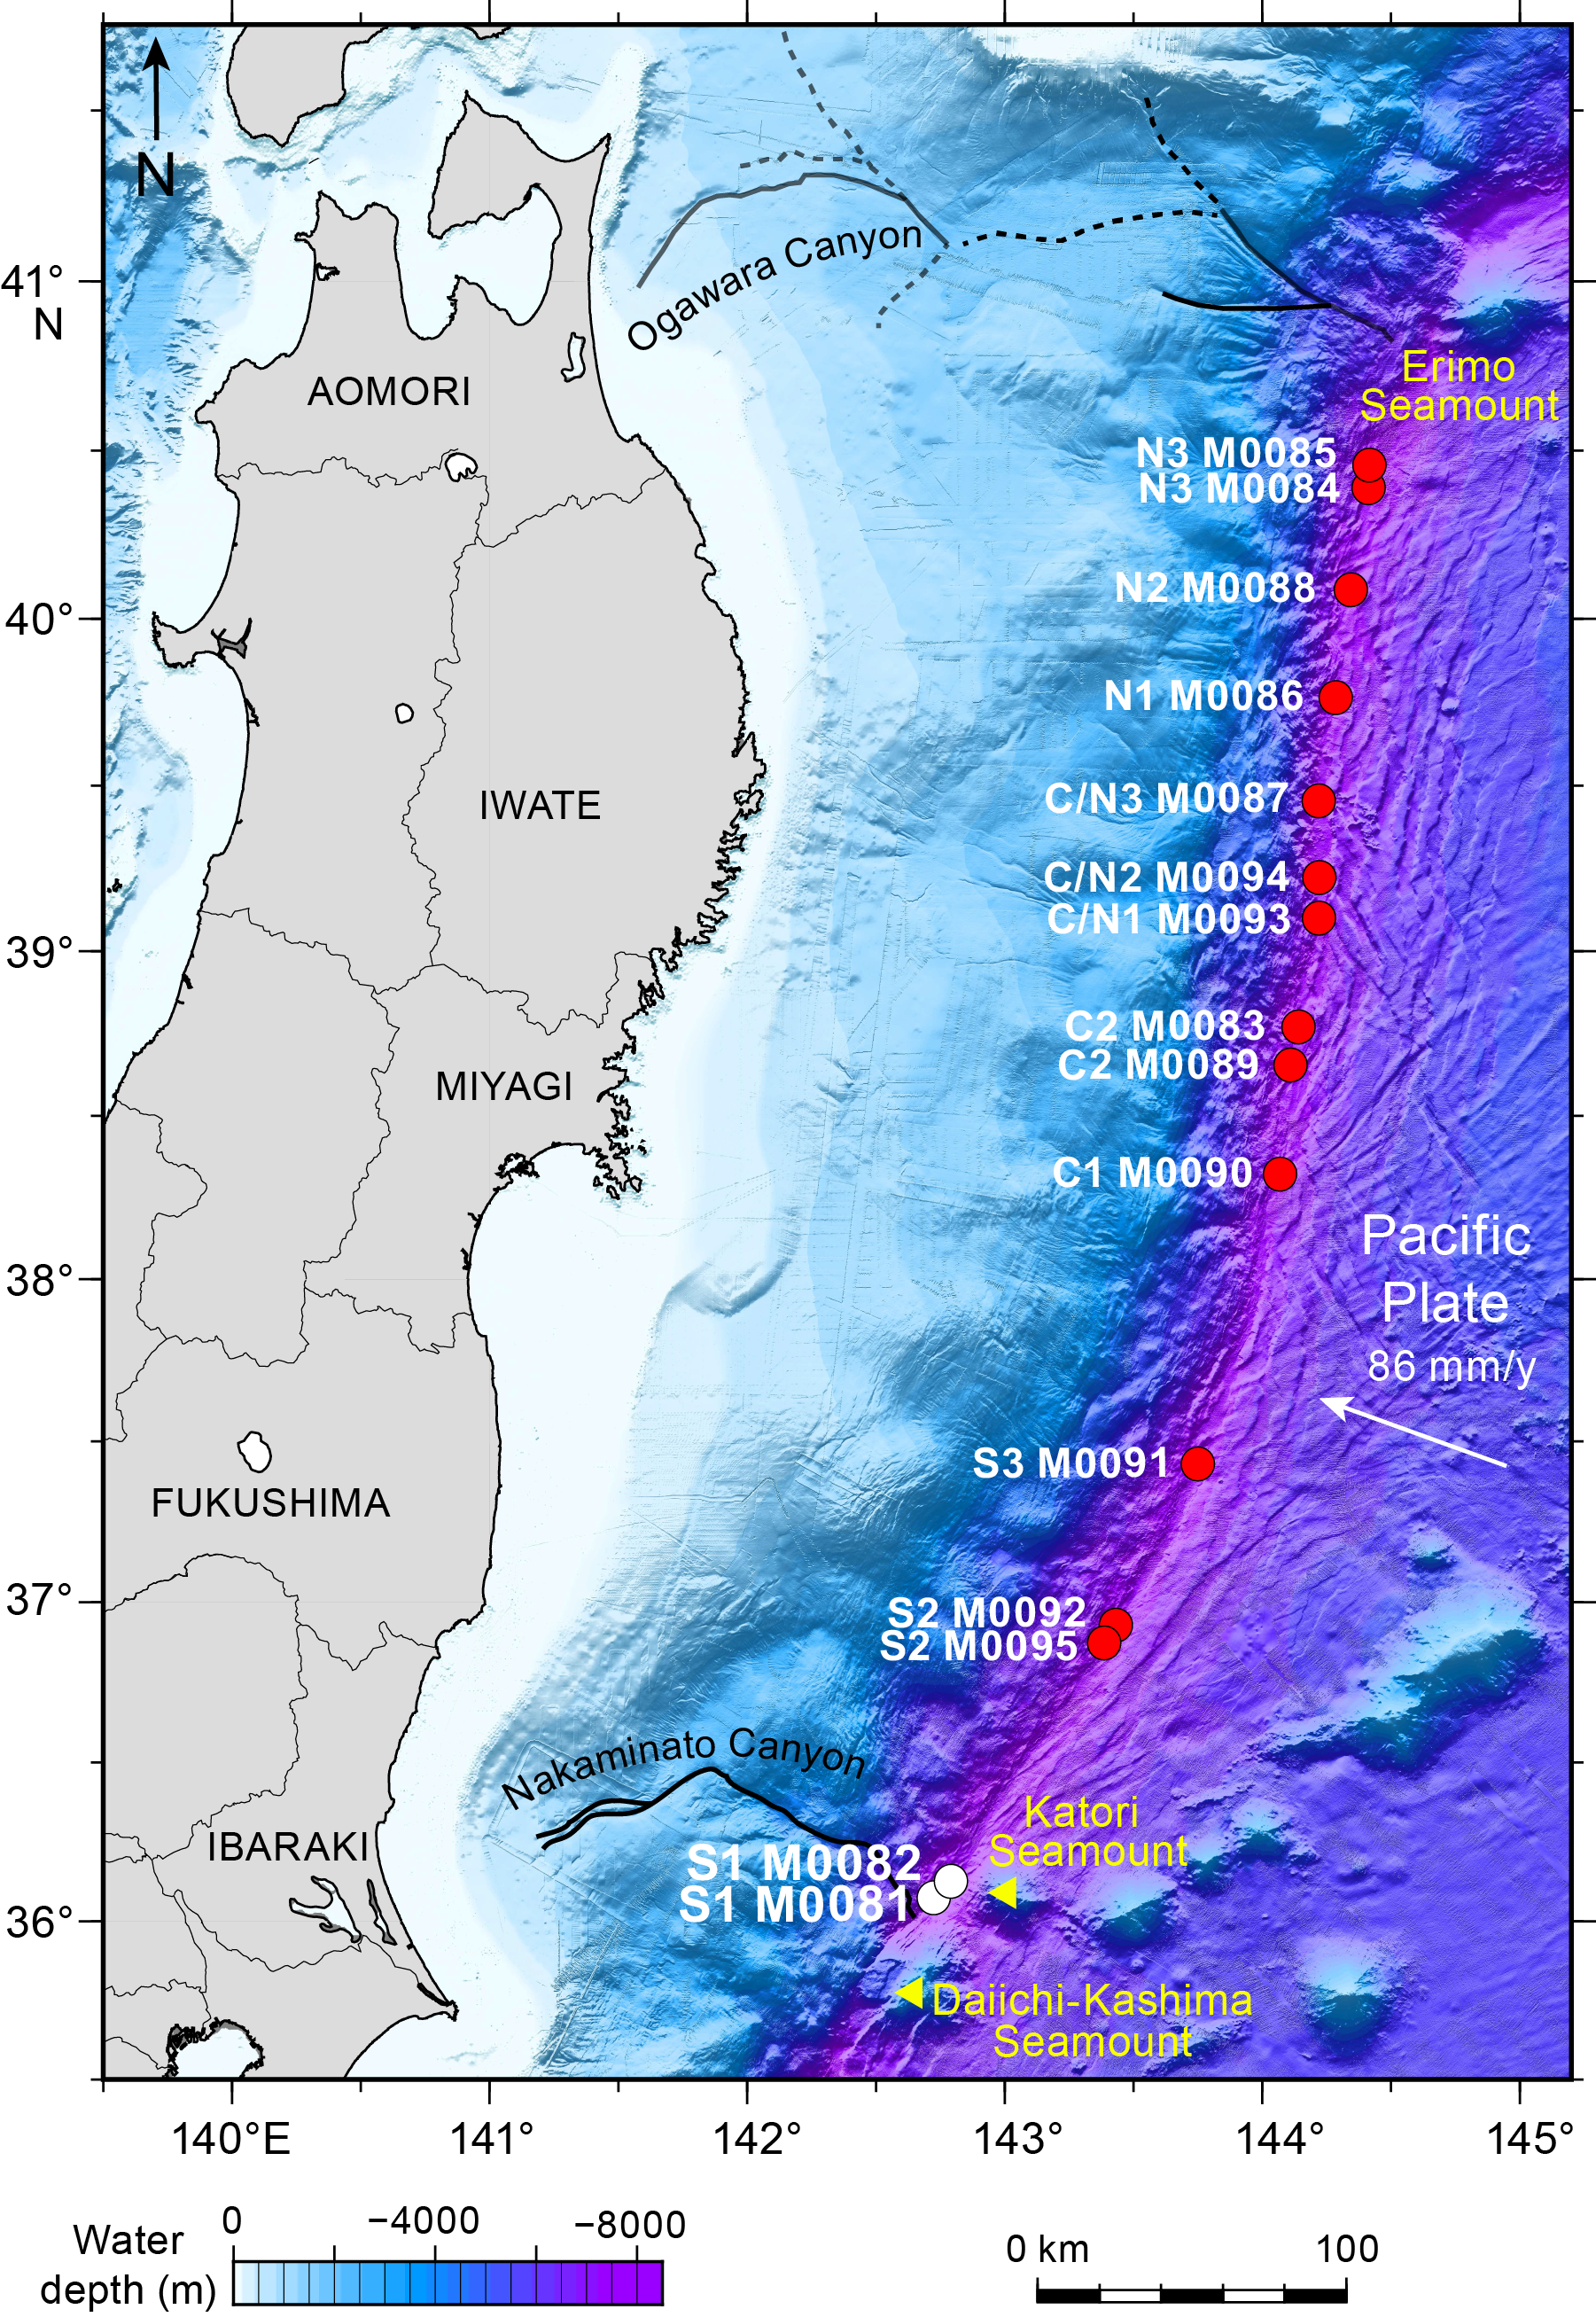
Figure F1. Site map.
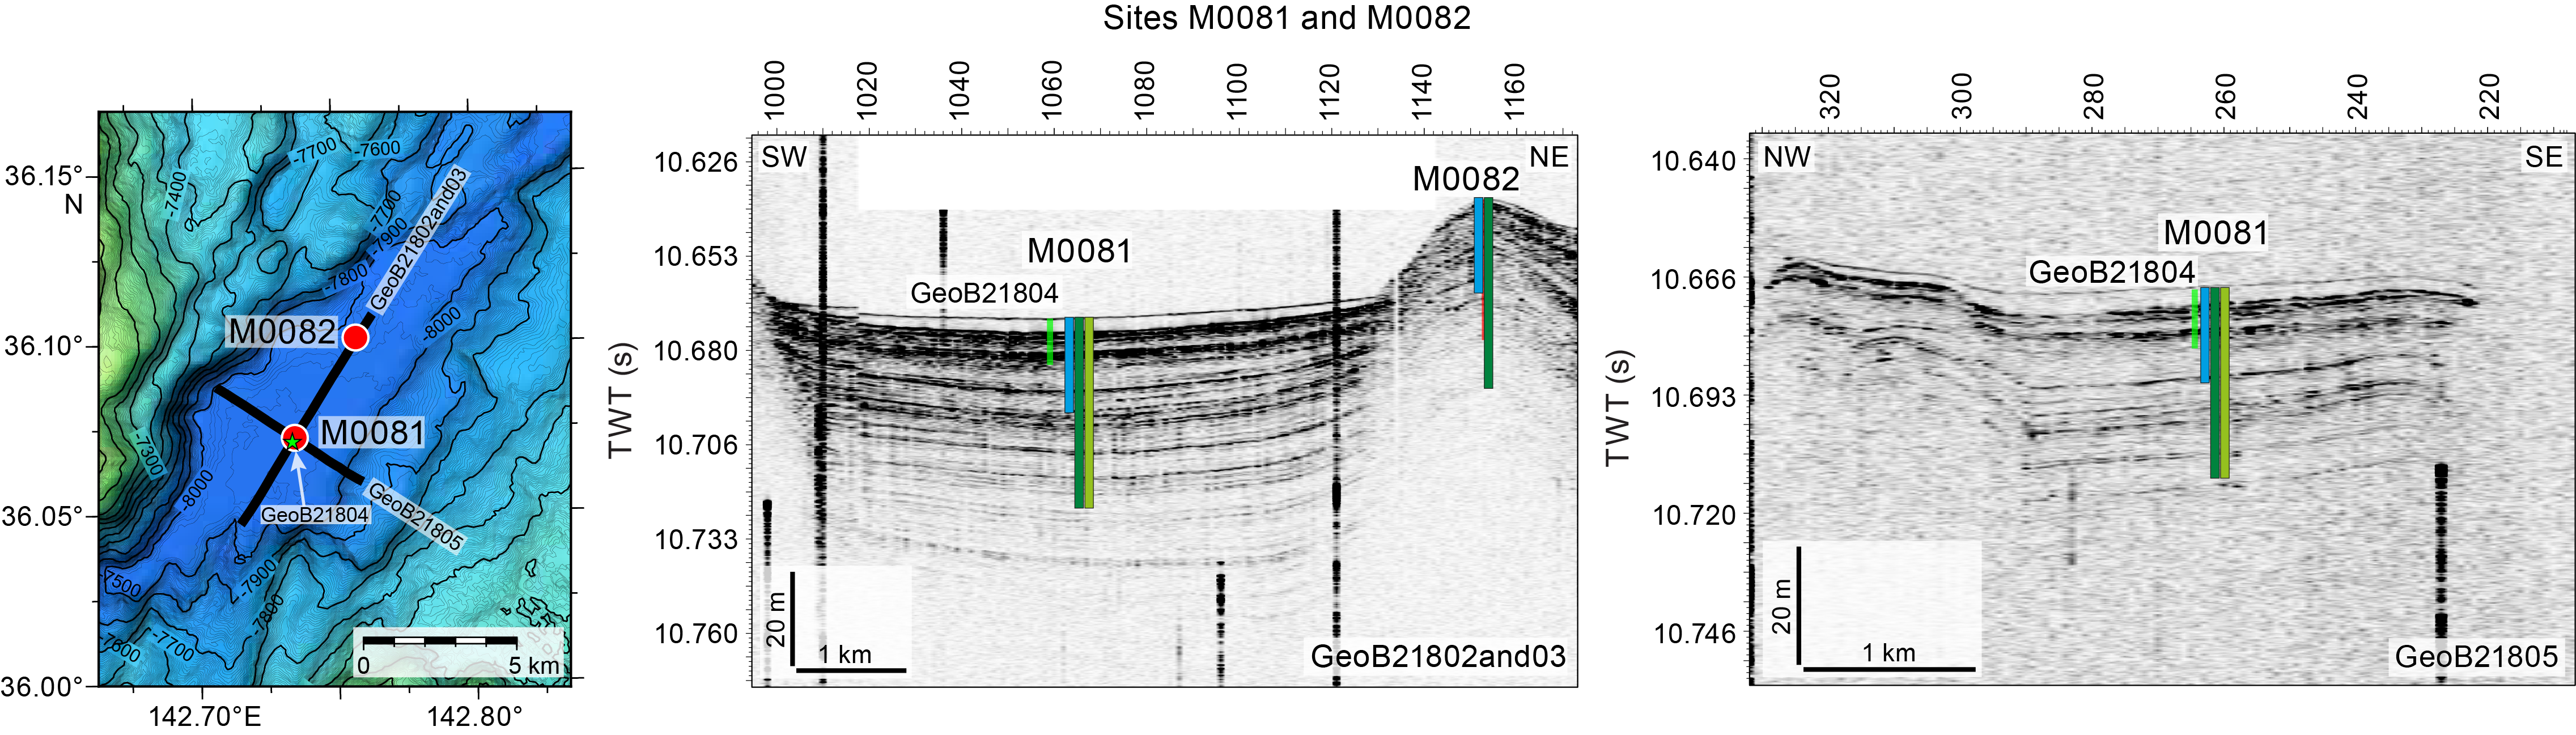
Figure F2. Sites M0081 and M0082.
The main site-specific scientific objectives for Basin S1 were as follows:
- Recover an expanded and condensed (relative to coupled-stratigraphy Sites M0081 and M0082, respectively) continuous Holocene stratigraphic succession comprising event deposits from the deepest depocenter in the southernmost part of the Japan Trench (see Site selection and coring strategy in the Expedition 386 summary chapter [Strasser et al., 2023b]; Strasser et al., 2019).
- Analyze the stratigraphic pattern and event deposit characteristics of each site and integrate them with its coupled site to establish robust stratigraphic pattern recognition of proxy evidence for earthquakes.
- Generate results for comparison with those from all other Expedition 386 sites to explore spatiotemporal distribution of event deposits and the northern extent of sediment transport routed through the Nakaminato Canyon to eventually develop a long-term record for giant earthquakes.
1.1. Operations summary
The R/V Kaimei prepared to sail on the morning of 13 April 2021, and the vessel departed the Japan Agency for Marine-Earth Science and Technology (JAMSTEC) quay at 1000 h (local time) and moved to a standby point off Yokosuka Port to wait on weather for 2 days before sailing to Basin S1 of the southern Japan Trench focus area. At 0500 h on 16 April, the vessel arrived at Site M0082, and an expendable bathythermograph (XBT) probe was deployed soon after setting the dynamic positioning (DP) system and while monitoring sea surface current (~2.6 kt to the northeast). The multibeam echo sounder/subbottom profiler (MBES/SBP) survey across Sites M0081 and M0082 started at 0630 h. The ship returned to Site M0082 at 0800 h. The captain attempted to keep position, but the ship was carried downstream due to a strong current (~2.6 kt) and wind (~12 m/s). The decision was made that GPC operations could not be conducted. MBES/SBP surveying continued from 0815 to 1530 h. The ship then moved off Inubosaki Cape and later off Choshi Port to wait on weather.
At 1300 h on 19 April, the ship arrived back at Sites M0081 and M0082. A MBES/SBP survey was conducted from 2000 to 0500 h on 20 April. GPC operations started in Holes M0081A and M0081B with a 20 m GPC barrel string at 0730 h and were completed when the GPC system was recovered on deck at 1445 h. The ship then drifted to Site M0082 and arrived near the location at 0600 h on 21 April. GPC operations using the 20 m GPC assembly in Holes M0082A and M0082B started at 0830 h and were completed when the GPC system was recovered on deck at 1530 h. The GPC assembly was then prepared for the 40 m barrel string while the ship remained on standby 2 nmi upstream (relative to the Kuroshio Current; ~1 kt northeast) from Site M0081. Because of high winds (~15 m/s) with a low surface current (~1 kt) and large swell (~2.5 m), the ship motion was severe. The captain confirmed that by operating the DP system in manual mode he was able to control the ship position at 0600 h on 22 April, when operations using the 40 m GPC assembly in Holes M0081C and M0081D started. GPC operations were completed when the GPC system was recovered on deck at 1300 h. The vessel sailed to Ishinomaki to wait on weather and then operations continued at Site M0083 (see Operations in the Sites M0083 and M0089 (Basin C2) chapter [Strasser et al., 2023c]) and other central and northern Japan Trench working areas.
Kaimei returned to the southern Japan Trench focus area and arrived at Site M0081 at 0400 h on 14 May. GPC operations using the 40 m GPC assembly in Holes M0081E and M0081F started at 0800 h and were completed when the GPC system was recovered on deck at 1545 h. The ship then drifted to Site M0082 and was on standby until operations using a 40 m GPC assembly in Holes M0082C and M0082D started at 0830 h on 15 May. Operations in the southern Japan Trench focus areas were completed when the GPC system was recovered on deck at 1445 h.
After cores were cut into sections, the 20 m GPC assembly for the next run was completed at 2015 h. The vessel began transit to the southern Japan Trench central working area to conduct a MBES/SBP survey around Site M0092 (see Operations in the Sites M0092 and M0095 (Basin S2) chapter [Strasser et al., 2023d]).
1.2. Site M0081
1.2.1. Holes M0081A and M0081B
Holes M0081A and M0081B were cored on 20 April 2021. The first GPC deployment of Expedition 386 was conducted with a 20 m barrel string. The GPC assembly was run into the water at 0845 h. After the transponder and inclinometer were set on the winch cable and the GPC assembly (see Figure F4 in the Expedition 386 methods chapter [Strasser et al., 2023a]), the GPC was run down at a winch speed of 1.2–1.5 m/s. Running was paused for 3 min at 1130 h at a cable length of 8200 m to stabilize the GPC assembly and then resumed at a winch speed of 0.3 m/s. Spud-in was confirmed at 11:40:42 h and ended at 11:40:45 h, as confirmed by the tension meter profile at a cable length of 8290 m. The cable tension rose to 2665 kgf at 11:40:46 h before dropping to 1175 kgf and then increasing again to a maximum of 7172 kgf at 11:42:01 h. It then dropped to 4825 kgf at 11:42:06 h, indicating the corer was clear of the seabed (see WINCHLOGS in Supplementary material). Inclinometer data for Hole M0081B show the piston corer barrel was rotated counterclockwise by 63.7° at the estimated seabed, with an east–west dip of 0.65° and a north–south dip of −0.32° (see Figure F5 in the Expedition 386 methods chapter [Strasser et al., 2023a]). The GPC was run back to the surface at a winch speed of ~1.5 m/s and was recovered on deck at 1445 h. Withdrawing the core liner from the GPC barrel and cutting the core into 5 m segments commenced at 1530 h, and full recovery was confirmed at 1700 h. The trigger core and GPC core from Holes M0081A and M0081B have a total length of 1.21 m (2 sections) and 19.89 m (21 sections), respectively (Table T1).
1.2.2. Holes M0081C and M0081D
Holes M0081C and M0081D were cored on 22 April 2021. The GPC assembly, with a 40 m barrel string, was set in a vertical position to check sea condition and then run into the water at 0710 h. Running the GPC at a winch speed of ~1.5 m/s continued until the cable length reached 8150 m. The running speed was then set at 0.3 m/s after pausing for 3 min to stabilize the GPC assembly. Spud-in commenced at 09:56:01 h and ended at 09:56:02 h. Recovery commenced, and the cable tension rose to 1809 kgf at 09:56:06 h before dropping to 1008 kgf and then increasing to a maximum of 12181 kgf at 09:57:31 h. It dropped to 7470 kgf at 09:57:48 h, indicating the corer was clear of the seabed (see WINCHLOGS in Supplementary material). Inclinometer data for Hole M0081D show the piston corer barrel was rotated clockwise by 116° at the estimated seabed with an east–west dip of 0.55° and a north–south dip of 2.52° (see Figure F5 in the Expedition 386 methods chapter [Strasser et al., 2023a]). The GPC was retrieved at a winch speed of 1.5 m/s and recovered on deck at 1300 h. The trigger core and GPC core from Holes M0081C and M0081D have a total length of 1.07 m (2 sections) and 35.47 m (37 sections), respectively (Table T1).
1.2.3. Holes M0081E and M0081F
A GPC deployment with a 40 m barrel string was conducted in Holes M0081E and M0081F on 14 May. The GPC assembly was run into the water at 0920 h (~1.5 kt current; <9 m/s winds). After the transponder and inclinometer were set on the winch cable and the GPC assembly (see Figure F4 in the Expedition 386 methods chapter [Strasser et al., 2023a]), the GPC assembly was run down at a winch speed of 1.1 m/s. Running the GPC assembly was suspended at a cable length of 8150 m at 1155 h and resumed with a winch speed of 0.3 m/s after holding 3 min for stabilization. Spud-in commenced at 12:06:37 h and ended at 12:06:40 h at a cable length of 8280 m. Recovery commenced, and the cable tension rose to 2218 kgf at 12:06:44 h before dropping to 1492 kgf and then increasing again to a maximum of 11101 kgf at 12:08:23 h. It dropped to 9071 kgf at 12:08:36 h, indicating the corer was clear of the seabed (see WINCHLOGS in Supplementary material). Inclinometer data for Hole M0081F show the piston corer barrel was rotated clockwise by 136.2° at the estimated seabed, with an east–west dip of 0.31° and a north–south dip of −0.03° (see Figure F5 in the Expedition 386 methods chapter [Strasser et al., 2023a]). Note that for this hole, the exact coordinates for the position of the GPC at the seabed could not be calculated due to the transponder malfunctioning. Therefore, the ship’s GPS position was applied for the positioning of Holes M0081E and M0081F. The GPC assembly was run back to the surface at a winch speed of 1.1 m/s and recovered on deck at 1545 h. The trigger core and GPC core from Holes M0081E and M0081F have a total length of 1.07 m (2 sections) and 35.47 m (37 sections), respectively (Table T1).
1.3. Site M0082
1.3.1. Holes M0082A and M0082B
Holes M0082A and M0082B were cored on 21 April 2021. The ship’s crew and the GPC operation team completed preparations for running the GPC assembly with a 20 m barrel at 0830 h. After the transponder and inclinometer were set on the winch cable and the GPC assembly (see Figure F4 in the Expedition 386 methods chapter [Strasser et al., 2023a]), the winch speed was set to 1.2–1.5 m/s at 0930 h. The GPC reached a cable length of 8150 m at 1205 h and was paused 3 min to stabilize the GPC assembly. Spud-in commenced at 12:17:42 h and ended at 12:17:45 h. Recovery commenced, and the cable tension rose to 3075 kgf at 12:17:47 h before dropping to 1287 kgf and then increasing again to a maximum of 7023 kgf at 12:18:48 h. It dropped to 5496 kgf at 12:18:52 h, indicating the corer was clear of the seabed (see WINCHLOGS in Supplementary material). Inclinometer data for Hole M0082B show the piston corer barrel was rotating counterclockwise at 83.1° at the estimated seabed, with an east–west dip of 0.26° and a north–south dip of 0.9° (see Figure F5 in the Expedition 386 methods chapter [Strasser et al., 2023a]; see PALEOMAG in Supplementary material). The trigger core and GPC core from Holes M0082A and M0081B have a total length of 1.46 m (3 sections) and 18.71 m (19 sections), respectively (Table T1).
1.3.2. Holes M0082C and M0082D
Holes M0092C and M0082D were cored on 15 May. The 40 m GPC operation began at 0800 h. After setting the inclinometer and transponder on the winch cable 20 and 50 m above the GPC trigger arm, respectively, and on the GPC assembly (see Figure F4 in the Expedition 386 methods chapter [Strasser et al., 2023a]), the GPC assembly was deployed into the water at 0850 h and run down at a winch speed of 1.1 m/s. Running the GPC assembly was suspended at a cable length of 8150 m at 1135 h for stabilization and, after holding for 3 min, resumed at a winch speed of 0.3 m/s. Spud-in commenced at 11:46:36 h and ended at 11:46:43 h. Recovery commenced, and the cable tension rose to 1436 kgf at 11:46:48 h before dropping to 971 kgf and then increasing again to a maximum of 10877 kgf at 11:48:16 h. It dropped to 8922 kgf at 11:48:25 h, indicating the corer was clear of the seabed (see WINCHLOGS in Supplementary material). Inclinometer data for Hole M0082D show the piston corer barrel was rotated clockwise by 126.7° at the estimated seabed, with an east–west dip of 1.47° and a north–south dip of −2.28° (see Figure F4 in the Expedition 386 methods chapter [Strasser et al., 2023a]; see PALEOMAG in Supplementary material). Note that the exact coordinates for the position of the GPC at the seabed could not be calculated due to malfunctioning of the transponder. Therefore, the ship’s GPS position was applied for the positioning of Holes M0082C and M0082D. The GPC assembly was run back to the surface at a winch speed of 1.1 m/s and recovered on deck at 1445 h.
2. Hydroacoustics
Sites M0081 and M0082 lie in Basin S1 at the southernmost end of the Japan Trench study area. The area surveyed for bathymetry includes both the basin floor and surrounding areas, covering approximately 702 km2. The grid area of acquired SBP data, restricted to the flat basin floor, extends for over 25,000 m in a trench-parallel direction and is up to 7,300 m wide perpendicular to the trench. The subbottom profiles comprise 18 lines: 7 lines perpendicular to the trench axis and 11 lines parallel to the trench axis, although two of the latter lines are extremely short, making a total of 90 km of profiles in Basin S1 (Figure F3). Trench axis–perpendicular lines all trend northwest–southeast, and trench axis–parallel lines trend northeast–southwest. The acquisition parameters for all subbottom profiles in this basin are documented in Table T2.
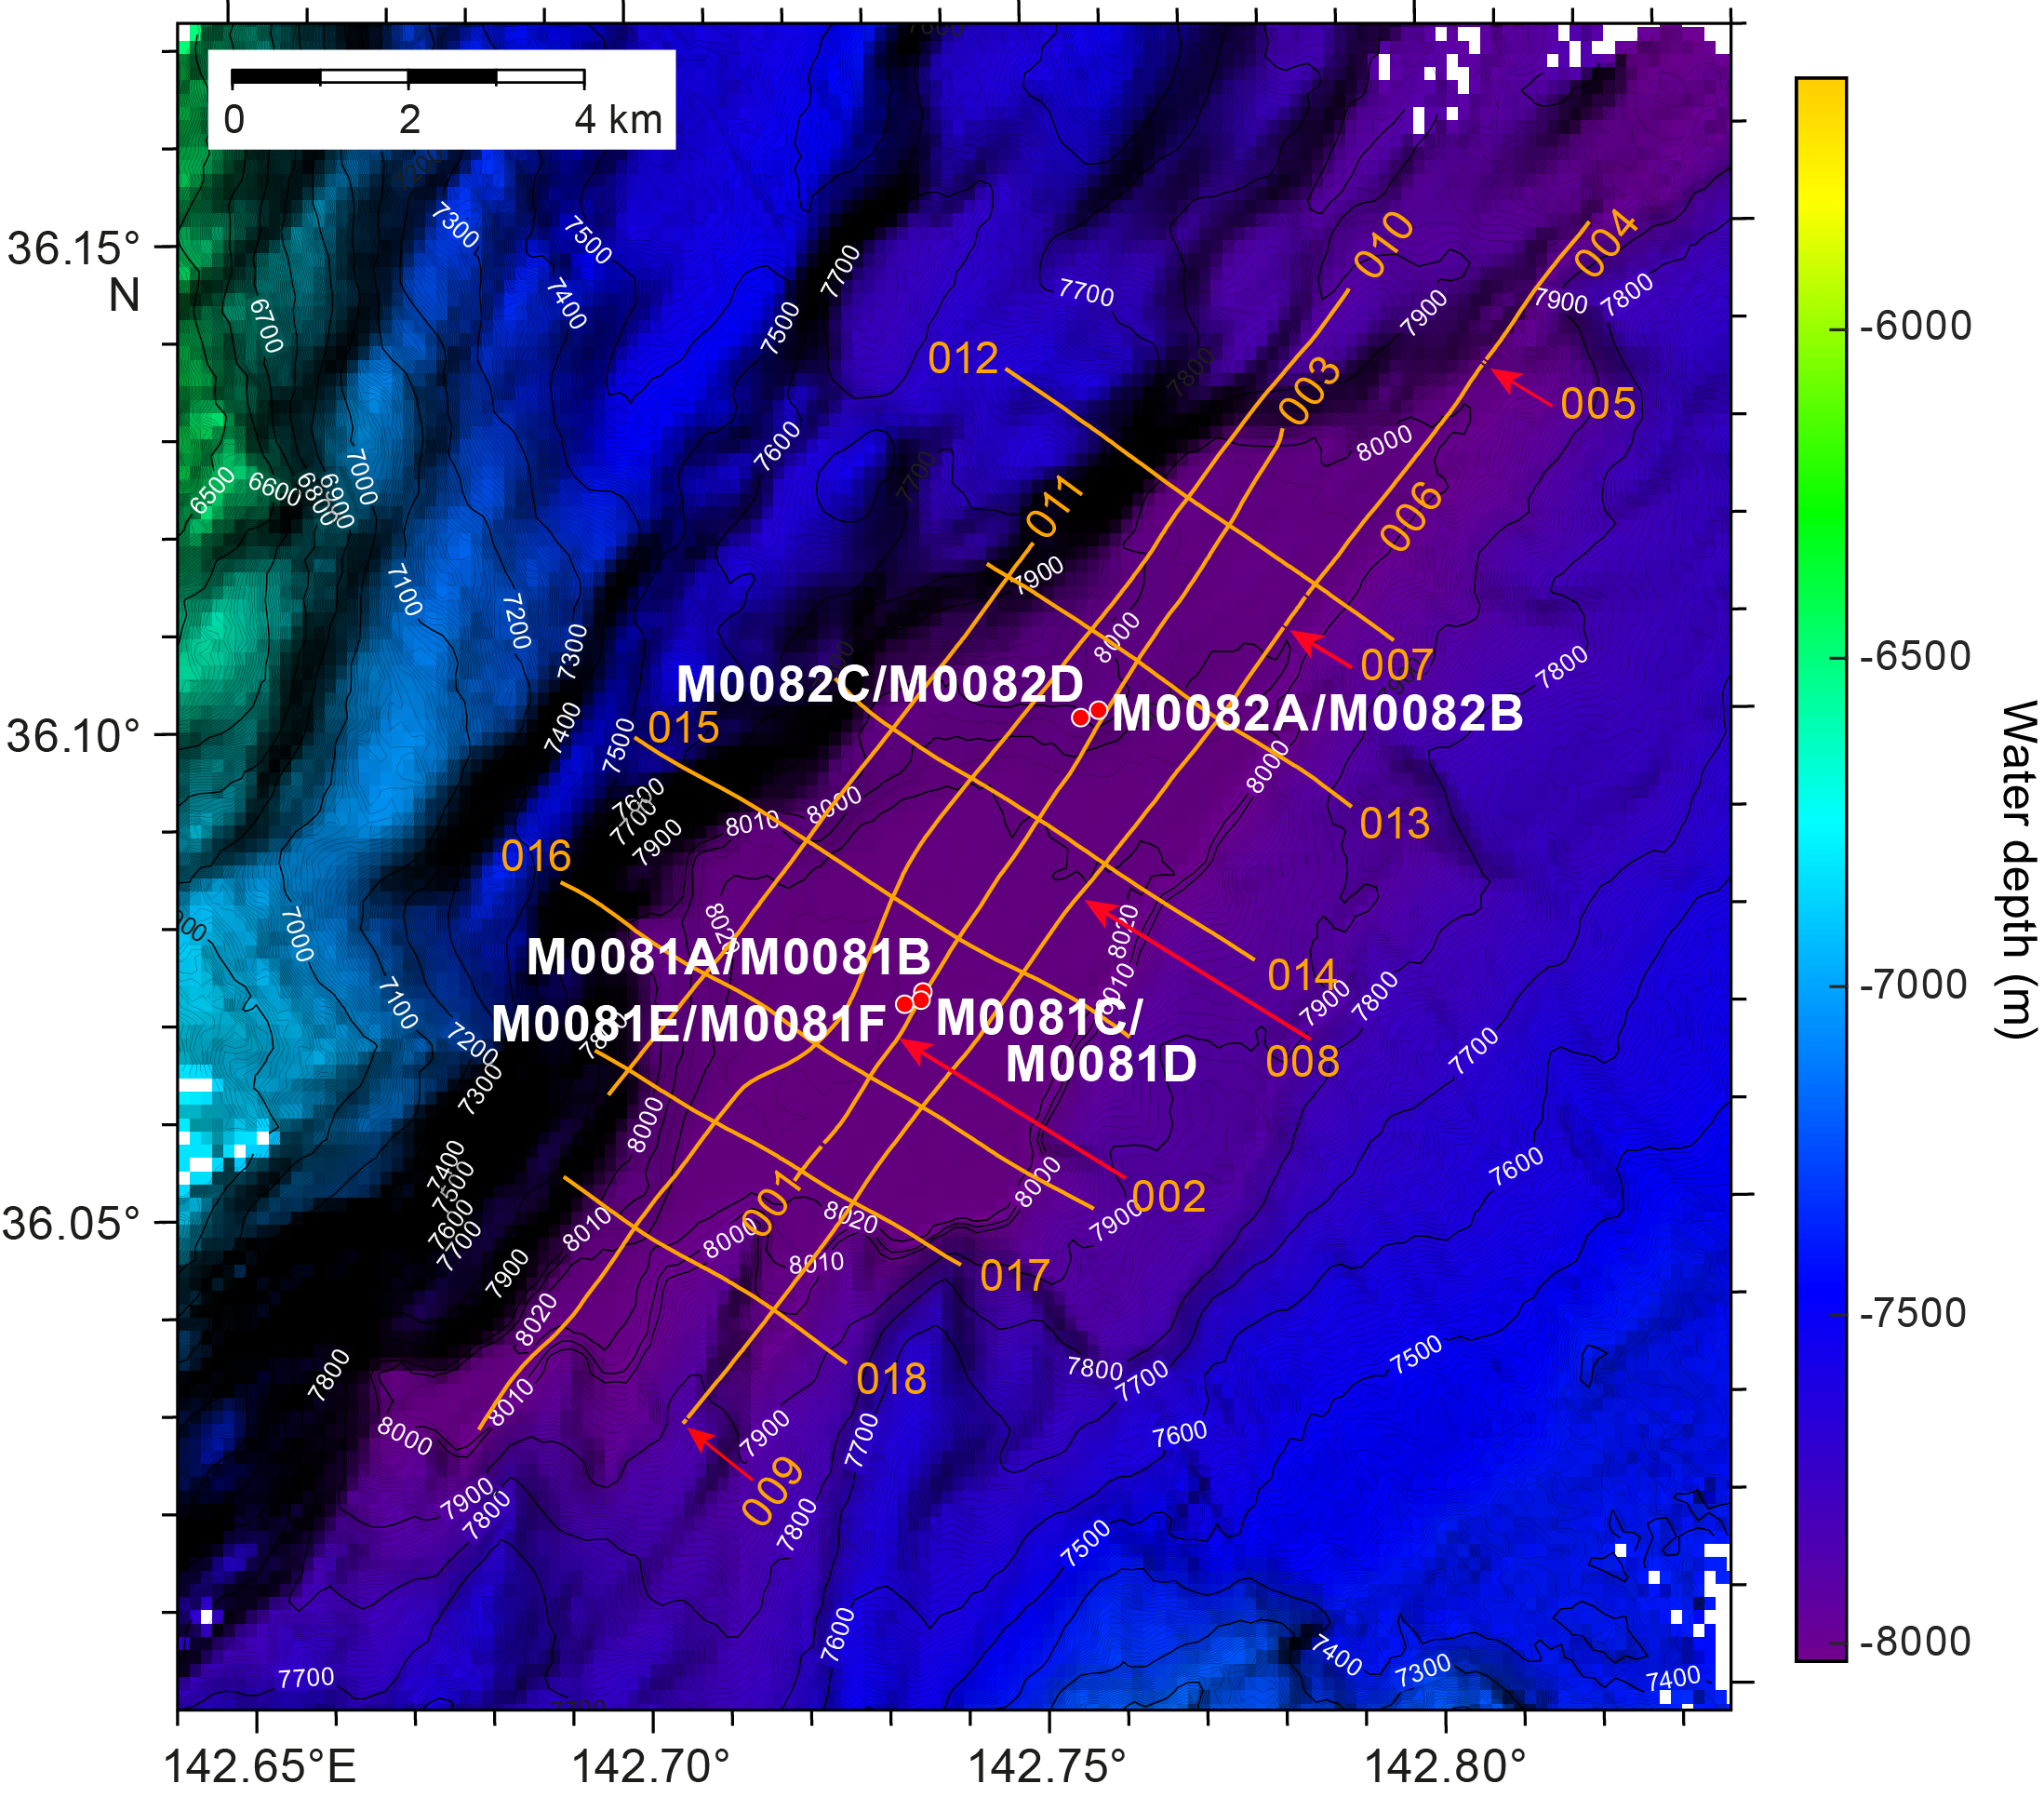
Figure F3. Subbottom profiler lines.
2.1. Bathymetry
Seafloor depths in Basin S1 vary between 8020 and 8028 mbsl for Site M0081 and between 7995 and 8005 mbsl for Site M0082. The width of the basin, defined as the change from flat basin floor to the first point of rapidly changing topography on either side, varies from approximately 5200 m at Site M0081 (the widest part of Basin 1) to approximately 3800 m at Site M0082 and 1000 m at the narrowest point.
The topography increases more steeply on the western side of the basin, where it shallows 500 m over a horizontal distance of 1000 m (50% slope angle). The eastern margin shallows more gently, with a slope angle of approximately 20%.
2.2. Basin characterization
Changes in basin character from north to south can be characterized through comparison of trench-perpendicular Lines 386_Underway_012 (northernmost line), 386_Underway 015 (centrally located in the grid), and 386-Underway_018 (southernmost line). The northern and central lines are 5700 m apart, whereas the central and southern lines are 4800 m apart (as measured perpendicular to the orientation of the lines). The northern and central trench-perpendicular lines show common characteristics that include disrupted basal layers with local basal highs underlying the basin-fill sediments (Figures F4, F5). On both lines, the boundary between the basal layers is diffuse under the center of the basin but sharp at the basal highs, especially on the central line. In the northern and central parts of the basin, the basin fill itself comprises a thick package of acoustically laminated materials, commonly with high amplitudes. On the northern line, this package is approximately 40 m thick at its thickest point (beneath Shotpoint 320; assuming a P-wave velocity of 1500 m/s throughout the basin infill) but thins dramatically over basal highs at the eastern and western ends of the line and in the basin center. The central line more closely shows regularly spaced acoustic laminations because the basin floor is not disrupted. Basin fill on the central line exceeds 50 m. Toward the seafloor, two acoustically transparent layers occur, both approximately 2–3 m thick, separated by a high-amplitude layer (northern line) that resolves into a high-amplitude reflector pair toward the center of the basin. Both lines show a low-amplitude seafloor reflector.

Figure F4. Line 386_Underway_012.
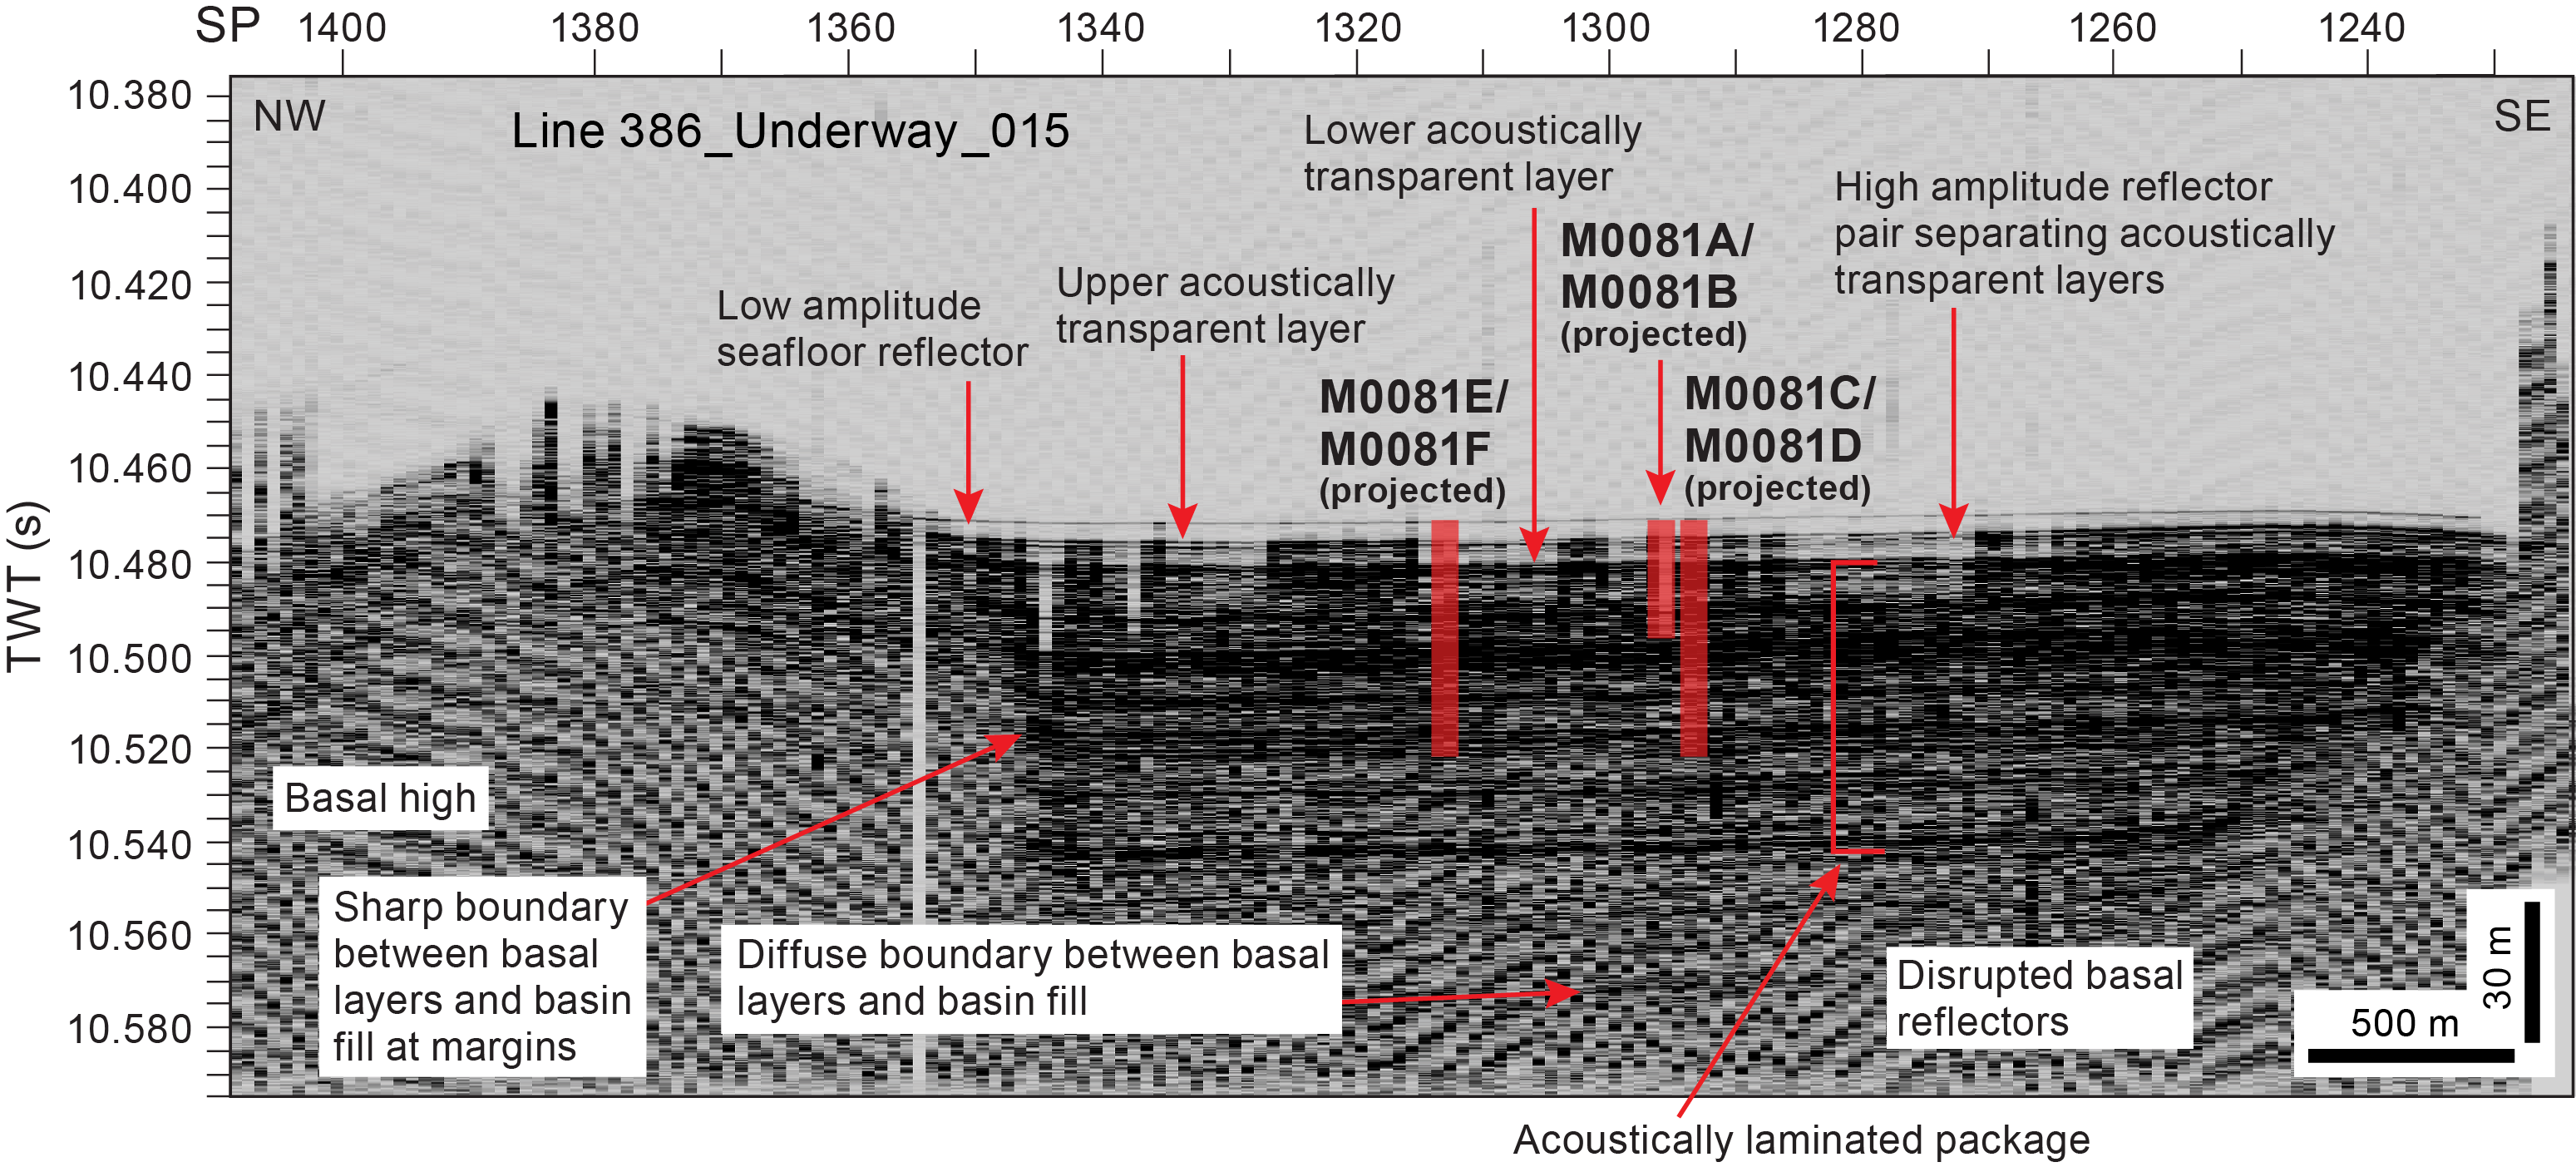
Figure F5. Line 386_Underway_015.
The acoustic character toward the south of the basin (Line 386_Underway_018; Figure F6) differs from the northern and central areas because the basin narrows at this point and is affected by a topographic ridge/basal high (Figure F3). The basin-fill package overall is thinner (maximum of approximately 20 m) and less coherent, and basal highs separate the basin into eastern and western compartments, the floors of which are not flat. Line 386_Underway_018 displays poorer resolution than the northern and central lines, with a low-amplitude seafloor layer and upper and lower acoustically transparent layers not clearly identifiable.
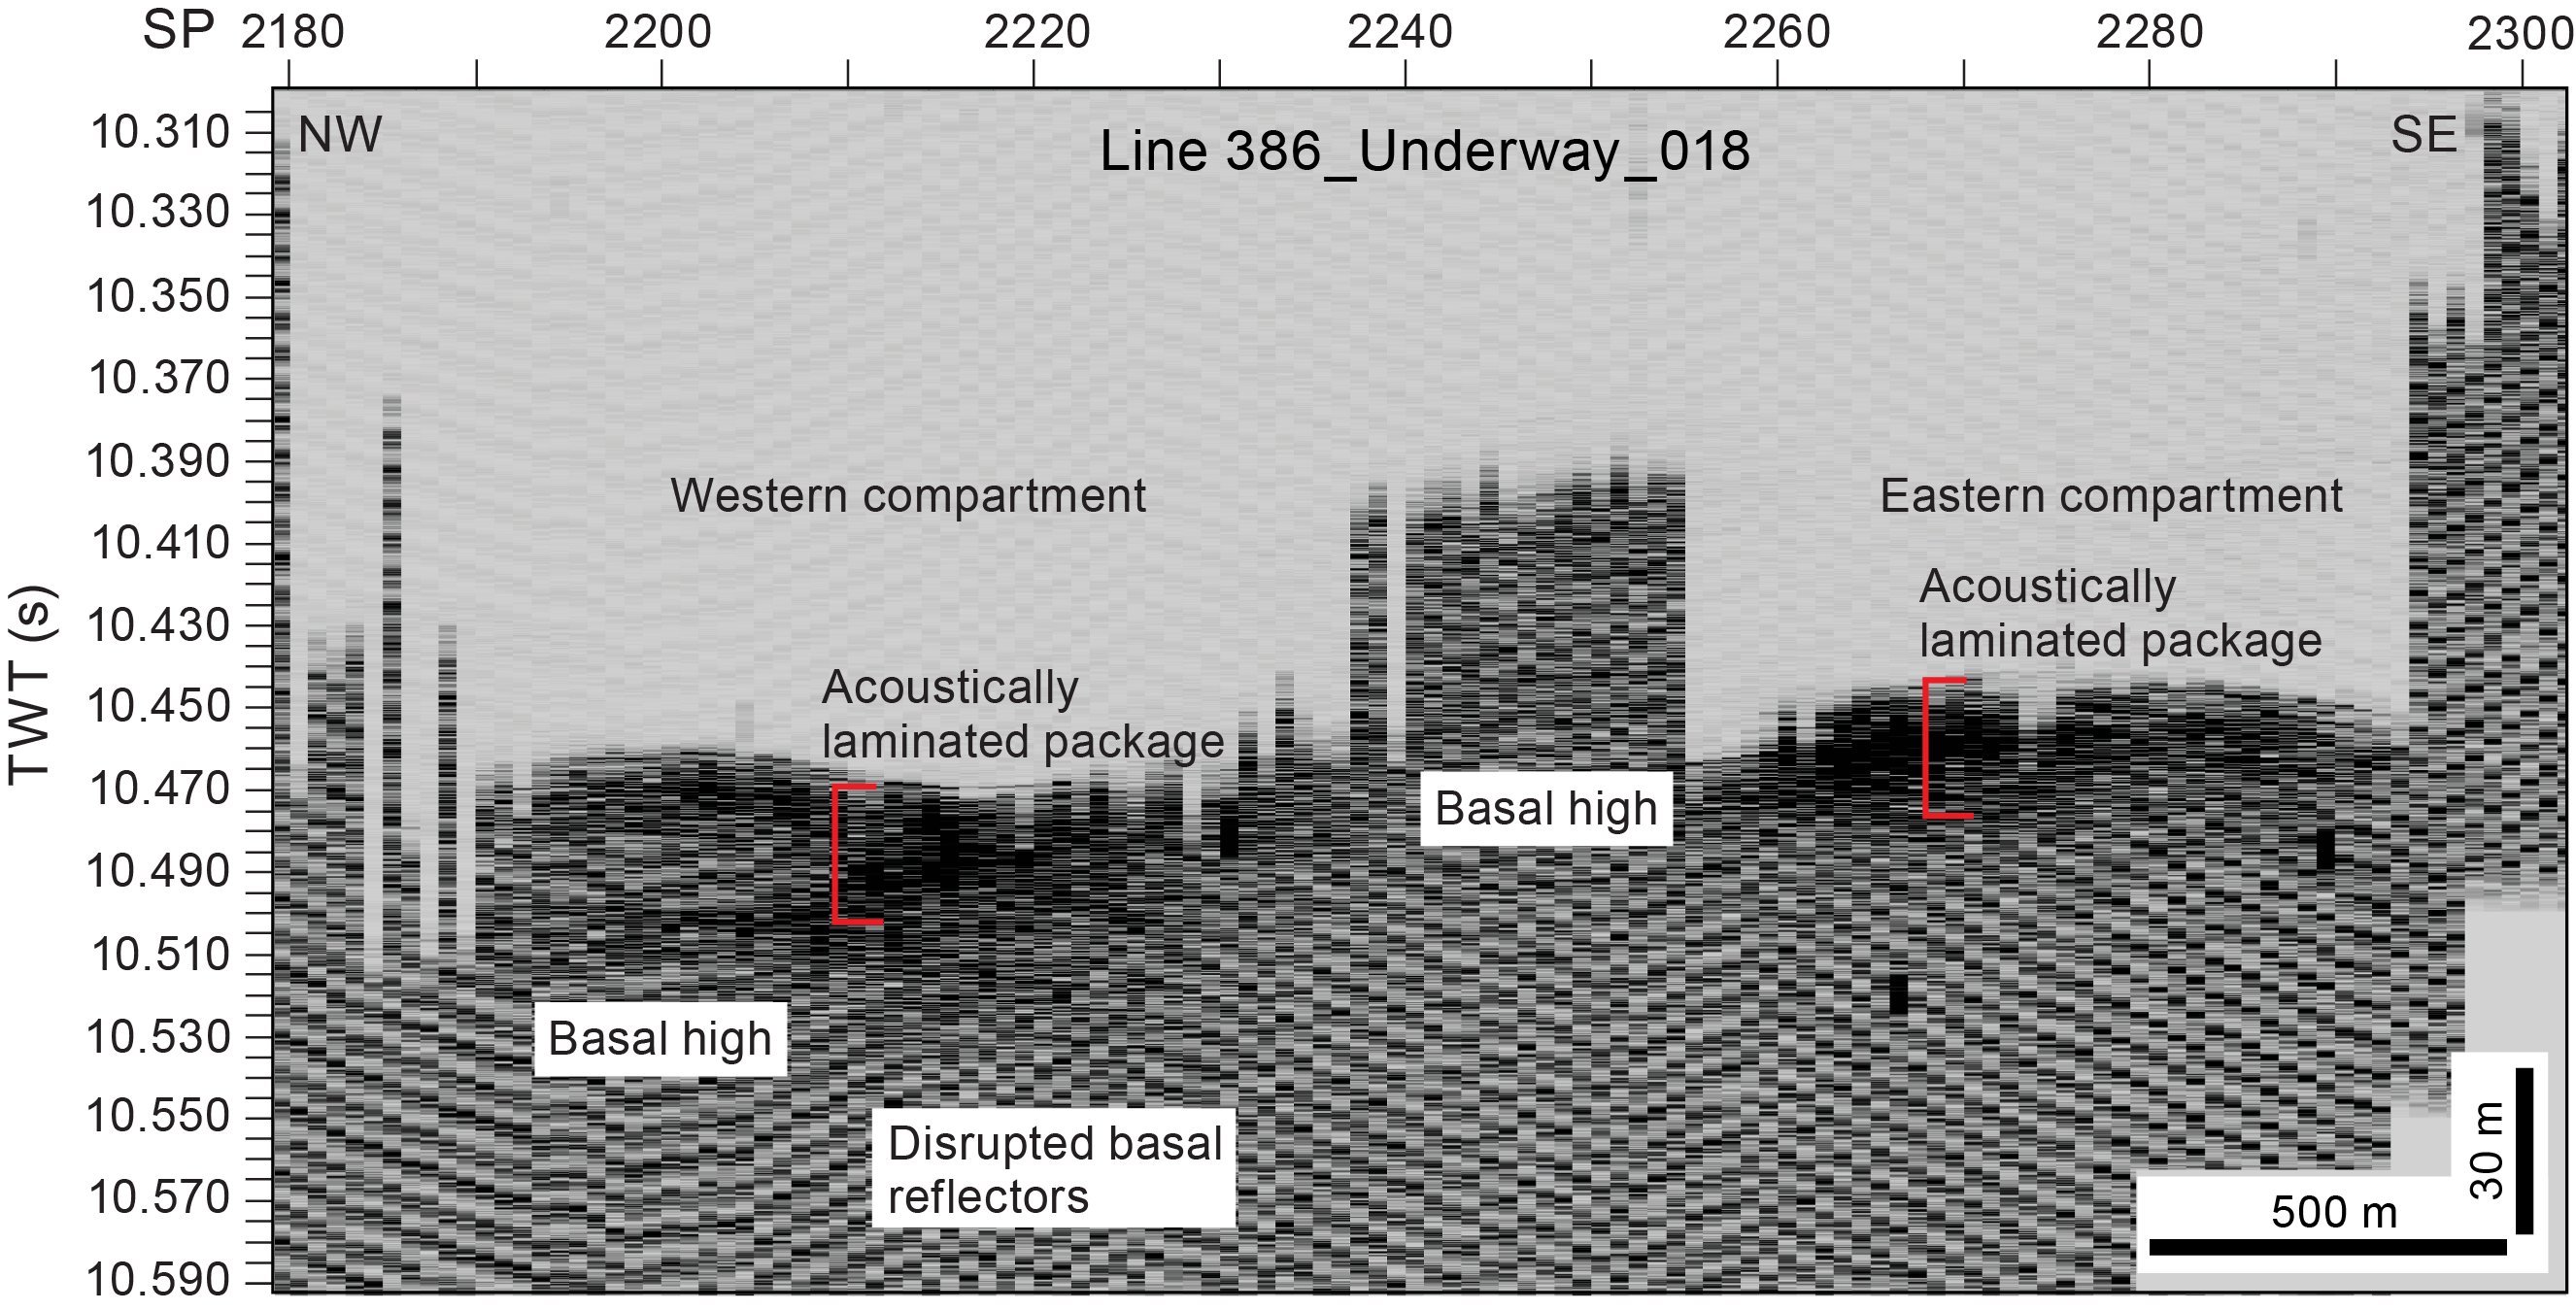
Figure F6. Line 386_Underway_018.
2.3. Site M0081
Holes M0081A and M0081B lie 20 m west of Line 386_Underway_002, and Holes M0081C and M0081D lie 58 m east of this line (as measured perpendicular to the orientation of the line) (Figure F7). Holes M0081E and M0081F do not lie close to any line; they are 320 m east of Line 386_Underway_010, 480 m west of Line 386_Underway 002, and 410 m south of Line 386_Underway_015.
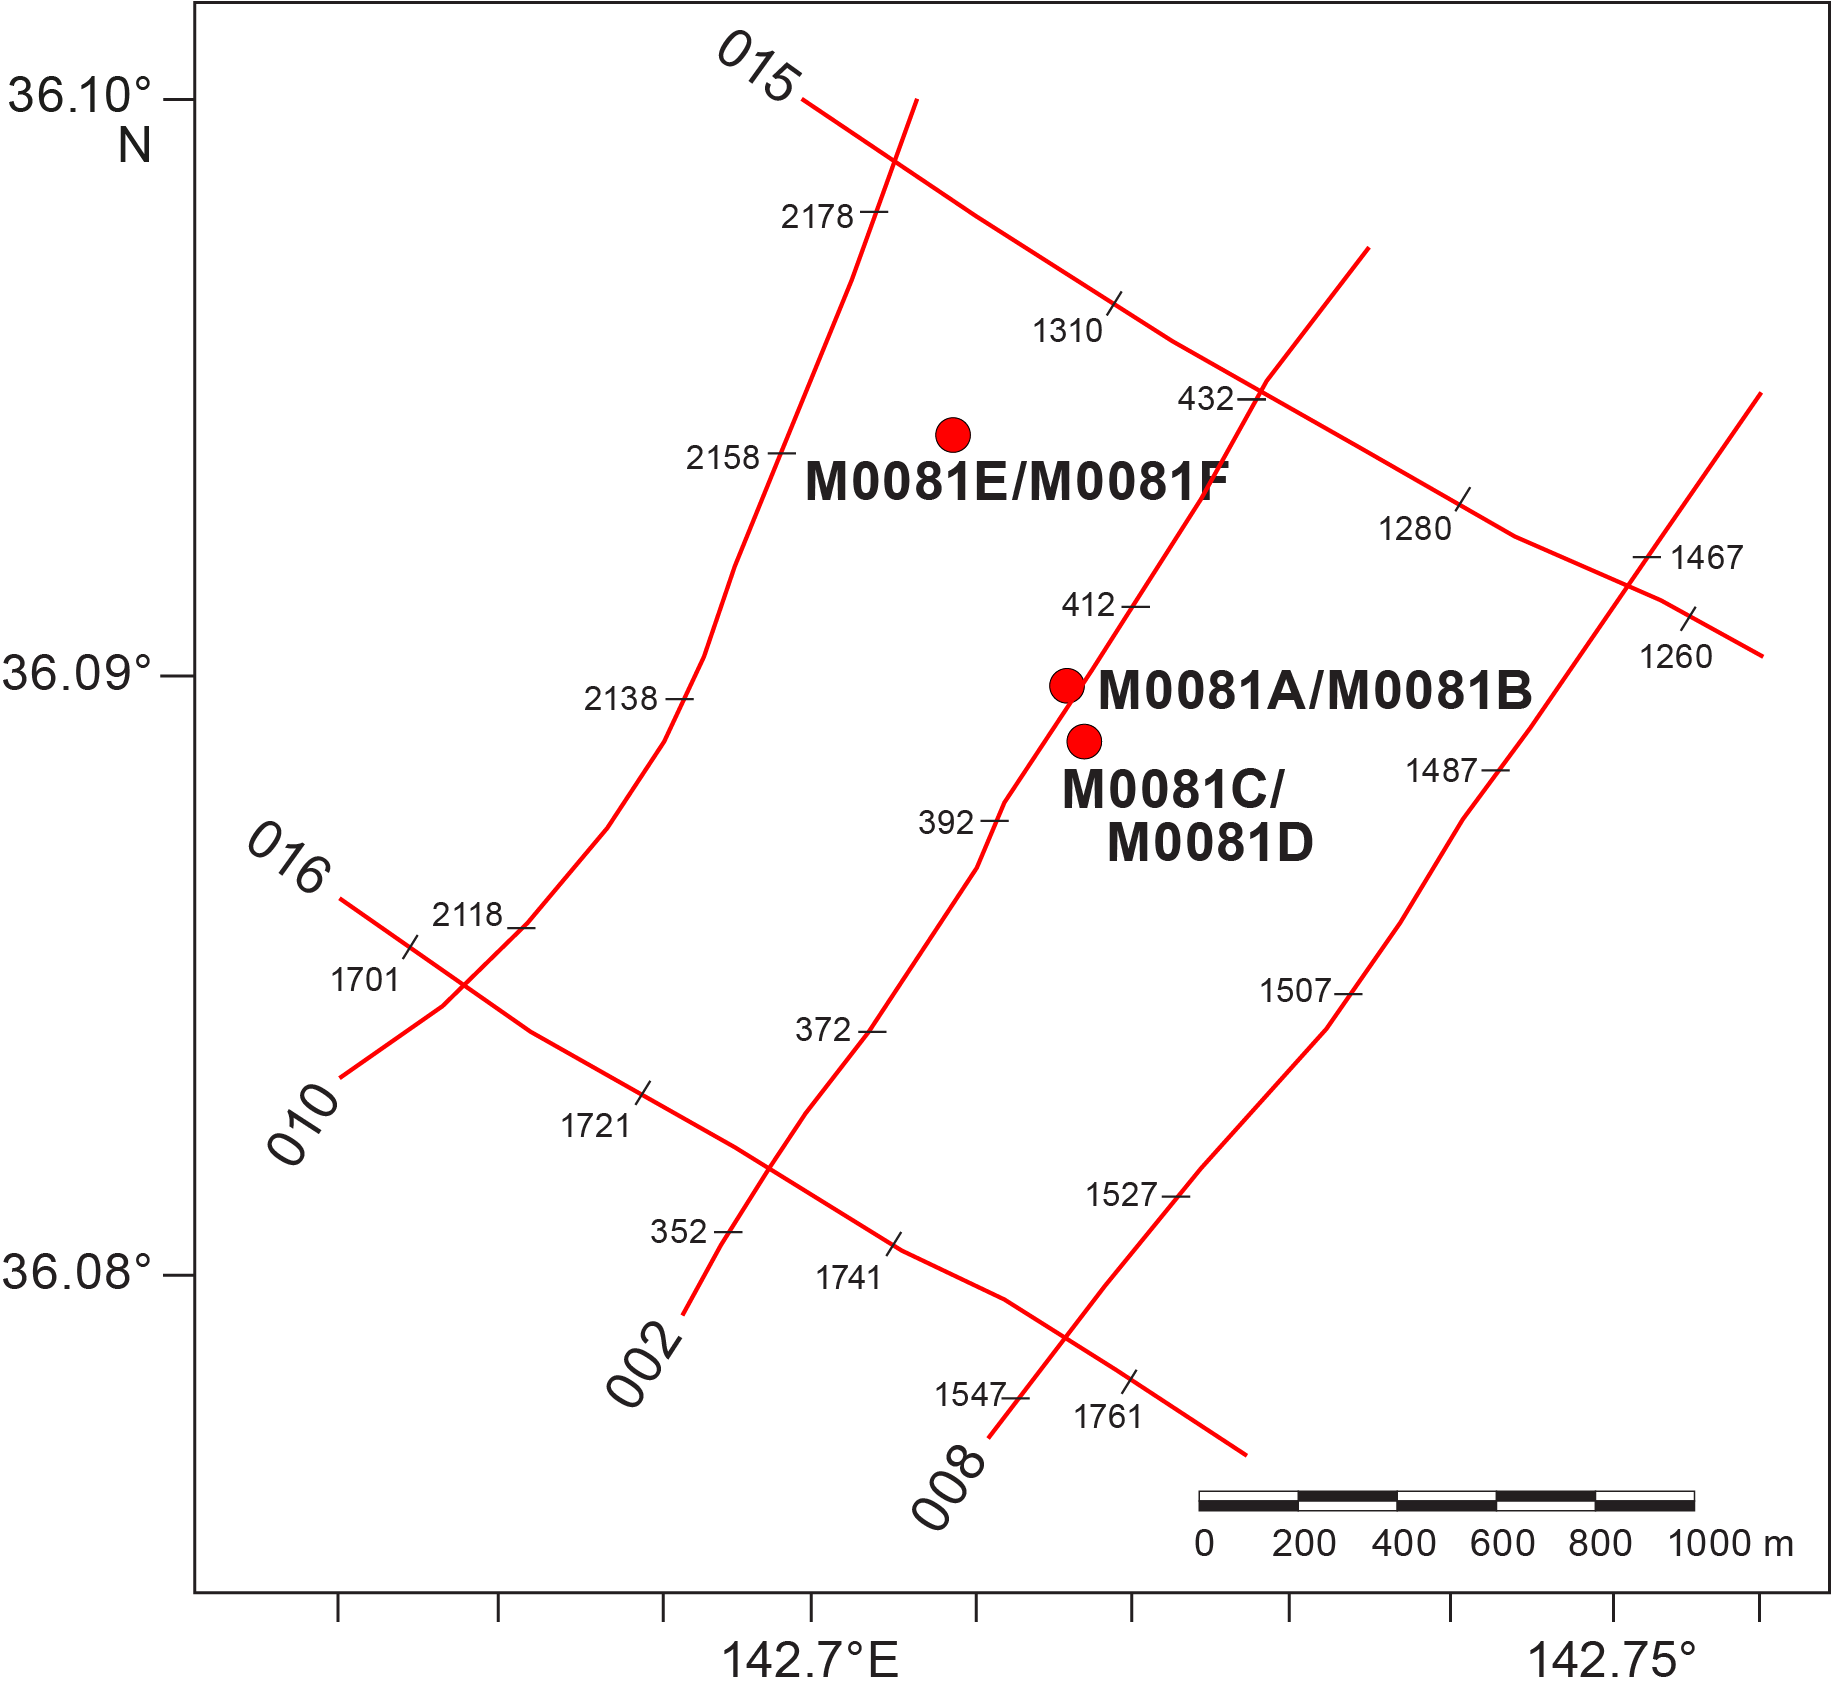
Figure F7. Subbottom profiles, Site M0081.
The two trench-parallel lines that bound Site M0081 are Lines 386_Underway_002 and 386-Underway_010. Line 386_Underway_002 is a key line for Holes M0081A–M0081D and allows projection of Holes M0081E and M0081F onto Line 386_Underway_002 (Figure F8). Holes M0081A–M0081F are projected onto Line 386_Underway_010, which also passes through Site M0082 to the north and provides a useful trench-parallel link between the holes (Figure F9). North of Site M0081 lies trench-perpendicular Line 386_Underway_015 (Figure F5).

Figure F8. Line 386_Underway_002.

Figure F9. Line 386_Underway_010.
The three lines that cross Site M0081 (386_Underway_015, 386_Underway_002, and 386_Underway_010) have a similar acoustic character. All display disrupted basal reflectors and an acoustically laminated package of reflectors thicker than 50 m and show a diffuse boundary between the basal layers and the basin fill. In addition, all three lines show two acoustically transparent layers, at and just below the seafloor, separated by a high-amplitude layer or reflector pair with a low-amplitude seafloor layer. Line 386_Underway_002 passes closest to the hole locations and images the subsurface below the flattest part of the basin floor. On Line 386_Underway_002, the upper of the two acoustically transparent packages is imaged more clearly, is approximately 3–4 m thick, forms a continuous horizon at the seafloor at 10.47 s two-way traveltime (TWT), and is entirely flat on this line. The lower of the acoustically transparent packages, at 10.485 s TWT, is also 3–4 m thick but is not imaged with as much clarity as the upper transparent layer. The thickness of the acoustically laminated package cannot be determined with accuracy because the contact between the basal layers and basin fill is diffuse.
The image quality of Line 386_Underway_010, 730 m west of Holes M0081E and M0081F, shows more detail, especially for the acoustically laminated package (Figure F9). The upper and lower acoustically transparent layers, both approximately 4 m thick, extend horizontally until they encounter the bathymetric high that is the location of the condensed section in Holes M0082A–M0082D. The acoustically laminated package (which extends to around 10.54 s TWT), is better imaged than in Line 386_Underway_002, as is the boundary between the disrupted basal layers and basal fill at around 10.57 s TWT. Several semitransparent layers are imaged, intercalated within the acoustically laminated package, as labeled in Figure F9. The lowest identifiable layers of basin fill occur beneath a flat-lying, high-amplitude reflector at 10.54 s TWT and dip gently to the north.
2.4. Site M0082
Holes M0082A and M0082B lie 80 m west of Line 386_Underway_003, and Holes M0082C and M0082D lie 215 m west of this line (Figures F10, F11). Site M0082 lies on the crest of a topographic high and forms the condensed section of Basin S1. In the basinal areas on either side of Site M0082, the acoustic characteristics are similar to those observed in the rest of the basin, with the low-amplitude seafloor reflectors, two acoustically transparent layers at and just below the surface, an acoustically laminated package, and disrupted basal layers. At Site M0082, these characteristics are significantly different. The contact between disrupted basal layers and the acoustically laminated basin fill is diffuse but appears to occur at ~10.49 s TWT in Holes M0082A and M0082B near the crest of the high, above which more acoustically laminated layers are present to the seabed. Holes M0082C and M0082D intersect the contact between the acoustically laminated package and basal layers near the base of the hole at around 10.49 s TWT. With this interpretation, the acoustically laminated package is approximately 35 m thick on the crest of the high in Holes M0082C and M0082D, although imaging quality issues over the high make it difficult to determine the top bound of the package and the location of the two acoustically transparent layers at and just below the surface.
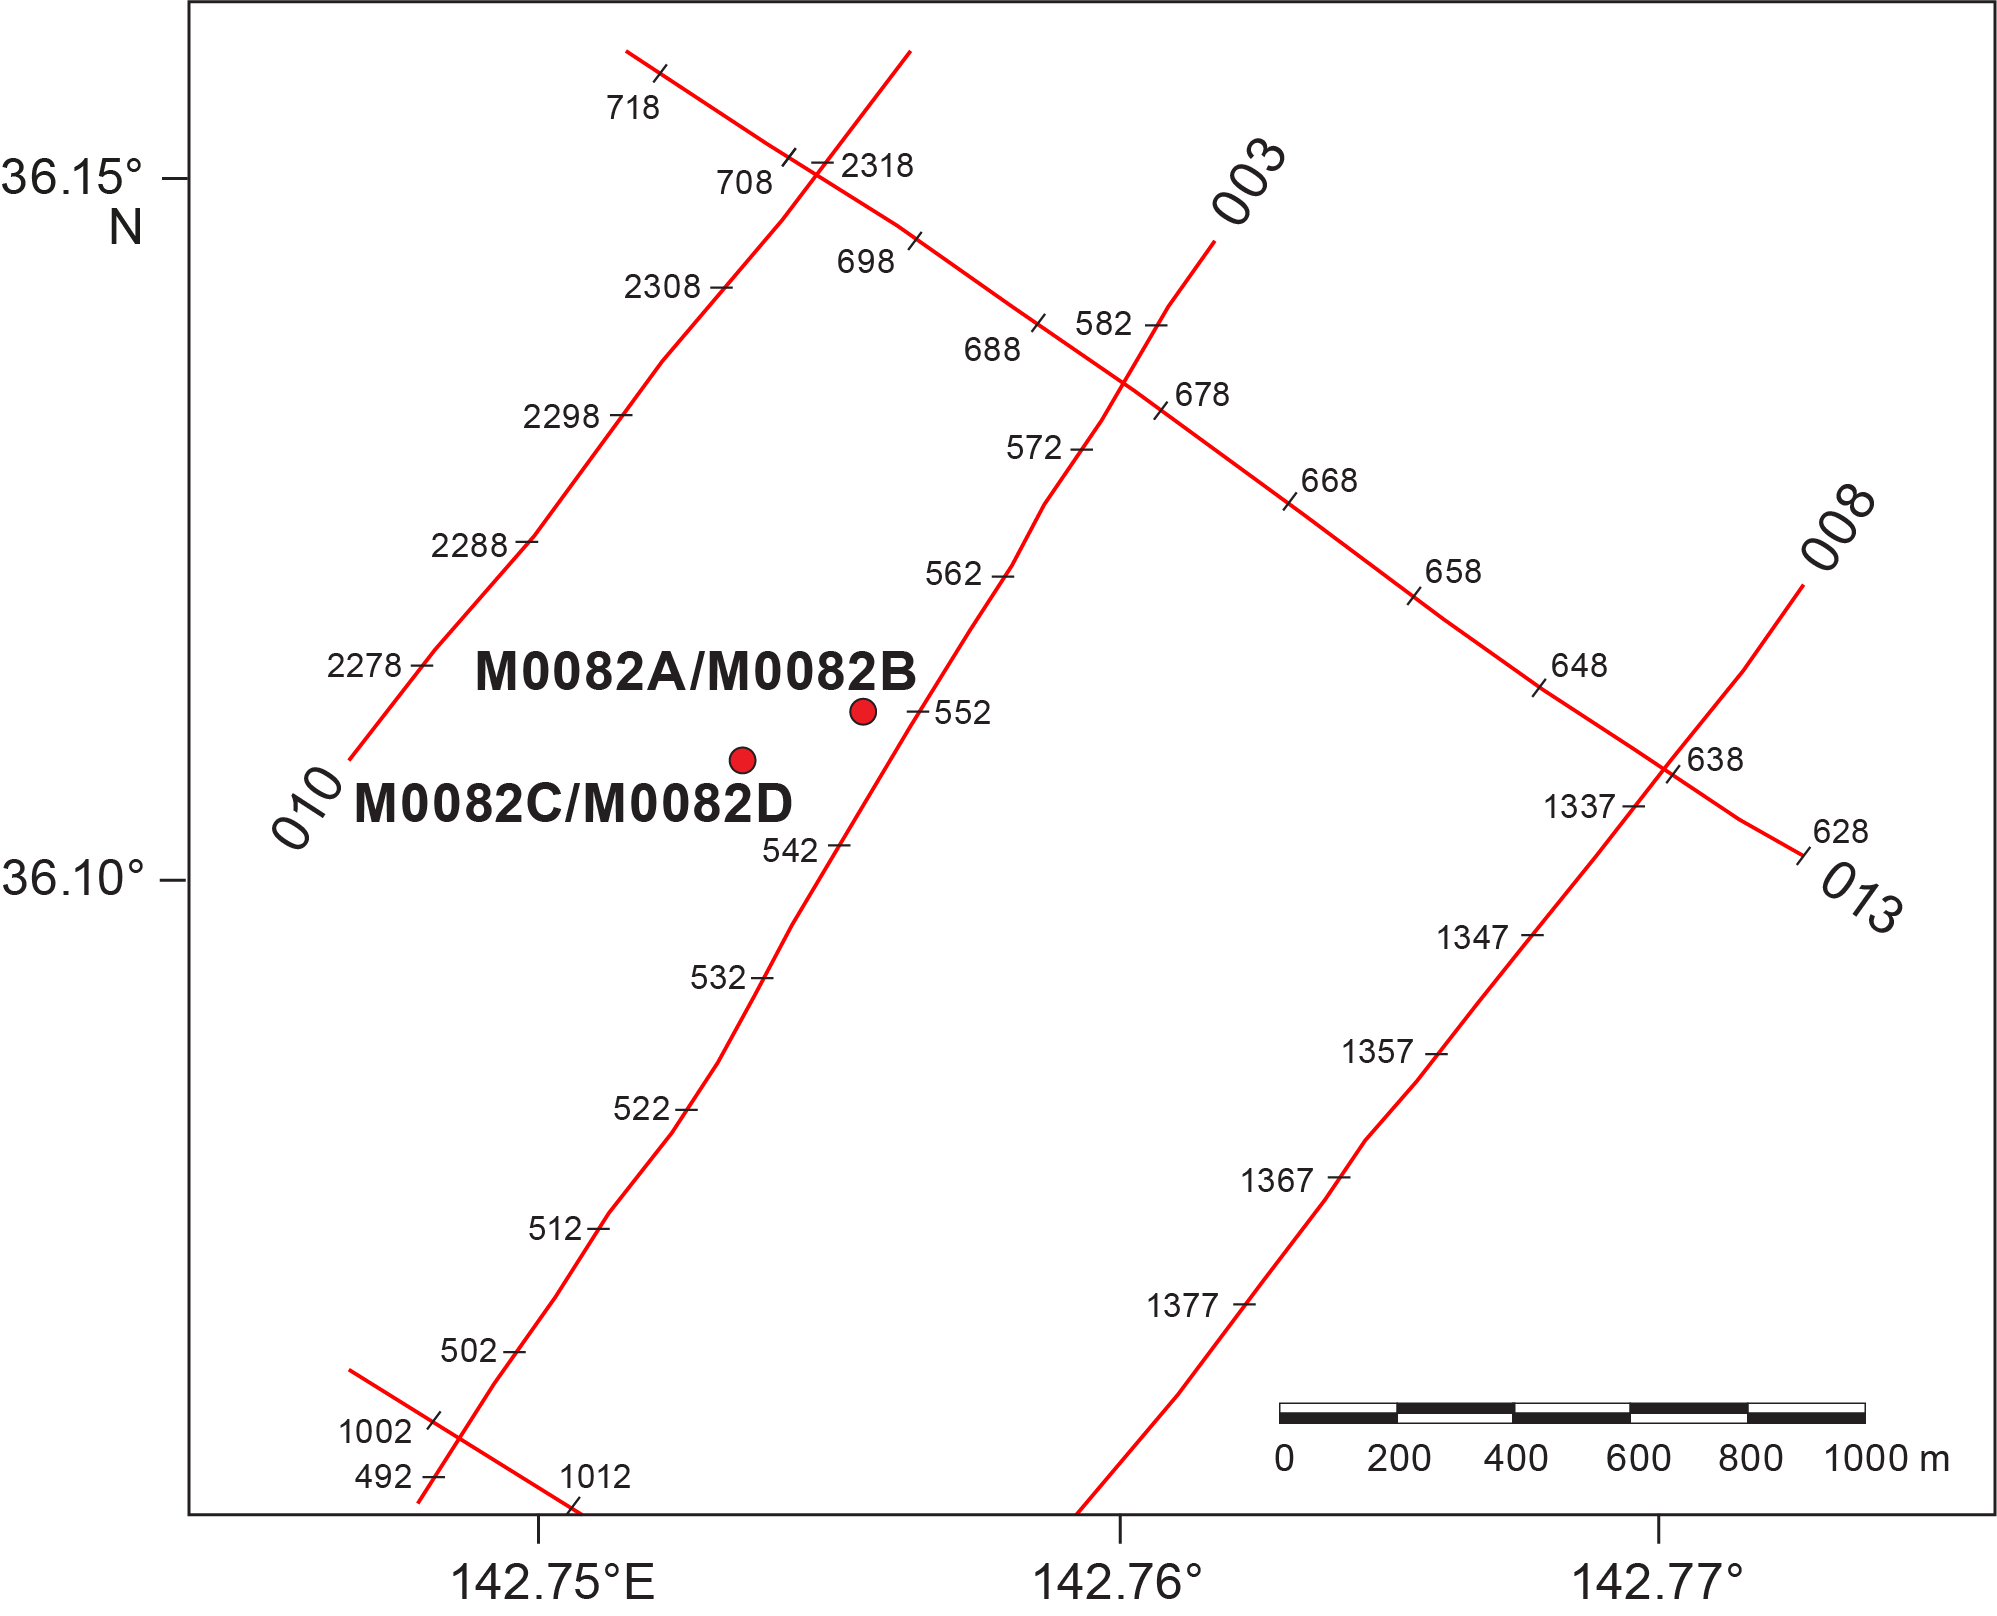
Figure F10. Subbottom profiles, Site M0082.
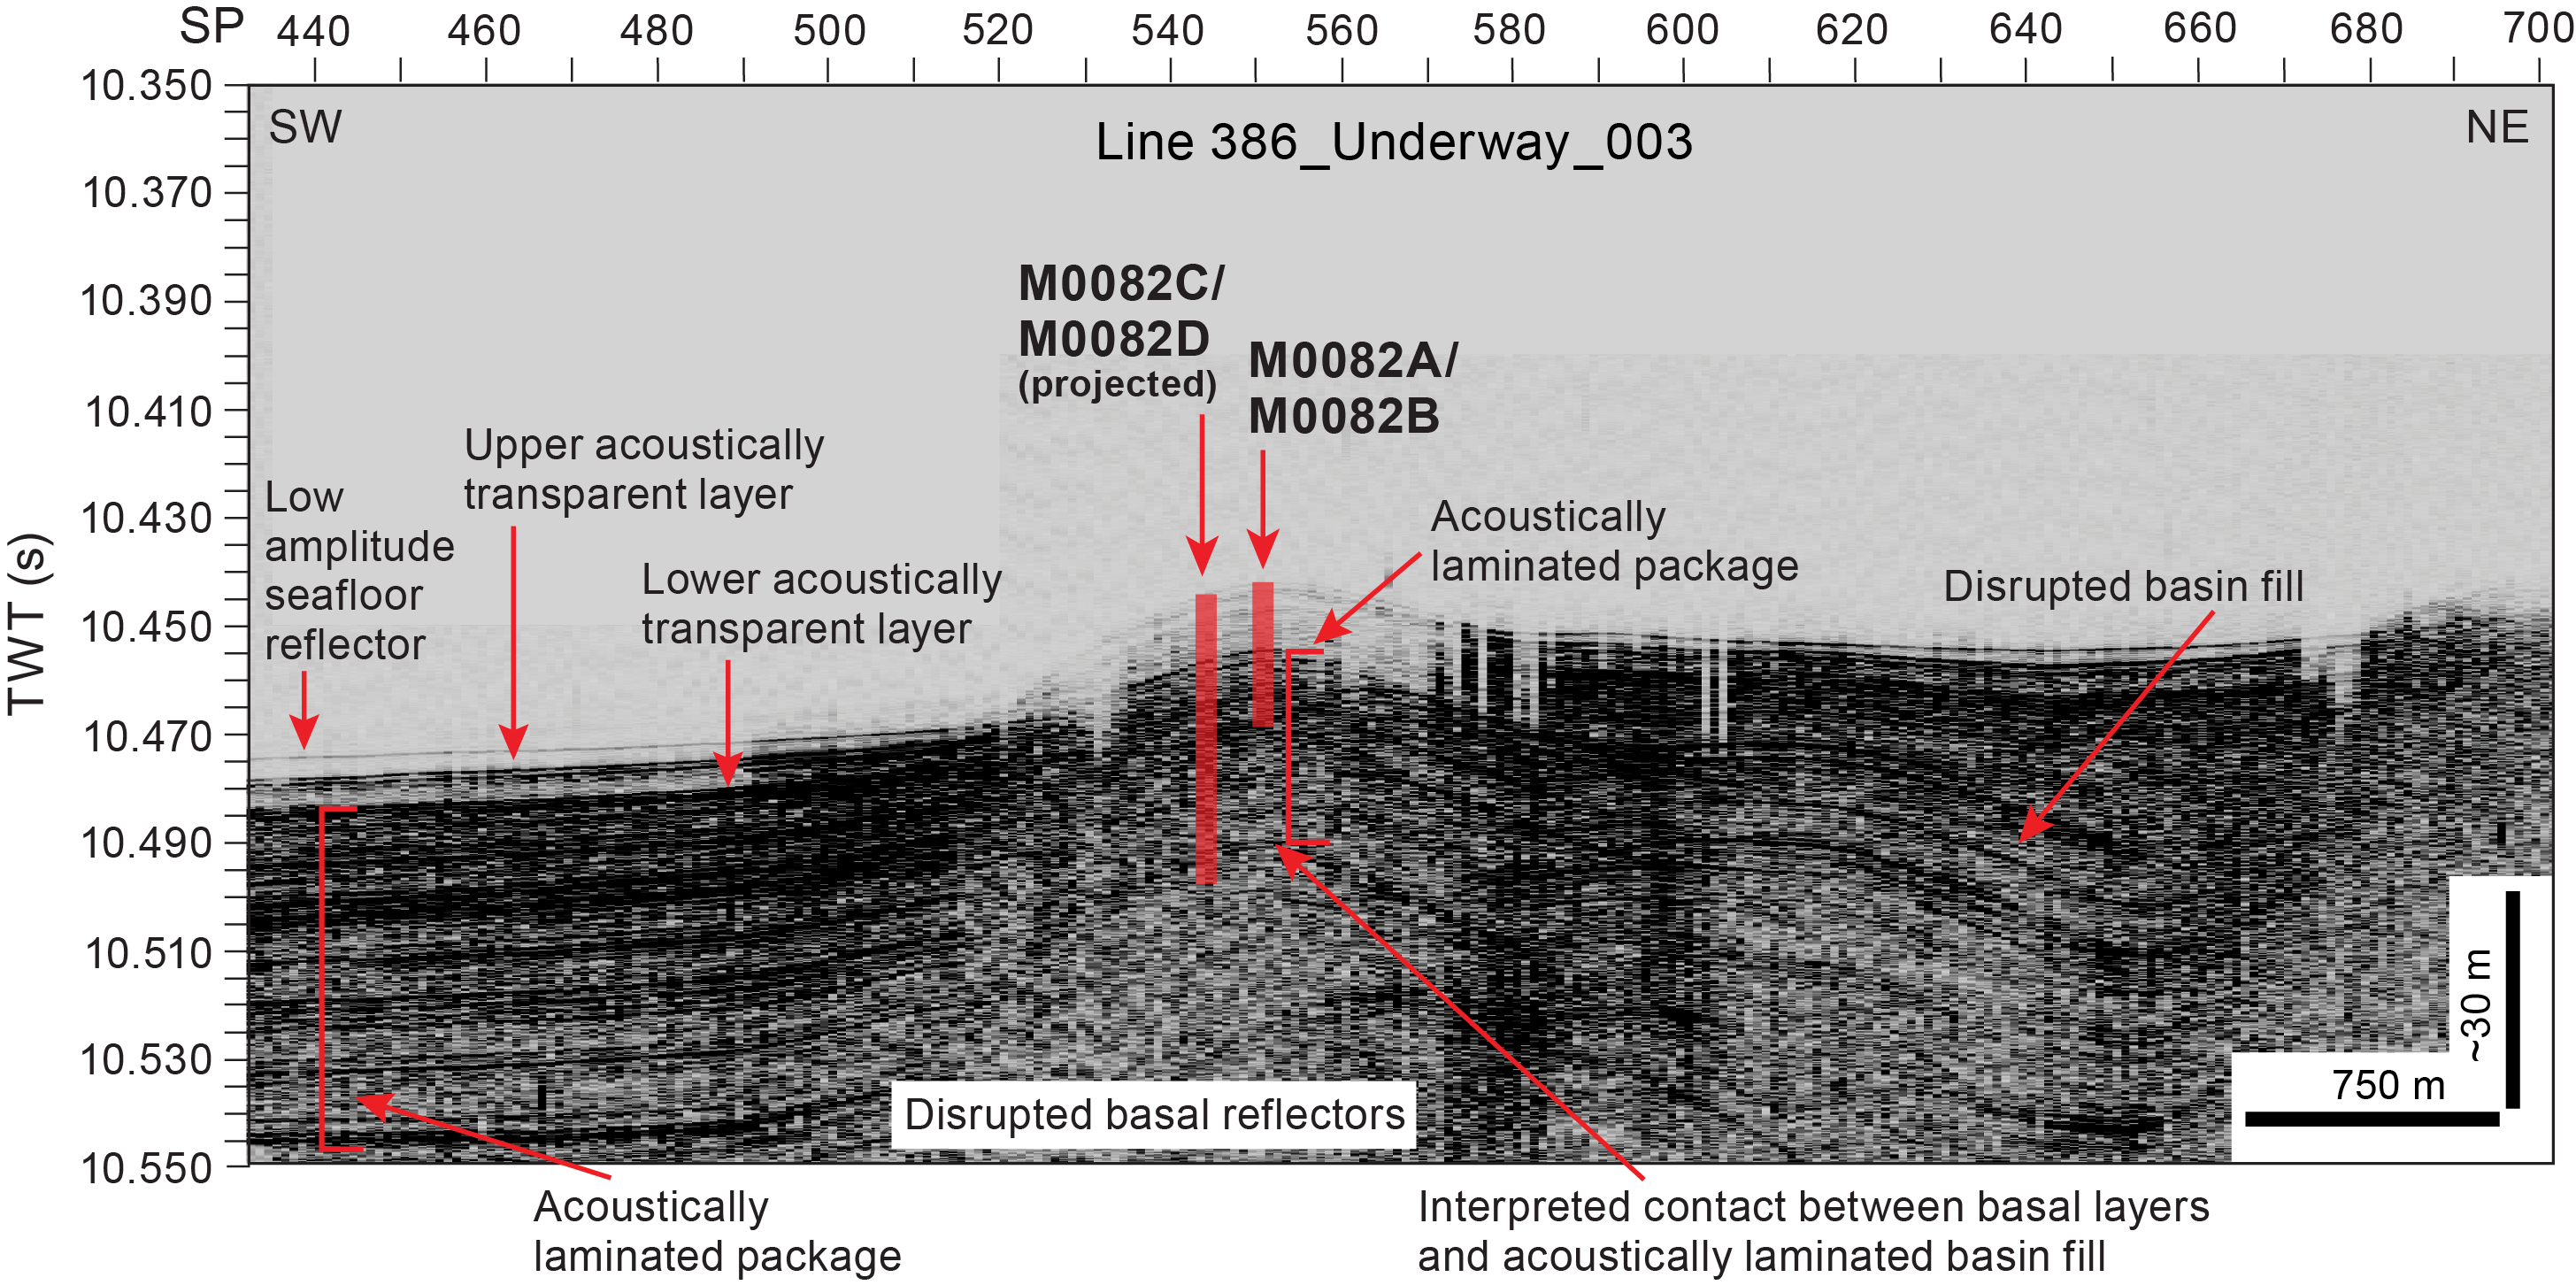
Figure F11. Line 386-Underway_003.
3. Lithostratigraphy
Sites M0081 and M0082 were cored in the southern Japan Trench focus area in Basin S1. Site M0081 comprises six holes (M0081A–M0081F), including those of the accompanying trigger cores, which were cored in the basin floor where the greatest sediment recovery was anticipated based on the subbottom profiles. Site M0082 comprises four holes (M0082A–M0082D), including those of the accompanying trigger cores, which were recovered from the basin flank in a topographic high where a condensed interval was anticipated.
This section describes the grain size–based lithology of Sites M0081 and M0082 as originally logged during visual core description. The use of major and minor lithologies, contacts, sedimentary structures, bioturbation, iron monosulfides, and accessories are defined in Lithostratigraphy in the Expedition 386 methods chapter (Strasser et al., 2023a) for both the grain size and smear slide descriptions. The lithology, structures and physical properties, and line scan and X-ray computed tomography (CT) images are displayed on 20 m lithostratigraphic summaries (Figures F15, F20, F22, F24, F27). Smear slide descriptions are semiquantitative and include grain size: sand, silt, and clay (100%). Lithogenic, biogenic, and volcanic components are also described as percentages of the total slide (Tables T3, T4). Smear slides were observed every 2 m, and the results are displayed as color bars representing the lithogenic, biogenic, and volcanic components on the smear slide summaries (Figures F18, F21, F23, F25, F28). X-ray CT scan and linescan images, which were used to interpret the grain size–based lithology, and X-ray diffraction (XRD) results, used in summary XRD figures, are available in XRAYCT, LINESCAN, and XRD, respectively, in Supplementary material. Smear slide tables and 3 m barrel sheets are available in Core descriptions. Core close-up photos and smear slide photomicrographs are available in CORECLOSEUP and SMEARSLD in Supplementary material.
Sites M0081 and M0082 are similar. The lithologies at both sites are dominated by clayey silt, silty clay, and clay with minor components of medium sand, fine sand, very fine sand, and silt (Figures F15, F20, F22, F24, F27). Detailed smear slide observations indicate a large biogenic component containing, in decreasing abundance, diatoms, sponge spicules, silicoflagellates, and radiolaria. Rare but also present are foraminifera and calcareous nannoplankton (Tables T3, T4; Figures F16, F17, F19, F26). The lithogenic components of the smear slides, in decreasing abundance, are clay minerals, quartz, and feldspar. The most common lithology names derived from the smear slide observations include lithogenic-rich siliceous ooze, siliceous-rich lithogenic silty clay, and vitric-bearing siliceous-rich lithogenic clayey silt. The smear slide–derived lithology names are displayed next to color boxes on the smear slide summaries (Figures F18, F21, F23, F25, F28). The color boxes sum to 100% lithogenic, biogenic, and vitric components.
Notable at Sites M0081 and M0082 is a thick clay interval. At Site M0081, the ~5 m thick clay layer is at 10.5–14.5 meters below seafloor (mbsf) in Hole M0081B, 9–13.5 mbsf in Hole M0081D, and 9.5–15 mbsf in Hole M0081F. A possibly comparable 4 m thick clay deposit is present in Hole M0082B at 8.5–12 mbsf and Hole M0082D at 7.5–11 mbsf (Figures F15, F20, F22, F24, F27). Further studies of these two sites will help identify the sedimentation patterns of each site and allow for better correlation between the two sites (see Stratigraphic correlation). Another main difference between Sites M0081 and M0082 is grain size. Ternary diagrams based on smear slide observations of Sites M0081 and M0082 show that the sediment at Site M0082 is finer grained (Tables T3, T4; Figures F17, F26).
The most common sedimentary structures at both sites are thin beds (1–3 cm) and laminae sometimes forming parallel laminated intervals that contain fine sand, very fine sand, silt, and clayey silt. These deposits can have sharp, erosional, wavy, gradational, and bioturbated lower and upper contacts (Figure F12). The sediment above the basal contacts can fine or coarsen upward. Layers containing tephras were recovered in intervals 386-M0081B-1H-8, 34.5–36.3 cm; 386-M0081D-1H-6, 86.3–87.5 cm; and 386-M0082B-1H-3, 59.1–60 cm. These layers are used for correlation between holes and sites (see Tephra). The possibly correlative tephra layers were observed in the X-ray CT images of interval 386-M0081F-1H-7, 84.5–86 cm, and at the top of Section 386-M0082D-1H-3.
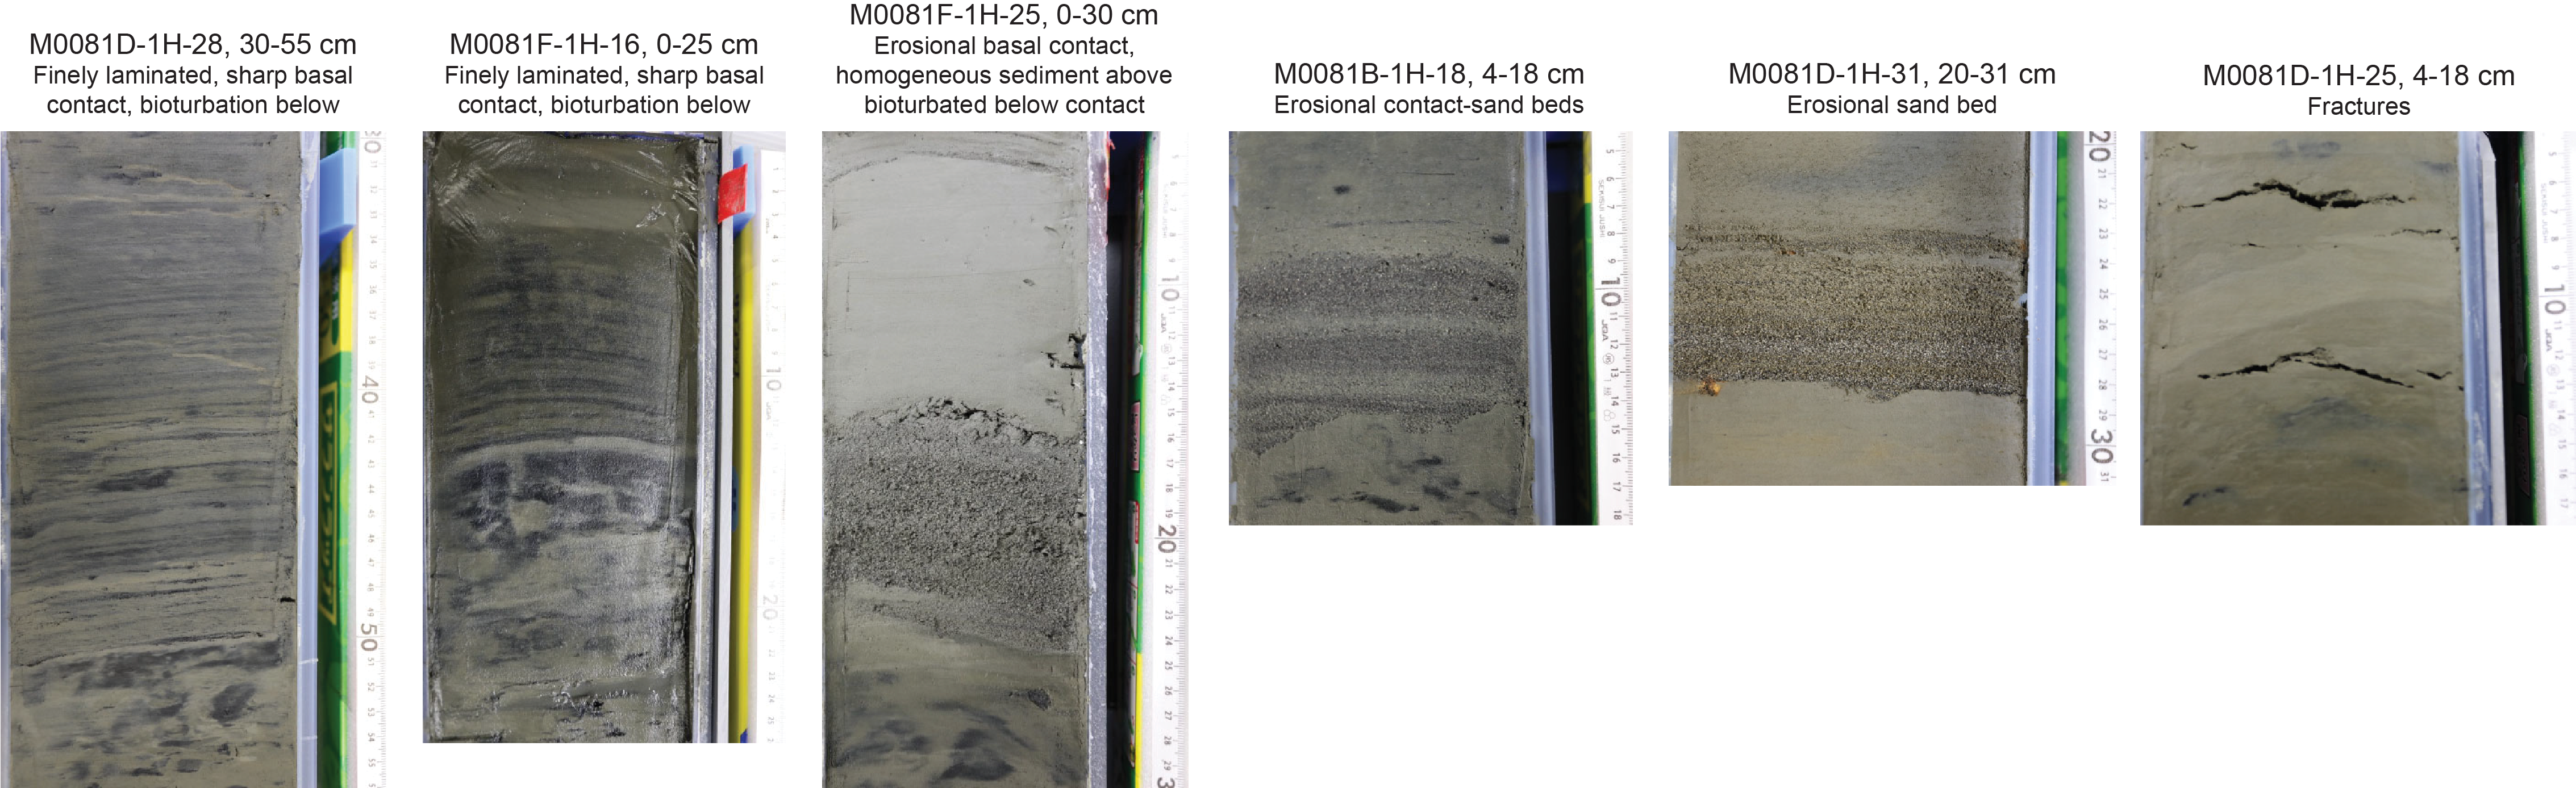
Figure F12. Sedimentary structures.
Bioturbation is common and has been classified on a scale ranging from no bioturbation (1) to completely bioturbated (5) (see Lithostratigraphy in the Expedition 386 methods chapter [Strasser et al., 2023a]). The sediments have undergone extensive organoclastic sulfate reduction and/or anaerobic oxidation of methane that is manifested as iron monosulfides (Figures F13, F14) and a sulfate–methane transition (SMT) at ~9–10 mbsf (see Geochemistry). These postdepositional processes (bioturbation and formation of iron monosulfides) overprint the primary depositional bedding features and are seen filling burrows, as mottling, and filling porosity in laminae forming color bands. Bioturbation is noted in color variability that ranges from 7.5 YR 4/3 brown to 5Y 4/2 grayish olive to 7.5Y 4/3 dark olive. Core deformation is minor and characterized by voids, slurry, and cracks. Cracks are more abundant with depth in the core. Most significant is the post–core recovery and splitting oxidation observed in many sections (Figure F29).
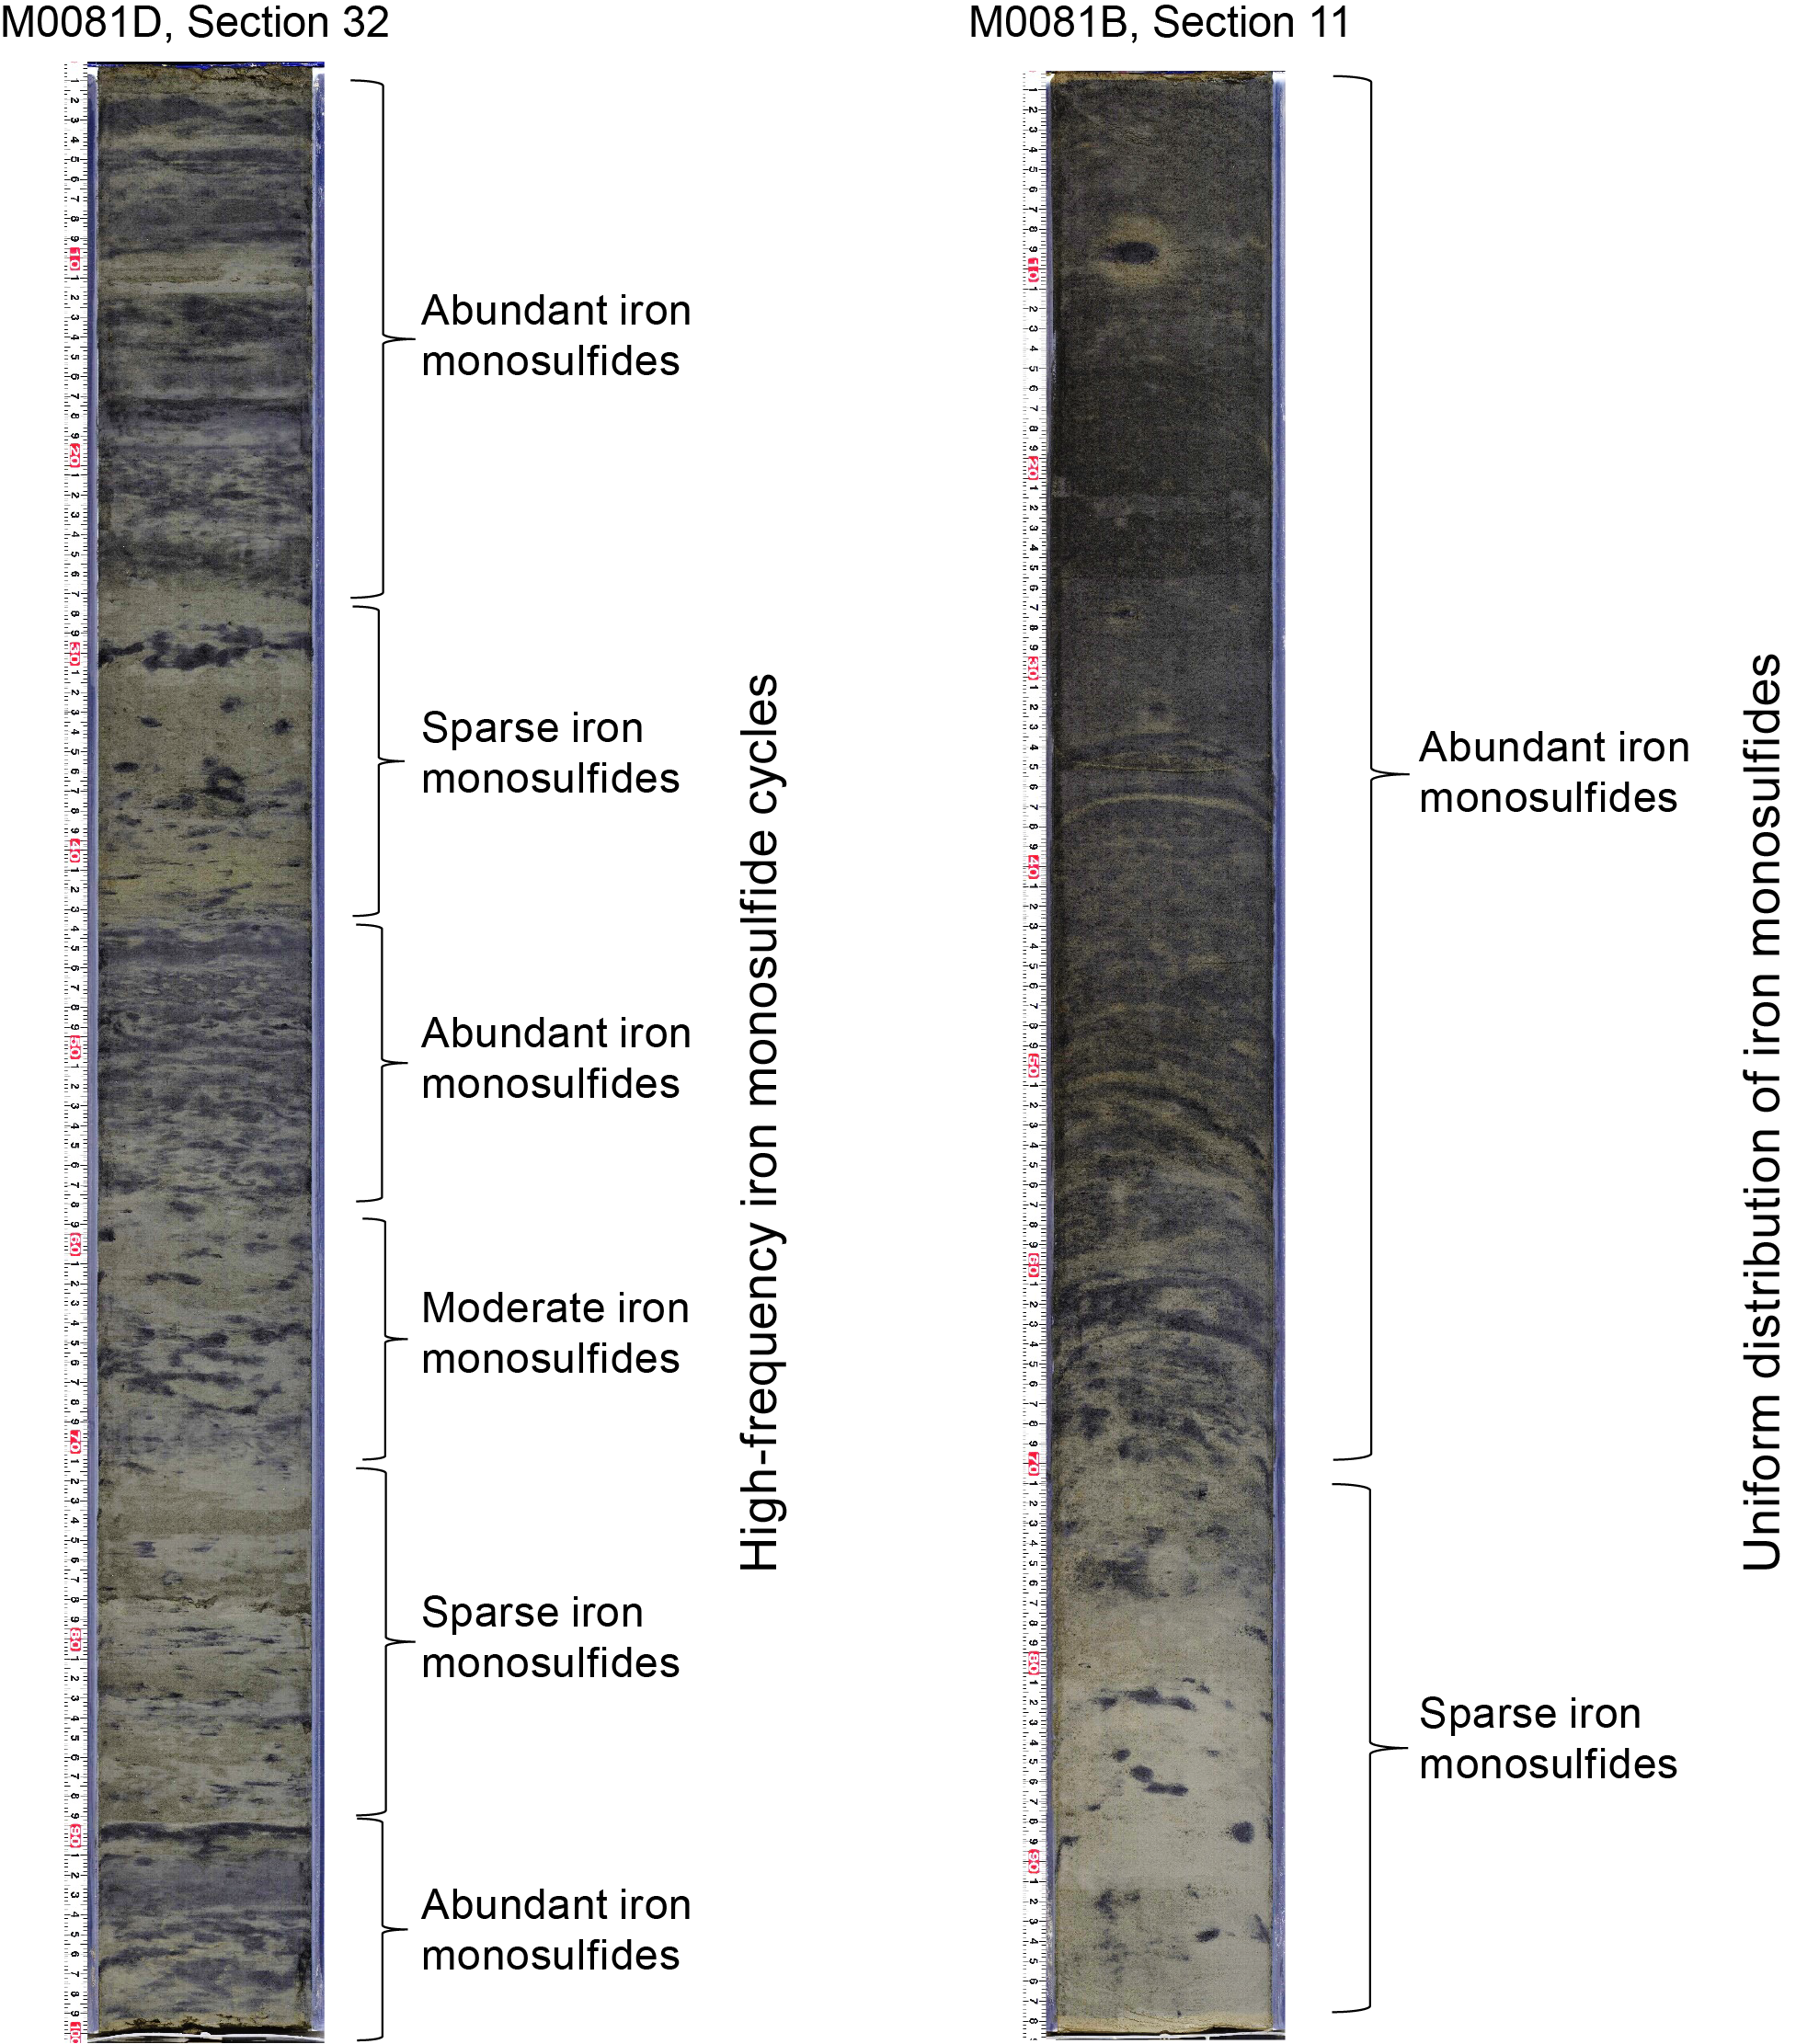
Figure F13. Monosulfide occurrences, Holes M0081B and M0081D.
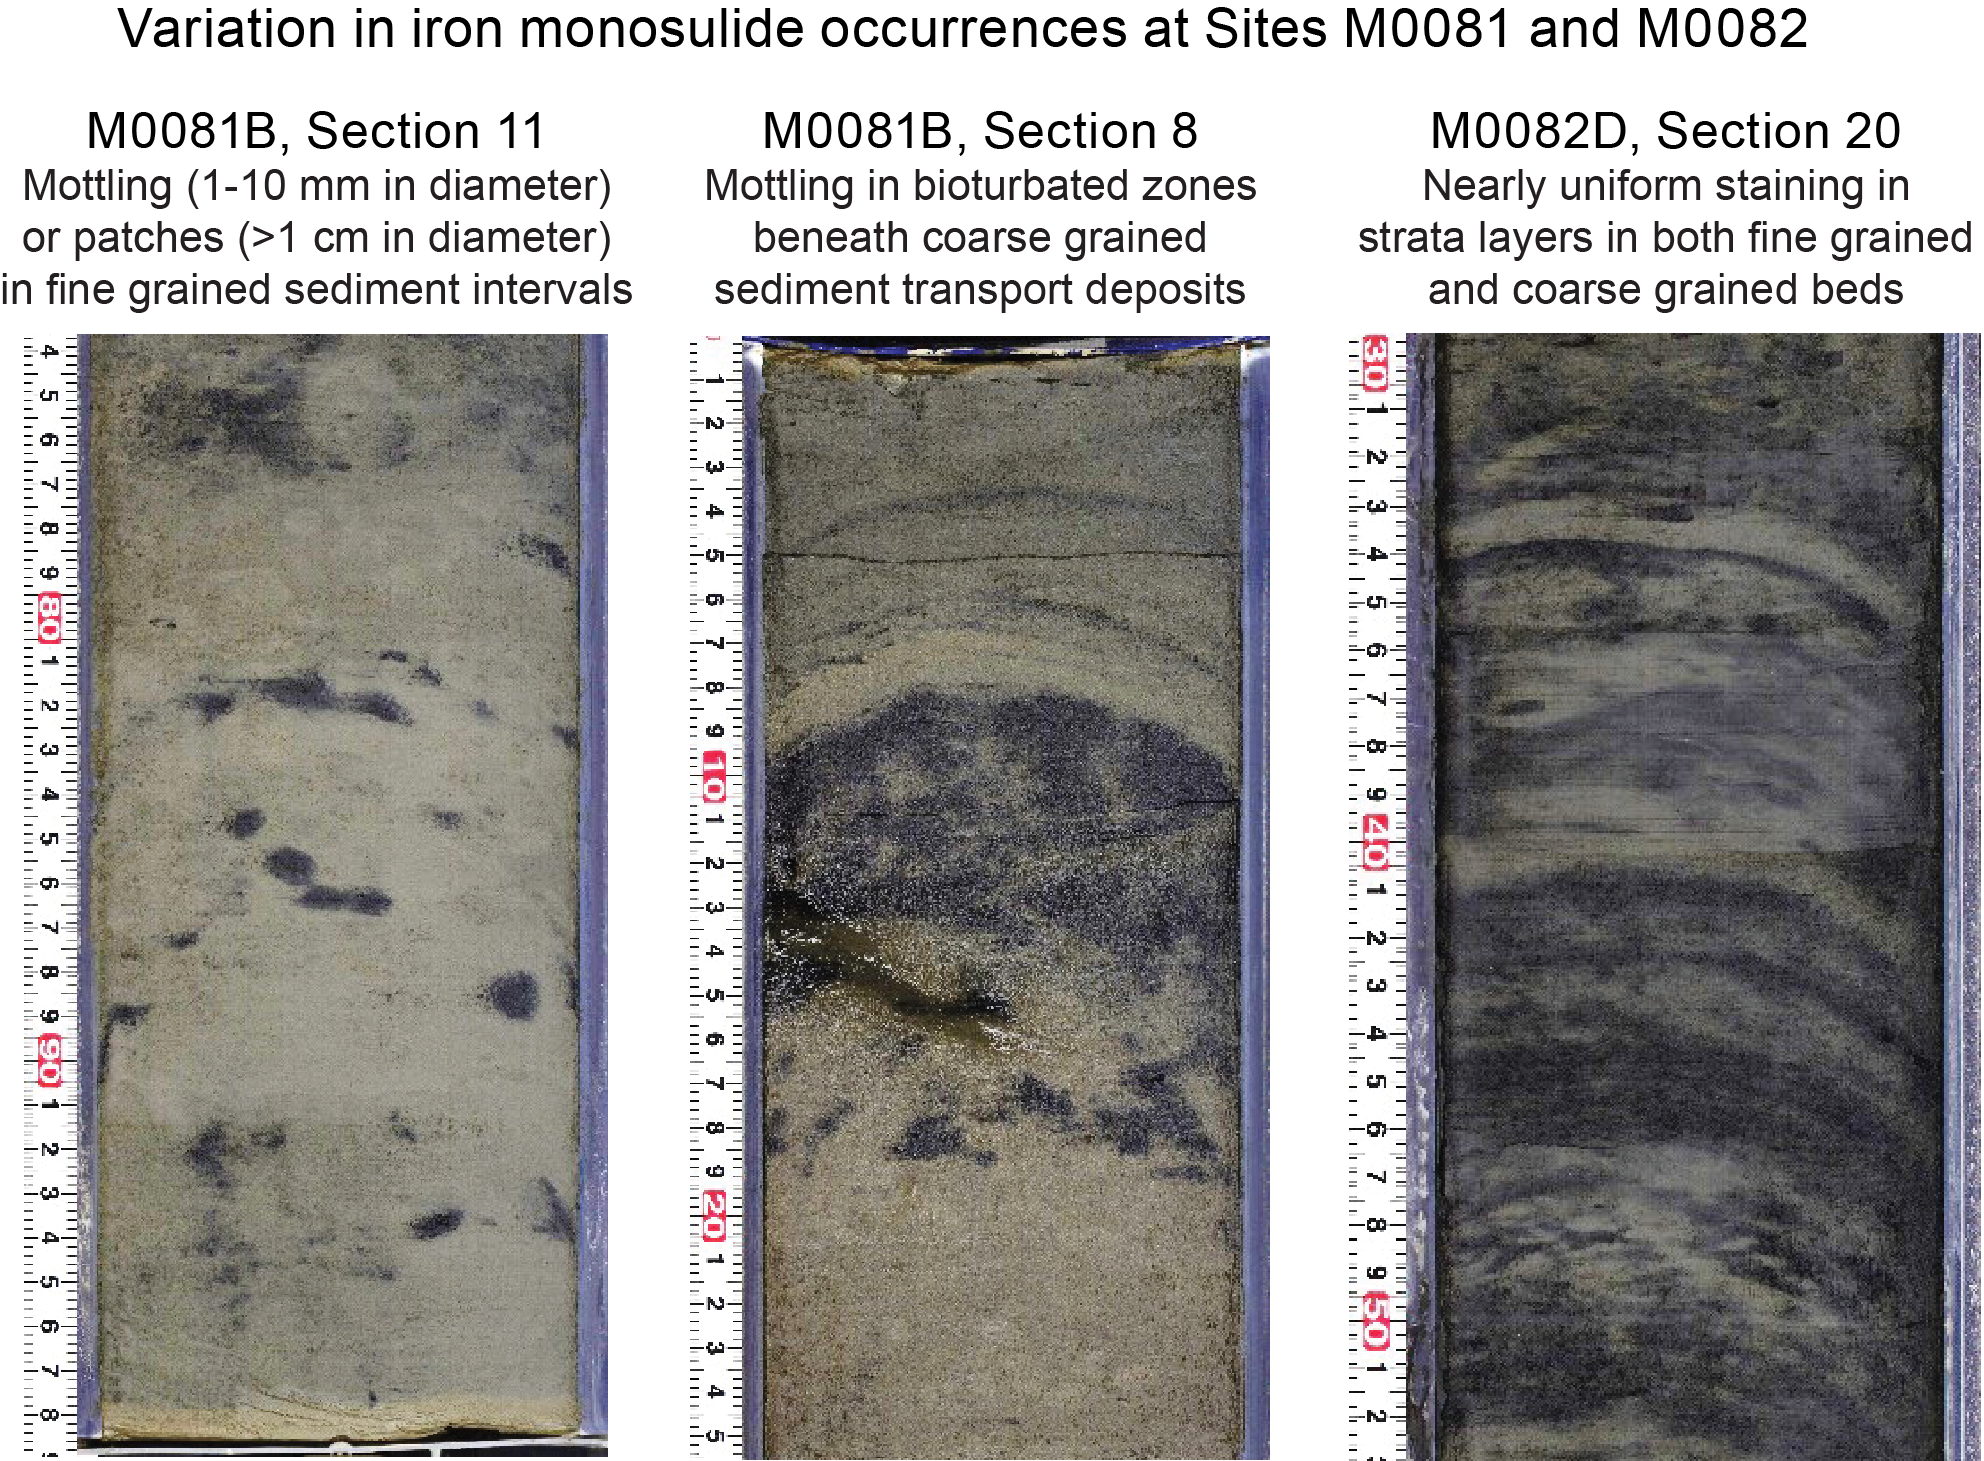
Figure F14. Monosulfide occurrences, Holes M0081B and M0082D.
Event deposits are identified at both sites (Figures F15, F20, F22, F24, F27) (see Lithostratigraphy in the Expedition 386 methods chapter [Strasser et al., 2023a]). These beds are characterized by a coarse-grained basal layer that ranges from medium sand to silty clay. A sharp or bioturbated contact is at the base of the coarse-grained layer. The coarser grained basal deposits contain laminae and beds (1–5 cm thick) and are often capped by structureless clays. This clay deposit can be a few centimeters thick to meters thick, such as the clay bed in Sections 386-M0081D-1H-11 through 1H-14 (9–13.5 mbsf) and 386-M0081F-1H-11 through 1H-15 (10.5–15 mbsf). The clay beds are structureless and generally lack bioturbation, as at Sites M0083 and M0089 (see Lithostratigraphy in the Sites M0083 and M0089 (Basin 2) chapter [Strasser et al., 2023c]).

Figure F15. Lithostratigraphic summaries, Holes M0081A and M0081B.
X-ray CT images are available for each site (Figures F15, F20, F22, F24, F27; see XRAYCT in Supplementary material). The density contrasts expressed in gray levels offer a detailed image of the sedimentary structures. Among these, the presence of tephra is noted in Sections 386-M0081B-1H-8, 386-M0081D-1H-6, 386-M0081F-1H-7, 386-M0082B-1H-3, and 386-M0082D-1H-3) (see Tephra). Complete core linescan images provide insights on how the sediments vary with depth in a core (see LINESCAN in Supplementary material).
3.1. Site M0081
3.1.1. Holes M0081A and M0081B
3.1.1.1. Hole M0081A
Hole M0081A is 1 m deep and composed of silty clay (Figure F15). A brownish black (10YR 3/2) 1 cm thick interval at the top of the hole is interpreted as being oxygenated, indicating that the surface of the seafloor was recovered. The lithology in this section is structureless and not bioturbated. Three color bands of black (2.5Y 2/1) are recognized in intervals 1P-1, 11–12, 20–21, and 24–25 cm. All three physical properties measured (magnetic susceptibility, density, and natural gamma radiation [NGR]) increase toward the bottom of the hole (see Physical properties).
One smear slide was observed, and the lithology was described as lithogenic-rich siliceous ooze. The grain size is clayey silt (Table T3; Figures F16, F17, F18). Clay is the most abundant component of the minerals (40%). Together, the biogenic component forms 60% of the smear slide and, in decreasing abundance, is composed of diatoms (30%), radiolaria (20%), and silicoflagellates (10%). In the ternary diagram of major components (biogenic, volcanic, and lithics), lithics are composed of minerals (quartz, feldspar, and others) and clay minerals.
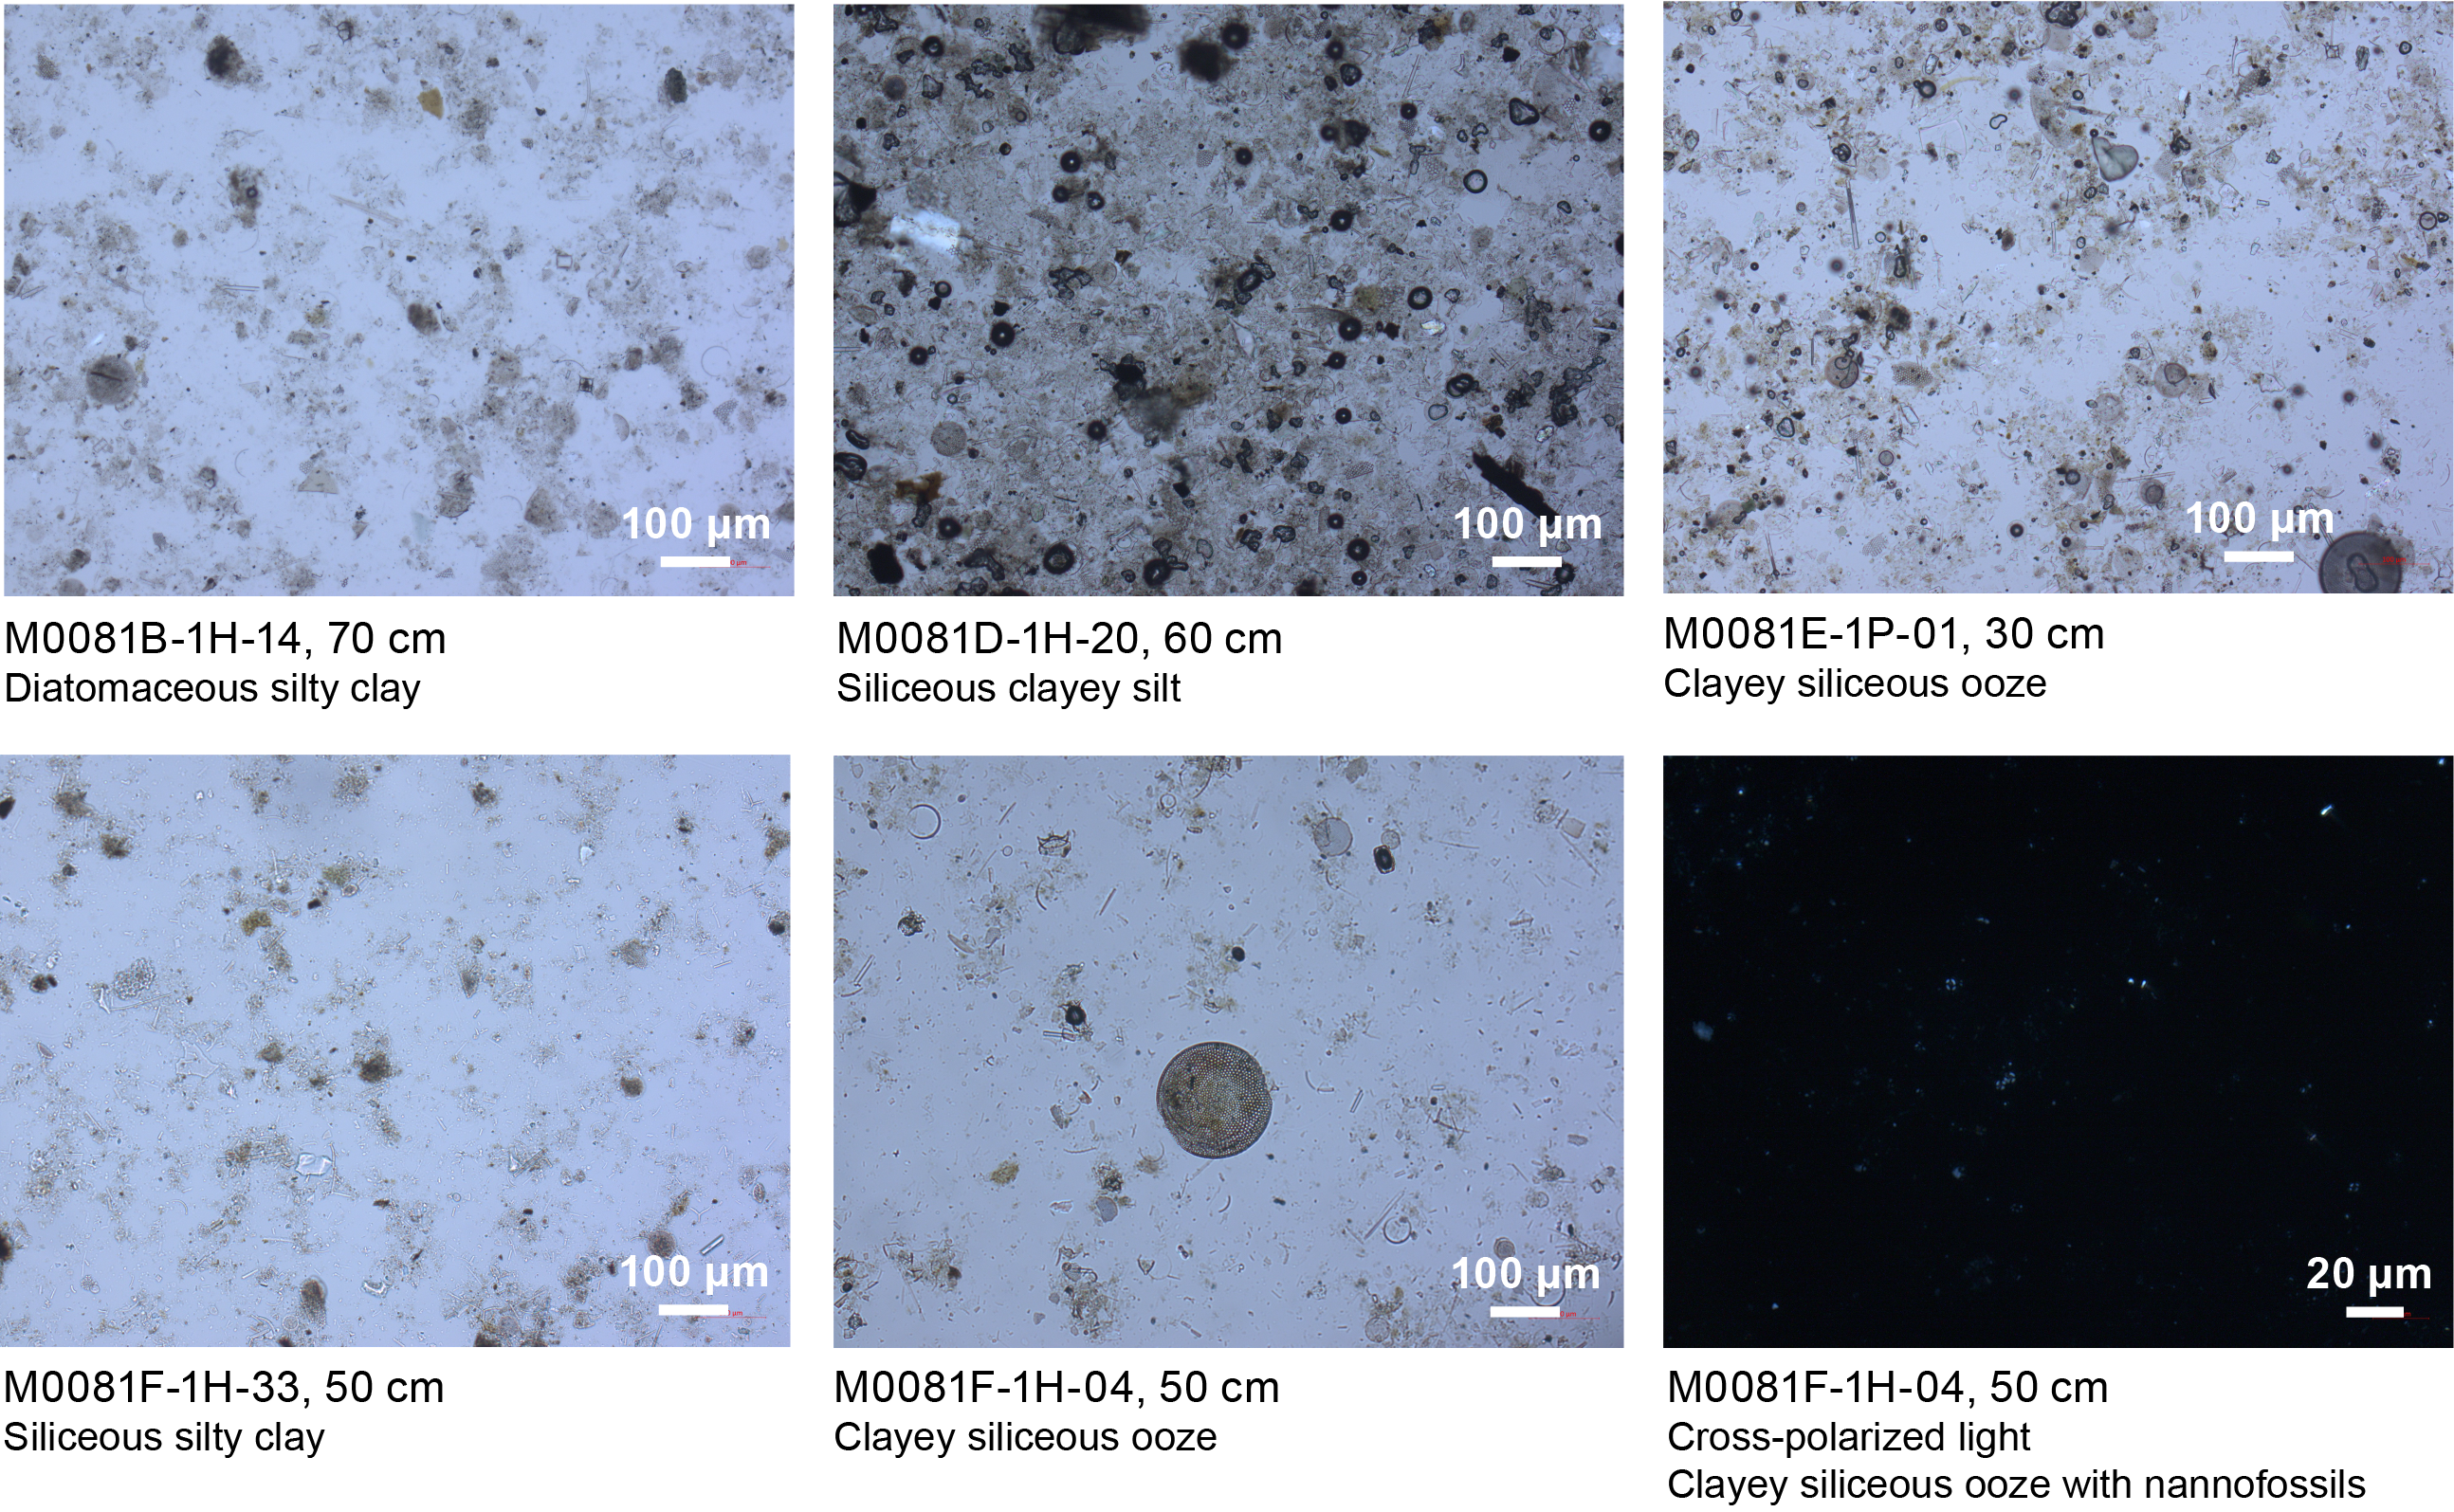
Figure F16. Lithologic components, Site M0081.

Figure F17. Major components, Site M0081.
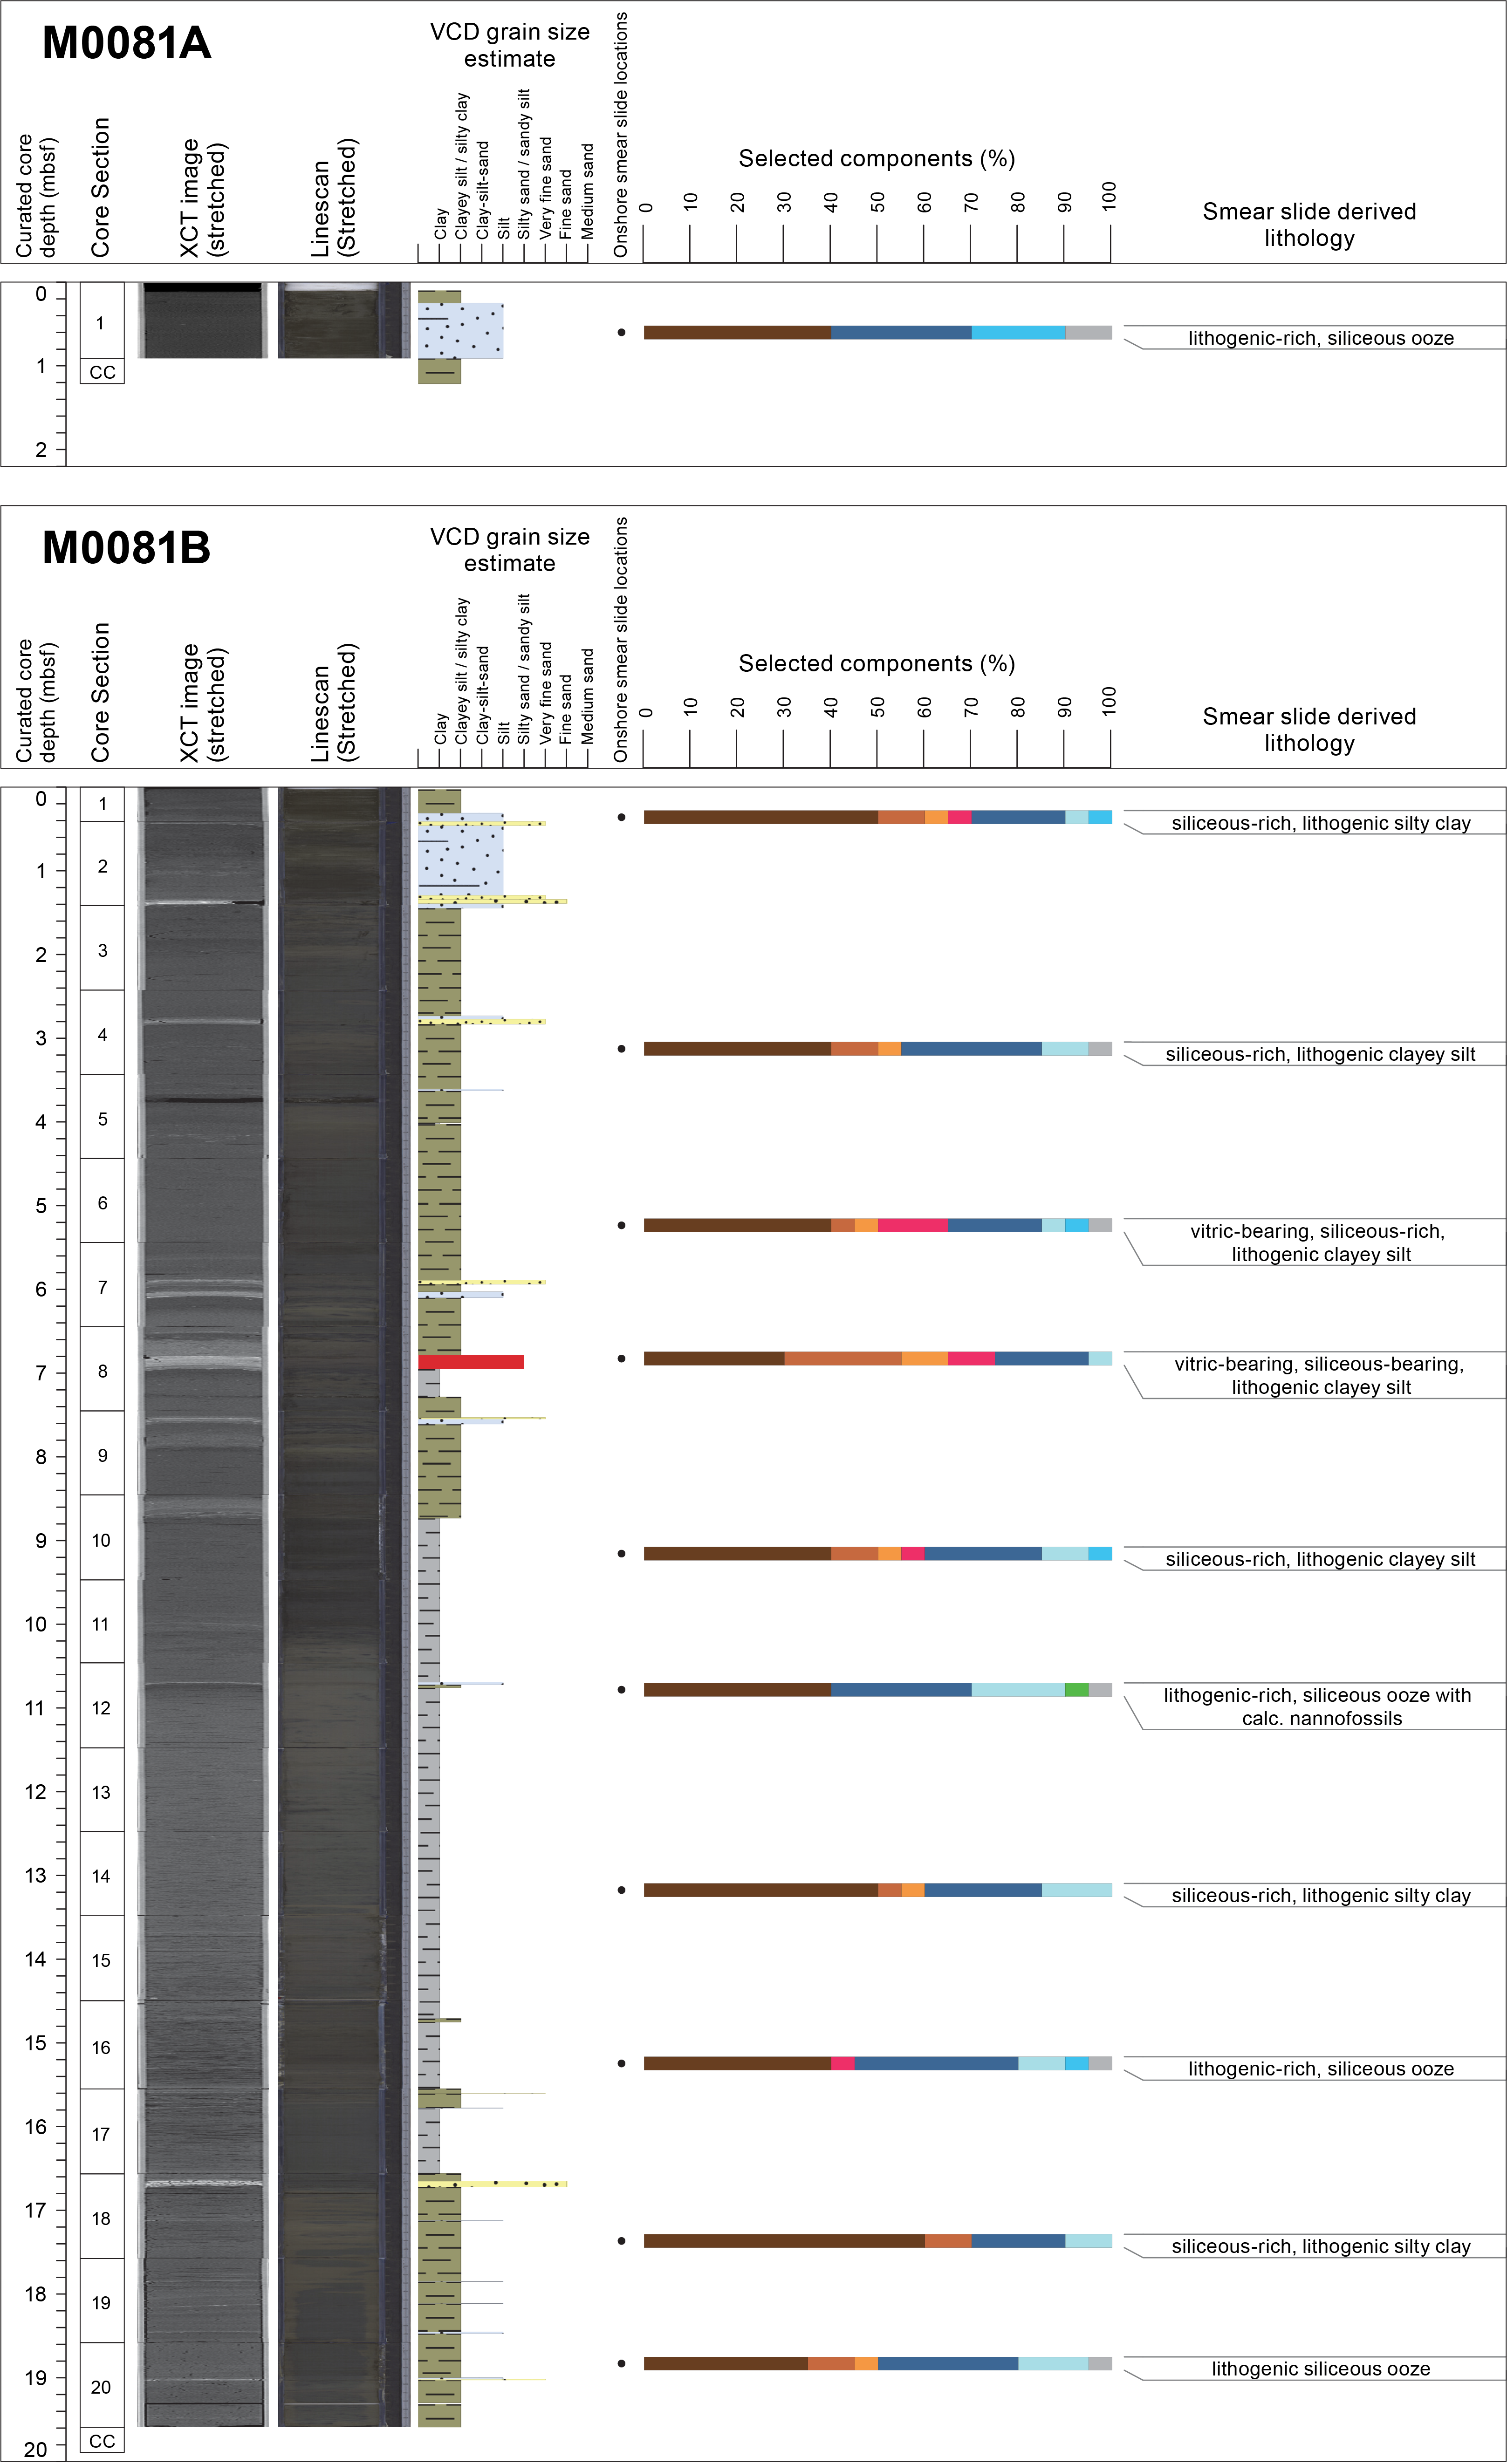
Figure F18. Smear slide summaries, Holes M0081A and M0081B.
3.1.1.2. Hole M0081B
The grain size–based lithology for the 20 m deep Hole M0081B is dominated by silty clay (Figure F15). Based on the grain size and bedding fine structures, Hole M0081B is divided into three intervals.
Interval 1 (0–9.5 mbsf) is silty clay interbedded with thin beds and laminae. The silty clay intervals are at 0–0.5, 1–1.5, 1.6–2.5, 3–3.5, and 4–6 mbsf. The laminae found at the base of each silty clay interval are coarser grained and range in grain size from clayey silt to fine sand. Laminae are described as single occurrences or sets of parallel laminae where very fine sand and silt are interlaminated or where the sequence fines upward. Generally, bioturbation coincides with intervals of dense laminae between 1.5 and 4 mbsf and between 6 and 8.5 mbsf.
Interval 2 (9.5–15 mbsf) is a 5.5 m structureless clay interval with sparse iron monosulfides and bioturbation.
Interval 3 (15–19.5 mbsf) is silty clay interbedded with thin beds (1–3 cm) and laminae. This interval has the same characteristics as Interval 1. The degree of bioturbation varies from slight to heavy. Generally, bioturbation coincides with intervals of silty clay and clayey silt in between the dense laminated intervals.
Magnetic susceptibility, density, and NGR show high variability in laminated intervals. These physical properties form a smooth and straight line, without increases and decreases, that correlates well with the thick clay in Interval 2 (9.5–15 mbsf). This is especially highlighted in the NGR data (see Physical properties).
A set of tephra laminae that was synchronously reworked with a deposit was identified in intervals 386-M0081B-1H-8, 34.5–36 cm, and 1H-8, 36–46 cm. This tephra set is also present in intervals 386-M0081D-1H-6, 86.3–87.5 and 87.5–93.5 cm, and can be used as a tie point between holes for correlation (see Tephra and Stratigraphic correlation). These deposits contain heavy mineral assemblages that will be further studied for identification and correlation with known volcanic eruptions (Figure F19). X-ray CT images define laminae and laminated intervals as well as tephra intervals as a result of density variability.
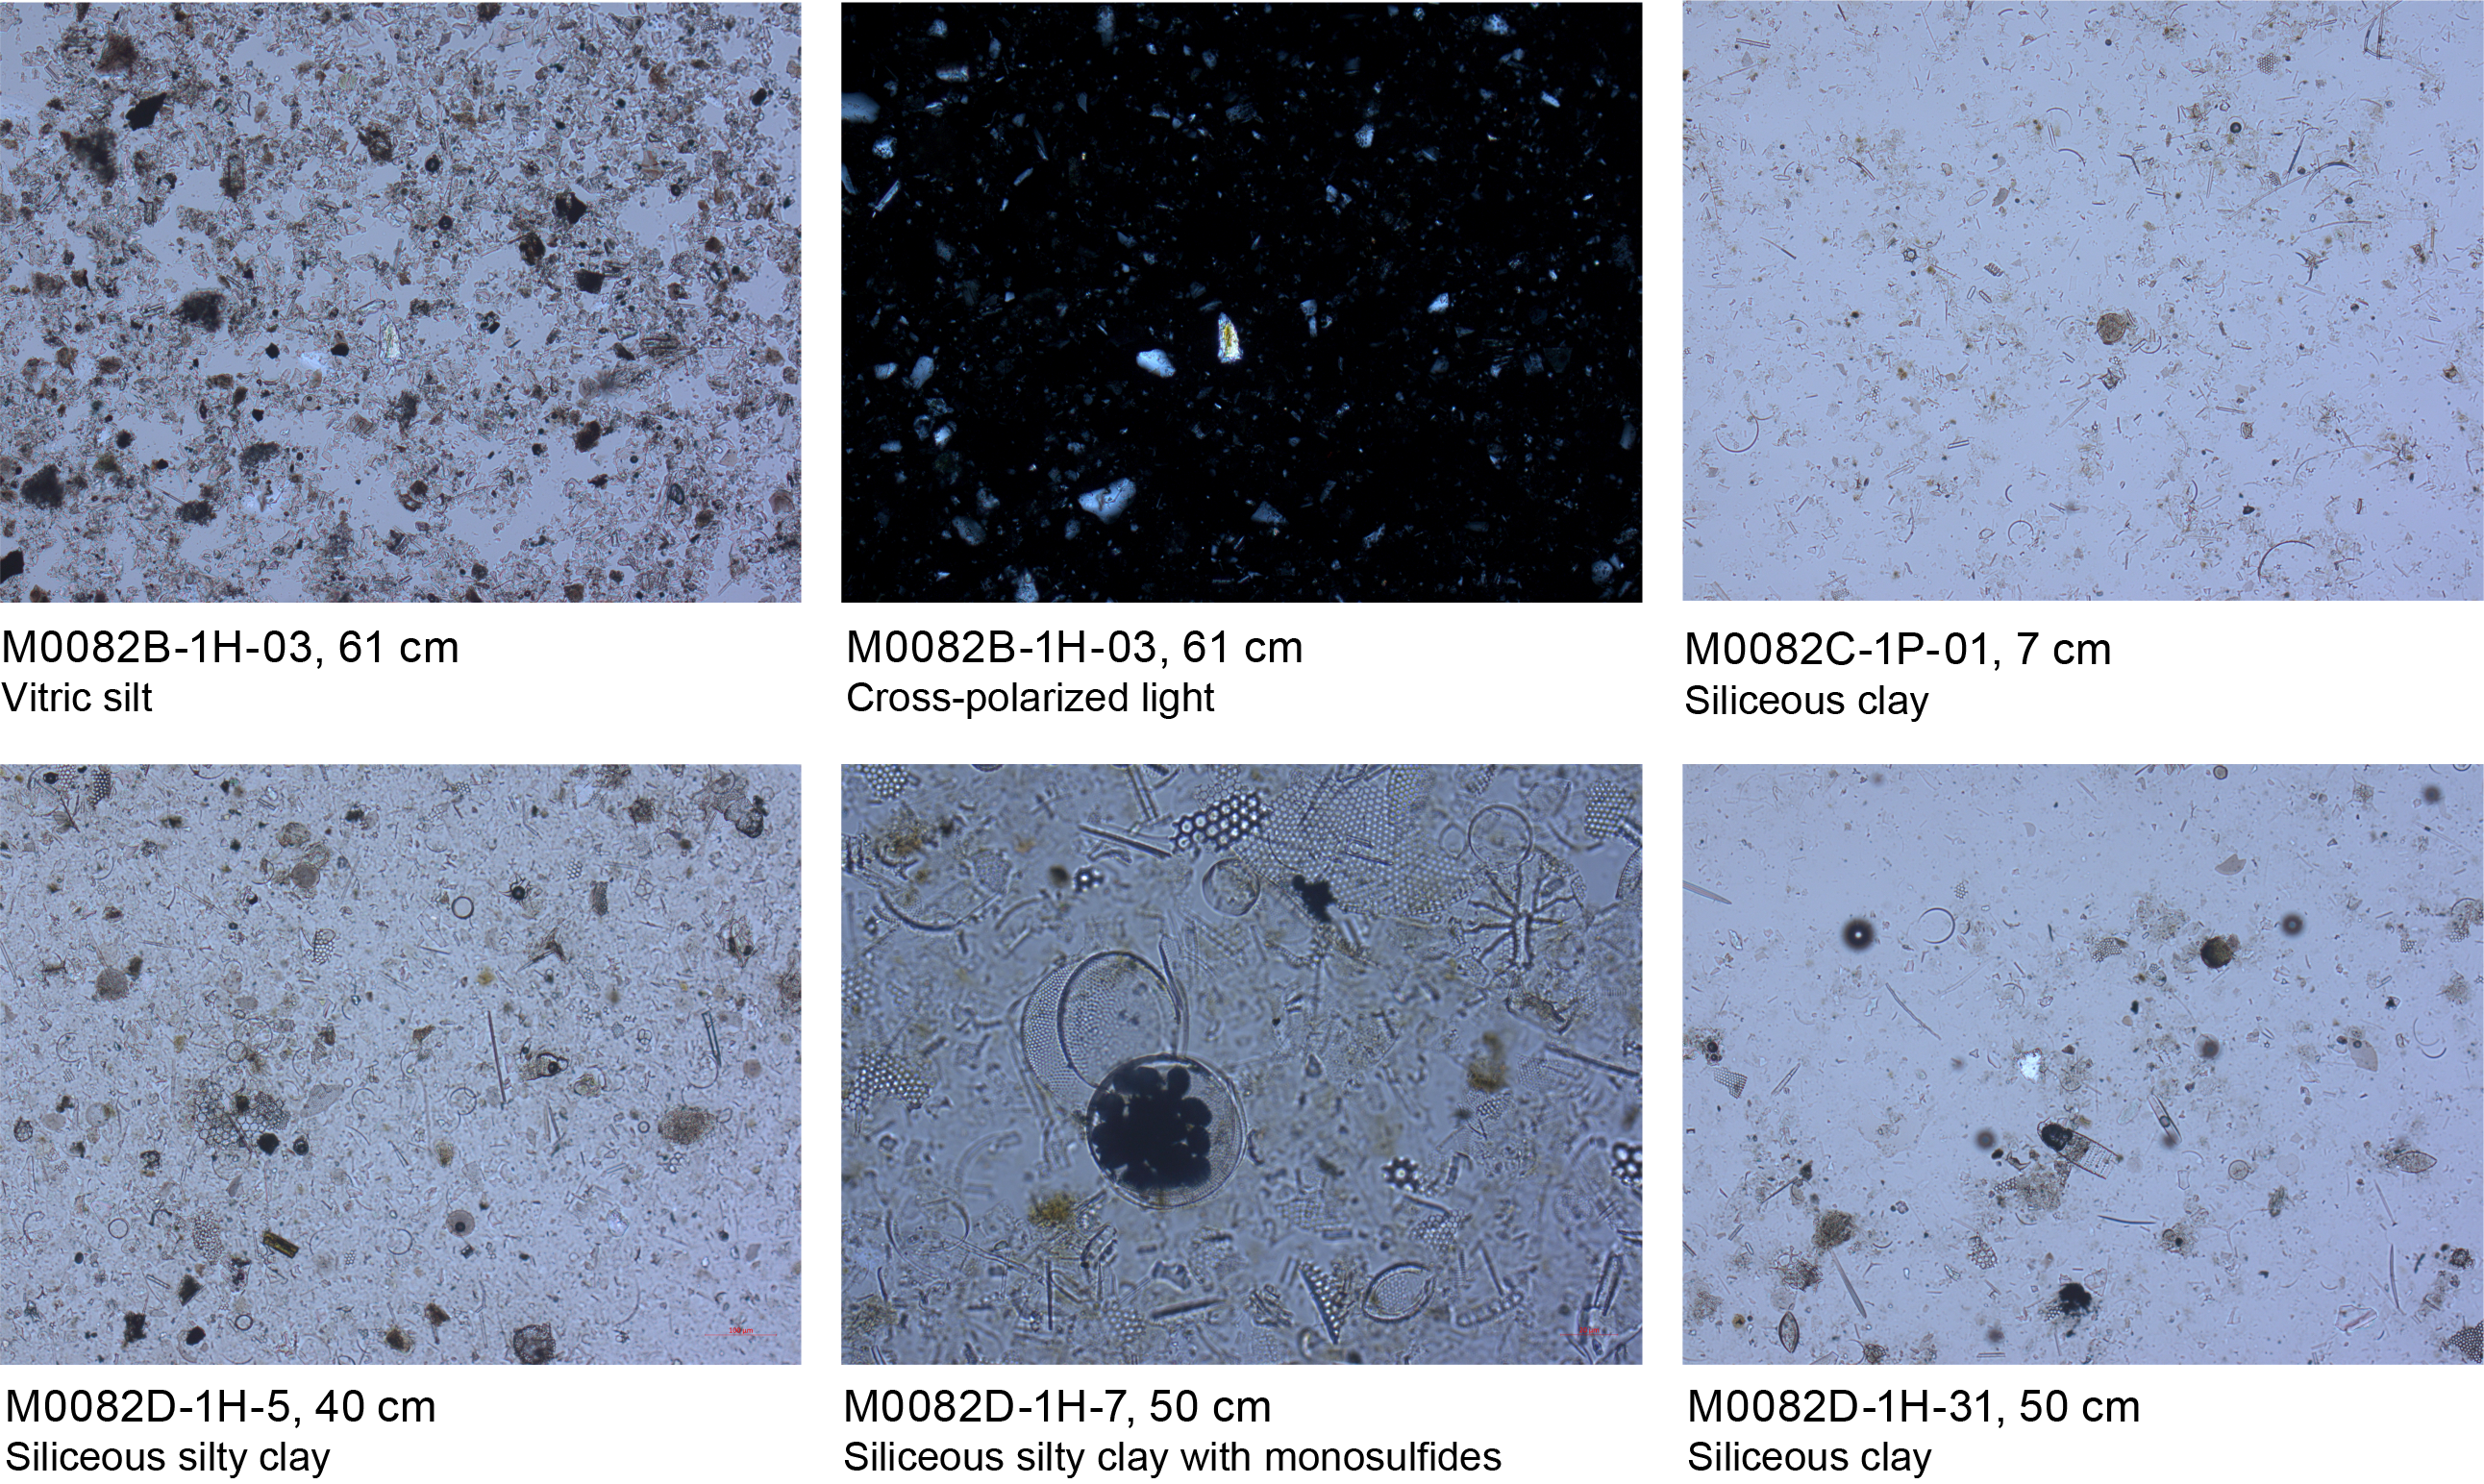
Figure F19. Lithologic components, Site M0082.
A total of 10 smear slides were studied for Hole M0081B (Table T3; Figure F18). The lithology is described as lithogenic-rich siliceous ooze, vitric-bearing lithogenic-rich siliceous ooze, and siliceous-rich lithogenic silty clay. The main components described in the smear slides are grain size, minerals, vitric, and biogenic. In each category, the grain size is dominated by clayey silt and to a lesser extent silty clays. Clay minerals, quartz, feldspar, and vitric grains make up the mineral components in decreasing abundance. Diatoms are the most abundant biogenic component with an abundance of up to 60% of the total smear slide components. Following in abundance are sponge spicules, radiolaria, and silicoflagellates (Figures F16, F17).
3.1.2. Holes M0081C and M0081D
3.1.2.1. Hole M0081C
Hole M0081C is 0.97 m deep and composed of structureless clay (Figure F20). A brownish black (10YR 3/2) 1 cm thick interval at the top of the hole is interpreted as oxygenated, indicating that the surface of the seafloor was recovered. Magnetic susceptibility, density, and NGR increase toward the bottom of the hole. Magnetic susceptibility shows two pronounced peaks that correlate with the lithologic changes from silty clay to silt (see Physical properties).


Figure F20. Lithostratigraphic summaries, Holes M0081C and M0081D.
A smear slide described for Hole M0081C shows that the dominant lithology is siliceous-rich silty clay (Table T3; Figures F17, F21). Clay is the dominant mineral component (50% of the total slide). Diatoms dominate the biogenic component (20% of the total slide), with lesser but equal proportions of radiolaria, sponge spicules, and silicoflagellates (10% of the slide each).

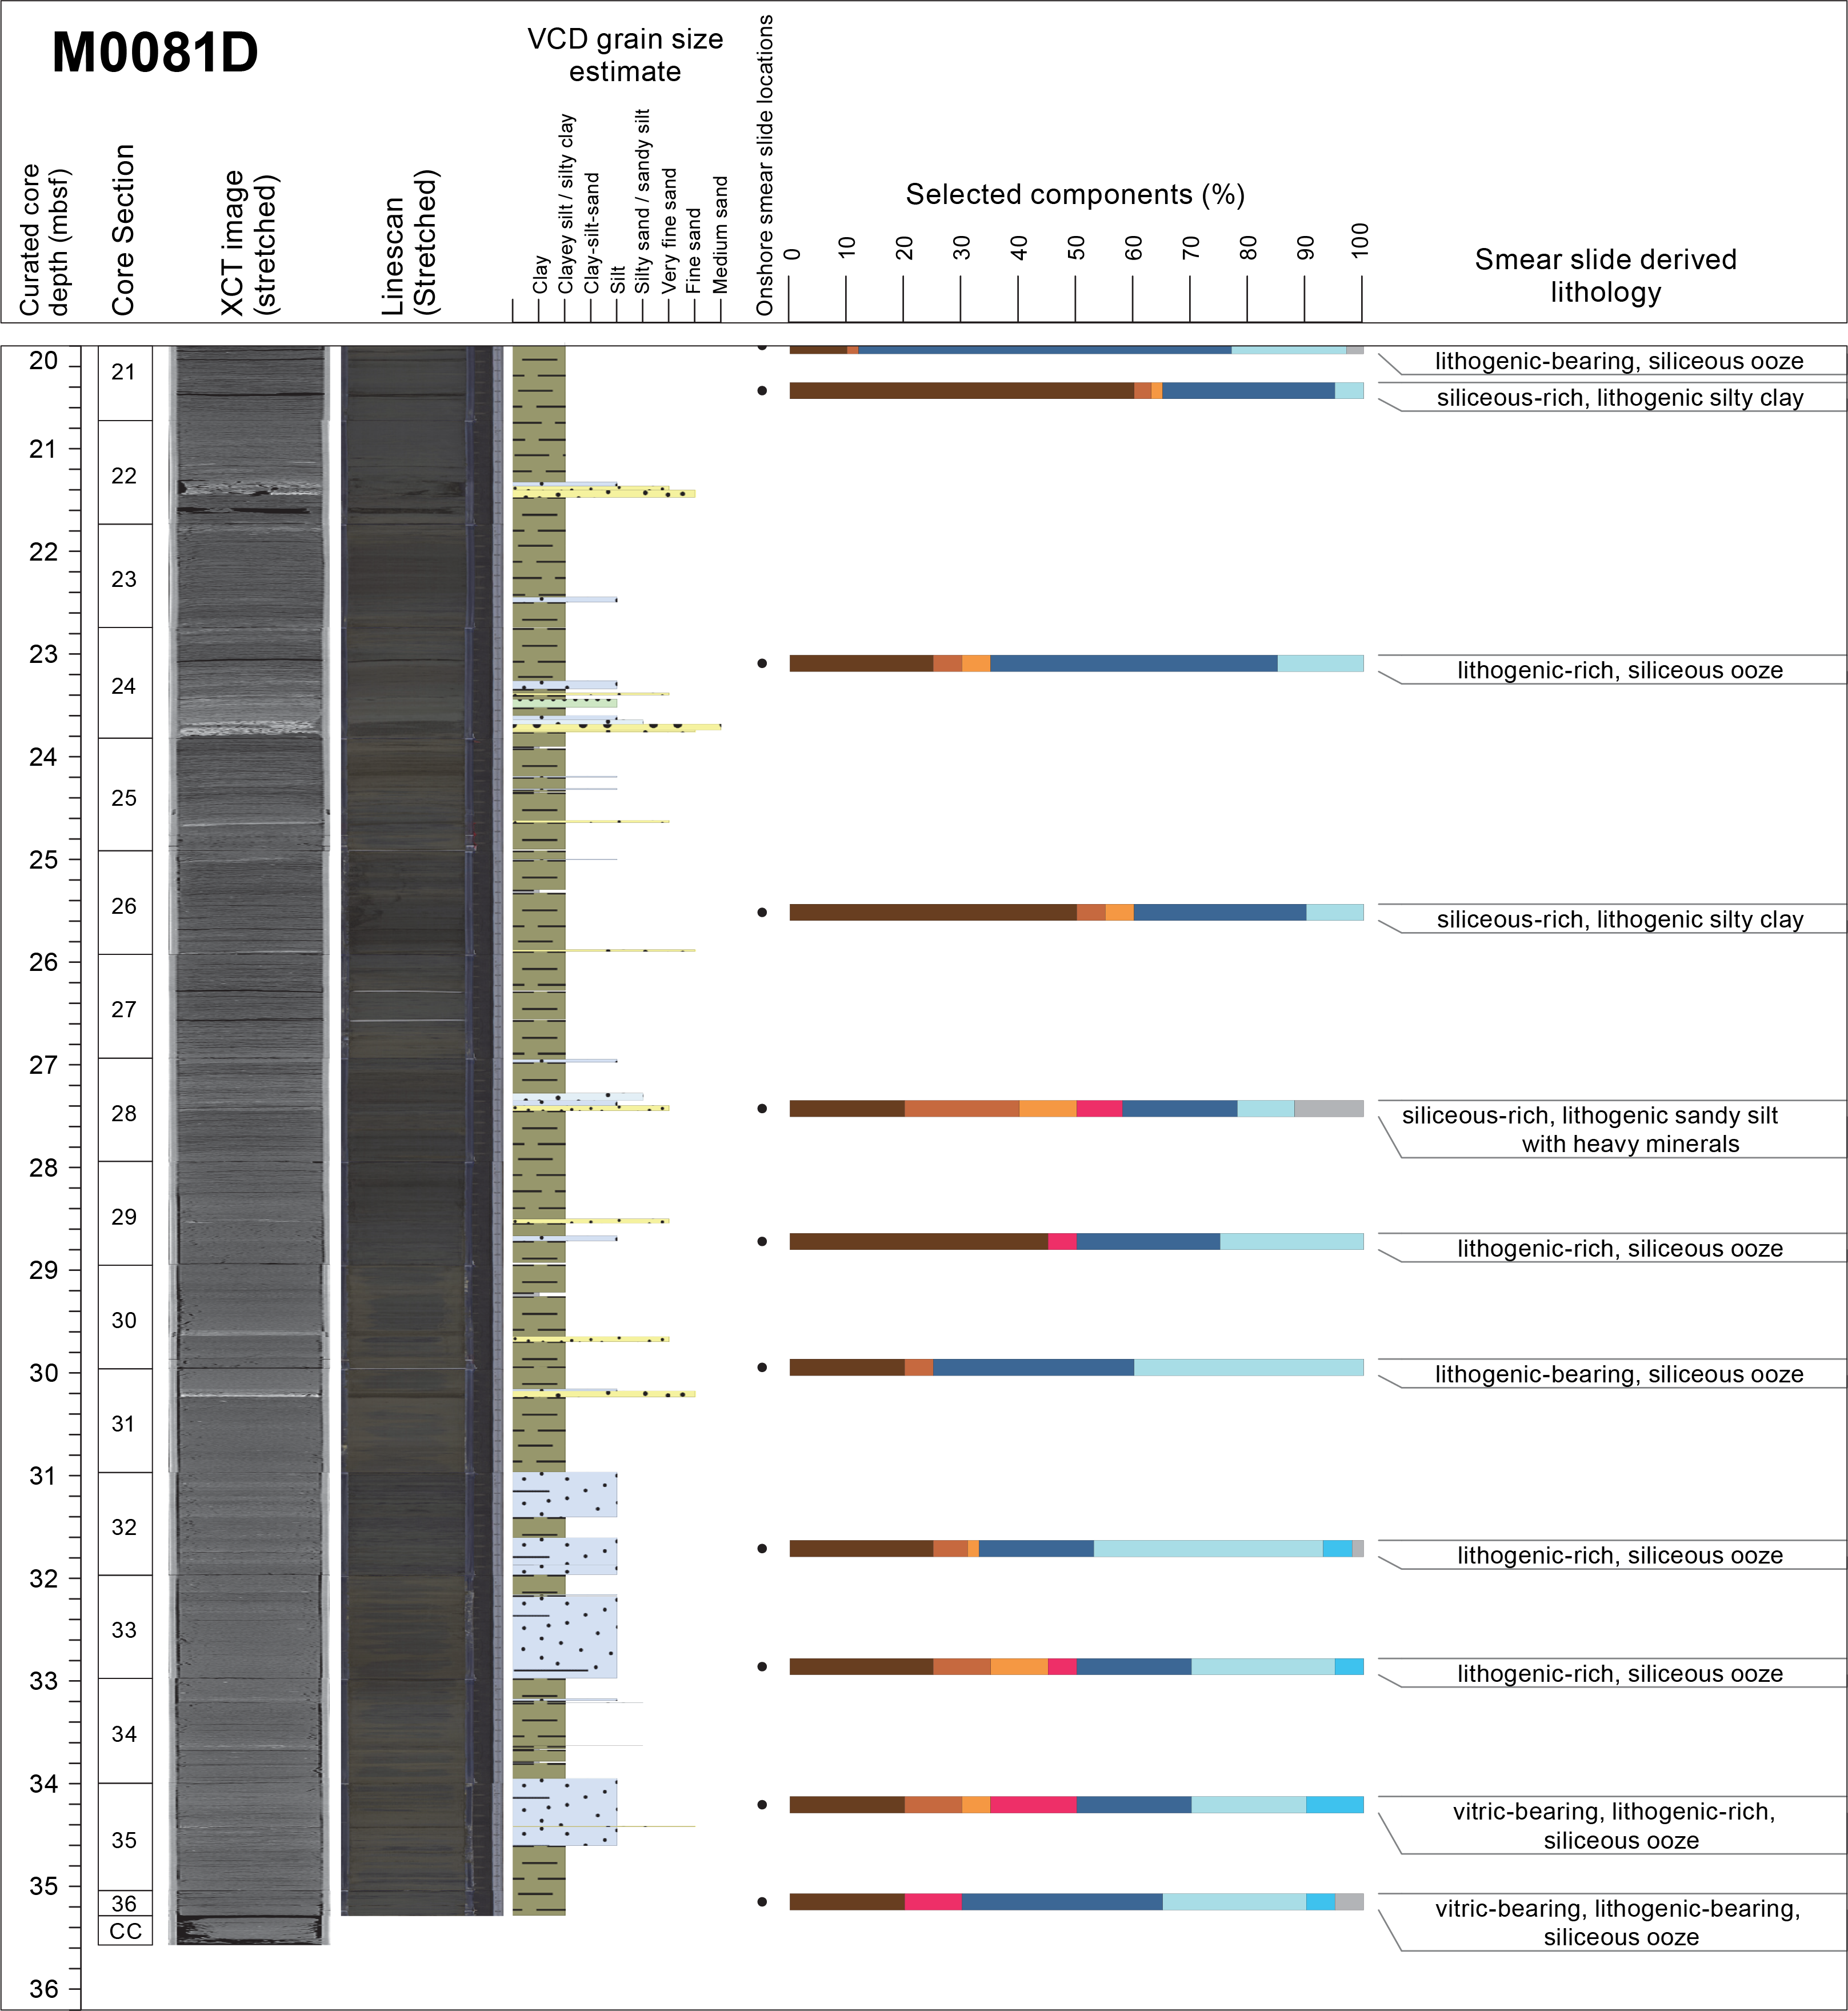
Figure F21. Smear slide summaries, Holes M0081C and M0081D.
3.1.2.2. Hole M0081D
Hole M0081D is 35.5 m deep, and the uppermost 20 m show patterns similar to those in Hole M0081B (Figure F20). Like Hole M0081B, Hole M0081D is divided into three intervals based on the lithology and bedding structures highlighted by the X-ray CT scan and linescan images.
Interval 1 forms the upper part of the hole (0–9 mbsf). Based on grain size, the lithology is dominated by clay and silty clay interbedded with thin beds (1–3 cm thick), laminae, and parallel laminae intervals. The contacts associated with the laminae and beds are sharp, wavy, or bioturbated. Structureless clay and silty clay sediments ranging from centimeters to 2 m thick are present above the laminae and beds, and these sediments can fine upwards. Moderate to heavy bioturbation occurs in association with the laminae and beds and within the clays and silty clays above. This section is similar to Interval 1 in Hole M0081B.
Interval 2 is thicker than Interval 1, and the most prominent section of structureless clay (9–13.5 mbsf) is equivalent to the structureless clay described in Interval 2 in Hole M0081B. Magnetic susceptibility, density, and NGR also exhibit similar patterns to those of Hole M0081B, with variability in the upper and lower parts of the hole (0–9 and 13.5–35.5 mbsf) and a smooth curve that correlates with the structureless clay (9.0–13.5 mbsf).
Interval 3 comprises the lower part of Hole M0081D (13.5–35.5 mbsf) and is similar to Interval 1. Interval 3 is composed of silty clay interbedded with laminae and parallel laminae of fine sand, very fine sand, silt, and clayey silt. These facies are equivalent to Interval 3 in Hole M0081B. As in Hole M0081B, the peaks of magnetic susceptibility, density, and NGR generally correlate with the fine sand, very fine sand, and silt layers (see Physical properties). Bioturbation is heaviest in association with the clay and silty clay laminated intervals and slight in the structureless clay intervals. A set of tephra laminae was identified in intervals 386-M0081D-1H-6, 86.3–87.5 cm, and 1H-6, 87.5–93.5 cm. This tephra set is present in Hole M0081B and can be used for correlation between holes (see Tephra and Stratigraphic correlation).
A total of 20 smear slides were described for Hole M0081D (Table T3; Figure F21; see SMEARSLD in Supplementary material). The dominant lithologies are lithogenic-rich siliceous ooze, siliceous-rich lithogenic silty clay, siliceous-rich lithogenic clayey silt, vitric-bearing lithogenic-rich siliceous ooze, and lithogenic-rich siliceous ooze with calcareous nannofossils. Clayey silt is the dominant grain size, followed by silty clay and rare silt (Figures F16, F17). Clays are the most abundant mineral, with lesser percentages of quartz, feldspar, vitric grains, and very rare heavy minerals occurring in association with the vitric components. Diatoms are the most abundant biogenic component, followed by sponge spicules, silicoflagellates, and radiolaria. According to the smear slide information, the biogenic components are listed as a major lithology for some intervals.
3.1.3. Holes M0081E and M0081F
3.1.3.1. Hole M0081E
Hole M0081E is 0.97 m deep and composed of structureless clay with an interval of clayey silt (0.8–0.9 mbsf) (Figure F22). A 0.5 cm thick brownish black (2.5Y 3/2) layer (interpreted as oxidized) in the uppermost 1 cm indicates that the seafloor surface was recovered. The magnetic susceptibility curve has two pronounced peaks at 0–55 and 55–97 cm below seafloor. Density is less at 0–55 cm below seafloor and greater at 55–98 cm below seafloor. NGR increases downsection, but the increase is greater at 55–98 cm below seafloor. An irregular color boundary is noted on the hand drawn visual core description (VCD) at this transition, but there is no change in the composition of the lithology that is clay.

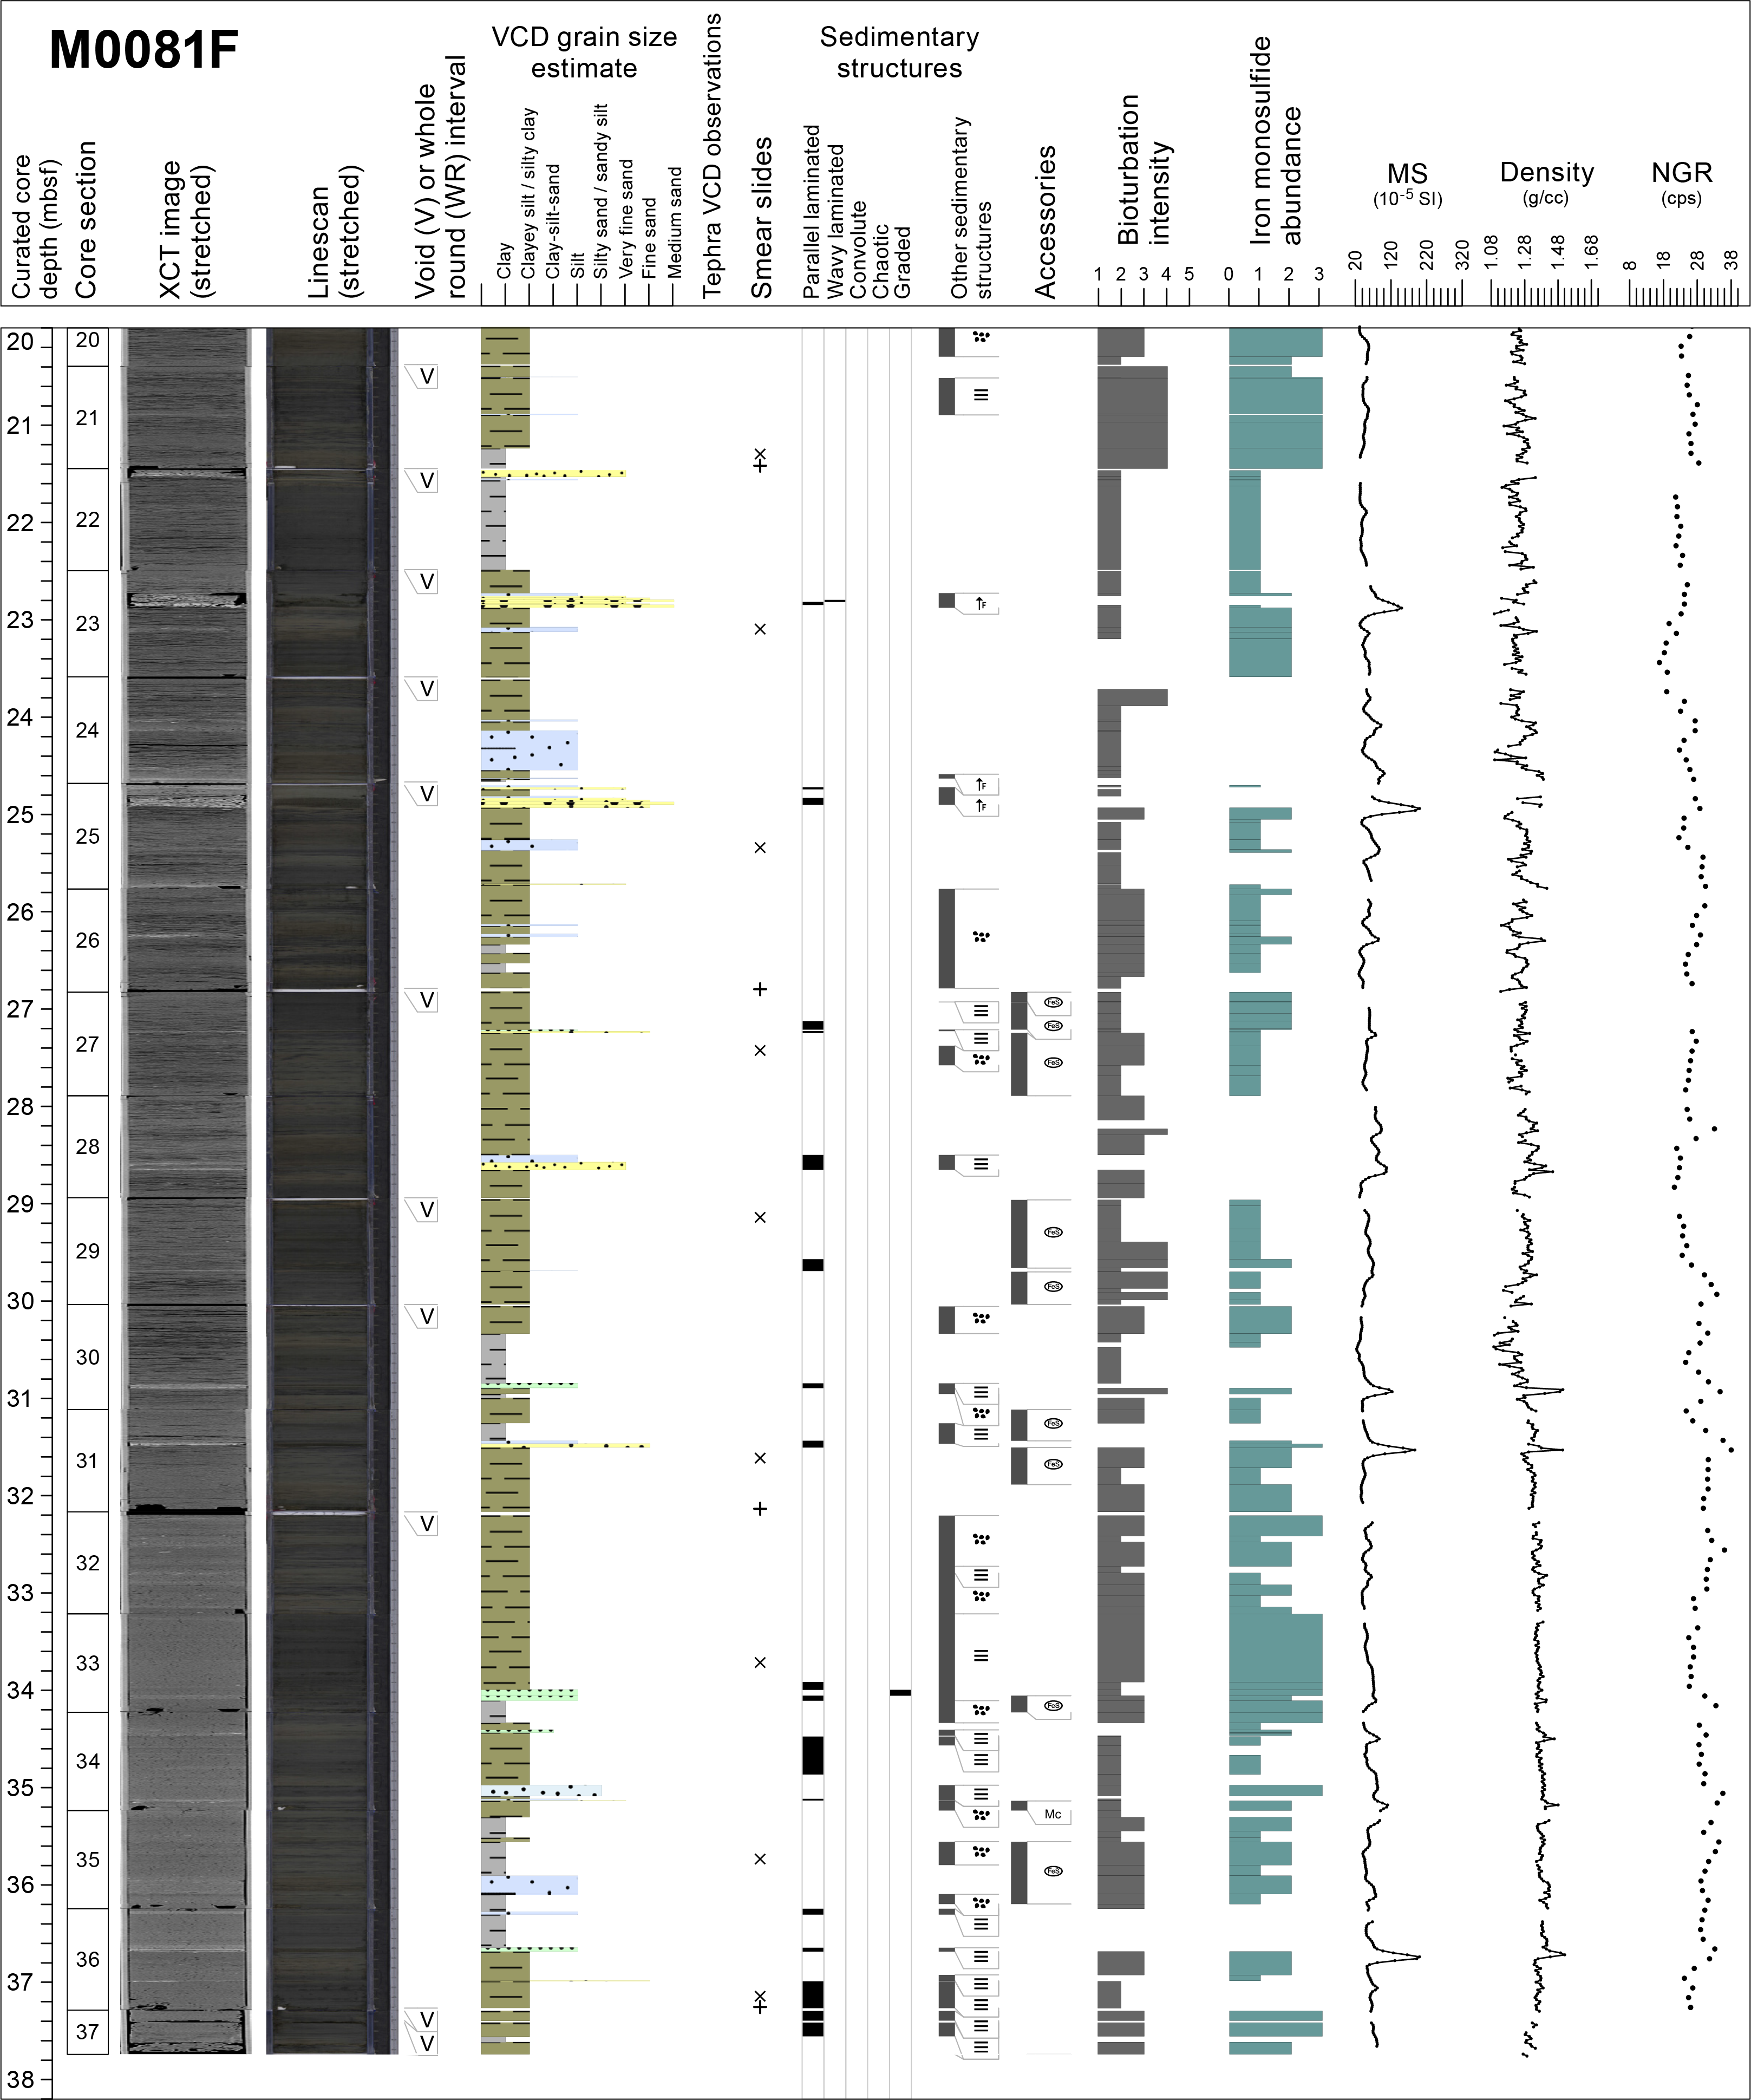
Figure F22. Lithostratigraphic summaries, Holes M0081E and M0081F.
One smear slide was studied for Hole M0081E (Table T3; Figure F23). The lithology is lithogenic-rich siliceous ooze, and the main grain size is silty clay (Figures F16, F17). Clays are the most abundant mineral component (25% of the slide), followed by quartz (15%), feldspar, and vitric grains (5% each). From the biogenic component, diatoms are the most abundant at 35% and sponge spicules compose 15% of the total slide.
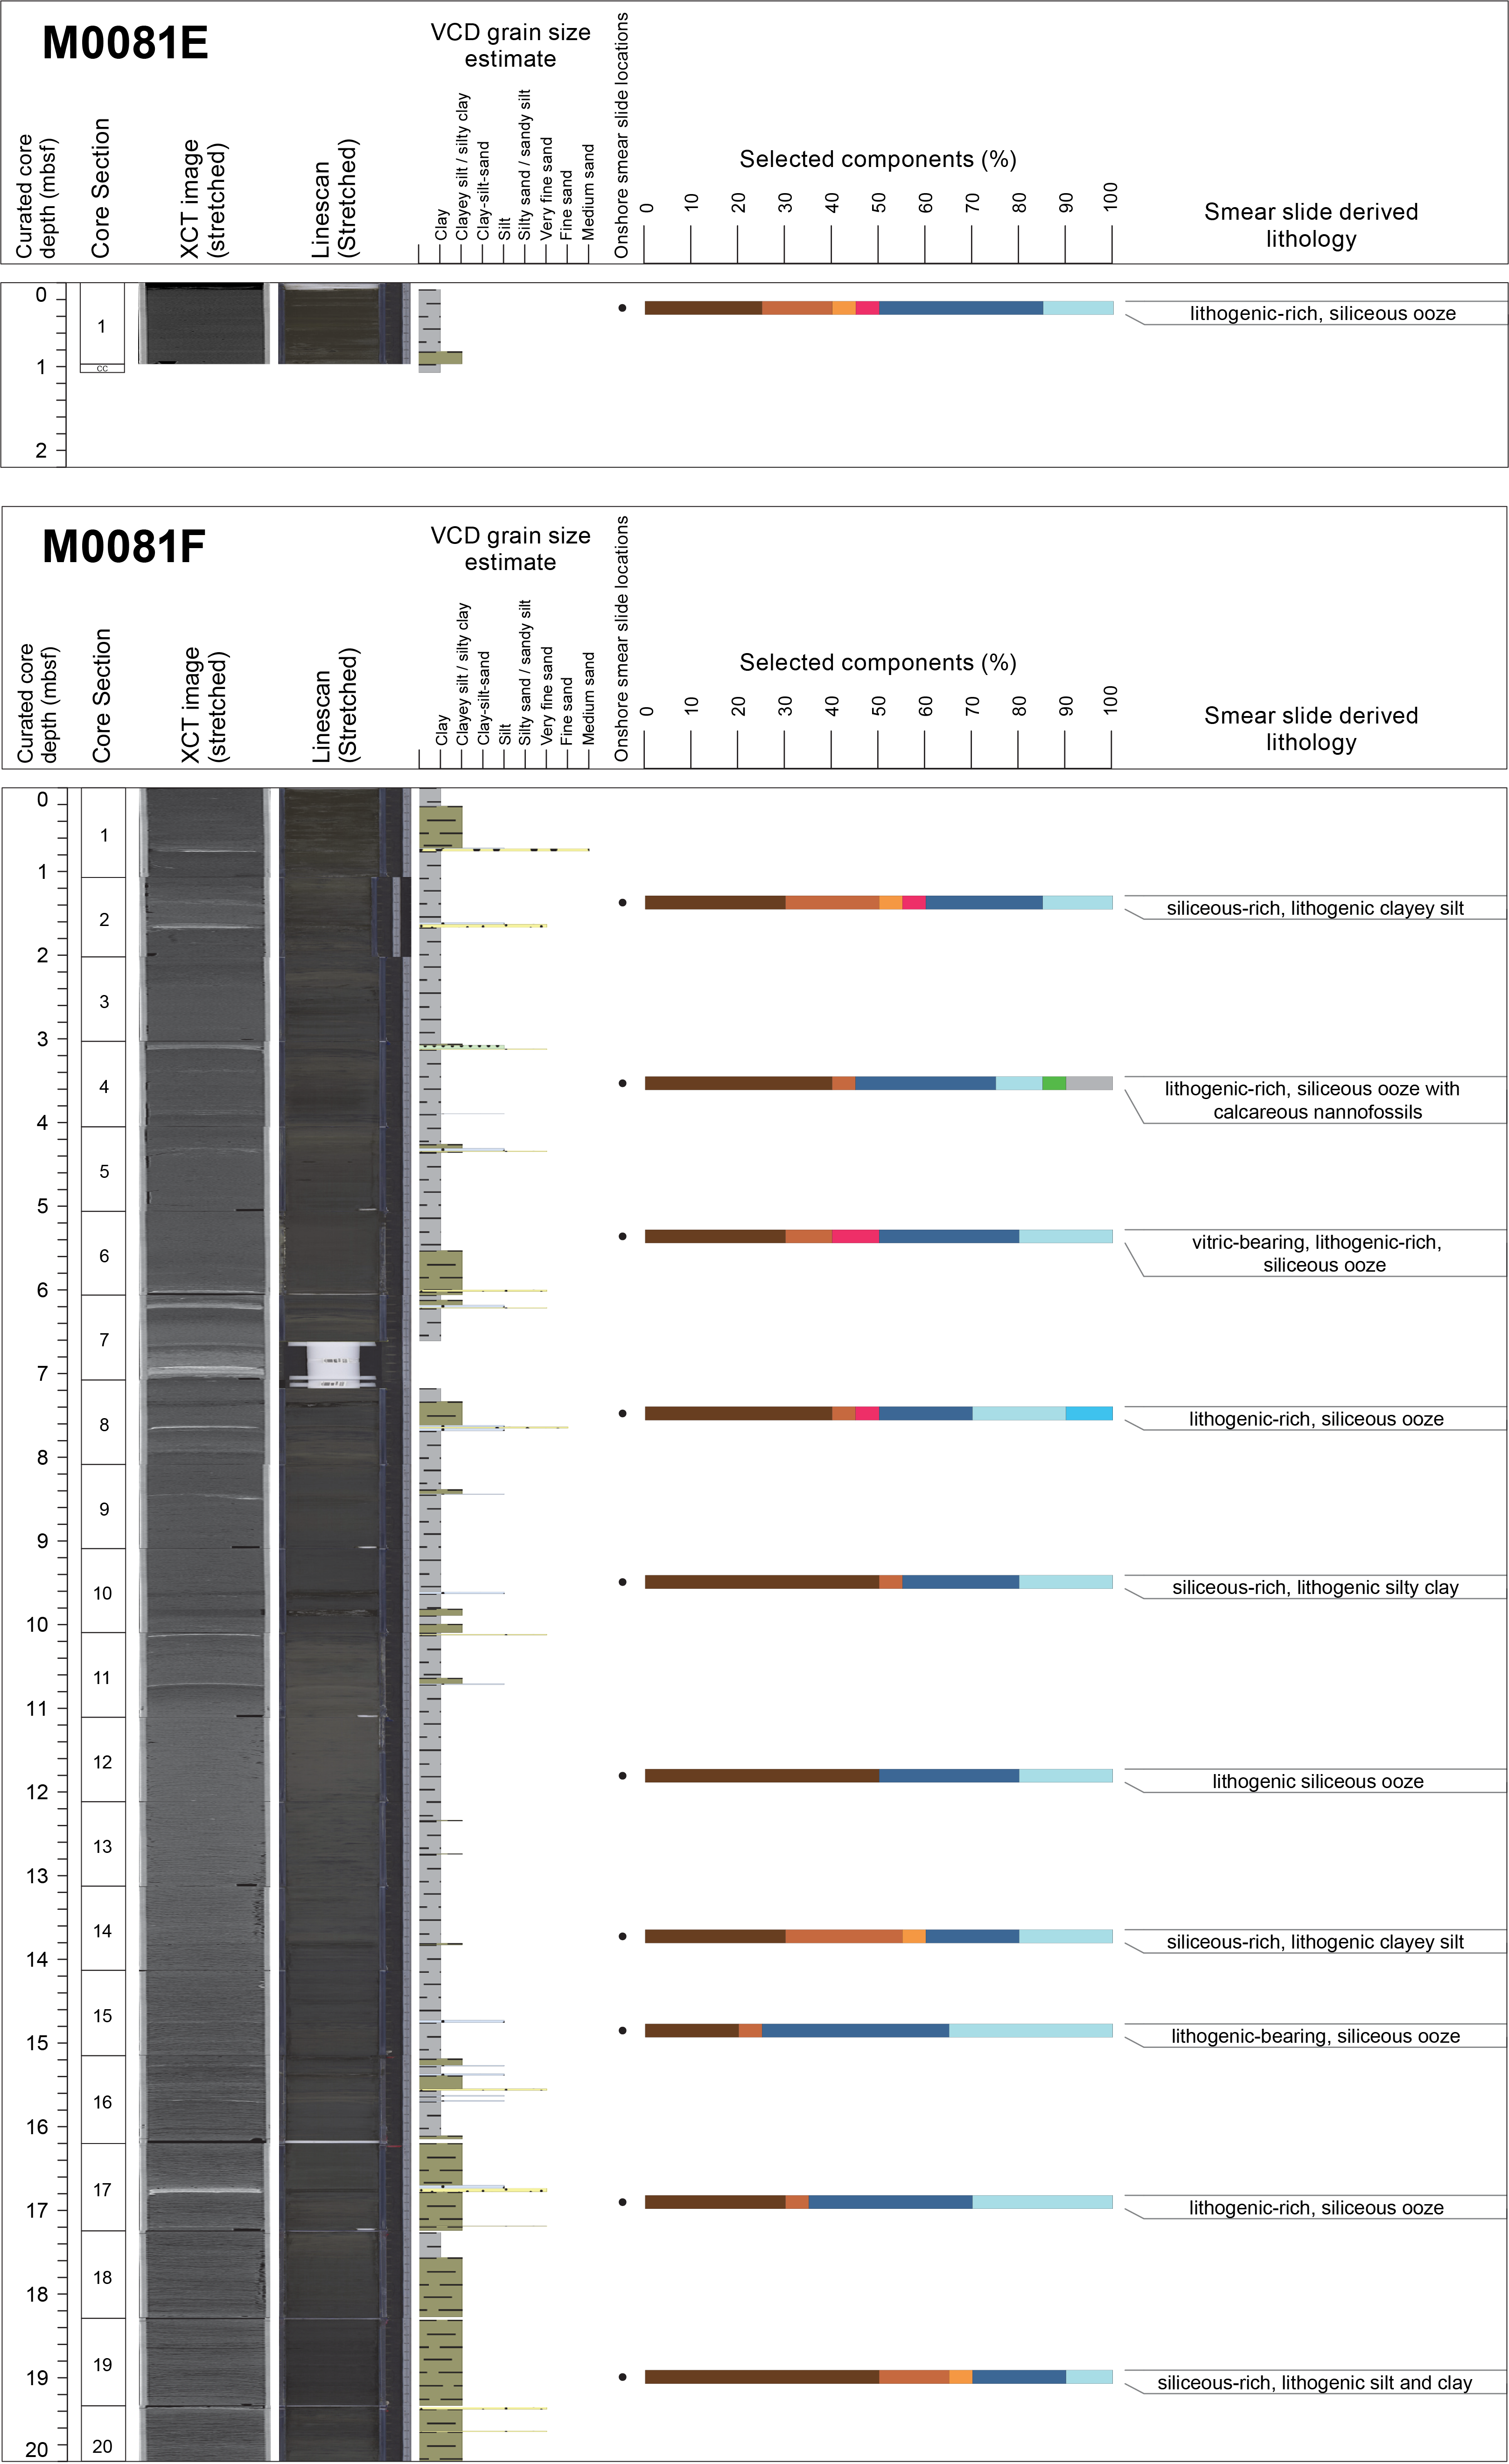
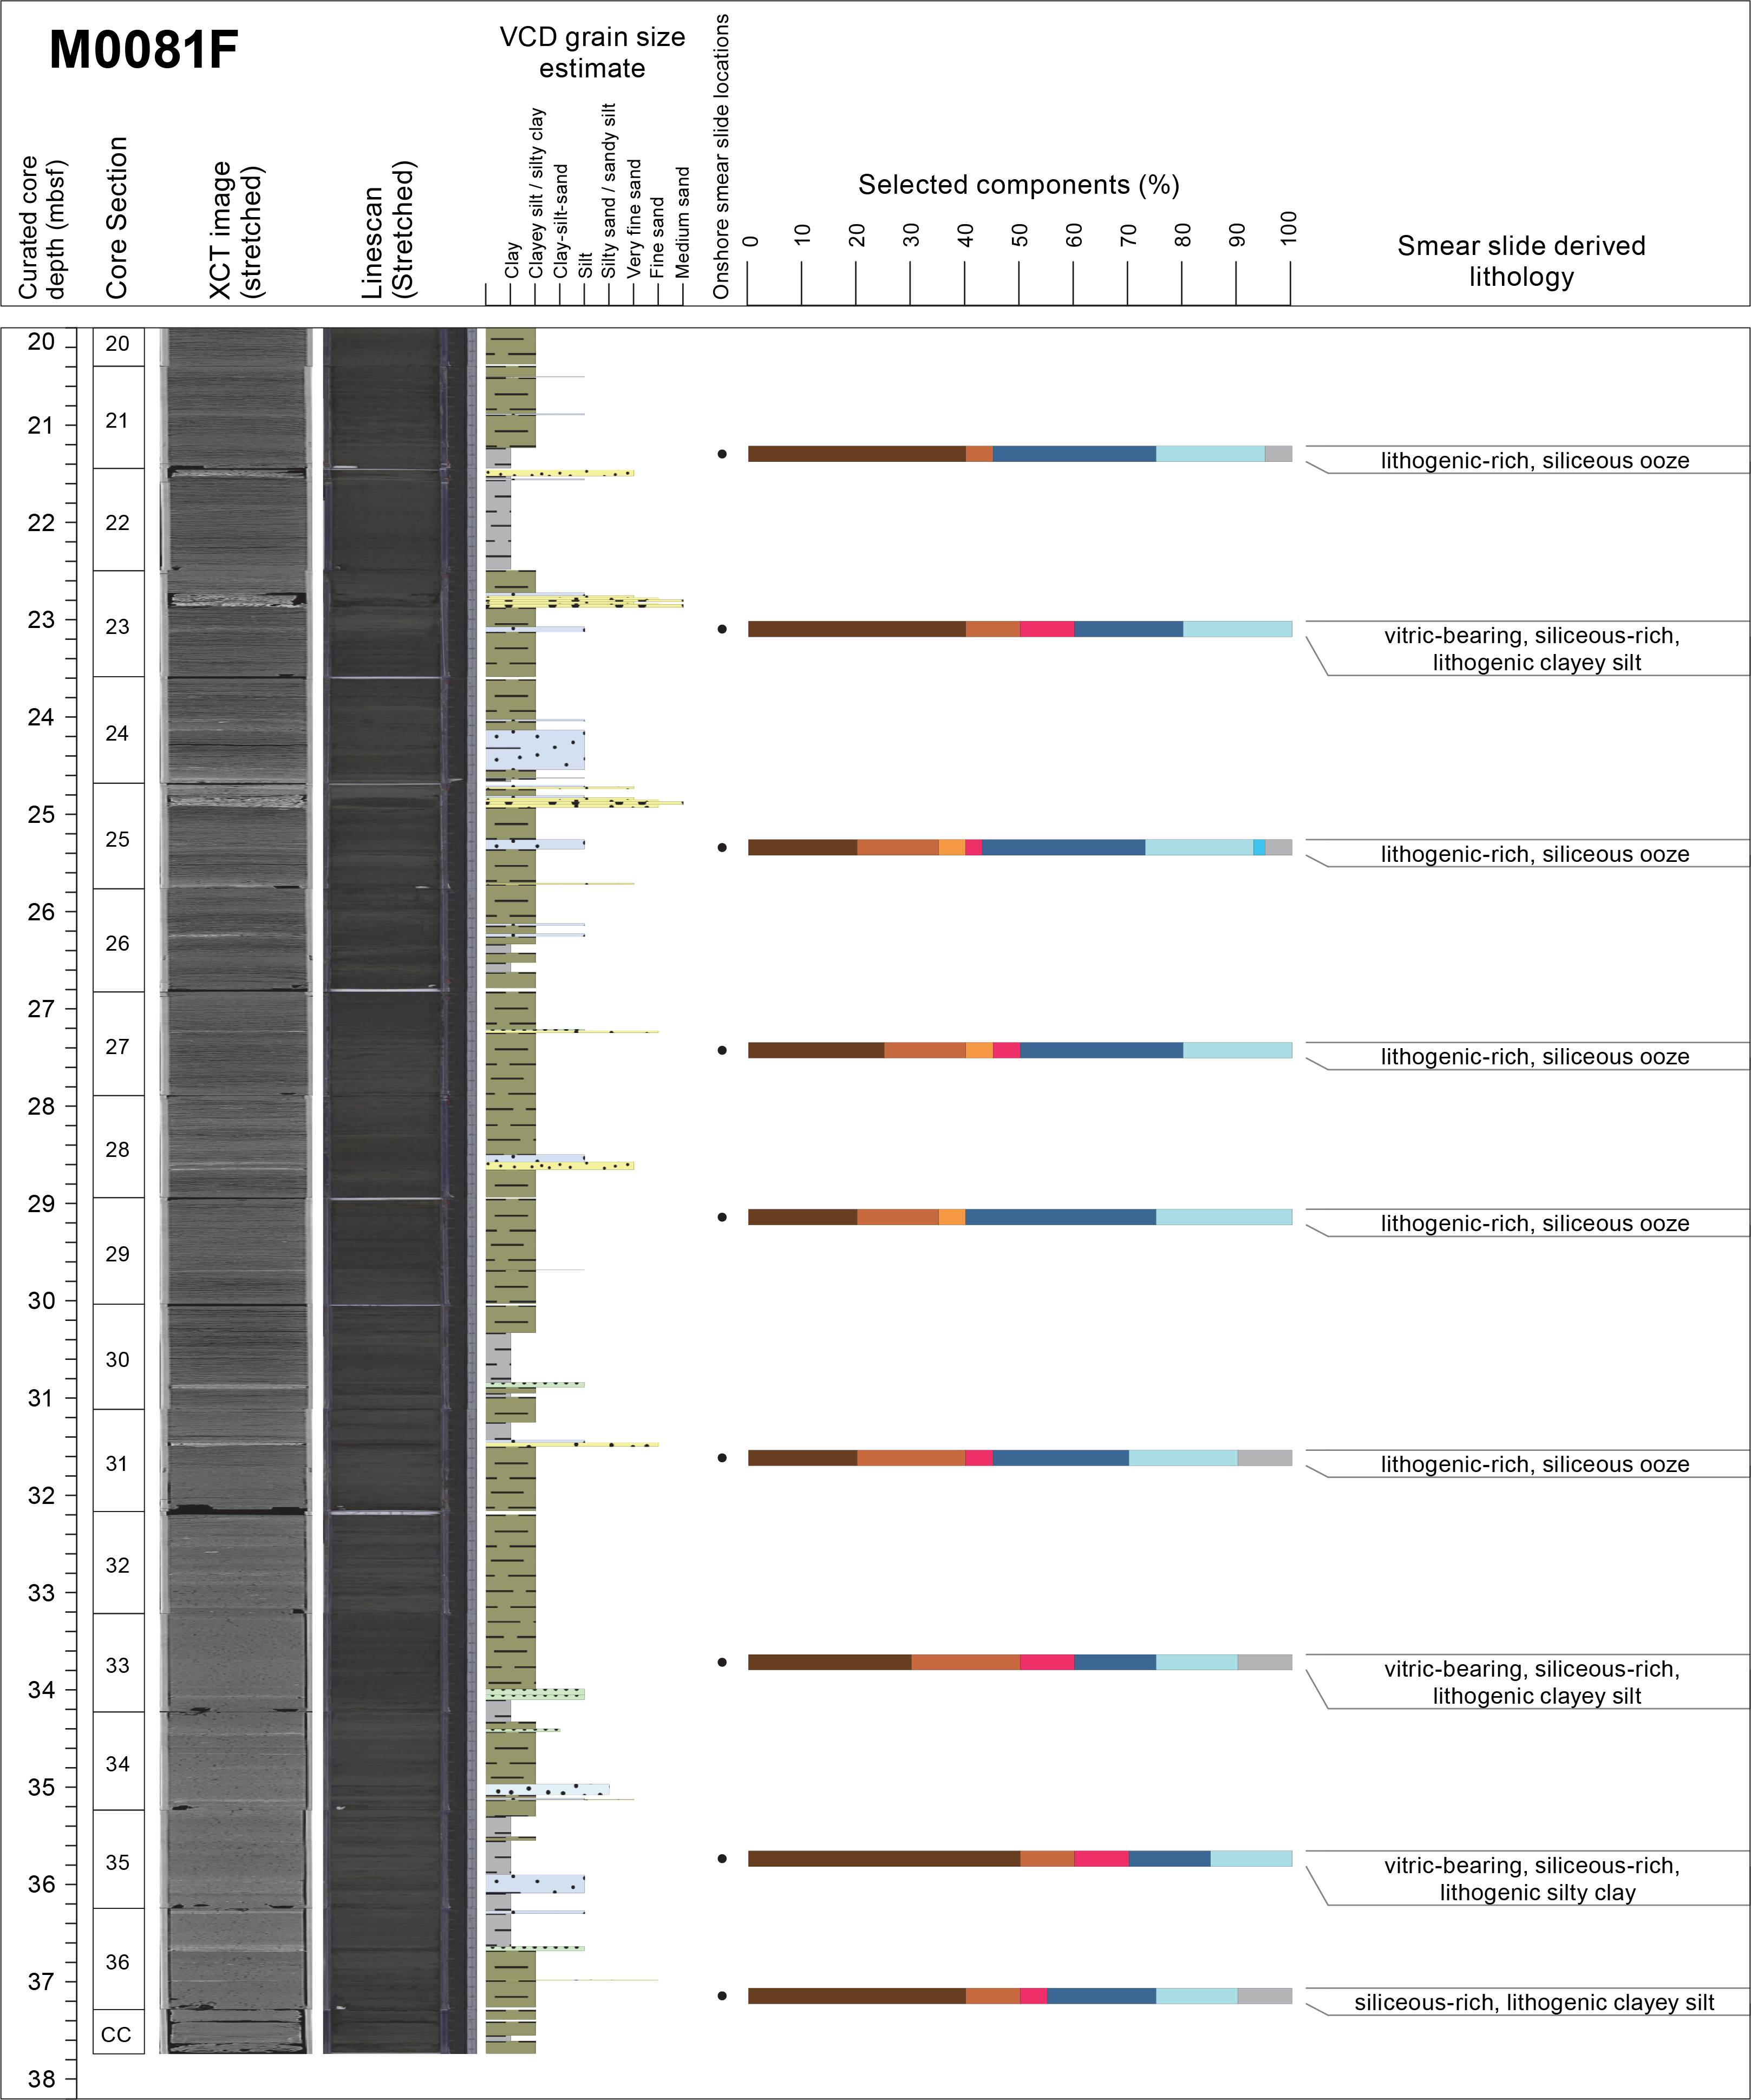
Figure F23. Smear slide summaries, Holes M0081E and M0081F.
3.1.3.2. Hole M0081F
Hole M0081F is 38 m deep and composed of three main intervals that are classified based on their lithology and bedding structures (Figure F22). Additional information was obtained from the linescan and X-ray CT scan images and physical properties.
In Interval 1 (0–9.8 mbsf), the sediments are composed of clay and silty clay interbedded with laminae, parallel laminae, and thin beds of fine sand, very fine sand, silt, and clayey silt (Figure F22). The upper and lower contacts in the laminae and sets of parallel laminae are sharp, erosive, or wavy. The sediment above some of the basal contacts fines upward. As in Holes M0081B and M0081D, the intervals of laminae are separated by structureless clay and silty clay ranging from centimeters to 2 m thick. Bioturbation intensity is associated with the laminated intervals and occurs either at their lower contacts or in the sediment above. As in Holes M0081B and M0081D, increases in magnetic susceptibility, density, and NGR show variability and are correlated with the fine sand, very fine sand, and silt laminae (see Physical properties). This interval is similar to Interval 1 in Holes M0081B and M0081D.
As in Holes M0081B and M0081D, a 5 m thick interval of structureless clay (Interval 2) is present (9.8–15.5 mbsf). This deposit is characterized by smooth NGR, magnetic susceptibility, and density that neither increase nor decrease. This interval can be used for correlation between the holes (see Stratigraphic correlation).
Interval 3 (15.5–38 mbsf; bottom of hole) is composed of silty clay and clay interbedded with laminae, parallel laminae, and thin beds. Grain size ranges from fine sand to clayey silt. The contacts and bioturbation patterns are similar to those in the uppermost 9.5 m of the hole. This interval is similar to Interval 3 in Holes M0081B and M0081D.
A total of 19 smear slides were described for Hole M0081F (Table T3; Figure F23). The major and minor lithologies are siliceous-rich lithogenic clayey silt, lithogenic-rich siliceous ooze with calcareous nannofossils, lithogenic-rich siliceous ooze, and vitric-bearing siliceous-rich lithogenic clayey silt (Figures F16, F17). The grain size is dominated by silt, clay, and minor sand. Clay minerals are the most abundant component of minerals, followed by quartz, feldspar, and vitric grains. The biogenic components are dominated by diatoms, sponge spicules, silicoflagellates, and radiolaria. Depending on the section and interval studied, grain size and mineral and biogenic components vary by small percentages and vary in abundance.
3.2. Site M0082
3.2.1. Holes M0082A and M0082B
3.2.1.1. Hole M0082A
Hole M0082A is 1.46 m deep and composed of clay (Figure F24). Several thin beds and laminae are recognized in the core by their sharp basal contacts and their fining-upward grading. These thin beds and laminae are composed of silty clay, silt, and silty sand and are present at 26–30, 68–74, and 82–85 cm below seafloor. The basal and top contacts are dipping and irregular. As at Site M0081, the core top has a 1 cm thick dark olive (5Y 4/3) layer interpreted as the oxygenated seafloor surface. All physical properties increase toward the bottom of the hole, where there are several laminae that fine upward from very fine sand to medium silt to silty clay (see Physical properties).
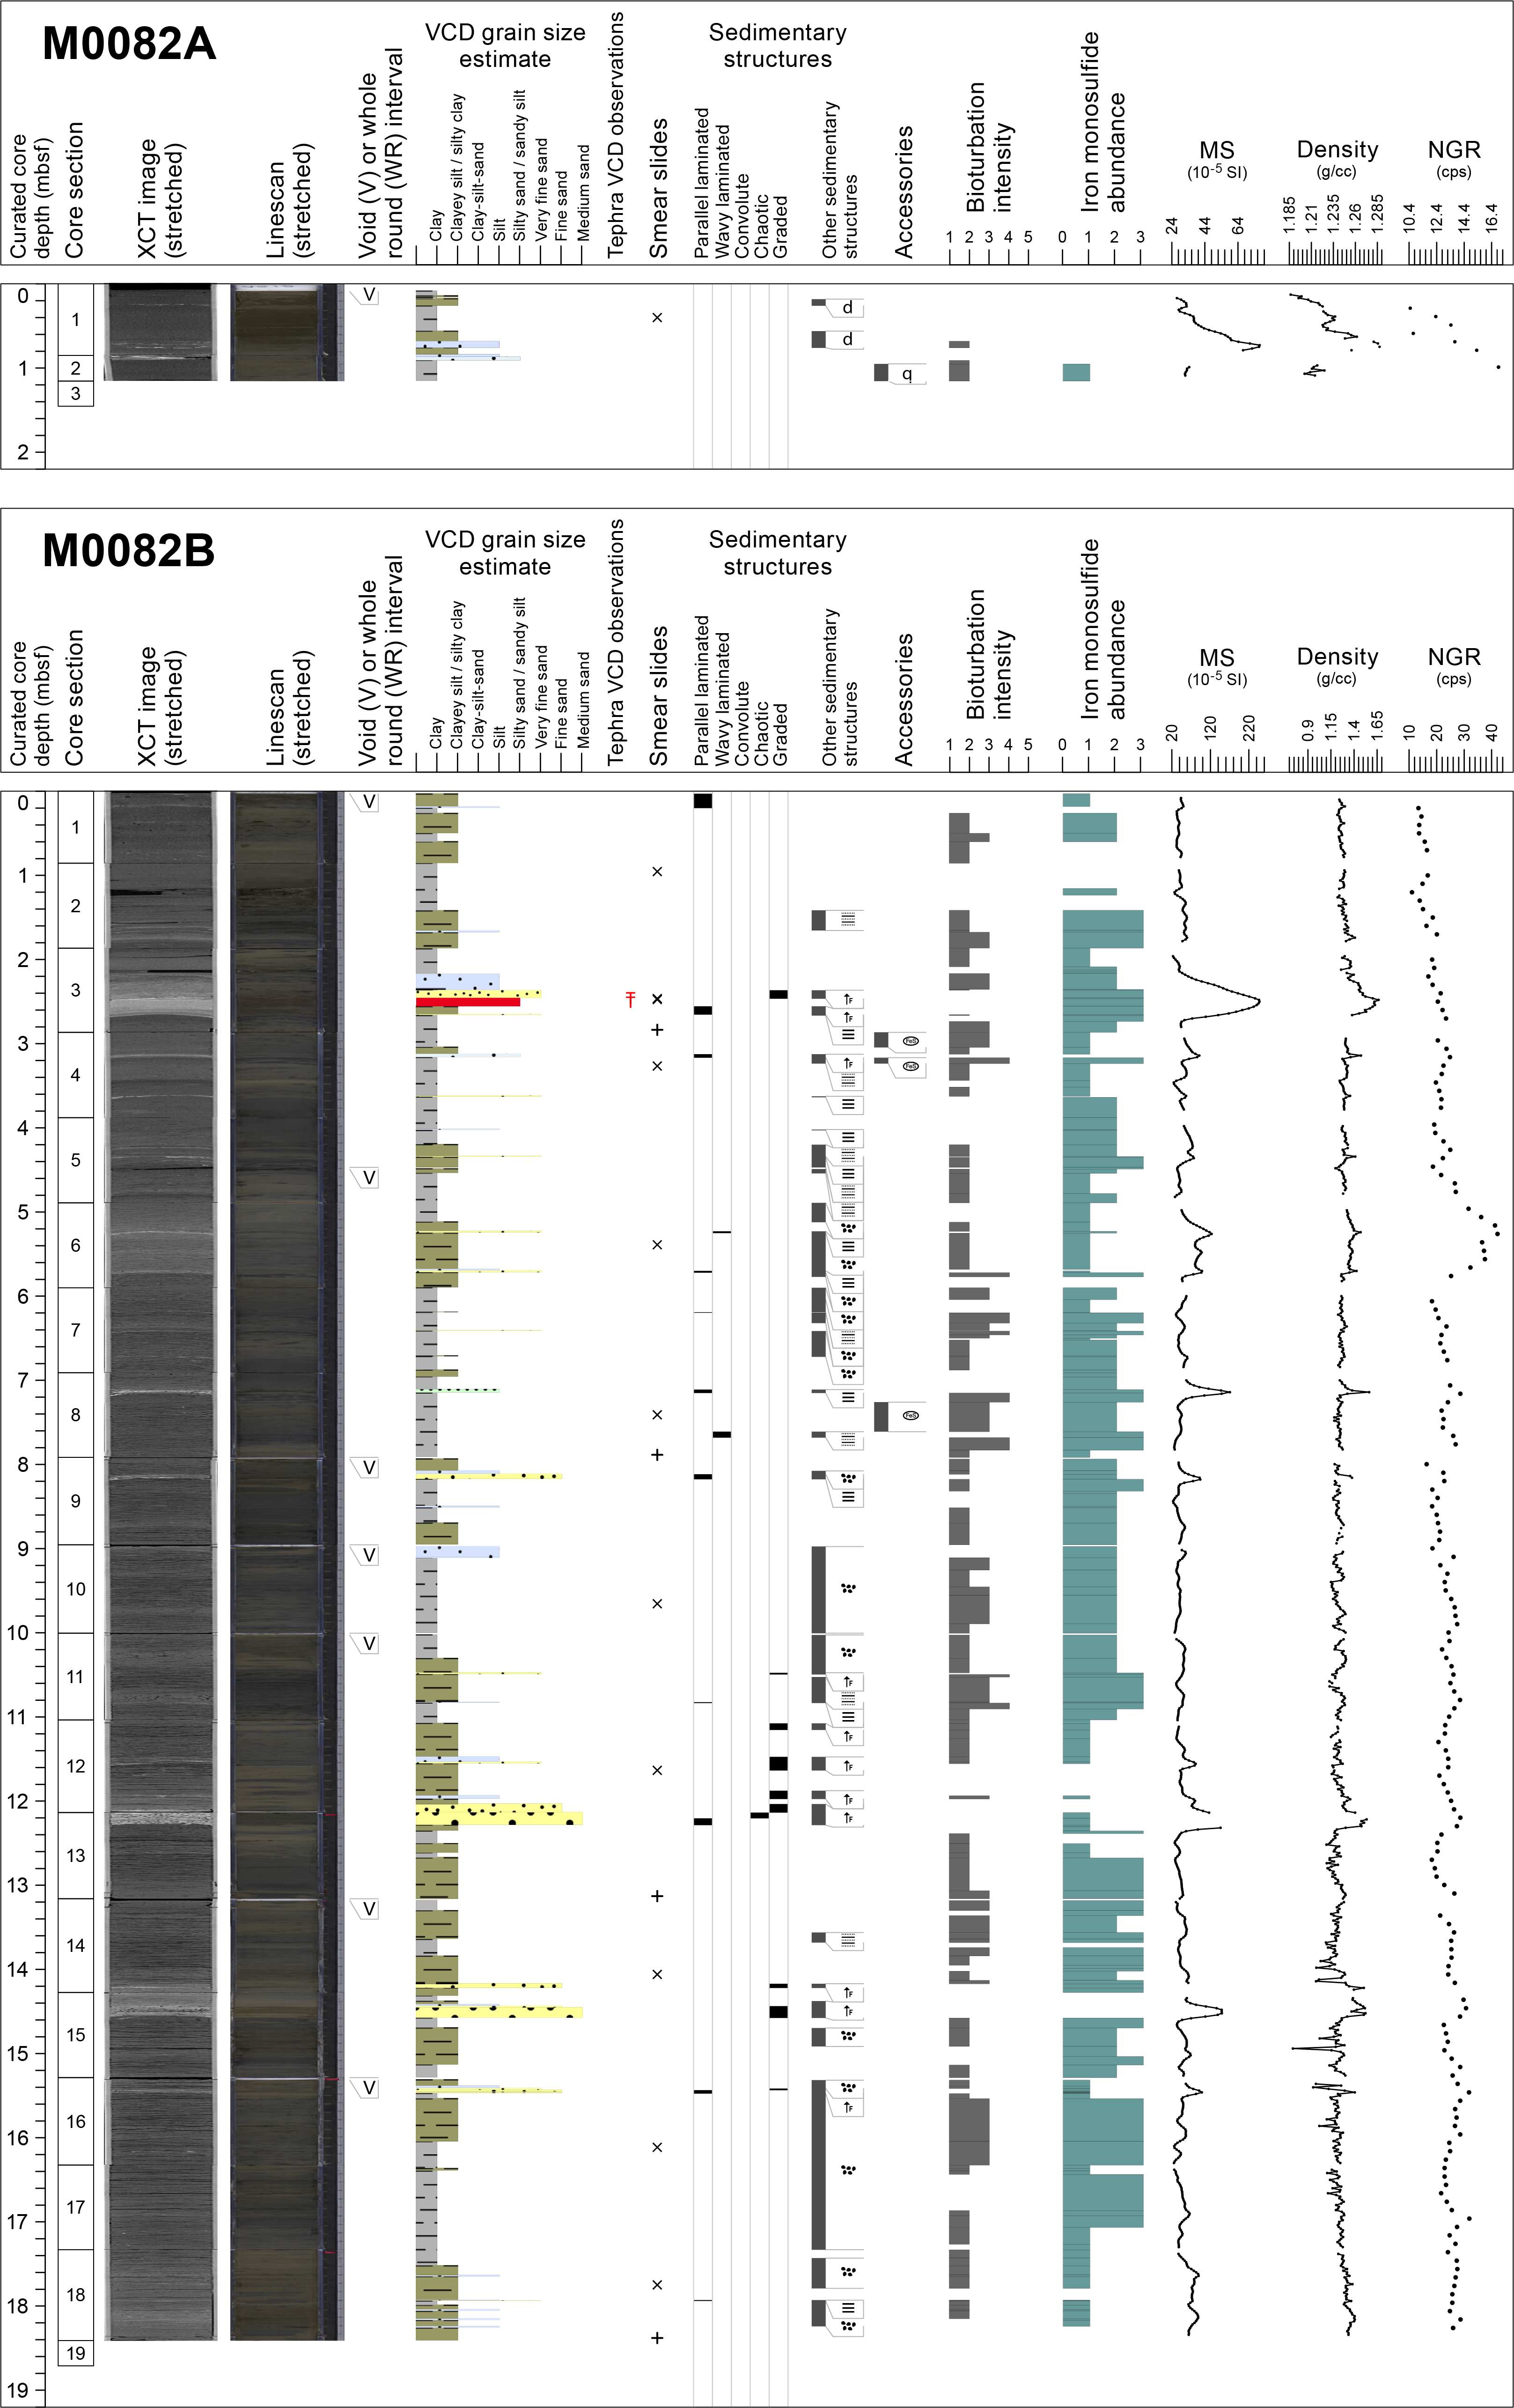
Figure F24. Lithostratigraphic summaries, Holes M0082A and M0082B.
One smear slide describes the lithology as siliceous- and lithogenic-rich clayey silt in Hole M0082A (Table T4; Figure F25). For the grain size components, silt constitutes 63%, clay 31%, and sand 6% of the total slide (Figure F26). Of the mineral components, clay minerals are the most abundant (31%), followed by quartz (15%), vitric grains (6%), and feldspar (2%). The dominant biogenic components are diatoms (31%) and sponge spicules (14%).
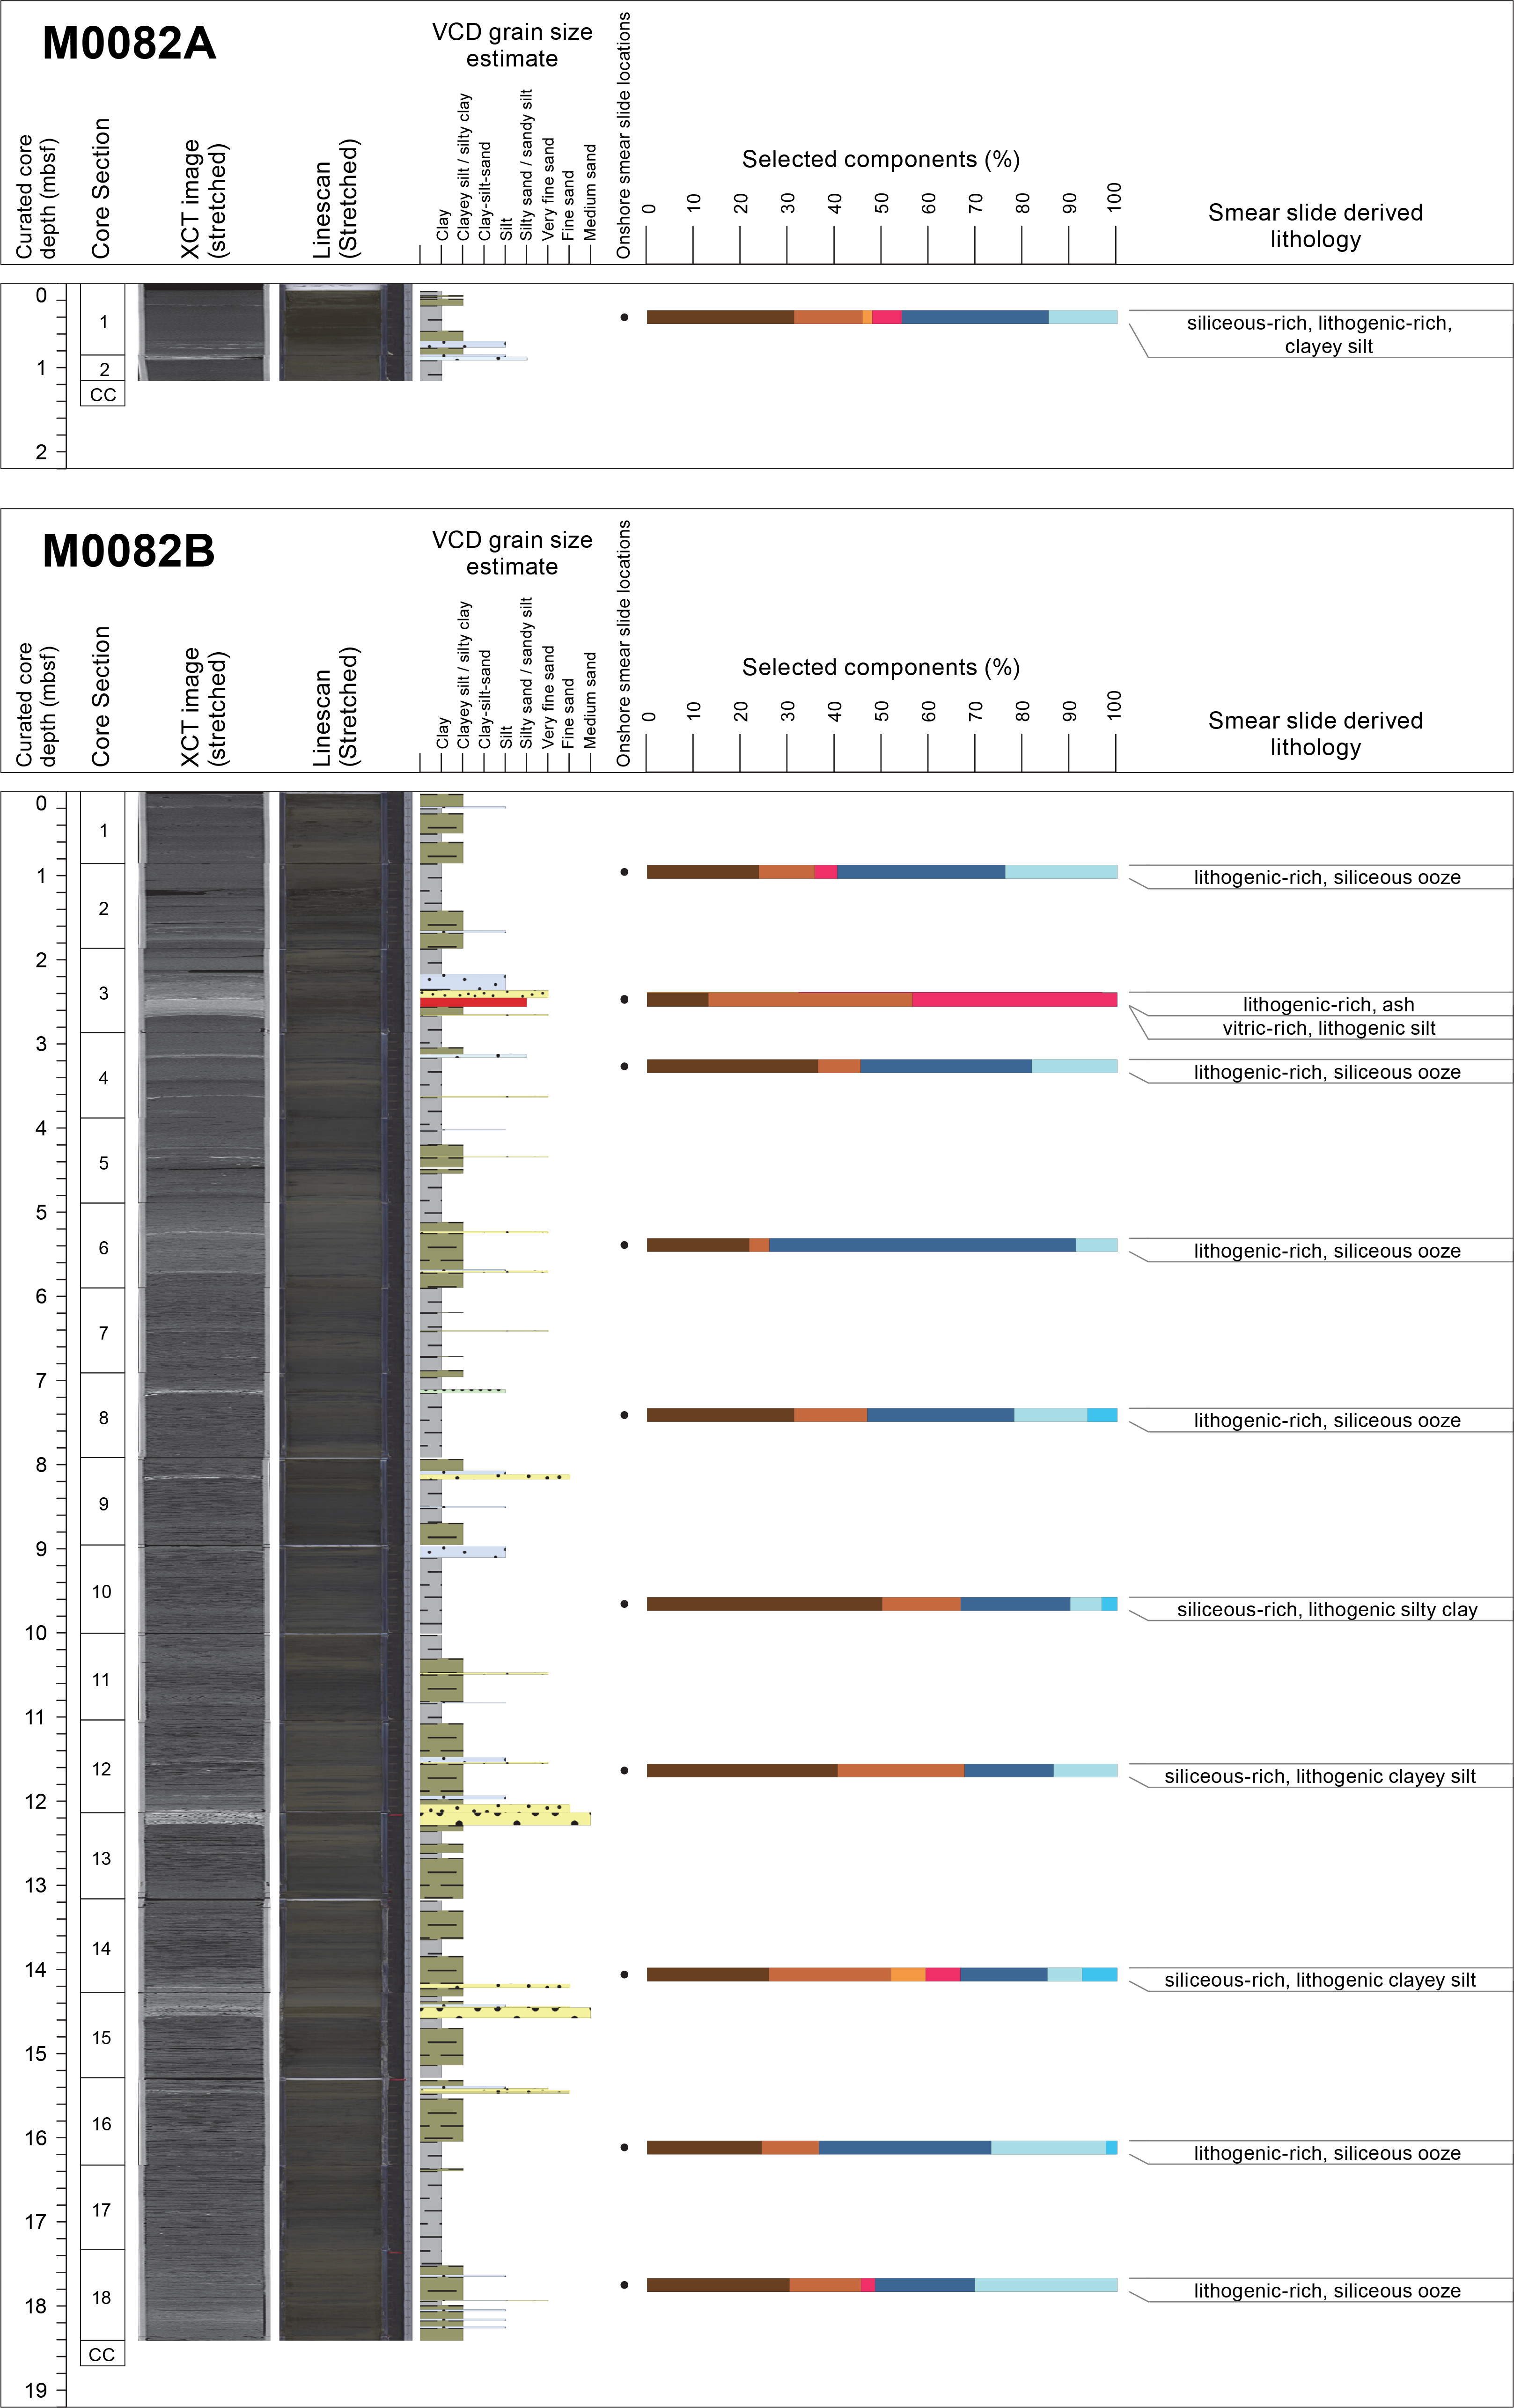
Figure F25. Smear slide summaries, Holes M0082A and M0082B.

Figure F26. Major components, Site M0082.
3.2.1.2. Hole M0082B
Hole M0082B is 19 m deep and composed of clay and silty clay intervals punctuated by thin beds and laminae containing fine sand, very fine sand, silt, and clayey silt (Figure F24). The contacts between the different lithologies tend to have sharp or wavy bases and can be gradational and/or have wavy tops. The identification of intervals is not as clear for this hole because the clay and silty clay intervals are thinner than those at Site M0081, ranging in thickness from centimeters to 1.5 m. As at Site M0081, there is good correspondence between the lithology and the physical properties (magnetic susceptibility, density, and NGR; see Physical properties), especially in the more prominent sand- and clay-rich intervals. The degree of bioturbation ranges from sparse to heavy, and monosulfide staining is sparse, moderate, and heavy (Figures F13, F14). A 1.5 cm tephra bed was found in interval 386-M0082B-1H-3, 58.5–60 cm, and in a 9 cm thick reworked interval (1H-3, 60–69 cm) (see Tephra).
A total of 11 smear slides were described for Hole M0082B (Table T4; Figure F25). The most common lithology is lithogenic-rich siliceous ooze, but also present are siliceous- and lithogenic-rich clayey silt, lithogenic-rich ash, vitric-rich lithogenic silt, and lithogenic-rich siliceous ooze. The dominant grain size is silt, followed by clay and to a minor extent sand (Figures F19, F26). Clay minerals are most abundant, followed by quartz, vitric grains, and feldspar. In decreasing abundance, the biogenic portion of the smear slide is composed of diatoms, sponge spicules, and radiolaria.
3.2.2. Holes M0082C and M0082D
3.2.2.1. Hole M0082C
Hole M0082C is 0.97 m deep (Figure F27). The sediment is composed of structureless clay. The uppermost 1 cm is olive black (5Y 3/2) and represents the oxygenated zone of the seafloor surface. Magnetic susceptibility, density, and NGR increase downhole. The lithologic interval was sampled for analysis, but the X-ray CT scan images show high density contrasts indicative of coarser grained laminae at the bottom of the hole that correspond to the physical properties.
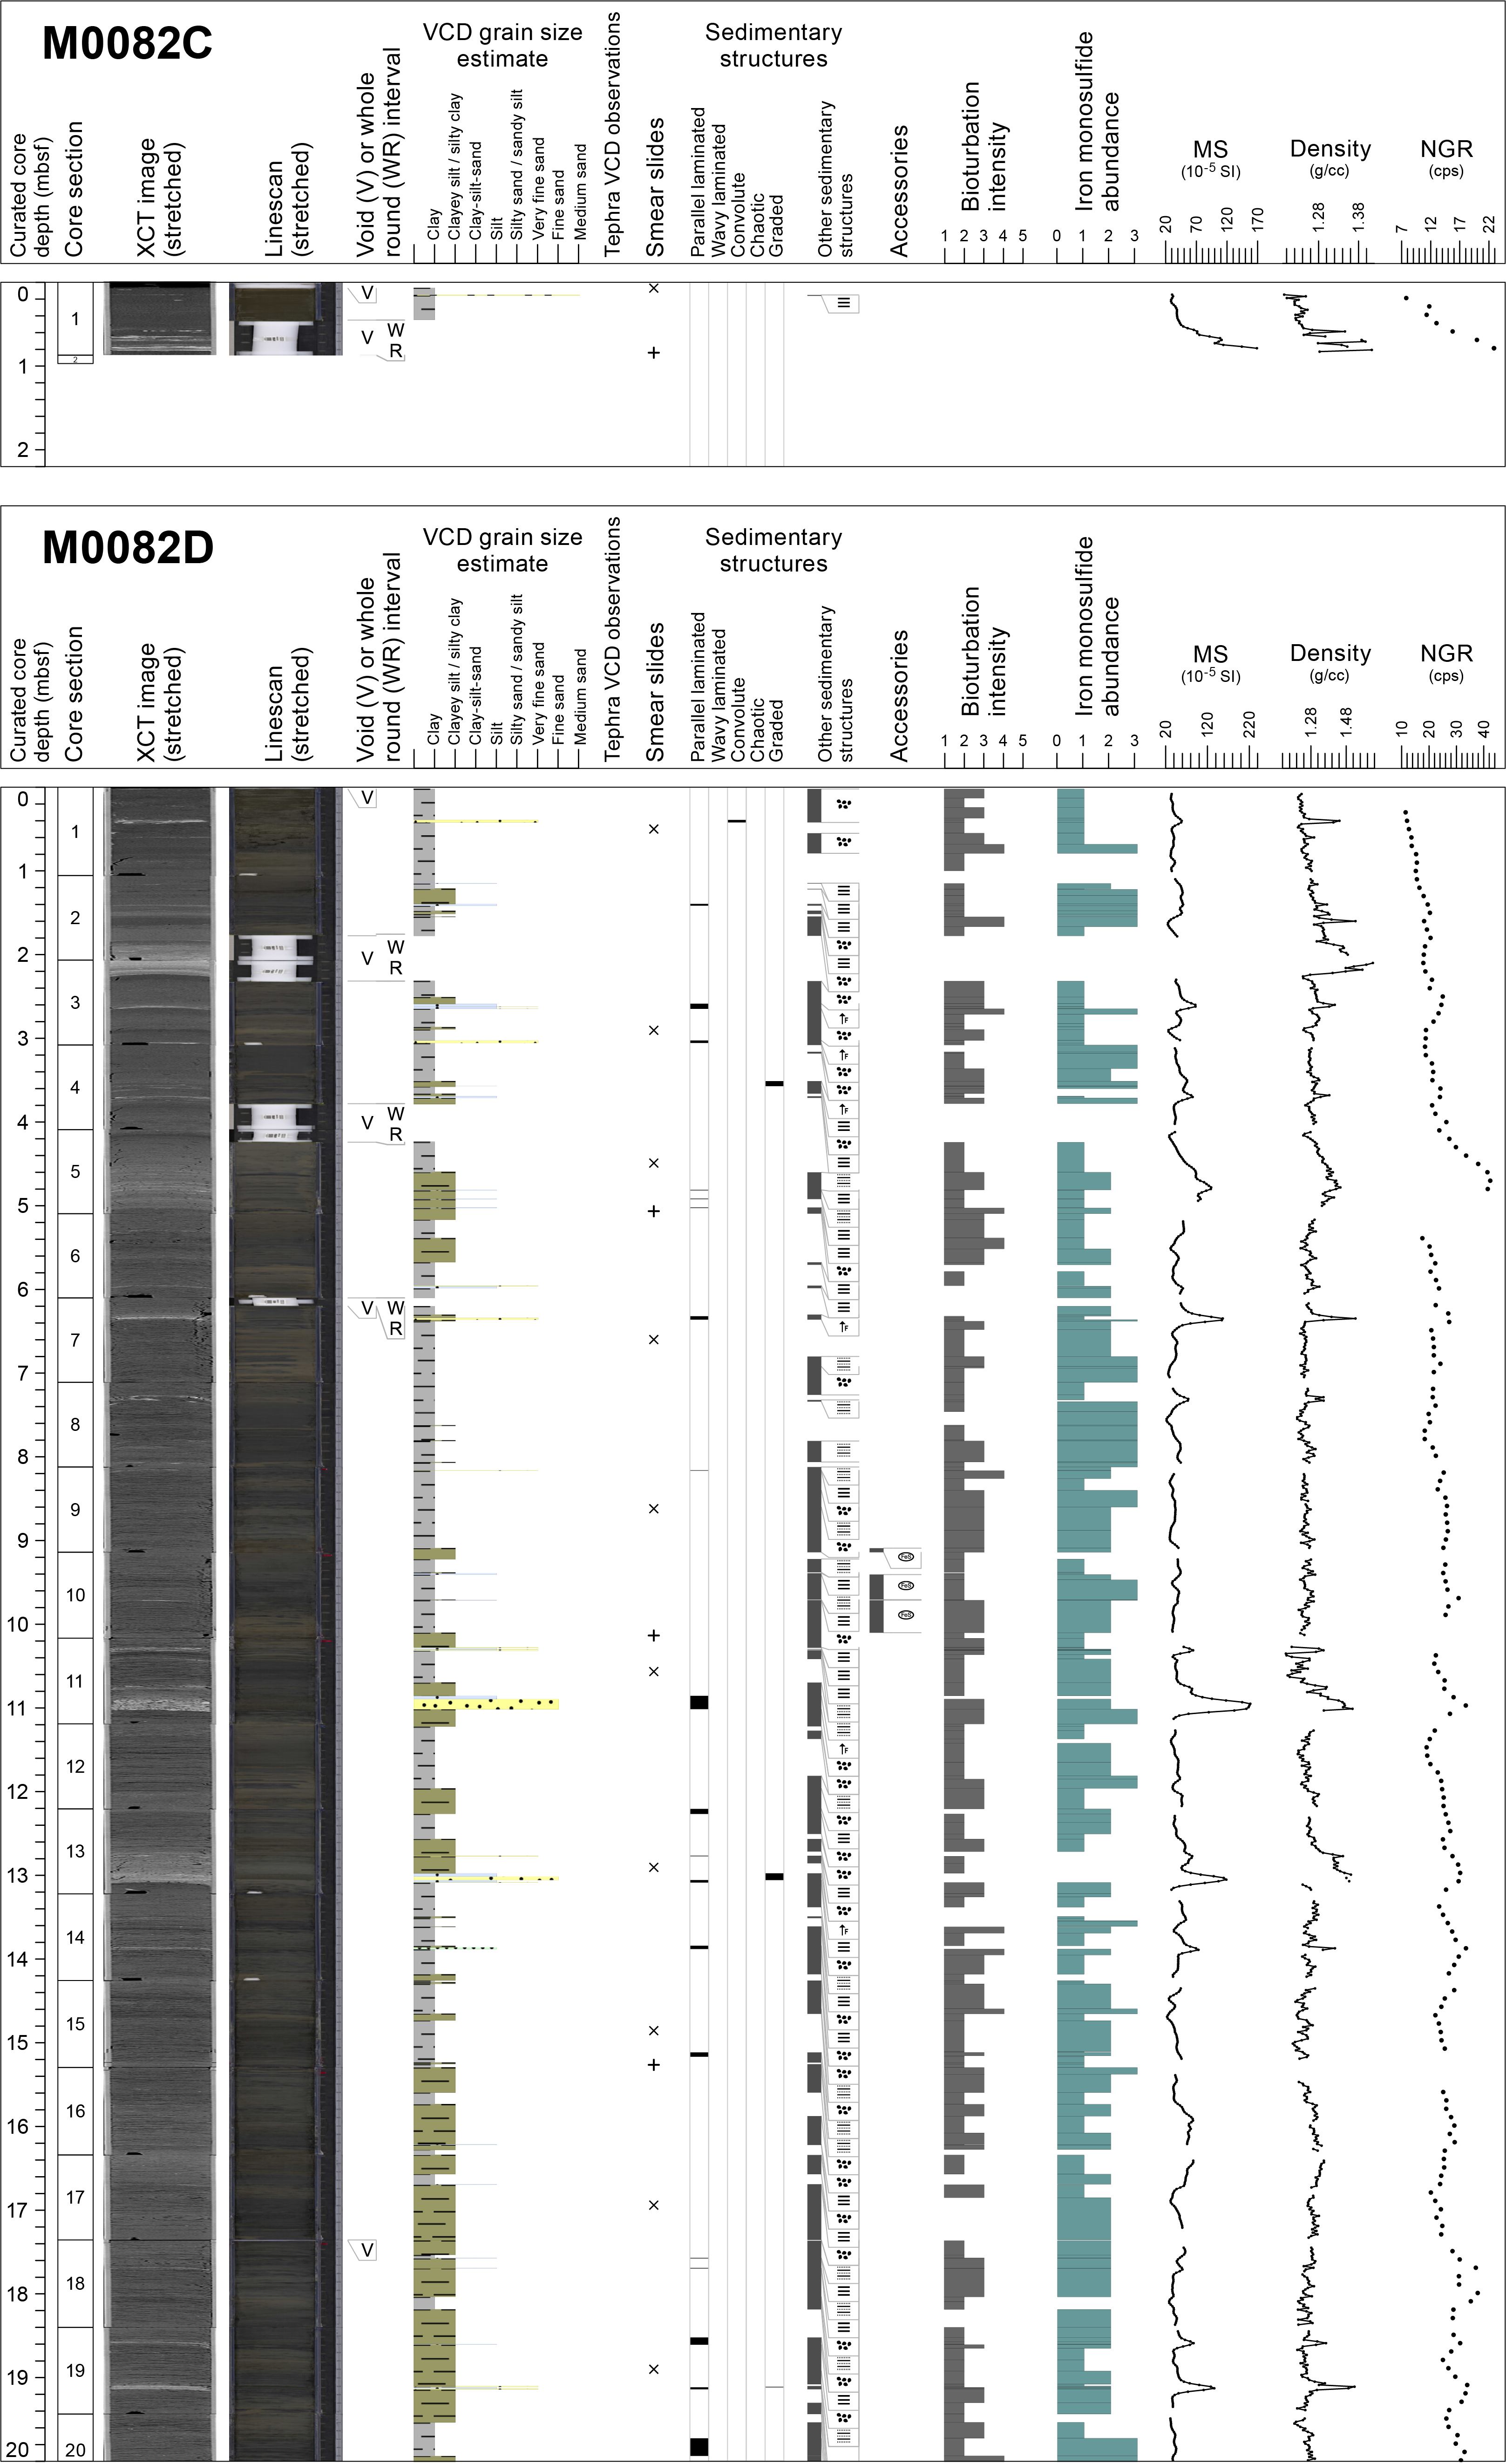

Figure F27. Lithostratigraphic summaries, Holes M0082C and M0082D
One smear slide was described for Hole M0082C (Table T4; Figure F28). The main lithology is siliceous-rich lithogenic silt and clay containing equal proportions of silt and clay (48%) with sand as a minor component (3%) (Figures F19, F26). For lithic components, clay minerals are 48% of the total slide and quartz is 3%. For biogenic components, diatoms are 32% of the total smear slide and sponge spicules are 16%.
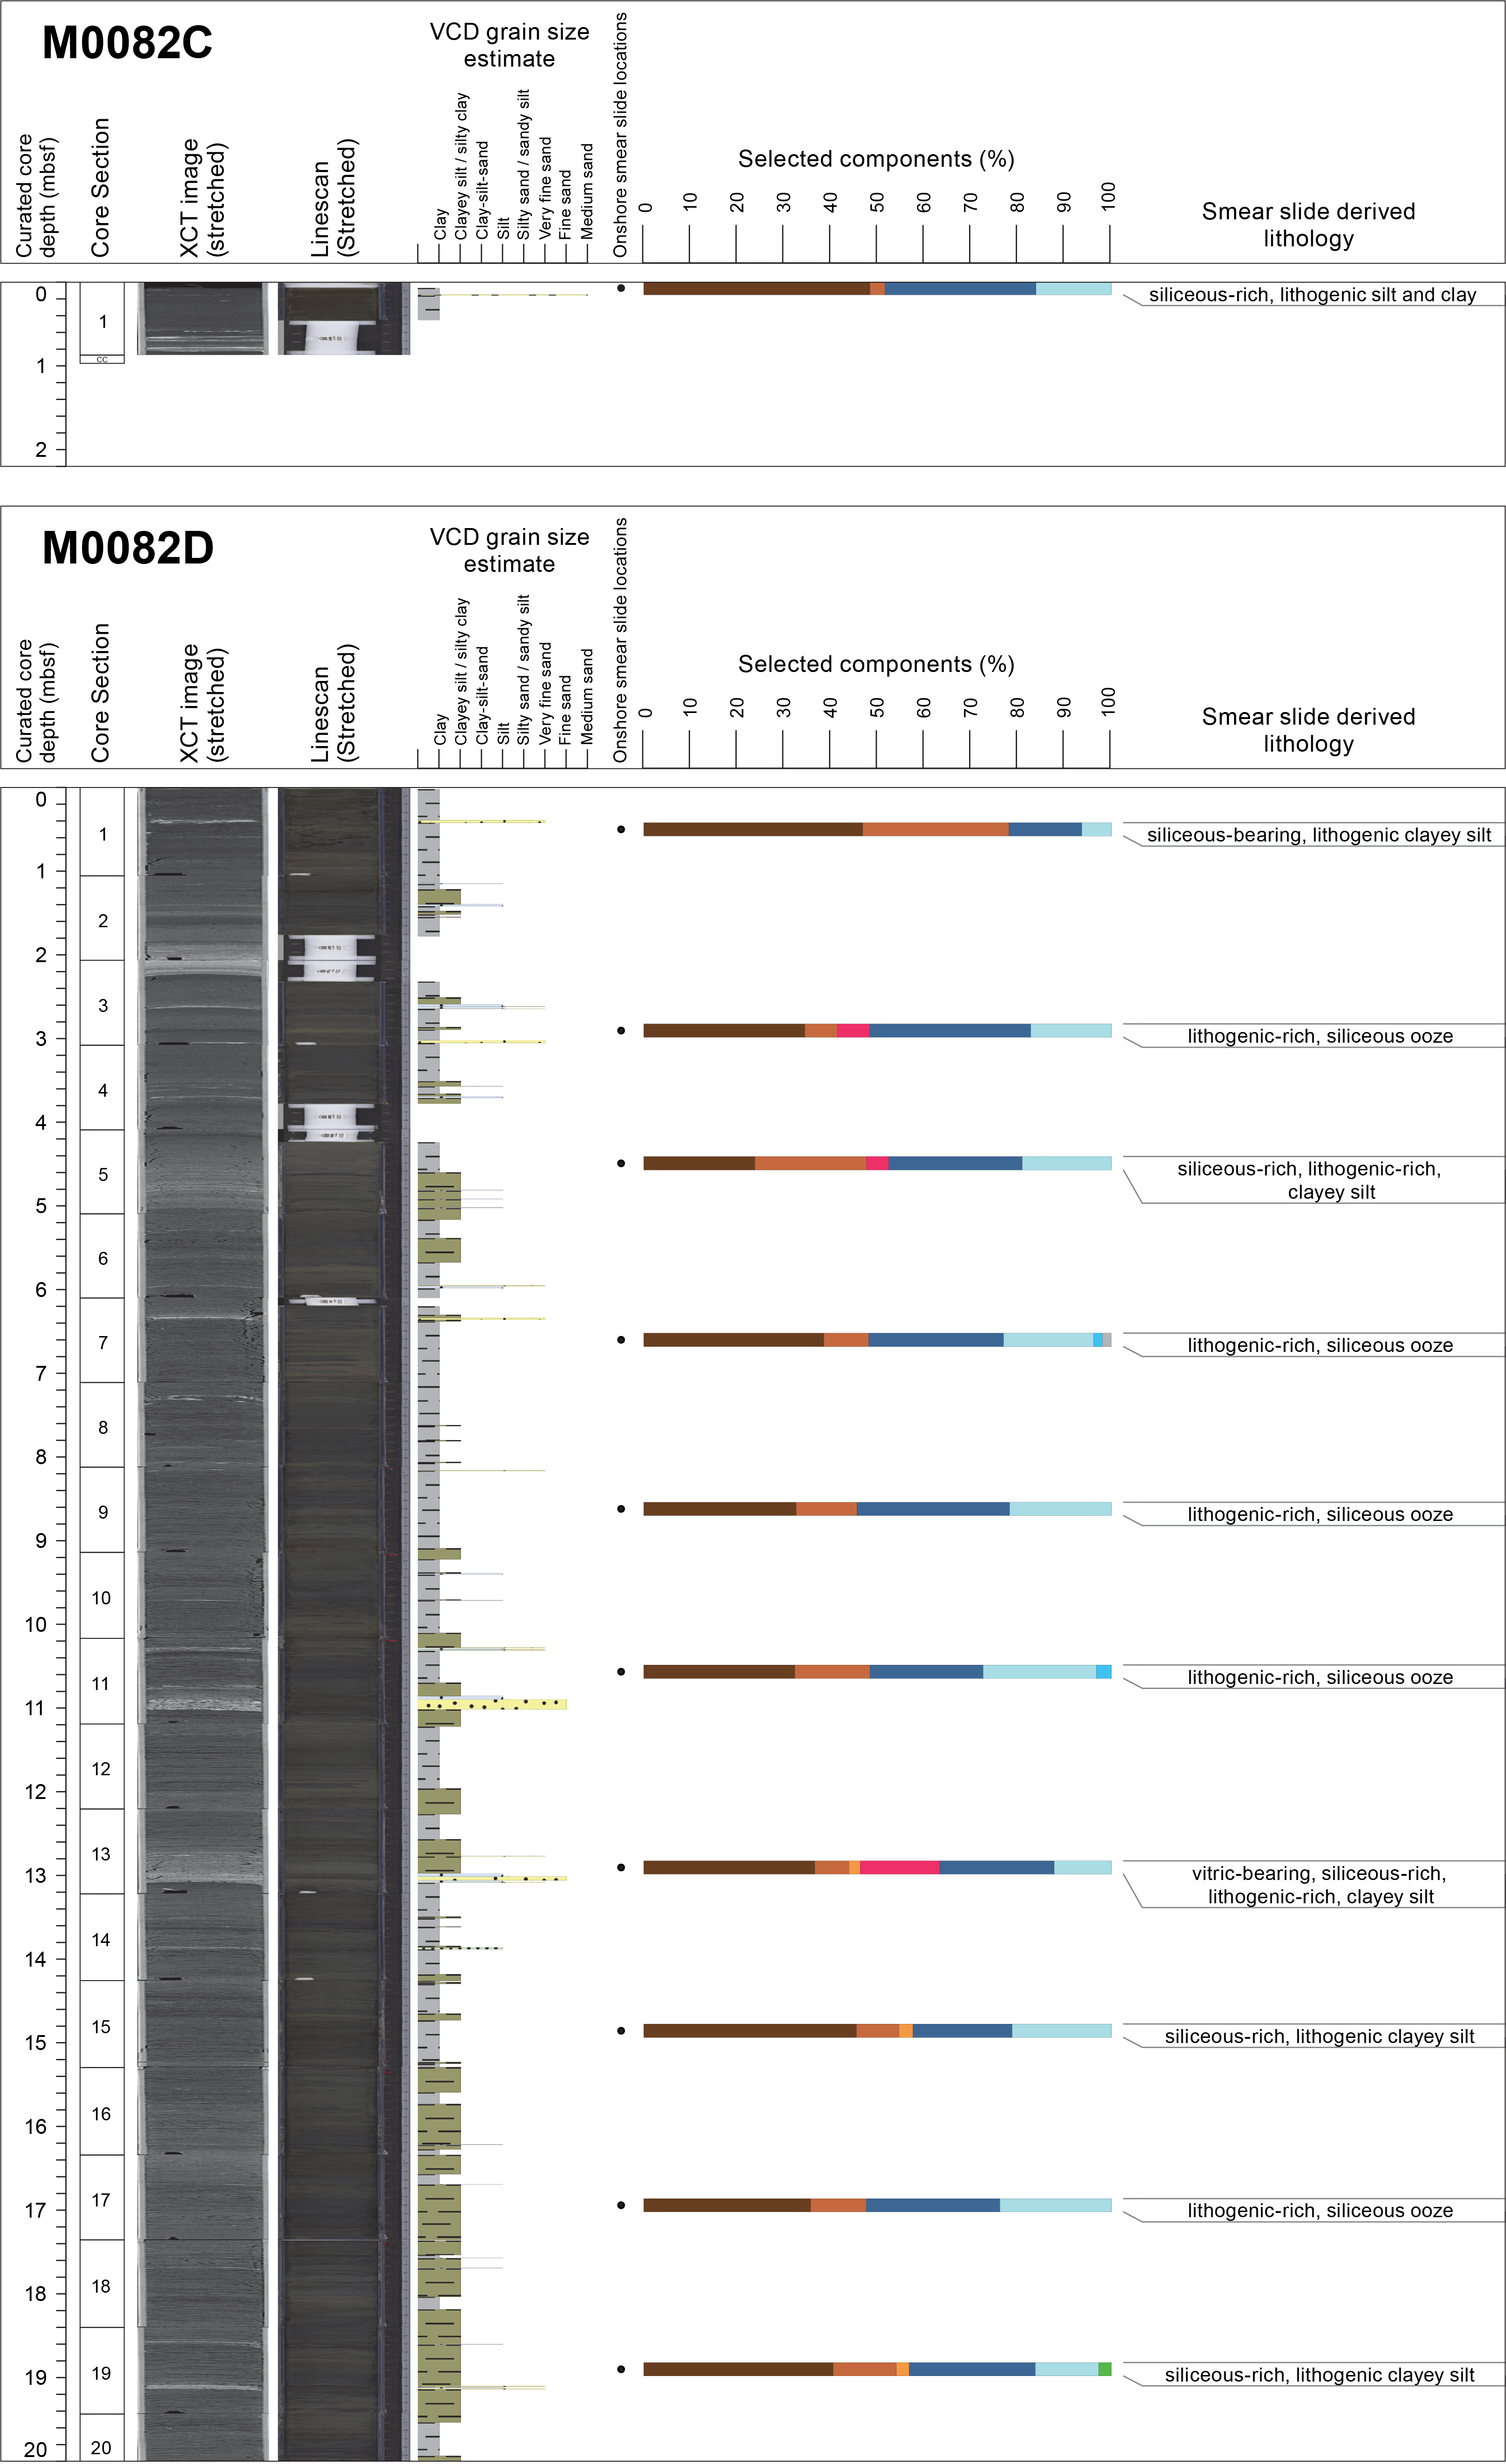

Figure F28. Smear slide summaries, Holes M0082C and M0082D.
3.2.2.2. Hole M0082D
Hole M0082D is 38 m deep and composed mainly of clay and silty clay (Figure F27). These main clay and silty clay lithologies contain laminae and thin beds of fine sand, very fine sand, silt, and clayey silt. As in Hole M0082B, the identification of intervals is not as clear for this hole because the clay and silty clay intervals are thinner than at Site M0081, ranging in thickness from centimeters to 1.5 m. There is a remarkable correlation between the lithology and physical properties illustrated when Holes M0082B and M0082D are plotted side by side. The peaks of magnetic susceptibility, density, and NGR correspond well to fine sand and very fine sand thin beds and laminae intervals in both holes. Another interesting correlation are the X-ray CT scan images that highlight the laminae, enhancing the lithology and physical properties correlations between Holes M0082B and M0082D. These correlations suggest that Hole M0082B may be missing the uppermost 15–20 cm. Hole M0082D (similar to Hole M0082B), also contains tephra (see Tephra). A reworked interval containing tephra was identified (386-M0082D-1H-22, 28–28.3 cm).
A total of 19 slides were described for Hole M0082D (Table T4; Figure F28). The main lithologies are lithogenic- and siliceous-rich clayey silt, lithogenic-rich siliceous ooze, vitric-bearing siliceous- and lithogenic-rich clayey silt, lithogenic-rich ash, and siliceous-bearing vitric-rich lithogenic clay-silt-sand. As in other holes, the grain size is dominated by silt and clay with a minor component of sand (Figures F19, F26). A similar pattern to that found in other holes occurs in the distribution of lithics, with clay minerals most abundant followed by quartz. Vitric grains and heavy minerals are present, but when present they are less abundant, except in four slides where vitric grains compose 70%, 35%, 20%, and 17% of the slide. Diatoms and sponge spicules are the most common biogenic components, with rare radiolaria and silicoflagellates.
3.3. Diagenesis
Sediments at Sites M0081 and M0082 show variations in the intensity of iron monosulfides throughout the cores. This variation ranges from ~10–15 cm thick intervals in the cores up to a nearly uniform presence (Figures F13, F14). Iron monosulfides are most easily observed during split core description and subsequent examination of the linescan images for each section. In addition, smear slide observations document framboidal occurrences of pyrite within microfossils (Figures F16, F19). Relative to the host lithostratigraphy, there are three main patterns of occurrence for iron monosulfides: (1) as mottles (1–10 mm in diameter) or patches (>1 cm in diameter) in fine-grained sediment intervals, (2) as mottling in bioturbated zones beneath coarse-grained sediments, and (3) as color bands in strata layers in both fine- and coarse-grained beds. Monosulfides generally increase in intensity from sparse to heavy with increased depth, consistent with the exposure time of the sediments to organoclastic sulfate reduction and/or the anaerobic oxidation of methane, the dominant diagenetic reactions that produce iron monosulfides and ultimately pyrite in marine sediments. Although bioturbation intensity is also variable throughout the cores, some bioturbated zones are most easily seen when amplified by iron monosulfide precipitates, particularly in lighter portions of the cores. After core splitting in March 2022, variable oxidation of the iron sulfide–rich sediments occurred. It is particularly visible along some core section ends and along core liner edges and fractures (Figure F29). More pronounced oxidation occurs in cores from Holes M0081B, M0081D, M0082B, and M0082D.

Figure F29. Oxidation.
3.4. X-ray diffraction mineralogy
XRD mineralogy was conducted for one sample per section, and some minerals have been grouped (Figure F30; see XRD in Supplementary material). These groupings will require additional processing to extract a signal for each mineral. For example, quartz has not been separated from opal-A, and clays, carbonates, amphiboles, pyroxenes and heavy minerals are composed of several minerals in each group (see Lithostratigraphy in the Expedition 386 methods chapter [Strasser et al., 2023a]). The interpretation of the mineralogy is at this stage an approximation; however, some interpretations can be made when the data is contrasted with the lithostratigraphic summaries. For Hole M0081F, the most abundant minerals are quartz, feldspar, and clay, followed by micas (muscovite and biotite). The data show correspondence between quartz, feldspar, clays, and mica abundance, and the smear slide data also show them as the most abundant minerals (Table T3). There is some correlation between intervals of thick sandier beds at 17, 19, 25, and 30 mbsf and peaks of quartz and feldspar. Palygorskite, a clay associated with the weathering of volcanic glasses, occurs throughout the core (5–15 and 30–36 mbsf), and in most instances it occurs where there are vitric grains or tephra. The amphibole group correlates with silty clay and clayey silt intervals at 5–10, 12–16, 21–25, and 25–35 mbsf. Pyroxene is present from 24 mbsf to the bottom of Hole M0081F and correlates with peak abundances of quartz and feldspar. As in Hole M0081F, quartz, feldspar, clays, and micas are the most abundant minerals in Hole M0082D. These mineral abundances also correspond to observations from smear slides (Table T4). Abundances of quartz, feldspar, and clays at 0–5, 12, 17, and 32–34 mbsf correspond approximately to several thick sandier beds. Palygorskite is present and corresponds to the occurrence of vitric grains at 0–3, 7–11, 13–18, and 26–32 mbsf. As in Hole M0081F, the amphibole group appears to correspond to the silty clay and clayey silt intervals and pyroxene is rarely present. Future studies will be required to fully extract the mineralogy of the sediments in these two holes.
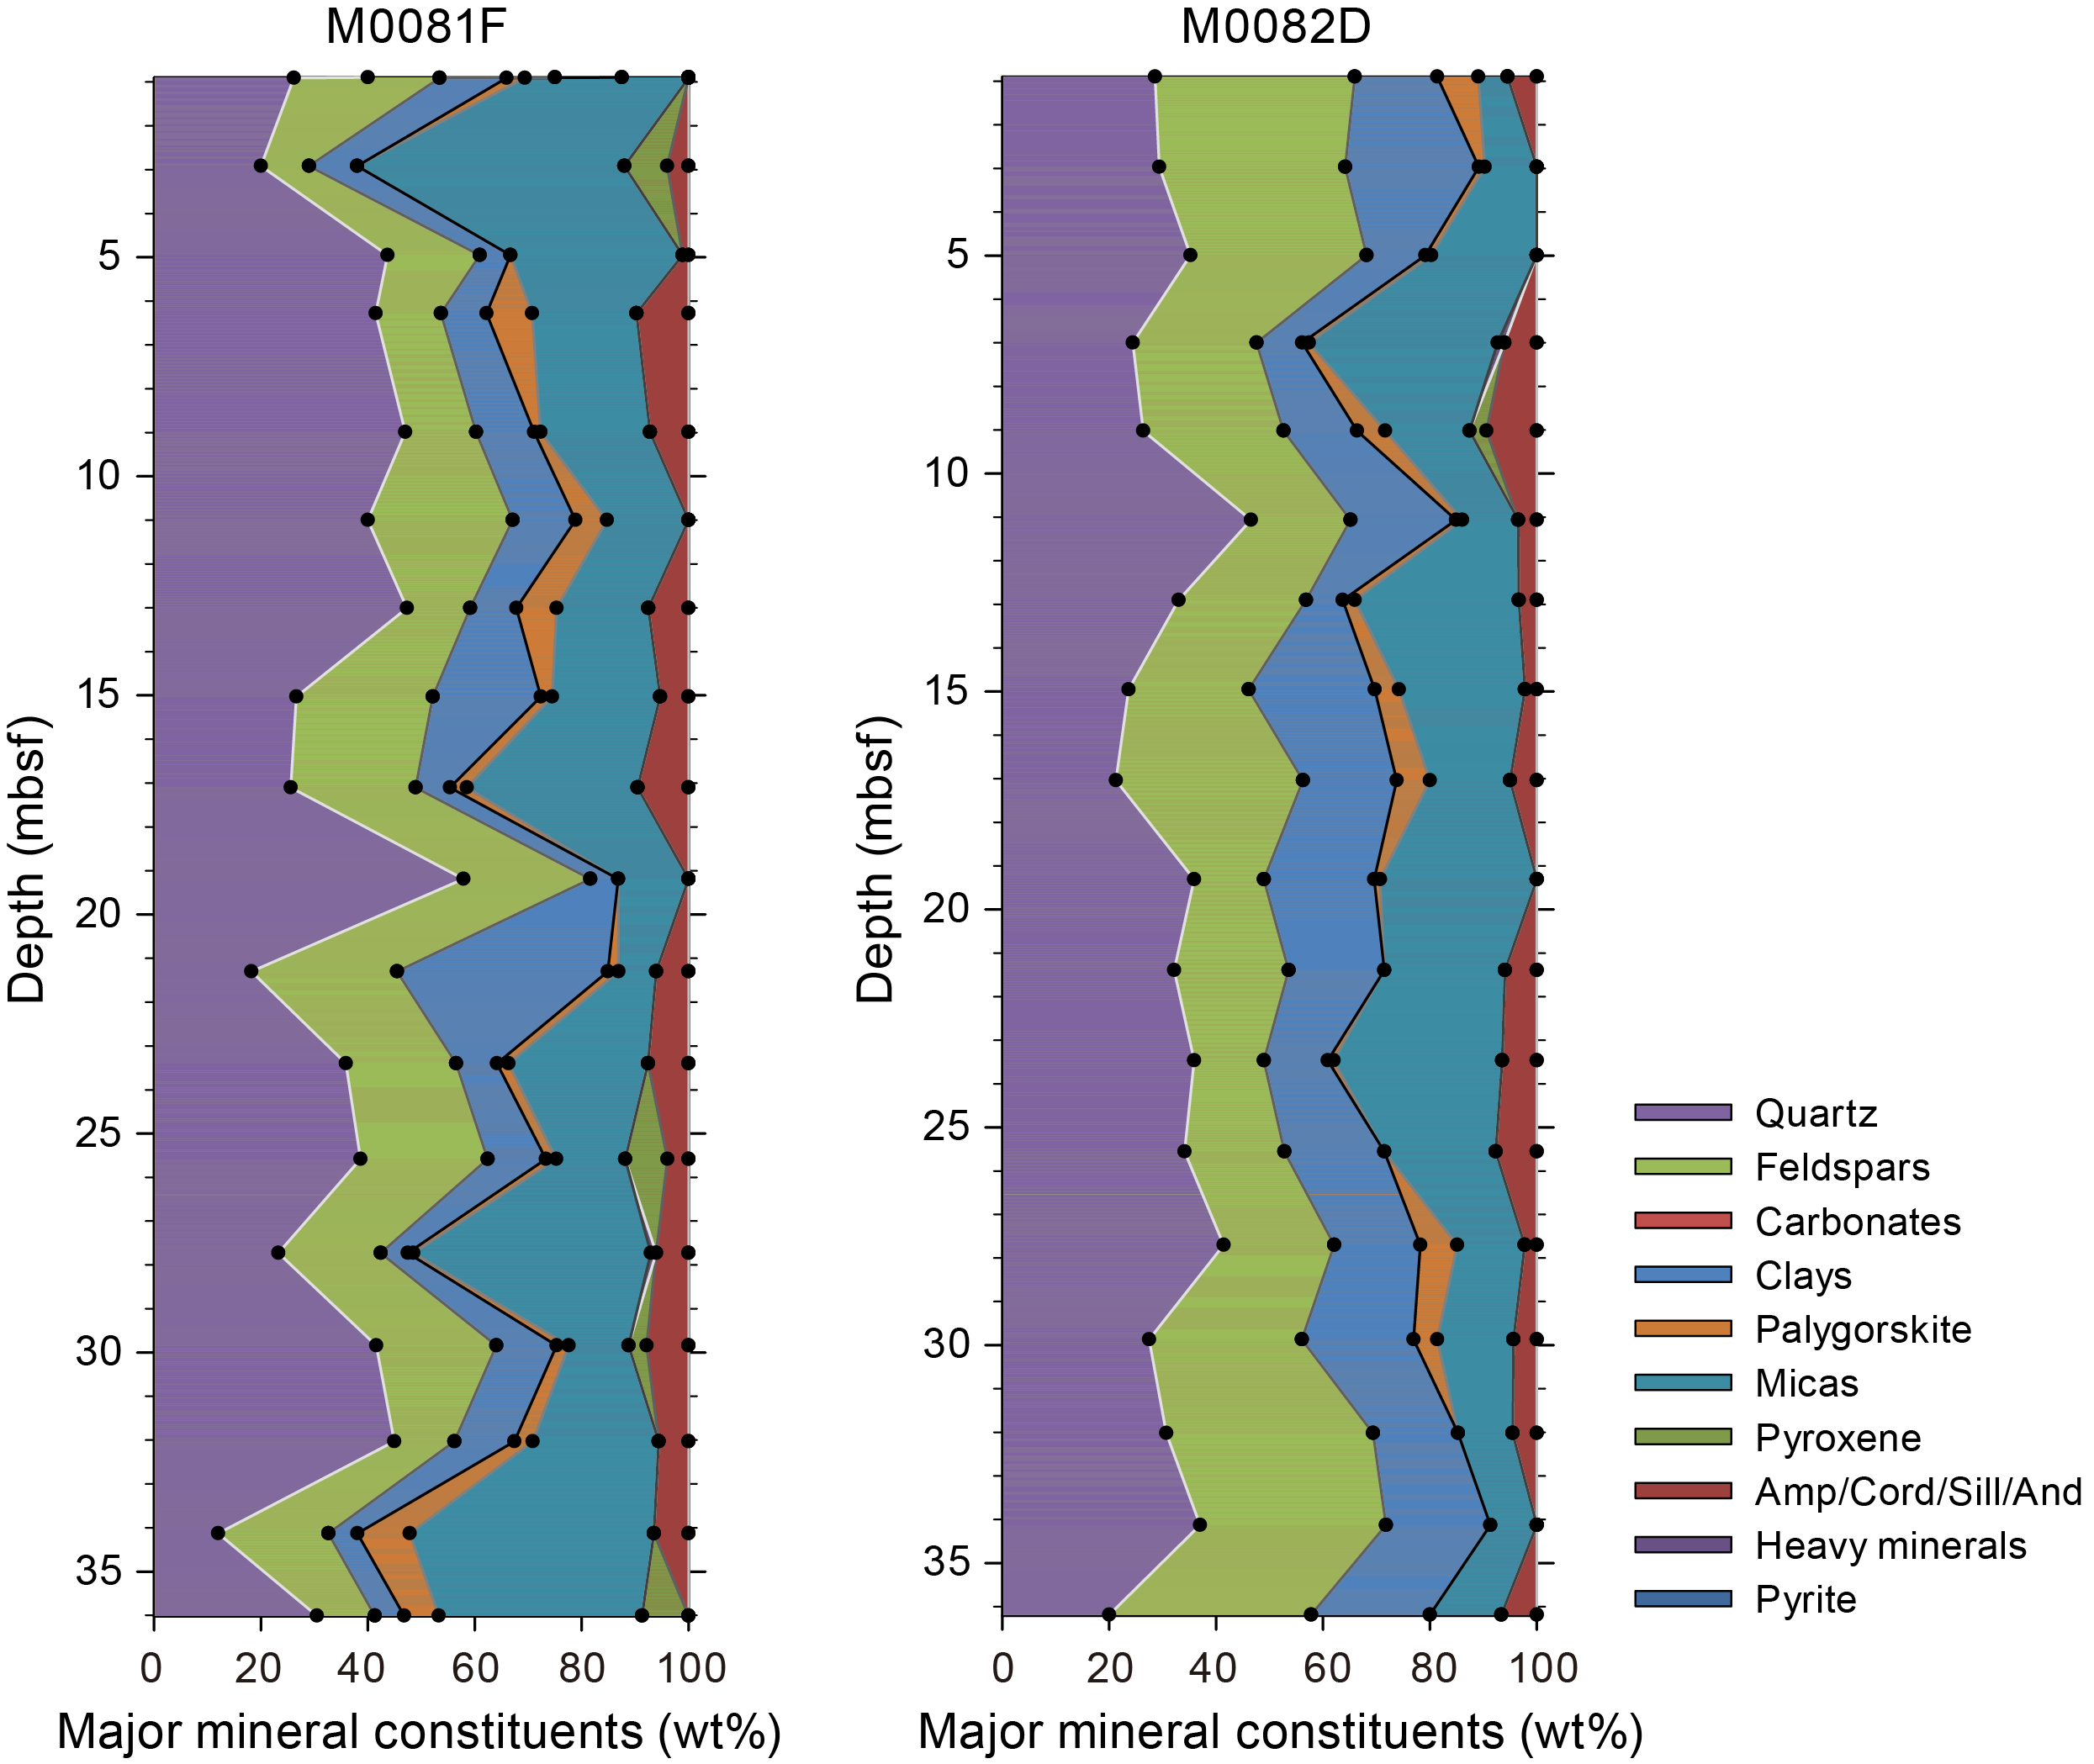
Figure F30. XRD mineralogy.
4. Tephra
Three tephra layers were described in Basin S1. There are two notable tephra layers in the upper part of the cores, and their characteristic facies are found as key beds at both Sites M0081 and M0082, with a superposition of the two tephra layers occupying similar stratigraphic positions in the cores (Figure F31). Stratigraphic correlation in Basin S1, for Holes M0081B, M0081D, M0082B, and M0082D, is possible using these two tephra layers (see Stratigraphic correlation). Another tephra layer was only observed in Hole M0082D. The tephra layers in Basin S1 (Table T5) are described below from the upper part to the lower part of the basin infill.
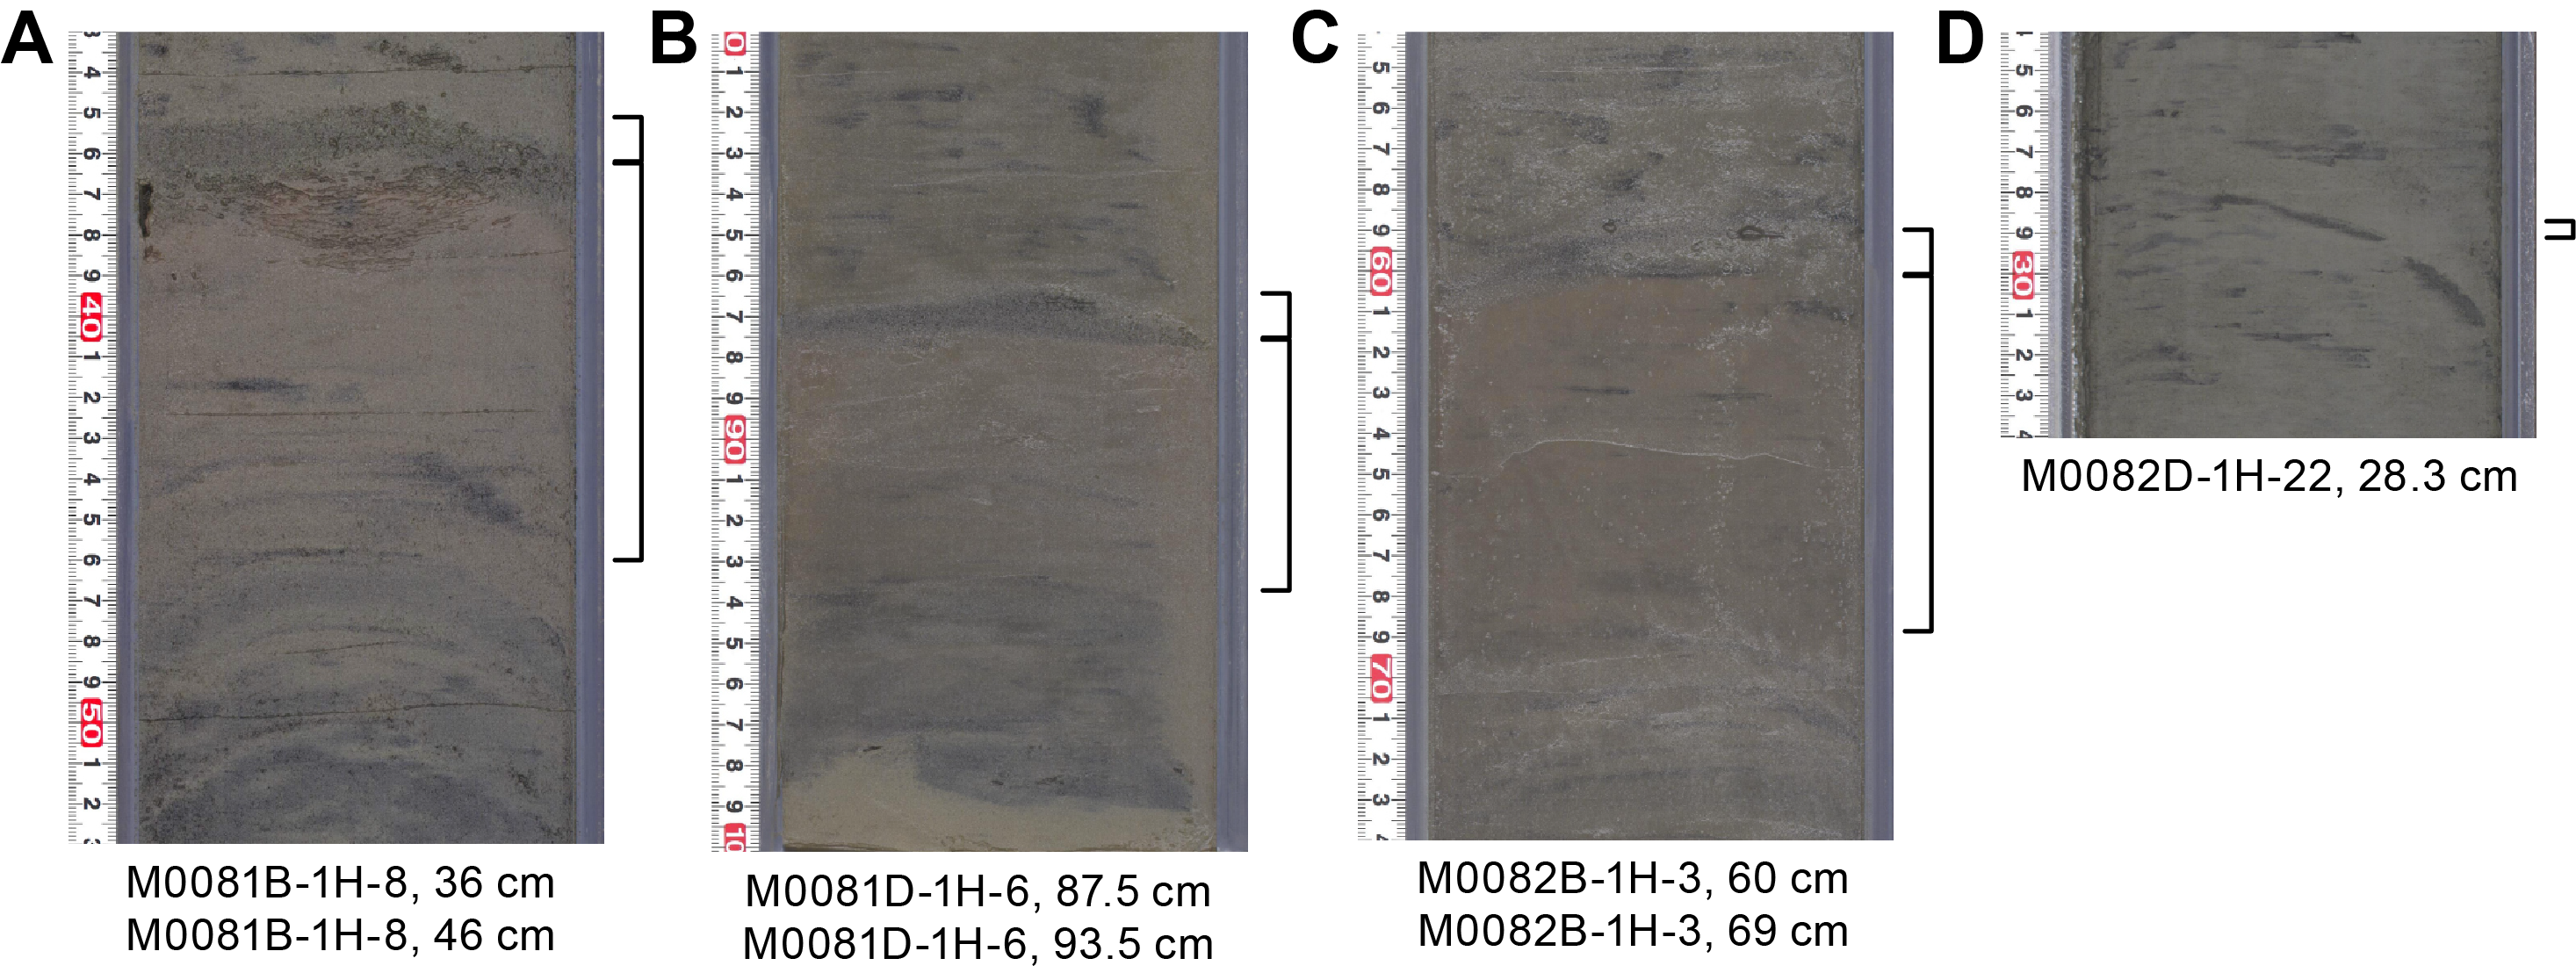
Figure F31. Tephra core photos.
The uppermost tephra layer (M0081B-1H-8, 36 cm; M0081D-1H-6, 87.5 cm; and M0082B-1H-3, 60 cm) was observed in multiple holes in intervals 386-M0081B-1H-8, 34.5–36 cm; 386-M0081D-1H-6, 86.3–87.5 cm; and 386-M0082B-1H-3, 58.5–60 cm (Figure F31). It was not possible to observe the assumed horizon in Holes M0081F and Hole M0082D during the Onshore Science Party (OSP) because of whole-round sampling; however, it is presumed that this tephra exists at these sites because it can be recognized by the characteristic superposition of the two tephra layers in the X-ray CT images (Figures F22, F27). The assumed horizons are in interval 386-M0081F-1H-7, 84–85.5 cm, and at the top of Section 386-M0082D-1H-3. The layer is a dark gray silt- to very fine sand–sized tephra approximately 1–1.5 cm in thickness.
The composition of the uppermost tephra is more than 80% volcanic glass shards, as observed during microscopic observation of smear slide Sample 386-M0082B-1H-3, 60 cm (Table T4). Abundant volcanic glass types are the pumiceous type and a smaller component formed of the fibrous type (Figure F32). The brown glass shard type is rare. The tephra contains mainly orthopyroxene and a trace amount of hornblende and apatite as its heavy mineral composition.
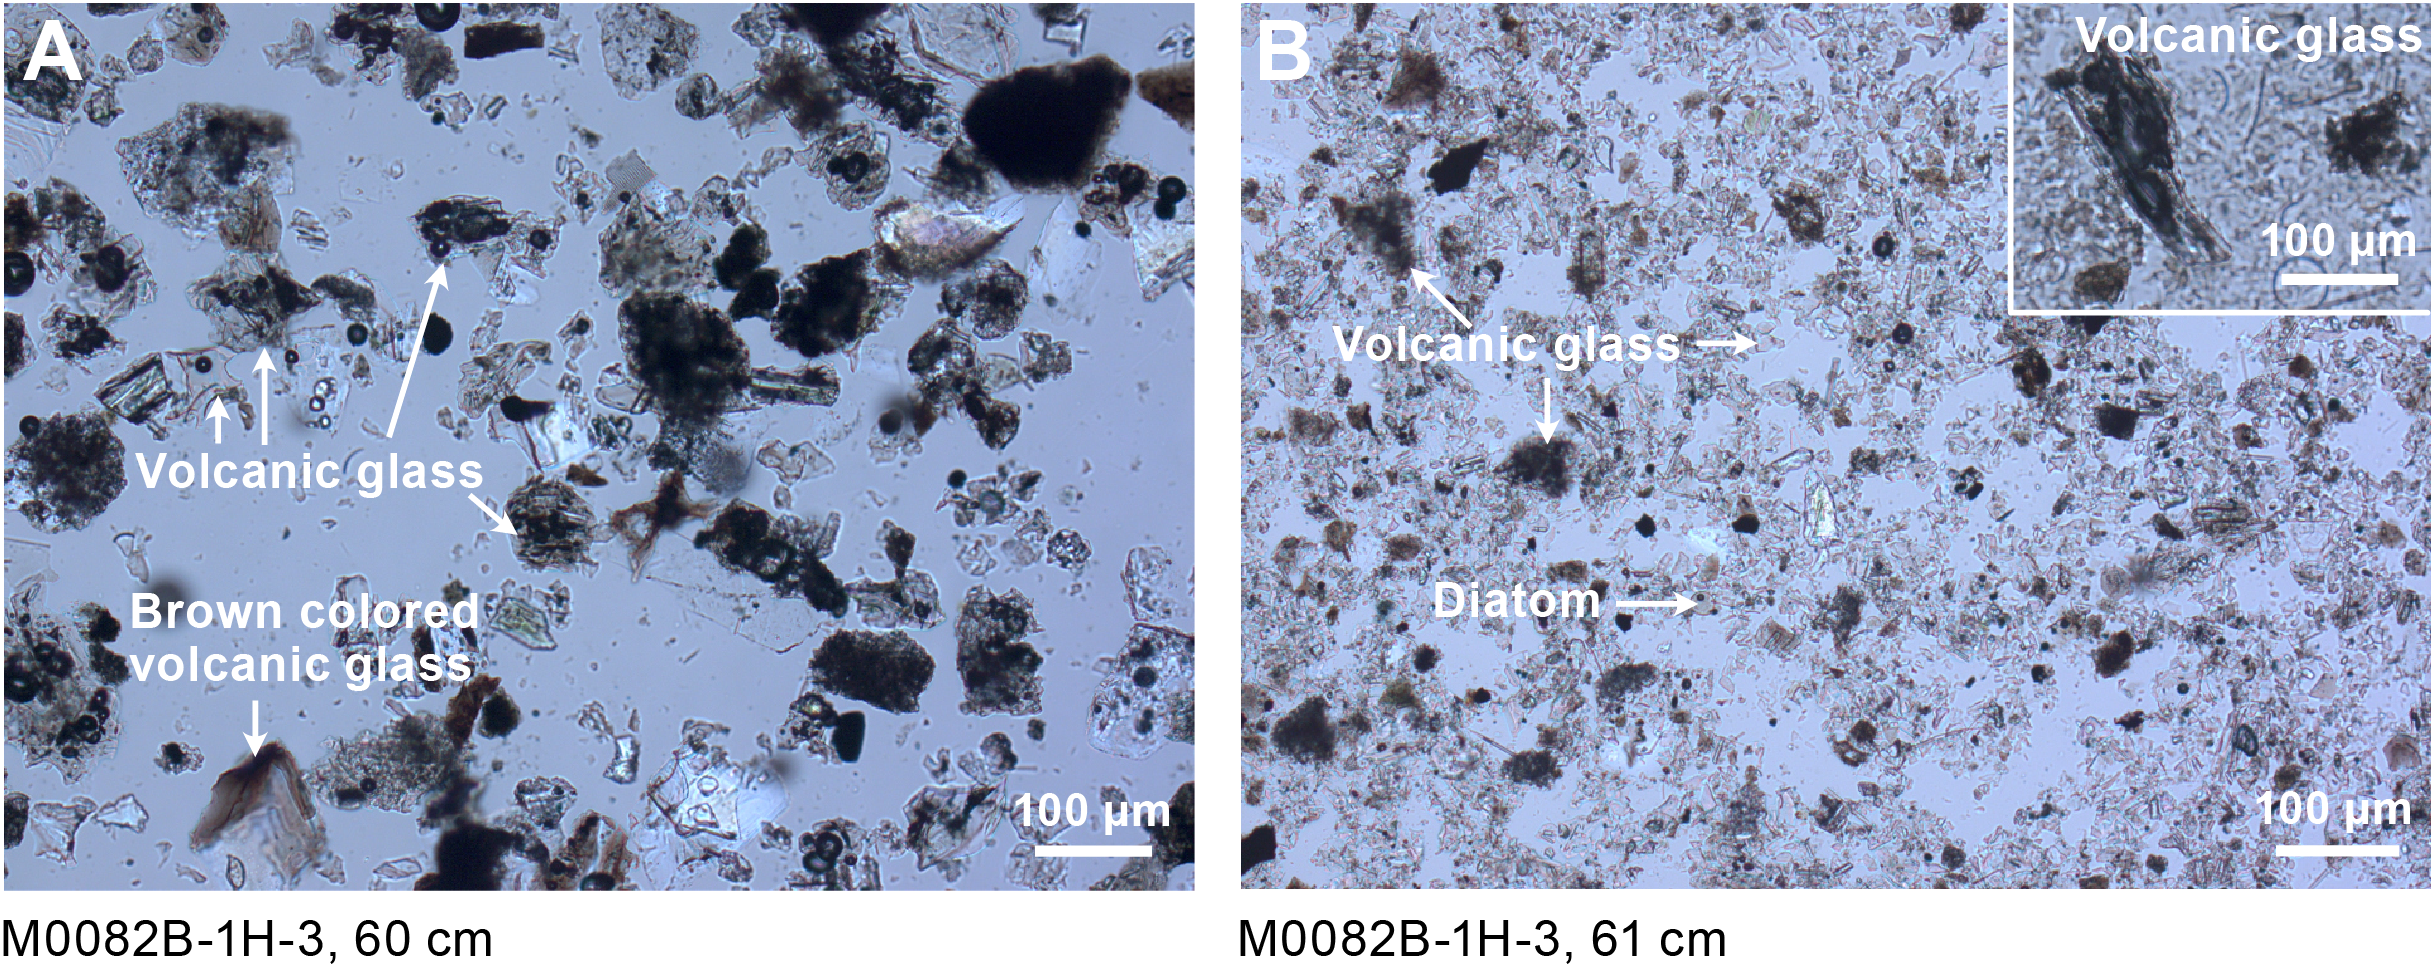
Figure F32. Tephra smear slides.
The next tephra layer (M0081B-1H-8, 46 cm; M0081D-1H-6, 93.5 cm; and M0082B-1H-3, 69 cm) was found in multiple holes in intervals 386-M0081B-1H-8, 36–46 cm; 386-M0081D-1H-6, 87.5–93.5 cm; and 386-M0082B-1H-3, 60–69 cm (Figure F31). It was not possible to observe the assumed horizon in Holes M0081F and Hole M0082D during the OSP because of whole-round sampling; however, it is presumed that this tephra exists at these sites because it can be recognized by the characteristic superposition of the two tephra layers in the X-ray CT images (Figures F22, F27). Those assumed horizons are in intervals 386-M0081F-1H-7, 85.5–92.5 cm, and 386-M0082D-1H-3, 1–7 cm. This tephra layer is intercalated directly below the M0081B-1H-8, 36 cm, tephra layer and is a characteristically light reddish brown silt-sized tephra layer in visual core description. The thickness of this tephra layer ranges between 6 and 10 cm.
Microscopic observation of smear slide Samples 386-M0081B-1H-8, 38 cm, and 386-M0082B-1H-3, 61 cm, shows the principal component of this layer comprises mostly volcanic glass shards (Table T4). Most volcanic glass grains are 10 µm to several tens of micrometers in size, with few sand-sized grains. The most abundant volcanic glass types are the pumiceous type and the fibrous type, and the brown glass shard type is less common (Figure F32). Orthopyroxene and clinopyroxene are the dominant heavy minerals found in this tephra. A high concentration of biogenic grains is observed in smear slide Sample 386-M0082B-1H-3, 61 cm, including diatoms and sponge spicules (Table T4; Figure F32). Glass shards are not well sorted and have sharp shapes, so it is possible that this sediment was deposited almost synchronously without a long transportation pathway. Therefore, this tephra layer can be used as a key tephra bed, indicating a synchronous horizon.
The black silt- to very fine sand–sized tephra layer (M0082D-1H-22, 28.3 cm) is intercalated as a lenticular bed in silty sediment interval 386-M0082D-1H-22, 28–28.3 cm (Figure F31). It is composed of platy and bubble-wall types of volcanic glass shards. Hornblende is dominant in the heavy minerals, and orthopyroxene and biotite are also observed.
5. Micropaleontology
Six holes were cored at Site M0081 and four holes were cored at Site M0082, recovering, respectively, three and two pairs of trigger cores and giant piston cores in Basin S1 of the southern part of the Japan Trench. The biostratigraphy determined for Holes M0081D and M0082D was based on an examination of radiolaria collected during the offshore phase of Expedition 386. For Site M0082D, additional samples were taken during the OSP phase to detect more detailed changes. Foraminifera from samples collected during the offshore phase were examined to determine the provenance of mass transport deposits.
5.1. Radiolaria
Relative abundance changes of Cycladophora davisiana, the Tetrapyle circularis/fruticosa group (hereafter Tetrapyle group), and Lithomelissa setosa in cores from Holes M0081D and M0082D in the southern basin of the Japan Trench are shown in Figure F33. Results of radiolarian analysis for these holes are described below. See Micropaleontology in the Expedition 386 methods chapter (Strasser et al., 2023a) for more details.
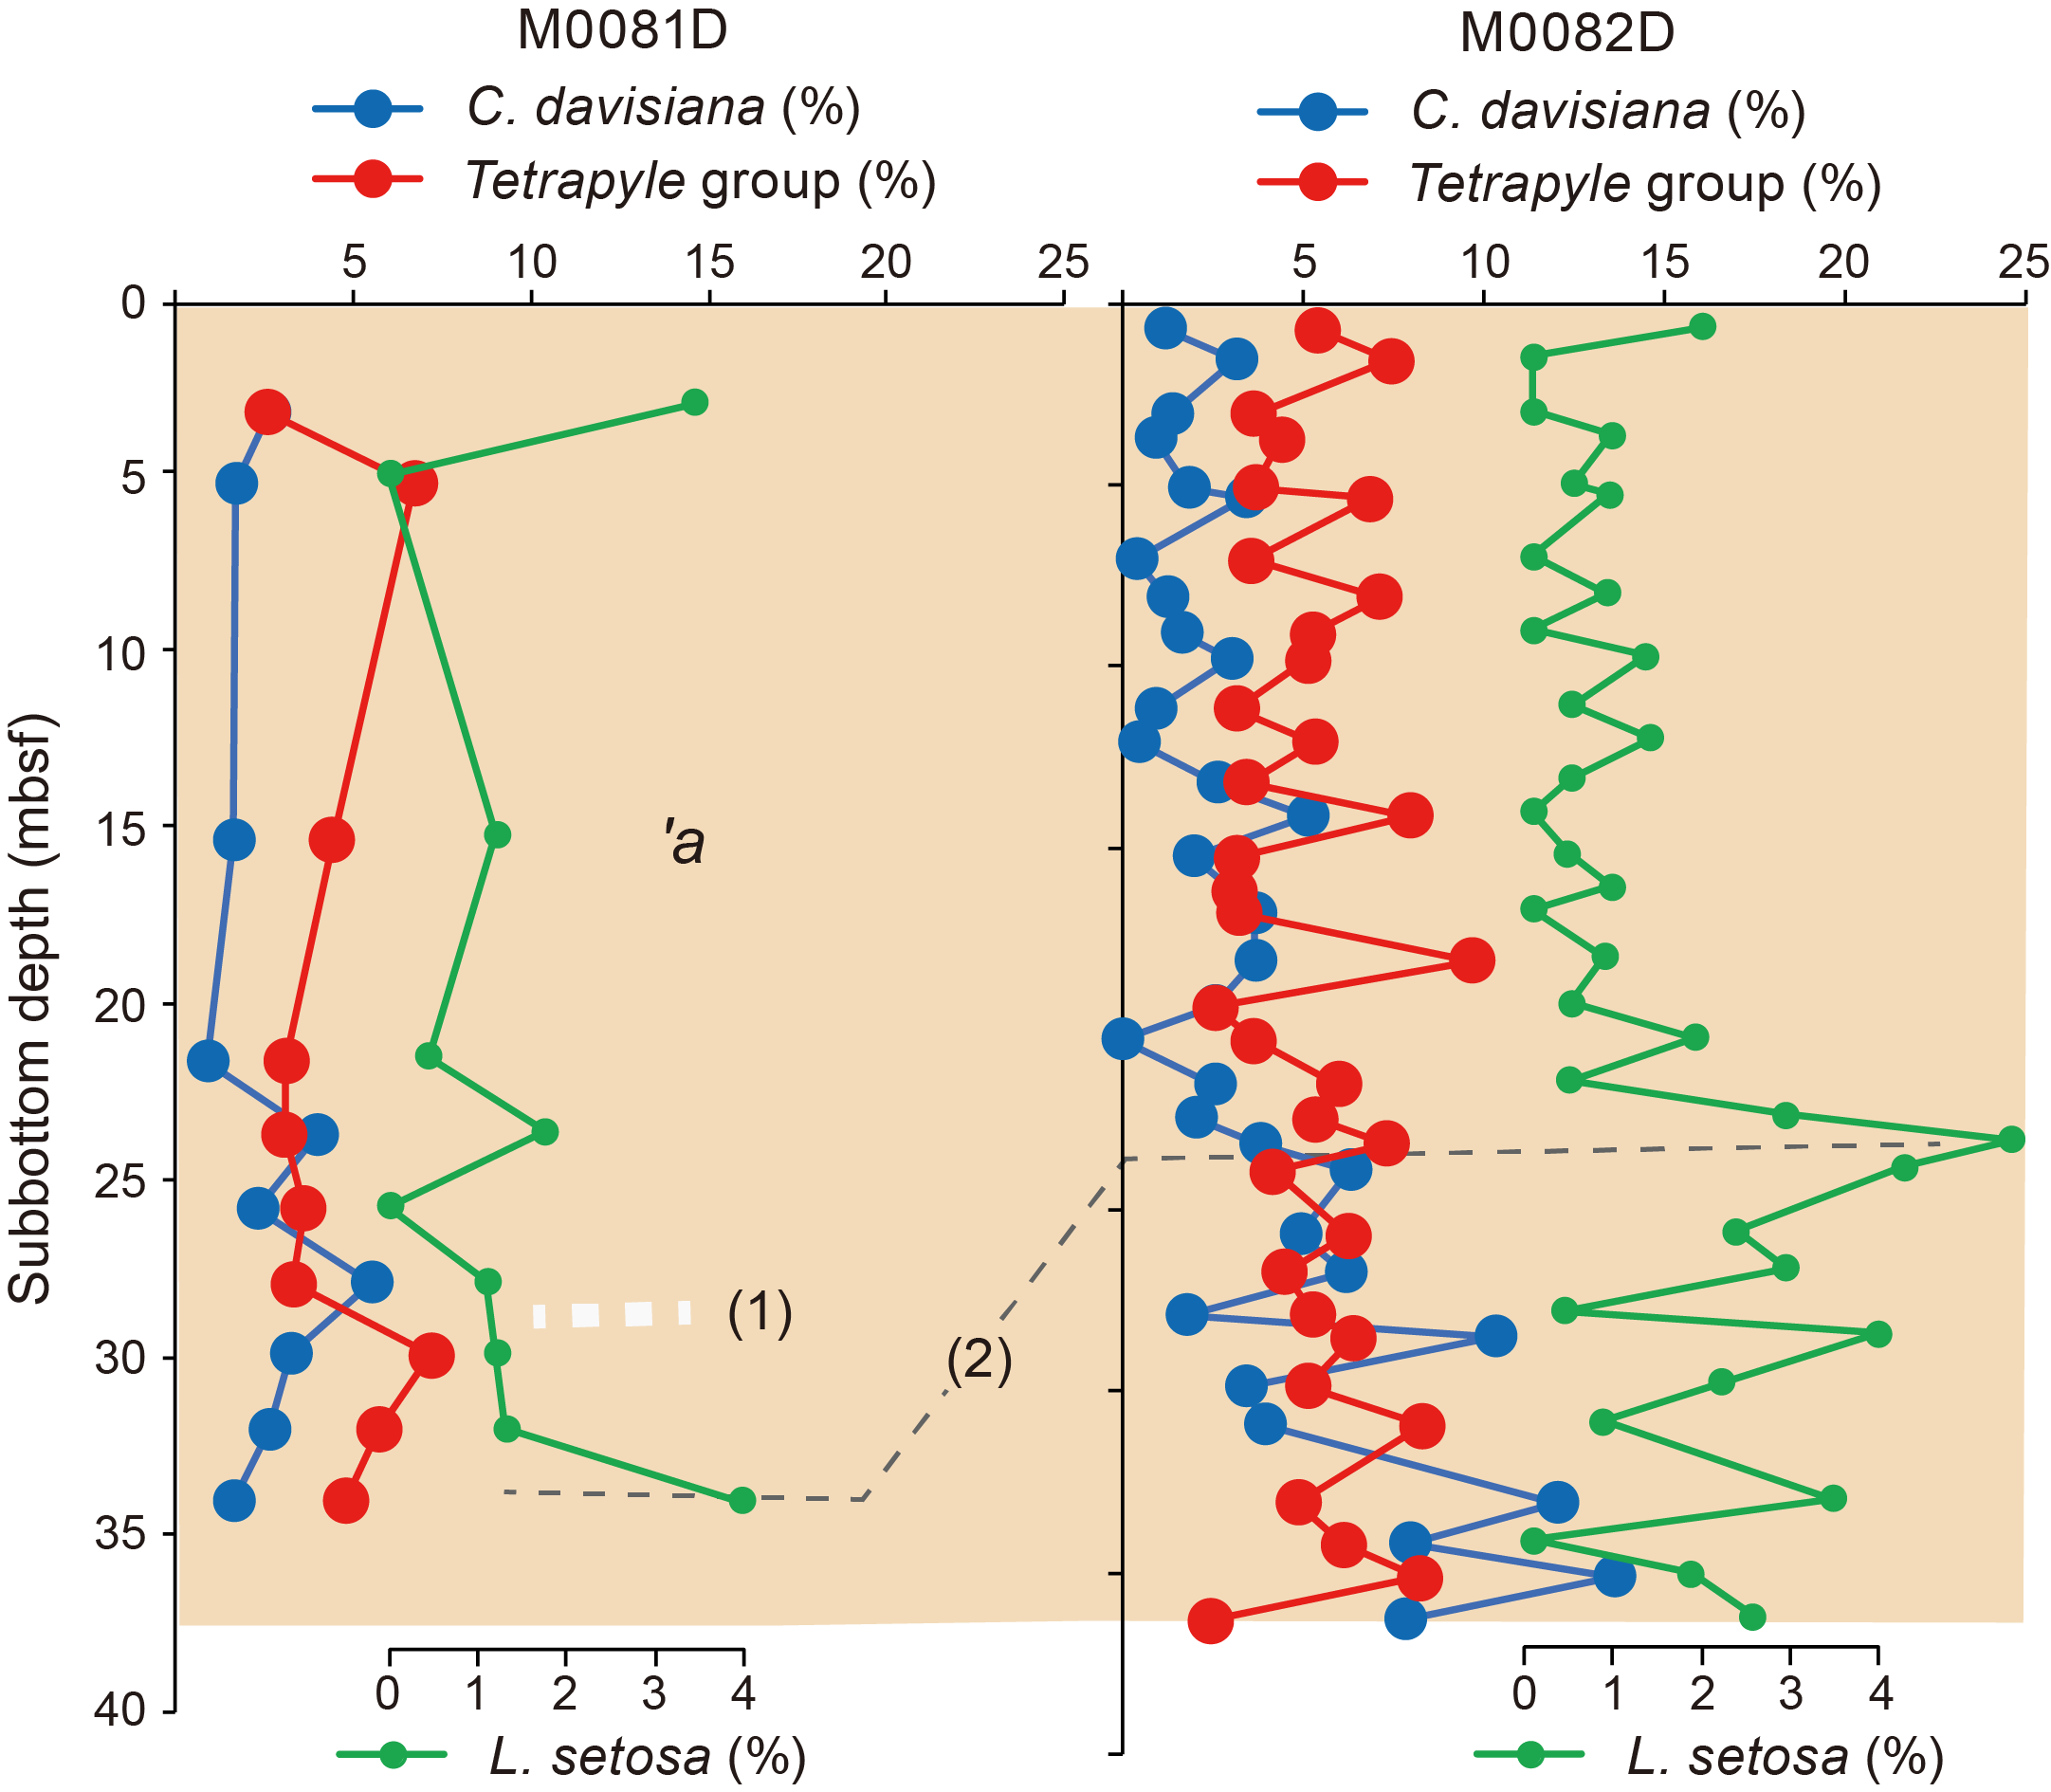
Figure F33. Radiolarian species abundance.
5.1.1. Site M0081
A total of 17 radiolarian samples were collected from Hole M0081D, and 10 samples were processed for analysis (Table T6). The remaining 7 samples were found within event layers and were not processed. Radiolarian fossils were abundant throughout the core, and their preservation was good. C. davisiana showed abundances of less than 6% throughout the core. Therefore, it is likely that this entire section of Hole M0081D is included in C. davisiana Zone ‘a, corresponding to the Holocene (Morley et al., 1982). Although the Tetrapyle group abundance was generally low (2%–8%), it is relatively high (>5%) below 27.9 mbsf, probably corresponding to the interval of the Hypsithermal climatic optimum event between Events 1 and 3). If the above correlations are correct, a relatively high value (>3%) of L. setosa abundance at the bottom of the core (34.1 mbsf) could be correlated to Event 2.
5.1.2. Site M0082
A total of 39 radiolarian samples were collected from Hole M0082D, and 34 samples were processed for analysis (Table T6). The remaining 5 samples were from event layers and were not processed. Radiolarian fossils were abundant throughout the core, and their preservation was good. C. davisiana showed abundances of less than 15% throughout the core and tended to be somewhat higher (>10%) below 27 mbsf. Therefore, it is likely that the entire section of this hole is included in C. davisiana Zone ‘a, corresponding to the Holocene, and if so, the lower part of the core is likely to correspond to the earliest Holocene, near the boundary of C. davisiana Zones ‘a and ‘b (Morley et al., 1982). The Tetrapyle group varied in abundance between 2% and 10%; however, it was difficult to recognize Events 1 and 3 from this record. The abundance of L. setosa reached a maximum (>3%) at 23.2 mbsf and could be correlated to Event 2).
According to above correlations from Sites M0081 and M0082, it is likely that the sedimentation rate is significantly higher at Site M0081 than at Site M0082 (Figure F33).
5.2. Foraminifera
5.2.1. Site M0081
Samples were taken at 5 m intervals offshore. With the exception of the agglutinated foraminifera, which may be either in situ or reworked, all foraminifera at Site M0081 are considered to be allochthonous.
5.2.1.1. Hole M0081B
Four samples from Hole M0081B were examined for foraminifera (Table T7). Benthic foraminifera with good preservation and planktonic foraminifera with good to very good preservation are present in two of the samples; two samples are barren. All samples examined for foraminifera contain abundant diatoms, radiolaria, and sponge spicules.
No provenance interpretation can be made for these samples due to low foraminifera abundance.
5.2.1.2. Hole M0081C
One sample from the base of Hole M0081C was examined for foraminifera (Table T7). One calcareous benthic foraminifer with moderate preservation is present. This sample contains abundant diatoms, radiolaria, and sponge spicules.
No provenance interpretation can be made for this sample due to low foraminifera abundance.
5.2.1.3. Hole M0081D
Seven samples from Hole M0081D were examined for foraminifera (Table T7). Benthic foraminifera with moderate preservation are present to rare in five samples; two samples are barren. Planktonic foraminifera with good or poor preservation, including brownish orange stained specimens, are present in two samples. All samples examined for foraminifera contain abundant diatoms, radiolaria, and sponge spicules.
No provenance interpretation can be made for these samples due to low foraminifera abundance.
5.2.1.4. Hole M0081E
One sample from the base of Hole M0081E was examined for foraminifera (Table T7). One calcareous benthic foraminifer with very good preservation is present. This sample contains abundant diatoms, radiolaria, and sponge spicules.
No provenance interpretation can be made for this sample due to low foraminifera abundance.
5.2.1.5. Hole M0081F
Eight samples from Hole M0081F were examined for foraminifera (Table T7). Benthic foraminifera with moderate to good preservation are present to rare in seven samples; one is barren. Planktonic foraminifera with poor to good preservation are present in five samples. Brownish orange foraminifera are present in three samples. All samples examined for foraminifera contain abundant diatoms, radiolaria, and sponge spicules.
No provenance interpretation can be made for these samples due to low foraminifera abundance.
5.2.2. Site M0082
Samples were taken at 5 m intervals offshore, as described in the Micropaleontology in the Expedition 386 methods chapter (Strasser et al., 2023a). With the exception of the agglutinated foraminifera, which may be either in situ or reworked, all foraminifera at Site M0082 are considered to be allochthonous.
5.2.2.1. Hole M0082B
Four samples from Hole M0082B were examined for foraminifera (Table T8). Benthic foraminifera with moderate to good preservation are present in two samples; two samples are barren. All samples examined for foraminifera contain abundant diatoms, radiolaria, and sponge spicules.
No provenance interpretation can be made for these samples due to low foraminifera abundance.
5.2.2.2. Hole M0082C
One sample from the base of Hole M0082C was examined for foraminifera (Table T8). Benthic and planktonic foraminifera with good preservation are present. This sample contains abundant diatoms, radiolaria, sponge spicules, glass, and iron monosulfides. Pieces of an unknown material, possibly plastic, occur in this sample.
No provenance interpretation can be made for this sample due to low foraminifera abundance.
5.2.2.3. Hole M0082D
Seven samples from Hole M0082D were examined for foraminifera (Table T8). Benthic foraminifera with poor to good preservation are present to rare in four samples; three are barren. Planktonic foraminifera with moderate preservation are present to common in three samples; four are barren. All samples examined for foraminifera contain abundant diatoms, radiolaria, and sponge spicules.
No provenance interpretation can be made for these samples based on benthic foraminifera due to low foraminifera abundance; however, the common planktonic assemblage in Sample 386-M0082D-1H-25, 102.5–105.5 cm (25.68 mbsf), suggests a source no shallower than an outer neritic environment.
5.2.3. Occurrence of stained foraminifera
Several samples from Sites M0081 and M0082 contain brownish orange stained benthic and planktonic foraminifera, with the most being found in Sample 386-M0082D-1H-25, 102.5–105.5 cm (25.68 mbsf). Stained specimens include the planktonic foraminifera Globigerina bulloides, Neogloboquadrina pachyderma, Neogloboquadrina dutertrei, Globorotalia inflata, and Orbulina universa. All specimens of the benthic foraminifer Chilostomella oolina are stained, and some are infilled with iron monosulfides. These displaced assemblages are of note because they may be useful in site correlation between Sites M0081 and M0082.
6. Geochemistry
6.1. Interstitial water
At Site M0081, two bottom water (BW) samples and a total of 77 interstitial water (IW) samples were collected using Rhizon samplers from two trigger cores (Holes M0081C and M0081E) and three GPC cores (Holes M0081B, M0081D, and M0081F). At Site M0082, two BW samples and 50 IW samples were collected from two trigger cores (Hole M0082A and M0082C) and two GPC cores (Holes M0082B and M0082D). See Geochemistry in the Expedition 386 methods chapter (Strasser et al., 2023a) for details of the sampling, analytical methods, and data quality.
The IW geochemical results from all holes at both sites closely match for all analytes and are generally discussed together unless otherwise noted. In general, IW composition at Sites M0081 and M0082 is influenced by organic matter degradation, including the release of metabolic products and consumption of electron acceptors, as well as dissolution/precipitation reactions within sediment.
6.1.1. Shipboard analyses: salinity, alkalinity, and ammonium
Salinity at Site M0081 generally varies between 34.5 and 36. The lowest values (34.5) are found at ~1 mbsf in the GPC cores, followed by a gradual but nonlinear increase with depth until values stabilize at 36 from ~20 mbsf to the bottom of the cores (Table T9; Figure F34). Total alkalinity at Site M0081 is near seawater values in the BW (Bruland et al., 2014) and well above seawater values in the trigger cores, increasing to greater than 10 mM in the uppermost 1 m (Table T9; Figure F34). In the GPC cores, values show an asymptotic increase with depth from ~10 mM, with values plateauing at ~75 mM from ~20 mbsf to the bottom of the cores. Ammonium (NH4+) in the BW at Site M0081 is low, like seawater but ~0.5 mM in the top of the trigger cores, increasing to higher values with depth (Table T9; Figure F34). In the GPC cores, there is a first asymptotic increase with depth, reaching ~3 mM at ~6 mbsf. These values remain stable to ~10 mbsf, followed by a second, more linear increase to ~6 mM at ~20 mbsf. From 20 mbsf to the bottom of the cores, ammonium increases more or less linearly to ~7 mM.
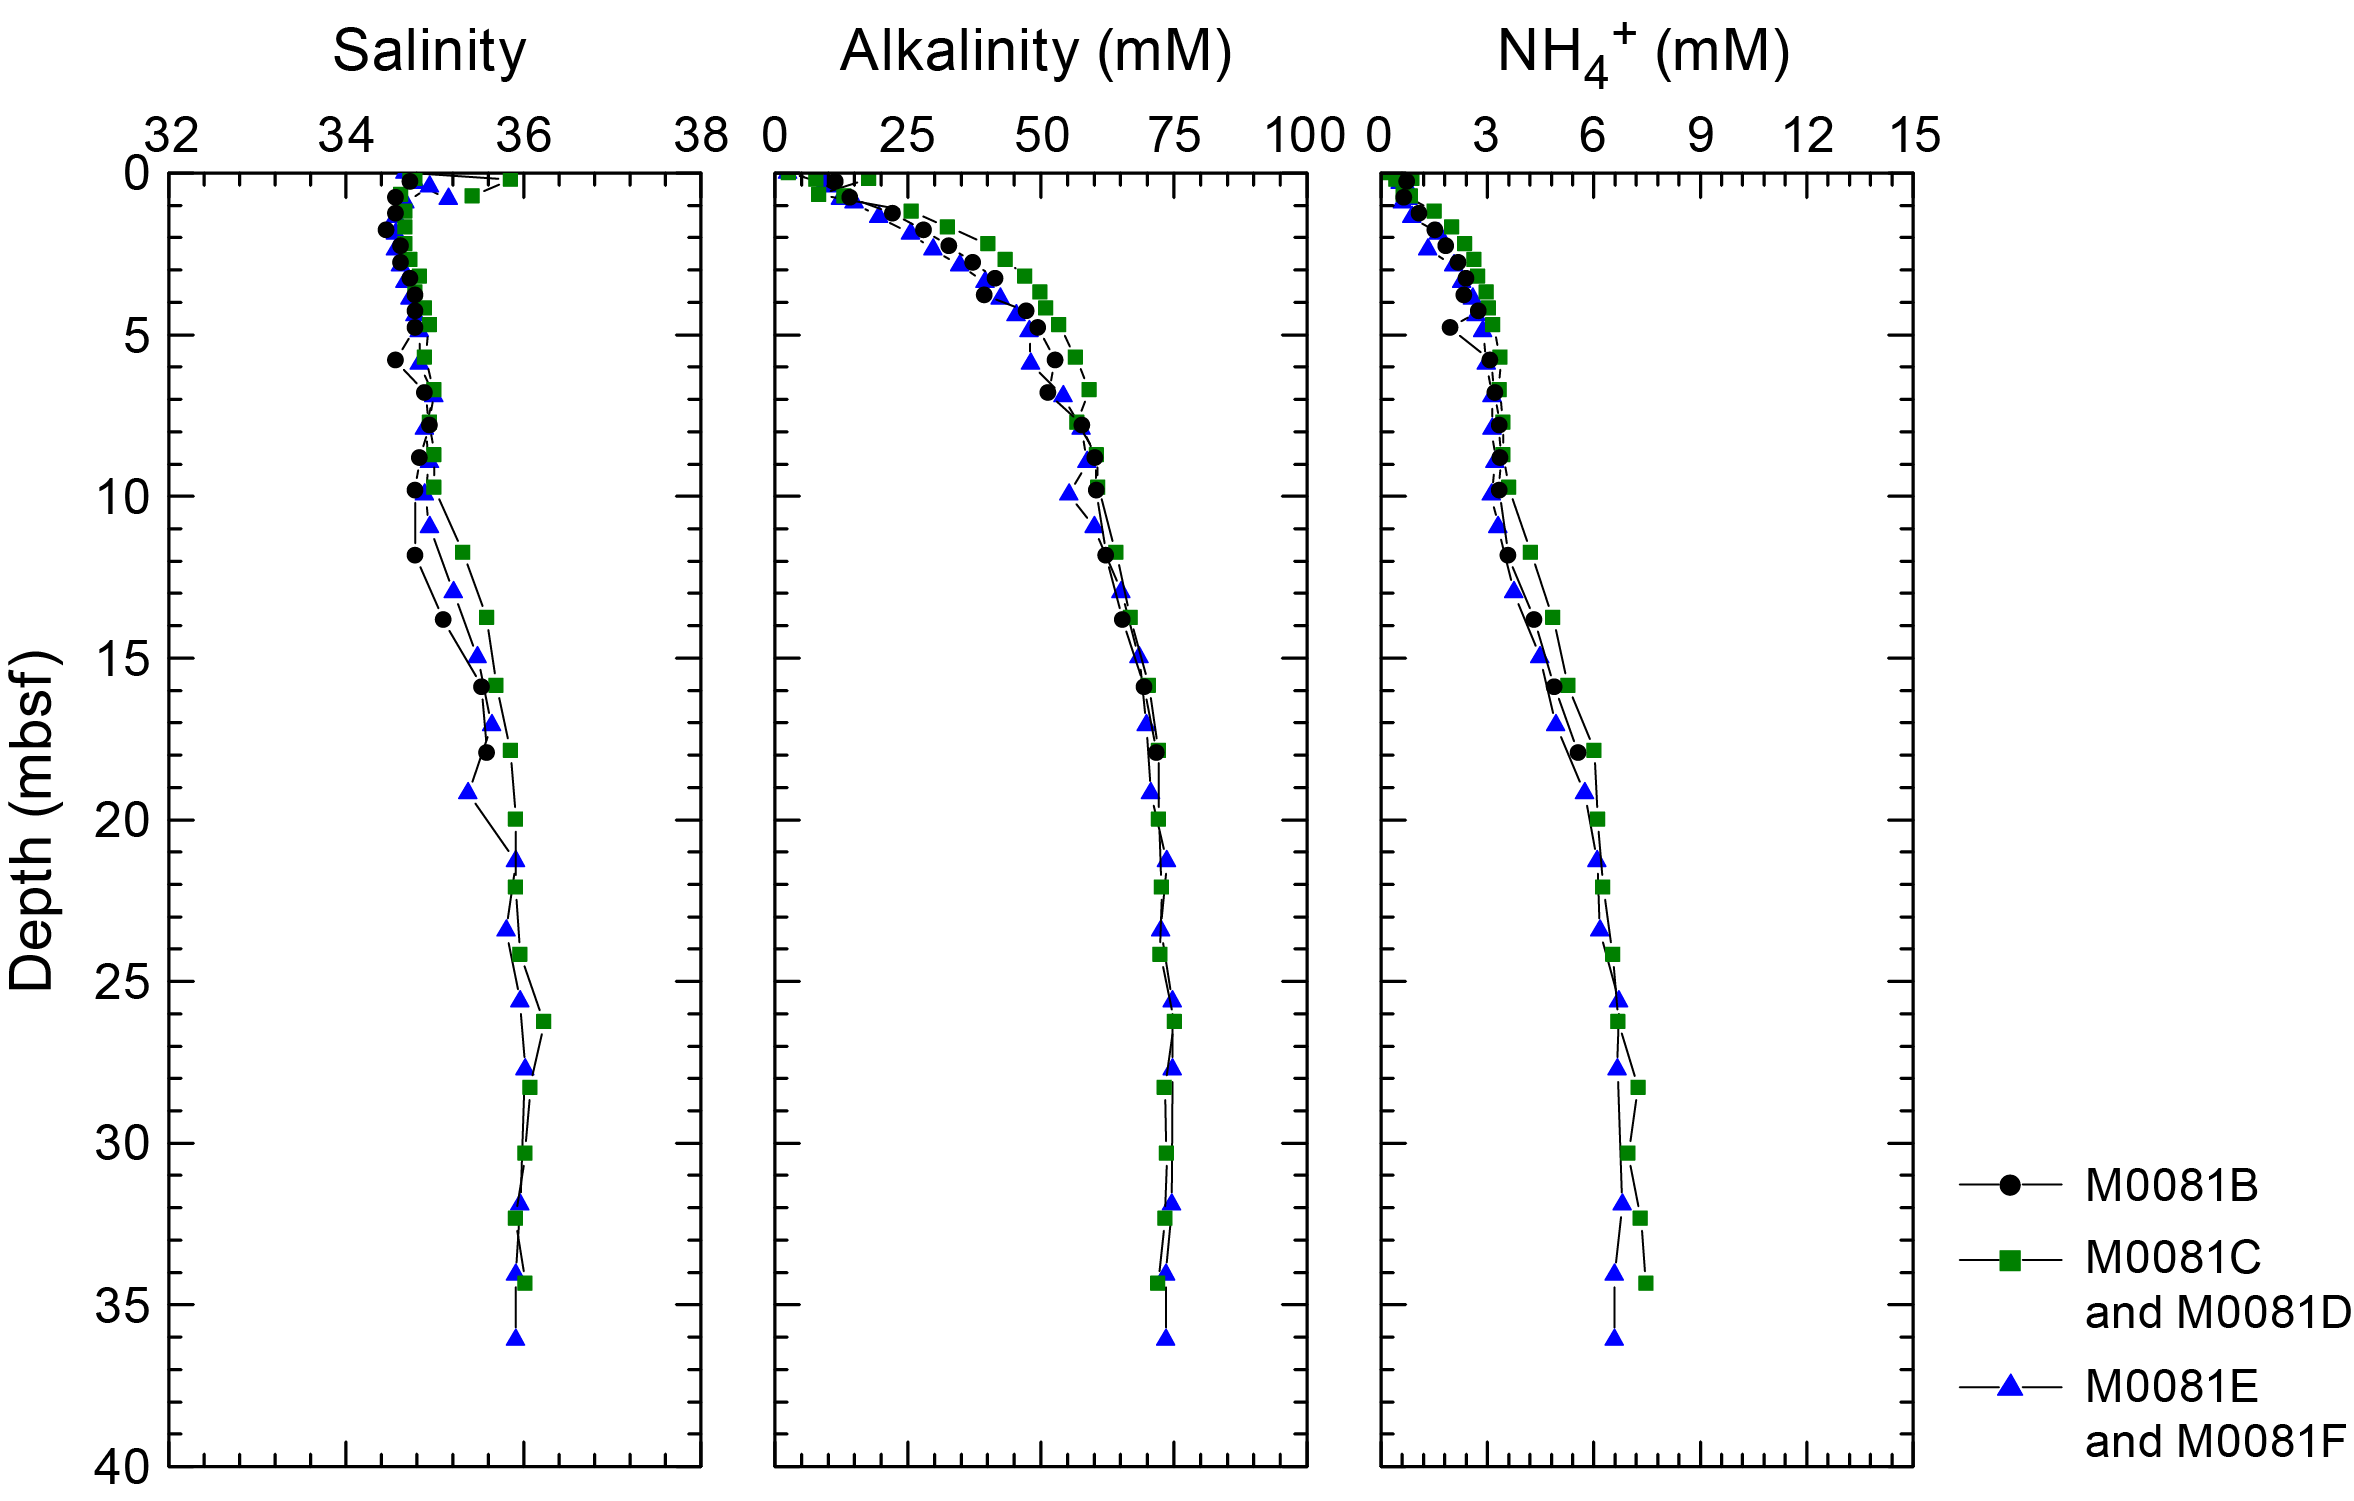
Figure F34. IW salinity, alkalinity, and ammonium, Site M0081.
Salinity at Site M0082 generally varies between 34.5 and 36. The lowest values (34.5) are found in the trigger core and the uppermost ~1 m of the GPC core, followed by a gradual but nonlinear increase with depth until values stabilize at 36 from ~20 mbsf to the bottom of the core (Table T10; Figure F35). Alkalinity at Site M0082 is low, similar to seawater, in the BW samples, but approaches 10 mM at the top of the trigger core and increases with depth (Table T10; Figure F35). In the GPC cores, there is an asymptotic increase with depth starting at values near 10 mM, with values reaching a plateau at ~75 mM from ~15 mbsf to the bottom of the core. Ammonium in BW at Site M0082 is low, similar to seawater, and values at the top of the trigger core are >0.4 mM and increase with depth (Table T10; Figure F35). In the GPC cores, values are elevated at the top relative to seawater (Bruland et al., 2014) and show an asymptotic increase with depth, reaching ~6 mM at ~27 mbsf and remaining stable to the bottom of the cored interval.
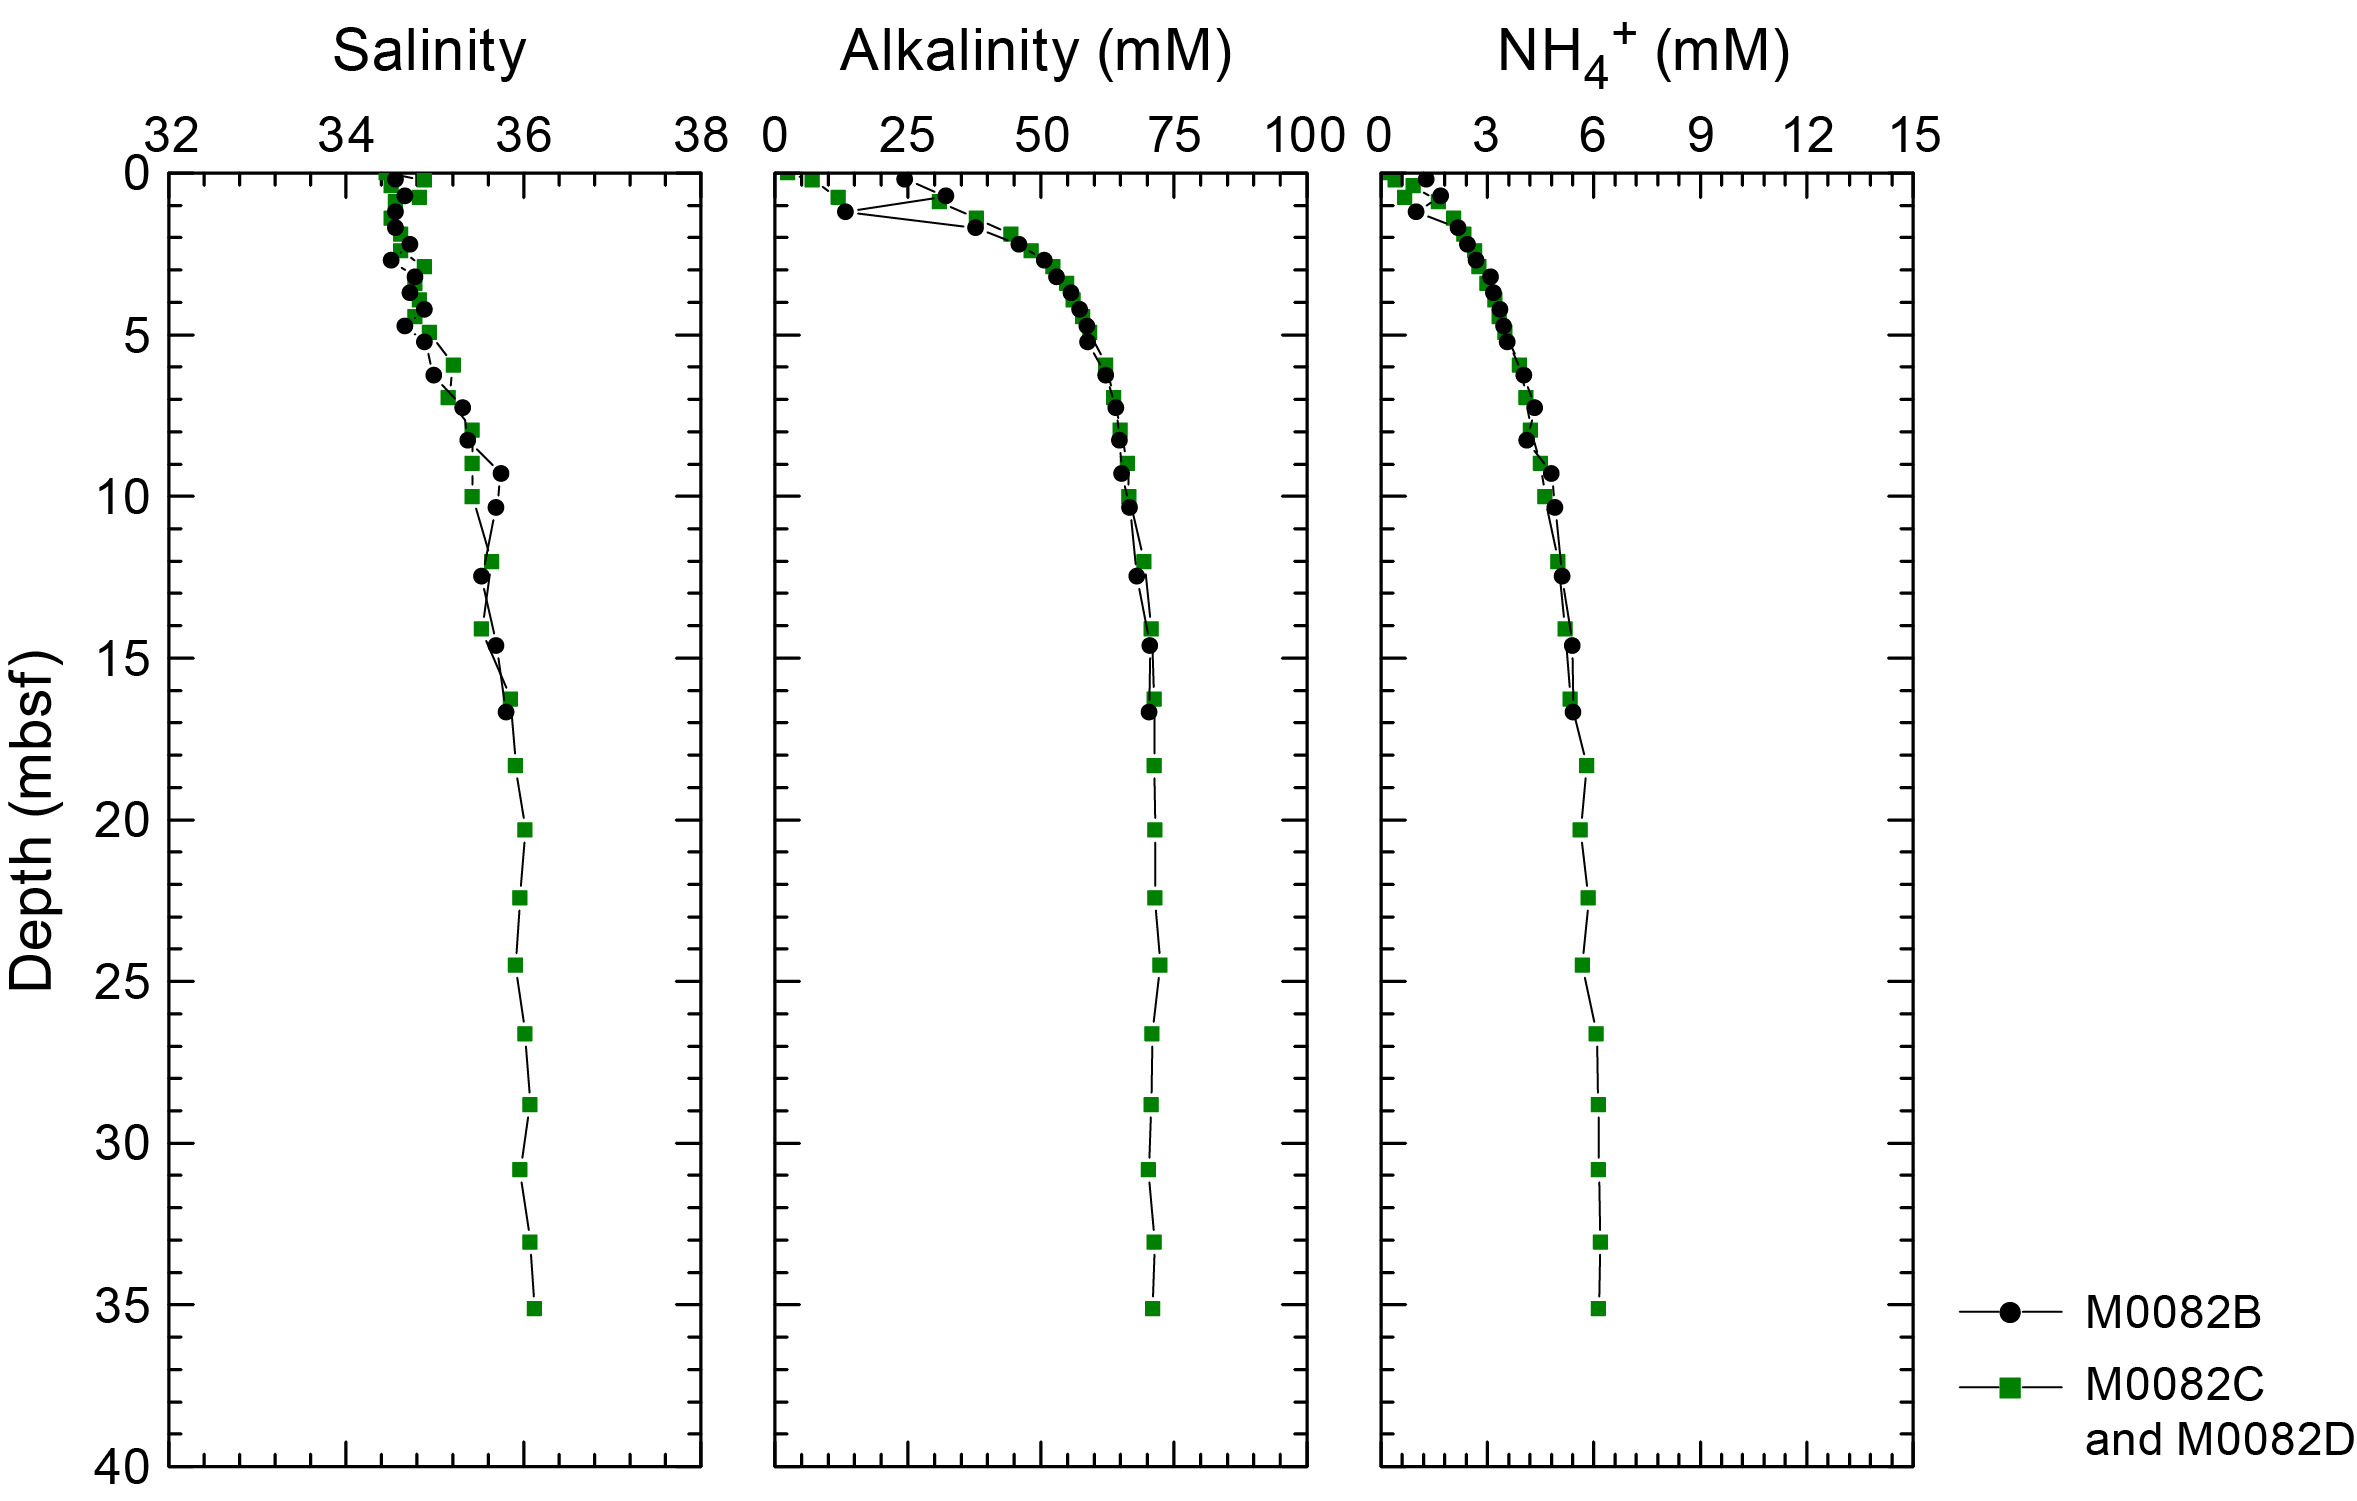
Figure F35. IW salinity, alkalinity, and ammonium, Site M0082.
6.1.2. Shore-based analysis
6.1.2.1. Dissolved vanadium, molybdenum, and uranium
A suite of trace metals was analyzed using inductively coupled plasma-mass spectroscopy (ICP-MS) including vanadium (V), molybdenum (Mo), and uranium (U), briefly described below, as well as copper (Cu) and rubidium (Rb) (Tables T9, T10).
Dissolved V concentrations in the trigger cores from Site M0081 differ between the holes (Figure F36). Although the lowest values (~35 nM) in Hole M0081C are at ~0.8 mbsf, the lowest values overall (~30 nM) are found at the top of Hole M0081D, with values approaching 200 nM at ~0.7 mbsf. In the GPC cores, V concentration patterns are relatively consistent between Holes M0081B and M0081F below ~3 mbsf but are slightly different in Hole M0081D. In Holes M0081B and M0081F, V concentrations increase rapidly to reach ~150–300 nM in the uppermost ~8–9 m and then decrease even more rapidly from ~9 to 10 mbsf to below 100 nM. This is followed by a gradual increase downcore that reaches ~120–140 nM. In Hole M0081D, the V concentration increase in the uppermost 8–9 m (to ~130 nM) and the subsequent drop around 9–10 mbsf (to ~100 nM) are less pronounced. In contrast, the V increase below 10 mbsf is more pronounced, and values of ~210–260 nM are reached in the lowest part of the core.
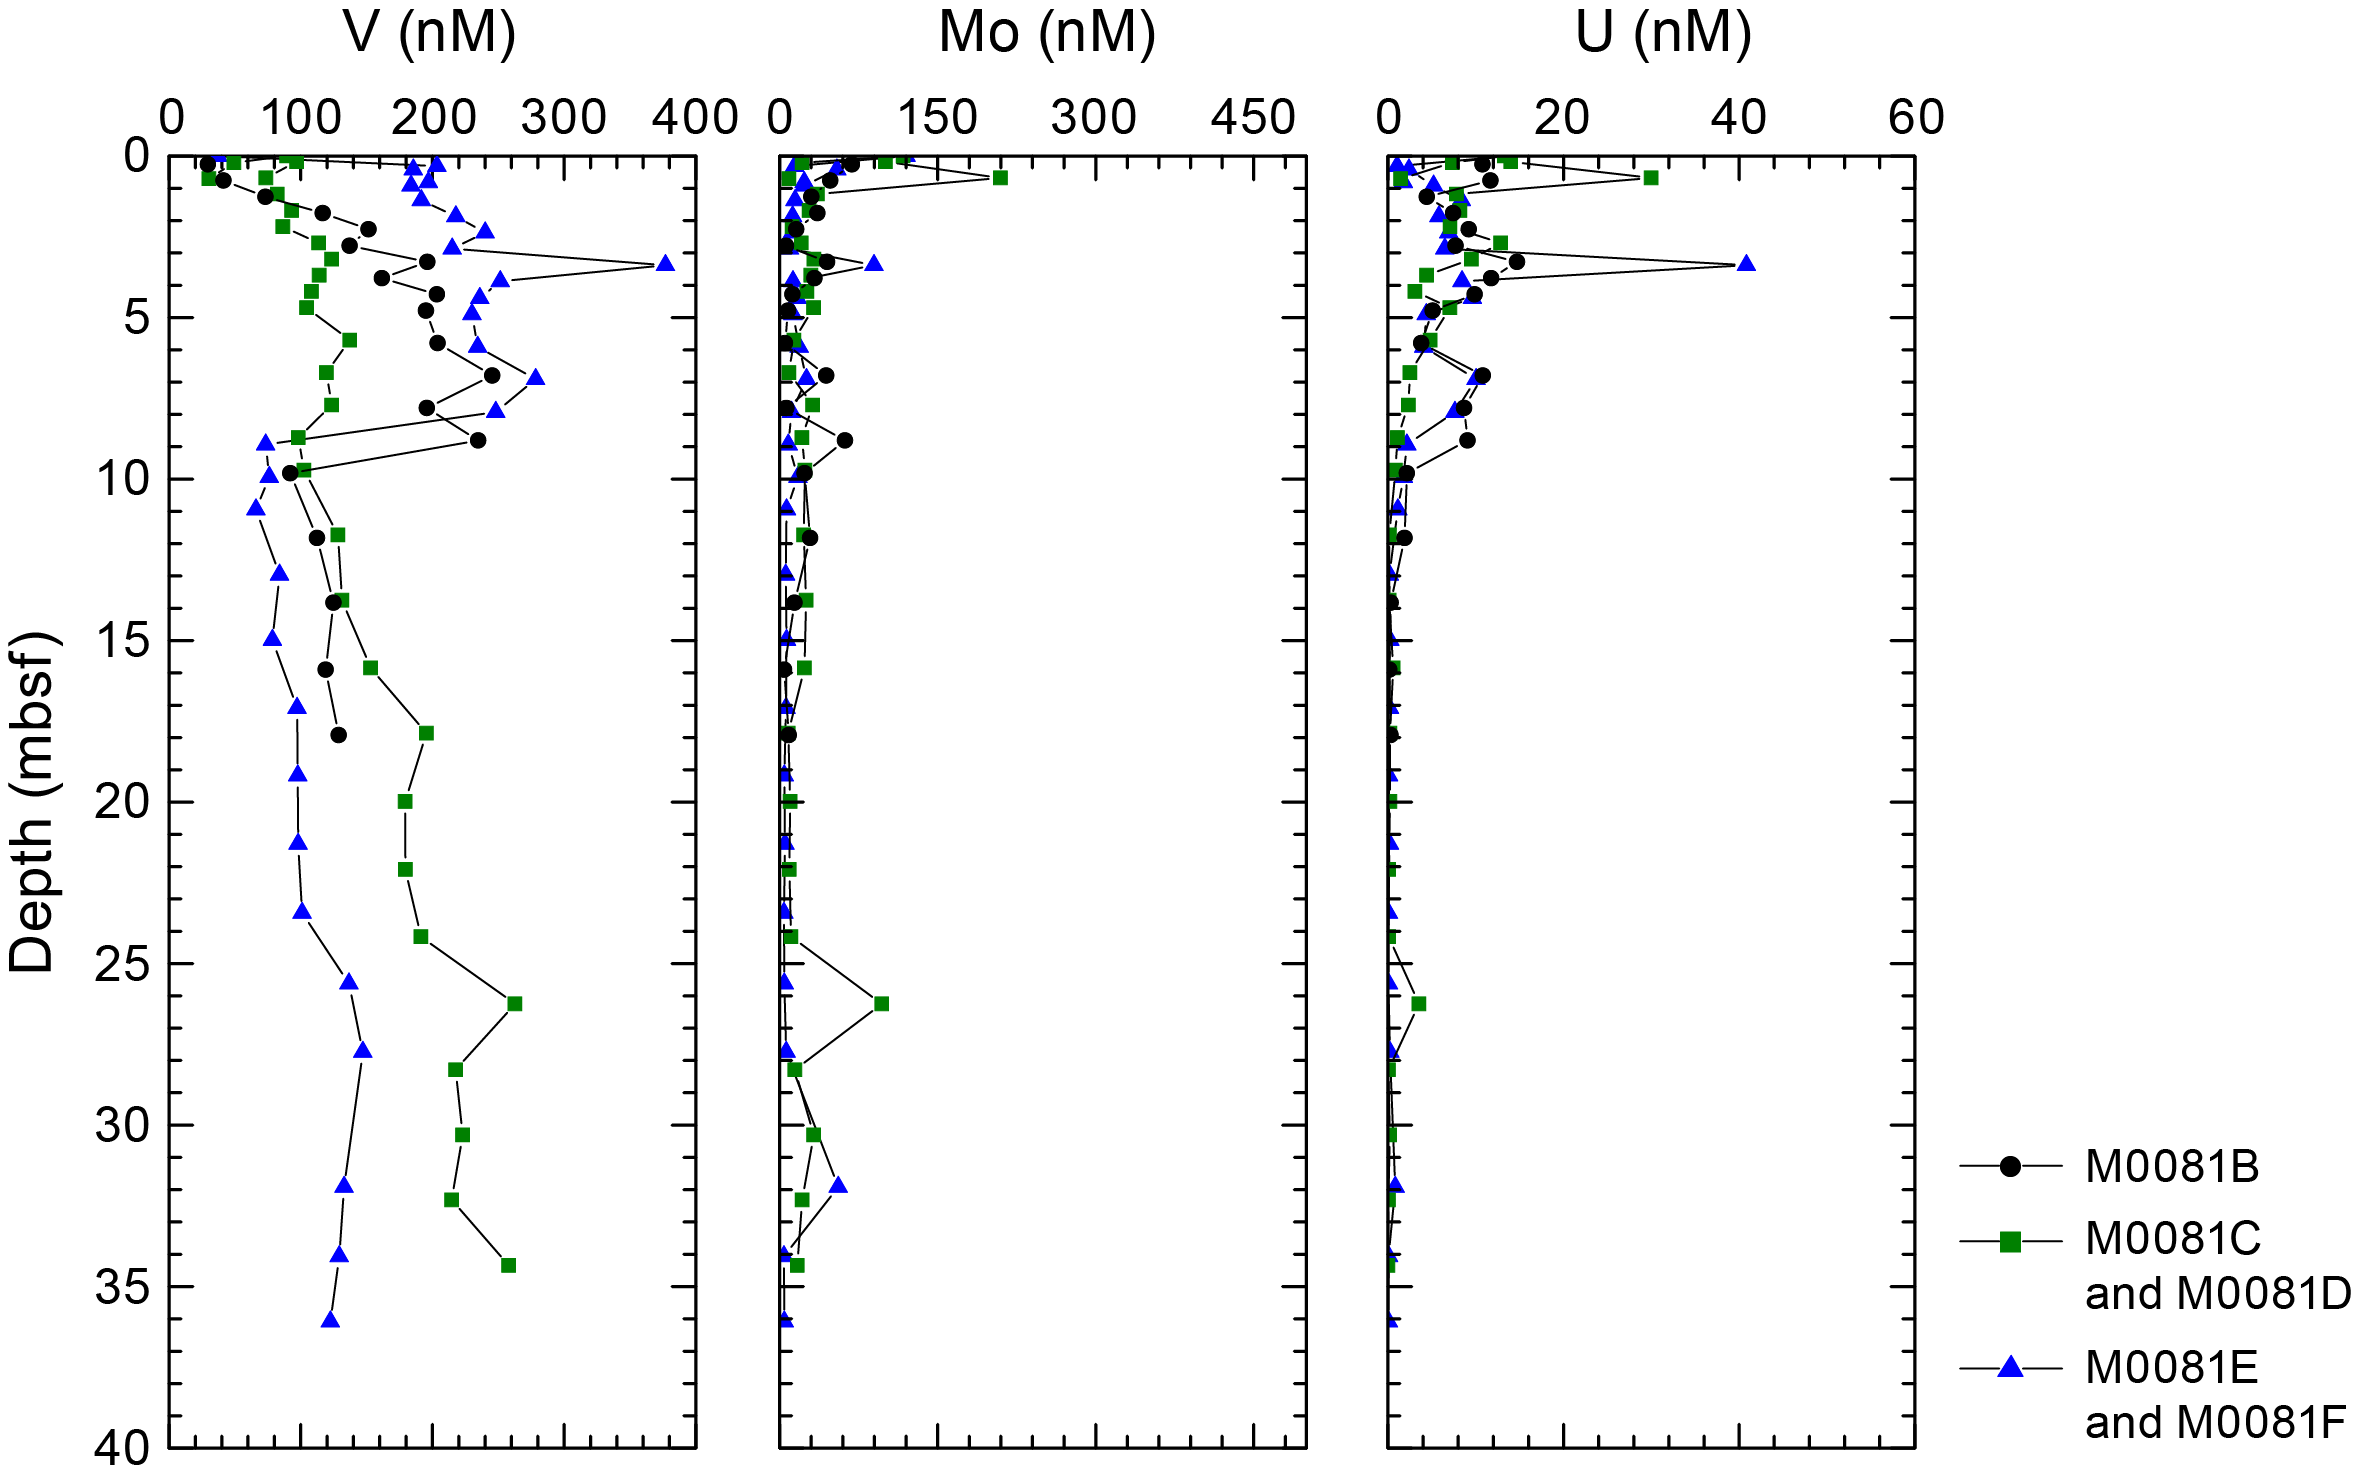
Figure F36. IW V, Mo, and U, Site M0081.
Dissolved Mo concentrations (Figure F36) are highest at the top of the trigger cores (~120 nM), followed by a rapid decrease to ~10–20 nM in the deeper parts. The GPC samples show variable concentrations of Mo, but the overall highest Mo concentrations are in the uppermost ~10 m, with peaks ranging between ~50 and 210 nM. Below that depth, Mo decreases to mostly below ~20 nM in the lower parts of the cores, apart from isolated samples reaching ~60–100 nM between ~25 and 35 mbsf.
Dissolved U concentrations (Figure F36) at the top of the trigger cores are ~13–14 nM, and values decrease to ~1 nM in the deeper parts. In the GPC cores, the U profiles look similar to Mo, with the highest values in the uppermost ~10 m and peaks reaching ~10–40 nM, a decrease of concentrations toward ~10 mbsf, and low values below 1 nM for the remainder of the core.
Dissolved V concentrations in the Site M0082 trigger core (Figure F37) are ~80–100 nM. In the GPC cores, V concentrations are relatively consistent between Holes M0082B and M0082D. V concentrations increase from ~100–110 nM to peaks of ~130–160 nM at ~2–3 mbsf and then decrease again to ~100–120 nM. Another increase in V concentrations starts at ~8–12 mbsf, and values reach ~240 nM at ~28 mbsf, remaining at this level to the bottom of the core.
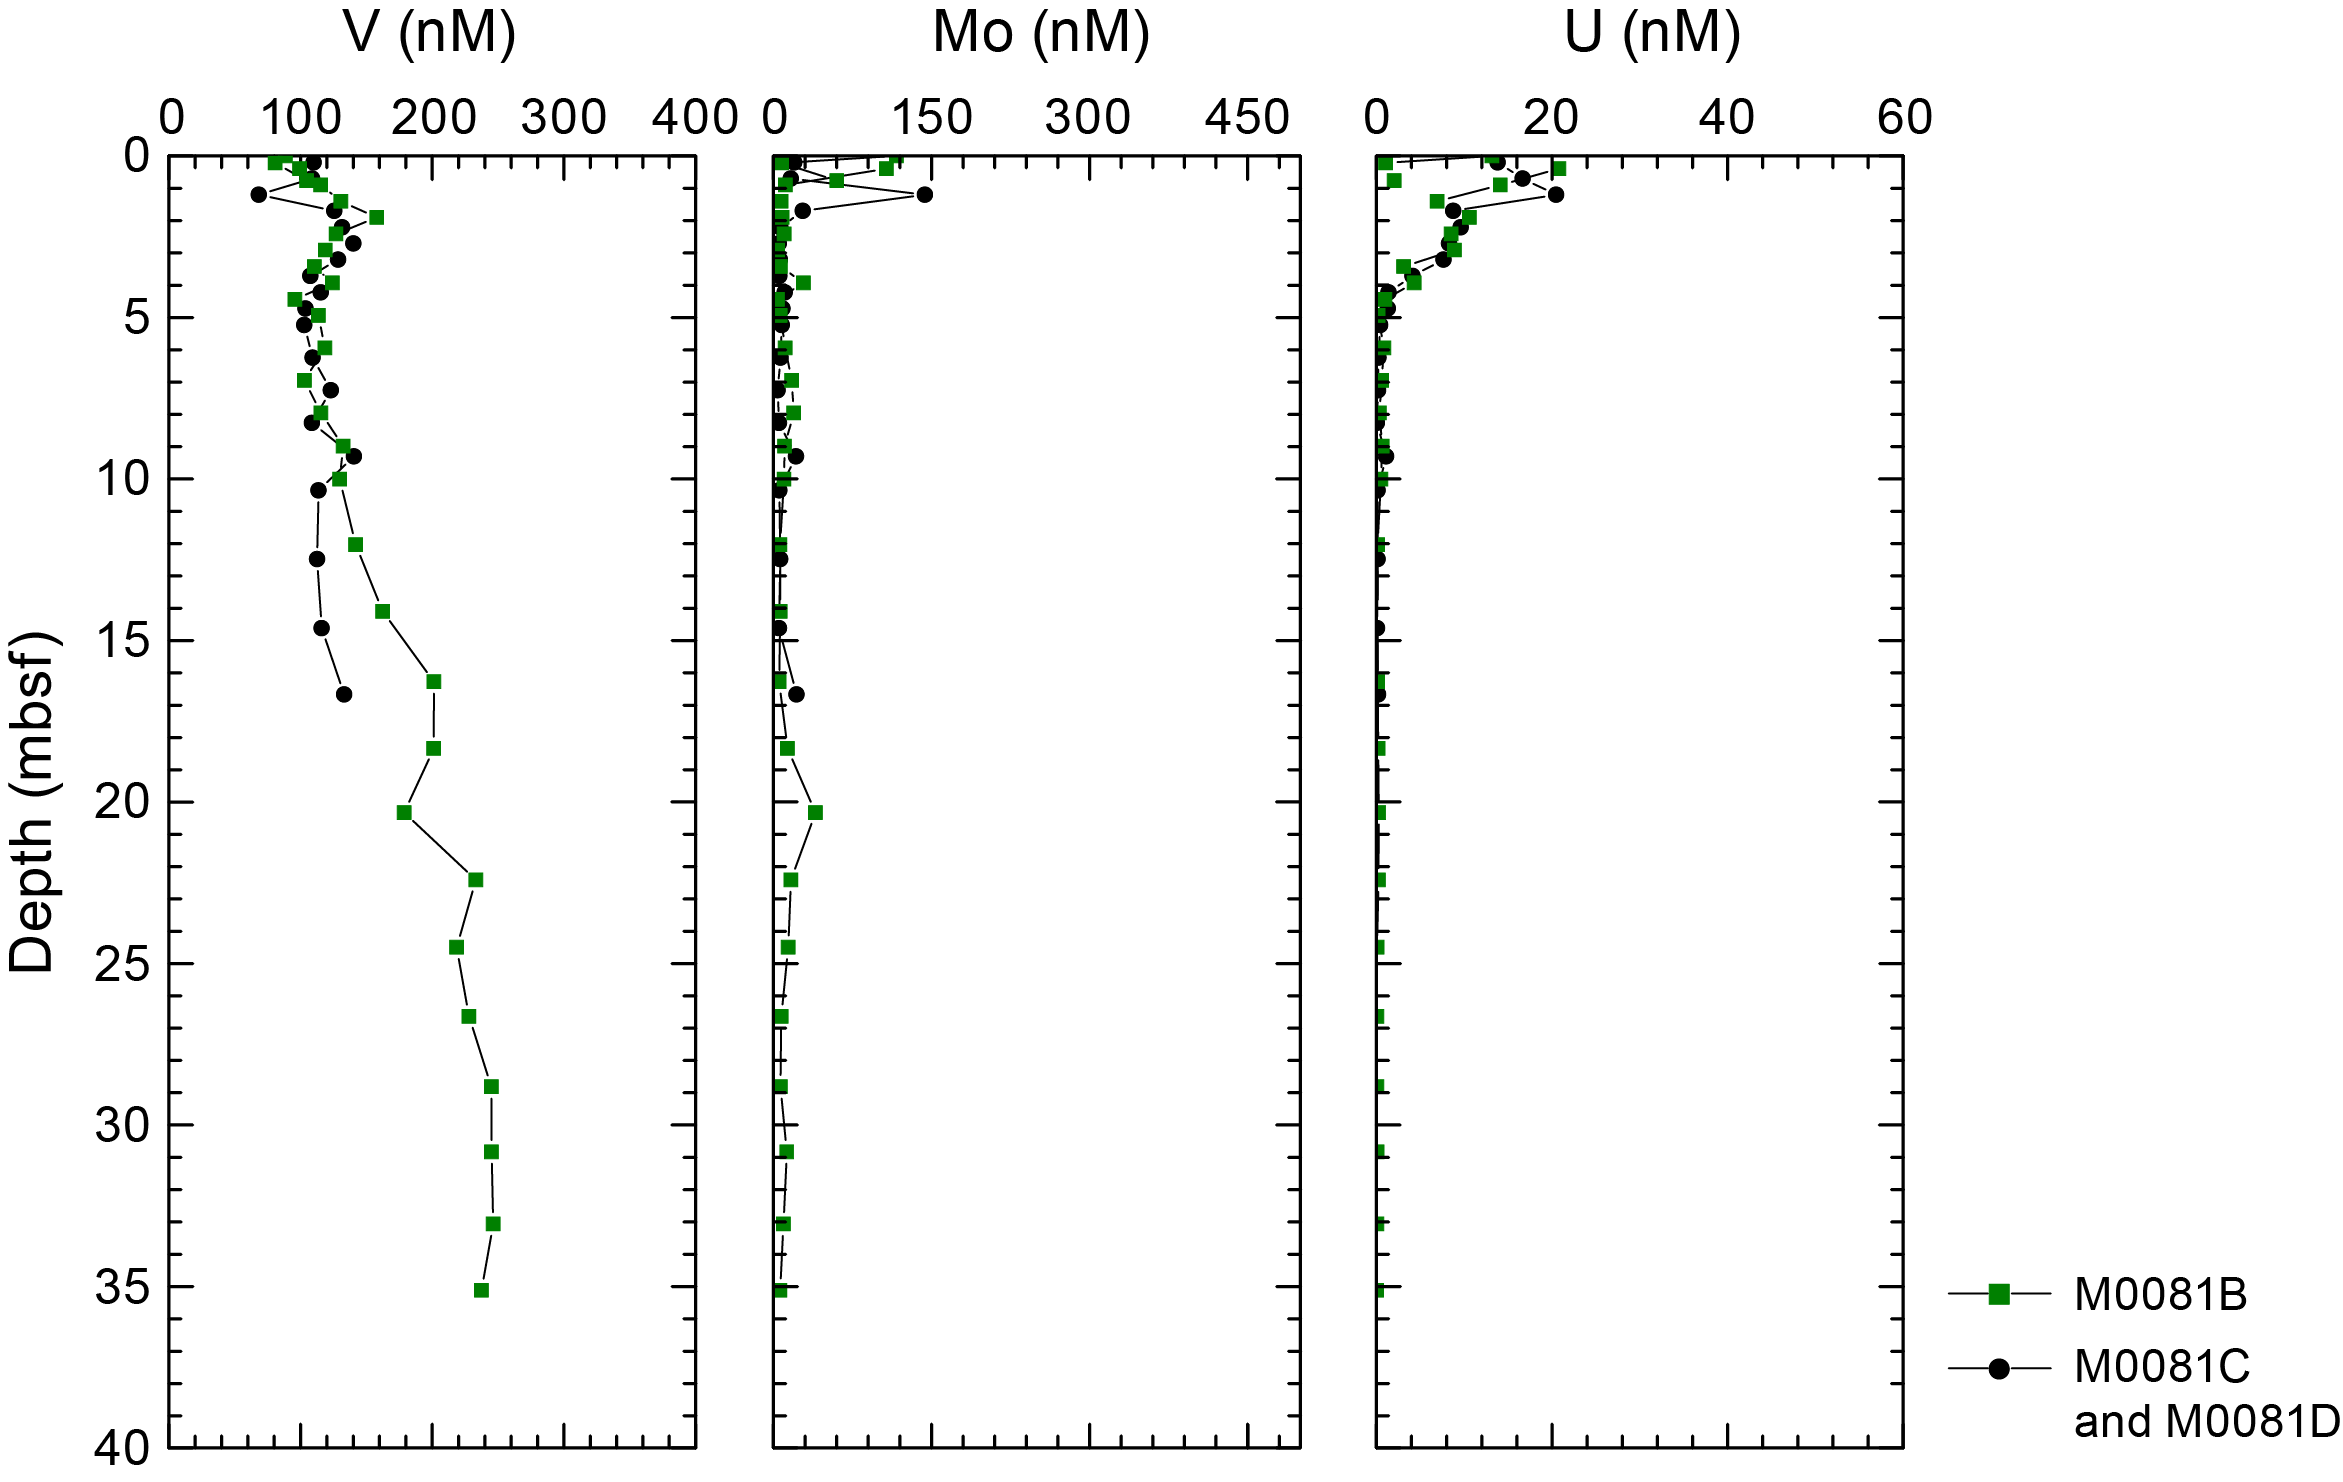
Figure F37. IW V, Mo, and U, Site M0082.
Dissolved Mo concentrations (Figure F37) are highest at the top of the trigger core (~120 nM), followed by a rapid decrease to ~8 nM in the middle part and another increase to ~60 nM at ~0.8 mbsf. The GPC samples show variations, but overall the highest Mo concentrations occur in the uppermost ~2 m, with peaks reaching ~110–140 nM. Below that depth, Mo decreases to mostly below ~10 nM over the lower parts of the cores, apart from isolated samples reaching ~20 nM between ~8 and 10 mbsf and ~40 nM at ~20 mbsf.
Dissolved U concentrations (Figure F37) at the top of the trigger core are ~13–14 nM, and values decrease to ~1–2 nM in the deeper parts of the cores. In the GPC cores, the U profiles are similar to Mo, with the highest values in the uppermost ~2 m and peaks reaching ~20 nM, a decrease in concentration toward ~5 mbsf, and low values mostly below 1 nM for the remainder of the core.
6.1.2.2. Dissolved lithium, boron, silica, manganese, iron, strontium, and barium
All minor elements analyzed using inductively coupled plasma–optical emission spectroscopy (ICP-OES) are listed in Tables T9 and T10.
Dissolved lithium (Li) at Site M0081 (Figure F38) shows the highest values (~26–29 µM) in the BW, which are similar to seawater values (Bruland et al., 2014). The highest Li concentrations at the top of the trigger cores are 24 µM, and these values decreases through the uppermost 1 m to ~21 µM. In the GPC cores, values of ~21 µM are followed by an exponential decrease to ~20 µM at ~5 mbsf, with values remaining relatively stable to ~8 mbsf. Below this depth, Li decreases linearly to minimum values (~13 µM) at ~13 mbsf. This is followed by a downcore increase to ~17 µM at ~15 mbsf and a further gradual downcore increase to ~19 µM at ~36 mbsf.

Figure F38. IW Li, B, Si, Mn, Fe, Sr, and Ba, Site M0081.
Dissolved boron (B) in the BW has seawater concentrations (~450 µM; Bruland et al., 2014). In the top IW sample of the trigger cores, B concentrations are well over 500 µM (Figure F38). GPC core IW samples have B concentrations >500 µM with values that increase to ~1000 µM at ~30 mbsf.
Dissolved silica (Si) in the BW shows values similar to seawater (~140 µM; Bruland et al., 2014). In the trigger cores, values are greater than 800 µM (Figure F38). In the GPC core, the Si concentration of the top samples is >800 µM, followed by a rapid increase to ~900–1000 µM, and then remains at this level over the entire length of the GPC cores, with isolated maxima of up to 1100 µM reached in the uppermost 10 m and a minimum of ~850 µM between ~8 and 13 mbsf.
Dissolved manganese (Mn) in the BW shows seawater values (~0.1 µM; Bruland et al., 2014). Mn concentrations at the top of the trigger cores are >550 µM, increasing to ~700 µM by the base of the trigger cores (Figure F38). In the GPC cores, this subseafloor maximum is recorded to different extents (~630–660 µM in Holes M0081B and M0081F; ~270 µM in Hole M0081D). Common to all holes, below the maximum values there is a strong Mn decrease, reaching values below 200 µM in Holes M0081B and M0081F and values below 120 µM in Hole M0081D in the uppermost 1–2 m. This minimum is followed by two minor downcore increases and decreases to the lowest Mn values (~25–35 µM), which are found between 10 and 15 mbsf. Following another minor increase to ~50–60 µM at ~15 mbsf, Mn concentrations decrease downcore to below 10 µM at ~35 mbsf.
Dissolved iron (Fe) (Figure F38) shows patterns similar to Mn. Values are below or at the detection limit in the BW. This is followed by a rapid increase to ~300 µM at ~0.2–0.3 mbsf in the trigger cores. In the GPC cores, this subseafloor maximum is recorded to different extents (~630 µM in Hole M0081B, ~65 µM in Hole M0081D, and ~275 µM in Hole M0081F). Common to all holes, below the maximum values there is a strong Fe decrease, reaching values below 20 µM in the uppermost 1–2 m. Values remain below 10 µM to ~20 mbsf in Hole M0081D and to ~10 mbsf in Hole M0081F. Below these respective depths, increased Fe concentrations reach ~65 µM at ~24 mbsf in Hole M0081D and ~150 µM at ~15 mbsf in Hole M0081F. Farther downcore, dissolved Fe remains below 10 µM in Hole M0081D, whereas there is some unsystematic fluctuation up to ~55 µM Fe in Hole M0081F.
Dissolved strontium (Sr) values in the BW and at the top of the trigger cores are ~90–100 µM (Figure F38). The top intervals of the GPC cores are characterized by relatively stable Sr concentrations of 80–90 µM to ~5 mbsf in Holes M0081B and M0081D and to ~7 mbsf in Hole M0081F. This is followed by a relatively linear increase to ~110 µM at ~15 mbsf and more or less stable values (~110 µM) to the bottom of the core.
Dissolved barium (Ba) values are lowest in the BW (~0.2 µM). Trigger cores are around 0.5 µM (Figure F38). In the GPC cores, concentrations begin around 0.5 µM and increase gradually to ~5 µM at 7–8 mbsf before increasing more rapidly below that depth, reaching ~55 µM at ~17 mbsf. Farther downcore, Ba concentrations are more or less stable around 55–65 µM.
Dissolved Li in BW at Site M0082 shows seawater values (~27 µM; Bruland et al., 2014). Dissolved Li at the top of the trigger cores is around 23 µM, decreasing to around 21 µM (Figure F39). In the GPC cores, Li concentrations are around 24 µM at the top followed by a rather linear decrease to ~14 µM at ~5 mbsf and then a slight and gradual downcore increase to ~16–17 µM at ~10 mbsf and stable concentrations of ~16–17 µM to the bottom of the core.

Figure F39. IW Li, B, Si, Mn, Fe, Sr, and Ba, Site M0082.
Dissolved B in BW shows the lowest values, which are similar to seawater (~440 µM; Bruland et al., 2014). The B concentration at the top of the trigger core is >550 µM, and concentrations increase rapidly to over 600 µM by the base of the cores (Figure F39). B concentration values at the tops of the GPC cores are nearly 600 µM, followed by a relatively steady and gradual increase to ~1000 µM at ~25 mbsf and below.
Dissolved Si in the BW is similar to seawater (~140 µM; Bruland et al., 2014). This is followed by a rapid increase to ~900 µM at ~0.2–0.3 mbsf in the trigger core (Figure F39). Si concentrations remain above 800 µM over the entire length of the GPC cores, with some variability and isolated maxima of up to ~930 µM in the uppermost 15 m of the GPC cores. Below this depth, dissolved Si decreases gradually to ~800 µM at ~35 mbsf.
Dissolved Mn shows low values similar to seawater (~0.2 µM; Bruland et al., 2014) in the BW. Trigger cores show elevated Mn concentrations of ~490 µM at ~0.2 mbsf and a further increase to ~990 µM at ~0.8 mbsf (Figure F39). In the GPC cores, this subseafloor maximum is not recorded, and although Mn concentrations are highest at the tops of the GPC cores, values are much lower than in the trigger core (~170–180 µM in Holes M0082B and M0082D). As in all holes, below the maximum values there is an exponential Mn decrease, reaching a local minimum of ~70–80 µM at ~5 mbsf. Following a short increase downcore to ~100 µM, Mn concentrations continue to exponentially decrease from ~7 mbsf downcore to values below 10 µM at ~30 mbsf.
Dissolved Fe is below the detection limit in the BW samples. The top samples in the trigger cores are ~190 µM at ~0.2 mbsf, and these decrease to ~100 µM at ~0.8 mbsf (Figure F39). In the GPC cores, this subseafloor maximum is not recorded. Like all holes discussed in this section, dissolved Fe values are below 20 µM in the uppermost ~5 m. Below this depth, there are unsystematic fluctuations between ~5 and ~75 µM.
Dissolved Sr in BW is~90 µM, which is a typical seawater value (Bruland et al., 2014). Sr concentrations in the trigger core are also ~90 µM (Figure F39). The top intervals of the GPC cores are characterized by Sr concentrations slightly lower than seawater (80–85 µM). This is followed by a relatively asymptotic increase to ~105 µM by ~5–6 mbsf and more or less stable values around ~110 µM below that depth.
Dissolved Ba values are lowest in BW and trigger core samples and similar to seawater concentrations (~0.2 µM; Bruland et al., 2014). In the GPC cores, Ba concentrations are ~4 µM at 2–3 mbsf, increase rapidly below that depth to ~50–60 µM at ~7–8 mbsf, and remain more or less stable around 50–60 µM (Figure F39).
6.1.2.3. Chloride, bromide, and sulfate
All anions analyzed using ion chromatography (IC) are listed in Tables T9 and T10. Dissolved chloride (Cl−) values at Site M0081 (Figure F40) are similar to seawater values throughout the cores, ranging ~540 and 560 mM. Hole M0081B has slightly lower concentrations, reaching ~530 mM at ~18 mbsf.

Figure F40. IW Cl−, Br−, and SO42−, Site M0081.
Dissolved bromide (Br−) concentrations show continuous and asymptotic increases with core depth in all holes, starting at seawater values of ~0.820 mM in the BW and trigger cores (Figure F40). Br− concentrations in the GPC cores reach values around 1 mM below ~17 mbsf and remain stable to the bottom of Holes M0081D and M0081F. In Hole M0081B, the concentrations reached at ~17 mbsf are a little lower (~0.950 mM).
Dissolved sulfate (SO42−) concentrations in the BW show seawater values of ~28–29 mM (Bruland et al., 2014). The trigger cores have seawater values (Figure F40). The GPC cores have lower than seawater values at the top (~25 mM) and exhibit an exponential decrease (that is slightly steeper in Hole M0081B) with depth until values near zero are reached at ~9–10 mbsf, remaining at such low levels to the bottom of Holes M0081D and M0081F.
Dissolved Cl− values in Hole M0082D (Figure F41) are similar to seawater values (~540 and 560 mM; Bruland et al., 2014). Hole M0082B displays two maxima of ~570–580 mM at ~3 and ~8 mbsf.

Figure F41. IW Cl−, Br−, and SO42−, Site M0082.
Dissolved Br− concentrations in the BW and trigger cores are similar to seawater (Bruland et al., 2014) (Figure F41). The IW from the GCP cores shows continuous and asymptotic increases with core depth in all holes, reaching values of around 1 mM below ~17 mbsf and remaining stable to the bottom of Hole M0082D.
Dissolved SO42− concentrations in the BW and in the trigger core IW samples shows seawater values (~28–29 mM; Bruland et al., 2014). These seawater values are not documented at the tops of the GPC cores, where concentrations reach ~21–23 mM. In Holes M0082B and M0082D, SO42− profiles then show an exponential decrease with depth until values around the detection limit are reached at ~3–4 mbsf. Values remain at such low levels to the bottom of the holes (Figure F41).
6.1.2.4. Sodium, potassium, calcium, and magnesium
Dissolved sodium (Na+) concentrations at Site M0081 fluctuate unsystematically and are mostly above average seawater values (~470 mM; Bruland et al., 2014) in all holes, ranging ~465–607 mM. Similarly, dissolved potassium (K+) concentrations at Site M0081 fluctuate throughout the core in all holes and are mostly above seawater values (~10 mM; Bruland et al., 2014), ranging ~9.9–14.2 mM. Dissolved calcium (Ca2+) concentrations at Site M0081 range ~8.5–11.9 mM and are mostly around seawater values (~10 mM; Bruland et al., 2014) in all holes. Dissolved magnesium (Mg2+) concentrations at Site M0081 fluctuate mostly around average seawater values (~53 mM; Bruland et al., 2014) in all holes, ranging 50.7–74 mM. Downcore profiles of Na+, K+, Ca2+, and Mg2+ at Site M0081 show very similar patterns overall.
At Site M0082, dissolved Na+ concentrations fluctuate unsystematically and are consistently above average seawater values (~470 mM; Bruland et al., 2014) in all holes, ranging ~483–599 mM. Similarly, dissolved K+ concentrations at Site M0082 fluctuate unsystematically and are consistently above seawater values (~10 mM; Bruland et al., 2014) in all holes, ranging ~10.7–13.2 mM. Dissolved Ca2+ concentrations vary around average seawater values (~10 mM; Bruland et al., 2014) in all holes, ranging ~8.1–12.1 mM. Dissolved Mg2+ concentrations are consistently above seawater values (~53 mM) in all holes, ranging ~55.1–73.3 mM. Overall, the downcore concentration profiles of Na+, K+, Ca2+, and Mg2+ at Site M0082 show very similar patterns. The IC cation data is only presented in GEOCHEM in Supplementary material because the samples require further postexpedition analysis for validation of absolute values (analytical accuracy).
6.2. Shore-based H2S analysis
At Sites M0081 and M0082, H2S concentrations were below the detection limit in all samples (see GEOCHEM in Supplementary material).
6.3. Headspace gas analysis: methane, ethane, and C1/C2 ratio
The offshore headspace gas analysis was mainly performed on the longest GPC core. A total of 37 headspace samples were measured from Holes M0081E (trigger core) and M0081F (GPC core) for hydrocarbon compositions, and a total of 42 headspace samples were measured from Holes M0082C (trigger core) and M0082D (GPC core) (Figures F42, F43; Tables T11, T12).

Figure F42. Methane, ethane, and methane to ethane ratio, Holes M0081F and M0081E.
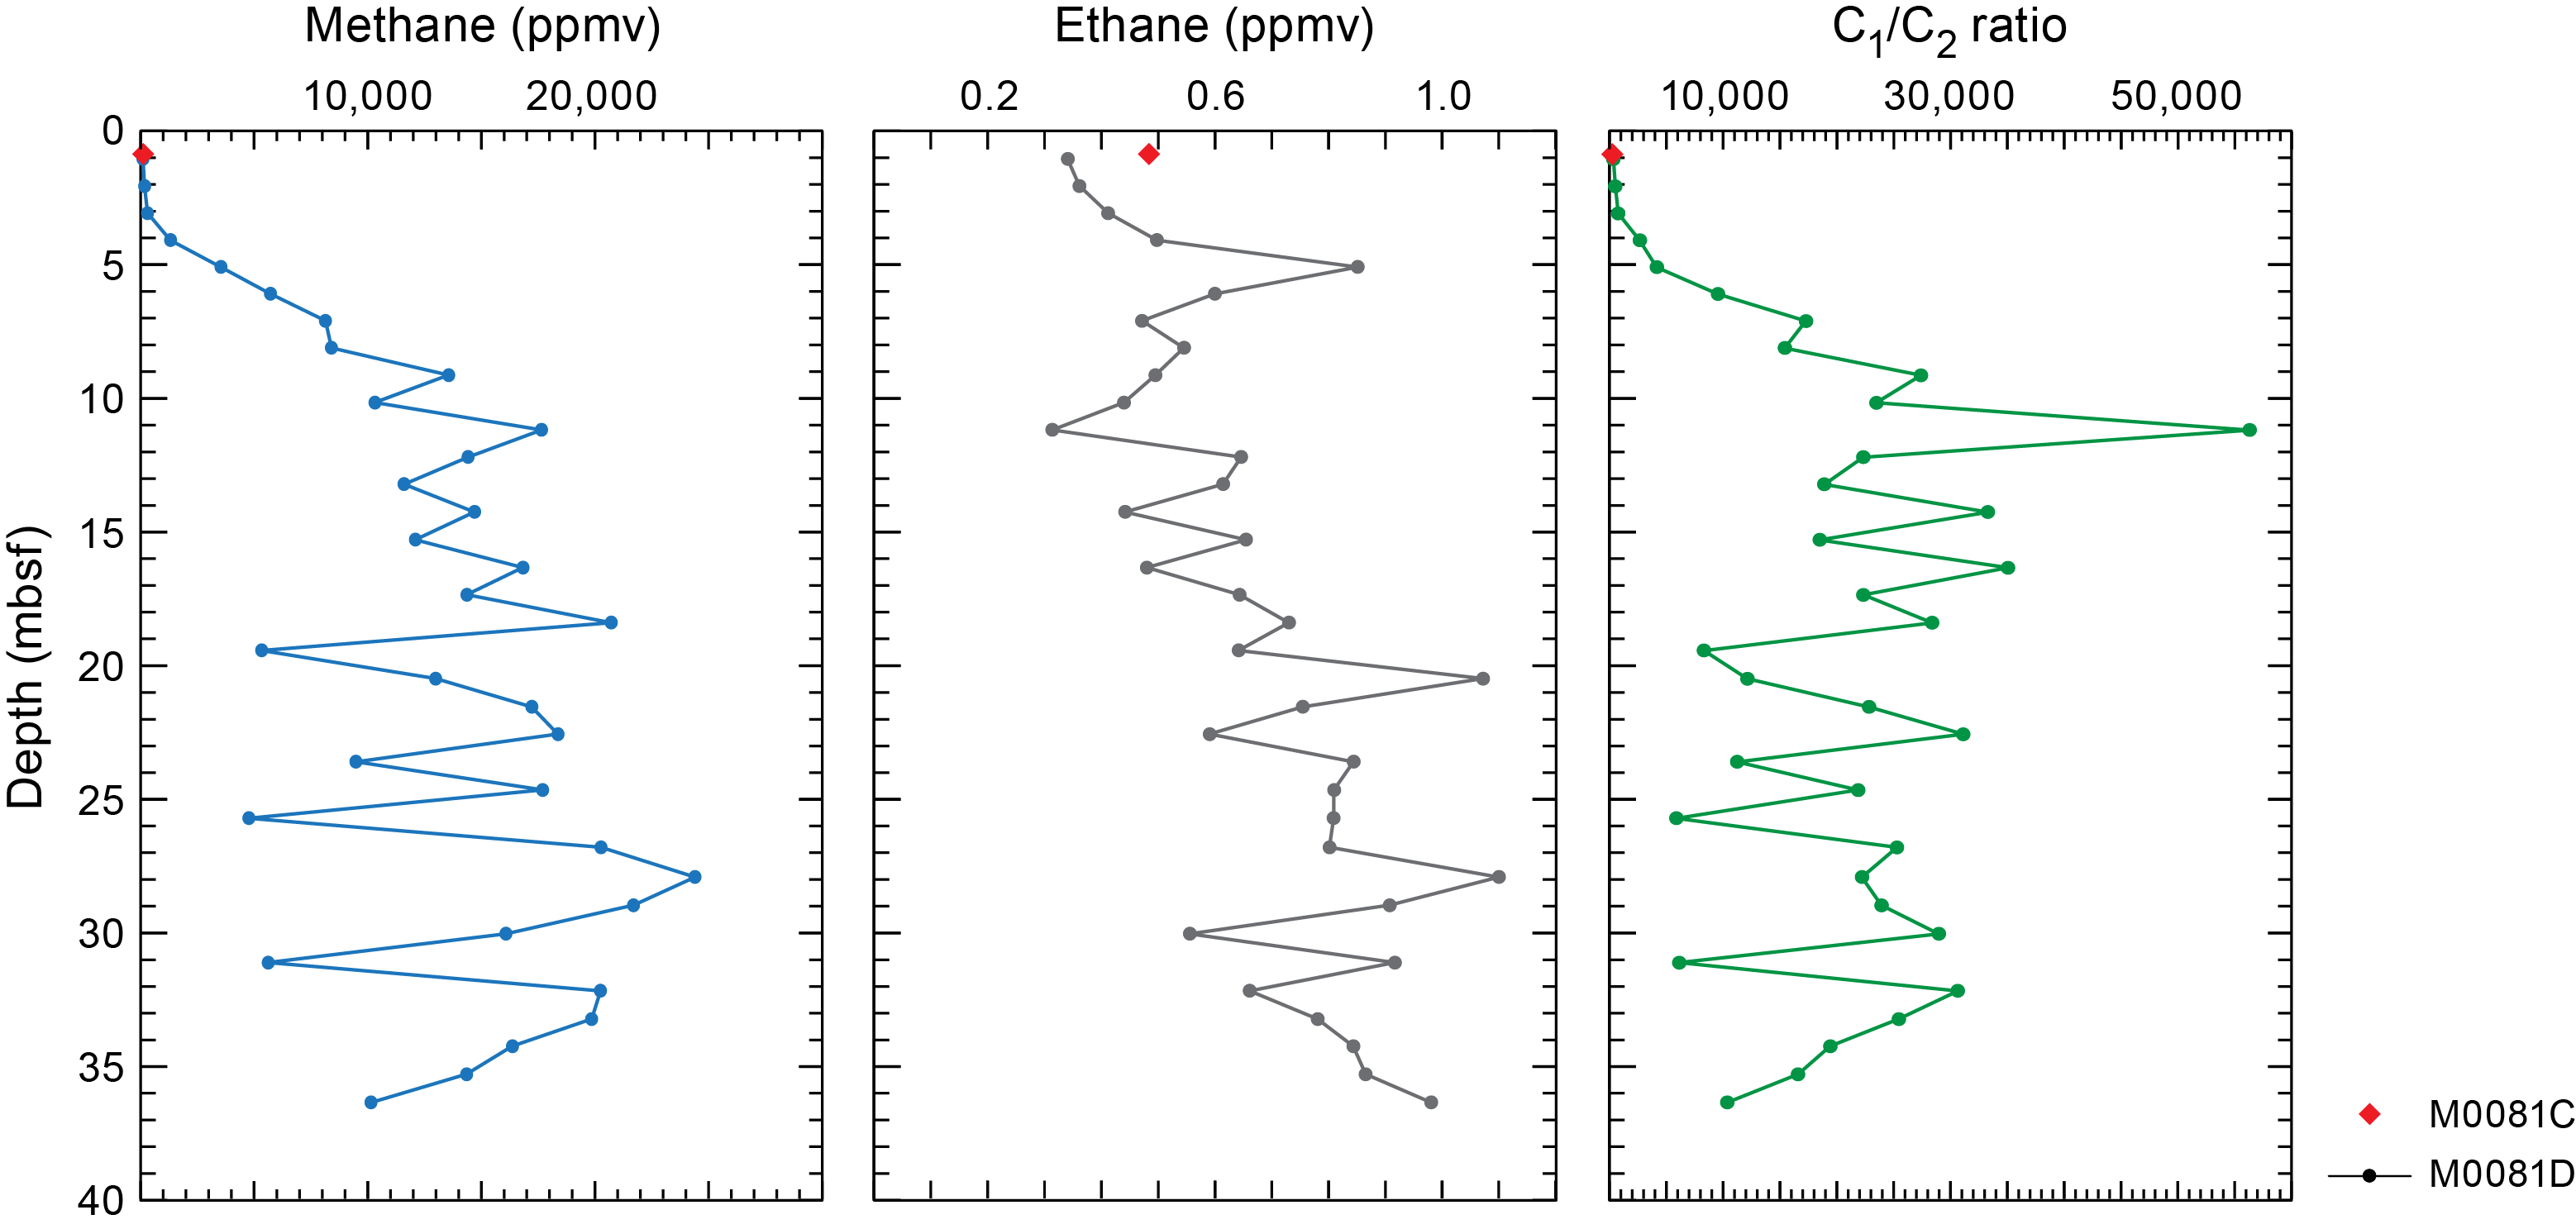
Figure F43. Methane, ethane, and methane to ethane ratio, Holes M0082D and M0082C.
At Site M0081, methane concentrations increase from ~45 to 227 ppm from 0 to 7.075 mbsf (Figure F42). Below 7.075 mbsf, methane concentrations increase rapidly with fluctuations. At ~35 mbsf, methane concentrations reach the maximum (23,556 ppmv). Ethane (C2H4 and C2) was detected in relatively constant but low concentrations (0.39–0.95 ppm) in all headspace samples. Methane/ethane (C1/C2) ratios follow the methane profile pattern and are consistently >8000 below ~17 mbsf.
Within the uppermost few meters (0–3.08 mbsf) of Site M0082, the methane concentration is low (119–317 ppmv) (Figure F43). Between 3.08 and 9.14 mbsf, methane concentrations increase rapidly. Below this depth, concentrations plateau at these elevated values but fluctuate. At ~28 mbsf, methane concentrations reach the maximum (24,402 ppmv). Ethane (C2H4 and C2) at Site M0082 was detected in relatively constant but low concentrations (0.31–1.09 ppmv) in all headspace samples. Methane/ethane (C1/C2) ratios follow the methane profile pattern and are consistently >6000 below ~9 mbsf. A methane/ethane outlier at 11.19 mbsf has a ratio peak of >50,000.
Alongside C1 and C2, other hydrocarbon gases such as ethylene (C2=), ethane (C2), propene/propylene (C3=), propane (C3), and n-butane (n-C4) were detected and measured, but their concentrations are very low, generally less than 1 ppmv at all sites (see GEOCHEM in Supplementary material).
6.4. Shore-based solid-phase analysis
6.4.1. Aluminum, calcium, silica, iron, and manganese
The solid-phase elements including aluminum (Al), calcium (Ca), silica (Si), iron (Fe), and manganese (Mn), briefly described below, as well as Ba, Br, Cr, Cu, K, Mg, Ni, P, Sr, Ti, V, Zn, and Zr are listed in Tables T13 and T14.
Solid-phase Al contents at Site M0081 range ~1.9–5.5 wt% (18,699–54,871 mg/kg) (Figure F44). In all holes, a common downcore pattern is expressed: relatively high contents of ~4.5 wt% in the uppermost 0–3 m are followed by an interval of lower contents (~2–4 wt% in Holes M0081B and M0081D; ~4 wt% in Hole M0081F) between ~3 and 10 mbsf. High Al contents of up to ~5.5 wt% characterize the interval between ~10 and 13 mbsf. Below ~13 mbsf, Al in Hole M0081D drops to values fluctuating between ~2 and 4 wt% to the bottom of the hole, whereas in Hole M0081F, Al values drop to ~4 wt% below ~13 mbsf but gradually increase again to reach ~5 wt% at the bottom of the hole.
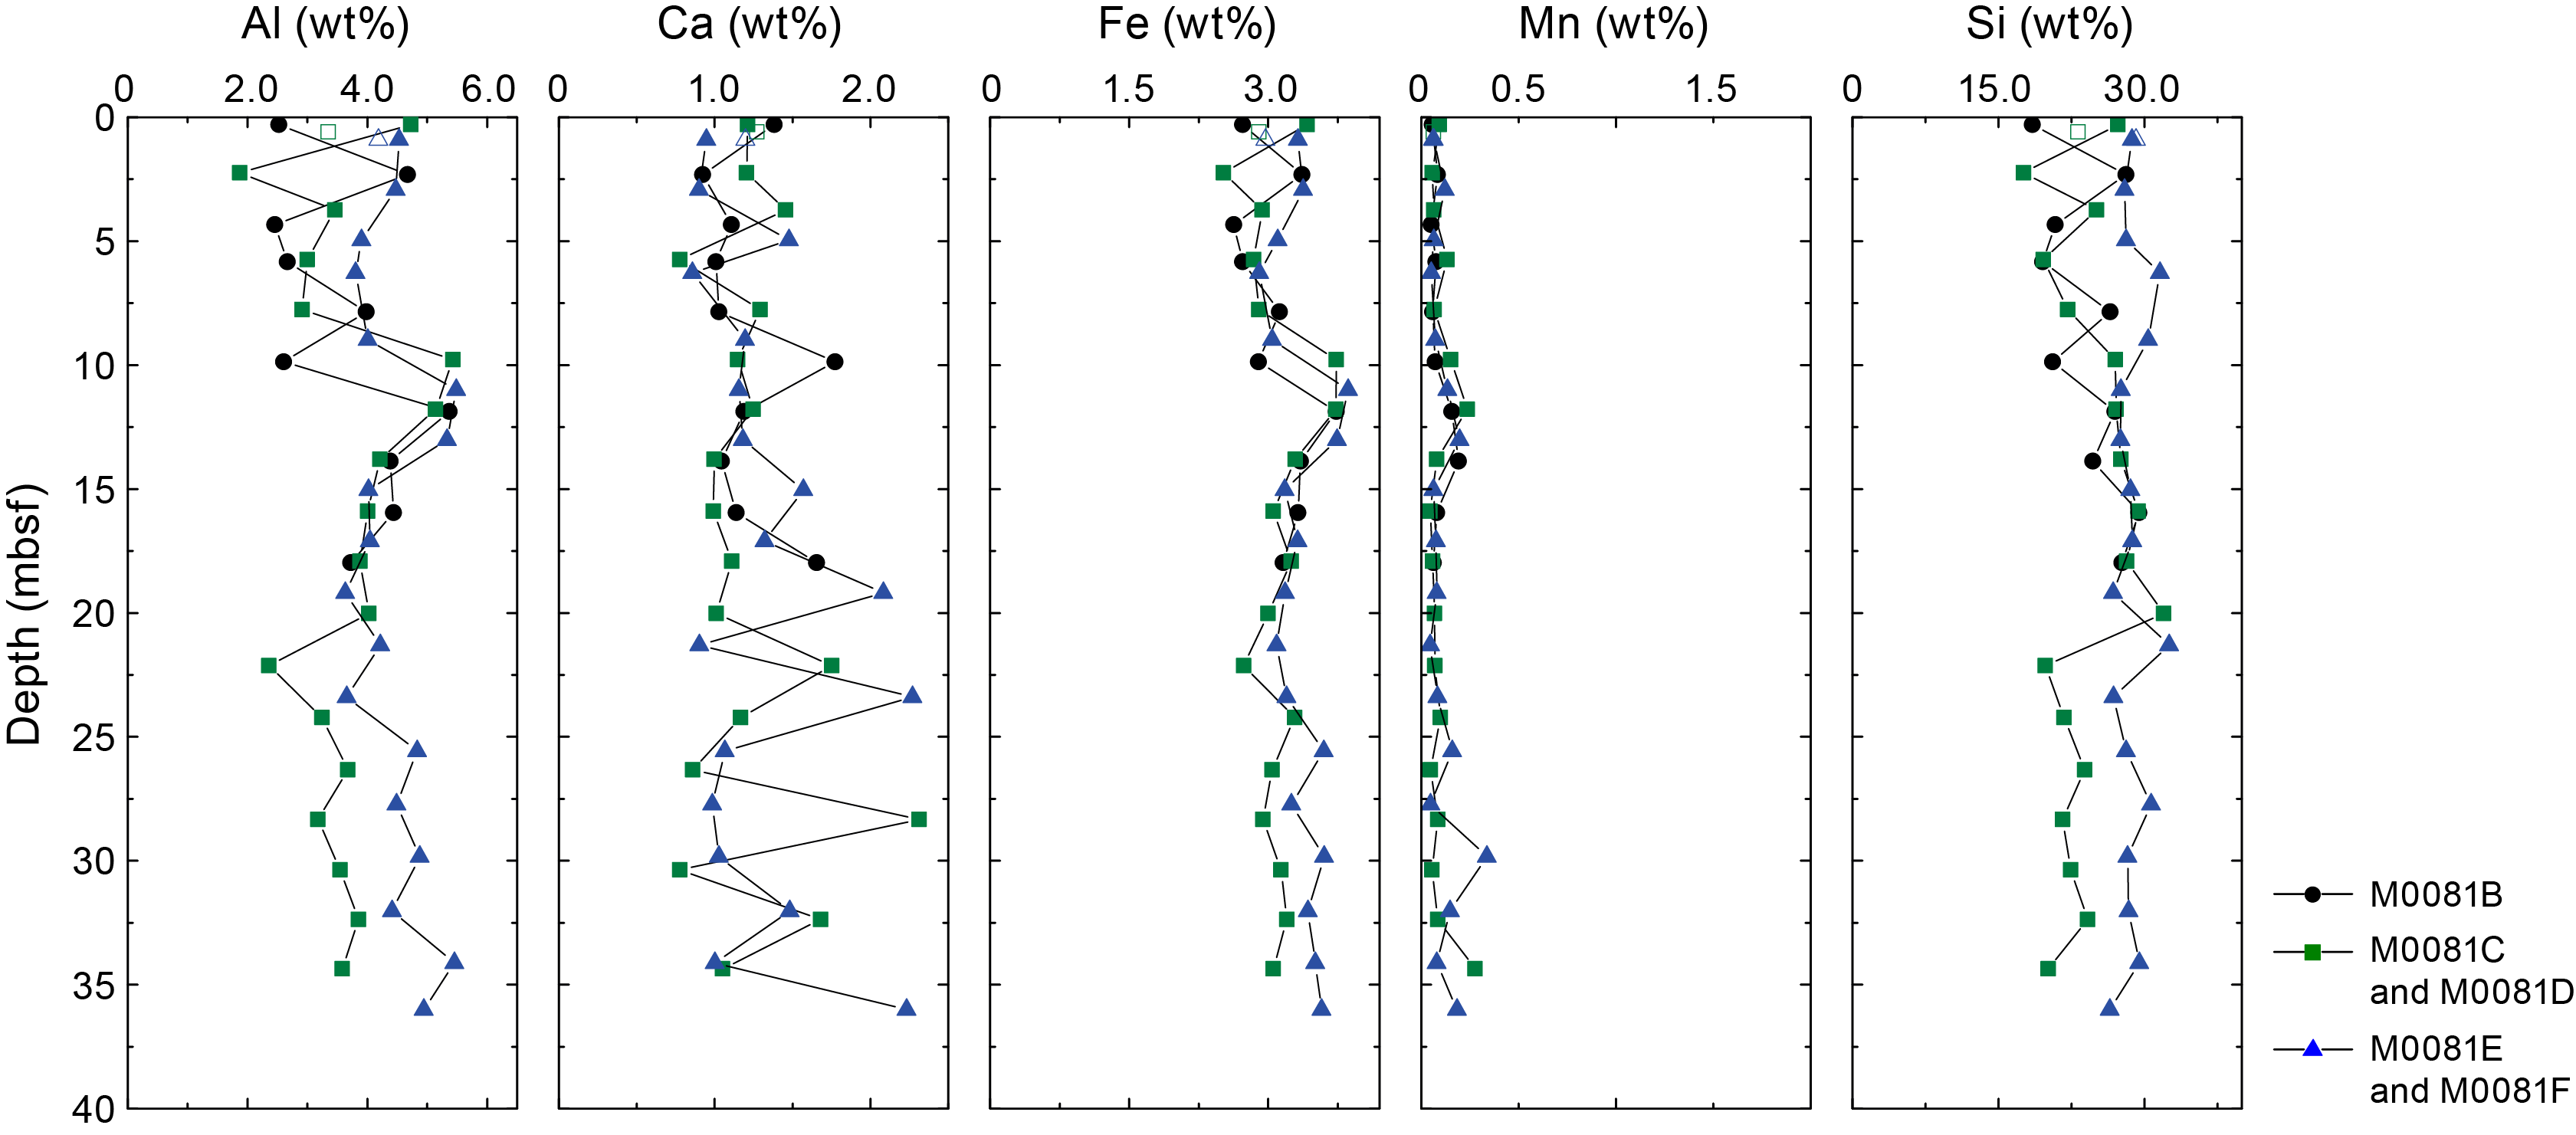
Figure F44. Al, Ca, Fe, Mn, and Si, Site M0081.
Ca contents range ~1–2.5 wt% (7,760–23,123 mg/kg) (Figure F44). In all holes, Ca variability is mostly between ~1 and 1.5 wt% to ~15 mbsf. Below this depth, Ca fluctuates rapidly between ~0.8 and 2.3 wt% to the bottom of the hole.
Solid-phase Si contents range ~17–33 wt% (175,742–325,539 mg/kg) (Figure F44) with strong fluctuations throughout the hole. In Hole M0081F, Si contents are more stable, fluctuating unsystematically between ~26 and 33 wt% over the entire depth of the hole.
Fe contents range ~2.7–3.9 wt% (25,174–28,624 mg/kg) (Figure F44). In all holes, a common downcore pattern is observed, resembling that of Al. There are relatively high contents (~3.3 wt%) in the uppermost 0–5 m, followed by an interval of lower contents (~2.5–3 wt%) between ~5 and 10 mbsf. High Fe contents of up to ~3.9 wt% characterize the interval between ~10 and 13 mbsf. Below ~13 mbsf, Fe drops to values fluctuating around 3 wt% to the bottom of the holes.
Solid-phase Mn contents range ~0.05–0.35 wt% (453–3,372 mg/kg) (Figure F44). In all holes, a common downcore pattern is observed. Relatively low Mn values (~0.05–0.13 wt%) characterize the uppermost ~8 m. Higher values (~0.2–0.25 wt%) are reached between ~10 and 15 mbsf, followed by a drop to lower values (~0.05–0.08 wt%) between ~15 and 23 mbsf. The deepest interval is characterized by strongly fluctuating Mn contents between ~0.04 and 0.35 wt%.
Al contents at Site M0082 range ~2.9–5.2 wt% (29,703–51,946 mg/kg) (Figure F45). In both Holes M0082B and M0082D, the records are characterized by rapid fluctuations without a clear downcore pattern.
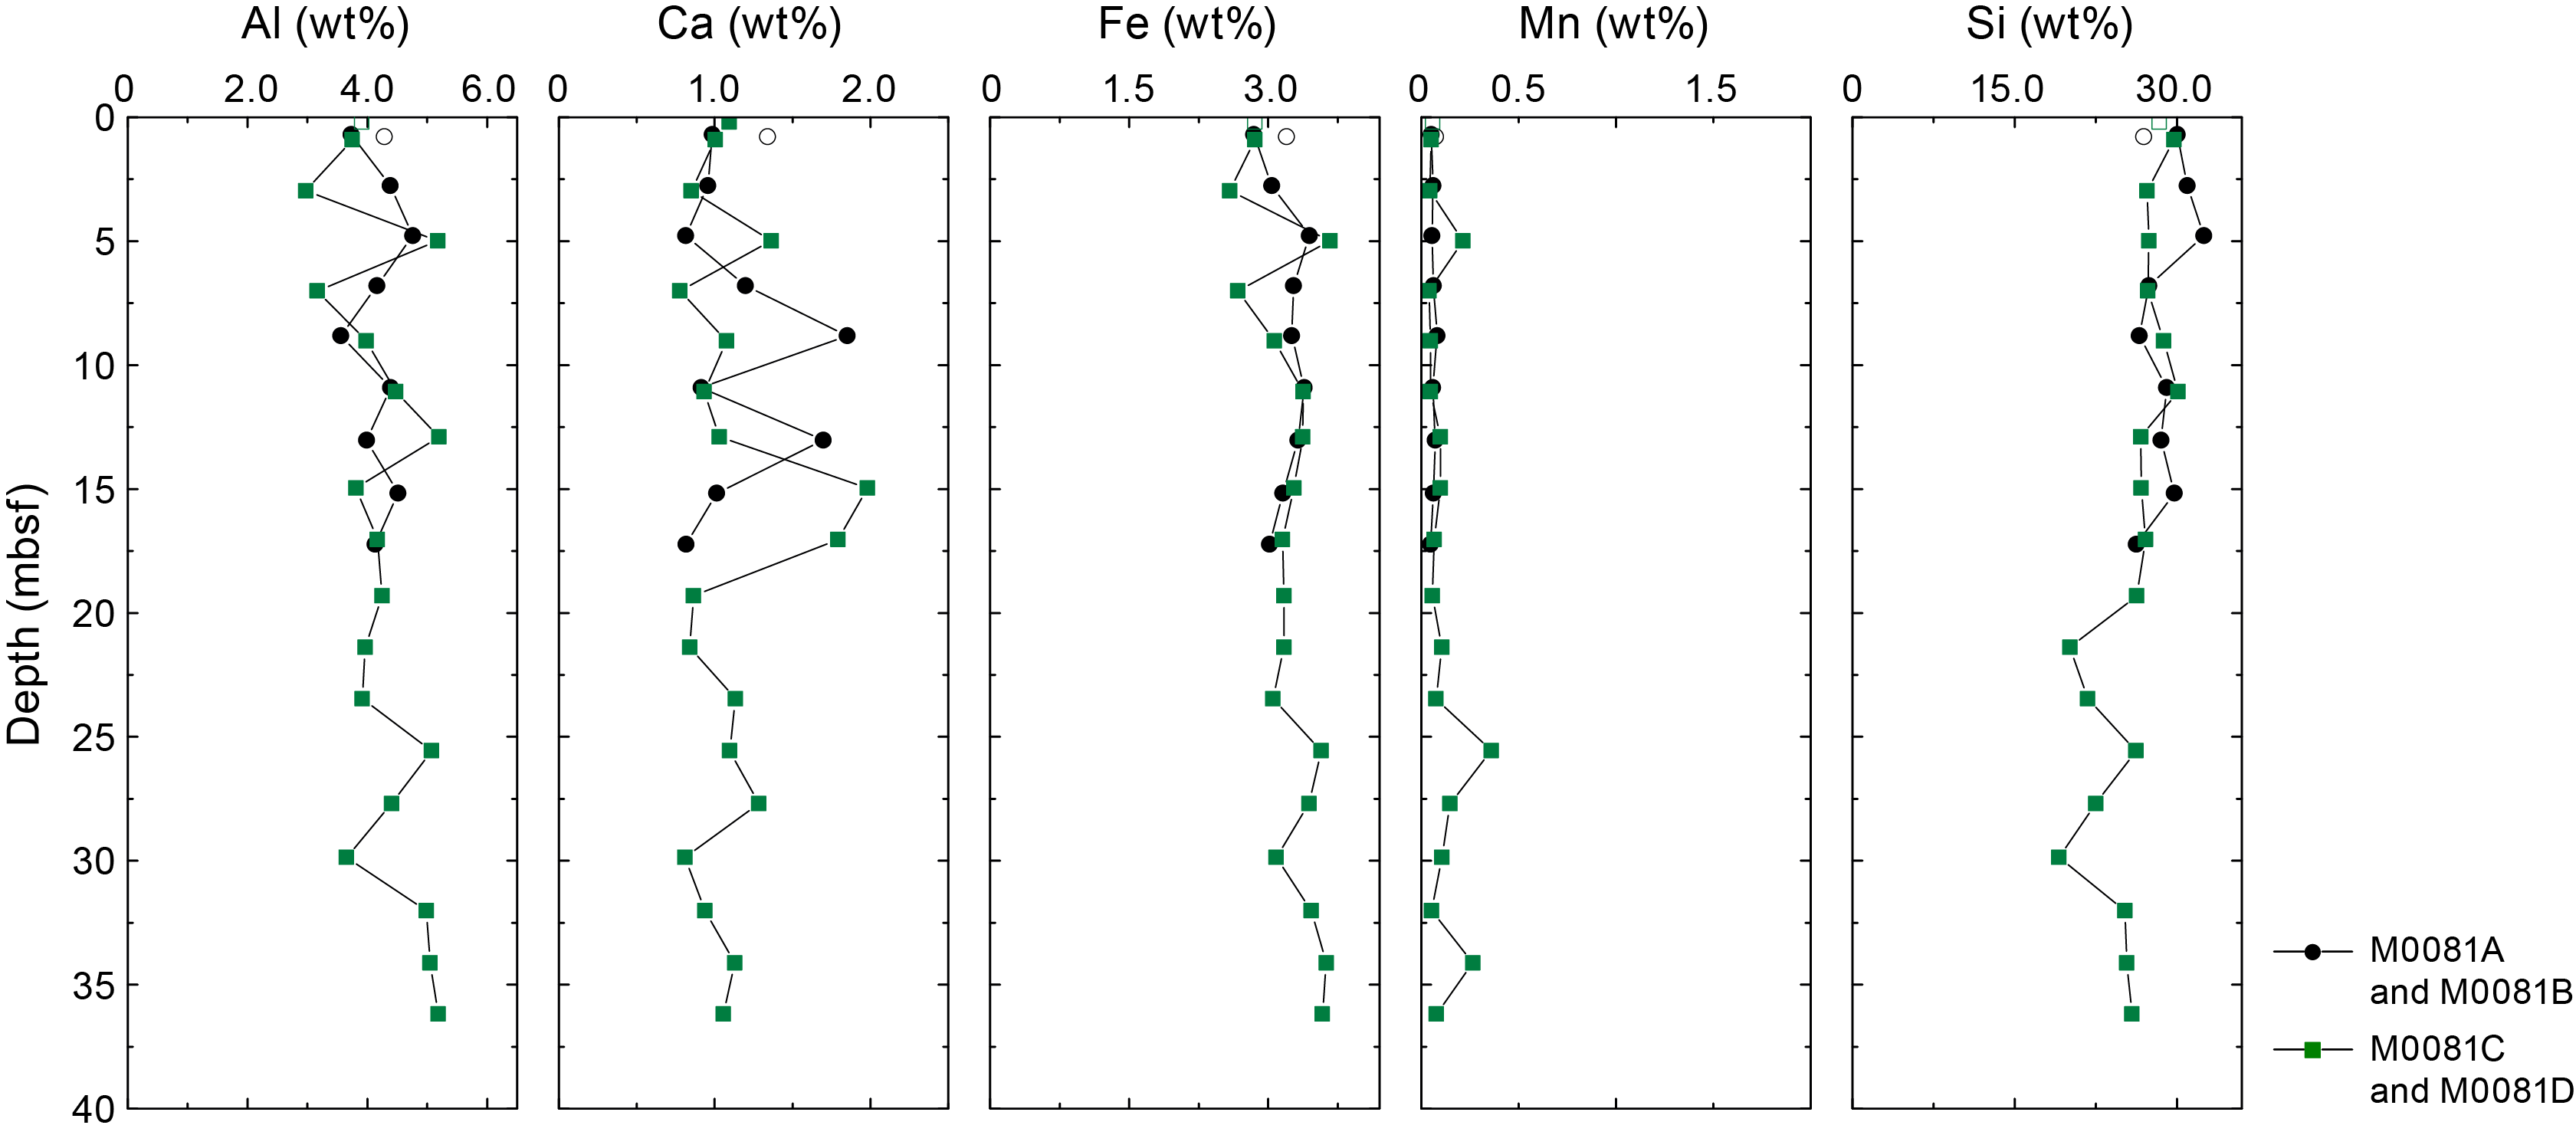
Figure F45. Al, Ca, Fe, Mn, and Si, Site M0082.
Solid-phase Ca contents range ~0.8–2 wt% (7,755–19,814 mg/kg) (Figure F45). Lower values (~0.8–1.3 wt%) dominate the uppermost ~6 m, followed by several Ca peaks reaching ~2 wt% to ~20 mbsf. Below this depth, Ca remains at lower values of ~0.8–1.3 wt% to the bottom of Hole M0082D.
Si contents range ~20–32 wt% (190,873–309,490 mg/kg) (Figure F45). In both Holes M0082B and M0082D, there is a relatively gradual decline with sediment depth, starting at ~28–30 wt% in the top samples and reaching ~20–25 wt% at the bottom of Hole M0082D.
Fe contents range ~2.5–3.6 wt% (25,866–36,672 mg/kg) but mostly fluctuate around 3.1–3.2 wt% (Figure F45). The lowest values are found in the uppermost ~7 m, and the highest values are restricted to below ~25 mbsf.
Solid-phase Mn contents range ~0.04–0.36 wt% (391–3,603 mg/kg) (Figure F45). Although Mn values in Hole M0082B are rather stable around 0.06 wt%, values in Hole M0082D exhibit more variability. An isolated peak of ~0.21 wt% is observed at ~5 mbsf. The interval below ~20 mbsf is characterized by overall higher values, reaching peaks of ~0.36 and ~0.26 wt% at ~25 and ~34 mbsf, respectively.
6.4.2. Carbon, sulfur, and nitrogen
Solid-phase total carbon (TC), total inorganic carbon (TIC), total organic carbon (TOC), total nitrogen (TN), and total sulfur (TS) are listed in Tables T13 and T14.
Two samples from the Site M0081 trigger cores (Holes M0081C and M0081E) were measured for TC and TOC contents (Figure F46). The mean TC and TOC contents are 2.13 and 1.87 wt%, respectively. TC and TOC vary in Hole M0081F; TC contents range 0.79–2.88 wt%, and TOC contents range 0.65–2.3 wt%. For Holes M0081B, M0081D, and M0081F, TC and TOC show similar trends. In Hole M0081B, TC contents range 0.91–2.38 wt% and TOC contents range 0.77–2.00 wt%. In Hole M0081D, TC contents range 0.91–2.30 wt% and TOC contents range 0.78–1.92 wt%. The lowest TC and TOC values at Site M0081 (0.91 and 0.78 wt%, respectively) are observed at ~10 mbsf, and the highest values (2.30 and 1.86 wt%, respectively) are found at ~22 mbsf.
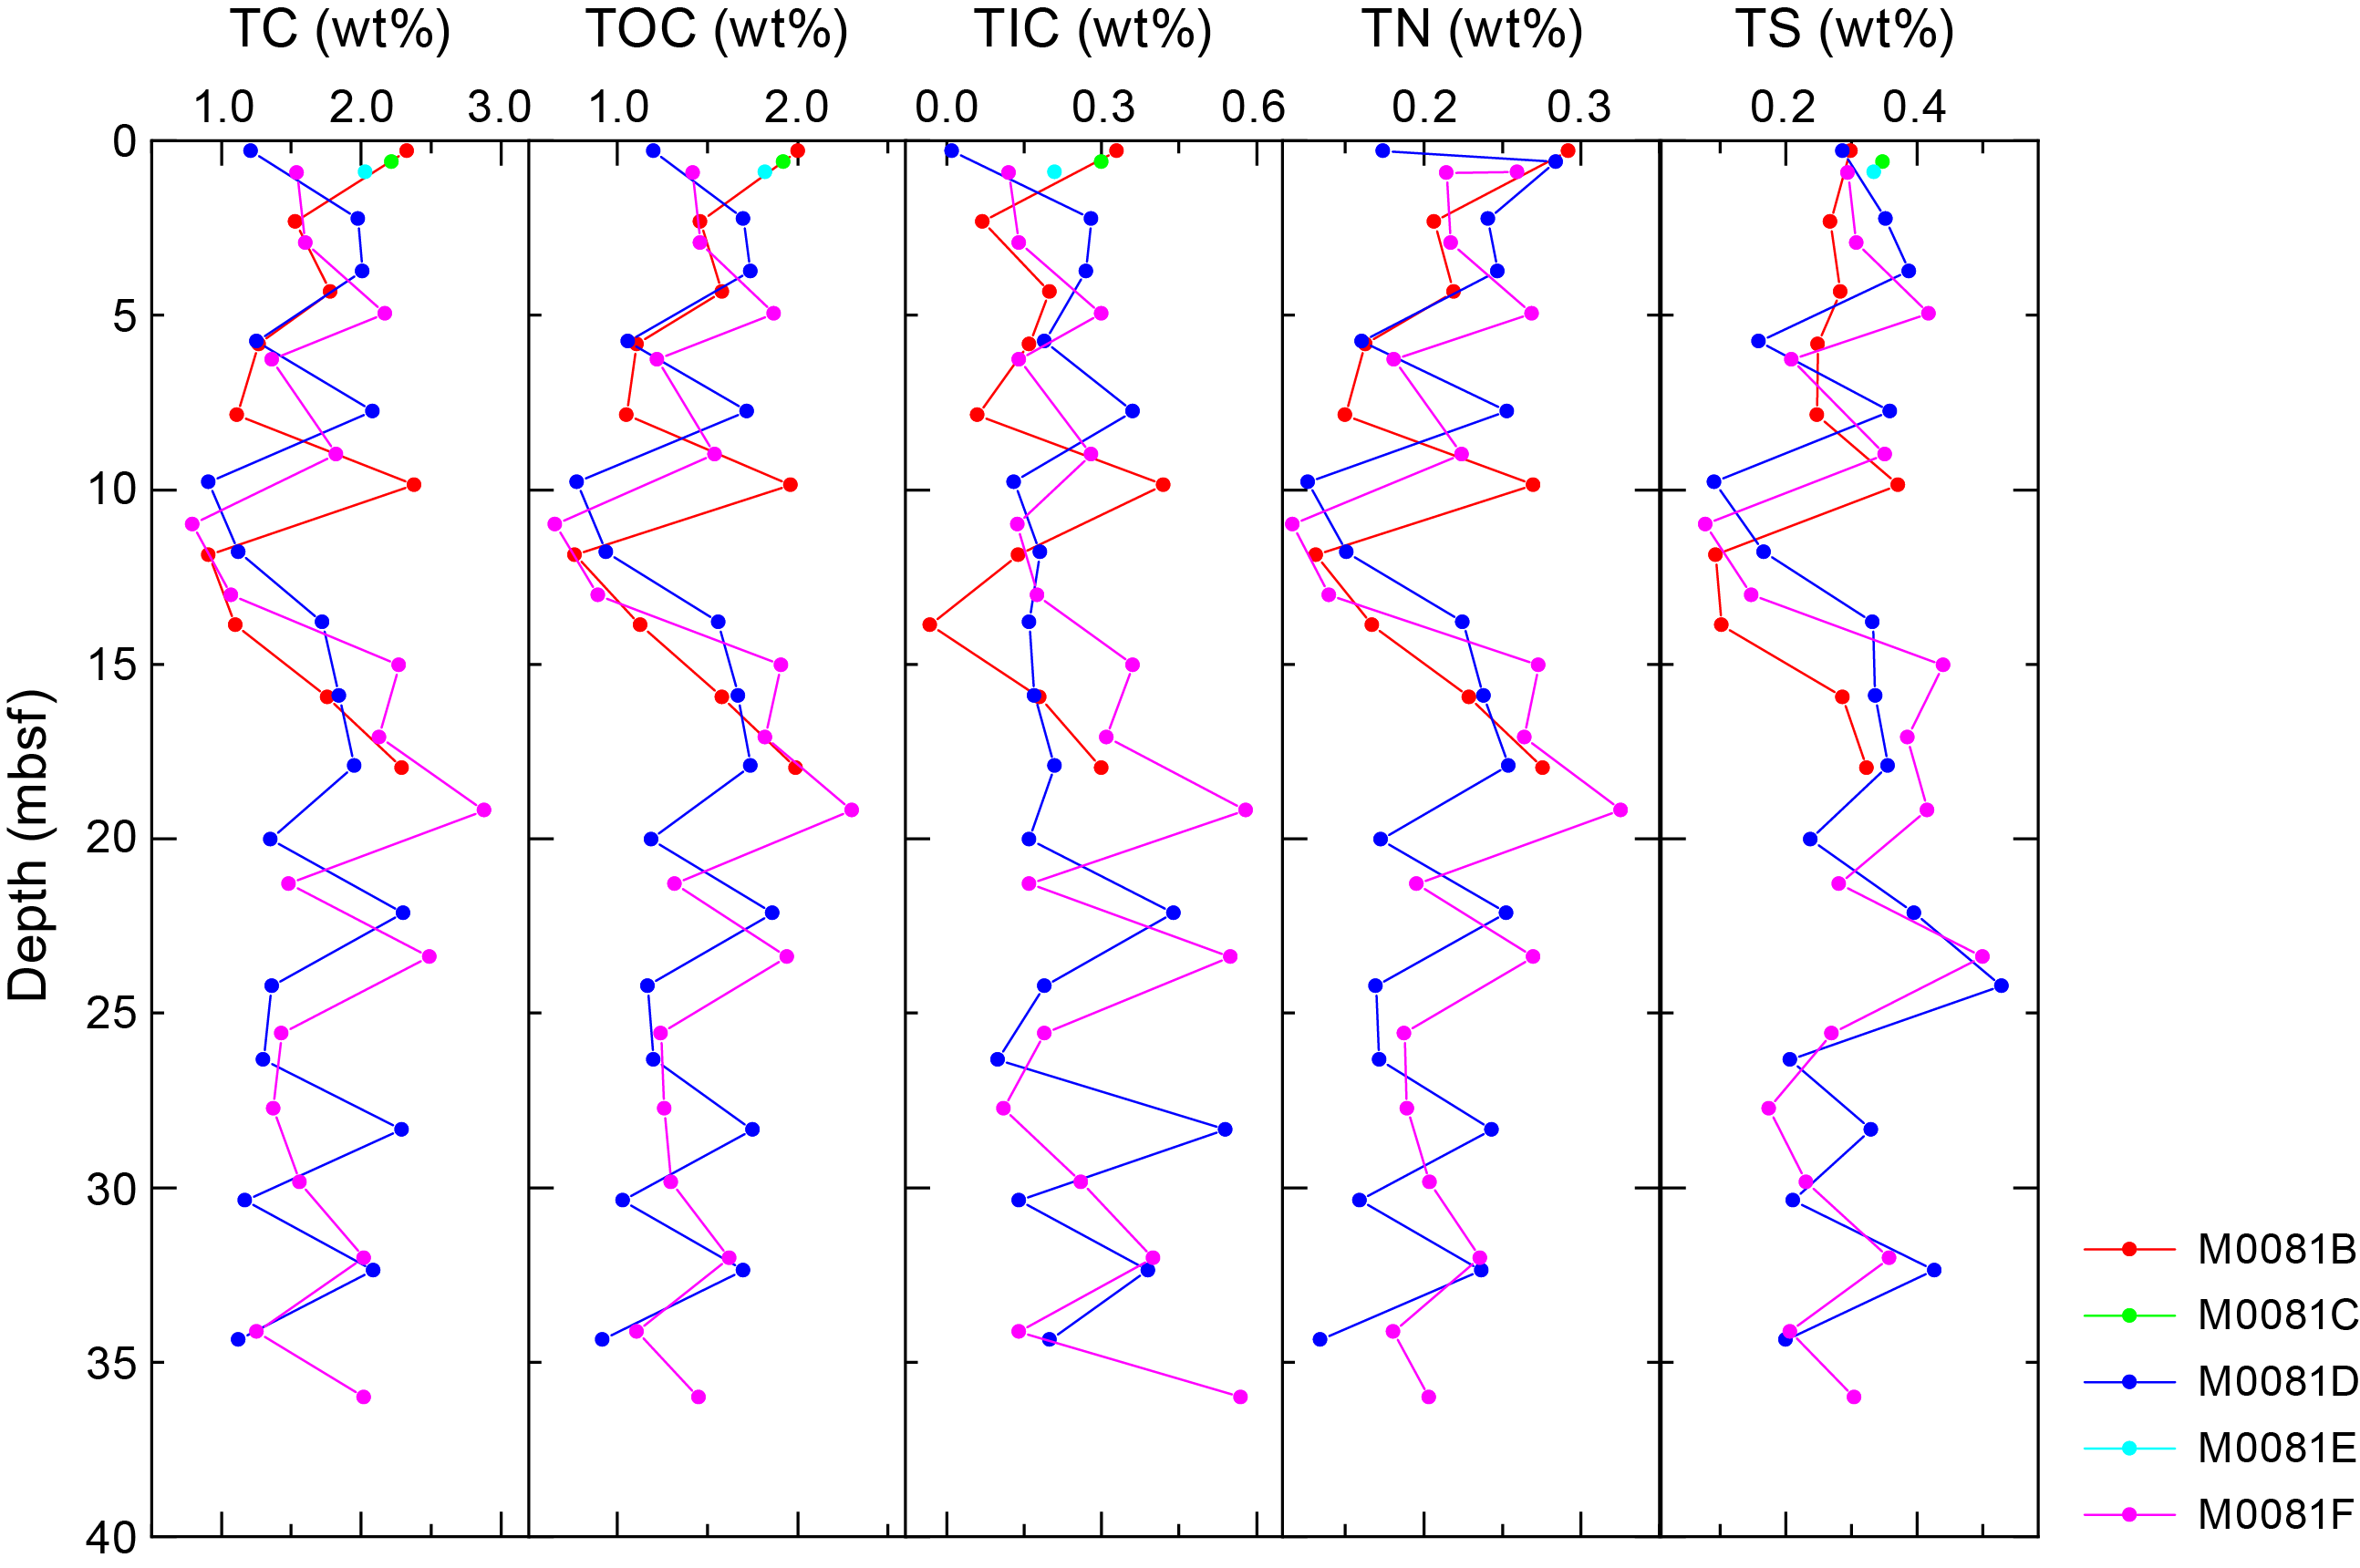
Figure F46. TC, TOC, TIC, TN, and TS, Site M0081.
Three samples from the Site M0082 trigger cores (Holes M0082A and M0082C) were measured (Figure F47), and the mean values of TC and TOC are ~1.84 and 1.65 wt%, respectively. In Hole M0082D, TC and TOC vary above ~20 mbsf. TC contents range 0.61–2.55 wt%, and TOC contents range 0.51–1.91 wt%. Below ~20 mbsf, TC and TOC contents are relatively constant, ranging around 1.20 and 1.00 wt%, respectively. For Hole M0082B, TC and TOC show similar trends to those for Hole M0082D. TC contents range 0.83–2.73 wt%, and TOC contents range 0.73–2.16 wt%. The lowest TC and TOC values of Site M0082 (0.61 and 0.51 wt%, respectively) are observed in Hole M0082D at ~13 mbsf. The highest TC and TOC values (2.73 and 2.16 wt%, respectively) are found in Hole M0082B at ~8 mbsf.
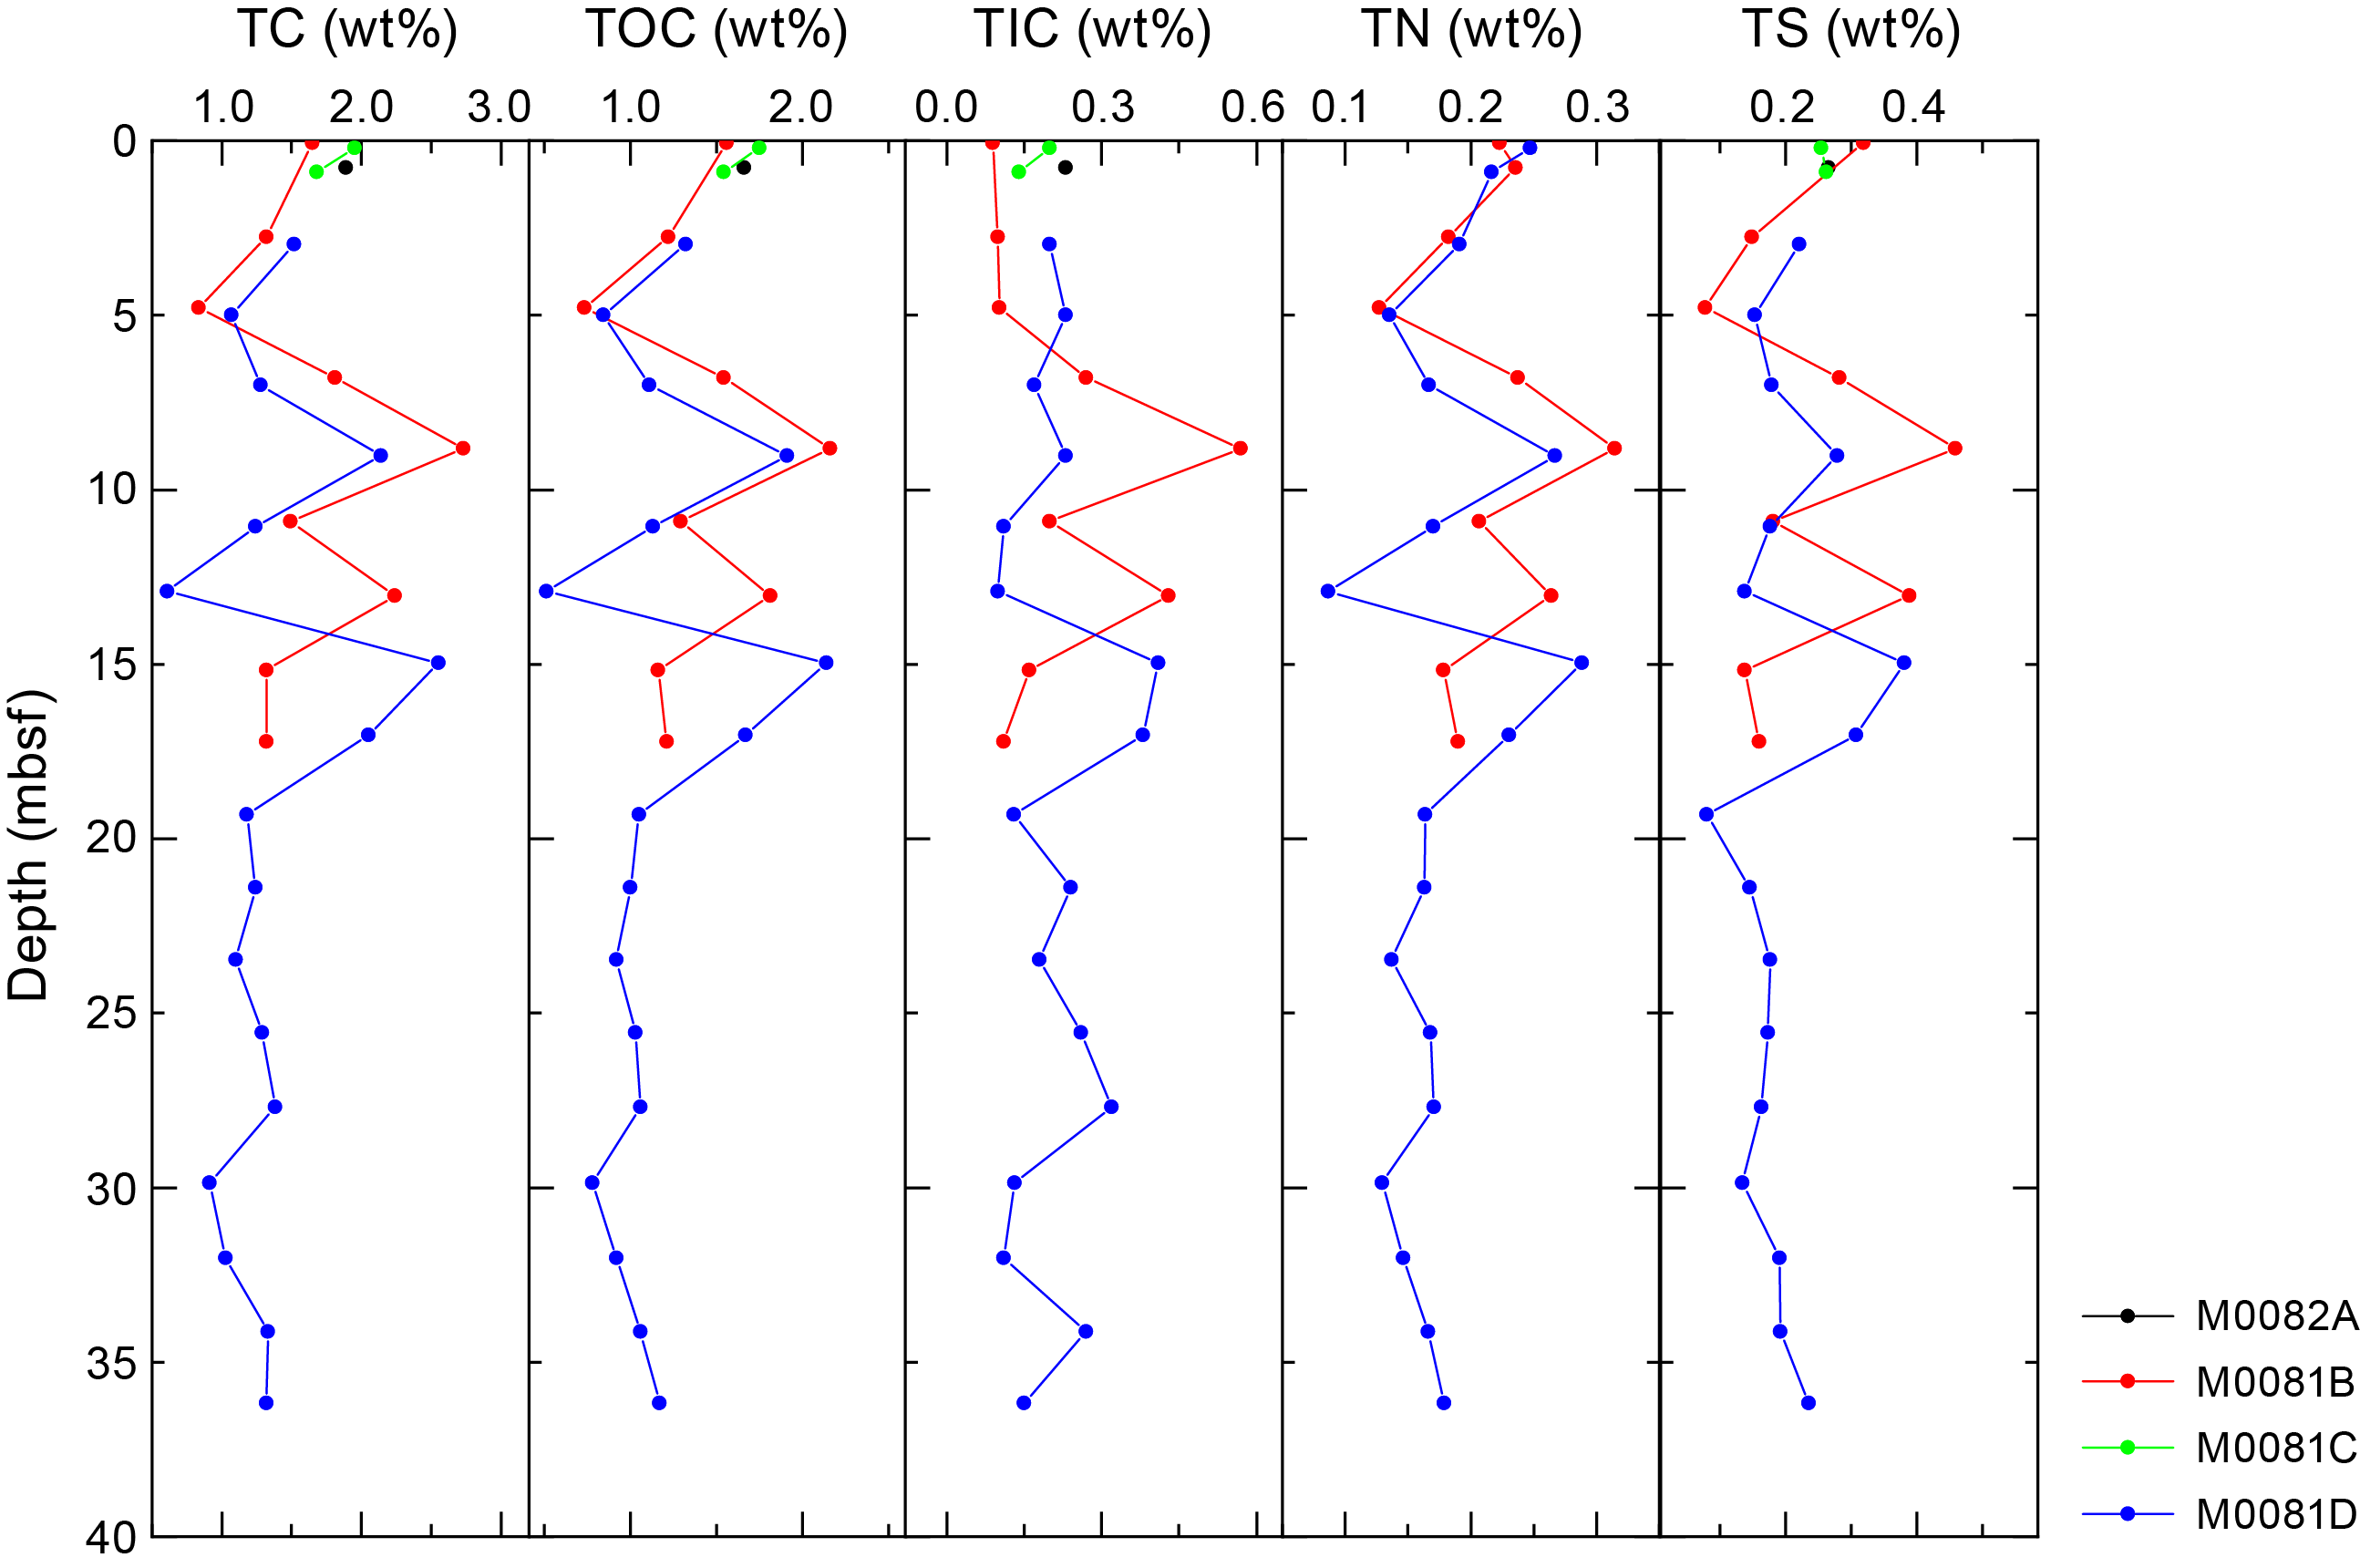
Figure F47. TC, TOC, TIC, TN, and TS, Site M0082.
Two samples from the Site M0081 trigger cores (Holes M0081C and M0081E) were measured for TIC contents, which are 0.30 and 0.21 wt%, respectively (Figure F46). At Site M0082, three samples from the trigger cores (Holes M0082C and M0082E) were measured (0.23, 0.20, and 0.14 wt%). For GPC samples from Sites M0081 and M0082, TIC contents vary from 0 to 0.57 wt% (Figure F47). The lowest TIC value at Site M0081 (0 wt%) is observed at ~14 mbsf, and the highest (0.57 wt%) is found at ~36 mbsf. Hole M0082B TIC contents range 0.09 (around 0.07 mbsf) to 0.57 wt% (around 9 mbsf). Hole M0082D TIC contents show trends similar to those of TC and TOC, with a maximum of 0.38 wt% at ~17 mbsf. Other TIC contents range 0.11–0.32 wt%.
Overall, trends in TN contents are similar to trends in TOC and TC (Figures F46, F47). TN contents in Holes M0081B, M0081D, and M0081E are low but vary, ranging 0.12–0.36 wt%. Trends in TN contents in Holes M0082B and M0082D are similar to trends in TOC and TC. TN contents range 0.09–0.40 wt%, with the largest variations above ~19 mbsf. Below ~19 mbsf in Hole M0082D, TN contents are constant around ~0.16 wt%.
Overall, TS trends are similar to those of TOC and TC (Figures F46, F47). TS contents in Holes M0081B, M0081D, and M0081E are low but vary (0.08–0.53 wt%) throughout the entire records and without any intervals of particularly high or low values. Two samples from the trigger cores (Holes M0081C and M0081E) were measured for TS contents, which are 0.35 and 0.34 wt%, respectively. TS trends in Holes M0082B and M0082D are also similar to those for TOC and TC. TS contents range 0.08–0.46 wt%, with the largest variations above ~19 mbsf. Below ~19 mbsf in Hole M0082D, TS contents are less variable and range 0.15–0.20 wt%. In addition, three samples from the trigger cores (Holes M0082A and M0082C) were measured for TS contents, averaging 0.26 wt%.
6.5. Discussion
Indicators of organic matter degradation in the IW and headspace samples (ammonium, alkalinity, bromide, and methane concentrations) suggest that intensive remineralization occurs at both Sites M0081 and M0082. This process is most active in the uppermost ~3–5 m, gradually diminishes downcore, and occurs at comparable rates at both sites. Notably, the ammonium profile at Site M0081 is less linear and more wavy than at Site M0082, potentially indicating more pronounced and/or more clearly preserved nonsteady-state diagenesis at the former site. The salinity changes closely follow ammonium, alkalinity, and bromide, implying seawater salinity in the sediments with the gradual downcore addition of ions that are metabolic products of organic matter degradation.
The different holes at each site show similar patterns, implying that both sites are characterized by only minor spatial heterogeneity in terms of IW and gas chemistry. Patterns and concentrations of most other IW parameters are similar between Sites M0081 and M0082, and changes in these patterns indicate that overall similar depositional and diagenetic processes affected both sites.
The coupled but marked variation of organic geochemical parameters may imply that material input plays a critical role in the burial of carbon, nitrogen, and sulfur. Although there is intensive remineralization, significant organic matter may survive and be buried in the trench sediments.
The organic carbon content in the sediments at Sites M0081 and M0082 is relatively high, leading to the high mineralization rates observed in the IW profiles (Glud et al., 2013). In addition, because high methane concentrations and C1/C2 values were observed, the roles of microbes in the burial and degradation of sedimentary organic carbon in the hadal sediments may be significant. The headspace gas data suggest that microbes in the sediments may be a main contributor for producing hydrocarbon gases (Claypool and Kvenvolden, 1983).
At both sites, dissolved Fe and Mn are very high in the uppermost 1 m of the sediment column, indicating organic matter remineralization by intensive dissimilatory Mn and Fe reduction (Froehlich et al., 1979). The nonlinear, wavy decrease in Mn concentrations below the uppermost 1 m may indicate repeated periods of nonsteady-state diagenesis preserved in the IW record. Below the uppermost sediment interval, organoclastic sulfate reduction becomes the dominant electron acceptor for organic matter remineralization, as shown by the exponential decrease in sulfate, followed by methanogenesis at greater depths, as shown by the steep increase in methane and C1/C2. Sulfate reduction and subsequent formation of diagenetic sulfide minerals is also evident from the abundance of likely iron sulfides in the VCDs (see Core descriptions).
One significant difference between Sites M0081 and M0082 (based on IW and dissolved gas profiles) is the depth of the SMT, which is located at ~9–10 mbsf at Site M0081 and at ~5 mbsf at Site M0082 based on the behavior of sulfate and Ba in the IW. This could be explained by different depositional histories, including different sedimentation rates, organic matter reactivities, and/or organic matter delivery rates. In particular, Site M0081 is marked by nonsteady-state chemical profiles, suggesting rather recent changes that lead to different geochemical profiles compared to Site M0082. Based on dissolved Ca and Mg profiles at both Sites M0081 and M0082, no significant precipitation of authigenic carbonates occurs at the SMT.
The abundance of amorphous silica (biogenic opal in diatom frustules and sponge spicules; volcanic glass shards) in the smear slide descriptions (see Core descriptions) supports the very high dissolved Si concentrations immediately below the sediment surface. The Si concentrations are some of the highest reported in marine sediments (e.g., Frings, 2017), suggesting that in this setting dissolution of diatoms and/or ash reaches an elevated equilibrium value. In contrast, subdued changes in dissolved Sr and Ca suggest very limited dissolution or diagenetic precipitation of carbonate material in the sediment. Indeed, carbonate material content, as shown by the TIC and partly by the Ca contents, is very low but not zero. The solid phase at Sites M0081 and M0082 is dominated by siliceous material, indicated by high Si contents that are corroborated by smear slide descriptions. Fine-grained siliciclastic material, as approximated by Al contents, is quantitatively the second most important sediment component. The Fe contents broadly parallel the Al records and, at first pass, do not indicate significant vertical redistribution by diagenetic dissolution-precipitation processes. This is different for Mn, which exhibits several dramatic peaks throughout the sites, indicating diagenetic precipitation of Mn and perhaps signals past SMTs.
7. Physical properties
This section summarizes the preliminary physical properties results from cores acquired at Sites M0081 and M0082 in the Southern Japan Trench (Basin S1) at water depths ranging 7989–8023 mbsl. At Site M0081, a total of six holes were cored: three pairs of trigger cores (Holes M0081A, M0081C, and M0081E) and corresponding GPC cores (Holes M0081B, M0081D, and M0081F). At Site M0082, a total of four holes were cored with two pairs of trigger cores (Holes M0082A and M0082C) and corresponding GPC cores (Holes M0082B and M0082D). The physical properties data sets were collected with standard techniques and sampling rates defined in Physical properties in the Expedition 386 methods chapter (Strasser et al., 2023a). During the offshore phase of the expedition, whole cores were scanned through the Multi-Sensor Core Logger (MSCL). During the onshore phase, cores were split, scanned through the Tri-Sensor Core Logger (TSCL), and sampled for moisture and density (MAD), undrained shear strength, and P-wave velocity. Overall, the physical properties data sets are high quality and correlate well with lithology, hydroacoustics, and other data sets. Note that the MSCL data is potentially adversely affected in Holes M0081E and M0081F due to cores being wrapped and gas charging associated with protocols for microbiological sampling (see Operations). This section summarizes the overall quantitative and qualitative aspects of the physical properties data acquired at Sites M0081 and M0082.
7.1. Bulk density
Offshore, density data (bulk density) were obtained using the gamma ray attenuation (GRA) technique on the MSCL.
7.1.1. Site M0081
In Holes M0081A and M0081B, bulk density values increase slightly downcore from ~1.25 g/cm3 at the top to ~1.30 g/cm3 at the bottom of Hole M0081B (19.9 mbsf) (Figure F48). However, density values show a few localized zones of variations superimposed on this overall trend. Notably, two spikes occur at ~3 mbsf (bulk density up to 1.5 g/cm3) and at 7 mbsf (bulk density up to 1.68 g/cm3). These high bulk density peaks occur within thin zones approximately 0.5 m thick and correspond to elevated values of magnetic susceptibility. A third peak in bulk density occurs at ~8.5 mbsf but does not have a corresponding peak in magnetic susceptibility. Below ~11 mbsf, bulk density decreases to a minimum of ~1.25 g/cm3 at ~16 mbsf. Below this depth, bulk density gradually increases to the bottom of Hole M0081B, reaching up to 1.30 g/cm3.
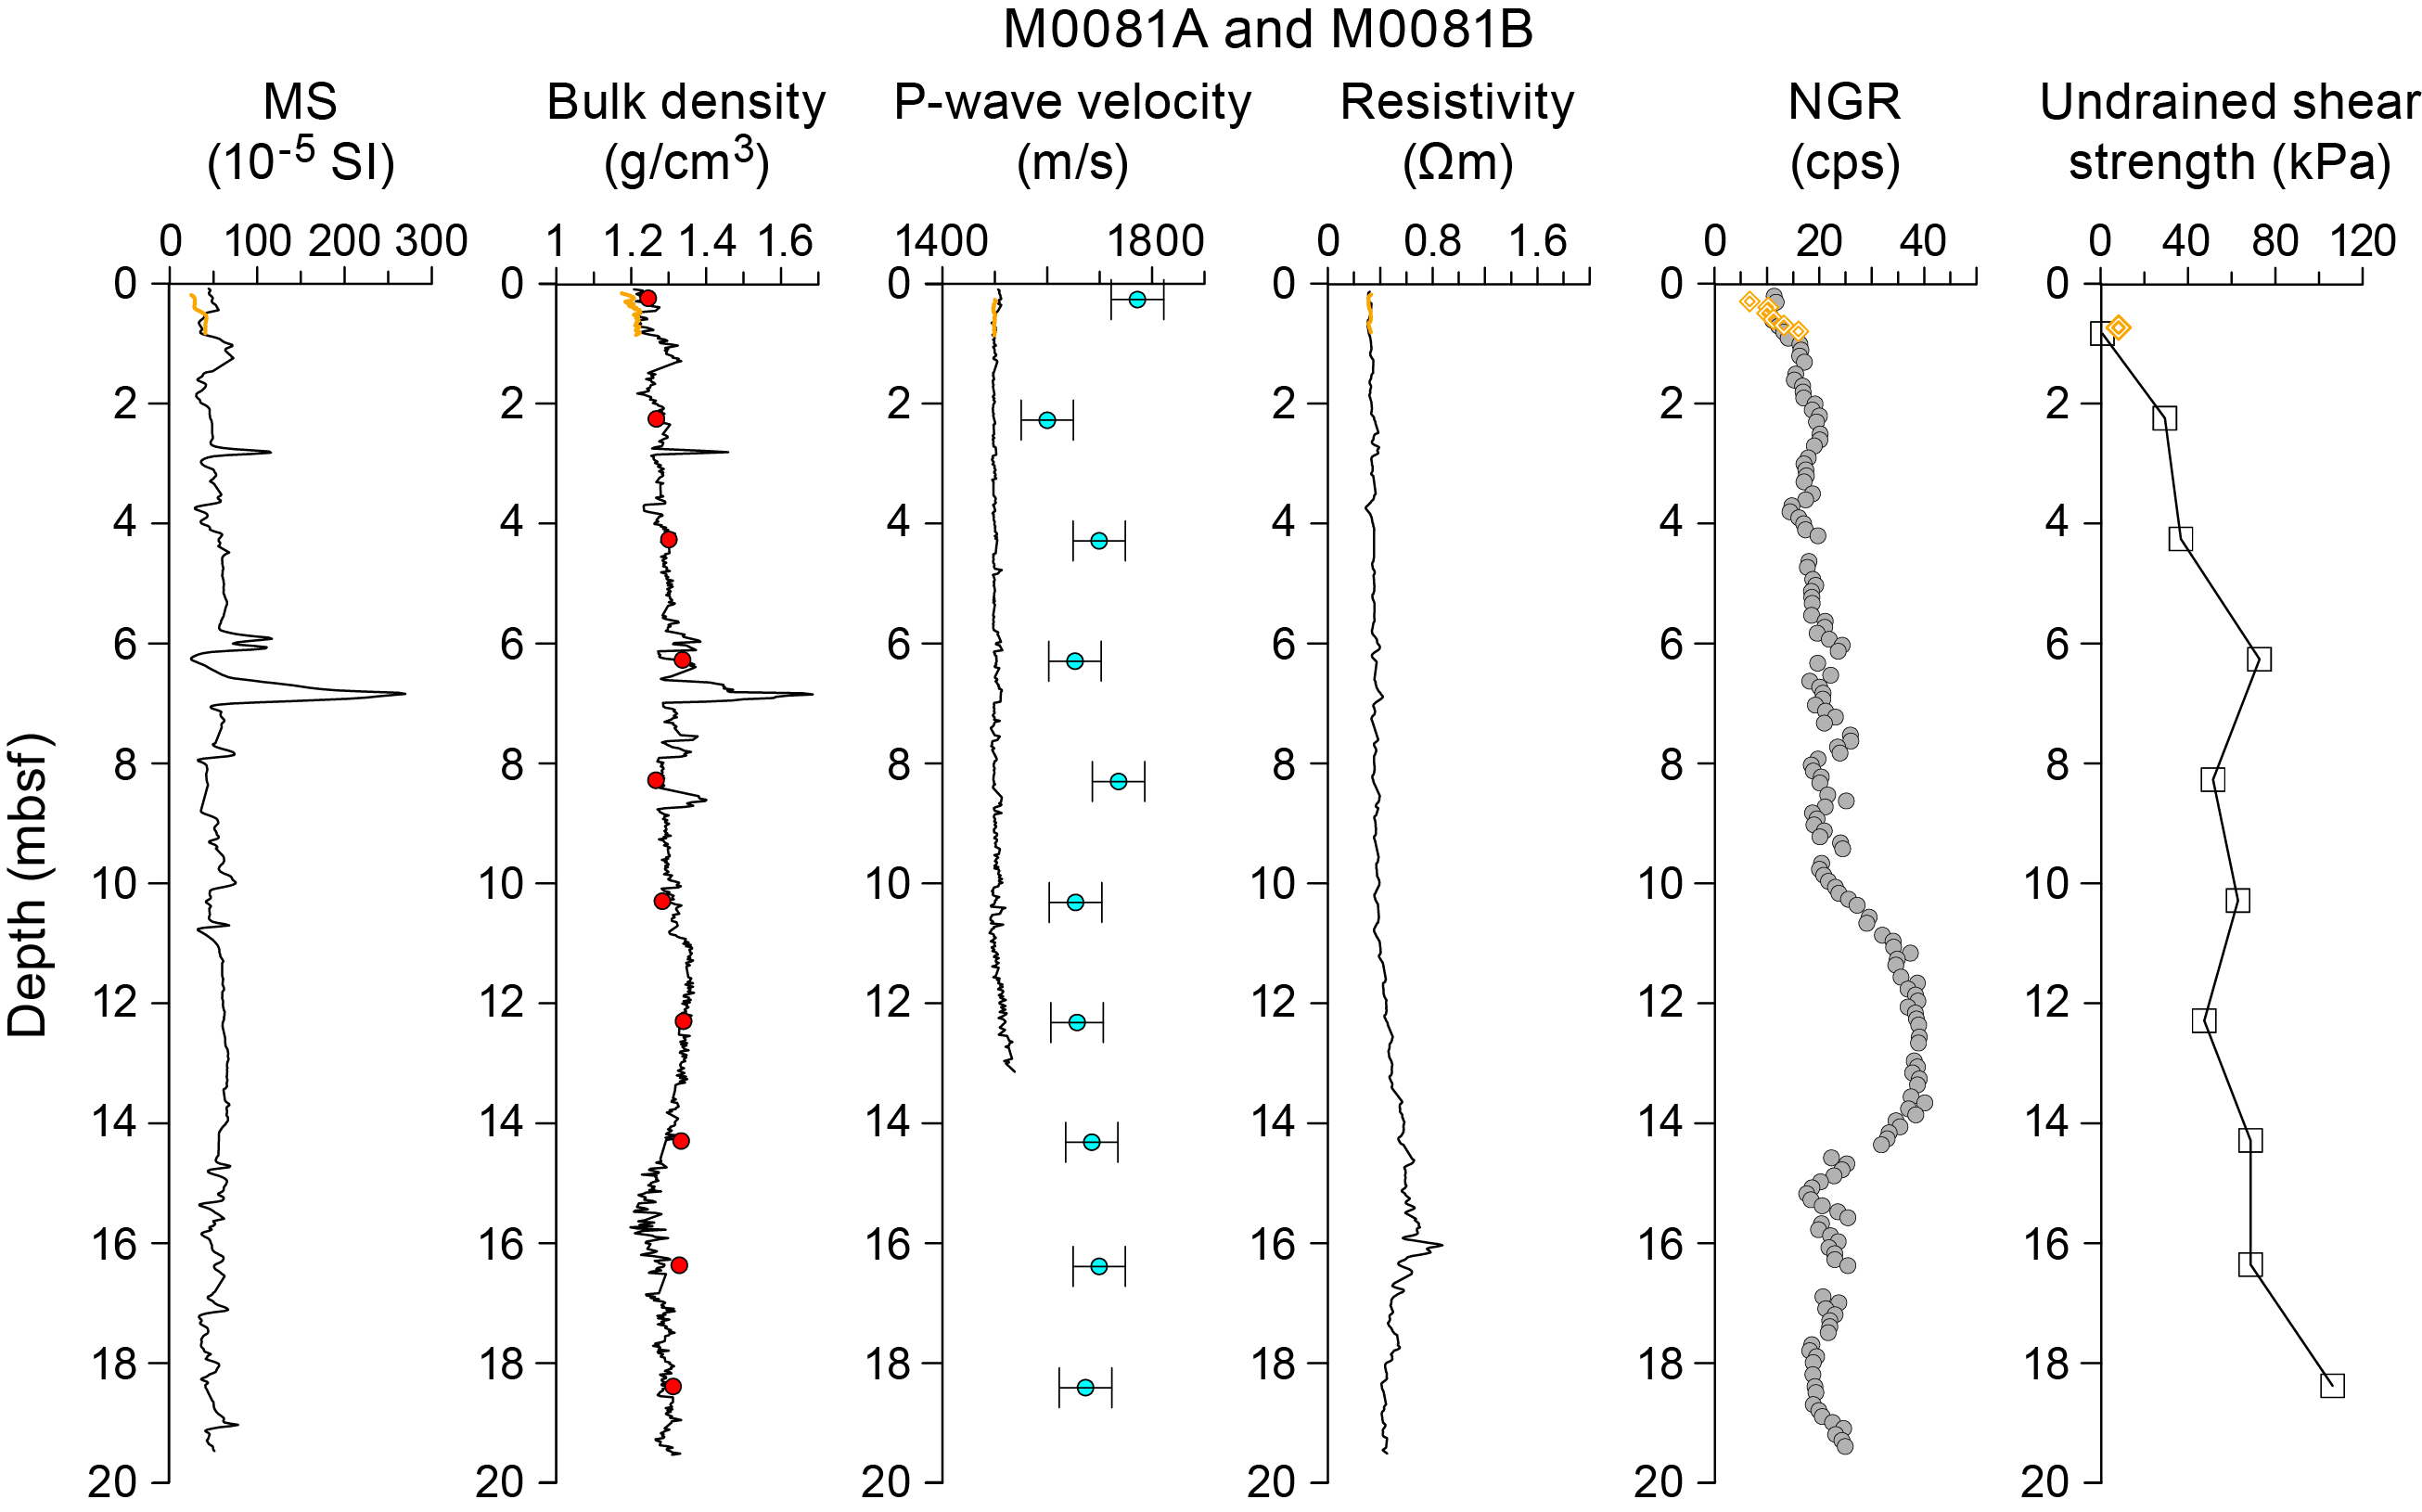
Figure F48. Physical properties summary, Holes M0081A and M0081B.
Bulk density increases downcore from ~1.25 g/cm3 at the top of Hole M0081D to ~1.35 g/cm3 at the bottom (35 mbsf) (Figure F49). However, instead of a smooth increase with depth there is a pattern of several zones of linearly increasing or decreasing density separated by narrower zones with relatively high or low density values. This is observed in both the MSCL and MAD data sets. For example, the zone between 10 and 13 mbsf is characterized by systematic decreasing bulk density with depth, followed by a zone between 13 and 25 mbsf characterized by rapid fluctuations of high and low values. This ~12 m thick interval also corresponds with similar fluctuations in magnetic susceptibility, resistivity, and NGR. Below 25 mbsf, bulk density is much less variable, and it increases with depth to the bottom of the core (35 mbsf).
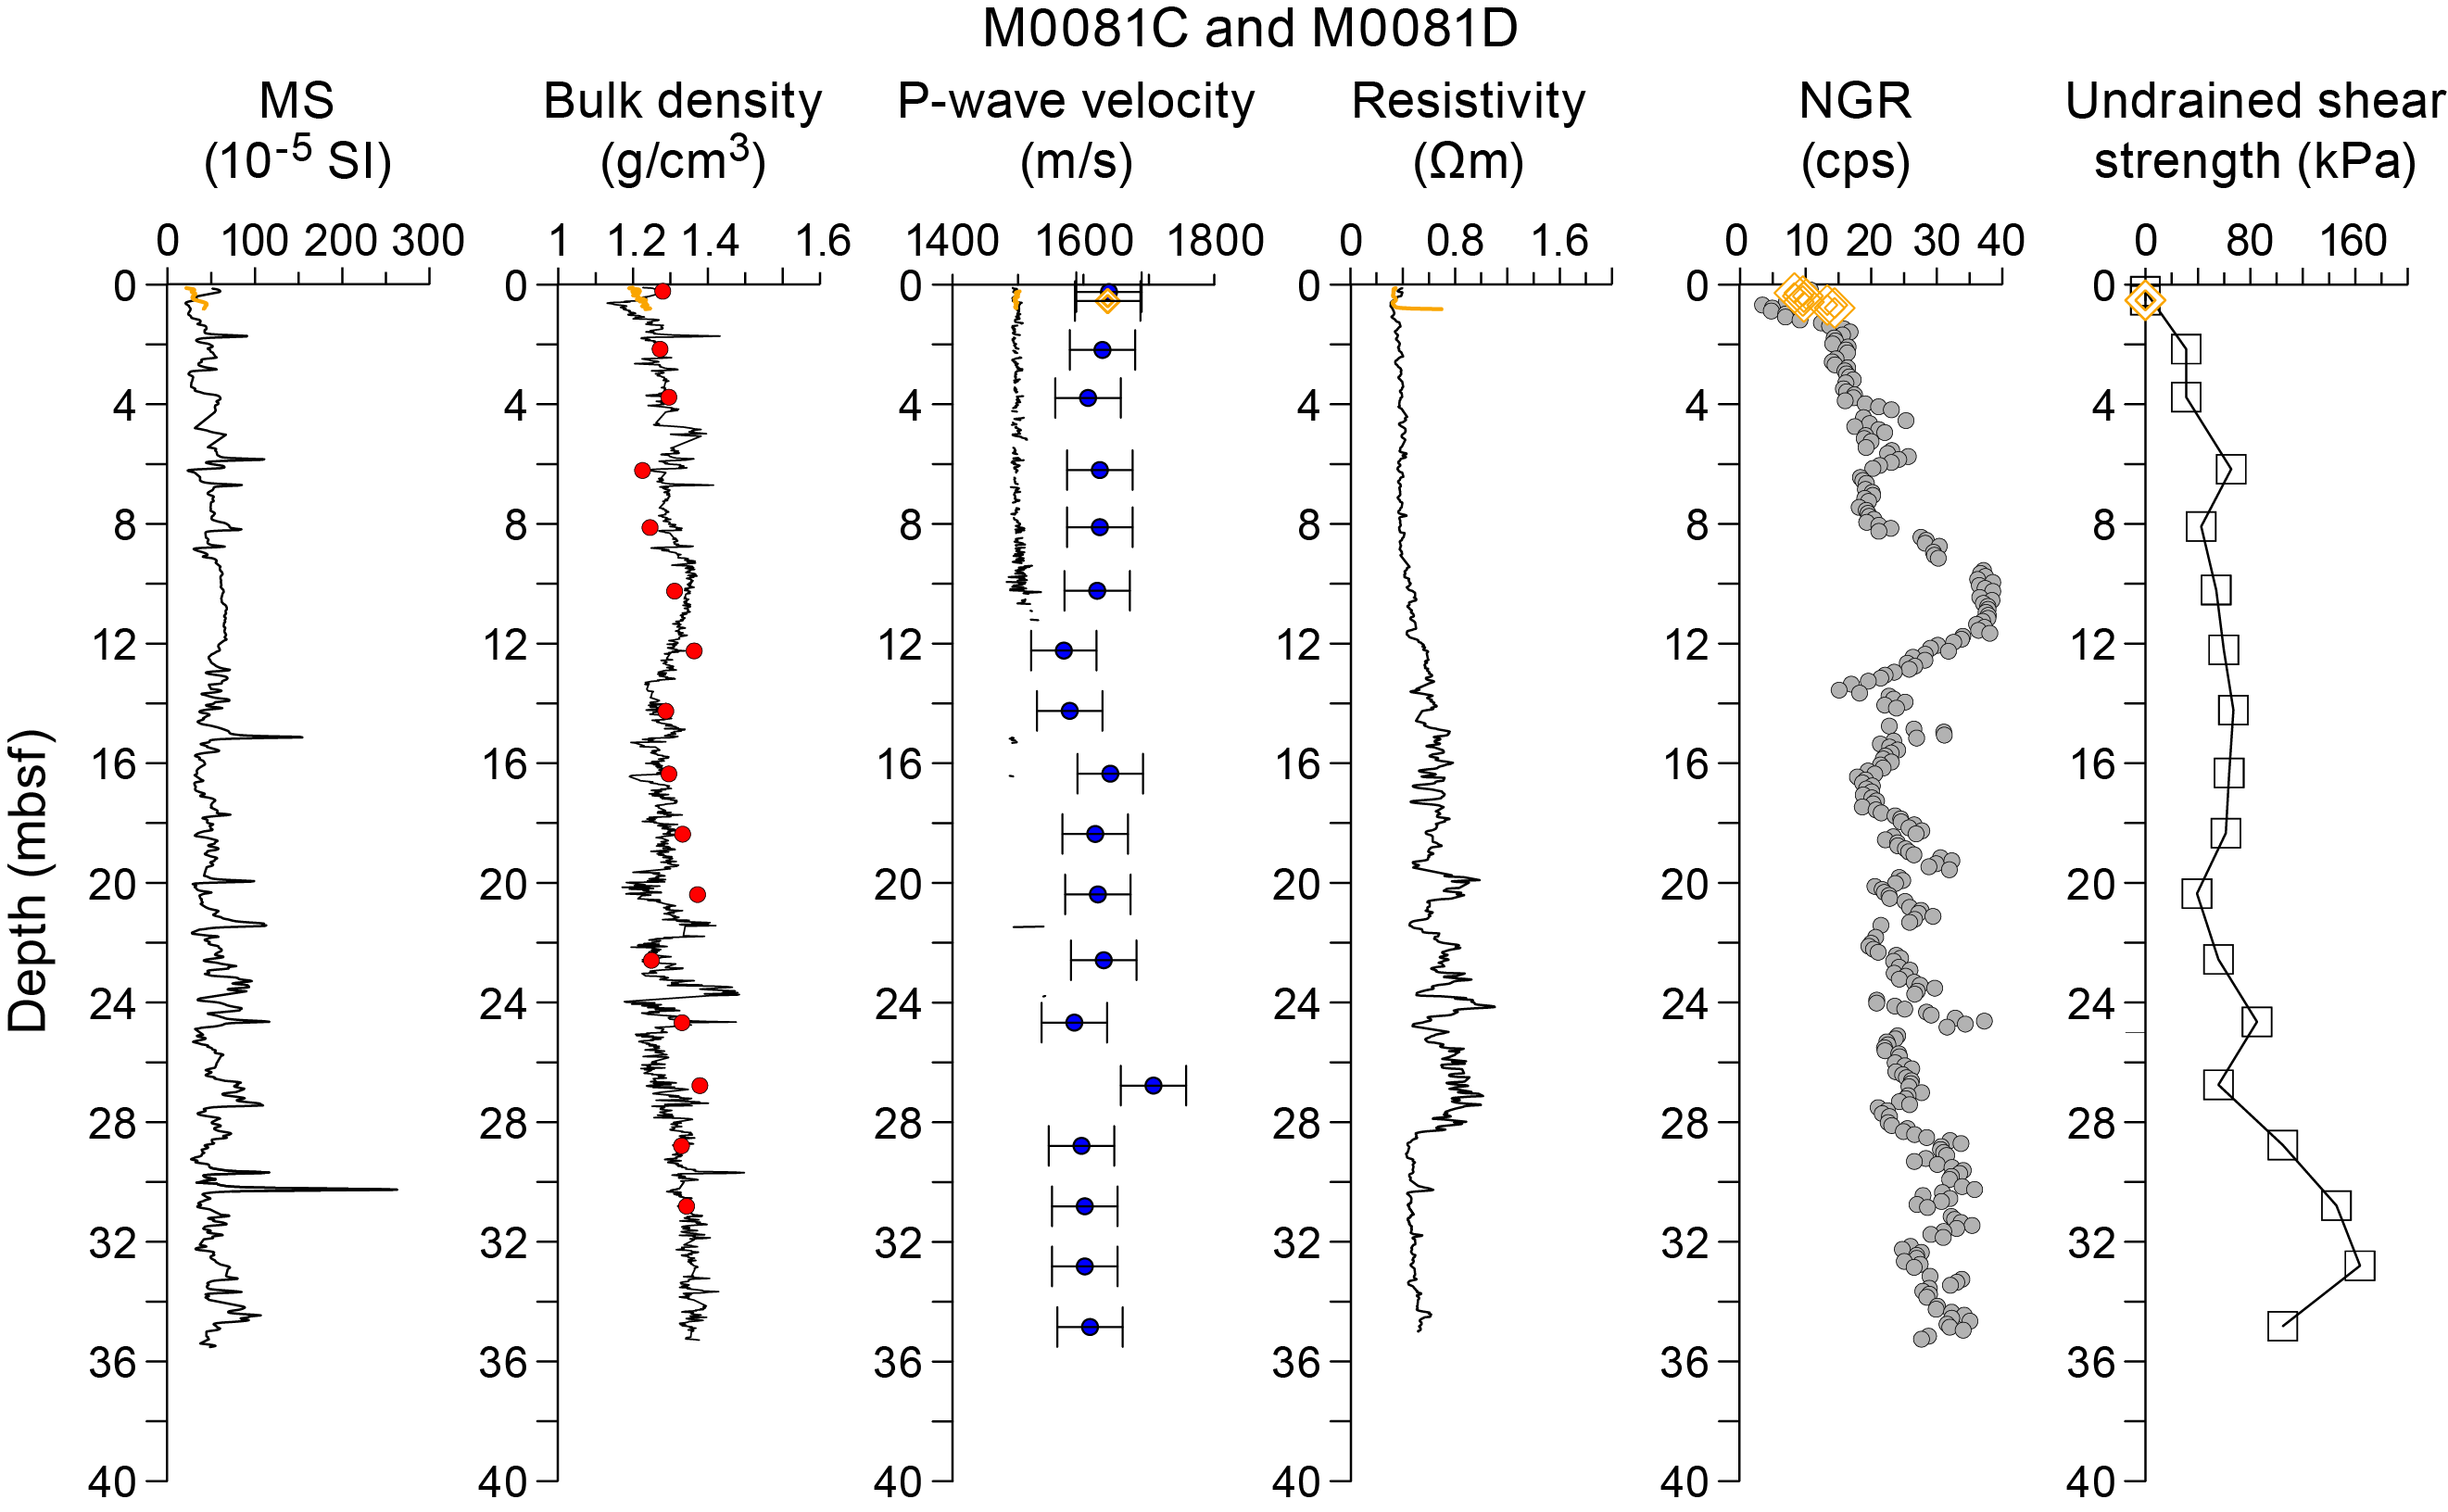
Figure F49. Physical properties summary, Holes M0081C and M0081D.
In Holes M0081E and M0081F, bulk density increases downcore from ~1.20 g/cm3 at the top to ~1.40 g/cm3 at the bottom of Hole M0081F (35 mbsf) (Figure F50). However, density values show localized zones of variations superimposed on this overall trend. For example, the zone between ~20 and 30 mbsf is characterized by rapid fluctuations of high and low values. This ~10 m thick interval also corresponds with similar fluctuations in magnetic susceptibility, resistivity, and NGR and bears resemblance to the similar interval in Hole M0081D (Figure F49). Peaks in MSCL density greater than 1.5 g/cm3 occur at ~7, 17, and 31 mbsf. A low-density (high porosity) zone approximately 1 m thick between ~30 and 31 mbsf has density values lower than those observed even at the top of the core (1.2 g/cm3).
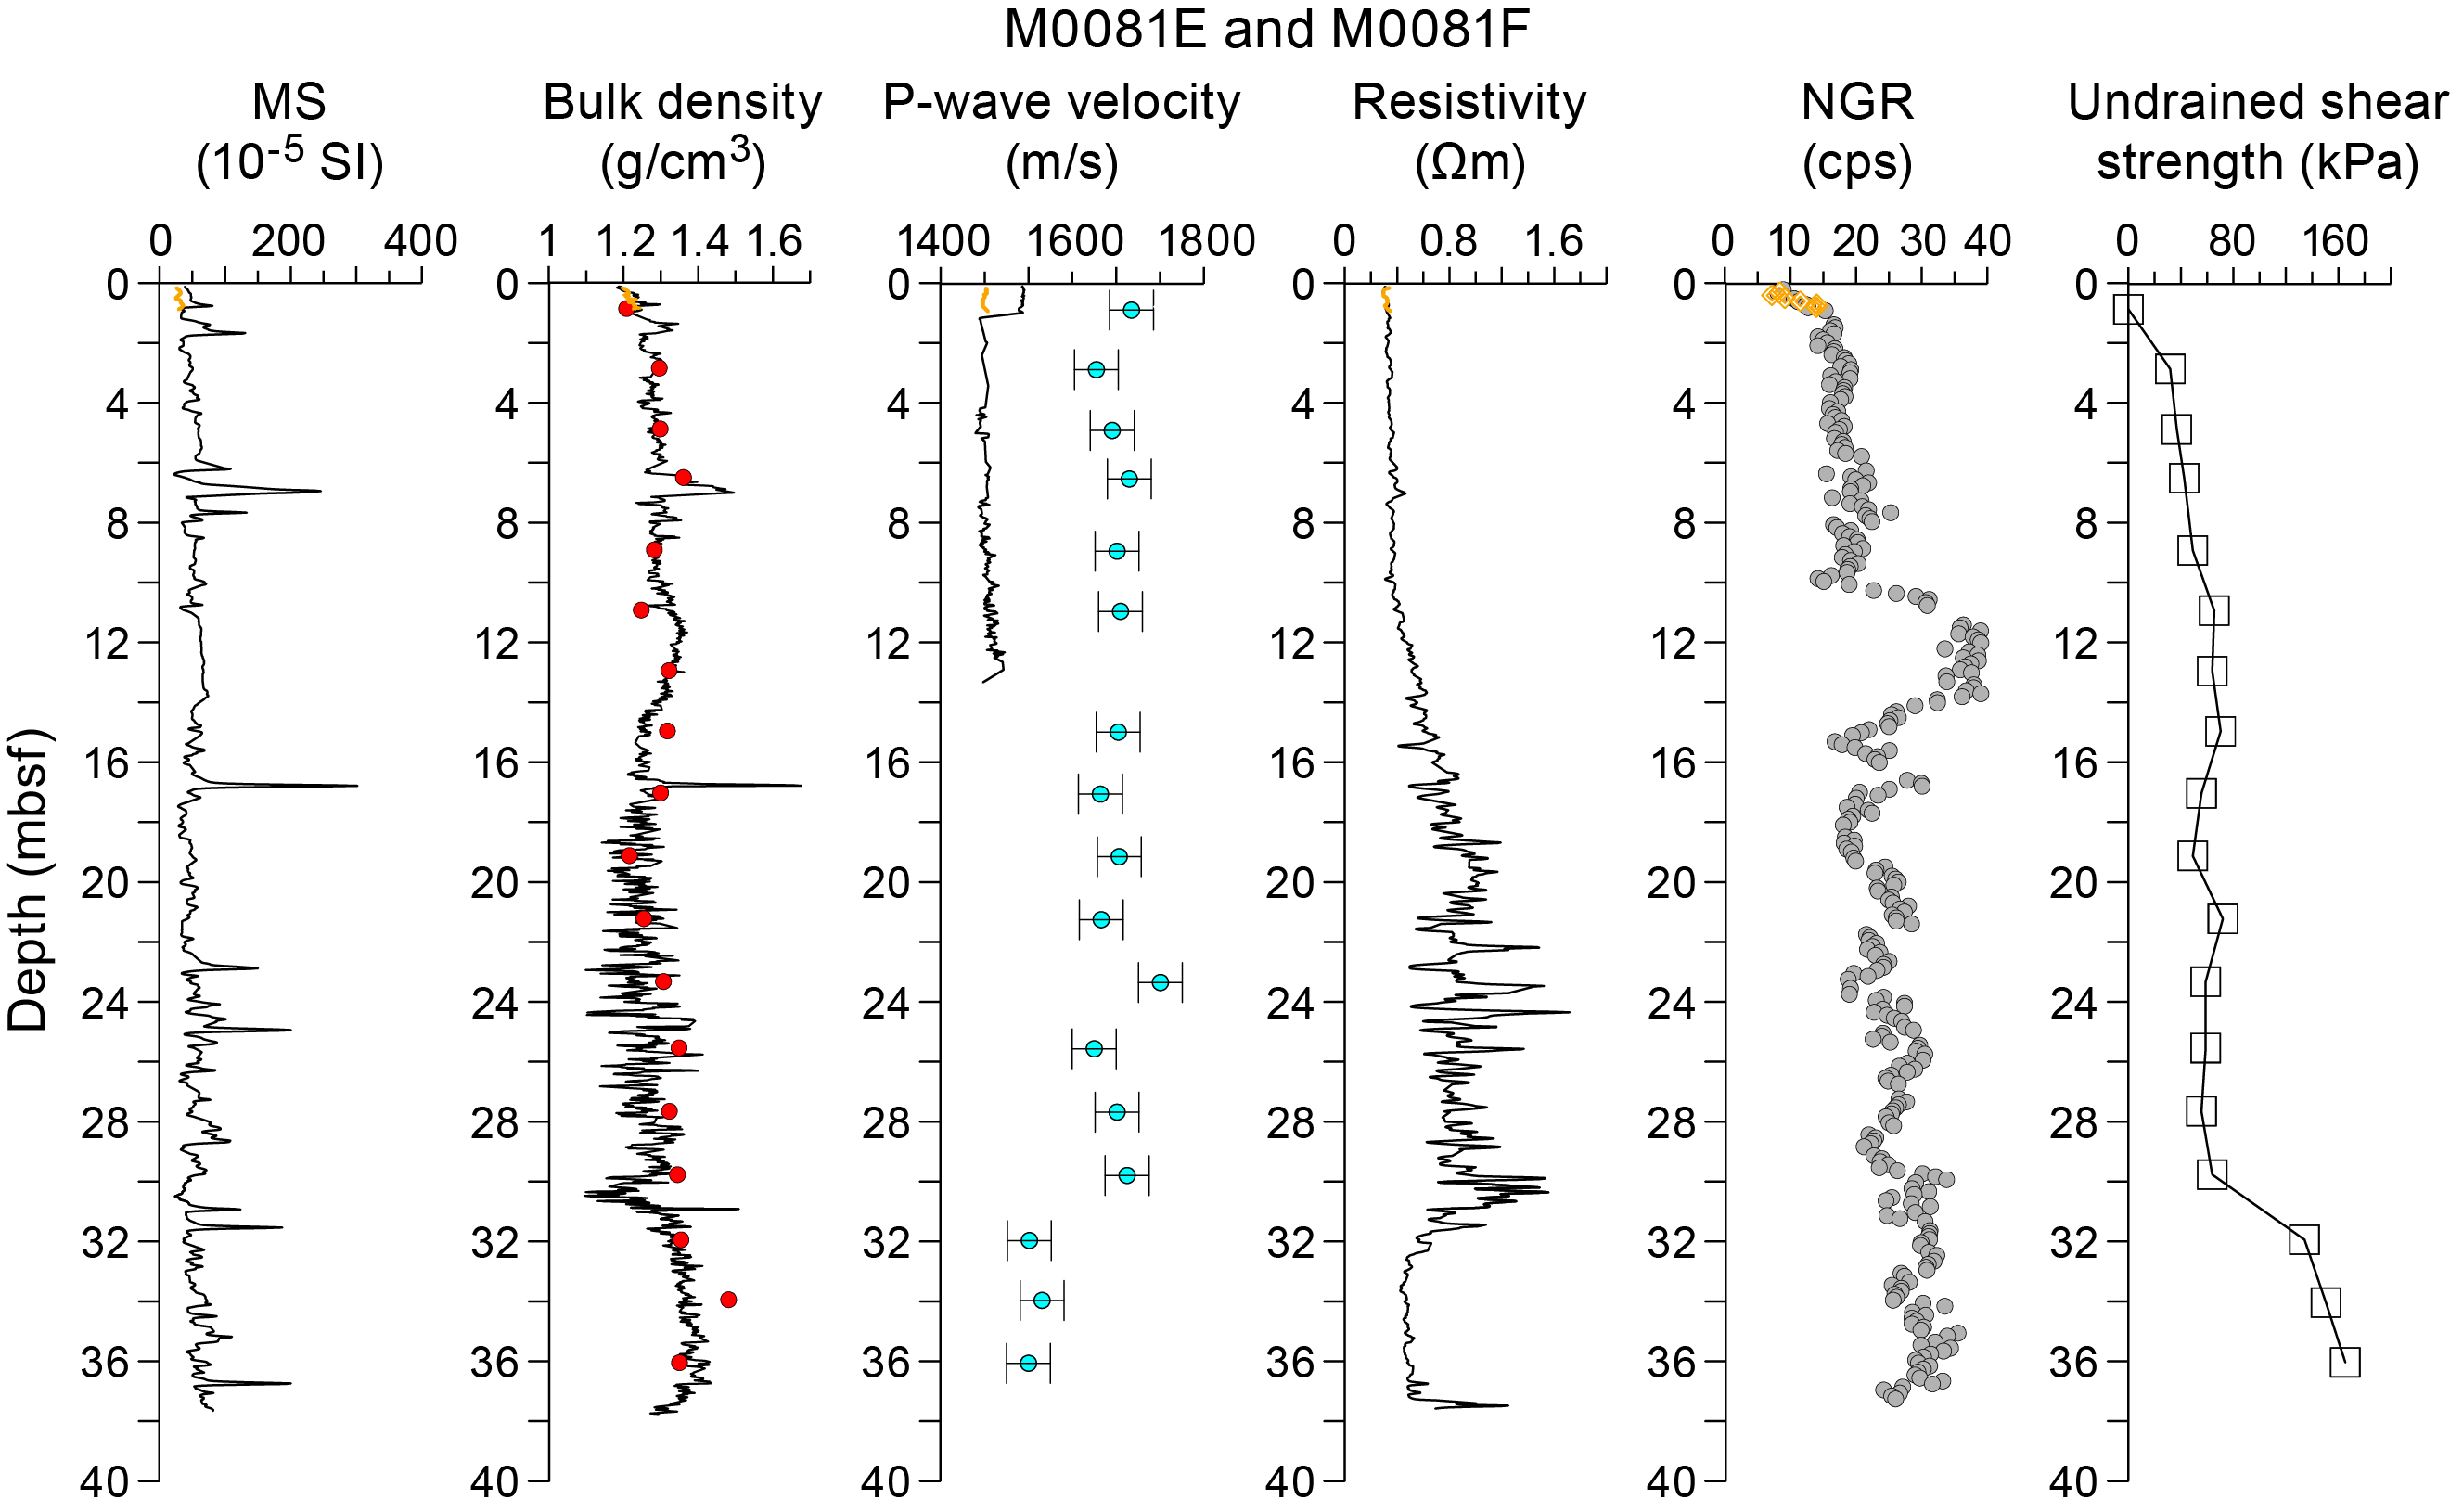
Figure F50. Physical properties summary, Holes M0081E and M0081F.
7.1.2. Site M0082
In Holes M0082A and M0082B, bulk density increases gradually with depth from ~1.20 g/cm3 at the top of the core to ~1.40 g/cm3 at the bottom of Hole M0082B (18 mbsf) (Figure F51). Downcore, several peaks in bulk density exceed 1.5 g/cm3 (e.g., at 3, 7, 8, 12, and 14 mbsf) and correspond to peaks in magnetic susceptibility. Although the general trend is increasing density with depth, as would be expected, a decreasing trend in bulk density (i.e., increasing porosity) occurs over from ~3 to 11.5 mbsf. Density decreases overall from 12 to 16 mbsf, but there are numerous spikes (high and low). The deepest 2 m (16–18 mbsf) show a rapid increase in bulk density from 1.2 to 1.4 g/cm3.
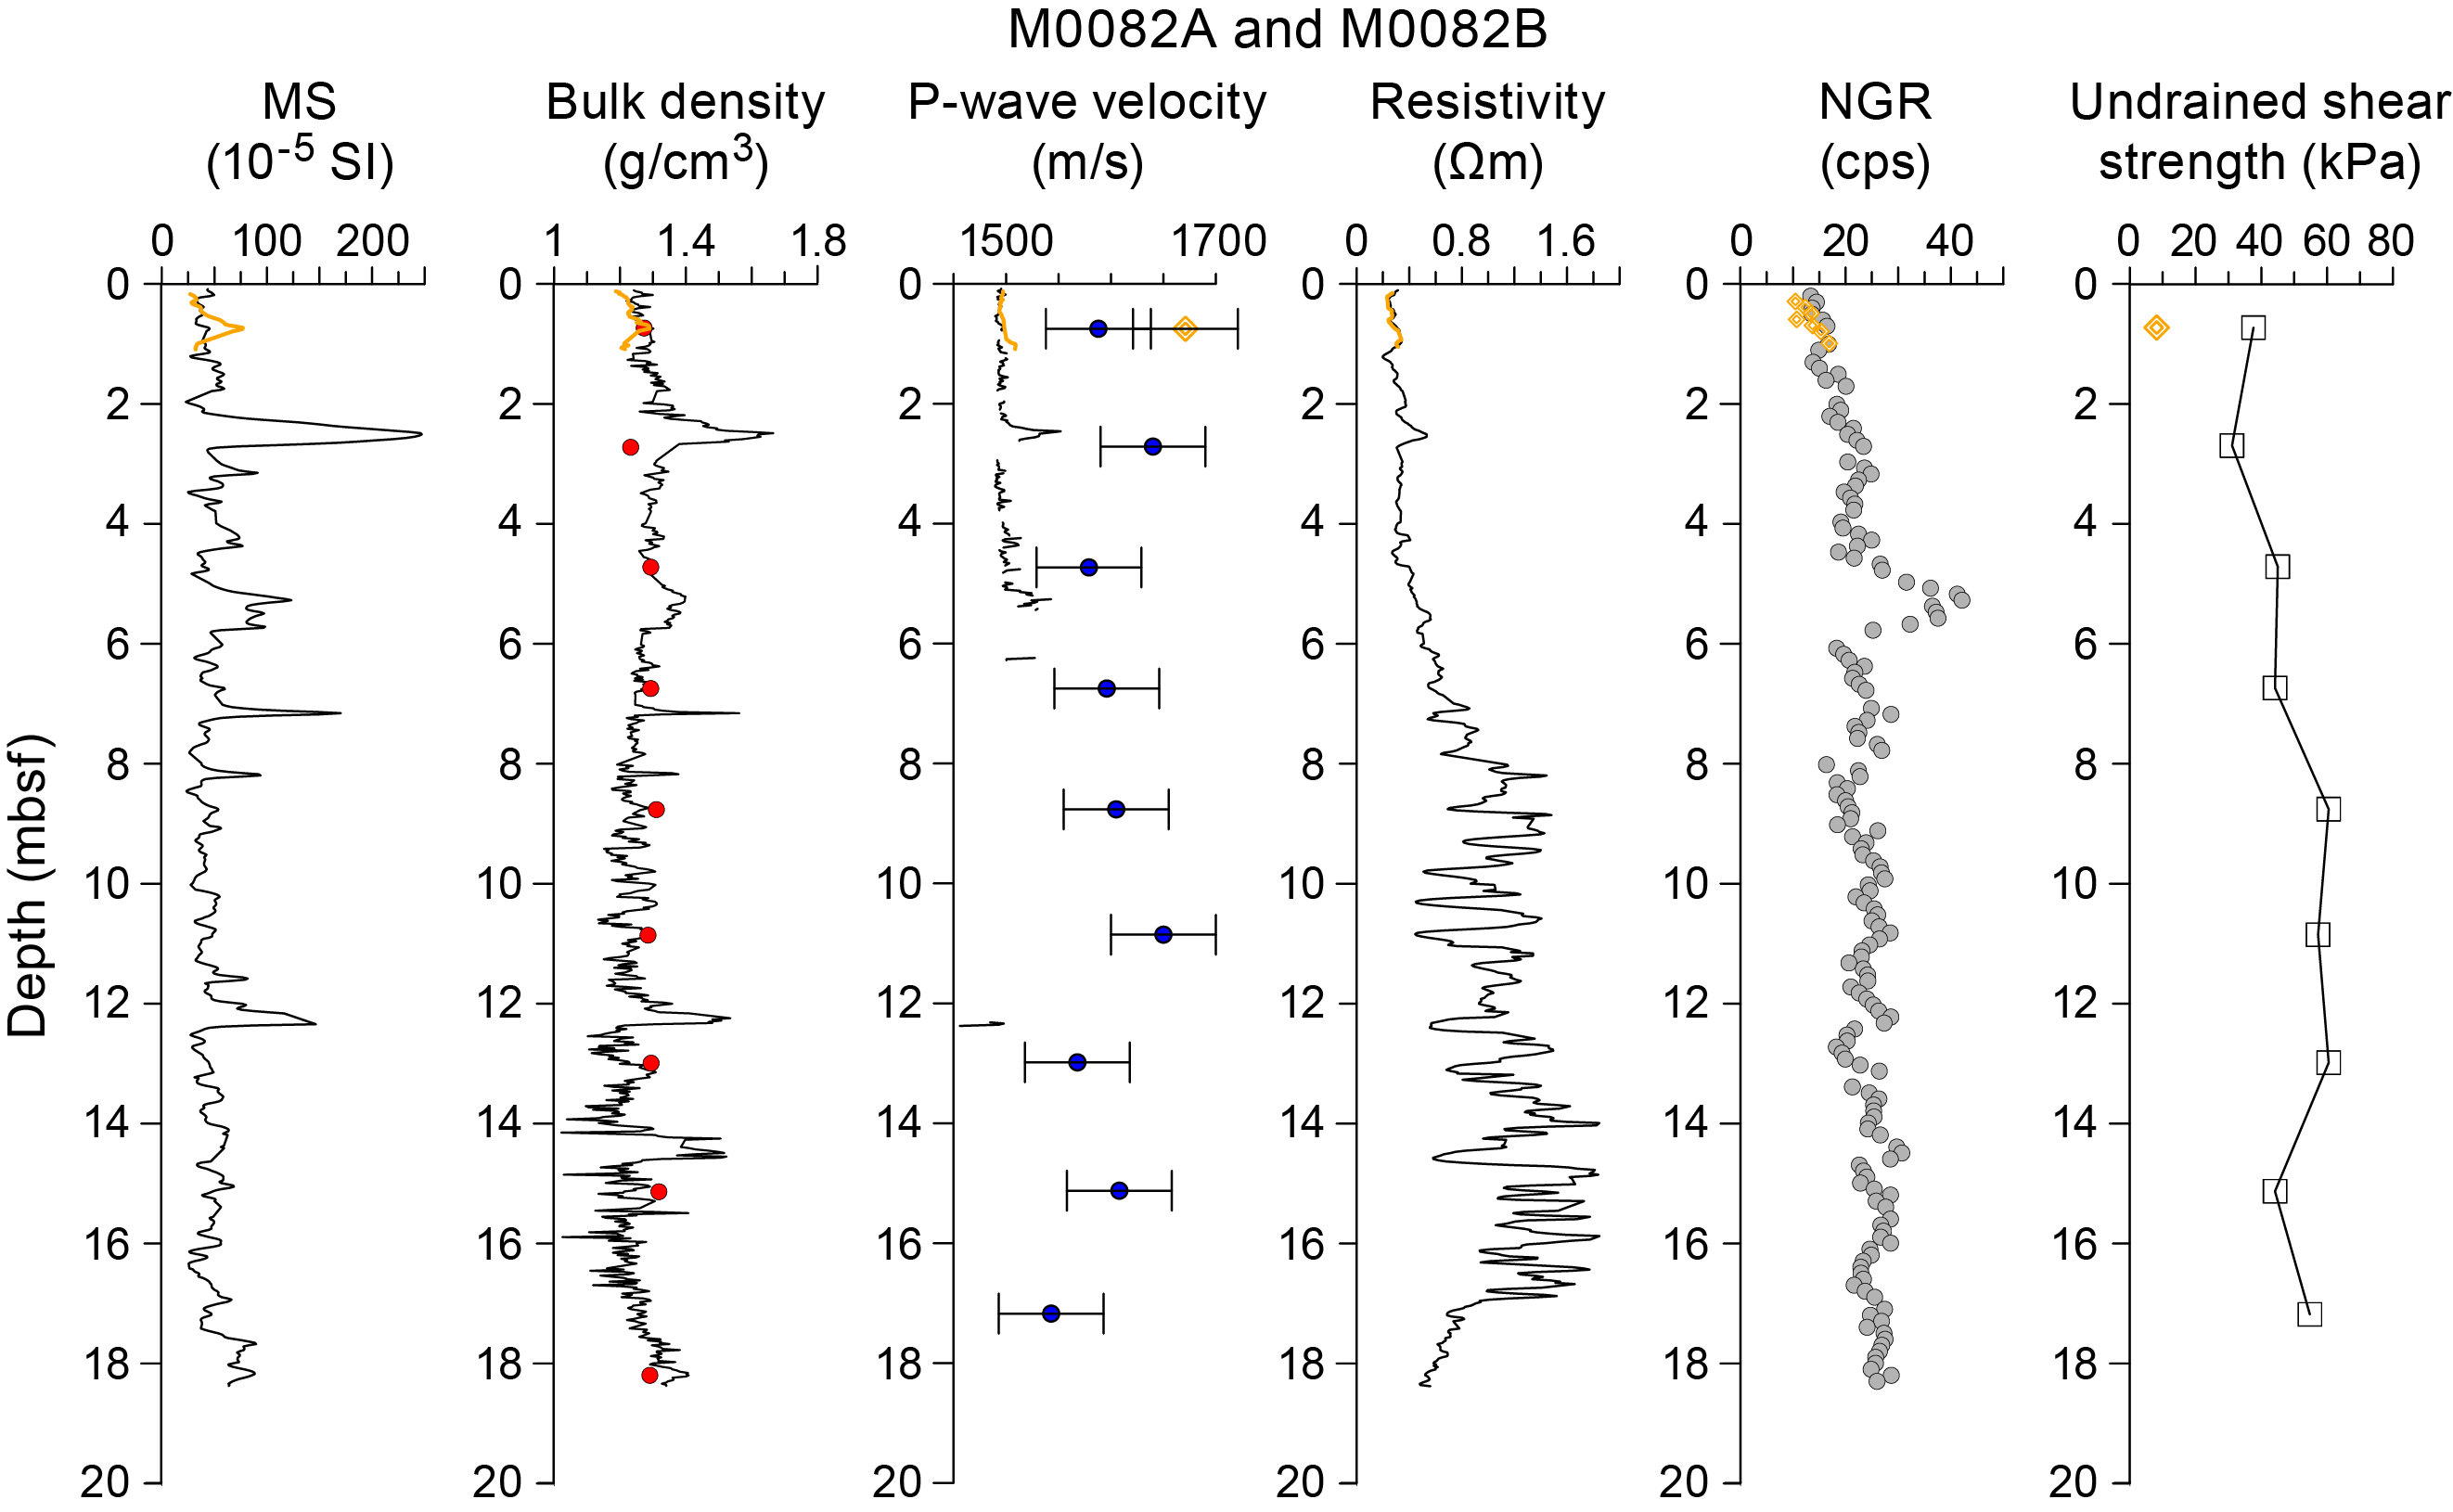
Figure F51. Physical properties summary, Holes M0082A and M0082B.
In Holes M0082C and M0082D, bulk density increases gradually from~1.20 g/cm3 at the top of the core to ~1.35 g/cm3 at the bottom of Hole M0082D (36 mbsf) (Figure F52). Several peaks in bulk density exceeding 1.5 g/cm3 occur throughout the core and correspond to peaks in magnetic susceptibility. MAD-derived bulk density data have an overall good correspondence with the MSCL-derived bulk density data but tend to be slightly higher than MSCL bulk density data. Two distinct high-density peaks at ~5 and 12 mbsf are captured well with both MSCL and MAD data.
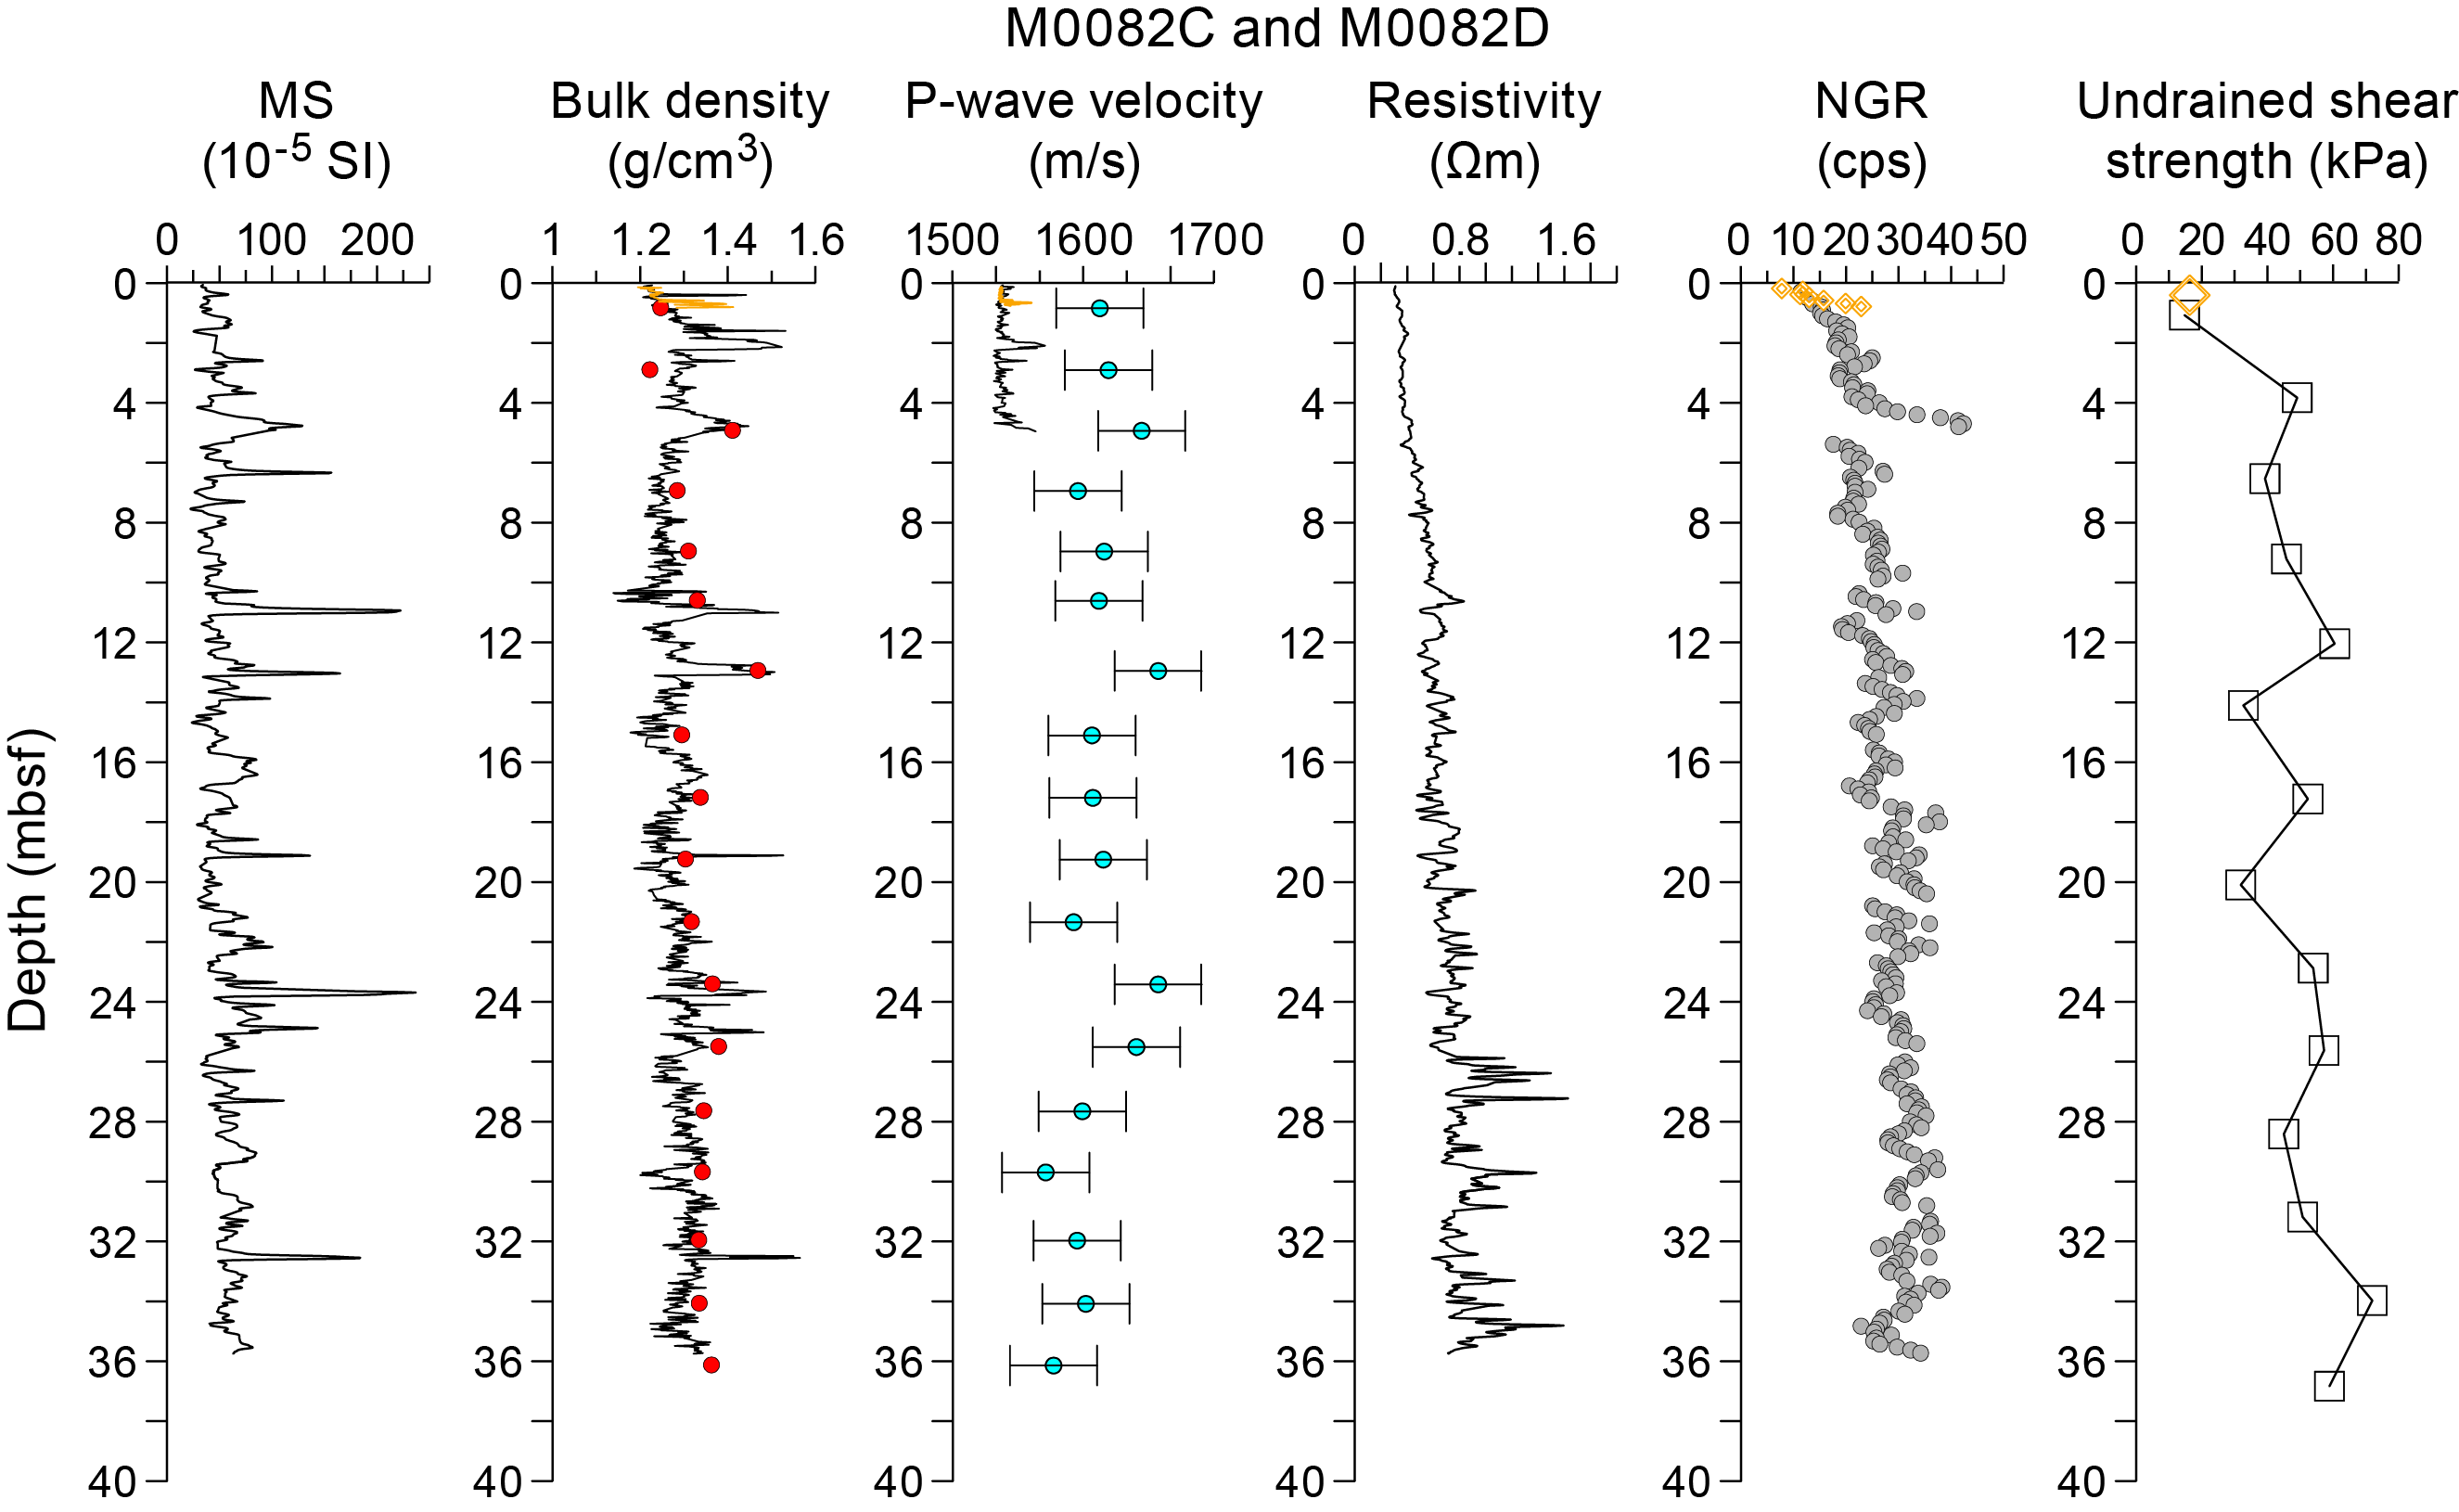
Figure F52. Physical properties summary, Holes M0082C and M0082D.
7.2. Magnetic susceptibility
Magnetic susceptibility data were obtained on whole cores using the MSCL during the offshore phase.
7.2.1. Site M0081
Overall, magnetic susceptibility in all Site M0081 cores fluctuate around a baseline value of approximately 50 × 10−5 SI throughout the cored depths but also show several pronounced peaks that exceed 100 × 10−5 SI (Figures F48, F49, F50). The highest peak values typically occur within short depth intervals of less than 50 cm. Otherwise, magnetic susceptibility shows high-frequency variations, typically with values of approximately 35 × 10−5 to 65 × 10−5 SI. Although magnetic susceptibility generally tends to vary over short, centimeter-scale depths, a 3 m thick zone of nearly stable readings of 65 × 10−5 SI occurs in all three GPC holes (M0081B, M0081D, and M0081F) at similar depths (10−15 mbsf).
7.2.2. Site M0082
Overall, magnetic susceptibility in all Site M0082 cores fluctuate around a baseline value of approximately 50 × 10−5 SI throughout the cored depths but also show several pronounced peaks that exceed 100 × 10−5 SI (Figures F51, F52). The highest peak values typically occur within short depth intervals of less than 50 cm. Otherwise, the typical high-frequency fluctuations in magnetic susceptibility vary between 35 × 10−5 and 65 × 10−5 SI.
7.3. P-wave velocity
P-wave velocity was measured on whole cores using the MSCL during the offshore phase. During the onshore phase, P-wave velocity was measured on discrete samples approximately every 2 m. Many of the MSCL velocity data were of insufficient quality below ~5 mbsf and have been omitted.
Offshore P-wave velocities recorded using the MSCL at both sites generally trend around 1500 m/s (the velocity of water). Shore-based discrete measurements are noticeably higher (closer to an average of 1700 m/s). The difference in velocity exceeds the uncertainty associated with the discrete velocity measurements (±50 m/s). The difference between the two datasets may be attributed to continued compaction or degassing of the sediments between the offshore and onshore phases of the expedition. Postcruise research will be required to fully understand the discrepancy, and the data should thus be used with a degree of caution.
MSCL and laboratory-measured P-wave data are plotted in Figures F48, F49, and F50 for Site M0081 and Figures F51 and F52 for Site M0082. High-velocity zones occur at 2.5 and ~5 mbsf in Hole M0082B and correspond to high bulk density and magnetic susceptibility.
7.4. Noncontact electrical resistivity
7.4.1. Site M0081
Noncontact electrical resistivity measured using the MSCL shows fairly consistent profiles in all holes at Site M0081, especially in the uppermost 10 m. Hole M0081B shows the simplest behavior with nearly constant readings of 0.4 Ωm to 10 mbsf, a gradual increase to a maximum value of ~0.8 Ωm at 16 mbsf, and a gradual decrease to the bottom of the hole (Figure F48). In both of the GPC holes, M0081D (Figure F49) and M0081F (Figure F50), the interval between ~15 and 30 mbsf shows the greatest amount of variability and the highest readings, with a maximum slightly higher than 1.5 Ωm in Hole M0081F. These high-variability zones are followed by a lower resistivity zone below ~30 mbsf with consistent resistivity values of 0.5 Ωm.
7.4.2. Site M0082
Noncontact electrical resistivity at Site M0082 generally increases from ~0.3 Ωm at the top of the core to ~1 Ωm at the bottom of Hole M0082D (37 mbsf) (Figures F51, F52). In Hole M0082B, resistivity between 8 and 17 mbsf has relatively rapid fluctuations between ~0.5 and 1 Ωm. Below this depth to the base of Hole M0082B, resistivity values are much more stable and have a decreasing trend. This same interval is characterized by an increasing bulk density trend. In Hole M0082D, resistivity values increase with depth, with the most variations occurring below 25 mbsf. The systematic increase in resistivity with depth interestingly appears to not be controlled by consolidation or clay content because the bulk density and NGR profiles remain relatively steady throughout the hole.
7.5. Natural gamma radiation
7.5.1. Site M0081
In all holes at Site M0081, NGR has similar profiles that generally fluctuate between 20 and 30 counts/s with the lowest readings in the shallowest 2 m (Figures F48, F49, F50). A relatively high NGR zone is consistently observed in the three GPC holes (M0081B, M0081D, and M0081F), with readings up to 40 counts/s. The zone gradually increases to its maximum value and then tapers back to background levels. This zone occurs between 10 and 15 mbsf in Holes M0081B and M0081F and between 9 and 14 mbsf in Hole M0081D.
7.5.2. Site M0082
NGR values at Site M0082 generally increase with depth and vary between 10 and 40 counts/s (Figures F51, F52). A prominent high-gamma interval occurs in both GPC holes (M0082B and M0082D) at 5–6 and 4–5 mbsf, respectively. These peaks also correspond to high magnetic susceptibility and high bulk density values.
7.6. Undrained shear strength
Undrained shear strength (Su) was measured on split cores with a handheld penetrometer, automated vane shear (AVS), and fall cone penetrometer (see Physical properties in the Expedition 386 methods chapter [Strasser et al., 2023a]).
7.6.1. Site M0081
Su, measured with a handheld penetrometer, increases in all holes at Site M0081 from ~0 kPa at the core top to maximum values of 150–160 kPa near the base of the deeper Holes M0081D and M0081F (Figure F48, F49, F50, F53). Although the overall trend increases with depth, three zones occur in the strength profiles. In the deeper GPC holes (M0081D and M0081F), a zone at 0–15 mbsf shows a gradual and approximately linear increase with depth from ~0 to 60 kPa, followed by a zone with an inversion in strength, decreasing from 15 to 20 mbsf. In the third zone, strengths increase with depth but at a faster rate than the first zone. In Hole M0081F, Su is mostly constant at ~70 kPa between 23 and 30 mbsf. Interestingly, this interval with constant values (and lack of increase with depth) is also characterized by higher MSCL density variability (and slightly lower MSCL-derived than MAD-derived density values). This behavior is perhaps related to the different core handling for the hole dedicated to microbiology (M0081F; see Operations). Between 30 and 32 mbsf, a rather sharp increase to ~160 kPa is followed by a linear increase with depth for the last two measurements.
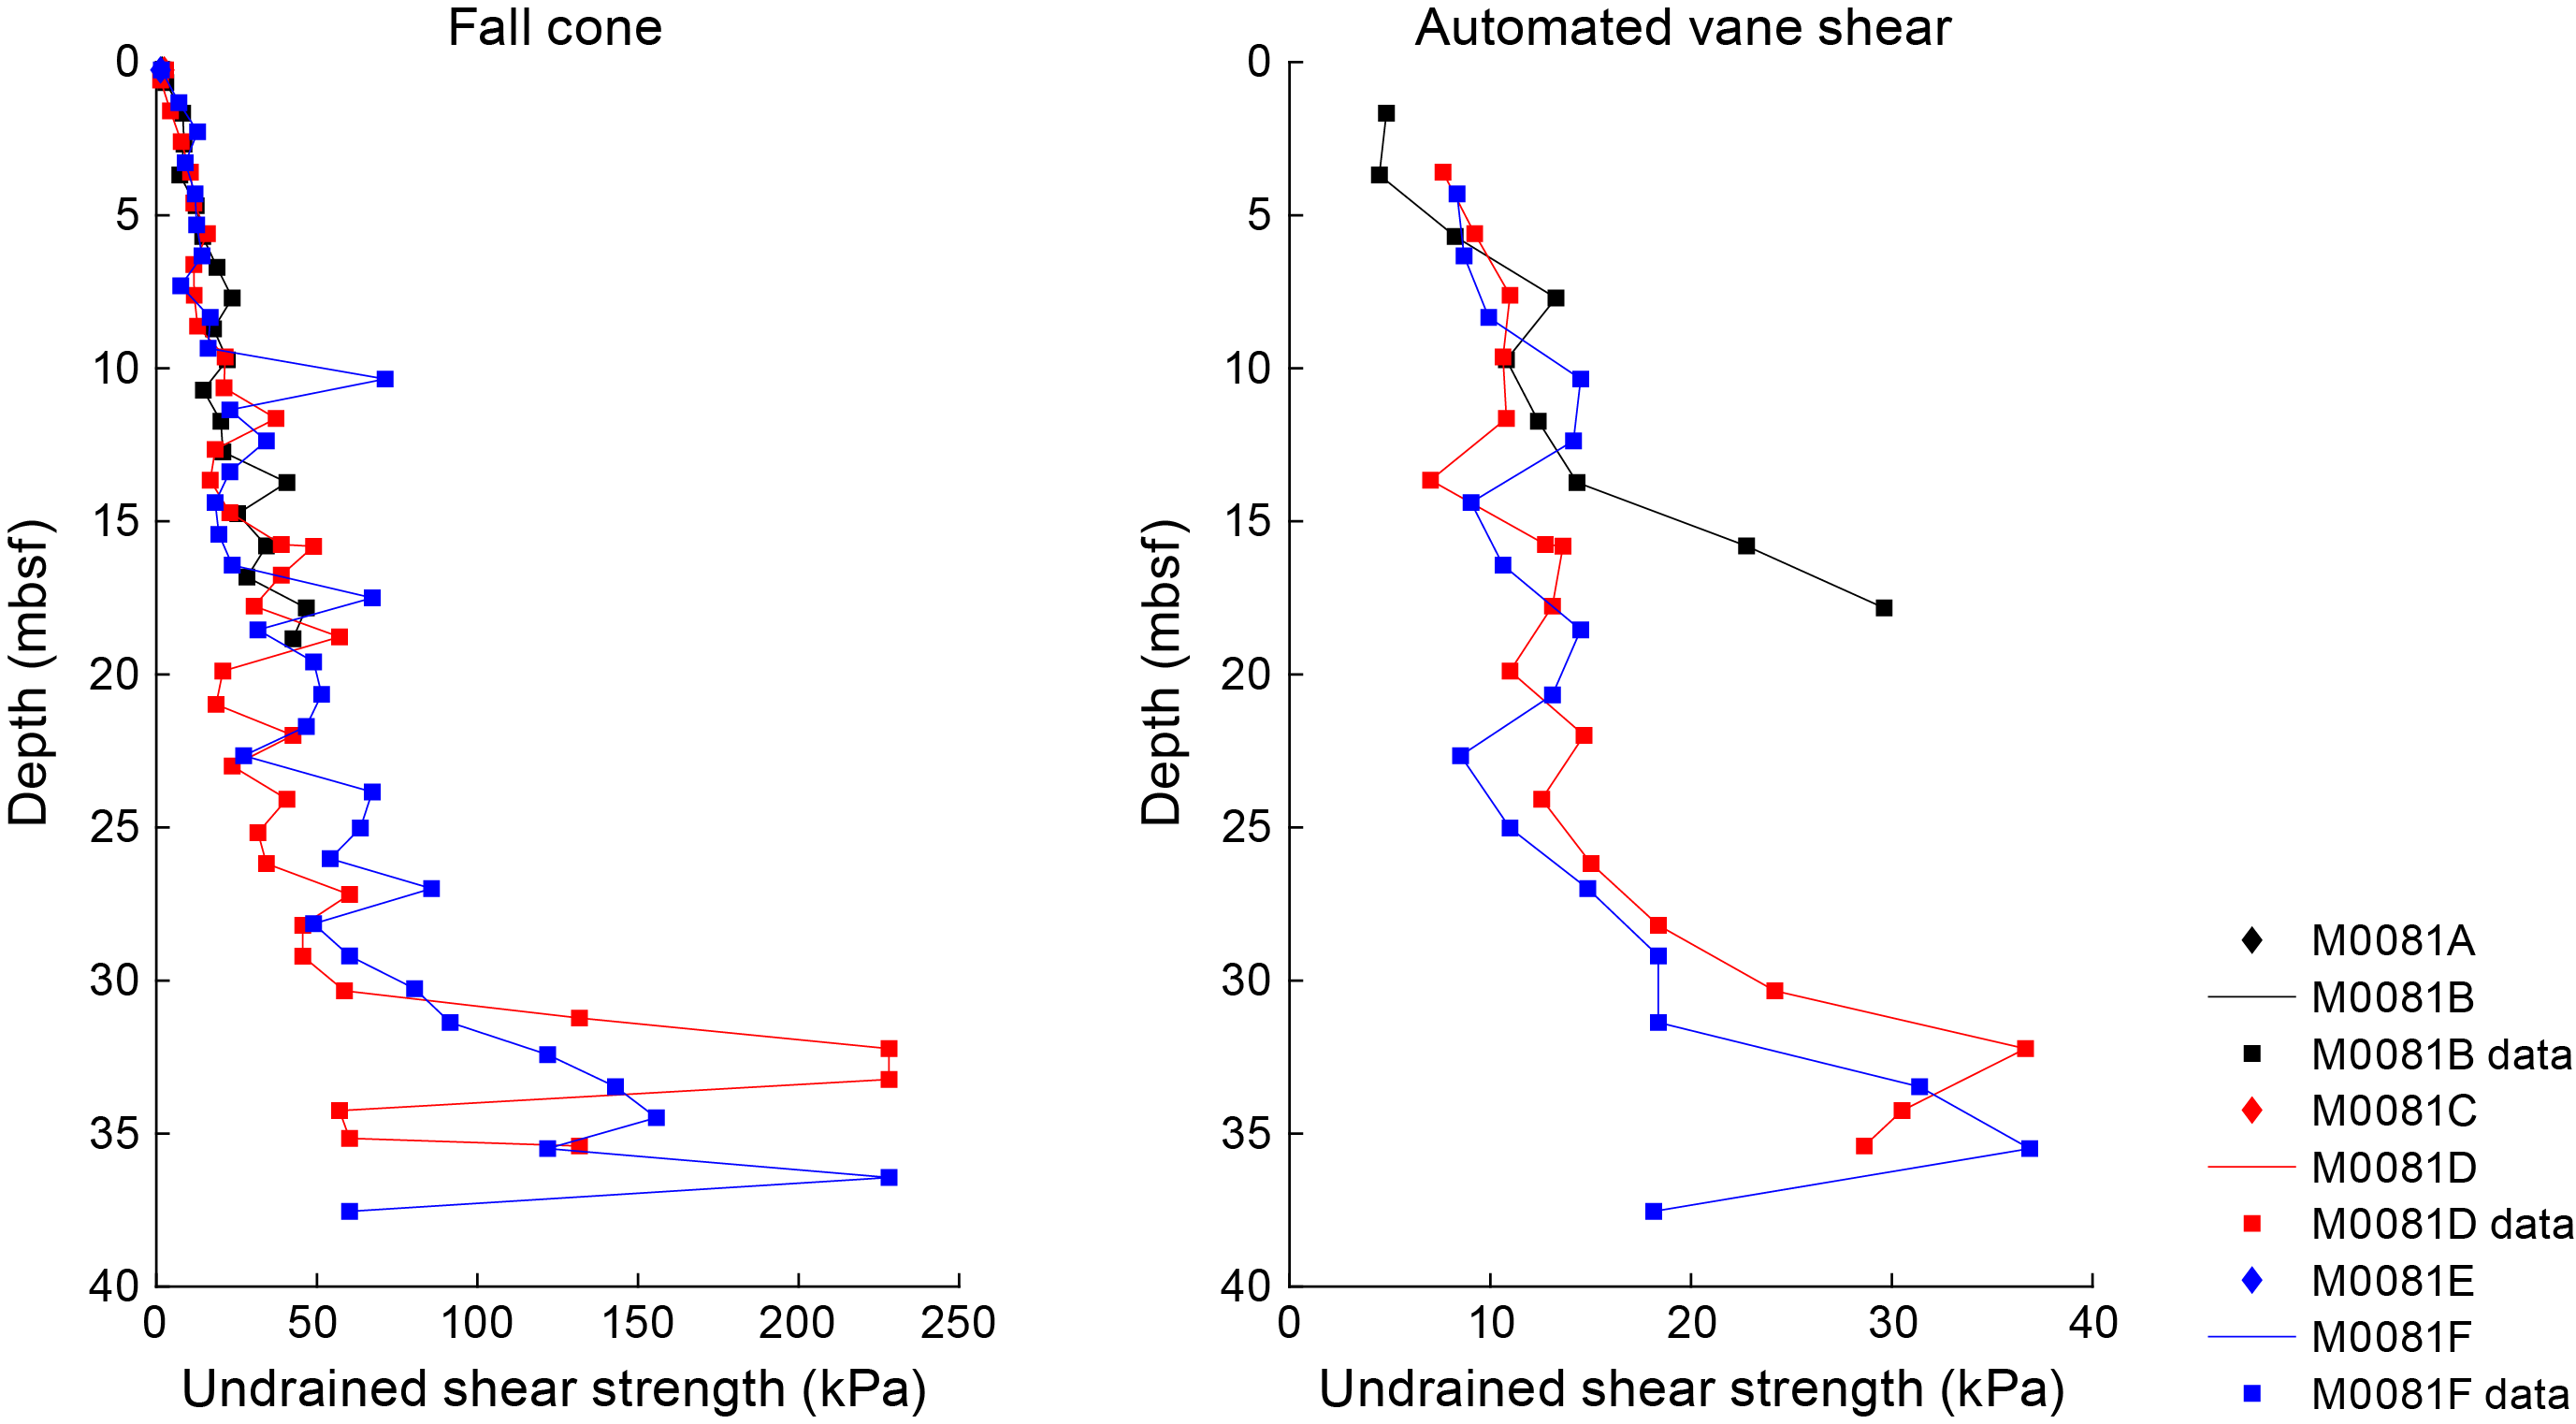
Figure F53. Undrained shear strength, Site M0081.
7.6.2. Site M0082
At Site M0082, Su increases with depth but not as much as at Site M0081 (Figures F51, F52, F54). Peak strengths are approximately 60 kPa, which are lower than values observed at Site M0081. Shear strengths within the uppermost ~15 m of Site M0082 increase rapidly with depth. There is a strength reduction at ~15 m. Below this depth, strengths increase again but at a lower rate than in the top section.
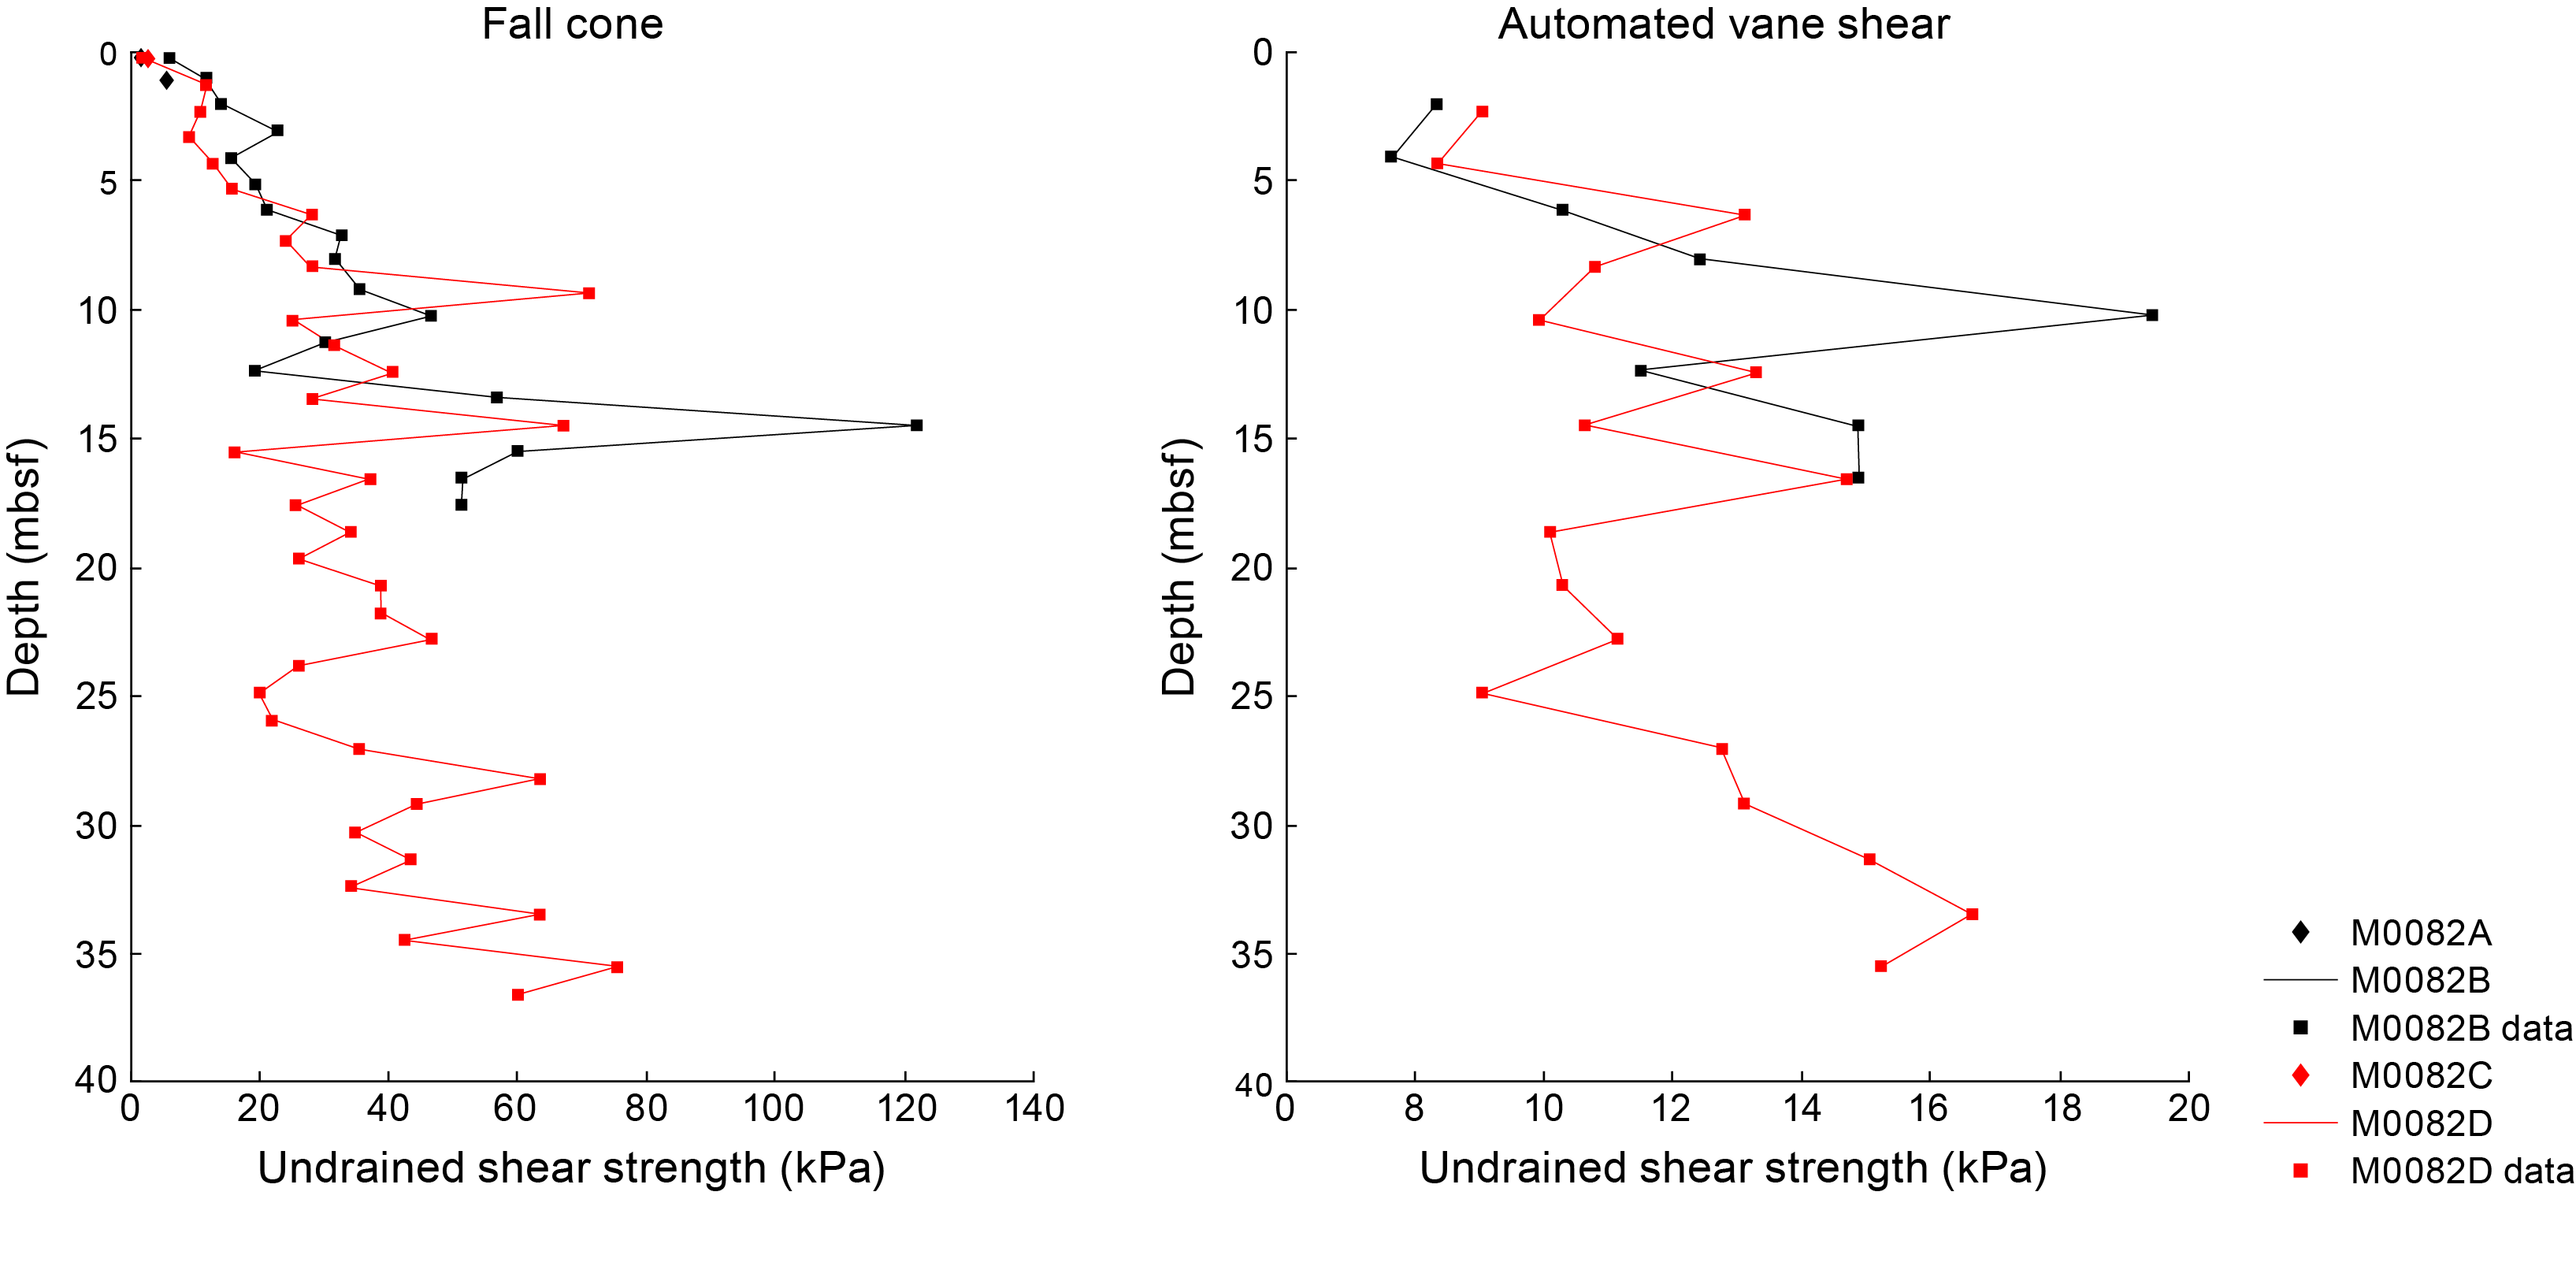
Figure F54. Undrained shear strength, Site M0082.
It should be noted that Su values vary according to the device used to obtain them (e.g., Figures F53, F54). For example, fall cone strengths are higher than those obtained with the vane shear and handheld penetrometer. The influence of the U-channel along the center of the core could result in lower strengths than the fall cone. The fall cone only impacts a small region of the core (~2–5 mm), whereas the AVS impacts a larger region of the core (~20–50 mm). Both measurements ideally should be obtained from the center of the core away from the core sidewall. However, samples could not be taken at the center because of the U-channel recovered during the OSP (see Operations). As a result, strength sampling points had to be placed halfway between the central U-channel and the sidewall of the core. During AVS measurements, the fractures that would open often propagated toward both the central U-channel and the sidewall, perhaps resulting in lower strength values. Fall cone measurements were not seen to be affected by the U-channel or the sidewall. Postcruise analysis will more closely examine the strength data to try to reconcile the differences.
7.7. Moisture and density
MAD measurements were made on discrete samples at a frequency of approximately one measurement every 2 m downcore. Plots of water content (wet and dry), porosity, void ratio, grain density, and dry density are presented in the figures in this section along with plots of bulk density MAD data and bulk density MSCL data.
7.7.1. Site M0081
In Holes M0081A and M0081B, the uppermost 6 m have systematic variations in the MAD properties (Figure F55). In particular, water content, porosity, and void ratio systematically decrease and dry density and grain density increase. This trend is interrupted at 8 mbsf, where water content, porosity, and void ratio increase. Below this depth, water content, porosity, and void ratio decrease with depth to 12 mbsf. The final three measurements all show increasing values of water content, porosity, and void ratio.
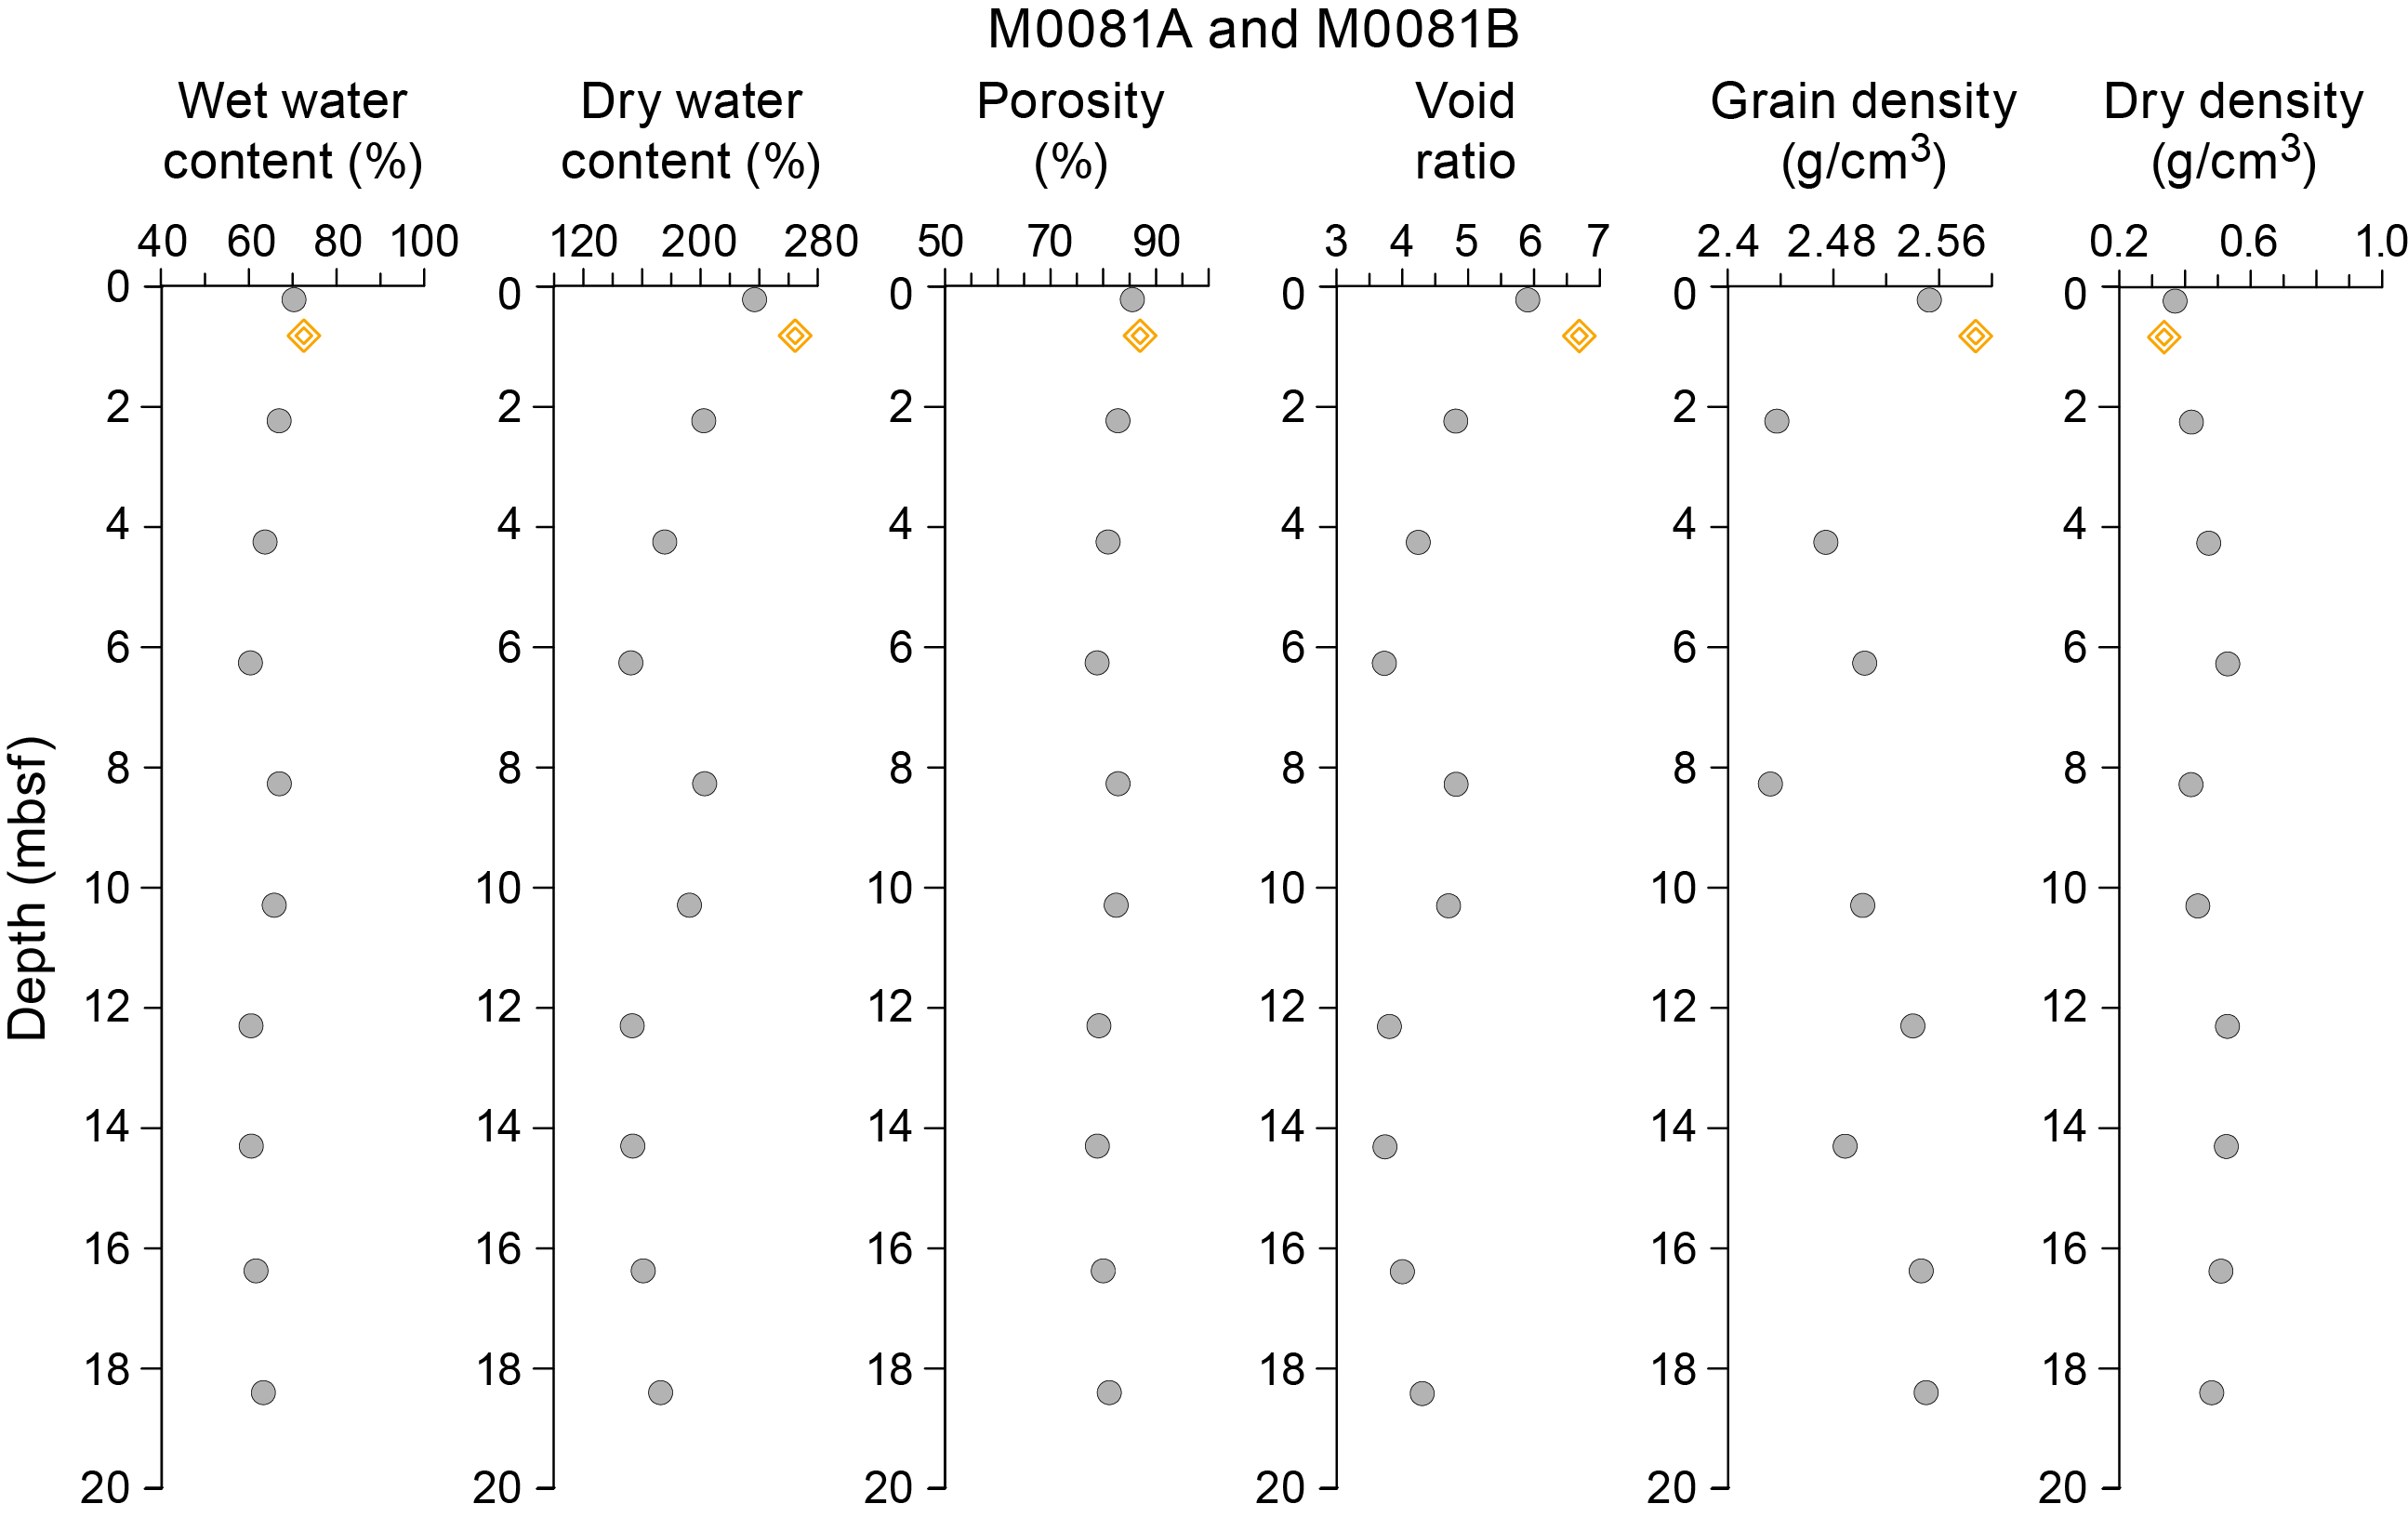
Figure F55. MAD data, Holes M0081A and M0081B.
No MAD measurements were taken for Hole M0081C. In Hole M0081D, water content, porosity, and void ratio generally decrease with depth (Figure F56). However, measurements at 6, 14, 22, and 28 mbsf correspond to increases in water content, porosity, and void ratio.

Figure F56. MAD data, Hole M0081D.
In Holes M0081E and M0081F (Figure F57), the shallowest MAD data points show remarkably similar values for the trigger core (Hole M0081E) and GPC core (M0081F). In Hole M0081F, MAD data generally trend with depth, as expected, with declines in water content, porosity, and void ratio. However, porosity and void ratio increase at 9 mbsf. Porosity and void ratio show an unexpected increasing trend with depth at 11–13 mbsf. This is also seen in the dry and wet water content data, although the trend is more subtle. Grain densities generally hover around 2.4 g/cm3, with two anomalously low values (<2 g/cm3) at 11 and 19 mbsf.

Figure F57. MAD data, Holes M0081E and M0081F.
7.7.2. Site M0082
In Holes M0082A and M0082B, MAD data profiles show little variation with depth with the exception of grain density (Figure F58). The lowest porosity (78%) occurs in the trigger core (Hole M0082A). It is not obvious why such a shallow depth has the lowest porosity (perhaps due to a change in lithology), but the same depth (0.73 mbsf) in the GPC core (Hole M0082B) also has a relatively low porosity (83%), suggesting it is not an error. At 3 mbsf, there is a localized zone where water content, porosity, and void ratio are the highest values in the entire core. Grain density varies from 2.43 to 2.56 g/cm3, which is low relative to quartz (2.65 g/cm3) and common clay minerals (2.7–2.8 g/cm3).

Figure F58. MAD data, Holes M0082A and M0082B.
In Holes M0082C and M0082D, MAD data show more variations than in Holes M0082A and M0082B, especially at 0–15 mbsf (Figure F59). Porosity, for example, starts at 85% at the core top and declines to 76% at the deepest measurement (36.1 mbsf). The MAD data show two depths (4.9 and 12.9 mbsf) with low values of porosity, water content, and void ratio and corresponding high values in grain and dry density.

Figure F59. MAD data, Holes M0082C and M0082D.
7.8. Color reflectance and RGB values
L*a*b* color values were measured using a photospectrometer, and RGB values were extracted from linescan images (see Physical properties in the Expedition 386 methods chapter [Strasser et al., 2023a]).
7.8.1. Site M0081
L* color values in Holes M0081A–M0081F (Figures F60, F61, F62) range approximately 20–30. a* values range approximately −1.5 to −0.5 with several localized spikes exceeding 0. b* values range approximately 0–10. RGB values in all holes vary with depth and with spectrometry parameters. In particular, there is a sharp contrast at approximately 10 mbsf in all holes that is characterized by a relatively sudden jump to high RGB values (~45 to ~90). Below this, color data gradually decreases over the next 5 m to ~60. This same interval corresponds to a very fine grained section (see Lithostratigraphy) and stands out in terms of many other physical properties parameters, including bulk density, NGR, resistivity, and magnetic susceptibility.
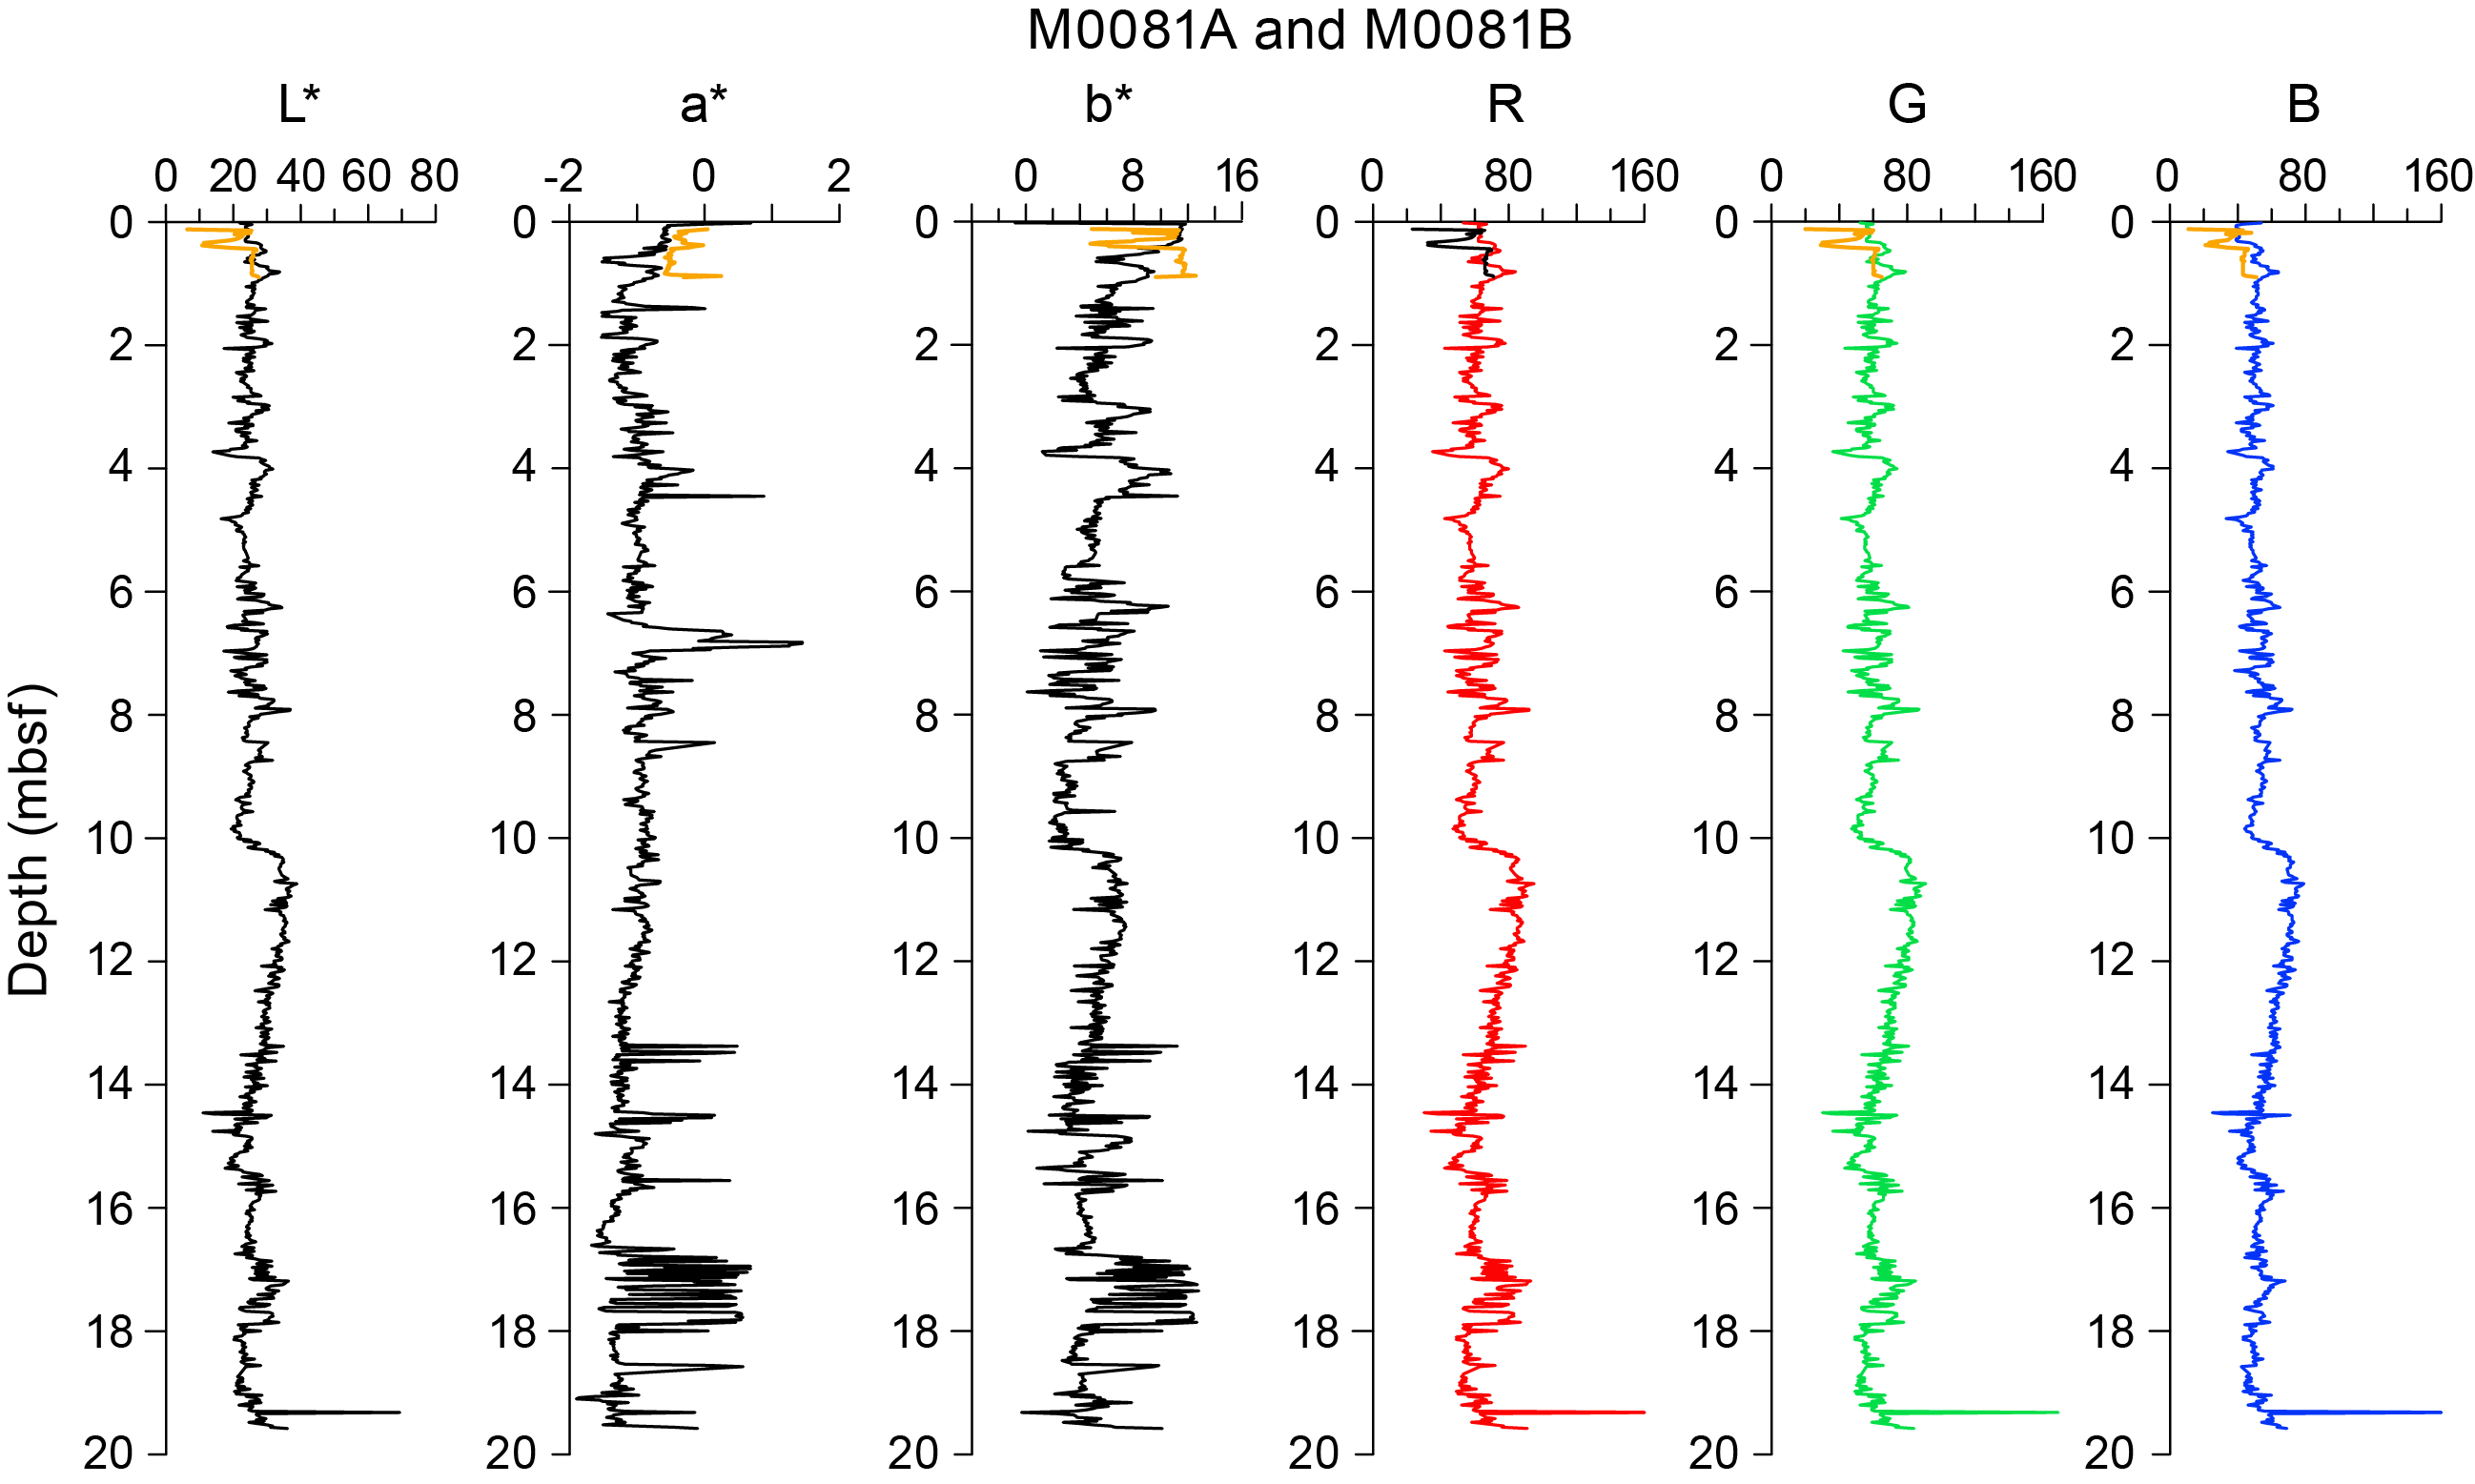
Figure F60. Color data, Holes M0081A and M0081B.
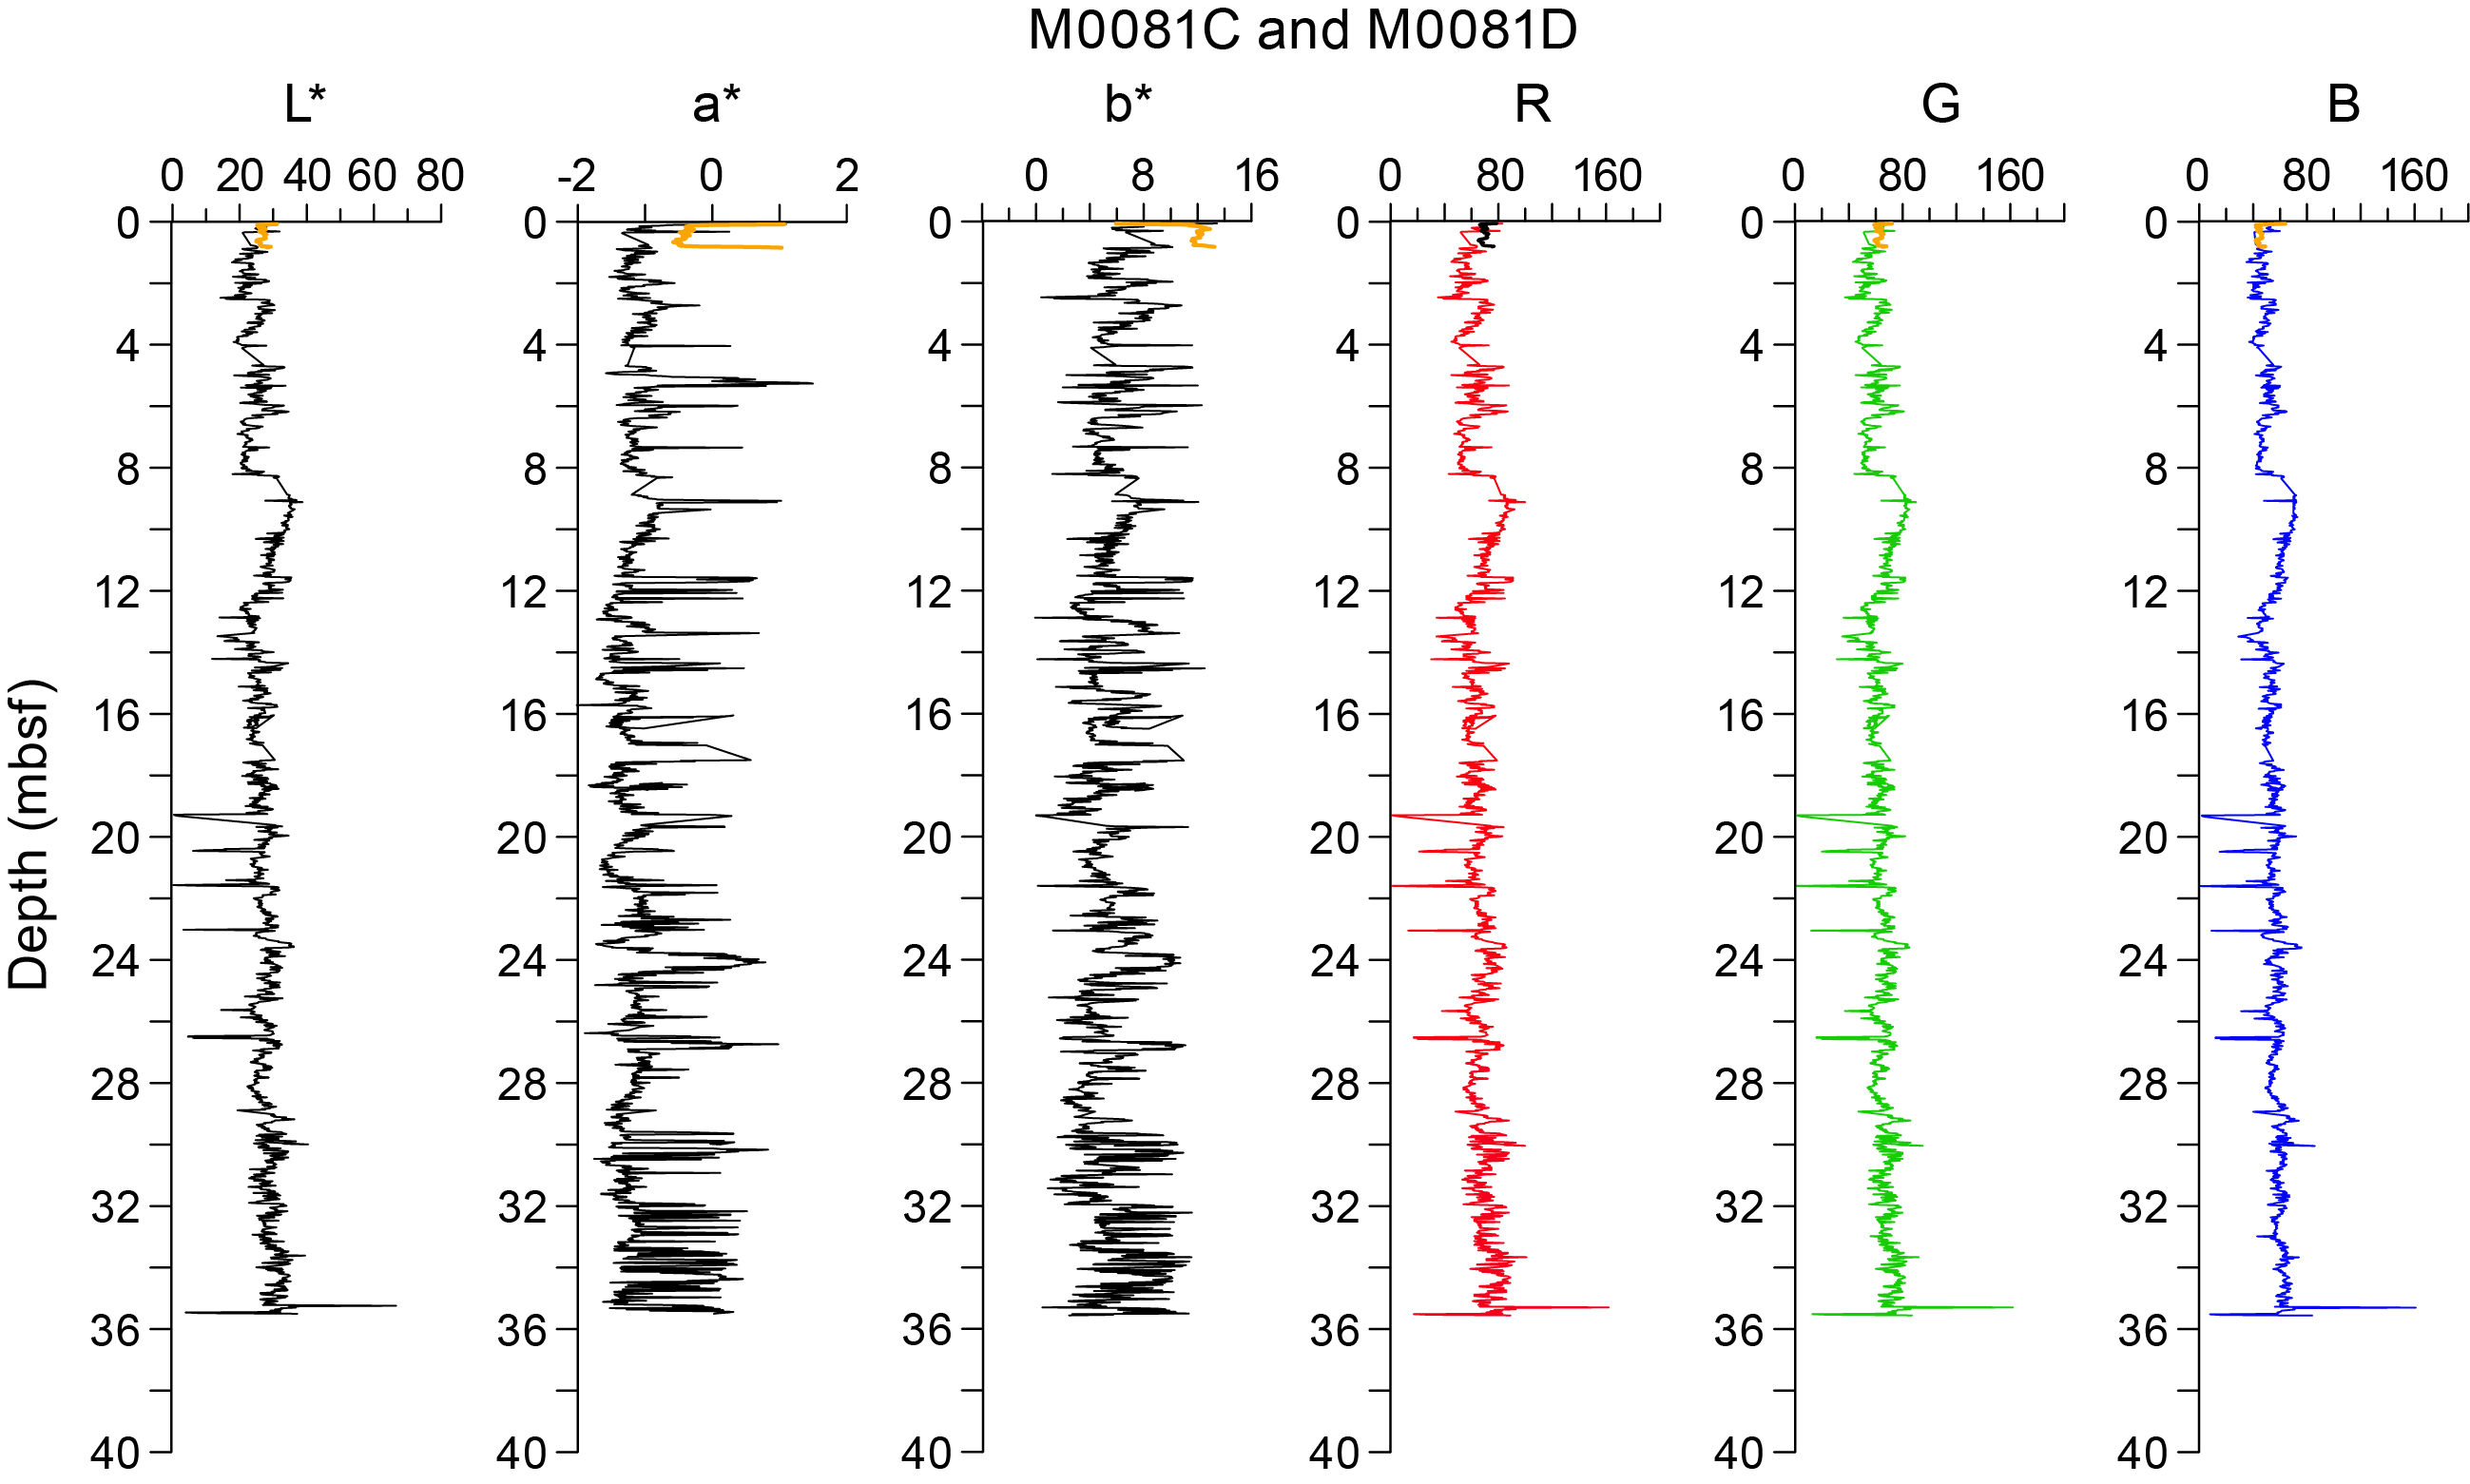
Figure F61. Color data, Holes M0081C and M0081D.

Figure F62. Color data, Holes M0081E and M0081F.
7.8.2. Site M0082
L* color values for Holes M0082B and M0082D (Figures F63, F64), range approximately 20–30. a* values range approximately −1.5 to −0.5 with several localized spikes exceeding 0. b* values range approximately 0–12. RGB values share similar values (40–50) with depth in all holes.
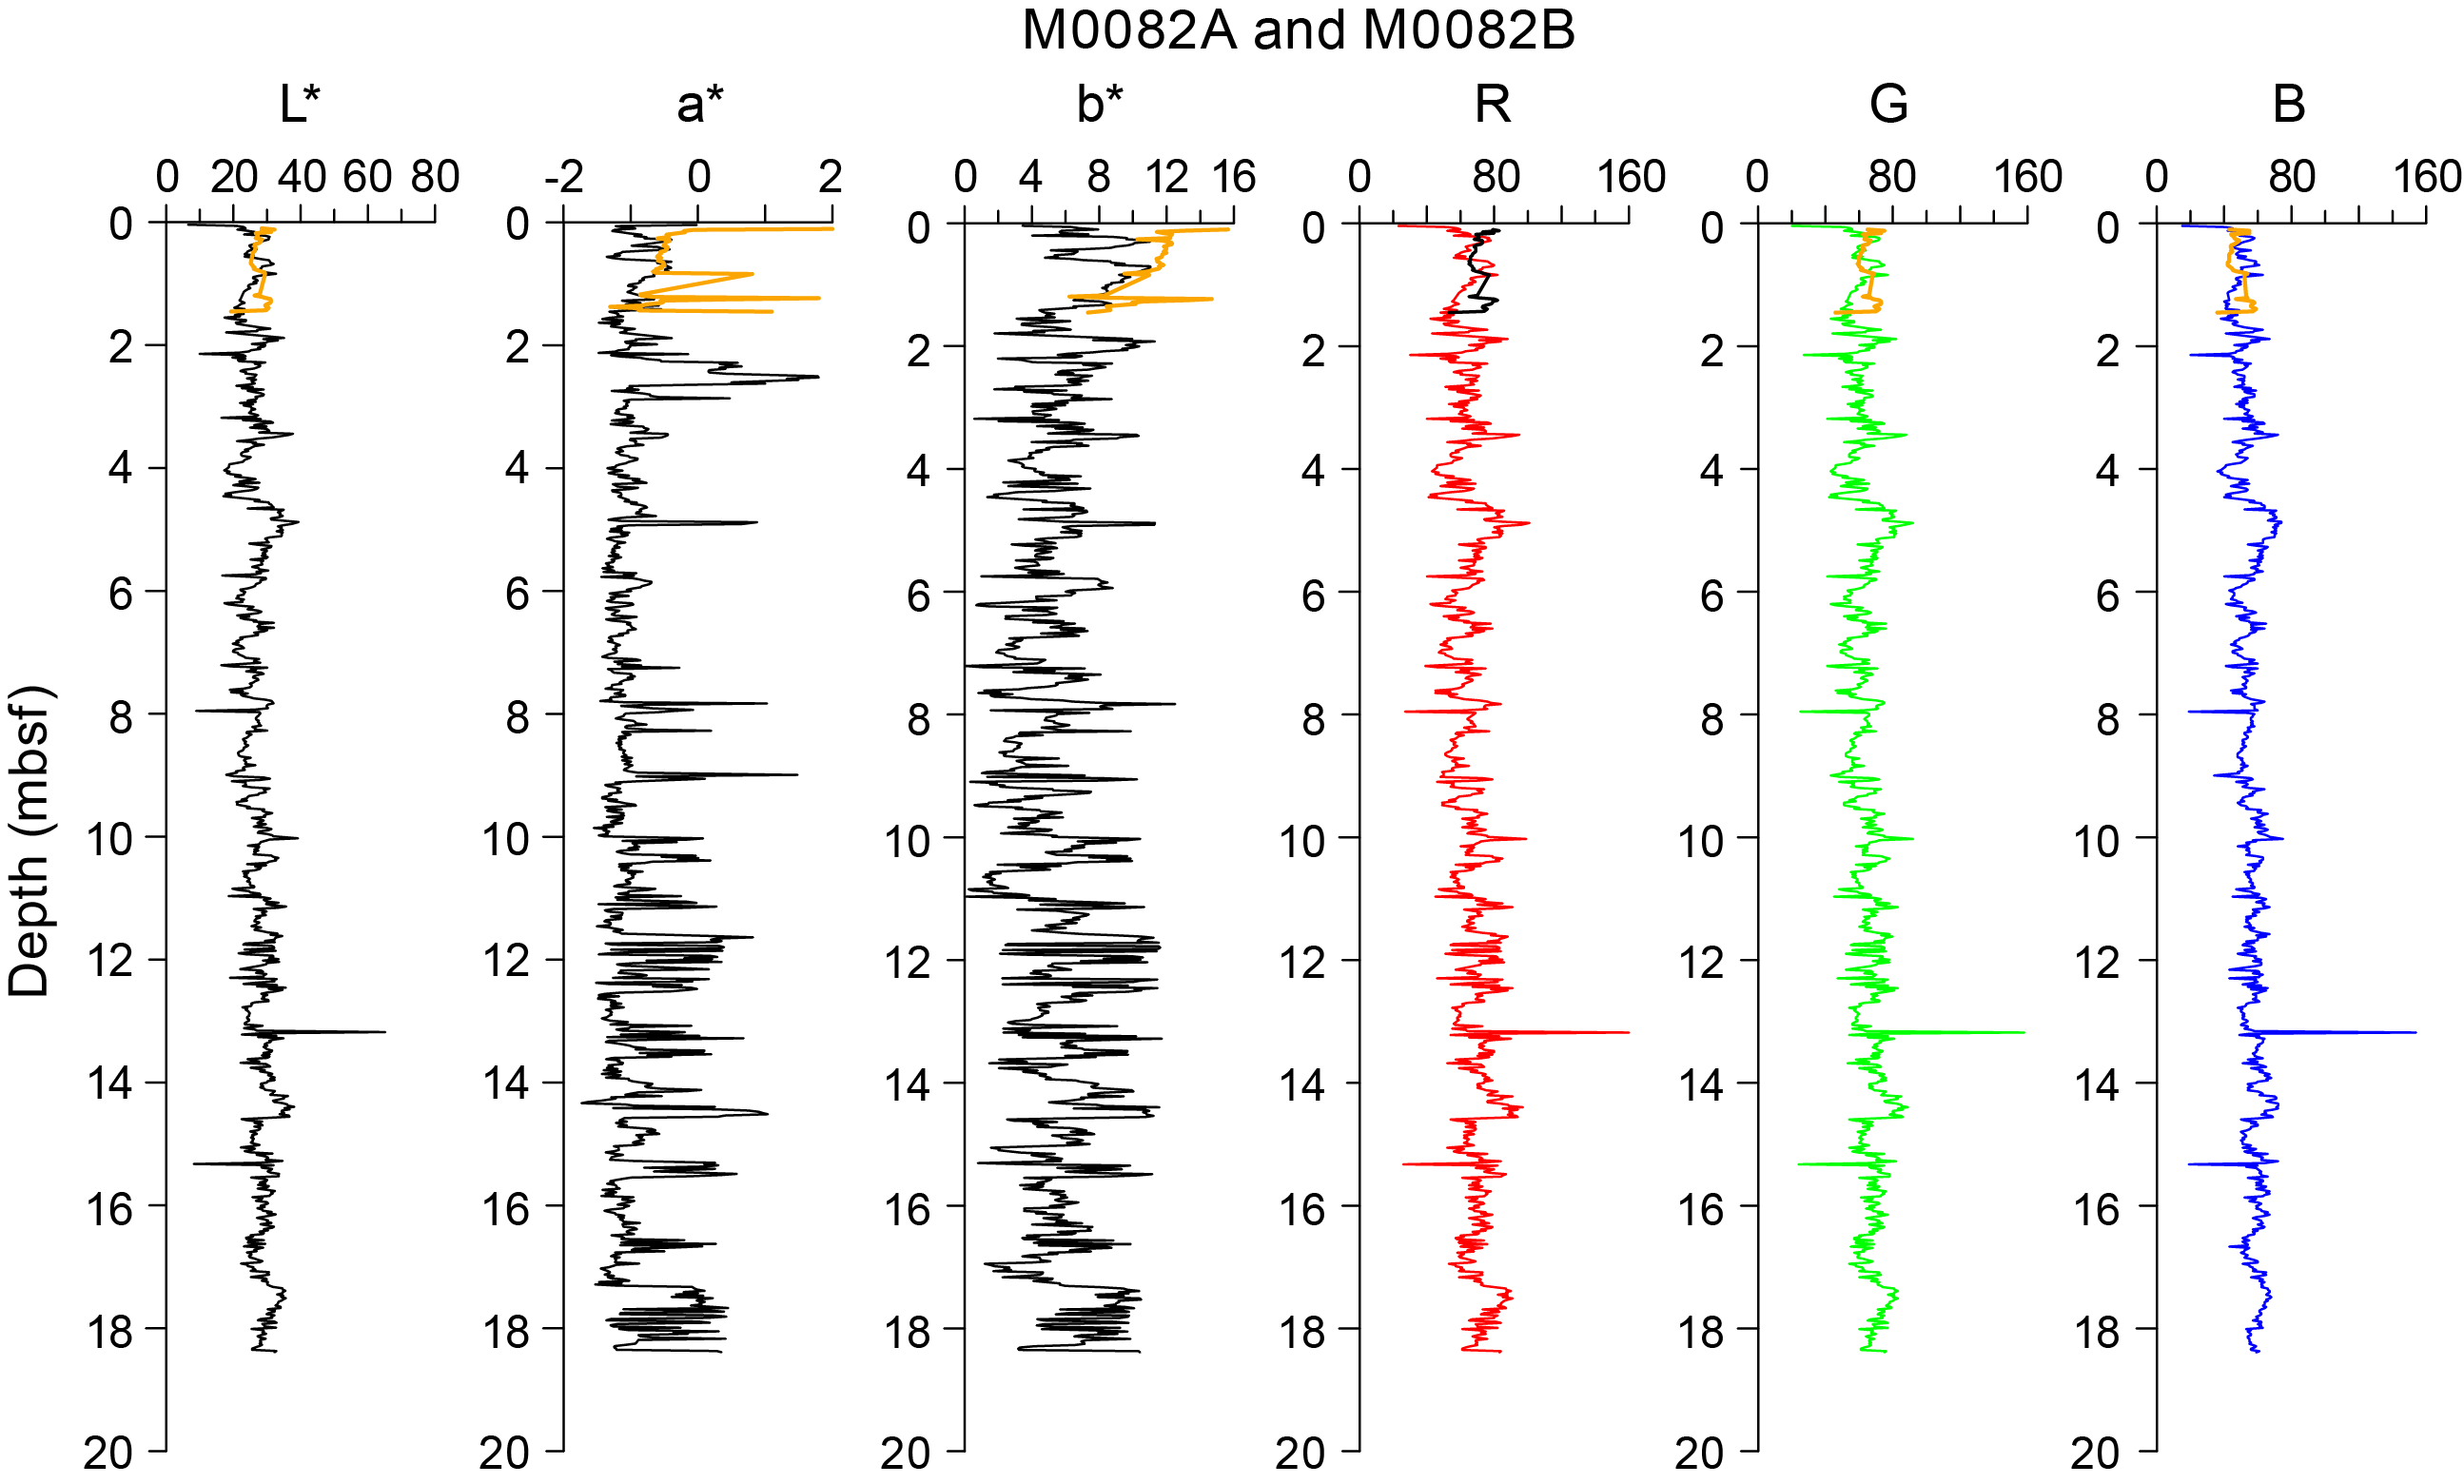
Figure F63. Color data, Holes M0082A and M0082B.

Figure F64. Color data, Holes M0082C and M0082D.
8. Paleomagnetism
Remanent magnetization was measured for Holes M0081A–M0081F and M0082A–M0082D, sampled in Basin S1, on U-channel samples taken from working halves at 2 cm intervals. Natural remanent magnetization (NRM) measurements were only performed at 0 and 5 mT peak fields due to time constraints. However, a previous paleomagnetic study of Japan Trench sediments (Kanamatsu et al., 2022) demonstrated that magnetization of the sediment is composed of a single stable component. Therefore, it is expected that magnetization treated even by a low demagnetization level can reliably represent properties of NRM measurements.
Profiles of intensity, inclination, and declination after demagnetization at 5 mT are displayed in the figures in this section. The profiles for Holes M0081A, M0081C, M0081E, M0082A, M0082C are plotted separately from those of their GPC counterparts because of the shallow depths of the trigger cores (Figure F65). In Holes M0081C, M0081E, M0082A, and M0082C, intensity increases downward (from less than 1 × 10⁻⁵ A/m to 2 × 10⁻⁵ and to 4 × 10⁻⁵ A/m), whereas in Hole M0081A it has a maximum value (1.7 × 10⁻⁵ A/m) at 0.10 mbsf and gradually decreases downward. Variations of declination for Holes M0081A and M0081C show broad changes, whereas variations of declination for Holes M0081E, M0082A, and M0082C are generally constant. Variations of inclination are scattered for Holes M0081A, M0081C, and M0081E, whereas variations of inclination for Holes M0082A and M0082C are generally constant.
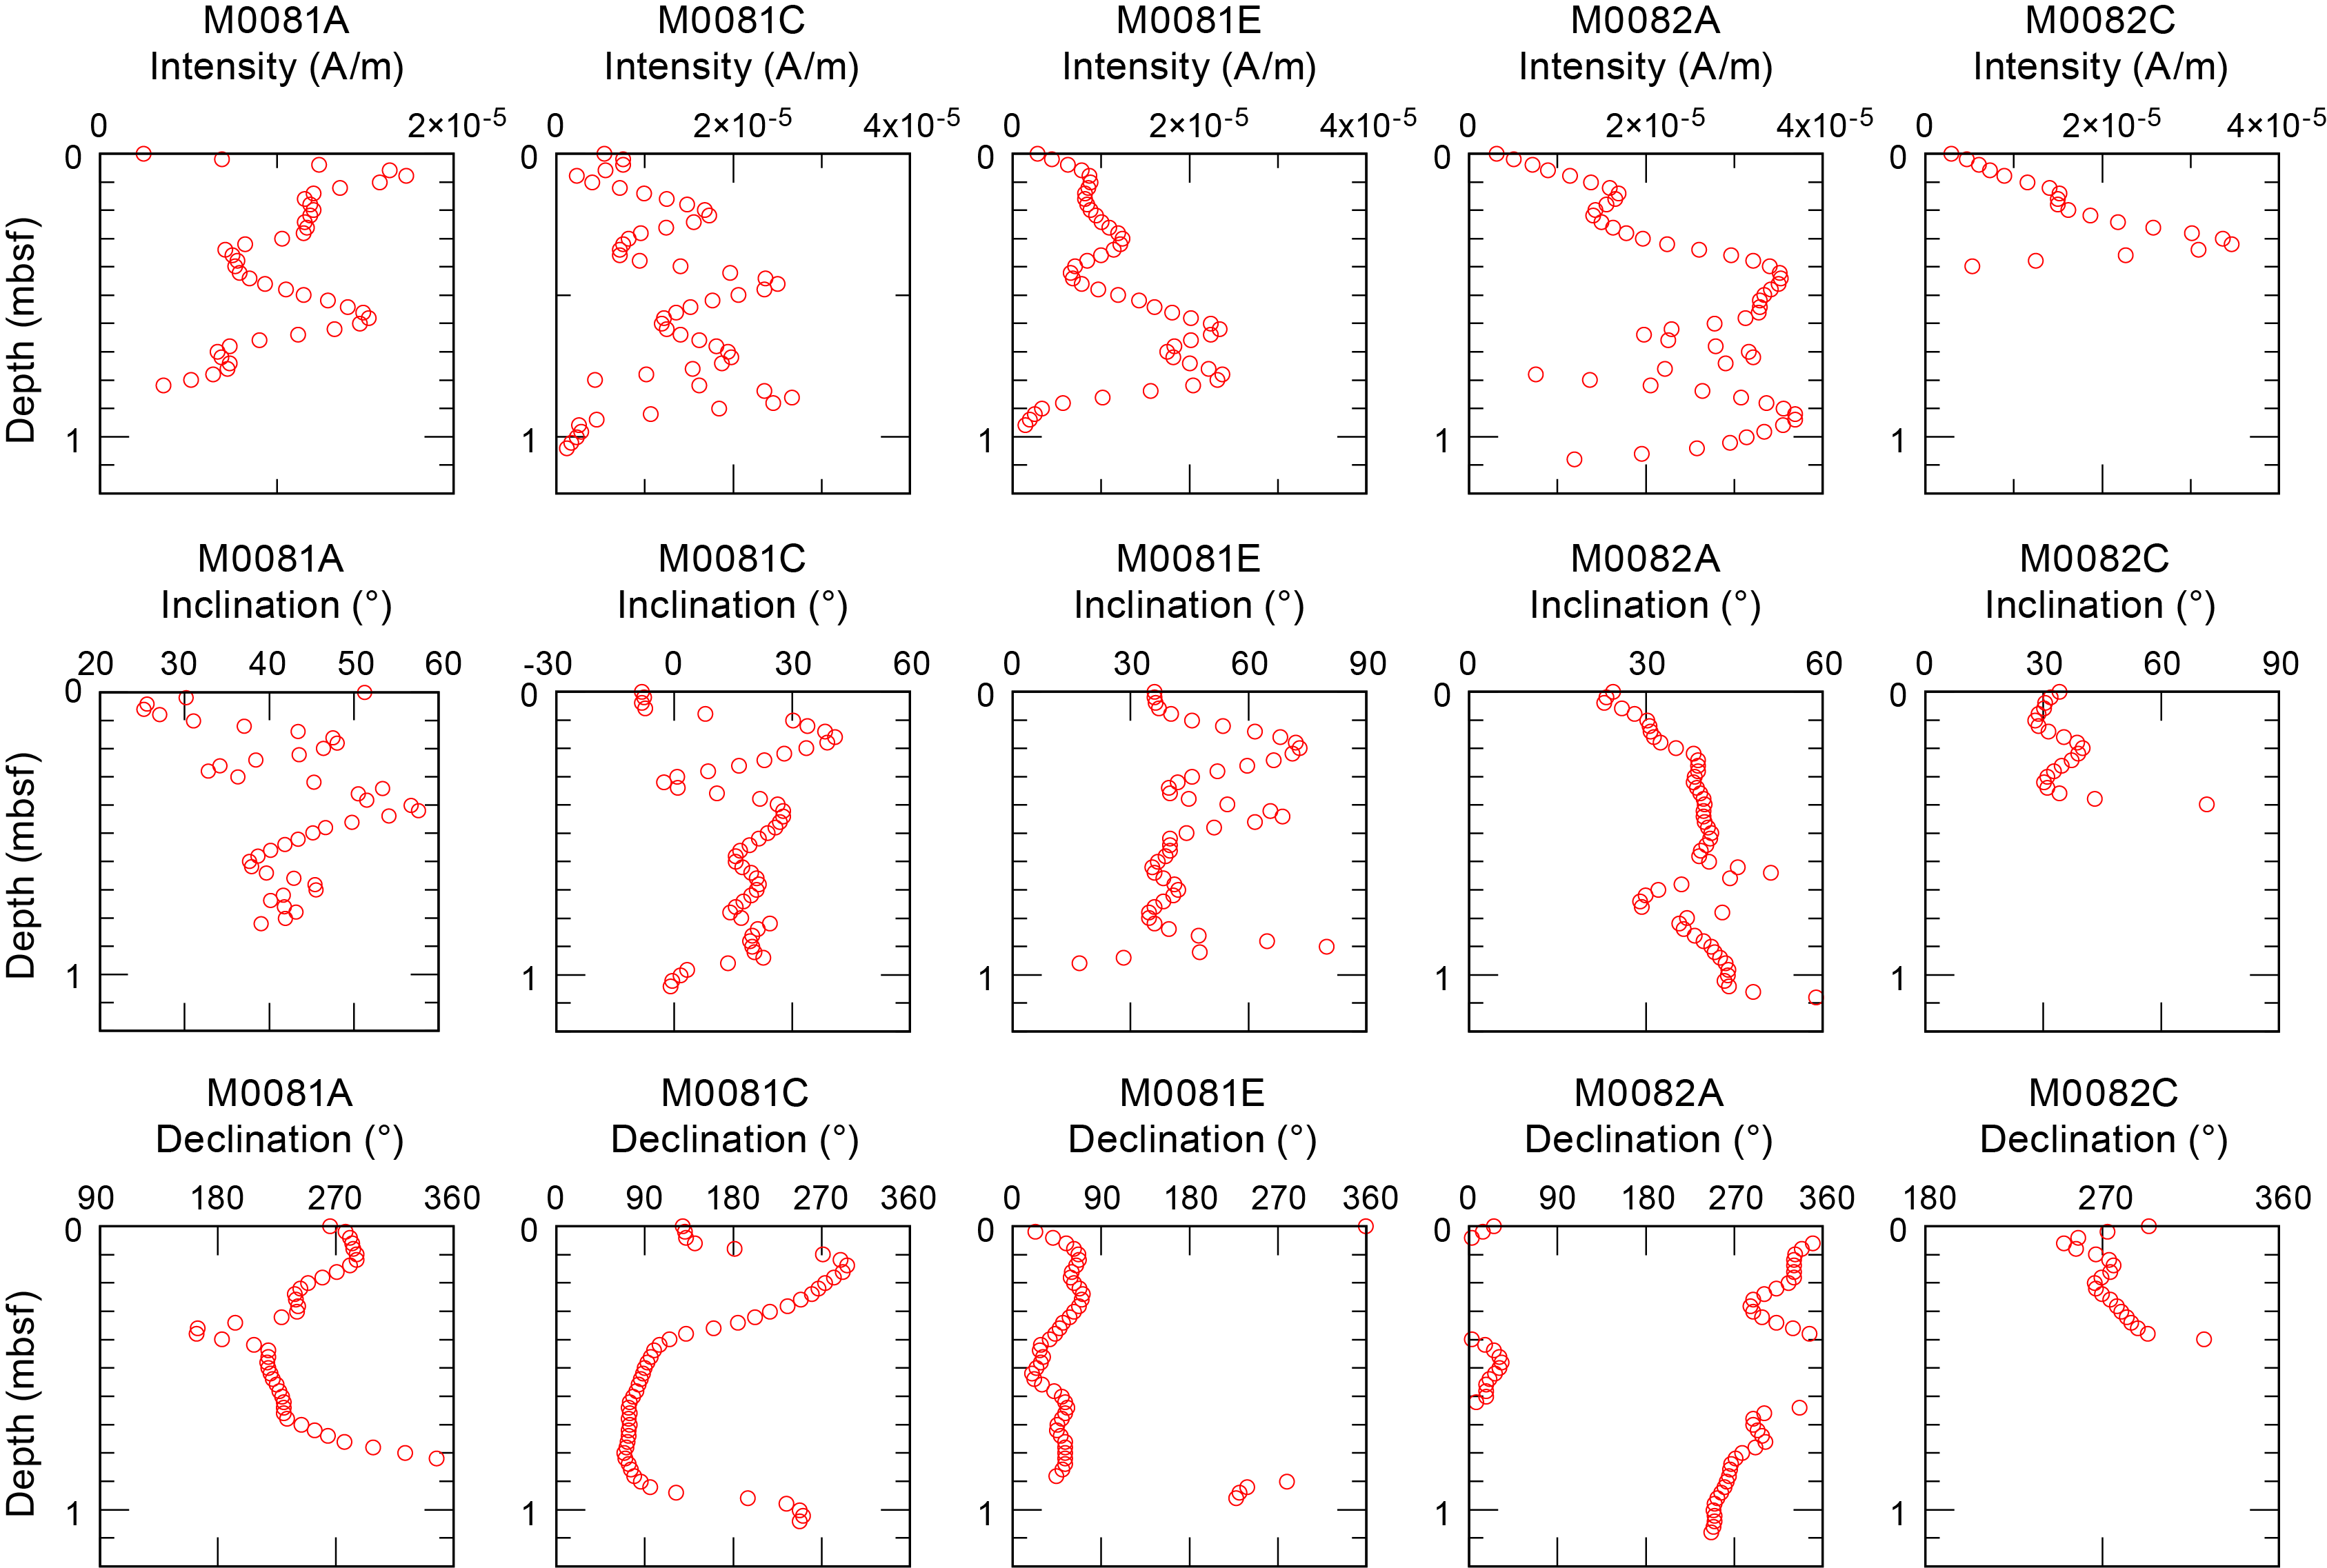
Figure F65. Intensity, inclination, and declination.
The intensity of the GPC cores recovered from Holes M0081B, M0081D, M0081F, M0082B, and M0082D are characterized by a broad range in intensity on the order of 10−5 to 10−4 A/m (Figure F66). Intensity data are generally scattered. However, the background intensity in all cores generally increases downward from the top to around a few meters below the seafloor and then decreases to more constant lower background values below around 20 mbsf. A gentle, symmetrical peak in intensity can be seen in Hole M0081D between ~5 and 10 mbsf and in Hole M0081F between ~8 and 12 mbsf. A similar trend in background intensity can be observed in Hole M0082D at a shallower subsurface level (between ~0 and 7.5 mbsf). In some holes (e.g., M0081B), spikes of high intensity to a maximum value of 1.5 × 10⁻⁴ A/m are observed.
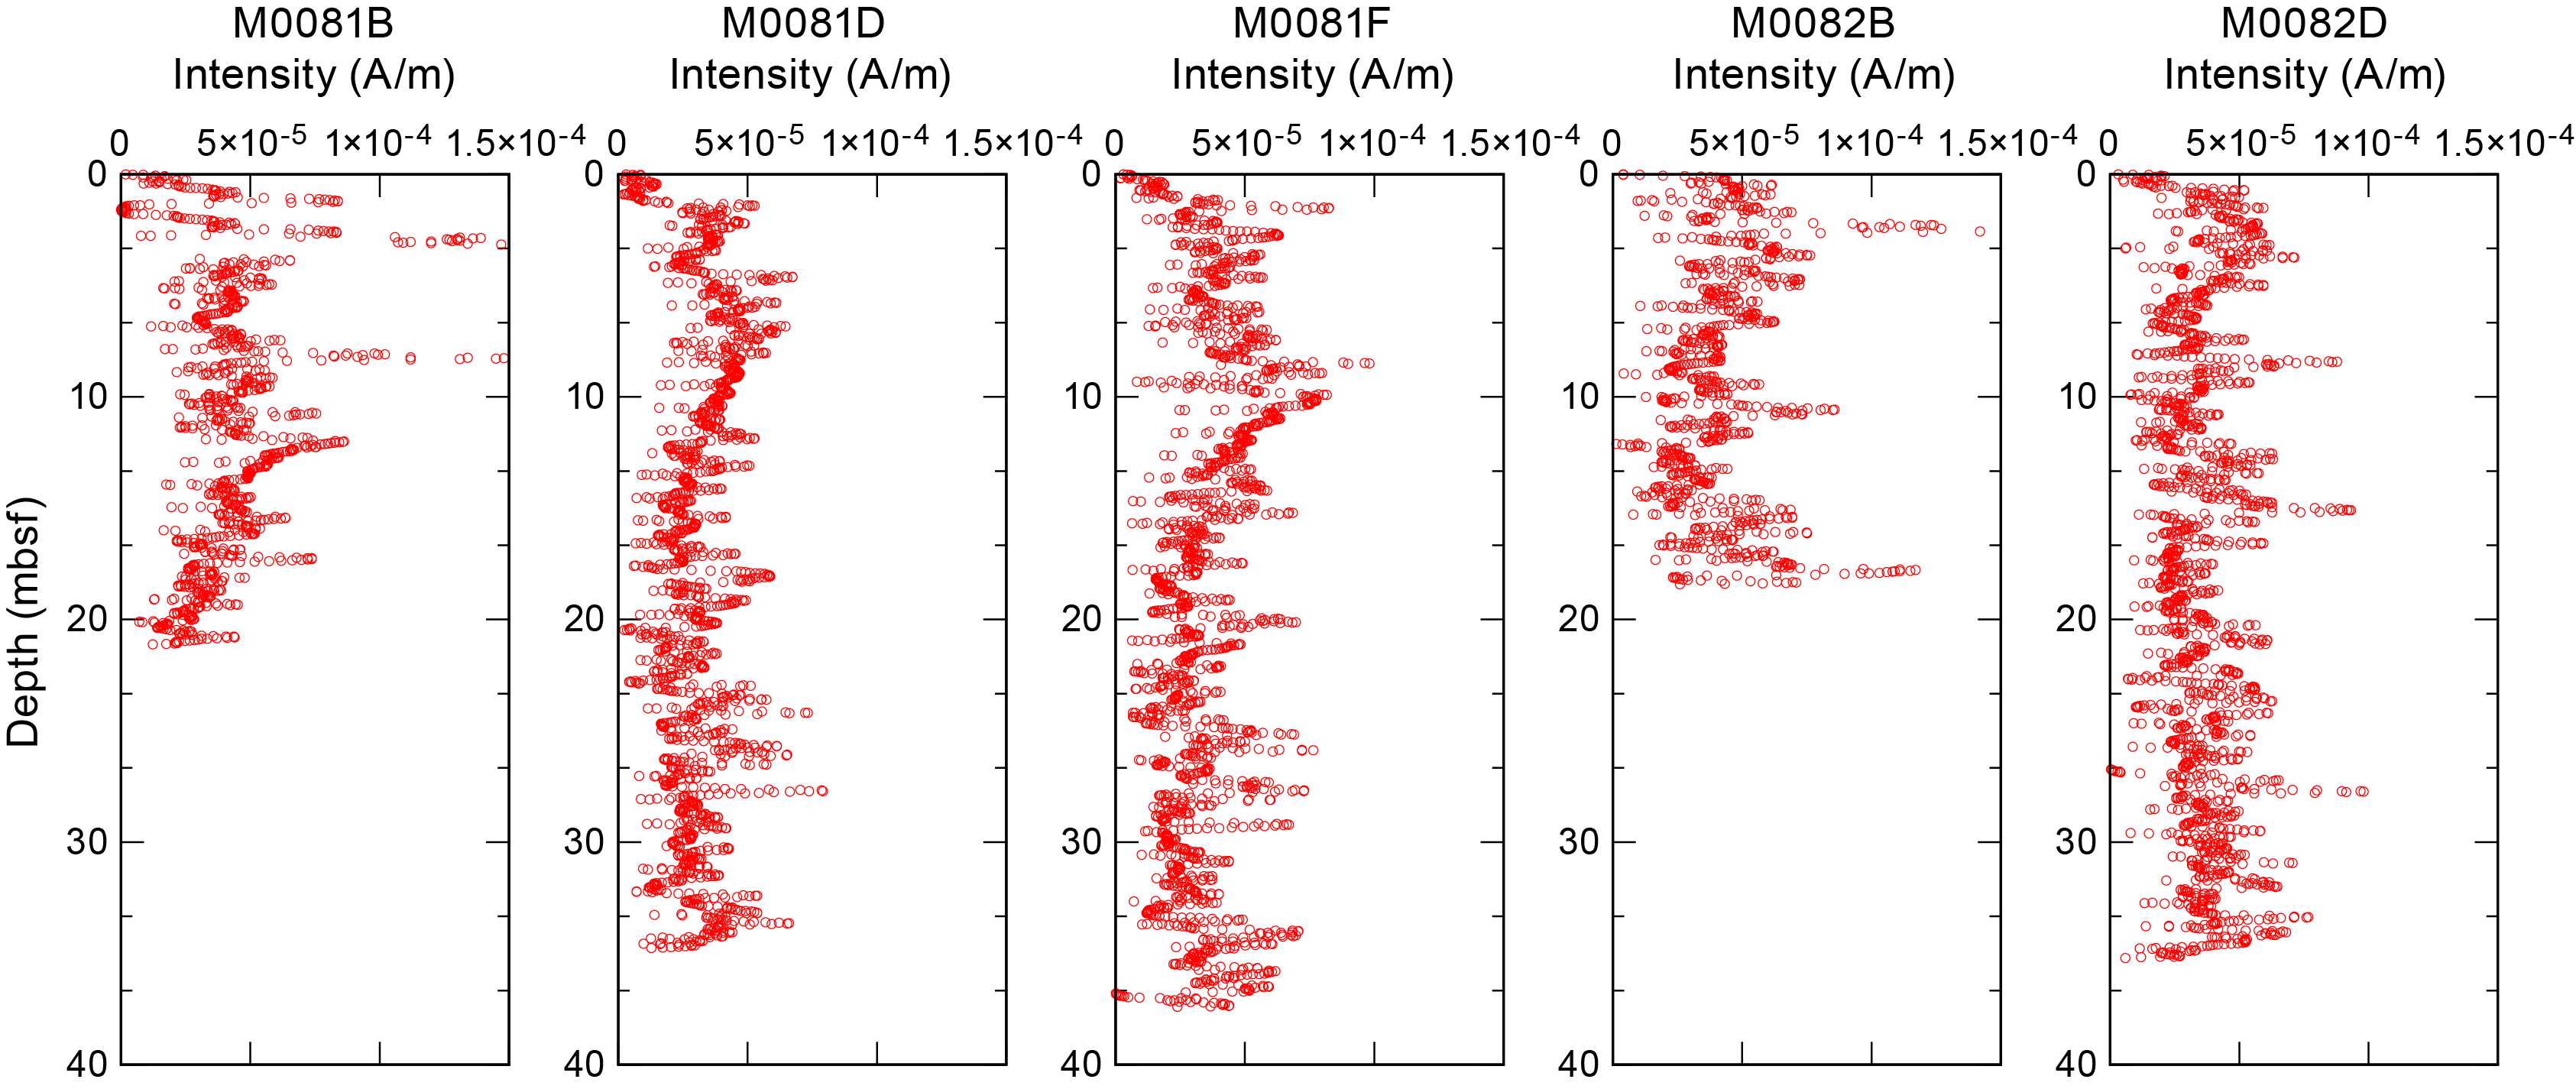
Figure F66. Intensity.
Various trends are observed in declination profiles for Sites M0081 and M0082 (Figure F67). The declination variation at these sites shows unique linear trends. For example, a clockwise shift from about 0° to 270° between 13 and 34 mbsf in Hole M0081D is accompanied by a discontinuity at 21 mbsf. It is presumed that this kind of linear trend was caused by the relative rotation of the core sample along the vertical axis during penetration of the GPC system into the subbottom sediments (see Figure F5 in the Expedition 386 methods chapter [Strasser et al., 2023a]). We applied a simple correction to reconstruct the original variation of declination trends. We assume that the amount of rotation is a linear function of core depth. It is expected that the sudden shift of declination could be caused by segmentation of the core into pieces. The declinations of intervals given here are shifted to fit those of the upper interval.
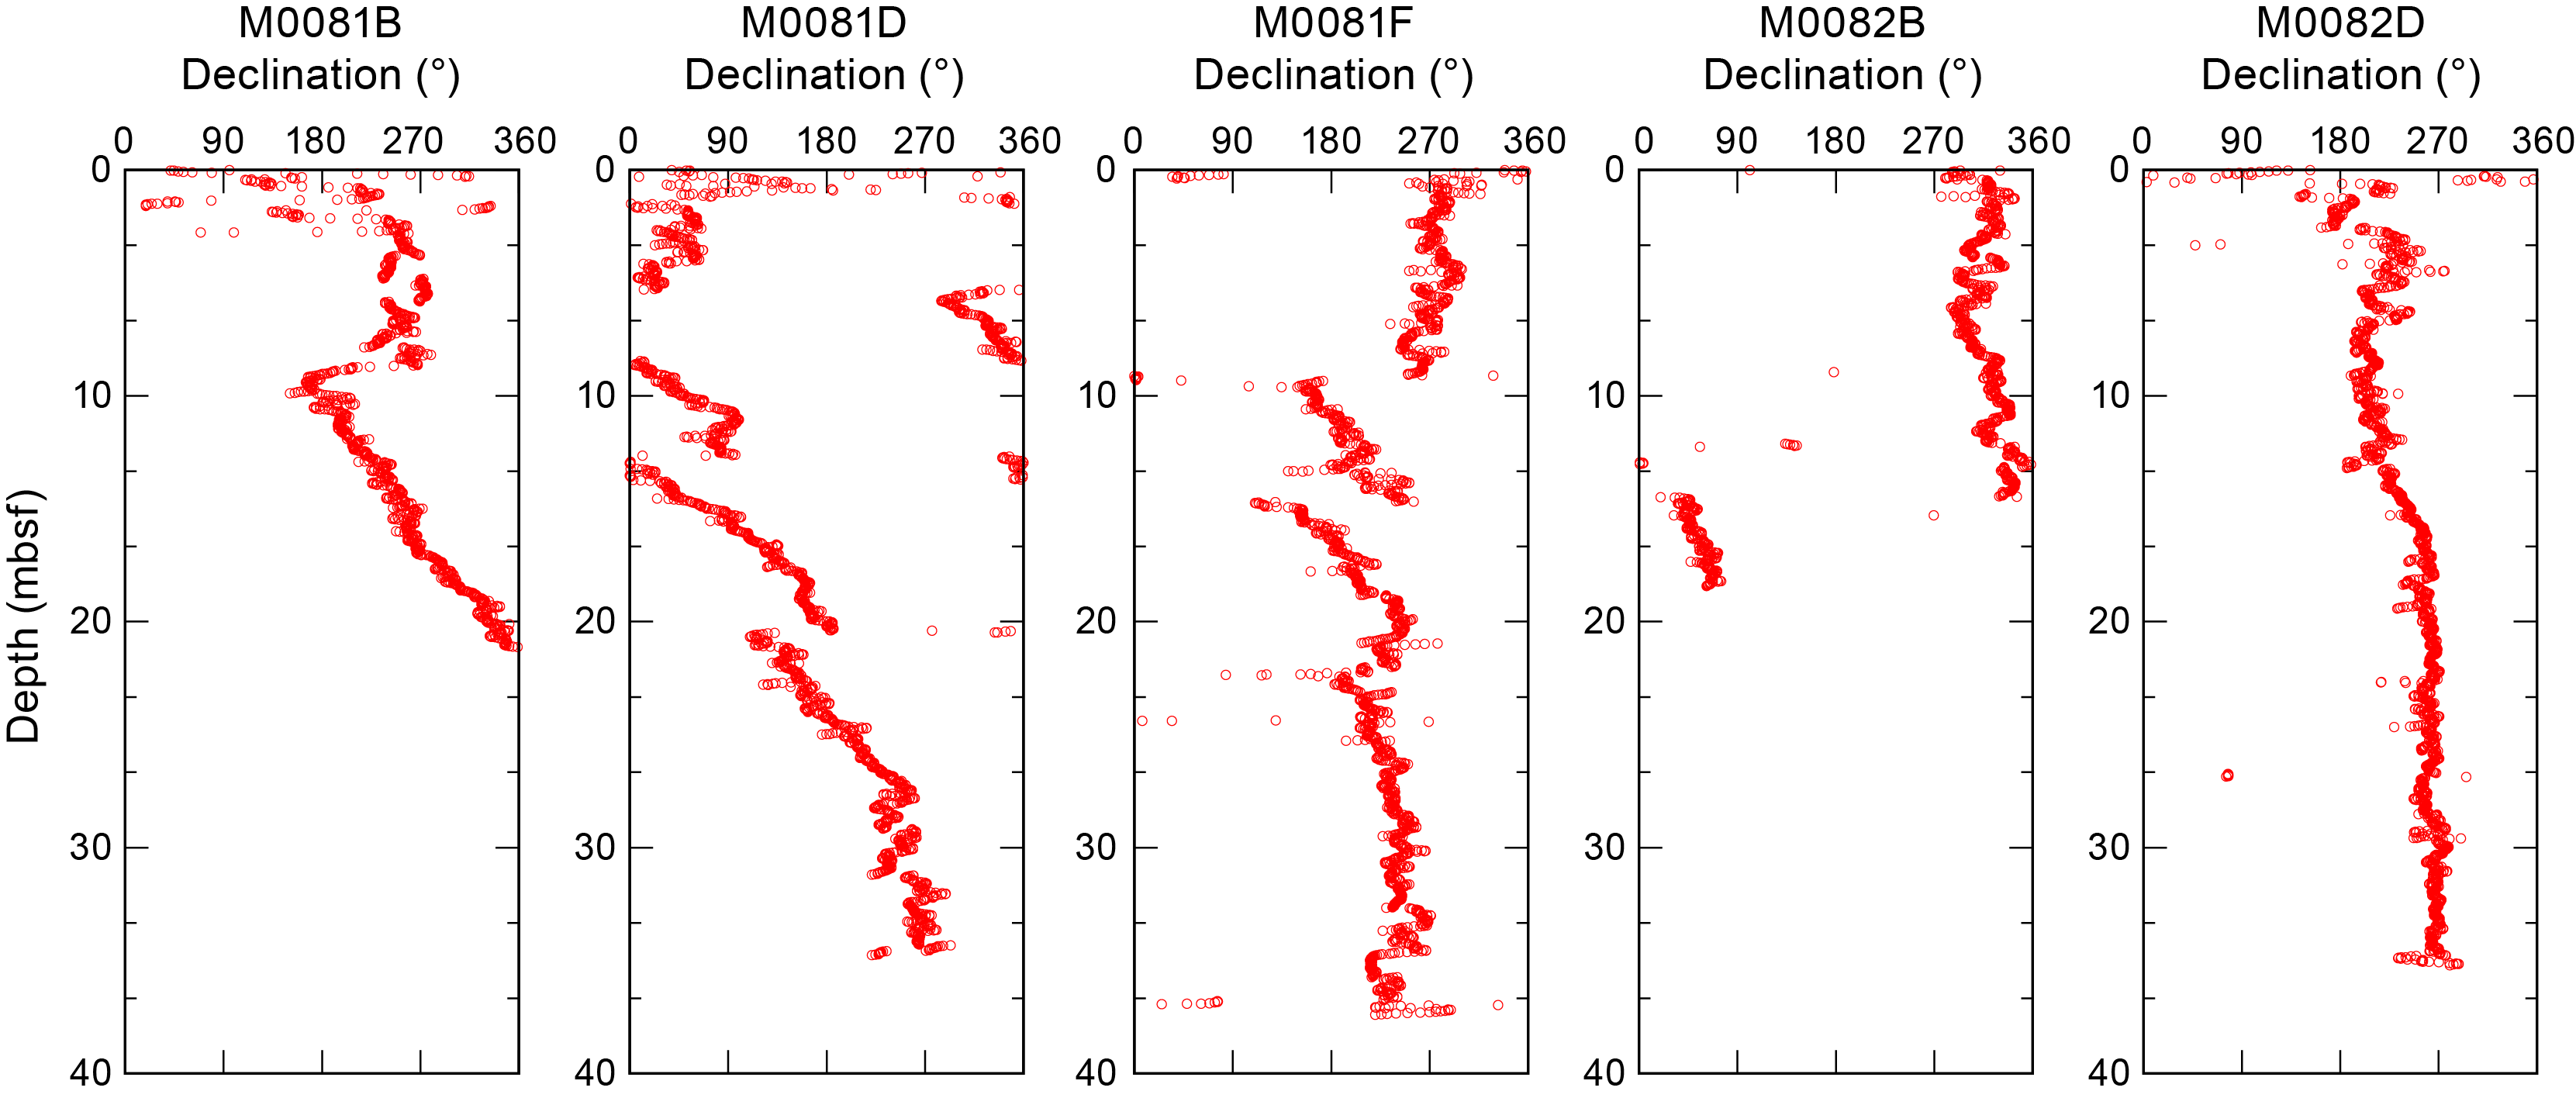
Figure F67. Declination.
The corrected declination curves of Holes M0081D and M0081F are characterized by shorter cyclic oscillations in the upper intervals and a long arch shape trend in the lower parts (Figure F68). The profile for Hole M0081B differs from the profiles of other holes at Site M0081. Note that the trend in Holes M0081F and M0081D still appears to be clockwise. This observation suggests that the reconstruction applied is not fully adequate and needs to be improved to correlate the paleomagnetic secular variations.

Figure F68. Corrected declination.
The inclination does not relate to the horizontal rotation like the declination. The inclination of all the holes oscillates with a high frequency between 30° and 60° (Figure F69). The expected mean inclinations based on the geocentric axial dipole model for the latitudinal range of the core are about 57°–58° (Hospers, 1954). The range of obtained inclinations is a little lower than the expected inclination. A possible explanation for this discrepancy is that the examined samples do not cover a large enough time range to reveal a geocentric axial dipole feature. In the inclination profiles, some sudden drops are observed in Holes M0081D and M0081F, at 10 mbsf in Hole M0082B, and at 7 mbsf in Hole M0082D. These features may be correlatable between holes and enable chronological tie points using inclination data.
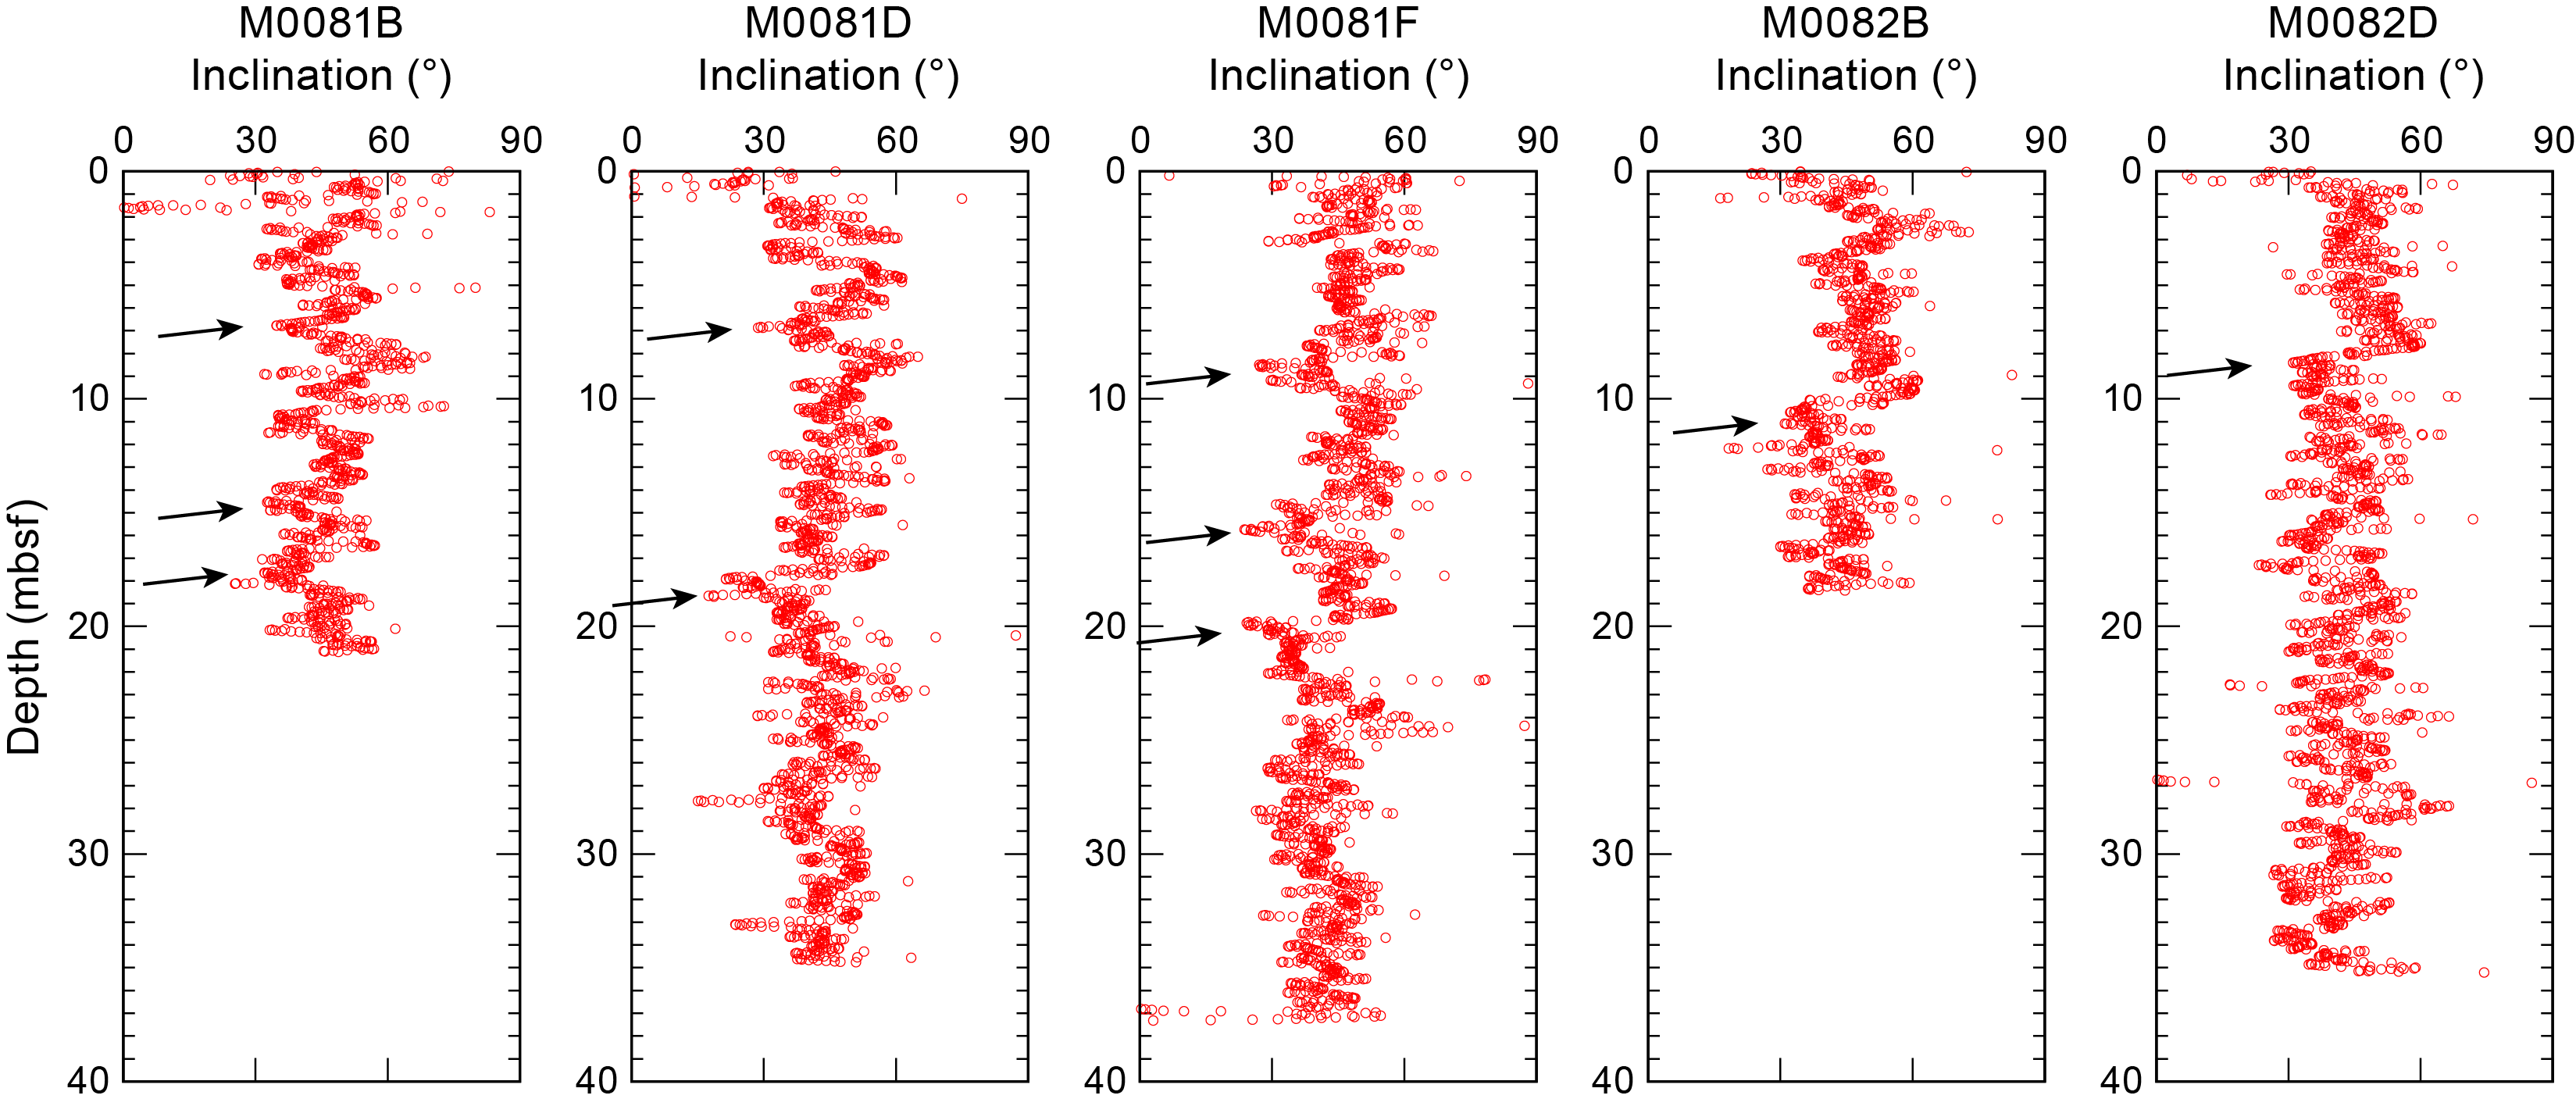
Figure F69. Inclination.
Preliminary paleomagnetic data for Sites M0081 and M0082 display varying patterns of declination and inclination. The declination profiles are characterized by short cyclic oscillation in the upper intervals and a longer arch shape trend in the lower part. Inclination is characterized by sudden drops in the profiles.
9. Stratigraphic correlation
A core composite depth scale and first-order splice were constructed separately for Sites M0081 and M0082 to establish first-order continuous sediment successions at each site (see Stratigraphic correlation in the Expedition 386 methods chapter [Strasser et al., 2023a]). One core each was recovered from Holes M0081A–M0081F and M0082A–M0082D.
First-order splicing at Site M0081 enabled construction of a continuous stratigraphic succession from the seafloor to the bottom of Core 386-M0081F-1H (38.56 meters composite depth [mcd]), except for one unresolved gap between the base of the trigger cores and the top of GPC Core 386-M0081F-1H. Therefore, the Site M0081 core composite depth below seafloor scales (mcd and meters composite depth in splice [mcd-splice]) for depths >0.91 mcd and >0.93 mcd-splice, respectively, are currently referred to as floating depths, assuming the coring gap to be zero.
For Site M0082, first-order splicing enabled construction of a continuous stratigraphic succession from the seafloor to the bottom of Core 386-M0082D-1H (38.705 mcd).
Stratigraphic correlation between the two sites will be the subject of postexpedition research, but the occurrence of two tephra layers in the upper part of Sites M0081 (7.94 mcd) and M0082 (3.07 mcd) that show comparable facies and stratigraphic superposition indicates that this sediment may have been deposited almost synchronously with a relatively short transportation pathway (see Tephra). Therefore, this tephra layer is a candidate tie point to be used for intersite correlation for postexpedition research, which will also integrate results from radiolarian biostratigraphy (see Micropaleontology) and other stratigraphic correlation methods including seismic stratigraphy using hydroacoustic data sets (see Hydroacoustics).
9.1. Construction of Site M0081 core composite scale
9.1.1. Definition of top and selection of seafloor anchor core
Visual core description reveals the presence of a thin oxidized top in the trigger cores from Holes M0081A, M0081C, and M0081E, which demonstrates that an undisturbed mudline was recovered in all three holes (Sections 386-M0081A-1P-1, 10.5 cm; 386-M0081C-1P-1, 7 cm; and 386-M0081E-1P-1, 7.5 cm). Hence, the top (0 mcd) is defined as the mudline and vertical shifts of −0.105 m to Core 386-M0081A-1P, −0.07 m to Core 386-M0081C-1P, and −0.075 m to Core 386-M0081E-1P are applied (Tables T15, T16, T17).
Some subtle stratigraphic horizons define a characteristic succession that can be correlated across all three trigger cores, revealing slight differences in the thickness of the stratigraphic succession recovered in Holes M0081A, M0081C, and M0081E. Therefore, the first downsection occurrence of a clear tie point (TP1, defined by a sharp color contrast overlying a higher radiodensity lamina; Tables T15, T16, T17) is used to correlate Core 386-M0081E-1P (containing the thickest and least disturbed interval between the mudline and TP1) to Core 386-M0081C-1P, the longest trigger core.
9.1.2. Compositing cores
Before compositing holes, artificial and/or natural voids were measured at the ends of sections (see Stratigraphic correlation in the Expedition 386 methods chapter [Strasser et al., 2023a]). The void length was subtracted from the curated section length to obtain the sediment length in each section (neglecting core catcher sections, which were sampled in a bag). Corrected section lengths and section top and bottom depths for Site M0081 are listed in Table T15.
The first-order core composite scale for Site M0081 is based on visual correlation of marker horizons on X-ray CT images and visual core description during the OSP, guided by visual inspection of trends and spikes in magnetic susceptibility and density data from the MSCL, linescan images and color reflectance data, and, where present, visible tephra layers. At this stage, thin but clear marker beds visible on X-ray CT and/or linescan images are used, in places verified by visual core description, instead of large (coarse and thick) event beds that may have eroded the underlying sediments. Primary air fall tephra beds, which were generated by a single volcanic eruption and fell through the water column, represent some of the best tie points between holes. Two notable tephra layers in Sections 386-M0081B-1H-8 and 386-M0081D-1H-6 have characteristic facies and superposition found at correlative stratigraphic positions and likely correlate to Section 386-M0081F-1H-7 (see Tephra).
First-order correlation does not allow for correlation of any of the trigger cores to the upper part of the GPC core, and no correlation tie point could be identified to tie the GPC cores to the mudline-anchored trigger core. This suggests that the coring gap at the top of the GPC cores is larger than the total length of the trigger cores, and the composite depth scale of the GPC cores remains floating. The base of the composite stratigraphy of the trigger cores in Section 386-M0081C-2P-1, 0.91 cm (mbsf-corrected core depth scale; see Table T15); 0.93 mcd-splice, and the top of GPC Core 386-M0081F-1H (which has more recovery at the core top than the other two GPC Cores [386-M0081B-1H and 386-M0081D-1H]) are aligned, assuming the gap to be zero. With an artificial void (1.5 cm) at the top of Section 386-M0081F-1H-1 (Table T15), a vertical depth shift of 0.93 m is calculated for the top of Core 1H (Table T16).
Several different types of tie points can be determined, and as a result, the general stratigraphic succession and several distinct marker horizons can be correlated across GPC cores. The uppermost clear tie point that occurs in all three GPC cores is the horizontal base of a 6 cm thick color band (TP2; Table T17). Horizontal alignment of TP2 is used to calculate the vertical offsets of the top depths of each core to create the first-order core composite depth scales at Site M0081 (Table T16). Note that these linear bulk shifts are only correct for the uppermost few meters shallower than the first occurrence of artificial voids added to the bottom or tops of sections during core cutting due to expanding sediment during core recovery (Table T15).
All tie points were evaluated for robustness of correlation and suitability for composing the splice. From these, five were selected (Table T17). Most of these are described as thin laminae, which are slightly coarser than the surrounding fine-grained sediments, or are correlative color bands within the overall succession of superpositioned facies associations (see Figure F30 in the Expedition 386 methods chapter [Strasser et al., 2023a]). The accuracy of correlation depends on how clearly the tie point can be recognized in X-ray CT and linescan images. The depth of each tie point was determined by visual core description, where noted, or based on X-ray CT and linescan images when visual description is lacking.
9.1.3. Construction of splice
With the exception of the unknown coring gap between the base of the longest trigger cores (386-M0081C-1P; 0.91 mbsf; 0.93 mcd-splice) and the top of the GPC core with the highest core top recovery (386-M0081F-1H), a combination of Cores 386-M0081E-1P (mudline-anchored core), 386-M0081C-1P (tied to the mudline-anchored core at TP1; Table T17), 386-M0081F-1H (appended at the first append point [AP1] to the base of the splice defined in the trigger cores), and 386-M0081B-1H reveals the longest, most complete and least disturbed stratigraphic interval at Site M0081.
The interval from below the appended top interval from Hole M0081B to TP2 was selected to be included in the splice. Below this depth (3.185 mcd-splice), the respective interval in Hole M0081B was selected for the splice because cores recovered from the 20 m long GPC barrel deployment are generally less disturbed (see Introduction in the Expedition 386 methods chapter [Strasser et al., 2023a]). However, the top of a few centimeters thick laminated silt bed verified by visual core description and correlative in all three holes (Sections 386-M0081B-1H-5, 18 cm; 386-M0081D-1H-4, 8 cm; and 386-M0081F-1H-4, 81.5 cm) is used as TP3 to avoid a 5 cm thick void in Section 386-M0081B-1H-5. Hence, the splice in the short interval between TP3 (4.83 mcd-splice) and TP4 (5.155 mcd-splice) is defined in Core 386-M0081F-1H before it moves back again to Hole M0081B, connecting the two holes along the top of a correlative, slightly brighter clay lamina with a subtle but sharp radiodensity contrast that overlies a bioturbated graded fine sand to silt bed (TP4). Below TP4 at 5.155 mcd-splice, interval 386-M0081B-1H-5, 59 cm, to 1H-18, 55 cm, is used as the first-order splice. This interval includes the stratigraphically correlative characteristic facies and superposition of two tephra layers (see Tephra). The base of the upper tephra layer is defined as TP5 (Table T17), which is likely to become a key tie point for stratigraphic correlation for intersite correlation (Site M0081 to Site M0082) and age constraint (to be tested during in depth postexpedition examination of volcanic glass chemical composition and tephra-stratigraphic correlation, respectively). Below TP5, the splice moves to Hole M0081E at TP6 (Sections 386-M0081B-1H-18, 55 cm; 386-M0081D-1H-17, 12 cm; and 386-M0081B-1H-17, 98 cm), which consists of a fine sand lamina just a few centimeters below an erosive sand bed and continues to the bottom of the hole (38.26 mcd-splice = bottom of splice). All splice tie points used to construct a complete first-order splice along with the calculated core composite depth within the splice (mcd) are given in Table T17.
9.2. Construction of Site M0082 core composite depth scale
9.2.1. Definition of and selection of seafloor anchor core
Visual core description reveals the presence of a thin oxidized top in the trigger cores from Holes M0082A and M0082C, demonstrating that an undisturbed mudline was recovered in both holes (Sections 386-M0082A-1P-1, 8.5 cm, and 386-M0082C-1P-1, 7.5 cm). Hence, the top (0 mcd) is defined at the mudline and a vertical shift of −0.085 m to Core 386-M0082A-1P and −0.075 m to Core 386-M0082C-1P is applied (Tables T18, T19, T20).
The first stratigraphic tie point (TP1) is defined at the base of a prominent distinct succession with two higher radiodensity, ~5 cm thick marker beds (with a sharp base in Section 386-M0082A-1P-2, 6 cm [verified by visual core description as the sharp base of a graded silty sand], and interval 386-M0082C-1P-1, 56–83 cm [no visual core description because this is a whole-round sample]), respectively. Horizontal alignment of the two trigger cores along the mudlines reveals different sediment thickness above the TP1 horizon (82.5 cm vs. 75.5 cm in Holes M0082A and M0082C, respectively), which might reflect subtle spatial differences in the original depositional succession or hint at some coring disturbance. Because sediment thickness (length of cored segment) between the mudline and TP1 is larger in Trigger Core 386-M0082A-1P than in Core 386-M0082C-1P, Core 386-M0082A-1P is selected as the anchor core.
9.2.2. Compositing cores
Before compositing holes, artificial and/or natural voids were measured at the ends of sections (see Stratigraphic correlation in the Expedition 386 methods chapter [Strasser et al., 2023a]) and void lengths were subtracted from the curated section length to obtain the sediment length in each section (neglecting core catchers that were sampled in a bag). Corrected section lengths and section top and bottom depths at Site M0082 are listed in Table T18.
The first-order core composite scale for Site M0082 is based on visual correlation of marker horizons on X-ray CT images and visual core description during the OSP, guided by visual inspection of trends and spikes in magnetic susceptibility and GRA data from the MSCL, linescan images and color reflectance data, and, where present, visible tephra layers. At this stage, thin but clear marker beds visible on X-ray CT and/or linescan images are used, in places verified by visual core description, instead of large (coarse and thick) event beds that may have eroded the underlying sediments. Primary air fall tephra beds, generated by a single volcanic eruption and fallen through the water column, represent some of the best tie points among holes. One such potential tephra layer was identified visually in Section 386-M0082B-1H-3, 60 cm (see Tephra), which, based on X-ray CT images, likely correlates to Section 386-M0082D-1H-3, ~0.5 cm, in a whole-round sample (TP3).
First-order correlation suggests that the sharp base of a graded silty sand bed in the two trigger cores described above (Sections 386-M0082A-1P-2, 6 cm, and 386-M0082C-1P-1, 83 cm) correlates to Sections 386-M0082B-1H-1, 19 cm, and 386-M0082D-1H-1, 44 cm (TP1). However, the upper part of Hole M0082D (and possibly also Hole M0082B) shows some coring disturbance identified visually and in the X-ray CT data, respectively, and horizontal alignment of the tephra TP3, described above, reveals significant differences in interval thickness of up to 60 cm in the uppermost part the two GPC holes (Table T20). Therefore, horizontal alignment of TP3 is prioritized for establishing relative depth shifts between Cores 386-M0082B-1H and 386-M0082D-1H (0.37 m). Horizontal alignment along TP2 (a subtle but sharp planar contact observed in both the mudline-anchored trigger core and GPC Core 386-M0082B-1H, about 4 and 7 cm below the base of the potentially erosive silty sand TP1 described above, respectively [Table T20]) defines a vertical offset for Core 386-M0082B-1H of 0.605 cm (Table T19). A depth shift of 1 m is therefore calculated for Core 386-M0082C-1H, based on the horizontal alignment of TP2 described above. The vertical offsets of the top depth of each core used to create the first-order core composite depth scale are given in the affine table (Table T19).
9.2.3. Construction of splice
A combination of Holes M0082A (mudline anchor core), M0082B, and M0082D reveals the longest complete and least disturbed stratigraphic interval at Site M0082.
At 0.865 mcd-splice, TP2 is used to tie the base of the first splice segment in the anchor core in Section 386-M0082A-1P-2, 10 cm, to Section 386-M0082B-1H-1, 26 cm. Below this depth, Hole M0082B is preferentially included in the splice because the cores recovered from the 20 m long GPC barrel deployment are generally less disturbed (see Introduction in the Expedition 386 methods chapter [Strasser et al., 2023a]). Near the bottom of Hole M0082B, the splice moves to deeper Hole M0082D at TP4 (15.97 mcd-splice), which is defined at the base of a 2 cm thick, high-radiodensity bed that consists of three thin grading upward fine sand laminae, as verified by visual core description, in both holes (Sections 386-M0082B-1H-16, 18 cm, and 386-M0082D-1H-14, 65 cm) and continues to the bottom of the hole (38.705 mcd-splice = bottom of splice). All splice tie points used to construct a complete first-order splice along with the calculated core composite depth within the splice (mcd-splice) are given in Table T20.
References
Bruland, K.W., Middag, R., and Lohan, M.C., 2014. Controls of trace metals in seawater. In Holland, H.D., and Turekian, K.K. (Eds.), Treatise on Geochemistry (Second Edition). Oxford (Elsevier), 19–51.
https://doi.org/
Claypool, G.E., and Kvenvolden, K.A., 1983. Methane and other hydrocarbon gases in marine sediment. Annual Review of Earth and Planetary Sciences, 11(1):299–327. https://doi.org/
Frings, P., 2017. Revisiting the dissolution of biogenic Si in marine sediments: a key term in the ocean Si budget. Acta Geochimica, 36(3):429-432. https://doi.org/
Froelich, P.N., Klinkhammer, G.P., Bender, M.L., Luedtke, N.A., Heath, G.R., Cullen, D., Dauphin, P., Hammond, D., Hartman, B., and Maynard, V., 1979. Early oxidation of organic matter in pelagic sediments of the eastern equatorial Atlantic: suboxic diagenesis. Geochimica et Cosmochimica Acta, 43(7):1075–1090. https://doi.org/
Glud, R.N., Wenzhöfer, F., Middelboe, M., Oguri, K., Turnewitsch, R., Canfield, D.E., and Kitazato, H., 2013. High rates of microbial carbon turnover in sediments in the deepest oceanic trench on Earth. Nature Geoscience, 6(4):284–288. https://doi.org/
Hospers, J., 1954. Rock magnetism and polar wandering. Nature, 173(4416):1183–1184. https://doi.org/
Kanamatsu, T., Ikehara, K., and Hsiung, K.-H., 2022. Stratigraphy of deep-sea marine sediment using paleomagnetic secular variation: refined dating of turbidite relating to giant earthquake in Japan Trench. Marine Geology, 443:106669. https://doi.org/
Kioka, A., Schwestermann, T., Moernaut, J., Ikehara, K., Kanamatsu, T., Eglinton, T.I., and Strasser, M., 2019. Event stratigraphy in a hadal oceanic trench: the Japan Trench as sedimentary archive recording recurrent giant subduction zone earthquakes and their role in organic carbon export to the deep sea. Frontiers in Earth Science, 7:319. https://doi.org/
Morley, J.J., Hays, J.D., and Robertson, J.H., 1982. Stratigraphic framework for the late Pleistocene in the northwest Pacific Ocean. Deep Sea Research, Part A: Oceanographic Research Papers, 29(12):1485–1499.
https://doi.org/
Strasser, M., Ikehara, K., and Cotterill, C., 2019d. Expedition 386 Scientific Prospectus: Japan Trench Paleoseismology. International Ocean Discovery Program. https://doi.org/
Strasser, M., Ikehara, K., Everest, J., Maeda, L., Hochmuth, K., Grant, H., Stewart, M., Okutsu, N., Sakurai, N., Yokoyama, T., Bao, R., Bellanova, P., Brunet, M., Cai, Z., Cattaneo, A., Hsiung, K.-H., Huang, J.-J.S., Ishizawa, T., Itaki, T., Jitsuno, K., Johnson, J.E., Kanamatsu, T., Keep, M., Kioka, A., Kölling, M., Luo, M., März, C., McHugh, C., Micallef, A., Nagahashi, Y., Pandey, D., Proust, J.-N., Rasbury, E.T., Riedinger, N., Satoguchi, Y., Sawyer, D.E., Seibert, C., Silver, M., Straub, S.M., Virtasalo, J., Wang, Y.H., Wu, T.-W., and Zellers, S.D., 2023a. Expedition 386 methods. In Strasser, M., Ikehara, K., Everest, J., and the Expedition 386 Scientists, Japan Trench Paleoseismology. Proceedings of the International Ocean Discovery Program, 386: College Station, TX (International Ocean Discovery Program). https://doi.org/
Strasser, M., Ikehara, K., Everest, J., Maeda, L., Hochmuth, K., Grant, H., Stewart, M., Okutsu, N., Sakurai, N., Yokoyama, T., Bao, R., Bellanova, P., Brunet, M., Cai, Z., Cattaneo, A., Hsiung, K.-H., Huang, J.-J.S., Ishizawa, T., Itaki, T., Jitsuno, K., Johnson, J.E., Kanamatsu, T., Keep, M., Kioka, A., Kölling, M., Luo, M., März, C., McHugh, C., Micallef, A., Nagahashi, Y., Pandey, D., Proust, J.-N., Rasbury, E.T., Riedinger, N., Satoguchi, Y., Sawyer, D.E., Seibert, C., Silver, M., Straub, S.M., Virtasalo, J., Wang, Y.H., Wu, T.-W., and Zellers, S.D., 2023b. Expedition 386 summary. In Strasser, M., Ikehara, K., Everest, J., and the Expedition 386 Scientists, Japan Trench Paleoseismology. Proceedings of the International Ocean Discovery Program, 386: College Station, TX (International Ocean Discovery Program). https://doi.org/
Strasser, M., Ikehara, K., Everest, J., Maeda, L., Hochmuth, K., Grant, H., Stewart, M., Okutsu, N., Sakurai, N., Yokoyama, T., Bao, R., Bellanova, P., Brunet, M., Cai, Z., Cattaneo, A., Hsiung, K.-H., Huang, J.-J.S., Ishizawa, T., Itaki, T., Jitsuno, K., Johnson, J.E., Kanamatsu, T., Keep, M., Kioka, A., Kölling, M., Luo, M., März, C., McHugh, C., Micallef, A., Nagahashi, Y., Pandey, D., Proust, J.-N., Rasbury, E.T., Riedinger, N., Satoguchi, Y., Sawyer, D.E., Seibert, C., Silver, M., Straub, S.M., Virtasalo, J., Wang, Y.H., Wu, T.-W., and Zellers, S.D., 2023c. Sites M0083 and M0089 (Basin C2). In Strasser, M., Ikehara, K., Everest, J., and the Expedition 386 Scientists, Japan Trench Paleoseismology. Proceedings of the International Ocean Discovery Program, 386: College Station, TX (International Ocean Discovery Program). https://doi.org/
Strasser, M., Ikehara, K., Everest, J., Maeda, L., Hochmuth, K., Grant, H., Stewart, M., Okutsu, N., Sakurai, N., Yokoyama, T., Bao, R., Bellanova, P., Brunet, M., Cai, Z., Cattaneo, A., Hsiung, K.-H., Huang, J.-J.S., Ishizawa, T., Itaki, T., Jitsuno, K., Johnson, J.E., Kanamatsu, T., Keep, M., Kioka, A., Kölling, M., Luo, M., März, C., McHugh, C., Micallef, A., Nagahashi, Y., Pandey, D., Proust, J.-N., Rasbury, E.T., Riedinger, N., Satoguchi, Y., Sawyer, D.E., Seibert, C., Silver, M., Straub, S.M., Virtasalo, J., Wang, Y.H., Wu, T.-W., and Zellers, S.D., 2023d. Sites M0092 and M0095 (Basin S2). In Strasser, M., Ikehara, K., Everest, J., and the Expedition 386 Scientists, Japan Trench Paleoseismology. Proceedings of the International Ocean Discovery Program, 386: College Station, TX (International Ocean Discovery Program). https://doi.org/
Strasser, M., Ikehara, K., Everest, J., and the Expedition 386 Scientists, 2023e. Supplementary material, https://doi.org/10.14379/iodp.proc.386supp.2023. In Strasser, M., Ikehara, K., Everest, J., and the Expedition 386 Scientists, Japan Trench Paleoseismology. Proceedings of the International Ocean Discovery Program, 386: College Station, TX (International Ocean Discovery Program).