Strasser, M., Ikehara, K., Everest, J., and the Expedition 386 Scientists
Proceedings of the International Ocean Discovery Program Volume 386
publications.iodp.org
https://doi.org/10.14379/iodp.proc.386.111.2023
Site M0086 (Basin N1) 1
![]() M. Strasser,
M. Strasser,
![]() K. Ikehara,
K. Ikehara,
![]() J. Everest,
J. Everest,
![]() L. Maeda,
L. Maeda,
![]() K. Hochmuth,
K. Hochmuth,
![]() H. Grant,
H. Grant,
![]() M. Stewart,
M. Stewart,
![]() N. Okutsu,
N. Okutsu,
![]() N. Sakurai,
N. Sakurai,
![]() T. Yokoyama,
T. Yokoyama,
![]() R. Bao,
R. Bao,
![]() P. Bellanova,
P. Bellanova,
![]() M. Brunet,
M. Brunet,
![]() Z. Cai,
Z. Cai,
![]() A. Cattaneo,
A. Cattaneo,
![]() K.-H. Hsiung,
K.-H. Hsiung,
![]() J.-J. Huang,
J.-J. Huang,
![]() T. Ishizawa,
T. Ishizawa,
![]() T. Itaki,
T. Itaki,
![]() K. Jitsuno,
K. Jitsuno,
![]() J.E. Johnson,
J.E. Johnson,
![]() T. Kanamatsu,
T. Kanamatsu,
![]() M. Keep,
M. Keep,
![]() A. Kioka,
M. Kölling,
A. Kioka,
M. Kölling,
![]() M. Luo,
M. Luo,
![]() C. März,
C. März,
![]() C. McHugh,
C. McHugh,
![]() A. Micallef,
A. Micallef,
![]() Y. Nagahashi,
Y. Nagahashi,
![]() D.K. Pandey,
D.K. Pandey,
![]() J.-N. Proust,
J.-N. Proust,
![]() E.T. Rasbury,
E.T. Rasbury,
![]() N. Riedinger,
N. Riedinger,
![]() Y. Satoguchi,
Y. Satoguchi,
![]() D.E. Sawyer,
D.E. Sawyer,
![]() C. Seibert,
C. Seibert,
![]() M. Silver,
M. Silver,
![]() S.M. Straub,
S.M. Straub,
![]() J. Virtasolo,
J. Virtasolo,
![]() Y. Wang,
Y. Wang,
![]() T.-W. Wu, and
T.-W. Wu, and
![]() S.D. Zellers2
S.D. Zellers2
1 Strasser, M., Ikehara, K., Everest, J., Maeda, L., Hochmuth, K., Grant, H., Stewart, M., Okutsu, N., Sakurai, N., Yokoyama, T., Bao, R., Bellanova, P., Brunet, M., Cai, Z., Cattaneo, A., Hsiung, K.-H., Huang, J.-J., Ishizawa, T., Itaki, T., Jitsuno, K., Johnson, J.E., Kanamatsu, T., Keep, M., Kioka, A., Kölling, M., Luo, M., März, C., McHugh, C., Micallef, A., Nagahashi, Y., Pandey, D.K., Proust, J.-N., Rasbury, E.T., Riedinger, N., Satoguchi, Y., Sawyer, D.E., Seibert, C., Silver, M., Straub, S.M., Virtasalo, J., Wang, Y., Wu, T.-W., and Zellers, S.D., 2023. Site M0086 (Basin N1). In Strasser, M., Ikehara, K., Everest, J., and the Expedition 386 Scientists, Japan Trench Paleoseismology. Proceedings of the International Ocean Discovery Program, 386: College Station, TX (International Ocean Discovery Program). https://doi.org/10.14379/iodp.proc.386.111.2023
2Expedition 386 Scientists’ affiliations.
1. Operations
During Expedition 386, one Giant Piston Corer (GPC) system deployment at this central study area of the northern Japan Trench (Basin N1) (Figure F1) resulted in the recovery of cores from two holes at Site M0086 (Figure F2). The water depth was 7502 meters below sea level (mbsl). A breakdown of operational time is reported weekly instead of daily (see OPS in Supplementary material) due to decisions to move between sites based on weather and current conditions. Holes at Sites M0086 were cored during Week 3 of the offshore phase. In total, 19.275 m of cores (Table T1) and 6.65 km of hydroacoustic profiles (see Hydroacoustics) were recovered and acquired in this focus area. An expendable bathythermograph (XBT) probe was deployed at Site M0086 on 2 May 2021 at 0715 h. Further operations details, including winch log and inclinometer information, are found for all sites in Coring methodology in the Expedition 386 methods chapter (Strasser et al., 2023a) and associated files (see PALEOMAG and WINCHLOGS in Supplementary material).

Figure F1. Site map.
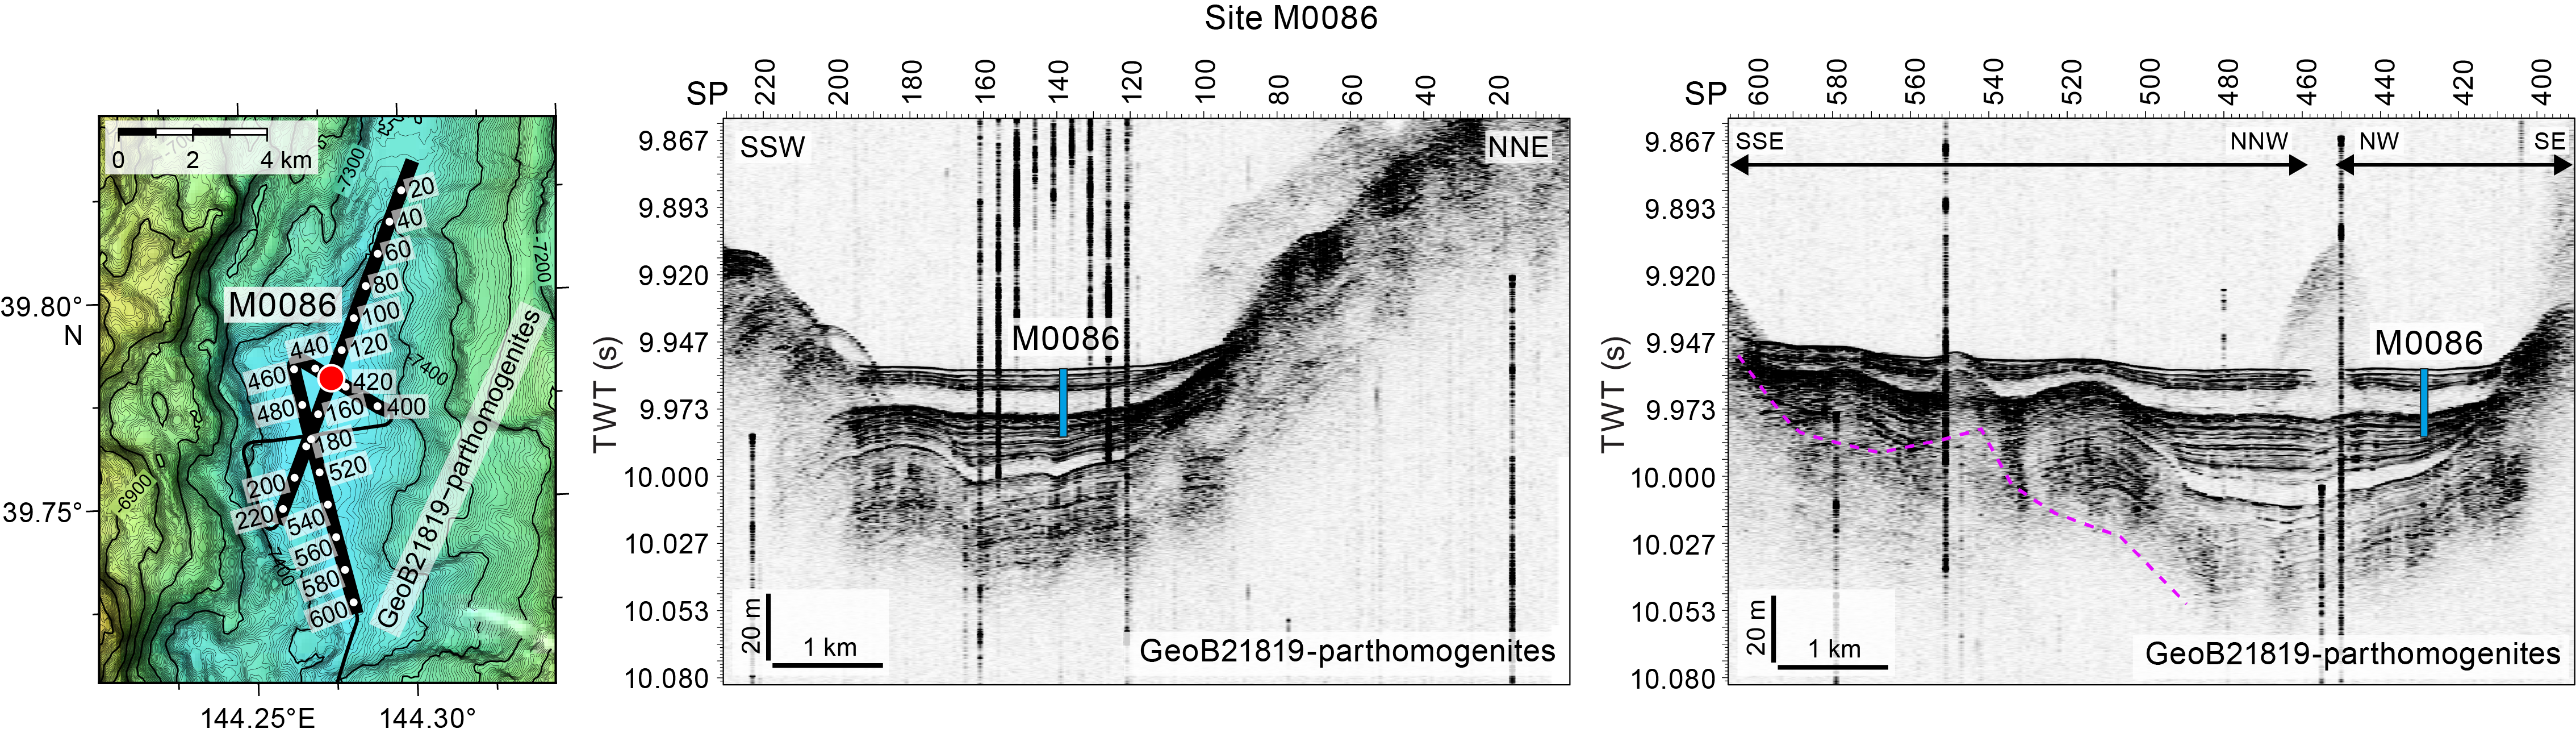
Figure F2. Site M0086.
The main site-specific scientific objectives for Site M0086 were as follows:
- Recover a continuous Pleistocene to Holocene stratigraphic succession comprising event deposits from this trench basin in the central area of northern Japan Trench.
- Analyze the stratigraphic pattern and event deposit characteristics and compare them with integrated results from other nearby sites (M0087 [~30 km south] and M0088 [~35 km north]) to establish robust stratigraphic pattern recognition of proxy evidence for earthquakes.
- Generate results for comparison with those from all other Expedition 386 sites to explore spatiotemporal distribution of event deposits and the southward extent of sediment transport routed through the Ogawara Submarine Canyon to eventually develop a long-term record for giant earthquakes.
1.1. Site M0086
The R/V Kaimei arrived at Site M0086 at 0030 h on 2 May 2021 and stood by to wait for a low pressure weather system to pass. At 0715 h, an XBT probe was deployed, and multibeam echo sounder/subbottom profiler (MBES/SBP) surveying started at 0739 h. Conditions during the day were calm, with winds of <8 m/s, wave heights of ~1 m, and a <0.6 kt current. GPC operations started in Holes M0086A and M0086B with a 20 m GPC barrel string at 0930 h. The GPC system was recovered on deck at 1530 h. The Science Party cut core into 1 m sections from 1600 to 1715 h. The 20 m GPC assembly was prepared for the next run at 1900 h, and the ship moved to Site M0087.
1.1.1. Holes M0086A and M0086B
Holes M0086A and M0086B were cored on 2 May 2021. Preparations for running the 20 m GPC were completed at 0930 h, and the GPC was run into the water at 0950 h with an inclinometer and transponder attached to the winch cable 20 and 50 m above the GPC trigger arm, respectively. Winch speed was set at 0.5–1.0 m/s for the first 100 m cable length and 1.2–1.5 m/s to 7600 m cable length. At 1215 h, the GPC was held at 7600 m cable length for stabilization for 3 min and then resumed at a winch speed of 0.3 m/s. Spud-in commenced at 12:27:33 h and ended at 12:27:36 h at a cable length of 7600 m. Recovery commenced, and the cable tension rose to 2628 kgf at 12:27:40 h before dropping to 1492 kgf and then rising again to a maximum of 6408 kgf at 12:28:21 h. It dropped to 4565 kgf at 12:28:20 h, indicating the corer was clear of the seabed (see Figure F4 in the Expedition 386 methods chapter [Strasser et al., 2023a]). Inclinometer data for Hole M0086B show the piston corer barrel was rotated clockwise by 150.5° at the estimated seabed, with an east–west dip of 0.26° and a north–south dip of −1.69° (see Figure F5 in the Expedition 386 methods chapter [Strasser et al., 2023a]). The GPC was run back to the surface at a winch speed of 1.0–1.5 m/s. The trigger corer and GPC were recovered on deck at 1450 and 1530 h, respectively. The trigger core and GPC core from Holes M0086A and M0086B have a total length of 1.02 m (2 sections) and 18.255 m (19 sections), respectively (Table T1).
2. Hydroacoustics
Site M0086 lies in Basin N1 in the northern Japan Trench survey area (Figure F3). The acquired subbottom profile data comprises a single line parallel to the trench that is approximately 6650 m long. The acquisition parameters for the line are documented in Table T2. All depth and thickness estimates in this section are approximate and assume a seismic velocity of 1500 m/s.
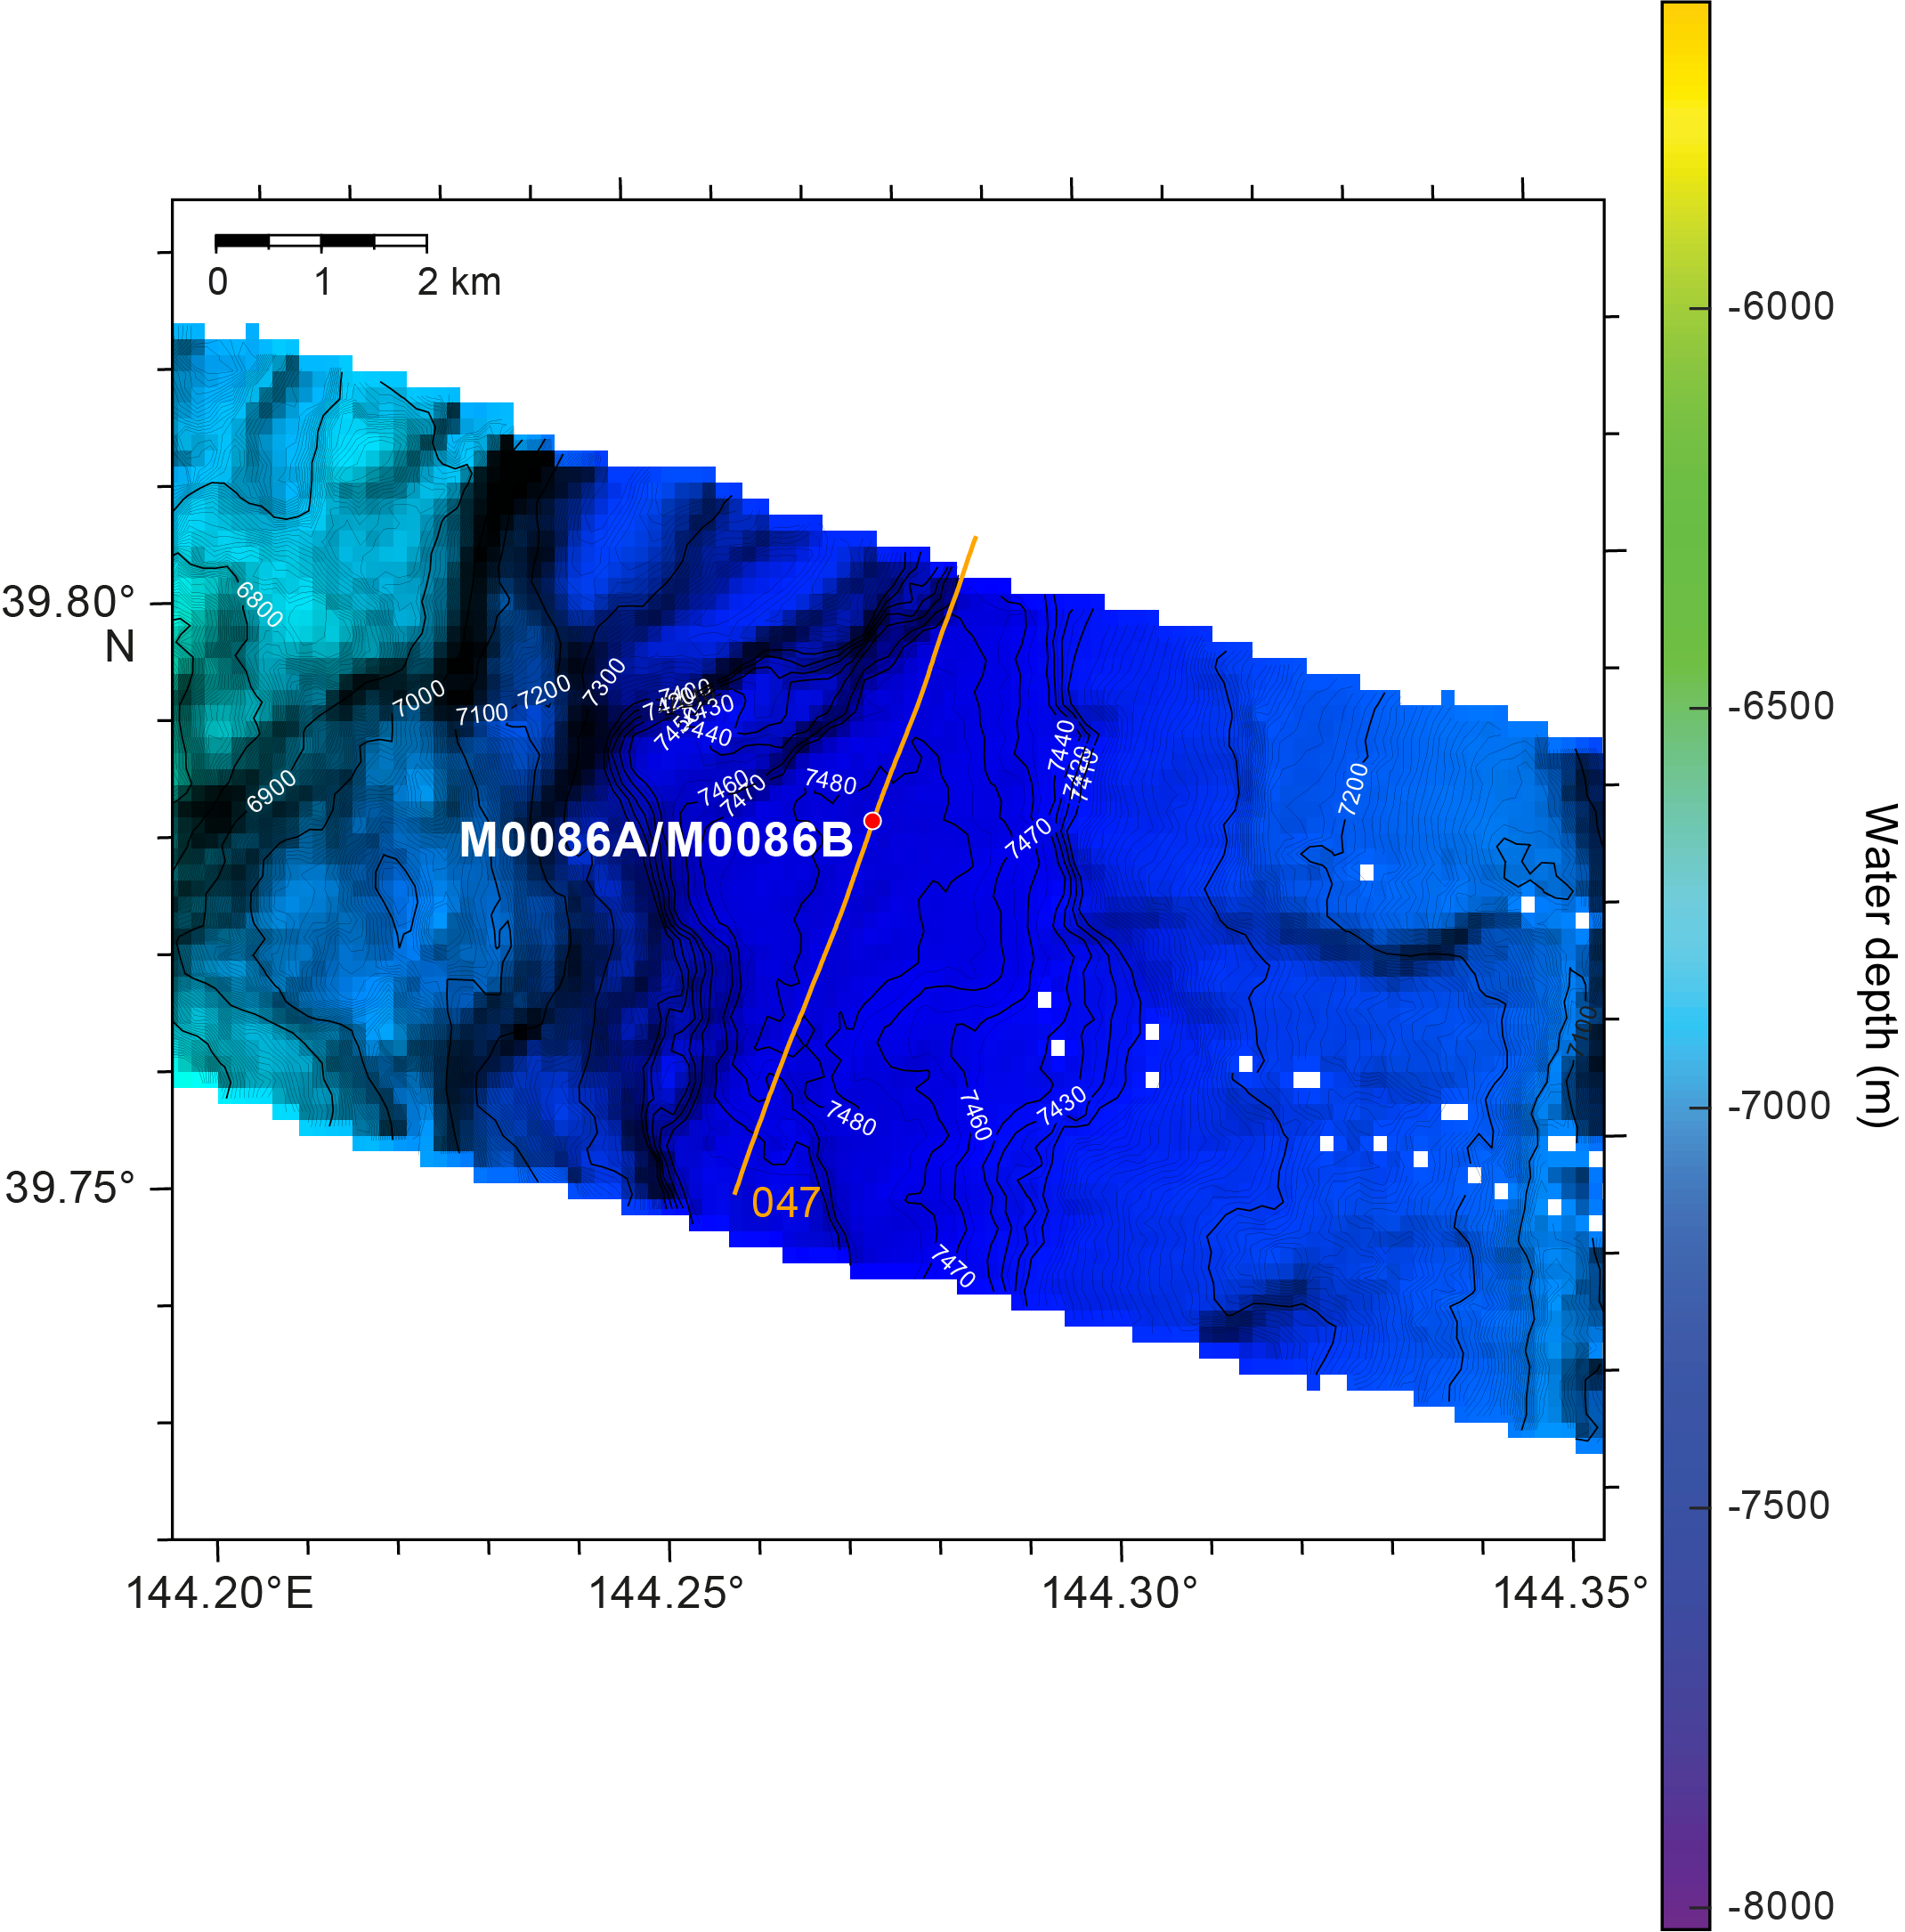
Figure F3. Subbottom profile lines.
2.1. Bathymetry
Holes M0086A and M0086B lie in the deepest part of the basin at 7502 m. To the west, the basin margin comprises a series of terraces with a maximum topographic slope of 10%–12%. The eastern basin margin slopes more gently with a slope gradient of less than 10%. Basin width is hard to determine given the diffuse basin margins, but the width of the flattest part of the basin is approximately 3000 m.
2.2. Basin characterization and Site M0086
Strike line 386_Underway_047 extends from north-northeast to south-southwest through the basin (Figure F4). The profile shows an acoustically well-stratified section from Shotpoint 340 to Shotpoint 540 that comprises a distinct series of both acoustically transparent and acoustically laminated packages. A high-amplitude seafloor reflector forms the upper bound of a semitransparent package of the youngest basin fill. This youngest package, which is approximately 4 m thick, contains a series of alternating high- and low-amplitude layers and is underlain by a high-amplitude reflector. Beneath this youngest package and high-amplitude reflector is a distinct acoustically transparent unit that is ~10 m thick near Hole M0086A and M0086B and thins toward the northern basin margin. A 10–12 m package of high-amplitude reflections underlies this upper transparent layer and also thins over basal highs to both the north and south. A lower acoustically transparent layer approximately 3 m thick separates the upper high-amplitude package above from a thicker (up to 25 m) lower package of laminated materials that extend to the basal layers.
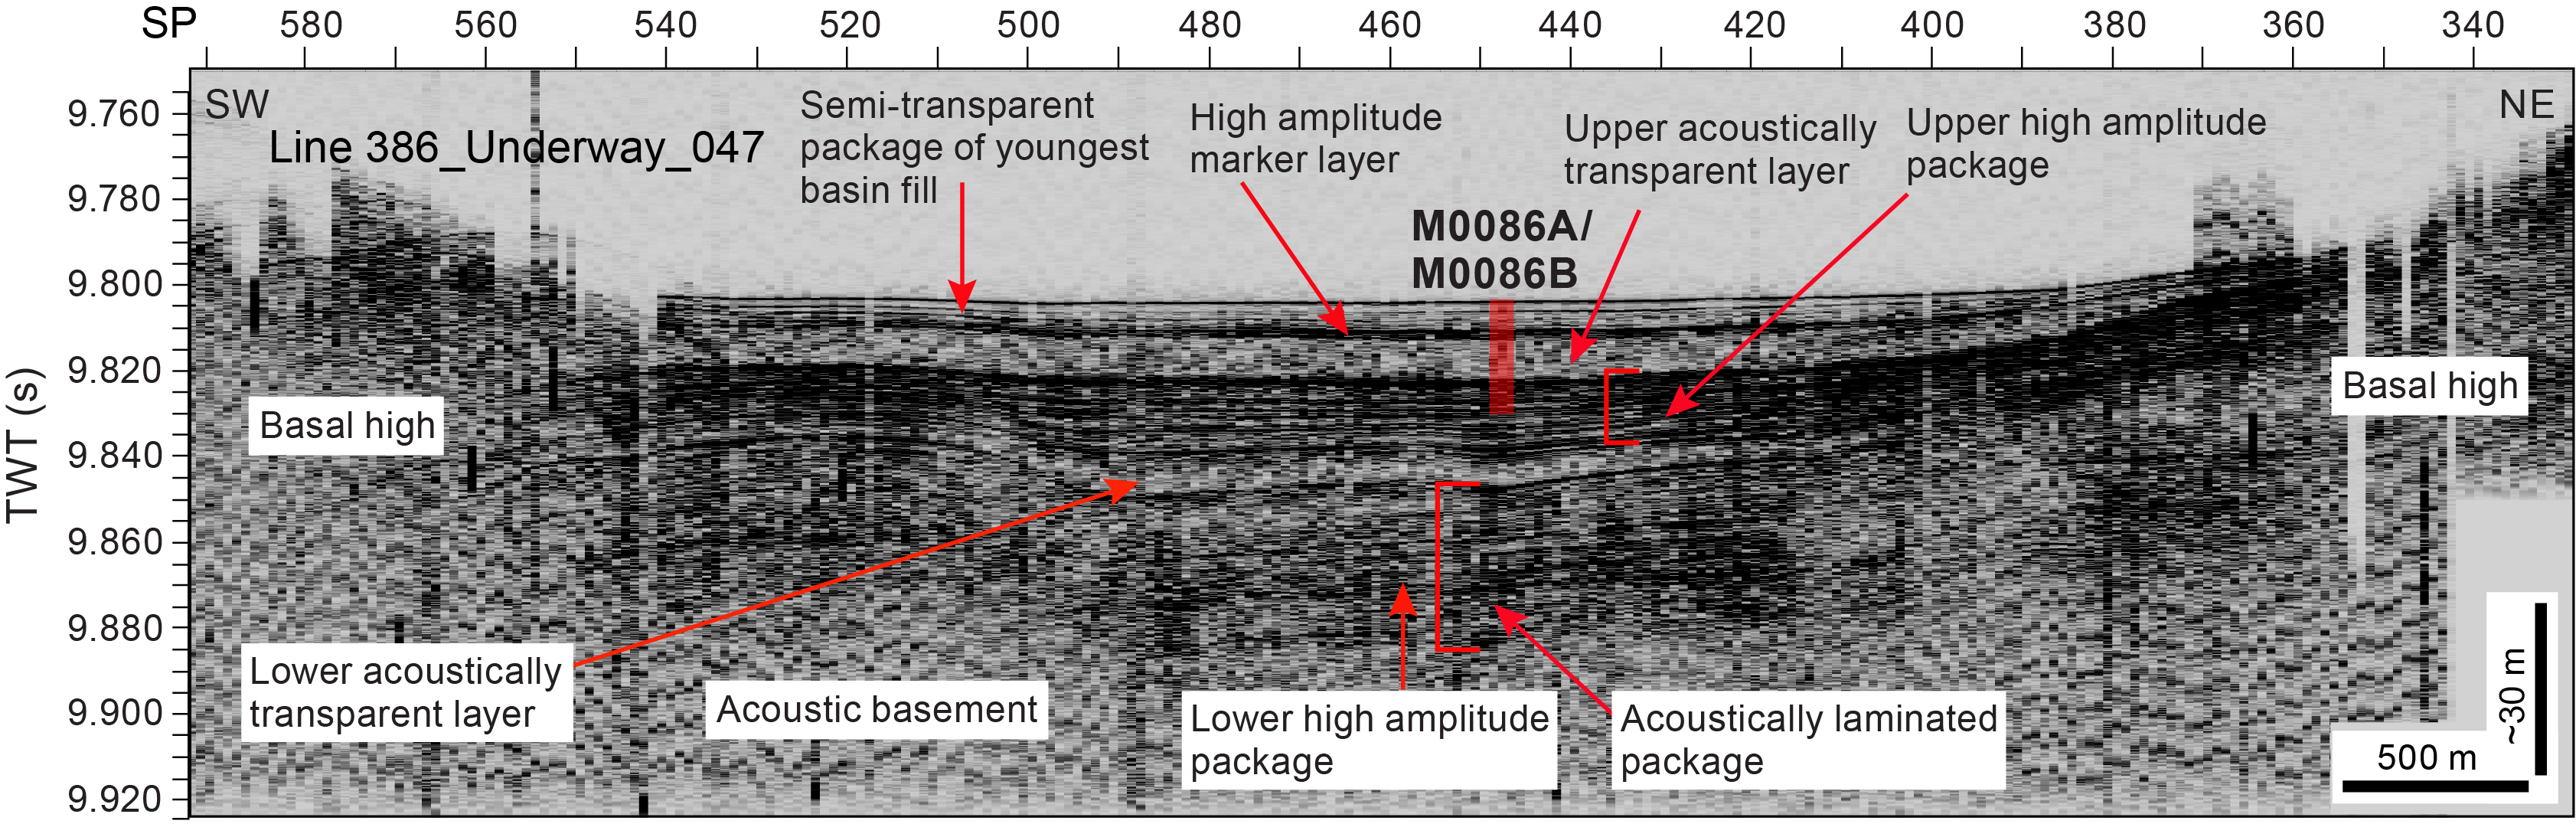
Figure F4. Line 386_Underway_047.
There is evidence for several stages of deposition in the basin. The upper high-amplitude package thins over the basal high beneath Shotpoint 520, and the upper semitransparent package and upper acoustically transparent layers onlap onto the basal high to the north at around Shotpoint 370.
3. Lithostratigraphy
Site M0086 was cored in the northern area of the northern Japan Trench in Basin N1. This site has two holes comprising one trigger core (Hole M0086A) and one GPC core (Hole M0086B). They were cored to recover a continuous Pleistocene to Holocene stratigraphic succession (see Operations). Lithostratigraphic summaries of the core sections, including X-ray computed tomography (CT) images, linescan images, visual grain size estimates, core description, and physical properties (see Physical properties) are shown in Figure F5, and barrel sheets can be found in Core descriptions. The use of major and minor lithologies, bedding, primary sedimentary structures, accessories, and secondary structures (bioturbation and iron monosulfides) are defined in Lithostratigraphy in the Expedition 386 methods chapter (Strasser et al., 2023a).
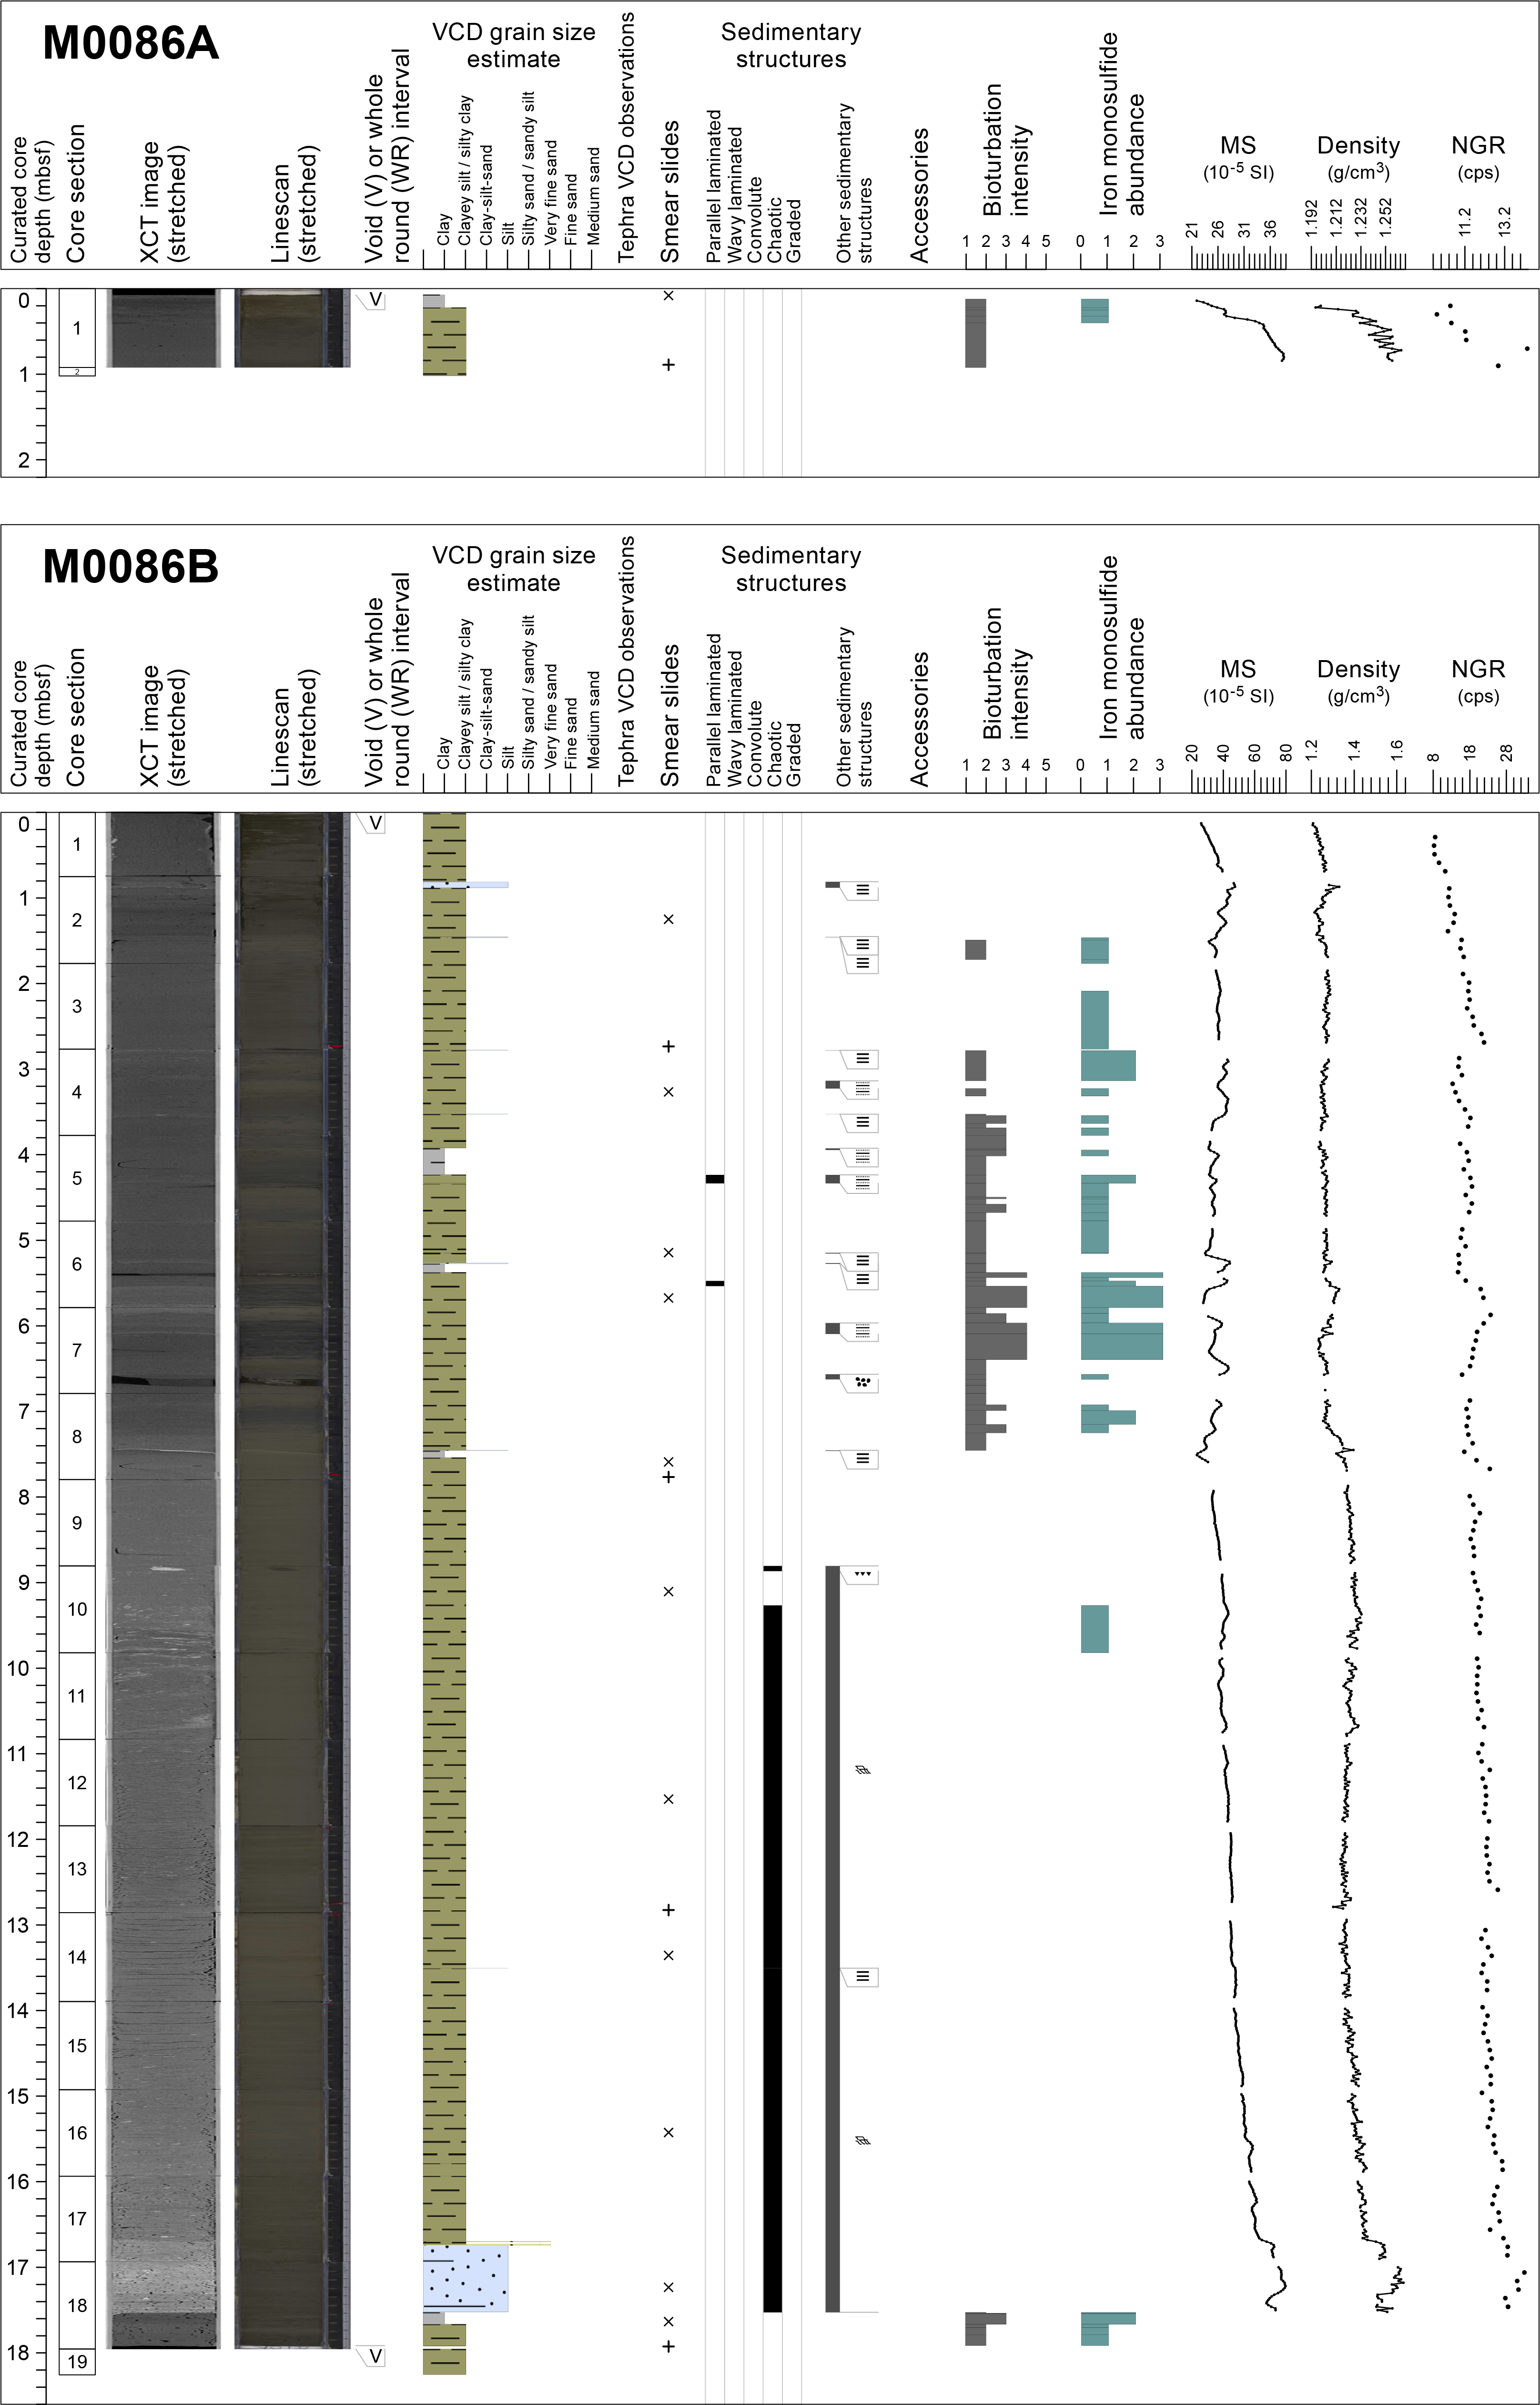
Figure F5. Lithostratigraphic summaries.
The sediment texture and composition determined from smear slide analysis performed during the Onshore Science Party (OSP) are semiquantitative. A total of 12 smear slides were obtained from the sediment of Site M0086: 1 for Hole M0086A and 11 for Hole M0086B. Smear slide data are presented in Core descriptions and shown in Figure F6 on ternary diagrams for grain size (sand, silt, and clay) and composition (vitric, lithic, and biogenic). Color bars represent the lithic, biogenic, and vitric components of smear slides on the smear slide summaries (Figure F7). Some smear slide photomicrographs of the main lithologies are presented in Figure F8. The 3 m barrel sheets, linescan composites, and smear slide data tables can be found in Core descriptions. Core close-up photos, line scan images, complete X-ray CT scan images, and X-ray diffraction (XRD) mineralogy data can be found in CORECLOSEUP, LINSCAN, XRAYCT, and XRD, respectively, in Supplementary material.
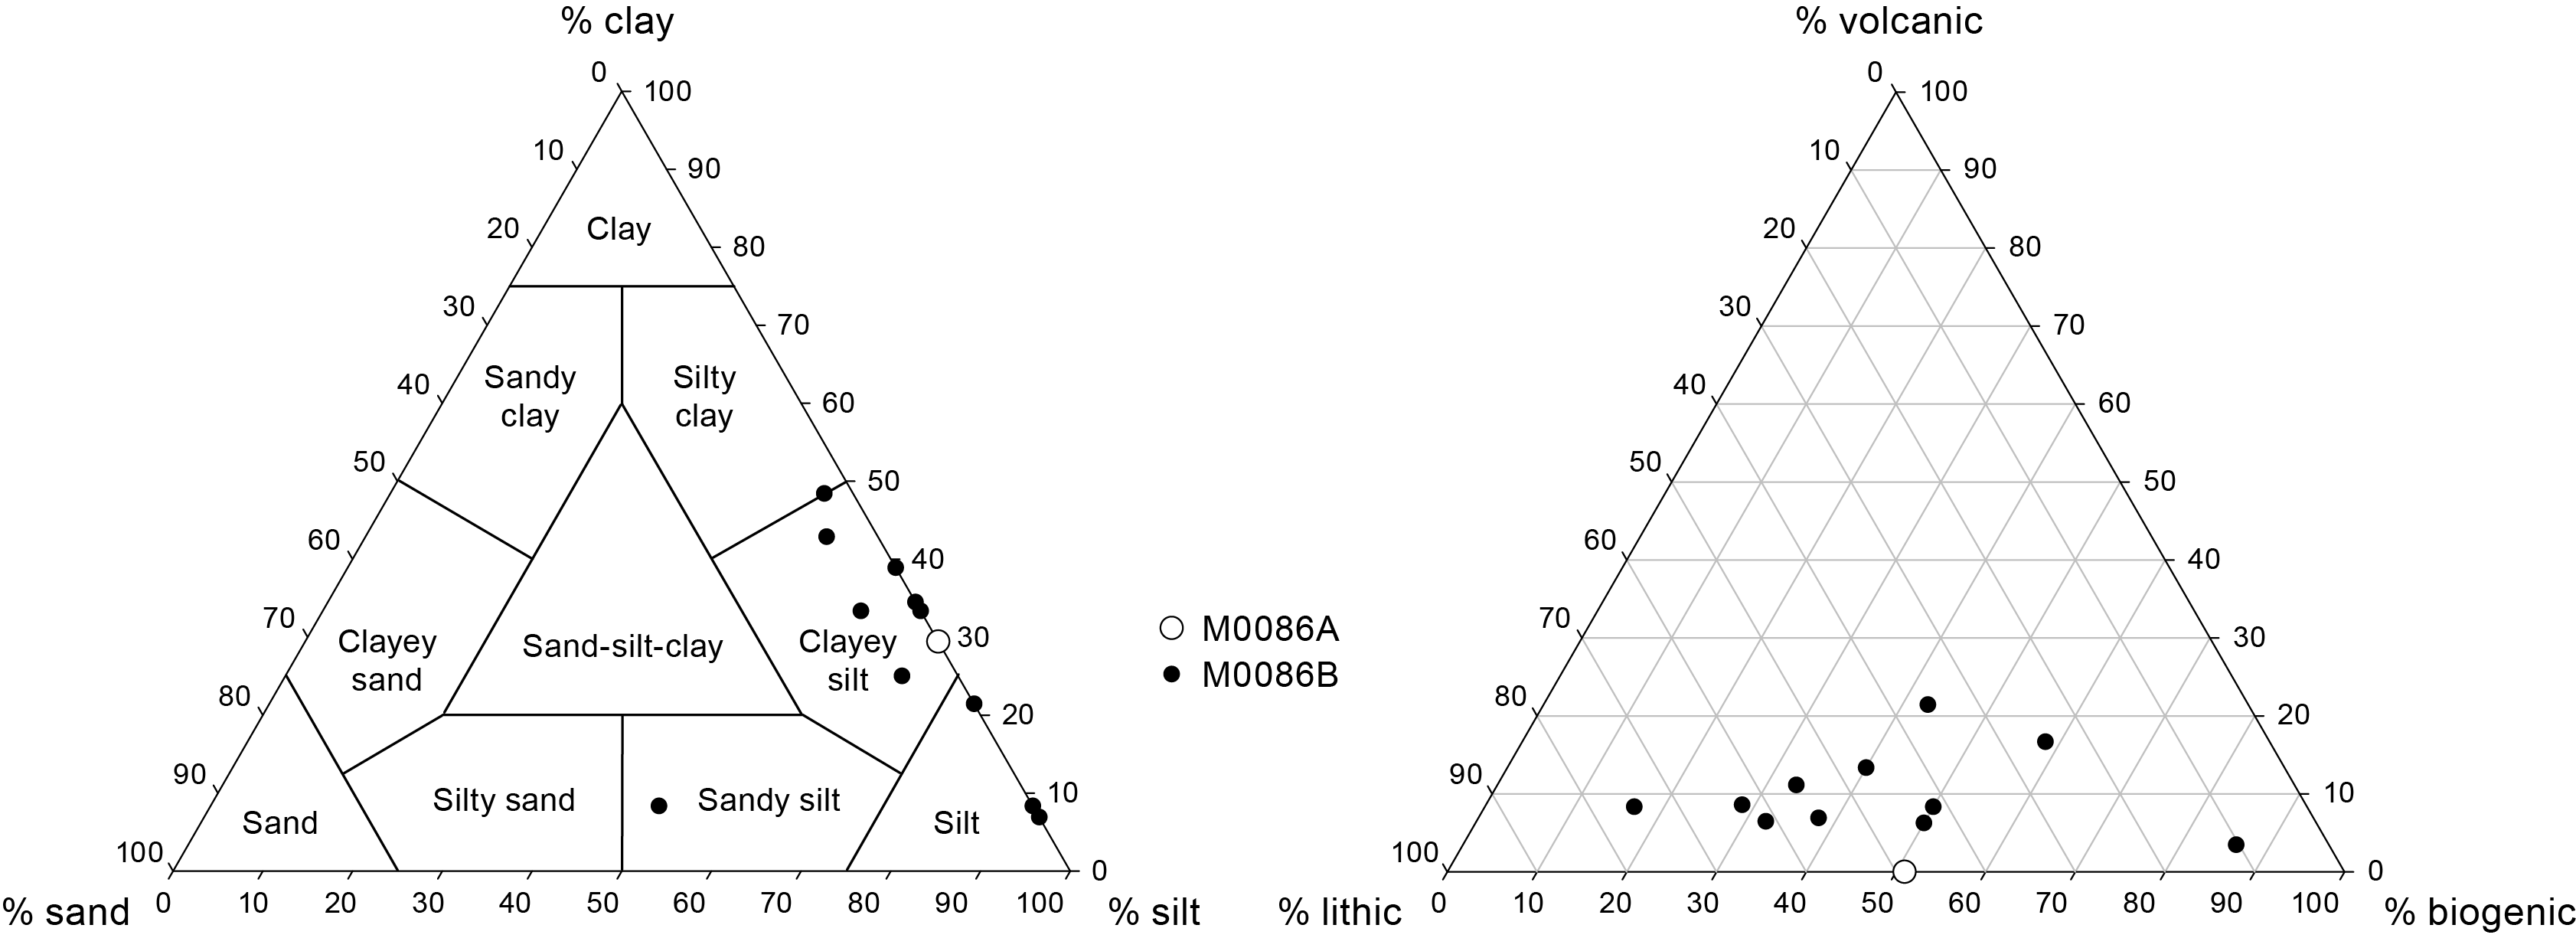
Figure F6. Ternary diagrams of major components.
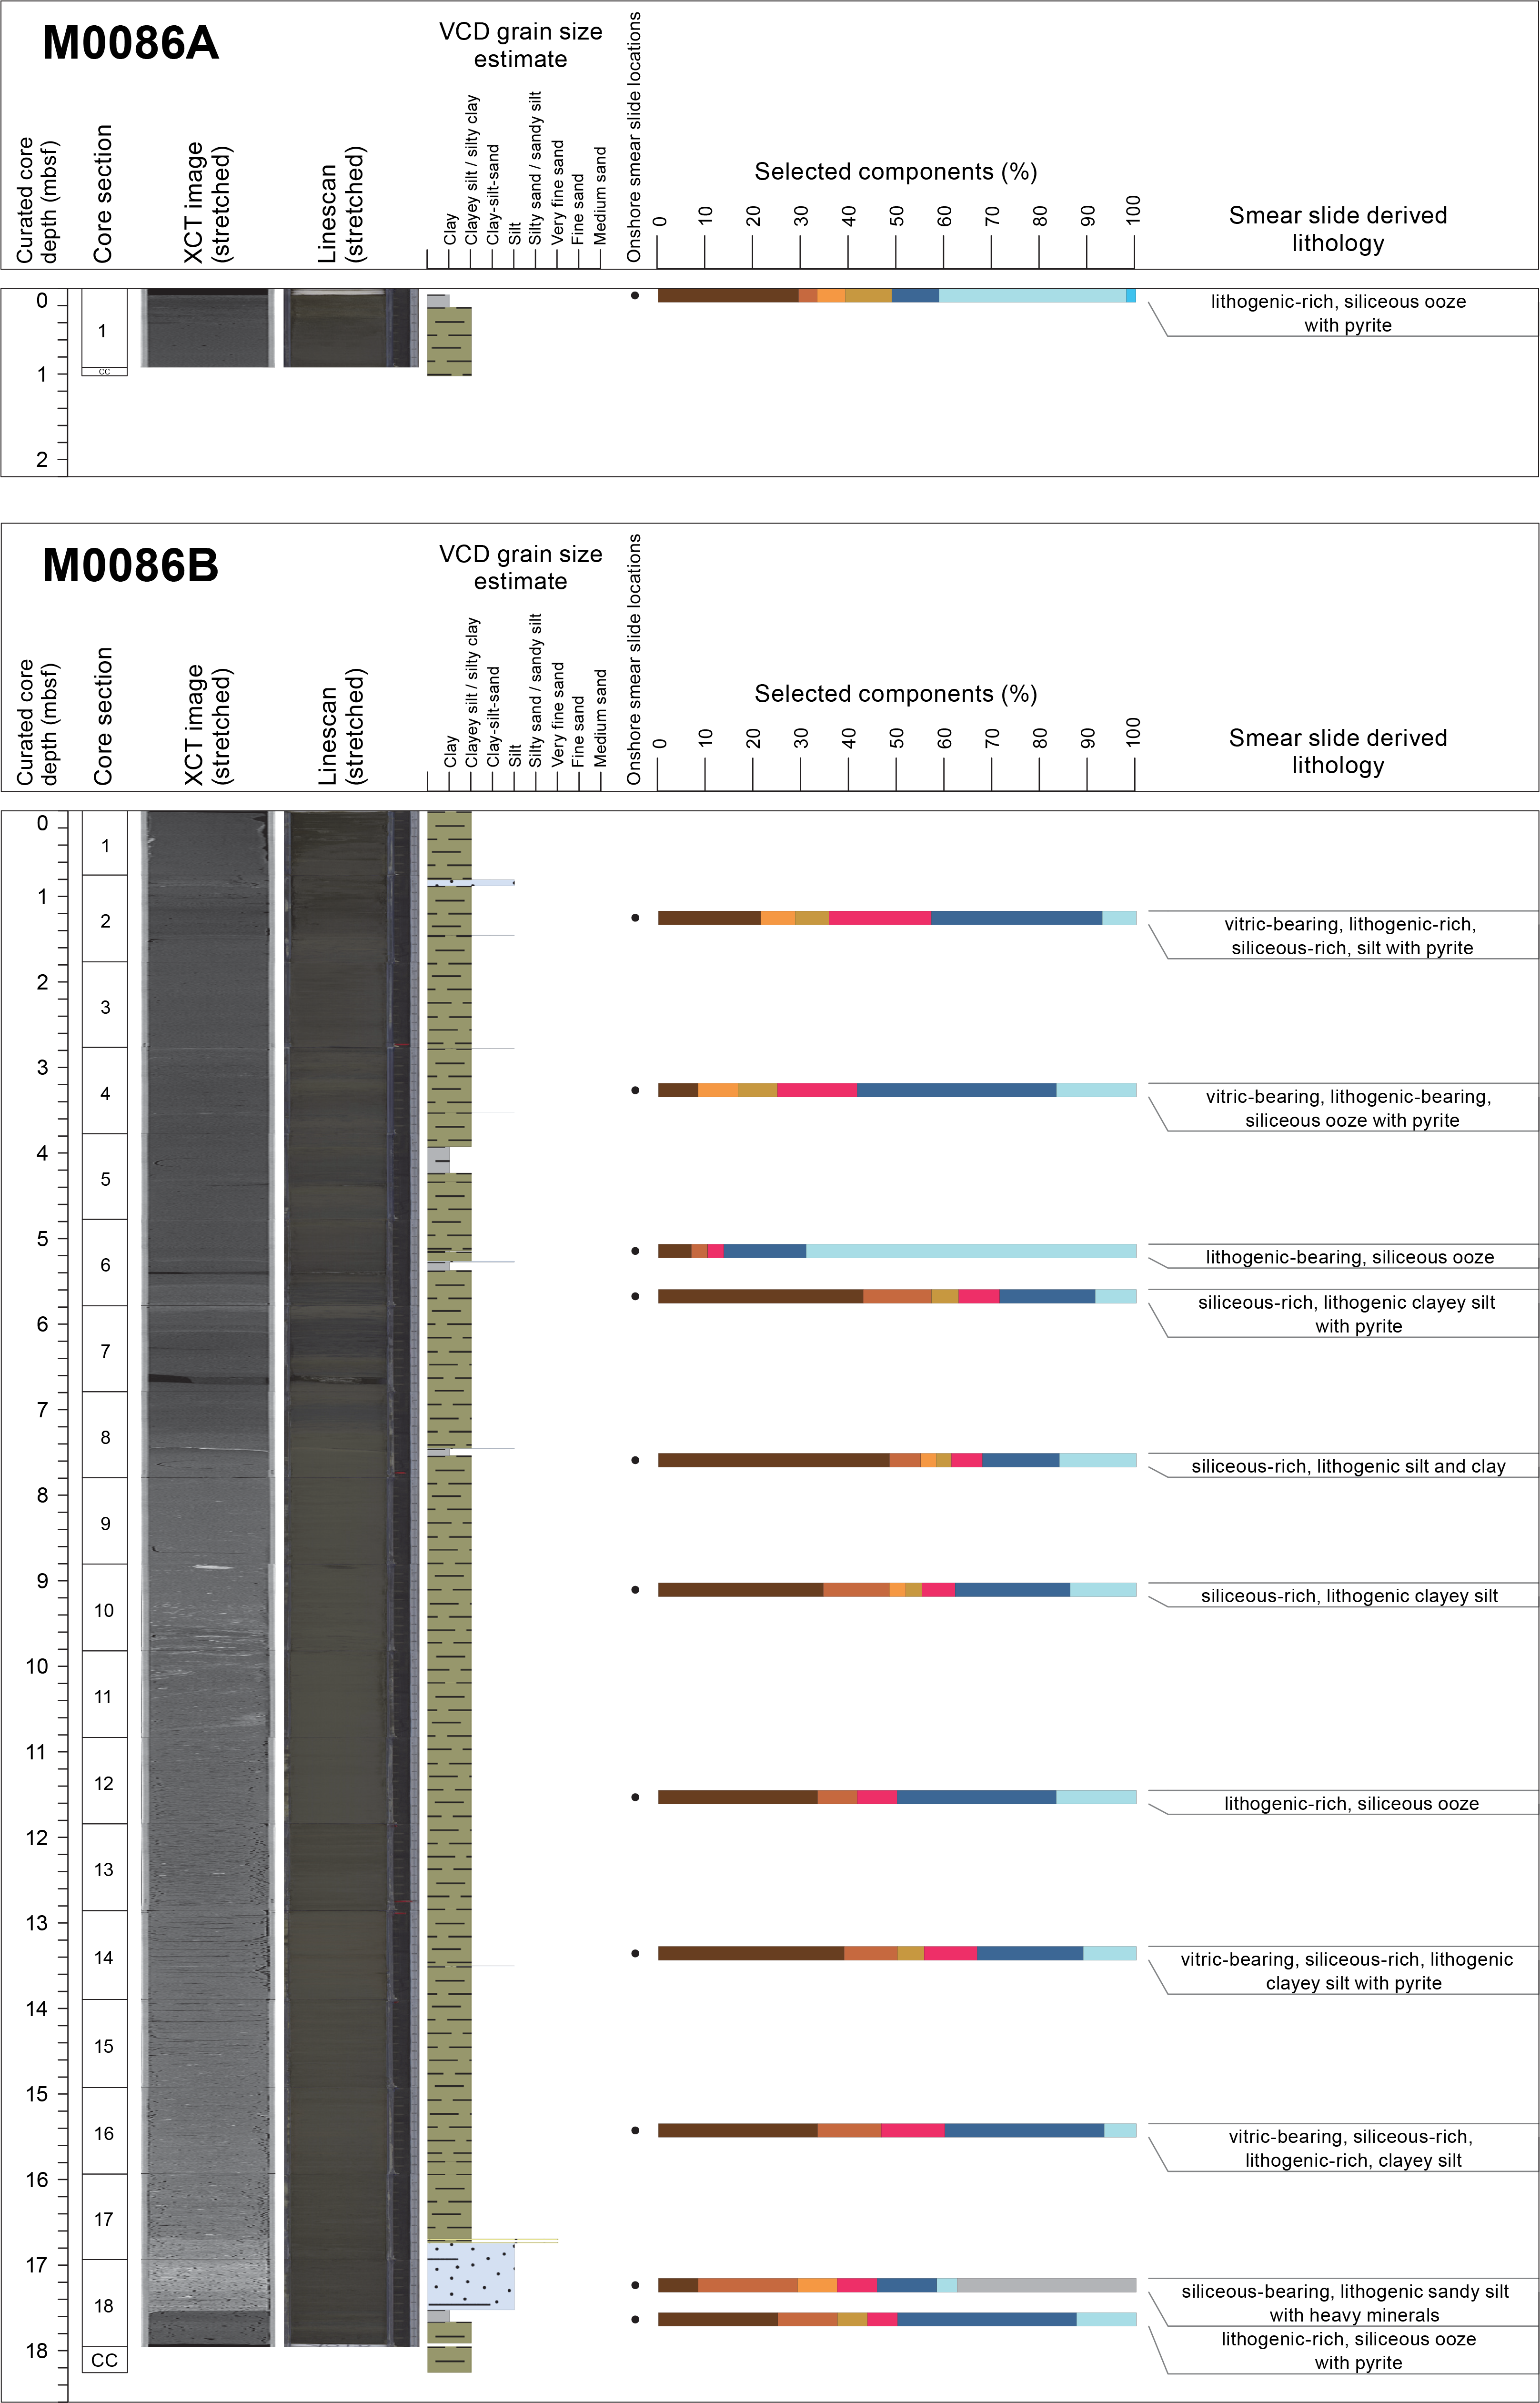
Figure F7. Smear slide summaries.
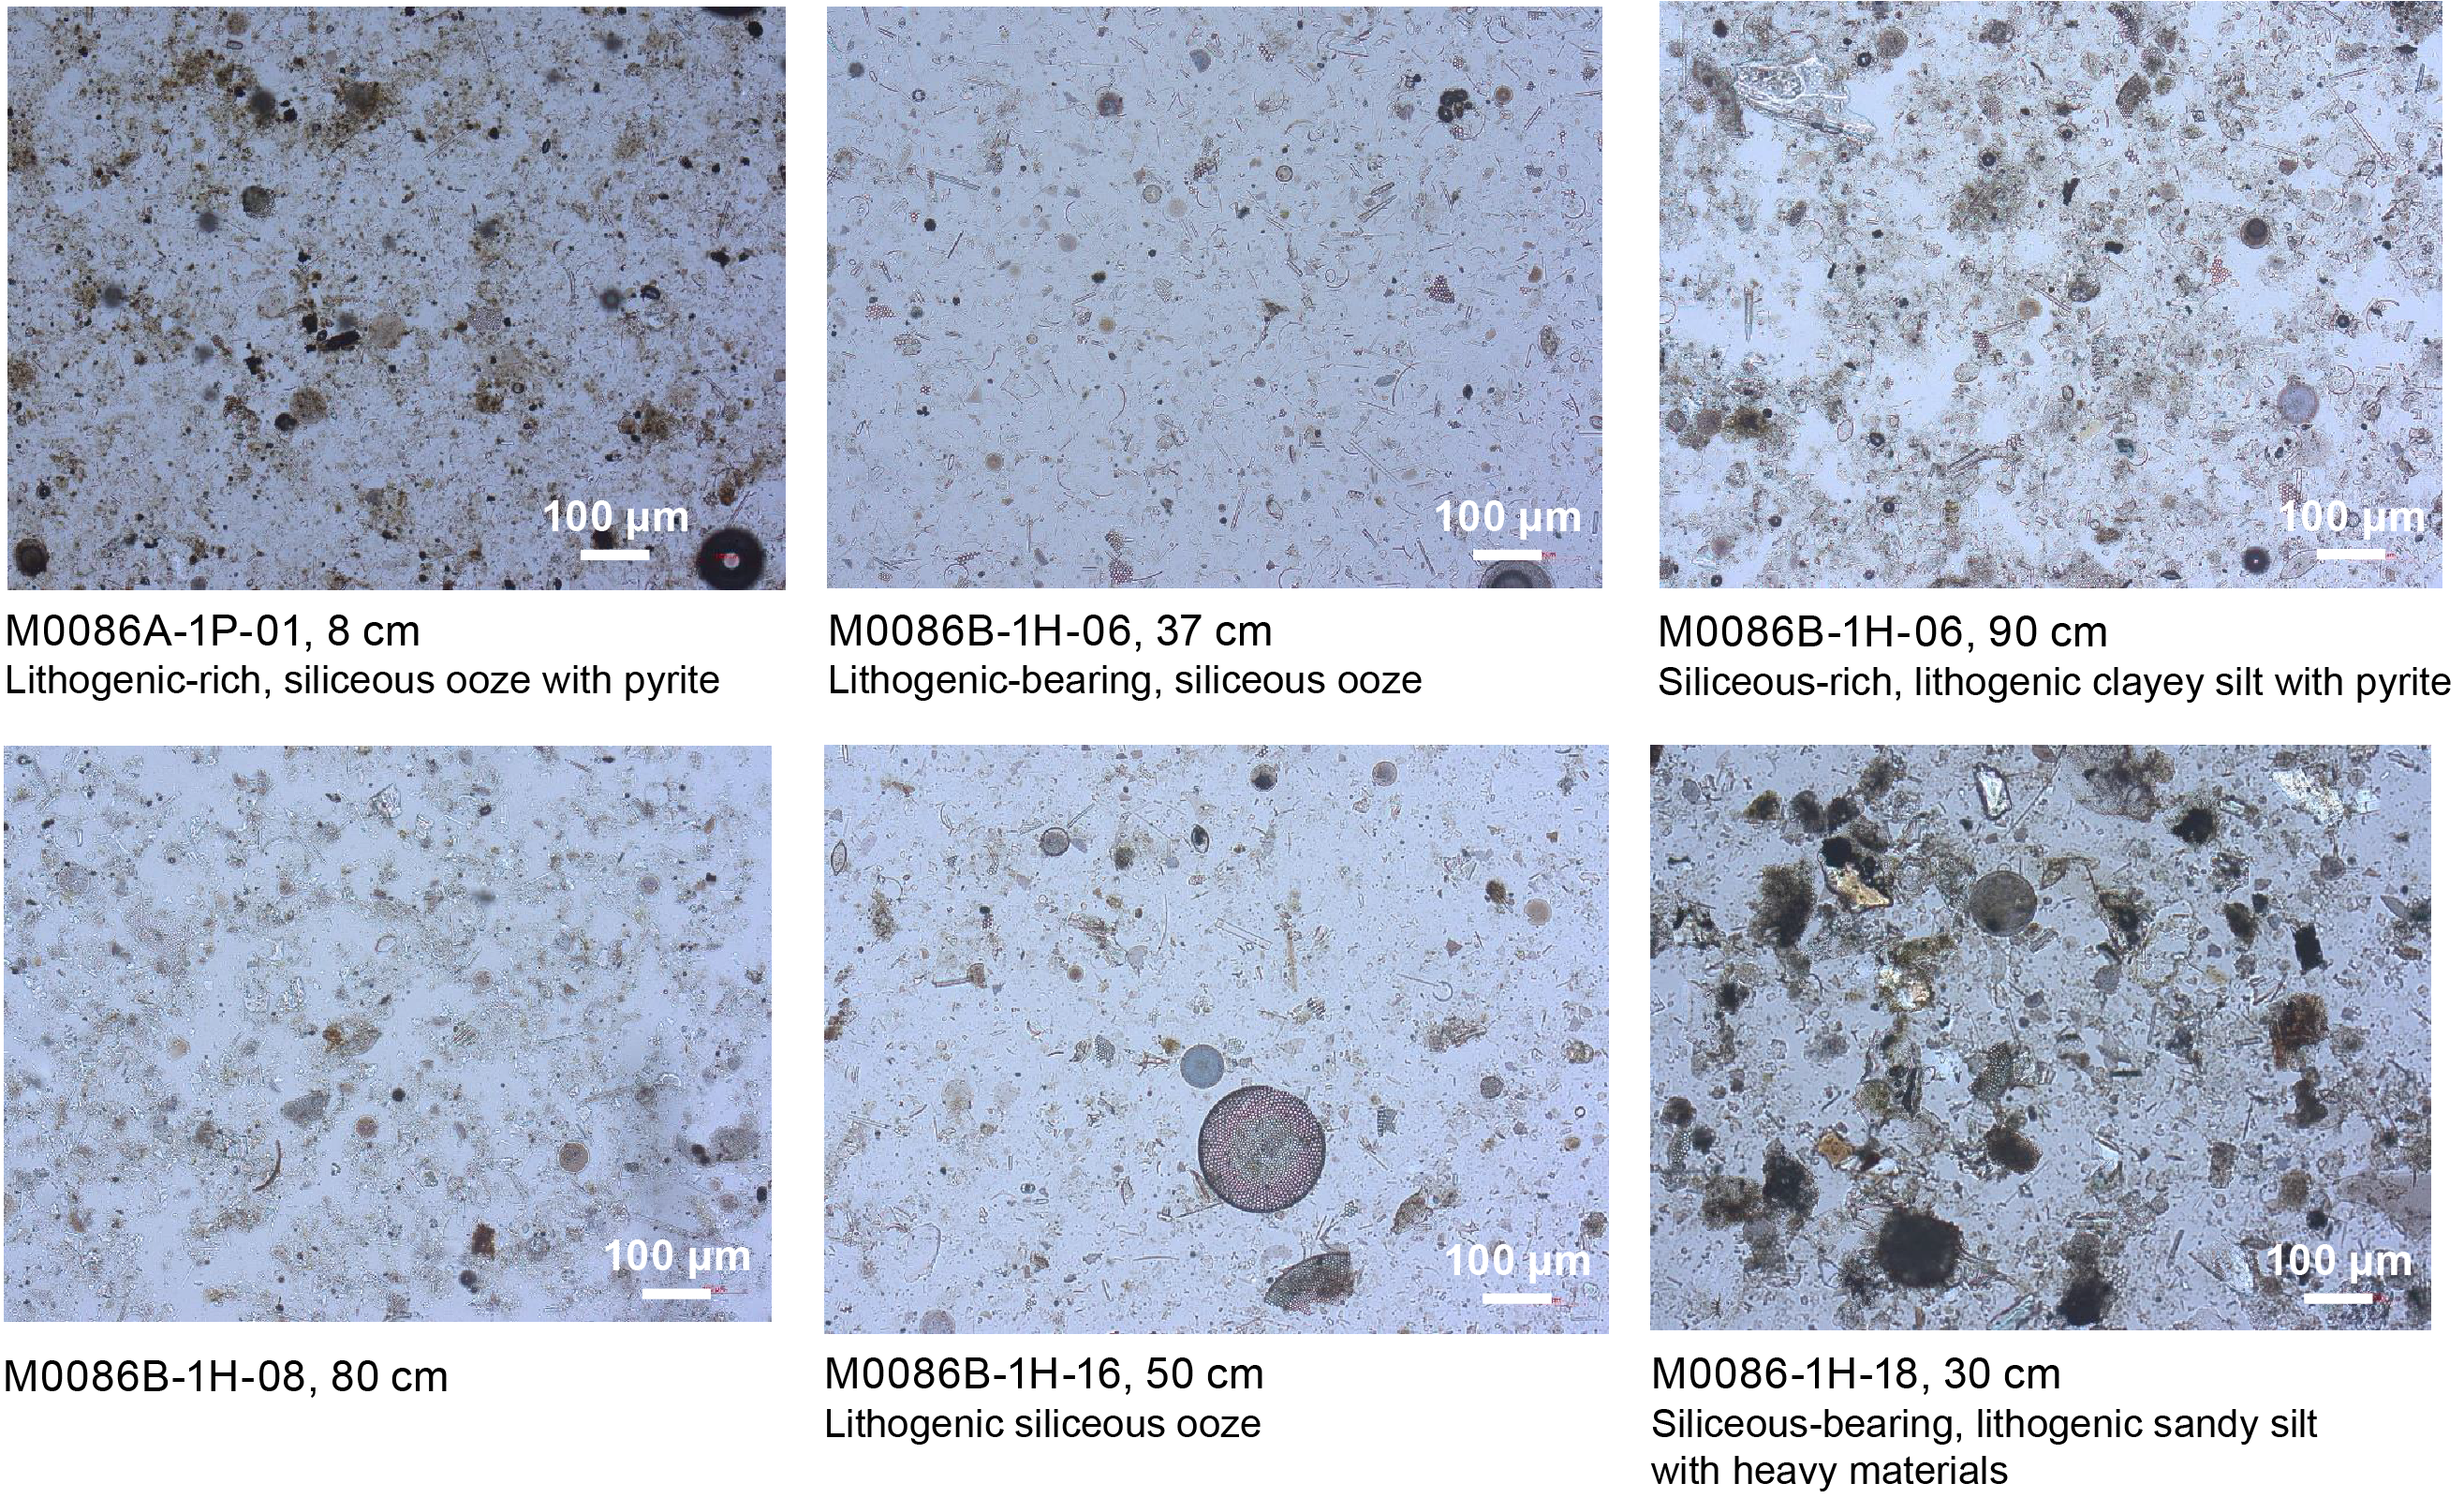
Figure F8. Lithologic components.
The lithology of Site M0086 is dominated by silty clay/clayey silt, with rare silt and very fine sand layers and some clay beds also present (Figures F5, F6, F7). Detailed smear slide observations from selected intervals indicate that the texture of the dominant lithology is silty clay and clayey silt, with silt layers, some sandy silt layers, and occasional sand observed in the smear slides (see Core descriptions; see SMEARSLD in Supplementary material). In terms of composition, the available smear slides show that the biogenic and lithogenic components are comparable. The main lithologic classification derived from smear slide observations comprises siliceous ooze, silt, clayey silt, silt and clay, sandy silt with the presence of lithogenic, siliceous and vitric grains, and pyrite with a dominance of diatoms in the biogenic component.
In terms of sedimentary structures, Site M0086B is divided into four parts: an unevenly laminated part with scattered silt/very fine sand laminae from the seafloor to about 7.6 mbsf; an interval with no apparent primary sedimentary structures from 7.6 to 9.2 mbsf; a part characterized by chaotic structures, soft-sediment deformation, and the presence of diffuse silt and sand patches (9.2–17.5 mbsf); and a basal part of bioturbated clay and silty clay from 17.5 mbsf to the base of the core at 18.26 mbsf.
3.1. Holes M0086A and M0086B
3.1.1. Hole M0086A
Hole M0086A comprises a 1.02 m long trigger core assembly (trigger core plus one core catcher). It is mainly composed of silty clay, and the uppermost part is composed of clay with a sharp base (interval 1P-1, 7–22 cm) (Figure F5). The dominant color is olive gray except for an interval characterized by slight bioturbation and a grayish olive color (interval 1P-1, 25–32 cm). No sedimentary structures appear on the core photos or X-ray CT images. Physical properties (magnetic susceptibility and density) show an overall decrease in values from the core bottom to the top, with a marked shift to the lowest values at the silty clay to clay transition (see Physical properties).
From one smear slide (Sample 386-M0086A-1P-1, 8 cm), the lithology is described as lithogenic-rich siliceous ooze with pyrite (Table T3; Figure F8), and the texture of the dominant lithology is clayey silt, as shown in the ternary diagram (Figure F6). The most abundant grain size component is silt (70.6%), and clay is the most abundant mineral component (29.4%). Sponge spicules (39.2%) and diatoms (9.8%) form the dominant biogenic component, and pyrite represents 9.8% of the assemblage.
3.1.2. Hole M0086B
Hole M0086B comprises a piston core with an overall length of 18.26 m in 19 core sections plus a core catcher (Figure F5). Its overall composition is silty clay/clayey silt with sparse clay, silt, or very fine sand layers distributed in four intervals.
Interval 1 (0–7.60 mbsf; Sections 386-M0086B-1H-1, 0 cm, to 1H-08, 75 cm) presents an overall silty clay/clayey silt lithology with scattered (less than one per meter) millimeter- to centimeter-thick silt laminae and three levels of clay (intervals 1H-5, 15–46 cm; 1H-6, 50–60 cm; and 1H-08, 67–75 cm) (Figure F5). Lithologic basal and upper contacts are sharp to bioturbated, especially where bioturbation is moderate to heavy (e.g., Sections 1H-4, 77.5 cm, to 1H-5, 24 cm, and 1H-06, 60 cm, to 1H-07, 61 cm). Lamination and color bands (e.g., interval 1H-7, 18–31 cm) occur sparsely. Physical property curves (magnetic susceptibility and density) show low to intermediate values manifested as irregular peaks repeated every 20 to 80 cm above a relatively low constant baseline. Correspondence between an increase of the signal as peaks of density and magnetic susceptibility with laminated silt horizons is good and anticorrelated to natural gamma radiation (NGR). NGR values are high in clayey intervals (see Physical properties). Core disturbance is limited to some soupy intervals at the core top and is coincident with piston suction gaps (intervals 1H-6, 60–66 cm, and 1H-7, 84–91 cm).
Interval 2 (7.60–16.70 mbsf; Sections 386-M0086B-1H-8, 75 cm, to 1H-17, 76 cm) is characterized by silty clay with no visible sedimentary structures in the upper part between Sections 1H-8, 75 cm, and 1H-10, 0 cm, nor any chaotic bedding due to soft-sediment deformation and no irregular contacts. Soft-sediment deformation occurs from Section 1H-10, 0 cm, to the base of Interval 2 in Section 1H-17, 76 cm, with floating rip-up clasts (interval 1H-10, 0–6 cm) and ubiquitous diffuse very fine sand and silt patches. Most of Interval 2 is affected by sediment oxidation and cracks. Physical properties show high values of magnetic susceptibility and density in the lowermost siltier horizon and then an overall decreasing trend to the top of the interval for magnetic susceptibility. The bulk density signal shows a slight increase at the top of a chaotic facies (Section 386-M0086B-1H-10, 0 cm) and more variability in values, giving a more jagged aspect to its signal (Figure F5) (see Physical properties). Interval 2 lacks bioturbation near its top.
Interval 3 (16.70–17.50 mbsf; Sections 386-M0086B-1H-17, 76 cm, to 1H-18, 60 cm) is composed of silt and very fine sand without bioturbation, with soft-sediment deformation in the upper part, and with diffuse very fine sand and silt patches. Physical property values (magnetic susceptibility and density) reach their highest values for the hole in this interval, with a blocky shape roughly corresponding to a silt and very fine sand lithology (see Physical properties).
Interval 4 (17.50–18.255 mbsf; bottom of core; Sections 386-M0086B-1H-18, 60 cm, to 1H-18, 98 cm) is composed of slightly bioturbated clay and silty clay. The upper boundary with overlying Interval 3 is sharp.
A total of 11 smear slides were studied for Hole M0086B (Table T3; Figure F7; see photomicrographs in SMEARSLD in Supplementary material). The lithology is described as siliceous ooze, silt, clayey silt, silt and clay, and sandy silt with variable lithogenic/biosiliceous and vitric components. Vitric components are present in four samples with a maximum occurrence of 21.4% in Sample 1H-2, 50 cm. Clay is the most abundant mineral component with values as high as 48.4% in Sample 1H-8, 80 cm. Diatoms are the most abundant biogenic component with an abundance as high as 41.7%; sponge spicules have an average value of about 17% but reach 69% in Sample 1H-6, 37 cm.
3.2. Diagenesis
Site M0086 presents variable patterns of iron monosulfides. Iron monosulfides are absent at the core top and in the soft-sediment deformation parts of Intervals 2 and 3. Iron monosulfides are sparse to moderate with black mottling as spots (1–15 mm) in other sections.
3.3. X-ray diffraction mineralogy
XRD mineralogy was conducted at one sample per section, and some minerals are grouped. These groupings will require additional processing to extract a signal for each mineral. For example, quartz has not been separated from opal-A, and clays, carbonates, amphiboles, pyroxenes, and heavy minerals are composed of several minerals in each grouping (see Lithostratigraphy in the Expedition 386 methods chapter [Strasser et al., 2023a]). The interpretation of the mineralogy is an approximation at this stage. However, some interpretations can be made when the data are contrasted with the lithostratigraphic summaries. For Hole M0086B, the most abundant minerals are quartz, feldspar, and clays (Figure F9). The least abundant are palygorskite, pyroxenes, and pyrite. There are no occurrences of carbonates, amphibole group minerals, or heavy minerals in the studied samples. The data show correspondence between quartz, feldspar, clays, and micas, and the smear slide data also show them as the most abundant minerals (Table T3). The abundance curves are smooth, pointing to low variability in the sediment composition that could be enhanced by the volumetrically important soft-sediment deformation and mixing in Intervals 2 and 3 (~5.5–17.5 mbsf). There is some correlation between the sharp boundaries of Intervals 1 and 2, Intervals 3 and 4, and peaks of quartz, feldspar, and clays. Palygorskite, a clay associated with the weathering of volcanic glasses, occurs at ~15 mbsf in a core horizon characterized by vitric-bearing sediment (13–16 mbsf) (Figure F7). Pyrite is rare and present only in the lower part of the hole from 7 to 14 mbsf. Future studies will be required to fully extract the mineralogy of the sediments in these two holes.

Figure F9. XRD mineralogy.
4. Micropaleontology
Two holes were cored at Site M0086 in Basin N1 in the northern Japan Trench. The radiolarian sample was to be taken from a planned second GPC deployment (40 m). However, no second deployment could be achieved at this site. Thus, no radiolarian-based age determinations were made. Foraminifera in samples collected during the offshore phase were examined to determine provenance of mass transport deposits.
4.1. Foraminifera
Samples were taken at 5 m intervals offshore, as described in Micropaleontology in the Expedition 386 methods chapter (Strasser et al., 2023a). With the exception of the agglutinated foraminifera, which may be either in situ or reworked, all foraminifera at Site M0086 are considered to be allochthonous.
4.1.1. Hole M0086A
One sample taken from the base of Hole M0086A was examined for foraminifera (Table T4). A total of 11 benthic specimens with moderate preservation from nine different taxa are present in this sample. Diatoms, radiolaria, and sponge spicules are common.
No provenance interpretation can be made for this sample due to low foraminifera abundance.
4.1.2. Hole M0086B
Four samples from Hole M0086B were examined for foraminifera (Table T4). Benthic foraminifera with poor to good preservation are common in one sample and present in three samples. Planktonic foraminifera with poor to very good preservation are common in one sample and present in three samples. All samples examined for foraminifera contain abundant diatoms, radiolaria, and sponge spicules, and three contain glass shards.
A paleobathymetric interpretation cannot be made for most samples due to low foraminifera abundance, with the exception of Sample 386-M0086B-1H-8, 97.5–100.5 cm (7.77 mbsf).
Sample 386-M0086B-1H-8, 97.5–100.5 cm, contains a common assemblage of calcareous benthic foraminifera dominated by Stainforthia fusiformis, Stainforthia apertura, Bolivina pacifica, and Nonionella globosa. Preservation of these and other thin-walled taxa is very good. The provenance of the displaced calcareous assemblage in this sample is likely to be from an upper bathyal environment based on the paleobathymetric zonation of Usami et al. (2017) after Matoba (1976).
5. Geochemistry
5.1. Interstitial water
At Site M0086, a total of 21 interstitial water (IW) samples were collected using Rhizon samplers from one trigger core (Hole M0086A) and one GPC core (Hole M0086B). In addition, one bottom water (BW) sample was taken from the top of the trigger core (see Geochemistry in the Expedition 386 methods chapter [Strasser et al., 2023a]) for details of the sampling, analytical methods, and data quality. In general, IW composition is influenced by organic matter degradation, including the release of metabolic products and consumption of electron acceptors, as well as dissolution/precipitation reactions with sediment.
5.1.1. Shipboard analyses: salinity, alkalinity, and ammonium
The salinity of BW at Site M0086 is 34.5 (Table T5). The salinity of IW from Hole M0086A is 34.8, and the salinity of IW from Hole M0086B varies between 34.5 and 35.3 with a very gentle increase from about 3 mbsf (~34.6) to the base of the core (35.3) (Figure F10). Alkalinity is low in the BW (2.37 mM) and 20.70 mM in the IW at 0.77 mbsf in Hole M0086A. In Hole M0086B, alkalinity increases with depth, with one negative excursion to 12.2 mM at 6.6 mbsf, after which the concentrations continue to increase through the rest of the core to a maximum of 67.16 mM (Figure F10). Ammonium (NH4+) in the BW is 0.03 mM. In both Holes M0086A and M0086B, ammonium concentrations increase downcore. In Hole M0086A, ammonium is 0.47 mM at 0.265 mbsf and 1.28 mM at 0.765 mbsf. In M0086B, ammonium increases linearly with depth from 1.16 mM at 0.11 mbsf and reaches a maximum value of 3.06 mM at 16.79 mbsf. A drop in NH4+ at 6.6 mbsf corresponds to the negative peak in alkalinity at the same depth.

Figure F10. IW salinity, total alkalinity, and ammonium.
5.1.2. Shore-based analysis
5.1.2.1. Dissolved vanadium, molybdenum, and uranium
Dissolved vanadium (V) concentration in the BW sample from Site M0086 is 170.6 nM, whereas the IW samples falls below the detection limit at 0.77 mbsf in Hole M0086A (Table T5; Figure F10). Dissolved V concentrations in Hole M0086B range 46–89 nM between 0.11 and 5.63 mbsf before falling below the detection limit values at 6.64 mbsf to the base of the core (Figure F11).
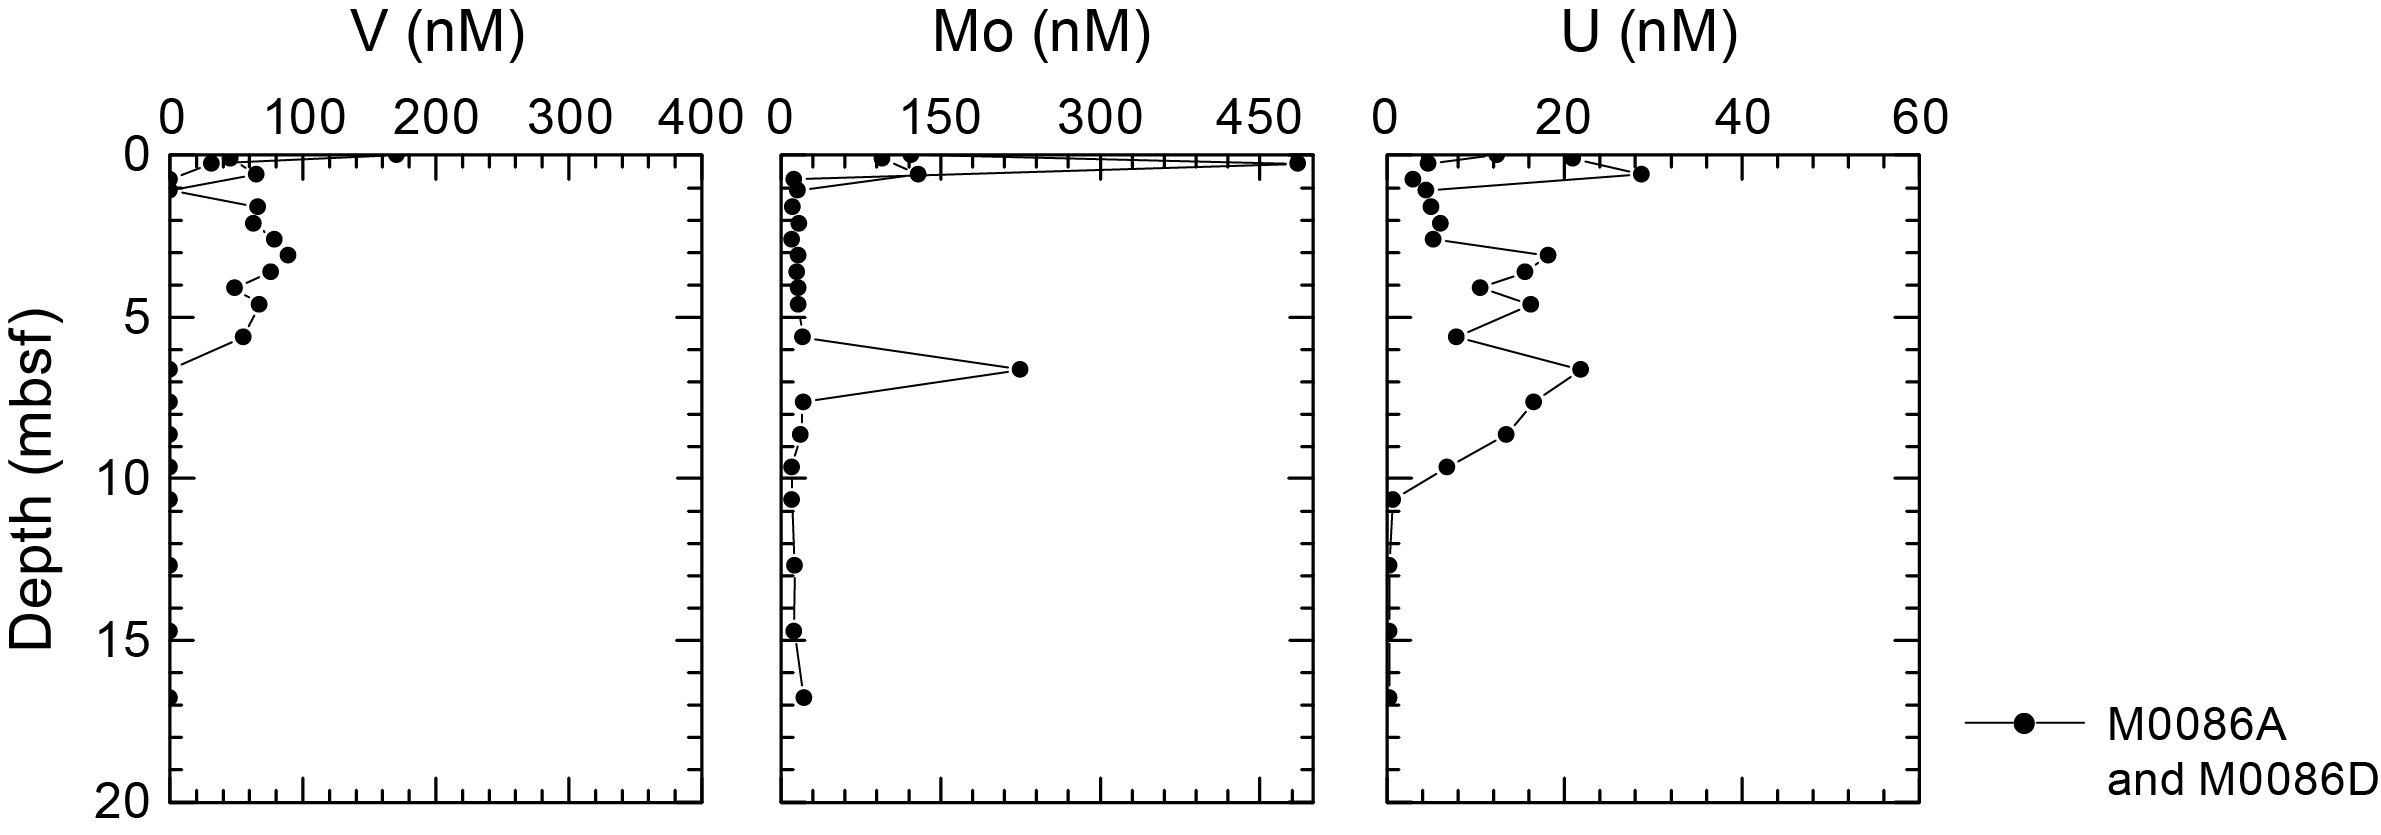
Figure F11. IW V, Mo, and U.
Dissolved molybdenum (Mo) concentrations in the BW are 122.6 nM (Table T5; Figure F11). Dissolved Mo in the IW is 485.5 nM at 0.27 mbsf, and then it declines to 12.1 nM at 0.77 mbsf in Hole M0086A. In Hole M0086B, Mo is elevated (~129 nM) in the uppermost 0.61 m, decreases to around 15–16 nM between 1.10 and 4.63 mbsf with a spike to 225 nM at 6.64 mbsf, and returns to values between 10 and 12 nM for the remainder of the core.
Dissolved uranium (U) is 12.35 nM in the BW sample from Hole M0086A. The U concentration in IW samples from Hole M0086A drops from 4.68 at 0.27 mbsf to 2.94 nM at 0.77 mbsf (Table T5; Figure F11). The highest values of dissolved U in Hole M0086B are found at 0.61 mbsf (28.67 nM), with a drop to values around 4–5 nM from 1.10 to 2.60 mbsf. Following these minima, values are elevated and fluctuate between 13 and 21.82 nM to 8.6 mbsf, where they decline rapidly to <1 nM at the base of the core. A notable peak at 6.64 mbsf (21.82 nM) corresponds to elevations in other redox-sensitive elements such as Mo, Mn, and Fe and depletion in alkalinity, B, and Si.
5.1.2.2. Dissolved lithium, boron, silica, manganese, iron, strontium, and barium
Dissolved lithium (Li) is 27.2 µM in the BW sample from Hole M0086A. In Hole M0086A, IW concentrations are ~20 µM for Li (Table T5; Figure F12). In IW samples from Hole M0086B, Li concentrations of ~22 µM at the top overlap with concentrations in Hole M0086A, where they are also the maximum values observed in Hole M0086B. Dissolved Li concentrations drop to around ~19 µM at 1.1 mbsf and remain between 17.4 and 19.2 µM throughout the rest of Hole M0068B, except for a peak at 6.64 mbsf (23.7 µM).
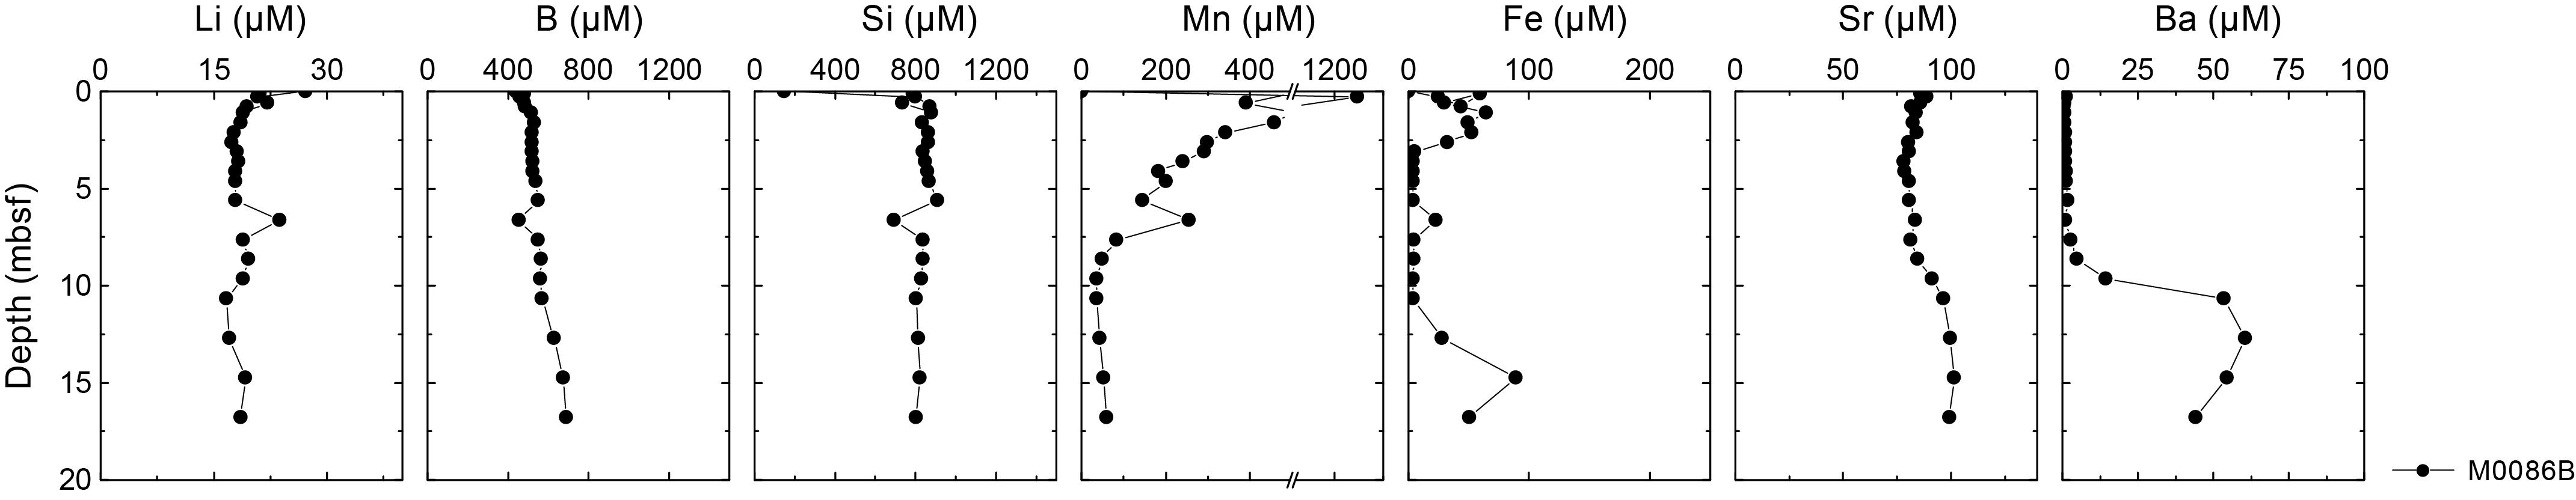
Figure F12. IW Li, B, Si, Mn, Fe, Sr, and Ba.
Dissolved boron (B) is 439.7 µM in the BW. Boron concentrations in Hole M0086A are 459 at 0.27 mbsf and 485 µM at 0.77 mbsf. In Hole M0086B, concentrations are lowest (480.9 µM) at 0.11 mbsf and gradually increase to ~691 µM at the base of the core (16.79 mbsf). There is a small minimum at 6.64 mbsf (455 µM) at the same depth that Li shows a positive peak.
The lowest values of dissolved Si (147 µM) are in the BW. IW Si values range from 799 at 0.27 mbsf to 872 µM at 0.77 mbsf in Hole M0086A. At the top of Hole M0086B (~0.11 mbsf), Si concentrations are 788 µM, followed by a decline to 732 µM at 0.61 mbsf. The remaining IW Si values are higher and fluctuate between 803 and 908 µM. There is a small negative peak in Si concentration (692 µM) at 6.64 mbsf in the same interval as a negative peak for boron and a positive peak for Li and the redox-sensitive elements (U, Mo, Fe, and Mn).
Dissolved manganese (Mn) is <1 µM in the BW and 1341 µM at 0.27 mbsf in the IW in Hole M0086A, dropping to 663 µM at 0.77 mbsf (Table T5; Figure F12). Concentrations in Hole M0086B start high (546 µM) at 0.11 mbsf and fluctuate between 145 and 530 µM to 6.64 mbsf. This is followed by a drop to 83 µM at 7.64 mbsf, and then values fluctuate between 83 and 35 µM to the bottom of the core. A small positive peak in Mn values at 6.64 mbsf is coincident with changes in Li, B, and Si.
Dissolved iron (Fe) is below the detection limit in the BW sample. Dissolved Fe is 24.6 µM at 0.27 mbsf and 43.4 µM at 0.77 mbsf in the IW in Hole M0086A trigger core samples. Dissolved Fe concentrations in Hole M0086B range 32–64 µM between 0.11 and 2.62 mbsf. This is followed by a shift to much lower concentrations (3.5–4.9 µM) between 3.1 and 10.67 mbsf, with a peak of 22.6 µM at 6.64 mbsf coincident with changes in Li, B, Si, and Mn. Fe concentrations rise to 27.5 µM at 12.7 mbsf and stay higher (27.5–89.3 µM) to the bottom of the core.
Dissolved Sr concentrations are 88.2 µM in the BW (Table T5). In Hole M0086A, the Sr concentration in the IW is 88.6 µM at 0.27 mbsf and 81.5 µM at 0.77 mbsf (Figure F12). In Hole M0086B, values range 78–101 µM without an overall depth trend.
Dissolved Ba values are 0.15 µM in the BW and low in the IW in the Hole M0086A trigger core (≤1.3 µM). Dissolved Ba is also low at the top of Hole M0086B (<2 µM) to 6.62 mbsf. Barium concentrations rise slowly to ~2 µM at 7.68 mbsf and then rise rapidly to a peak of ~60 µM at 12.7 mbsf before slowly decreasing again with depth.
5.1.2.3. Chloride, bromide, and sulfate
All anions analyzed using ion chromatography (IC) are listed in Table T5.
Dissolved chloride (Cl−) values at Site M0086 are like seawater values (Bruland et al., 2014) throughout the cores, ranging ~540–560 mM (Figure F13).

Figure F13. IW Cl−, Br−, and SO42−.
Dissolved Br− values are similar to those of seawater in the BW and in the IW in Hole M0086A (Figure F13). Concentrations show a continuous slight increase with depth in Hole M0086B, reaching around 0.96 mM below ~14.5 mbsf.
Dissolved sulfate (SO42−) concentrations in BW are similar to those of seawater (28.8 mM) (Bruland et al., 2014). The IW in Hole M0086A contains dissolved sulfate concentrations of 26.0 and 19.7 mM at 0.27 and 0.77 mbsf, respectively. Sulfate (SO42−) concentrations in Hole M0086B are around 21 mM at the top and decrease with depth, except for a sharp spike of 23.2 mM at 6.64 mbsf that coincides with changes in alkalinity, redox sensitive elements, B, Li, and Si, described above. Sulfate levels then continue to decrease until they reach the detection limit at ~9-10 mbsf.
5.1.2.4. Sodium, magnesium, potassium, and calcium
Dissolved sodium (Na+) concentrations at Site M0086 vary unsystematically and appear to mostly approximate average seawater values (Bruland et al., 2014), ranging ~459–526 mM (see GEOCHEM in Supplementary material). Similarly, dissolved potassium (K+) concentrations fluctuate throughout the cores and are mostly comparable to average seawater values (~9.04–11.2 mM). Dissolved Ca2+ concentrations range 8.9–10.8 mM and are also similar to average seawater values (~10 mM). Dissolved magnesium (Mg2+) concentrations fluctuate mostly around average seawater values, ranging 41–61 mM. Downcore profiles of Na+, K+, Ca2+ and Mg2+ show very similar patterns overall with little variability and values that are similar to seawater (Bruland et al., 2014). The IC cation data is only presented in GEOCHEM in Supplementary material because the samples require further analysis for validation of absolute values (analytical accuracy).
5.2. Shore-based H2S analysis
At Site M0086, H2S concentrations were below the detection limit in all samples (see GEOCHEM in Supplementary material).
5.3. Headspace gas analysis: methane, ethane, and C1/C2 ratio
Offshore headspace samples were taken following standard methods (see Geochemistry in the Expedition 386 methods chapter [Strasser et al., 2023a]). A total of 19 headspace samples were measured from Holes M0086A (n = 1) and M0086B (n = 18). Methane, ethylene, ethane, propylene, and butane were identified in both holes, and methane (CH4 and C1) is a major component of the headspace samples (see GEOCHEM in Supplementary material).
In Hole M0086B, from 0 to ~10 mbsf, methane concentrations increase from ~184 to ~950 ppmv. Below 10 mbsf, values rise rapidly to a peak of 18,678 ppmv at 15 mbsf and fluctuate between ~10,700 and ~18,700 ppmv for the remainder of the core (Table T6; Figure F14).
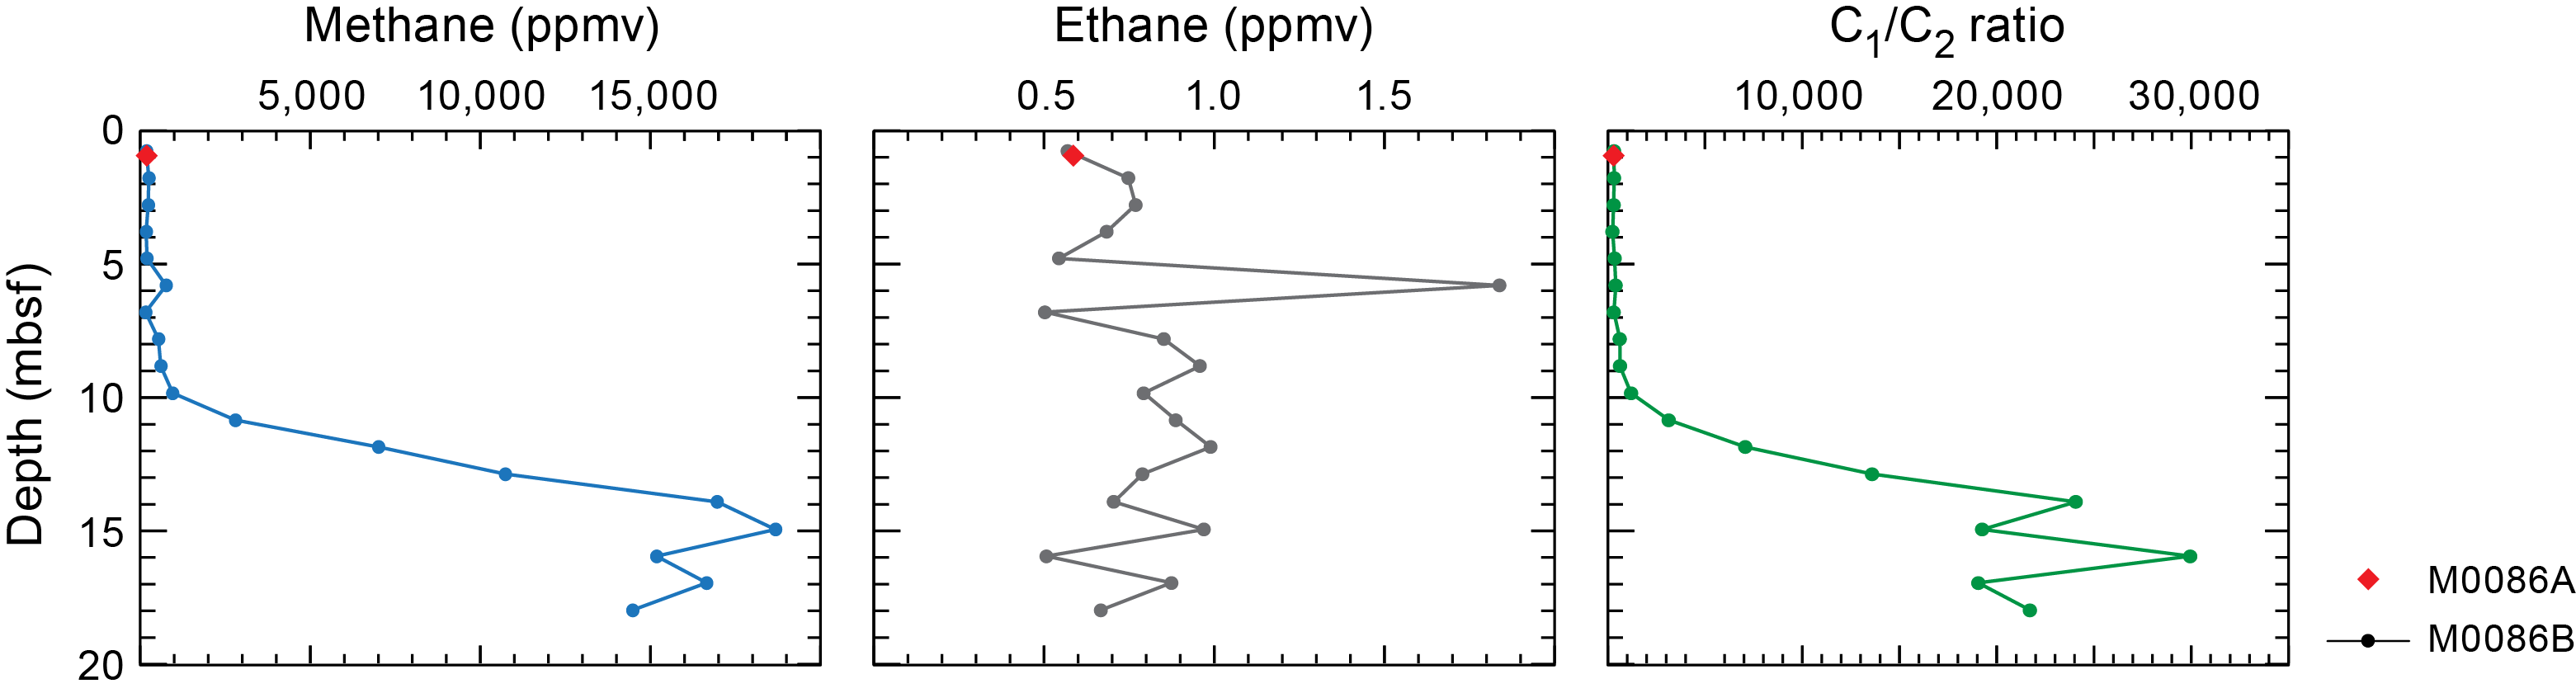
Figure F14. Methane, ethane, and C1/C2 ratios.
Ethane (C2H4 and C2) was detected in relatively constant but low concentrations (~0.5–1 ppmv) in all headspace samples, with a small peak to about 2.0 ppmv at 6 mbsf in Hole M0086B. The methane/ethane (C1/C2) ratios follow the methane profile pattern, reaching a peak of about ~30,000 at 15.9 mbsf (Table T6; Figure F14).
Alongside C1 and C2, other hydrocarbon gases such as ethylene (C2=), ethane (C2), propene/propylene (C3=), propane (C3), and n-butane (n-C4) were detected and measured, but their concentrations are very low, generally less than 1 ppmv at all sites (see GEOCHEM in Supplementary material).
5.4. Shore-based solid-phase analysis
5.4.1. Aluminum, calcium, silica, iron, and manganese
The solid-phase elements, including aluminum (Al), calcium (Ca), silica (Si), iron (Fe), and manganese (Mn), briefly described below, as well as Ba, Br, Cr, Cu, K, Mg, Ni, P, Sr, Ti, V, Zn, and Zr, are listed in Table T7. Al contents at Site M0086 range ~2.7–4 wt% (27,055–40,088 mg/kg) without a trend relating to depth (Figure F15). Solid-phase Ca contents range ~0.85–1.6 wt% (8,359–16,384 mg/kg) with a general increase in values toward the base of the core. Si contents range ~26–31 wt% (260,429–313,148 mg/kg). There appears to be a slight decrease in Si concentrations from the top of the core to the base. Fe contents range ~2.7–3.2 wt% (26,952–32,725 mg/kg) and do not display trends with depth. Solid-phase Mn contents range ~0.04–0.32 wt% (440–3,276 mg/kg) with a pronounced peak in Mn between 2.665 and 4.675 mbsf in Hole M0086B.

Figure F15. Al, Ca, Fe, Mn, and Si.
5.4.2. Carbon and sulfur
Total carbon (TC) contents are low (0.9–1.65 wt%) in all measured parts of both the trigger core and GPC core from Site M0086 (Table T7; Figure F16). Total organic carbon (TOC) contents are relatively high for these deep sediments (0.75–1.6 wt%). Total sulfur (TS) contents are overall low in the sediments (0.25–0.78 wt%). Slightly elevated TS values are observed between 8.7 and 14.8 mbsf in the core from Hole M0086B.

Figure F16. TC, TOC, TIC, and TS.
5.5. Discussion
The IW concentration profiles of ammonium and alkalinity at Site M0086 show an increase to 0.75 mbsf that can be explained by moderate rates of organic matter remineralization. The highest concentrations of dissolved Fe and Mn are present in the uppermost 2.5 m of the sediment column, consistent with organic matter remineralization by dissimilatory Mn and Fe oxide reduction. Elevated Mo in the same interval can result from release of Mo that is adsorbed to these oxide phases. The Mn and Fe oxide reduction is followed by organoclastic sulfate reduction. At ~10 mbsf, evidence for the sulfate–methane transition (SMT) is revealed by a transition to low sulfate and elevated methane. The kink-type shape of the concentration profiles of sulfate, alkalinity, and ammonium with a strong slope change at ~1.1 mbsf clearly indicate nonsteady-state conditions and likely result from a very recent sedimentary event (see Lithostratigraphy). The observed excursion in many IW constituents occurs at 6.64 mbsf (alkalinity, ammonium, B, and Si decrease, whereas SO42−, Mo, Li, and Mn show a positive spike). This could indicate a potential postsampling contamination with seawater.
Dissolved Si concentrations are elevated throughout the cores. This is consistent with the smear slides, which show abundant diatoms, volcanic glass shards (see Lithostratigraphy in the Site M0088 (Basin N2) chapter [Strasser et al., 2023b]), and elevated Si contents in the solid phase, as determined by X-ray fluorescence (XRF). B is also very elevated in the IW samples, with values higher than seawater (Bruland et al., 2014). Li concentrations drop substantially from seawater values, likely suggesting authigenic phases are forming that have an affinity for Li (You et al., 1995).
6. Physical properties
This section summarizes the preliminary physical properties results from cores acquired at Site M0086 at a water depth of 7502 mbsl in Basin N1 in the northern Japan Trench. One trigger core (Hole M0086A) and corresponding GPC core (Hole M0086B) were collected (see Operations). The physical properties data sets were collected with the techniques and sampling rates defined in Physical properties in the Expedition 386 methods chapter (Strasser et al., 2023a). During the offshore phase, whole cores were scanned through the Multi-Sensor Core Logger (MSCL). During the onshore phase, cores were split, scanned through the Tri-Sensor Core Logger (TSCL), and sampled for moisture and density (MAD), undrained shear strength, and P-wave velocity. Overall, the physical properties data sets are high quality and correlate well with lithology and hydroacoustic data.
6.1. Bulk density
Offshore, density data (bulk density) were obtained using the gamma ray attenuation (GRA) technique on the MSCL. Onshore, bulk density, porosity, water content, void ratio, and grain density were obtained using the MAD analysis technique on discrete samples. Overall, the MCSL- and MAD-derived bulk density are in good agreement.
Bulk density values at Holes M0086A and M0086B increase from ~1.2 g/cm3 at the top of the core to ~1.6 g/cm3 at the bottom (~17 mbsf) (Figure F17). There is a good match between the MSCL and MAD data sets with the lone exception of a local increased discrete measurement at 10.7 mbsf. Although bulk density generally increases steadily with depth, there is a sudden increase at ~7.5 mbsf in Hole M0086B where MSCL bulk density increases from ~1.25 to ~1.35 g/cm3. At this depth, there are also shifts in several other physical properties data sets (e.g., magnetic susceptibility, resistivity, and NGR). Below this depth, bulk density increases steadily to ~9.5 mbsf before it starts to slowly decrease with depth to ~12 mbsf. From 12 mbsf to the bottom of the core, bulk density steadily increases. There is a 1 m thick interval at the bottom of Hole M0086B where bulk density increases above 1.6 g/cm3, which are the highest values encountered at Site M0086.

Figure F17. Physical properties summary.
6.2. Magnetic susceptibility
Magnetic susceptibility data were obtained during the offshore phase using the MSCL. Overall, magnetic susceptibility values at Site M0086 vary between 20 × 10−5 SI at the top of the hole and 80 × 10−5 SI near the bottom of Hole M0086B (Figure F17). There is a good match between Holes M0086A and M0086B. Very high peaks (>100 × 10−5 SI), as seen at other Expedition 386 sites, are absent. In the uppermost ~7.5 m, magnetic susceptibility fluctuates around a baseline of ~35 × 10−5 SI. Below ~7.5 mbsf, magnetic susceptibility steadily increases with depth and the fluctuations are much more suppressed. At this transition depth, there are also shifts in several other physical properties data sets (e.g., bulk density, resistivity, and NGR).
6.3. P-wave velocity
P-wave velocity was measured using the MSCL on whole cores during the offshore phase. During the onshore phase, P-wave velocity was measured on discrete samples approximately every 2 m. Many of the MSCL velocity data were of insufficient quality below ~11 mbsf and have been omitted.
Offshore P-wave velocities recorded with the MSCL at Site M0086 generally trend around 1500 m/s (the velocity of water) (Figure F17). Shore-based discrete measurements are noticeably higher (closer to an average of 1800 m/s). The difference in velocity exceeds the uncertainty associated with the discrete velocity measurements (±50 m/s). The difference between the two datasets may be attributed to continued compaction or degassing of the sediments between the offshore and onshore phases of the expedition. Further investigation will be required to fully understand the discrepancy, and the data should thus be used with a degree of caution.
There is good agreement between the trigger core (Hole M0086A) and GPC core (Hole M0086B). Overall in Hole M0086B, MSCL-measured P-wave velocity is nearly constant throughout the uppermost 10 m, staying within a narrow range of 1490–1510 m/s. In the uppermost 2 m, there is a slight decrease in P-wave velocity from 1500 to 1490 m/s. Below 2 mbsf, P-wave velocity generally fluctuates around 1490 m/s to ~8 mbsf. Below ~8 mbsf, P-wave velocity increases to ~1540 m/s at ~11.5 mbsf and becomes more variable, especially below 10 mbsf. Below this depth, MSCL velocity data are of insufficient quality.
6.4. Noncontact electrical resistivity
Noncontact electrical resistivity measured using the MSCL shows very consistent values around 0.4 Ωm (Figure F17). There is a good match between Holes M0086A and M0086B, but at ~1.5 mbsf, a pronounced resistivity spike at the very bottom of Hole M0086A approaches 1.6 Ωm. Such a spike is not observed in Hole M0086B and should be considered questionable. At the bottom of Hole M0086B (~17 mbsf), a subtle zone of increased resistivity corresponds to high values of magnetic susceptibility, bulk density, and NGR.
6.5. Natural gamma radiation
NGR generally increases with depth from 8–10 counts/s at the top to ~30 counts/s at the bottom of Hole M0086B (Figure F17). Values in the trigger core (Hole M0086A) are slightly elevated relative to the same depth interval in Hole M0086B. At ~3 mbsf, there is a shift to lower values from 25 to 15 counts/s. From 3.5 to 5.5 mbsf, NGR fluctuates around 16 counts/s and then sharply increases to 25 counts/s at 6 mbsf. Below 6 mbsf, NGR decreases to 15 counts/s and then steadily increases with depth to the bottom of the hole. There is a 1 m thick zone at the bottom of Hole M0086B where NGR increases to 30 counts/s that corresponds with increases in magnetic susceptibility, bulk density, and resistivity.
6.6. Undrained shear strength
Undrained shear strength (Su) was measured on split cores with a handheld penetrometer, automated vane shear (AVS) apparatus, and fall cone penetrometer (see Physical properties in the Expedition 386 methods chapter [Strasser et al., 2023a]).
Su measured with the handheld penetrometer increases with depth at Site M0086 from near 0 kPa in the uppermost sections of the core to a maximum value of 160 kPa at the bottom of Hole M0086B. Although overall Su increases with depth, two subzones in the strength profiles are observed in all data sets (Figures F17, F18). From 0 to 11 mbsf, Su increases steadily with depth to ~60 kPa. Below 11 mbsf, Su decreases to ~50 kPa at 12.5 mbsf. Below 12.5 mbsf, Su increases, especially the deepest data point, which jumps to 160 kPa. This maximum shear strength measurement also corresponds with the depth where magnetic susceptibility and bulk density increase and, to a lesser degree, resistivity and NGR.
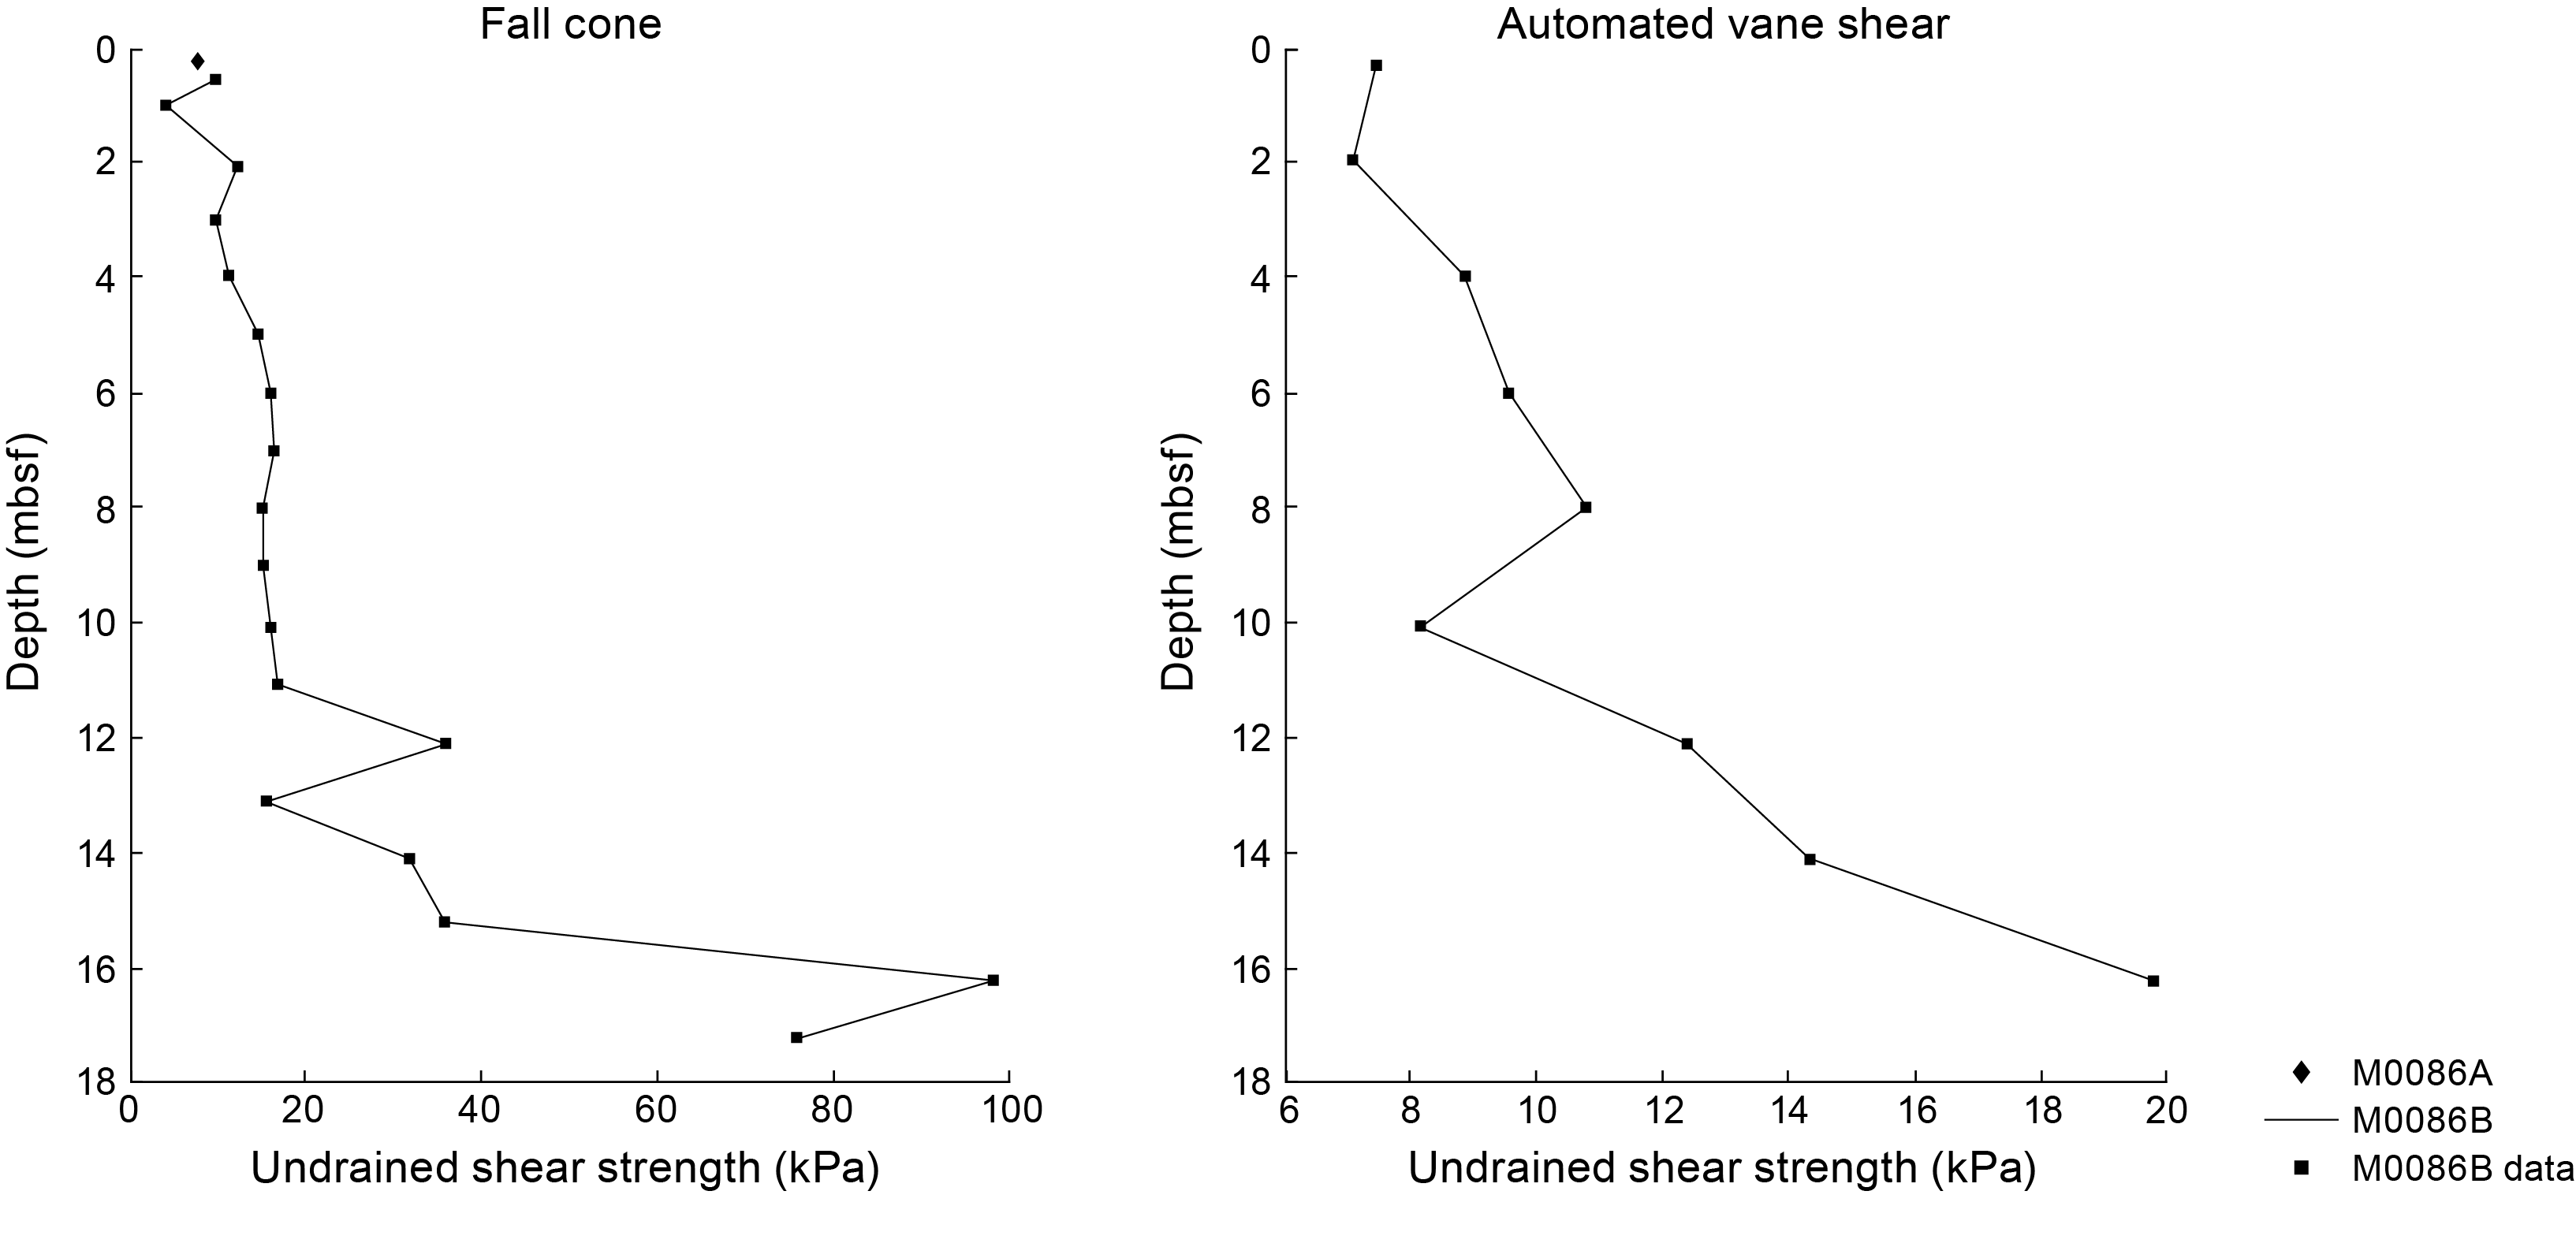
Figure F18. Undrained shear strength.
It should be noted that the values of Su vary according to the device used to obtain them (Figure F18). For example, fall cone strengths are higher than those obtained with the AVS and handheld penetrometer. The influence of the U-channel along the center of the core could result in lower strengths than those obtained with the fall cone. The fall cone only impacts a small region of the core (~2–5 mm), whereas the AVS impacts a larger region of the core (~20–50 mm). Both measurements ideally should be obtained from the center of the core away from the core sidewall. However, the samples could not be taken at the center because of the U-channel (see Physical properties in the Expedition 386 methods chapter [Strasser et al., 2023a]). As a result, strength sampling points had to be placed halfway between the central U-channel and the sidewall of the core. During AVS measurements, the fractures that opened often propagated toward both the central U-channel and the sidewall, perhaps resulting in lower strength values. The fall cone measurements were not seen to be affected by the U-channel or the sidewall. Further analysis will more closely examine the strength data to try to reconcile the differences.
6.7. Moisture and density
MAD measurements were made on discrete samples at a frequency of approximately 1 measurement every 2 m.
Profiles of water content (wet and dry), porosity, void ratio, grain density, and dry density share similar patterns with depth (Figure F19). In the uppermost 7 m, most of the MAD data sets have a near-vertical profile with almost no change with depth, except grain density, which increases with depth. Between 7 and 11 mbsf, there is a sharp decrease in values of water content (wet and dry), porosity, and void ratio, whereas dry density sharply increases with depth. At 11 mbsf, another shift occurs; water content, porosity, and void ratio increase and then decrease to the bottom of the hole. Grain density and dry density have the opposite profiles below 11 mbsf.

Figure F19. MAD data.
6.8. Color reflectance and RGB values
There is a clear difference in the color data above ~7.5 mbsf relative to the color data below this depth (Figure F20). The highest variability occurs between ~5 and 7.5 mbsf in all color parameters. Below 7.5 mbsf, all color parameters generally have more consistent values and fewer fluctuations to the bottom of the core. However, an exception to this occurs at ~13–14 mbsf, where there are significant fluctuations in a* and b* but only small scale fluctuations in L* and RGB values.
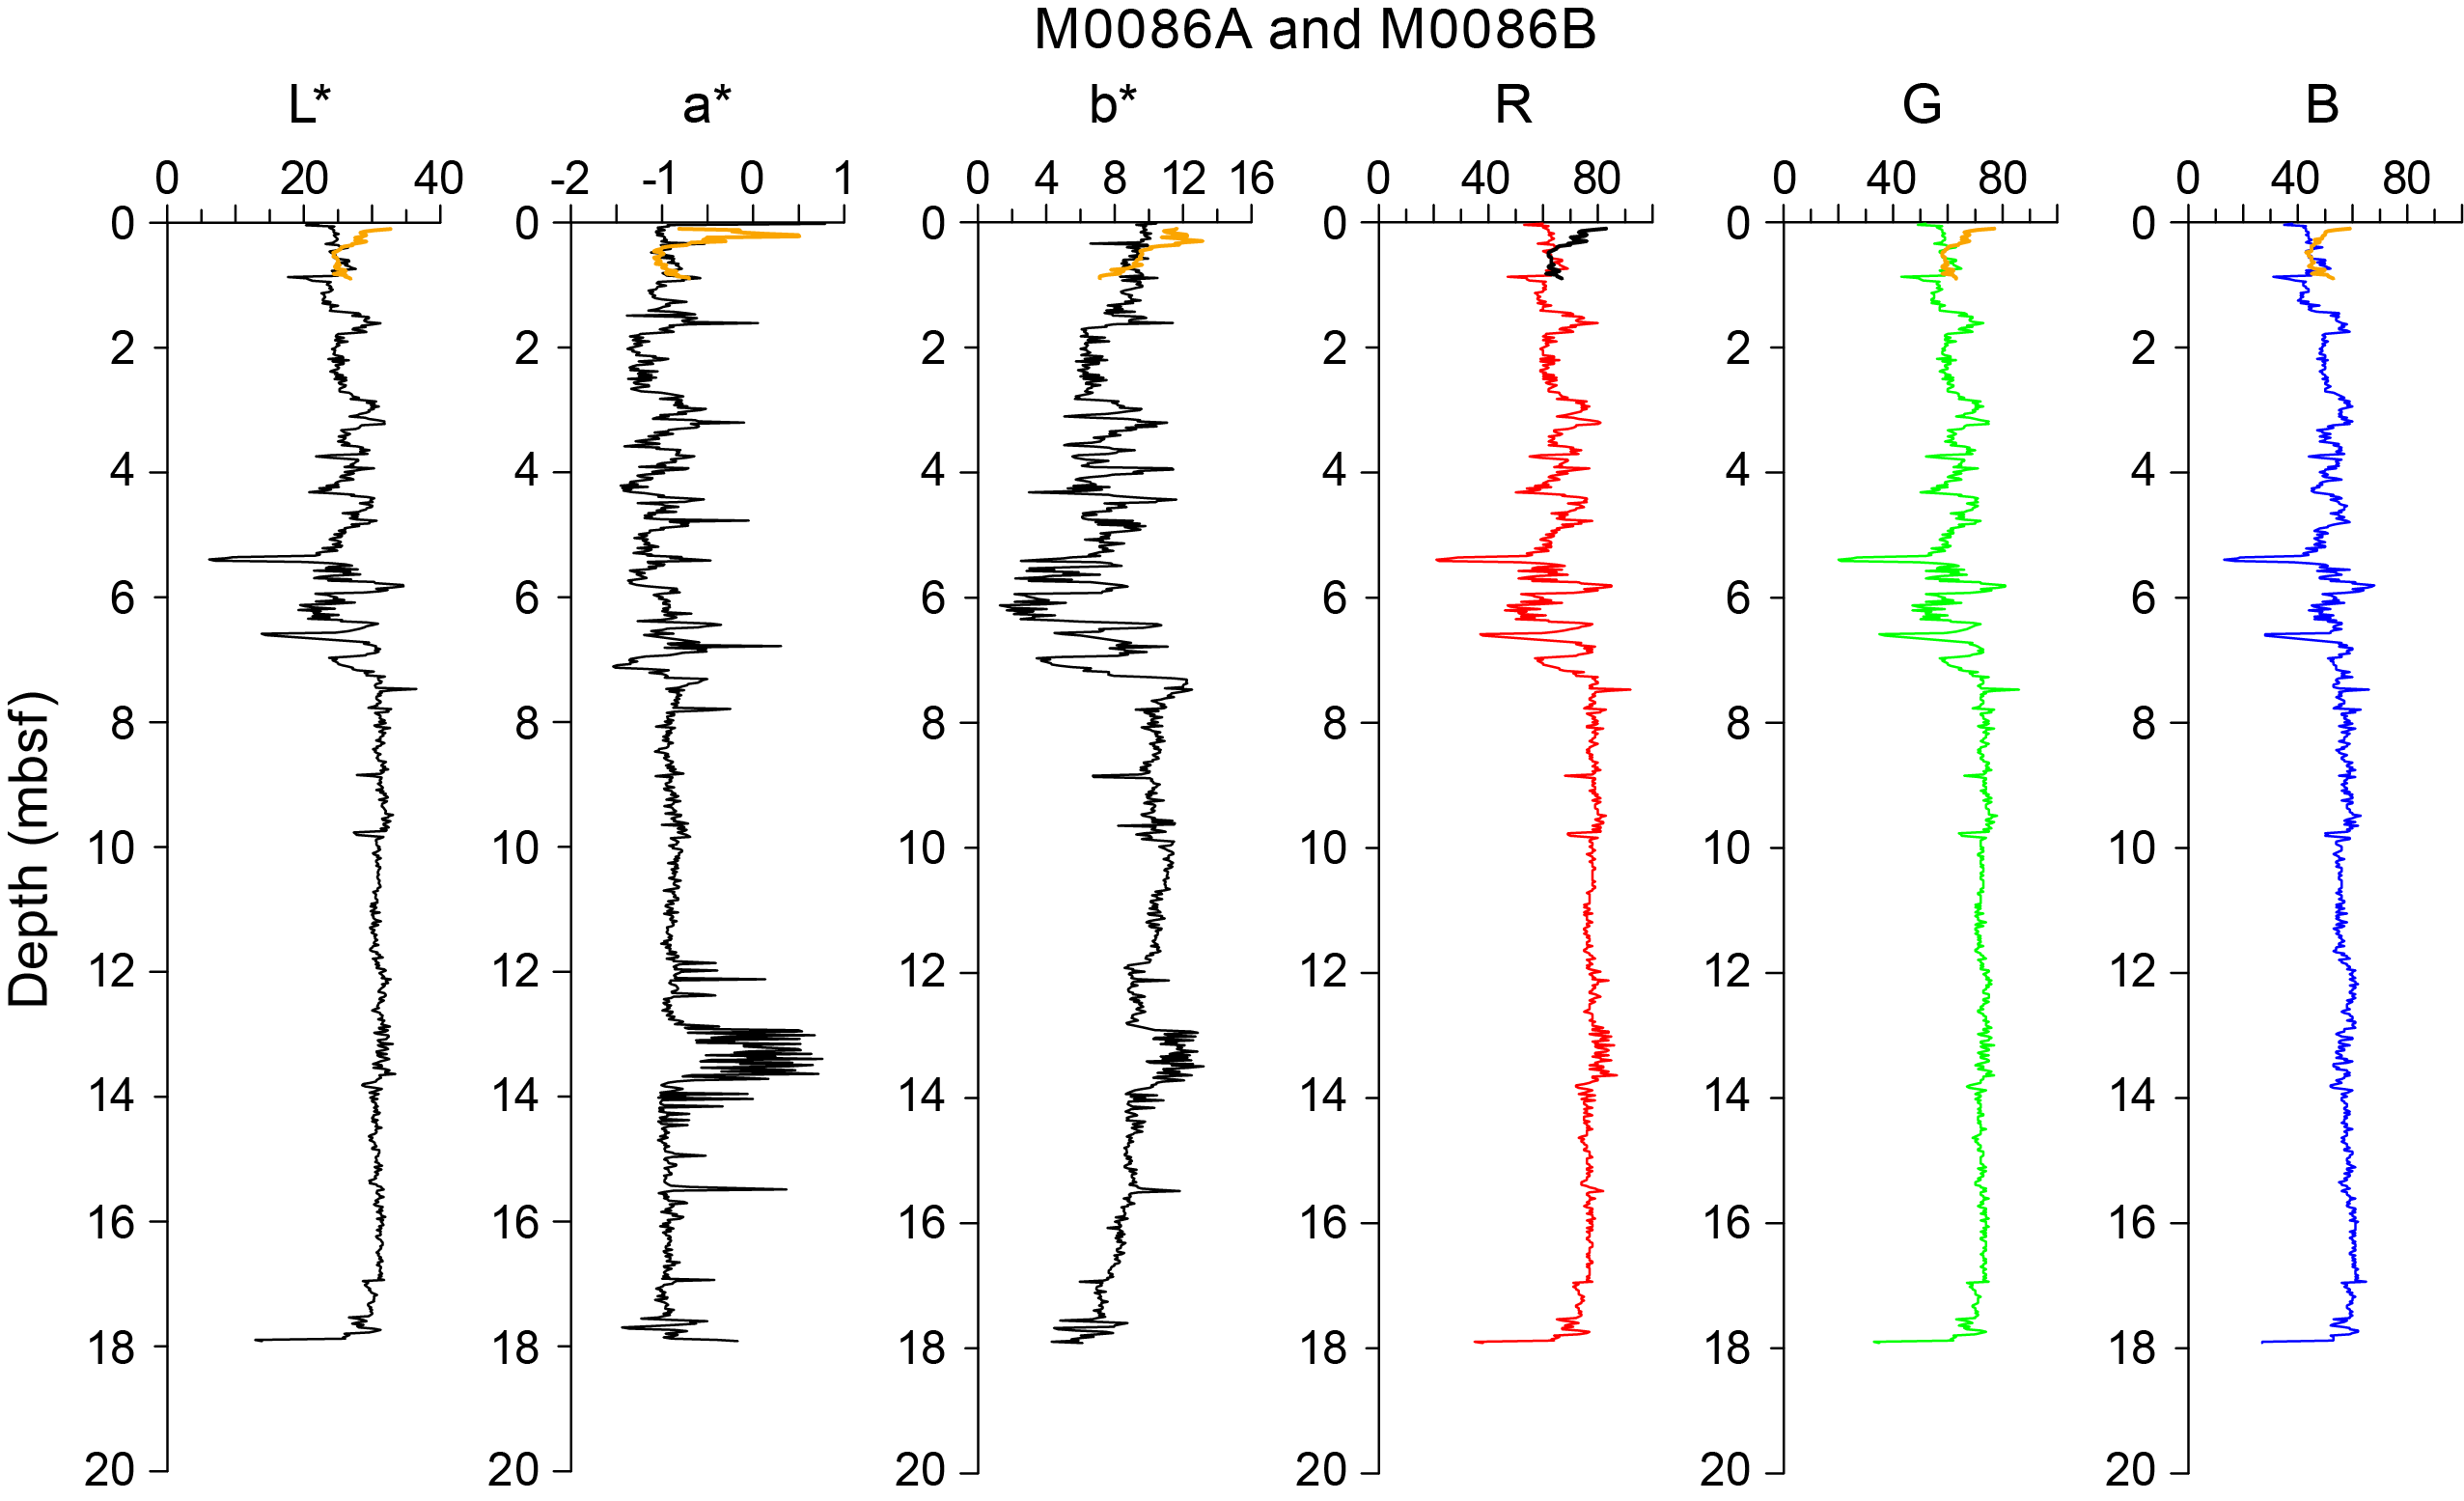
Figure F20. Color data.
7. Paleomagnetism
This section reports the measurement of remanent magnetization in Holes M0086A and M0086B, which were cored in the central study area of the northern Japan Trench (Basin N1). Remanent magnetization of U-channel samples was measured on the working halves of the cores at 2 cm intervals. Natural remanent magnetization (NRM) measurements were only conducted at 0 and 5 mT peak fields due to the time constraints of the hybrid OSP (see Paleomagnetism in the Expedition 386 methods chapter [Strasser et al., 2023a]).
Profiles of intensity, inclination, and declination after demagnetization at 5 mT are displayed in Figures F21 and F22. Peaks of intensity in Hole M0086A are recognized at 0.15, 0.45, and 0.75 mbsf. The declination and inclination profiles of Hole M0086A are generally constant. The variation of intensity of Hole M0086B is characterized by fluctuation, with higher values above 8 mbsf and less variation with lower values below 8 mbsf.

Figure F21. Intensity, inclination, and declination.

Figure F22. Intensity, declination, corrected declination, and inclination.
The declination trend for Hole M0086B shows a gradual clockwise rotation, which, after correction (assuming that this linear trend is a function of core depth), shows high fluctuations throughout the entire hole. Inclination fluctuates between 30° and 60°. Large inclination drops are recognized at 10 and 13 mbsf.
Preliminary paleomagnetic data for Holes M0086A and M0086B reveal a unique pattern in intensity, which is characterized by highly fluctuating variations in the upper interval between 0 and 8 mbsf and a less variable, lower intensity between 8 and 18 mbsf. Declination and inclination patterns are generally very variable throughout Hole M0086B.
8. Stratigraphic correlation
A GPC core was recovered from Site M0086.
First-order correlation between the two holes at Site M0086 enabled construction of a continuous stratigraphic succession from the seafloor to the bottom of Hole M0086B (18.745 meters composite depth in splice [mcd-splice]), with the exception of one currently unresolved gap between the base of Trigger Core 386-M0086A-1P and the top of GPC Core 386-M0086B-1H. Therefore, the Site M0086 composite depth in splice below seafloor scales (mcd-splice) for depths >0.83 mcd-splice are currently referred to as floating depths, assuming the coring gap to be zero (see Stratigraphic correlation in the Expedition 386 methods chapter [Strasser et al., 2023a]).
8.1. Construction of the core composite depth scale
8.1.1. Definition of top
The presence of a thin (~0.5 cm) oxidized top in the trigger core (interval 386-M0086A-1P-1, 7.5–8 cm) (see Lithostratigraphy) suggests that an undisturbed mudline was recovered in the hole. Thus, the vertical offset was determined as −0.075 m for Hole M0086A. Because only a trigger core was obtained at this site, Hole M0086A was selected as the anchor core, and Section 386-M0086A-1P-1, 7.5 cm, was defined as 0 mbsf (Tables T8, T9).
8.1.2. Compositing of cores
Before compositing holes, artificial and/or natural voids were measured at the ends of sections and void lengths were subtracted from the curated section length to obtain the sediment length of each section (neglecting core catchers that were sampled in bags). Corrected section lengths and the section top and bottom depths for Site M0086 are listed in Table T8.
The core composite scale for Site M0086 is currently tentatively based on the visual correlation marker horizons on X-ray CT images. Visual core descriptions (VCDs) and linescan images generated during the OSP and spikes in magnetic susceptibility and GRA data from the MSCL, measured at 2 cm intervals (see Physical properties in the Expedition 386 methods chapter [Strasser et al., 2023a]), were used for interhole correlation. At this stage, thin but clear marker beds visible on X-ray CT images, verified on the hand drawn VCDs, were tentatively used as large (coarse and thick) event beds that possibly eroded the underlying sediments.
Only one append point (AP1) was determined between the trigger core and GPC core (Table T10). First-order correlation does not allow for correlation between Trigger Core 386-M0086A-1P and the upper part of GPC Core 386-M0086B-1H, and no correlation tie point could be identified to tie the GPC cores to the mudline-anchored trigger core. This suggests that the coring gap on top of the GPC cores is larger than the total length of the trigger cores, and the composite depth scale of the GPC cores remains floating. Following the methodology in Stratigraphic correlation in the Expedition 386 methods chapter (Strasser et al., 2023a), the base of the trigger core (Section 386-M0086A-1P-1, 92 cm; corrected core depth = 0.845 mbsf; Table T8) and the top of GPC Core 386-M0086B-1H were horizontally aligned, assuming the gap to be zero (AP1). With an artificial void (1.5 cm) at the top of Section 386-M0086B-1H-1 (Table T8), a vertical depth shift of 0.83 m is calculated for the top of Core 386-M0086B-1H (Table T9).
8.1.3. Construction of splice
A combination of Holes M0086A and M0086B reveals the longest complete and least disturbed stratigraphic interval at Site M0086. Although the degree of bioturbation changed from weakly bioturbated to nonbioturbated in Section 386-M0086A-1P-1, 40 cm, such a change was not recognized in Hole M0086B. Therefore, direct correlation between the two holes is impossible. Thus, the bottom of Hole M0086A and the top of Hole M0086B were connected using AP1 at 0.845 mcd-splice (Table T10).
Below 0.845 mcd-splice, the splice is located in Hole M0086B, and it continues to the base of that hole (18.745 mcd-splice) to construct a first-order splice. The tentatively defined tie points and splice intervals and a calculated splice composite depth are given in Table T10.
References
Bruland, K.W., Middag, R., and Lohan, M.C., 2014. Controls of trace metals in seawater. In Holland, H.D., and Turekian, K.K. (Eds.), Treatise on Geochemistry (Second Edition). Oxford (Elsevier), 19–51. https://doi.org/
Kioka, A., Schwestermann, T., Moernaut, J., Ikehara, K., Kanamatsu, T., Eglinton, T.I., and Strasser, M., 2019. Event stratigraphy in a hadal oceanic trench: the Japan Trench as sedimentary archive recording recurrent giant subduction zone earthquakes and their role in organic carbon export to the deep sea. Frontiers in Earth Science, 7:319. https://doi.org/
Matoba, Y., 1976. Recent foraminiferal assemblages off Sendai, northeast Japan. Maritime Sediments, Spec. Pub. A:205–220. https://cir.nii.ac.jp/
Strasser, M., Ikehara, K., and Cotterill, C., 2019. Expedition 386 Scientific Prospectus: Japan Trench Paleoseismology. International Ocean Discovery Program. https://doi.org/
Strasser, M., Ikehara, K., Everest, J., Maeda, L., Hochmuth, K., Grant, H., Stewart, M., Okutsu, N., Sakurai, N., Yokoyama, T., Bao, R., Bellanova, P., Brunet, M., Cai, Z., Cattaneo, A., Hsiung, K.-H., Huang, J.-J., Ishizawa, T., Itaki, T., Jitsuno, K., Johnson, J.E., Kanamatsu, T., Keep, M., Kioka, A., Kölling, M., Luo, M., März, C., McHugh, C., Micallef, A., Nagahashi, Y., Pandey, D.K., Proust, J.-N., Rasbury, E.T., Riedinger, N., Satoguchi, Y., Sawyer, D.E., Seibert, C., Silver, M., Straub, S.M., Virtasalo, J., Wang, Y., Wu, T.-W., and Zellers, S.D., 2023a. Expedition 386 methods. In Strasser, M., Ikehara, K., Everest, J., and the Expedition 386 Scientists, Japan Trench Paleoseismology. Proceedings of the International Ocean Discovery Program, 386: College Station, TX (International Ocean Discovery Program). https://doi.org/
Strasser, M., Ikehara, K., Everest, J., Maeda, L., Hochmuth, K., Grant, H., Stewart, M., Okutsu, N., Sakurai, N., Yokoyama, T., Bao, R., Bellanova, P., Brunet, M., Cai, Z., Cattaneo, A., Hsiung, K.-H., Huang, J.-J., Ishizawa, T., Itaki, T., Jitsuno, K., Johnson, J.E., Kanamatsu, T., Keep, M., Kioka, A., Kölling, M., Luo, M., März, C., McHugh, C., Micallef, A., Nagahashi, Y., Pandey, D.K., Proust, J.-N., Rasbury, E.T., Riedinger, N., Satoguchi, Y., Sawyer, D.E., Seibert, C., Silver, M., Straub, S.M., Virtasalo, J., Wang, Y., Wu, T.-W., and Zellers, S.D., 2023b. Site M0088 (Basin N2). In Strasser, M., Ikehara, K., Everest, J., and the Expedition 386 Scientists, Japan Trench Paleoseismology. Proceedings of the International Ocean Discovery Program, 386: College Station, TX (International Ocean Discovery Program). https://doi.org/
Strasser, M., Ikehara, K., Everest, J., and the Expedition 386 Scientists, 2023c. Supplementary material, https://doi.org/10.14379/iodp.proc.386supp.2023. In Strasser, M., Ikehara, K., Everest, J., and the Expedition 386 Scientists, Japan Trench Paleoseismology. Proceedings of the International Ocean Discovery Program, 386: College Station, TX (International Ocean Discovery Program).
Usami, K., Ikehara, K., Jenkins, R.G., and Ashi, J., 2017. Benthic foraminiferal evidence of deep-sea sediment transport by the 2011 Tohoku-Oki earthquake and tsunami. Marine Geology, 384:214–224. https://doi.org/
You, C.F., Chan, L.H., Spivack, A.J., and Gieskes, J.M., 1995. Lithium, boron, and their isotopes in sediments and pore waters of Ocean Drilling Program Site 808, Nankai Trough: implications for fluid expulsion in accretionary prisms. Geology, 23(1):37–40. https://doi.org/