Strasser, M., Ikehara, K., Everest, J., and the Expedition 386 Scientists
Proceedings of the International Ocean Discovery Program Volume 386
publications.iodp.org
https://doi.org/10.14379/iodp.proc.386.112.2023
Site M0088 (Basin N2)1
![]() M. Strasser,
M. Strasser,
![]() K. Ikehara,
K. Ikehara,
![]() J. Everest,
J. Everest,
![]() L. Maeda,
L. Maeda,
![]() K. Hochmuth,
K. Hochmuth,
![]() H. Grant,
H. Grant,
![]() M. Stewart,
M. Stewart,
![]() N. Okutsu,
N. Okutsu,
![]() N. Sakurai,
N. Sakurai,
![]() T. Yokoyama,
T. Yokoyama,
![]() R. Bao,
R. Bao,
![]() P. Bellanova,
P. Bellanova,
![]() M. Brunet,
M. Brunet,
![]() Z. Cai,
Z. Cai,
![]() A. Cattaneo,
A. Cattaneo,
![]() K.-H. Hsiung,
K.-H. Hsiung,
![]() J.-J. Huang,
J.-J. Huang,
![]() T. Ishizawa,
T. Ishizawa,
![]() T. Itaki,
T. Itaki,
![]() K. Jitsuno,
K. Jitsuno,
![]() J.E. Johnson,
J.E. Johnson,
![]() T. Kanamatsu,
T. Kanamatsu,
![]() M. Keep,
M. Keep,
![]() A. Kioka,
M. Kölling,
A. Kioka,
M. Kölling,
![]() M. Luo,
M. Luo,
![]() C. März,
C. März,
![]() C. McHugh,
C. McHugh,
![]() A. Micallef,
A. Micallef,
![]() Y. Nagahashi,
Y. Nagahashi,
![]() D.K. Pandey,
D.K. Pandey,
![]() J.-N. Proust,
J.-N. Proust,
![]() E.T. Rasbury,
E.T. Rasbury,
![]() N. Riedinger,
N. Riedinger,
![]() Y. Satoguchi,
Y. Satoguchi,
![]() D.E. Sawyer,
D.E. Sawyer,
![]() C. Seibert,
C. Seibert,
![]() M. Silver,
M. Silver,
![]() S.M. Straub,
S.M. Straub,
![]() J. Virtasolo,
J. Virtasolo,
![]() Y. Wang,
Y. Wang,
![]() T.-W. Wu, and
T.-W. Wu, and
![]() S.D. Zellers2
S.D. Zellers2
1 Strasser, M., Ikehara, K., Everest, J., Maeda, L., Hochmuth, K., Grant, H., Stewart, M., Okutsu, N., Sakurai, N., Yokoyama, T., Bao, R., Bellanova, P., Brunet, M., Cai, Z., Cattaneo, A., Hsiung, K.-H., Huang, J.-J., Ishizawa, T., Itaki, T., Jitsuno, K., Johnson, J.E., Kanamatsu, T., Keep, M., Kioka, A., Kölling, M., Luo, M., März, C., McHugh, C., Micallef, A., Nagahashi, Y., Pandey, D.K., Proust, J.-N., Rasbury, E.T., Riedinger, N., Satoguchi, Y., Sawyer, D.E., Seibert, C., Silver, M., Straub, S.M., Virtasalo, J., Wang, Y., Wu, T.-W., and Zellers, S.D., 2023. Site M0088 (Basin N2). In Strasser, M., Ikehara, K., Everest, J., and the Expedition 386 Scientists, Japan Trench Paleoseismology. Proceedings of the International Ocean Discovery Program, 386: College Station, TX (International Ocean Discovery Program). https://doi.org/10.14379/iodp.proc.386.112.2023
2 Expedition 386 Scientists’ affiliations.
1. Operations
During Expedition 386, two Giant Piston Corer (GPC) system deployments at this study area in the northern Japan Trench (Basin N2; Figure F1) resulted in the recovery of cores from four holes at Site M0088 (Figure F2). The water depth was between 7525 and 7550 meters below sea level (mbsl). A breakdown of operational time is reported weekly instead of daily (see OPS in Supplementary material) due to decisions to move between sites based on weather and current conditions. Holes at Site M0088 were cored during Week 4 of the offshore phase. In total, 56.205 m of cores (Table T1) and 49.7 km of hydroacoustic profiles (see Hydroacoustics) were recovered and acquired in this focus area. Further operations details, including winch log and inclinometer information, are found for all sites in Coring methodology in the Expedition 386 methods chapter (Strasser et al., 2023a) and associated files (see PALEOMAG and WINCHLOGS in Supplementary material). Note that inclinometer data were not properly recorded and are therefore not reported for Site M0088.

Figure F1. Site map.
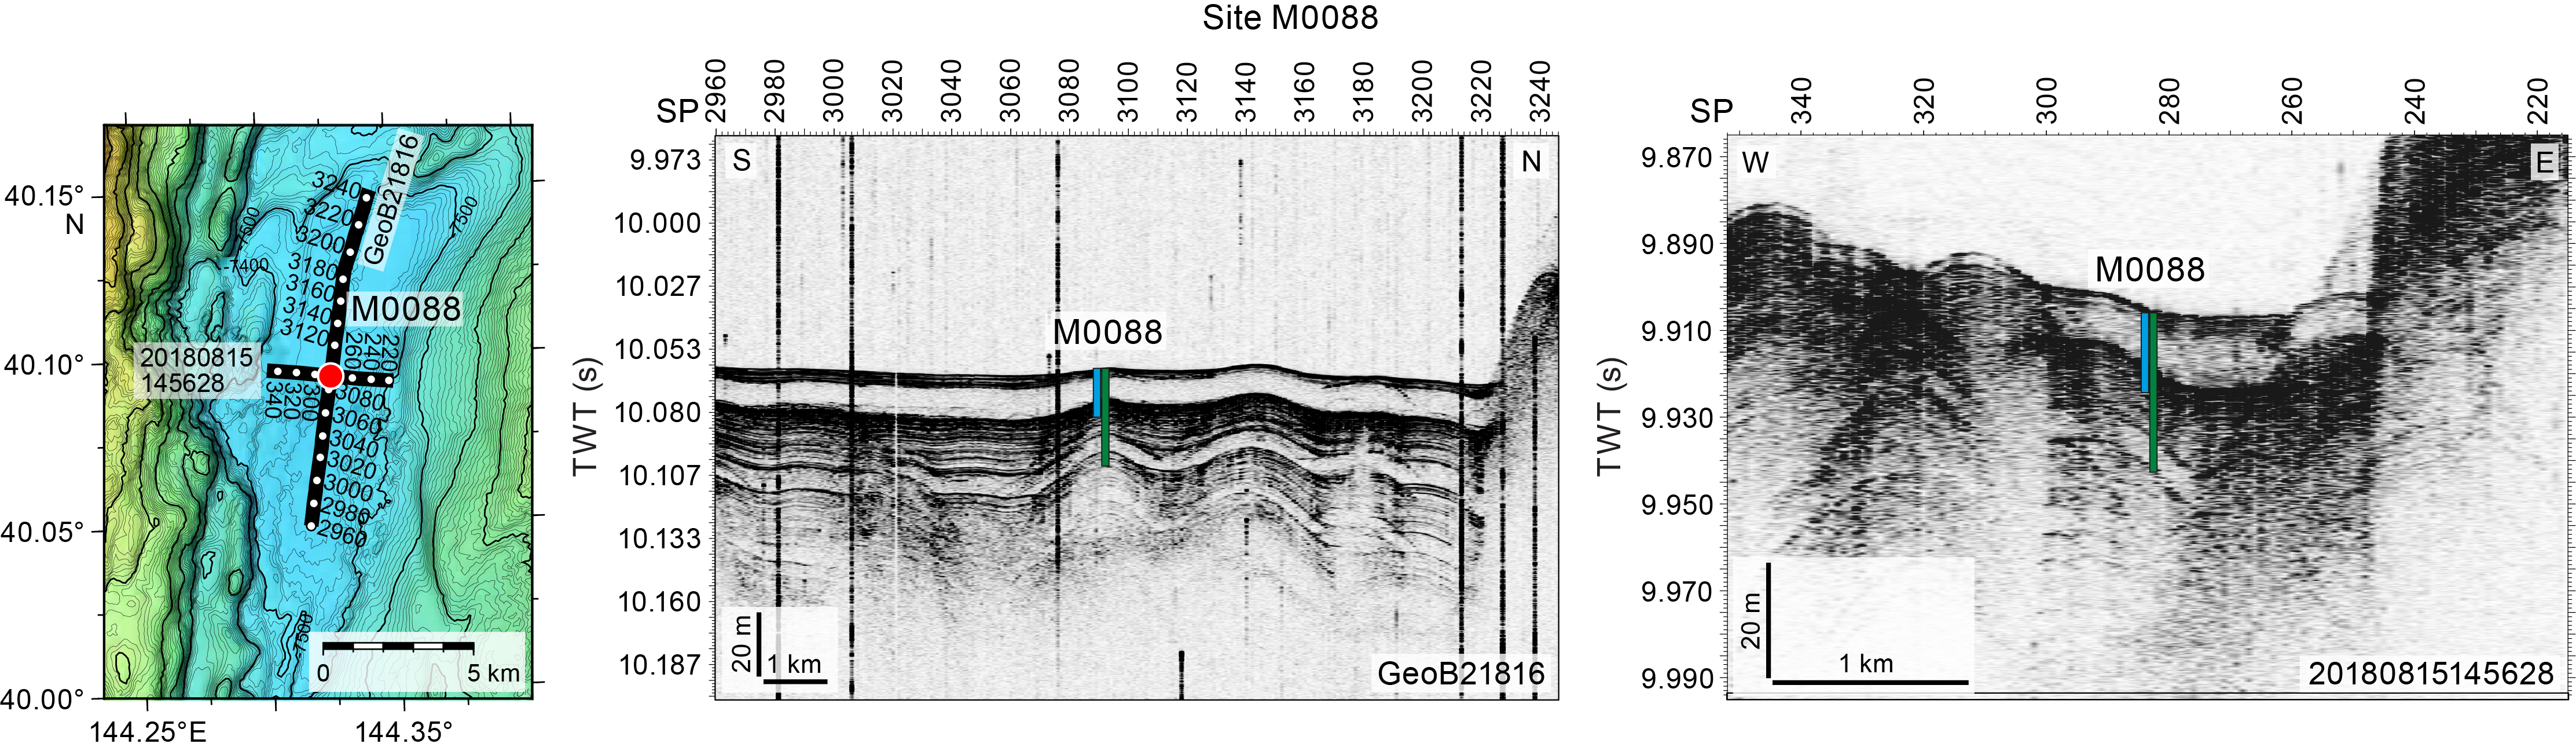
Figure F2. Site M0088.
The main site-specific scientific objectives for Site M0088 were as follows:
- Recover a continuous Pleistocene to Holocene stratigraphic succession comprising event deposits from the isolated trench basin in the northern part of the northern Japan Trench.
- Analyze the stratigraphic pattern and event deposit characteristics and compare them with integrated results from other nearby sites (M0086 [~35 km south] and M0084 and M0085 [~35 km north]) to establish robust stratigraphic pattern recognition of proxy evidence for earthquakes.
- Generate results for comparison with those from all other Expedition 386 sites to explore spatiotemporal distribution of event deposits and the southward extent of sediment transport routed through the Ogawara Submarine Canyon to eventually develop a long-term record for giant earthquakes.
1.1. Site M0088
The R/V Kaimei moved to Site M0088 at 1616 h on 4 May 2021. At 2030 h, an expendable bathythermograph (XBT) probe was deployed, followed by multibeam echo sounder/subbottom profiler (MBES/SBP) surveys from 2045 h on 4 May to 0500 h on 5 May, when the ship stood by for GPC deployment. Conditions during the day were cloudy with winds of ~10 m/s, wave heights of 1 m, and a 1.5 kt current. After 1800 h, winds increased to >20 m/s and waves to 2.5 m until 0000 h. GPC operations started in Holes M0088A and M0088B with a 20 m GPC barrel string at 0600 h. After holding the GPC assembly at a cable depth of 7700 m, a malfunction was found on the friction roller at 0900 h, when running was restarted. However, the decision was made to operate without the friction roller because it was not required for running the 20 m GPC, and running resumed at 0910. The GPC system was recovered on deck at 1215 h. The deck crew and GPC operation team withdrew the core from the GPC assembly and cut it into 5 m segments. The Science Party cut the core into 1 m sections from 1330 to 1500 h. The 40 m GPC assembly was prepared for the next run at 1700 h, but no surveys were conducted due to rough sea conditions overnight.
Conditions were calmer on the morning of 6 May, with winds <10 m/s, a 1.2 kt current, and wave heights of ~1 m. GPC operations started in Holes M0088C and M0088D with a 40 m GPC barrel string at 0530 h, and the GPC was recovered on deck at 1315 h. The Science Party cut the core into 1 m sections from 1400 to 1615 h. Breaking out and washing the GPC assembly was complete at 1700 h, and the ship sailed for the midexpedition port call at Hachinohe port at 1715 h, arriving at 0900 h on 7 May.
1.1.1. Holes M0088A and M0088B
Holes M0088A and M0088B were cored on 5 May 2021. Preparations for running the 20 m GPC began at 0600 h, and the GPC was run into the water at 0640 h with an inclinometer and transponder attached to the winch cable 20 and 50 m above the GPC trigger arm, respectively, and on the GPC assembly (see Figure F4 in the Expedition 386 methods chapter [Strasser et al., 2023a]). Winch speed was set at 0.5–1.0 m/s. At 0900 h, running the GPC down was paused at a cable length of 7700 m for stabilization and monitoring the GPC position and resumed at 0910 h at a winch speed of 0.3 m/s after checking a malfunction of the friction roller. Spud-in commenced at 09:14:58 h and ended at 09:15:00 h at a cable length of 7814 m. Recovery commenced, and the cable tension rose to 2684 kgf at 09:15:03 h before dropping to 2107 kgf and then rising again to a maximum of 6222 kgf at 09:15:45 h. It dropped to 4881 kgf at 09:15:53 h, indicating the corer was clear of the seabed (see WINCHLOGS in Supplementary material). Unfortunately, inclinometer data were not correctly recorded and are therefore not reported. The GPC was run back to surface at a winch speed of 1.5–1.6 m/s. The trigger corer and GPC were recovered on deck at 1120 and 1215 h, respectively. The trigger core and GPC core from Holes M0088A and M0088B have a total length of 1.09 m (2 sections) and 17.69 m (19 sections), respectively.
1.1.2. Holes M0088C and M0088D
Holes M0088C and M0088D were cored on 6 May 2021. Preparations for running the 40 m GPC began at 0530 h, and the GPC was run into the water at 0720 h with an inclinometer and transponder attached to the winch cable 20 and 50 m above the GPC trigger arm, respectively, and on the GPC assembly (see Figure F4 in the Expedition 386 methods chapter [Strasser et al., 2023a]). Winch speed was set at 0.5–1.0 m/s. At 0945 h, running the GPC down was paused at a cable length of 7700 m for stabilization and monitoring the GPC position and resumed at a winch speed of 0.3 m/s. Spud-in commenced at 09:54:45 h and ended at 09:54:47 h at a cable length of 7814 m. Recovery commenced, and the cable tension rose to 1827 kgf at 09:54:51 h before dropping to 1287 kgf and then rising again to a maximum of 10021 kgf at 09:56:18 h. It dropped to 8568 kgf at 09:56:33 h, indicating the corer was clear of the seabed (see WINCHLOGS in Supplementary material). Unfortunately, inclinometer data were not correctly recorded and are therefore not reported. At 1000 h, the GPC was run back to surface with a winch speed of 1.0–1.5 m/s. The trigger corer and GPC were recovered on deck at 1210 and 1315 h, respectively. The trigger core and GPC core from Holes M0088C and M0088D have a total length of 0.96 m (2 sections) and 36.465 m (37 sections), respectively (Table T1).
2. Hydroacoustics
Site M0088 lies within Basin N2 in the northern Japan Trench survey area (Figure F3). The acquired SBP data comprises two trench-perpendicular lines north of the basin and three trench-parallel lines, with approximately 49.7 km of lines acquired. The acquisition parameters for all subbottom profiles in this basin are documented in Table T2. The area surveyed for bathymetry includes the basin floor and extends into the surrounding areas with a footprint of approximately 337 km2. Depth estimates and thicknesses in this section are approximate and assume a seismic velocity of 1500 m/s.
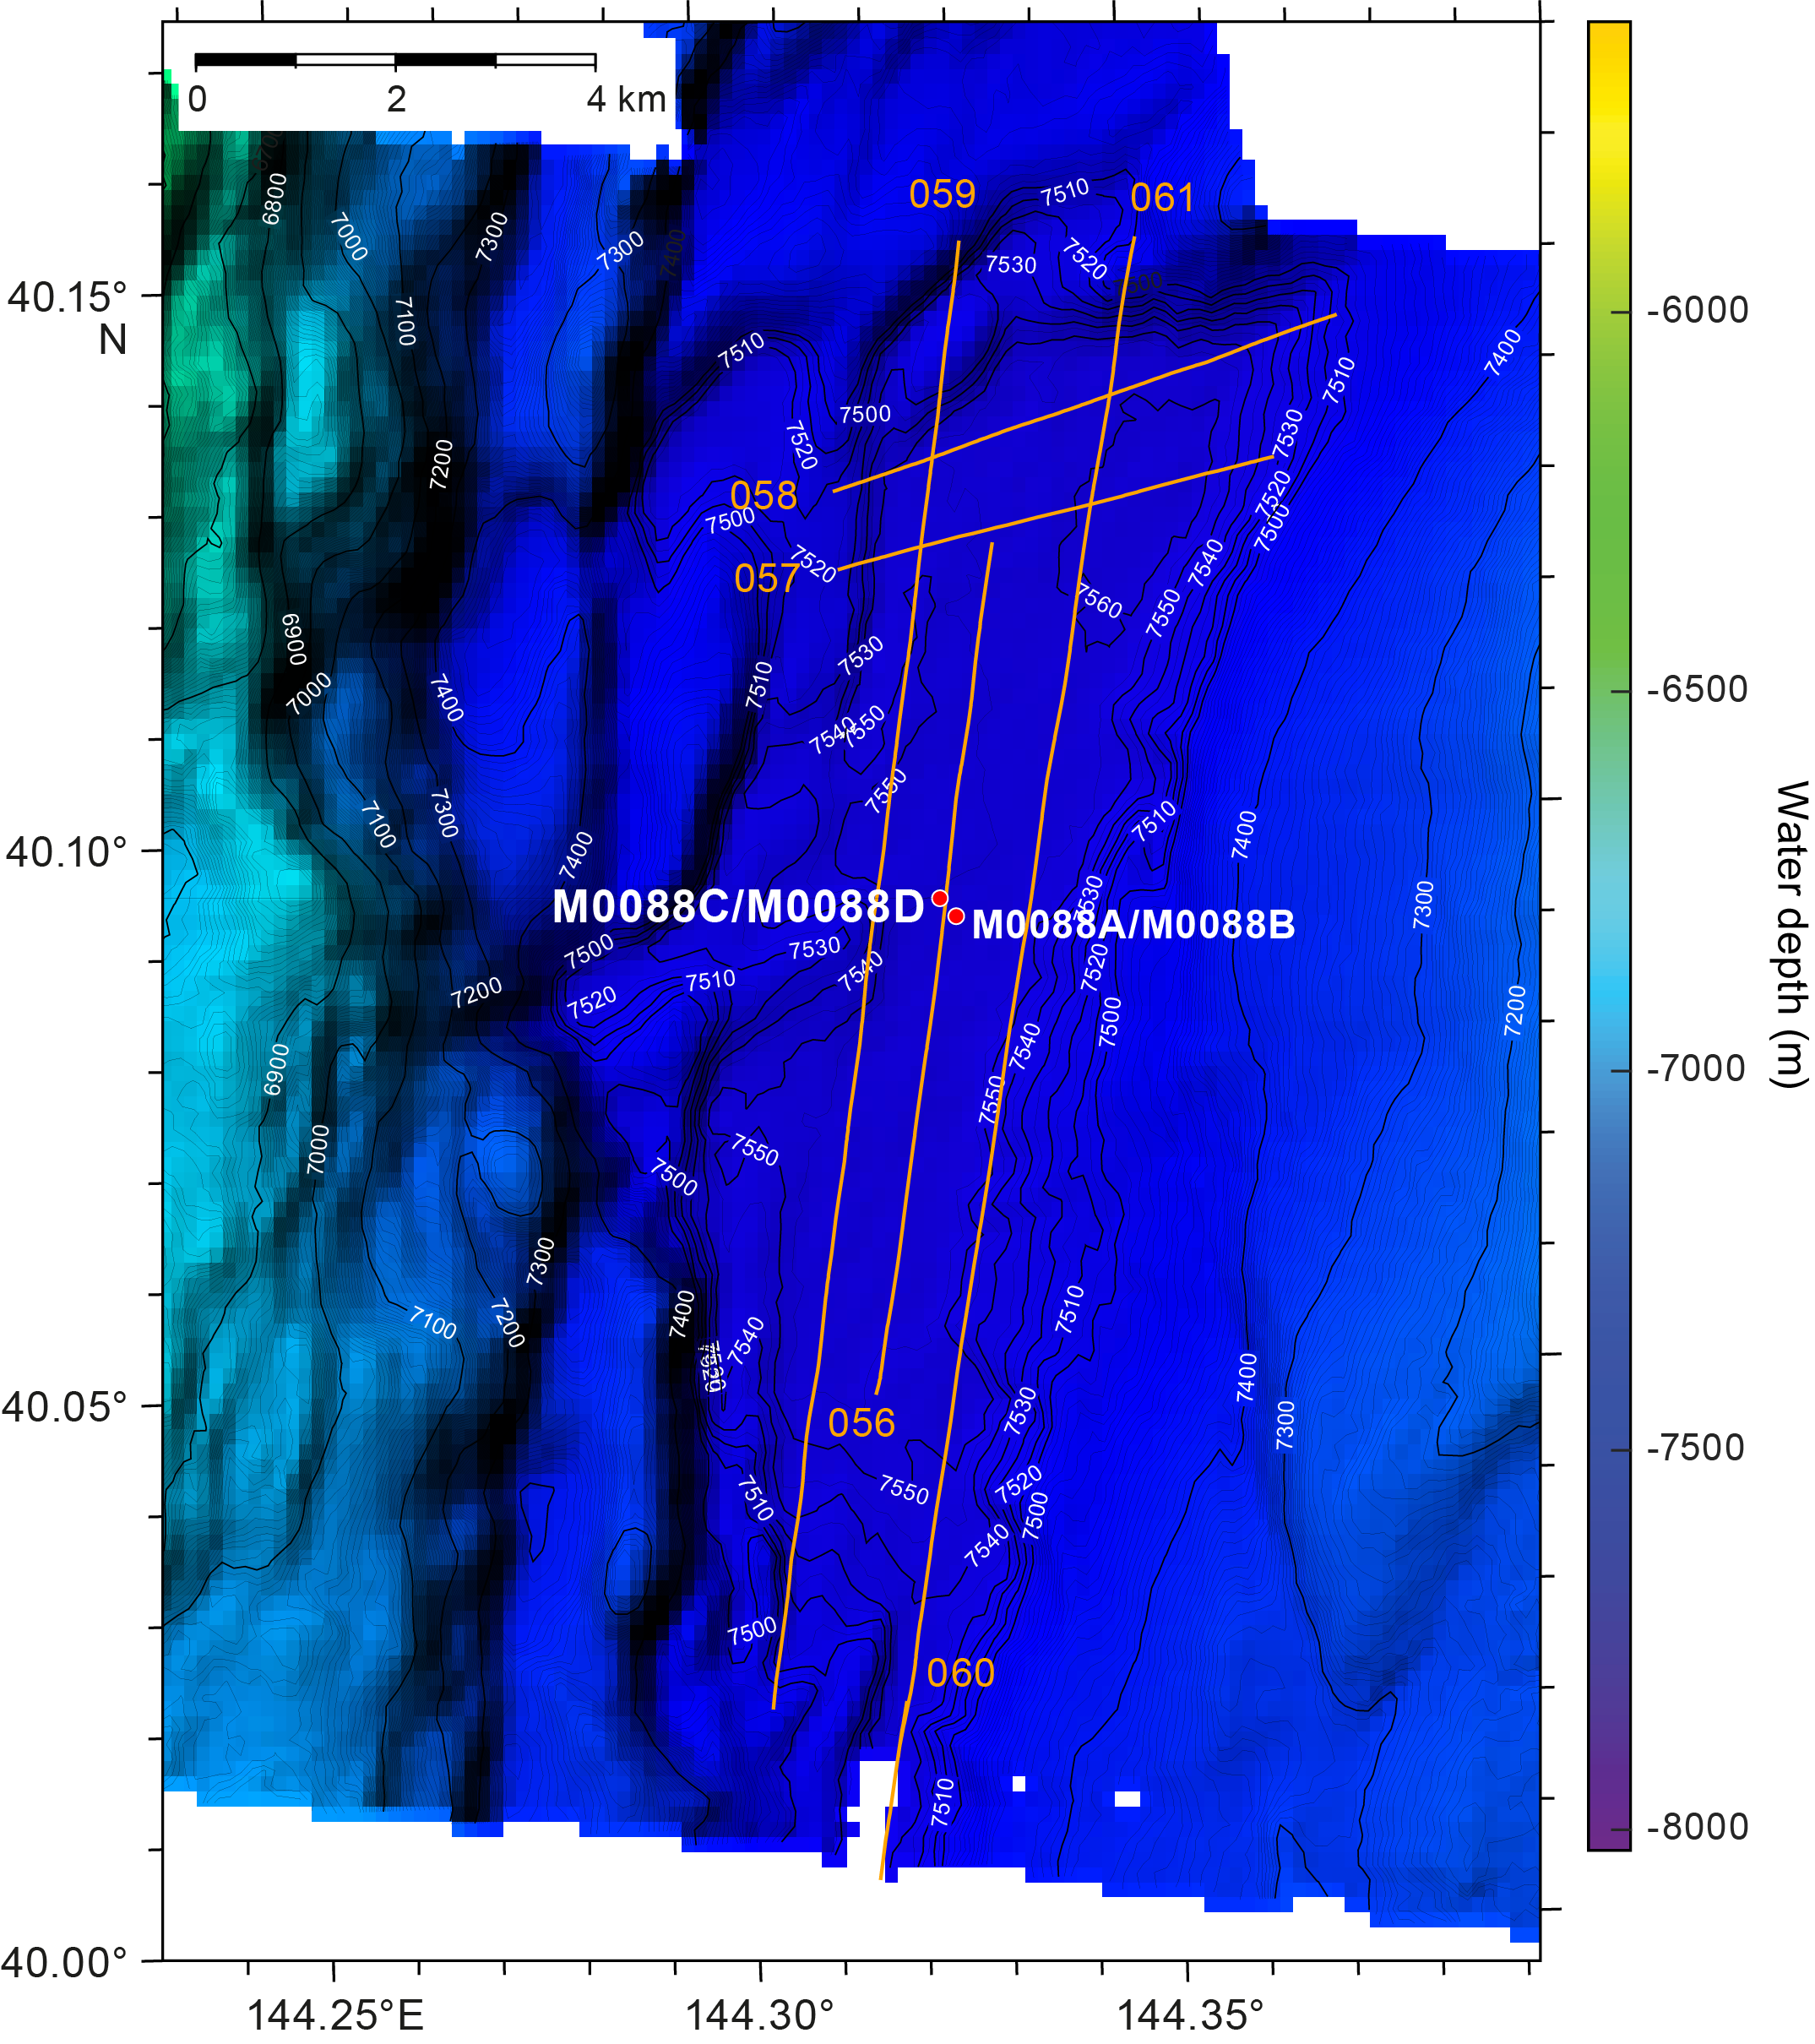
Figure F3. Subbottom profile lines.
2.1. Bathymetry
Holes M0088–M0088D lie in the deepest part of the basin, with Holes M0088A and M0088B at 7550 mbsl and Holes M0088C and M0088D at 7525 mbsl. The western boundary to the basin comprises a series of discontinuous, generally north–south trending ridges that bound a series of terraces. Bathymetric gradients on the western boundary reach up to 10%–12% on some short sections, but the stepped nature of the margin reduces areas of high slope gradient. The eastern boundary has a shallower topographic gradient of around 5%–6%. The width of the basin, defined as the extent of flat basin floor between bounding elements, is approximately 4000 m, although this varies with the more diffuse basin margins.
2.2. Basin characterization
Changes in basin character from north to south are best seen on a long strike line that extends through the basin, Line 386_Underway_061 (Figure F4). From the northern end of line (near Shotpoint 540) to the center of the basin (Shotpoint 350), the basin exhibits a characteristic pattern of acoustic reflections similar to other lines in the basin. A high-amplitude seafloor reflector forms the upper boundary of a thin (~2 m) package of semitransparent materials. Beneath this reflector, a thick (>10 m) acoustically transparent layer is present. A package (~10 m) of higher amplitude reflections separates the upper transparent layer from a lower transparent layer that is ~7–8 m thick. The lowest layers of basin fill comprise a package of acoustically laminated materials with varying but generally lower amplitude. In the southern part of the line (south of Shotpoint 350), the acoustic reflections are disrupted at the seafloor and the character of the laminated package is not clear.
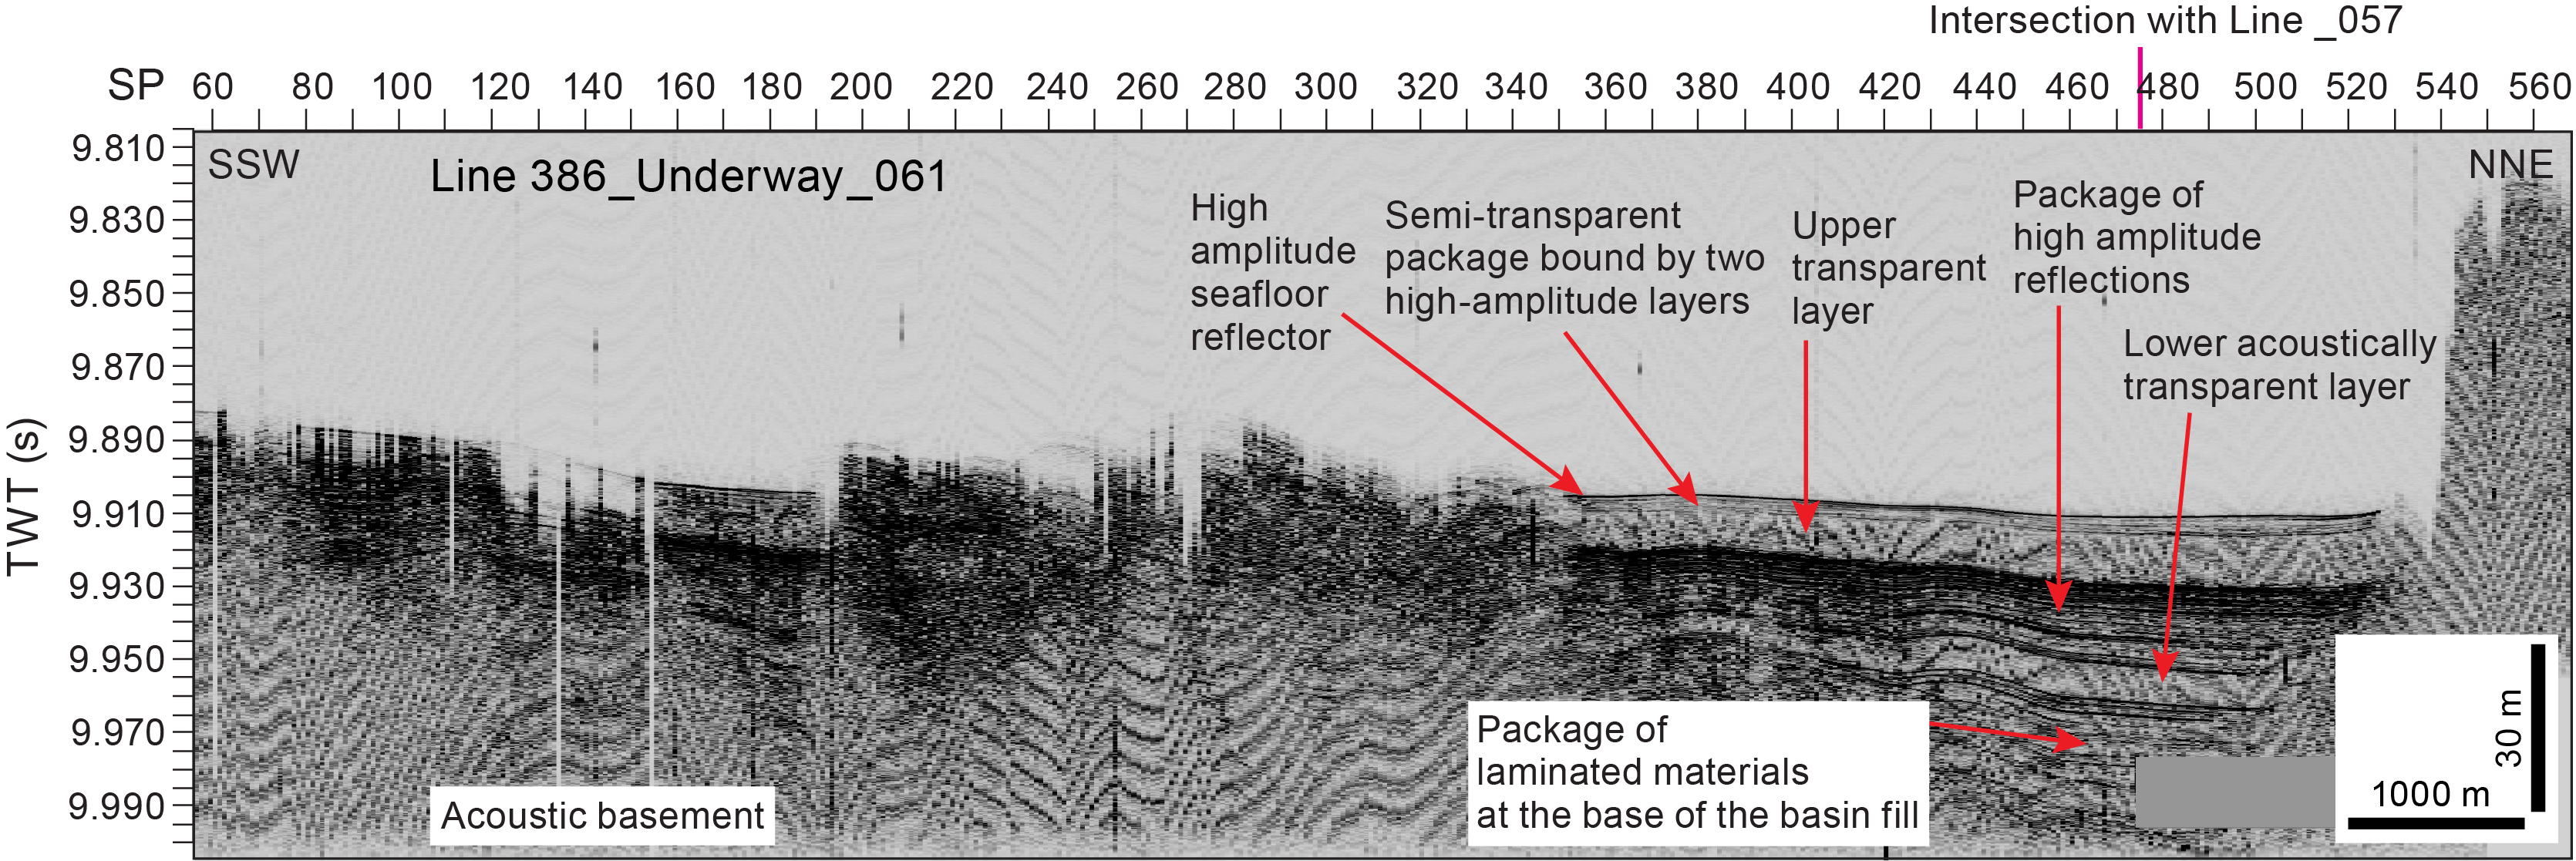
Figure F4. Line 386_Underway_061.
Similar seismic packages are observed on trench-perpendicular Line 386_Underway_057 (Figure F5), which, from Shotpoint 1070 to Shotpoint 1180, shows a high-amplitude seafloor reflector overlying a thick transparent package, which in turn overlies a higher amplitude laminated package. Beneath these layers lies a package characterized by laminated/somewhat transparent and variable (but generally lower) amplitudes. Various onlap relationships are visible in SSW–NNE trending Line 386_Underway_057. At Shotpoint 1180, the uppermost semitransparent layer onlaps onto the upper acoustically transparent layer and onto the basal high.
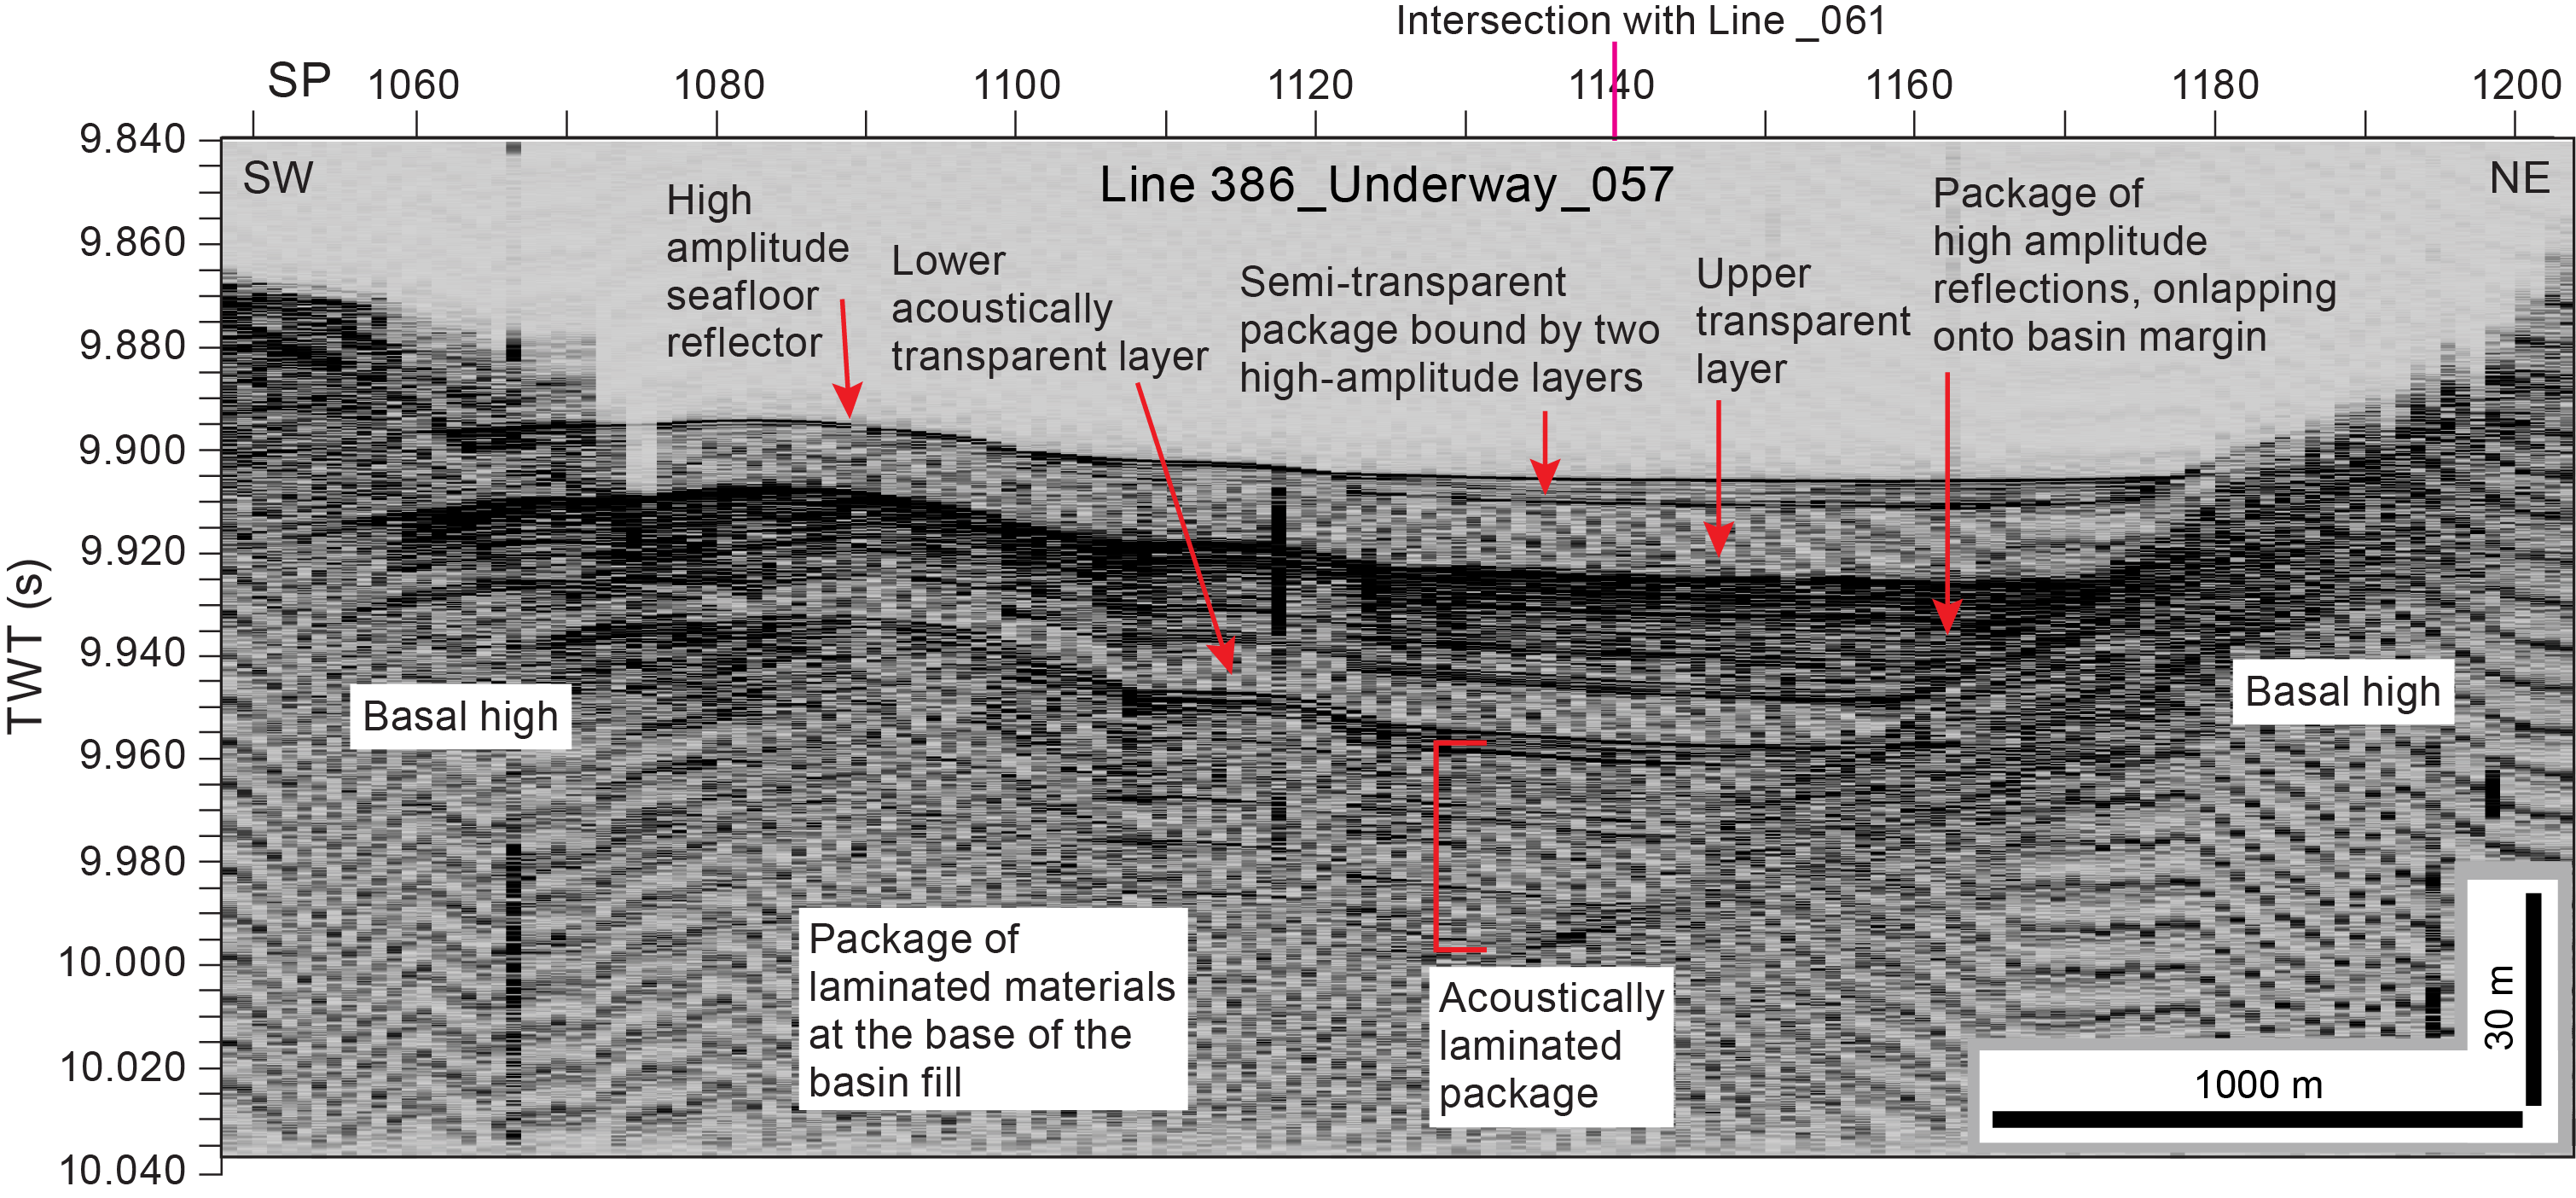
Figure F5. Line 386_Underway_057.
2.3. Site M0088
The main strike line that intersects Site M0088 is Line 386_Underway_056 (Figures F6, F7). Holes M0088A and M0088B lie 120 m east of this line, and Holes M0088C and M0088D lie 60 m west (as measured perpendicular to the line). Line 386_Underway_056 images all of the same acoustic elements described for Line 386_Underway_057, including the high-amplitude seafloor layer, the upper semitransparent layer beneath the seafloor, the upper and lower acoustically transparent layers, and a lower package of laminated higher amplitude reflections. Both holes are on a topographic rise, with the shallowest layers of basin fill (semitransparent package bound by high-amplitude layers) thinning onto the high, so that both holes intersect only a thinner part of the semitransparent layers. The upper transparent package at this location is approximately 13 m thick, and the package of high-amplitude reflections is nearly 20 m thick at Shotpoint 700. The lower acoustically transparent package is ~5 m thick in this line.

Figure F6. Subbottom profile lines around Site M0088.
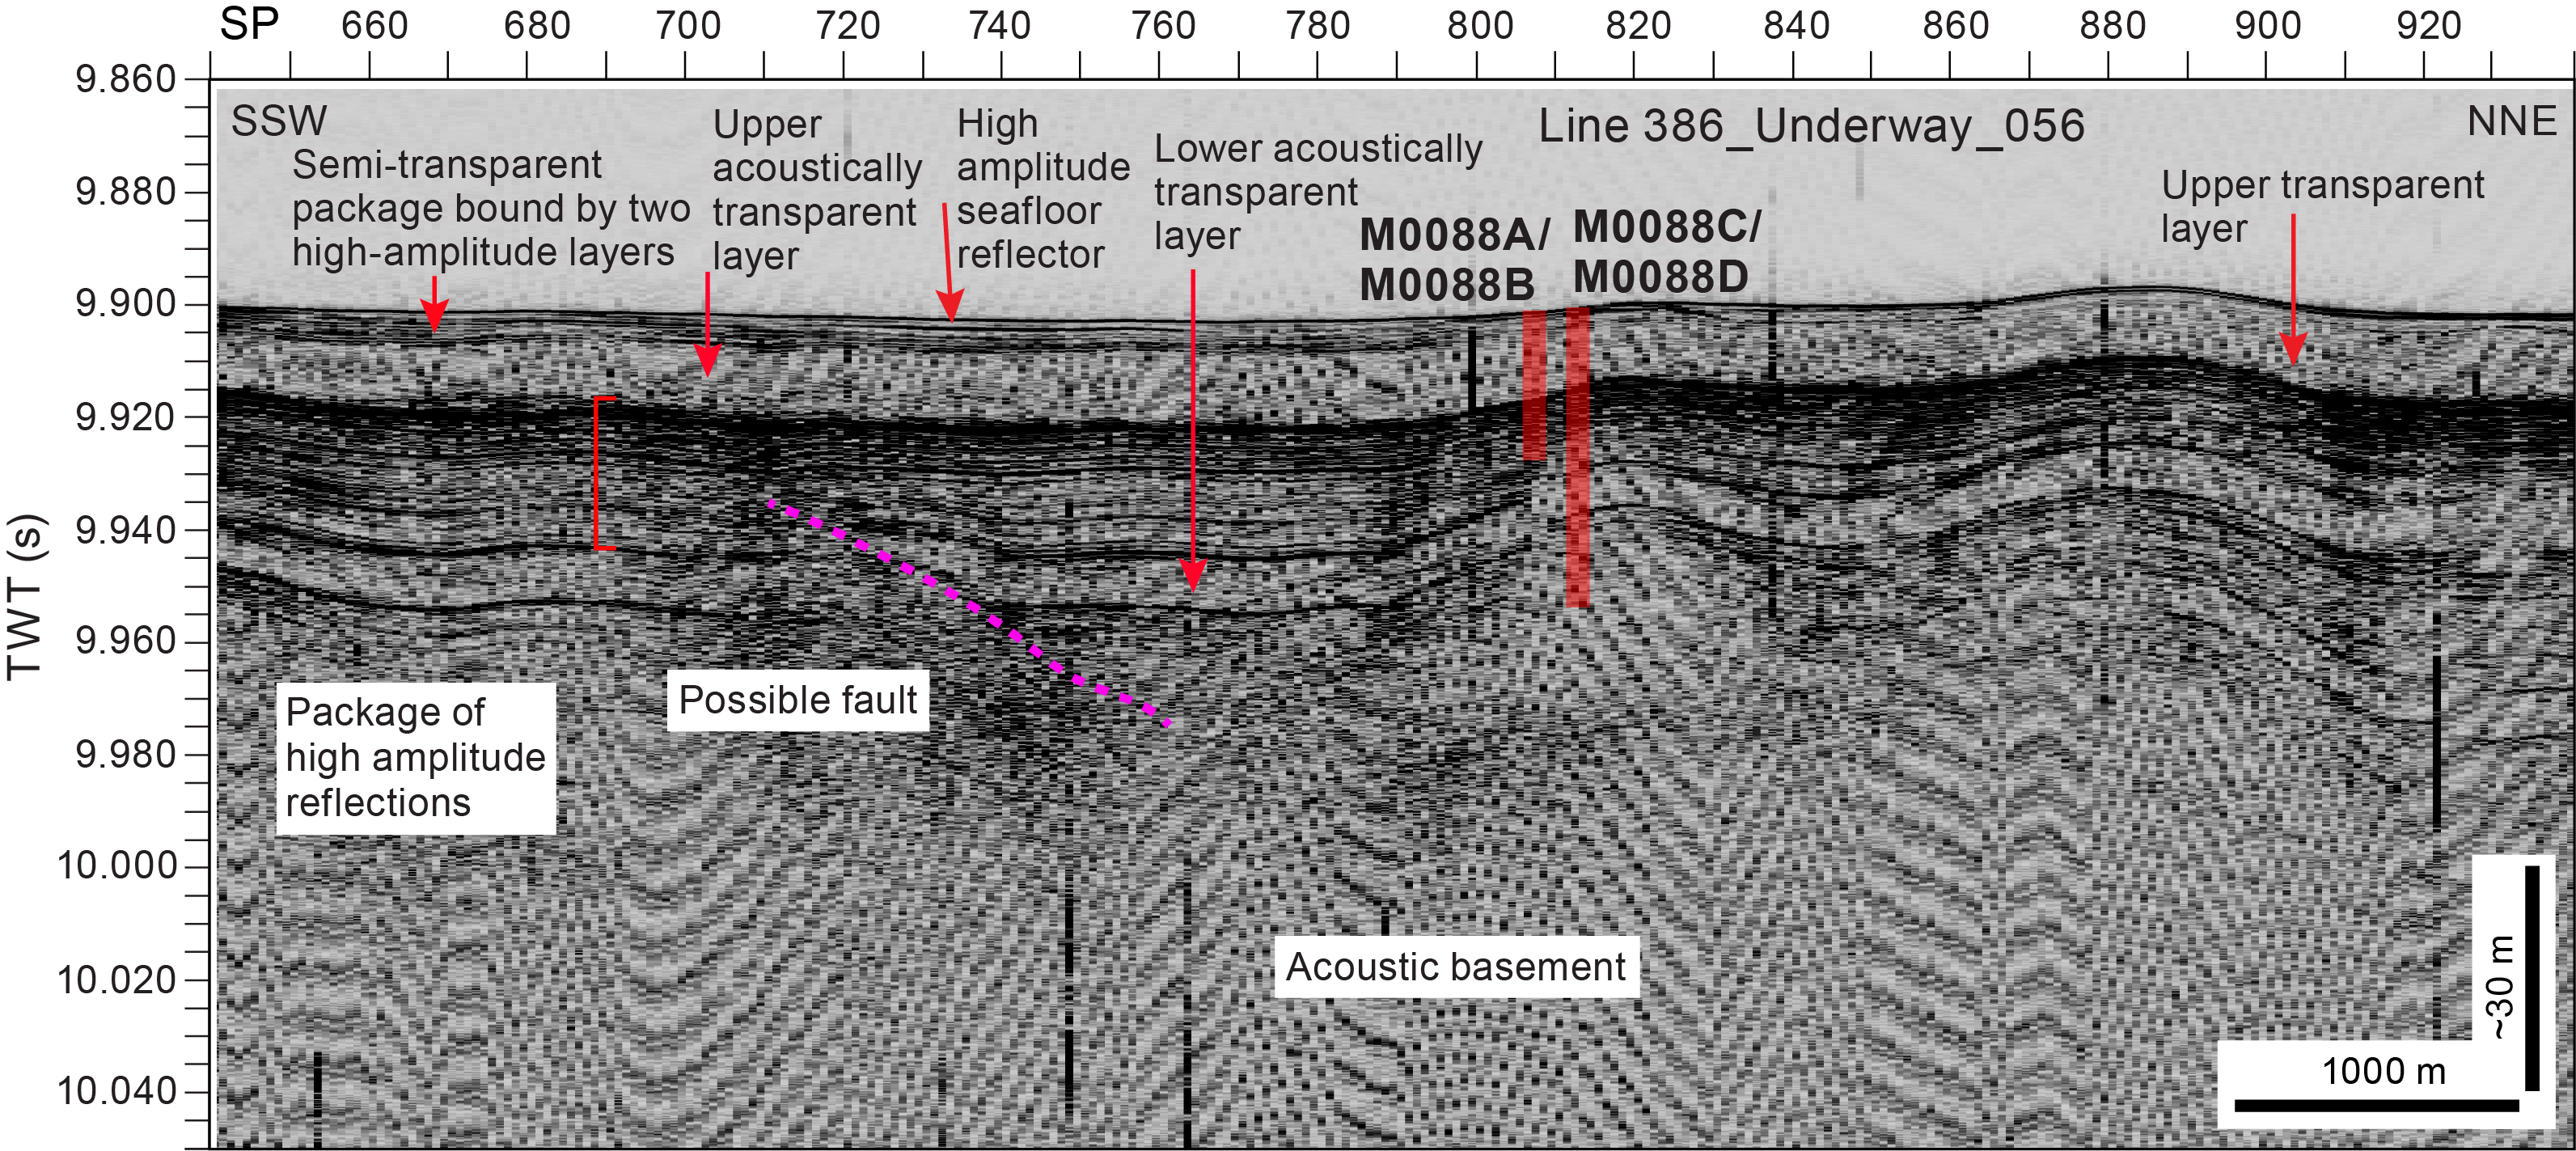
Figure F7. Line 386_Underway_056.
Toward the northern end of Line 386_Underway_056, between Shotpoints 800 and 920, the entire acoustic sequence displays gentle folds that affect all layers to the seafloor. These folds do not extend along strike; they stop at Shotpoint 790 where the sequence reverts to flat-laying between Shotpoints 790 and 740. From Shotpoint 740 to the southern end of the line, more gentle undulations occur. At Shotpoint 720, some structural elements occur where the lower transparent layer appears to be offset by a fault that causes repetition of the lower acoustically transparent layer.
Trench-parallel Line 386_Underway_059 lies 690 m west of Line 386_Underway_056 (Figure F8). This line gives a different perspective of the location of Holes M0088A–M0088D, which lie on the side of a topographic rise. All of the same acoustic elements occur. However, on Line 386_Underway_059, a distinct topographic high occurs between Shotpoints 1880 and 1820. All of the acoustic packages, with the exception of the uppermost semitransparent package, thin onto the high, indicating that the high predates the deposition of all of the onlapping packages. The upper transparent package appears to drape over the high. North of Shotpoint 1810, both the transparent and laminated acoustic sequences show gentle folding, whereas south of Shotpoint 1880 the acoustic sequences are generally flat-lying, indicating some differences in timing of events on this line.

Figure F8. Line 386_Underway_059.
3. Lithostratigraphy
Site M0088 was cored in Basin N2 of the northern Japan Trench. It comprises four holes, including those of the accompanying trigger cores (M0088A–M0088D), which were cored in the basin floor where the greatest sediment recovery was anticipated based on the subbottom profiles and next to a 5–7 m high topographic high. Lithostratigraphic summaries of the core sections, including linescans, X-ray computed tomography (CT) scan images, grain size–based lithology, accessories, and sedimentary structures, are shown in Figures F9 and F14. The sediment texture and composition determined from smear slide analysis is presented in ternary diagrams for the site (Figure F11) and smear slide summaries for each hole (Figures F19, F20) and illustrated with some selected photomicrographs (Figure F13). Typical examples for some coarse-grained sediments observed in cores are shown in Figures F10, F12, F15, and F17. A close-up photo of interval 386-M0088D-1H-28, 68–70 cm, a possible ikaite occurrence, is shown in Figure F16. X-ray diffraction (XRD) mineralogy is shown in Figure F18. All core close-up photos, composite X-ray CT scan images, XRD data tables, and smear slide photos can be found in CORECLOSEUP, XRAYCT, XRD, and SMEARSLD, respectively, in Supplementary material. The 3 m scale barrel sheets, composite line scans, and smear slide tables can be found in Core descriptions.
The sediments in Holes M0088B and M0088D are quite similar to each other. The two long cores from Holes M0088B and M0088D are divided into five main intervals based on their lithostratigraphic character. A tentative correlation between the two holes (M0088B and M0088D) would lead to the following sedimentary succession. Such a correlation has to be confirmed by additional work on stratigraphic correlation (see Stratigraphic correlation).
Interval 1 (Sections 386-M0088B-1H-1, 0 cm, to 1H-4, 3 cm [~0–2.5 meters below seafloor (mbsf)] and 386-M0088D-1H-1, 0 cm, to 1H-2, 78 cm [~0–2 mbsf]) consists of slightly to moderately bioturbated silty clay and clay with moderate to heavy iron monosulfide abundance.
Interval 2 consists of two parts. The upper part (Sections 386-M0088B-1H-4, 3 cm, to 1H-13, 20 cm [~2.5–11.5 mbsf], and 386-M0088D-1H-2, 78 cm, to 1H-14, 68 cm [~2–14.2 mbsf]) is a thick silty clay to clay bed that is not bioturbated and contains soft-sediment deformation. The lower part (Sections 386-M0088B-1H-13, 20 cm, to 1H-16, 21.5 cm [~11.5–14.8 mbsf], and 386-M0088D-1H-14, 68 cm, to 1H-15, 45.5 cm [~14.2–14.8 mbsf]) is composed of a fining-upward sand to silt succession with planar and wavy laminations.
Interval 3 (Sections 386-M0088B-1H-16, 21.5 cm, to 1H-18, 102 cm [~14.8–17.8 mbsf], and 386-M0088D-1H-15, 45.5 cm, to 1H-30, 61 cm [~14.8–30.1 mbsf]) consists of slightly to moderately bioturbated silty clay and clay with iron monosulfide staining and includes silt laminae.
Interval 4 (Sections 386-M0088D-1H-30, 61 cm, to 1H-36, 67 cm [~30.1–35.6 mbsf]) consists of slightly to nonbioturbated silty clay to clay with thin silt to sand laminae. A thick fining-upward sand to silt succession is included within the silty clay to clay at the base of the interval.
Interval 5 (Sections 386-M0088D-1H-36, 67 cm, to 1H-37, 53 cm [~35.6–36.5 mbsf]) consists of nonbioturbated silty clay to clay with sparse iron monosulfide.
Smear slide observations of major lithologies conducted at ~2 m intervals revealed that the texture is clayey silt with some silty clay and silt (Table T3). The smear slides show that lithic and biogenic components are the most abundant (80%–100%) and volcanics are minor (0%–20%) (Figure F11).
3.1. Site M0088
3.1.1. Holes M0088A and M0088B
3.1.1.1. Hole M0088A
A 1.09 m long core was recovered from Hole M0088A (Figure F9). The main lithology of the core is a slightly to nonbioturbated clay to silty clay. The uppermost 1 cm of the core is an oxidized reddish layer, indicating the surface of the seafloor was recovered. Thin silt laminae (~1 mm) are locally observed in the clay (interval 386-M0088A-1P-1, 40–60 cm) (Figure F10A). Magnetic susceptibility, density, and natural gamma radiation (NGR) values increase toward the base of the core except in the lowermost 6 cm. Silt laminae correlate to high magnetic susceptibility and density values (see Physical properties).
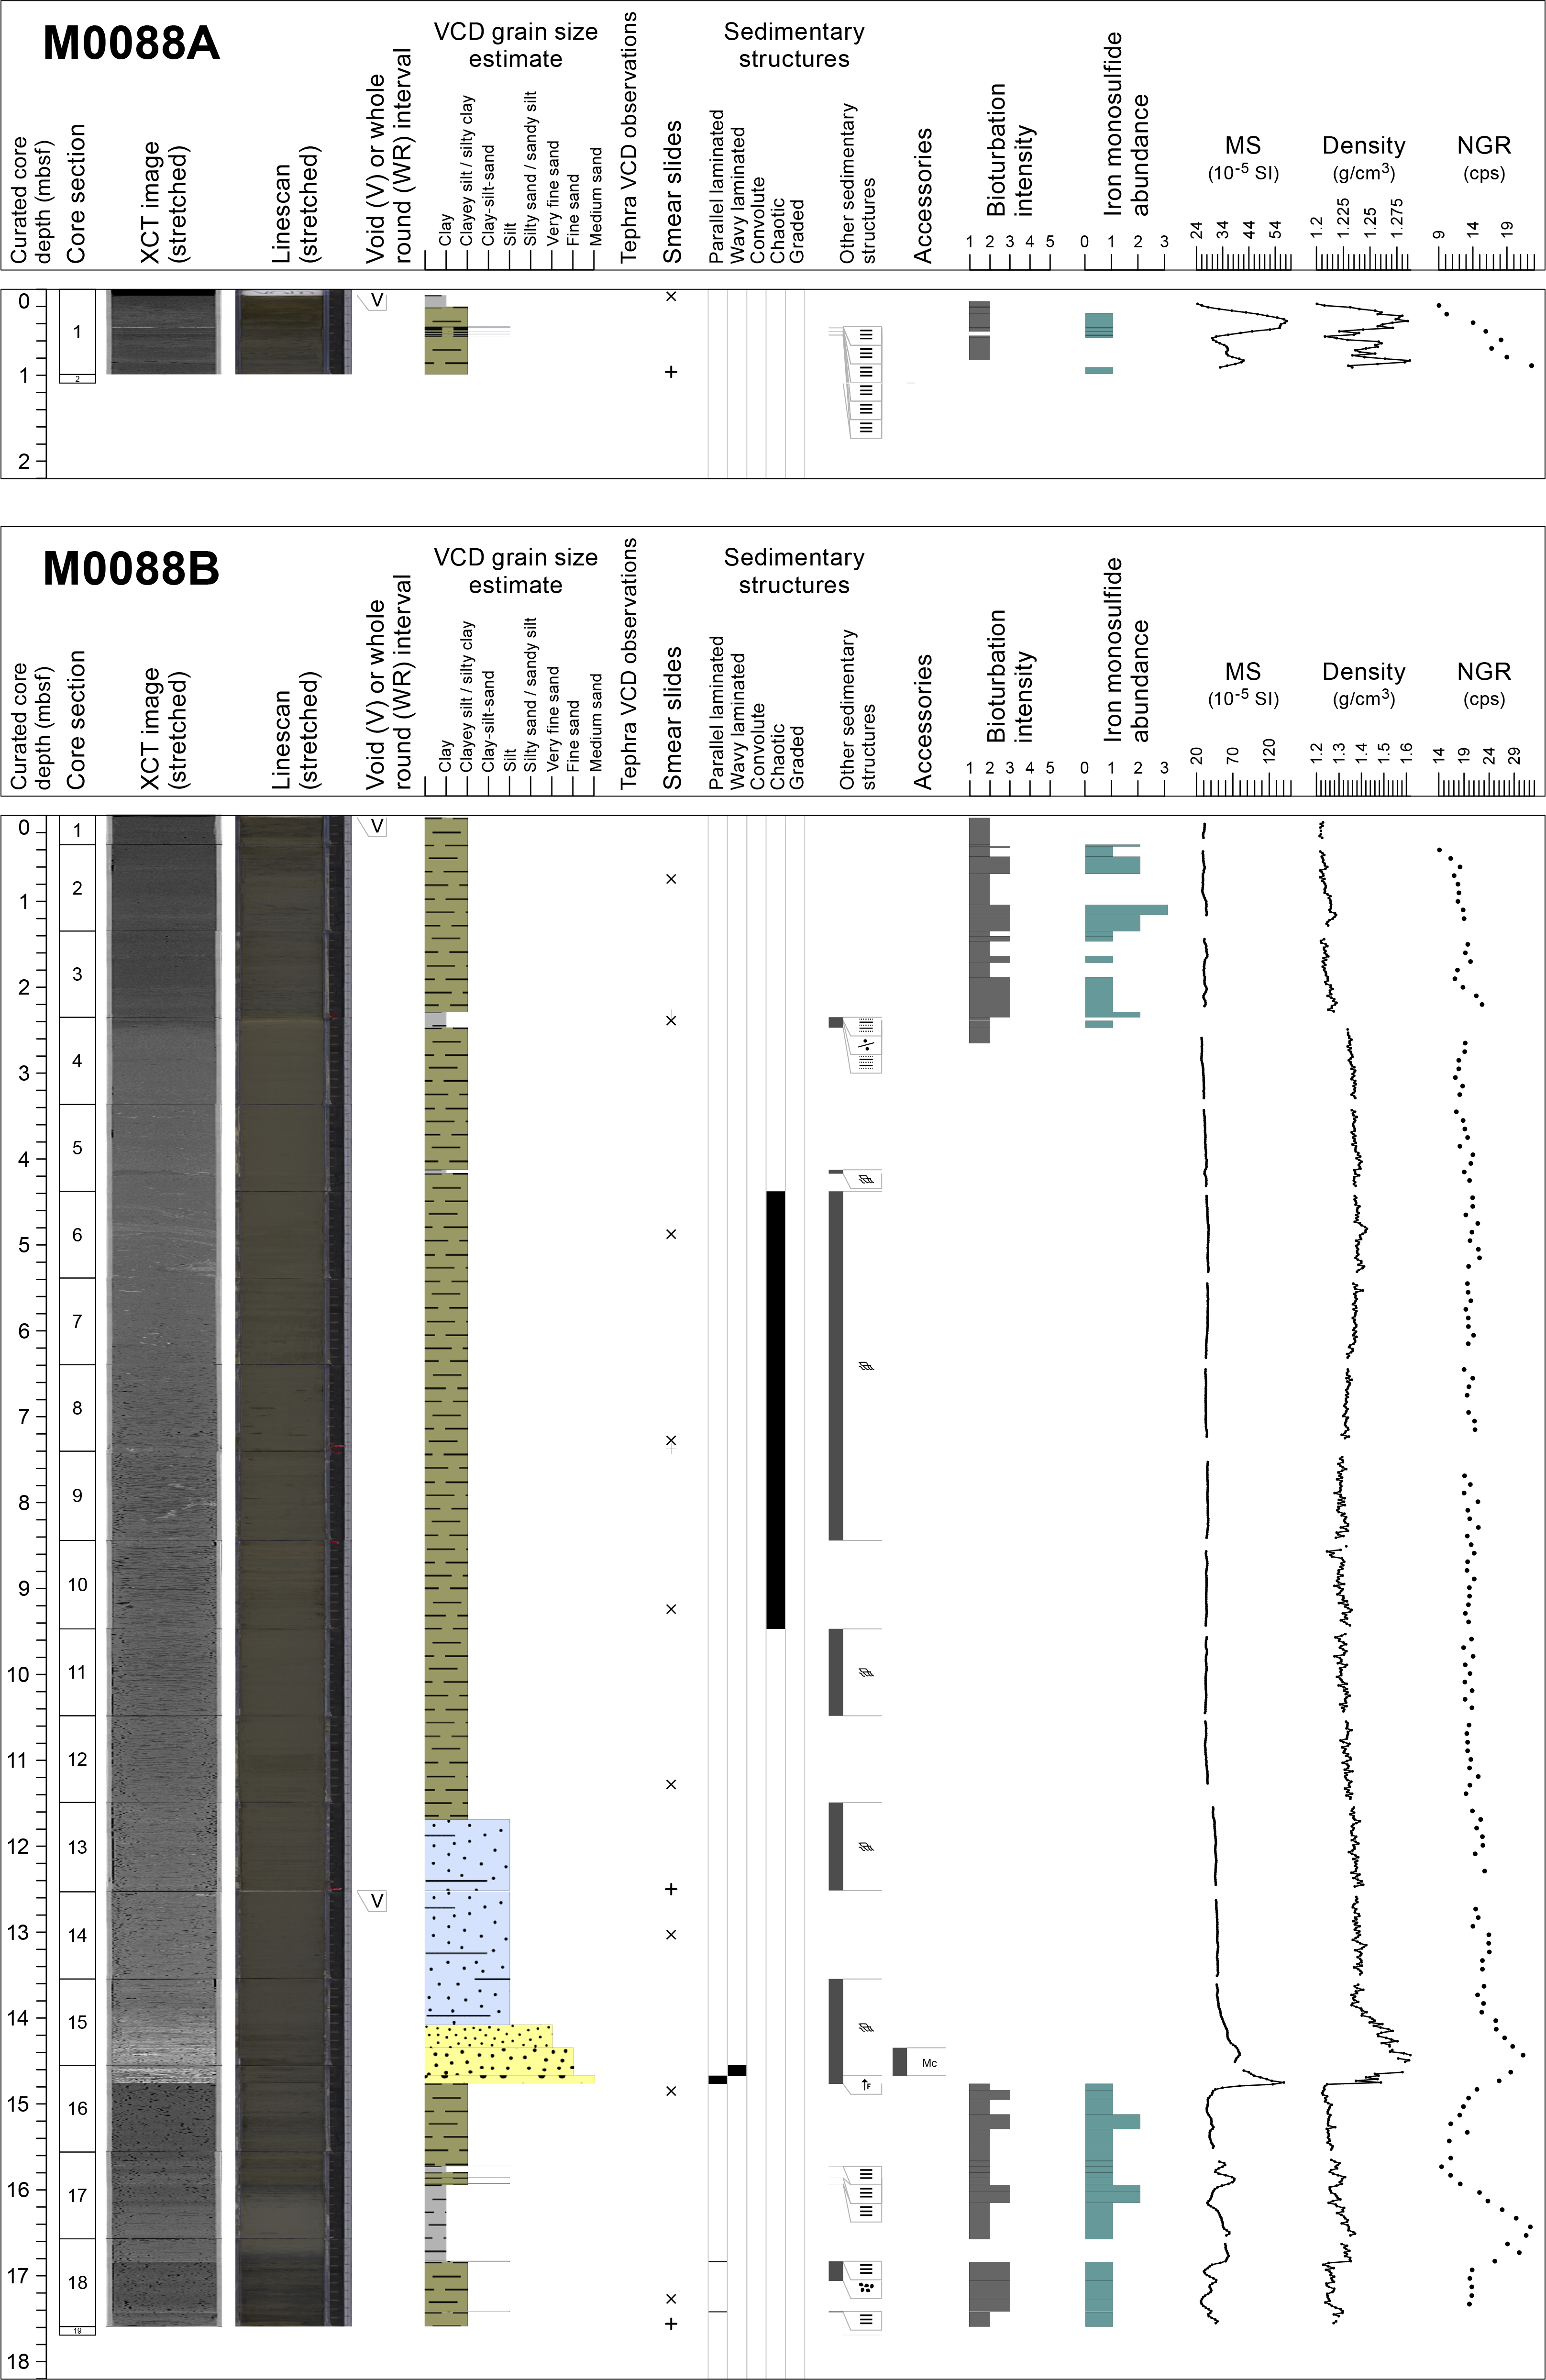
Figure F9. Lithostratigraphic summaries, Holes M0088A and M0088B.

Figure F10. Thin silt beds and laminae.
One smear slide was observed for Hole M0088A (Table T3; Figure F11). The lithology is siliceous- and lithogenic-rich clayey silt with pyrite. Clay is the most abundant mineral component (33.3%), with additional pyrite (9.5%), quartz (4.8%), and feldspar (4.8%); diatoms (33.3%) and sponge spicules (14.3%) dominate the biogenic fraction.

Figure F11. Ternary diagrams of grain size and major components.
3.1.1.2. Hole M0088B
A 17.69 m long core was recovered from Hole M0088B (Figure F9). The lithology comprises three intervals. The contacts of the intervals are gradual except for the contact between Intervals 2 and 3, which is sharp.
Interval 1 (0 to ~2.5 mbsf; Sections 386-M0088B-1H-1, 0 cm, to 1H-4, 3 cm) shows thick-bedded silty clay and clay that are slightly to moderately bioturbated. Iron monosulfide traces are sparse to abundant and mainly concentrated in Sections 1H-2, 70 cm, to 1H-3, 100 cm. Calcareous fossil fragments are observed in Section 1H-2, 76 cm.
Interval 2 (~2.5–14.8 mbsf) is divided into two parts. The upper part (~2.5–11.5 mbsf; Sections 386-M0088B-1H-4, 3 cm, to 1H-13, 20 cm) shows thick-bedded silty clay with an interbedded clay layer in interval 1H-5, 76–85 cm. The silty clay and clay are nonbioturbated and show no iron monosulfides. The silty clay shows soft-sediment deformation and includes isolated silt clasts (0.2–1 cm in size). The lower part (~11.5–14.8 mbsf; Sections 1H-13, 20 cm, to 1H-16, 21.5 cm) shows a fining-upward succession from medium sand to silt. The medium sand (interval 1H-16, 14–21.5 cm) shows parallel laminations. The fine sand (Sections 1H-15, 80 cm, to 1H-16, 14 cm) shows wavy laminations (interval 1H-16, 4–14 cm). The very fine sand to silt (Sections 1H-13, 20 cm, to 1H-15, 80 cm) shows soft-sediment deformation and includes isolated very fine sand to silt clasts. The interval shows no evidence of bioturbation and no significant traces of any iron monosulfides. The basal contact is sharp.
Interval 3 (~14.8–17.8 mbsf; Sections 386-M0088B-1H-16, 21.5 cm, to 1H-18, 102 cm) shows thick-bedded silty clay and clay. The silty clay and clay are slightly to moderately bioturbated. Iron monosulfide traces are sparse to moderate. Thin silt laminae are interbedded in the silty clay and clay in intervals 1H-17, 10–38.5 cm; 1H-18, 26–27 cm; and 1H-18, 84.5–85.5 cm (Figure F12A).
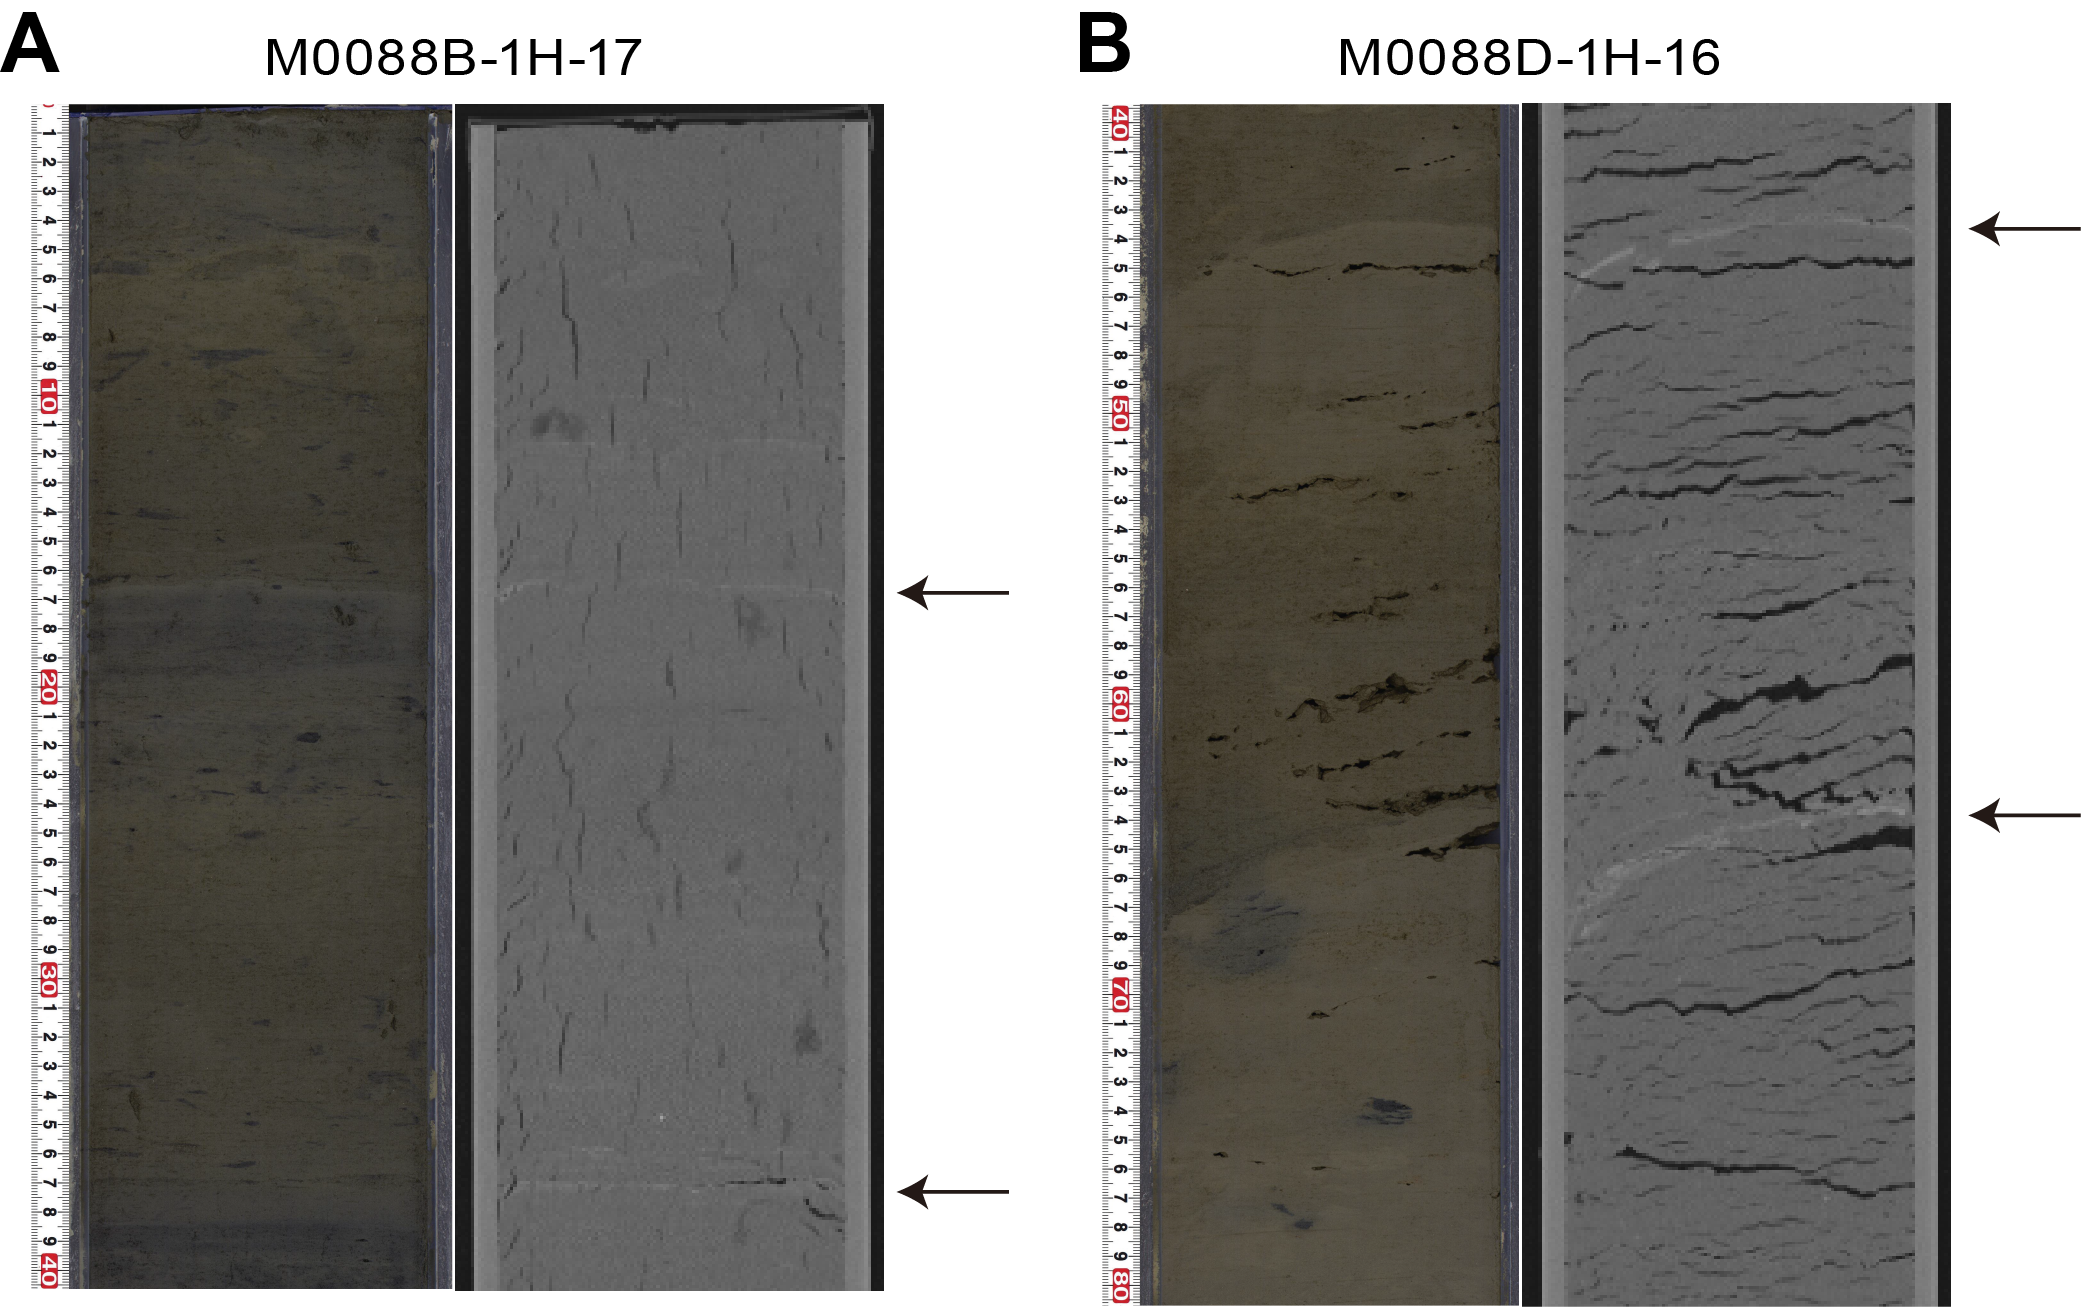
Figure F12. Thin silt layers.
Magnetic susceptibility, density, and NGR show higher values in the fine to medium sand layer in Interval 3 (Sections 386-M0088B-1H-15, 80 cm, to 1H-16, 21.5 cm) and show a sharp increase in values at the base of Interval 2 (Section 1H-16, 21.5 cm). In addition, NGR shows higher values and an upward decreasing trend in correlation with the clay lithology of Sections 1H-17, 38.5 cm, to 1H-18, 26 cm. Magnetic susceptibility and density show slightly higher values and an upward decreasing trend in correlation with the clay lithology (see Physical properties).
Nine smear slides were observed for Hole M0088B (Table T3). The observed lithologies mostly vary between lithogenic- and siliceous-rich silt/silty clay and lithogenic-bearing/rich siliceous ooze (Figures F11, F13). The main mineral components are clay minerals (4%–38.9%), quartz (3.2%–21.7%), pyrite (0%–12%), and feldspar (0%–12%). Diatoms are the most common biogenic component of the sediment (16.7%–38.5%), except in Section 386-M0088B-1H-4, where sponge spicules represent 64.5% of the biogenic fraction. Smear slides of Samples 1H-10, 80 cm, and 1H-14, 50 cm, show 4% foraminifera.
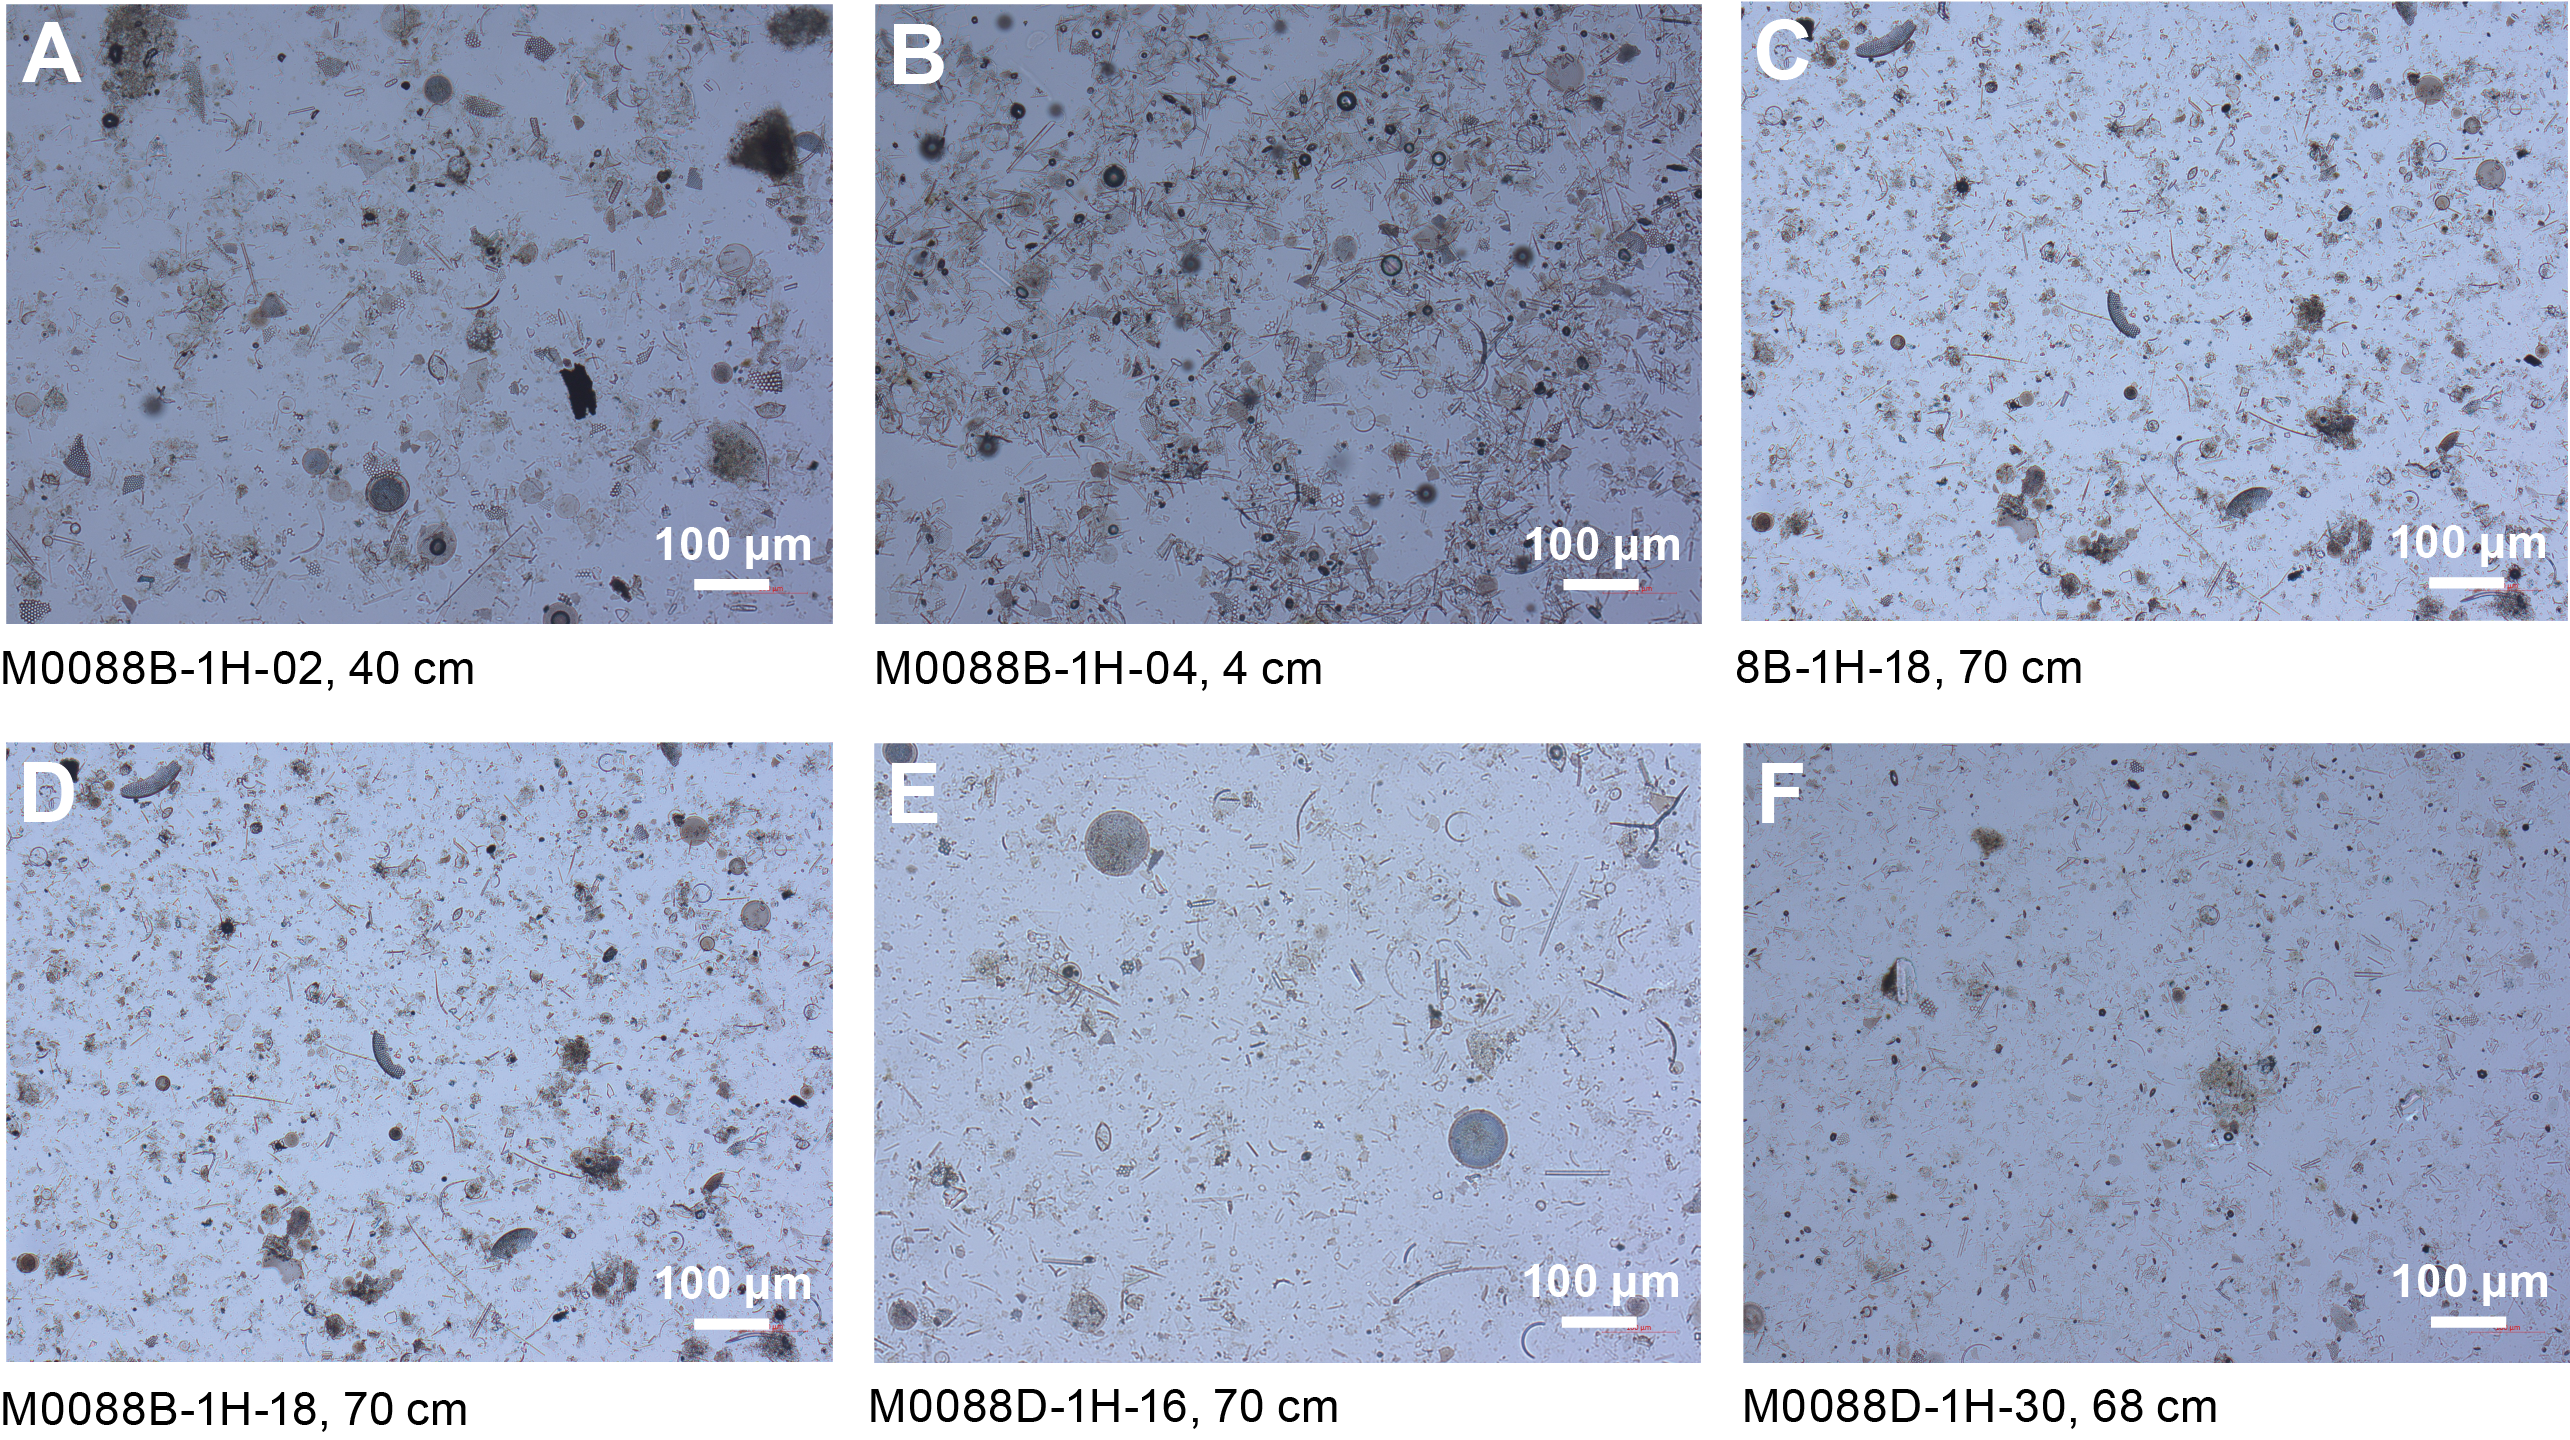
Figure F13. Lithologic components.
3.1.2. Holes M0088C and M0088D
3.1.2.1. Hole M0088C
A 0.96 m long core was recovered from Hole M0088C (Figure F14). The main lithology identified from visual core description is clay to silty clay with slight to moderate bioturbation. The uppermost 1 cm of the core is an oxidized reddish layer, indicating that the surface of the seafloor was probably recovered. Thin silt laminae (~2 mm thick) are observed within the silty clay in interval 1P-1, 51.5–54.2 cm (Figure F10B). Magnetic susceptibility and density values increase toward the base of the core except in the lowermost 6 cm. Silt laminae correlate with high magnetic susceptibility and bulk density values. NGR increases toward the bottom of the hole (see Physical properties).
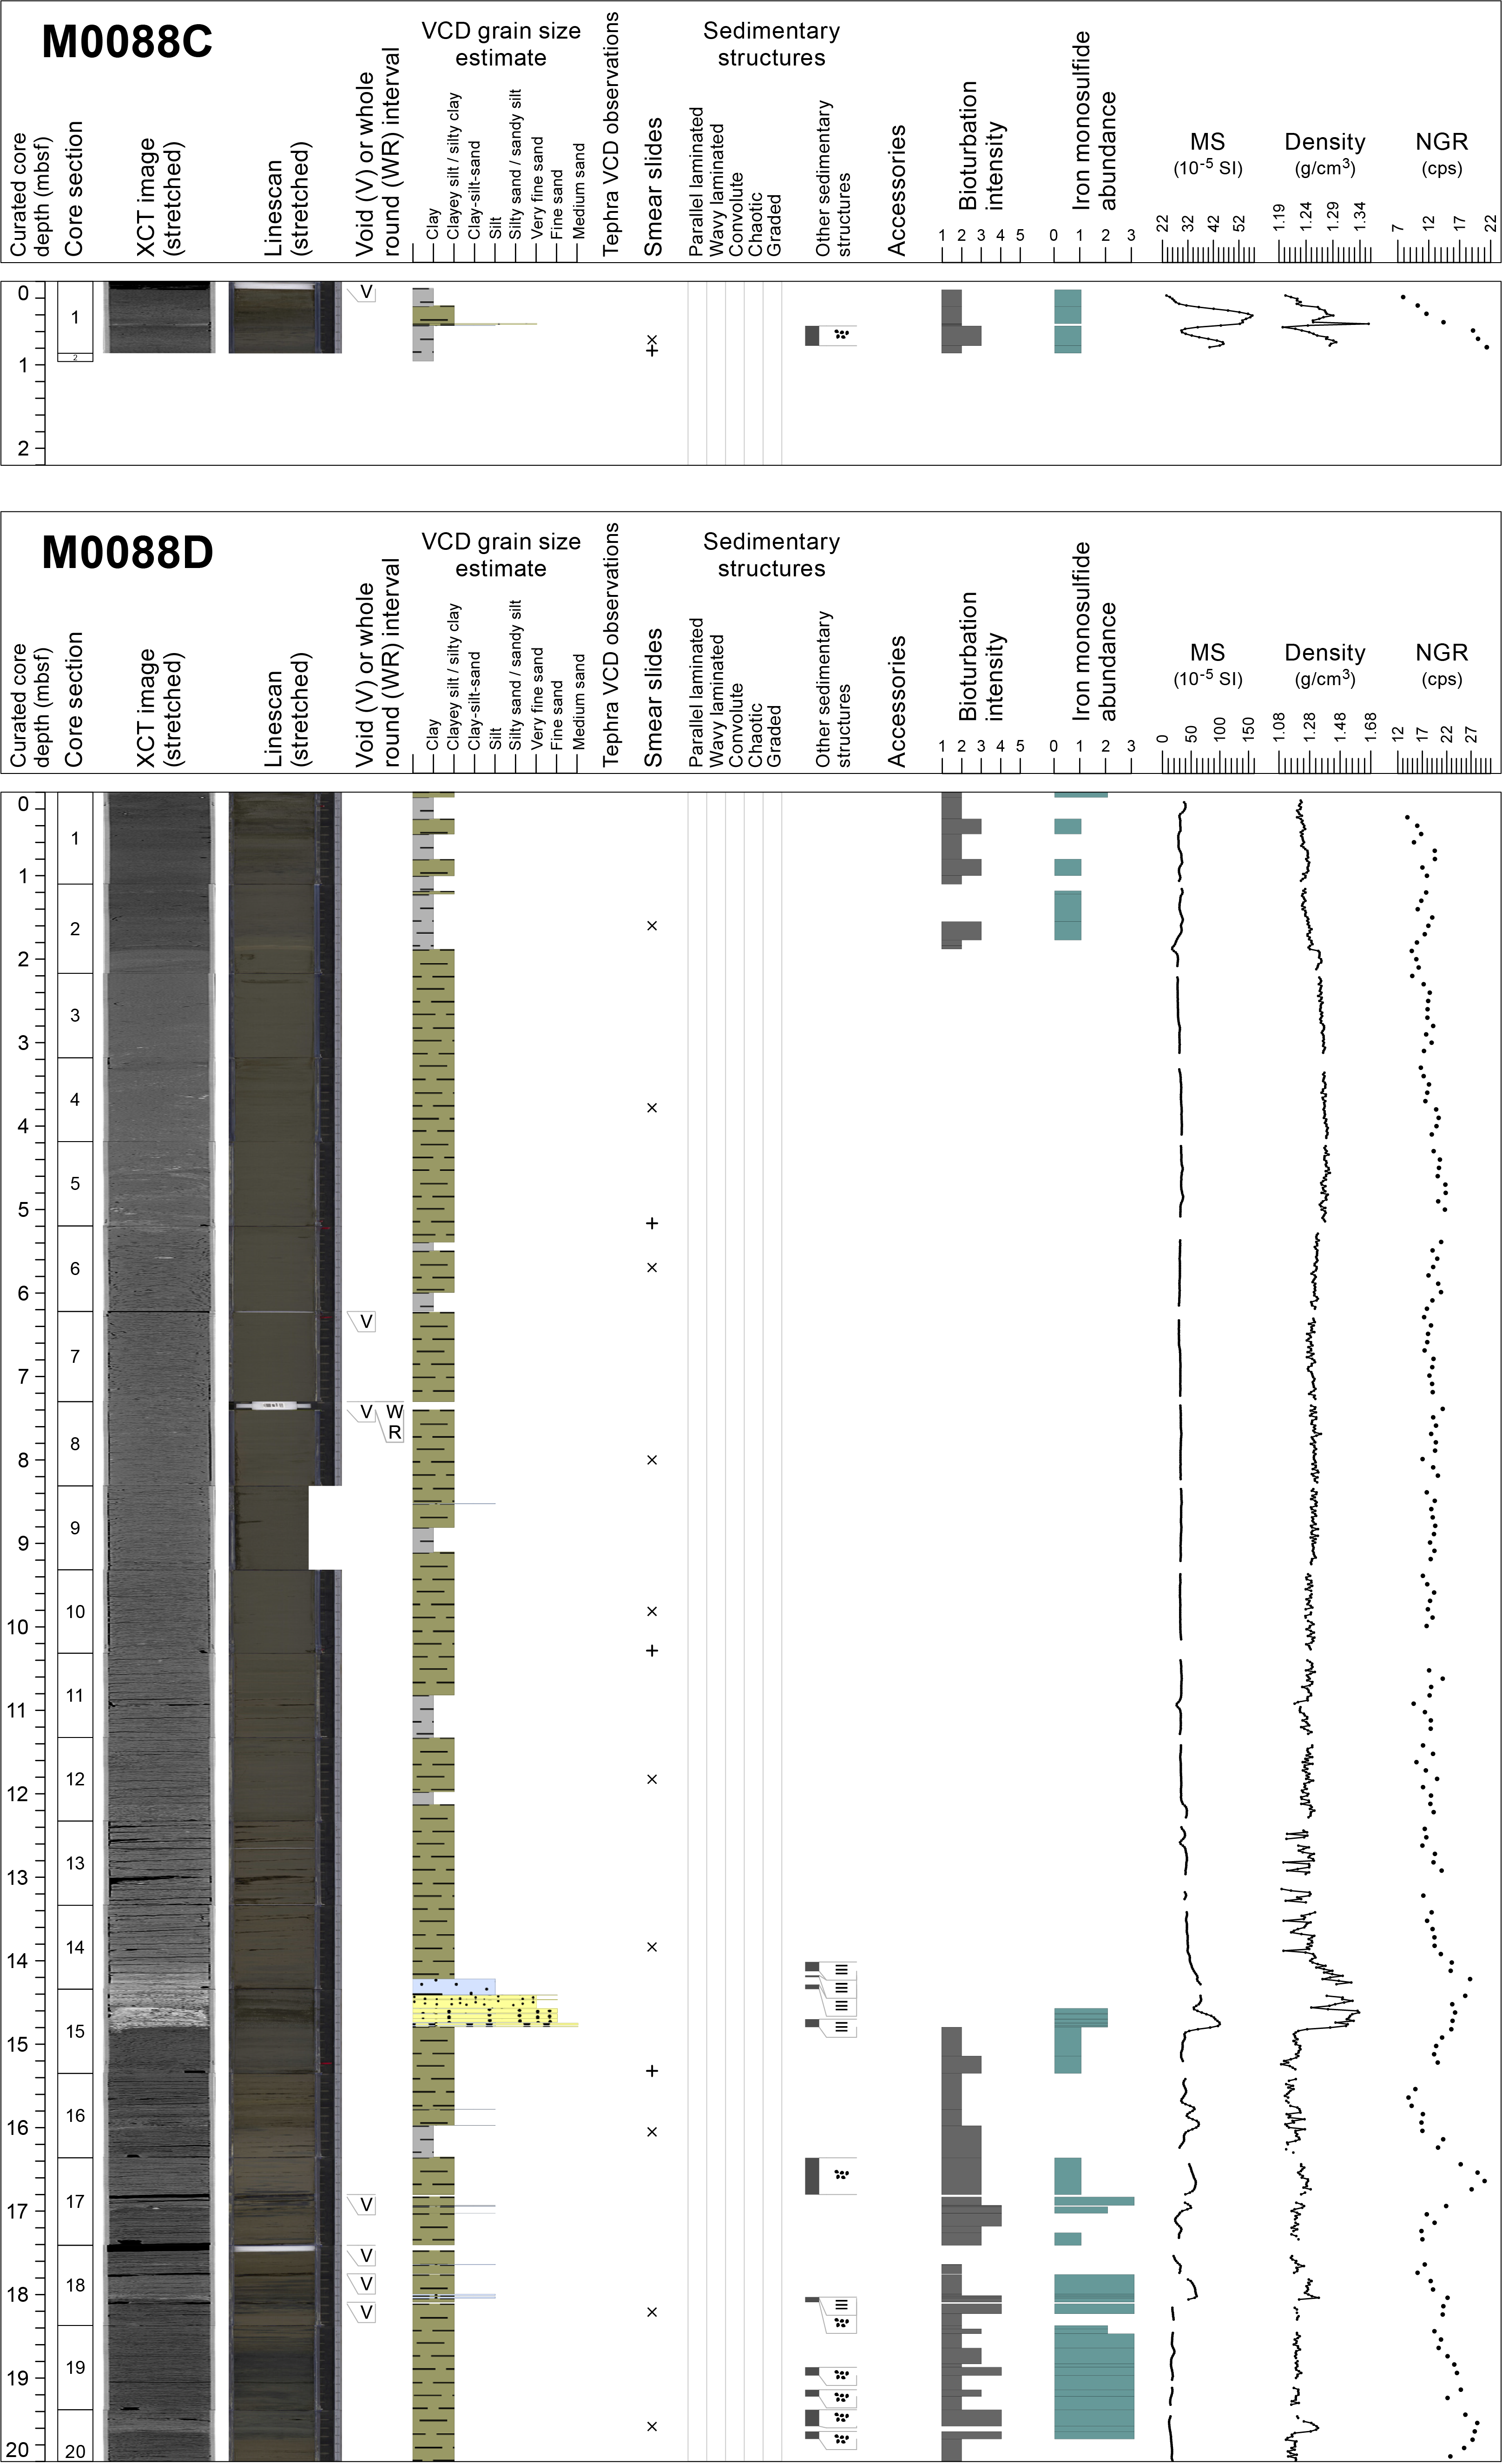

Figure F14. Lithostratigraphic summaries, Holes M0088C and M0088D.
One smear slide sample was collected in Hole M0088C (Table T3). The lithology is defined as lithogenic-rich siliceous ooze (Figure F11). Biosiliceous components are the most abundant (diatoms [27.8%] and sponge spicules [27.8%]). Clay (38.9%) and quartz (5.6%) are the main mineral components.
3.1.2.2. Hole M0088D
A 36.48 m long core was recovered from Hole M0088D (Figure F14). The lithology comprises five main intervals. The contacts between intervals are gradual except for the basal contacts of Intervals 3 and 4, which are sharp.
Interval 1 (0 to ~2 mbsf; Sections 386-M0088D-1H-1, 0 cm, to 1H-2, 78 cm) shows thick-bedded silty clay and clay that are slightly to moderately bioturbated. Iron monosulfide traces are sparse to moderate. The bottom 11 cm of this interval (interval 1H-2, 67–78 cm) includes isolated silt and silty clay clasts.
Interval 2 (~2–14.8 mbsf) is divided into two parts. The upper part (~2–14.2 mbsf; Sections 386-M0088D-1H-2, 78 cm, to 1H-14, 68 cm) shows thick-bedded silty clay and clay (Figure F15). Thin silt laminae are interbedded in the silty clay in interval 1H-9, 21–21.5 cm. The silty clay and clay are nonbioturbated and show no iron monosulfides. The silty clay and clay show soft-sediment deformation that includes isolated silt clasts. The lower part (~14.2–14.8 mbsf; Sections 1H-14, 68 cm, to 1H-15, 45.5 cm) shows a fining-upward succession from medium sand to silty clay. The medium sand (interval 1H-15, 41–45.5 cm) and fine sand (interval 1H-15, 23–41 cm) include ~1 cm thick silt laminae. The medium sand shows moderate iron monosulfide traces. The very fine sand (interval 1H-15, 6.5–23 cm) includes laminae of fine sand and silt in interval 1H-15, 6.5–12.5 cm. The silt (Sections 1H-14, 88 cm, to 1H-15, 6.5 cm) includes laminae of thin very fine sand. The silty clay (interval 1H-14, 68–88 cm) includes laminae of thin silt. The interval shows no bioturbation. The basal contact of the interval is sharp.
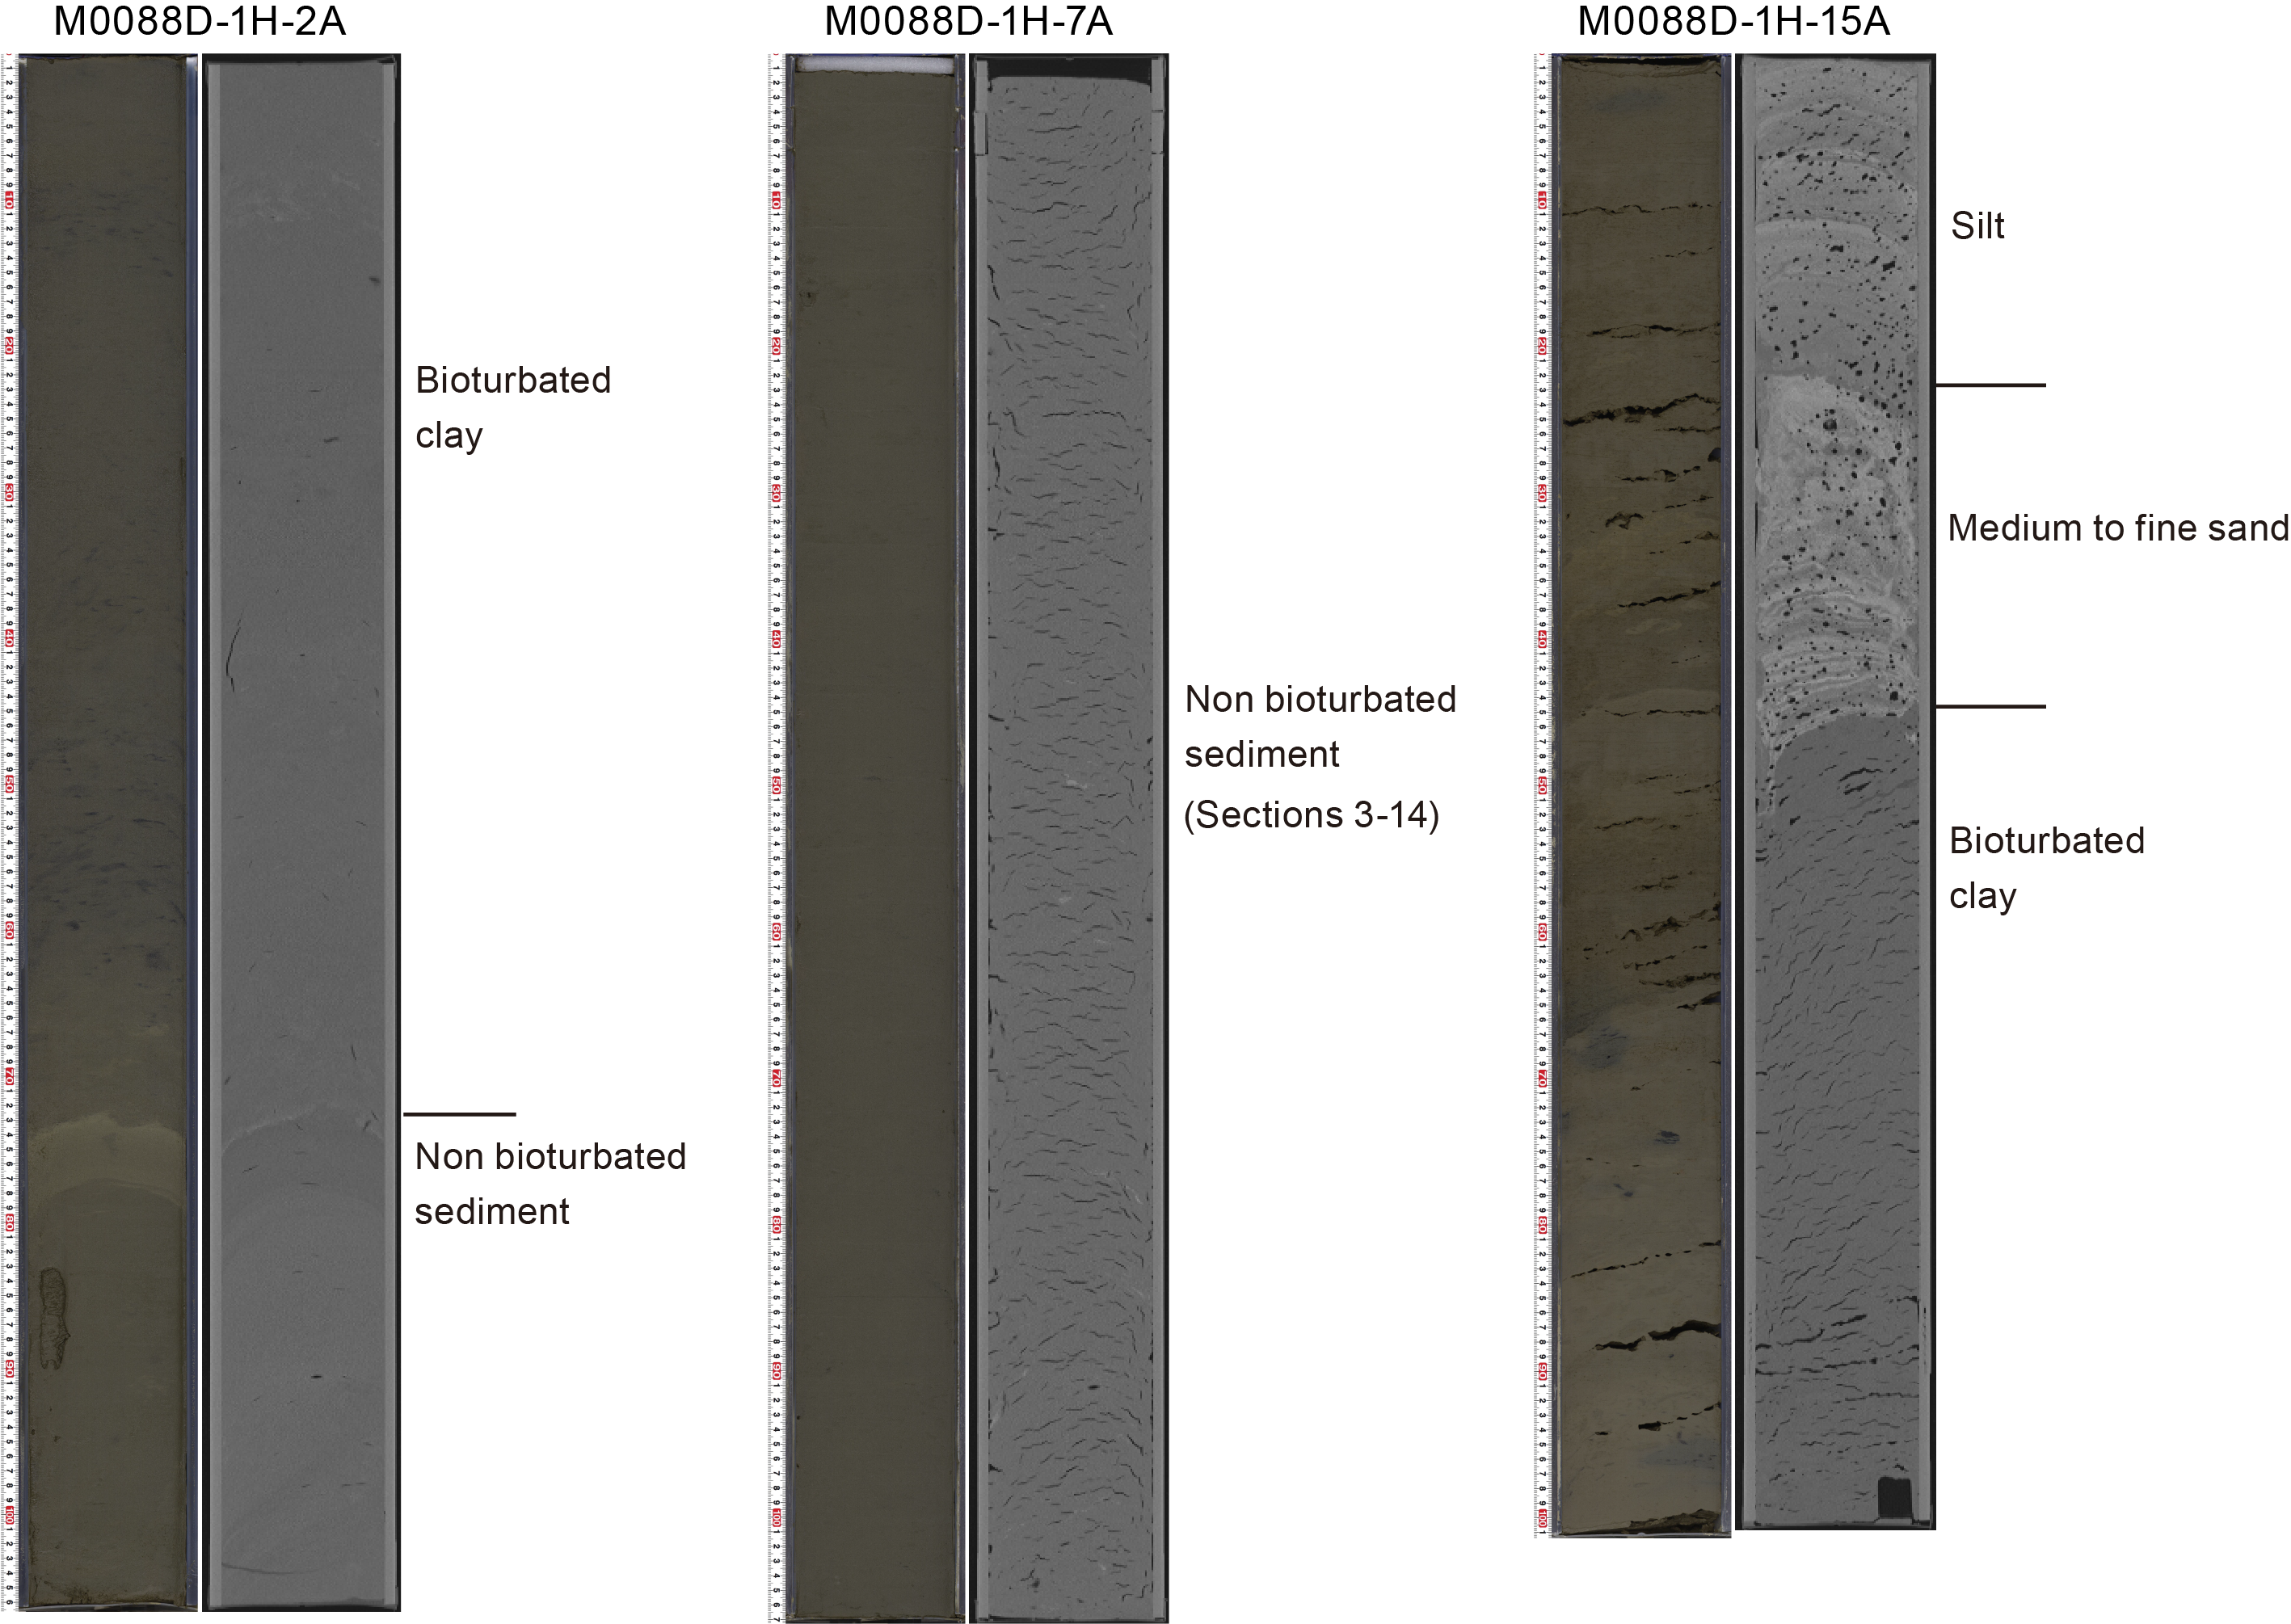
Figure F15. Bioturbation and fining-upward succession.
Interval 3 (~14.8–30.1 mbsf; Sections 386-M0088D-1H-15, 45.5 cm, to 1H-30, 61 cm) shows thick-bedded silty clay with interbedded clay layers in intervals 1H-16, 62.7–101 cm and 1H-22, 46–49 cm. The silty clay and clay are slightly to heavily bioturbated. Iron monosulfide traces are sparse to abundant. Thin silt laminae are interbedded in the silty clay in intervals 1H-16, 43–62.7 cm; 1H-17, 57–66.7 cm; 1H-18, 22.5–23.5 cm; 1H-18, 58.5–63.5 cm; 1H-23, 24–26 cm; and 1H-25, 82–83.1 cm (Figure F12B). The silty clay includes white clasts (~2 cm) in Sections 1H-28, 2 cm; 1H-28, 6 cm; and 1H-28, 68 cm, that are possible ikaite occurrences (Figure F16). The lower part shows a fining-upward medium sand to clay succession overlain by a centimeter-scale silt layer in interval 1H-30, 28–68.2 cm (Figure F17A), that shows no bioturbation. The basal contact of this interval is sharp.
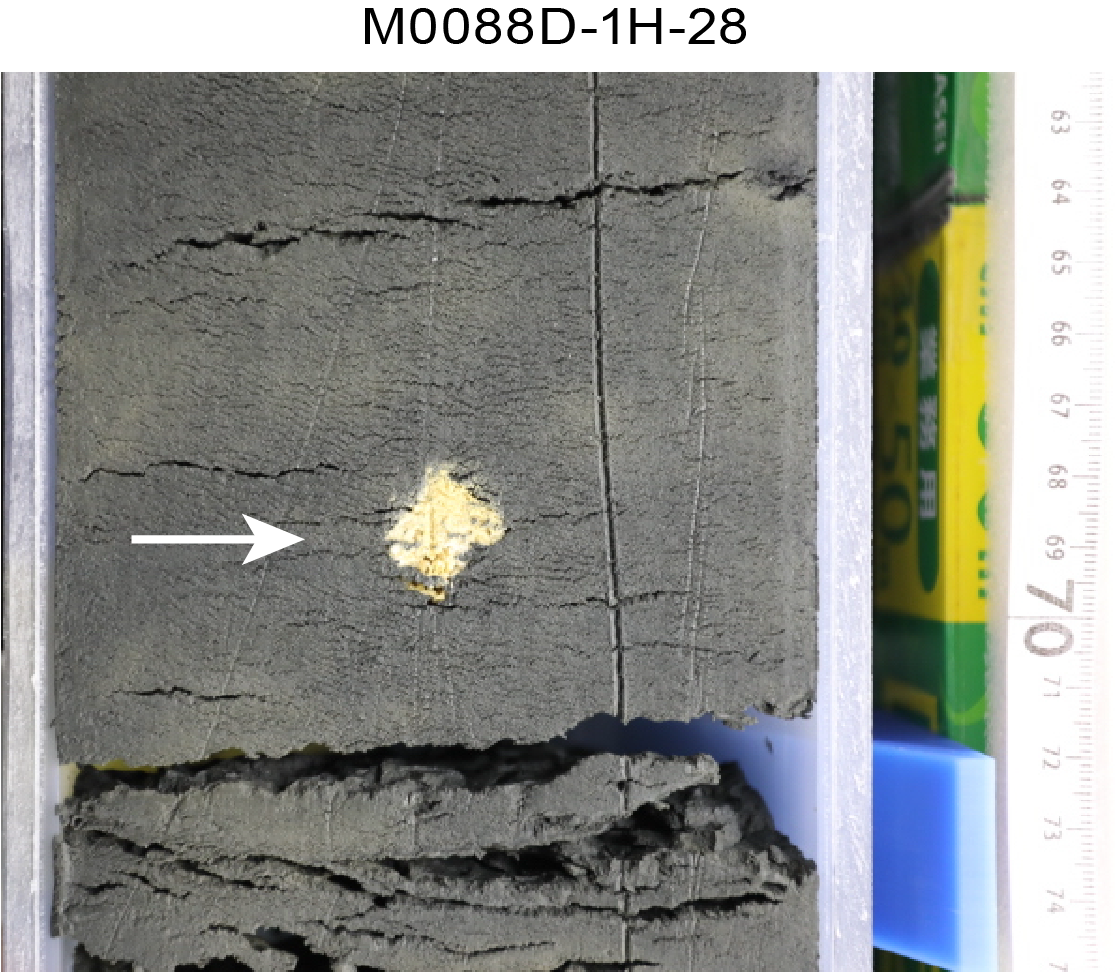
Figure F16. Possible ikaite occurrence.
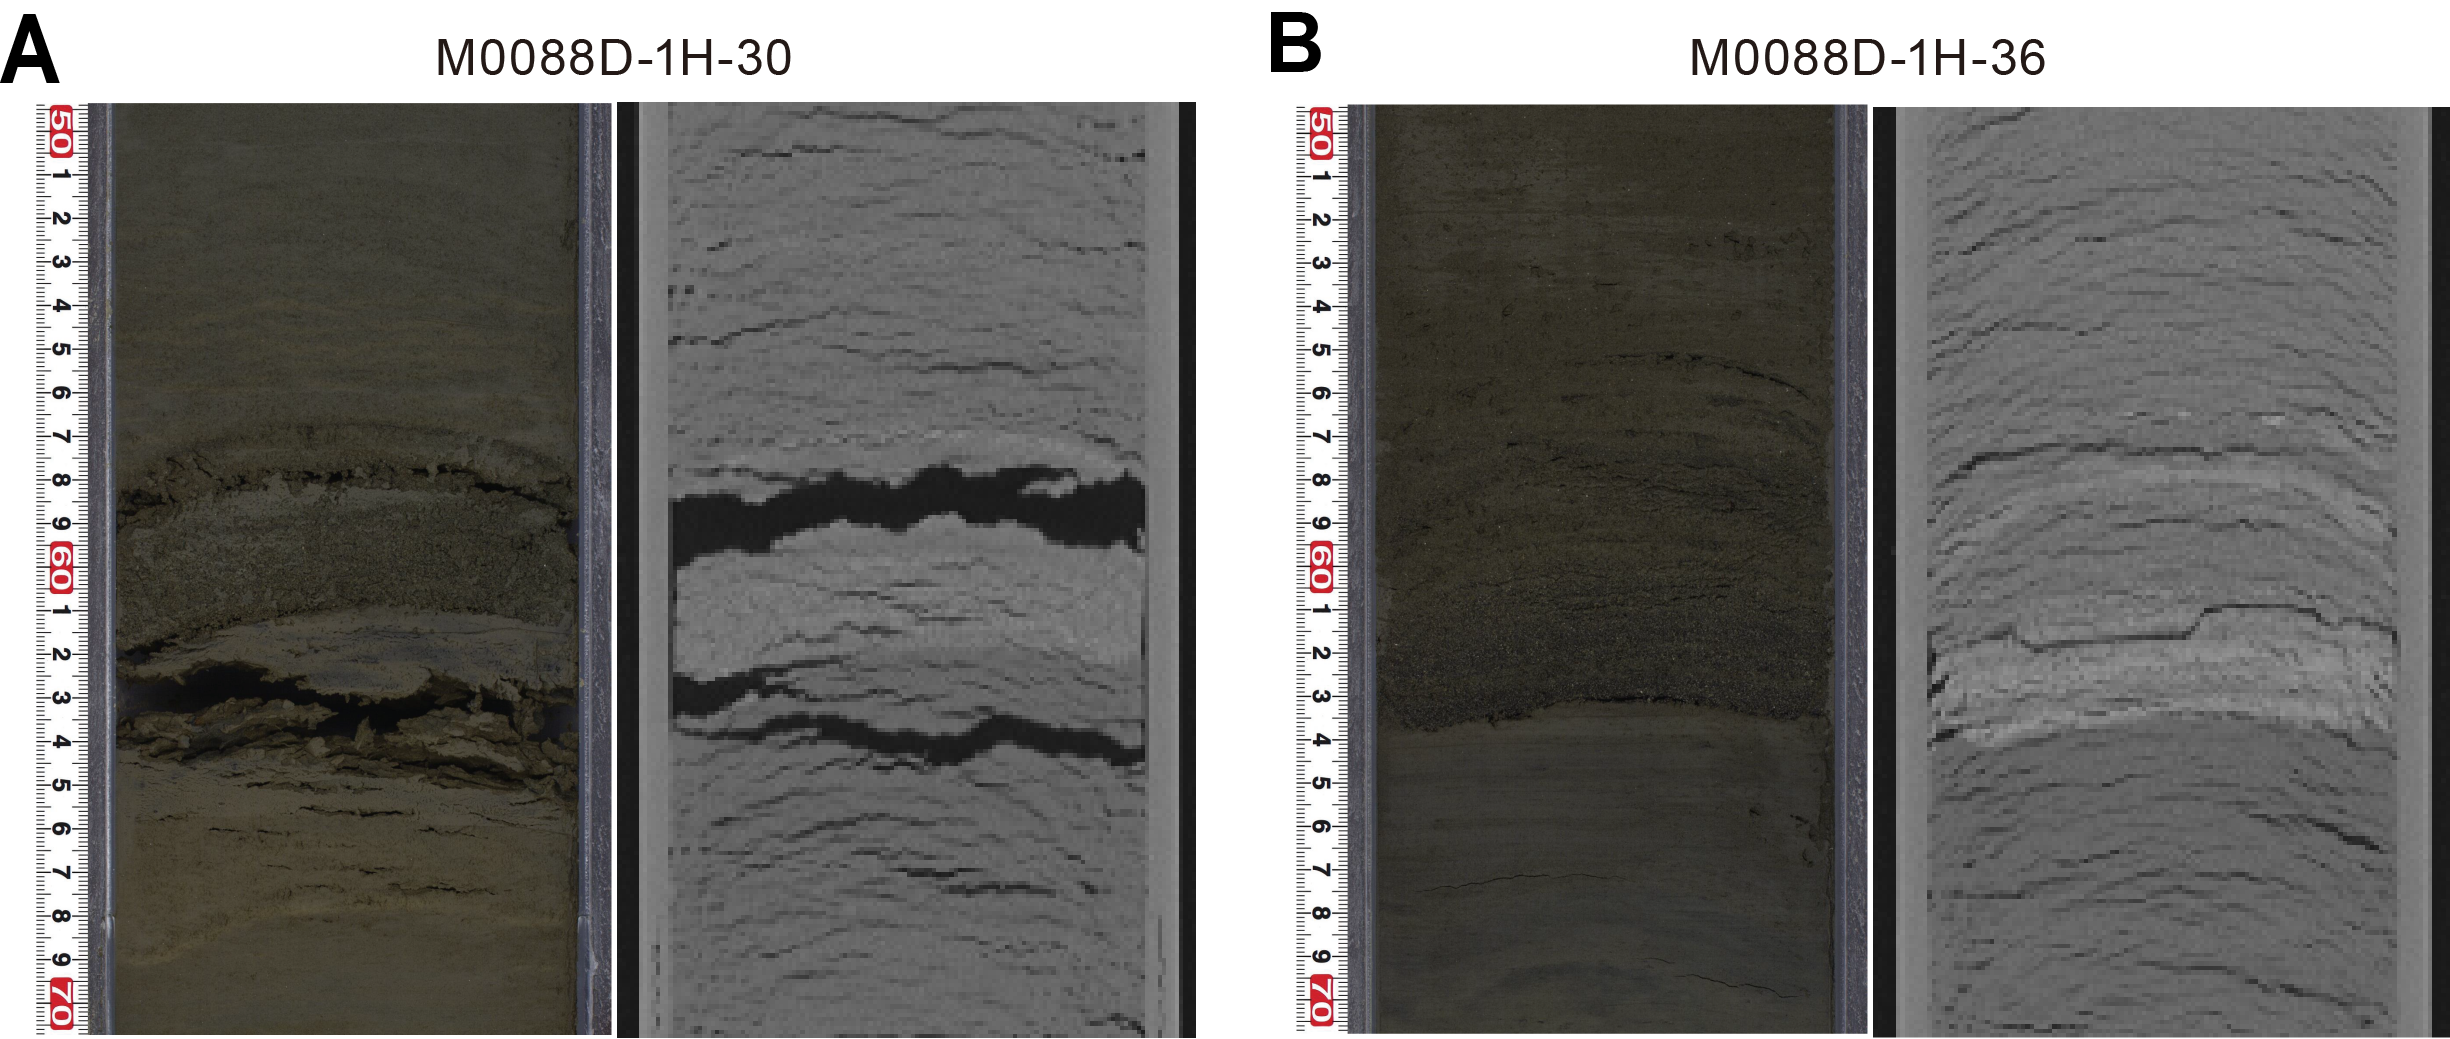
Figure F17. Fining-upward successions with sharp basal contacts.
Interval 4 (~30.1–35.6 mbsf; Sections 386-M0088D-1H-30, 61 cm, to 1H-36, 67 cm) shows thick-bedded silty clay and clay. The silty clay includes a fining-upward medium sand to silt succession in interval 1H-36, 40–67 cm (Figure F17B). The upper part of the interval (Sections 1H-29, 58 cm, to 1H-31, 14 cm) shows slightly to moderate bioturbation, whereas the lower part (Sections 1H-31, 14 cm, to 1H-36, 67 cm) shows no bioturbation. Iron monosulfide traces are sparse. The basal contact of this interval is sharp.
Interval 5 (~35.6–36.5 mbsf; Sections 386-M0088D-1H-36, 67 cm, to 1H-37, 53 cm) shows thick-bedded silty clay and clay. Iron monosulfide traces are sparse. The interval shows no bioturbation.
Magnetic susceptibility, density, and NGR show higher values at the fine to medium sand layer in Interval 2 (interval 386-M0088D-1H-15, 6.5–45.5 cm) and Interval 5 (interval 1H-36, 40–67 cm). Magnetic susceptibility and density show a sharp increase at the base of the interval (Sections 1H-15, 45.5 cm, and 1H-36, 67 cm). Values decrease toward the top of the interval in correlation with the fining-upward trend in grain size. NGR shows the highest value at the silt part of Intervals 2 and 5 (Sections 1H-14, 88 cm, to 1H-15, 4 cm, and interval 1H-36, 40–57 cm), and values decrease toward the upper and lower part of the interval. High NGR values are often recognized in Intervals 3–5. The high NGR values not only correspond with silt and sand but also clayey silt/silty clay (Sections 1H-25, 58.8 cm, to 1H-27, 67.9 cm). Magnetic susceptibility and density values do not change, producing a smooth profile in the clayey silt/silty clay part (see Physical properties).
A total of 18 smear slides were observed for Hole M0088D (Table T3). The observed lithologies mostly vary between siliceous-rich lithogenic silty clay and lithogenic-bearing/rich siliceous ooze (Figures F11, F13). The main components for lithic grains are clay minerals (7.1%–62.5%), quartz (0%–23.8%), pyrite (0%–14.3%), and feldspar (0%–22.2%). For biogenic materials, common components are diatoms (3.6%–53.8%) and sponge spicules (4.8%–71.4%). Smear slides for Samples 386-M0088D-1H-3, 68 cm, and 1H-12, 50 cm, include minor foraminifer and calcareous nannofossil components (<1%). Sample 1H-34, 70 cm, includes a relatively large percentage of foraminifera (14.3%).
3.2. X-ray diffraction mineralogy
XRD mineralogy was conducted for one sample every two sections, and the most abundant mineral and/or mineral groups are summed and shown as a downcore cumulative abundance plot with depth for the longest hole in each basin, in this case Hole M0088D (Figure F18). Some of these mineral groupings will require additional processing to extract a signal for each mineral. For example, clays, carbonates, amphiboles, pyroxenes, and heavy minerals are composed of several minerals in each grouping (see Lithostratigraphy in the Expedition 386 methods chapter [Strasser et al., 2023a]). The interpretation of the mineralogy is preliminary at this stage; however, some interpretations can be made when the data are compared with the smear slides (Figures F19, F20) and lithostratigraphic summaries (Figures F9, F14). For Hole M0088D, the most abundant minerals are quartz, feldspar, and clays, followed by micas (muscovite and biotite). The data show correspondence between quartz, feldspar, clays, and micas, and the smear slide data also show them as the most abundant minerals (Table T3). Palygorskite, a clay associated with the weathering of glasses, occurs in the core (0–3, 19–23, and 29–30 mbsf), in most instances where there are vitric grains or tephra. The amphibole group minerals are absent in this data set, and there are minor occurrences of the heavy minerals (35 mbsf) and pyroxene (11–13 and 25–36 mbsf) that correlate with silty clay intervals. Carbonate is rare in most of the cores; however, the XRD data indicate it is present in Hole M0088D at 15 and 35 mbsf. Pyrite is also detected at 3–7, 11–13, and 30–35 mbsf. Future studies will be required to fully extract the bulk mineralogy of the sediments in these two holes.
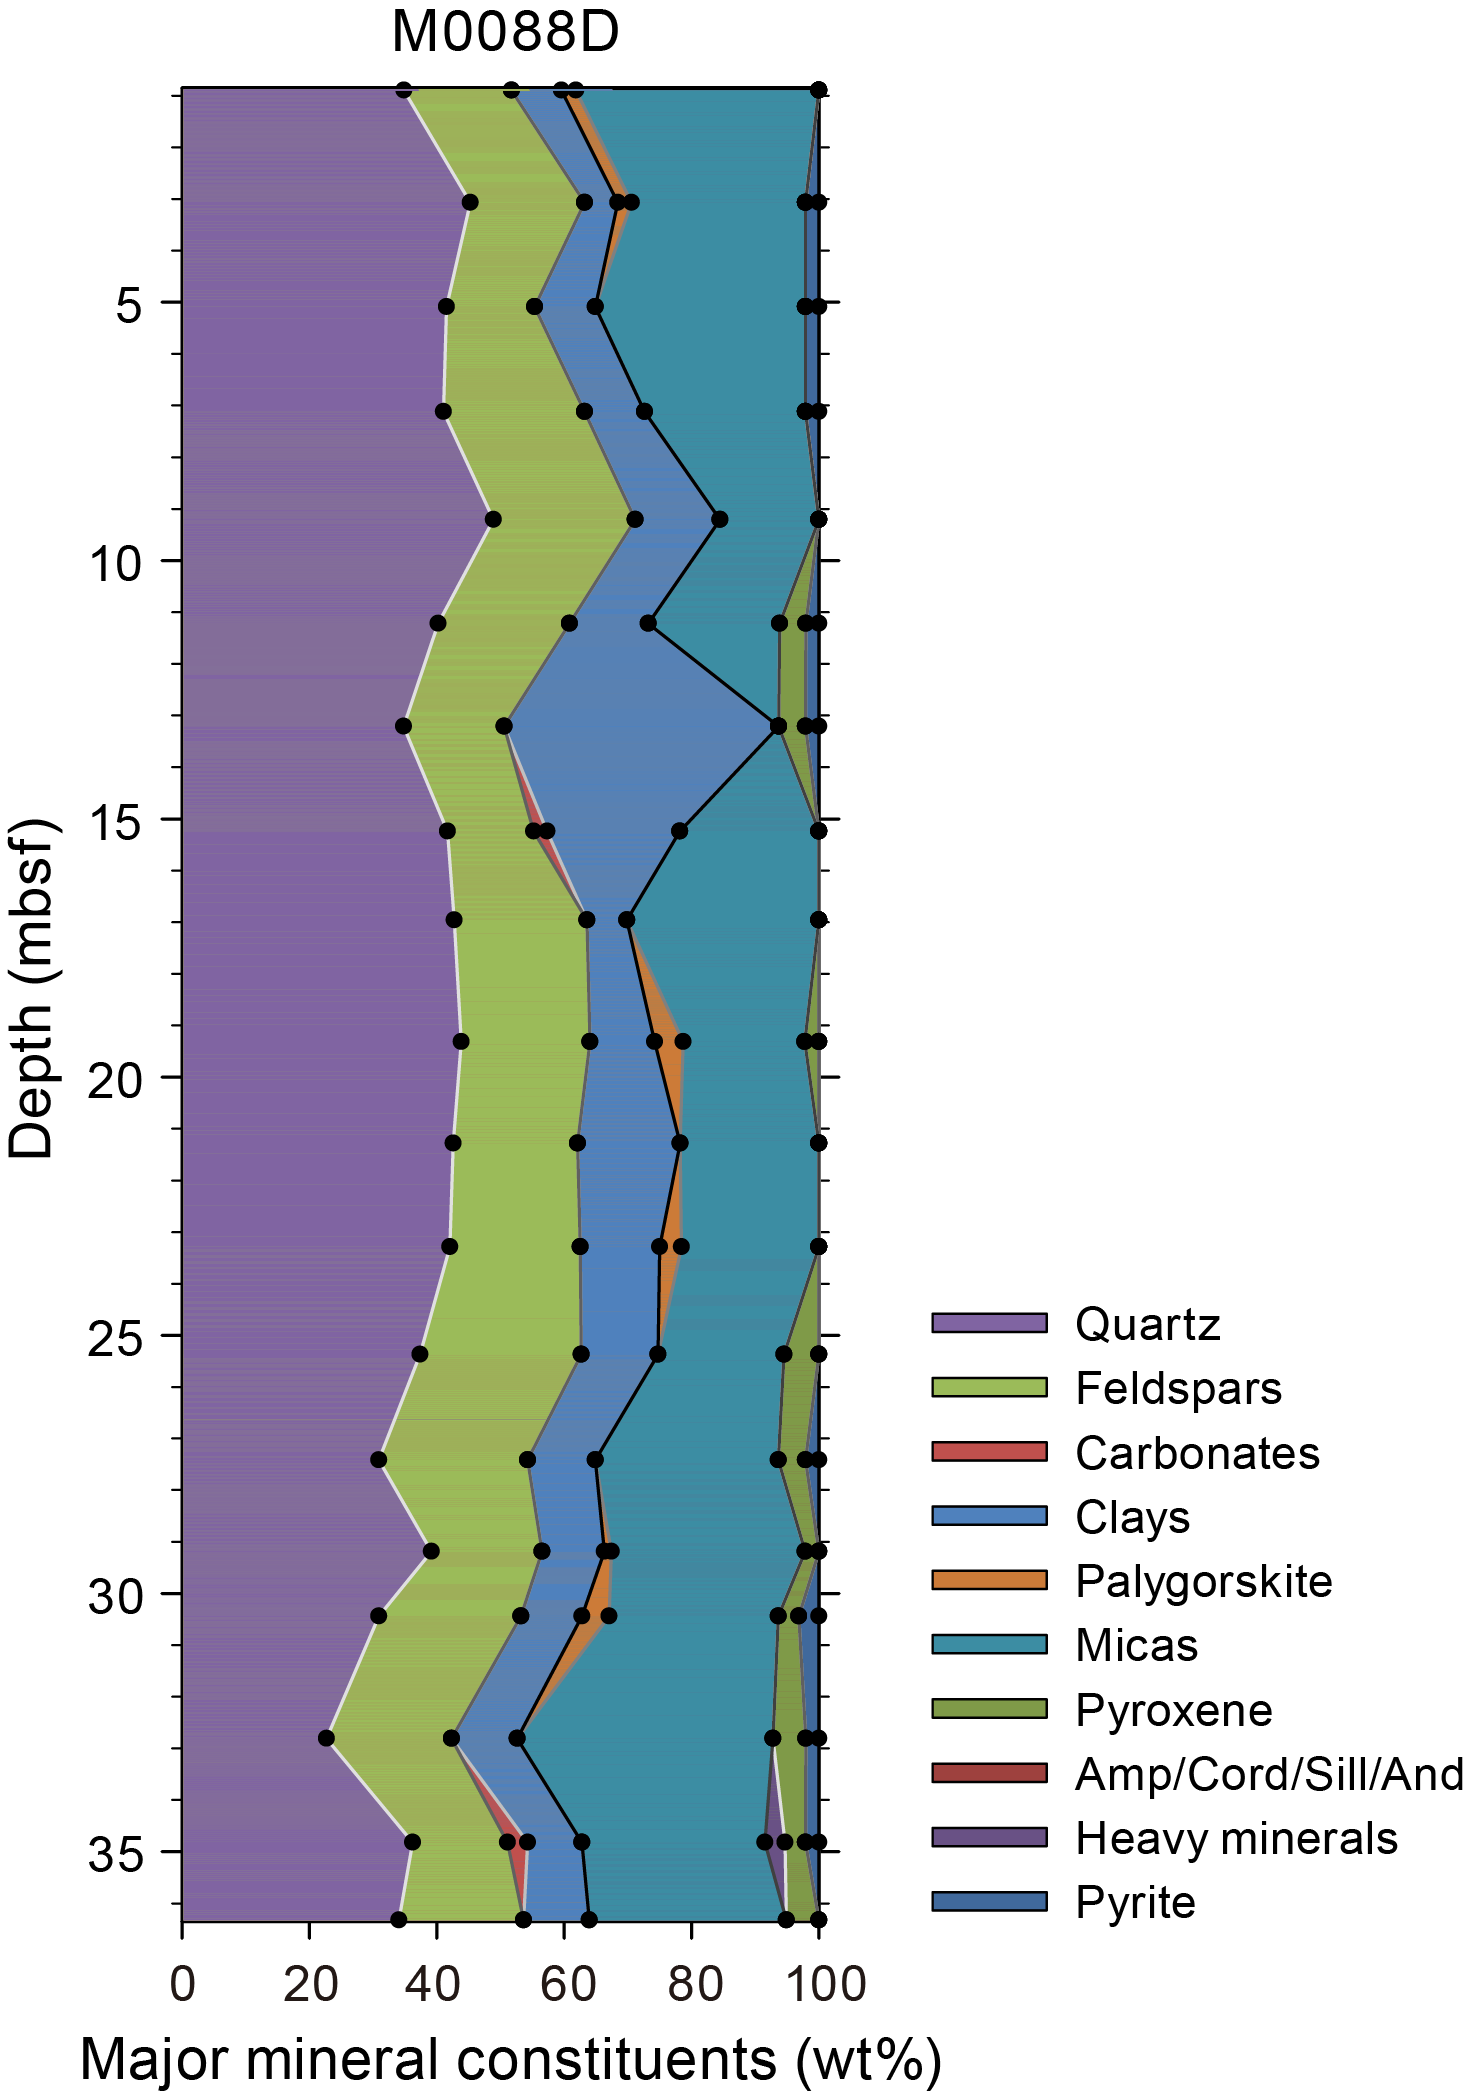
Figure F18. XRD mineralogy.

Figure F19. Smear slide summaries, Holes M0088A and M0088B.
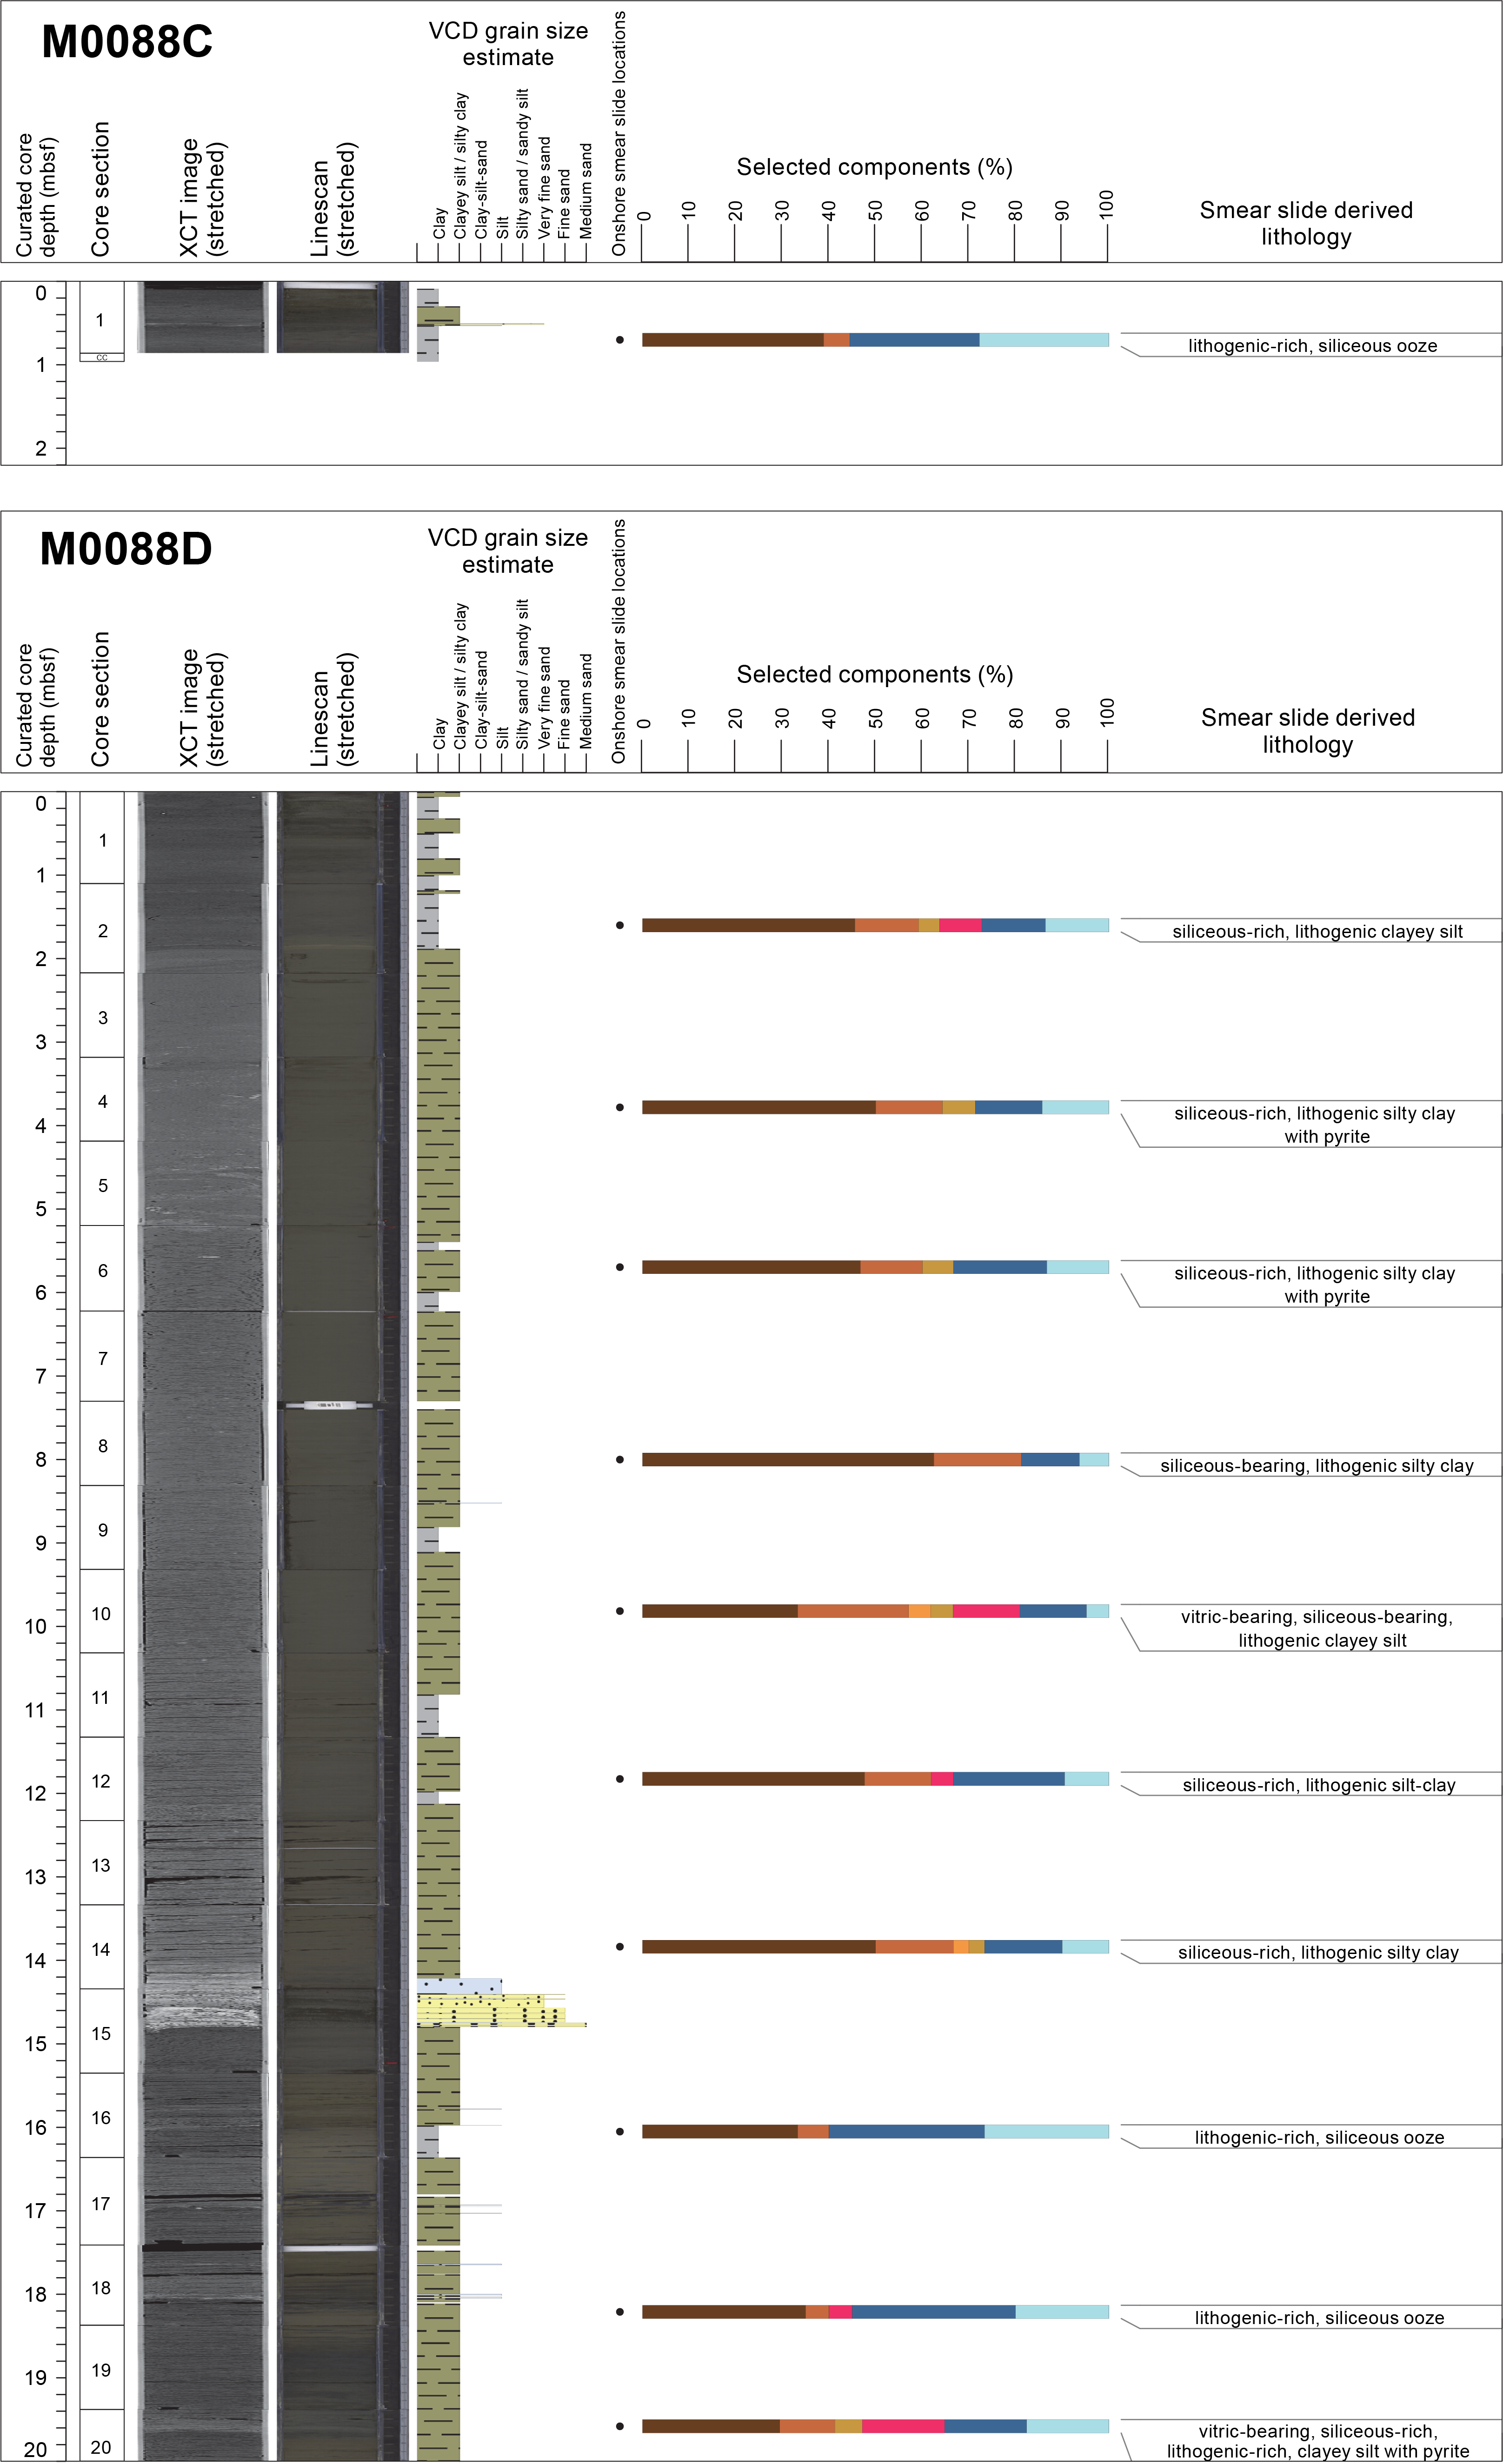
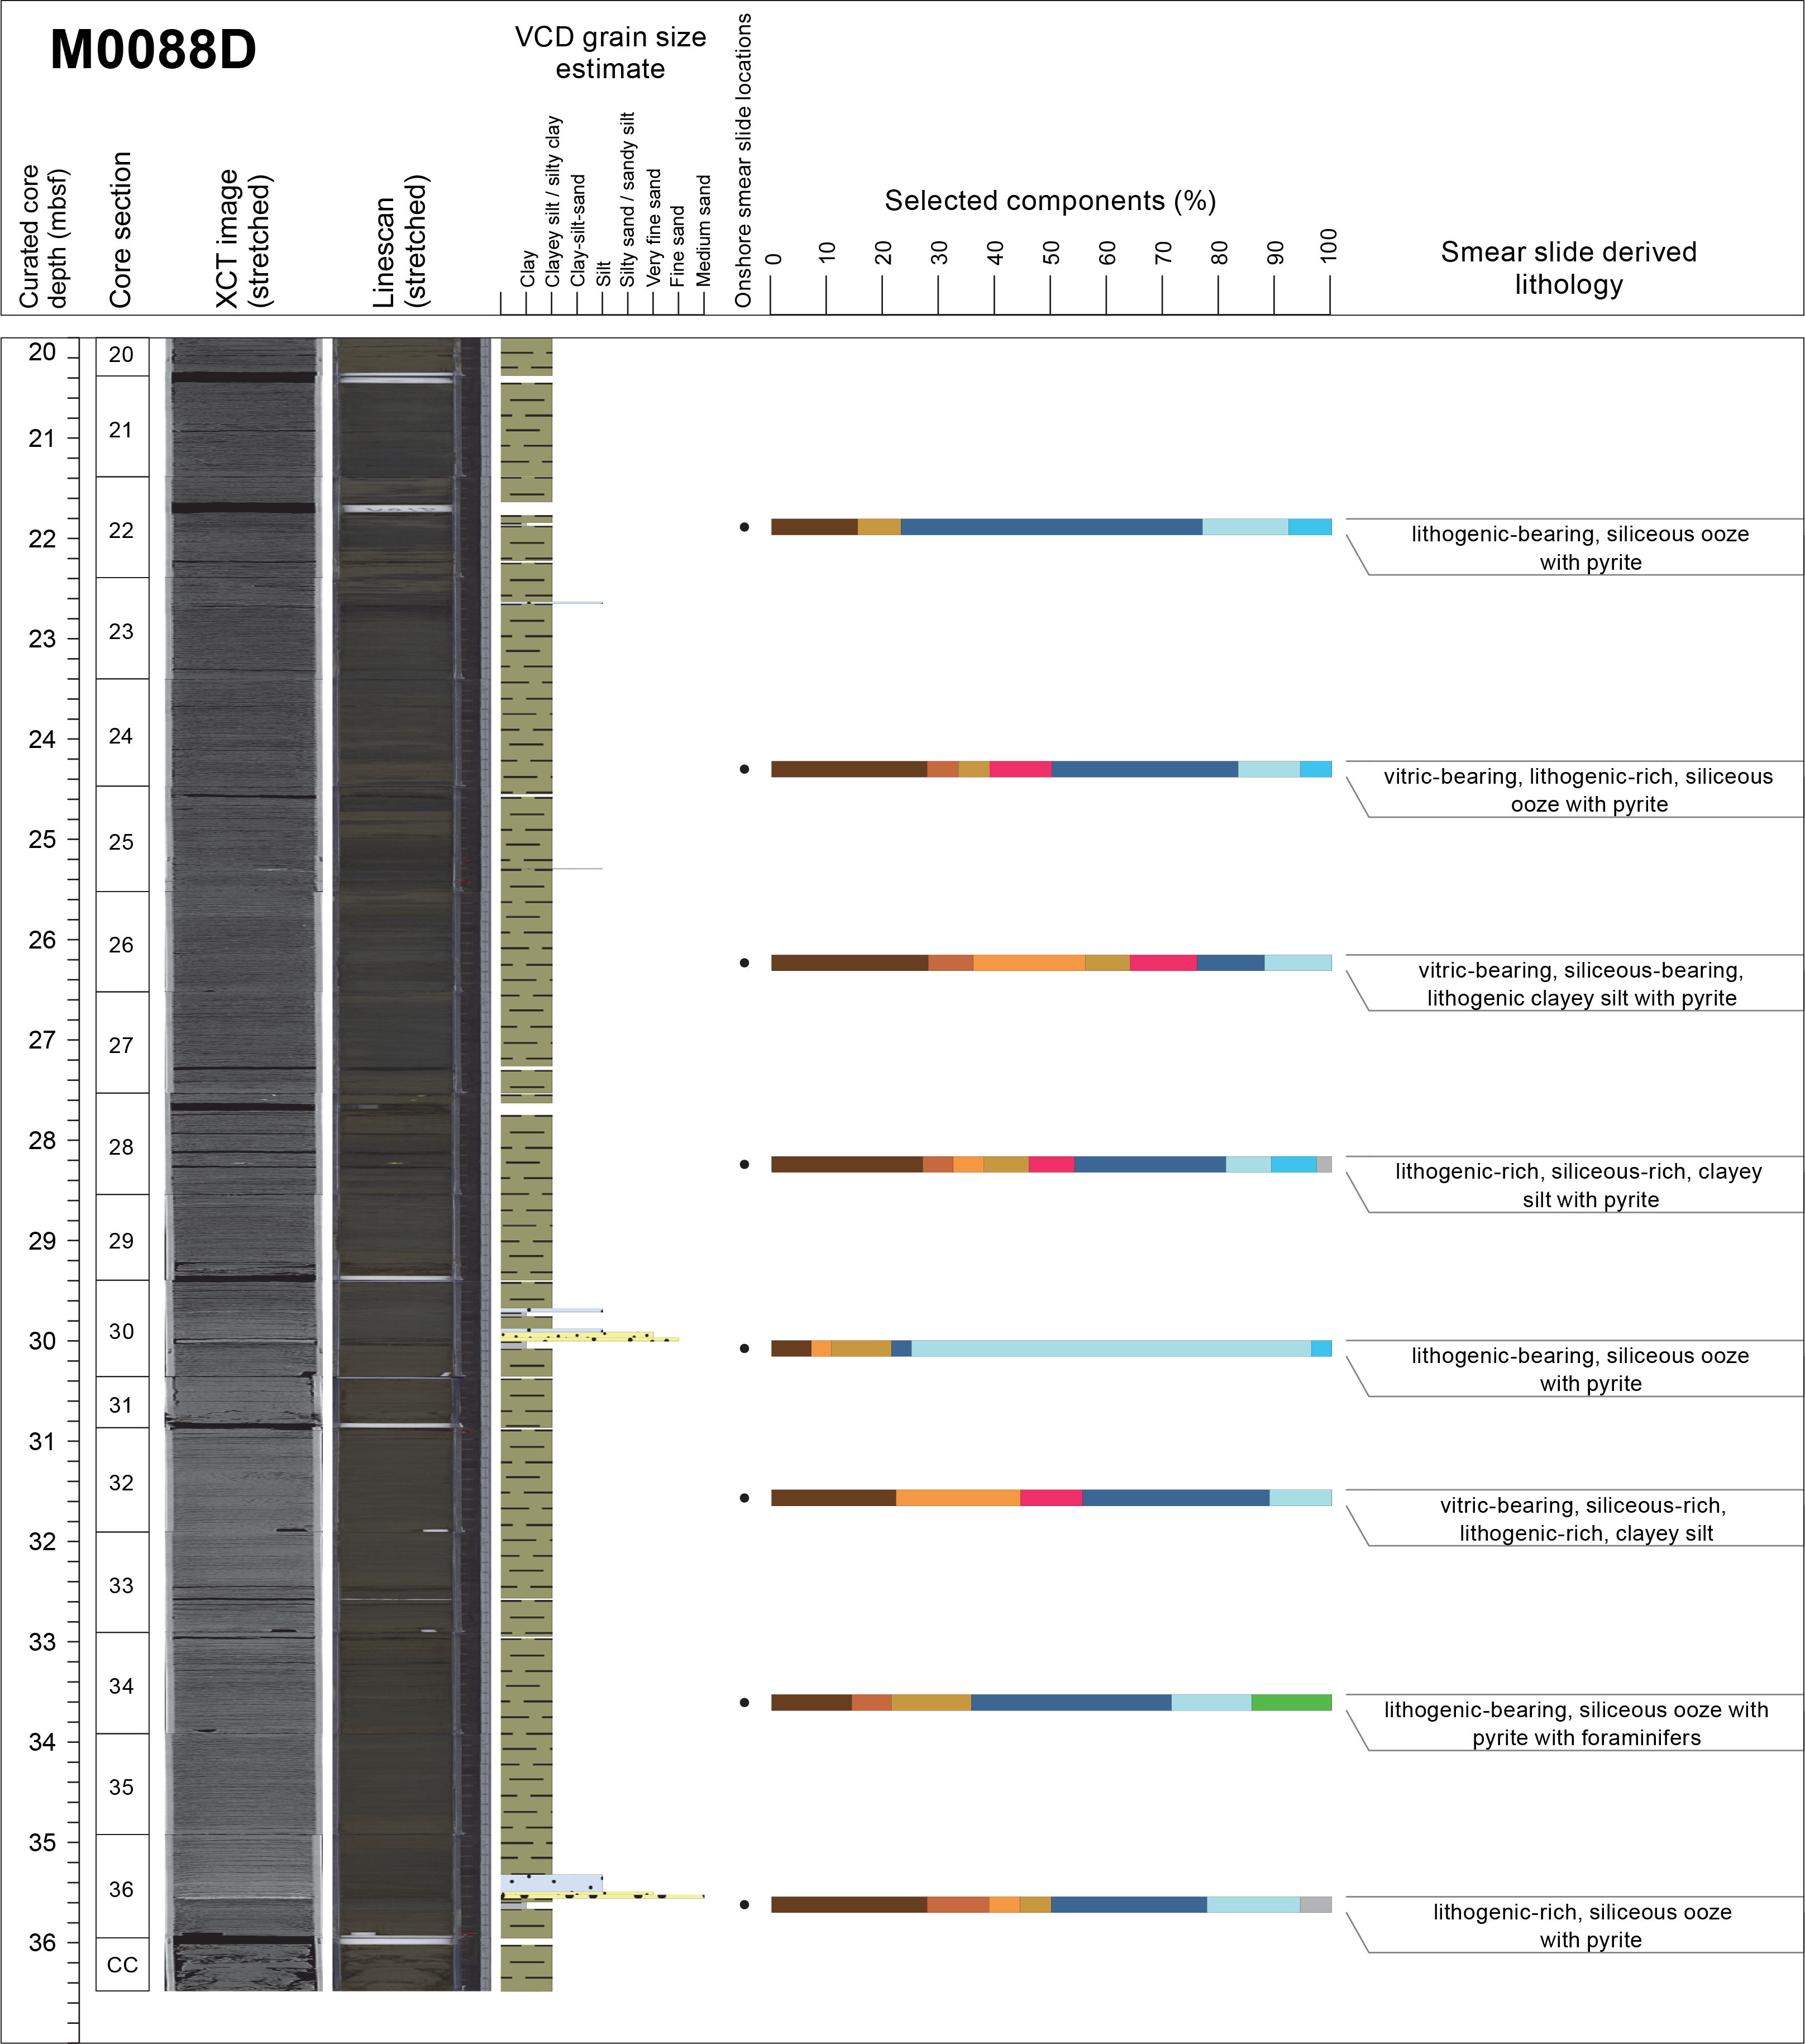
Figure F20. Smear slide summaries, Holes M0088C and M0088D.
4. Micropaleontology
Four holes were cored at Site M0088 in Basin N2 in the central part of the northern Japan Trench. The biostratigraphy determined for Hole M0088D was based on an examination of radiolaria collected during the offshore phase of Expedition 386. Foraminifera examined in samples collected during the offshore phase were examined to determine provenance of mass transport deposits.
4.1. Radiolaria
Relative abundance changes of Cycladophora davisiana, the Tetrapyle circularis/fruticosa group (hereafter Tetrapyle group), and Lithomelissa setosa in cores from Hole M0088D are shown in Figure F21. Results of radiolarian analysis for these cores are described below.
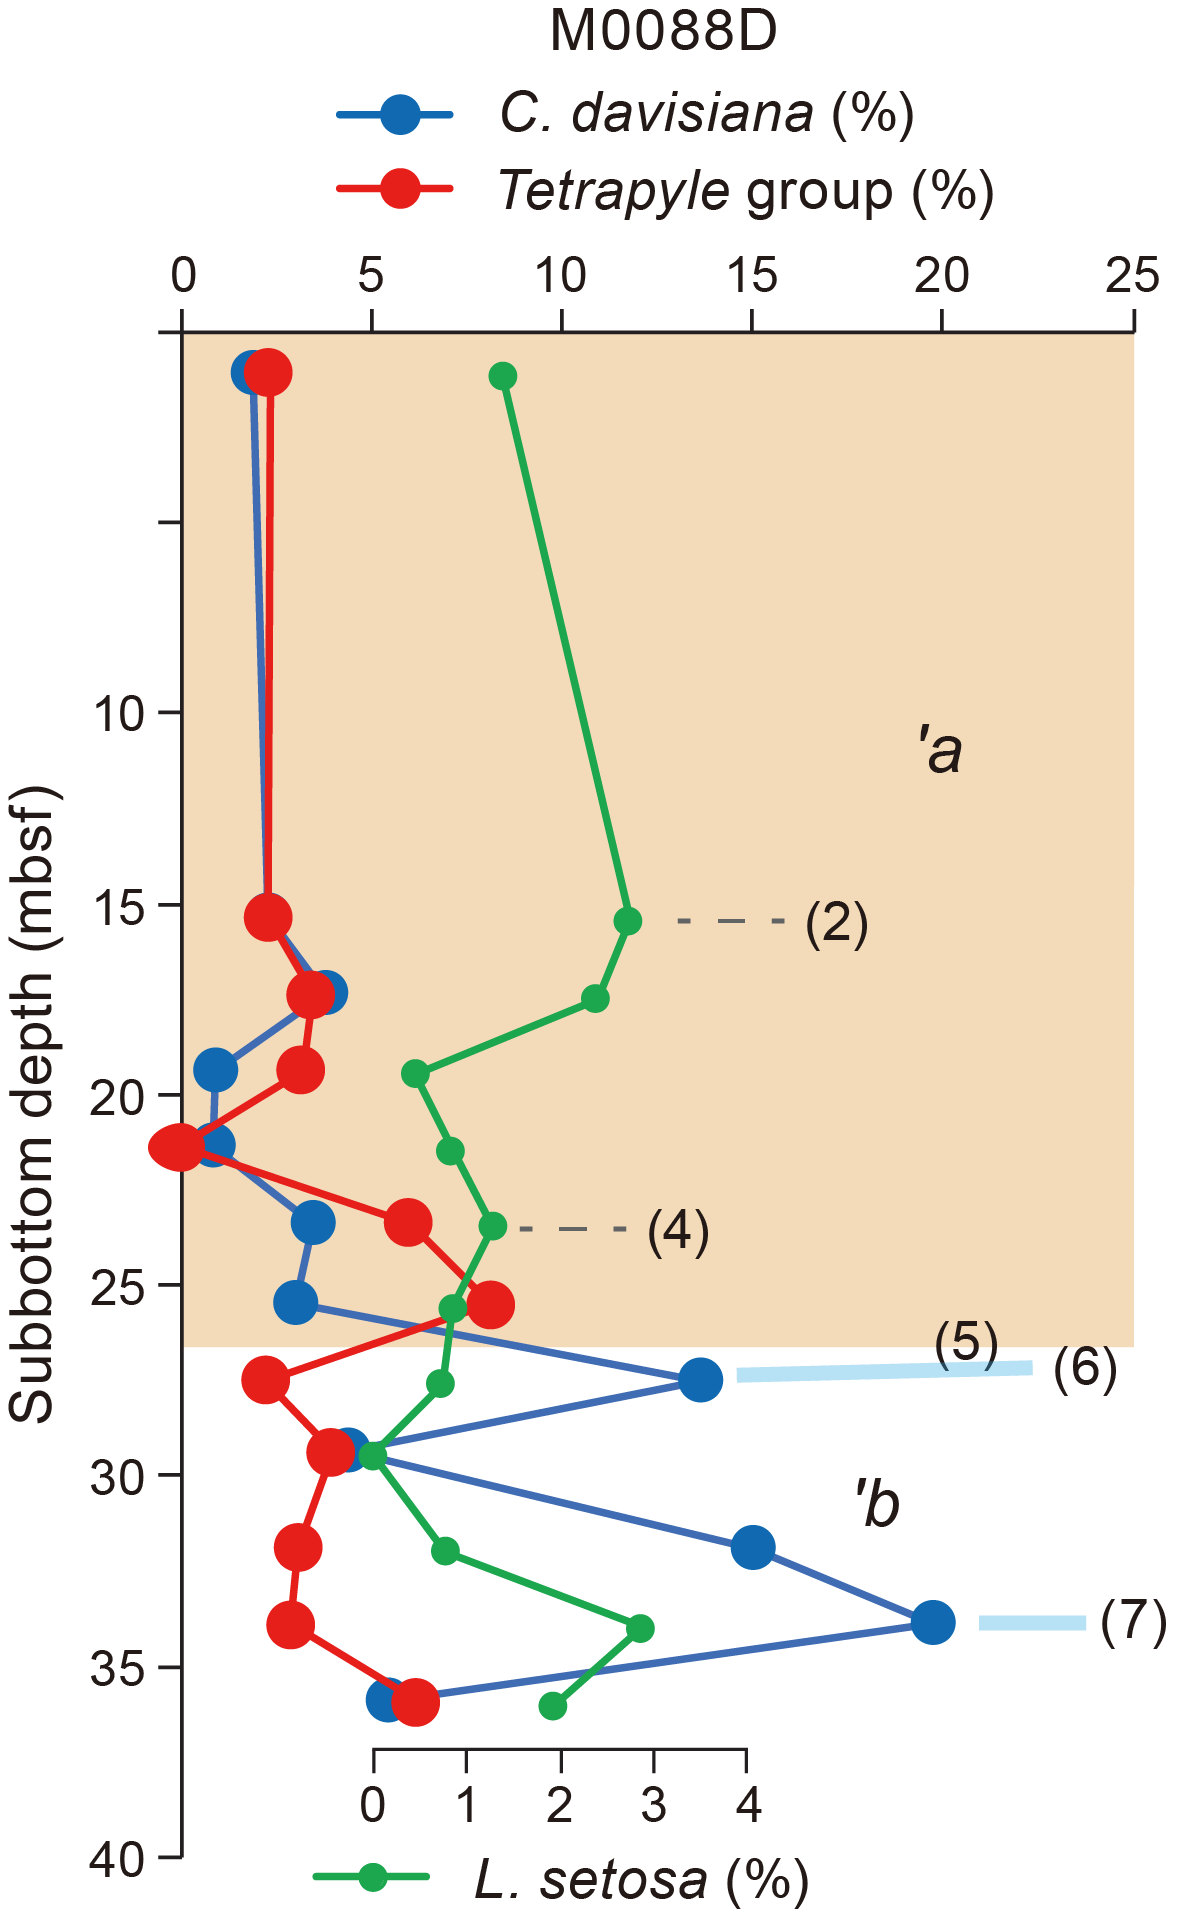
Figure F21. Radiolarian species abundance.
A total of 18 radiolarian samples were collected from Hole M0088D, and 12 samples were processed for analysis. The remaining 6 were found within possible event layers and were not processed (Table T4). Radiolarian fossils were abundant in all samples examined, with good preservation. The relative abundance of C. davisiana varies between 1% and 20% and tends to be high (>5%) below 27.5 mbsf. The sharp increase in the relative abundance of C. davisiana from <5% to >10% at this depth could be correlated with the boundary horizon of C. davisiana Zones ‘a and ‘b (Event 5), corresponding to the Holocene/Pleistocene boundary (Morley et al., 1982; see Micropaleontology in the Expedition 386 methods chapter [Strasser et al., 2023a]). Two peaks in the relative abundance of C. davisiana at 27.5 and 33.9 mbsf likely correlate with Events 6 and 7, corresponding to Davisiana Event (DAE)-2 (~12 ka) and DAE-3 (~17 ka) of Matsuzaki et al. (2014). The relative abundance of the Tetrapyle group ranges 0%–8%; however, it is difficult to define the interval between Events 1 and 3 (see Micropaleontology in the Expedition 386 methods chapter [Strasser et al., 2023a]). Two minor peaks in the relative abundance of L. setosa at 15.3 and 23.4 mbsf likely correlate to Events 2 and 4, corresponding to approximately 7 and 11 ka, respectively (see Micropaleontology in the Expedition 386 methods chapter [Strasser et al., 2023a]).
4.2. Foraminifera
Samples were taken at 5 m intervals offshore, as described in Micropaleontology in the Expedition 386 methods chapter (Strasser et al., 2023a). With the exception of the agglutinated benthic foraminifera, which may be either in situ or reworked, all foraminifera at Site M0088 are considered to be allochthonous.
4.2.1. Hole M0088A
One sample taken from the base of Hole M0088A was examined for foraminifera (Table T5). Only two specimens of Trochammina spp. with good preservation are present. The sample contains abundant diatoms, radiolaria, and sponge spicules.
No provenance interpretation can be made for this sample due to low foraminifera abundance.
4.2.2. Hole M0088B
Four samples from Hole M0088B were examined for foraminifera (Table T5). Benthic foraminifera with moderate to good preservation are rare in three of the samples; one sample is barren. Planktonic foraminifera with poor or good preservation are present in two of the four samples. All samples examined for foraminifera contain abundant diatoms, radiolaria, and sponge spicules.
No provenance interpretation can be made for these samples due to low foraminifera abundance.
4.2.3. Hole M0088C
One sample from the base of Hole M0088C was examined for foraminifera (Table T5). A total of 11 specimens of Trochammina spp., considered to be autochthonous, are the only benthic foraminifera, along with abundant diatoms, radiolaria, and sponge spicules.
4.2.4. Hole M0088D
Seven samples from Hole M0088D were examined for foraminifera (Table T5). Benthic foraminifera with medium to good preservation are present to rare in all samples, except for one. Planktonic foraminifera with good preservation are present in only one of the samples. Samples examined for foraminifera contain abundant diatoms, radiolaria, and sponge spicules, along with some glass, iron monosulfides and possible crustacean fragments.
No provenance interpretation can be made for these samples due to low foraminifer abundance, with the exception of Sample 386-M0088D-1H-30, 93.5–96 cm (30.3 mbsf).
Sample 386-M0088D-1H-30, 93.5–96 cm, contains frequent calcareous benthic foraminifera dominated by Stainforthia apertura, Bolivina pacifica, Fursenkoina complanata, and Nonionellina labradorica. Preservation of these thin-shelled taxa is good. Using the paleobathymetric zonation of Usami et al. (2017) after Matoba (1976), the provenance of the displaced calcareous assemblage in this sample is interpreted to be from an upper bathyal environment (200–600 m).
5. Geochemistry
5.1. Interstitial water
At Site M0088, in addition to two bottom water (BW) samples, a total of 49 interstitial water (IW) samples were collected. The IW samples were recovered using Rhizon samplers from two trigger cores (Holes M0088A and M0088C) and two GPC cores (Holes M0088B and M0088D). Results of shipboard and shore-based analyses are described in this section. See Geochemistry in the Expedition 386 methods chapter (Strasser et al., 2023a) for details of the sampling, analytical methods, and data quality.
The IW geochemical results from all holes closely match for all analytes and are generally discussed together except where noted. In general, IW composition at Site M0088 is influenced by organic matter degradation, including the release of metabolic products and consumption of electron acceptors, as well as dissolution/precipitation reactions with sediment.
5.1.1. Shipboard analyses: salinity, alkalinity, and ammonium
Salinity at Site M0088 generally varies between 34.24 and 37.53. The lowest values (34.24) are found in BW associated with trigger core Hole M0088A (Table T6; Figure F22). The salinity in both GPC cores follows a gradual but nonlinear increase with depth to ~37 at ~20 mbsf, where values stabilize (Hole M0088D). From ~20 mbsf to the bottom of the Hole M0088D core, salinity slightly declines to 36.88. Alkalinity values in BW at Site M0088 are near the detection limit. In the GPC cores, alkalinity at the top (~0.45 mbsf) is relatively low (~26 mM), followed by an asymptotic increase with depth, and values stabilize at ~85–90 mM at ~16 mbsf, increase to ~97 mM at ~24 mbsf, and decline to 85.9 mM at the bottom of Hole M0088D (34.77 mbsf) (Figure F22). Ammonium (NH4+) concentrations in BW of Site M0088 are near the detection limit (0.03 mM). In the GPC cores, ammonium concentrations follow a gradual but nonlinear increase with depth and then stabilize (~2.5 mM) between ~4 and 8 mbsf. Ammonium concentrations gradually increase again, reaching ~9 mM at the base of the core at ~24 mbsf (Figure F22).

Figure F22. IW salinity, alkalinity, and ammonium.
5.1.2. Shore-based analysis
5.1.2.1. Dissolved vanadium, molybdenum, and uranium
A suite of trace metals were analyzed using inductively coupled plasma–mass spectroscopy (ICP-MS) including vanadium (V), molybdenum (Mo), and uranium (U), briefly described below, as well as copper (Cu) and rubidium (Rb) (Table T6). Dissolved V concentrations in the BW and trigger cores are lower in concentration (~32–79 nM) than the upper ~2 m of the GPC cores from Hole M0088B, and comparably low below this depth (Figure F23). The GPC cores from Holes M0088B and M0088D follow different concentration patterns. V concentrations in Hole M0088D increase from the lowest concentration (81.1 nM) at 0.45 mbsf to ~170 nM at 3.53 mbsf. Below 3.53 mbsf, concentrations stabilize with minor fluctuations, followed by a significant concentration increase between 16.2 and 20.2 mbsf. At 20.2 mbsf, V reaches maximum concentrations (425.7 nM) before slightly decreasing and stabilizing in concentration (~250 nM) to the bottom of the hole (20.2–34.7 mbsf).
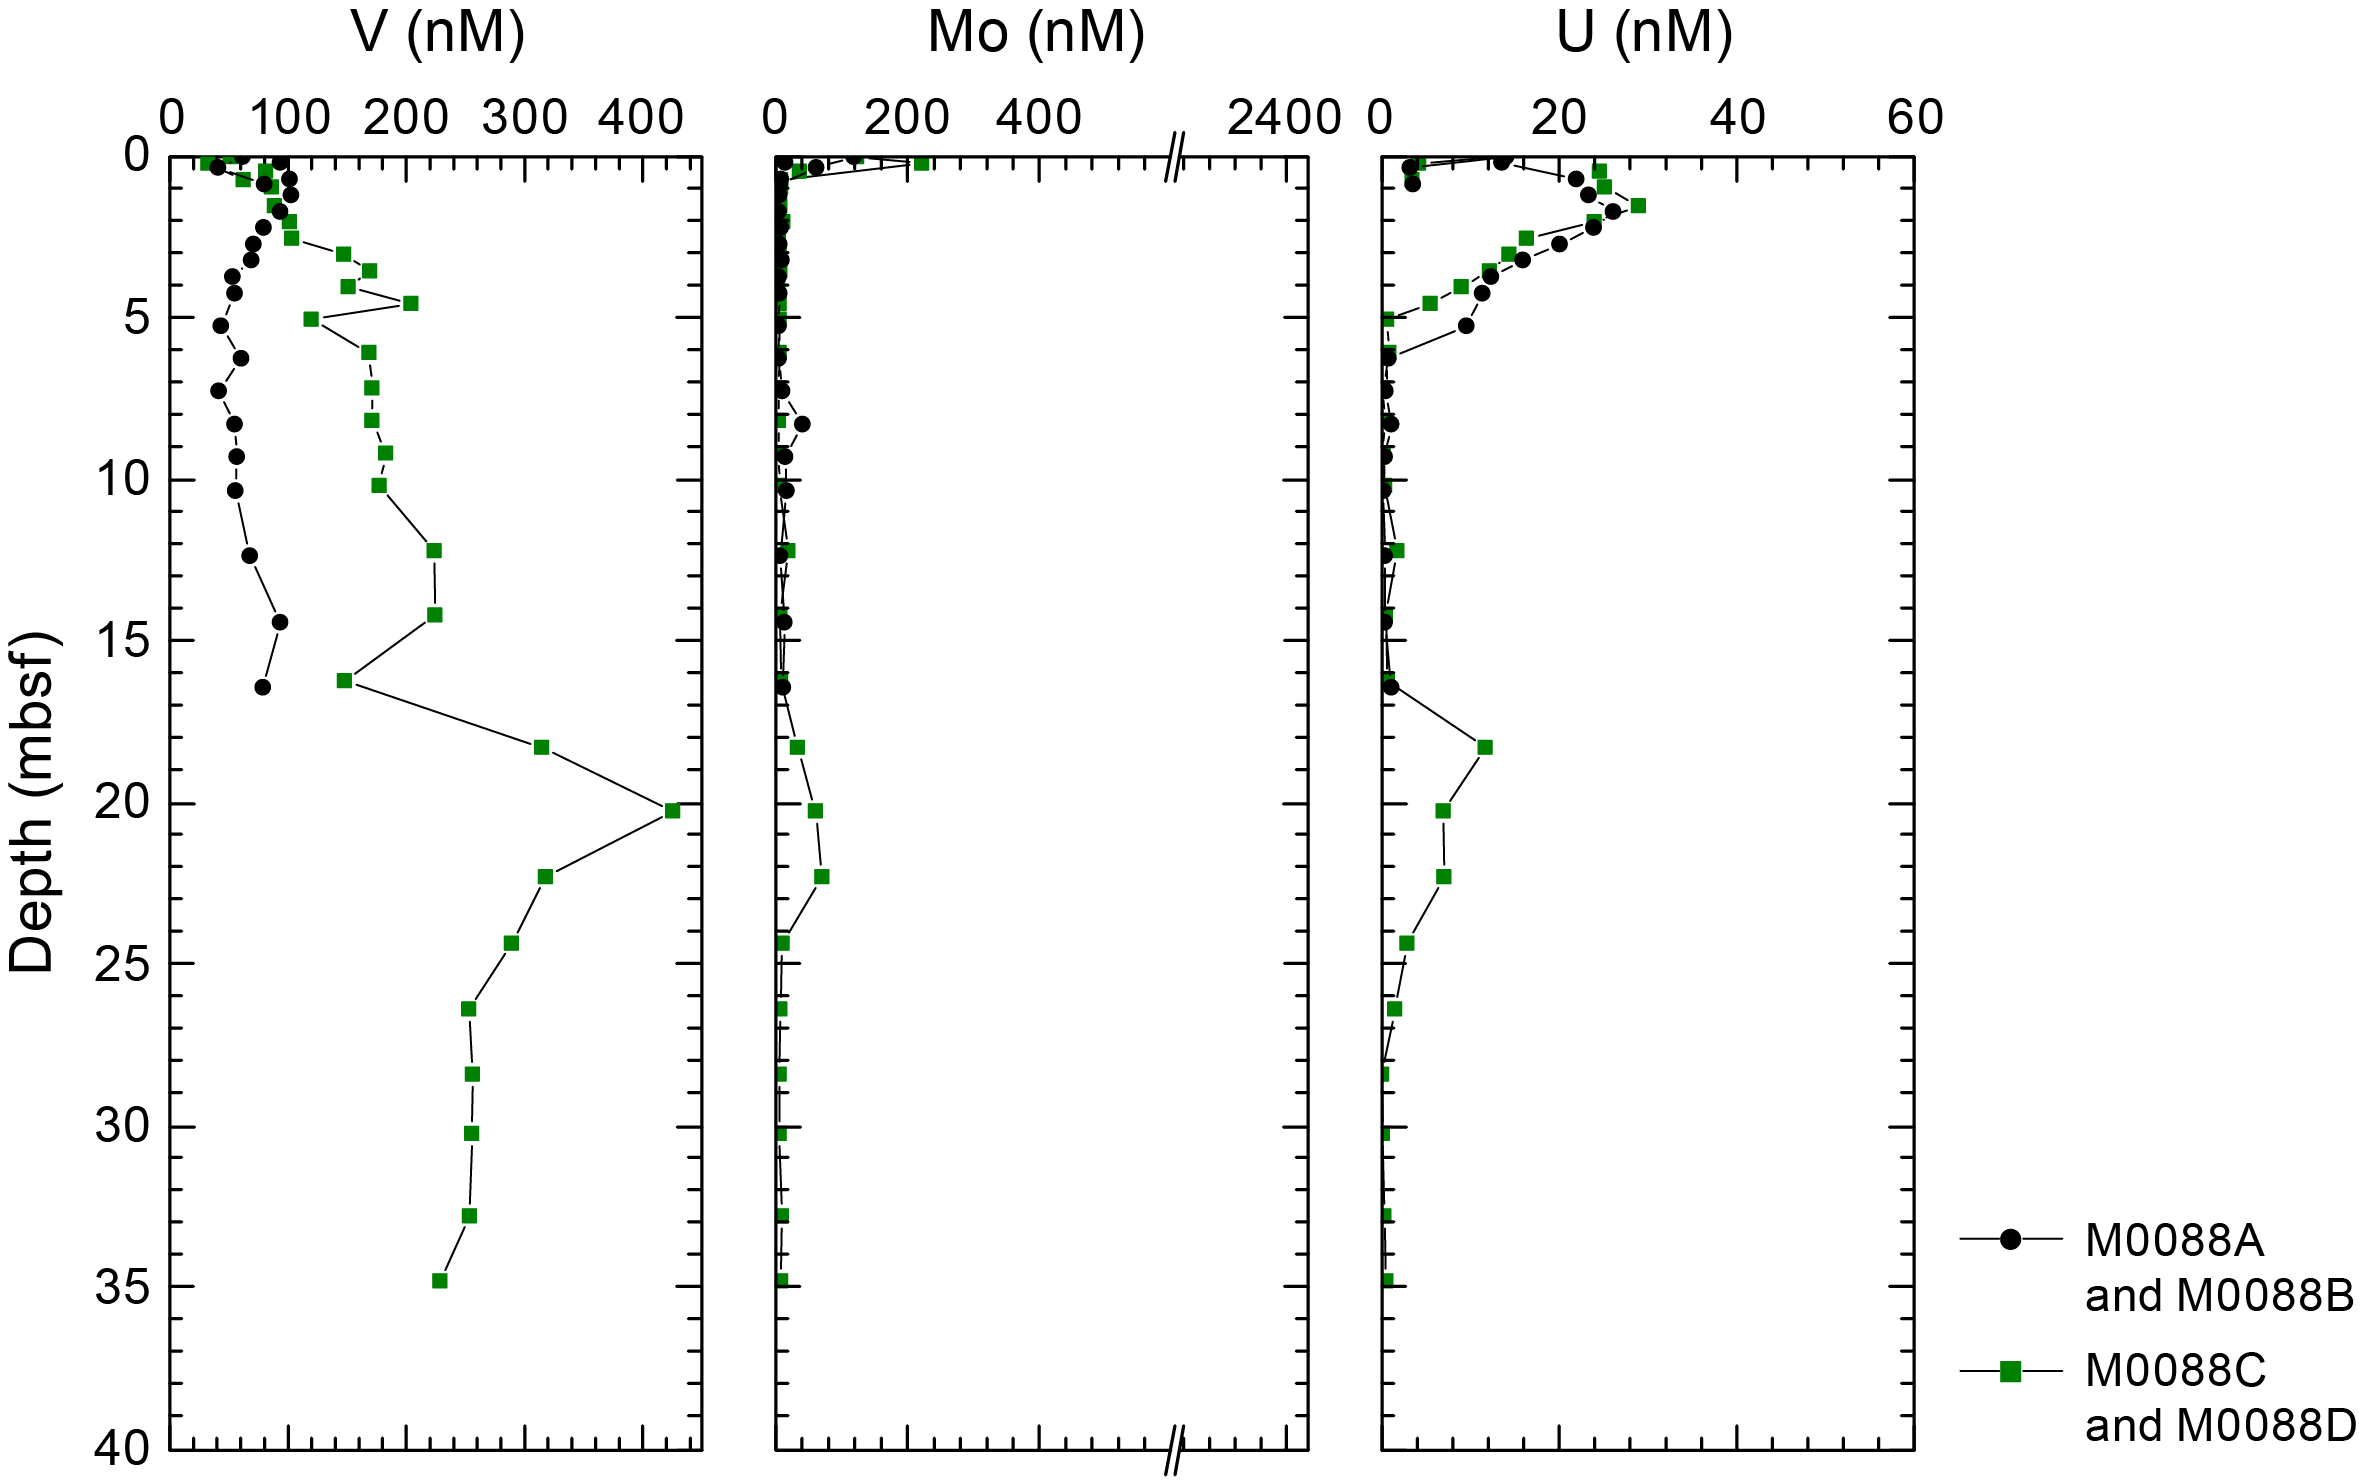
Figure F23. IW V, Mo, and U.
Dissolved Mo concentrations are highest in the BW and at the top of the trigger core (Hole M0088C) (~220 nM), followed by a rapid decrease to <10 nM below the surface at ~0.5 mbsf. The GPC samples show variable but lower Mo concentrations <10 nM. The highest Mo concentrations (~36 nM) occur at the top of the GPC cores. An increase in Mo concentrations to 41 nM is observed at 8.27 mbsf in Hole M0088B. Hole M0088D shows a Mo excursion up to 70 nM between 18.26 and 22.27 mbsf before stabilizing at values of <10 nM to the bottom of the core (Figure F23).
Dissolved U concentrations in the BW are ~13–14 nM, and values decrease to ~3 nM in the trigger cores (0.21–0.85 mbsf). In the GPC cores, the U profiles show an initial concentration increase from 13 nM at top of Hole M0088B and 24 nM at the top of Hole M0088D to their maximum concentration at this site (~26–29 nM) at ~1.5 mbsf. Downcore, U concentration profiles decrease to 0.6–1.7 nM below ~5 mbsf. In Hole M0088D, another dissolved U concentration increase to 11.6 nM occurs at 18.26 mbsf before values decline to a stable concentration level of <1 nM at the bottom of the hole (Figure F23).
5.1.2.2. Dissolved lithium, boron, silica, manganese, iron, strontium, and barium
All minor elements analyzed using inductively coupled plasma–optical emission spectroscopy (ICP-OES) are listed in Table T6. Dissolved lithium (Li) shows the highest values (~26 µM) in the BW (Figure F24). In the GPC cores, dissolved Li concentrations are ~21 µM at the top (0.19–0.45 mbsf) to ~4 mbsf, followed by a slow decrease to ~16 µM at ~6 mbsf. Values slightly increase to ~18–19 µM at ~12 mbsf. Concentration decreases again to ~15 µM at ~16 mbsf before increasing once again to ~21 µM at ~30 mbsf and then slowly decreasing to 20.13 µM at the bottom of Hole M0088D. Dissolved boron (B) at Site M0088 shows the lowest values (~430 µM) in the BW of the trigger cores at ~0.0 mbsf. This is followed by a gradual linear increase to >1100 µM at the base of the core (Figure F24). Dissolved silica (Si) shows the lowest values (~140 µM) in the BW. This is followed by a rapid increase in the trigger cores to ~800–900 µM at ~0.2–0.3 mbsf. Silica concentrations remain relatively stable from ~7 mbsf to the base of the GPC cores with values above 800 µM and isolated maxima of up to 1035 µM at ~5 mbsf and a minimum of ~800 µM at 16.41 mbsf (Figure F24).

Figure F24. IW Li, B, Si, Mn, Fe, Sr, and Ba.
Dissolved manganese (Mn) shows very low values (~0.2–0.5 µM) in the BW. This is followed by a rapid increase to ~275–375 µM at ~0.7–0.8 mbsf in the trigger cores. In the GPC cores, the highest concentrations (~130–270 µM) are reached at ~0.19–0.45 mbsf. Below these maxima, a strong Mn decrease reaches <50 µM at 3 mbsf in Holes M0088B and M0088D. This is followed by a gradual downcore decrease in Mn concentration with the lowest concentrations (<20 µM) at the bottom of the core (34.765 mbsf) (Figure F24). Dissolved iron (Fe) is below or at the detection limit in the BW. This is followed by a rapid increase to ~40–70 µM at ~0.3–0.8 mbsf in the trigger cores. In the GPC cores, Fe concentrations at the top are 9–26 µM, and they slowly decrease and/or remain relatively stable at a low level (~5–8 µM) at ~7 mbsf. This is followed by a rapid concentration increase to ~21–38 µM at 9–10 mbsf before decreasing to fluctuating concentration levels between 8 and 20 µM to the bottom of Hole M0088D (Figure F24).
Dissolved strontium (Sr) is lowest (~80 µM) in the BW and the top interval of the cores (0–4 mbsf). Sr concentrations increase to ~90–100 µM at ~4.5–6 mbsf and remain relatively stable to the bottom of the GPC cores. The maximum Sr concentration of 108 µM is reached at 9.29 mbsf in Hole M0088B (Figure F24). Dissolved barium (Ba) values are lowest in the BW (~0.2 µM). Concentrations increase gradually to ~5 µM at 4–5 mbsf and then increase more rapidly between ~5 and 7 mbsf, reaching concentrations of ~52–60 µM. Farther downcore, Ba concentrations lightly decrease to ~30 µM at the bottom of Hole M0088D (Figure F24).
5.1.2.3. Chloride, bromide, and sulfate
All anions analyzed using ion chromatography (IC) are listed in Table T6.
Dissolved Cl− values show little variation and range ~540–560 mM throughout the core, resembling seawater concentrations (Bruland et al., 2014) (Figure F25). Dissolved Br− concentrations are ~0.81 in the BW. In the trigger and GPC cores, Br− displays an almost linear trend with a very small increase from 0.85 mM at the top of Hole M0088B to 0.98 mM at the bottom and from 0.87 to 1.04 mM in Hole M0088D (Table T6). Values slightly lower than average seawater (~0.84 mM) between 0.8 and 0.84 mM are observed in the trigger cores from both holes (Figure F25). Sulfate (SO42−) concentrations in the BW from both holes show seawater values of ~28–29 mM, followed by a linear decrease in the trigger and GPC cores that reached the limit of detection at around 5.2 and 4.5 mbsf in Holes M0088B and M0088D, respectively (Figure F25).

Figure F25. IW Cl–, Br–, and SO42–.
5.1.2.4. Sodium, magnesium, potassium, and calcium
Dissolved concentrations of sodium (Na+), potassium (K+), calcium (Ca2+), and magnesium (Mg2+) downcore profiles show overall very similar patterns with little variations. Dissolved Na+ concentrations fluctuate unsystematically and are mostly above average seawater values (~470 mM) in all holes, ranging ~455–615 mM. Dissolved K+ concentrations are mostly above seawater values (~10 mM) in all holes, ranging ~9.47–15.2 mM. Dissolved K+ fluctuates unsystematically downcore but appears on average to be slightly higher in Hole M0088D (11.7 ± 0.6 mM) than in Hole M0088B (10.6 ± 0.6 mM). Dissolved Ca2+ concentrations fluctuate unsystematically and are mostly around or slightly above seawater values (~10 mM) in all holes between 0 and 5 mbsf, ranging ~9.2–11.3 mM. Below ~5 mbsf, the concentration of dissolved Ca2+ decreases to 5.08 mM at ~18 mbsf. Below ~18 mbsf to the bottom of Hole M0088D, Ca2+ concentration increases to between 8.16 and 10.01 mM, with one outlier (1.3 mM) at ~28 mbsf. Dissolved Mg2+ concentrations fluctuate unsystematically and are mostly around or slightly above seawater values (~53 mM) in all holes, ranging ~49.7–84.2 mM.
The IC cation data is only presented in GEOCHEM in Supplementary material because the samples require further analysis for validation of absolute values (analytical accuracy).
5.2. Shore-based H2S analysis
At Site M0088, H2S concentrations were below the detection limit in all the samples (see GEOCHEM in Supplementary material).
5.3. Headspace gas analysis: methane, ethane, and C1/C2 ratio
The offshore headspace gas analysis was mainly performed on the longest GPC core. A total of 36 headspace samples were measured from Holes M0088C (trigger core) and M0088D (GPC core) for hydrocarbon compositions (Figure F26; Table T7). The hydrocarbons methane, ethylene, ethane, propylene, and butane were identified at each site, and methane (CH4 and C1) is the major component of the headspace samples.
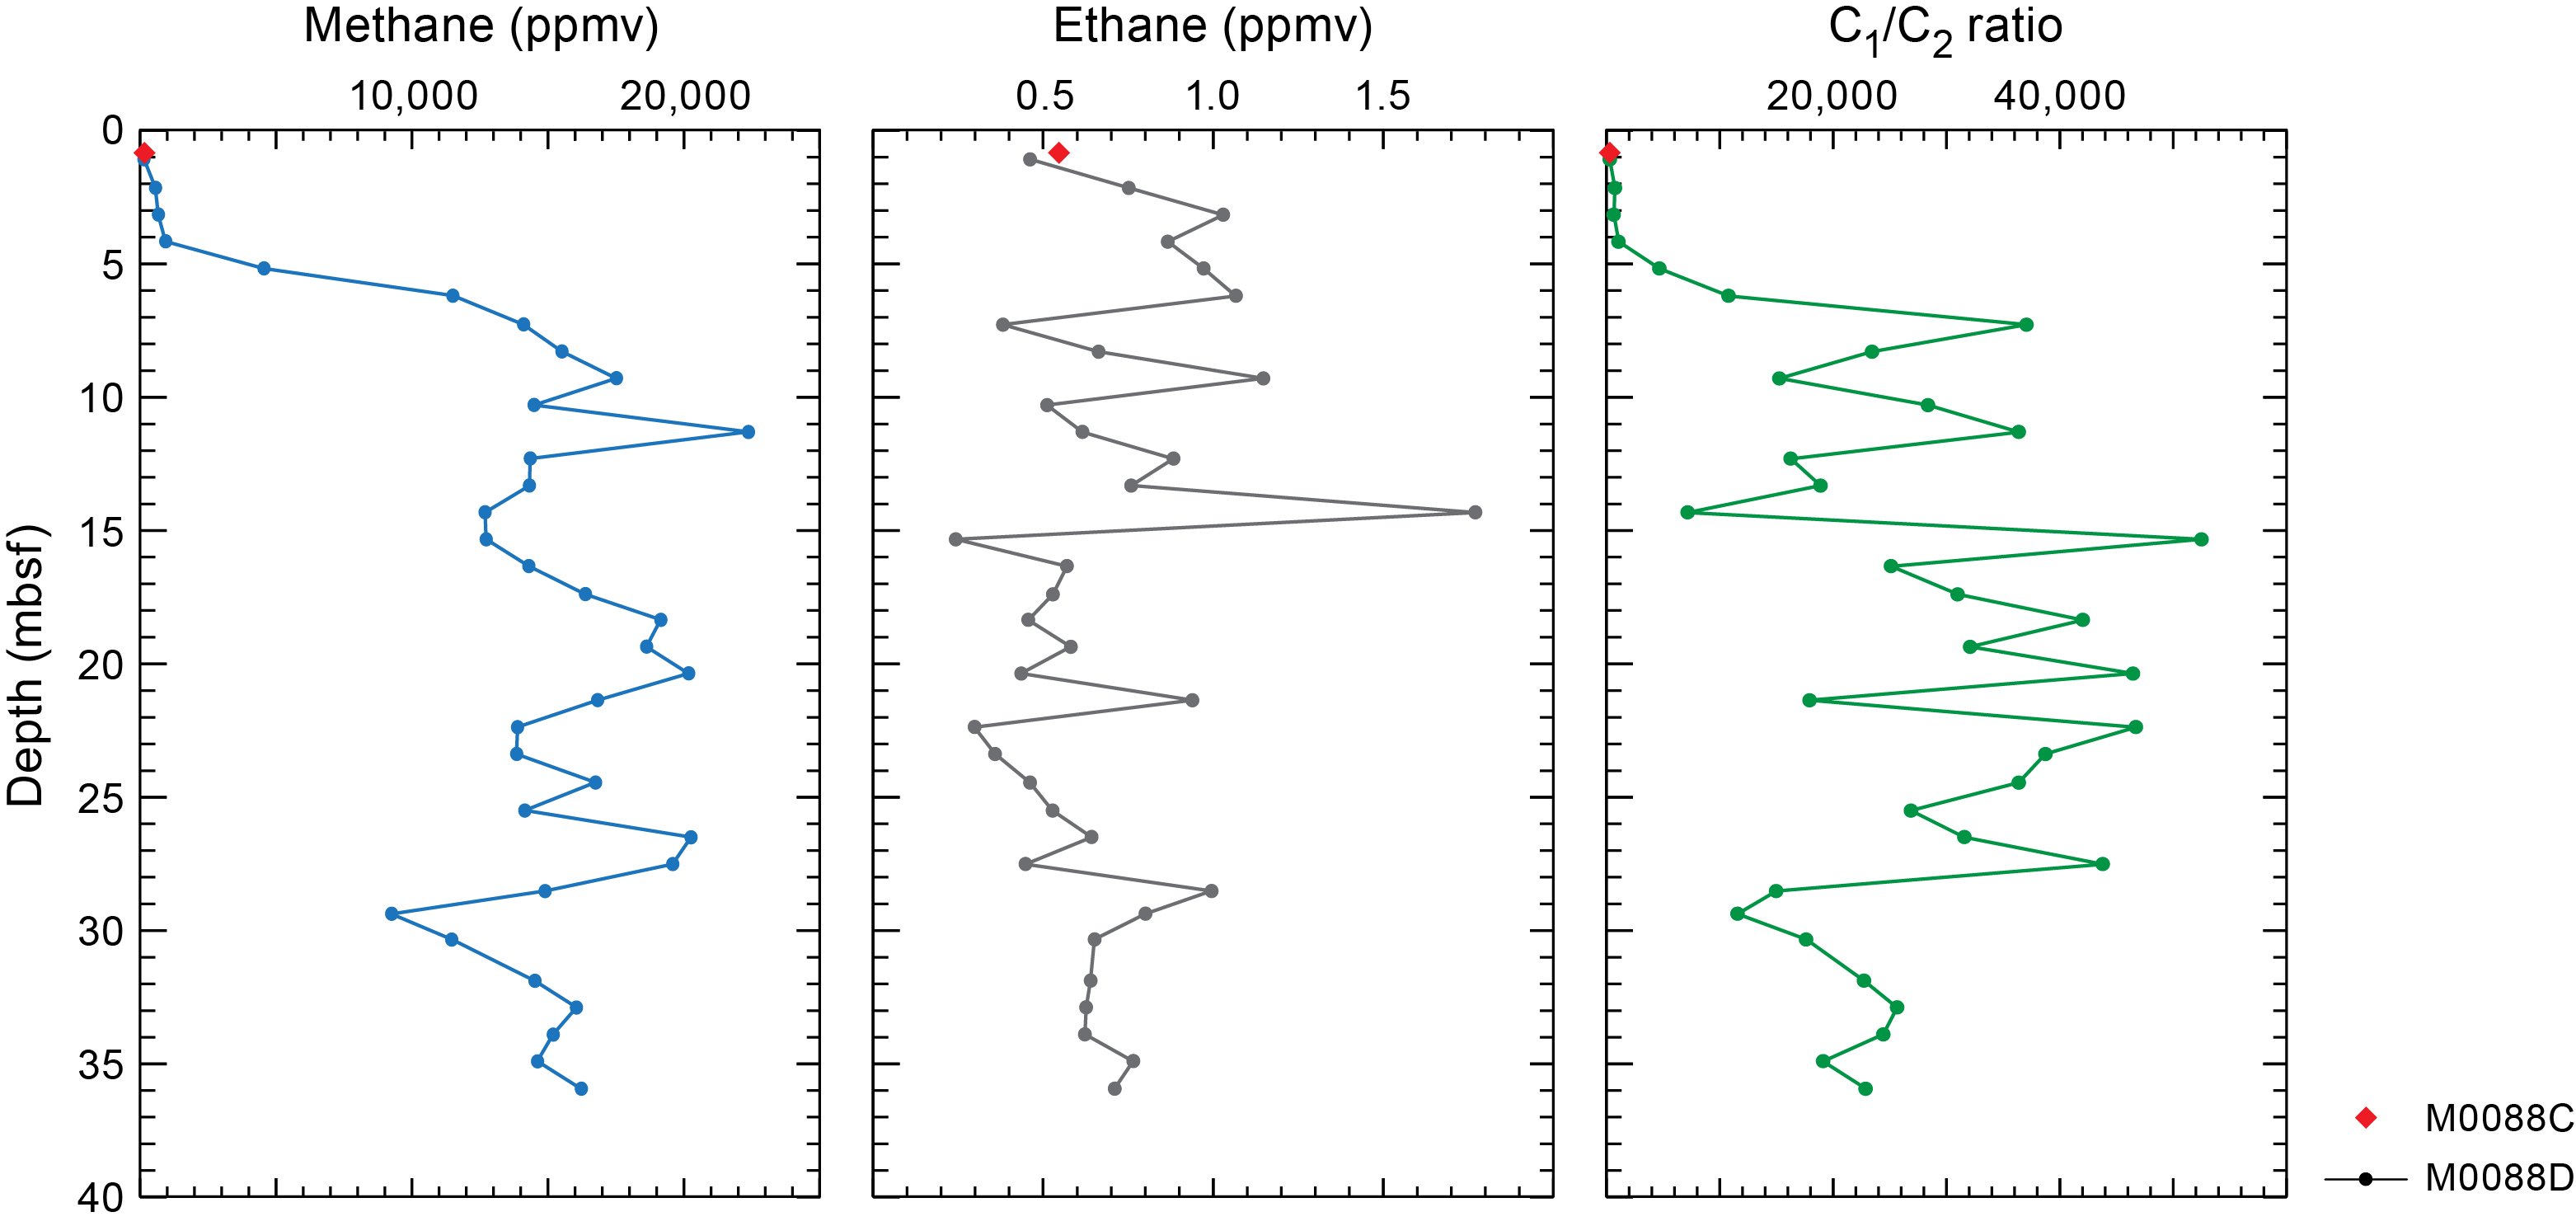
Figure F26. Methane, ethane, and methane to ethane ratio.
From 0 to 4.19 mbsf, methane concentrations increase from ~138 to 937 ppmv in the cores. Below 4.19 mbsf, methane concentration increases rapidly to ~12,500–20,000 ppmv at 9.315 mbsf and remain high but fluctuate to the bottom of Hole M0088D. Maximum concentrations (22,379 ppmv) are reached at ~11.33 mbsf (Figure F26).
Ethane (C2H4 and C2) at Site M0088 was detected in relatively constant but low concentrations (0.24–1.1 ppmv) in all headspace samples. One outlier (1.77 ppmv) occurs at 14.34 mbsf. The methane/ethane (C1/C2) ratios follow the methane profile pattern but noticeably fluctuate below 7.3 mbsf (Figure F26).
Alongside C1 and C2, other hydrocarbon gases such as ethylene (C2=), ethane (C2), propene/propylene (C3=), propane (C3), and n-butane (n-C4) were detected and measured, but their concentrations are very low, generally less than 1 ppmv at all sites (see GEOCHEM in Supplementary material).
5.4. Shore-based solid-phase analysis
5.4.1. Aluminum, calcium, silica, iron, and manganese
The solid-phase elements include aluminum (Al), calcium (Ca), silicon (Si), iron (Fe), and manganese (Mn), briefly described below, as well as Ba, Br, Cr, Cu, K, Mg, Ni, P, Sr, Ti, V, Zn, and Zr (Table T8). Al contents range ~2.3–5.6 wt% (23,078–56,876 mg/kg). Between 0.9 and ~13 mbsf in the GPC cores, Al fluctuates downcore between 3.5 and 4.2 wt% (Figure F27). At ~15–16 mbsf, both GPC cores show a change: in Hole M0088B, an increase to the highest measured Al concentration (5.6 wt%) is observed, and the Al concentration in Hole M0088D declines to 2.3–2.5 wt%. At ~21 mbsf, the Al concentration recovers to ~4.1 wt% and then continues to decline to 3.2 wt% at ~29 mbsf. Another Al increase to 4.2 wt% follows at ~30 mbsf, and concentrations remain relatively stable, varying between 4.2 and 3.9 wt%, to the bottom of Hole M0088D.
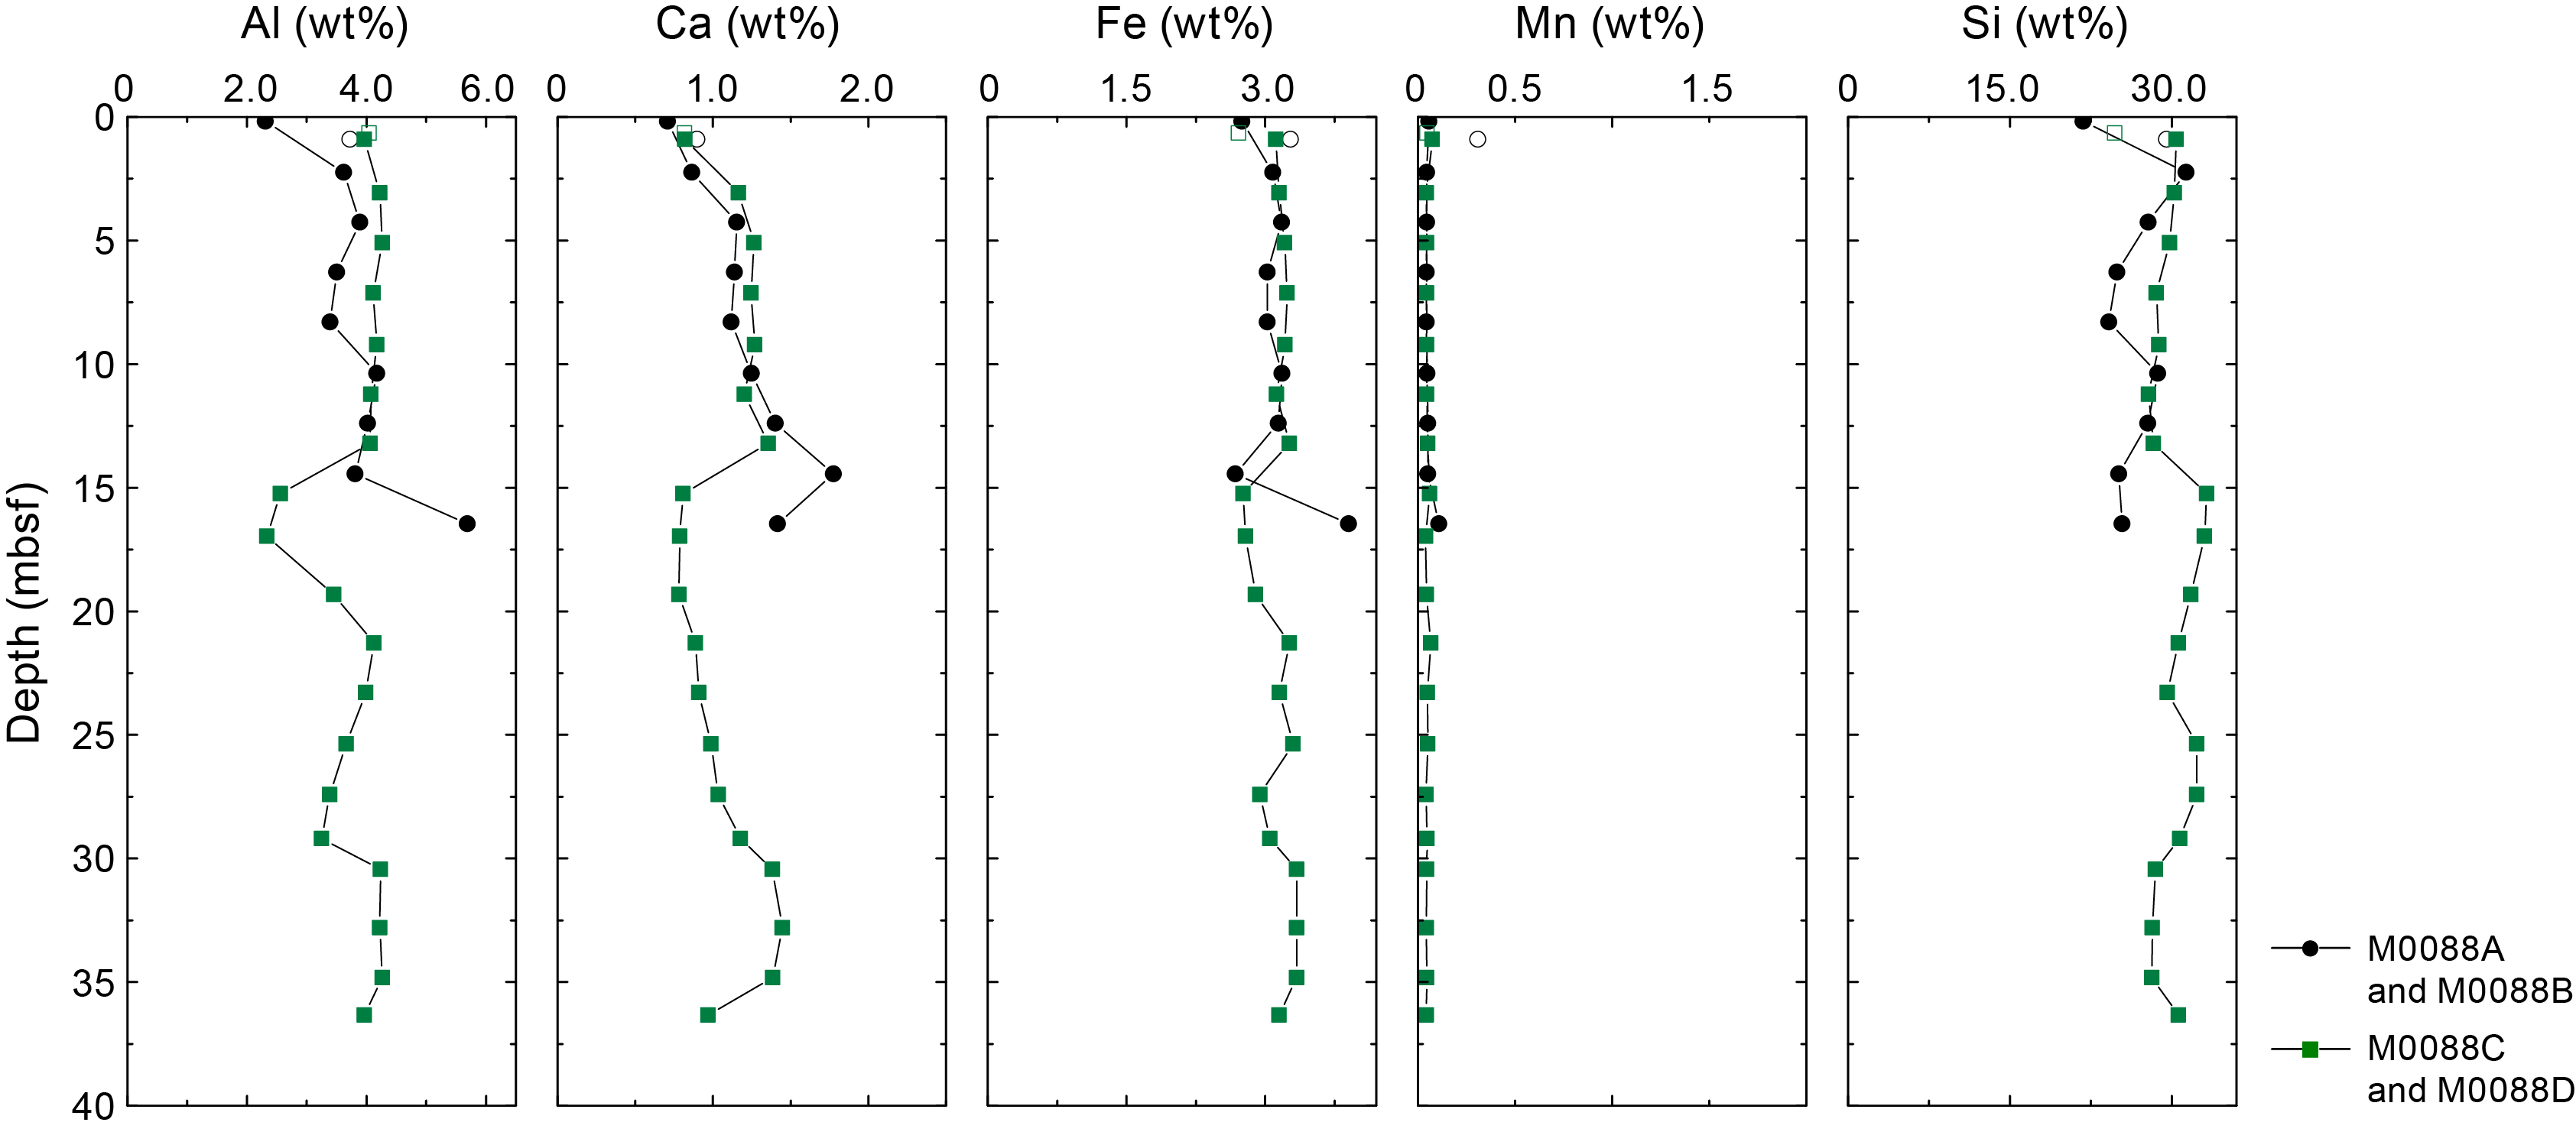
Figure F27. Solid-phase major elements.
Ca contents range ~0.7–1.7 wt% (7,079–17,755 mg/kg). In all holes, Ca variability is at or slightly below ~1 and 1.5 wt% down to ~13 mbsf. Below 15 mbsf, Ca concentrations decline to 0.8 wt% and then increase to 1.4 wt% at ~32 mbsf. Below ~32 mbsf, Ca concentrations decline to 0.9 wt% at the bottom of Hole M0088D.
Solid-phase Si contents range ~21–33 wt% (217,709–332,543 mg/kg). The GPC cores differ in their Si variation downcore. Hole M0088B shows an initial Si peak at ~2 mbsf (31 wt%) and continues to decline downcore to 25 wt% at the base of the core with an increase at ~10 mbsf to 28 wt%. Hole M0088D, on the other hand, shows relatively stable Si concentrations (28–30 wt%) between 0.9 and 13 mbsf. At ~15 mbsf, the Si concentration increases to 33 wt%, and then it slowly decreases to 29.5 wt% at ~23 mbsf. This pattern is repeated at 25 mbsf with an increase to 32 wt% followed by a decrease to 28.1 wt% at 34.8 mbsf. At the bottom of Hole M0088D, another increase to 30.6 wt% is detected.
Solid-phase Fe contents range ~2.6–3.9 wt% (26,754–39,032 mg/kg). Downcore, Fe values fluctuate without any trend with depth.
The Mn contents are very low (~0.039–0.3 wt%; 393–3086 mg/kg). The highest concentration (0.309 wt%) was measured in the Hole M0088A trigger core. Downcore in both Hole M0088B and M0088D GPC cores, Mn variation is minimal (0.4–0.5 wt%); the only outlier (0.109 wt%) is at ~16 mbsf in Hole M0088B.
5.4.2. Carbon and sulfur
From both trigger cores (Holes M0088A and M0088C), one sample was measured for total carbon (TC) and total organic carbon (TOC) (Figure F28; Table T8). In Hole M0088A, the TC content is 1.37 wt% and the TOC content is 1.33 wt% at 0.9 mbsf. For Hole M0088C, the TC content is 1.01 wt% and the TOC content is 0.99 wt% at 0.65 mbsf. In Holes M0088B and M0088D, TC ranges 0.67–1.46 wt% and TOC ranges 0.53–1.34 wt%. Both GPC cores have a similar distribution to ~14 mbsf, with relatively stable concentrations of TC (1.1–1.4 wt%) and TOC (1.1–1.2 wt%). Overall, TC contents are low in all stratigraphic units at Site M0088 and TOC is high for these hadal environments.
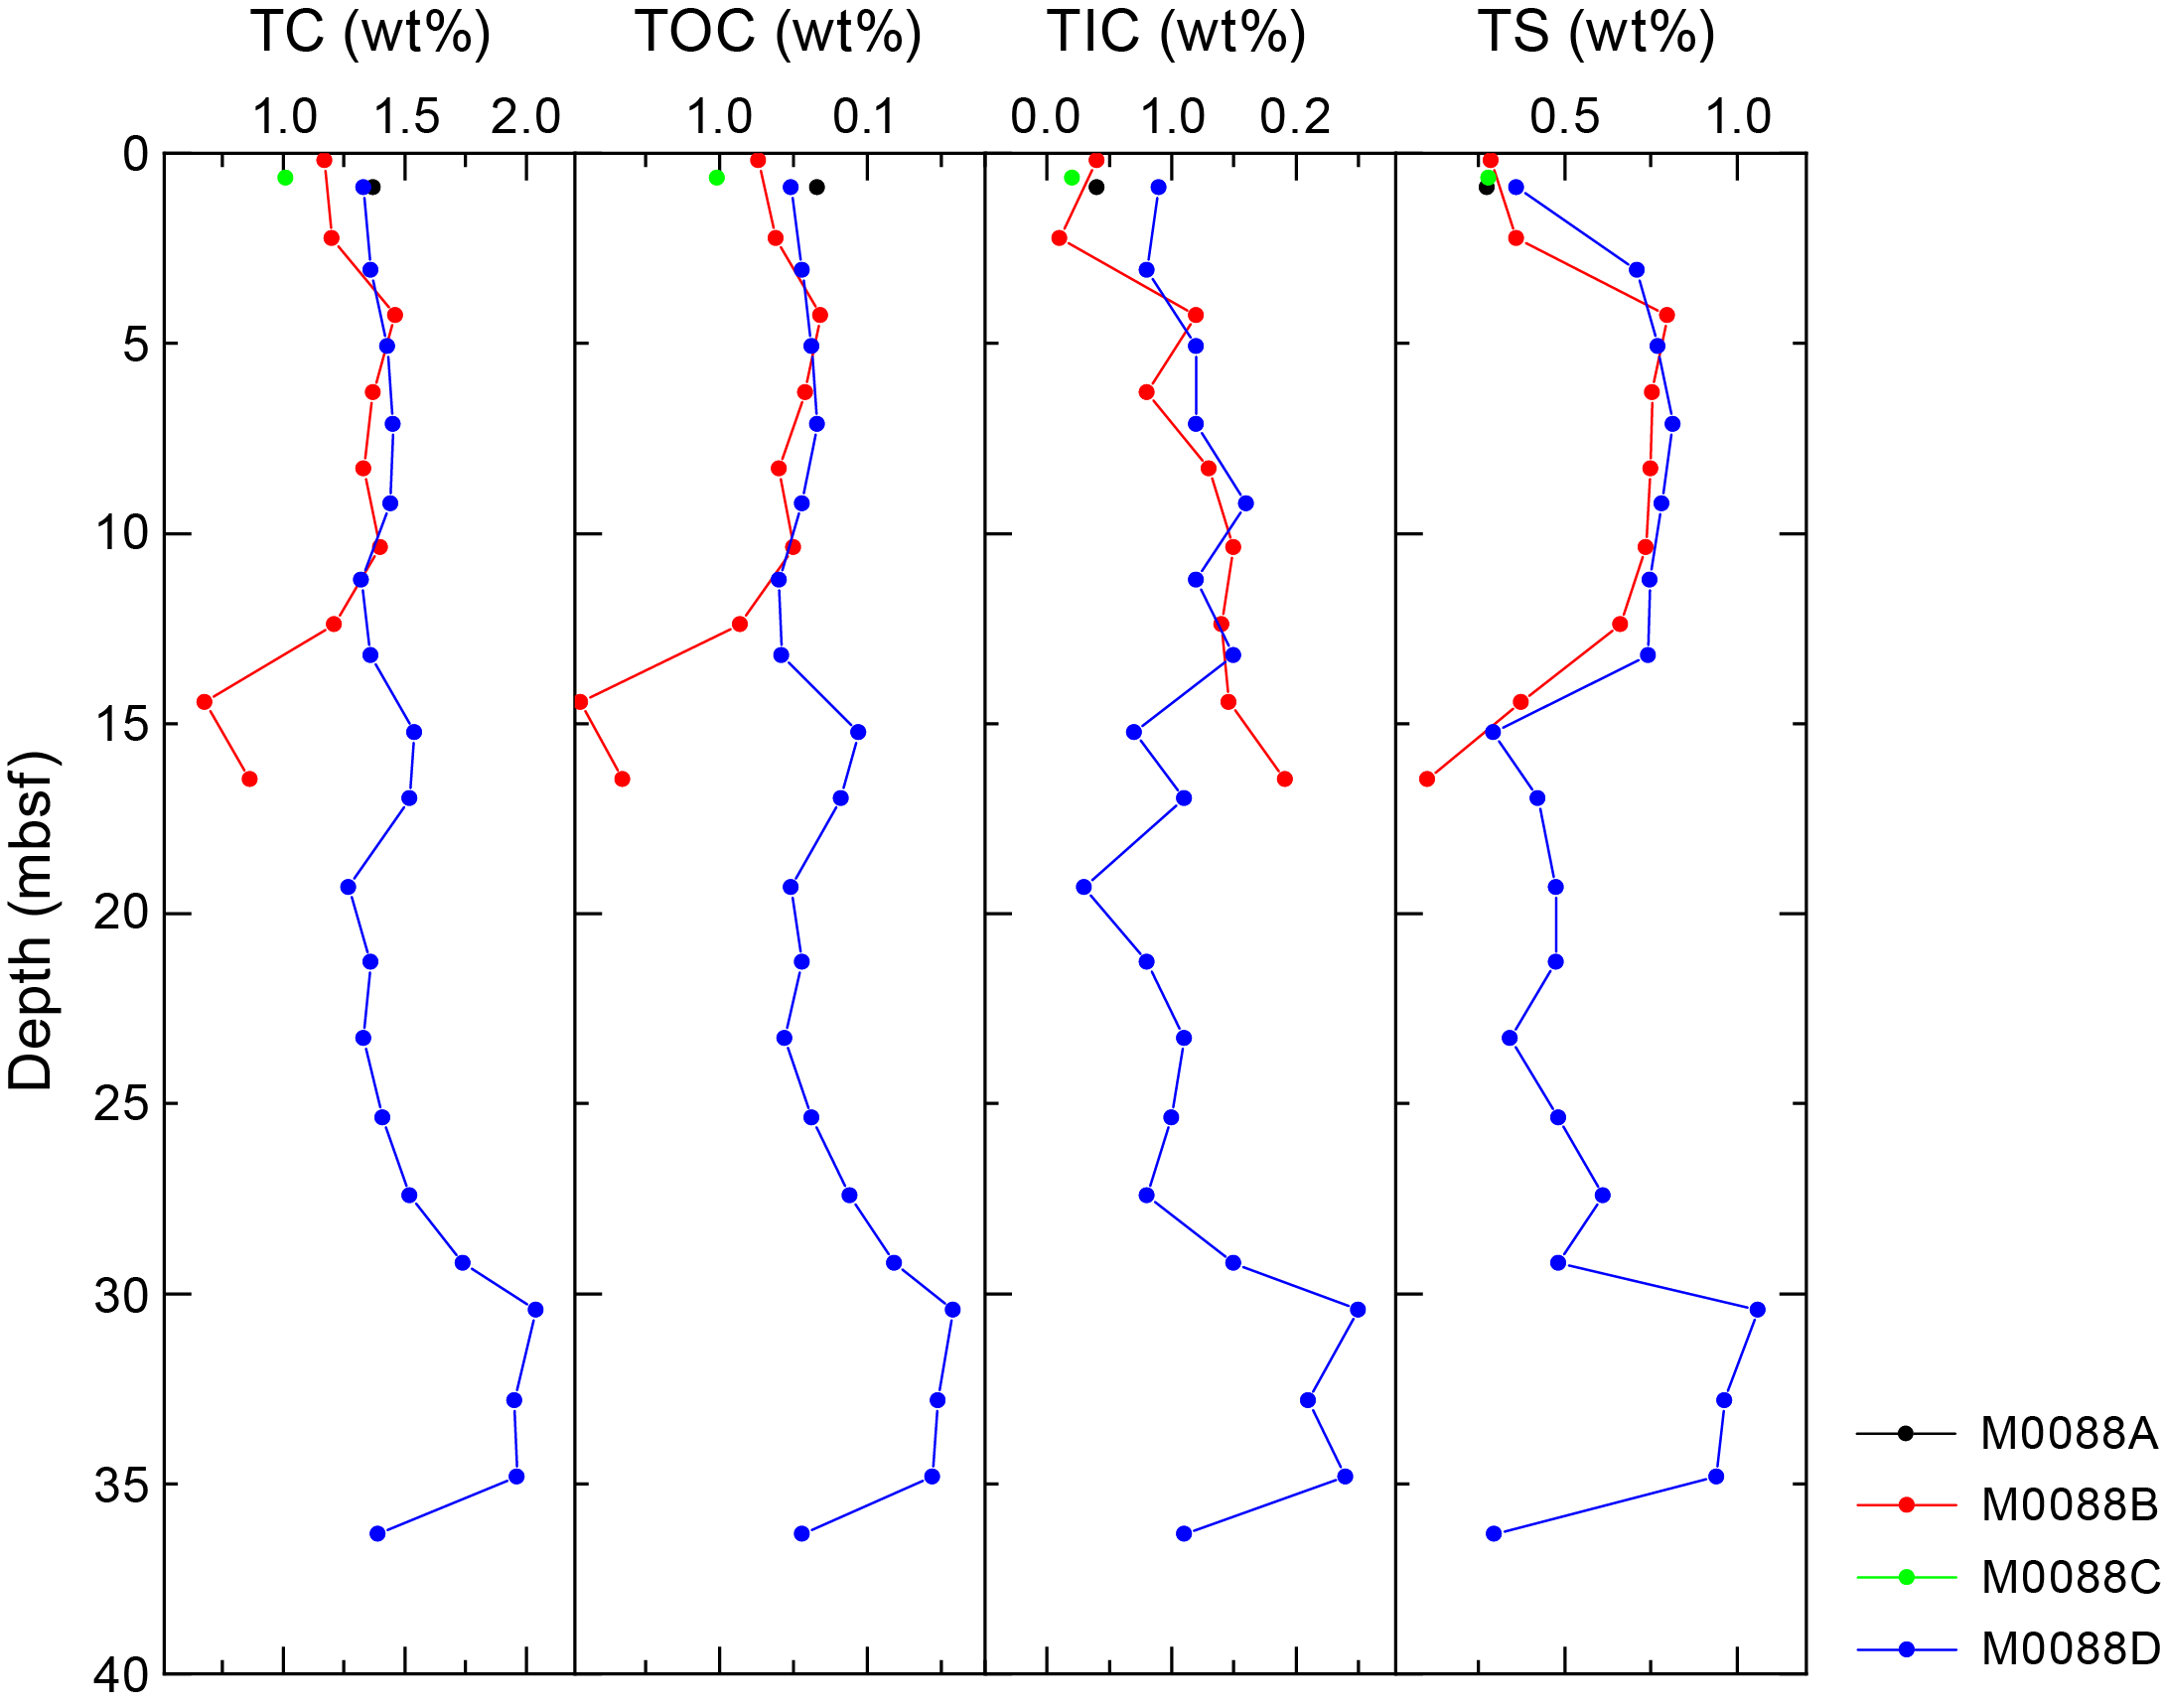
Figure F28. TC, TOC, TIC, and TS.
The total inorganic carbon (TIC) contents were calculated from both trigger cores (Holes M0088A and M0088C) and the GPC cores (Holes M0088B and M0088D). The TIC content is very low at both holes, not exceeding 0.25 wt%. Overall, the trends in total sulfur (TS) contents are similar to those of TOC and TC. One sample from each trigger core (Holes M0088A and M0088C) was measured for TS. In Hole M0088A, the TS content is 0.275% at 0.9 mbsf, and in Hole M0088C, it is 0.279% at 0.65 mbsf. The TS content in the GPC cores (Holes M0088B and M0088D) is low, ranging 0.1–1.06 wt%.
5.5. Discussion
Indicators of organic matter degradation in the IW and headspace samples (ammonium, alkalinity, bromide, and methane concentrations) suggest that intensive remineralization occurs at Site M0088, most actively in the uppermost ~4–5 m. Notably, the ammonium profile at Site M0088 presents a rather wavy pattern, potentially indicating pronounced and/or clearly preserved nonsteady-state diagenesis. Both GPC holes at Site M0088 show very similar patterns, implying that each hole is characterized by only minor spatial heterogeneity in terms of IW and gas chemistry and indicating that overall similar depositional and diagenetic processes affected both holes.
Dissolved Fe and Mn are highest in the uppermost 1 m of the sediment column, indicating organic matter remineralization by intensive dissimilatory Mn and Fe reduction (Froehlich et al., 1979). Below the uppermost sediment interval (~0–5 mbsf), organoclastic sulfate reduction becomes the dominant electron acceptor for organic matter degradation, followed by methanogenesis at greater depth. Sulfate reduction and subsequent formation of diagenetic sulfide minerals are also evident from the abundance of what are likely iron sulfides (see Lithostratigraphy).
Methane/ethane ratios fluctuate between 7,166 and 52,514, suggesting that the observed hydrocarbon gases are of biogenic origin (Claypool and Kvenvolden, 1983). The depth of the sulfate–methane transition (SMT) at Site M0088 is ~5–7 mbsf. Slight differences between Holes M0088B and M0088D could be explained by different depositional histories, including different sedimentation rates, organic matter reactivity, and/or organic matter delivery rates, or may be related to coring effects with different coring gaps at the top of the GPC cores. The SMT is also clearly visible in the Ba profile, which shows the highest concentrations below the SMT and low values directly above it.
The high silica content in the solid phase, in tandem with low calcium and TIC contents, indicates that siliceous materials dominate the sediment composition compared to carbonate minerals (Figure F28). Similar to the IW profiles, all solid-phase profiles analyzed using X-ray fluorescence (XRF) show relatively little variation in their overall concentration trends.
The organic carbon content in the sediments is relatively high, reaching 1.79 wt%, supporting the high mineralization rates observed in the IW profiles (Glud et al., 2013). The coupled but marked variations of TC, TOC, and TIC may imply alien material input into the Japan Trench. In addition, although intensive remineralization occurs in the top part of sediments, high TOC and TC contents are found in the deeper sediments, suggesting that significant amounts of organic matter may be buried in the trench sediments.
6. Physical properties
This section summarizes the preliminary physical properties results from cores acquired at Site M0088 in Basin N2 in the northern Japan Trench at water depths ranging 7525–7550 mbsl. A total of four holes were cored: two pairs of trigger cores (Holes M0088A and M0088C) and corresponding GPC cores (Holes M0088B and M0088D) (see Operations). The physical properties data sets were collected with the techniques and sampling rates defined in Physical properties in the Expedition 386 methods chapter (Strasser et al., 2023a). During the offshore phase, whole cores were scanned through the Multi-Sensor Core Logger (MSCL). During the onshore phase, cores were split, scanned through the Tri-Sensor Core Logger (TSCL), and sampled for moisture and density (MAD), undrained shear strength, and P-wave velocity. Overall, the physical properties data sets are high quality and correlate well with lithology and hydroacoustic data.
6.1. Bulk density
Bulk density data were obtained offshore using the gamma ray attenuation (GRA) technique on the MSCL. Throughout Hole M0088B, MSCL bulk density data have overall good quality and trend well with other physical properties (Figure F29). In Hole M0088D, the uppermost 10 m shows the least variability, and below 10 mbsf, variability is more significant (Figure F30). The upper part of both holes shows the same trend to ~8.5 and ~5 mbsf in Holes M0088B and M0088D, respectively. These intervals are characterized first by a density increase, followed by a second increase to 1.4 g/cm3. Below 8.5 and 5 mbsf in Holes M0088B and M0088D, respectively, the values show opposite trends, with an increase from 1.3 to 1.4 g/cm3 in Hole M0088B and a decrease from 1.32 to 1.25 g/cm3 in Hole M0088D. Both holes are characterized by a pronounced peak that exceeds 1.6 g/cm3 between 14 and 15 mbsf. In Hole M0088D, this peak has sharp base, where density values immediately drop by about 0.3 g/cm3 from maximum values of 1.6 g/cm3. Below 20 mbsf, the bulk density of Hole M0088D increases steadily with depth from 1.1 to 1.35 g/cm3. At the bottom of the hole (35.55 mbsf), the highest bulk density peak is reached (1.64 g/cm3).
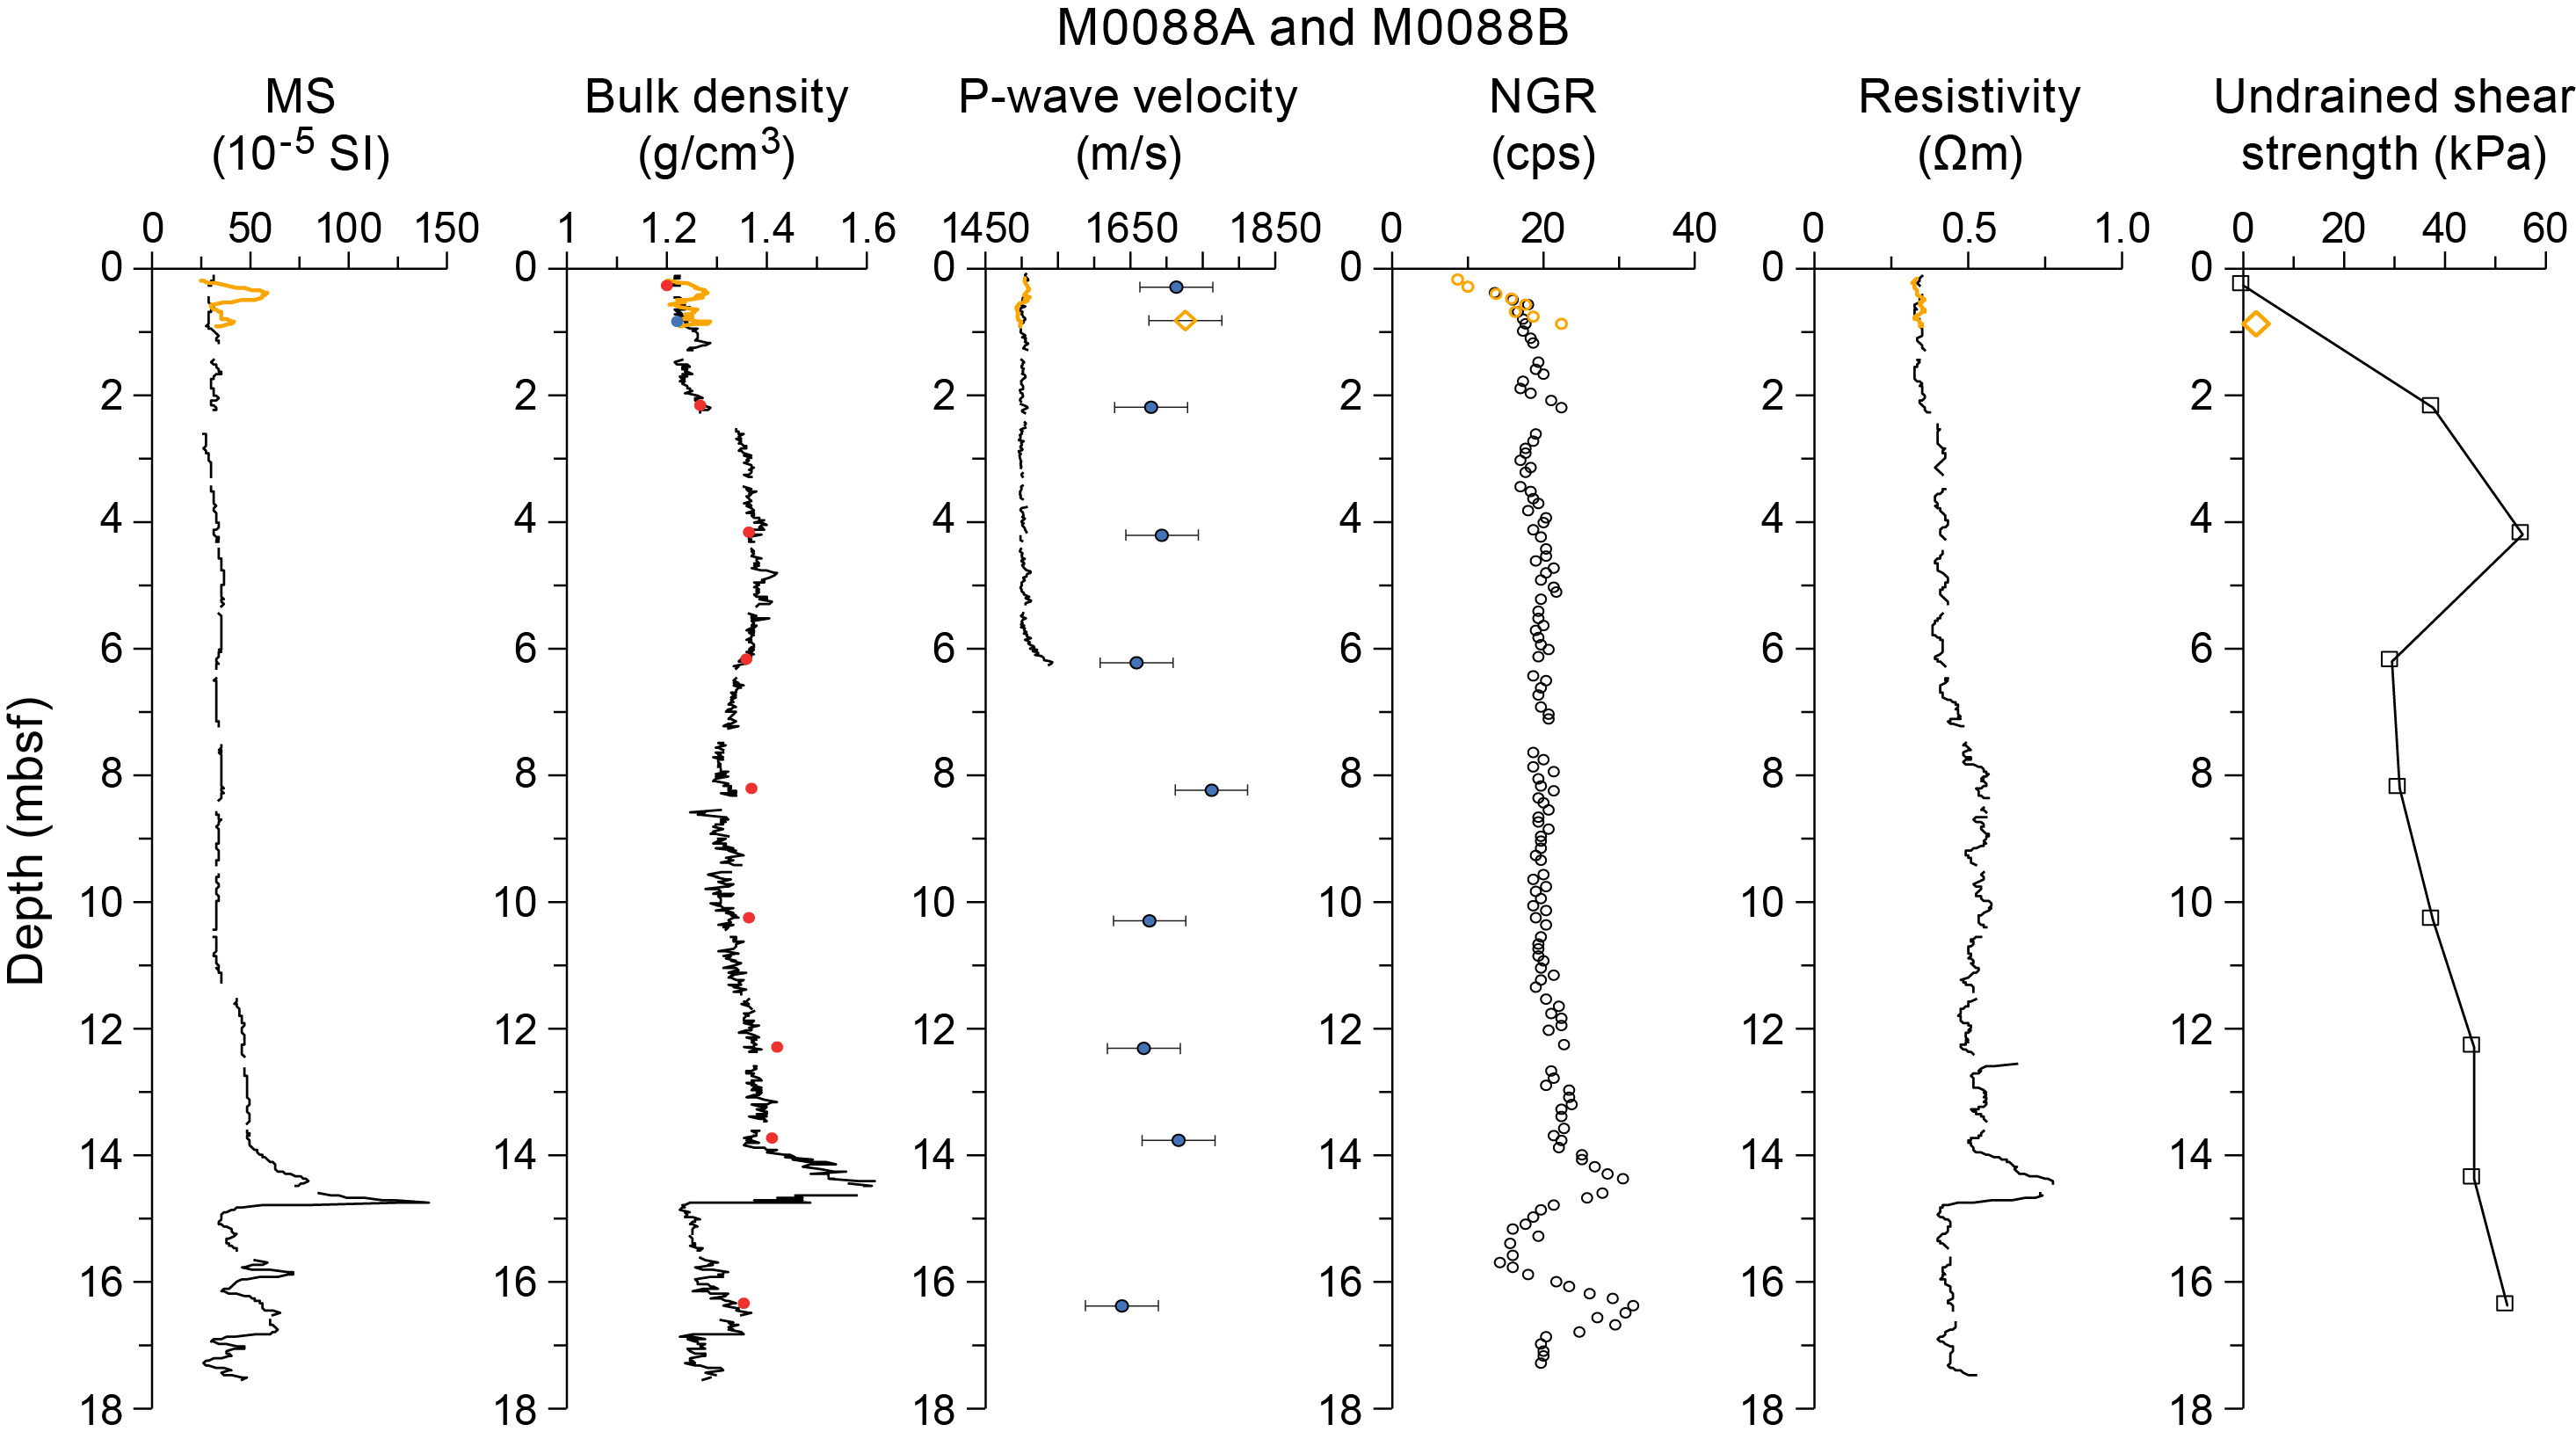
Figure F29. Physical properties summary, Holes M0088A and M0088B.
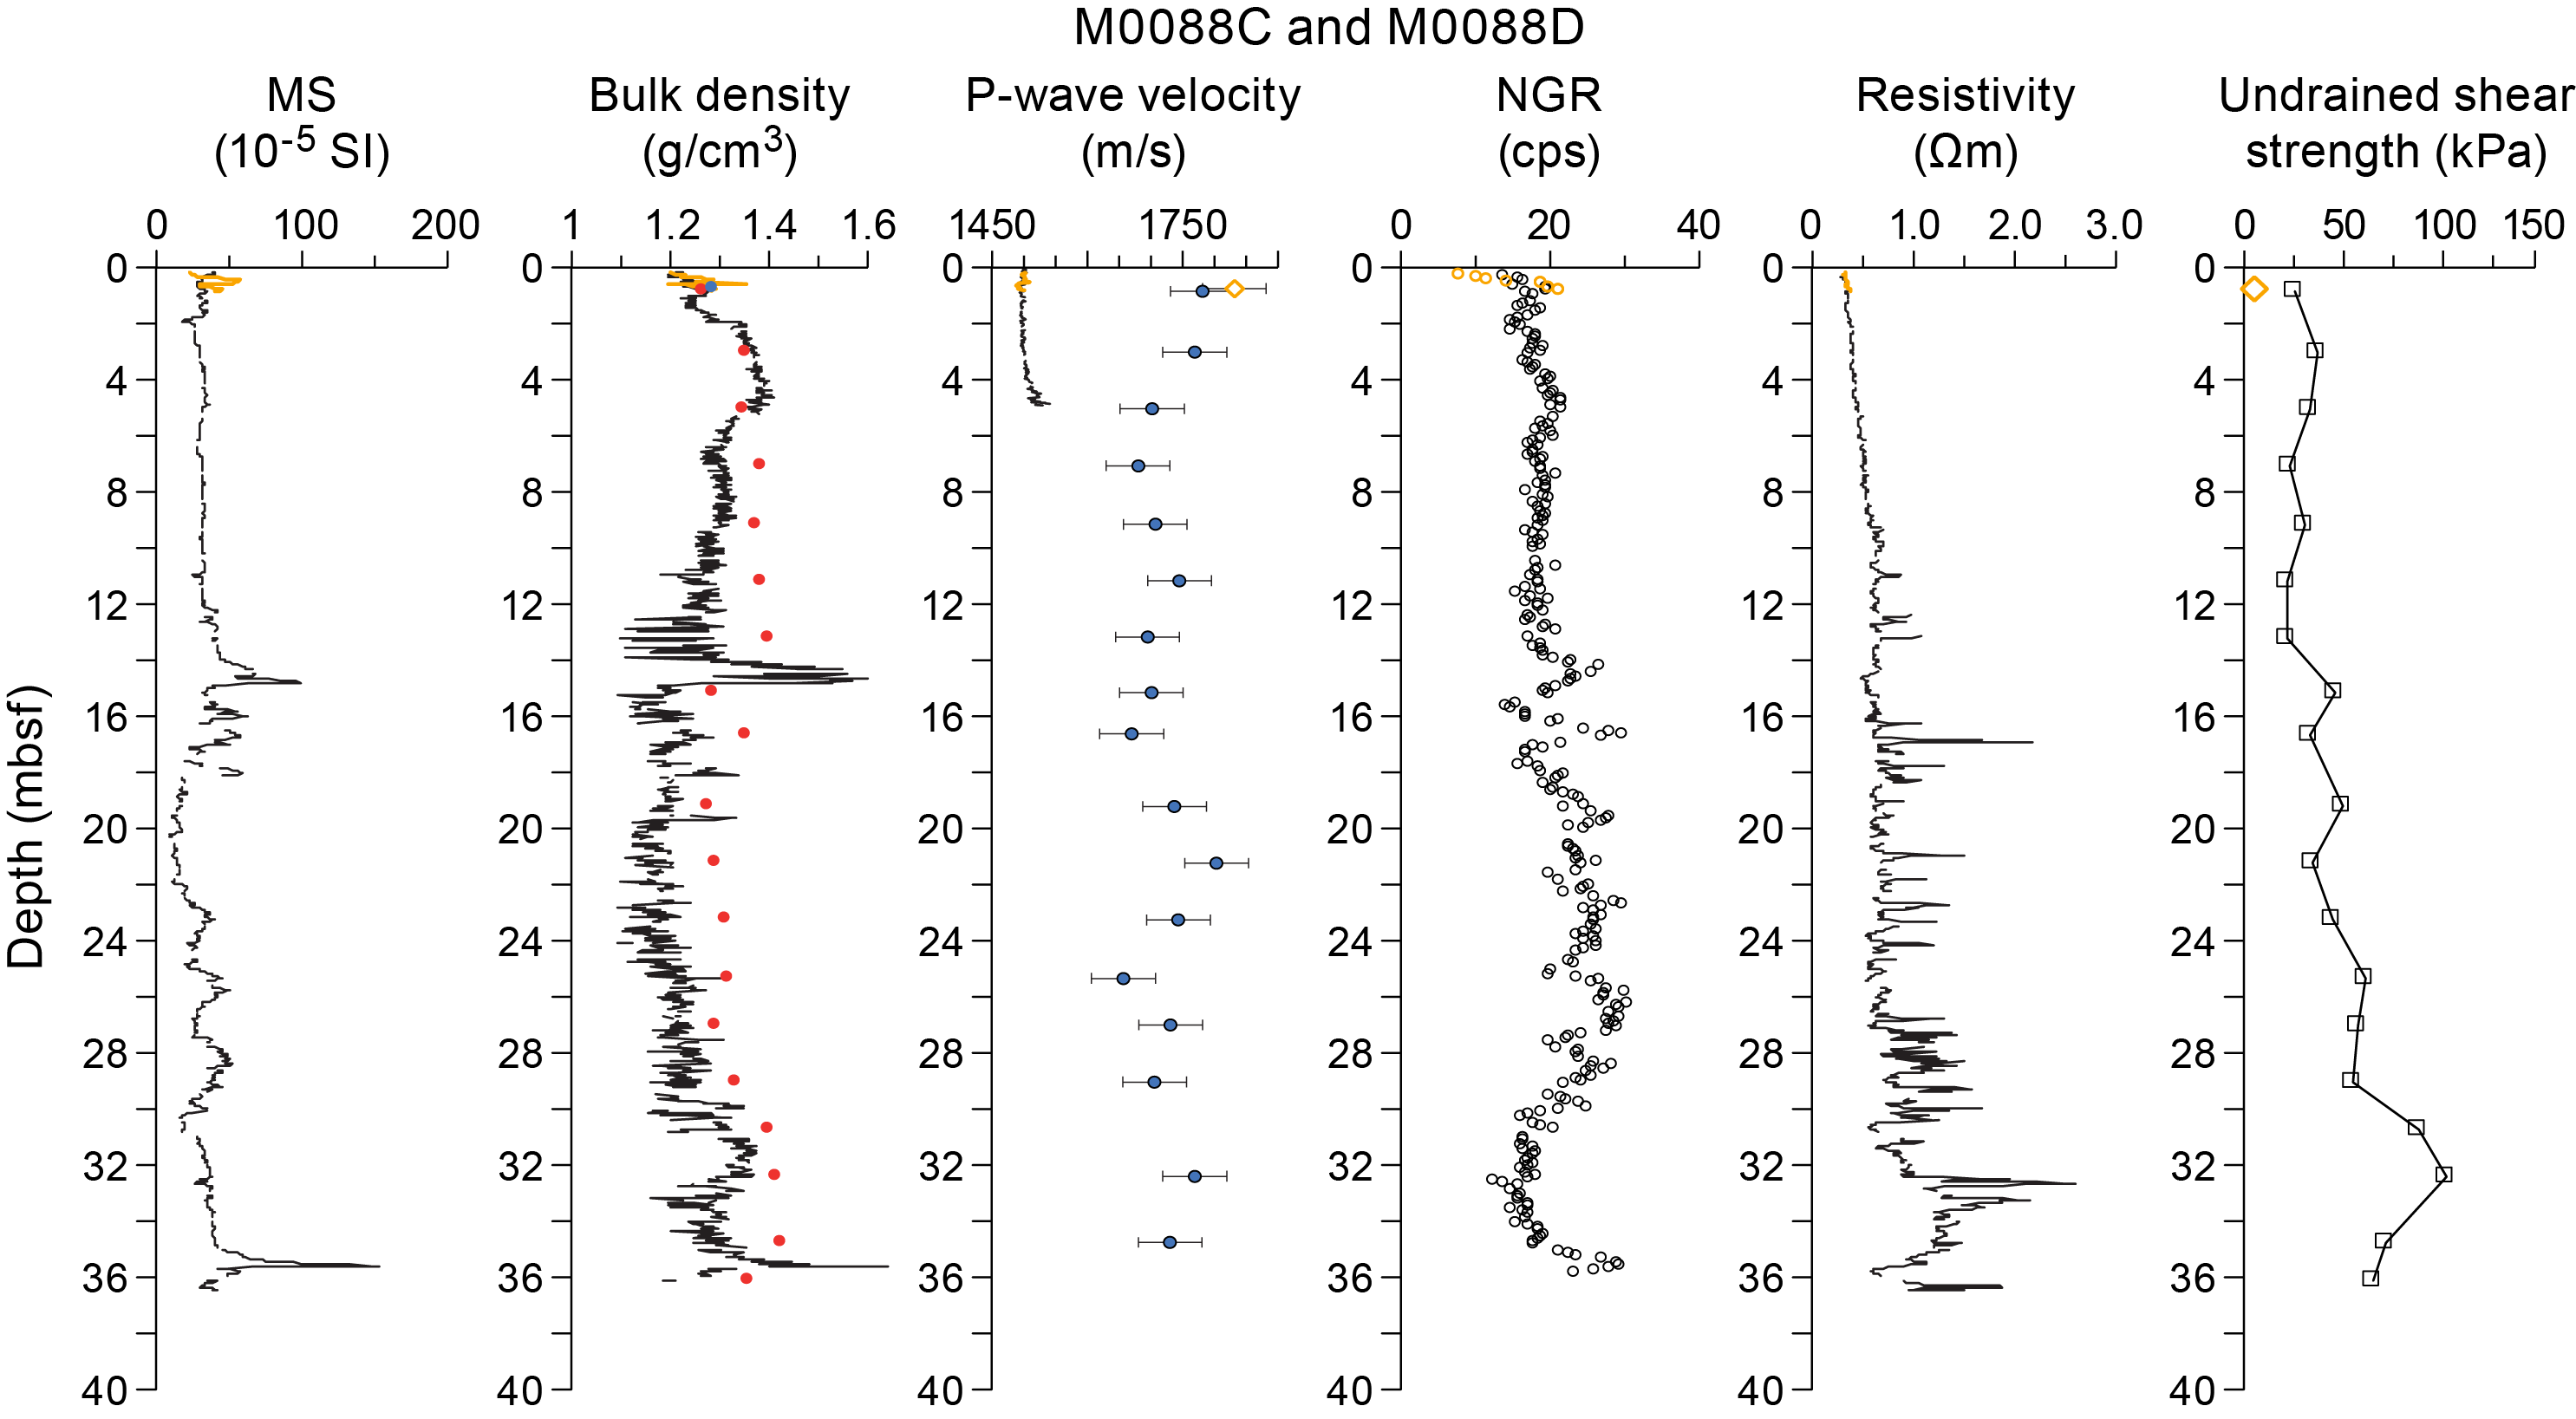
Figure F30. Physical properties summary, Holes M0088C and M0088D.
Onshore, additional bulk density data were obtained using the MAD technique on discrete samples from trigger and piston cores, appended as blue and red dots, respectively, in Figures F29 and F30. In Hole M0088B, the values of the discrete samples are consistent with the MSCL measurement. Shallower than 6 mbsf, MSCL and MAD measurements are similar, and deeper MAD bulk density values are slightly higher (~0.04 g/cm3 higher). In Hole M0088D, MAD and MSCL bulk density are similar throughout the uppermost 5 m. Below this depth, the MAD data show higher values (~0.08 g/cm3 higher) but retain the same trend.
6.2. Magnetic susceptibility
Magnetic susceptibility data were obtained during the offshore phase of the expedition using the MSCL. Both holes (M0088B and M0088D) show consistent values (Figures F29, F30) that can be divided into four subzones:
- The uppermost 2 m fluctuate around a baseline value of ~30 × 10−5 SI.
- Throughout the next ~10 m, magnetic susceptibility is relatively constant at ~30 × 10−5 SI.
- A succession of four peaks occurs at around 15, 16, 17, and 18 mbsf. Hole M0088B reaches the third peak but does not record further. The first peak is characterized by an asymmetric shape with a very sharp base that reaches 140 × 10−5 SI in Hole M0088B and 100 × 10−5 SI in Hole M0088D. The value immediately drops to 50 × 10−5 SI and then sharply increases and gradually decreases upward. The three other peaks reach around 60 × 10−5 SI in Hole M0088D.
- Subzone 4 is recorded only in Hole M0088D from 20 mbsf downcore. It shows an increasing trend in values from ~10 × 10−5 to 40 × 10−5 SI with four superimposed peaks. The first three peaks around 23, 26, and 28.5 mbsf are about 2.5 m wide. They show a downcore rapid increase followed by a larger decrease. In contrast, the last peak at 35.5 mbsf shows a sharp base that exceeds 150 × 10−5 SI and has an upward gradual decrease.
6.3. P-wave velocity
P-wave velocity was measured using the MSCL on whole cores during the offshore phase. During the onshore phase, P-wave velocity was measured on discrete samples approximately every 2 m. Many of the MSCL velocity data were of insufficient quality below ~5 mbsf and have been omitted.
Offshore P-wave velocities recorded with the MSCL at Site M0088 generally trend around 1500 m/s (the velocity of water). Shore-based discrete measurements are noticeably higher (closer to an average of 1700 m/s). The difference in velocity exceeds the uncertainty associated with the discrete velocity measurements (±50 m/s). The difference between the two data sets may be attributed to continued compaction or degassing of the sediments between offshore and onshore phase of the expedition. Further investigation will be required to fully understand the discrepancy, and the data should thus be used with a degree of caution.
MSCL and laboratory-measured P-wave data are plotted in Figures F29 and F30. Both holes show the same trend, with the uppermost part of the core characterized by values fluctuating closely around a baseline value of ~1500 m/s and rapidly increasing to 1540 m/s at 6.2 and 4.8 mbsf in Holes M0088B and M0088D, respectively.
Onshore, P-wave measurements were performed on discrete samples, resulting in higher values than the MSCL data (Figures F29, F30). The onshore measurements on the discrete samples of Holes M0088B and M0088D resulted in average P-wave velocities around 1688 and 1724 m/s, respectively. In Hole M0088D, two samples (30.7 and 36.1 mbsf) developed cracks under the uniaxial compression, and the signal was noisy and not detectable. Moreover, the sample at 27 mbsf (1730 m/s) shows cracks.
6.4. Noncontact electrical resistivity
Noncontact electrical resistivity measured using the MSCL shows a gradual increase from 0.3 Ωm at the top of the hole to ~0.7 Ωm at ~10 mbsf (Figures F29, F30). Below 10 mbsf in Hole M0088D, the overall trend continues to increase with numerous well-marked superimposed peaks. The maximum value exceeds 2.5 Ωm at ~32.5 mbsf.
6.5. Natural gamma radiation
NGR in Holes M0088B and M0088D shows consistent profiles. The uppermost 4 m are characterized by an increase followed by a fluctuation in values. Below this depth, both profiles can be divided into two well-defined intervals (Figures F29, F30). The first interval, between ~4 and 14 mbsf, is characterized by constant values with small fluctuations around 20 counts/s in Hole M0088B and 18 counts/s in Hole M0088D. The second interval, between 14 and 30 mbsf, thus mainly recorded in Hole M0088D, is characterized by large variations with a minimum value of 14 counts/s and a maximum value exceeding 30 counts/s. Below 30 mbsf in Hole M0088D, values again show lower variability around 16 counts/s before increasing to 30 counts/s at 35 mbsf.
6.6. Undrained shear strength
Undrained shear strength (Su) was measured on split cores with a handheld penetrometer, automated vane shear (AVS) apparatus, and fall cone penetrometer (see Physical properties in the Expedition 386 methods chapter [Strasser et al., 2023a]).
Su generally increases with depth in Holes M0088B and M0088D (Figures F29, F30, F31). Hole M0088B is characterized by two intervals where Su values increase: in the uppermost 4 m, values measured with the handheld penetrometer increase from 0 to ~55 kPa, and from 6 mbsf to the base of the core, values increase from ~30 to ~50 kPa. Hole M0088D is characterized by a constant penetrometer-derived Su around ~25 kPa throughout the uppermost 13 m. Below this depth, values gradually increase to 67 kPa with some variability and a maximum value of 104 kPa at 32 mbsf.

Figure F31. Undrained shear strength from fall cone and AVS.
It should be noted that values of Su vary according to the device used to obtain them (Figure F31). For example, fall cone strengths are higher than those obtained with the AVS and handheld penetrometer. The influence of the U-channel along the center of the core could result in lower strengths than those measured with the fall cone. The fall cone only impacts a small region of the core (~2–5 mm), whereas the AVS impacts a larger region of the core (~20–50 mm). Both measurements ideally should be obtained from the center of the core away from the core sidewall. However, samples could not be taken at the center because of the U-channel sampled during the Onshore Science Party (OSP) (see Physical properties in the Expedition 386 methods chapter [Strasser et al., 2023a]). As a result, strength sampling points had to be placed halfway between the central U-channel and the sidewall of the core. During AVS measurements, the fractures that opened often propagated toward both the central U-channel and the sidewall, perhaps resulting in lower strength values. Fall cone measurements were not seen to be affected by the U-channel or the sidewall. Further analysis will more closely examine the strength data to try to reconcile the differences.
6.7. Moisture and density
Several MAD properties are calculated from onshore measurements of the wet and dry masses of discrete samples and their volumes. Holes M0088B and M0088D show similar profiles with depth (Figures F32, F33). The wet and dry water content curves and the porosity and void ratio curves show similar variations. For Hole M0088D, wet water content ranges 52%–68%, dry water content ranges 112%–180%, porosity ranges 74%–84%, and void ratio ranges 3–5. Bulk density and dry density vary inversely to these trends, with downcore values ranging 1.2–1.4 and 0.4–0.7 g/cm3 in Holes M0088B and M0088D, respectively. The grain density curve is variable but does not exhibit any particular trend. Values range 2.5–2.7 g/cm3 with a peak exceeding 2.7 g/cm3 at 16.6 mbsf.
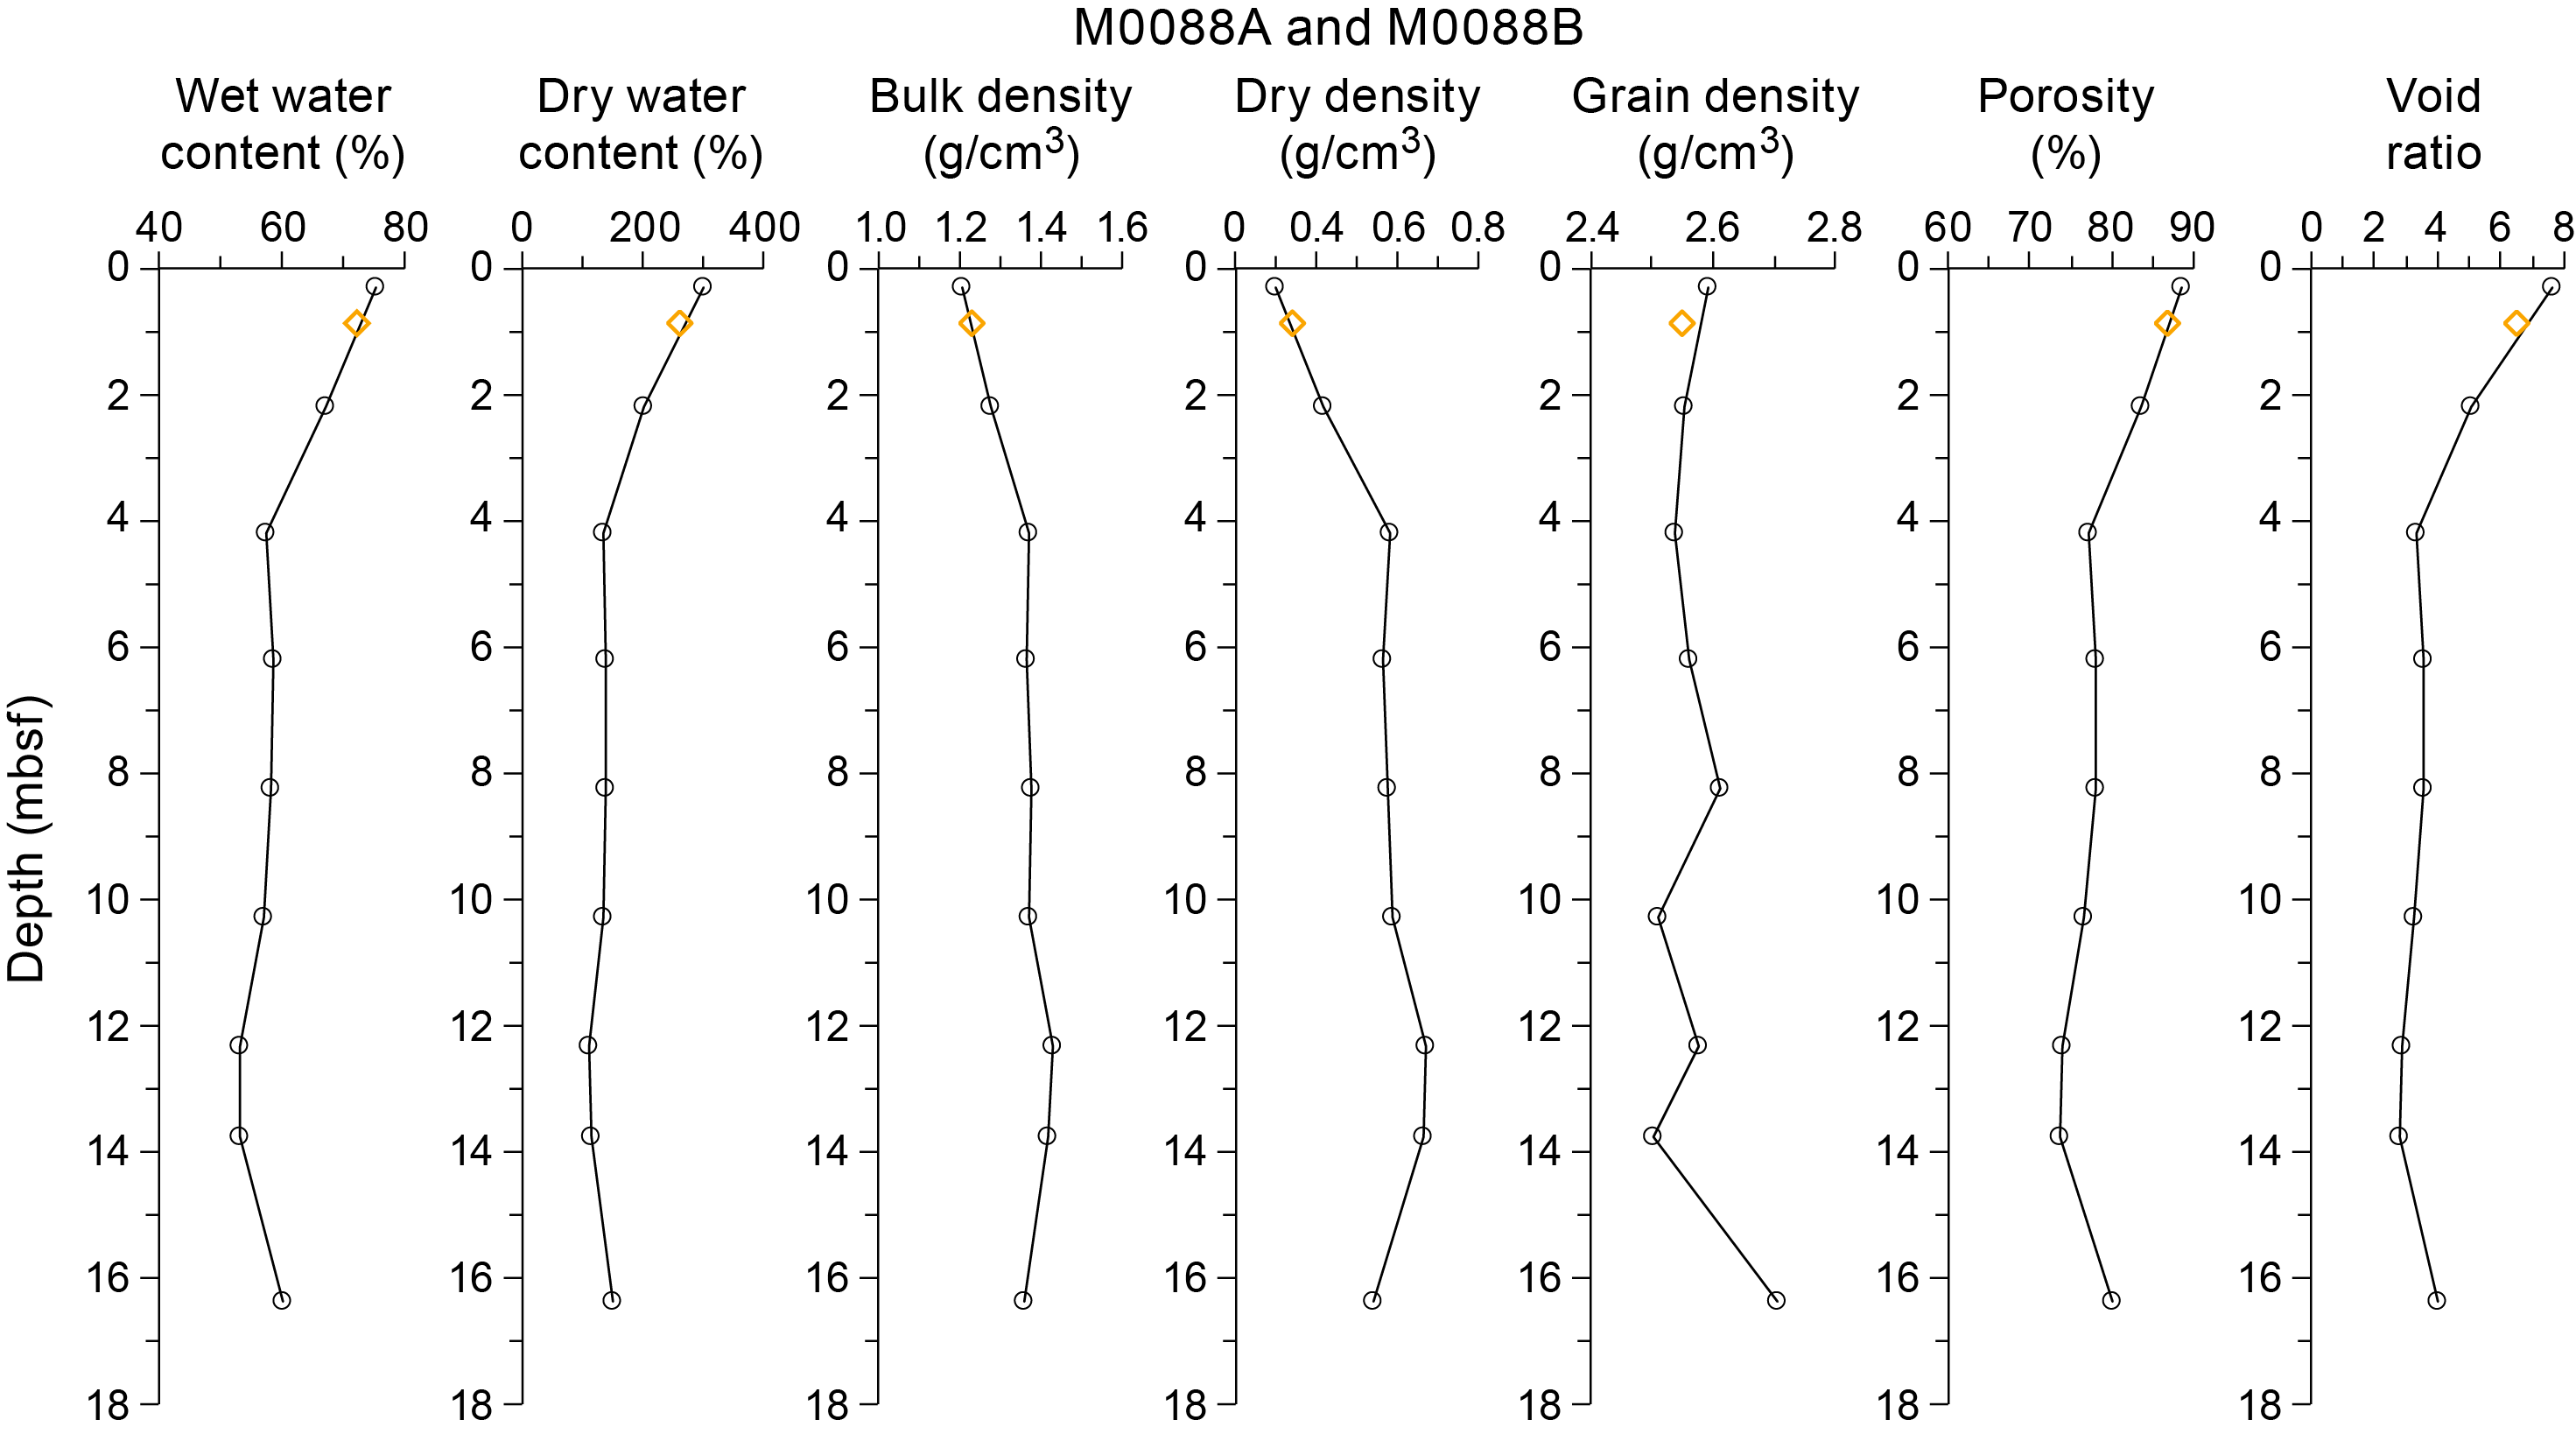
Figure F32. MAD data, Holes M0088A and M0088B.
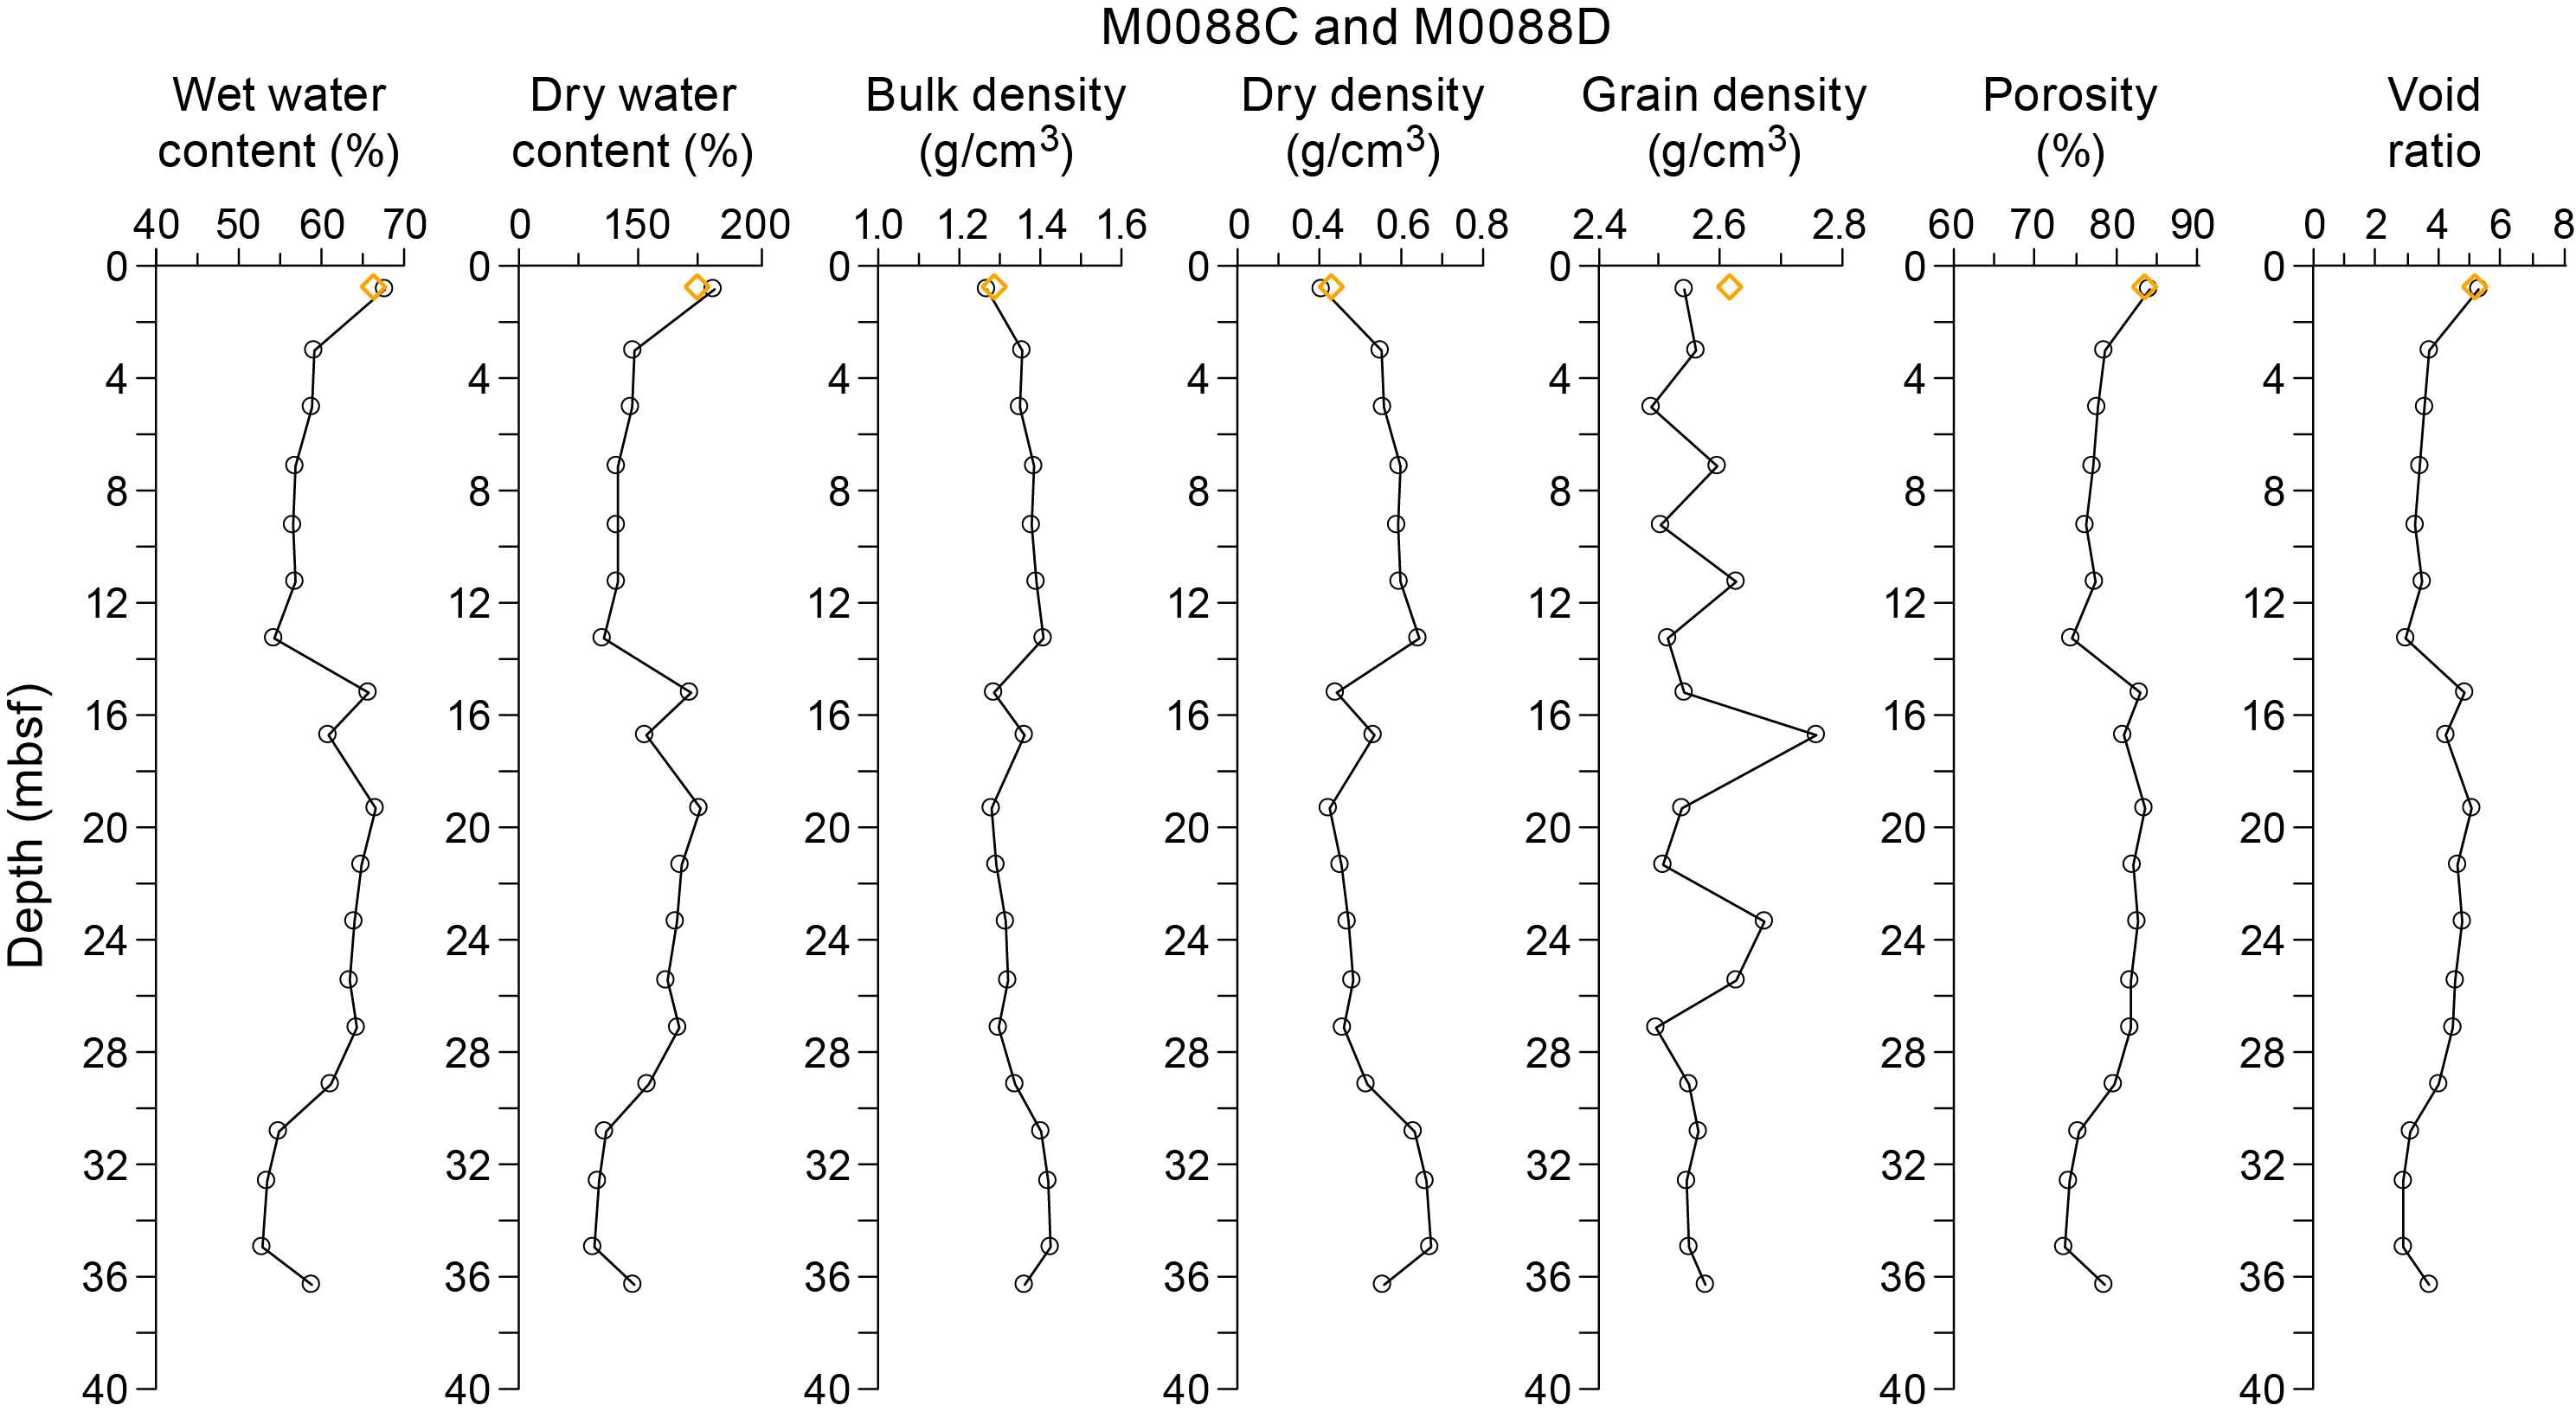
Figure F33. MAD data, Holes M0088C and M0088D.
6.8. Color reflectance and RGB values
In Hole M0088B, color spectrometry L* values vary between approximately 20 and 32 with one spike at ~11 at the top of the hole and two peaks that exceed 35 at ~2.5 mbsf and between 16 and 17 mbsf (Figure F34). Values of a* vary between approximately −1.5 and 0.5. Values of b* vary between approximately 1.5 and 12.5. RGB values vary with depth and generally follow variations in spectrometry (Figure F35). All of the curves, with the exception of a*, highlight a nearly homogeneous color between 2.5 and 14 mbsf, with gentle downcore trends toward lower values in all parameters.

Figure F34. Color data, Hole M0088B.

Figure F35. Color data, Hole M0088D.
In Hole M0088D, color spectrometry L* values vary between approximately 20 and 40, although values fall as low as 5 and one peak exceeds 50 at ~28 mbsf (Figure F35). Values of a* vary between approximately −2 and 1 with a spike exceeding 3 at ~28 mbsf. Values of b* vary between approximately 0 and 15 with the same spike at 28 mbsf. RGB values vary with depth and generally follow variations in spectrometry. All of the curves highlight a nearly homogeneous color between 2.5 and 10 mbsf. Two thinner intervals (31–32 and 33.5–34.5 mbsf) are also characterized by a nearly homogeneous color.
7. Paleomagnetism
This section reports the measurement of remanent magnetization in Holes M0088A–M0088D, which were cored in the northern study area of the northern Japan Trench (Basin N2). Remanent magnetization of U-channel samples was measured on sections of the working halves of the cores at 2 cm intervals. Natural remanent magnetization (NRM) measurements were only conducted at 0 and 5 mT peak fields due to the time constraints of the hybrid OSP.
Profiles of intensity, inclination, and declination after demagnetization at 5 mT are displayed in the figures in this section. Intensity is characterized by two peaks at 0.4 and 0.75 mbsf in Hole M0088A and 0.2 and 0.4 mbsf in Hole M0088C. Inclination shows high values at 0.15 and 0.65 mbsf in Hole M0088A and at 0.1, 0.3, and 0.65 mbsf in M00088C. Declination in Holes M0088A and M00088C shows constant values.
The variation of intensity in Holes M0088B and M0088D is very similar to that seen in Holes M0084B, M0084D, and M0084F; the interval between 0 and 14 mbsf in both holes is characterized by large areas of low intensity (Figures F36, F37; see Paleomagnetism in the Sites M0084 and M0085 (Basin N3) chapter [Strasser et al., 2023b]). Both holes are characterized by highly fluctuating intensity between 14 and 17 mbsf. The lower part is characterized by low intensity intervals with four high peaks at 23, 26, 29, and 36 mbsf in Hole M0088D.
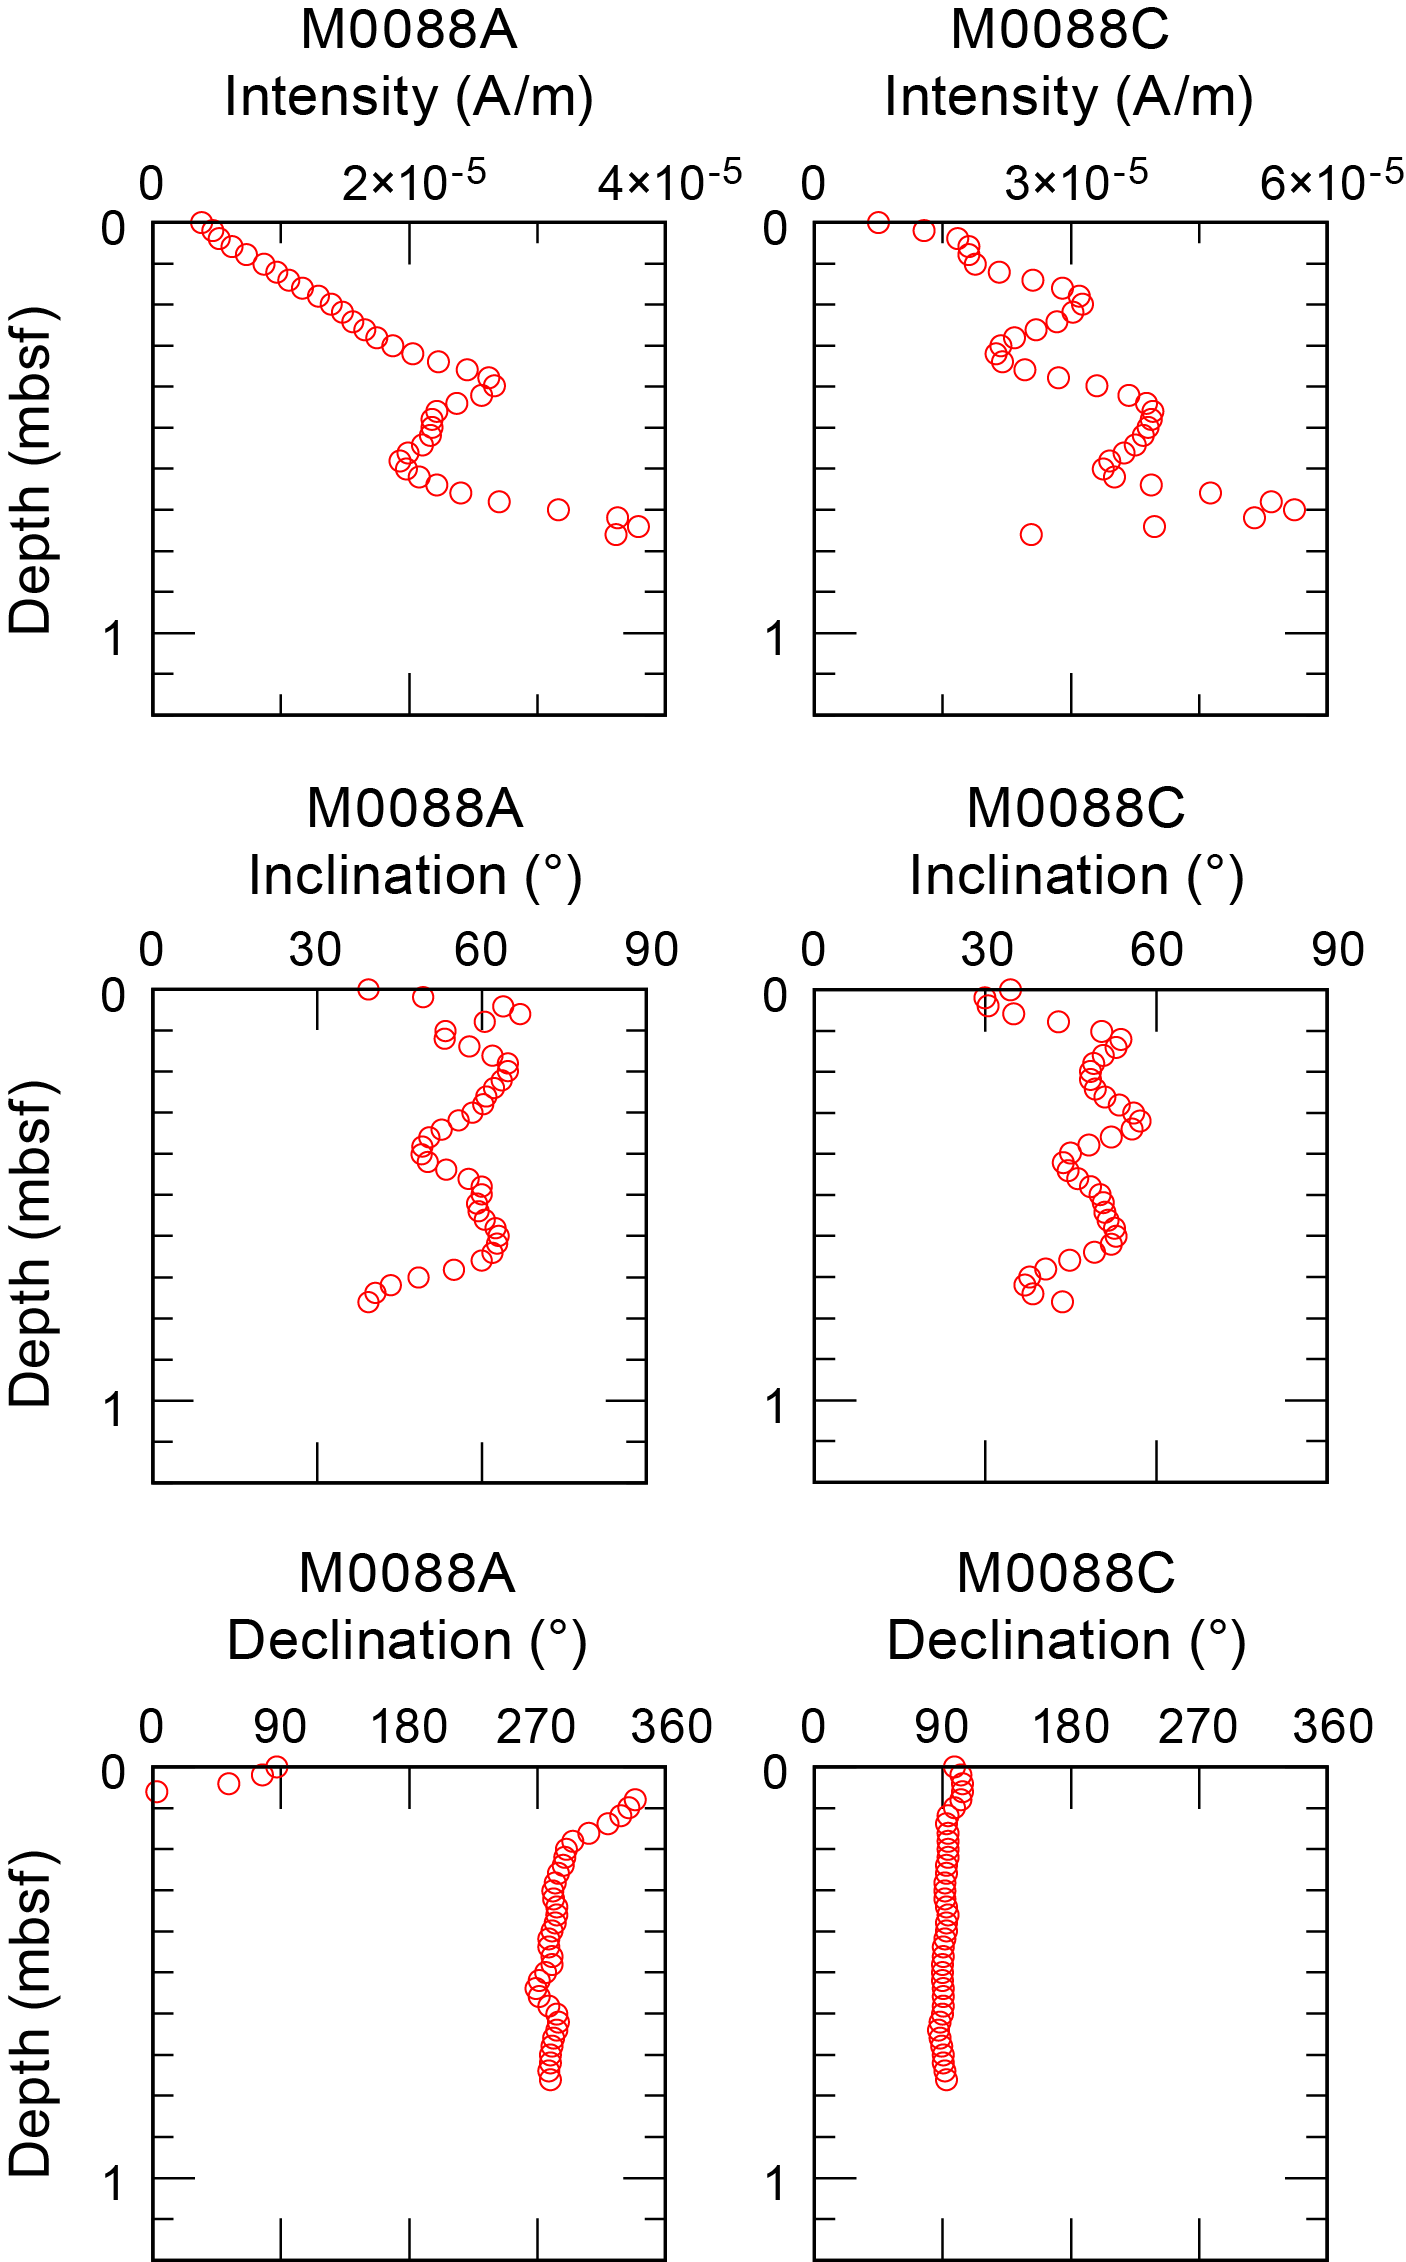
Figure F36. Intensity, inclination, and declination.
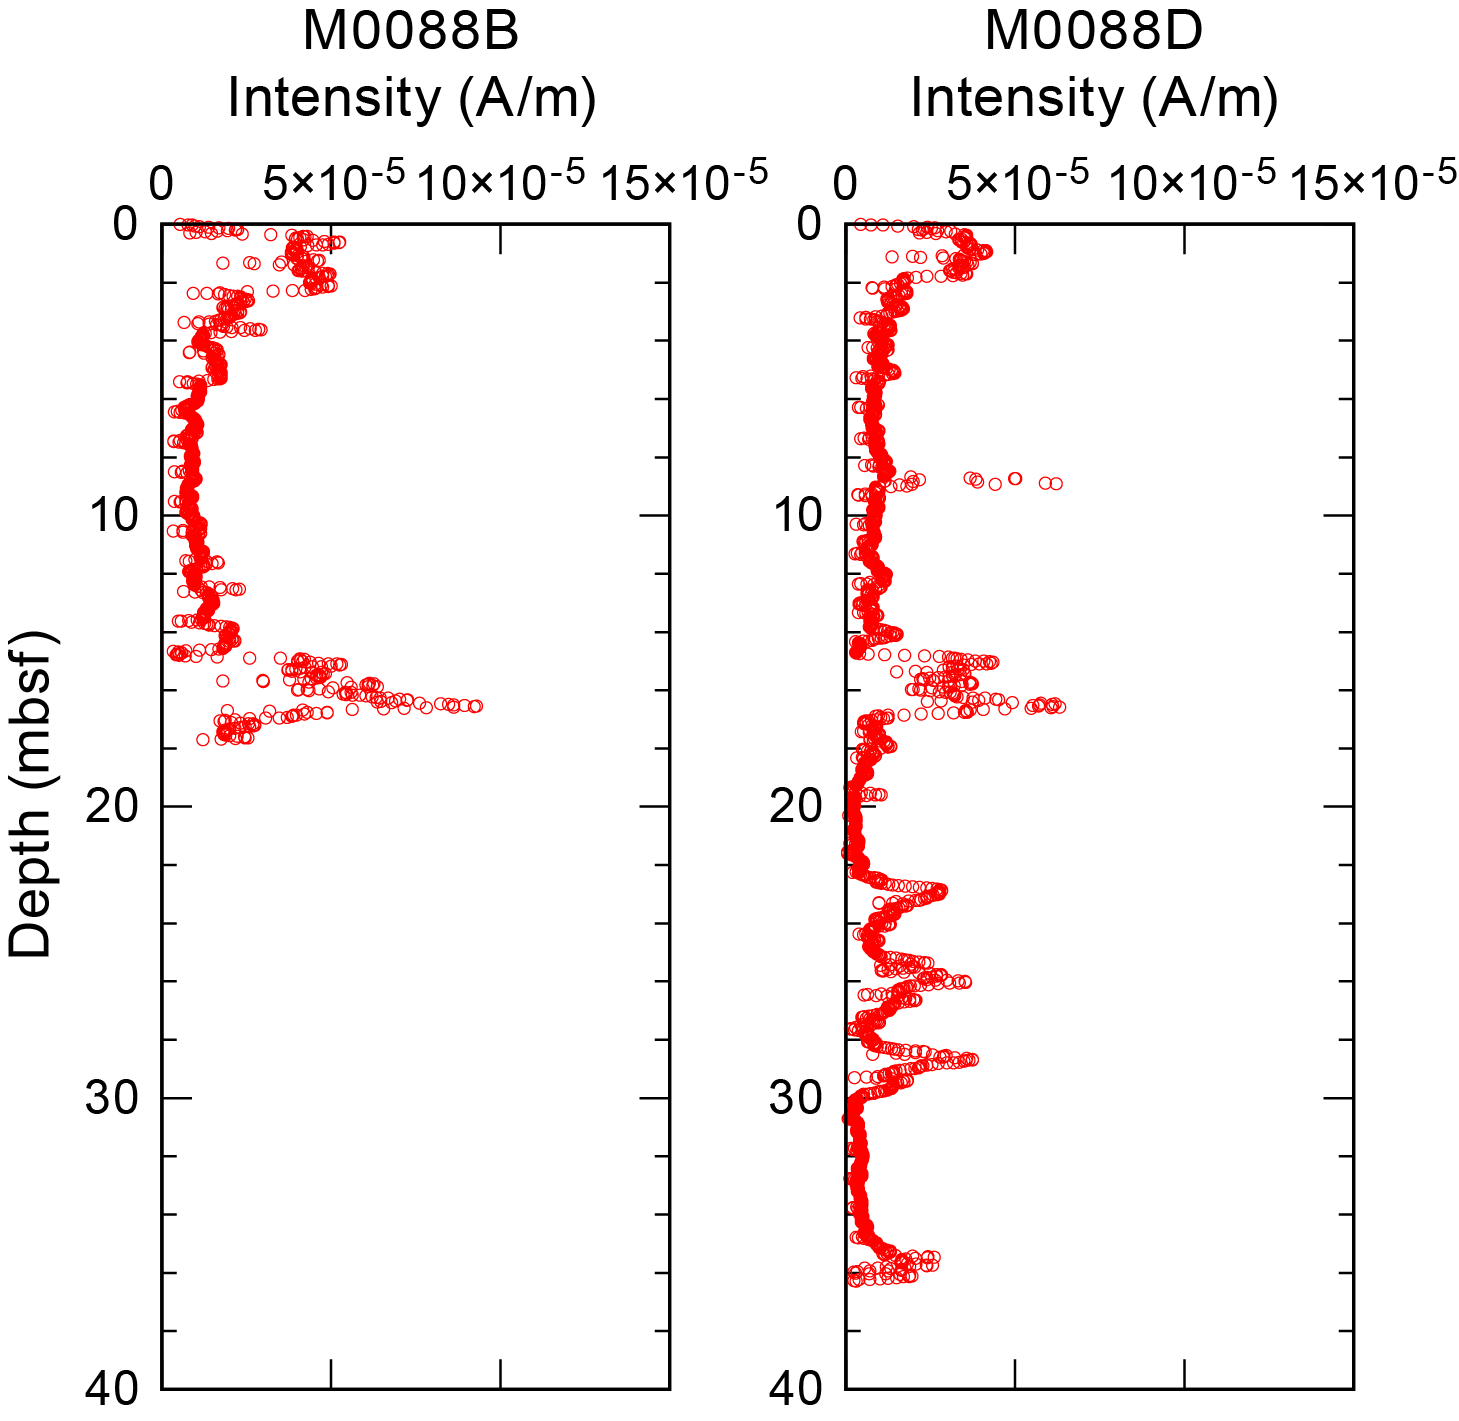
Figure F37. Intensity.
Declination trends in Holes M0088B and M0088D are shown in Figure F38. The interval between 0 and 14 mbsf is characterized by fluctuations in declination direction. Areas of less variable declination changes below 14 mbsf are recognized. Declination showing gradual clockwise rotation is corrected by a simple method, assuming that this linear trend is a function of core depth (Figure F39). The lower declination pattern, which shows a large hump peaking at 26 mbsf, could be interpreted as signatures of paleomagnetic secular variation.
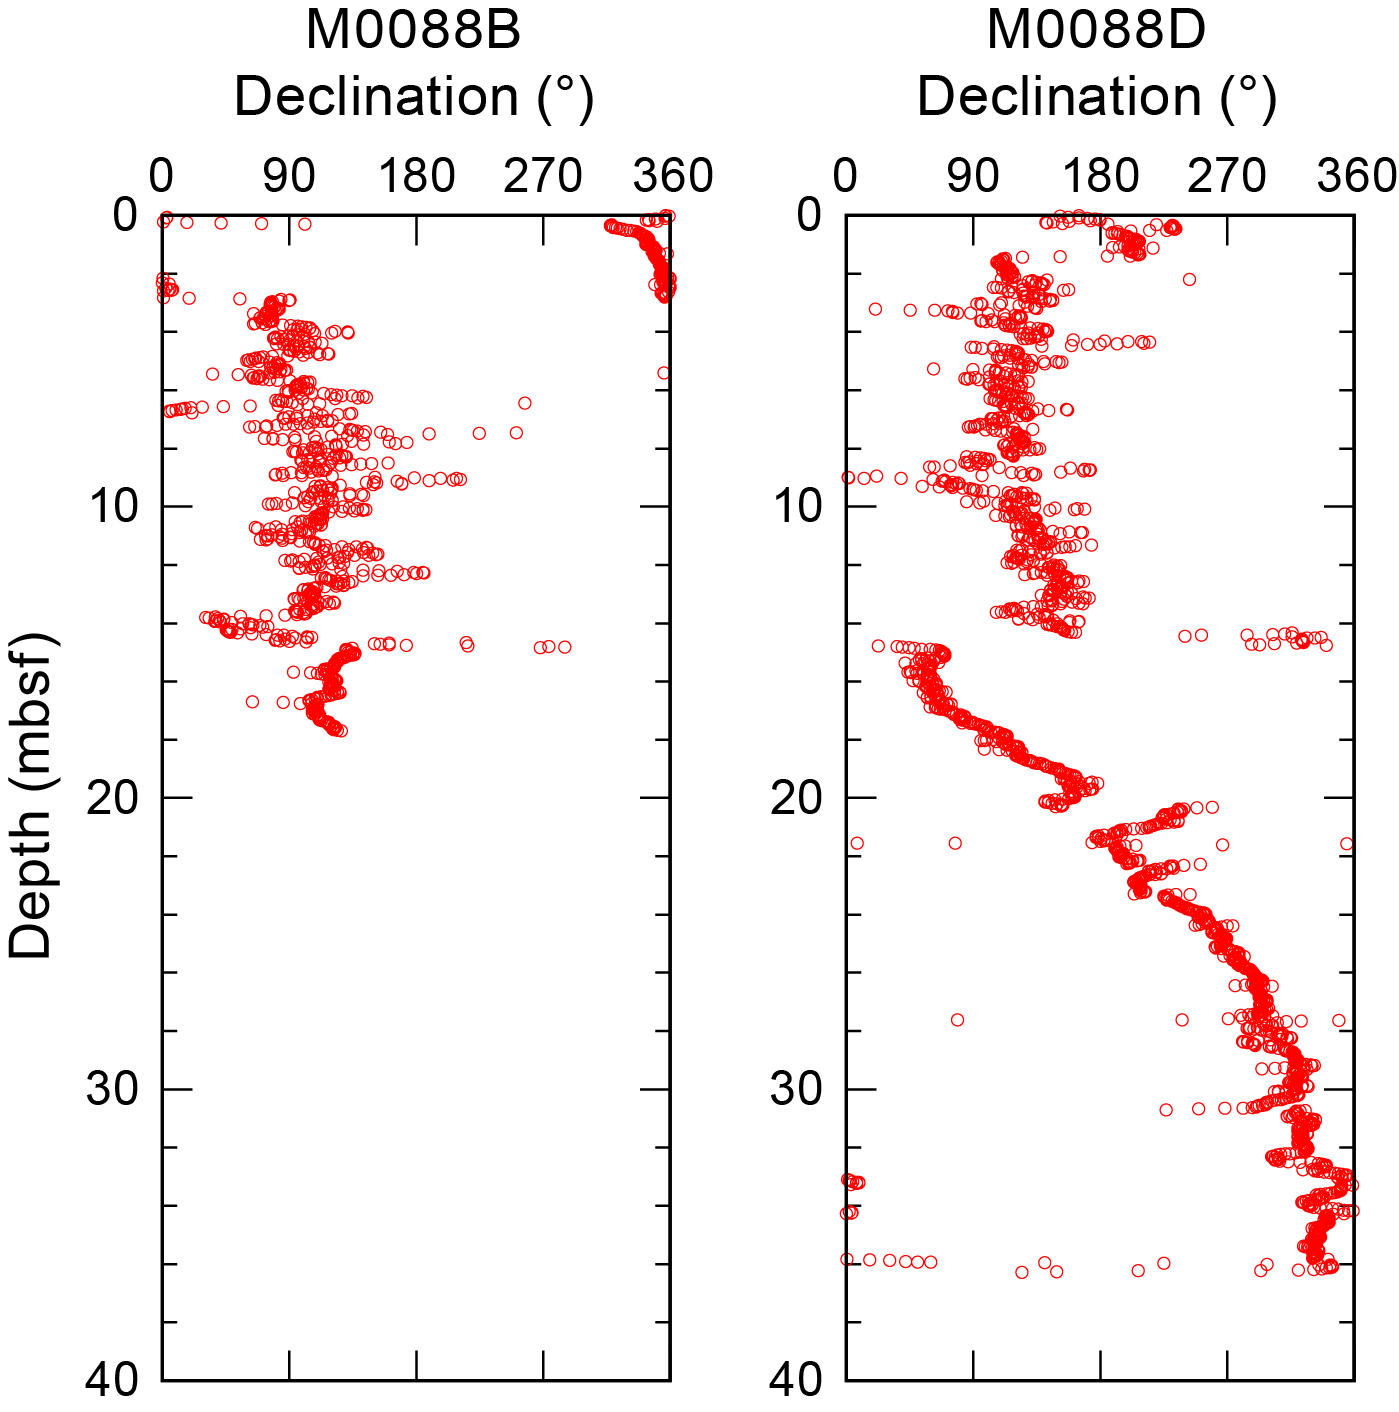
Figure F38. Declination.
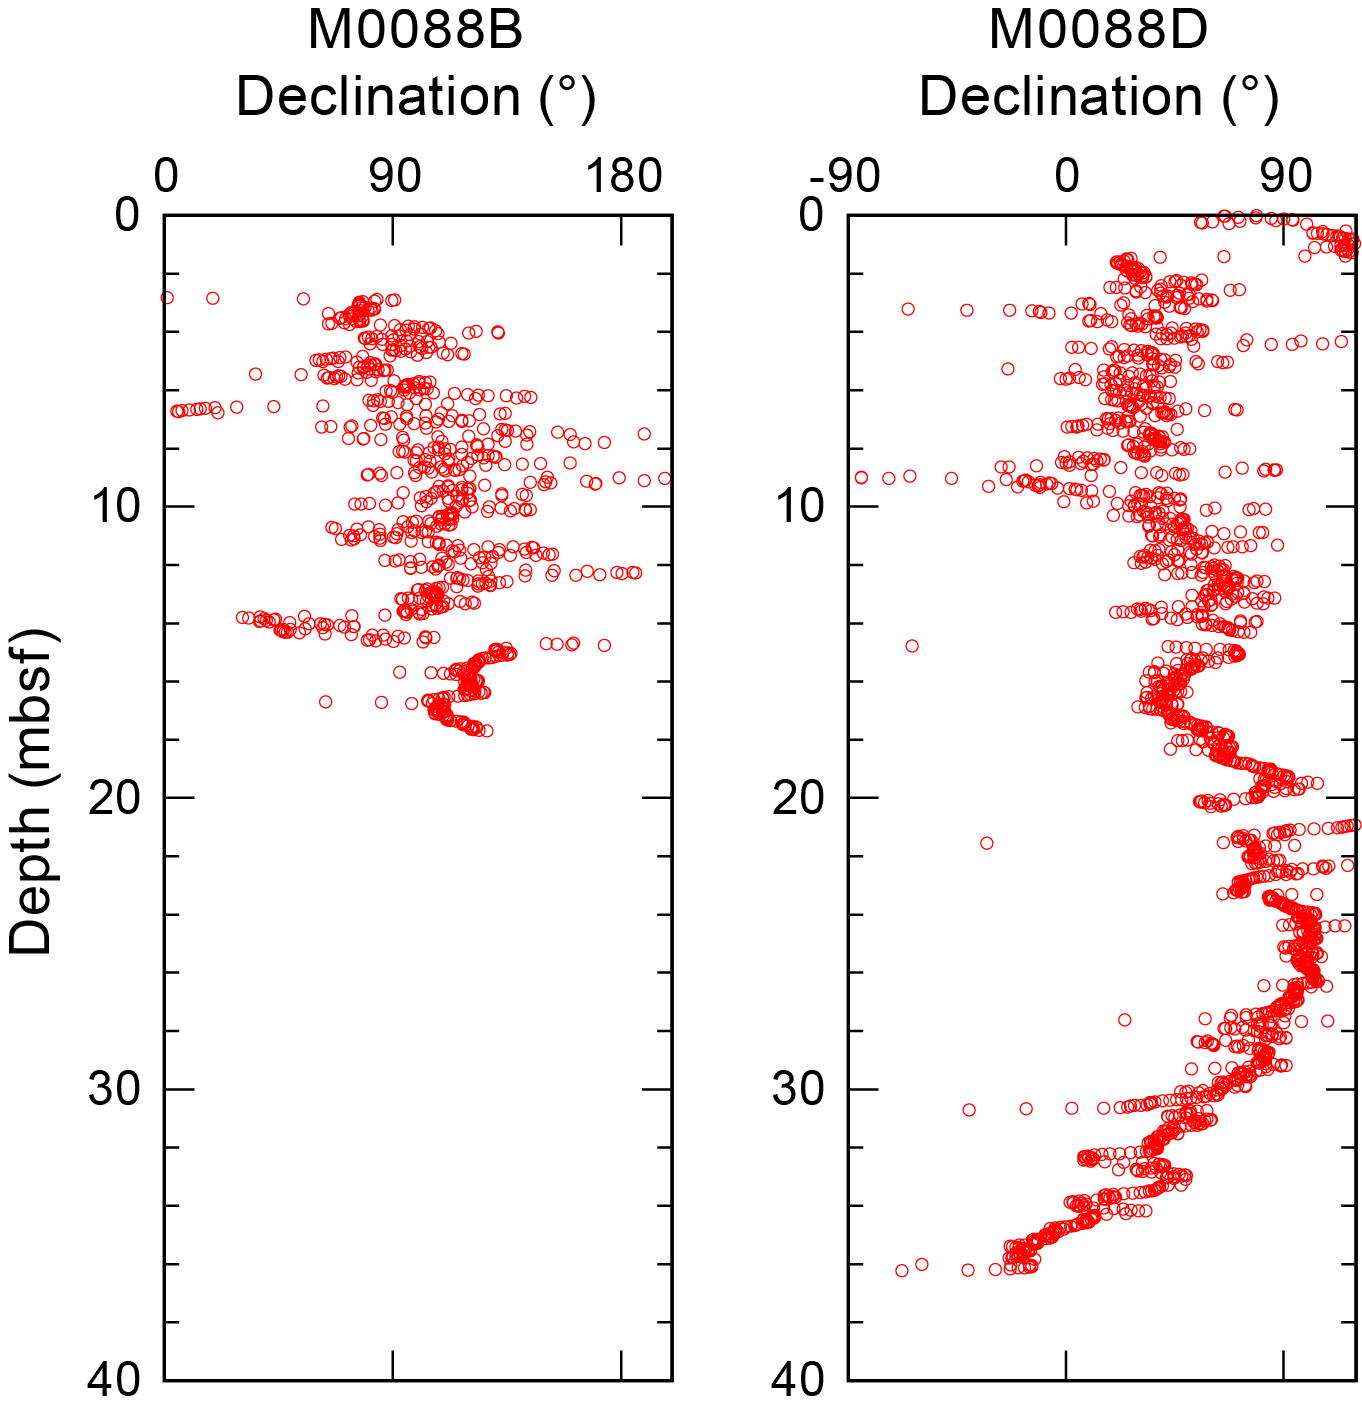
Figure F39. Corrected declination.
The inclination profile of Hole M0088D broadly shows variation between 30° and 90° (Figure F40). There is a general shallowing trend downward throughout the profile from ~60° to ~40°.
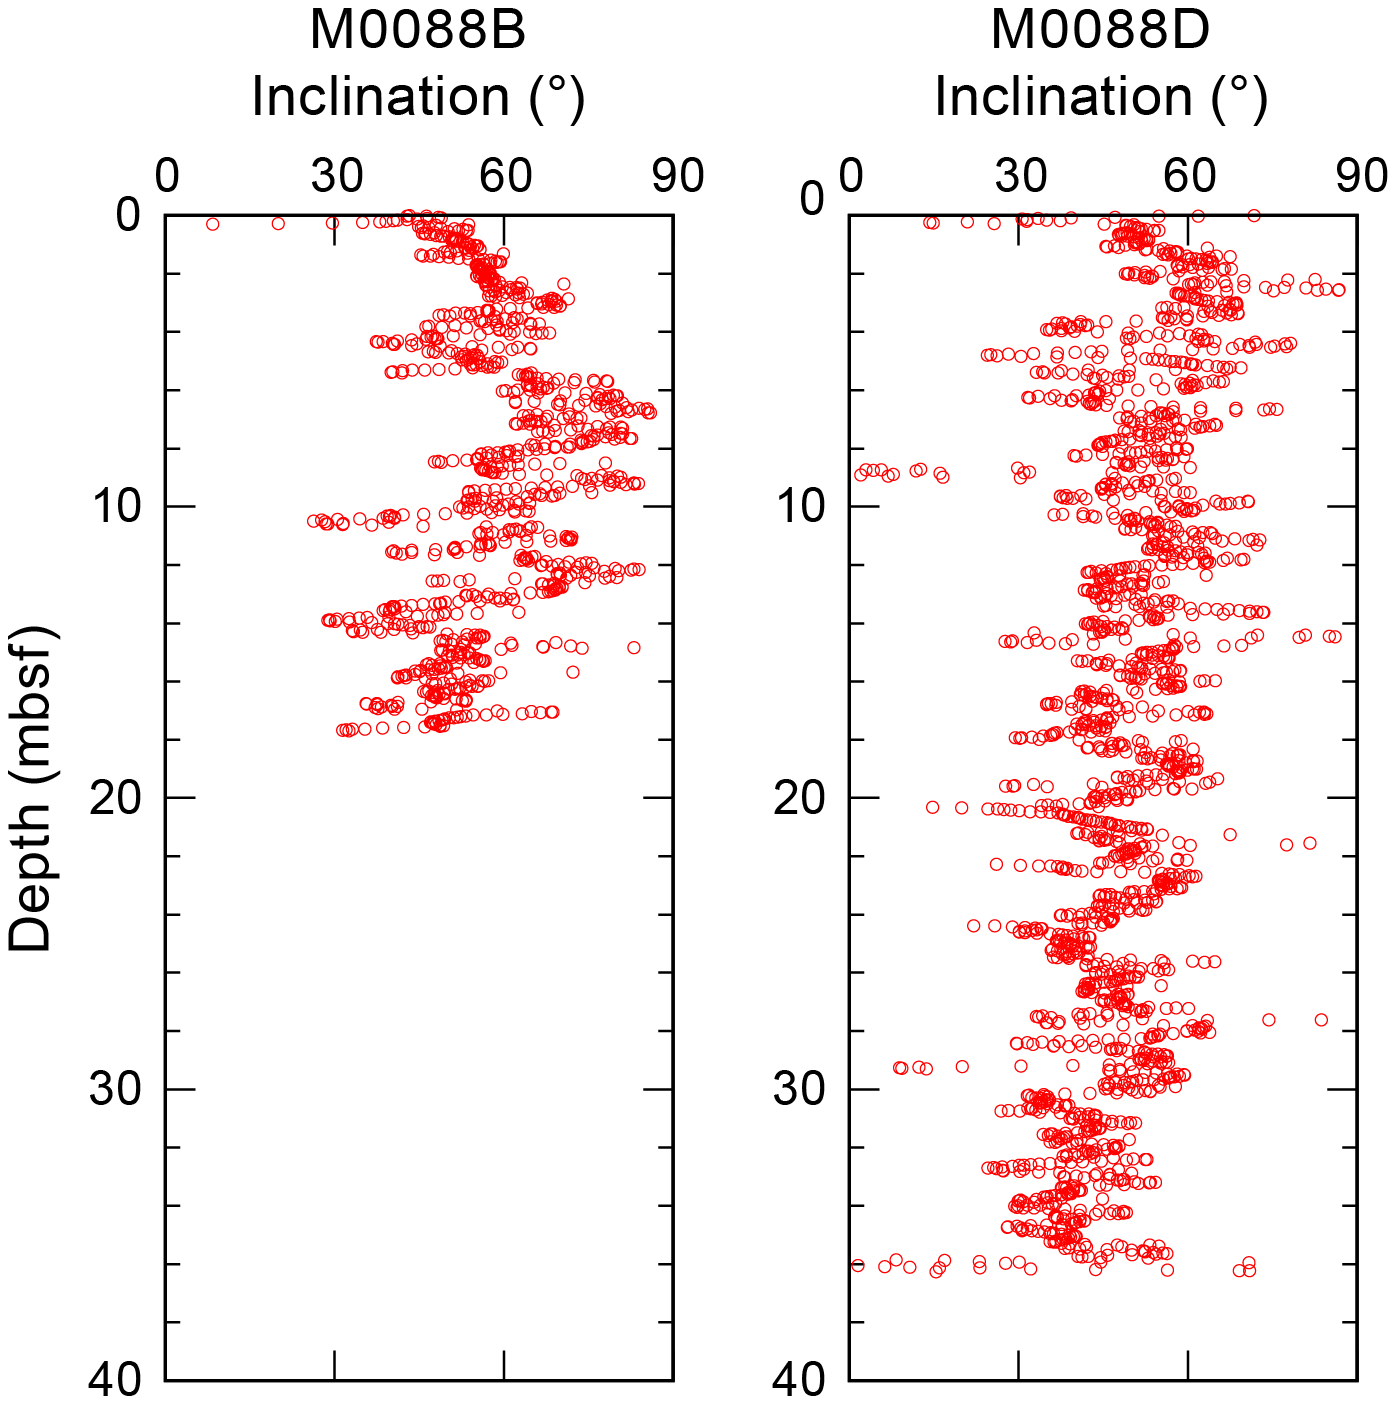
Figure F40. Inclination.
Preliminary paleomagnetic data for Holes M0088A–M0088D display a unique pattern in intensity that is similar to that found at Site M0084. This pattern is characterized by smoothed low intensity and highly fluctuating intensity intervals. The declination pattern in the lower interval of Hole M0088D probably represents a signature of paleomagnetic secular variation.
8. Stratigraphic correlation
A core composite depth scale and first-order splice (see Stratigraphic correlation in the Expedition 386 methods chapter [Strasser et al., 2023a]) were constructed for Site M0088 to establish a first-order continuous sediment succession. Two sets of cores were recovered during two GPC deployments (Holes M0088A–M0088D).
First-order splicing between the four holes at Site M0088 enabled construction of a continuous stratigraphic succession from the seafloor to the bottom of Hole M0088D (36.84 meters composite depth in splice [mcd-splice]), with the exception of one currently unresolved gap between the base of Trigger Core 386-M0088A-1P and the top of GPC Core 386-M0088B-1H. Therefore, the Site M0088 composite depth in splice below seafloor scale (mcd-splice) for depths >0.885 mcd is currently referred to as a floating depth, assuming the coring gap to be zero (see Stratigraphic correlation in the Expedition 386 methods chapter [Strasser et al., 2023a]).
8.1. Construction of core composite depth scale
8.1.1. Definition of top
The presence of a thin (~1 cm) oxidized top in the trigger cores (Sections 386-M0088A-1P-1 and 386-M0088C-1P-1) (see Lithostratigraphy) suggests that an undisturbed mudline was recovered in both holes. Thus, the vertical offset was determined as −0.08 m for Hole M0088A and −0.095 m for Hole M0088C (Tables T9, T10). Based on hand drawn visual core descriptions (VCDs) and X-ray CT images, a few silt laminae were observed in intervals 386-M0088A-1P-1, 43–52.5 cm, and 386-M0088C-1P-1, 51–53.2 cm. The laminae with the highest radiodensity occur in the upper part of Sections 386-M0088A-1P-1, 44.5 cm, and 386-M0088C-1P-1, 51 cm, and these can be correlated as the stratigraphically first tie point (TP1). Sediment thickness between the mudline and TP1 in Hole M0088C is greater than in Hole M0088A. Thus, Hole M0088C was selected as the anchor core and Section 386-M0088C-1P-1, 9.5 cm, was defined as 0 mbsf (Tables T9, T10).
8.1.2. Compositing of cores
Before compositing holes, artificial and/or natural voids at the ends of sections were measured and void lengths were subtracted from the curated section length to obtain the sediment length for each section (neglecting core catchers that were sampled in a bag). Corrected section lengths and section top and bottom depths for Site M0088 are listed in Table T9.
The core composite scale for Site M0088 is currently tentatively based on the visual correlation of marker horizons on X-ray CT images. VCDs and linescan images generated during the OSP and spikes in magnetic susceptibility and GRA data from the MSCL, measured at 2 cm intervals (see Physical properties in the Expedition 386 methods chapter [Strasser et al., 2023a]), were used for interhole correlation. At this stage, thin but clear marker beds visible on X-ray CT and/or linescan images were used, in places verified by the hand drawn VCDs, instead of large (coarse and thick) event beds that may have eroded the underlying sediments. No tephra beds were observed at Site M0088.
Initially, three tie or append points were determined; one in the two trigger cores (Holes M0088A and M0088C), one between the trigger core (Hole M0088A) and GPC core (Hole M0088B), and another in the two GPC cores (Holes M0088B and M0088D). Another minor tie point in each GPC core was used to calculate the vertical offsets of the top depth of each GPC hole used to create the first-order core composite depth scales at Site M0088 (Table T10). Note that these linear bulk shifts are only correct for the uppermost few meters shallower than the first occurrence of artificial voids added to the bottom or tops of section during core cutting due to sediment expansion during core recovery (Table T9). All tie points were evaluated for robustness of correlation and suitability for composing the splice, for which three were selected (Table T11). Most of these are described as thin silt laminae that are slightly coarser in grain size and higher in radiodensity than the surrounding fine-grained sediments. The accuracy of correlation depends on how clearly the tie point can be recognized in X-ray CT and linescan images. The depth of each tie point was determined using the hand drawn VCDs, but some were based on the X-ray CT image because they were not described in the VCDs.
First-order correlation does not allow for correlation between either of the trigger cores (386-M0088A-1P and 386-M0088C-1P) and the upper part of the GPC cores (386-M0088B-1H and 386-M0088D-1H), and no correlation tie point could be identified to tie the GPC cores to the mudline-anchored trigger core. This suggests that the coring gap at the top of the GPC cores is larger than the total length of the trigger cores, and the composite depth scale of the GPC cores remains floating. Following the methodology in Stratigraphic correlation in the Expedition 386 methods chapter (Strasser et al., 2023a), the base of the longest trigger core (Section 386-M0088A-1P-1, 99 cm; 0.91 mbsf; 0.96 mcd-splice) and the top of GPC Core 386-M0088B-1H (which has more recovery of the core top than Core 386-M0088D-1H) were horizontally aligned, assuming the gap to be zero (append point AP2). With an artificial void (2.5 cm) at the top of Section 386-M0088B-1H-1 (Table T9), a vertical depth shift of 0.935 m is calculated for the top of Core 1H (Table T10). A minor stratigraphic tie point between the two GPC holes was recognized by a subtle radiodensity difference in a bioturbated clay succession with black spots in Sections 386-M0088B-1H-3, 31 cm (1.63 mbsf), and 386-M0088D-1H-2, 11 cm (1.21 mbsf), although this tie point is not used as a splice tie point. Based on the vertical offset of Hole M0088B and the corrected core depths of the minor tie point in the two holes, the vertical depth shift was calculated as 1.355 m for Hole M0088D (Table T10).
Overall, the general stratigraphic succession and several distinct marker horizons, as observed in X-ray CT images, can be correlated across GPC cores (Table T11). However, sequential horizontal alignment of marker beds from the top to bottom of the cores reveals that the stratigraphic succession covered by both holes is more expanded in Hole M0088D than the stratigraphically equivalent succession in Hole M0088B, likely due to more gas expansion and elastic rebound during core recovery. This is noted below ~12 mbsf.
8.1.3. Construction of splice
A combination of Holes M0088A–M0088D reveals the longest complete and least disturbed stratigraphic interval at Site M0088. As a result of the lack of tie points connecting trigger core Hole M0088A and GPC Holes M0088B and M0088D, the bottom of Hole M0088A (0.96 mcd-splice) and top of Hole M0088B are connected (Table T11).
Below 0.96 mcd-splice, the splice is located along Hole M0088B because the cores recovered from the 20 m long GPC barrel deployment are generally less disturbed. A ~1 cm thick, parallel laminated and bioturbated silt lamina in Section 386-M0088B-1H-18, 85.5 cm, is correlated with a ~1 cm thick bioturbated silt in Section 386-M0088D-1H-18, 23.5 cm (TP3). The splice continues to the base of Hole M0088D (36.84 mcd-splice) to construct a first-order splice. The tentatively defined tie points and splice intervals with tentatively calculated splice composite depth are given in Table T11.
References
Bruland, K.W., Middag, R., and Lohan, M.C., 2014. Controls of trace metals in seawater. In Holland, H.D., and Turekian, K.K. (Eds.), Treatise on Geochemistry (Second Edition). Oxford (Elsevier), 19–51. https://doi.org/
Claypool, G.E., and Kvenvolden, K.A., 1983. Methane and other hydrocarbon gases in marine sediment. Annual Review of Earth and Planetary Sciences, 11(1):299–327. https://doi.org/
Froelich, P.N., Klinkhammer, G.P., Bender, M.L., Luedtke, N.A., Heath, G.R., Cullen, D., Dauphin, P., Hammond, D., Hartman, B., and Maynard, V., 1979. Early oxidation of organic matter in pelagic sediments of the eastern equatorial Atlantic: suboxic diagenesis. Geochimica et Cosmochimica Acta, 43(7):1075–1090. https://doi.org/
Glud, R.N., Wenzhöfer, F., Middelboe, M., Oguri, K., Turnewitsch, R., Canfield, D.E., and Kitazato, H., 2013. High rates of microbial carbon turnover in sediments in the deepest oceanic trench on Earth. Nature Geoscience, 6(4):284–288. https://doi.org/
Kioka, A., Schwestermann, T., Moernaut, J., Ikehara, K., Kanamatsu, T., Eglinton, T.I., and Strasser, M., 2019. Event stratigraphy in a hadal oceanic trench: the Japan Trench as sedimentary archive recording recurrent giant subduction zone earthquakes and their role in organic carbon export to the deep sea. Frontiers in Earth Science, 7:319. https://doi.org/
Matoba, Y., 1976. Recent foraminiferal assemblages off Sendai, northeast Japan. Maritime Sediments, Spec. Pub. A:205–220. https://cir.nii.ac.jp/
Matsuzaki, K.M., Nishi, H., Suzuki, N., Kawate, Y., Takashima, R., and Sakai, T., 2014. Cycladophora davisiana abundances as a paleoceanographic and stratigraphic tool in high latitude siliciceous sediments. Marine Micropaleontology, 106:1–9. https://doi.org/
Morley, J.J., Hays, J.D., and Robertson, J.H., 1982. Stratigraphic framework for the late Pleistocene in the northwest Pacific Ocean. Deep Sea Research, Part A: Oceanographic Research Papers, 29(12):1485–1499. https://doi.org/
Strasser, M., Ikehara, K., and Cotterill, C., 2019. Expedition 386 Scientific Prospectus: Japan Trench Paleoseismology. International Ocean Discovery Program. https://doi.org/
Strasser, M., Ikehara, K., Everest, J., Maeda, L., Hochmuth, K., Grant, H., Stewart, M., Okutsu, N., Sakurai, N., Yokoyama, T., Bao, R., Bellanova, P., Brunet, M., Cai, Z., Cattaneo, A., Hsiung, K.-H., Huang, J.-J., Ishizawa, T., Itaki, T., Jitsuno, K., Johnson, J.E., Kanamatsu, T., Keep, M., Kioka, A., Kölling, M., Luo, M., März, C., McHugh, C., Micallef, A., Nagahashi, Y., Pandey, D.K., Proust, J.-N., Rasbury, E.T., Riedinger, N., Satoguchi, Y., Sawyer, D.E., Seibert, C., Silver, M., Straub, S.M., Virtasalo, J., Wang, Y., Wu, T.-W., and Zellers, S.D., 2023a. Expedition 386 methods. In Strasser, M., Ikehara, K., Everest, J., and the Expedition 386 Scientists, Japan Trench Paleoseismology. Proceedings of the International Ocean Discovery Program, 386: College Station, TX (International Ocean Discovery Program). https://doi.org/
Strasser, M., Ikehara, K., Everest, J., Maeda, L., Hochmuth, K., Grant, H., Stewart, M., Okutsu, N., Sakurai, N., Yokoyama, T., Bao, R., Bellanova, P., Brunet, M., Cai, Z., Cattaneo, A., Hsiung, K.-H., Huang, J.-J., Ishizawa, T., Itaki, T., Jitsuno, K., Johnson, J.E., Kanamatsu, T., Keep, M., Kioka, A., Kölling, M., Luo, M., März, C., McHugh, C., Micallef, A., Nagahashi, Y., Pandey, D.K., Proust, J.-N., Rasbury, E.T., Riedinger, N., Satoguchi, Y., Sawyer, D.E., Seibert, C., Silver, M., Straub, S.M., Virtasalo, J., Wang, Y., Wu, T.-W., and Zellers, S.D., 2023b. Sites M0084 and M0085 (Basin N3). In Strasser, M., Ikehara, K., Everest, J., and the Expedition 386 Scientists, Japan Trench Paleoseismology. Proceedings of the International Ocean Discovery Program, 386: College Station, TX (International Ocean Discovery Program). https://doi.org/
Strasser, M., Ikehara, K., Everest, J., and the Expedition 386 Scientists, 2023c. Supplementary material, https://doi.org/10.14379/iodp.proc.386supp.2023. In Strasser, M., Ikehara, K., Everest, J., and the Expedition 386 Scientists, Japan Trench Paleoseismology. Proceedings of the International Ocean Discovery Program, 386: College Station, TX (International Ocean Discovery Program).
Usami, K., Ikehara, K., Jenkins, R.G., and Ashi, J., 2017. Benthic foraminiferal evidence of deep-sea sediment transport by the 2011 Tohoku-Oki earthquake and tsunami. Marine Geology, 384:214–224. https://doi.org/