Strasser, M., Ikehara, K., Everest, J., and the Expedition 386 Scientists
Proceedings of the International Ocean Discovery Program Volume 386
publications.iodp.org
https://doi.org/10.14379/iodp.proc.386.108.2023
Site M0093 (Basin C/N1)1
![]() M. Strasser,
M. Strasser,
![]() K. Ikehara,
K. Ikehara,
![]() J. Everest,
J. Everest,
![]() L. Maeda,
L. Maeda,
![]() K. Hochmuth,
K. Hochmuth,
![]() H. Grant,
H. Grant,
![]() M. Stewart,
M. Stewart,
![]() N. Okutsu,
N. Okutsu,
![]() N. Sakurai,
N. Sakurai,
![]() T. Yokoyama,
T. Yokoyama,
![]() R. Bao,
R. Bao,
![]() P. Bellanova,
P. Bellanova,
![]() M. Brunet,
M. Brunet,
![]() Z. Cai,
Z. Cai,
![]() A. Cattaneo,
A. Cattaneo,
![]() K.-H. Hsiung,
K.-H. Hsiung,
![]() J.-J. Huang,
J.-J. Huang,
![]() T. Ishizawa,
T. Ishizawa,
![]() T. Itaki,
T. Itaki,
![]() K. Jitsuno,
K. Jitsuno,
![]() J.E. Johnson,
J.E. Johnson,
![]() T. Kanamatsu,
T. Kanamatsu,
![]() M. Keep,
M. Keep,
![]() A. Kioka,
M. Kölling,
A. Kioka,
M. Kölling,
![]() M. Luo,
M. Luo,
![]() C. März,
C. März,
![]() C. McHugh,
C. McHugh,
![]() A. Micallef,
A. Micallef,
![]() Y. Nagahashi,
Y. Nagahashi,
![]() D.K. Pandey,
D.K. Pandey,
![]() J.-N. Proust,
J.-N. Proust,
![]() E.T. Rasbury,
E.T. Rasbury,
![]() N. Riedinger,
N. Riedinger,
![]() Y. Satoguchi,
Y. Satoguchi,
![]() D.E. Sawyer,
D.E. Sawyer,
![]() C. Seibert,
C. Seibert,
![]() M. Silver,
M. Silver,
![]() S.M. Straub,
S.M. Straub,
![]() J. Virtasolo,
J. Virtasolo,
![]() Y. Wang,
Y. Wang,
![]() T.-W. Wu, and
T.-W. Wu, and
![]() S.D. Zellers2
S.D. Zellers2
1 Strasser, M., Ikehara, K., Everest, J., Maeda, L., Hochmuth, K., Grant, H., Stewart, M., Okutsu, N., Sakurai, N., Yokoyama, T., Bao, R., Bellanova, P., Brunet, M., Cai, Z., Cattaneo, A., Hsiung, K.-H., Huang, J.-J., Ishizawa, T., Itaki, T., Jitsuno, K., Johnson, J.E., Kanamatsu, T., Keep, M., Kioka, A., Kölling, M., Luo, M., März, C., McHugh, C., Micallef, A., Nagahashi, Y., Pandey, D.K., Proust, J.-N., Rasbury, E.T., Riedinger, N., Satoguchi, Y., Sawyer, D.E., Seibert, C., Silver, M., Straub, S.M., Virtasalo, J., Wang, Y., Wu, T.-W., and Zellers, S.D., 2023. Site M0093 (Basin C/N1). In Strasser, M., Ikehara, K., Everest, J., and the Expedition 386 Scientists, Japan Trench Paleoseismology. Proceedings of the International Ocean Discovery Program, 386: College Station, TX (International Ocean Discovery Program). https://doi.org/10.14379/iodp.proc.386.108.2023
2 Expedition 386 Scientists’ affiliations.
1. Operations
During Expedition 386, one Giant Piston Corer (GPC) system deployment at Basin C/N1 in the boundary area between the central and northern Japan Trench (Figure F1) resulted in the recovery of cores from two holes at Site M0093 (Figure F2). The water depth was 7454 m below sea level (mbsl). A breakdown of operational time is reported weekly instead of daily (see OPS in Supplementary material) due to decisions to move between sites based on weather and current conditions. Holes at Site M0093 were cored during Week 7 of the offshore phase. In total, 26.91 m of cores (Table T1) and 3.89 km of hydroacoustic profiles (see Hydroacoustics) were recovered and acquired, respectively, in this focus area. Further operations details, including winch log and inclinometer information, are found for all sites in Coring methodology in the Expedition 386 methods chapter (Strasser et al., 2023a) and associated files (see PALEOMAG and WINCHLOGS in Supplementary material).
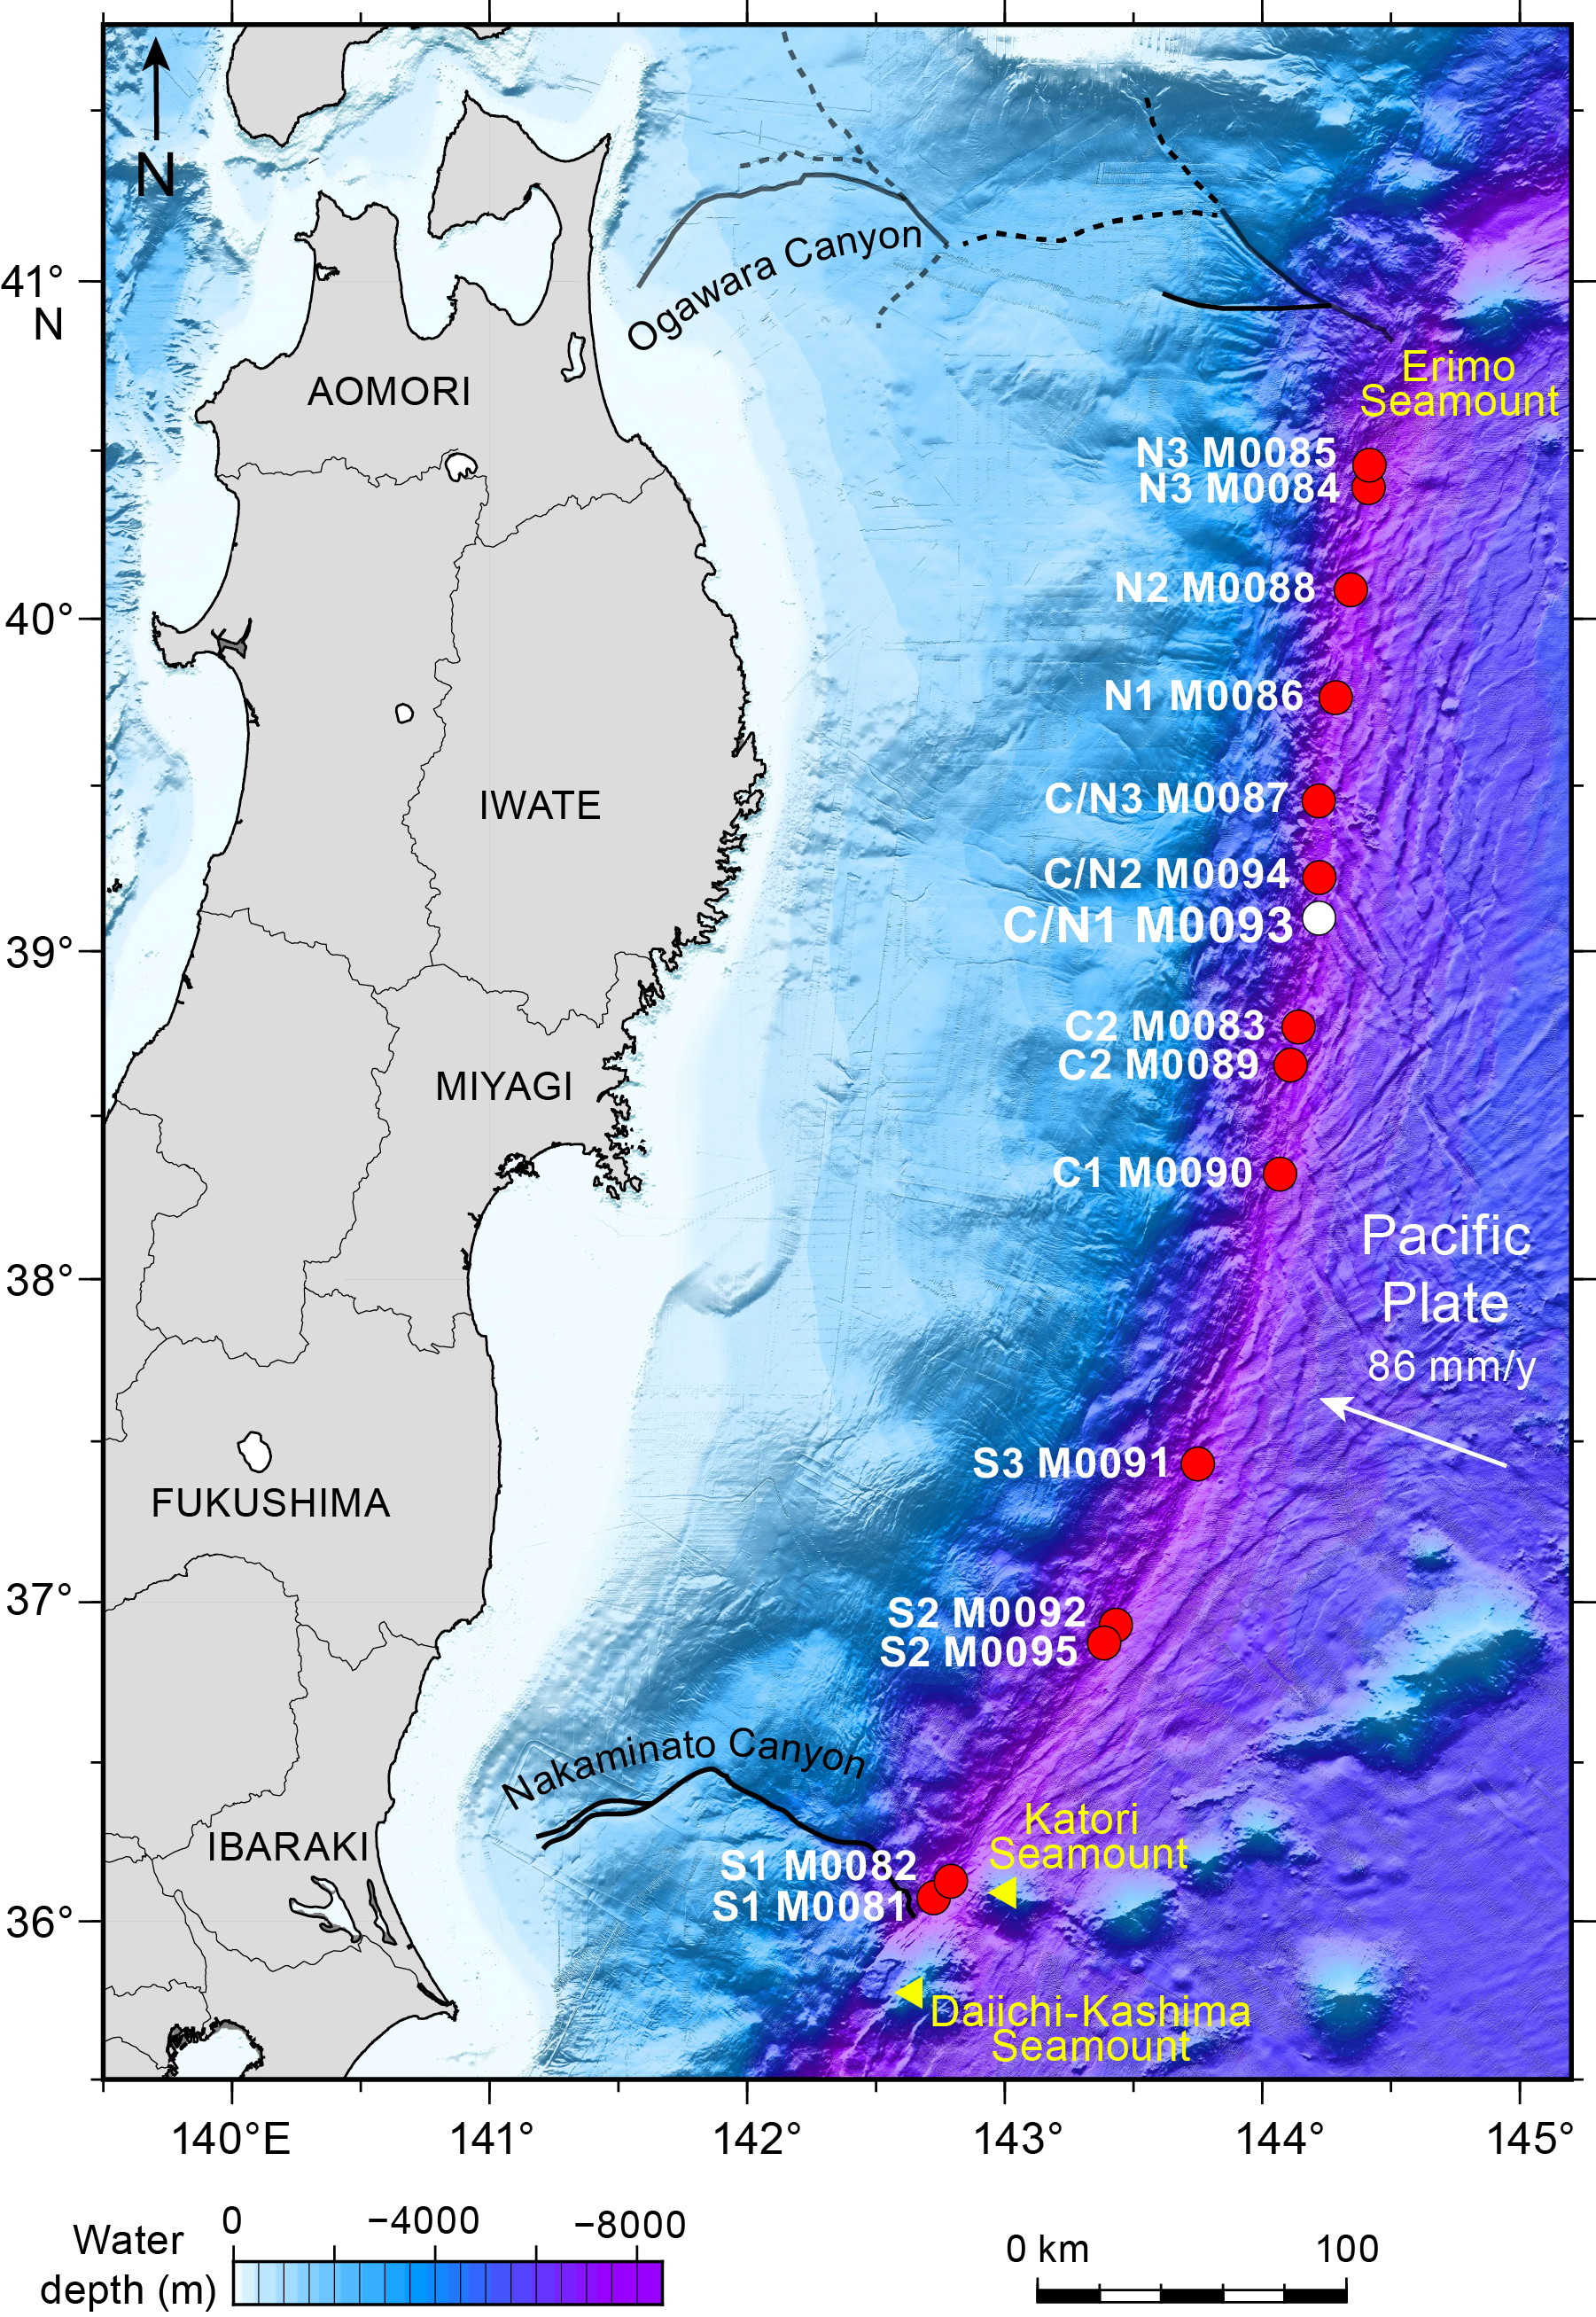
Figure F1. Site map.
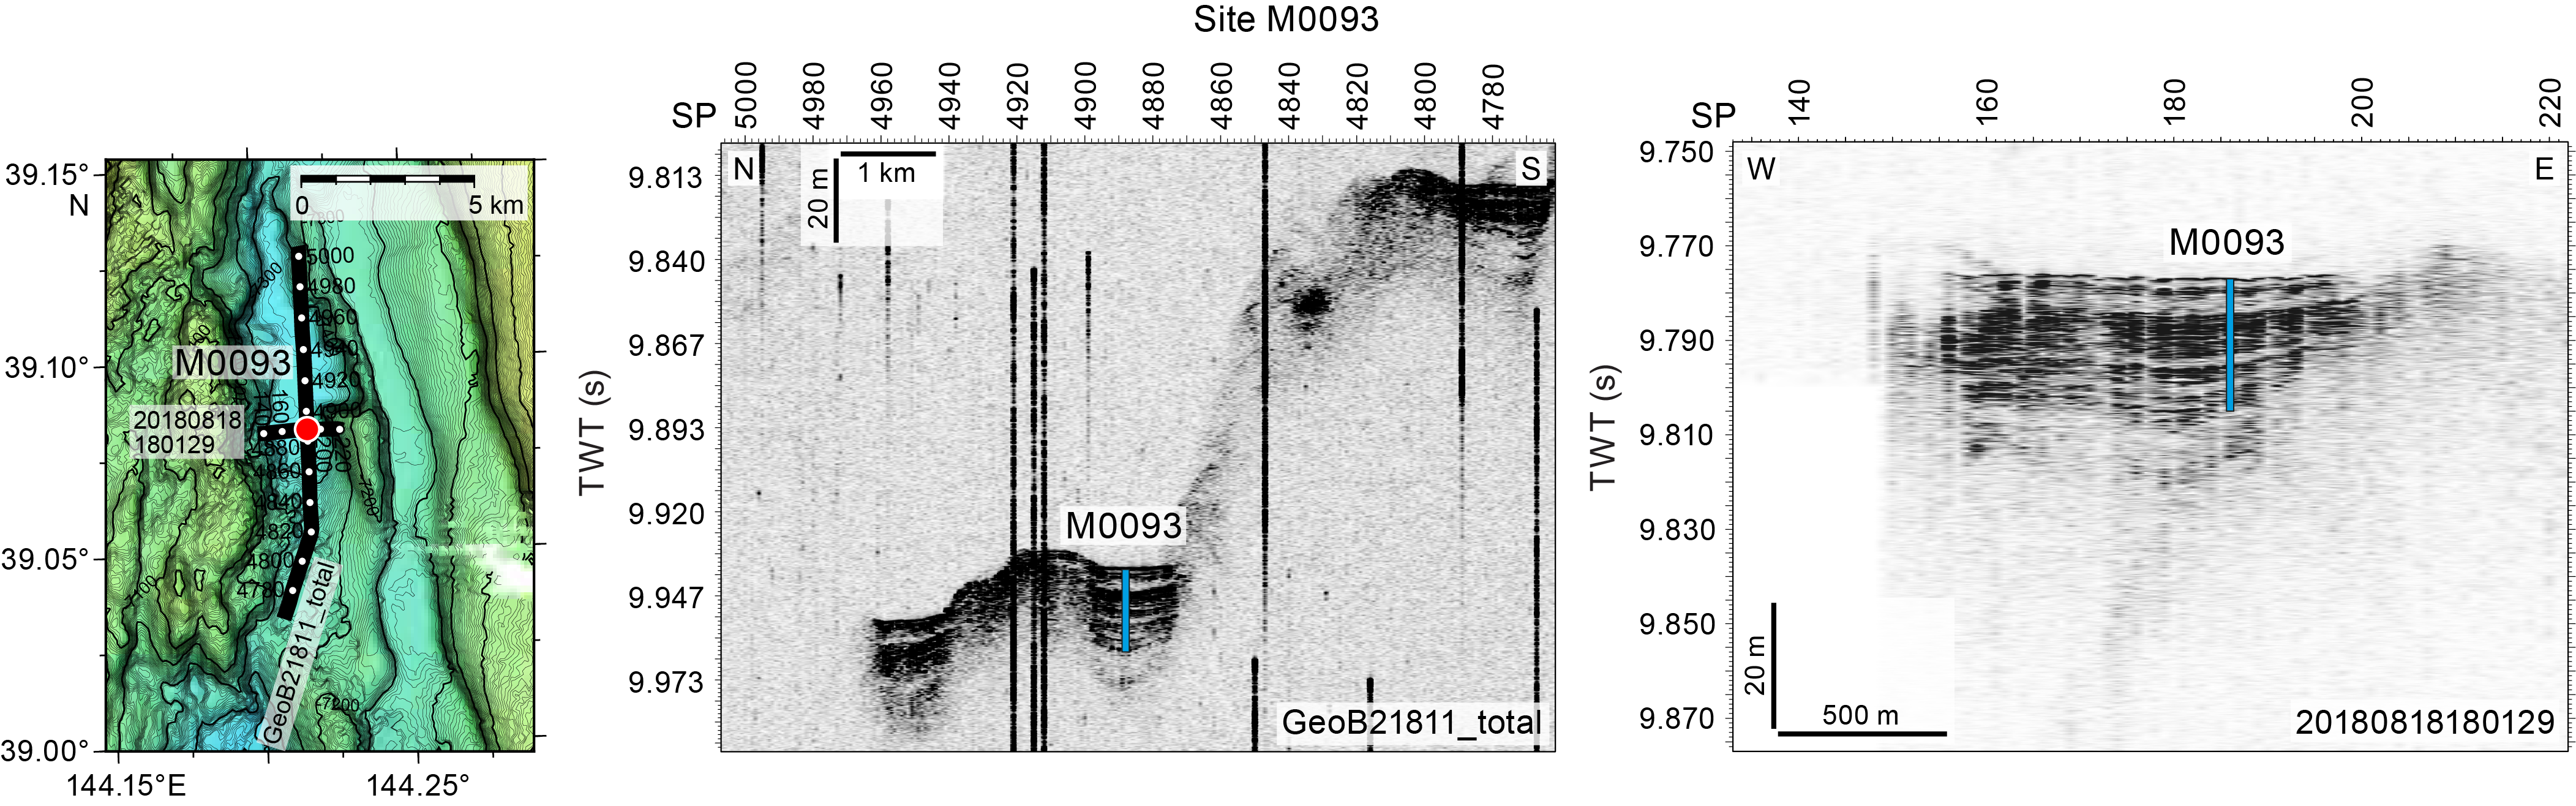
Figure F2. Site M0093.
The main site-specific scientific objectives for Site M0093 were as follows:
- Recover a continuous Pleistocene to Holocene stratigraphic succession comprising event deposits from the isolated trench basin within the relatively elevated trench floor segment in the structurally complex northernmost part of the central Japan Trench.
- Analyze the stratigraphic pattern and event deposit characteristics and compare with integrated results from other nearby sites (coupled Sites M0083 and M0089 [~35 km south] and M0094 [~15 km north]) to establish robust stratigraphic pattern recognition of proxy evidence for earthquakes.
- Generate results for comparison with those from all other Expedition 386 sites to explore spatiotemporal distribution of event deposits to eventually develop a long-term record for giant earthquakes.
1.1. Site M0093
The R/V Kaimei first arrived at Site M0093 in the early morning of 4 May 2021 and went on standby for 20 m GPC operations. However, strong winds with high waves were encountered throughout the day, and at 1300 h the decision was made to postpone operations. Waiting on weather continued until 1530 h, when wind speed decreased to <15 m/s. A multibeam echo sounder/subbottom profiler (MBES/SBP) survey was conducted along a south to north survey line across the site before the ship moved to Site M0088 (see Operations in the Site M0088 (Basin N2) chapter [Strasser et al., 2023b]). The ship returned to Site M0093 at 0330 h on 27 May. Conditions were cloudy with winds <5 m/s, wave heights at 1.5 m, and a 1 kt current. Poor weather forecast for the evening meant that GPC operations began at 0600 h. GPC operations started in Holes M0093A and M0093B with a 30 m GPC barrel string and were completed when the GPC system was recovered on deck at 1130 h. The deck crew and GPC operation team withdrew the core from the GPC barrel and cut it into 5 m segments. The Science Party cut core into 1 m sections from 1235 to 1430 h. The 40 m GPC assembly was prepared for the next run at 1600 h, and the ship moved northwest to wait out a low pressure system. Waiting on weather continued until 2100 h.
1.1.1. Holes M0093A and M0093B
Holes M0093A and M0093B were cored on 27 May 2021. Preparations for running the 30 m GPC began at 0600 h, and the GPC was run into the water at 0650 h with an inclinometer attached to the winch cable 20 m above GPC trigger arm and on the GPC assembly (see Figure F4 in the Expedition 386 methods chapter [Strasser et al., 2023a]). Winch speed was set at 1.0 m/s. At 0850 h, running the GPC down was paused at a cable length of 7500 m for stabilization and monitoring the GPC position and resumed after 3 min at a winch speed of 0.3 m/s. Spud-in commenced at 09:03:53 h and ended at 09:03:55 h at a cable length of 7690 m. Recovery commenced, and the cable tension rose to 1324 kgf at 09:03:58 h before dropping to 784 kgf and then rising again to a maximum of 9146 kgf at 09:05:14 h. It dropped to 6762 kgf at 09:05:25 h, indicating the corer was clear of the seabed (see WINCHLOGS in Supplementary material). Inclinometer data for Hole M0093B show the piston corer barrel was rotated counterclockwise by 120.3° at the estimated seabed, with an east–west dip of 0.79° and a north–south dip of −4.39° (see Figure F5 in the Expedition 386 methods chapter [Strasser et al., 2023a]). The GPC was run back to the surface at a winch speed of 1.0 m/s. The trigger corer and GPC were recovered on deck at 1105 and 1130 h, respectively. The trigger core and GPC core from Holes M0093A and M0093B have a total length of 0.775 m (2 sections) and 26.135 m (27 sections), respectively.
2. Hydroacoustics
Site M0093 lies within Basin C/N1 in the boundary area between the central and northern Japan Trench. The acquired SBP data comprises a single trench-parallel line oriented north–south (Figure F3). The acquired line is 3.89 km long. Acquisition parameters of the line are documented in Table T2.The area surveyed for bathymetry includes the basin floor and surrounding area, covering an area of approximately 178 km2. All depth estimates in this section are approximate and assume a seismic velocity of 1500 m/s.

Figure F3. Subbottom profile line.
2.1. Bathymetry
Bathymetry data for Basin C/N1 are limited, with patchy coverage away from the basin floor (Figure F3). These data do not cover the entirety of the basin and do not extend the full length of the trench-parallel line of SBP data. Holes M0093A and M0093B sit at a water depth of 7454 mbsl. The poor resolution and coverage of the bathymetric data makes it difficult to determine with accuracy the length or width of the basin. At Site M0093, basin width, as measured across the flat part of the basin floor, is estimated as 1350 m, although the eastern margin is not clearly mapped, so this is a minimum basin width. A short east–west topographic ridge east of the line may extend across the width of the basin just north of Site M0093, but this is not well imaged.
2.2. Basin characterization and Site M0093
Site M0093 lies 20 m east of Line 386_Underway_055 (Figure F4). The data quality of this line is poor, with numerous time shifts that obscure the acoustic character, especially at the seabed. At Site M0093, a high-amplitude seafloor layer appears to resolve as a couplet of parallel reflectors: the top reflector at 9.774 s two-way traveltime (TWT) and the lower reflector at 9.776 s TWT. Between the two reflectors, the acoustic response is transparent, but this may simply be an acoustic artifact in the data. An acoustically transparent layer (~2–3 m) is sometimes present beneath the seafloor layers near Site M0093. Here, it overlies a 12–15 m thick package of high-amplitude, acoustically laminated materials. The base of the acoustically laminated package and its contact with the acoustic basement are not clear. However, the package occurs across most of Line 386_Underway_055 and appears to thin toward basal highs, for example north of Shotpoint 410 (red package markers in Figure F4).
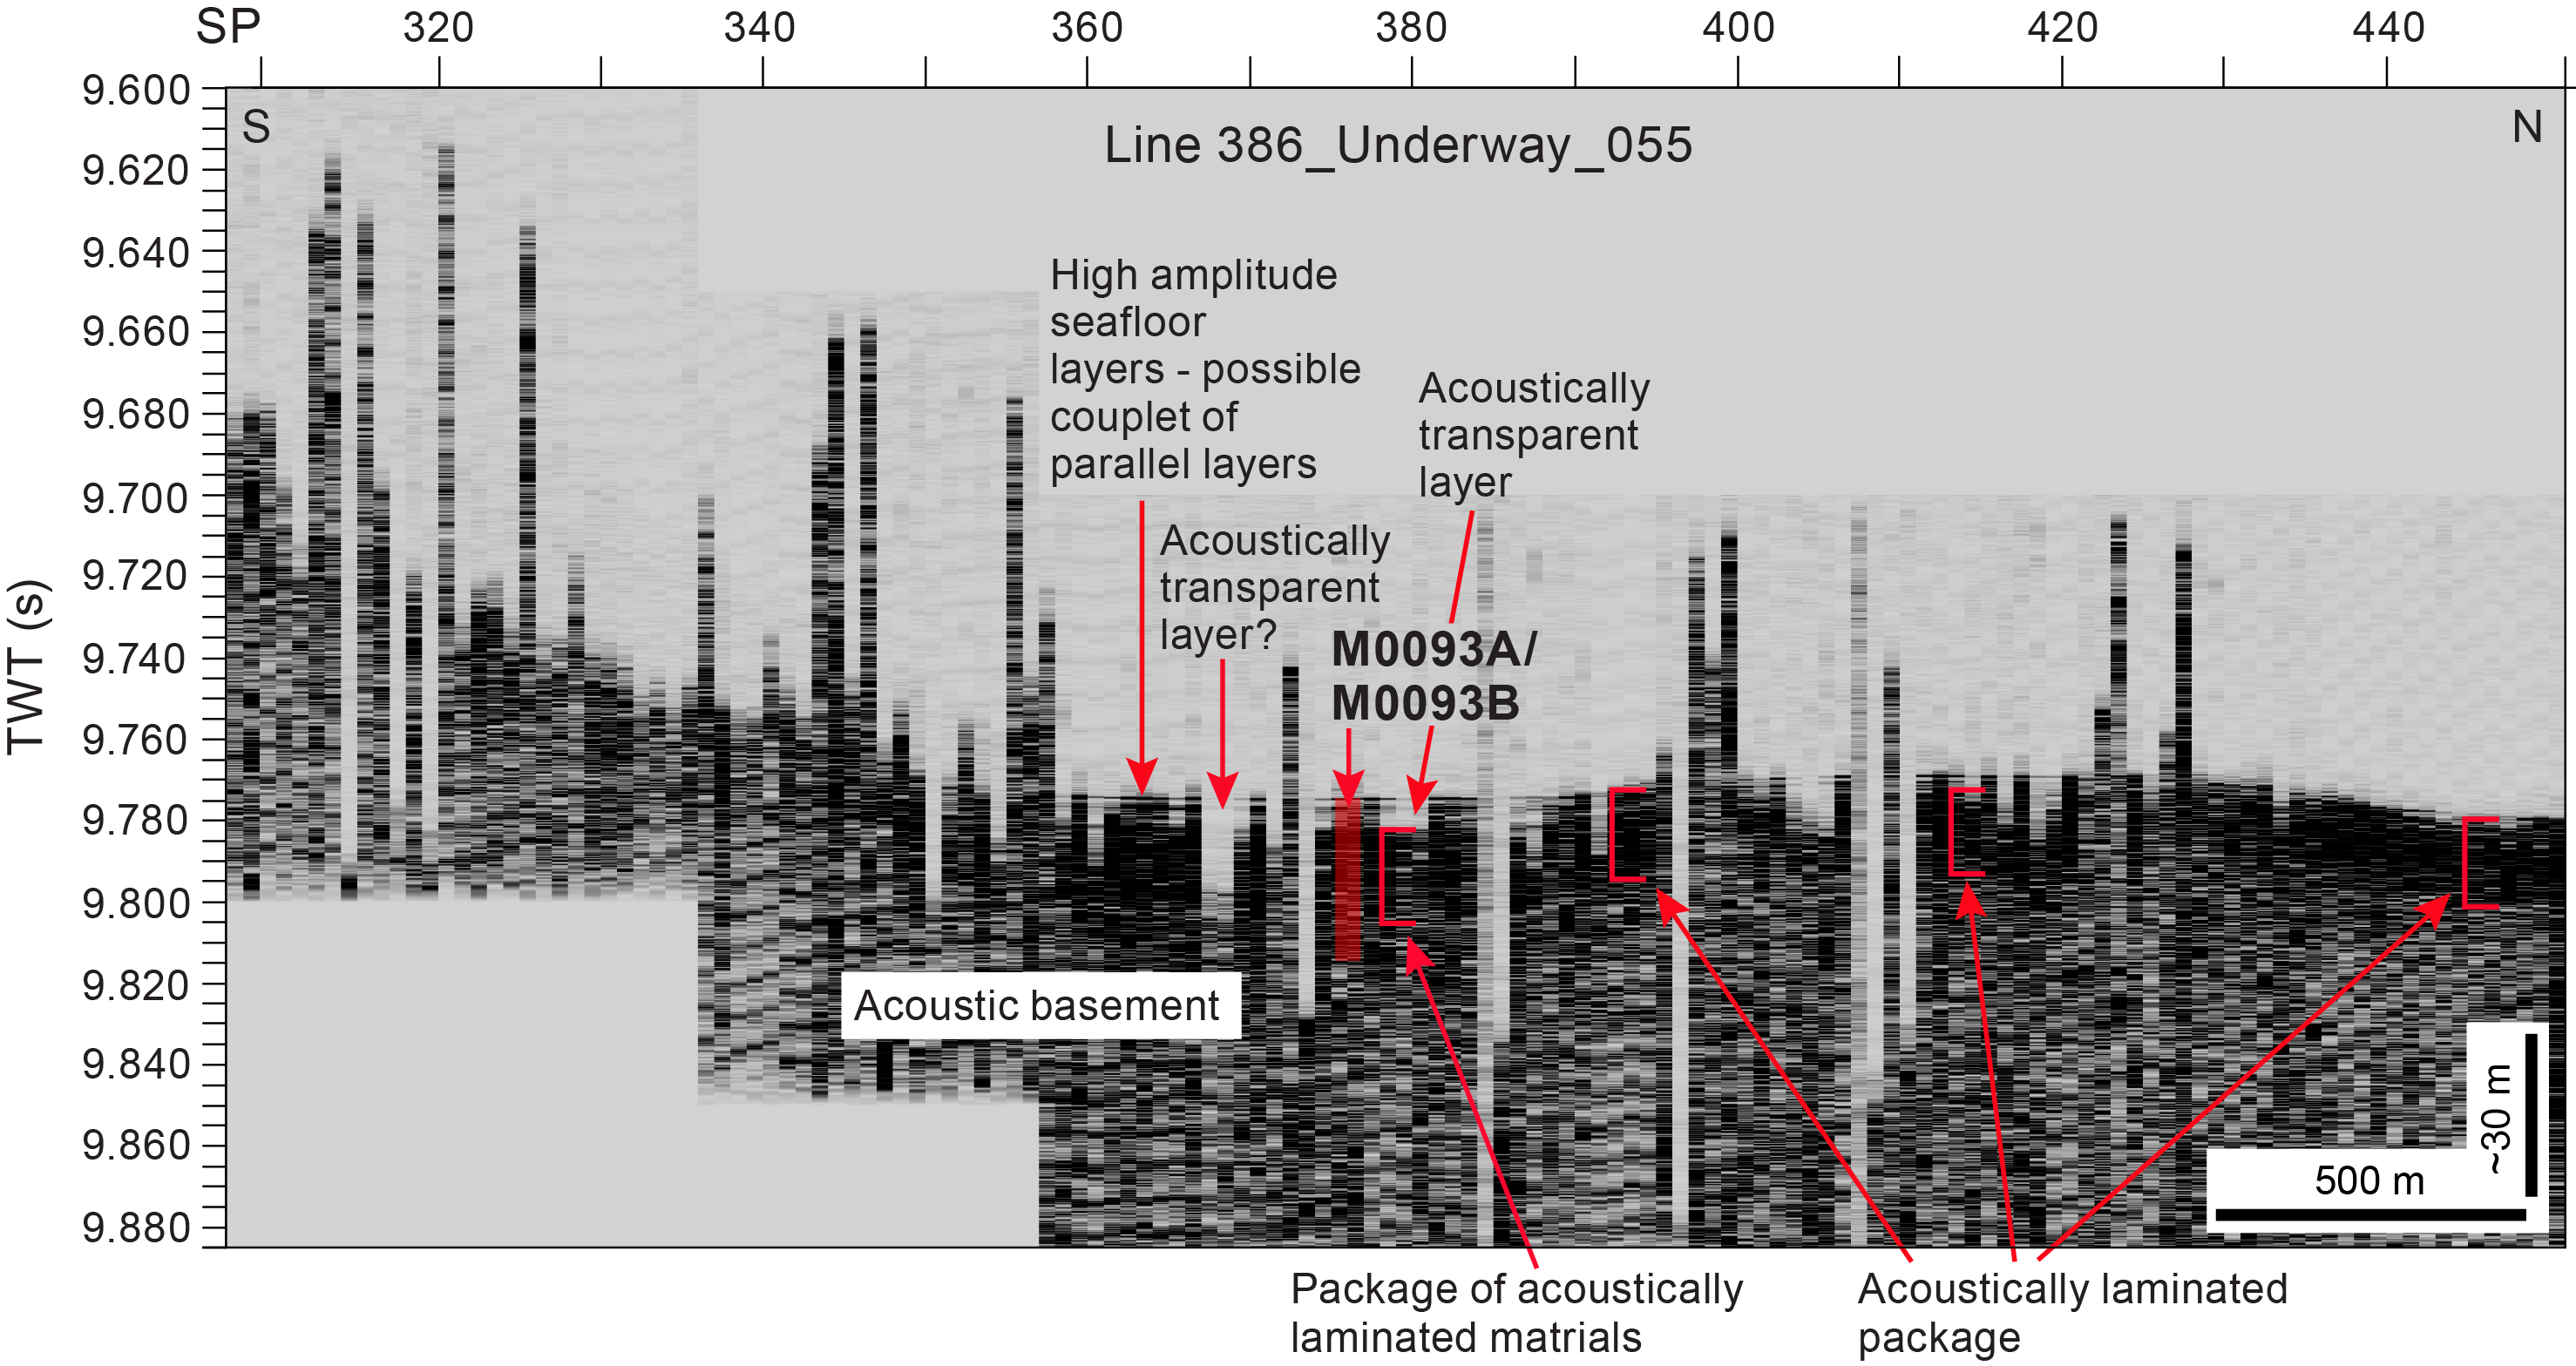
Figure F4. Line 386_Underway_055.
3. Lithostratigraphy
Site M0093 was cored in the northernmost region of the central Japan Trench in Basin C/N1. Site M0093 has two holes: a trigger core (Hole M0093A) and a GPC core (Hole M0093B). They were cored in the basin floor where the greatest sediment recovery was anticipated based on the subbottom profile analysis (see Hydroacoustics).
This section reports the lithology as described in the hand drawn visual core descriptions (VCDs) of core sections (see Lithostratigraphy in the Expedition 386 methods chapter [Strasser et al., 2023a]). Full-length lithostratigraphy summaries of the core sections, including X-ray computed tomography (CT) scan and linescan images, visual grain size estimates, and core descriptions are shown in Figure F5. The use of major and minor lithologies, primary sedimentary structures, accessories, and secondary structures (bioturbation and iron monosulfides) are defined in Lithostratigraphy in the Expedition 386 methods chapter (Strasser et al., 2023a). The sediment texture and composition determined from smear slide analysis performed during the offshore phase of the expedition are semiquantitative and include grain size (sand, silt, and clay) and the mineral, biogenic, and volcanic components (see Core descriptions). Smear slides were observed every 2 m, and the results are illustrated by color bars in smear slide summaries representing the lithogenic, biogenic, and volcanic components for Site M0093 (Figure F6). The core close-up photos and X-ray CT scan and linescan images that were used to determine the lithology and X-ray diffraction (XRD) data can be found in CORECLOSEUP, XRAYCT, and XRD, respectively, in Supplementary material. The 3 m barrel sheets, smear slide tables, and linescan composite plots can be found in Core descriptions.
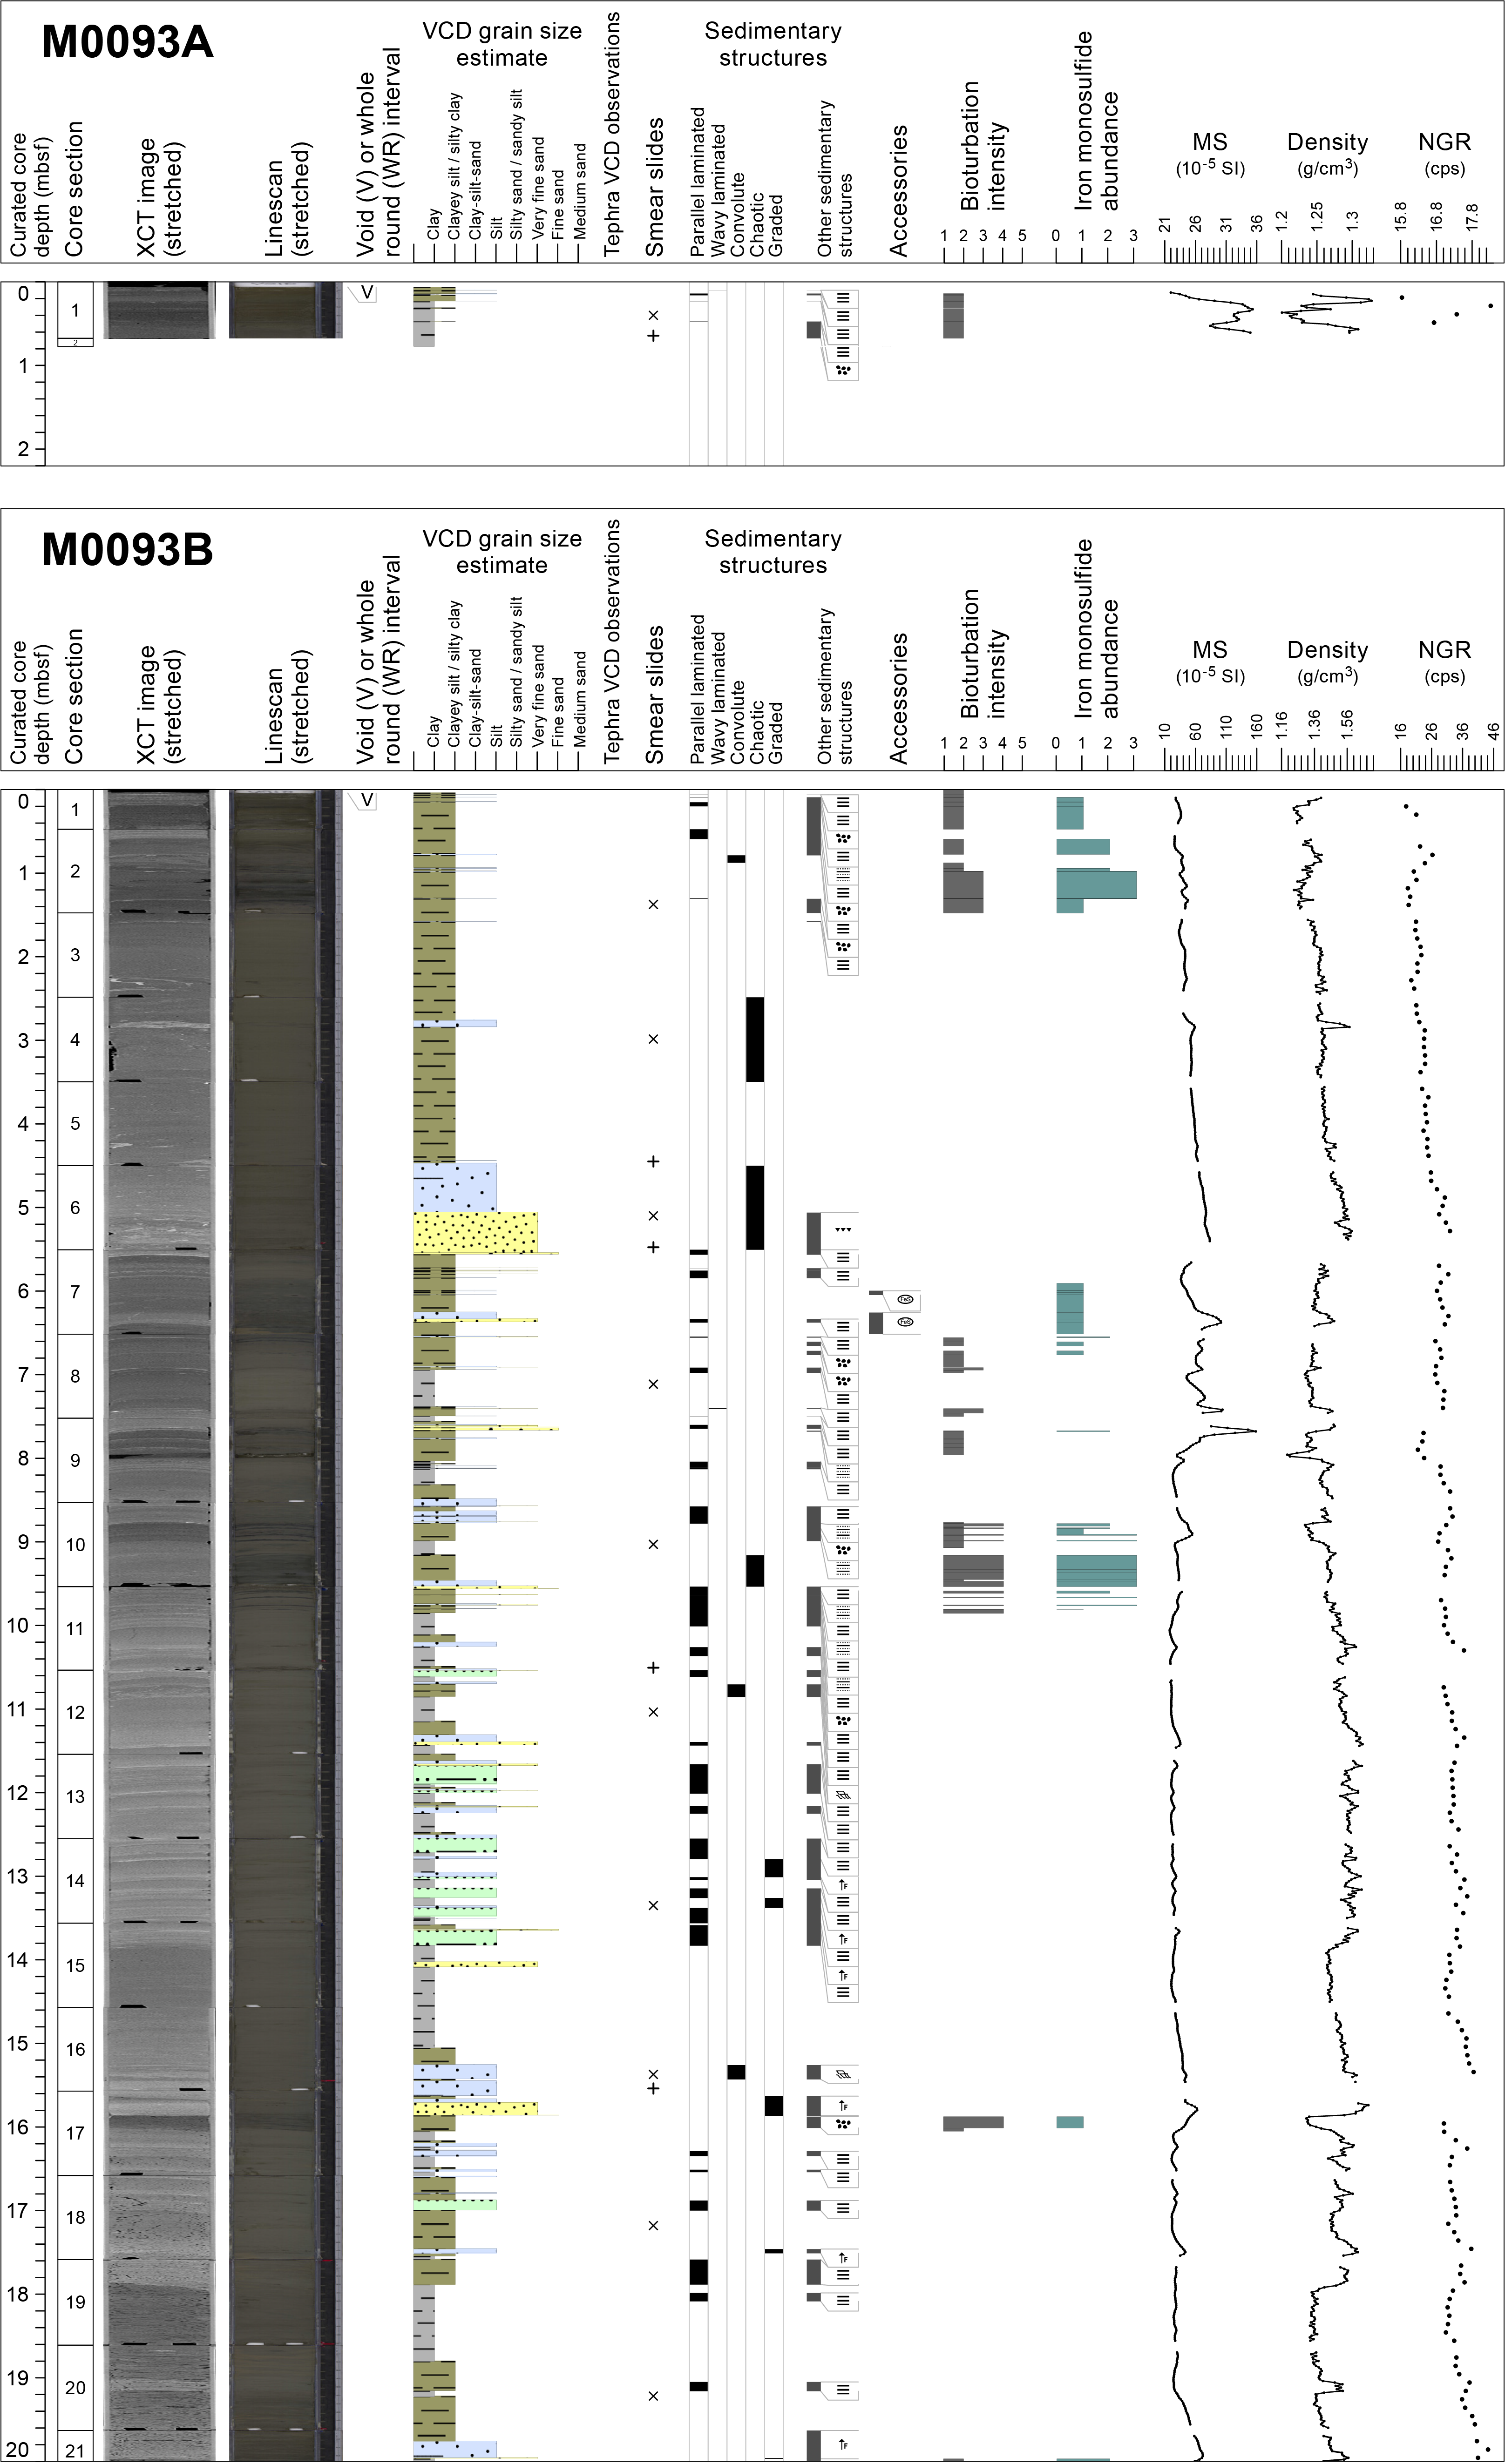
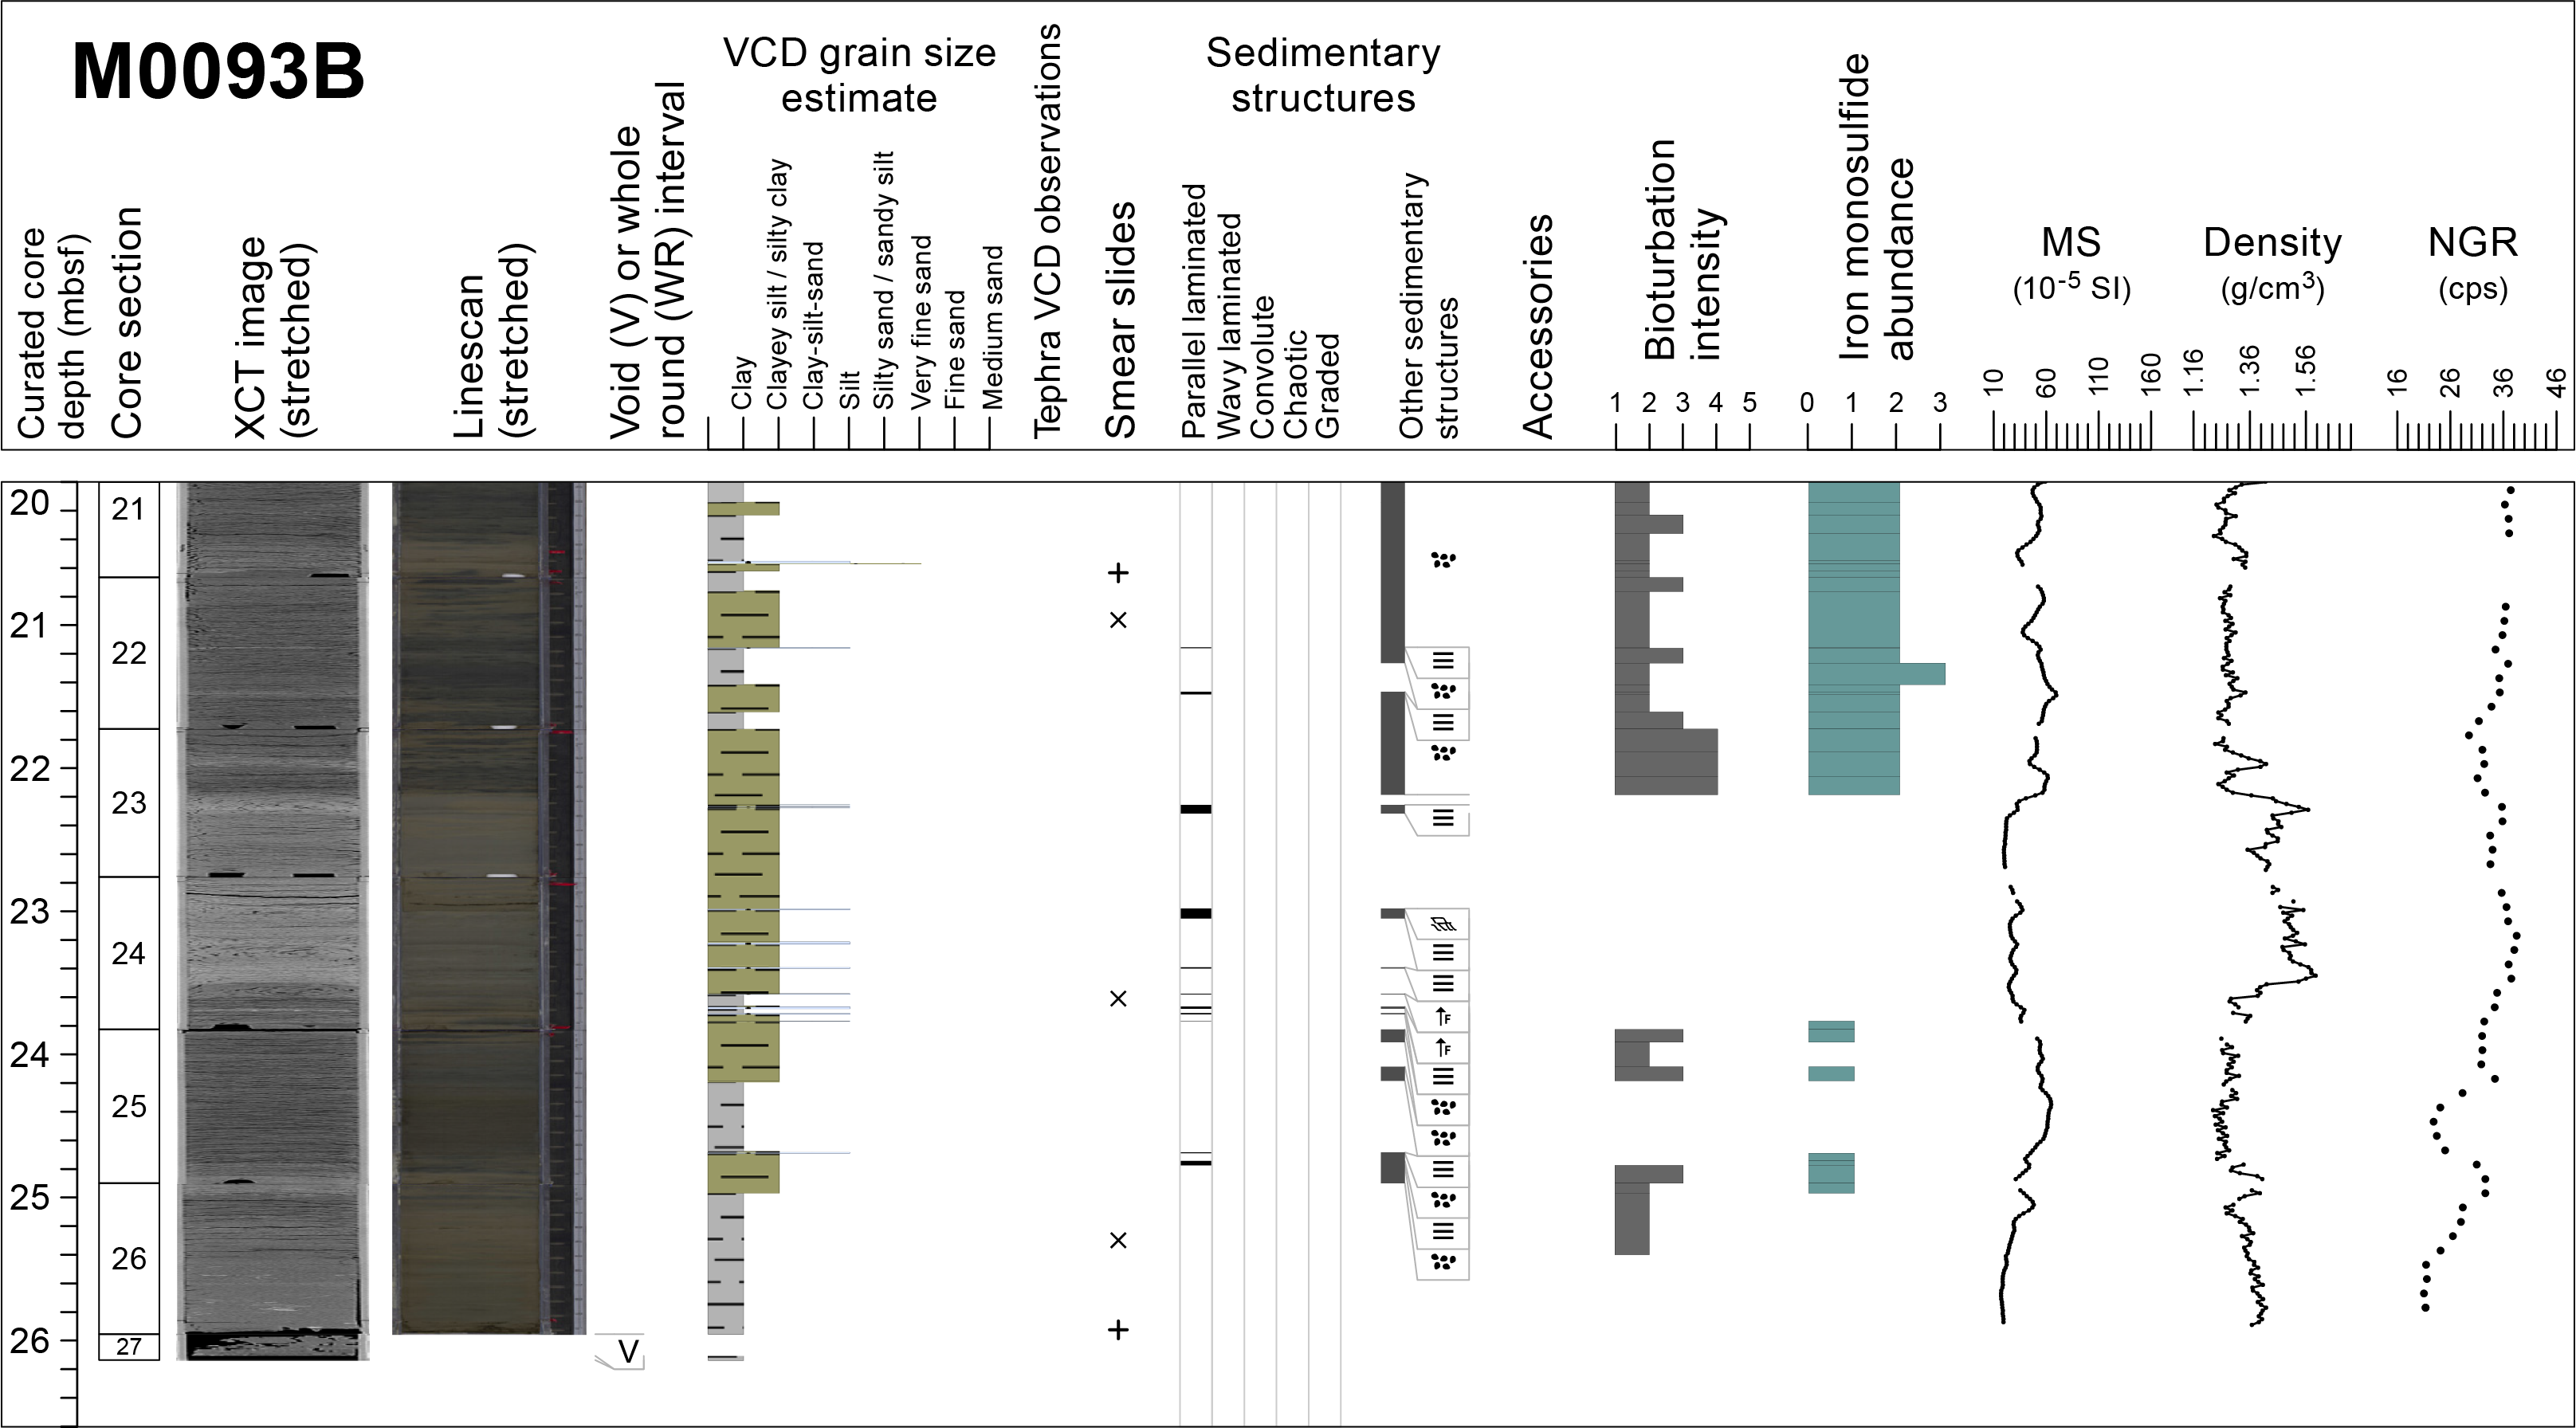
Figure F5. Lithostratigraphic summary.
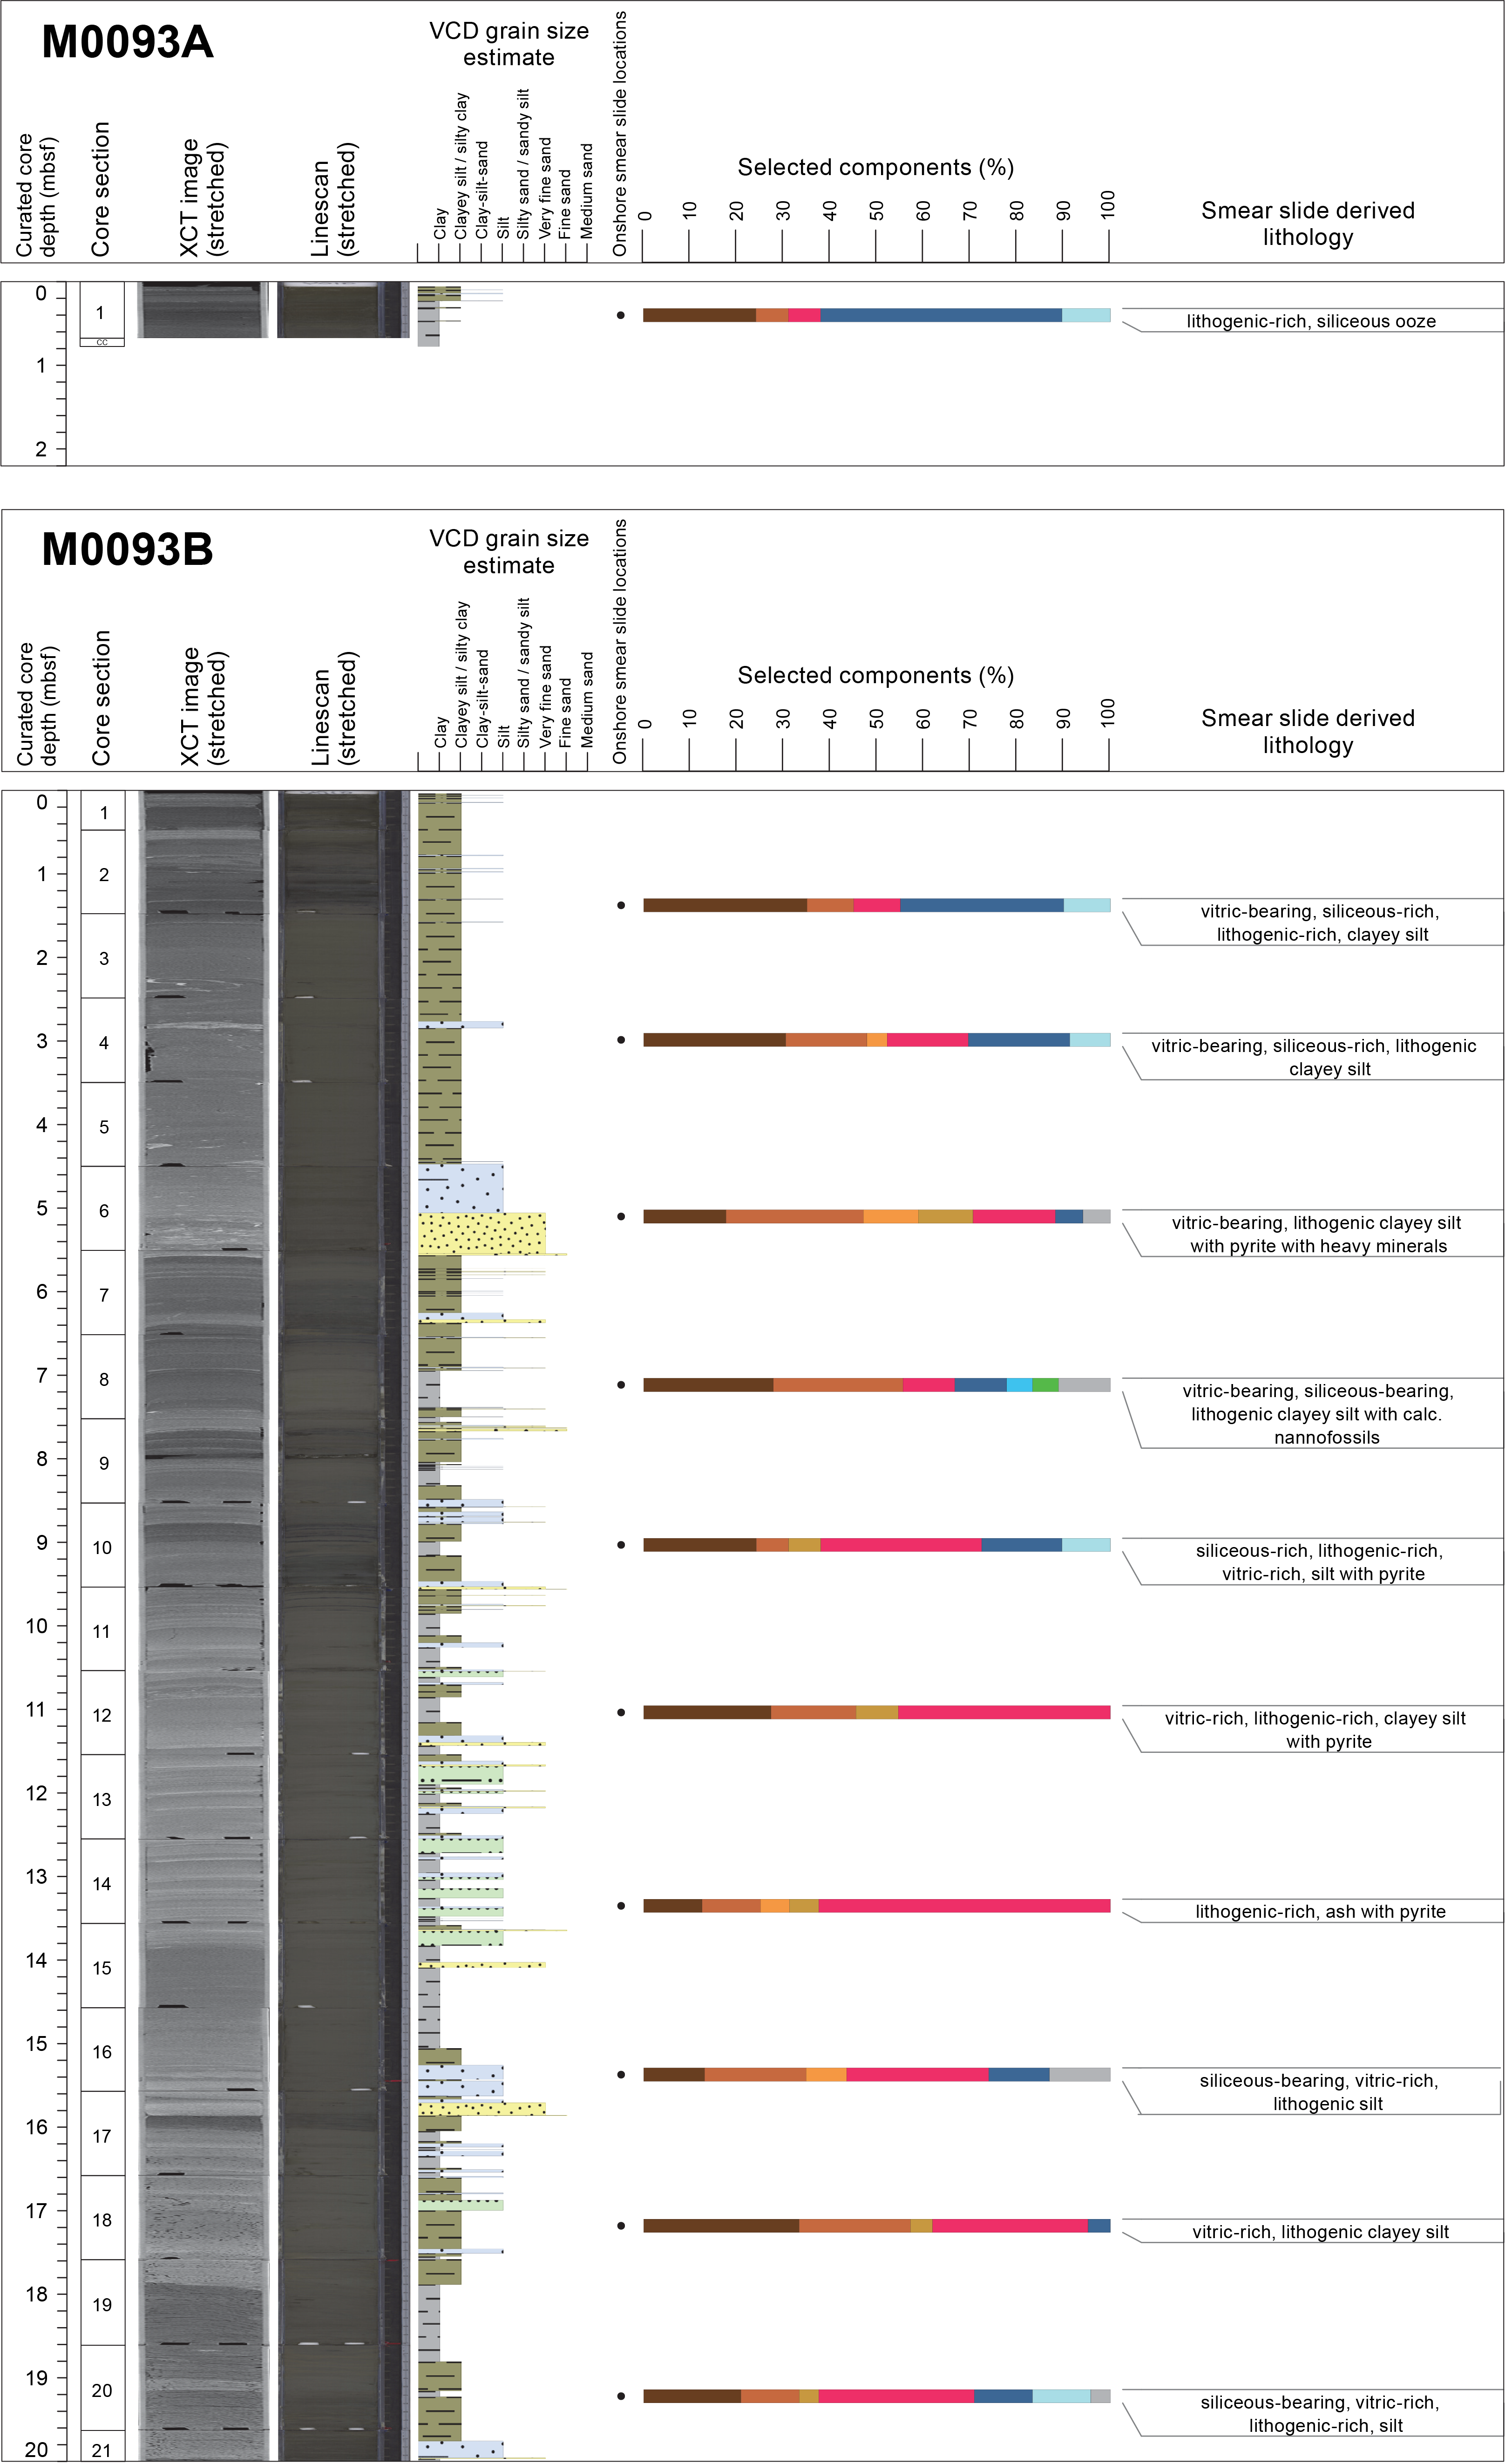
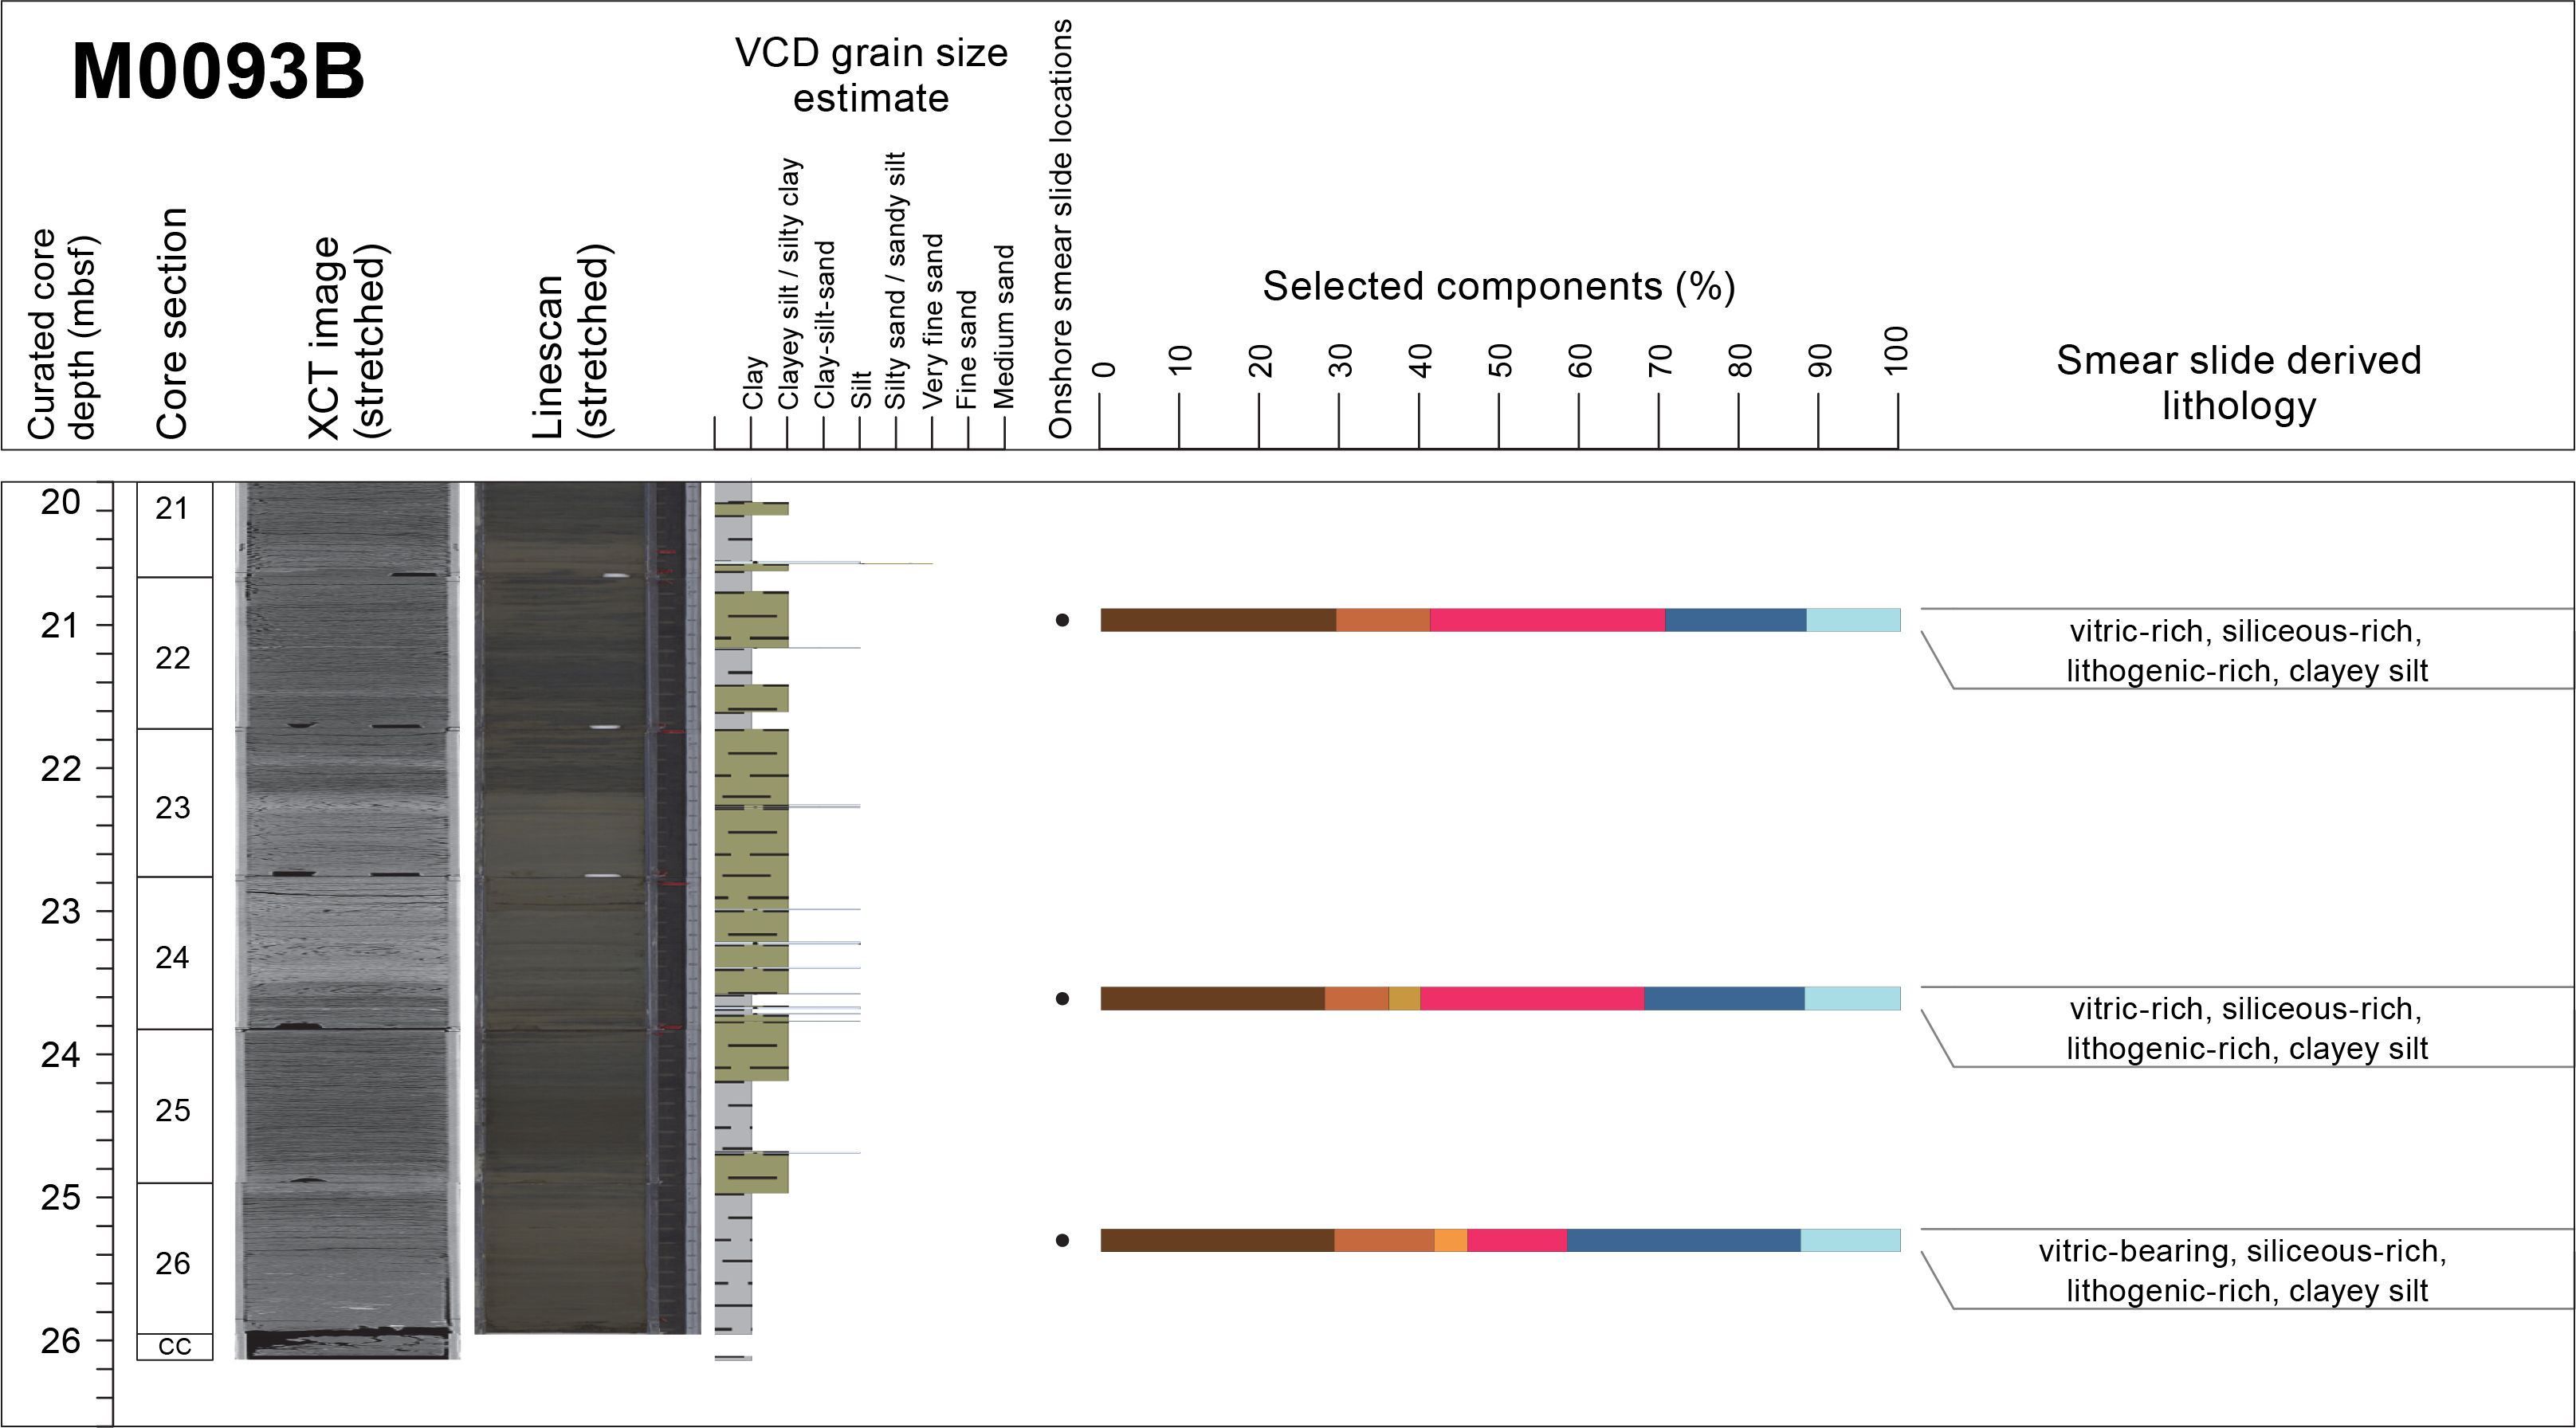
Figure F6. Smear slide summary.
Hand drawn VCDs from Site M0093 show the following intervals in a downcore direction (Figure F5): (1) a ~5.5 m thick-bedded silty clay with deformed silt laminae above a fining-upward sand to silt interval, (2) a ~8.5 m thin- to medium-bedded section composed of fine sand and silt beds and laminae interbedded with silty clay, (3) a ~1.2 m thick fining-upward succession of silty clay to clay, (4) a 0.6 m thick normally graded succession with basal laminae of fine to very fine sand and silt layers interbedded with silty clay, and (5) a ~10.2 m thick section of silty to sandy clay with scattered planar silt laminae and centimeter-thick beds of silt underlined by millimeter-scale very fine sand laminae. Iron monosulfides are absent in Intervals 3 and 4 but are sparsely present in Intervals 1, 2, and 5. The results of the smear slide analyses show that the textures are dominated by clayey silts with minor silts (Figure F7; Table T3). The sediment composition is mostly lithogenic (30%–70%) with some scattered biogenic components. Calcareous nannofossils and radiolaria are observed in one sample (>5%; 386-M0093B-1H-8, 60 cm). The abundance of volcanic material varies from 7% to 62.5%, with tephra occasionally observed (Section 386-M0093A-1H-14, 80 cm) (see Tephra).
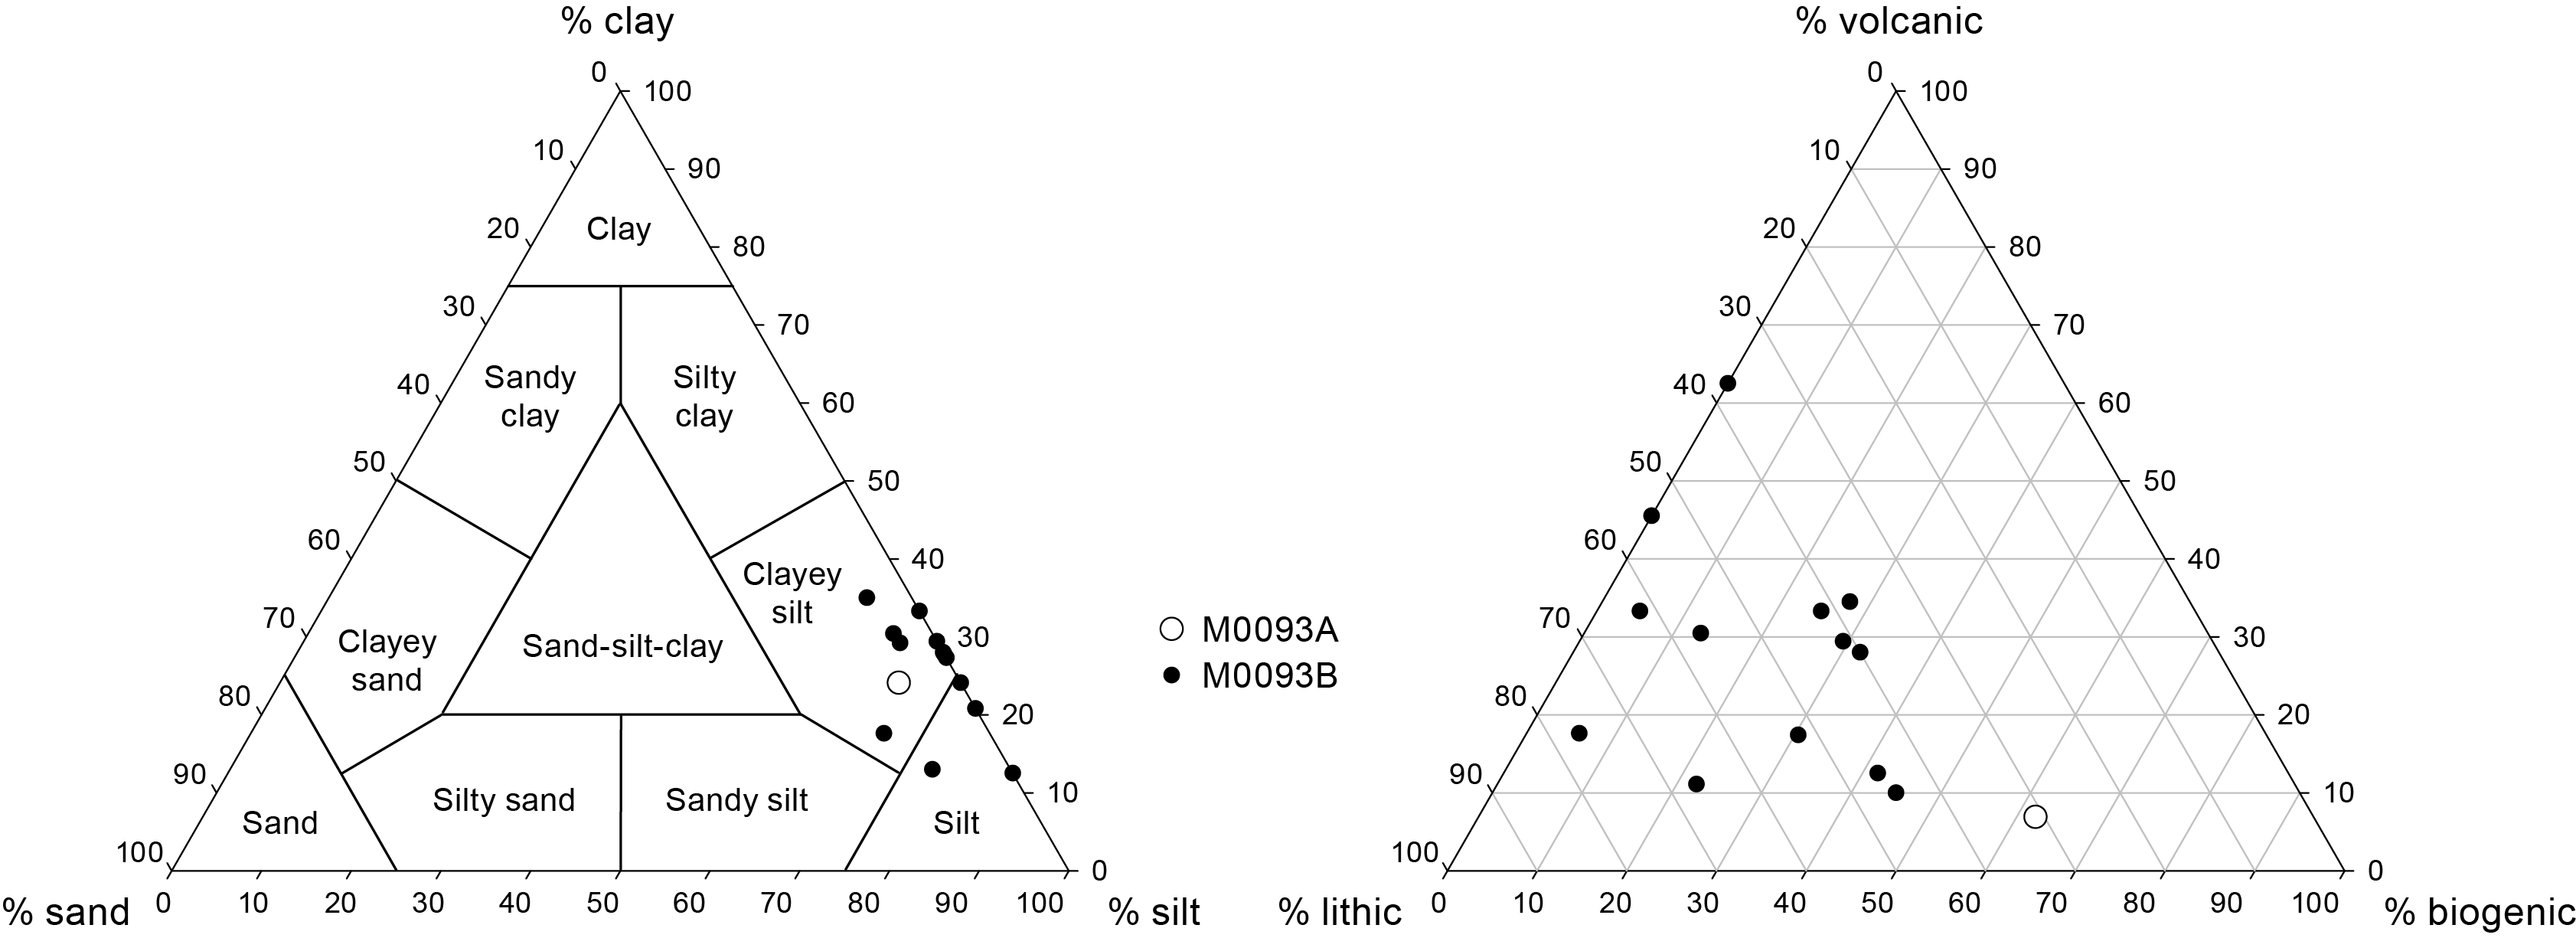
Figure F7. Ternary diagrams of major components and composition.
3.1. Holes M0093A and M0093B
3.1.1. Hole M0093A
Hole M0093A is 0.775 m deep and mainly composed of clay and silty clay with intercalated parallel silty laminae (Figure F5A). Slight bioturbation traces are observed from Section 1P-1, 14 cm, to the base of the section with some mottling in Sections 1P-1, 40 cm, to 1P-1, 67 cm. Magnetic susceptibility, bulk density, and natural gamma radiation (NGR) exhibit an increase in their signal with a peak around 0.23 mbsf, concordant with silty lamina. Magnetic susceptibility and bulk density also increase toward the bottom of the hole. The NGR signal cannot be resolved with the available data (see Physical properties).
One smear slide was collected in Hole M0093A (see Core descriptions; Figures F6, F7, F8). The lithology is a lithogenic-rich siliceous ooze. Silt and clay are the dominant textures (69% and 24.1%, respectively) with mineral components of quartz (6.9%) and vitric material (6.9%). Diatoms (51.7%) and sponge spicules (10.3%) dominate the biogenic fraction.
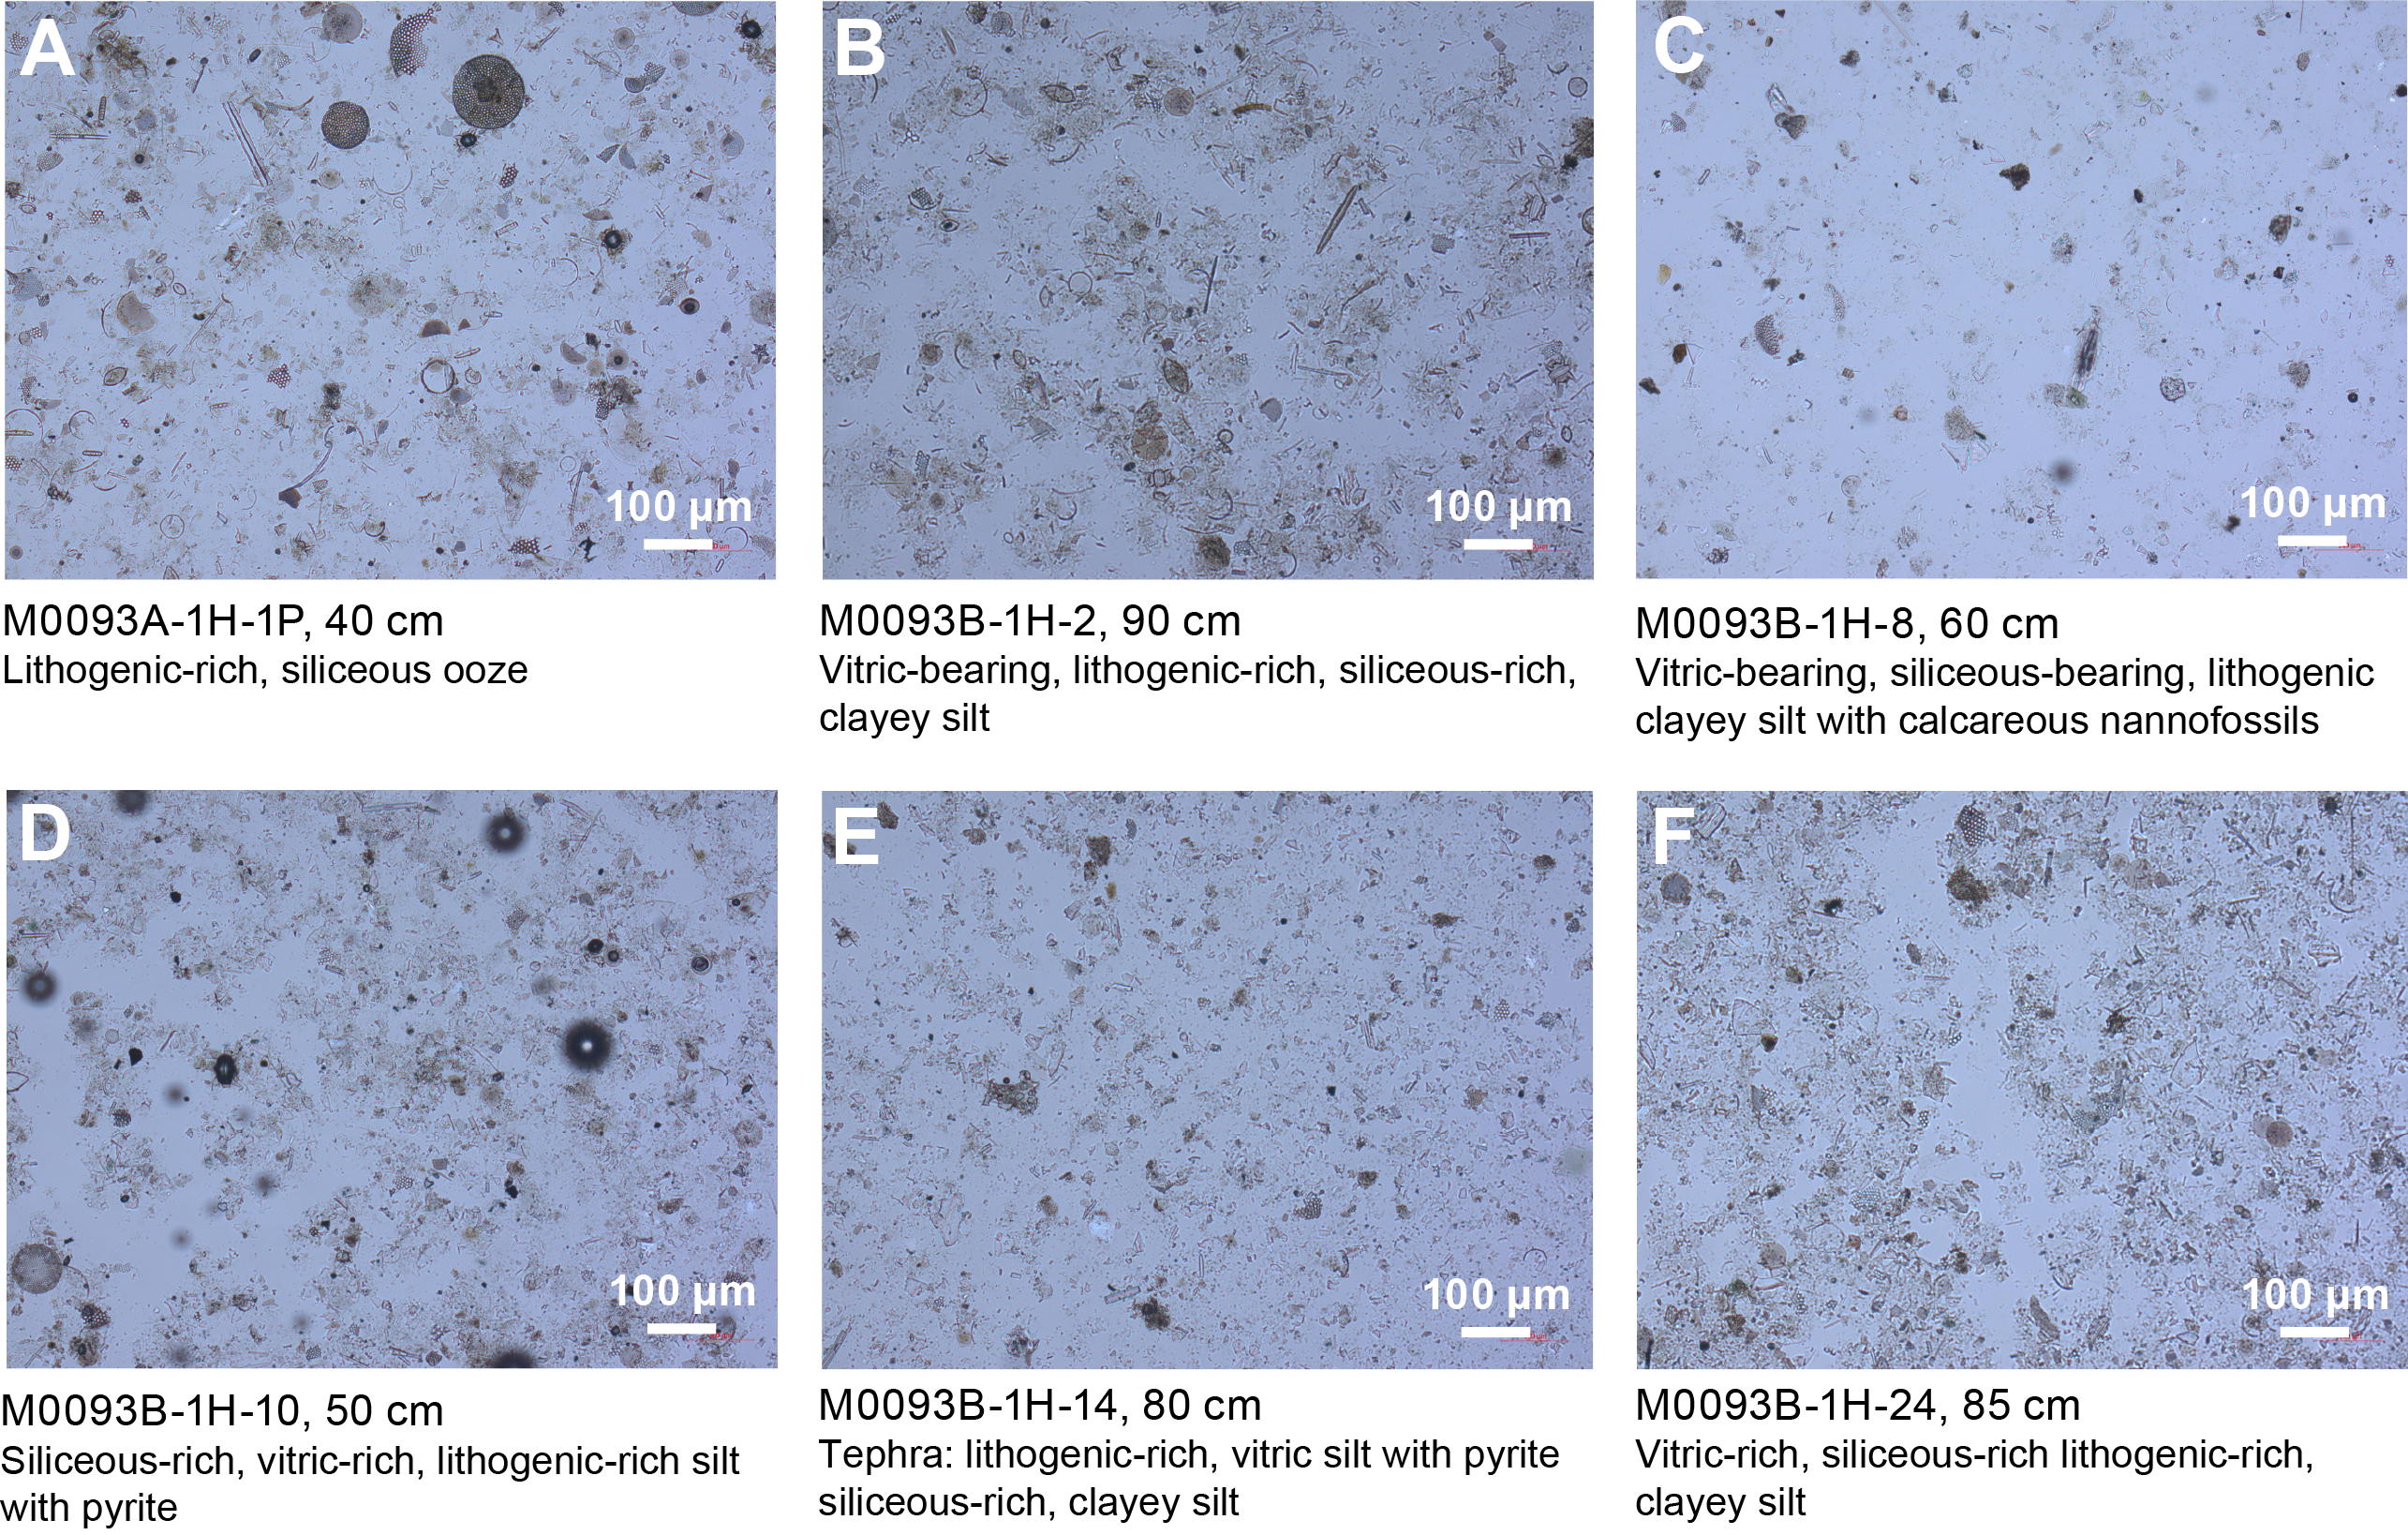
Figure F8. Lithologic and biogenic components.
3.1.2. Hole M0093B
The lithology for the 26 m deep Hole M0093B (Figure F5B) comprises six main intervals with sharp and erosional contacts (Figures F9, F10).
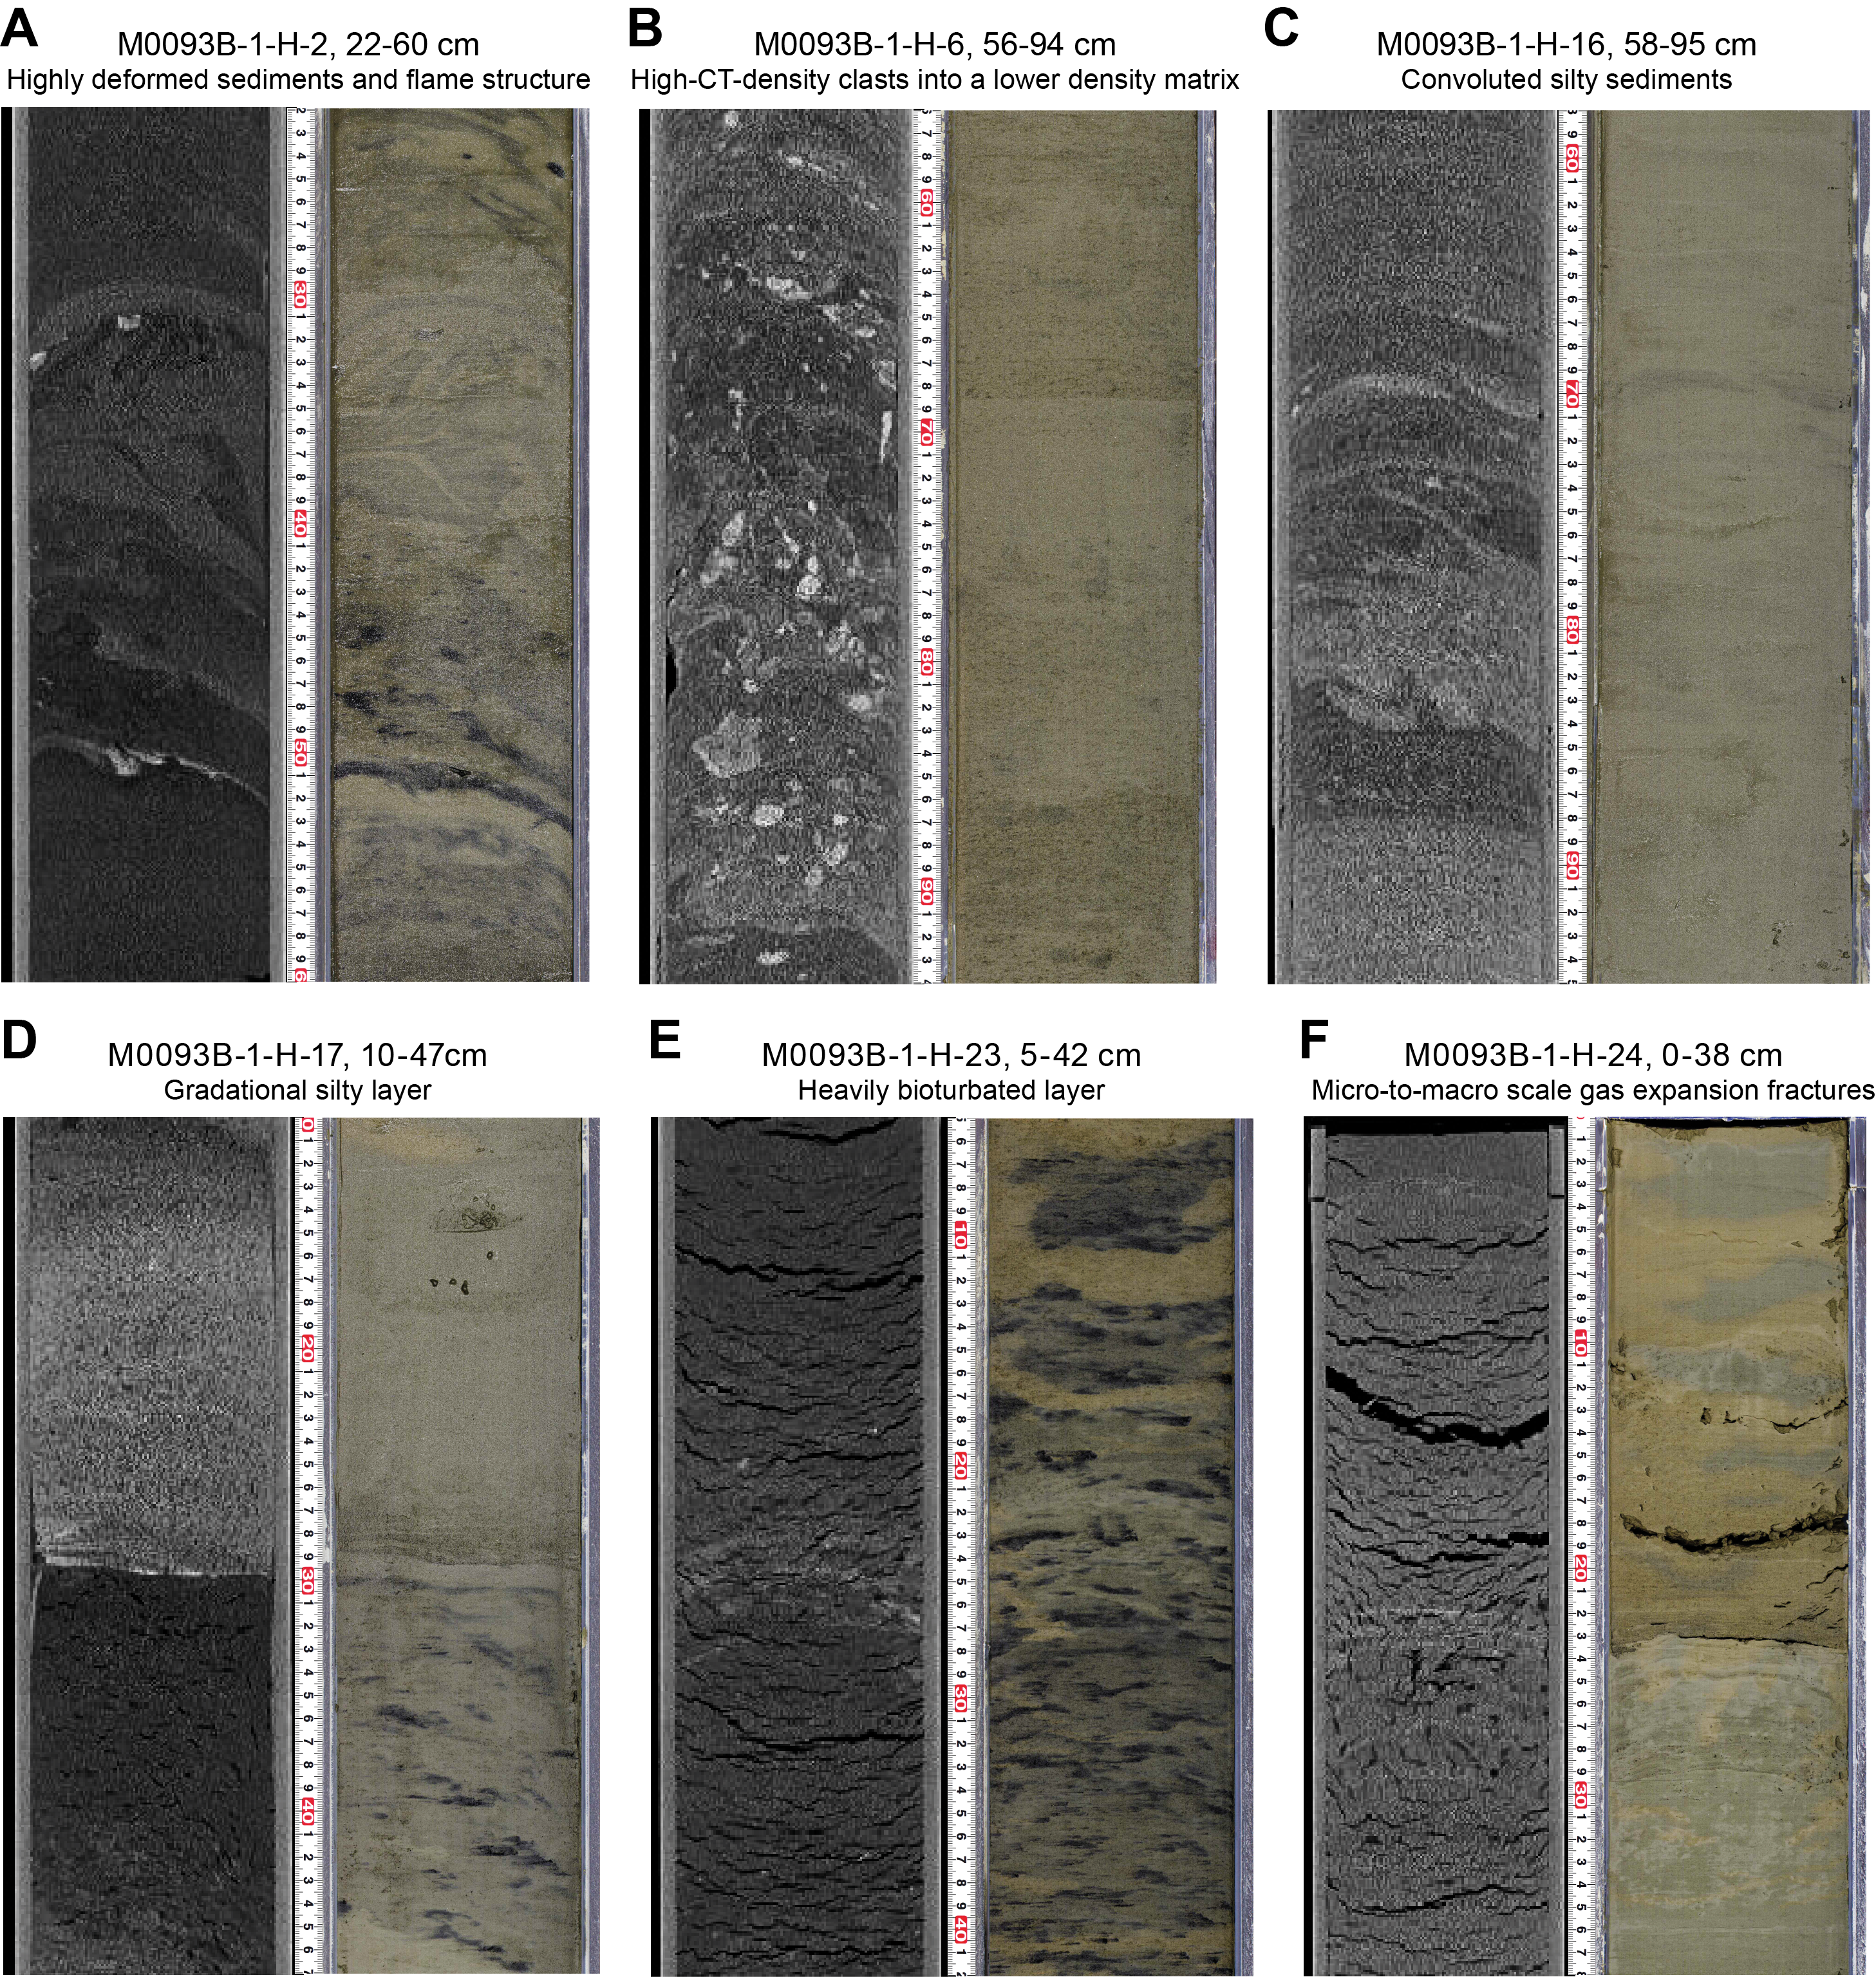
Figure F9. X-ray CT images and line scans.
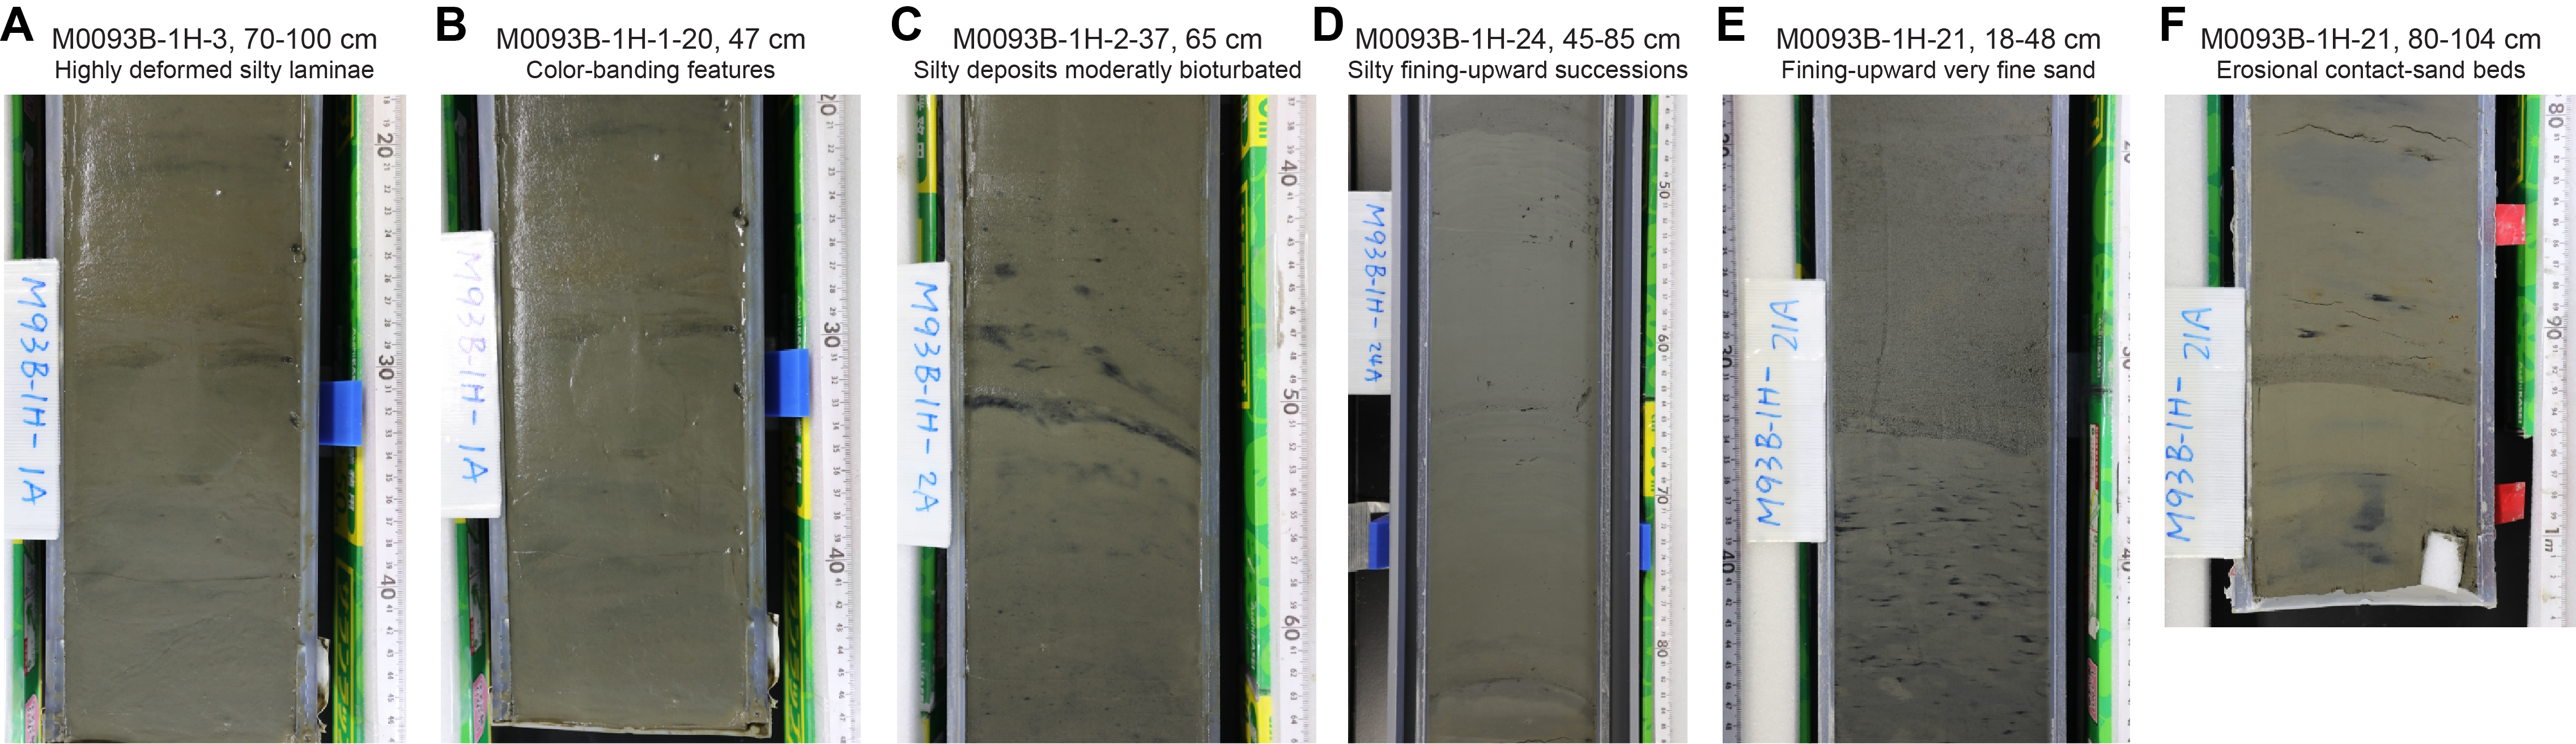
Figure F10. Core close-up photos.
Interval 1 (0 to ~5.5 mbsf; Sections 386-M0093B-1H-1, 0 cm, to 1H-7, 6 cm) is a thick-bedded interval composed of a sharp base, fining-upward succession from very fine sand to silty clay interbedded with locally deformed silt beds and laminae (interval 1H-3, 70–100 cm; Figure F10A). Wavy to planar laminations are frequent in the uppermost 1.5 m. A deformed interval is characterized by inclined and convolute layers and flame structures (Figure F9A). Color bands are identified in Sections 1H-1 to 1H-20, 47 cm (Figure F10B). The X-ray CT images highlight highly deformed sediments, as illustrated by convoluted structures and deformed silty deposits (intervals 1H-2, 37–65 cm [Figure F10B], and 1H-3, 71–100 cm [Figure F10A]) that contrast with the structureless appearance of the silty clay sediments in the linescans. The basal fine sand exhibits parallel laminae with a sharp basal contact (Sections 1H-7, 4 cm, to 1H-7, 6 cm). The very fine sand unit above displays parallel laminations with gradational contacts (Sections 1H-7, 0 cm, to 1H-7, 4 cm) and high radiodensity in the X-ray CT scan, highlights rounded clasts in an overall chaotic bed (Sections 1H-6, 56 cm, to 1H-6, 99.5 cm) (Figure F9B). The silty bed (Sections 1H-5, 98 cm, to 1H-6, 56 cm) shows an irregular base and sparse very fine to fine sand patches, elongated in a vertical position. Bioturbation in the silty clay layer of Interval 1 varies from slight to moderate close to the top of the core (0–1.5 mbsf) and is absent in the remainder of the interval. Iron monosulfide abundance ranges from heavy to sparse to absent, in accordance with bioturbation trace observations (Figure F5).
Interval 2 (~5.5 to ~14 mbsf; Sections 386-M0093B-1H-7, 6 cm, to 1H-15, 53 cm) is ~8.5 m thick and composed of a thin- to medium-bedded succession of fine sand and silt beds and laminae interbedded with silty clay. Beds and laminae fine upward and contain planar laminae. Soft-sediment deformation structures in the clayey silt to silty clay sediments occur in Sections 1H-12, 17 cm, to 1H-12, 25 cm. Bioturbation is sparse. Where present, it ranges from slight to heavy, as in the upper half of Interval 2 (Sections 1H-8, 4 cm, to 1H-11, 32 cm), but it is absent in Sections 1H-11 through 1H-15. Iron monosulfides follow similar patterns of bioturbation.
Interval 3 (~14 to ~15.2 mbsf; Sections 386-M0093B-1H-15, 53 cm, to 1H-16, 69 cm) is thickly bedded and fining-upward silty clay to clay. It lacks any primary sedimentary structures or secondary structures such as bioturbation and iron monosulfide impregnations.
Interval 4 (~15.2 to ~15.8 mbsf; Sections 386-M0093B-1H-16, 69 cm, to 1H-17, 29.5 cm) is composed of fining-upward fine sand laminae grading into a fining-upward very fine sand bed overlain by three centimeter-scale interbedded silt and silty clay layers. One of the three silty layers (Sections 1H-16, 69 cm, to 1H-16, 86 cm) displays convolute structures and an irregular base (Figure F9C), whereas the other two (Sections 1H-16, 88 cm, to 1H-17, 6 cm, and 1H-17, 10 cm, to 1H-17, 14 cm) show gradational contacts (Figure F9D). Interval 4 shows no evidence of iron monosulfides or bioturbation.
Interval 5 (~15.8 to ~26 mbsf; Sections 386-M0093B-1H-17, 29.5 cm, to 1H-27, 15 cm) is a thick-bedded silty to sandy clay with scattered planar silt laminae and centimeter-thick beds of silt (interval 1H-24, 45–85 cm; Figure F10D) underlain by very fine sand with erosional basal contacts (intervals 1H-21, 18–48 cm, and 1H-21, 80–104 cm; Figure F9E, F9F). The silt beds fine upward into silty clay. Bioturbation is not present from Section 386-M0093B-1H-17, 50 cm, to the base of Section 1H-20. Bioturbation varies from slight to heavy throughout the rest of the interval, with a major bioturbated layer in Sections 1H-21, 34 cm, to 1H-23, 46 cm. Iron monosulfide follows the same pattern as bioturbation, with none recorded at the top of the interval and ranging from sparse to heavy in the remaining of the interval. Core deformation is highlighted in the X-ray CT images by the occurrence of small-scale, multidirectional, low-density cracks affecting all of Interval 5. The size and abundance of the cracks increase toward the base of the hole. The cracks most likely reflect gas expansion below the sulfate–methane transition (SMT; 15 mbsf) where methane concentration typically increases (see Geochemistry).
A total of 13 smear slides were analyzed for Hole M0093B (see smear slide tables in Core descriptions and photomicrographs in SMEARSLD in Supplementary materials; Figures F6, F7, F8). The observed lithologies and textures mostly vary between lithogenic-rich clayey silt and lithogenic- and siliceous-rich clayey silt. Silt and clay are the most abundant textures (60%–87.5% and 12.5%–35%, respectively) with abundant quartz (6.9%–29.4%) and vitric material (6.9%–62.5%). Vitric components are more abundant in the lower half of the hole (Section 1H-10, 50 cm, to the bottom of Interval 2). Vitric-rich or vitric-bearing sediments and one tephra occur in Section 1H-14, 80 cm (containing 62.5% of vitric components). Pyrite was observed in smear slides collected from Sections 1H-6 (~5 mbsf; base of Interval 1), 1H-10, 1H-12, 1H-14 (~9–13 mbsf; Interval 2), 1H-18, 1H-20, and 1H-24 (17–24 mbsf; Interval 5). Example smear slide photomicrographs are shown in Figure F8. Diatoms and sponge spicules dominate the biogenic fraction, with more diatoms (maximum = 51.7%) than sponge spicules (maximum = 12.5%) in all samples. Calcareous nannofossils (5.5%) are observed in only one smear slide, which was collected in a thick and structureless clayey interval (Section 1H-8, 60 cm) together with radiolaria (5.6%) and diatoms (11.1%).
3.2. X-ray diffraction mineralogy
XRD mineralogy was conducted every two sections, and some minerals are grouped. These groupings will require additional processing to extract a signal for each mineral. For example, quartz has not been separated from opal-A, and clays, carbonates, amphiboles, pyroxenes, and heavy minerals are composed of several minerals in each grouping (see Lithostratigraphy in the Expedition 386 methods chapter [Strasser et al., 2023a]). The interpretation of the mineralogy is an approximation at this stage. However, some interpretations can be made when the data are contrasted with the lithostratigraphic summaries.
For Hole M0093B, the most abundant minerals are quartz, feldspar, and clays, followed by micas (muscovite and biotite) (Figure F11). The data show correspondence between quartz, feldspar, clays, and micas, and the smear slide data also show them as the most abundant minerals (see Core descriptions). Palygorskite, a clay associated with the weathering of glasses, occurs from 3 to 27 mbsf. In most instances in Hole M0093B, palygorskite occurs where there are vitric grains or tephra. Pyroxene is observed from 4.5 to 12 mbsf. The amphibole group is absent, and pyrite is present at few occurrences and in low amounts (i.e., at 4.5 and 22.5–27.5 mbsf). Heavy minerals occur at 2.5, 10, and 20.5 mbsf. The few peaks of mineral abundances in Hole M0093B, such as heavy minerals and pyroxene, are indicative of a local heterogeneity of the mineral composition throughout the hole. Future studies will be required to fully extract the mineralogy of the sediments in this hole.

Figure F11. XRD mineralogy.
4. Tephra
There were no tephra layers described in Basin C/N1. Sediments contain volcanic glass shards, according to smear slide observations (see smear slide tables in Core descriptions and smear slide photos in SMEARSLD in Supplementary material), and particularly high volcanic glass content (ratio exceeding 25%) is reported for Sections 386-M0093-1H-10 through 1H-24.
5. Micropaleontology
Two holes were cored at Site M0093 in Basin C/N1 in the southern part of the boundary area between the central and northern Japan Trench. Because of the prevalence of event layers, no radiolarian-based age determinations were made at this site. Foraminifera in samples collected during the offshore phase were examined to determine provenance of mass transport deposits.
5.1. Foraminifera
Samples were taken at 5 m intervals offshore, as described in Micropaleontology in the Expedition 386 methods chapter (Strasser et al., 2023a). With the exception of the agglutinated benthic foraminifera, which may be either in situ or reworked, all foraminifera at Sites M0093 are considered to be allochthonous.
5.1.1. Hole M0093A
One sample taken from the base of Hole M0093A was examined for foraminifera (Table T4). Only one specimen is present in this sample, which contains abundant diatoms, radiolaria, sponge spicules, and volcanic glass.
No provenance interpretation can be made for this sample due to low foraminifera abundance.
5.1.2. Hole M0093B
Six samples from Hole M0093B were examined for foraminifera (Table T4). Benthic foraminifera with moderate to good preservation are present in three of the samples; three samples are barren. Planktonic foraminifera with good preservation are common in one, present in another, and barren in the other four samples. All samples examined for foraminifera contain abundant diatoms, radiolaria, and sponge spicules.
A paleobathymetric interpretation cannot be made for most samples due to low foraminifera abundance, with the exception of Sample 386-M0093B-1H-6, 97.5–100.5 cm (5.48 mbsf).
Sample 386-M0093B-1H-6, 97.5–100.5 cm, contains a diverse assemblage of calcareous benthic foraminifera dominated by Nonionella globosa, Nonionellina labradorica, Stainforthia fusiformis, Stainforthia apertura, Cassidulina reniforme, Globocassidulina subglobosa, and Bolivina pacifica. Preservation of these and other thin-walled taxa, such as rare Chilostomellina fimbriata and Globobulimina pacifica, are good to very good. Thicker walled, rare specimens of Elphidium spp. show breakage, and a few are infilled with iron monosulfides. Agglutinated taxa include rare specimens of Reophax spp., Haplophragmoides spp., and Trochammina spp. Planktonic foraminifera are abundant and are dominated by sinistrally coiled Neogloboquadrina pachyderma with rare Globigerina bulloides.
Some benthic foraminifera present, such as C. fimbriata and G. pacifica, have been found living within the oxygen minimum zone off Hachinohe, Japan (Fontanier et al., 2014). Using the paleobathymetric zonation of Usami et al. (2017) after Matoba (1976), the provenance of the displaced calcareous assemblage in Sample 386-M0093B-1H-6, 97.5–100.5 cm, is interpreted to be from an upper bathyal environment within the oxygen minimum zone (200–600 mbsl).
6. Geochemistry
6.1. Interstitial water
At Site M0093, a total of two bottom water (BW) and 22 interstitial water (IW) samples were collected using Rhizon samplers from one trigger core (Hole M0093A) and one GPC core (Hole M0093B). See Geochemistry in the Expedition 386 methods chapter (Strasser et al., 2023a) for details of the sampling, analytical methods, and data quality. In general, the IW compositions of Site M0093 cores are influenced by organic matter degradation, including the release of metabolic products and consumption of electron acceptors, as well as dissolution/precipitation reactions with sediment. The IW concentration profiles show a strong impact of nonsteady-state conditions likely related to changes in sediment deposition.
6.1.1. Shipboard analyses: salinity, alkalinity, and ammonium
The trigger core from Hole M0093A shows ~0.9 higher salinity at 0.52 mbsf than the GPC core from Hole M0093B. Salinity at Site M0093 varies between 33.75 and 35.43 (Table T5; Figure F12). The lowest value occurs at 14.41 mbsf in Hole M0093B. Salinity does not show a clear trend above 15 mbsf but increases gradually from 33.91 to 35.43 below 15 mbsf.

Figure F12. IW salinity, total alkalinity, and ammonium.
Alkalinity in Hole M0093B increases from 18.19 mM at the top of the hole to 36.74 mM at 3.85 mbsf. Values remain relatively constant at ~40 mM from 3.85 to 10.39 mbsf and increase to 66.97 mM at the bottom of the hole (Figure F12).
Ammonium (NH4+) shows a varying vertical distribution that mimics the shape of the alkalinity profile. The uppermost 5 m of Hole M0093B shows a gradual increase from 0.79 to 1.65 mM. From 5.35 to 12.39 mbsf, where alkalinity remains relatively stable, ammonium decreases to a minimum of 0.82 mM, and then it increases and reaches a maximum value of ~3.1 mM at the bottom of the hole (~25 mbsf) (Figure F12).
6.1.2. Shore-based analysis
6.1.2.1. Dissolved vanadium, molybdenum, and uranium
A suite of trace metals were analyzed using inductively coupled plasma–mass spectroscopy (ICP-MS) including vanadium (V), molybdenum (Mo), and uranium (U), briefly described below, as well as copper (Cu) and rubidium (Rb) (Table T5). The BW concentration of V at Site M0093 is 84.2 nM. Dissolved V concentrations in Hole M0093A are relatively low compared to those in the upper 8.5 mbsf of Hole M0093B (Figure F13). In the upper part of Hole M0093B (above ~10 mbsf), V concentrations are higher than in the lower part (below ~10 mbsf). Dissolved V concentrations increase rapidly from ~20 nM at ~0.5 mbsf to ~160 nM at ~4 mbsf and then decrease dramatically to the lowest part of the core below ~10 mbsf, where the concentrations are below the detection limit except for one sample at ~25 mbsf with a V concentration of ~80 nM.

Figure F13. IW V, Mo, and U.
Dissolved Mo concentrations in Hole M0093B are highest in the BW at ~120 nM. In the trigger core, the Mo concentration is 20.2 nM at ~0.52 mbsf. Mo concentrations reach a maximum value of 73.5 nM at the top of Hole M0093B (0.83 mbsf). Below 0.83 mbsf, Mo concentrations rapidly drop to <20 nM and remain low to the bottom of the core, ranging 6.2–13.8 nM, except for one sample with a concentration of 39 nM at 16.42 mbsf. One sample from Hole M0093A was measured for Mo concentrations: 20.2 nM at 0.52 mbsf (Figure F13).
The BW U concentration is ~14 nM. Dissolved U concentrations reach a maximum of 20.9 nM at the top of Hole M0093B (0.33 mbsf) and then decrease to <10 nM at ~3 mbsf before rising to 12 nM at 6 mbsf. Below 6 mbsf, U concentrations decrease downcore to 1.2 nM at ~10.39 mbsf and to below the minimum detection limit for dissolved U below 18.5 mbsf. Only one sample at Hole M0093A was above minimum detection limits for U, a concentration of 3.06 nM at ~0.52 mbsf (Figure F13).
6.1.2.2. Dissolved lithium, boron, silica, manganese, iron, strontium, and barium
All minor elements analyzed using inductively coupled plasma–optical emission spectroscopy (ICP-OES) are listed in Table T5. The dissolved lithium (Li) concentration of 25.5 µM in the BW and 21.8 µM at ~0.52 mbsf in Hole M0093A is overall similar to the upper ~7 m in Hole M0093B (Figure F14). The highest dissolved Li concentrations of ~35 µM are found at ~10 mbsf in Hole M0093B, and they decrease gradually to the lowest value of ~16 µM at 22.61 mbsf.
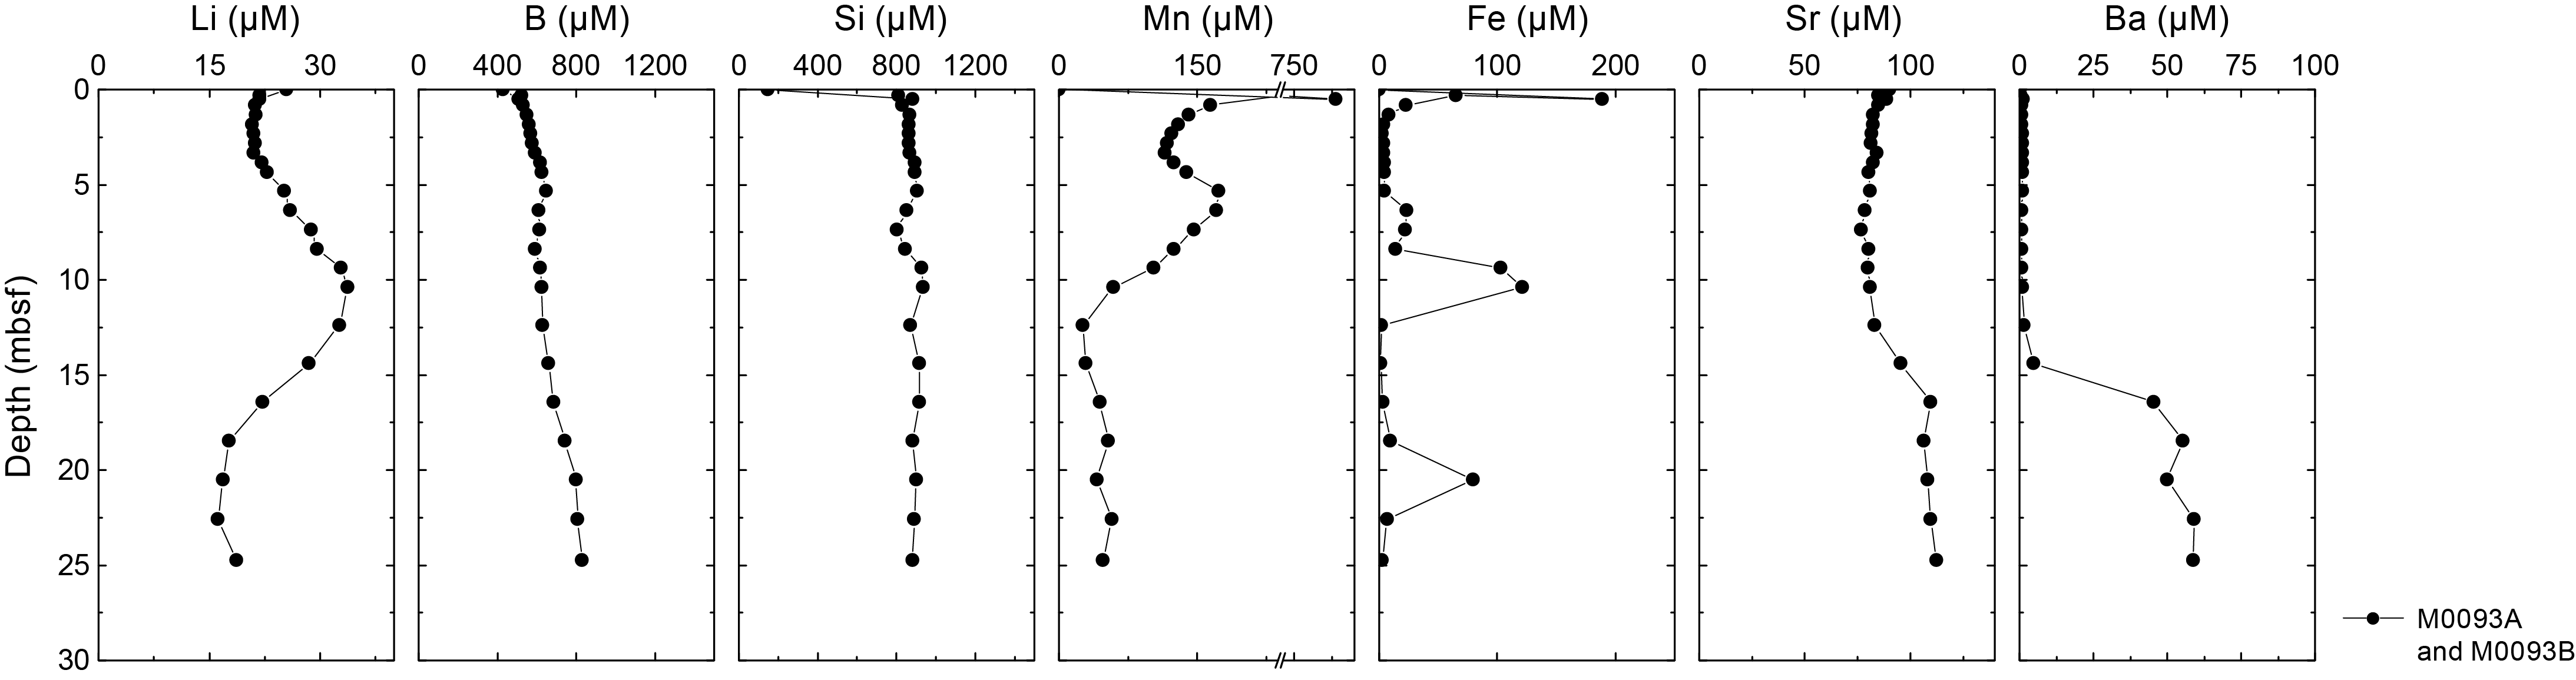
Figure F14. IW Li, B, Si, Mn, Fe, Sr, and Ba.
Dissolved boron (B) shows the lowest values in the BW (~430 µM) and values of 509.2 and 524.0 µM at the top of the trigger core (Hole M0093A) and the GPC core (Hole M0093B) at 0.52 and 0.33 mbsf, respectively. This is followed by a gradual increase to 647.6 µM at 6.1 mbsf. Dissolved B concentrations then remain at ~630 µM between 6.1 and 13.3 mbsf and increase downcore to 829 µM at the base of the core (25.5 mbsf) (Figure F14).
The dissolved silica (Si) concentration is lowest in the BW (<150 µM) and reaches 811.4 µM at the top of Hole M0093B (0.33 mbsf). Si concentrations increase to 869.3 µM at 1.33 mbsf and remain stable to 4.09 mbsf, where they stabilize at a higher value of 906.5 µM at 5.35 mbsf, and then decrease to 804 µM at 7.37 mbsf in M0093B. This is followed by an increase to a maximum value of 935.8 µM at 10.39 mbsf. Dissolved Si concentrations fluctuate around ~900 µM to the base of the hole. In addition, the dissolved Si concentration is 883.0 µM at 0.52 mbsf in Hole M0093A (Figure F14).
The dissolved manganese (Mn) concentration is near the detection limit in the BW. The Mn concentration shows the highest value (887.2 µM) at 0.52 mbsf in Hole M0093A. It shows a relatively low value of 363.9 µM at 0.33 mbsf at the top of Hole M0093B. Concentrations then fluctuate from 164.6 µM at 0.83 mbsf to 138.5 µM at 5.2 mbsf. Concentrations increase to 173.4 µM at 6.1 mbsf and then decrease to 26.0 µM at 12.39 mbsf. Below 12.39 mbsf, dissolved Mn remains at concentrations varying from 29.2 to 57.4 µM to the bottom of the hole (Figure F14).
Similar to Mn, dissolved iron (Fe) is at the detection limit in the BW. Dissolved Fe concentrations are 188.6 µM at 0.52 mbsf in Hole M0093A, and Fe concentrations are 65.0 µM at 0.33 mbsf in Hole M0093B. In the GPC core, dissolved Fe is almost absent between 1.83 and 5.35 mbsf, and its concentration stabilizes at 23.1 µM from 6.36 to 7.36 mbsf. From 9.38 to 10.39 mbsf, the dissolved Fe concentration reaches high values (~103 and 120.9 µM). Below 12 mbsf, the dissolved Fe concentration remains less than 7 µM, except for a high value of 79.5 µM at 20.51 mbsf (Figure F14).
The dissolved strontium (Sr) concentration at 0.52 mbsf in the trigger core is 88.91 µM; it is 90 µM in the BW. The dissolved Sr concentration is 84.91 µM at the top of GPC Hole M0093B and gradually decreases to 76.7 µM at 7.37 mbsf followed by an increase to a maximum value of ~112.42 µM at 24.76 mbsf (Figure F14).
The dissolved barium (Ba) concentration is very low in the BW (near detection limit), and at 0.52 mbsf in the trigger core it is 1.23 µM. The dissolved Ba concentration in the GPC core is less than 2 µM in the uppermost 12 m of Hole M0093B. Ba concentrations then increase rapidly from 4.91 mbsf to 58.92 µM at 25.51 mbsf (Figure F14).
6.1.2.3. Chloride, bromide, and sulfate
All anions analyzed using ion chromatography (IC) are listed in Table T5. In Hole M0093A, dissolved chloride (Cl−) is similar to seawater values (539.5 mM) (Bruland et al., 2014). Hole M0093B reaches slightly lower concentrations at 0.33 mbsf and then fluctuates, reaching 539.4 mM at 9.38 mbsf (Figure F15). Cl− concentrations decrease to 534.3 mM at 16.42 mbsf and then increase to 540.7 mM at 24.76 mbsf.
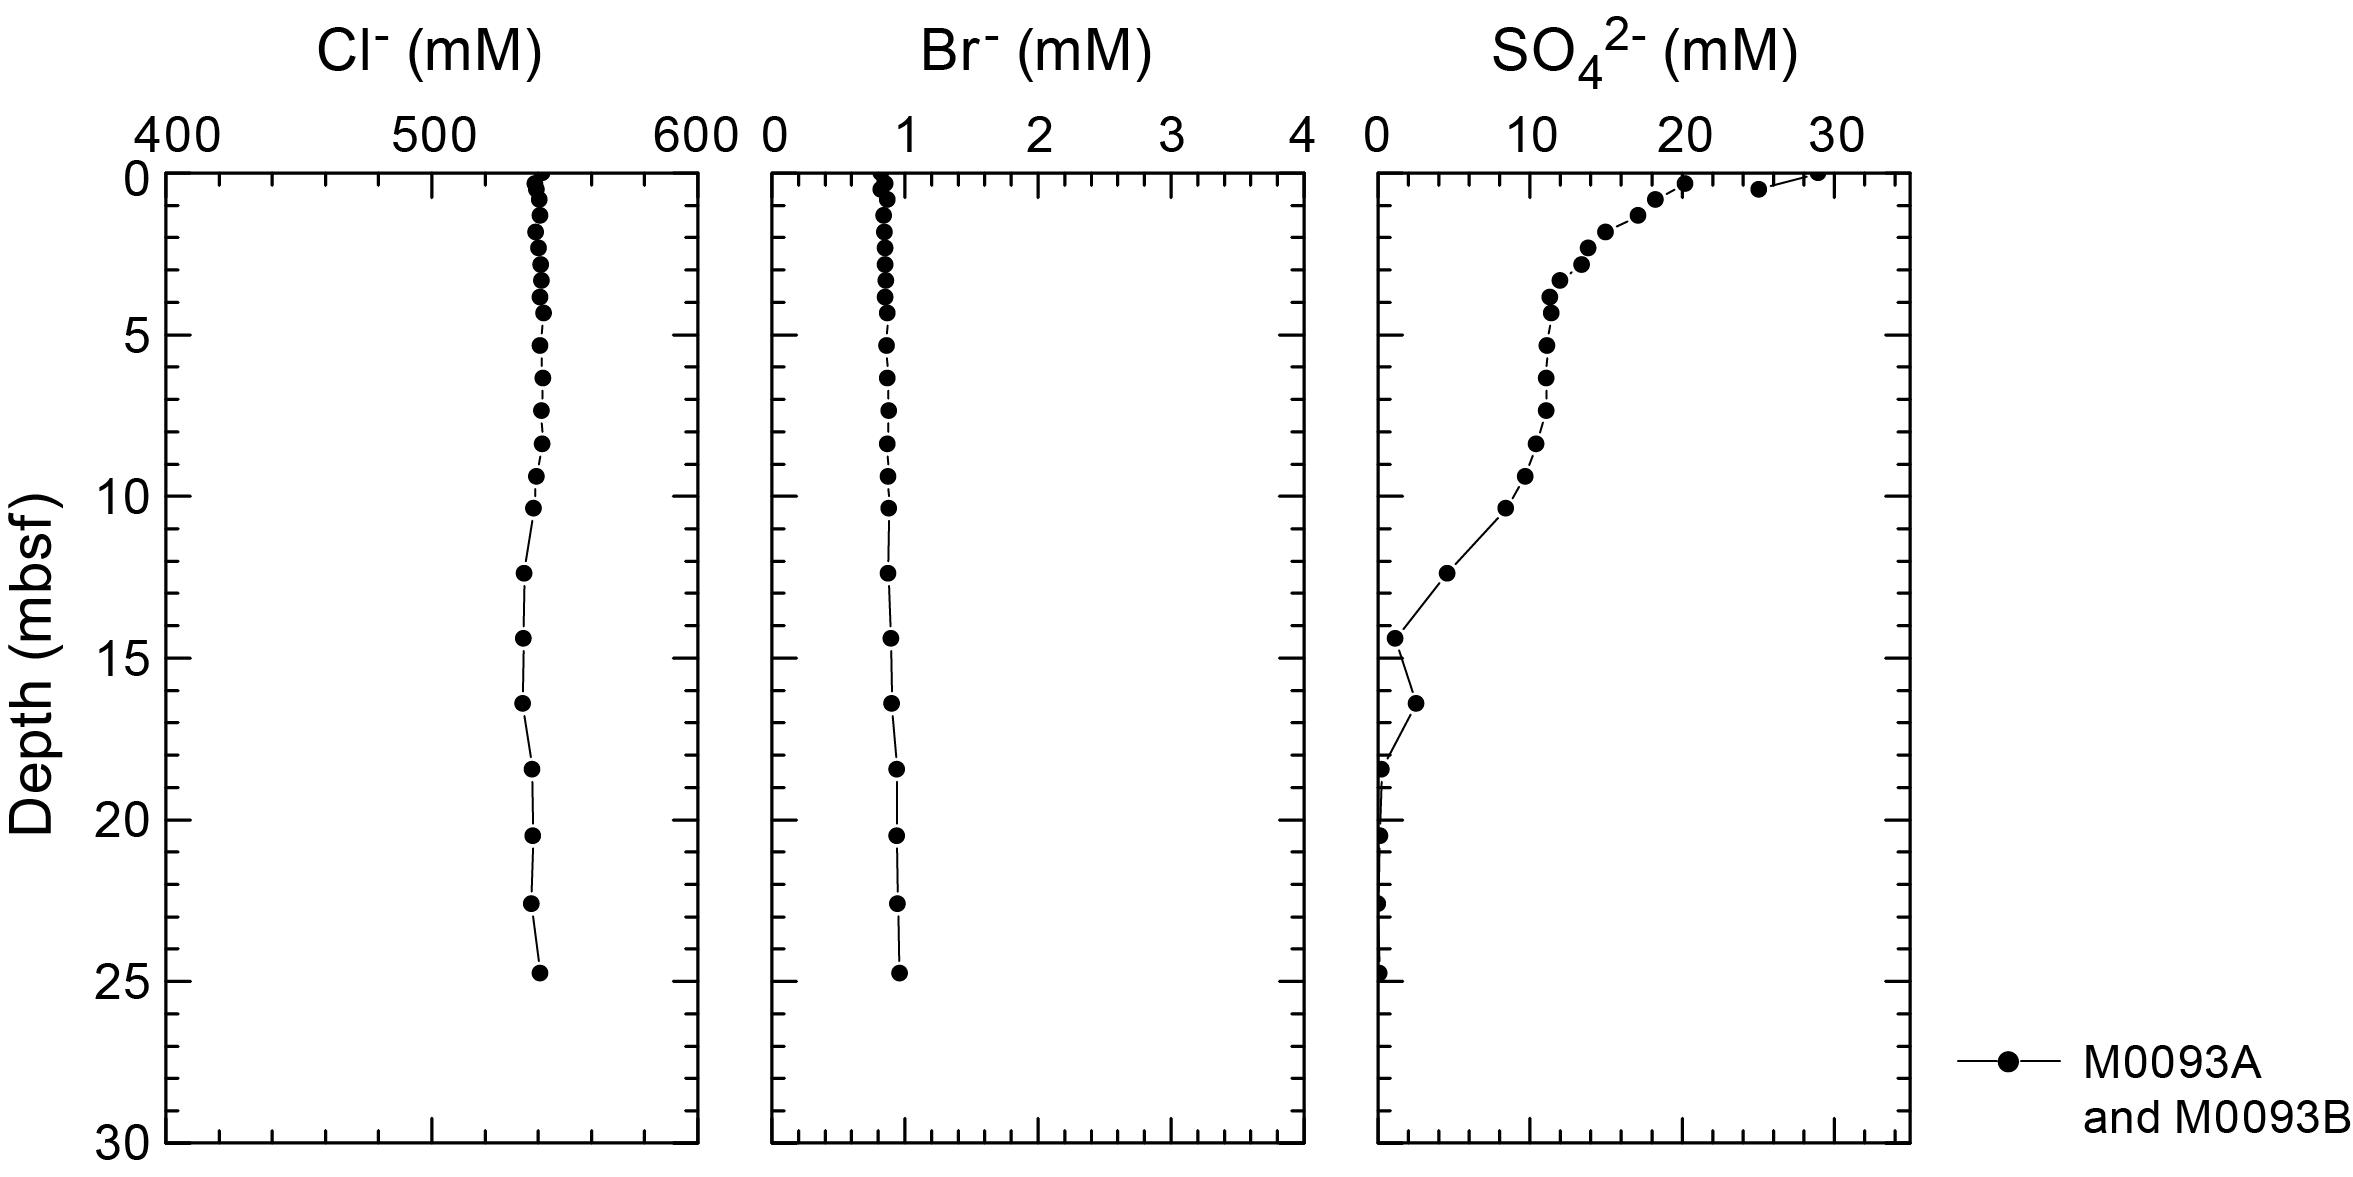
Figure F15. IW Cl−, Br−, and SO42−
The dissolved bromide (Br−) concentration is 0.82 mM at 0.52 mbsf in the BW and the trigger core. In general, Br concentrations increase from 0.855 mM at 0.33 mbsf to 0.964 mM at 24.76 mbsf (Figure F15).
The dissolved sulfate (SO42−) concentration shows seawater values (29 mM) in the BW and decreases to 25.1 mM at 0.52 mbsf in the trigger core. In general, SO42− concentrations decrease from 20.2 mM at 0.33 mbsf to 0.1 mM at 24.76 mbsf (Figure F15).
6.1.2.4. Sodium, magnesium, potassium, and calcium
Downcore profiles of sodium (Na+), potassium (K+), calcium (Ca2+), and magnesium (Mg2+) IW concentrations show overall very similar patterns compared to each other with little variation. Dissolved Na+ concentrations in Hole M0093B fluctuate unsystematically and are mostly above average seawater values (~470 mM; Bruland et al., 2014) in all samples, ranging ~459–586 mM. The dissolved Na+ concentration at 0.57 mbsf in Hole M0093A is 464 mM.
Dissolved K+ concentrations fluctuate unsystematically and are mostly above seawater values (~10 mM) in all samples, ranging ~9.48–11.92 mM. The dissolved K+ concentration at 0.57 mbsf in Hole M0093A is 10.47 mM. The dissolved K+ concentration at 9.38 m is 12.43 mM.
Dissolved Ca2+ concentrations are mostly around average seawater values (~10 mM; Bruland et al., 2014) in all samples, ranging ~9.64–11.75 mM. The dissolved Ca2+ concentration at 0.57 mbsf in Hole M0093A is 9.76 mM. The dissolved Ca2+ concentration at 9.38 m is 13.58 mM.
Dissolved Mg2+ concentrations fluctuate unsystematically and are mostly around average seawater values (~53 mM; Bruland et al., 2014) in all holes, ranging ~50.63–67.8 mM. The dissolved Mg2+ concentration at 0.57 mbsf in Hole M0093A is 51.76 mM.
The IC cation data are only presented in GEOCHEM in Supplementary material because the samples require further postexpedition analysis for validation of absolute values (analytical accuracy).
6.2. Shore-based H2S analysis
At Site M0093, H2S concentrations were below the detection limit in all samples (see GEOCHEM in Supplementary material).
6.3. Headspace gas analysis: methane, ethane, and C1/C2 ratio
The offshore headspace gas analysis was mainly performed on the longest GPC core. A total of 26 headspace samples from Holes M0093A (trigger core) and M0093B (GPC core) were measured for hydrocarbon compositions (Figure F16; Table T6).

Figure F16. Methane and ethane concentrations and C1/C2 ratios.
At Site M0093, methane concentrations are lower than ~500 ppmv from 0 to ~16 mbsf. Below ~16 mbsf, the methane concentration increases rapidly to 10,570 ppmv at ~18 mbsf, and with increasing depth, the C1 concentration decreases dramatically to 6,649 ppmv at 20.5 mbsf before it increases abruptly. At 21.5 mbsf, methane concentrations are at maximum (18,080 ppmv).
Ethane (C2H4 and C2) was detected at a relatively constant value (less than 1 ppmv), but there are three intervals with high values >0.8 ppmv at 10.5–13.5, 17.5, and 22.8 mbsf. The methane/ethane (C1/C2) ratios follow the methane profile pattern. The ratios are low to ~17 mbsf, and the maximum ratio was >70,000 below ~22.5 mbsf.
Alongside C1 and C2, other hydrocarbon gases such as ethylene (C2=), ethane (C2), propene/propylene (C3=), propane (C3), and n-butane (n-C4) were detected and measured, but their concentrations are very low, generally less than 1 ppmv at all sites (see GEOCHEM in Supplementary material).
6.4. Shore-based solid-phase analysis
6.4.1. Aluminum, calcium, silica, iron, and manganese
Energy dispersive X-ray fluorescence (ED-XRF) was used to quantify elements from 14 ground solid sediment samples from Hole M0093B and one sample from trigger core Hole M0093A (Figure F17). The solid-phase elements, including aluminum (Al), Ca, Si, Fe, and Mn, briefly described below, as well as Ba, Br, Cr, Cu, K, Mg, Ni, P, Sr, Ti, V, Zn, and Zr, are listed in Table T7. Solid-phase Al content ranges 3.9–5.5 wt% (39,343–55,127 mg/kg) at Site M0093, with 3.9 wt% at 0.51 mbsf in the trigger core. Solid-phase Al contents in Hole M0093B decrease slightly from 4.4 wt% at 0.32 mbsf to 4.1 wt% at 4.3 mbsf. Below 4.3 mbsf, Al contents generally increase, reaching a maximum of 5.5 wt% at 10.4 mbsf. Below 12.4 mbsf, Al contents decrease from 5.4 wt% at 12.4 mbsf to 4.5 wt% at 20.33 mbsf.
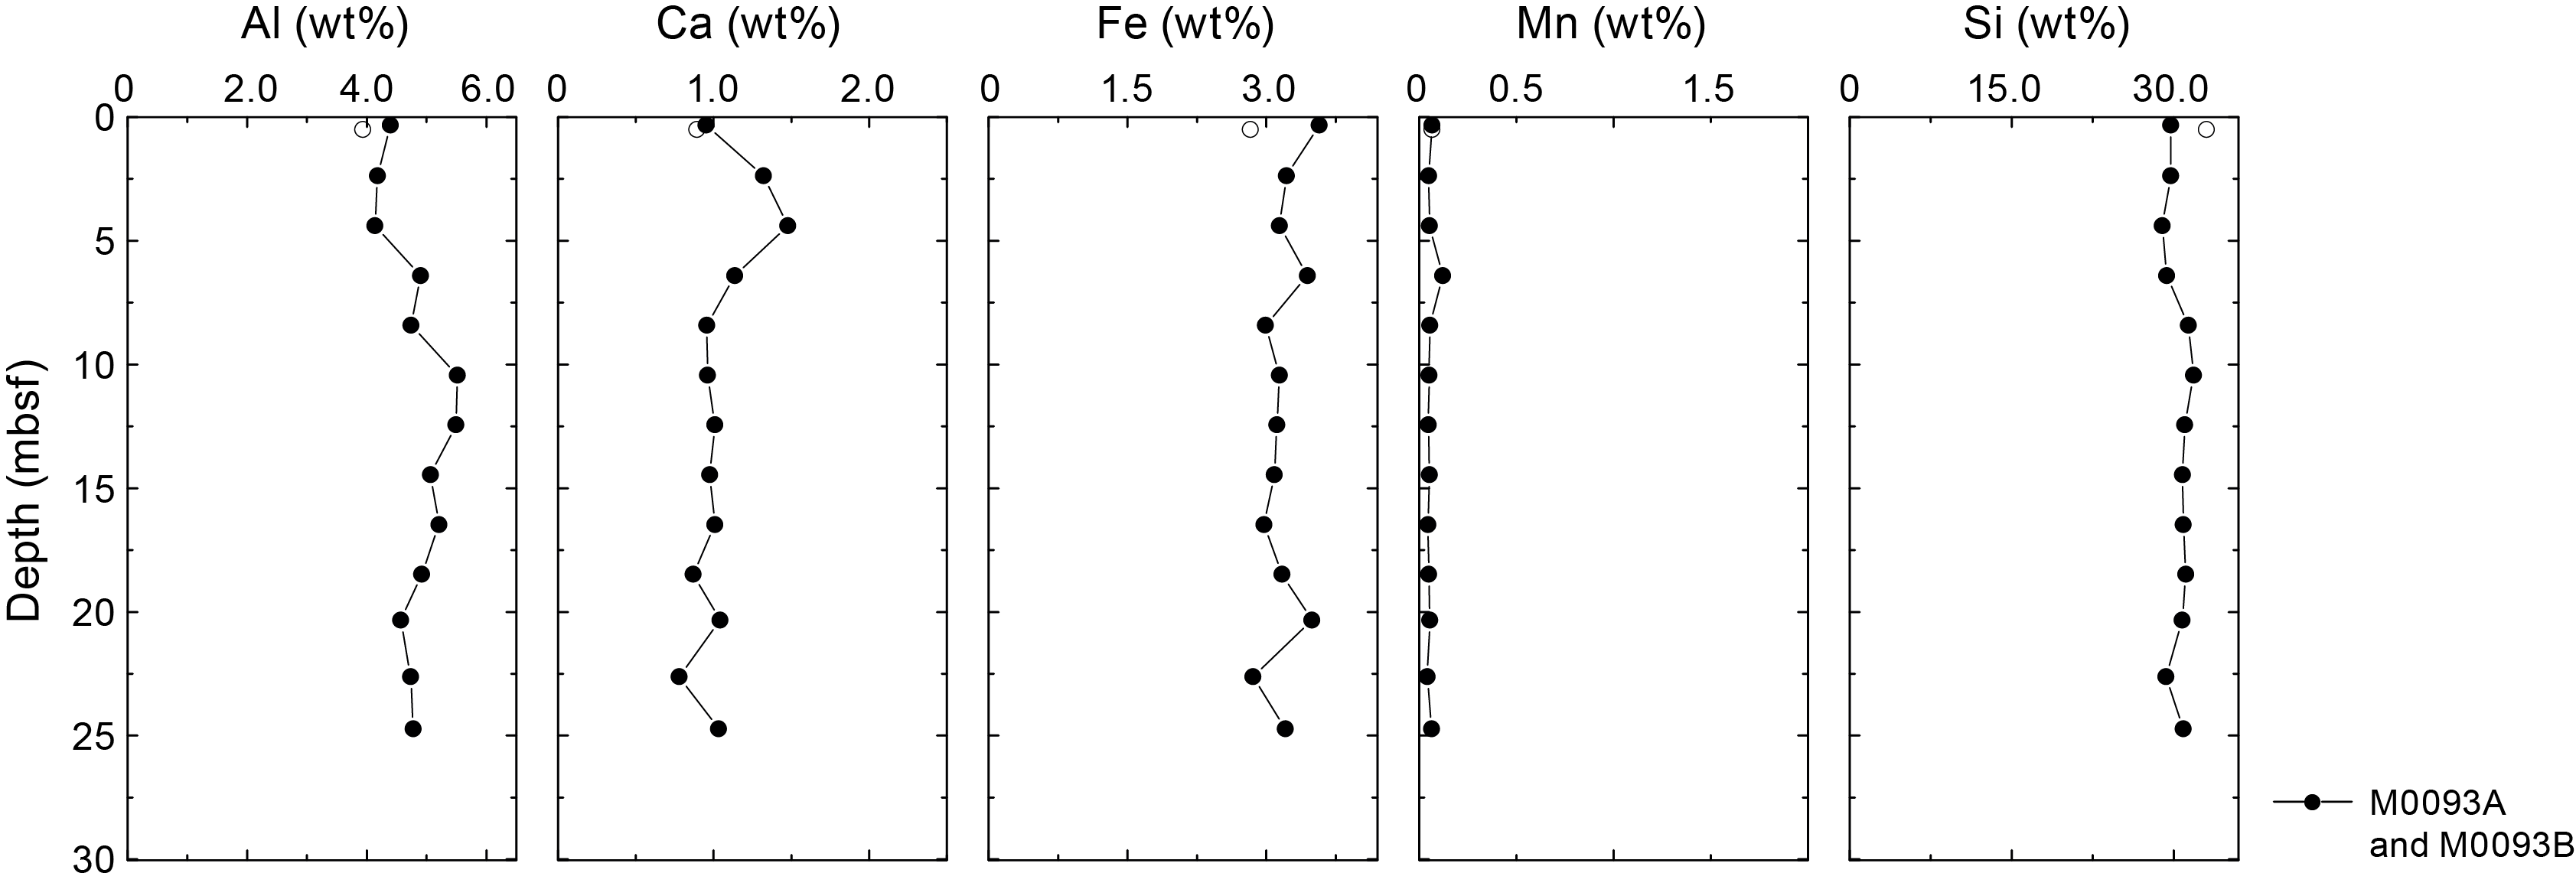
Figure F17. Solid-phase major elements in sediments.
Ca content ranges ~0.8–1.5 wt% (7,795–14,774 mg/kg) at Site M0093. Ca is ~0.89 wt% at 0.51 mbsf in the trigger core. Ca contents in the GPC core increase from 0.95 wt% at 0.32 mbsf to 1.48 wt% at 4.39 mbsf. Ca concentrations decrease from 1.1 wt% at 6.4 mbsf to 0.96 wt% at 10.43 mbsf. Ca stabilizes at ~1.0 wt% below 16 mbsf and fluctuates between 0.77 and 1.0 wt%.
Solid-phase Si content is between 29 and 33 wt% (289,583–330,178 mg/kg) at Site M0093. The Si concentration is 33 wt% at 0.51 mbsf in the trigger core. Solid-phase Si contents in Hole M0093B decrease slightly from 29.7 wt% at 0.32 mbsf to 28.9 wt% at 4.3 mbsf. At 4.3 mbsf, Si generally increases, reaching a maximum of 31.8 wt% at 10.4 mbsf. Below 12.4 mbsf, Si contents are ~30 wt%, except for one sample with a concentration of 29.2 wt% at 22.6 mbsf.
Fe contents overall range ~2.9–3.6 wt% (28,567–35,723 mg/kg). The solid-phase Fe value is ~2.8 wt% at 0.51 mbsf in the trigger core, which is lower than ~3.6 wt% at 0.32 mbsf in the top sample from the GPC core. Fe contents decrease to 2.9 wt% at 16.47 mbsf, except for one sample at 6.4 mbsf that contains 3.4 wt% Fe. Below 18.5 mbsf, Fe concentrations fluctuate, ranging 2.8–3.4 wt%.
Solid-phase Mn contents in the GPC core are relatively constant at about ~0.05 wt% (>411 mg/kg), except for one sample with a concentration of 0.12 wt% (1220 mg/kg) at 6.4 mbsf. The Mn concentration is 0.06 wt% (671 mg/kg) at 0.51 mbsf in the trigger core.
6.4.2. Carbon and sulfur
One sample from the trigger core (Hole M0093A) has 1.2 wt% total carbon (TC) and 1.1 wt% total organic carbon (TOC) (Figure F18; Table T7). In Hole M0093B, TC and TOC vary in a similar way. TC ranges 0.56–1.3 wt%, and TOC ranges 0.54–1.2 wt%. TC and TOC increase from the top sample to 2.37 mbsf and then decrease to 0.54 and 0.55 wt%, respectively, at 10 mbsf. Below 10 mbsf, TC and TOC are variable and have maxima of 1.15 and 1.09 wt%, respectively, at 20.33 mbsf. In Hole M0093A, total inorganic carbon (TIC) contents are 0.02 wt%. In Hole M0093B, TIC contents are also very low (<0.1 wt%). Overall, the total sulfur (TS) trends are similar to those of TOC and TC. TS fluctuates in Hole M0093B, ranging 0.2–0.82 wt%. One sample from the trigger core has 0.36 wt% TS.

Figure F18. TC, TOC, TIC, and TS.
6.5. Discussion
Indicators of organic matter degradation in the IW and headspace samples (ammonium, alkalinity, bromide, and methane concentrations) suggest that intensive remineralization occurs at Site M0093. Notably, the ammonium profile at Site M0093 is less linear, potentially indicating more pronounced and/or more clearly preserved nonsteady-state diagenesis. At Site M0093, dissolved Fe and Mn are very high in the top meter of the sediment column, indicating organic matter remineralization by intensive dissimilatory Mn and Fe reduction (Froehlich et al., 1979). The nonlinear, wavy decrease in Mn concentrations below the top meter is comparable to the trend in alkalinity and ammonium IW concentration profiles, pointing to nonsteady-state diagenesis preserved in the IW record. Below the uppermost sediment interval, organoclastic sulfate reduction becomes the dominant electron acceptor for organic matter remineralization, followed by methanogenesis at greater depth. Sulfate reduction and subsequent formation of diagenetic sulfide minerals is also evident from the observation of (likely) iron sulfide minerals in the barrel sheets (see Lithostratigraphy; see Core descriptions).
Similar to dissolved Fe and Mn, the sulfate concentrations show a wavy profile, supporting the notion of a nonsteady-state event. Sulfate is depleted below about 14 mbsf with a small recurring peak and complete depletion at about 18 mbsf, marking the SMT. The high C1/C2 values suggest that the hydrocarbon gases are mainly of biogenic origin (Claypool and Kvenvolden, 1983). The SMT is also clearly visible in the Ba profile, which shows the highest concentrations below the SMT and a decrease directly above it. The abundance of amorphous silica (biogenic opal in diatom frustules and sponge spicules; volcanic glass shards) in the smear slide descriptions (see Lithostratigraphy; see Core descriptions) supports the very high dissolved Si concentrations immediately below the sediment surface. Amorphous silica in the IW are some of the highest dissolved Si concentrations reported in marine sediments (e.g., Frings, 2017). In contrast, subdued changes in dissolved Ca suggest very limited dissolution of carbonate material in the sediment.
The high silica content in the solid phase, in tandem with low calcium and TIC contents, indicates that silicate minerals dominate the sediment composition, which is in good agreement with sedimentary observations (see Lithostratigraphy). Solid-phase Fe does not parallel the Al profile, indicating diagenetic dissolution-precipitation processes in the sediment column.
7. Physical properties
This section summarizes the preliminary physical properties results from cores collected at Site M0093 at water depths of ~7450 mbsl in Basin C/N1 in the boundary area between the central and northern Japan Trench study area. One trigger core (Hole M0093A) and a corresponding GPC core (Hole M0093B) were collected (see Operations). The physical properties data sets were acquired with the techniques and sampling rates defined in Physical properties in the Expedition 386 methods chapter (Strasser et al., 2023a). During the offshore phase, whole cores were scanned through the Multi-Sensor Core Logger (MSCL). During the onshore phase, cores were split, scanned through the Tri-Sensor Core Logger (TSCL), and sampled for moisture and density (MAD), undrained shear strength, and P-wave velocity. Overall, the physical properties data sets are high quality and correlate well with lithology and hydroacoustic data.
7.1. Bulk density
Bulk density data were obtained offshore using the gamma ray attenuation (GRA) technique on the MSCL. Bulk density does not increase significantly with depth (Figure F19), but instead fluctuates between 1.2 and 1.7 g/cm3. However, two short intervals are characterized by a downcore increase in density: from 1.3 to 1.6 g/cm3 from ~1.5 to ~5.5 mbsf and from 1.4 to 1.65 g/cm3 from ~8 to ~13.5 mbsf. At 16, 20, and 23.5 mbsf, three layers (1–1.5 m thick) are characterized by a sharp density increase at the bottom (up to 0.4 g/cm3) and a gradual upcore decreasing trend. Over these trends are several pronounced peaks in Hole M0093B.
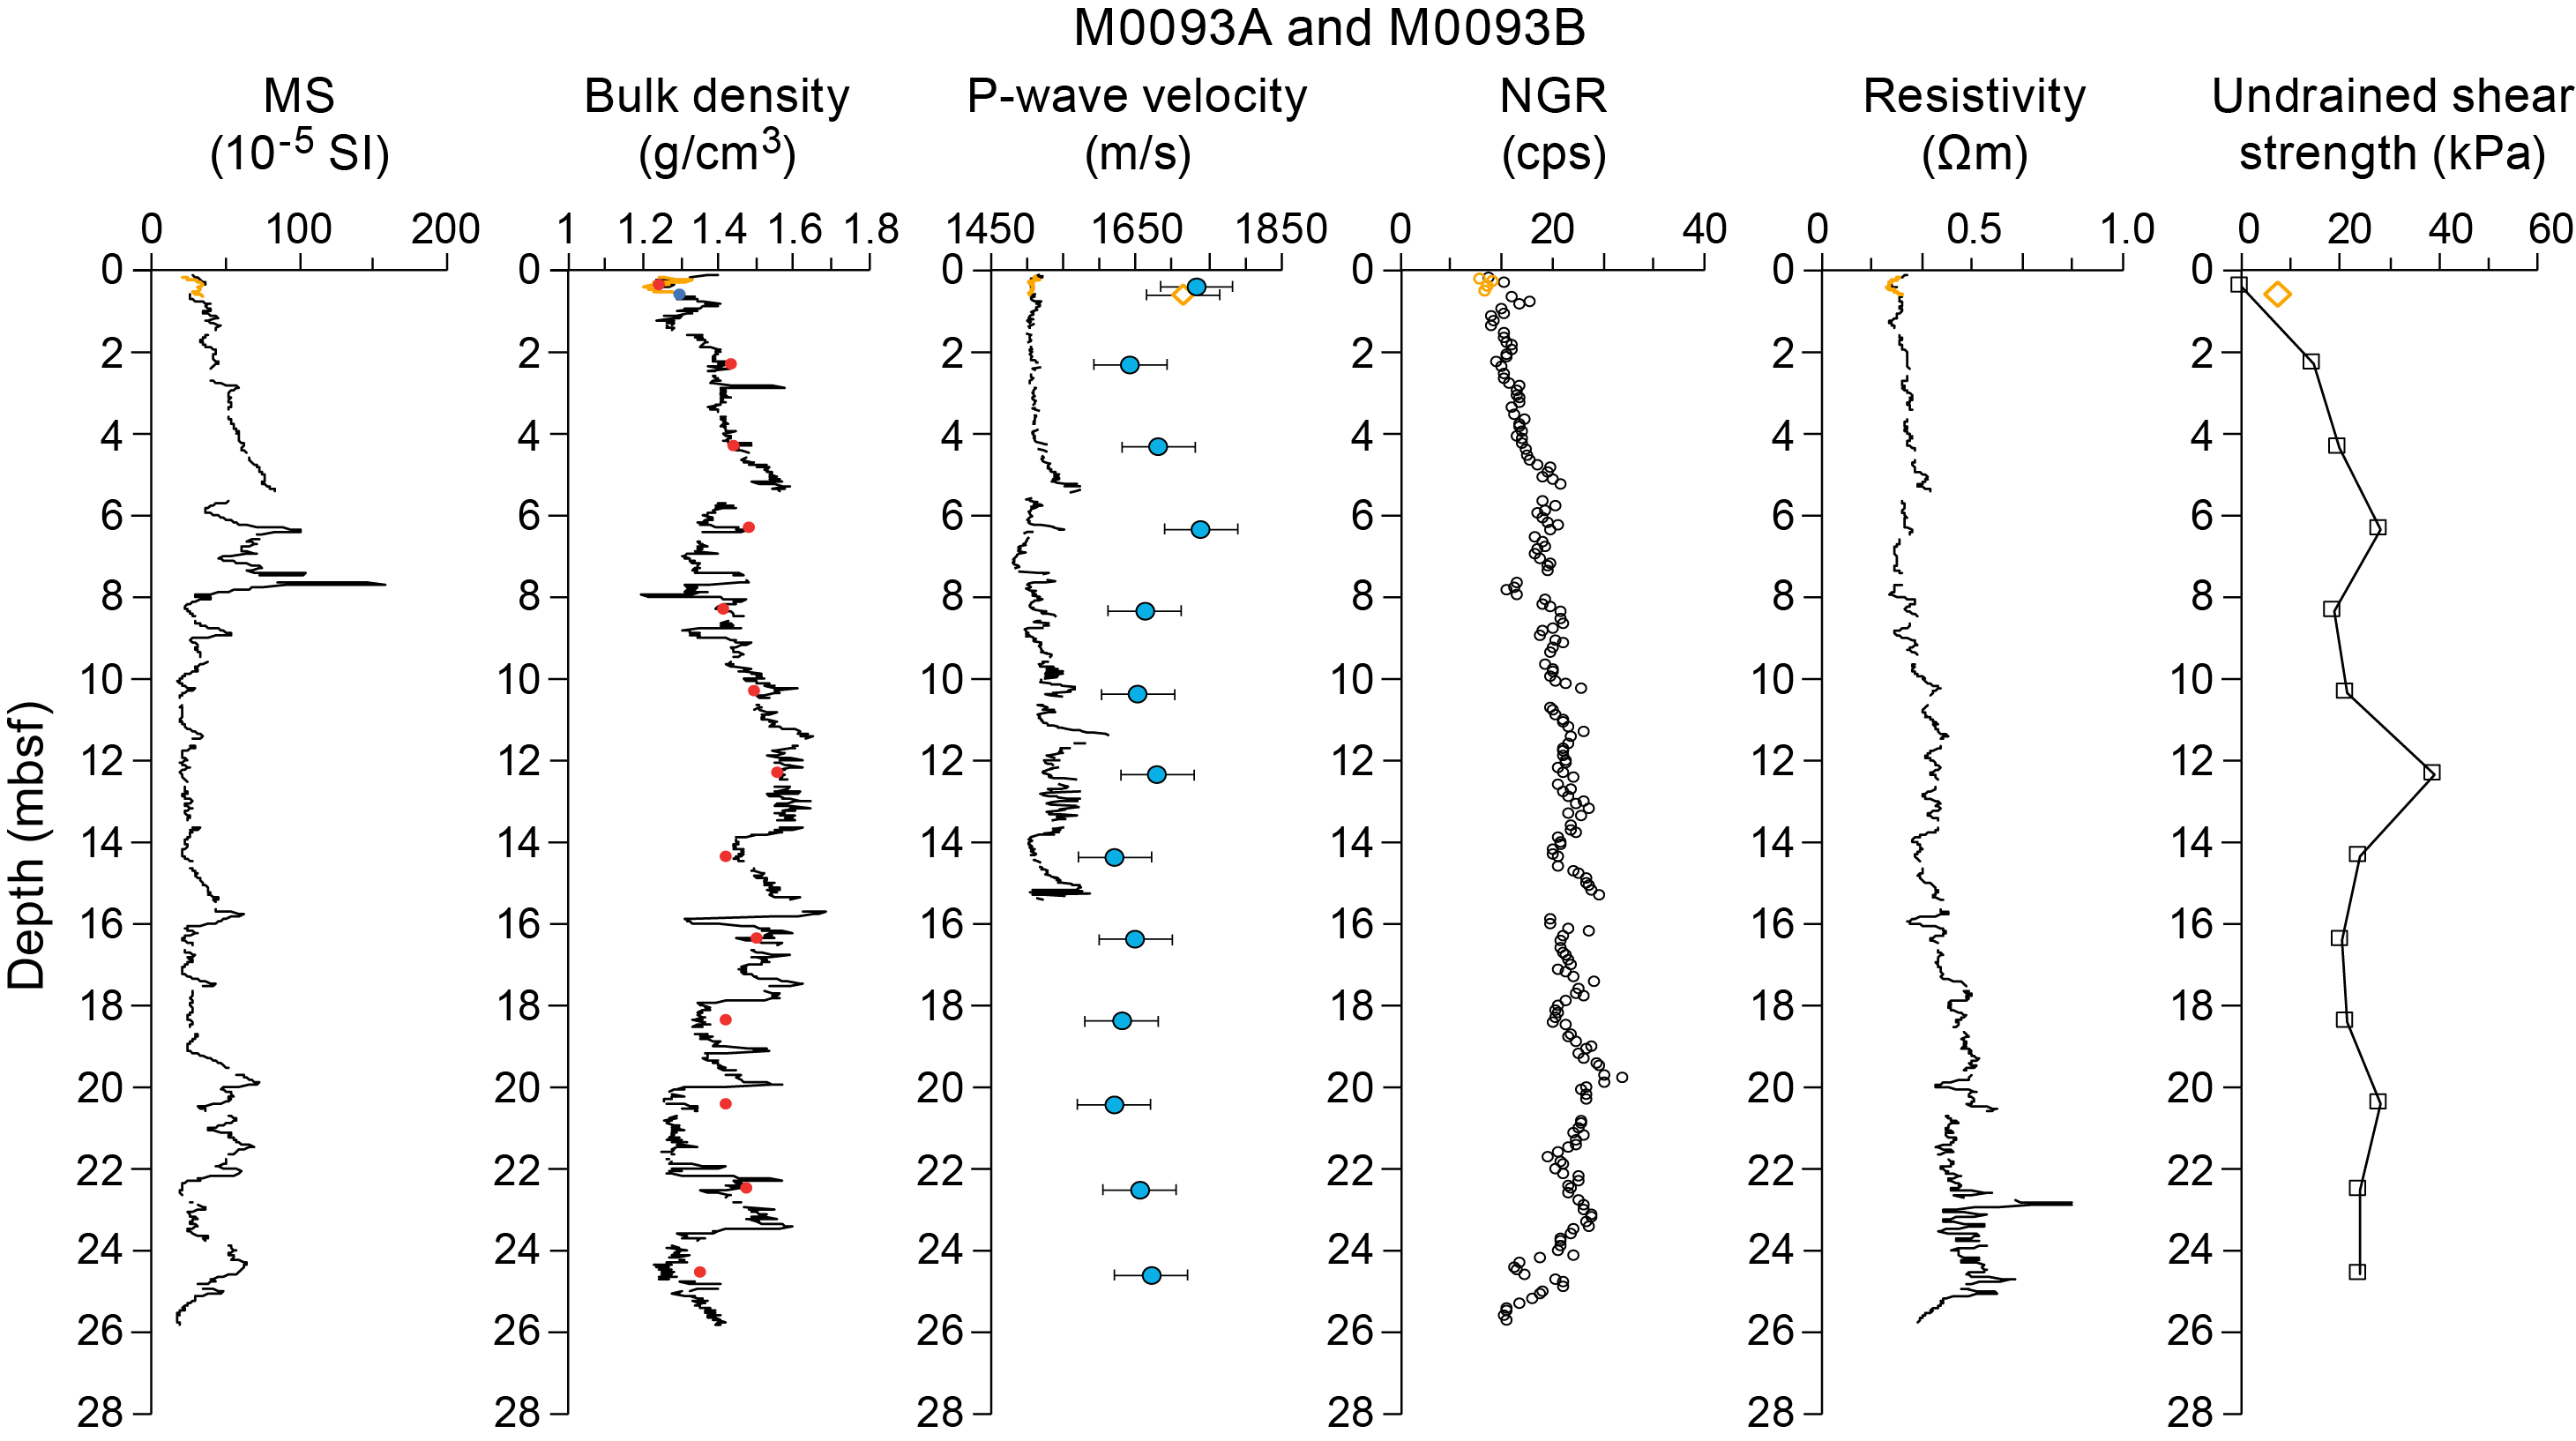
Figure F19. Physical properties summary.
Onshore, additional bulk density data were obtained using the MAD technique on discrete samples from trigger and piston cores (appended as blue and red dots, respectively, in Figure F19). Discrete sample values are consistent with MSCL measurements. At the base of Hole M0093B, the four deepest MAD samples (18.4, 20.5, 22.5, and 24.6 mbsf) show a small offset toward higher values (0.05–0.1 g/cm3) compared to the MSCL-derived data.
7.2. Magnetic susceptibility
Magnetic susceptibility data were obtained during the offshore phase using the MSCL. The uppermost 5 m of Hole M0093B are characterized by an increase from 25 to 80 × 10−5 SI (Figure F19). Below this depth, values fluctuate around a baseline value of approximately 25 × 10−5 SI throughout the cored depths. Two pronounced peaks at 6.4 and 7.7 mbsf exceed 100 × 10−5 SI.
7.3. P-wave velocity
P-wave velocity was measured using the MSCL on whole cores during the offshore phase. During the onshore phase, P-wave velocity was measured on discrete samples approximately every 2 m. Many of the MSCL velocity data were of insufficient quality below ~5 mbsf and have been omitted.
Offshore P-wave velocities recorded with the MSCL at Site M0093 generally trend around 1500 m/s (the velocity of water). Shore-based discrete measurements are noticeably higher (closer to an average of 1700 m/s). The difference in velocity exceeds the uncertainty associated with the discrete velocity measurements (±50 m/s). The difference between the two datasets may be attributed to continued compaction or degassing of the sediments between the offshore and onshore phases of the expedition. Postcruise research will be required to fully understand the discrepancy, and the data should thus be used with a degree of caution.
MSCL and laboratory-measured P-wave data are plotted in Figure F19. In the uppermost 4 m, the MSCL P-wave velocity is near constant at around 1510 m/s. Below this depth, values show higher variations with a maximum value of 1611 m/s at 11.4 mbsf. Overall, the trends in P-wave data from the MSCL generally correspond well with the trends in MSCL bulk density.
Onshore, P-wave measurements were performed on discrete samples, which have higher values than the MSCL curve (average = 1660 m/s) (Figure F19). Measurements for Hole M0093A resulted in a poor signal.
7.4. Noncontact electrical resistivity
Noncontact electrical resistivity measured with the MSCL gradually increases from 0.4 Ωm at the top of the hole to ~0.8 Ωm at ~20 mbsf (Figure F19). Below this depth, values gradually increase but have higher variability. A pronounced peak at ~23 mbsf reaches the maximum value for the hole (1.25 Ωm).
7.5. Natural gamma radiation
NGR gradually increases from 20 counts/s at the top of Hole M0093B to 34 counts/s at ~20 mbsf, followed by decreasing values to the bottom of the hole (Figure F19). Around 8 mbsf, values highlight a small interval with lower NGR than the overall trend.
7.6. Undrained shear strength
Undrained shear strength (Su), measured with a handheld penetrometer during the onshore phase, increases in the uppermost 6 m to 30 kPa (Figure F19). Below this, Su decreases to ~20 kPa for the rest of the cored interval, except for a peak value of ~40 kPa at 12 mbsf. Su was measured during the Personal Sampling Party using a fall cone penetrometer once in each section in all holes at Site M0093 (Figure F20). Su measured across all holes with the fall cone generally increases with depth, ranging 3.12–105.05 kPa and averaging 32.06 ± 23.26 kPa. Su measured during the PSP using an automated vane shear (AVS) device was recorded in alternating sections in Hole M0093B (Figure F20). AVS values were generally lower than those measured with the fall cone. AVS Su values generally increase with depth, ranging 5.88–18.37 kPa and averaging 12.17 ± 3.66 kPa.

Figure F20. Undrained shear strength.
It should be noted that Su values vary according to the device used to obtain them (Figures F19, F20). For example, fall cone strengths are higher than those obtained with the AVS and handheld penetrometer. The influence of the U-channel along the center of the core could result in lower strengths than those measured with the fall cone. The fall cone only impacts a small region of the core (~2–5 mm), whereas the AVS impacts a larger region of the core (~20–50 mm). Both measurements ideally should be obtained from the center of the core away from the core sidewall. However, samples could not be taken at the center because of the U-channel recovered during the Onshore Science Party (OSP) (see Operations). As a result, strength sampling points had to be placed halfway between the central U-channel and the sidewall of the core. During AVS measurements, the fractures that opened often propagated toward both the central U-channel and the sidewall, perhaps resulting in lower strength values. Fall cone measurements were not seen to be affected by the U-channel or the sidewall. Postcruise analysis will more closely examine the strength data to try to reconcile the differences.
7.7. Moisture and density
Several MAD properties were calculated from onshore measurement of the wet and dry masses of discrete samples and their volumes (Figure F21). In Hole M0093B, wet water content and dry water content, as well as porosity and void ratio, show similar trends. Between the two uppermost samples (0.4 and 2.3 mbsf), values decrease for all parameters except dry and bulk densities. Below this depth, values remain relatively constant to 22.5 mbsf. The baseline for wet and dry water contents is around 50% and 100%, respectively, around 72% for porosity, and 2.5 for the void ratio. Values increase between the two deeper samples (22.5 and 24.6 mbsf).
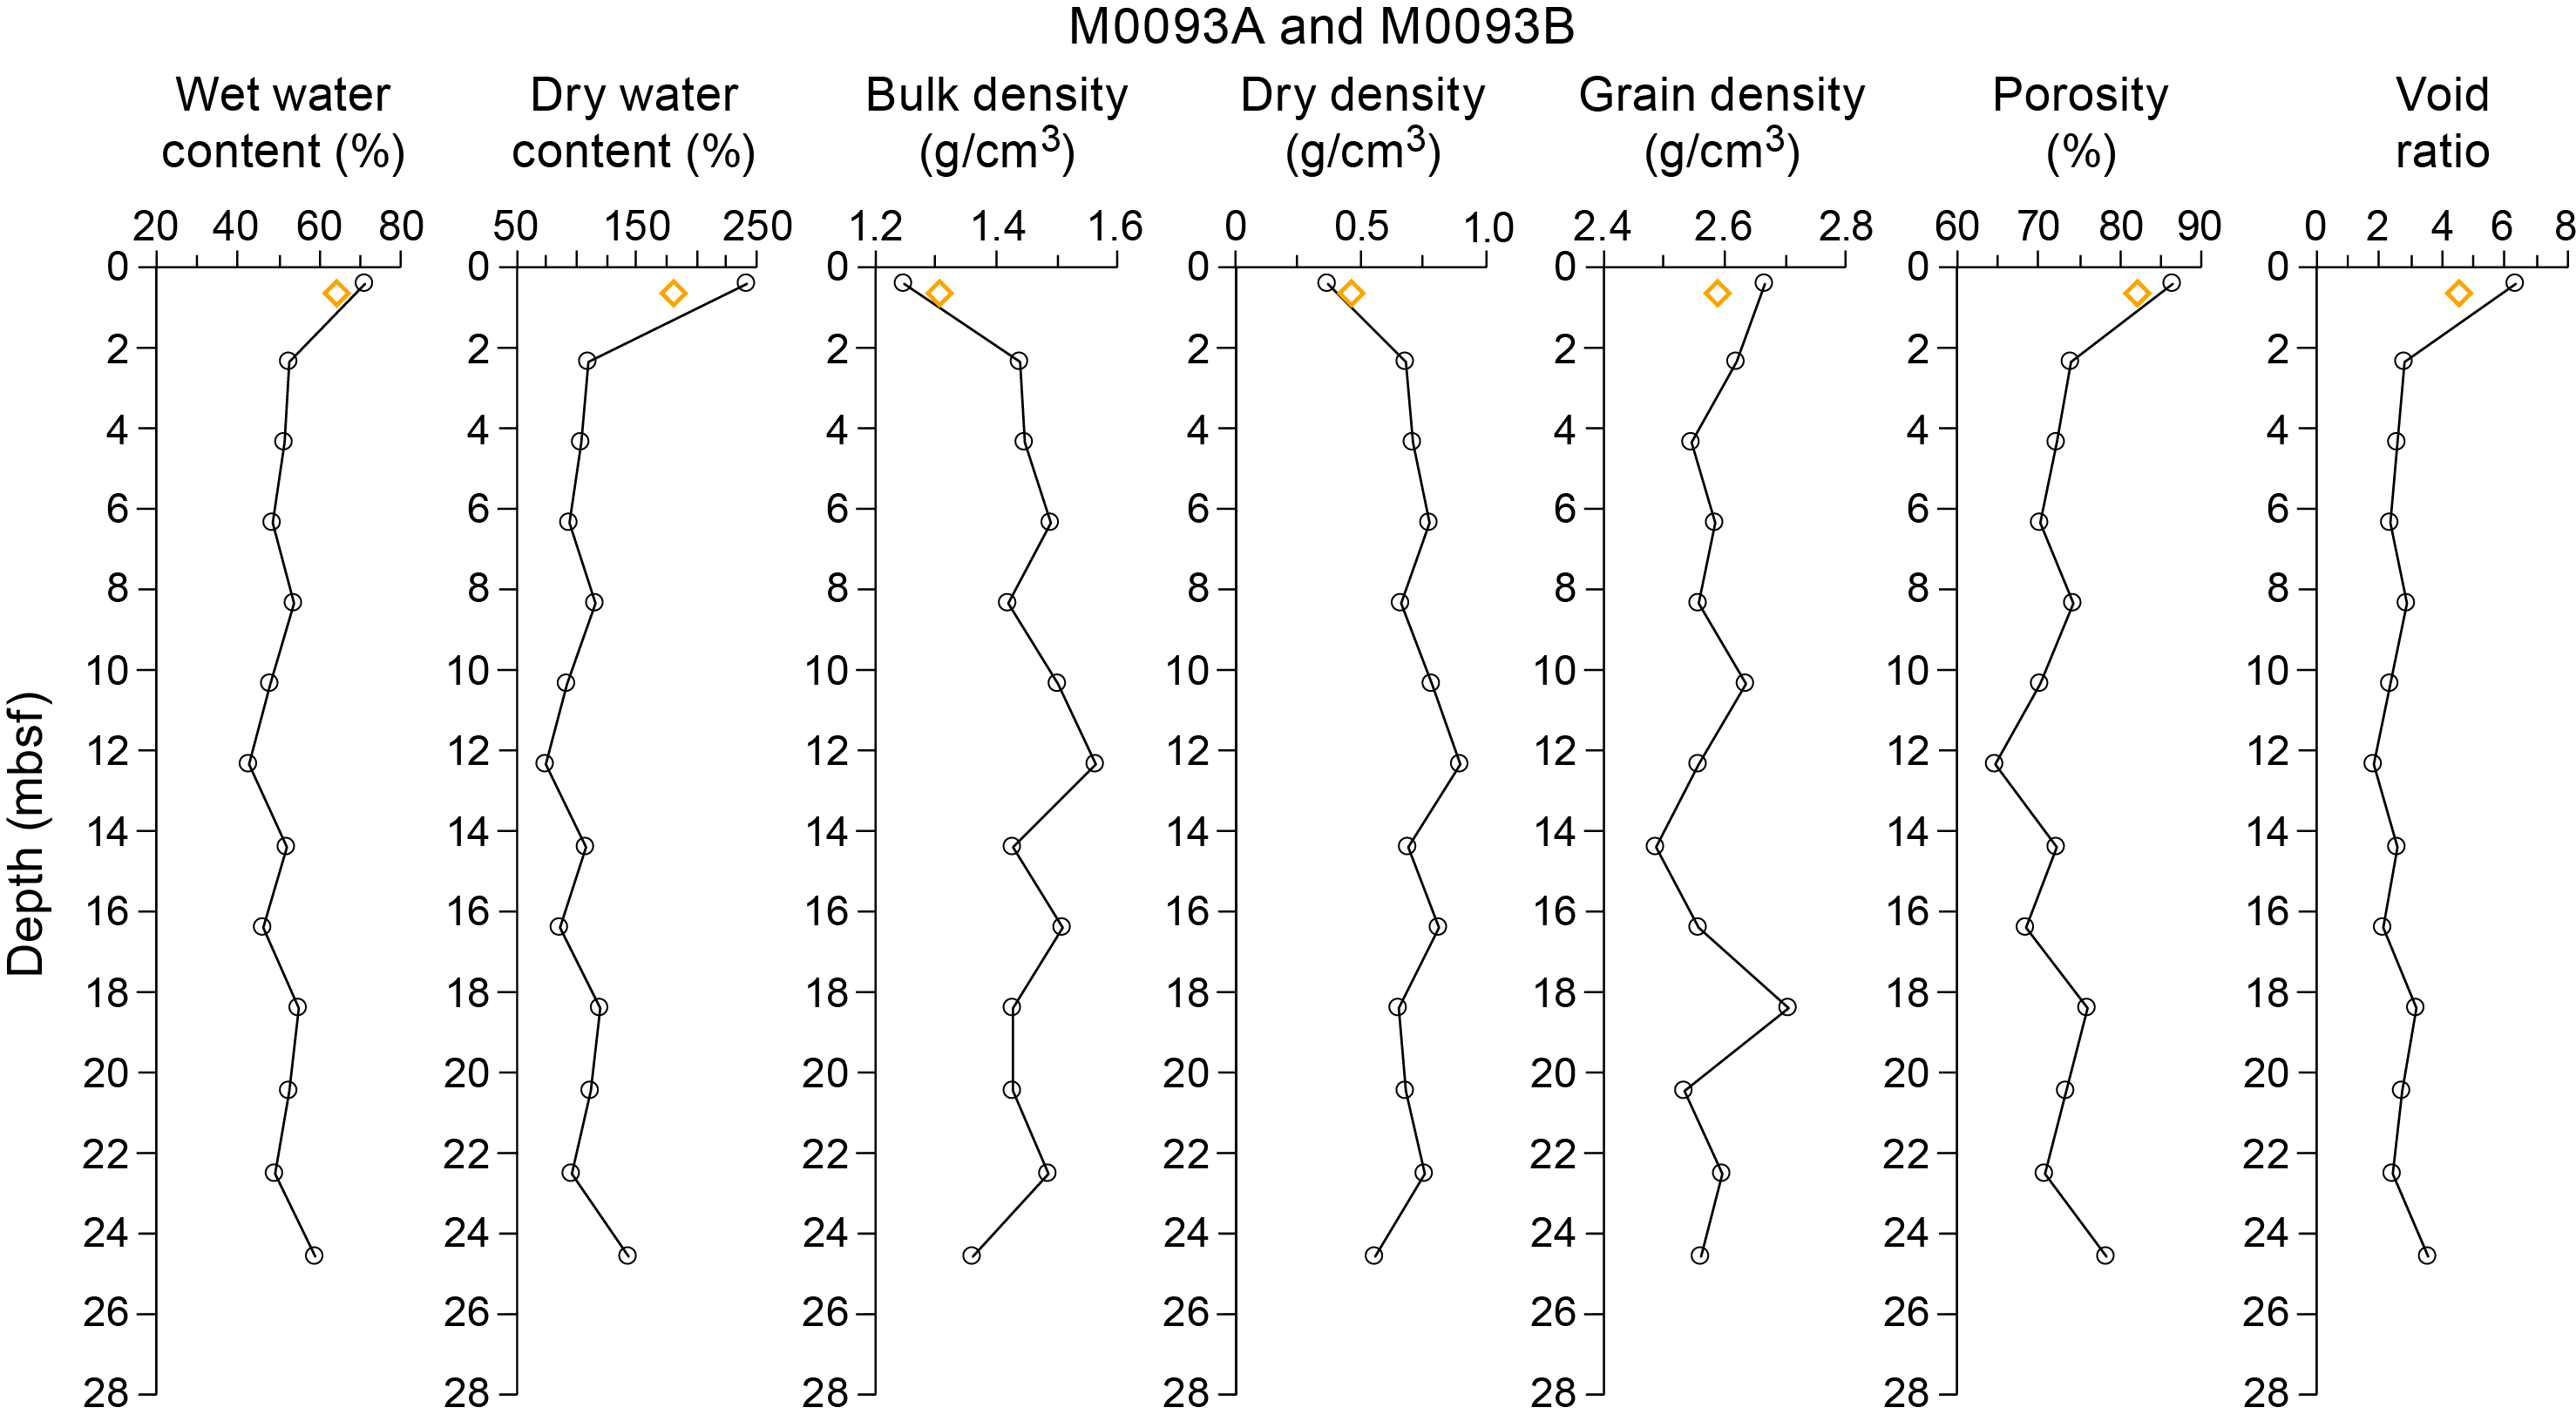
Figure F21. MAD data.
The bulk density and the dry density curves show opposite trends (Figure F21) to water content, porosity, and void ratio, with an increase at the top of the hole and a decrease at the bottom. In between, the bulk density curve averages around 1.45 g/cm3 with a slight increase at 12.3 mbsf, where dry density reaches 0.75 g/cm3.
The grain density curve does not show a particular trend (Figure F21). Values vary slightly between 2.48 g/cm3 at 14.4 mbsf and 2.7 g/cm3 at 18.4 mbsf.
7.8. Color reflectance and RGB values
In Hole M0093B, L* color spectrometry ranges approximately 20–40 (Figure F22). Values of a* range approximately −2–1. Values of b* range approximately 0–12.5. Between 1.5 and 6.5 mbsf, b* values decrease from 12.5 to 5, whereas L* and a* values are constant around 30 and −0.5, respectively. Below 18 mbsf, the variability of the three parameters increases. RGB values vary with depth comparable with the spectrometry parameters.

Figure F22. Color data.
8. Paleomagnetism
This section reports the measurement of remanent magnetization in Holes M0093A and M0093B, which were cored in Basin C/N1, in the boundary area between the central and northern Japan Trench. Remanent magnetization of U-channel samples was measured on sections of the working halves at 2 cm intervals. Natural remanent magnetization (NRM) measurements were only conducted at 0 and 5 mT peak fields due to the time constraints of the hybrid OSP.
Profiles of intensity, inclination, and declination after demagnetization at 5 mT are displayed in Figures F23 and F24. Intensity in Hole M0093A peaks at 0.2 mbsf. The variation of declination is constant around 270° with small cyclic fluctuations. Inclination shows a moderate rise between 0.2 and 0.5 mbsf in Hole M0093A.

Figure F23. Intensity, inclination, and declination.
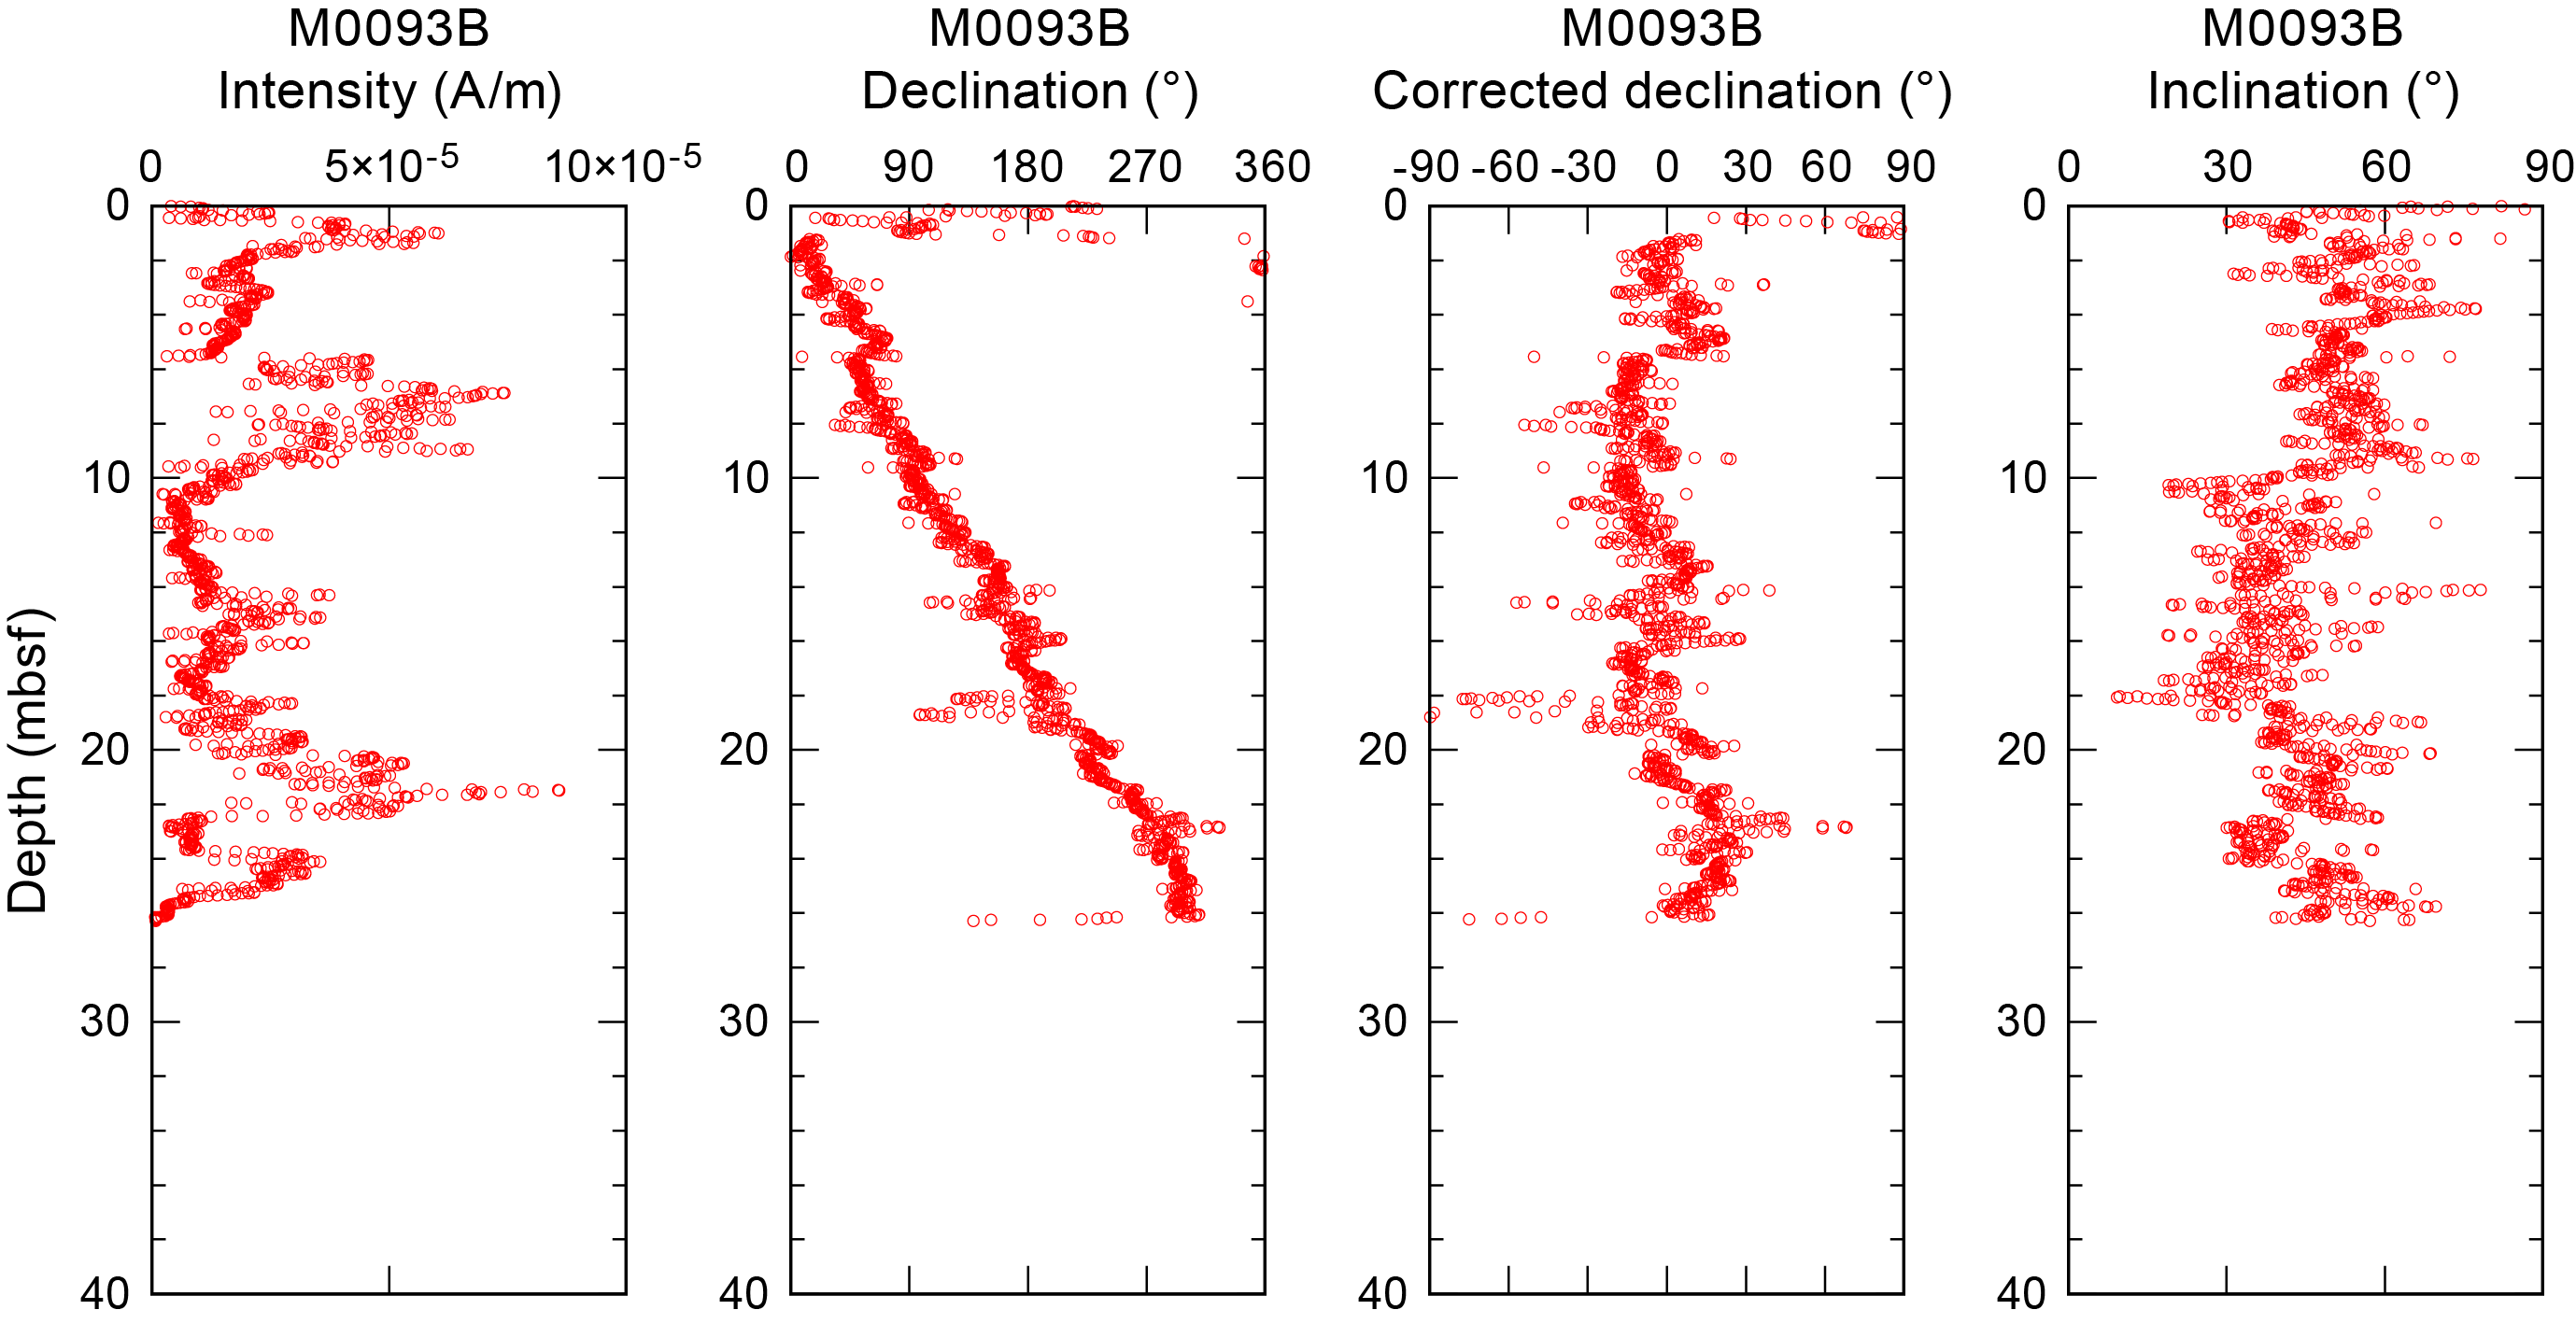
Figure F24. Intensity, declination, corrected declination, and inclination.
The variation of intensity in Hole M0093B is characterized by two modes. First, there are large fluctuations in intensity between around 1.0 × 10⁻⁵ and 8.5 × 10⁻⁵ A/m at 0–2, 5.6–9.5, 14.2–22.4, and 23.7–26.3 mbsf. The second mode comprises an area of less variability with lower values at 2–5.6, 9.5–14.2, and 22.4–23.7 mbsf.
Hole M0093B shows an obvious linear trend in declination. This clockwise trend downward is removed by a linear function of core depth. Declination stays relatively constant, accompanied by spiky fluctuations, although small sudden offsets are identified at 6 and 22 mbsf.
The inclination profile of Hole M0093B generally fluctuates between 30° and 60°. At 10 and 18 mbsf, large sudden shifts in inclination can be seen. Inclination between 10 and 18 mbsf has somewhat lower values, but it reverts to fluctuations in the 30°–60° range below 18 mbsf.
Preliminary paleomagnetic data for Hole M0093B reveal that the intensity profile is characterized by both low intensity intervals and intervals of high fluctuations. Declination is relatively constant. The interval of shallow inclination between 10 and 18 mbsf corresponds with the low intensity interval. This may suggest that this inclination low is not representative of geomagnetic secular variation.
9. Stratigraphic correlation
One GPC core and one trigger core were recovered from two holes (M0093A and M0093B) during a GPC deployment.
First-order correlation between the two holes at Site M0093 enabled construction of a continuous stratigraphic succession from the seafloor to the bottom of Hole M0093B (26.635 meters composite depth in splice [mcd-splice]), with the exception of one currently unresolved gap between the base of the trigger core (386-M0093A-1P) and the top of the GPC core (386-M0093B-1H). Therefore, the Site M0093 composite depth below seafloor scales (mcd and mcd-splice) for depths >0.61 mcd-splice are currently referred to as floating depths, assuming the coring gap to be zero (see Stratigraphic correlation in the Expedition 386 methods chapter [Strasser et al., 2023a]).
9.1. Construction of core composite depth scale
9.1.1. Definition of top
The presence of a thin (~0.5 cm) oxidized top in the trigger core at the top of Section 386-M0093A-1P-1 (see Lithostratigraphy) suggests that an undisturbed mudline was recovered in the hole. Thus, the vertical offset was determined as −0.065 m for Hole M0093A. Because only one trigger core was obtained at this site, Hole M0093A is selected as the anchor core, and Section 386-M0093A-1P-1, 6.5 cm, is defined as 0 mbsf (Tables T8, T9).
9.1.2. Compositing cores
Before compositing holes, artificial and/or natural voids at the ends of sections were measured and void lengths were subtracted from the curated section length to obtain the sediment length of each section. Corrected section lengths and section top and bottom depths of Site M0093 are listed in Table T8.
The core composite scale for Site M0093 is currently tentatively based on the visual correlation of marker horizons observed in X-ray CT images. VCDs and linescan images obtained during the OSP and spikes in magnetic susceptibility and GRA data from the MSCL, measured at 2 cm intervals (see Physical properties in the Expedition 386 methods chapter [Strasser et al., 2023a]), were used for interhole correlation. At this stage, thin but clear marker beds visible on X-ray CT images and verified during visual core description were tentatively used because large (coarse and thick) event beds may have eroded the underlying sediments.
Only one append point (AP1) was determined between the trigger core (Hole M0093A) and the GPC core (Hole M0093B) (Table T10). First-order correlation does not allow for correlation between the trigger core (386-M0093A-1P) and the upper part of the GPC core (386-M0093B-1H), and no correlation tie point could be identified to tie the GPC cores to the mudline-anchored trigger core. This suggests that the coring gap at the top of the GPC core is larger than the total length of the trigger core, and the composite depth scale of the GPC cores remains floating. Following the methodology in Stratigraphic correlation in the Expedition 386 methods chapter (Strasser et al., 2023a), the base of the trigger core (Section 386-M0093A-1P-1, 67.5 cm; mbsf in corrected core depth scale [Table T8]; 0.61 mcd-splice) and the top of the GPC core (386-M0093B-1H) are horizontally aligned, assuming the gap to be zero (AP1). With an artificial void (4.5 cm) at the top of Section 386-M0093B-1H-1, a vertical depth shift of 0.565 m was calculated for the top of Core 1H (Table T9).
9.1.3. Construction of splice
A combination of Holes M0093A and M0093B reveals the longest complete and least disturbed stratigraphic interval at Site M0093. As discussed above, direct correlation between the two holes is impossible. Thus, the bottom of Hole M0093A and the top of Hole M0093B were connected using AP1 at 0.61 mcd-splice. Below 0.61 mcd-splice, the splice is located in Hole M0093B, and it continues to the base of that hole (26.635 mcd-splice) to construct a first-order splice. The tentatively defined tie points and splice intervals and a calculated splice composite depth are given in Table T10.
References
Bruland, K.W., Middag, R., and Lohan, M.C., 2014. Controls of trace metals in seawater. In Holland, H.D., and Turekian, K.K. (Eds.), Treatise on Geochemistry (Second Edition). Oxford (Elsevier), 19–51. https://doi.org/
Claypool, G.E., and Kvenvolden, K.A., 1983. Methane and other hydrocarbon gases in marine sediment. Annual Review of Earth and Planetary Sciences, 11(1):299–327. https://doi.org/
Fontanier, C., Duros, P., Toyofuku, T., Oguri, K., Koho, K.A., Buscail, R., Grémare, A., Radakovitch, O., Deflandre, B., De Nooijer, L.J., Bichon, S., Goubet, S., Ivanovsky, A., Chabaud, G., Menniti, C., Reichart, G.-J., and Kitazato, H., 2014. Living (stained) deep-sea foraminifera off Hachinohe (NE Japan, Western Pacific): environmental interplay in oxygen-depleted ecosystems. Journal of Foraminiferal Research, 44(3):281–299. https://doi.org/
Frings, P., 2017. Revisiting the dissolution of biogenic Si in marine sediments: a key term in the ocean Si budget. Acta Geochimica, 36(3):429–432. https://doi.org/
Froelich, P.N., Klinkhammer, G.P., Bender, M.L., Luedtke, N.A., Heath, G.R., Cullen, D., Dauphin, P., Hammond, D., Hartman, B., and Maynard, V., 1979. Early oxidation of organic matter in pelagic sediments of the eastern equatorial Atlantic: suboxic diagenesis. Geochimica et Cosmochimica Acta, 43(7):1075–1090. https://doi.org/
Kioka, A., Schwestermann, T., Moernaut, J., Ikehara, K., Kanamatsu, T., Eglinton, T.I., and Strasser, M., 2019. Event stratigraphy in a hadal oceanic trench: the Japan Trench as sedimentary archive recording recurrent giant subduction zone earthquakes and their role in organic carbon export to the deep sea. Frontiers in Earth Science, 7:319. https://doi.org/10.3389/feart.2019.00319
Matoba, Y., 1976. Recent foraminiferal assemblages off Sendai, northeast Japan. Maritime Sediments, Spec. Pub. A:205–220. https://cir.nii.ac.jp/
Strasser, M., Ikehara, K., and Cotterill, C., 2019. Expedition 386 Scientific Prospectus: Japan Trench Paleoseismology. International Ocean Discovery Program. https://doi.org/
Strasser, M., Ikehara, K., Everest, J., Maeda, L., Hochmuth, K., Grant, H., Stewart, M., Okutsu, N., Sakurai, N., Yokoyama, T., Bao, R., Bellanova, P., Brunet, M., Cai, Z., Cattaneo, A., Hsiung, K.-H., Huang, J.-J., Ishizawa, T., Itaki, T., Jitsuno, K., Johnson, J.E., Kanamatsu, T., Keep, M., Kioka, A., Kölling, M., Luo, M., März, C., McHugh, C., Micallef, A., Nagahashi, Y., Pandey, D.K., Proust, J.-N., Rasbury, E.T., Riedinger, N., Satoguchi, Y., Sawyer, D.E., Seibert, C., Silver, M., Straub, S.M., Virtasalo, J., Wang, Y., Wu, T.-W., and Zellers, S.D., 2023a. Expedition 386 methods. In Strasser, M., Ikehara, K., Everest, J., and the Expedition 386 Scientists, Japan Trench Paleoseismology. Proceedings of the International Ocean Discovery Program, 386: College Station, TX (International Ocean Discovery Program). https://doi.org/
Strasser, M., Ikehara, K., Everest, J., Maeda, L., Hochmuth, K., Grant, H., Stewart, M., Okutsu, N., Sakurai, N., Yokoyama, T., Bao, R., Bellanova, P., Brunet, M., Cai, Z., Cattaneo, A., Hsiung, K.-H., Huang, J.-J., Ishizawa, T., Itaki, T., Jitsuno, K., Johnson, J.E., Kanamatsu, T., Keep, M., Kioka, A., Kölling, M., Luo, M., März, C., McHugh, C., Micallef, A., Nagahashi, Y., Pandey, D.K., Proust, J.-N., Rasbury, E.T., Riedinger, N., Satoguchi, Y., Sawyer, D.E., Seibert, C., Silver, M., Straub, S.M., Virtasalo, J., Wang, Y., Wu, T.-W., and Zellers, S.D., 2023b. Site M0088 (Basin N2). In Strasser, M., Ikehara, K., Everest, J., and the Expedition 386 Scientists, Japan Trench Paleoseismology. Proceedings of the International Ocean Discovery Program, 386: College Station, TX (International Ocean Discovery Program). https://doi.org/
Strasser, M., Ikehara, K., Everest, J., and the Expedition 386 Scientists, 2023c. Supplementary material, https://doi.org/10.14379/iodp.proc.386supp.2023. In Strasser, M., Ikehara, K., Everest, J., and the Expedition 386 Scientists, Japan Trench Paleoseismology. Proceedings of the International Ocean Discovery Program, 386: College Station, TX (International Ocean Discovery Program).
Usami, K., Ikehara, K., Jenkins, R.G., and Ashi, J., 2017. Benthic foraminiferal evidence of deep-sea sediment transport by the 2011 Tohoku-Oki earthquake and tsunami. Marine Geology, 384:214–224. https://doi.org/