Strasser, M., Ikehara, K., Everest, J., and the Expedition 386 Scientists
Proceedings of the International Ocean Discovery Program Volume 386
publications.iodp.org
https://doi.org/10.14379/iodp.proc.386.109.2023
Site M0094 (Basin C/N2)1
![]() M. Strasser,
M. Strasser,
![]() K. Ikehara,
K. Ikehara,
![]() J. Everest,
J. Everest,
![]() L. Maeda,
L. Maeda,
![]() K. Hochmuth,
K. Hochmuth,
![]() H. Grant,
H. Grant,
![]() M. Stewart,
M. Stewart,
![]() N. Okutsu,
N. Okutsu,
![]() N. Sakurai,
N. Sakurai,
![]() T. Yokoyama,
T. Yokoyama,
![]() R. Bao,
R. Bao,
![]() P. Bellanova,
P. Bellanova,
![]() M. Brunet,
M. Brunet,
![]() Z. Cai,
Z. Cai,
![]() A. Cattaneo,
A. Cattaneo,
![]() K.-H. Hsiung,
K.-H. Hsiung,
![]() J.-J. Huang,
J.-J. Huang,
![]() T. Ishizawa,
T. Ishizawa,
![]() T. Itaki,
T. Itaki,
![]() K. Jitsuno,
K. Jitsuno,
![]() J.E. Johnson,
J.E. Johnson,
![]() T. Kanamatsu,
T. Kanamatsu,
![]() M. Keep,
M. Keep,
![]() A. Kioka,
M. Kölling,
A. Kioka,
M. Kölling,
![]() M. Luo,
M. Luo,
![]() C. März,
C. März,
![]() C. McHugh,
C. McHugh,
![]() A. Micallef,
A. Micallef,
![]() Y. Nagahashi,
Y. Nagahashi,
![]() D.K. Pandey,
D.K. Pandey,
![]() J.-N. Proust,
J.-N. Proust,
![]() E.T. Rasbury,
E.T. Rasbury,
![]() N. Riedinger,
N. Riedinger,
![]() Y. Satoguchi,
Y. Satoguchi,
![]() D.E. Sawyer,
D.E. Sawyer,
![]() C. Seibert,
C. Seibert,
![]() M. Silver,
M. Silver,
![]() S.M. Straub,
S.M. Straub,
![]() J. Virtasolo,
J. Virtasolo,
![]() Y. Wang,
Y. Wang,
![]() T.-W. Wu, and
T.-W. Wu, and
![]() S.D. Zellers2
S.D. Zellers2
1 Strasser, M., Ikehara, K., Everest, J., Maeda, L., Hochmuth, K., Grant, H., Stewart, M., Okutsu, N., Sakurai, N., Yokoyama, T., Bao, R., Bellanova, P., Brunet, M., Cai, Z., Cattaneo, A., Hsiung, K.-H., Huang, J.-J., Ishizawa, T., Itaki, T., Jitsuno, K., Johnson, J.E., Kanamatsu, T., Keep, M., Kioka, A., Kölling, M., Luo, M., März, C., McHugh, C., Micallef, A., Nagahashi, Y., Pandey, D.K., Proust, J.-N., Rasbury, E.T., Riedinger, N., Satoguchi, Y., Sawyer, D.E., Seibert, C., Silver, M., Straub, S.M., Virtasalo, J., Wang, Y., Wu, T.-W., and Zellers, S.D., 2023. Site M0094 (Basin C/N2). In Strasser, M., Ikehara, K., Everest, J., and the Expedition 386 Scientists, Japan Trench Paleoseismology. Proceedings of the International Ocean Discovery Program, 386: College Station, TX (International Ocean Discovery Program). https://doi.org/10.14379/iodp.proc.386.109.2023
2 Expedition 386 Scientists’ affiliations.
1. Operations
During Expedition 386, one Giant Piston Corer (GPC) system deployment at the boundary area between the central and northern Japan Trench (Figure F1) resulted in the recovery of cores from two holes at Site M0094 (Figure F2). The water depth was 7469 meters below sea level (mbsl). A breakdown of operational time is reported weekly instead of daily (see OPS in Supplementary materials) due to decisions to move between sites based on weather and current conditions. Holes at Site M0094 were acquired during Week 7 of the offshore phase. In total, 19.065 m of cores (Table T1) and 5.8 km of hydroacoustic profiles (see Hydroacoustics) were recovered and acquired in this focus area. Further operations details, including winch log and inclinometer information, are found for all sites in Coring methodology in the Expedition 386 methods chapter (Strasser et al., 2023a) and associated files (see PALEOMAG and WINCHLOGS in Supplementary materials).

Figure F1. Site map.

Figure F2. Site M0094.
The main site-specific scientific objectives for Site M0094 were as follows:
- Recover a continuous Pleistocene to Holocene stratigraphic succession comprising event deposits from the trench basin south of the large >1 km high escarpment at 39.4°N.
- Recover and analyze the top of mass-transport deposits potentially linked to megalandslides.
- Analyze the stratigraphic pattern and event deposit characteristics and compare with integrated results from other nearby sites (M0093 [~15 km south] and M0087 [~30 km north]) to establish robust stratigraphic pattern recognition of proxy evidence for earthquakes.
- Generate results for comparison with those from all other Expedition 386 sites to explore spatiotemporal distribution of event deposits to eventually develop a long-term record for giant earthquakes.
1.1. Site M0094
The R/V Kaimei arrived at Site M0094 at 0100 h on 29 May 2021 and undertook multibeam echo sounder/subbottom profiler (MBES/SBP) surveying until 0145 h. Conditions were cloudy in the morning, with winds of ~12 m/s, wave heights of 2 m, and a ~2 kt current. GPC operations started in Holes M0094A and M0094B with a 30 m GPC barrel string at 0830 h. The GPC system was recovered on deck at 1430 h. The deck crew and GPC operation team withdrew the core from the GPC assembly and cut it into 5 m segments. The Science Party cut the core into 1 m sections from 1500 to 1600 h. The 30 m GPC assembly was prepared for the next run at 1815, and the ship set sail south.
1.1.1. Holes M0094A and M0094B
Holes M0094A and M0094B were cored on 29 May 2021. Preparations for running the 30 m GPC began at 0830 h, and the GPC was run into the water at 0920 h with an inclinometer and transponder attached to the winch cable 20 and 50 m above the GPC trigger arm. Winch speed was set at 1.1 m/s. At 1130 h, running the GPC down was paused at a cable length of 7550 m for stabilization and monitoring the GPC position and resumed after 3 min at a winch speed of 0.3 m/s. Spud-in commenced at 11:39:13 h and ended at 11:39:16 h at a cable length of 7722 m. Recovery commenced, and the cable tension rose to 989 kgf at 11:39:16 h before dropping to 747 kgf and then rising again to a maximum of 8438 kgf at 11:40:33 h. It dropped to 6781 kgf at 11:40:40 h, indicating the corer was clear of the seabed (see WINCHLOGS in Supplementary materials). Inclinometer data for Hole M0094B show the piston corer barrel was rotated clockwise by 126.7° at the estimated seabed, with an east–west dip of 0.84° and a north–south dip of 1.93° (see Figure F5 in the Expedition 386 methods chapter [Strasser et al., 2023a]). The GPC was run back to the surface at a winch speed of 1.1 m/s. The trigger corer and GPC were recovered on deck at 1340 and 1430 h, respectively. The trigger core and GPC core from Holes M0094A and M0094B have a total length of 0.805 m (2 sections) and 18.26 m (19 sections), respectively (Table T1).
2. Hydroacoustics
Site M0094 lies within Basin C/N2 in the boundary region between the northern and central Japan Trench (Figure F3). The acquired SBP line (Line 386_Underway_102) trends NNW–SSE, parallel to the strike of the basin, and is approximately 5800 m long. Site M0094 lies in the center of the basin approximately 400 m east of the line. The acquisition parameters for the subbottom profile in this basin are shown in Table T2. The area surveyed for bathymetry is approximately 138 km2. All depth and thickness estimates in this section are approximate and assume a seismic velocity of 1500 m/s.
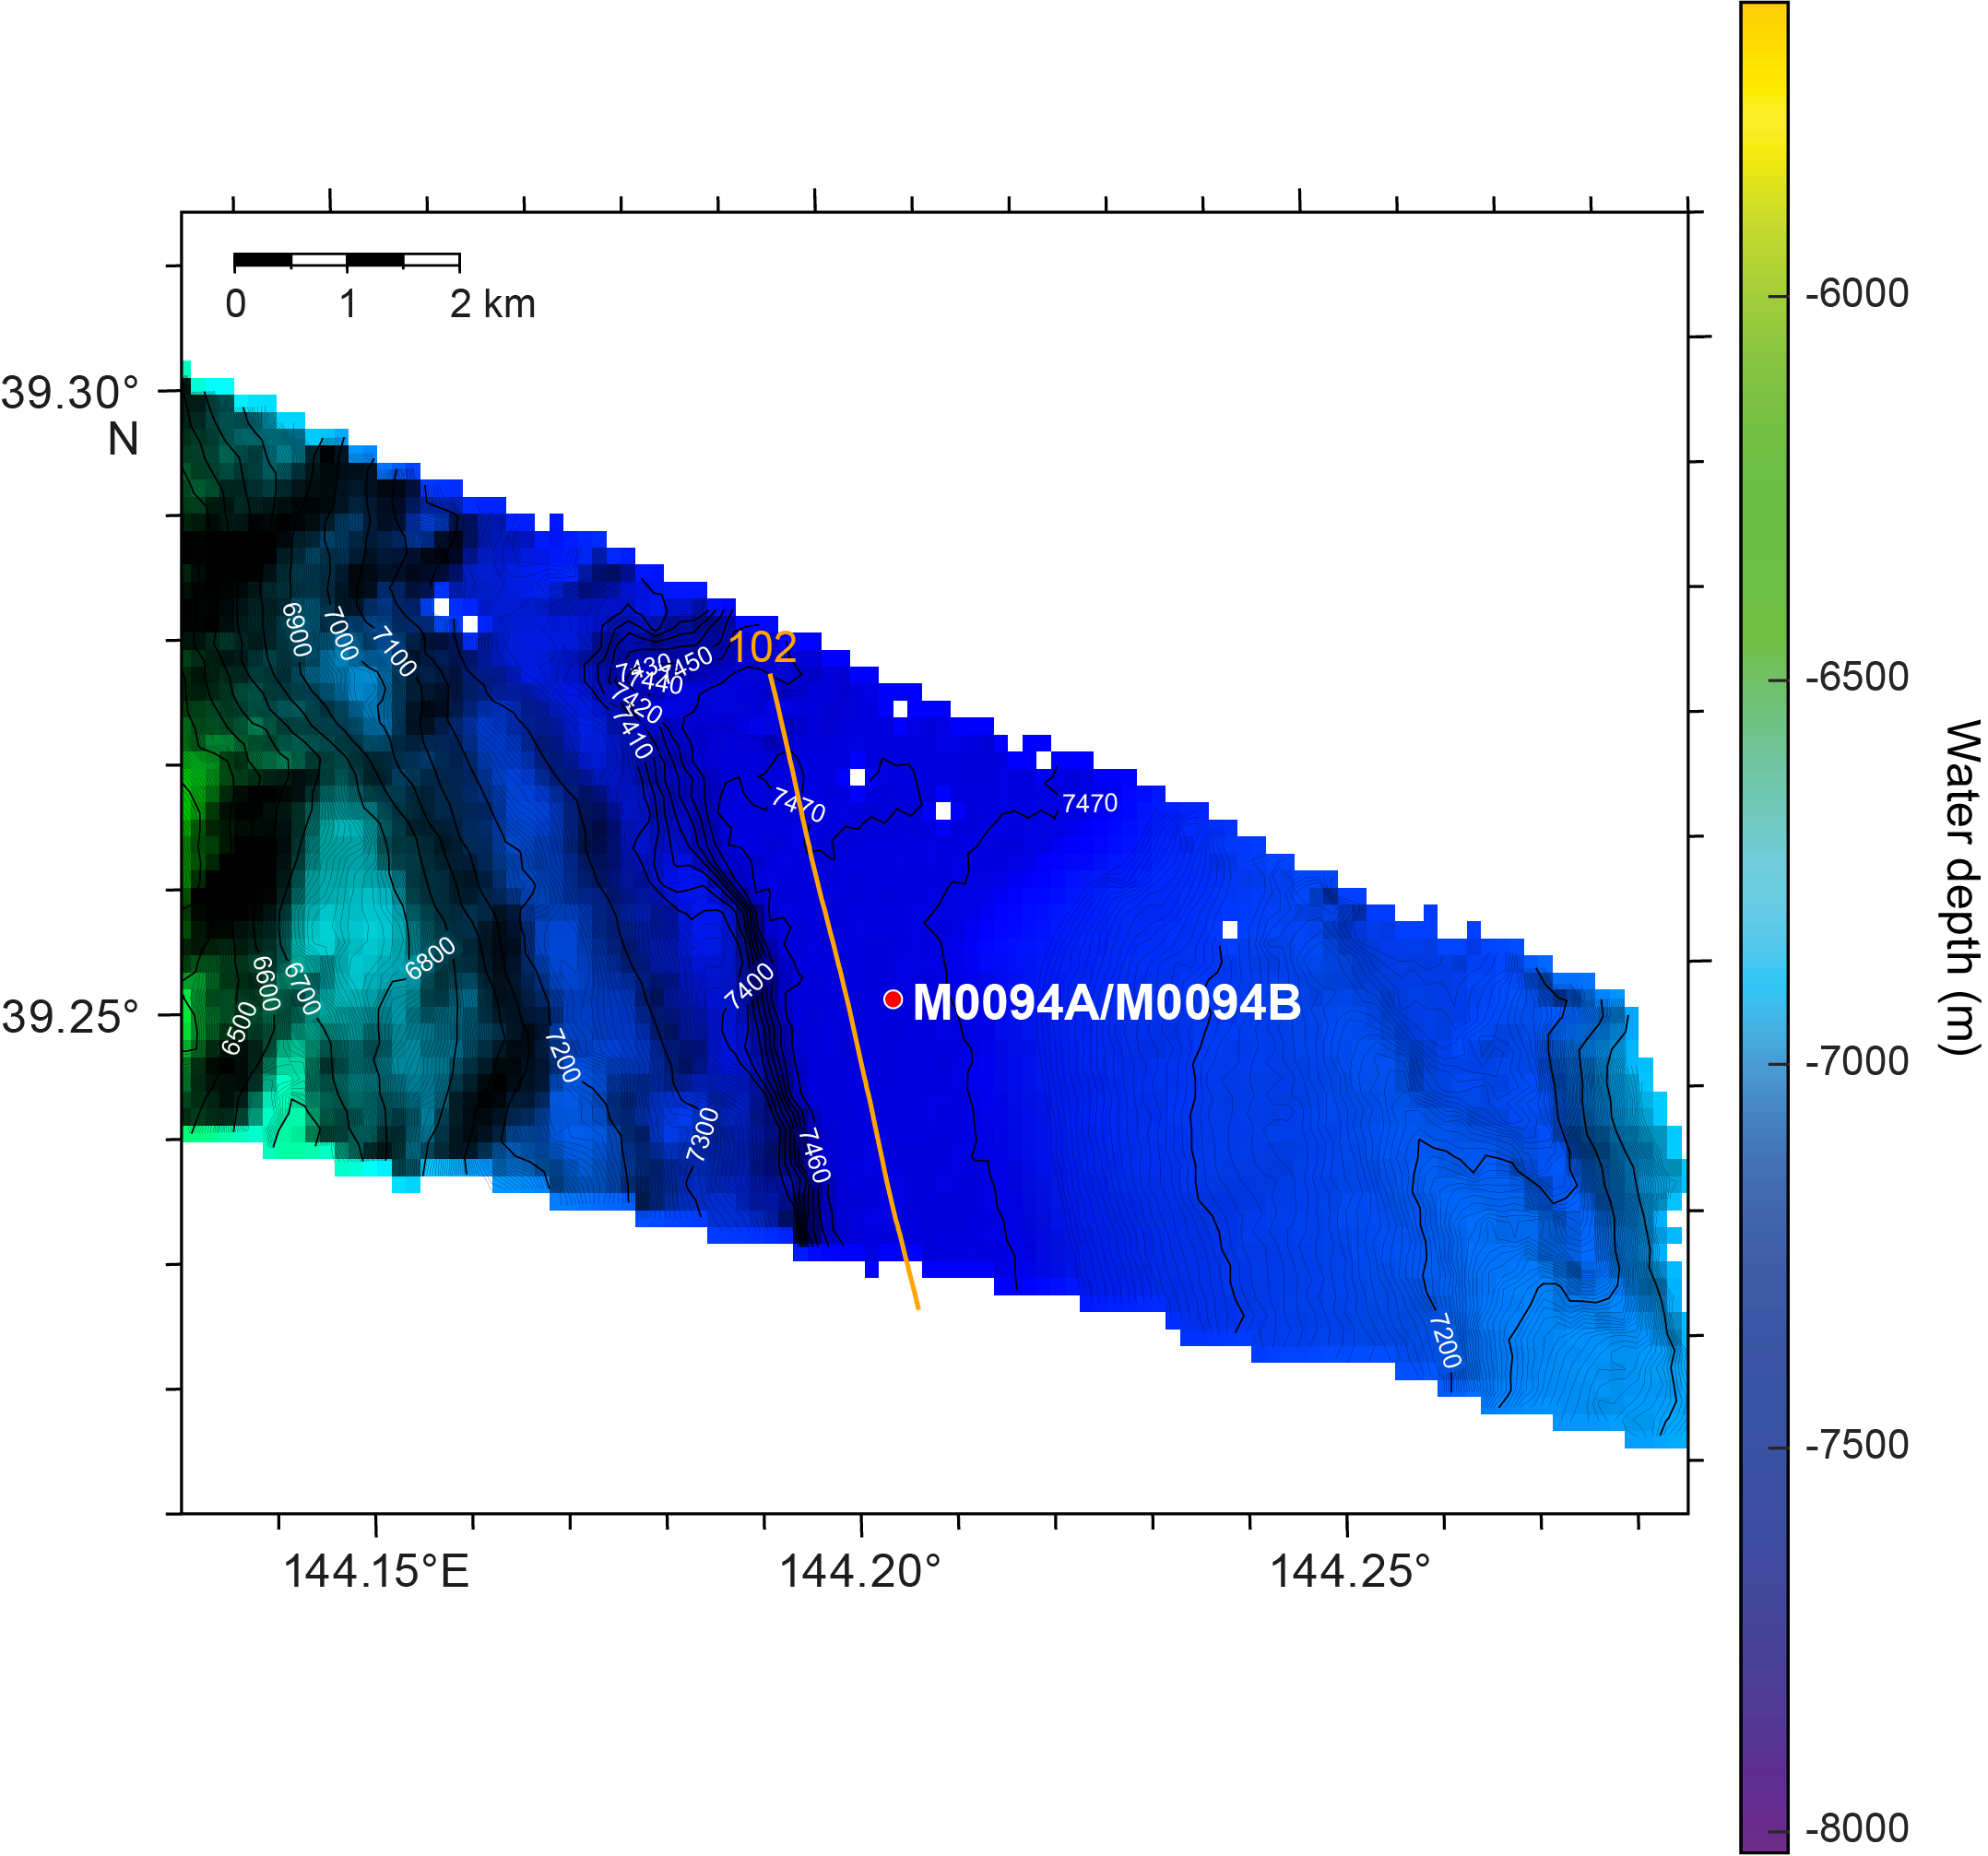
Figure F3. Subbottom profiler line.
2.1. Bathymetry
Holes M0094A and M0094B lie in the deepest part of the basin at 7469 m. The acquired bathymetry data do not capture the entire basin but are instead limited to the length of the subbottom profile. The western side of the basin is bound by a series of north-northwest-trending topographic terraces that cause topography to step up to the west, with a maximum slope gradient of 12%–15% at the steepest points. To the east, the topography has a lower slope gradient, rising gently at 6%–8%. Basin width, defined as the extent of the flat bottom basin between sharp topographic boundaries, is less than 1700 m for most of the basin, although it broadens toward the northern end of the profile line.
2.2. Basin characterization and Site M0094
Strike Line 386_Underway_102 extends north-northwest to south-southeast through the basin (Figure F4). The profile shows a well-stratified section comprising both acoustically transparent and acoustically laminated packages, which are mostly flat-lying. The northern end of the line displays some undulations in basal topography that disrupt the laminated sequence at Shotpoints 310 and 280. The bulk of the basin displays a coherent series of reflector packages. At the seafloor, a high-amplitude reflector forms the top boundary of a series of approximately 7–8 m of alternating interlayers of high and low amplitude. The interlayered package overlies a distinct acoustically transparent layer (~4–6 m thick) that appears to thin to the north as it nears the basal uplifts (e.g., around Shotpoints 280–300). Beneath the transparent layer lies another package of high-amplitude reflections that extend to the base of the basinal sequence (around 9.84 s two-way traveltime [TWT] at Site M0094). The flat-lying reflections at ~9.860 s TWT between Shotpoints 110 and 150 may indicate deeper layers of basin fill.

Figure F4. Line 386_Underway_102.
3. Lithostratigraphy
Site M0094 was cored in the southernmost region of the northern Japan Trench in Basin C/N2. One GPC deployment recovered one trigger core (Hole M0094A) and one GPC core (Hole M0094B). They were cored in the basin floor where the greatest sediment recovery was anticipated based on the subbottom profile analysis.
This section reports the lithology described in the visual core descriptions (VCDs) (see Lithostratigraphy in the Expedition 386 methods chapter [Strasser et al., 2023a]). The 20 m lithostratigraphic summary displays X-ray computed tomography (CT) and linescan images of the core sections, the sedimentary texture and structure, bioturbation, accessories, and some physical properties of the sediment (density, magnetic susceptibility, and natural gamma radiation [NGR]) (Figure F5). Smear slide descriptions are semiquantitative and include grain size (sand, silt, and clay; 100%), and the mineral, biogenic, and volcanic components are also described as percentages of 100% of the total slide (Table T3). Smear slides were observed every 2 m, and the results are illustrated by color bars representing the lithogenic, biogenic, and volcanic components on the smear slide summary (Figure F6; see smear slide photos in SMEARSLD in Supplementary materials). X-ray CT images documenting details of sedimentary structures, core close-up photos, and X-ray diffraction (XRD) tables presenting bulk mineralogy linescan images can be found in XRAYCT, CORECLOSEUP, and XRD in Supplementary materials. Linescan composite plots, smear slide data tables, and 3 m barrel sheets can be found in Core descriptions.
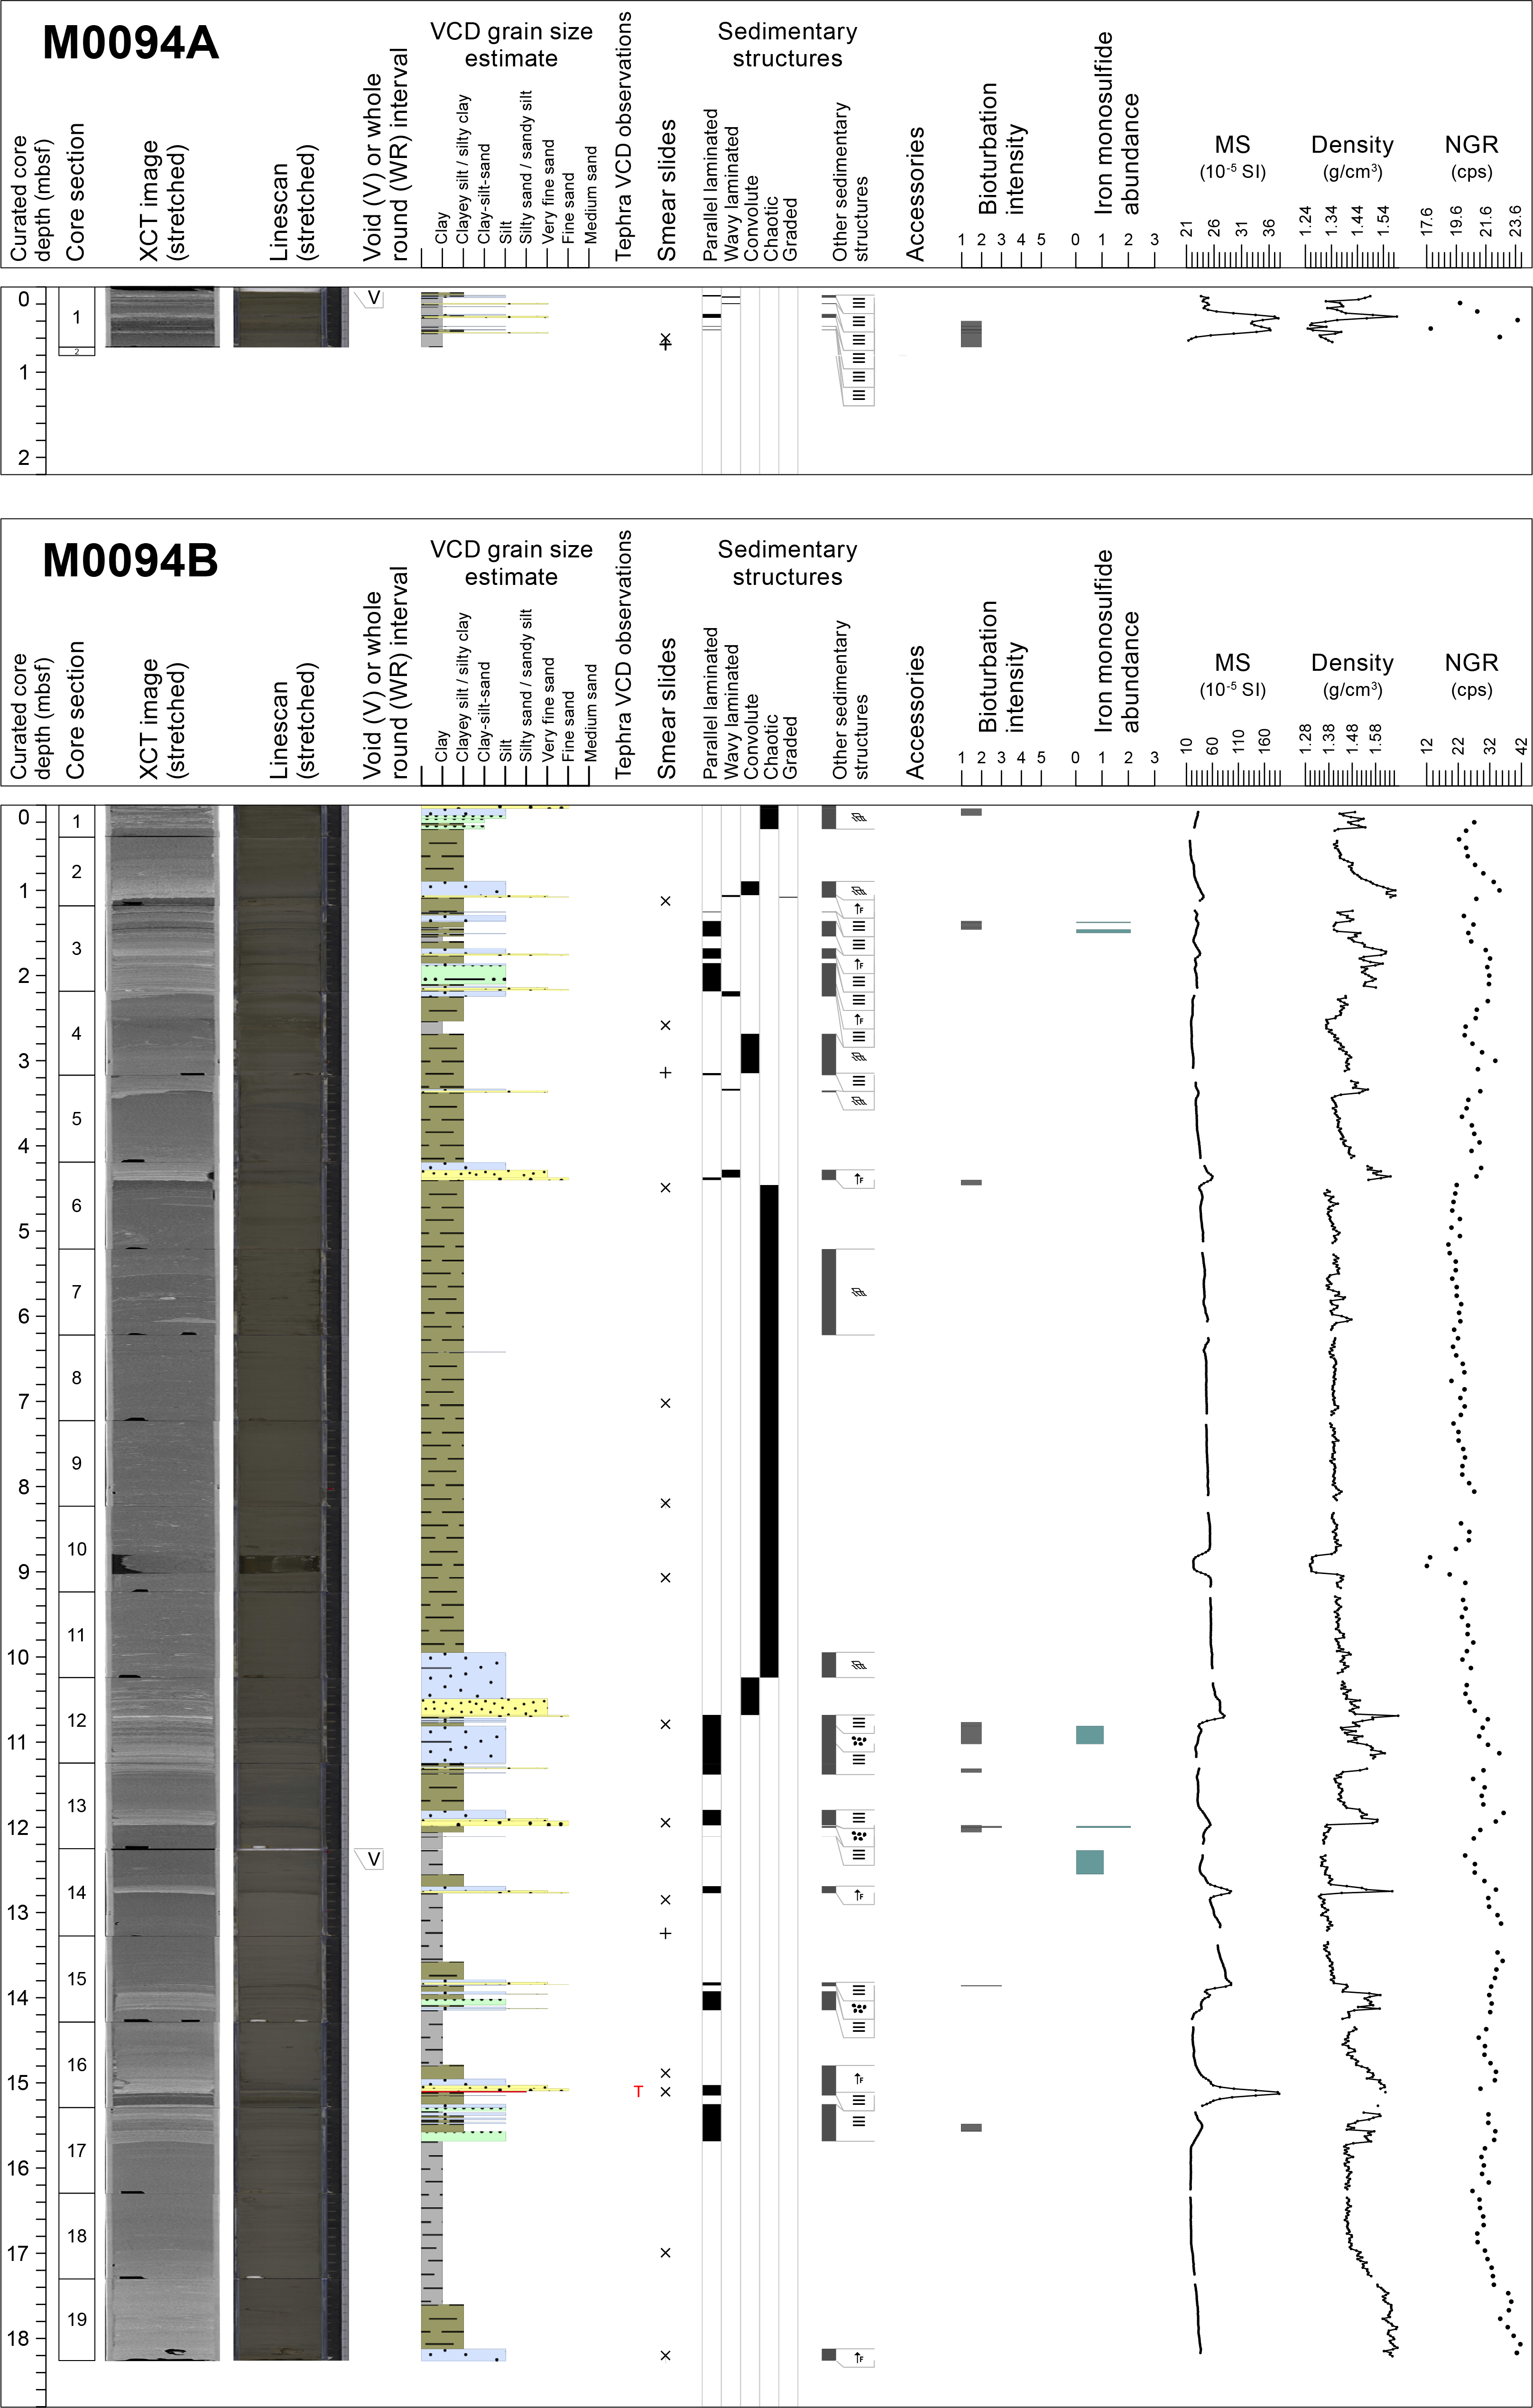
Figure F5. Lithostratigraphic summaries.
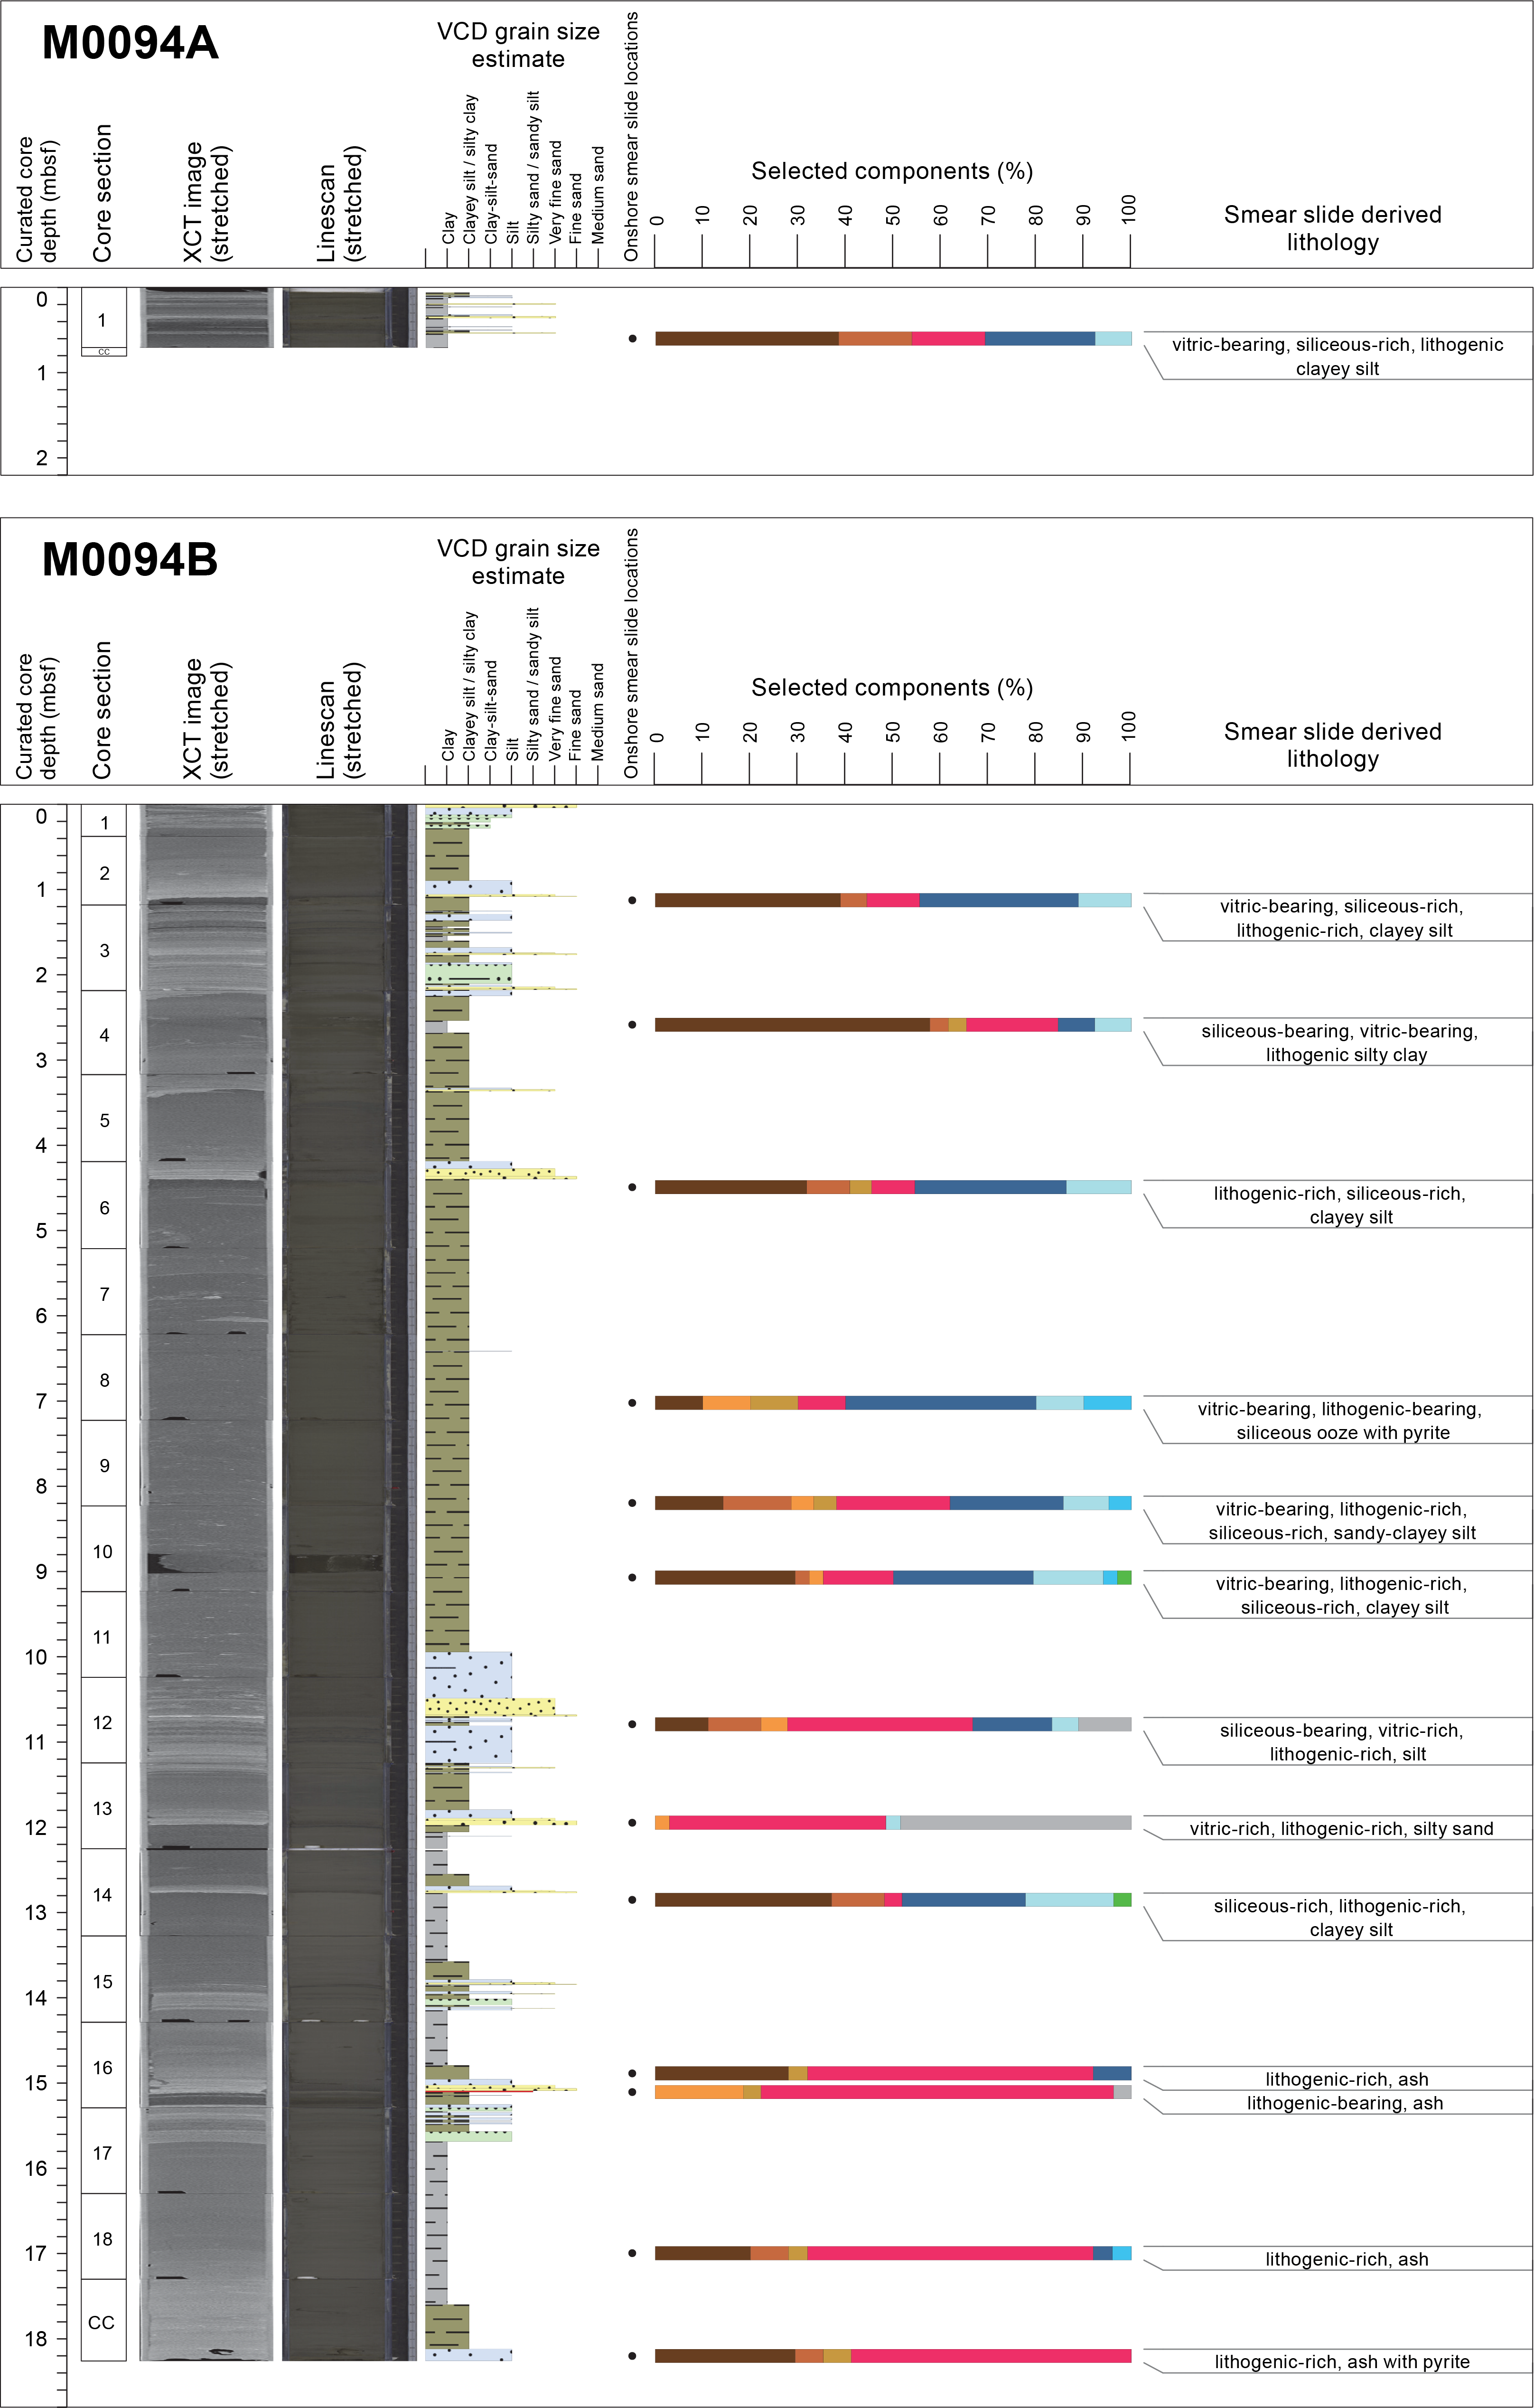
Figure F6. Smear slide summaries.
The lithostratigraphic summary of the GPC core from Hole M0094B indicates the following intervals in a downcore direction (Figure F5): (1) a ~4.5 m thick-bedded interval composed of millimeter- to centimeter-scale deposits grading from basal fine sand beds to very fine sand and silty beds interspersed into silty clay/clayey silt; (2) a 5.9 m thick-bedded, highly deformed fining-upward sedimentary succession grading from very fine sand to silt and structureless clayey silt/silty clay; (3) a ~5.2 m thick-bedded interval composed of millimeter- to centimeter-scale silt to fine sand deposits scattered in clayey sediment; and (4) a ~2.6 m thick, fining-upward sedimentary succession that comprises a basal silt bed grading upward into a silty clay/clayey silt overlain by a 1.9 m thick clay bed. Smear slide analyses show that the textures at Site M0094 are dominated by clayey silts (Table T3; Figure F7; see smear slide photos in SMEARSLD in Supplementary materials). The sediment composition is mostly lithogenic (2%–65%) with scattered biogenic components (maximum = 60%). Calcareous nannofossils and radiolaria are observed in two samples (>2%–3%; Samples 386-M0094B-1H-14, 60 cm, and 1H-10, 84 cm). The abundance of volcanic material varies from 3.7% to 74%. Sample 1H-16, 82 cm, is a tephra also observed during visual core description (Figure F6; see Tephra).

Figure F7. Ternary diagrams of major components and grain size.
3.1. Hole M0094A
Hole M0094A recovered 70 cm of silt and clay with parallel silt and very fine sand laminae (Figure F5). Slight bioturbation traces are observed from Section 1P-1, 40 cm, to the base of the core. Magnetic susceptibility, bulk density, and NGR exhibit a large peak value at ~0.5 meters below seafloor (mbsf), concordant with silty laminae. Bulk density also slightly increases toward the bottom of the hole (see Physical properties).
One smear slide was collected in Hole M0094A (Table T3; Figures F6, F7, F8). The lithology is vitric-bearing siliceous-rich lithogenic clayey silt. Silt and clay are the dominant textures (61.5% and 38.5%, respectively), with mineral components of quartz (15.4%) and vitric material (15.4%). Diatoms (23.1%) and sponge spicules (7.7%) dominate the biogenic fraction.
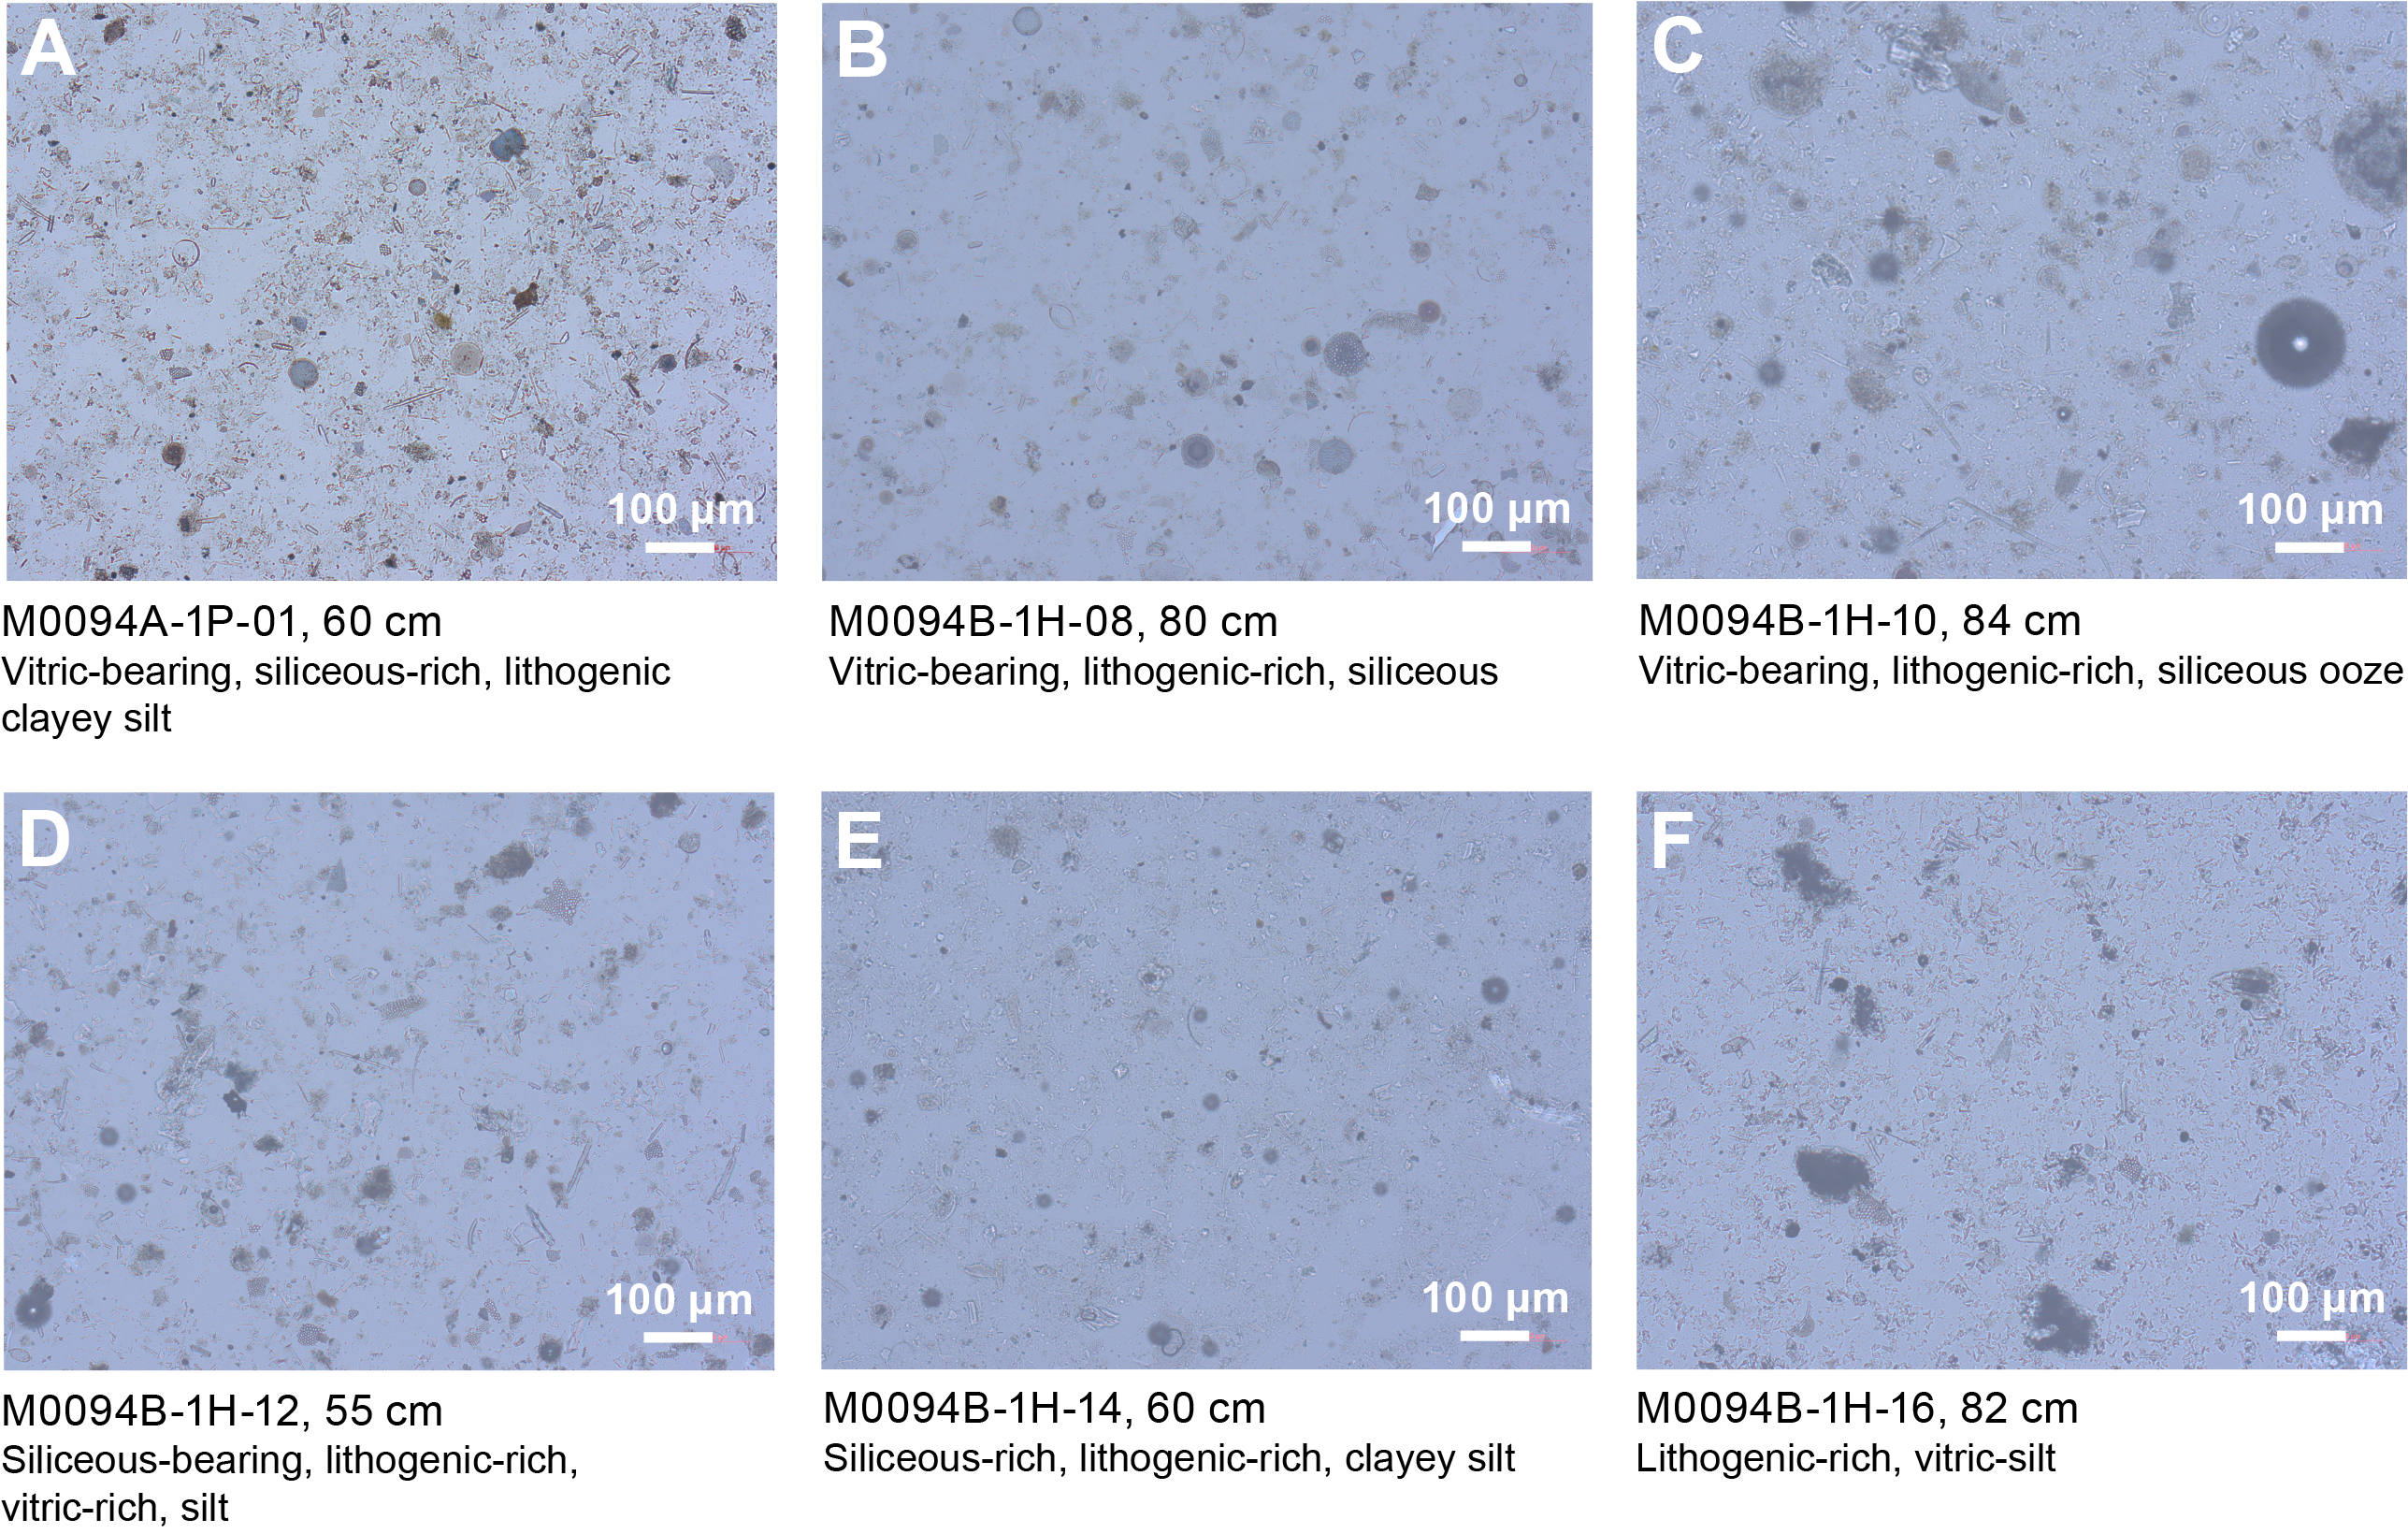
Figure F8. Lithologic and biogenic components.
3.2. Hole M0094B
The lithology for the 18.2 m deep Hole M0094B (Figure F5) comprises four main intervals with sharp and erosional contacts.
Interval 1 (0 to ~4.5 mbsf; Sections 386-M0094B-1H-1, 0 cm, to 1H-6, 22 cm) is a ~4.5 m thick-bedded interval composed of several millimeter- to centimeter-scale deposits grading from basal fine sand beds to very fine sand and silty beds interspersed into silty clay/clayey silt. The basal contact is erosional, sharp, and appears deformed on the X-ray CT images (Figure F9A). Soft-sediment deformation structures such as convolutes (Figure F9B), folds, and load casts are locally identified in centimeter-scale clay, silt, or sand layers (e.g., Sections 1H-2, 52 cm, to 1H-2, 68 cm, and 1H-4, 50 cm, to 1H-4, 90 cm), as well as color banding features (interval 1H-3, 17–40 cm; Figure F10A). Imbricated and deformed silt clasts occur in Sections 1H-1, 0 cm, to 1H-1, 28 cm (Figure F9C). Fining-upward, planar laminations are commonly observed. Two occurrences of bioturbation are identified in silt and silty clay deposits (intervals 1H-1, 4–12 cm, and 1H-3, 17–40 cm). The iron monosulfide abundance ranges from slight to moderate, in accordance with bioturbation trace observations (Figure F5).
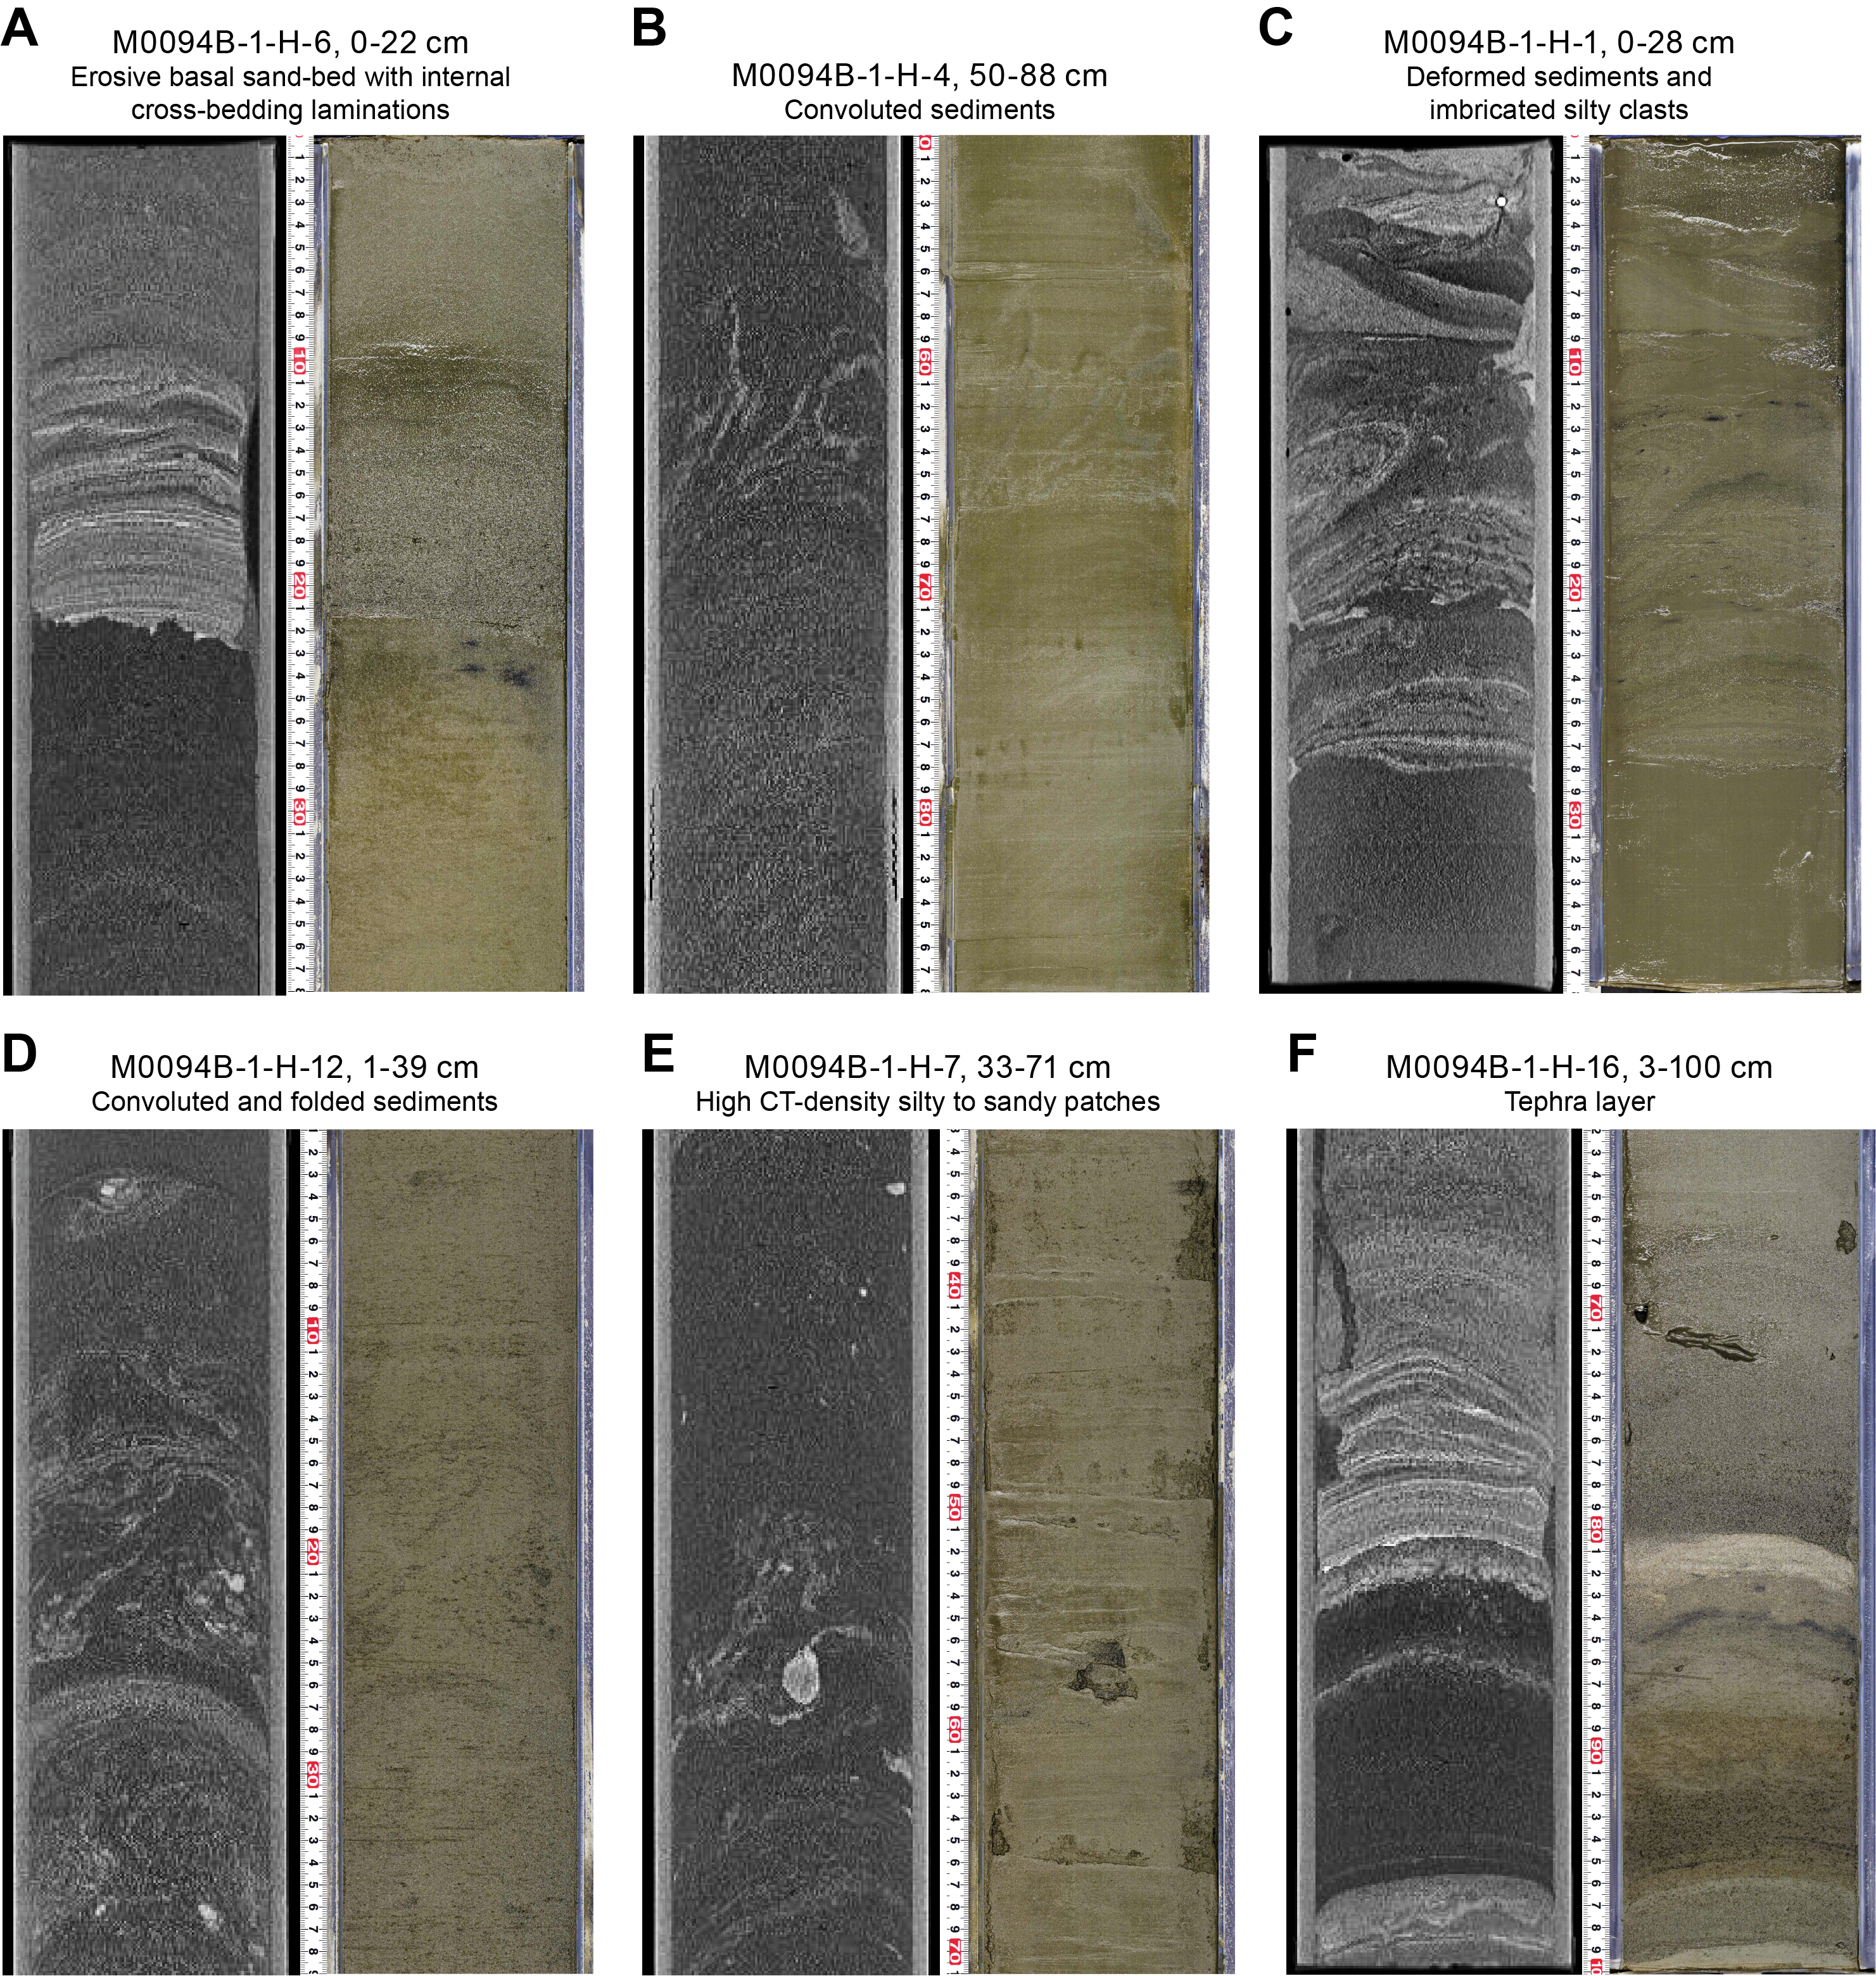
Figure F9. X-ray CT images and linescans.
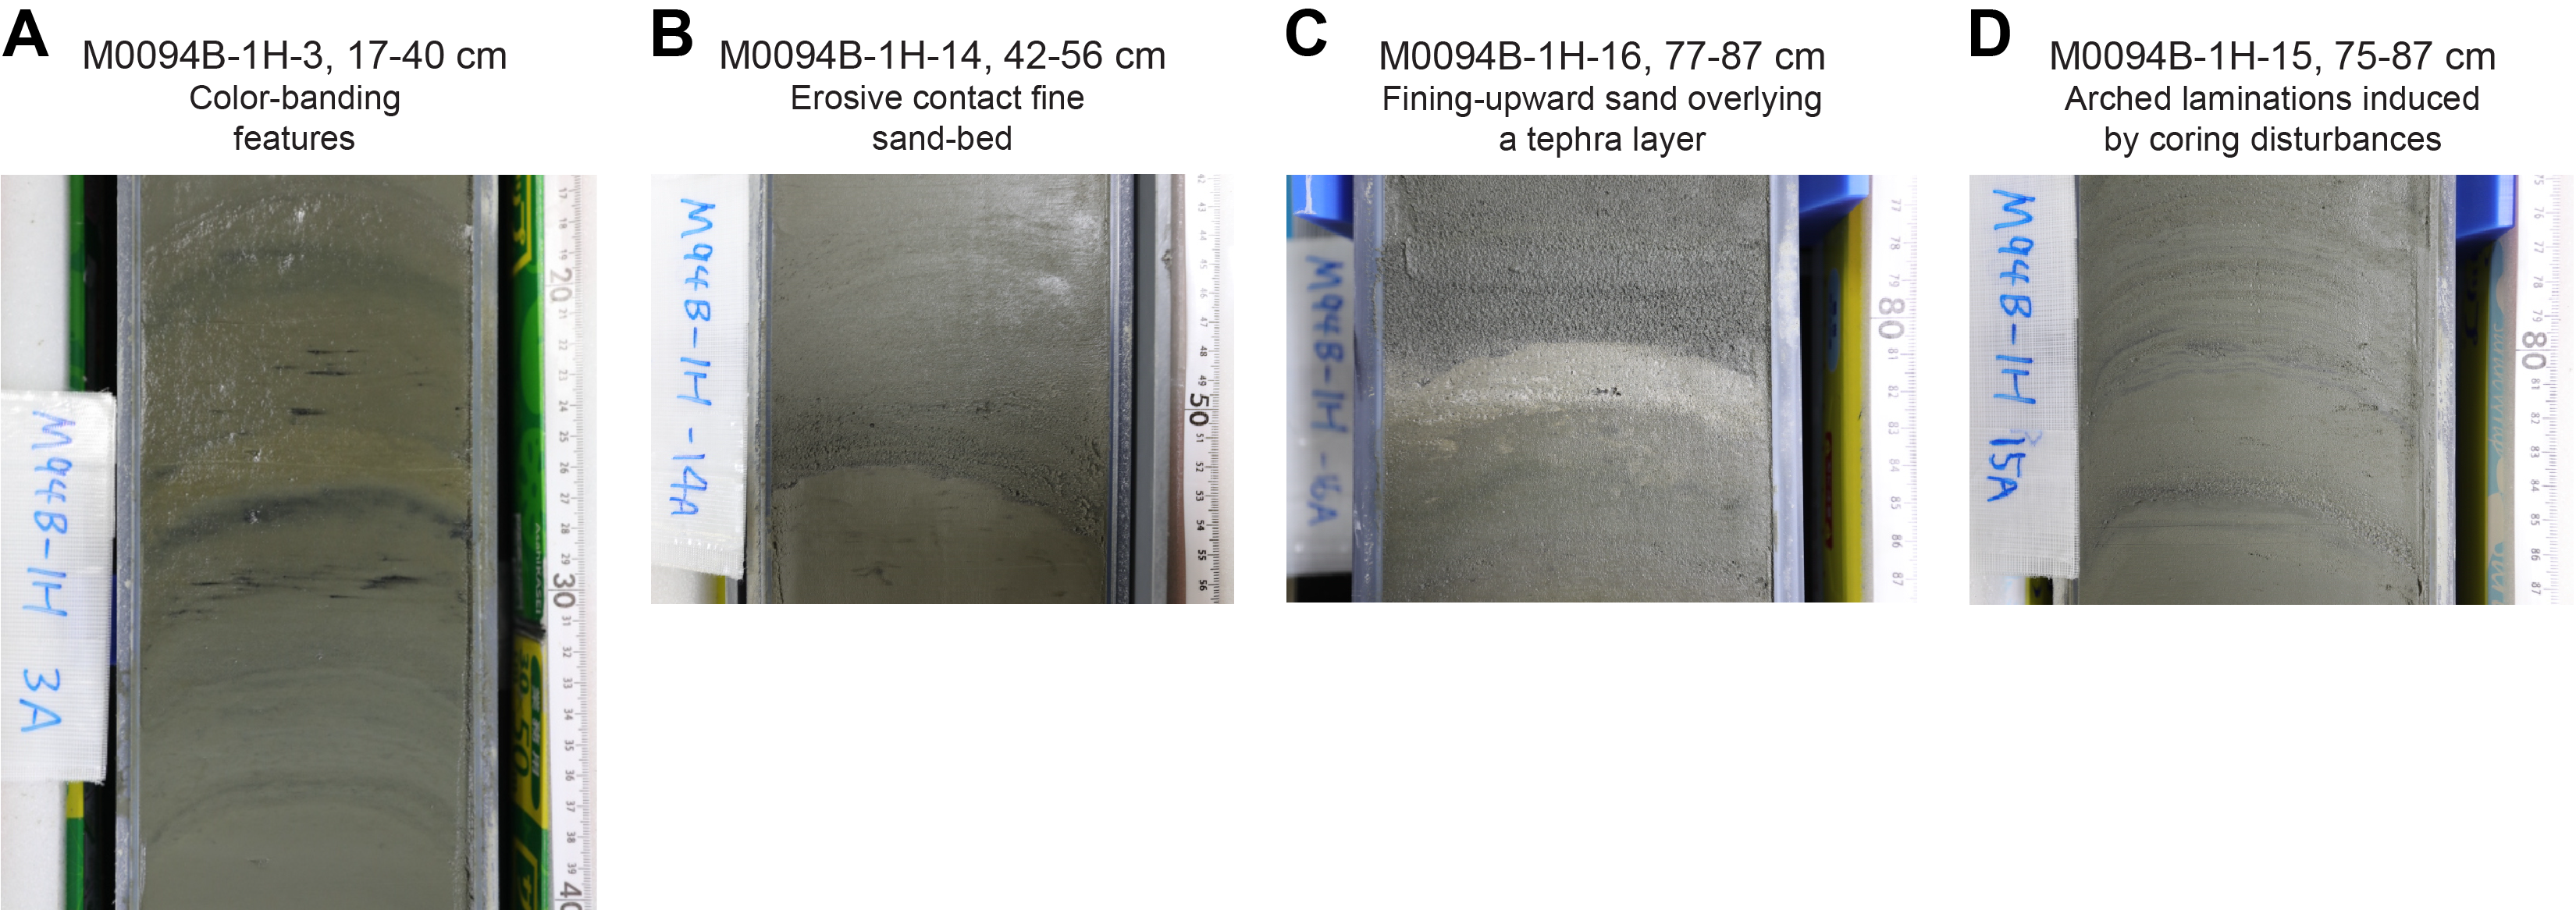
Figure F10. Sedimentary facies.
Interval 2 (~4.5 to ~10.4 mbsf; Sections 386-M0094B-1H-6, 21 cm, to 1H-12, 44 cm) is a thick-bedded, deformed, fining-upward sedimentary succession. From base to top, a very fine sand bed with a gradational base (interval 1H-12, 25–44 cm) fines upward to a silt (interval 1H-11, 71–25 cm) and a structureless clayey silt/silty clay bed (interval 1H-6, 21–71 cm). Soft-sediment deformation structures such as convolutes and folds occur in the basal silt (Figure F9D), and numerous high radiodensity features point to deformed very fine sand to silty patches dispersed in the clayey silt/silty clay upper chaotic bed (Figure F9E). No bioturbation or iron monosulfide traces are observed.
Interval 3 (~10.4 to ~15.6 mbsf; Sections 386-M0094B-1H-12, 44 cm, to 1H-17, 39.5 cm) is a ~5.2 m thick-bedded interval composed of a 2 cm thick, sharp base and parallel laminated fine sand (interval 1H-12, 44–46 cm) underlain by millimeter- to centimeter-scale silt to fine sand deposits scattered in clayey sediment (e.g., interval 1H-14, 42–56 cm; Figure F10B). A graded, very fine sand–sized tephra layer is located in interval 1H-16, 80.5–82.5 cm (Figures F9F, F10C; see Tephra). Fining-upward fine sand layers show planar laminations with some mottled bioturbation. Slight arched bedding induced by coring was observed on X-ray CT images or hand drawn VCDs (interval 1H-15, 75–87 cm; Figure F10D). Three sparse to moderate iron monosulfide traces are identified in Interval 3 in silty clay deposits (Sections 1H-12, 57–78 cm, 1H-13, 74 cm–76 cm, and 1H-14, 2–30 cm).
Interval 4 (~15.6 to ~18.2 mbsf; Sections 386-M0094B-1H-17, 39.5 cm, to 1H-19, 95 cm) is a ~2.6 m thick, fining-upward sedimentary succession that comprises a basal silt bed (interval 1H-19, 82–95 cm) fining upward into a silty clay/clayey silt (interval 1H-19, 30–82 cm) overlain by a 1.9 m thick clay bed (Sections 1H-17, 39.5 cm, to 1H-19, 30 cm). X-ray CT images show deformed bedding in the lower half of Interval 4 (Sections 1H-18, 50 cm, to 1H-19, 95 cm). No bioturbation or iron monosulfide traces are identified.
A total of 13 smear slides were analyzed for Hole M0094B (Table T3; Figures F6, F7, F8; see smear slide photos in SMEARSLD in Supplementary materials). The observed lithologies and textures mostly vary between lithogenic-rich vitric-ash and vitric-bearing lithogenic- and siliceous-rich clayey silt. Clay is the most abundant textural component (maximum = 57.7%) with mineral components of quartz (maximum = 15.4%) and vitric material (3.7%–74.1%). Vitric components become more abundant in the lower half of the hole from Section 1H-12, 55 cm, to the base of the core (Intervals 3 and 4) within ash, vitric-rich, or vitric-bearing sediments. Four tephra occurrences were observed in smear slides from Sections 1H-16, 60 cm, 1H-16, 82 cm, 1H-18, 70 cm, and 1H-19, 90 cm (see Tephra). These locations contain 60%, 74.1%, 60%, and 58.8% of vitric components, respectively. Sample 1H-16, 82 cm (Figure F8F) is from a tephra layer also observed during visual core description (Figure F10C; see Tephra). Pyrite was observed in smear slides collected in Sections 1H-8 (~7 mbsf; Interval 2) and 1H-9 (~8 mbsf; Interval 2). Diatoms and sponge spicules dominate the biogenic fraction, with more diatoms (maximum = 40%) than sponge spicules (maximum = 18.5%) and radiolaria (maximum = 10%) in all samples. Calcareous nannofossils were observed in two smear slides collected within a thick and structureless clayey silt/silty clay deposit (Samples 1H-10, 84 cm [2.9%], and 1H-14, 60 cm [3.7%]). Radiolaria (2.9%) and diatoms (29.4%) were also documented in the Section 1H-10 smear slide, but only diatoms (25.9%) were described in the Section 1H-14 smear slide. Some smear slide photomicrographs are shown in Figure F8.
3.3. X-ray diffraction mineralogy
XRD mineralogy was conducted every 2 m, and some minerals are grouped. These groupings will require additional processing to extract a signal for each mineral. For example, quartz has not been separated from opal-A, and clays, carbonates, amphiboles, pyroxene, and heavy minerals are composed of several minerals in each grouping (see Lithostratigraphy in the Expedition 386 methods chapter [Strasser et al., 2023a]). The interpretation of the mineralogy is an approximation at this stage. However, some interpretations can be made when the data are contrasted with the lithostratigraphy and smear slide summaries.
For Hole M0094B (Figure F11), the most abundant minerals are quartz, feldspar, and micas (muscovite and biotite), followed by clay. The XRD data show correspondence between quartz, feldspar, micas, and clays, and smear slide analysis also shows them as the most abundant minerals (see XRD in Supplementary materials). There is a very small occurrence of palygorskite, a clay associated with the weathering of volcanic glasses, at 10 mbsf. Pyroxene is observed almost throughout the core, except at 14.5 mbsf. The amphibole mineral group is absent, and pyrite has a few occurrences and in low amounts (i.e., 5–7 mbsf). Pyrite occurrence correlates with peak abundances of quartz, feldspar, micas, and clays at 14.5 mbsf. Heavy minerals occur between 10 and 14.5 mbsf. The few peaks of mineral abundances in Hole M0094B are indicative of local heterogeneities of the mineral composition throughout the hole. Future studies will be required to fully extract the mineralogy of the sediments in this hole.
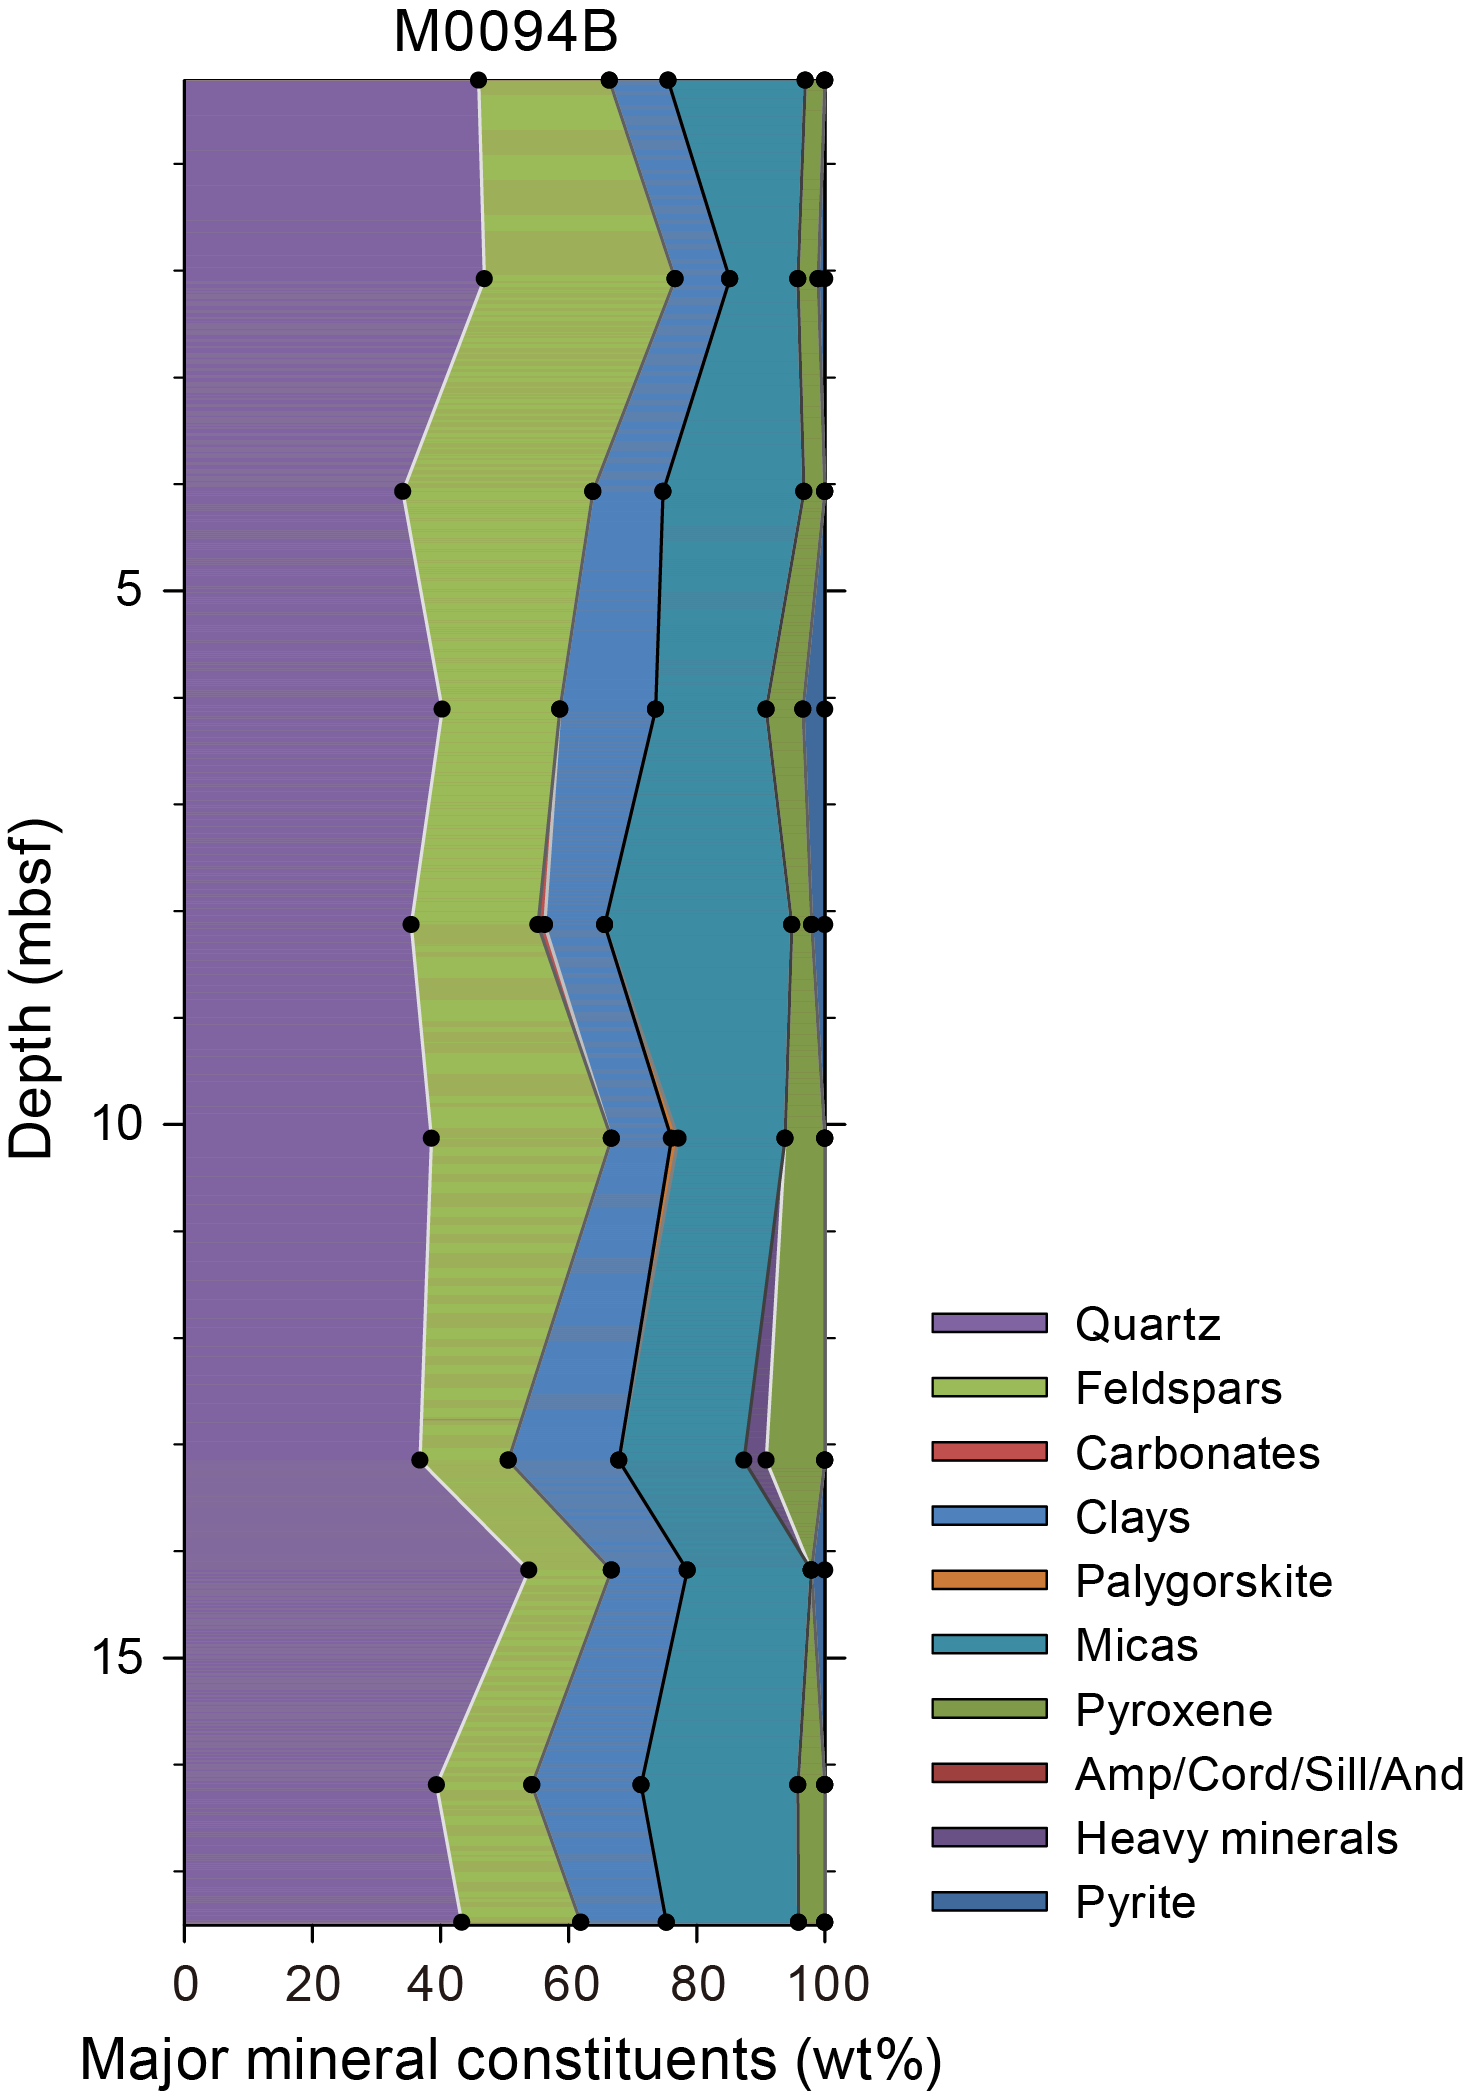
Figure F11. XRD mineralogy.
4. Tephra
One tephra layer was described in Basin C/N2. This tephra layer has similar facies to the M0087B-1H-19, 16.4 cm, and M0087D-1H-20, 87.5 cm, tephra layers in Basin C/N3, which is located geographically just north of Basin C/N2.
A light reddish brown silt-sized tephra layer (M0094B-1H-16, 82.5 cm) is intercalated in silty sediment interval 386-M0094B-1H-16, 81.7–82.5 cm (Figure F12). This tephra layer overlies bioturbated silty sediment and in turn is directly overlain by a thick sand layer. Below the layer, small lumps composed of this tephra are scattered within the underlying approximately 3 cm thick bioturbated silty sediment. The tephra is composed predominantly of pumiceous type volcanic glass shards (Table T4; Figure F13). The heavy mineral composition is dominated by abundant hornblende and smaller amounts of orthopyroxene, and clinopyroxene and opaque minerals are very rare. It also contains characteristic ß-quartz.
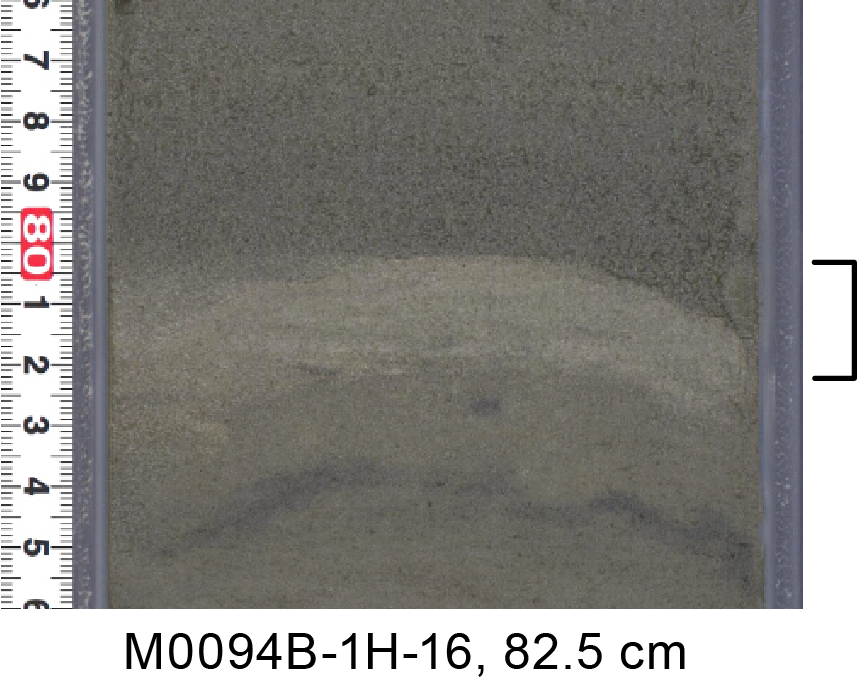
Figure F12. Tephra M0094B-1H-16, 82.5 cm.

Figure F13. Smear slide of Tephra layer M0094B-1H-16, 82.5 cm.
This tephra layer is probably correlated with the M0087B-1H-19, 16.4 cm, and M0087D-1H-20, 87.5 cm, tephra layers based on similarities in lithofacies, volcanic glass type, and heavy mineral composition (Figure F14; see Tephra in the Site M0087 (Basin C/N3) chapter [Strasser et al., 2023b]). More detailed analysis, such as for chemical composition, is needed to test for this possible correlation and potential tephrochronological age constraint by correlation to known and dated volcanic eruptions.
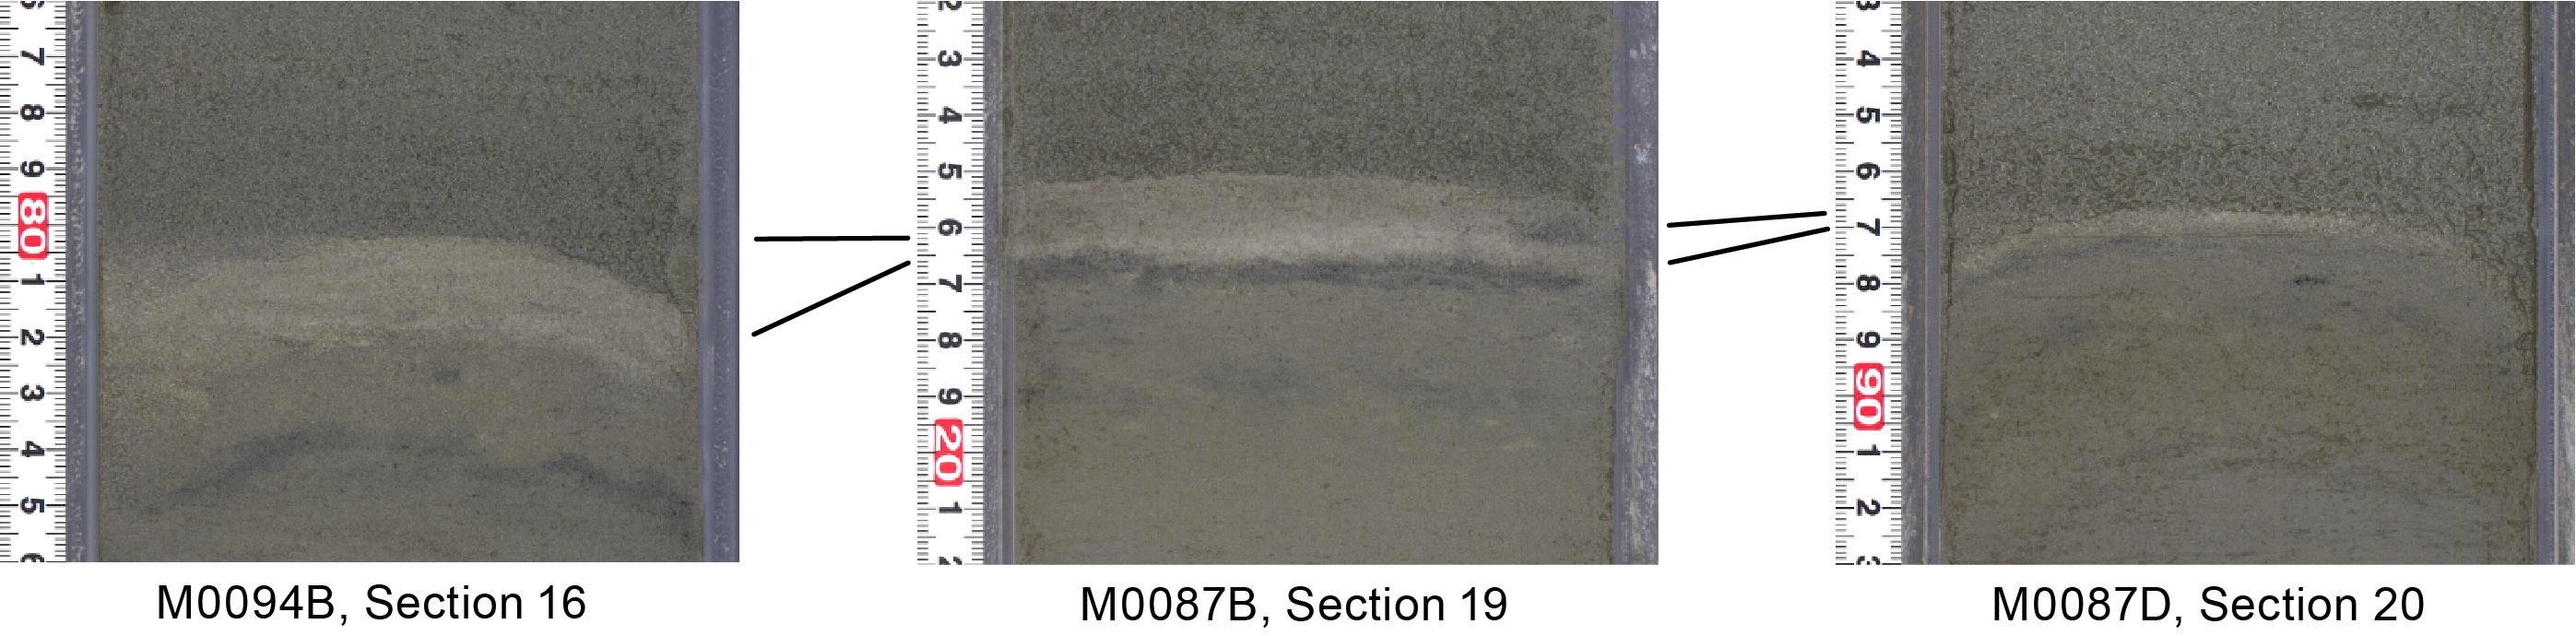
Figure F14. Tephra layer potentially enabling intersite correlation.
The sediment at the bottom of Section 386-M0094B-1H-19 was sampled during the offshore phase for chemical analysis of volcanic glass shards because pyroclastic materials were observed, even though it was not possible to identify a tephra layer at this horizon by visual core description during the onshore phase. Most of the volcanic glasses in this sample are rhyolitic (SiO2 > 73 wt%), except for one grain. The SiO2, Na2O, and K2O contents are largely dispersed and were divided into three groups based on K2O ratio (Table T5; Figure F15). The points are dispersed on the Harker diagram, so these shards were considered to be derived from several tephras.
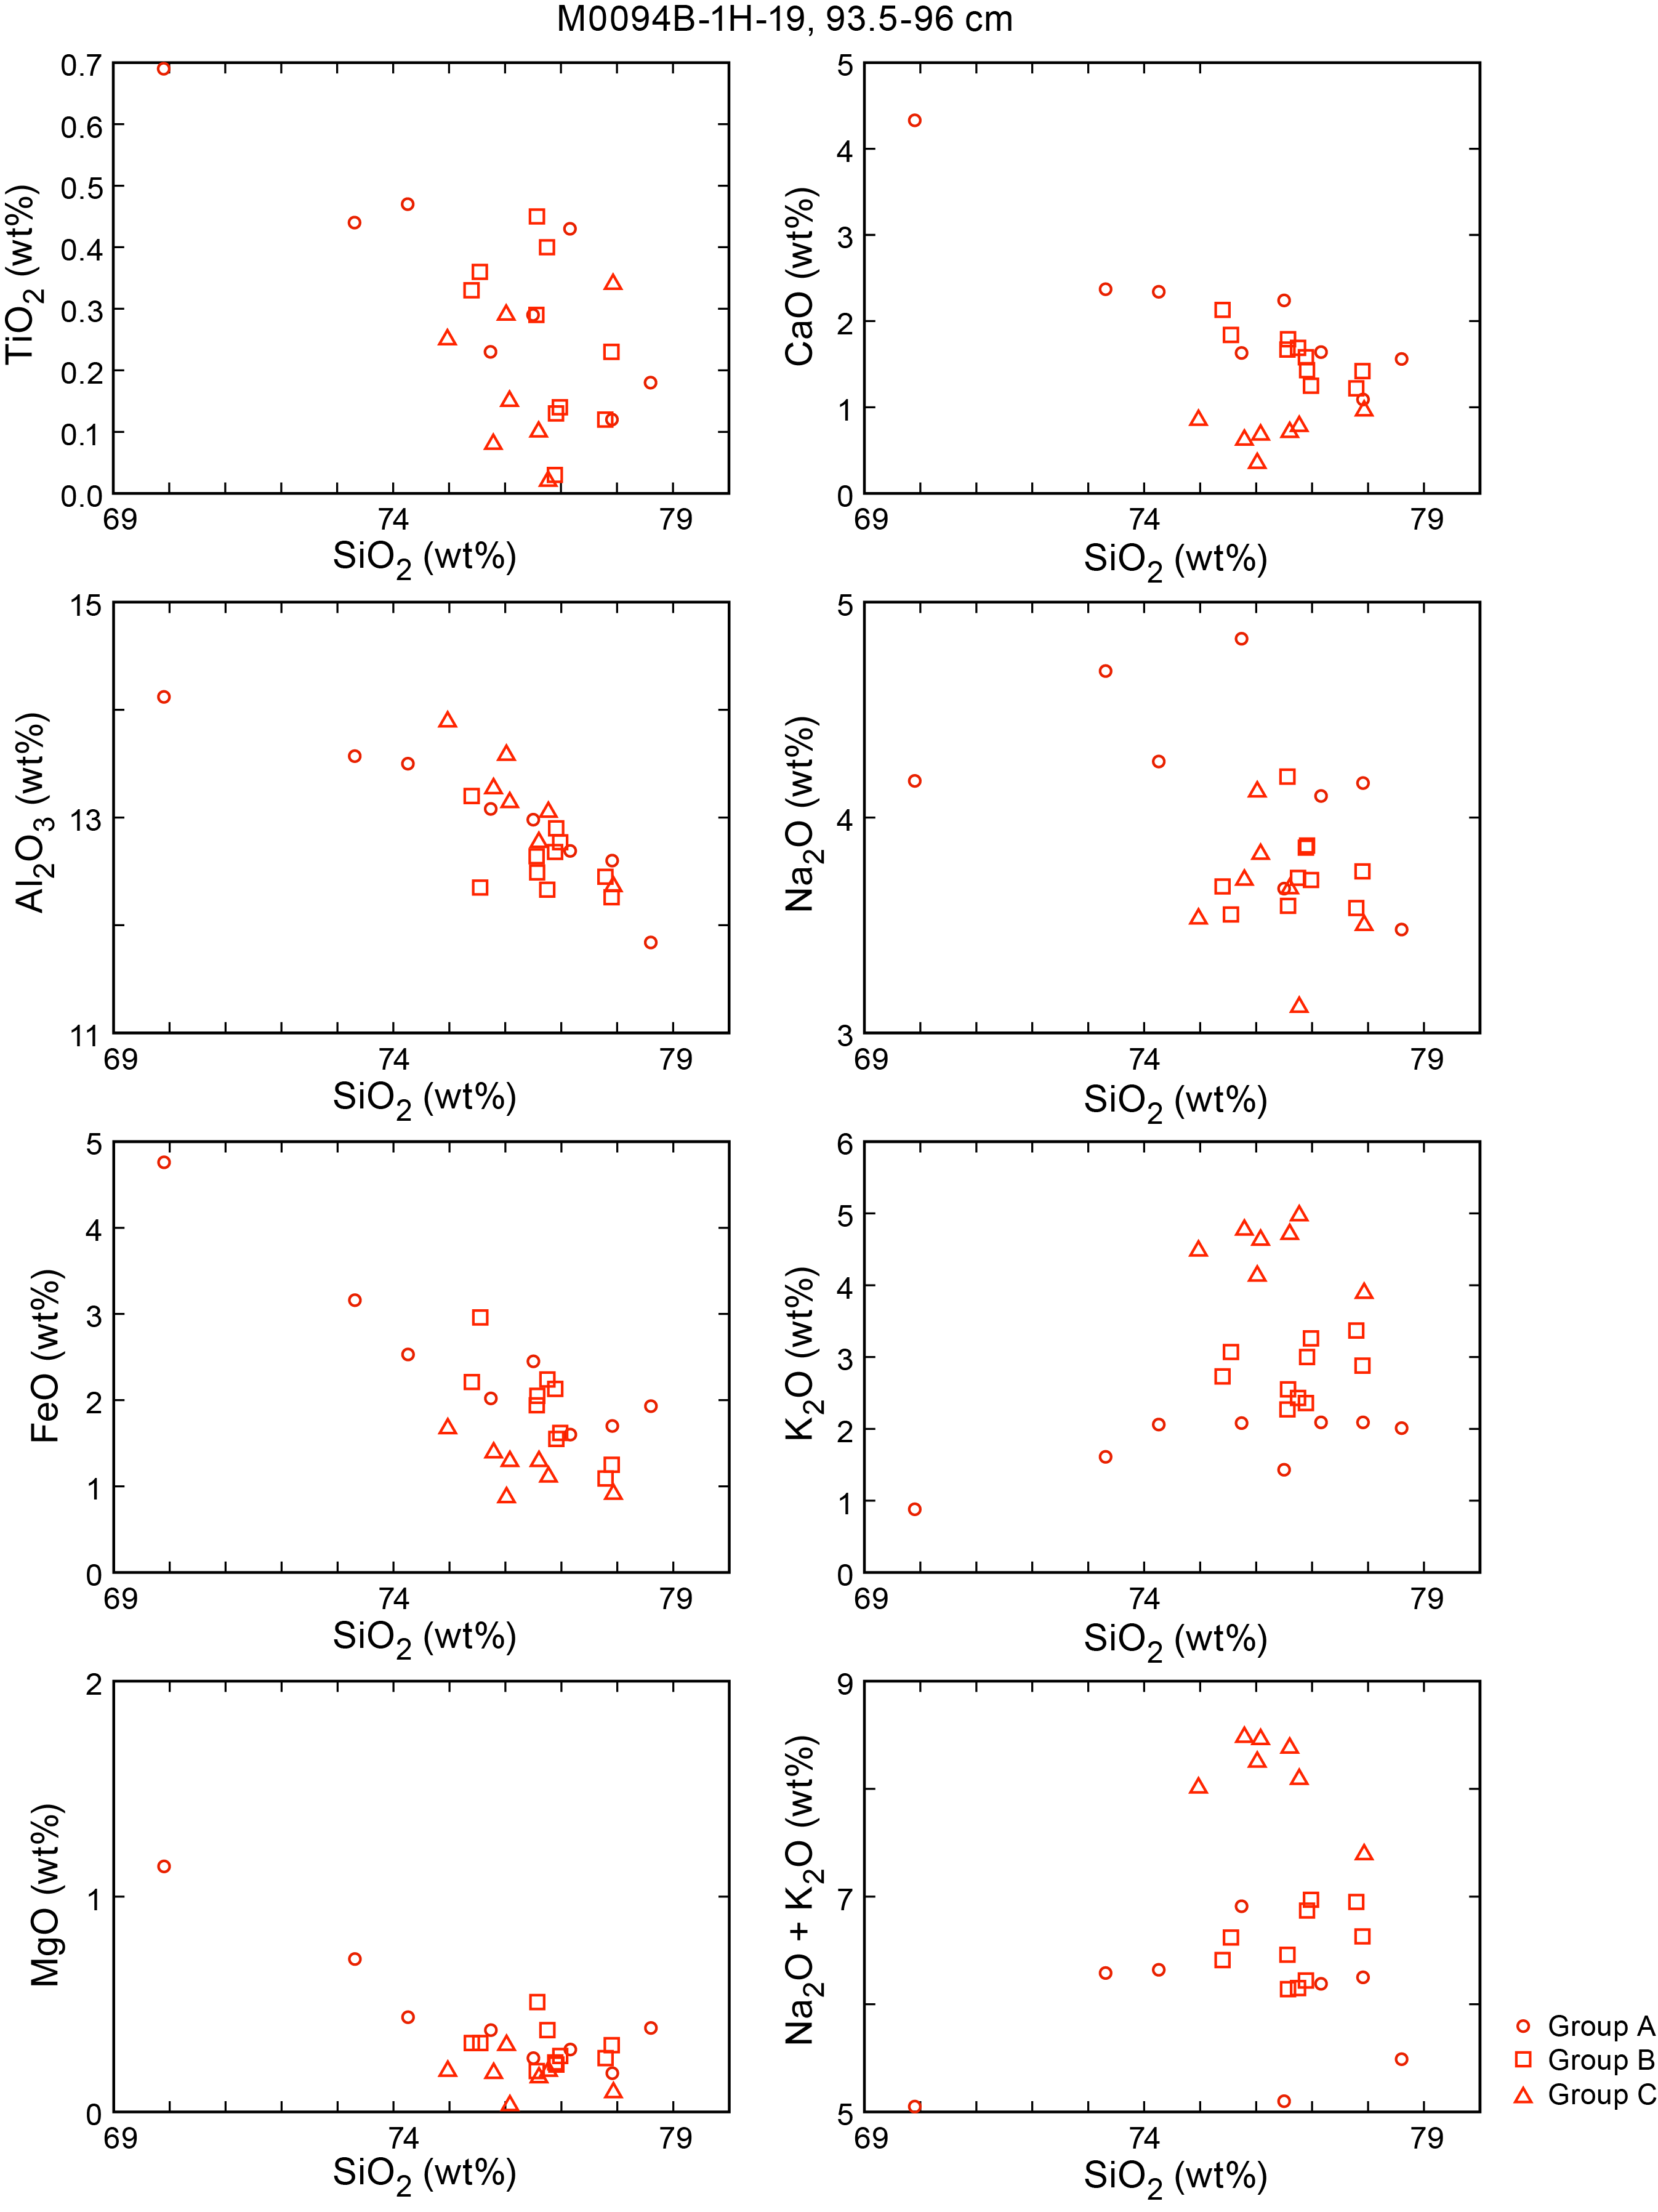
Figure F15. Volcanic glass shards.
5. Micropaleontology
Two holes were cored at Site M0094 in Basin C/N2 at the boundary of the central and northern Japan Trench. Because of the prevalence of event layers, no radiolarian-based age determinations were made at this site. Foraminifera in samples collected during the offshore phase were examined to determine provenance of mass transport deposits.
5.1. Foraminifera
Samples were taken at 5 m intervals offshore, as described in Micropaleontology in the Expedition 386 methods chapter (Strasser et al., 2023a). With the exception of the agglutinated benthic foraminifera, which may be either in situ or reworked, all foraminifera at Site M0094 are considered to be allochthonous.
5.1.1. Hole M0094A
One sample taken from the base of Hole M0094A was examined for foraminifera (Table T6). No foraminifera are present in this sample. The sample contains abundant diatoms, radiolaria, sponge spicules, and abundant volcanic glass.
No provenance interpretation can be made for this sample due to low foraminifera abundance.
5.1.2. Hole M0094B
Four samples from Hole M0094B were examined for foraminifera (Table T6). Benthic foraminifera with moderate to good preservation are present in two of the samples; two samples are barren. Planktonic foraminifera with good preservation are present in one of the four samples. All samples examined for foraminifera contain abundant diatoms, radiolaria, and sponge spicules.
No provenance interpretation can be made for these samples due to low foraminifera abundance.
6. Geochemistry
6.1. Interstitial water
At Site M0094, a total of 21 interstitial water (IW) samples were collected using Rhizon samplers from one trigger core (Hole M0094A) and one GPC core (Hole M0094B). In addition, one bottom water (BW) sample was taken from the top of the trigger core. See Geochemistry in the Expedition 386 methods chapter (Strasser et al., 2023a) for details of the sampling, analytical methods, and data quality. In general, IW composition at Site M0094 is influenced by low amounts of organic matter degradation and the subsequent release of metabolic products and consumption of electron acceptors. Additional sources of ions such as sulfate and lithium occur at greater depth, leading to a concentration increase below about 6–8 mbsf.
6.1.1. Shipboard analyses: salinity, alkalinity, and ammonium
Salinity varies between 33.4 and 35.2 with an overall linear trend throughout the core (Table T7; Figure F16). Only in the trigger core is salinity below 32 (0.56 mbsf). Alkalinity displays the lowest concentrations compared to the other Expedition 386 sites, with values not exceeding 35 mM. The concentration increases with depth in the uppermost ~5 m from 2.5 to about 30 mM. Between 5 and 9 mbsf, alkalinity is near constant before decreasing downhole to 18.4 mM at the bottom of the core (Figure F16). The lowest ammonium (NH4+) values are recorded in the uppermost sediments (0.27 mM) at ~0.56 mbsf in the trigger core. Ammonium displays a concentration trend similar to that of alkalinity with a maximum of 1.75 mM at ~8 mbsf. The concentration decreases from this peak to the bottom of the core (0.65 mM) (Figure F16).

Figure F16. IW salinity, total alkalinity, and ammonium.
6.1.2. Shore-based analysis
6.1.2.1. Dissolved vanadium, molybdenum, and uranium
A suite of trace metals were analyzed using inductively coupled plasma–mass spectroscopy (ICP-MS) including vanadium (V), molybdenum (Mo), and uranium (U), briefly described below, as well as copper (Cu) and rubidium (Rb) (Table T7). The BW sample has a V concentration of 43.3 nM; in contrast, no V was detected in the IW samples from the uppermost ~4 m of sediments at Site M0094 (Figure F17). Dissolved V concentrations are highest at 10.1 mbsf at Hole M0094B and range ~31–137 nM throughout the remainder of the sediment column (Figure F16). Dissolved Mo concentrations are highest in the BW (118.7 nM), within the range of average seawater (105 nM; Bruland et al., 2014), and show a small peak (~97 nM) at 0.53 mbsf with otherwise very low concentrations (<60 nM) throughout the remainder of the sediment column (Figure F16). Dissolved U peaks in the upper sediments (20.1 nM at 0.53 mbsf in Hole M0094B) and increases between 4.55 and 10.1 mbsf (Figure F16). Overall, U concentrations are low compared to the other sites.
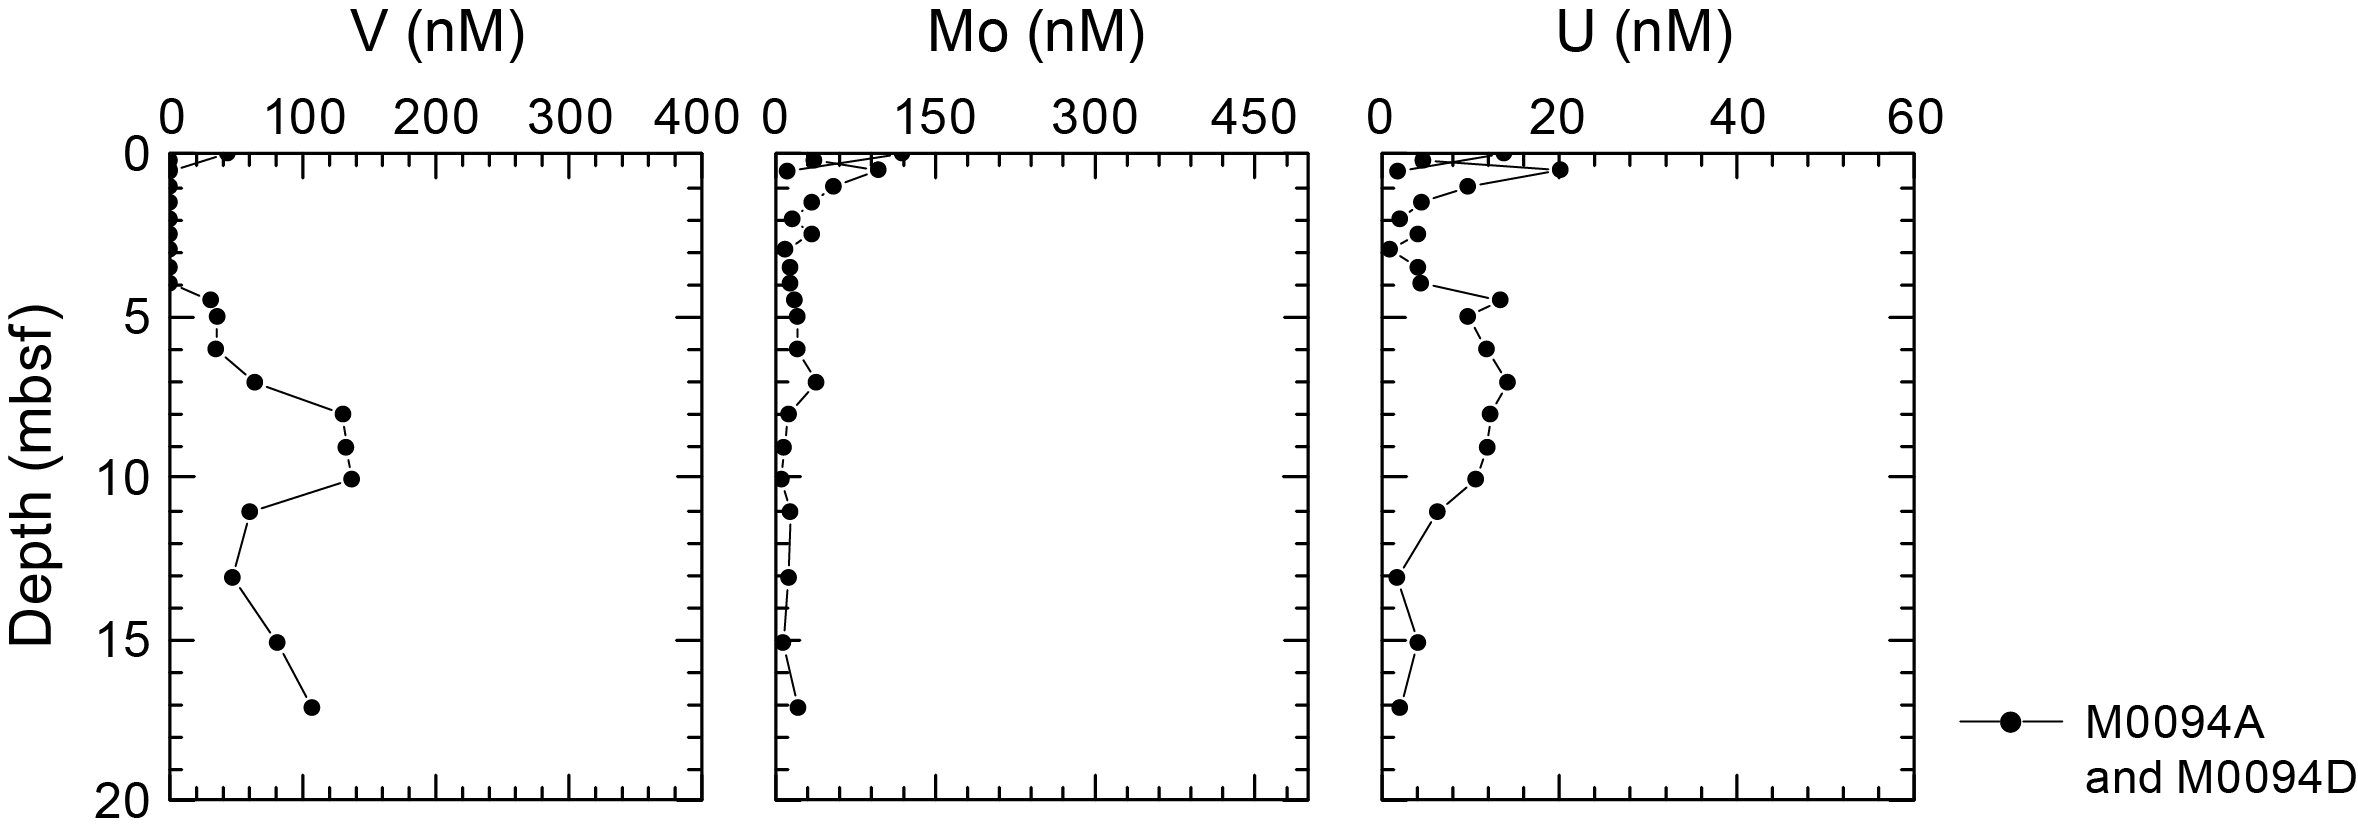
Figure F17. IW V, Mo, and U.
6.1.2.2. Dissolved lithium, boron, silica, manganese, iron, strontium, and barium
All minor elements analyzed using inductively coupled plasma–optical emission spectroscopy (ICP-OES) are listed in Table T7. Except for the trigger core, the dissolved lithium (Li) concentrations at Site M0094 are rather homogeneous (31.07–22.1 µM) in the uppermost ~11 m with a light concave profile shape and corresponding lower values around 6 to 10 mbsf (Figure F18). Dissolved Li concentrations strongly increase below 12 mbsf, reaching 41.4 µM at the bottom of Hole M0094B (17.15 mbsf), exceeding seawater values (Bruland et al., 2014). The boron (B) concentration profile shows an overall gentle linear increase with depth, with concentrations of 542 µM at 0.56 mbsf in the trigger core, 577 µM in the uppermost sediments of Hole M0094B (0.22 mbsf), and 670 µM at the bottom of the hole (Figure F18). Only the BW sample shows B concentrations similar to seawater (431 µM; Bruland et al., 2014). Similar to B, dissolved silica (Si) has seawater concentrations (140 µM; Bruland et al., 2014) in the BW sample, with all IW concentrations far higher than seawater. The Si concentration profile at Site M0094 is mainly linear with depth, ranging ~850–970 µM. Only at 0.53 and 13.1 mbsf do the Si values drop to 762 and 767 µM, respectively (Figure F18).
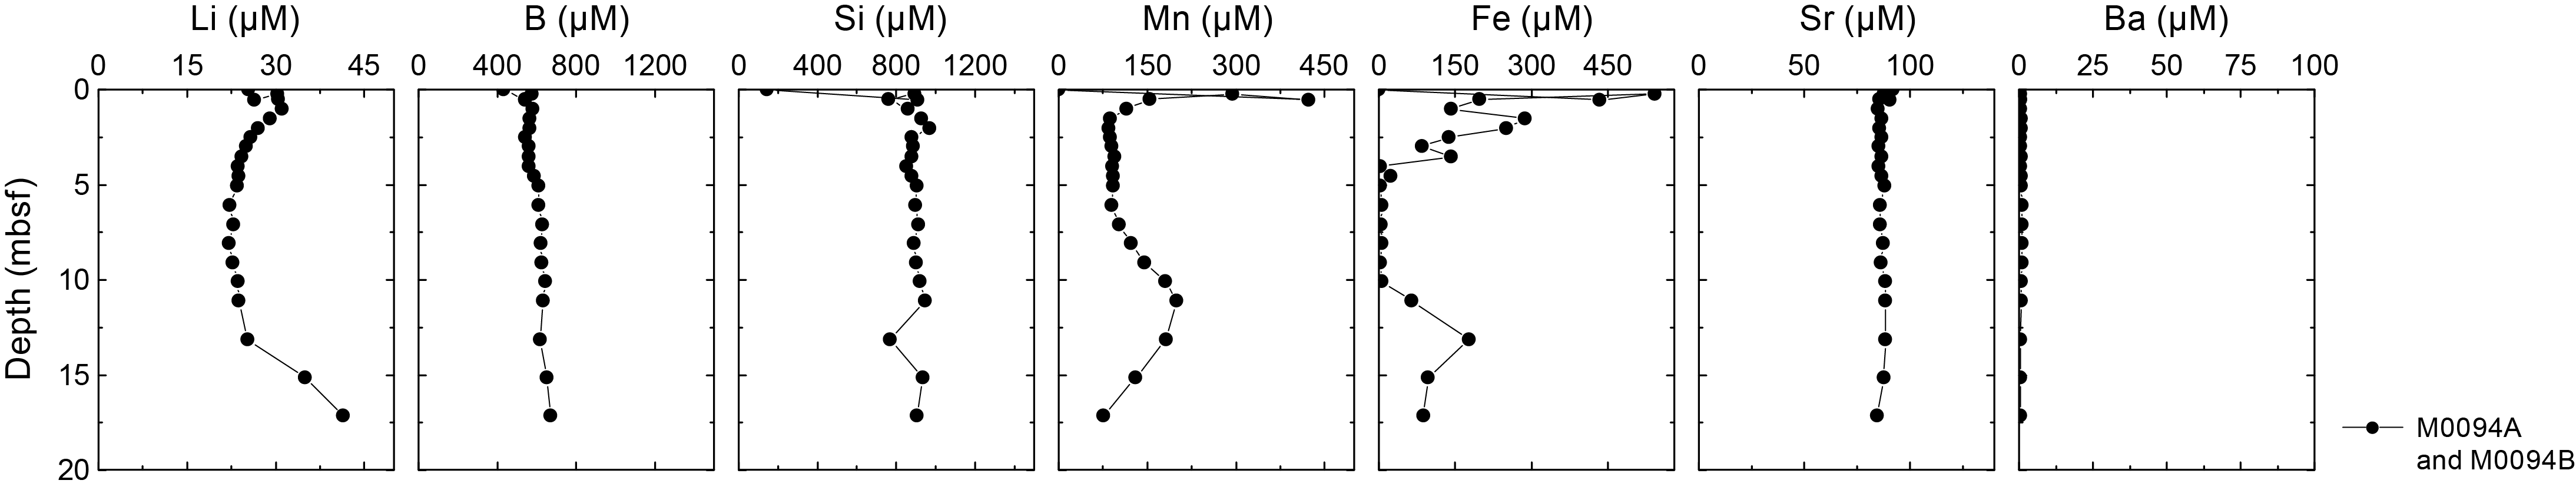
Figure F18. IW Li, B, Si, Mn, Fe, Sr, and Ba.
The highest dissolved manganese (Mn) concentrations (~430 µM) were detected in the trigger core at 0.56 mbsf, whereas the BW was at the detection limit. In the GPC core, the highest values (294 µM) are observed in the uppermost sediments (0.22 mbsf), followed by a decrease to ~85 µM at ~2 mbsf. Between 7 and 15 mbsf, dissolved Mn increases to 200 µM before a final drop at the base of the hole to 76 µM (Figure F18). The dissolved iron (Fe) concentration profile shows a variable but overall decreasing trend with depth to 5 mbsf, where it drops below 6 µM. Concentrations stay low for the next 5 m before increasing again to 177 µM at 13 mbsf and then slowly decrease in the remaining 4 m downcore (Figure F18). The BW was below detection limit.
Dissolved strontium (Sr) concentrations are homogeneous and vary little throughout the core (average = 86.6 µM in Hole M0094B). The highest values were analyzed in the BW (91.85 µM) and the IW (90.35 µM) of the trigger core at 0.56 mbsf (Figure F18). All dissolved Ba concentrations were near the detection limit and did not exceed 1.1 µM (Figure F18).
6.1.2.3. Chloride, bromide, and sulfate
All anions analyzed using ion chromatography (IC) are listed in Table T7.
Dissolved chloride (Cl−) values are very near average seawater values (546 mM; Bruland et al., 2014) throughout the sediment column, ranging ~534–543 mM (Figure F19, Table T7). Similar to Cl−, dissolved bromide (Br−) concentrations display almost average seawater values (~0.84 mM; Bruland et al., 2014) throughout the sediment column with a slight excursion reaching 0.87 mM at around 8 mbsf (Figure F19). Dissolved sulfate (SO42−) concentrations show seawater values of ~28–29 mM at the top of the trigger core from Hole M0094A, followed by a gradual decrease with depth reaching the lowest values between about 5 and 9 mbsf before increasing to ~23 mM at the base of Hole M0094B (17.15 mbsf) (Figure F19).
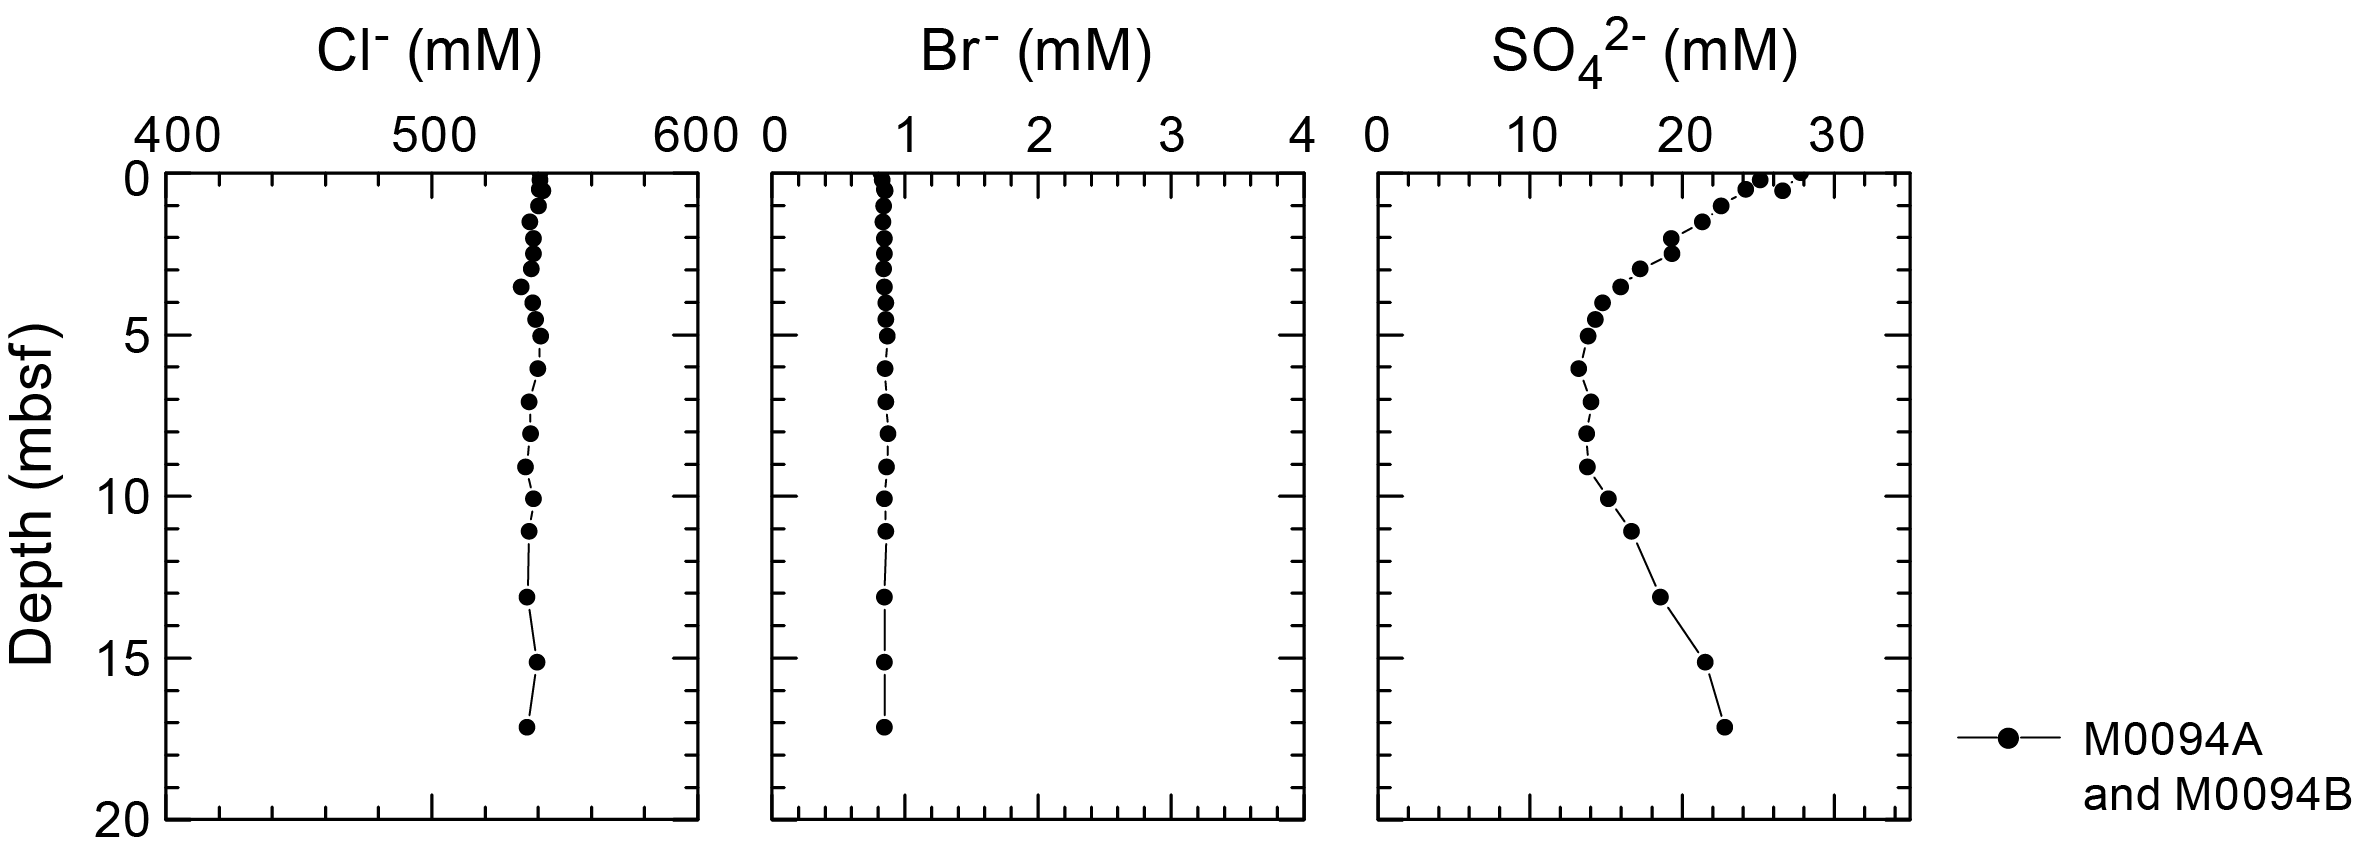
Figure F19. IW Cl−, Br−, and SO42−.
6.1.2.4. Sodium, magnesium, potassium, and calcium
Downcore profiles of sodium (Na+), potassium (K+), calcium (Ca2+), and magnesium (Mg2+) IW concentrations overall show very similar patterns with little variation. Dissolved Na+ concentrations are at or above average seawater values (~470 mM; Bruland et al., 2014), ranging ~470–554 mM with fluctuations in the uppermost ~8 m and more constant values between 8 and 17.15 mbsf. The dissolved K+ concentration profile displays values very close to average seawater values (~10 mM; Bruland et al., 2014), ranging ~10.2–11.5 mM. Similar to Na+ and K+, dissolved Ca2+ concentrations fluctuate unsystematically in the uppermost 8 m with values close to or slightly above average seawater values (10.3 mM; Bruland et al., 2014), ranging ~10.4–13.5 mM. Below 8 mbsf, a slight increase in Ca2+ with depth is observed. Dissolved Mg2+ concentrations are near average seawater values (~53 mM; Bruland et al., 2014) in all holes, ranging ~51.5–65.5 mM. Similar to Na+ and Ca2+, Mg2+ concentrations show a slight increase at about 5 mbsf.
The IC cation data is only presented in GEOCHEM in Supplementary materials because the samples require postexpedition analysis for validation of absolute values (analytical accuracy).
6.2. Shore-based H2S analysis
At Site M0090, H2S concentrations were below the detection limit in all samples (see GEOCHEM in Supplementary materials).
6.3. Headspace gas analysis: methane, ethane, and C1/C2 ratio
A total of 20 headspace samples from Holes M0094A (trigger core) and M0094B (GPC core) were measured for hydrocarbon compositions (Figure F20; Table T8).
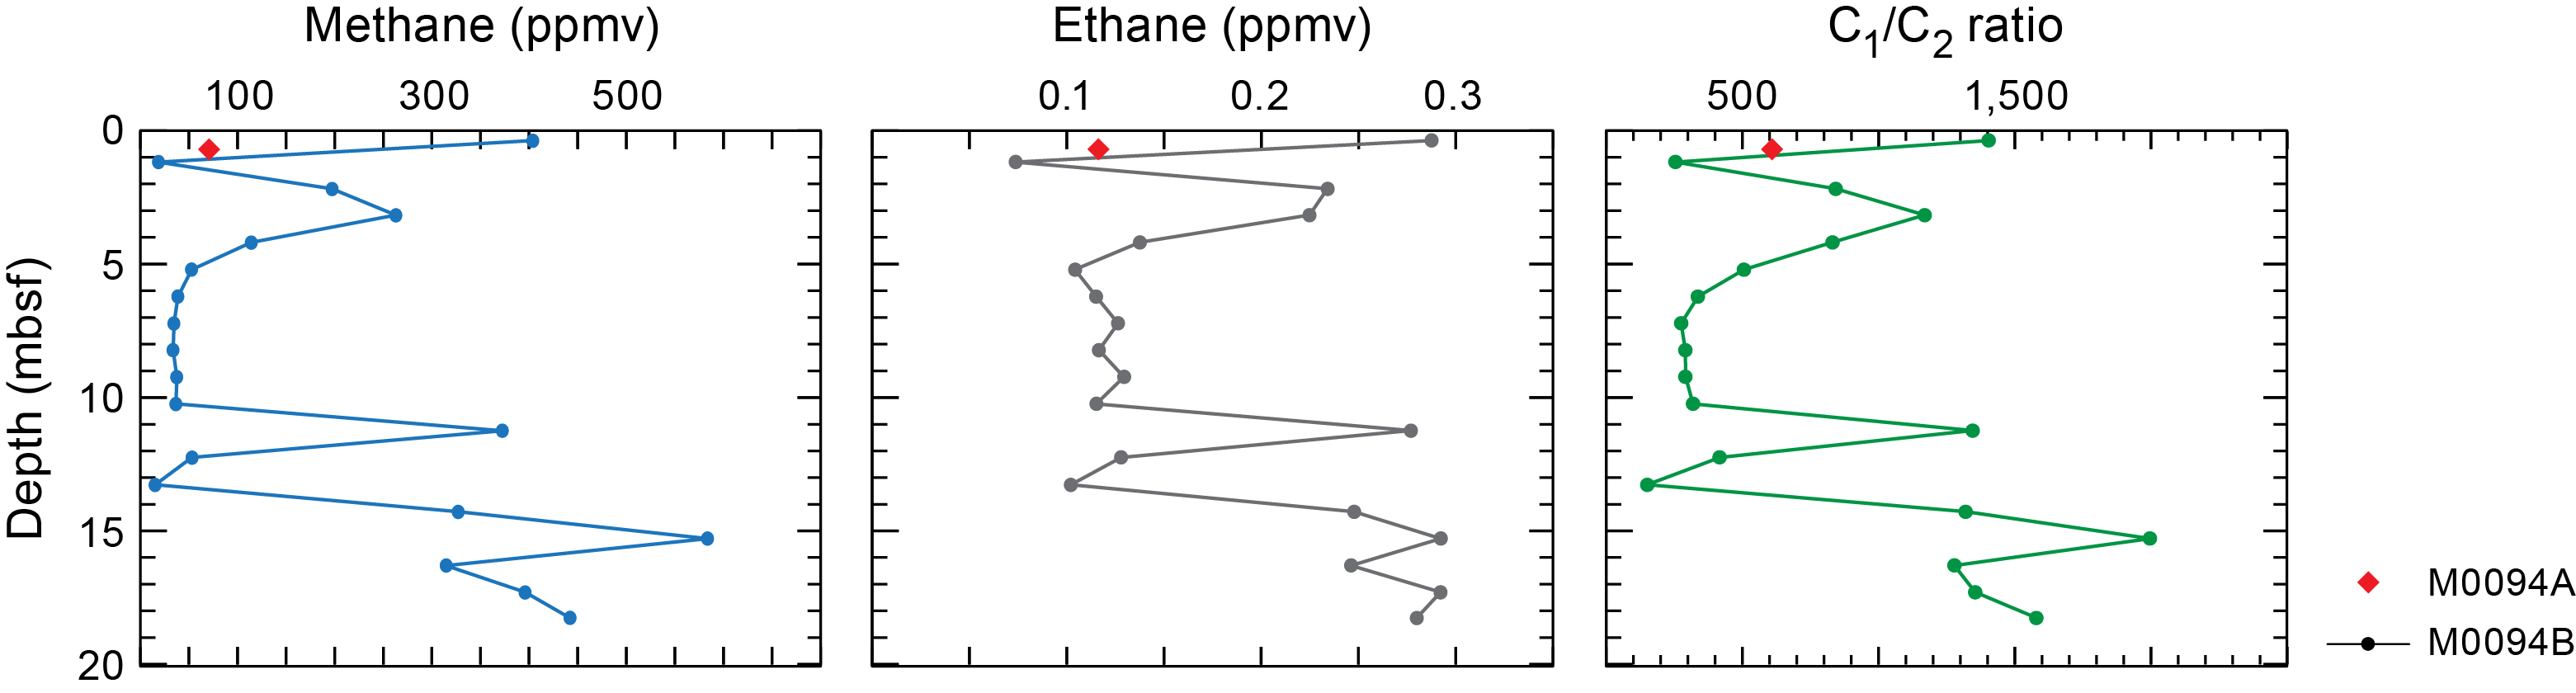
Figure F20. Methane, ethane, and C1/C2 ratios.
Methane (CH4 and C1) concentrations are overall very low, with values not exceeding 600 ppmv (Figure F20). Concentrations decrease from ~400 ppmv at the sediment surface to ~50 ppmv at around 5 mbsf with one big drop to 19 ppmv at 1.18 mbsf. Values stay low between 5 and 13.3 mbsf with one spike to 373 ppmv at 11.25 mbsf and an increase in the sediments below ~14 mbsf. Ethane concentrations are extremely low (<0.3 ppmv) and mainly follow the trend of the methane concentrations. C1/C2 ratios are below 2000 throughout the sediment column (Figure F20).
Alongside C1 and C2, other hydrocarbon gases such as ethylene (C2=), ethane (C2), propene/propylene (C3=), propane (C3), and n-butane (n-C4) were detected and measured, but their concentrations are very low, generally less than 1 ppmv at all sites (see GEOCHEM in Supplementary materials).
6.4. Shore-based solid-phase element analysis
6.4.1. Aluminum, calcium, silica, iron, and manganese
Energy dispersive X-ray fluorescence (ED-XRF) was used to quantify elements from 10 ground solid sediment samples from Hole M0094B and one sample from the Hole M0094A trigger core. The solid-phase elements, including aluminum (Al), Ca, Si, Fe, and Mn, briefly described below, as well as Ba, Br, Cr, Cu, K, Mg, Ni, P, Sr, Ti, V, Zn, and Zr, are listed in Table T9. The selected elements plotted highlight the compositional differences in the sediments at Site M0094 (see Lithostratigraphy).
Solid-phase Al contents range ~3.7–5.3 wt% (36,709–53,149 mg/kg) (Figure F21). Maximum Al values of 5.3 wt% are observed at ~16 mbsf. Ca contents are ~0.74 wt% in the trigger core sediments of Hole M0094A and range 0.81–1.36 wt% (8,130–13,620 mg/kg) in Hole M0094B. The highest Ca contents are observed at around 10 mbsf before they decrease with depth, followed by a slight increase in the lowermost sediments (17.5 mbsf) in Hole M0094B (Figure F21). Si contents range ~27–31 wt% (273,473–313,096 mg/kg) and show an inverse trend compared to Ca, with the lowest Si values between 6 and 12 mbsf followed by an increase to 31 wt% at ~16 mbsf and another decrease at 17.5 mbsf (Figure F21).
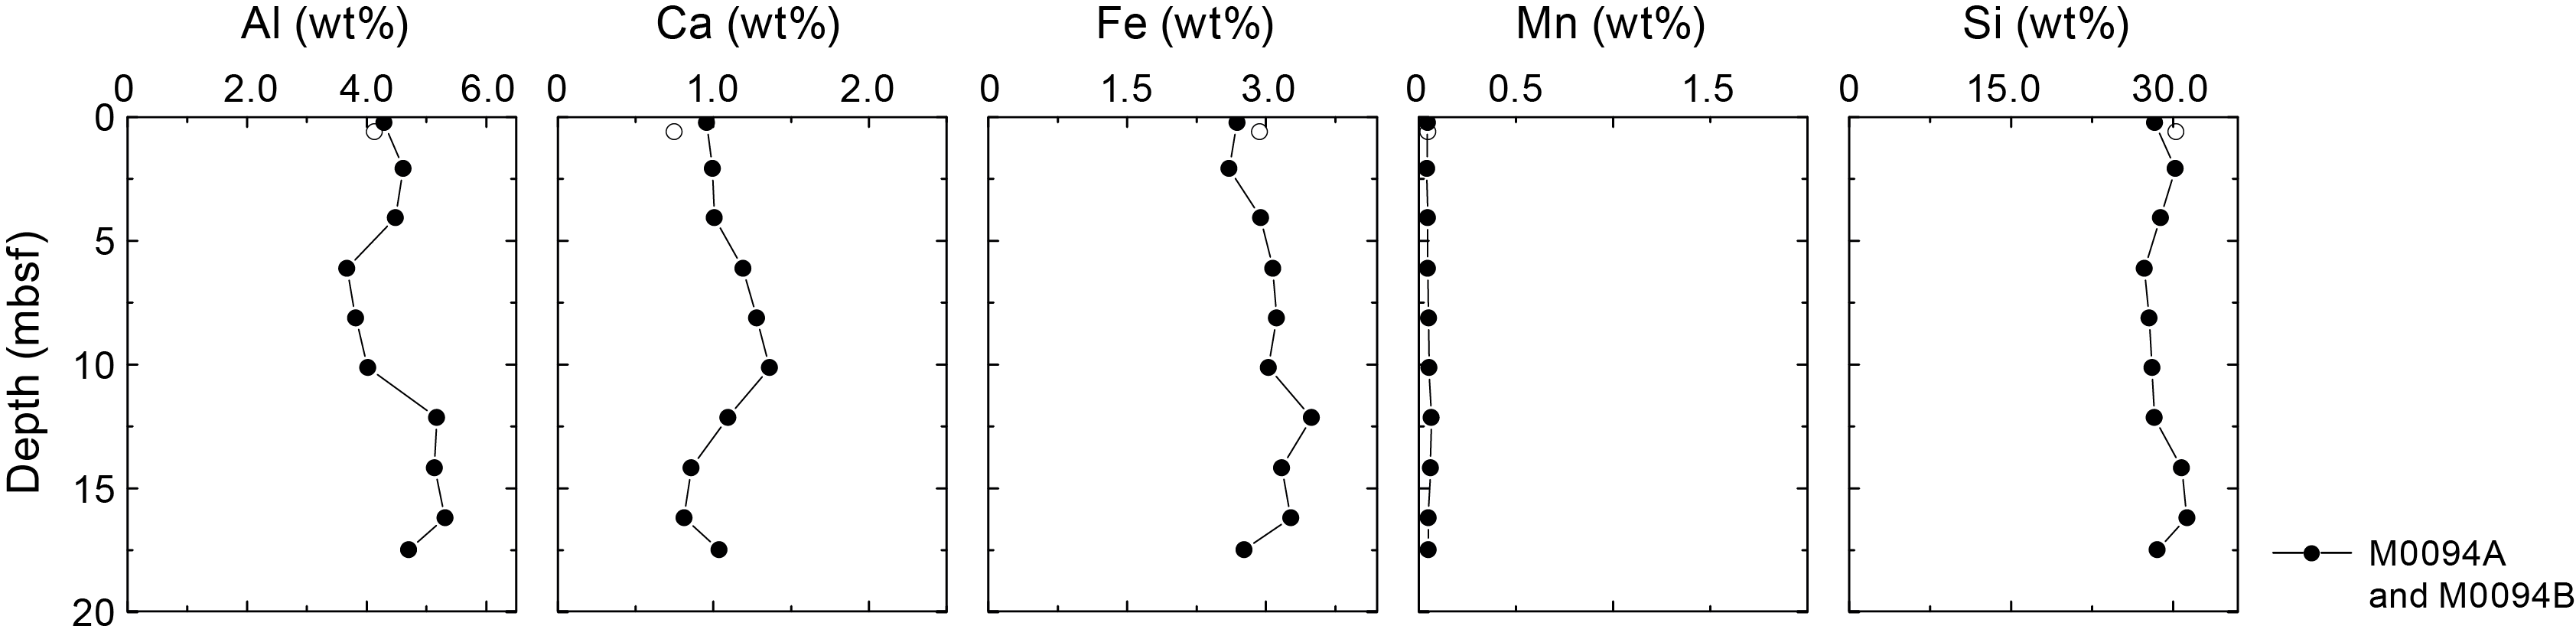
Figure F21. Al, Ca, Fe, Mn, and Si.
Solid-phase Fe contents are similar throughout the sediment column, ranging ~2.6–3.5 wt% (25,996–34,916 mg/kg) with slightly elevated contents between 12 and 16 mbsf (Figure F21). The Fe trend is followed by the solid-phase Mn contents, which range ~0.04–0.065 wt% (440–649 mg/kg) with highest values at ~12 mbsf (Figure F21).
6.4.2. Carbon and sulfur
Total organic carbon (TOC) contents reach 1.25 wt% (Figure F22; Table T9), with the highest values between 6 and 8 mbsf. TOC is the major component of the total carbon (TC) analyzed. Total inorganic carbon (TIC) is very low throughout the sediment column, not exceeding 0.2 wt% and with a spike at 6 mbsf. Total sulfur (TS) is very low with a maximum of 0.79 wt% at 6 mbsf.

Figure F22. TC, TOC, TIC, and TS.
6.5. Discussion
In contrast to all other sites, the low ammonium, alkalinity, and methane concentrations indicate that little organic matter remineralization occurs at Site M0094. The low mineralization rates are also reflected in the broad iron reduction zone (Froelich et al., 1979) that stretches to almost 5 mbsf in Hole M0094B. The cation concentrations (especially, Na2+, Mg2+, and Ca2+) show very little variation with a small increase at around 5 mbsf. Sulfate is found in all IW samples. A slight decrease with depth in the uppermost ~6 m suggests low sulfate reduction rates, and the sulfate increase with depth below ~8 mbsf indicates a source of sulfate from below. Dissolved Li increases in the lowermost sediments below 15 mbsf to values that exceed typical seawater values (which could be suggested as a source for the increased sulfate values at depth) and thus likely suggests other Li sources such as deep subseafloor clay mineral diagenesis (e.g., Torres et al., 2015).
The high Si content in the solid phase, in tandem with low Ca and TIC contents, indicates that siliceous materials dominate the sediment composition (Figure F22), which is in good agreement with sedimentary observations (see Lithostratigraphy). High amounts of solid-phase Fe compared to low TS point to an iron-dominated system.
7. Physical properties
This section summarizes the preliminary physical properties results from cores acquired at Site M0094, located at water depths of about 7470 mbsl in Basin C/N2 in the boundary area of the central/northern Japan Trench. Two holes were cored: trigger core Hole M0094A and GPC Hole M0094B. The physical properties data sets were collected with standard techniques and sampling rates defined in Physical properties in the Expedition 386 methods chapter (Strasser et al., 2023a). During the offshore phase, whole cores were scanned through the Multi-Sensor Core Logger (MSCL). During the onshore phase, cores were split, scanned through the Tri-Sensor Core Logger (TSCL), and sampled for moisture and density (MAD), undrained shear strength, and P-wave velocity. Overall, the physical properties data sets are high quality and correlate well with lithology, hydroacoustics, and other data sets. Note that the MSCL data is potentially adversely affected in Holes M0081E and M0081F due to cores being wrapped and gas charging associated with protocols for microbiological sampling (see Operations).
7.1. Bulk density
Downcore MSCL bulk density variations in Holes M0094A and M0094B range ~1.25–1.6 g/cm3 and ~1.3–1.67 g/cm3, respectively. From the top of Hole M0094B to ~1 mbsf, bulk density increases steadily, reaching a high of ~1.6 g/cm3 at ~1.1 mbsf, followed by a sharp drop to ~1.4 g/cm3 (Figure F23). Bulk density in Hole M0094B shows a variable pattern between ~1.1 and ~4.2 mbsf with at least three local highs and lows (~1.36–1.66 g/cm3). Higher bulk density could be attributed to the dominance of sandy beds (see Lithostratigraphy), whereas lower bulk density may be attributed to soft, clayey sediments. The bulk density at intermediate depths (e.g., ~4.2 to ~11 mbsf) remains fairly uniform (average = ~1.4 g/cm3). However, between ~11 and 16 mbsf, the variable density pattern resumes. Density values increase steadily between ~16 mbsf and the bottom of Hole M0094B. When examined in detail, such repetitive changes are typically linked to downcore lithologic changes. A linear increase in bulk density toward the bottom of Hole M0094B is consistent with a steady increase in other physical properties (e.g., magnetic susceptibility, P-wave velocity, resistivity, NGR, and shear strength).
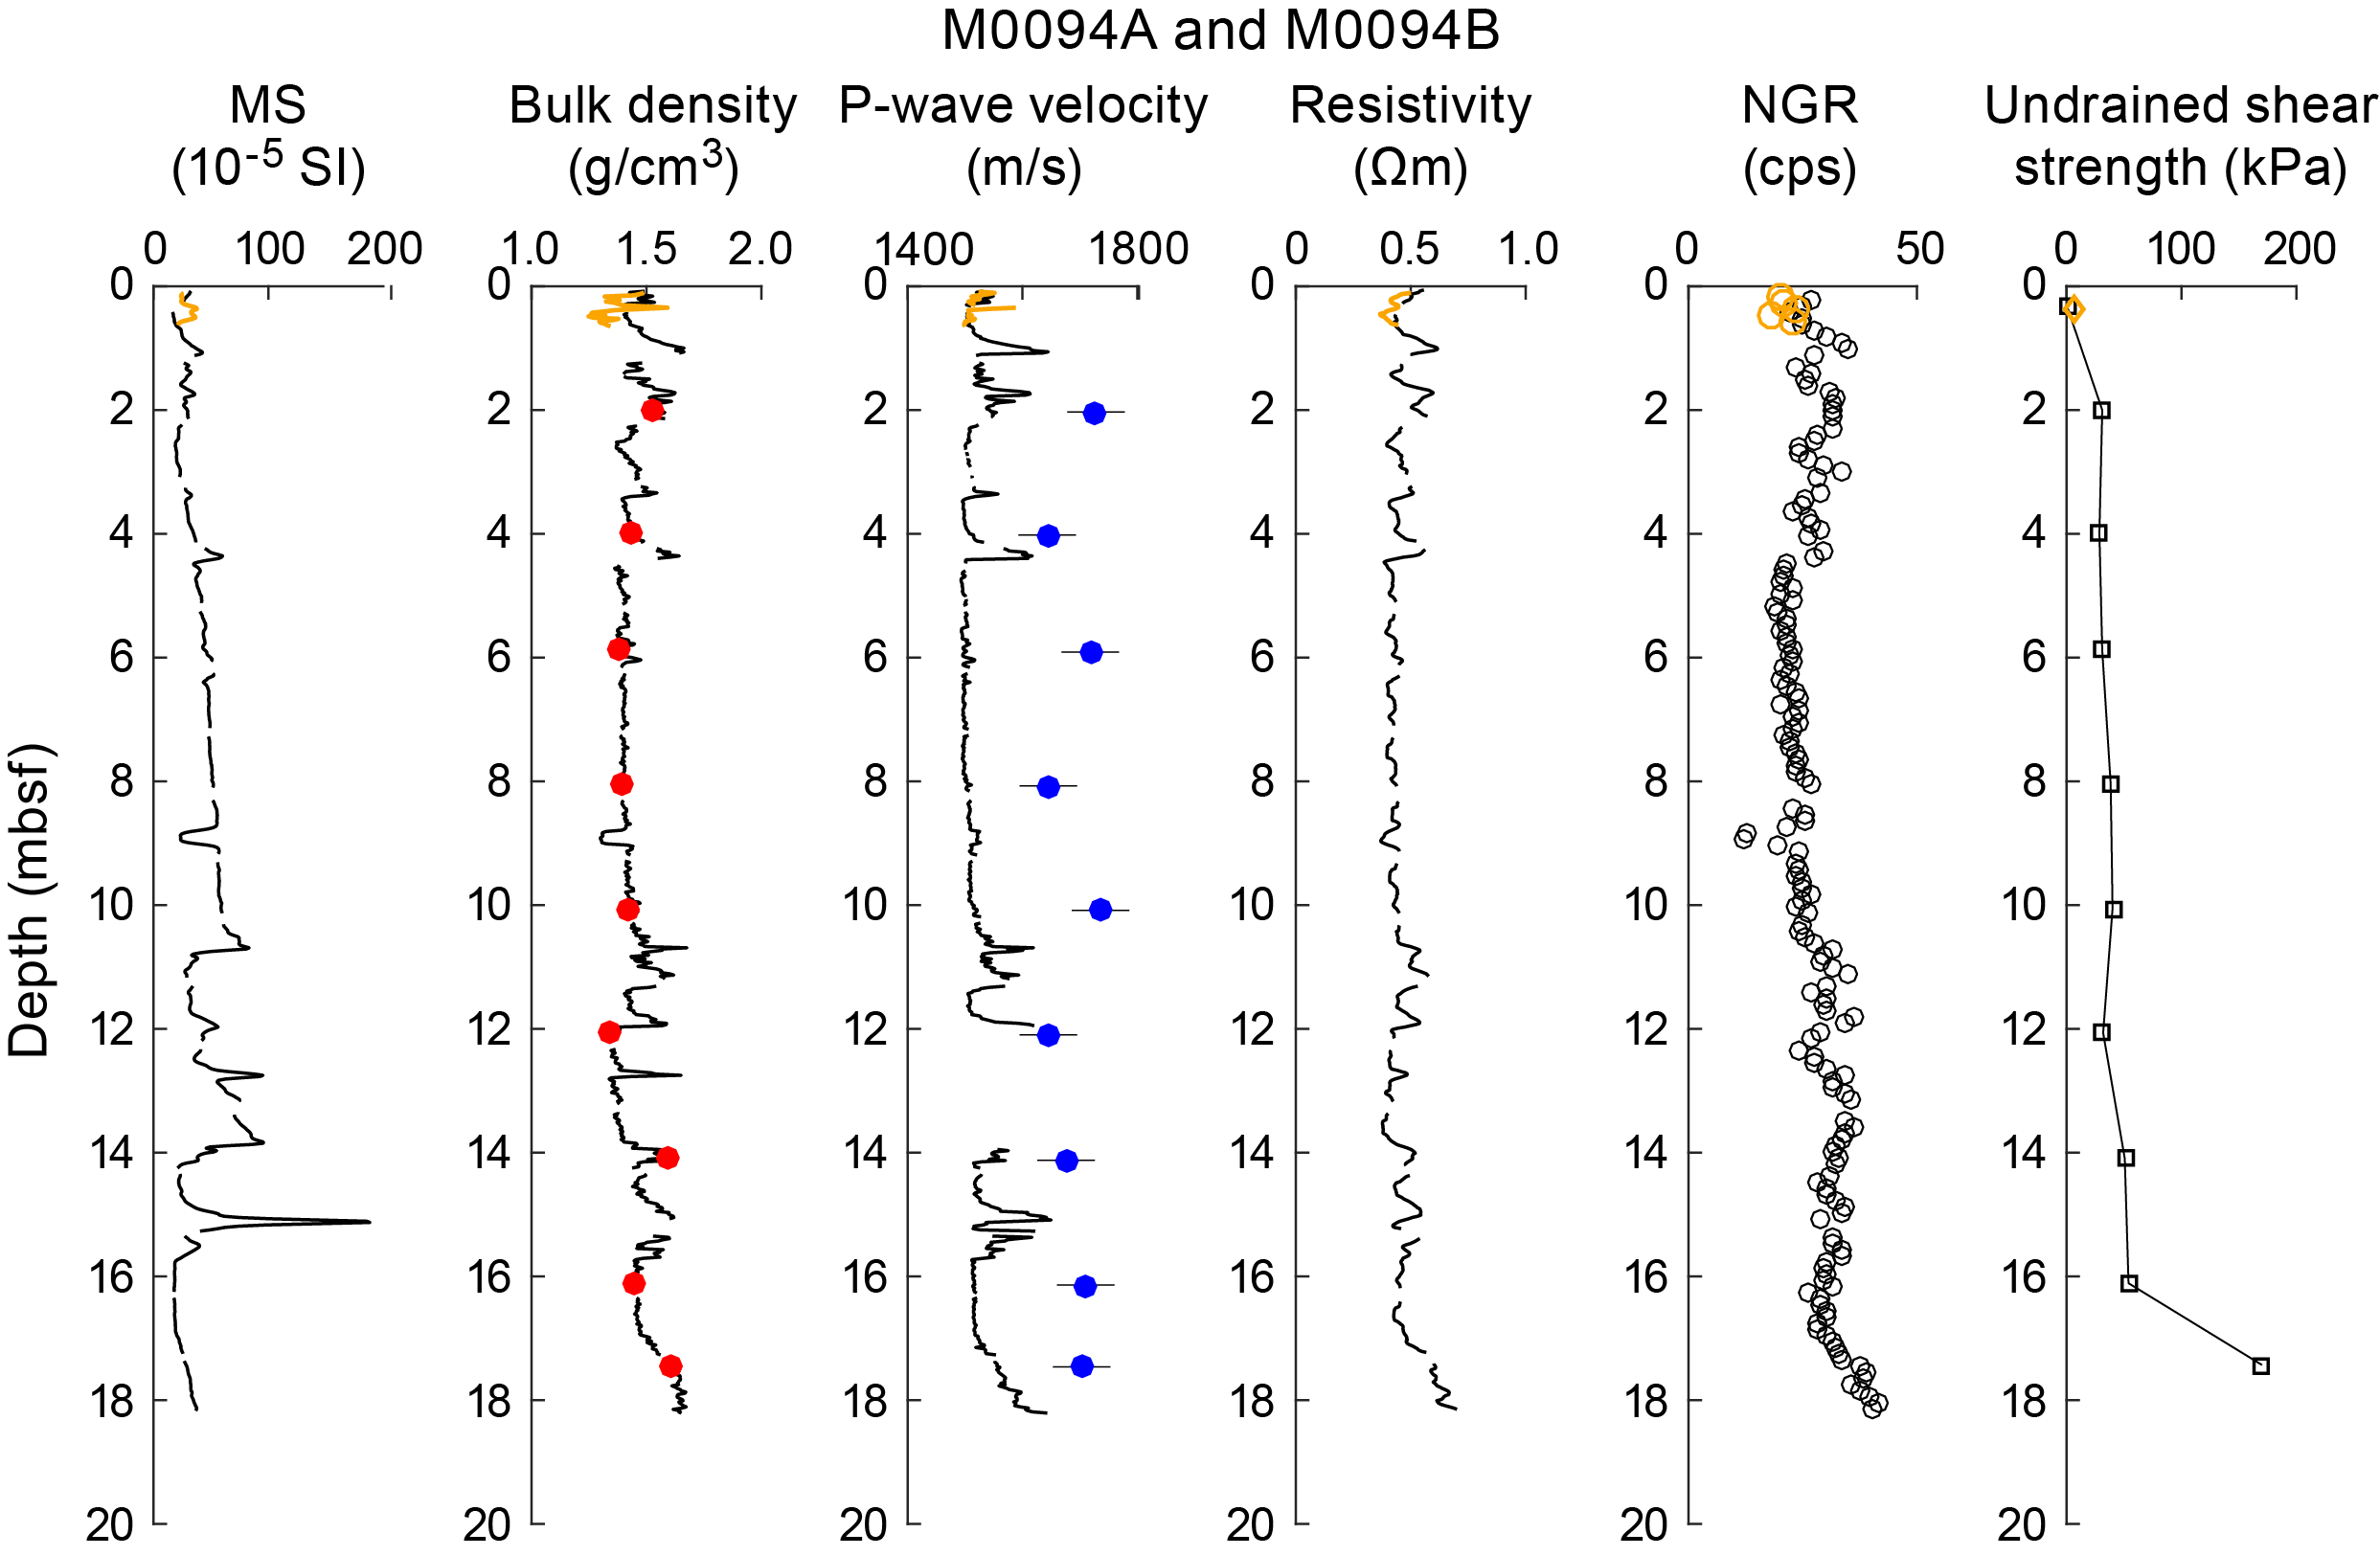
Figure F23. Physical properties summary.
Onshore, bulk density, porosity, and grain density were obtained using the MAD analysis technique on discrete samples. MSCL density shows higher frequency fluctuations due to a higher sampling rate, but at the sampling depths, a very good match exists between the MSCL bulk density and MAD bulk density.
7.2. Magnetic susceptibility
Downcore magnetic susceptibility variations at Site M0094 range 16 × 10−5 to 188 × 10−5 SI. The top sections of the trigger core (Hole M0094A) and the GPC core (Hole M0094B) show consistent trends comprising high-frequency undulations. The general background magnetic susceptibility at this site is ~40 × 10−5 SI (Figure F23). The central section of Hole M0094B (~4.4–10.75 mbsf) shows a downcore increasing magnetic susceptibility trend. A number of distinct highs and lows at the bottom of Hole M0094B are clearly evident. A high magnetic susceptibility peak (~188 × 10−5 SI) at ~15 mbsf seems to correspond well with a dark, thin tephra layer (see Tephra). A corresponding positive shift in bulk density values (~1.62 g/cm3) between ~14 and 15.5 mbsf is also observed, although bulk density measurements corresponding to the exact magnetic susceptibility peak are missing from the MSCL data.
7.3. P-wave velocity
P-wave velocity was measured with the MSCL on whole cores during the offshore phase. During the onshore phase, P-wave velocity was measured on discrete samples approximately every 2 m. Many of the MSCL velocity data were of insufficient quality below ~5 mbsf and have been omitted.
Offshore P-wave velocities recorded with the MSCL at Site M0094 generally trend around 1500 m/s (the velocity of water). Shore-based discrete measurements are noticeably higher (closer to an average of 1700 m/s). The difference in velocity exceeds the uncertainty associated with the discrete velocity measurements (±50 m/s). The difference between the two datasets may be attributed to continued compaction or degassing of the sediments between the offshore and onshore phases of the expedition. Further investigation will be required to fully understand the discrepancy, and the data should thus be used with a degree of caution.
MSCL and laboratory-measured P-wave data are plotted in Figures F23 and F24 for Site M0094.
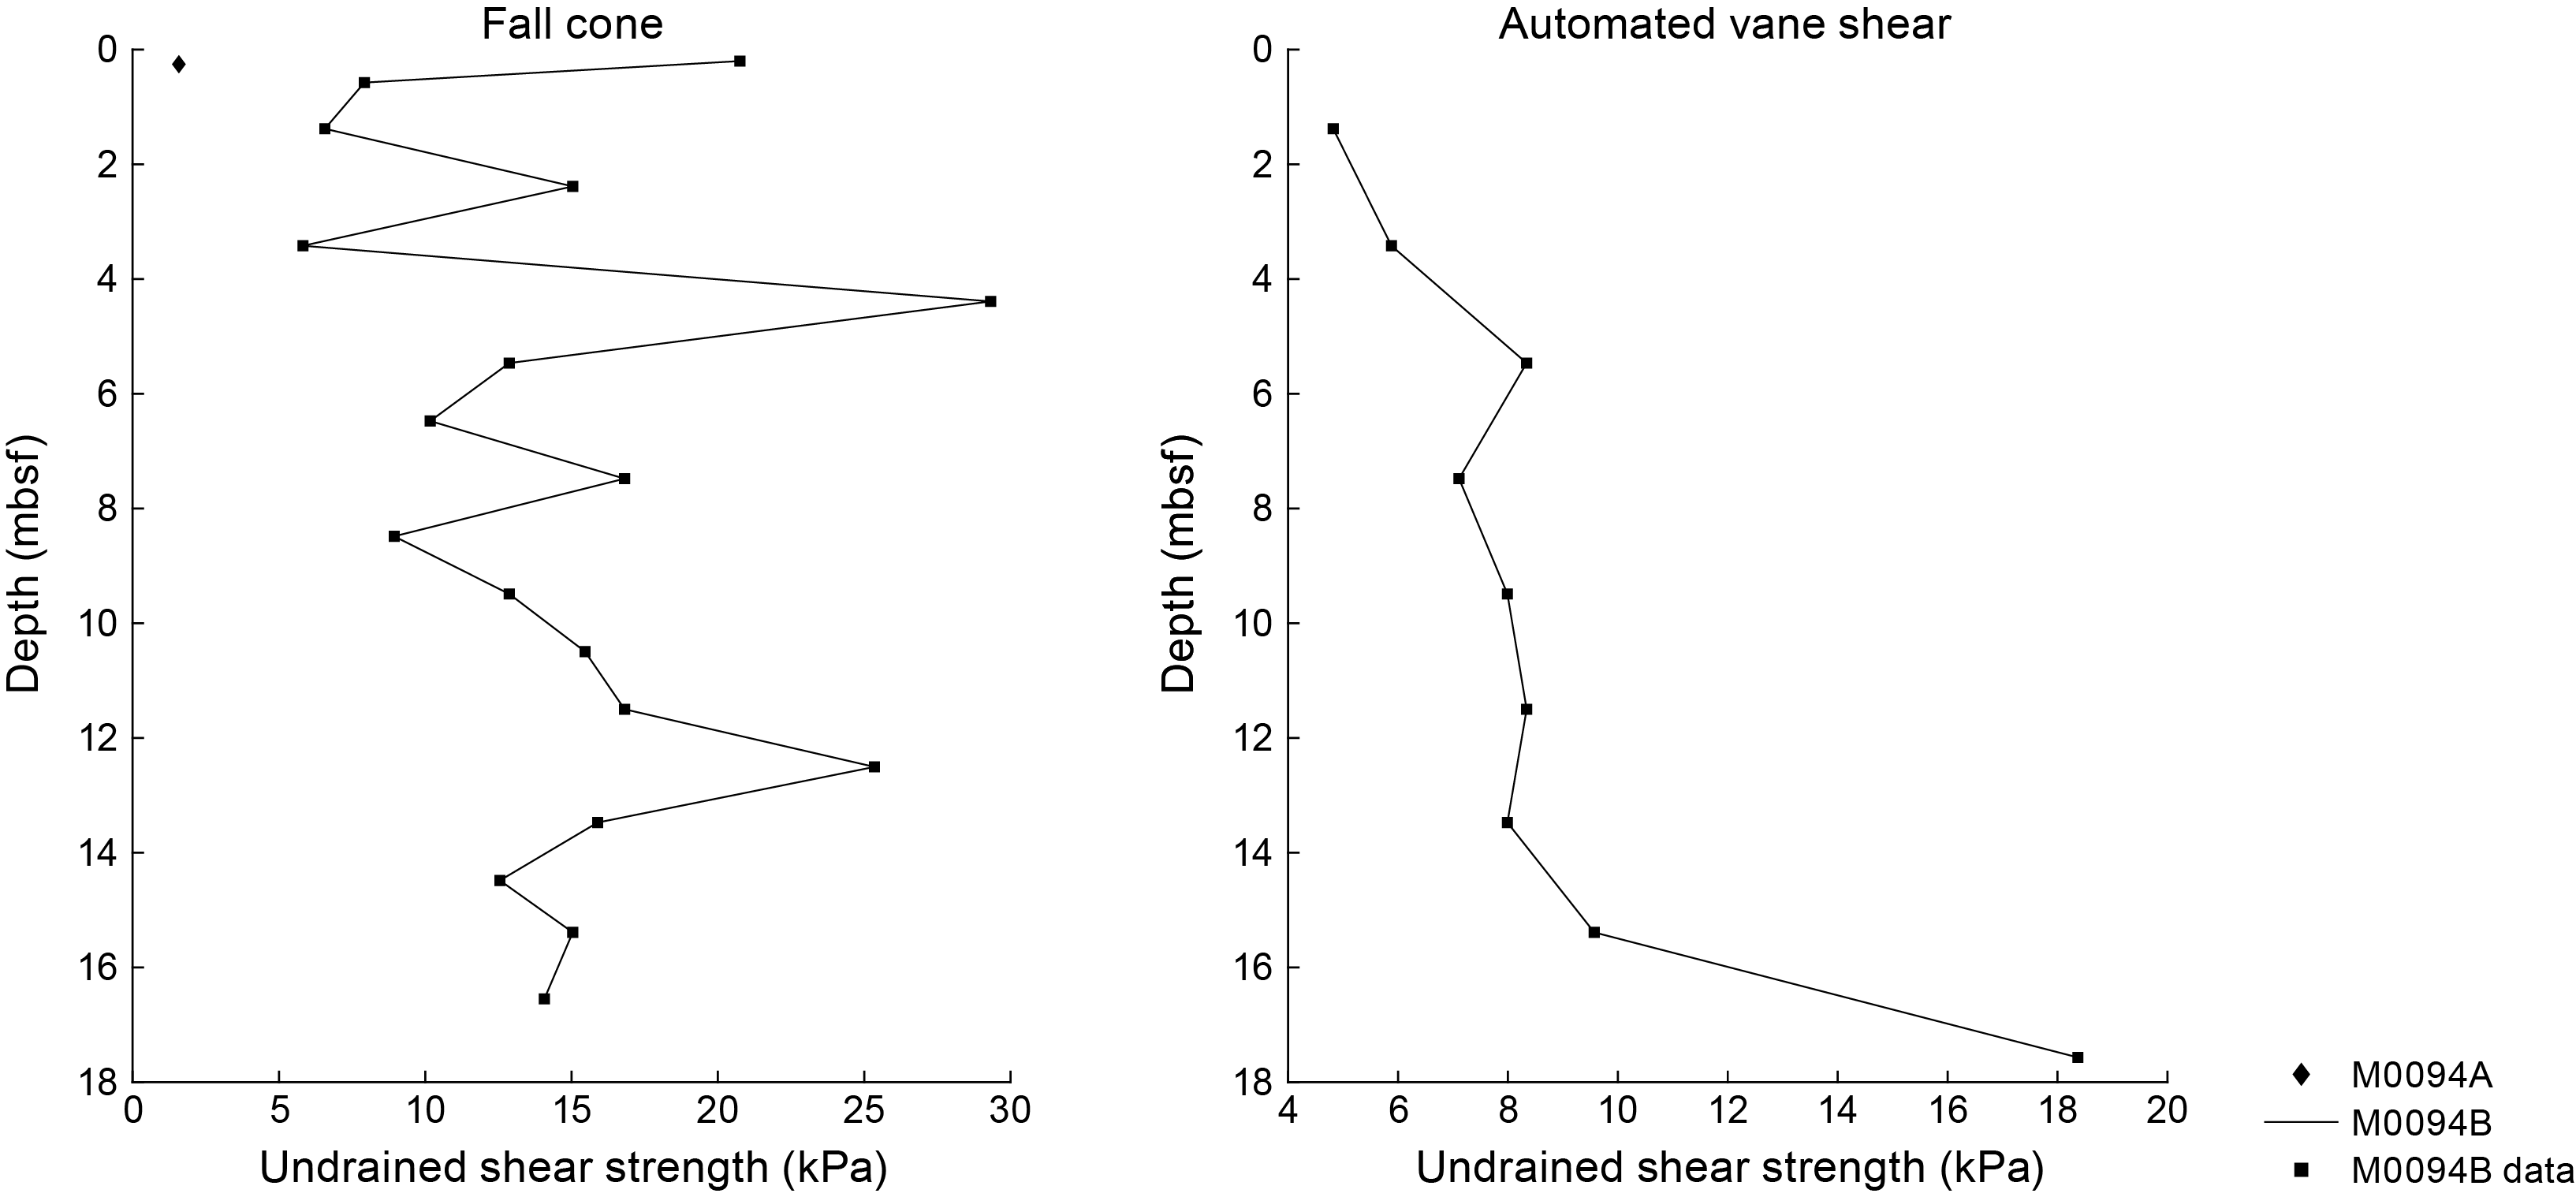
Figure F24. Undrained shear strength.
7.3.1. MSCL measurements
P-wave velocities vary between 1493 and 1650 m/s across the entire core depth in Hole M0094B (Figure F23). The uppermost 4.5 m of the core shows an undulating velocity pattern ranging 1495.1–1644.8 m/s. Below 4.5 mbsf, there seems to be a sudden negative shift in P-wave velocity (average = ~1513 m/s), which then remains consistent to ~11 mbsf. Downcore velocity variations between ~11 and ~16 mbsf (with a data gap between ~11 and 13 mbsf) show an undulating trend ranging 1512–1650 m/s. From ~16 mbsf to the base of the core, a steady increase in velocity is observed (average = ~1548 m/s). Overall, the top, middle, and bottom sections of the cores show characteristic velocity variations that are likely related to downcore lithologic changes.
7.3.2. Discrete measurements
A single discrete measurement (~1737 m/s) was completed at 0.42 mbsf in Hole M0094A. Discrete velocity measurements in Hole M0094B yield values between 1643 and 1736 m/s (average = ~1689 m/s). P-wave velocity values initially drop between 2 and 4 mbsf, with the lowest value of 1643 m/s at 4 mbsf (Figure F23). A variable pattern of highs and lows between 4 and 12 mbsf is noted. Between 12 and 18 mbsf, a linear increase in discrete velocity measurements was observed.
7.4. Noncontact electrical resistivity
MSCL-derived noncontact electrical resistivity values at Site M0094 are relatively low but consistent throughout the core. A low-frequency variable resistivity pattern (average = ~0.4 Ωm) between 0 and ~4.2 mbsf is observed. Slightly lower (~0.36 Ωm) but steady resistivity variations between 4.2 and ~11 mbsf are noted (Figure F23). Farther downcore, resistivity variations return to a fluctuating pattern at ~15 mbsf. Between 16 mbsf and the bottom of Hole M0094B, electrical resistivity increases steeply (0.5–0.7 Ωm).
7.5. Natural gamma radiation
Both the trigger and GPC cores at Site M0094 show consistent NGR variations, especially in the top section of the cores (Figure F23). In general, NGR values range 12–41 counts/s, with the lowest count at ~8.93 mbsf (Sample 386-M0094B-1H-10, 70–72 cm). The top (~0–4 mbsf) and bottom (~11–18 mbsf) sections of Hole M0094B show a fluctuating pattern. The middle section of the core (~4–11 mbsf) shows a rather low but consistent NGR of ~20 counts/s. These observations correspond well with the downcore bulk density variations. A steep positive change in NGR at ~16 mbsf continues to the base of the core. In general, depending on the downcore lithologic changes, silty clay beds may exhibit high NGR values and low values could be associated with diatom ooze (see Lithostratigraphy).
7.6. Undrained shear strength
Undrained shear strength (Su) measured with a handheld penetrometer increases between the core top (0 kPa) and 2 mbsf (30 kPa) and remains fairly consistent downcore, with an average of ~38 kPa between 2 and 16 mbsf (Figure F23). At the base of Hole M0094B, Su jumps to an anomalously high value of ~170 kPa.
Su was measured during the Personal Sampling Party (PSP) using a fall cone penetrometer once in each section in all holes at Site M0094 (Figure F24). Su measured across all holes using the fall cone generally increases with depth, ranging 1.6–29.3 kPa and averaging 13.89 ± 6.45 kPa. Su measured during the PSP using an automated vane shear (AVS) device were recorded in alternating sections in Hole M0094B. AVS Su values were generally lower than Su values measured using the fall cone. AVS Su values generally increase with depth, ranging 4.82–18.37 kPa and averaging 8.71 ± 3.67 kPa.
It should be noted that Su values vary according to the device used to obtain them (Figure F24). For example, fall cone strengths are higher than those obtained with the AVS and hand-held penetrometer. The influence of the U-channel along the center of the core could result in lower strengths than those measured with the fall cone. The fall cone only impacts a small region of the core (~2–5 mm), whereas the AVS impacts a larger region (~20–50 mm). Both measurements ideally should be obtained from the center of the core away from the core sidewall. However, samples could not be taken at the center because of the U-channel recovered during the Onshore Science Party (OSP). As a result, strength sampling points had to be placed halfway between the central U-channel and the sidewall of the core. During AVS measurements, the fractures that opened often propagated toward both the central U-channel and the sidewall, perhaps resulting in lower strength values. The fall cone measurements were not seen to be affected by the U-channel or the sidewall. Further analysis will more closely examine the strength data to try to reconcile the differences.
7.7. Moisture and density
MAD analyses of discrete samples were performed during the onshore phase. Wet and dry water contents, bulk density, dry density, grain density, porosity, and void ratio were obtained using this technique (Figure F25). Wet and dry water contents both decrease initially with depth in the uppermost 2 m and remain relatively stable down to ~12 mbsf. Water content values drop at ~14 mbsf, increase slightly at ~16 mbsf, and drop slightly at the bottom of Hole M0094B.
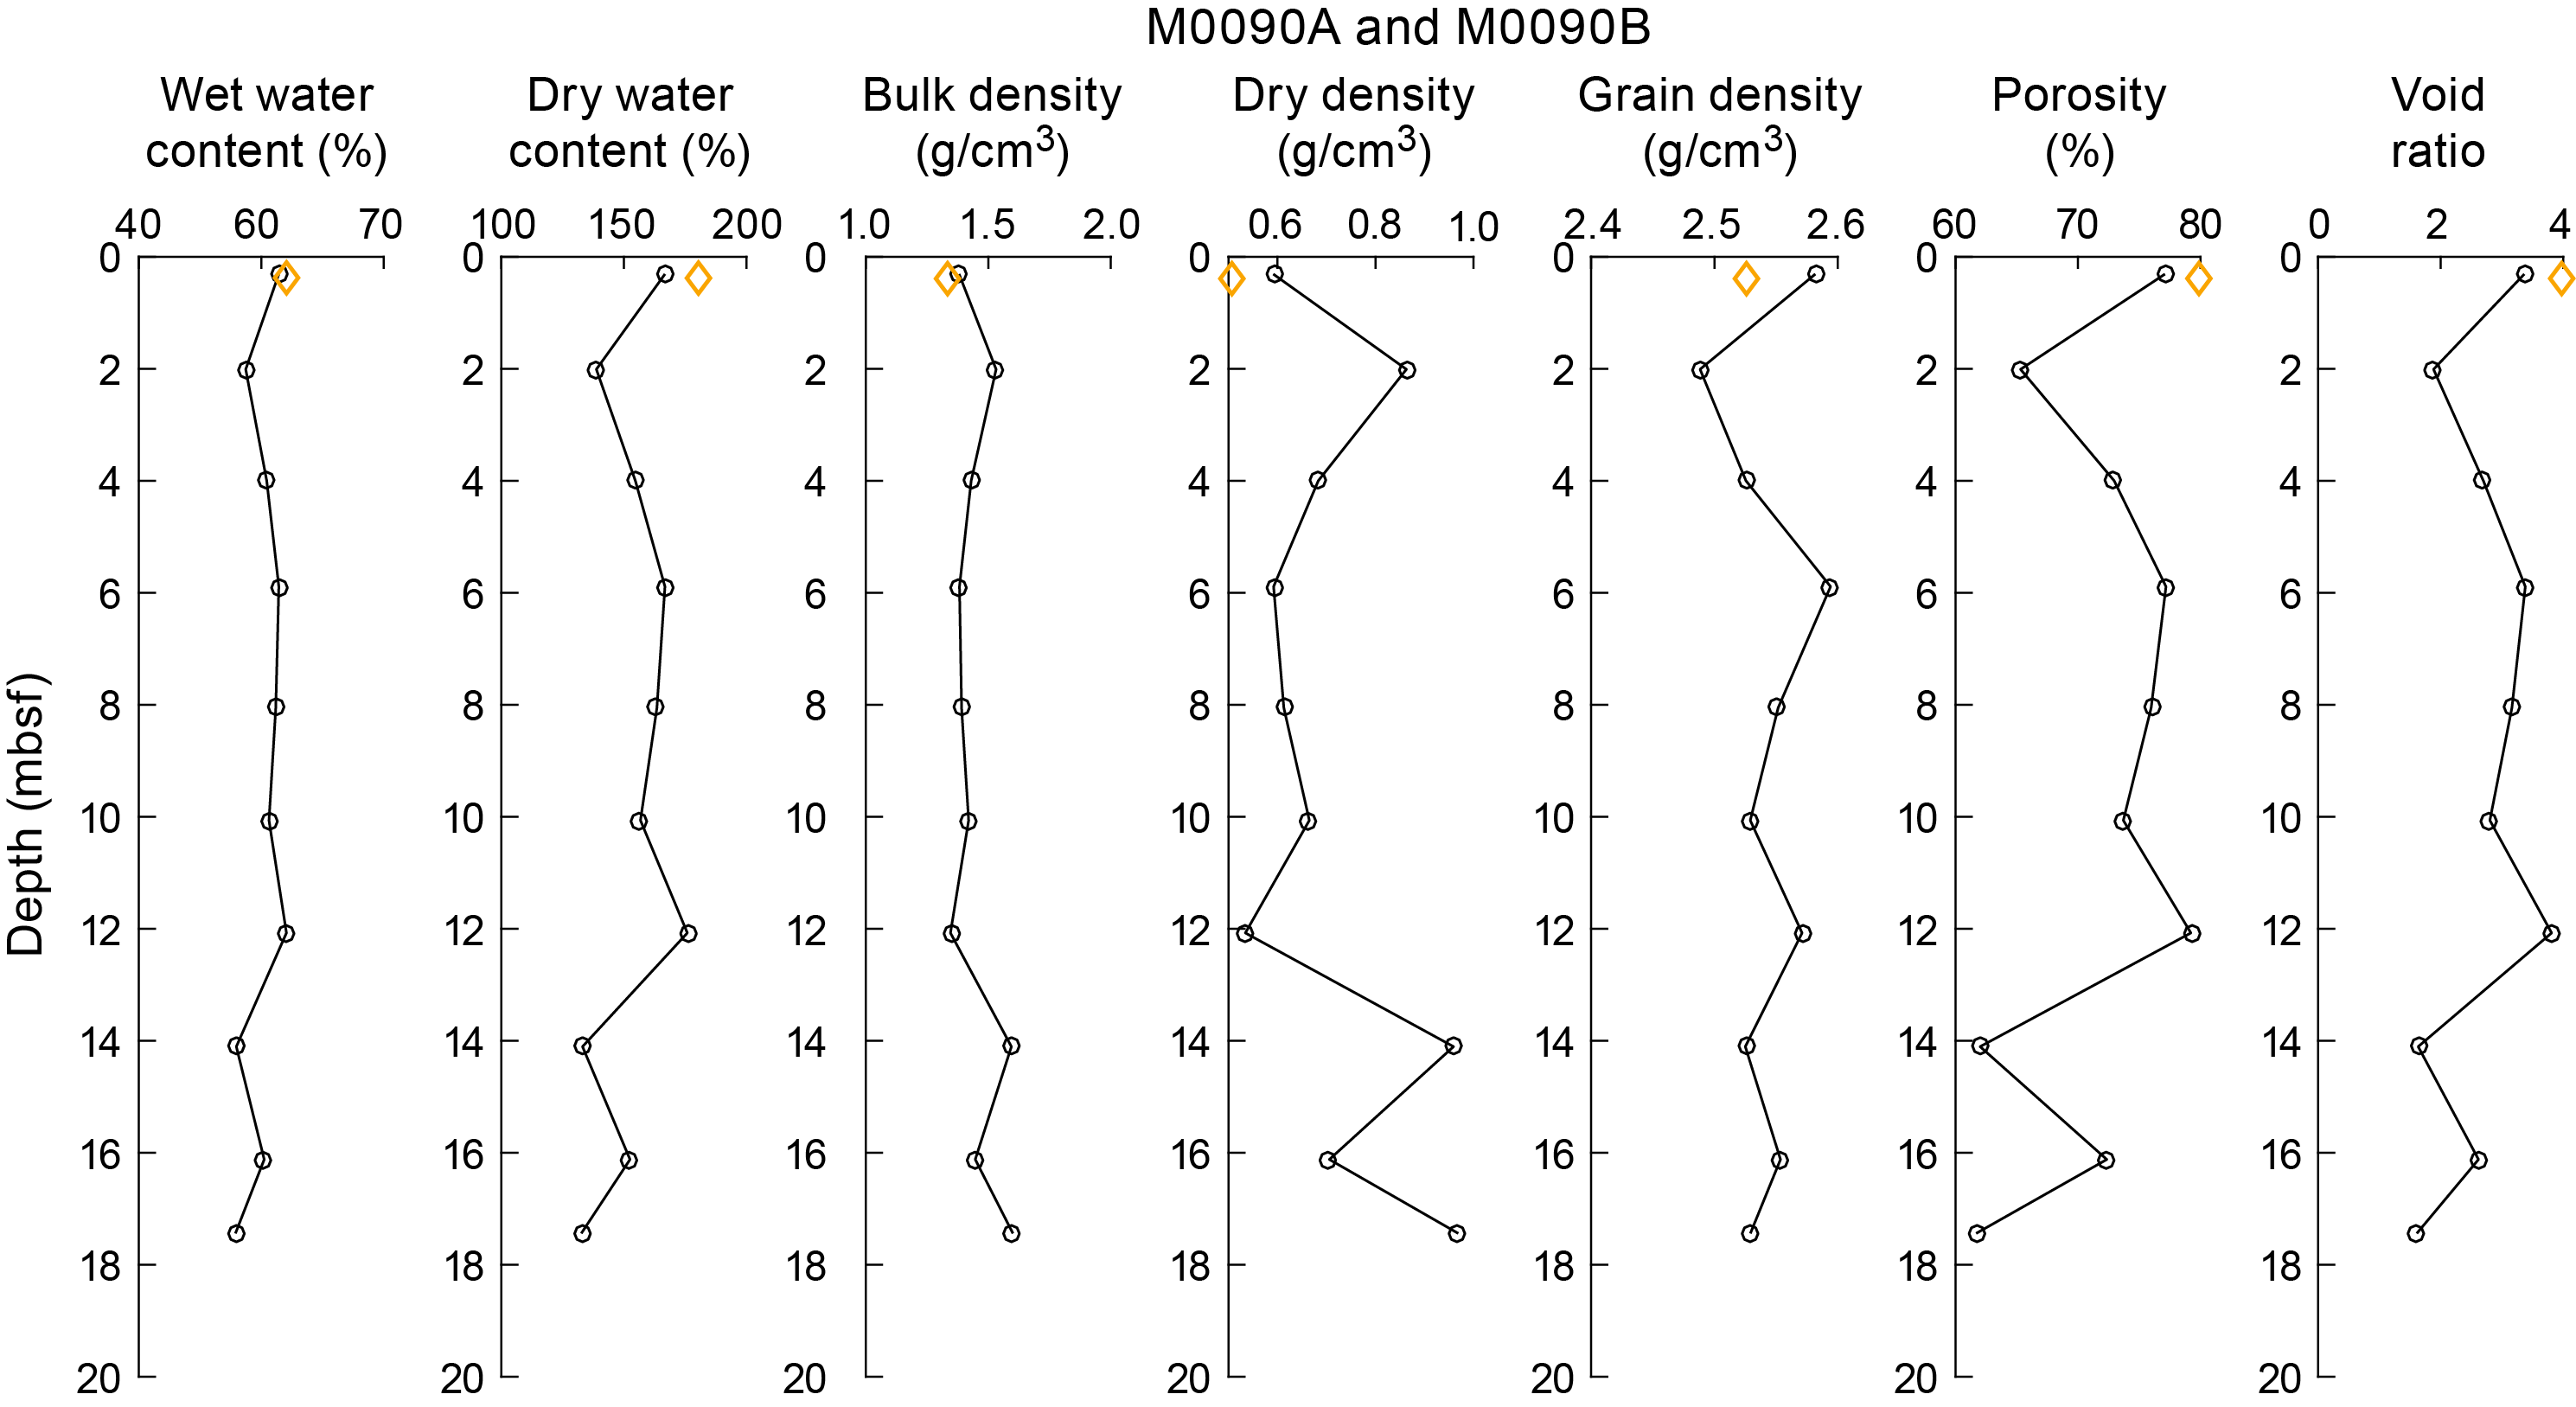
Figure F25. MAD data.
Bulk density values in Holes M0094A and M0094B increase from ~1.4 g/cm3 at the top of the core to ~1.5 g/cm3 at 2 mbsf. Between 2 and 12 mbsf, bulk density values remain fairly constant at ~1.4 g/cm3. Between 14 mbsf and the base of Hole M0094B, bulk density fluctuates between ~1.6 and ~1.4 g/cm3. Grain density, porosity, and void ratio variations with depth correspond well with each other across the entire core length. Co-varying downhole trends in dry density, porosity, and void ratio are most likely related to compaction and shifts in lithology. The lower sections of Hole M0094B exhibit relatively higher variability in porosity and void ratios.
Downcore grain density variation seems to exhibit an opposite trend to the bulk density profile. This likely reflects the grain density of the major lithologic components at this site. Grain density mostly ranges ~2.5–2.6 g/cm3 between the top and bottom of Hole M0094B. Apart from a sharp decrease at ~2 mbsf (2.6–2.4 g/cm3), no overall trend can be discerned. Porosity initially decreases between 0 and 2 mbsf from ~77% to ~65%. A gradual increase in porosity between 2 and 6 mbsf is followed by a decreasing trend between 6 and 10 mbsf. Porosity sharply decreases to 60% at 14 mbsf.
7.8. Color reflectance and RGB values
Color reflectance shows noisy cyclic variability of all three L*a*b* color components downcore.
L* values in Hole M0094B range approximately ~13–38 (Figure F26). They fluctuate between 30 and 35 in the uppermost ~3.8 m. Between 4 and 11 mbsf, values become rather invariant (~30). Between ~11 mbsf and the base of Hole M0094B, values are generally higher than at the top and show greater variability (25–38).
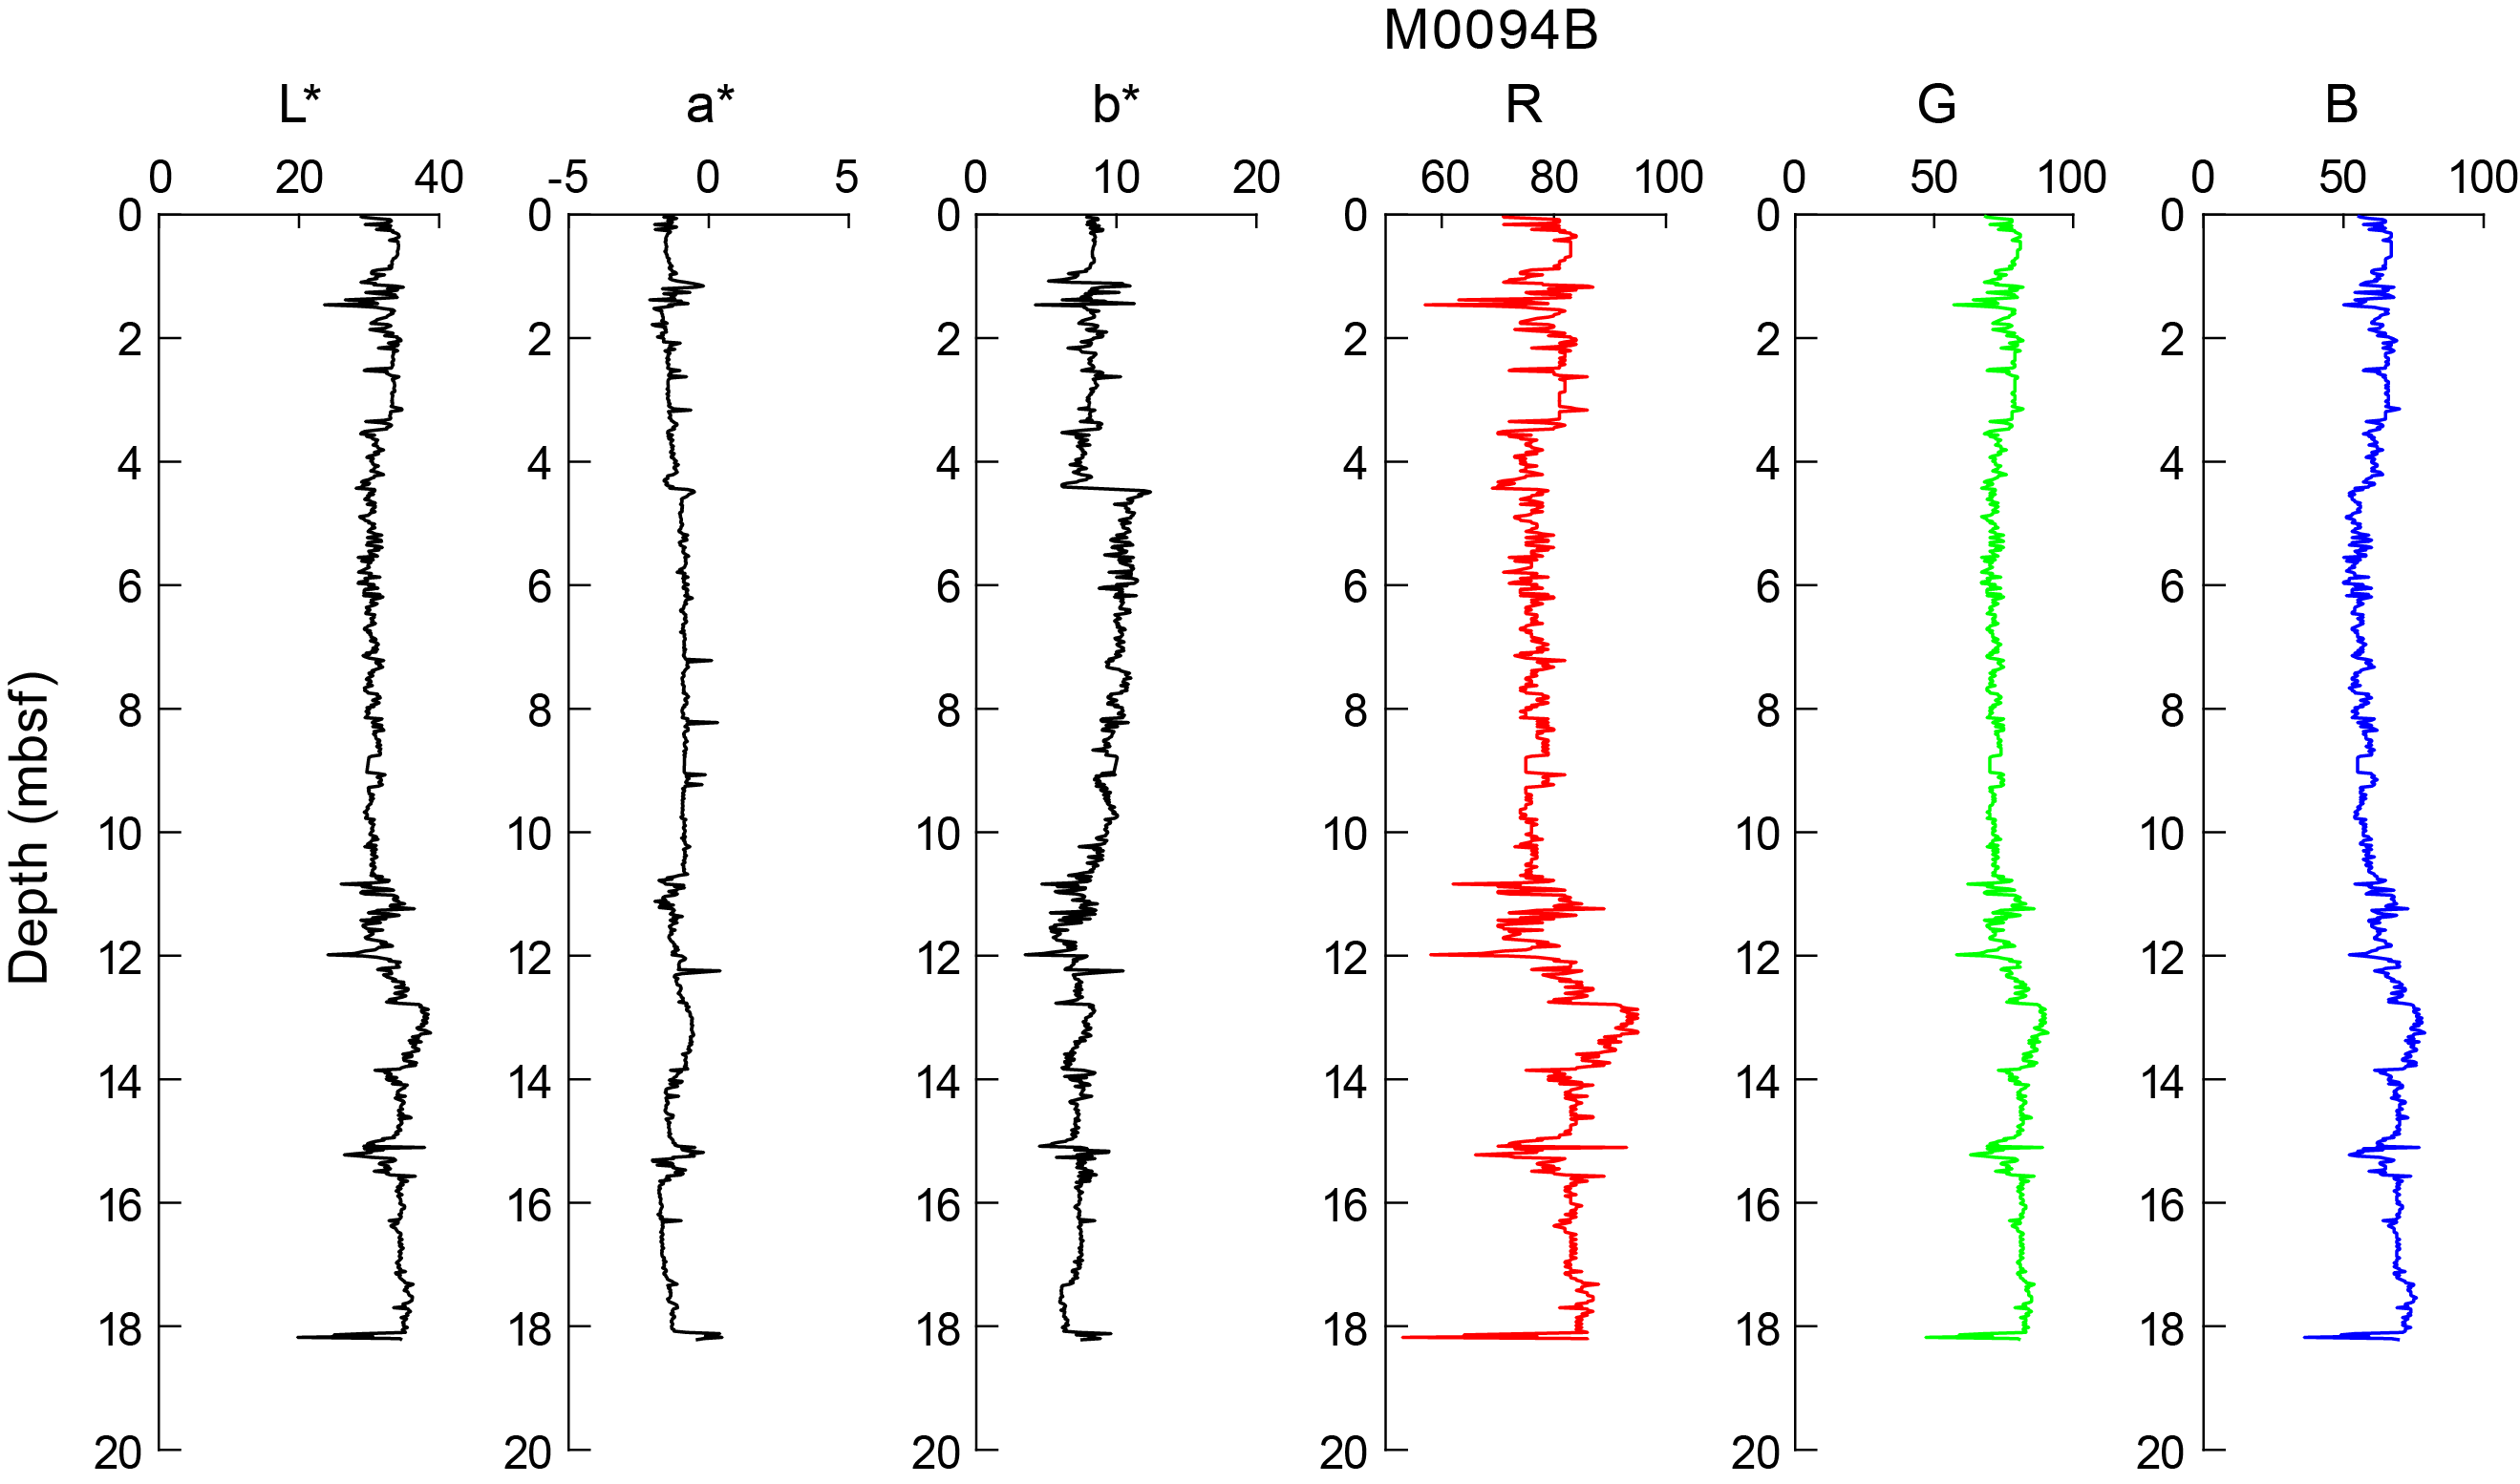
Figure F26. Color data.
Values of a* in Hole M0094B range approximately between −2.1 and 0.48 with several localized spikes exceeding 0. Values are low and consistent throughout the core. Values of b* in Hole M0094B range ~5 to ~12.4 with a distinct positive shift at ~4.4 mbsf.
RGB values vary with depth in all holes in accordance with the spectrometry parameters. A detailed visual inspection of the downcore variations suggests three different zones: 0–4.5, 4.5–12, and 12 mbsf to the bottom of the hole.
8. Paleomagnetism
This section reports the measurement of remanent magnetization in Holes M0094A and M0094B, which were cored in the boundary area between the central and northern Japan Trench (Basin C/N2). Remanent magnetization of U-channel samples was measured on sections of the working halves at 2 cm intervals. Natural remanent magnetization (NRM) measurements were only conducted at 0 and 5 mT peak fields due to the time constraints of the hybrid OSP.
Profiles of intensity, inclination, and declination after demagnetization at 5 mT are displayed in Figures F27 and F28. Intensities in Hole M0094A peak at 0.45 mbsf. Declination shows constant values. Inclination in Hole M0094A shows positive spikes at 0.25 and 0.5 mbsf.

Figure F27. Intensity, inclination, and declination, Hole M0094A.
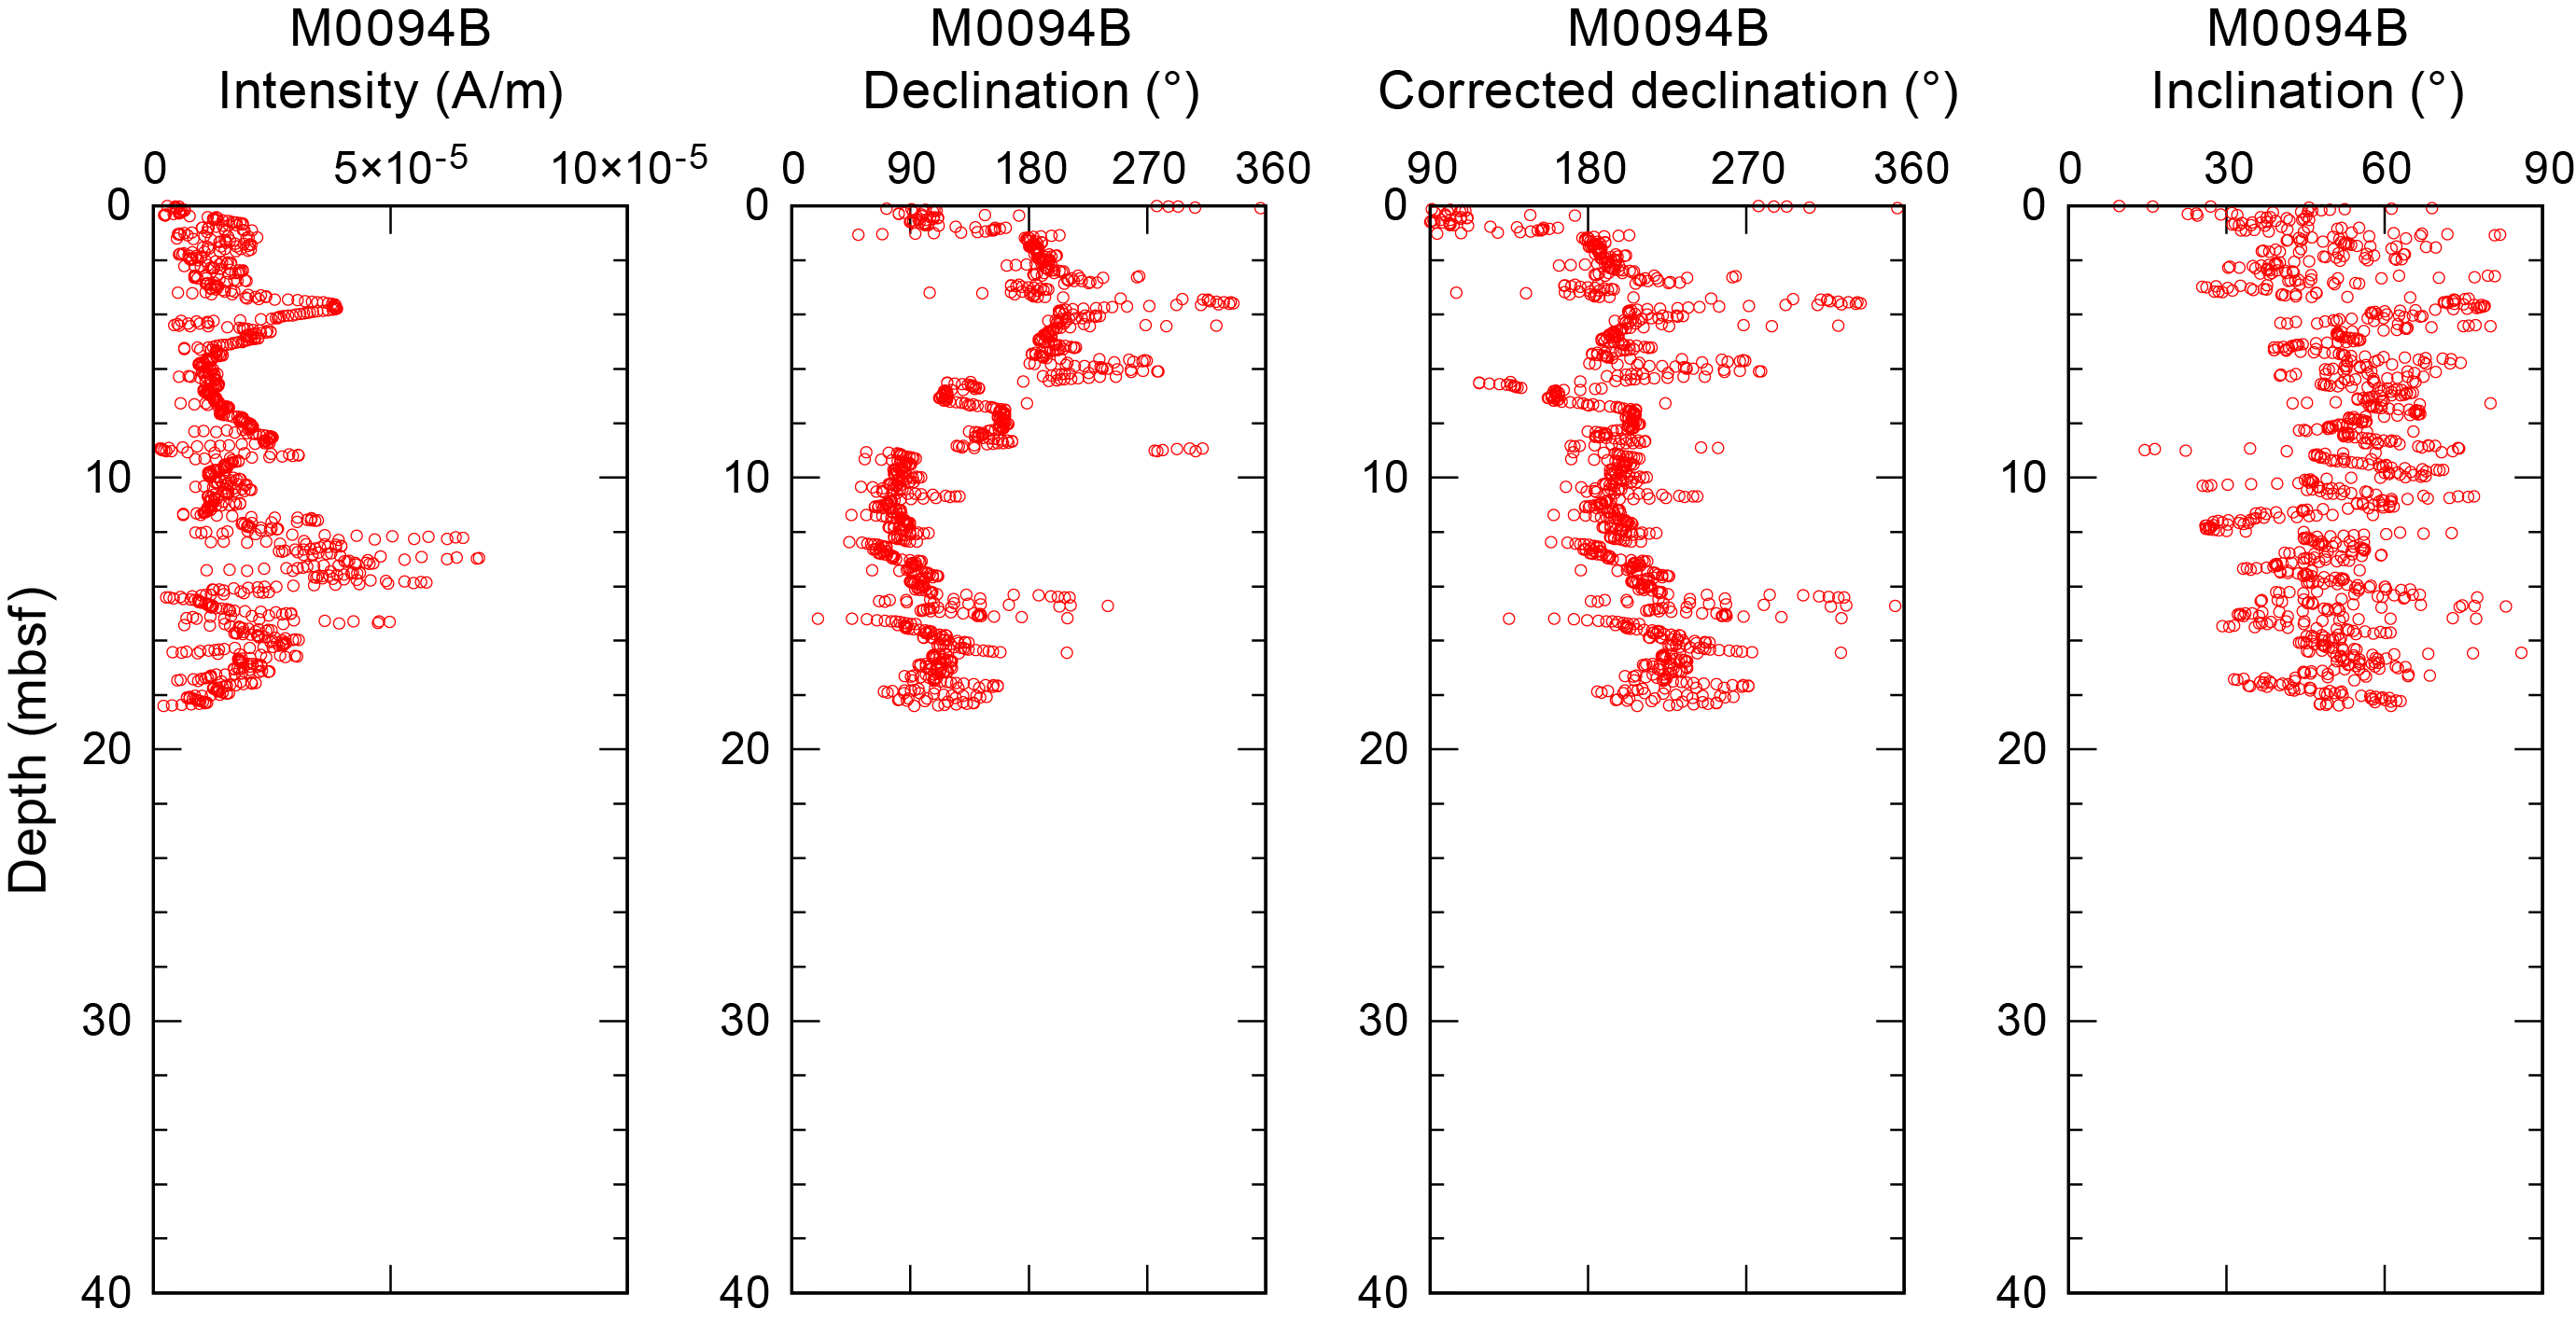
Figure F28. Intensity, declination, corrected declination, and inclination.
Intensity data from Hole M0094B show a peak at 3 mbsf and smoothed variations between 4 and 8 mbsf. Scattered but relatively higher intensities are recognized between 12 and 14 mbsf.
Discontinuities in the declination trend in Hole M0094B (6 and 9 mbsf) were corrected by shifting to compensate for directional gaps. The corrected declination reveals several short fluctuations, but the general trend is around 200°.
The inclination profile of Hole M0094B shows values predominantly distributed between 30° and 80° down to 11 mbsf. Below this, inclination values are distributed between 30° and 60°.
Preliminary paleomagnetic data for Hole M0094B reveal unique patterns of intensity: low intensity and highly fluctuated intervals. The signature of paleomagnetic secular variations is not clear in the preliminary results at this site.
9. Stratigraphic correlation
One GPC core was recovered from two holes (M0094A and M0094B) during a GPC deployment.
First-order correlation between the two holes at Site M0094 enabled the construction of a continuous stratigraphic succession from the seafloor to the bottom of Hole M0094B (18.885 meters composite depth [mcd]), with the exception of one currently unresolved gap between the base of the trigger core (386-M0094A-1P) and the top of the GPC core (386-M0094B-1H). Therefore, the Site M0094 composite depth below seafloor scale (mcd in splice [mcd-splice]) for depths >0.645 mcd-splice is currently referred to as a floating depth, assuming the coring gap to be zero (see Stratigraphic correlation in the Expedition 386 methods chapter [Strasser et al., 2023a]).
9.1. Construction of core composite depth scale
9.1.1. Definition of top
The presence of a thin (~0.5 cm) oxidized top in the trigger core in Section 386-M0094A-1P-1, 6–6.5 cm (see Lithostratigraphy), suggests that an undisturbed mudline was recovered in the hole. Thus, the vertical offset was determined as −0.06 m for Hole M0094A. Because only a single trigger core was obtained at this site, Hole M0094A is selected as the anchor core, and Section 386-M0094A-1P-1, 6 cm, is defined as 0 mbsf (Tables T10, T11).
9.1.2. Compositing of cores
Before compositing holes, artificial and/or natural voids at the ends of sections were measured and void lengths were subtracted from the curated section length to obtain the sediment length of each section. Corrected section lengths and section top and bottom depths of Site M0094 are listed in Table T10.
The core composite scale for Site M0094 is currently tentatively based on visual correlation of marker horizons visible in X-ray CT images. VCDs and linescan images generated during the OSP and spikes in magnetic susceptibility and gamma ray attenuation (GRA) data from the MSCL, measured at 2 and 10 cm intervals, respectively (see Physical properties in the Expedition 386 methods chapter [Strasser et al., 2023a]), were used for interhole correlation. At this stage, thin but clear marker beds visible on X-ray CT images were tentatively used, where possible verified by visual core description, because large (coarse and thick) event beds may have eroded the underlying sediments.
Primary air fall tephra beds, which were created by a single volcanic eruption and fell through the water column, are amongst the most effective tie points. A tephra bed was observed in interval 386-M0094B-1H-16, 81.7–82.5 cm (see Tephra). Because this tephra is a potential candidate for intersite correlation, its detailed analysis is important.
Only one append point (AP1) was defined between the trigger core (Hole M0094A) and the GPC core (Hole M0094B) (Table T12). First-order correlation does not allow for correlation between the trigger core (386-M0094A-1P) and the upper part of the GPC core (386-M0094B-1H), and no correlation tie point could be identified to tie the GPC core to the mudline-anchored trigger core. This suggests that the coring gap at the top of the GPC core is larger than the total length of the trigger core, and the composite depth scale of the GPC core remains floating. Following the methodology in Stratigraphic correlation in the Expedition 386 methods chapter (Strasser et al., 2023a), the base of the trigger core (Section 386-M0094A-1P-1, 70.5 cm; 0.705 mbsf in the corrected core depth scale [Table T10]; 0.645 mcd) and the top of the GPC core (386-M0094B-1H) are aligned, assuming the gap to be zero (AP1). With no artificial void at the top of Section 386-M0094B-1H-1 (Table T10), a vertical depth shift of 0.645 m is calculated for the top of Core 1H (Table T11).
9.1.3. Construction of splice
With only one GPC deployment at this site, no splice has been constructed.
References
Bruland, K.W., Middag, R., and Lohan, M.C., 2014. Controls of trace metals in seawater. In Holland, H.D., and Turekian, K.K. (Eds.), Treatise on Geochemistry (Second Edition). Oxford (Elsevier), 19–51. https://doi.org/
Froelich, P.N., Klinkhammer, G.P., Bender, M.L., Luedtke, N.A., Heath, G.R., Cullen, D., Dauphin, P., Hammond, D., Hartman, B., and Maynard, V., 1979. Early oxidation of organic matter in pelagic sediments of the eastern equatorial Atlantic: suboxic diagenesis. Geochimica et Cosmochimica Acta, 43(7):1075–1090. https://doi.org/
Kioka, A., Schwestermann, T., Moernaut, J., Ikehara, K., Kanamatsu, T., Eglinton, T.I., and Strasser, M., 2019. Event stratigraphy in a hadal oceanic trench: the Japan Trench as sedimentary archive recording recurrent giant subduction zone earthquakes and their role in organic carbon export to the deep sea. Frontiers in Earth Science, 7:319. https://doi.org/
Strasser, M., Ikehara, K., and Cotterill, C., 2019. Expedition 386 Scientific Prospectus: Japan Trench Paleoseismology. International Ocean Discovery Program. https://doi.org/
Strasser, M., Ikehara, K., Everest, J., Maeda, L., Hochmuth, K., Grant, H., Stewart, M., Okutsu, N., Sakurai, N., Yokoyama, T., Bao, R., Bellanova, P., Brunet, M., Cai, Z., Cattaneo, A., Hsiung, K.-H., Huang, J.-J., Ishizawa, T., Itaki, T., Jitsuno, K., Johnson, J.E., Kanamatsu, T., Keep, M., Kioka, A., Kölling, M., Luo, M., März, C., McHugh, C., Micallef, A., Nagahashi, Y., Pandey, D.K., Proust, J.-N., Rasbury, E.T., Riedinger, N., Satoguchi, Y., Sawyer, D.E., Seibert, C., Silver, M., Straub, S.M., Virtasalo, J., Wang, Y., Wu, T.-W., and Zellers, S.D., 2023a. Expedition 386 methods. In Strasser, M., Ikehara, K., Everest, J., and the Expedition 386 Scientists, Japan Trench Paleoseismology. Proceedings of the International Ocean Discovery Program, 386: College Station, TX (International Ocean Discovery Program). https://doi.org/
Strasser, M., Ikehara, K., Everest, J., Maeda, L., Hochmuth, K., Grant, H., Stewart, M., Okutsu, N., Sakurai, N., Yokoyama, T., Bao, R., Bellanova, P., Brunet, M., Cai, Z., Cattaneo, A., Hsiung, K.-H., Huang, J.-J., Ishizawa, T., Itaki, T., Jitsuno, K., Johnson, J.E., Kanamatsu, T., Keep, M., Kioka, A., Kölling, M., Luo, M., März, C., McHugh, C., Micallef, A., Nagahashi, Y., Pandey, D.K., Proust, J.-N., Rasbury, E.T., Riedinger, N., Satoguchi, Y., Sawyer, D.E., Seibert, C., Silver, M., Straub, S.M., Virtasalo, J., Wang, Y., Wu, T.-W., and Zellers, S.D., 2023b. Site M0087 (Basin C/N3). In Strasser, M., Ikehara, K., Everest, J., and the Expedition 386 Scientists, Japan Trench Paleoseismology. Proceedings of the International Ocean Discovery Program, 386: College Station, TX (International Ocean Discovery Program). https://doi.org/
Strasser, M., Ikehara, K., Everest, J., and the Expedition 386 Scientists, 2023c. Supplementary material, https://doi.org/10.14379/iodp.proc.386supp.2023. In Strasser, M., Ikehara, K., Everest, J., and the Expedition 386 Scientists, Japan Trench Paleoseismology. Proceedings of the International Ocean Discovery Program, 386: College Station, TX (International Ocean Discovery Program).
Torres, M.E., Cox, T., Hong, W.L., McManus, J., Sample, J.C., Destrigneville, C., Gan, H.M., Gan, H.Y., and Moreau, J.W., 2015. Crustal fluid and ash alteration impacts on the biosphere of Shikoku Basin sediments, Nankai Trough, Japan. Geobiology, 13(6):562–580. https://doi.org/