Strasser, M., Ikehara, K., Everest, J., and the Expedition 386 Scientists
Proceedings of the International Ocean Discovery Program Volume 386
publications.iodp.org
https://doi.org/10.14379/iodp.proc.386.110.2023
Site M0087 (Basin C/N3)1
![]() M. Strasser,
M. Strasser,
![]() K. Ikehara,
K. Ikehara,
![]() J. Everest,
J. Everest,
![]() L. Maeda,
L. Maeda,
![]() K. Hochmuth,
K. Hochmuth,
![]() H. Grant,
H. Grant,
![]() M. Stewart,
M. Stewart,
![]() N. Okutsu,
N. Okutsu,
![]() N. Sakurai,
N. Sakurai,
![]() T. Yokoyama,
T. Yokoyama,
![]() R. Bao,
R. Bao,
![]() P. Bellanova,
P. Bellanova,
![]() M. Brunet,
M. Brunet,
![]() Z. Cai,
Z. Cai,
![]() A. Cattaneo,
A. Cattaneo,
![]() K.-H. Hsiung,
K.-H. Hsiung,
![]() J.-J. Huang,
J.-J. Huang,
![]() T. Ishizawa,
T. Ishizawa,
![]() T. Itaki,
T. Itaki,
![]() K. Jitsuno,
K. Jitsuno,
![]() J.E. Johnson,
J.E. Johnson,
![]() T. Kanamatsu,
T. Kanamatsu,
![]() M. Keep,
M. Keep,
![]() A. Kioka,
M. Kölling,
A. Kioka,
M. Kölling,
![]() M. Luo,
M. Luo,
![]() C. März,
C. März,
![]() C. McHugh,
C. McHugh,
![]() A. Micallef,
A. Micallef,
![]() Y. Nagahashi,
Y. Nagahashi,
![]() D.K. Pandey,
D.K. Pandey,
![]() J.-N. Proust,
J.-N. Proust,
![]() E.T. Rasbury,
E.T. Rasbury,
![]() N. Riedinger,
N. Riedinger,
![]() Y. Satoguchi,
Y. Satoguchi,
![]() D.E. Sawyer,
D.E. Sawyer,
![]() C. Seibert,
C. Seibert,
![]() M. Silver,
M. Silver,
![]() S.M. Straub,
S.M. Straub,
![]() J. Virtasolo,
J. Virtasolo,
![]() Y. Wang,
Y. Wang,
![]() T.-W. Wu, and
T.-W. Wu, and
![]() S.D. Zellers2
S.D. Zellers2
1 Strasser, M., Ikehara, K., Everest, J., Maeda, L., Hochmuth, K., Grant, H., Stewart, M., Okutsu, N., Sakurai, N., Yokoyama, T., Bao, R., Bellanova, P., Brunet, M., Cai, Z., Cattaneo, A., Hsiung, K.-H., Huang, J.-J., Ishizawa, T., Itaki, T., Jitsuno, K., Johnson, J.E., Kanamatsu, T., Keep, M., Kioka, A., Kölling, M., Luo, M., März, C., McHugh, C., Micallef, A., Nagahashi, Y., Pandey, D.K., Proust, J.-N., Rasbury, E.T., Riedinger, N., Satoguchi, Y., Sawyer, D.E., Seibert, C., Silver, M., Straub, S.M., Virtasalo, J., Wang, Y., Wu, T.-W., and Zellers, S.D., 2023. Site M0087 (Basin C/N3). In Strasser, M., Ikehara, K., Everest, J., and the Expedition 386 Scientists, Japan Trench Paleoseismology. Proceedings of the International Ocean Discovery Program, 386: College Station, TX (International Ocean Discovery Program). https://doi.org/10.14379/iodp.proc.386.110.2023
2 Expedition 386 Scientists’ affiliations.
1. Operations
During Expedition 386, two Giant Piston Corer (GPC) system deployments in Basin C/N3 in the boundary area between the central and northern Japan Trench (Figure F1) resulted in the recovery of cores from four holes at Site M0087 (Figure F2). The water depth was between 7518 and 7520 meters below sea level (mbsl). A breakdown of operational time is reported weekly instead of daily (see OPS in Supplementary material) due to decisions to move between sites based on weather and current conditions. Holes at Site M0087 were cored during Weeks 3 and 6 of the offshore phase. In total, 47.63 m of cores (Table T1) and 69 km of hydroacoustic profiles (see Hydroacoustics) were recovered and acquired, respectively, in this focus area. In addition, one expendable bathythermograph (XBT) probe was deployed. Further operations details, including winch log and inclinometer information, are found for all sites in Coring methodology in the Expedition 386 methods chapter (Strasser et al., 2023a) and associated files (see PALEOMAG and WINCHLOGS in Supplementary material).
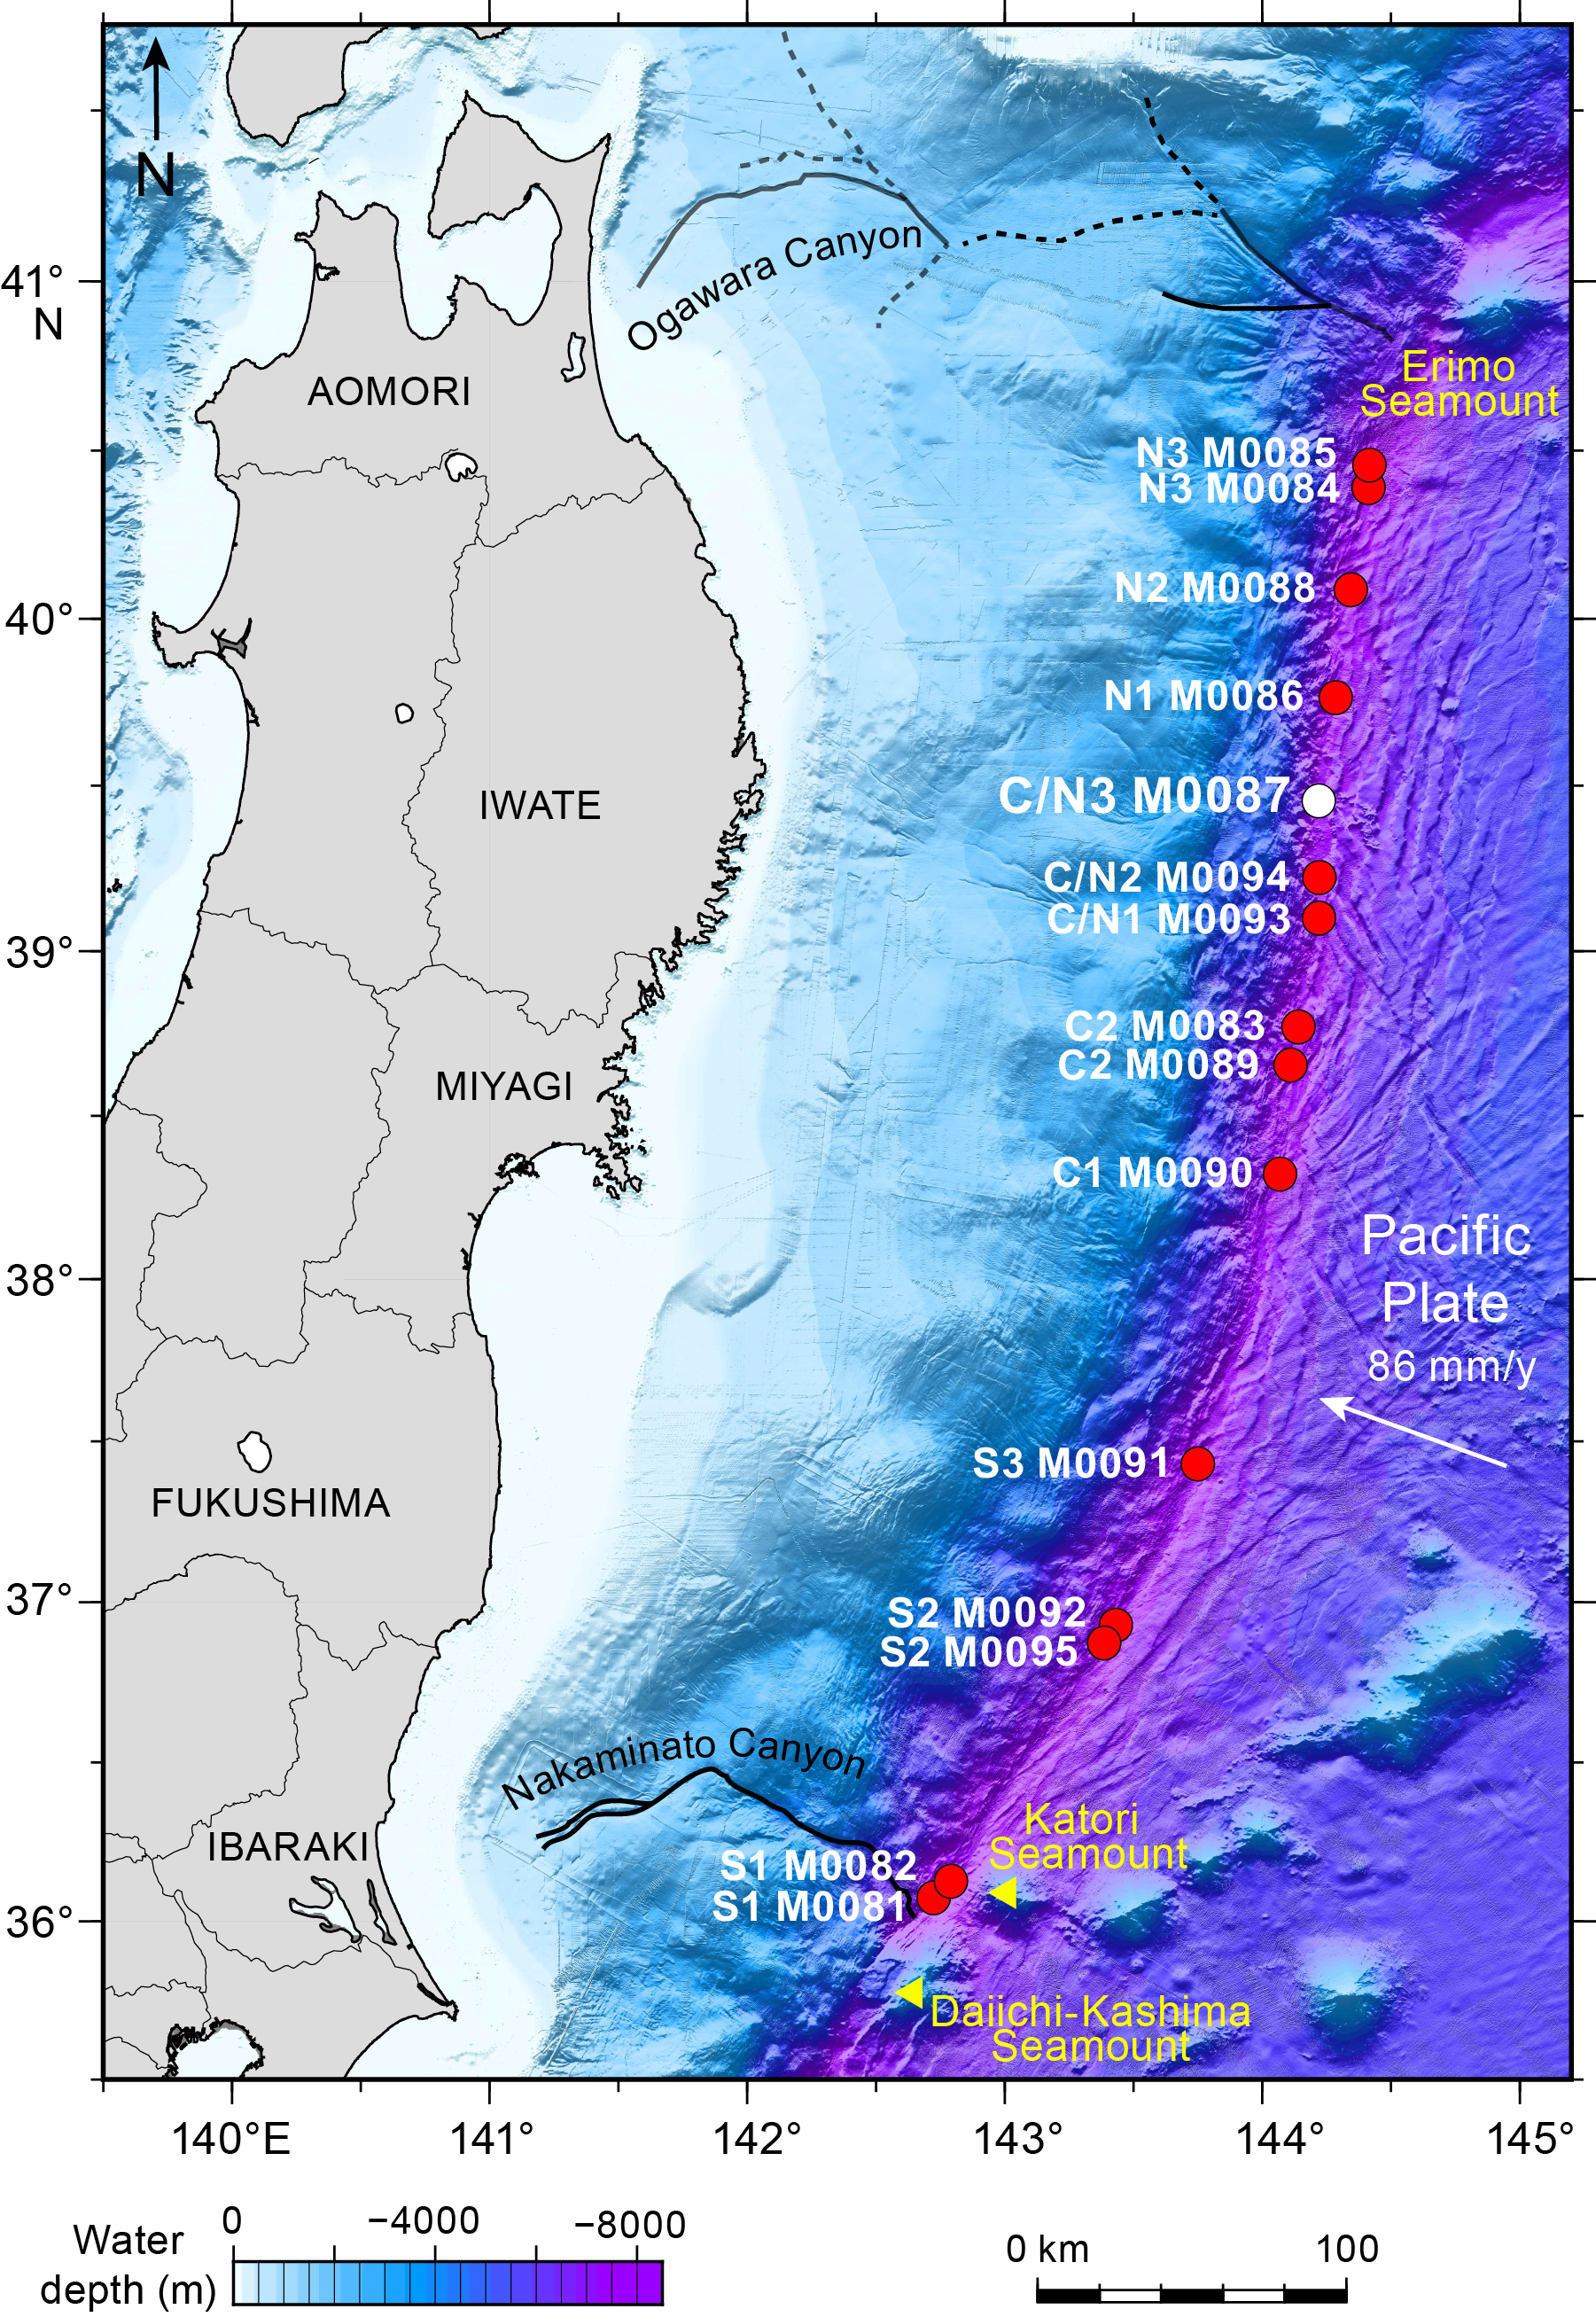
Figure F1. Site map.
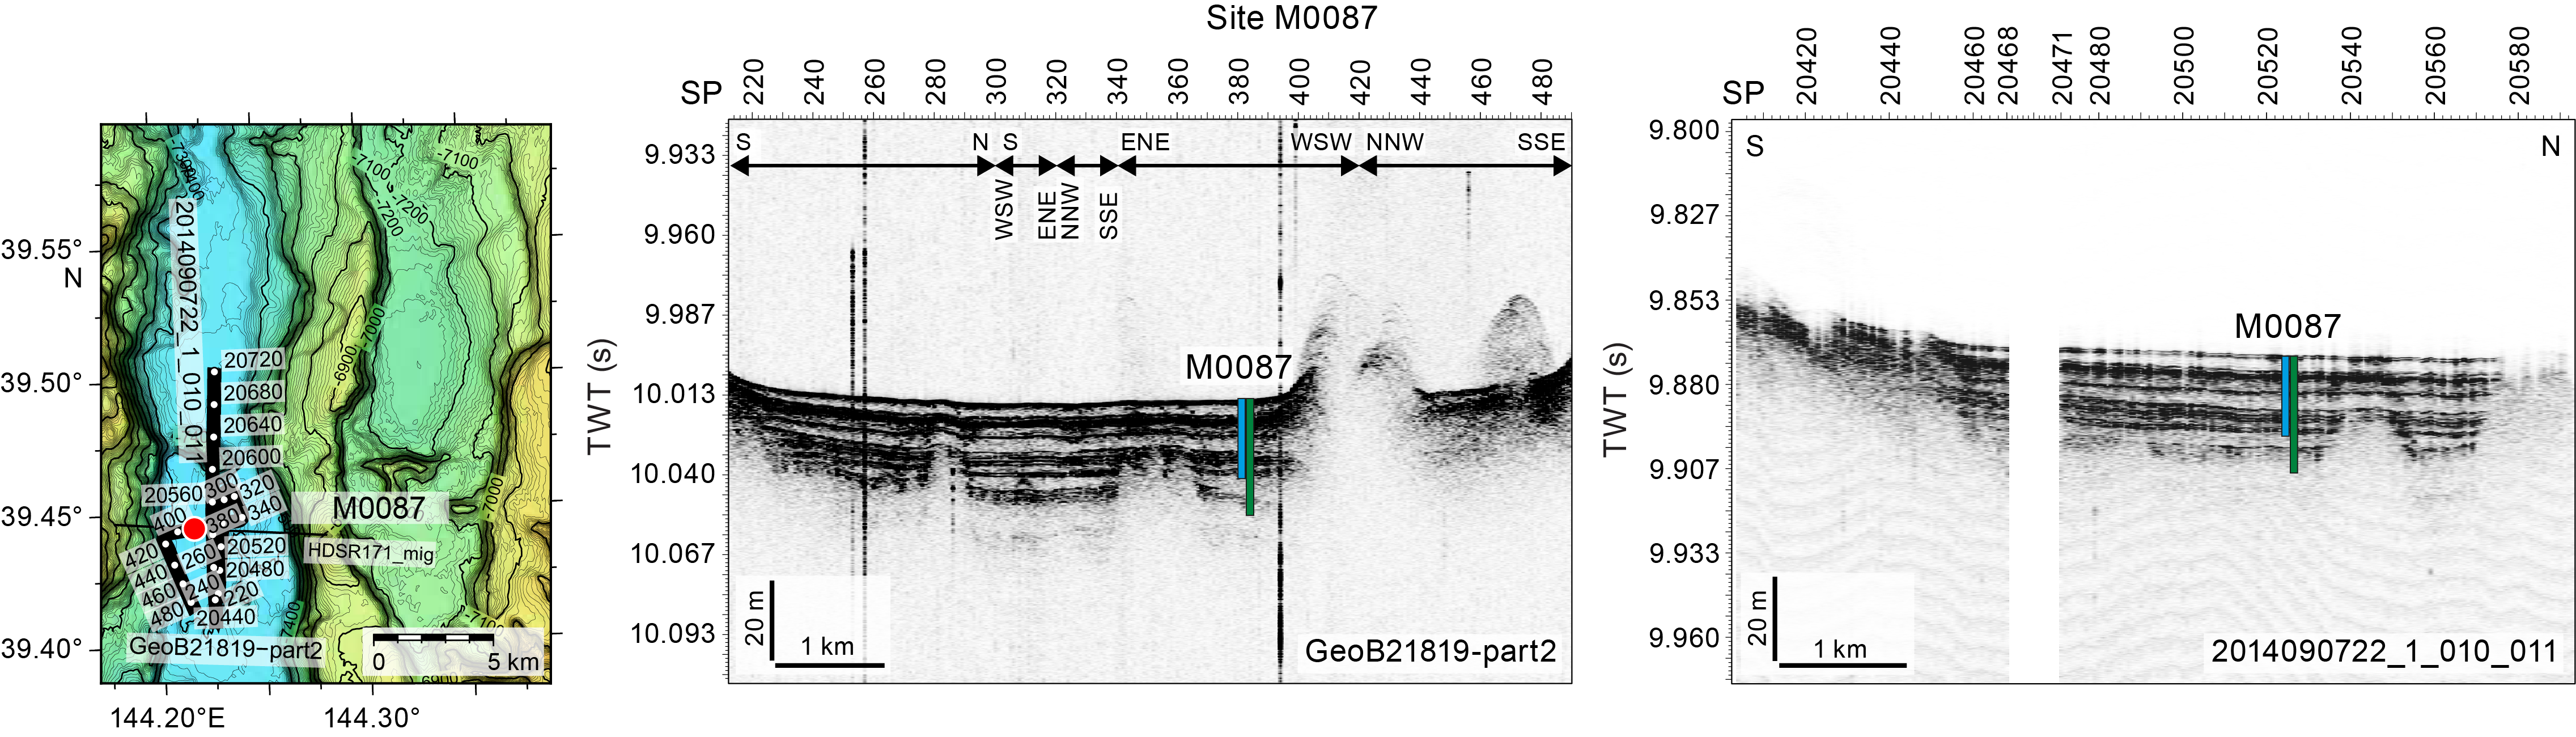
Figure F2. Site M0087.
The main site-specific scientific objectives for Site M0087 were as follows:
- Recover a continuous Pleistocene to Holocene stratigraphic succession comprising event deposits from the trench basin north of the large >1 km high escarpment at 39.4°N.
- Recover and analyze the top of mass transport deposits potentially linked to megalandslides.
- Analyze the stratigraphic pattern and event deposit characteristics and compare them with integrated results from other nearby sites (M0094 [~30 km south] and M0086 [~30 km north]) to establish robust stratigraphic pattern recognition of proxy evidence for earthquakes.
- Generate results for comparison with those from all other Expedition 386 sites to explore spatiotemporal distribution of event deposits to eventually develop a long-term record for giant earthquakes.
1.1. Site M0087
The R/V Kaimei arrived at Site M0087 on 2 May 2021 at 2000 h. The first XBT probe was deployed. Multibeam echo sounder/subbottom profiler (MBES/SBP) surveying was conducted from 2030 on 2 May to 0330 h on 3 May. Conditions that morning saw winds at <14 m/s, a 1.5 m wave height, and a 1.3 kt current, but winds increased to 19 m/s and wave heights to 3.5 m during GPC recovery (1230 h). GPC operations started in Holes M0087A and M0087B with a 20 m GPC barrel string at 0600 h and were completed when the GPC system was recovered on deck at 1345 h. Winch speed on return was run faster than the normal speed due to worsening sea conditions. The Science Party cut the core into 1 m sections from 1415 to 1515 h. The 20 m GPC assembly was prepared for the next run at 1800 h, and the ship moved to Site M0093 at 2030 h, where it waited on weather (see Operations in the Site M0093 (Basin C/N1) chapter [Strasser et al., 2023b]).
Kaimei arrived back at Site M0087 at 0215 h on 22 May and carried out MBES/SBP surveys until 0515 h, when the ship stood by for GPC operations. Conditions were overcast, with winds of <10 m/s, a ~2 m wave height, and a 1.5 kt surface current. GPC operations started in Holes M0087C and M0087D with a 40 m GPC barrel string at 0515 h and were completed when the GPC system was recovered on deck at 1430 h. The deck crew and GPC operation team withdrew the core from the GPC assembly and cut it into 5 m segments. The Science Party cut the core into 1 m sections from 1445 to 1630 h. The 40 m GPC assembly was prepared for the next run at 2000 h, and the ship began sailing to the southern part of the central Japan Trench.
1.1.1. Holes M0087A and M0087B
Holes M0087A and M0087B were cored on 3 May 2021. Preparations for running the 20 m GPC began at 0600 h, and the GPC was run into the water at 0855 h with an inclinometer and transponder attached to the winch cable 20 and 50 m above the GPC trigger arm, respectively, and on the GPC assembly (see Figure F4 in the Expedition 386 methods chapter [Strasser et al., 2023a]). Winch speed was set at 0.5–1.0 m/s. At 1115 h, running the GPC down was paused at a cable length of 7700 m for stabilization and monitoring the GPC position and resumed after 3 min at a winch speed of 0.3 m/s. Spud-in commenced at 11:23:58 h and ended at 11:24:00 h at a cable length of 7788 m. Recovery commenced, and the cable tension rose to 2647 kgf at 11:24:13 h before dropping to 2535 kgf and then rising again to a maximum of 6408 kgf at 11:24:58 h. It dropped to 4658 kgf at 11:25:08 h, indicating the corer was clear of the seabed (see WINCHLOGS in Supplementary material). Inclinometer data for Hole M0087B show the piston corer barrel was rotated counterclockwise by 65.1° at the estimated seabed, with an east–west dip of 1.13° and a north–south dip of −2.28° (see Figure F5 in the Expedition 386 methods chapter [Strasser et al., 2023a]). The trigger corer and GPC were recovered on deck at 1305 and 1345 h, respectively. The trigger core and GPC core from Holes M0087A and M0087B have a total length of 1.475 m (3 sections) and 18.975 m (20 sections), respectively.
1.1.2. Holes M0087C and M0087D
Holes M0087C and M0087D were cored on 22 May 2021. Preparations for running the 40 m GPC began at 0515 h, and the GPC was run into the water at 0850 h with an inclinometer and transponder attached to the winch cable 20 m above GPC trigger arm and on the GPC assembly (see Figure F4 in the Expedition 386 methods chapter [Strasser et al., 2023a]). Winch speed was set at 1.0 m/s. At 1110 h, running the GPC down was paused at a cable length of 7600 m for stabilization and monitoring the GPC position and resumed after 3 min at a winch speed of 0.3 m/s. Spud-in commenced at 11:32:23 h and ended at 11:32:25 h at a cable length of 7748 m. Recovery commenced, and the cable tension rose to 1827 kgf at 11:24:13 h before dropping to 1101 kgf and then rising again to a maximum of 10524 kgf at 11:24:58 h. It dropped to 8959 kgf at 11:25:22 h, indicating the corer was clear of the seabed (see WINCHLOGS in Supplementary material). Inclinometer data for Hole M0087D show the piston corer barrel was rotated clockwise by 172° at the estimated seabed, with an east–west dip of 0.12° and a north–south dip of −0.86° (see Figure F5 in the Expedition 386 methods chapter [Strasser et al., 2023a]). The GPC was run back to the surface at a winch speed of 1.0 m/s. The trigger corer and GPC were recovered on deck at 1350 and 1430 h, respectively. The trigger core and GPC core from Holes M0087C and M0087D have a total length of 0.835 m (2 sections) and 26.345 m (27 sections), respectively (Table T1).
2. Hydroacoustics
Site M0087 lies within Basin C/N3 in the boundary region between the northern and central Japan Trench basins. The acquired SBP data comprises five trench-perpendicular lines and four trench-parallel lines, although one of the latter (Line 386_Underway_048) is extremely short (500 m) and is effectively a continuation of Line 386_Underway_049 (Figure F3). One of the trench-perpendicular lines (386_Underway_095) lies more than 11,000 m north of the rest of the grid. Approximately 69 km of subbottom profiles were acquired. Holes M0087A–M0087D lie in the southern part of the grid area. The acquisition parameters for all subbottom profiles in this basin are documented in Table T2. The area surveyed for bathymetry includes the basin floor and extends to the surrounding areas with a footprint of approximately 483 km2.
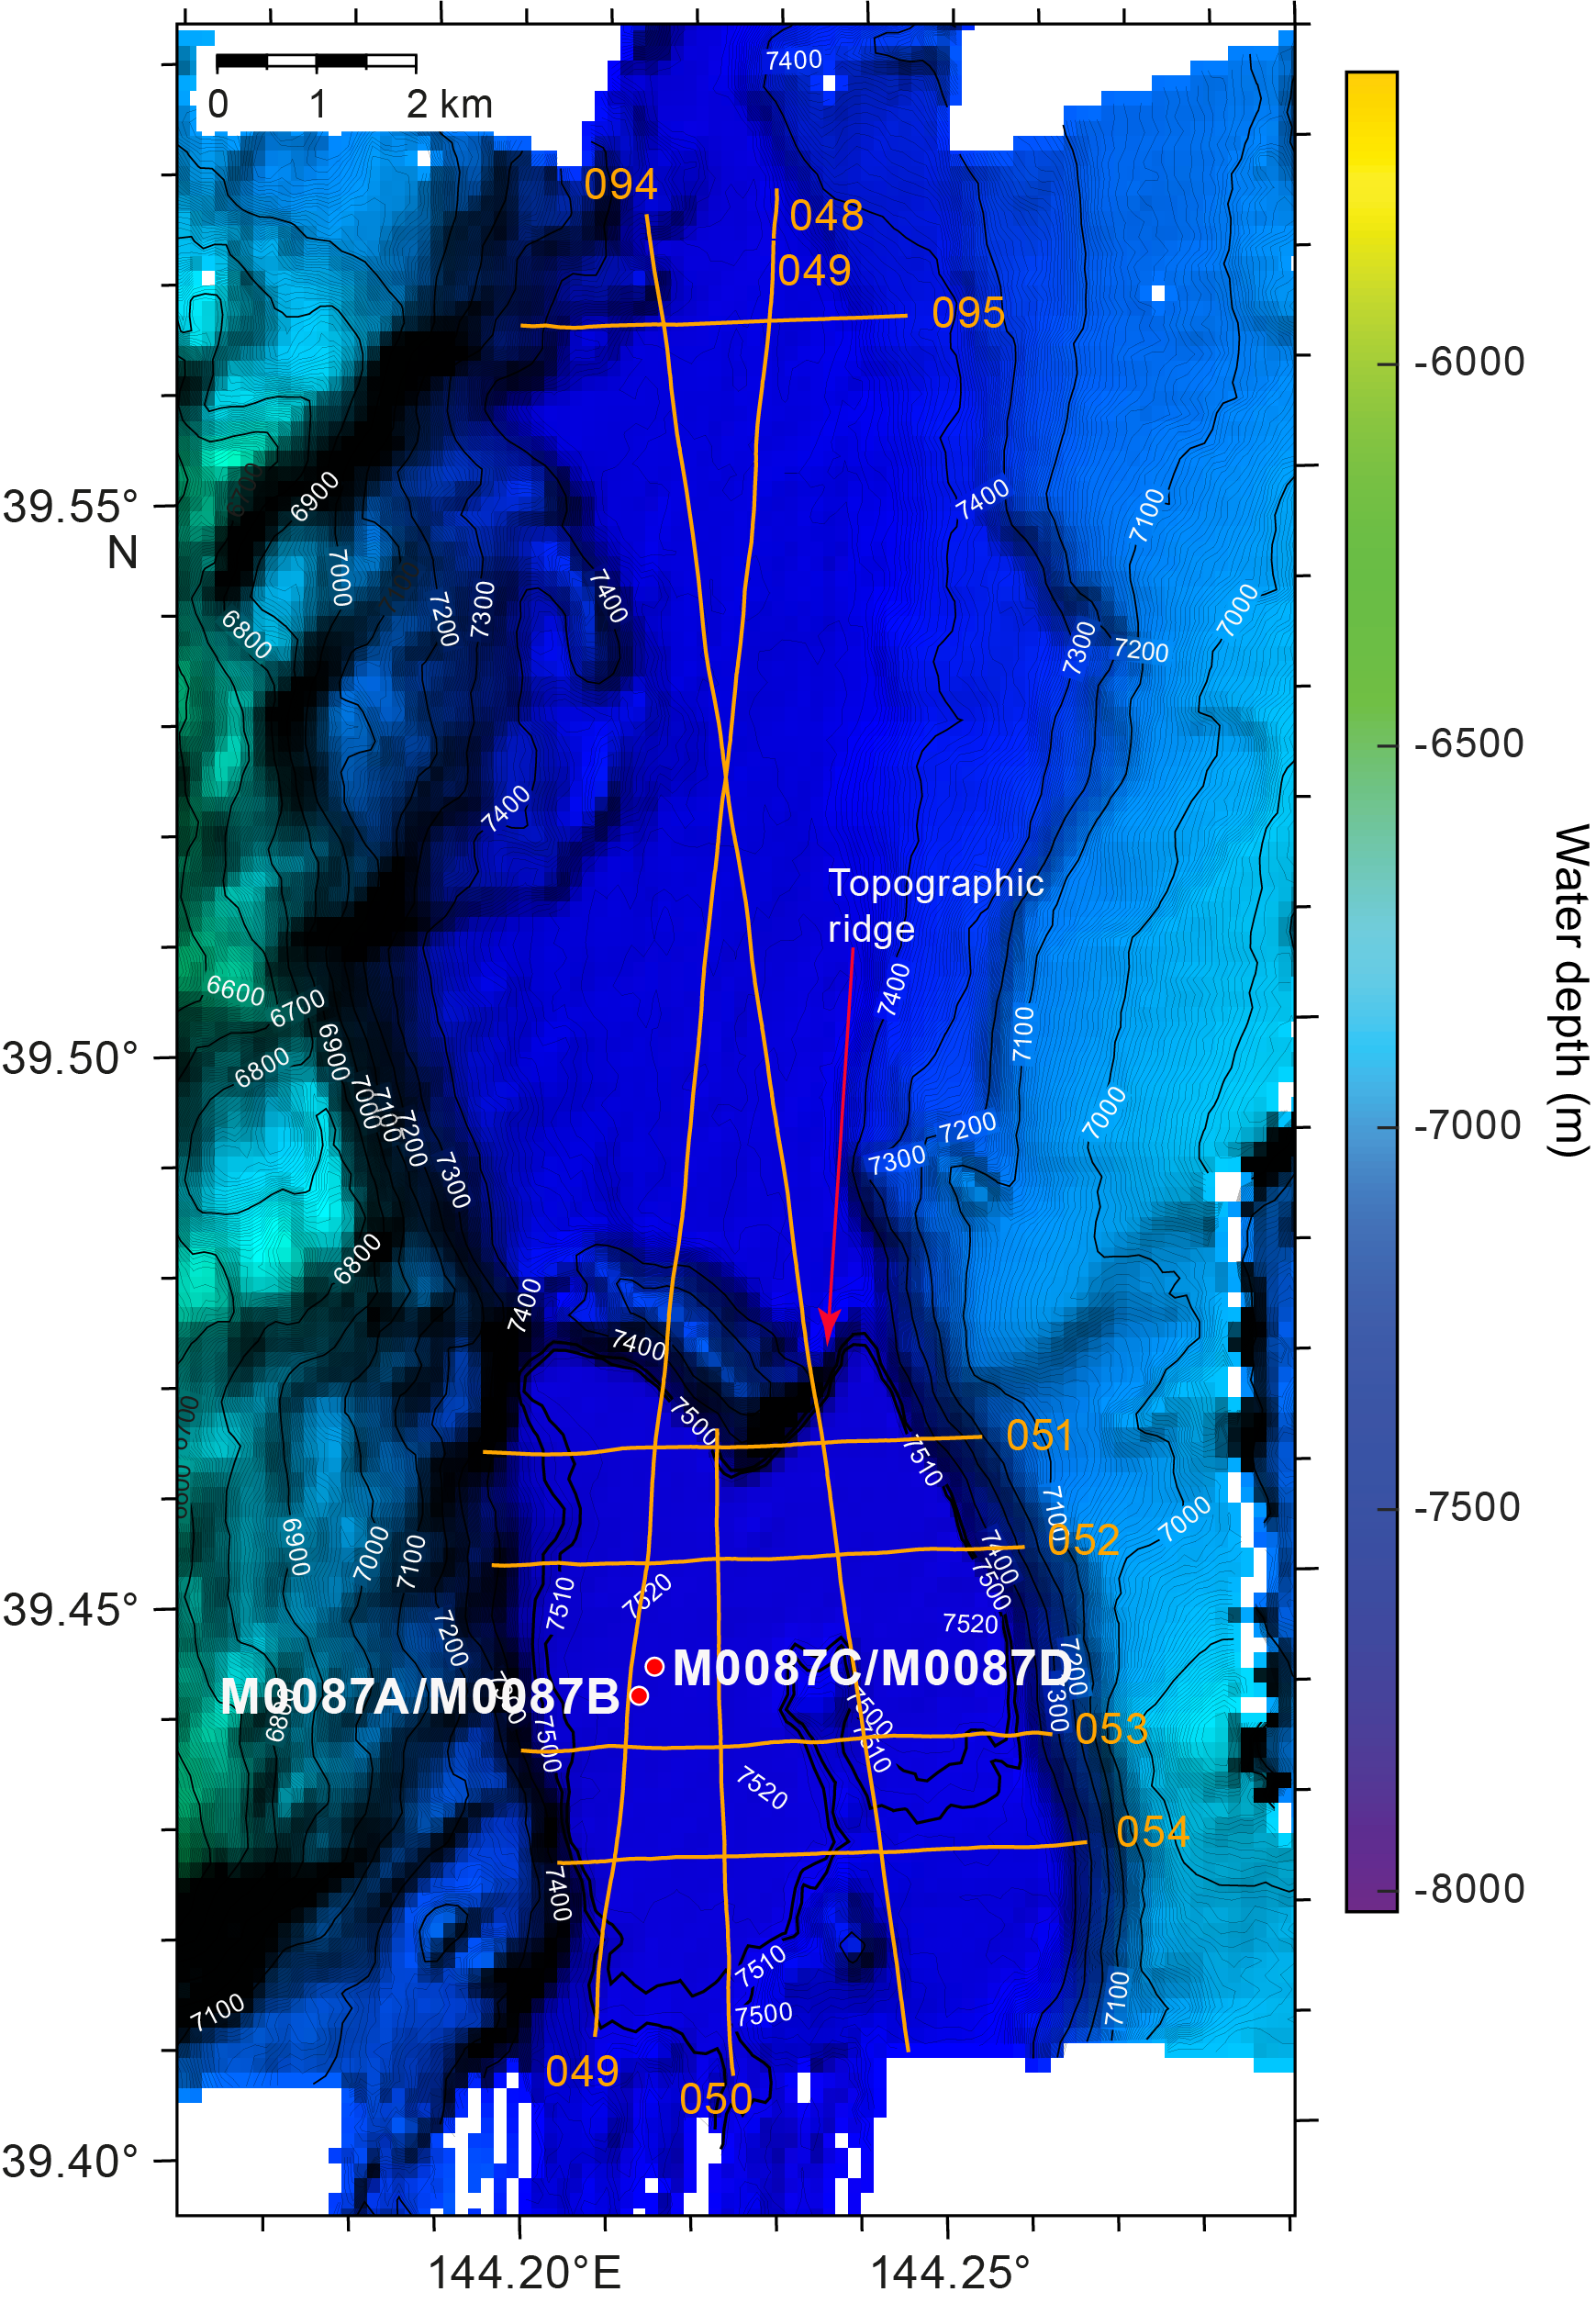
Figure F3. Subbottom profiler lines.
2.1. Bathymetry
The entire basin extends for nearly 20 km in a north–south direction but comprises two distinct depocenters, one in the north and one in the south, separated by a topographic ridge (Figure F3). The ridge lies south of the midway point of the basin, where the basin width is around 4000 m, and displays both a northeast and a northwest trend. It exhibits a slope gradient of up to 40% at its maximum, changing elevation by 100 m vertically over a horizontal distance of approximately 250 m from north to south.
The northern depocenter of the basin extends from the northern end of the trench-parallel lines to the ridge, a distance of nearly 12,000 m. The width of the northern depocenter (defined as the change from flat basin floor to rapidly changing topography on either side) ranges between 4000 and 5000 m. The southern depocenter, on which the seismic grid is centered, extends from the ridge to the southern end of the seismic grid, a distance of approximately 6000 m. The basin width of the southern depocenter is approximately 5000 m.
The ridge separates average depths of 7480 m in the northern depocenter from depths of 7520 m in the southern depocenter, representing an approximately 40 m depth increase from north to south.
2.2. Basin characterization
A series of trench-perpendicular lines from north to south captures changes in basin character of Basin C/N3. Line 386_Underway_095 (Figure F4), the northernmost trench-perpendicular line of the survey, displays a relatively continuous high-amplitude seafloor reflector that overlies a shallow package of varying thickness and varying amplitudes. Overall, the package has a lower amplitude than the seafloor layer. At its thickest point, the basin fill package is approximately 8 m thick, but it thins to less than 5 m on top of the eastern basal high at around Shotpoint 980, indicating that it is filling a preexisting topography. Below this fill, an acoustically laminated sequence with high seismic amplitudes and varying thicknesses (approximately 6–8 m at its thickest) overlies an irregular basal structure that controls the extent of deposition. The acoustically laminated package mimics the underlying basal topography, so it thins over the basal highs and thickens in the central part of the basin (Shotpoint 960).

Figure F4. Line 386_Underway_095.
Toward the center of Basin C/N3, the closest trench-perpendicular line (386_Underway_051; Figure F5) lies nearly 12,000 m south of Line 386_Underway_095 and immediately to the south of the topographic ridge, which it intersects at Shotpoint 960. On this line, a high-amplitude discontinuous reflector at the seabed overlies an acoustically transparent layer that is up to 2 m thick in the western depocenter and 3–4 m thick in the eastern depocenter. In both depocenters, the acoustically transparent layer overlies a package of flat-lying, acoustically laminated, high-amplitude materials, which are up to 28 m thick in the west and 20 m thick in the east. The thickness of this laminated package appears to be controlled by underlying basal structures, with the laminated package apparently filling in older topography. Contacts between the acoustic basement and the laminated package are relatively clear, and the high-amplitude laminated package thins onto the basement highs. In the western depocenter, a lower amplitude, somewhat acoustically transparent layer occurs in the middle of the acoustically laminated package at 9.880 s two-way traveltime (TWT).

Figure F5. Line 386_Underway_051.
Line 386_Underway_054, the southernmost trench-perpendicular line of Basin C/N3, lies 4,000 m south of Line 386_Underway_051 and 15,000 m south of Line 386_Underway_095 (Figure F6). From Shotpoint 4725 to Shotpoint 4818, Line 386_Underway_054 displays similar acoustic characteristics to Lines 386_Underway_51 and 386_Underway_96, including a high-amplitude reflector at the seabed that overlies a 2–3 m thick acoustically transparent layer and a deeper package of flat-lying laminated reflectors (up to 18 m thick). The contact between the acoustically laminated layer and acoustic basement is not as clear as in the central part of the basin, but the basin fill still appears to have an onlapping relationship with the acoustic basement and appears to thin over highs (e.g., beneath Shotpoint 4785).
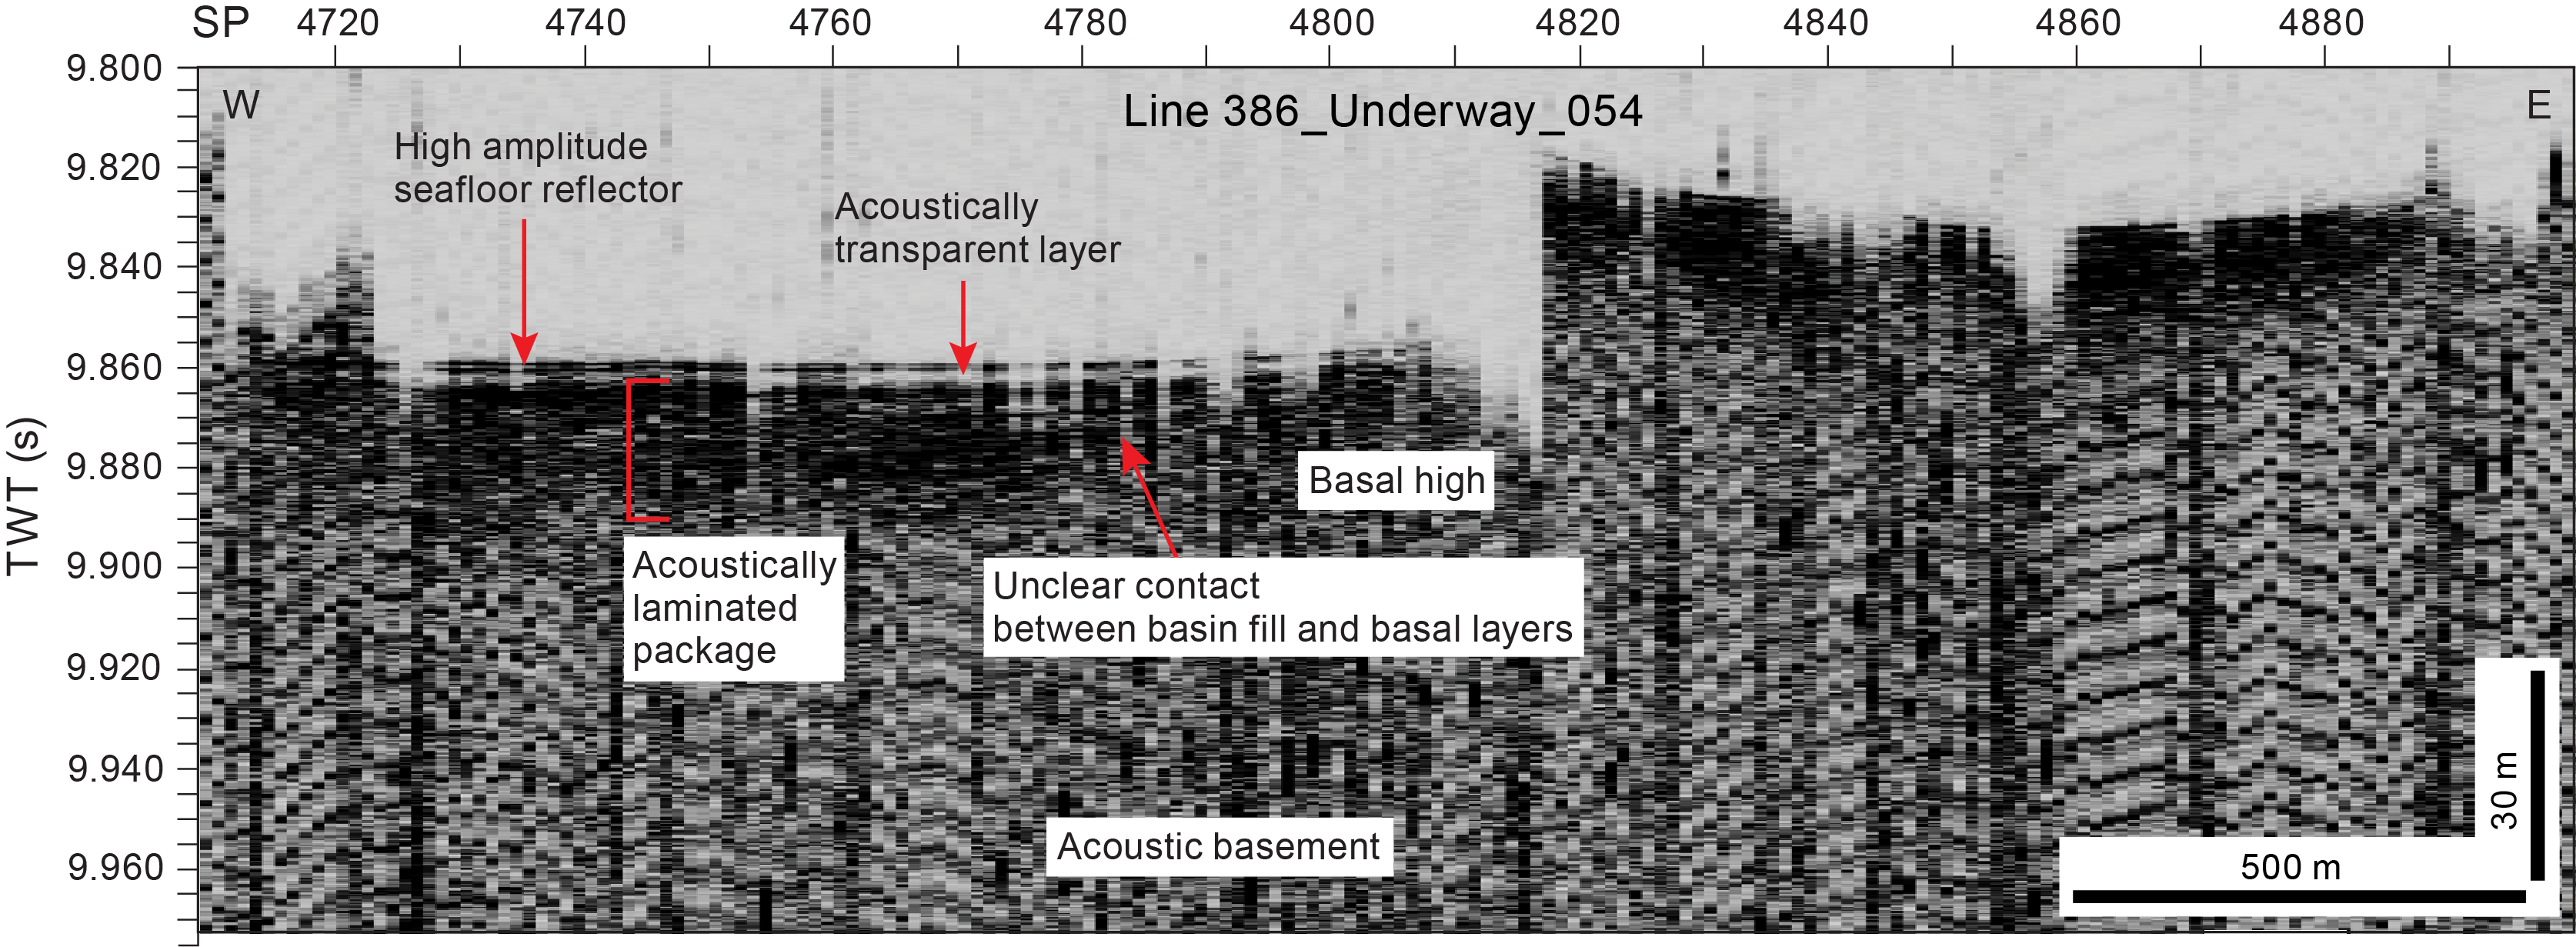
Figure F6. Line 386_Underway_054.
2.3. Site M0087
Trench-parallel Line 386_Underway_049 passes closest to Site M0087 (Figures F7, F8). Holes M0087A and M0087B lie 109 m east of this line (as measured perpendicular to the line), and Holes M0087C and M0087D lie 230 m east. Line 386_Underway_049 images the topographic ridge within the basin from Shotpoint 3200 to Shotpoint 3260, which appears as a steep topographic change and disruption in the center of the line. South of the topographic ridge, a high-amplitude seabed reflector is deeper (~9.86 s TWT) than the seabed reflector to the north, where a relatively flat-lying high-amplitude seabed reflector occurs at 9.825 s TWT.
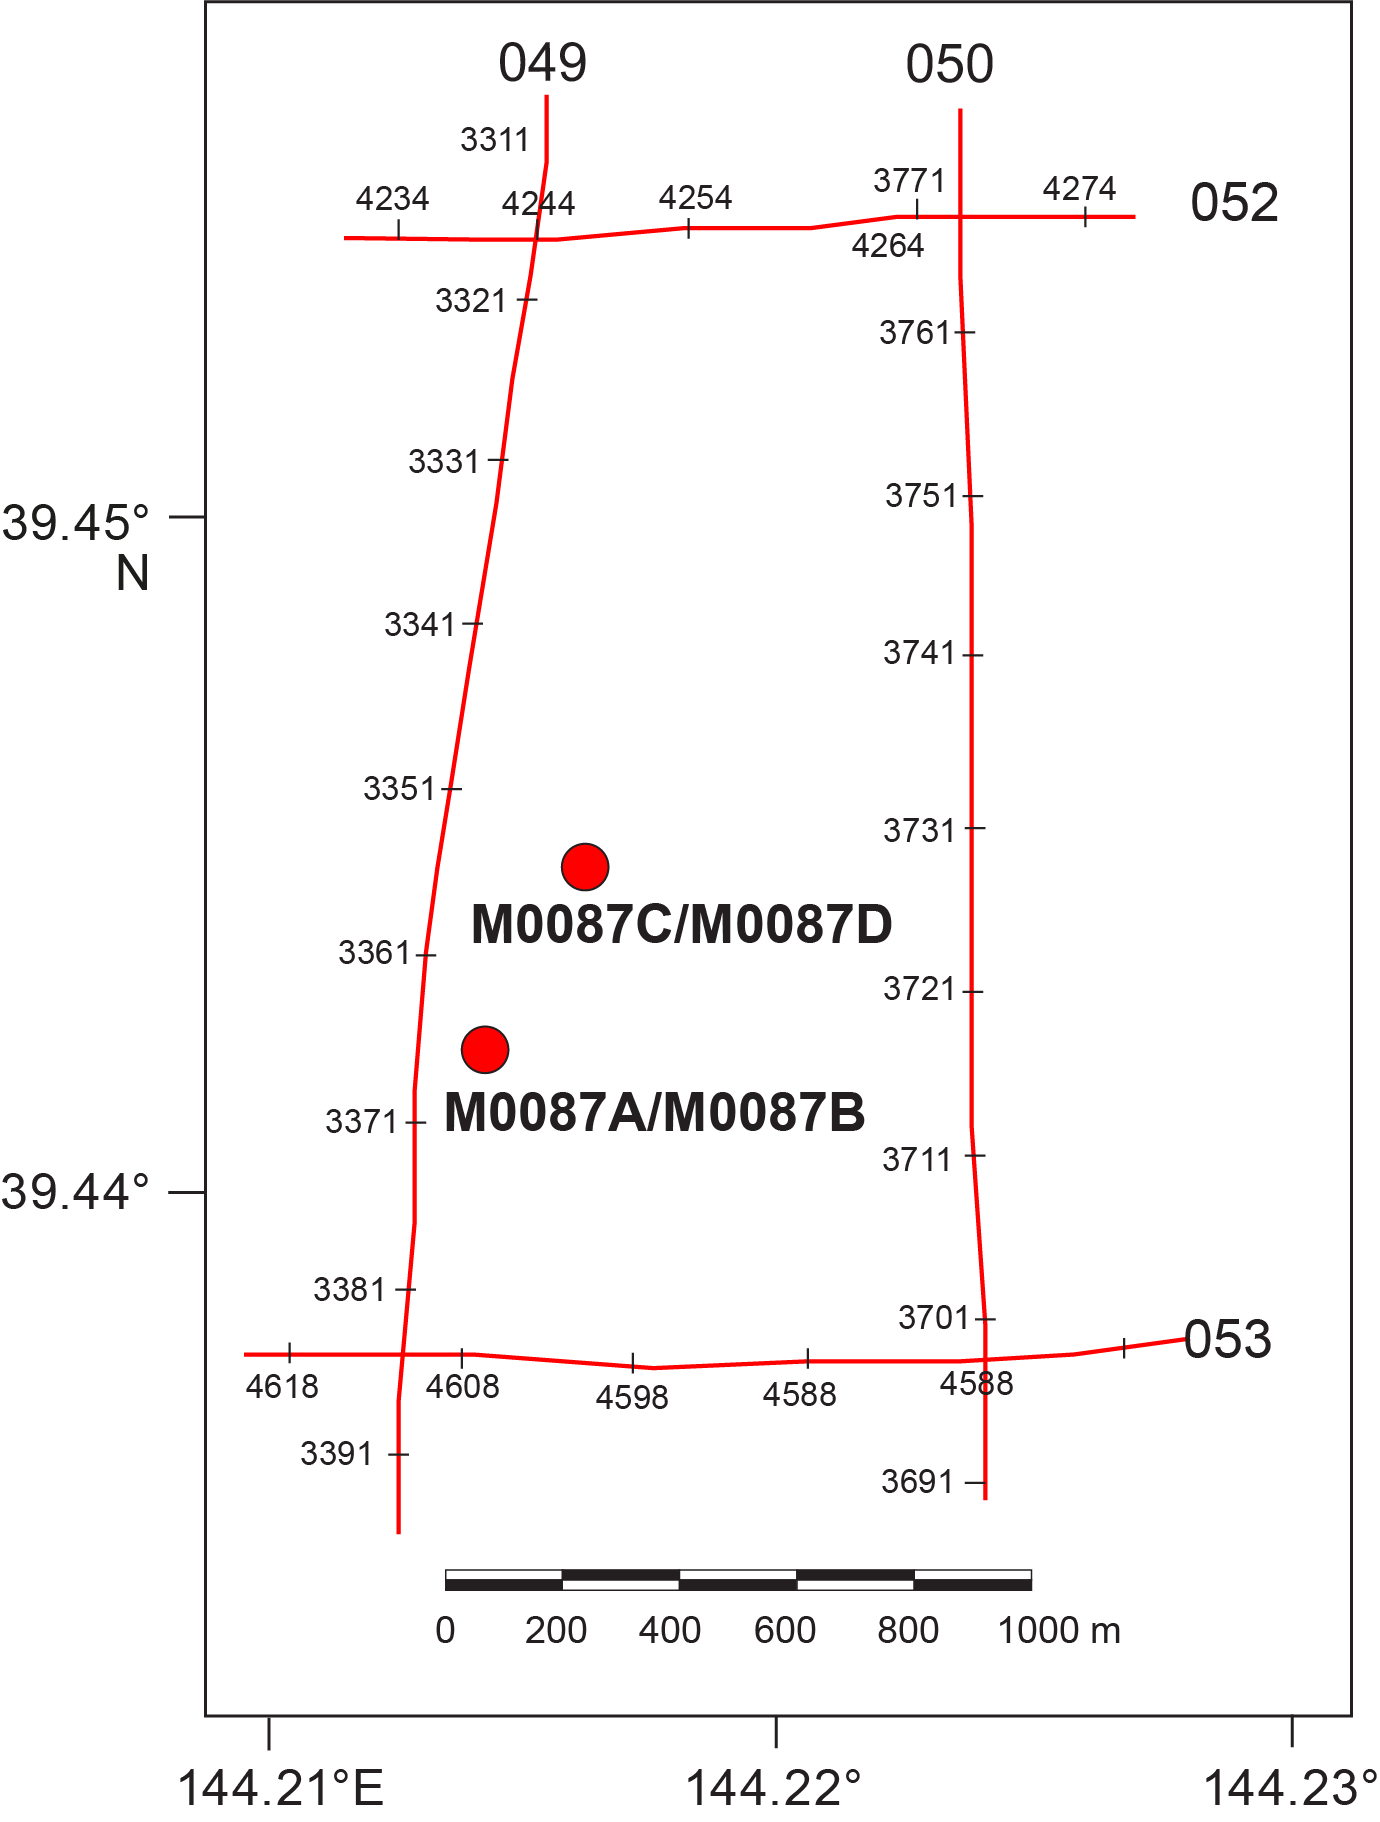
Figure F7. Subbottom profiles.
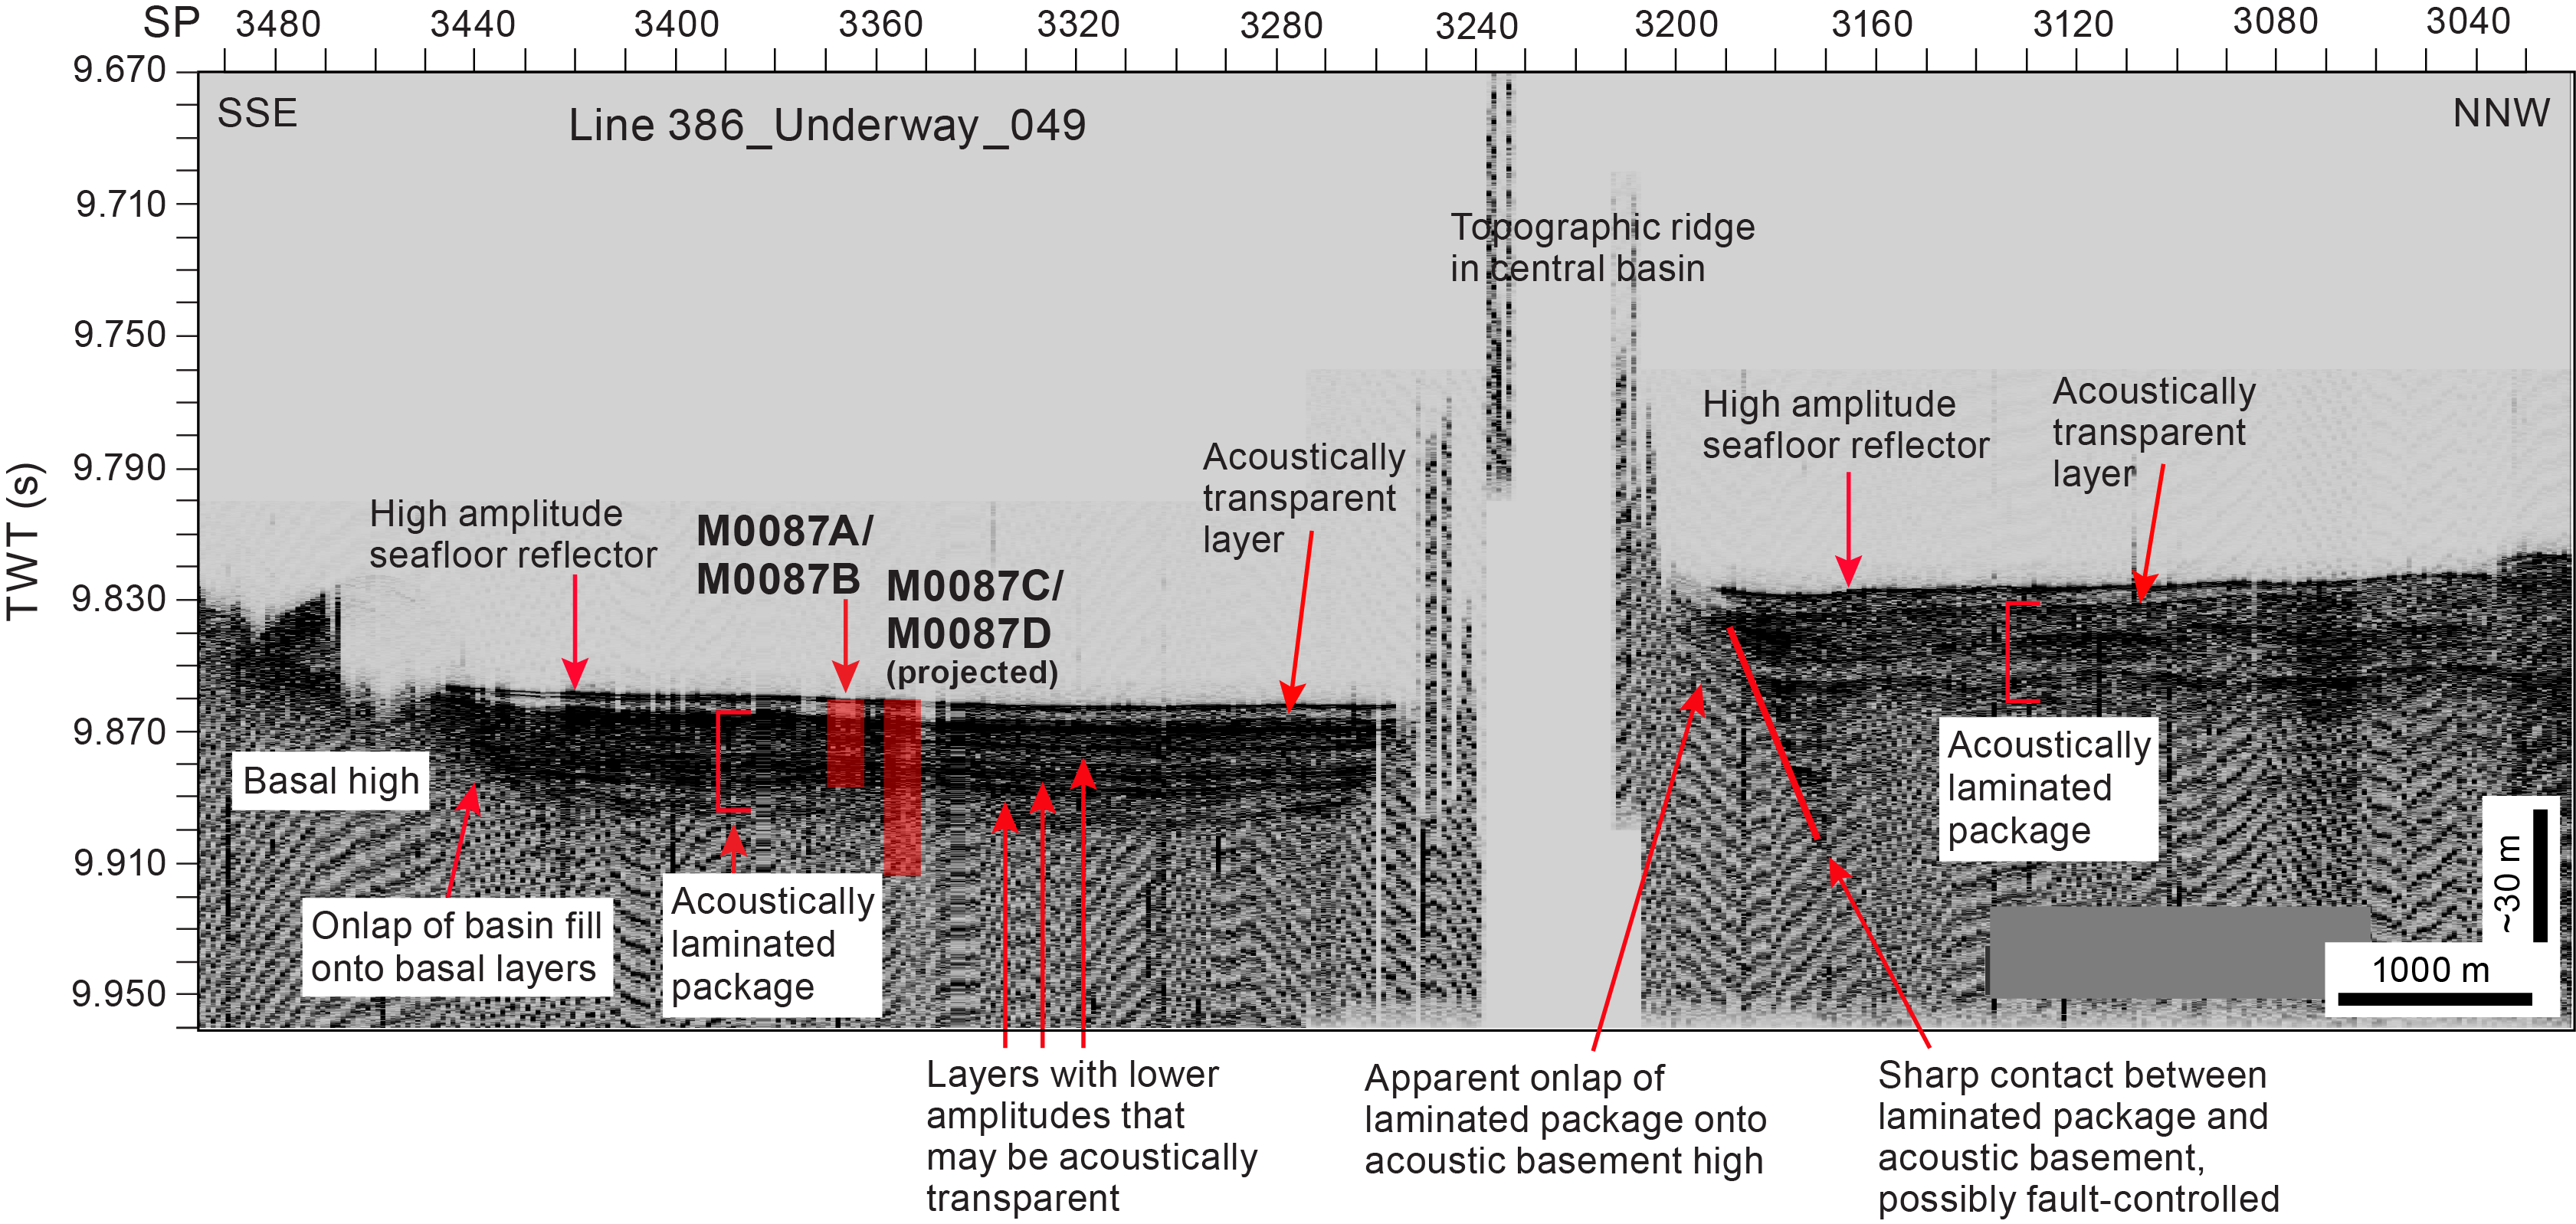
Figure F8. Line 386_Underway_049.
Beneath the seafloor, both north and south of the topographic ridge, the seismic facies are similar but at a shallower depth on the northern side. An acoustically transparent unit up to 4 m thick lies above a flat-lying package of acoustically laminated basin fill that is up to ~26 m thick at its thickest point. The laminated package onlaps acoustic basement, and there is a sharp contact between the acoustic basement and the laminated package, which may be fault controlled. Within the acoustically laminated package, there is a series of flat-lying reflections that have lower amplitudes and appear to be acoustically transparent layers within the laminated sequence. On Line 386_Underway_049, these layers are located at 9.74, 9.879, and 9.892 s TWT on the southern part of the line, with thicknesses of ~3, 1, and up to 5 m, respectively.
Line 386_Underway_053 (Figure F9) is the closest trench-perpendicular line to Site M0087. Holes M0087A and M0087B lie 520 m north of the line, and Holes M0087C and M0087D lie 820 m north (Figure F7). Line 386_Underway_053 images a high-amplitude seafloor reflector overlying a ~4 m thick acoustically transparent layer, as seen on Line 386_Underway_049 (Figure F8). An acoustically laminated package underneath the transparent layers is approximately 30 m thick. A sharp contact east of Holes M0087A and M0087B may represent a faulted contact at this location. Changes in amplitude with depth within the laminated package may indicate acoustically transparent layers, but these are not as clearly imaged as on Line 386_Underway_049.

Figure F9. Line 386_Underway_053.
3. Lithostratigraphy
Site M0087 was cored in Basin C/N3 in the northern Japan Trench in the undisturbed trench basin-fill succession, which overlies deformed trench basin or mass transport deposits, as revealed on the subbottom profiles (See Operations). Site M0087 has four holes, GPC Holes M0087B and M0087D and trigger core Holes M0087A and M0087C. Lithostratigraphic summary plots of the core sections, including linescan and X-ray computed tomography (CT) scan images, visual core descriptions (VCDs), and physical properties (magnetic susceptibility and density), are shown in Figures F10 and F11.
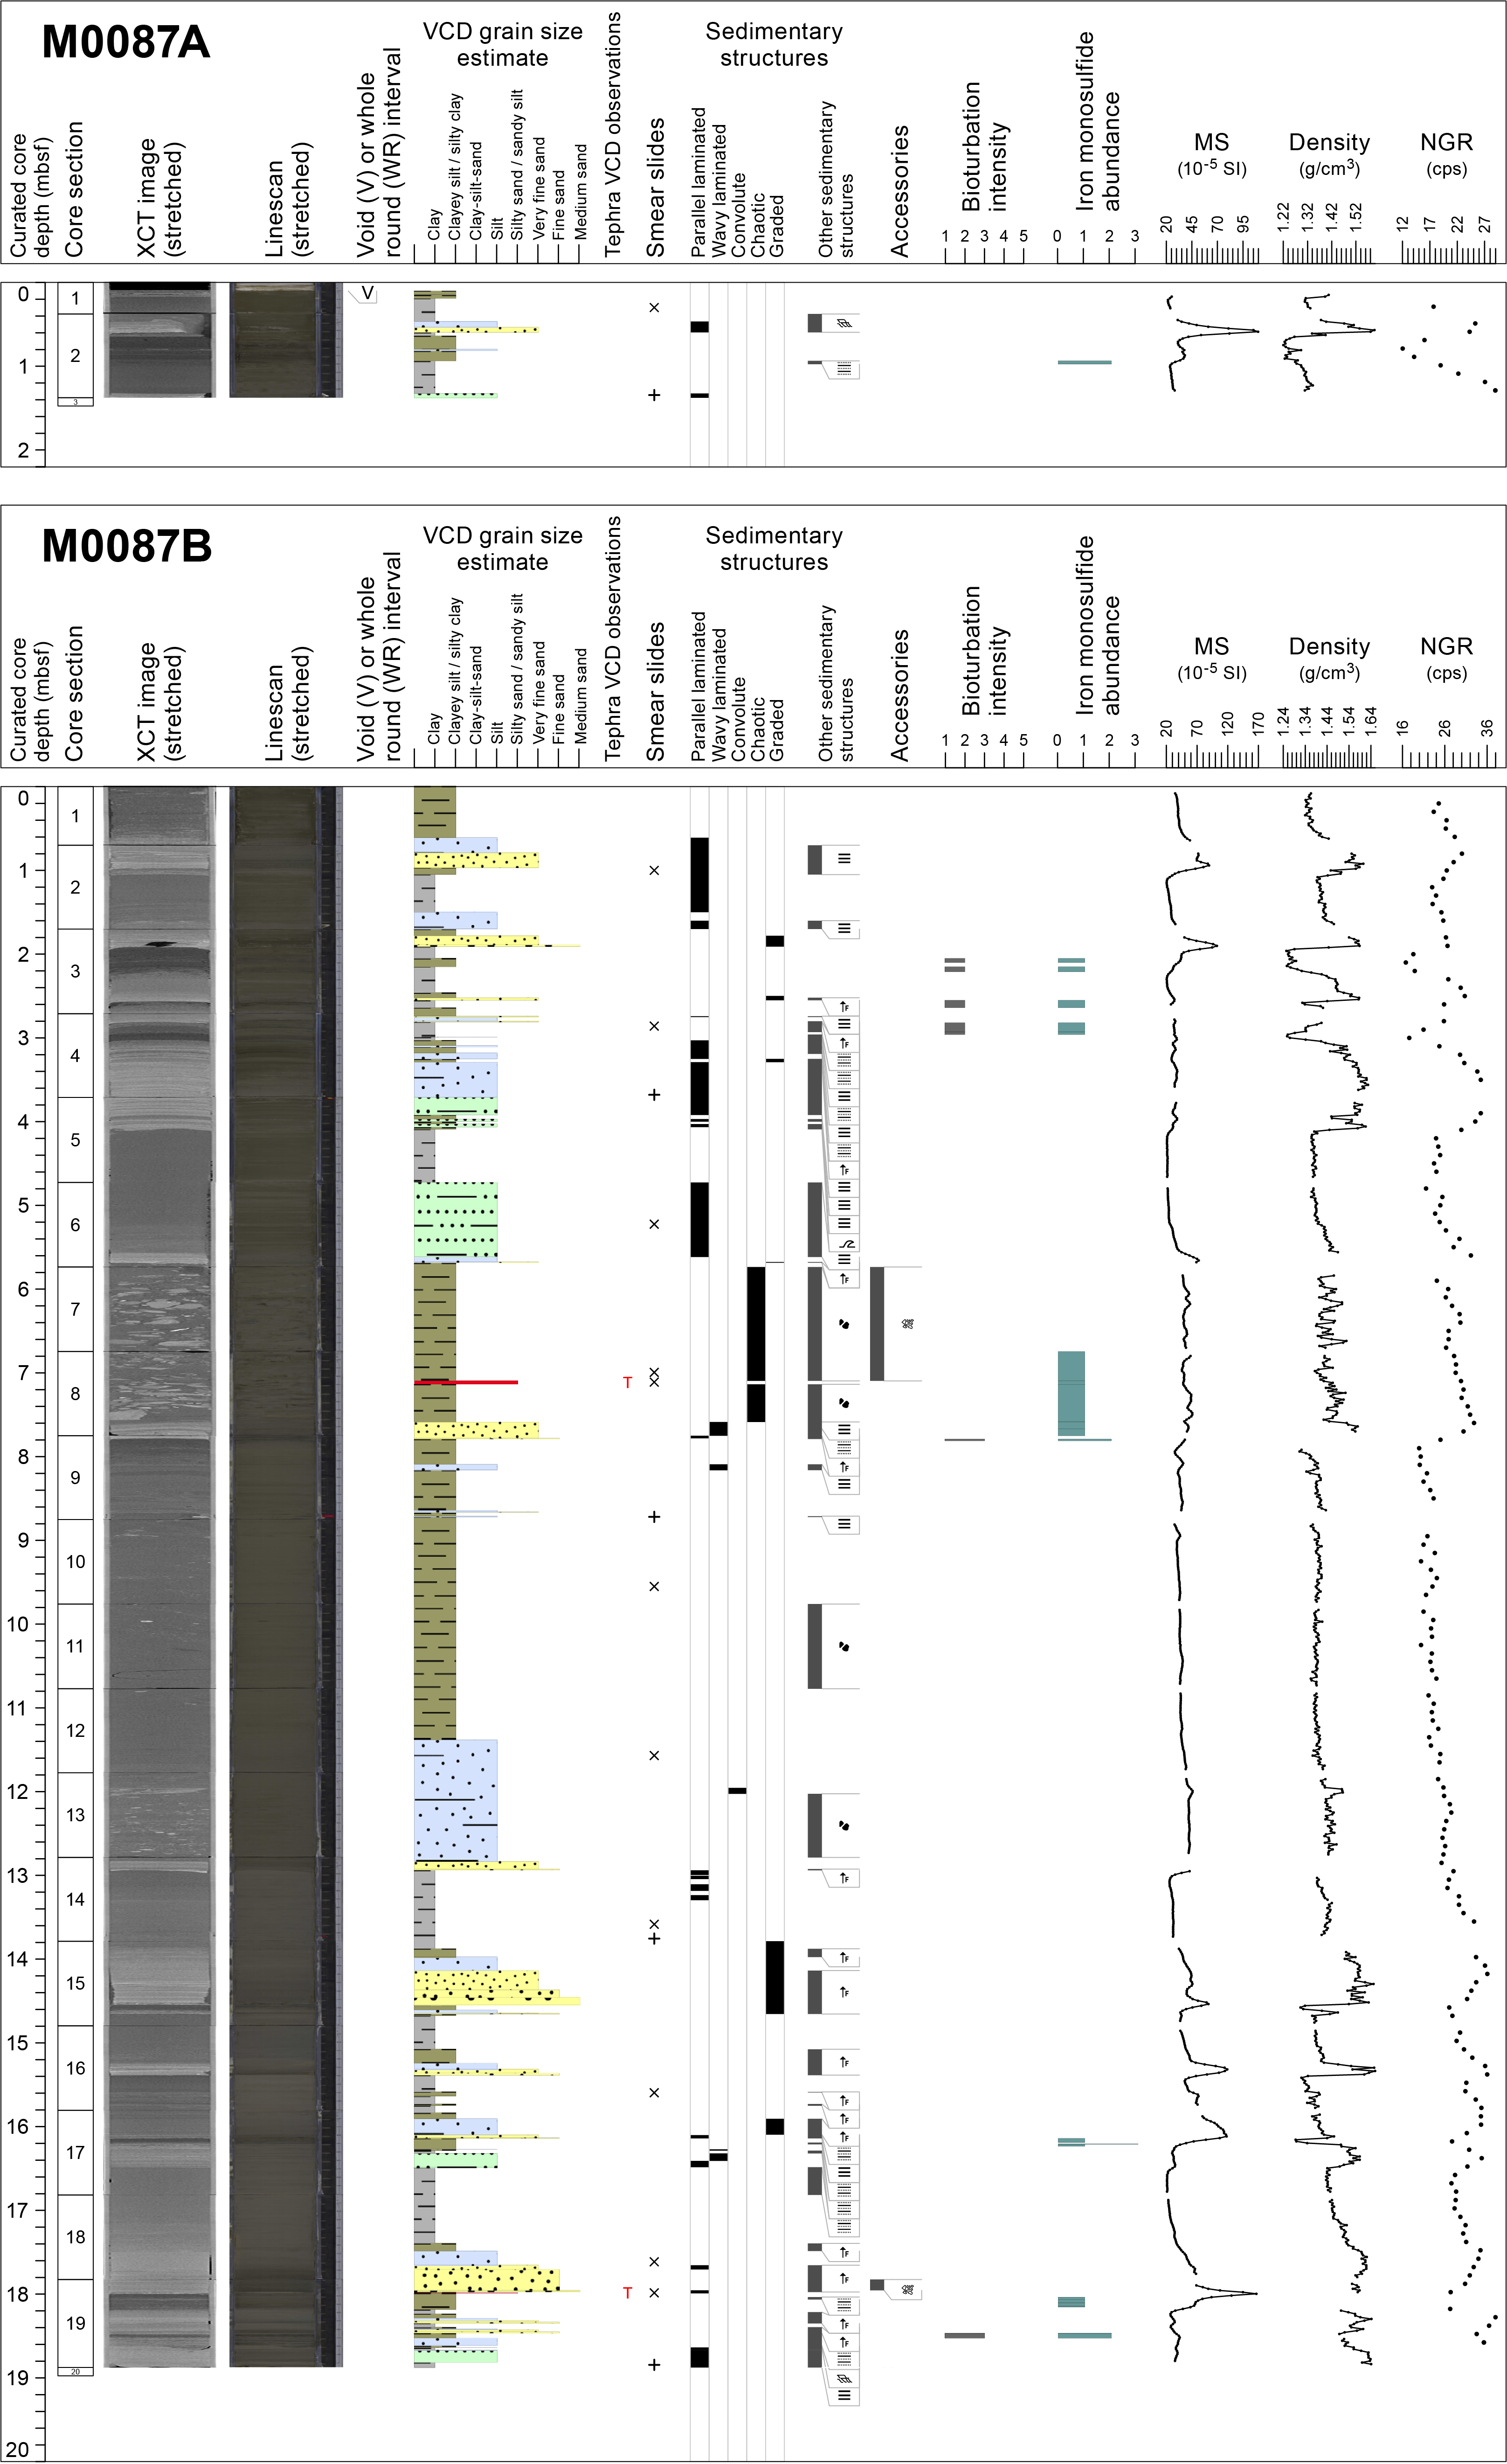
Figure F10. Lithostratigraphic summaries, Holes M0087A and M0087B.


Figure F11. Lithostratigraphic summaries, Holes M0087C and M0087D.
This section describes the lithology as it appears on the VCDs (see HANDDRAWNVCD in Supplementary material). The mode of description of major and minor lithologies, contacts, sedimentary structures, bioturbation, and accessory elements and iron monosulfides is defined in Lithostratigraphy in the Expedition 386 methods chapter (Strasser et al., 2023a). The description of the smear slides is semiquantitative and includes grain size: sand, silt, and clay (100%) and lithogenic, biogenic, and volcanic components as 100% of the total slide. The smear slides were observed every 2 m, and the results are displayed as color bars representing lithogenic, biogenic, and volcanic components (Figure F12). Close-up photos of the core and the X-ray CT and linescan images that were used to determine lithology, as well as X-ray diffraction (XRD) data, can be found in CORECLOSEUP, LINESCAN, XRAYCT, and XRD, respectively, in Supplementary material). The 3 m barrel sheets, smear slide tables, and composite linescan plots can be found in Core descriptions.
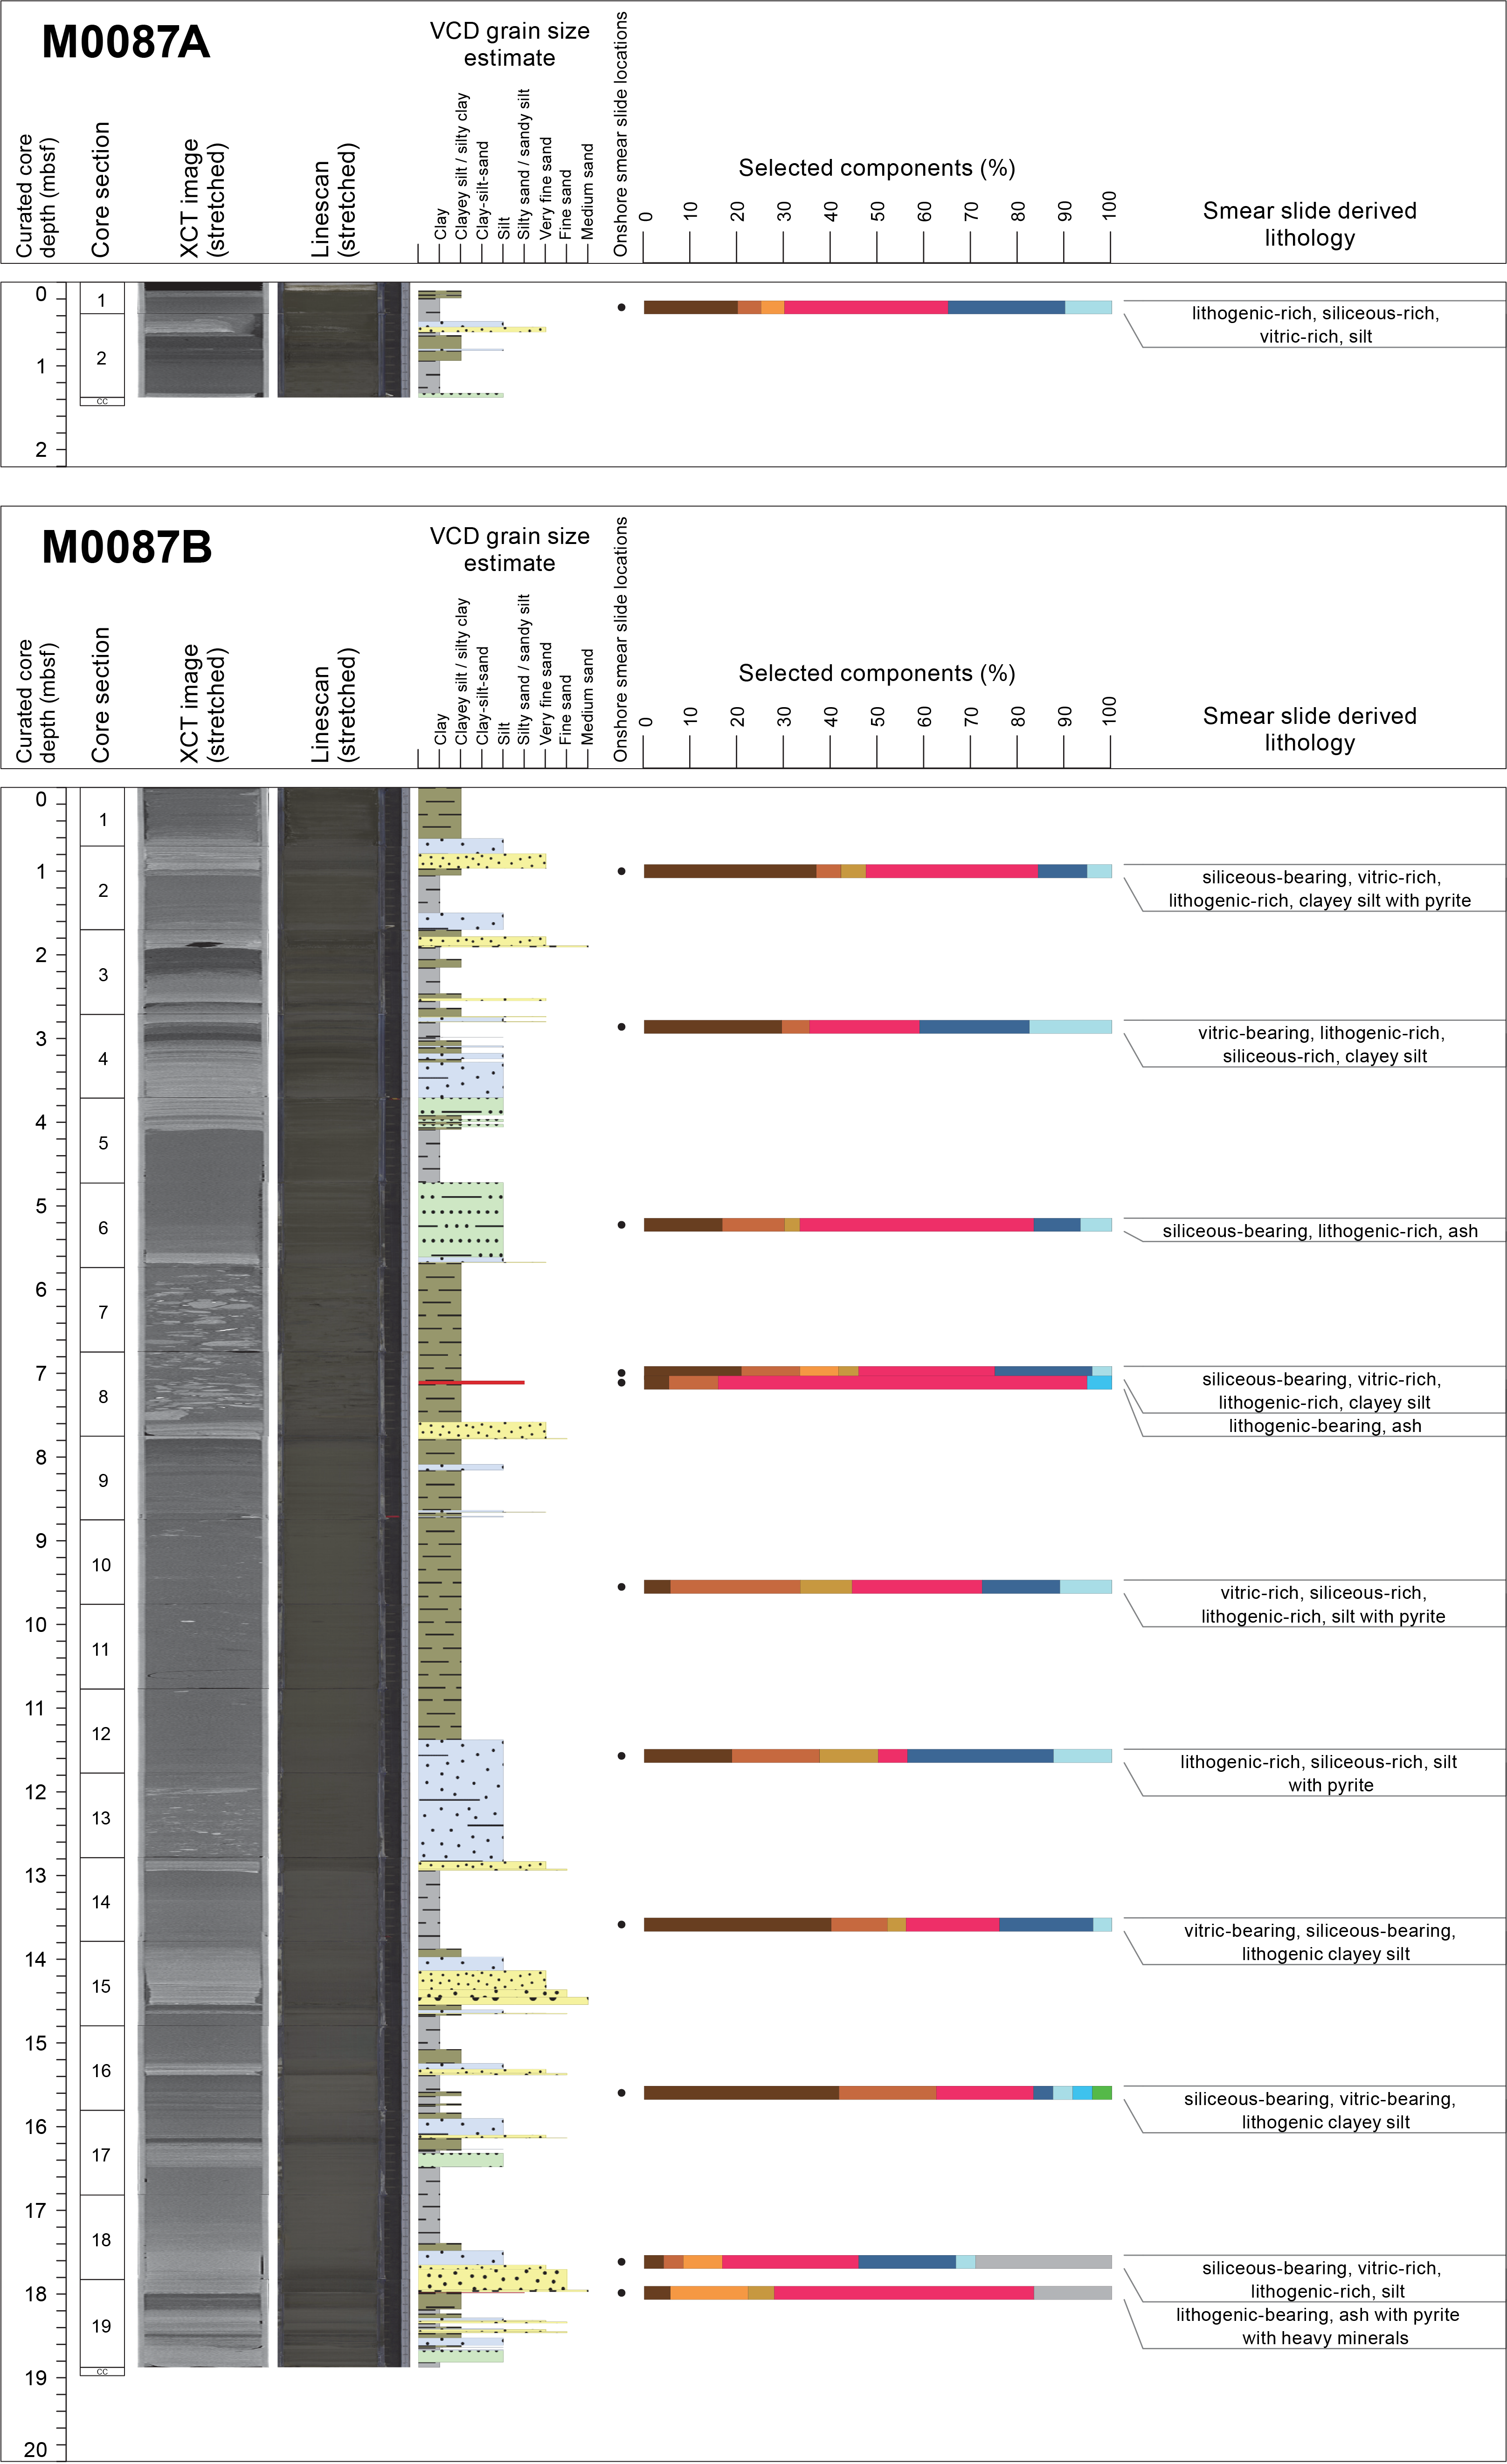
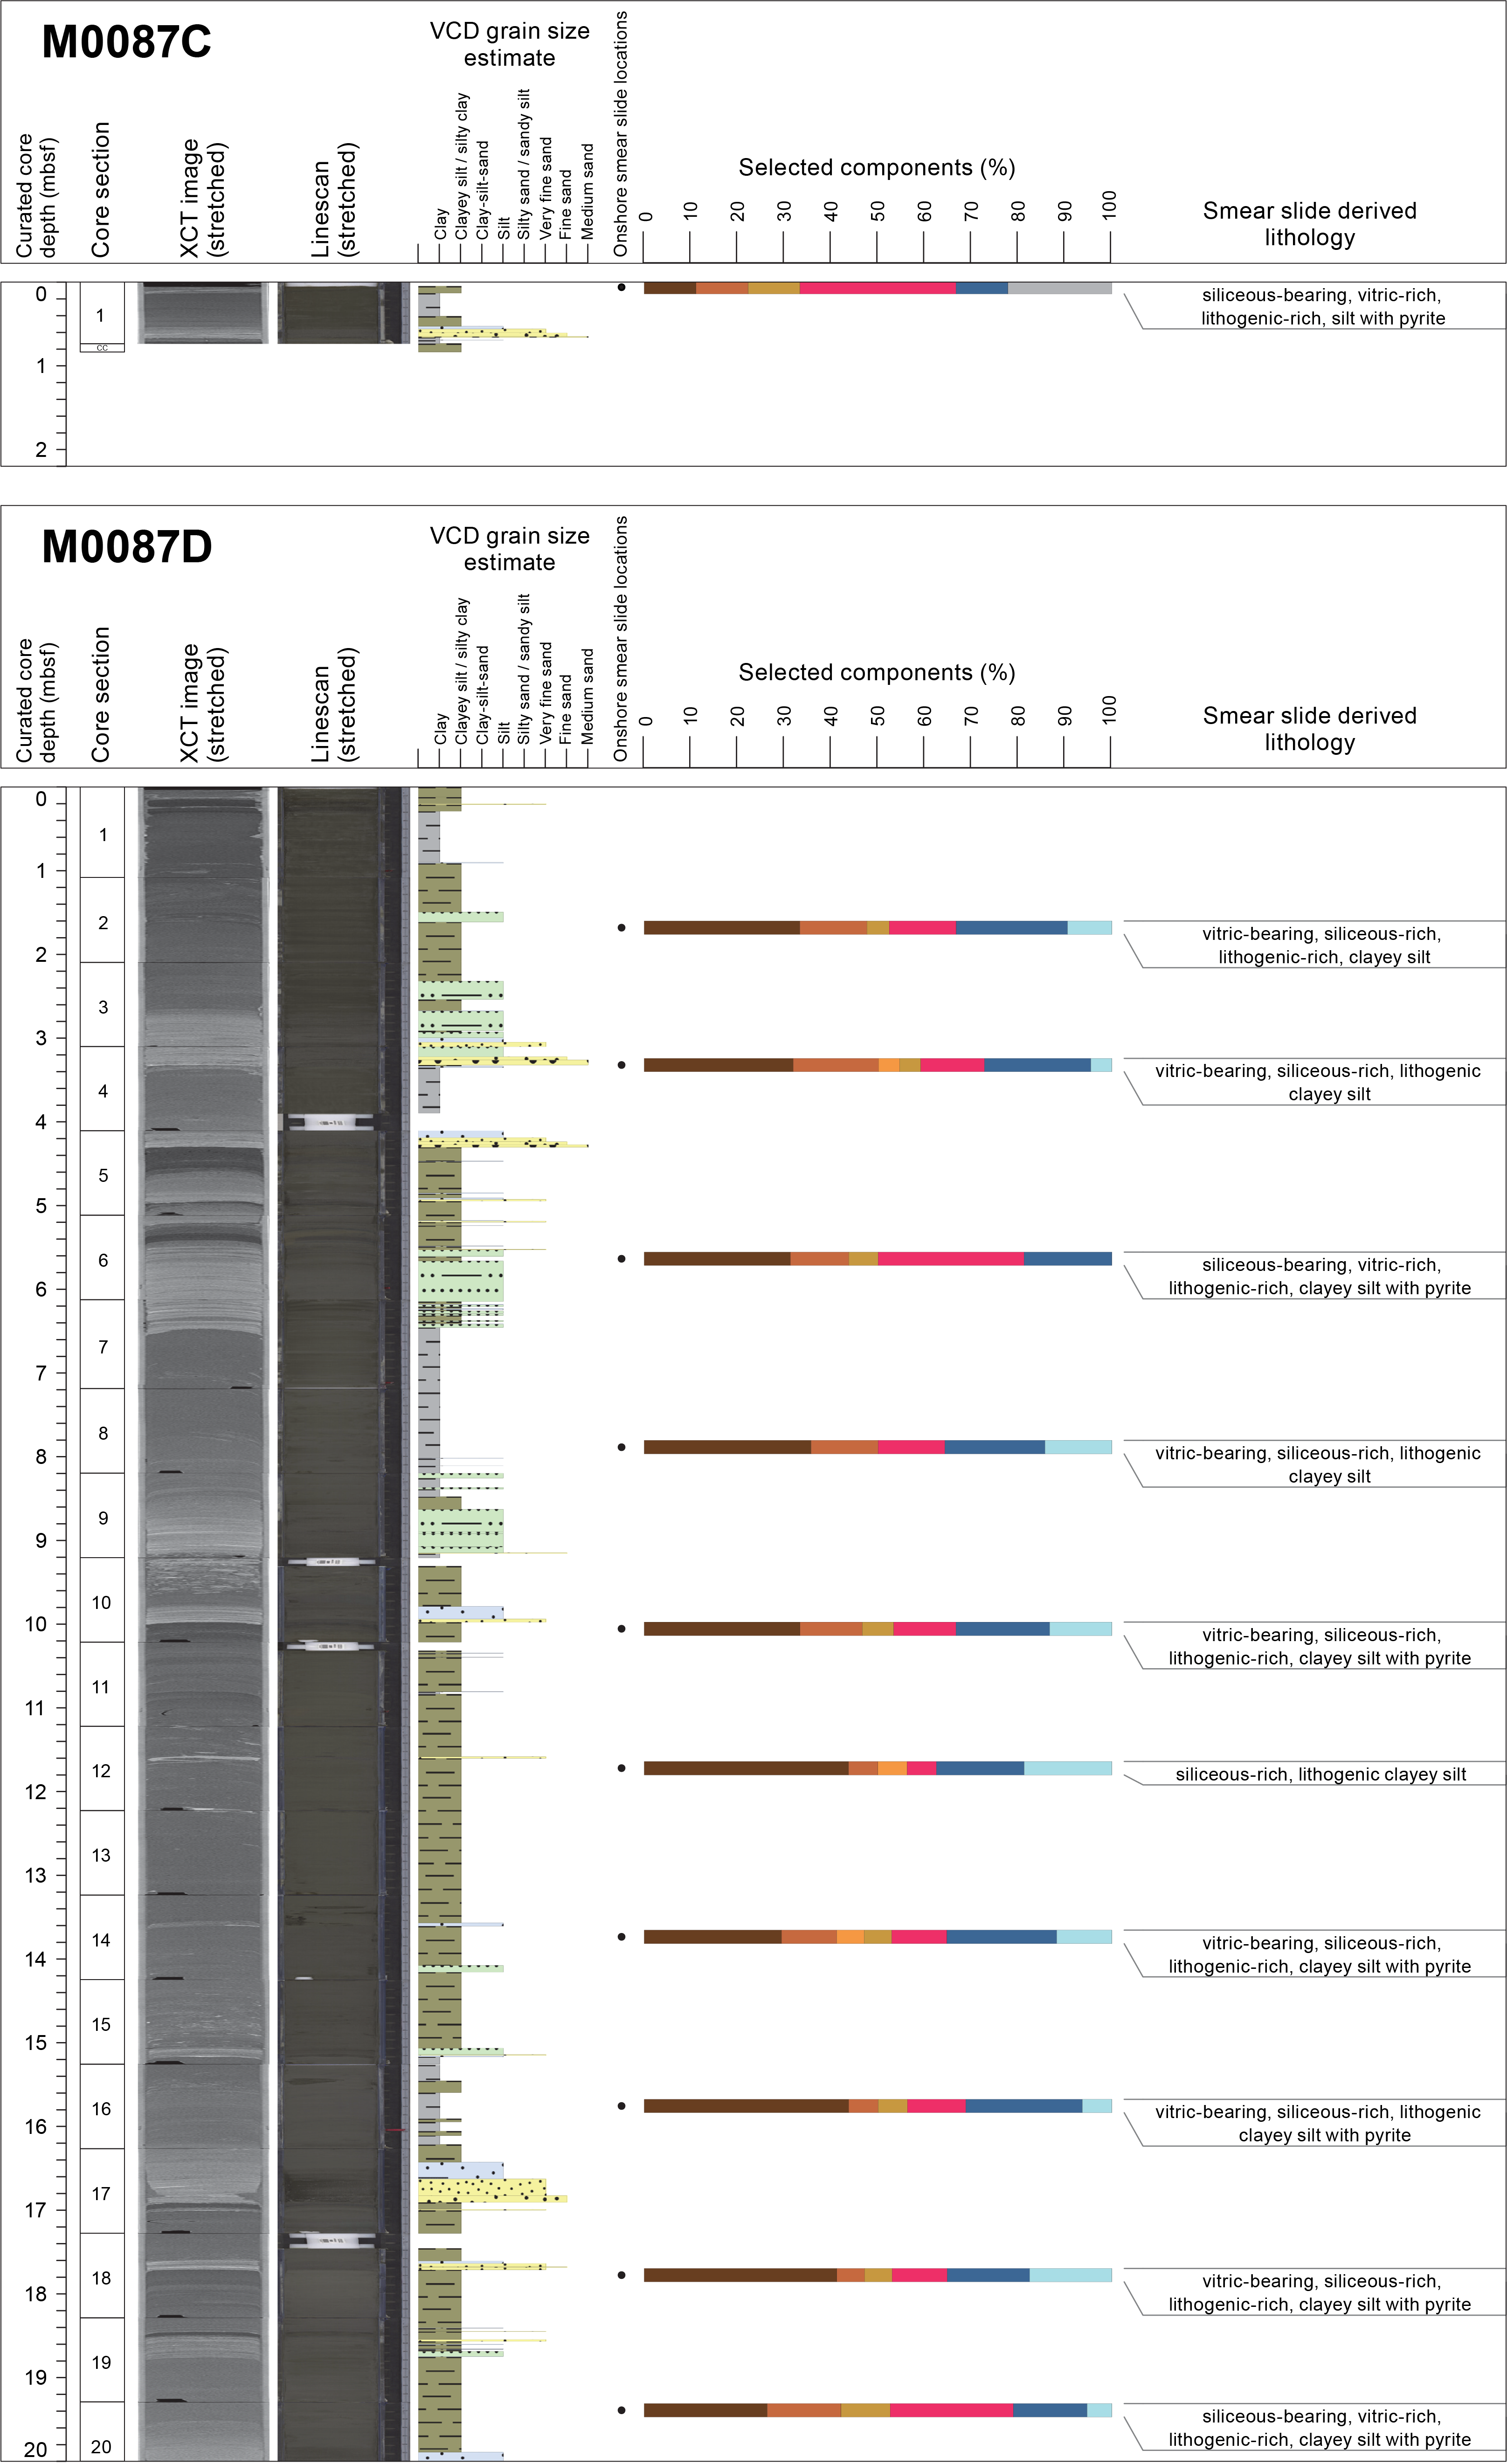
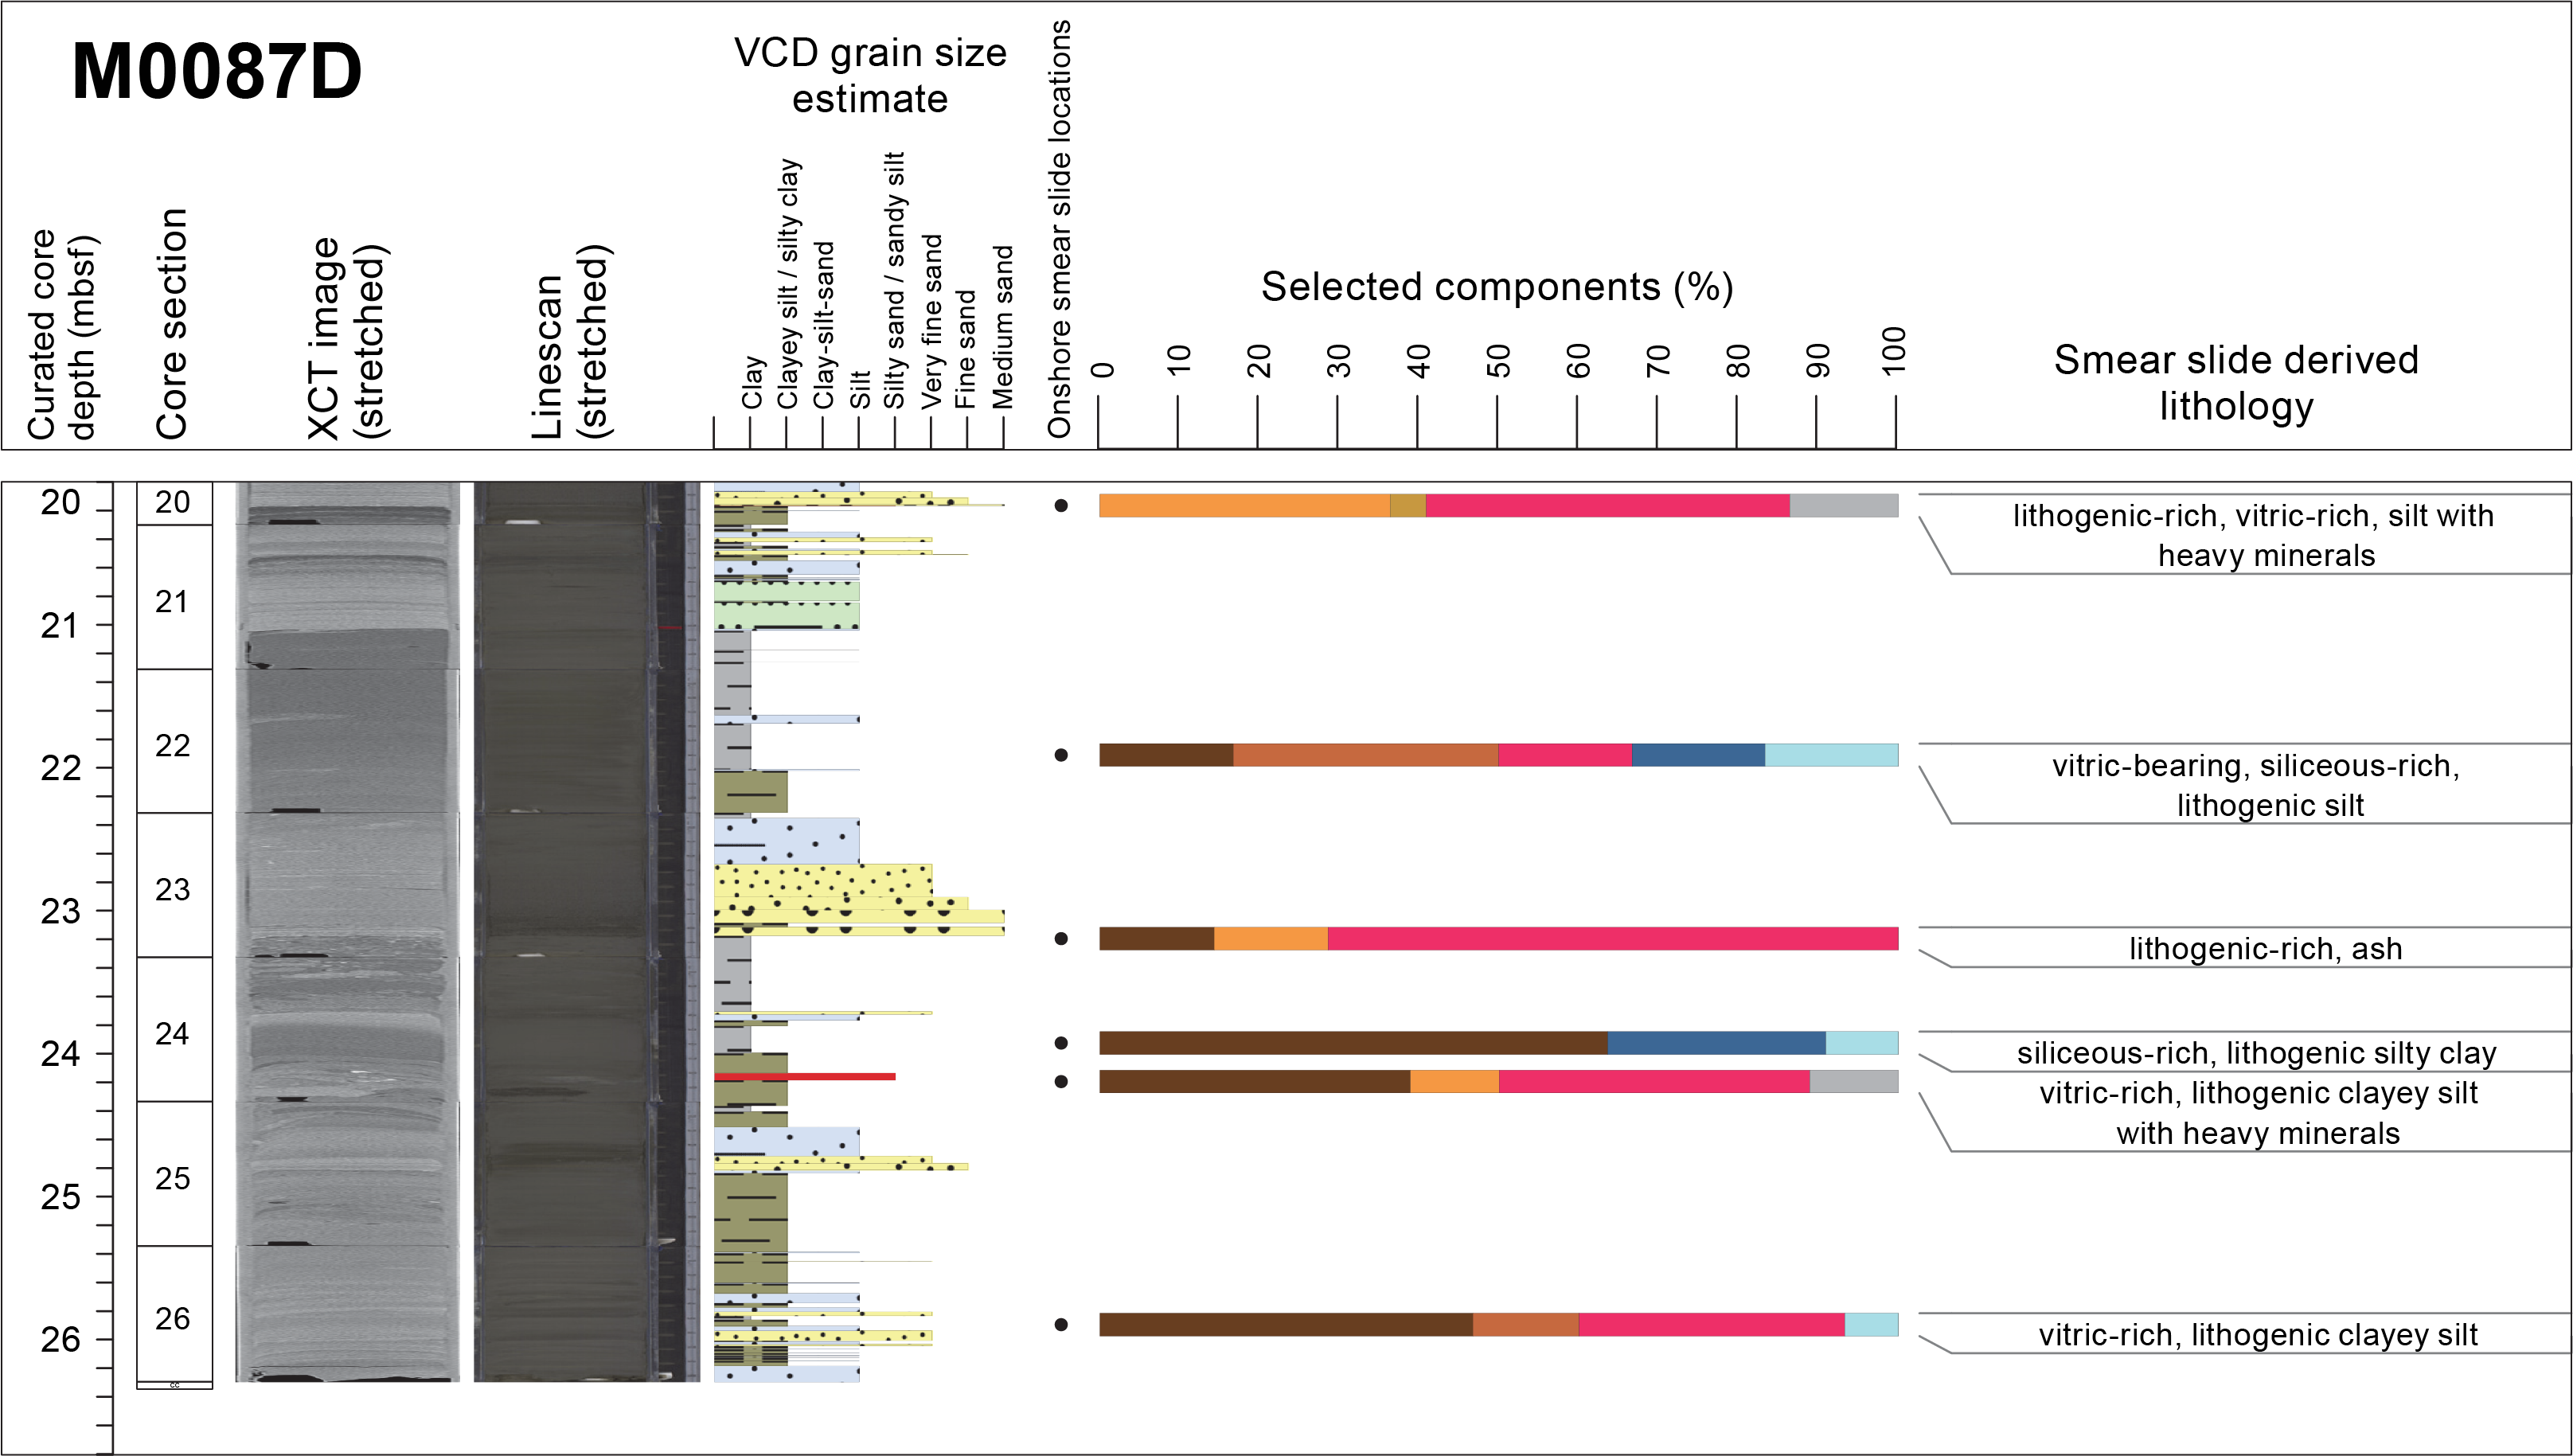
Figure F12. Smear slide summaries.
The lithology at Site M0087 is dominated by clayey silt and silty clay with minor components of medium, fine, and very fine sand (Figures F10, F11). The grain size percentages examined from 29 smear slide observations show the lithology is composed of silty sand, silt, clayey silt, and silty clay (Figure F13). Smear slide observations show equal mixtures of vitric and lithic grains (clay minerals, quartz, and feldspar), with fewer biogenic grains (diatoms, sponge, spicules, radiolaria, and calcareous microfossils) (Table T3; Figure F13; see smear slide photos in SMEARSLD in Supplementary material). The smear slides suggest a dominance of vitric-bearing siliceous-rich lithogenic clayey silt.

Figure F13. Ternary diagrams of major components.
Five types of lithologies were determined based on grain size and sedimentary structures derived from visual core description (Figures F10, F11). Soft-sediment deformation structures such as folds, dipping layers, and convolute layers were observed at this site. In addition, three tephra layers were reported in the VCDs for Site M0087 (see Tephra).
Type 1 is composed of silt, silty clay, and clay with minor components of very fine sand and silt patches without bioturbation. The patches are olive-black (7.5 Y 3/2) and relatively darker than their matrix, which is grayish olive (7.5 Y 4/2). Most of the patches are <1 cm in diameter and consist of various grain size particles (very coarse sand to silt) (Figure F14A).
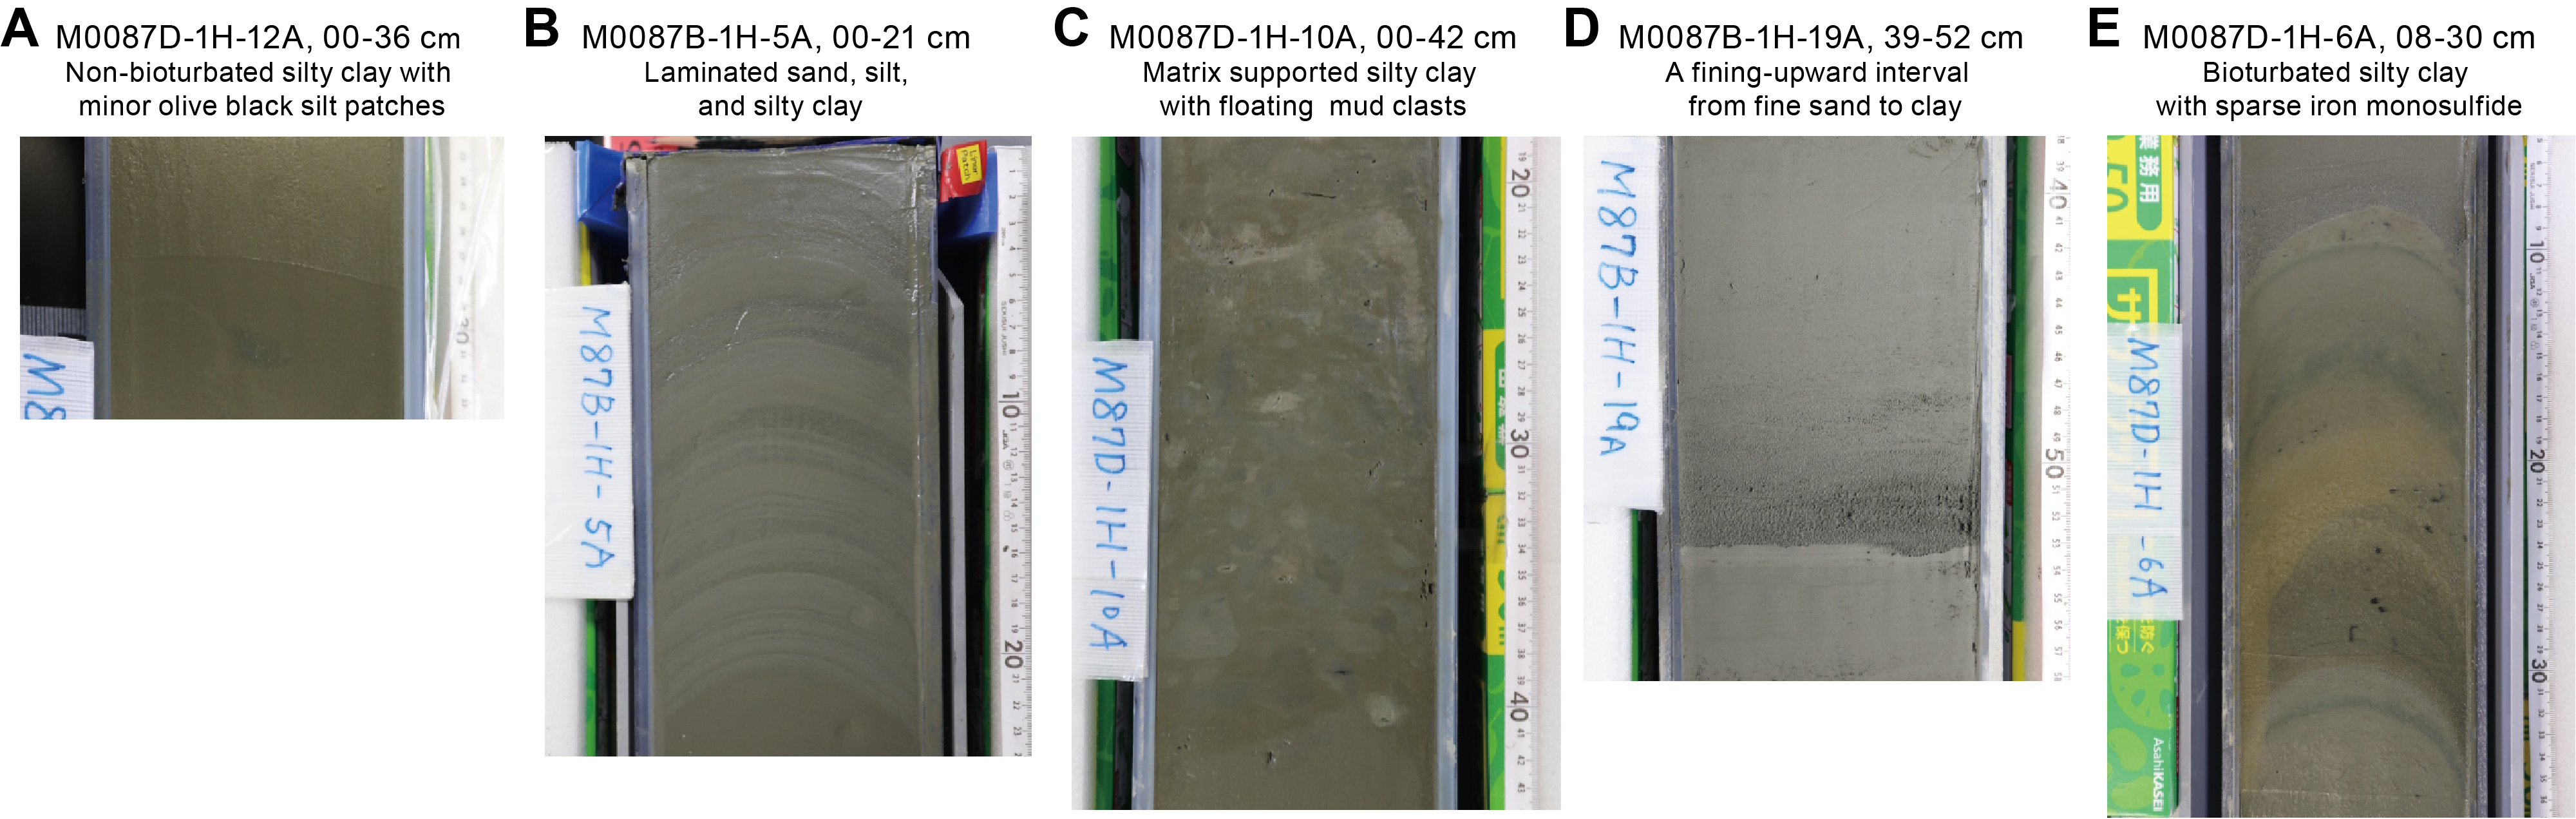
Figure F14. Main lithologic components.
Type 2 is laminated sand and silty clay forming parallel beds and laminae. The laminae and thin beds are composed of medium sand, fine sand, very fine sand, silt, and silty clay. Most laminated intervals arch upward and are likely related to coring deformation. Laminae can be 0.3 to 1 cm thick (Figure F14B).
Type 3 is matrix-supported chaotically mixed silty clay with mud clasts. The clasts are grayish olive (7.5 Y 4/2) and composed of silt. The matrix is composed of silty clay. The clasts range 2–10 cm in diameter, and they are bright (7.5 Y 5/2) and dark (7.5 Y 3/2). The clast margins are sharp, which is different from the silt patches of Type 1, which have diffuse boundaries (Figure F14C). Three intervals of Lithology Type 3 can be found at 5.7–7.5 mbsf in Hole M0087B and 9.15–9.95 and 23.2–23.9 mbsf in Hole M0087D.
In Lithology Type 4, the fining-upward intervals are characterized by a sharp basal contact, and the basal part consists of coarse sediments decreasing in grain size upward (Figure F14D). The grain size is usually fine sand at the base of the interval and progressively fines upward to clay. The thicknesses of the fining-upward intervals vary from a few centimeters to 1 m. Event deposits are identified in Type 4 (see Lithostratigraphy in the Expedition 386 methods chapter [Strasser et al., 2023a]).
In Type 5, bioturbation ranges from slight to moderate in the silty clay and clay and bioturbated intervals are common below Type 4 lithology (Figure F14E). Both bioturbation and iron monosulfides are rare throughout this site. Iron monosulfide staining varies from sparse to moderate in ~10–15 cm thick intervals.
Core deformation is minor and characterized by voids, slurry, and cracks. Cracks are more abundant with depth in the core. Most significant is the post–core recovery oxidation observed in many sections after splitting. X-ray CT scan images were processed and are available for each site (see XRAYCT in Supplementary material) The density contrasts expressed in gray levels offer a detailed image of the sedimentary structures. Among these, tephra is present in Hole M0087B (Sections 1H-8, 39 cm, and 1H-19, 16.4 cm) and Hole M0087D (Sections 1H-20, 87.5 cm; 1H-23, 88 cm; and 1H-24, 87 cm) (see Tephra). Complete core linescan image composites provide insights on how the sediments vary with depth in a core (see linescan composite plots in Core descriptions and individual images in LINESCAN in Supplementary material). More detailed information about the lithology, X-ray CT scans, linescan images, bioturbation, iron monosulfides and associated physical properties are shown on the 3 m barrel sheets (see Core descriptions) and close-up photos (see CORECLOSEUP in Supplementary material). XRD tables can be found in XRD in Supplementary material.
3.1. Holes M0087A and M0087B
3.1.1. Hole M0087A
Hole M0087A is 1.475 m deep and is mainly composed of nonbioturbated silty clay. An olive-brown (2.5Y 4/3) 0.5 cm interval at the top of the hole is interpreted as oxygenated, indicating that the surface of the seafloor was recovered. A 0.5 cm thick silt lamina is recognized at 0.140–0.145 mbsf. A fining-upward interval from silt to clay occurs at 0.18–0.59 mbsf. The other fining-upward interval from very fine sand and coarse sand to clay occurs at 0.59–0.81 mbsf. The coarse part of the fining-upward interval shows good correlation to the increased signal and peaks of magnetic susceptibility and density (see Physical properties). A 12 cm thick parallel laminated silty clay occurs at 0.81–0.93 mbsf. The lithology of Hole M0087A is comparable to lithology Types 2 and 4.
One smear slide observation at 0.30 mbsf describes this lithology as lithogenic-, siliceous-, and vitric-rich silt (Table T3). Vitric grains are the most abundant mineral components (35%), with additional quartz (5%) and feldspar (5%). Diatoms (25%) and sponge spicules (10%) dominate the biogenic fraction. The composition of this smear slide includes volcanic (35%), biogenic (35%), and lithic (30%) grains (Figure F13). The dominant grain size is silt.
3.1.2. Hole M0087B
In Hole M0087B, the lithology is dominated by silty clay and silt. This hole is 18.98 m deep. Slight to moderate bioturbation, together with iron monosulfide intensity, occurs in rare intervals. Magnetic susceptibility, bulk density, and natural gamma radiation (NGR) show an increase in values manifested as peaks corresponding to the coarse part of each fining-upward interval (Figure F10). The sediments recovered from Hole M0087B comprise four discrete intervals defined based on visual core description, grain size, and sedimentary structures.
Interval 1 (0–5.7 mbsf) includes lithology Types 1, 2, 4, and 5. A silt and very fine sand parallel laminated interval occurs at 0.6–1.0 and 1.60—1.90 mbsf. The latter is underlain by a medium sand lamina. A silt parallel laminated silty clay occurs at 3.4–4.1 mbsf and a silt-clay/silt-sand laminated horizon underlain by a very fine sand lamina occurs at 4.80—5.70 mbsf. Each lamina is <0.5 cm thick. Bioturbated silty clays or clays are observed at 1.9–2.2, 2.5–2.6, and 2.8–2.9 mbsf.
Interval 2 (5.7–7.8 mbsf) includes Type 3 and 4 lithologies. Mixed silt clasts contained in the silty clay matrix are <10 cm in diameter and have a subrounded shape. The profiles of magnetic susceptibility and bulk density in this interval have slight increases and decreases in their signal. This may be due to the floating distribution of clasts (Figure F10). A fining-upward deposit of very fine sand to silty clay lies below the silt clasts. A tephra (interval 386-M0087B-1H-8, 35–39 cm) was collected from this interval (see Tephra). This interval can be correlated to 9.15–9.95 mbsf in Hole M0087D (Interval 2).
Interval 3 (7.8–12.95 mbsf) contains Type 1 lithology. There is a 2.7 m thick, structureless interval of silty clay with silt to very fine sand patches from 8.8 to 11.4 mbsf. From 11.4 to 12.6 mbsf is an interval of silt with very fine sand patches. Below 12.6 mbsf, a fining-upward deposit of very fine sand to silt is observed.
Interval 4 (12.95 mbsf to the bottom of the hole) includes Type 2, 4, and 5 lithologies. Two fining-upward deposits of medium sand to clay are observed at 12.95–14.55 and 16.5–18.0 mbsf. Bioturbated silty clays or clays are observed at 16.1–16.2 and ~18.5 mbsf. Another tephra (interval 386-M0087B-1H-19, 15.6–16.4 cm) was recovered from a 0.5 cm thick silt lamina at ~17.9 mbsf (see Tephra).
A total of 11 smear slides were described for Hole M0087B (Table T3; Figure F12; see smear slide photos in SMEARSLD in Supplementary material). Smear slide observations indicate that the lithology is dominated by vitric- and siliceous-bearing lithogenic clayey silt. The grain size, as determined from the smear slide, includes silty sand, silt, and clayey silt (Figure F13). The major components of the sediment are lithic-rich vitric grains. Vitric shards are the most abundant mineral component (6%–50%), with additional quartz (4.2%–27%), pyrite (0%–12.5%), and feldspar (0%–8.3%); diatoms and sponge spicules dominate the biogenic fraction, with more diatoms (4.2%–31.3%) than sponge spicules (4.0%–17.6%) in all samples. Tephras are discussed in Tephra. Calcareous nannofossils are observed in one silty clay smear slide (Sample 1H-16, 80 cm).
3.2. Holes M0087C and M0087D
3.2.1. Hole M0087C
Hole M0087C is 0.835 m thick, and the main lithology is silty clay. The sediment is nonbioturbated. There is a 1.5 cm olive-brown (2.5Y 4/3) silty clay interval at the top of the hole. This interval is interpreted as the oxygenated zone, indicating that the surface of the seafloor was recovered. One fining-upward interval from medium sand to clay occurs at 0.14–0.66 mbsf. Magnetic susceptibility and density show an increase in their signals that corresponds to the coarser grained interval (see Physical properties). A 0.5 cm thick medium sand lamina occurs at 0.690–0.695 mbsf (Figure F11). The sediment characteristics are associated with lithology Types 2 and 4.
One smear slide was described (Sample 386-M0087C-1P-1, 6.0 cm) (Table T3; Figure F12; see smear slide photos in SMEARSLD in Supplementary material). This smear slide lithology is siliceous-bearing vitric-rich lithogenic silt with pyrite. Vitric grains are the most abundant mineral component (33.3%), with additional quartz (11.1%), pyrite (11.1%), lithic grains (22.2%), and diatoms (11.1%). The composition of this smear slide includes lithic (55.6%), volcanic (33.3%), and biogenic (11.1%) components (Figure F13). The dominant grain size is silt.
3.2.2. Hole M0087D
Hole M0087D is 26.345 m deep. The lithology is dominated by silt with minor very fine and medium sand. Bioturbation is slight to moderate, and iron monosulfide intensity is similar. The lithology of the upper 23.1 m shows patterns similar to those in Hole M0087B (Figures F10, F11). The sediment recovered from Hole M0087D comprises five discrete intervals based on visual core description, grain size, and sedimentary structures.
Interval 1 (0–9.15 mbsf) includes Type 1, 2, 4, and 5 lithologies. A silty clay to clay interval containing silty clay patches occurs at 0.3–2.3 mbsf. Another clay interval containing silty clay patches occurs at 6.5–8.6 mbsf. A silt and very fine sand parallel laminated silt-sand interval occurs at 5.5–6.5 mbsf. Another interval of silt parallel laminated silt-sand including very fine sand laminations occurs at 8.6–9.2 mbsf. Each lamina is <1 cm thick. Two fining-upward deposits of medium sand to clay are observed at 3.8–4.45 and 2.3–3.4 mbsf. Bioturbated silty clays are observed at 3.3, 4.3–4.45, 4.9–5.1, and 5.3–5.4 mbsf in between the laminated intervals.
Interval 2 (9.15–9.95 mbsf) includes Type 3 and 4 lithologies. The mud clasts in the chaotic interval are <10 cm in diameter and subrounded. The grain size of clasts ranges from fine sand to silt. The color of the clasts is bright (7.5Y 5/2) and dark (7.5Y 3/2). The matrix is composed of grayish olive (7.5Y 4/2) silty clay. A fining-upward deposit of very fine sand to silty clay lies below the mud clast bearing chaotic interval.
Interval 3 (9.95–15.1 mbsf) includes Type 1 lithology. A thick, silty clay with some silt and very fine sand patches occurs in this interval. One silt bed (~5 and ~10 cm thick) is observed at 13.6 mbsf, and a silt-sand bed is observed at 14.1 mbsf. A shell 4 mm in diameter was found in Section 386-M0087D-1H-10, 77.5 cm, between Intervals 2 and 3.
Interval 4 (15.1–23.2 mbsf) includes lithologies of Types 2, 4, and 5. A thick, parallel laminated silt and very fine sand occurs at 20.2–21.0 mbsf. Each lamina is <1 cm thick. Three fining-upward deposits of medium sand to clay can be observed at 16.3–16.9, 19.5–20.2, and 22.0–23.2 mbsf. Bioturbated silty clays are observed at 16.9–17.1, 17.7–18.6, 20.17, and 20.5–20.7 mbsf. A layered tephra interval occurs in interval 386-M0087D-1H-20, 87.5–88.0 cm (~20.1 mbsf).
Interval 5 (23.2 mbsf to the bottom of the hole) includes lithologies of Types 2, 3, and 4. Silt clasts and very fine sand patches occur in the silty clay matrix at 23.2–23.9 mbsf. The clasts are <5 cm diameter and subrounded. The dimensions of the clasts are smaller than those in Hole M0087D Interval 2. Below the silt clasts, a ~30 cm thick interval of convoluted silty clay is present at 23.9–24.2 mbsf. Both silt clasts and convoluted silty clay are associated with Type 3 lithology. A tephra event contains spots at 23.2–23.7 mbsf and patches at 23.9–24.2 mbsf of grayish olive (7.5 Y 6/2) (see Tephra). A fining-upward deposit of medium sand to clay is observed at 22–23.2 mbsf, and another one of fine sand to clay is observed at 24.4–24.8 mbsf. Below the fining-upward interval, silty clay streaks are interbedded with silt, very fine sand, and sand from 24.8 mbsf to the bottom of the hole. These streaks and laminations are associated with Type 2 lithology.
A total of 16 smear slides were described for Hole M0087D (Table T3; Figure F12; see smear slide photos in SMEARSLD in Supplementary material). The main lithology is vitric-bearing siliceous-rich lithogenic clayey silt with pyrite. The grain size, as determined from the smear slide, includes silt, clayey silt, and silty clay (Figure F13). The major components are lithogenic and biogenic grains. Clay is the most abundant mineral component (11.1%–43.8%). Additional mineral components are quartz (<33.3%), volcanic glass shards (<33.3%), feldspar (<11.1%), and pyrite (<10.5%). Diatoms and sponge spicules dominate the biogenic fraction, with more diatoms (<27.3%) than sponge spicules (<18.8%) in all samples except for the three tephra intervals. Hole M0087D includes three tephra samples: 1H-20, 87.5 cm; 1H-23, 88.0 cm; and 1H-24, 87.0 cm (see Tephra).
3.3. X-ray diffraction mineralogy
XRD mineralogy was conducted for one sample every two sections, and some minerals have been grouped. These groupings will require additional processing to extract a signal for each mineral. For example, quartz has not been separated from opal-A, and clays, carbonates, amphiboles, pyroxenes, and heavy minerals are composed of several minerals in each grouping (see Lithostratigraphy in the Expedition 386 methods chapter [Strasser et al., 2023a]). The interpretation of the mineralogy is an approximation at this stage. However, some interpretations can be made when the data are contrasted with the lithostratigraphic summaries (Figure F11). For Hole M0087D (Figure F15), the most abundant minerals are quartz, feldspar, and micas (muscovite and biotite), followed by clays. The data show correspondence between quartz, feldspar, micas, and clays, and the smear slide data also show them as the most abundant minerals (Table T3). Pyroxene is present at 0–5, 8.5–15, and 23 mbsf. Palygorskite is rare in abundance at 0–7, 11, and 17 mbsf. Heavy minerals are also rare at 8.5 and 23–25 mbsf. Future studies will be required to fully extract the mineralogy of the sediments in this hole.
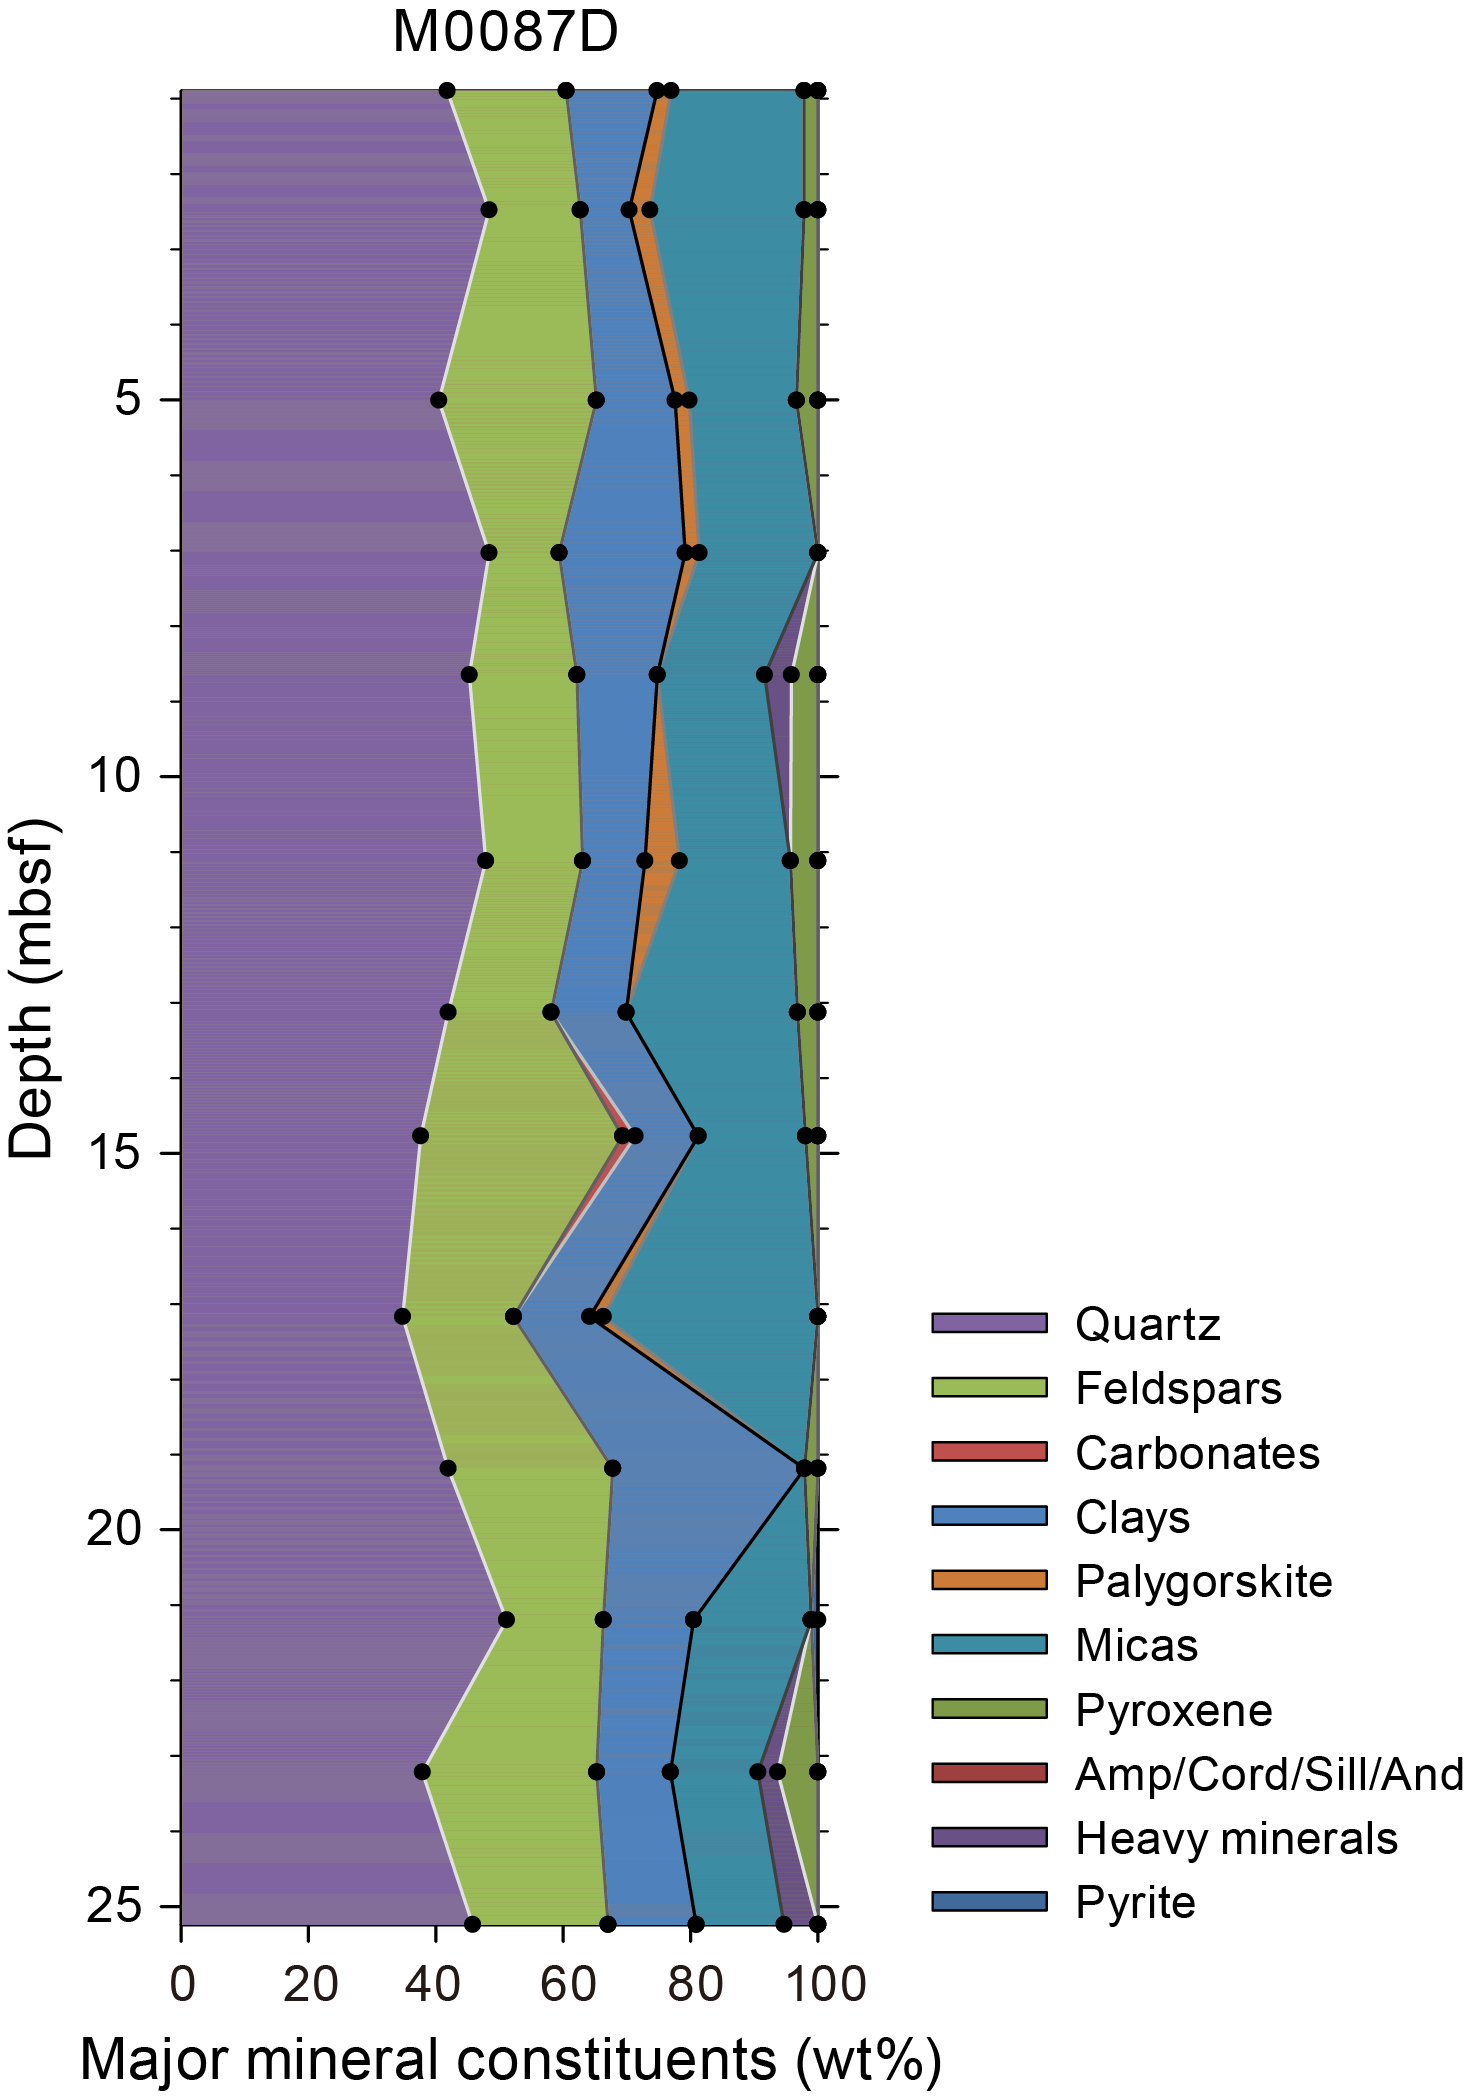
Figure F15. XRD mineralogy.
4. Tephra
Three tephra layers are present in Basin C/N3. One of them is a key bed for interhole correlation between Holes M0087B and M0087D (tephras M0087B-1H-19, 16.4 cm, and M0087D-1H-20, 87.5 cm, respectively) and represents a candidate tephra for regional tephrostratigraphic correlation. The other two tephra layers occur within intervals of reworked sediments and do not occupy true tephrostratigraphic positions.
Light brown silt-sized tephra patches (M0087B-1H-8, 39 cm) are included in a silty mass transport deposit interval in interval 386-M0087B-1H-8, 35–39 cm (Figure F16A). Therefore, this tephra does not occupy a true tephrostratigraphic horizon. It is composed of multiple types of volcanic glass shards, including pumiceous, fibrous, and bubble-wall types (Figure F17A; Table T4). Observed heavy minerals are represented by weathered biotite.
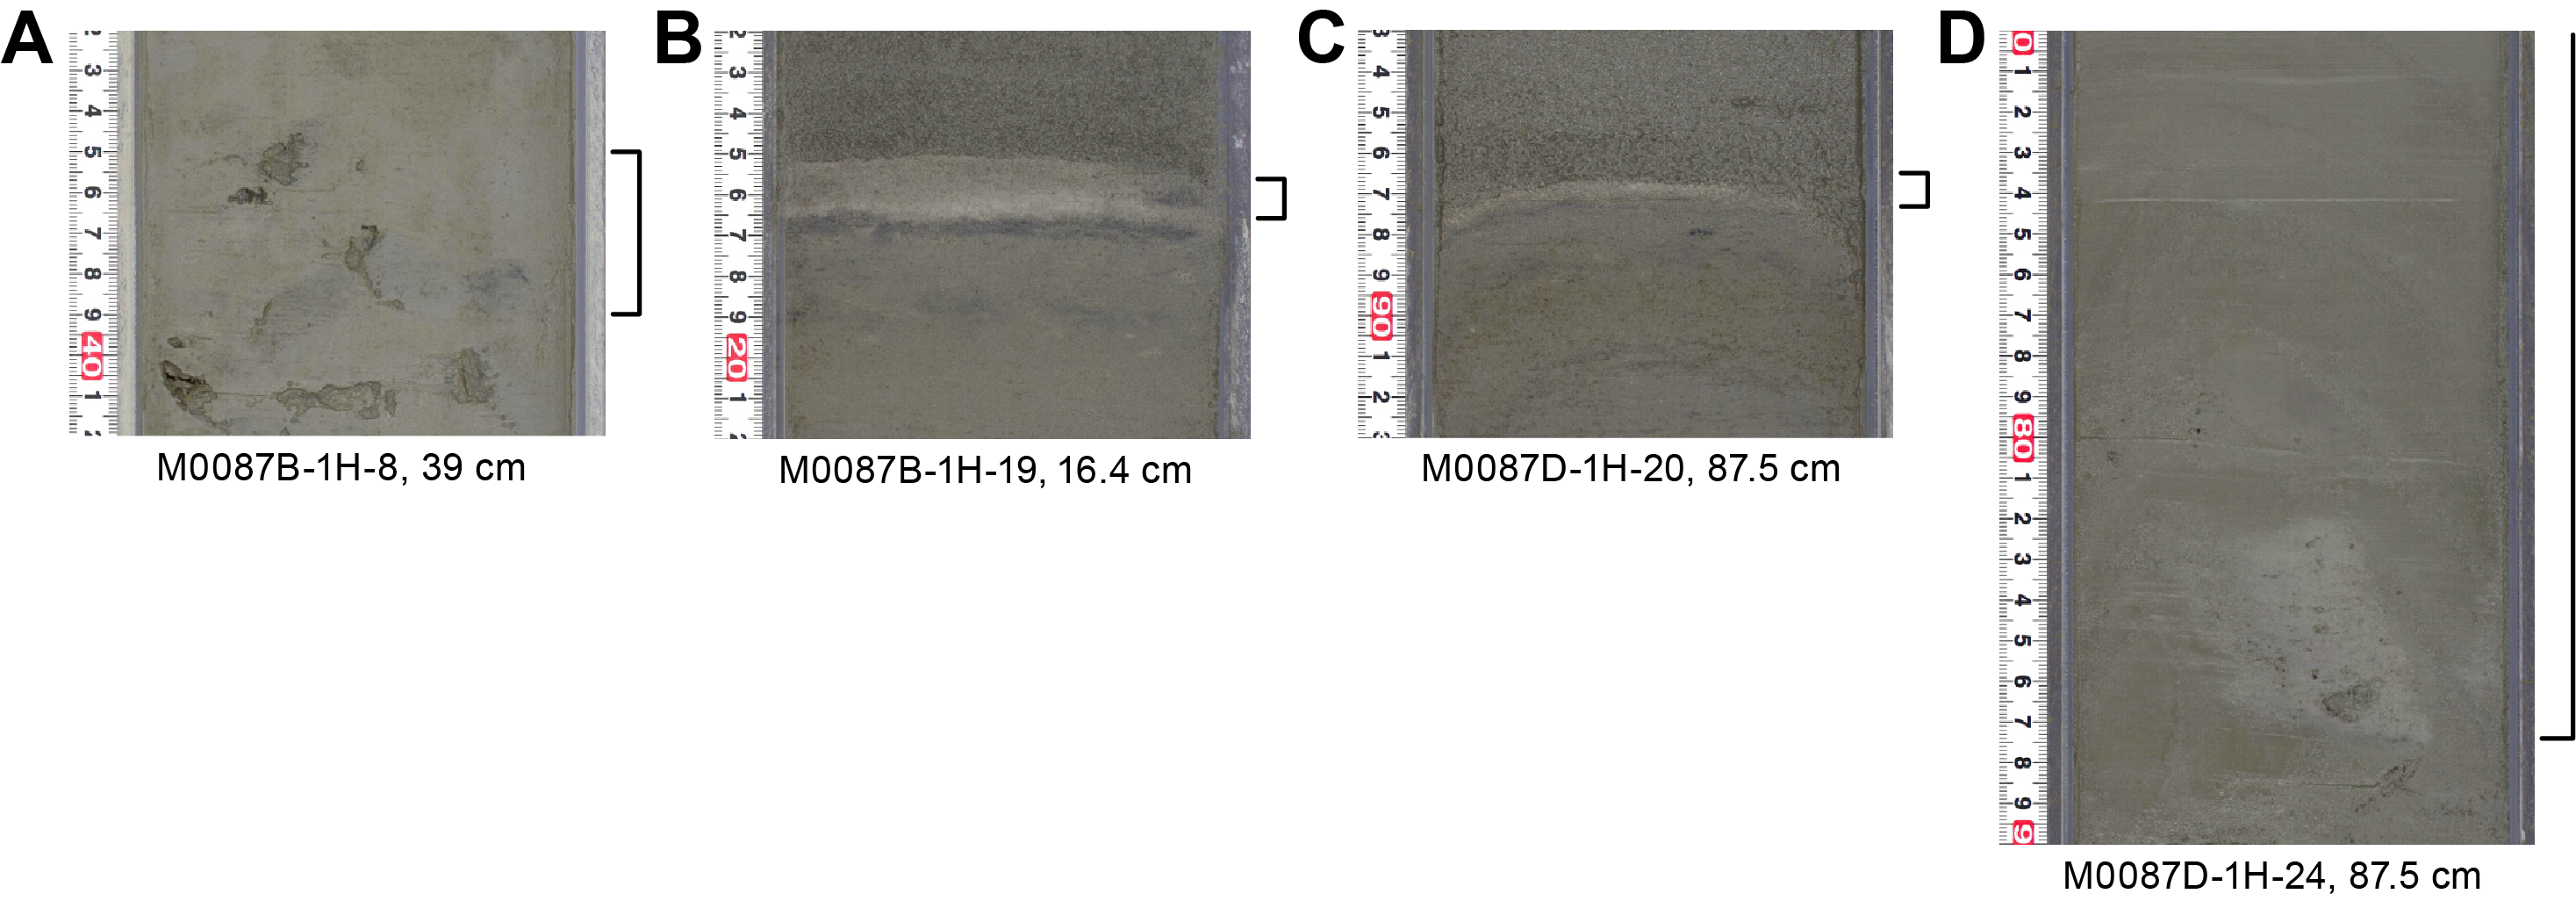
Figure F16. Core closeup photos of tephras.

Figure F17. Smear slides representing tephras.
A tephra layer (M0087B-1H-19, 16.4 cm, and M0087D-1H-20, 87.5 cm) was observed in intervals 386-M0087B-1H-19, 15.6–16.4 cm (Figure F16B), and 386-M0087D-1H-20, 87–87.5 cm (Figure F16C). The facies of the layer is light reddish brown silt-sized tephra. In Hole M0087B, the tephra layer grades upward into a thin (0.6 cm) silty sediment interval that is separated from an overlying thick sand layer by a sharp basal contact. In contrast, the tephra layer in Hole M0087D is directly overlain by the thick sand layer. Below the tephra layer, patches composed of this tephra are scattered within the underlying approximately 5 cm thick interval of bioturbated silty sediment in both holes. The tephra is composed of dominant pumiceous type volcanic glass shards with fewer fibrous type volcanic glass shards (Table T4). The heavy mineral composition is abundant hornblende and smaller amounts of orthopyroxene and clinopyroxene. Opaque minerals are very rare (Figure F17B, F17C).
This tephra layer is probably correlated with the M0094B-1H-16, 82.5 cm, tephra layer based on similarities in lithofacies, volcanic glass type, and heavy mineral composition, although ß-quartz was not found in this tephra (see Tephra in the Site M0094 (Basin C/N2) chapter [Strasser et al., 2023c]). This is of key importance for regional tephrostratigraphic correlation with tephras of similar lithofacies, but more detailed analysis, such as chemical composition analysis, is needed to test for this possible correlation.
Reddish brown silt-sized tephra blocks and patches (interval 386-M0087D-1H-24, 87.5 cm) are included in silty mass transport deposit interval 386-M0087D-1H-23, 85 cm, to 1H-24, 87.5 cm (Figure F16D). This tephra therefore does not occupy a true tephrostratigraphic horizon. It is composed of abundant bubble-wall and platy types of volcanic glass shards (Figure F17D; Table T4). Heavy minerals are rare, and clinopyroxene, orthopyroxene, and apatite are observed.
5. Micropaleontology
Four holes were cored at Site M0087 in Basin C/N3, located in the boundary area between the central and northern Japan Trench. Because of the prevalence of event layers, no radiolarian-based age determinations were made at this site. Foraminifera in samples collected during the offshore phase were examined to determine the provenance of mass transport deposits.
5.1. Foraminifera
Samples were taken at 5 m intervals offshore, as described in Micropaleontology in the Expedition 386 methods chapter (Strasser et al., 2023a). With the exception of the agglutinated foraminifera, which may be either in situ or reworked, all foraminifera at Site M0087 are considered to be allochthonous.
5.1.1. Hole M0087A
One sample taken from the base of Hole M0087A was examined for foraminifera (Table T5). Only two benthic and one planktonic foraminifer with moderate preservation are present in this sample. Diatoms, radiolaria, and sponge spicules are common, and glass shards are very abundant. The glass includes very angular shards, clear and dark colored shards, and bubble glass.
No provenance interpretation can be made for this sample due to low foraminifera abundance.
5.1.2. Hole M0087B
Four samples from Hole M0087B were examined for foraminifera (Table T5). These samples are all barren. Glass shards, diatoms, radiolaria, and sponge spicules are abundant.
No provenance interpretation can be made for these samples due to the absence of foraminifera.
5.1.3. Hole M0087C
One sample from the base of Hole M0087C was examined for foraminifera (Table T5). Only one broken unidentifiable agglutinated foraminifer is present. Glass shards, diatoms, radiolaria, and sponge spicules are abundant.
No provenance interpretation can be made for this sample due to low foraminifera abundance.
5.1.4. Hole M0087D
Six samples from Hole M0087D were examined for foraminifera (Table T5). Moderately preserved benthic foraminifera are present in one sample; the remaining five samples are barren. All samples are barren of planktonic foraminifera. Glass shards, diatoms, radiolaria, and sponge spicules occur in all samples.
No provenance interpretation can be made for these samples due to low foraminifera abundance.
6. Geochemistry
6.1. Interstitial water
At Site M0087, a total of 48 interstitial water (IW) samples were collected using Rhizon samplers from two trigger cores (Holes M0087A and M0087C) and two GPC cores (Holes M0087B and M0087D). Additionally, two bottom water (BW) samples were taken from each of the trigger cores. See Geochemistry in the Expedition 386 methods chapter (Strasser et al., 2023a) for details of the sampling, and analytical methods and data quality used. In general, IW compositions at Site M0087 reflect the combined effects of organic matter degradation, including the release of metabolic products and consumption of electron acceptors, and mineral dissolution/precipitation reactions within sediments. Notably, concentrations of some pore water species (e.g., sulfate, alkalinity, and ammonium) at Site M0087 exhibit reversal trends toward seawater values below ~10 mbsf.
6.1.1. Shipboard analyses: salinity, alkalinity, and ammonium
Salinity at Site M0087 generally shows relatively stable values ranging ~34.5–35 in the uppermost ~20 m, followed by a slight decrease to ~34 at the bottom of Hole M0087D (Figure F18; Table T6) Alkalinity concentrations increase monotonically from ~2.5 mM in the BW to a peak value of 36 mM at 9.6 mbsf in Hole M0087B, followed by a gradual decrease to 23 mM at the bottom of the hole (Figure F18). In Holes M0087C and M0087D, alkalinity concentrations first increase from the BW value of ~2.6 mM to 14.7 mM at 2.5 mbsf and then remain at this level for ~1.5 m downward before increasing again to ~35 mM at ~11 mbsf (Figure F18). This rise is followed by a decrease to ~20 mM at the bottom of Hole M0087D. Similar to the alkalinity profiles, ammonium (NH4+) concentrations in Holes M0087A and M0087B also exhibit a first increase to a peak of 1.78 mM at 9.6 mbsf and then gradually decrease to 1 mM at the bottom of the hole (Figure F18). In Holes M0087C and M0087D, NH4+ concentrations first increase from the BW value of 0.03 mM to 0.45 mM at ~2.5 mbsf, followed by relatively constant values to ~4.5–5 mbsf, where NH4+ concentrations start increasing again to 1.6–1.7 mM at 11–13 mbsf (Figure F18). Below 13 mbsf, NH4+ concentrations decrease to ~0.7 mM at the bottom of Hole M0087D.
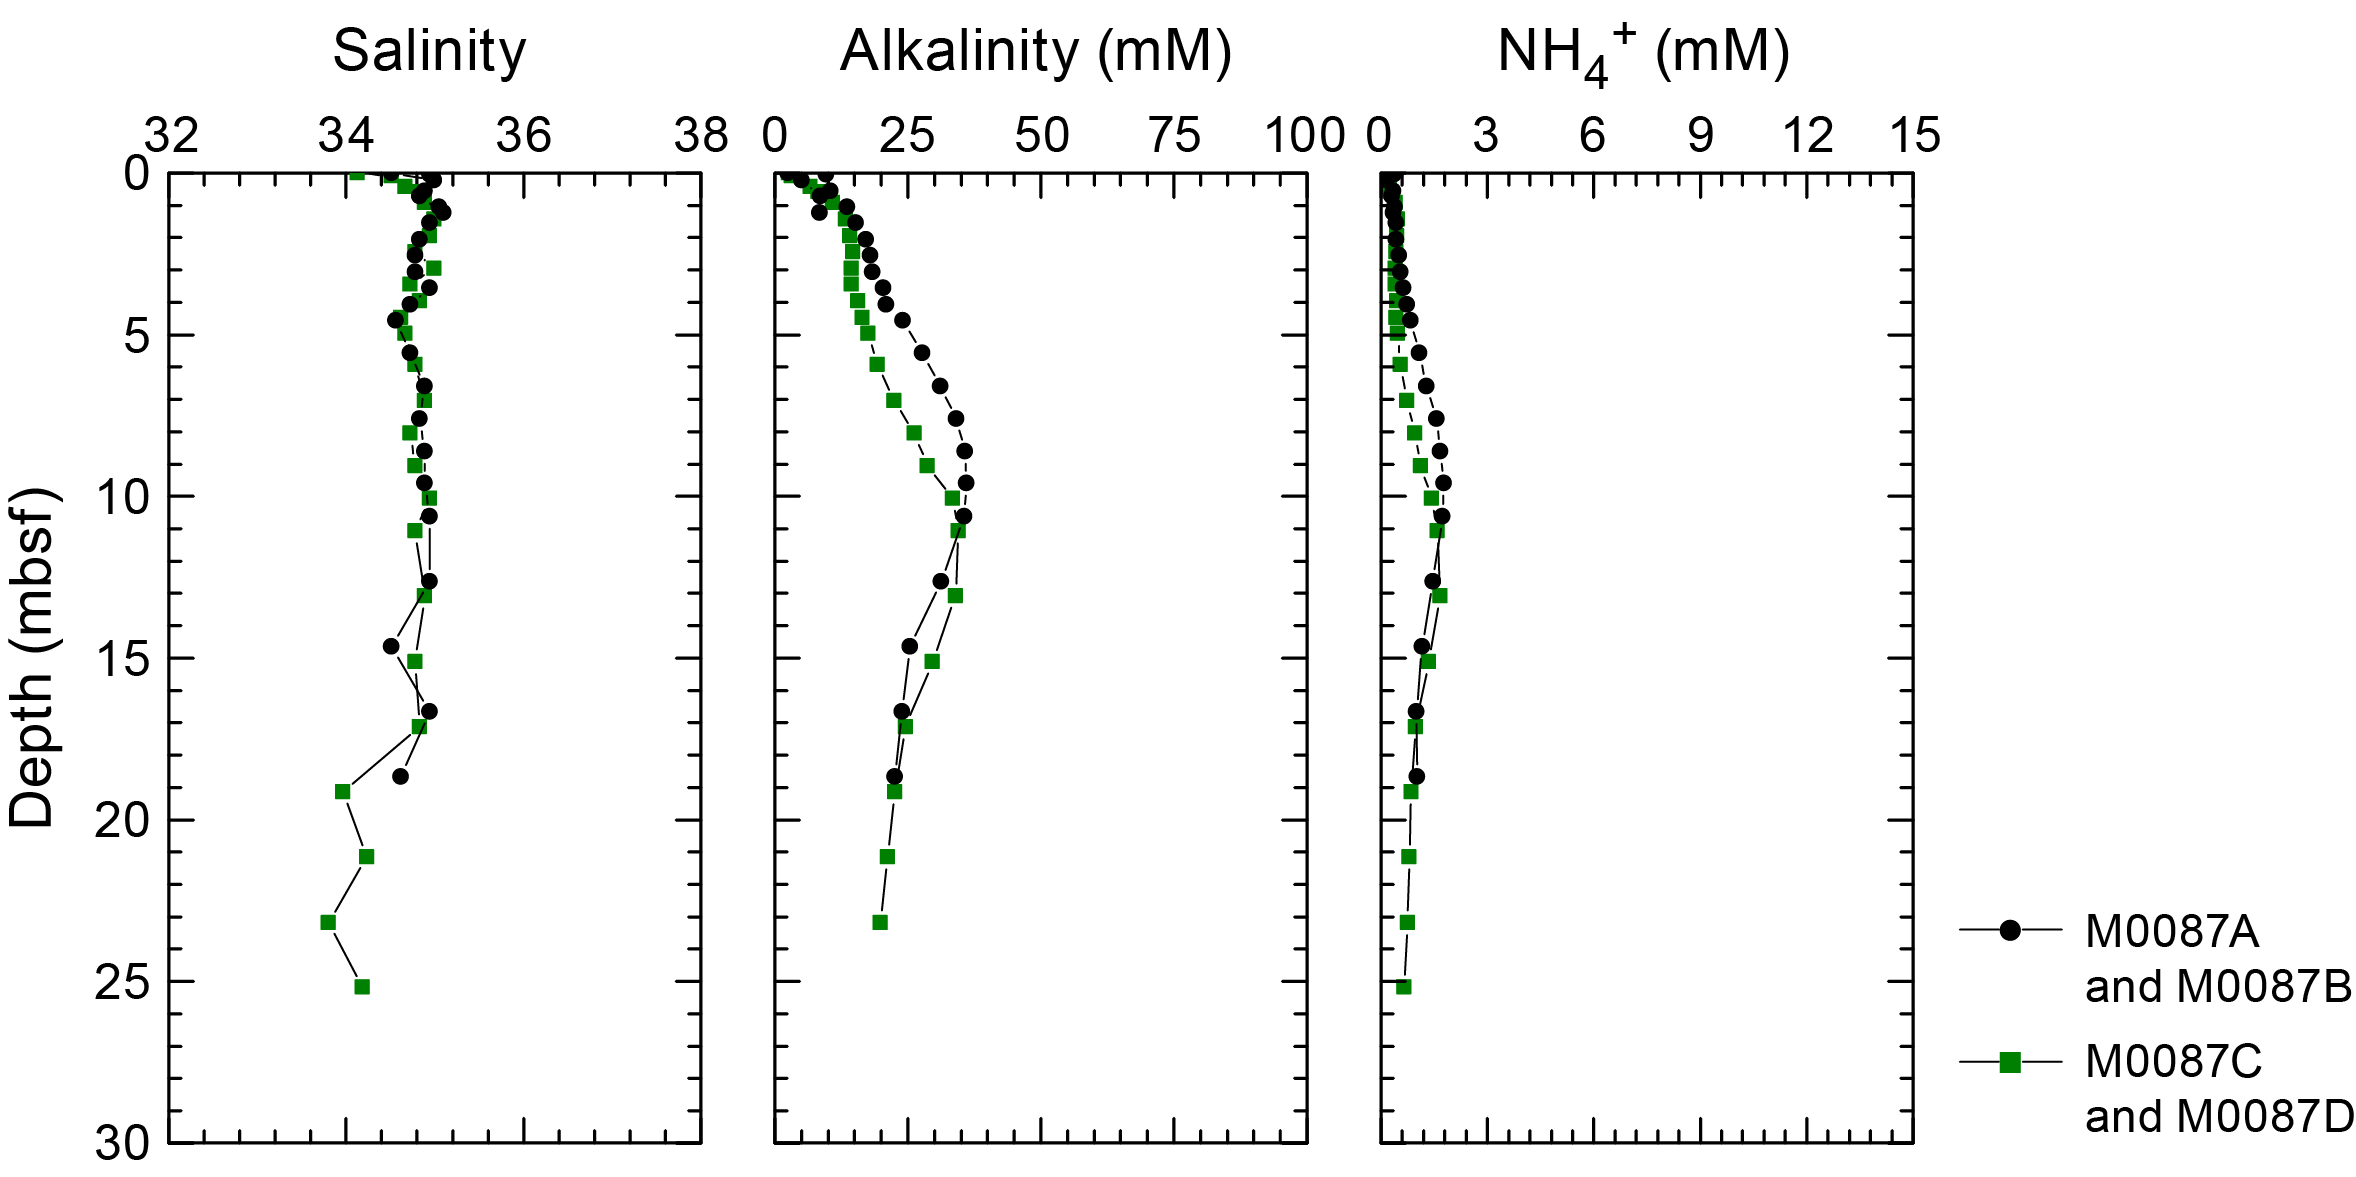
Figure F18. IW salinity, total alkalinity, and ammonium.
6.1.2. Shore-based analysis
6.1.2.1. Dissolved vanadium, molybdenum, and uranium
A suite of trace metals were analyzed using inductively coupled plasma–mass spectroscopy (ICP-MS) (including V, Mo, and U, briefly described below, as well as Cu and Rb) (Table T6; Figure F19). Dissolved vanadium (V) concentrations in the trigger cores from Site M0087 range 0–70 nM. For the GPC cores, V concentrations in Hole M0087B are depleted in the uppermost ~10 m and show slightly elevated values (~2 nM) between ~10 and 19 mbsf. In Hole M0087D, V concentrations are higher (~20–108 nM). Dissolved molybdenum (Mo) concentrations in the trigger cores range 5–585 nM. In the GPC cores, Mo concentrations rapidly decrease from ~70–120 nM in the uppermost sample to less than 10 nM at ~2 mbsf and remain at a low level downcore. Dissolved uranium (U) concentrations in the trigger cores range ~1–30 nM. In the GPC cores, U concentrations decrease with depth from ~17 nM in the BW sample to mostly 2–3 nM between ~1.5 and 8 mbsf. Uranium concentrations increase at 9–10 mbsf, followed by a decrease to less than 2 nM at ~15 mbsf and for the remainder of the cores.

Figure F19. IW V, Mo, and U.
6.1.2.2. Dissolved lithium, boron, silica, manganese, iron, strontium, and barium
All minor elements analyzed using inductively coupled plasma–optical emission spectroscopy (ICP-OES) are listed in Table T6. Dissolved lithium (Li) concentrations at Site M0087 decrease from 27–28 µM in BW at the top of the trigger core to ~22 μM at 10–11 mbsf, followed by a monotonic increase to ~36 µM at the bottom of Hole M0087D (Figure F20). Dissolved boron (B) concentrations generally remain relatively stable throughout the cores, ranging 507–620 µM (Figure F20). Dissolved silica (Si) concentrations increase rapidly from ~140 μM in the overlying waters (BW sample of the trigger cores) to 860 μM at 1.6 mbsf in the GPC cores, and remain at a constant high level to the base of the hole (Figure F20).
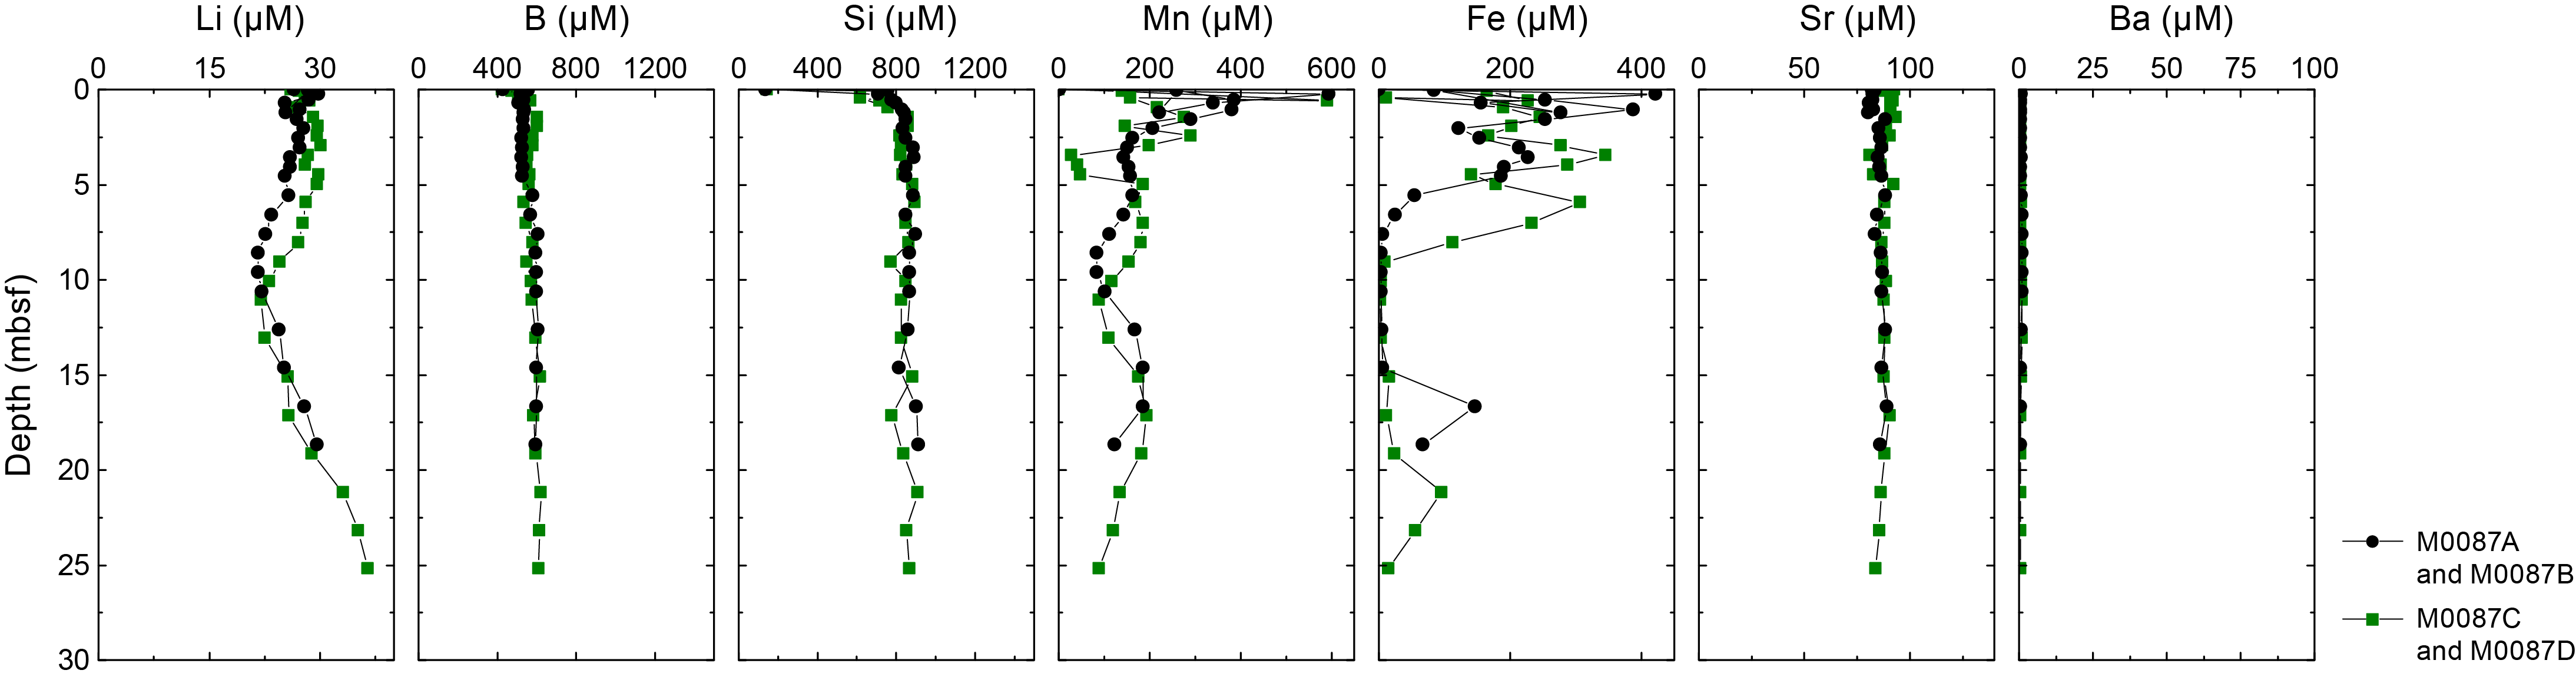
Figure F20. IW Li, B, Si, Mn, Fe, Sr, and Ba.
Dissolved manganese (Mn) concentrations in the trigger cores range 140–594 µM. In the GPC cores, Mn concentrations first increase from ~160–260 to ~300–385 µM from ~1 to 2.5 mbsf, followed by a decrease to ~83–88 µM at 8.6–11 mbsf. From there to the base of the holes, Mn concentrations show slight variations between 90 and 190 µM (Figure F20). Dissolved iron (Fe) concentrations in the trigger cores range ~156–422 µM. In the GPC cores, Fe concentrations show a rapid increase from ~83–91 µM in the uppermost samples to high values between 121 and 387 µM at ~0.6–8 mbsf, followed by a general decrease to 2.2 µM at ~11 mbsf, and then they remain at a low level farther downcore except for the two samples from ~17 mbsf in Hole M0087B and ~21 mbsf from Hole M0087D, which show elevated concentrations of 96–147 µM (Figure F20).
Dissolved strontium (Sr) concentrations show relatively constant values ranging ~80–92 µM throughout the cores. Dissolved barium (Ba) is low throughout the cores, ranging 0.34–1 µM (Figure F20).
6.1.2.3. Chloride, bromide, and sulfate
All anions analyzed using ion chromatography (IC) are listed in Table T6 and shown in Figure F21.
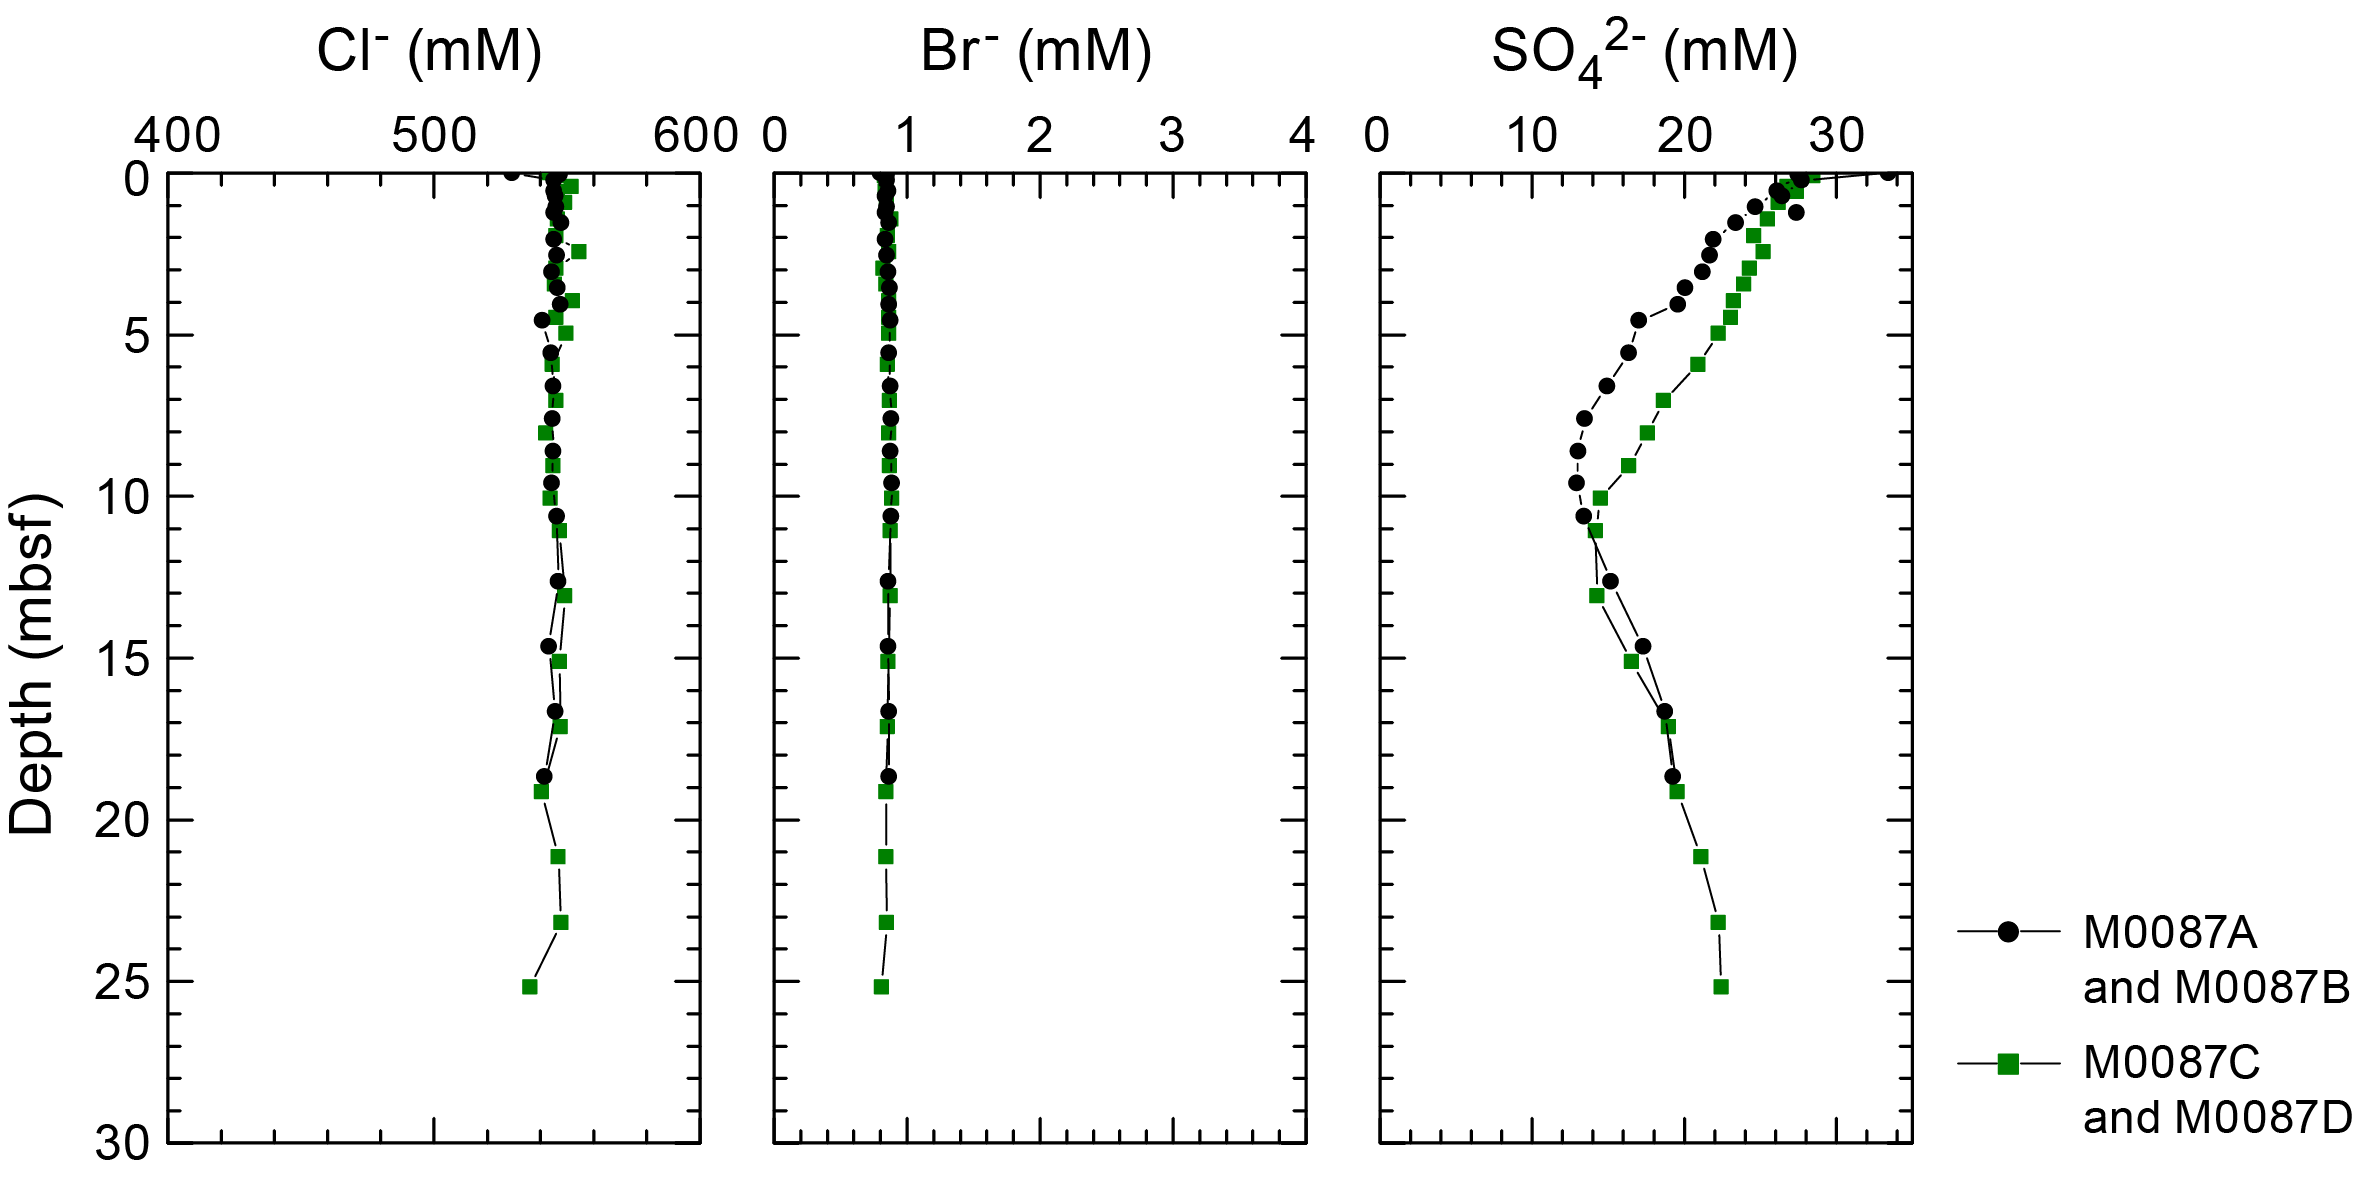
Figure F21. IW Cl−, Br−, and SO42−.
Dissolved chloride (Cl−) shows limited downcore variations, and concentrations range ~540–550 mM. Likewise, dissolved bromide (Br−) concentrations exhibit mostly constant values (~0.81–0.89 mM) throughout the cores. Dissolved sulfate (SO42−) concentrations decrease linearly from ~28–33 mM in the BW and at the top of the trigger cores to minimum values of ~13–14 mM at ~9–11 mbsf. Farther downcore, the trend reverses and SO42- concentrations increase to 19.3 mM at the bottom of Hole M0087D.
6.1.2.4. Sodium, magnesium, potassium, and calcium
Downcore profiles of Na+, K+, Ca2+, and Mg2+ IW concentrations at Site M0087 show overall very similar patterns to each other with little variations. Dissolved sodium (Na+) concentrations at Site M0087 do not exhibit clear downcore trends and are generally highly scattered, ranging ~454–509 mM. Dissolved potassium (K+) concentrations at Site M0087 generally remain constant, ranging ~9–11 mM. Dissolved calcium (Ca2+) concentrations in Hole M0087B generally show constant values between ~10.4 and 11.6 mM. In Hole M0087D, Ca2+ concentrations decrease from 10.9 mM in the uppermost sample to ~8 mM at ~4.5 mbsf, followed by a slight increase to ~12 mM at the base of the hole (~25 mbsf). Dissolved magnesium (Mg2+) concentrations at Site M0087 do not show clear downcore trends. Concentrations range ~52–58 mM.
The IC cation data is only presented in GEOCHEM in Supplementary material because the samples require further analysis for validation of absolute values (analytical accuracy).
6.2. Shore-based H2S analysis
At Site M0087, H2S concentrations were below the detection limit in all samples (see GEOCHEM in Supplementary material).
6.3. Headspace gas analysis: methane, ethane, and C1/C2 ratio
The offshore headspace gas analysis was mainly performed on the longest GPC core. A total of 27 headspace samples were measured from the Hole M0087C trigger core (1 sample) and Hole M0087D GPC core for hydrocarbon compositions. The results from offshore headspace gas analysis are shown in Figure F22, and the results of onshore headspace gas measurements for all cores are documented in Table T7.
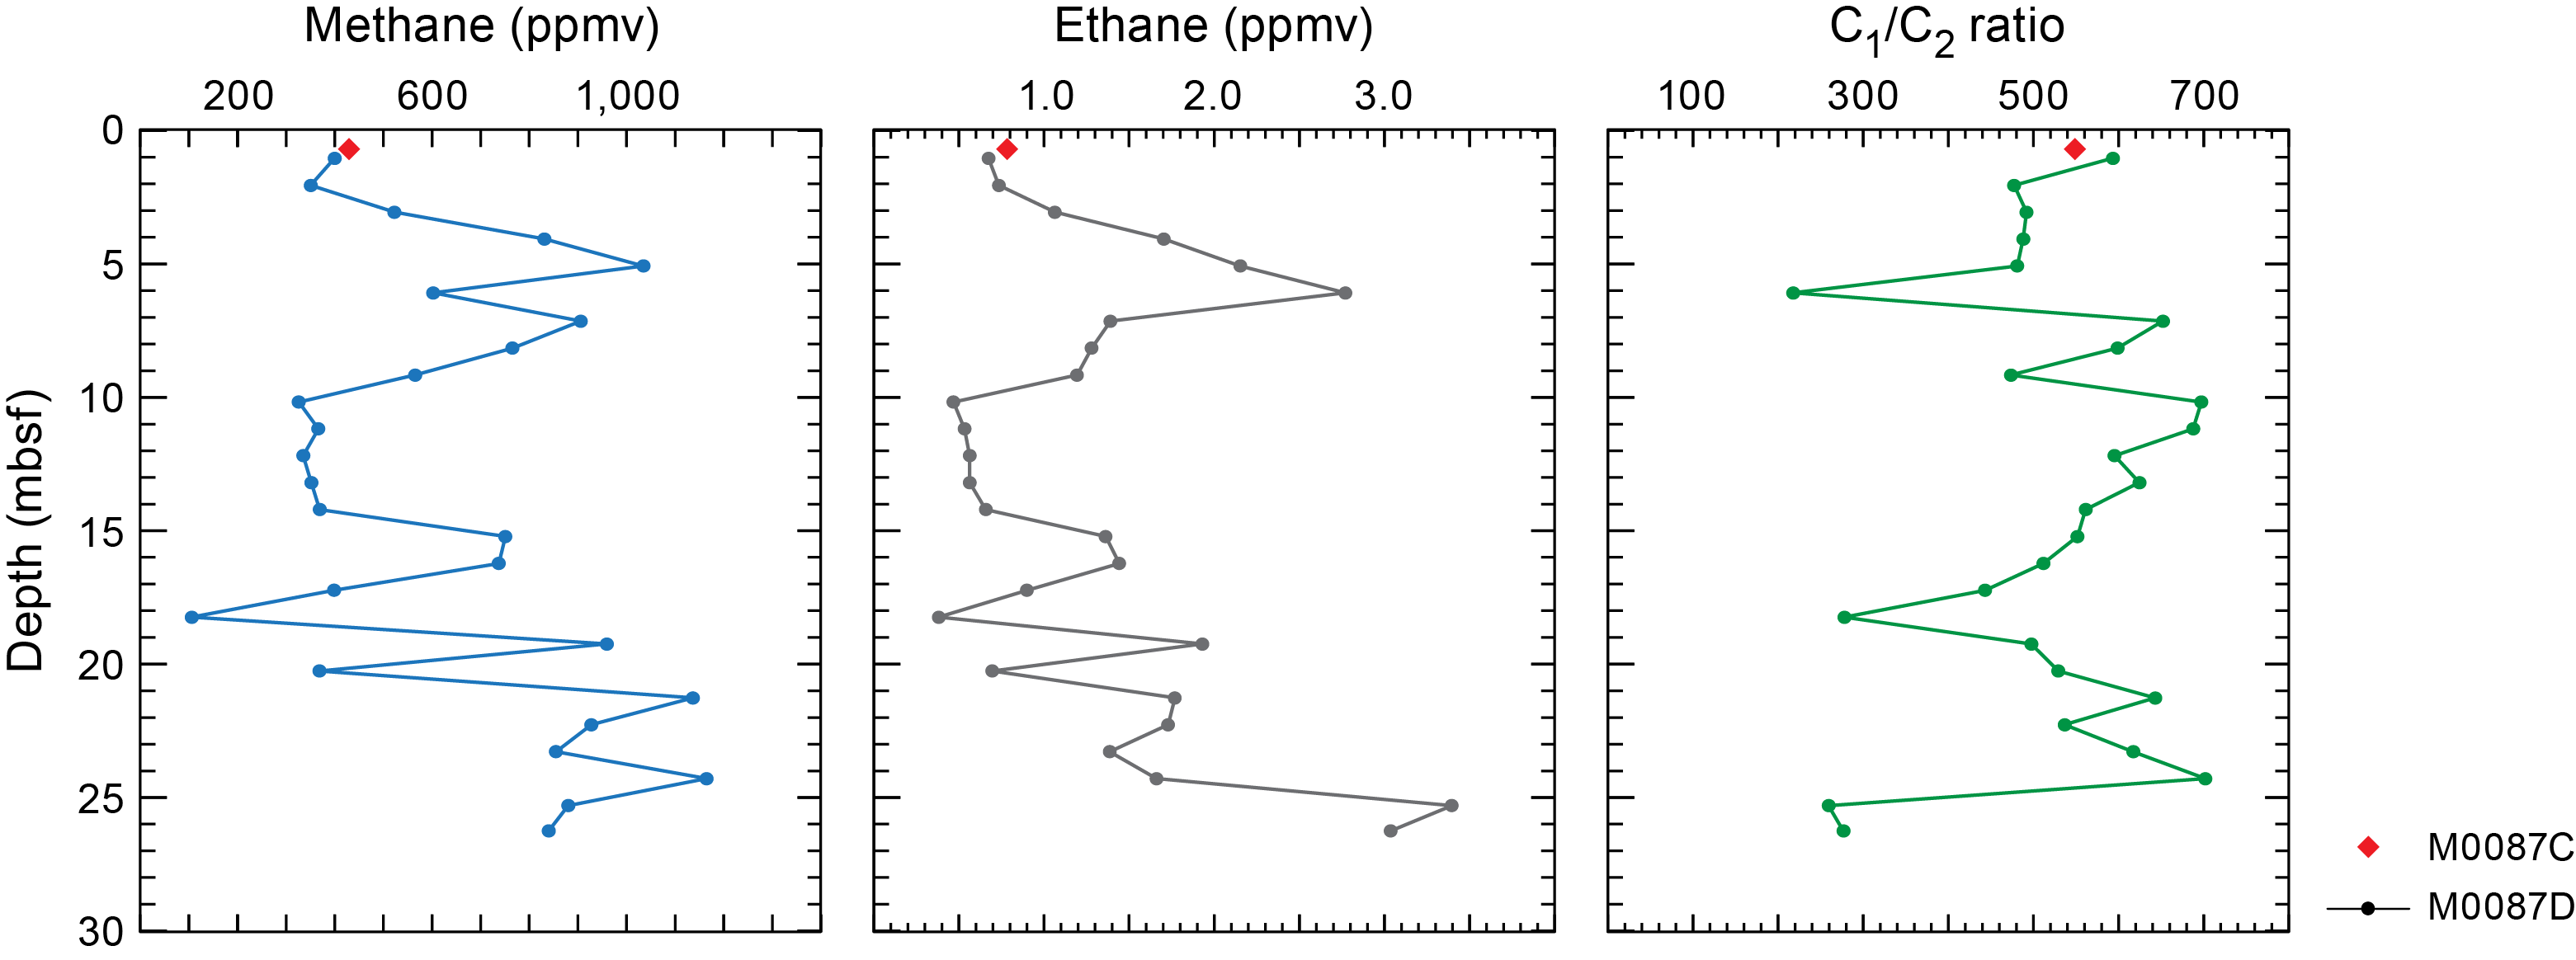
Figure F22. Methane, ethane, and methane to ethane ratios.
At Site M0087, methane concentrations are low throughout the core. Ethane (C2H4 and C2) follows a pattern similar to that of methane, and the methane/ethane (C1/C2) ratios fluctuate with methane values.
Alongside C1 and C2, other hydrocarbon gases such as ethylene (C2=), ethane (C2), propene/propylene (C3=), propane (C3), i-butane (i-C4), and n-butane (n-C4) were detected and measured, but their concentrations are very low, generally less than 1 ppmv at all sites (see GEOCHEM in Supplementary material).
6.4. Shore-based solid-phase analysis
6.4.1. Aluminum, calcium, silica, iron, and manganese
Energy dispersive X-ray fluorescence (ED-XRF) was used to quantify elements from 23 ground solid sediment samples from Holes M0087B and M0087D and two samples from the trigger cores from Holes M0087A and M0087C. The solid-phase elements, including aluminum (Al), calcium (Ca), silica (Si), iron (Fe), manganese (Mn), briefly described below, as well as Ba, Br, Cr, Cu, K, Mg, Ni, P, Sr, Ti, V, Zn, and Zr, are listed in Table T8. Downcore variations are shown in Figure F23. Al contents do not show clear downcore trends at Site M0087, and except for the trigger core where Al is ~2.7 wt%, values range ~4–5.4 wt% (39,327–54,316 mg/kg). Solid-phase Ca contents also do not exhibit clear downcore trends, and values fluctuate between ~0.8 and 1.4 wt% (7,872–14,083 mg/kg). Silica (Si) contents are high throughout the cores, ranging ~27–32 wt% (274,176–322,949 mg/kg). Fe contents are stable throughout the cores, ranging ~2.9–3.5 wt% (25,845–34,809 mg/kg), except at the base of Hole M0087B (~19 mbsf), where they are slightly lower (2.6 wt%). Manganese (Mn) contents are low and range ~0.04–0.06 wt% (441–636 mg/kg).
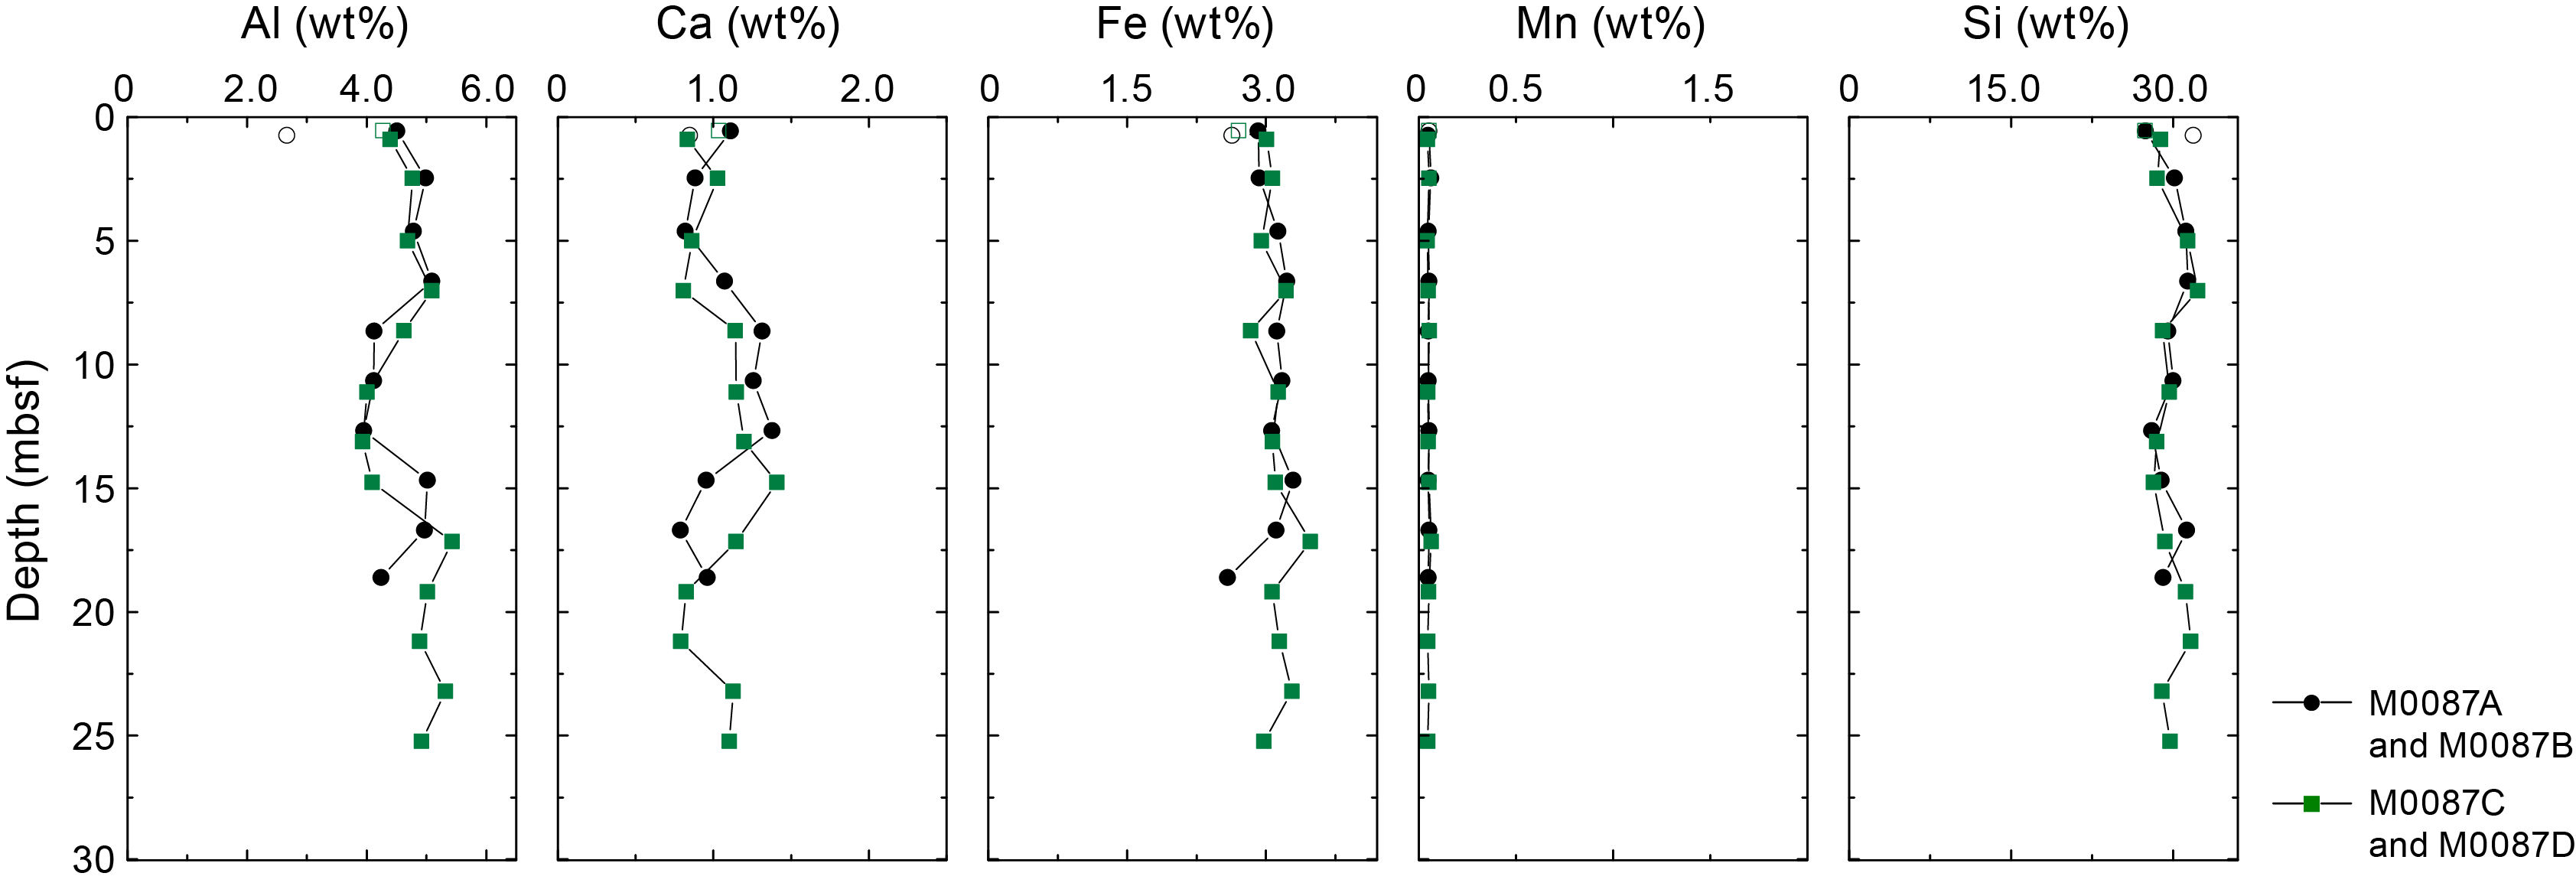
Figure F23. Al, Ca, Fe, Mn, and Si.
6.4.2. Carbon and sulfur
Total carbon (TC) contents vary between 0.43 and 1.66 wt% for Holes M0087A and M0087B and between 0.57 and 1.24 wt% for Holes M0087C and M0087D. In Holes M0087A and M0087B, total organic carbon (TOC) contents first decrease from 0.71 to 0.43 wt% at ~2.5 mbsf and then increase to 1.3 wt% at ~10.7 mbsf. Below ~10.7 mbsf, TOC contents decrease to 0.58 wt% at ~18.6 mbsf. In Holes M0087C and M0087D, TOC contents decrease from 0.9 to 0.54 wt% at ~9 mbsf, followed by an increase to 1.24 wt% at 11–13 mbsf, and then they decrease again to 0.6 wt% at ~25 mbsf. Total inorganic carbon (TIC) contents generally show low levels for all the holes, with values lower than 0.12 wt%. Total sulfur (TS) generally does not exhibit clear downcore trends and is scattered, ranging 0.28–0.76 wt% for Holes M0087A and M0087B and 0.27–0.72 wt% for Holes M0087C and M0087D (Figure F24).
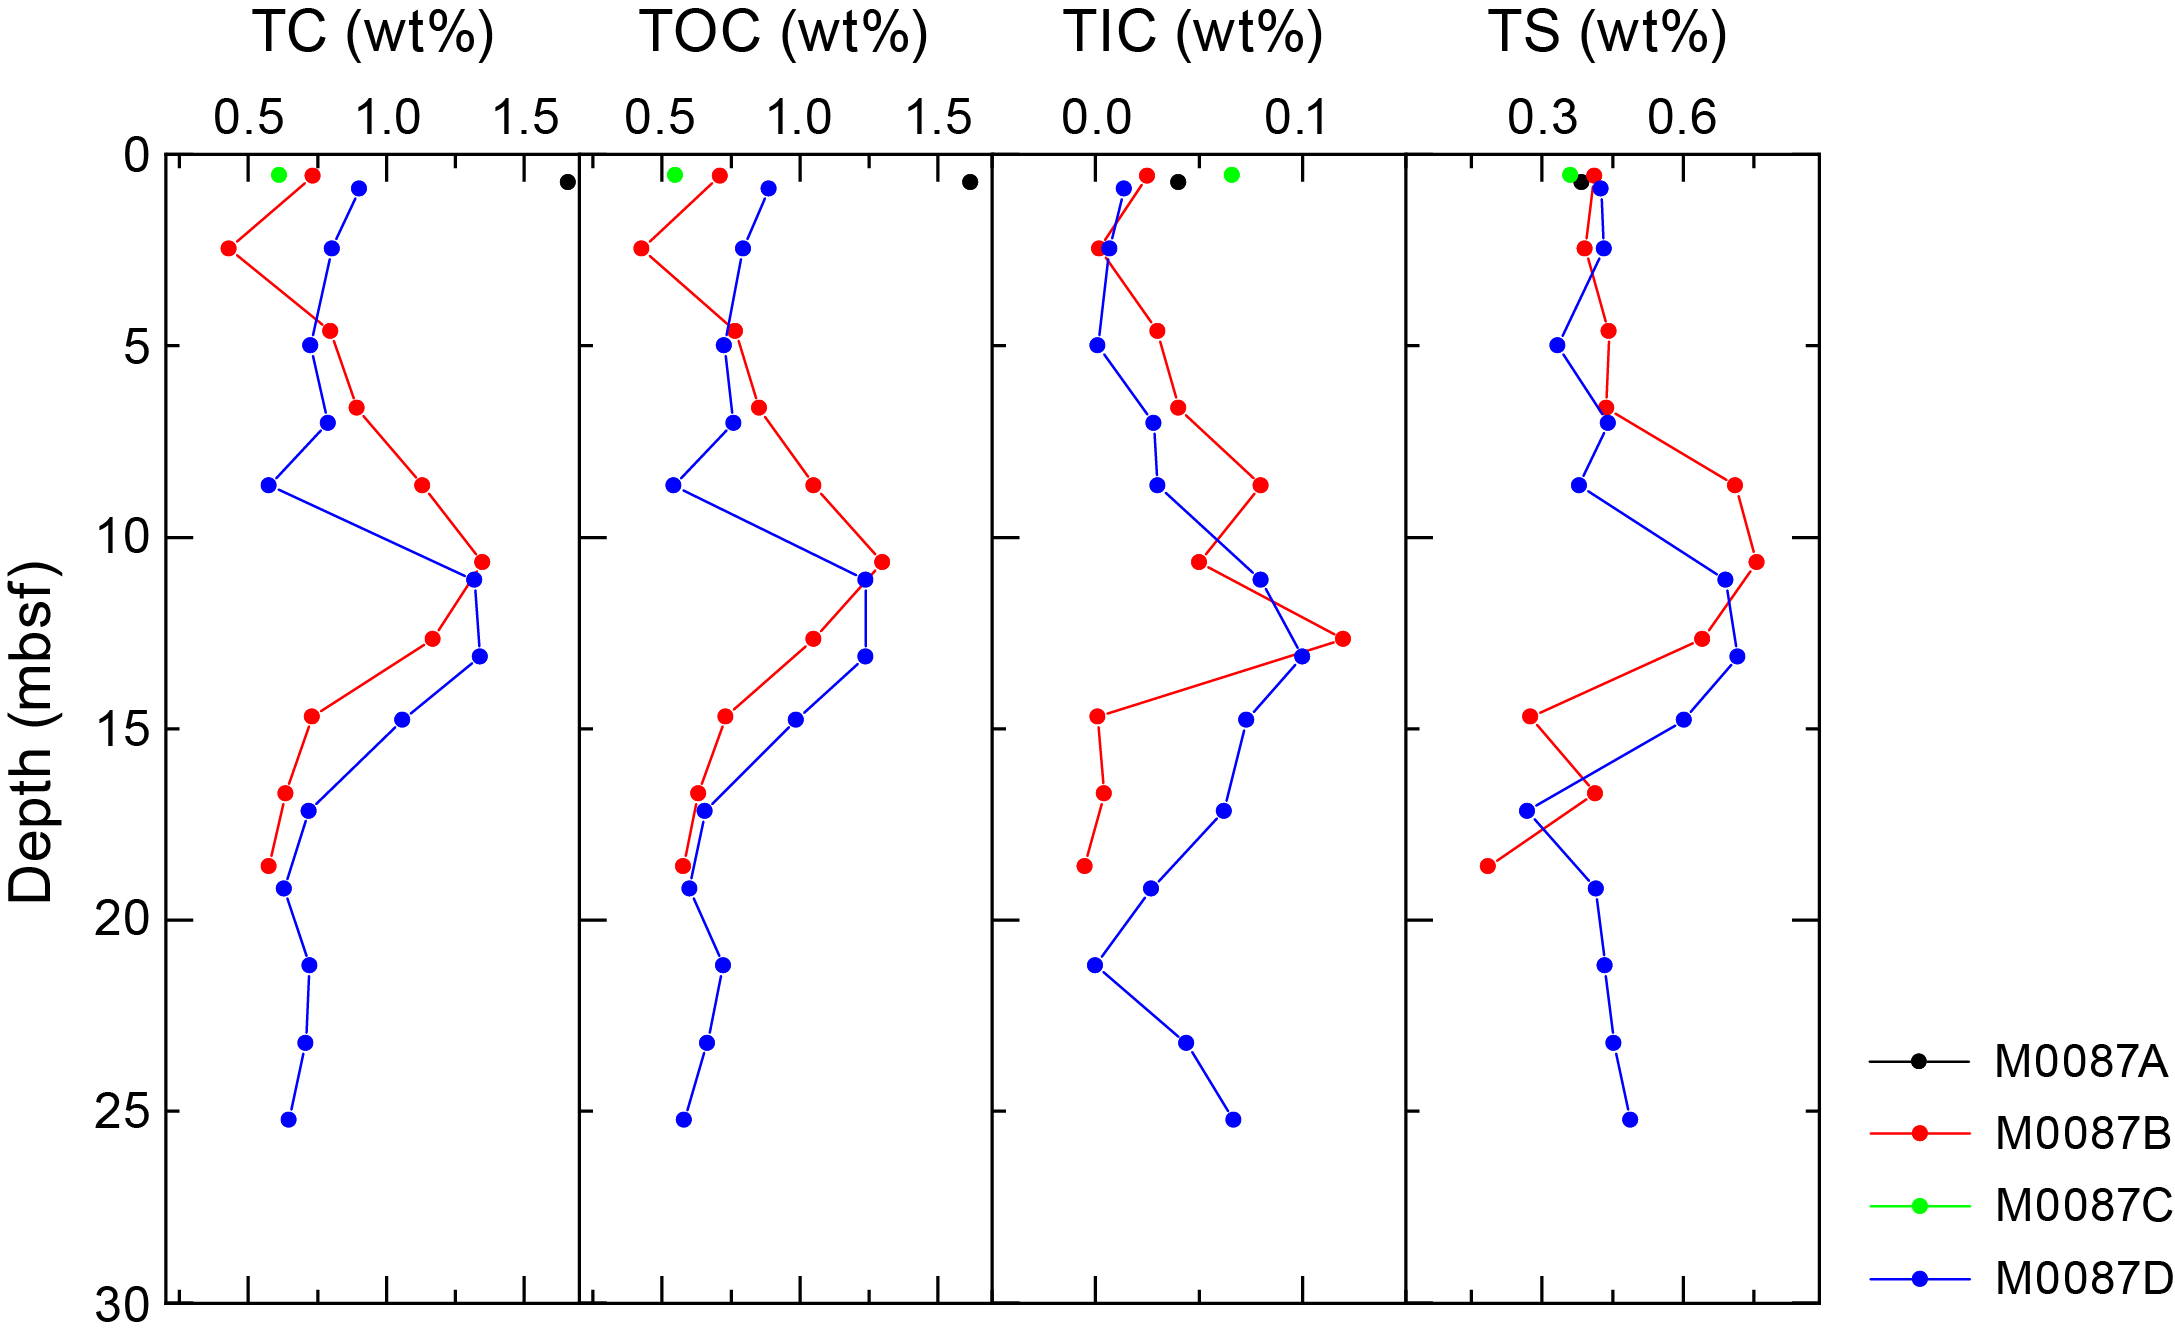
Figure F24. TC, TOC, TIC, and TS.
6.5. Discussion
The downcore pore water profiles of sulfate, alkalinity, and ammonium in the uppermost ~10 m at Site M0087 show characteristic changes related to organic matter degradation (Froelich et al., 1979). The downcore decrease in sulfate concentrations is mainly caused by organoclastic sulfate reduction, but sulfate is not depleted within the recovered cores. The absence of a sulfate–methane transition (SMT) is due to sulfate supply from below the coring depth. In addition, elevated Fe and Mn concentrations throughout the cores, especially for the uppermost 10 m of sediments, reflect dissimilatory Fe and Mn reduction coupled with organic matter oxidation.
High Si concentrations at this site are probably sustained by biogenic opal dissolution, as evidenced by smear slide observation showing a substantial amount of diatom frustules and sponge spicules in the sediments (see Lithostratigraphy). The slight downcore increase in B concentrations suggest B desorption from clay minerals and/or biogenic silica dissolution. In contrast, the downcore Li profiles in the uppermost ~10 m could reflect low-temperature silicate diagenesis, which adsorbs and incorporates Li in the secondary minerals.
One notable feature of the pore water profiles at Site M0087 is the reversal of most pore water species toward seawater values below ~10 mbsf, similar to the pore water profiles at Site M0085. The high silica content in the solid phase in tandem with low calcium and TIC contents indicates that siliceous material dominates the sediment composition, whereas calcium carbonate phases are low (Figure F24), which is in good agreement with sedimentary observations (see Lithostratigraphy). High amounts of solid-phase Fe, which does not parallel the Al profile, and low TS point to an iron-dominated system with likely formation of iron sulfide minerals, as suggested from smear slides (see Lithostratigraphy).
7. Physical properties
This section summarizes the preliminary physical properties results from cores acquired at Site M0087 in Basin C/N3 in the boundary area between the central/northern Japan Trench at water depths between 7518 and 7520 mbsl. A total of four holes were cored: two pairs of trigger cores (Holes M0087A and M0087C) and corresponding GPC cores (Holes M0087B and M0087D) (see Operations). The physical properties data sets were collected with the techniques and sampling rates defined in Physical properties in the Expedition 386 methods chapter (Strasser et al., 2023a). During the offshore phase, whole cores were scanned through the Multi-Sensor Core Logger (MSCL). During the onshore phase, cores were split, scanned through the Tri-Sensor Core Logger (TSCL), and sampled for moisture and density (MAD), undrained shear strength, and P-wave velocity. Overall, the physical properties data sets are high quality and correlate well with lithology and hydroacoustic data.
A synthesis of MSCL and shear strength properties is presented in Figure F25 for Holes M0087A and M0087B and Figure F26 for Holes M0087C and M0087D. Trigger core data are plotted in orange, and piston core data are plotted in black.
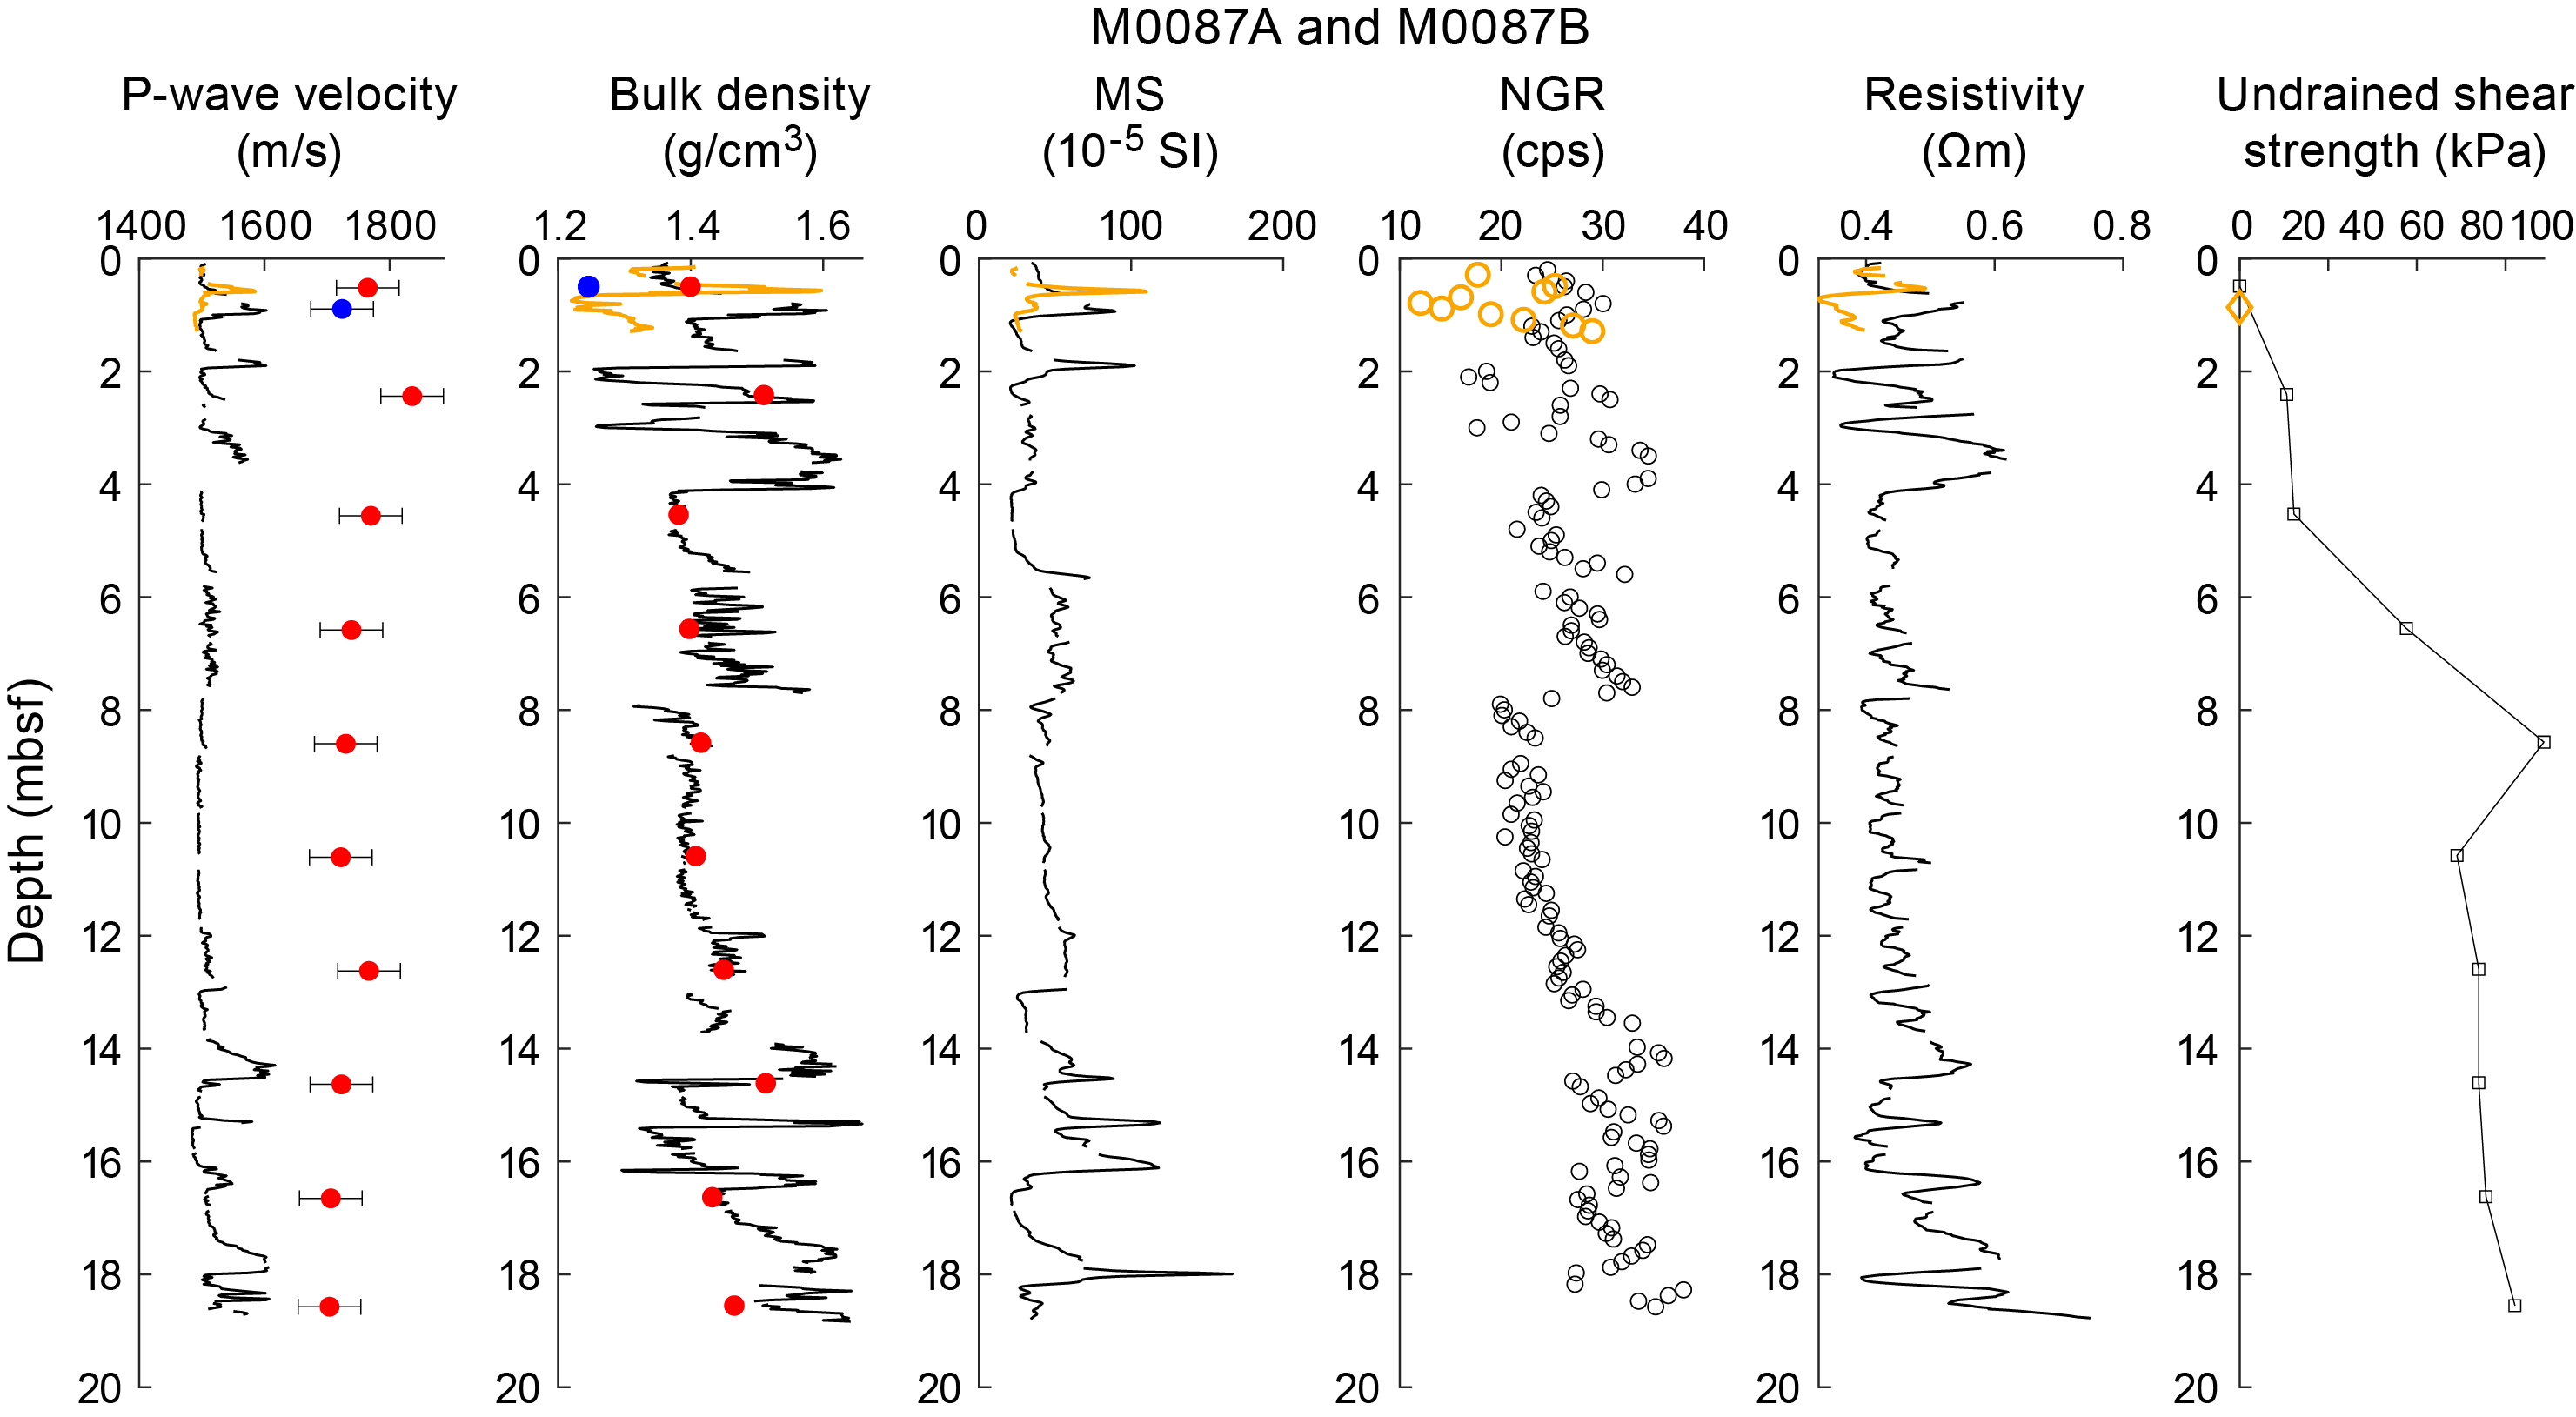
Figure F25. Physical properties summary, Holes M0087A and M0087B.
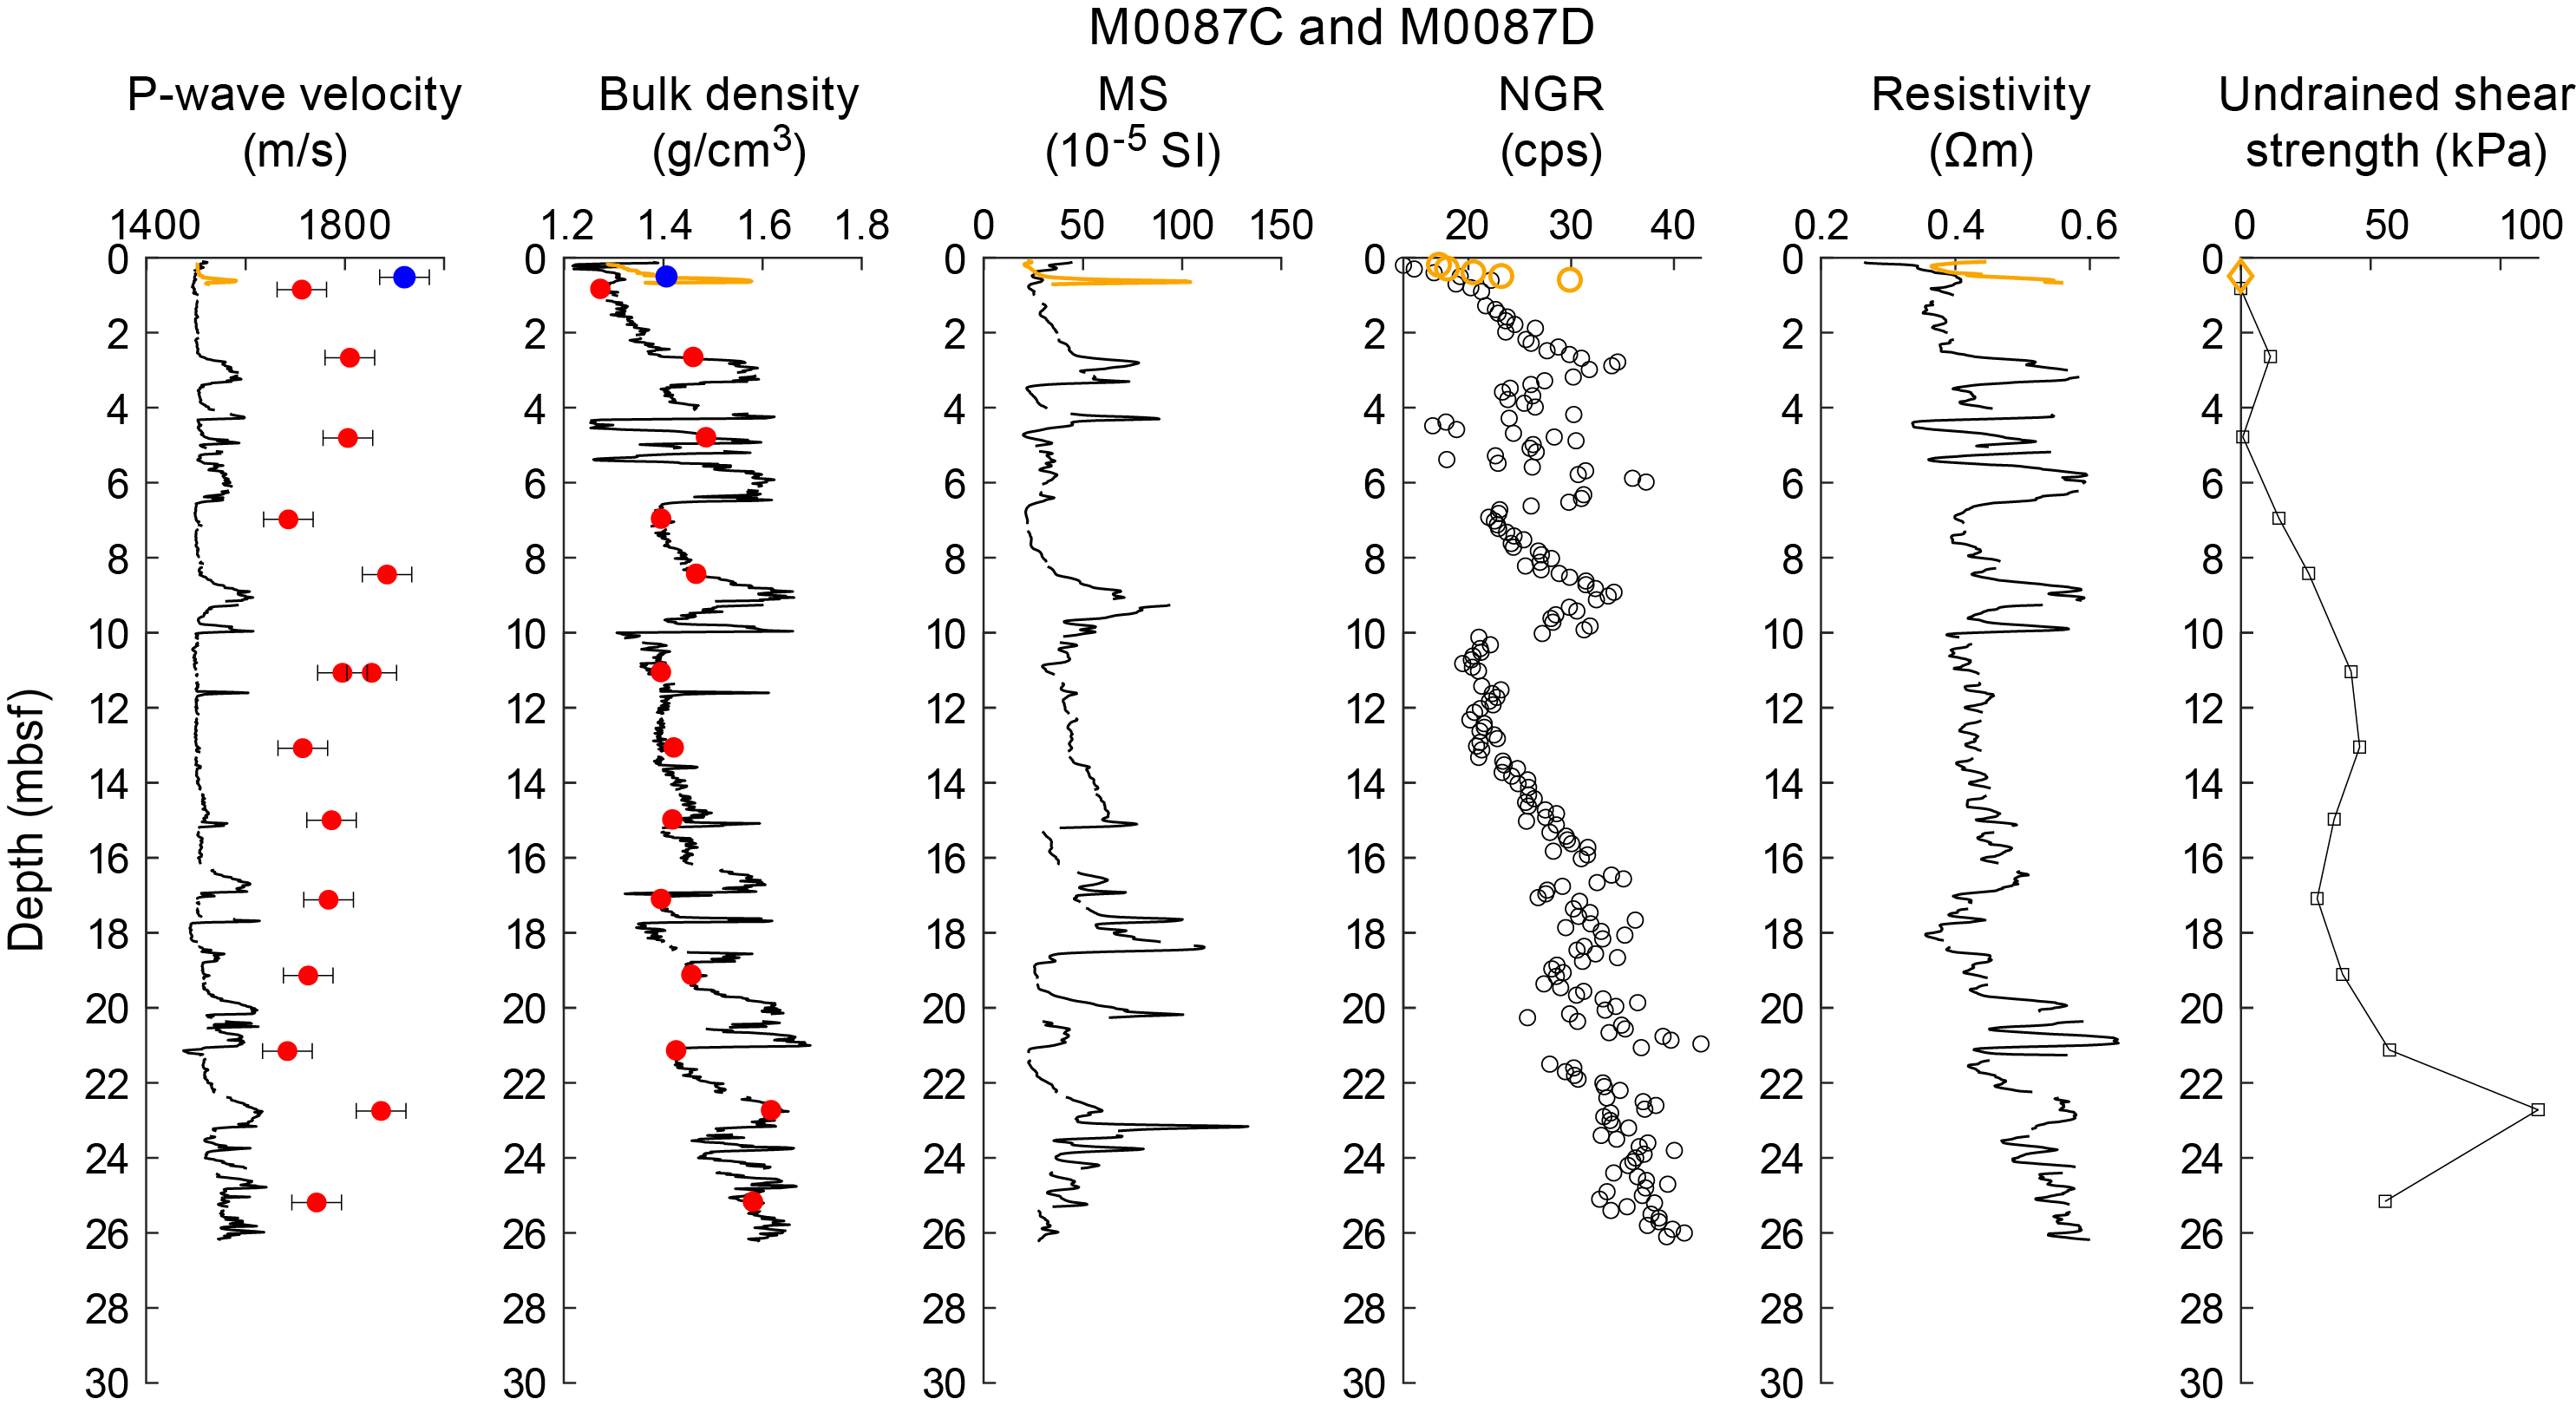
Figure F26. Physical properties summary, Holes M0087C and M0087D.
7.1. Bulk density
Bulk density data were obtained using the gamma ray attenuation (GRA) technique on the MSCL (Figures F25, F26). Density values generally show an increasing trend with depth. However, there are a number of localized zones that show variations superimposed on this trend. There is generally a systematic pattern for several intervals: a gradual downcore increase to a local maximum, followed by a sharp decrease immediately below.
The uppermost 0–4 m in Holes M0087A and M0087B show the highest MSCL bulk density fluctuations, including pronounced peaks reaching as low as 1.22 g/cm3 and as high as 1.63 g/cm3. Between 4 and 8 mbsf in Hole M0087B, bulk density increases. Between 8 and 13 mbsf in Hole M0087B, there is another zone where bulk density steadily increases with depth with low variability. Below this depth, bulk density increases to the bottom of the hole with some fluctuations. In Hole M0087B, the highest density peak (1.66 g/cm3) is observable at 15.3 mbsf (Figure F25).
In Holes M0087C and M0087D, bulk density increases from ~1.3 g/cm3 at the mudline to ~1.6 g/cm3 at the bottom of Hole M0087D (26.2 mbsf) (Figure F26). Hole M0087D shows three zones with steady increases in bulk density with depth: 0–3, 7–8, and 10–15 mbsf. Other zones show higher fluctuations in density, which are most pronounced between 3 and 7 mbsf. Below 15 mbsf, bulk density increases to the bottom with some fluctuation. The highest density value at Site M0087 (1.70 g/cm3) is measured at 21.0 mbsf in Hole M0087D.
Bulk density values obtained from discrete samples from trigger and piston cores are shown as blue and red dots, respectively, in Figures F25 and F26. MSCL density shows higher frequency fluctuations due to a higher sampling rate, but at the sampling depths, a very good match exists between MSCL bulk density and MAD bulk density (see Moisture and density) values in all holes. This good match suggests that Site M0087 is not distorted by methane degassing, which is in accordance with geochemical analysis, which shows that the cored materials are from above the SMT (see Geochemistry).
7.2. Magnetic susceptibility
Overall, magnetic susceptibility in all holes at Site M0087 fluctuates around a baseline value of approximately 44 × 10−5 SI throughout the cored depths but also shows several pronounced peaks that exceed 100 × 10−5 SI (Figures F25, F26). A 5 m thick zone of continuous readings close to 50 × 10−5 SI (with a slight trend of increasing values downcore) occurs in both piston core holes (M0087B and M0087D) at similar depths (between 8 and 13 mbsf in Hole M0087B and between 10 and 15 mbsf in Hole M0087D), with a very sharp drop at the base. Below this zone, magnetic susceptibility fluctuates; the highest value in Hole M0087B is 167 × 10−5 SI at 18.0 mbsf, and the highest value in Hole M0087D is 133 × 10−5 SI at 23.2 mbsf.
7.3. P-wave velocity
P-wave velocity was measured using the MSCL on whole cores during the offshore phase. During the onshore phase, P-wave velocity was measured on discrete samples approximately every 2 m. Many of the MSCL velocity data were of insufficient quality below ~5 mbsf and have been omitted.
Offshore P-wave velocities recorded with the MSCL at Site M0087 generally trend around 1500 m/s (the velocity of water). Shore-based discrete measurements are noticeably higher (closer to an average of 1700 m/s). The difference in velocity exceeds the uncertainty associated with the discrete velocity measurements (±50 m/s). The difference between the two data sets may be attributed to continued compaction or degassing of the sediments between the offshore and onshore phases of the expedition. Further investigation will be required to fully understand the discrepancy, and the data should thus be used with a degree of caution.
MSCL and laboratory-measured P-wave data are plotted in Figures F25 and F26 for Site M0087. MSCL P-wave velocity at the mudline is around 1507 m/s in all holes. The trigger core from Hole M0087C captured a shallow peak value of 1580 m/s at 0.6 mbsf, which is not observable at a similar depth in the GPC core from Hole M0087D. MSCL P-wave velocity values generally show an increasing trend with depth. There are several zones with relatively stable P-wave velocity values close to the mudline value: 4–8 and 8–13 mbsf in Hole M0087B and 0–3, 7–8, and 10–15 mbsf in Hole M0087D. Outside of these zones, P-wave velocity fluctuates significantly. Below 13 mbsf in Hole M0087B and 15 mbsf in Hole M0087D, MSCL P-wave velocity shows very high variability. The minimum value at Site M0087 (1474 m/s) occurs at 21.1 mbsf in Hole M0087D, and the maximum value (1642 m/s) occurs at 24.8 mbsf in Hole M0087D.
In Holes M0087A and M0087B, the average laboratory-measured P-wave velocity is 1744 m/s. Unlike the MSCL data, laboratory-measured P-wave velocities show a slightly decreasing trend with depth. In Holes M0087C and M0087D, the average P-wave velocity measured on discrete samples is 1783 m/s. The highest value is 1920 m/s at 0.5 mbsf (Hole M0087C). Unlike the MSCL data, laboratory-measured P-wave velocities show a slightly decreasing trend with depth despite a local high value of 1873 m/s at 22.7 mbsf in Hole M0087D.
7.4. Noncontact electrical resistivity
Noncontact electrical resistivity measured using the MSCL shows a gentle increasing profile in Holes M0087B and M0087D, from ~0.4 Ωm at the core top of Hole M0087B to ~0.7 Ωm near the bottom at 18.8 mbsf (Figure F25) and from ~0.3 Ωm at the core top of Hole M0087D to ~0.6 Ωm near the bottom at 26.2 mbsf (Figure F26). The intervals between ~8 and 13 mbsf in Hole M0087B and between ~10 and 16 mbsf in Hole M0087D show the most consistent resistivity values around 0.4–0.5 Ωm. Intervals above and below this zone show greater variability.
7.5. Natural gamma radiation
At all holes at Site M0087, NGR has similar profiles (Figures F25, F26) that generally fluctuate between 15 and 35 counts/s in the uppermost 8 m in Hole M0087B and 10 m in Hole M0087D. A continuous zone of increasing NGR is observable between 8 and 13 mbsf in Hole M0087B and between 10 and 16 mbsf in Hole M0087D. Below this zone, NGR fluctuates between 25 and 40 counts/s with a slightly increasing trend with depth. Other downward increasing trends over several meters can also be observed, although with more scatter, in Hole M0087D between about 0–3 and 7–9 mbsf.
7.6. Undrained shear strength
Undrained shear strength (Su) was measured on split cores with a handheld penetrometer, automated vane shear (AVS) apparatus, and fall cone penetrometer (see Physical properties in the Expedition 386 methods chapter [Strasser et al., 2023a]).
Su obtained using the handheld penetrometer generally increases with depth in all holes at Site M0087 (Figures F25, F26). The highest penetrometer shear strength values are at 8.6 mbsf in Hole M0087B (109 kPa) and at 22.7 mbsf in M0087D (114 kPa). It is worth noting that the Su peak at 22.7 mbsf in Hole M0087D corresponds to a peak in laboratory-measured P-wave velocity. In Hole M0087B, fall cone strengths range from near 0 kPa at the core top to 62 kPa near the base of the hole at 18.6 mbsf; they range to 76 kPa near the base of deeper Hole M0087D at 25.2 mbsf (Figure F27). The AVS and fall cone data profiles for Hole M0087B are higher than the profile for Hole M0087D. It is not obvious why this might be, but it could be due to lithologic effects.

Figure F27. Undrained shear strength from fall cone and AVS.
It should also be noted that values of Su vary according to the device used to obtain them (Figure F27). For example, fall cone strengths are higher than those obtained with the AVS and handheld penetrometer. The influence of the U-channel along the center of the core could result in lower strengths than those measured using the fall cone. The fall cone only impacts a small region of the core (~2–5 mm), whereas the AVS impacts a larger region of the core (~20–50 mm). Both measurements ideally should be obtained from the center of the core away from the core sidewall. However, samples could not be taken at the center because of the U-channel (see Physical properties in the Expedition 386 methods chapter [Strasser et al., 2023a]). As a result, strength sampling points had to be placed halfway between the central U-channel and the sidewall of the core. During AVS measurements, the fractures that opened often propagated toward both the central U-channel and the sidewall, perhaps resulting in lower strength values. The fall cone measurements were not seen to be affected by the U-channel or the sidewall. Further analysis will more closely examine the strength data to try to reconcile the differences.
7.7. Moisture and density
Using the MAD technique on discrete samples onshore, wet water (WW) and dry water (DW) contents, bulk density, dry density, grain density, porosity, and void ratio were obtained (Figures F28, F29).
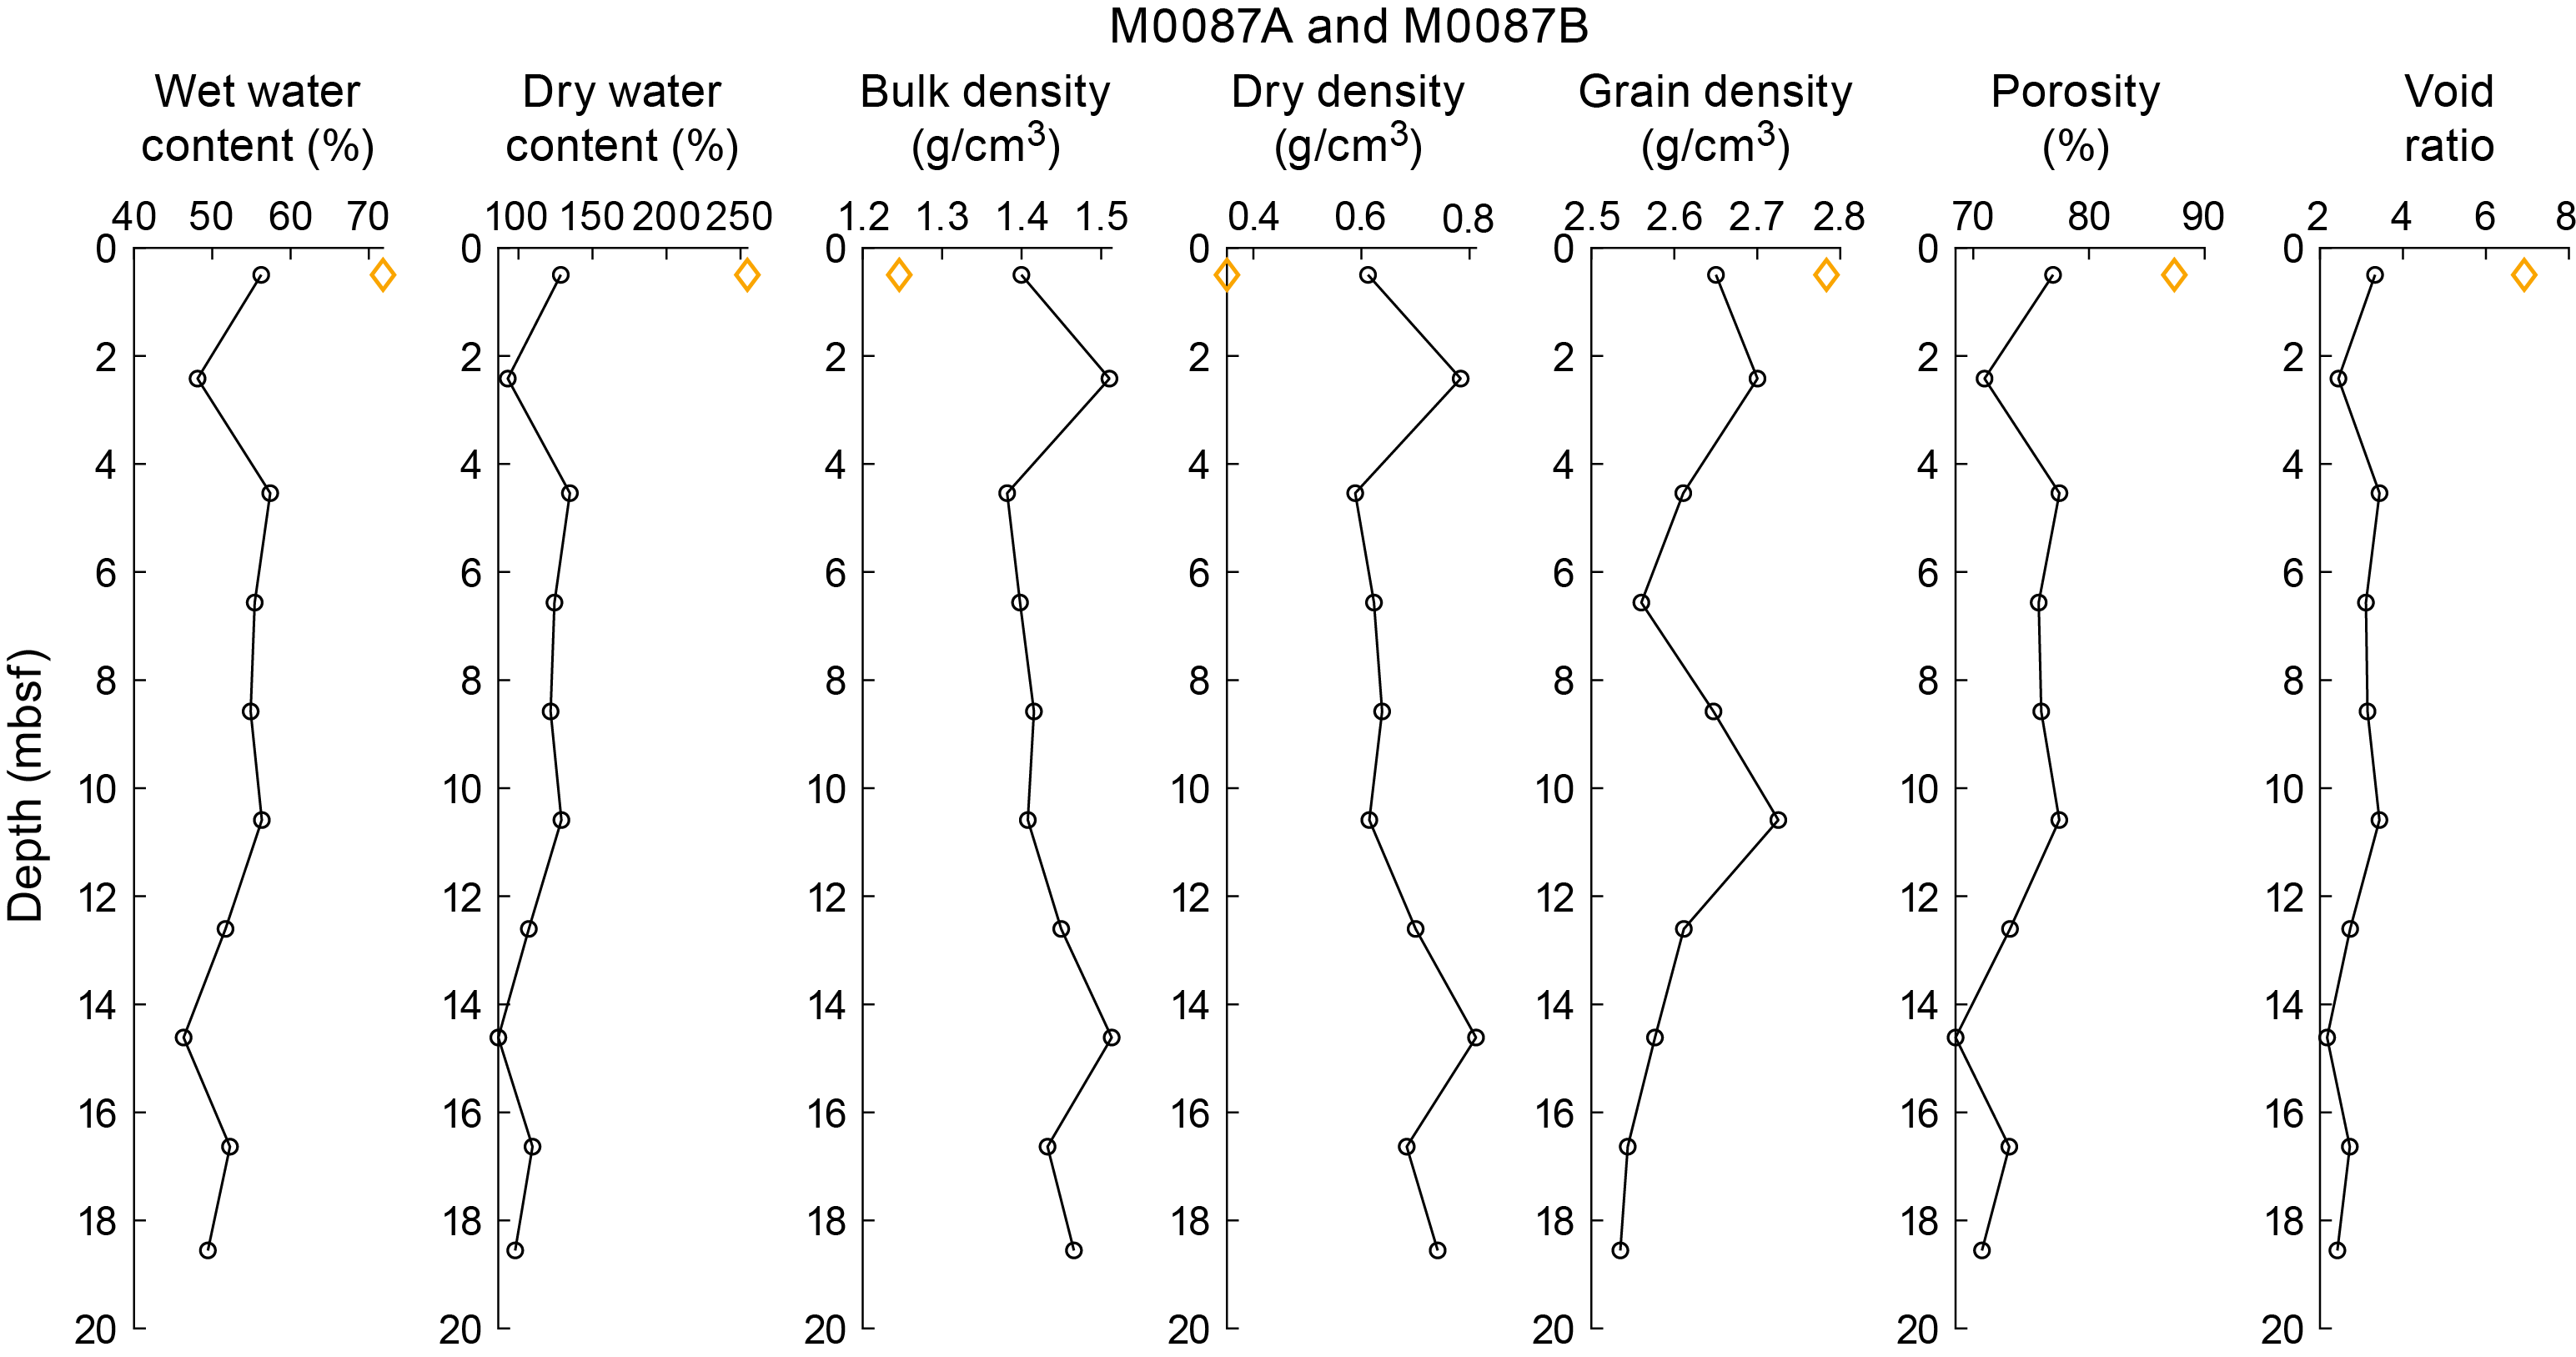
Figure F28. MAD data, Holes M0087A and M0087B.

Figure F29. MAD data, Holes M0087C and M0087D.
WW and DW contents gradually decrease with depth. In Hole M0087B, water contents decrease from 56% WW and 129% WD at 0.5 mbsf to 49% WW and 98% WD at 18.6 mbsf. At 0.5 mbsf, Hole M0087A shows higher water contents (72% WW and 255% WD) than Hole M0087B. In Hole M0087D, water contents decrease from 68% WW and 217% WD at 0.8 mbsf to 42% WW and 74% WD at 25.2 mbsf. At 0.5 mbsf, Hole M0087C shows lower water contents (54% WW and 116% WD) than Hole M0087D.
Bulk density increases in Hole M0087B from ~1.40 g/cm3 at 0.5 mbsf to ~1.47 g/cm3 at the bottom of the hole (18.6 mbsf), corresponding to porosity values of 76.9% and 70.8%, respectively (Figure F28). Despite the general increasing trend with depth, two local high values can be observed at 2.4 and 14.6 mbsf.
In Hole M0087D, bulk density increases from ~1.27 g/cm3 at 0.8 mbsf to ~1.58 g/cm3 at the bottom of the hole (25.2 mbsf), corresponding to porosity values of 85.1% and 65.4%, respectively (Figure F29).
Grain density shows a local peak of ~2.73 g/cm3 at 10.6 mbsf in Hole M0087B and ~2.69 g/cm3 at 13.1 mbsf in Hole M0087D (Figures F28, F29). However, these local high grain densities do not correspond with any similar local variations in MSCL physical properties (Figures F25, F26).
7.8. Color reflectance and RGB values
In Hole M0087B, color spectrometry L* values range approximately 20–40 with a spike of 14 at 14.7 mbsf. Values of a* range approximately −2–0 with several localized spikes exceeding 0 (7.5, 10.8, and 15.3 mbsf). Values of b* range 0–15 with a slight decreasing trend with depth. Hole M0087D shows similar L*a*b* ranges with more local peaks. Calculated RGB values in all holes vary with depth in concert with the spectrometry parameters. The furthest right column in Figures F30 and F31 represents merged color from RGB values, and white bars show intervals that contain no data.
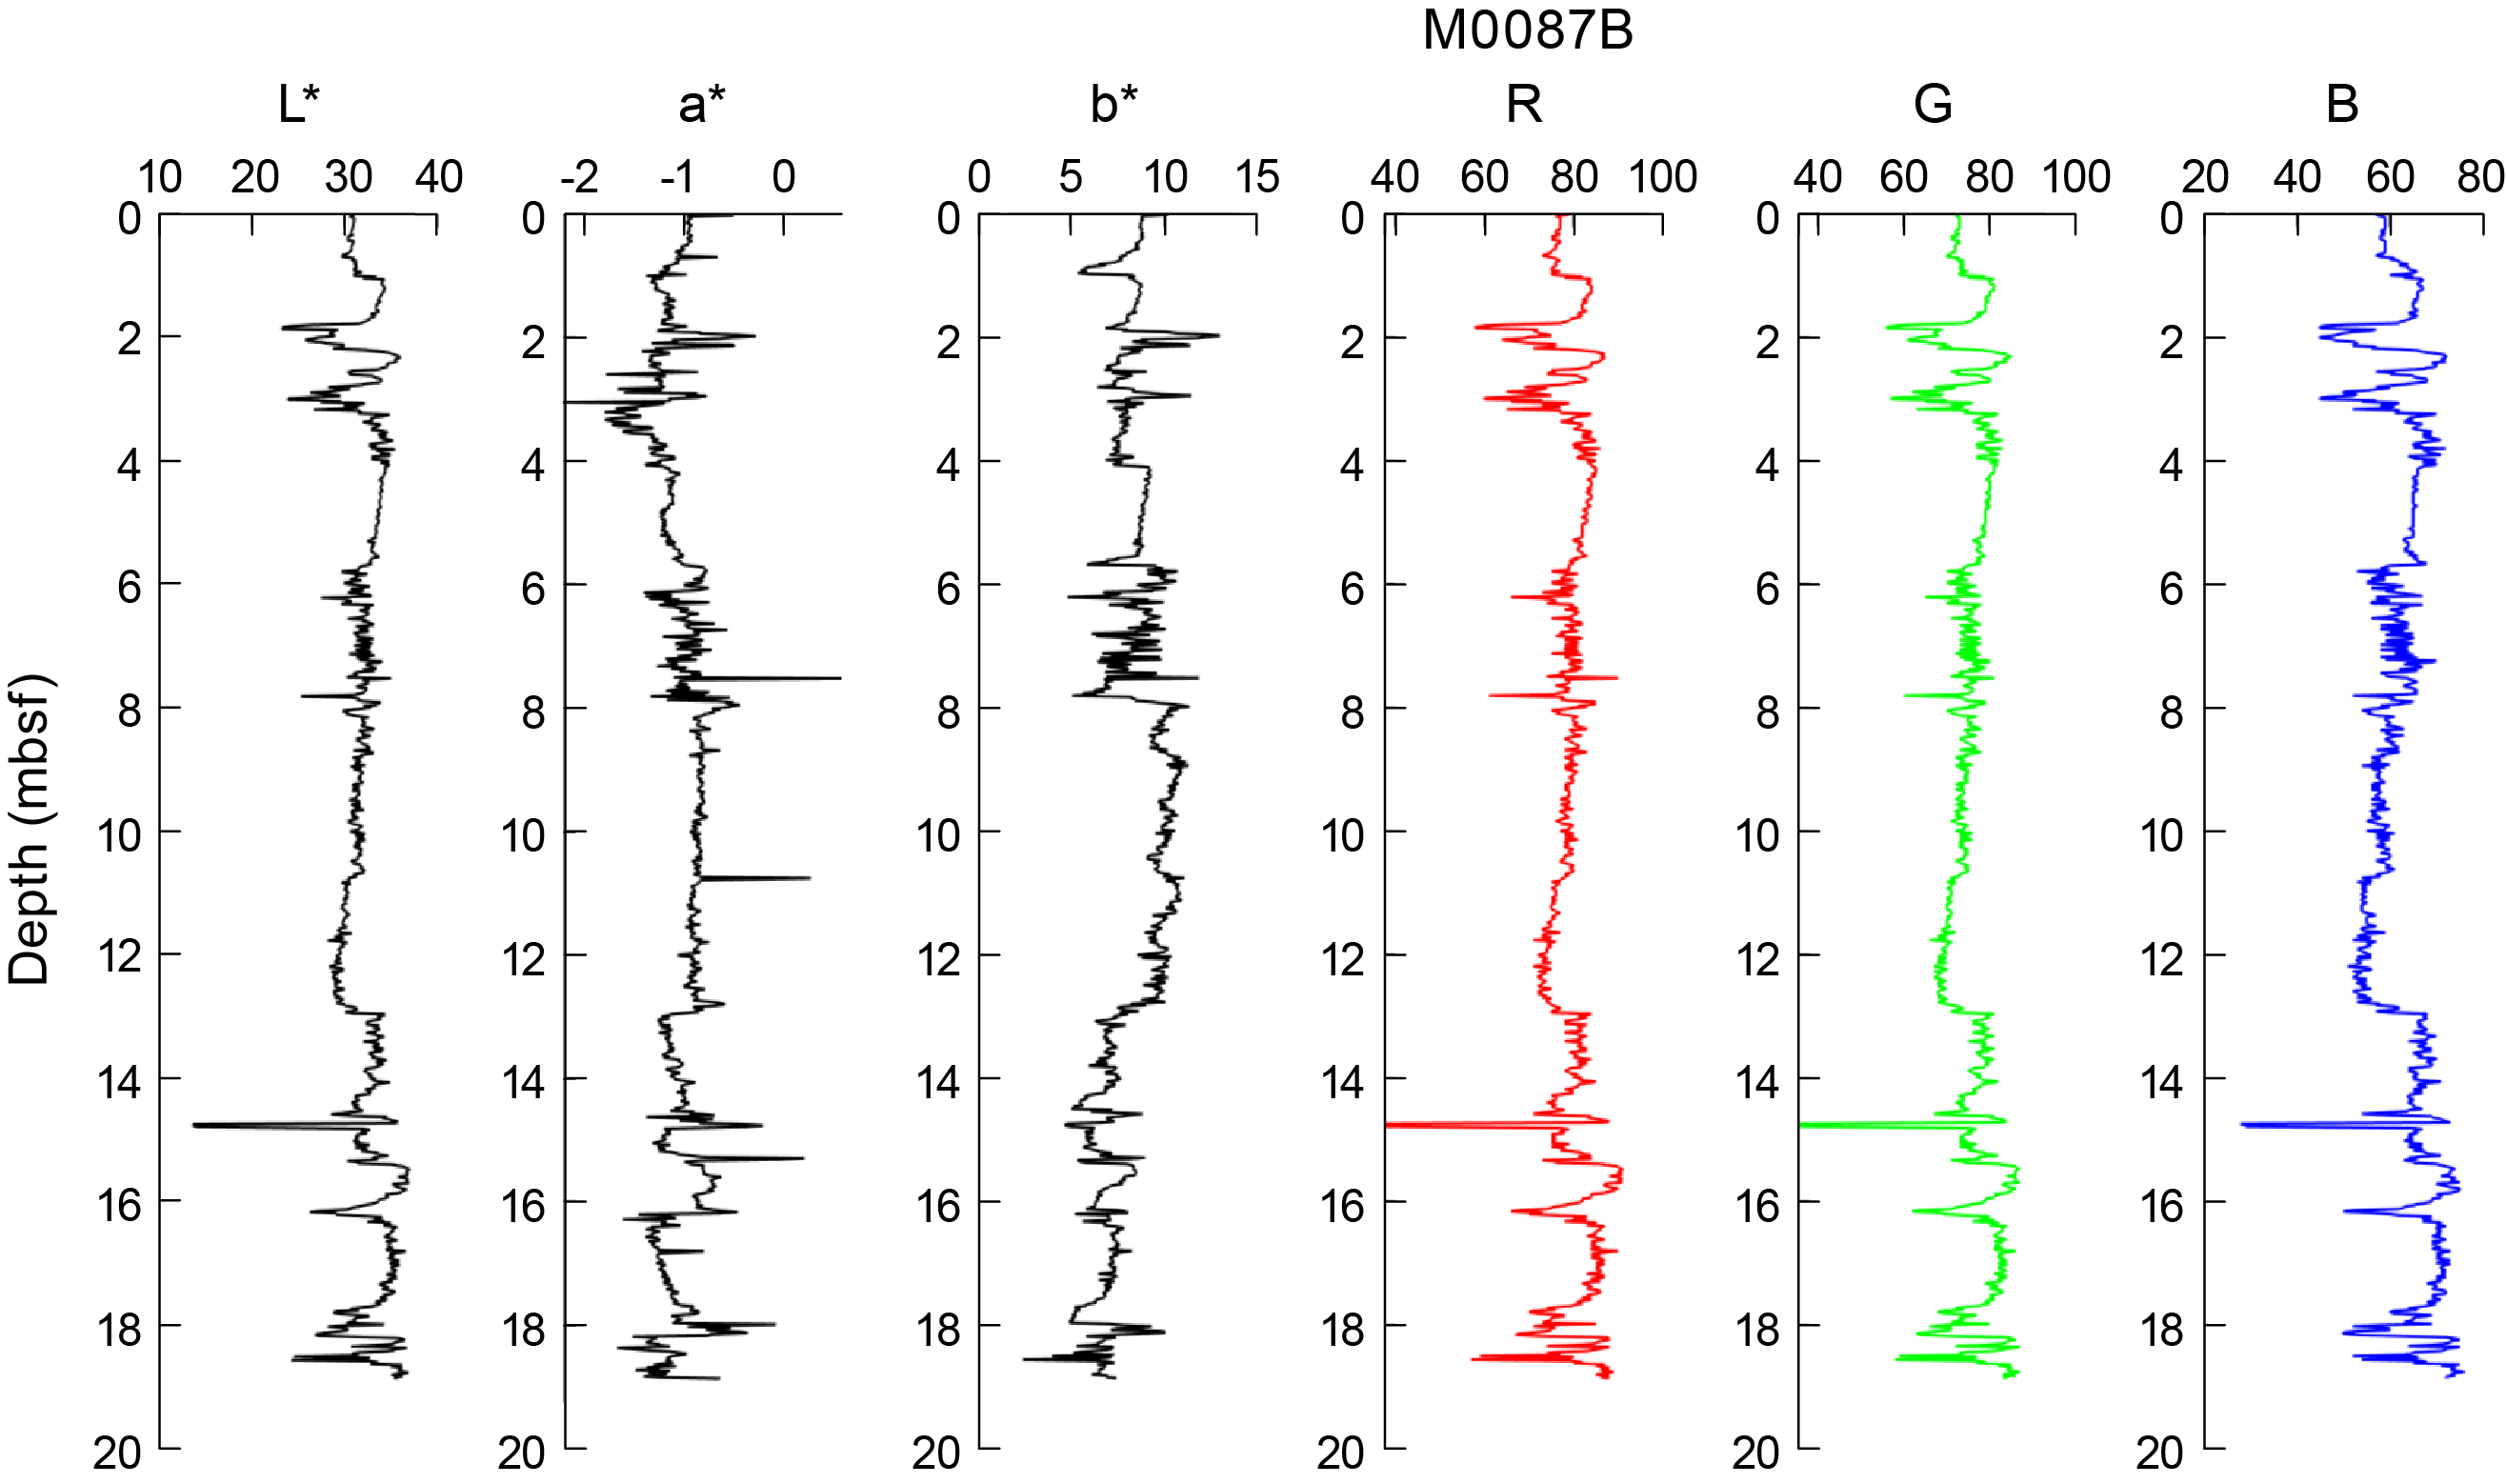
Figure F30. Color data, Hole M0087B.
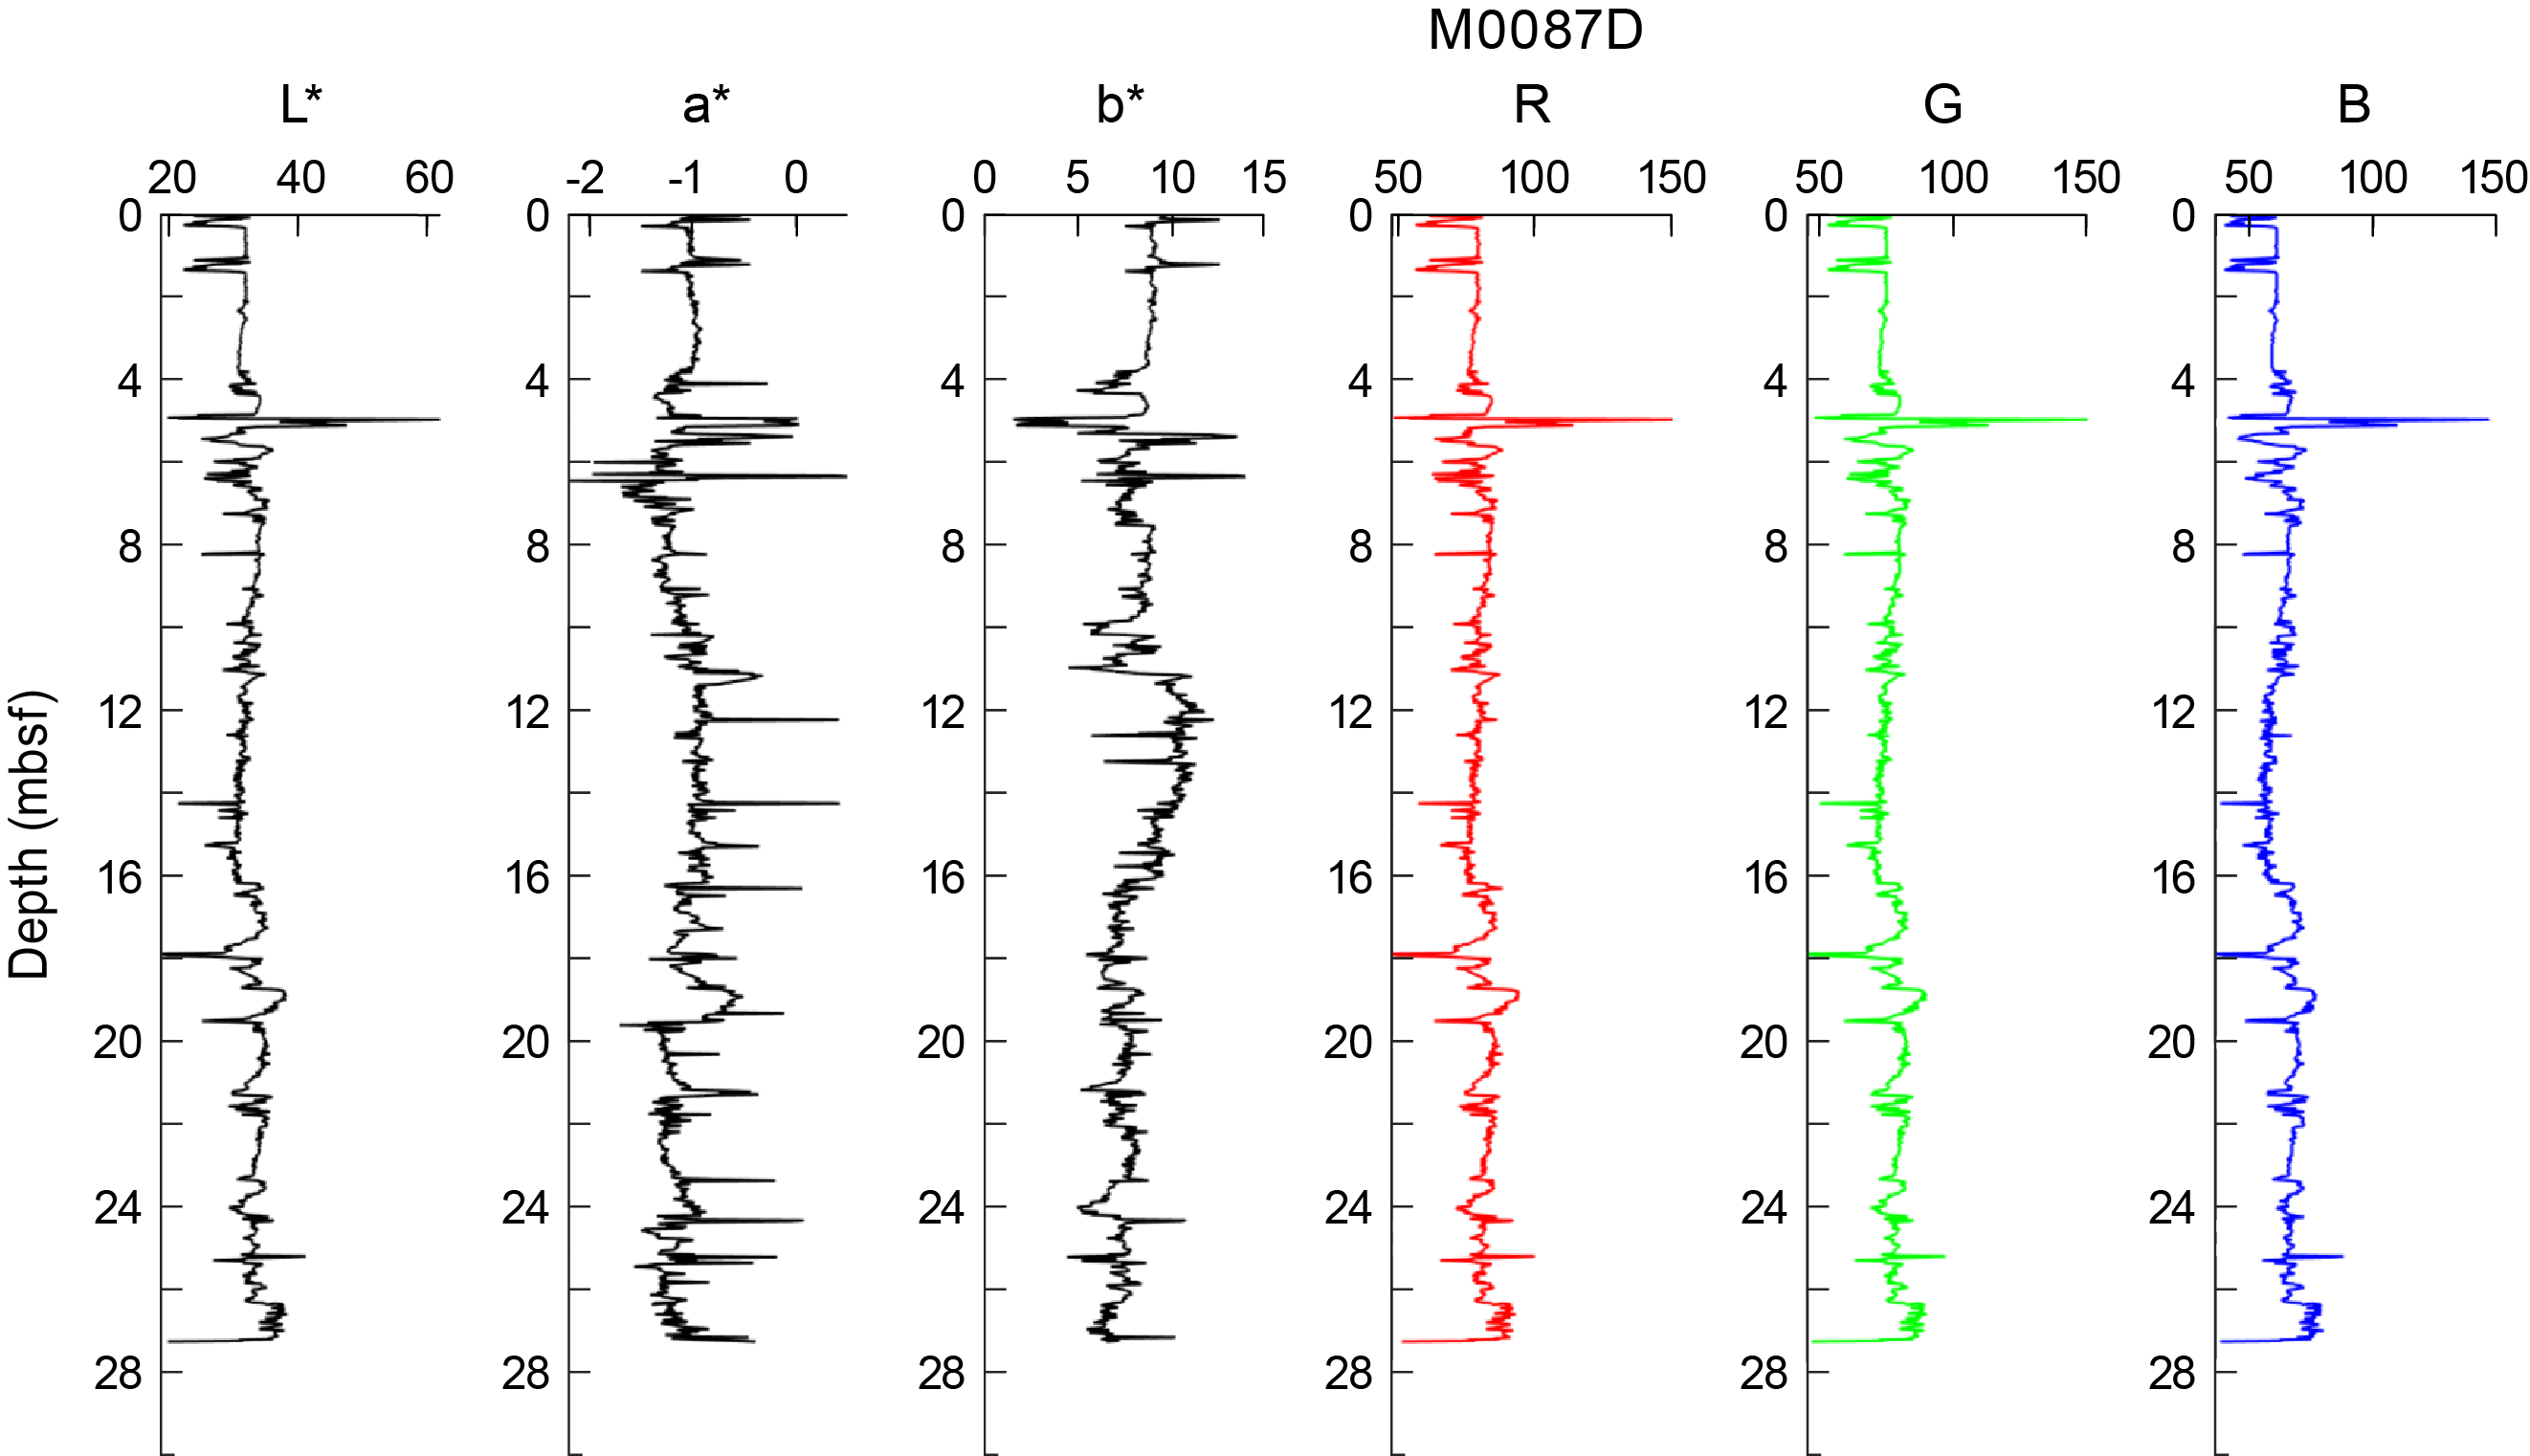
Figure F31. Color data, Hole M0087D.
In Hole M0087B, dark tones can be seen at approximately 1.9, 3.0, 14.8, 16.2, 18.1, and 18.5 mbsf (Figure F30). These intervals are characterized by a sudden drop to low RGB values. The dark interval at 14.8 mbsf is in fact not a real sedimentary property; it only represents a void space that can be seen from X-ray CT scans and linescan images.
In Hole M0087D, local dark intervals can be seen at approximately 0.3, 1.3, and 17.9 mbsf. A pale interval at 5.0 mbsf corresponds to high RGB values (Figure F31).
A downhole darkening interval lies at 8–13 mbsf in Hole M0087B and at 10–16 mbsf in Hole M0087D (Figures F30, F31). This same interval also stands out in many other physical properties parameters, including P-wave velocity, bulk density, NGR, resistivity, and magnetic susceptibility (Figures F25, F26).
8. Paleomagnetism
This section reports the measurement of remanent magnetization for Holes M0087A–M0087D, which were cored in Basin C/N3 of the boundary area between the central and northern Japan Trench.
Remanent magnetization of U-channel samples was measured on sections of the working halves at 2 cm intervals. Natural remanent magnetization (NRM) measurements were only conducted at 0 and 5 mT peak fields due to the time constraints of the hybrid Onshore Science Party (OSP).
Profiles of intensity, inclination, and declination after demagnetization at 5 mT are displayed in the figures in this section. The profiles of Holes M0087A and M0087C are shown separately from the other longer holes because they are trigger cores with short core lengths.
The intensity profile of Hole M0087A peaks at 0.15 mbsf. Intensity in Hole M0087C increases gradually downward (Figure F32). Hole M0087A is too short to observe any characteristic pattern in inclination and declination. Inclination in Hole M0087C shows a cyclic change from 0.2 to 0.7 mbsf, whereas declination shows a large swing above 0.15 mbsf.

Figure F32. Intensity, inclination, and declination.
Intensity profiles of Holes M0087B and M0087D are characterized by intervals of high fluctuation, which dominates the profiles of both holes. Areas of less variation with lower values can be seen between 8 and 12 mbsf in Hole M0087B and between 10 and 13 mbsf in Hole M0087D (Figure F33). The difference in depths between these low intensity intervals suggests that the depths of key intervals measured in Hole M0087D are about 1–2 m lower than the same intervals in Hole M0087B.

Figure F33. Intensity.
Declination variations are displayed in Figure F34. The obvious clockwise trend downward in Hole M0087D has been removed by a linear function of core depth. However, declination patterns in Hole M0087B and corrected Hole M0087D show different trends (Figure F35).
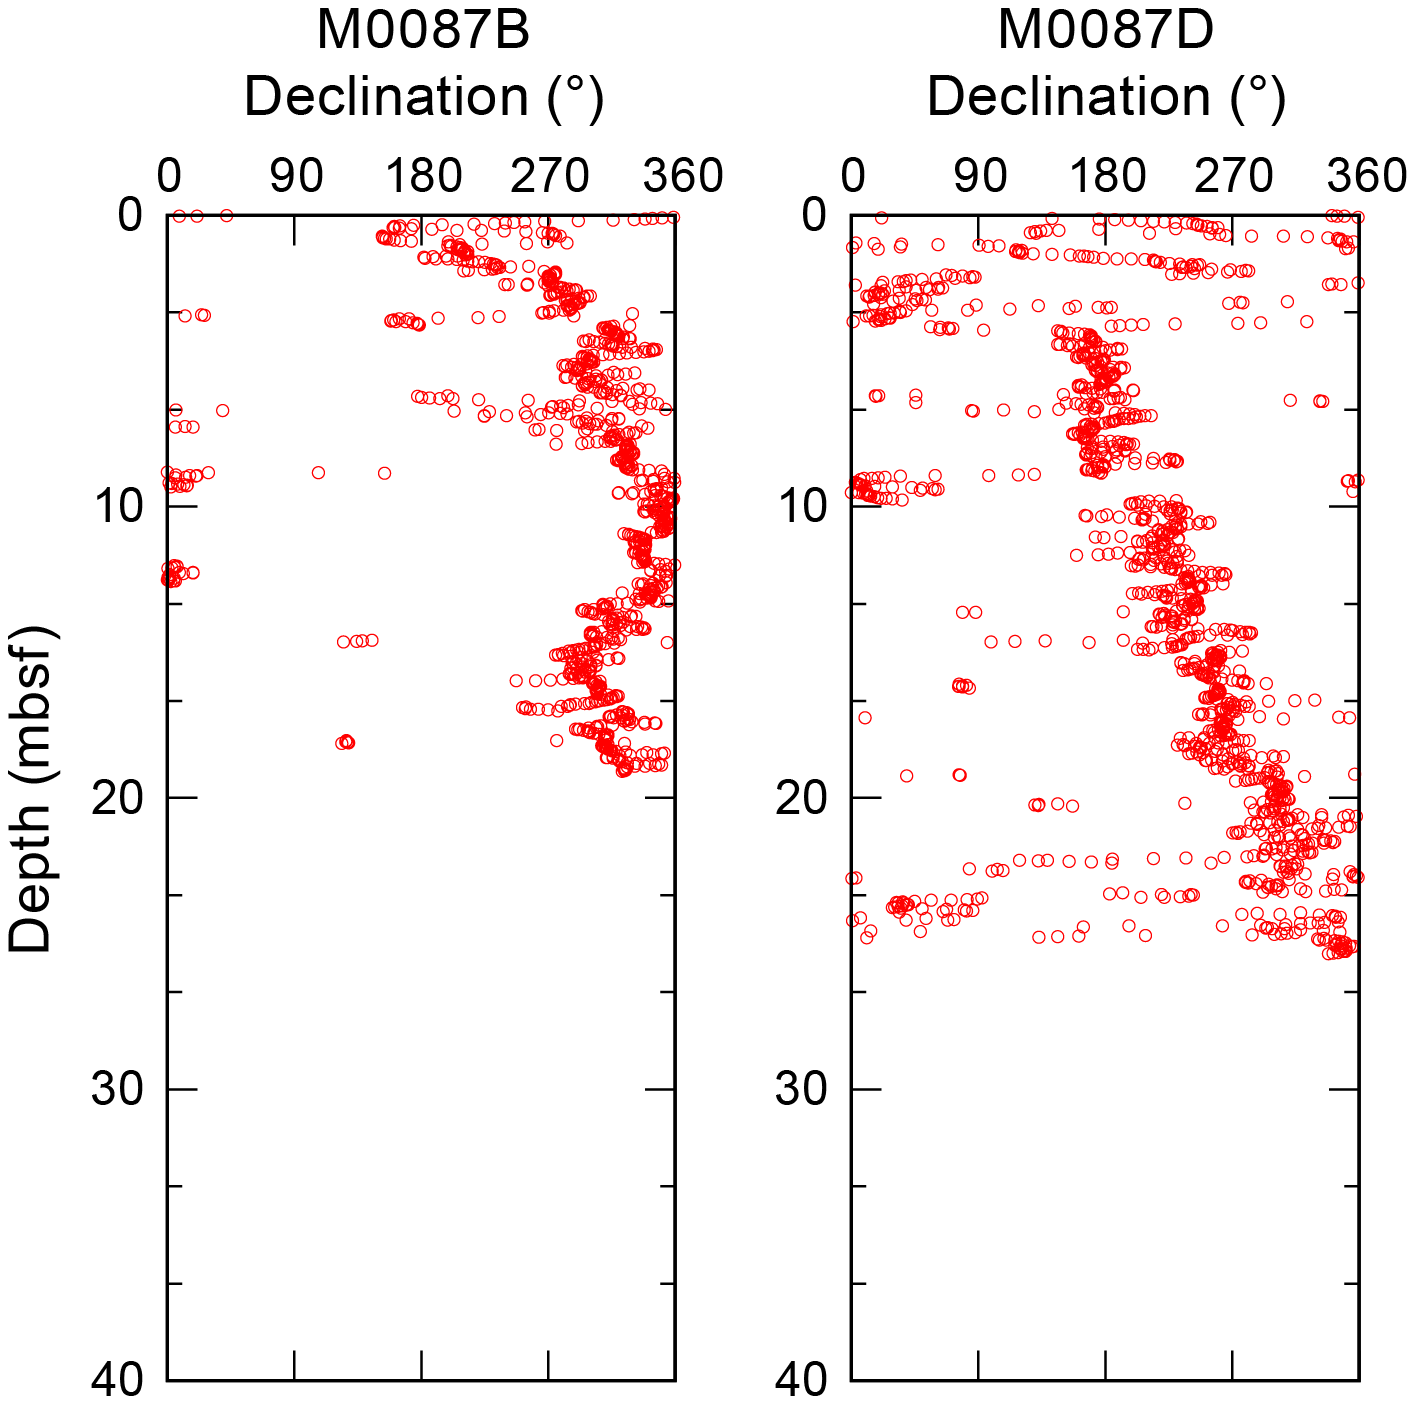
Figure F34. Declination.
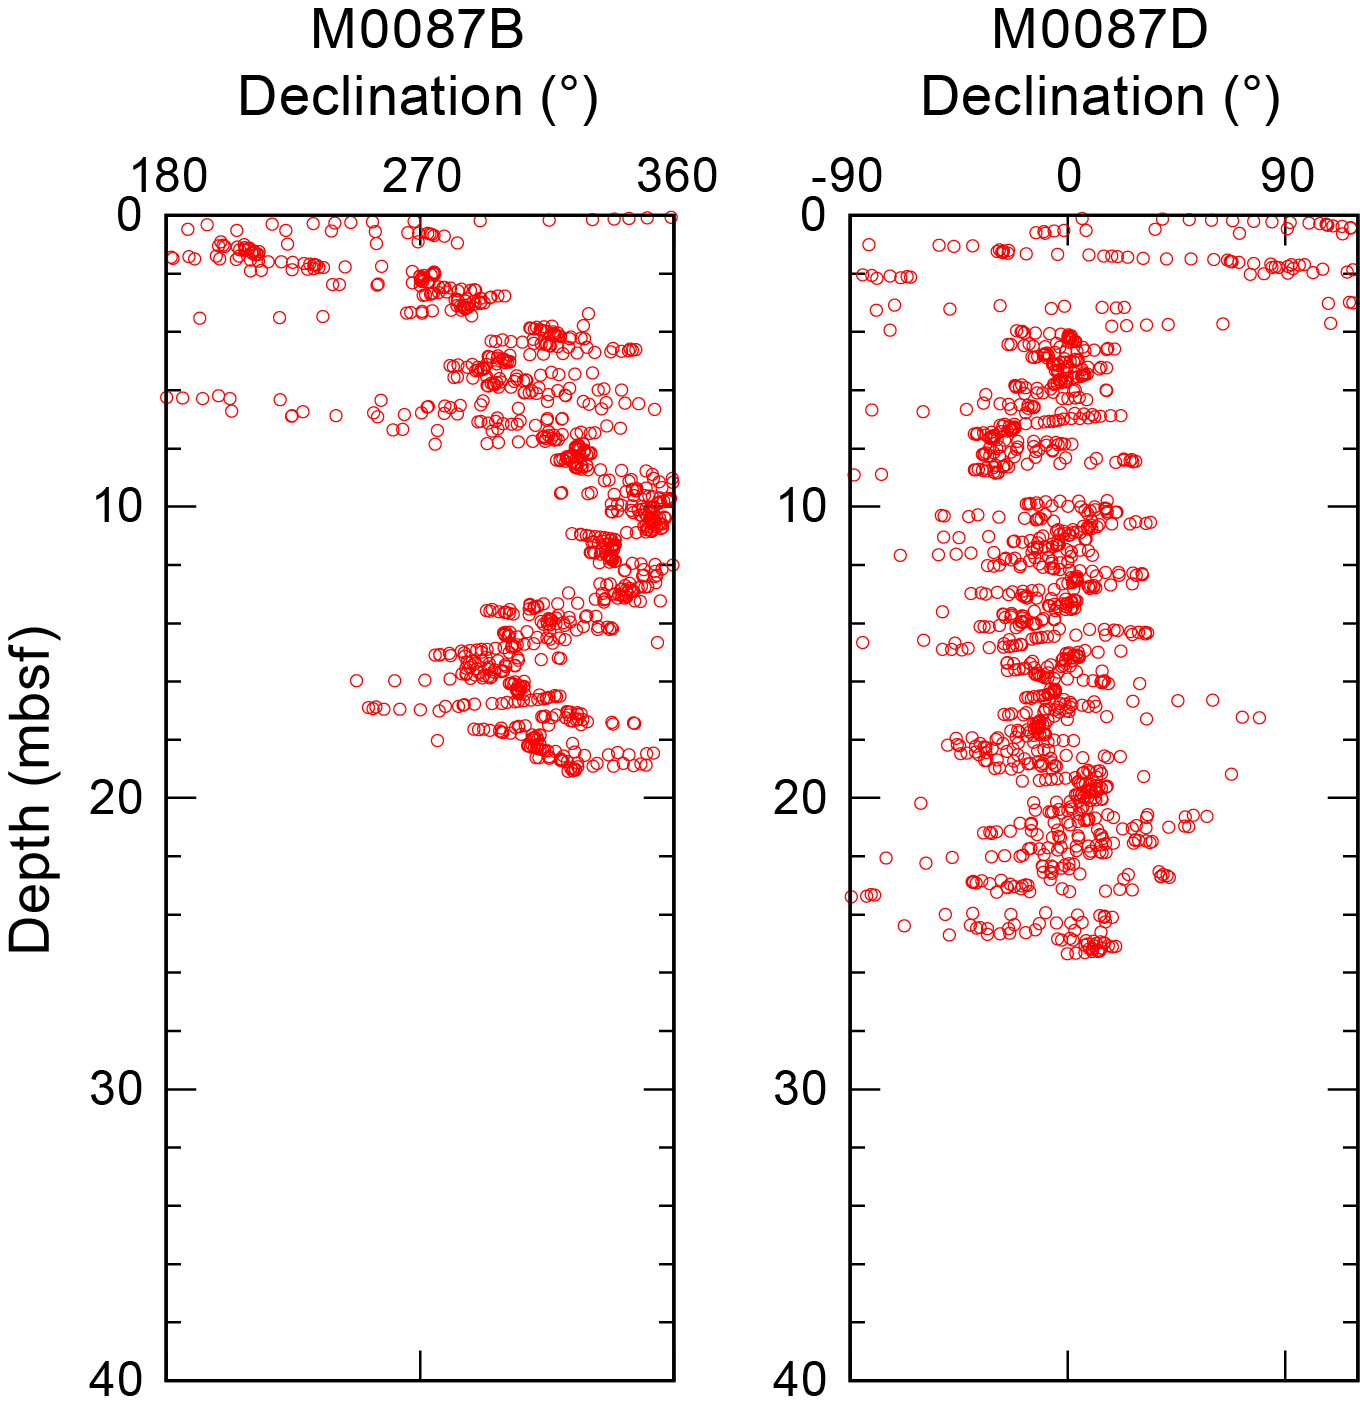
Figure F35. Corrected declination.
The inclination profiles of Holes M0087B and M0087D generally fluctuate between 30° and 60° (Figure F36). The large offset in inclination at 13 mbsf in Hole M0087B and 15 mbsf in Hole M0087D are regarded as the same event.

Figure F36. Inclination.
Preliminary paleomagnetic data for Holes M0087B and M0087D reveal similar trends in intensity and inclination but not declination profiles, which makes correlation difficult.
9. Stratigraphic correlation
A core composite depth scale and first-order splice (see Stratigraphic correlation in the Expedition 386 methods chapter [Strasser et al., 2023a]) were constructed for Site M0087 to establish a first-order continuous sediment succession. Cores were recovered from four holes during two GPC deployments (Holes M0087A–M0087D).
First-order splicing among the four holes at Site M0087 enabled construction of a continuous stratigraphic succession from the seafloor to the bottom of Hole M0087D (27.185 meters composite depth in splice [mcd-splice]).
9.1. Construction of core composite depth scale
9.1.1. Definition of top
The presence of a thin (0.5–1.5 cm) oxidized top in the trigger cores from the top of Sections 386-M0087A-1P-1 and 386-M0087C-1P-1 (see Lithostratigraphy) suggests that an undisturbed mudline was recovered in both holes. Thus, the vertical offset was determined to be −0.105 m for Hole 386-M0087A and −0.055 m for Hole M0087C (Tables T9, T10.) Based on the VCDs and X-ray CT images, both holes have the same lithostratigraphy. At the core top, ~8 cm of thick silty clay to silt with slightly high radiodensity was observed in both holes. Below this interval, a fining-upward succession is recognized from laminated medium sand through laminated fine to very fine sand and silt to structureless silty clay and clay. Another band of structureless clay 3–4 cm thick underlies the sand bed. The base of this lower structureless clay is sharp, and a thin layer with high radiodensity is found below its base in the X-ray CT images. The base of this lower structureless clay (Tie Point TP1) occurs in Sections 386-M0087A-1P-2, 26 cm (0.53 mbsf on the corrected core depth scale), and 386-M0087C-1P-1, 69 cm (0.635 mbsf on the corrected core depth scale). Because the sediment thickness between the mudline and TP1 in Hole M0087C is larger than that in Hole M0087A, Hole M0087C was selected as the anchor core, and Section 386-M0087C-1P-1, 5.5 cm, was defined as 0 mbsf.
9.1.2. Compositing cores
Before compositing holes, artificial and/or natural voids at the ends of sections were measured and void lengths were subtracted from the curated section lengths to obtain the sediment length of each section (neglecting core catchers that were sampled in bags). Corrected section lengths and section top and bottom depths for Site M0087 are listed in Table T9.
The core composite scale for Site M0087 is currently tentatively based on the visual correlation marker horizons on the X-ray CT images. VCDs and linescan images generated during the OSP and spikes in magnetic susceptibility and GRA data from the MSCL, measured at 2 and 10 cm intervals, respectively (see Physical properties in the Expedition 386 methods chapter [Strasser et al., 2023a]), were used for interhole correlation. At this stage, thin but clear marker beds that were visible on X-ray CT and/or linescan images and verified by visual core description where possible were used instead of large (coarse and thick) event beds that may have eroded the underlying sediments.
Primary air fall tephra beds, which were created by a single volcanic eruption and fell to the sea bed through the water column, are among the best tie points between holes. Four tephra beds are recognized in intervals 386-M0087B-1H-8, 35–39 cm; 1H-19, 15.6–16.4 cm; 386-M0087D-1H-20, 87–87.5 cm; and 1H-23, 85 cm, through 1H-24, 87.5 cm (see Tephra). The tephra bed in interval 386-M0087B-1H-19, 15.6–16.4 cm, is possibly correlated with the one in interval 386-M0087D-1H-20, 87–87.5 cm.
Initially, five tie or append points, including one correlative tephra bed, were determined; one point occurred in the two trigger cores (Holes M0087A and M0087C), one between the trigger core (Hole M0087A) and the GPC core (Hole M0087D), and the others in the two GPC cores (Holes M0087B and M0087D). The uppermost tie points in each core were used to calculate the vertical offsets of the top depth of each core used to create the first-order core composite depth scales (Table T10). Note that these linear bulk shifts are only correct for the uppermost few meters shallower than the first occurrence of artificial voids added to the bottom or tops of section during core cutting due to sediment expansion during core recovery (Table T9). All five initial tie points were evaluated for robustness of correlation and suitability for composing the splice (Table T11). Most of these are described as thin silt laminae that are slightly coarse grained and have high radiodensity below a relatively thick sand bed. The accuracy of correlation depends on how clearly the tie point can be recognized in X-ray CT and linescan images. The depth of each tie point was determined using the VCDs.
First-order correlation suggests that a sharp boundary between laminated clay and structureless clay without bioturbation in Sections 386-M0087A-1P-2, 56 cm (0.83 mbsf on the corrected core depth scale), and 386-M0087D-1H-1, 29 cm (0.265 mbsf), can be correlated (TP2). With an artificial void (2.5 cm) at the top of the GPC core (Hole M0087D) (Table T9), a vertical offset of 0.54 m is calculated for the top of Hole M0087D (Table T10). The uppermost tie point (TP3) between the two GPC holes (M0087B and M0087D) was recognized as a thin and high-radiodensity layer at the base of a structureless clay in Sections 386-M0087D-1H-4, 25 cm (3.325 mbsf), and 386-M0087B-1H-2, 35 cm (1.05 mbsf). With an artificial void (0 cm) at the top of Hole M0087B (Table T9), the vertical depth shift at the top of Hole M0087B is calculated as 2.815 m (Table T10).
Overall, the general stratigraphic succession and several distinct marker horizons, as observed in X-ray CT images, can be correlated across the GPC cores from this site (Table T11).
9.1.3. Construction of splice
A combination of Holes M0087A–M0087D reveals the longest complete and least disturbed stratigraphic interval at Site M0087.
As mentioned above, TP1 (0.635 mcd-splice), TP2 (0.935 mcd-splice), and TP3 (3.995 mcd-splice) were correlative among the holes. Below TP3, the splice continues to the next splice tie point (TP5) along Hole M0087B. In this interval, a tephra layer in Section 386-M0087B-1H-19, 16.4 cm, occurs just below a thick sand bed. This tephra layer is correlated to the one in Section 386-M0087D-1H-20, 87.5 cm (see Tephra), and provides a robust tie point (TP4). The last tie point (TP5) consists of the basal surface of a fine sand layer underlying a structureless clay in Sections 386-M0087B-1H-19, 64 cm, and 386-M0087D-1H-21, 21 cm. The splice continues to the base of Hole M0087D (27.185 mcd-splice) to construct a first-order splice. The tentatively defined tie points and splice intervals and tentatively calculated splice composite depth are given in Table T11.
References
Froelich, P.N., Klinkhammer, G.P., Bender, M.L., Luedtke, N.A., Heath, G.R., Cullen, D., Dauphin, P., Hammond, D., Hartman, B., and Maynard, V., 1979. Early oxidation of organic matter in pelagic sediments of the eastern equatorial Atlantic: suboxic diagenesis. Geochimica et Cosmochimica Acta, 43(7):1075–1090. https://doi.org/
Kioka, A., Schwestermann, T., Moernaut, J., Ikehara, K., Kanamatsu, T., Eglinton, T.I., and Strasser, M., 2019. Event stratigraphy in a hadal oceanic trench: the Japan Trench as sedimentary archive recording recurrent giant subduction zone earthquakes and their role in organic carbon export to the deep sea. Frontiers in Earth Science, 7:319. https://doi.org/
Strasser, M., Ikehara, K., and Cotterill, C., 2019. Expedition 386 Scientific Prospectus: Japan Trench Paleoseismology. International Ocean Discovery Program. https://doi.org/
Strasser, M., Ikehara, K., Everest, J., Maeda, L., Hochmuth, K., Grant, H., Stewart, M., Okutsu, N., Sakurai, N., Yokoyama, T., Bao, R., Bellanova, P., Brunet, M., Cai, Z., Cattaneo, A., Hsiung, K.-H., Huang, J.-J., Ishizawa, T., Itaki, T., Jitsuno, K., Johnson, J.E., Kanamatsu, T., Keep, M., Kioka, A., Kölling, M., Luo, M., März, C., McHugh, C., Micallef, A., Nagahashi, Y., Pandey, D.K., Proust, J.-N., Rasbury, E.T., Riedinger, N., Satoguchi, Y., Sawyer, D.E., Seibert, C., Silver, M., Straub, S.M., Virtasalo, J., Wang, Y., Wu, T.-W., and Zellers, S.D., 2023a. Expedition 386 methods. In Strasser, M., Ikehara, K., Everest, J., and the Expedition 386 Scientists, Japan Trench Paleoseismology. Proceedings of the International Ocean Discovery Program, 386: College Station, TX (International Ocean Discovery Program). https://doi.org/
Strasser, M., Ikehara, K., Everest, J., Maeda, L., Hochmuth, K., Grant, H., Stewart, M., Okutsu, N., Sakurai, N., Yokoyama, T., Bao, R., Bellanova, P., Brunet, M., Cai, Z., Cattaneo, A., Hsiung, K.-H., Huang, J.-J., Ishizawa, T., Itaki, T., Jitsuno, K., Johnson, J.E., Kanamatsu, T., Keep, M., Kioka, A., Kölling, M., Luo, M., März, C., McHugh, C., Micallef, A., Nagahashi, Y., Pandey, D.K., Proust, J.-N., Rasbury, E.T., Riedinger, N., Satoguchi, Y., Sawyer, D.E., Seibert, C., Silver, M., Straub, S.M., Virtasalo, J., Wang, Y., Wu, T.-W., and Zellers, S.D., 2023b. Site M0093 (Basin C/N1). In Strasser, M., Ikehara, K., Everest, J., and the Expedition 386 Scientists, Japan Trench Paleoseismology. Proceedings of the International Ocean Discovery Program, 386: College Station, TX (International Ocean Discovery Program). https://doi.org/
Strasser, M., Ikehara, K., Everest, J., Maeda, L., Hochmuth, K., Grant, H., Stewart, M., Okutsu, N., Sakurai, N., Yokoyama, T., Bao, R., Bellanova, P., Brunet, M., Cai, Z., Cattaneo, A., Hsiung, K.-H., Huang, J.-J., Ishizawa, T., Itaki, T., Jitsuno, K., Johnson, J.E., Kanamatsu, T., Keep, M., Kioka, A., Kölling, M., Luo, M., März, C., McHugh, C., Micallef, A., Nagahashi, Y., Pandey, D.K., Proust, J.-N., Rasbury, E.T., Riedinger, N., Satoguchi, Y., Sawyer, D.E., Seibert, C., Silver, M., Straub, S.M., Virtasalo, J., Wang, Y., Wu, T.-W., and Zellers, S.D., 2023c. Site M0094 (Basin C/N2). In Strasser, M., Ikehara, K., Everest, J., and the Expedition 386 Scientists, Japan Trench Paleoseismology. Proceedings of the International Ocean Discovery Program, 386: College Station, TX (International Ocean Discovery Program). https://doi.org/
Strasser, M., Ikehara, K., Everest, J., and the Expedition 386 Scientists, 2023d. Supplementary material, https://doi.org/10.14379/iodp.proc.386supp.2023. In Strasser, M., Ikehara, K., Everest, J., and the Expedition 386 Scientists, Japan Trench Paleoseismology. Proceedings of the International Ocean Discovery Program, 386: College Station, TX (International Ocean Discovery Program).