Webster, J.M., Ravelo, A.C., Grant, H.L.J., and the Expedition 389 Scientists
Proceedings of the International Ocean Discovery Program Volume 389
publications.iodp.org
https://doi.org/10.14379/iodp.proc.389.108.2025
Site M01011
![]() J.M. Webster,
J.M. Webster,
![]() A.C. Ravelo,
A.C. Ravelo,
![]() H.L.J. Grant,
H.L.J. Grant,
![]() M. Rydzy,
M. Rydzy,
![]() M. Stewart,
M. Stewart,
![]() N. Allison,
N. Allison,
![]() R. Asami,
R. Asami,
![]() B. Boston,
B. Boston,
![]() J.C. Braga,
J.C. Braga,
![]() L. Brenner,
L. Brenner,
![]() X. Chen,
X. Chen,
![]() P. Chutcharavan,
P. Chutcharavan,
![]() A. Dutton,
A. Dutton,
![]() T. Felis,
T. Felis,
![]() N. Fukuyo,
N. Fukuyo,
![]() E. Gischler,
E. Gischler,
![]() S. Greve,
S. Greve,
![]() A. Hagen,
A. Hagen,
![]() Y. Hamon,
Y. Hamon,
![]() E. Hathorne,
E. Hathorne,
![]() M. Humblet,
M. Humblet,
![]() S. Jorry,
S. Jorry,
![]() P. Khanna,
P. Khanna,
![]() E. Le Ber,
E. Le Ber,
![]() H. McGregor,
H. McGregor,
![]() R. Mortlock,
R. Mortlock,
![]() T. Nohl,
T. Nohl,
![]() D. Potts,
D. Potts,
![]() A. Prohaska,
A. Prohaska,
![]() N. Prouty,
W. Renema,
N. Prouty,
W. Renema,
![]() K.H. Rubin,
K.H. Rubin,
![]() H. Westphal, and
H. Westphal, and
![]() Y. Yokoyama2
Y. Yokoyama2
1 Webster, J.M., Ravelo, A.C., Grant, H.L.J., Rydzy, M., Stewart, M., Allison, N., Asami, R., Boston, B., Braga, J.C., Brenner, L., Chen, X., Chutcharavan, P., Dutton, A., Felis, T., Fukuyo, N., Gischler, E., Greve, S., Hagen, A., Hamon, Y., Hathorne, E., Humblet, M., Jorry, S., Khanna, P., Le Ber, E., McGregor, H., Mortlock, R., Nohl, T., Potts, D., Prohaska, A., Prouty, N., Renema, W., Rubin, K.H., Westphal, H., and Yokoyama, Y., 2025. Site M0101. In Webster, J.M., Ravelo, A.C., Grant, H.L.J., and the Expedition 389 Scientists, Hawaiian Drowned Reefs. Proceedings of the International Ocean Discovery Program, 389: College Station, TX (International Ocean Discovery Program). https://doi.org/10.14379/iodp.proc.389.108.2025
2 Expedition 389 Scientists’ affiliations.
1. Operations
The multipurpose vessel MMA Valour was used as the drilling platform throughout Expedition 389. At all Expedition 389 sites, dynamic positioning was used to provide accurate positions throughout operations and water depth was established using a Sound Velocity Profiler (SVP) placed on the top of the PROD5 drilling system. For more detail on acquisition methods, see Introduction in the Expedition 389 methods chapter (Webster et al., 2025a).
Summary operational information for Site M0101 is provided in Table T1. All times stated are in Hawaiian Standard Time (HST).
1.1. Hole M0101A
Operations resumed at 0330 h on 2 October 2023 following investigation of the root cause of the Differential Global Positioning Systems (DGPS) loss on 1 October and the subsequent corrective and preventative actions that were put in place. PROD5 was launched at 0352 h at a water depth of 931.9 m. Coring of Hole M0101A began at 0553 h with an attempt at push coring at the mudline due to the landing location clearly having a sediment covered seafloor. One push core was taken to a depth of 6 cm, where more lithified material was encountered, and then a switch was made back to rotary coring. Rotary coring and casing continued to 18.09 meters below seafloor (mbsf). At 1628 h on 3 October, all rotary core barrels had been utilized, and PROD5 was recovered to deck at 1844 h. On-deck operations commenced, and core barrels were extracted for curation. The transit to Site M0102 was initiated at 1904 h.
A total of 29 cores were recovered from Hole M0101A from a total drilled depth of 18.09 m. The total recovered core length was 12.34 m (68.21% recovery).
1.2. Hole M0101B
At 0150 on 5 October 2023, the MMA Valour arrived back on location at Hole M0101B. PROD5 was deployed at 0205 h and underwent wet tests until 0524 h. Because of the presence of live corals in the landing area, two attempts were made to find a suitable landing place where the corals could be avoided. PROD5 landed approximately 45° and 20 m away from Hole M0101A at a water depth of 932.0 m. At 0710 h, rotary coring commenced; it progressed to 5.21 mbsf to capture the top of Hole M0101B for comparison to the top of Hole M0101A. Below this depth, the hole was wash bored to 16.86 mbsf, just above the final depth of Hole M0101A. At 1650 h (16.82 mbsf), rotary coring and casing commenced. Because of difficult ground, small intervals of wash boring at 21.27–22.44, 23.19–25.19, and 26.19–28.20 mbsf were used to advance progress. The borehole was also cleaned multiple times with a wash bore after running the drill string due to debris fall-in. The target depth of 45.15 mbsf was achieved at 1135 h on 7 October, and PROD5 was recovered to deck by 1335 h. On-deck operations commenced, and core barrels were extracted for curation. The transit back to Site M0102 was initiated at 1538 h.
A total of 27 cores were recovered from Hole M0101B from 45.15 m of drilling (28.33 m rotary coring and 16.82 m of wash boring). The total recovered core length was 26.44 m (93.33% recovery).
2. Lithostratigraphy
Two holes were cored in the Kohala region at Site M0101 (M0101A and M0101B) (Figure F1). In both holes, core material consists, from top to bottom, of (1) a 30–50 cm thick interval of brecciated lava, (2) an interval of consolidated and unconsolidated bioclastic material extending to ~5 mbsf, and (3) coralgal-microbialite boundstone composed predominantly of laminar and branching Porites with thin crustose coralline algal crusts overlain by thin microbialite crusts. In Hole M0101B, beneath the coralgal-microbialite boundstone at ~25 mbsf, there is a ~3.5 m thick layer of unconsolidated biodetrital sediment. Below that layer, lava extends to the bottom of the hole at 45.15 mbsf. Core recovery is reduced in the nonvolcanic intervals.
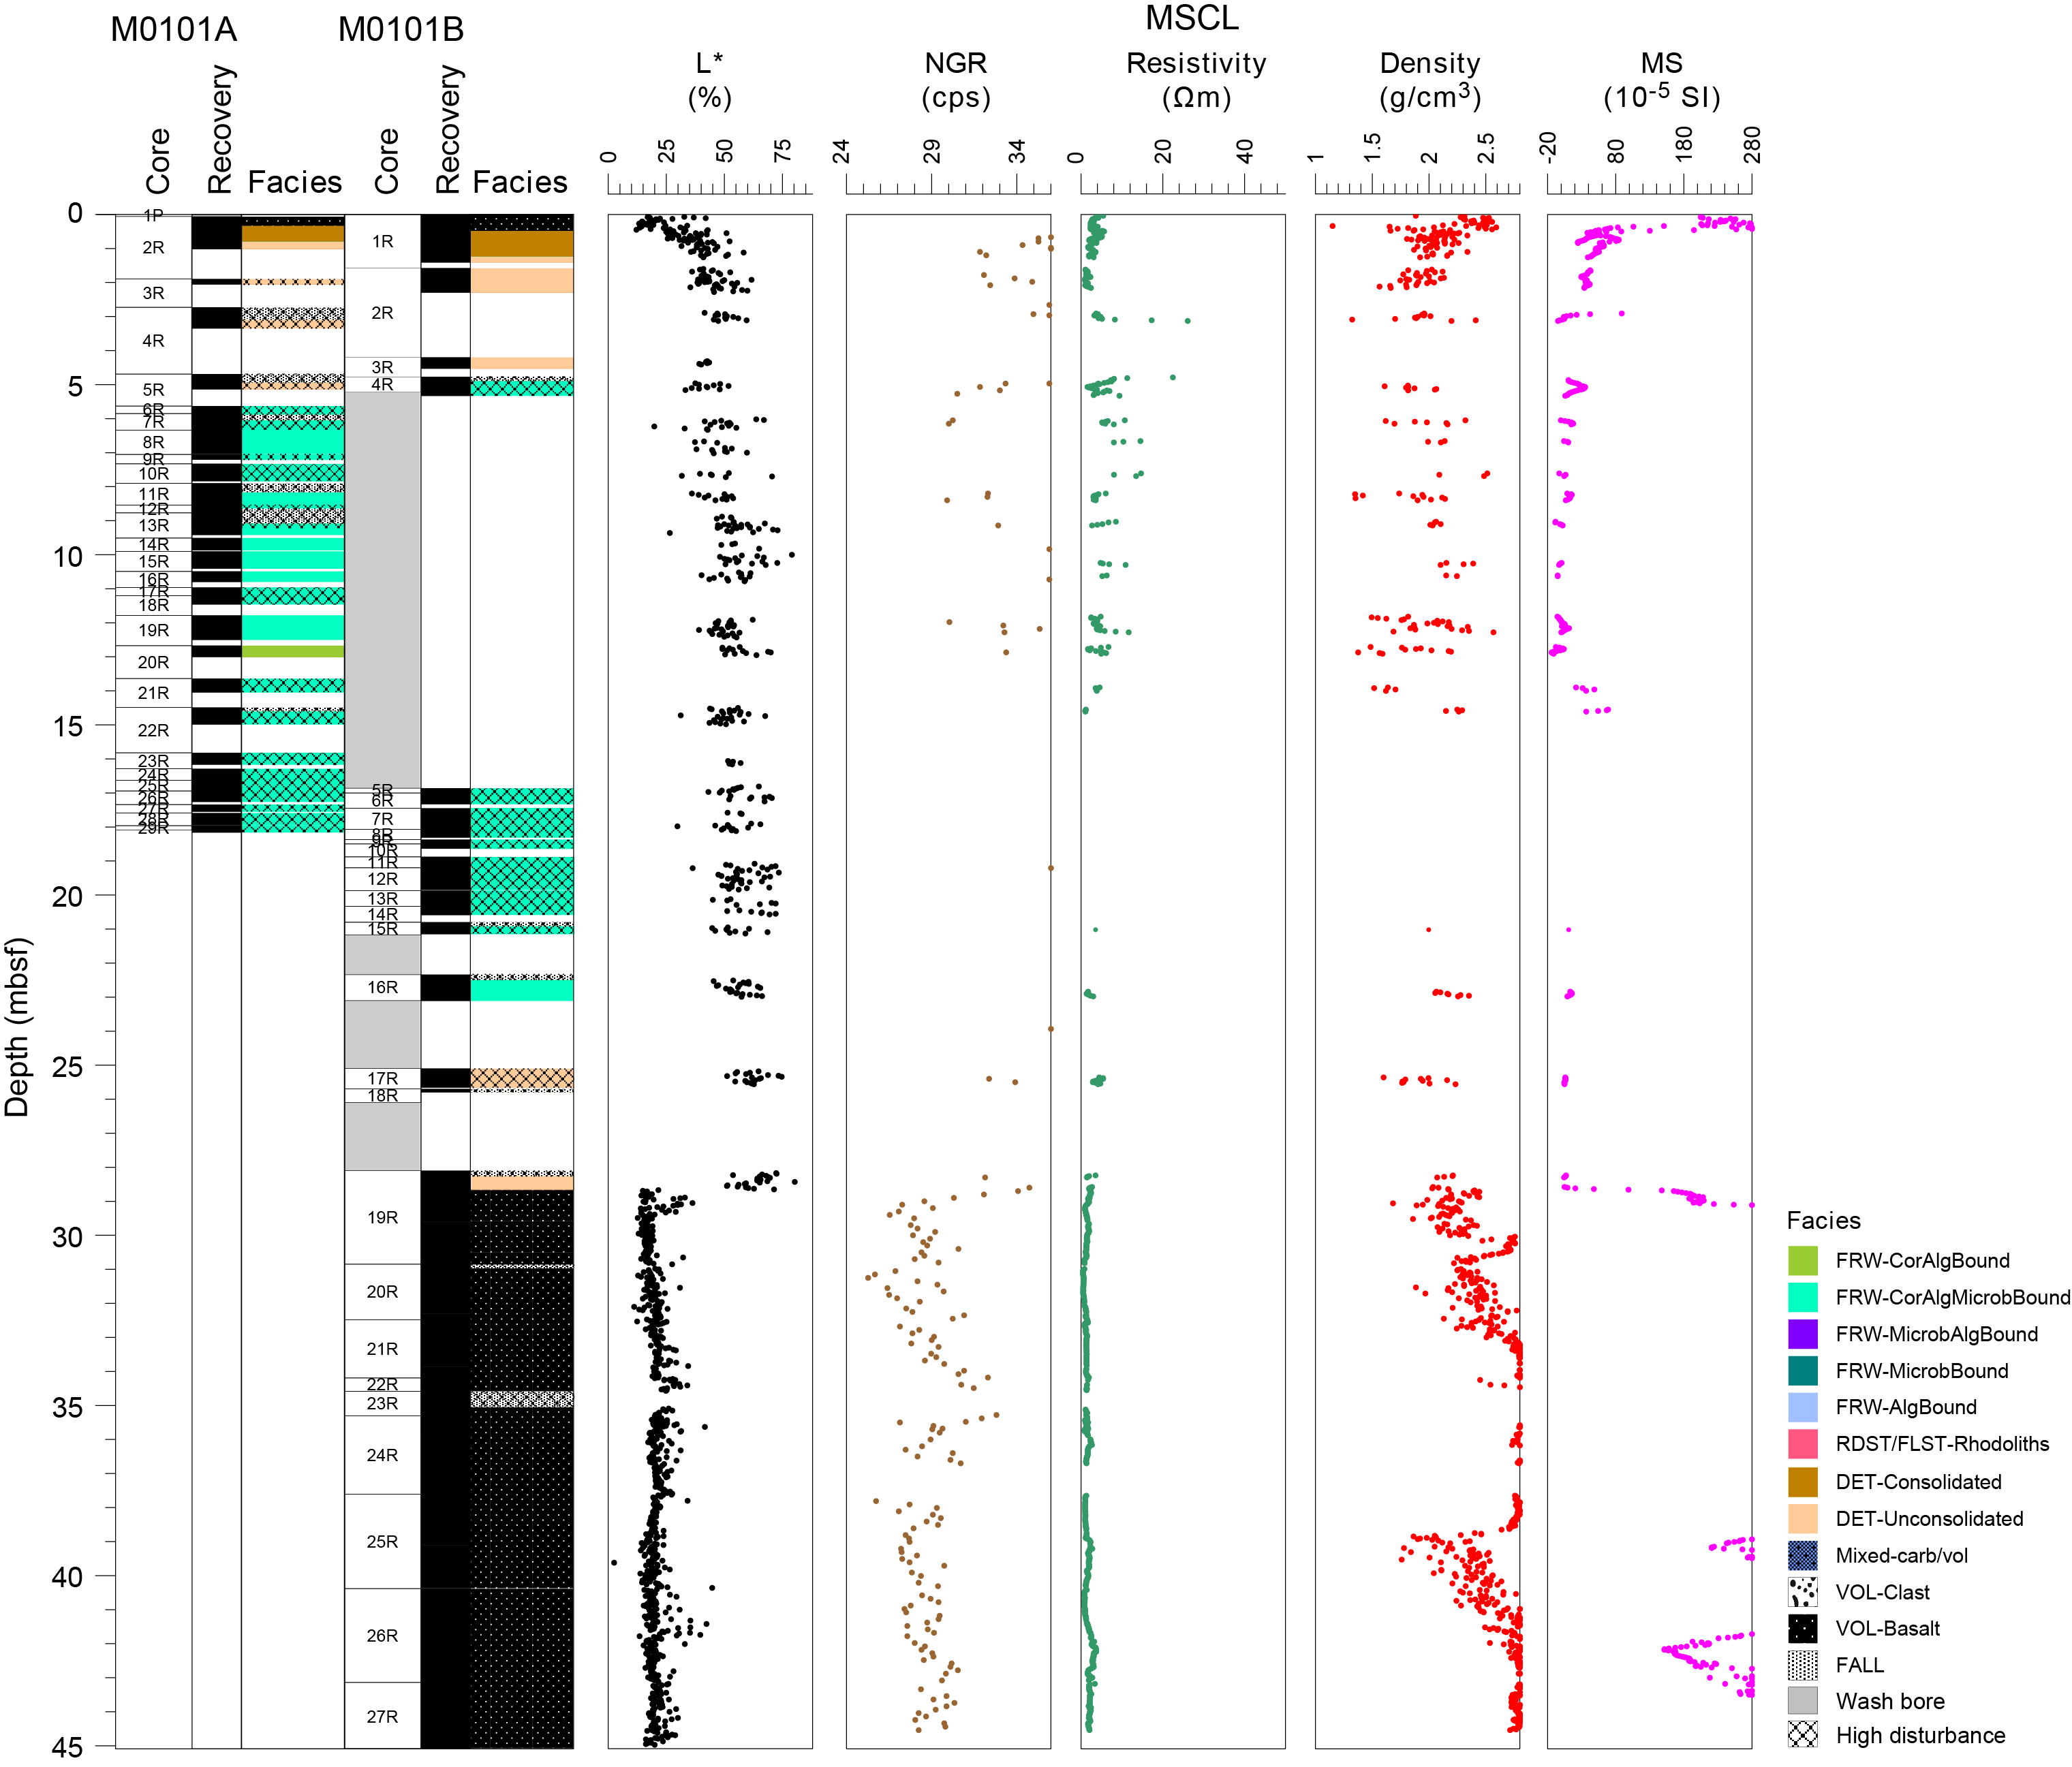
Figure F1. Lithostratigraphy, Holes M0101A and M0101B.
2.1. Hole M0101A
Hole M0101A was cored to 18.09 mbsf (Figure F2). Recovery varied downcore, and drilling disturbance was generally high. The succession in this hole is divided into three intervals: (1) lava breccia at the top, followed downcore by (2) consolidated and unconsolidated bioclastic material that is underlain by (3) coralgal-microbialite boundstone, which makes up most of the hole.
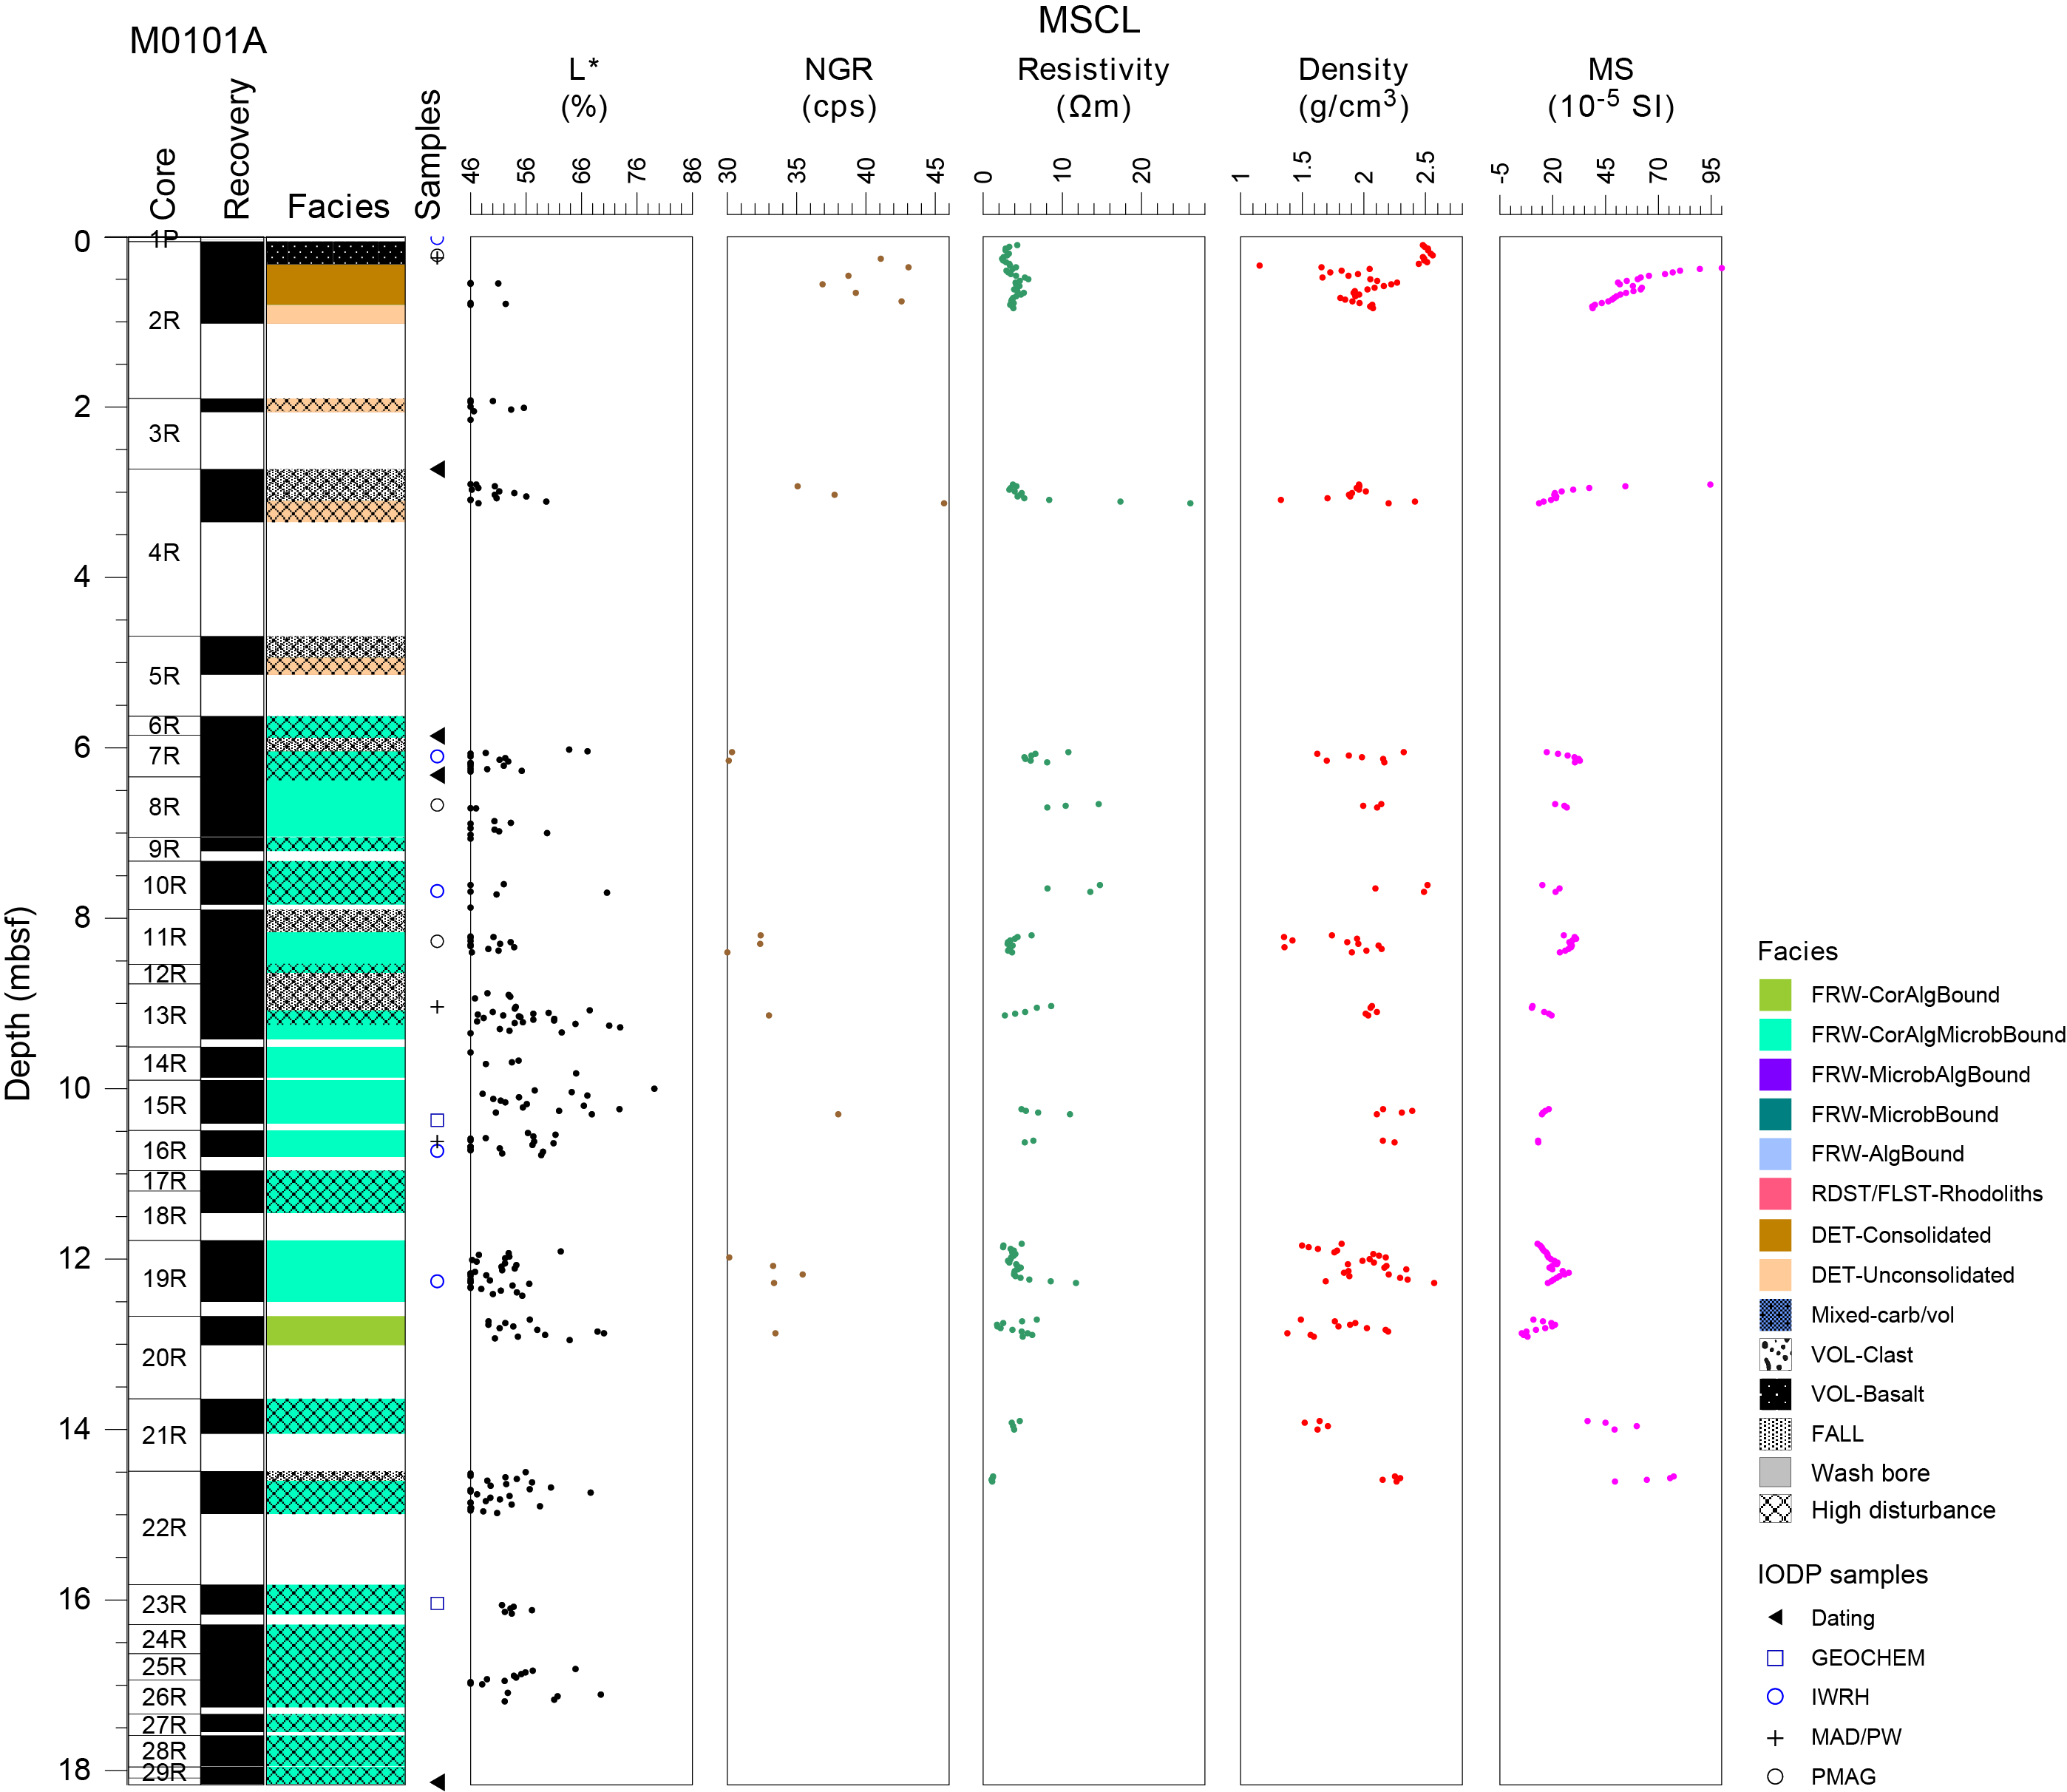
Figure F2. Lithostratigraphy and MSCL data, Hole M0101A.
The first interval (0.06–0.33 mbsf) is lava breccia with angular to subrounded fragments in three size fractions (1–3, 5–15, and >30 mm). The dark gray breccia matrix grades upward from less oxidized at the lower contact (Section 389-M0101A-2R-1; 0.30–0.33 mbsf), to a more oxidized portion with a brown-red stain higher up (Section 2R-1; 0.07–0.14 mbsf) (Figure F3A); the entire breccia appears well indurated. The larger lava clasts are not porphyritic to mildly porphyritic (1%–3%) with small yet abundant vesicles (1–2 mm; 10%–15%) (Figure F3B, F3C); it is visually similar to the intact lava in Hole M0101B (described below).
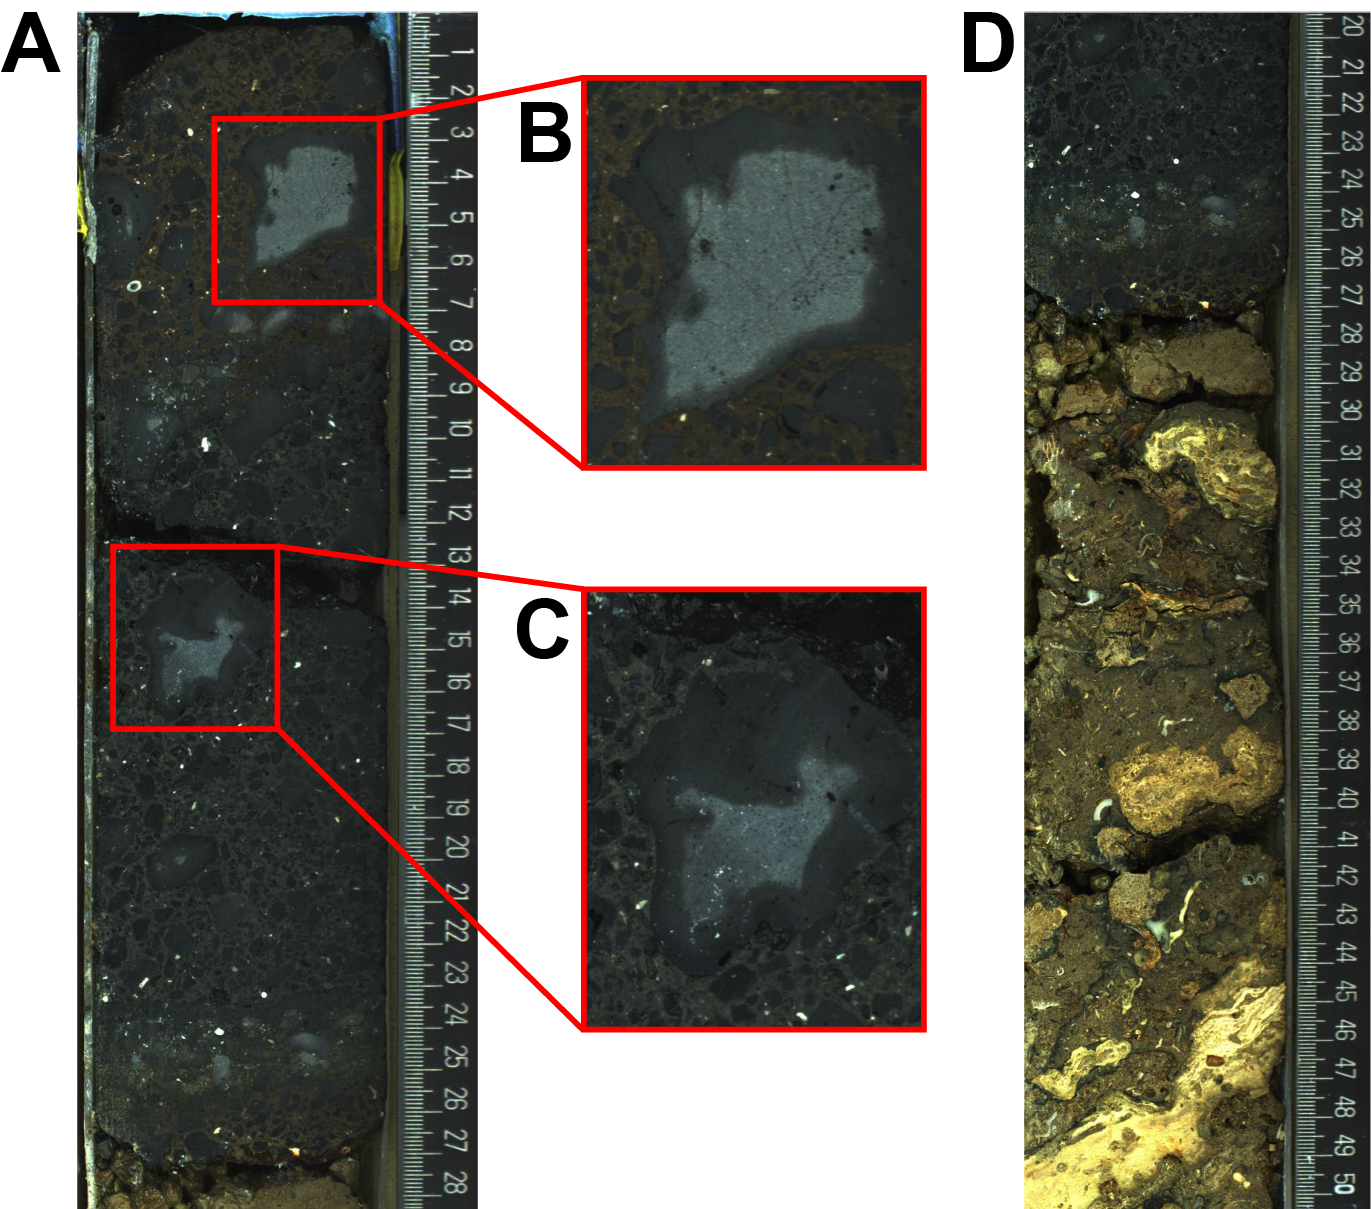
Figure F3. Lava breccia, Hole M01011.
The second interval (0.33–5.63 mbsf) comprises both unconsolidated and consolidated bioclastic sediments consisting of coral, crustose coralline algae (CCA), and microbialite, as well as volcaniclastics (Figure F3D).
The third interval consists of coralgal-microbialite boundstone from 5.63 mbsf to the bottom of the hole at 18.09 mbsf (Figure F4). Laminar corals, mostly Porites, predominate, and locally Cyphastrea and Montipora are identified. Mostly thin crustose coralline algal crusts on the corals are overlain by thin crusts of microbialite, and the sediment matrix contains manifold bioclasts of corals, calcareous algae, mollusk shells, echinoid spines, and some volcanic grains. There is an interval of coralgal boundstone from 12.67 to 13.64 mbsf.
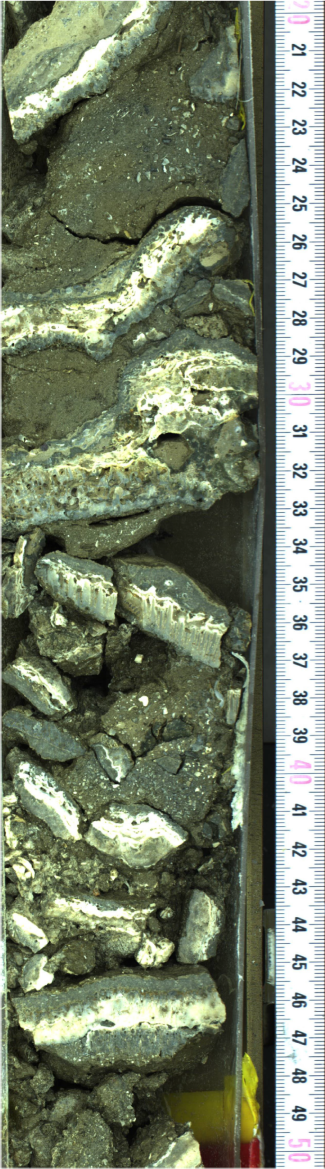
Figure F4. Coralgal-microbialite boundstone.
2.2. Hole M0101B
Hole M0101B was cored to 45.15 mbsf (Figure F5). Material from 0.00 to 0.48 mbsf consists of brecciated lava (hyaloclastite?) composed of brown to black angular not porphyritic clasts. The lava layer is underlain by a 76 cm thick biodetrital rudstone with laminar and foliaceous corals in a mixed carbonate-volcaniclastic matrix composed of fragments of mollusk shells, echinoid spines, CCA, and corals (Porites) (Figure F6A). Pockets of unconsolidated sediments occur within this interval. Unconsolidated brown, biodetrital sandy sediment is found from 1.24 to 4.89 mbsf with laminar and foliaceous corals and mollusk shell fragments (Figure F6B). From 4.89 to 5.33 mbsf and from 16.86 to 23.11 mbsf, the cored material consists of coralgal-microbialite boundstone with a brown bioclastic sandy matrix. Note that part of the hole was wash bored, and no cores were recovered between 5.33 and 16.86 mbsf. The coral assemblage is dominated by laminar, foliaceous, and to a lesser extent branching corals (mainly Porites) down to 19.14 mbsf (Figure F6C) and then by robust branching Porites to 23.11 mbsf (Figure F6D). Crustose coralline algal crusts are up to 5 mm thick, and microbialite crusts are brown, structureless, and less than 2 cm thick. The interval from 25.10 to 28.66 mbsf is composed of unconsolidated brown biodetrital sediment with pebble-sized rhodoliths and coral clasts (Porites, Pavona, Pocillopora, and Leptoseris?) (Figure F6E). Some coral clasts are encrusted with CCA up to 1 cm thick. The lowermost part of this interval is occupied by an 18.5 cm thick massive Porites colony and a fragment of an Acropora branch. Generally, the nonvolcanic core sections are disturbed.
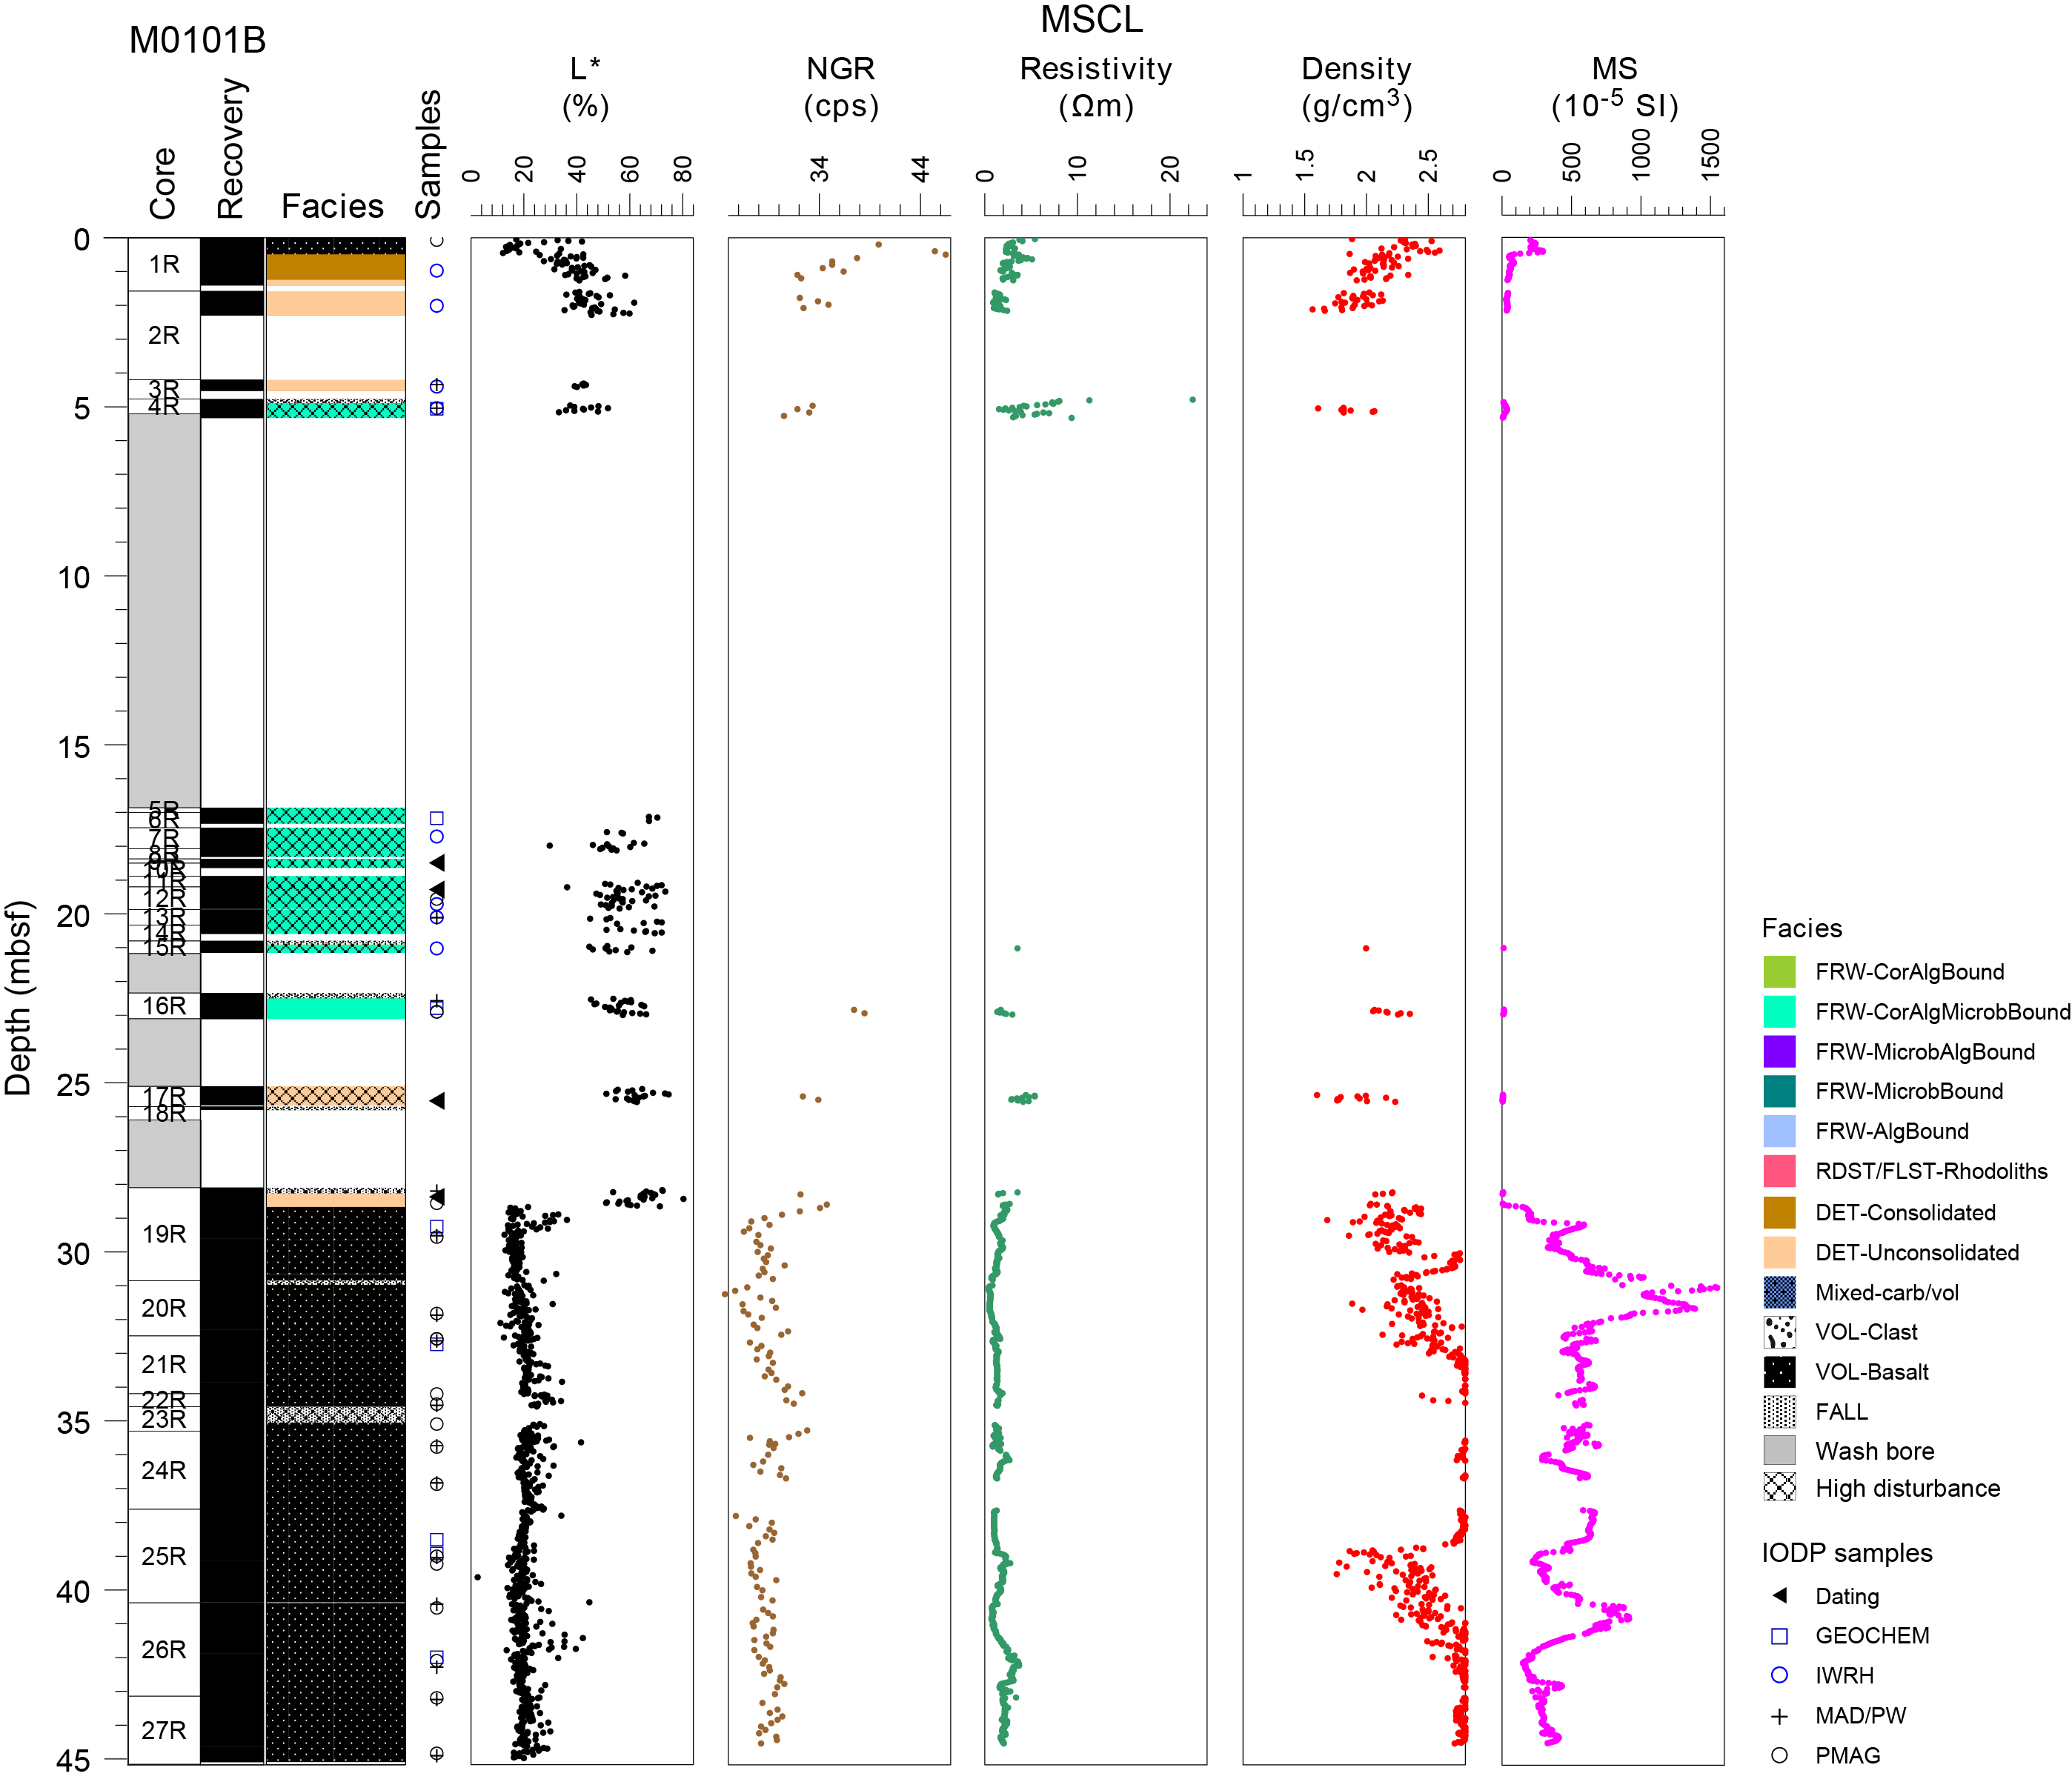
Figure F5. Lithostratigraphy and MSCL data, Hole M0101B.
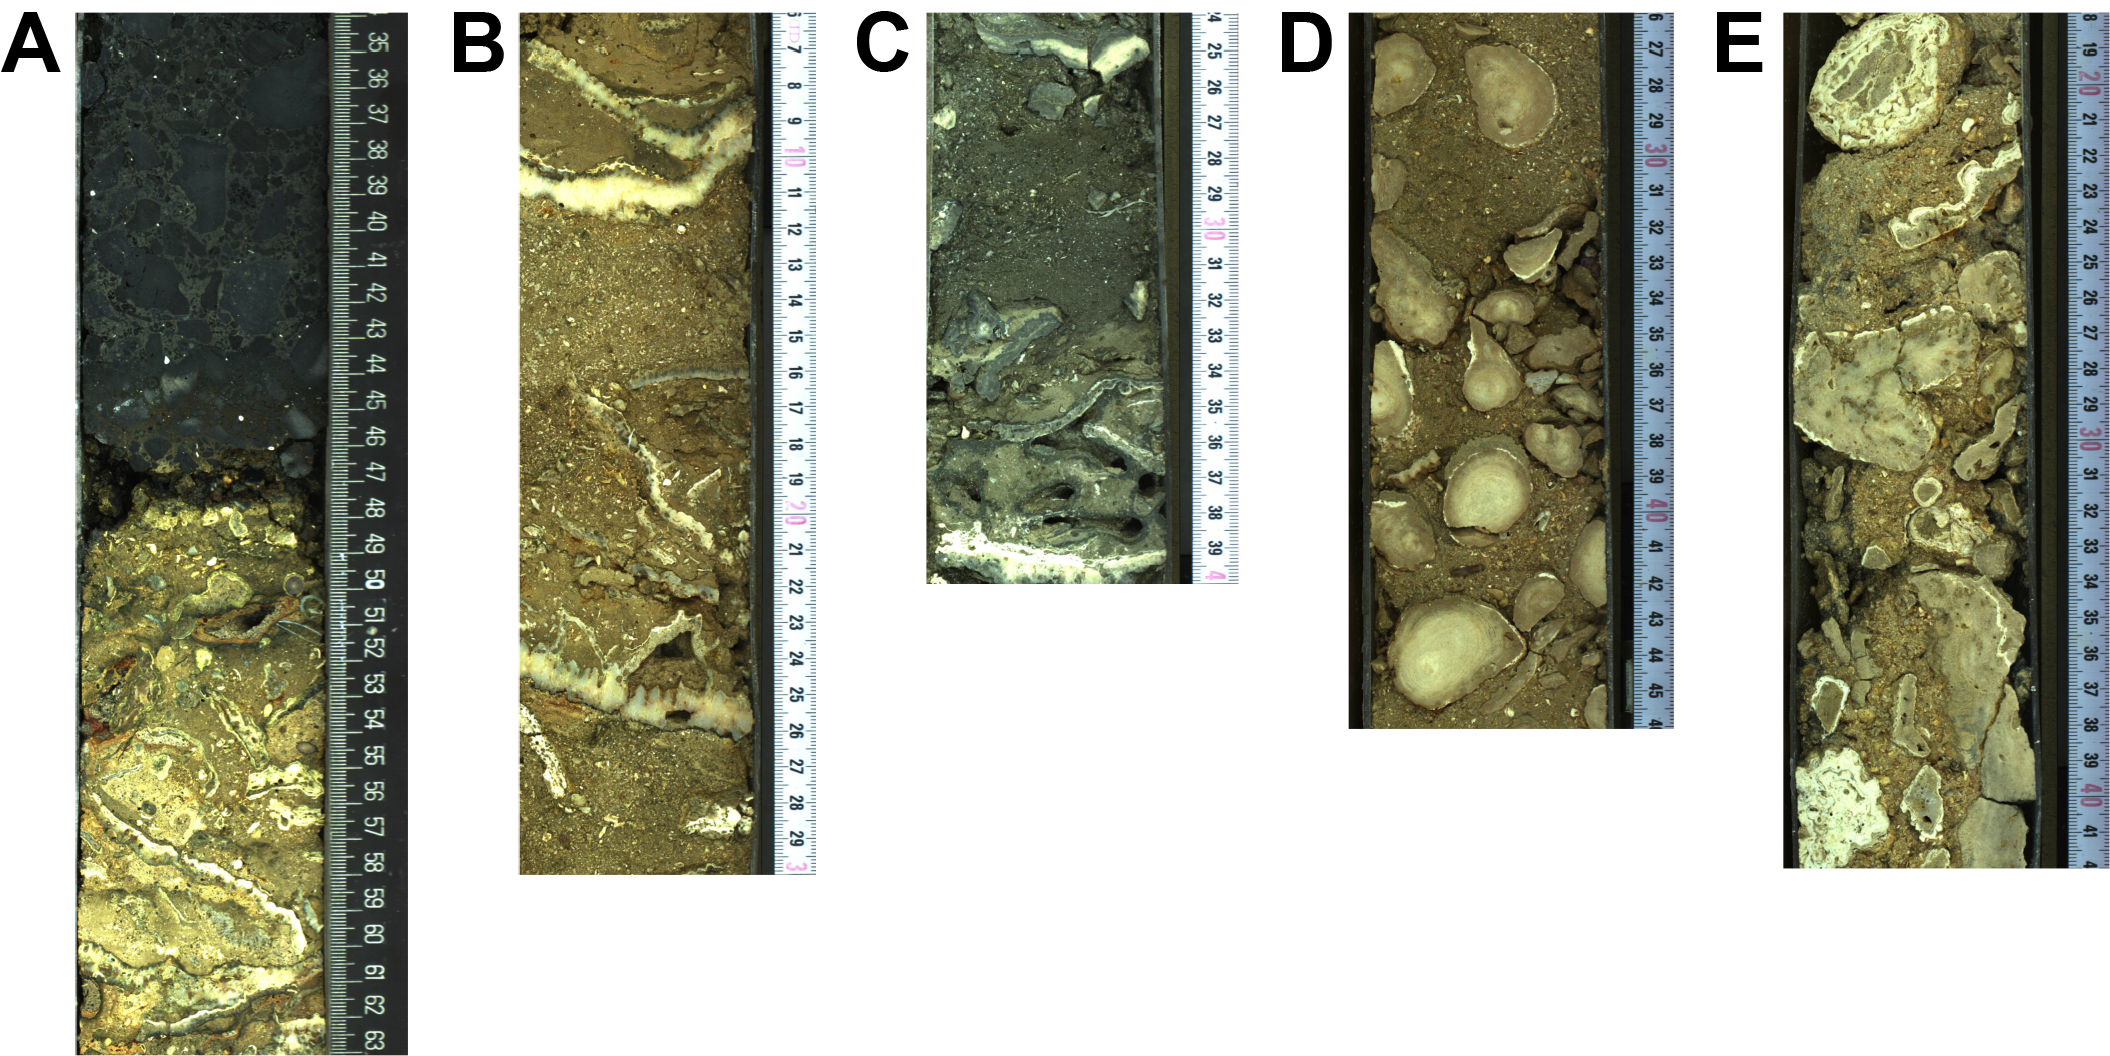
Figure F6. Lithologies, Hole M0101B.
Below 28.66 mbsf, an interval of lava extends to the bottom of the hole at 45.15 mbsf (Figure F7). The lava is not porphyritic to sparsely porphyric (maximum 1%–2% phenocrysts) throughout but has marked variations in groundmass texture and vesicle abundance and size. The groundmass texture is not porphyritic, except from 33.90 to 37.60 mbsf and from 39.10 to 44.60 mbsf where the lava has a slightly coarser, porphyritic texture. From 28.66 to 30.85 mbsf, round vesicles, submillimeter to millimeter (1–3 mm) in size, make up approximately 25%–35% of the volume. Texturally, the shallowest portion of lava in the hole is scoriaceous. The size of vesicles increases to several millimeters downhole from 30.85 to 33.20 mbsf, and they are commonly irregularly shaped and coalesced. From 33.20 to 38.70 mbsf, the lava has a massive (not porphyritic and with no fractures and void) texture, with abundant vesicles less than 1 mm in diameter. There is a contact between two lava flows at 38.83–38.84 mbsf (Figure F8). Above this contact, lava is fresh (visually unaltered) and generally massive, except for a 10–15 cm thick zone with 10%–15% round, millimeter-sized vesicles and several elongate pipe vesicles. Their occurrence is restricted to the lower portion of the lava unit (e.g., 38.54–38.79 mbsf). Below this horizon is a surface of extensively weathered, highly oxidized lava with markedly different texture, primarily vesicular but with smaller vesicle sizes and density. The vesicularity in the underlying lava unit (i.e., lava flow) varies smoothly across the bottom of this section and into the next, from small, round vesicles through larger round vesicles and into even larger, centimeter-sized irregularly shaped vesicles, indicating that the upper eruption surface of this lower lava is still intact despite the extensive weathering. Vesicle infilling also changes downsection, becoming less complete (Figure F8). Another visual difference at this lava unit contact is the degree of oxidation and discoloration. It decreases downhole below this contact from a 7 cm thick bright orange, clay-rich zone through a longer interval extending roughly 60 cm into the next core section (25R-2) and is underlain by generally fresh, unaltered lava. There is a clear depositional discontinuity in the core here, indicated by a lithologic change in depositional facies. Namely, a sharp change in lava texture coupled with the top-to-bottom graduated pattern of weathering (including an oxidized mineral zone in the lower lava unit) suggests a substantial time gap between deposition and alteration of the lower lava on the one hand and emplacement of the overlying lava on the other.
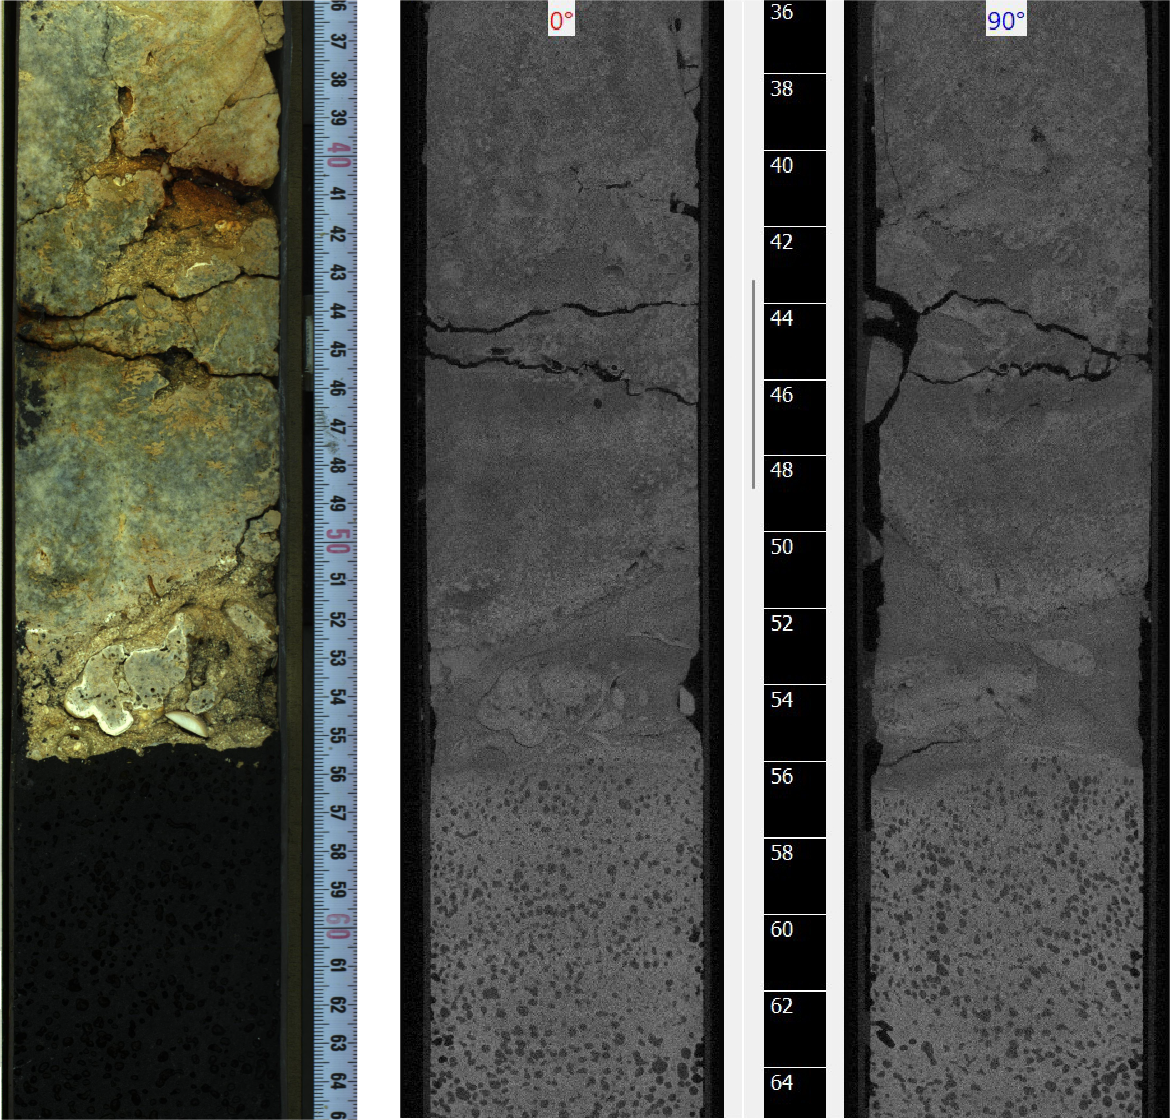
Figure F7. Contact between unconsolidated biodetrital sediment and lava.
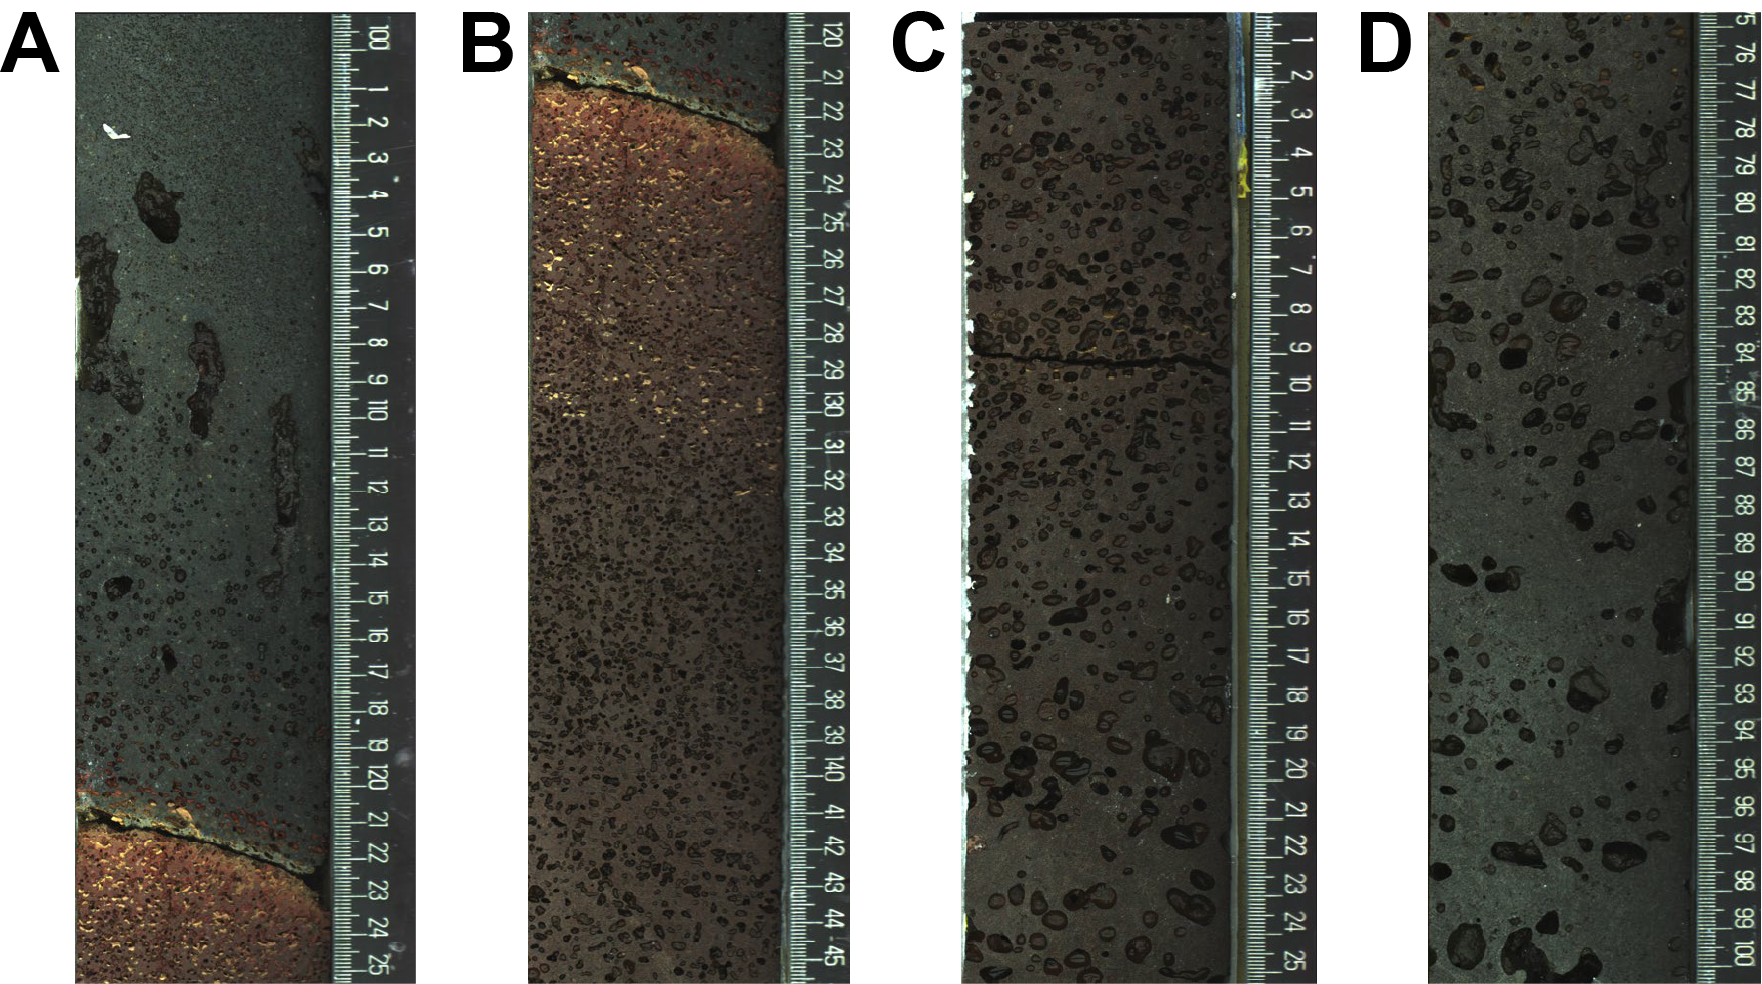
Figure F8. Contact between lava units.
Beneath the aforementioned alteration zone, the textual characteristic of the lower lava is similar to that of the overlying one. From 38.70 to 41.00 mbsf, vesicle size increases downhole, with some coalesced vesicles reaching 2.5 cm in length (Figure F9). Below a crack at 38.80 mbsf, the lava is stained brownish red. From 41.00 to 44.60 mbsf, vesicles are abundant but smaller (less than 1 mm in diameter). Their size increases slightly (1–2 mm) from 44.60 mbsf to the bottom of Hole M0101B at 45.15 mbsf.
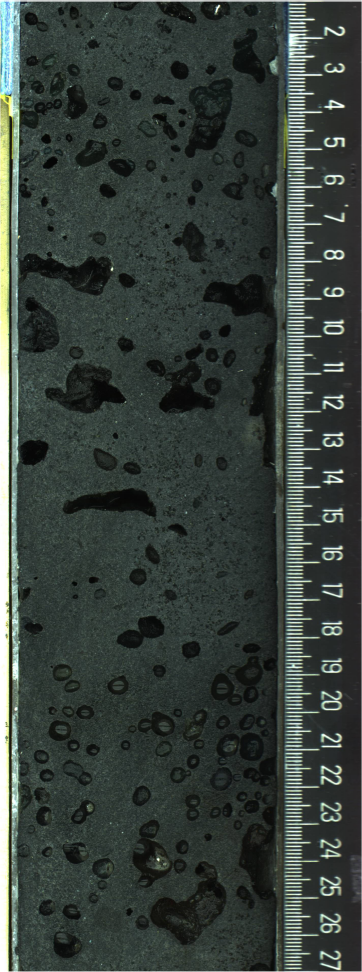
Figure F9. Basaltic lava rock.
3. Physical properties
Physical properties data for Site M0101 are shown in Table T2 in the Site M0096 chapter (Webster et al., 2025b).
3.1. Hole M0101A
A total of 9.18 m of core from Hole M0101A was scanned with the multisensor core logger (MSCL), and because the core exhibited major drilling-induced disturbance, 34% of the acquired data passed QA/QC (see Table T10 in the Expedition 389 methods chapter [Webster et al., 2025a]). A total of three discrete samples were taken for P-wave velocity and moisture and density (MAD) measurements. Digital linescans, color reflectance, and hyperspectral imaging were acquired on all the cores.
3.1.1. Density and porosity
Data for density and porosity measurements are presented in Figures F2 and F10. MSCL bulk density measurements range 1.15–2.57 g/cm3. Drilling-induced disturbances and short core lengths compromised data quality (see Physical properties in the Expedition 389 methods chapter [Webster et al., 2025a]) and limited sampling. Three discrete samples were analyzed for MAD, giving a bulk density range of 2.14–2.49 g/cm3. Porosity values for the same samples range 21.1%–36.9%, and grain density values fluctuate between 2.787 and 2.884 g/cm3. There are no clear downhole trends in the density and porosity data sets and no clear relationship between the MSCL and discrete bulk density measurements.
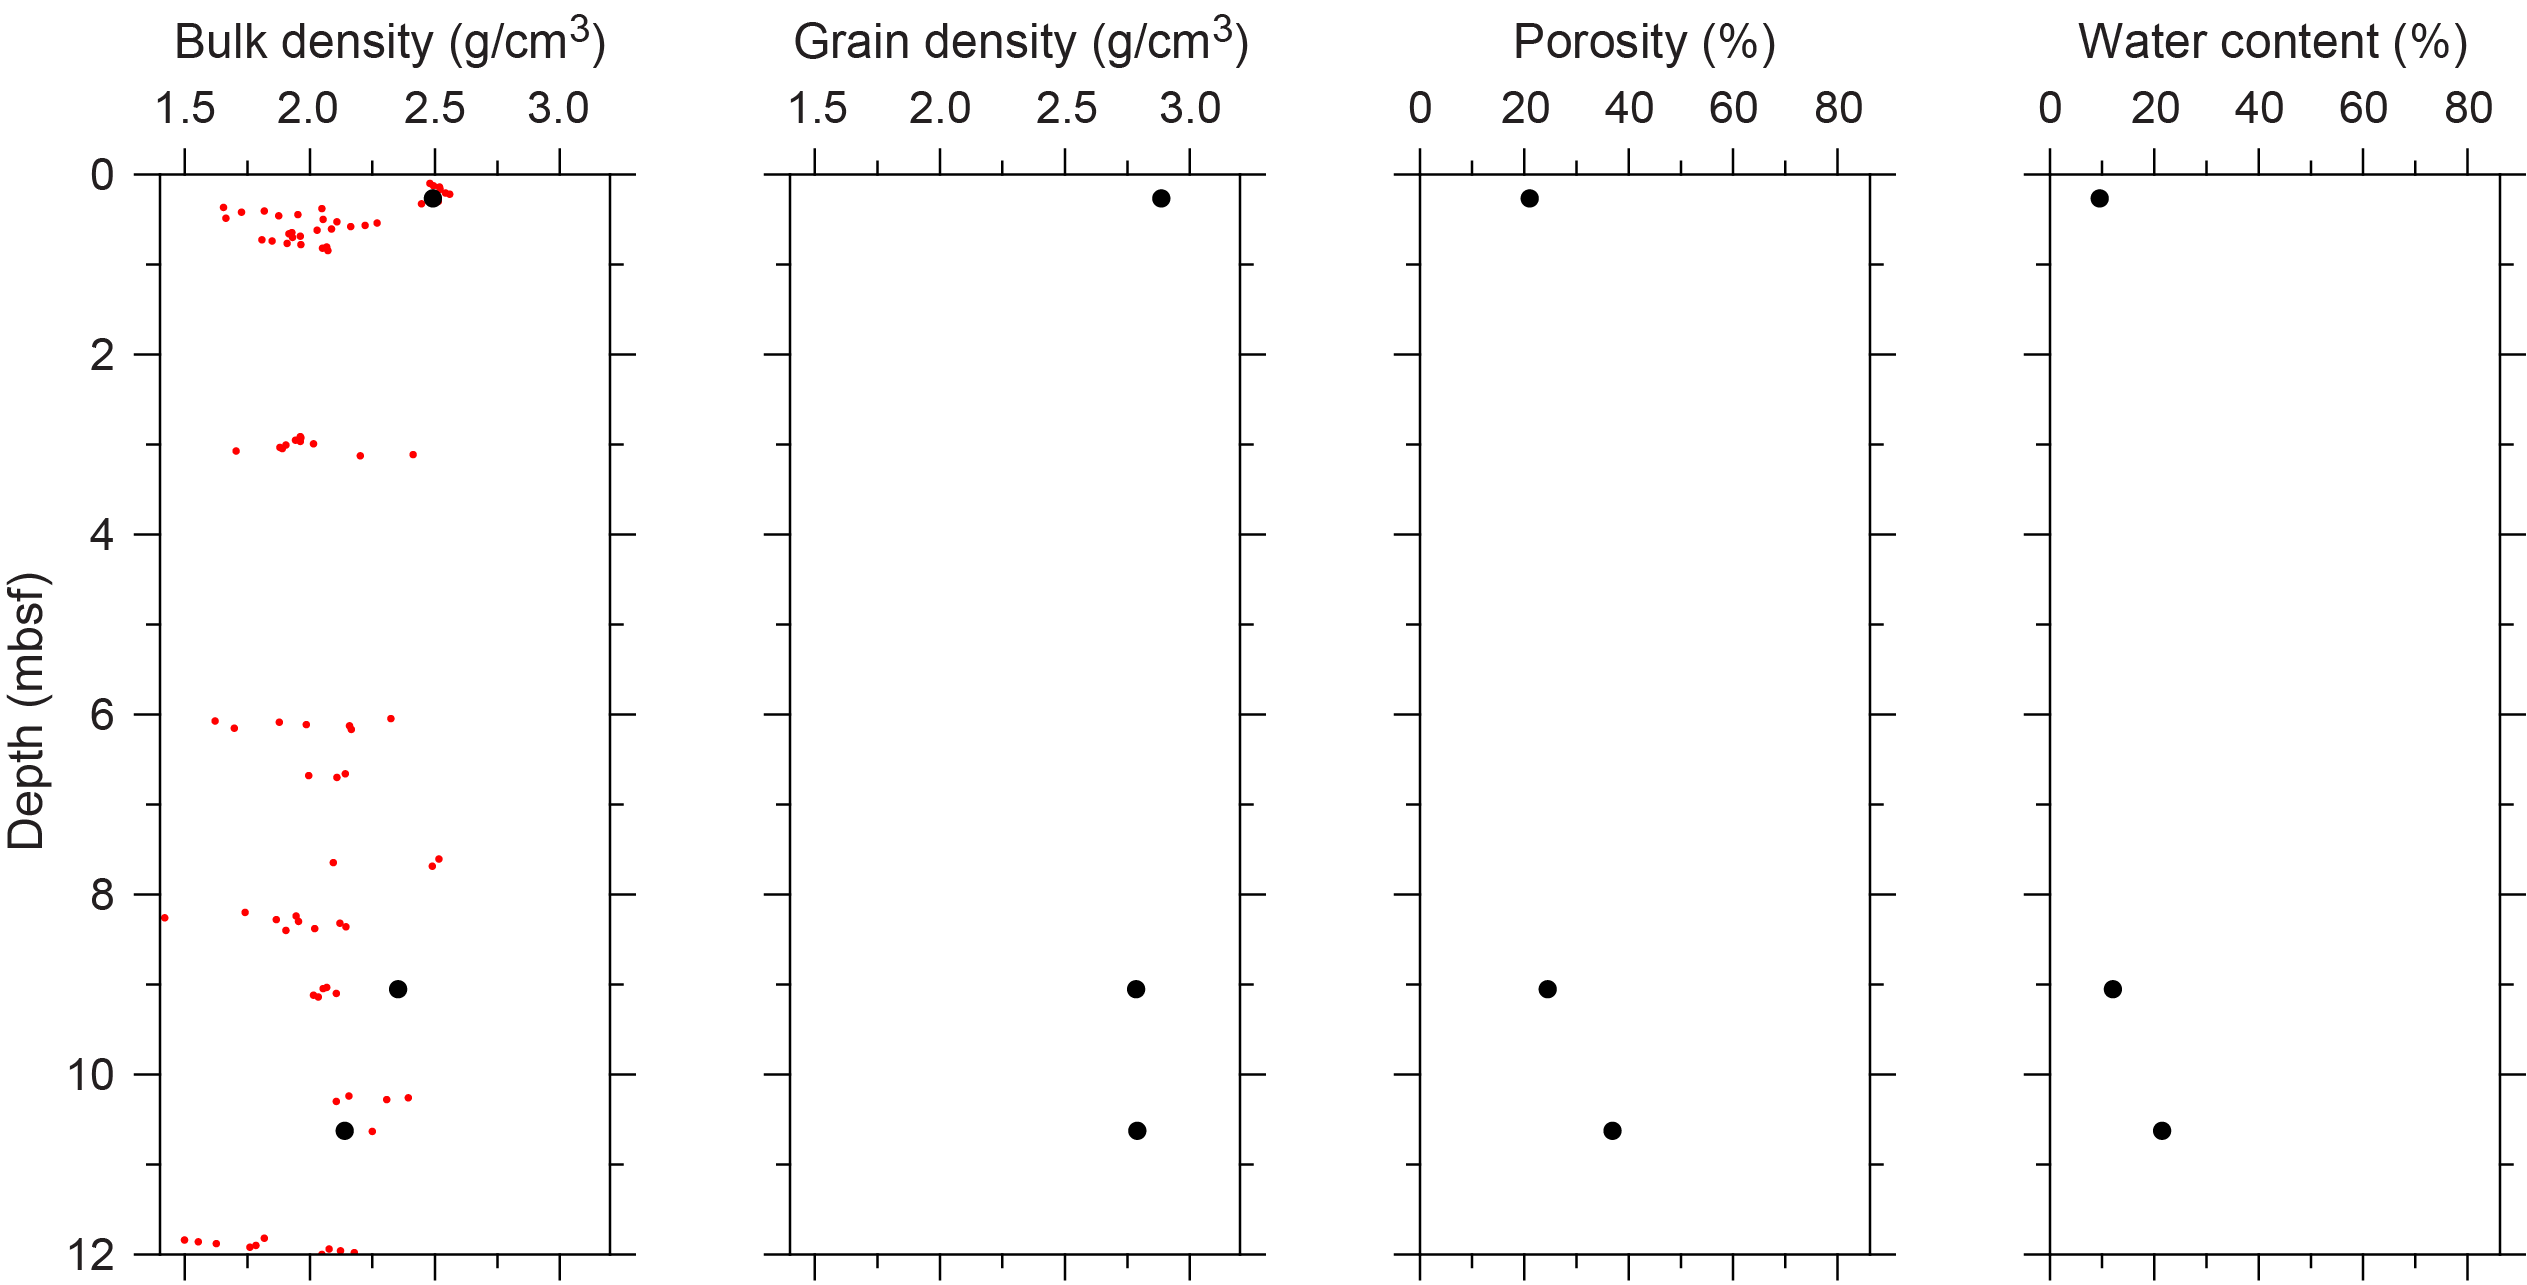
Figure F10. Physical properties, Hole M0101A.
3.1.2. P-wave velocity
MSCL P-wave velocity measurements yielded no data. A total of three samples were measured using the discrete P-wave logger. Dry measurement values range 1888–3361 m/s (Figure F11). P-wave velocities of 3842 and 4926 m/s were recorded for two of the samples after resaturation. No downhole trends are apparent.
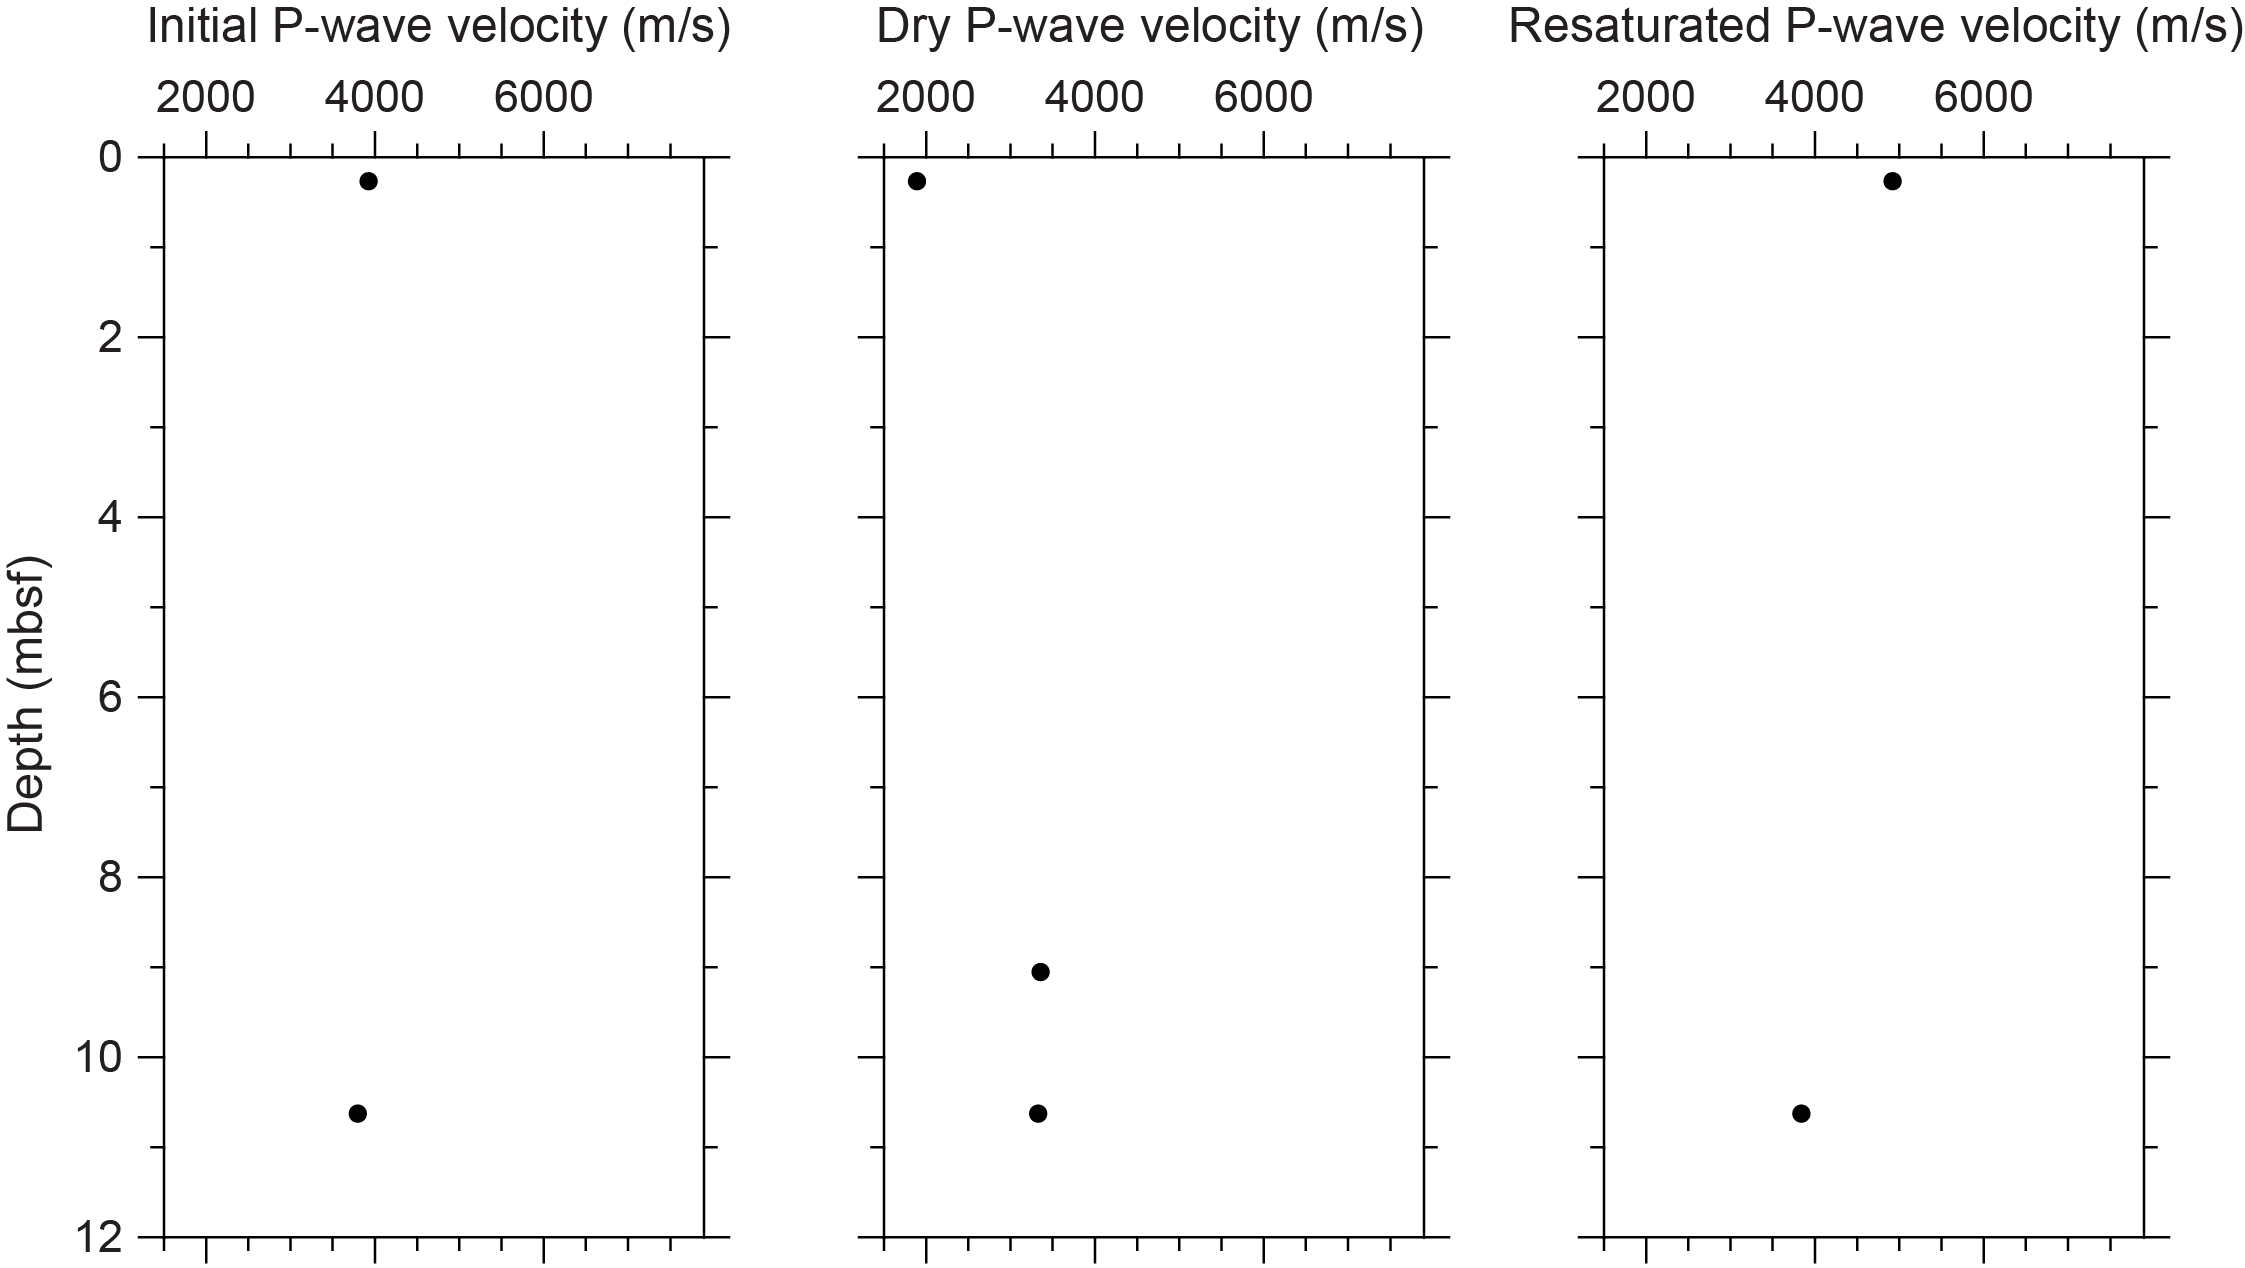
Figure F11. P-wave velocities, Hole M0101A.
3.1.3. Thermal conductivity
Because of the presence of drilling-induced disturbances, large voids, and uneven surfaces, thermal conductivity measurements were not performed on Hole M0101A cores.
3.1.4. Magnetic susceptibility
MSCL magnetic susceptibility data range 5.31 × 10⁻⁵ to 259.00 × 10⁻⁵ SI (Figure F2) with the majority of magnetic susceptibility values close to 49.54 × 10⁻⁵ SI. No downhole trends are apparent.
3.1.5. Electrical resistivity
MSCL noncontact resistivity measurements yielded data ranging 1.06–26.16 Ωm (Figure F2). There are no apparent notable features in the resistivity data.
3.1.6. Natural gamma radiation
MSCL NGR measurements display values ranging 30–46 counts/s (Figure F2), showing no apparent downhole change.
3.1.7. Digital linescans, color reflectance, and hyperspectral imaging
All cores were digitally scanned, measured for color reflectance (where appropriate), and imaged with the hyperspectral scanner (see HYPERSPECTRAL in Supplementary material). Color reflectance L* values vary between 14.61% and 79.15%, a* varies between −1.08 and 6.73, b* varies between 1.47 and 27.26, and a*/b* varies between −0.15 and 0.33. (Figure F2).
3.2. Hole M0101B
A total of 23.60 m of core from Hole M0101B was scanned with the MSCL, and because the core exhibited minor drilling-induced disturbance, 75% of the acquired data passed QA/QC (see Table T10 in the Expedition 389 methods chapter [Webster et al., 2025a]). A total of 16 discrete samples were taken for P-wave velocity and MAD measurements. Digital linescans, color reflectance, and hyperspectral imaging were acquired on all cores.
3.2.1. Density and porosity
Data for density and porosity measurements are presented in Figures F5 and F12. MSCL bulk density measurements range 1.56–2.97 g/cm3. A total of 16 discrete samples were analyzed for MAD, giving bulk density values ranging 1.55–2.82 g/cm3. Porosity values for the same samples range 5.7%–70.5%, and grain density values fluctuate between 2.517 and 3.068 g/cm3. Because of poor recovery, no clear downhole trend is discernible; however, the lava at the base generally shows higher density than the carbonate deposits at the top.
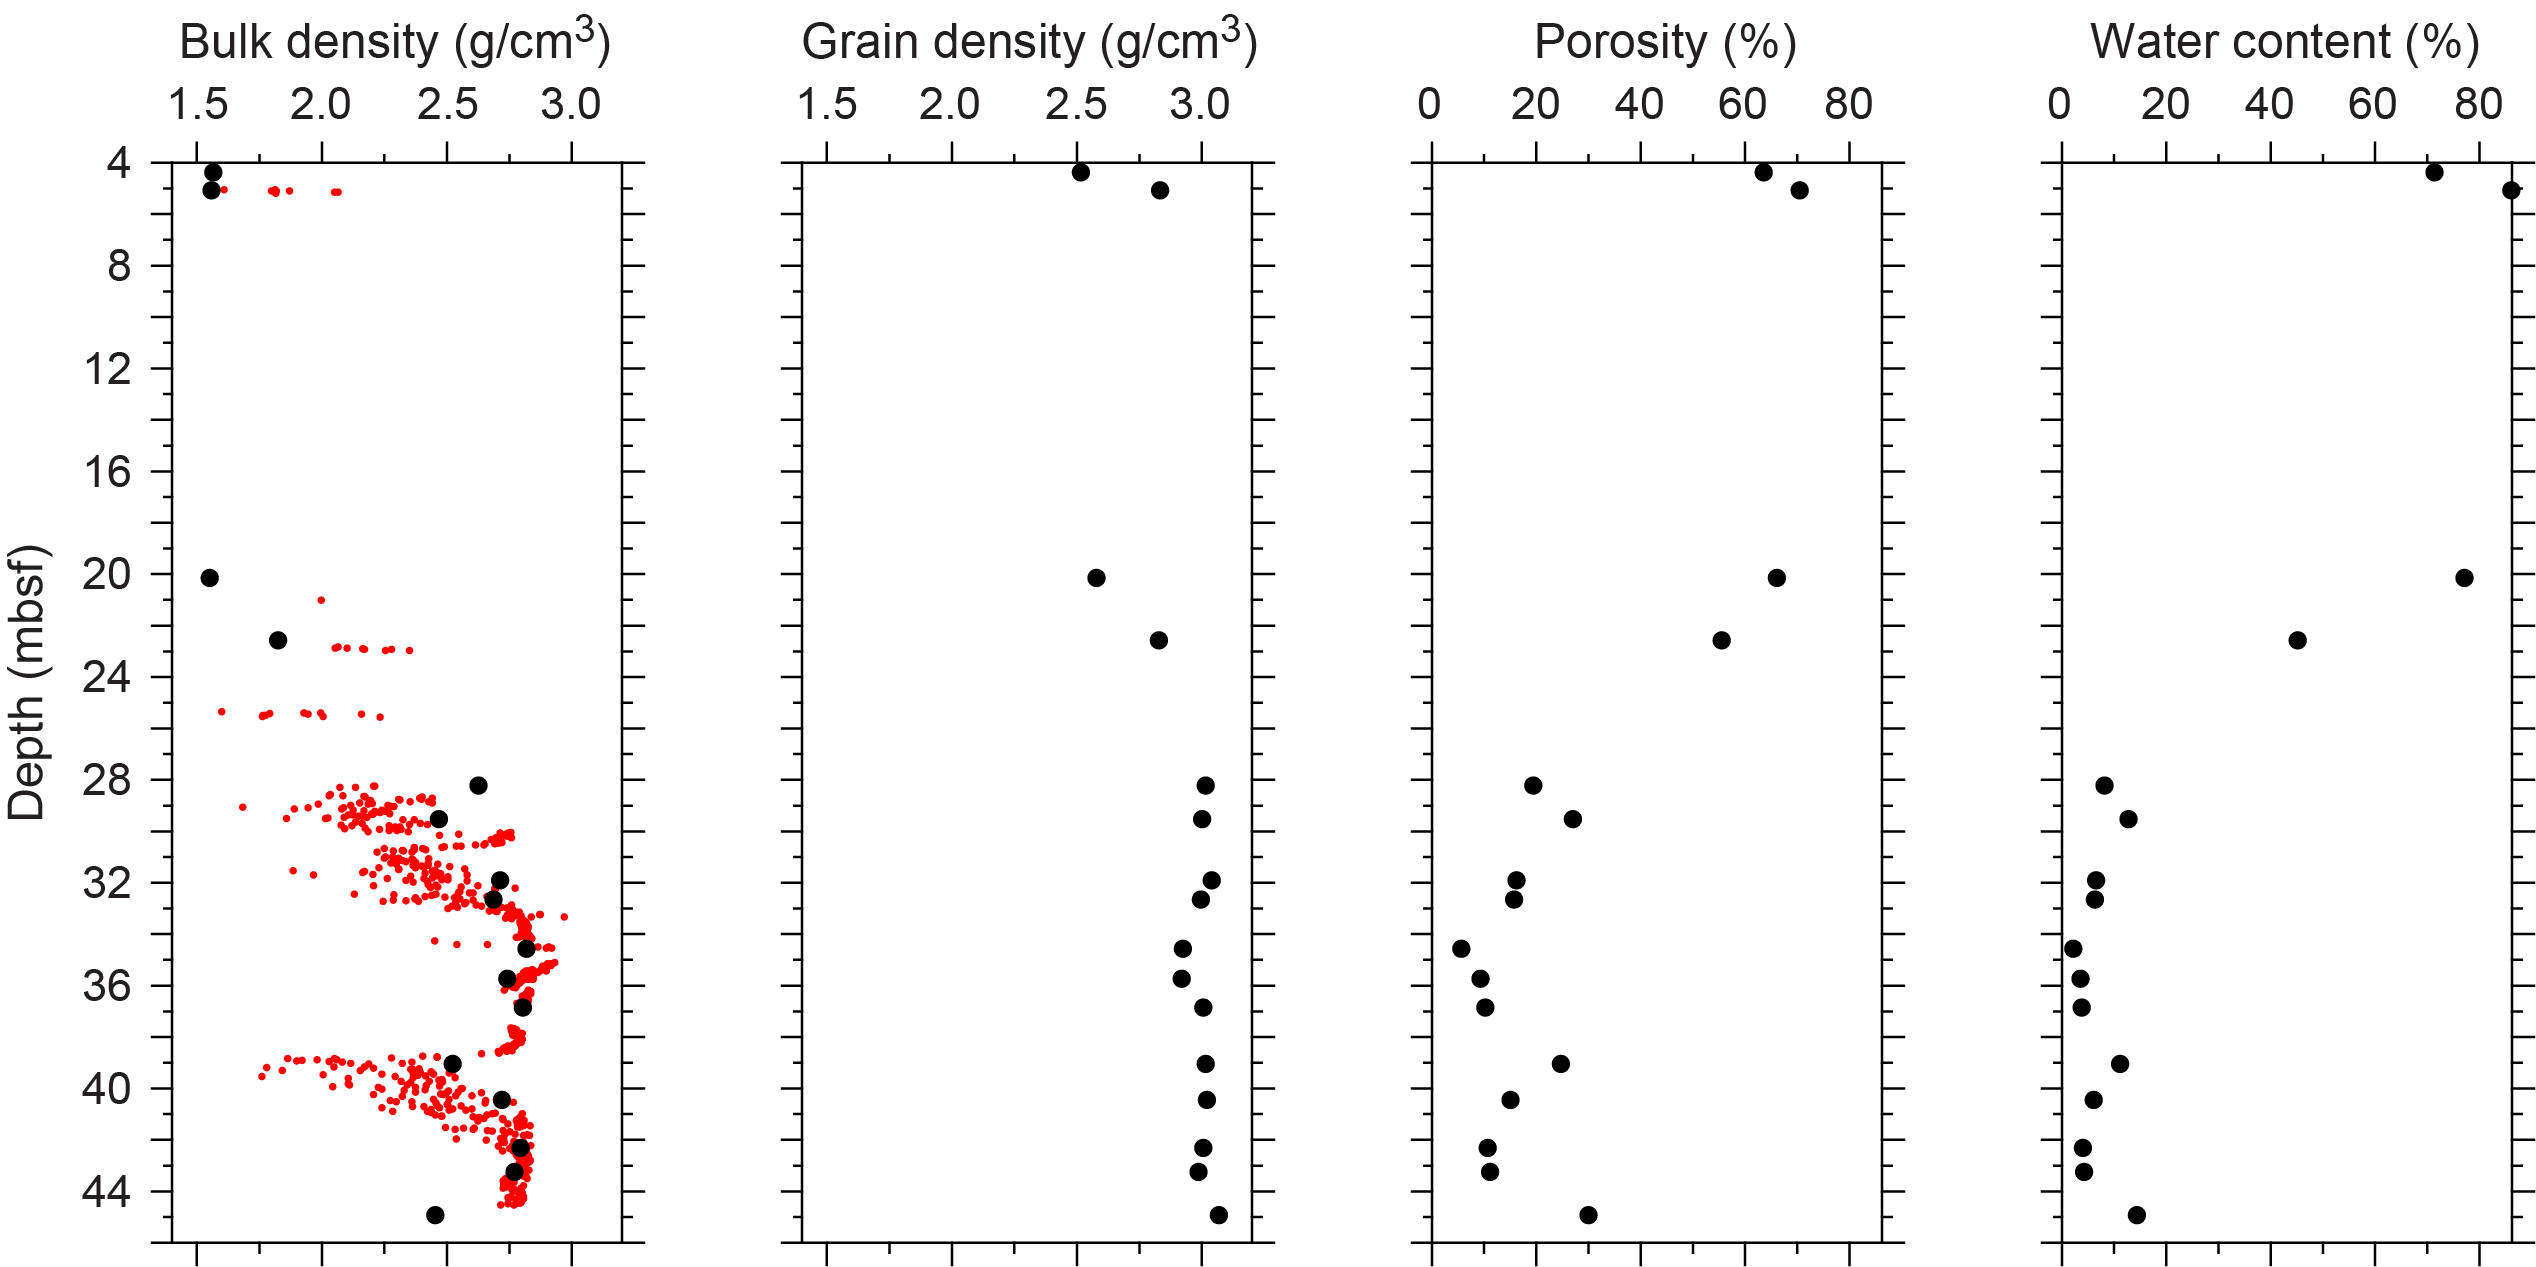
Figure F12. Physical properties, Hole M0101B.
3.2.2. P-wave velocity
MSCL P-wave velocity measurements yielded no data. A total of 12 samples were measured using the discrete P-wave logger. Dry measurement values range 4316–5494 m/s (Figure F13). P-wave velocity recorded for the samples after resaturation range 4371–7219 m/s. No trends in P-wave velocity are found with depth.
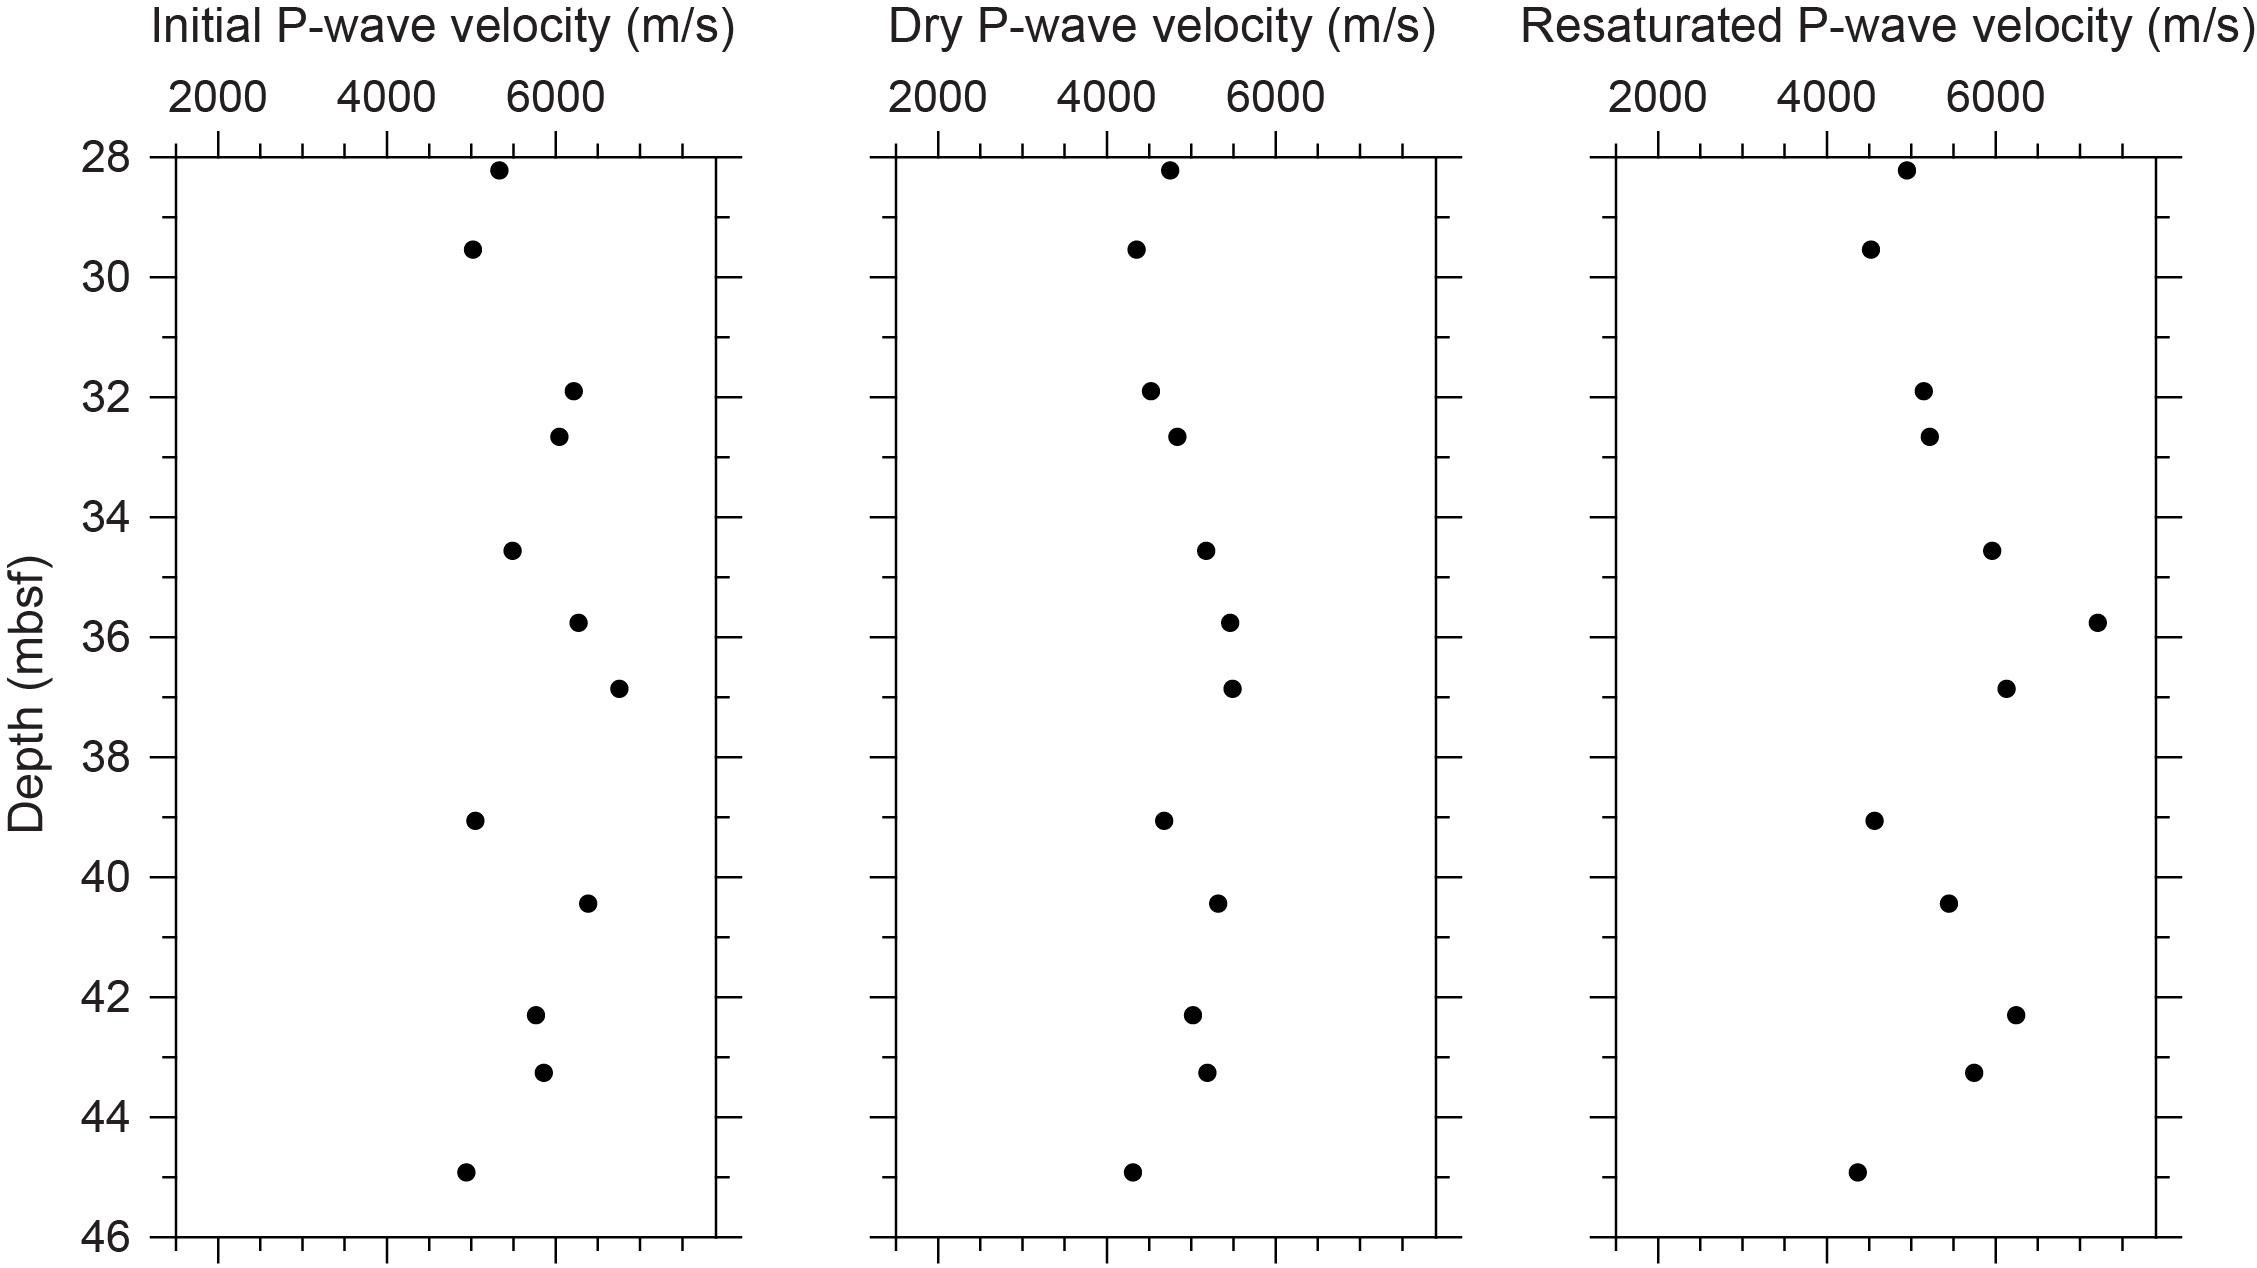
Figure F13. P-wave velocities, Hole M0101B.
3.2.3. Thermal conductivity
Thermal conductivity measurements were performed on five cores (see Table T11 in the Expedition 389 methods chapter [Webster et al., 2025a]) and range 1.116–1.804 W/(m·K).
3.2.4. Magnetic susceptibility
MSCL magnetic susceptibility data range 4.24 × 10⁻⁵ to 1548.13 × 10−5 SI (Figure F5) with the majority of magnetic susceptibility values close to 443.40 × 10⁻⁵ SI. The highest magnetic susceptibility values are measured in the lava unit at the base of the core compared to the carbonate deposits above.
3.2.5. Electrical resistivity
MSCL noncontact resistivity measurements range 0.43–22.45 Ωm (Figure F5). Values are generally low (close to 1.82 Ωm) throughout the hole.
3.2.6. Natural gamma radiation
MSCL natural gamma radiation (NGR) measurements display values ranging 25–47 counts/s (Figure F5), with lower NGR values found in the lava lithology compared to the carbonate deposits.
3.2.7. Digital line scans, color reflectance, and hyperspectral imaging
All cores were digitally scanned, measured for color reflectance (where appropriate), and imaged with the hyperspectral scanner (see HYPERSPECTRAL in Supplementary material). Color reflectance L* values vary between 2.52% and 80.29%, a* varies between −1.28 and 10.35, b* varies between −1.02 and 28.61, and a*/b* varies between −5.50 and 1.50 (Figure F5). Variations in color reflectance parameters drop drastically at the boundary between the carbonate deposits and the underlying lava unit.
4. Geochemistry
4.1. Interstitial water
A total of five interstitial water samples were collected with a Niskin bottle from Hole M0101A and nine from M0101B, which together are a composite section (Figure F14). The concentrations of major ions in these samples are comparable between sites and are generally within the normal range of seawater, with slightly elevated alkalinity in two samples (see Tables T15 and T16 in the Expedition 389 methods chapter [Webster et al., 2025a]). Ions with notable downhole trends include sulfate (SO42−) and chloride (Cl−) (R2 0.69 p-value <0.005). Sulfate concentrations are low near the surface in Hole M0101A (approximately 2660 mg/L), reach a maximum of 2732 mg/L at approximately 5 mbsf, and decrease back to approximately 2660 at 20 mbsf. Strontium is low in the shallowest sample (7.85 mg/L) but higher below (8.51 mg/L in the deepest sample). Manganese ranges 0.04–0.144 mg/L. Barium decreases within the top 5 m (0.25–0.09 mg/L) and then increases to around 0.19 mg/L at 12.26 mbsf.
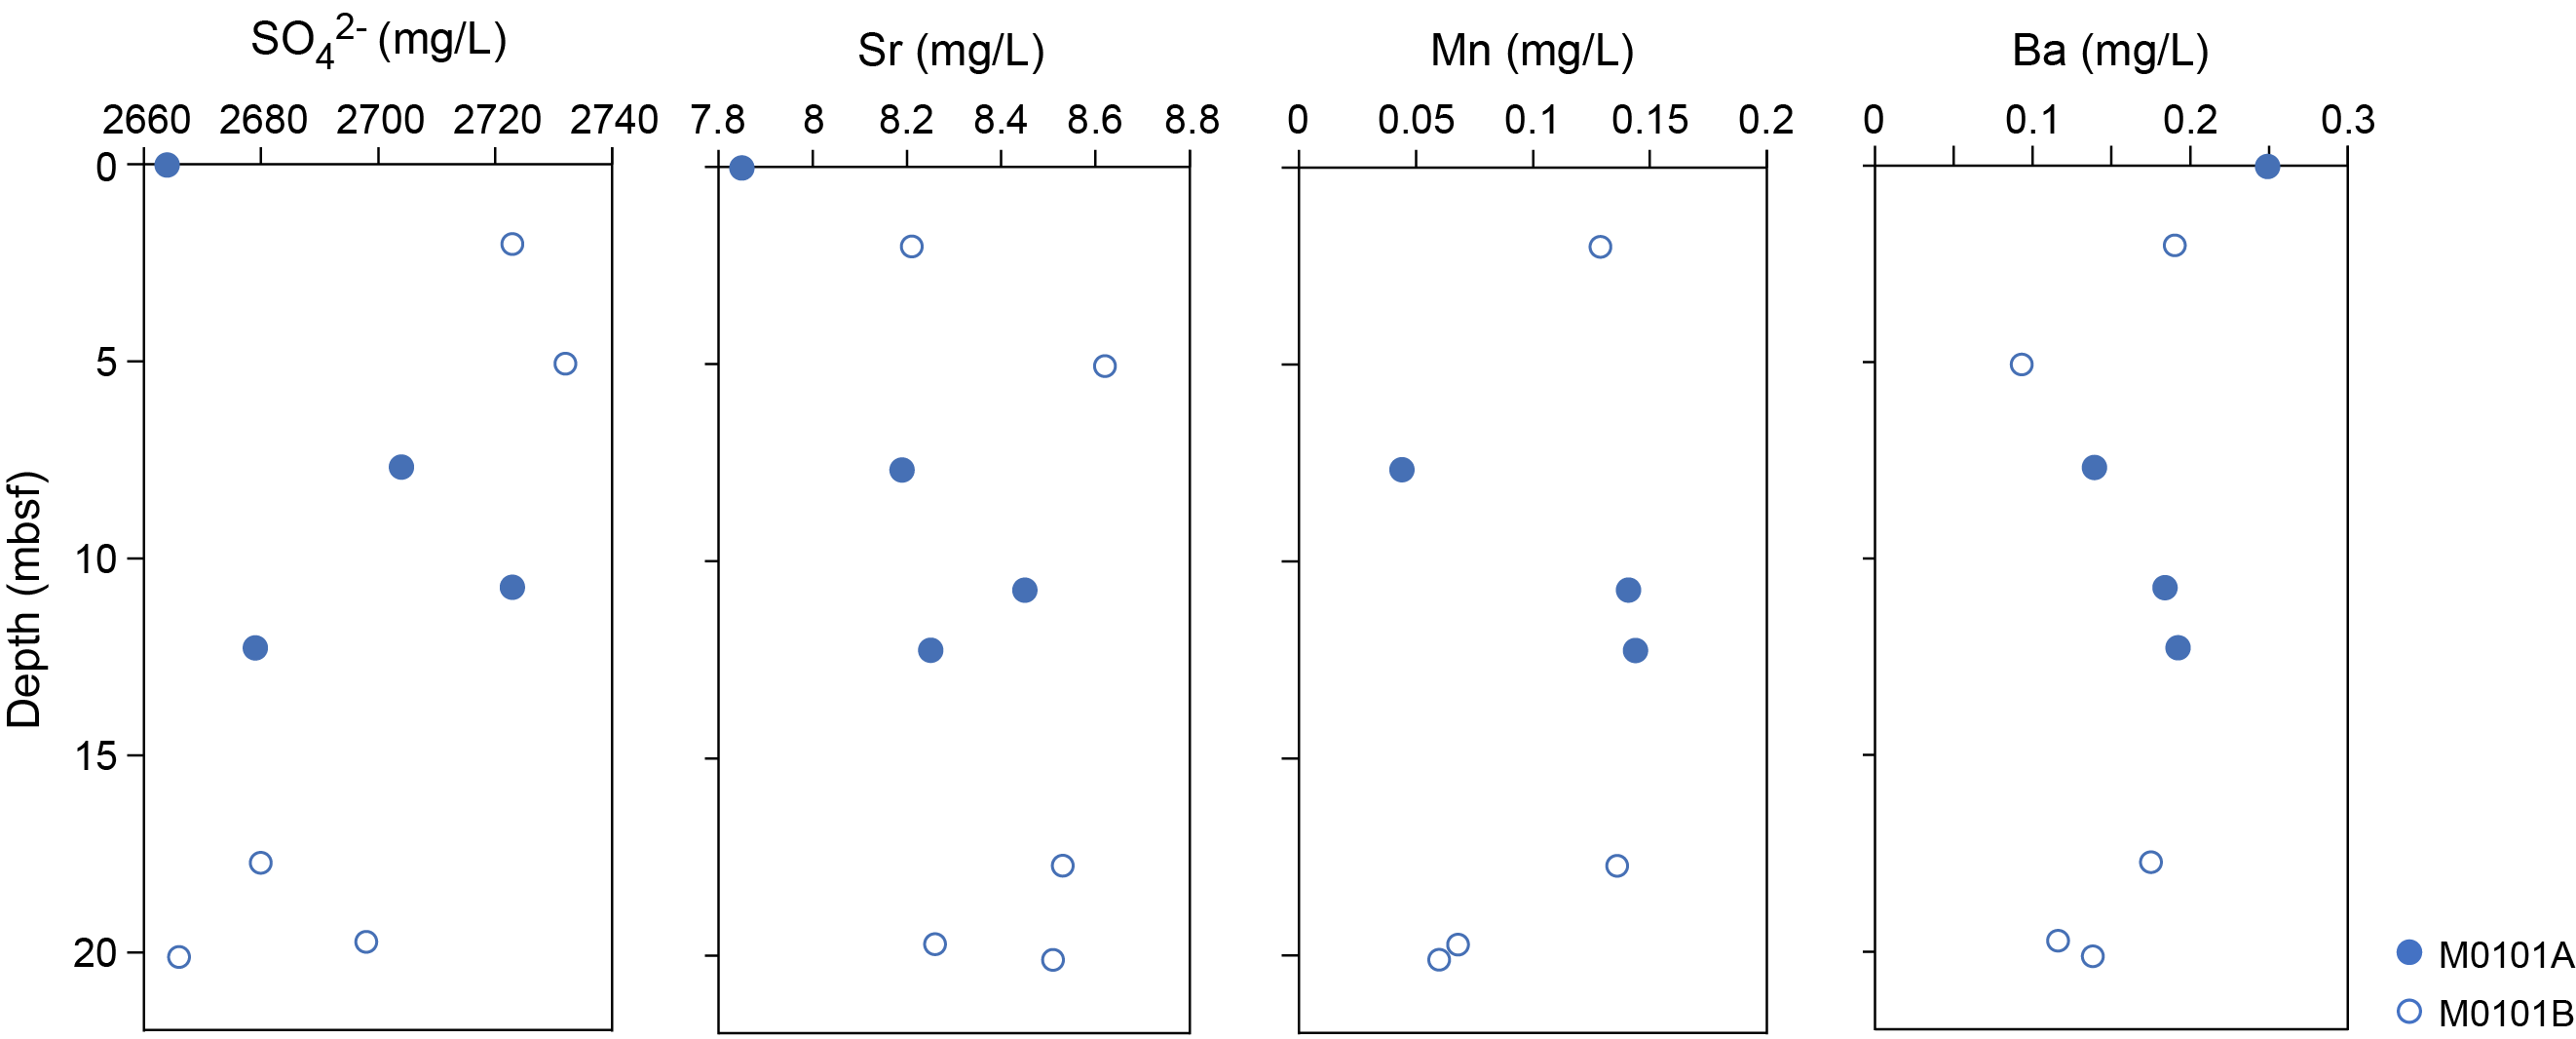
Figure F14. Interstitial water analyses.
4.2. Surface seawater
One surface seawater sample was collected from Site M0101 using a Niskin bottle deployed from the side of the vessel (see Geochemistry in the Expedition 389 methods chapter [Webster et al., 2025a]). Salinity, pH, alkalinity, and the concentration of ammonium were analyzed off shore, and major cations and anions were measured during the OSP. Results for all parameters at Site M0101 are consistent with other Expedition 389 seawater samples and align with published surface seawater values (see Tables T15 and T17 in the Expedition 389 methods chapter [Webster et al., 2025a]).
4.3. Bulk sediment
A total of 10 bulk sediments were taken from Holes M0101A and M0101B (Figure F2) and analyzed for mineralogy, elemental composition, and carbon content. Samples are derived from sections containing various combinations of coral, algal, and microbial boundstone, as well as mixed sediment and basalt.
4.4. Mineralogy
Site M0101 samples have diverse mineralogical compositions, principally because of differences between carbonate and basaltic lava facies (Table T2). Consolidated sediment and boundstone samples are rich in carbonate minerals, containing up to 7% calcite, 18%–54% high-Mg calcite, and 38%–62% aragonite. These samples also contain varying amounts of volcanic minerals and precipitates: christobalite, plagioclase (up to 11%), manganocalcites, gypsum, barite, chlorite, and pyroxenes. Lava samples are rich in plagioclase (48%–82%) and pyroxenes (14%–41%). Some lava samples also contain christobalite, apatite, muscovite, kaolinite, chlorite, zeolites, and Fe-oxides.
4.5. Elemental abundances
The concentrations of major and minor elements in bulk sediment and rock samples from Site M0101 vary significantly due to differences between carbonate and basalt facies (Table T3). Aluminum abundance in carbonate samples ranges from below detection limits to 27,565 mg/kg, and Al in basalt samples ranges 66,207–78,037 mg/kg (Figure F15). Calcium (Ca) ranges 45,275–323,071 mg/kg, Si ranges from below detection limits to 202,548 mg/kg, Mg ranges 18,940–53,646 mg/kg, Fe ranges 5,207–72,452 mg/kg, Ti ranges 885–14,217 mg/kg, Zn ranges 12–98 mg/kg, and Ba ranges from below detection limits to 122 mg/kg. The maxima and minima values for these elements, and others such as Sr, vary with facies, and downhole trends (Figure F14) are also controlled by a facies transition from carbonate to basalt at around 30 mbsf (Figure F2).
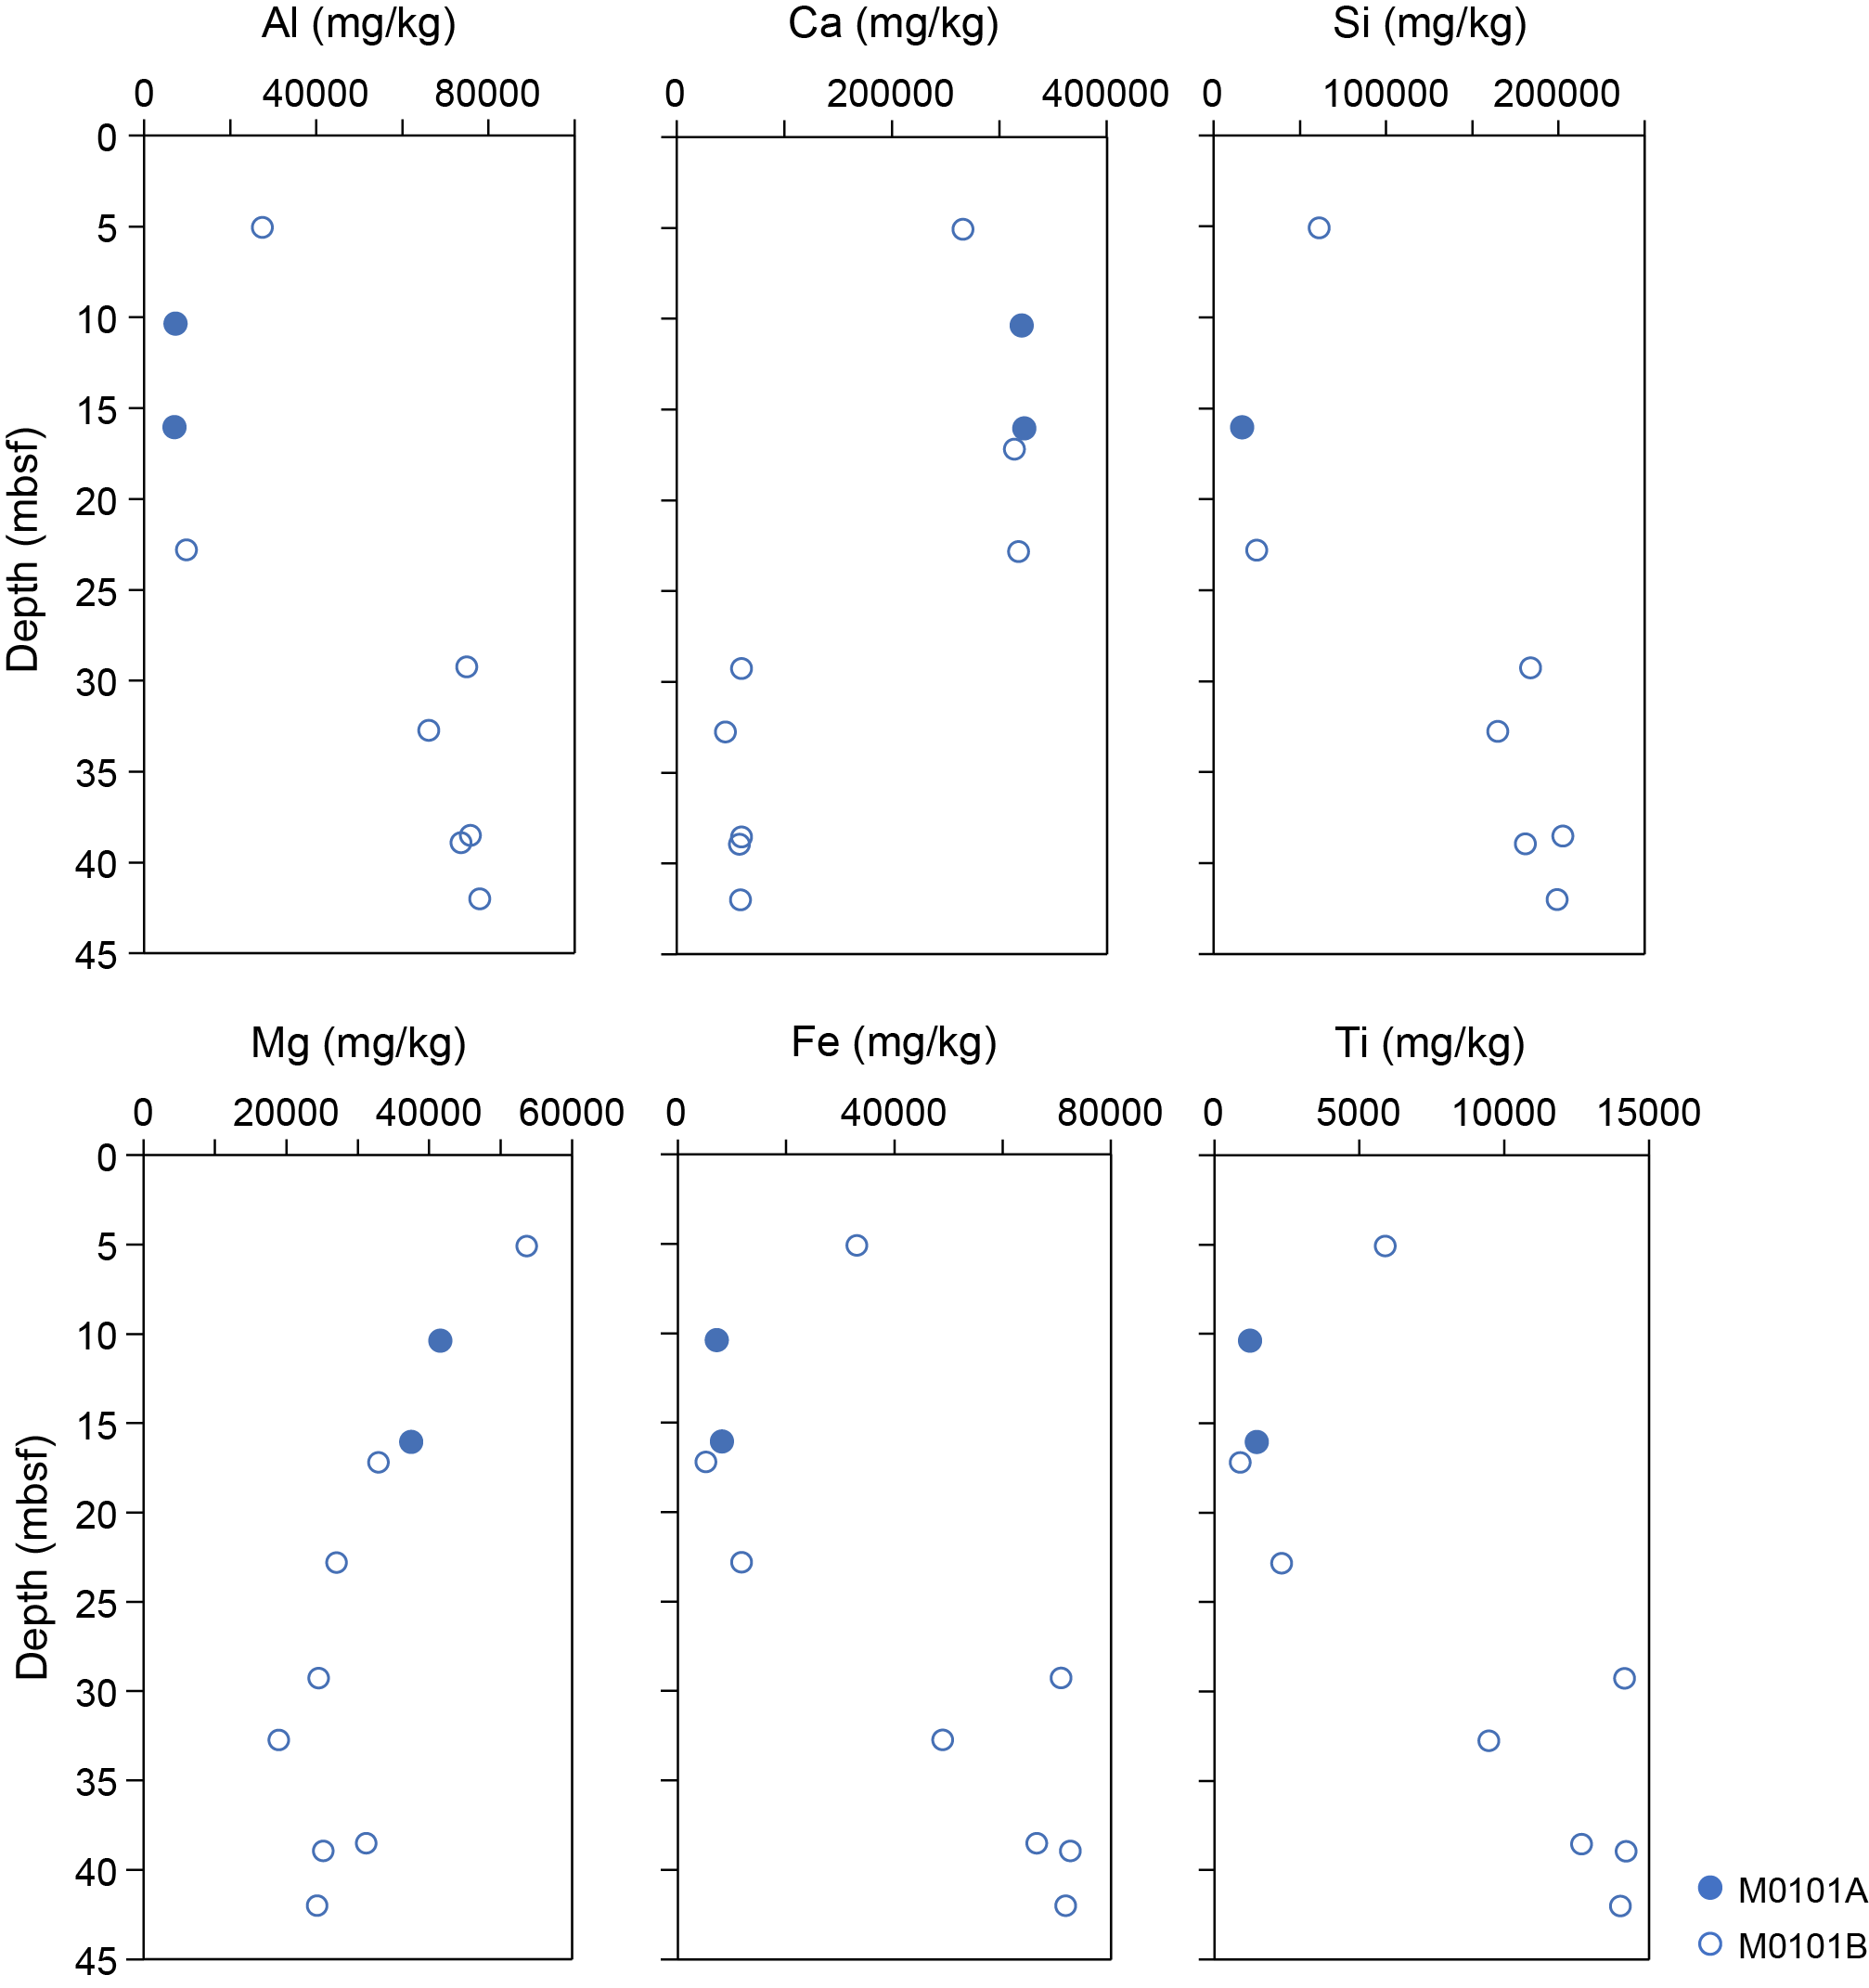
Figure F15. Bulk sediment and rock analyses.
Basalt samples have elevated concentrations of the trace metals Cu, Ti, and V compared to carbonate samples. The concentrations of bromine, potassium, and sulfur are below the detection limit for the majority of samples.
4.6. Carbon content
The results for total organic carbon (TOC), total carbon (TC), and total inorganic carbon (TIC) at Site M0101 are presented in Figure F16 and Table T4. TC content ranges 0.7%–11.1%, TOC content ranges 0.10%–0.34%, and TIC content ranges 0.58%–10.86%. TOC content gradually decreases with depth as lithology transitions from carbonate to basalt at around 30 mbsf.
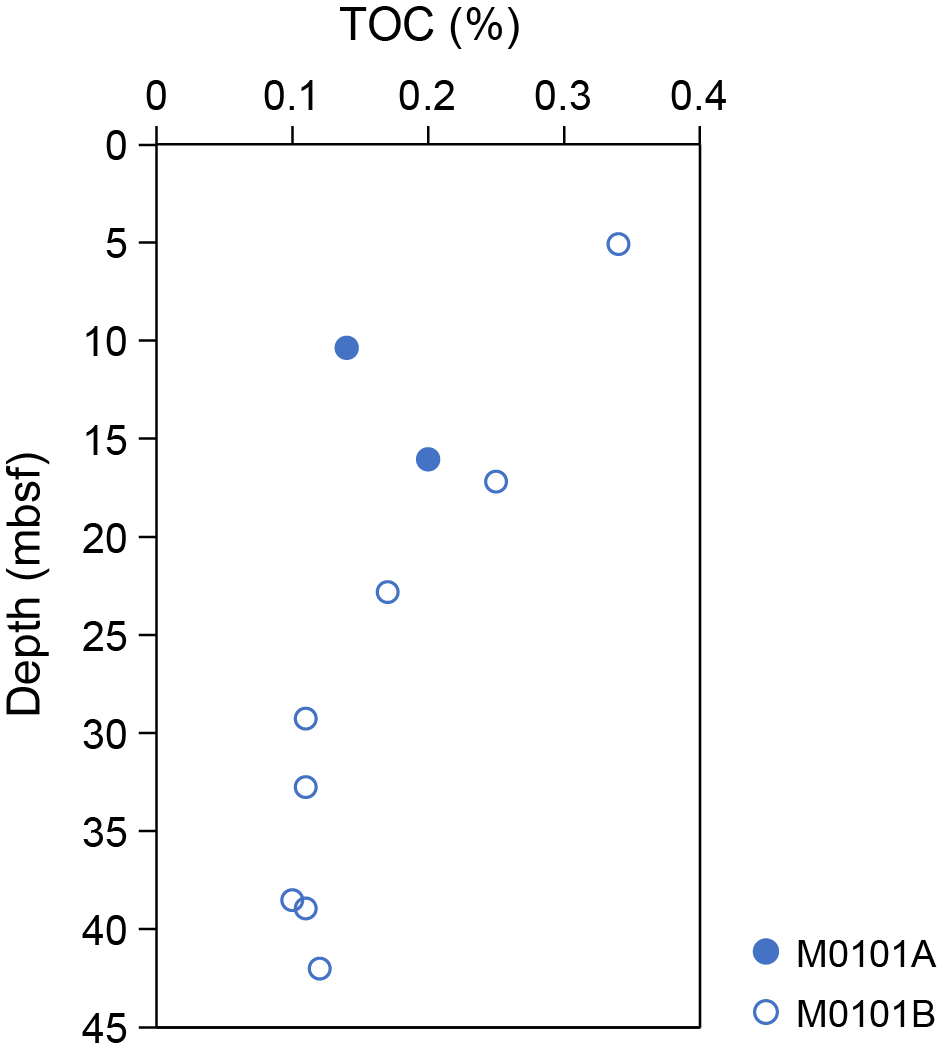
Figure F16. TOC.
5. Paleomagnetism
A total of 20 plug samples and 1 cube sample were obtained from Holes M0101A and M0101B. Measurements of low-field and mass-specific magnetic susceptibility (χ) were carried out for all samples. Natural remanent magnetization (NRM) was measured for all plug samples, as well as remanence following stepwise alternating field (AF) demagnetization up to a peak AF of 20 mT for carbonate samples and 100 mT for basalt samples. For further details, see Paleomagnetism in the Expedition 389 methods chapter (Webster et al., 2025a).
5.1. Hole M0101A
One lava sample was taken at 0.23 mbsf in Hole M0101A (2R-1, 16–18 cm). The χ value is 9.16 × 10⁻⁶ m3/kg, and the initial NRM intensity is 1.37 A/m. Two carbonate samples were taken from 6.69 and 8.28 mbsf. The χ values of the samples are 1.00 × 10⁻⁶ m3/kg (Sample 8R-1, 33–36 cm) and 6.45 × 10⁻⁷ m3/kg (Sample 11R-1, 37–39 cm). The initial NRM intensities are 5.97 × 10⁻² and 1.77 × 10⁻² A/m, respectively (Table T5).
5.2. Hole M0101B
One cube sample was taken at 22.92 mbsf in Hole M0101B (16R-1, 56.5–58.5 cm); it consists of bioclastic sand. The χ value of the cube sample is 18.7 × 10⁻⁸ m3/kg.
One carbonate plug sample was taken at 19.58 mbsf in Hole M0101B (2R-1, 16–18 cm). The χ value of the sample is 2.11 × 10⁻⁸ m3/kg, and the initial NRM intensity is 2.51 × 10⁻³ A/m. A total of 16 lava samples were collected from Hole M0101B. High positive χ values occur throughout, ranging 5.19 × 10⁻⁶ to 3.92 × 10⁻⁵ m3/kg with an arithmetic mean of 2.10 × 10⁻⁵ m3/kg. The initial NRM intensity values of lava samples for 0 mT range 0.401 to 16.2 A/m with an arithmetic mean of 6.53 A/m. χ and NRM values vary similarly from 32.59 to 39.03 mbsf (Figure F17).
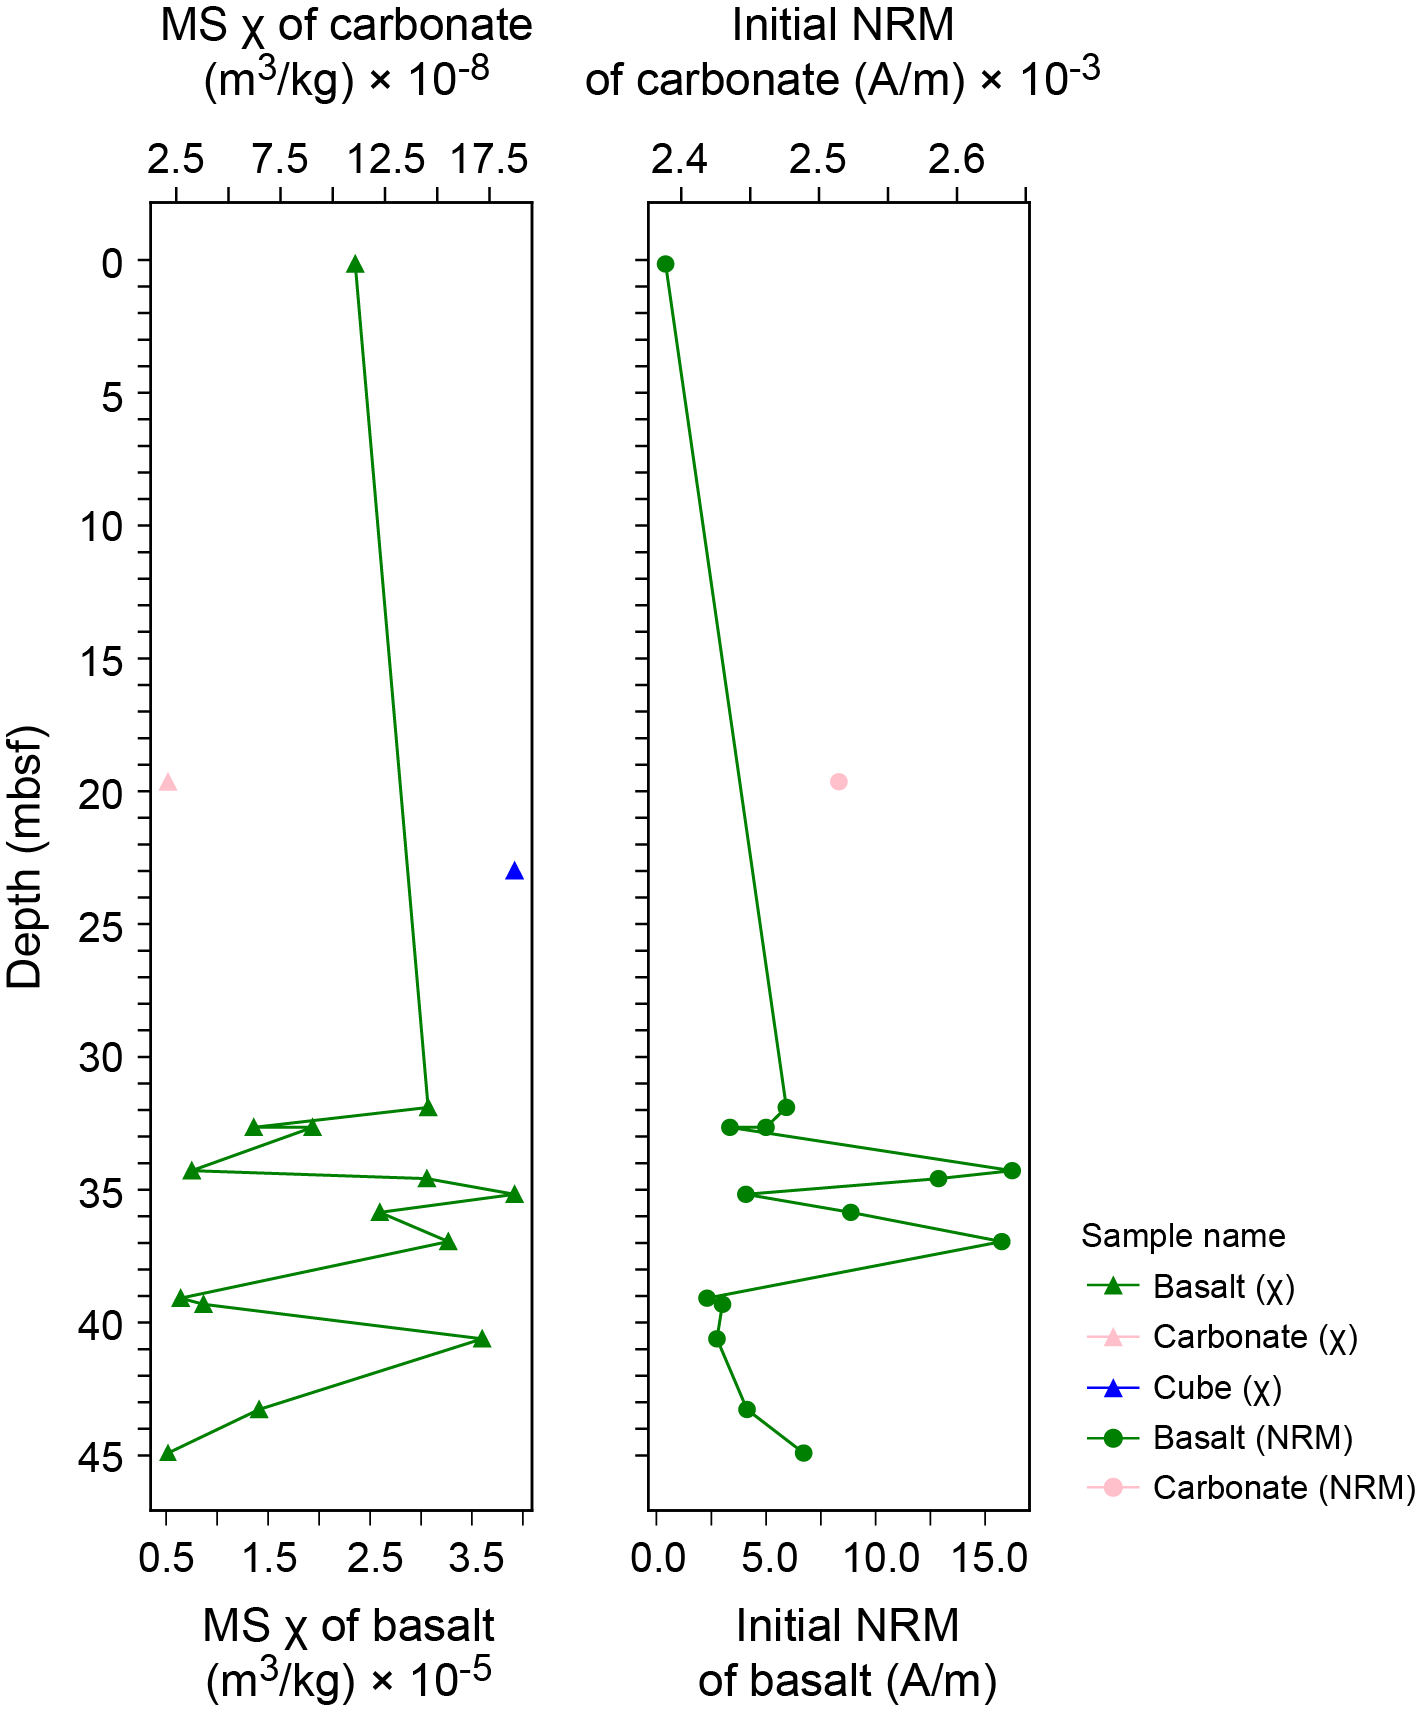
Figure F17. MS and NRM.
6. Geochronology
A total of six U-Th dates were obtained for five samples from Site M0101, including three coral samples from Hole M0101A and two coral samples from Hole M0101B (see Tables T21 and T22 in the Expedition 389 methods chapter [Webster et al., 2025a]). One date is rejected based on anomalously high 238U concentration (i.e., >4 ppm; Sample 389-M0101B-11R-1, 41–43 cm). Replicates were run on one sample from Hole M0101A (29R-1, 18–20), which yielded the same date within the reported uncertainty. There is one age inversion in Hole M0101A between Samples 29R-1, 18–20 cm, and 7R-1, 47–48 cm. Overall, the dates span ~365–434 ky BP, consistent with the estimated age of the H7 terrace (Ludwig et al., 1991; Webster et al., 2009).
References
Ludwig, K.R., Szabo, B.J., Moore, J.G., and Simmons, K.R., 1991. Crustal subsidence rate off Hawaii determined from 234U/238U ages of drowned coral reefs. Geology, 19(2):171–174. https://doi.org/10.1130/0091-7613(1991)019<0171:CSROHD>2.3.CO;2
Webster, J.M., Braga, J.C., Clague, D.A., Gallup, C., Hein, J.R., Potts, D.C., Renema, W., Riding, R., Riker-Coleman, K., Silver, E., and Wallace, L.M., 2009. Coral reef evolution on rapidly subsiding margins. Global and Planetary Change, 66(1–2):129–148. https://doi.org/10.1016/j.gloplacha.2008.07.010
Webster, J.M., Ravelo, A.C., Grant, H.L.J., and the Expedition 389 Scientists, 2025. Supplementary material, https://doi.org/10.14379/iodp.proc.389supp.2025. In Webster, J.M., Ravelo, A.C., Grant, H.L.J., and the Expedition 389 Scientists, Hawaiian Drowned Reefs. Proceedings of the International Ocean Discovery Program, 389: College Station, TX (International Ocean Discovery Program).
Webster, J.M., Ravelo, A.C., Grant, H.L.J., Rydzy, M., Stewart, M., Allison, N., Asami, R., Boston, B., Braga, J.C., Brenner, L., Chen, X., Chutcharavan, P., Dutton, A., Felis, T., Fukuyo, N., Gischler, E., Greve, S., Hagen, A., Hamon, Y., Hathorne, E., Humblet, M., Jorry, S., Khanna, P., Le Ber, E., McGregor, H., Mortlock, R., Nohl, T., Potts, D., Prohaska, A., Prouty, N., Renema, W., Rubin, K.H., Westphal, H., and Yokoyama, Y., 2025a. Expedition 389 methods. In Webster, J.M., Ravelo, A.C., Grant, H.L.J., and the Expedition 389 Scientists, Hawaiian Drowned Reefs. Proceedings of the International Ocean Discovery Program, 389: College Station, TX (International Ocean Discovery Program). https://doi.org/10.14379/iodp.proc.389.102.2025
Webster, J.M., Ravelo, A.C., Grant, H.L.J., Rydzy, M., Stewart, M., Allison, N., Asami, R., Boston, B., Braga, J.C., Brenner, L., Chen, X., Chutcharavan, P., Dutton, A., Felis, T., Fukuyo, N., Gischler, E., Greve, S., Hagen, A., Hamon, Y., Hathorne, E., Humblet, M., Jorry, S., Khanna, P., Le Ber, E., McGregor, H., Mortlock, R., Nohl, T., Potts, D., Prohaska, A., Prouty, N., Renema, W., Rubin, K.H., Westphal, H., and Yokoyama, Y., 2025b. Site M0096. In Webster, J.M., Ravelo, A.C., Grant, H.L.J., and the Expedition 389 Scientists, Hawaiian Drowned Reefs. Proceedings of the International Ocean Discovery Program, 389: College Station, TX (International Ocean Discovery Program). https://doi.org/10.14379/iodp.proc.389.103.2025