Coggon, R.M., Teagle, D.A.H., Sylvan, J.B., Reece, J., Estes, E.R., Williams, T.J., Christeson, G.L., and the Expedition 390/393 Scientists
Proceedings of the International Ocean Discovery Program Volume 390/393
publications.iodp.org
https://doi.org/10.14379/iodp.proc.390393.104.2024
Site U15611
![]() R.M. Coggon,
R.M. Coggon,
![]() J.B. Sylvan,
J.B. Sylvan,
![]() E.R. Estes,
E.R. Estes,
![]() D.A.H. Teagle,
D.A.H. Teagle,
![]() J. Reece,
J. Reece,
![]() T.J. Williams,
T.J. Williams,
![]() G.L. Christeson,
G.L. Christeson,
![]() M. Aizawa,
M. Aizawa,
![]() C. Borrelli,
C. Borrelli,
![]() J.D. Bridges,
J.D. Bridges,
![]() E.J. Carter,
E.J. Carter,
![]() J. Dinarès-Turell,
J. Dinarès-Turell,
![]() J.D. Estep,
J.D. Estep,
![]() W.P. Gilhooly III,
W.P. Gilhooly III,
![]() L.J.C. Grant,
L.J.C. Grant,
![]() M.R. Kaplan,
M.R. Kaplan,
![]() P.D. Kempton,
P.D. Kempton,
![]() C.M. Lowery,
C.M. Lowery,
![]() A. McIntyre,
A. McIntyre,
![]() C.M. Routledge,
C.M. Routledge,
![]() A.L. Slagle,
A.L. Slagle,
![]() M. Takada,
M. Takada,
![]() L. Tamborrino,
L. Tamborrino,
![]() Y. Wang,
Y. Wang,
![]() K. Yang,
K. Yang,
![]() E. Albers,
E. Albers,
![]() C. Amadori,
C. Amadori,
![]() T.M. Belgrano,
T.M. Belgrano,
![]() T. D'Angelo,
T. D'Angelo,
![]() N. Doi,
N. Doi,
![]() A. Evans,
A. Evans,
![]() G.M. Guérin,
G.M. Guérin,
![]() M. Harris,
M. Harris,
![]() V.M. Hojnacki,
V.M. Hojnacki,
![]() G. Hong,
G. Hong,
![]() X. Jin,
X. Jin,
![]() M. Jonnalagadda,
M. Jonnalagadda,
![]() D. Kuwano,
D. Kuwano,
![]() J.M. Labonte,
J.M. Labonte,
![]() A.R. Lam,
A.R. Lam,
![]() M. Latas,
M. Latas,
![]() W. Lu,
W. Lu,
![]() P. Moal-Darrigade,
P. Moal-Darrigade,
![]() S.F. Pekar,
S.F. Pekar,
![]() C. Robustelli Test,
C. Robustelli Test,
![]() J.G. Ryan,
J.G. Ryan,
![]() D. Santiago Ramos,
D. Santiago Ramos,
![]() A. Shchepetkina,
A. Shchepetkina,
![]() A. Villa,
A. Villa,
![]() S.Y. Wee,
S.Y. Wee,
![]() S.J. Widlansky,
S.J. Widlansky,
![]() W. Kurz,
W. Kurz,
![]() M. Prakasam,
M. Prakasam,
![]() L. Tian,
L. Tian,
![]() T. Yu, and
T. Yu, and
![]() G. Zhang2
G. Zhang2
1 Coggon, R.M., Sylvan, J.B., Estes, E.R., Teagle, D.A.H., Reece, J., Williams, T.J., Christeson, G.L., Aizawa, M., Borrelli, C., Bridges, J.D., Carter, E.J., Dinarès-Turell, J., Estep, J.D., Gilhooly, W.P., III, Grant, L.J.C., Kaplan, M.R., Kempton, P.D., Lowery, C.M., McIntyre, A., Routledge, C.M., Slagle, A.L., Takada, M., Tamborrino, L., Wang, Y., Yang, K., Albers, E., Amadori, C., Belgrano, T.M., D'Angelo, T., Doi, N., Evans, A., Guérin, G.M., Harris, M., Hojnacki, V.M., Hong, G., Jin, X., Jonnalagadda, M., Kuwano, D., Labonte, J.M., Lam, A.R., Latas, M., Lu, W., Moal-Darrigade, P., Pekar, S.F., Robustelli Test, C., Ryan, J.G., Santiago Ramos, D., Shchepetkina, A., Villa, A., Wee, S.Y., Widlansky, S.J., Kurz, W., Prakasam, M., Tian, L., Yu, T., and Zhang, G., 2024. Site U1561. In Coggon, R.M., Teagle, D.A.H., Sylvan, J.B., Reece, J., Estes, E.R., Williams, T.J., Christeson, G.L., and the Expedition 390/393 Scientists, South Atlantic Transect. Proceedings of the International Ocean Discovery Program, 390/393: College Station, TX (International Ocean Discovery Program). https://doi.org/10.14379/iodp.proc.390393.104.2024
2 Expedition 390/393 Scientists' affiliations.
1. Background and objectives
Site U1561 (30˚43.2902′S, 26˚41.7162′W; proposed Site SATL-55A) is in the central South Atlantic Ocean at a water depth of 4910 meters below sea level (mbsl) ~1250 km west of the Mid-Atlantic Ridge (see Figure F1 and Tables T1, T2, all in the Expedition 390/393 summary chapter [Coggon et al., 2024d]) on crust that formed at a slow half spreading rate of ~13.5 mm/y, which is the slowest spreading rate in the study region (Kardell et al., 2019; Christeson et al., 2020; see Figure F7 in the Expedition 390/393 summary chapter [Coggon et al., 2024d]). With an estimated age of 61.2 Ma, Site U1561 is the oldest location of the South Atlantic Transect (SAT) campaign (International Ocean Discovery Program [IODP] Expeditions 390C, 395E, 390, and 393). Site U1561 sits on a basement ridge and is therefore less heavily sedimented than Sites U1556 and U1557, which are located ~25 km south of Site U1561 on 61.2 and 60.7 Ma ocean crust, respectively. Together, all sites in this region allow for investigation of the effect of sediment thickness on crustal evolution.
1.1. Geologic setting
Site U1561 is located on the approximately north-south–trending (358.5) Crustal Reflectivity Experiment Southern Transect (CREST) Seismic Line 05 at Common Depth Point 16750 about 25 km north of the east-west–trending (094) CREST crossing Line 1A/1B (Figures F1, F2) (Reece et al., 2016; Reece and Estep, 2019). Interpretation of multichannel seismic and ocean-bottom seismograph data in this region suggests that the ocean crust is anomalously thin at the site (~3.6 km; Christeson et al., 2020) compared to normal ocean crust (~6.15 ± 0.93 km; Christeson et al., 2019). Reasons for the thin crust could be the proximity to the plume-derived Rio Grande Rise (see Figure F1 in the Expedition 390/393 summary chapter [Coggon et al., 2024d]) and a potentially reduced magma supply. At a water depth of 4910 m, Site U1561 is shallower than predicted by simple lithospheric cooling models (see Figure F4 in the Expedition 390/393 summary chapter [Coggon et al., 2024d]) (e.g., Parsons and Slater, 1977; Korenaga and Korenaga, 2008; Marty and Cazenave, 1989).
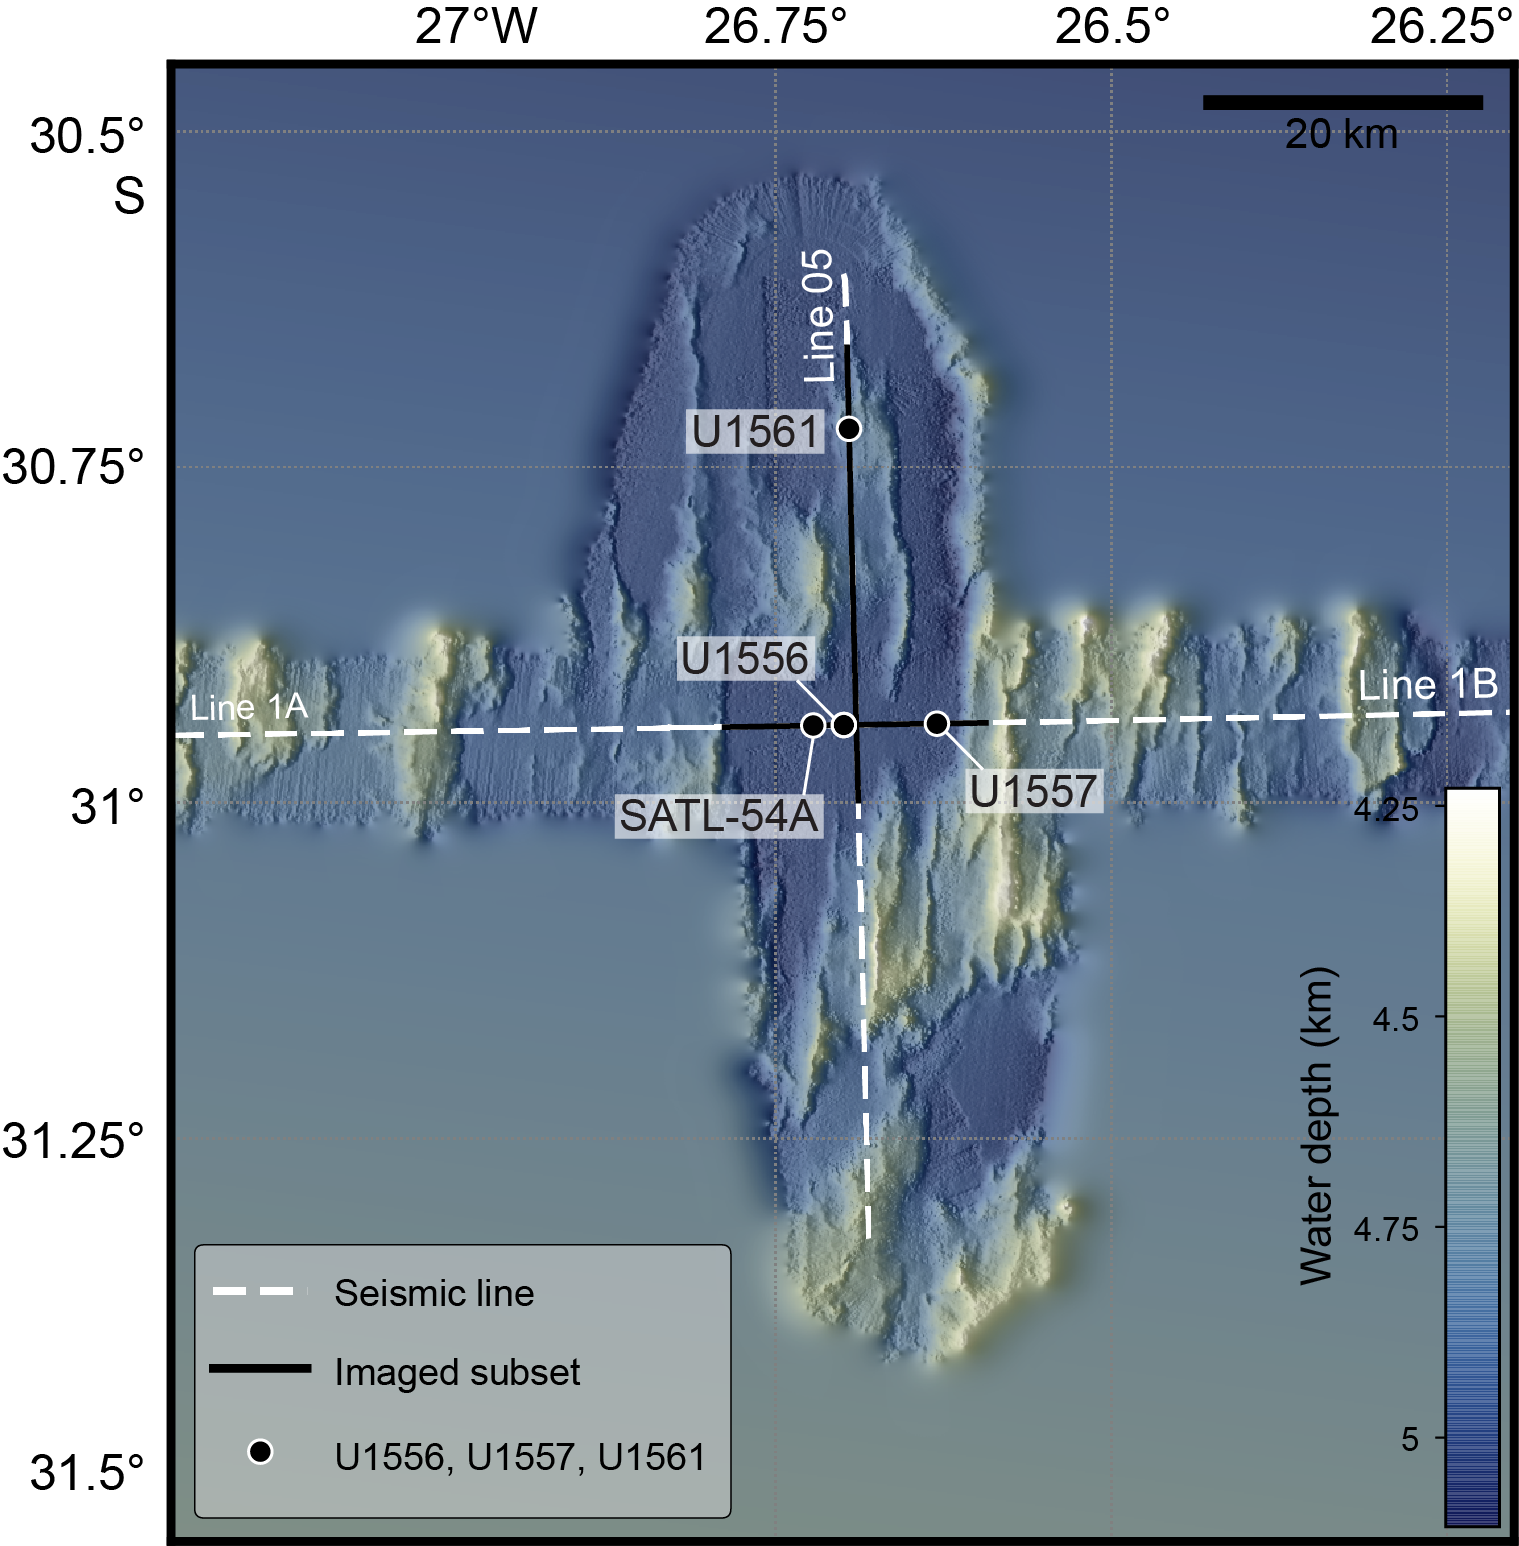
Figure F1. Bathymetric map.
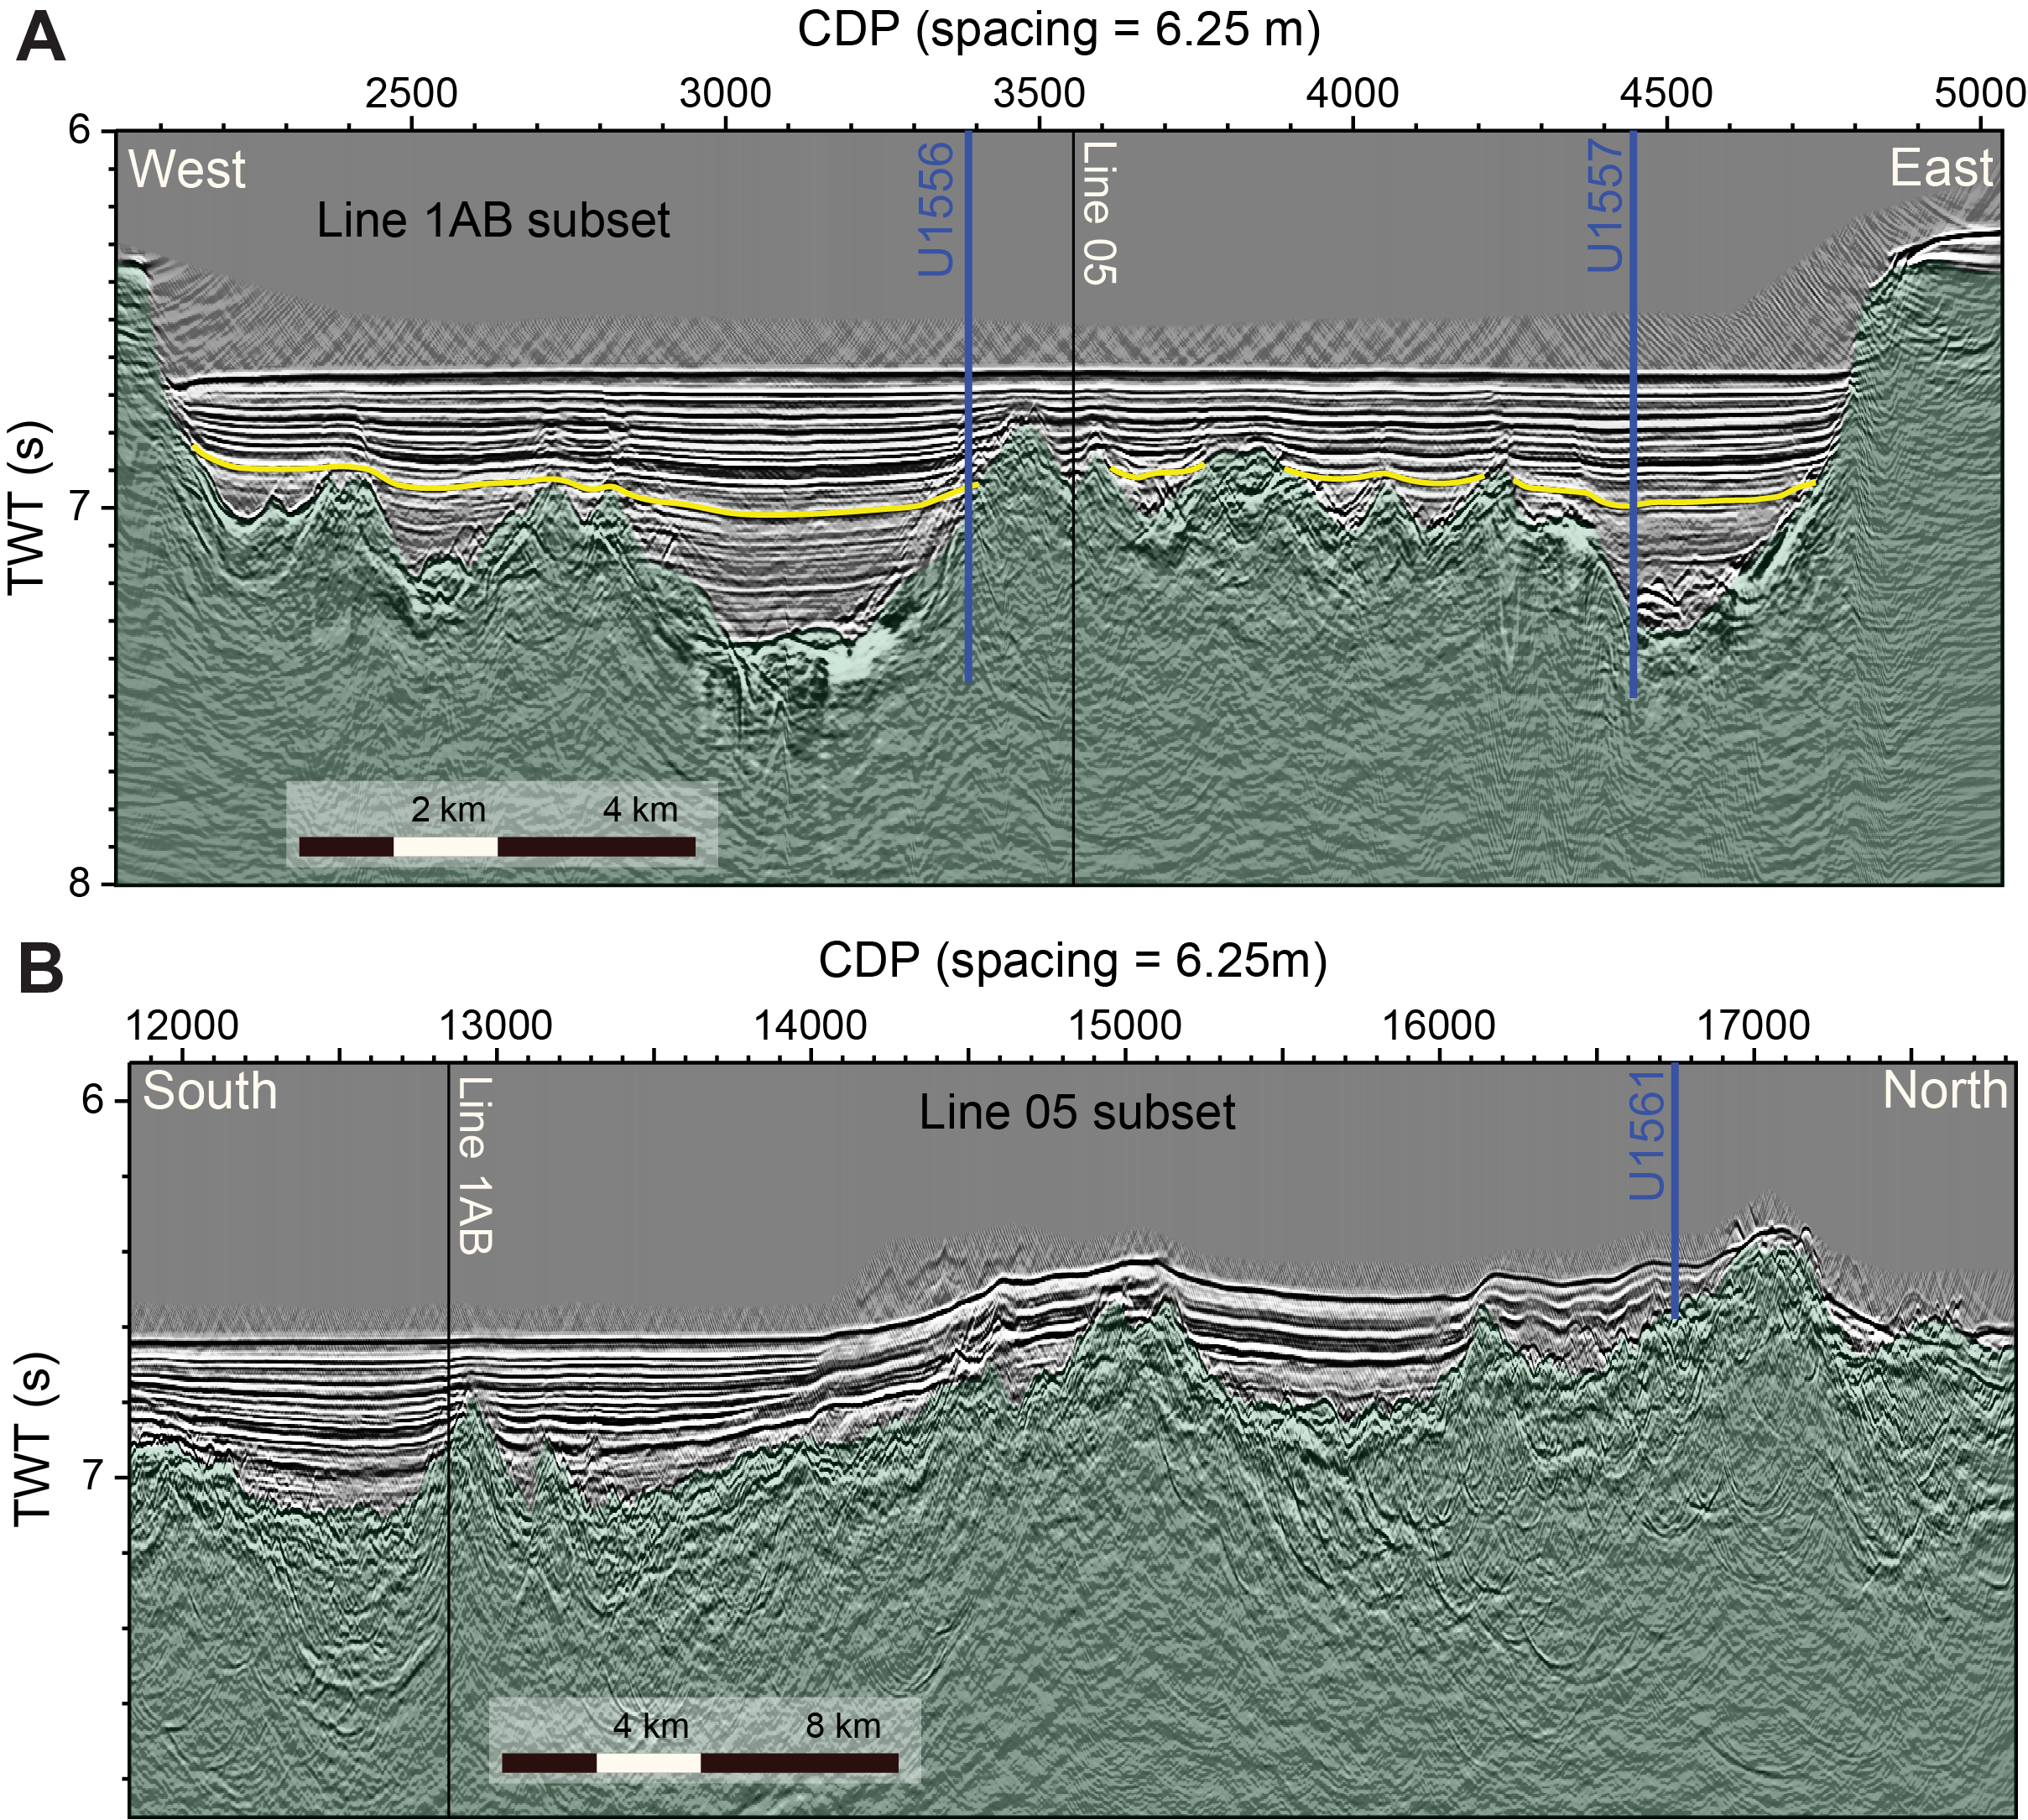
Figure F2. Seismic reflection profiles.
Site U1561 appears to be located on the same north-south–trending basement ridge as Site U1556, although the latter site is covered by a thicker sediment package. This ridge has its lowest elevation near Site U1556 and gradually shallows toward Site U1561 (Figure F2). As a result, the sedimentary thickness decreases from Site U1556 toward Site U1561. At Site U1561, the ocean crust has a sediment cover of only 46 m, which is much thinner than the global average overburden thickness for basement of this age (~200 m; Spinelli et al., 2004; see Figure F3 in the Expedition 390/393 summary chapter [Coggon et al., 2024d]) and the reported mean sediment thickness encountered along CREST Seismic Lines 1B (48–63 Ma) and 1A (63–70 Ma) of 132 and 223 m, respectively (Estep et al., 2019). This thinner-than-normal sediment cover is due to the location of this site on a basement ridge. A recent sedimentation thickness global synthesis suggests though that ~60 Ma ocean crust should host around 460 m of sediment (cf. Olson et al., 2016), although there are very large ranges in global and regional estimates of sediment thickness with crustal age (e.g., ~560 m; Straume et al., 2019).
Backscatter reflections from multibeam profiles (Figure F3) reveal that portions of the seafloor to the north, west, and east of Site U1561 boast continuous sediment cover, which is in contrast to other sites along the SAT. Therefore, ventilation of the volcanic rocks of the upper ocean crust through the ingress of seawater and egress of seawater-derived low-temperature hydrothermal fluids may be reduced compared to other sites. However, the emerging basement ridge north of Site U1561 is only thinly sedimented, as can be seen by the high normalized reflectivity (Figure F3) and may influence the local fluid flow system with consequent impacts on heat flow, sediment pore waters, basement hydrothermal alteration, and microbial communities in both the marine sediments and underlying basalts. Basement age at Site U1561 was predicted to be ~61.2 Ma based on CREST site survey magnetic data (Kardell et al., 2019) and preliminary biostratigraphy analyses from Hole U1561A, sampled during Expedition 395E.
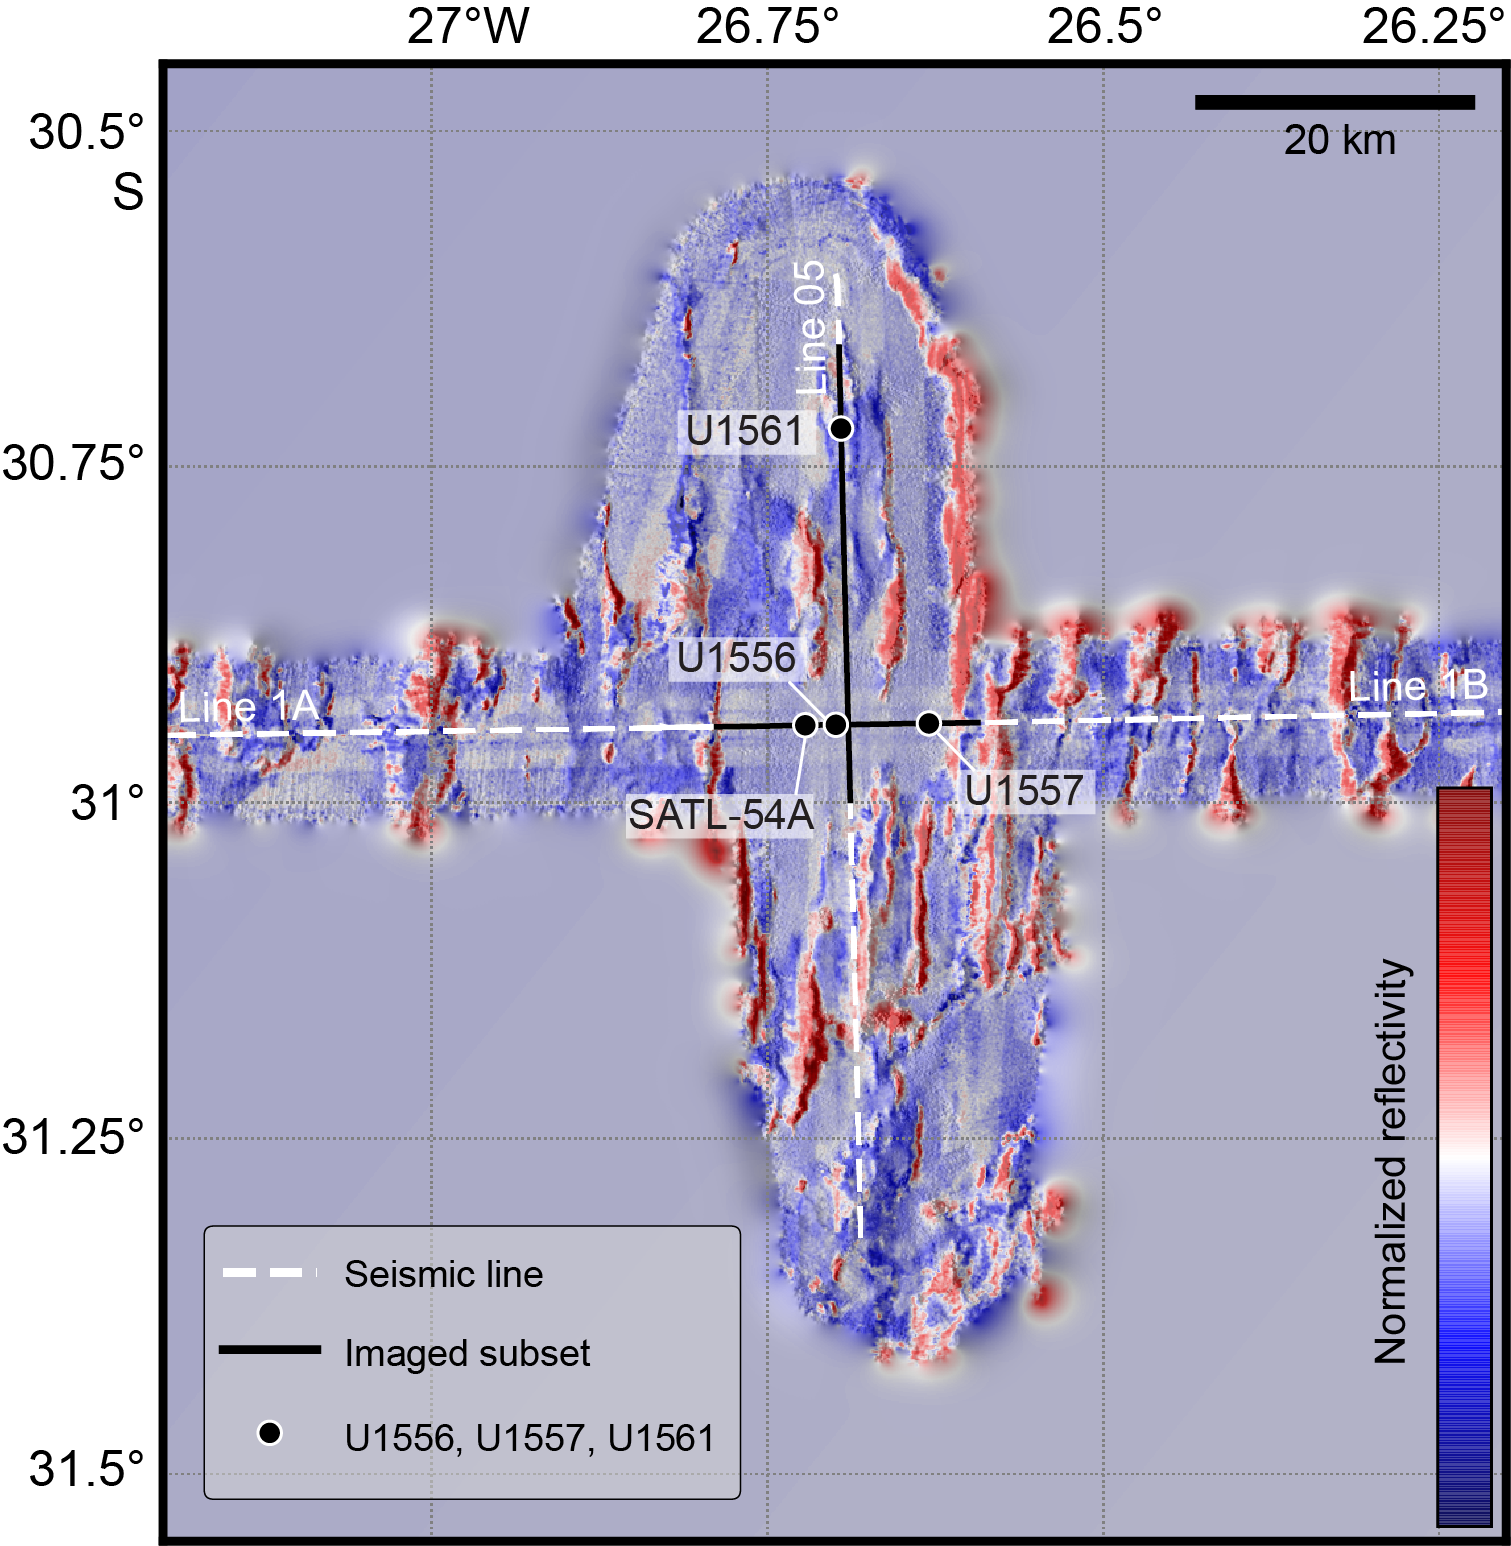
Figure F3. Backscatter reflections.
Site U1561 was first occupied during engineering Expedition 395E. Hole U1561A was cored using the advanced piston corer (APC) and extended core barrel (XCB) systems to a total depth of 48.9 meters below seafloor (mbsf), penetrating the entire sediment succession and ~2.7 m into basement (Figure F4) (see Table T2 in the Expedition 390/393 summary chapter [Coggon et al., 2024d]; Williams et al., 2021).
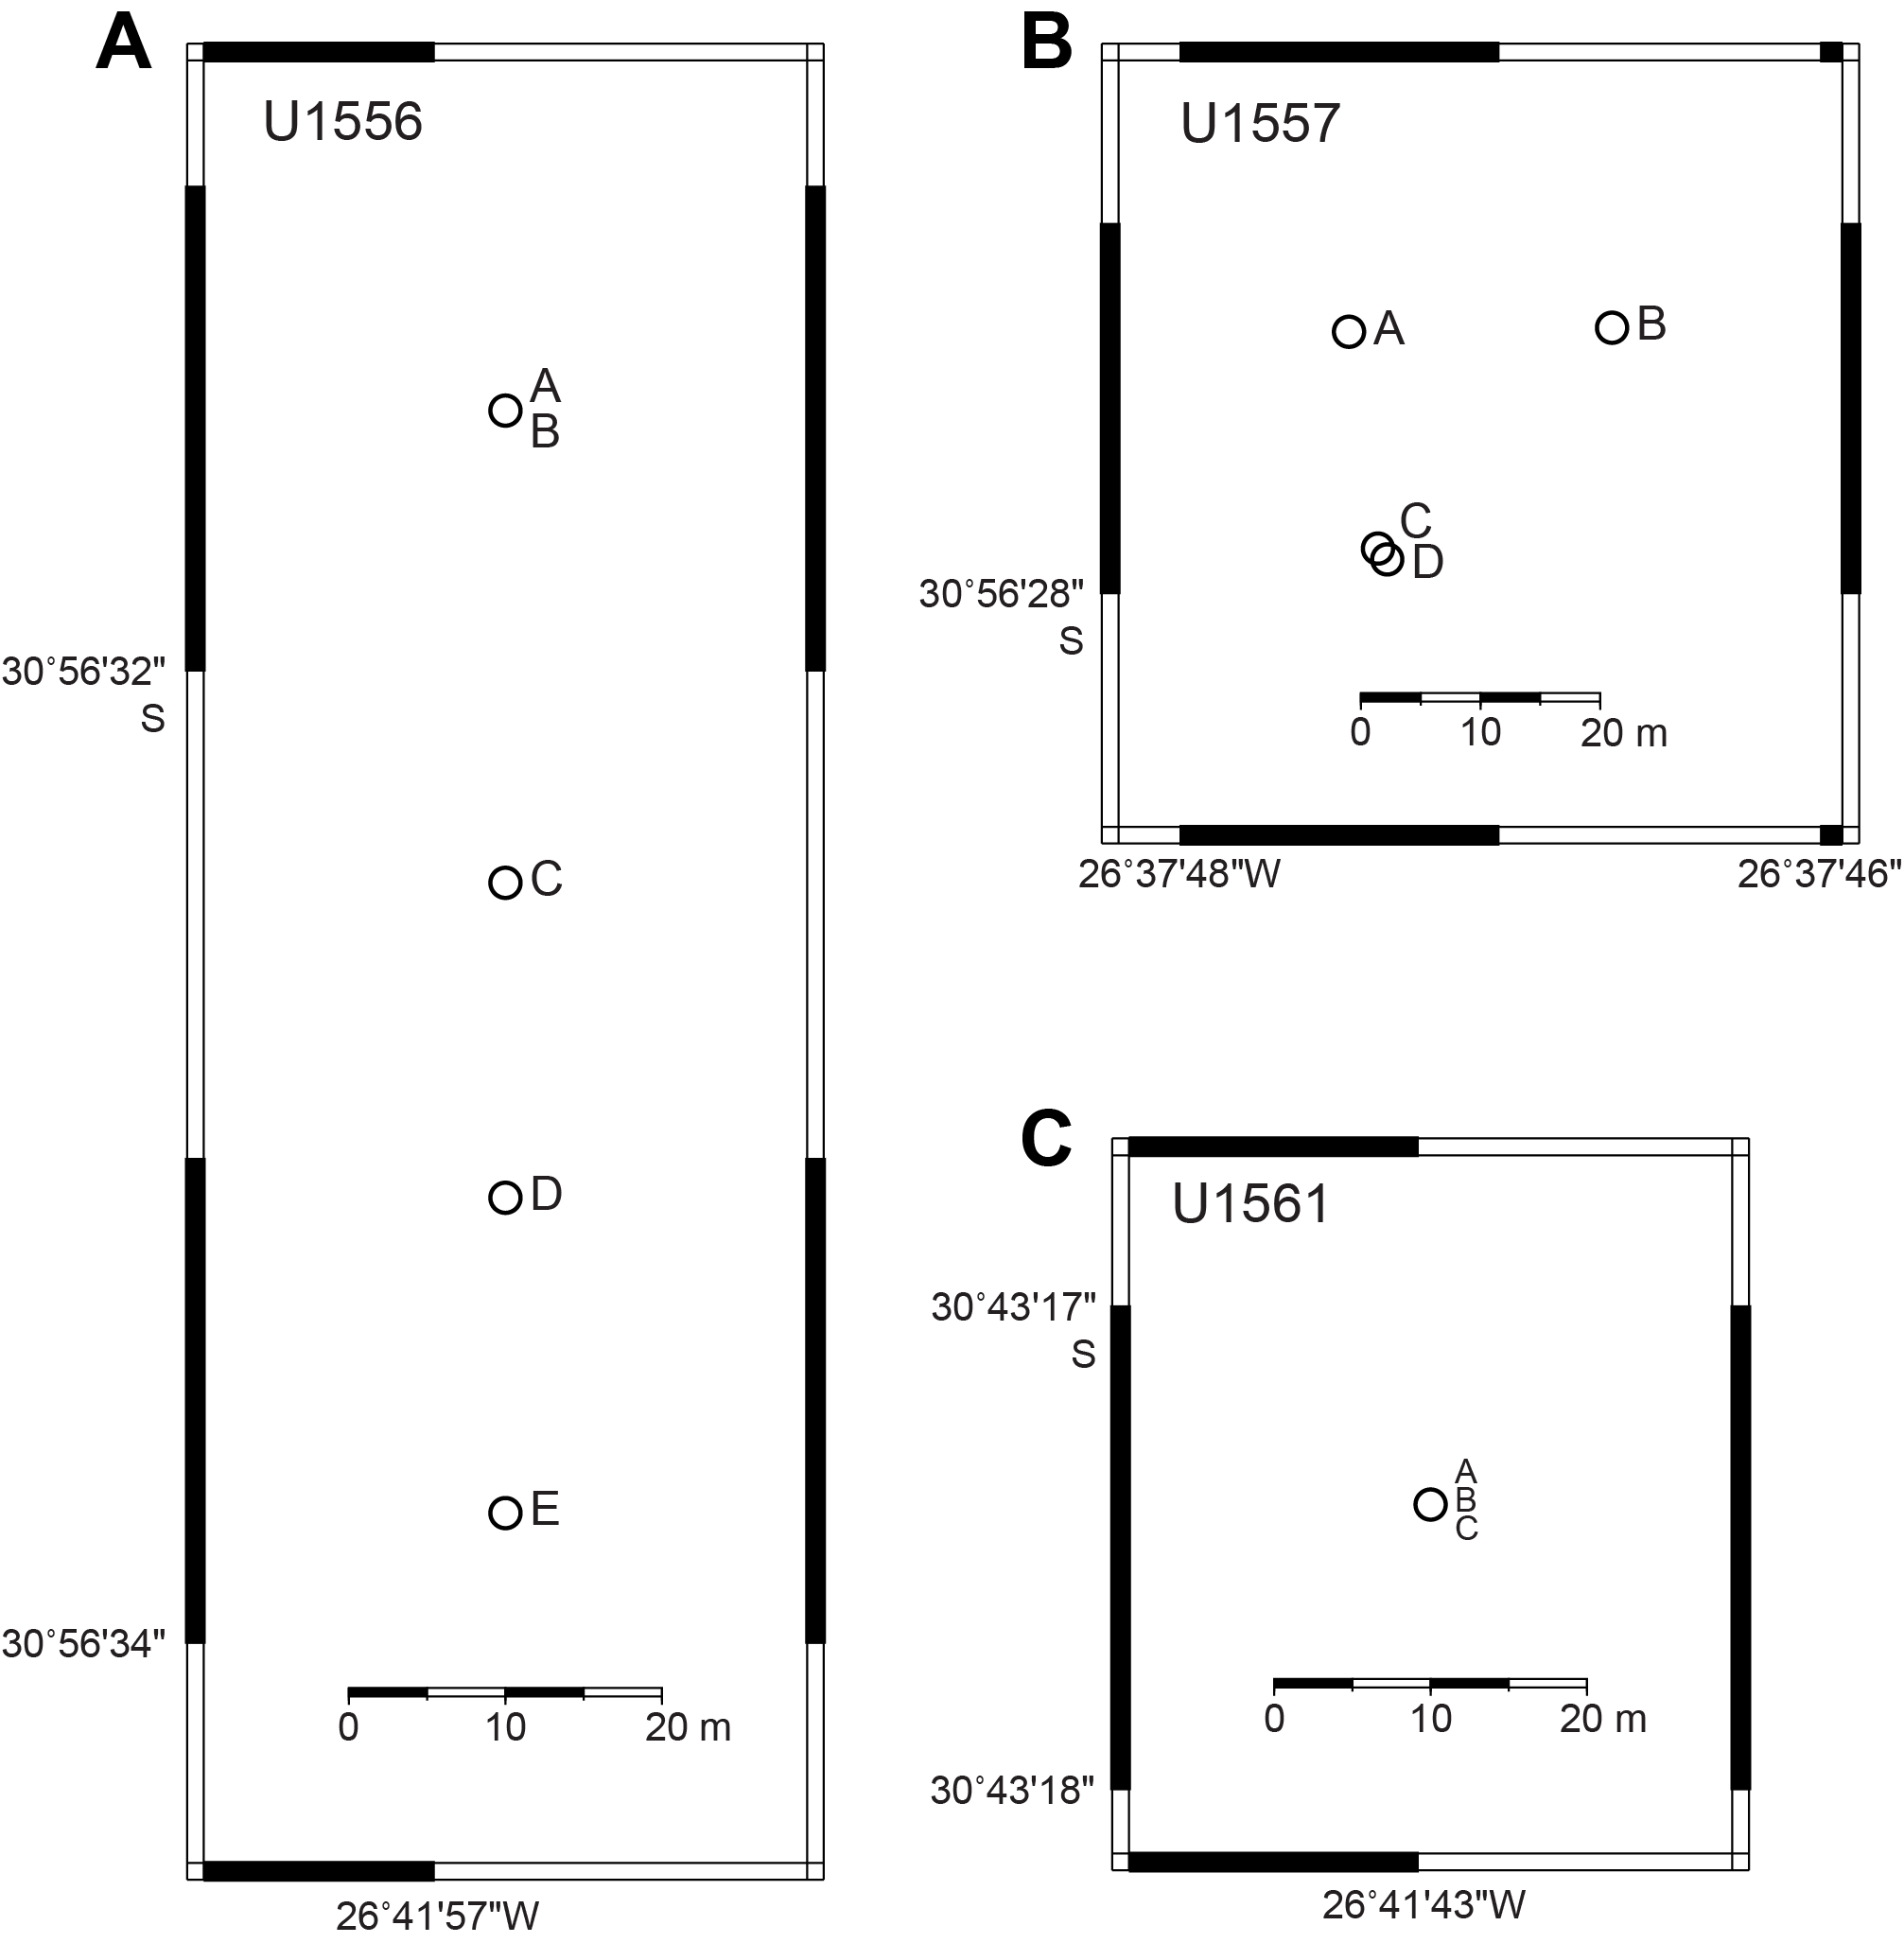
Figure F4. Map of holes drilled.
1.2. Objectives
Because Site U1561 was a bonus site established during Expedition 395E, there were no plans to return to this site during Expedition 390 or 393. All scientific objectives could be addressed by drilling, coring, and logging operations at Sites U1556 and U1557, the other two sites located on ~61 Ma crust at the old western end of the SAT.
2. Operations
Site U1561 was the last site visited during Expedition 395E. Hole U1561A contacted basalt at 46.2 mbsf and reached a total depth of 48.9 mbsf. Holes U1561B and U1561C were single missed-mudline cores.
After completing reentry system installations in Holes U1560B, U1557D, and U1556B, only about 2.5 days of operations time remained during Expedition 395E before the ship had to depart for Reykjavík, Iceland, on 14 May 2021. It was decided to use this time to core at nearby Site U1561, where the sedimentary succession was expected to be thinner than at nearby Sites U1556 and U1557 and would provide information on sediment accumulation patterns and pore water chemical profiles of this local area.
Following the 13 nmi transit from Site U1556, the ship arrived at Site U1561 at 0324 h on 11 May. Based on the seafloor reflection in the seismic profile, the water depth at Site U1561 was expected to be 4857 mbsl (Coggon et al., 2020). On arrival at the site, the precision depth recorder 3.5 kHz signal malfunctioned and the depth reading had to be taken with the 12.5 kHz signal instead, which gave an apparent water depth of 4963 mbsl (106 m deeper than the depth in the Scientific Prospectus [Coggon et al., 2020]). Because of this discrepancy, the drill bit was lowered slowly below 4857 mbsl and the weight of the drill string was monitored. The drill string took noticeable weight at 4927 mbsl, indicating that the bottom-hole assembly (BHA) was partly supported by the formation. The drill bit was raised to 4917 mbsl to attempt a mudline core, which returned full, showing that the seafloor was shallower than 4917 mbsl. The drill bit was raised by a further 5 m to 4912 mbsl for a second attempt, but this core was also full and did not recover a mudline. At first these two cores were assigned to be test cores, but the next day they were named Cores 395E-U1561B-1H and 395E-U1561C-1H, respectively. The drill bit was raised to 4907 mbsl for a third attempt. The ship made no lateral offset between the three holes (Figure F4).
Hole U1561A (30°43.2902′S, 26°41.7162′W) was spudded at 2335 h on 11 May, and Core 395E-U1561A-1H recovered 6.7 m, establishing a seafloor depth of 4909.5 mbsl. On 12 May, Cores 2H–6H advanced from 6.7 to 46.2 mbsf (Table T1). Core 6H struck hard rock, which bent the APC cutting shoe. We switched to the XCB system, and Cores 7X–9X advanced from 46.2 to 48.9 mbsf (Core 7X was empty). Core 9X took 2 h to advance 1.2 m, recovering 1.18 m of basalt. The slow rate of penetration was partly caused by the BHA being mostly above the seafloor, limiting the weight that could be applied safely. Cores 1H–9X recovered 45.4 m (93%). At 2245 h, we stopped coring to prepare for the transit to Reykjavík. We raised the drill bit, clearing the seafloor at 2355 h on 12 May and reaching the rig floor at 1150 h on 13 May, ending operations in Hole U1561A.
From 1230 to 1730 h, we deployed the subsea camera to 4881 mbsl, without the drill pipe, to detorque the camera's umbilical cable. This was done because the cable had wrapped around the drill pipe up to eight times during a deployment at Site U1556, and any residual twisting could damage the cable. While the camera was being lowered and raised back, the ship was secured for transit. We raised the thrusters, and at 1806 h we began the sea passage to Reykjavík. The transit took 22.6 days at an average speed of 10.6 kt.
3. Stratigraphic unit summary
The cores recovered at Site U1561 comprise two sedimentary units overlying one basement unit identified on the basis of macro- and microscopic visual observations combined with mineralogical analyses by X-ray diffraction (XRD), spectral color analyses, and magnetic susceptibility (MS) data. The units are numbered from the top of the hole, with units in the sedimentary section designated by Roman numerals (e.g., I and II) and basement units designated by Arabic numerals (e.g., 1 and 2).
3.1. Sedimentary units
The entire (as thick as ~48 m) sedimentary sequence was cored at Site U1561, and two lithologic units are defined comprising two main lithologies (Table T2). Unit I is composed mainly of reddish brown silty clay with a variable amount of zeolite, whereas Unit II is mainly composed of Paleocene to Eocene calcareous nannofossil ooze with a variable abundance of foraminifera (see Sedimentology).
3.2. Basement units
Igneous basement was recovered at 46.5 mbsf in Hole U1561A, below which 2.4 m of aphyric basalt was recovered from a cored interval of 2.4 m (100% recovery). This short volcanic sequence (Lithologic Unit 1) contains several complete pillow lavas intercalated with thin (<3 cm) intervals of pelagic sediment (see Igneous petrology).
3.3. Sediment/basement interface
The sediment/basement interface was only penetrated in Hole U1561A (cored during engineering Expedition 395E) because Holes U1561B and U1561C were single-core holes that failed to recover the mudline. Hard rock was struck when drilling Core 395E-U1561A-6H at 46.2 mbsf, which bent the APC cutting shoe (Williams et al., 2021). This was substantially shallower than the expected basement depth because the main basement seismic reflector was identified at ~126 mbsf at this site location (Coggon et al., 2020). Following a switch to the XCB system, Core 7X advanced 0.3 m but with no recovery. Cores 8X and 9X advanced a further 1.2 m each, with 100% recovery of basalt pillow lavas with minor (<3 cm) intercalated sediment intervals.
3.3.1. Sediment/basement interface depth
While drilling during Expedition 395E, the cause of the discrepancy between the expected basement depth and the shallow depth at which basalt lavas were encountered was unclear. Did the basalts recovered represent the uppermost basement, a sill intruded within the lava pile, or an off-axis lava flow? The latter two options would have required volcanism a considerable distance off axis if there was another ~80 m of sediment beneath them/above true basement. However, biostratigraphic analyses of these cores during Expedition 390 revealed that the sediments above the recovered lavas flows are Paleocene (see Biostratigraphy), which is consistent with the underlying lavas having erupted at ~61 Ma. This is the expected basement age at the western end of the SAT (Coggon et al., 2020), which was confirmed by our biostratigraphic and magnetostratigraphic analyses at nearby Sites U1556 and U1557 (see Age model and mass accumulation rates in the Site U1556 chapter and Age model and mass accumulation rates in the Site U1557 chapter [Coggon et al., 2024a, 2024b]). On reexamination of the bathymetric maps and seismic reflection profiles of this region (Figures F1, F2), it was noted that the north–south seismic reflection profile was shot parallel to (and on the flank of) a basement ridge (Figure F1). We therefore conclude that the basalts recovered at Site U1561 were basement lavas and the sediment was thinner than expected because the site is located on the steeply sloping western flank of a basement ridge such that locating the site even slightly east of the seismic reflection profile would result in a shallower sediment/basement depth.
For stratigraphic correlation between SAT sites and with other sections of upper ocean crust recovered by scientific ocean drilling, we have defined a site basement/sediment interface depth for each SAT site. For consistency, this is taken as the curated depth of the top of the shallowest occurrence of basalt in the hole with the greatest basement penetration at each site. The Site U1561 sediment/basement interface depth is therefore defined as 46.5 mbsf based on the first occurrence of basalt in Hole U1561A.
4. Sedimentology
Three holes were cored at Site U1561, one penetrating the entire sedimentary column (~48 m; Hole U1561A) and two penetrating only the uppermost subseafloor (~10 m; Holes U1561B and U1561C). The sediments recovered at Site U1561 correspond to two main lithologies: silty clay and calcareous nannofossil ooze (Figure F5). Visual core descriptions (VCDs) summarize observations recorded in the shipboard DESClogik program, including assessment of sediment color, grain size, sedimentary structures, bioturbation, and drilling disturbance. Sediment colors reported here are defined according to the Munsell color system (color codes are provided in the VCDs). The color of the sediment primarily reflects its lithologic characteristics; sediments composed mainly of nannofossil and calcareous ooze are generally pinkish white, whereas silty clays range from brown/dark brown where carbonate is absent to reddish brown where the carbonate content is higher (Figure F8). Holes U1561A–U1561C were cored in May 2021 during Expedition 395E (see Background and objectives) and not described until May 2022 during Expedition 390. Some color differences may exist between the digital color images generated on the Section Half Imaging Logger (SHIL) during Expedition 395E and the visual color determinations made during Expedition 390, likely reflecting changes such as postcoring drying and/or oxidation of the sediments.
We used smear slides (Figure F6) and XRD (Figure F7) to confirm lithologic compositions. In general, the silty clay and nannofossil ooze are well correlated with MS and the luminosity (L*) color reflectance parameter, as well as with natural gamma radiation (NGR) (see Physical properties and downhole measurements). The bioturbation index is generally sparse throughout Site U1561 sediments (see Sedimentology in the Expedition 390/393 methods chapter [Coggon et al., 2024c]).
Two sedimentary lithologic units at Site U1561 were defined based on a combination of visual observations of sedimentologic characteristics (color, sedimentary structures, bioturbation, and general appearance), microscopic examination of smear slides, and bulk mineralogical analysis by XRD (see Sedimentology in the Expedition 390/393 methods chapter [Coggon et al., 2024c]) integrated with MS and color spectral observations (see Physical properties and downhole measurements in the Expedition 390/393 methods chapter [Coggon et al., 2024c]). Ages were assigned to each unit based on micropaleontology results (see Biostratigraphy) and magnetostratigraphy (see Paleomagnetism).
4.1. Unit descriptions
4.1.1. Unit I
- Intervals: 395E-U1561A-1H-1, 0 cm, to 3H-6, 65 cm; 395E-U1561B-1H-1, 0 cm, to 1H-CC, 20 cm; 395E-U1561C-1H-1, 0 cm, to 1H-CC, 15 cm
- Depths: Hole U1561A = 0–24.36 m core depth below seafloor, Method B (CSF-B); Hole U1561B = 0–9.57 m CSF-B; Hole U1561C = 0–10.20 m CSF-B
- Thickness: Hole U1561A = 24.36 m; Hole U1561B = 9.57 m; Hole U1561C, 10.2 m
- Age: late Neogene
- Lithology: silty clay
Unit I is composed mainly of reddish brown silty clay with a variable amount of zeolite (Figures F5, F6, F7). Some organic-rich dots occur in Unit I. The bioturbation index is generally sparse. Sections 395E-U1561A-1H-1 and 1H-2, as well Sections 395E-U1561C-1H-1 through 1H-3, have moderate drilling disturbance.
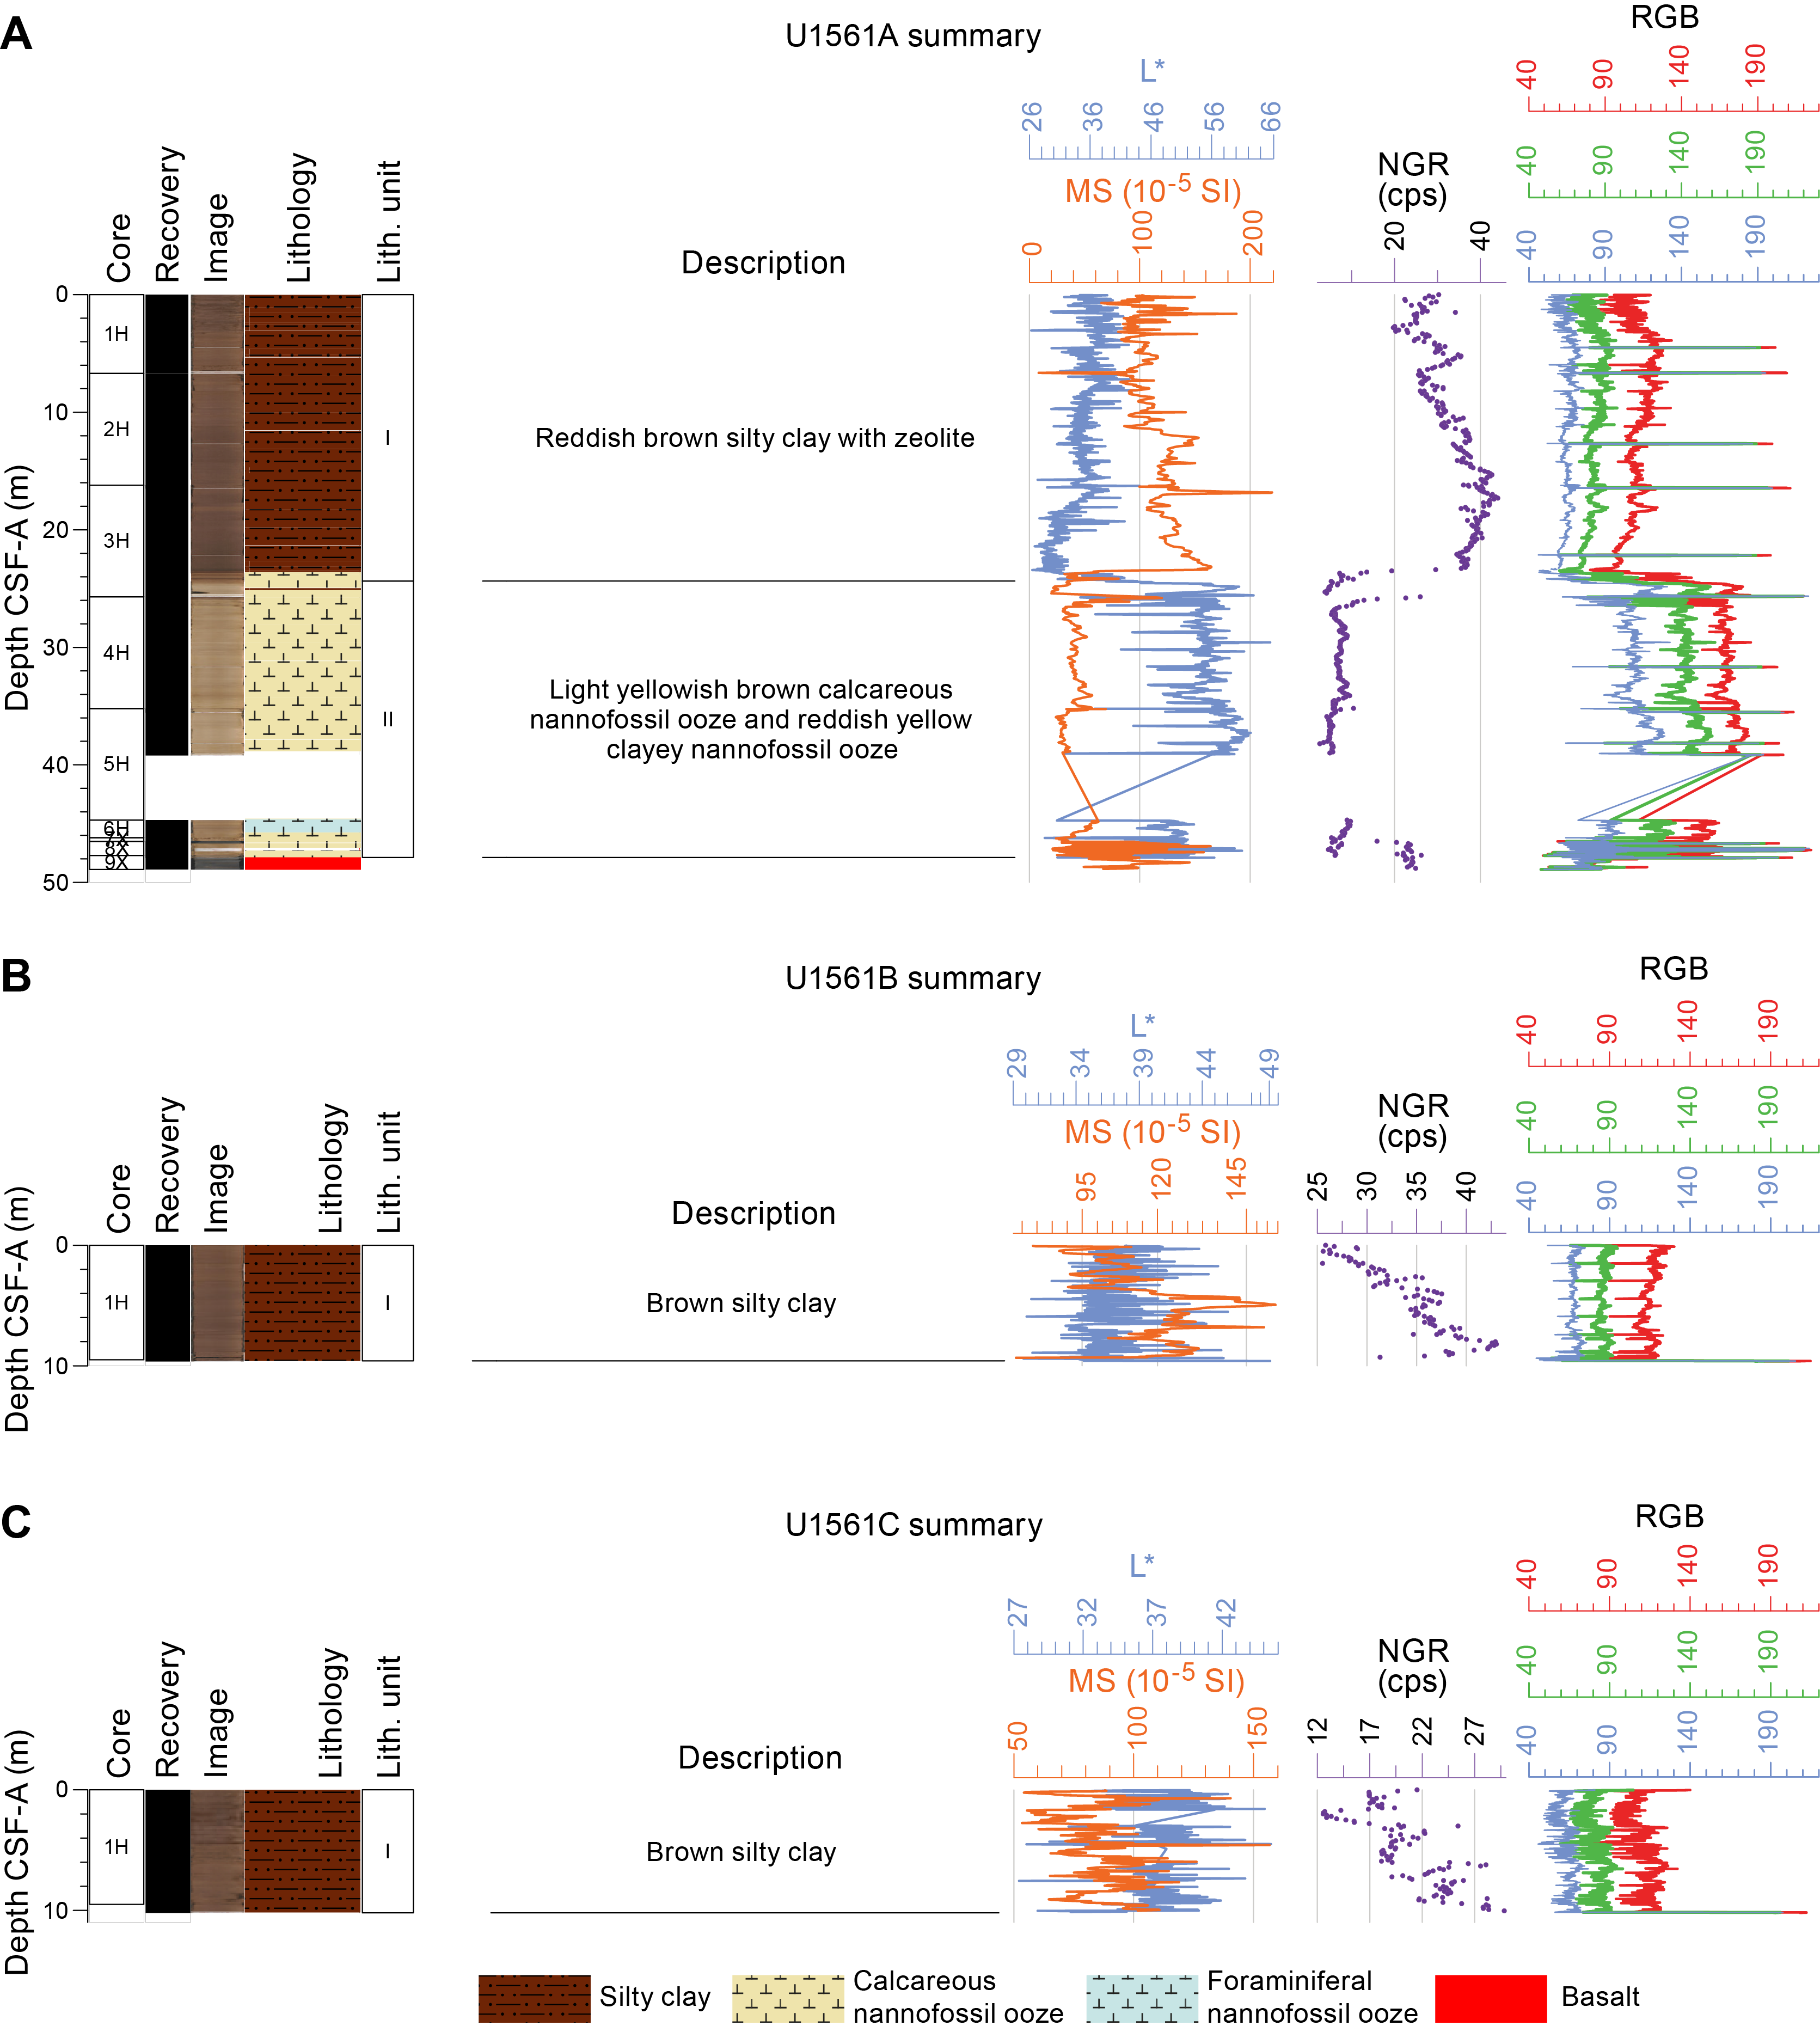
Figure F5. Lithologic summary.
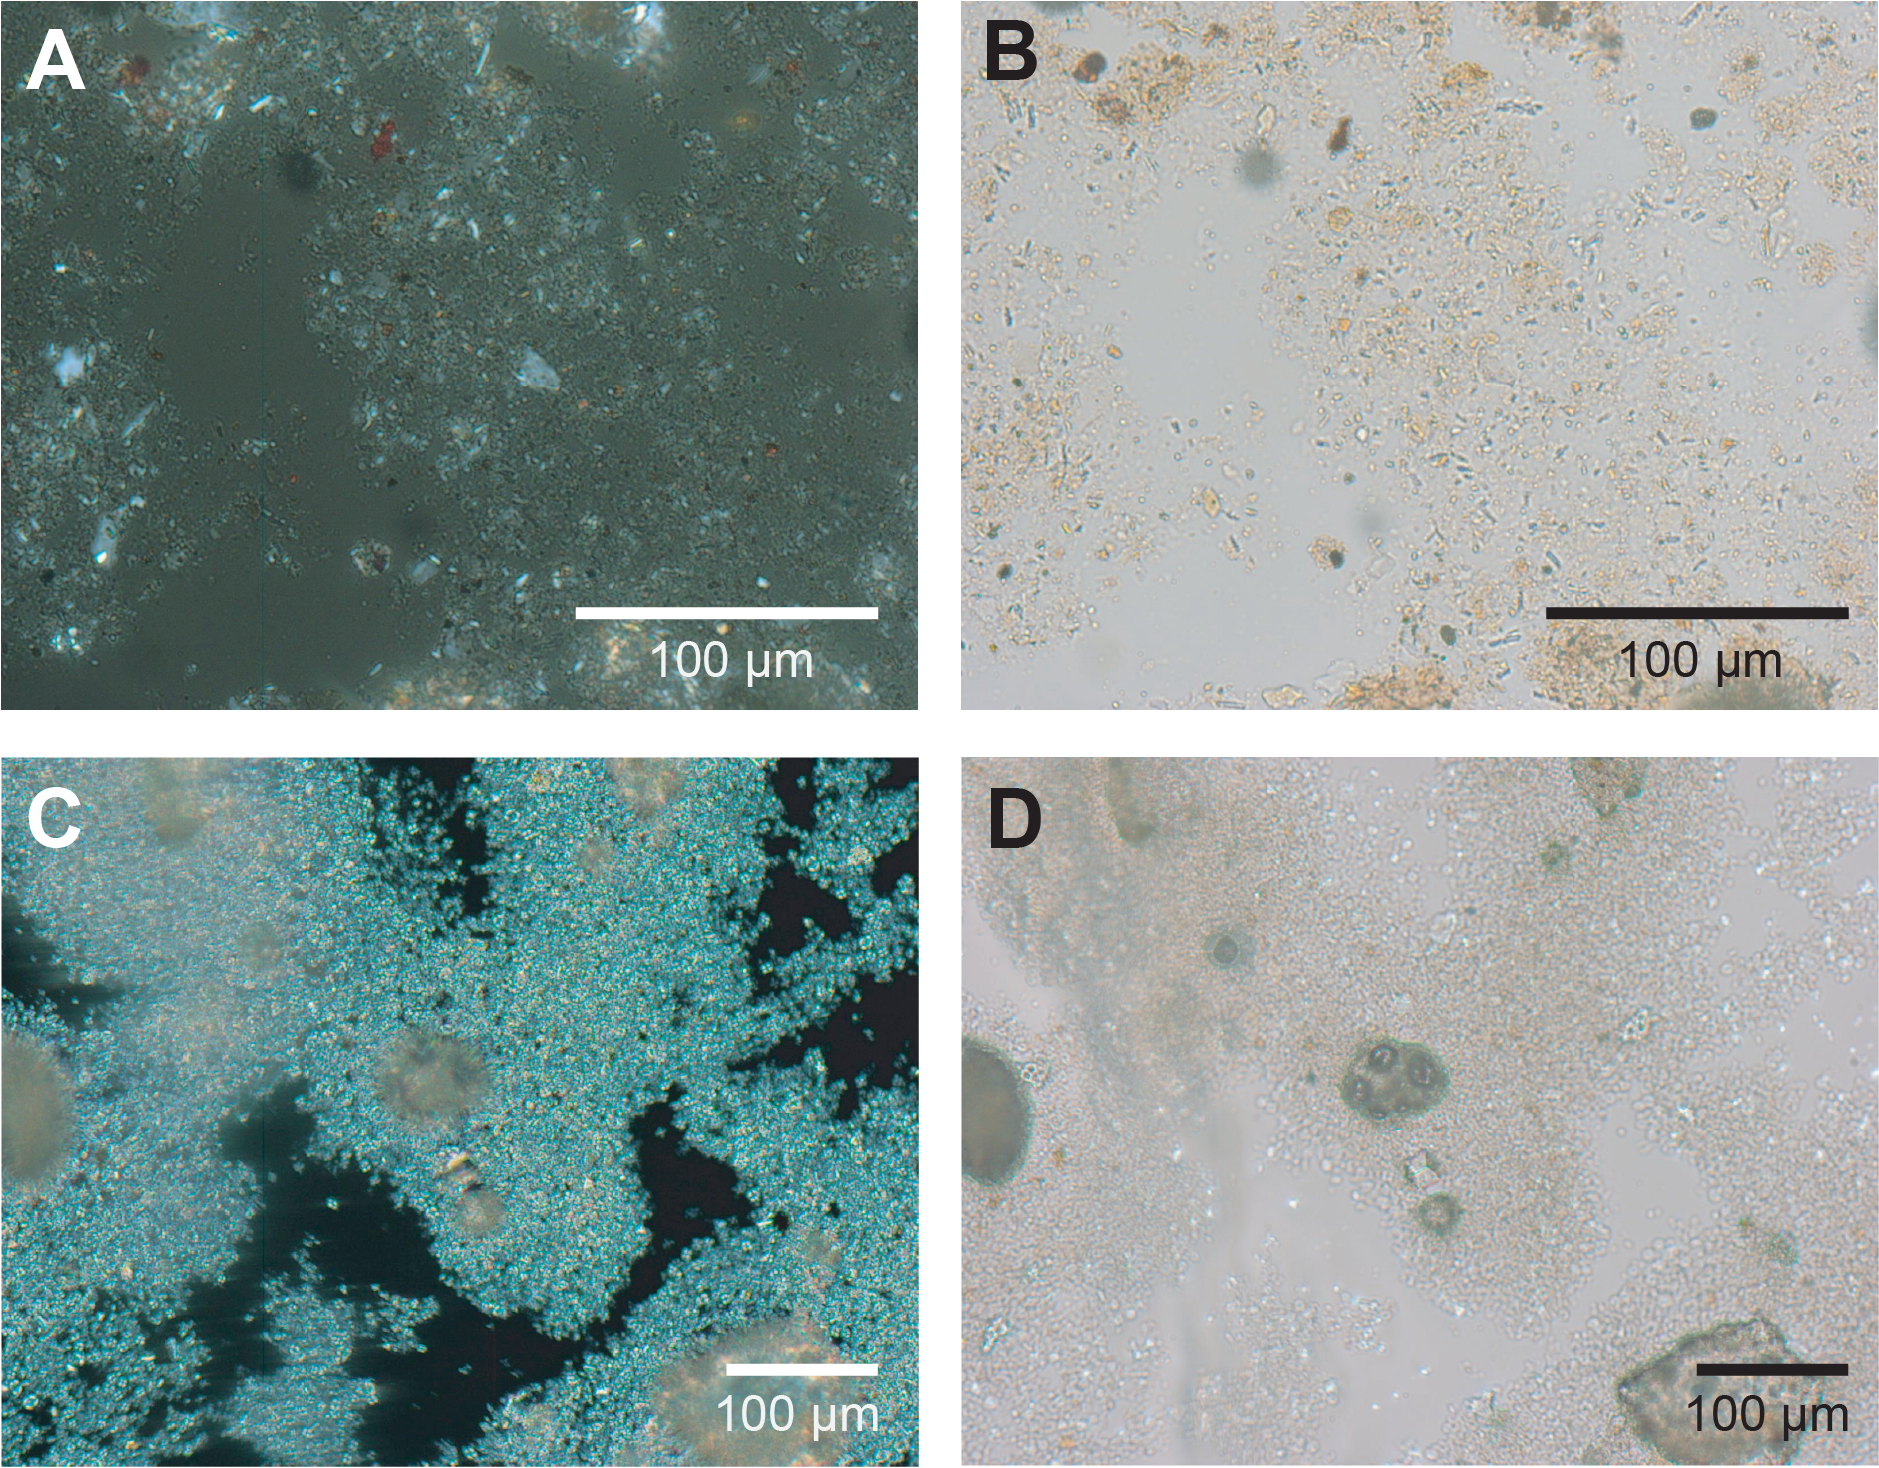
Figure F6. Main sedimentary components.
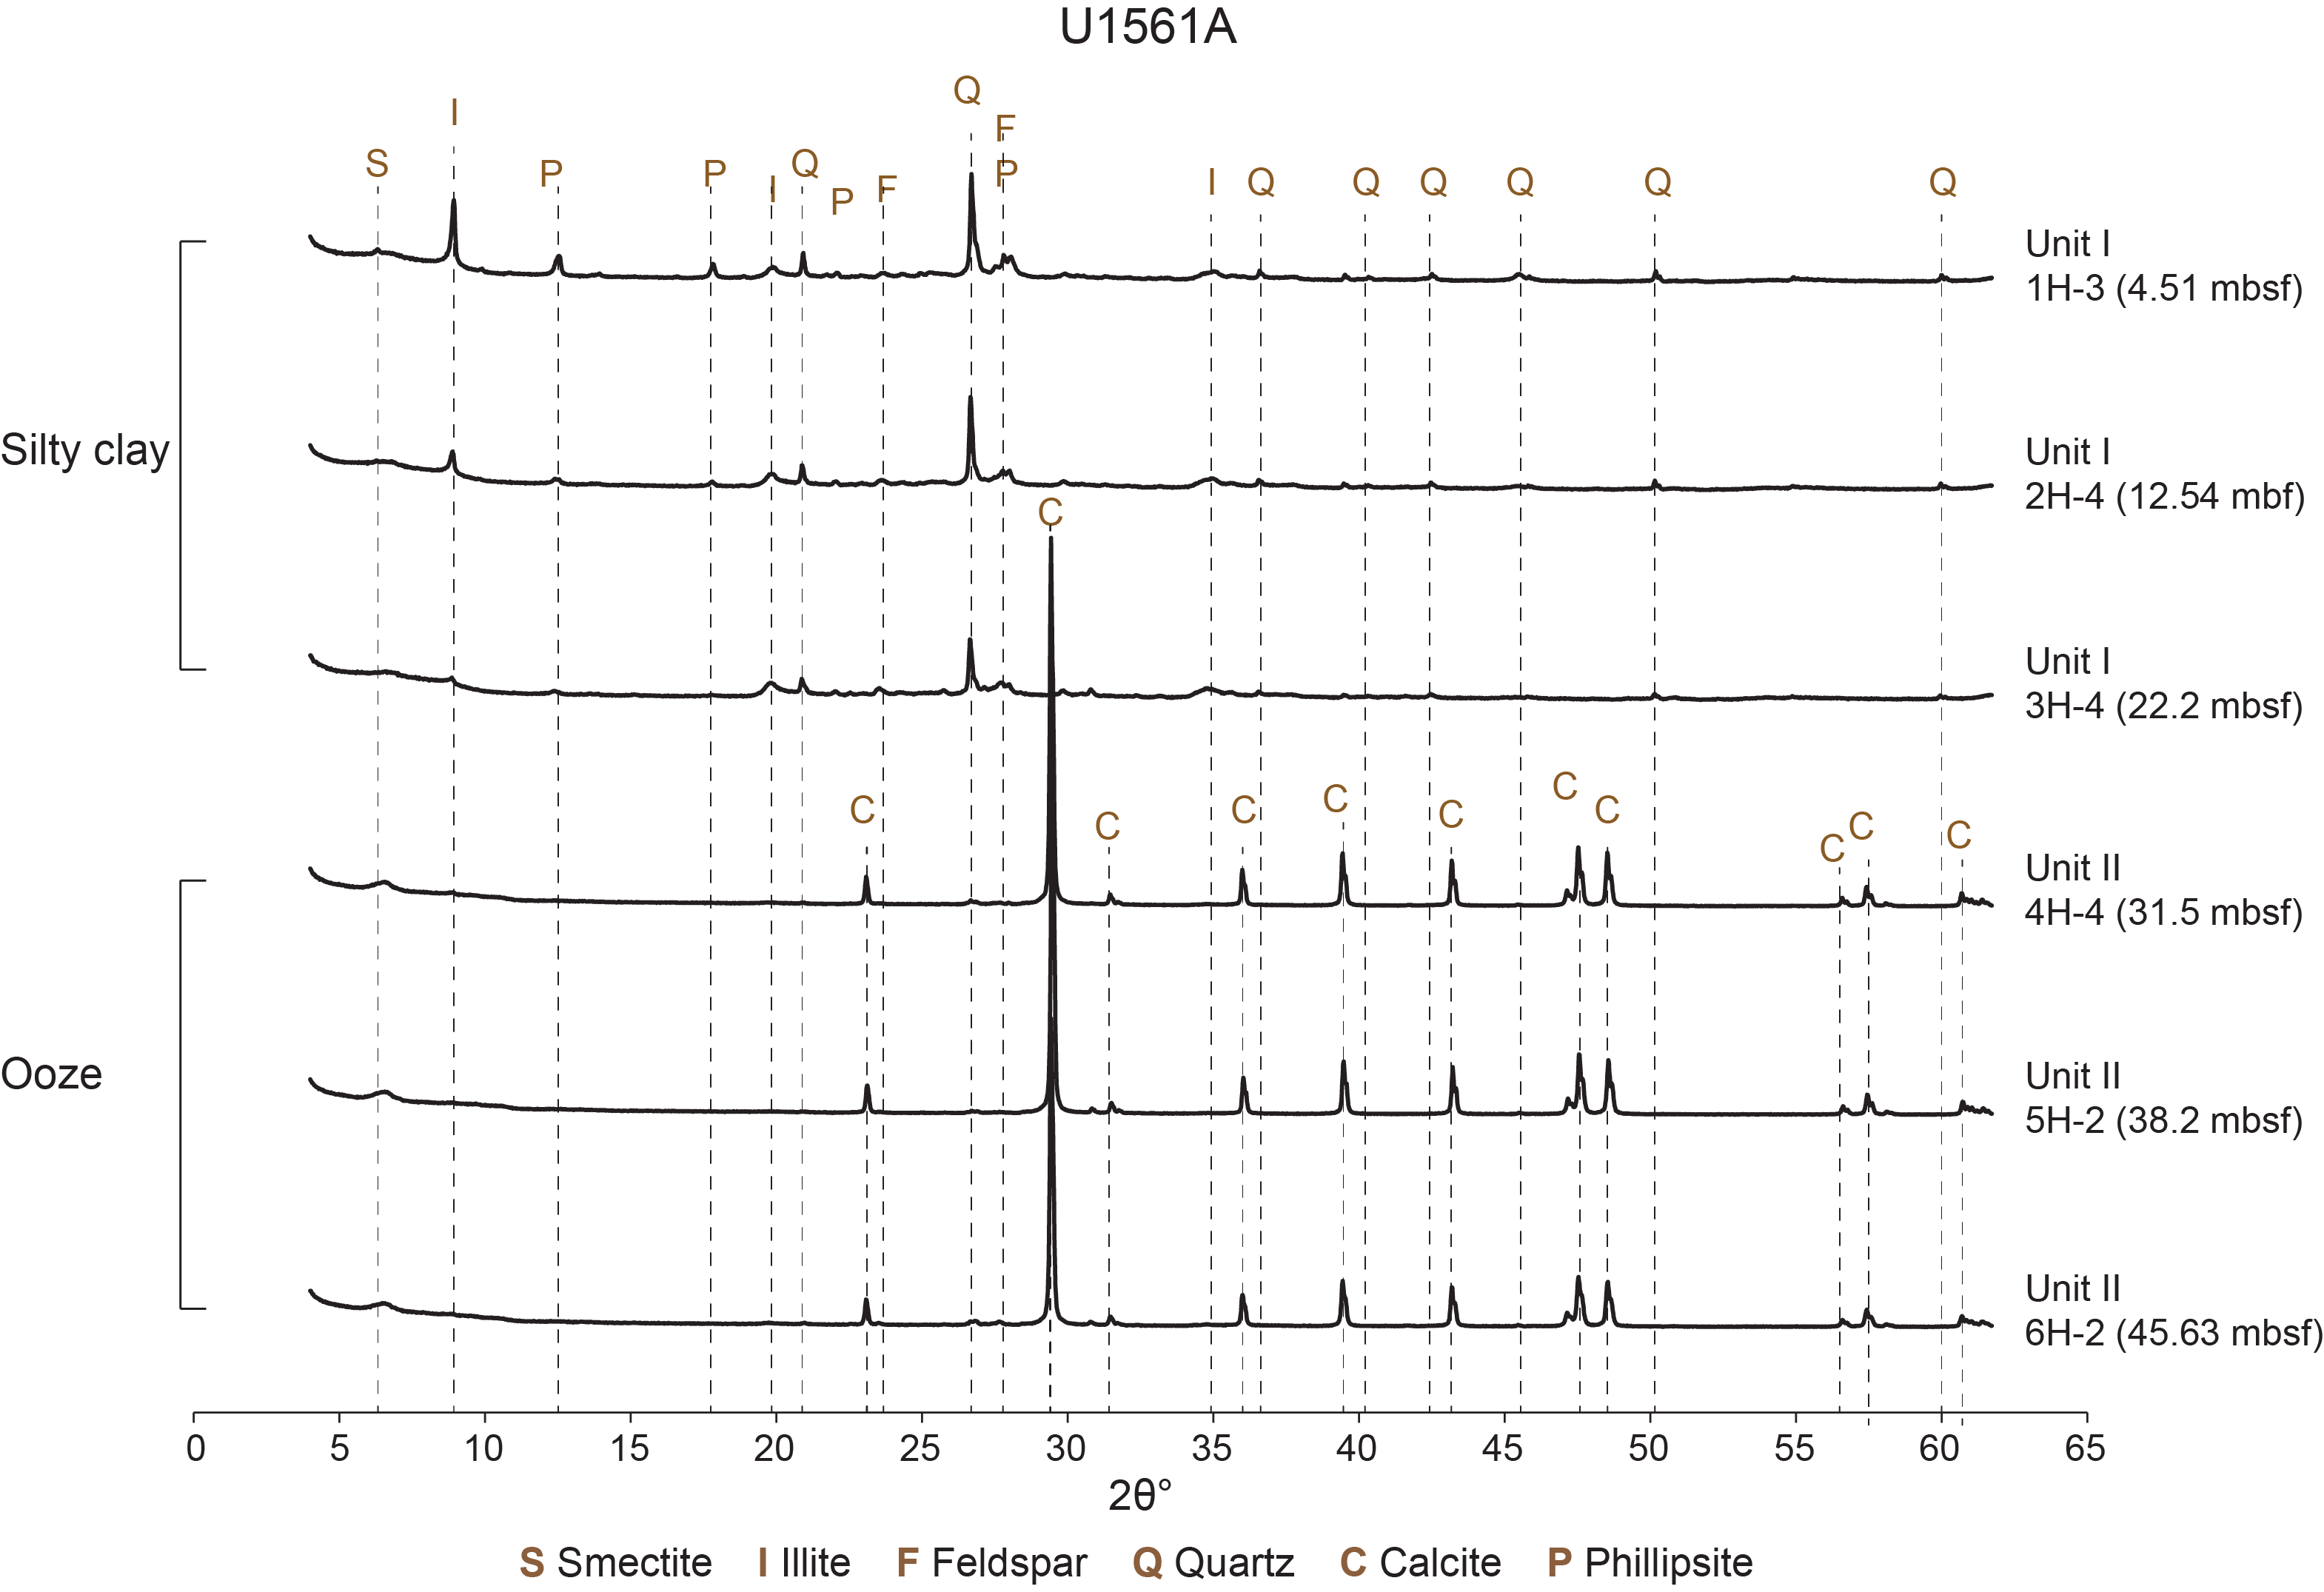
Figure F7. X-ray diffractograms.
The lithologic Unit I/II boundary is located in Section 395E-U1561A-3H-6, 65 cm (49.665 m CSF-B), where the amount of siliciclastic material appears reduced through a gradational transition between the two units (Figures F8, F9, F10). Neither Hole U1561B nor Hole U1561C penetrated the base of Unit I; hence, Unit II was only recovered in Hole U1561A.
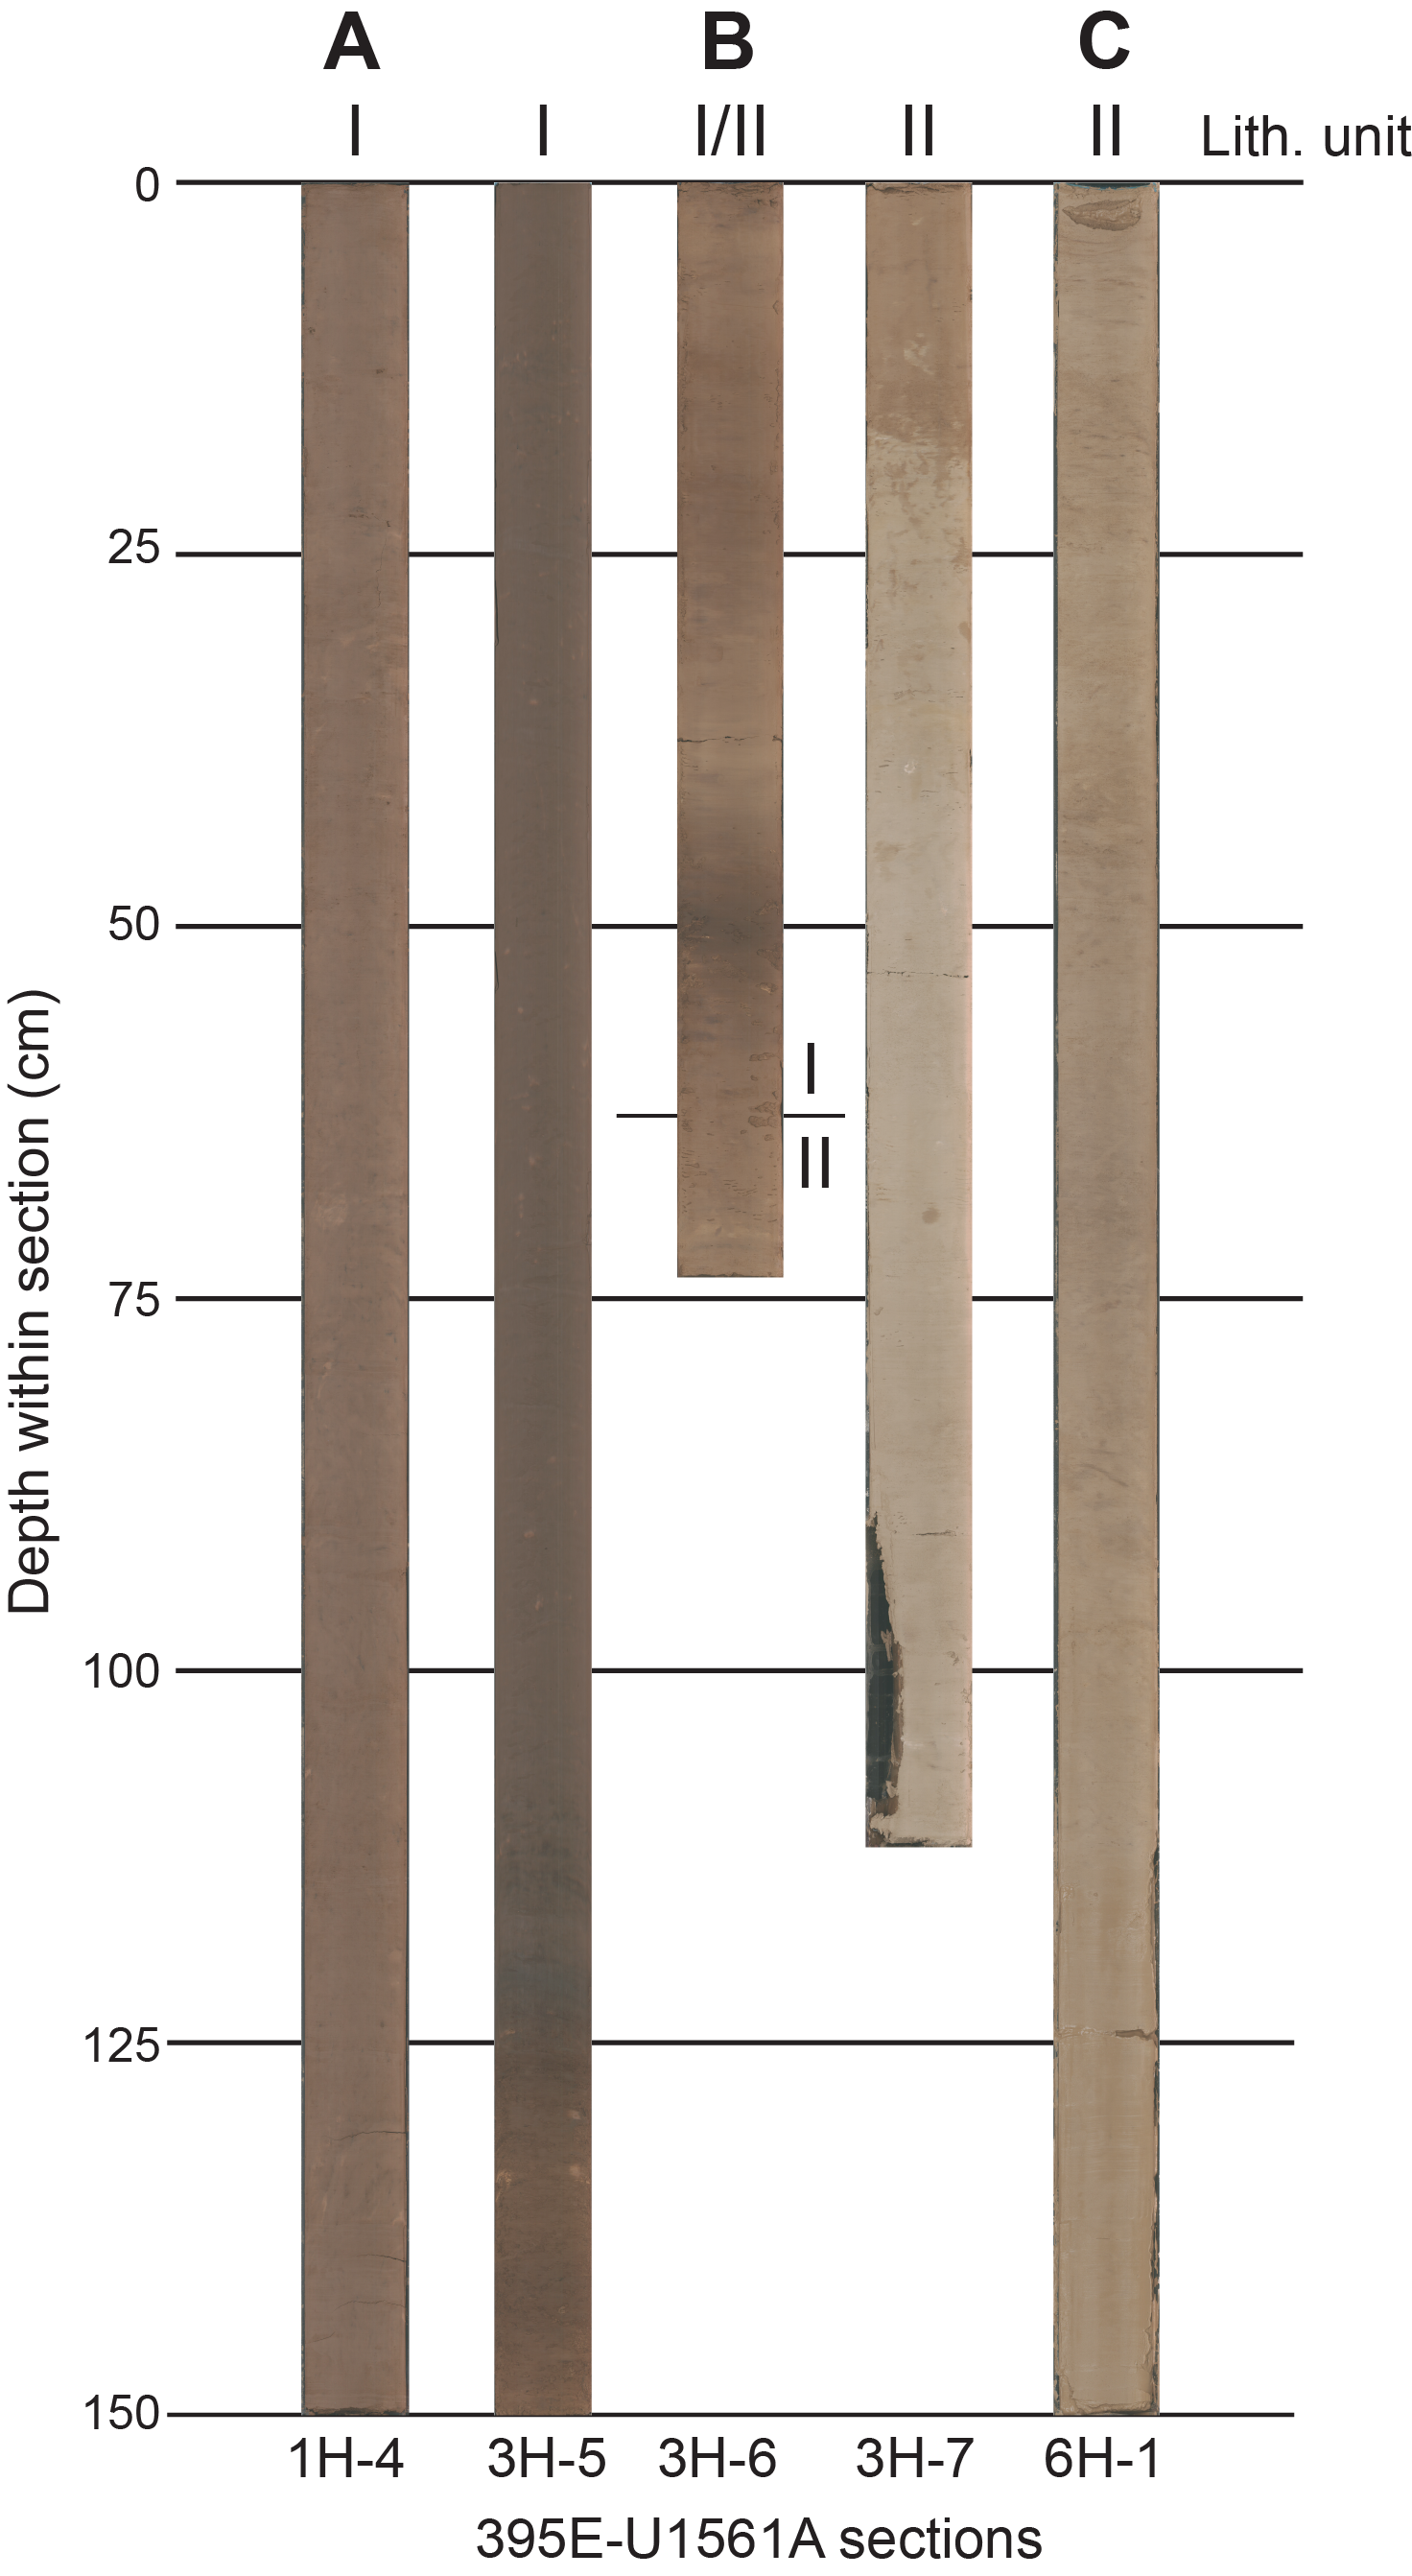
Figure F8. Core sections.
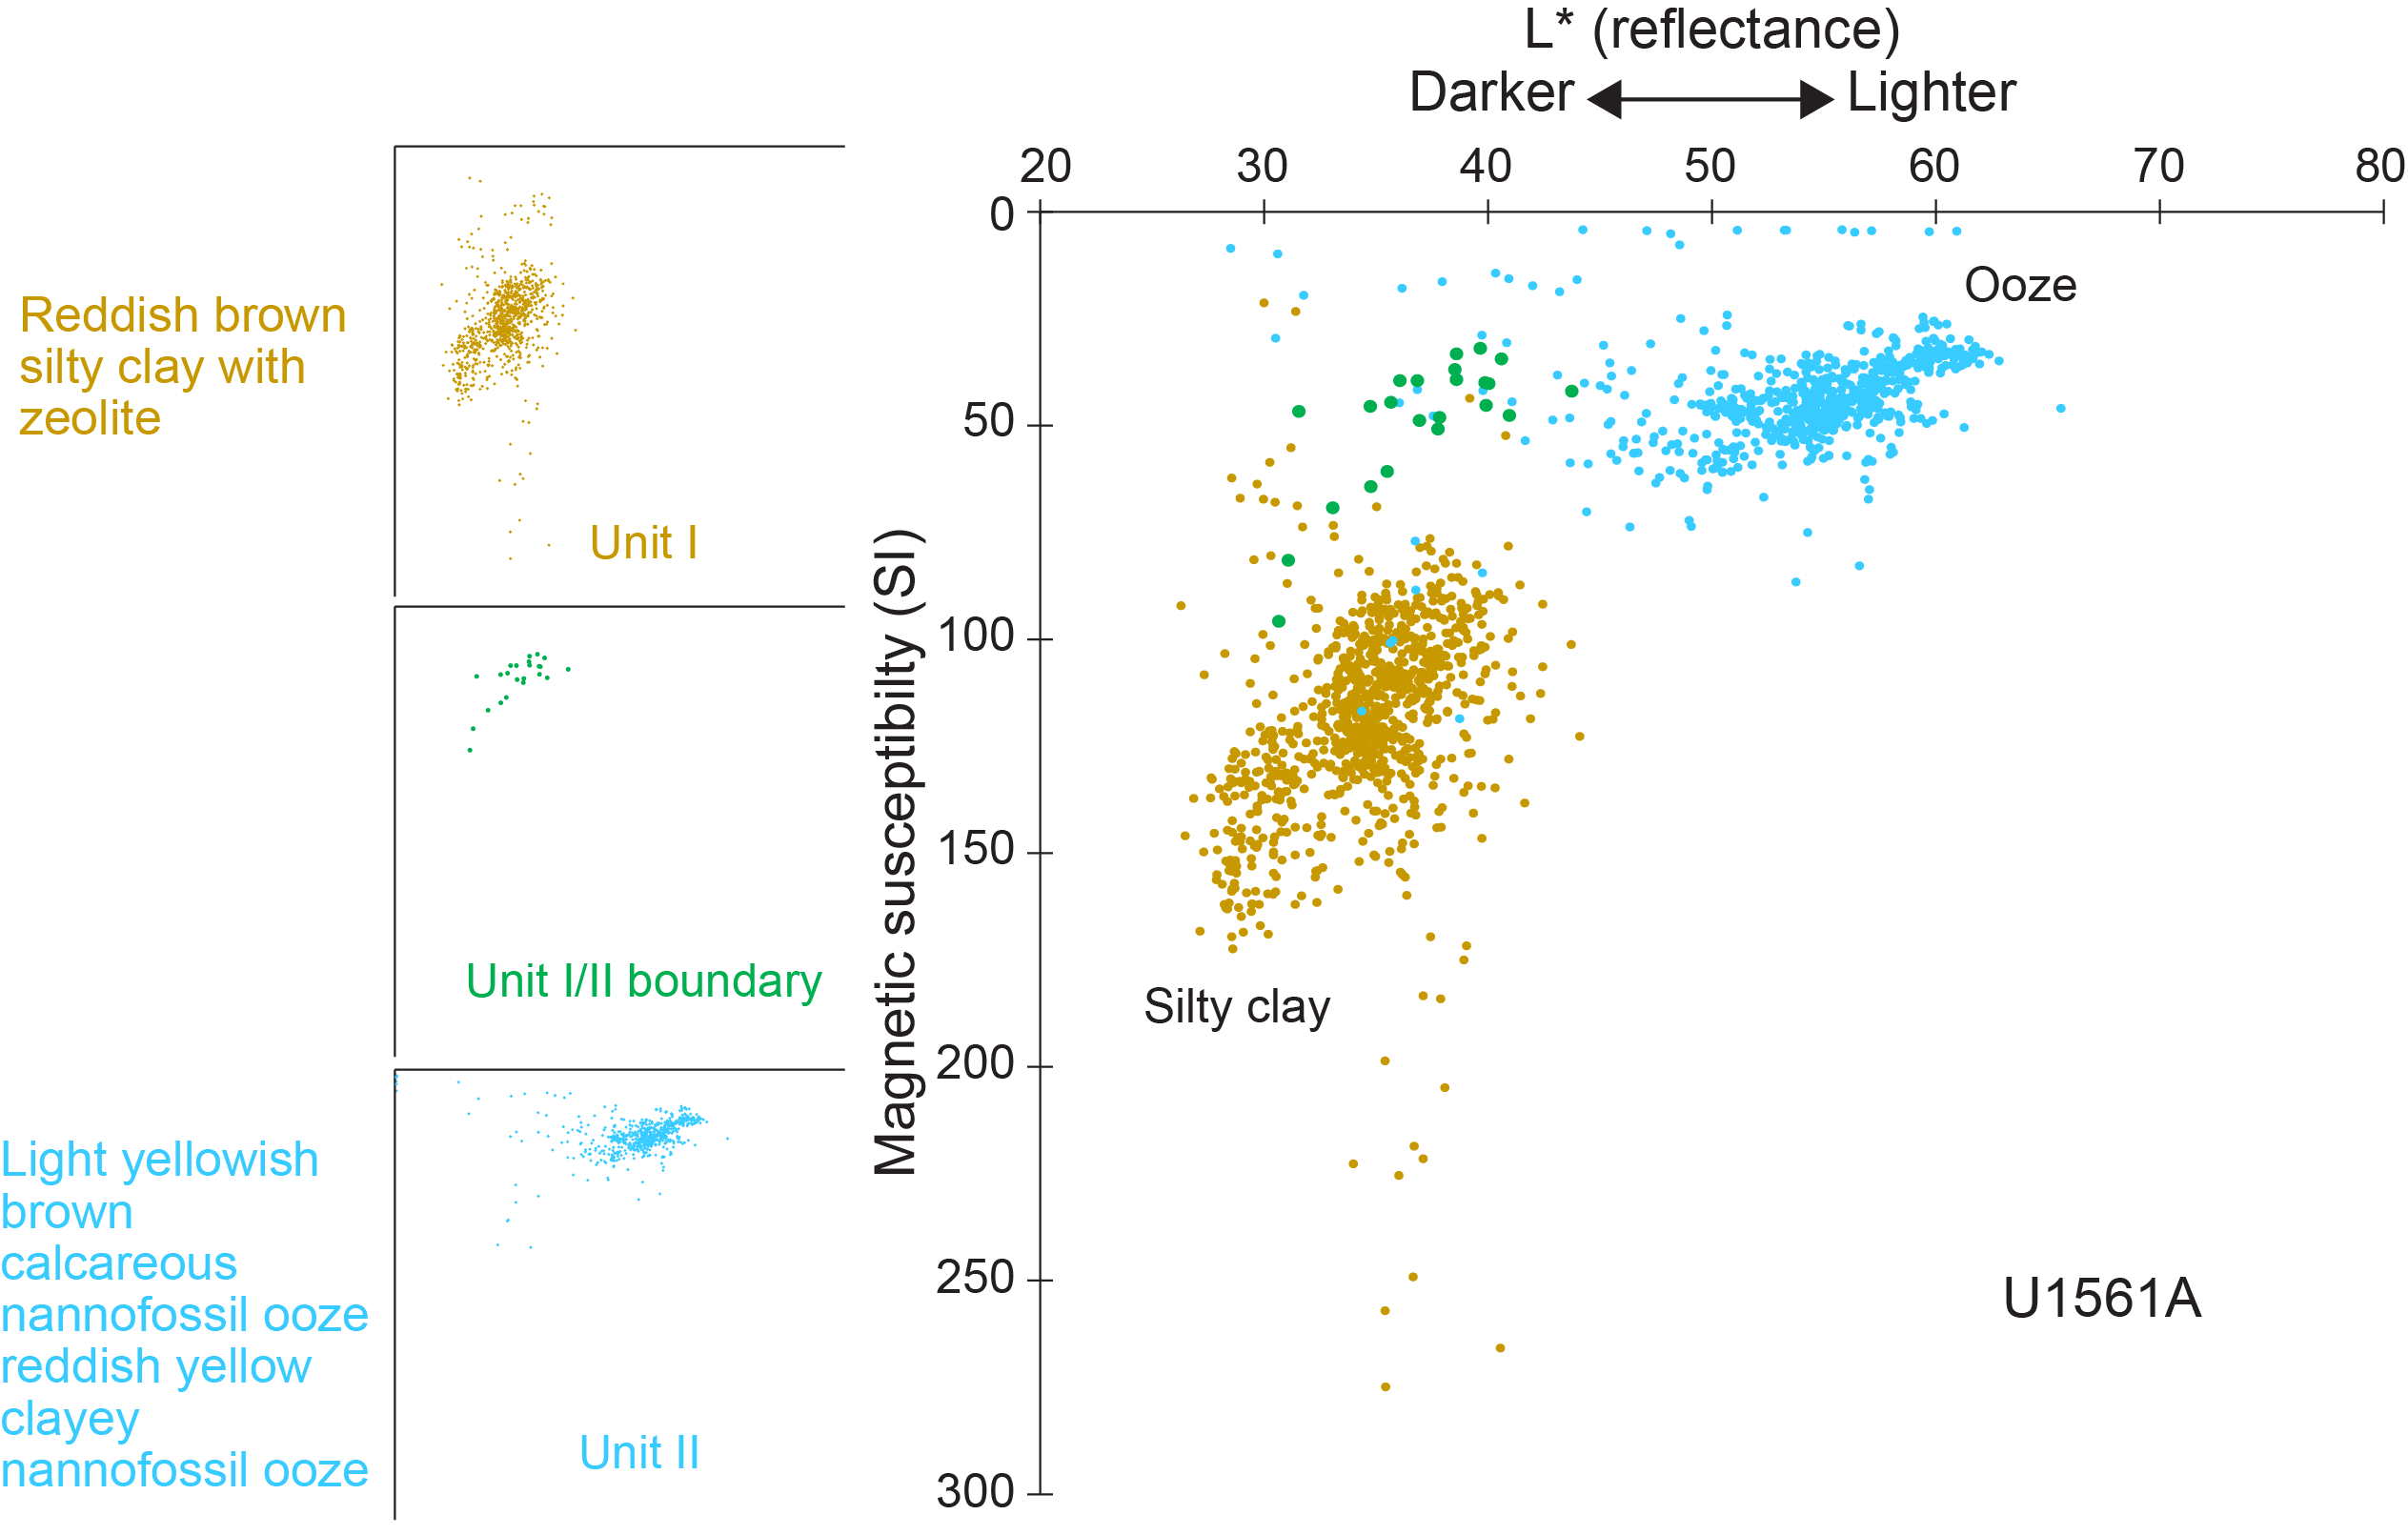
Figure F9. MSP and L* (reflectance).
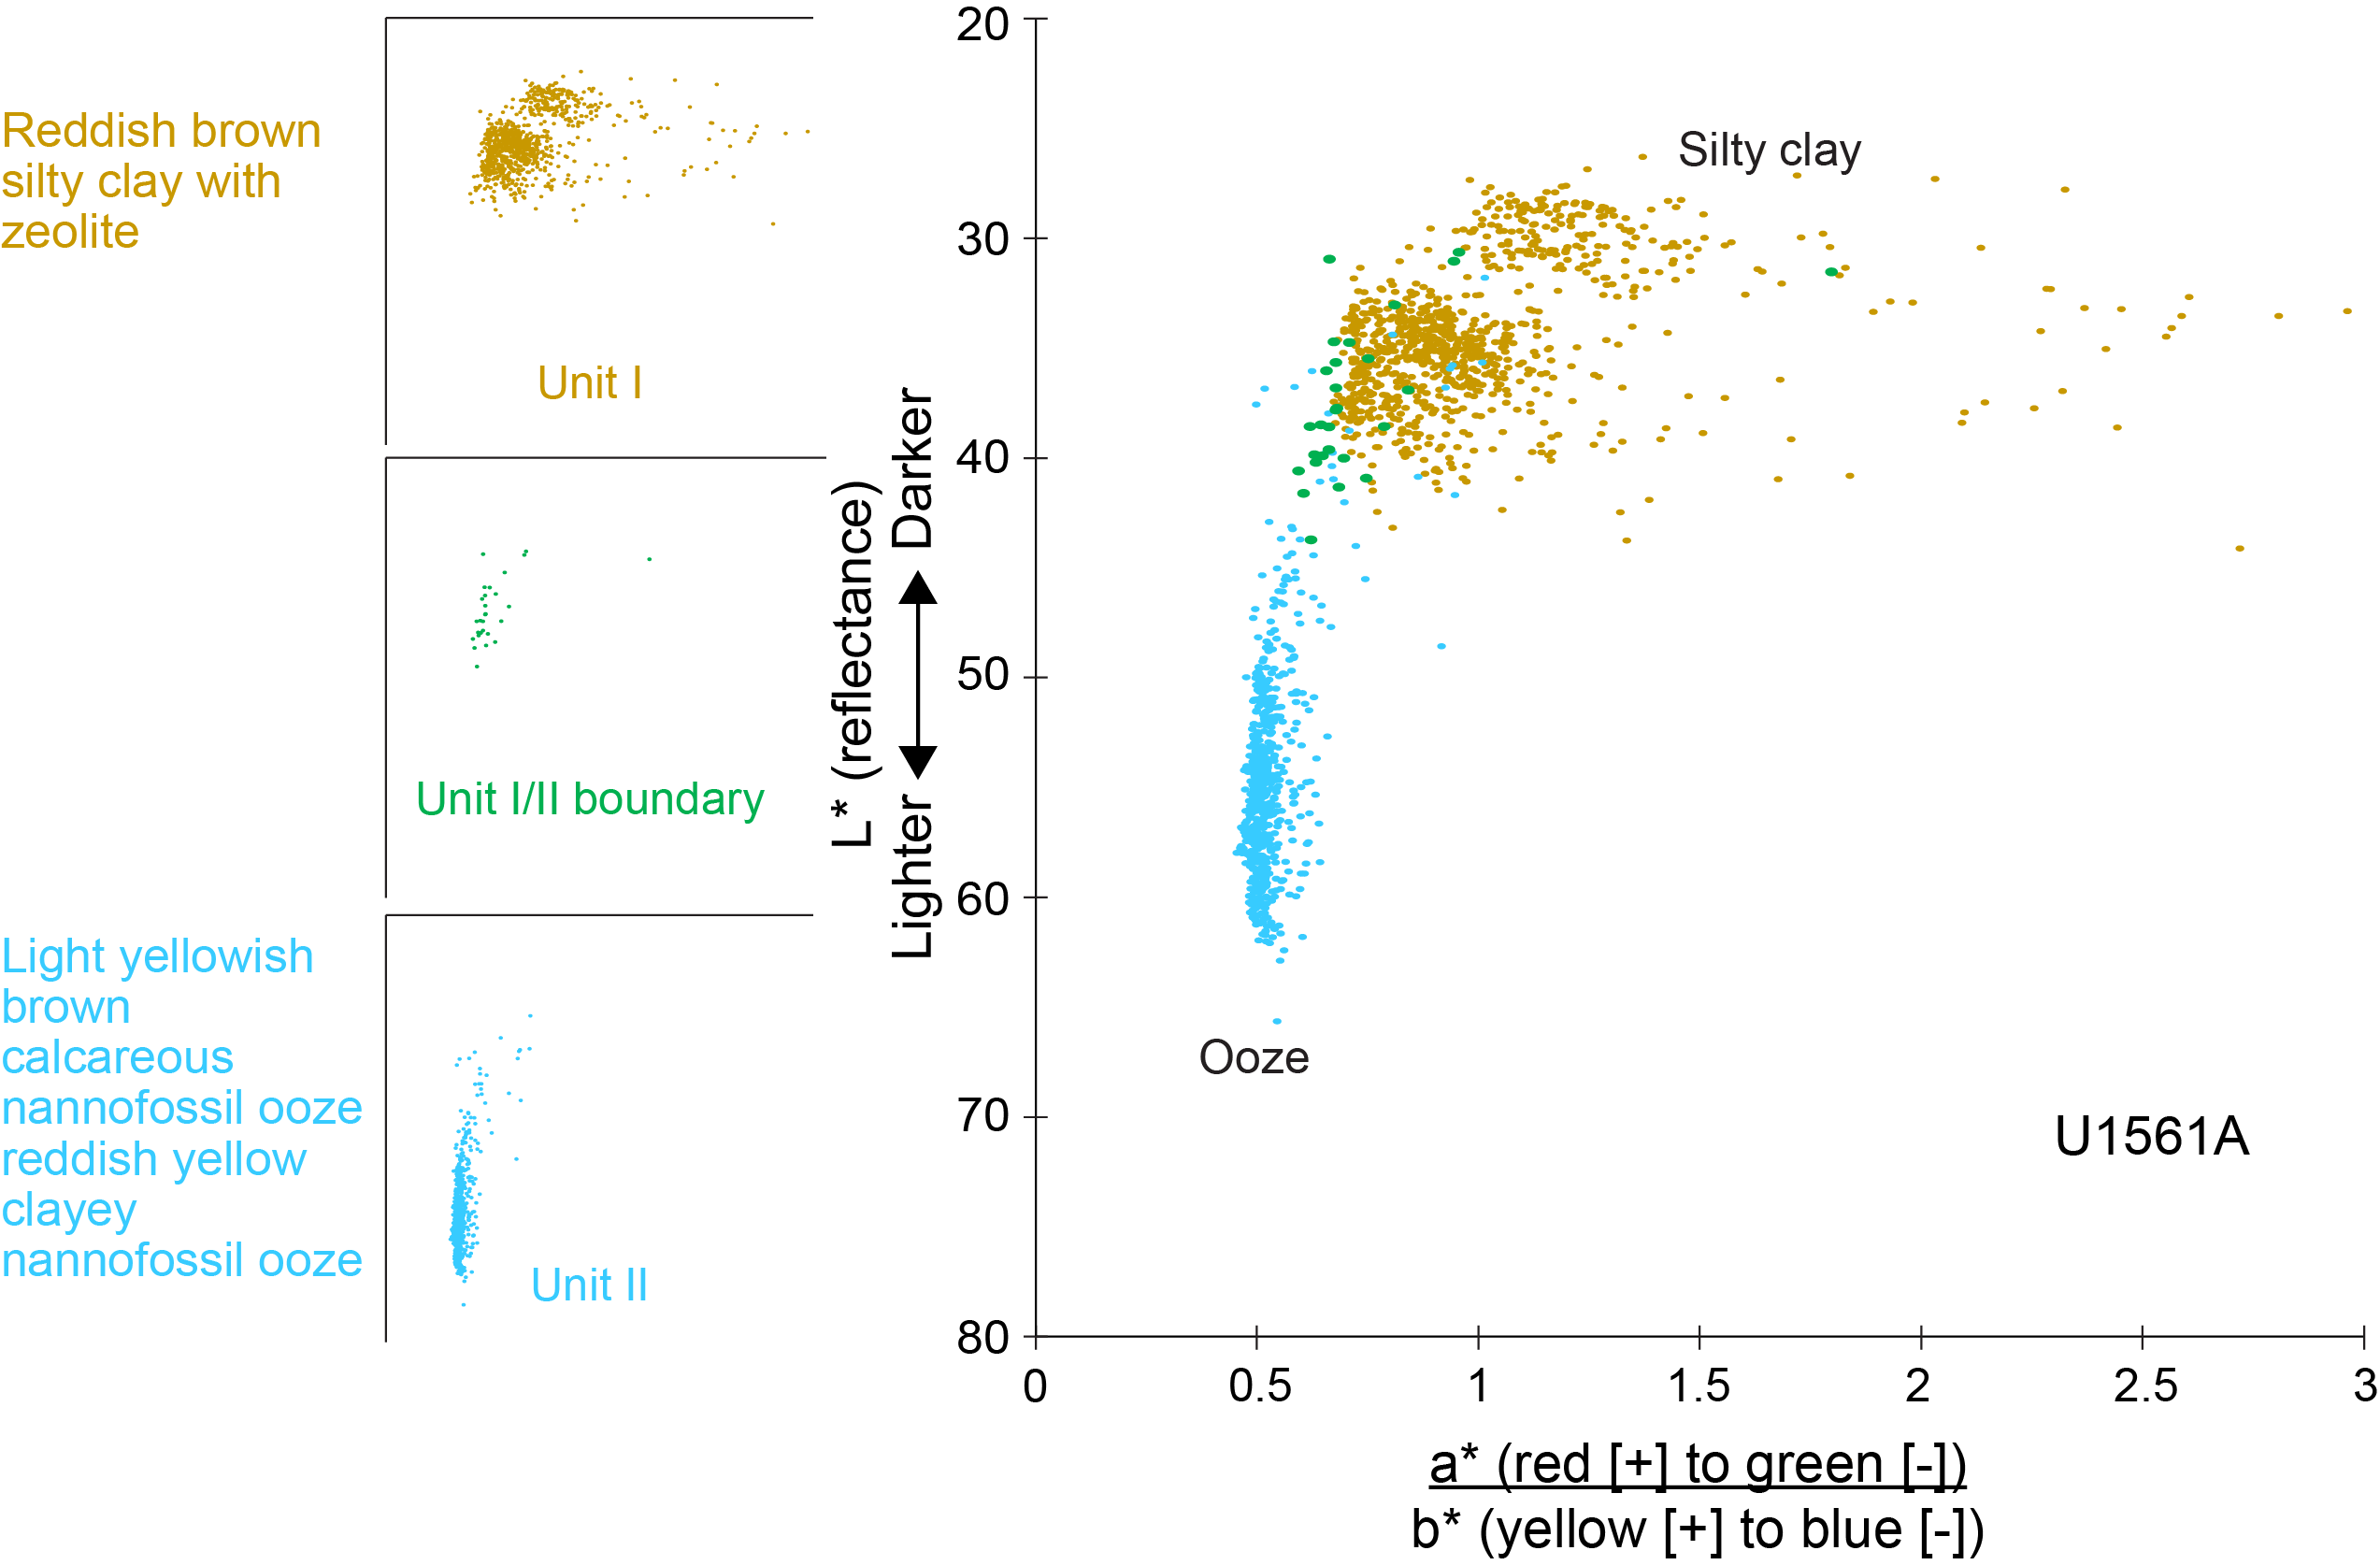
Figure F10. Color reflectance data.
4.1.2. Unit II
- Interval: 395E-U1561A-3H-6, 65 cm, to 6H-CC, 16 cm
- Depth: 24.36–47.88 m CSF-B
- Thickness: 23.52 m
- Age: late Paleocene and earliest Eocene
- Lithology: calcareous nannofossil ooze, clayey nannofossil ooze
Unit II is mainly composed of light yellowish calcareous nannofossil ooze and hosts a variable abundance of foraminifera (Figures F5, F6). Other lithologies include ~19 cm of clayey nannofossil ooze at the top of Unit II (24.36–24.55 m CSF-B) and foraminiferal nannofossil ooze in Section 395E-U1561A-6H-1 (44.74–45.83 m CSF-B). The bioturbation index is sparse throughout Unit II.
The boundary between Unit II and the underlying basement lithology was not recovered. Therefore, the deepest occurrence of nannofossil ooze in Section 395E-U1561A-6H-CC, 16 cm (47.88 m CSF-B), is considered the bottom contact of the unit. Below this depth, Cores 8X and 9X comprise only basement lava flows (see Igneous petrology) with thin (<2 cm) sediment-bearing intervals between chilled margins (indurated calcareous sediment: Section 9X-1 at 33–34, 71–73, 81, and 100 cm).
4.2. X-ray diffraction
Bulk powder XRD analyses results are summarized in Figure F7 and Table T3. Samples were analyzed during engineering Expedition 395E and were predominantly collected from homogeneous intervals (silty clay and ooze/chalk) (see Background and objectives). Differences in mineral assemblages are relatively small with increasing burial depth in the silty clay and ooze/chalk lithologies. The average mineral assemblages for silty clay in Unit I and calcareous nannofossil ooze in Unit II are shown in Table T3.
4.3. Spectrophotometry and point source magnetic susceptibility
Comparisons of spectral data, specifically reflectance and color space (L* a* b*) and point magnetic susceptibility (MSP) measured on the Section Half Multisensor Logger (SHMSL) (see Physical properties and downhole measurements and Sedimentology, both in the Expedition 390/393 methods chapter [Coggon et al., 2024c]) confirm that the two units exhibit different physical properties (Figures F5, F9, F10). The late Neogene silty clay, which occurs only in Unit I, has lower reflectance and higher MSP than the Paleocene–Eocene nannofossil oozes in Unit II (Figures F5, F9). Reflectance and MSP values for silty clay and nannofossil ooze are concentrated in distinct clusters (Figures F9, F10). At the Unit I/II boundary, there is a <1 m thick interval (22.71–24.39 m CSF-B) of sediment that exhibits gradational chromaticity and MSP changes between the dominant values of Units I and II (Figures F9, F10). Unit II, which contains a high concentration of calcite (Figure F7), displays high reflectance and low a*/b* ratios (Figure F10) (i.e., less yellowish or more pink/red).
5. Igneous petrology
Site U1561 targeted sediments and the uppermost basalts in ~61.2 Ma upper ocean crust, approximately the same age as Site U1556 but 24 km to the north and with a much thinner sediment cover. Igneous basement in Hole U1561A was reached at 46 mbsf, and 2.4 m of dark reddish gray aphyric basalt was recovered from a cored interval of 2.4 m (100% recovery). Analysis of the rocks using portable X-ray fluorescence (pXRF) suggests that they are alkali basalts with [Zr/Ti]N values (1.65 ± 0.07, n = 4, 1σ) similar to those of the alkali basalts at the top of Hole U1556B (i.e., Stratigraphic Sequence A; see Igneous petrology in the Site U1556 chapter [Coggon et al., 2024a]).
The recovered basaltic interval includes several complete pillow lavas chilled against each other and/or themselves (Figure F11). Each chilled contact consists of brecciated and altered glass interlaid with 0.5–3 cm of pinkish gray to white indurated calcareous sediment (Figure F11). These sediments contain fossil foraminifera, indicating a pelagic origin. Not all of the recovered glassy intervals represent the margins of separate pillow lava flows. In interval 395E-U1561A-8X-1, 80–81 cm, for example, the glassy section may represent a fold in a larger pillow because it does not completely transect the core face and it has broad chilled zones above and below it. The distance between successive chilled contacts indicates pillow lobe sizes of 30–40 cm.
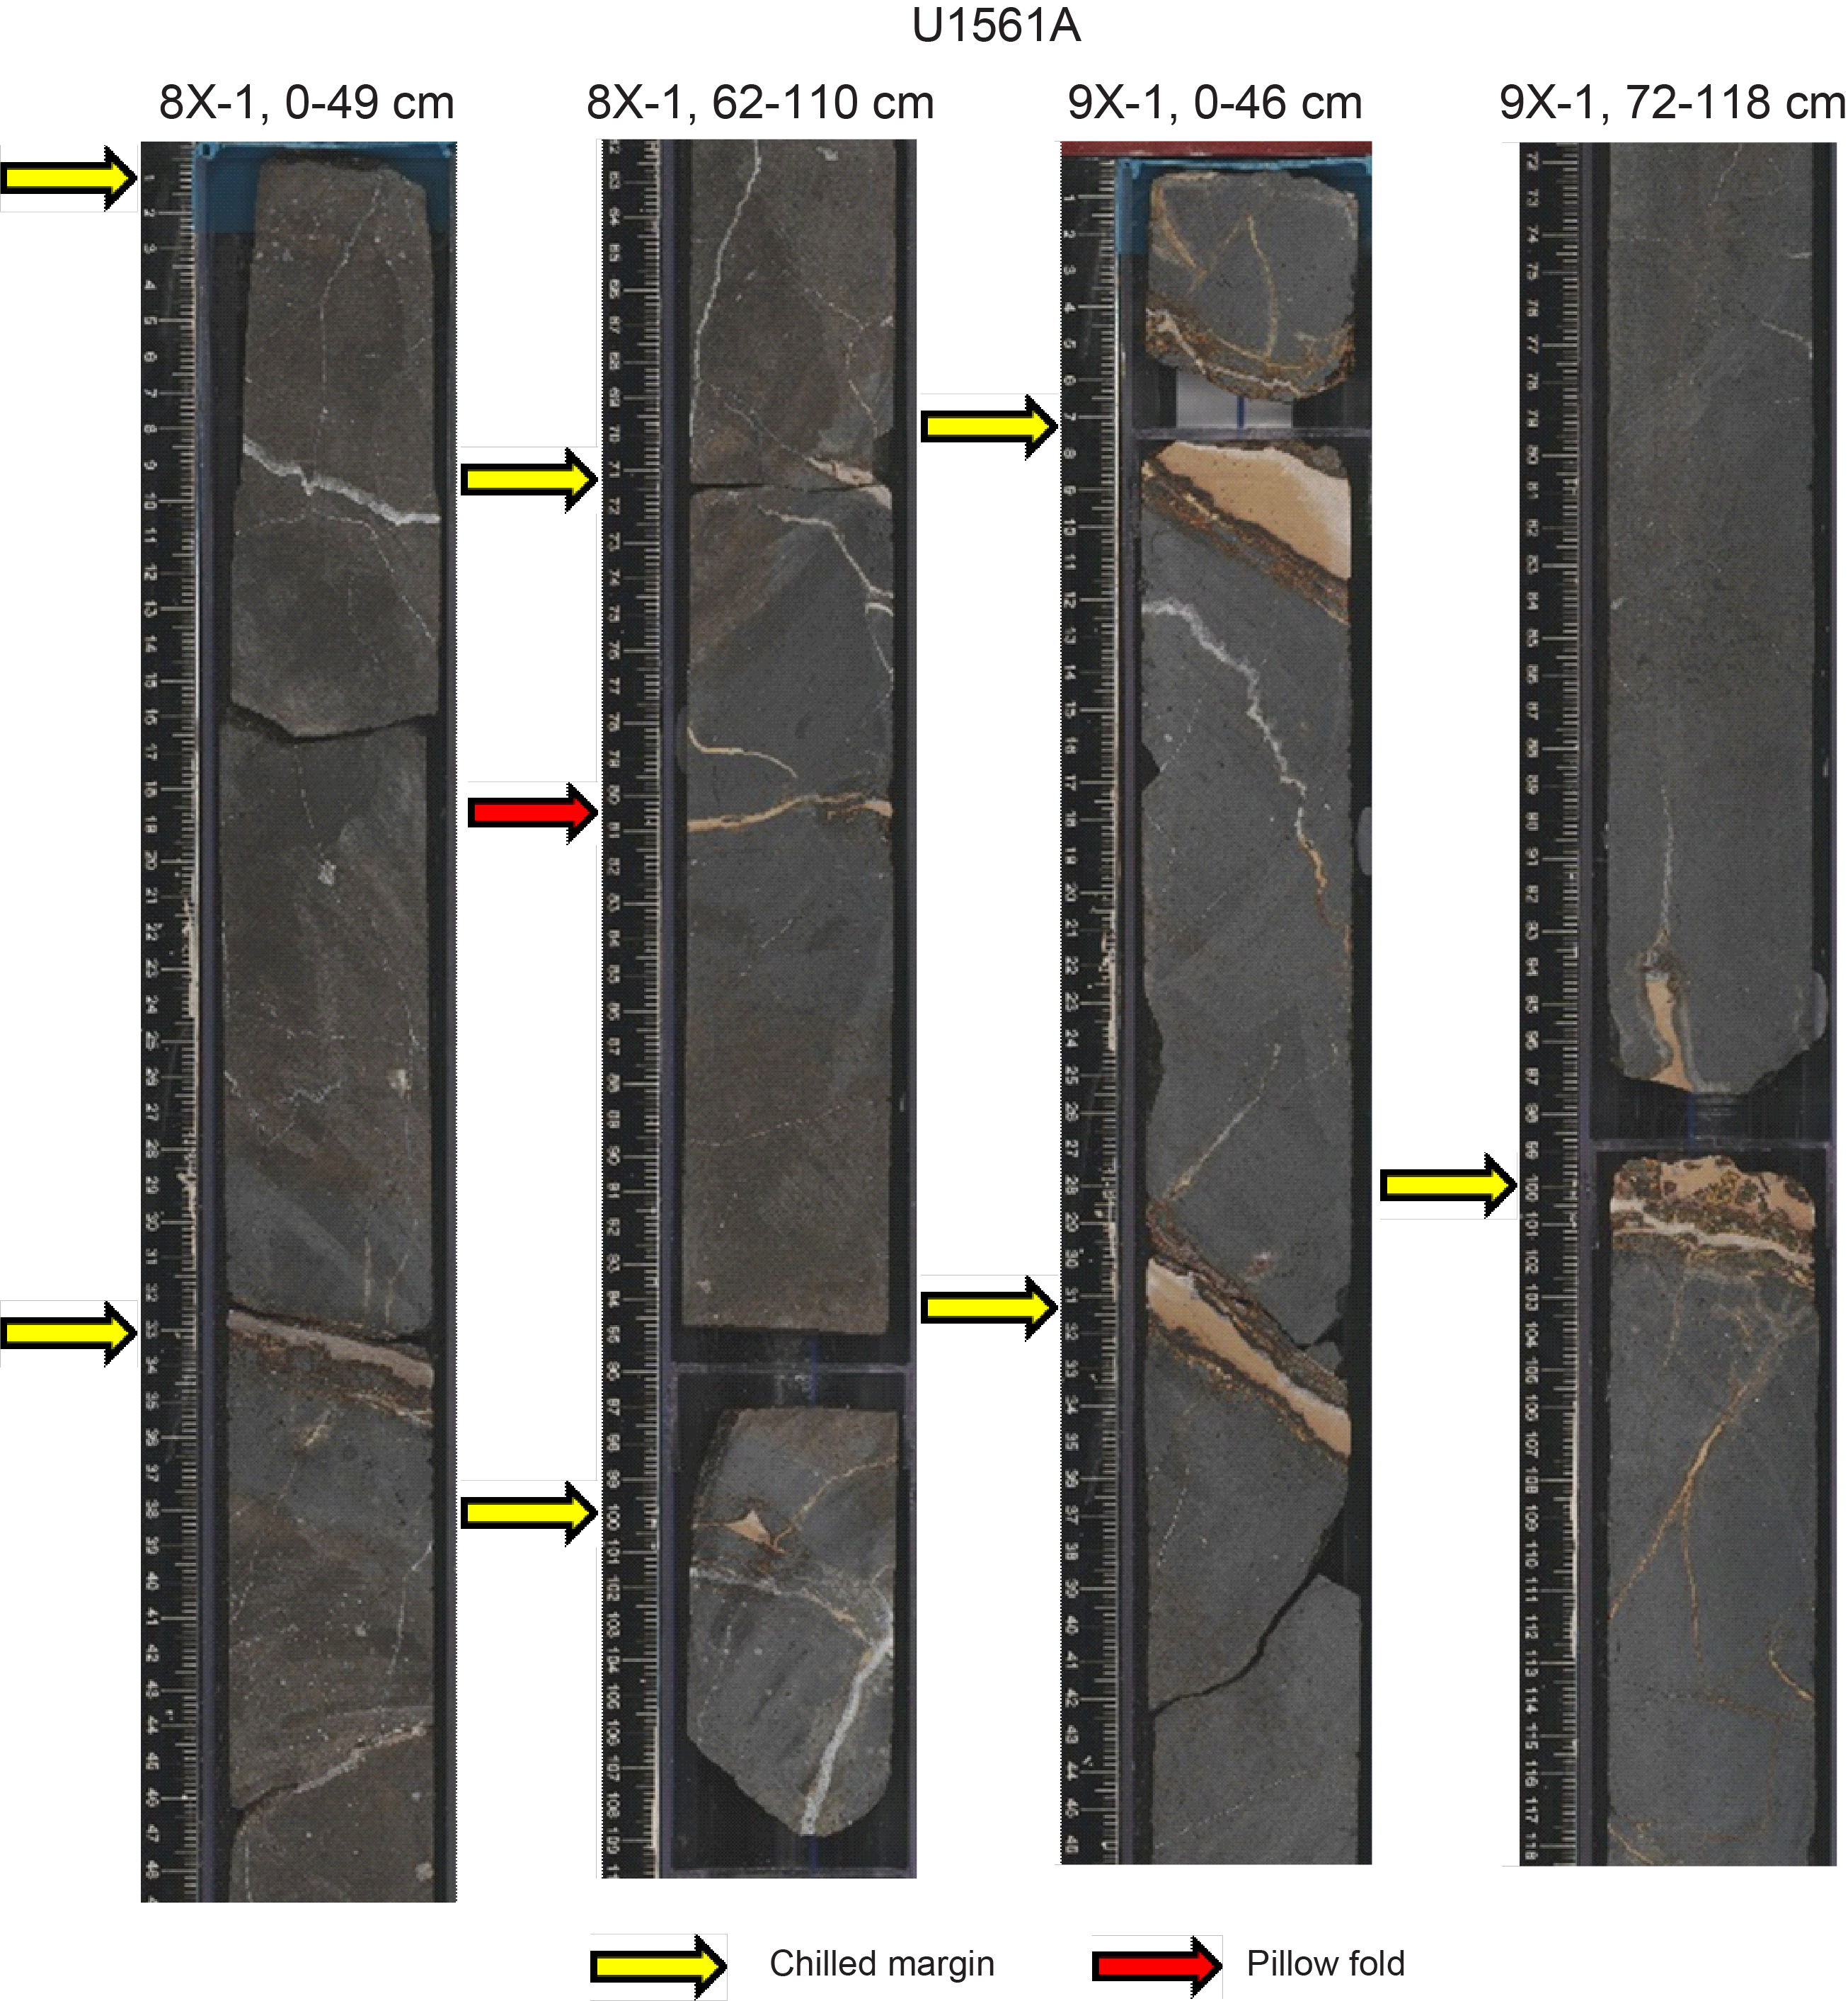
Figure F11. Numerous chilled contacts.
The basalts are sparsely vesicular overall but are locally moderately vesicular. The most abundant vesicles are small (<2 mm) and round, and they cluster near chilled margins. There are rare larger vesicles that in some cases form elongate tubes that range up to 30 mm long and 5 mm wide. Both vesicle types are filled by calcite in most areas of the recovered cores, but some vesicles in chilled margins are unfilled.
In thin section, the basalts are very sparsely olivine microphyric with cryptocrystalline groundmass dominated by dendritic and plumose quench crystal morphologies. Olivine microphenocrysts (up to 0.3 mm) range from euhedral equant to skeletal in form, including some lantern and hopper crystals (Figure F12A). Where they are trapped in a glassy chilled margin, the olivine phenocrysts are remarkably fresh, whereas outside these areas they are completely altered to a mixture of smectite ± Fe oxyhydroxides (see Alteration petrology). Groundmass olivines may also be skeletal, with hollow centers and acicular extensions from the apexes of the crystals (Figure F12B). Groundmass plagioclase is restricted to tiny needles that lie at the heart of the brown plumose quench crystal growth (Figure F12B).
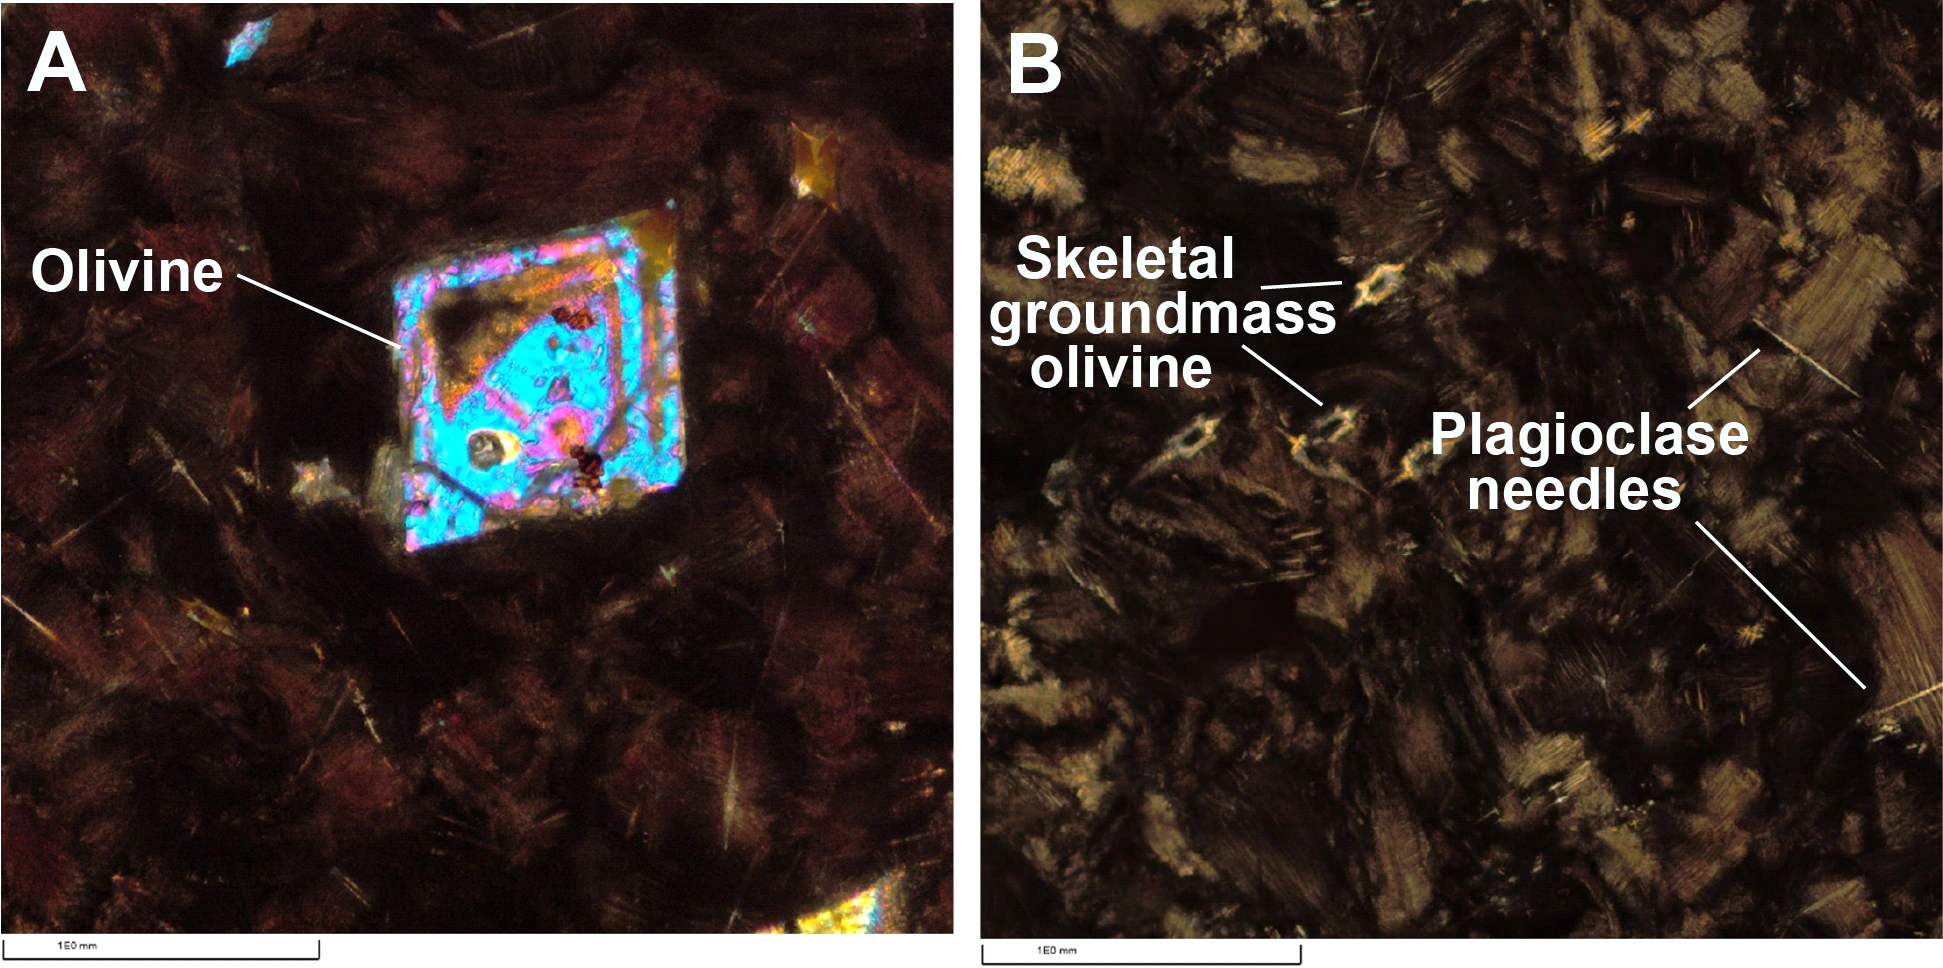
Figure F12. Skeletal olivine microphenocryst and groundmass crystals.
6. Alteration petrology
6.1. Basement alteration
Alteration features logged at Site U1561 comprise background alteration, halos, and secondary mineral–filled veins and vesicles similar to those described at Site U1556 (see Alteration petrology in the Site U1556 chapter [Coggon et al., 2024a]). The pillow basalts recovered from the uppermost basement in Hole U1561A show variable alteration with gradation from slightly altered dark gray cryptocrystalline pillow margins through mottled alteration with concentric bull's-eye patterns in thin section (Figure F13) to fairly intense orange halos (see Alteration petrology in the Site U1556 chapter [Coggon et al., 2024a]) paralleling the chilled margins. Orange speckled background alteration, characterized by pseudomorphic alteration of olivine phenocrysts with fresher groundmass, albeit somewhat reddened, occurs in some pillow interiors (Figure F14).
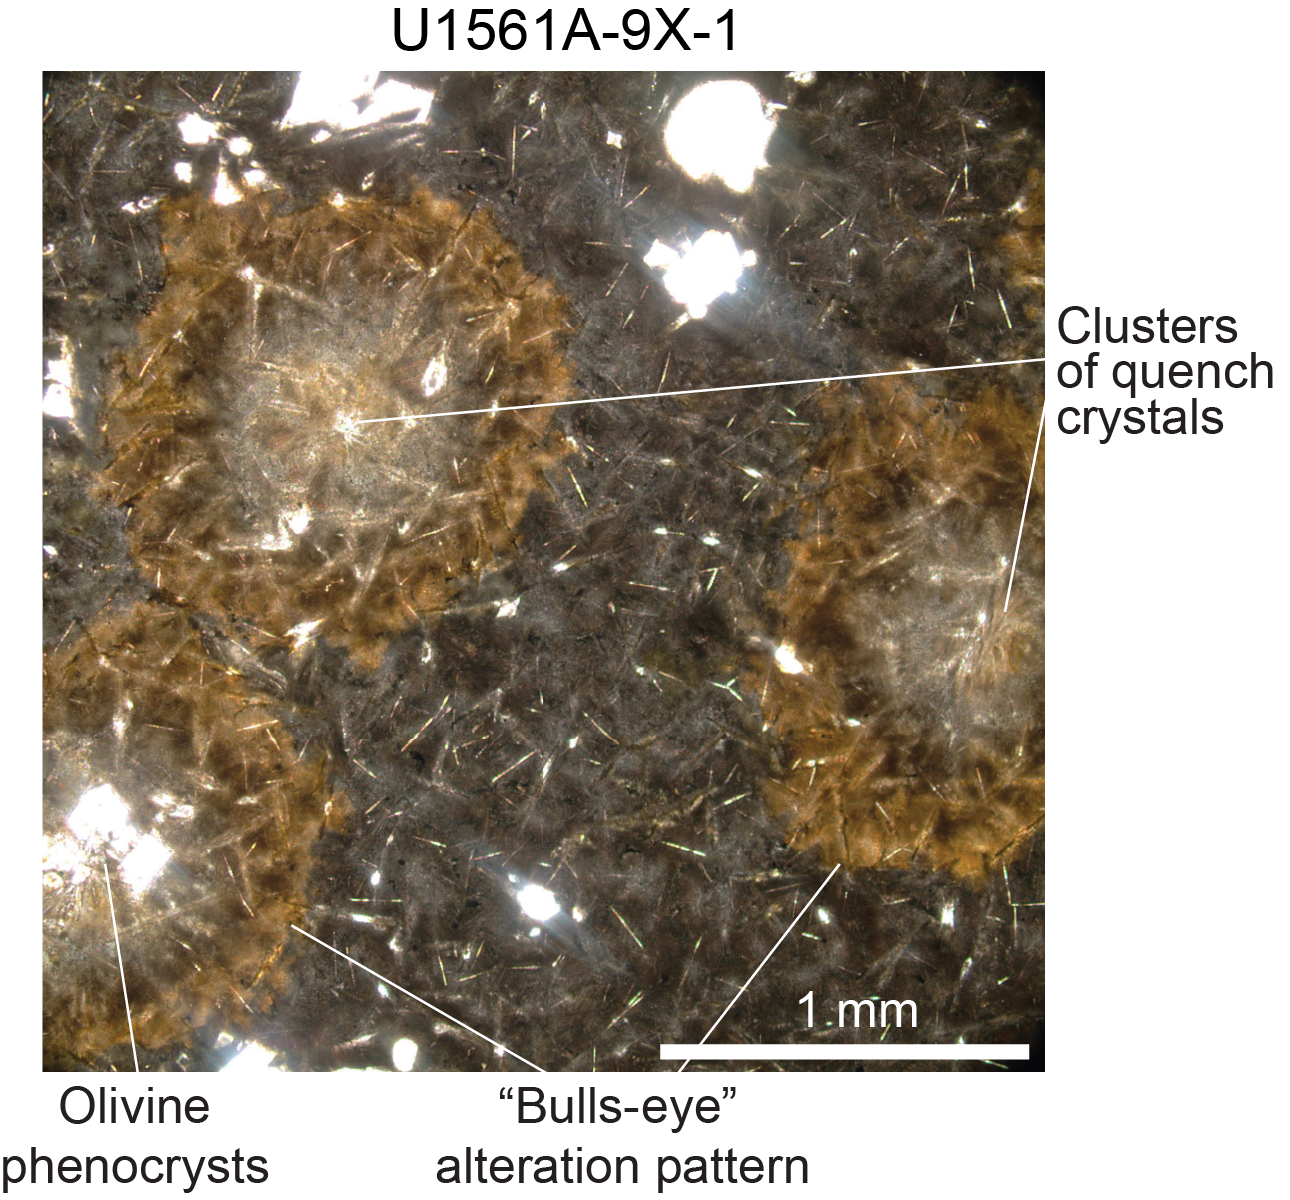
Figure F13. Bull's-eye alteration pattern.
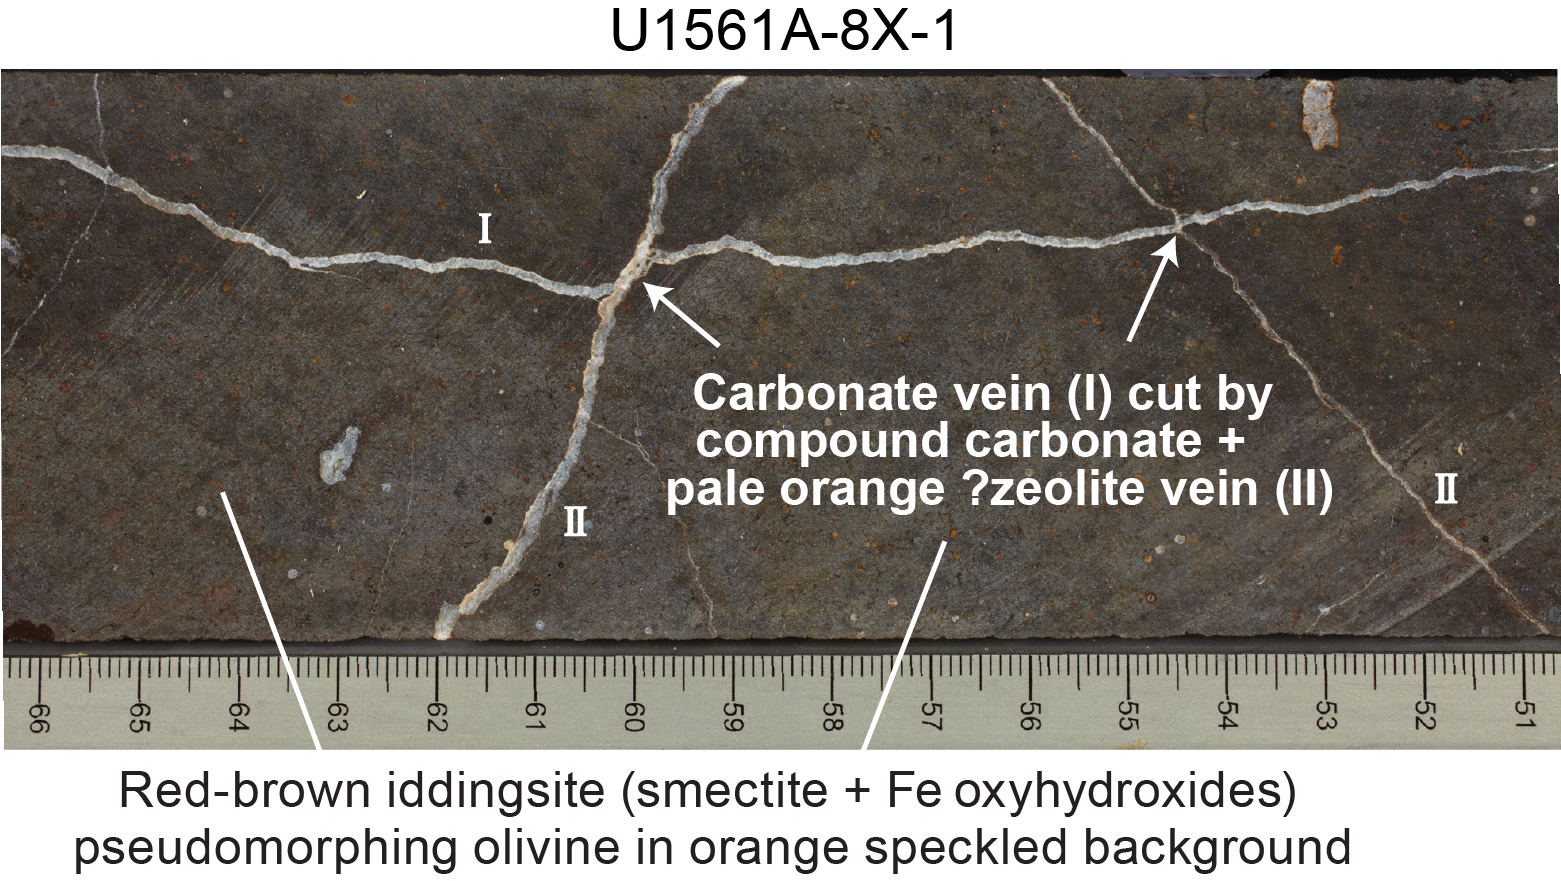
Figure F14. White carbonate and compound carbonate + zeolite veins.
Thick (up to 3 mm wide) carbonate veins are common. Some veins record multiple episodes of fracturing and precipitation, and many have developed >10 mm wide dark orange halos. Some carbonate veins crosscut one another (Figure F14). Recrystallized sediment/sediment-derived veins (see Alteration petrology in the Site U1556 chapter [Coggon et al., 2024a]) are associated with and sandwiched between glassy margins. Other veins exhibit a range of different mineral fills including massive yellow zeolite + carbonate (most likely sediment derived), carbonate, and zeolite + clay. Small vesicles are abundant and are typically unfilled in the cryptocrystalline chilled margins of the basalt pillows but filled with zeolite and carbonate in the pillow interiors.
7. Biostratigraphy
The ~45 m thick sedimentary succession at Site U1561 contains a sequence of Neogene pelagic clay and Paleocene–Eocene calcareous nannofossil ooze. Calcareous nannofossils and planktic foraminifera are abundant in the ooze and very rare (planktic foraminifera) to absent (calcareous nannoplankton) from the clays, and they are moderately preserved throughout the carbonate sequence. Biostratigraphic zonation is based on analysis of core catcher samples from Hole U1561A (collected during Expedition 395E) and additional nannofossil samples taken from the archive halves of split sections to further refine the biostratigraphic zonation.
Benthic foraminifera are present in Paleocene samples and suggest that Site U1561 was at upper abyssal depths (2000–3000 m) at this time.
An integrated calcareous nannofossil and planktic foraminiferal biozonation for Site U1561 is shown in Figure F15 and summarized in Table T4. An age-depth plot of biostratigraphic datums and paleomagnetic reversals can be found in Figure F20, and datums are provided in Table T8. A summary of microfossil preservation and abundance is shown in Figure F16.
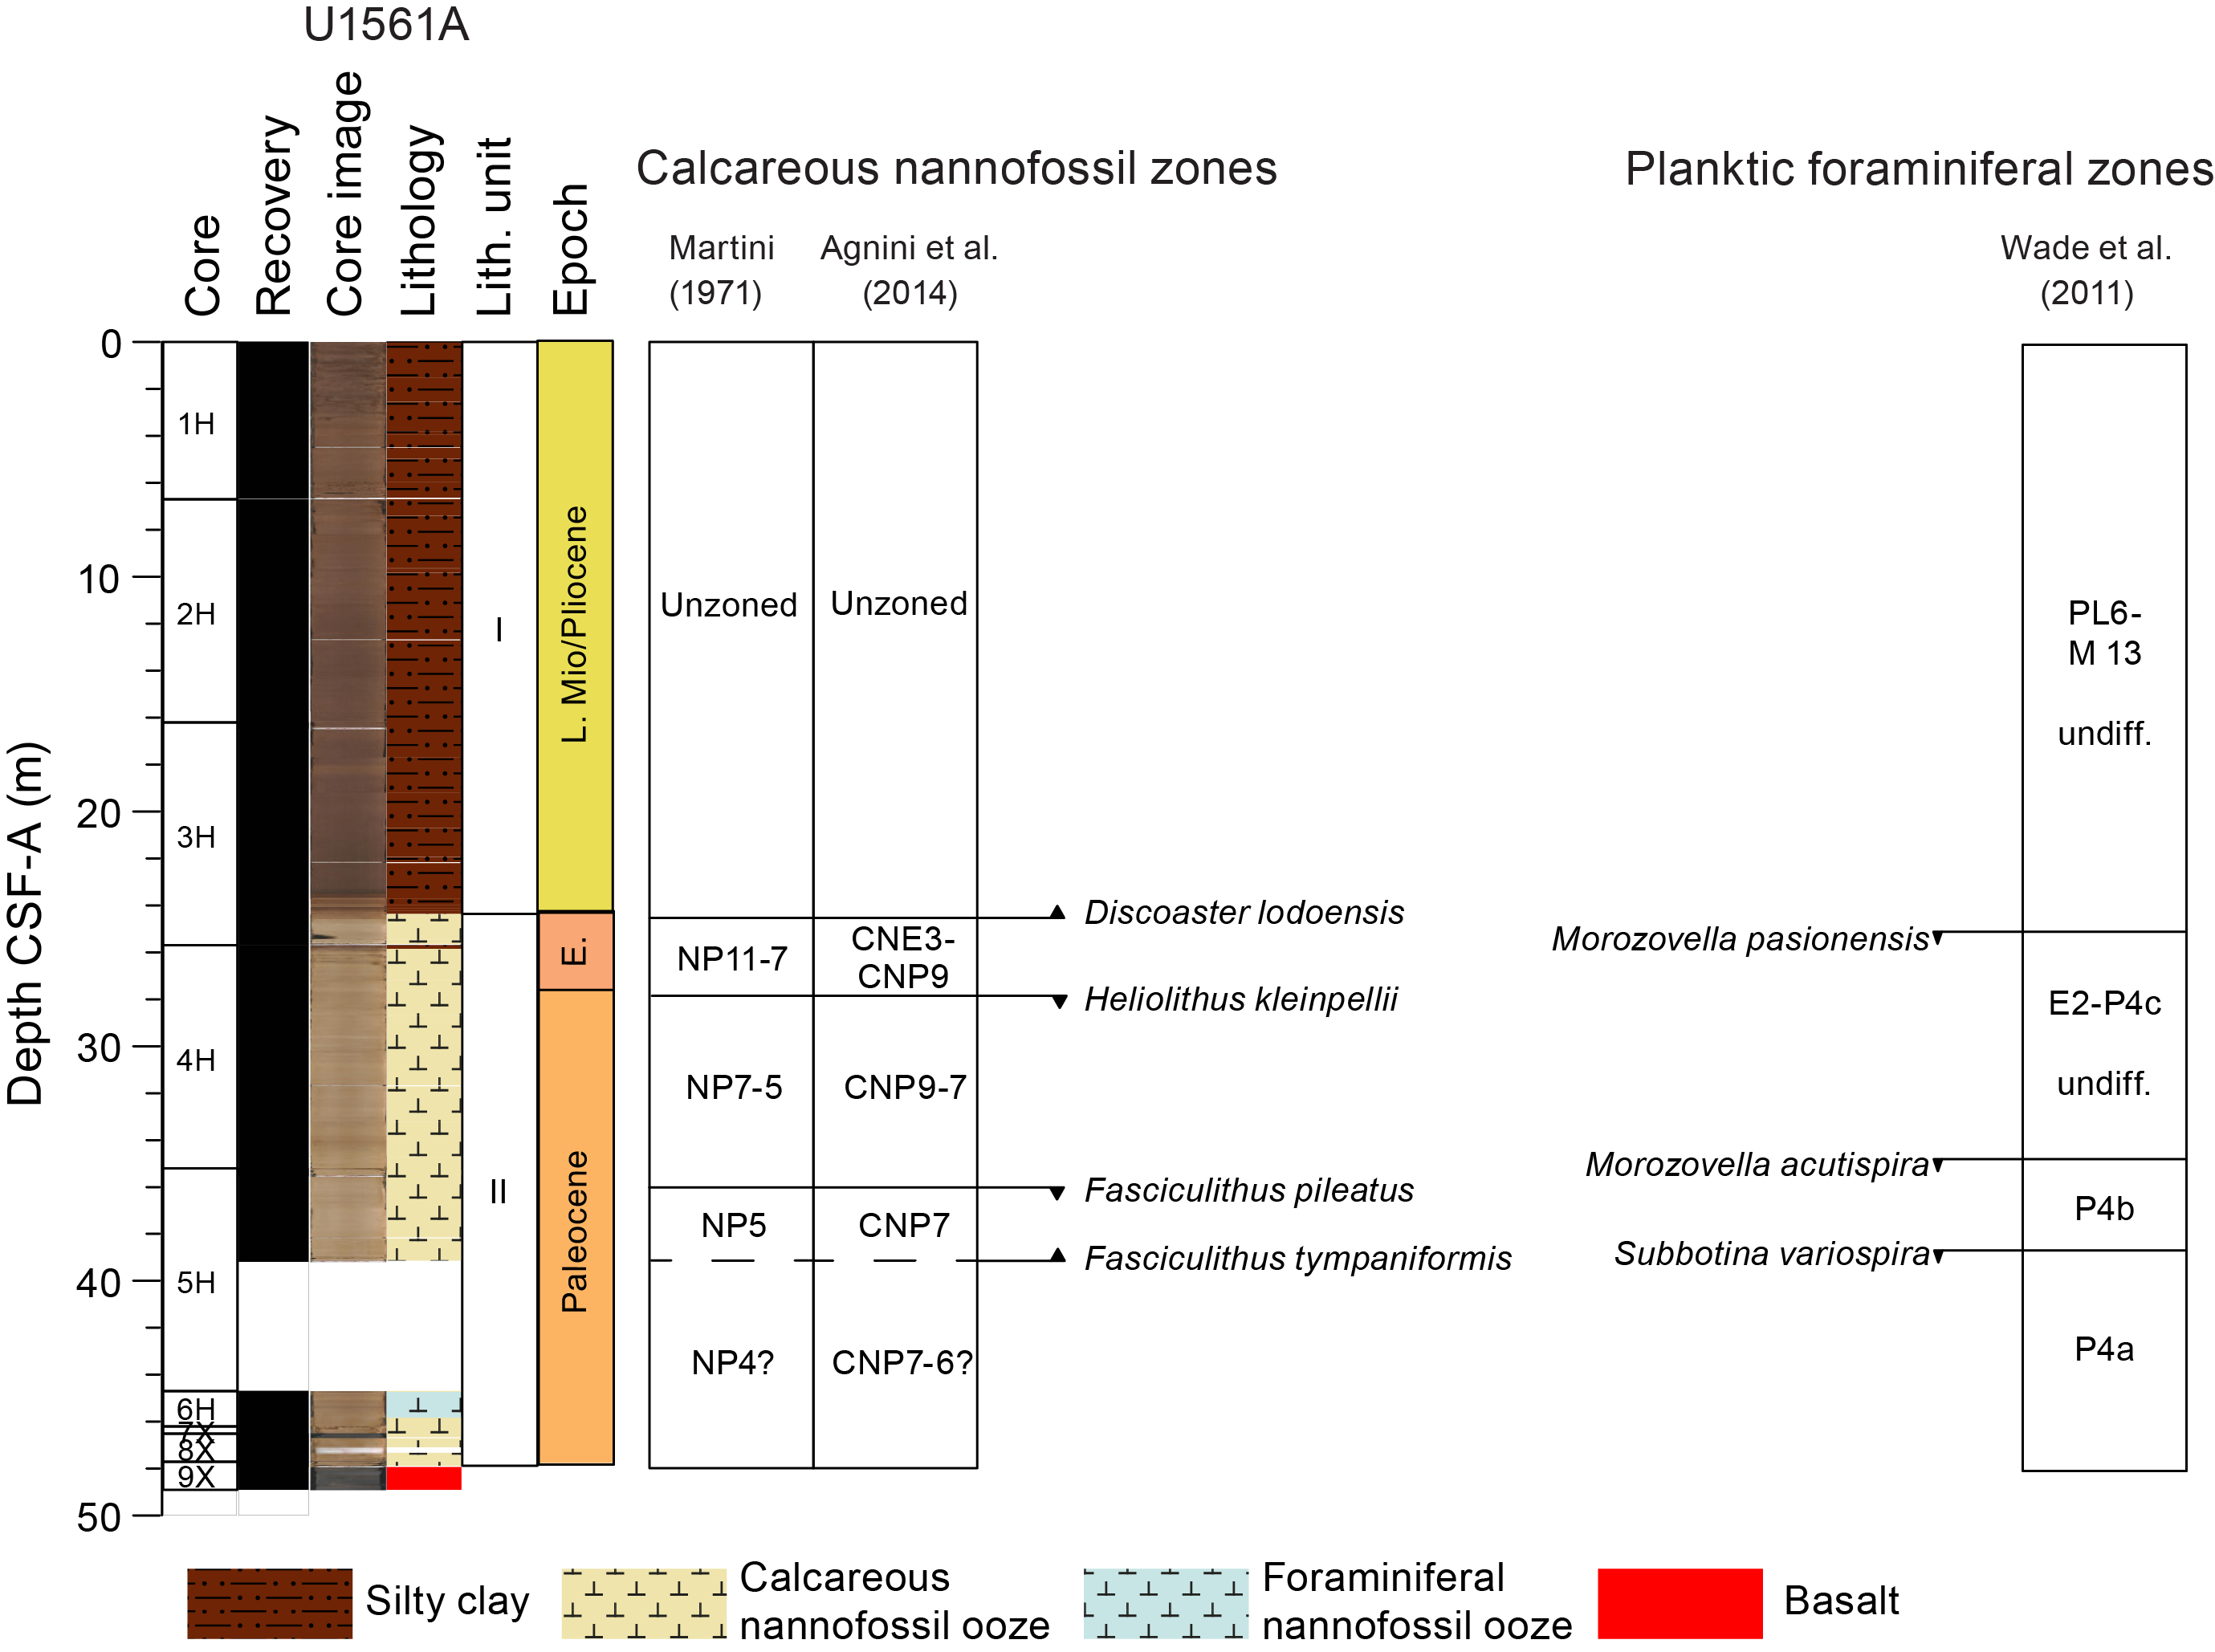
Figure F15. Nannofossil and foraminifera biostratigraphic zones.
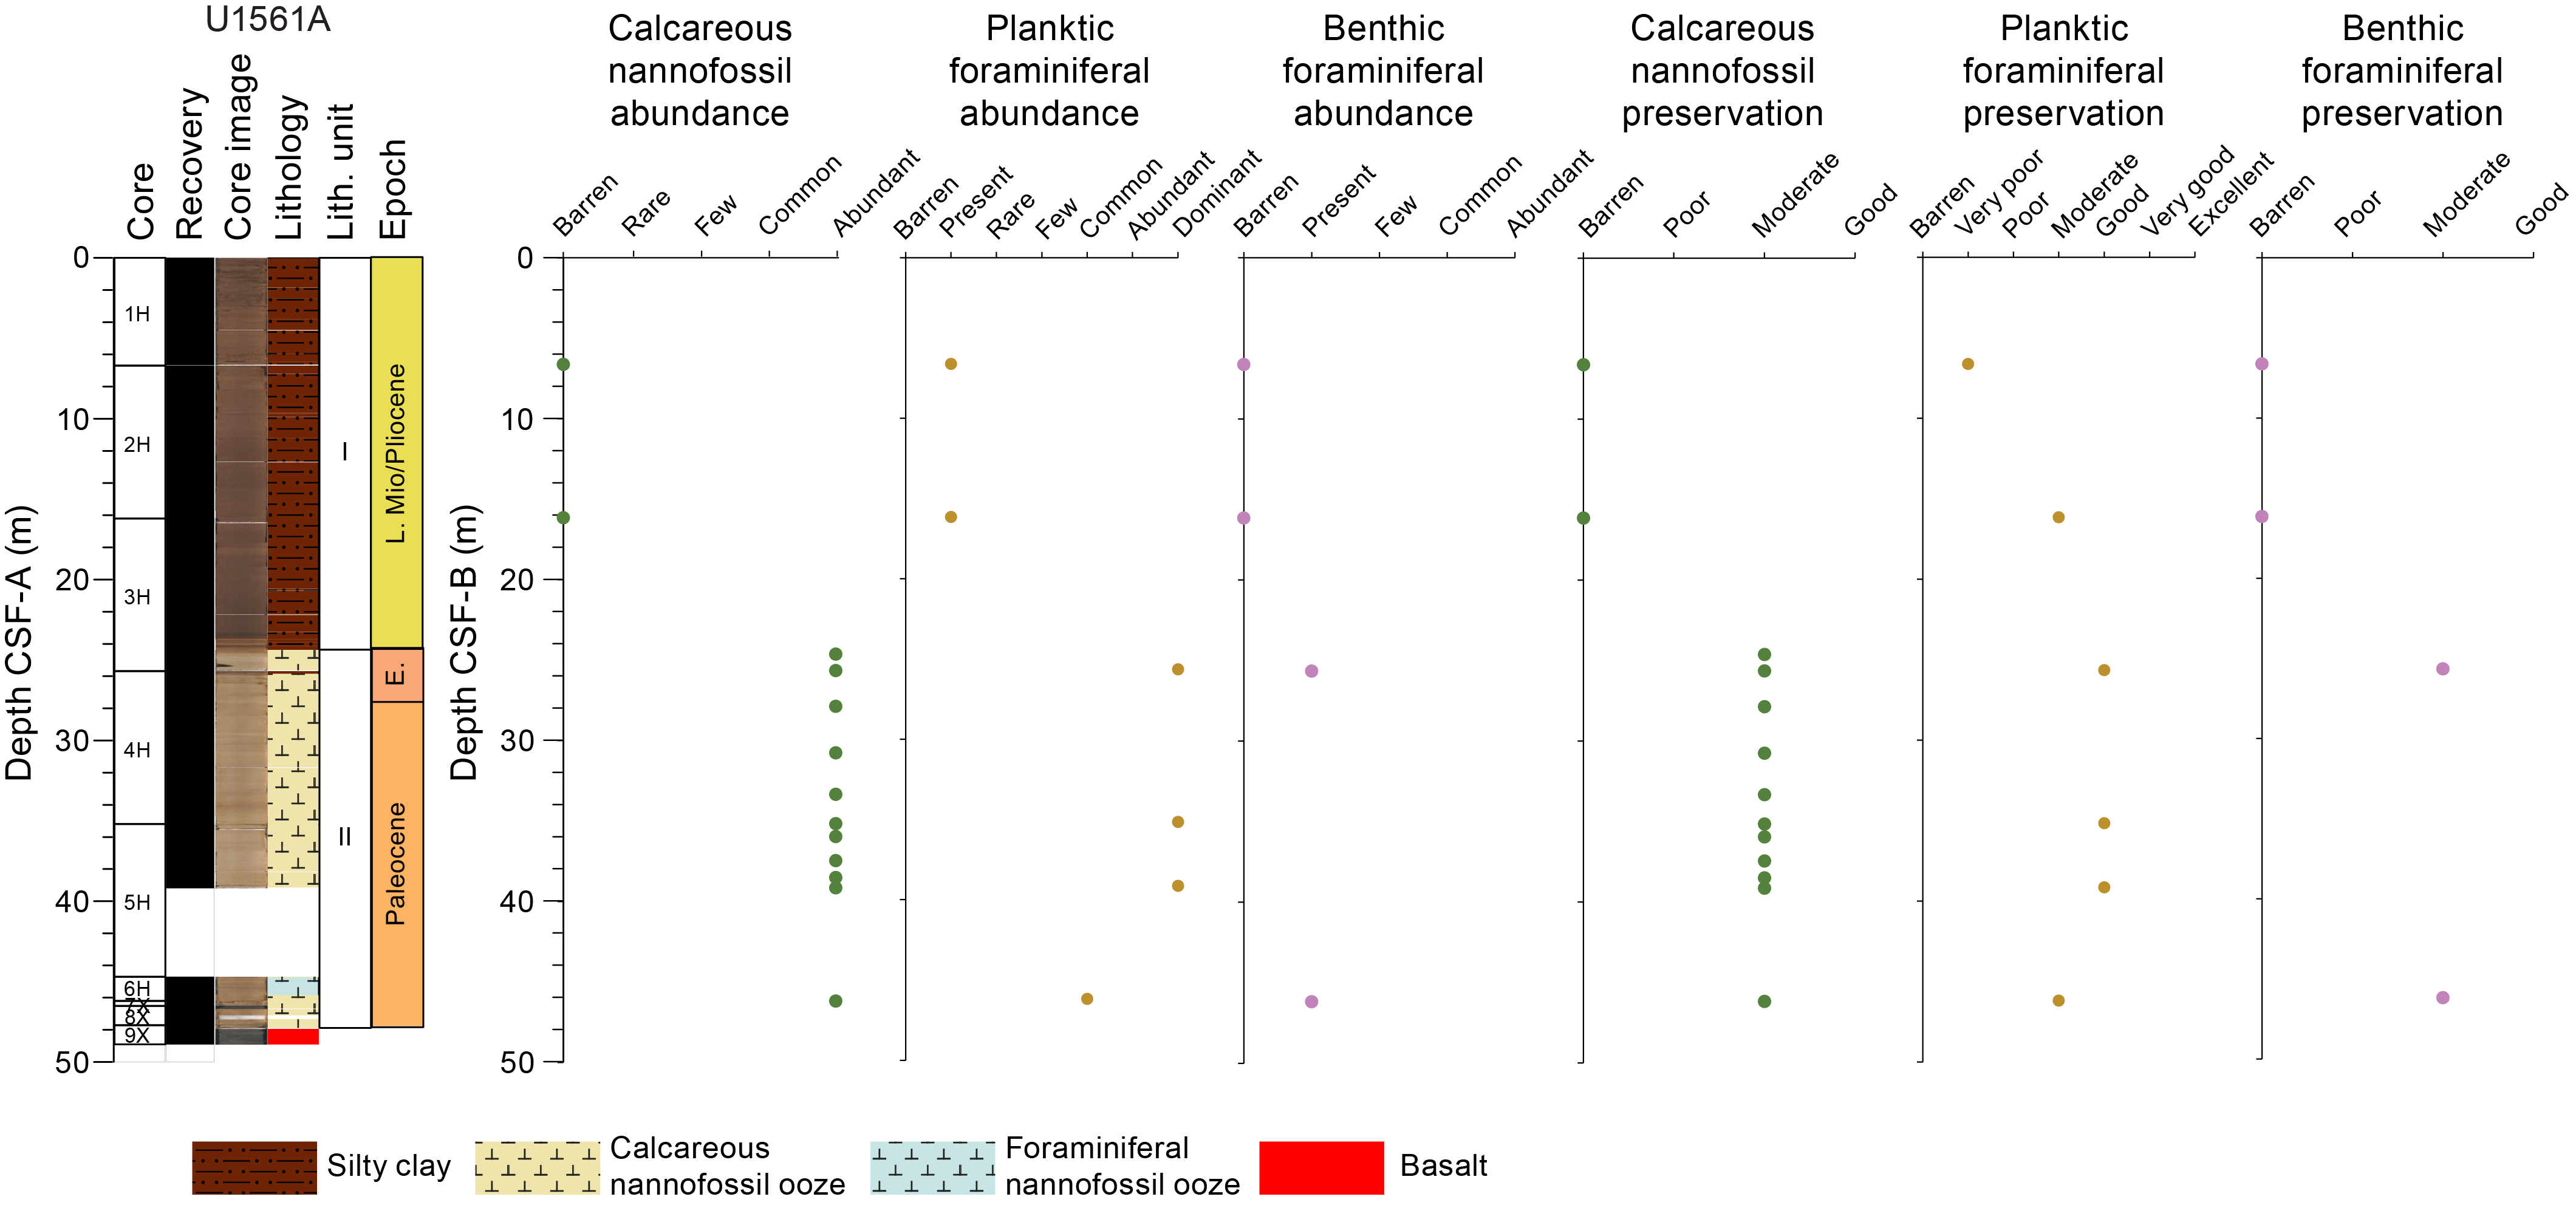
Figure F16. Abundance and preservation of nannofossils and foraminifera.
7.1. Age of basement
The deepest sample at Site U1561, Sample 395E-U1561A-6H-CC, 0–5 cm (46.18 m CSF-B), contains common sand-sized clasts of altered glass, indicating that it is relatively close to the sediment/basement interface. Planktic foraminifera are assigned to Zone P4a based on the co-occurrence of Globanomalina pseudomenardii and Parasubbotina variospira, and calcareous nannoplankton are assigned to Zones CNP8–CNP7 based on the presence of Fasciculithus tympaniformis and absence of Heliolithus kleinpellii. This is equivalent in age to the oldest assemblages observed at Sites U1556 and U1557 (see Biostratigraphy in the Site U1556 chapter and Biostratigraphy in the Site U1557 chapter (Coggon et al., 2024a, 2024b) and the 61 Ma projected age of basement (see Background and objectives).
7.2. Calcareous nannofossils
All core catcher samples from Hole U1561A were examined to establish a calcareous nannofossil biostratigraphy; additional samples were taken from archive halves of the split-core sections to better constrain biohorizons. Biostratigraphic datums used for the age-depth model are listed in Table T8 and illustrated in Figure F20, and calcareous nannofossil occurrence data are shown in Table T5. Note that the distribution chart is biased toward age-diagnostic and other notable taxa.
At Site U1561, calcareous nannofossils are absent in the silty clays of Lithologic Unit I and abundant in the oozes that characterize Unit II (see Sedimentology). Four calcareous nannofossil bioevents were identified across 13 samples at Site U1561, the youngest of which is base Discoaster lodoensis in Sample 395E-U1561A-3H-7, 23 cm (24.62 m CSF-B), identified at top of the carbonate section at this site. The co-occurrence of Sphenolithus radians and Tribrachiatus orthostylus within this same sample confirms that it is early Eocene (50.65–53.58 Ma; Gradstein et al., 2020) (i.e., within Zones CNE4–CNE3 due to the presence of T. orthostylus, which marks the top of Zone CNE4).
Sample 395E-U1561A-3H-CC (25.65 m CSF-B) contains a relatively typical late Paleocene assemblage including Chiasmolithus consuetus, Discoaster multiradiatus, Discoaster mohleri, and several species of Fasciculithus and Toweius. The sample below this (Sample 4H-2, 75 cm; 27.87 m CSF-B) represents the top (and base) of H. kleinpellii, which occurs in Zone CNP9. This suggests that there could be as much as ~5 My missing between Samples 3H-7, 23 cm, and 4H-2, 75 cm (24.62–27.87 m CSF-B). This unconformity or extremely condensed interval is also observed at Sites U1556 and U1557, which lie at the westernmost end of the SAT on similar age ocean crust (see Background and objectives). Higher resolution sampling across this interval postexpedition would allow for tighter constraints on the unconformity.
Samples 395E-U1561A-4H-2, 75 cm, through 4H-CC, 0–5 cm (27.87–35.15 m CSF-B), contain a similar late Paleocene assemblage that can be zoned to calcareous nannofossil Zones CNP9–CNP7. Samples 5H-1, 75 cm, to 5H-CC, 0–5 cm (35.95–39.14 m CSF-B), are restricted to Zone CNP7 by the co-occurrence of Fasciculithus pileatus (base in Sample 5H-1, 75 cm; 35.95 m CSF-B), which is a distinctive middle Paleocene taxon, and F. tympaniformis. The absence of F. tympaniformis as well as other fasciculiths in the deepest sample analyzed directly above basement (Sample 6H-CC, 0–5 cm; 46.18 m CSF-B) and the presence of Sphenolithus moriformis suggests this sample is likely within Zones CNP7–CNP6. This agrees with the predicted basal age (61.2 Ma) at Site U1561 (see Background and objectives) and is correlative to nearby Sites U1556 and U1557, although the nearby sites record F. tympaniformis to the base of the hole.
7.3. Planktic foraminifera
Core catcher samples were examined for planktic foraminifera from Hole U1561A following Expedition 395E. Planktic foraminiferal occurrences are summarized in Table T6.
The upper two and a half cores from Hole U1561A are composed of pelagic clay and contain abundant fish teeth and what appear to be sand-sized manganese oxide grains. A single planktic foraminifera is present in each sample; Sample 395E-U1561A-1H-CC, 0–5 cm (6.62 m CSF-B), contains Trilobatus trilobus, and Sample 2H-CC, 0–5 cm (16.15 m CSF-B), contains Globigerinoides extremus. The former taxon ranges from Lower Miocene to recent, whereas the latter taxon more helpfully ranges from Late Miocene Zone M13 to Late Pliocene Zone PL6. The transition from pelagic clay to calcareous ooze occurs in Core 3H; this transition is likely associated with a major unconformity because Sample 3H-CC, 0–5 cm (25.65 m CSF-B), contains an early Eocene/late Paleocene assemblage somewhere between Zones E2 and P4c, based on the absence of common early Eocene taxa and the absence of Paleocene taxa indicative of Zone P4 found in the samples below. Common late Paleocene taxa found in this sample include Acarinina esnehensis, Acarinina pentacamerata, Acarinina soldadoensis, Morozovella aequa, Morozovella pasionensis, and Morozovella subbotinae. Sample 4H-CC, 0–5 cm (35.15 m CSF-B), is assigned to Zone P4b based on the presence of Morozovella acutispira, which has a highest occurrence at the top of that zone. This sample also contains G. pseudomenardii, the range of which comprises the entirety of Zone P4, and Marginotruncana conicotruncata, which ranges from near the base of Zone P3 to the top of Zone P4. Sample 5H-CC, 0–5 cm (39.14 m CSF-B), contains G. pseudomenardii and P. variospira, the highest occurrence of which marks the top of Zone P4a. The deepest sample examined, Sample 6H-CC, 0–5 cm (46.18 m CSF-B), is still within Zone P4a based on the occurrence of G. pseudomenardii. This sample also contains common sand-sized fragments of altered volcanic glass.
7.4. Benthic foraminifera
Onshore analysis of benthic foraminifera was conducted on core catcher samples of cores retrieved from Hole U1561A during Expedition 395E. Benthic foraminifera preservation, abundance, and assemblage composition are qualitatively assessed based on the observation of depth-diagnostic calcareous species and other notable calcareous taxa. Agglutinated benthic foraminifera are reported if identified. Benthic foraminiferal preservation and abundance are summarized in Figure F16. The occurrence of important benthic foraminiferal species is reported in Table T7.
No benthic foraminifera are found in core catcher samples from Cores 395E-U1561A-1H and 2H (6.62 and 16.15 m CSF-B, respectively). Benthic foraminifera are present in Samples 3H-CC, 0–5 cm (25.65 m CSF-B), and 6H-CC, 0–5 cm (46.18 m CSF-B), which contain a typical Paleogene assemblage including Anomalina praeacuta, Aragonia ouezzanensis, Gavelinella beccariiformis, Nonion havanense, Nuttallides truempyi, Oridorsalis umbonatus, and Pullenia coryelli. Additional species observed include Aragonia velascoensis, Bulimina trinitatensis, Bulimina velascoensis, and Gavelinella danica. Stilostomellids are present in Samples 3H-CC, 0–5 cm, and 6H-CC, 0–5 cm. Overall, this benthic foraminiferal assemblage suggests that Site U1561 was located at upper abyssal depths (2000–3000 m) during the Paleocene.
8. Paleomagnetism
During Expedition 390, archive halves from Holes U1561A–U1561C were available for description and physical properties analyses (see Sedimentology and Physical properties and downhole measurements) but were not remeasured on the superconducting rock magnetometer (SRM), having been previously measured during engineering Expedition 395E (Williams et al., 2021; see Paleomagnetism in the Expedition 390/393 methods chapter [Coggon et al., 2024c]). The natural remanent magnetization (NRM) of the archive halves of core sections was measured at 2 cm intervals. Three alternating field (AF) steps (5, 10, and 20 mT) were applied, and remanence was measured after each step. No discrete samples were taken from sediment cores from Site U1561 (see Background and objectives). Here, we report the paleomagnetic data gathered during Expedition 395E for Holes U1561A and U1561B because the single Hole U1561C core was too disturbed to provide meaningful data. APC Cores 395E-U1561A-1H through 4H and 6H were oriented using the Icefield MI-5 core orientation tool.
8.1. Results
Paleomagnetic results include data measured using the SRM (Figures F17, F18). The NRM intensities of sediment cores from Holes U1561A and U1561B show mean values of 1.2 × 10⁻¹ and 4.5 × 10⁻² A/m, respectively. The 20 mT remanence intensity significantly varies within the range of 10−4 to 10−1 A/m, with higher values in the uppermost 4 m. Declination data for the oriented cores appear to align well with the expected 360° and 180° for normal and reversed polarities, respectively, for the undisturbed part of Cores 395E-U1561A-1H through 3H. However, oriented Core 4H does not show a good match to the expected declinations, which could be indicative of failure of the Icefield MI-5 core orientation tool procedure. Paleomagnetic inclinations after the 20 mT demagnetization step are bimodal, reflecting intervals of reversed and normal polarity during sediment deposition. Histograms of the inclination data at 20 mT for Holes U1561A and U1561B (Figure F19) illustrate the normal and reversed inclinations of Site U1556 sediments that conform well to the expected geocentric axial dipole (GAD) inclination for the site latitude (49.1° at 30°S). However, reversed polarity inclinations from Hole U1561A are somewhat steeper than the expected +49.1° inclination. This may reflect steeper inclinations in the interval below 26 m CSF-B in Cores 395E-U1561A-4H and 5H that are of uncertain origin but are perhaps due to drilling disturbances/overprint not completely clean after the 20 mT AF step in this interval.
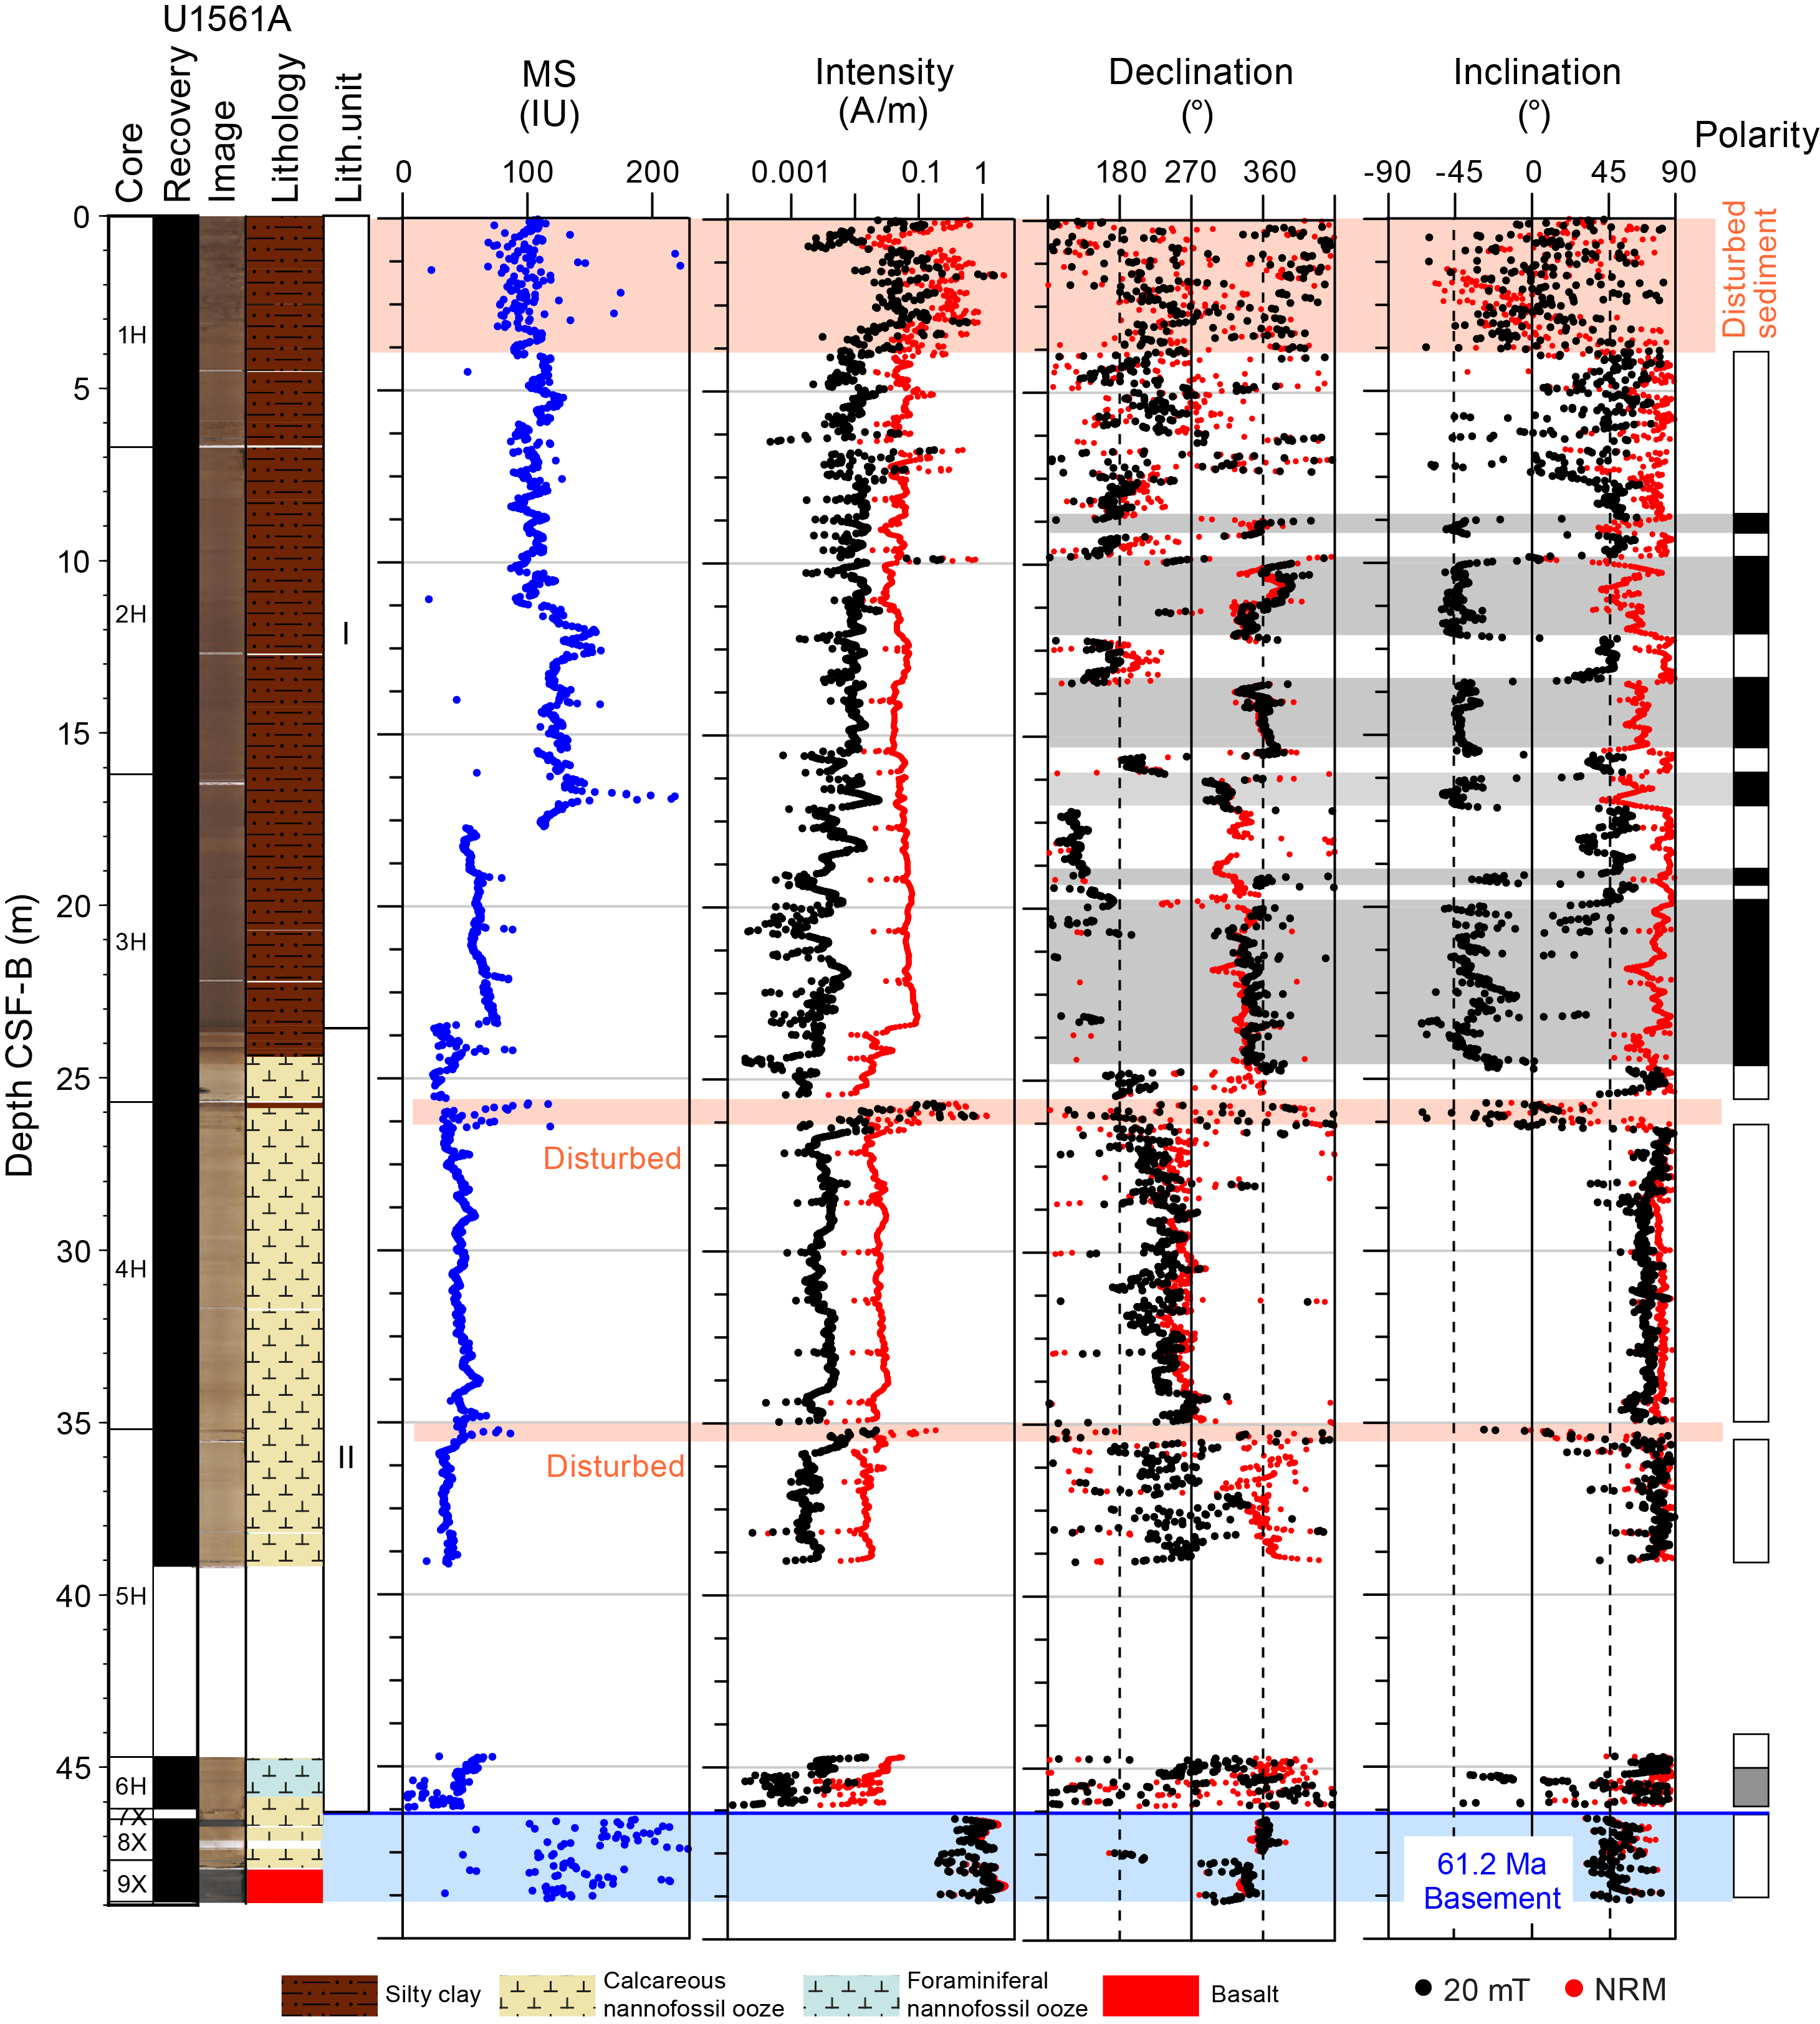
Figure F17. MSP and SRM, Hole U1561A.
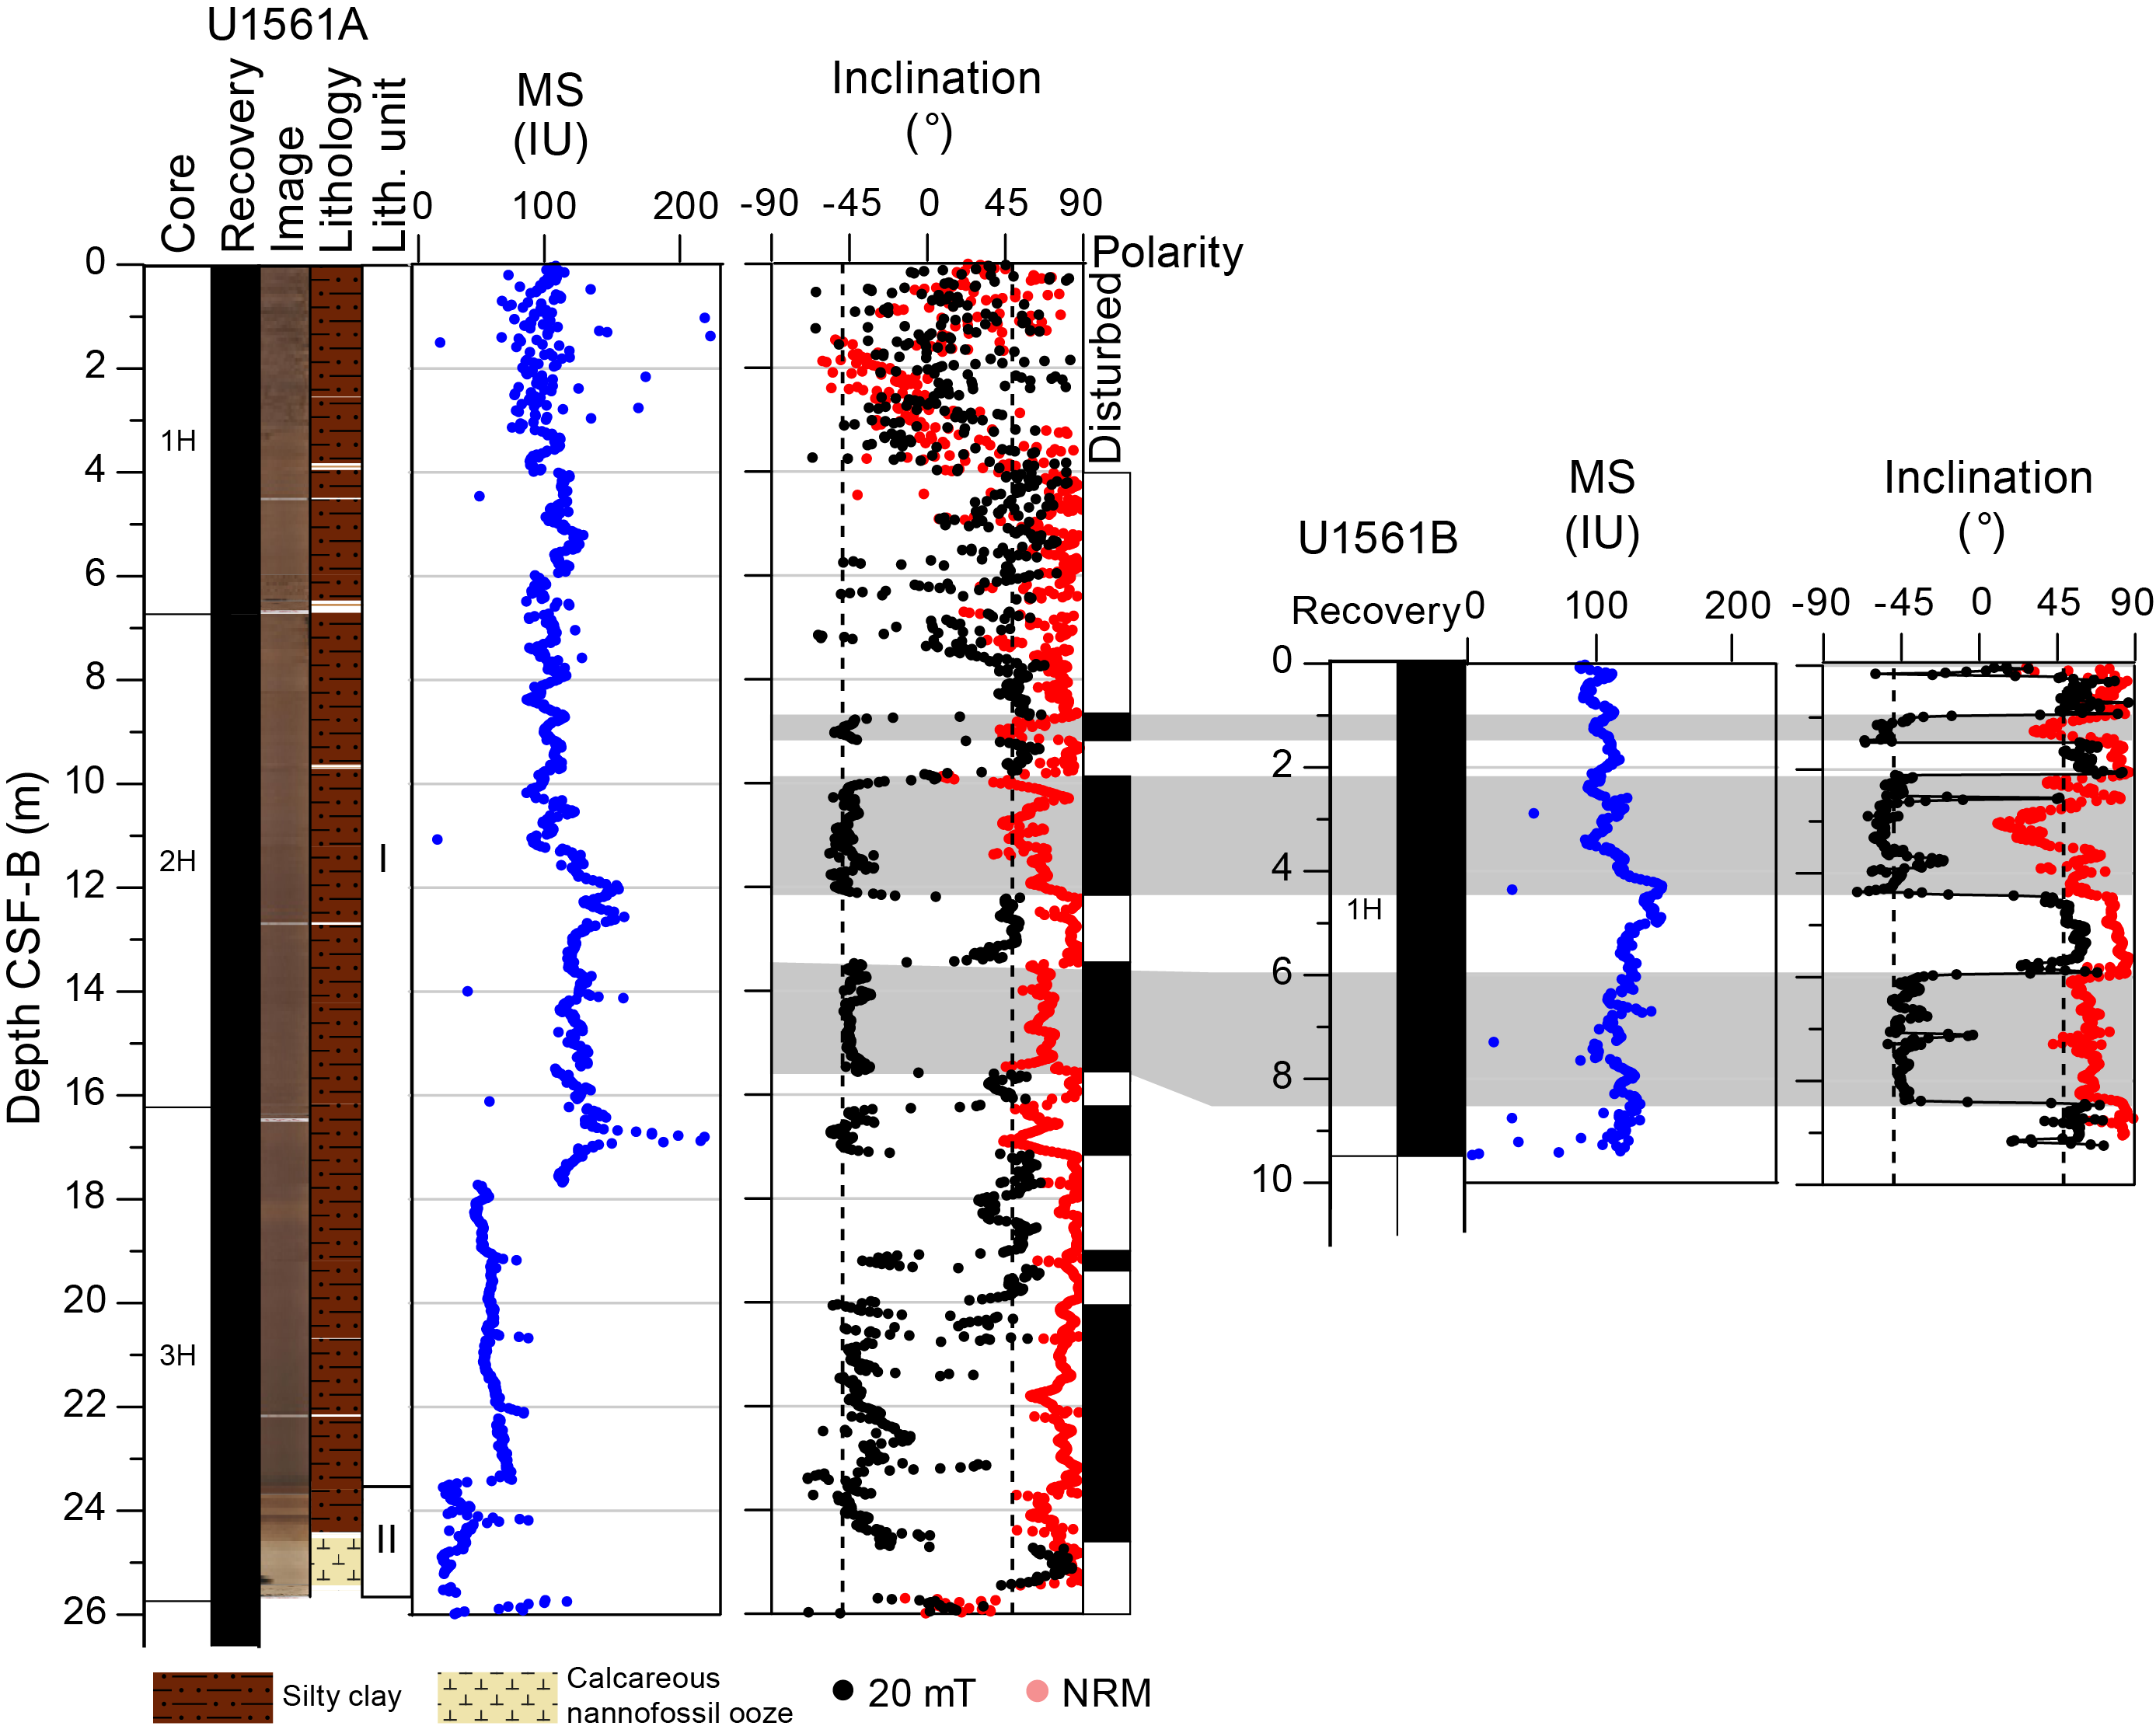
Figure F18. MSP and inclination, Holes U1561A and U1561B.
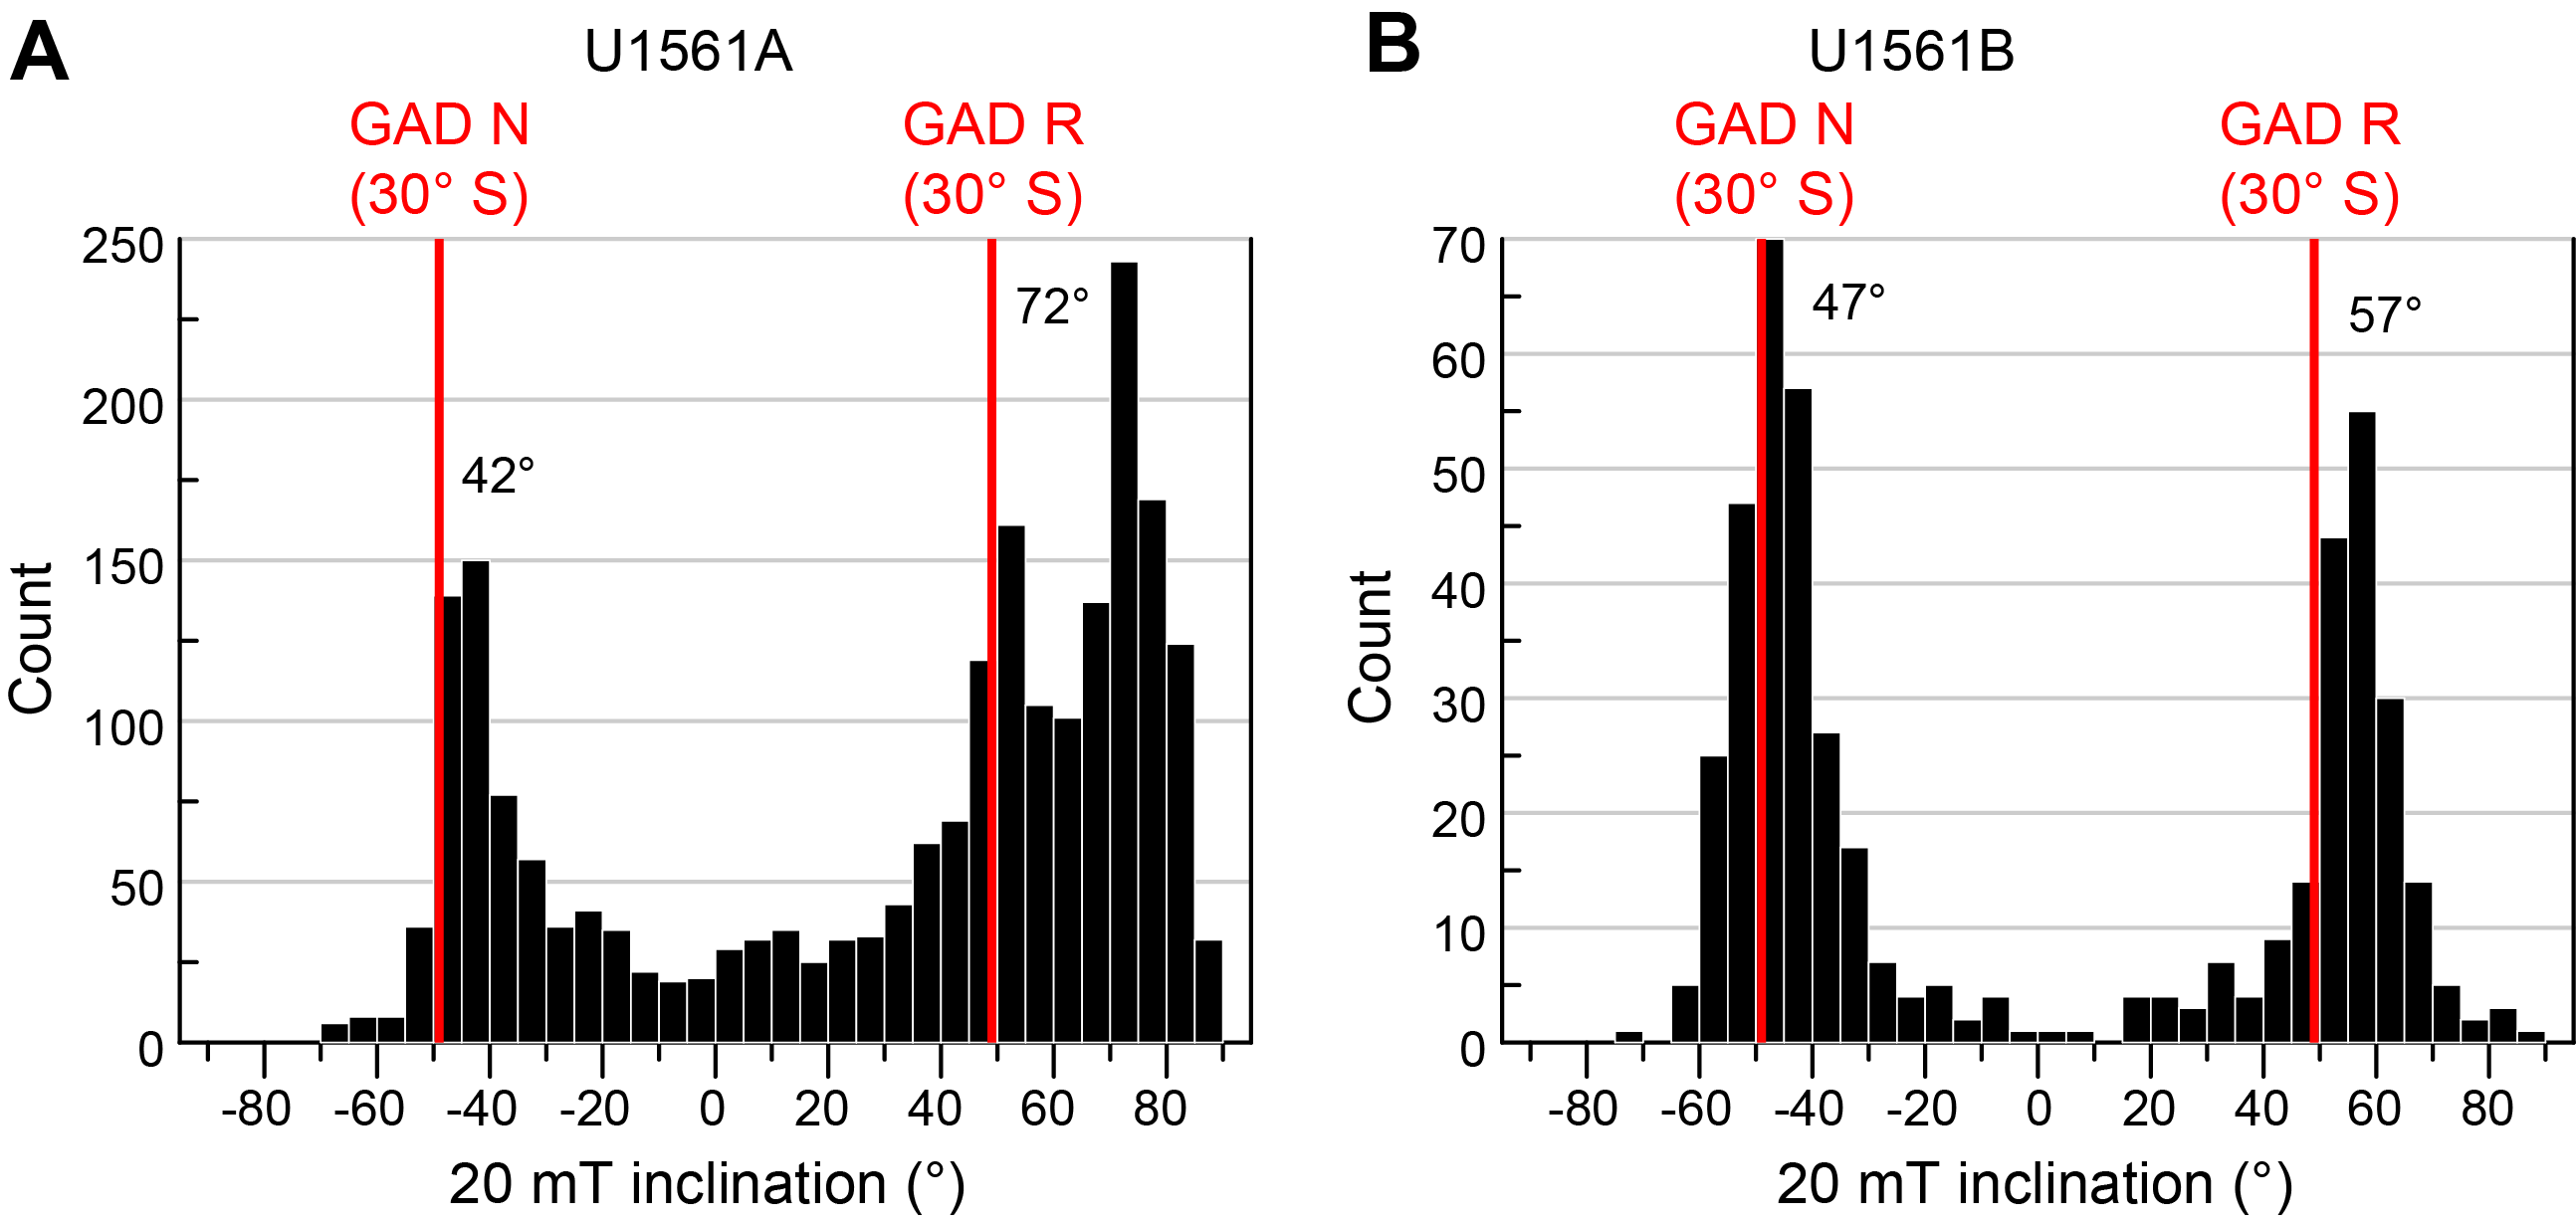
Figure F19. Inclination after 20 mT AF.
8.1.1. Magnetostratigraphy
SRM measurements of the archive halves of Hole U1561A and U1561B core sections after AF demagnetization at 20 mT were used to construct a polarity sequence for the Site U1561 sediment package. There is a clear polarity sequence for most of both holes based on the inclination sign (after the 20 mT demagnetization step) and supplemented by the corrected declination measurements of the oriented (APC) cores. The sediments throughout the uppermost 3 m in Core 395E-U1561A-1H, as well as the upper part of Sections 4H-1 and 5H-1, appear disturbed and provided spurious SRM results. Basement rocks from Cores 8X and 9X consistently provide positive (reversed) inclinations compatible with the GAD field at the site latitude and with their expected age of 61.2 Ma in the Selandian (Paleocene) in Chron C26r (59.237–62.278 Ma; Gradstein et al., 2020). Paleomagnetic data throughout the lowermost sediment interval above the sediment/basement interface in Sections 6H-2 and 6H-3 are difficult to interpret, thanks in part to shallow inclinations that are represented by gray shading in the polarity columns (Figure F17). Magnetostratigraphic correlation to the geologic timescale (Gradstein et al., 2020) will be carried out postexpedition, constrained by biostratigraphy.
9. Age model and mass accumulation rates
9.1. Age model and linear sedimentation rates
The age model for Site U1561 is based on calcareous nannoplankton and planktic foraminiferal lowest (base) and highest (top) occurrence datums from Hole U1561A (Table T8; Figure F20). Planktic foraminifera and calcareous nannoplankton are very abundant in the calcareous ooze of Unit II and very rare (planktic foraminifera) or absent (calcareous nannoplankton) in the pelagic clay of Unit I. We identified three planktic foraminiferal and two calcareous nannoplankton bioevents in Hole U1561A, and the age model is entirely based on biostratigraphy.
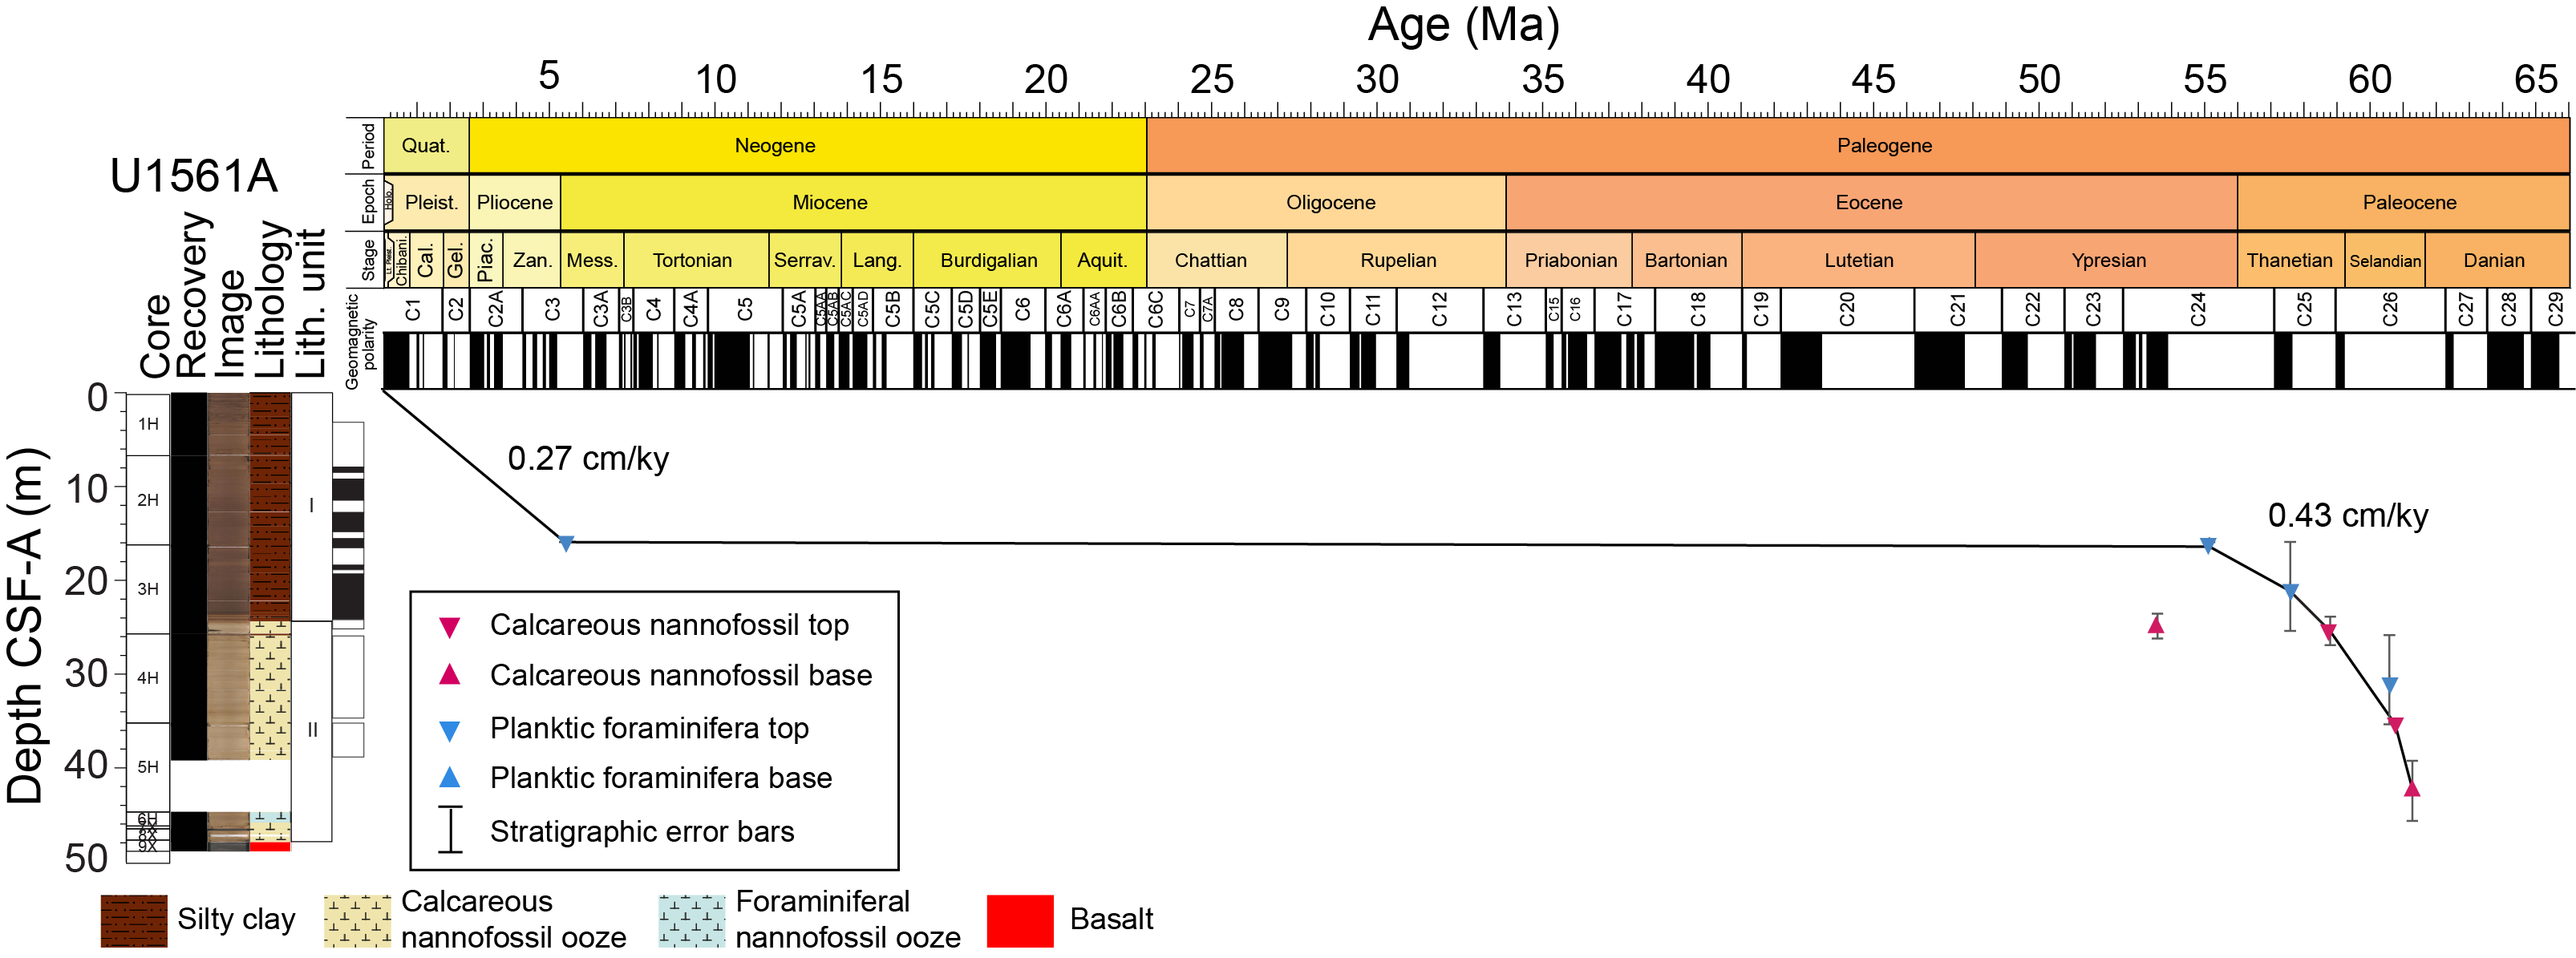
Figure F20. Age-depth model.
A major hiatus spans from the latest Paleocene to latest Late Miocene (~55.1–5.9 Ma) in Hole U1561A. Above and below this hiatus, average linear sedimentation rates are fairly similar. Assuming that the seafloor is Holocene (a big assumption because the mudline sample was barren), sedimentation rates in Unit I average 0.27 cm/ky. In the Paleocene–Eocene Unit II, linear sedimentation rates are slightly higher, averaging 0.43 cm/ky.
9.2. Mass accumulation rates
Mass accumulation rates (MARs) for Hole U1561A were calculated using bulk density calculated from gamma ray attenuation (GRA) collected during Whole-Round Multisensor Logger (WRMSL) scans because no shipboard discrete dry bulk density samples were taken during Expedition 395E (see U1561_MAR.xlsx in AGEMODEL in Supplementary material). Because of changes in the physical properties of core material during storage (drying, compaction, etc.), useful discrete measurement data can only be generated shipboard. Because of the very low sedimentation rates, which means that 60 My of time is represented by six cores and six discrete carbonate/organic carbon samples, the data presented in Figure F21 are binned at 10 My intervals. (see U1561_MAR.xlsx in AGEMODEL in Supplementary material).
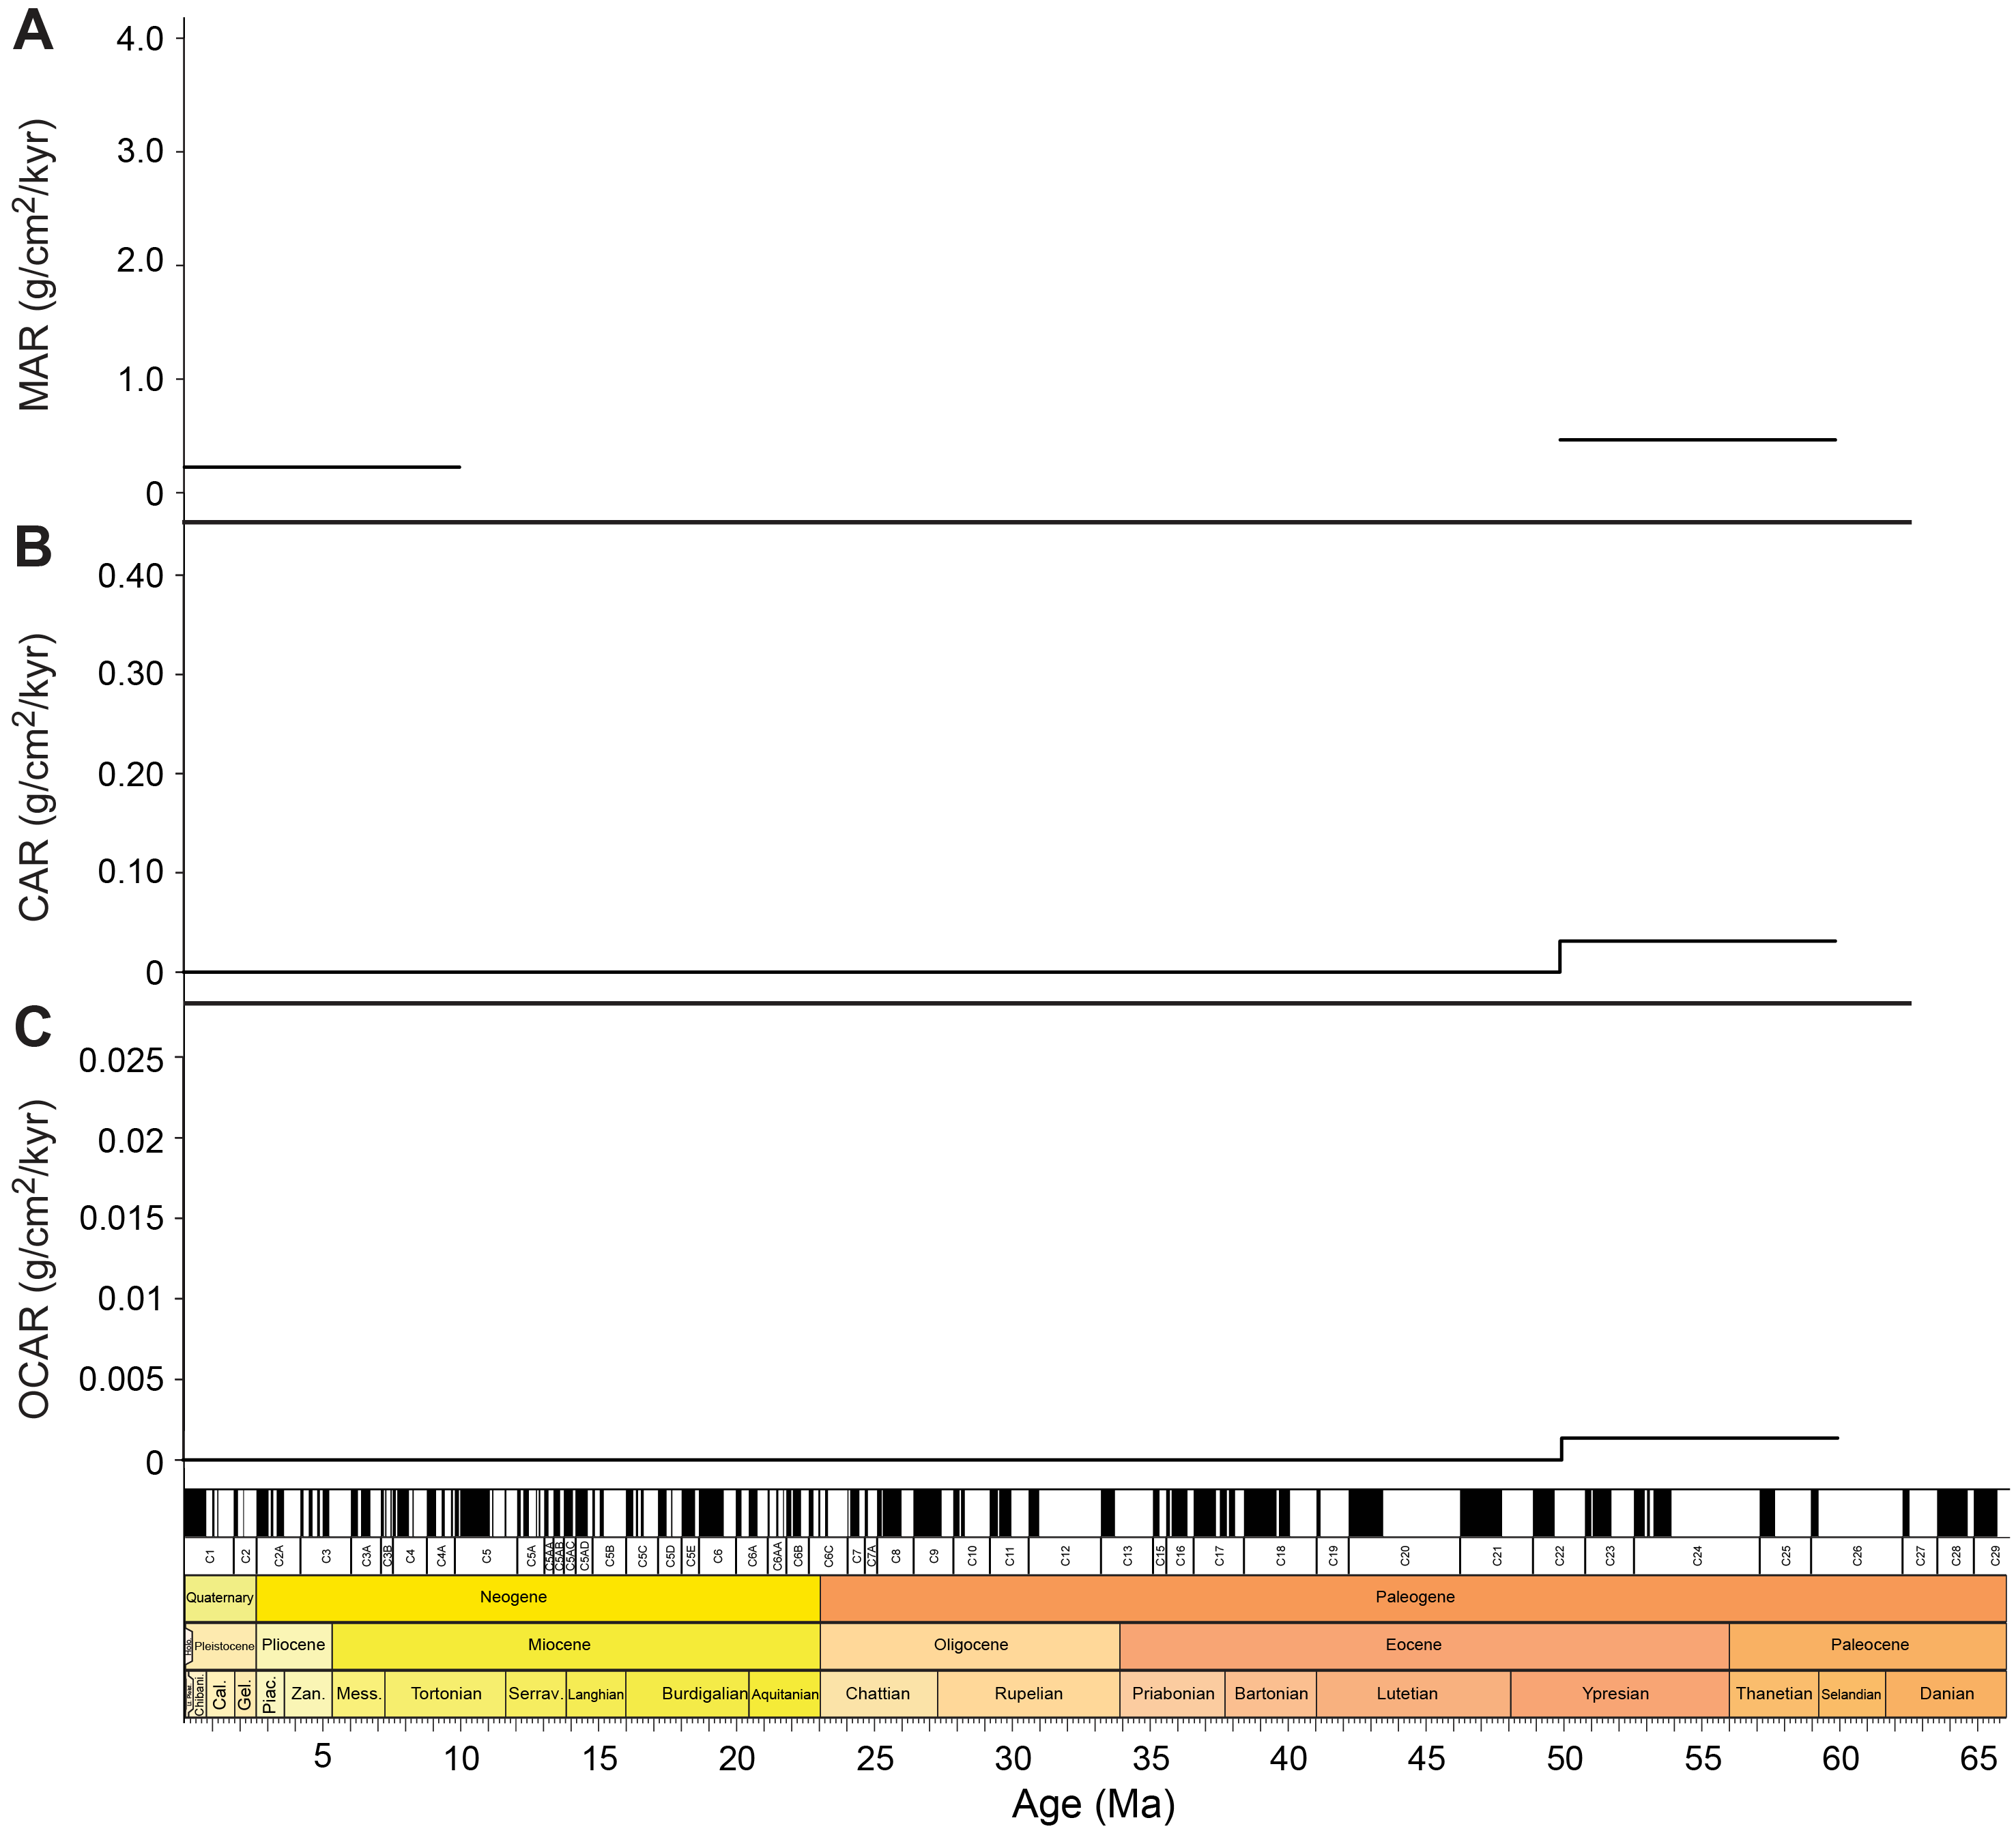
Figure F21. MAR, CAR, and OCAR.
MAR in the Miocene/Pliocene is 0.22 g/cm2/ky, whereas MAR in the Paleocene and Eocene is 0.46 g/cm2/ky.
9.3. Carbonate and organic carbon accumulation rates
Carbonate accumulation rates (CARs) and organic carbon accumulation rates (OCARs) were calculated by multiplying the MAR by the weight percent of carbonate and of total organic carbon (TOC), respectively (see U1561_MAR.xlsx in AGEMODEL in Supplementary material). Carbonate and organic carbon at Site U1561 were measured on material from interstitial water (IW) squeeze cakes collected shipboard during Expedition 395E. TOC was not measured in samples from Unit I.
CAR in the Neogene pelagic clays of Unit I is unsurprisingly extremely low (0.000005 g/cm2/ky). In the Paleocene–Eocene calcareous ooze of Unit II, CAR jumps up to 0.03 g/cm2/ky.
No OCAR values were obtained for the late Neogene section of Hole U1561A. Paleocene–Eocene OCAR values are 0.001 g/cm2/ky.
10. Physical properties and downhole measurements
10.1. Physical properties
Whole-round core section measurements at Site U1561 included core logger NGR, GRA bulk density, MS, and compressional wave (P-wave) velocity, all measured on the WRMSL. Section-half measurements included MSP measured on the SHMSL and thermal conductivity. These whole-round and split-core measurements were conducted during Expedition 395E (Williams et al., 2021). The physical properties data provide a first-order characterization of the lithology, composition, mineralogy, rheology, density, porosity, and fabric of the sediment and basement sections at this site.
10.1.1. Natural gamma radiation
NGR was measured at 10 cm intervals on all whole-round core sections that exceeded 50 cm in length; the minimum section length was limited by the response function of the sodium iodide detectors (see Physical properties and downhole measurements in the Expedition 390/393 methods chapter [Coggon et al., 2024c]). NGR is a proxy for the concentration of radioactive elements (40K, 238U, and 232Th) in the cored sediment. NGR measured in marine sediments can be especially useful in distinguishing clay-rich intervals from clay-poor carbonate ooze intervals (Dunlea et al., 2013).
NGR from Site U1561 ranges 3–45 counts/s (Figure F22). In Hole U1561A, NGR ranges 20–45 counts/s between 0 and 23 m CSF-B, likely reflecting silty clay lithologies. Holes U1561B and U1561C have similarly high NGR throughout this depth interval, validating the observation in Hole U1561A. Below ~23 m CSF-B, NGR is ≤10 counts/s, which likely reflects the downhole lithologic change from silty clays above to carbonate ooze below (see Sedimentology). Between 46.5 and 48.9 m CSF-B, 2.4 m of basalt from the uppermost basement was recovered, and NGR increased to 20–25 counts/s, suggesting greater contents of radioactive elements relative to the overlying calcareous sediments.
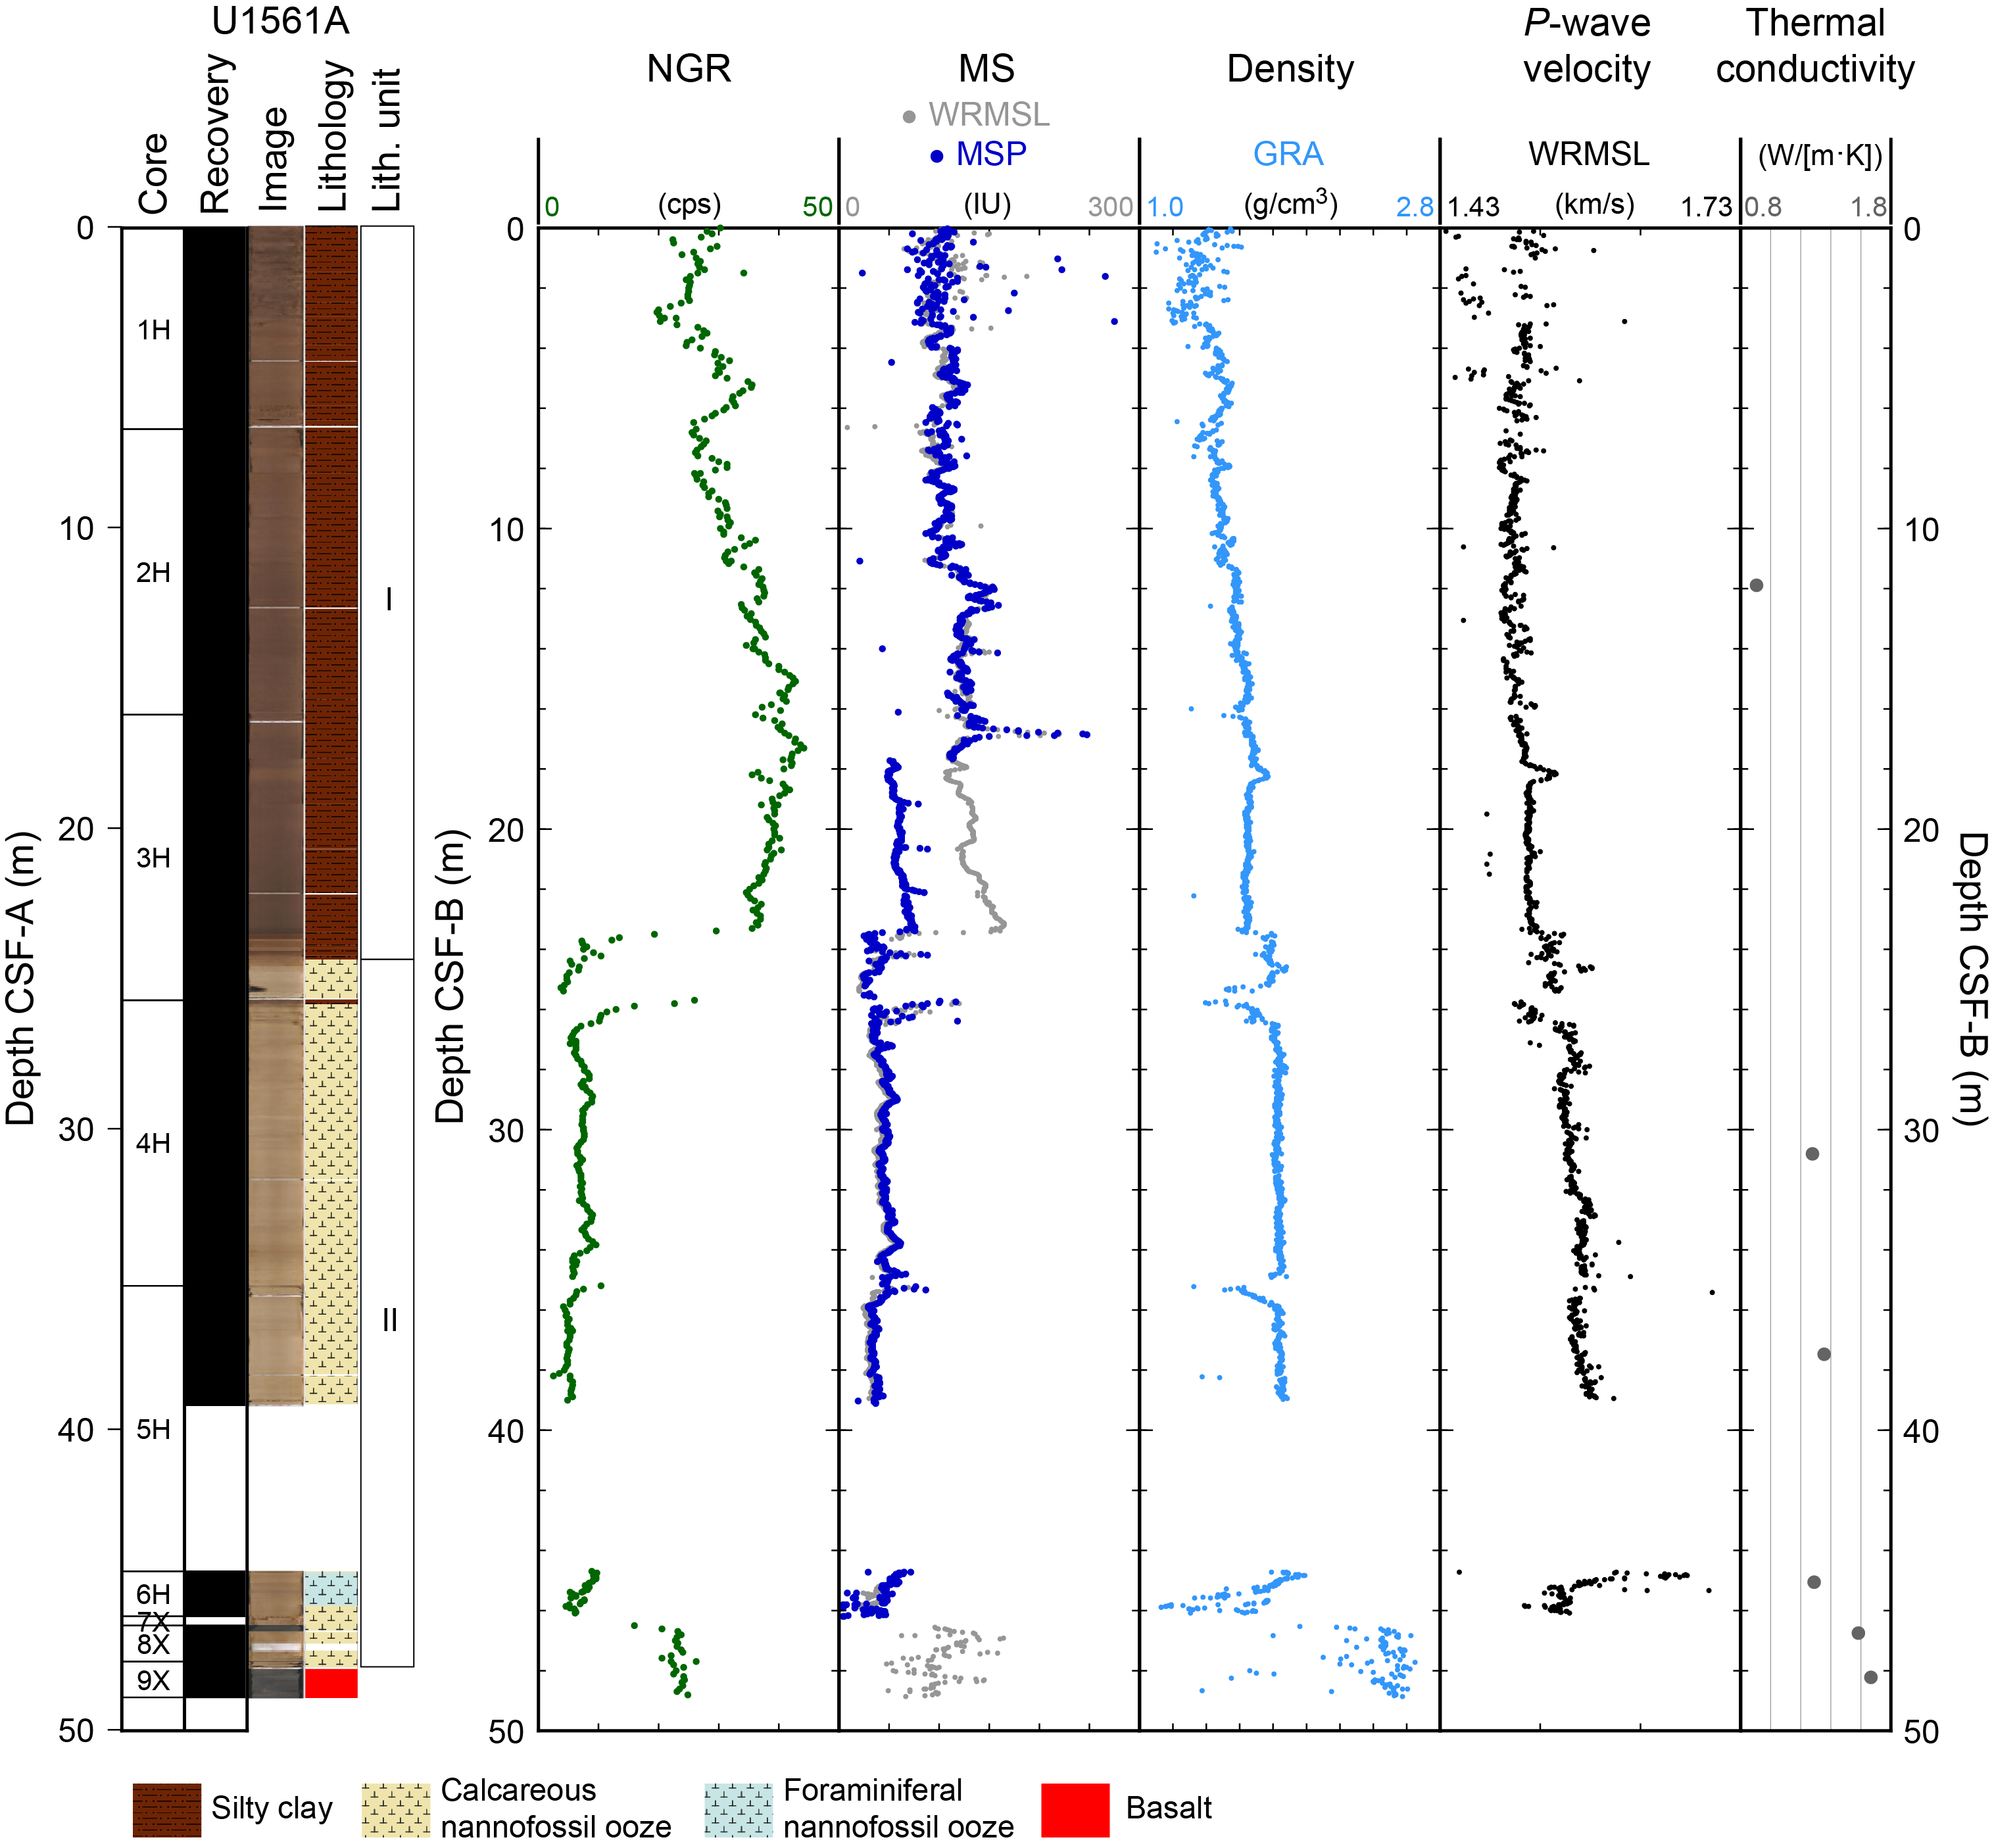
Figure F22. Core physical properties data.
10.1.2. Gamma ray attenuation bulk density
GRA is defined as the fraction of gamma rays that are not absorbed by a material, and it can be used as a proxy for bulk density. Variations in bulk density can reflect changes in mineralogy, composition, and porosity in the cored section.
Density at Site U1561 ranges 1.00–2.65 g/cm3 (Figure F22). Data from the upper 2–3 m are noisy as a result of drilling disturbance. In Holes U1561A and U1561B, density increases downhole from the seafloor to ~23 m CSF-B (1.50–1.65 g/cm3). Below 23 m CSF-B in Hole U1561A, density steps up to ~1.70–1.80 g/cm3. This increase in density coincides with a decrease in NGR, similarly reflecting the lithologic change from silty clay to carbonate lithology. Between 45.4 and 46.2 m CSF-B, density decreases to <1.50 g/cm3. The carbonates in this interval are poorly consolidated and heavily disturbed (see Sedimentology and Core descriptions), so the change in properties reflects drilling disturbance.
A sharp change in physical properties marks the sediment/basement interface. In the uppermost basement (46.5–48.9 m CSF-B), mean density is 2.40 g/cm3, compared to the sediment mean of 1.60 g/cm3. GRA bulk density is highly variable in the basement cores from Site U1561; similar variability is observed in basement sections from other Expedition 390 sites and is a function of curation and limitations of the WRMSL-derived GRA measurements (see Physical properties and downhole measurements in the Site U1556 chapter [Coggon et al., 2024a]).
10.1.3. Magnetic susceptibility
MS is an indicator of the tendency of minerals to become magnetized upon application of a magnetic field and can be considered an approximation of the concentration of magnetic minerals in the rock. Similar to NGR, MS from marine sediments is primarily affected by the proportion of terrigenous sediment in the cored material (magnetic minerals and to a certain extent clay minerals). Higher MS is generally an indication of clay-rich intervals, and lower MS is generally an indication of clay-poor carbonate ooze intervals.
In the uppermost 2–3 m in Holes U1561A and U1561C, MS data are highly variable (~65–188 instrument units [IU]; Figure F22). This variability is likely due to drilling disturbance, particularly in Hole U1561C (see Core descriptions and Sedimentology). Between the seafloor and ~23 m CSF-B, MS increases moderately from ~100 to ~160 IU. From ~23 m CSF-B to the sediment/basement interface, MS is ~30 IU with a few small-scale variations. A step decrease from higher MS above to lower MS below at ~23 m CSF-B is coincident with the sharp transition from silty clay above to carbonate below (see Sedimentology). In the uppermost basement (46.5–48.9 m CSF-B), MS increases and varies between 50 and 160 IU.
MSP values show excellent correspondence with WRMSL-derived MS data downhole, except for the interval at 17–23 m CSF-B, where the MSP data appear to be offset lower by 60–70 IU. The section halves associated with the offset MSP data were rerun during Expedition 390, and the newer MSP data closely correspond to the WRMSL MS data, thus replacing Expedition 395E data.
10.1.4. P-wave velocity
P-wave velocity is a measure of the velocity with which a compressional body wave (P-wave) propagates through a sample. P-wave velocity is directly related to the bulk density, compressibility, and shearability of the material sampled and indirectly related to the porosity, mineralogy, and grain fabric of the lithology. Although P-wave velocity data from the whole-round core sections run on the WRMSL are more reliable in sediments than in basement sections because of more complete filling of the core liner, spurious values may still occur because of expansion, cracks, and drilling disturbance.
Velocity increases from approximately 1.50 km/s at the seafloor to ~1.60 km/s at ~40 m CSF-B (Figure F22). The downhole increase in P-wave velocity is indicative of increasing compaction with depth. P-wave velocities in the basement interval are highly variable, which is likely an artifact of the recovered basalt rocks not completely filling the core liner.
10.1.5. Thermal conductivity
Thermal conductivity is a measure of the potential for conductive heat flow through a material and can be affected by the mineralogy, porosity, density, and fabric of the sample. Thermal conductivity data may help develop an understanding of thermal insulation and heat dissipation processes from the underlying igneous crust through the sediment to the ocean.
Thermal conductivity measurements were made on Hole U1561A cores during Expedition 395E from four representative sediment sections and two basalt pieces from the uppermost basement. Sediment thermal conductivity ranges 0.9–1.4 W/(m·K) and generally increases with depth (Figure F22). Thermal conductivity in Core 395E-U1561A-6H at 45 m CSF-B does not follow this trend, likely due to drilling disturbance, which has been shown to affect other physical properties in this interval. Thermal conductivity values in the two basalt samples at the bottom of cores recovered in Hole U1561A were 1.58 and 1.67 W/(m·K), consistent with the expected greater thermal conductivity of basalt compared to overlying sediments.
10.2. Stratigraphic correlation
During Expedition 395E, three holes were drilled at Site U1561 using APC and XCB coring techniques. Because of issues with the precision depth recorder, the first two attempts to recover a mudline core resulted in full cores that overshot the mudline and were designated as Cores 395E-U1561B-1H and 395E-U1561C-1H (Williams et al., 2021). For the second attempt (Hole U1561C), the drill string was pulled up 5 m, so Cores 395E-U1561B-1H and 395E-U1561C-1H likely recovered some stratigraphic overlap. The third mudline recovery attempt was successful, designated Core 395E-U1561A-1H, and recovered 6.7 m, establishing a seafloor depth of 4909.5 mbsl (Table T1). Hole U1561A consists of nine cores to a depth of 48.9 m drilling depth below seafloor (DSF) and penetrates the uppermost basement. The first six cores recovered 47.9 m of sediment, Core 7X advanced 0.3 m with no recovery, and the total recovery from subsequent Cores 8X and 9X was 2.4 m. Core recovery in Hole U1561A was ~104% in the sediment section and 88% in the basement section.
Physical properties data from Holes U1561A–U1561C were compared to establish a core composite depth below seafloor (CCSF) scale (Table T9). Cores 395E-U1561A-1H and 395E-U1561C-1H were both disturbed by drilling, which is reflected in the noisy physical properties and paleomagnetic data (Figure F23; see Paleomagnetism). However, tentative correlation based on MS can be achieved between Cores 395E-U1561A-1H and 395E-U1561C-1H, as indicated in the Site U1561 splice (Figure F23; Table T10). Based on the correlation, ~1 m of stratigraphy is missing at the top of Hole U1561C. Additionally, the correspondence in GRA bulk density, MS, and NGR between Cores 395E-U1561A-2H and 395E-U1561B-1H was expected because the first core shot depth was 10 m deeper in Hole U1561B relative to Hole U1561A (see Table T1). A tie point aligning Cores 395E-U1561B-1H and 395E-U1561A-2H anchors Core 395E-U1561A-2H in the CCSF depth scale. The coring gap between the first two consecutive cores in Hole U1561A (Cores 1H and 2H) is covered by the recovery in Core 395E-U1561C-1H (Figure F23).
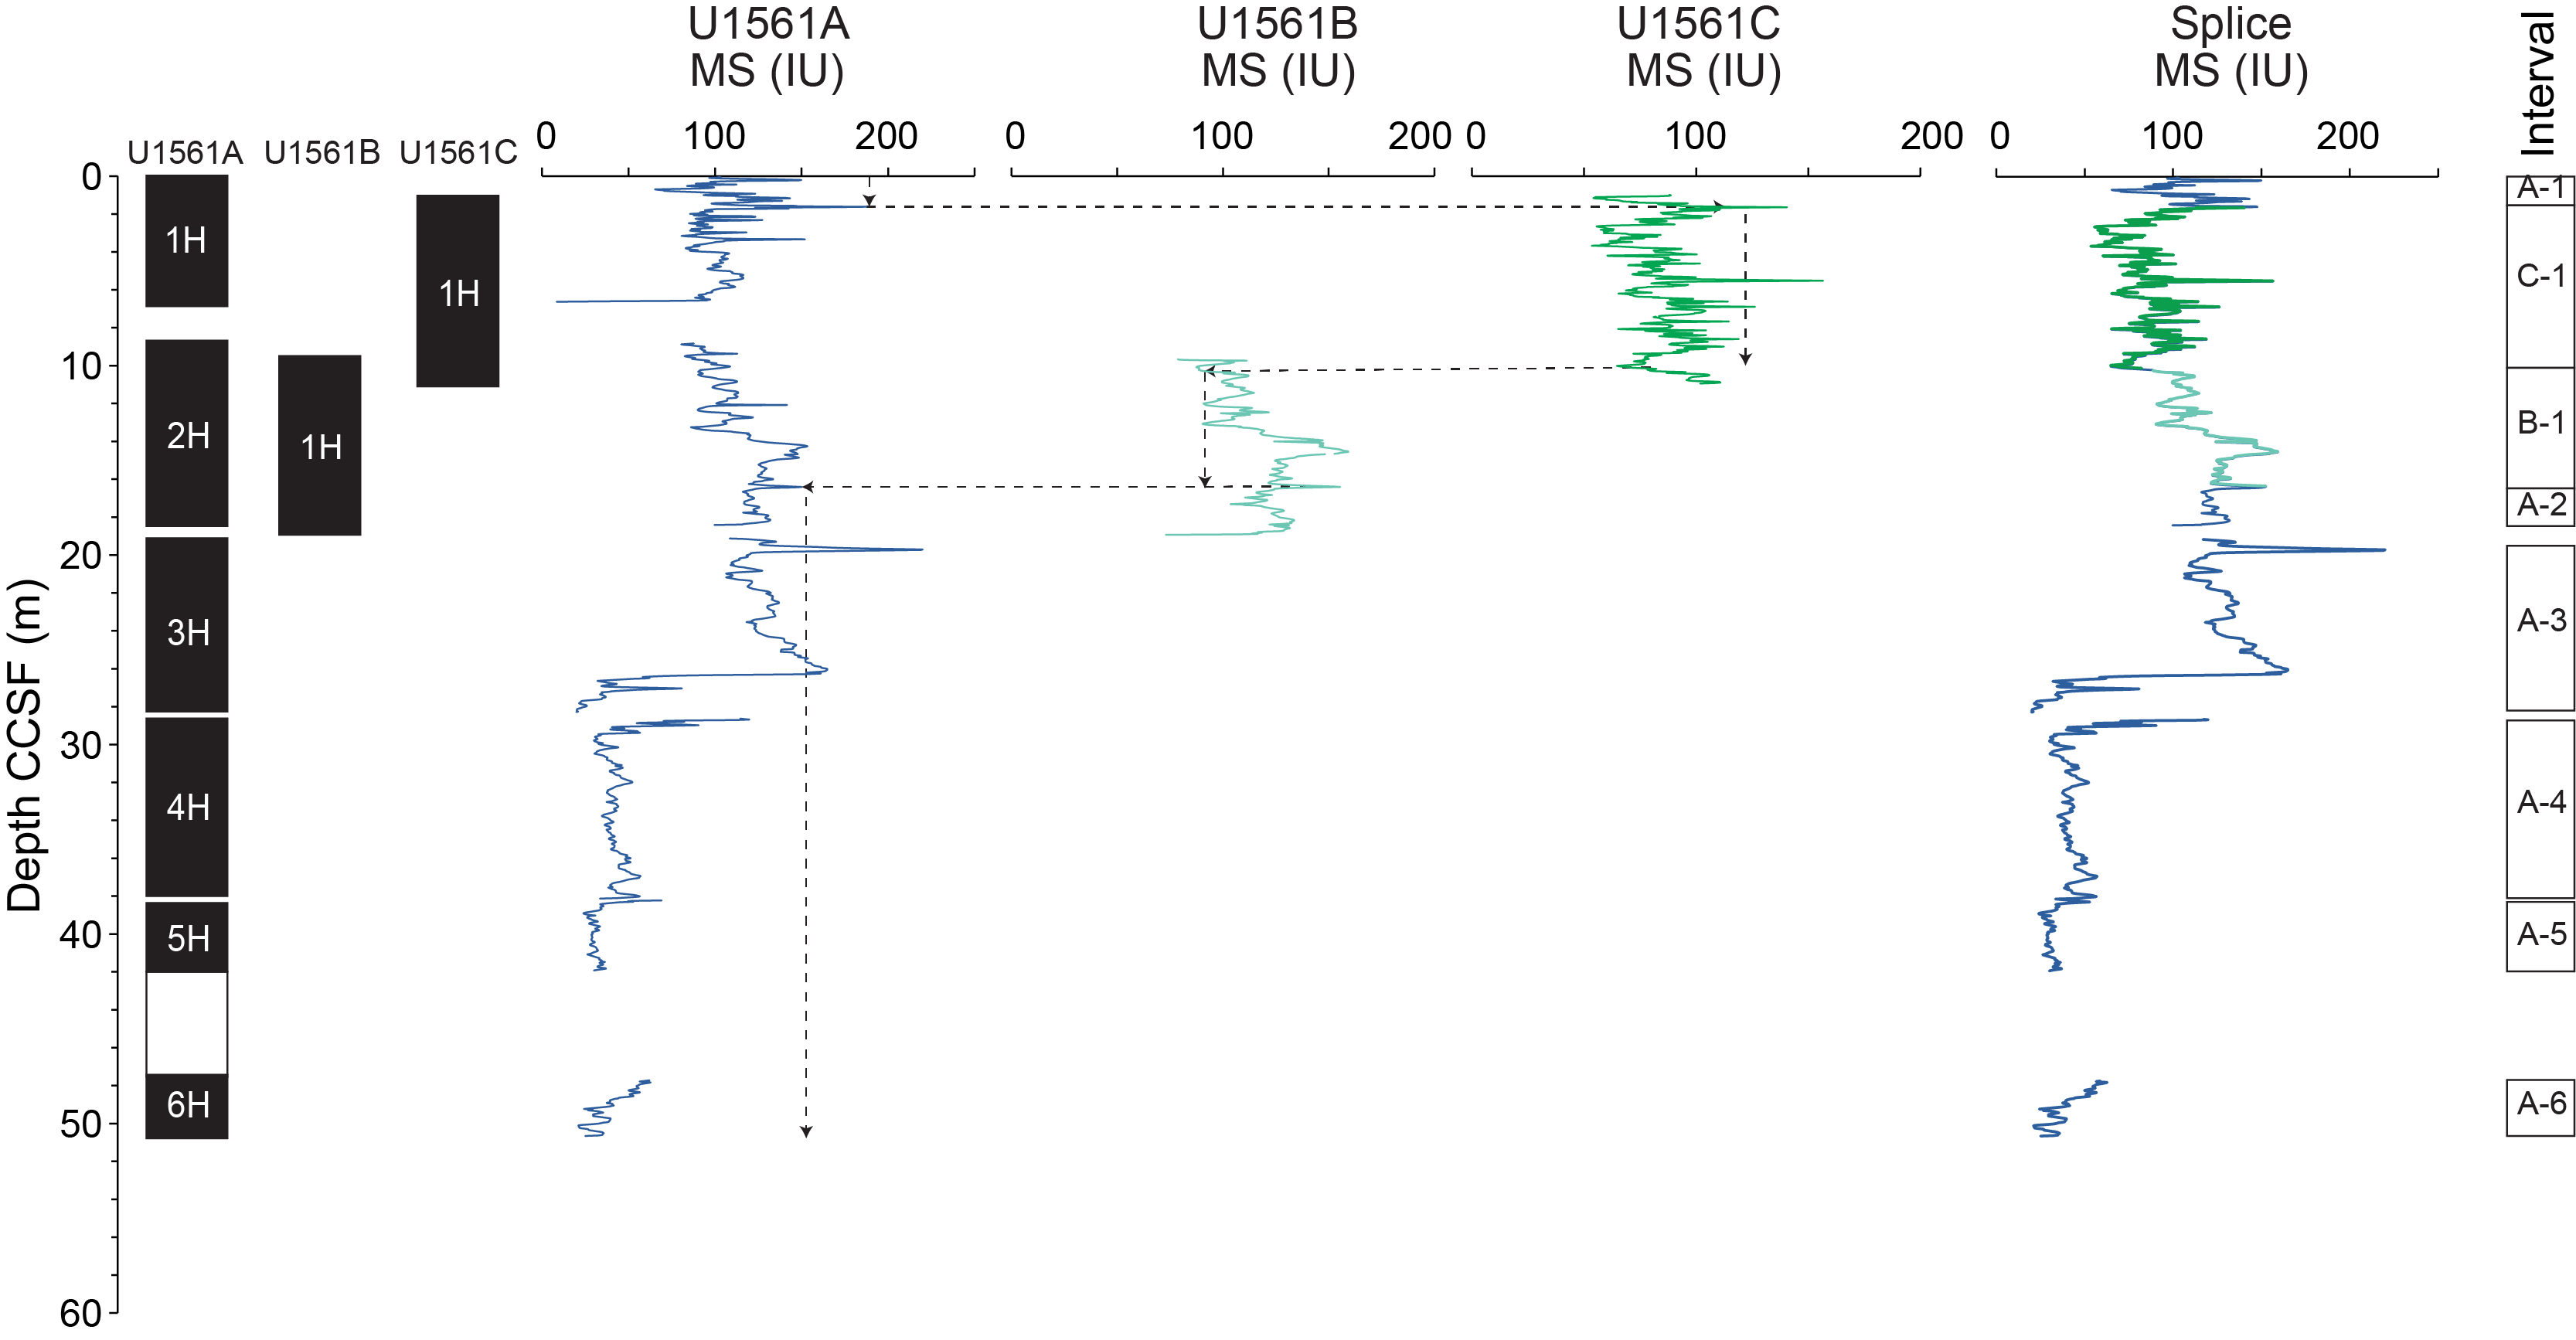
Figure F23. Composite depth scale and splice.
Tie points were placed at (1) a peak in MS present in Sections 395E-U1561A-1H-2 and 395E-U1561C-1H-1 and (2) a sharp decrease in NGR in both Sections 395E-U1561B-1H-1 and 395E-U1561C-1H-7 (Table T10). These correlations allowed a splice to be created for the uppermost 18.4 m CCSF at Site U1561 using data from all three holes (Figure F23). Below 18.4 m CCSF, a complete and continuous splice could not be established because Hole U1561A was the only hole for which deeper sediment was drilled. The spliced physical properties data used in stratigraphic correlation at Site U1561 are presented on the core composite depth scale in Figure F24.
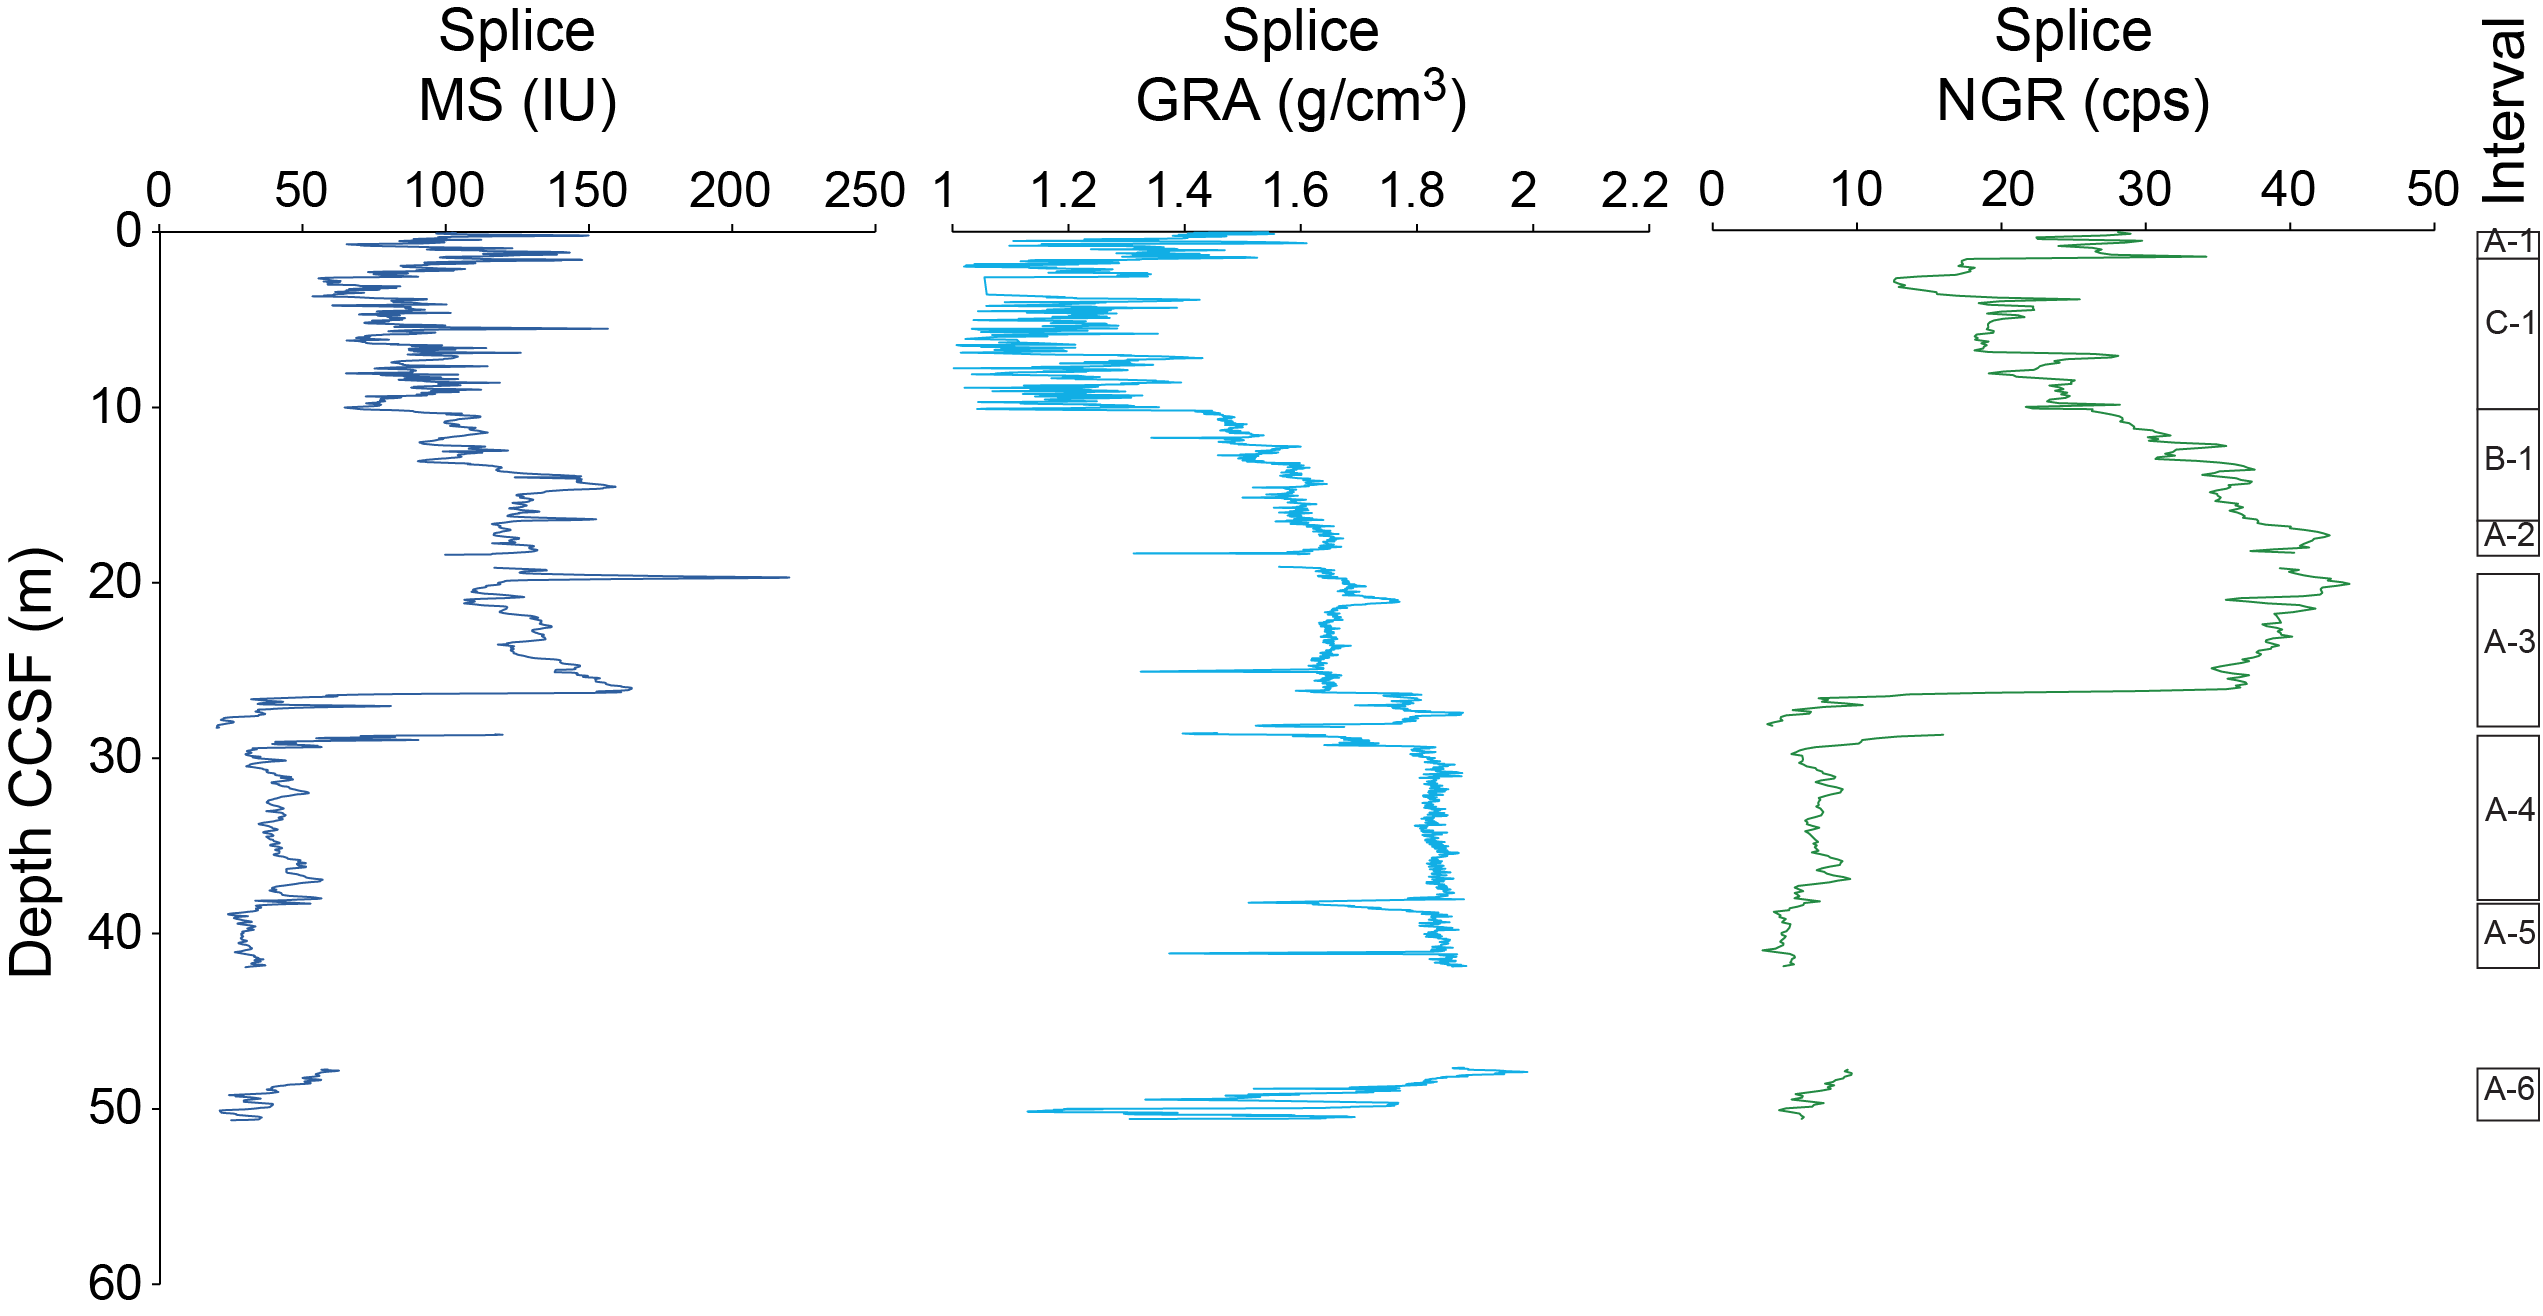
Figure F24. Splice showing correlated data types.
10.2.1. Downhole temperature
Formation temperature measurements were made using an advanced piston corer temperature (APCT-3) probe inside the APC coring shoe, which is fired into the sediment during APC coring and held in place for 10 min to make a formation temperature measurement (see Physical properties and downhole measurements in the Expedition 390/393 methods chapter [Coggon et al., 2024c]). A single formation temperature measurement was taken in Hole U1561A when coring Core 395E-U1561A-4H (Table T11; Figure F25). The data show that although the probe was not steady at the beginning of the deployment, it remained in position long enough to fit a theoretical decay curve and estimate a formation temperature of 8.17°C at 35.5 mbsf. This estimated formation temperature combined with an estimated mudline temperature of 1.4°C suggests that the geothermal gradient could be as high as 194°C/km (Figure F26C).
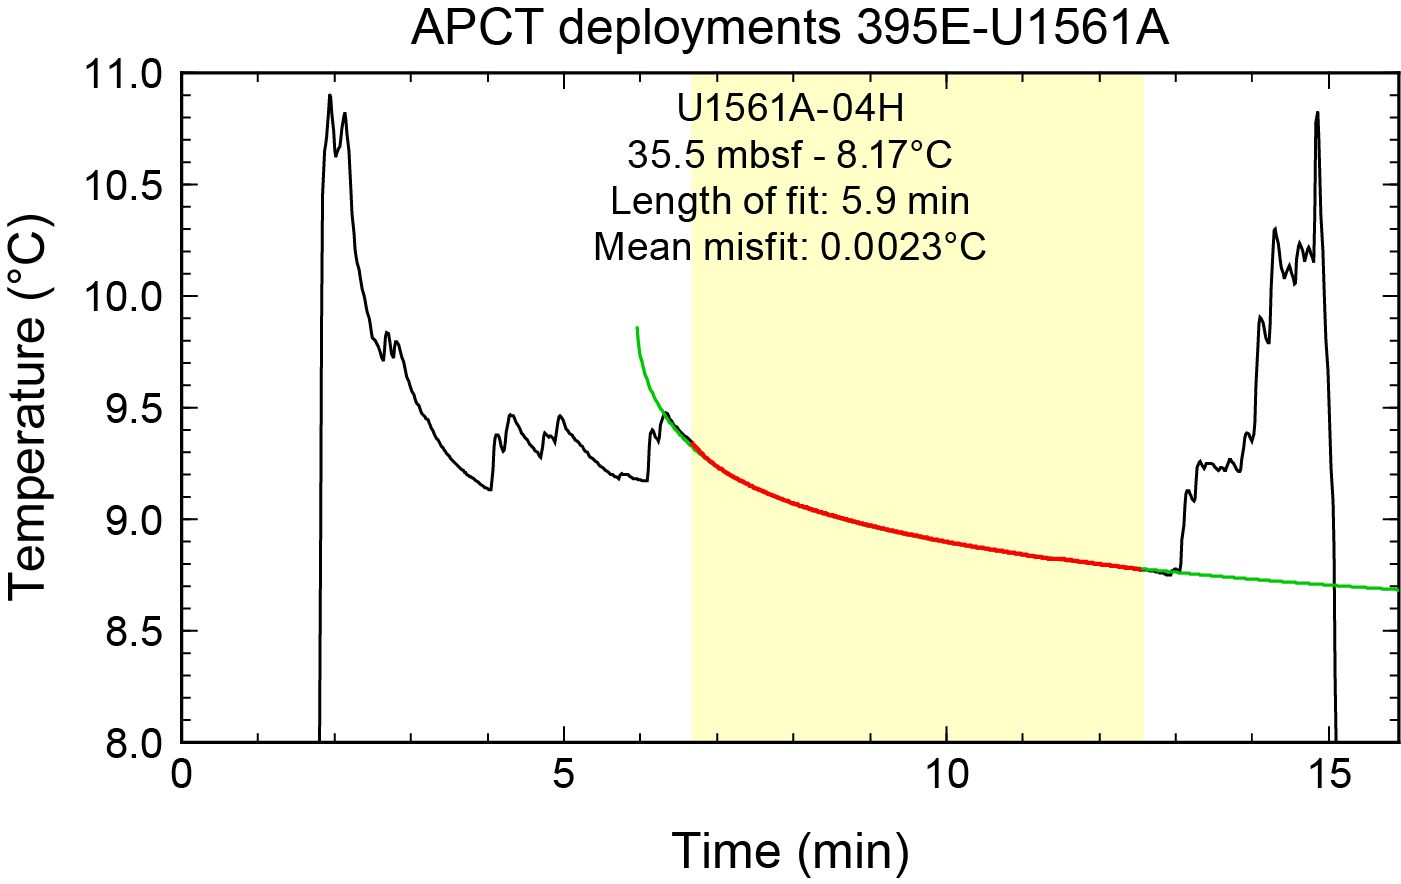
Figure F25. APCT-3 temperature.
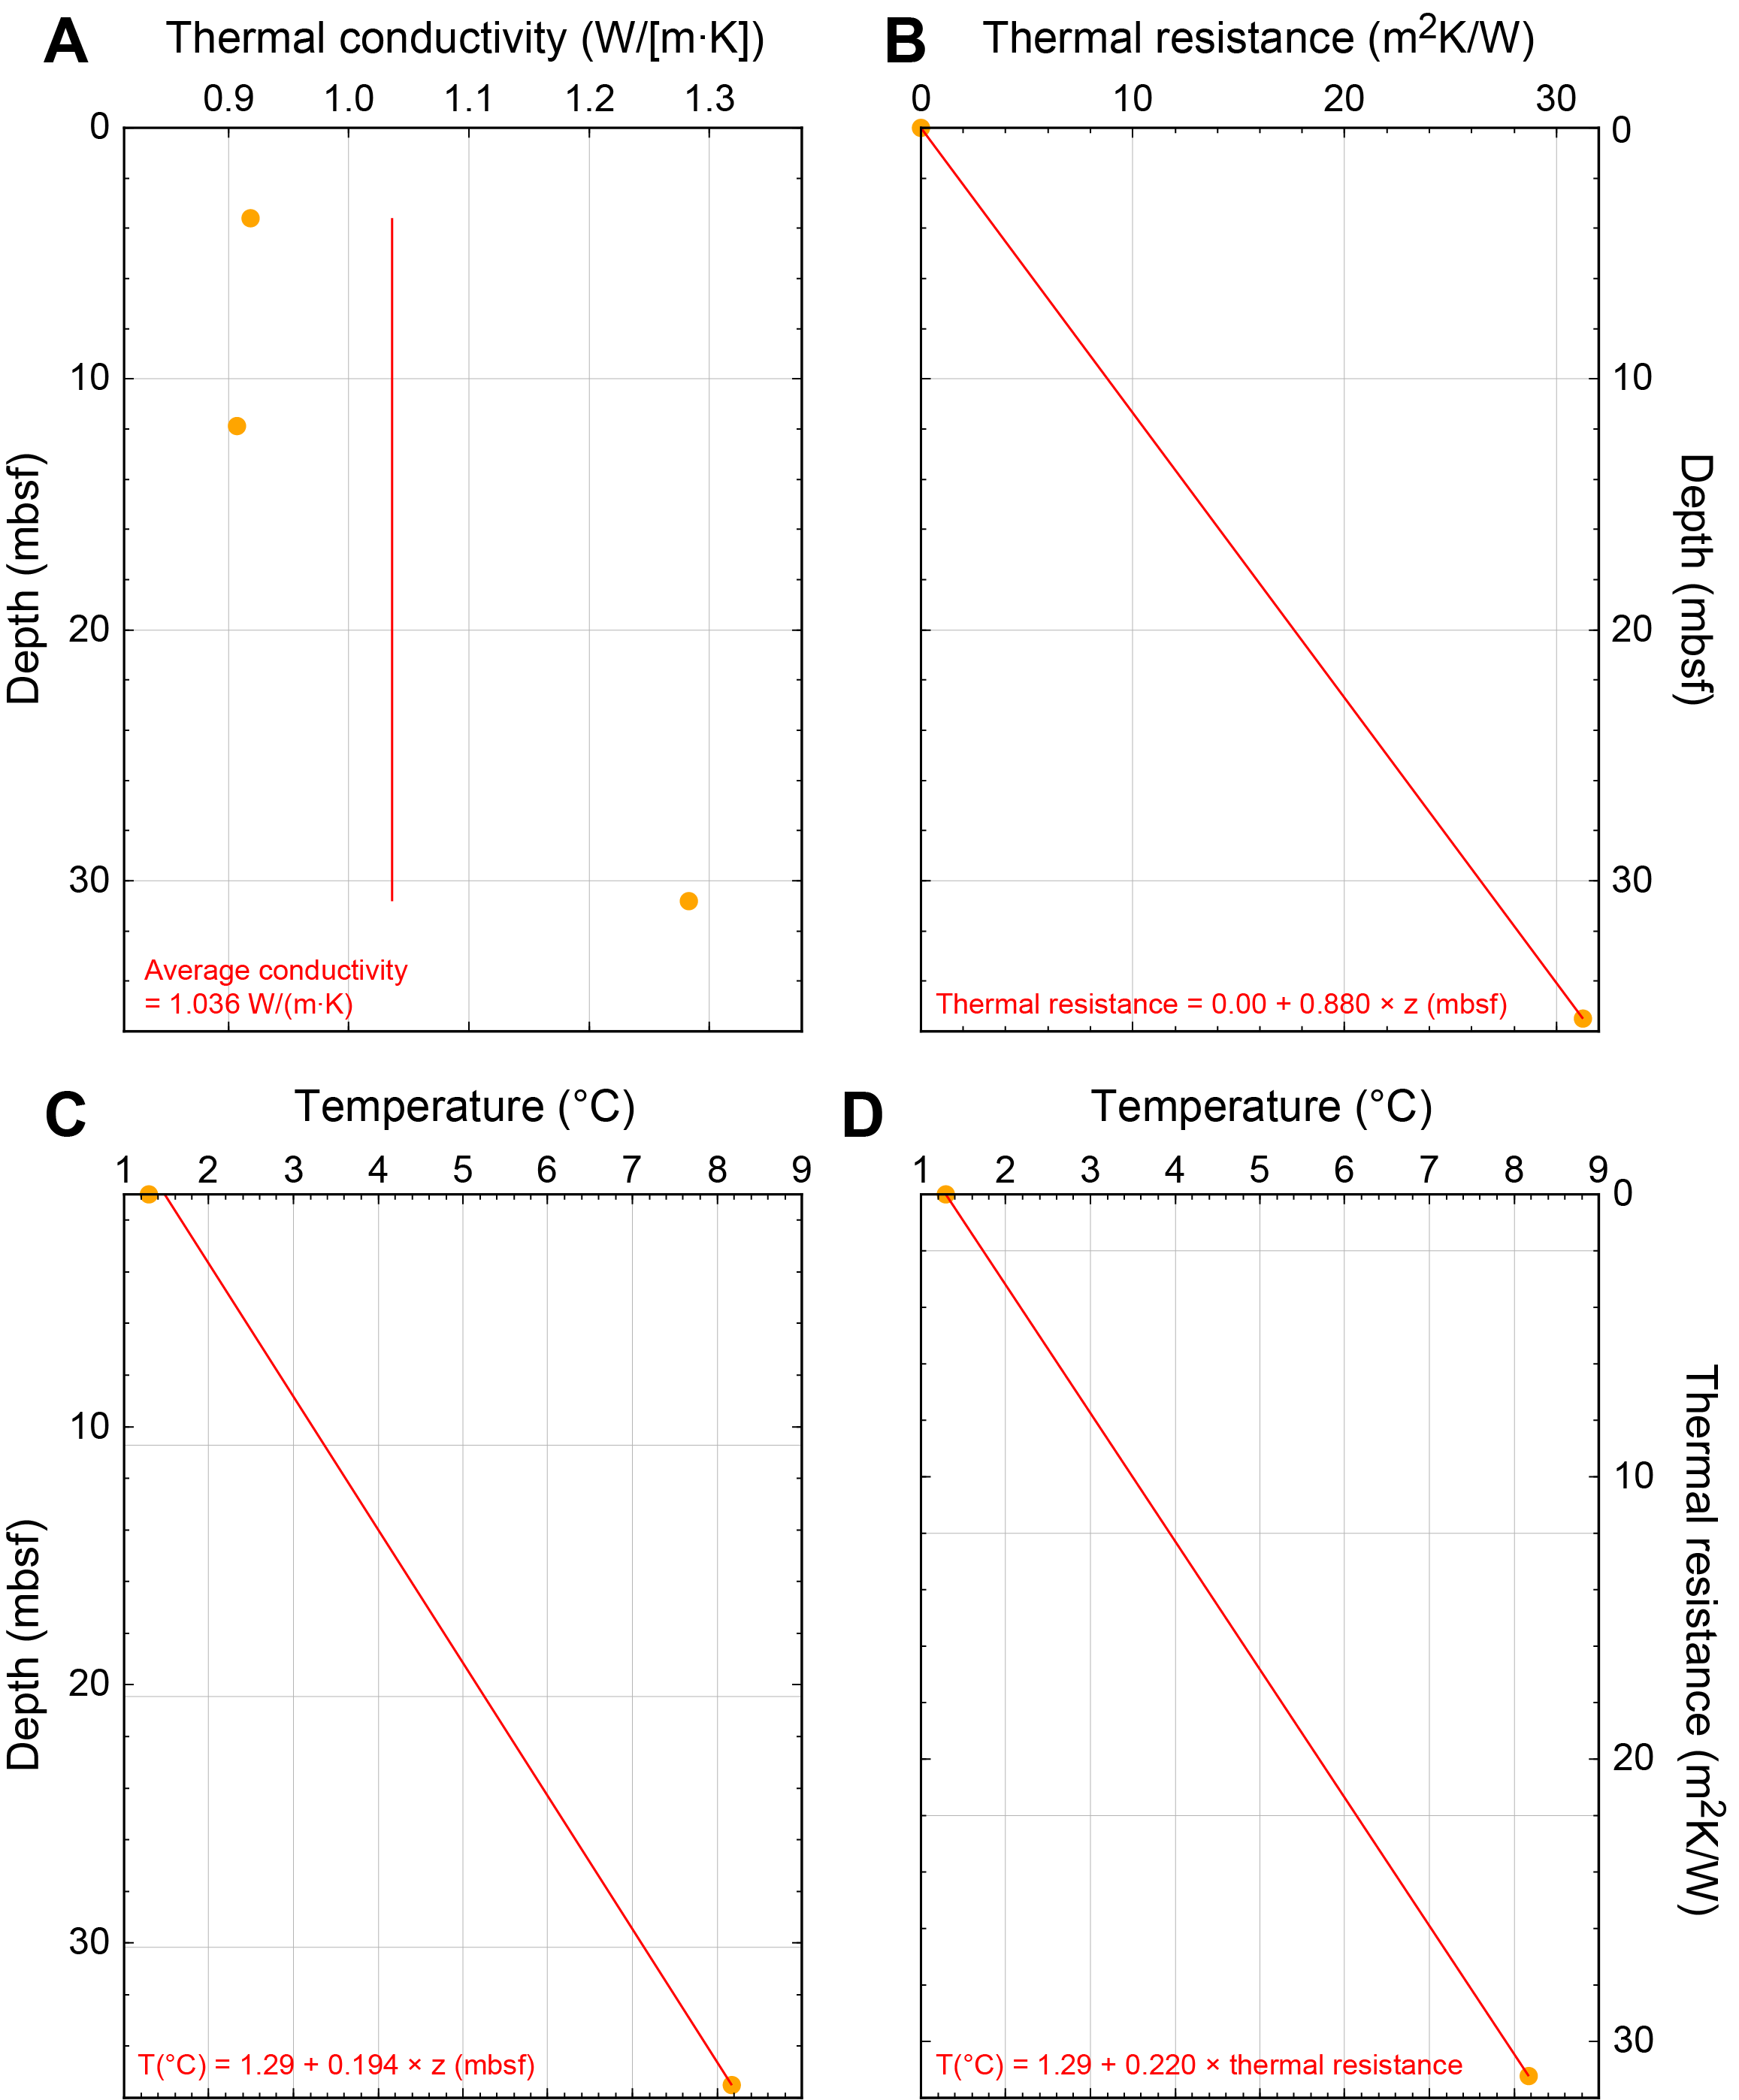
Figure F26. Conductive heat flow.
10.2.2. Heat flow
The discrete thermal conductivity data from Hole U1561A were used to calculate thermal resistance downhole using the method described in Pribnow et al. (2000). Thermal resistance was plotted against depth, allowing the thermal resistance at depths where APCT-3 temperature measurements were made to be interpolated (Figure F26B). The downhole temperature data were then plotted against thermal resistance; the slope of a linear regression of this plot is equivalent to the conductive heat flow, and its intercept yields the temperature at 0 depth (i.e., the temperature at the seafloor; T0). Based on the single downhole temperature measurement and the estimated mudline temperature of 1.4°C, an estimate of vertical conductive heat flow at Site U1561 can be established with a Bullard plot (220 mW/m2; Figure F26D). Because this value is based on bottom seawater estimation and only one formation temperature, it may be an overestimate because the temperature measured in Hole U1561A is much higher than might be expected in such old (~61 Ma) crust with a thin sediment cover.
11. Geochemistry
11.1. Interstitial water sampling
IW samples were collected from Hole U1561A at a frequency of one per core from Cores 395E-U1561A-1H through 6H to 48.9 m core depth below seafloor, Method A (CSF-A). A mudline sample was also collected from Hole U1561A, resulting in a total of seven IW samples. IW samples were squeezed under laboratory atmosphere. Shipboard analyses of IW samples included pH, salinity, alkalinity, major cations and anions (sodium, calcium, magnesium, potassium, chloride, and sulfate) using ion chromatography (IC), major and minor elements using the inductively coupled plasma–atomic emission spectroscopy (ICP-AES), and nutrients (phosphate and ammonium) on the spectrophotometer (see Geochemistry in the Expedition 390/393 methods chapter [Coggon et al., 2024c]). Major cations were measured by both ICP-AES and IC with similar results, but only IC data are presented here for consistency with other sites. Carbonate, TOC, and total nitrogen (TN) measurements were conducted on the solid IW sample residues (squeeze cakes) from Cores 1H–6H. Selected pore water geochemical profiles are shown in Figures F27, F28, F29, and F30, and shipboard analyses are presented in Table T12. Carbonate, TOC, and TN data are presented in Figure F31 and Table T13.
11.2. Measurement results of interstitial water
11.2.1. Salinity, chloride, bromine, sodium, and potassium
Salinity has a near-constant value of 34–35 throughout the hole (Table T12). Chloride (Cl) concentration is 578 mM at the mudline and decreases to lower concentrations of 562–568 mM from 4.5 to ~45.5 m CSF-A (Figure F27A). The downhole bromide (Br) profile is similar in shape to Cl, with concentrations of 0.86–0.88 mM (Figure F27B). The pore waters have Br/Cl molar ratios (~1.5 × 10⁻³) that are consistent with seawater. Sodium (Na) has a similar shape profile to Br and Cl; concentrations decrease from 496 mM in the mudline to 479–485 mM between 4.5 and ~45.5 m CSF-A (Figure F27C). Potassium (K) concentrations increase from 11.2 mM in the mudline to 12.3 mM at 4.5 m CSF-A, below which they are lower (11.1–11.8 mM) (Figure F27D).
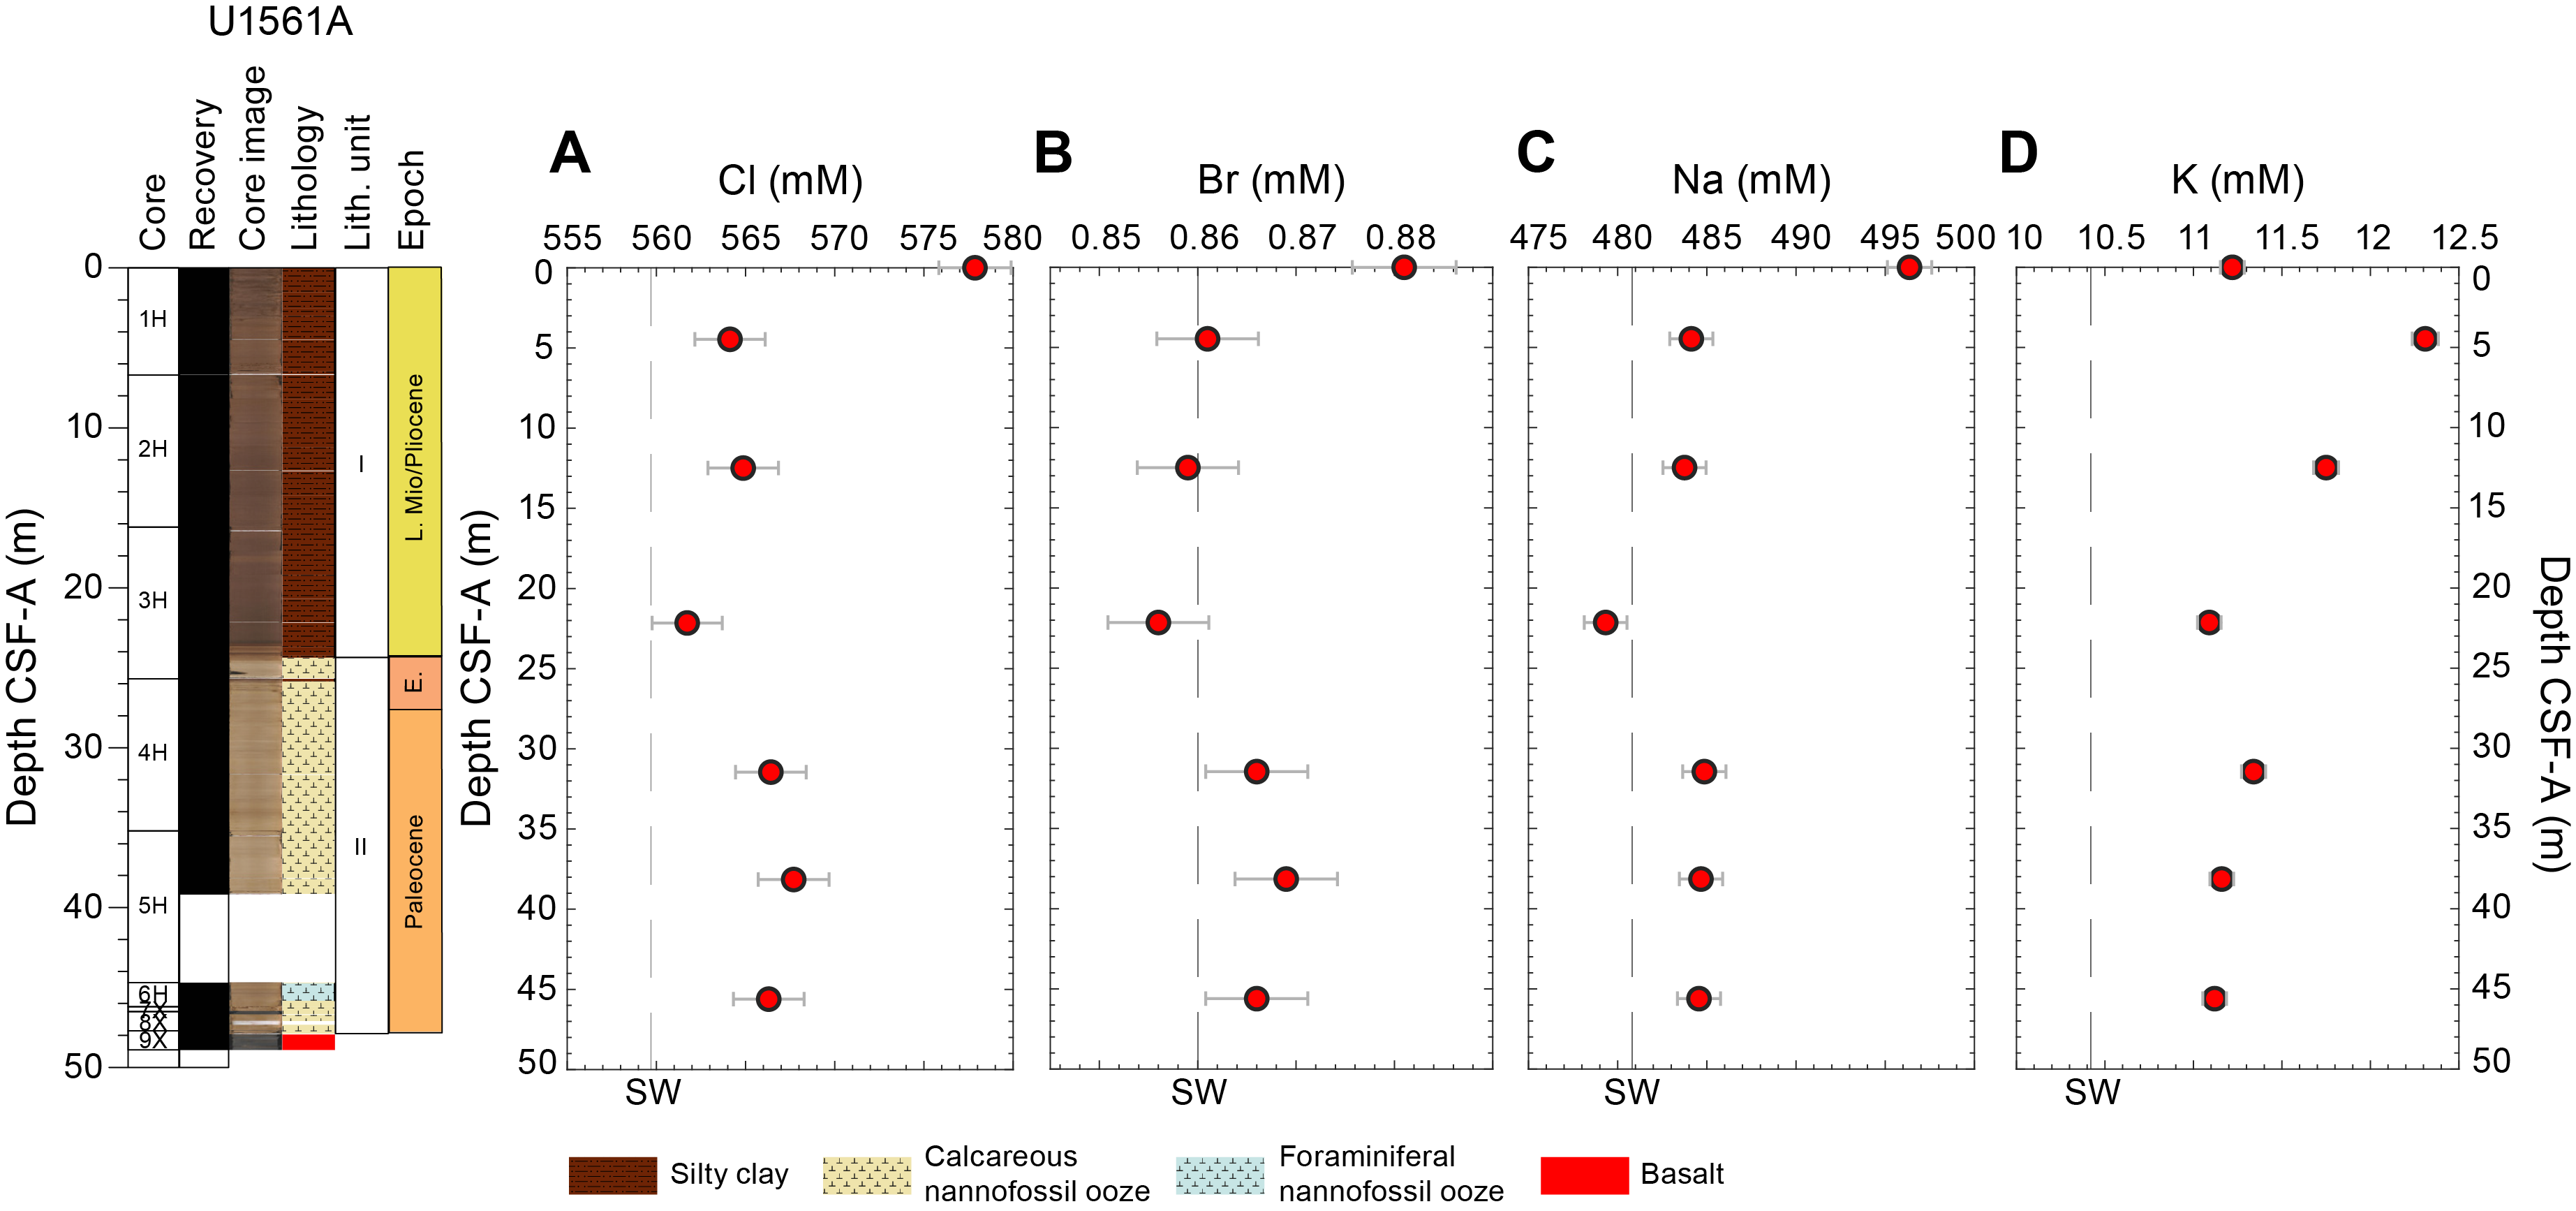
Figure F27. Chloride, bromine, sodium, and potassium.
11.2.2. pH, alkalinity, calcium, magnesium, and strontium
The pH in Hole U1561A is ~7.9, slightly higher than local bottom seawater values (Ríos et al., 2015) and remains overall constant throughout the sediment column (Figure F28A). The downhole profile of alkalinity concentration is inverse of the Na, Cl, and Br profiles. Alkalinity variation is generally small (2.2–2.6 mM); however, concentrations in Unit I are higher than those in Unit II (Figure F28B). Calcium (Ca; ~10.4–11 mM) and strontium (Sr; ~78–89 µM) also exhibit small changes in concentration that are higher in Unit I than in Unit II (Figure F28C, F28E). Magnesium (Mg) concentration is 55.5 mM in the mudline sample, decreases in Unit I, and increases to a maximum of 53.7 mM downhole (Figure F28D).
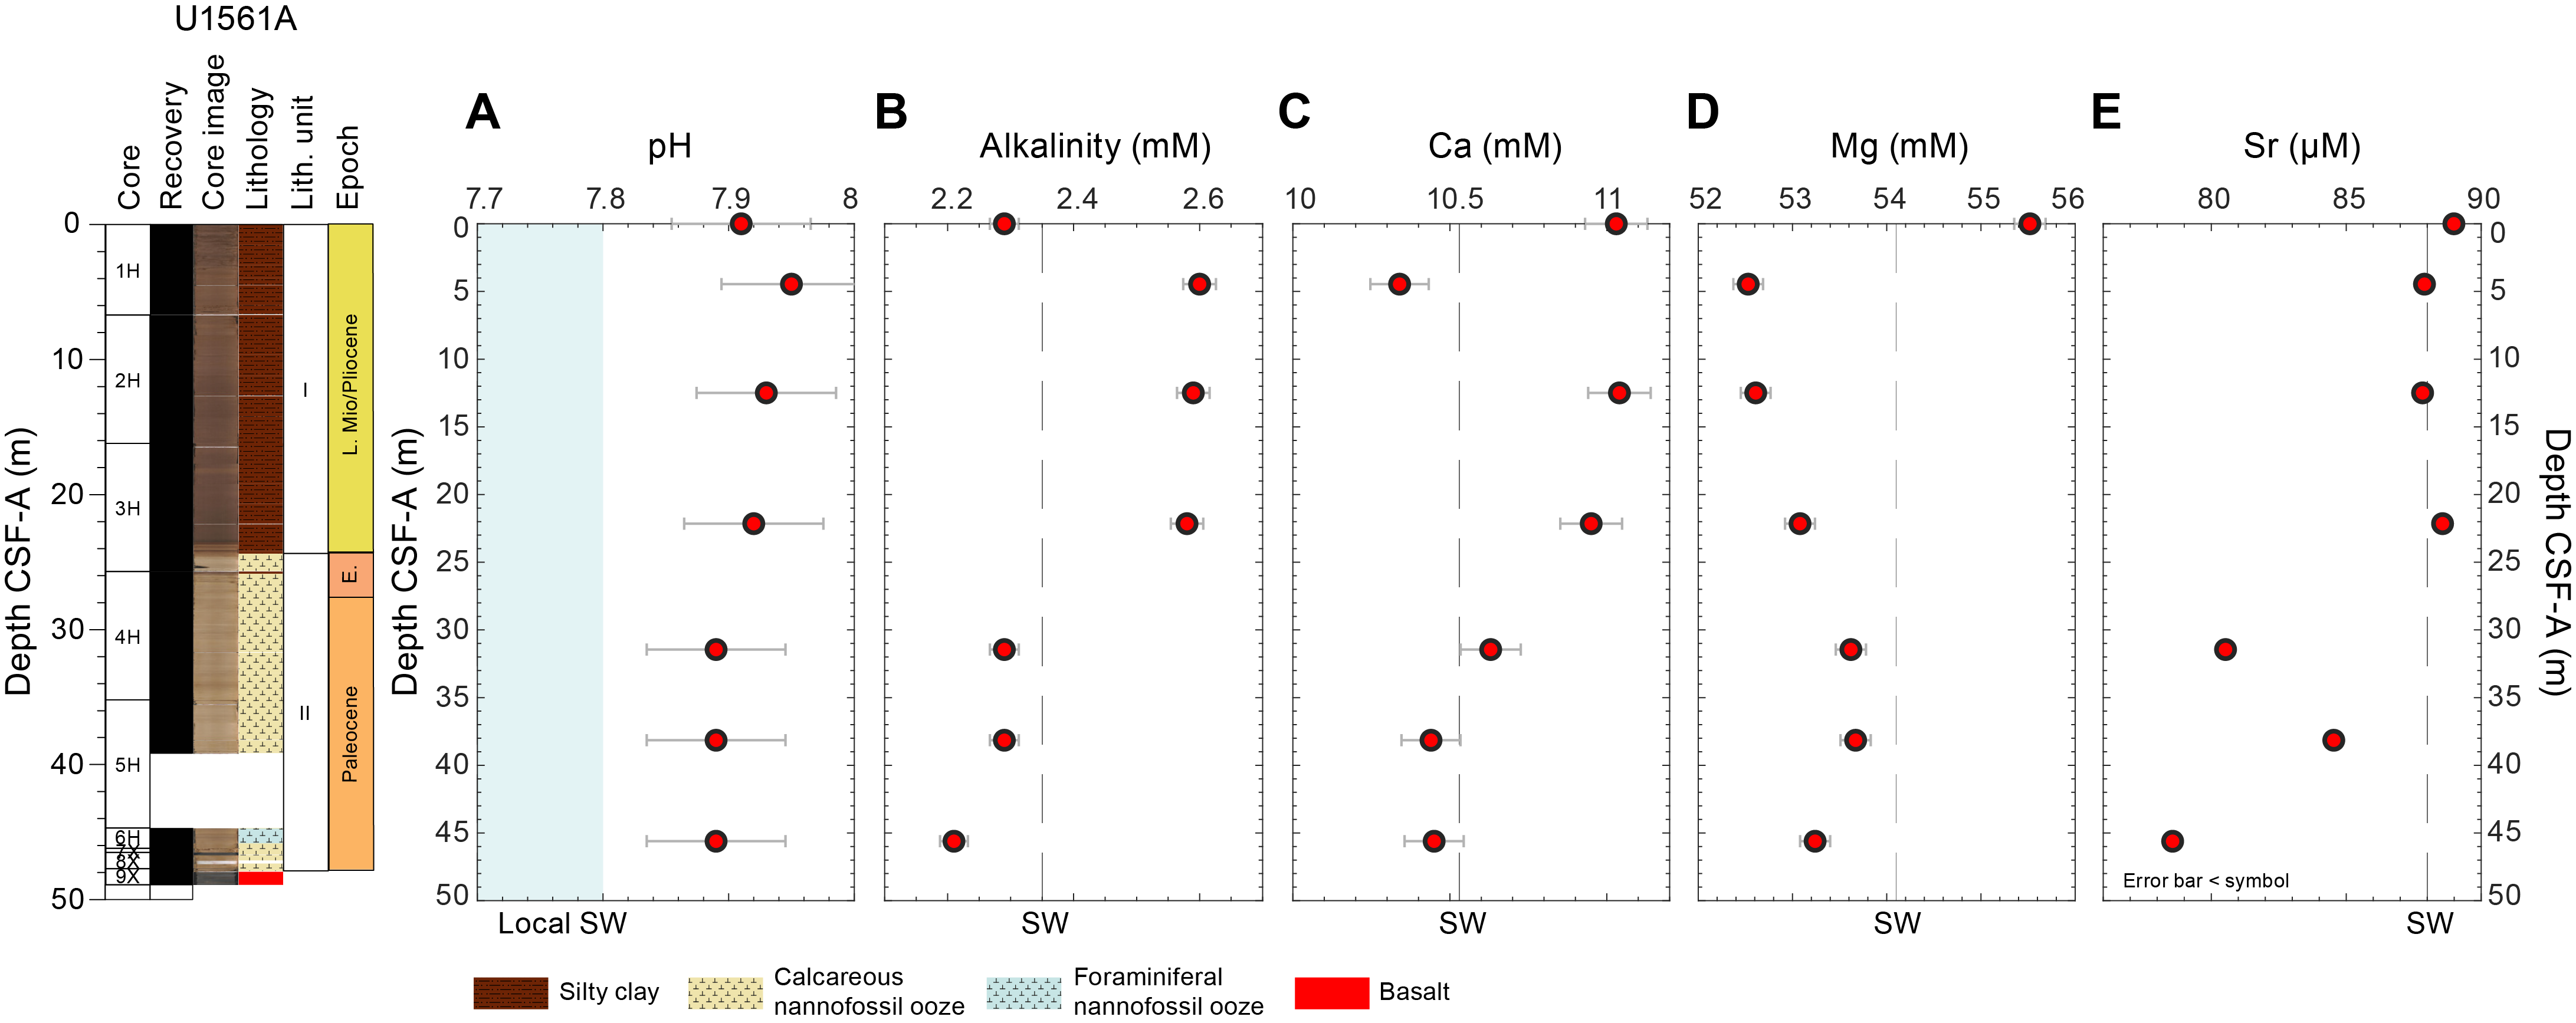
Figure F28. pH, alkalinity, calcium, magnesium, and strontium.
11.2.3. Boron, lithium, and silica
Boron (B) concentration is 424 µM in the mudline, whereas it is higher in the pore waters of the uppermost ~25 m of the sedimentary section (674–734 µM) but lower (~500 µM) below 31.5 m CSF-A (Figure F29A). The B profile has a similar shape to the alkalinity profile (Figure F28B). Lithium (Li) concentrations are 27–28 µM from the mudline to 22 m CSF-A (Unit I) and decrease to ~23.5–25 µM in Unit II, yielding a profile similar in shape to that of Sr (Figures F28E, F29B). Dissolved silica (Si) concentrations are the lowest in the mudline (24 µM), whereas Si concentrations of the sedimentary pore waters range ~87–108 µM throughout Hole U1561A (Figure F29C).
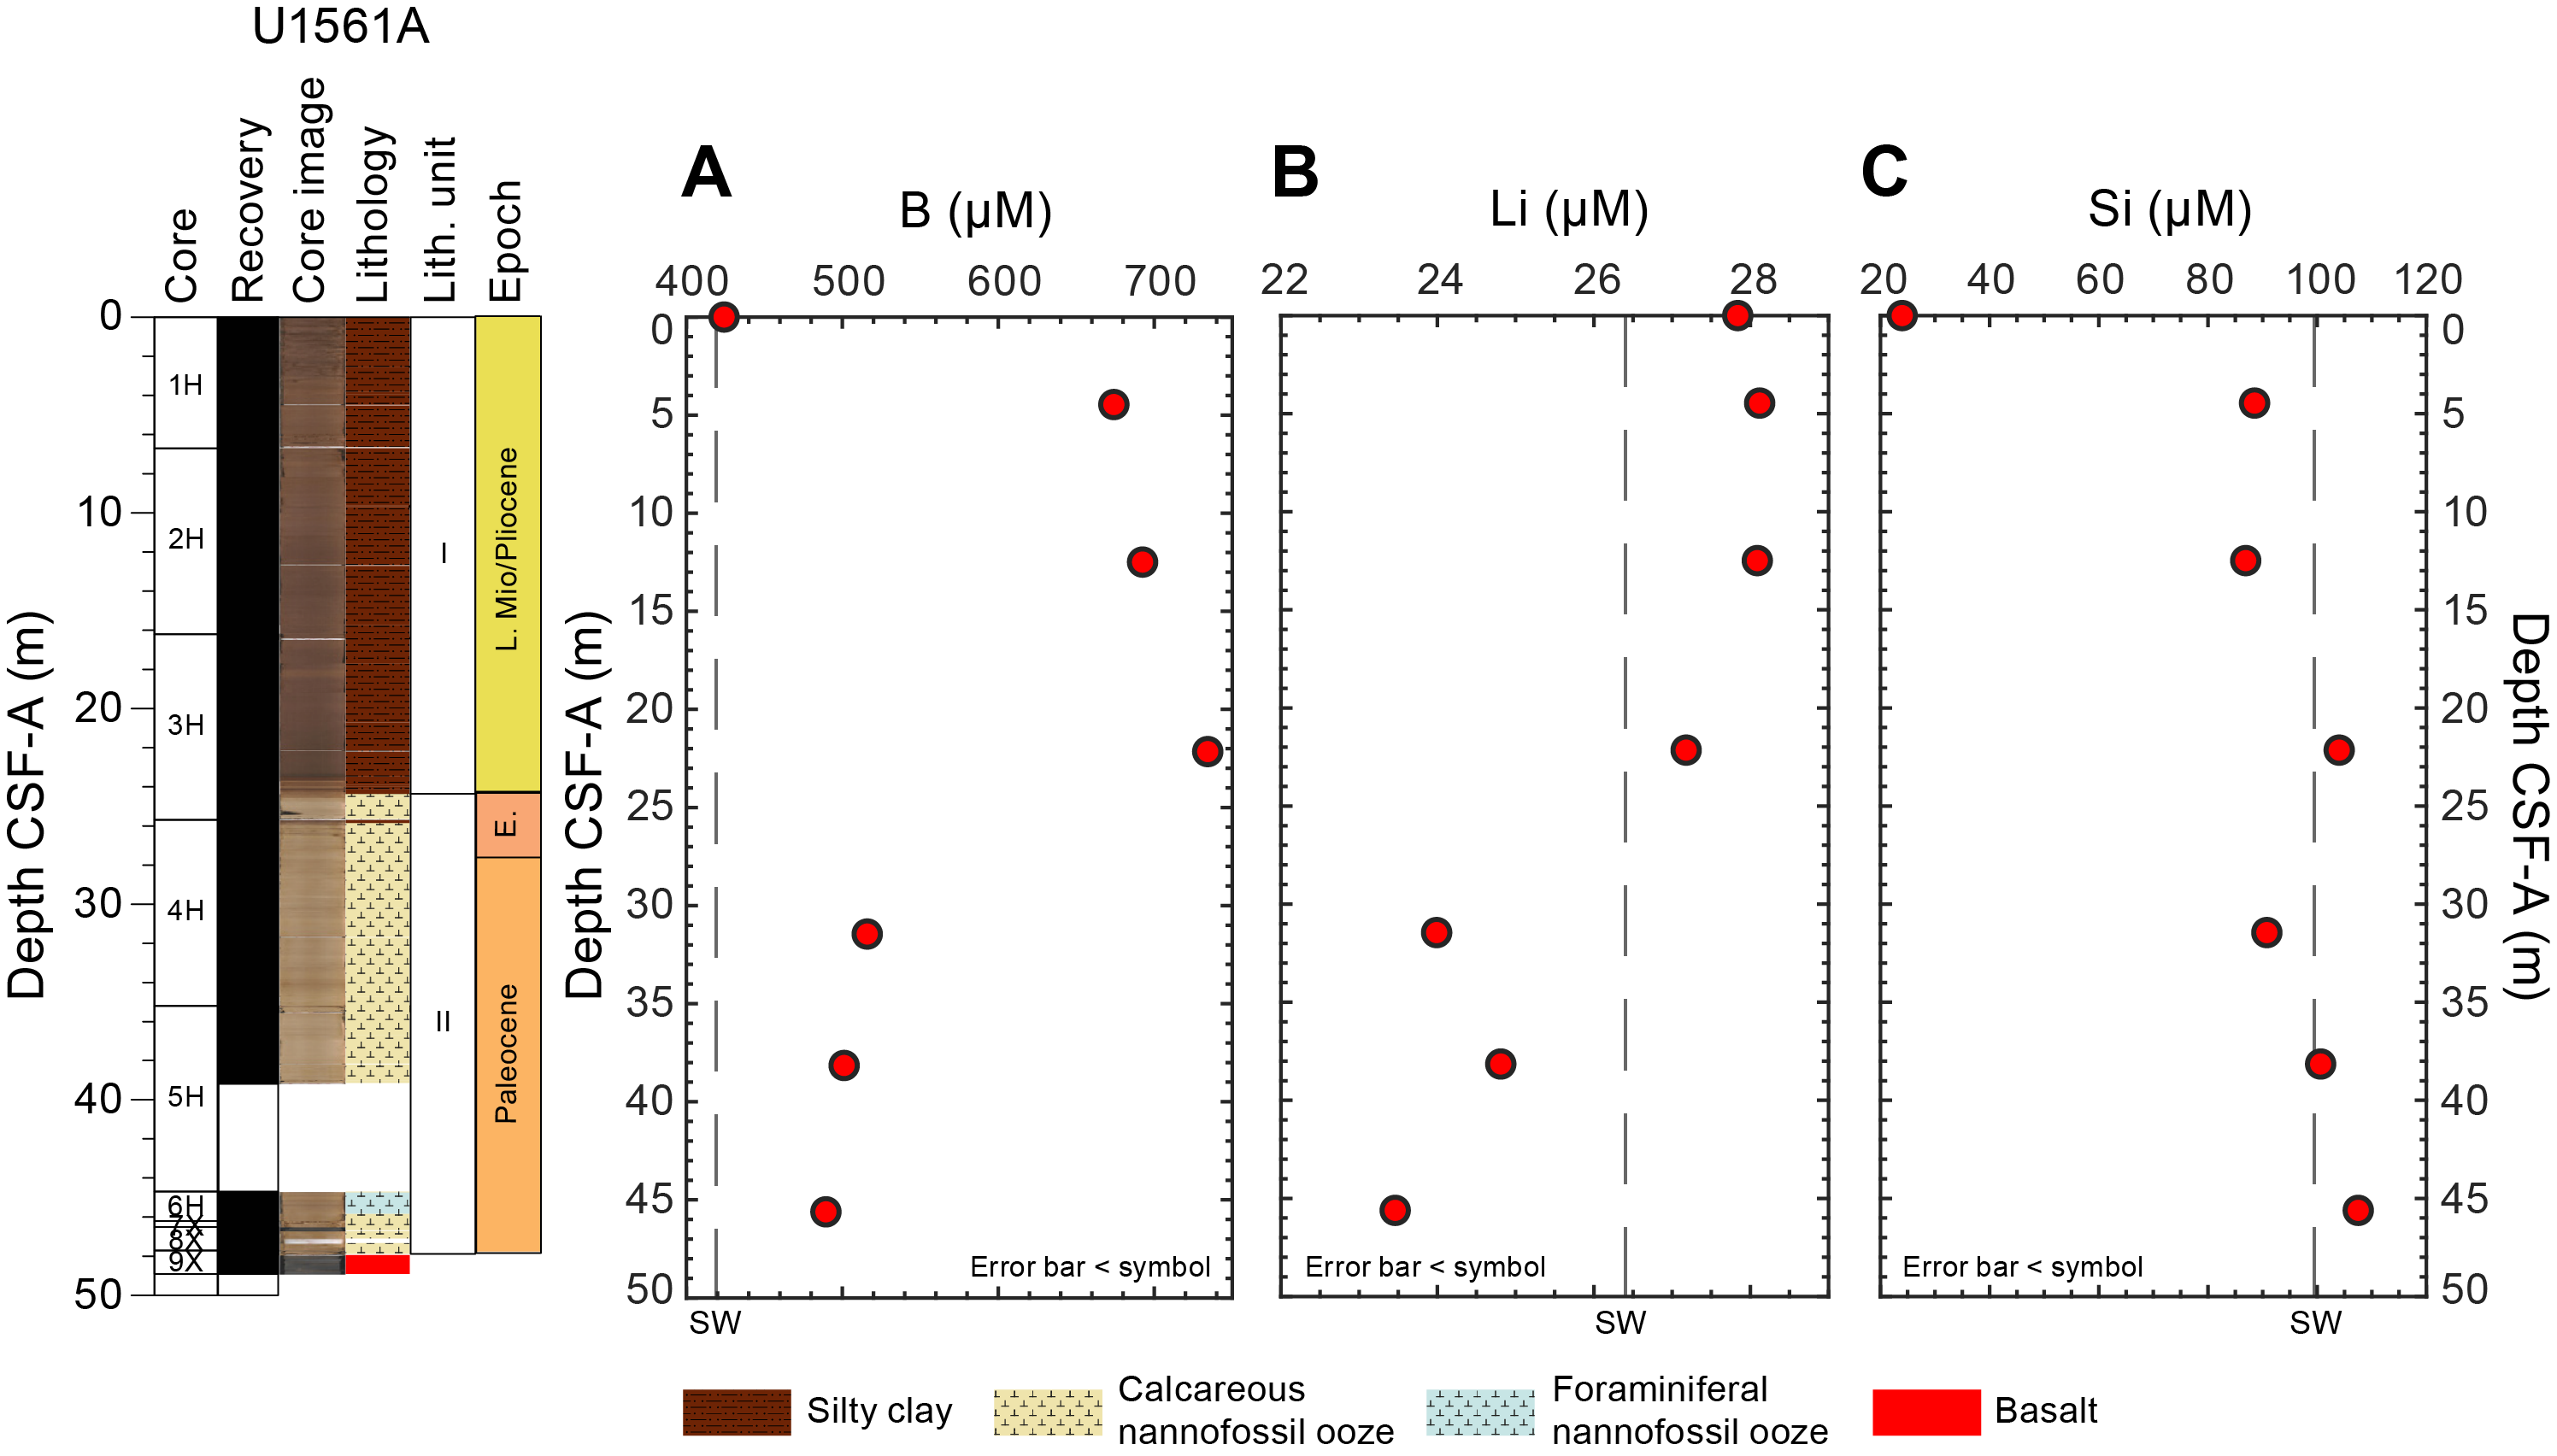
Figure F29. Boron, lithium, and silica.
11.2.4. Sulfate, manganese, ammonium, phosphate, iron, and barium
The sulfate (SO42−) concentration of 29.6 mM measured in the mudline sample is close to the International Association for the Physical Sciences of the Oceans (IAPSO) seawater sulfate concentration (28.9 mM) (Figure F30A). Pore water sulfate concentrations decrease to 26.5 mM within the upper 22 m of the sediment section, below which they range ~26.7–26.8 mM to the bottom of the hole. Manganese (Mn) concentrations are generally low and range 0.19–3.24 µM, with maxima in the mudline sample and at 38.15 m CSF-A (Figure F30B). Ammonium (NH4+) is 12.4 µM in the mudline, increases to 54.19 µM at 12.49 m CSF-A, and then decreases to 38.34 µM at the bottom of the hole (Figure F30C). Phosphate (PO43−) concentrations fall within 4.4–6.3 µM with no apparent trend downhole (Figure F30D).
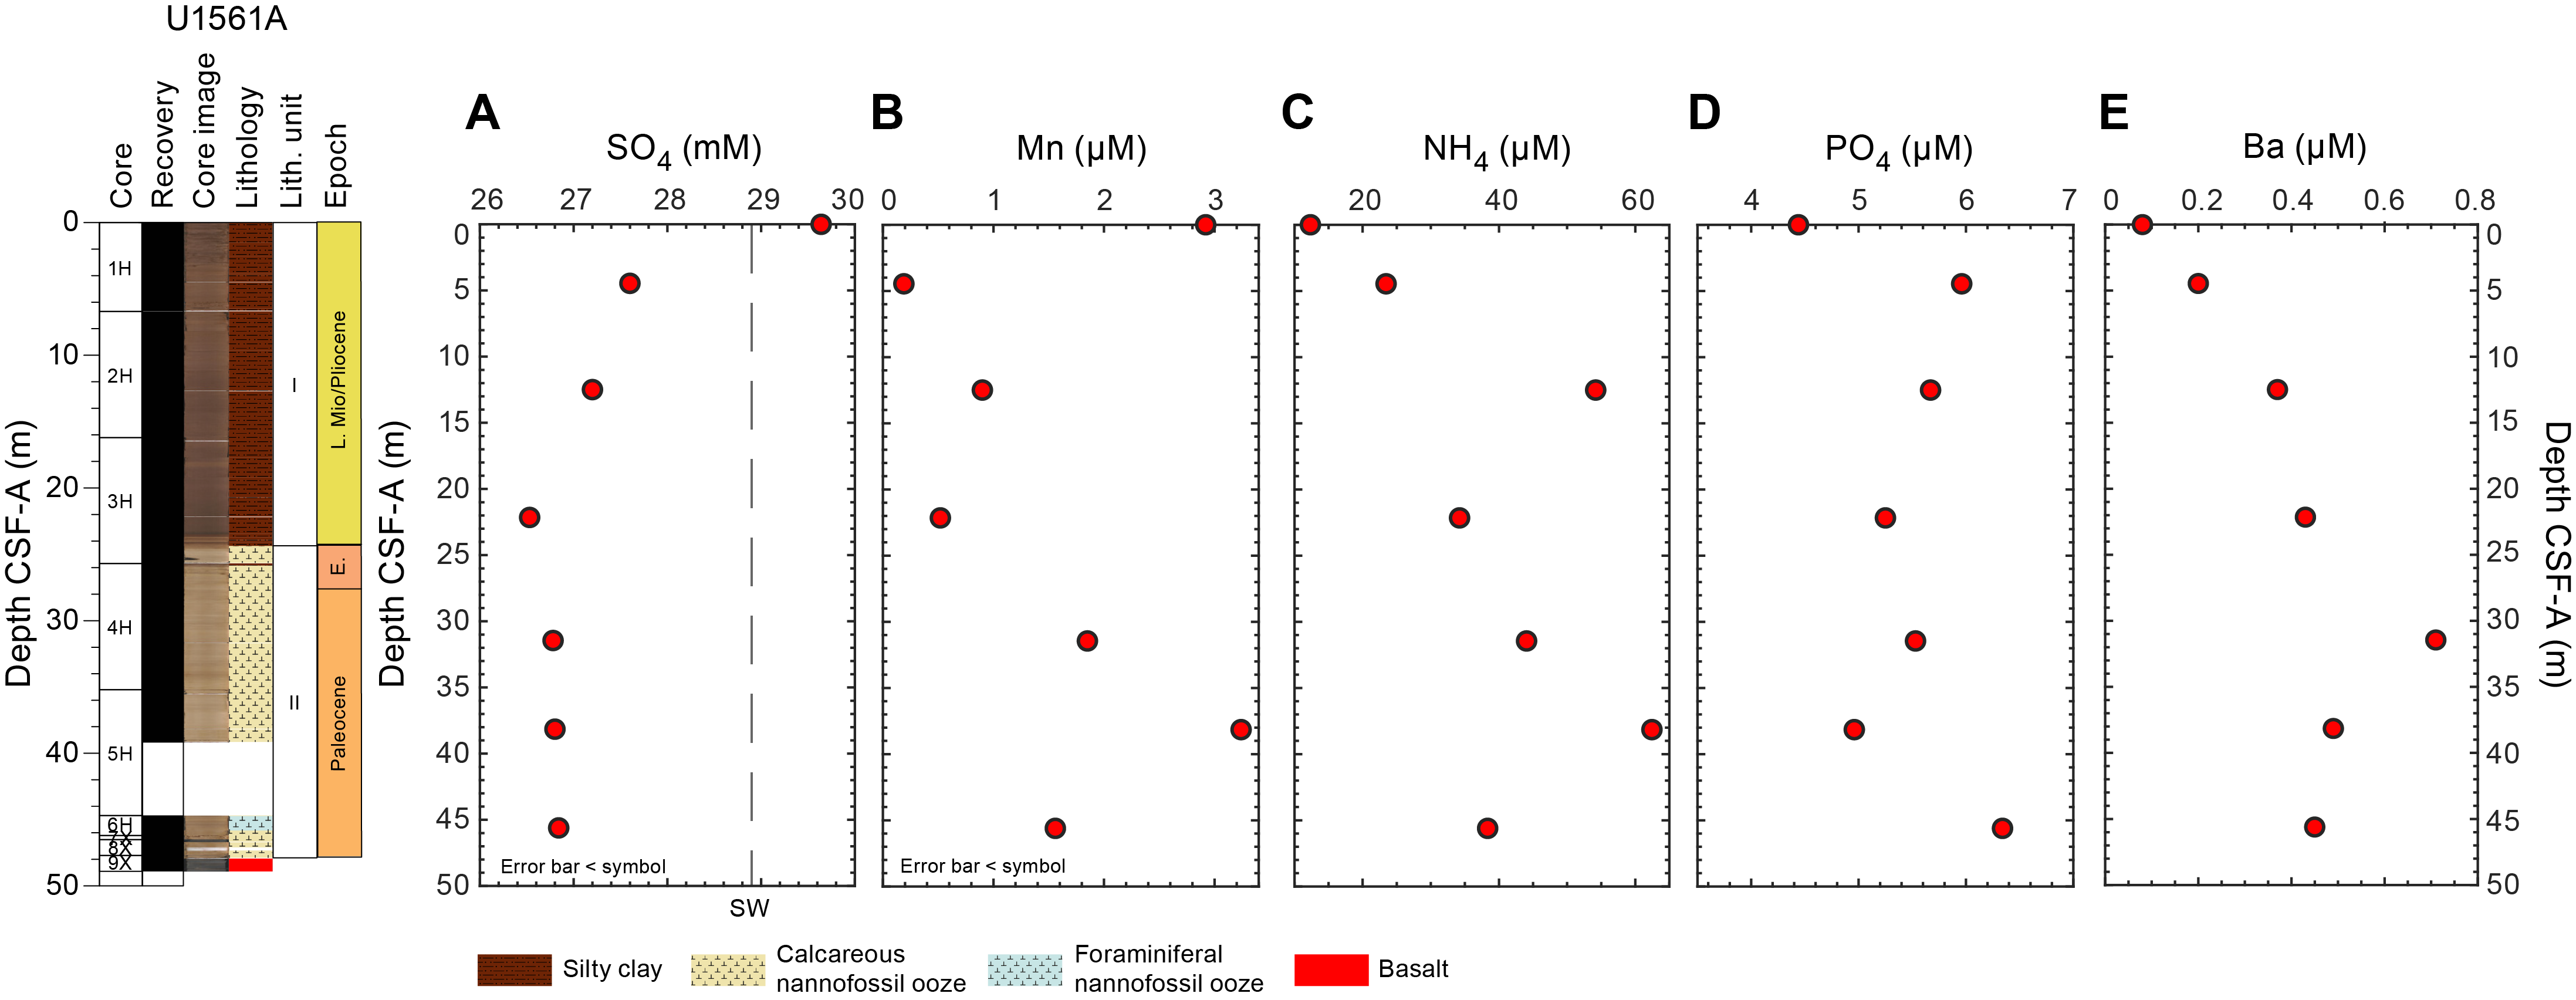
Figure F30. Sulfate, manganese, ammonium, phosphate, and barium.
Iron (Fe) and barium (Ba) were detected in the pore waters from Hole U1561A, albeit at low concentrations (Table T12). Fe concentrations are 0.1 µM in the mudline and 1.17 µM at 38.15 m CSF-A. The barium profile shows a monotonic increase from 0.08 µM in the mudline to 0.71 µM at 31.5 m CSF-A, below which it decreases to 0.45 µM at 45.5 m CSF-A (Figure F30E).
11.3. Sediment bulk geochemistry
11.3.1. Calcium carbonate
Calcium carbonate (CaCO3) contents of the sediments from Hole U1561A depend on lithology (Figure F31A). The average CaCO3 is 0.25 ± 0.06 wt% (±1 standard deviation [σ], n = 3) in Unit I (silty clay; see Sedimentology) and 85.9 ± 4.6 wt% (±1σ, n = 3) in Unit II (calcareous nannofossil ooze or clayey nannofossil ooze; see Sedimentology). The maximum CaCO3 content of the sediments measured in Hole U1561A is 90.20 wt% in Unit II, whereas the lowest measured value of 0.18 wt% occurs in Unit I.
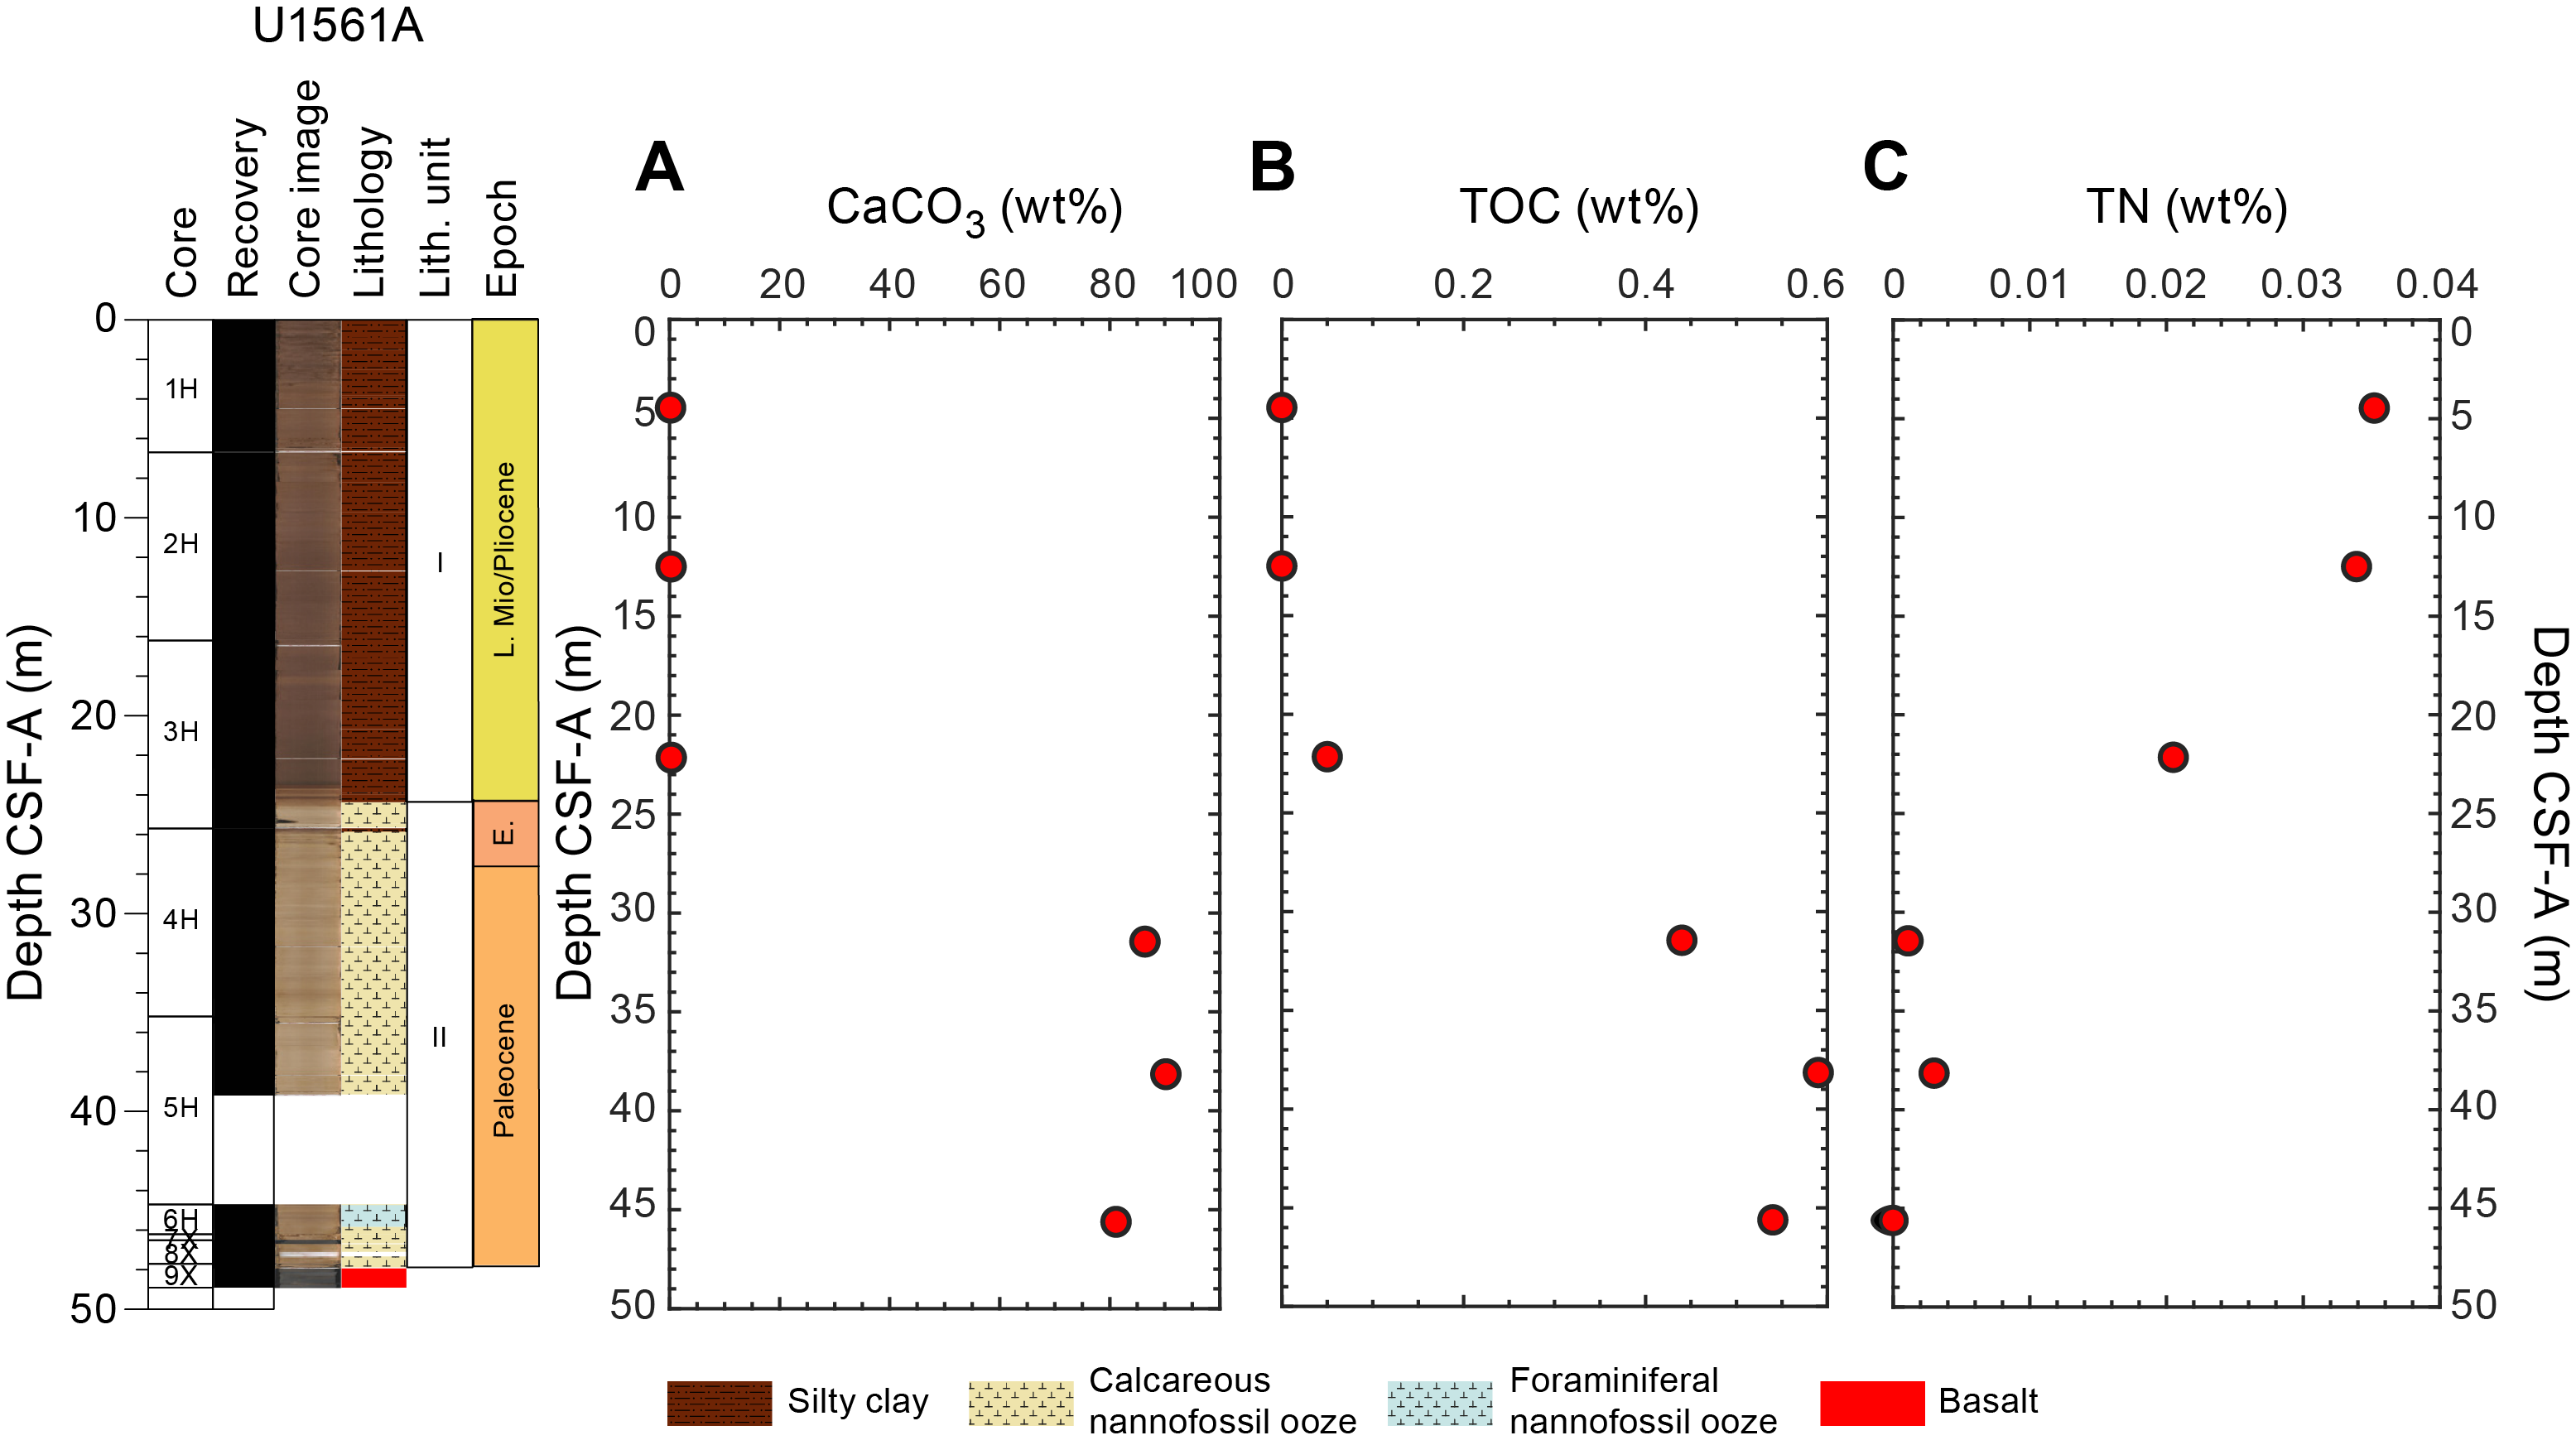
Figure F31. Calcium carbonate, TOC, and TN.
11.3.2. Total organic carbon
TOC was calculated in all samples as the difference between total carbon (TC) and total inorganic carbon (TIC) (see Geochemistry in the Expedition 390/393 methods chapter [Coggon et al., 2024c]). TOC concentrations are low overall in Unit I (0–0.05 wt%) but are higher in Unit II, where the three samples average 0.52 ± 0.08 wt% (±1σ) (Figure F31B).
11.3.3. Total nitrogen and sulfur
TN concentrations were low throughout Hole U1561A (0–0.035 wt%) (Figure F31C). However, TN values are an order of magnitude higher in Unit I (0.020–0.035 wt%) compared to Unit II (0–0.001 wt%). This trend is opposite to the TOC variations downhole, whereby the highest TOC occurs in Unit II. Relatively high TN but low TOC in Unit I could be produced by inorganic nitrogen (e.g., ammonium) incorporation into clays because ammonium can substitute for potassium in the clay minerals (Müller, 1977; Lehmann et al., 2002). Higher K concentrations observed in pore waters from Unit I are consistent with this hypothesis (Figure F27D), and inorganic nitrogen incorporation into clay is also supported by the high clay mineral concentrations across this interval (see Figure F7). Alternatively, diagenetic reactions may have preferentially consumed nitrogenous compounds during decomposition, leading to higher C/N ratios in Unit II (Meyers, 1994). Total sulfur contents are all below detection limit and are thus not reported here.
11.4. Sediment gas sampling
Routine safety hydrocarbon measurements were made in Hole U1561A during Expedition 395E (Williams et al., 2021) at a sampling resolution of one analysis per core until contact with basement (Table T13). No gas was detected in any of the samples.
References
Agnini, C., Fornaciari, E., Raffi, I., Catanzariti, R., Pälike, H., Backman, J., and Rio, D., 2014. Biozonation and biochronology of Paleogene calcareous nannofossils from low and middle latitudes. Newsletters on Stratigraphy, 47(2):131–181. https://doi.org/10.1127/0078-0421/2014/0042
Boyer, T.P., García, H.E., Locarnini, R.A., Zweng, M.M., Mishonov, A.V., Reagan, J.R., Weathers, K.A., Baranova, O.K., Paver, C.R., Seidov, D., and Smolyar, I.V., 2018. World Ocean Atlas 2018. NOAA National Centers for Environmental Information. https://www.ncei.noaa.gov/archive/accession/NCEI-WOA18
Christeson, G., and Reece, R., 2020. Bathymetric site survey gridded data in support of IODP Expeditions 390 and 393, South Atlantic Transect (MGL1601, CREST). Interdisciplinary Earth Data Alliance (IEDA). https://doi.org/10.26022/IEDA/327528
Christeson, G.L., Goff, J.A., and Reece, R.S., 2019. Synthesis of oceanic crustal structure from two-dimensional seismic profiles. Reviews of Geophysics, 57(2):504–529. https://doi.org/10.1029/2019RG000641
Christeson, G.L., Reece, R.S., Kardell, D.A., Estep, J.D., Fedotova, A., and Goff, J.A., 2020. South Atlantic transect: variations in oceanic crustal structure at 31°S. Geochemistry, Geophysics, Geosystems, 21(7):e2020GC009017. https://doi.org/10.1029/2020GC009017
Coggon, R.M., Christeson, G.L., Sylvan, J.B., Teagle, D.A.H., Estes, E., Williams, T., and Alvarez Zarikian, C.A., 2020. Expedition 390/393 Scientific Prospectus: The South Atlantic Transect. International Ocean Discovery Program. https://doi.org/10.14379/iodp.sp.390393.2020
Coggon, R.M., Sylvan, J.B., Estes, E.R., Teagle, D.A.H., Reece, J., Williams, T.J., Christeson, G.L., Aizawa, M., Borrelli, C., Bridges, J.D., Carter, E.J., Dinarès-Turell, J., Estep, J.D., Gilhooly, W.P., III, Grant, L.J.C., Kaplan, M.R., Kempton, P.D., Lowery, C.M., McIntyre, A., Routledge, C.M., Slagle, A.L., Takada, M., Tamborrino, L., Wang, Y., Yang, K., Albers, E., Amadori, C., Belgrano, T.M., D'Angelo, T., Doi, N., Evans, A., Guérin, G.M., Harris, M., Hojnacki, V.M., Hong, G., Jin, X., Jonnalagadda, M., Kuwano, D., Labonte, J.M., Lam, A.R., Latas, M., Lu, W., Moal-Darrigade, P., Pekar, S.F., Robustelli Test, C., Ryan, J.G., Santiago Ramos, D., Shchepetkina, A., Villa, A., Wee, S.Y., Widlansky, S.J., Kurz, W., Prakasam, M., Tian, L., Yu, T., and Zhang, G., 2024a. Site U1556. In Coggon, R.M., Teagle, D.A.H., Sylvan, J.B., Reece, J., Estes, E.R., Williams, T.J., Christeson, G.L., and the Expedition 390/393 Scientists, South Atlantic Transect. Proceedings of the International Ocean Discovery Program, 390/393: College Station, TX (International Ocean Discovery Program). https://doi.org/10.14379/iodp.proc.390393.103.2024
Coggon, R.M., Sylvan, J.B., Estes, E.R., Teagle, D.A.H., Reece, J., Williams, T.J., Christeson, G.L., Aizawa, M., Borrelli, C., Bridges, J.D., Carter, E.J., Dinarès-Turell, J., Estep, J.D., Gilhooly, W.P., III, Grant, L.J.C., Kaplan, M.R., Kempton, P.D., Lowery, C.M., McIntyre, A., Routledge, C.M., Slagle, A.L., Takada, M., Tamborrino, L., Wang, Y., Yang, K., Albers, E., Amadori, C., Belgrano, T.M., D'Angelo, T., Doi, N., Evans, A., Guérin, G.M., Harris, M., Hojnacki, V.M., Hong, G., Jin, X., Jonnalagadda, M., Kuwano, D., Labonte, J.M., Lam, A.R., Latas, M., Lu, W., Moal-Darrigade, P., Pekar, S.F., Robustelli Test, C., Ryan, J.G., Santiago Ramos, D., Shchepetkina, A., Villa, A., Wee, S.Y., Widlansky, S.J., Kurz, W., Prakasam, M., Tian, L., Yu, T., and Zhang, G., 2024b. Site U1557. In Coggon, R.M., Teagle, D.A.H., Sylvan, J.B., Reece, J., Estes, E.R., Williams, T.J., Christeson, G.L., and the Expedition 390/393 Scientists, South Atlantic Transect. Proceedings of the International Ocean Discovery Program, 390/393: College Station, TX (International Ocean Discovery Program). https://doi.org/10.14379/iodp.proc.390393.105.2024
Coggon, R.M., Sylvan, J.B., Teagle, D.A.H., Reece J., Christeson, G.L., Estes, E.R., Williams, T.J., and the Expedition 390 Scientists, 2022. Expedition 390 Preliminary Report: South Atlantic Transect 1. International Ocean Discovery Program. https://doi.org/10.14379/iodp.pr.390.2022
Coggon, R.M., Teagle, D.A.H., Sylvan, J.B., Reece, J., Estes, E.R., Williams, T.J., Christeson, G.L., Aizawa, M., Albers, E., Amadori, C., Belgrano, T.M., Borrelli, C., Bridges, J.D., Carter, E.J., D'Angelo, T., Dinarès-Turell, J., Doi, N., Estep, J.D., Evans, A., Gilhooly, W.P., III, Grant, L.J.C., Guérin, G.M., Harris, M., Hojnacki, V.M., Hong, G., Jin, X., Jonnalagadda, M., Kaplan, M.R., Kempton, P.D., Kuwano, D., Labonte, J.M., Lam, A.R., Latas, M., Lowery, C.M., Lu, W., McIntyre, A., Moal-Darrigade, P., Pekar, S.F., Robustelli Test, C., Routledge, C.M., Ryan, J.G., Santiago Ramos, D., Shchepetkina, A., Slagle, A.L., Takada, M., Tamborrino, L., Villa, A., Wang, Y., Wee, S.Y., Widlansky, S.J., Yang, K., Kurz, W., Prakasam, M., Tian, L., Yu, T., and Zhang, G., 2024c. Expedition 390/393 methods. In Coggon, R.M., Teagle, D.A.H., Sylvan, J.B., Reece, J., Estes, E.R., Williams, T.J., Christeson, G.L., and the Expedition 390/393 Scientists, South Atlantic Transect. Proceedings of the International Ocean Discovery Program, 390/393: College Station, TX (International Ocean Discovery Program). https://doi.org/10.14379/iodp.proc.390393.102.2024
Coggon, R.M., Teagle, D.A.H., Sylvan, J.B., Reece, J., Estes, E.R., Williams, T.J., Christeson, G.L., Aizawa, M., Albers, E., Amadori, C., Belgrano, T.M., Borrelli, C., Bridges, J.D., Carter, E.J., D'Angelo, T., Dinarès-Turell, J., Doi, N., Estep, J.D., Evans, A., Gilhooly, W.P., III, Grant, L.J.C., Guérin, G.M., Harris, M., Hojnacki, V.M., Hong, G., Jin, X., Jonnalagadda, M., Kaplan, M.R., Kempton, P.D., Kuwano, D., Labonte, J.M., Lam, A.R., Latas, M., Lowery, C.M., Lu, W., McIntyre, A., Moal-Darrigade, P., Pekar, S.F., Robustelli Test, C., Routledge, C.M., Ryan, J.G., Santiago Ramos, D., Shchepetkina, A., Slagle, A.L., Takada, M., Tamborrino, L., Villa, A., Wang, Y., Wee, S.Y., Widlansky, S.J., Yang, K., Kurz, W., Prakasam, M., Tian, L., Yu, T., and Zhang, G., 2024d. Expedition 390/393 summary. In Coggon, R.M., Teagle, D.A.H., Sylvan, J.B., Reece, J., Estes, E.R., Williams, T.J., Christeson, G.L., and the Expedition 390/393 Scientists, South Atlantic Transect. Proceedings of the International Ocean Discovery Program, 390/393: College Station, TX (International Ocean Discovery Program). https://doi.org/10.14379/iodp.proc.390393.101.2024
Coggon, R.M., Teagle, D.A.H., Sylvan, J.B., Reece, J., Estes, E.R., Williams, T.J., Christeson, G.L., and the Expedition 390/393 Scientists, 2024e. Supplementary material, https://doi.org/10.14379/iodp.proc.390393supp.2024. In Coggon, R.M., Teagle, D.A.H., Sylvan, J.B., Reece, J., Estes, E.R., Williams, T.J., Christeson, G.L., and the Expedition 390/393 Scientists, South Atlantic Transect. Proceedings of the International Ocean Discovery Program, 390/393: College Station, TX (International Ocean Discovery Program).
Dunlea, A.G., Murray, R.W., Harris, R.N., Vasiliev, M.A., Evans, H., Spivack, A.J., and D'Hondt, S., 2013. Assessment and use of NGR instrumentation on the JOIDES Resolution to quantify U, Th, and K concentrations in marine sediment. Scientific Drilling, 15:57–63. https://doi.org/10.2204/iodp.sd.15.05.2013
Estep, J., Reece, R., Kardell, D.A., Christeson, G.L., and Carlson, R.L., 2019. Seismic Layer 2A: evolution and thickness from 0- to 70-Ma crust in the slow-intermediate spreading South Atlantic. Journal of Geophysical Research: Solid Earth, 124(8):7633–7651. https://doi.org/10.1029/2019JB017302
Gradstein, F.M., Ogg, J.G., Schmitz, M.D., and Ogg, G.M. (Eds.), 2020. The Geologic Time Scale 2020: Amsterdam (Elsevier BV). https://doi.org/10.1016/C2020-1-02369-3
Kardell, D.A., Christeson, G.L., Estep, J.D., Reece, R.S., and Carlson, R.L., 2019. Long-lasting evolution of Layer 2A in the western South Atlantic: evidence for low-temperature hydrothermal circulation in old oceanic crust. Journal of Geophysical Research: Solid Earth, 124(3):2252–2273. https://doi.org/10.1029/2018JB016925
Korenaga, T., and Korenaga, J., 2008. Subsidence of normal oceanic lithosphere, apparent thermal expansivity, and seafloor flattening. Earth and Planetary Science Letters, 268(1):41–51. https://doi.org/10.1016/j.epsl.2007.12.022
Lehmann, M.F., Bernasconi, S.M., Barbieri, A., and McKenzie, J.A., 2002. Preservation of organic matter and alteration of its carbon and nitrogen isotope composition during simulated and in situ early sedimentary diagenesis. Geochimica et Cosmochimica Acta, 66(20):3573–3584. https://doi.org/10.1016/S0016-7037(02)00968-7
Martini, E., 1971. Standard Tertiary and Quaternary calcareous nannoplankton zonation. Proceedings of the Second Planktonic Conference, Roma, 1970:739–785.
Marty, J.C., and Cazenave, A., 1989. Regional variations in subsidence rate of oceanic plates: a global analysis. Earth and Planetary Science Letters, 94(3):301–315. https://doi.org/10.1016/0012-821X(89)90148-9
Meyers, P.A., 1994. Preservation of elemental and isotopic source identification of sedimentary organic matter. Chemical Geology, 114(3–4):289–302. https://doi.org/10.1016/0009-2541(94)90059-0
Müller, P.J., 1977. CN ratios in Pacific deep-sea sediments: effect of inorganic ammonium and organic nitrogen compounds sorbed by clays. Geochimica et Cosmochimica Acta, 41(6):765–776. https://doi.org/10.1016/0016-7037(77)90047-3
Olson, P., Reynolds, E., Hinnov, L., and Goswami, A., 2016. Variation of ocean sediment thickness with crustal age. Geochemistry, Geophysics, Geosystems, 17(4):1349–1369. https://doi.org/10.1002/2015GC006143
Parsons, B., and Sclater, J.G., 1977. An analysis of the variation of ocean floor bathymetry and heat flow with age. Journal of Geophysical Research (1896-1977), 82(5):803–827. https://doi.org/10.1029/JB082i005p00803
Pribnow, D.F.C., Kinoshita, M., and Stein, C.A., 2000. Thermal data collection and heat flow recalculations for ODP Legs 101-180: Hannover, Germany (Institute for Joint Geoscientific Research, GGA). http://www-odp.tamu.edu/publications/heatflow/
Reece, R., Christeson, G., Amara, A., Estep, J., Greene, J., Koch, C., Henning, L., Worman, W., Wright, A., 2016. CREST: Crustal Reflectivity Experiment Southern Transect South Atlantic multichannel seismic and ocean bottom seismometer experiment, 4 January-25 February 2016. Cruise Report:31. http://www.iris.washington.edu/data/reports/2016/16-003/CREST_2016-01-04-2016-02-25_MGL1601_CruiseReport.pdf
Reece, R., and Estep, J., 2019. Processed MCS (PSTM) data from the Mid-Atlantic Ridge (MAR) to the Rio Grande Rise, South Atlantic Ocean, acquired by the R/V Marcus G. Langseth in 2016 (MGL1601). https://doi.org/10.1594/IEDA/500255
Ríos, A.F., Resplandy, L., García-Ibáñez, M.I., Fajar, N.M., Velo, A., Padin, X.A., Wanninkhof, R., Steinfeldt, R., Rosón, G., and Pérez, F.F., 2015. Decadal acidification in the water masses of the Atlantic Ocean. Proceedings of the National Academy of Sciences, 112(32):9950–9955. https://doi.org/10.1073/pnas.1504613112
Spinelli, G.A., Giambalvo, E.R., and Fisher, A.T., 2004. Sediment permeability, distribution, and influence on fluxes in oceanic basement. In Davis, E.E., and Elderfield, H. (Eds.), Hydrogeology of the Oceanic Lithosphere. Cambridge, UK (Cambridge University Press), 151–188.
Straume, E.O., Gaina, C., Medvedev, S., Hochmuth, K., Gohl, K., Whittaker, J.M., Abdul Fattah, R., Doornenbal, J.C., and Hopper, J.R., 2019. GlobSed: updated total sediment thickness in the world's oceans. Geochemistry, Geophysics, Geosystems, 20(4):1756–1772. https://doi.org/10.1029/2018GC008115
Wade, B.S., Pearson, P.N., Berggren, W.A., and Pälike, H., 2011. Review and revision of Cenozoic tropical planktonic foraminiferal biostratigraphy and calibration to the geomagnetic polarity and astronomical time scale. Earth-Science Reviews, 104(1–3):111–142. https://doi.org/10.1016/j.earscirev.2010.09.003
Williams, T., Estes, E.R., Rhinehart, B., Coggon, R.M., Sylvan, J.B., Christeson, G.L., and Teagle, D.A.H., 2021. Expedition 395E Preliminary Report: Complete South Atlantic Transect Reentry Systems. International Ocean Discovery Program. https://doi.org/10.14379/iodp.pr.395E.2021