Coggon, R.M., Teagle, D.A.H., Sylvan, J.B., Reece, J., Estes, E.R., Williams, T.J., Christeson, G.L., and the Expedition 390/393 Scientists
Proceedings of the International Ocean Discovery Program Volume 390/393
publications.iodp.org
https://doi.org/10.14379/iodp.proc.390393.105.2024
Site U15571
![]() R.M. Coggon,
R.M. Coggon,
![]() J.B. Sylvan,
J.B. Sylvan,
![]() E.R. Estes,
E.R. Estes,
![]() D.A.H. Teagle,
D.A.H. Teagle,
![]() J. Reece,
J. Reece,
![]() T.J. Williams,
T.J. Williams,
![]() G.L. Christeson,
G.L. Christeson,
![]() M. Aizawa,
M. Aizawa,
![]() C. Borrelli,
C. Borrelli,
![]() J.D. Bridges,
J.D. Bridges,
![]() E.J. Carter,
E.J. Carter,
![]() J. Dinarès-Turell,
J. Dinarès-Turell,
![]() J.D. Estep,
J.D. Estep,
![]() W.P. Gilhooly III,
W.P. Gilhooly III,
![]() L.J.C. Grant,
L.J.C. Grant,
![]() M.R. Kaplan,
M.R. Kaplan,
![]() P.D. Kempton,
P.D. Kempton,
![]() C.M. Lowery,
C.M. Lowery,
![]() A. McIntyre,
A. McIntyre,
![]() C.M. Routledge,
C.M. Routledge,
![]() A.L. Slagle,
A.L. Slagle,
![]() M. Takada,
M. Takada,
![]() L. Tamborrino,
L. Tamborrino,
![]() Y. Wang,
Y. Wang,
![]() K. Yang,
K. Yang,
![]() E. Albers,
E. Albers,
![]() C. Amadori,
C. Amadori,
![]() T.M. Belgrano,
T.M. Belgrano,
![]() T. D'Angelo,
T. D'Angelo,
![]() N. Doi,
N. Doi,
![]() A. Evans,
A. Evans,
![]() G.M. Guérin,
G.M. Guérin,
![]() M. Harris,
M. Harris,
![]() V.M. Hojnacki,
V.M. Hojnacki,
![]() G. Hong,
G. Hong,
![]() X. Jin,
X. Jin,
![]() M. Jonnalagadda,
M. Jonnalagadda,
![]() D. Kuwano,
D. Kuwano,
![]() J.M. Labonte,
J.M. Labonte,
![]() A.R. Lam,
A.R. Lam,
![]() M. Latas,
M. Latas,
![]() W. Lu,
W. Lu,
![]() P. Moal-Darrigade,
P. Moal-Darrigade,
![]() S.F. Pekar,
S.F. Pekar,
![]() C. Robustelli Test,
C. Robustelli Test,
![]() J.G. Ryan,
J.G. Ryan,
![]() D. Santiago Ramos,
D. Santiago Ramos,
![]() A. Shchepetkina,
A. Shchepetkina,
![]() A. Villa,
A. Villa,
![]() S.Y. Wee,
S.Y. Wee,
![]() S.J. Widlansky,
S.J. Widlansky,
![]() W. Kurz,
W. Kurz,
![]() M. Prakasam,
M. Prakasam,
![]() L. Tian,
L. Tian,
![]() T. Yu, and
T. Yu, and
![]() G. Zhang2
G. Zhang2
1 Coggon, R.M., Sylvan, J.B., Estes, E.R., Teagle, D.A.H., Reece, J., Williams, T.J., Christeson, G.L., Aizawa, M., Borrelli, C., Bridges, J.D., Carter, E.J., Dinarès-Turell, J., Estep, J.D., Gilhooly, W.P., III, Grant, L.J.C., Kaplan, M.R., Kempton, P.D., Lowery, C.M., McIntyre, A., Routledge, C.M., Slagle, A.L., Takada, M., Tamborrino, L., Wang, Y., Yang, K., Albers, E., Amadori, C., Belgrano, T.M., D'Angelo, T., Doi, N., Evans, A., Guérin, G.M., Harris, M., Hojnacki, V.M., Hong, G., Jin, X., Jonnalagadda, M., Kuwano, D., Labonte, J.M., Lam, A.R., Latas, M., Lu, W., Moal-Darrigade, P., Pekar, S.F., Robustelli Test, C., Ryan, J.G., Santiago Ramos, D., Shchepetkina, A., Villa, A., Wee, S.Y., Widlansky, S.J., Kurz, W., Prakasam, M., Tian, L., Yu, T., and Zhang, G., 2024. Site U1557. In Coggon, R.M., Teagle, D.A.H., Sylvan, J.B., Reece, J., Estes, E.R., Williams, T.J., Christeson, G.L., and the Expedition 390/393 Scientists, South Atlantic Transect. Proceedings of the International Ocean Discovery Program, 390/393: College Station, TX (International Ocean Discovery Program). https://doi.org/10.14379/iodp.proc.390393.105.2024
2 Expedition 390/393 Scientists' affiliations.
1. Background and objectives
Site U1557 (30°56.4651′S, 26°37.7892′W, proposed Site SATL-56A) is in the central South Atlantic Ocean at a water depth of ~5011 meters below sea level (mbsl) ~1243 km west of the Mid-Atlantic Ridge (see Figure F1 and Tables T1, T2, all in the Expedition 390/393 summary chapter [Coggon et al., 2024d]) on crust that formed at a slow half spreading rate of ~13.5 mm/y, which is the slowest spreading rate in the study region (Kardell et al., 2019; Christeson et al., 2020) (see Figure F7 in the Expedition 390/393 summary chapter [Coggon et al., 2024d]; Reece et al., 2016; Reece and Estep, 2019). With an estimated age of 60.7 Ma, Site U1557 is just about the oldest location of the South Atlantic Transect (SAT) campaign (International Ocean Discovery Program [IODP] Expeditions 390C, 395E, 390, and 393). Site U1557 is more heavily sedimented than Site U1556, which is located 6.5 km west of Site U1557 on 61.2 Ma ocean crust. Together, both sites allow for investigation of the effect of sediment thickness on crustal evolution.
1.1. Geologic setting
Site U1557 is located on the approximately east-west–trending (094) Crustal Reflectivity Experiment Southern Transect (CREST) Seismic Line 1A/1B at Common Depth Point 4470 about 5.7 km east of the north-south–trending (358.5) CREST crossing Line 05 (Figures F1, F2; Reece et al., 2016; Reece and Estep, 2019). Interpretation of multichannel seismic and ocean-bottom seismograph data in this region suggests that the ocean crust is anomalously thin at the site (~3.6 km; Christeson et al., 2020) compared to normal ocean crust (~6.15 ± 0.93 km; Christeson et al., 2019). Reasons for the thin crust could be the proximity to the plume-derived Rio Grande Rise (see Figure F1 in the Expedition 390/393 summary chapter [Coggon et al., 2024d]) and a potentially reduced magma supply. With a water depth of 5011 m and 564 m of sediment, the basement at Site U1557 is significantly deeper than predicted by simple lithospheric cooling models (see Figure F4 in the Expedition 390/393 summary chapter [Coggon et al., 2024d]) (e.g., Parsons and Slater, 1977; Korenaga and Korenaga, 2008; Marty and Cazenave, 1989).
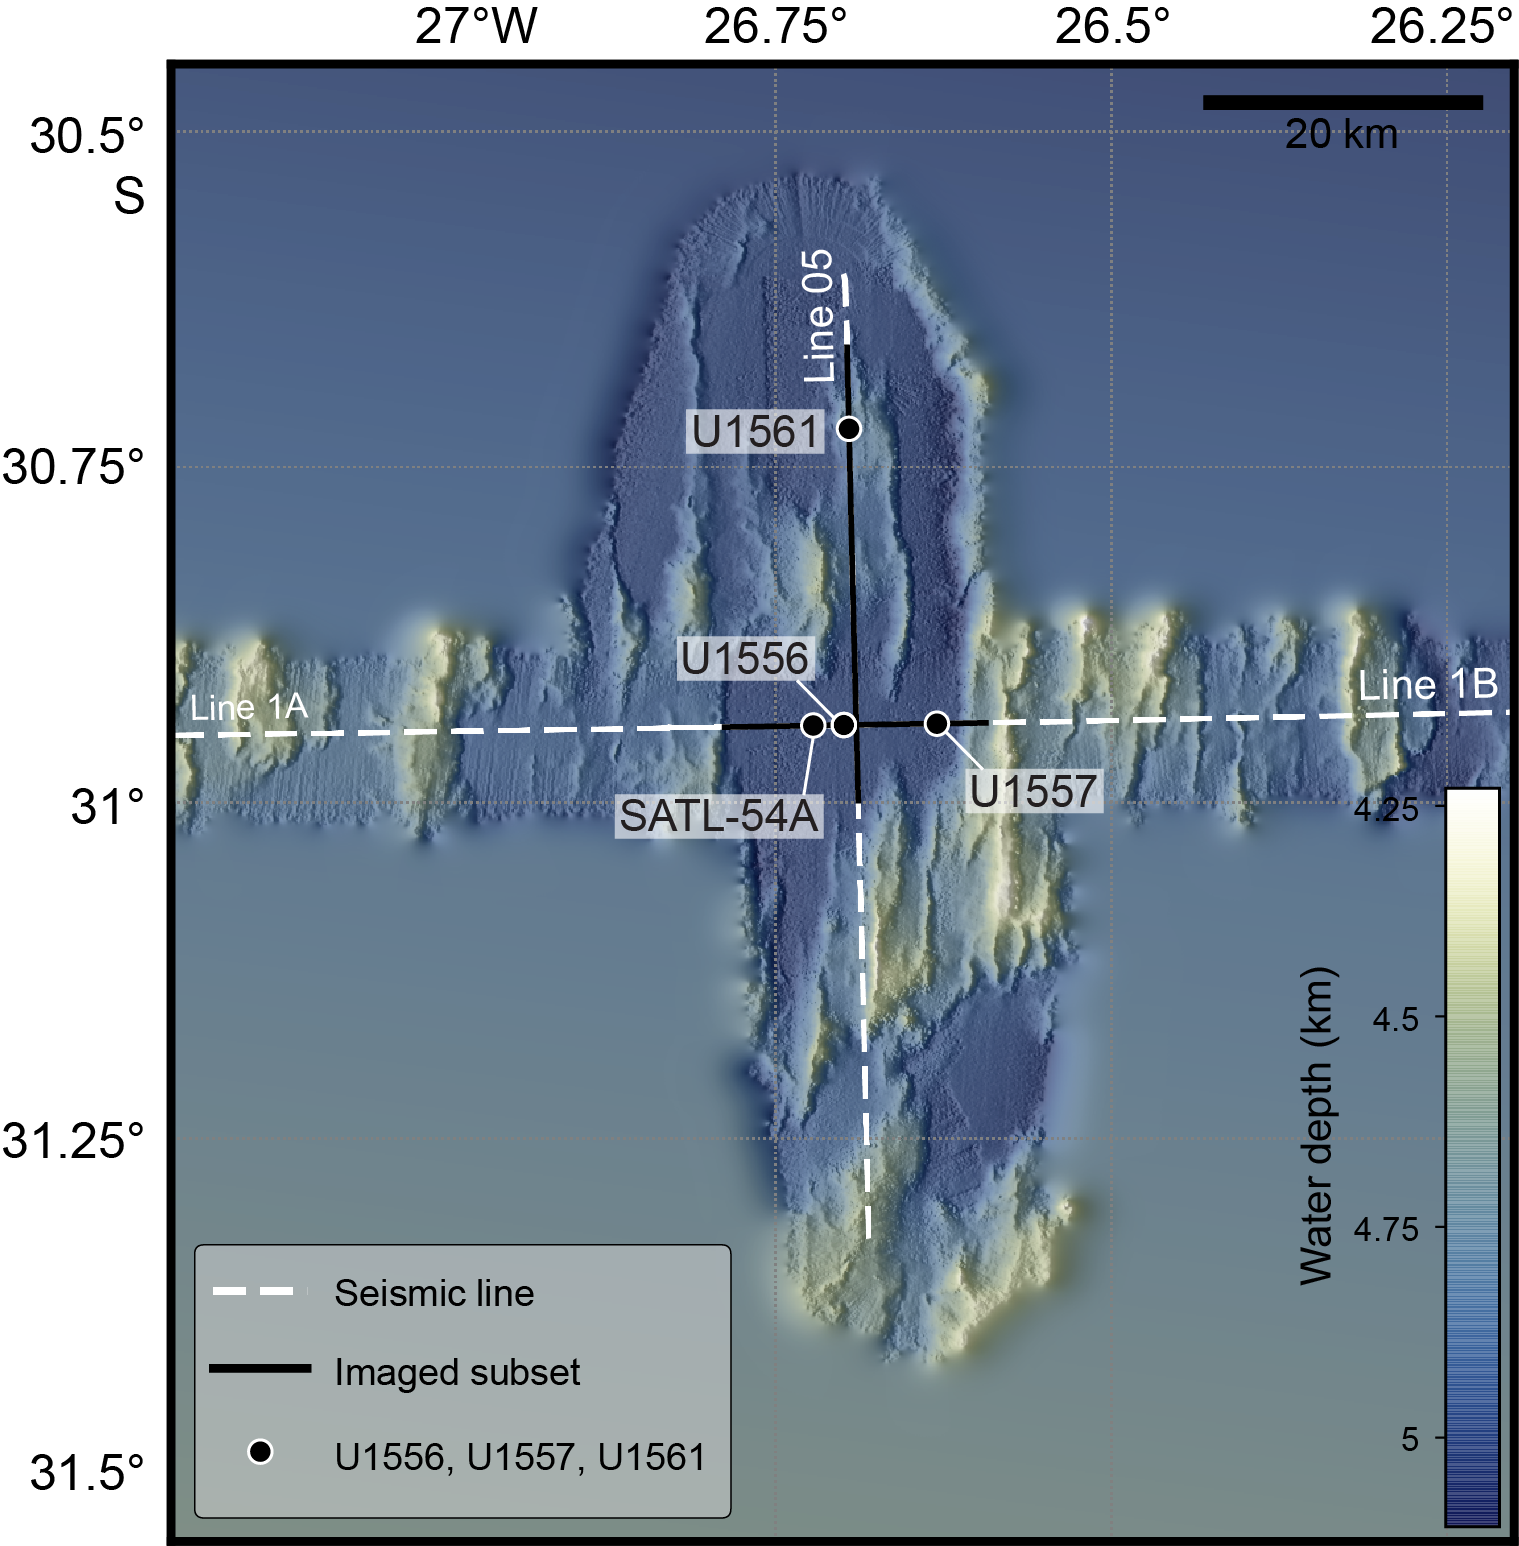
Figure F1. Bathymetric map.
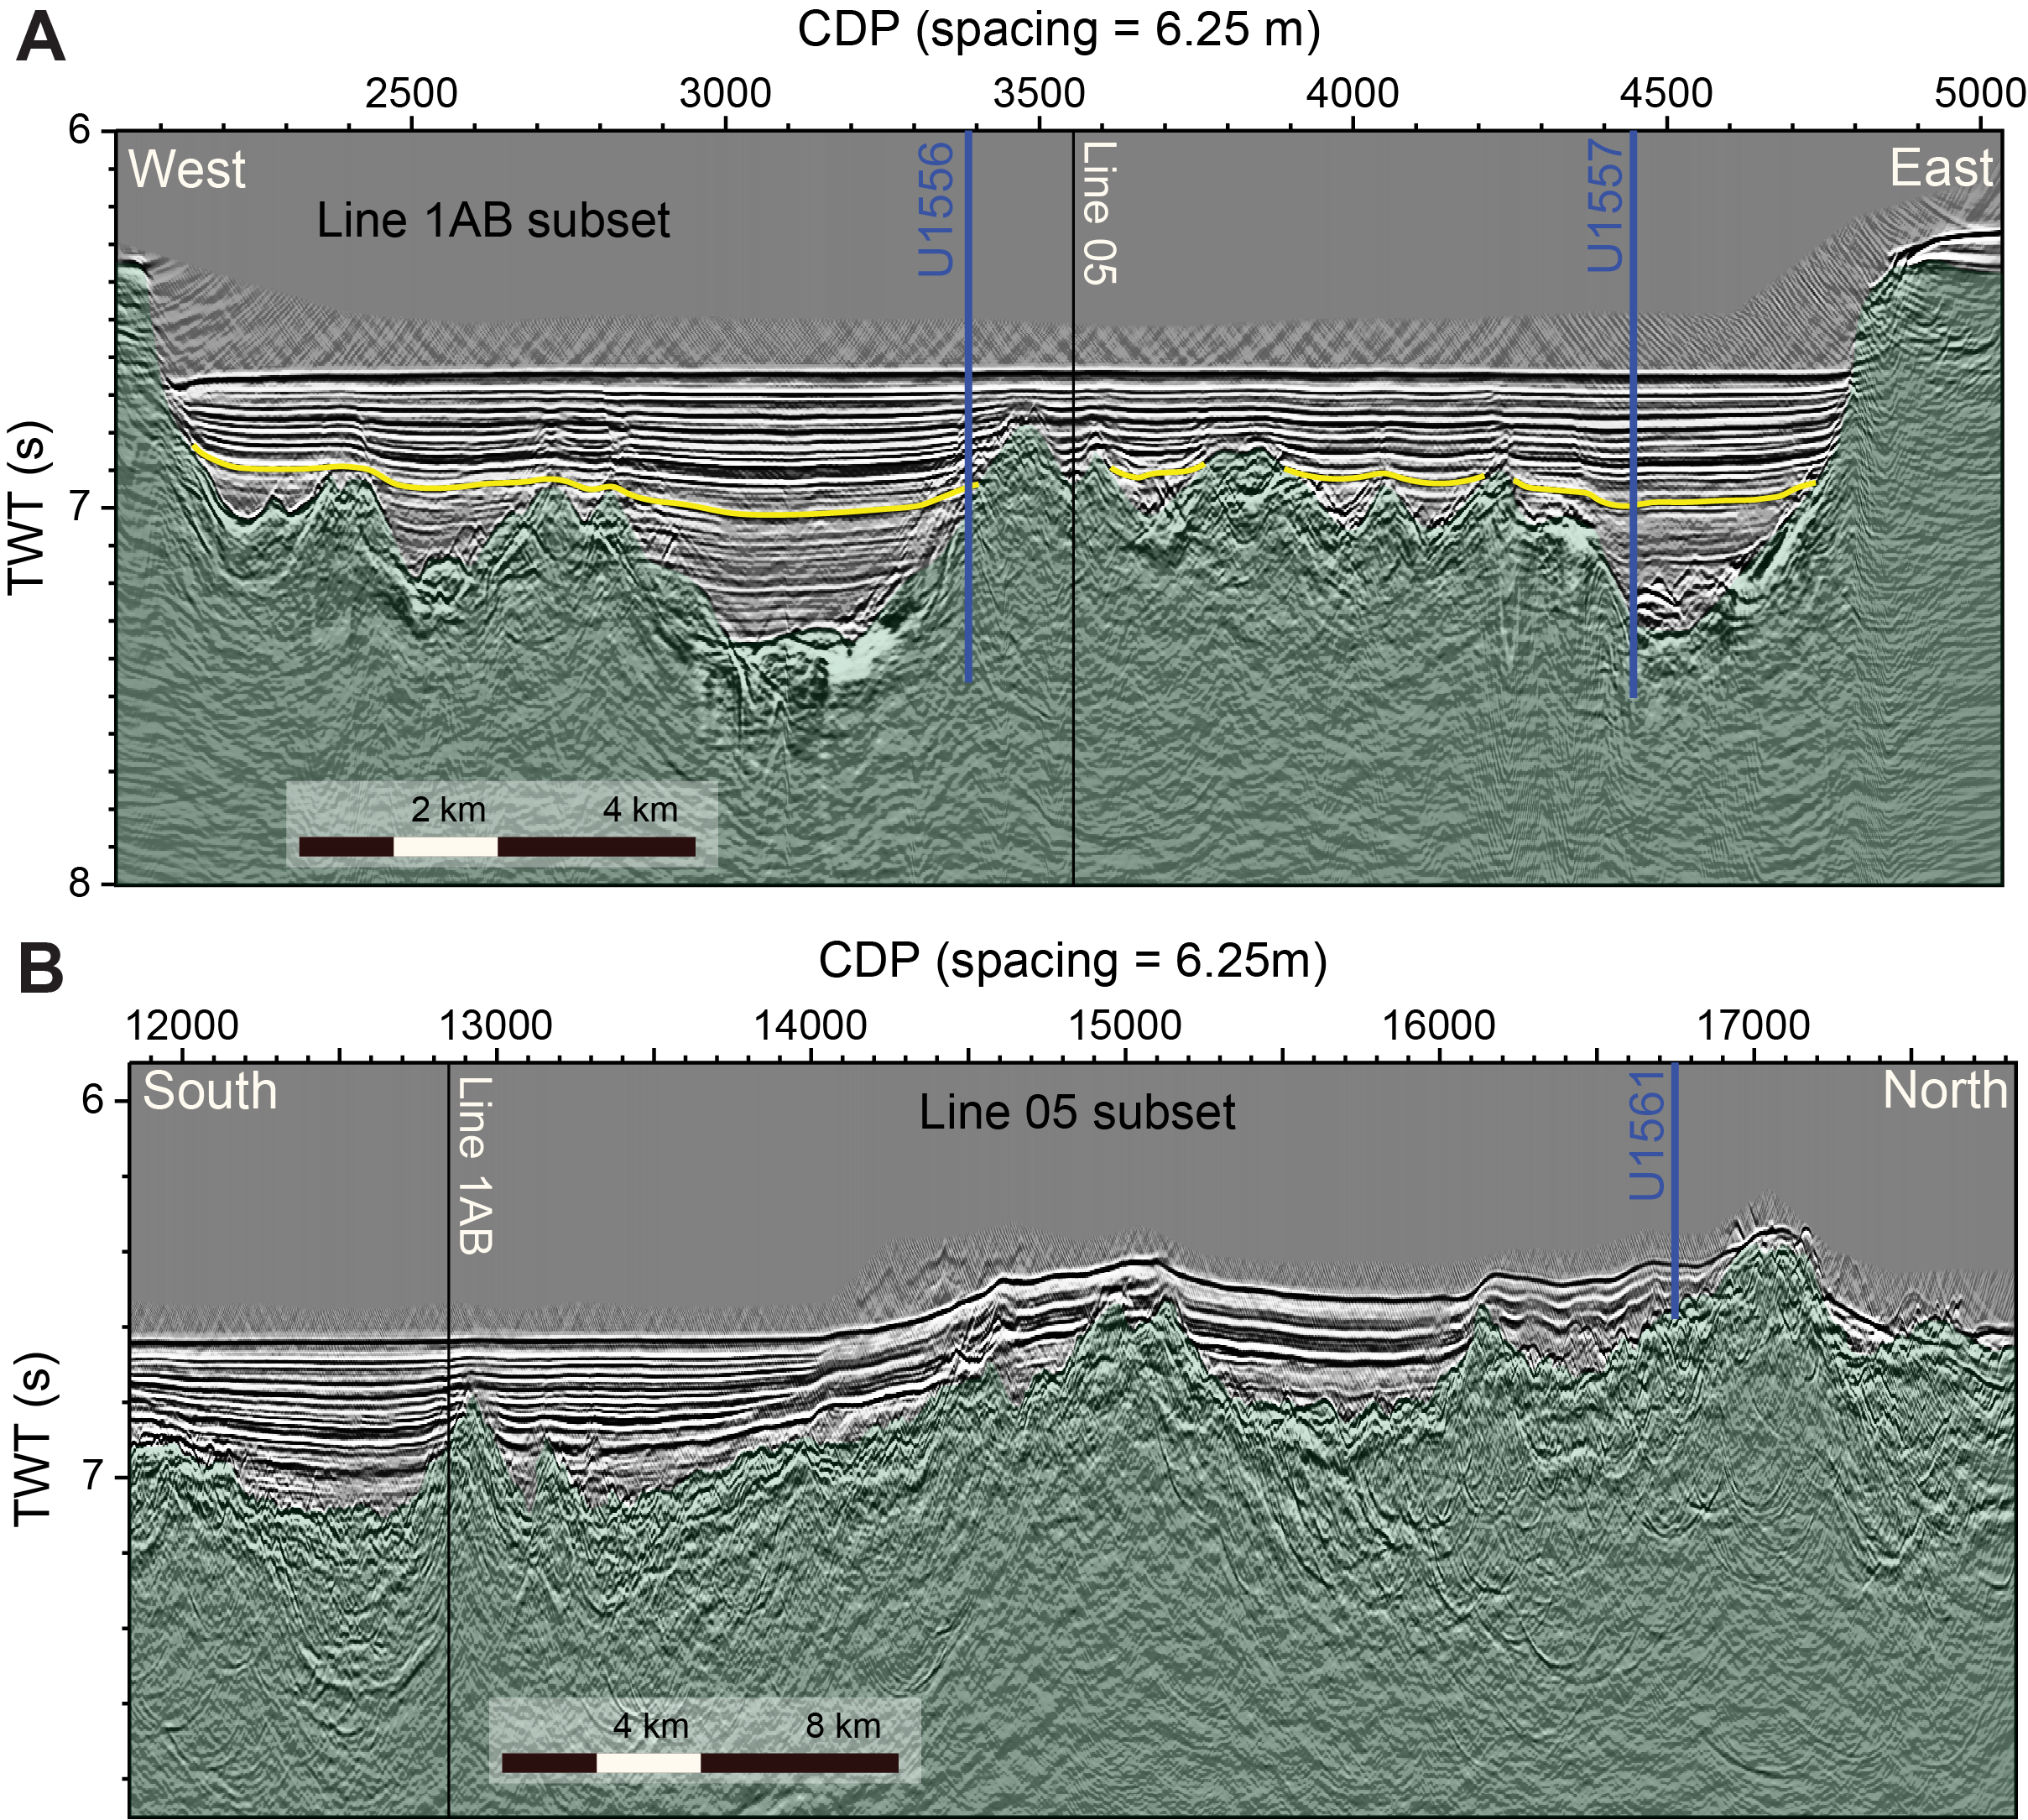
Figure F2. Seismic reflection profiles.
Site U1557 is located toward the eastern end of a ~17.5 km wide basin that is filled with sediments to a uniform bathymetric level of ~5000 mbsl (Figure F1). The basin sits between two near north-south–trending, strongly faulted basement ridges that have steep flanks and very thin or no sediment cover (Figures F1, F2A). Basement topography changes significantly within this basin, resulting in large differences in sedimentary cover. Site U1557 is located in a 2 km wide subbasin including the deepest point of the basin (~565 m) (Figure F2). This subbasin is east of the basement ridge on which Sites U1556 and U1561 are located. The north–south crossing line does not pass over Site U1557 directly but runs 5.7 km west of Site U1557 (Figure F2).
The ocean crust at Site U1557 has a sediment cover of 564 m, which is thicker than the global average overburden thickness for basement of this age (~200 m; Spinelli et al., 2004) (see Figure F3 in the Expedition 390/393 summary chapter [Coggon et al., 2024d]) and the reported mean sediment thickness encountered along CREST Seismic Lines 1B (48–63 Ma) and 1A (63–70 Ma) of 132 and 223 m, respectively (Estep et al., 2019). This thicker-than-normal sediment cover is due to the location of this site in a deep subbasin. A recent sedimentation thickness global synthesis suggests though that ~60 Ma ocean crust should host around 460 m of sediment (cf. Olson et al., 2016), although there are very large ranges in global and regional estimates of sediment thickness with crustal age (e.g., ~560 m; Straume et al., 2019).
Backscatter reflections from multibeam profiles (Figure F3) reveal that a significant proportion of the seafloor in this basin near Site U1557 boasts continuous sediment cover, which is in contrast to other sites along the SAT. Therefore, ventilation of the volcanic rocks of the upper ocean crust through the ingress of seawater and egress of seawater-derived low-temperature hydrothermal fluids may be reduced compared to other sites. However, the relatively steep flanks of the faulted basement ridges and sometimes also crests of the Site U1557 region are unsedimented, as can be seen by the high normalized reflectivity (Figure F3) and may influence the local fluid flow system with consequent impacts on heat flow, sediment pore waters, basement hydrothermal alteration, and microbial communities in both the marine sediments and underlying basalts. Basement at Site U1557 was predicted to be ~60.7 Ma based on CREST site survey magnetic data (Kardell et al., 2019) and preliminary biostratigraphy analyses from Hole U1557B sampled during Expedition 390C.
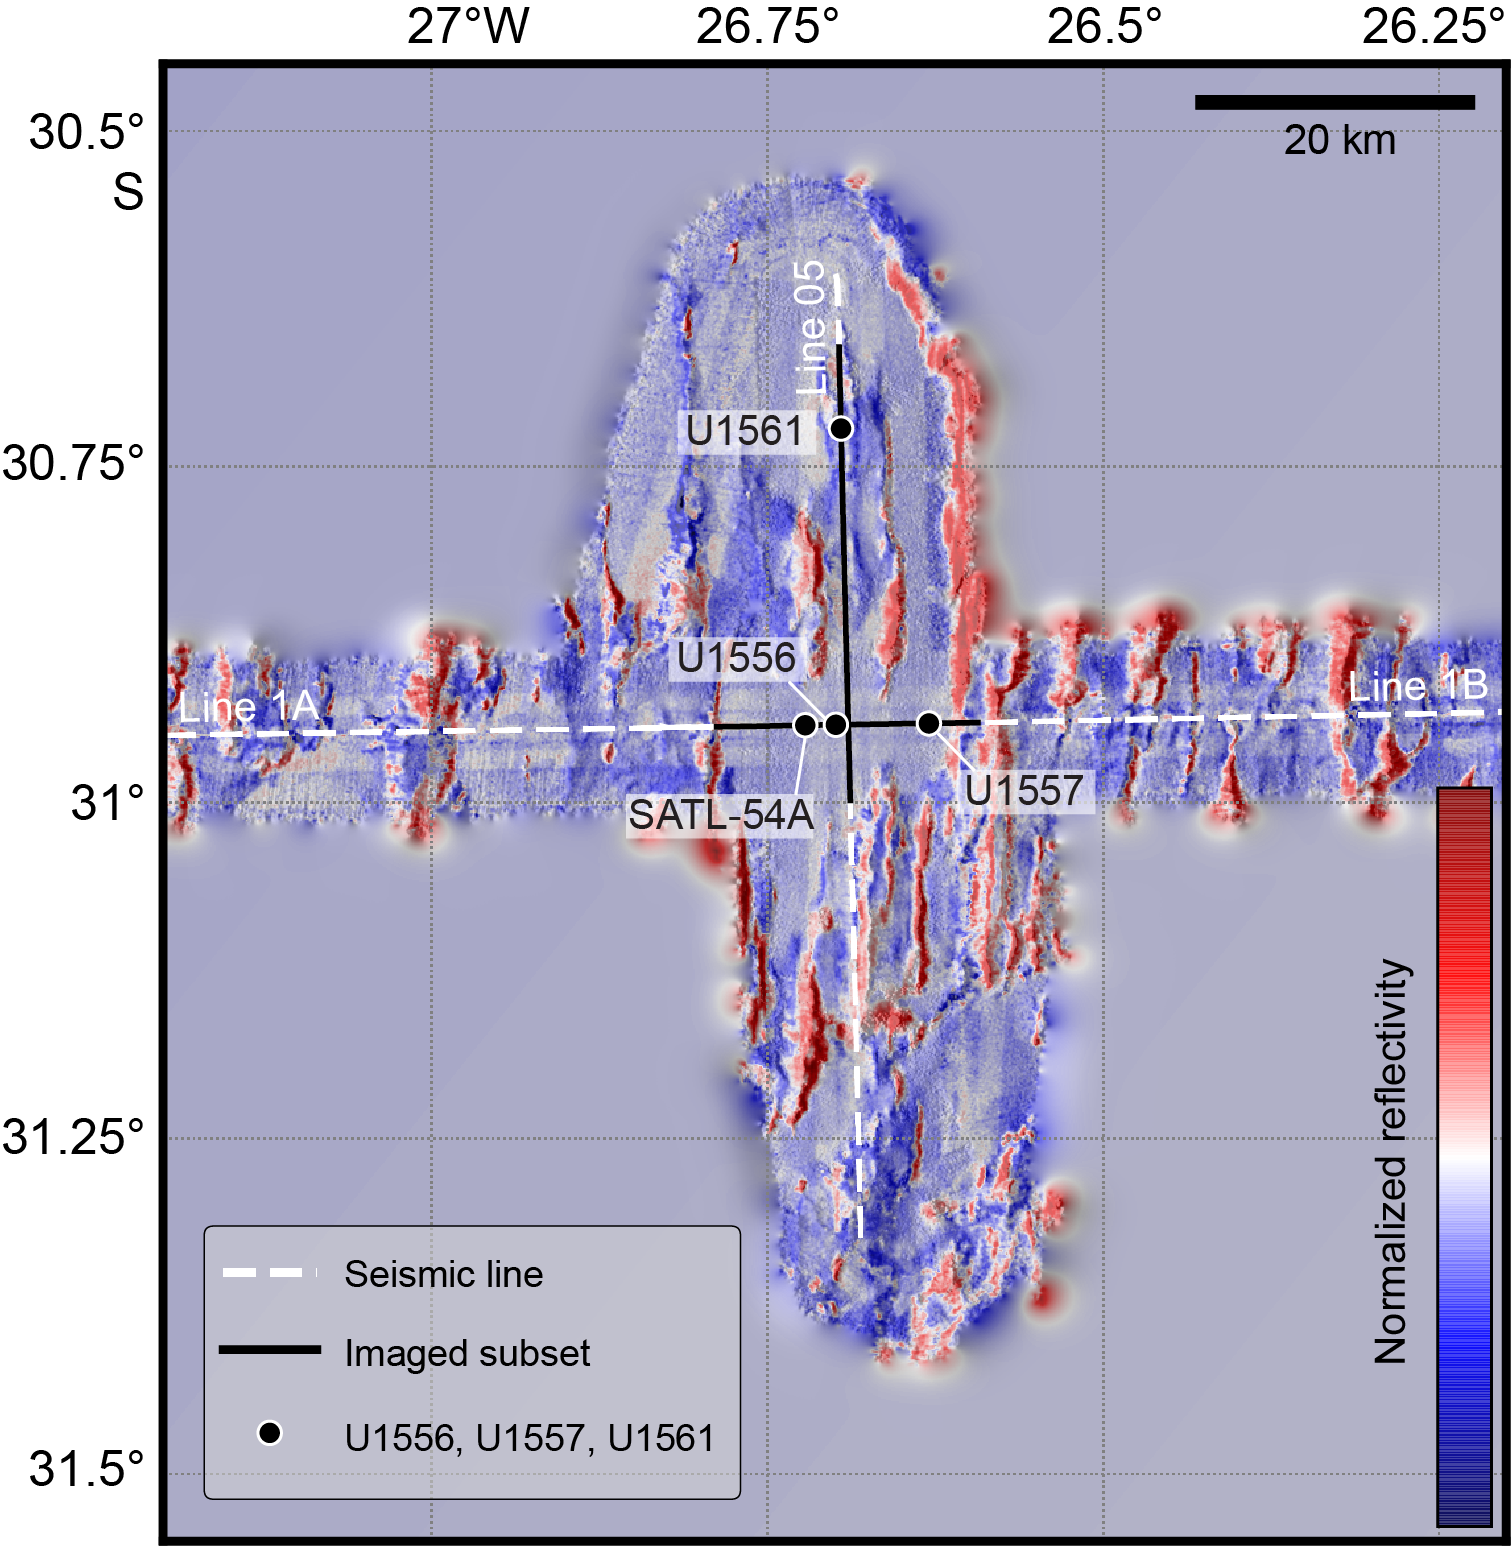
Figure F3. Backscatter reflections.
Site U1557 was first occupied during engineering Expeditions 390C and 395E. During Expedition 390C, Hole U1557B was cored using the advanced piston corer (APC) and extended core barrel (XCB) systems to a total depth of 574 meters below seafloor (mbsf), penetrating the entire sediment succession and ~10 m into basement (Figure F4; Table T1) (see Table T2 in the Expedition 390/393 summary chapter [Coggon et al., 2024d]; Estes et al., 2021), and Hole U1557D was drilled to 64.2 mbsf. During Expedition 395E, Hole U1557D was deepened to 576.6 mbsf and a reentry system with 10¾ inch casing was installed to 571.6 mbsf (Figure F5). In Hole U1557D, the sediment/basement contact was encountered at 566.6 mbsf.
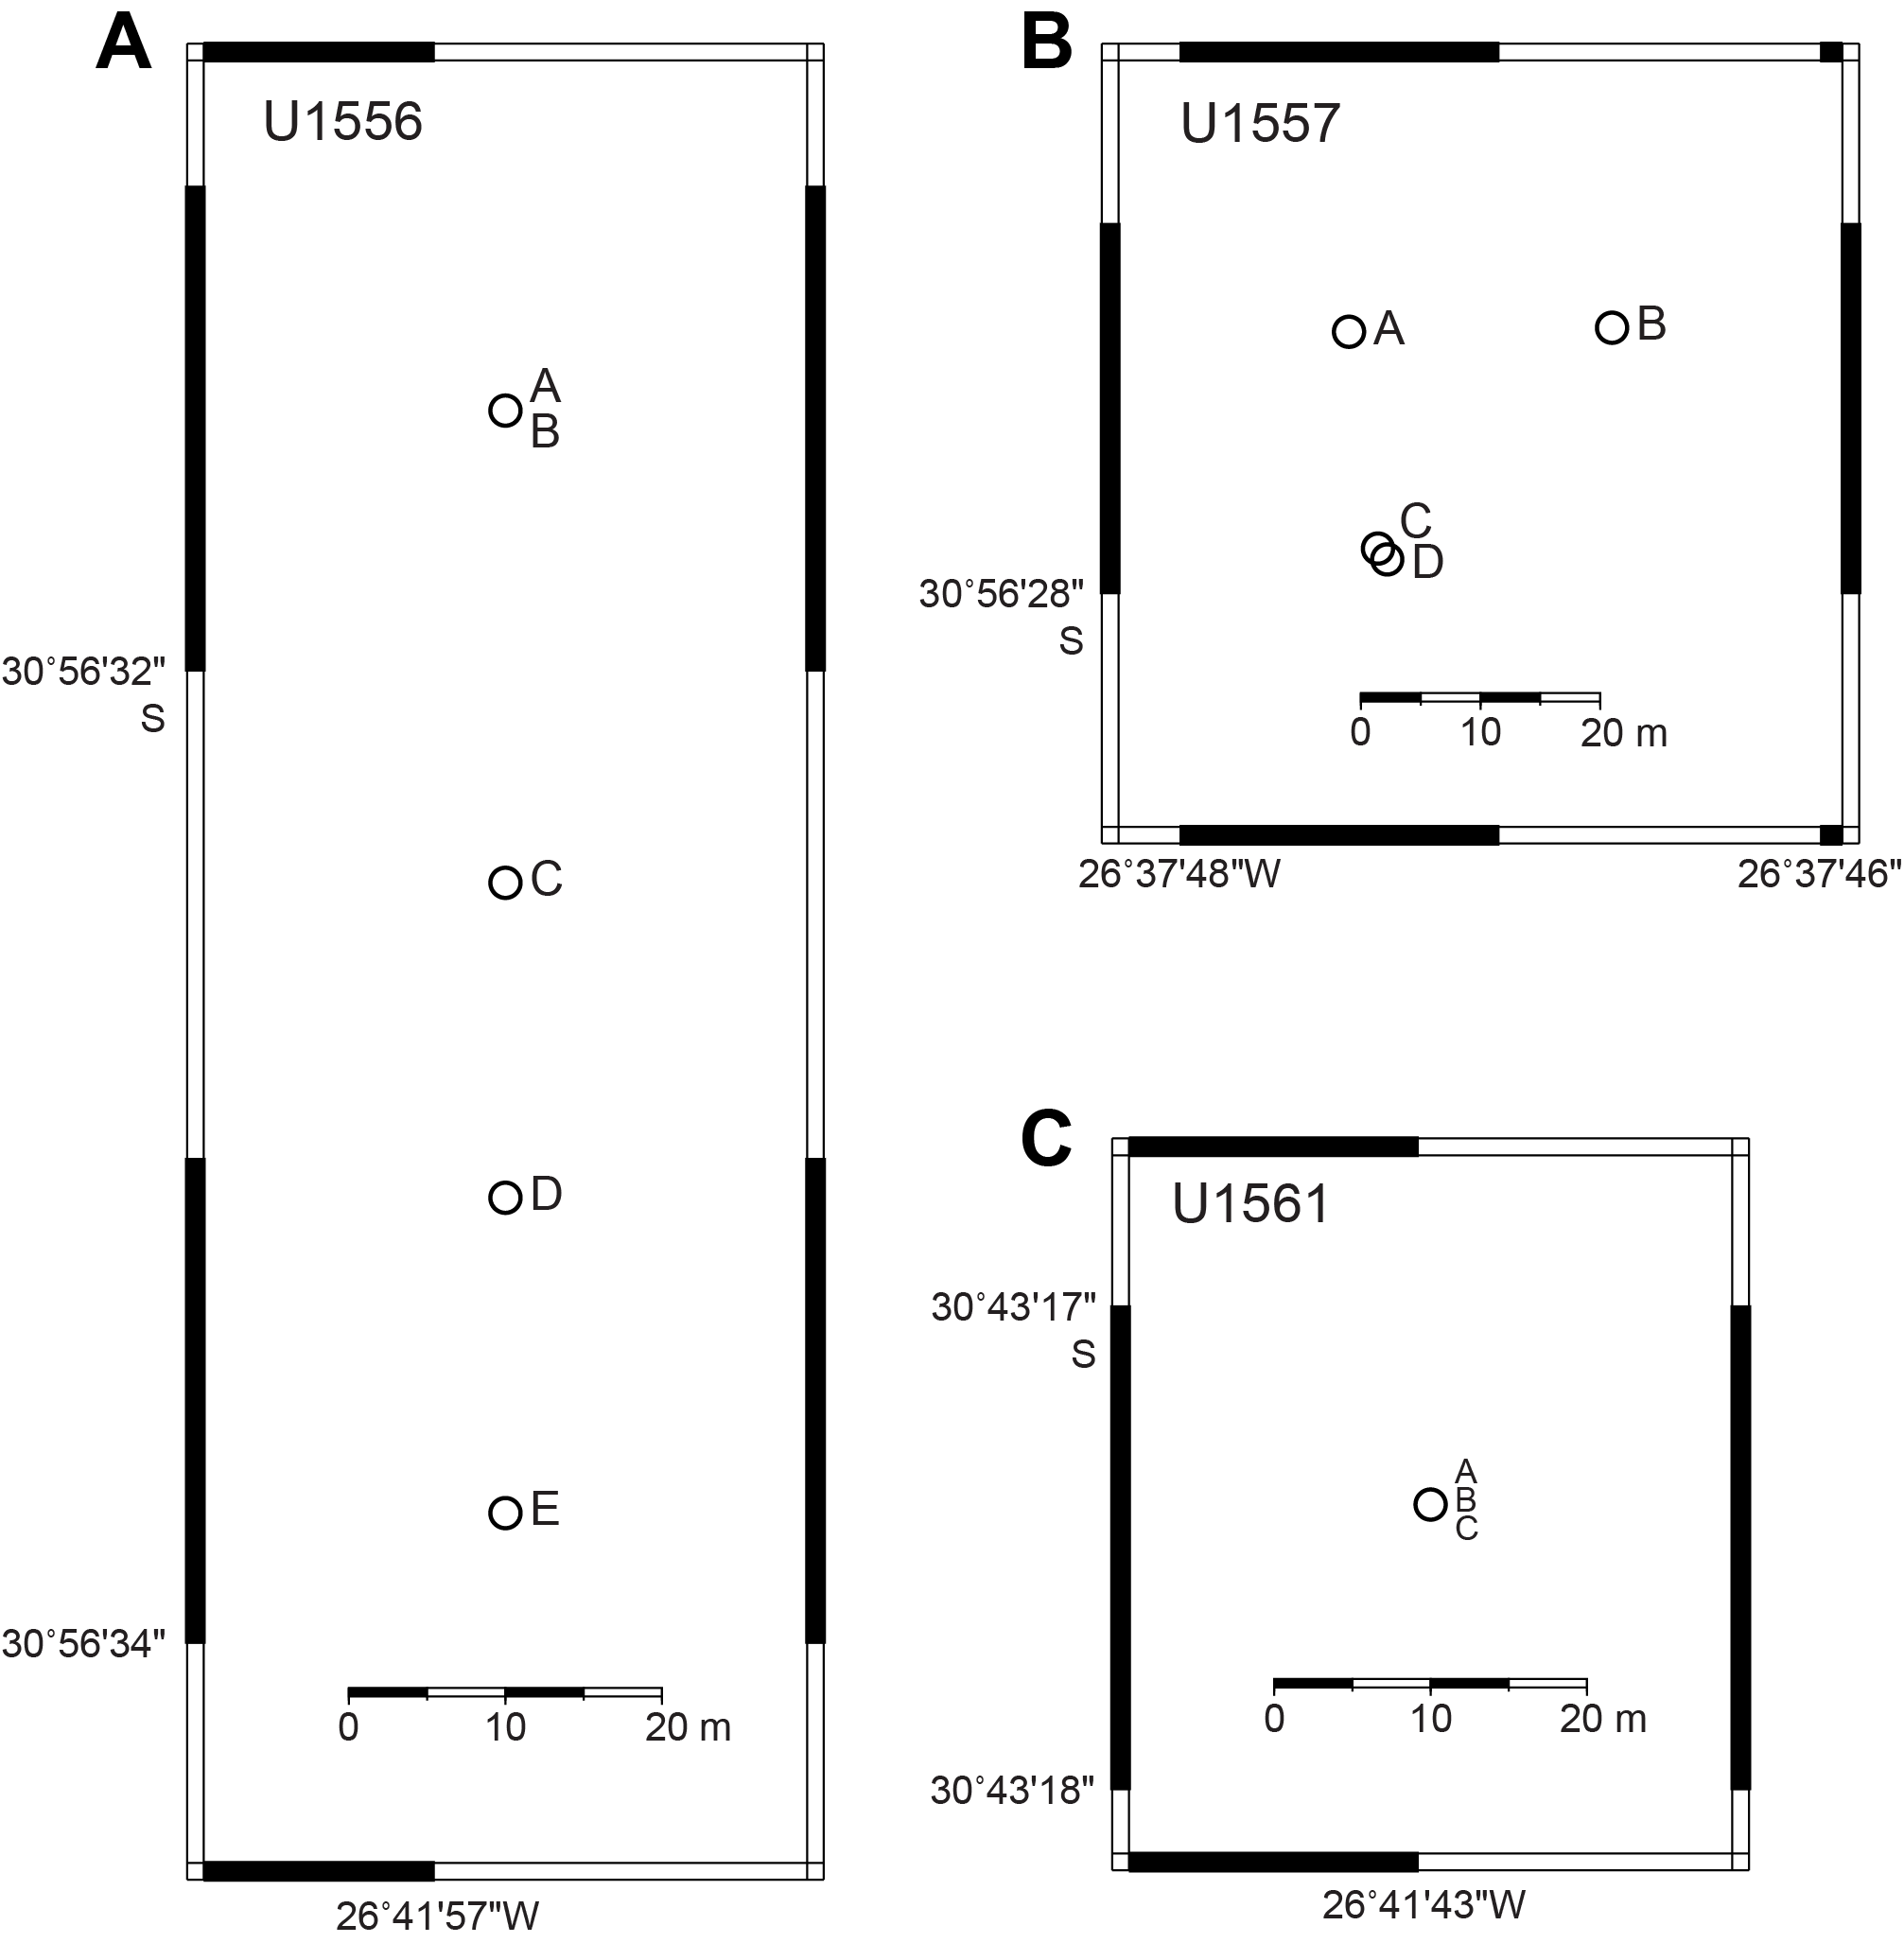
Figure F4. Map of holes drilled.
1.2. Objectives
The operational objectives at Site U1557 during Expedition 390 were to (1) core 250 m into basement with the rotary core barrel (RCB) system in Hole U1557D to collect material that addresses the petrologic, geochemical, and microbiological objectives of the SAT expeditions; and (2) collect a comprehensive suite of wireline geophysical logging data through the basement section (Coggon et al., 2022b).
2. Operations
Site U1557 was visited during engineering Expeditions 390C and 395E, as well as Expedition 390. Hole U1557A was a missed mudline, but Hole U1557B (Expedition 390C) completed APC/XCB coring through the sediment column to the basement interface. In Hole U1557C, a casing jet-in test was conducted during Expedition 390C that concluded that the casing would need to be drilled in. A reentry system and casing were installed during Expedition 390C, starting Hole U1557D, and the casing was extended into basement during Expedition 395E. During Expedition 390, RCB coring in Hole U1557D cored a 109.1 m interval of basement to 684.7 mbsf, extending to ~120 m into basement (see Stratigraphic unit summary). The drill bit was dropped on the seafloor to establish Hole U1557D as a legacy hole for potential future deepening and the installation of a borehole observatory.
2.1. Expeditions 390C and 395E
Site U1557 was first visited during Expedition 390C, an engineering leg with the goal of coring a single hole with the APC and XCB systems to basement for gas safety monitoring and installing a reentry system with casing through sediment to ~5 m into basement (Estes et al., 2021). We opted to replace proposed primary Site SATL-54A with proposed alternate Site SATL-56A because the thinner sediment (estimated to be 510 m at Site SATL-56A instead of 640 m at Site SATL-54A) would allow installation of casing to basement. Stress calculations indicated that casing could only be installed to 600 m without exceeding the safe utilization threshold of the drill pipe, given the water depth. The reentry system and casing installation was planned as two stages. First, the reentry cone and five joints of 16 inch casing would be jetted in to ~60 mbsf. Then, 10¾ inch casing string would be drilled into basement.
After a missed mudline in Hole U1557A, Hole U1557B penetrated to 574.0 mbsf, contacting basement at 564.0 mbsf, with an overall recovery of 414.94 m of sediment as well as the sediment/basement interface (72% recovery; Table T1) (Estes et al., 2021). In Hole U1557C, a jet-in test determined that we would not be able to jet in the Dril-Quip reentry system and five joints of 16 inch casing. Instead, the reentry system and 16 inch casing was drilled into Hole U1557D. The casing could not be extended during Expedition 390C because of a subsea camera system failure. Expedition 395E returned to Hole U1557D and installed 10¾ inch casing to a depth of 571.6 mbsf, with the hole reaching a depth of 576.6 mbsf (Figure F5) (Williams et al., 2021).
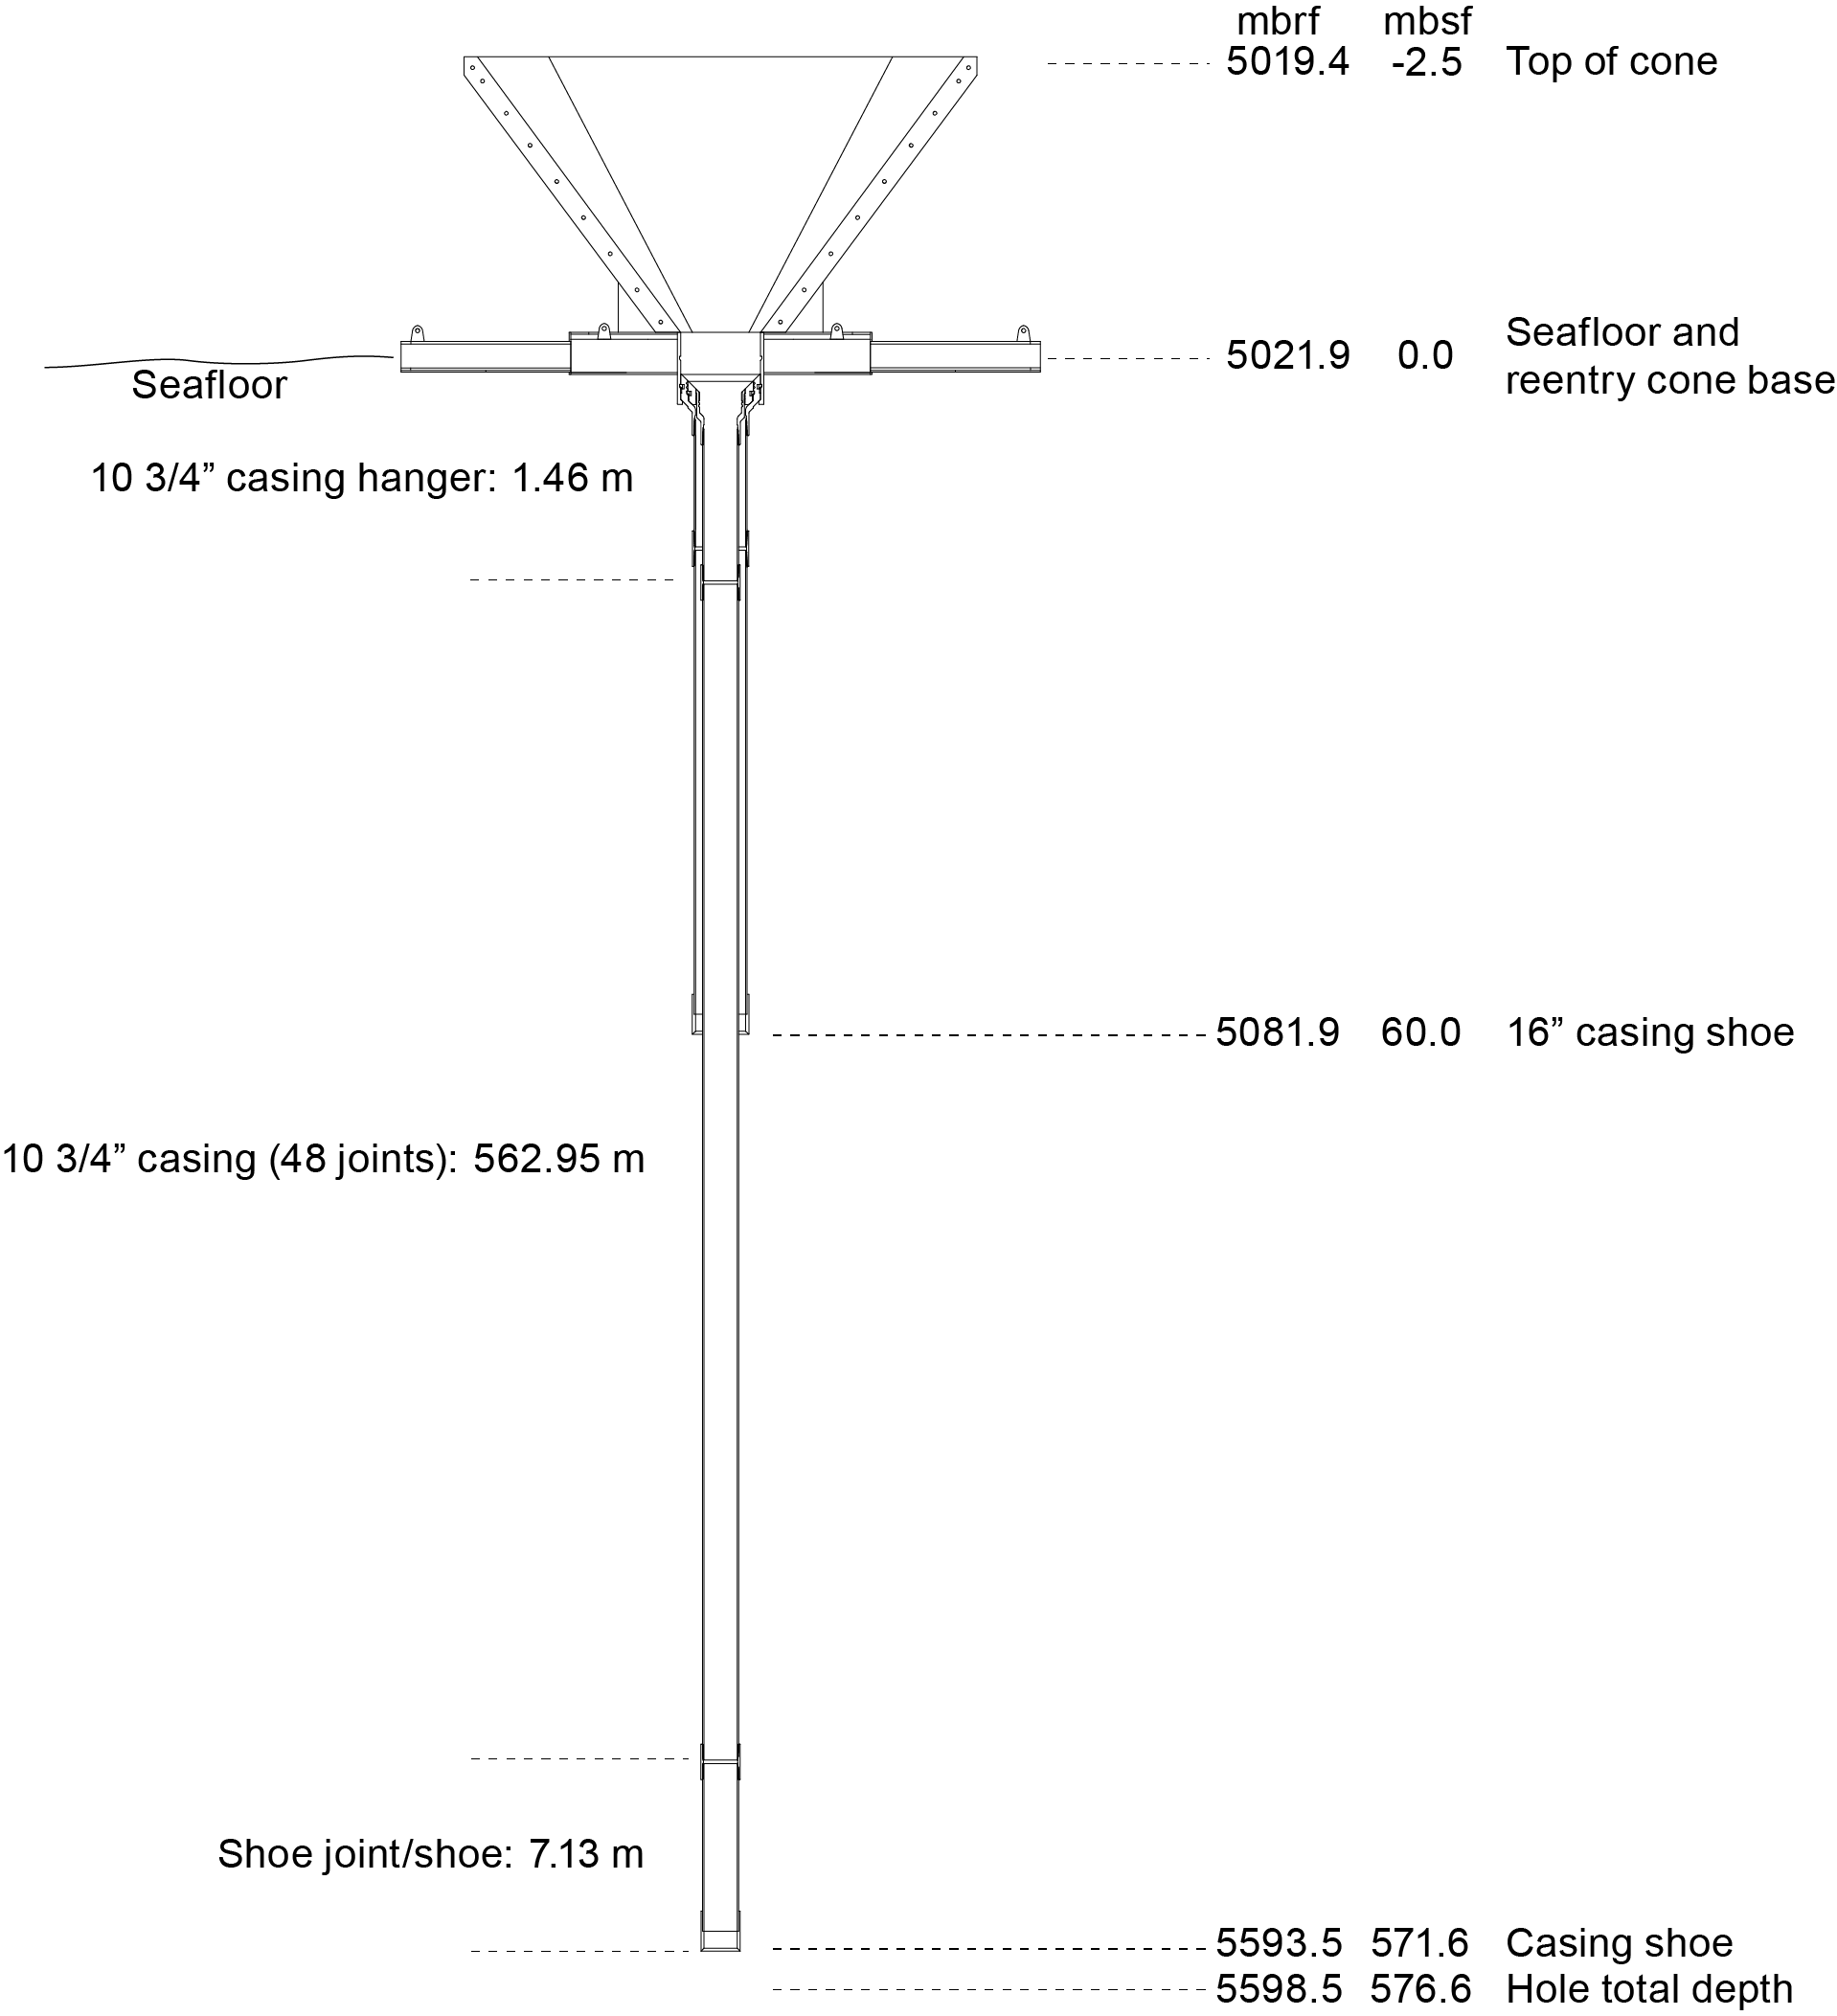
Figure F5. Reentry system, casing, and bottom-hole assembly.
2.2. Expedition 390 Hole U1557D
Expedition 390 arrived at Site U1557 on 12 May 2022 after moving over from Site U1556 in dynamic positioning (DP) mode. Pipe was tripped toward the seafloor, stopping twice to fill the drill pipe with water. At 0415 h, the subsea camera system was deployed through the moonpool to guide reentry into Hole U1557D. The Conductivity-Temperature-Depth (CTD) sensor was attached to the subsea camera frame. We located and reentered Hole U1557D at 0653 h, recovered the subsea camera system, and began tripping pipe through the casing to the hole bottom. Core 390-U1557D-2R was the first recovered core in this hole following the two drilled intervals, and it arrived on deck at 1925 h. Coring continued smoothly through Core 8R; Core 9R had advanced only 1 m when it was recovered because of poor weather and drilling conditions. We then pulled out of the hole, with the bit reaching the seafloor at 0930 h on 14 May, and tripped pipe up to 3327 meters below rig floor (mbrf), where we positioned to wait for weather conditions to improve.
Operations resumed at 1800 h on 15 May after waiting on weather for 1.5 days. The subsea camera system was deployed at 2130 h to guide reentry in Hole U1557D, with a successful reentry accomplished at 0246 h on 16 May. With the top drive in, we tripped pipe inside the casing to 637.1 mbsf. The top drive was then set back to replace the wash pipe. After this repair, we continued coring from 637.1 mbsf with Core 390-U1557D-10R. Core 14R was the final core for the site and advanced to 684.7 mbsf; after its recovery, we began tripping out of the hole to drop the bit on the seafloor and reenter for logging. Excluding Cores 2R, 3R, and 9R, all cores were full length. A mud sweep was pumped after every core following Core 5R. Additional mud (50 bbl) was pumped during the final mud sweep to prepare the hole for logging. Penetration rates were <3.0 m/h throughout the hole. In total, coring in Hole U1557D during Expedition 390 advanced 109.1 m and recovered 71.28 m (65%).
The drill pipe cleared the seafloor at 0025 h on 18 May, and the bit was dropped on the seafloor using the mechanical bit release (MBR) at 0220 h. The decision to drop the bit on the seafloor allows future reentry, deepening of the hole, and the potential for installation of a borehole observatory at this site. Subsequent logging operations confirmed Hole U1557D to be stable, with no washouts, further confirming its suitability as a legacy hole for any future operations.
The subsea camera system was then deployed through the moonpool to guide reentry into Hole U1557D for logging operations. Reentry occurred at 0437 h on 18 May, the subsea camera system was recovered, and the end of the drill pipe was positioned at 30 mbsf. The triple combo tool string, including tools for measuring formation density, resistivity, magnetic susceptibility (MS), and the borehole caliper was deployed at 0919 h and lowered to the hole bottom. Two upward passes covering the basement section of the hole were completed, and then the sediment section of the hole was logged through casing as the tools were pulled back to the surface. We elected to not deploy the other two logging drill strings to recover time lost to weather and to prioritize operations at Site U1559. The tools were back on deck by 1735 h, and we tripped pipe out of the hole and performed a slip and cut of the drilling line before tripping back to the surface. By 0644 h on 19 May, the bottom-hole assembly had been recovered and laid out and the thrusters were raised and secured. The vessel transitioned into cruise mode from DP mode at 0648 h and began the 600 nmi transit to Site U1559. Operations time at Site U1557 totaled 7.6 days during Expedition 390.
3. Stratigraphic unit summary
The cores recovered at Site U1557 comprise two sedimentary units overlying a single basement unit identified on the basis of macro- and microscopic visual observations combined with mineralogical analyses by X-ray diffraction (XRD), spectral color analyses, and MS data. The units are numbered from the top of the hole, with units in the sedimentary section designated by Roman numerals (e.g., I and II) and basement units designated by Arabic numerals (e.g., 1 and 2); subunits are designated with letters (e.g., IA, IIA, 2a, and 2b).
3.1. Sedimentary units
Sediments recovered at Site U1557 from a single core in Hole U1557A and an ~565 m sequence cored to basement in Hole U1557B are a mix of biogenic (predominantly calcareous nannofossils and foraminifera) and siliciclastic (predominantly clay-rich) sediments (Figure F6). Lithologic Unit I is composed of ~290 m of Eocene to recent alternating silty clay and nannofossil ooze layers and is divided into five subunits (IA–IE; Table T2) based on alternations in the proportions of biogenic carbonates (mostly nannofossil ooze) and siliciclastic sediments (silty clays). Unit II is composed of ~275 m of Paleocene to Eocene nannofossil/calcareous chalk and is also divided into five subunits (IIA–IIE; Table T2). In contrast to Unit I, siliciclastic lithologies are absent in Unit II, with the exception of Subunit IIC, which is a distinct ~0.8 m thick interval composed of layers of silty clay and calcareous nannofossil chalk with distinct colors (brown, light brown, and light greenish gray), likely deposited during the Paleocene/Eocene Thermal Maximum (PETM). The other Unit II subunits are defined by differences in sediment color (likely controlled by the abundance of clay minerals), the dominant biogenic components of the lithology, and the sediment age.
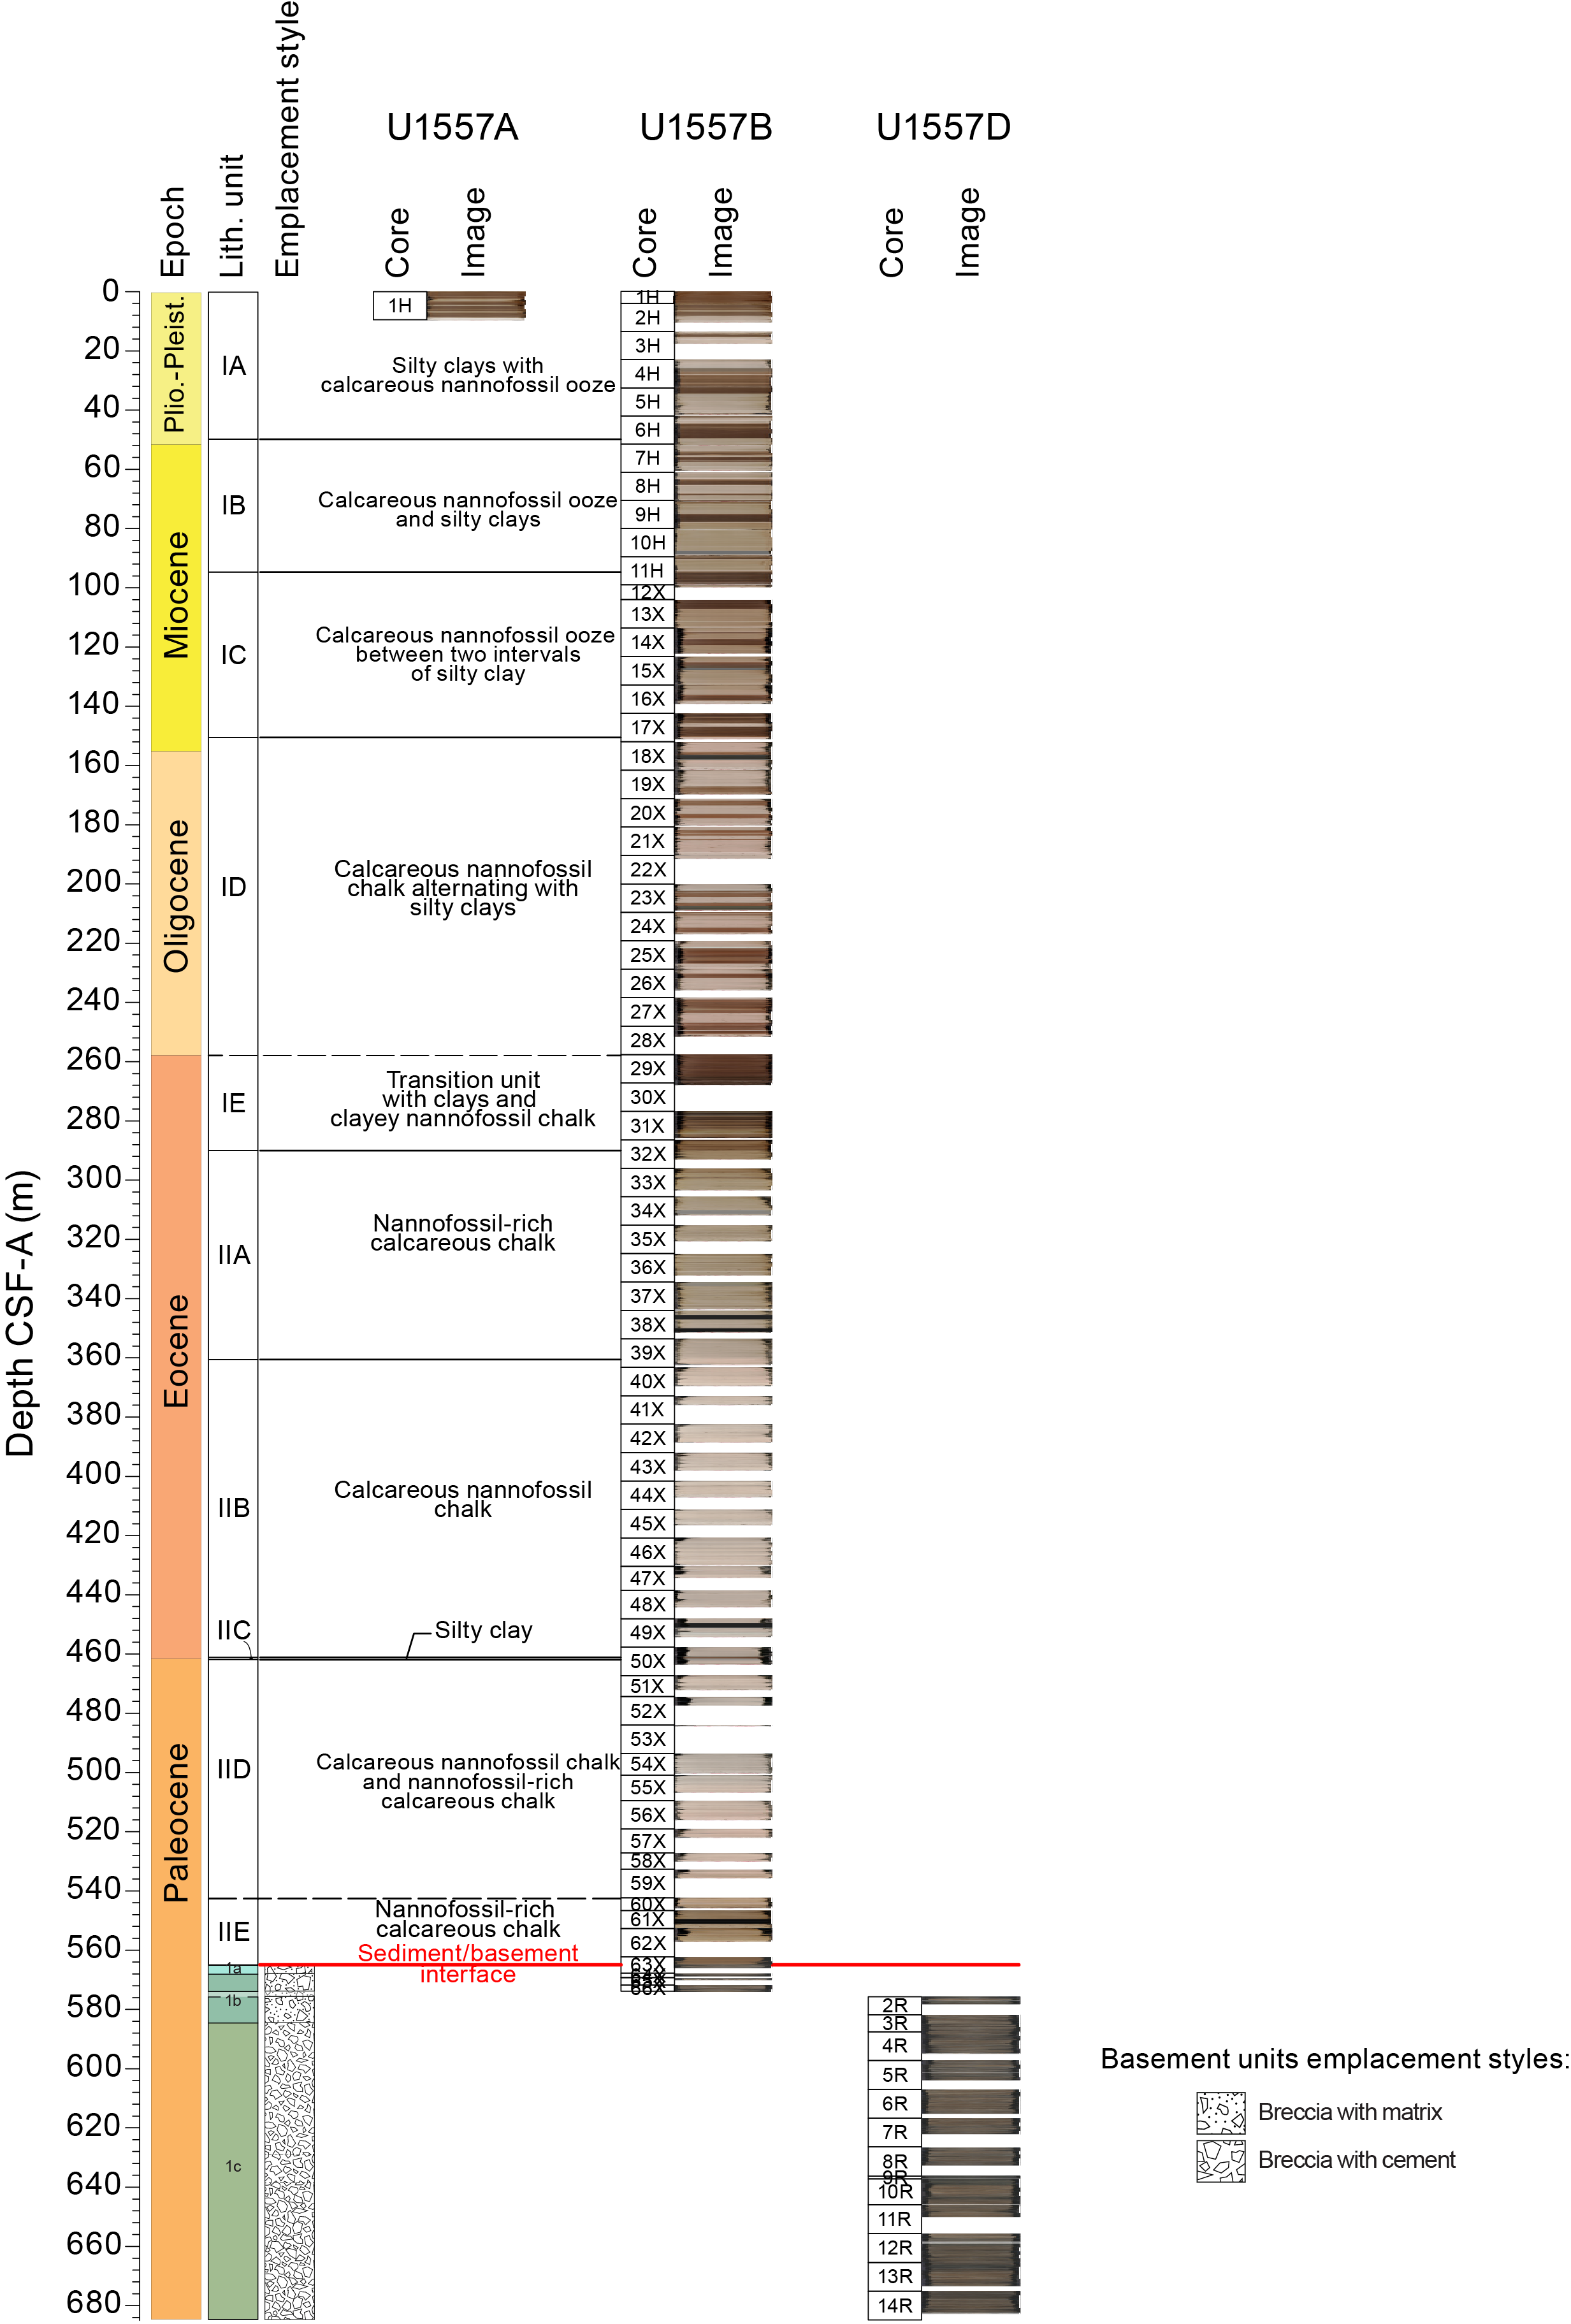
Figure F6. Stratigraphic unit summary.
3.2. Basement units
The basement rocks cored at Site U1557 are sedimentary breccias that contain a range of basaltic clast types derived predominantly from pillow lavas. Ubiquitous volcanic glass clasts are almost all completely altered with rare fresh glass. Hole U1557B penetrated the sediment/basement interface at 564.77 mbsf, below which 9.5 m of sedimentary breccia was cored. A further ~109 m of sedimentary breccia was cored in Hole U1557D between ~10 and ~120 meters subbasement (msb). Although some variation in clast lithology is observed downhole, systematic variations are not observed, and the entire sequence of rocks recovered is defined as a single lithologic unit (1; Figure F6). Unit 1 is divided into three lithologic subunits based on variations in the relative proportions and mineralogy of both the breccia matrix and cement.
3.3. Sediment/basement interface
At Site U1557, the sediment/basement interface was only recovered in Hole U1557B in interval 390C-U1557B-63X-2, 87 cm, at 564.77 m core depth below seafloor, Method B (CSF-B). This interface is defined by the shallowest occurrence of basalt in the hole, comprising a <10 cm interval of basalt rubble (pieces <4 cm in diameter) underlying the nannofossil-rich chalk of Subunit IIE. The uppermost basement unit (Subunit 1a; 564.77–567.9 mbsf) is a transitional unit that comprises both pelagic sedimentary material and volcanic clasts (see Igneous petrology). The pelagic component of these rocks occurs as the matrix between basalt blocks (>10 cm diameter) and is predominantly composed of indurated calcareous sediment that likely formed from a foraminifera-bearing nannofossil chalk lithified through circulation of hydrothermal fluids combined with burial diagenesis.
3.3.1. Sediment/basement interface depth
The sediment/basement interface was not recovered in Hole U1557D because the cased reentry system in this hole was deliberately drilled into basement (see Operations). During its installation during engineering Expedition 395E, hard rock was encountered at ~566 mbsf, casing was installed ~5 m into basement, and the drilled interval reached ~10 m into basement. A distinct horizon that shares physical properties characteristics with core-based data was observed in downhole logs through the casing at ~558 m wireline log matched depth below seafloor (WMSF) (see Physical properties and downhole measurements).
At many of the SAT sites, there is >10 m of basement topography between closely spaced (20–30 m) holes. For stratigraphic correlation between SAT sites and with other sections of upper ocean crust recovered by scientific ocean drilling, we have therefore defined a site basement/sediment interface depth for each of the SAT sites. For consistency, this is taken as the curated depth of the top of the shallowest occurrence of basalt in the hole with the greatest basement penetration at each site. Because the interface was deliberately not recovered in Hole U1557D, for Site U1557 we define it as the curated depth of the top of the shallowest occurrence of basalt in Hole U1557B (564.77 m CSF-B). This is in good agreement with the depth of the sediment/basement interface in Hole U1557D based on drilling parameters (see Operations), indicating minimal basement topography between Holes U1557B and U1557D.
4. Sedimentology
The sediments recovered at Site U1557 mainly come from Hole U1557B, which was cored to basement at 564.76 mbsf. Sediments from Holes U1557A (only 0–9.63 m CSF-B) and U1557B contain of a mix of biogenic (predominantly calcareous nannofossils and foraminifera) and siliciclastic (predominantly clay-rich) sediments (Figure F7). Visual core descriptions (VCDs) summarize observations recorded in the shipboard DESClogik program, including assessment of sediment color, grain size, sedimentary structures, bioturbation, and drilling disturbance. Sediment colors reported here are defined according to the Munsell color system (color codes are provided in the VCDs). The color of the sediment primarily reflects its lithologic characteristics; sediments composed mainly of nannofossil and calcareous ooze are generally pinkish white, whereas silty clays range from brown/dark brown where carbonate is absent to reddish brown where the carbonate content is higher (Figure F11). Holes U1557A and U1557B were cored in November 2020 during Expedition 390C but were not described until April 2022 during Expedition 390. We observed some differences in color on the digital color images obtained using the Section Half Imaging Logger (SHIL) during Expedition 390C (see Physical properties and downhole measurements in the Expedition 390/393 methods chapter [Coggon et al., 2024c]) and the visual color determinations made during Expedition 390, likely reflecting changes such as postcoring drying and/or oxidation of the sediments.
Smear slides (Figure F10) and XRD (Figures F9, F14) were used to confirm lithologic composition. In general, the alternations between nannofossil ooze/chalk and silty clays are well correlated with MS and the luminosity (L*) color reflectance parameter, as well as with natural gamma radiation (NGR) (see Physical properties and downhole measurements) (Figure F7). The bioturbation index (see Sedimentology in the Expedition 390/393 methods chapter [Coggon et al., 2024c]) ranges from absent to heavy in Holes U1557A and U1557B, but bioturbation is generally sparse throughout Site U1557 sediments.
In addition to the major lithologies (nannofossil ooze/chalk and silty clay), several minor distinct sedimentologic features are observed (Figure F11) including greenish white foraminifera layers/lenses, microstructural deformation (faulting and folding), and a unique clay-bearing layer in the long sequence of nannofossil-rich calcareous chalk of Unit II.
Two lithologic sedimentary units and ten subunits are defined at Site U1557 based on a combination of visual observations of sedimentologic characteristics (color, sedimentary structures, bioturbation, and general appearance), microscopic examination of smear slides, and bulk mineralogical analysis by XRD (see Sedimentology in the Expedition 390/393 methods chapter [Coggon et al., 2024c]) integrated with MS and color spectral observations (see Physical properties and downhole measurements in the Expedition 390/393 methods chapter [Coggon et al., 2024c]). Ages were assigned to each subunit based on micropaleontology results and magnetostratigraphy (see Age model and mass accumulation rates).
4.1. Unit descriptions
4.1.1. Unit I
- Intervals: 390C-U1557A-1H-1, 0 cm, to 1H-CC, 13 cm; 390C-U1557B-1H-1, 0 cm, to 32X-3, 45 cm
- Depths: Hole U1557A = 0–9.63 m CSF-B; Hole U1557B = 0–289.84 m CSF-B
- Thickness: Hole U1557A = 9.63 m; Hole U1557B = 289.84 m
- Age: Eocene to recent
- Lithology: nannofossil ooze/chalk, silty clay
Unit I is composed of 289.84 m of upper Eocene to Pleistocene silty clay and calcareous nannofossil ooze (Figure F7). Unit I is divided into five subunits based on alternations between biogenic carbonates (mostly nannofossil ooze) and siliciclastic sediments (silty clays) (Figure F8). In detail, the top of Unit I comprises ~50 m of Pliocene–Pleistocene brown silty clays with minor pinkish white nannofossil ooze intervals (Subunit IA). Below this interval, nannofossil oozes are more common but have a different color (light gray), defining Subunit IB (49.67–94.55 m CSF-B; Late Miocene–Pliocene). Two relatively thick intervals (>5 m) of dark brown clays split by a sequence of pinkish gray nannofossil ooze characterize most of the Miocene sediments (Subunit IC; 94.55–150.38 m CSF-B). Below 150.38 m CSF-B, reddish brown silty clays alternate with pink nannofossil chalk for ~56 m, with the color and mineralogy (Figure F9) indicative of a partially marly composition of the two major lithologies in this subunit (Subunit ID; Oligocene). Below Subunit ID, unconsolidated oozes turn into moderately consolidated chalks, reflecting diagenetic burial processes. Dark brown to black silty clays and brown clayey nannofossil chalk occur at the bottom of Unit I (Subunit IE; 276.90–289.84 m CSF-B) around the level identified as the Eocene–Oligocene transition (see Biostratigraphy and Age model and mass accumulation rates).
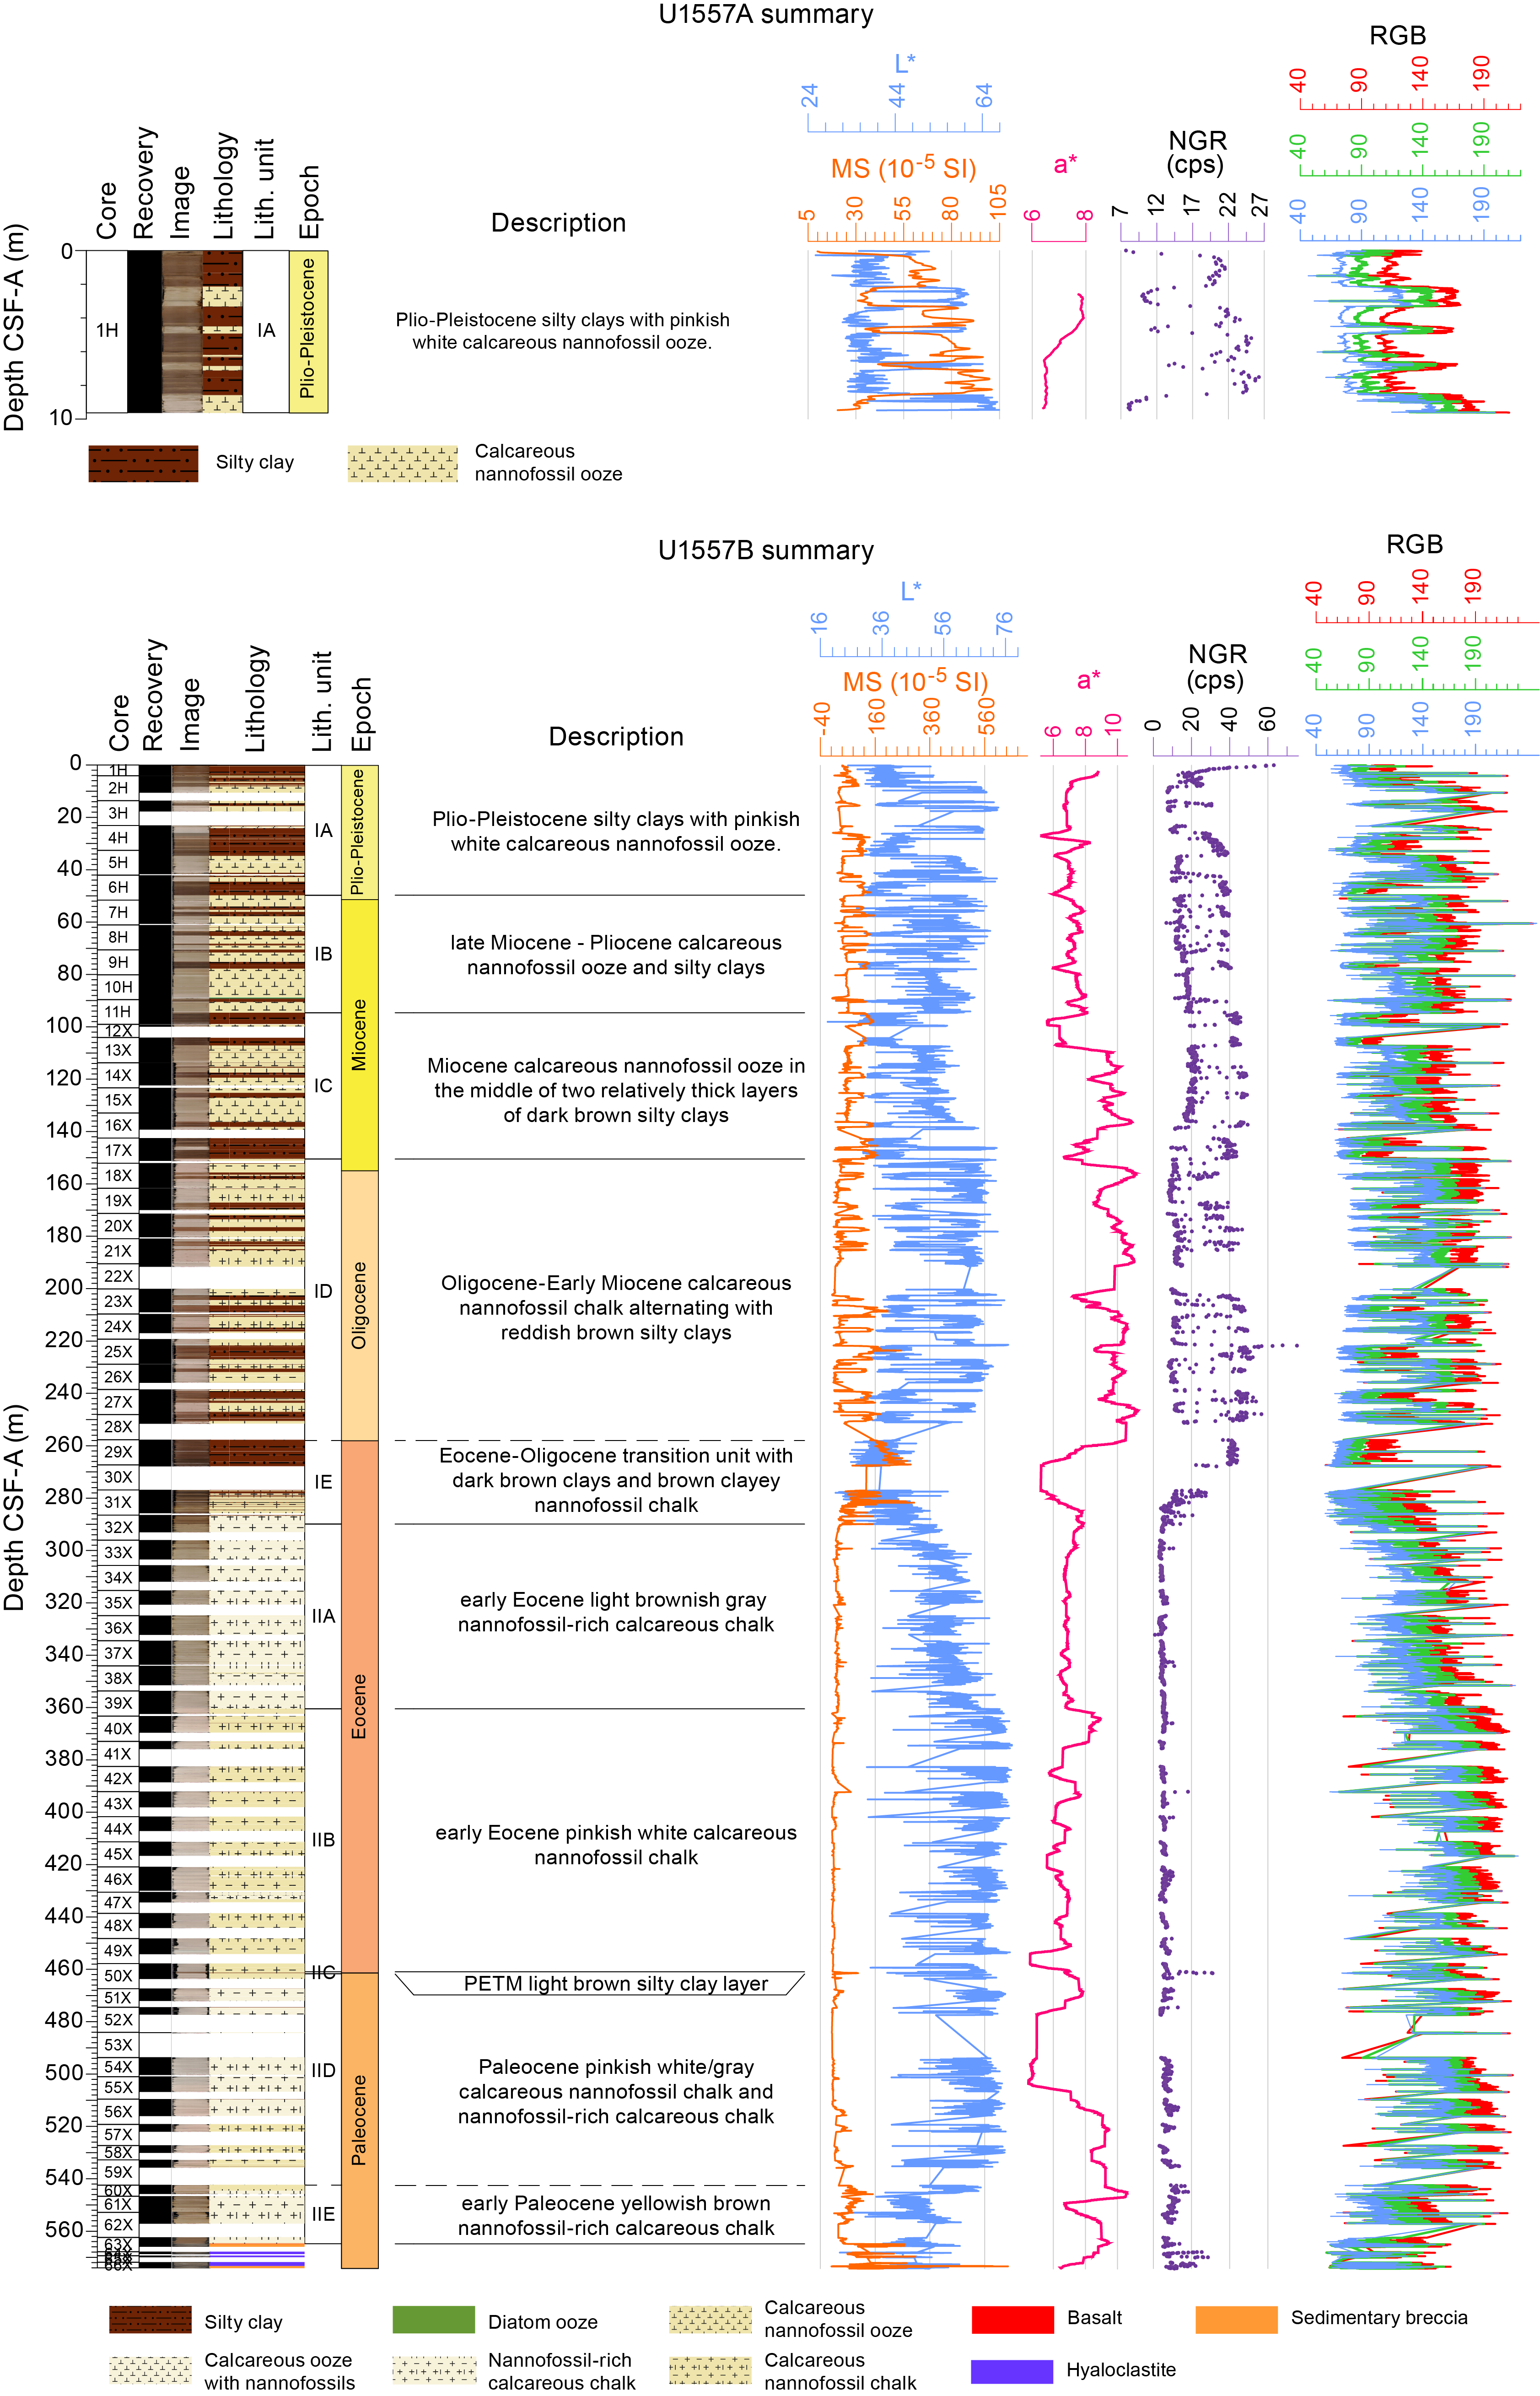
Figure F7. Lithologic summary, Holes U1557A and U1557B.
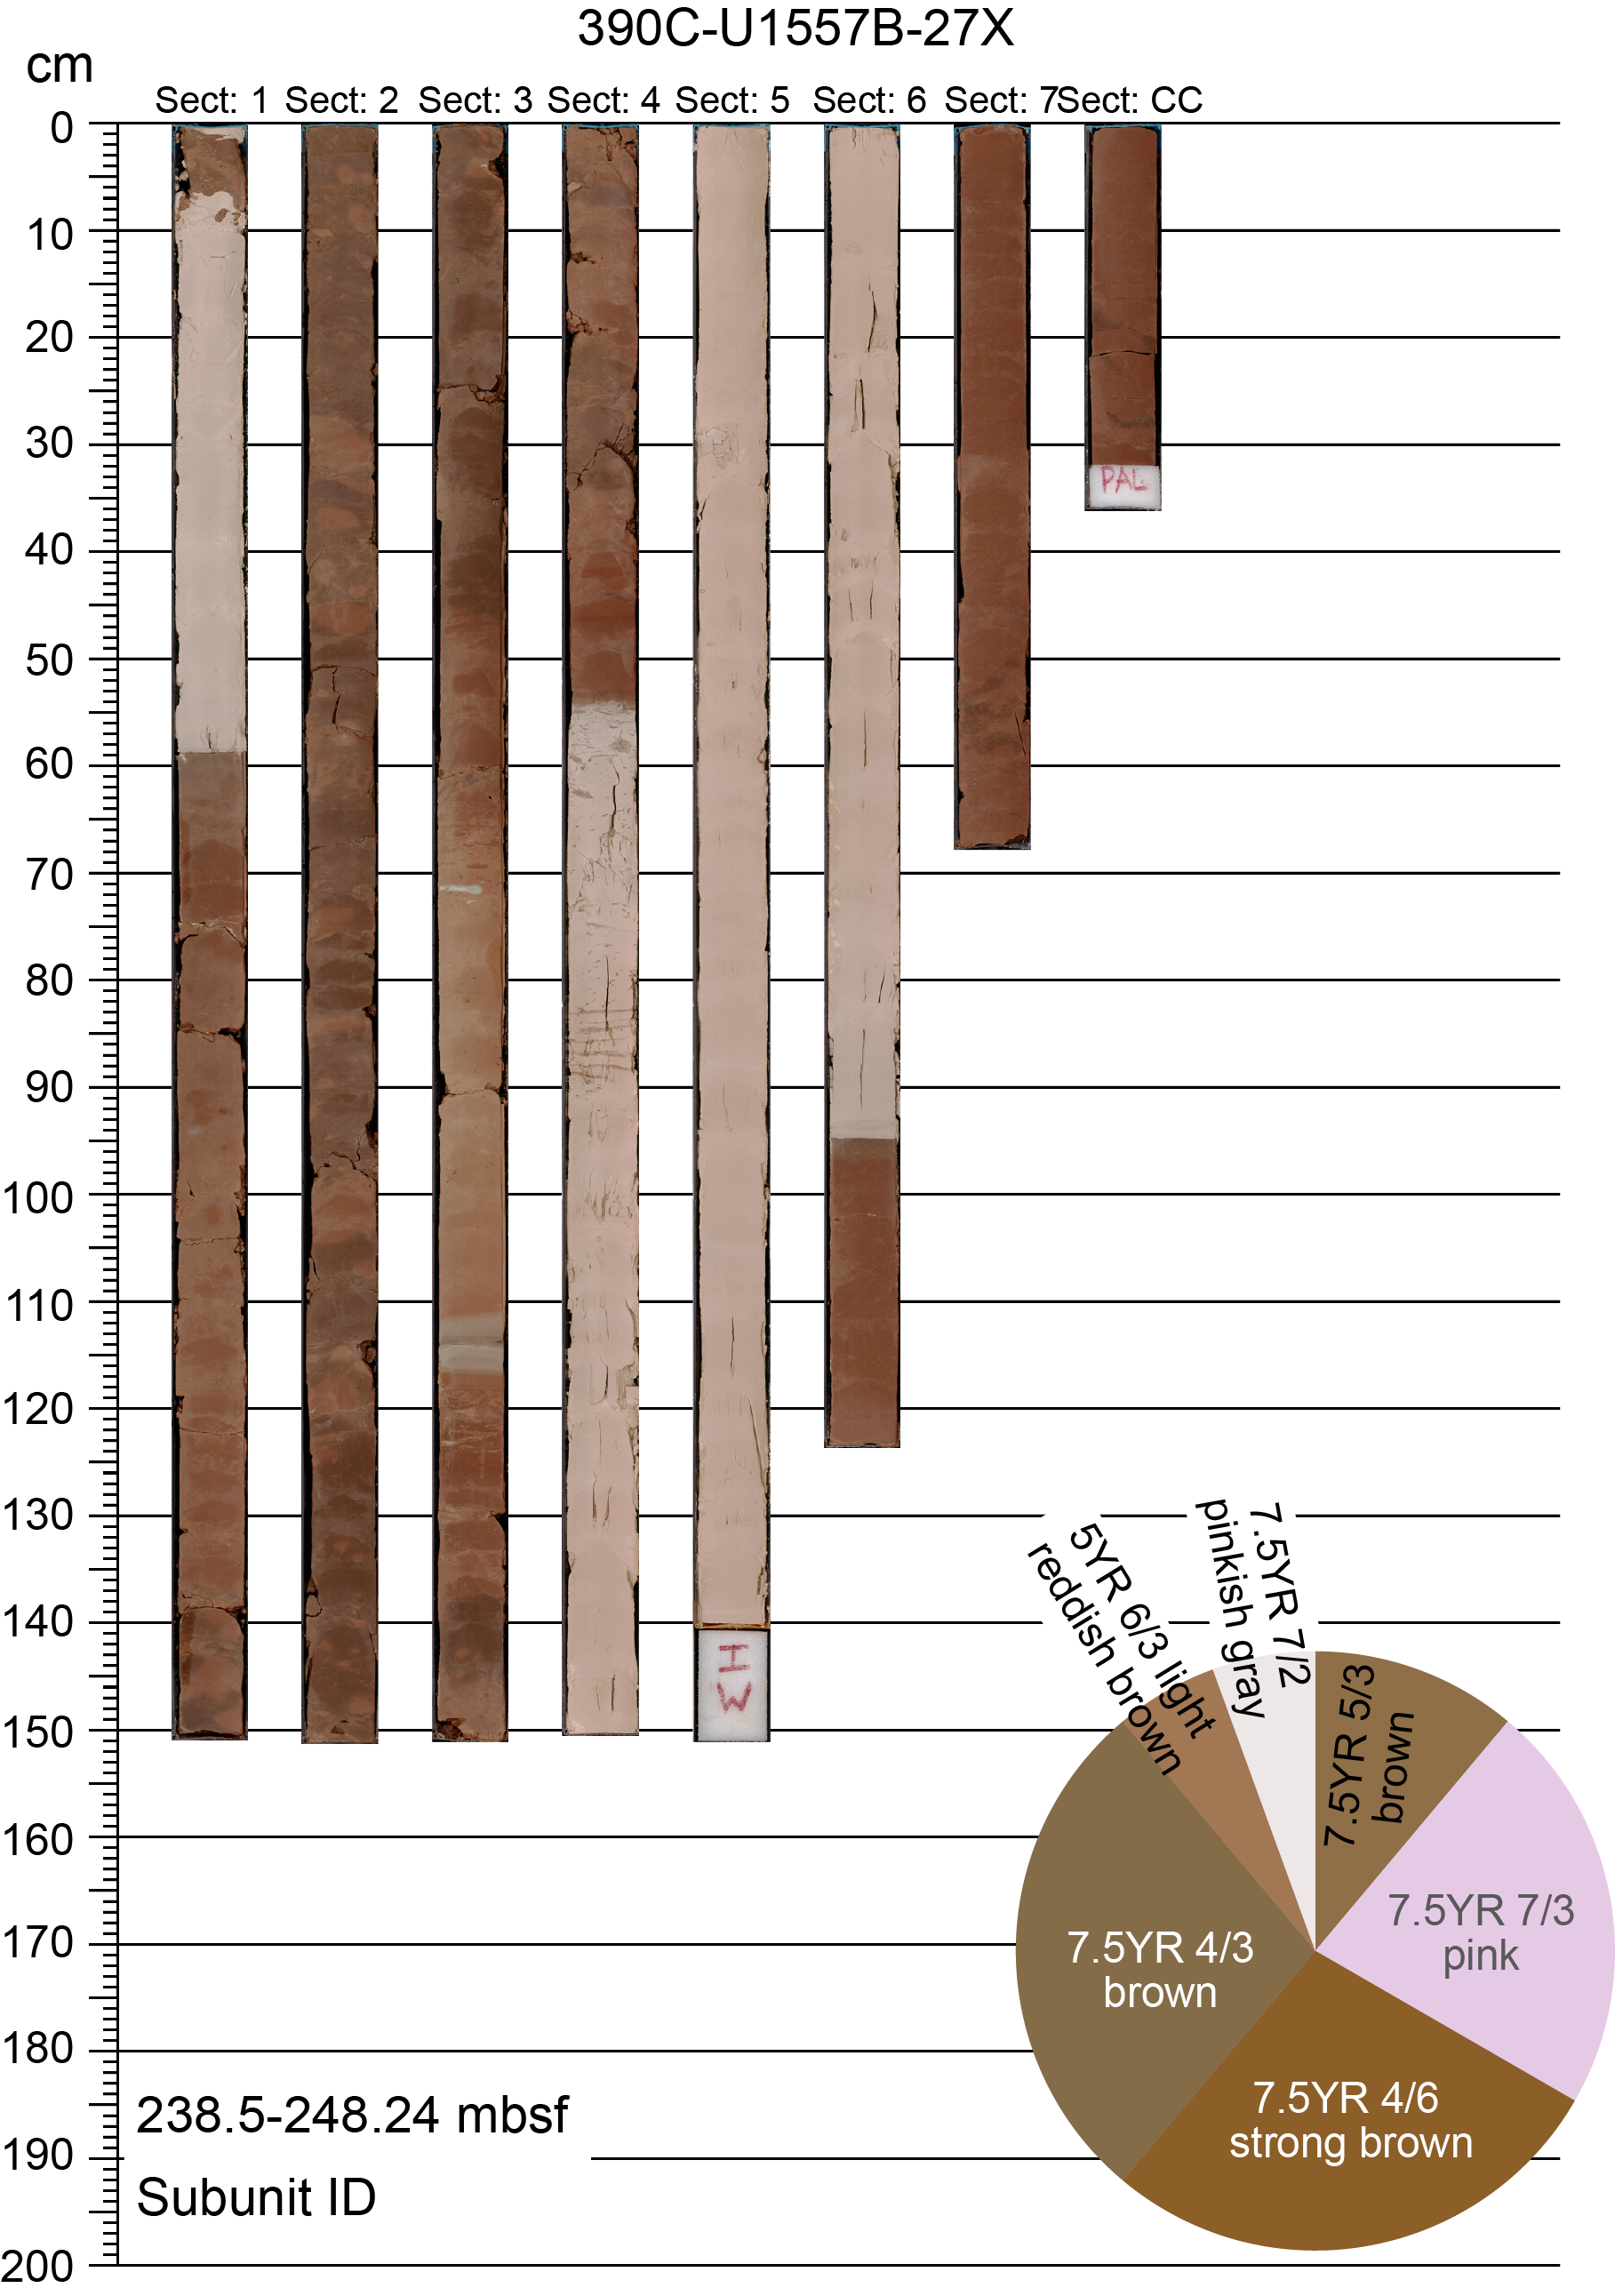
Figure F8. Characteristic lithology and color alternations, Unit I.
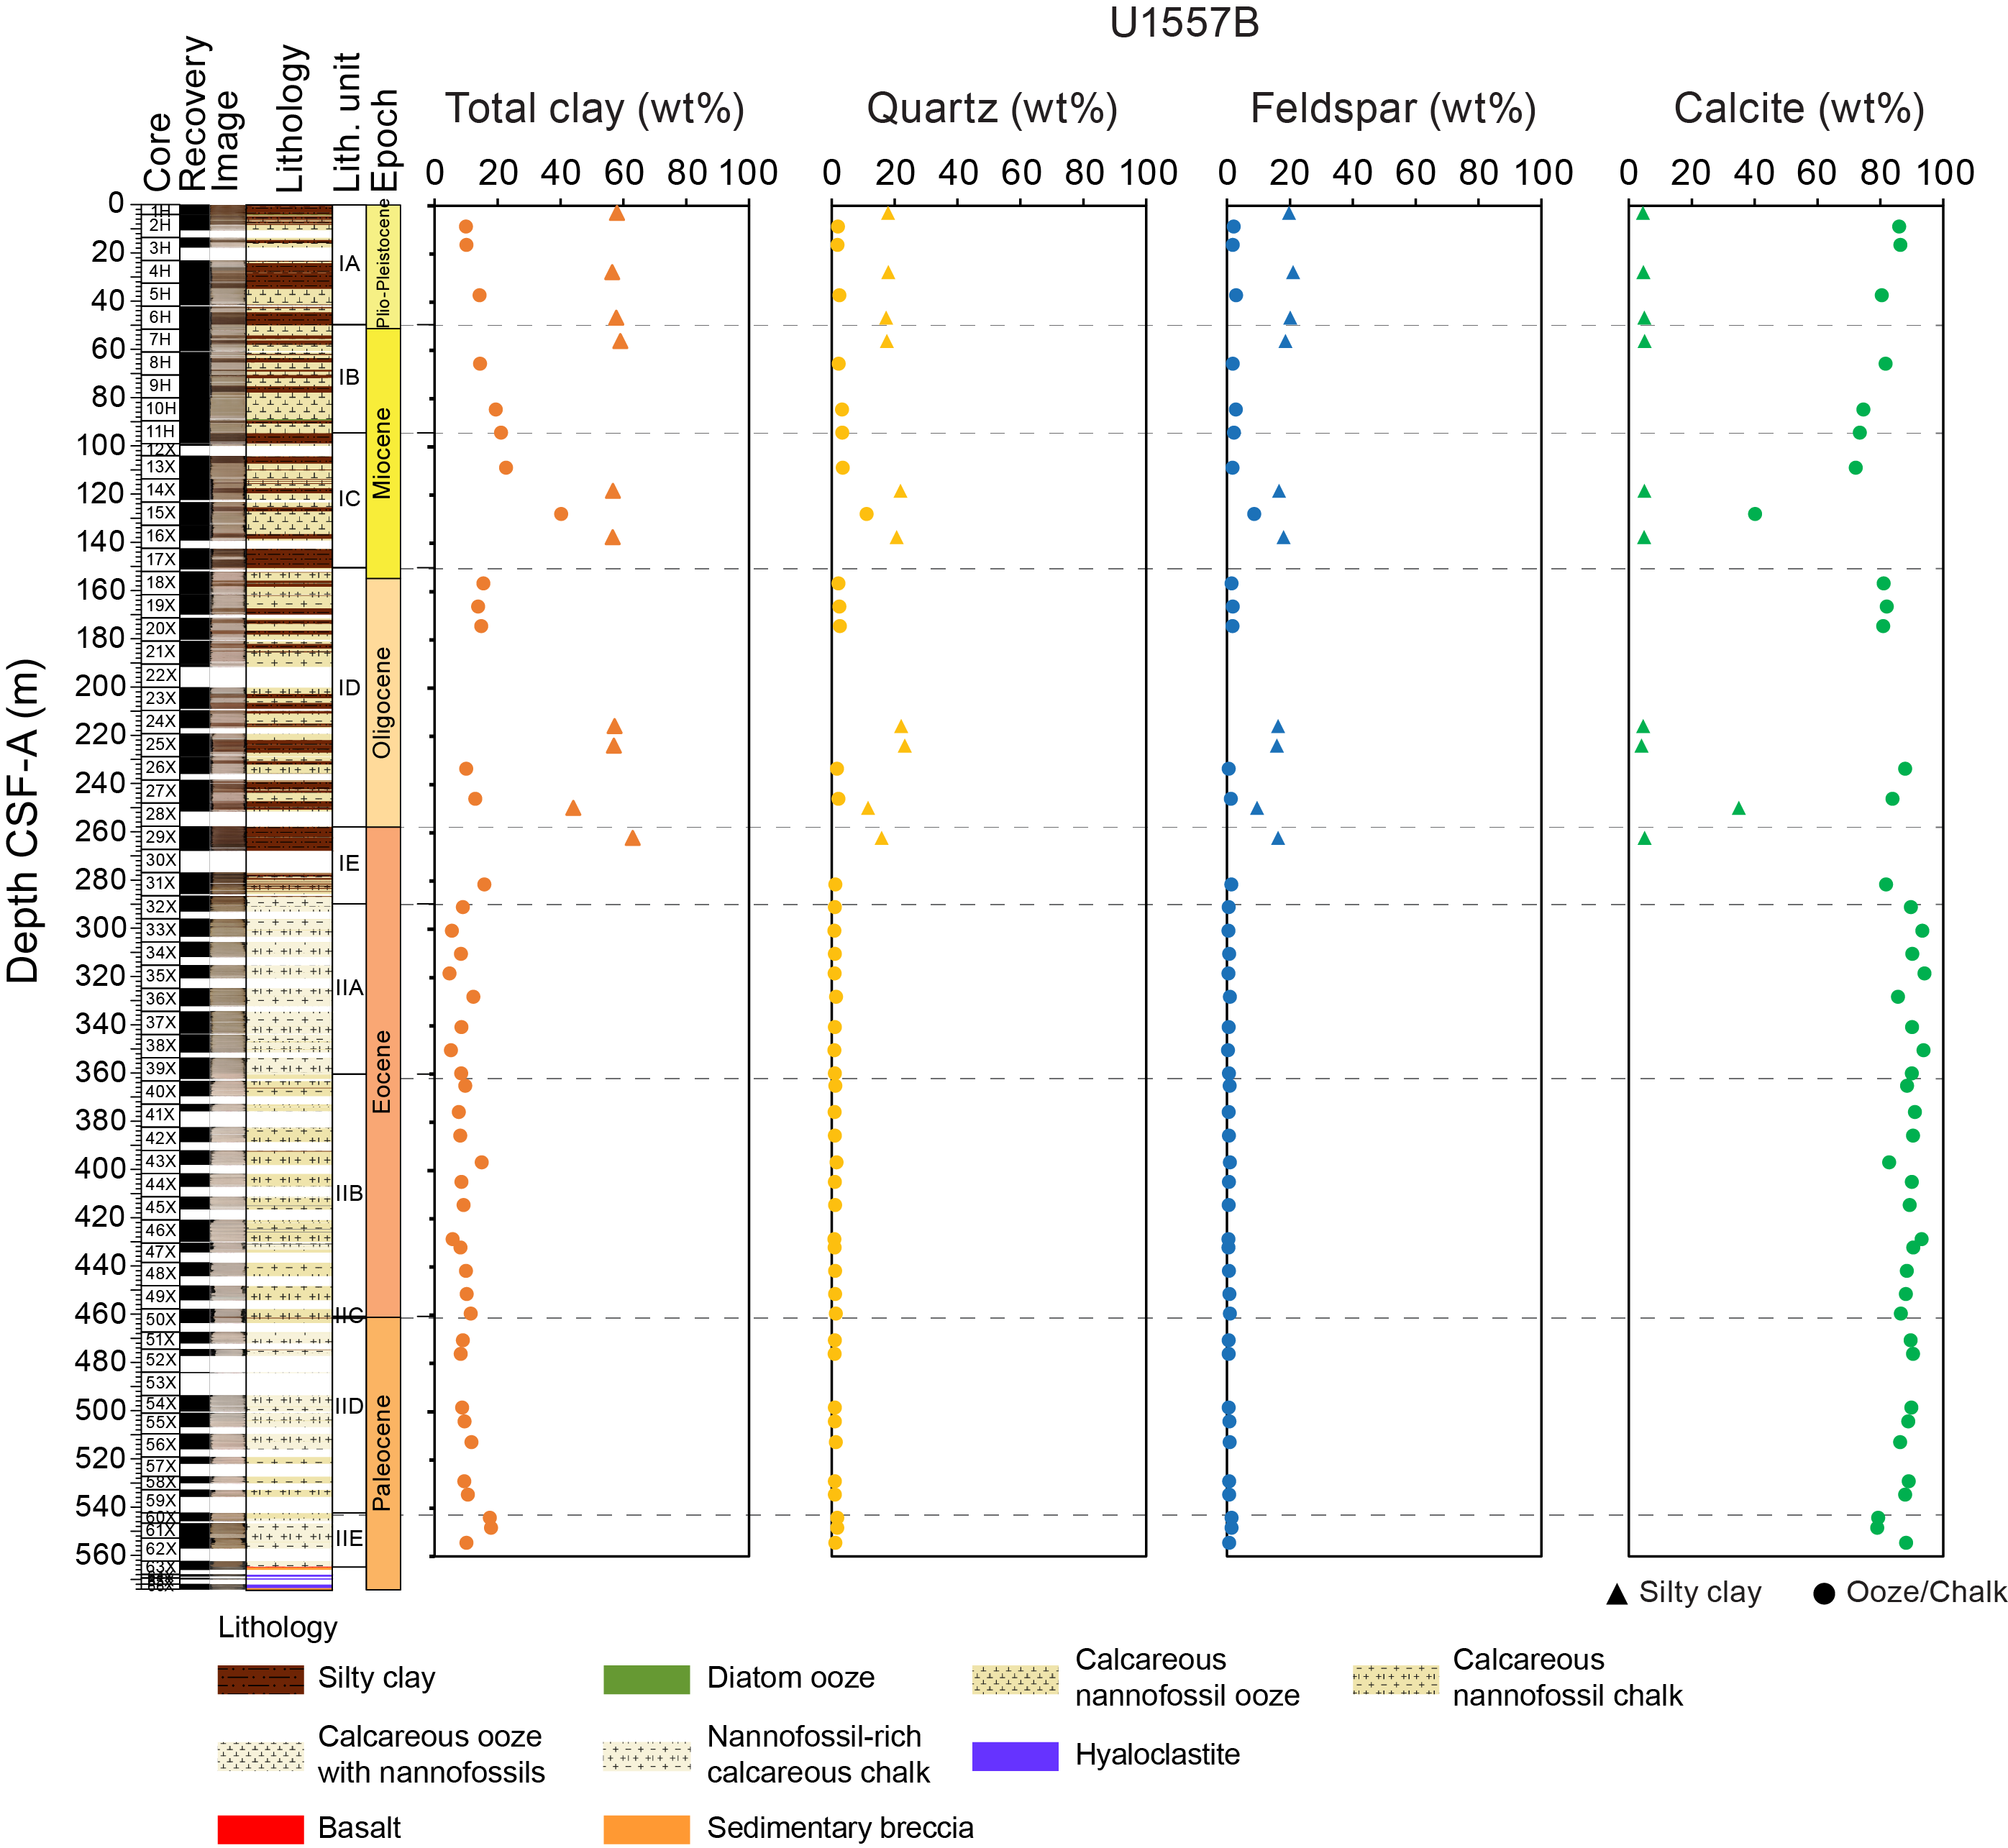
Figure F9. XRD mineralogy, Hole U1557B.
The lithologic contacts vary between bioturbated, gradational, and planar, with less common sharp or irregular contacts. Centimeter-thick intervals or lenses of greenish white foraminifera-rich nannofossil ooze often occur at the boundaries between silty clays and nannofossil ooze, likely indicative of changes in environmental conditions (selective deposition of foraminifera by bottom currents and/or selective dissolution of the nannofossil shells). The bioturbation index in Unit I ranges from absent to high, although it is most commonly absent or sparse. Drilling disturbance manifests as slight uparching throughout Unit I. Toward the bottom of Unit I, drilling gaps are more common, likely reflecting both the change from the APC system to the XCB system in Core 390C-U1557B-12X (see Operations) and/or a change in sediment rheology.
4.1.1.1. Subunit IA
- Intervals: 390C-U1557A-1H-1, 0 cm, to 1H-CC, 13 cm; 390C-U1557B-1H-1, 0 cm, to 6H-6, 6.5 cm
- Depths: Hole U1557A = 0–9.63 m CSF-B; Hole U1557B = 0–49.66 m CSF-B
- Thickness: Hole U1557A = 9.63 m; Hole U1557B = 49.66 m
- Age: Pliocene–Pleistocene
- Lithology: silty clays, calcareous nannofossil ooze, diatom-rich biosiliceous ooze
Subunit IA is composed mainly of brown silty clay interrupted by pinkish white calcareous nannofossil ooze intervals. Thin (<4 cm) diatom-rich biosiliceous ooze layers within a silty clay interval occur in Sections 390C-U1557A-1H-1 and 390C-U1557B-1H-1. Diatoms are predominantly concentrated in pale green laminations. Bioturbation is generally sparse throughout Subunit IA. Some organic-rich laminations occur in silty clay intervals in Cores 390C-U1557B-4H through 6H.
The Lithologic Subunit IA/IB boundary is located at Section 390C-U1557B-6H-6, 6.5 cm (49.66 m CSF-B), where there is a sharp transition from brown silty clay at the base of Subunit IA to light gray calcareous nannofossil ooze at the top of Subunit IB that is visually distinct from the pinkish white calcareous nannofossil ooze observed in Cores 1H–6H.
4.1.1.2. Subunit IB
- Interval: 390C-U1557B-6H-6, 6.5 cm, to 11H-4, 45.3 cm
- Depth: 49.67–94.55 m CSF-B
- Thickness: 44.88 m
- Age: Late Miocene to Pliocene
- Lithology: calcareous nannofossil ooze, silty clay
Subunit IB is mostly composed of light gray/pinkish white calcareous nannofossil ooze with minor brown silty clay intervals. Foraminifera are rare (<10%) in the nannofossil ooze (Figure F10). Light greenish gray foraminiferal ooze occurs near the bottom of Subunit IB (Figure F11) at 94.49–94.55 m CSF-B. Bioturbation is generally sparse throughout Subunit IB.
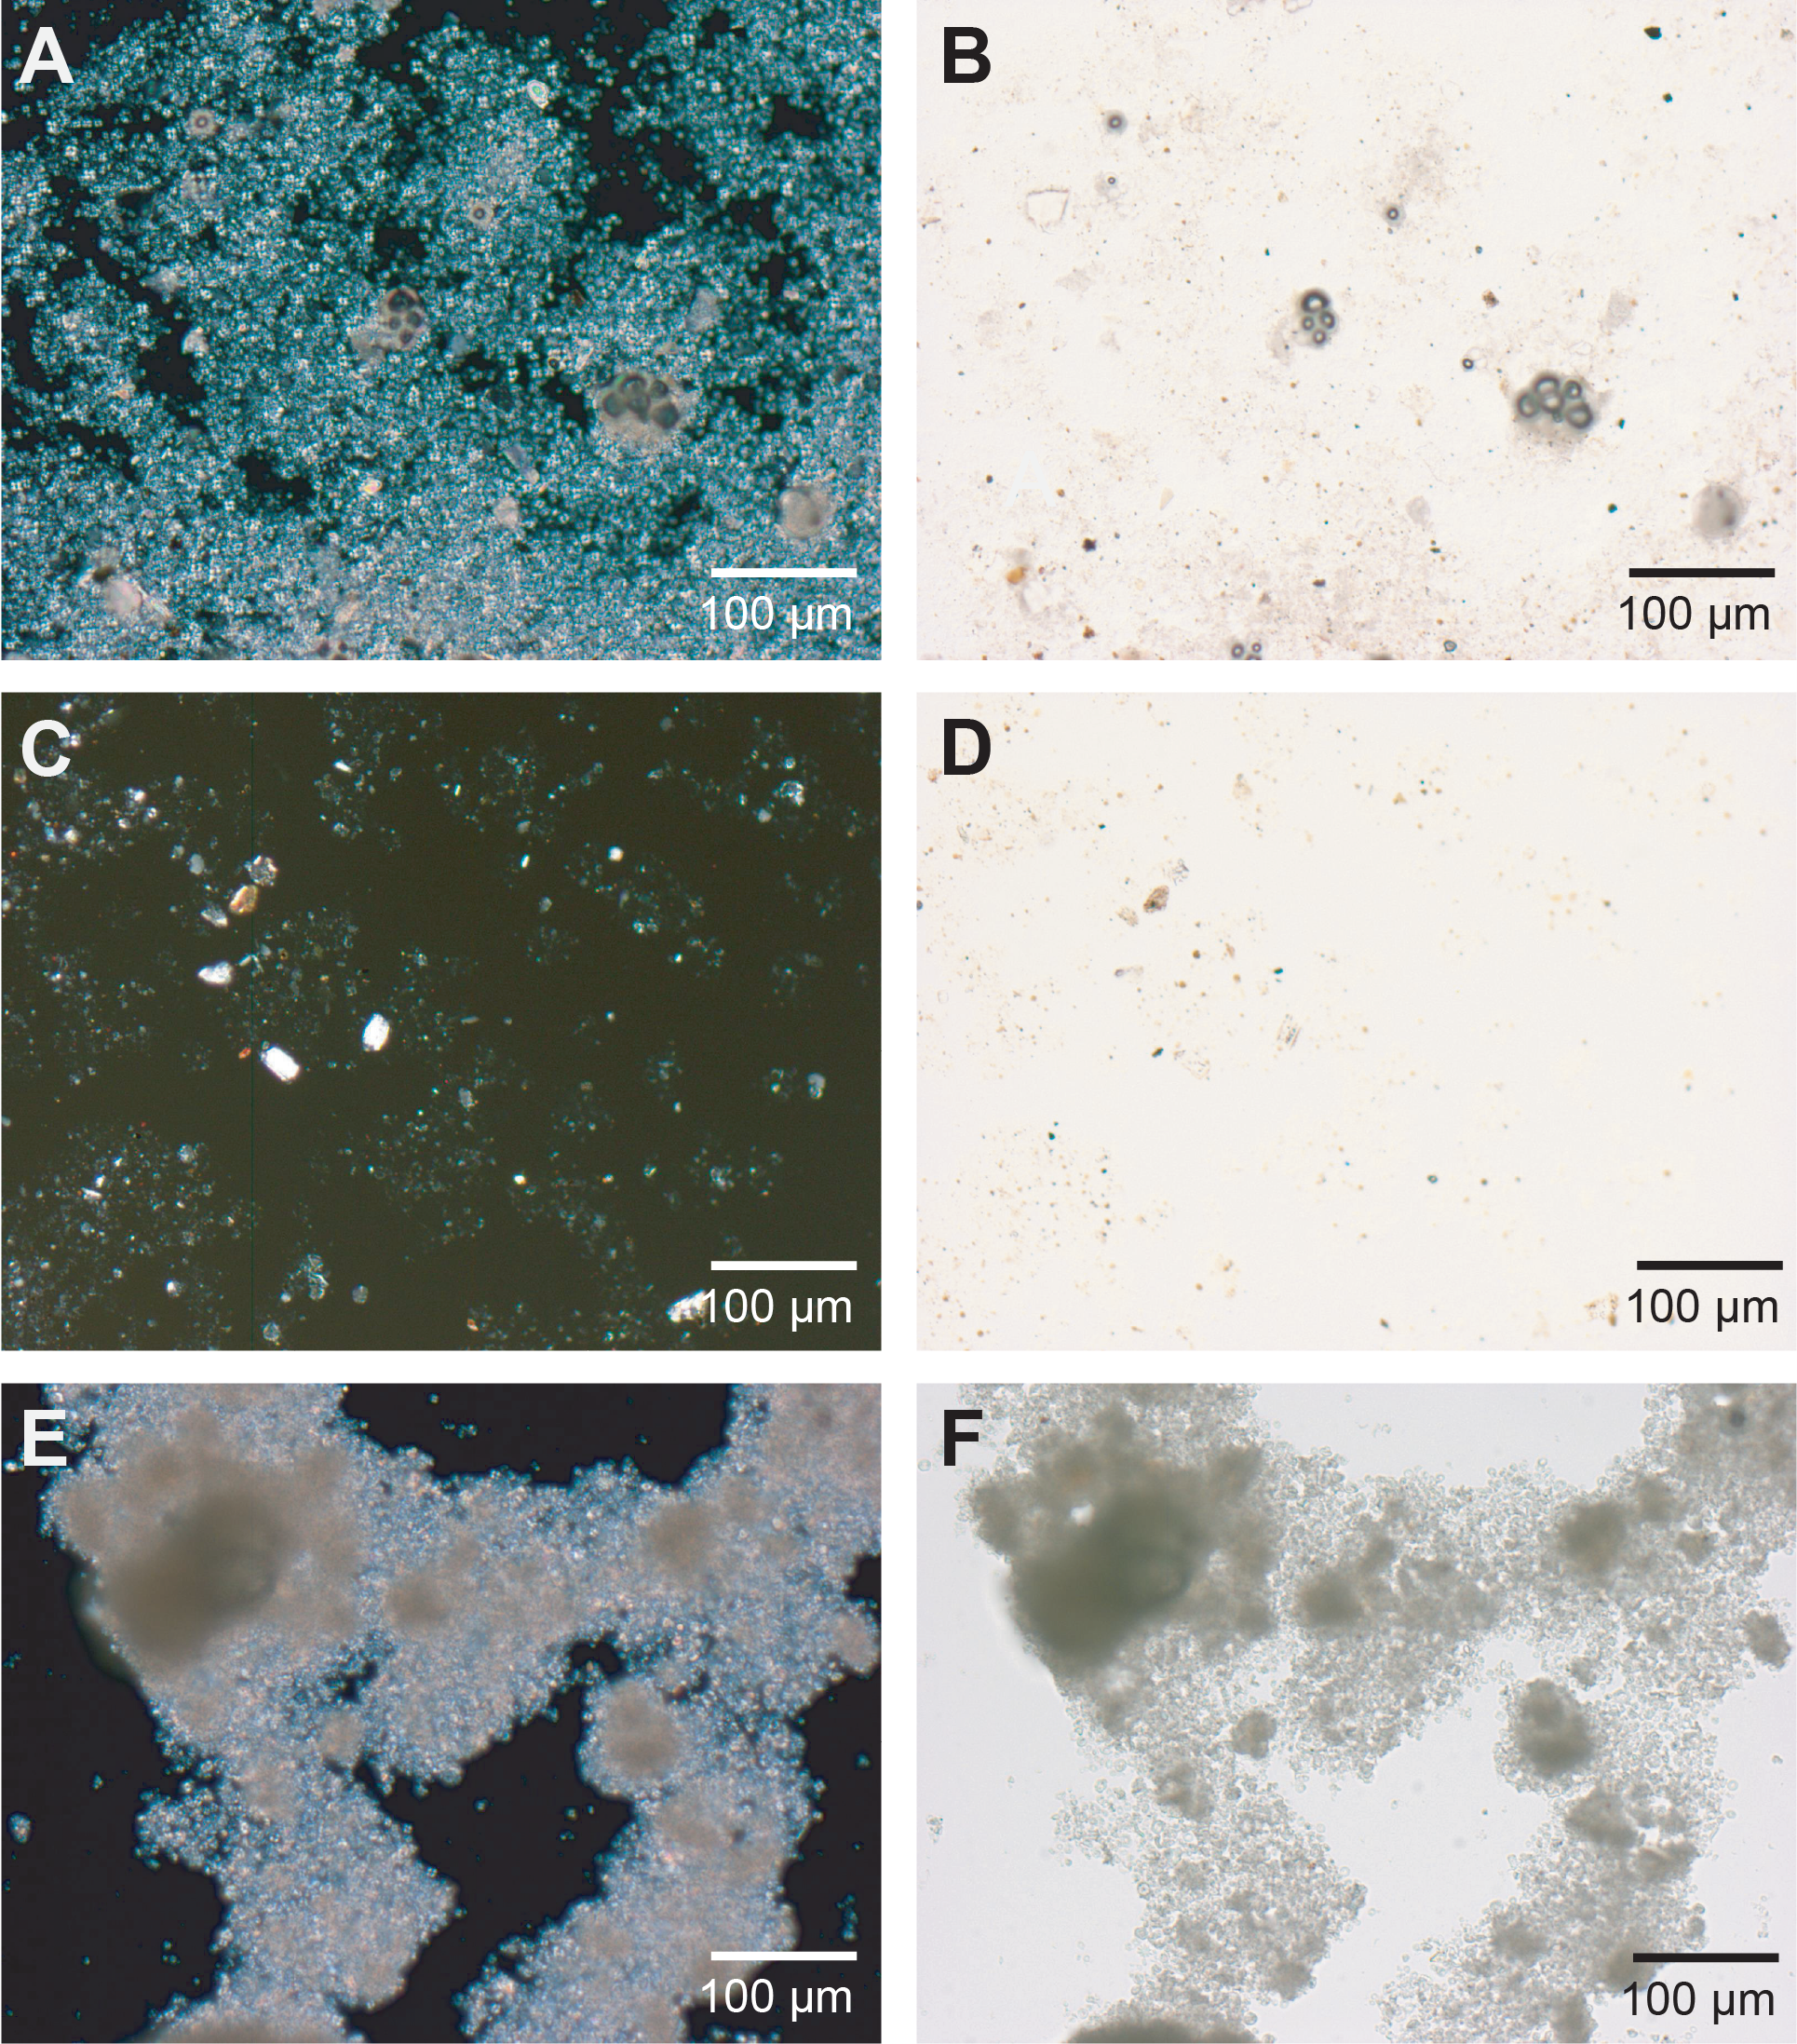
Figure F10. Ooze, clay, and chalk, Hole U1557B.
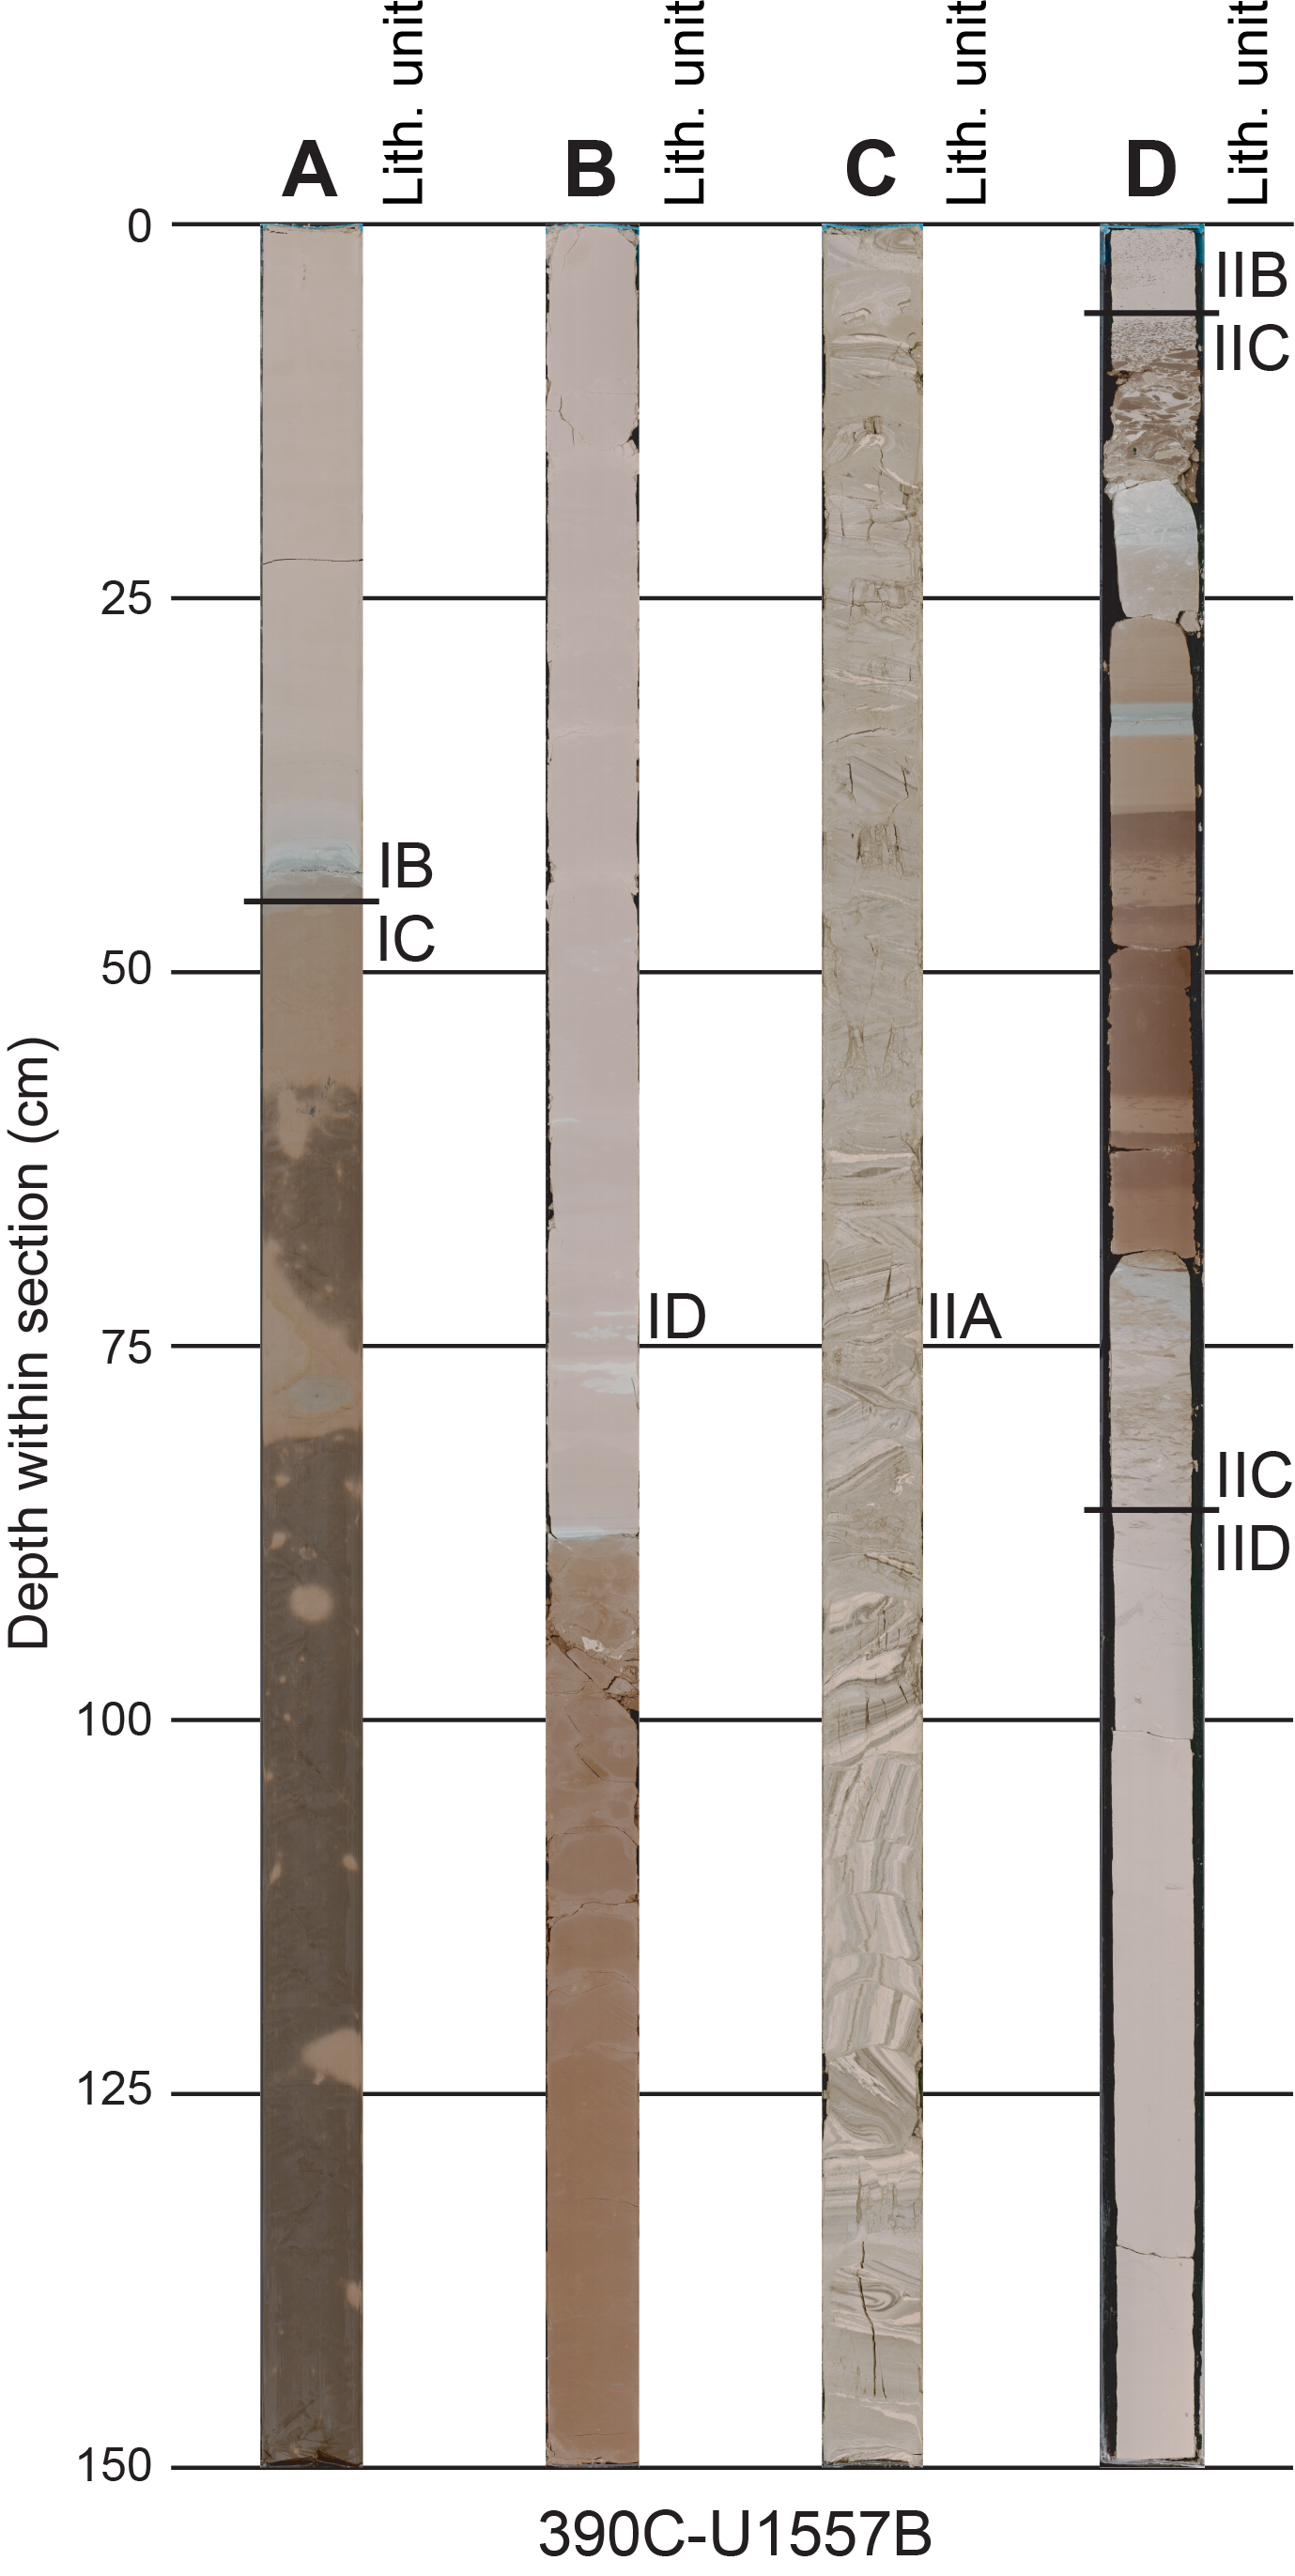
Figure F11. Silty clays and chalk, Hole U1557B.
The Lithologic Subunit IB/IC boundary is located at Section 390C-U1557B-11H-4, 45.3 cm (94.553 m CSF-B), where there is a sharp transition between calcareous nannofossil ooze at the base of Subunit IB and the brown silty clay at the top of Subunit IC.
4.1.1.3. Subunit IC
- Interval: 390C-U1557B-11H-4, 45.3 cm, to 17X-6, 37 cm
- Depth: 94.55–150.38 m CSF-B
- Thickness: 55.83 m
- Age: Middle Miocene
- Lithology: calcareous nannofossil ooze, silty clays
Subunit IC is composed of two relatively thick (>5 m) brown silty clays that bookend a thicker layer (>43 m) of pinkish gray calcareous nannofossil ooze with minor silty clays intervals (~1 cm to ~1 m thickness). Foraminifera are rare (<10%) in the nannofossil ooze intervals (Figure F11). The bioturbation index is generally sparse to low throughout Subunit IC.
The Lithologic Subunit IC/ID boundary is located at Section 390C-U1557B-17X-6, 37 cm (150.38 m CSF-B), where there is a sharp transition between brown silty clay at the base of Subunit IC and pink calcareous nannofossil chalk at the top of Subunit ID. Subunits IC and ID have different colors for calcareous nannofossil ooze/chalk (Subunit IC = pinkish gray; Subunit ID = pink) and silty clays (Subunit IC = brown; Subunit ID = reddish brown).
4.1.1.4. Subunit ID
- Interval: 390C-U1557B-17X-6, 37 cm, to 28X-CC, 20 cm
- Depth: 150.38–251.53 m CSF-B
- Thickness: 101.15 m
- Age: late Oligocene to Middle Miocene
- Lithology: calcareous nannofossil chalk, silty clays
Subunit ID is mostly composed of pink calcareous nannofossil chalk with reddish brown silty clay intervals (2–3 per core; ~1 m average thickness). Trace to abundant foraminifera are observed in the nannofossil ooze intervals. The bioturbation index is generally absent to sparse throughout Subunit ID.
The Lithologic Subunit ID/IE boundary is located at Section 390C-U1557B-28X-CC, 20 cm (251.53 m CSF-B), where a sharp transition between pink nannofossil chalk at the base of Subunit ID and brown/very dark brown silty clay at the top of Subunit IE also corresponds to a gap in core recovery.
4.1.1.5. Subunit IE
- Interval: 390C-U1557B-29X-1, 0 cm, to 32X-3, 45 cm
- Depth: 257.70–289.84 m CSF-B
- Thickness: 32.14 m
- Age: early to late? Eocene
- Lithology: silty clay, organic-rich silty clay, clayey nannofossil chalk
Subunit IE predominantly comprises dark brown silty clay or clay (Figure F7), which is particularly abundant in the upper portion of the subunit (251.39–277.94 m CSF-B). Brown clayey calcareous chalk mostly characterizes the lower portion of Subunit IE (277.94–289.84 m CSF-B). Black organic-rich silty clay layers (~5 cm average thickness) are common throughout Core 390C-U1557B-31X. Foraminifera are only observed in a prominent ~4 cm thick layer in interval 32X-1, 134–138 cm, within very pale brown calcareous foraminiferal ooze with nannofossils. Prominent organic-rich intense laminations are observed in Section 31X-6.
The Lithologic Subunit IE/IIA boundary is located at Section 390C-U1557B-32X-3, 45 cm (289.84 m CSF-B), at a bioturbated contact between a 5 cm thick unit of brown silty clay (Subunit IE) and pale brown nannofossil-rich calcareous chalk (Subunit IIA). Subunit IE represents the transition from Unit I to Unit II; the latter is characterized by the almost complete absence of siliciclastic lithologies.
4.1.2. Unit II
- Interval: 390C-U1557B-32X-3, 45 cm, to 63X-2, 86 cm
- Depth: 289.84–564.76 m CSF-B
- Thickness: 274.92 m
- Age: middle Paleocene to early Eocene
- Lithology: nannofossil chalk with or without foraminifera, nannofossil-rich calcareous chalk with or without foraminifera, organic-rich silty clay with nannofossil, silty clay
Unit II is composed of ~275 m of Paleocene to early Eocene sediments, predominantly nannofossil-rich calcareous chalk or calcareous nannofossil chalk (Figures F7, F12). Unit II is divided into five subunits (Figure F7). Foraminifera are more common throughout Unit II than in Unit I, especially below ~400 m CSF-B. In contrast to Unit I, siliciclastic lithologies are almost absent in Unit II (Figures F8, F13). Subunit IIA also hosts a notable section (390C-U1557B-35X-3; Figure F11) of material exhibiting complex synsedimentary deformation (folding and microfaulting) associated with different rheological behaviors of the sediment (degree of lithification). Subunit IIB (360.37–460.86 m CSF-B) is predominantly composed of nannofossil-rich calcareous chalk with variable foraminifera abundance (from trace to common; see Sedimentology in the Expedition 390/393 methods chapter [Coggon et al., 2024c]). In the middle of the ooze/chalk of Unit II, Subunit IIC is a distinct layer bearing brown clays associated with calcareous nannofossil chalk and colors (brown, light brown, and light greenish gray) that was likely deposited during the PETM (see Biostratigraphy; Figure F11D). Subunit IID cores are dominated by pinkish white nannofossil chalk with minor (up to 5 cm thick) pinkish gray foraminifera-rich intervals. Subunit IIE primarily comprises grayish brown nannofossil-rich calcareous chalk with foraminifera and yellowish brown calcareous nannofossil chalk.
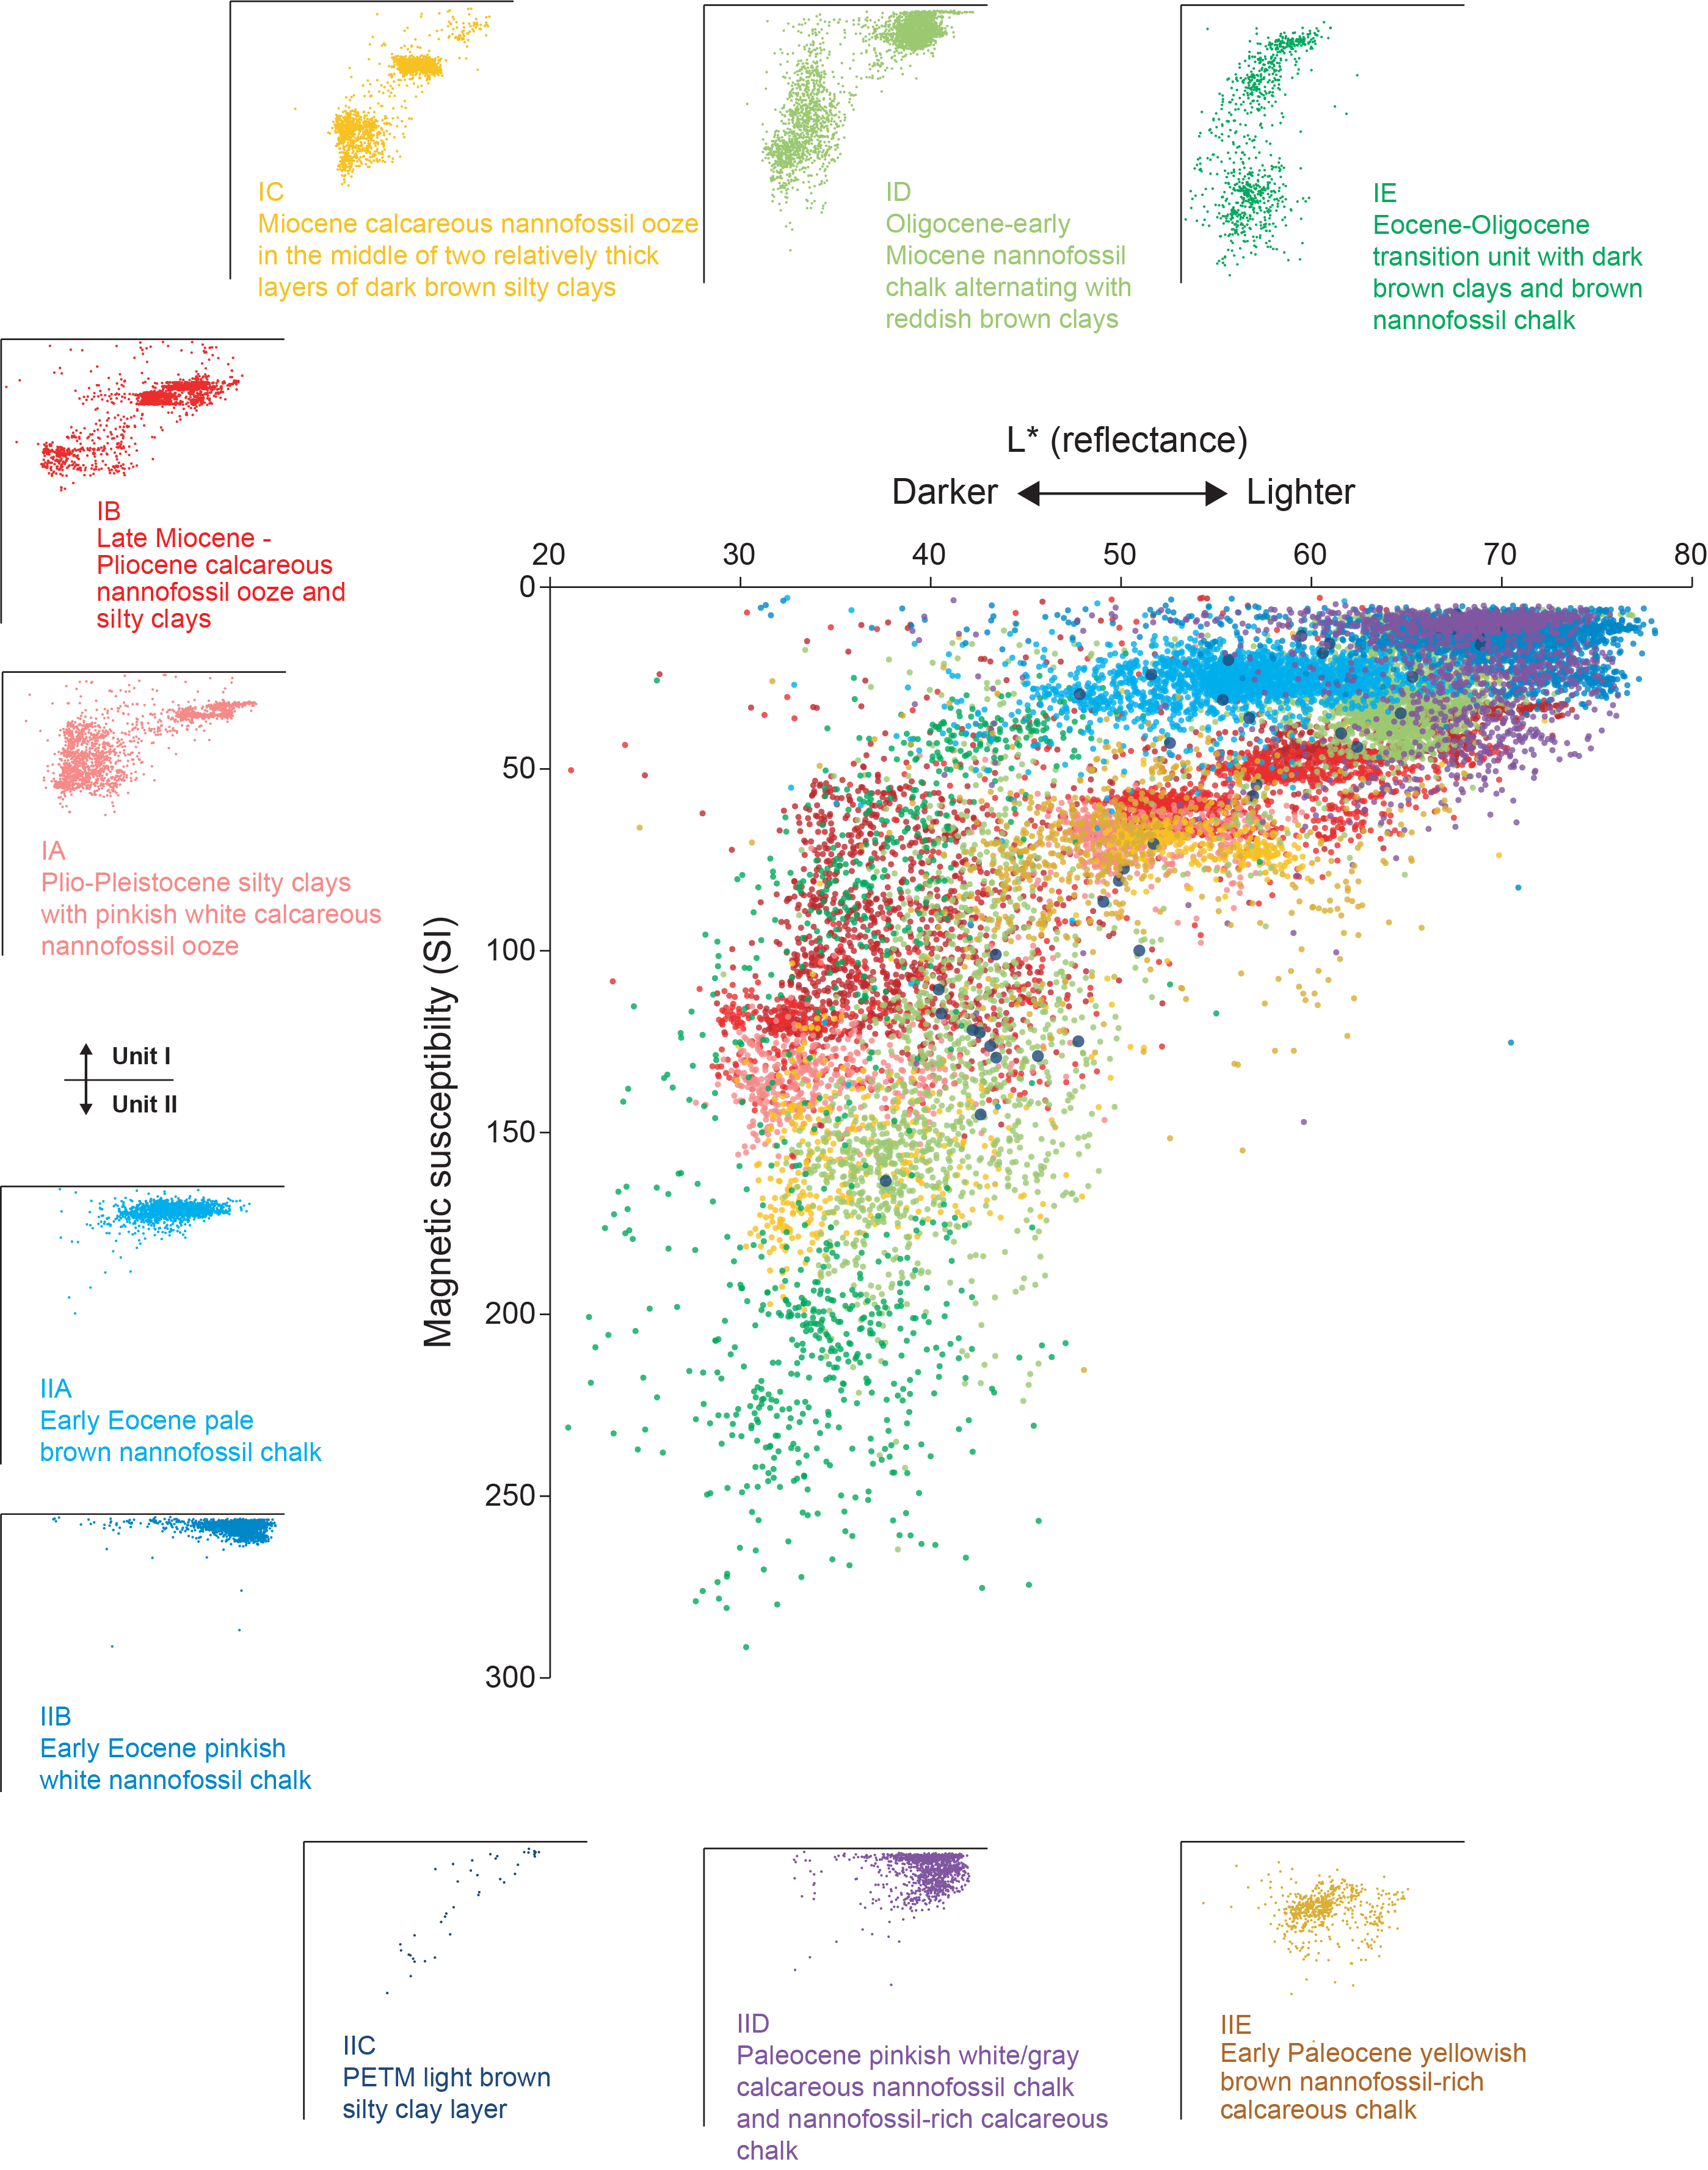
Figure F12. SHMSL MSP and L* by lithology.
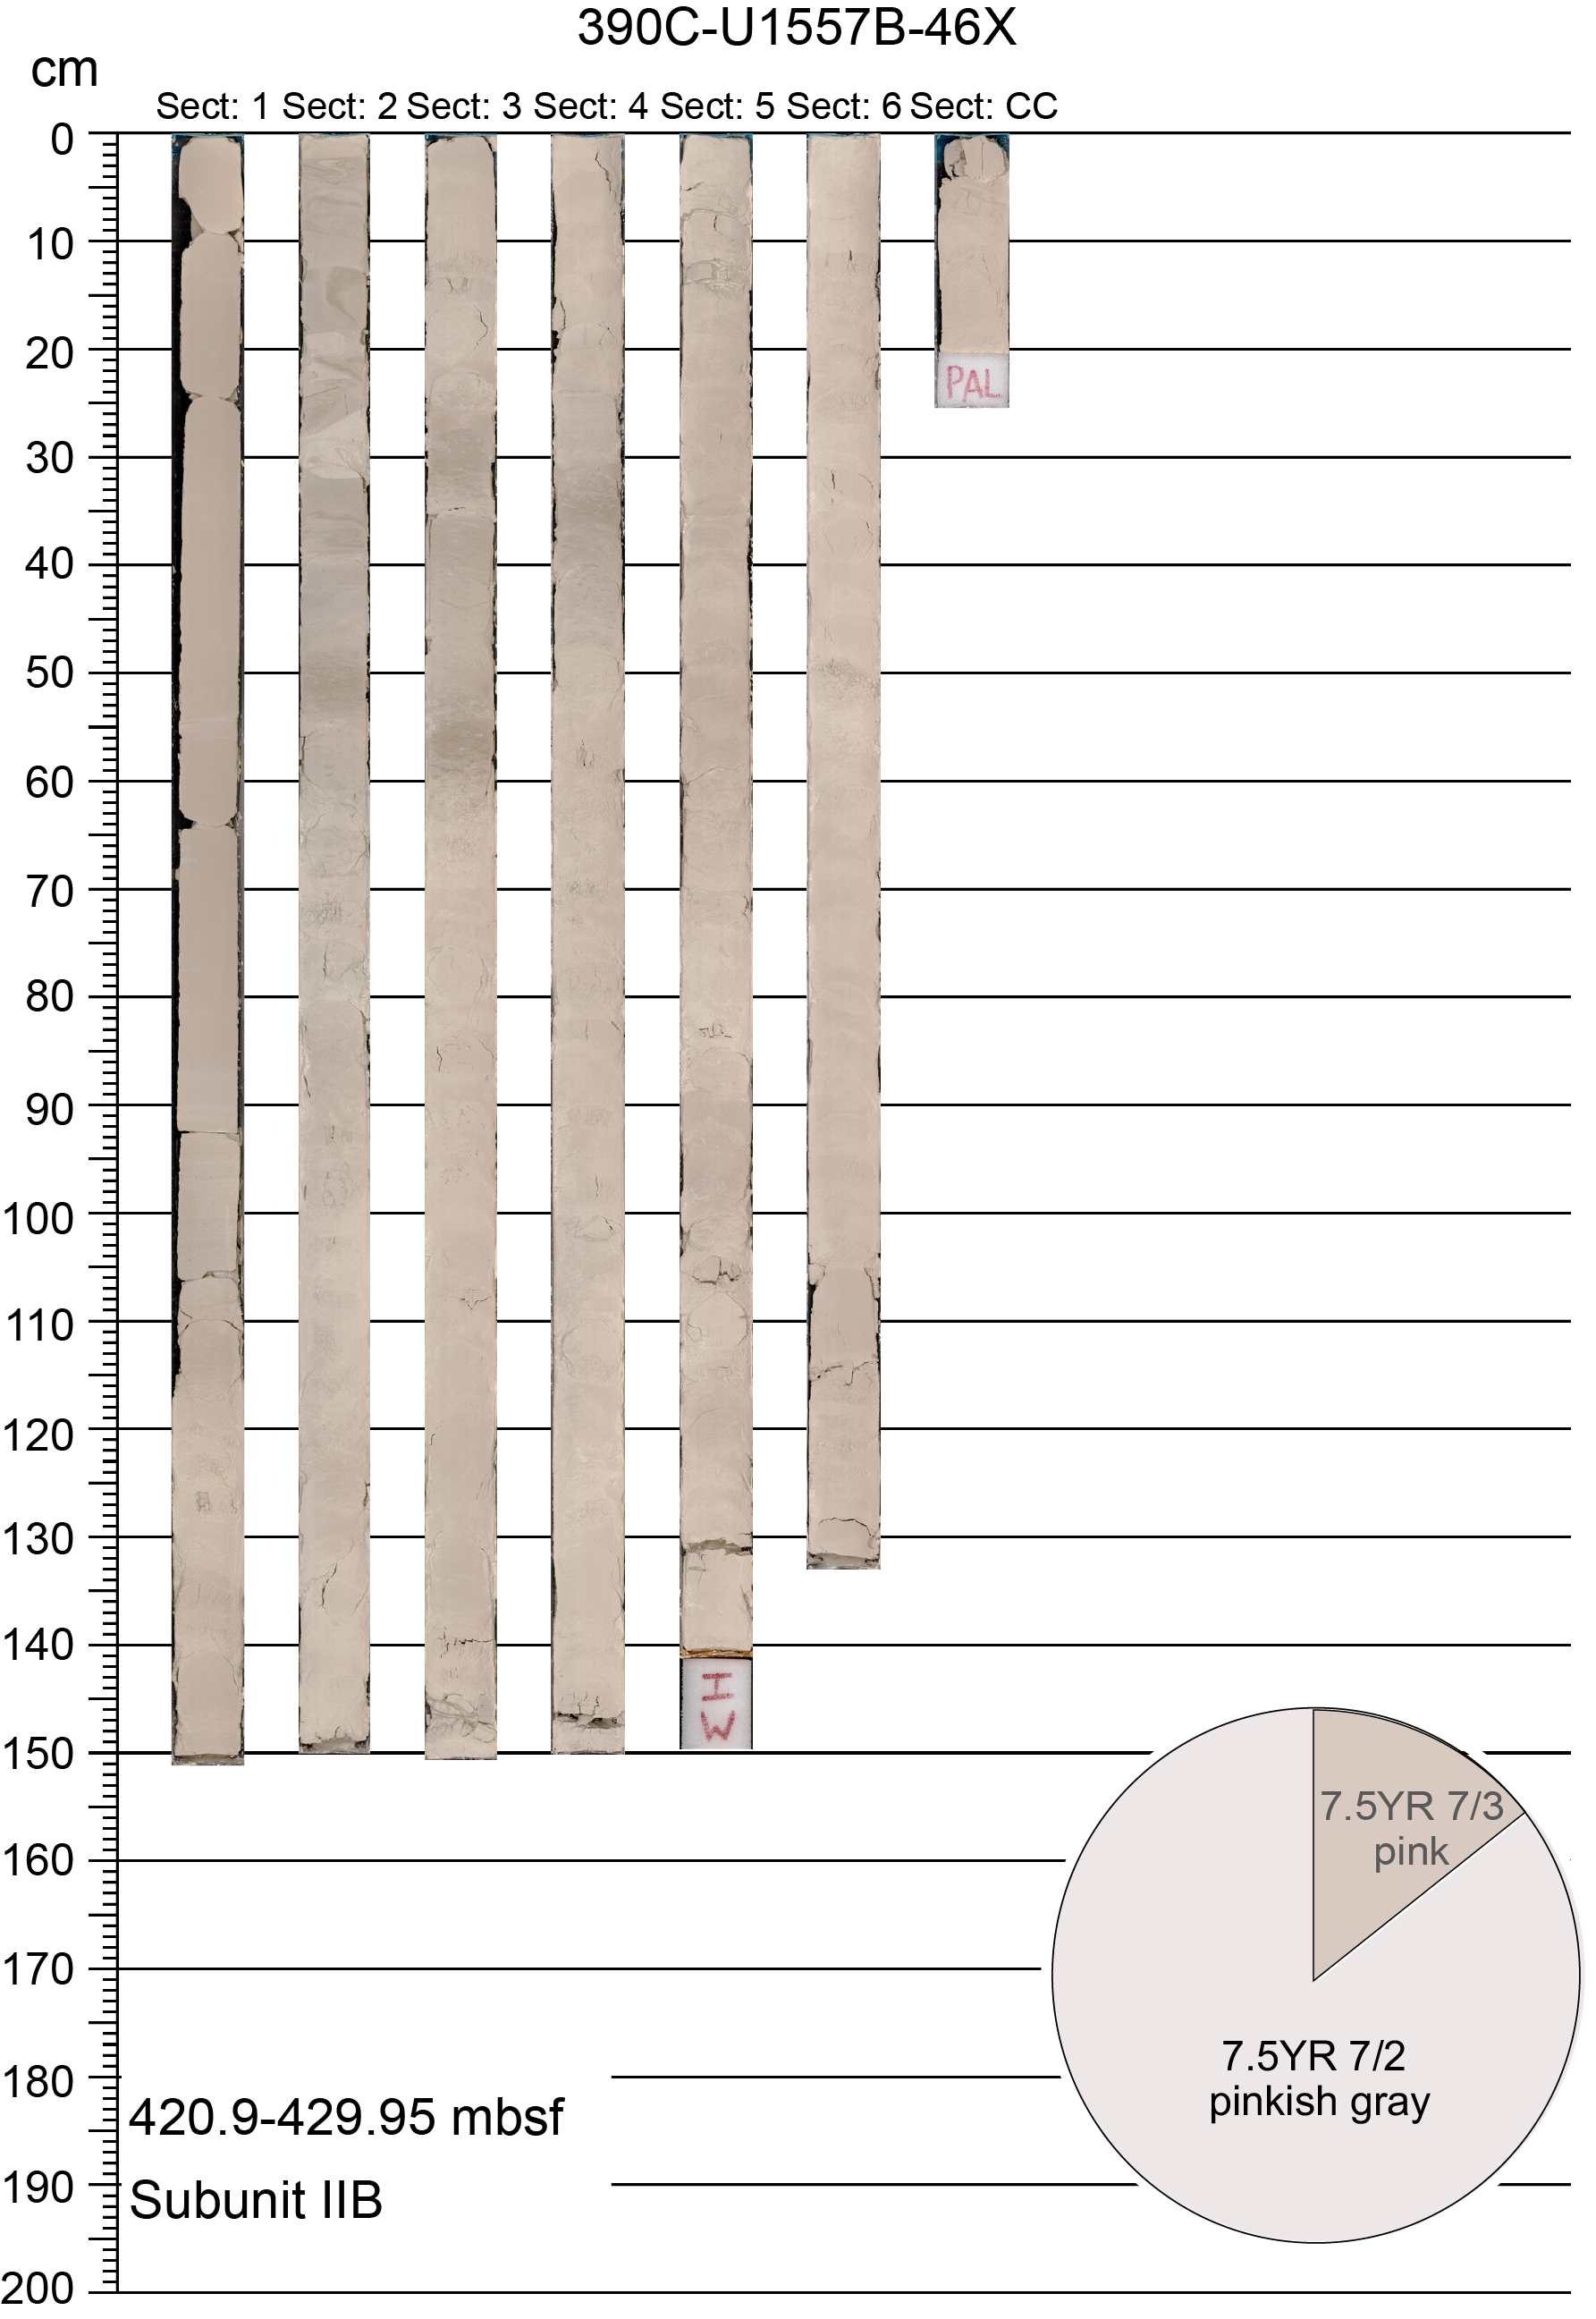
Figure F13. Lithology and color alternations, Unit II.
The lithologic subunit boundaries of Unit II vary between bioturbated, gradational, and planar, with less common sharp or irregular contacts. The bioturbation index in Unit II ranges from absent to high, although it is generally absent or sparse. Drilling disturbance manifests as slight biscuiting throughout much of Unit II. However, toward the bottom of Unit II, particularly in Subunit IID, biscuits are commonly surrounded by ooze that appears unconsolidated because of the drilling disturbance, and the original sedimentary characteristics (e.g., bioturbation and color changes) are only preserved in the centers of the biscuits.
4.1.2.1. Subunit IIA
- Intervals: 390C-U1557B-32X-3, 45 cm, to 39X-6, 65.5 cm
- Depth: 289.84–360.37 m CSF-B
- Thickness: 70.53 m
- Age: early Eocene
- Lithology: nannofossil-rich calcareous chalk
Subunit IIA primarily consists of nannofossil-rich calcareous chalk that varies in color between very pale brown, brown, light brownish gray, and pinkish gray. In addition, Subunit IIA contains minor amounts of foraminiferal calcareous chalk with nannofossils, nannofossil-rich calcareous chalk with foraminifera, and calcareous nannofossil chalk with foraminifera that collectively exhibit a similar color range to the primary lithology. Sections 390C-U1557B-35X-1 and 35X-2 contain particularly noteworthy pods of sediment that consist of millimeter-sized volcanic basalt/glass clasts surrounded by halos of subcentimeter-wide very pale brown sediment. In addition, the lower portion of Core 35X (Sections 35X-2 [~70 cm] through 35X-CC) exhibits complex synsedimentary deformation (folding and microfaulting; Figure F11C) associated with the variable rheological properties of the sediment (lithification degree). Within the deformed sediments in Sections 35X-2 through 35X-CC, the nannofossil-rich calcareous chalk is on average light brownish gray (10YR 6/2), hosting thin to thick laminations (see Sedimentology in the Expedition 390/393 methods chapter [Coggon et al., 2024c]) with different colors (e.g., light brownish gray and very pale brown). The bioturbation index is generally absent or sparse throughout Subunit IIA except for a few intervals where it is low to high.
4.1.2.2. Subunit IIB
- Interval: 390C-U1557B-39X-6, 65.5 cm, to 50X-3A, 6 cm
- Depth: 360.37–460.86 m CSF-B
- Thickness: 100.49 m
- Age: early Eocene
- Lithology: calcareous nannofossil chalk
Subunit IIB primarily comprises pink or pinkish white calcareous nannofossil chalk (Figure F13). The abundance of foraminifera is variable (trace to common) throughout Subunit IIB. Three thin (<2 cm) layers bearing volcaniclastic material (dark brown to greenish black volcanic ash/glass with sandy silt grain sizes) are observed near the top of Subunit IIB (362.09–362.1, 373.45–373.47, and 382.68–382.76 m CSF-B). Thin laminations occur sparsely throughout Subunit IIB. The bioturbation index is almost always either absent or sparse throughout Subunit IIB except for rare intervals with low intensity.
The Lithologic Subunit IIB/IIC boundary is located at Section 390C-U1557B-50X-3, 6 cm (454.18 m CSF-B), where there is a transition between pinkish white calcareous nannofossil ooze with foraminifera at the base of Subunit IIB and generally light brown, brown, and greenish gray units in Subunit IIC.
4.1.2.3. Subunit IIC
- Interval: 390C-U1557B-50X-3, 6–86 cm
- Depth: 460.86–461.66 m CSF-B
- Thickness: 0.8 m
- Age: latest Paleocene
- Lithology: calcareous nannofossil chalk, calcareous nannofossil chalk with clay, calcareous silty clay
Subunit IIC is composed of light brown to brown calcareous silty clays and calcareous nannofossil chalk with clay. Subunit IIC is a unique interval in Unit II because it contains a relatively high content of clayey material (Figures F7, F11D) compared to the rest of Unit II. From 460.97 to 461.06 m CSF-B, light greenish gray calcareous nannofossil chalk occurs with foraminifera. From 461.12 to 461.14 m CSF-B, there are <1 cm thick greenish gray, grayish green, and pinkish white layers of calcareous nannofossil chalk; within these layers, there is a grayish green ~0.1 cm laminae. Below the greenish gray and grayish green layers, light brown calcareous nannofossil chalk with clay and brown calcareous silty clay are interstratified from 461.14 to 461.45 m CSF-B and interpreted to be the PETM. The bioturbation index is generally absent to sparse or low.
The Lithologic Subunit IIC/IID boundary is located at Section 390C-U1557B-50X-3, 86 cm (461.66 m CSF-B), at a transition from pale brown and light greenish gray calcareous nannofossil chalk (with clay or foraminifera) to the underlying pervasive pink and pinkish white calcareous nannofossil chalk with foraminifera.
4.1.2.4. Subunit IID
- Interval: 390C-U1557B-50X-3, 86 cm, to 59X-CC, 21 cm
- Depth: 461.66–535.73 m CSF-B
- Thickness: 74.07 m
- Age: late Paleocene (?)
- Lithology: nannofossil-rich calcareous chalk, calcareous nannofossil chalk
Subunit IID is mainly composed of pinkish white nannofossil-rich calcareous chalk and pinkish gray calcareous nannofossil chalk. Thin to medium organic-rich laminations (gray to dark bluish gray) are observed in Core 390C-U1557B-56X. Prominent <2.5 cm thick layers of calcareous nannofossil chalk with bluish gray organic particles occur in Core 57X. Prominent silty clay beds <10 cm thick occur at the bottom of Core 59X. Relatively organic rich, ~10–15 cm (and one 2 cm) thick layers that are likely associated with bioturbation also occur in Core 59X. A bed of calcareous nannofossil chalk (535.06–535.2 m CSF-B) bearing fine bluish gray volcaniclasts and medium laminations of light olive-brown ferromagnesian oxides are observed (Section 59X-2). The bioturbation index is generally sparse to moderate.
Drilling disturbance (biscuiting) commonly turned the nannofossil chalk into unconsolidated material (ooze) throughout cores in Subunit IID. Only in the center of the biscuits, where undisturbed sediment still exists, can original sedimentary characteristics (e.g., bioturbation and color changes) be observed.
The Lithologic Subunit IID/IIE boundary is located at Section 390C-U1557B-59X-CC, 21 cm (535.73 m CSF-B), where there is a transition between pinkish gray calcareous nannofossil chalk (Subunit IID) and dark grayish brown nannofossil-rich calcareous chalk (Subunit IIE), which also corresponds to a gap in core recovery.
4.1.2.5. Subunit IIE
- Interval: 390C-U1557B-60X-1, 0 cm, to 63X-2, 87 cm
- Depth: 542.40–564.77 m CSF-B
- Thickness: 22.36 m
- Age: early to middle Paleocene?
- Lithology: nannofossil-rich calcareous chalk, calcareous nannofossil chalk
Subunit IIE is composed mainly of pinkish gray calcareous nannofossil chalk (542.40–553.38 m CSF-B) and yellowish brown or dark grayish brown nannofossil-rich calcareous chalk with foraminifera (553.38–564.76 m CSF-B). Minor (from a few millimeters up to 10 cm) intervals of bluish gray nannofossil-rich calcareous chalk containing igneous clasts (up to sand sizes) occur in Core 390C-U1557B-60X. Sections 61X-3, 61X-4, and 62X-3 contain organic-rich laminations <5 cm thick. Silt-sized medium laminae contain strong brown ferromagnesian oxide grains at 556.70–557.16 m CSF-B. The bioturbation index is generally sparse to moderate throughout Subunit IIE except near the bottom, where it is high (Sections 63X-1 and 63X-2) to intense (Section 60X-CC).
The lithologic boundary between Subunit IIE and basement Unit 1 (see Igneous petrology) is located at Section 390C-U1557B-63X-2, 87 cm (564.77 m CSF-B), and is the shallowest occurrence of igneous basement lithologies (basalt cobbles).
4.1.3. Unit 1
- Interval: 390C-U1557B-63X-2, 86 cm, to 63X-3, 115 cm
- Depth: 564.8–567.9 mbsf
- Thickness: 9.5 m
- Age: late Paleocene (?)
- Sedimentary lithology: indurated calcareous sediment
- Basement lithology: basalt, hyaloclastite
Below the sediment/basement interface in Hole U1557B, which is defined as 564.77 m CSF-B at Site U1557 based on the shallowest occurrence of basalt material cored in Hole U1557B (see Stratigraphic unit summary), the uppermost basement unit is a transitional unit that comprises both pelagic sedimentary material and volcanic clasts (see Igneous petrology). The sediment occurs as the matrix among basalt blocks (>10 cm diameter) in the sedimentary breccias (Subunit 1a; 564.88–566.01 and 573.32–574.22 m CSF-B) as well as hyaloclastite layers (volcanic glass clasts; sizes <1 mm to ~10 cm) at 567.90–573.32 m CSF-B (Subunit 1b). In both lithologies, the sediment is mostly composed of indurated calcareous sediment, likely from nannofossil chalk that was lithified by hydrothermal fluids. This indurated calcareous sediment is pale brown, dark brown, or reddish yellow, and its color is probably indicative of different degrees of hydrothermal alteration. Sparse, submillimeter-sized dark particles (altered sediment particles or igneous clasts) are embedded in the indurated calcareous sediment. Sedimentary textures are mostly absent or limited except for rare bioturbation features (burrows). Sparse secondary calcite veins (millimeter to subcentimeter thickness) crosscut the sedimentary matrix of Unit 1 (see Alteration petrology).
4.2. X-ray diffraction
Bulk powder XRD analyses results are summarized in Figures F9 and F14 and Table T3. Powder samples were collected from every interstitial water (IW) geochemistry whole-round residue section (see X-ray diffraction analysis in the Expedition 390/393 methods chapter [Coggon et al., 2024c]) during Expedition 390C. In Lithologic Unit II, IW sampling was only carried out in the chalk layers and no analysis of any silty clay lithology was conducted. Most of the XRD samples were collected from homogeneous intervals (e.g., silty clay and ooze/chalk), and the differences in mineral assemblages between samples of similar lithologies were negligible. Downhole variations in the mineral assemblages within the silty clay and ooze/chalk sediments, respectively, are also relatively small (Figures F9, F14).
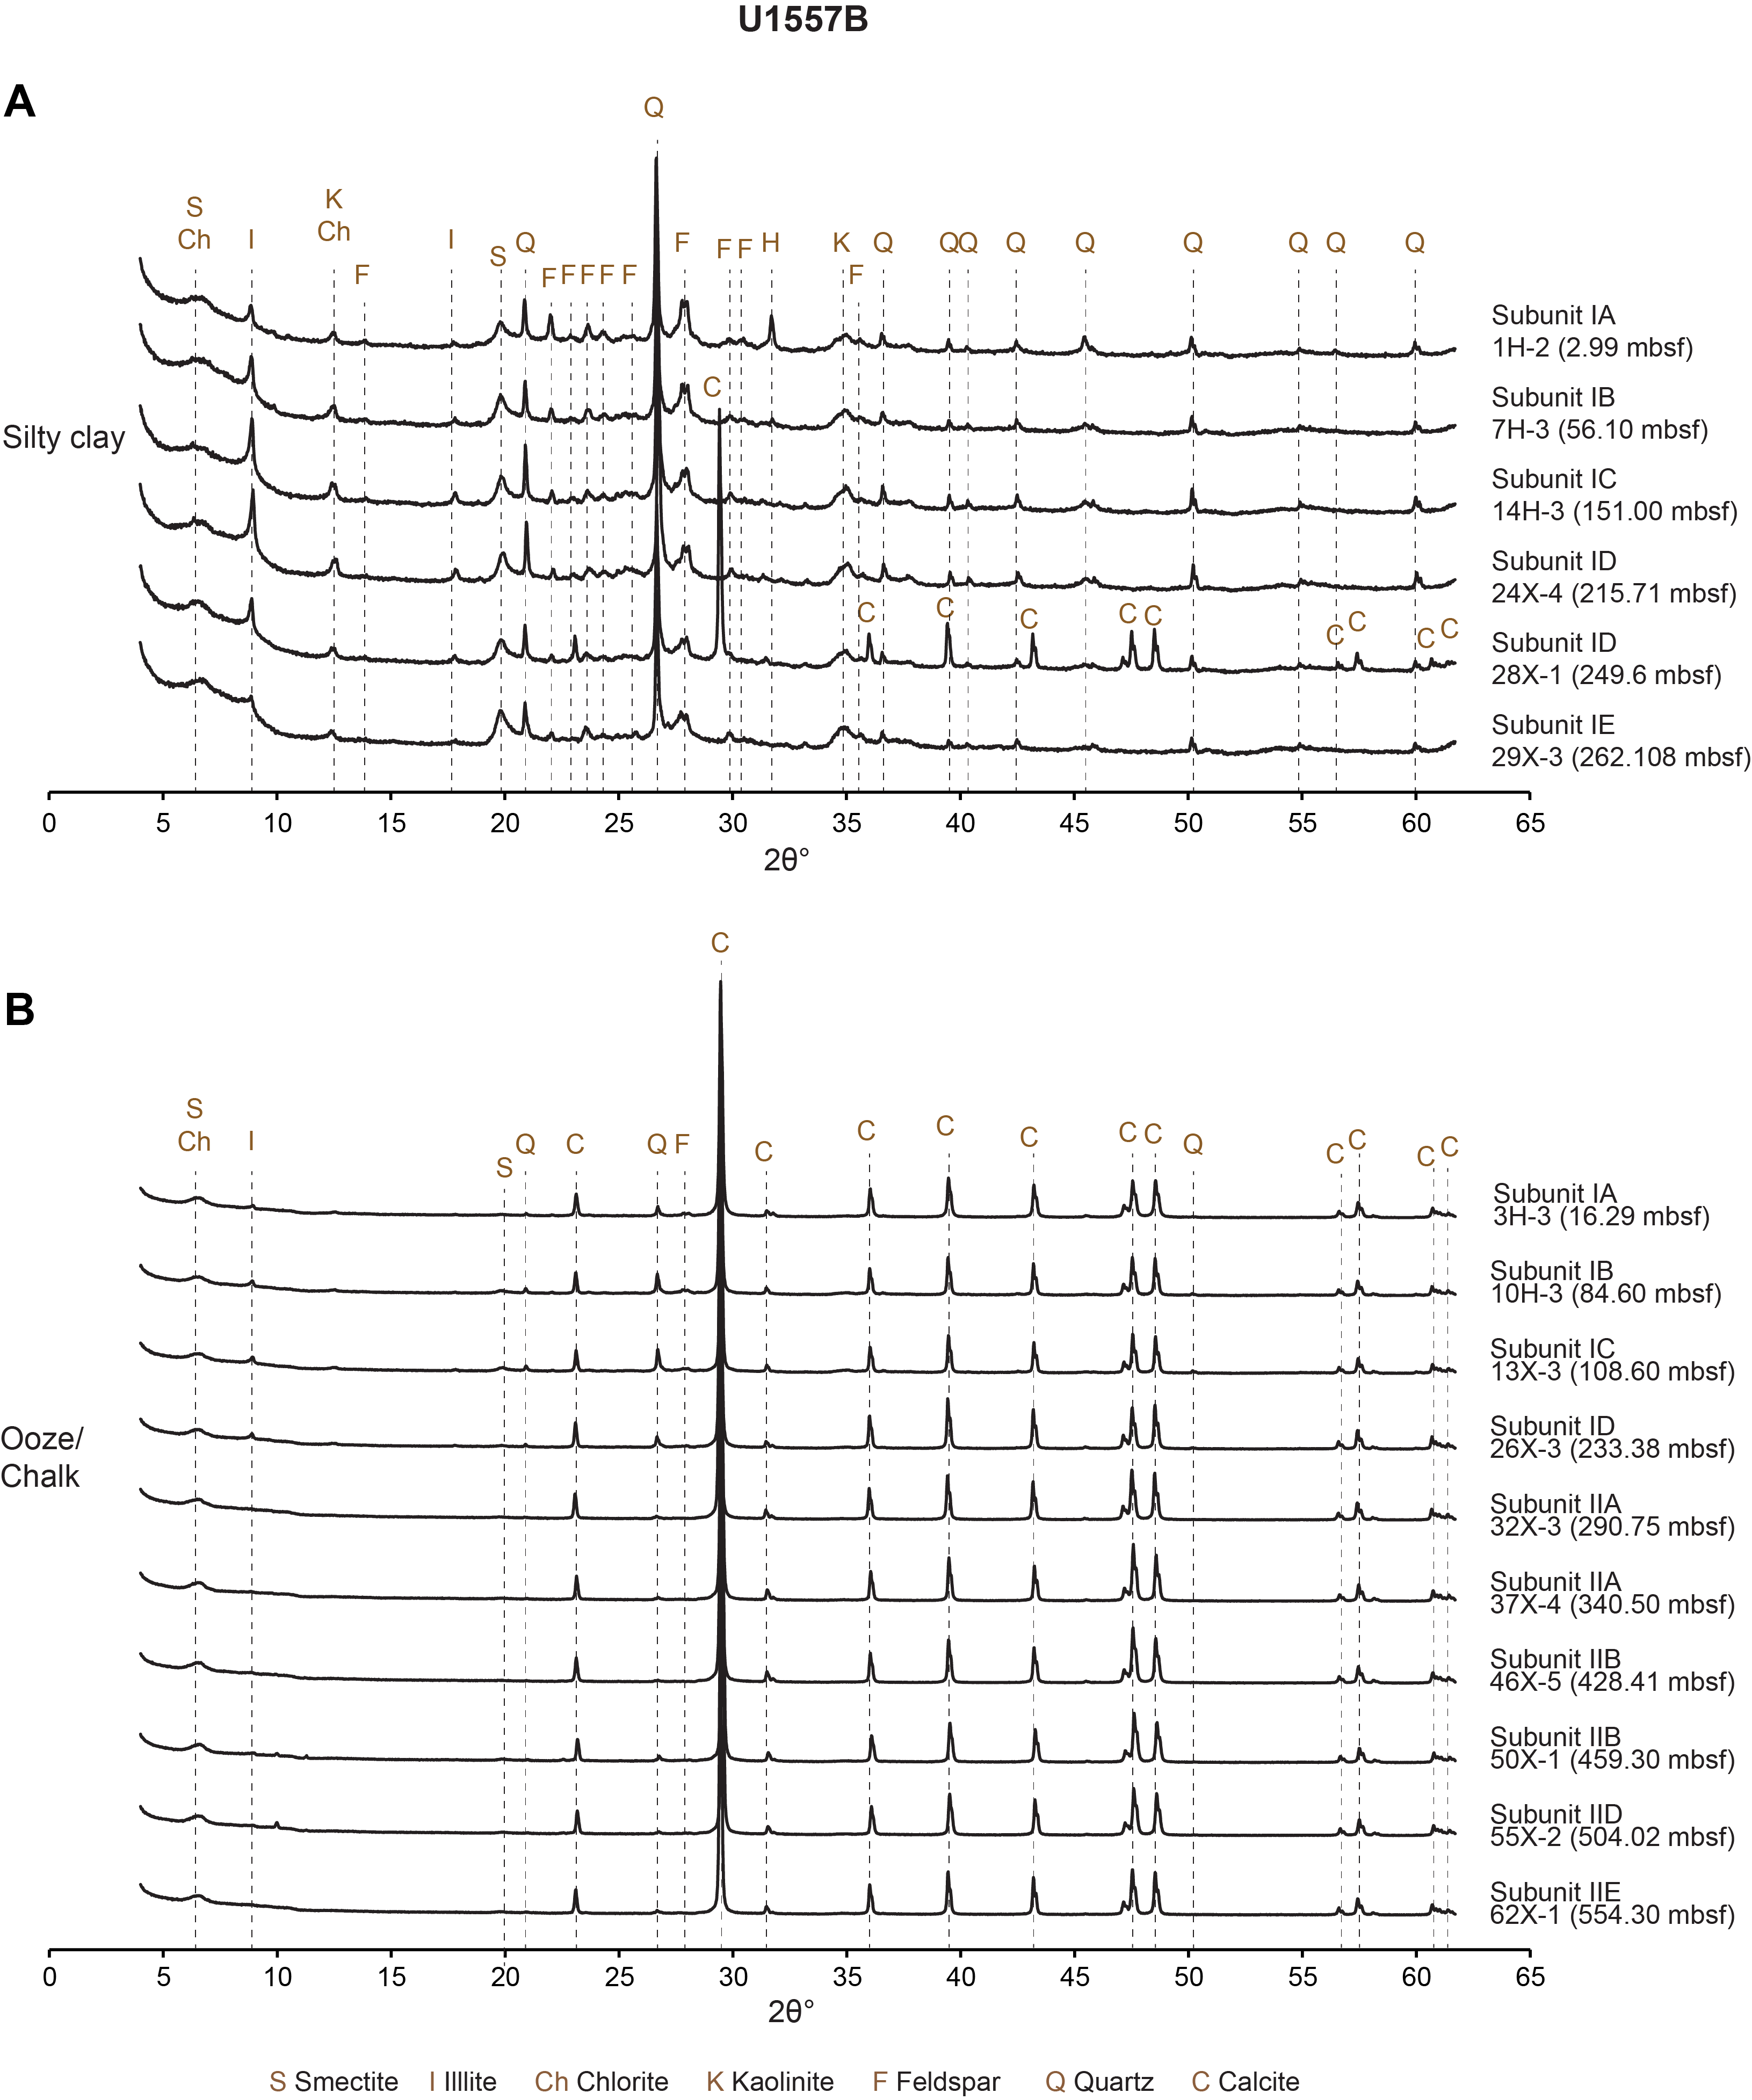
Figure F14. X-ray diffractograms, Hole U1557B.
The average mineral composition of the silty clay intervals from Unit I is as follows:
The average mineral composition of the calcareous ooze from Unit I is as follows:
On average, the calcareous chalk from Unit II contains the following:
The alternation of silty clays and calcareous ooze in Unit I is well highlighted by the quantitative mineral composition. Compared to Unit II, however, the calcareous ooze of Unit I hosts a higher amount of siliciclastic minerals, perhaps indicative of the shifts between the two lithologies in Unit I.
4.3. Spectrophotometry and point source magnetic susceptibility
Comparisons of spectral data, specifically reflectance and color space (L* a* b*) (see Sedimentology in the Expedition 390/393 methods chapter [Coggon et al., 2024c]), and point magnetic susceptibility (MSP) measured on the Section Half Multisensor Logger (SHMSL) (see Physical properties and downhole measurements in the Expedition 390/393 methods chapter [Coggon et al., 2024c]) confirm that the subunits exhibit different respective physical properties (Figures F12, F15). Essentially, the silty clays, which are more dominant in Lithologic Unit I than in Unit II, have lower reflectance and higher MSP than the carbonate oozes/chalks. For example, for Subunits IA–ID, which comprise alternating silty clays and nannofossil ooze/chalk (Figure F8), reflectance and MSP values are grouped into two clusters. In Figures F12 and F15, Unit I subunits overlap with Unit II subunits, but ooze dominates in the latter. Notably, Subunit IE, which contains low reflectance and chromaticity and the highest MSP, represents the Eocene–Oligocene transition and is dominated by dark brown silty clay. Subunits IIB and IID, which are predominantly chalk with a high proportion of calcite (Figures F9, F14), only display high reflectance and high a*/b* ratios (e.g., less yellow or red). Subunit IIC, which contains the PETM, displays a wide range of reflectance, color, and related MSP values, reflecting its varied lithology.
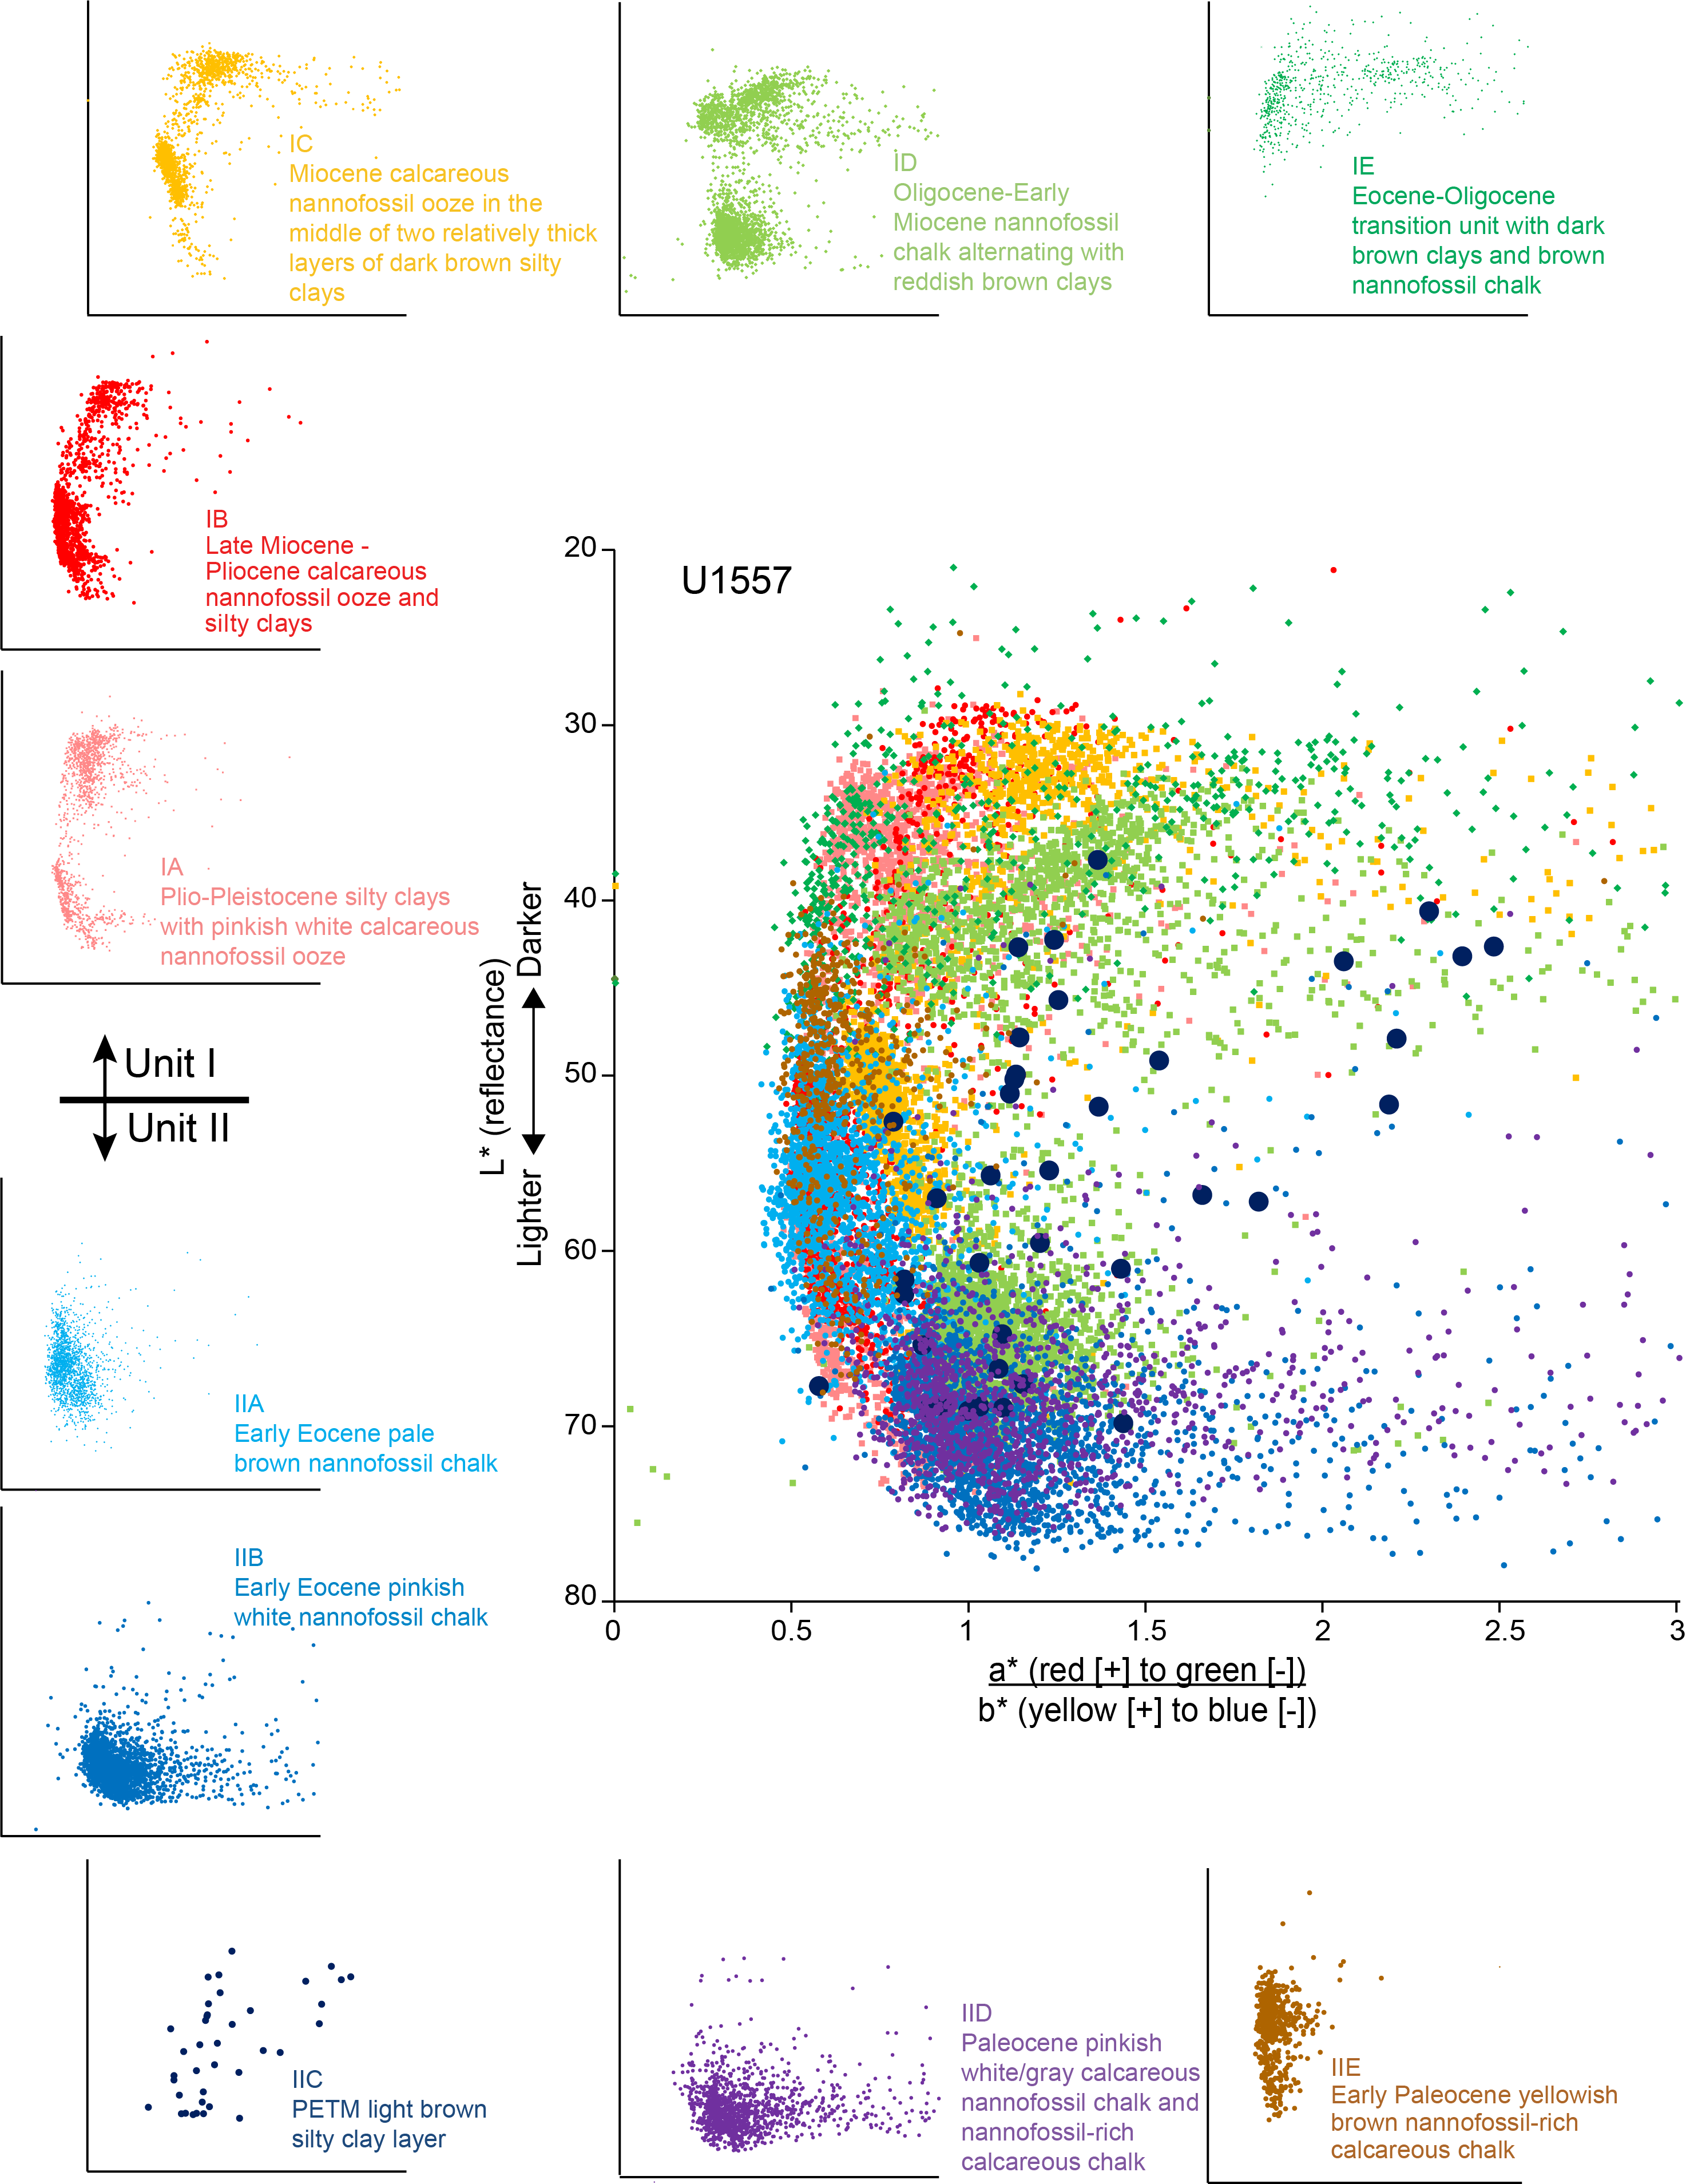
Figure F15. SHMSL color reflectance by lithology.
4.4. Comparison with DSDP Leg 3 lithologic formations
Given that Site U1557 was the longest record obtained in Expeditions 390/393 back to the Paleocene (Coggon et al., 2022a), we provide a comparison with the earlier Deep Sea Drilling Project (DSDP) Leg 3 findings in the area from more than 50 y ago. The general sedimentologic characteristics and ages of the subunits in Lithologic Units I and II can be tentatively correlated with the lithologic formations and sediments spot-cored during Leg 3 (The Shipboard Scientific Party, 1970). Leg 3 sediments were divided into nine lithologic formations. We interpret Leg 3 formations at DSDP Sites 15, 19, and 20 (see Figure F1 in the Expedition 390/393 summary chapter [Coggon et al., 2024d]) to correspond to Site U1557 sediments (Table T4).
Leg 3 lithologic formations were inferred to be represented across the central South Atlantic Basin (or at least at the sites cored); relative to Site U1557, Site 15 is ~800 km east, Site 19 is ~400 km northeast, and Site 20 is ~250 km north. Sites 19 and 20 have a water depth (>4500 m) and distance (>1000 km) from the axis of the Mid-Atlantic Ridge that make them comparable to Site U1557. The poor recovery of post-Oligocene sediment at these sites during Leg 3 does not allow any correlation with Lithologic Subunits IA and IC of Site U1557. However, it seems that Subunit IB resembles the coeval sediments described at Site 15 (Challenger/Blake ooze). The poor recovery/incomplete coring of sediment sections during Leg 3 also prevented the collection of cores lithologically equivalent to Site U1557 Subunits IIC and IIE. Additionally, the Eocene–Oligocene transition in Subunit IE seems to only partially overlap with Gazelle ooze, likely indicating a lower recovery of the identifying dark brown silty clay material (indeed, core recovery gaps also occurred during operations in Hole U1557B; see Operations).
5. Igneous petrology
Two holes at Site U1557 recovered basement rocks in the form of sedimentary breccia. In Hole U1557B, 9.5 m of sedimentary breccia was cored after basement, marked by the shallowest presence of lithified/volcanic rock, was reached at 564.8 mbsf. A reentry system was installed in Hole U1557D during engineering Expeditions 390C and 395E, with the casing installed ~5 m into basement and the open hole below the casing reaching ~10 m into basement (575.6 mbsf) (see Operations). Expedition 390 cored 109.1 m of basement in Hole U1557D, recovering sedimentary breccia throughout the depth of the hole.
The breccia recovered in Hole U1557D consists of a range of basaltic clast types derived predominantly from pillow lavas. The clasts are all moderately to highly altered (see Alteration petrology), making it difficult to discriminate reliably among all clasts based on primary igneous lithology alone. Therefore, for the purposes of macroscopic core description, we have distinguished between altered glass and basalts (cryptocrystalline to microcrystalline) and grouped the basalts into three categories based on color that broadly reflect different degrees of alteration: gray, brown, and orange (Figure F16) (see Alteration petrology). In general, gray basalts are the least altered and most diverse lithologically; they range from cryptocrystalline to microcrystalline and from aphyric to highly plagioclase-olivine-clinopyroxene phyric, although aphyric textures are most common. Brown and orange basalts are typically aphyric to sparsely plagioclase or olivine phyric. In addition, orange basalts are typically associated with textures indicative of an origin in a pillow chilled margin. With few exceptions, basaltic glass is completely altered throughout the core. Although some variation in clast lithology is observed downhole (see Clast petrology), systematic variations were not identified, and the entire sequence of rocks recovered is defined as a single lithologic unit. It is divided into three lithologic subunits based on variations in breccia matrix and cement: Lithologic Subunit 1a in Sections 390C-U1557B-63X-2, 86 cm, through 63X-3; Subunit 1b in Sections 64X-1 through 66X-2 and 390-U1557D-2R-1 through 3R-2; and Subunit 1c in Sections 390-U1557D-3R-3 through 14R-6 (Figure F17).
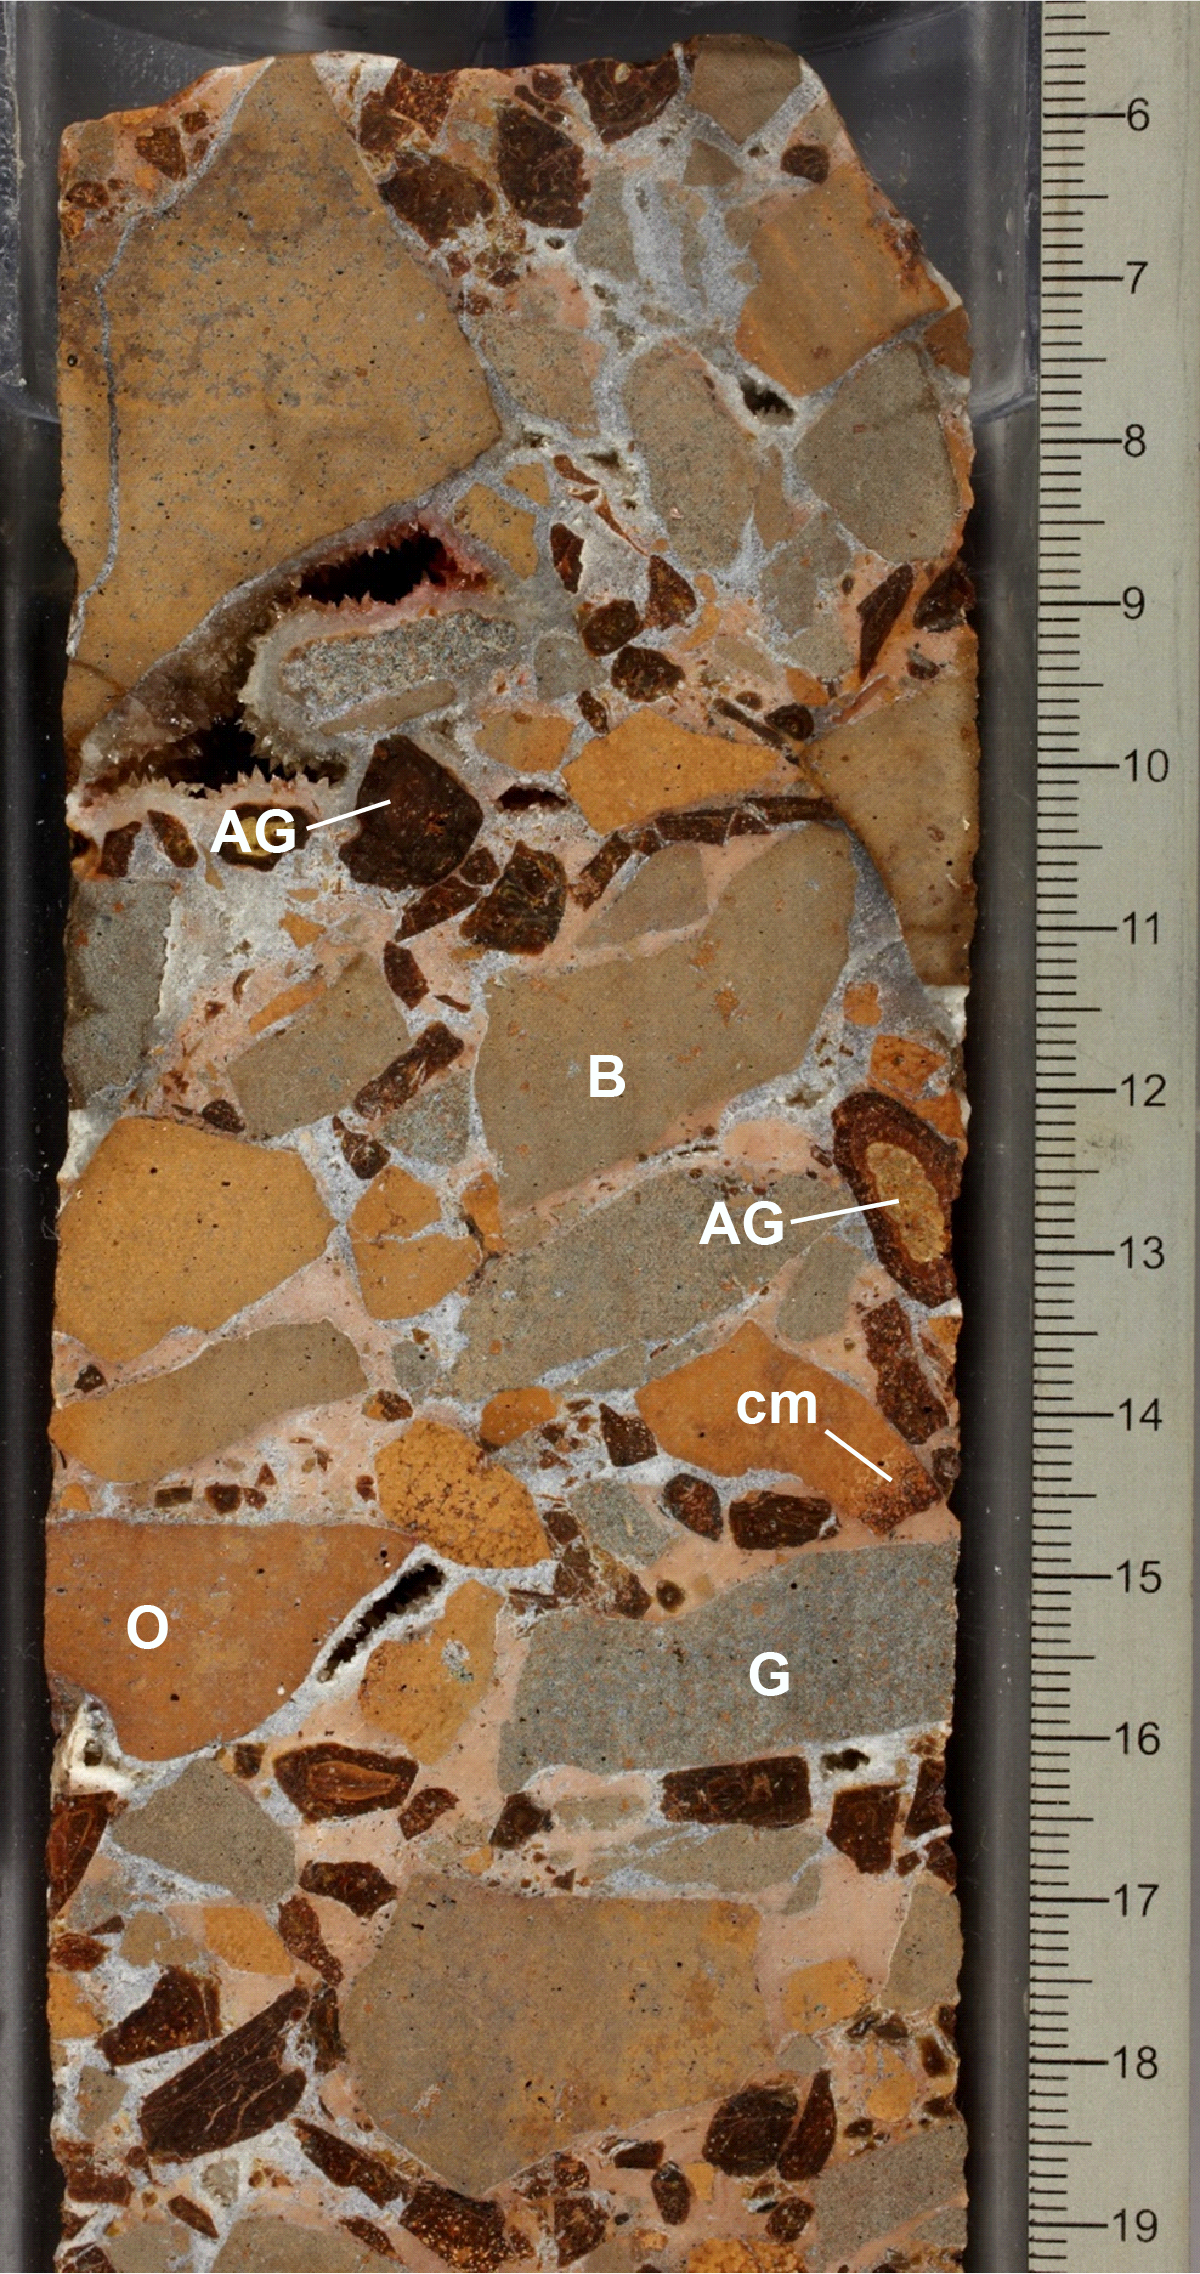
Figure F16. Various clast types encountered.
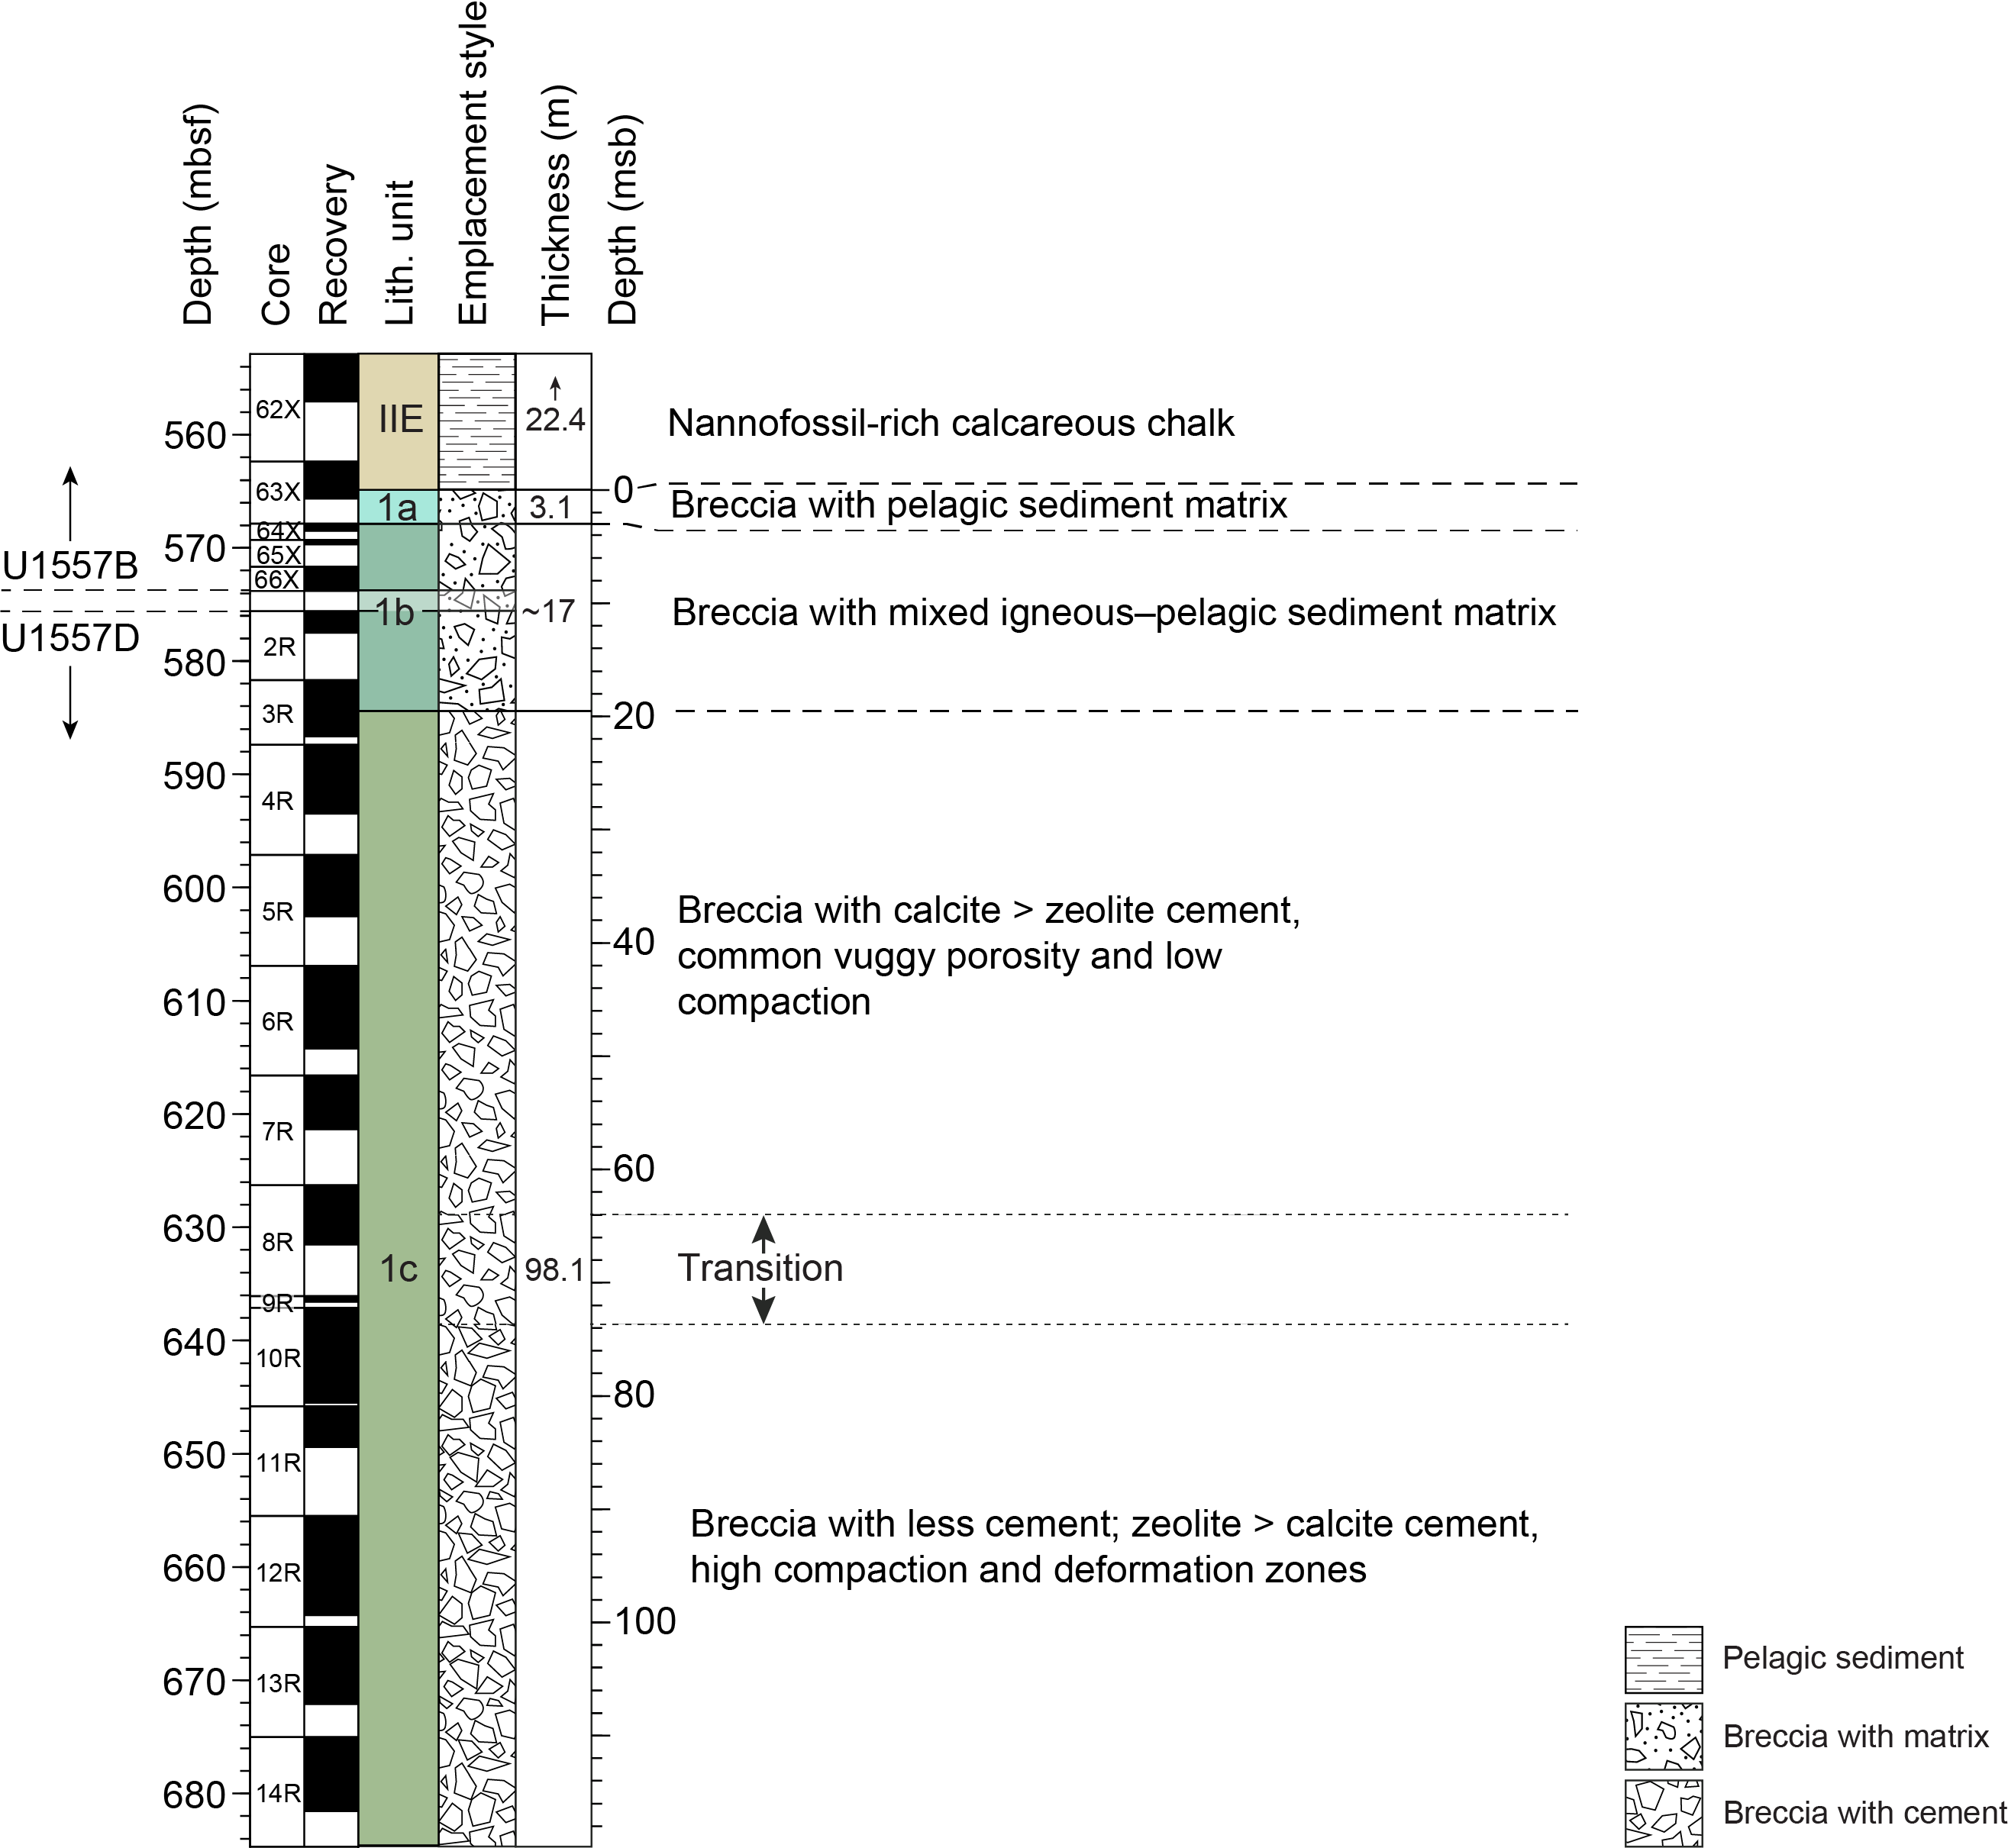
Figure F17. Basement stratigraphic summary.
In this section, we describe each of the igneous subunits and provide our interpretation of the entire basement succession.
5.1. Unit descriptions
5.1.1. Unit 1
5.1.1.1. Subunit 1a
- Interval: 390C-U1557B-63X-2, 86 cm, through 63X-3, 115 cm
- Depth: 564.8–567.9 mbsf
- Lithology: sedimentary breccia with pelagic sediment matrix
Subunit 1a was recovered only in Hole U1557B. It is a 3.1 m interval of sedimentary breccia that ranges from matrix to clast supported (Figure F18). It consists of moderately sorted basaltic clasts in a pelagic calcareous sediment matrix that is pinkish gray (7.5YR 7/2) to white. The clasts, which are up to 7 cm, are predominantly aphyric and moderately altered and range in color from gray to brown. Chilled margin textures are recovered in some clasts, suggesting they originated as pillow lavas. Altered glass, although present, is in low abundance.
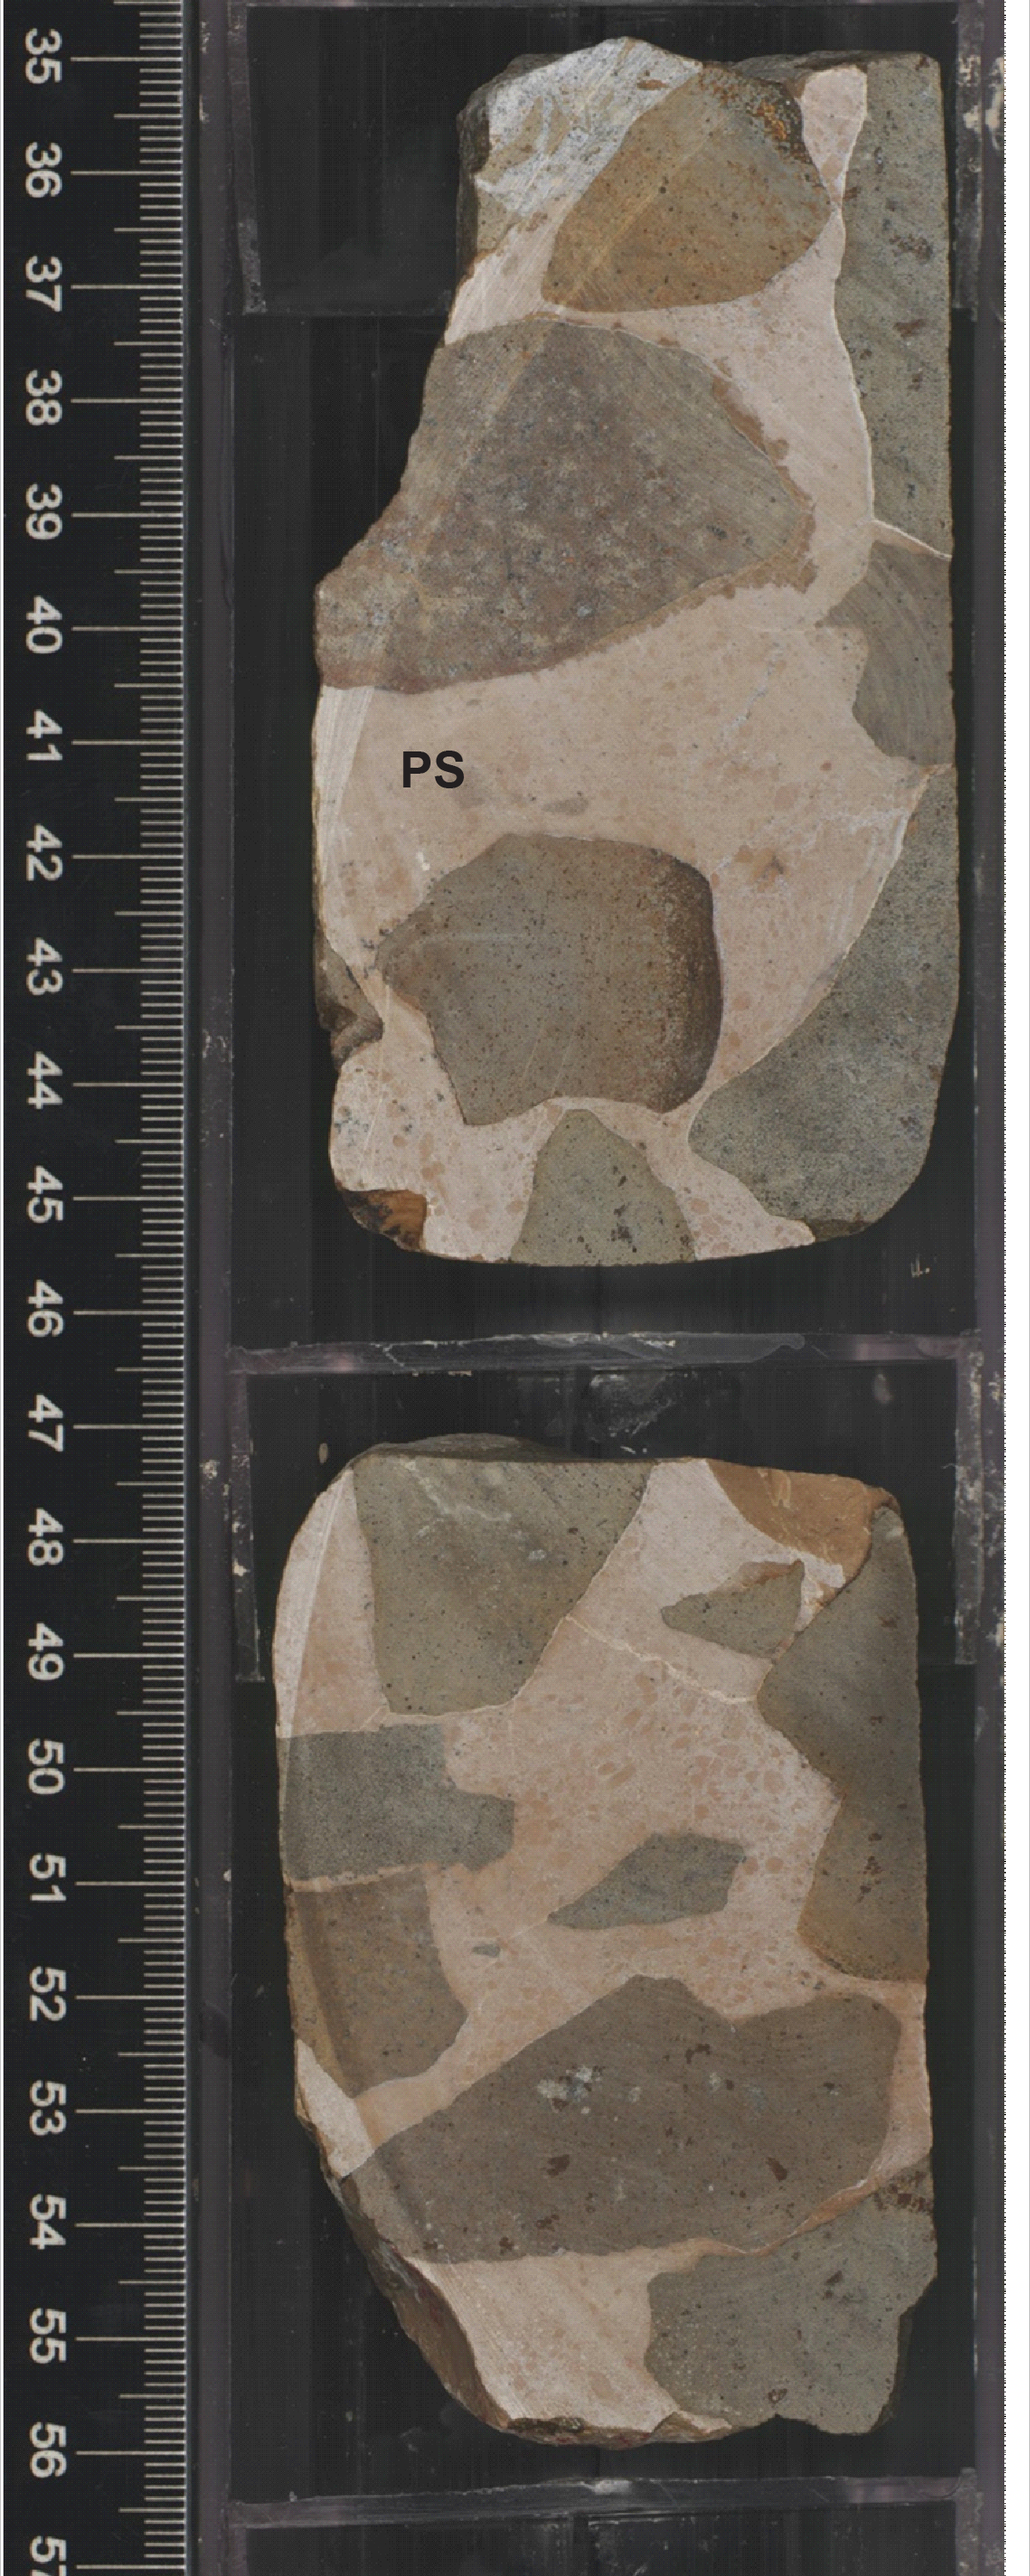
Figure F18. Sedimentary breccia, Subunit 1ay.
5.1.1.2. Subunit 1b
- Intervals: 390C-U1557B-64X-1 through 66X-2; 390-U1557D-2R-1 through 3R-2
- Depths: Hole U1557B = 567.9–574.22 mbsf (base of subunit not recovered); Hole U1557D = 575.6–584.52 mbsf
- Lithology: Sedimentary breccia with mixed igneous–pelagic sediment matrix
Subunit 1b is a clast-supported, poorly sorted sedimentary breccia. It occurs in both Holes U1557B and U1557D; 6.3 m was cored in Hole U1557B (in which the base of this subunit was not penetrated), and 8.9 m was cored in Hole U1557D. Subunit 1b differs from Subunit 1a in that the matrix is more variable in composition. It consists of pelagic sediment that hosts a range of millimeter- to centimeter-sized altered glass clasts as well as submillimeter dark particles of altered volcaniclastic material (Figure F19). Foraminifera are preserved in the matrix (Figure F19A), and locally the micritic matrix is partially recrystallized to a microsparry calcite (Figure F19B). Many of the clasts included in the sediment are lithics consisting of altered glass and cryptocrystalline basalt cemented by zeolite (Figure F19C, F19D). This indicates that at least some of the clasts are derived from a unit that had already undergone zeolite cementation.
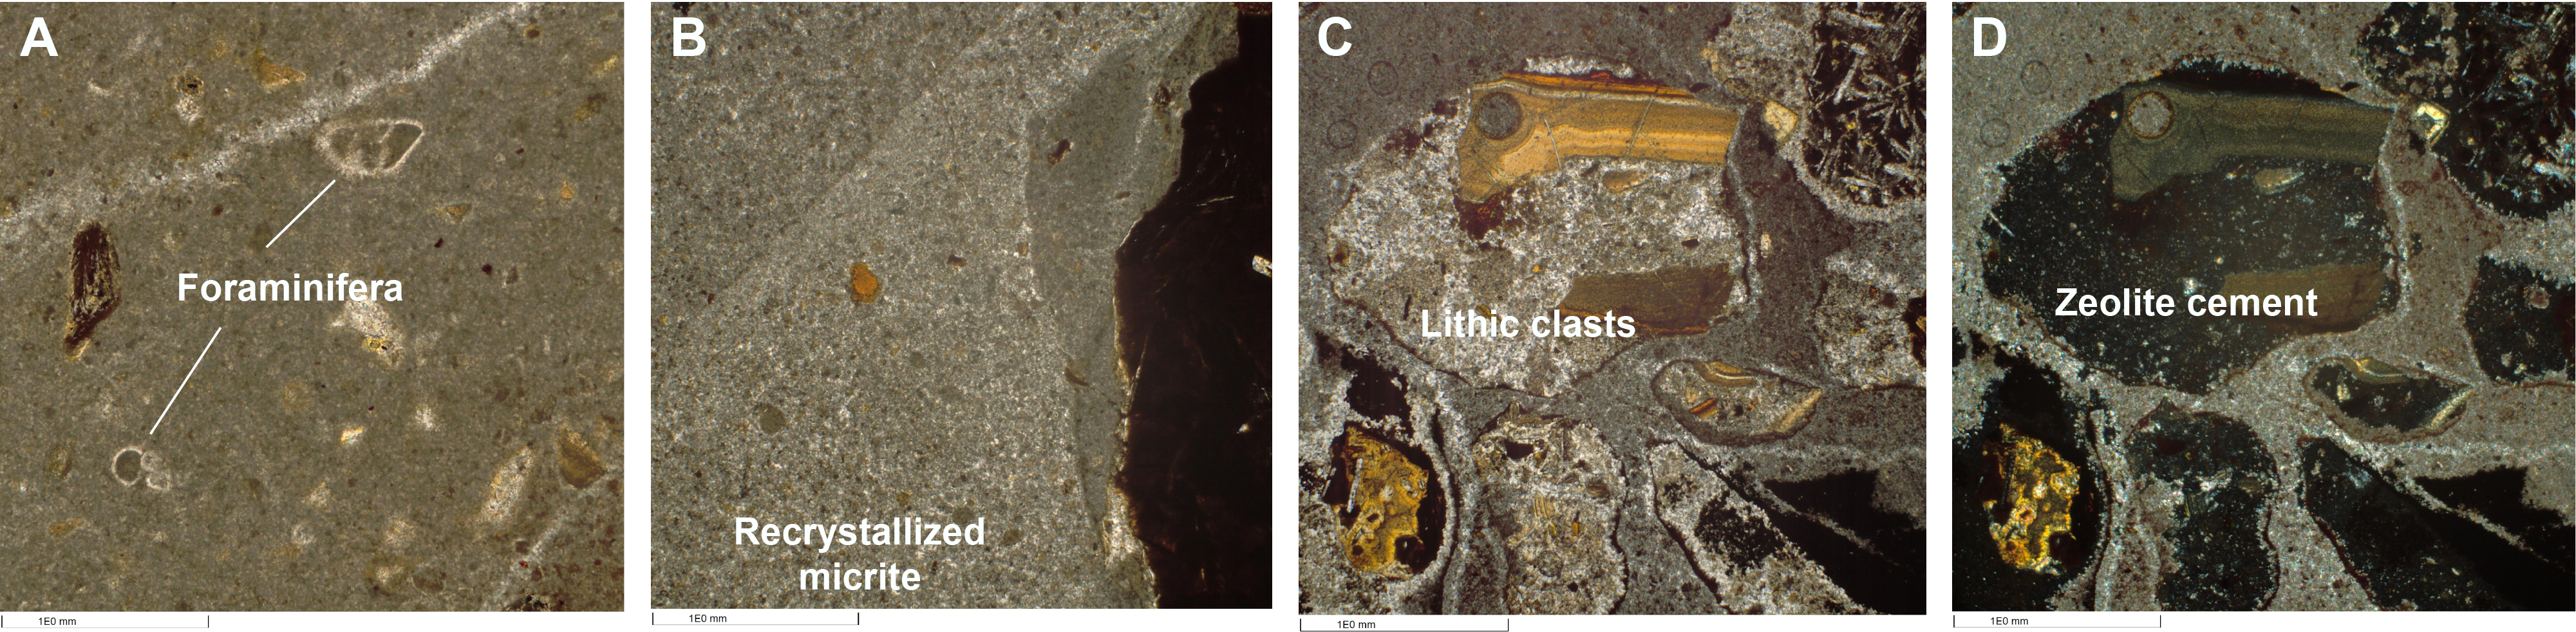
Figure F19. Sedimentary breccia, Subunit 1b.
The color of the pelagic sediment matrix changes in response to the variable clast load. It is more reddish yellow where altered glass clasts are abundant and more pale brown to brown where they are not (Figure F20). Variations in alteration also have an impact on overall breccia appearance, with colors ranging from orange-brown to greenish gray, depending on the alteration style (see Alteration petrology) (Figure F21). Aside from the increase in altered glass abundance, clast types are similar to those in Subunit 1a, consisting predominantly of aphyric gray, brown, and orange basalts, some with chilled margins (Figures F20C, F21). Locally, sparry calcite veins crosscut the breccia (Figure F22), but they are in relatively low abundance (see Alteration petrology).
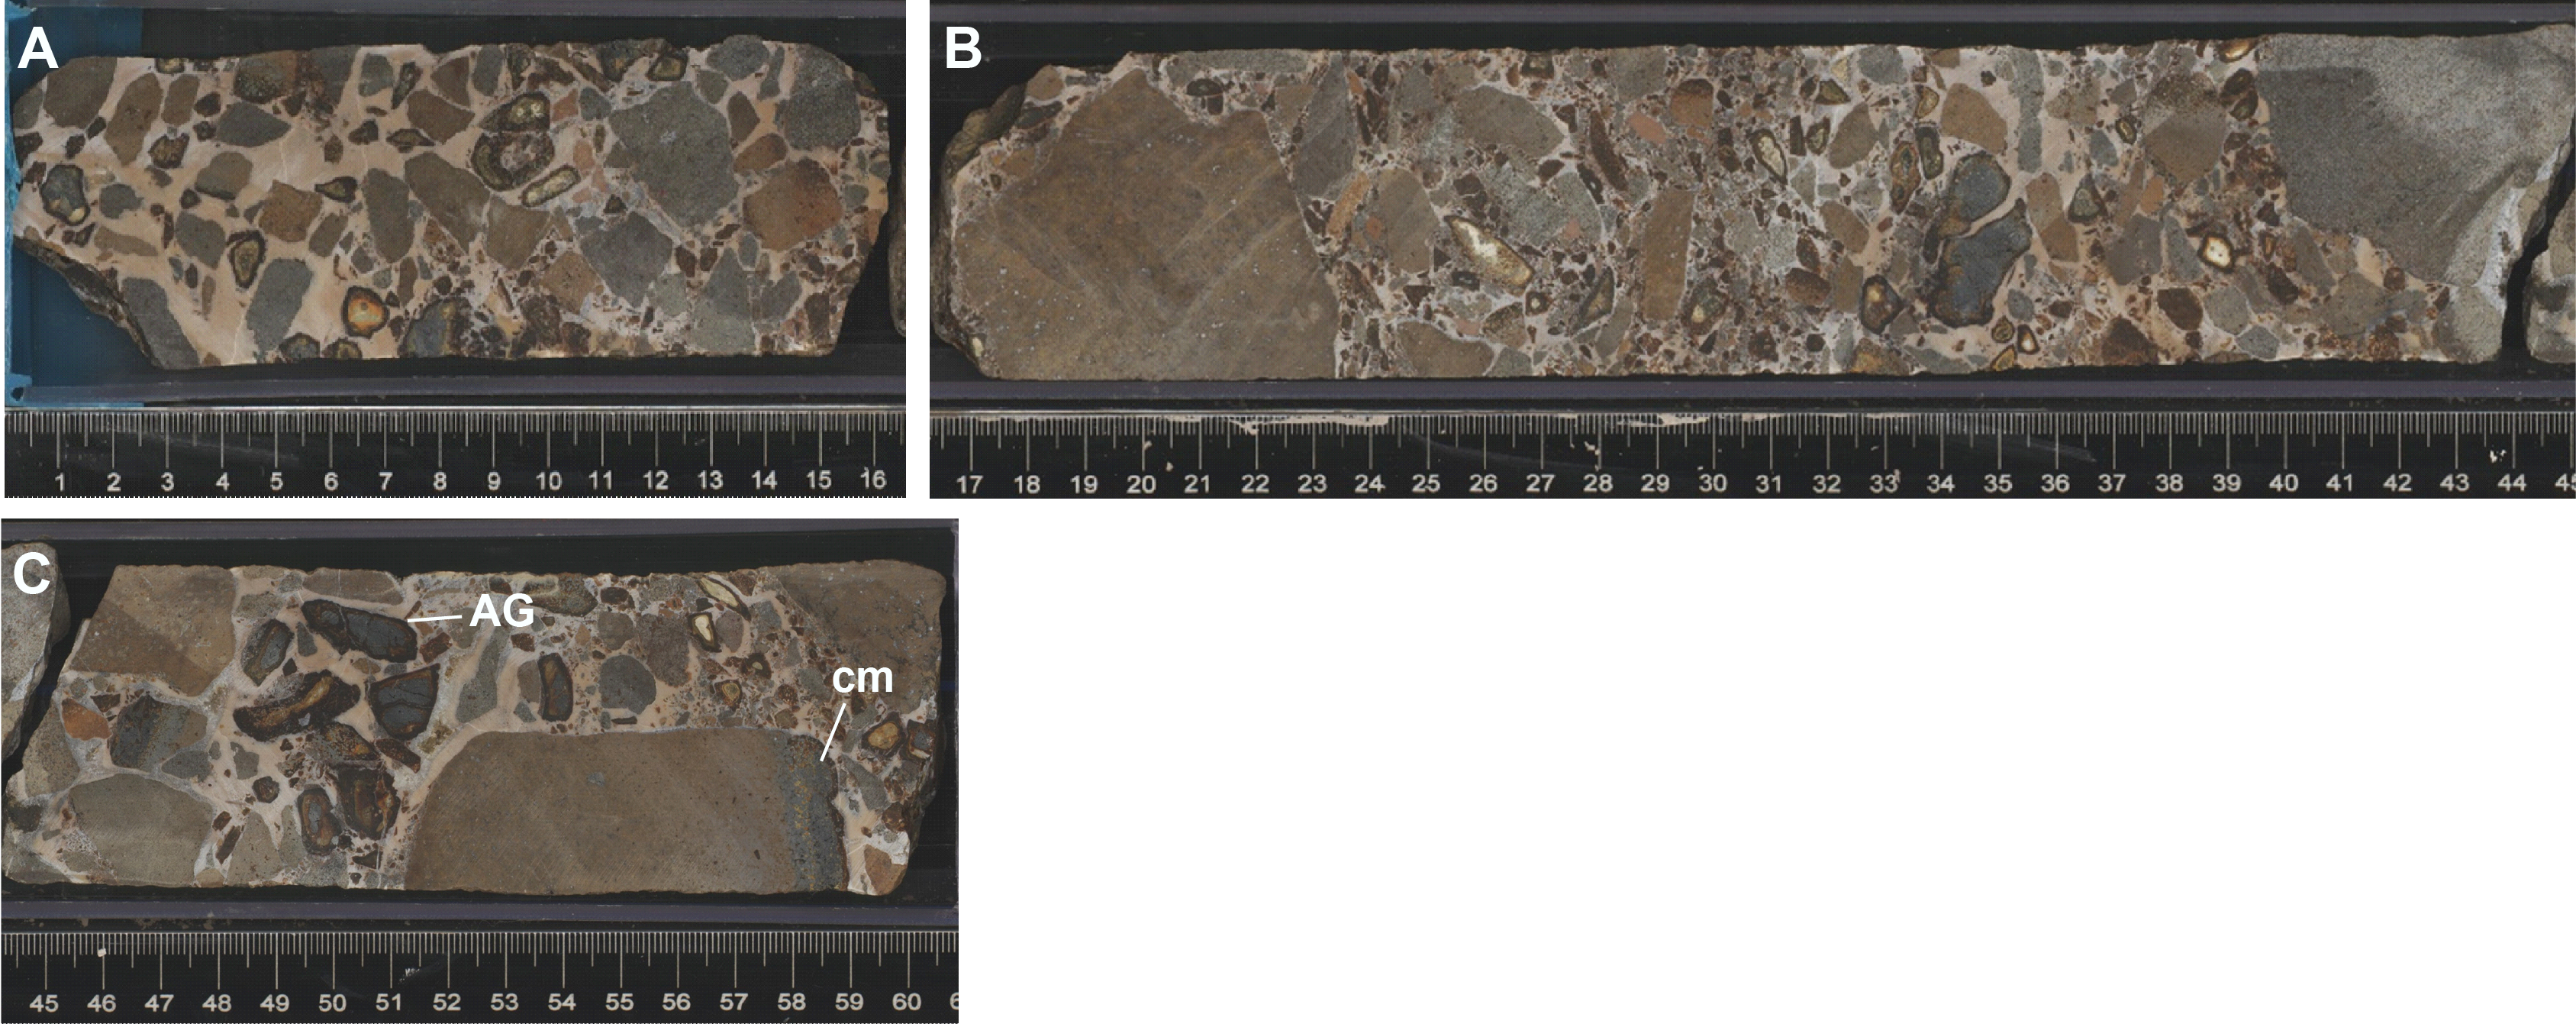
Figure F20. Variation in clast type and grain size.
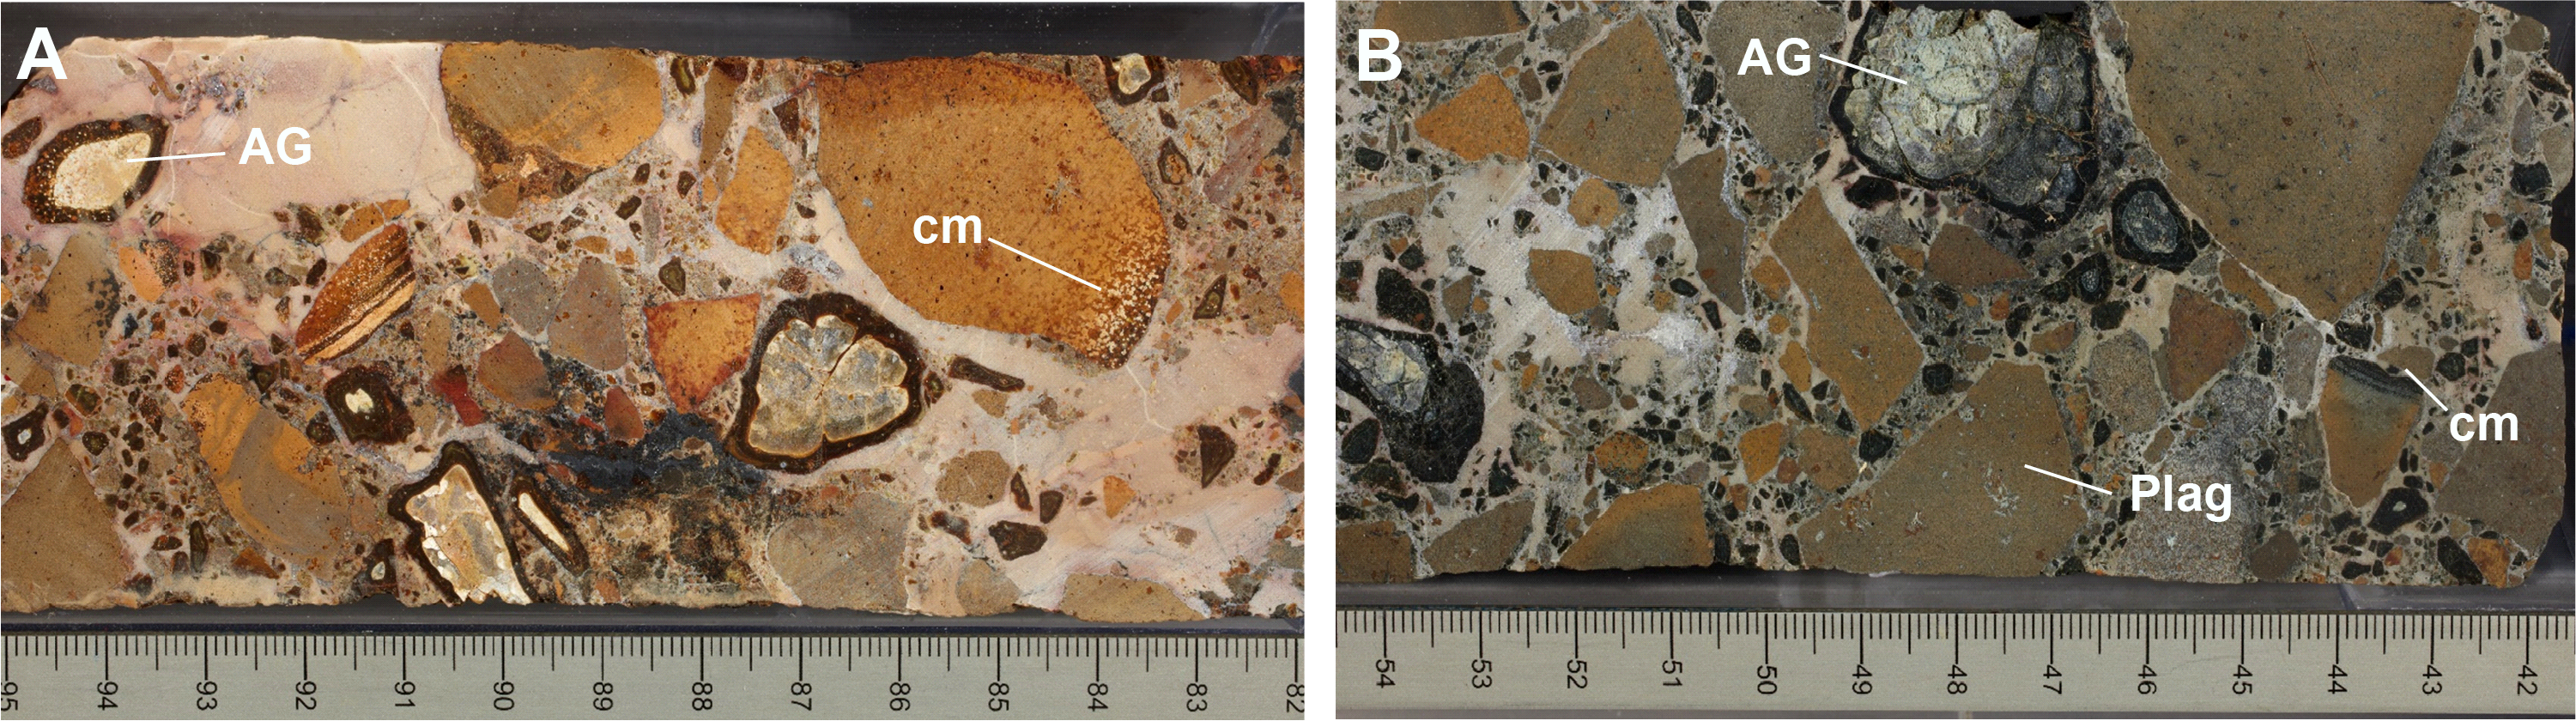
Figure F21. Oxidative and reducing alteration styles.
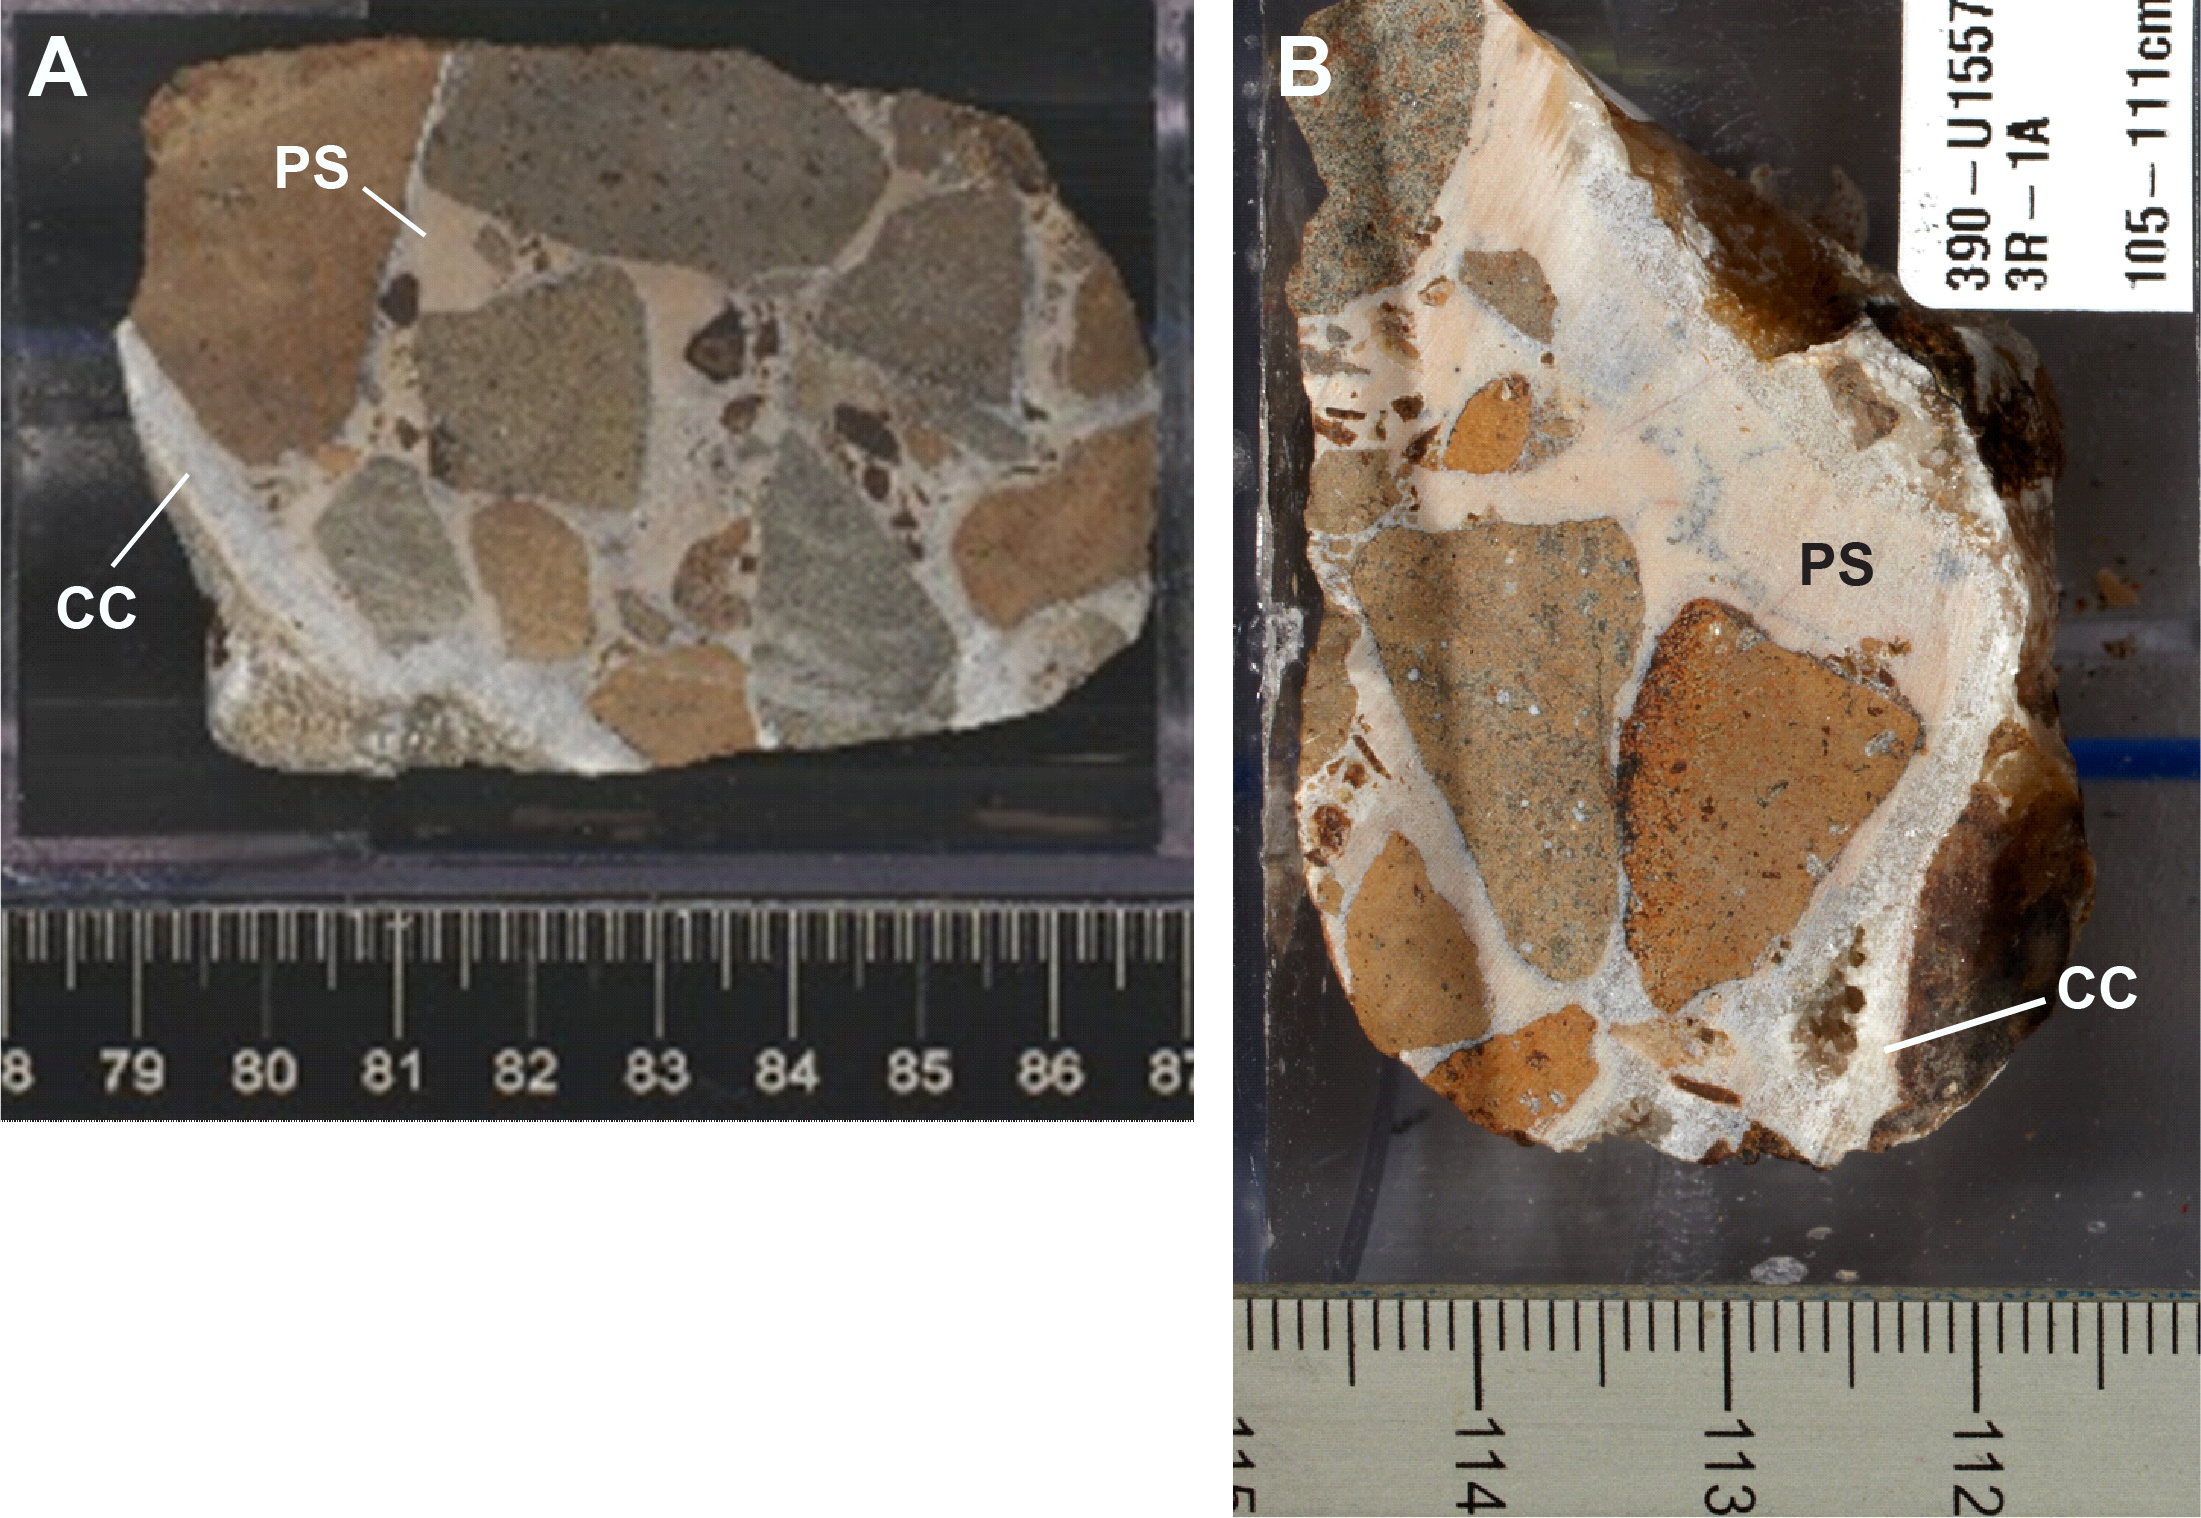
Figure F22. Sparry calcite vein.
5.1.1.3. Subunit 1c
- Interval: 390-U1557D-3R-3 through 14R-6
- Depth: 584.52–682.66 mbsf
- Lithology: sedimentary breccia with carbonate and zeolite cement
Subunit 1c was recovered only in Hole U1557D. It is a 98.1 m thick interval of sedimentary breccia, variably cemented by carbonate and zeolites. In many respects, it is similar to Subunits 1a and 1b. The deposit is poorly sorted and clast supported. The clasts are predominantly aphyric basalts and include the gray, brown, and orange varieties; altered glass is common throughout and locally abundant (e.g., intervals 390-U1557D-7R-1, 14–28 cm, and 10R-1, 34–47 cm; Figure F23). The main difference between Subunits 1b and 1c is the absence of pelagic sediment matrix and the presence of calcite and zeolite cements instead. Calcite cementation is first present in Section 3R-1 (Subunit 1b), but it becomes the dominant cement material starting in Section 3R-3 (Figure F24), which defines the boundary between the two subunits. In Sections 3R-3 through 8R-2, the calcite ranges from thin, clast-rimming cement to coarse calcite spar that can be associated with significant vuggy porosity (Figure F24) (Alteration petrology). Throughout this interval, patches of pinkish gray (5YR 7/2) to light brown (7.5YR 6/3) clay-sized material occur that superficially resemble pelagic sediment in the core (Figure F25). This material is commonly associated with areas where fine-grained igneous detritus concentration is high (Figure F25B). However, thin section analysis shows that this material is not pelagic sediment. Rather, the detritus-rich areas are typically cemented by a zeolite ± micritic or microsparry calcite (Figure F26). The zeolite is commonly relatively coarse grained, subhedral to euhedral, with a bladed habit in which the blades grow perpendicular to clast surfaces (Figure F27). In some cases, the crystals are large enough for sector twinning to be observable (Figure F27A, F27B), a growth habit that is typical of the zeolite phillipsite. Phillipsite has been confirmed by XRD analysis, and it is the predominant zeolite in Site U1557 basement (see Alteration petrology).
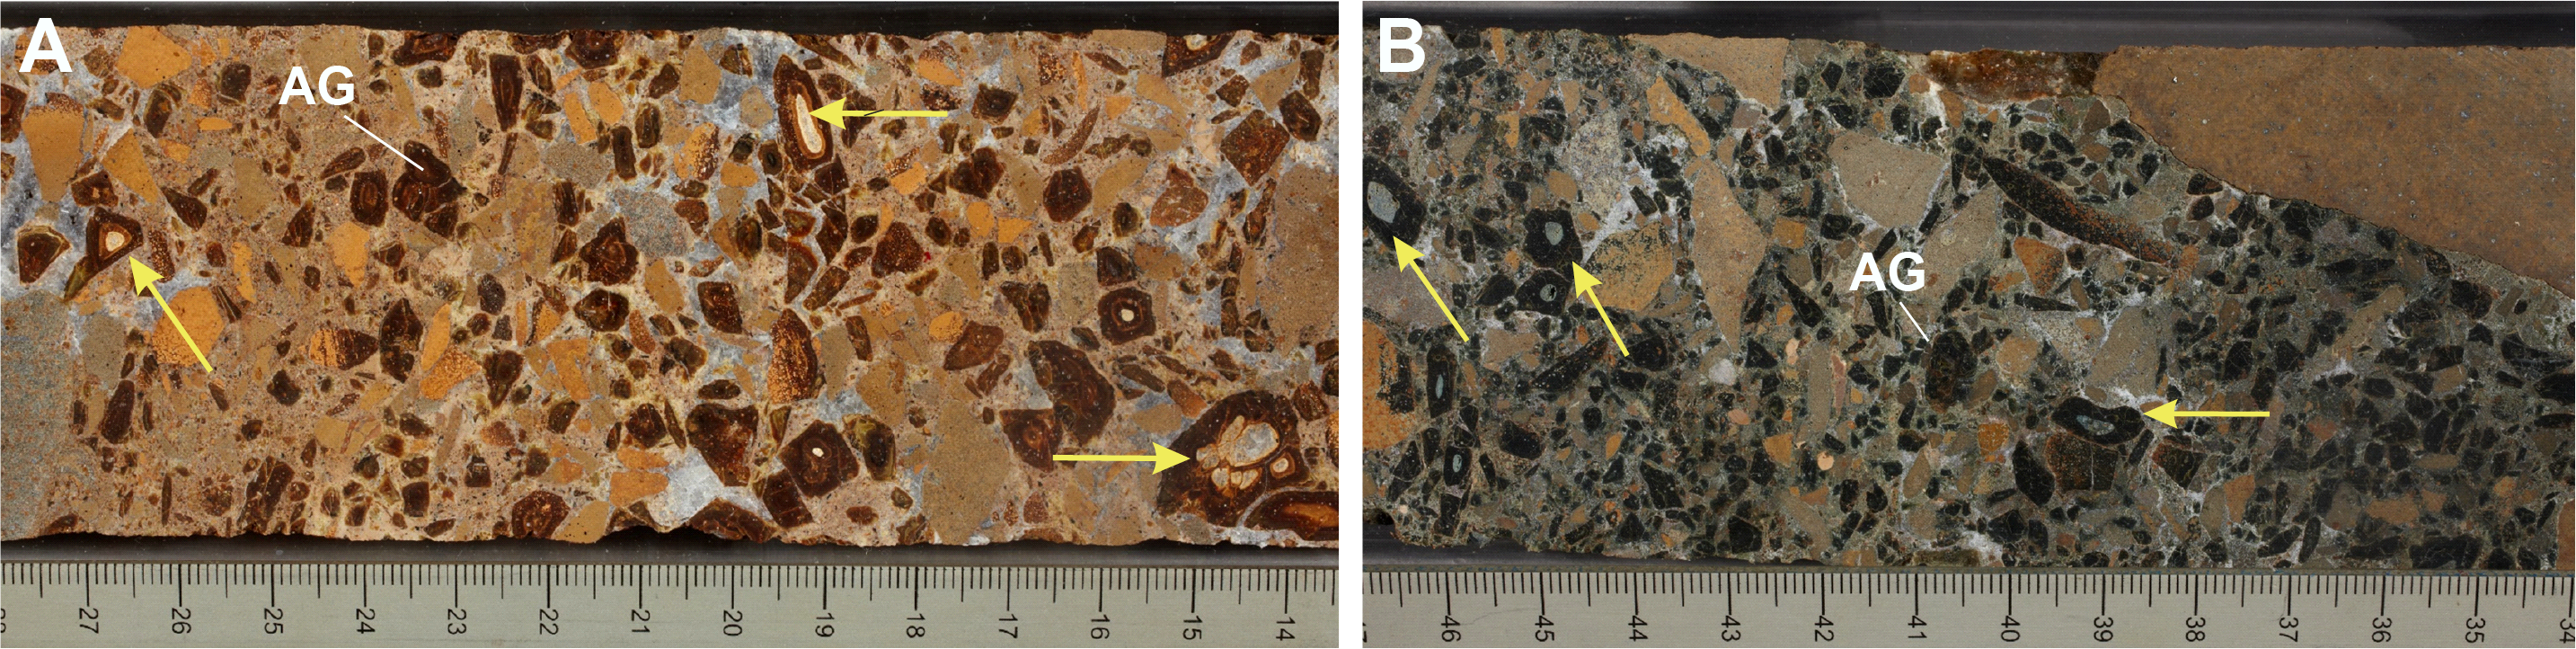
Figure F23. Altered glass with concentric zoning.
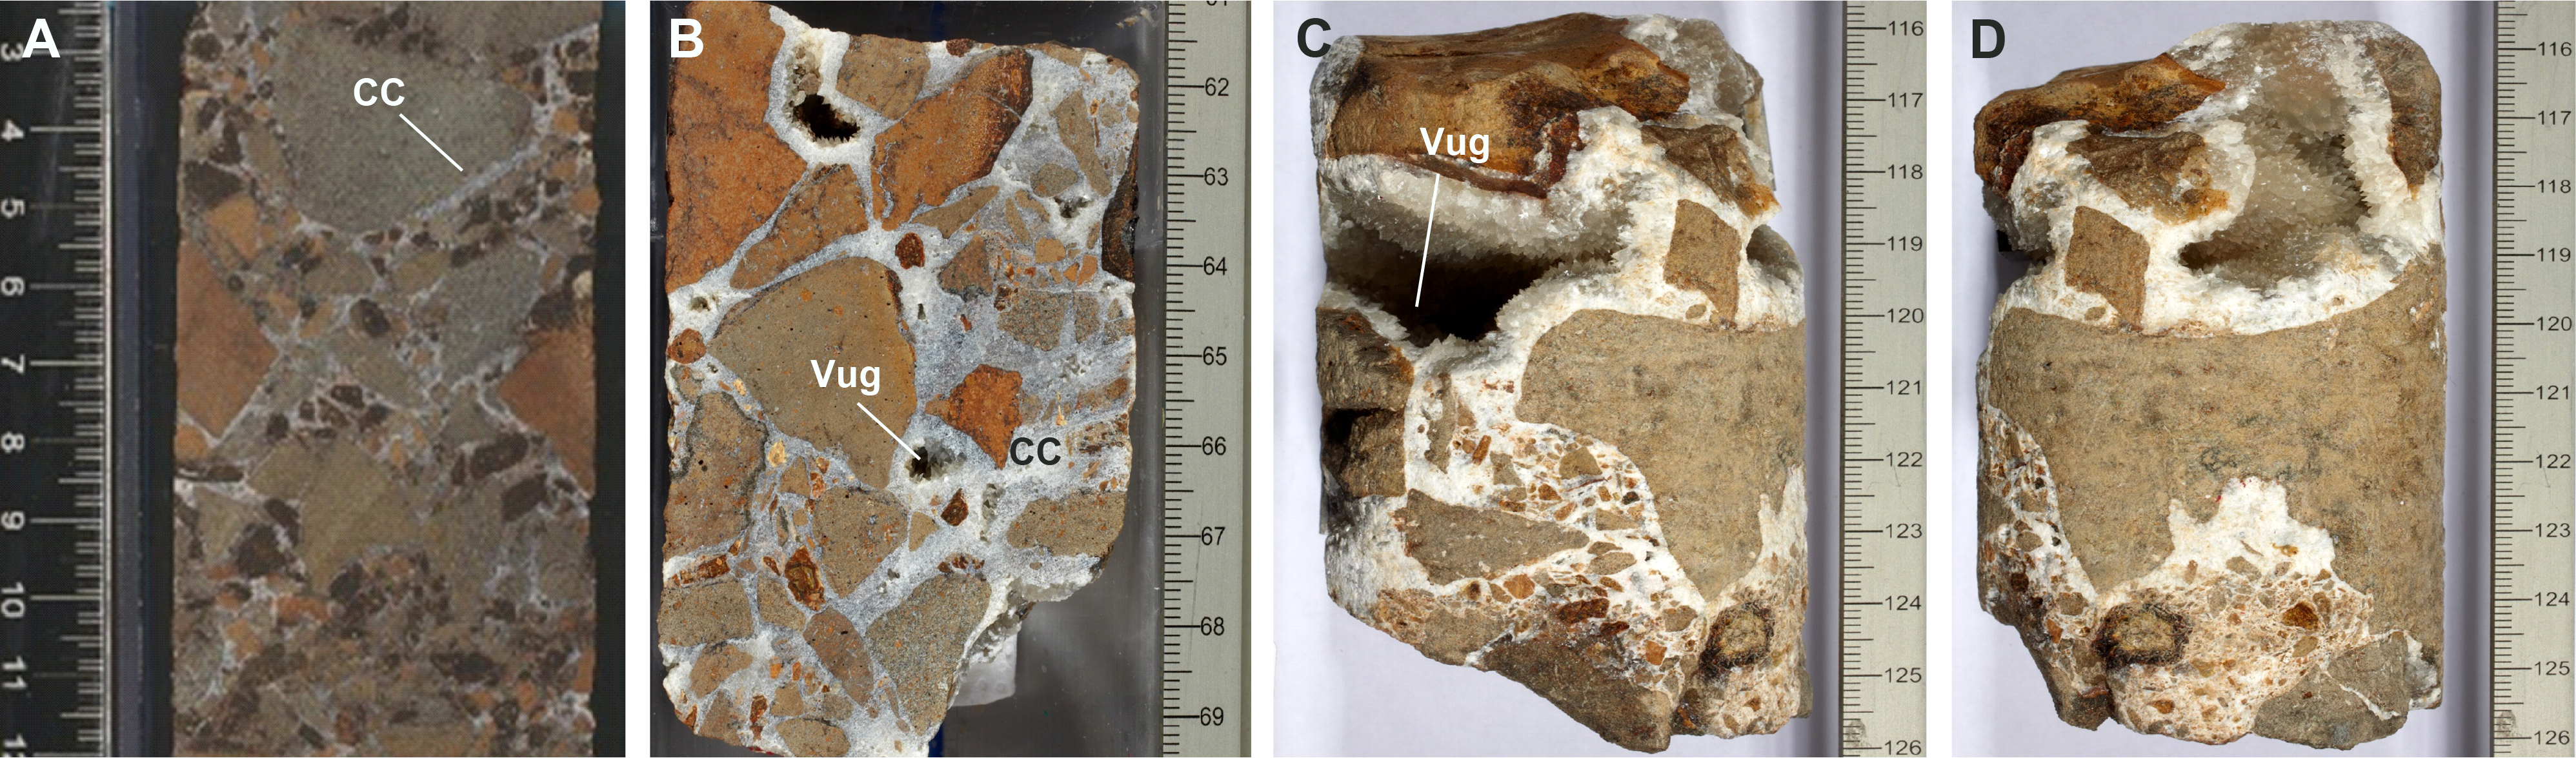
Figure F24. Variation in calcite cement.
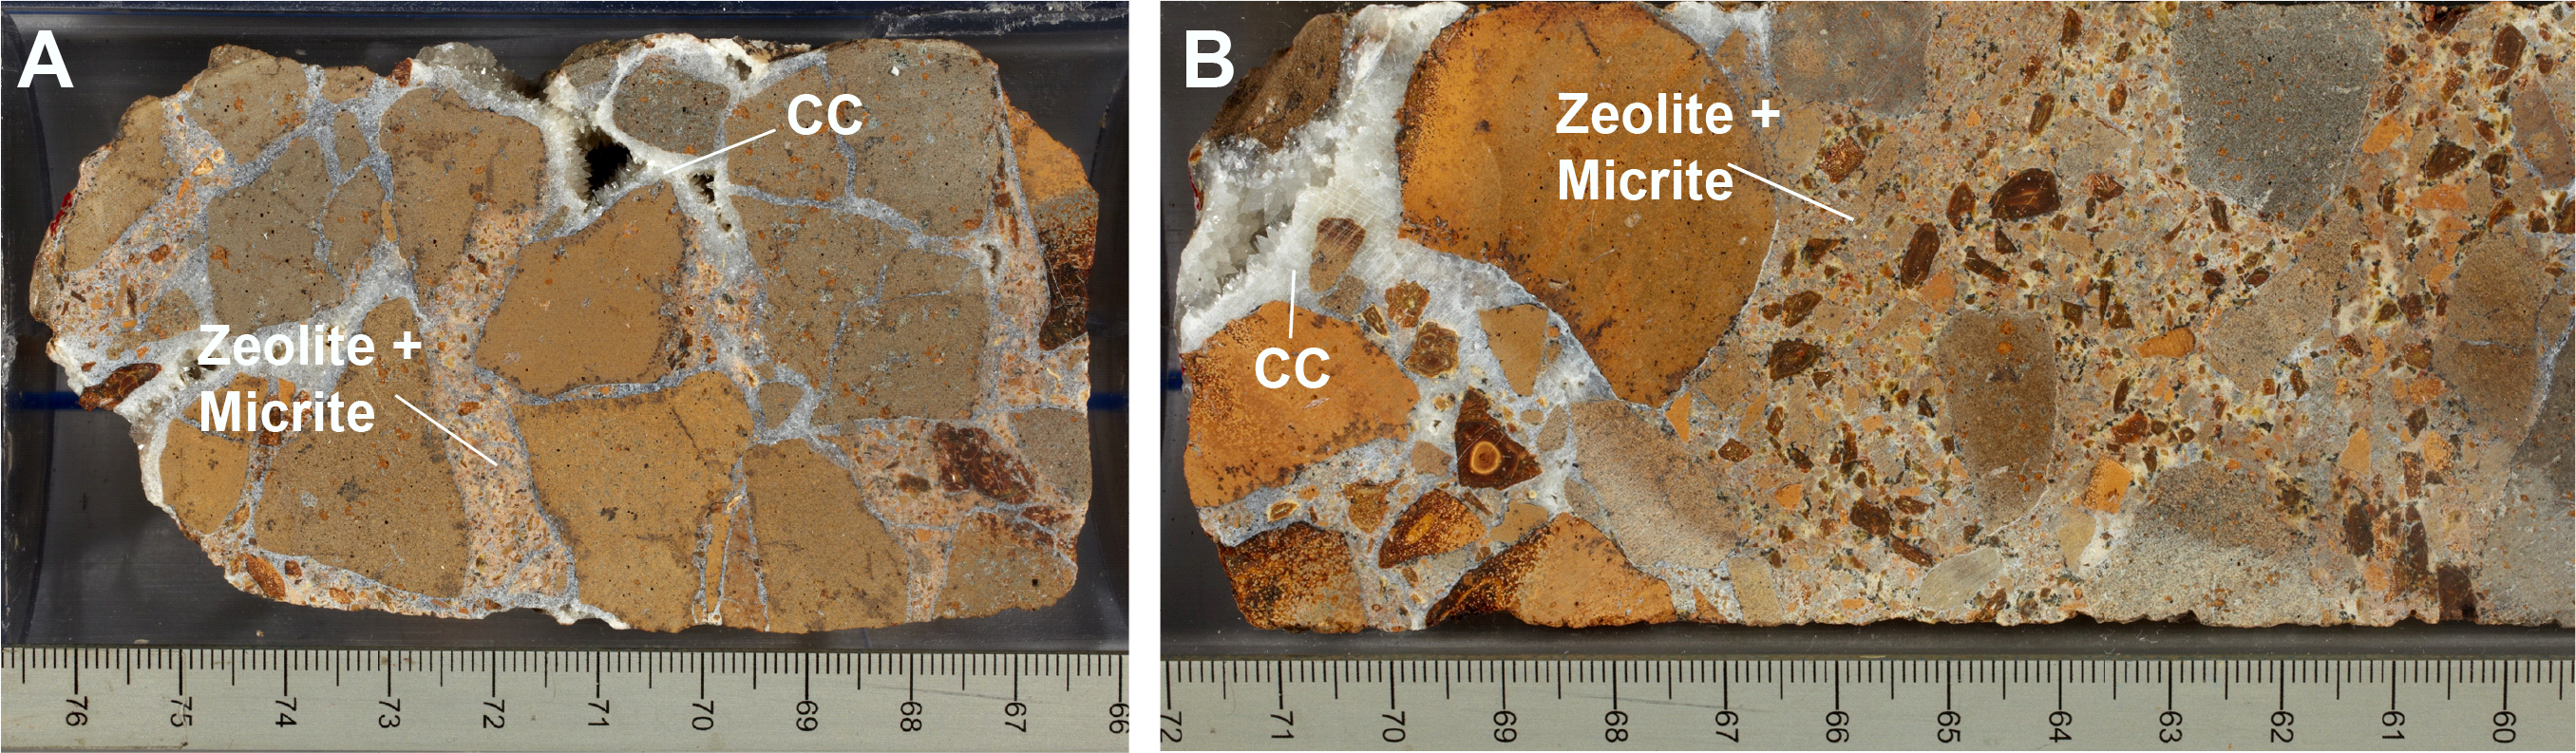
Figure F25. Zeolite and sparry calcite cements.
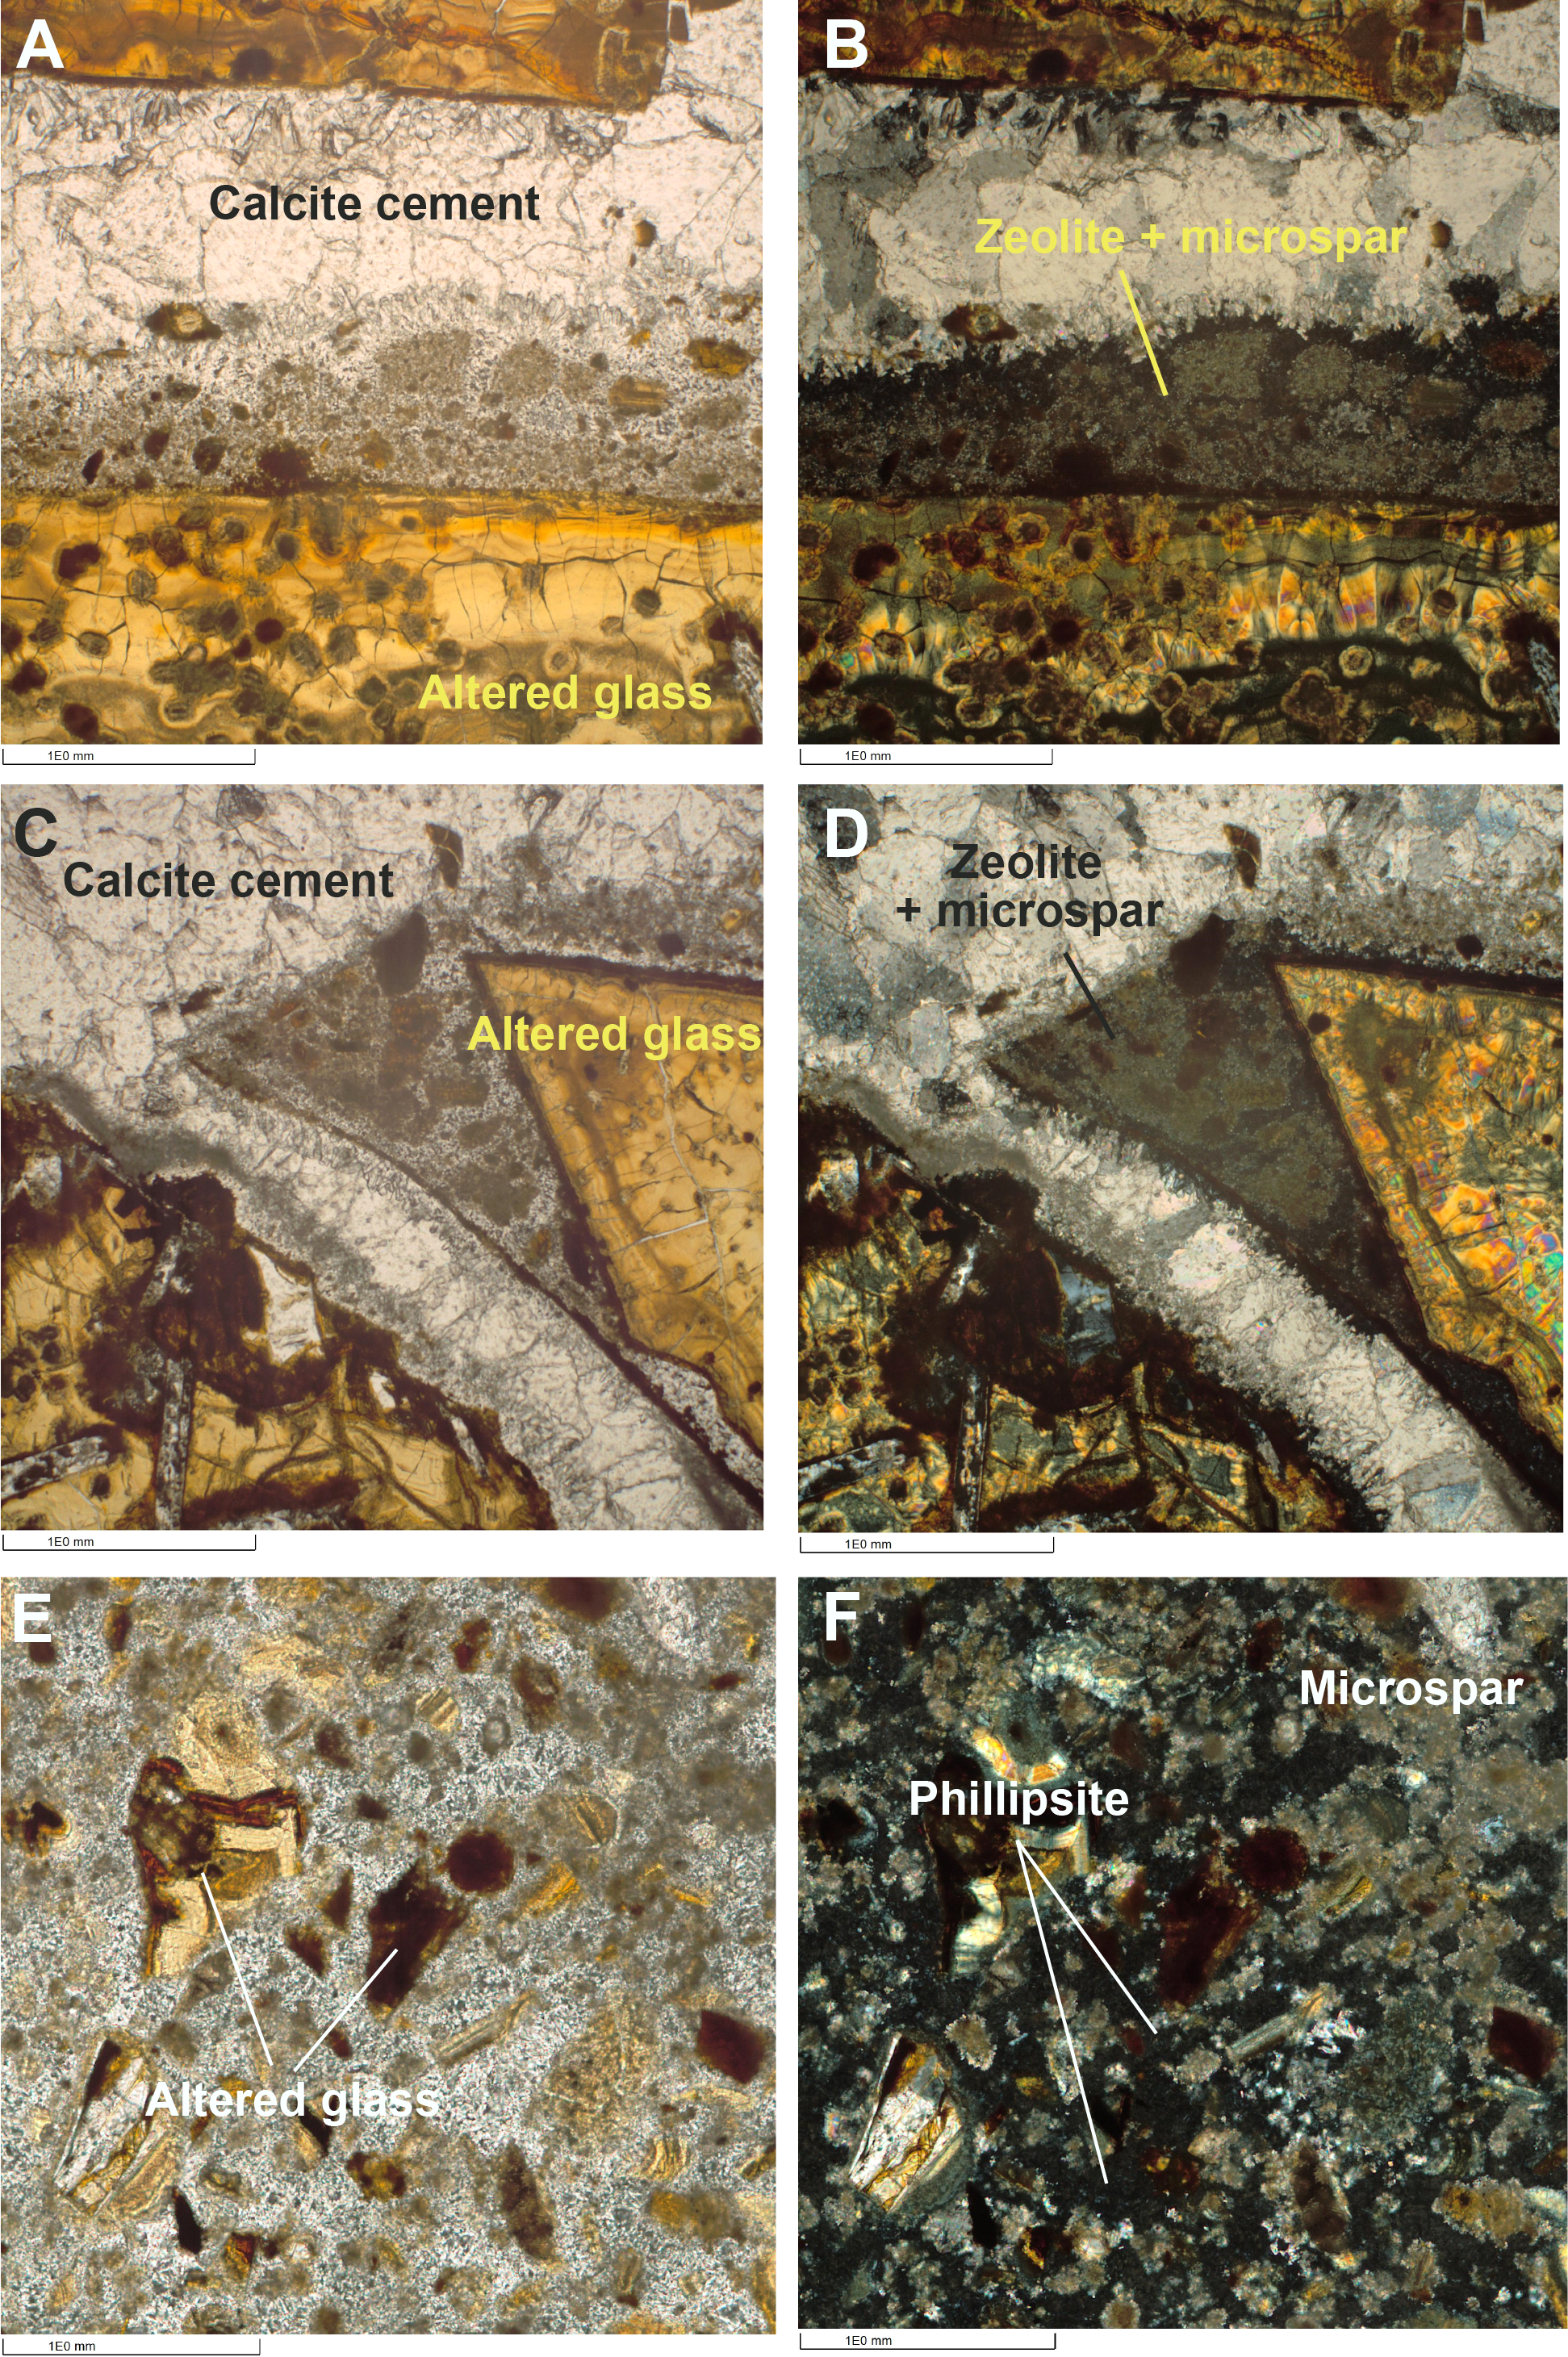
Figure F26. Zeolite cement.
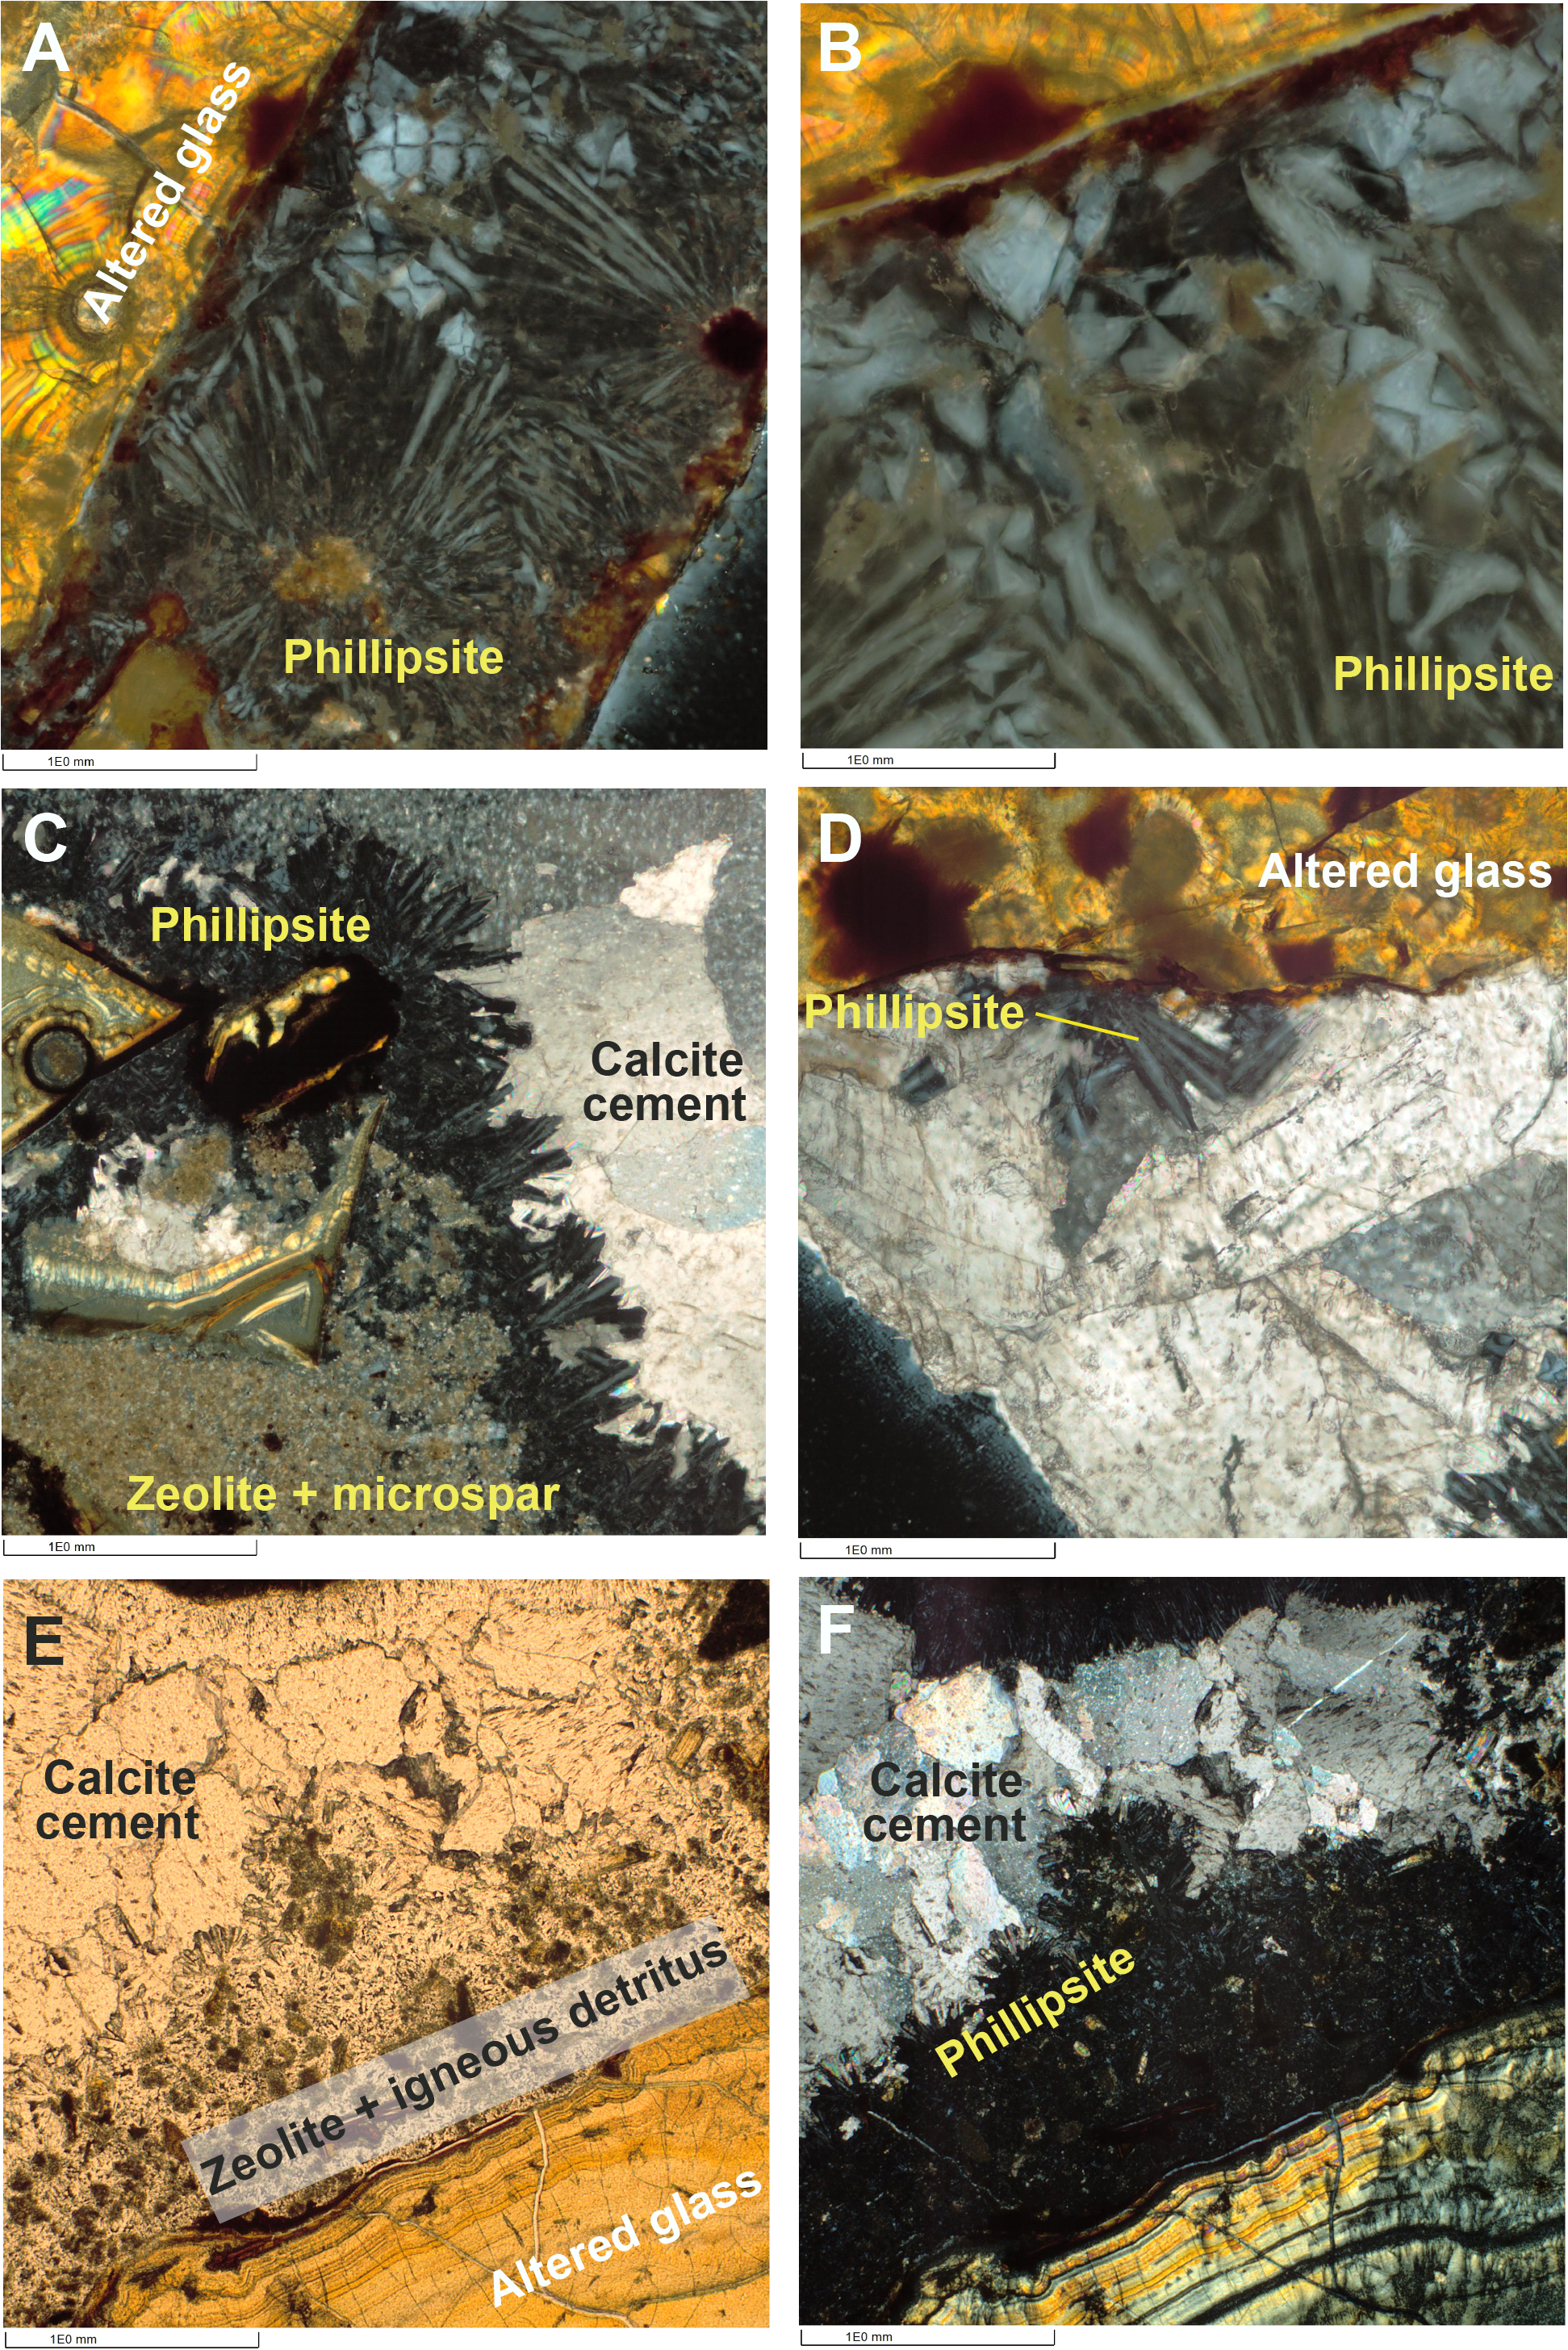
Figure F27. Phillipsite cement styles in breccias.
The coarse-grained, bladed growth habit is primarily observed in association with altered glass (Figures F26, F27), which is not surprising because altered glass is a common source of the dissolved silica and aluminum required for phillipsite crystallization (Kastner, 1979). Where phillipsite is the cementing material, in areas with high modal proportions of silt- and sand-sized igneous particles (Figure F26C–F26F), its habit is anhedral and/or cryptocrystalline, but the two morphologies grade from one to the other. Sample 390-U1557D-10R-1 (Piece 9, 122–124 cm), for example, shows a patch of fine-grained igneous detritus adjacent to an altered glass clast; it is cemented by fine-grained, anhedral phillipsite that grows outward as blades with euhedral terminations against sparry calcite that fills the center of a vein (Figure F27E, F27F).
Although phillipsite is one of the most common zeolite minerals in marine systems (Kastner, 1979; Walton and Schiffman, 2003), it generally does not occur below 500 m in the sediment column. The presence of phillipsite throughout this hole may, therefore, have implications for the origin and diagenesis of the Site U1557 breccias. Phillipsite is a hydrated K-Na-(Ca)-rich aluminosilicate that forms during low-temperature (<150°C) diagenesis. It requires a source of dissolved silica and aluminum to form, and it is usually assumed that altered glass and/or smectite are the main mineral precursors. The strong association of phillipsite with altered glass at Site U1557 (Figures F26, F27) is consistent with this assumption. Moreover, we observe examples of spongy disintegration of altered glass where phillipsite occupies the pore spaces created by the breakdown of the altered glass (Figure F28). Depending on the sequence of diagenetic events, this could have implications for element mass balance during alteration of oceanic crust. Some studies of seafloor alteration of basaltic glass propose that the process leads to the complete loss of Si and alkali elements to seawater (Kruber et al., 2008). However, crystallization of phillipsite may fix some of the Si (along with Na, K, and some incompatible trace elements) released within the altered crust and/or sequester some of it from seawater. Indeed, preliminary analysis based on portable X-ray fluorescence (pXRF) data (see Clast petrology) shows significant enrichment in K in the detrital basalt clasts at Site U1557.
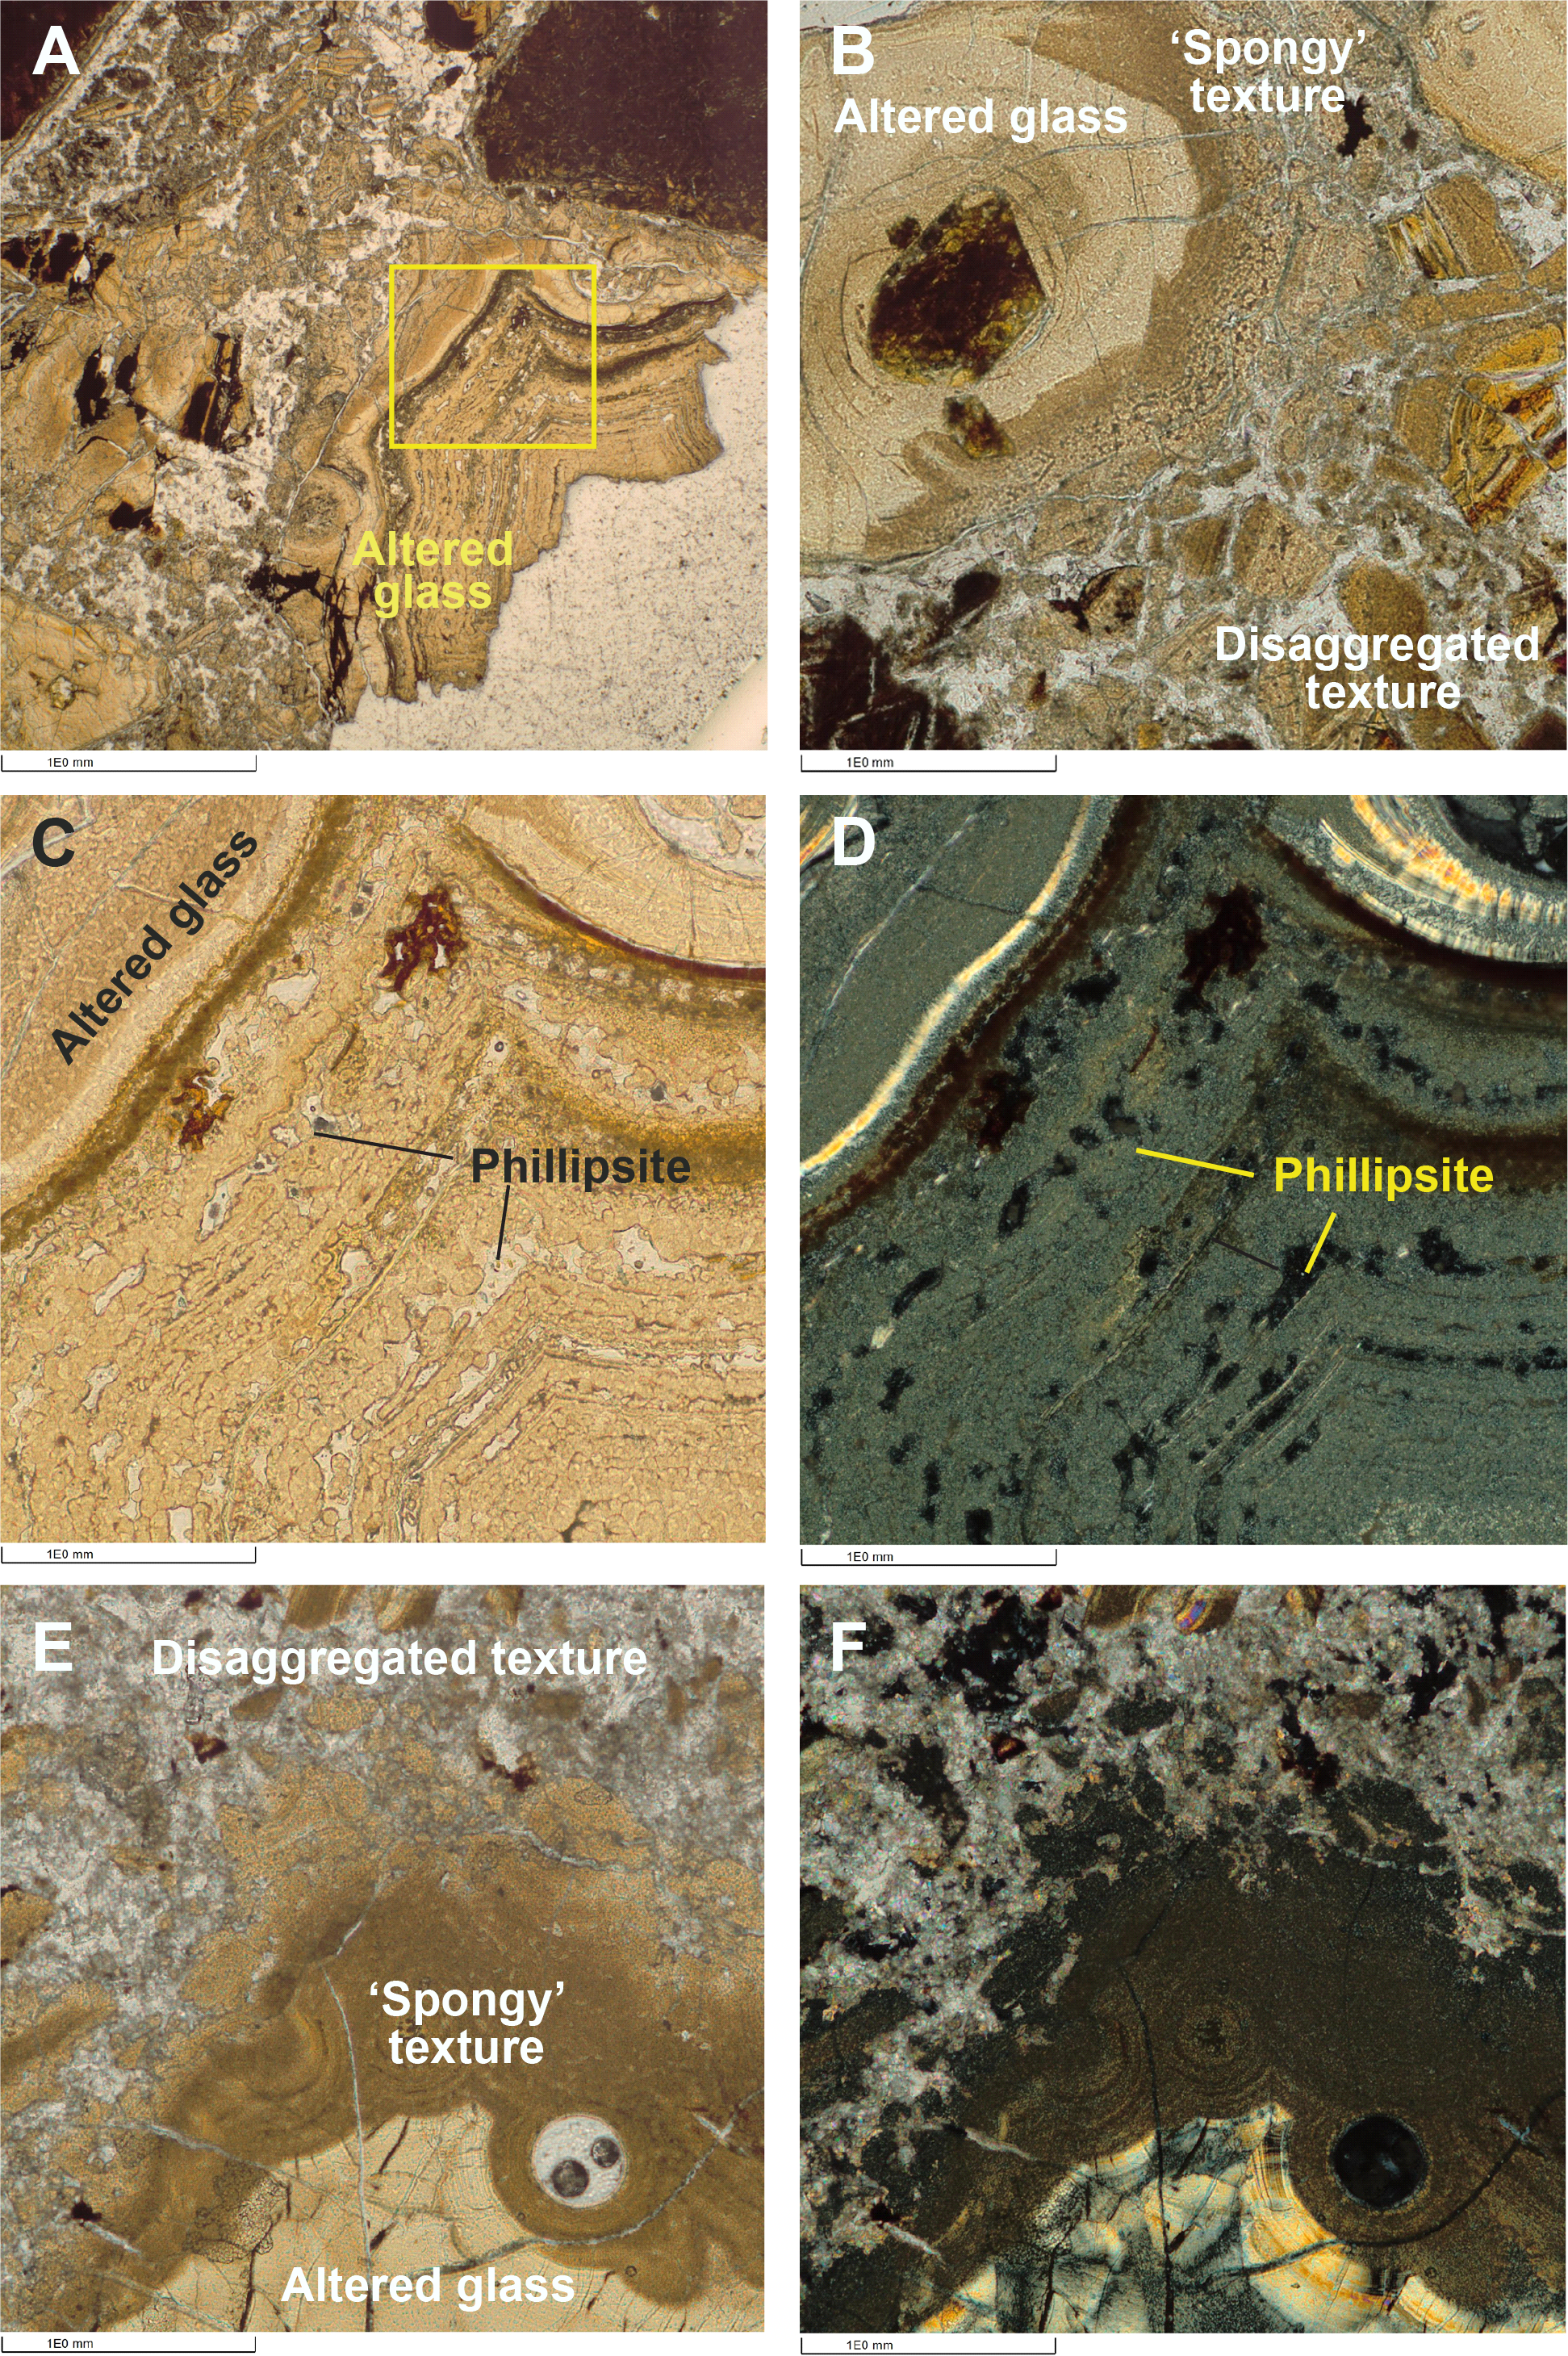
Figure F28. Spongy disintegration of altered glass.
Breakdown of the altered glass also appears to contribute to the silt- and sand-sized fraction within the rocks, even after deposition (Figure F28A, F28B, F28E, F28F). Although the bladed rimming morphology is most commonly observed in association with altered glass, it is also present surrounding highly altered basaltic clasts (Figure F29A, F29B), where it has been shown to derive the silica it needs to stabilize its growth from secondary minerals such as smectite (Kastner, 1979).
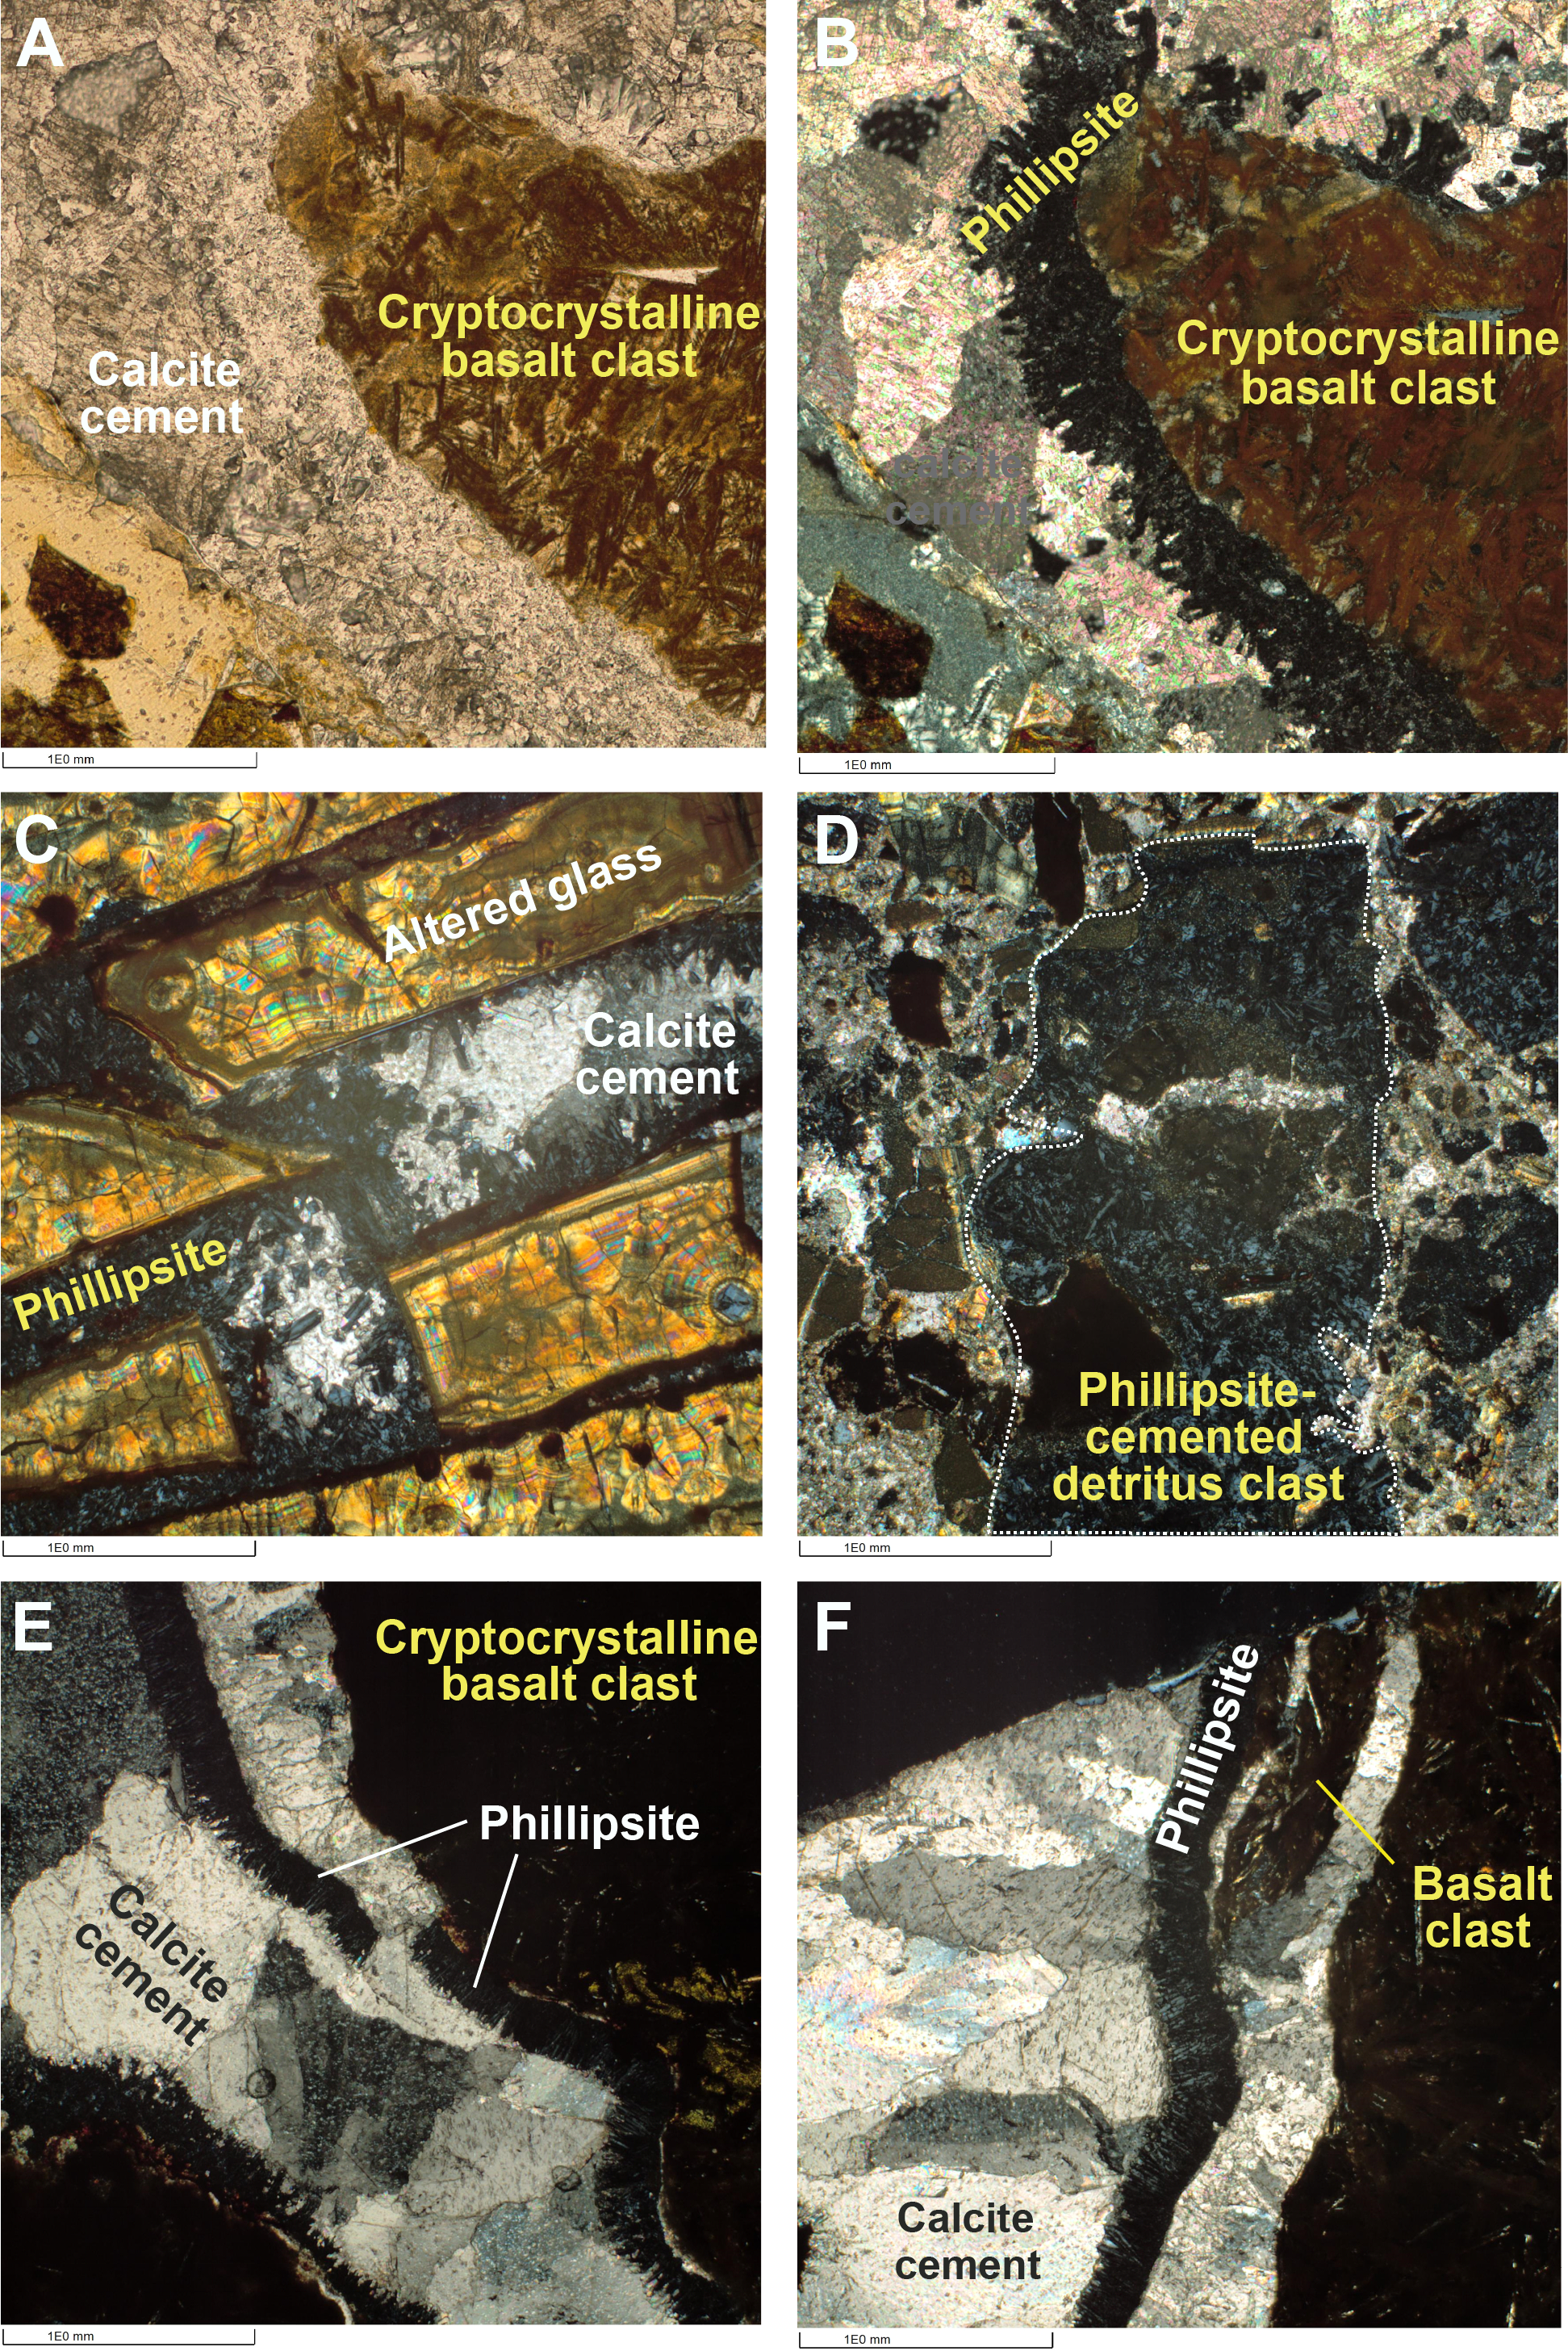
Figure F29. More phillipsite cement styles in breccias.
Growth relationships observed in thin section indicate that phillipsite precedes sparry calcite in the diagenetic history of the Site U1557 breccias. The euhedral terminations on the bladed phillipsite crystals suggest growth into open space unopposed by other minerals, and Figures F26, F27, and F28 show that calcite commonly occupies the centers of the veins or voids into which the blades of phillipsite grew. In addition, patches of silt- and sand-sized igneous detritus that have been cemented by phillipsite appear to behave like clasts themselves where they were later disrupted by the calcite veining (Figure F29D). In Sample 390-U1557D-6R-6 (Piece 1, 1–3 cm), the calcite veining has detached not only some of the rimming phillipsite cement but also a sliver of the basalt to which it was attached (Figure F29E, F29F).
Although both calcite and zeolite cements occur between Sections 390-U1557D-3R-3 and 8R-2, calcite is almost always the dominant cement. However, between Sections 8R-3 and 10R-2 there are breccia intervals where the clasts are more highly compacted (e.g., higher ratio of clasts to matrix and some apparent preferred alignment of clasts) (Figure F30) and zeolite cements dominate over calcite. From Section 10R-3 to the bottom of the hole, several characteristics of the breccia change in concert: (1) the degree of compaction increases, (2) the reduction in calcite cement continues, and (3) there is evidence for deformation (Figure F31). Microscopic examination shows that these structural features have resulted in significant comminution of clasts (Figure F32A), and at least some of the deformation must have occurred after calcite cementation because the deformation has produced rounding of sparry calcite crystals in the zone of movement (Figure F32B). The deformation has also led to realignment of clasts into preferred orientations and cataclasis (Figure F32C–F32F). Detailed structural measurements were not made during shipboard macroscopic description because of time constraints; however, aside from a small fault in Section 11R-2, most of the deformation features observed were relatively small scale (less than a few centimeters thick) and gently to steeply dipping (Figure F31). The role of fluids in facilitating the deformation may have been significant because there are low-angle to subhorizontal calcite veins parallel to deformation surfaces (Figure F33), particularly from Section 13R-3 to the bottom of the hole. Whether these structural elements represent the base of the talus deposit at Site U1557 or more localized, smaller scale features will require detailed shore-based research.
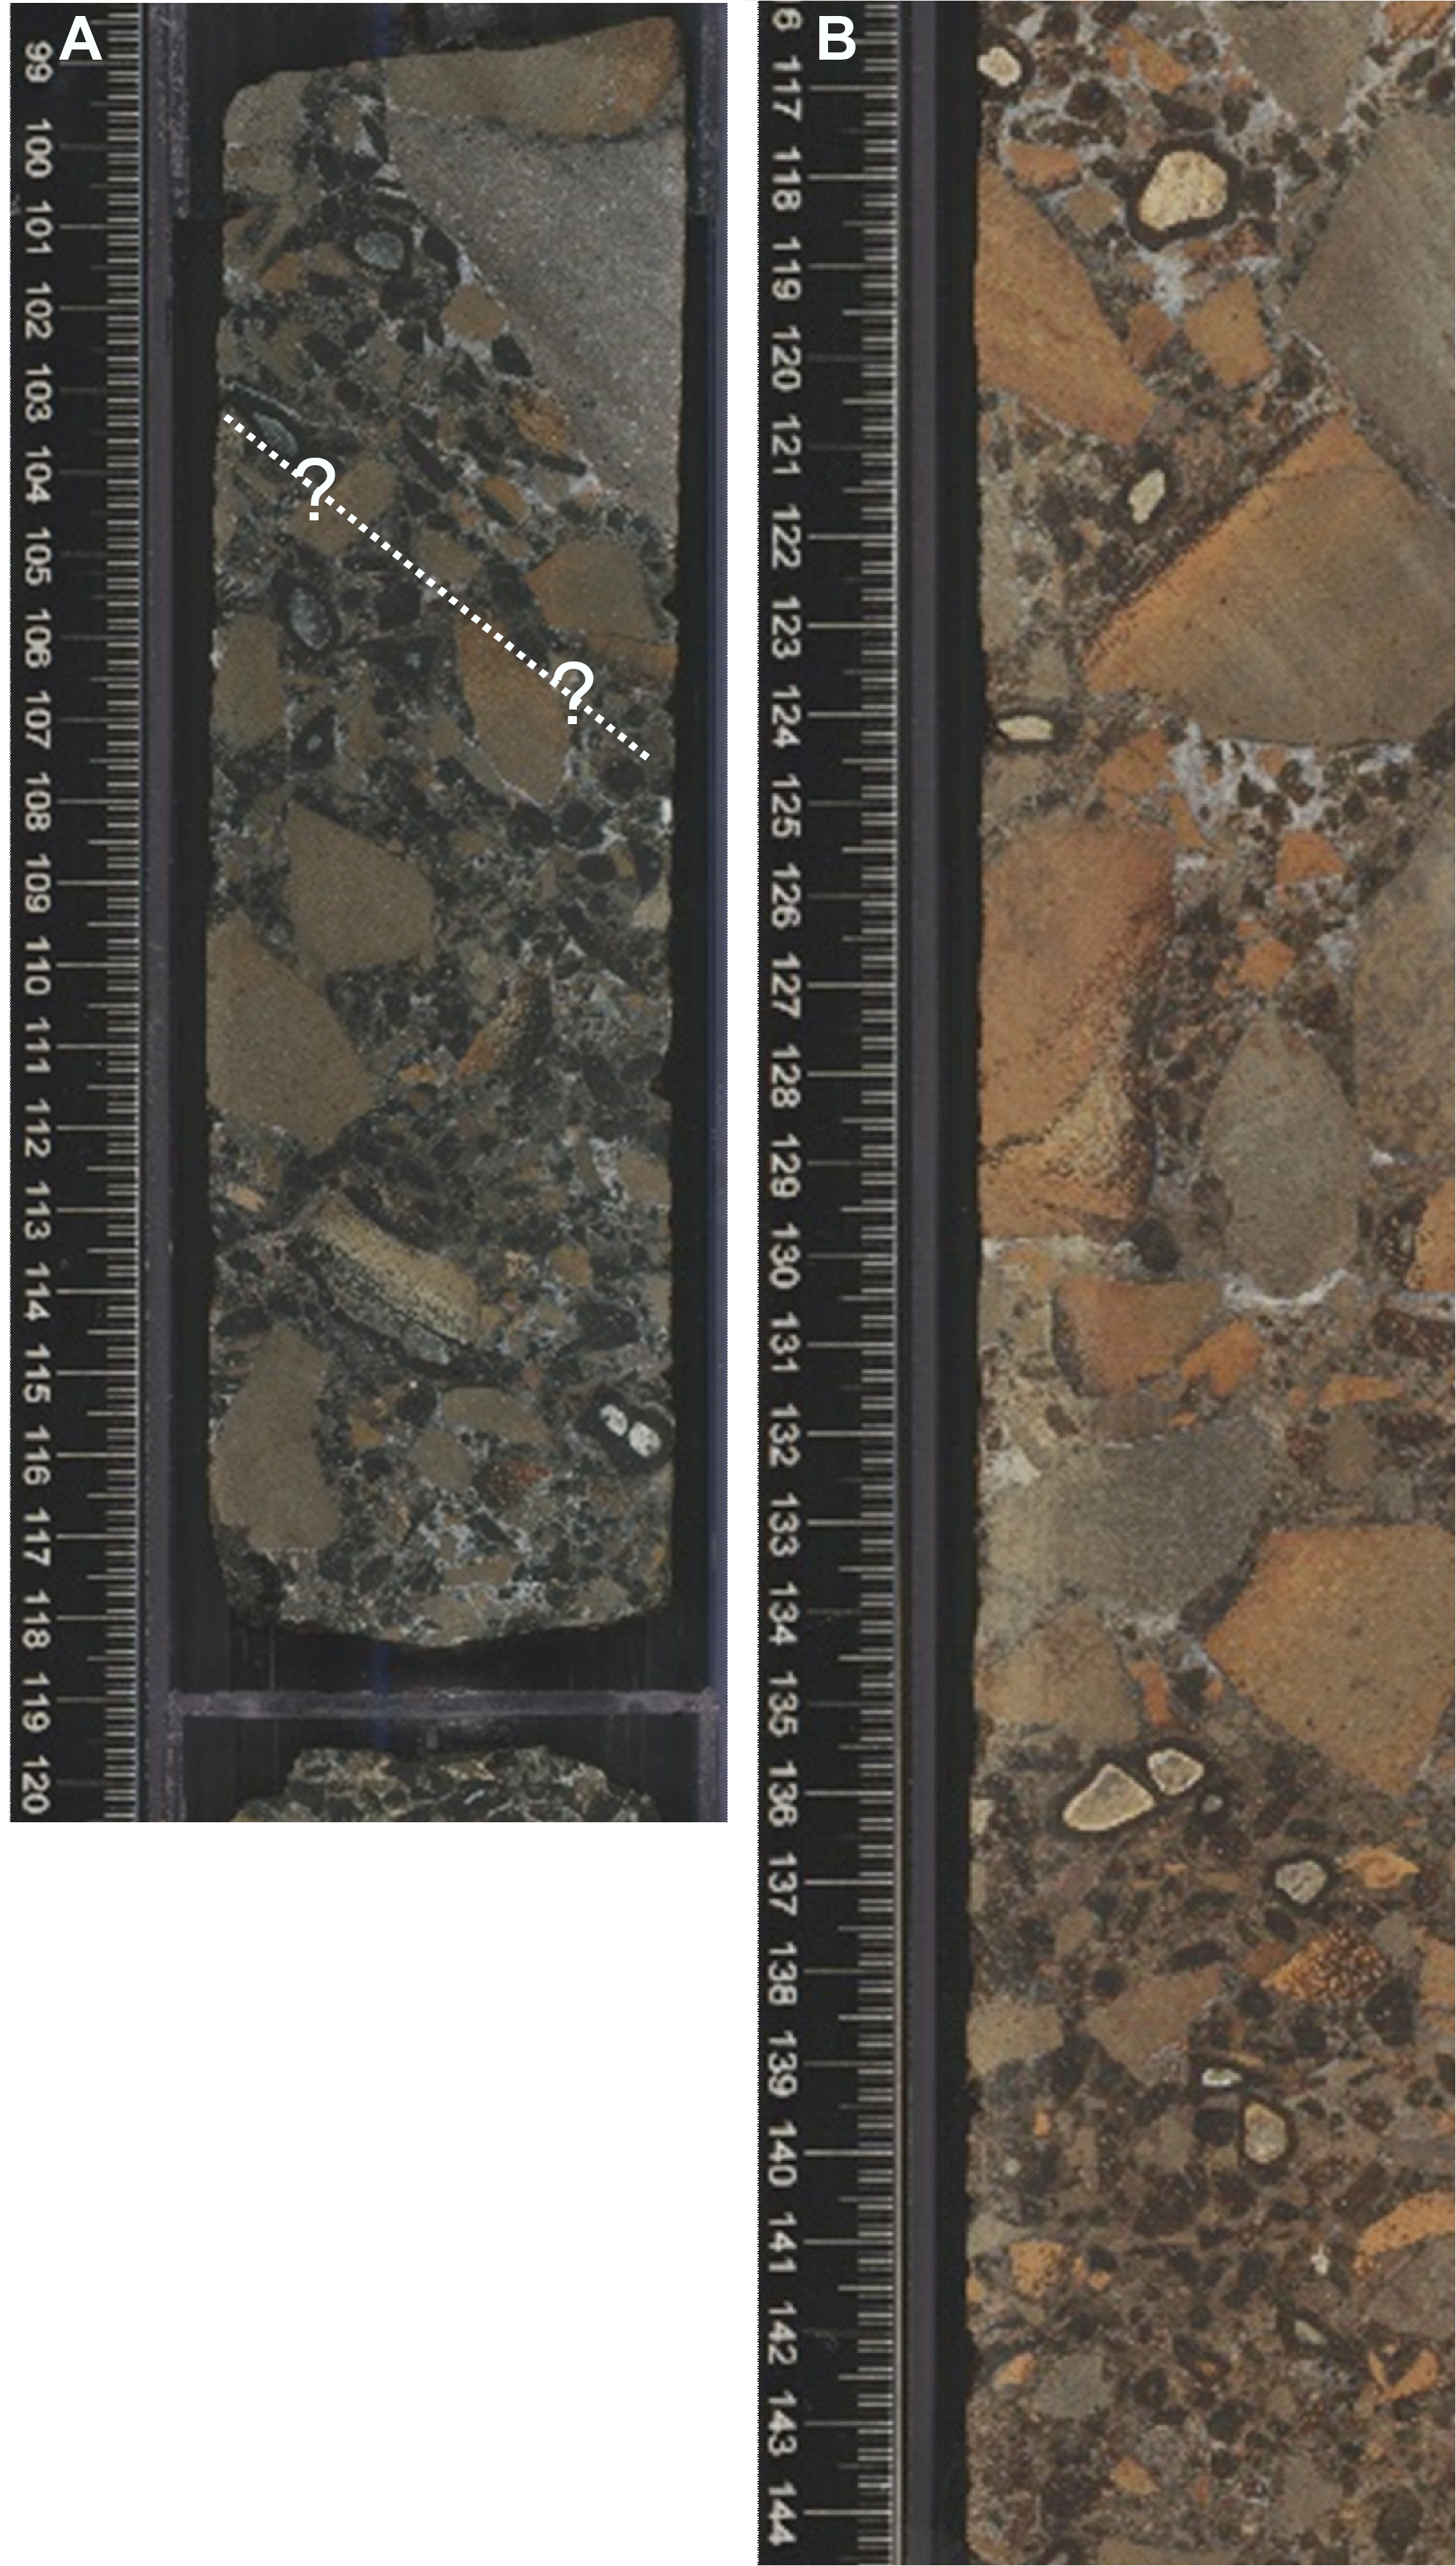
Figure F30. Compaction increase near bottom of hole.
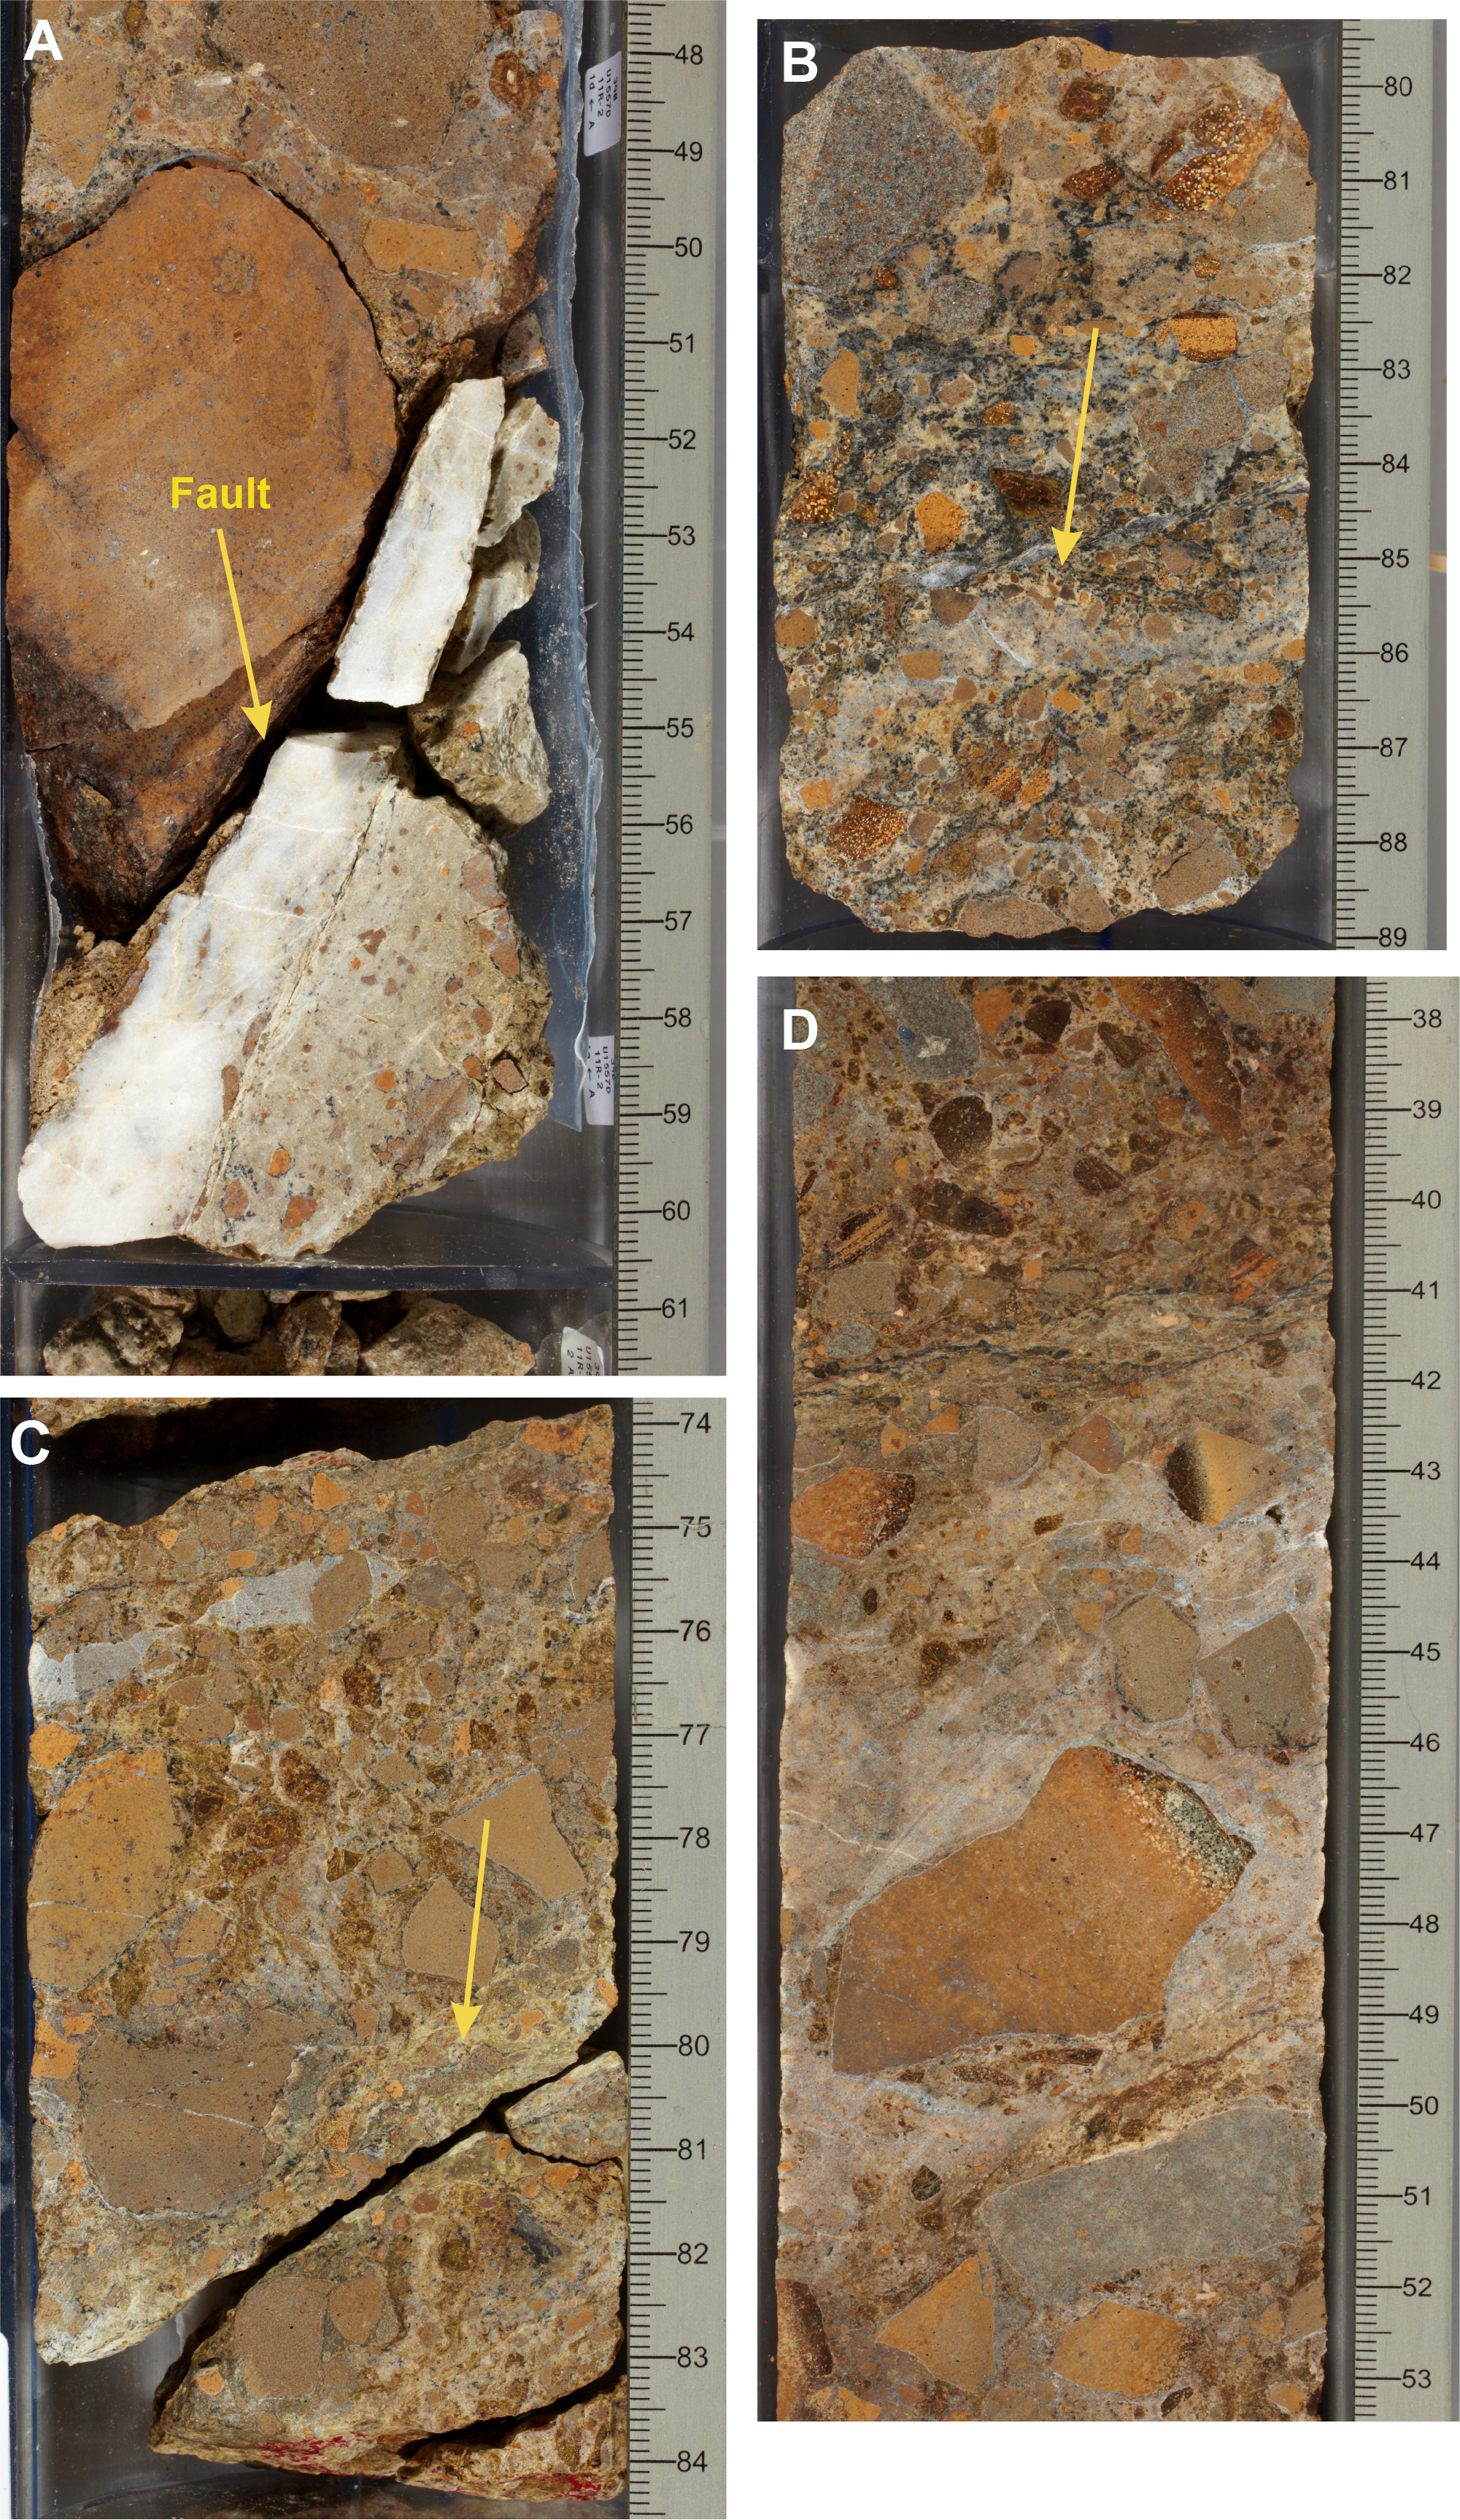
Figure F31. Deformation features.
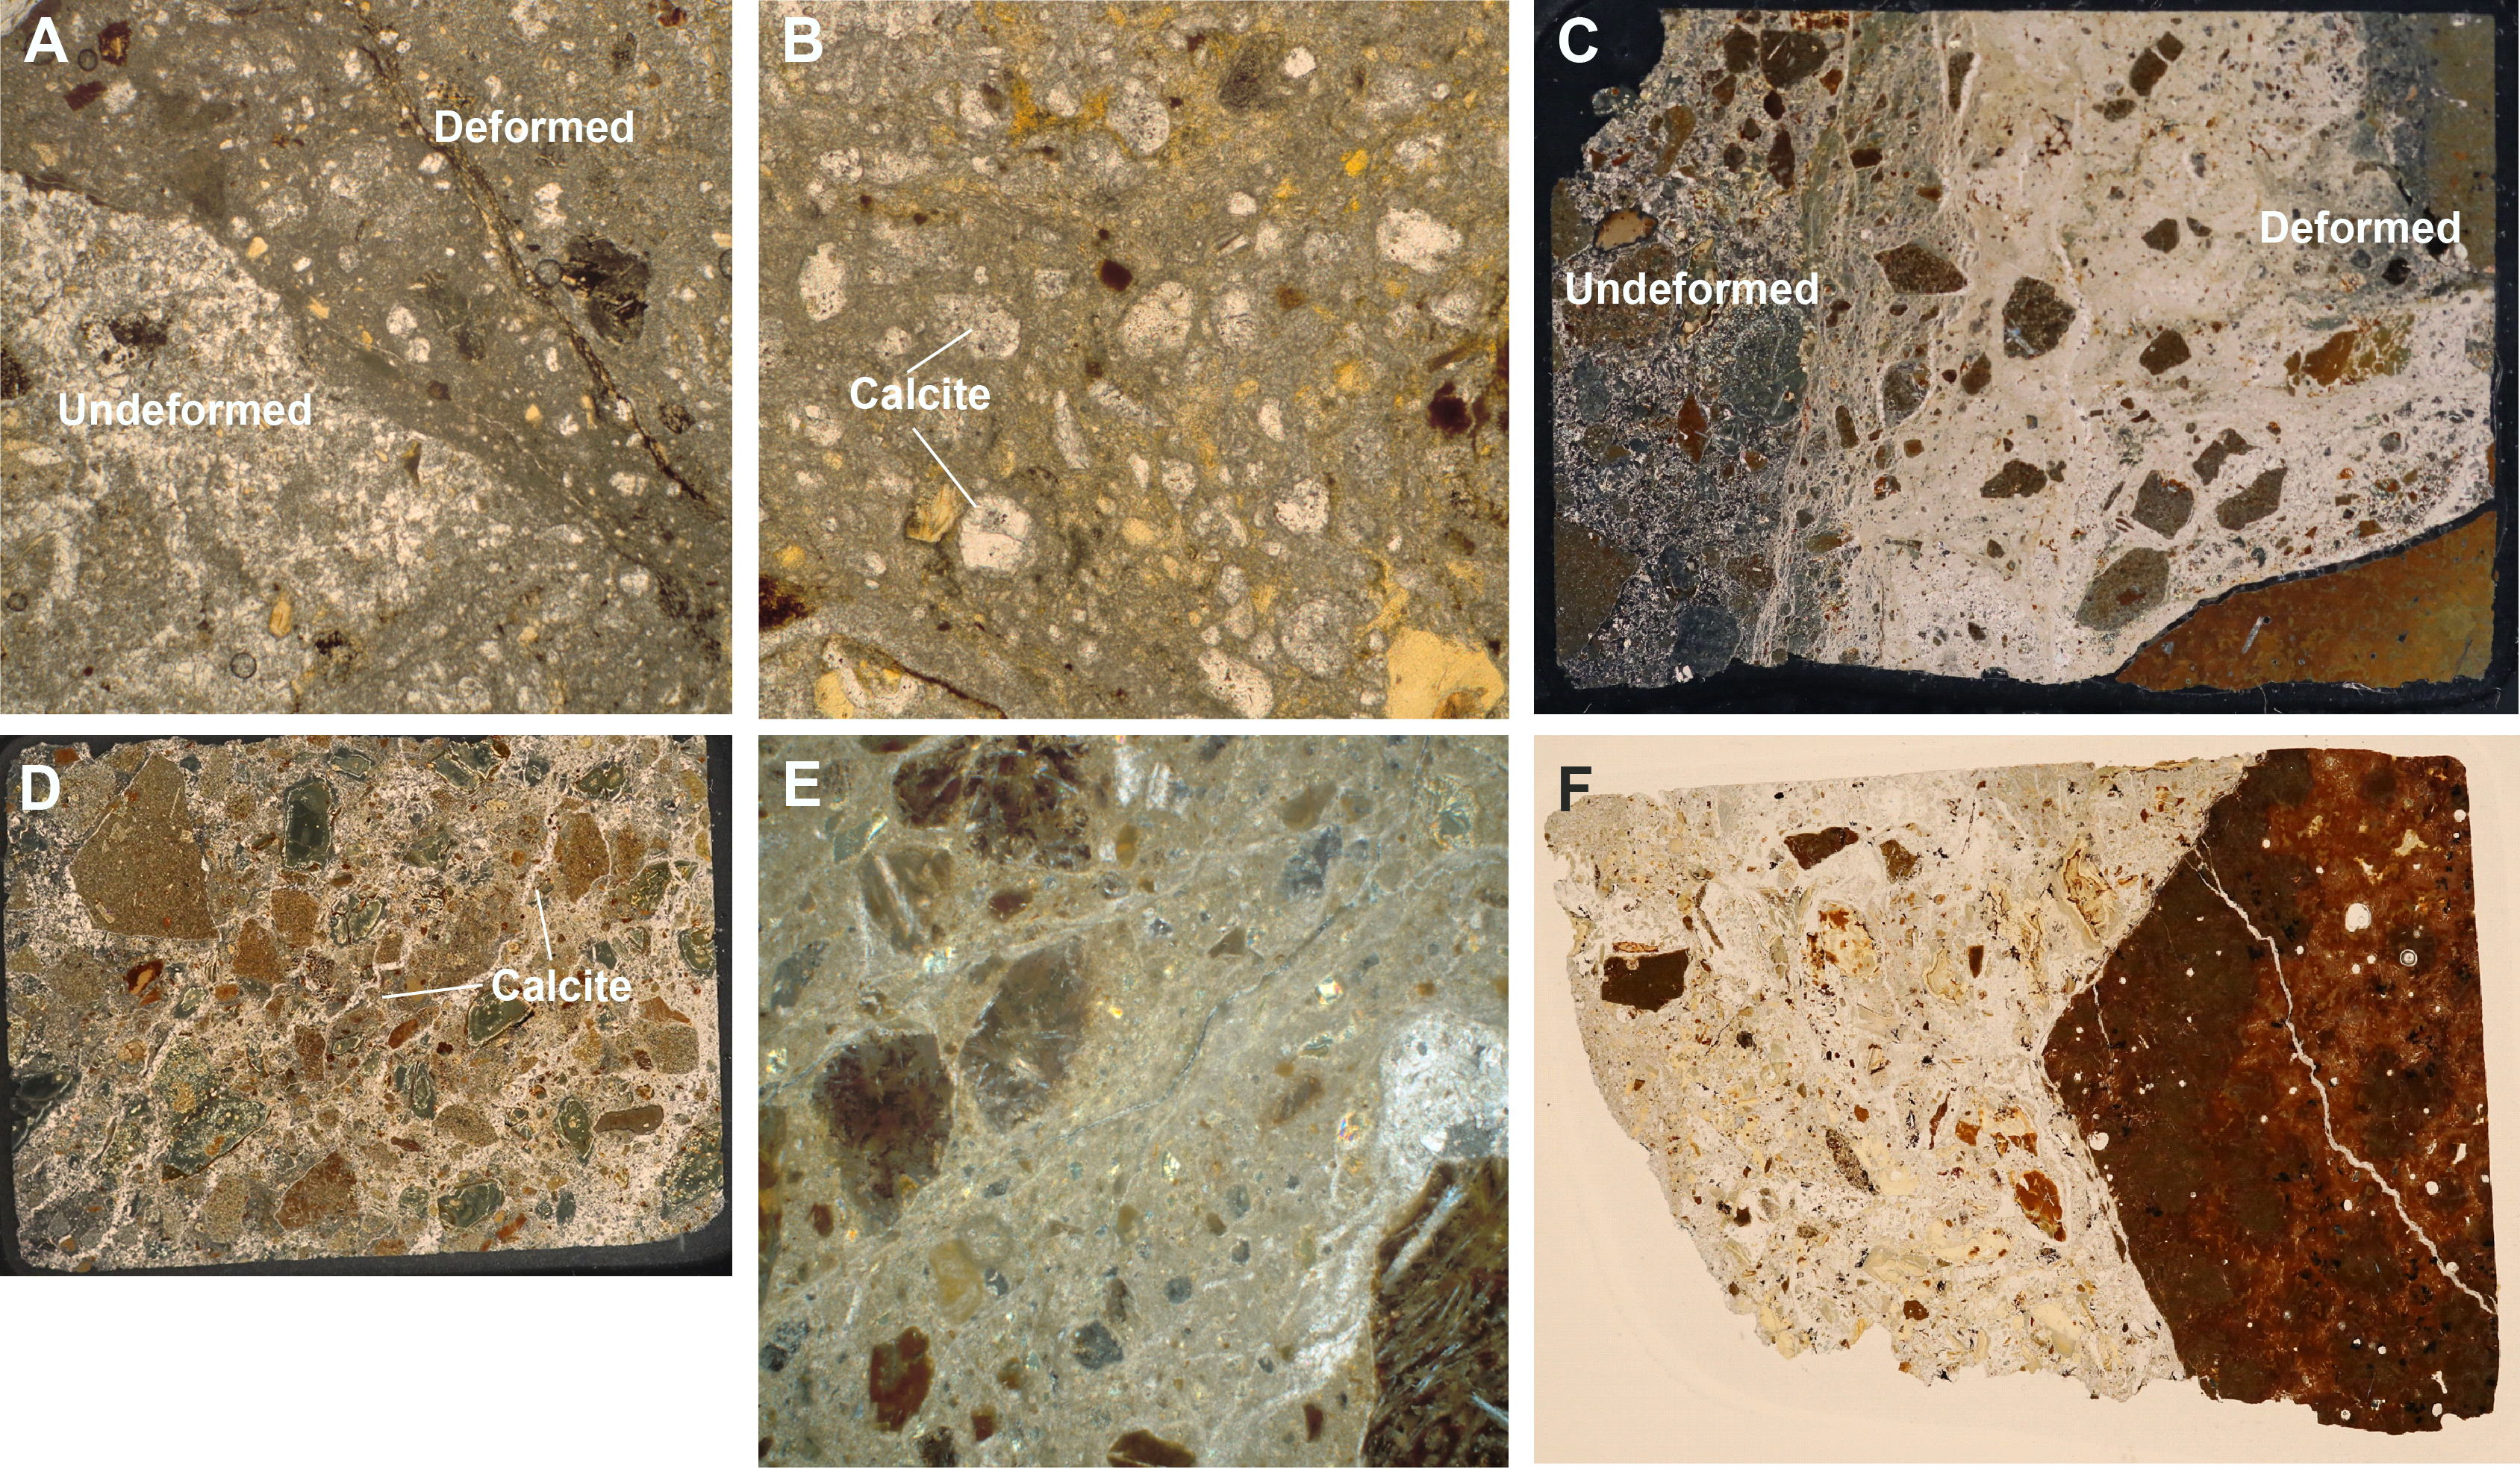
Figure F32. Comminution and preferred alignment of grains.
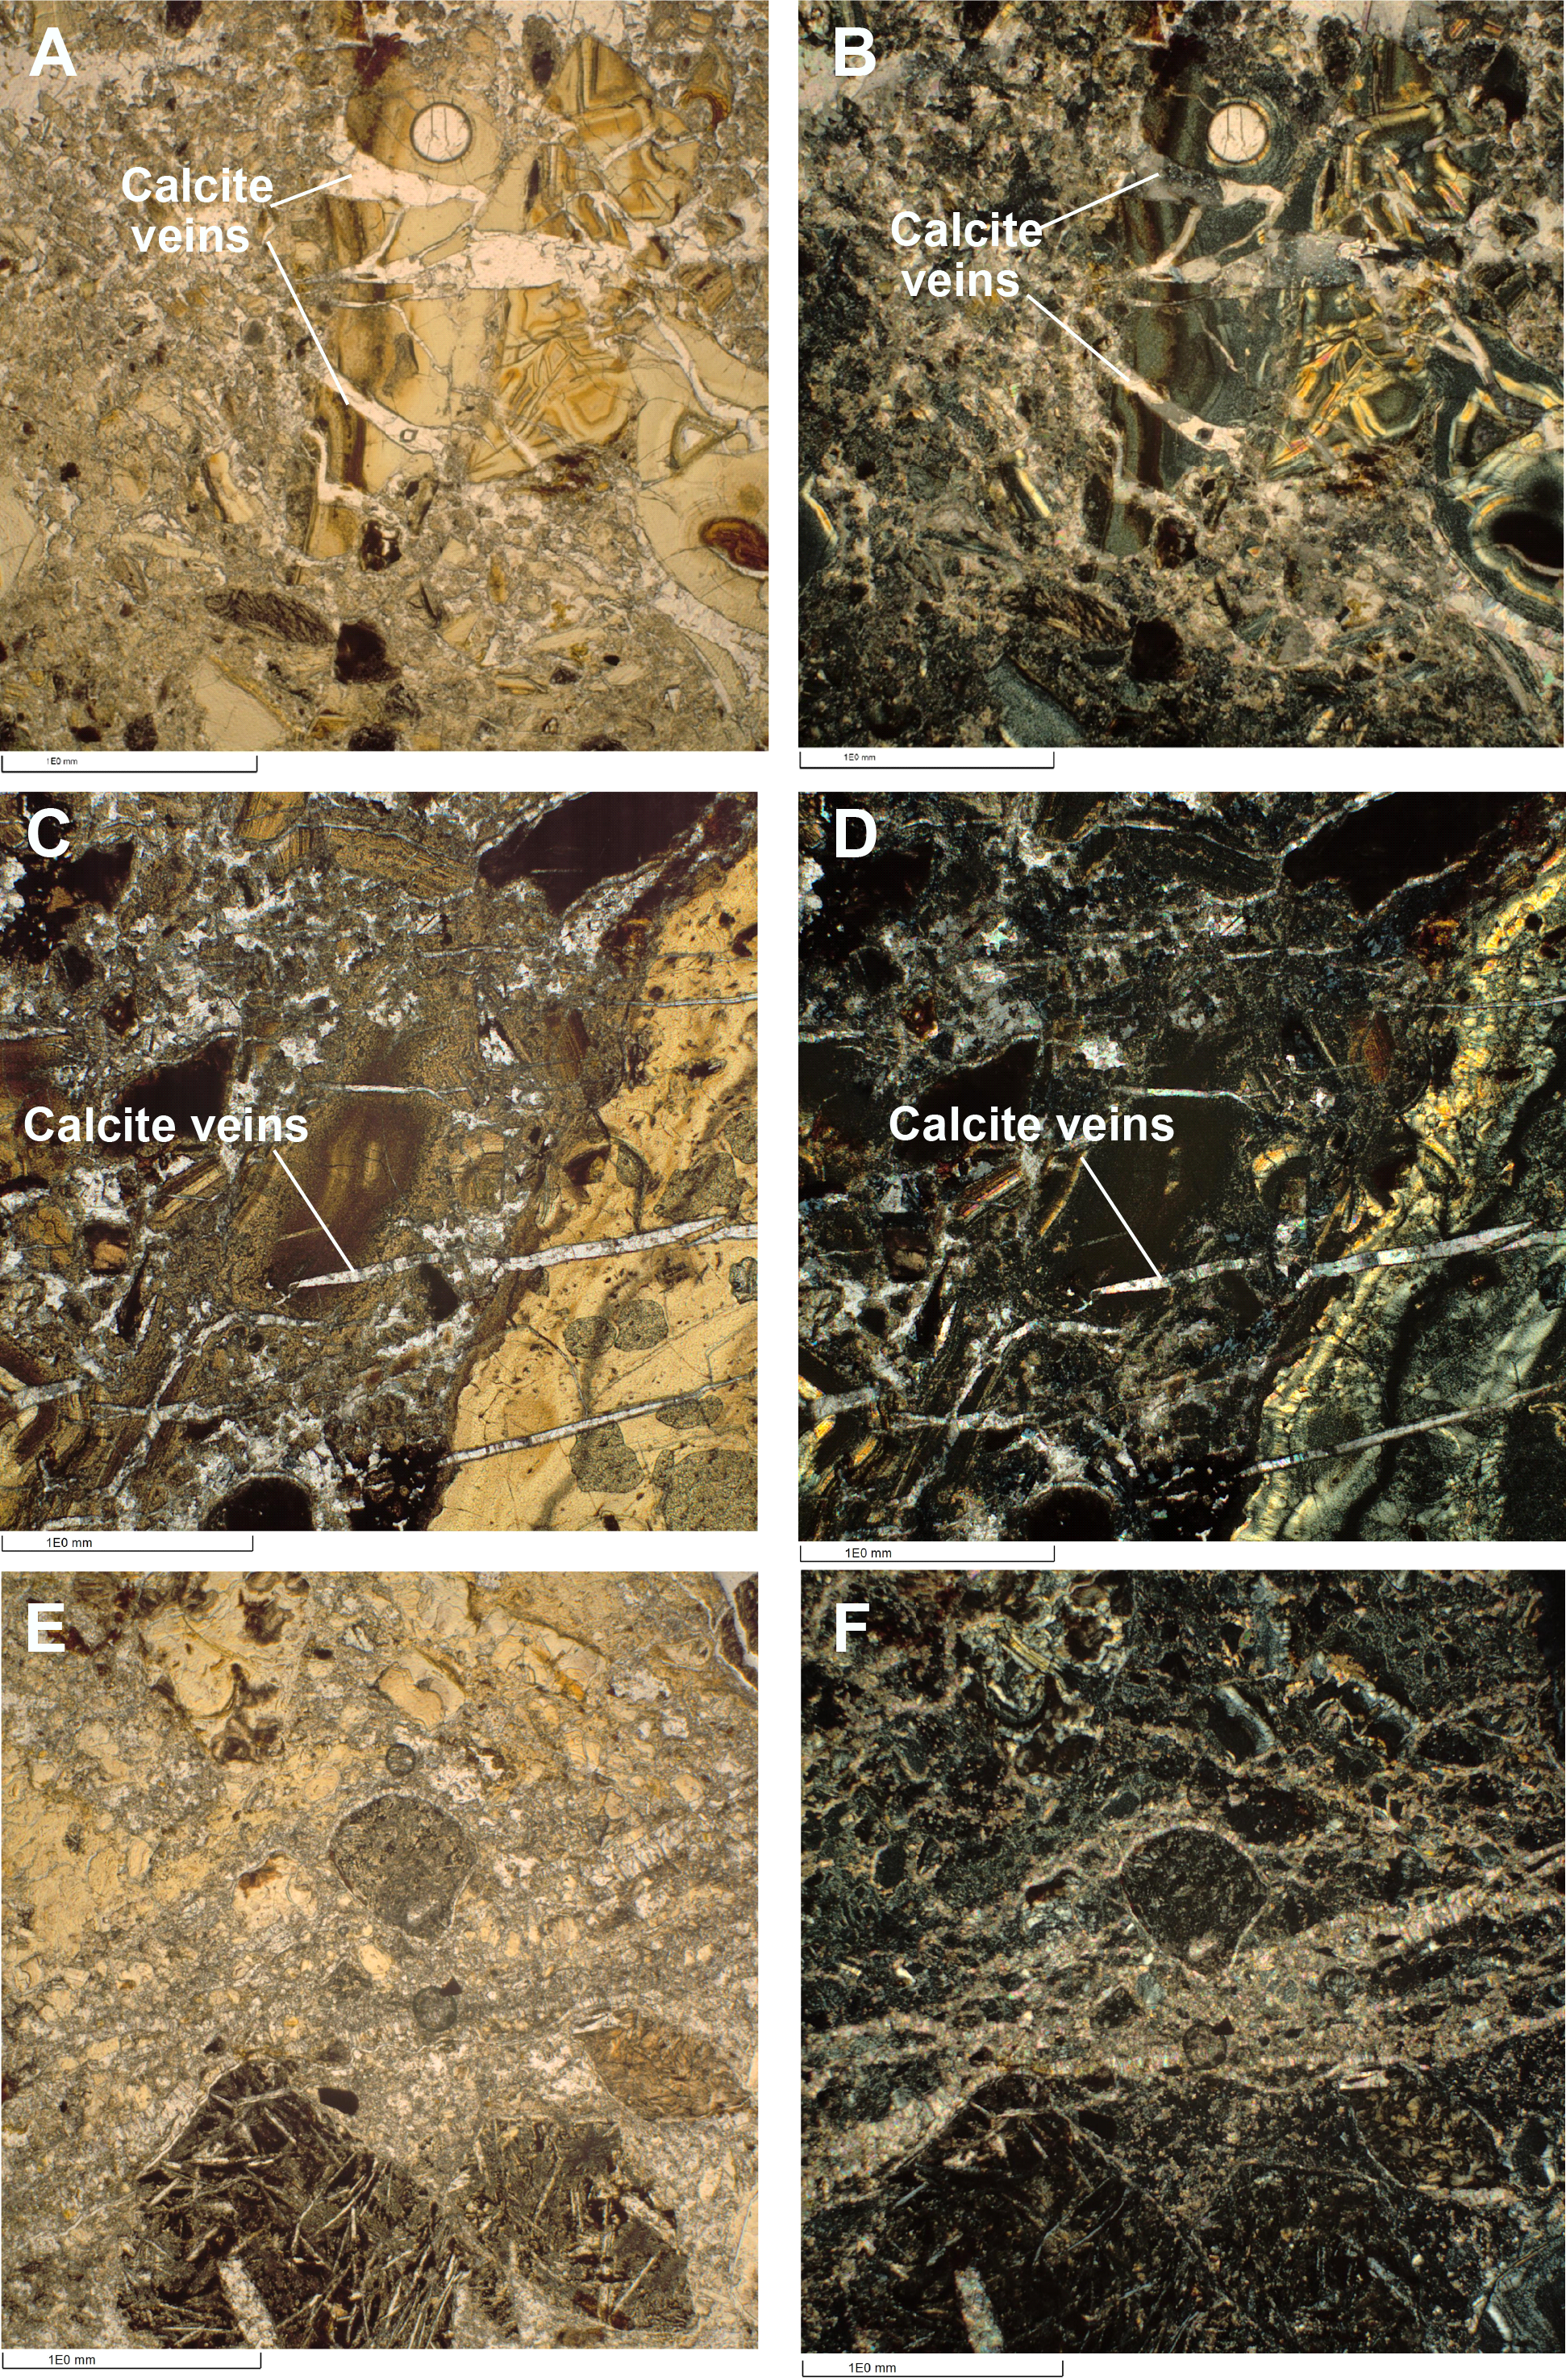
Figure F33. Association of deformation with calcite veins.
Subunit 1c is defined by the overall absence of pelagic sediment matrix. However, during microscopic analysis of the core, two fragments of foraminifera are present in the lowermost two cores of the hole (Sections 390-U1557D-13R-2 and 14R-2; Figure F34). We do not take these fossil fragments as evidence that there was ever a significant quantity of pelagic sediment in Subunit 1c, however. As seen at Site U1556, it is not uncommon for pelagic sediment to be intercalated within the chilled margins of pillow basalts. The fossil fragments could simply have been entrained along with the basalt and altered glass clasts when the breccia was formed.
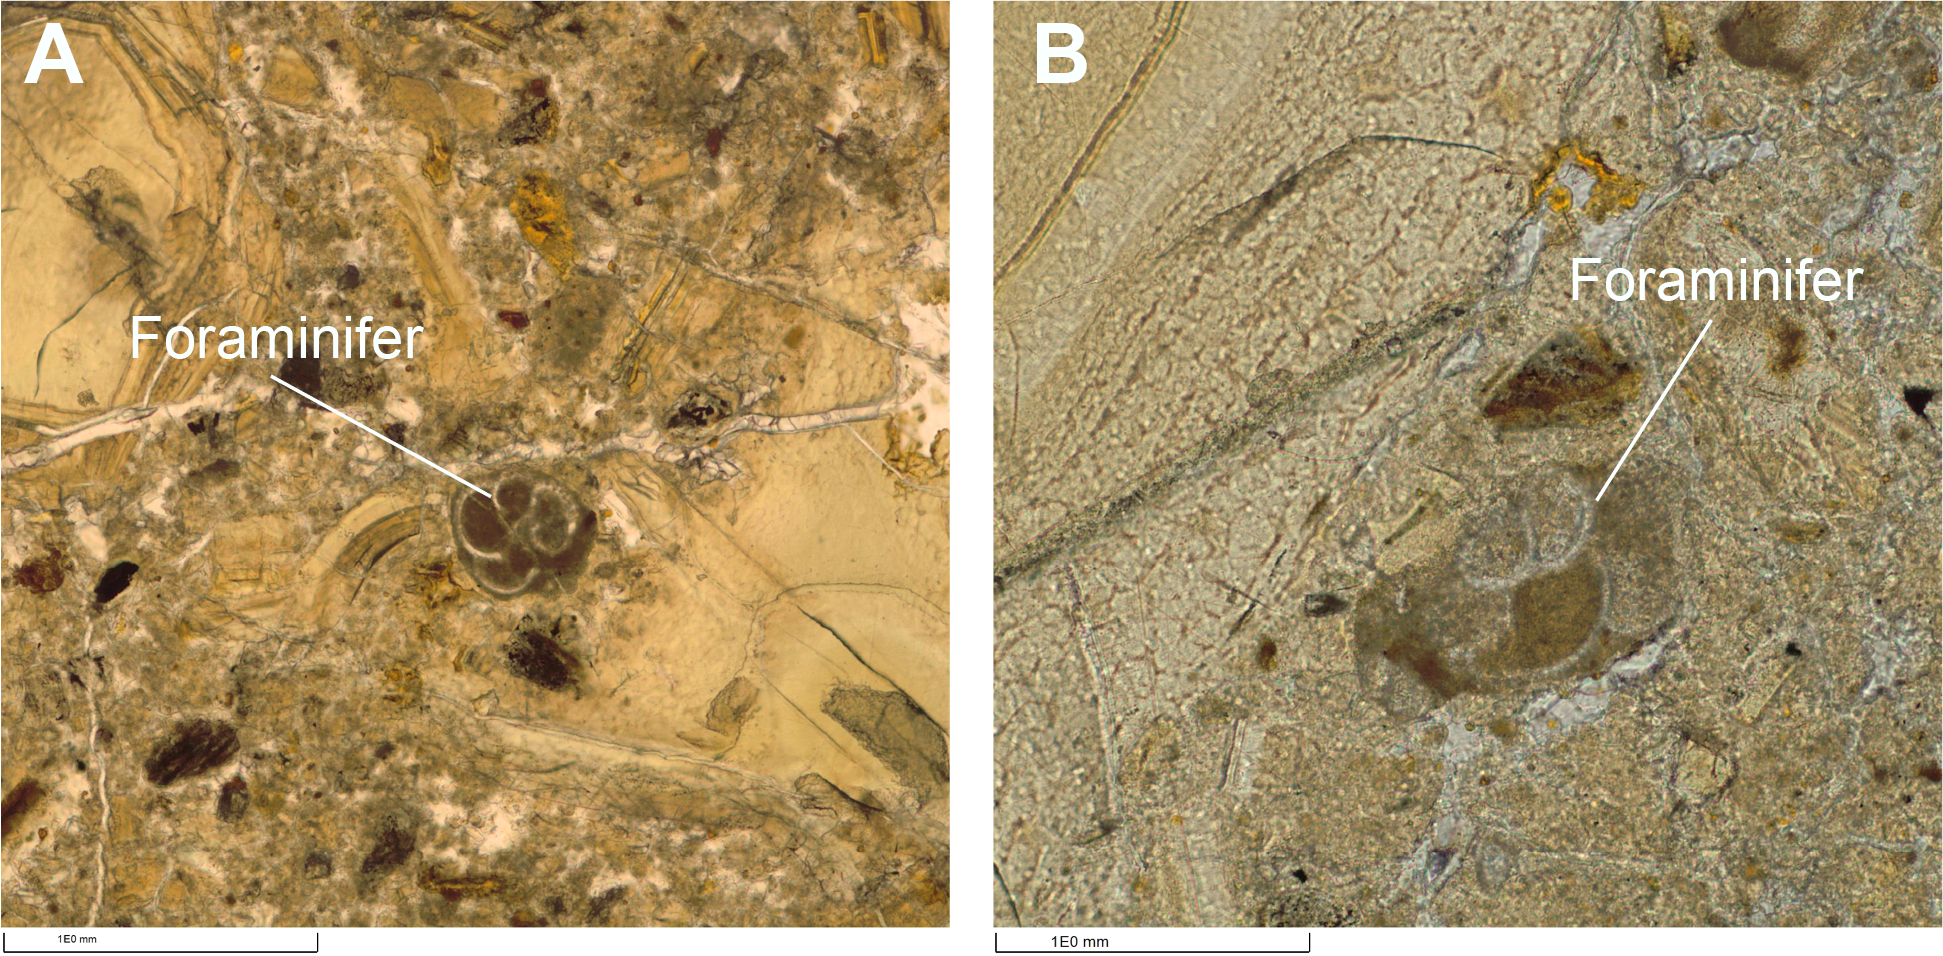
Figure F34. Foraminifera associated with altered glass clasts.
5.1.2. Stratigraphic interpretation
The Site U1557 breccias formed as a talus pile adjacent to fault scarps that bound the sediment basin in which it now occurs. Our observations are not consistent with eruption of basaltic magma into a sediment pond or even deposition of the basalt clasts into a thick sequence of pelagic sediment. Significant amounts of pelagic sediment are limited in occurrence to the uppermost ~10 m of the deposit. The sediments in this interval could have infiltrated from the top during deposition of the overlying pelagic sedimentary sequence. Moreover, to support the widespread crystallization of phillipsite within the breccias, there must have been considerable pore space available in between breccia clasts because phillipsite is known to form where sedimentation rates are low (Kastner, 1979). Whether the breccia deposit formed as a single mass wasting event or accumulated gradually will require detailed shore-based research to resolve.
5.2. Clast petrology
5.2.1. Clast type variation with depth
Although the basement rocks at Site U1557 are essentially a sedimentary deposit, we examined the breccia clasts recovered in terms of their igneous petrology based on macroscopic core descriptions, thin section analysis, and geochemistry (as determined by pXRF) (see Igneous petrology in the Expedition 390/393 methods chapter [Coggon et al., 2024c]). The purpose of this analysis was to assess whether there were any systematic variations in clast type with depth that might affect physical properties (see Physical properties and downhole measurements). In addition, at Site U1556 we observed that volcanostratigraphic sequences maintained similar physical characteristics over tens (possibly hundreds) of meters. As such, depending on the depositional mechanism, the breccia deposit at Site U1557 might record the stratigraphy of the uplifted fault blocks from which it was derived. Such information could provide insights into whether the breccia formed as a single depositional event or accumulated gradually. We also wanted to assess whether the basalts at Site U1557 encompassed the same lithologies as those observed at Site U1556, particularly the presence or absence of alkali basalts.
Time constraints limited us to only a very qualitative assessment of clast abundance. Using the three color-based categories that emerged from macroscopic core description, we ranked the clasts from most to least abundant (or absent) based on visual estimates down the hole (i.e., the exercise resulted in a qualitative ranking, not a quantitative assessment of modal proportions). We did not include altered glass as a clast for this analysis because it commonly occurs as small pebbles or sand- to silt-sized particles in the matrix. It was also not possible to link the altered glass to a specific basalt lithology based on macroscopic observation, which limited its utility in this context.
Figure F35 shows the results of the analysis. In general, all three clast types (gray, brown, or orange) are present throughout the hole, and there are no significant gaps or trends in occurrence. However, we note that gray clasts tend to be either the most abundant lithology in a given interval or in very low abundance to absent. In contrast, orange clasts are rarely the most abundant, and only below Core 390-U1557D-6R, but they were the least likely to be entirely absent. Brown clasts tended to be the most abundant, ranking first or second in abundance more often than either gray or orange basalts.
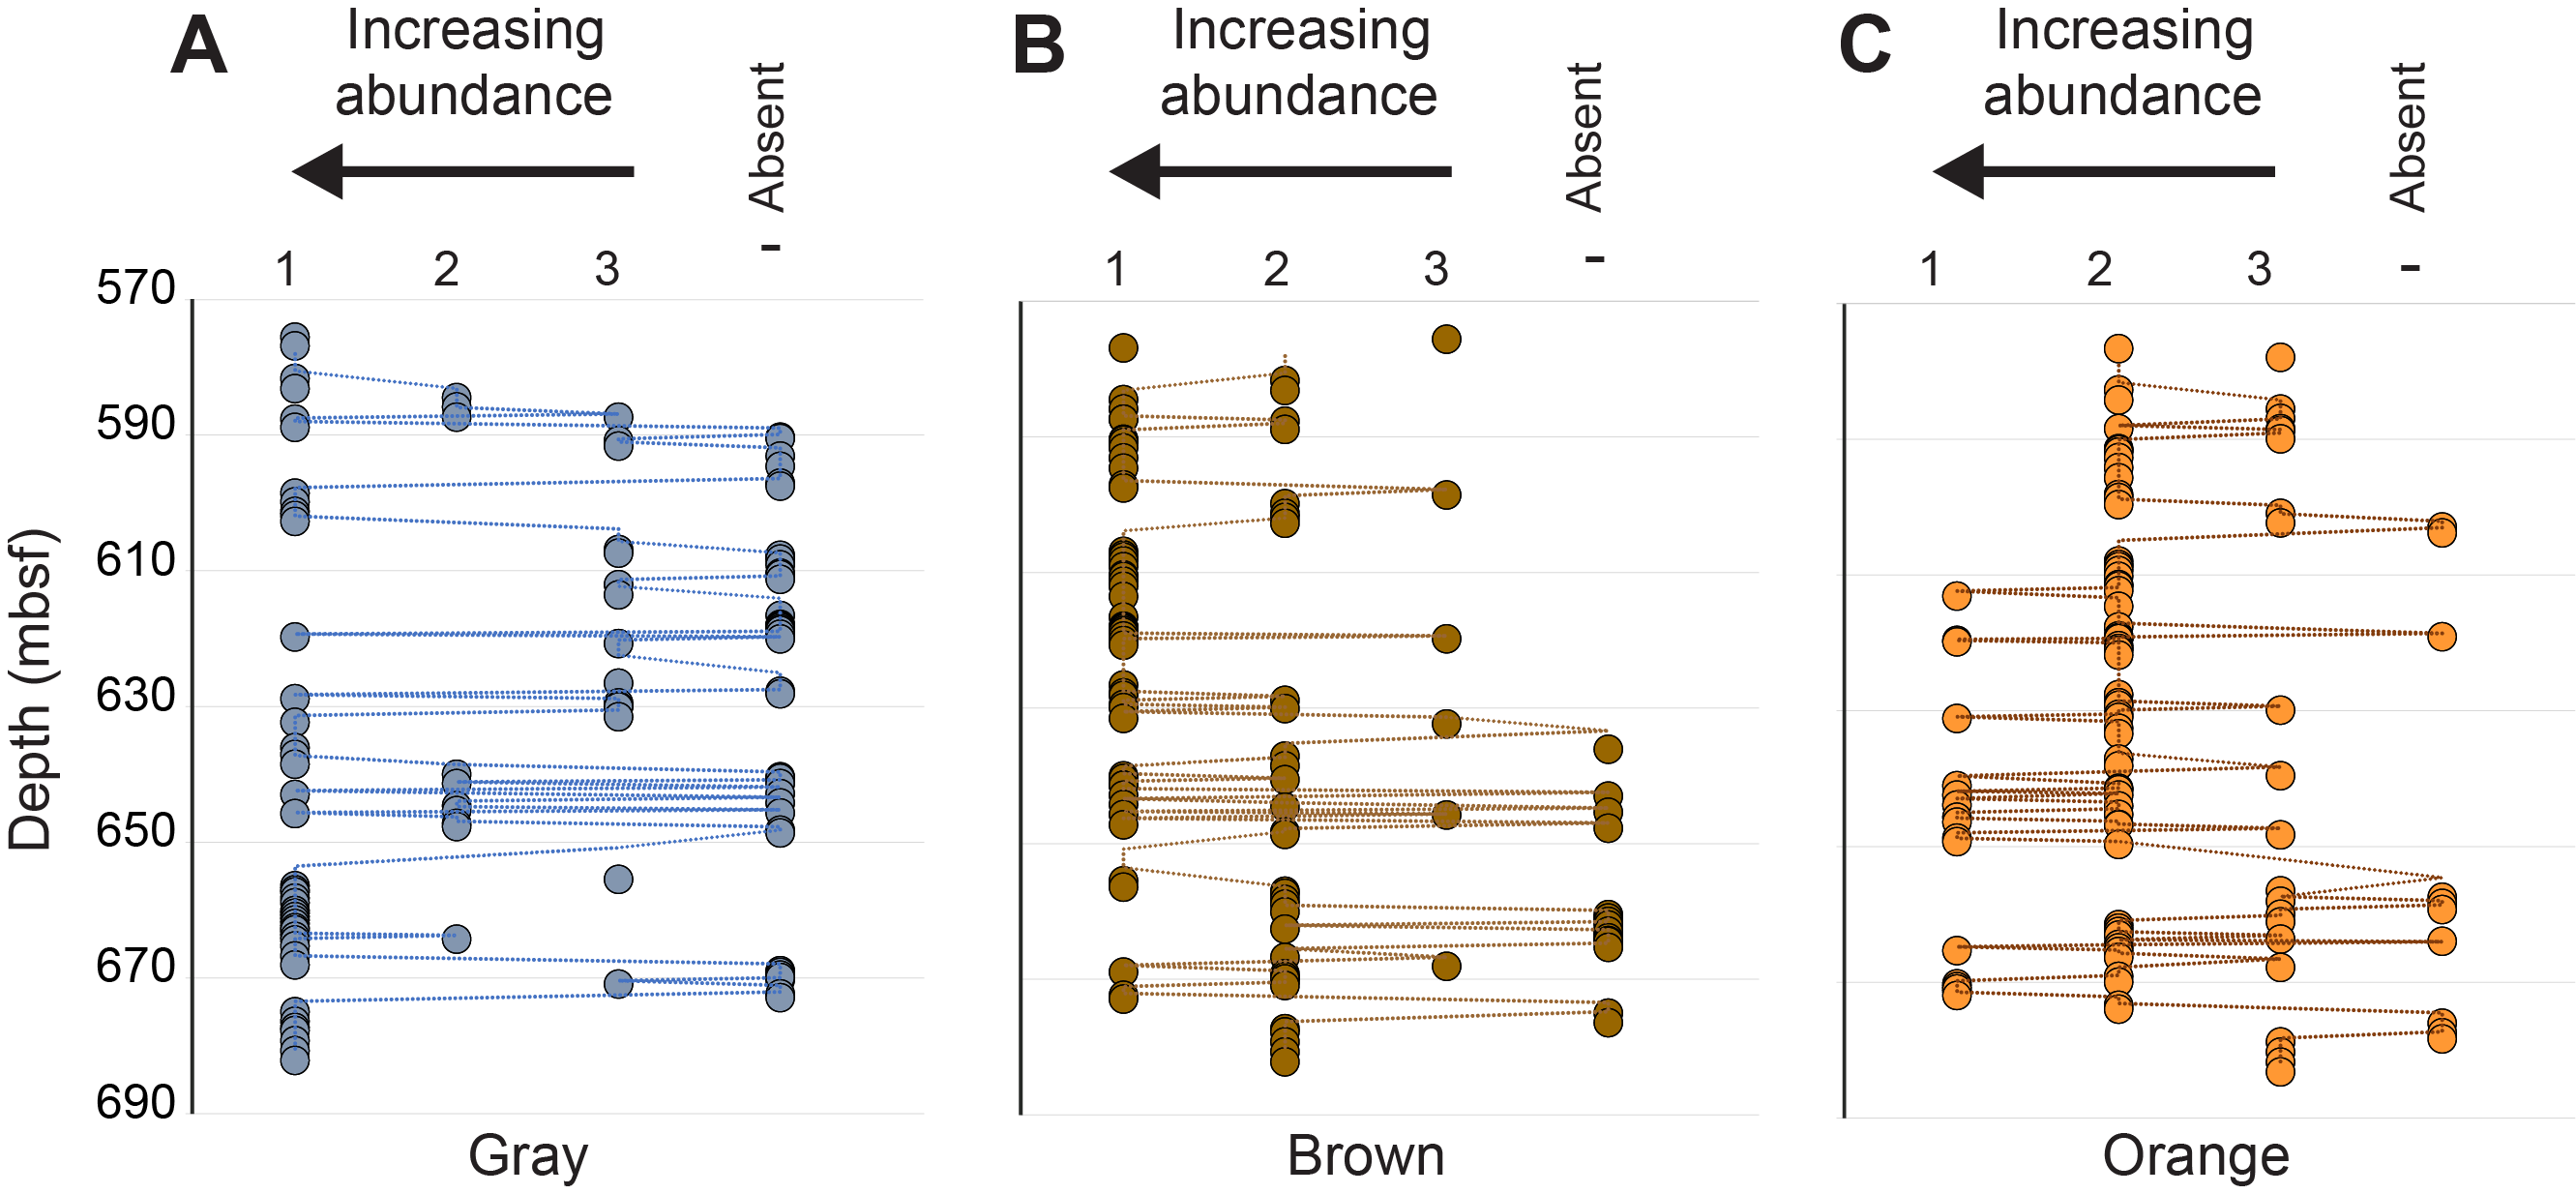
Figure F35. Clast modal abundance ranking.
As a first-order qualitative analysis, we believe the lack of systematic stratigraphic variations is inconsistent with the talus pile forming through the progressive erosion of a stratigraphic succession from an adjacent fault scarp. If it were, we would expect to see long intervals that represent a more limited range of clast types. Instead, the Site U1557 breccia probably formed as one or more slump/mass wasting events that mixed lithologies over multiple stratigraphic (magmatic) sequences.
5.2.2. Petrographic observations
The basalt clasts at Site U1557 are predominantly aphyric; however, where phenocrysts (or microphenocrysts) are present, the rocks are predominantly plagioclase phyric or olivine phyric. Highly or even moderately plagioclase-olivine-clinopyroxene phyric basalts like those present at Site U1556 and other sites along the SAT are uncommon. Green clinopyroxenes (i.e., diopside) are rare in the core, and thin section analysis confirmed that titanaugite is not present. The latter indicates that alkali basalts were not recovered at Site U1557, and this observation is confirmed by the pXRF analyses (see Insights from pXRF analysis and Geochemistry). In this sense, the rocks are more typical of mid-ocean-ridge basalts (MORBs; i.e., tholeiitic). Compositionally, this makes them most similar to Stratigraphic Sequence C at the bottom of Hole U1556B. Although plagioclase phenocrysts/macrocrysts are rare, where they are seen, they exhibit a multistage history, having older cores that were partially resorbed and enclosed in a younger phase of plagioclase crystallization (Figure F36A), similar to plagioclase macrocrysts in highly plagioclase-olivine-pyroxene phyric (H-POPP) basalts at Site U1556.
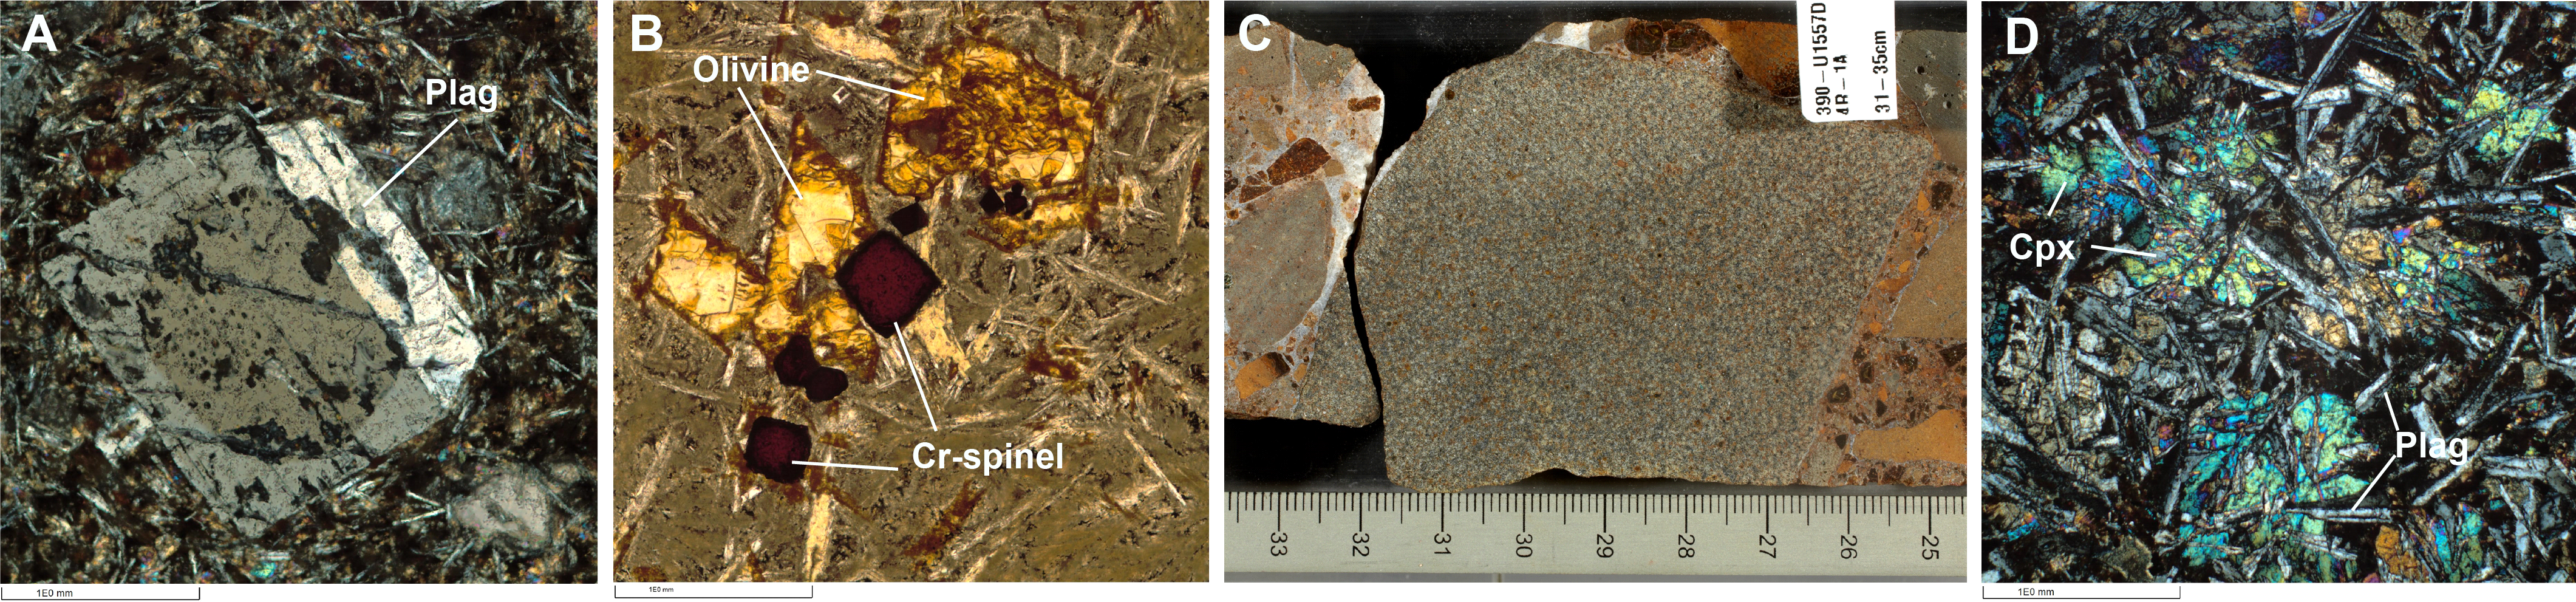
Figure F36. Phenocrysts and crystals in microcrystalline basalt.
We also encountered basalts with microcrystalline textures that were not observed at Site U1556 (Figure F36C). These are typically gray basalts that range from aphyric to sparsely plagioclase ± olivine phyric. In thin section, they exhibit subophitic textural relationships between clinopyroxene and plagioclase (Figure F36D).
Finally, although olivine was observed to contain small equant crystals of Cr-spinel in several samples from Site U1556, much larger Cr-spinels are present as discrete crystals in at least two samples from Site U1557 (Samples 390-U1557D-6R-4 [Piece 5, 104–105 cm] and 14R-3 [Piece 3, 85–87 cm]) (Figure F36B). The composition of Cr-spinel is known to be a good indicator of the melt composition from which it crystallized (Kamenetsky et al., 2001). These crystals can, therefore, provide information on preeruptive petrogenetic events, such as magma chamber recharge. In a deposit where the basalts are as thoroughly altered as those from Site U1557, Cr-spinel composition could be a useful tool for reconstructing at least some of the primary igneous petrogenesis.
5.2.3. Insights from pXRF analysis
Petrologic interpretations made from macroscopic core descriptions and thin section observations were corroborated using geochemical data produced by pXRF (see Geochemistry). A total of 53 analyses of 44 discrete basaltic clasts were determined from the archive half of the core along with 52 analyses of 20 sample powders prepared for inductively coupled plasma–atomic emission spectroscopy (ICP-AES). Our sampling includes clasts from all groups (i.e., gray, brown, and orange). As explained in the Site U1556 chapter [Coggon et al., 2024a], in our usage of the pXRF we found that most elements were insufficiently precise and/or accurate or too mobile in response to alteration to be useful for examining aspects of primary igneous petrogenesis (see Geochemistry). We have, therefore, relied on the ratio of Zr to Ti, normalized to the average normal MORB (N-MORB) composition of Sun and McDonough (1989) (i.e., [Zr/Ti]N), for our analysis. Note that we have applied the same correction procedure to the samples from Site U1557 as we did for Site U1556 (see Igneous petrology in the Site U1556 chapter [Coggon et al., 2024a]). Our results are shown in Figure F37 relative to the data for basalts from Site U1556.
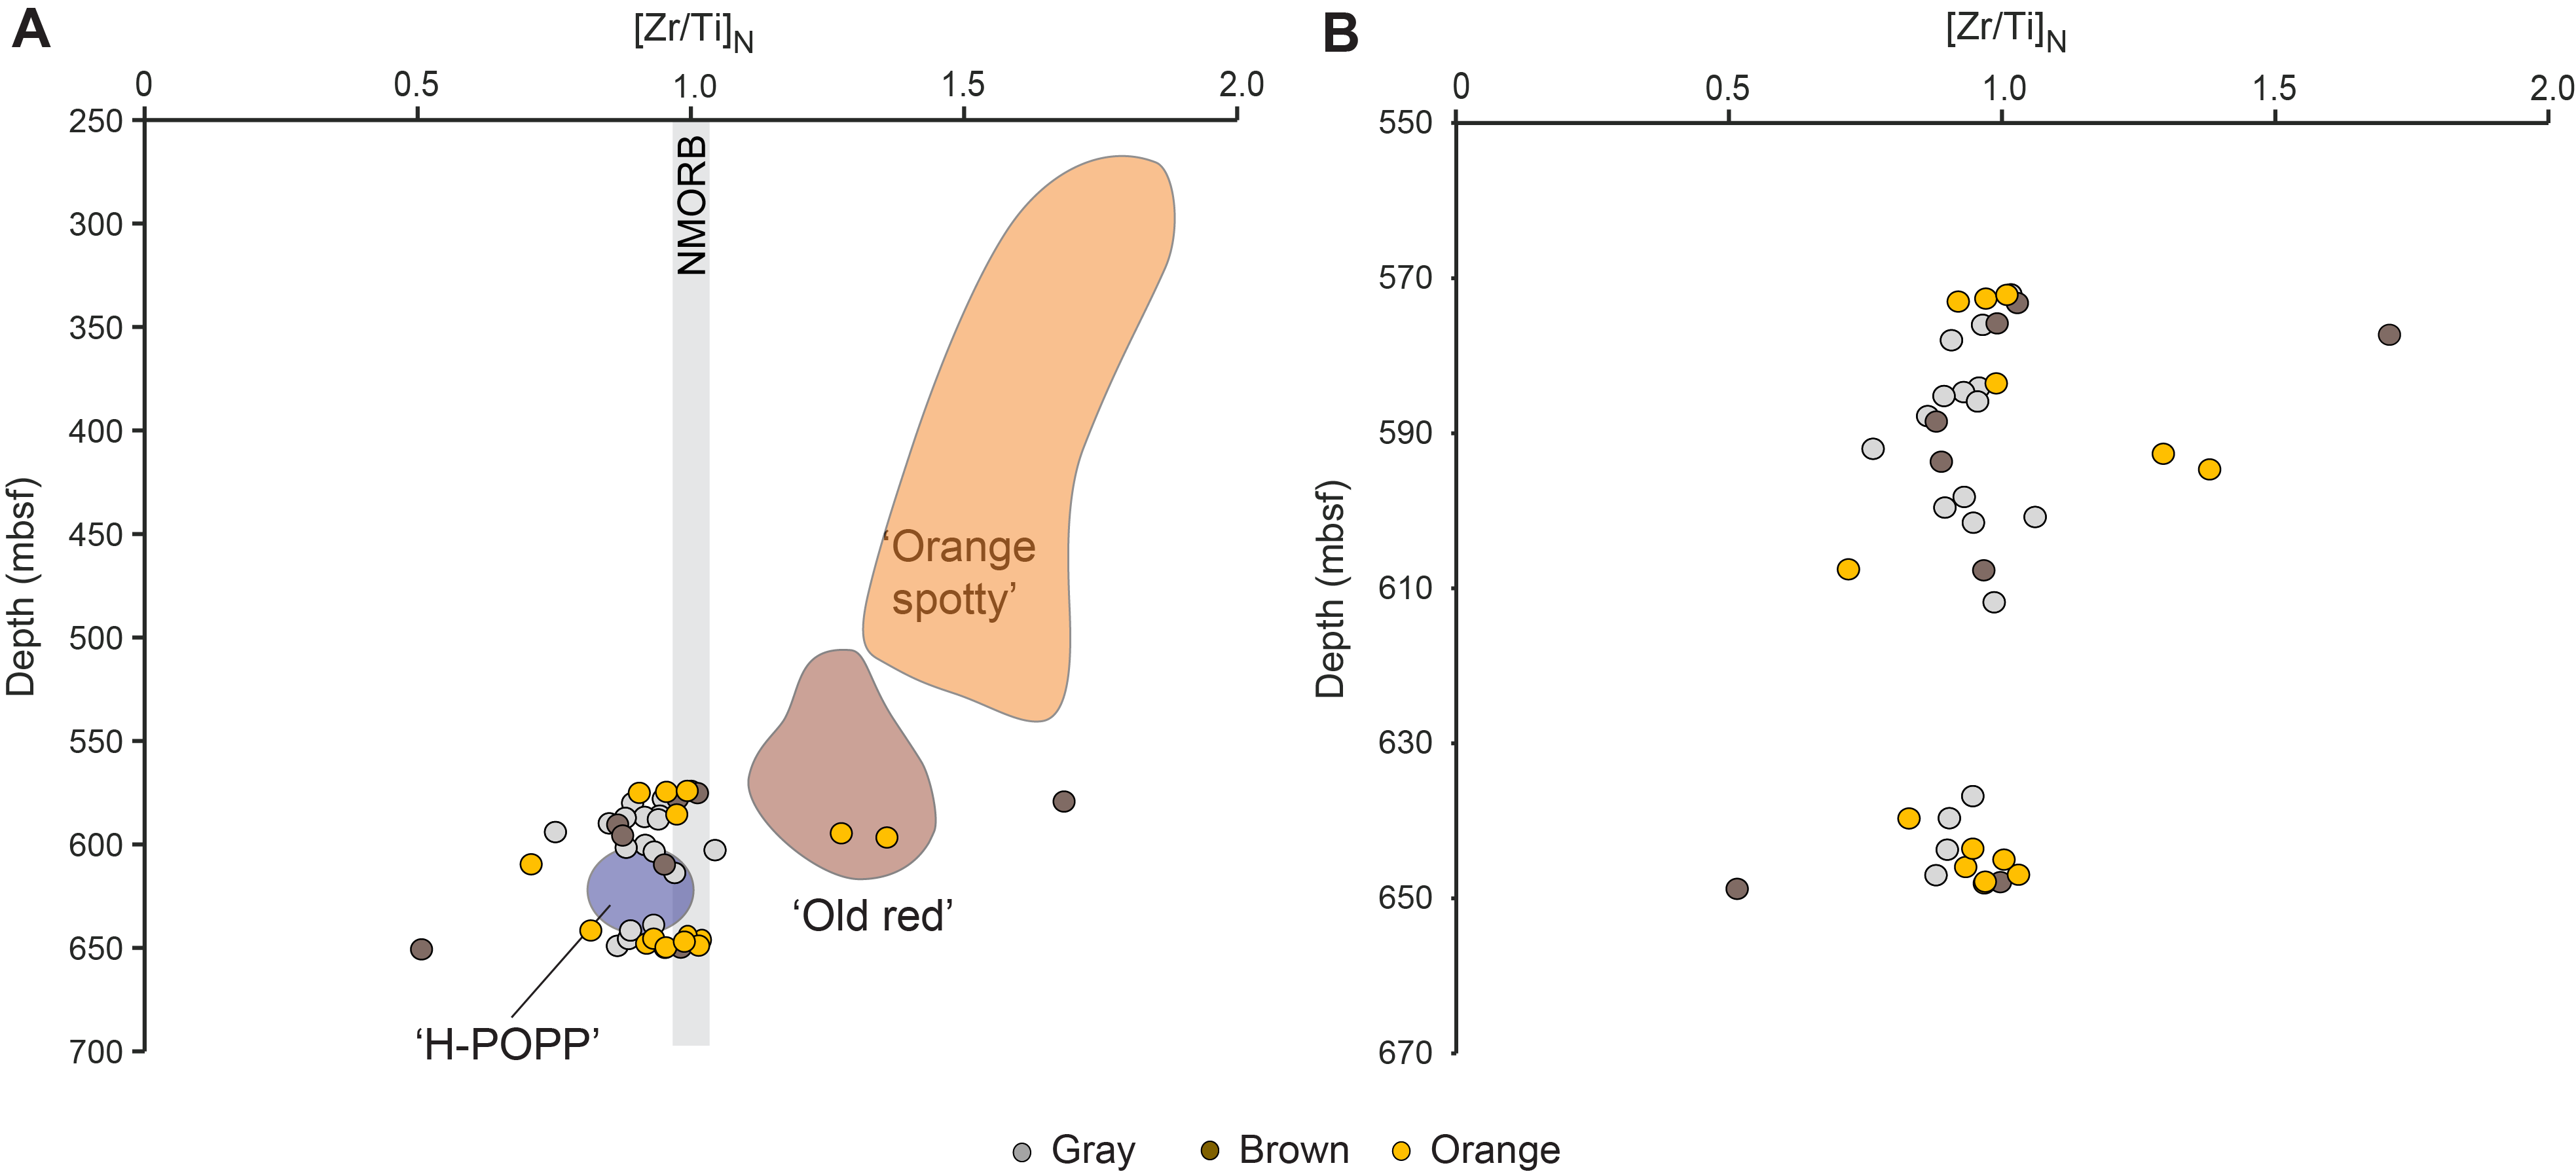
Figure F37. [Zr/Ti]N for basalt breccia clasts.
Basalt breccia clasts from Site U1557 have [Zr/Ti]N values similar to N-MORB and overlap the compositions of Stratigraphic Sequence C (H-POPP) basalts, although with considerably more scatter. Three of the more extreme high values, one from a brown basalt (Section 390-U1557D-2R-2, 36 cm) and two from orange clasts (Sections 4R-4, 88 cm, and 4R-5, 142 cm) overlap the compositions of alkali basalts from Site U1556 (Stratigraphic Sequences A and B) even though petrographic evidence indicates that these basaltic clasts are not of this lithologic type. Conversely, one sample (11R-2, 22 cm) has the lowest [Zr/Ti]N value measured during Expedition 390, which is significantly lower than N-MORB (Figure F37). These extreme values should be considered with caution, however, considering the ~1 cm2 analytical footprint of the pXRF instrument and hence its propensity for perturbation by inadvertent analysis of phenocrysts.
The data are plotted in Figure F37B on an expanded scale relative to Figure F37A and distinguished by clast color so that variations within each color group can be seen more easily. The data show that the gray clasts (i.e., those that are least altered) have the smallest range of [Zr/Ti]N values. The average value for the gray basalt clasts (0.92 ± 0.06) is slightly lower than average N-MORB but overlaps the compositions of H-POPP basalts from Site U1556 (0.91 ± 0.03). Somewhat surprisingly, the brown clasts, which were assumed to be the next least altered, extend to both significantly higher and lower values than both the gray and the orange basalts; the range for brown clasts is 0.51–1.69, whereas the range for orange clasts is 0.71–1.36.
The data suggest that the [Zr/Ti]N ratio may have been affected by alteration in some samples, and the variation appears to be related more to the behavior of Ti than to Zr. The samples with the anomalously high [Zr/Ti]N (Samples 390-U1557D-2R-2, 36 cm; 4R-4, 88 cm; and 4R-5, 142 cm) have much lower TiO2 concentrations than is typical for the basalt clasts (~0.5–0.6 wt% corrected concentration as compared to ~1.0 ± 0.1 wt% for basalt clasts on average). Conversely, the sample with the anomalously low [Zr/Ti]N (Sample 11R-2, 22 cm) has a corrected concentration of ~1.5 wt% TiO2. In contrast, the average corrected Zr concentration for the basalt clasts is 54 ± 5 ppm, and all four anomalous clasts have Zr concentrations within that range.
These data indicate that, despite assumptions to the contrary, the concentration of Ti appears to have been affected by alteration in some cases, suggesting that caution should be used when assuming high field strength element immobility during alteration. The impacts of alteration are even more dramatic for some of the large ion lithophile elements (LILEs), namely elements that are well known to be fluid mobile. Figure F38 shows the variation in the concentration of K relative to [Zr/Ti]N for the Site U1557 basalt clasts compared with the data for basalts from Site U1556 (Stratigraphic Sequences A–C). Not surprisingly, the alkali basalts from Stratigraphic Sequence A ("orange spotty") have high K concentrations, which is consistent with their alkali basalt compositions. The "old red" basalts (Stratigraphic Sequence B) have lower K concentrations, which is more consistent with an origin as an enriched MORB (E-MORB). The K concentrations for H-POPP basalts (Stratigraphic Sequence C) were too low to be determined by pXRF, but results of ICP-AES analysis indicate concentrations <2000 ppm. By comparison, all of the basalt clasts from the Site U1557 breccia have K concentrations greater than ~3000 ppm. This is five times the K concentration of N-MORB (~600 ppm [Sun and McDonough, 1989]). The highly altered clast with the lowest [Zr/Ti]N also has the highest K concentration we have measured (>35,000 ppm), which is equivalent to a K2O content of more than 4 wt%. These high concentrations are potentially consistent with the abundance of phillipsite throughout the core, as discussed above. Other LILEs, such as Sr, do not show these extreme enrichments, even among the most altered basalt breccia clasts (Figure F38B). This may be because the data reported here are for basalt clasts only. We did not analyze the breccia matrix separately or attempt whole-rock analysis, given the lithologic heterogeneity of the breccia. Shore-based research is obviously required to understand the full panoply of element fluxes into and out of the breccias at Site U1557.
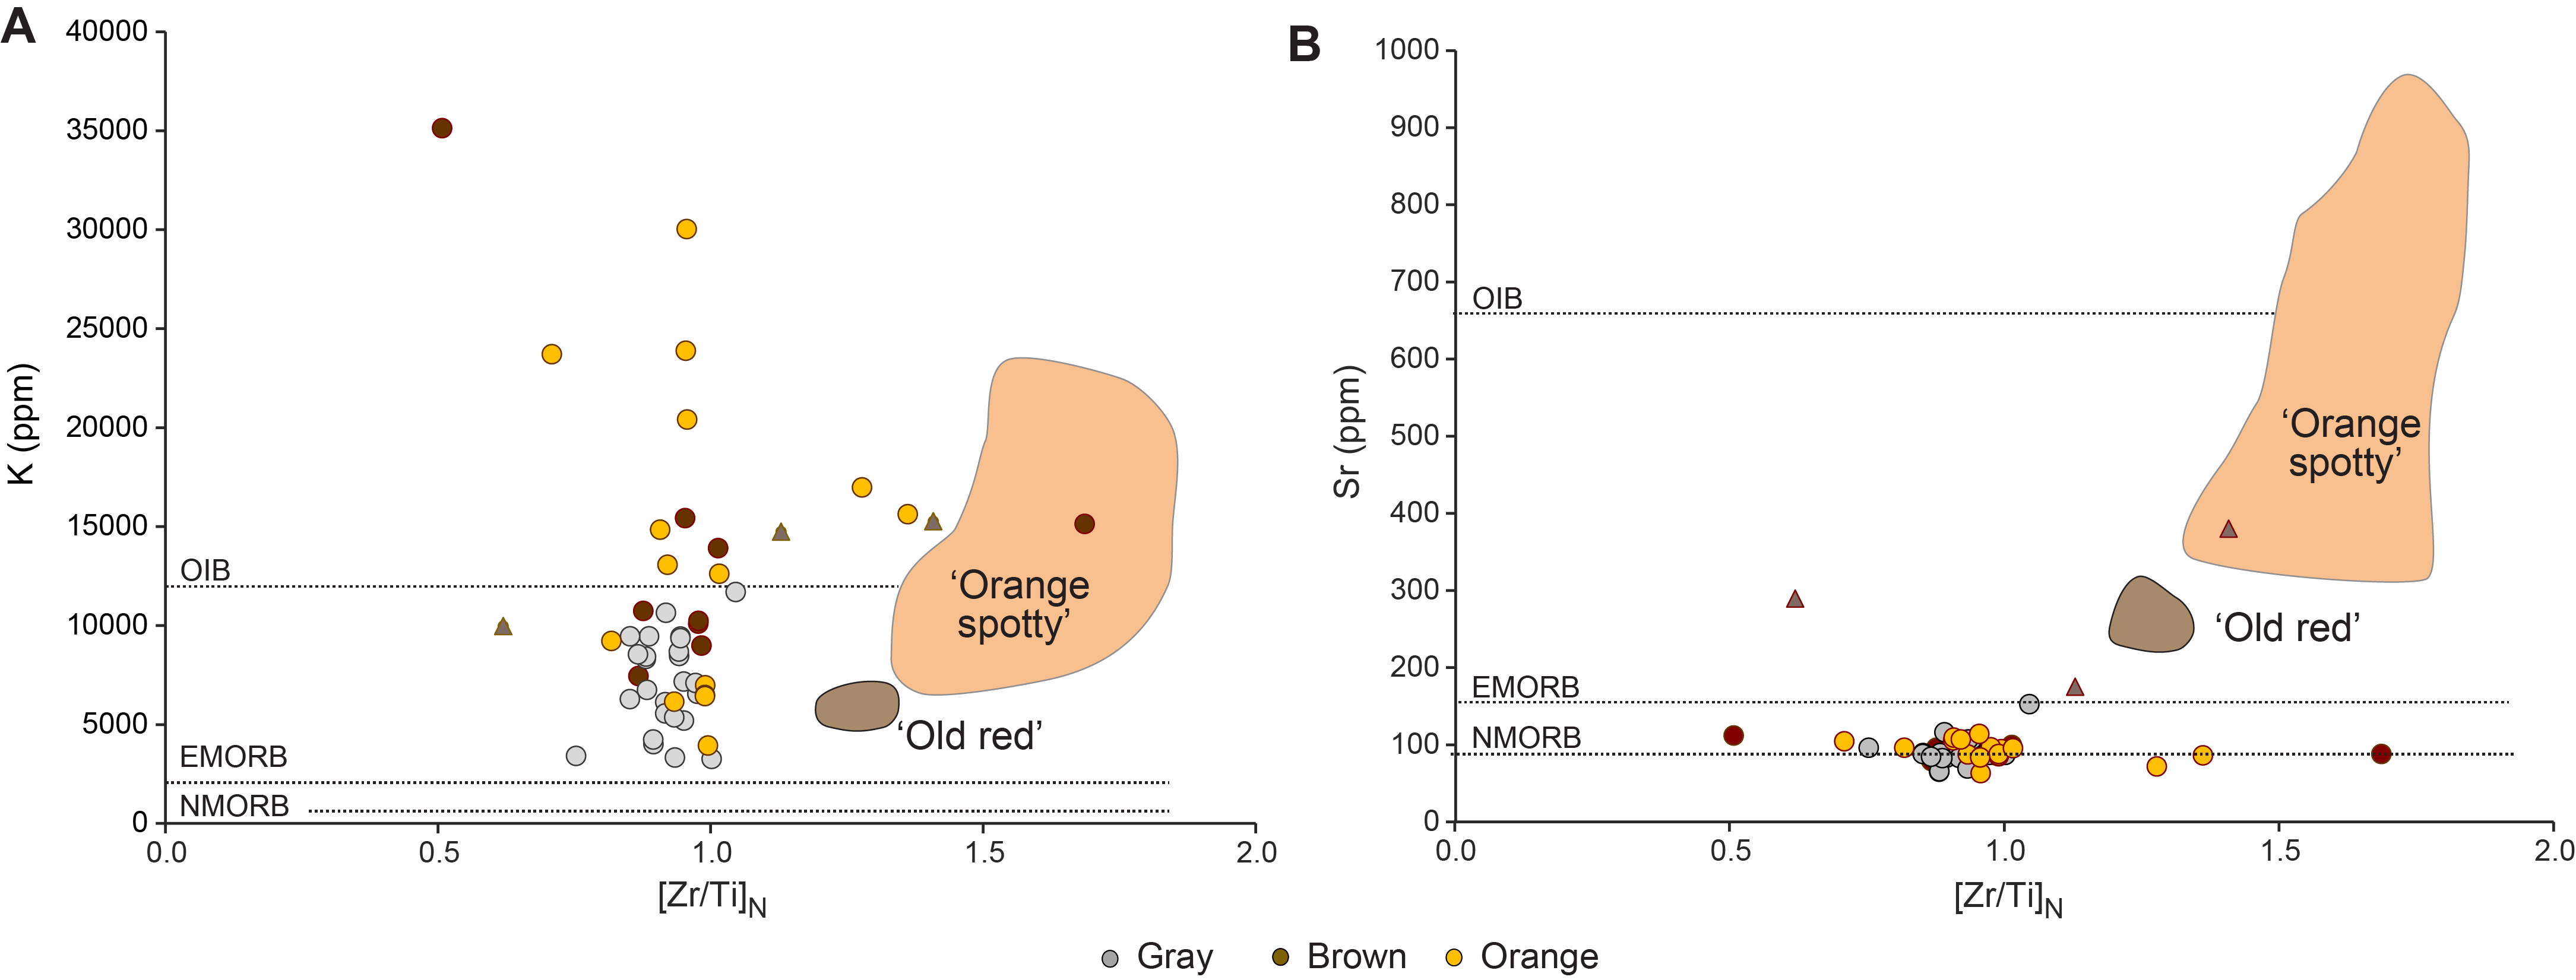
Figure F38. K and Sr vs. [Zr/Ti]N.
In summary, if we focus on the least altered samples from Site U1557, the data suggest that there is no systematic variation in clast composition with depth. The overlap in [Zr/Ti]N compositions of the gray breccia clasts and the H-POPP rocks from Site U1556 and their similarity to N-MORB (Figure F37) suggest they are most likely derived from a mantle source that is similar to that of N-MORB. Alkali basalt compositions like those seen in Stratigraphic Sequences A and B (i.e., orange spotty and old red) at Site U1556 are not observed. Therefore, the breccia clasts at Site U1557 were not derived from the stratigraphic succession observed at Site U1556 6.5 km west of Site U1557. At a spreading rate of 13.5 mm/y for Site U1557 (see Background and objectives), there could have been ~500,000 y between the events that formed the seafloor at Sites U1557 and U1556. Whatever the origin of the alkali basalts at Site U1556, the conditions that gave rise to them have been lost in the space (and time) that has been traversed to Site U1557.
6. Alteration petrology
Alteration of the breccias at Site U1557 is variable, with evidence of alteration within the breccia pile as well as earlier alteration prior to brecciation and deposition. A range of different alteration styles are evident, from oxide-rich halos to apparently more reducing conditions characterized by green clay minerals. Alongside alteration of the igneous clasts, there is extensive cementation and filling of void spaces by carbonate and zeolite.
The overall range of alteration is very similar in color, extent, and mineralogy to that present in Hole U1556B, ~6.5 km to the west. However, the basalts at Site U1557 are fragmented and juxtaposed as clasts in a talus breccia where they were further altered. This history gives rise to a number of hybrid styles of alteration and adds complexity to the tasks of logging and interpreting the alteration petrology (Figure F40).
The interclast space of the breccias is variably filled with pelagic sediment, sparry carbonate, fine-grained igneous material (glass and basalt), and/or authigenic zeolite + micritic sediment with open millimeter- to centimeter-scale porosity common throughout much of the hole. The volume proportion of porosity and cements decreases downhole (Figure F55).
Macroscopic observations of secondary mineralogy were refined using thin section observations and XRD analyses of vein-filling minerals and breccia cements (34 mineral samples + 21 whole-rock powder samples) (Tables T5, T6). Full alteration and vein logs are available in DESC_WKB in Supplementary material; piece logs are available in ALTPET in Supplementary material.
6.1. Types of alteration
Alteration in the breccias results from two or more stages, with a range of alteration pre- and postbrecciation histories apparent in the clasts throughout the hole. This dual-stage alteration is most macroscopically apparent in the occurrence of several meter-scale intervals of pervasive dark green alteration that clearly overprint earlier oxidative alteration. These contrast with the rest of the basement cores, where orange alteration colors and mineralogy indicate primarily oxidative alteration.
As in rocks at Site U1556, the expression of alteration in a given rock is partly a function of its primary igneous characteristics, principally grain size and primary mineralogy. Cryptocrystalline rocks are more commonly altered to intense bright orange, whereas coarser grained equivalents may preserve more fresh material and appear grayer in color.
6.1.1. Background alteration
6.1.1.1. Orange speckled background alteration
Orange speckled background alteration represents the freshest material in Hole U1557D. It is defined macroscopically by the occurrence of orange or red speckling in an otherwise moderately altered gray (dark gray [GLEY 1 4/N]) to gray-brown (dark gray [2.5Y 4/1]) groundmass. This type of alteration corresponds to the gray clasts described in Igneous petrology. The speckling results from pseudomorphic alteration of olivine to a mixture of smectite and Fe oxyhydroxides (± carbonate), which is often referred to as iddingsite and likely similar to the cryptocrystalline red-brown material replacing groundmass in orange halos (Figure F39). The major difference between this and other observed oxidative alteration styles is that alteration of the groundmass is principally to smectite clays with relatively little reddening from Fe oxyhydroxides. The distinction between orange speckled background alteration and khaki-brown (gray [7.5YR 5/1]) background alteration (see Khaki-brown background alteration) is gradational in macroscopic color and secondary mineralogy.
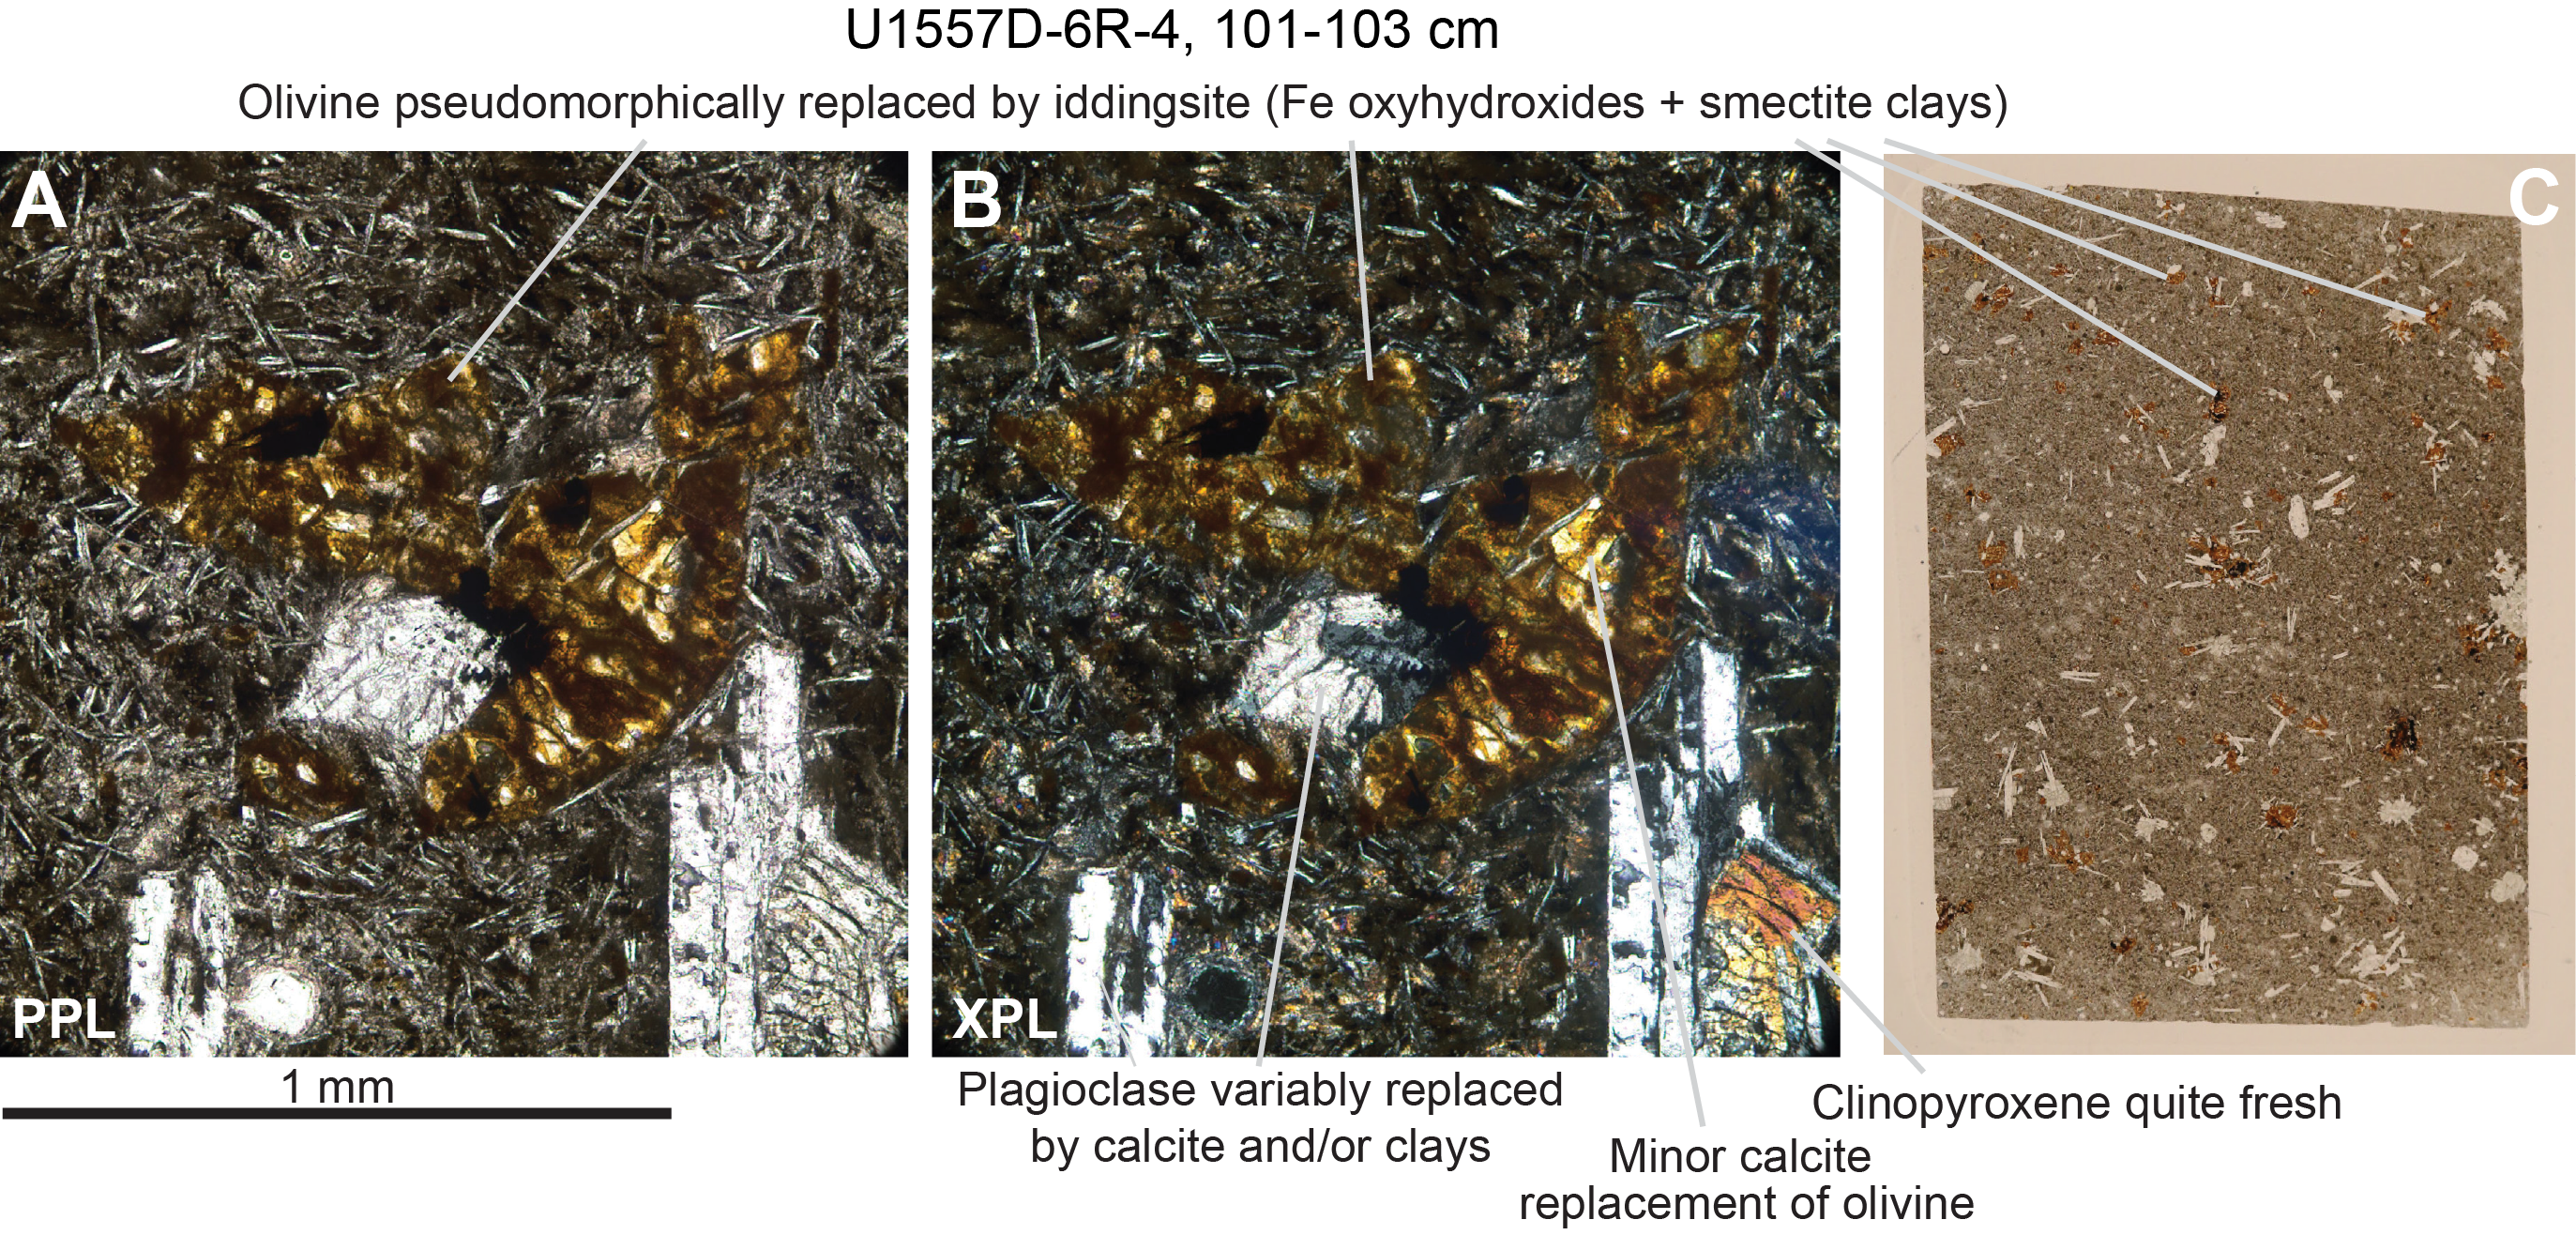
Figure F39. Pseudomorphic replacement of olivine.
6.1.1.2. Khaki-brown background alteration
The most abundant alteration type in Hole U1557D is basalt altered to a distinct khaki-brown color (gray [2.5Y 5/1] to brown [10YR 5/3]) (Figure F40). This type of alteration corresponds to the brown clasts described in Igneous petrology. Olivine phenocrysts, if present, are ubiquitously altered to brick-red, similar to orange speckled background. At the scale of individual clasts, this style of alteration can appear quite variable and commonly grades into intense orange halos or, more rarely, grayer orange speckled background. Nonetheless, allowing for differences in the expression of alteration by basalts of different grain size, the color and macroscopic appearance of khaki-altered clasts is quite homogeneous at the scale of a core section. This homogeneity of alteration contrasts with the variable intensity and clear gradients of alteration apparent in clasts with orange halo alteration (see Orange halos). There are also examples where khaki alteration has developed as concentric halos in larger clasts, indicating alteration occurred after brecciation and hence most likely in situ.
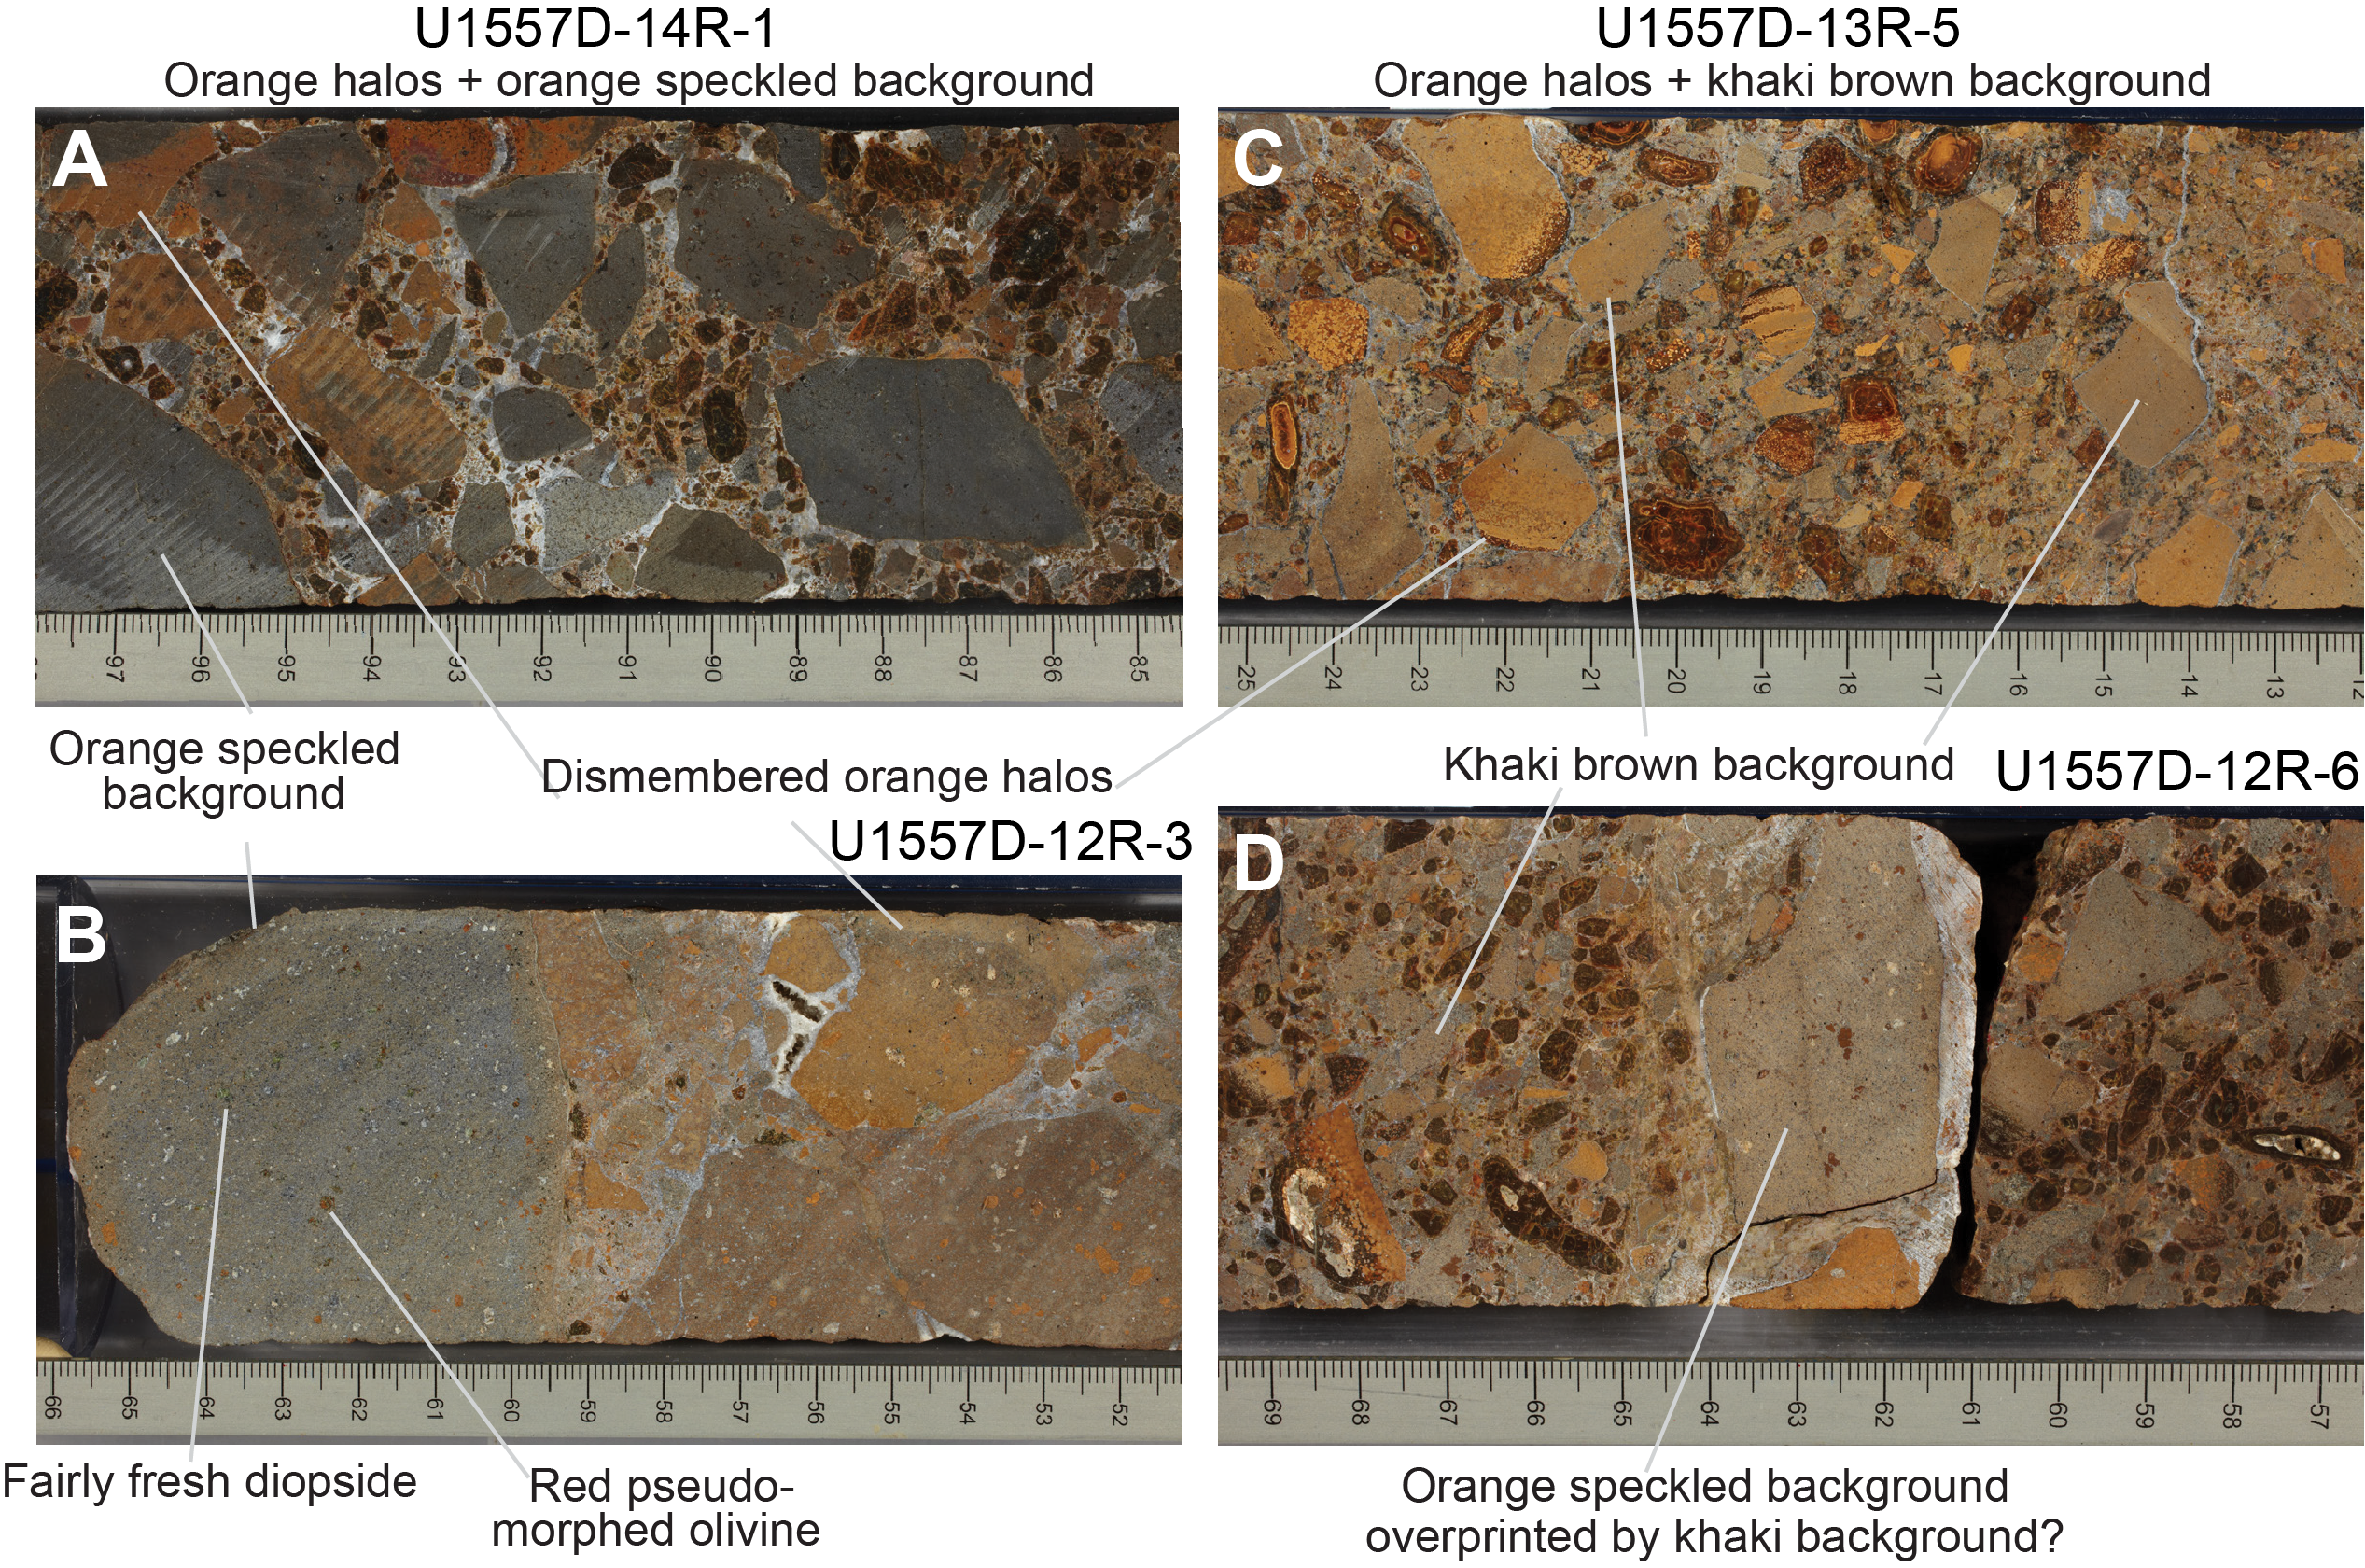
Figure F40. Orange speckled and khaki-brown backgrounds.
In thin section, the khaki-altered mesostasis is characterized by patchy but intense alteration to cryptocrystalline, dusty, grayish clays, as well as moderately intense reddening from replacement of plumose quench crystals (likely olivine and/or clinopyroxene) and olivine phenocrysts by Fe oxyhydroxides (Figure F41). The result is a distinctive dark, dull brown appearance of the groundmass in thin section.
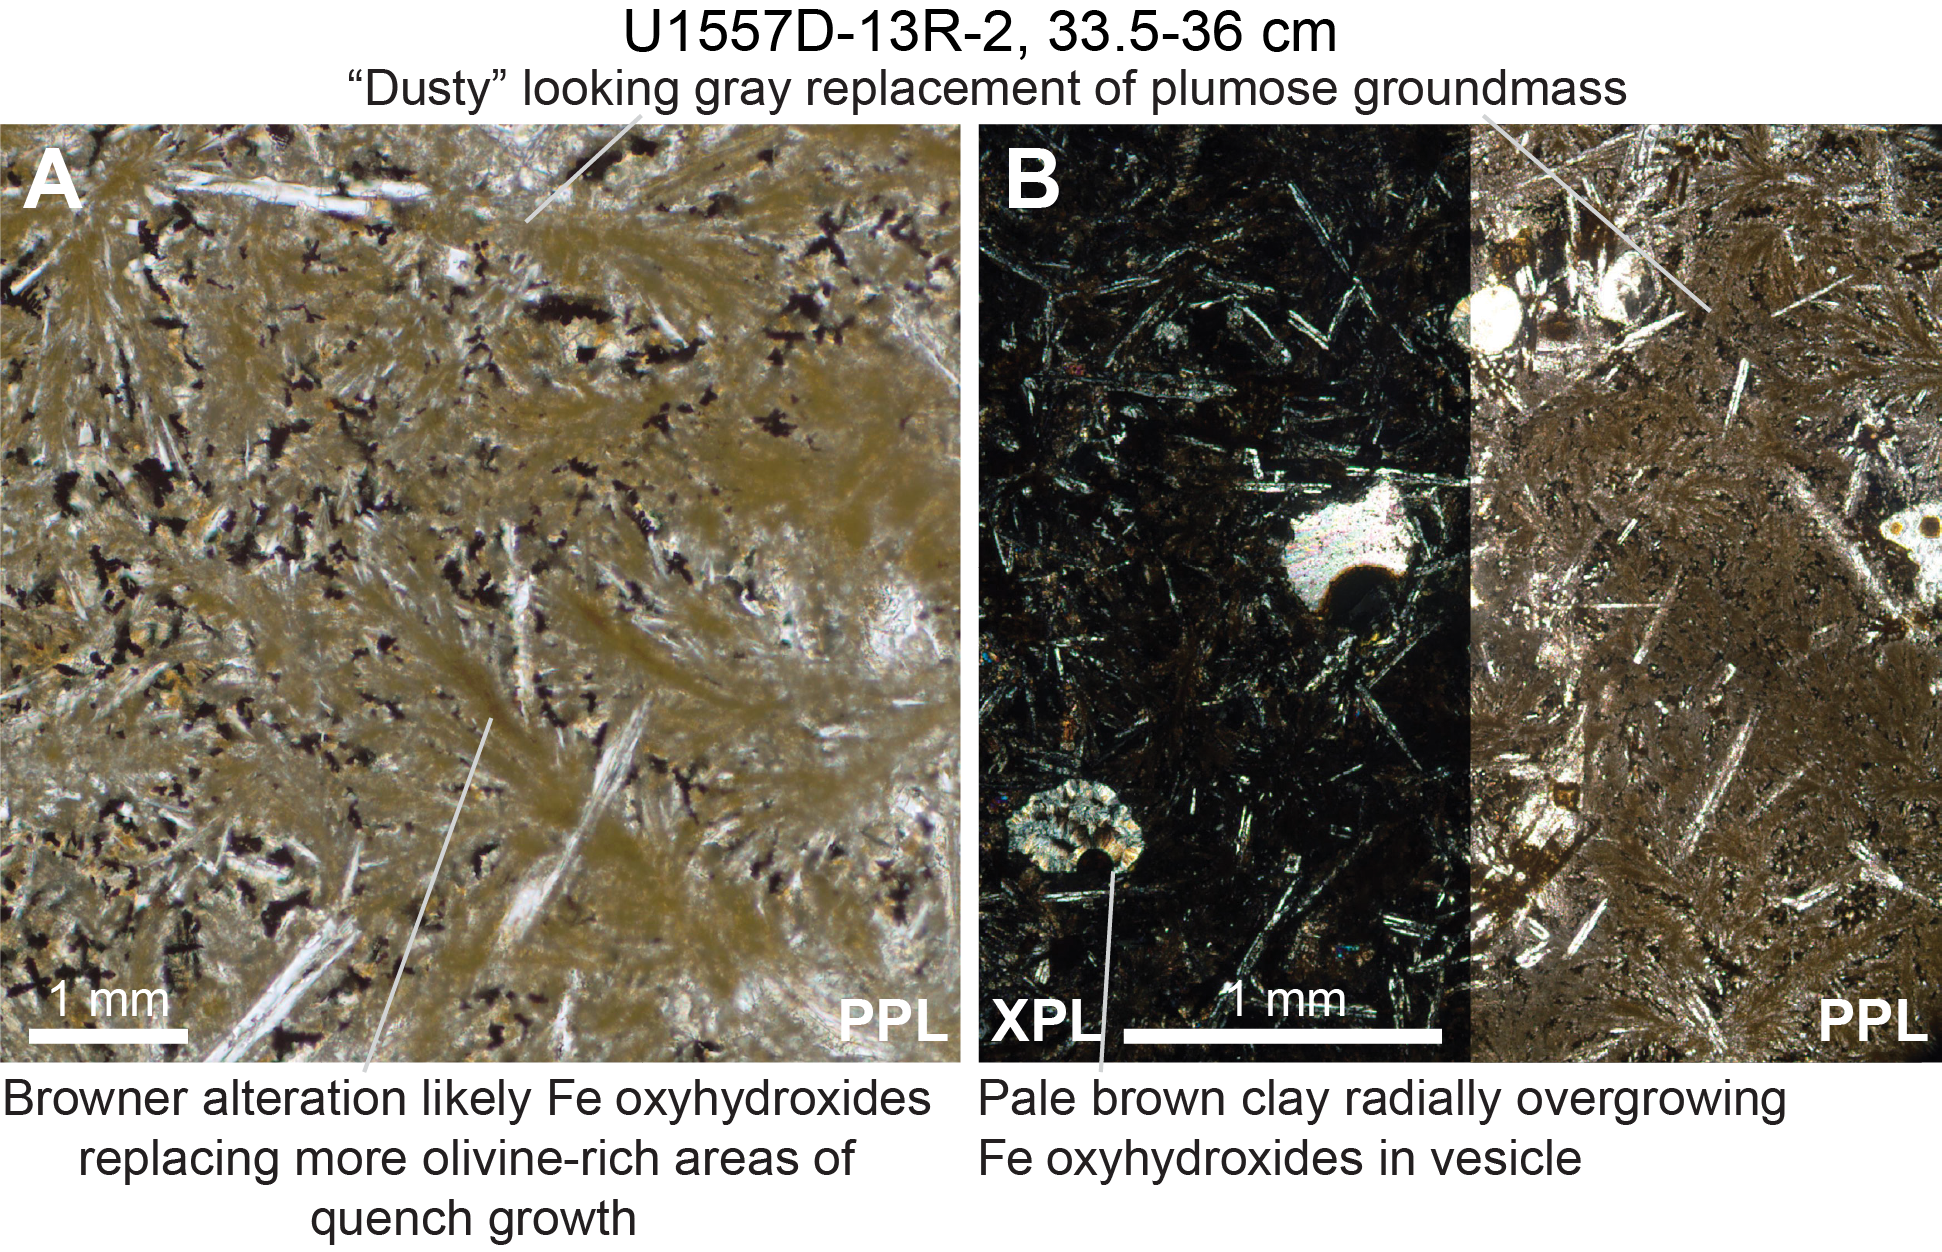
Figure F41. Khaki-brown alteration.
Compared to orange speckled background alteration, khaki alteration shows more intense reddening of groundmass in thin section, reflecting a greater abundance of red-brown clays + Fe oxyhydroxides replacing groundmass, but not as intense or pervasive as in the orange halos. Bright yellow clays are also common throughout the rock, replacing groundmass and lining or filling vesicles. Similar yellow clays from Hole U1556B cores were only observed in orange halos around veins or pillow margins. In vesicles, pale brown clays, sometimes over/intergrown with a fibrous mineral phase (possibly a zeolite), overgrow green clay and yellow to brown clay ± Fe oxyhydroxide. In rare examples, these pale brown clays have been patchily stained orange-brown (Figure F42). Similar phases overgrow iddingsite after olivine (Figure F43).
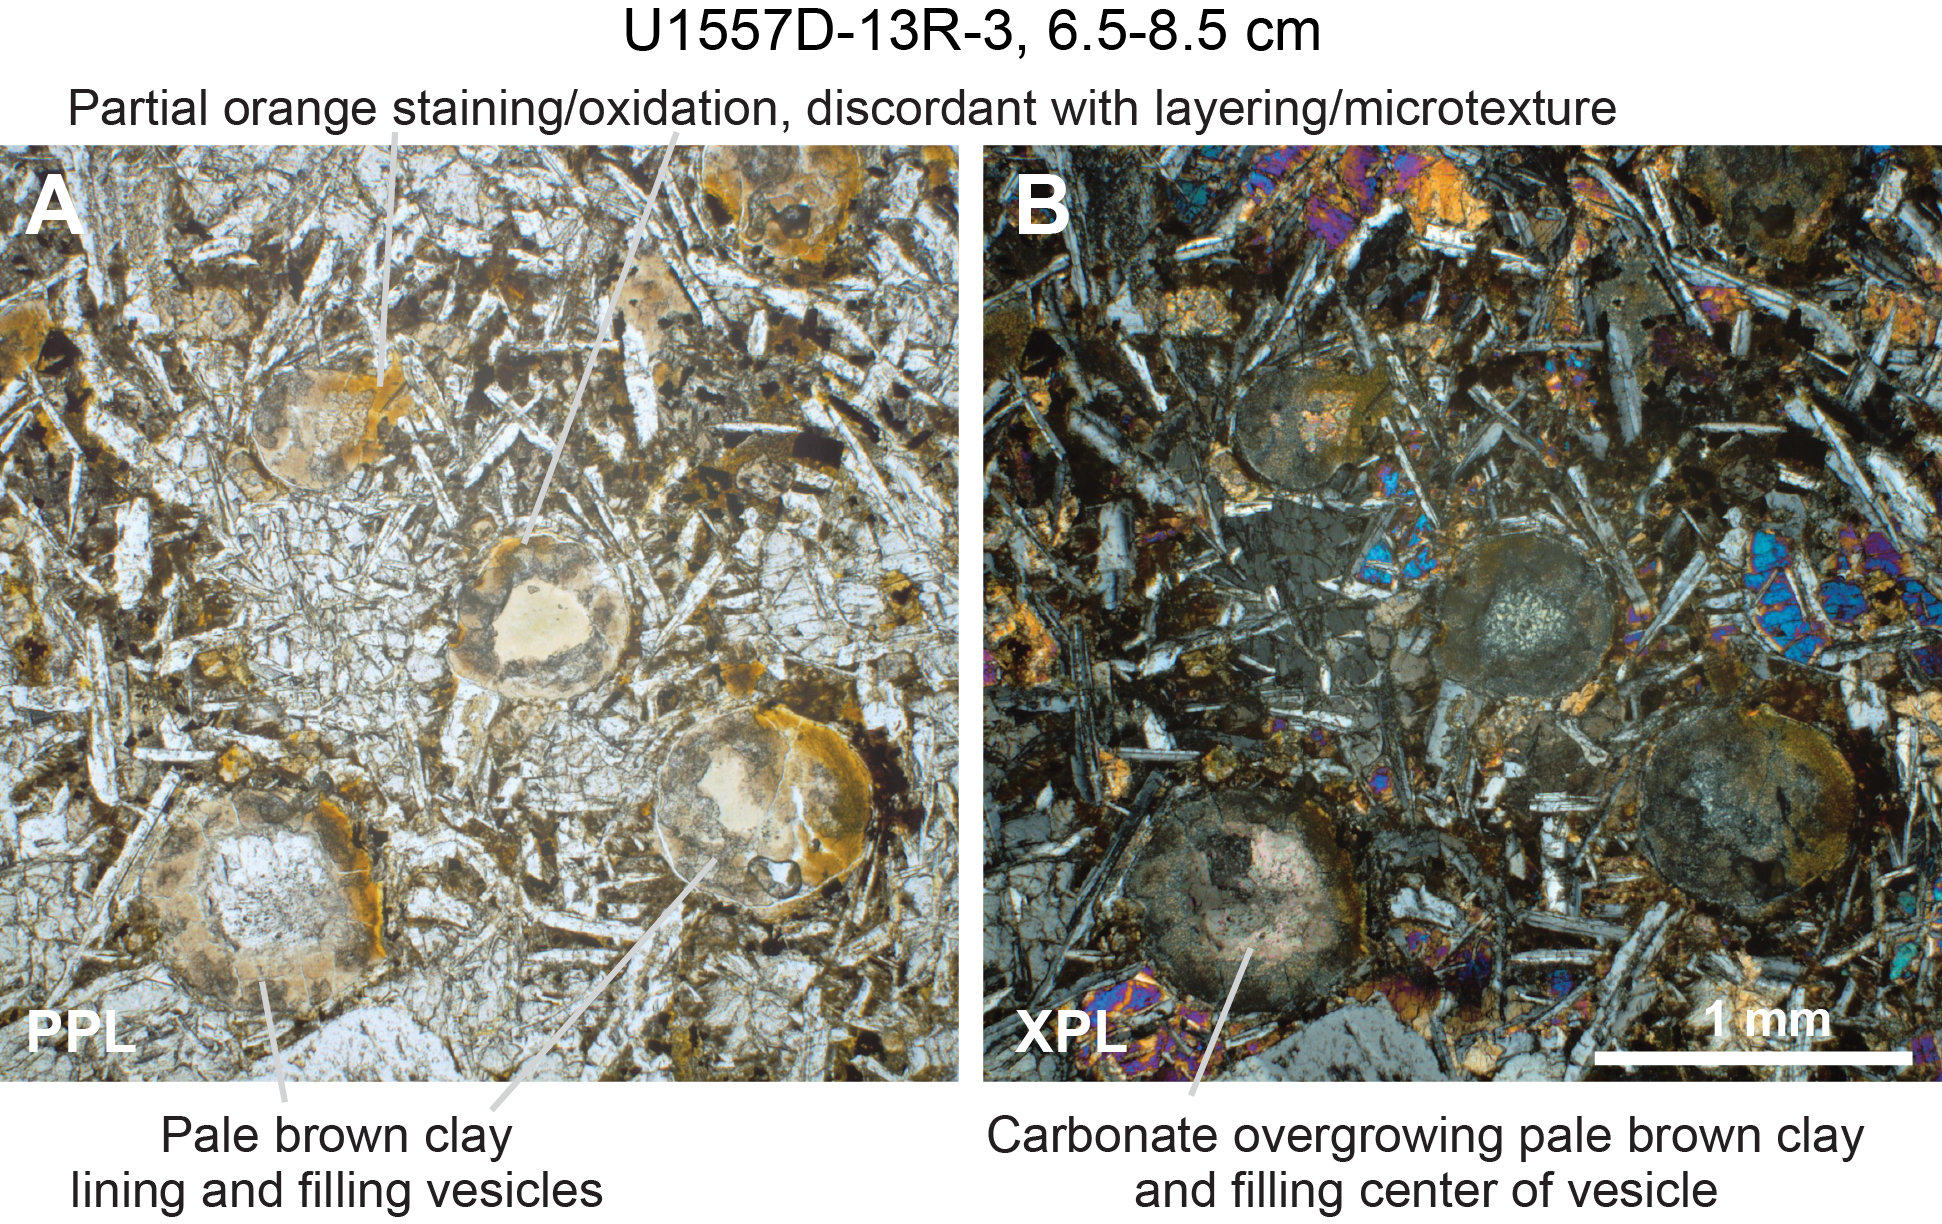
Figure F42. Oxidative overprinting of pale brown clay.
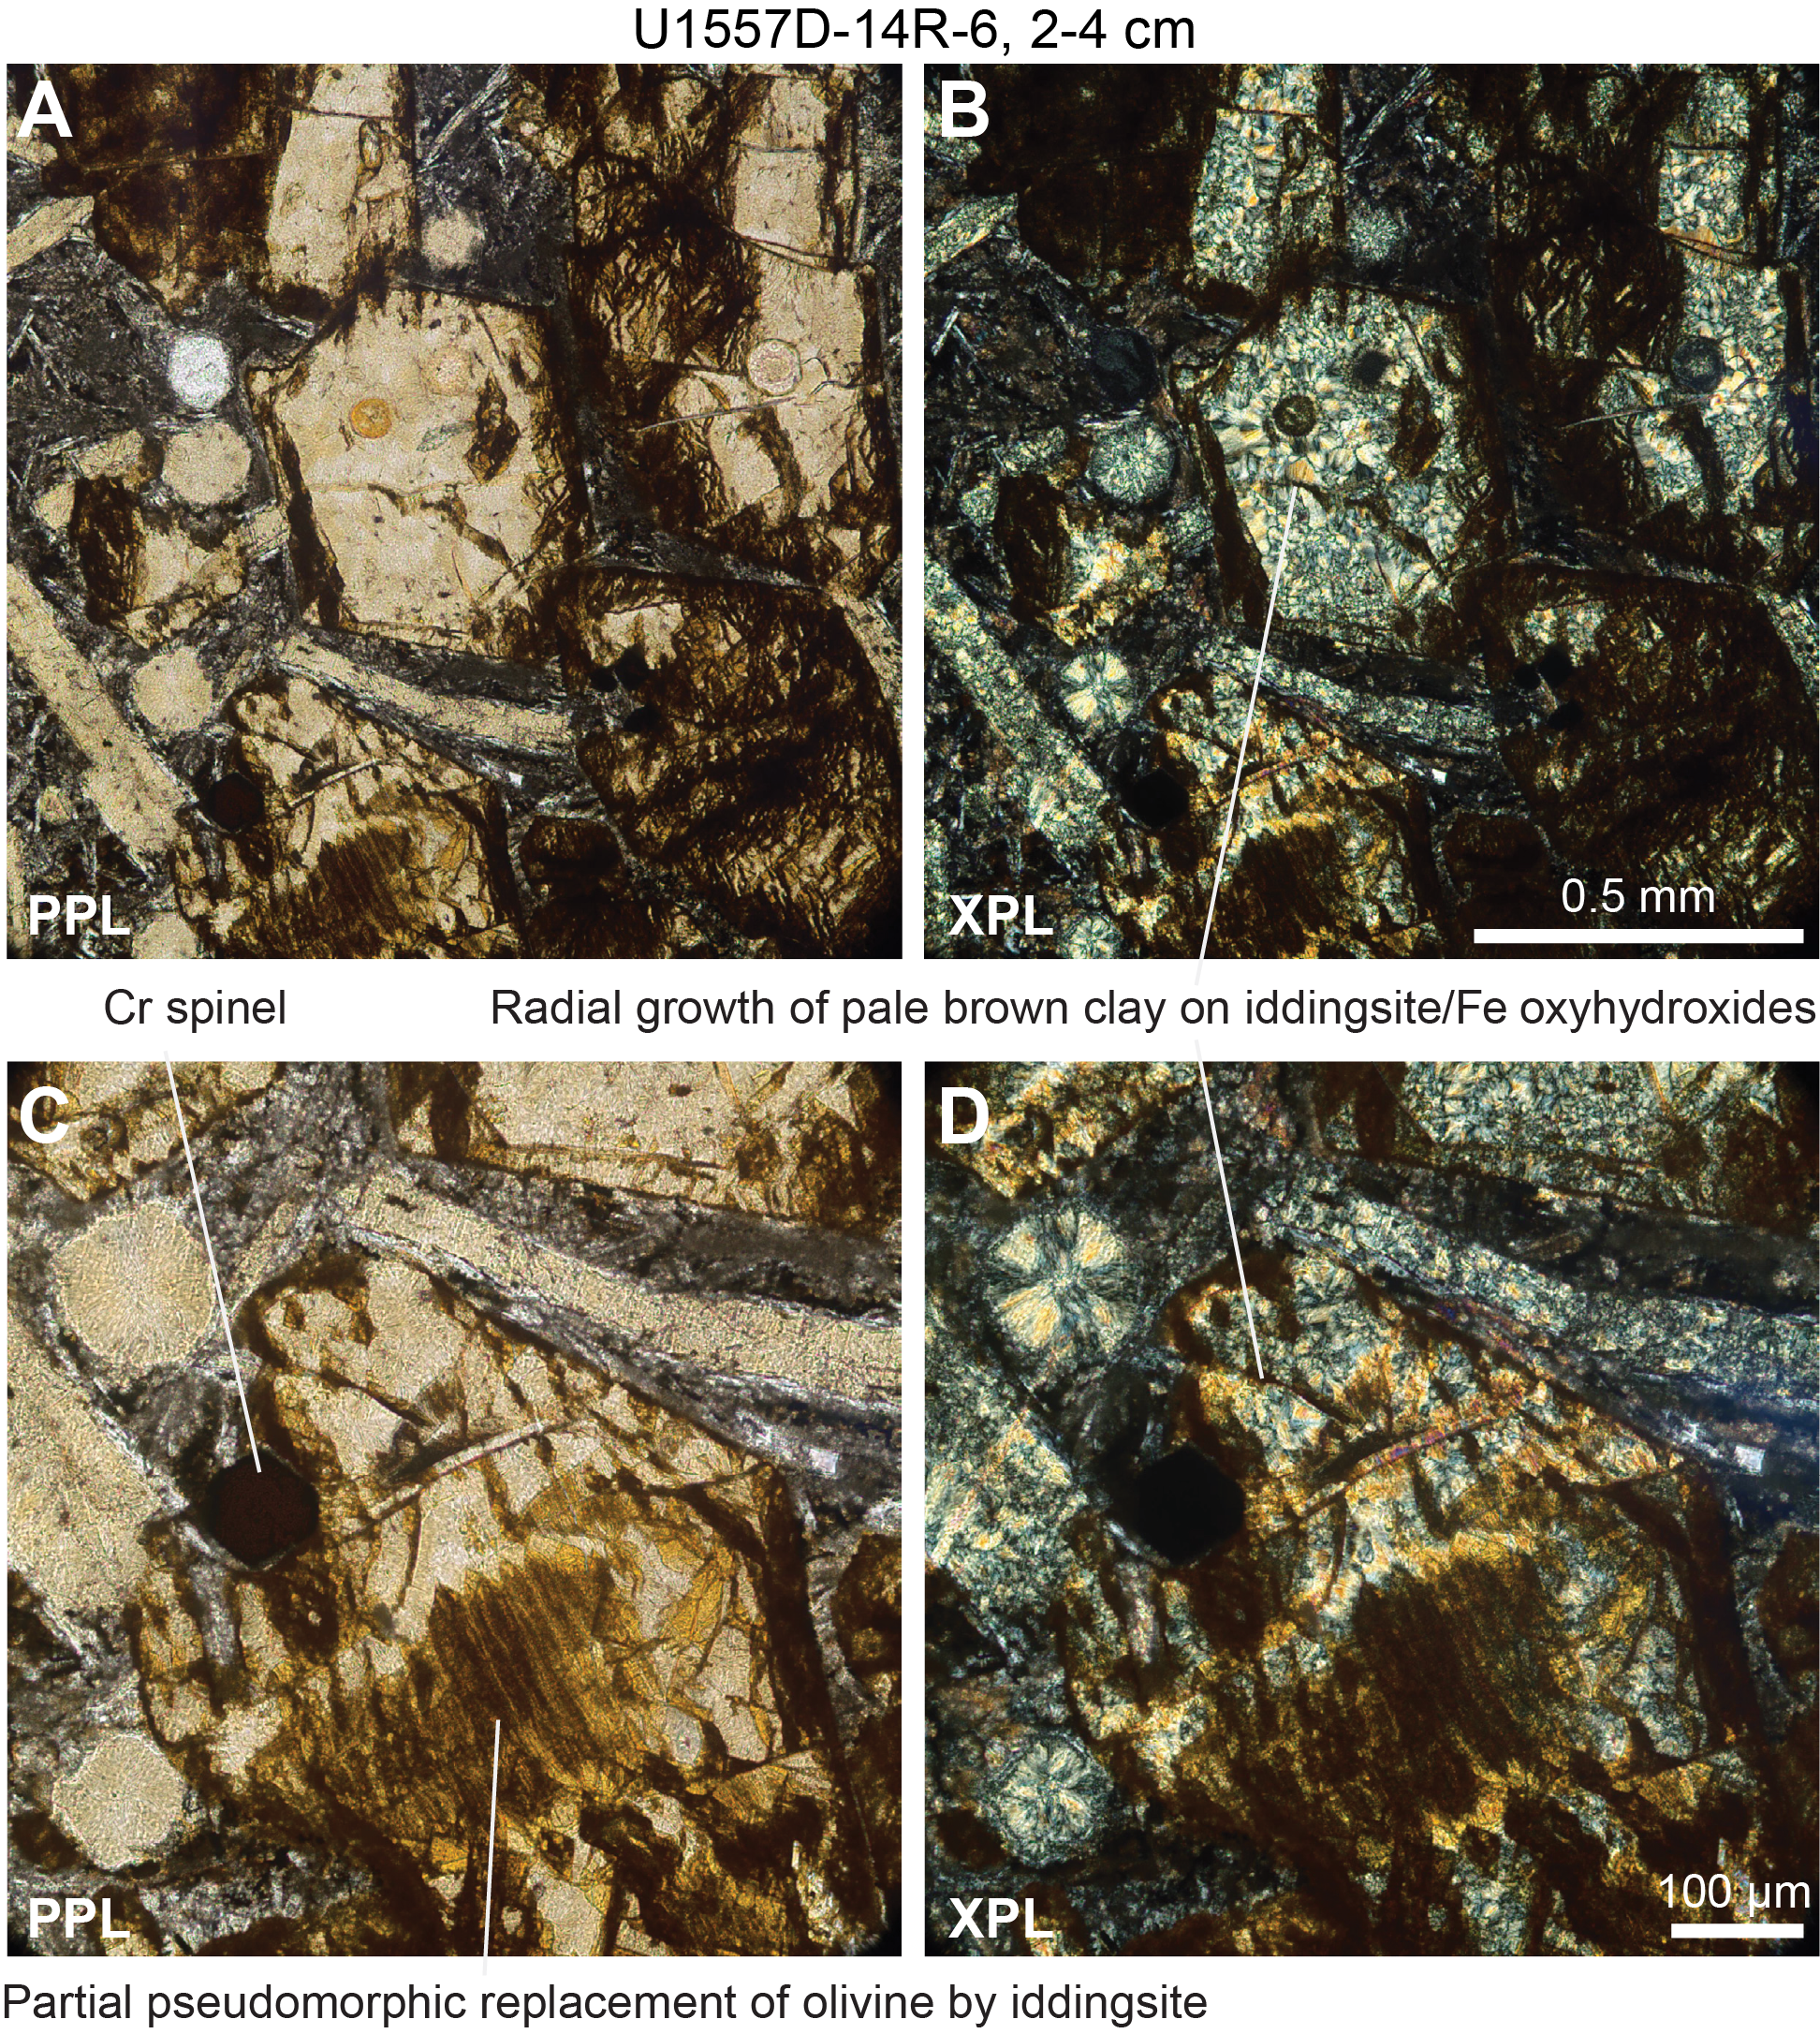
Figure F43. Alteration and overgrowth.
6.1.1.3. Dark green background alteration
One of the most marked features of the Hole U1557D breccias is the occurrence of numerous intervals of pervasive dark green alteration. These consist of ~0.5–2.0 m intervals in which glass is altered to (macroscopically) dark green clay, sediment is greenish beige, and basalt clasts have a gray to olive- or blue-green hue to their groundmass, superimposed on any orange halo or orange speckled alteration (Figure F44A, F44D). Vesicles in basalt are commonly filled with pale greenish to dark green minerals. Orange halos (see Orange halos) are largely unaffected by the green alteration, and only the patches or minerals not already altered to Fe oxyhydroxides are green hued (Figures F44A, F44D, F45). This is especially true in cryptocrystalline rocks, where orange halos are most strongly developed.
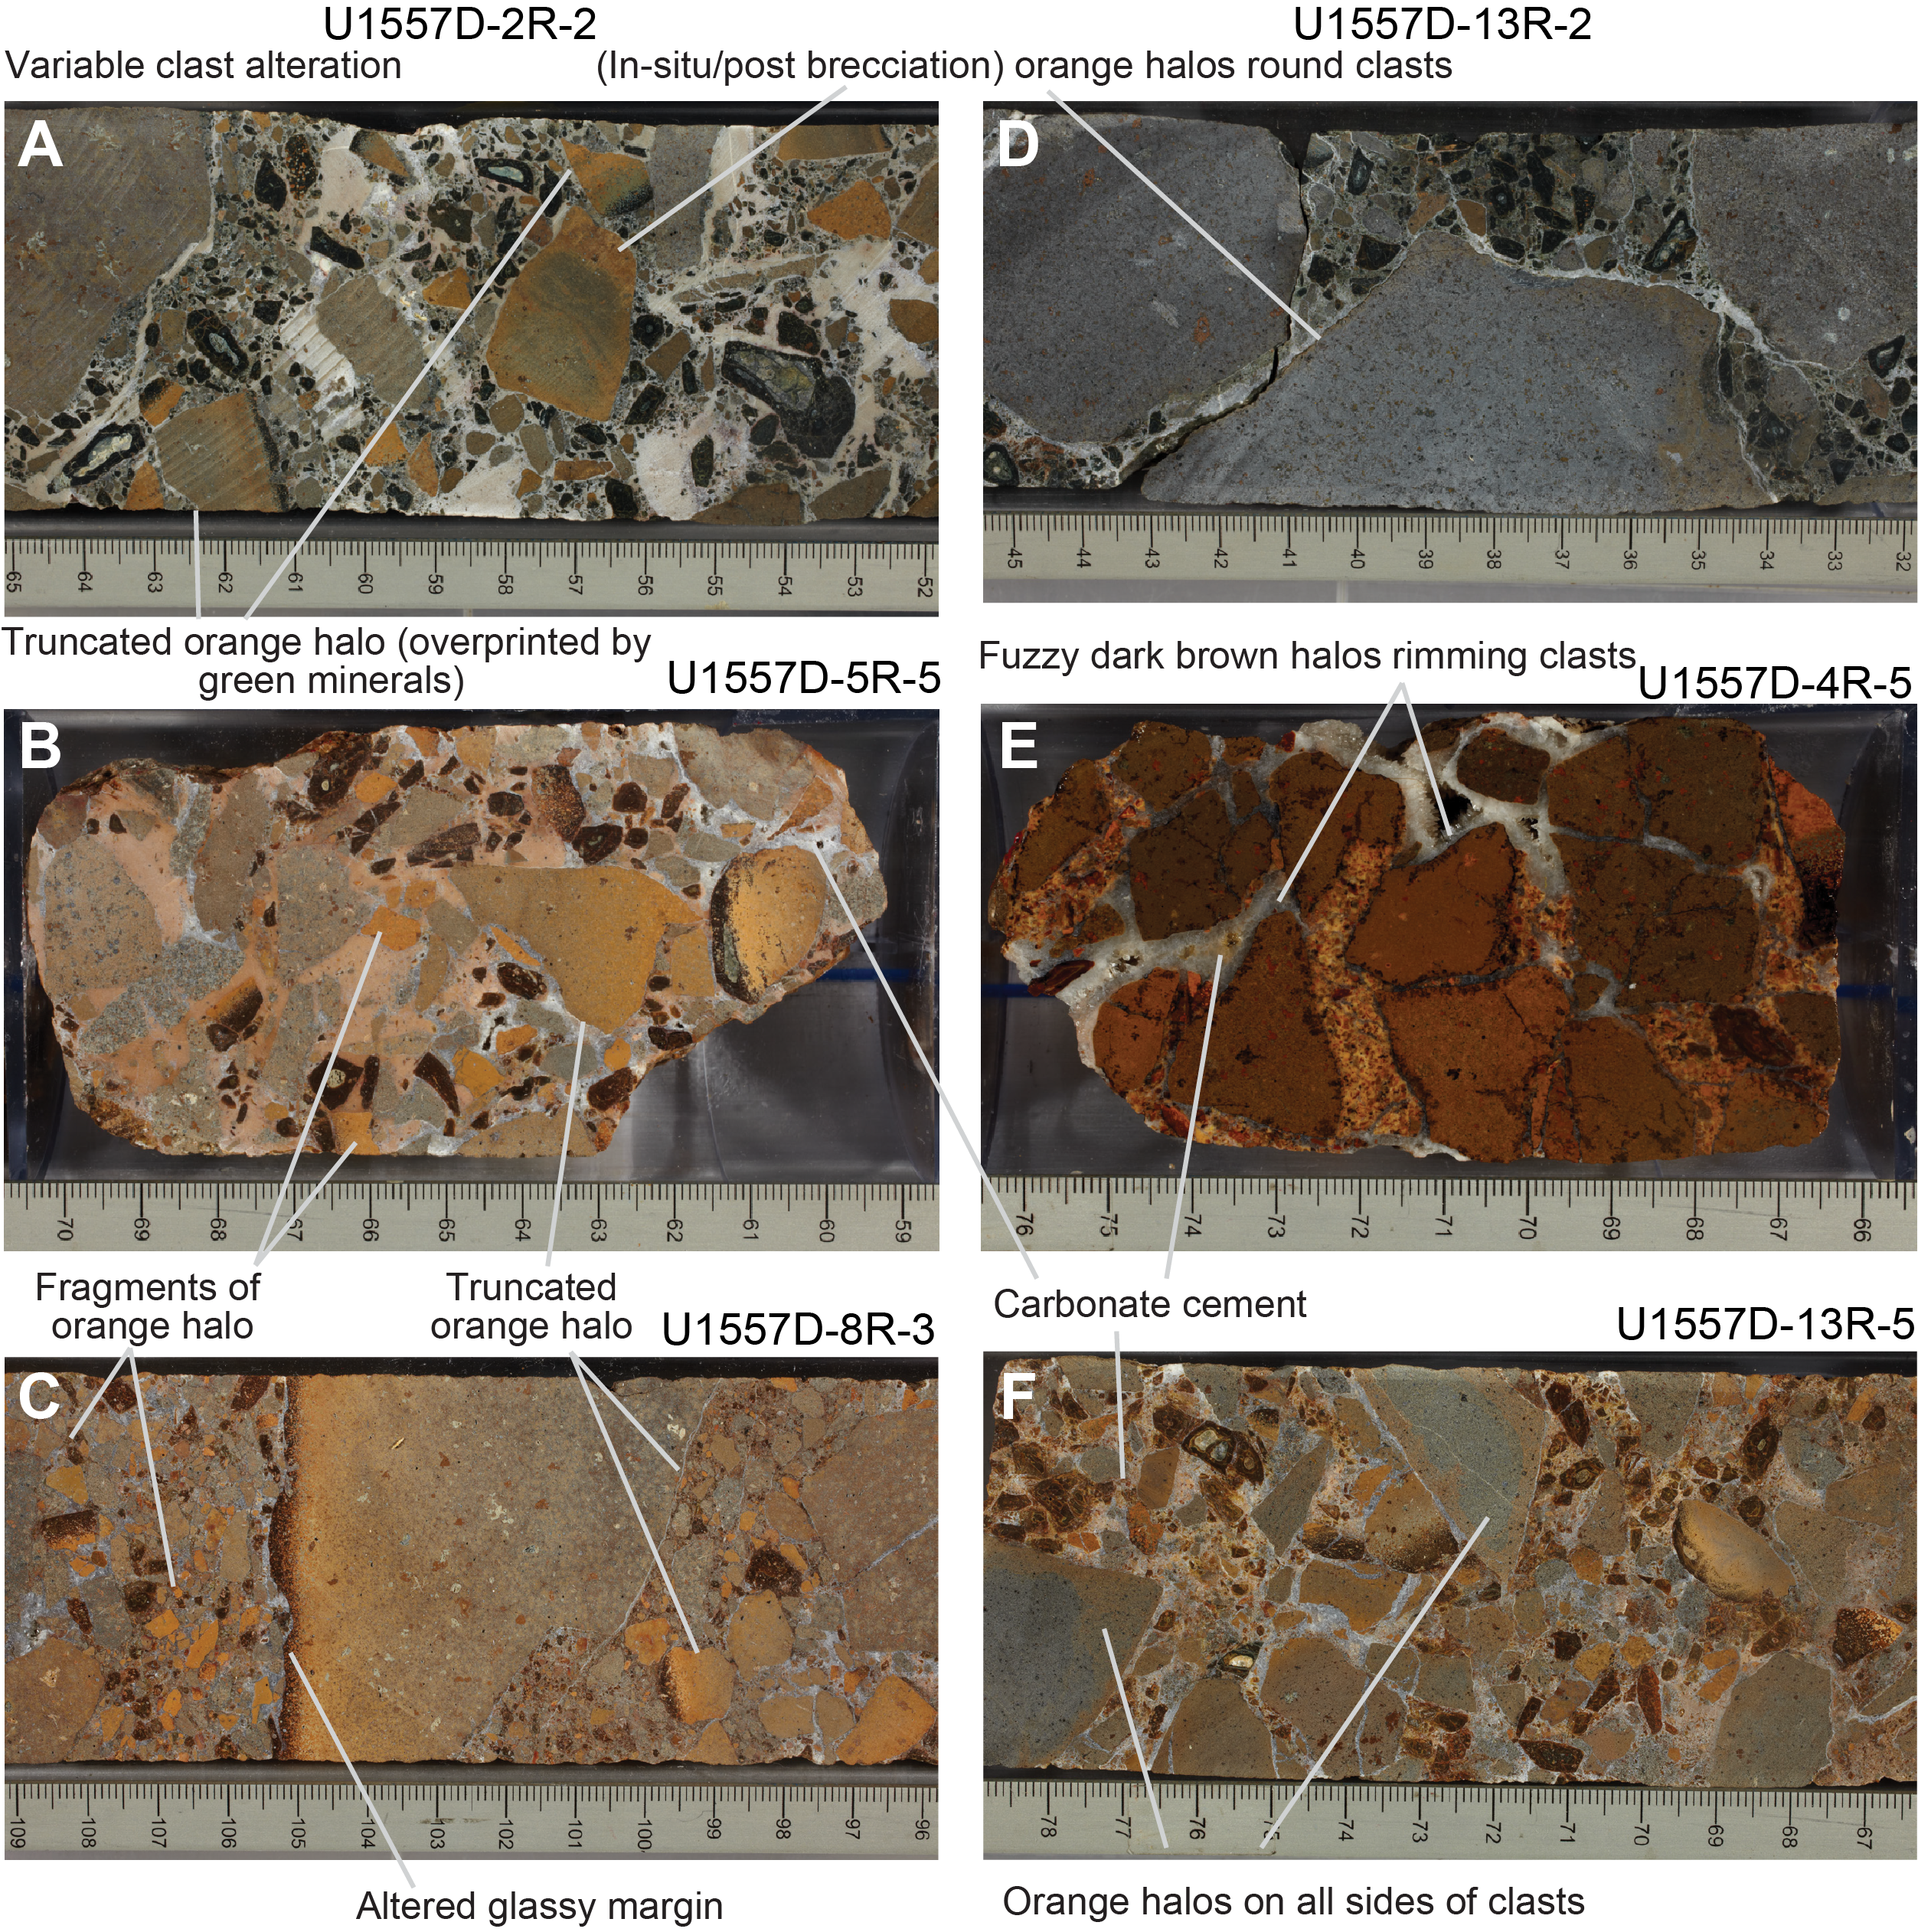
Figure F44. Alteration styles seen in breccia pile.
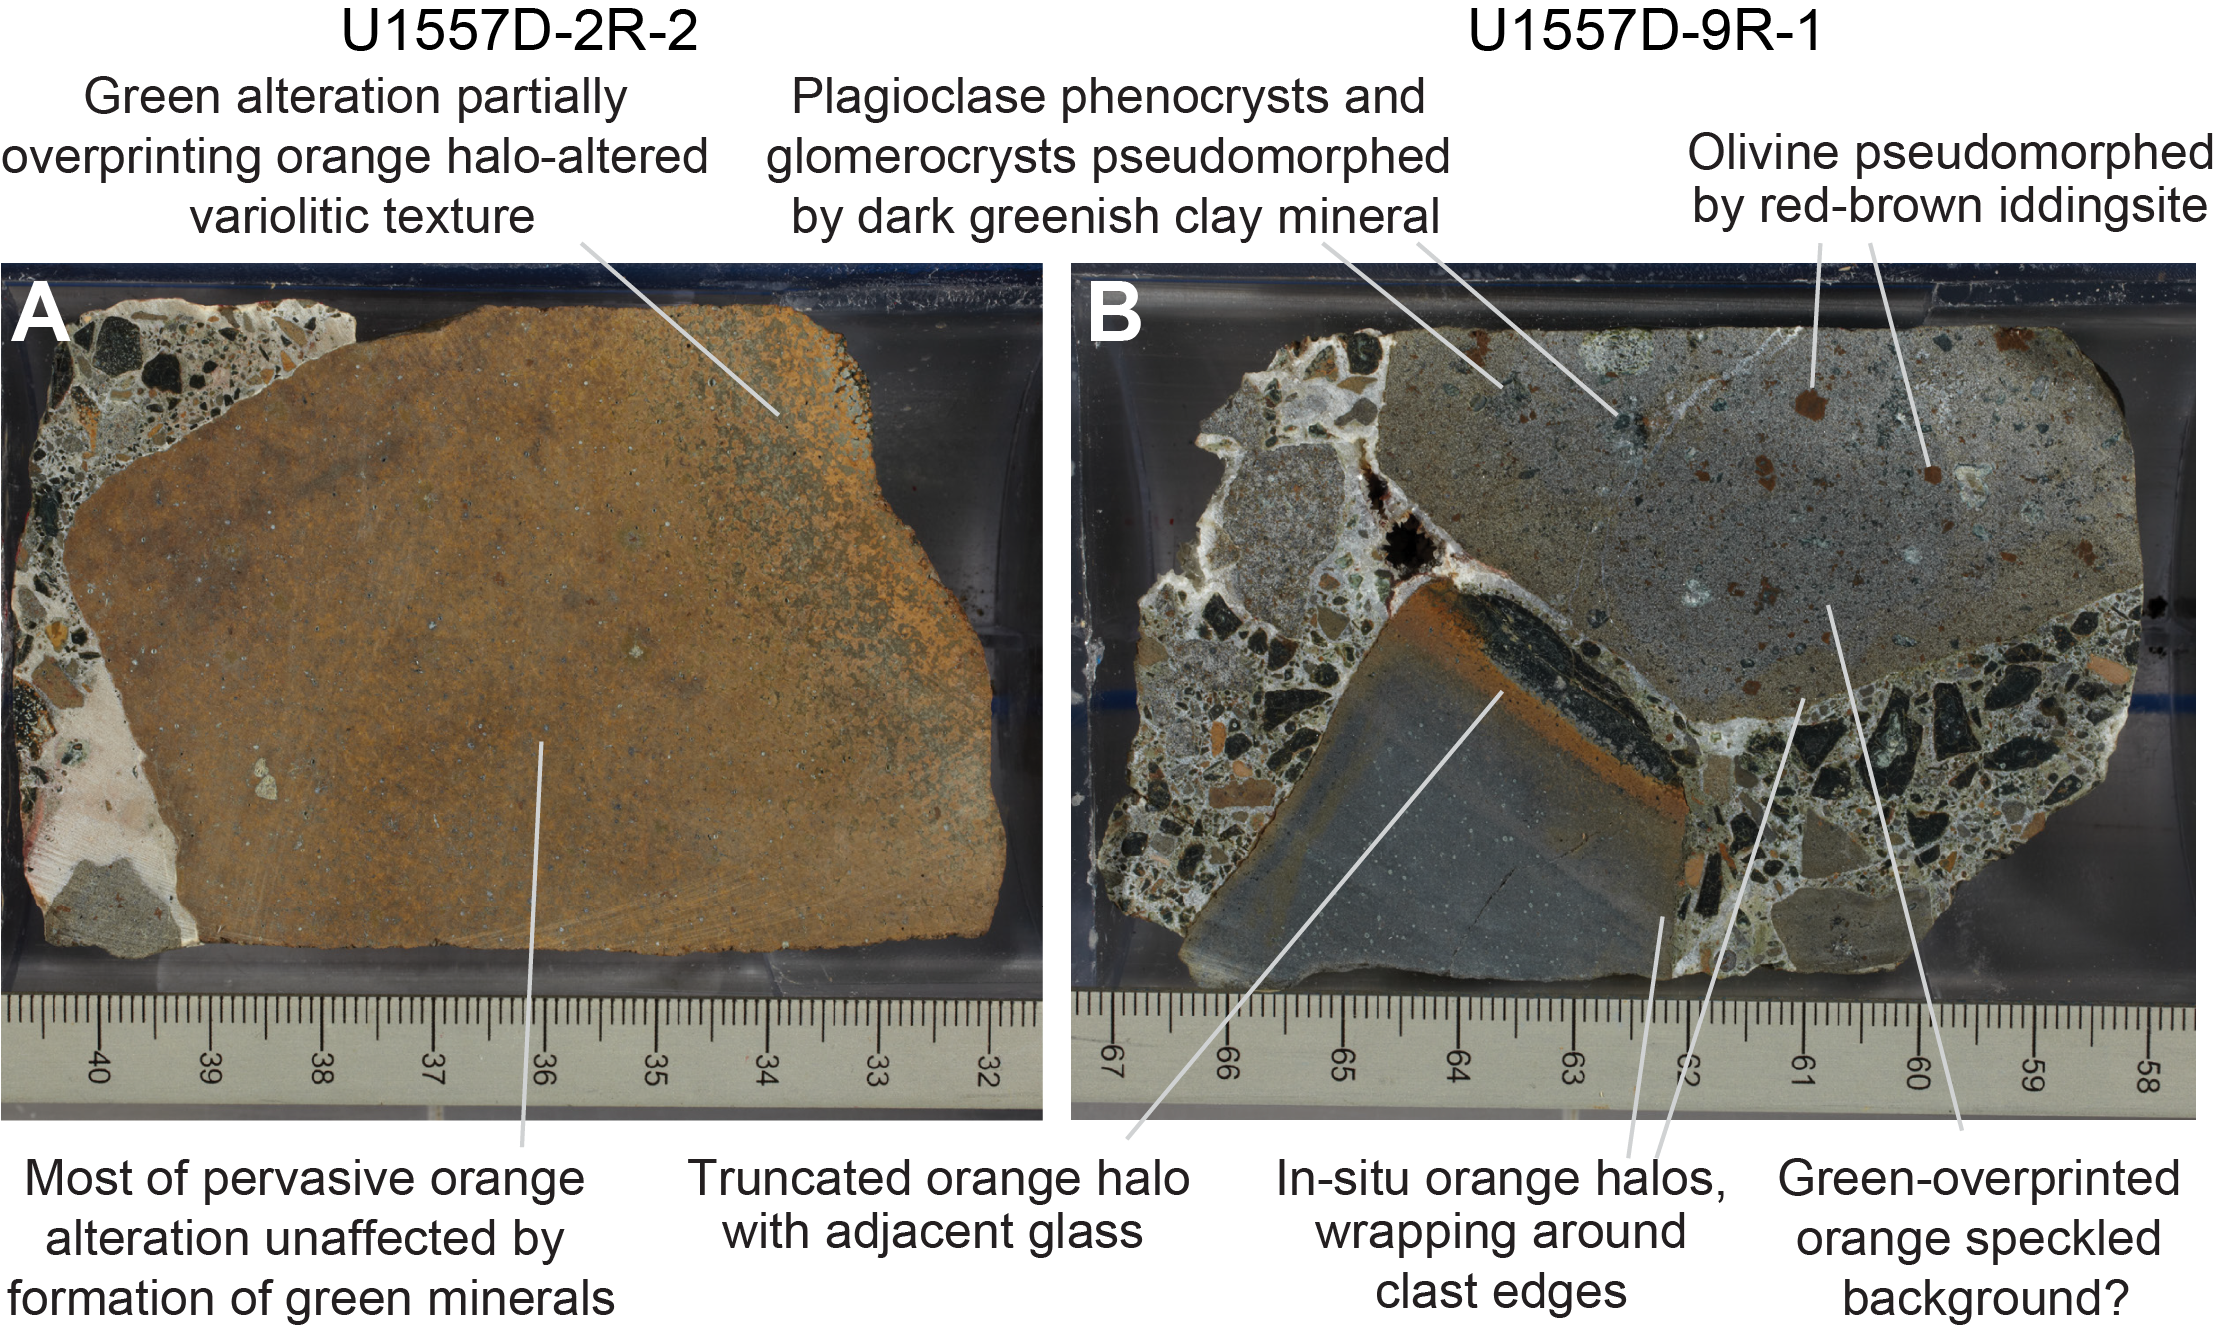
Figure F45. Green alteration partially overprinting oxidative alteration.
Similar meter-scale green alteration zones occur in Hole U1556B and are characterized by very dark gray alteration colors in olivine phyric basalts and the presence of black or very dark green altered glass. In Hole U1557D (and at the bottom of Hole U1556B), this alteration style is typically expressed as paler gray-green altered basalt groundmass (intermediate between Munsell colors GLEY 1 4/N and GLEY 1 5/5GY). The difference in color appears to relate to the grain size of the rocks and their plagioclase phyric nature.
In thin section, green alteration of basalts is characterized by the presence of pale green clay (Figure F46) that occurs as a pseudomorphic replacement for olivine and plagioclase and as a vesicle-filling phase. Carbonate is also present filling vesicles (typically without other phases) and replacing small patches of groundmass. The groundmass mesostasis is gray and dusty in plane-polarized light with variable proportions of reddish Fe oxyhydroxide (Figure F46). Where Fe oxyhydroxides occur in dark green background, they are related to overprinting of orange halos or orange speckled background by green alteration.
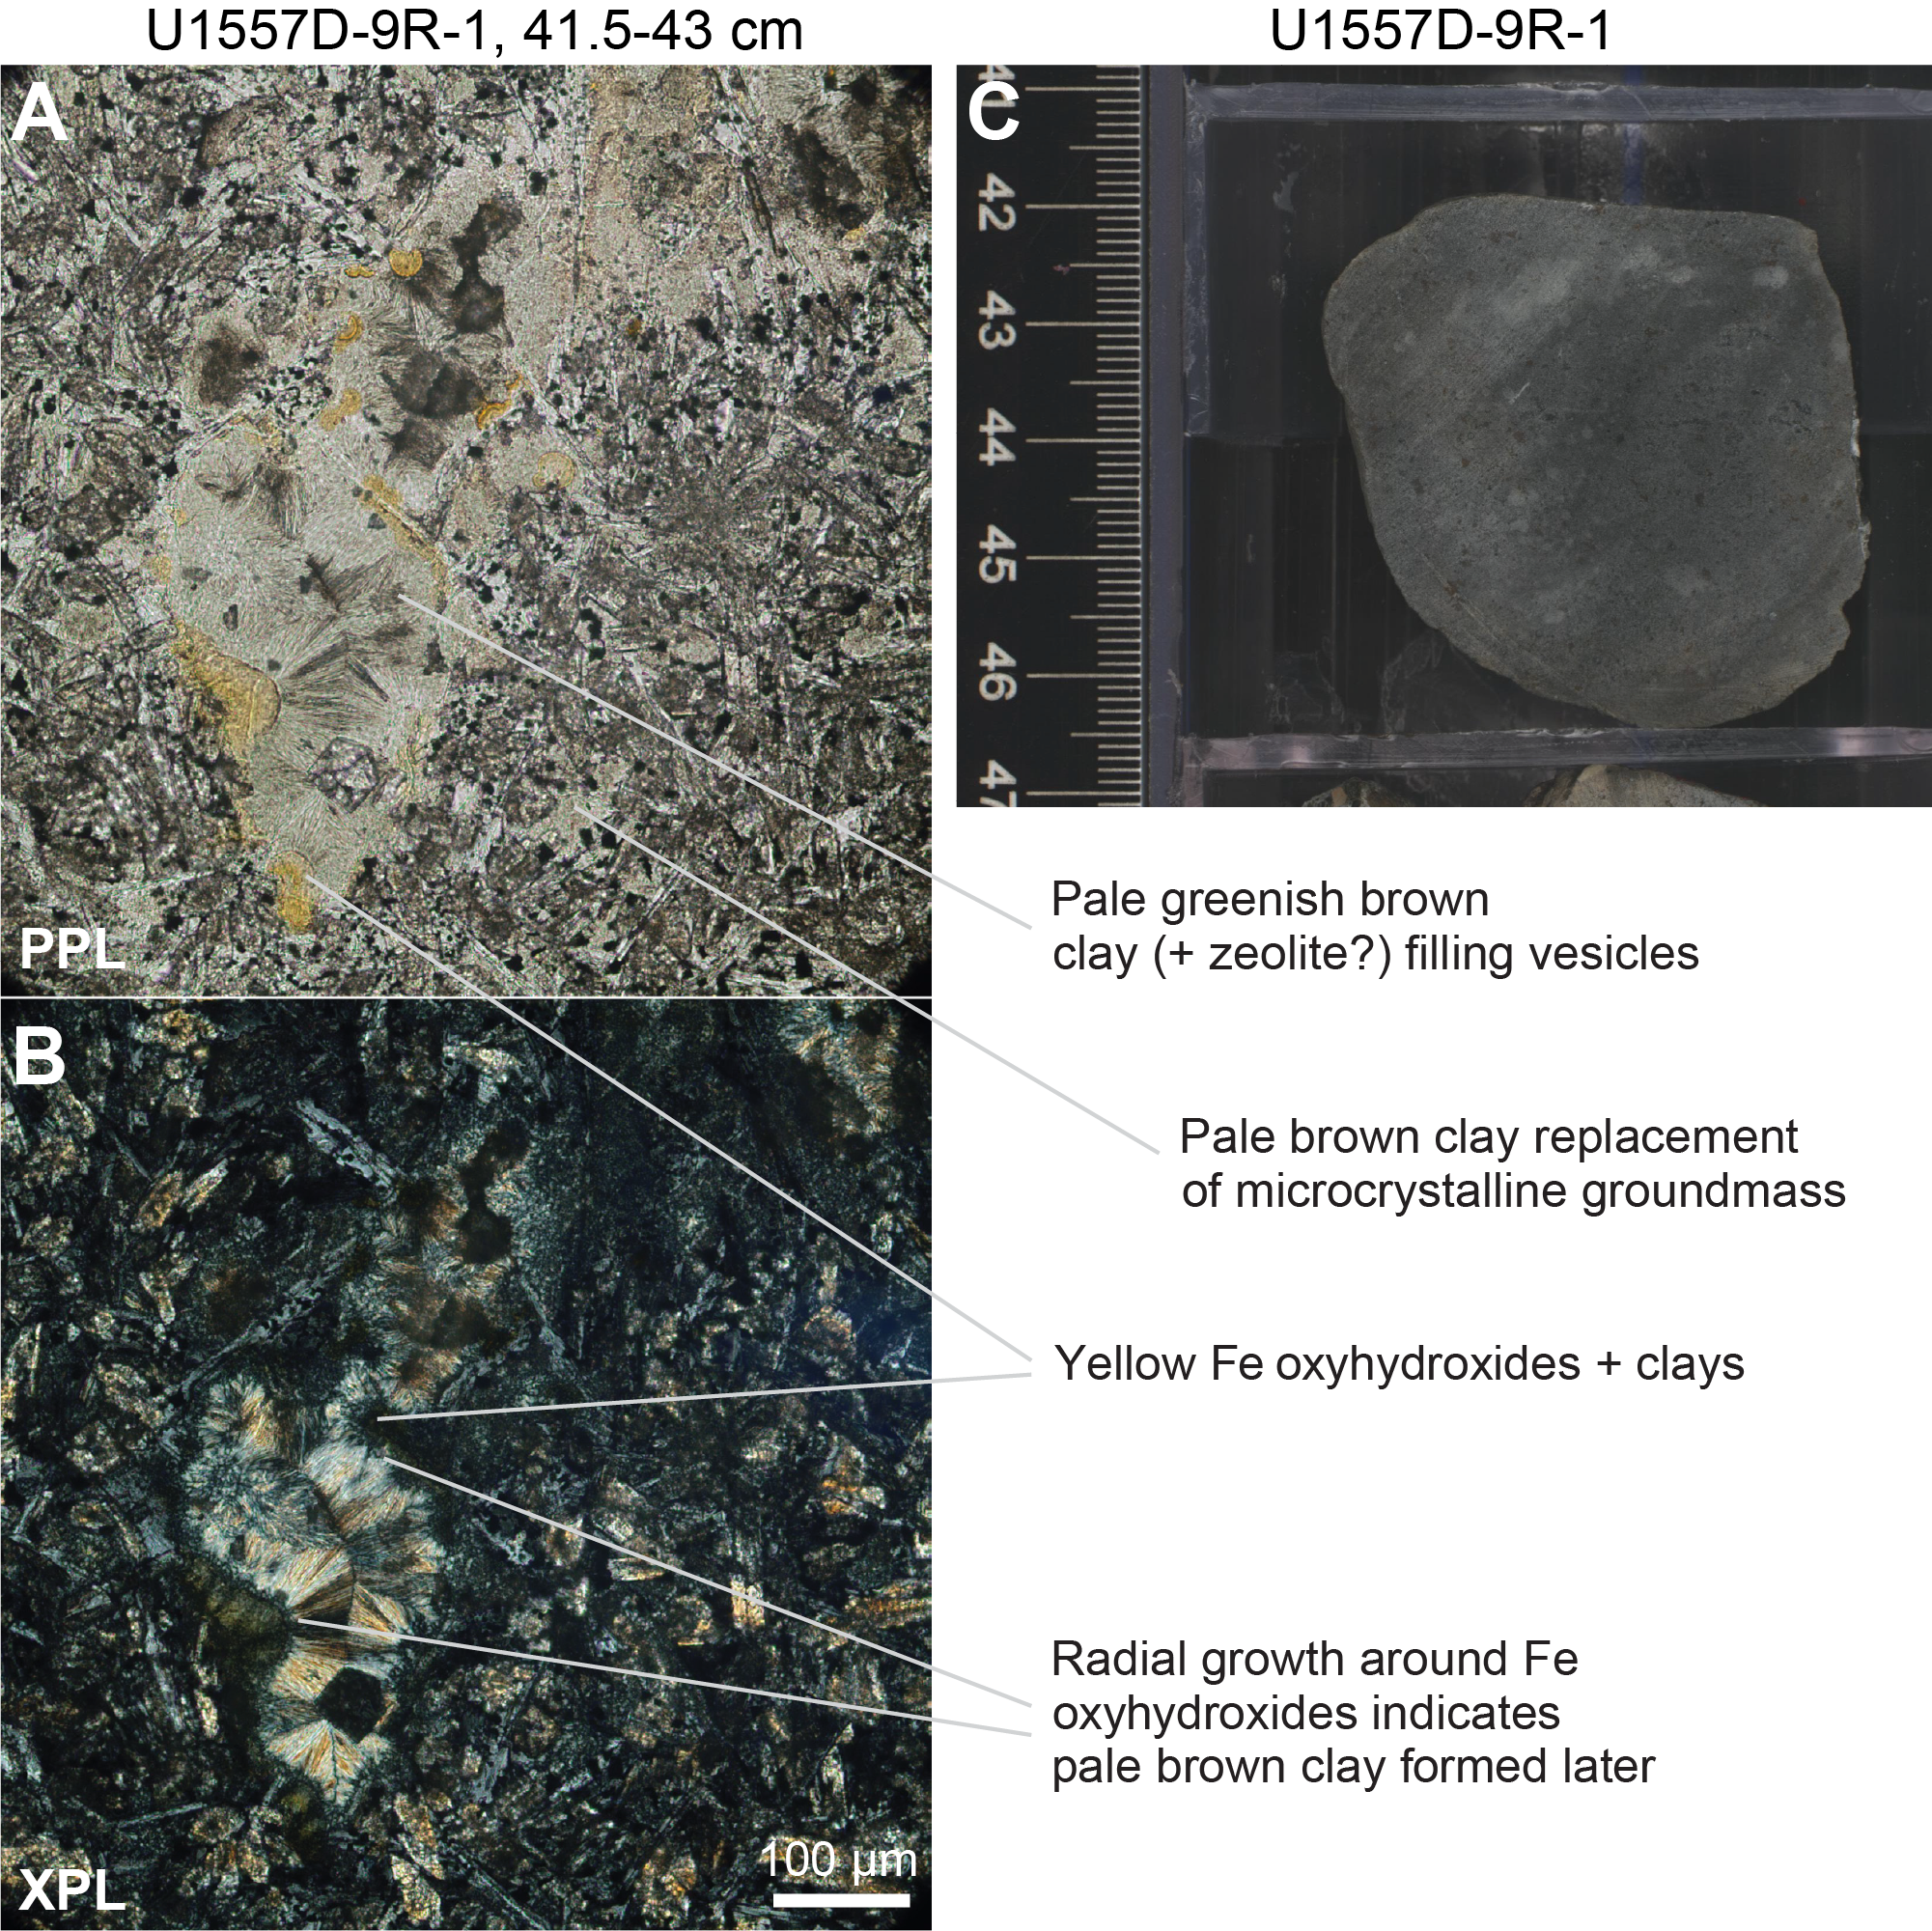
Figure F46. Pale greenish brown clay in dark green background.
Bright green clays occur in thin section in the green altered basalts but only as narrow fronts to orange halos (see Green halos). Wherever bright green clays coexist with pale green clays, the latter overgrow the former. These pale green/brown clays also typically overgrow oxidative phases such as Fe oxyhydroxides or iddingsite pseudomorphing olivine (Figure F43) and are apparently unaffected by a yellow clay overprint commonly developed on the green clays (Figure F47).
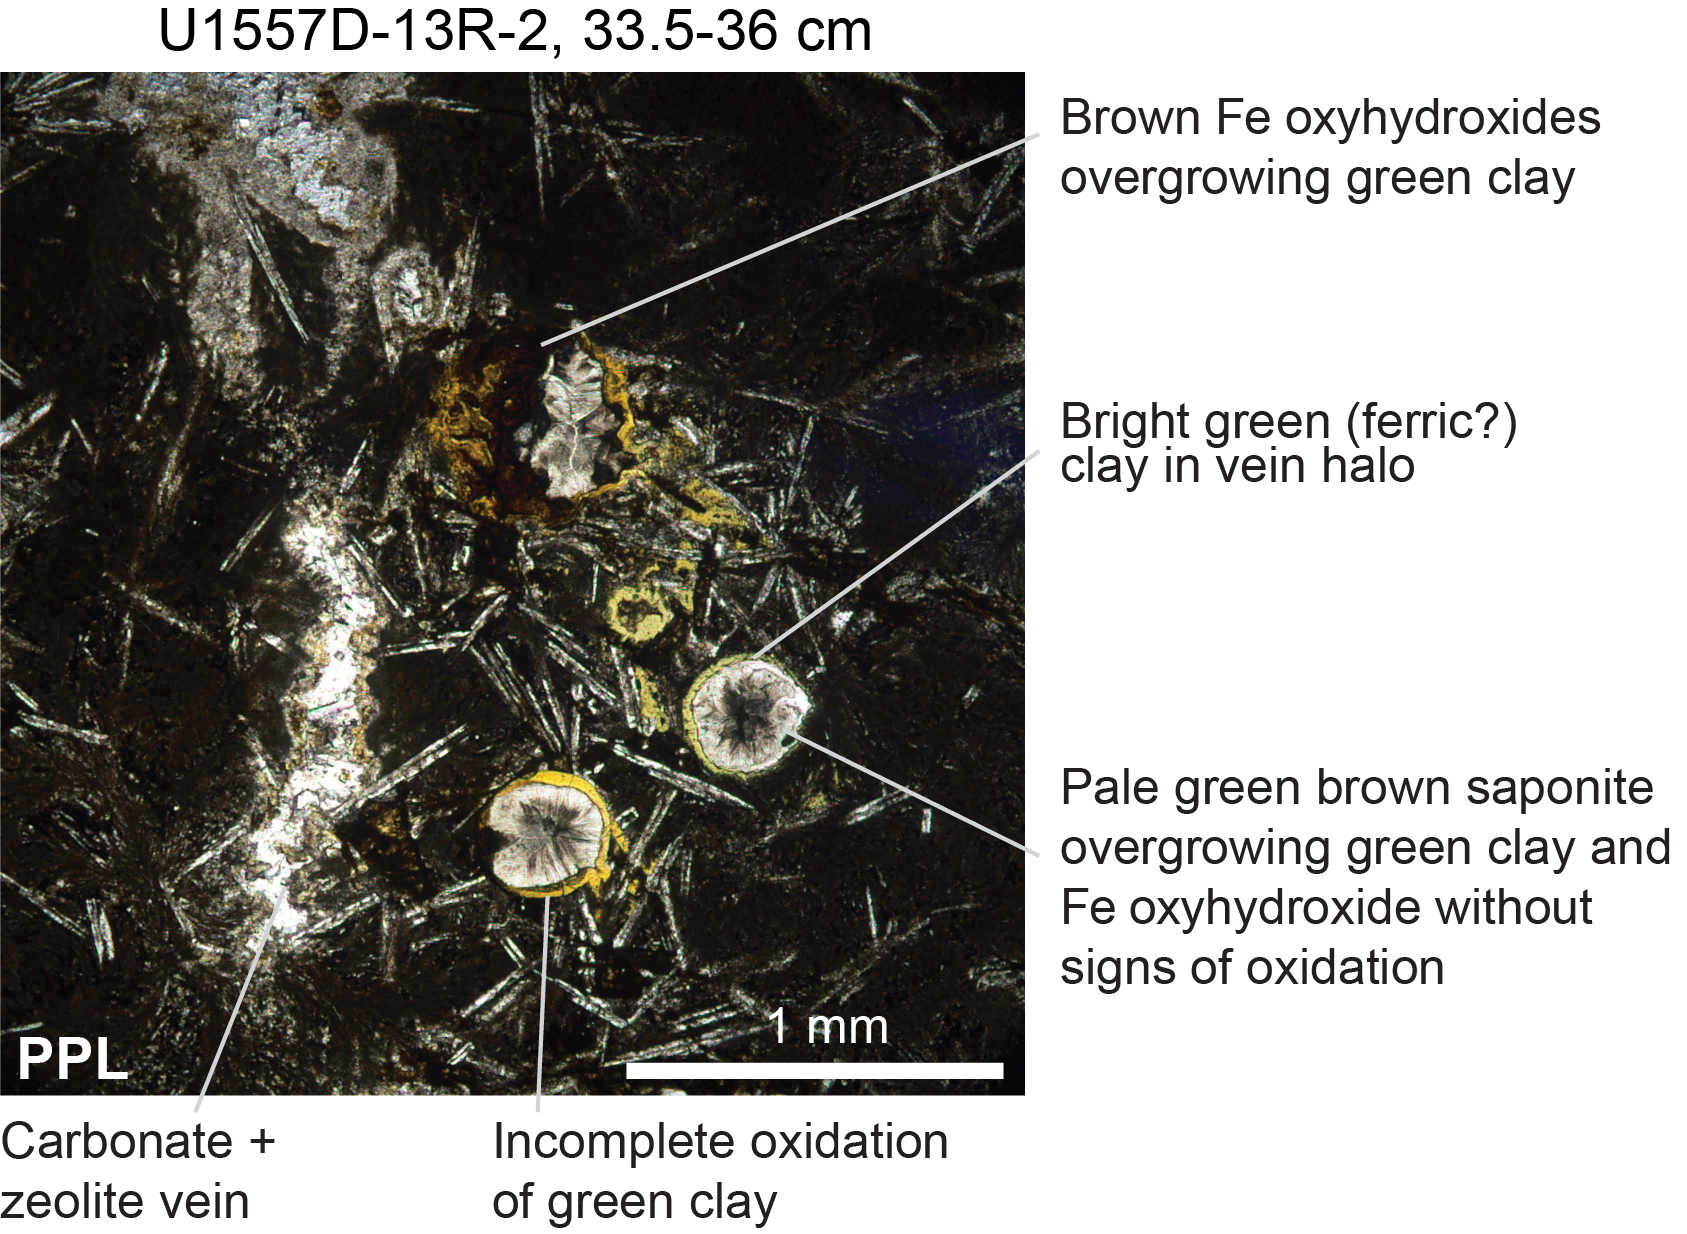
Figure F47. Phases of overprinting alteration.
The intervals of dark green background alteration occur at all levels in the basement, although they are more numerous in the lower part below Core 390-U1557D-7R (~620–680 mbsf) (Figure F48). Where it was recovered, the boundary between orange and green alteration typically consists of a sharp front (Figure F49), though some intervals show more gradual transitions (e.g., interval 10R-5, 68–82 cm). These boundaries are clearest where they cut across the fine-grained matrix and can be subhorizontal or moderately dipping (<45°).
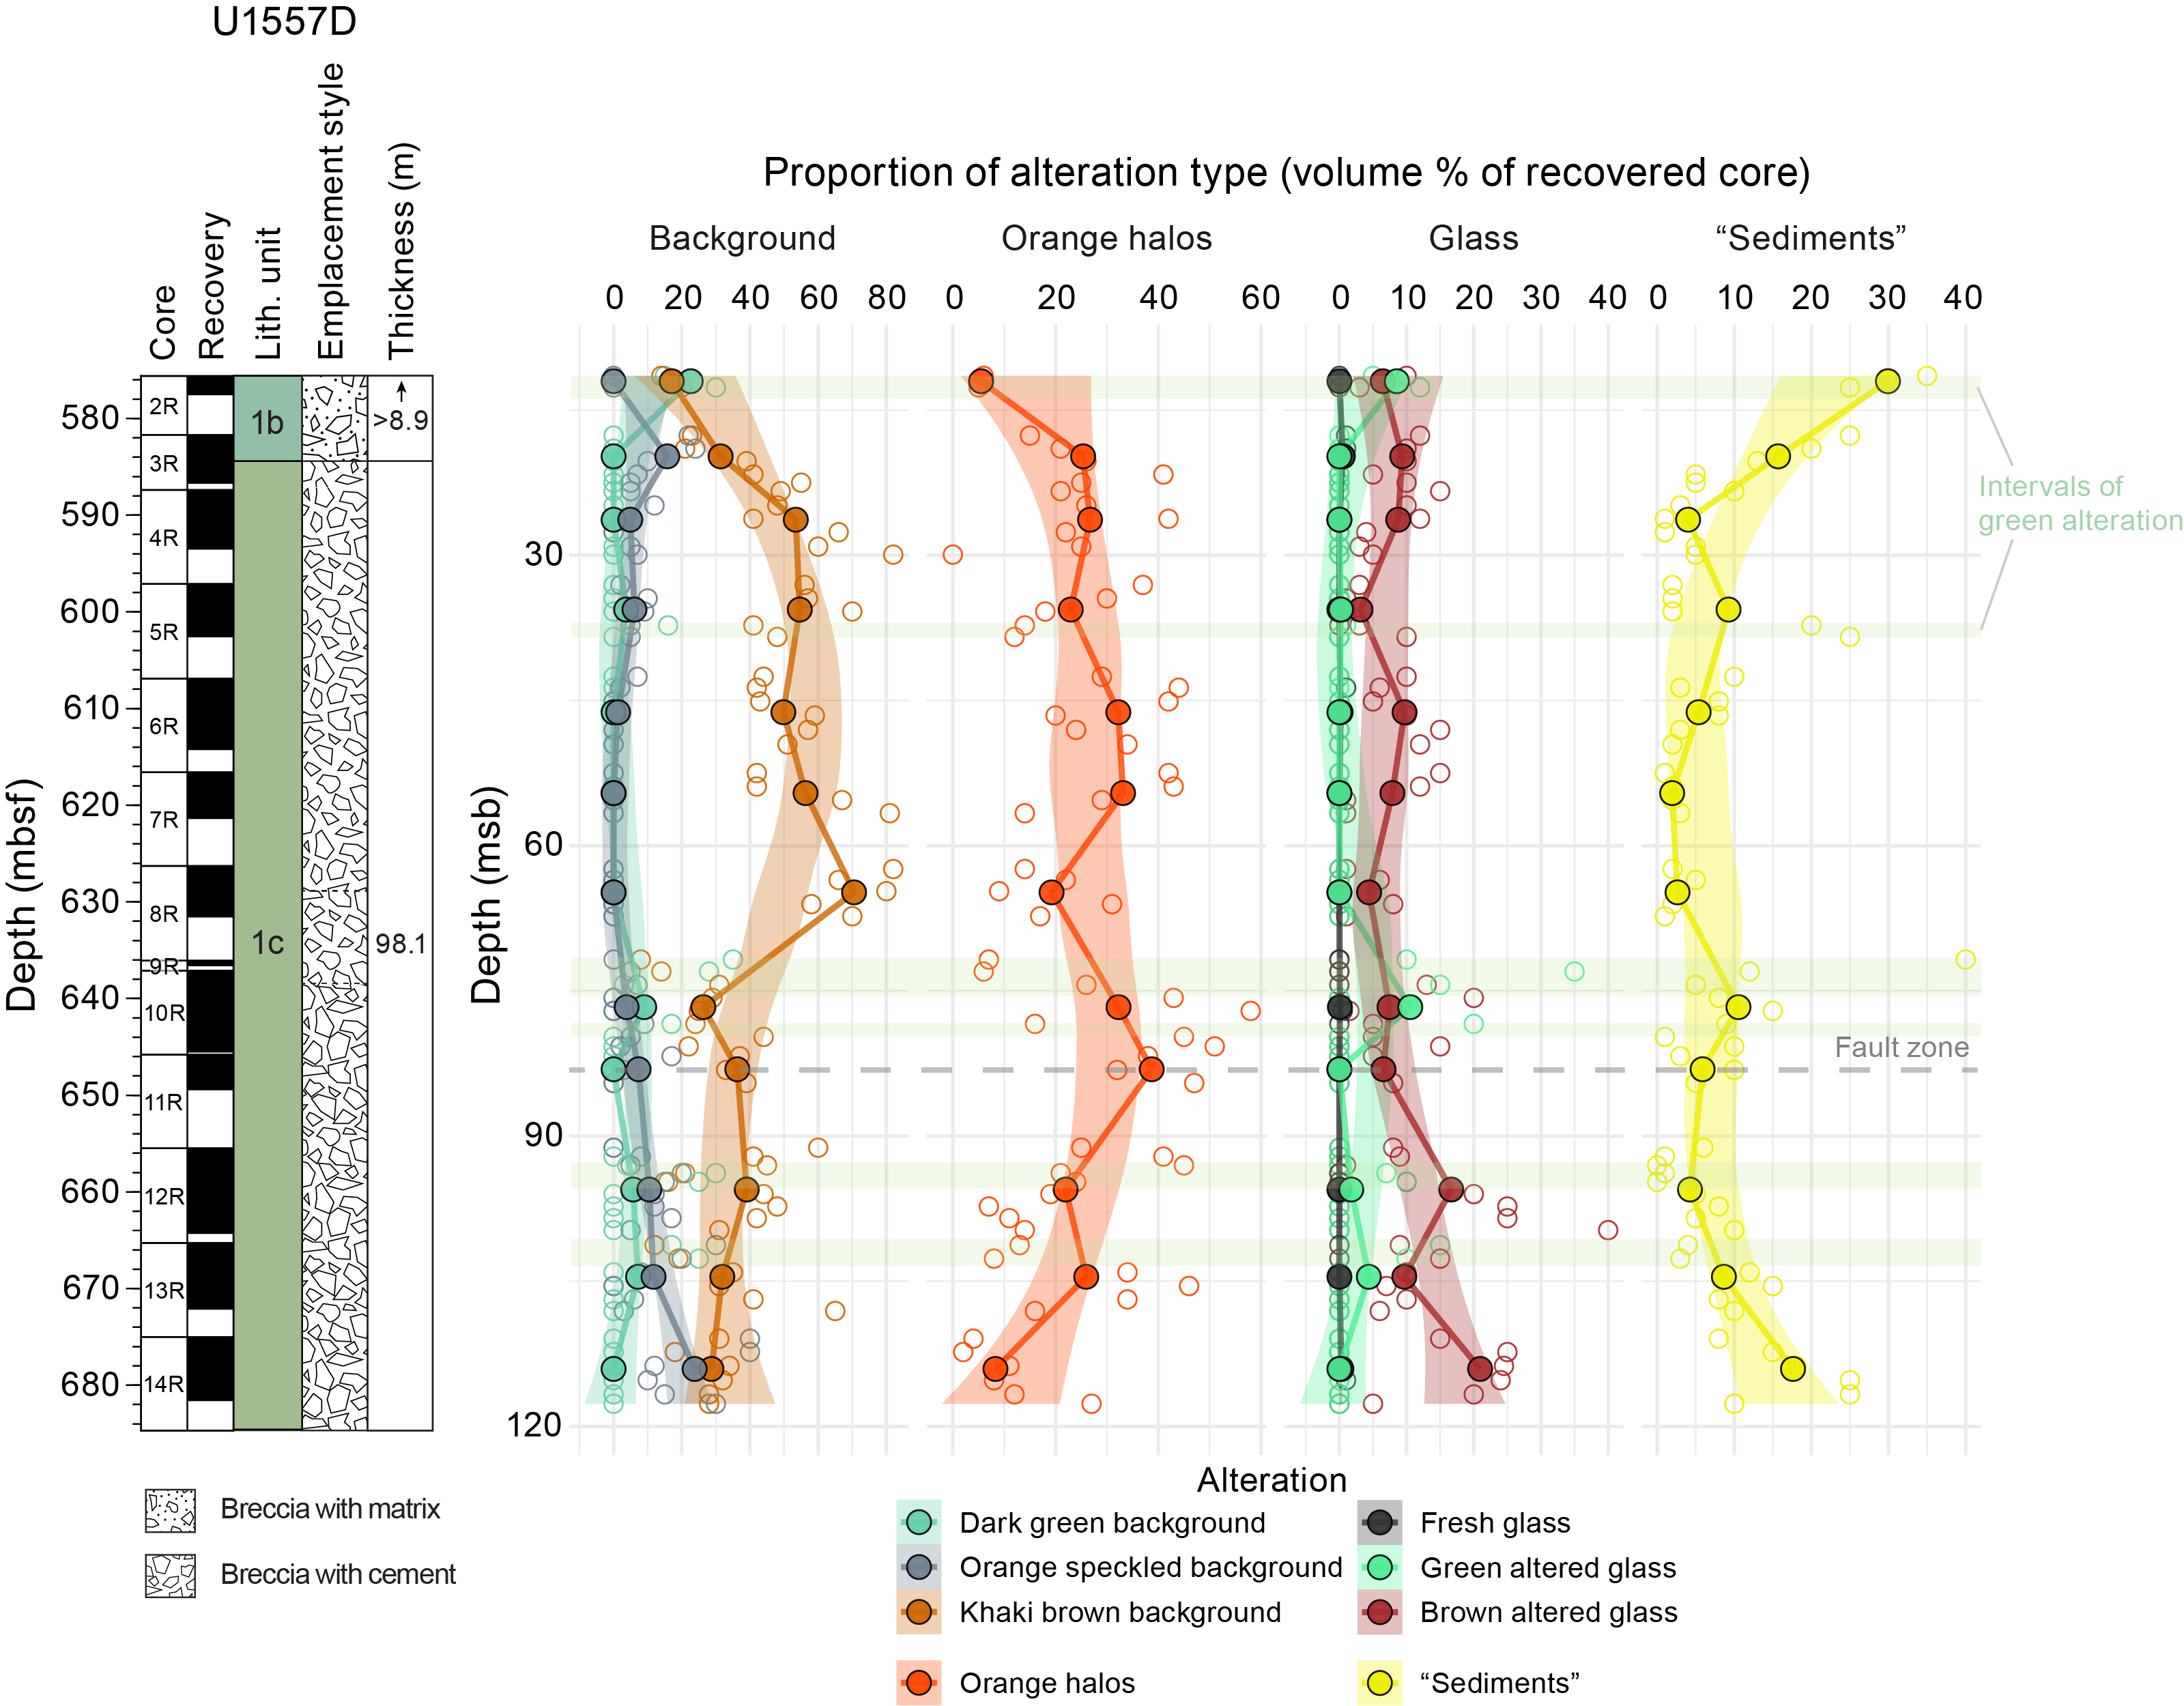
Figure F48. Alteration types.
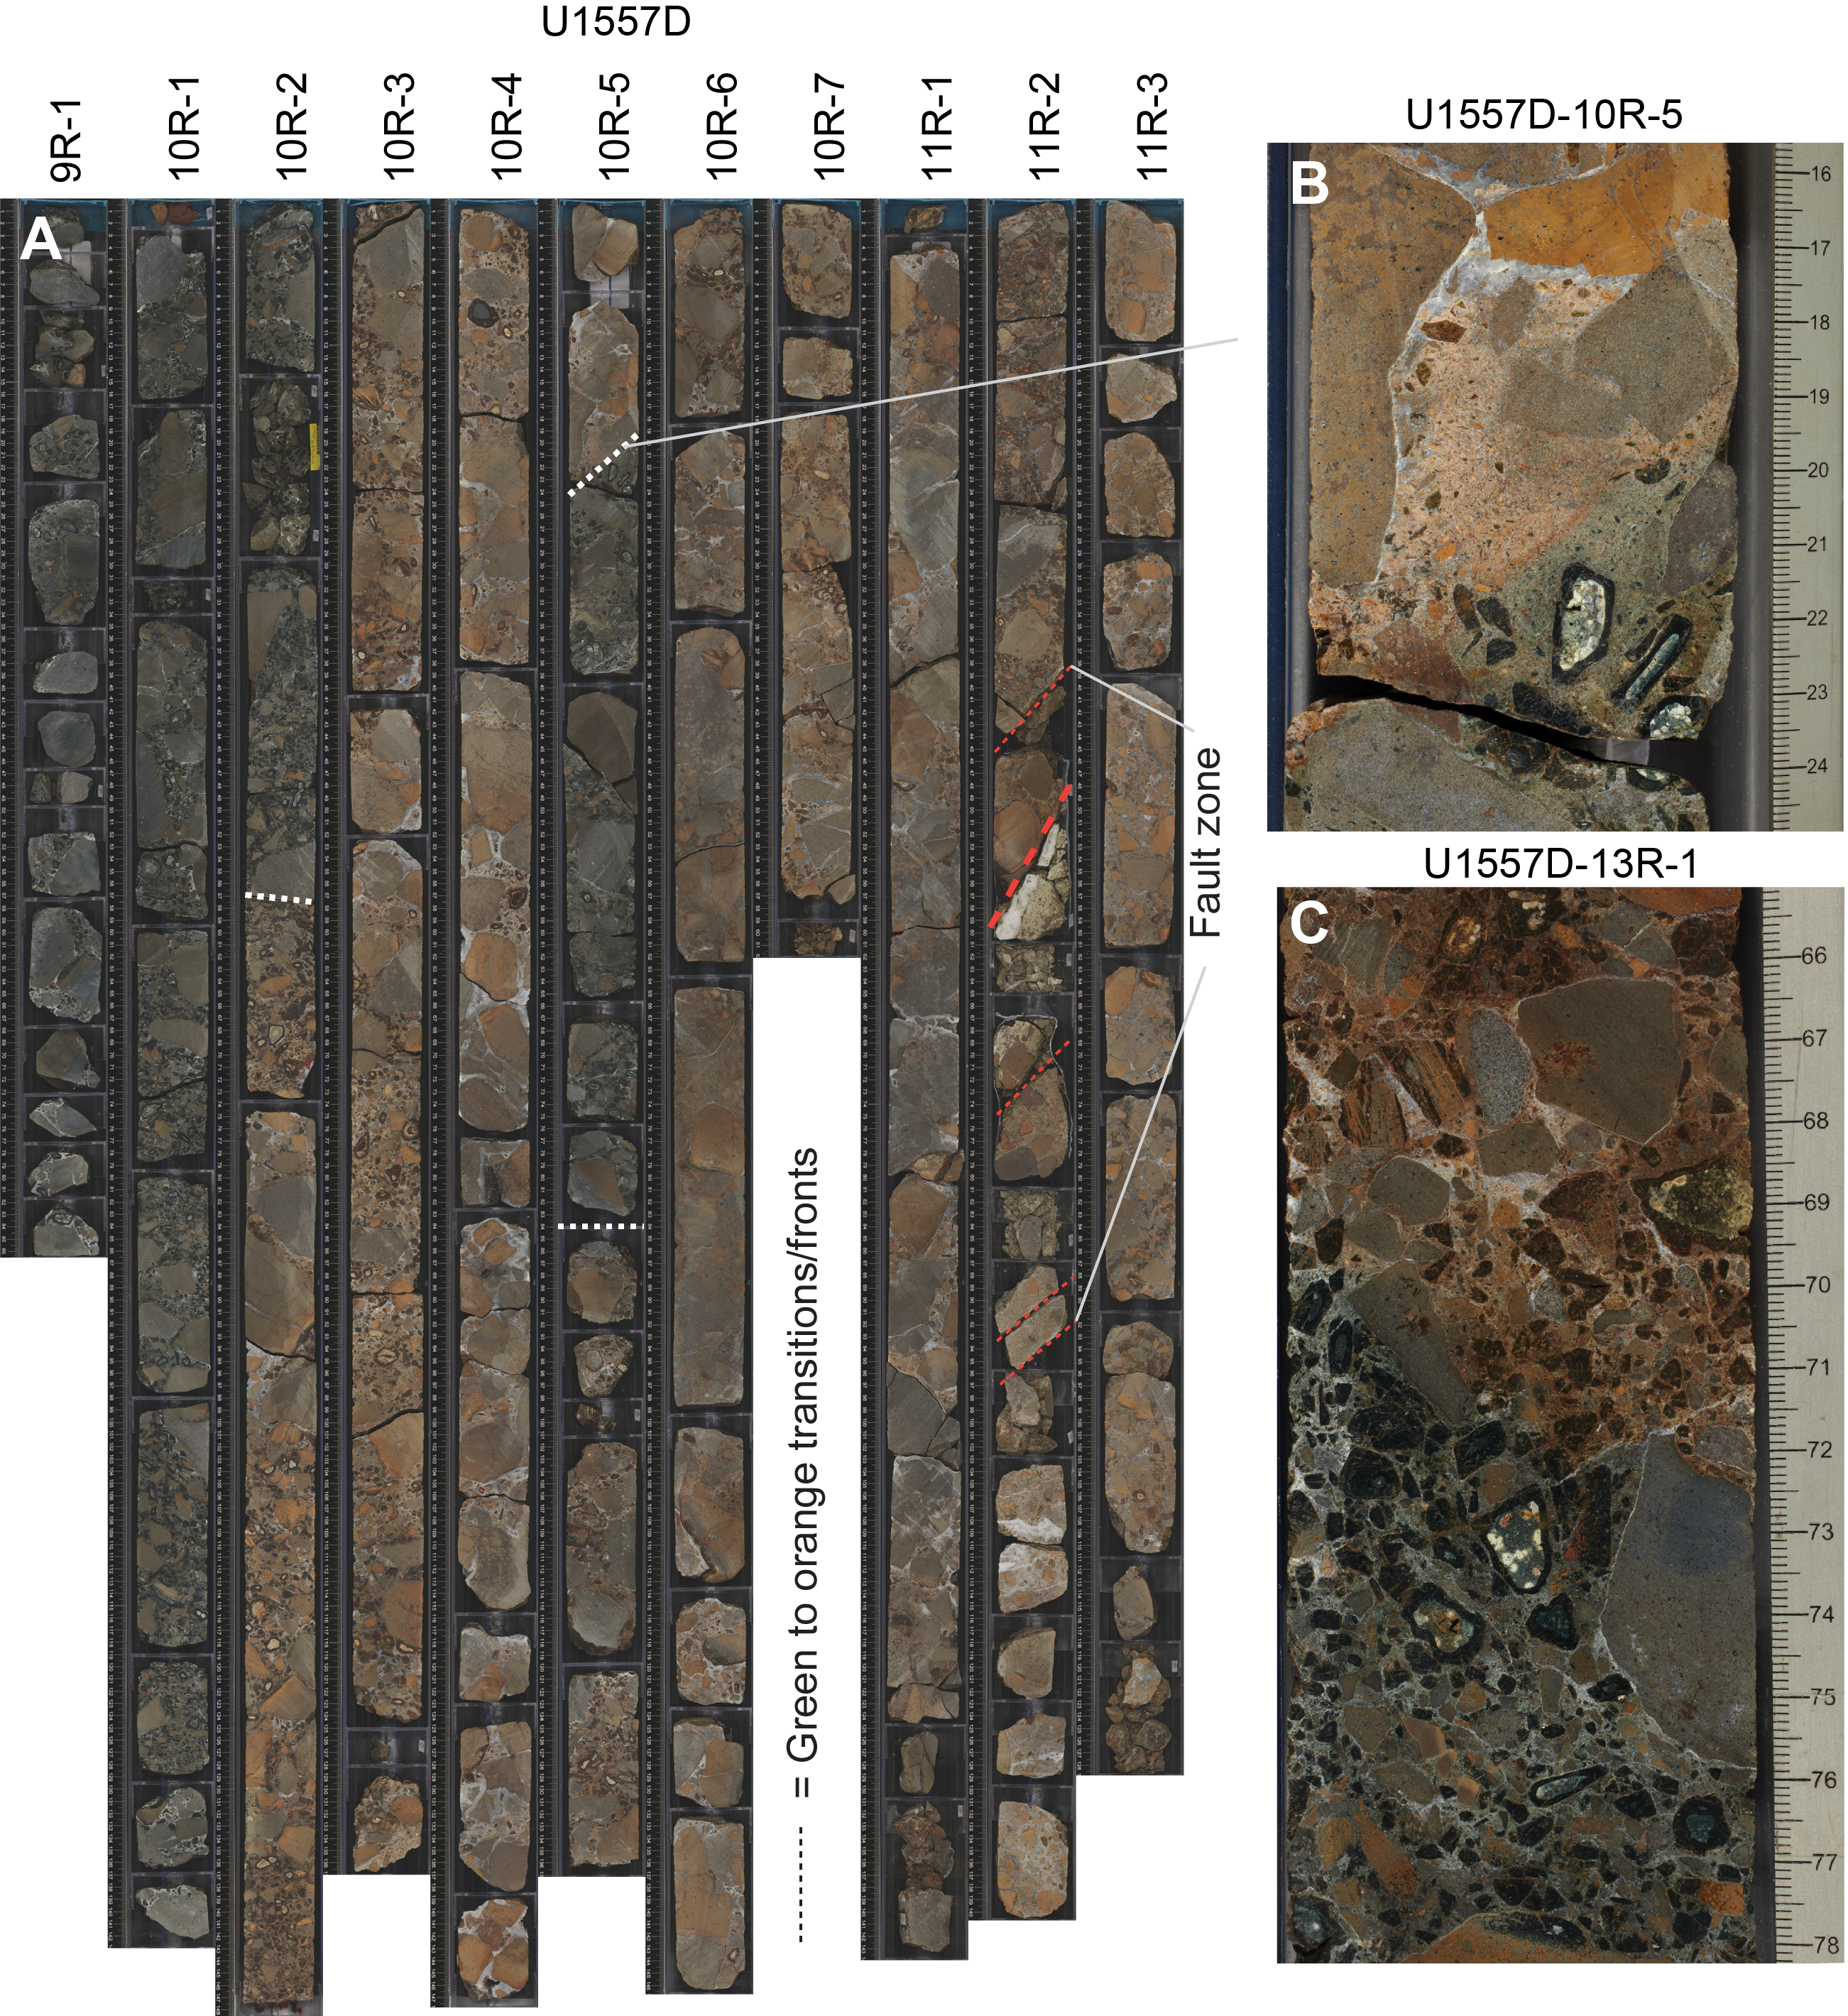
Figure F49. Alternation green and khaki-brown/orange alteration zones.
6.1.2. Alteration halos
6.1.2.1. Orange halos
One of the most distinctive types of alteration seen in Hole U1557D are orange halos, which occur abundantly throughout the core (Figures F40, F44). These occur most commonly in clasts of cryptocrystalline basalt that are highly altered to a strong orange (brown [7.5YR 5/4] to reddish yellow [7.5YR 6/6]) similar to the intense alteration seen along the interior of the chilled margins of pillow basalts in Hole U1556B. This type of alteration corresponds to the orange clasts described in Igneous petrology. Orange halos commonly occur as fragments with a gradient in the intensity of alteration color and, more rarely, may have remnants of a glassy margin paralleling the alteration gradient. Such gradients are commonly truncated by the broken edges of the clast, indicating formation prior to brecciation. Conversely, there are numerous examples of clasts that show orange halos paralleling their edges, which appear to have formed after brecciation. These are commonly juxtaposed with clasts of similar lithology and grain size showing no orange halos (Figure F44A, F44D).
In thin section, orange halos are defined by intense and near-complete replacement of the cryptocrystalline quench groundmass by red-brown Fe oxyhydroxides and clays (Figure F50). This type of oxidative alteration appears highly resistant to overprinting or overgrowth by later phases of alteration (except by more Fe oxyhydroxides). As such, orange halos are almost completely unaffected when their host breccia is pervasively altered to deep green (Figure F44A) (see Dark green background alteration).
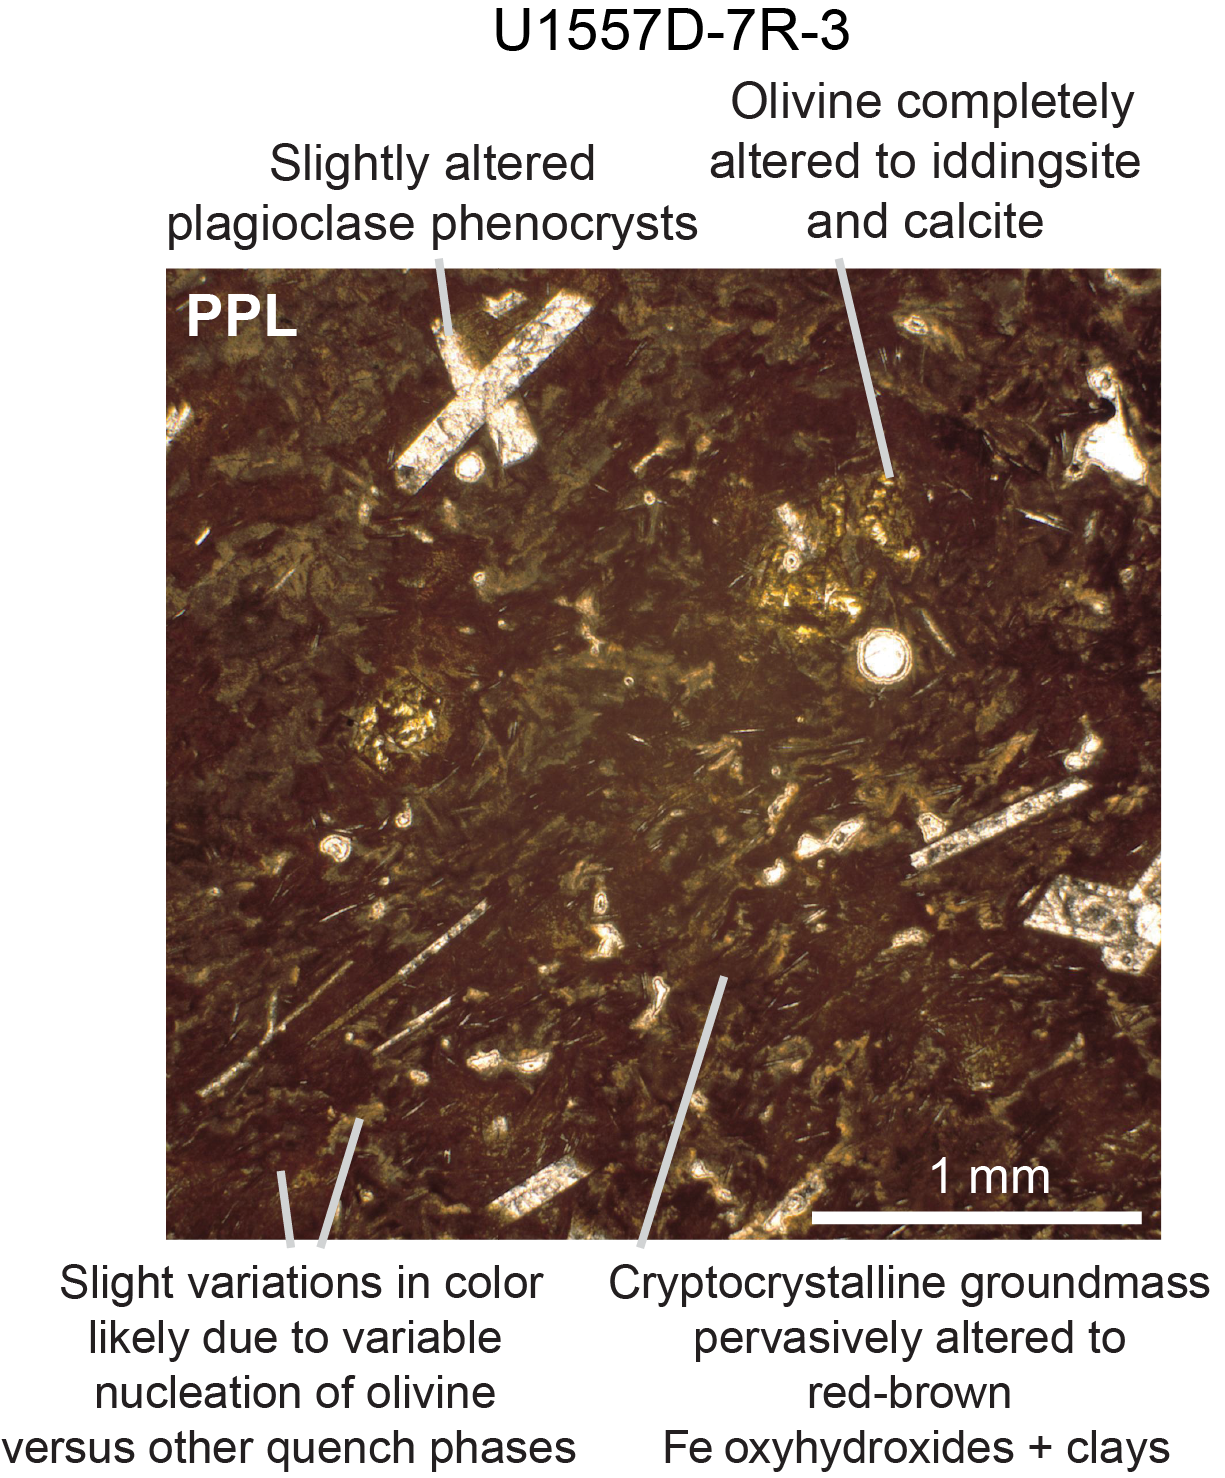
Figure F50. Well-developed orange halo.
6.1.2.2. Green halos
Green halos are defined by the presence of clays that appear bright green in thin section and very dark green or black in hand specimen. These were only observed in thin section in Hole U1557D and were not recognized during core description except when cross-checked with thin section observations. Similar micro- and macroscopic colors were exhibited by green altered glass in Hole U1556B (see Alteration petrology in the Site U1556 chapter [Coggon et al., 2024a]).
In thin section, the clays appear bright green and optically clear in plane-polarized light but cryptocrystalline or feathery in texture under crossed nichols (Figure F51). Green halos occur most commonly along one or more edges of a clast or, less commonly, within a narrow halo along a vein. Within such halos, green clays fill or line vesicles or less commonly replace groundmass. Where the relative order of secondary mineral formation is clear, such as concentric growth layers in filled vesicles, the green clays are the first stage of alteration (e.g., Figure F47).
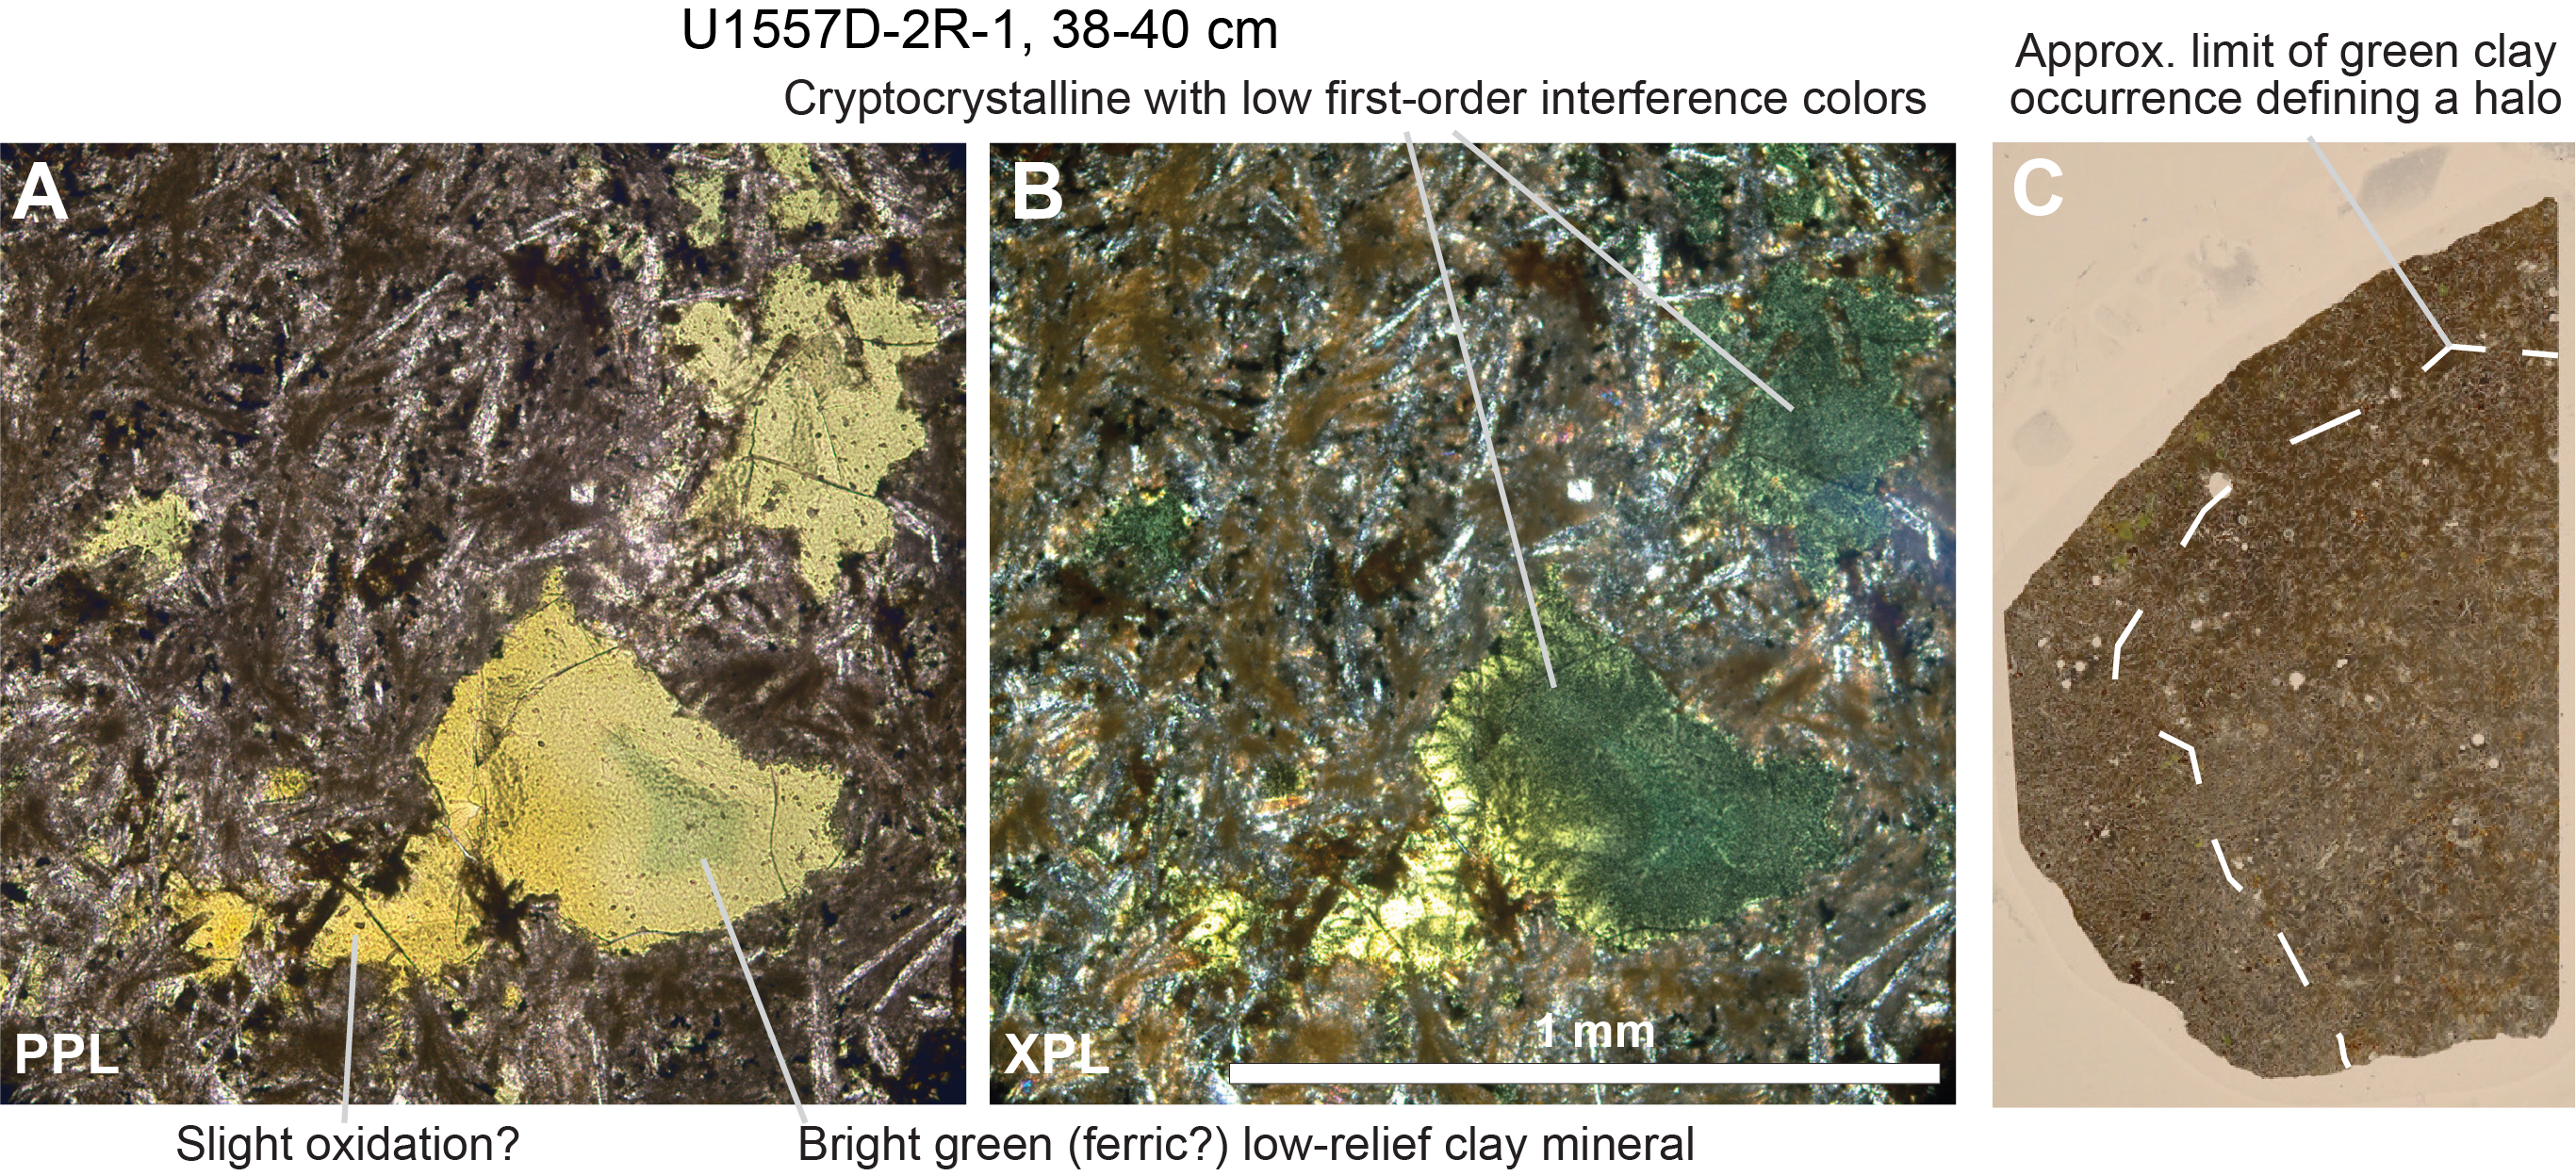
Figure F51. Bright green, likely ferric clays filling vesicles.
6.1.2.3. Dark brown fuzzy halos
Some intervals are characterized by abundant but thin (typically 2–3 mm) dark brown halos with a fuzzy, blotchy, or dendritic appearance that form around the edges of clasts and along thin veins and in isolated patches within the clasts (Figure F52). The affected clasts are typically highly altered cryptocrystalline fragments of orange halo (Figure F52B). In thin section, the fuzzy appearance is defined by abundant opaque clays + Fe oxyhydroxides that grow from the edges of the clast inward, nucleating along and spreading from pseudomorphed relics of elongate quench groundmass phases (likely originally olivine; Figure F53). Similar features occur as vein halos and isolated patches in Hole U1556B, principally in highly altered aphyric pillow basalts of Stratigraphic Sequence B (see Igneous petrology in the Site U1556 chapter [Coggon et al., 2024a]). The concentric pattern of these halos fringing the outer portion of clasts indicates that they principally formed postbrecciation. XRD analysis of the dark material coating such clasts (similar to the halo-forming phases) suggests that it is smectite with a large proportion of amorphous material that may be Fe oxyhydroxides (Table T5). Some samples display peaks that indicate the presence of Mn oxide or oxyhydroxide (see Manganese oxides).
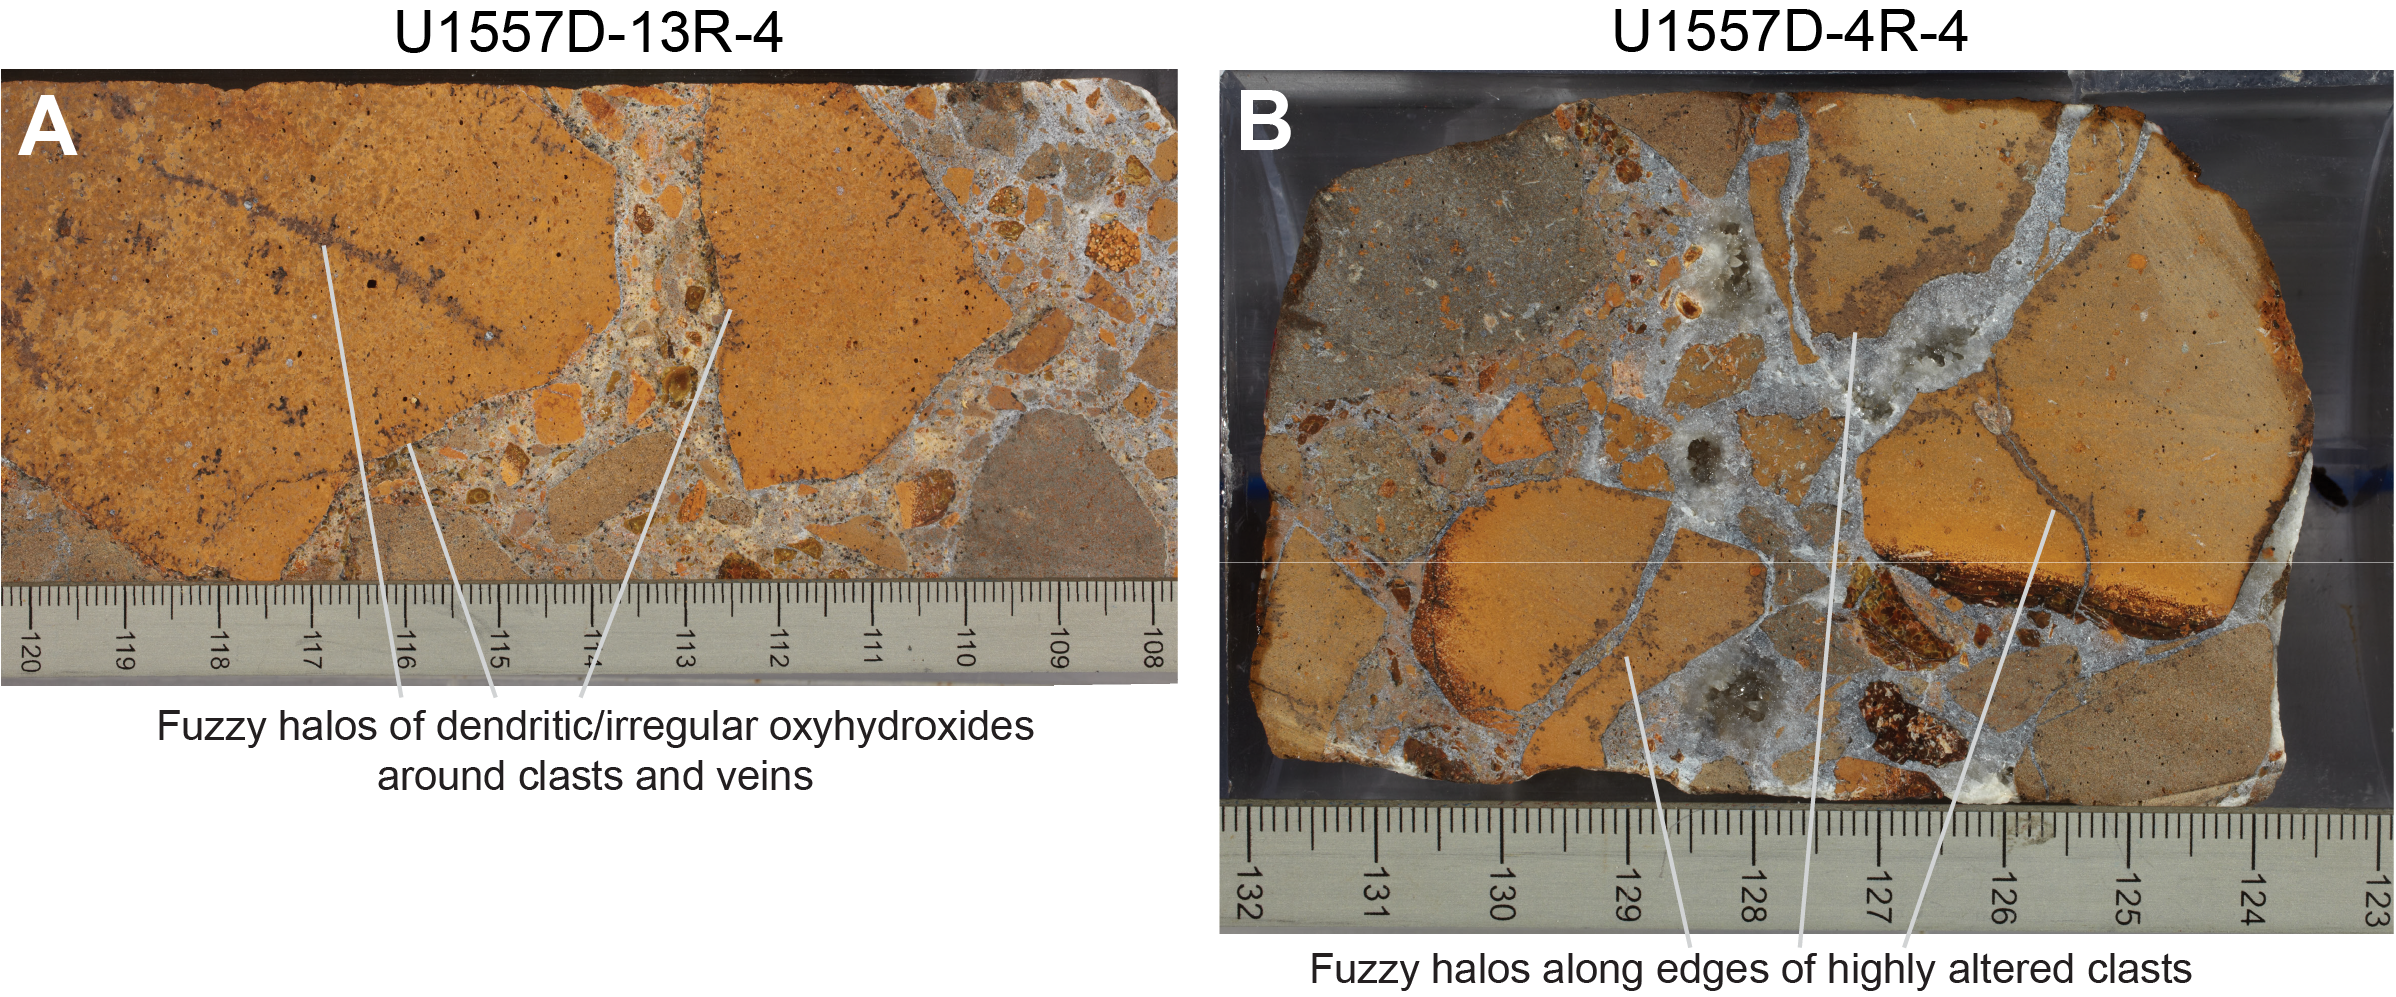
Figure F52. Fuzzy dark brown halos along clast edges and veins.
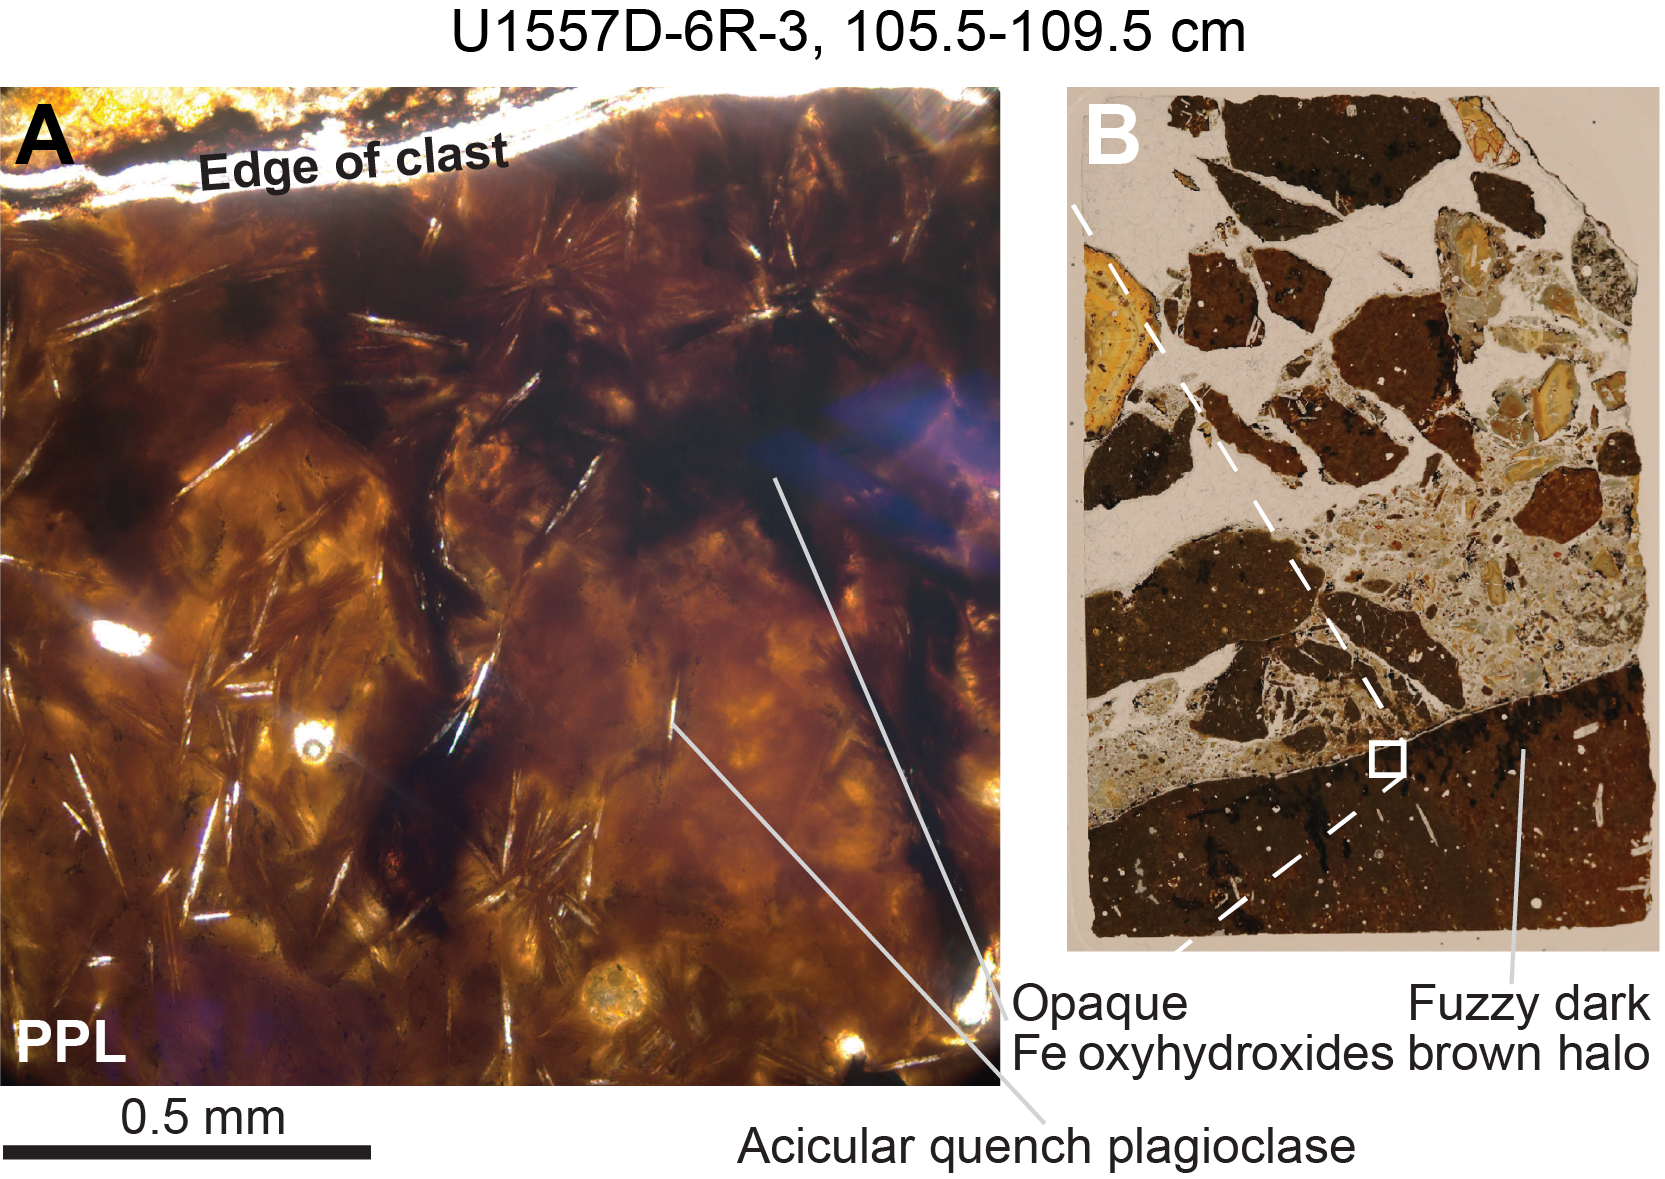
Figure F53. Fuzzy dark brown halos along elongate quench crystals.
6.1.3. Authigenic zeolite-bearing sediment
In Hole U1557D, the breccia matrix consists of pale yellow, pink, or brown carbonate-bearing, fine-grained, massively textured or laminated material and typically fills interclast pore space in gravity-controlled positions. During alteration logging, the proportion of this material in each section was recorded together with the various types of alteration of the basalt and glass clasts and treated as distinct from crystalline cements (mostly carbonate) that grew in the pore space (recorded as breccia cements in the vein log; see DESC_WKB in Supplementary material). In thin section, it is clear that much of this material, especially below Core 390-U1557D-3R, constitutes authigenic zeolites and carbonates rather than pelagic sediment (see Igneous petrology). To maintain consistency with the alteration and vein logs, in this section both pelagic sediment and authigenic material are referred to collectively throughout as sediment. This also allows us to retain the meaningful petrologic distinction between authigenic microspar + zeolite matrix and crystalline void-filling calcite (and other mineral) cements in the data and downhole plots.
6.2. Downhole variations in alteration
During alteration logging, the area proportions of the alteration types described above—background (orange speckled, dark green, and khaki-brown), halos (orange and dark/fuzzy), altered and unaltered glass (brown, green, and fresh), and sediment matrix (see Authigenic zeolite-bearing sediment)—were estimated for each section of core (see Alteration petrology in the Expedition 390/393 methods chapter [Coggon et al., 2024c]). These data are averaged as a weighted mean by recovered length for each core in Hole U1557D (Figure F48). The most abundant alteration types are khaki-brown background and orange halos, which constitute approximately 20%–70% and 5%–40%, respectively, of the rock by area per core.
The proportion of green altered glass and green background alteration show several spikes in six intervals spaced throughout the hole. Several of these intervals appear to correspond to intervals of elevated K-derived NGR identified from downhole logging (Figure F93).
Below ~75 msb (~640 mbsf), both altered glass and sediment become more abundant (Figure F48). This depth corresponds to a 3 m unrecovered interval between Cores 390-U1557D-8R and 9R. The same interval corresponds to an apparent transition in physical properties including NGR and resistivity logs, which broadly increase and decrease, respectively, over a similar depth range (~630–645 mbsf) (see Physical properties and downhole measurements) (Figures F92, F93).
The proportion of orange halos shows apparent cyclicity in the upper part of the hole (above 75 msb), although this appears to be largely an artifact of minor variations in the proportions of various other alteration types/components (including glass and sediment). Below ~75 msb, the proportion of orange halos decreases. This trend is more clearly seen where orange halos are plotted as a proportion of the total area of basalt clasts (i.e., data normalized to exclude glass and sediment) (Figure F54A). The proportion of orange halos increases slightly at ~75 msb, below which it decreases steadily downhole. Plotting the proportion of khaki-brown alteration as a proportion of all background alteration (khaki and orange speckled background) shows a similar change at ~75 msb, with the relative proportion of khaki alteration uniform above this horizon but steadily decreasing downhole (Figure F54B). These trends might reflect decreasing intensity of both prebrecciation (orange halo) and postbrecciation (khaki background) alteration downhole.
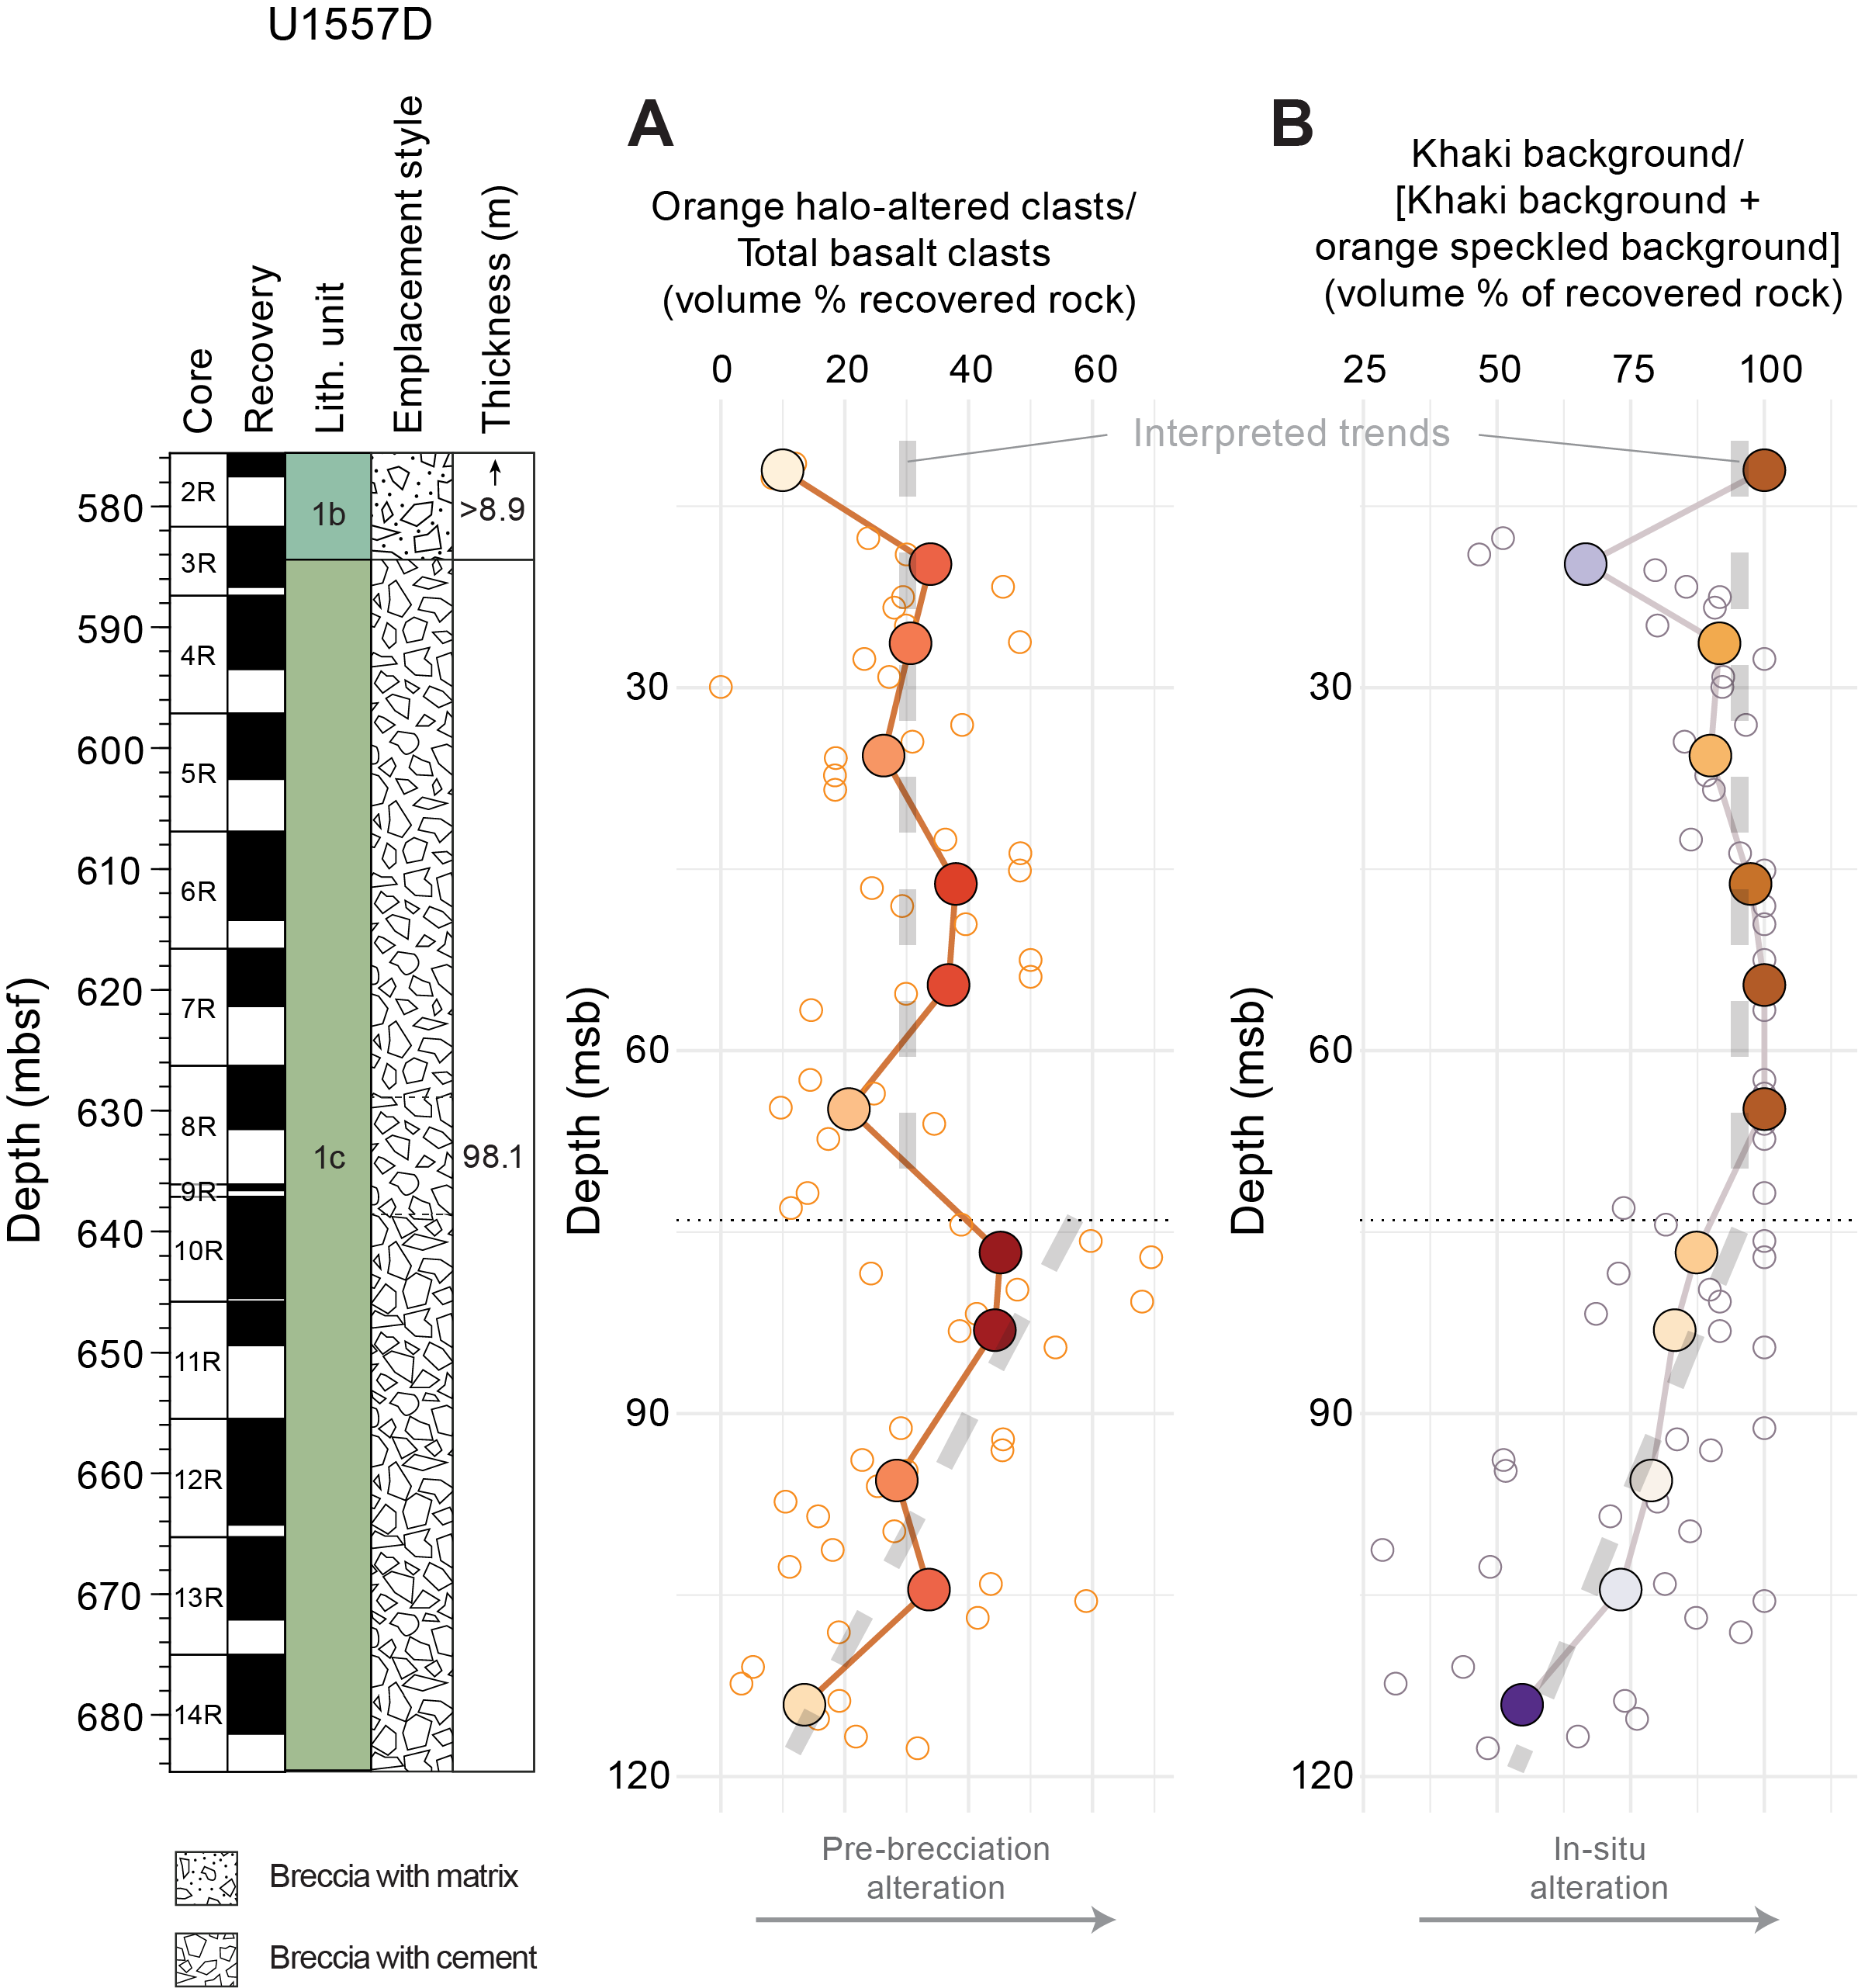
Figure F54. Alteration type abundance ratios.
6.3. Order of alteration events
The earliest alteration event, which is only preserved in some altered basalt clasts, appears to be green halo development, characterized in thin section by the presence of bright green clays (see Green halos). Where these occur, a partial oxidative overprint is commonly manifested in alteration of the color of green clays to bright yellow, with these apparent oxidation gradients cutting discordantly across patches and vesicles filled by green clay (Figure F47).
Almost all samples show oxidative alteration, characterized in thin section by replacement of groundmass, cryptocrystalline quench phases, and olivine phenocrysts by various red-brown, orange, or yellow clay + Fe oxyhydroxide mixtures. This oxidative alteration is generally followed by formation of pale green to pale brown clays, possibly saponitic in composition, that overgrow iddingsite, replace groundmass, and fill vesicles. In thin section, these pale clays occur ubiquitously throughout the basalts showing khaki-brown background, dark green background, and orange speckled background alteration (Figures F41, F46, F49). Wherever pale brown/green clays, bright green clays, and brown Fe oxyhydroxides occur together in thin section, the sequence of formation begins with bright green clays that are overgrown by red-yellow-brown clay ± Fe oxyhydroxides and finally by pale brown clay. The pale brown clays are mostly, although not universally, unaffected by oxidative overprints that commonly alter the color of the bright green clays to yellow or orange (Figure F47; cf. Figure F42). In rare examples, there is evidence for multiple generations of pale brown/green clay alteration (e.g., Sample 390-U1557D-13R-3, 7–9 cm). When present, carbonate typically represents the latest forming phase seen in thin section, overgrowing pale brown clays in vesicles (Figure F42).
6.3.1. Relative timing of orange halo alteration and brecciation
Orange halos show evidence for formation both along the original chilled margins of pillows and around the edges of fragments of basalt (Figure F44A, F44D). In many cases, the former are sharply truncated by the broken edges of clasts. Various clasts, including those with truncated halos, concentric halos around their edges, and no halos, are commonly juxtaposed in the breccias. Some clasts show both truncated and concentric halos (Figure F45B).
These observations suggest that extensive oxidative alteration, manifest by the formation of orange halos, occurred both prior to and following brecciation. Formation of orange halos prior to incorporation in the breccia pile would have to have proceeded rapidly given the 60.76–61.27 Ma age of basal sediments at Site U1557 (see Biostratigraphy). Intact basalts from young oceanic crust, including those from Site U1559, do not typically show such intense alteration (see Alteration petrology in the Site U1559 chapter [Coggon et al., 2024e]), implying some extra mechanism is needed for their alteration. This could include partial brecciation of basalts in a rubble pile and/or localization of fluid flow. The apparent truncation of orange pillow margin halos could also partly reflect the interaction of postbrecciation alteration with primary igneous grain size variation, with cryptocrystalline portions being more easily altered or more strongly expressing intense orange alteration colors. Another alternative is that early-forming alteration halos (e.g., dark gray halos seen in young crust; see Alteration petrology in the Site U1559 chapter [Coggon et al., 2024e]) might alter the mineralogy or microstructure of the rock to promote later oxidation.
6.3.2. Formation of zones of dark green background alteration
Zones of dark green background alteration clearly formed in situ within the breccia and overprint orange halos in basalt clasts (Figure F44A) and, where present, represent the latest phase of alteration. Green intervals lack voluminous carbonate cement and open porosity (Figure F55). Rather, they are characterized by comparatively sparse cement, with few open vugs (e.g., compare Sections 390-U1557D-9R-1 and 10R-4; Figure F49). Outside of these intervals of low porosity, orange halo, khaki background, and orange speckled background alteration predominate, likely reflecting relatively more oxidizing conditions.
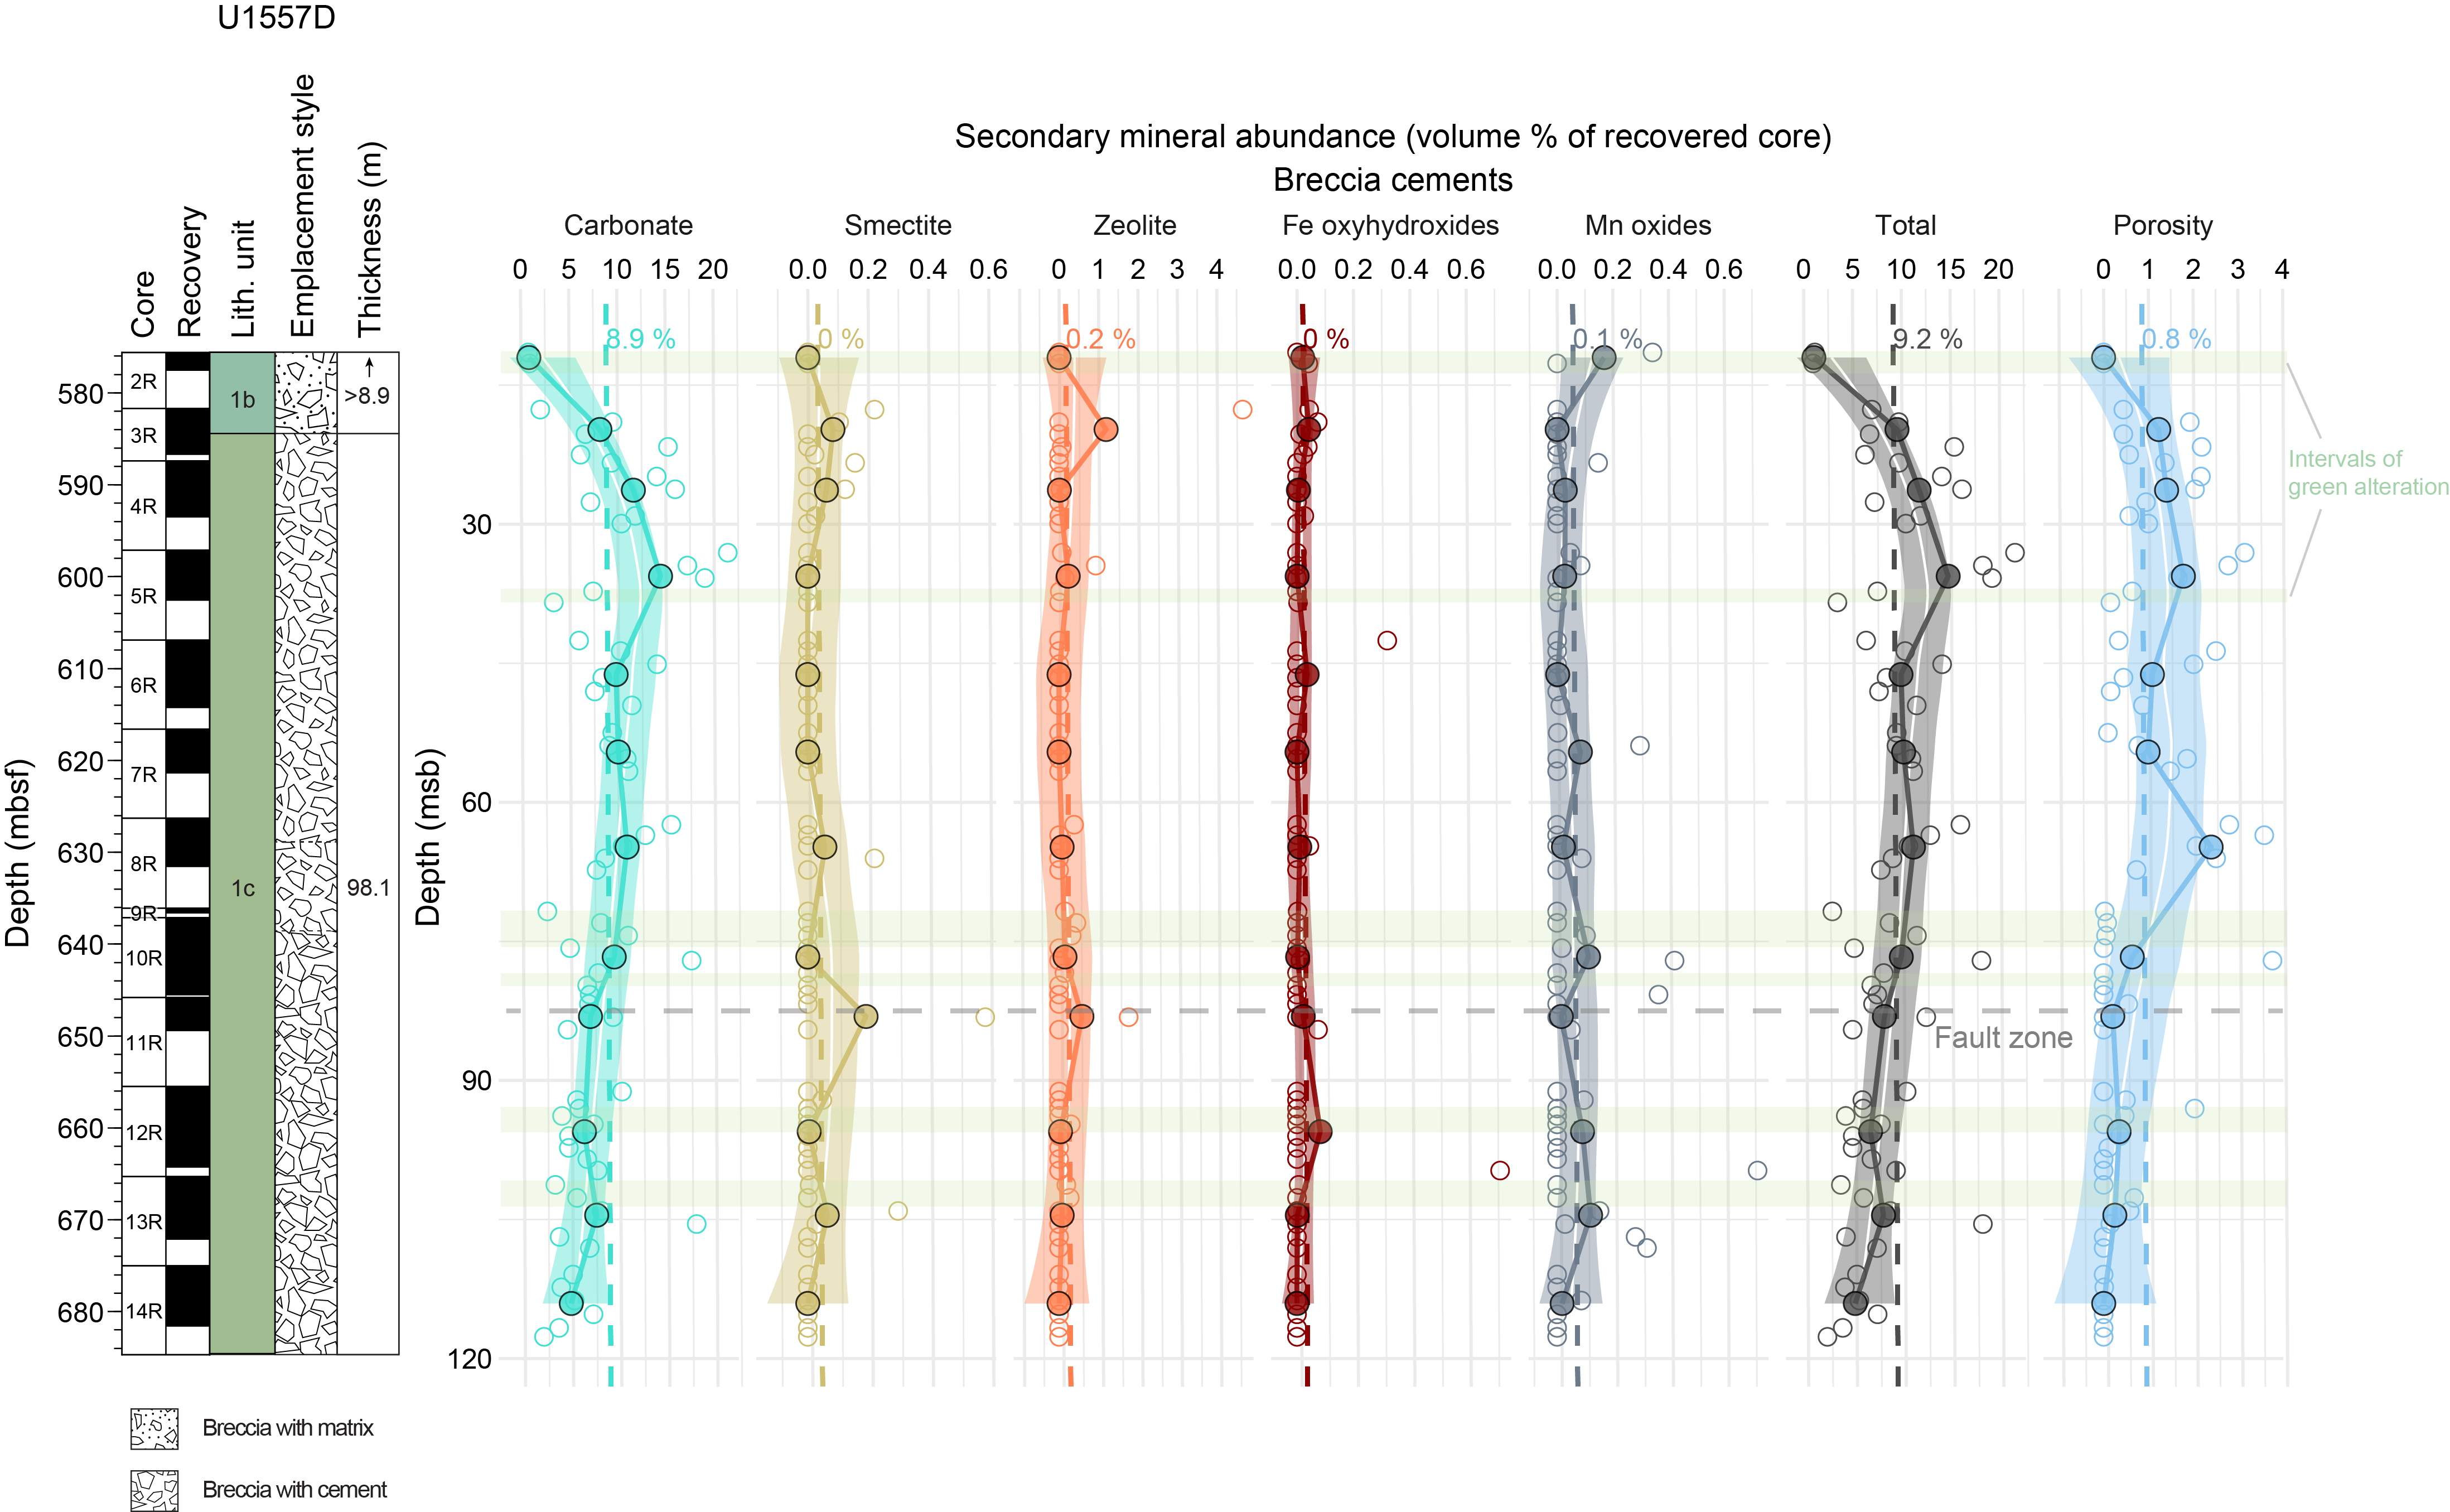
Figure F55. Secondary minerals and porosity in breccia cements.
6.4. Vein logging
The area proportion of the core that is filled by veins and breccia cements and vesicles, together with the mineralogy of these features, was quantitatively logged in the basement cores from Holes U1557B and U1557D. Vein density (as number of veins per meter of recovered core) is plotted downhole in Figure F56, and the corresponding mean, median, and maximum vein width are plotted in Figure F57. The volume proportions of selected secondary minerals in breccia cements and vesicle fills are plotted downhole in Figures F55 and F58, respectively. The abundance of veins in Hole U1557D is unsurprisingly low compared to Site U1556, with only 334 veins recorded, corresponding to an average of 4.8 veins/m of recovered core (68.95 m). The low abundance reflects the fact that fractures or veins present in basalts prior to brecciation and redeposition will have been preferentially fractured and now form the outside surfaces of clasts.
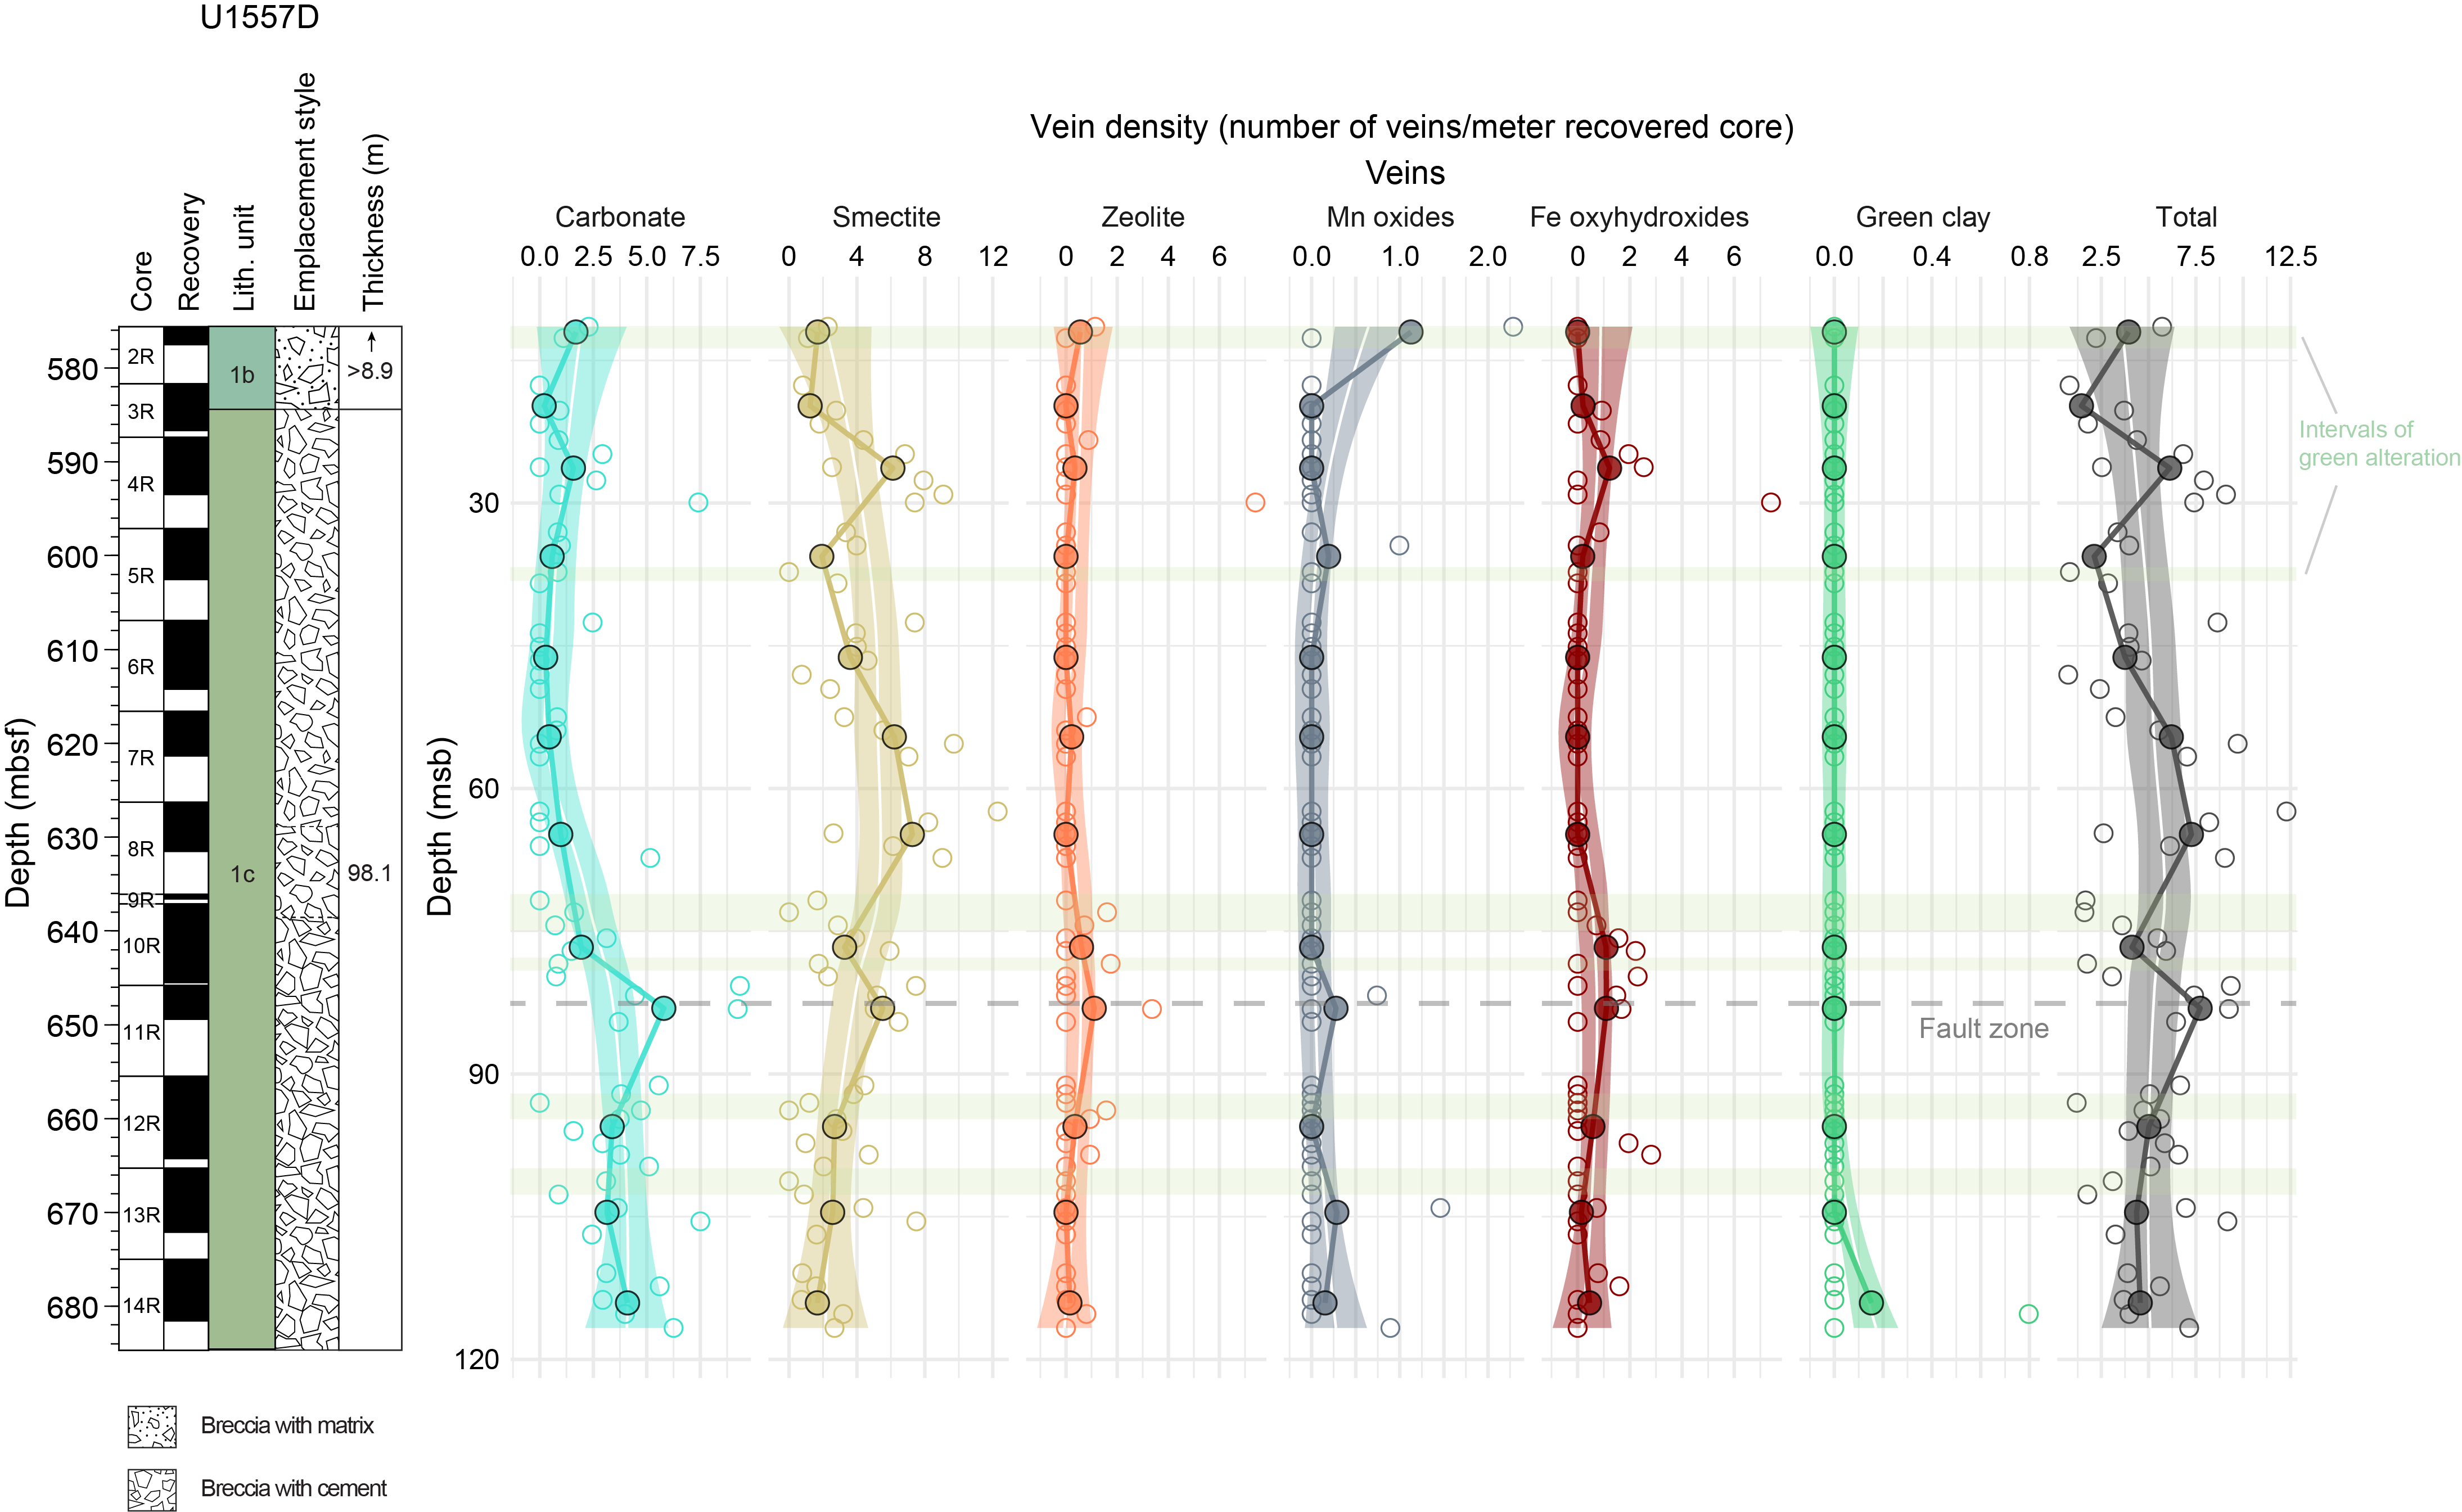
Figure F56. Vein density.
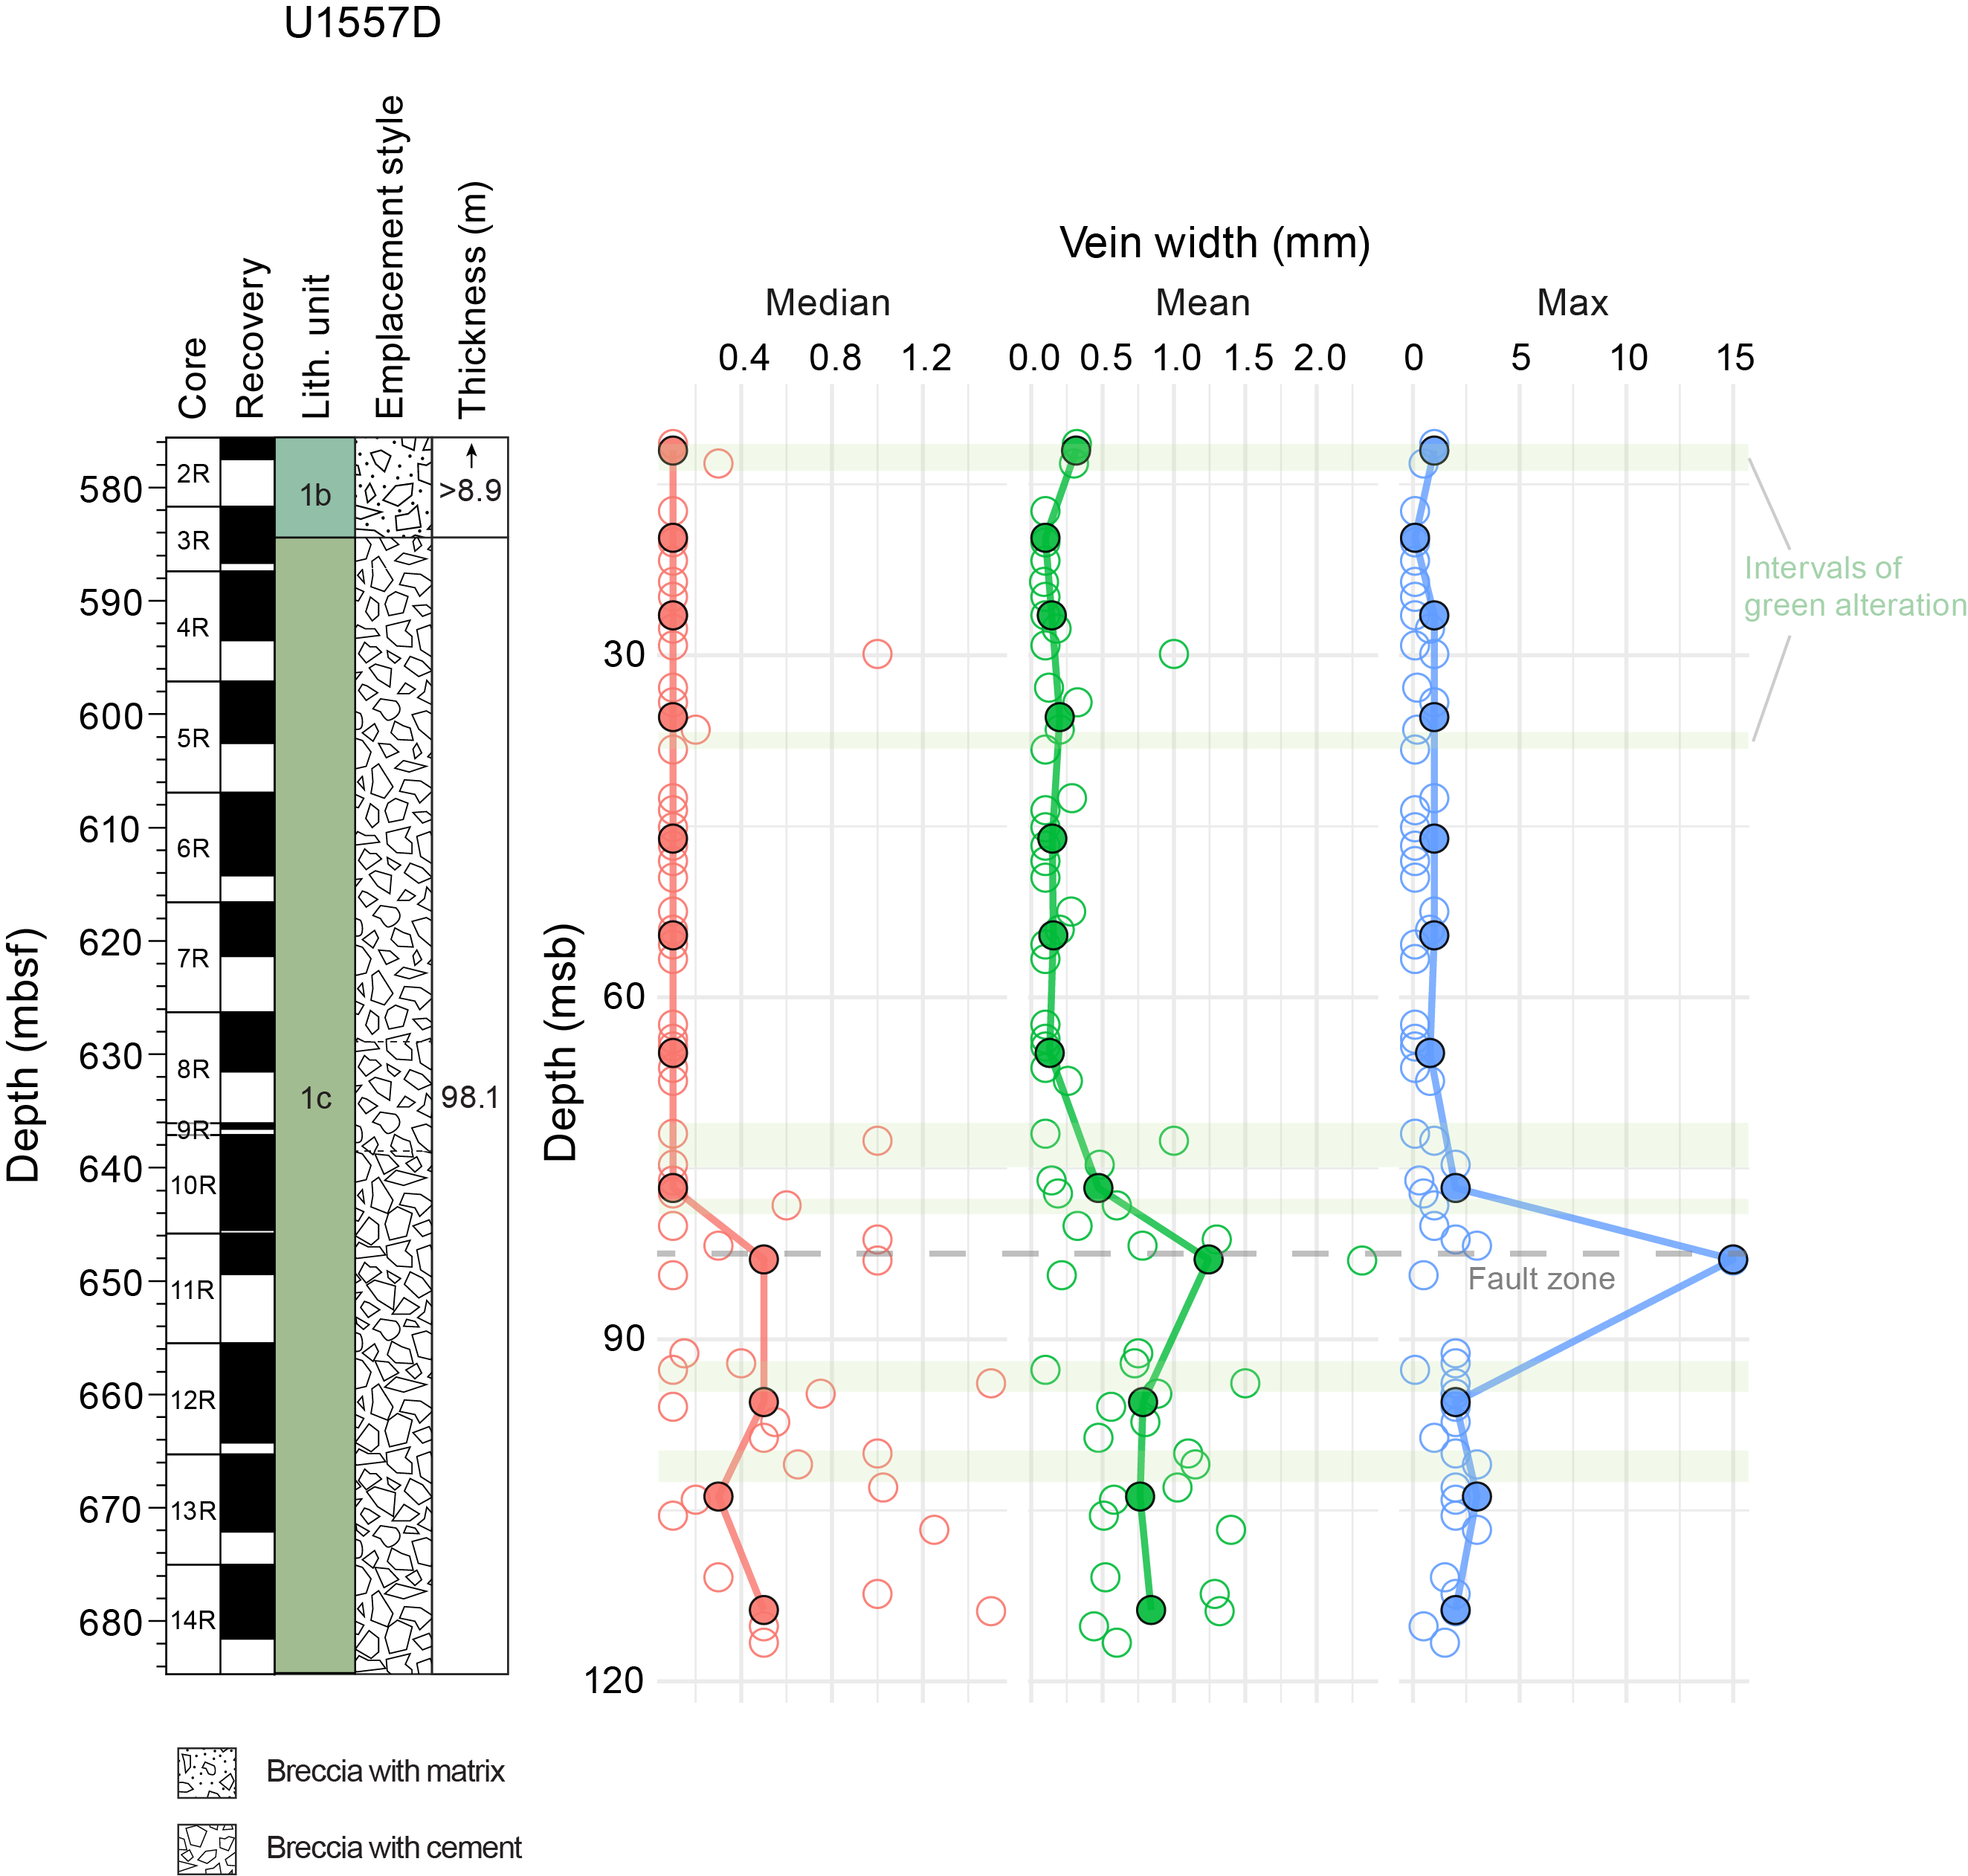
Figure F57. Vein widths.
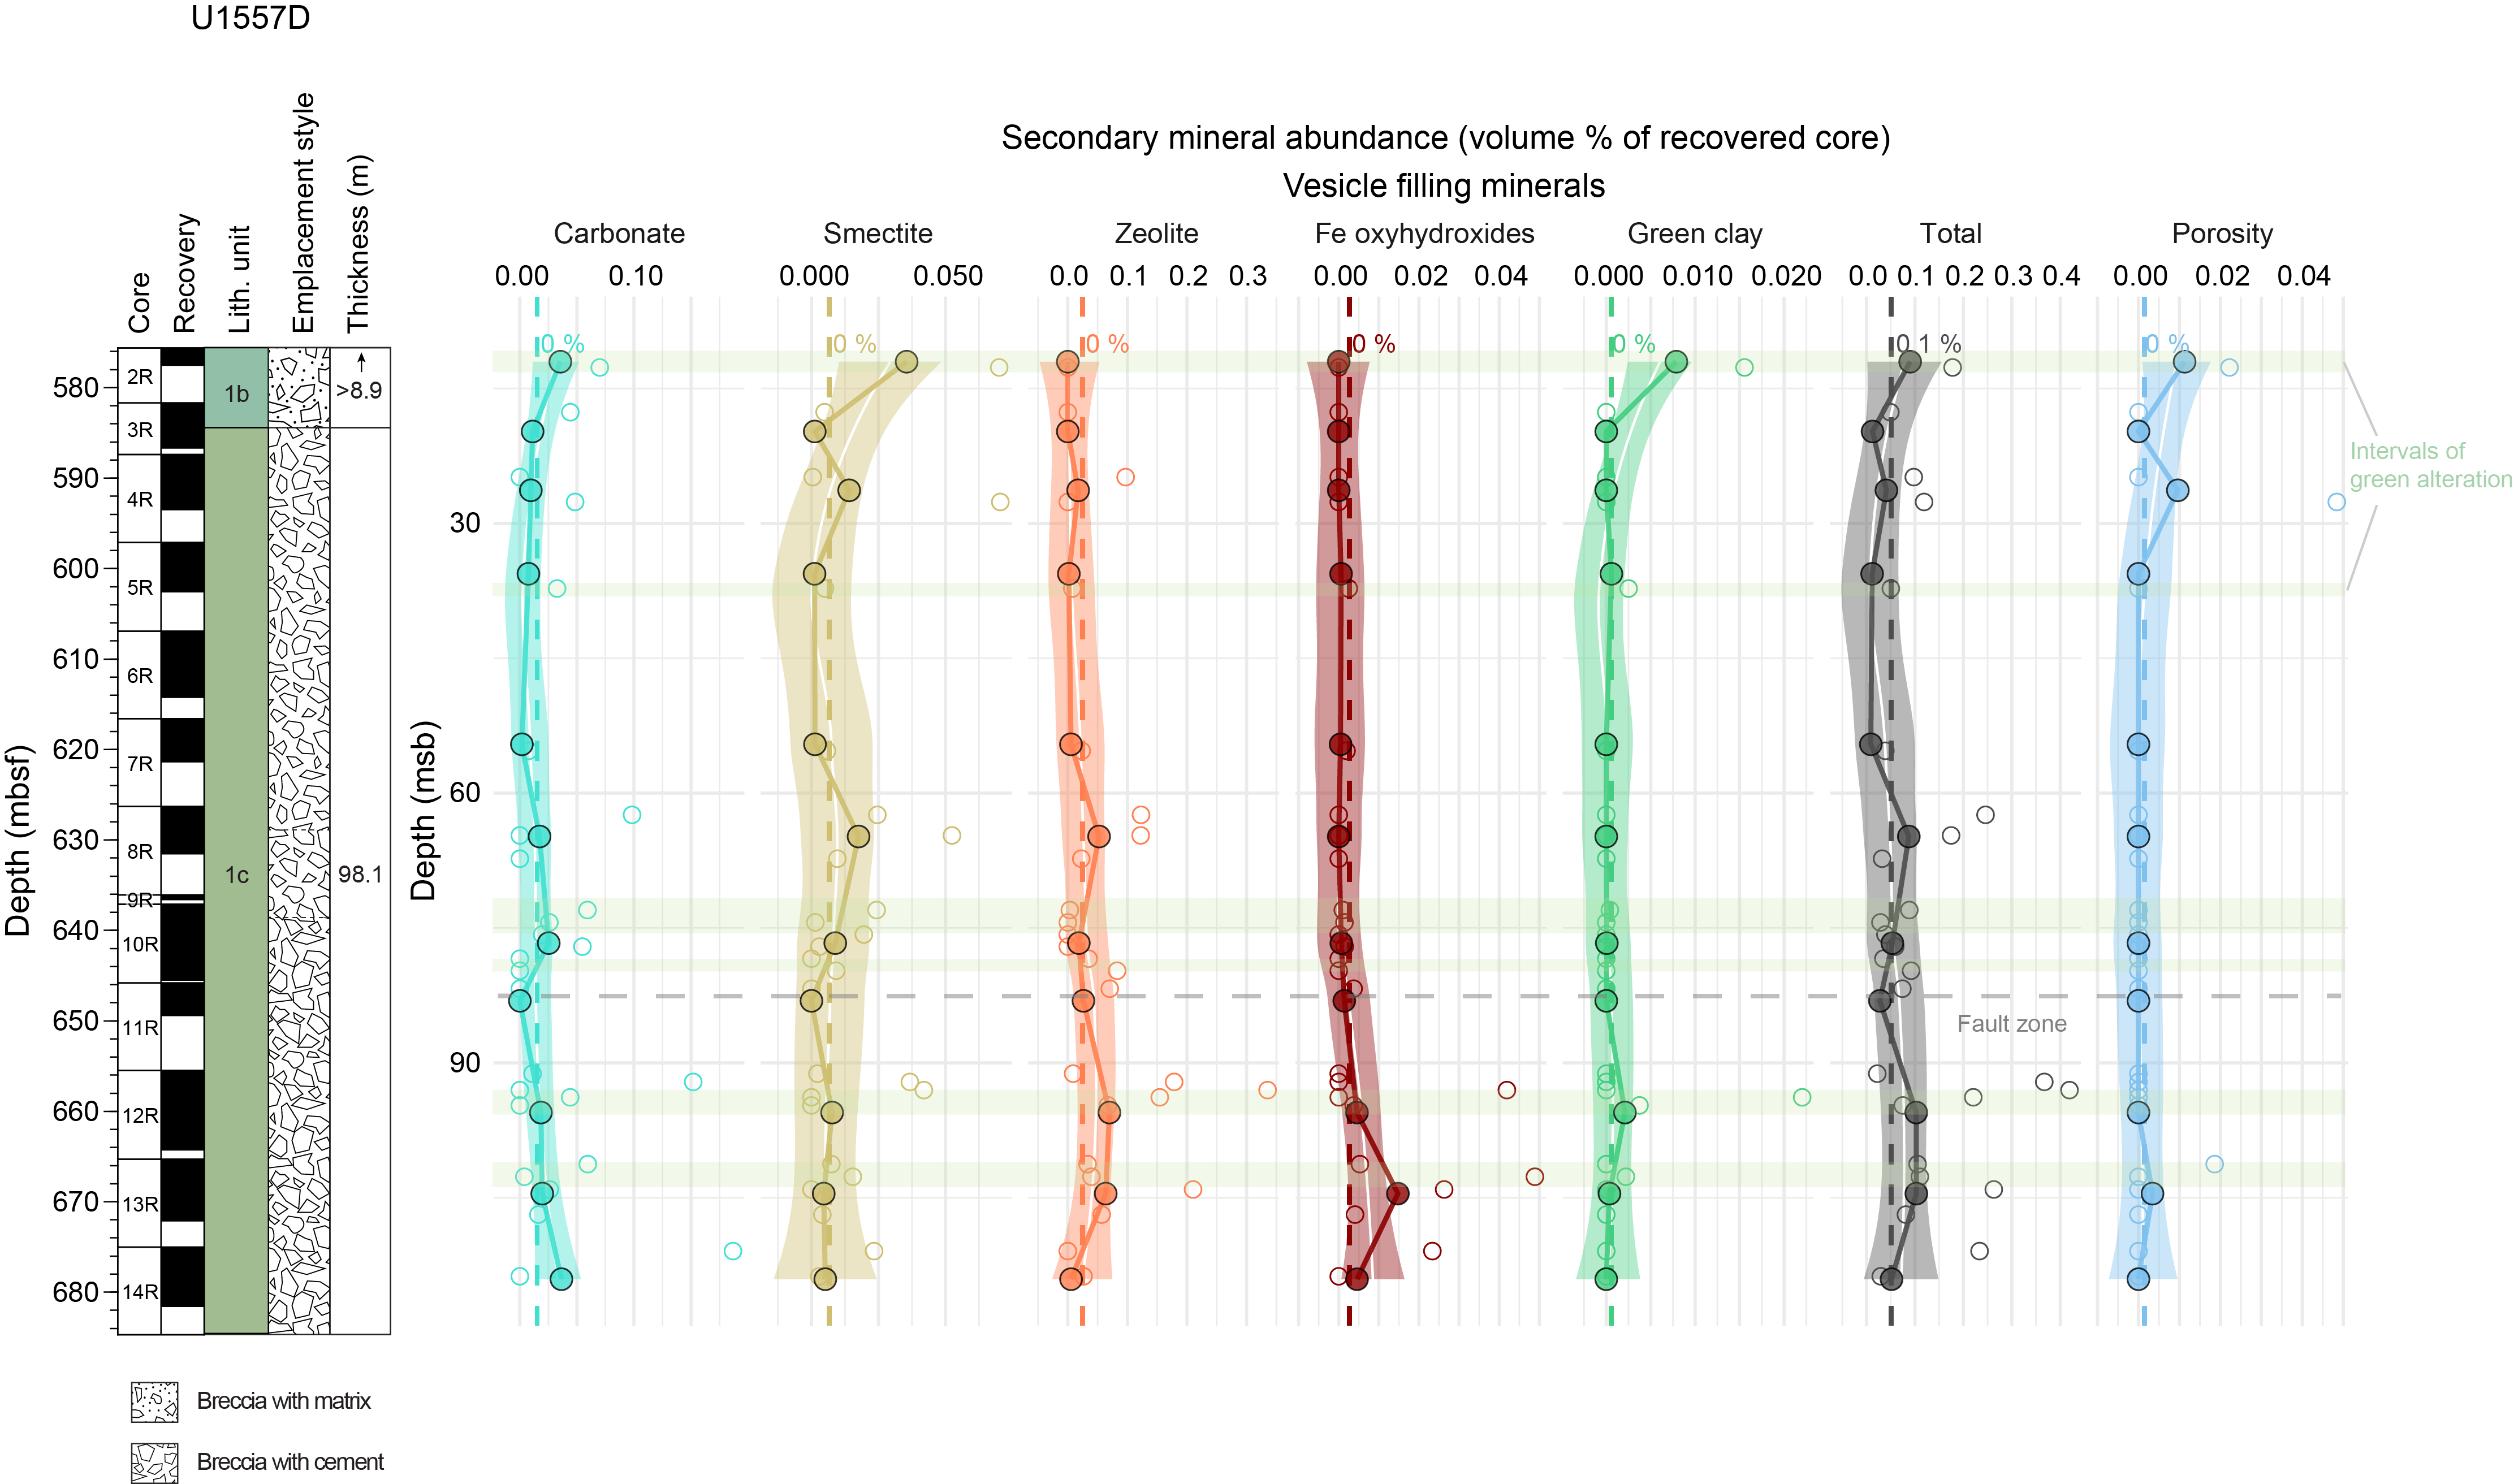
Figure F58. Secondary minerals and porosity in vesicles.
The density of veins in Hole U1557D broadly increases downhole, with a sharp increase in carbonate vein density (from ~1 to 5 veins/m) coinciding with a discontinuity in the alteration style at ~75–85 msb identified in alteration logs (Figure F56) and physical properties downhole logging (see Downhole variations in alteration). Across the same interval, the mean and median width of veins also increases (Figure F57). This change correlates with tighter packing of the breccias and the disappearance of open porosity (Figure F55); below 75 msb, veins were more commonly observed cutting both clasts and matrix than in the upper part of the hole (Figure F59).
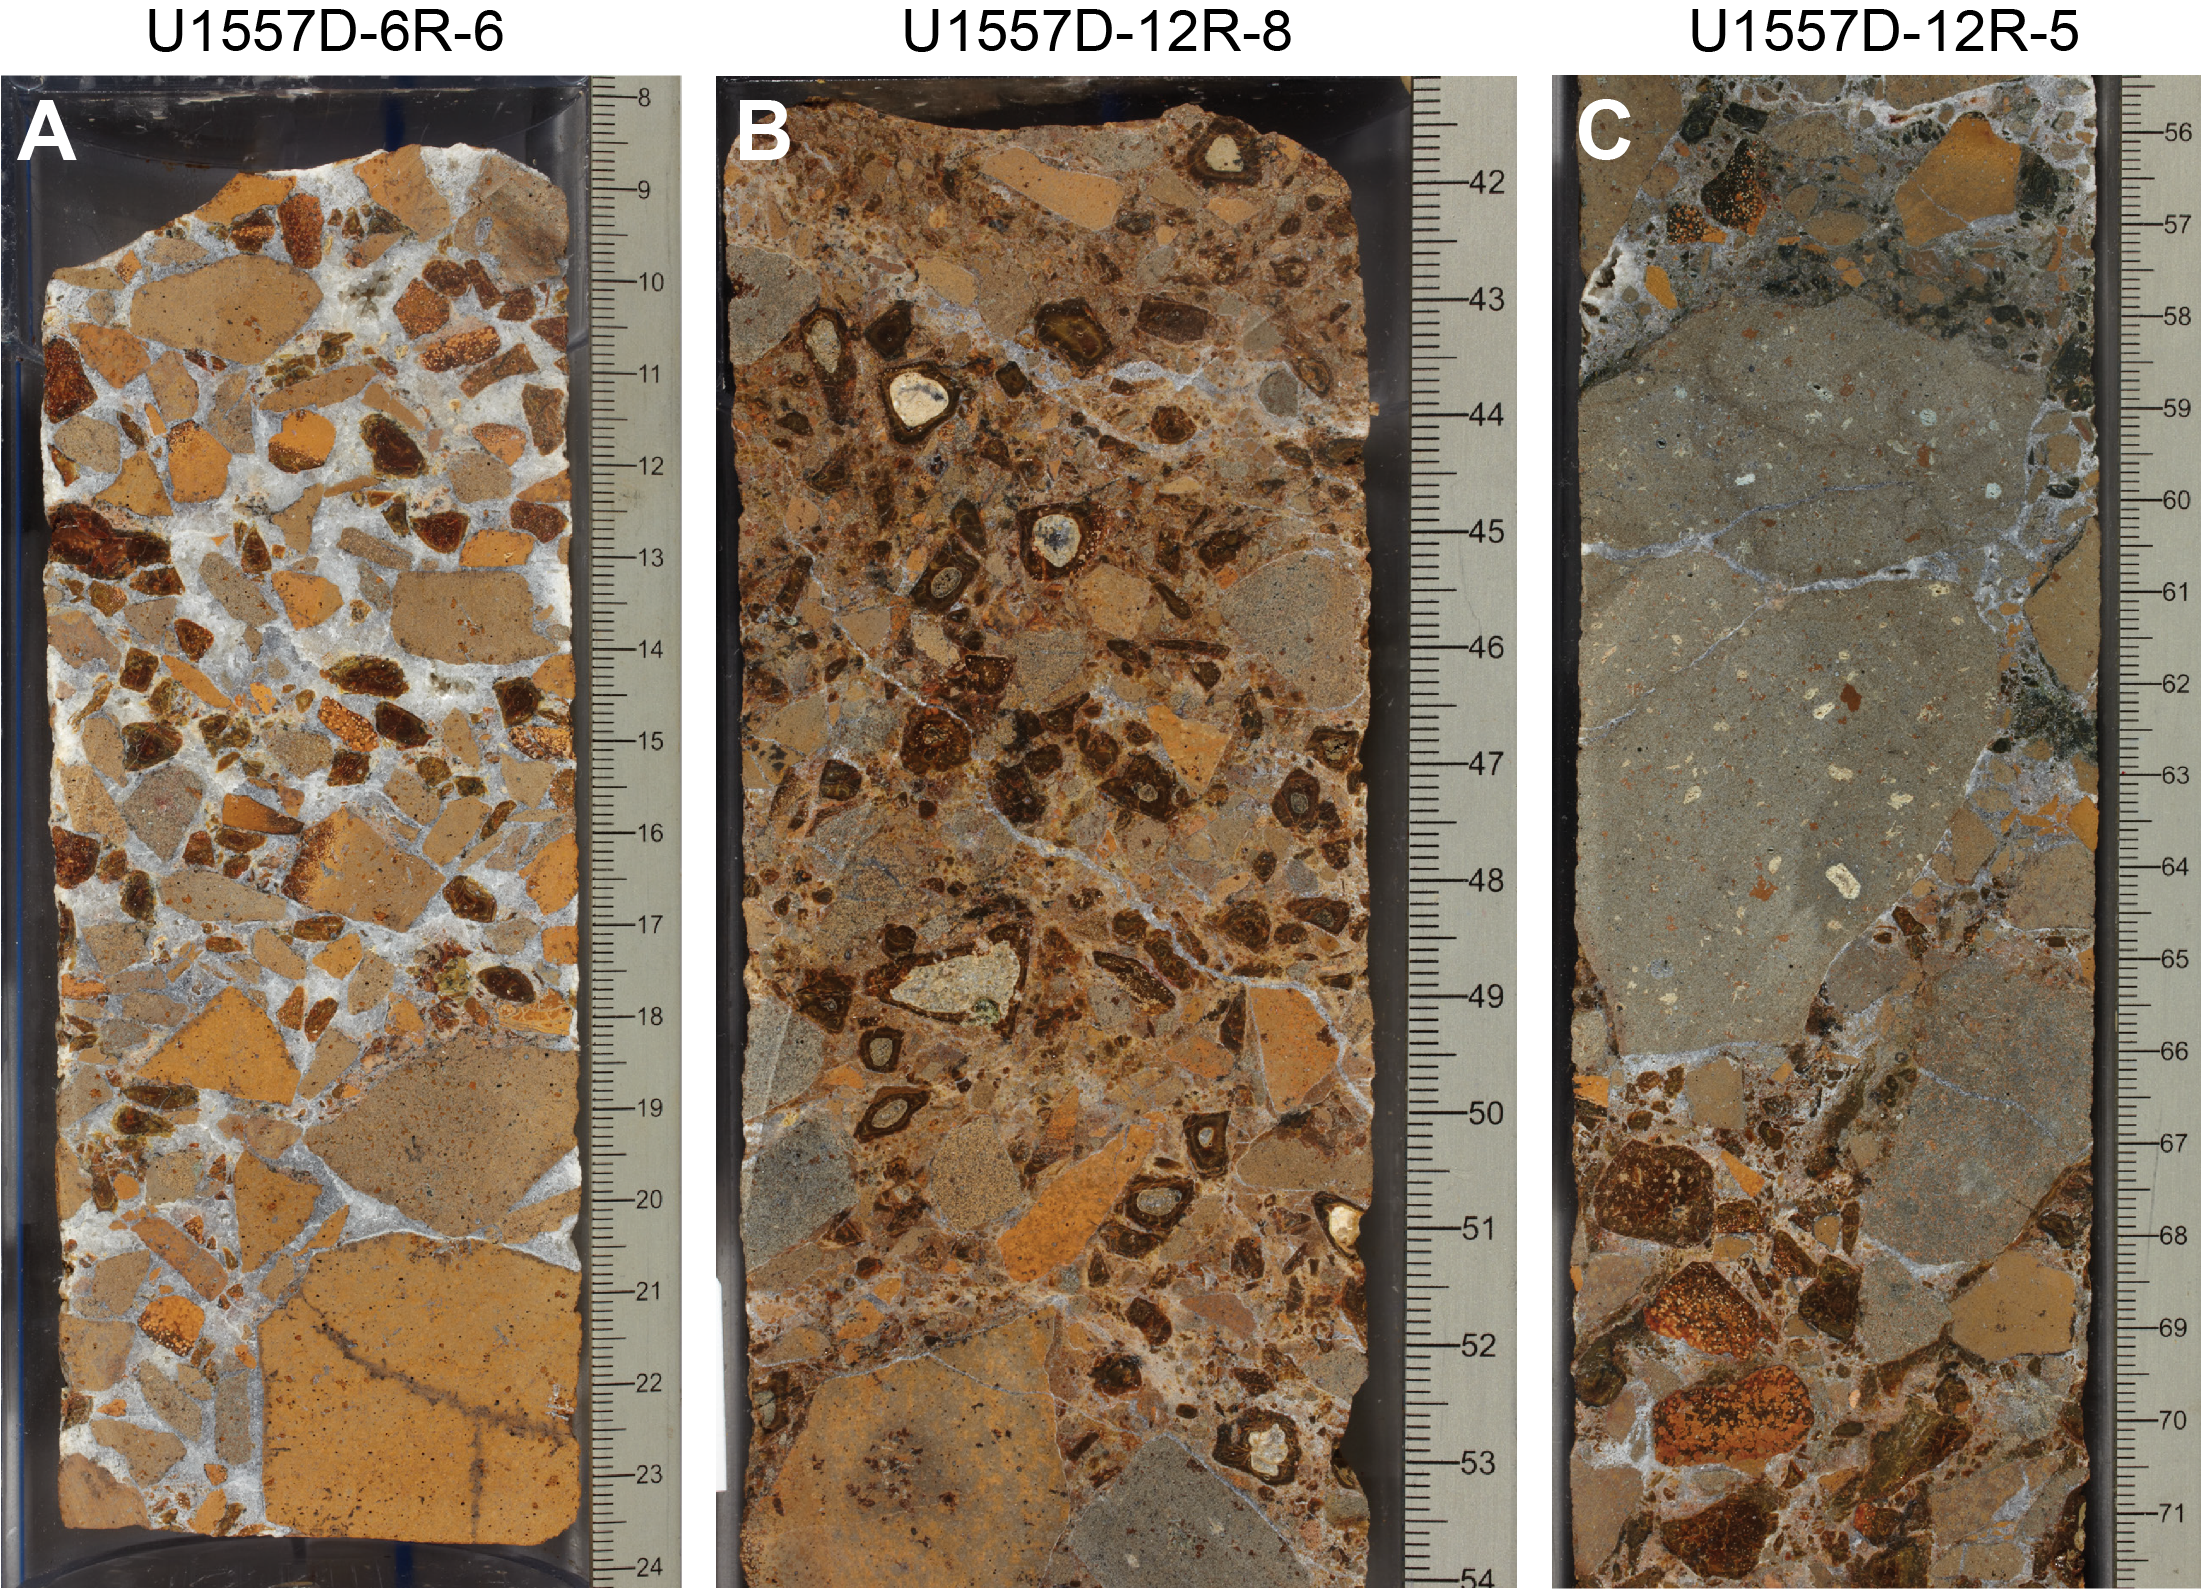
Figure F59. Through-going veins in breccia matrix.
Throughout the core, breccia cements were the most abundant type of secondary mineral fill recorded. The vast majority of these consisted of vuggy crystalline carbonate filling the interclast void spaces, often with significant centimeter-scale open porosity remaining (Figures F55, F60). In 26 carbonate-bearing samples analyzed using XRD for their mineralogy, the fitted mineral spectra always included calcite (Table T5). Vesicles in basalt clasts are sparsely present throughout the hole and show no clear downhole trends in their distribution (Figure F58).
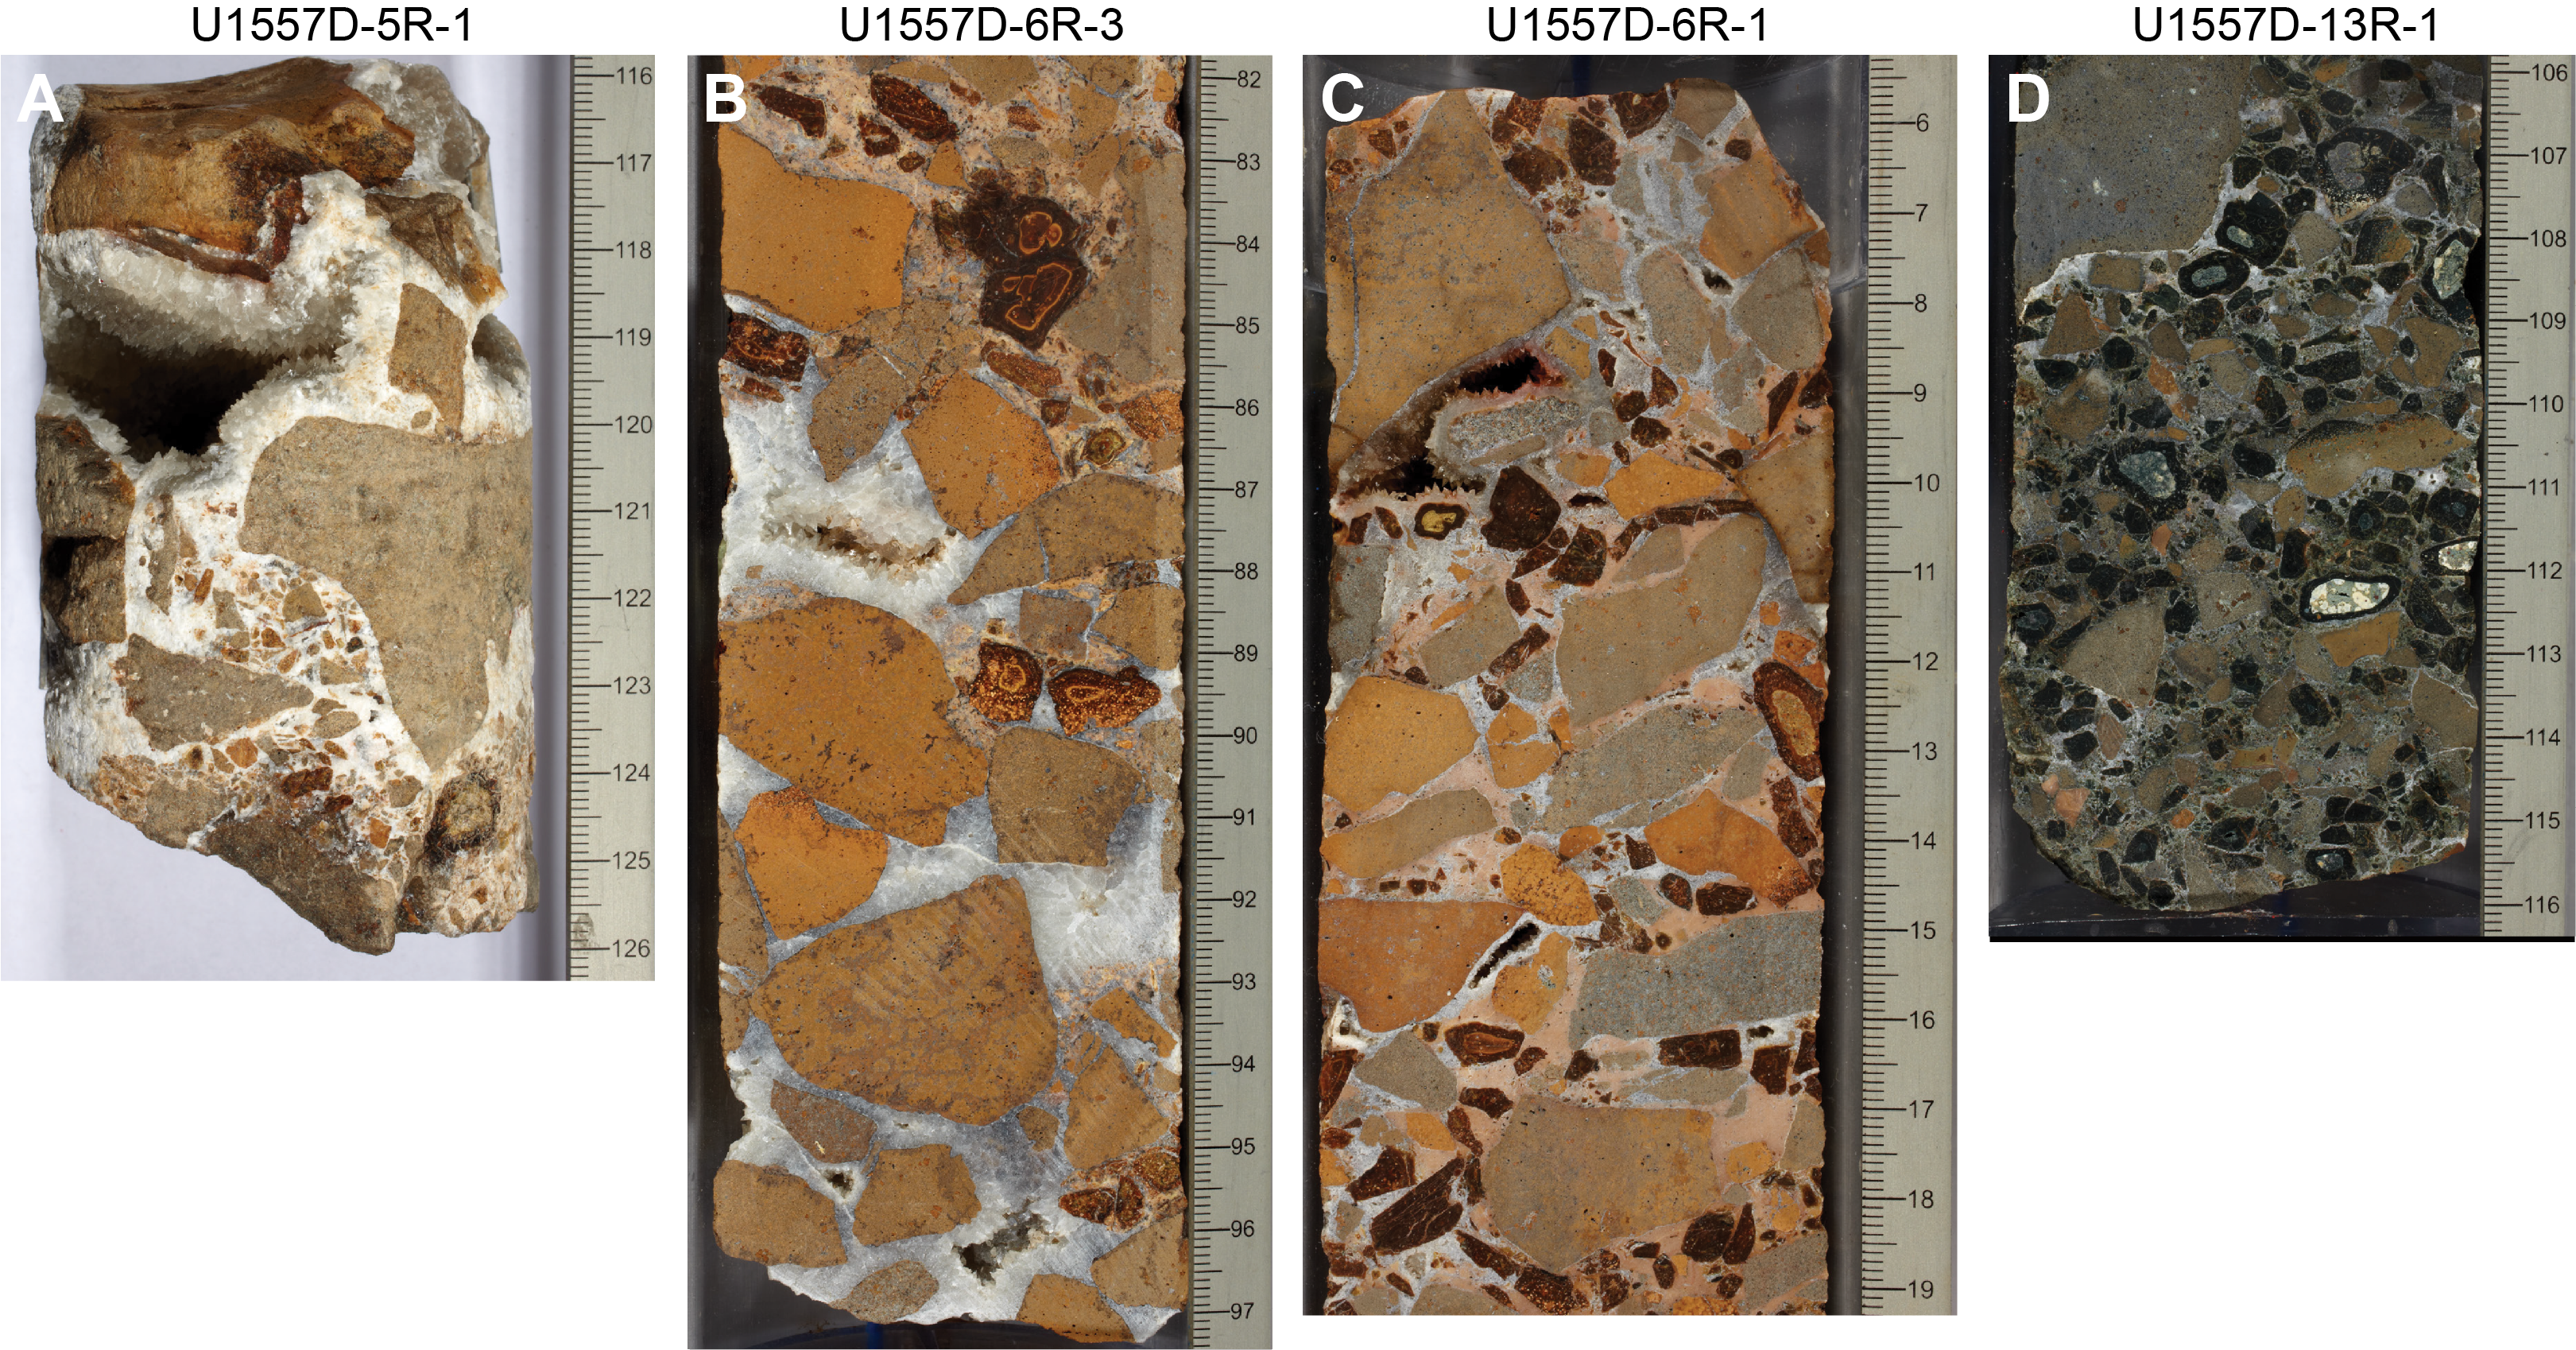
Figure F60. Carbonate breccia cements.
6.4.1. Abundance of carbonate in the breccias
The volume proportion of carbonate in the cores was determined for each section and logged as a proportion of recovered core, assuming that area percentage and volume percentage are proportional to one another (see DESC_WKB in Supplementary material). Carbonate abundance, expressed as the volume proportion of carbonate in recovered core, is plotted downhole in Figure F61.
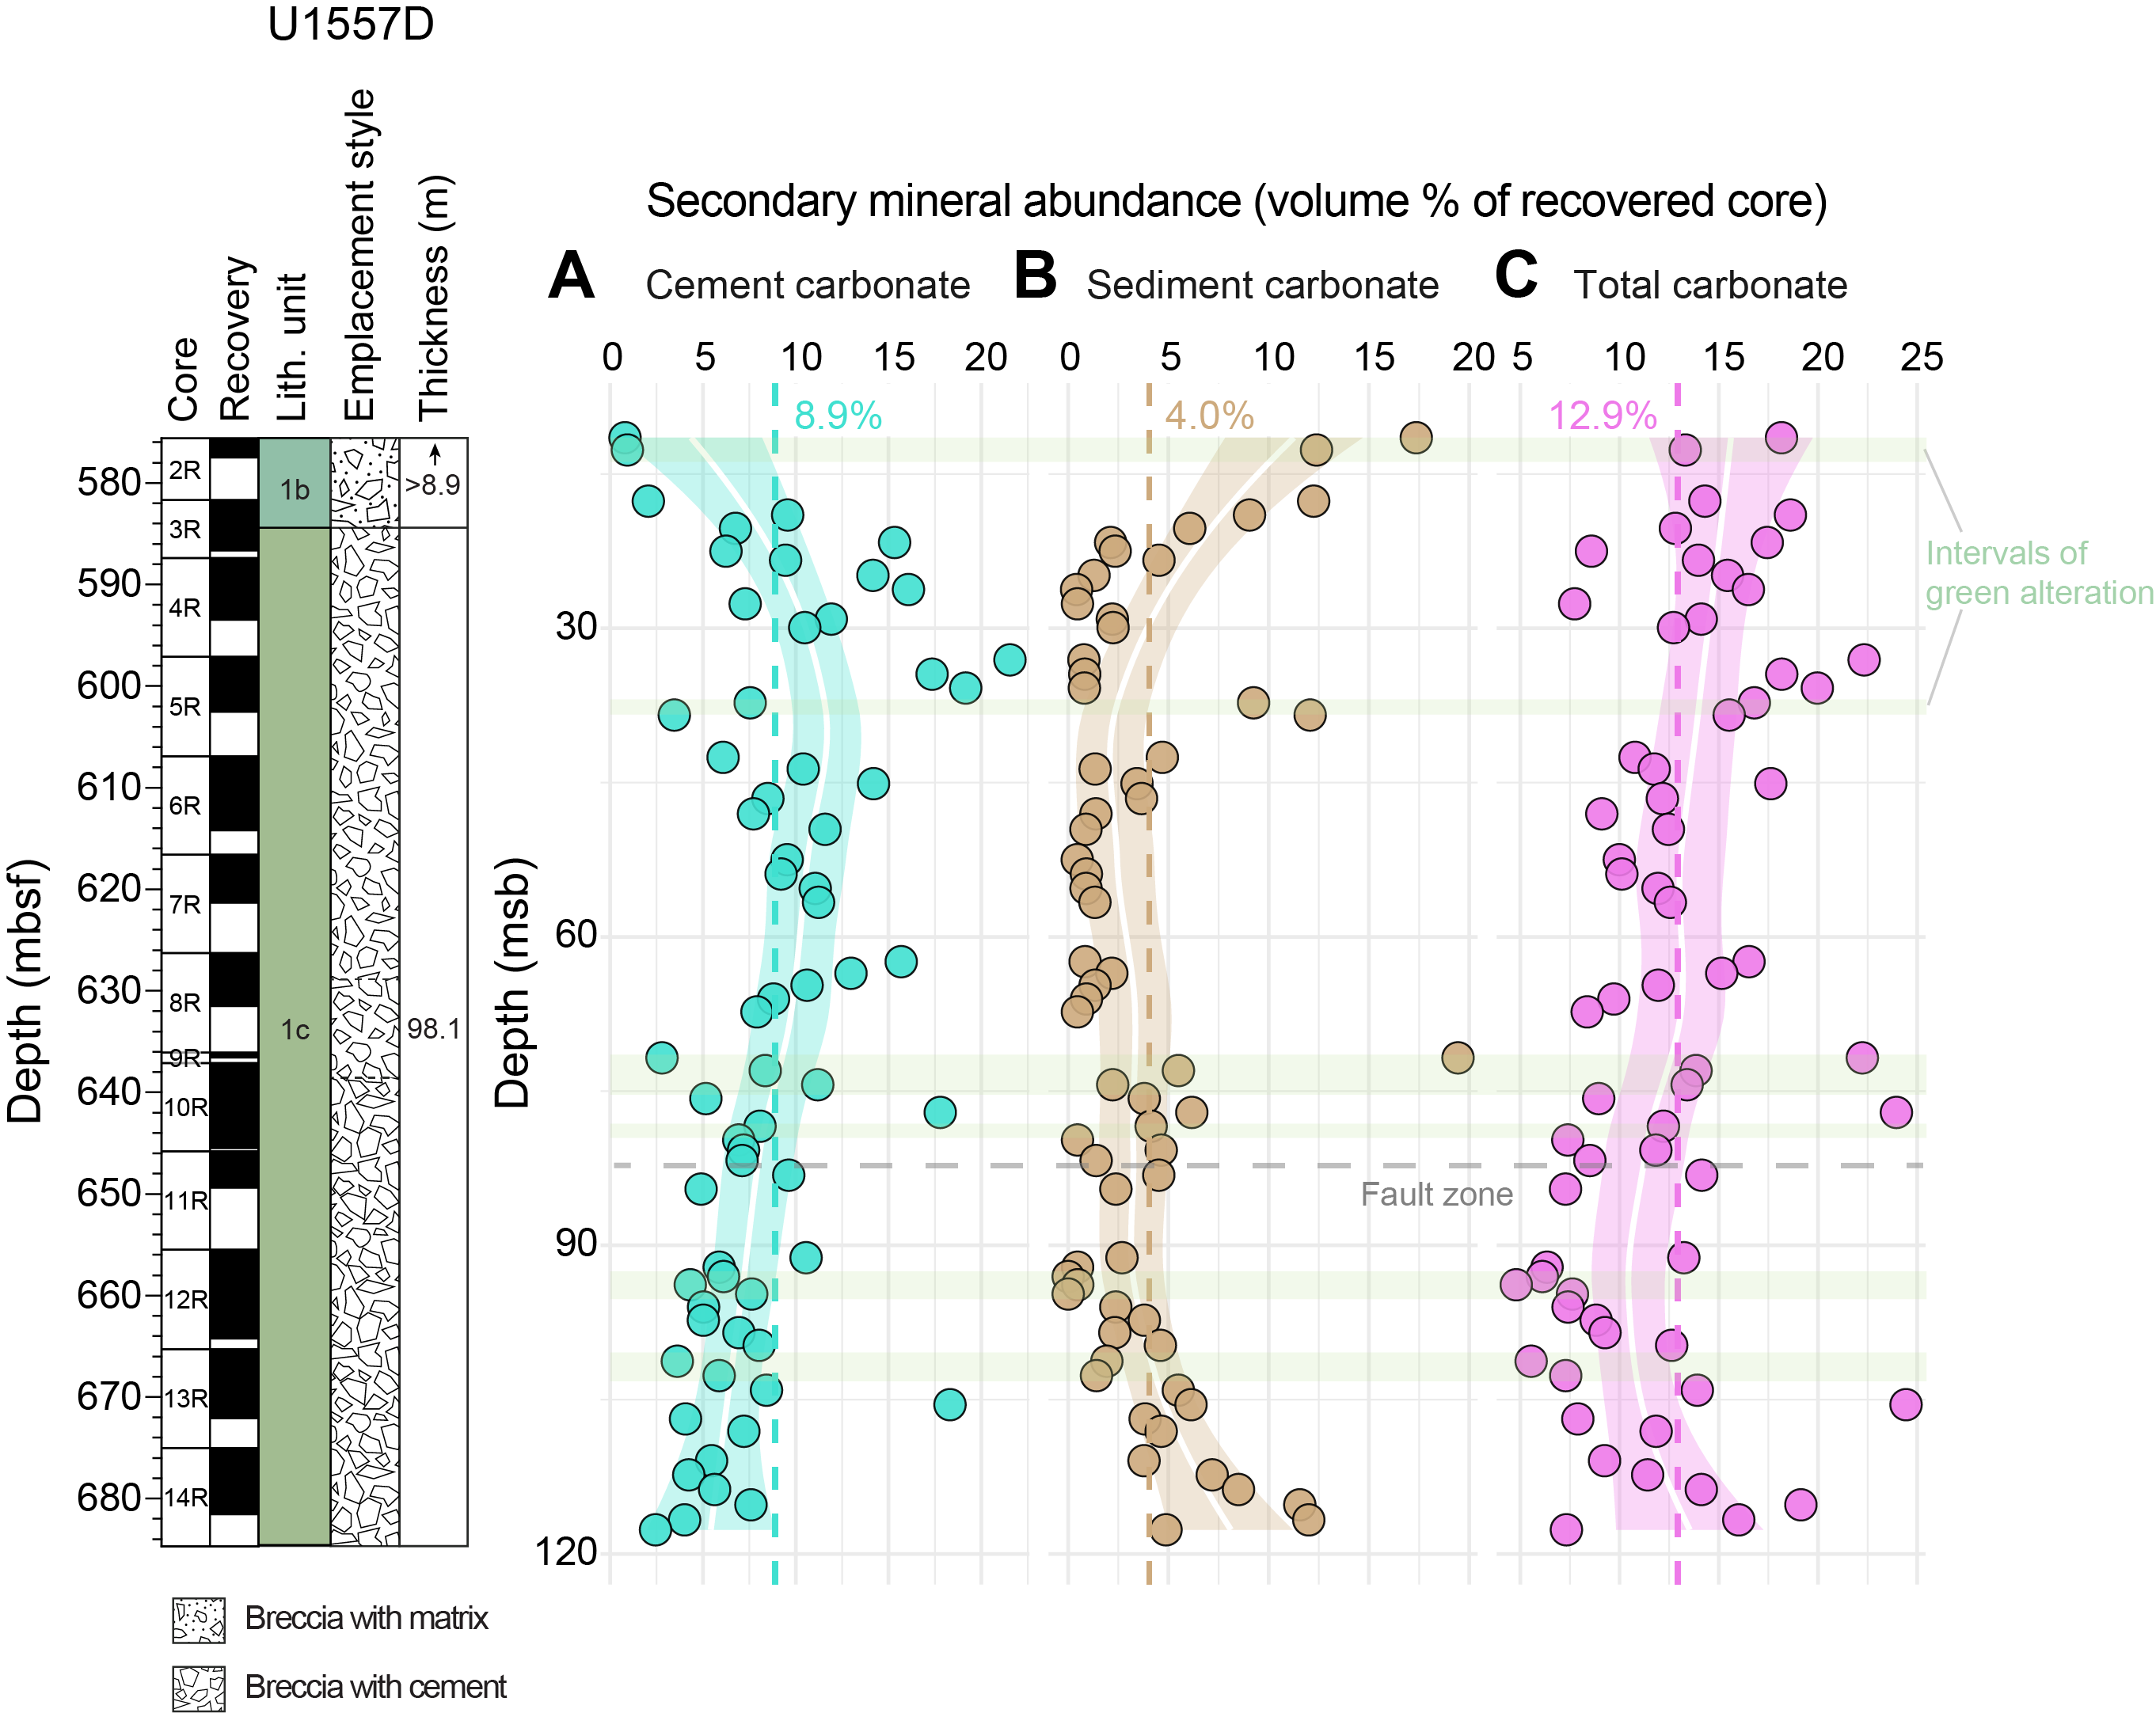
Figure F61. Proportion of carbonate in cements and matrix.
The volume proportion of recovered rock made up of carbonate breccia cement is high throughout Hole U1557D, averaging 8.9 vol% of the recovered rock (calculated as a weighted mean by recovered length of rock). Carbonate cement abundance is low in the uppermost cores (Cores 390-U1557D-2R and 3R), where sediment commonly fills much of the interclast space but increases rapidly with depth, reaching a maximum between about 30 and 40 msb. Some core sections have 15–20 vol% carbonate in this interval, below which its abundance gradually decreases to about 5 vol% at the bottom of the hole. This trend parallels the proportion of open porosity, which ranges 0–4 vol% in the upper part of the hole but decreases to near zero below 75 msb (Figure F55). This suggests that carbonate cements have filled existing porosity in the breccias (Figure F57). As such, the proportion of remaining porosity is a fairly constant (and low) proportion of the original interclast pore space.
Authigenic carbonate + zeolite matrix (see Authigenic zeolite-bearing sediment) also represents a reservoir of carbonate in the rock. Based on thin section observations, its carbonate abundance has been conservatively estimated as 50 vol%. Assuming this value, the proportion of sediment matrix–hosted carbonate has been calculated downhole from the alteration log (see DESC_WKB in Supplementary material), together with the total of breccia cement and sediment matrix carbonate (Figure F61). Based on these very approximate calculations, the average carbonate content for Hole U1557D could be as high as 12.9 vol% of the recovered rock.
6.4.2. Fault zone and associated veins
A notable feature in Hole U1557D was a small fault zone recovered in interval 390-U1557D-11R-2, 39–95 cm (647.63–648.19 mbsl). The fault zone consists of a 2 cm thick, massive, white carbonate vein dipping 57° with a marble-like appearance markedly different from the translucent sparry carbonate cements (Figures F49, F62). This feature is underlain by at least 50 cm of greenish yellow, highly fissile fault gouge containing angular clastic material. The clasts are formed of the same variably altered igneous materials that form the rest of the breccias. Their grain size decreases approaching the thick white vein (Figure F63A). Several 0.5–1 mm thick greenish veins with slickensided surfaces and slip lineations parallel to their maximum dip occur in the fault gouge and adjacent rocks. Slickenside surfaces reflect both normal and reverse movement senses. One of these is in the same core piece as the thick white vein and parallels it (Figure F49A). Although the relative rotation of other pieces is unknown, their dips are all slightly gentler than but broadly consistent with that of the thick carbonate vein (dips 25°–50°).
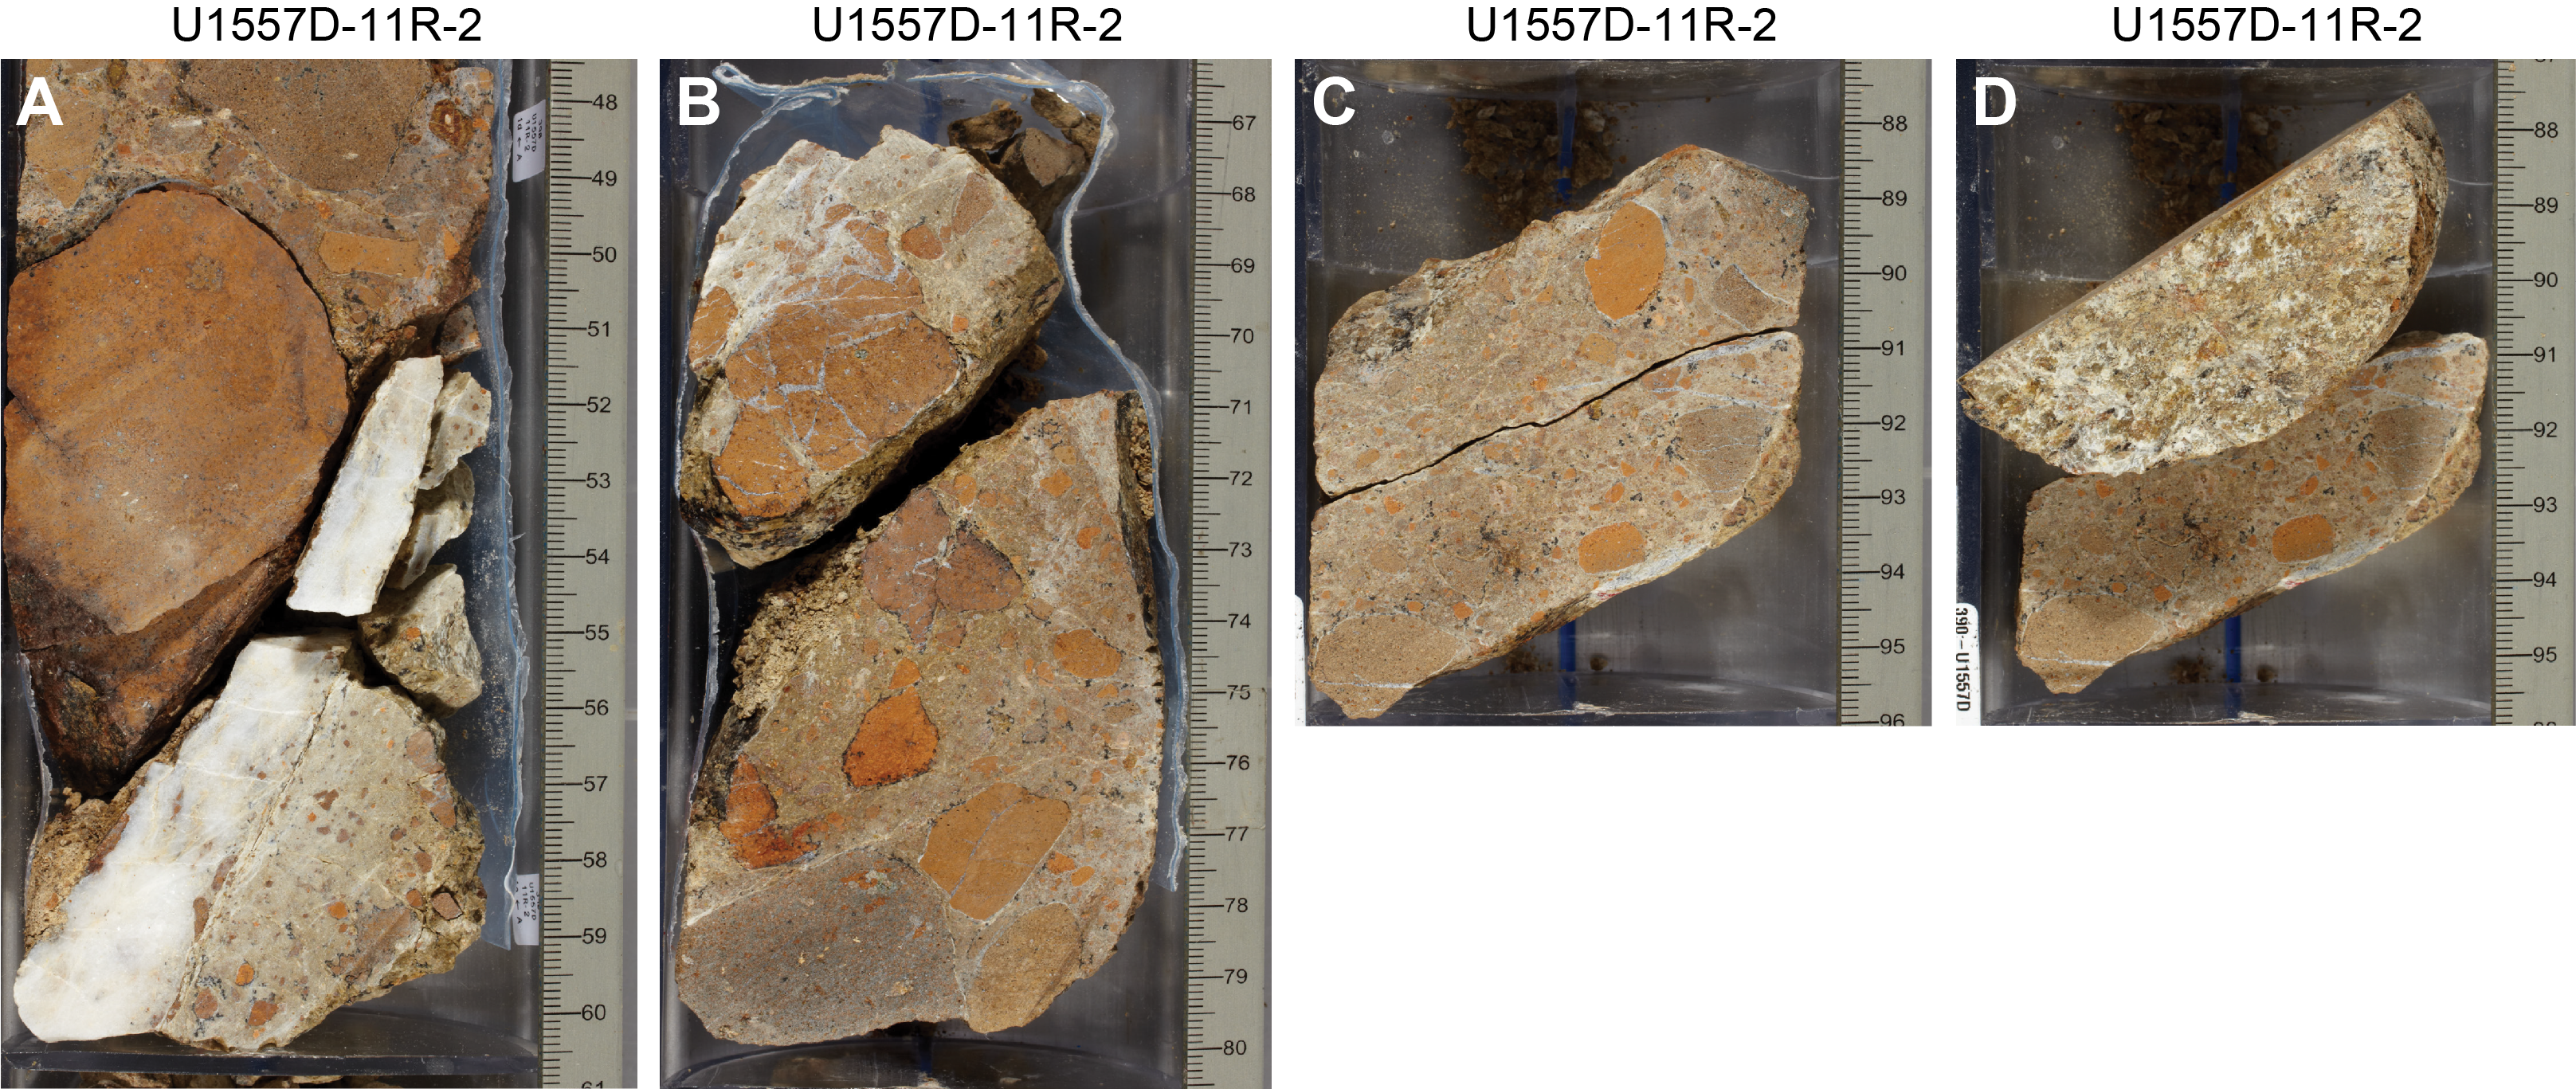
Figure F62. Fault veins and associated fault gouge.
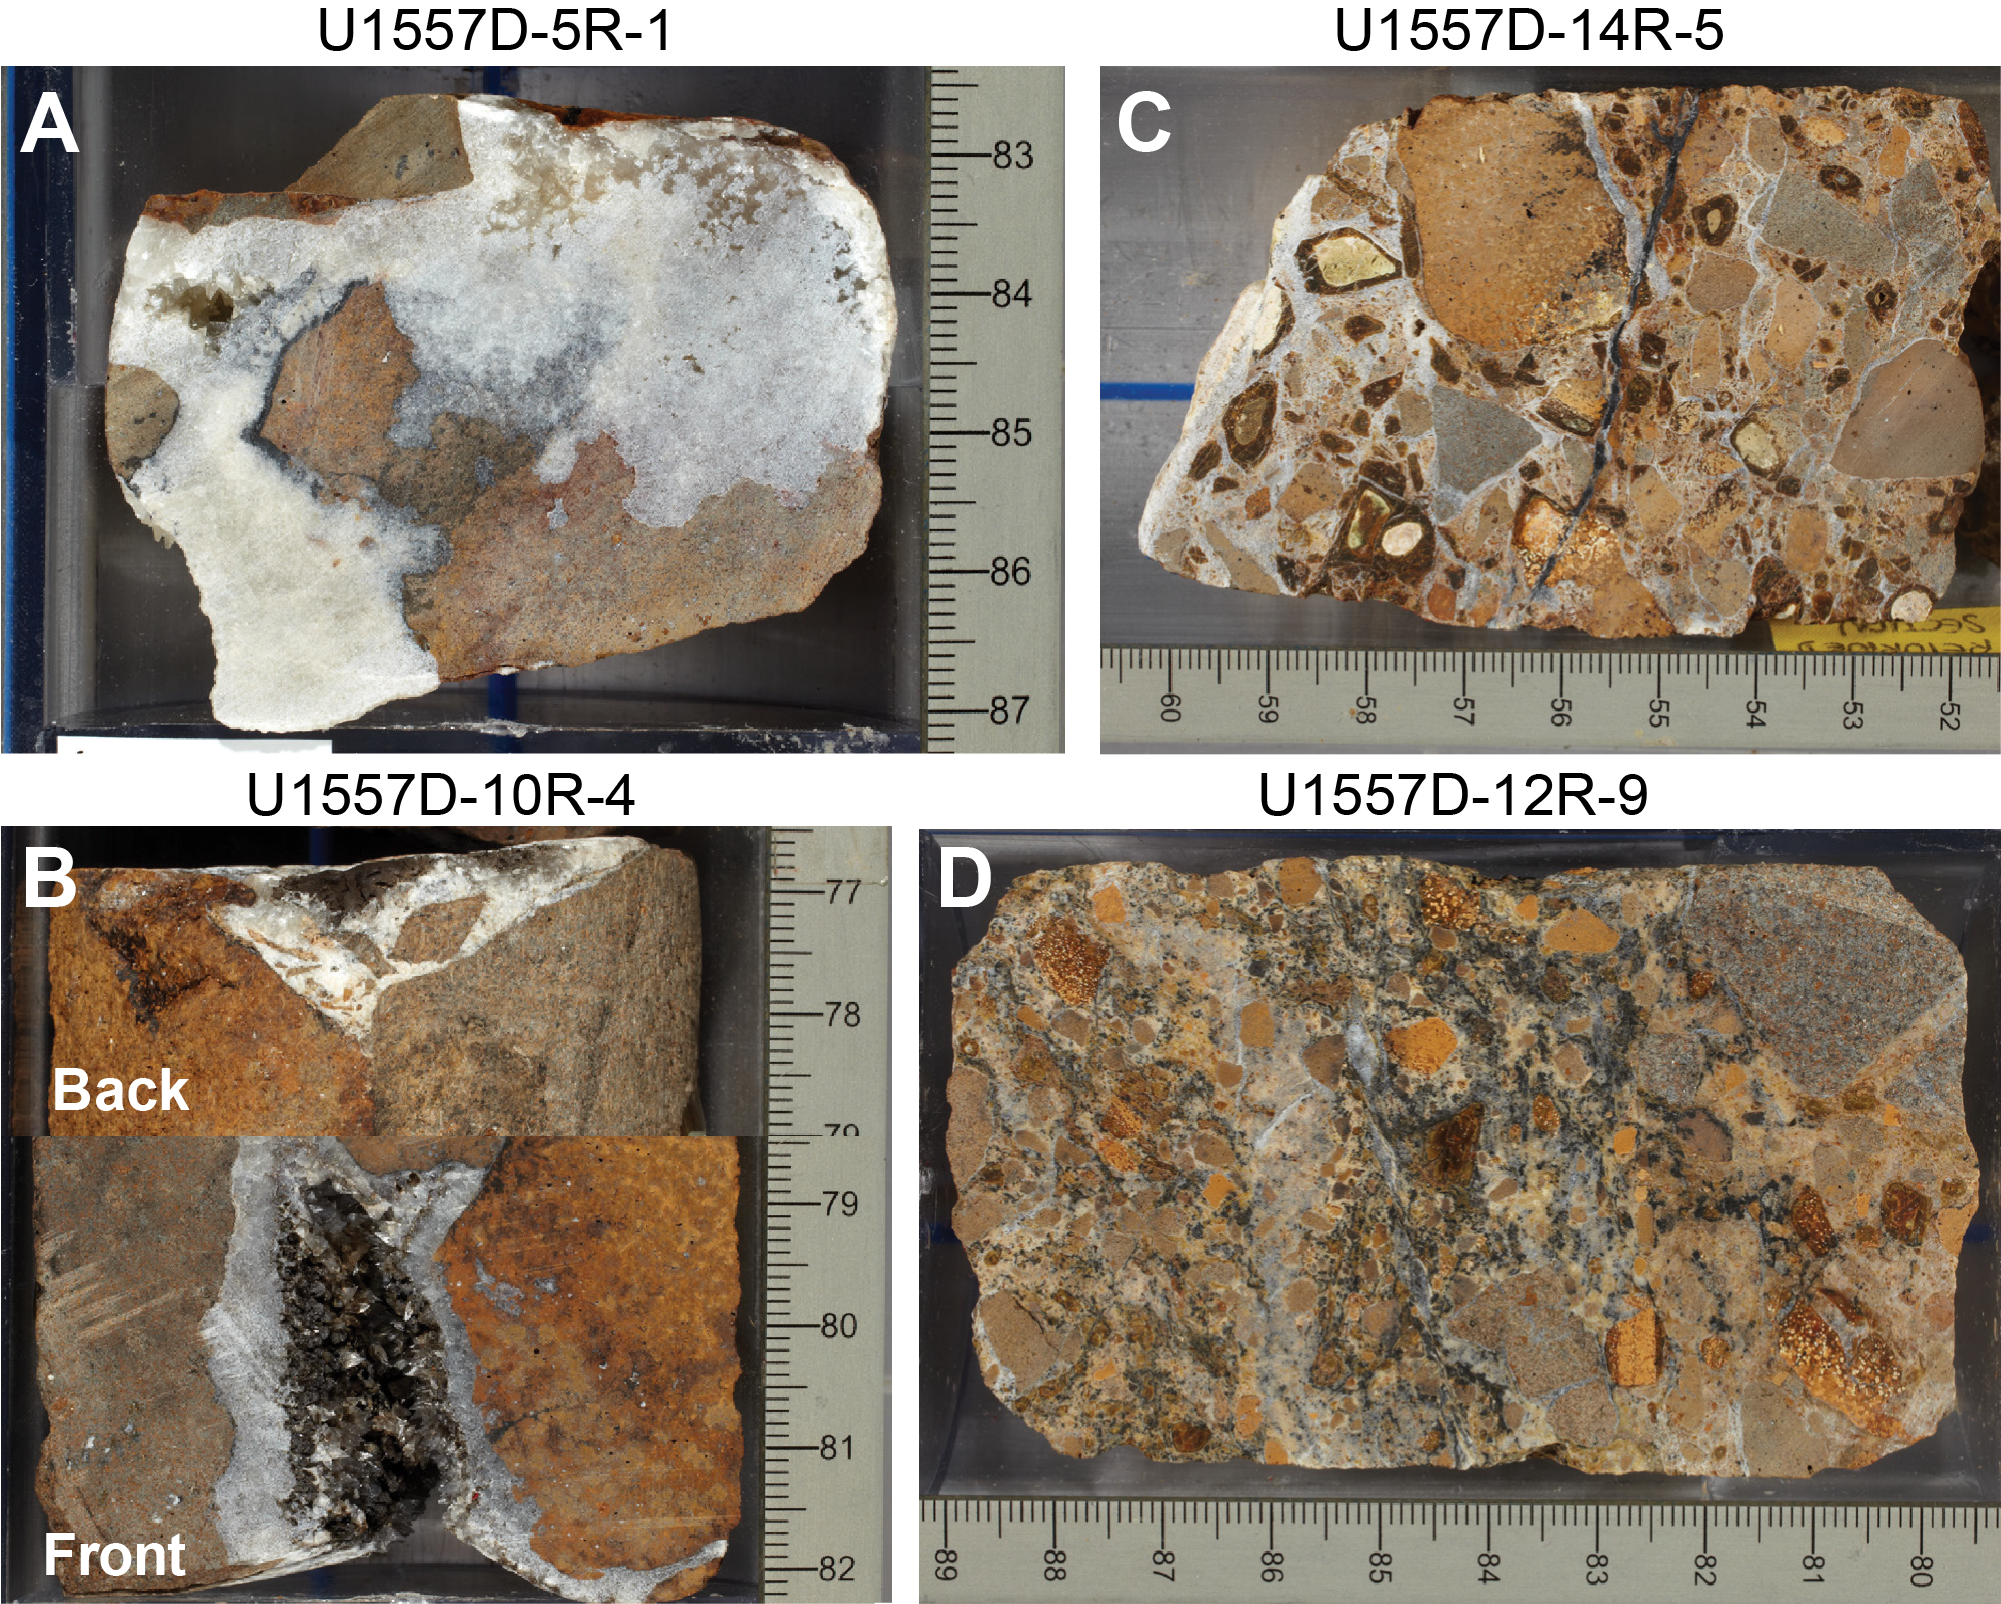
Figure F63. Manganese oxide and associated minerals.
The mineralogies of the slickensided veins and fault gouge, determined using XRD and confirmed in a thin section of the fault gouge, are all very similar and consist of calcite and phillipsite with abundant smectite clays as well as other zeolite species and/or mixed layer clays possibly present (Table T5). This assemblage is similar to the mineralogy of the authigenic sediment matrix sampled adjacent to the fault zone at the base of Section 390-U1557D-11R-2, but the fault gouge has more abundant clays. No hint of primary igneous minerals was recorded on the XRD pattern (Table T5). Although alteration within the ~50 cm thick fault zone appears to be high, there is no indication of substantial alteration in the surrounding rocks outside the immediate fault zone.
6.4.3. Manganese oxides
Dark gray to black secondary minerals occur throughout Hole U1557D. These phases exhibit a range of properties, with luster ranging from graphitic/submetallic to sparkly black to dull and hardness ranging from very hard to soft. They occur as thin coatings, nodules, or amorphous overgrowths to vuggy calcite, as well as veins and more cryptic intergrowths within carbonate cements (Figure F63). These minerals are always extremely dark in color and occur as late phases, either intergrown with or overgrowing carbonate. They occur throughout Hole U1557D but are slightly more common in the lower half of the hole (Figure F55). XRD analyses of several examples hinted at the presence of a variety of Mn oxide and hydroxide phases, commonly coexisting with smectite clays (Table T5), but were inconclusive and will require more detailed research to identify precisely.
6.5. Summary
The breccias recovered at Site U1557 show evidence for alteration under a range of conditions, resulting in a sequence of overprinting events manifested as replacement and void filling by a range of secondary minerals. Petrographic observations indicate a sequence of events from (oldest to youngest) green, possibly ferric clays; red-yellow-brown clays + Fe oxyhydroxides; pale brown to green clays (possibly saponite) ± zeolite; carbonate cements; and manganese oxide ± clay. There are, however, exceptions to this broad sequence of alteration that point to greater complexity. Macroscopic alteration colors and textural relationships, including fragmented orange halos and meter-scale zones of overprinting green alteration, indicate that alteration of the basalt clasts likely occurred both prior to and following their brecciation and deposition.
The breccias host few veins but are ubiquitously cemented by sparry calcite, which partially fills millimeter- to centimeter-scale open space between the clasts. These cements are highly abundant, constituting altogether 8.9 vol% of the recovered rock in Hole U1557D and making up as much as 22 vol% in individual core sections. If the carbonate in these cements derives from seawater, breccias such as these in fault-bounded basins along slow-spread crust may represent important overlooked sinks in the global carbon cycle.
7. Biostratigraphy
The 564.76 m thick sedimentary succession of pelagic ooze, chalk, and clay in Hole U1557B ranges in age from Pleistocene to middle Paleocene. Samples analyzed from Holes U1557A (terminated after one core) and U1557B were primarily core catcher samples sent to the science party biostratigraphers following Expedition 390C (see Background and objectives). These samples were supplemented shipboard during Expedition 390 by additional nannofossil smear slides taken from the archive halves of cores from Hole U1557B as well as working-half foraminiferal samples directly above basement from previously unsplit Core 390C-U1557B-63X. An integrated calcareous nannoplankton and planktic foraminiferal biozonation for Site U1557 is summarized in Table T7 and Figure F64. An age-depth plot of biostratigraphic datums and paleomagnetic reversals can be found in Figure F81. Benthic foraminifera are present and indicate an abyssal paleodepth throughout. A summary of microfossil preservation and abundance is shown in Figure F65.
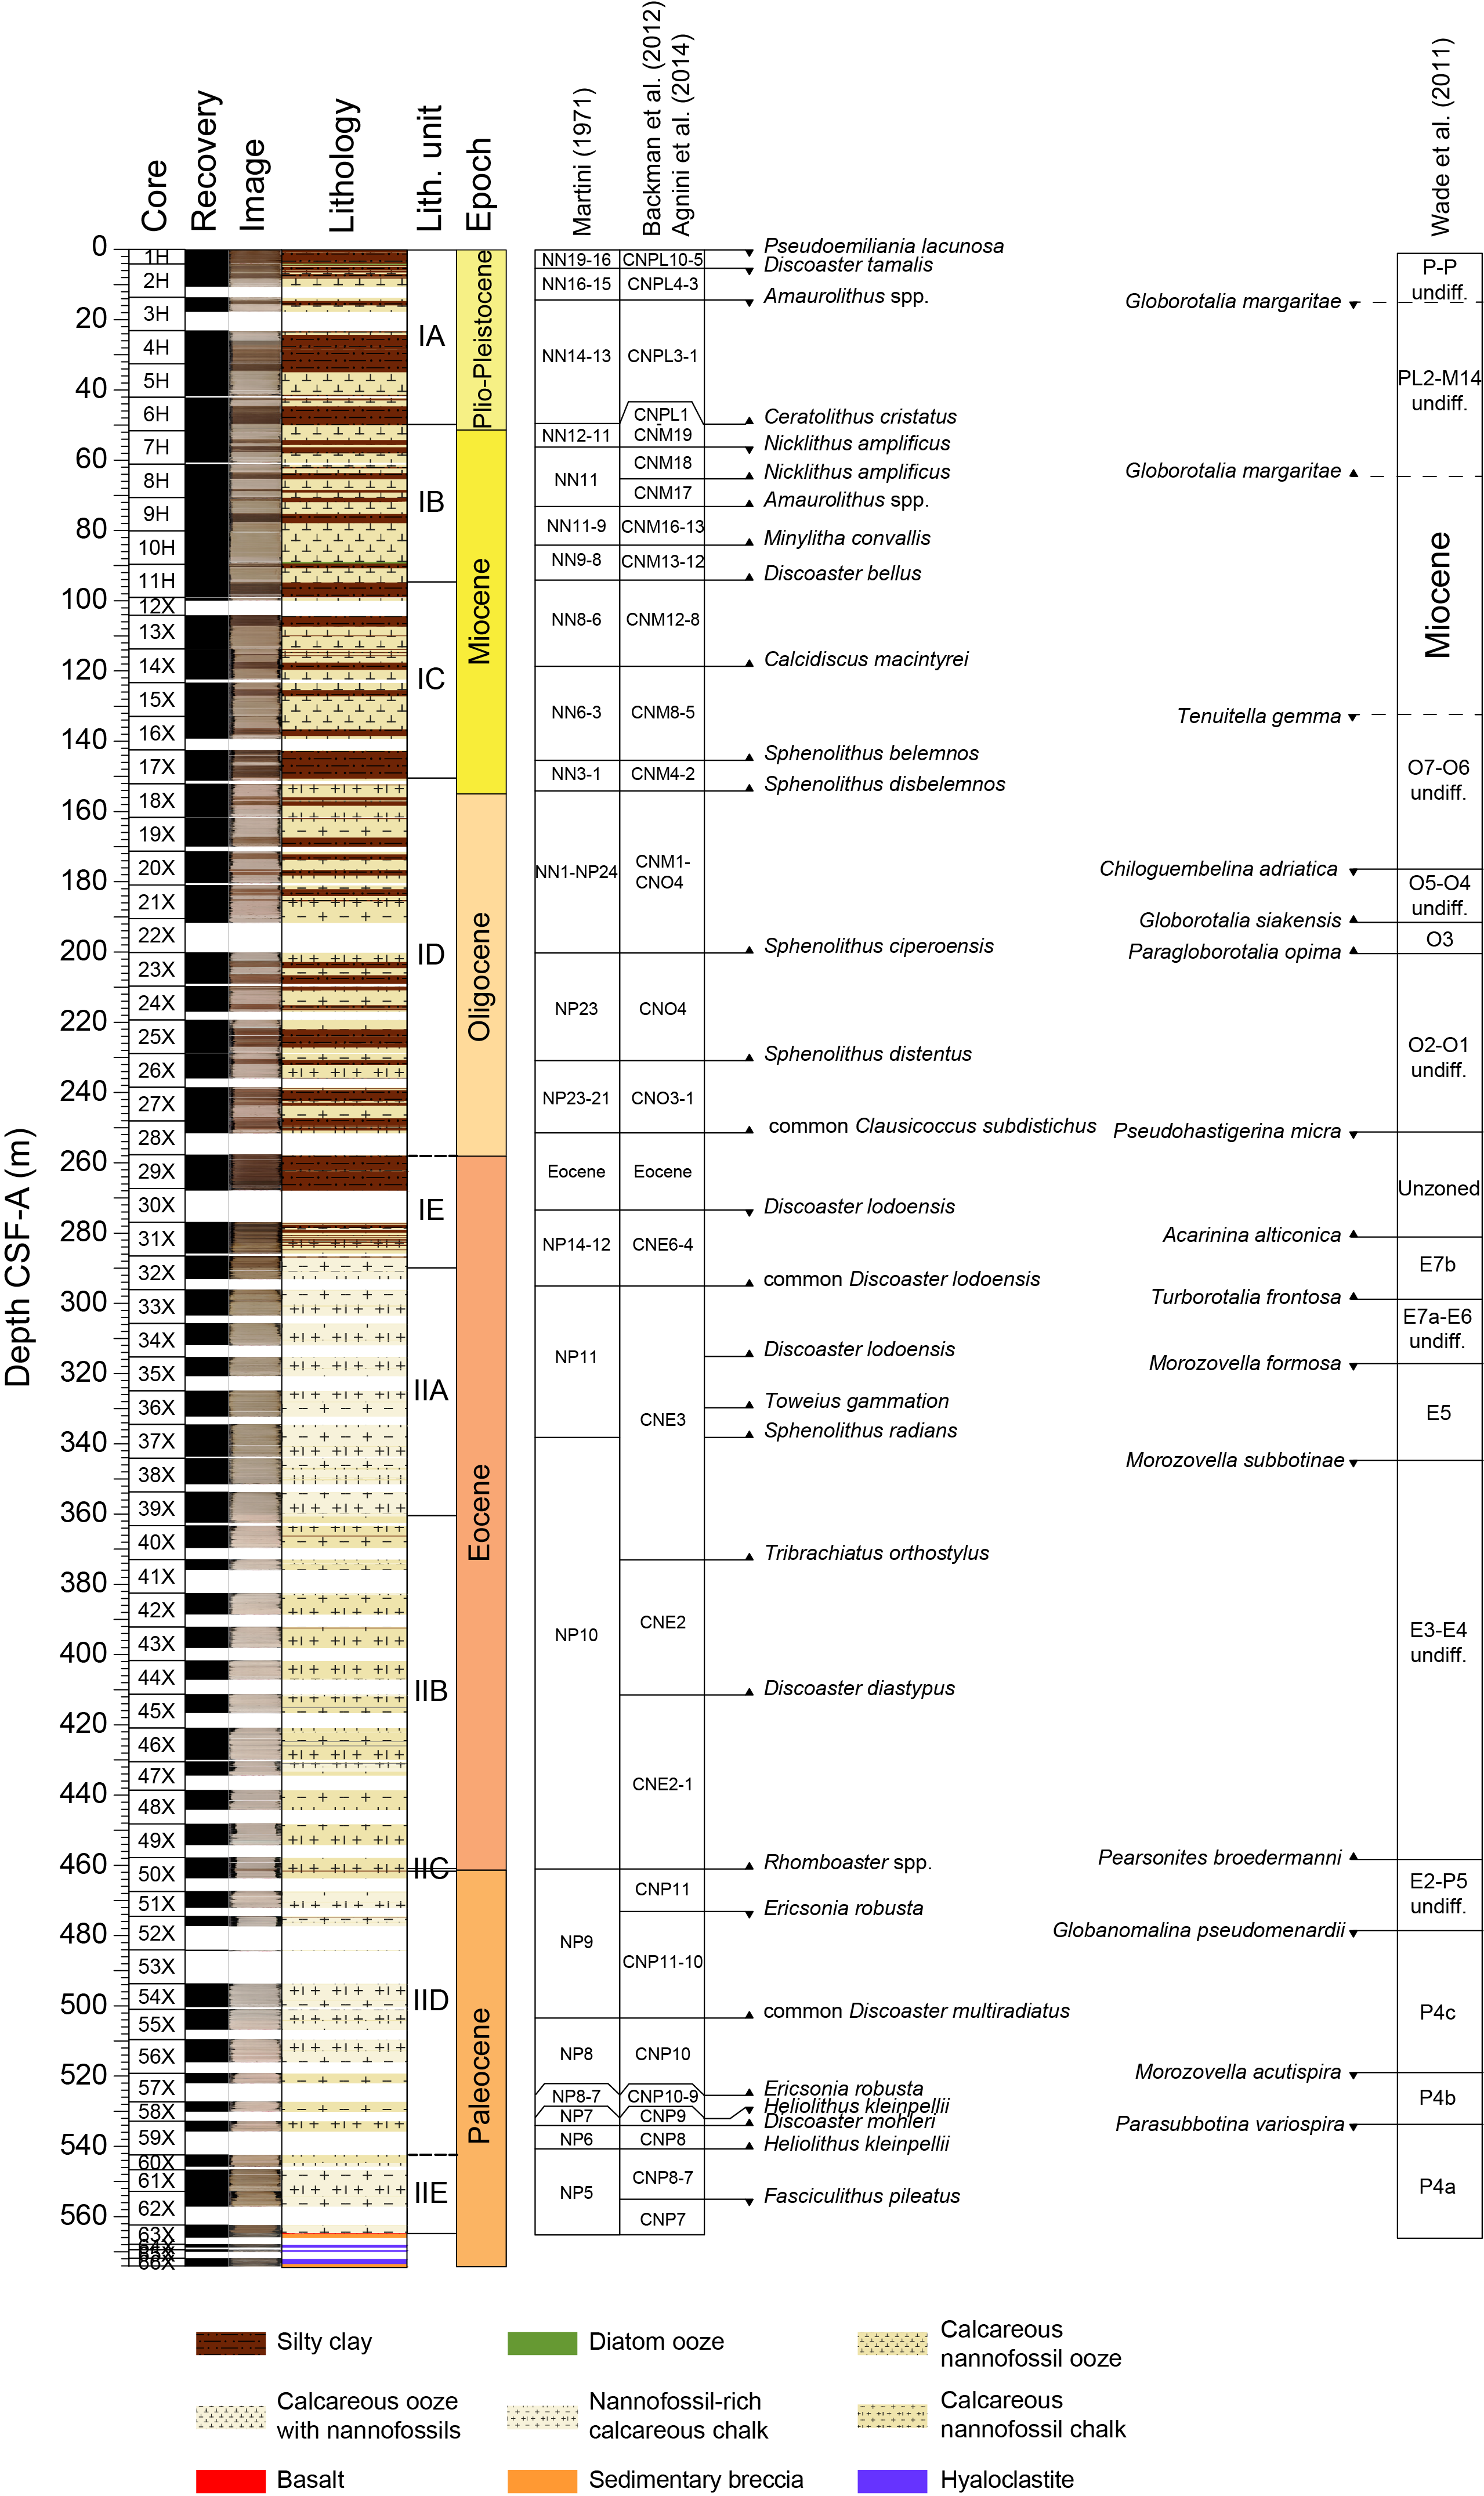
Figure F64. Nannofossil and foraminiferal biostratigraphic zones.
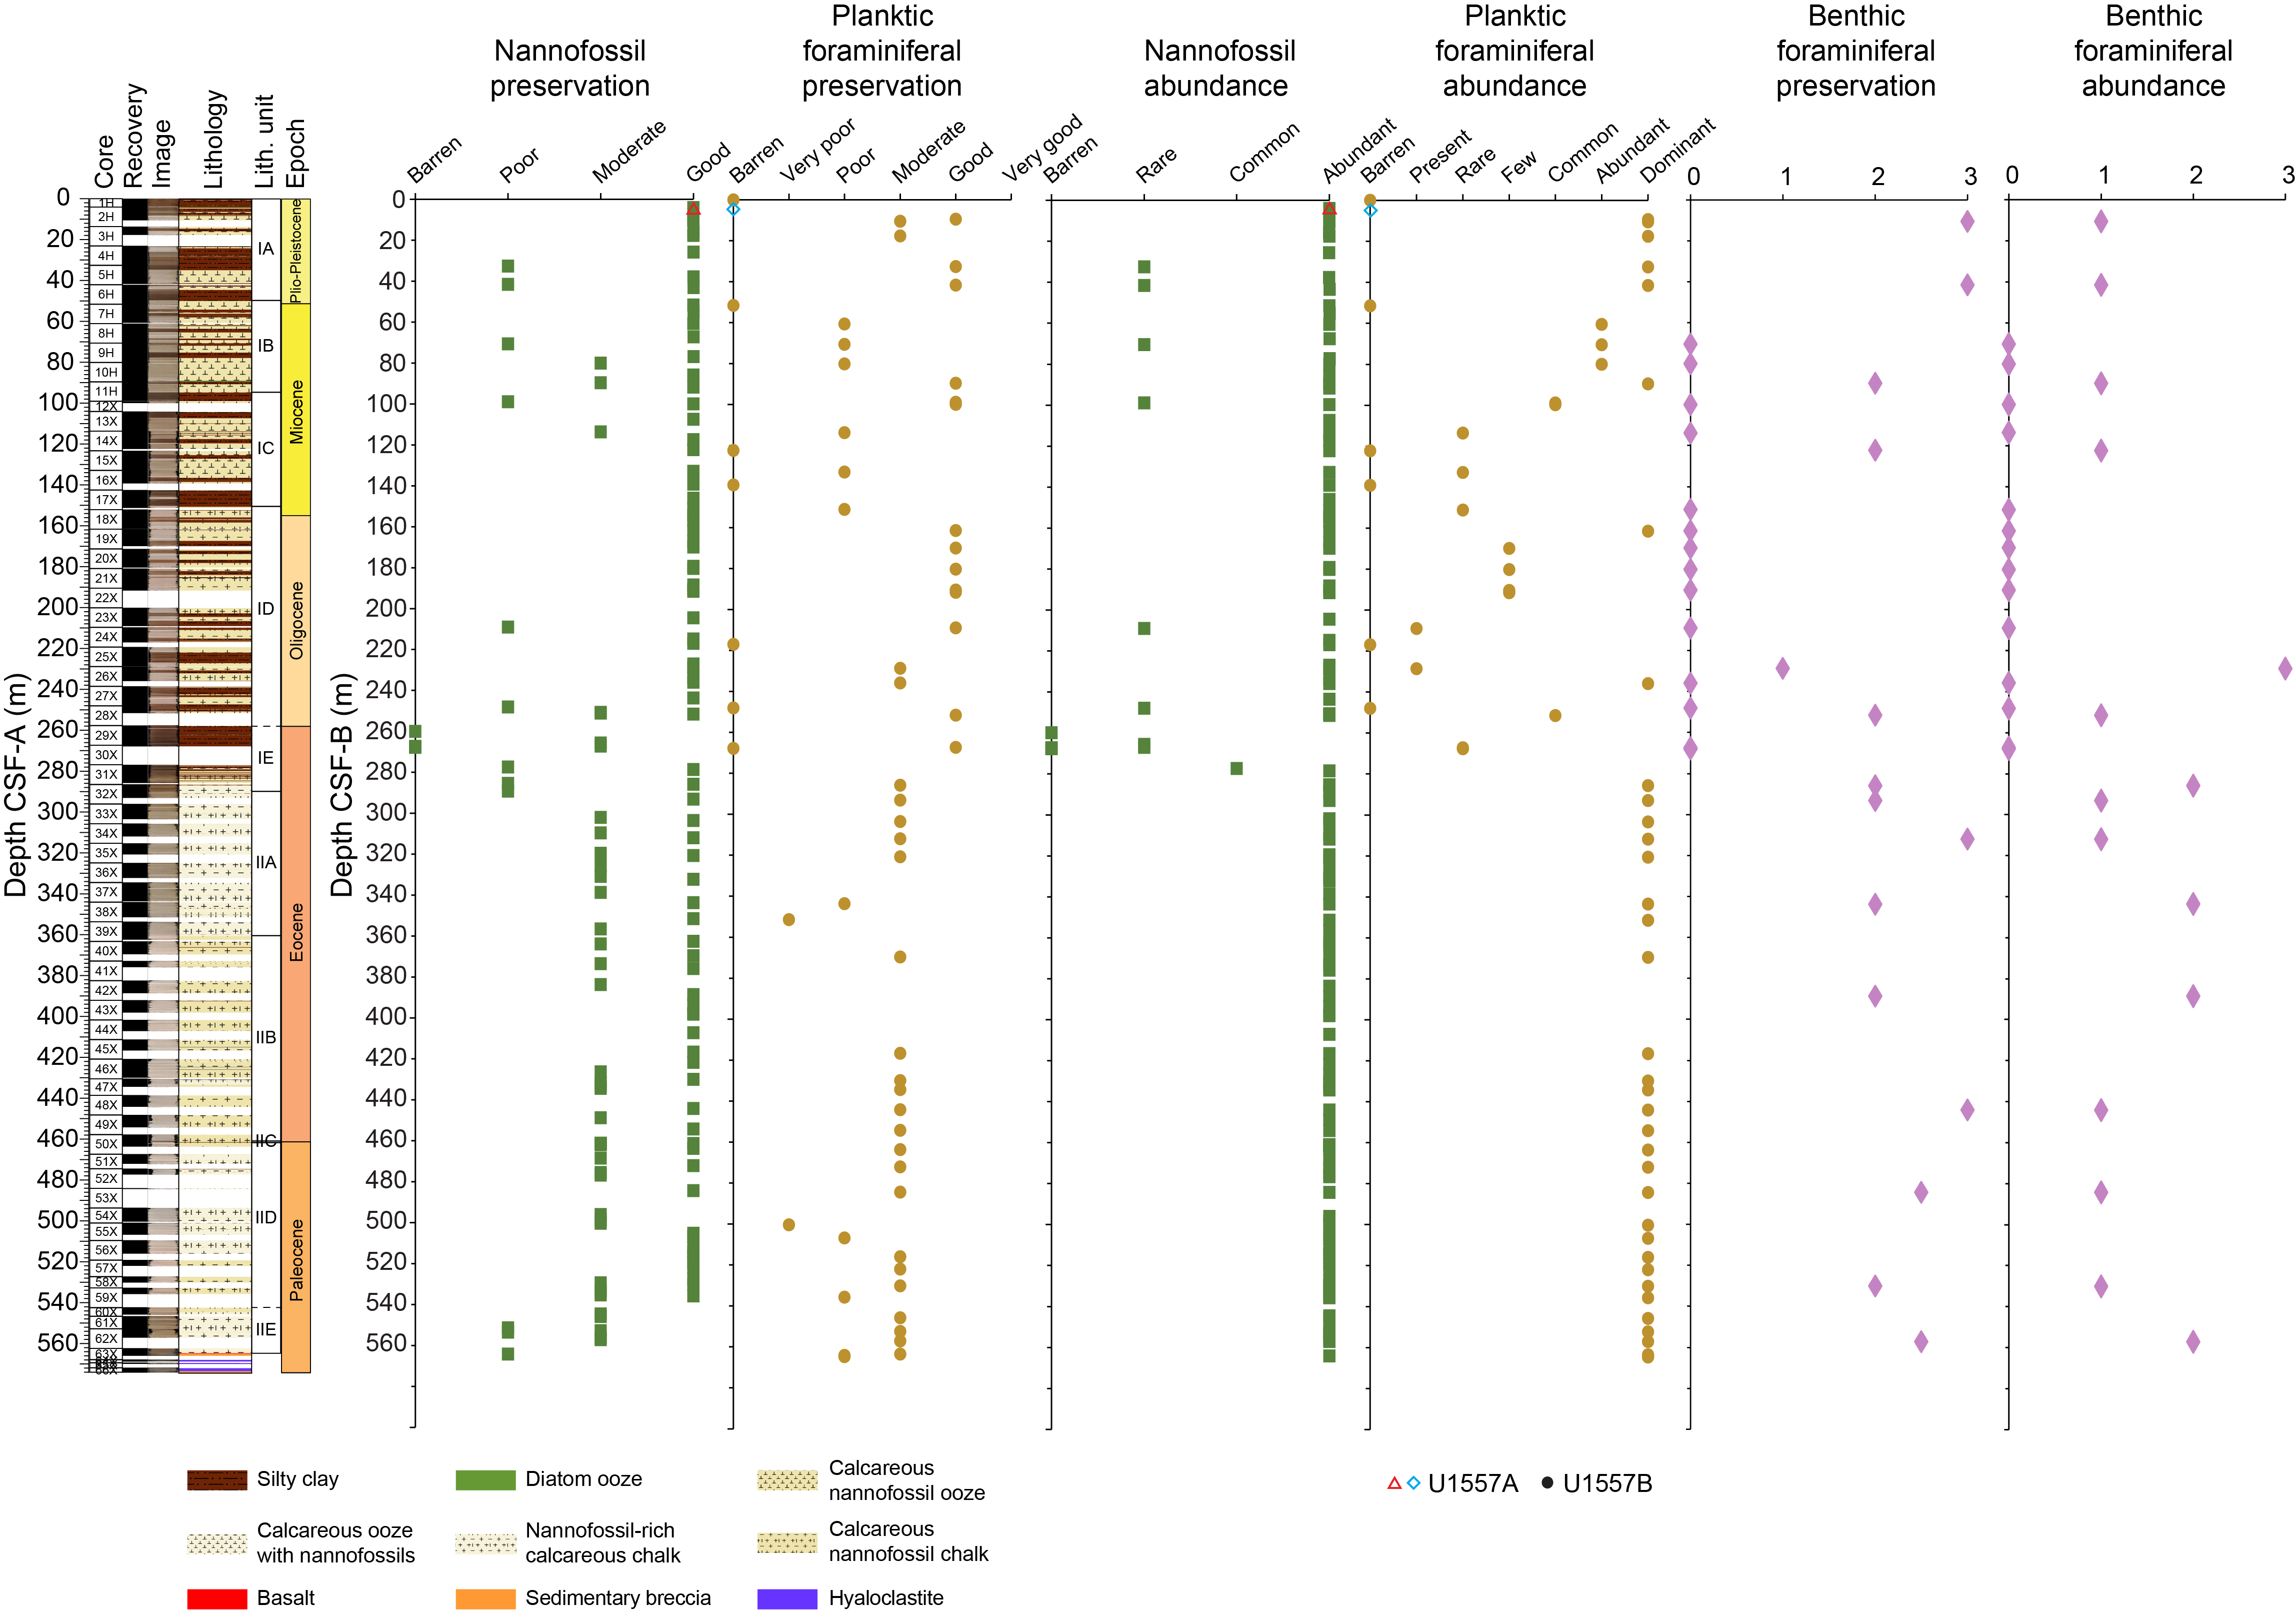
Figure F65. Abundance and preservation of nannofossils and foraminifera.
Planktic and benthic foraminifera and calcareous nannoplankton are present in varying abundances in the oozes and chalks but are mostly absent from the clays at this site. The Hole U1557B mudline sample is barren and thus the Holocene was not observed, but sedimentation appears to be continuous from the Pleistocene to early Oligocene. A 12.94 m thick condensed interval composed of dark brown pelagic clay and spanning the middle Eocene to early Oligocene occurs in Cores 390C-U1557B-29X through 31X (Figure F66). Thin horizons that visually appear to have higher carbonate content (i.e., lighter in color) were sampled for nannofossil analysis in this interval, but all samples are barren or contain few non-age-diagnostic taxa. Below this interval, sedimentation appears to be continuous, although there are significant gaps in recovery through to the bottom of the hole. We interpret a prominent reddish brown clay in Section 50X-3 (~461 m CSF-B) to represent the PETM based on the occurrence of the calcareous nannofossil genus Rhomboaster, which is characteristic of the PETM interval, as well as sedimentologic and physical properties data indicating a significant drop in carbonate content (see Sedimentology and Physical properties and downhole measurements). These observations are strong evidence that a PETM section was recovered at Site U1557. Below this hyperthermal event, continuous sedimentation is observed through to the sediment/basement interface.
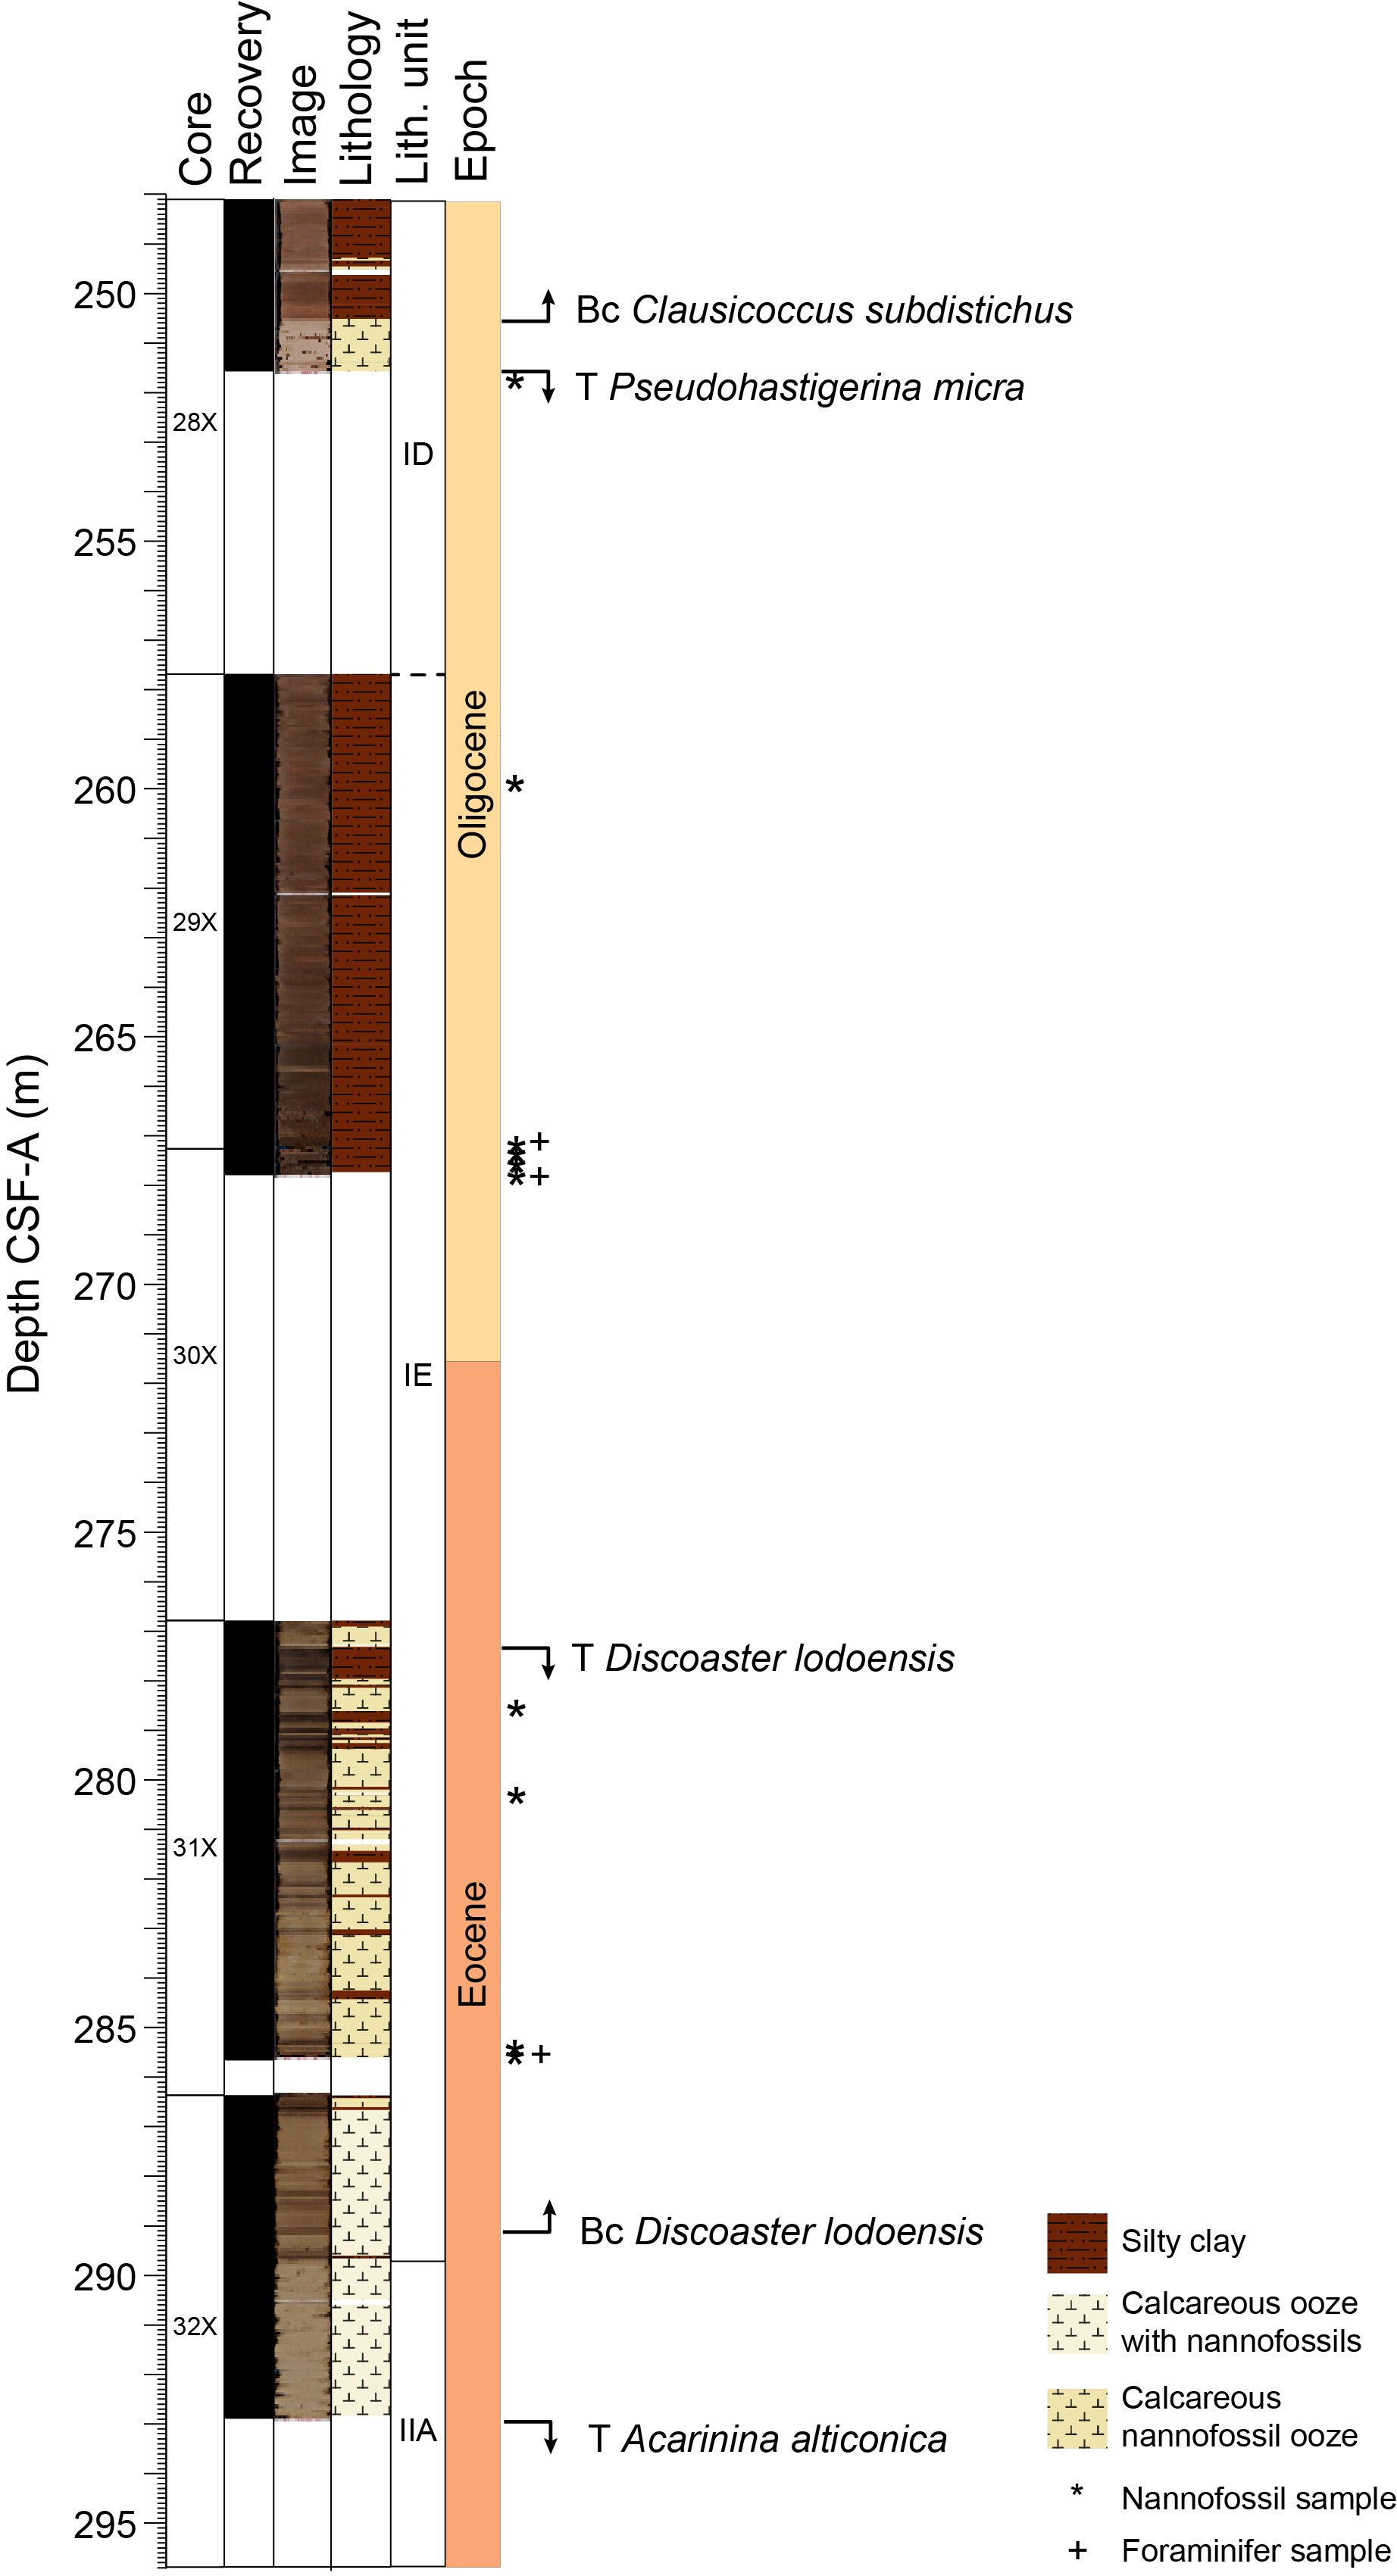
Figure F66. Integrated sedimentology and biostratigraphy for Eocene–Oligocene.
7.1. Age of basement
One sample analyzed directly above basement (Sample 390C-U1557B-63X-2, 78–80 cm; 564.15–564.17 m CSF-B) is assigned to planktic foraminiferal Zone P4a (60.54–60.76 Ma; Gradstein et al., 2020) and calcareous nannofossil Zone CNP7 (60.76–61.27 Ma; Gradstein et al., 2020), both of which are in good agreement with the projected crustal age of 61 Ma at Site U1557 and which correlate well to nearby Sites U1556 and U1561 (see Background and objectives; also see Biostratigraphy in the Site U1556 chapter and Biostratigraphy in the Site U1561 chapter [Coggon et al., 2024a, 2024b]).
7.2. Calcareous nannofossils
Calcareous nannofossil biostratigraphy is based on analysis of core catcher samples and additional smear slide samples from the Hole U1557B archive halves. Biostratigraphic datums used for the age-depth model are shown in Table T7, and calcareous nannofossil occurrence data are shown in Table T8. Note that the distribution chart is biased toward age-diagnostic and other notable taxa; a plate of photomicrographs including many of these taxa is shown in Figure F67.
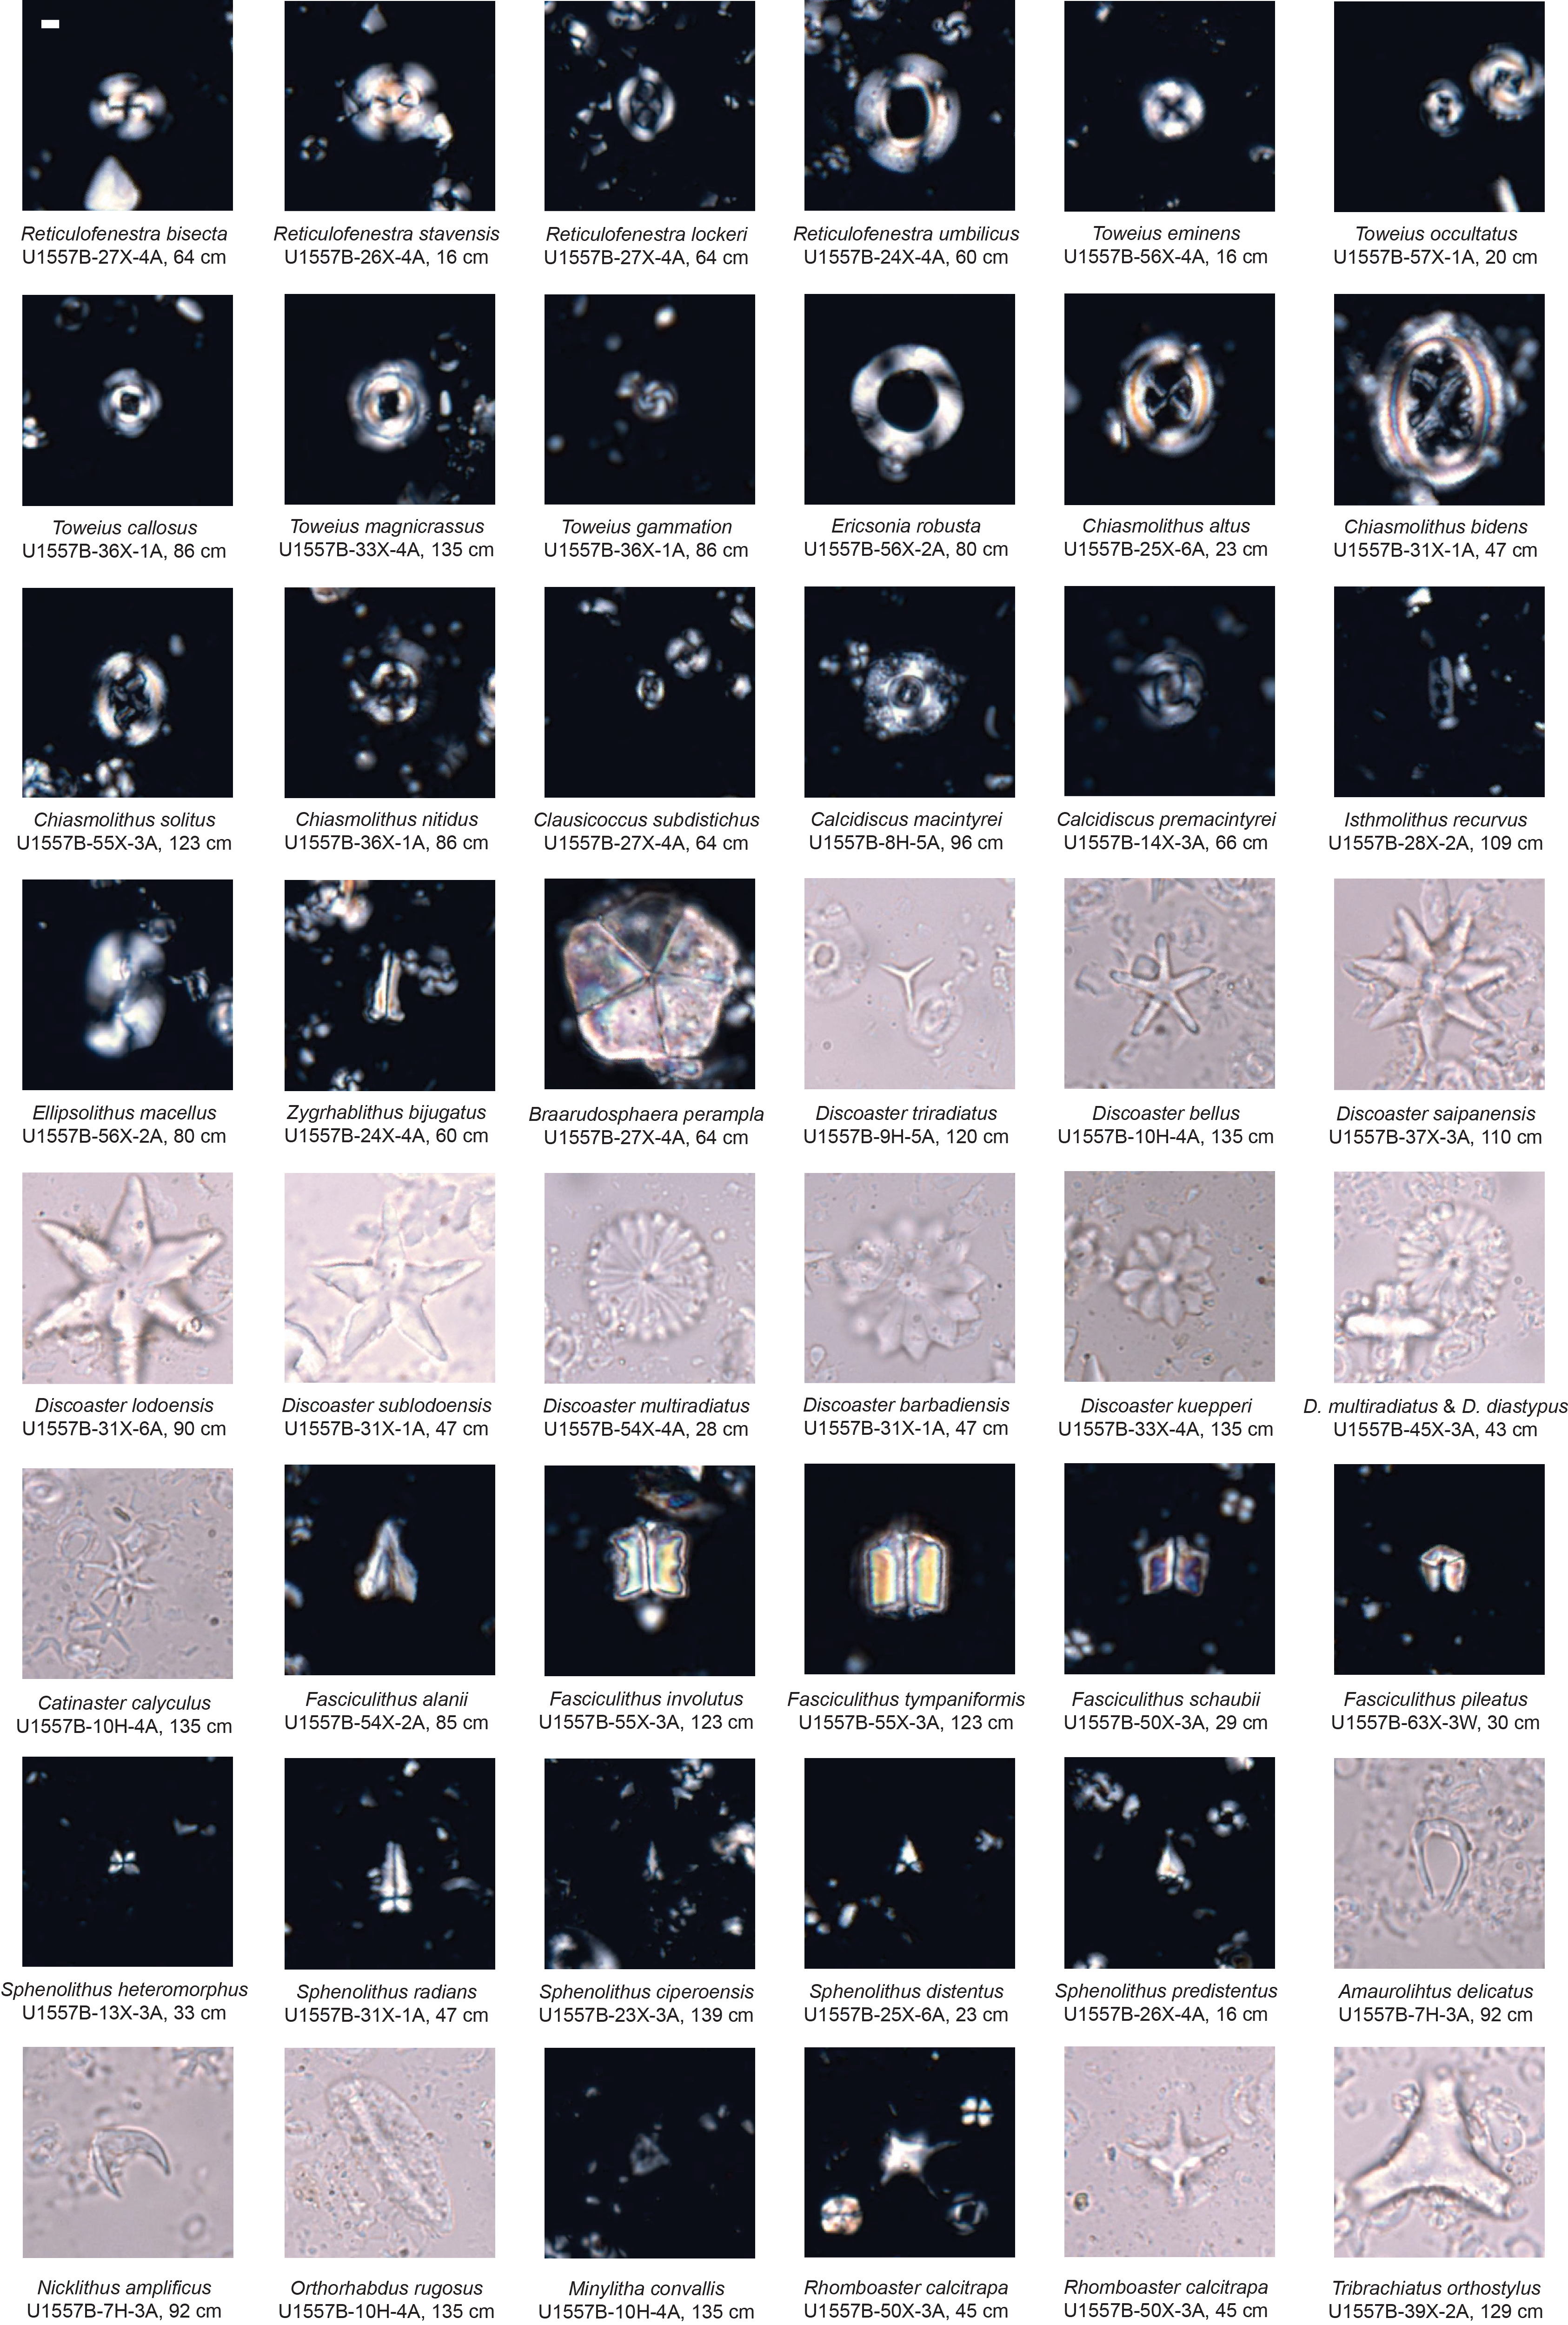
Figure F67. Important and notable calcareous nannofossil taxa.
At Site U1557, the preservation of calcareous nannofossils varies from poor to good and abundance varies from barren to abundant depending on lithology. Throughout Lithologic Units I and II (see Sedimentology), nannofossils are abundant and moderately to well preserved in the nannofossil ooze and chalk intervals, but nannofossils are rare to common and poorly to moderately preserved in the pelagic clay intervals. Where core catcher samples comprise pelagic clays (mostly in Lithologic Unit I) and nannofossil preservation is poor and/or samples were barren or rare to common in abundance, additional nannofossil samples were taken to refine the age model. There is common reworking of Paleogene and Neogene taxa throughout Lithologic Unit I and common reworking of Paleogene taxa throughout Lithologic Unit II; therefore, top occurrences were considered carefully before being included in the age model.
The uppermost sediments in Holes U1557A and U1557B (Samples 390C-U1557A-1H-CC, 8–13 cm [9.50 m CSF-B], and 390C-U1557B-1H-CC, 13–18 cm, to 2H-CC, 8–13 cm [4.02–10.49 m CSF-B]) contain abundant well-preserved nannofossils that we judged to be Pliocene–Pleistocene in age (Zone CNPL4). Several species of Discoaster are present, including Discoaster brouweri, Discoaster triradiatus, Discoaster pentaradiatus, Discoaster surculus, and Discoaster tamalis and abundant small reticulofenestrids. This suggests a very condensed Pleistocene section at Site U1557 that encompasses nannofossil Zones CNPL10–CNPL5.
The interval below these occurrences (15.99–85.77 m CSF-B) in Hole U1557B represents the mid-Pliocene through Late Miocene (nannofossil Zones CNPL3–CNM13) based on the top of Amaurolithus spp. in Sample 390C-U1557B-3H-3, 120 cm (15.99 m CSF-B), base of Ceratolithus cristatus in Sample 6H-CC, 13–18 cm (51.55 m CSF-B), top of Nicklithus amplificus in Sample 7H-3, 92 cm (55.52 m CSF-B), and base of N. amplificus in Sample 8H-5, 96 cm (67.83 m CSF-B). The top of Zone CNM16 is marked by the base of Amaurolithus spp. in Sample 8H-CC, 15–20 cm (70.53 m CSF-B), whereas the base of Minylitha convallis in Sample 10H-4, 135 cm (85.77 m CSF-B), falls within Zone CNM16.
The Early–Middle Miocene (Zones CNM13–CNM2) is recognized between Samples 390C-U1557B-11H-2, 65 cm, and 18X-2, 75 cm (91.75–154.35 m CSF-B), by the following nannofossil events: the base of Discoaster bellus (Sample 11H-2, 65 cm; 91.75 m CSF-B), base of Calcidiscus macintyrei (Sample 14X-3, 66 cm; 117.36 m CSF-B), base of Sphenolithus belemnos (Sample 17X-3, 50 cm; 146.00 m CSF-B), and base of Sphenolithus disbelemnos (Sample 18X-2, 75 cm; 154.35 m CSF-B). The late Oligocene, including the Oligocene/Miocene boundary, is poorly constrained in Hole U1557B in part because of lithology, sampling resolution, and reworking of nannofossil marker taxa; thus, top occurrences of bioevents were not used in this interval. The first useful Oligocene bioevent identified is the base of Sphenolithus ciperoensis in Sample 23X-3, 139 cm (204.49 m CSF-B), which is within Zone CNO4. The base of Sphenolithus distentus occurs in Sample 25X-CC, 13–18 cm (228.71 m CSF-B), marking the top of Zone CNO3.
Sample 390C-U1557B-28X-3, 28 cm (251.04 m CSF-B), is assigned to earliest Oligocene Zone CNO1 by the base common of Clausicoccus subdistichus, which is the closest event to the Eocene/Oligocene boundary identified at this site. Sample 28X-CC, 20–25 cm (251.53 m CSF-B), contains abundant and well-preserved nannofossils, but the assemblage is not diverse and lacks any early Oligocene or late Eocene biostratigraphically significant taxa. This is also the lowest sample in the carbonate-rich Lithologic Subunit ID before the transitional Subunit IE, which is classified as primarily silty clay and organic-rich silty clay in Cores 29X and 30X; this unit is either barren of calcareous nannofossils or contains rare taxa that are not age diagnostic (i.e., Samples 29X-2, 78 cm, through 30X-CC, 16–21 cm; 259.93–267.81 m CSF-B). In the lowermost part of Subunit IE, which is described as clayey nannofossil ooze (see Sedimentology), Sample 31X-1, 47 cm (277.37 m CSF-B), contains very few calcareous nannofossils, but the presence of Discoaster lodoensis and Discoaster sublodoensis and the absence of Blackites inflatus indicates the sample is early middle Eocene within Zone CNE6. This sample is assigned an age of 48.22 Ma (Gradstein et al., 2020) according to the top of D. lodoensis, but it could be as old as 48.80 Ma (base age of D. sublodoensis; Gradstein et al., 2020). We therefore interpret the barren/depauperate clay-rich interval from Cores 29X to 30X, below the base common of C. subdistichus (dated to 33.88 Ma; Gradstein et al., 2020), to represent a large condensed interval spanning ~15 My that encompasses nannofossil Zones CNE20–CNE7 as well as the Eocene/Oligocene boundary (dated at 33.90 Ma; Gradstein et al., 2020). Figure F66 provides an overview of lithologic changes and microfossil sampling and events through this Eocene–Oligocene interval.
Nannofossil preservation in Samples 390C-U1557B-31X-1, 47 cm, through 32X-2, 121 cm (277.37–289.15 m CSF-B), alternates between poor and good; these samples comprise an assemblage of relatively robust early Eocene taxa including Tribrachiatus orthostylus, Sphenolithus radians, and the large discoasters D. lodoensis and D. sublodoensis. The absence of a prominent central boss in the discoasters suggests these samples are affected by dissolution. The base common occurrence of D. lodoensis is recorded in Sample 32X-CC, 11–16 cm (293.08 m CSF-B), and marks the top of Zone CNE3. The sample contains a more diverse early Eocene assemblage, including a variety of Eocene Chiasmolithus species. All Eocene samples analyzed below this depth contain abundant and diverse calcareous nannofossils.
Interval 390C-U1557B-33X-4, 135 cm, through 49X-CC, 16–21 cm (301.94–454.19 m CSF-B), contains abundant moderately to well-preserved early Eocene calcareous nannofossil assemblages representing Zones CNE3–CNE1. These zones are identified based on the bioevents base of Toweius gammation in Sample 36X-4, 138 cm (330.79 m CSF-B), base of S. radians in Sample 37X-3, 110 cm (338.60 m CSF-B), base of T. orthostylus in Sample 41X-1, 60 cm (373.50 m CSF-B), and base of Discoaster diastypus in Sample 45X-3, 43 cm (414.72 m CSF-B).
The base of the genus Rhomboaster (Zone CNP11) is recorded in Sample 390C-U1557B-50X-3, 45 cm (461.25 m CSF-B), and multiple species are present including Rhomboaster bramlettei, Rhomboaster calcitrapa, and Rhomboaster cuspis. This genus is one of the classic markers for the PETM, which is dated at 56.00 Ma (Gradstein et al., 2020). Other excursion taxa, including the Discoaster araneus group, are not observed in Hole U1557B; however, identification of the PETM (in Subunit IIC) is supported by lithologic and physical properties data (see Sedimentology and Sediment in Physical properties and downhole measurements).
Below the PETM section (Samples 390C-U1557B-51X-1, 110 cm, through 60X-CC, 41–46 cm; 468.50–545.79 m CSF-B), Zones CNP11–CNP8 are recognized from the base common of Discoaster multiradiatus in Sample 55X-3, 123 cm (505.25 m CSF-B), base of Ericsonia robusta in Sample 58X-1, 24 cm (527.54 m CSF-B), top of Heliolithus kleinpellii in Sample 59X-1, 60 cm (533.40 m CSF-B), base of Discoaster mohleri in Sample 59X-2, 91 cm (535.21 m CSF-B), and base of H. kleinpellii in Sample 60X-2, 64 cm (544.54 m CSF-B). Paleocene nannofossil assemblages in this interval are generally diverse with moderate to good preservation.
The preservation state of calcareous nannofossils deteriorates slightly in the lowermost three cores of Hole U1557B (Sample 390C-U1557B-61X-4, 40 cm, through 63X-2, 25 cm; 551.36–564.17 m CSF-B), but the top of Fasciculithus pileatus is recorded in Sample 62X-1, 70 cm (553.50 m CSF-B), and the presence of Fasciculithus tympaniformis in the lowermost sample (63X-2, 25 cm; 551.36–564.15 m CSF-B) place these samples in Zone CNP7 within the Selandian/Thanetian Stages. This zonation correlates to the planktic foraminiferal biostratigraphy in Hole U1557B as well as the lowermost sediment samples at Sites U1556 and U1561, and it is close to the estimated crustal age of ~61 Ma (see Background and objectives).
7.3. Planktic foraminifera
Planktic foraminifera analysis at Site U1557 was predominantly reliant on shore-based investigation of core catcher samples, supplemented by three working-half samples from Core 390C-U1557B-63X, which was split on board the R/V JOIDES Resolution during Expedition 390. As such, the zonation scheme is strongly biased by preservation because many core catchers happened to collect pelagic clays and foraminiferal-poor nannofossil oozes from Lithologic Unit I (0–289.84 m CSF-B), which is composed of alternating calcareous and clay-rich layers (see Sedimentology). Table T9 shows the occurrences of biostratigraphically significant species and other notable taxa. Overall, the succession of species appears to match that of Site U1556, where shipboard sampling of Hole U1556C provided a more complete biostratigraphic succession that likely also exists in the unsampled carbonate intervals at Site U1557. Preservation and foraminiferal abundance improve in the Eocene and Paleocene sections of Unit II (289.84–564.76 m CSF-B), but the absence of some marker taxa prevents identification of some early Eocene zones. Calcareous nannoplankton do not indicate any significant hiatuses in this interval, so we do not suspect that any time is missing here.
The mudline sample is barren, indicating the modern seafloor is below the carbonate compensation depth (CCD), as at nearby Site U1556 (6.7 km west). Deeper samples from Hole U1557B (Samples 390C-U1557B-1H-CC, 13–18 cm, through 17X-CC, 29–34 cm; 4.02–151.16 m CSF-B) are either barren pelagic clays or nannofossil oozes with very small (<125 µm) and sometimes very rare planktic foraminifera. The exception is Core 5H-CC, 71–76 cm (41.57 m CSF-B), which contains foraminiferal ooze, discussed below. In general, primary zonal markers were absent and age-diagnostic taxa were few. Sample 1H-CC, 13–18 cm, was barren of foraminifera but dominated by large broken diatoms similar to the discrete diatoms layers observed at Site U1556. Sample 390C-U1557A-1H-CC, 8–13 cm (9.45 m CSF-B), from the only core from Hole U1557A (which overshot the mudline), contains a depauperate assemblage of generally Pliocene–Pleistocene foraminifera. The first useful datum is the top of Globorotalia margaritae (marking the top of Zone PL2) based on the occurrence of that taxon in Sample 390C-U1557B-3H-CC, 8–13 cm (17.63 m CSF-B). The foraminiferal ooze in Sample 5H-CC, 71–76 cm (41.57 m CSF-B), contains an assemblage that is similar to that of the overlying samples and appears to still represent Zone PL2 based on the absence of Globoturborotalita nepenthes from this otherwise diverse population. The next biostratigraphically useful sample is Sample 10H-CC, 35–40 cm (89.55 CSF-B), which contains Globoconella conomiozea, Globoconella miotumida, and Globoturborotalita decoraperta and lacks G. margaritae. The presence of these taxa indicates that this sample is in Upper Miocene Zone M14. The next seven samples (11H-CC, 11–16 cm, through 17X-CC, 29–34 cm; 98.86–151.16 m CSF-B) are either barren or contain depauperate assemblages of broadly Neogene taxa.
Sample 390C-U1557B-18X-CC, 13–18 cm (161.48 m CSF-B), contains a more abundant assemblage of mostly small foraminifera that includes Tenuitella gemma (top in Zone O7), indicating that this sample was deposited during the Oligocene. Other taxa are generally long-ranging Oligocene to Early Miocene species including Globorotalia siakensis, Globoturborotalita ouachitaensis, Globoturborotalita occlusa, Globigerina officinalis, Paragloborotalia nana, and Cassigerinella chipolensis. Sample 21X-CC, 16–21 cm (190.45 m CSF-B), contains Chiloguembelina adriatica, which indicates that this sample cannot be younger than Zone O5. Sample 22X-CC, 21–26 cm (191.56 m CSF-B), contains G. siakensis and Globoturborotalita brazieri, both of which are not older than Zone O3. Likewise, the occurrence of Paragloborotalia opima in Sample 23X-CC, 19–24 cm (208.98 m CSF-B), restricts this sample to Zones O5–O2. Together, these three adjacent samples indicate that Cores 21X–23X are broadly mid-Oligocene in age. Samples 24X-CC, 14–19 cm, through 28X-CC, 20–25 cm (216.93–251.53 m CSF-B), are barren or contain no age-diagnostic taxa. Sample 29X-CC, 32–37 cm (267.25 m CSF-B), contains very few foraminifera, but fortunately, one of these is Pseudohastigerina micra, which places the sample within Zone O1 or older. Because this sample occurs at the top of the thick dark brown pelagic clay that separates the Eocene from the Oligocene at Sites U1557 and U1556 (see Biostratigraphy in the Site U1556 chapter [Coggon et al., 2024a]), we interpret this occurrence of P. micra to indicate an earliest Oligocene age for this sample.
Core 390C-U1557B-30X is barren, but Sample 31X-CC, 11–16 cm (285.75 m CSF-B), contains an abundant and diverse middle Eocene assemblage assigned to Zone E7 (based on the occurrence of Acarinina boudreauxi, which ranges from Zone E9 to Zone E7, and the questionable occurrence of Acarinina alticonica, which has a top in Zone E7). The sample is dominated by robust taxa, including Subbotina senni, and contains abundant test fragments that indicate that this assemblage was affected by dissolution. From Core 32X (~286 m CSF-B) to the base of the sediment section in Hole U1557B (564.68 m CSF-B), planktic foraminifera are generally much more abundant and diverse, and the average size of specimens is larger (many >125 µm). Samples 31X-CC, 11–16 cm, through 34X-CC, 31–36 cm (285.75–311.89 m CSF-B), all contain a similar assemblage indicative of Zone E7, including Acarinina pentacamerata, Acarinina pseudosubsphaerica, Acarinina soldadoensis, A. boudreauxi, and Acarinina coalingensis. Acarinina cuneicamerata, which is a distinctive taxon that marks the top of Zone E6, was not present in any of our samples, so it is not clear whether Zone E6 is missing or we simply cannot identify it because the marker taxon is not found in this area. Sample 35X-CC, 27–32 cm (320.65 m CSF-B), contains Morozovella aequa, Morozovella gracilis, and Morozovella marginodentata and is tentatively assigned to Zones E5/E4. Morozovella aragonensis, which is another distinctive form whose extinction marks the top of Zone E5, was not observed at Site U1557, so we cannot separate Zone E5 from Zone E4. The base of Zone E4 is defined by the base of Morozovella subbotinae, which is present in our cores and is not found below Sample 40X-CC, 21–26 cm (369.56 m CSF-B). The Zone E3/E2 boundary is defined by the extinction of Morozovella velascoensis, which is also absent from Site U1557. Samples 45X-CC, 33–38 cm, through 49X-CC, 16–21 cm (416.58–454.19 m CSF-B), are therefore assigned to Zone E3/E2 undifferentiated. These samples are also characterized by some degree of reworking, where well-known Paleocene taxa like Globanomalina pseudomenardii co-occur with well-known Eocene taxa like Pearsonites broedermanni. There is sedimentary evidence for event deposits in this interval of Lithologic Unit II (including scour surfaces, coarse layers, and fining-upward sequences) (Figure F68; see Sedimentology), so we interpret this co-occurrence to be the result of Eocene reworking of Paleocene material. Care should be taken when sampling these cores to avoid intervals with evidence of bottom water flow or scouring.
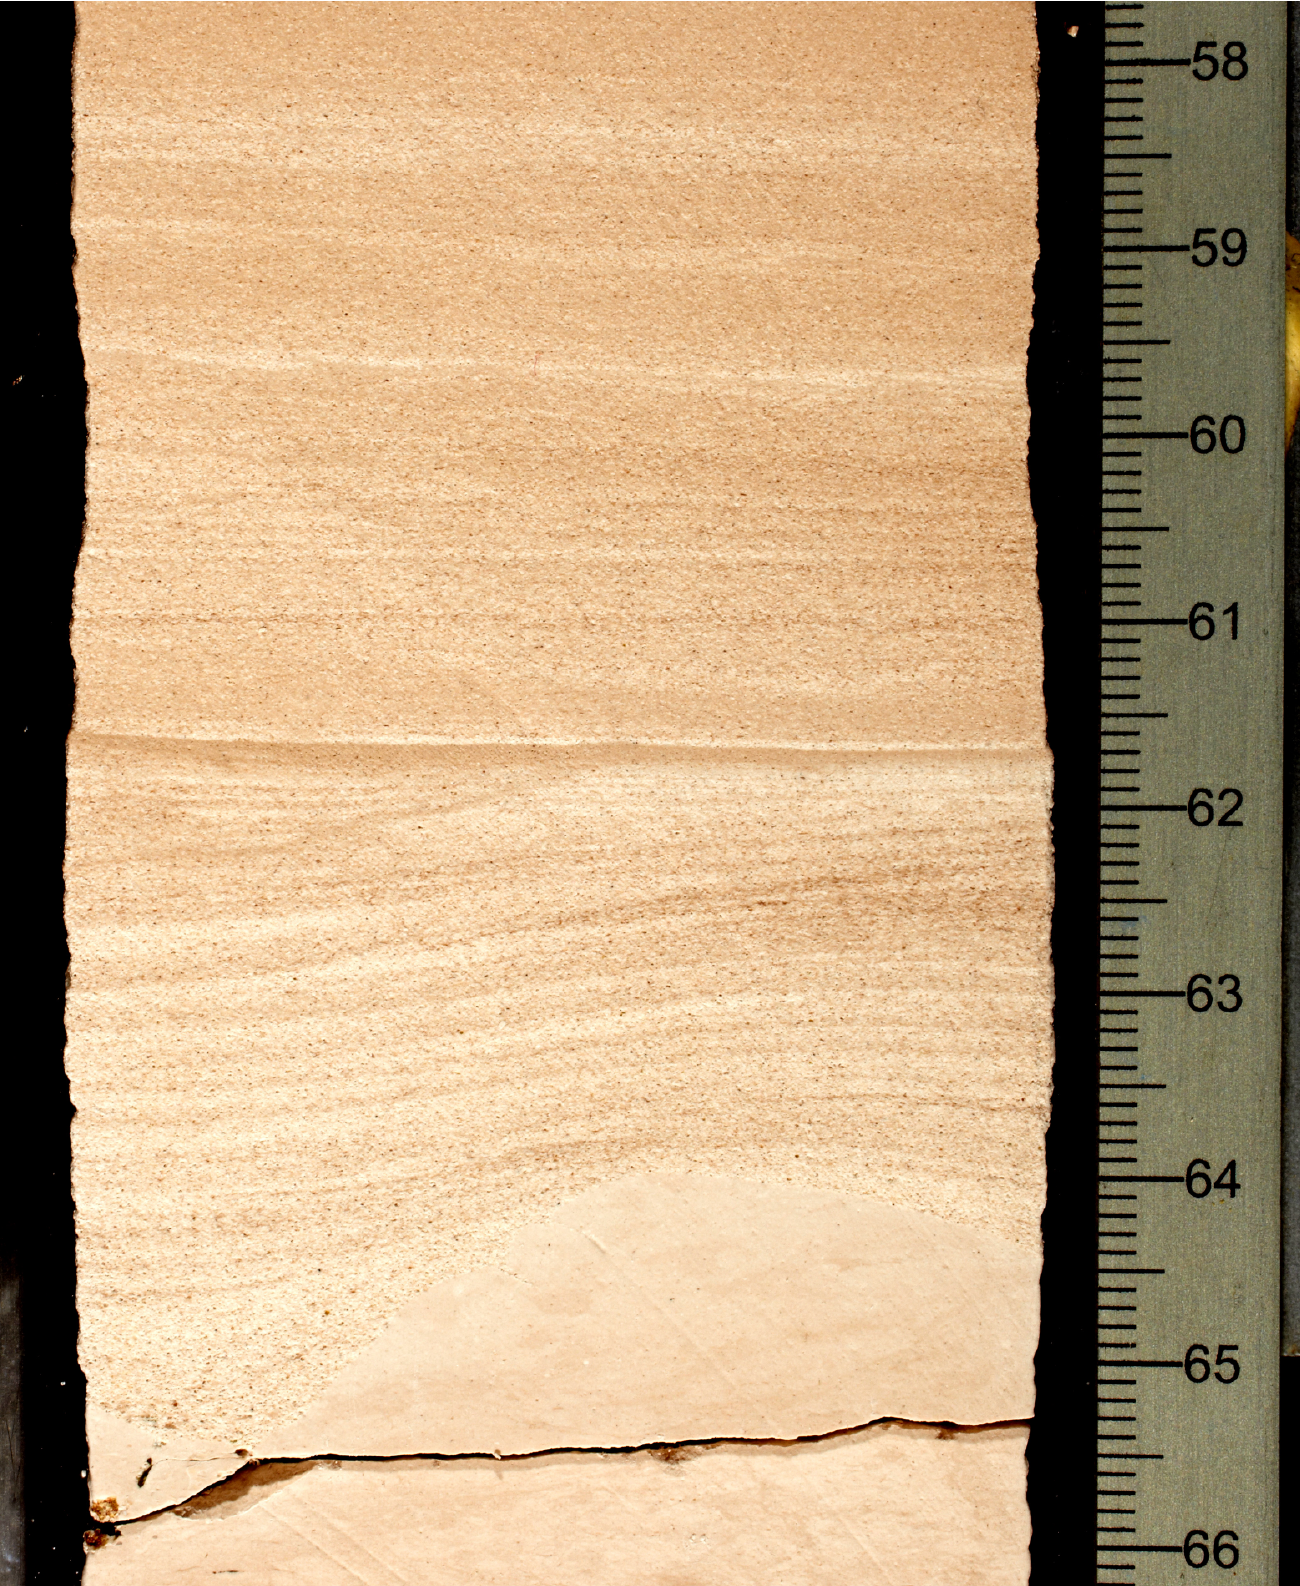
Figure F68. Feature indicative of microfossil reworking.
Sample 390C-U1557B-50X-CC, 15–20 cm (463.65 m CSF-B), contains no Paleocene marker taxa but also lacks species limited to the Eocene, like P. broedermanni, and is therefore assigned to Zone P5. The top of G. pseudomenardii, which marks the top of Zone P4c, occurs in Sample 53X-CC, 26–31 cm (484.36 m CSF-B), although given the reworking of this taxon into the Eocene, the placement of the top of this zone is uncertain. A. soldadoensis, which marks the top of Zone P4b, was not identified at Site U1557B; however, Morozovella acutispira, which is a uniquely high-spired morozovellid that ranges Zone P4a–P4b, is present in fairly high abundance in our samples (as at Site U1556; see Biostratigraphy in the Site U1556 chapter [Coggon et al., 2024a]), and the highest occurrence of this taxon in Sample 57X-CC, 8–13 cm (522.04 m CSF-B), allows us to identify the top of Zone P4b at this level. The base of Subbotina variospira, which marks the top of Zone P4a, occurs in Core 59X-CC, 21–26 cm (535.73 m CSF-B). Zone P4a extends all the way to the base of the sedimentary succession at Site U1557. The lowest sample examined in the sediment section (Sample 63X-2, 78–80 cm; 564.68 m CSF-B) lacks both M. acutispira and G. pseudomenardii, but it contains a number of other taxa that are younger than the base of Zone P4a including Globanomalina chapmani, Morozovella conicotruncata, and Morozovella occlusa. Many of the M. occlusa appear transitional with M. acutispira but lack the distinctive knob on the raised early spiral chambers of that taxon; we therefore interpret this sample to be near the first appearance of M. acutispira, which would place it very close to the base of Zone P4a (the first occurrence is 95% through Zone P3b according to Olsson et al. [1999], although this particular species is not a well-calibrated zonal marker and Site U1557 is in the mid-latitudes, so some variability in this datum could be expected). A lowest Zone P4a age at this depth is in line with the age indicated by calcareous nannoplankton. A plate of biostratigraphically useful taxa from the base of the sediments in Hole U1557B can be found in Figure F69, and changes in planktic and benthic foraminiferal preservation are illustrated in Figure F70.
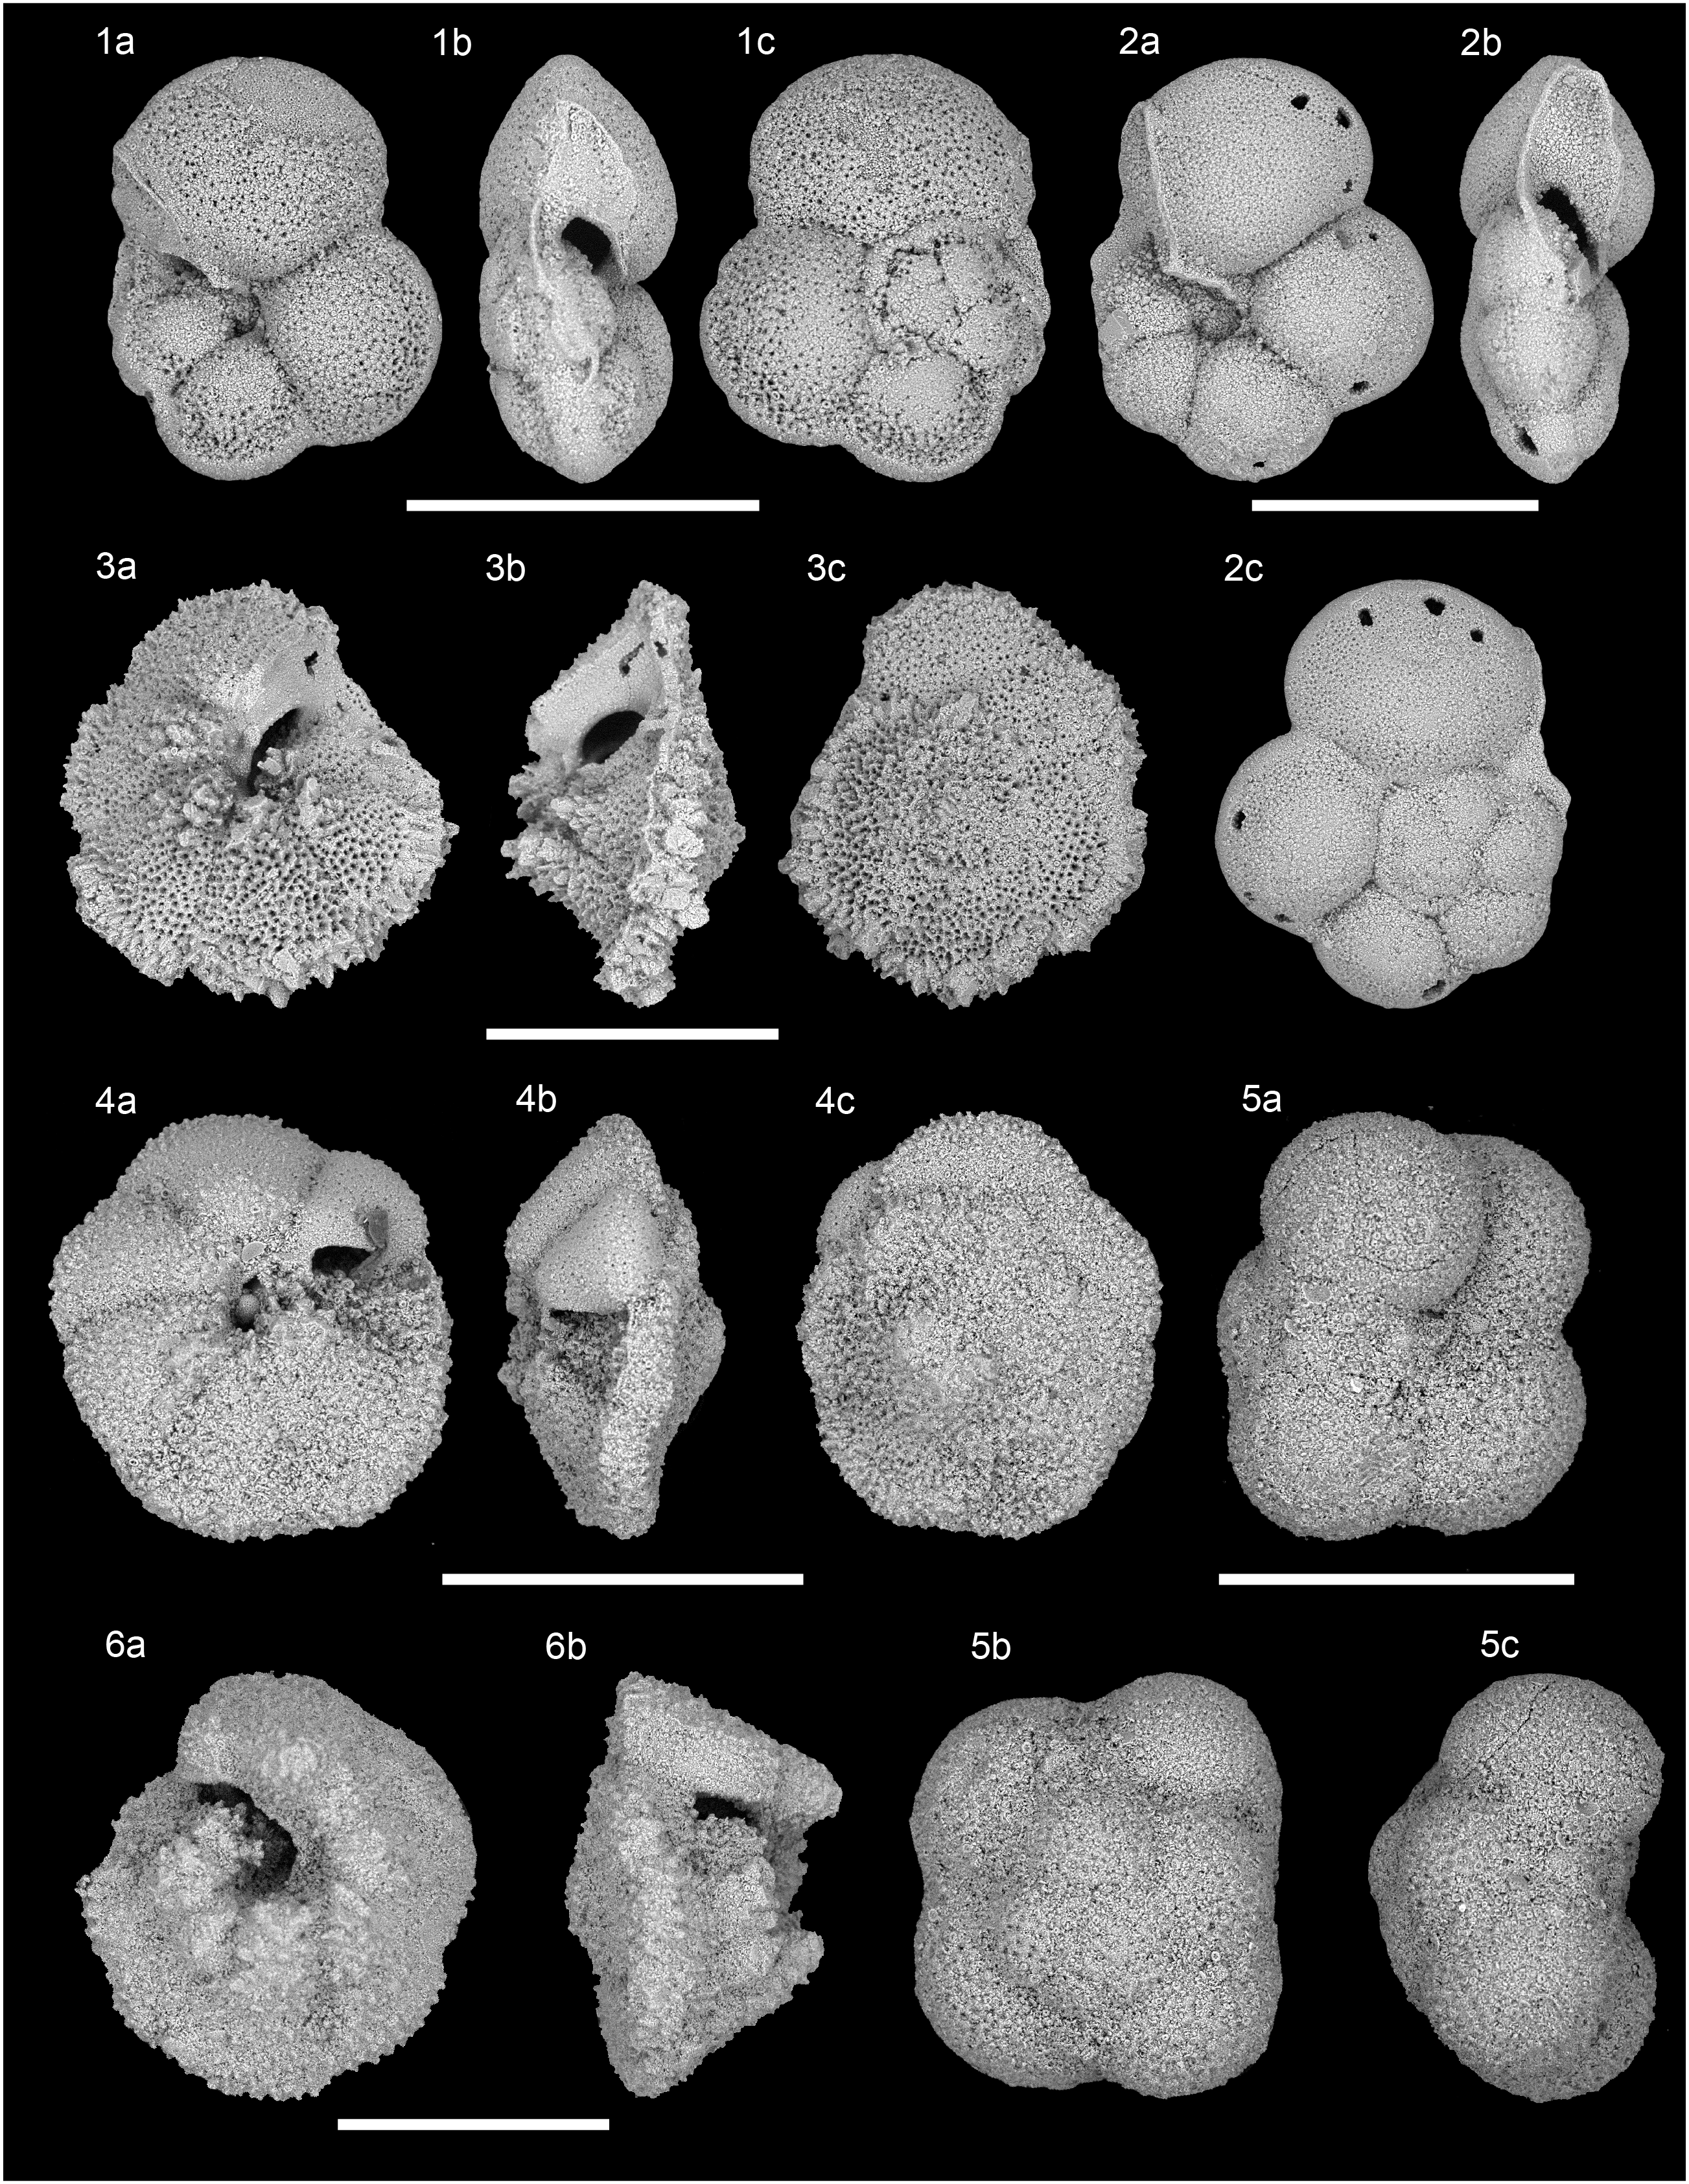
Figure F69. Key middle Paleocene planktic foraminifera.
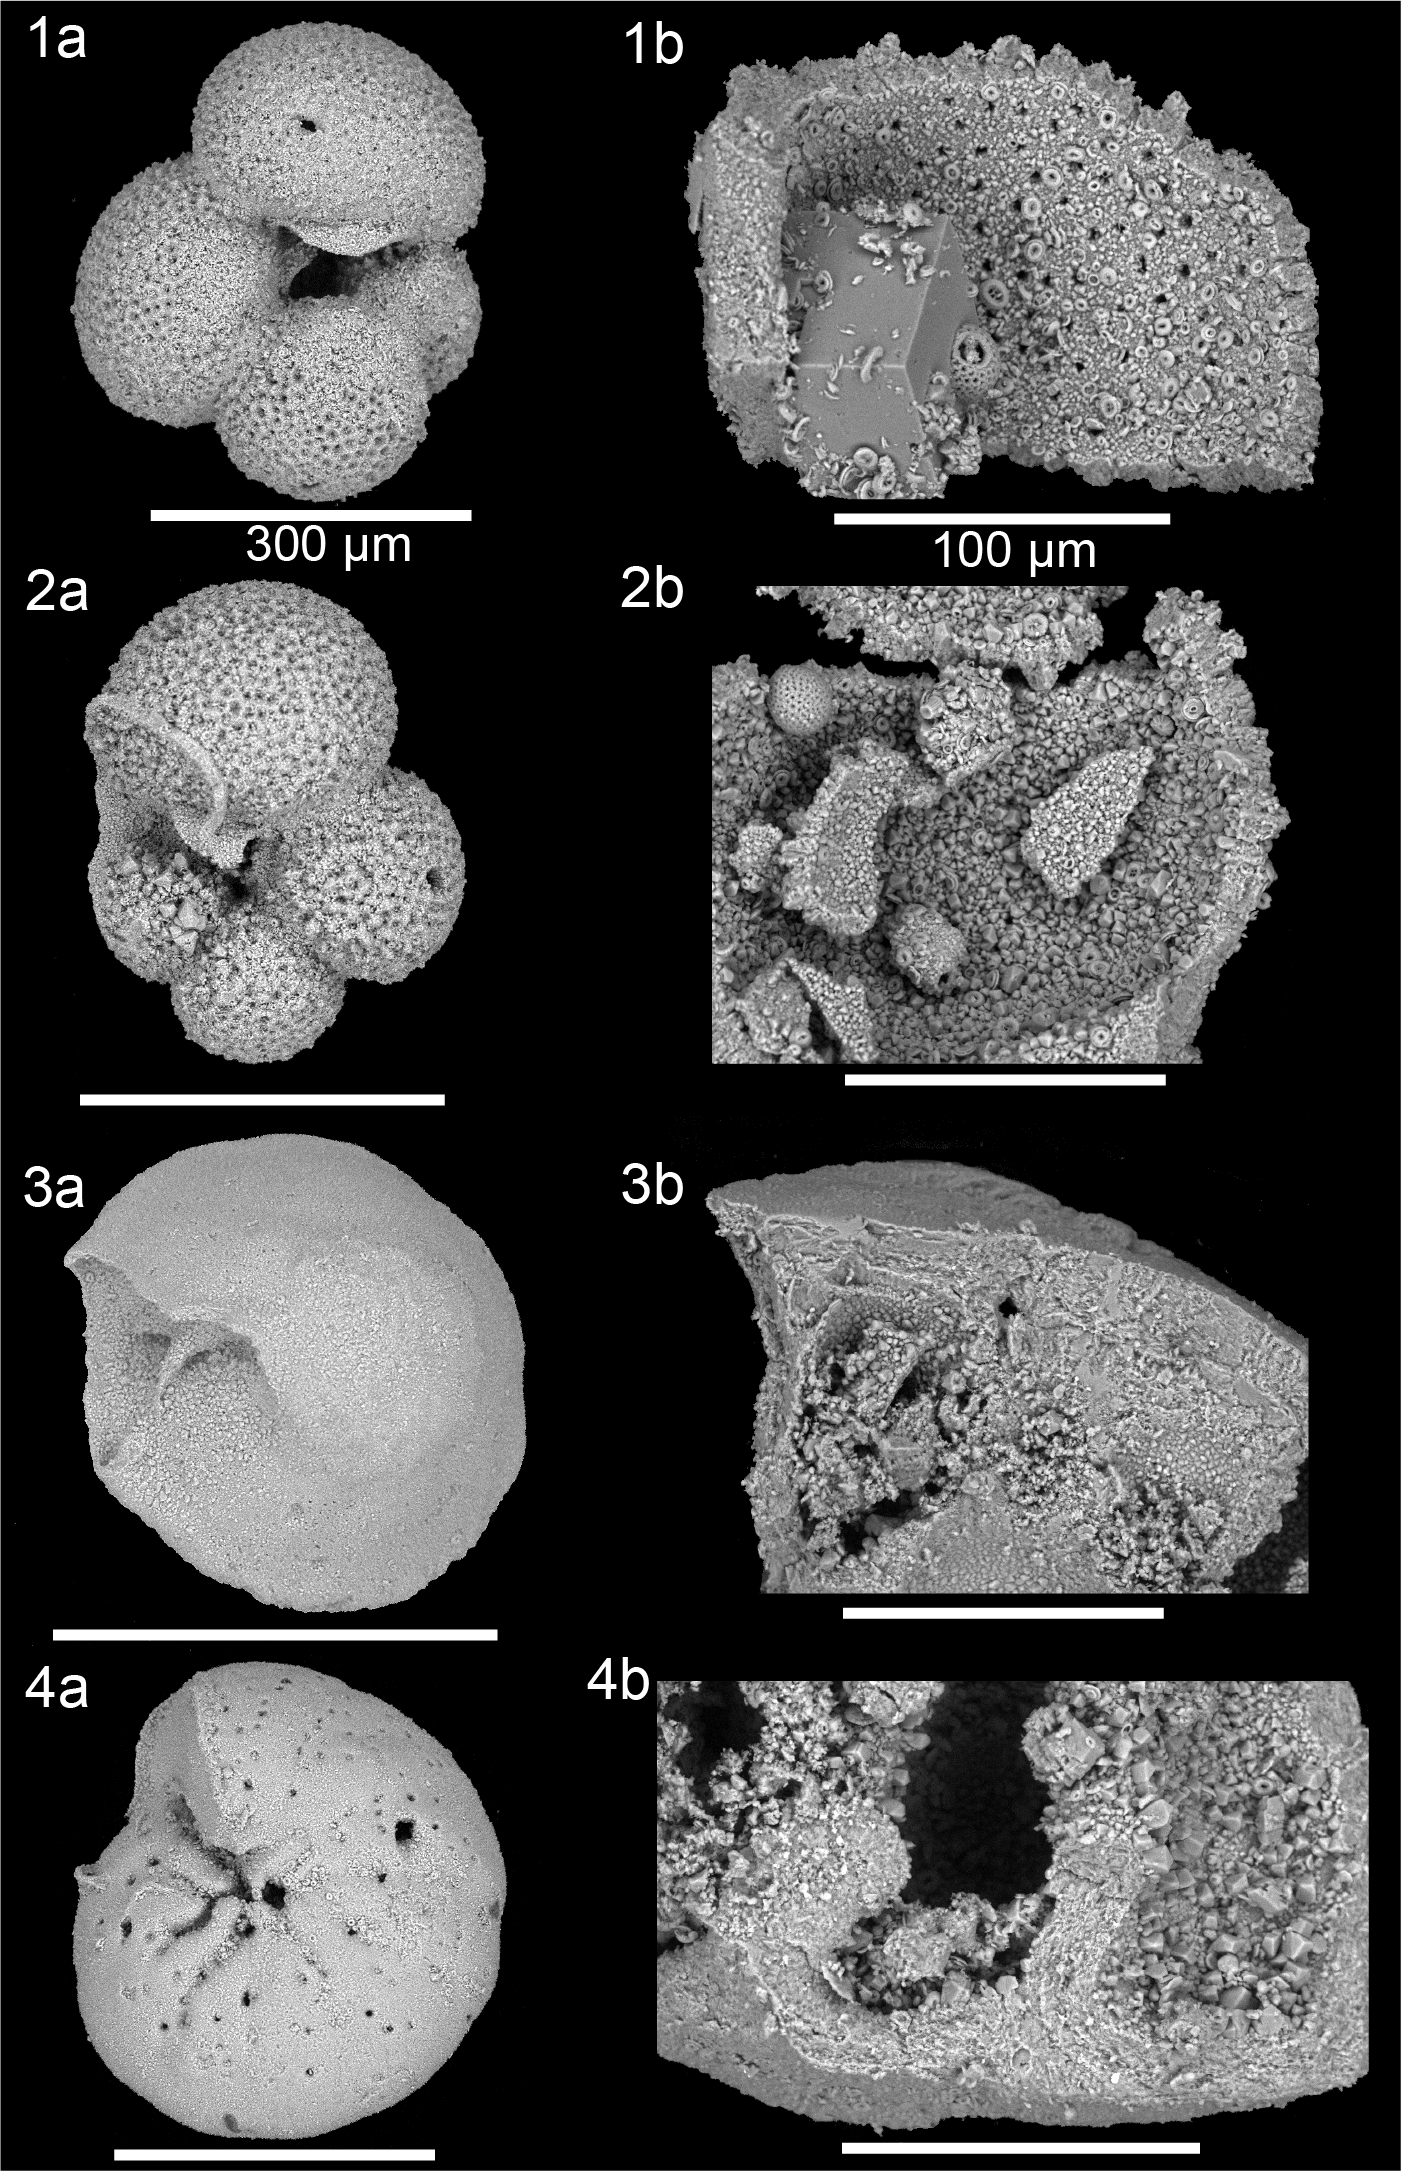
Figure F70. Calcite preservation from foraminifera.
7.4. Benthic foraminifera
Onshore analysis of benthic foraminifera was conducted on core catcher samples of the cores recovered in Hole U1557B during Expedition 390C. Benthic foraminifera preservation, abundance, and assemblage composition were assessed based on the observation of depth-diagnostic calcareous species and other notable calcareous taxa. Agglutinated foraminifera were reported if identified. Benthic foraminiferal preservation and abundance are summarized in Figure F65, and some examples of benthic foraminiferal preservation are illustrated in Figure F70. The occurrence of important benthic foraminiferal species is reported in Table T10. Overall, the benthic foraminiferal assemblages suggest that Site U1557 could have been lying at upper abyssal depths (~2000–3000 m) during the late Paleocene and earliest middle Eocene (~61–48 Ma) and reached lower abyssal depths (>3000 m) by the Late Miocene; however, the timing of this transition is uncertain. Middle and late Eocene samples are characterized by a benthic foraminiferal assemblage composed of species with a wide abyssal distribution (Holbourn et al., 2013; Tjalsma and Lohmann, 1893). In addition, a lot of late Eocene–Middle Miocene samples were barren of benthic foraminifera. However, the presence of Nuttallides umbonifera in one early Oligocene sample (Sample 390C-U1557B-25X-CC, 13–18 cm; 228.71 m CSF-B) implies that Site U1557 could have been lying at lower abyssal depths by the early Oligocene. This interpretation carries some uncertainties because the amount of sediment in this sample was so scarce that analysis was performed without sieving the residue and the benthic foraminiferal specimens picked were rather small (<100 µm) and of very poor preservation.
Benthic foraminifera are present in Samples 390C-U1557B-2H-CC, 8–13 cm, and 5H-CC, 71–76 cm (10.49 and 41.57 m CSF-B, respectively), including Melonis barleeanus, N. umbonifera, Oridorsalis umbonatus, Pullenia bulloides, and Pullenia quinqueloba. Sample 5H-CC, 71–76 cm, is also characterized by Anomalinoides globosus, Cibicidoides mundulus, and Cibicidoides wuellerstorfi. N. umbonifera is a species considered indicative of Antarctic Bottom Water (Corliss, 1979; Mackensen et al., 1995) and is the dominant species in both of these samples, implying that this site was lying at lower abyssal depths (>3000 m) from the Late Miocene.
Many samples were barren of benthic foraminifera between Samples 390C-U1557B-8H-CC, 15–20 cm, and 30X-CC, 16–21 cm (70.53 and 267.81 m CSF-B, respectively), with few exceptions. Sample 10H-CC, 35–40 cm (89.55 m CSF-B), contains a few specimens of Cibicidoides sp., Lagena sp., and P. bulloides, and Sample 14X-CC, 18–23 cm (122.30 m CSF-B), contains only one Lagena sp. specimen. In Sample 25X-CC, 13–18 cm (228.71 m CSF-B), a few specimens of Cibicidoides sp. and N. umbonifera are observed. N. umbonifera is an indicator of low abyssal depths, and its presence might imply that Site U1557 could have been lying at lower abyssal depths by the early Oligocene. However, this interpretation is uncertain as explained in detail above. Finally, in Sample 28X-CC, 20–25 cm (251.53 m CSF-B), a few specimens belonging to O. umbonatus and P. bulloides are identified.
Early middle Eocene Sample 390C-U1557B-31X-CC, 11–16 cm (285.75 m CSF-B), is characterized by abundant Nuttallides truempyi and O. umbonatus specimens. Alabamina dissonata, Bulimina trinitatensis, Cibicidoides havanensis, Clinapertina complanata, Globocassidulina subglobosa, and Nonion havanense are also observed. Sample 32X-CC, 11–16 cm (293.03 m CSF-B), is dominated by N. truempyi as well. Anomalina spissiformis, Cibicidoides tuxpamensis, Cibicidoides ungerianus, Lenticulina excisa, N. havanense, and O. umbonatus are present. Pullenia coryelli is also identified, suggesting some degree of reworking. The presence of B. trinitatensis and some lenticulinids in these samples suggest that Site U1557 layed at upper abyssal depths until the earliest middle Eocene (~48 Ma).
In early Eocene samples (390C-U1557B-34X-CC, 31–36 cm; 37X-CC, 13–18 cm; 42X-CC, 10–15 cm, 47X-CC, 23–28 cm; and 48X-CC, 12–17 cm; 311.89, 343.59, 388.53, and 444.19 m CSF-B, respectively), N. truempyi and O. umbonatus are commonly identified. Other observed species include B. trinitatensis, Buliminella beaumonti, Gavelinella capitata, N. havanense, Quadrimorphina profunda, and P. bulloides. Many Cibicidoides are also present in these samples, such as Cibicidoides bradyi, Cibicidoides cf. pseudoperlucidus, Cibicidoides eoceanus, Cibicidoides hyphalus, Cibicidoides praemundulus, and C. ungerianus. The presence in these samples of several diachronous species, like Aragonia ouezzanensis, Lenticulina whitei, Neoflabellina reticulata, and P. coryelli is interpreted to be evidence of reworking.
Paleocene samples (390C-U1557B-53X-CC, 26–31 cm; 58X-CC, 8–13 cm; and 62X-CC, 28–33 cm; 484.36, 530.10, and 557.11 m CSF-B, respectively) are characterized by a typical Paleocene assemblage. N. truempyi dominates all these samples. Numerous additional specimens belong to Anomalina praeacuta, A. ouezzanensis, C. hyphalus, C. cf. pseudoperlucidus, Gavelinella beccariiformis, Gyroidinoides globosus, Gyroidinoides cf. quadratus, Neoeponides hillebrandti, Neoflabellina semireticulata, N. havanense, O. umbonatus, Osangularia velascoensis, and P. coryelli. Buliminids (i.e., Bulimina cf. trihedra, Bulimina velascoensis, and Bulimina spp.) and lenticulinids (i.e., L. excisa and L. whitei) are also observed in these samples. Interestingly, C. praemundulus is a species that evolved in the early Eocene (Holbourn et al., 2013) and is identified in all the Paleocene samples analyzed.
8. Paleomagnetism
8.1. Sediment
The sediment package at Site U1557 was cored in Holes U1557A (a single missed mudline core) and U1557B during engineering Expedition 390C (Estes et al., 2021), during which all but the lowermost sediment cores were split, and remanence measurements were made using the superconducting rock magnetometer (SRM) (see Paleomagnetism in the Expedition 390/393 methods chapter [Coggon et al., 2024c]). We remeasured many of the Hole U1557B cores during Expedition 390, noting that they had previously been demagnetized to 20 mT during Expedition 390C. The natural remanent magnetization (NRM) of core sections was measured at 2 cm spacing. Three alternating field (AF) demagnetization steps (5, 10, and 20 mT) were applied, and the remanence was measured after each step. Hereafter, the intensity/inclination after demagnetization at 20 mT is referred to as the 20 mT intensity/inclination. We use these data to establish a magnetostratigraphy for the upper part of the sediment package at Site U1557. APC Cores 390C-U1557B-1H through 11H were oriented using the Icefield MI-5 core orientation tool.
Because there was no shipboard science party during Expedition 390C, discrete samples were taken only from the working halves of cores recovered from the sediment–basement transition (Cores 390C-U1557B-63X through 66X). Hence, there was no opportunity to supplement the split-core section remanence data collected during Expedition 390C with discrete sample analyses during Expedition 390.
8.1.1. Results
Measurement of the NRM and in-line AF demagnetization of APC cores (390C-U1557A-1H and 390C-U1557B-1H through 11H) and XCB cores (12X–63X) were carried out to establish a magnetostratigraphy for the entire sediment package at Site U1557. AF demagnetization of 5–20 mT generally removes a viscous overprint (Figures F71, F72). In cores recovered by scientific ocean drilling, viscous overprints are in most cases an unavoidable drilling overprint, even when nonmagnetic core barrels are employed (i.e., during APC coring), although this is not always the case. Such an overprint will manifest as a near-vertical component on an orthogonal vector plot (Zijderveld, 1967) and will bias inclinations, in this case toward more positive values. The 20 mT inclinations in Core 390C-U1557A-1H are bimodal, clustering around −46.7° or 45.3° (Figure F73A). The 20 mT inclinations for Hole U1557B are also bimodal and cluster around −52.2° and 49.8° (Figure F73B), but it is notable that there are many shallower and steeper values than those expected for a geocentric axial dipole (GAD) at this latitude (±49.1° at 30°S) (Figure F73B).
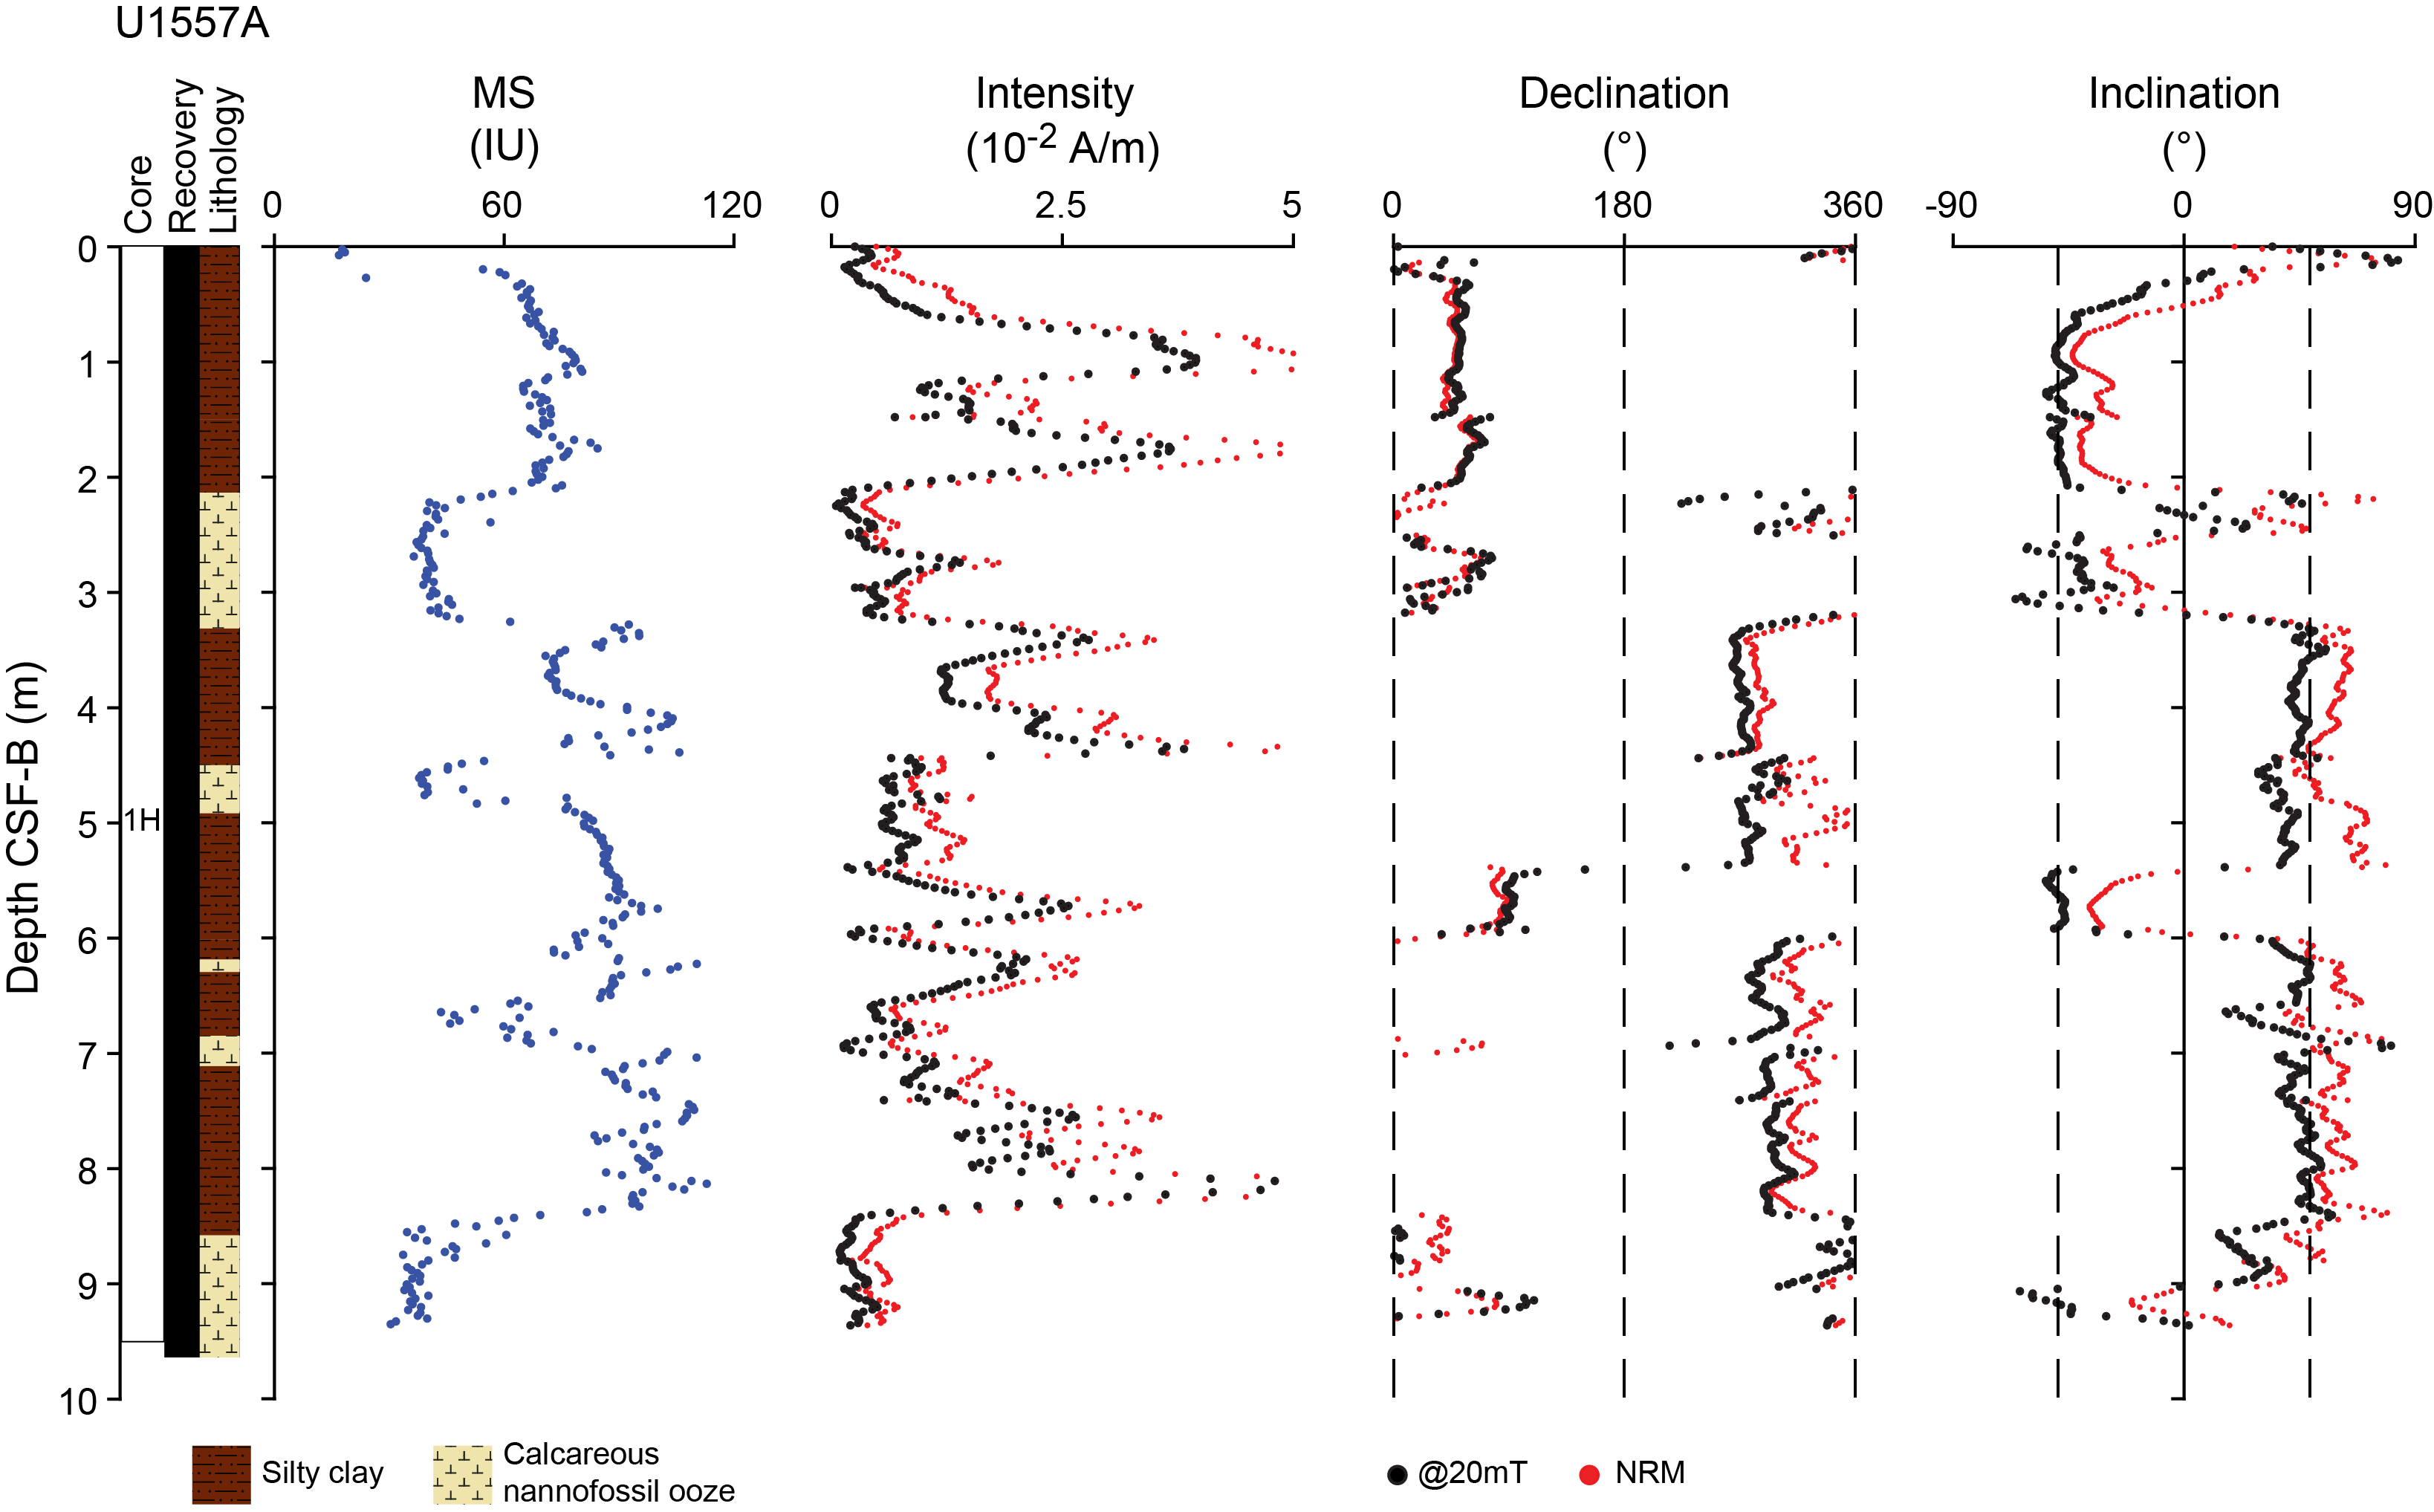
Figure F71. MSP and SRM measurements, Hole U1557A.
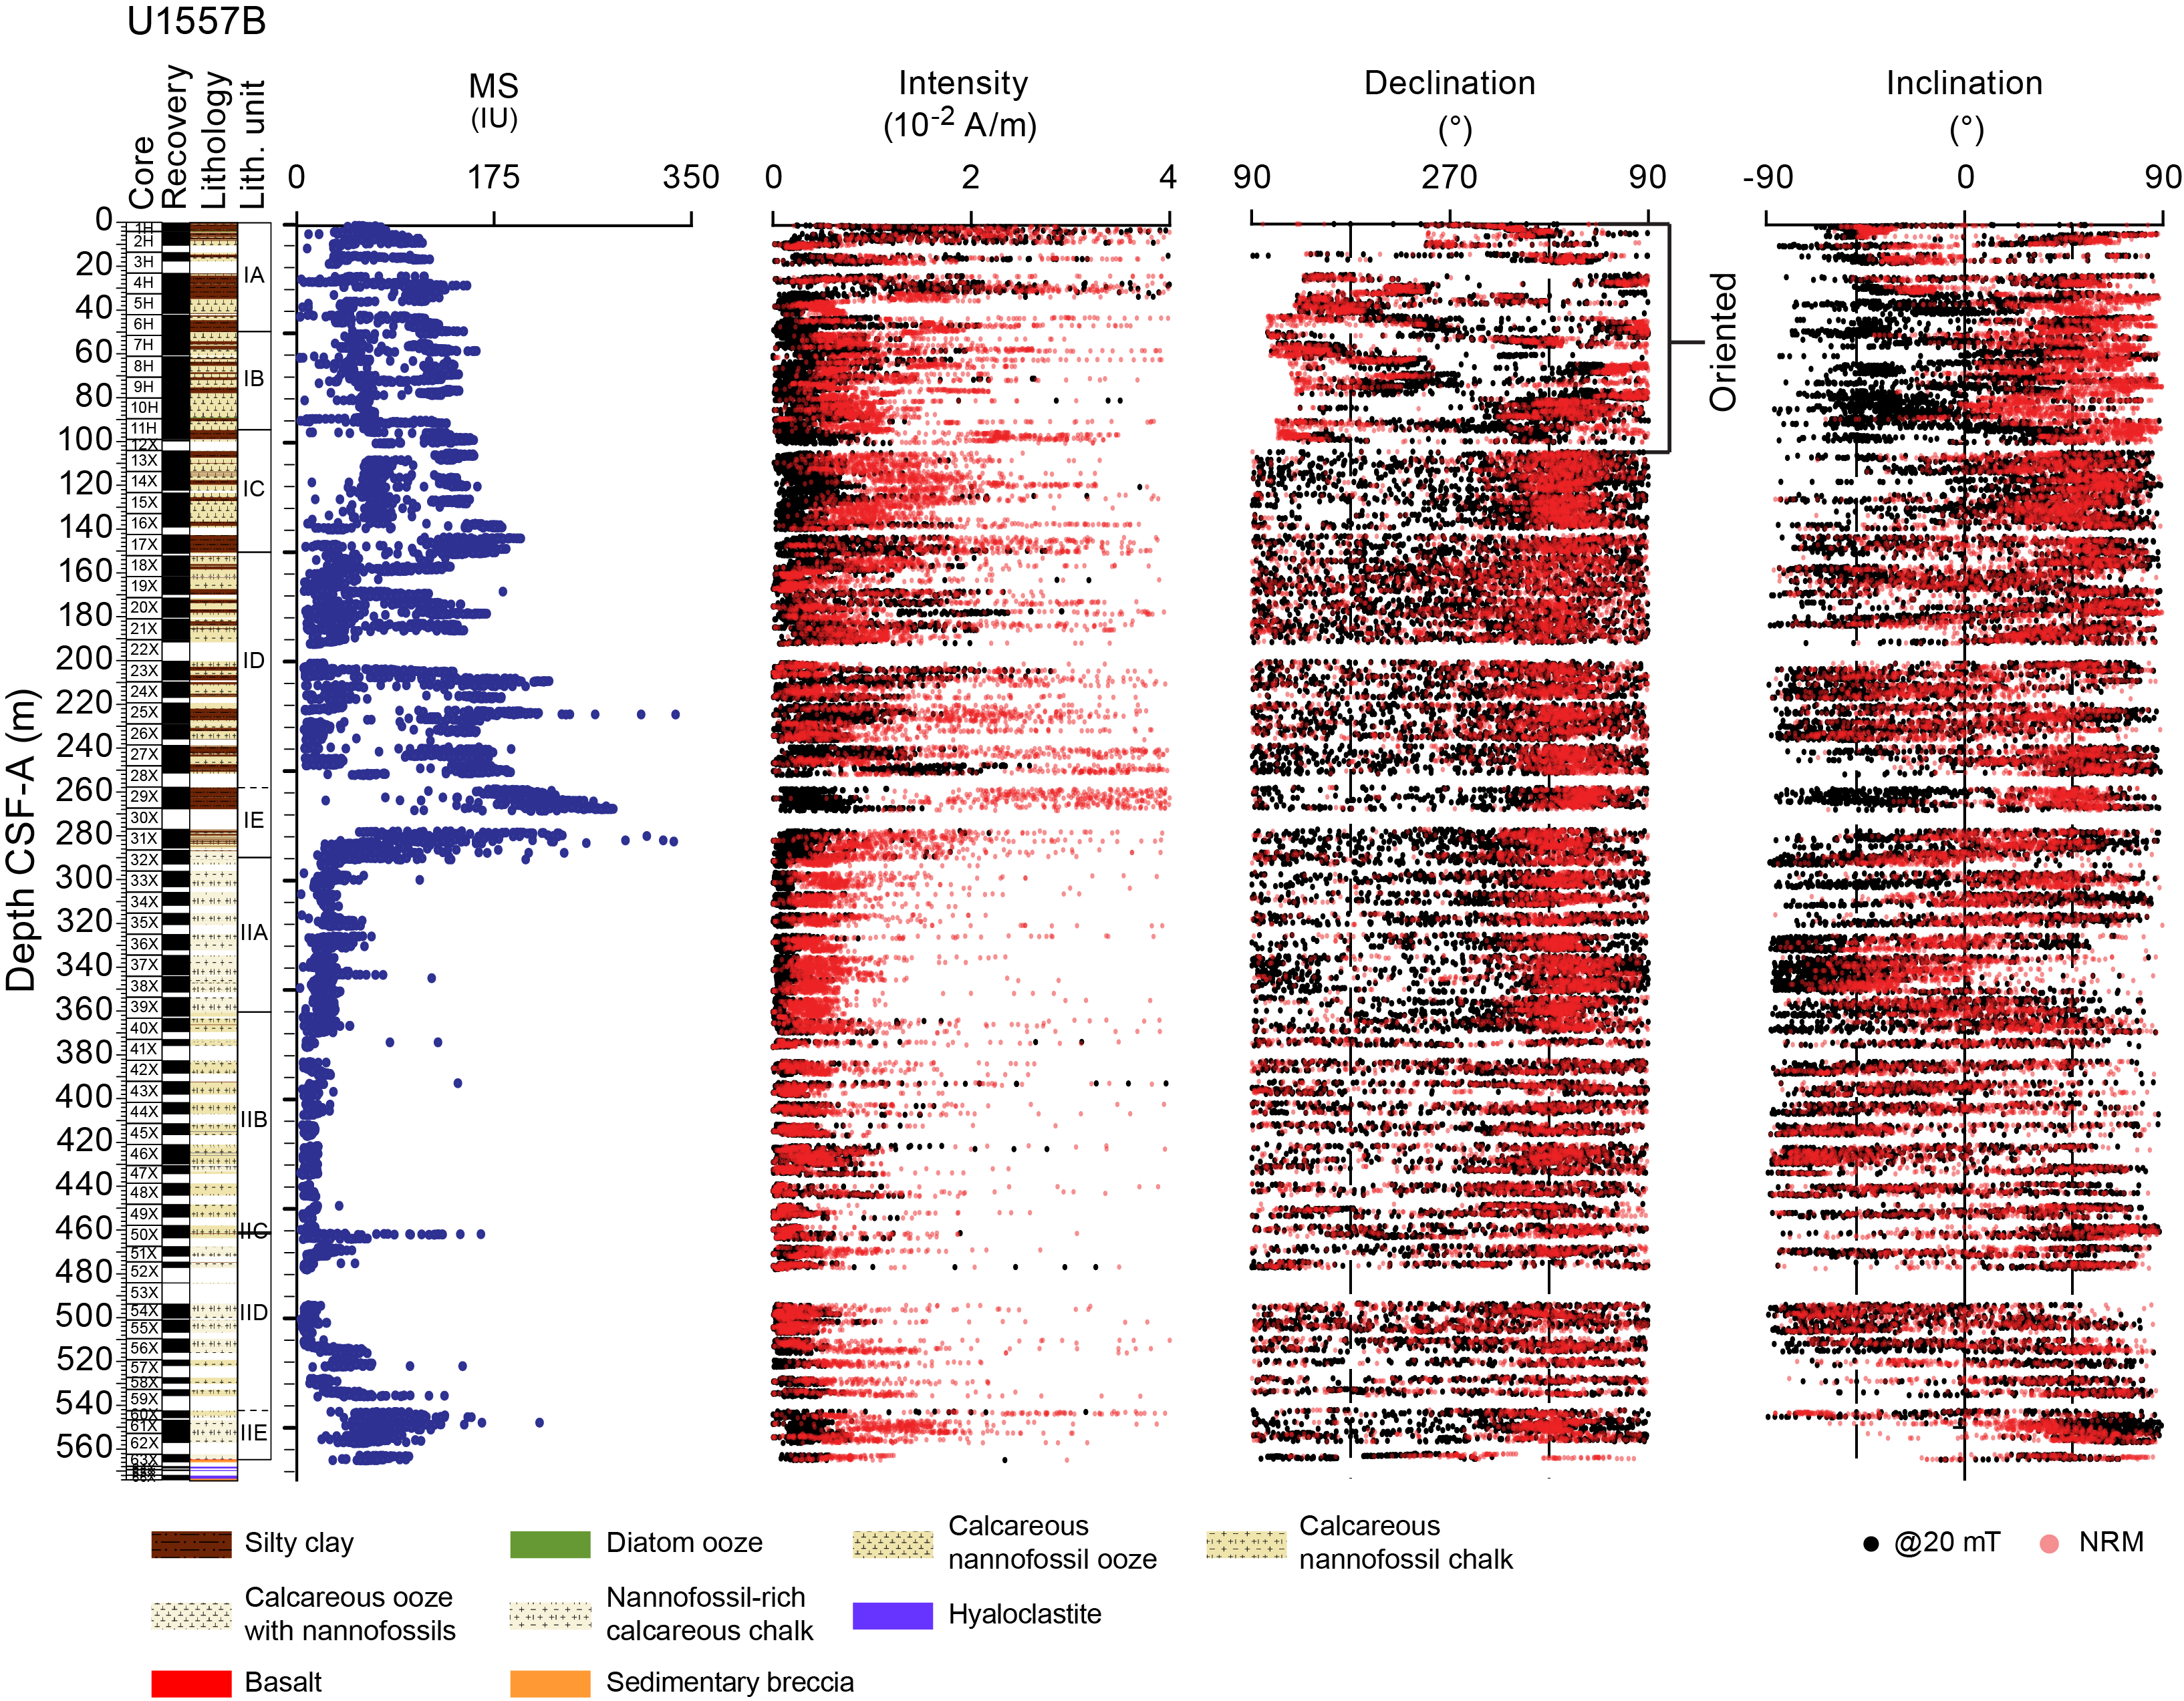
Figure F72. MSP and SRM measurements, Hole U1557B.
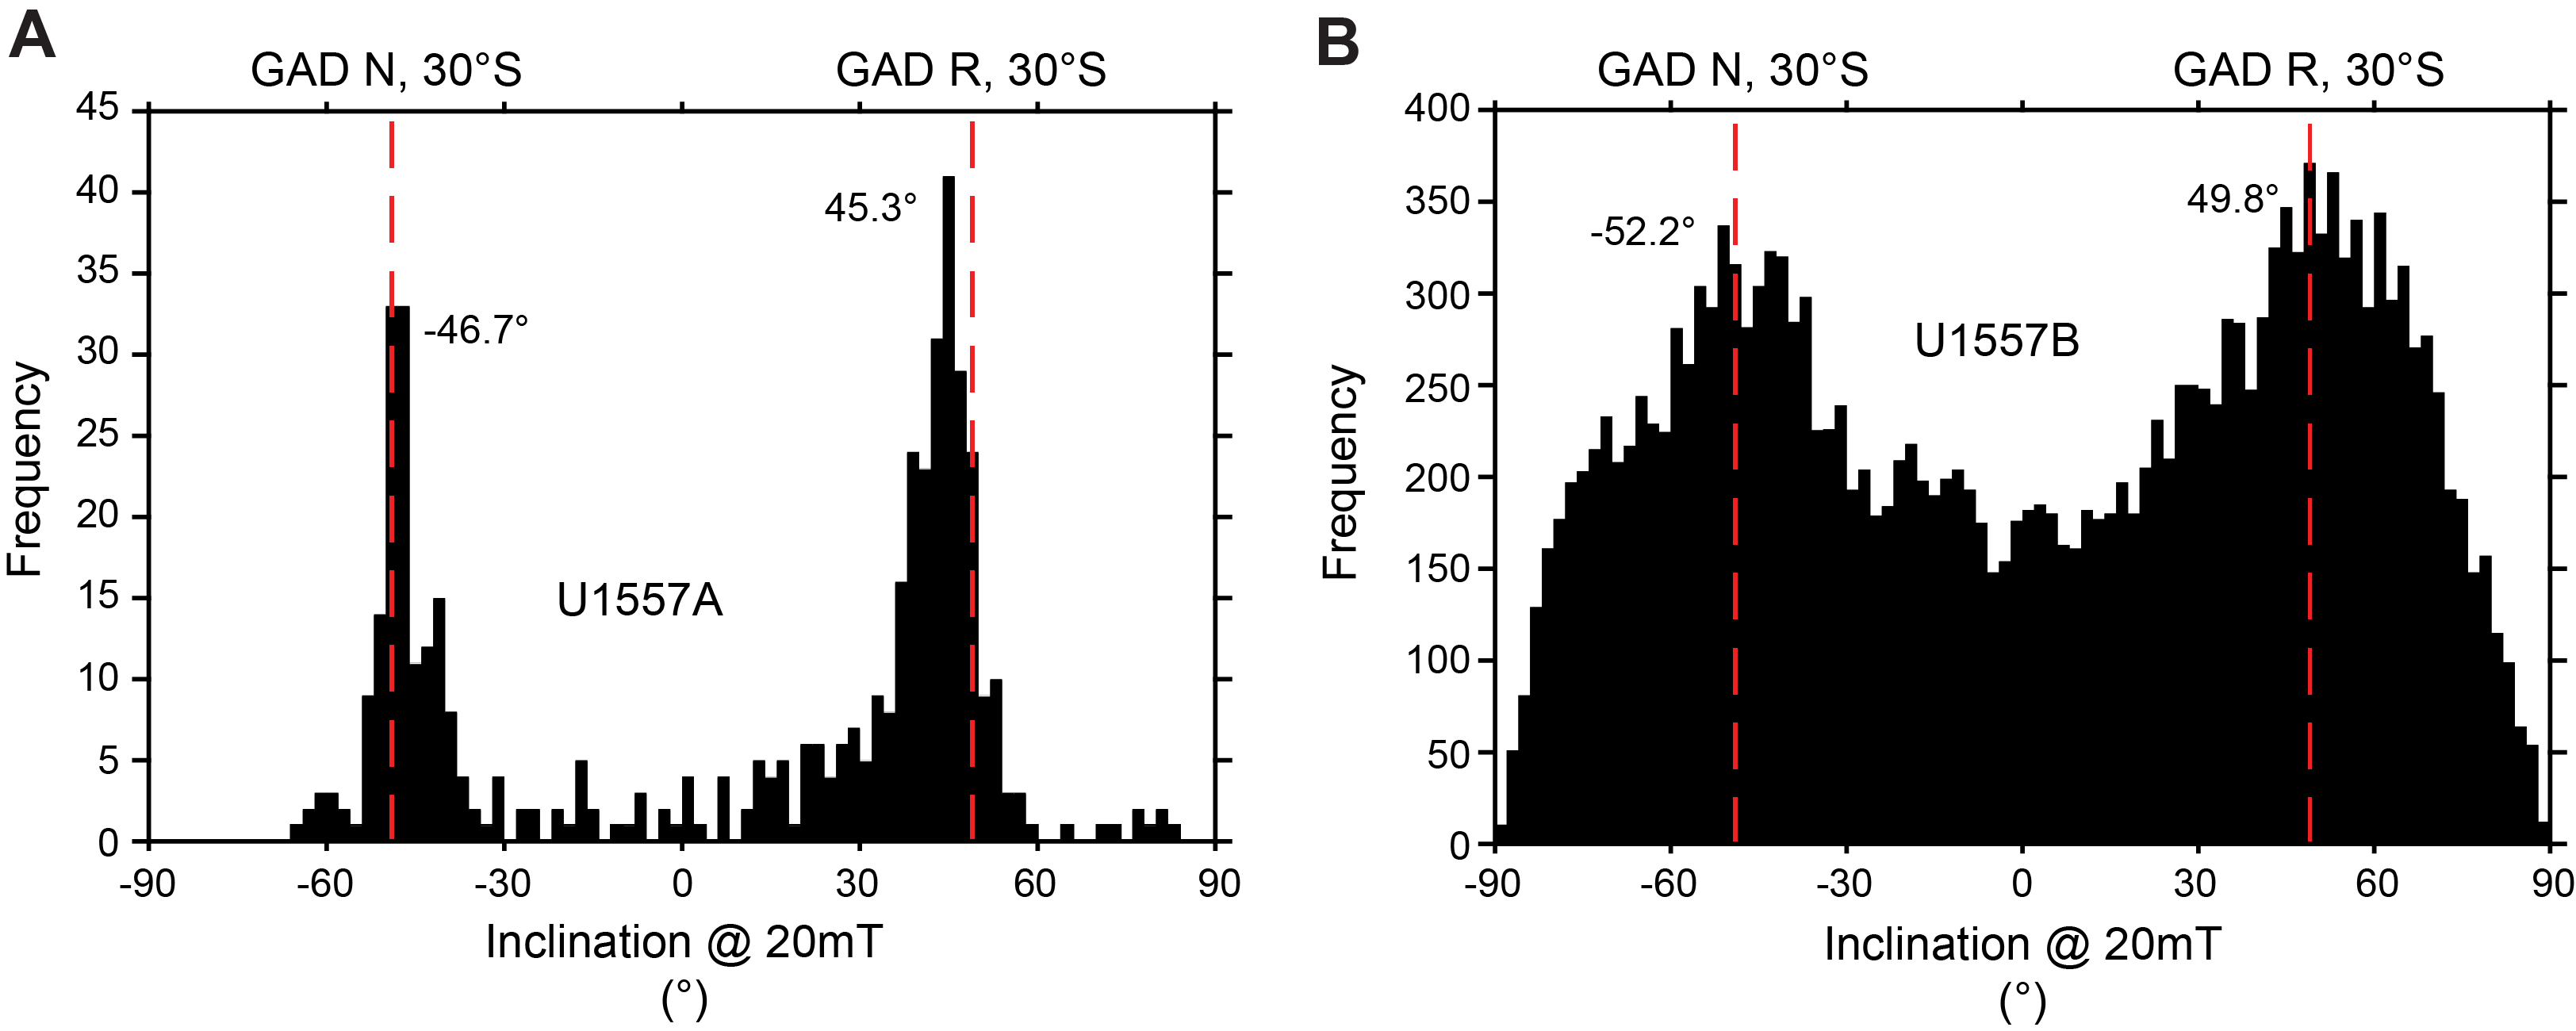
Figure F73. Inclination after 20 mT AF histograms.
For both holes at Site U1557, MS and intensity correlate with lithologic variations (see Sedimentology); high values correspond to the silty clays, whereas lower values correspond to the biogenic carbonates. The remanence intensities for the sediment succession at Site U1557 are relatively strong for pelagic material. The single core collected from Hole U1557A has average NRM and 20 mT intensities of 2 × 10⁻² and 5 × 10⁻² A/m, respectively (Figure F71). Hole U1557B has average NRM and 20 mT intensities of 1.3 × 10⁻² and 0.43 × 10⁻² A/m, respectively. NRM and 20 mT intensity vary by several orders of magnitude throughout the hole. In some intervals containing drilling disturbance manifested as prominent biscuiting (see Sedimentology), the observed high remanence intensity may not reflect the magnetic feature of the in situ sediments. Consequently, the intensity data presented for Hole U1557B in Figure F72 are restricted to a maximum of 4 × 10⁻² A/m because values beyond this are likely spurious. Variations in 20 mT intensity downhole reflect the variable clay content of the sediments; Unit I has an average 20 mT intensity of 0.58 × 10⁻² A/m, whereas the carbonate-dominated Unit II (mostly calcareous nannofossil chalk; see Sedimentology) has a lower average 20 mT intensity of 0.22 × 10⁻² A/m.
8.1.1.1. Discrete samples
Discrete sampling for magnetic investigations in Hole U1557B was limited to 5 samples from the working halves of the sediment/basement interface cores (390C-U1557B-63X through 66X; 562.4–574.0 m CSF-B).
Two of the discrete samples comprise lithified sediment collected from Core 390C-U1557B-63X above the sediment–basement transition. The other three discrete samples are basalts and a hyaloclastite breccia from Cores 65X and 66X in basement Unit 1 (see Basement in this section for discussion). The discrete sediment samples were subjected to full stepwise AF demagnetization up to 100 mT. By demagnetizing the samples in a stepwise fashion, we are able to determine the characteristic remanent magnetization (ChRM) of the sample, which reflects the magnetic field direction at or soon after sediment deposition and aids in the magnetostratigraphic interpretation. The anisotropy of magnetic susceptibility (AMS) was also measured for both samples, whereas isothermal remanent magnetization (IRM) experiments were conducted only on Sample 63X-1, 112–114 cm (see Paleomagnetism in the Expedition 390/393 methods chapter [Coggon et al., 2024c]).
Sample 390C-U1557B-63X-1, 112–114 cm, shows a smooth demagnetization curve and a well-defined ChRM with a downward (positive) inclination, indicating a reversed polarity chron at the base of Hole U1557B (Figure F74). This is consistent with the Site U1557 biostratigraphic age model (see Biostratigraphy) and the CREST regional site survey (Kardell et al., 2019). The ChRM inclination and direction of this discrete sediment sample (inclination ≈ 37°; declination ≈ 128°) calculated using principal component analysis (PCA) (Kirschvink, 1980) between 30 and 60 mT is lower than that expected for a GAD at this latitude (30°S).
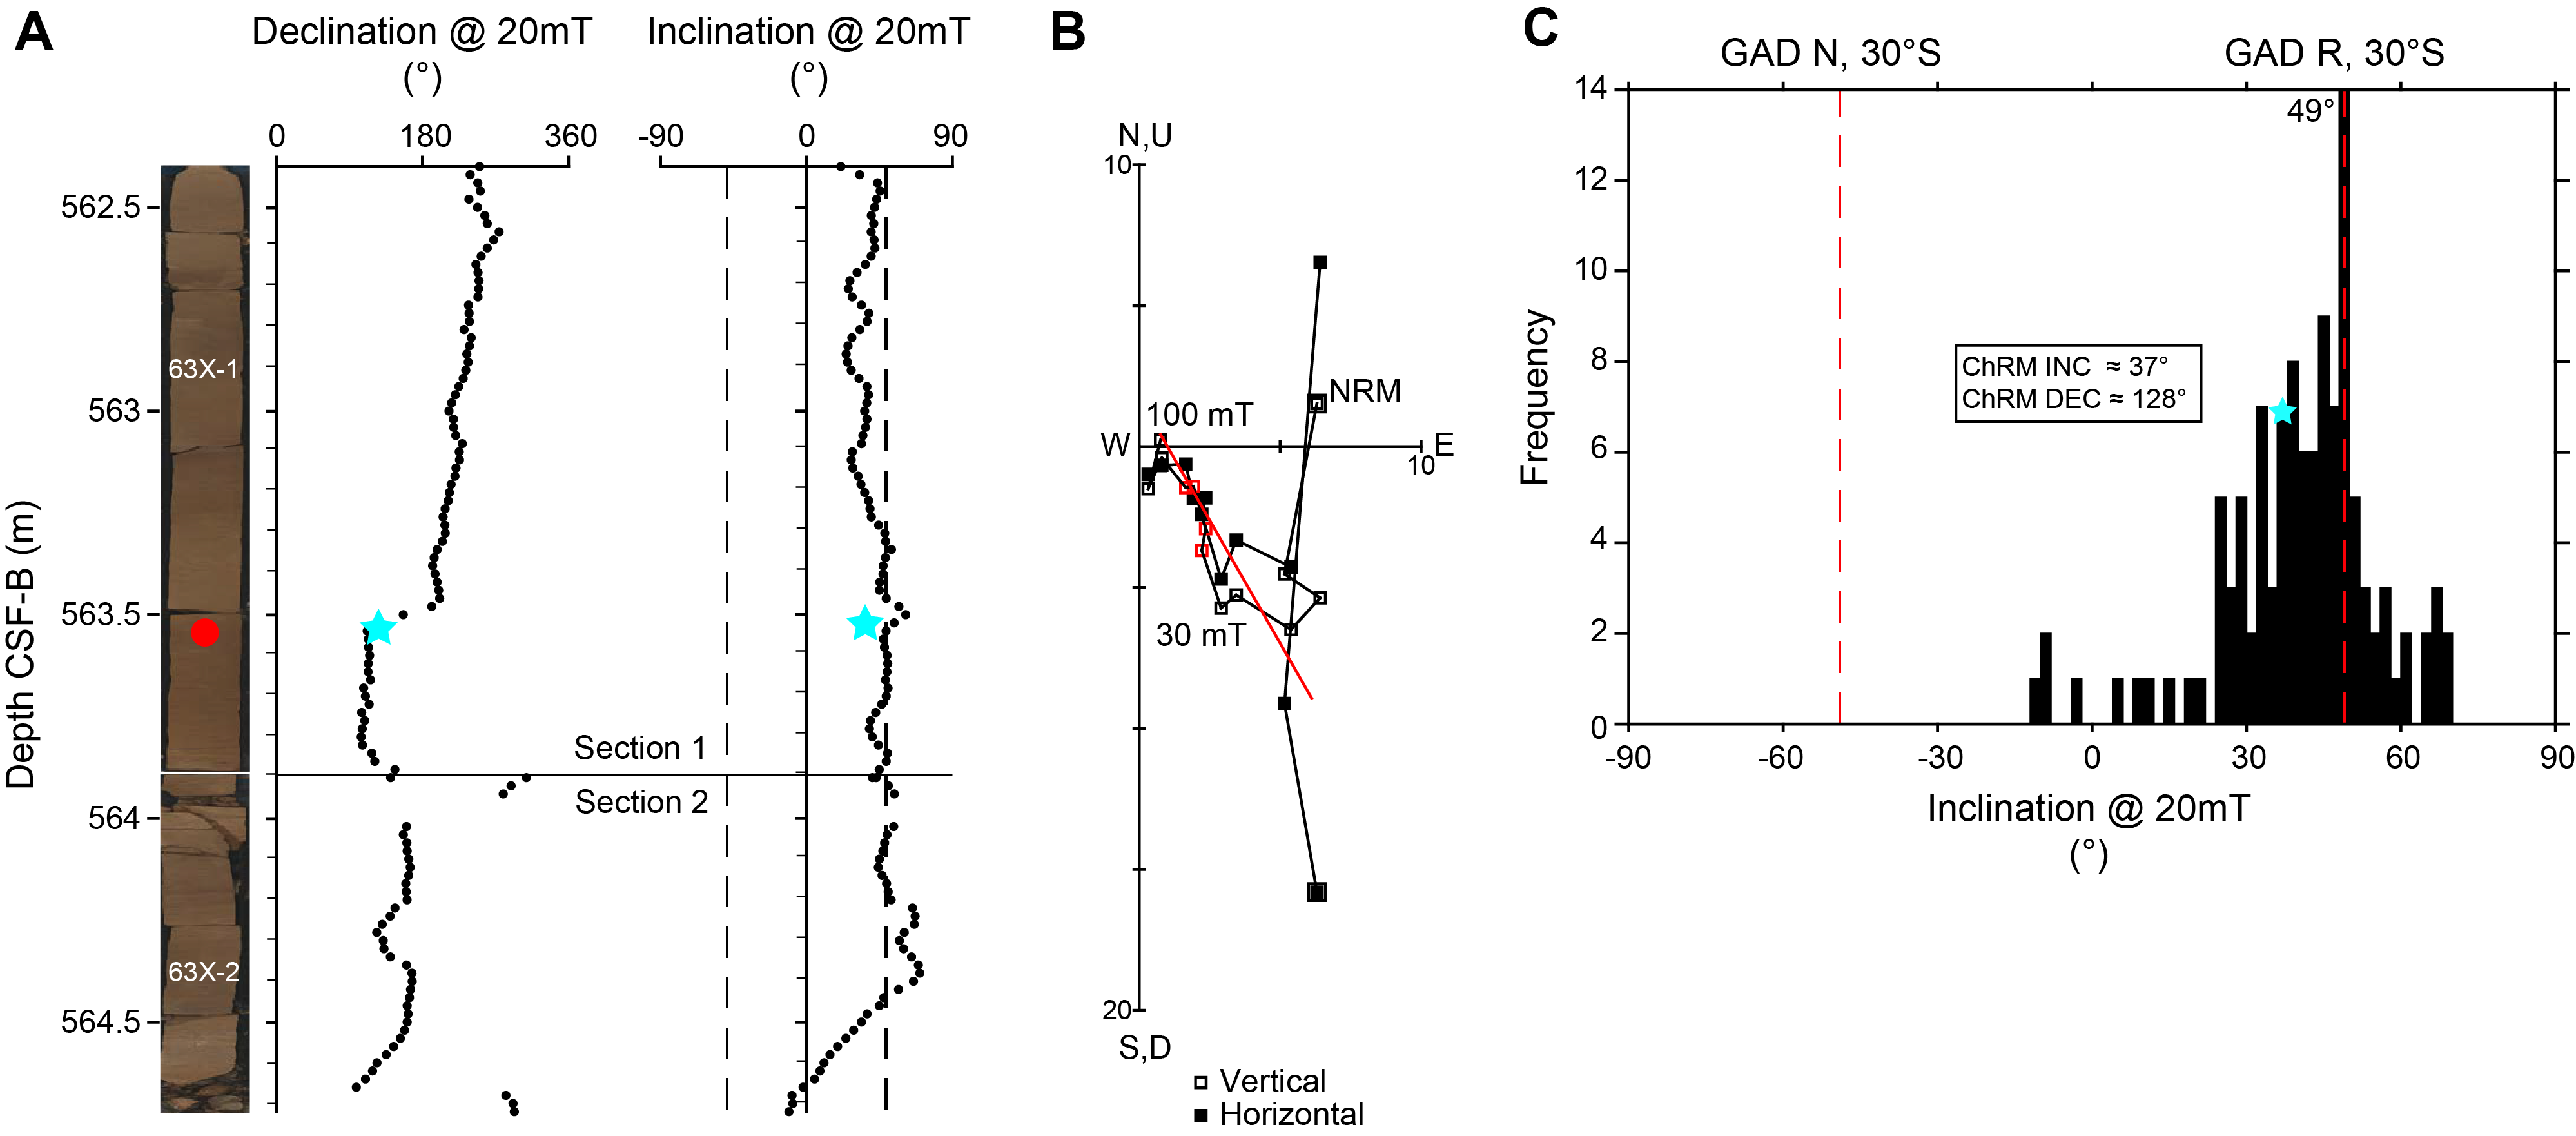
Figure F74. SRM declination, inclination, and ChRM for a discrete sample.
The median destructive field and coercivity spectra for these samples suggest magnetite-like phases as the dominant magnetic carrier, but future shore-based experiments are needed to confirm this.
8.1.1.2. Magnetostratigraphy
SRM measurements on the archive halves after AF demagnetization at 20 mT helped determine a preliminary partial polarity sequence for this site. Corrected declinations (Richter et al., 2007) are shown alongside the inclination data for APC Cores 390C-U1557B-1H through 11H (0–98.74 m CSF-B), whereas declinations for XCB cores (Core 12X and below) are uncorrected (Figure F75). Our interpretations are based on the inclination sign after the 20 mT demagnetization step. A preliminary magnetostratigraphy extends to 110 m CSF-B. Large coring gaps (up to ~9 m) are present in intervals cored using both the APC and XCB systems, and continuous drilling disturbance throughout XCB cores makes magnetostratigraphic interpretation for Hole U1557B difficult below this depth. Three intervals of normal polarity are identified in Core 390C-U1557A-1H that we correlate to the Brunhes, Jaramillo, and Cobb Mountain Chrons. Similar normal polarity intervals are also identified in the uppermost cores from Hole U1557B (Cores 390C-U1557B-1H and 2H) (Figure F76). MS data, along with our chron identification presented here, contribute to stratigraphic correlation efforts to identify missing strata in Cores 1H and 2H and the construction of a splice between the two holes (see Physical properties and downhole measurements). Unfortunately, the incomplete recovery of the uppermost 10 m of the sediment package in Hole U1557B results in uncertainty in the depth estimate of the Brunhes/Matuyama Chron boundary in that hole because the reversal itself was not recovered (Figure F76). We have tentatively identified the onset of Chron 5Bn at ~15.2 Ma in Core 11H-5 (96.15 m CSF-B) based on a reversal pattern comparison with the current geomagnetic polarity timescale (Gradstein et al., 2020) (Figure F75). Biostratigraphic datums from both nannofossils and foraminifera (see Biostratigraphy) were used to refine this model, although there are some discrepancies between the biostratigraphic and paleomagnetic datums for Site U1557 (see Age model and mass accumulation rates). Magnetostratigraphic dating of the upper ~220 m of Site U1557 will be attempted during postexpedition work by incorporating the polarity sequence from Site U1556, which can be correlated quite well to the sequence at Site U1557.
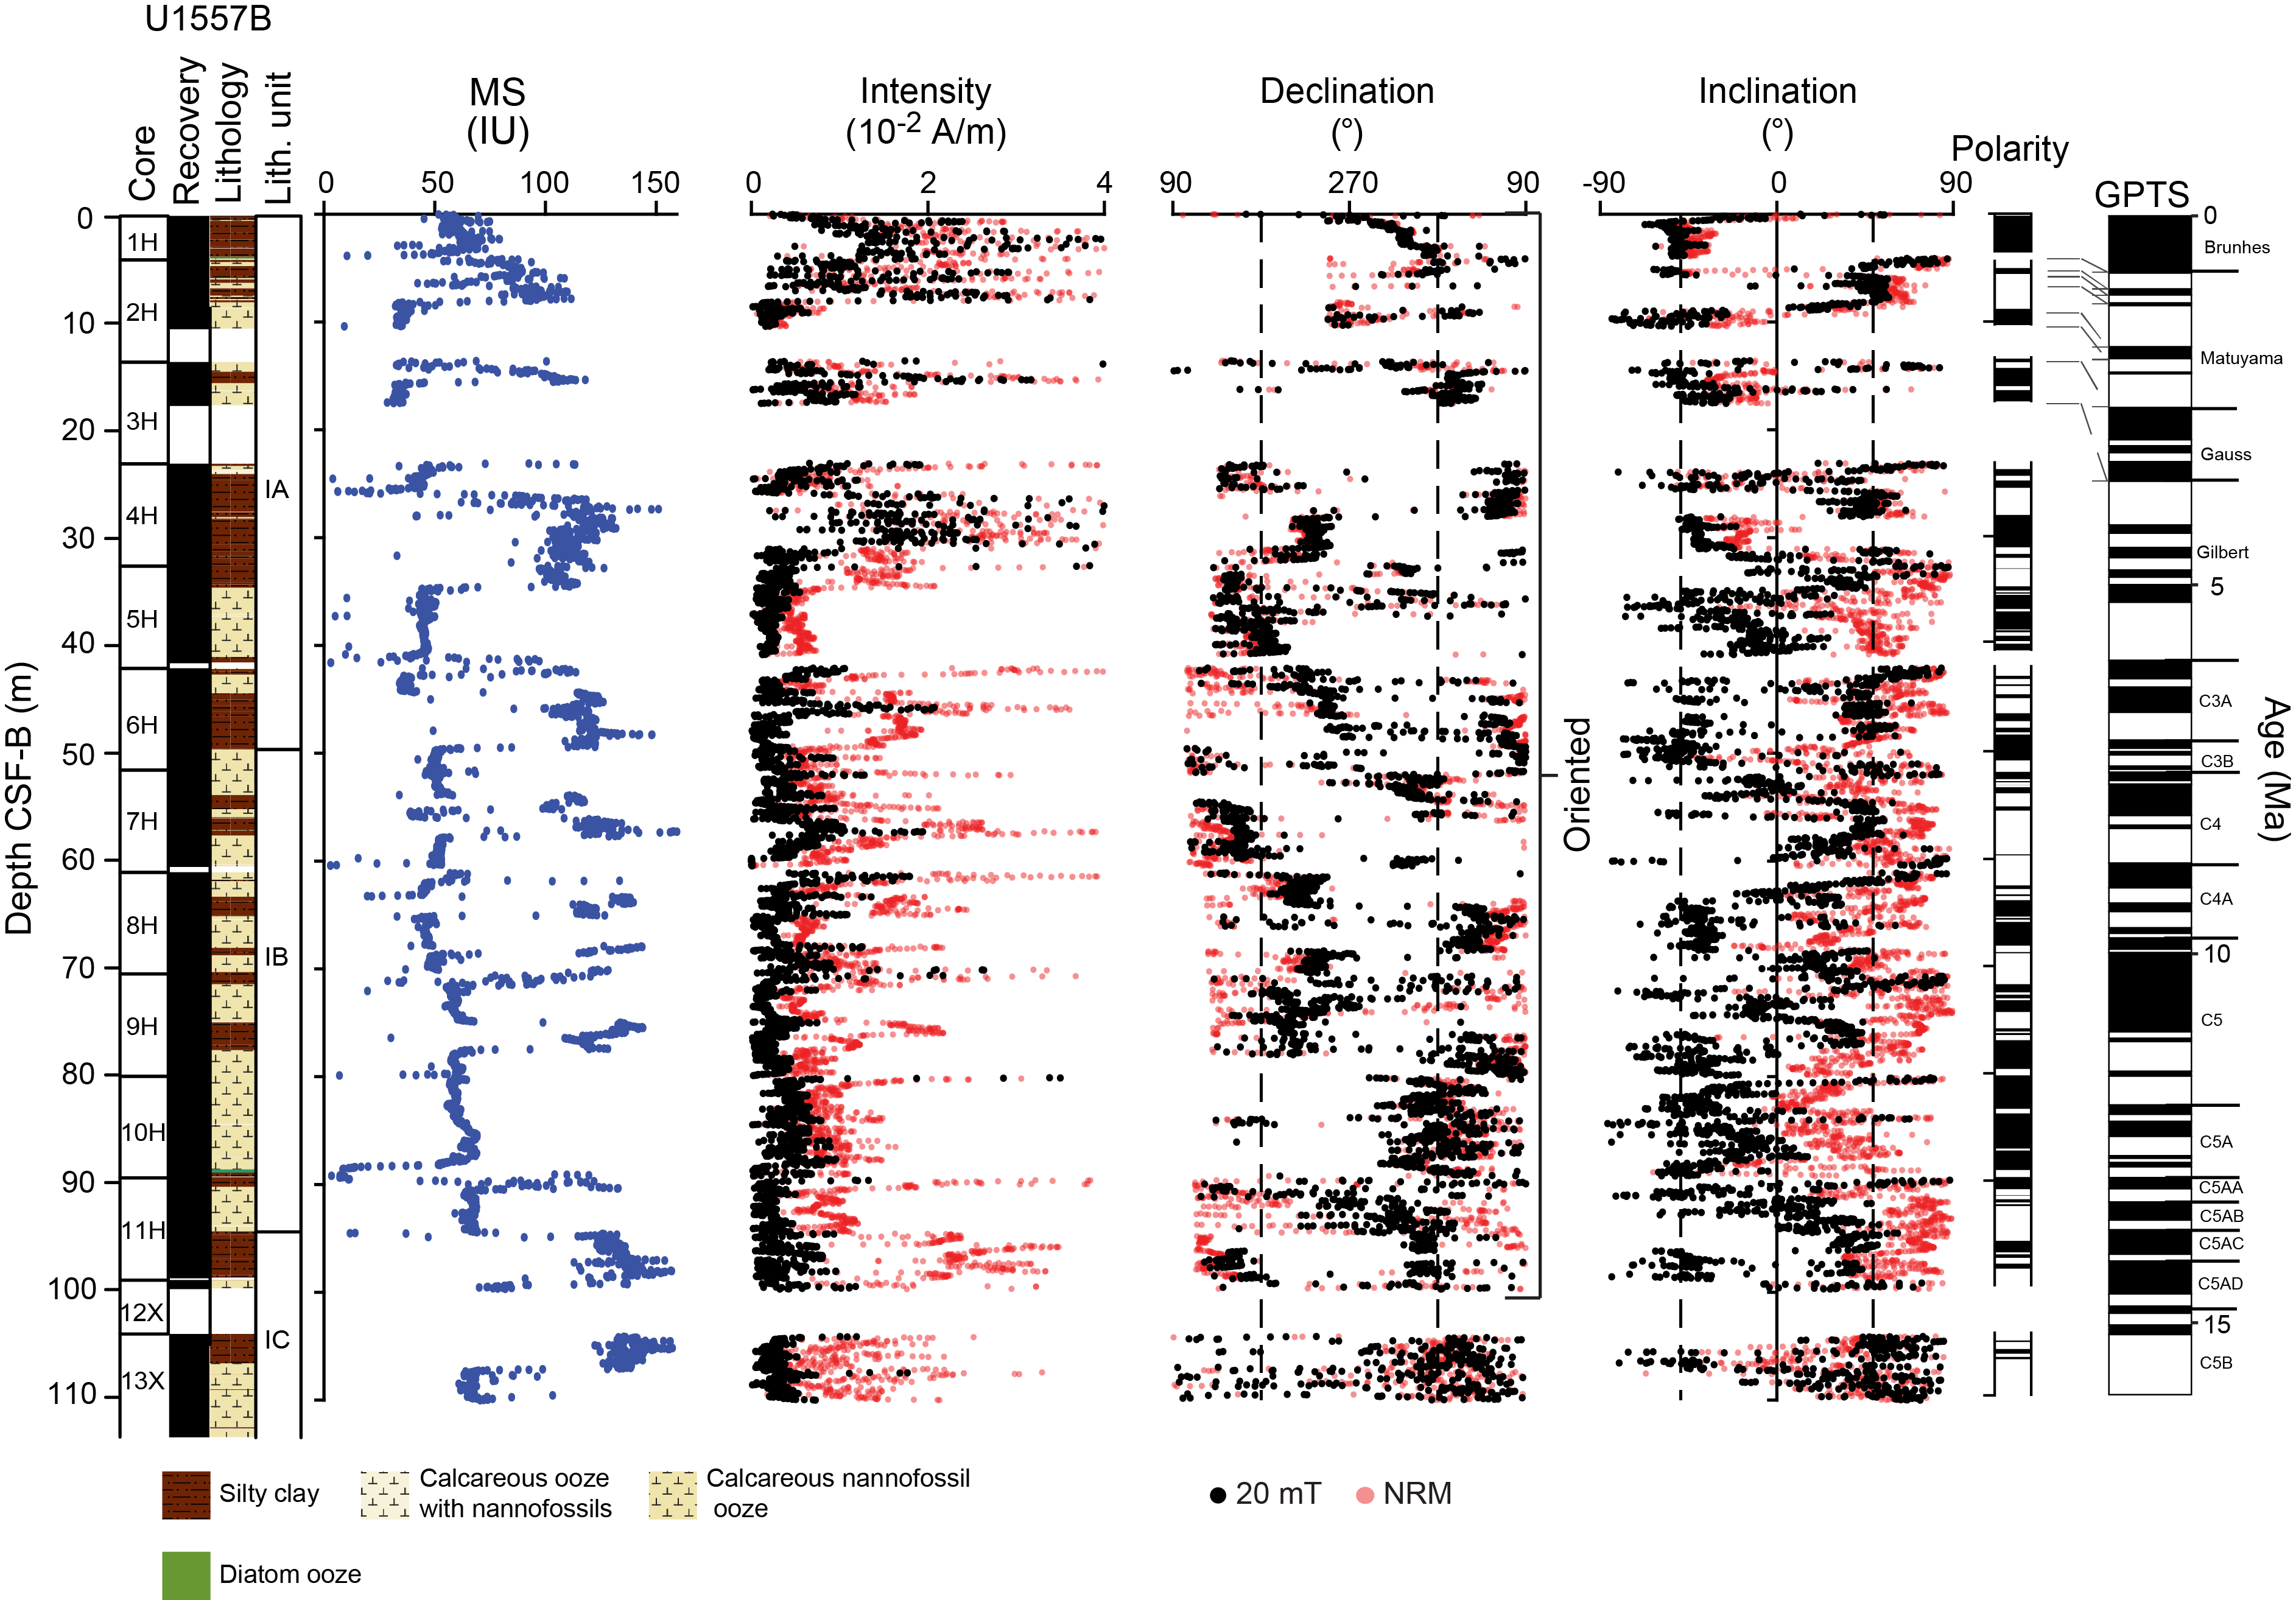
Figure F75. MSP and SRM measurements for 0–110 m CSF-B, Hole U1557B.
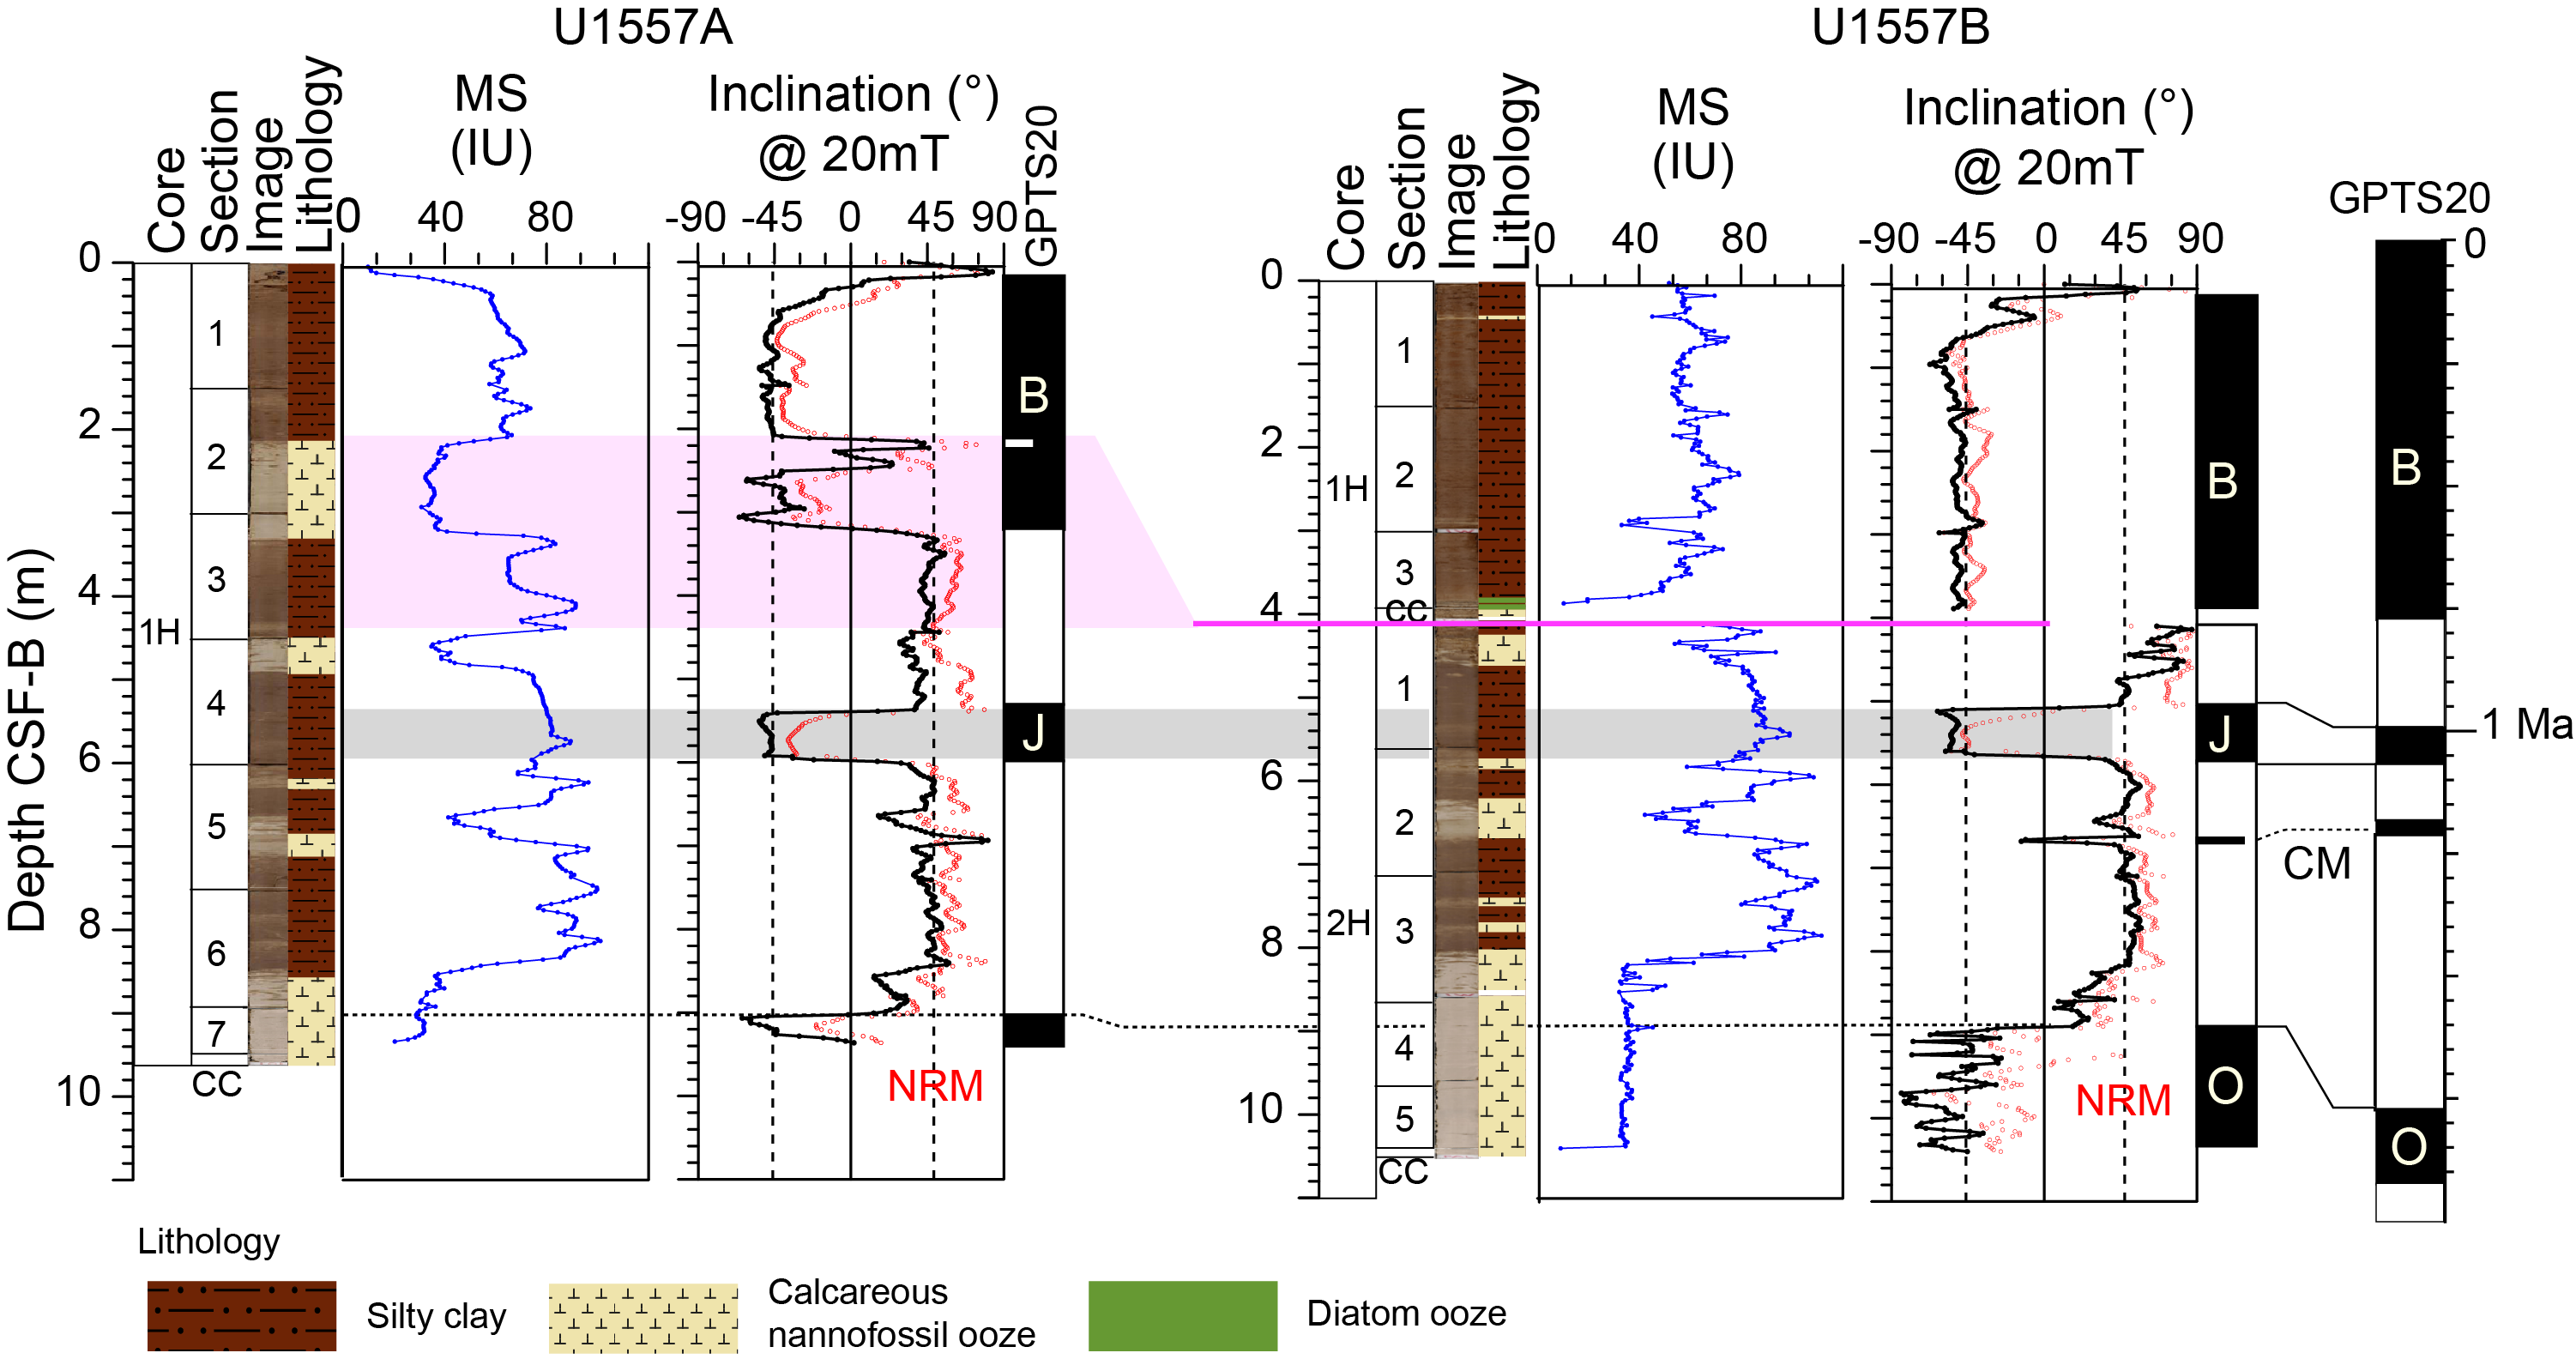
Figure F76. MSP and SRM inclination for 0–10 m, Holes U1557A and U1557B.
8.2. Basement
Progressive AF demagnetization of basement split-core sections and discrete samples was used to characterize the paleomagnetic signal and resolve the magnetization components and history recorded in breccias at Site U1557. Remanence measurements on archive-half split cores were made at 2 cm spacing using the SRM (see Paleomagnetism in the Expedition 390/393 methods chapter [Coggon et al., 2024c]). Three AF steps (5, 10, and 20 mT) were applied, and the remanence was measured after each step.
The basement section in Hole U1557D comprises a sedimentary (talus) breccia with basalt clasts in a matrix of lithified pelagic sediment and/or volcanic material (see Igneous petrology). Discrete sampling in Hole U1557D targeted individual clasts of the breccia with diverse styles of alteration and yielded 13 discrete cube samples (8 cm3).
Discrete breccia clast samples were used primarily to characterize the magnetic mineral assemblage. In addition, AMS was measured on all discrete samples to characterize their magnetic fabric. Acquisition of IRM and backfield IRM experiments were performed on two discrete samples.
8.2.1. Results
Measurement of the NRM and in-line AF demagnetization of Cores 390-U1557D-2R through 14R was conducted using the SRM to understand the magnetization history of the volcaniclastic sedimentary breccias. Hereafter, the intensity/inclination after demagnetization at 20 mT will be referred to as the 20 mT intensity/inclination.
AF demagnetization in the range 5–20 mT generally removes a small viscous overprint in Hole U1557D cores, observed as a consistent shift in the inclination data through the hole, although the scatter in the data makes this difficult to resolve (Figure F77). In cores recovered by scientific ocean drilling, viscous overprints are in most cases an unavoidable drilling overprint even when nonmagnetic core barrels are employed (i.e., during APC and RCB coring). Unlike other cores collected during Expedition 390, cores from Hole U1557D have 20 mT inclinations that are not bimodal; they instead display a Gaussian-like distribution (Figure F78). The inclinations measured by SRM in Hole U1557D span the full spectrum of values from −90° to 90° with a modal value around 7°. This is much shallower than the inclination expected for this latitude for a GAD (±49.1° at 30°S). This large departure from that GAD inclination is likely a function of the effect induced by the large clasts from the sedimentary breccia, which should produce randomly oriented directions if the ChRM was blocked before clast emplacement (see below).
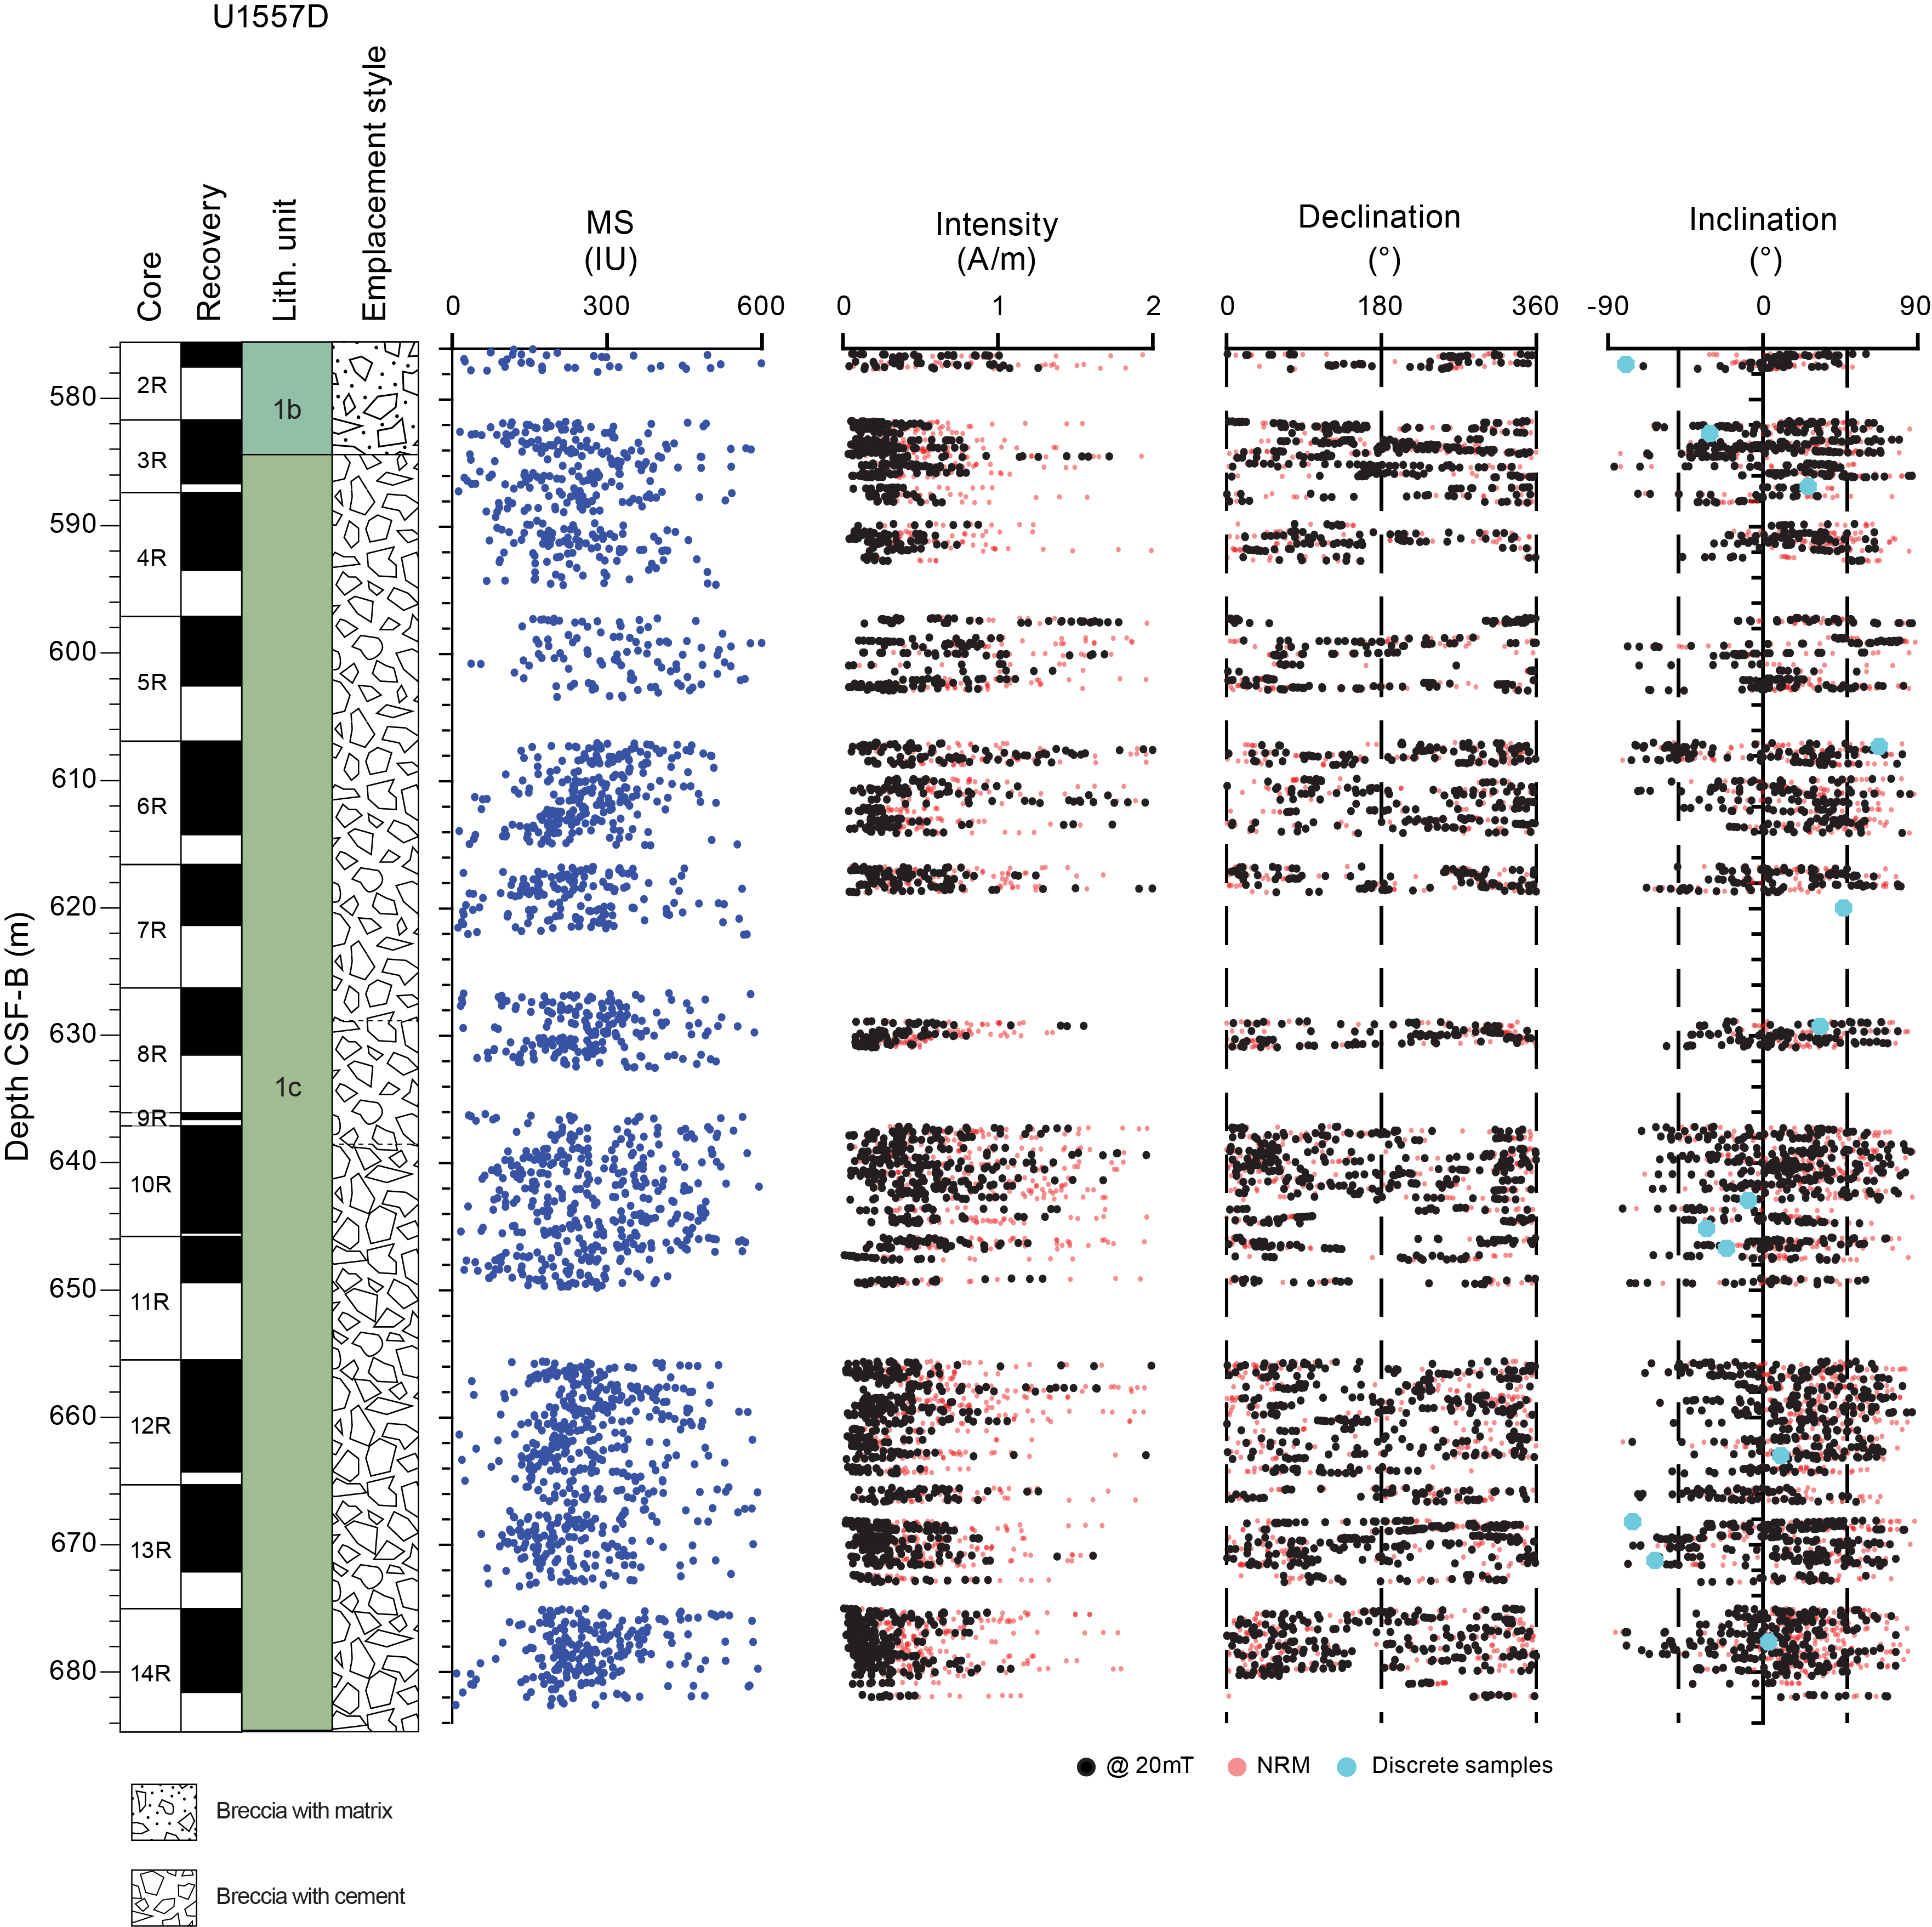
Figure F77. MSP and SRM measurements of basement, Hole U1557D.
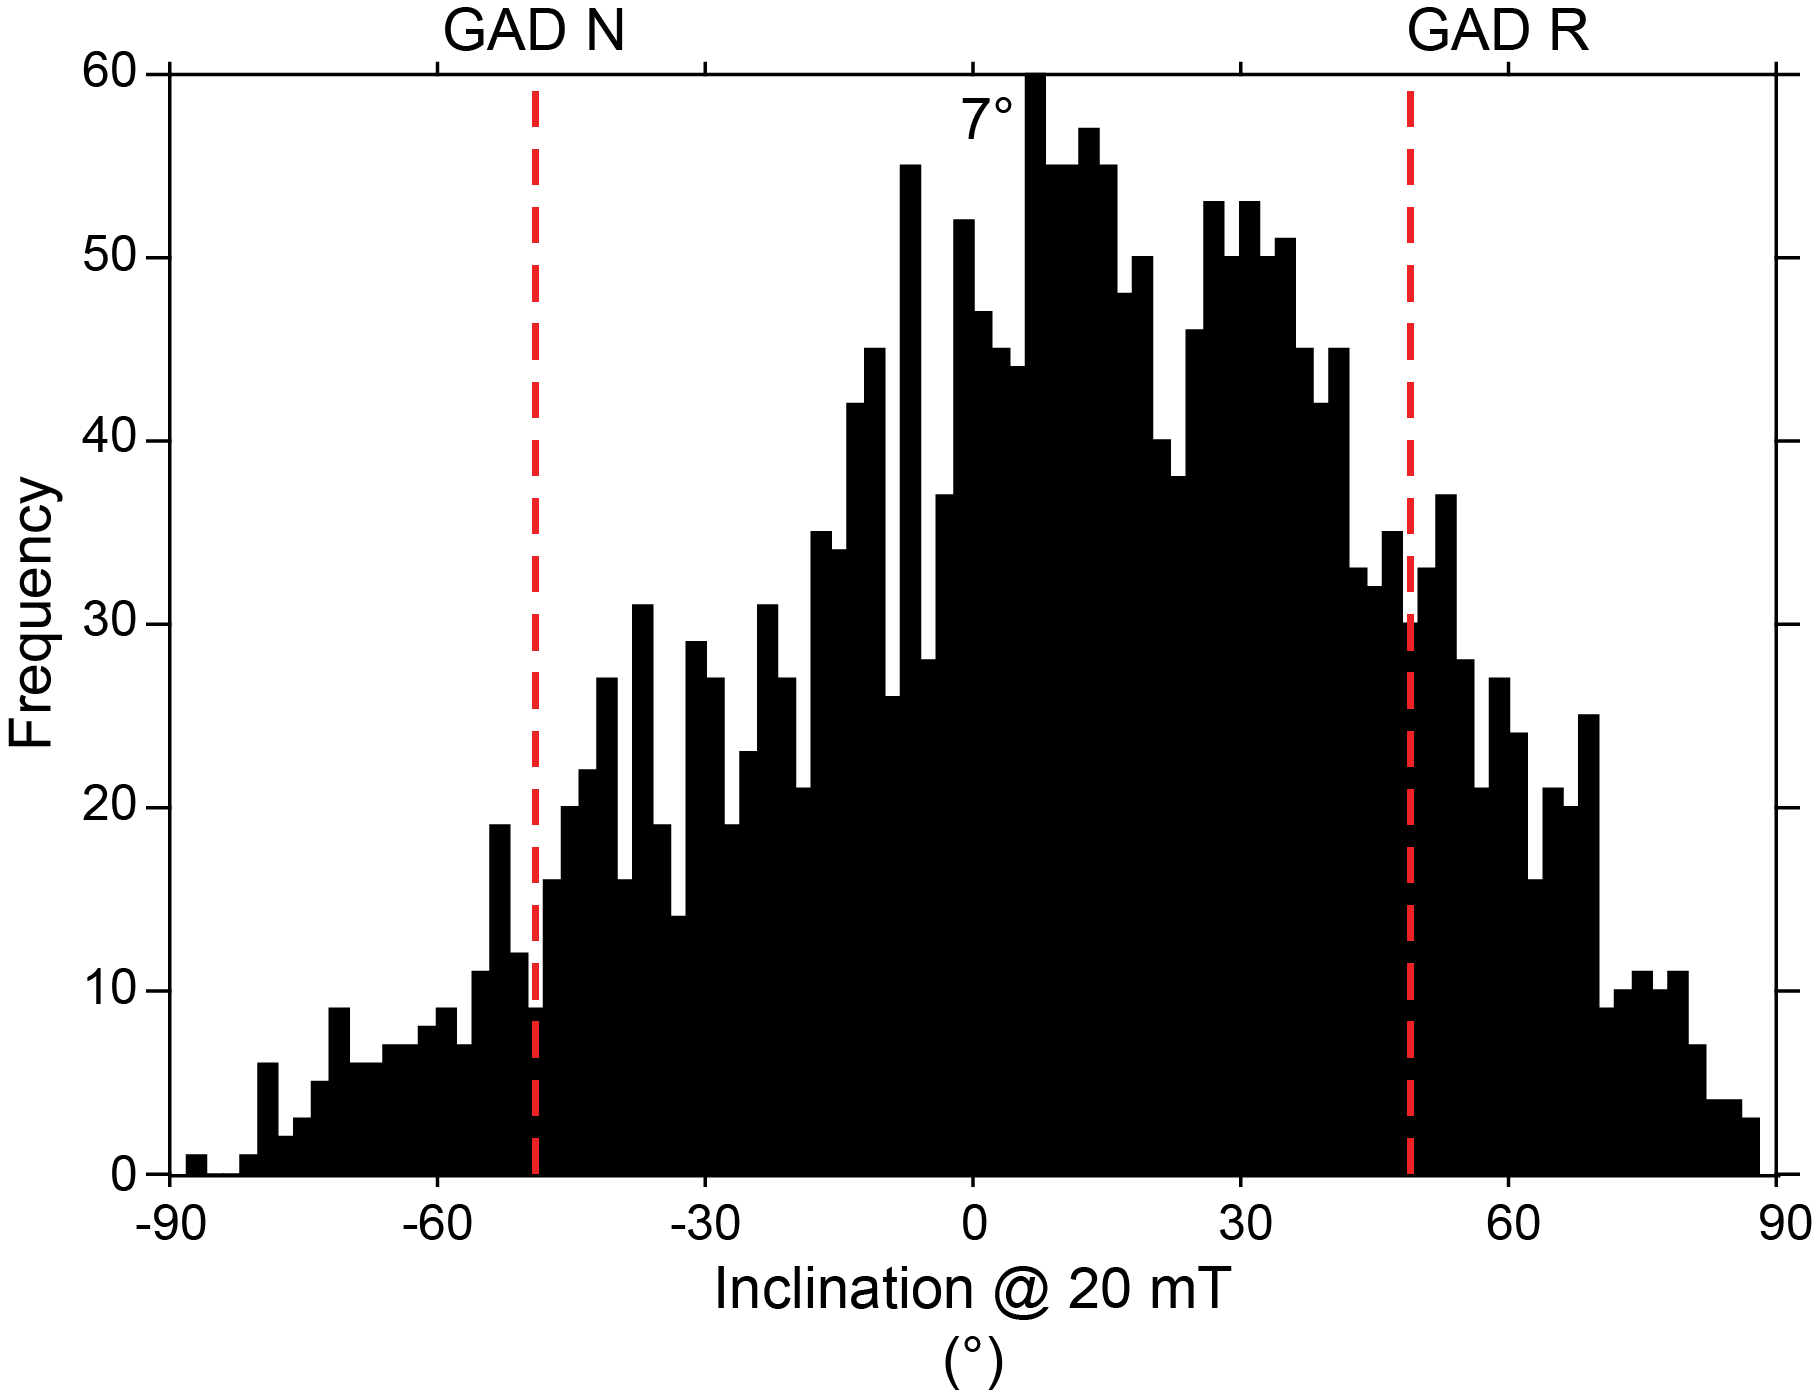
Figure F78. Inclination after 20 mT AF in basement, Hole U1557D.
8.2.1.1. Discrete samples
We collected ~1 discrete cube per core in Hole U1557D (13 samples total), with all discrete samples comprising basalt clasts from the sedimentary breccia. AMS was measured on all discrete cubes. AMS is routinely used as a petrofabric proxy to determine the preferred alignment of minerals in a sample.
Demagnetization of all the discrete samples in a stepwise fashion to at most 100 mT was conducted to determine the ChRM of each sample. Every discrete breccia clast sample displayed good-quality stable demagnetization data of a single component that describes a straight line to the origin, defining the ChRM (Figure F79A). Inclinations of the ChRM, calculated using PCA (Kirschvink, 1980), show similarly variable values to those measured by SRM. All discrete samples gave maximum angular deviation angles <15°, which is typically considered the uppermost threshold for well-defined field directions (Table T11) (Butler, 1992). Two of the 13 studied samples suggest the presence of a small spurious component or overprint that is removed by either 10 or 20 mT. Stepwise demagnetization at higher fields defines the ChRM component direction, supporting the SRM data. Moreover, nearly every discrete sample was fully demagnetized by 60 mT, whereas 70% of the NRM was already removed by 30 mT, indicating the magnetic mineral assemblage consists of soft coercivity phases (e.g., titanomagnetite or titanomaghemite), probably coarser grained. Acquisition of IRM and backfield IRM experiments (Figure F80) further illustrate the softness of the ferrimagnetic assemblage. In the two studied samples from Hole U1557D, the coercivity of remanence (Bcr) values are around 20 mT. The S ratios are equal to 1, and the IRM100/SIRM ratios are 0.99 and 1 (Table T11), suggesting the dominance of low-coercivity (soft) mineral phases (e.g., magnetite and titanomagnetite).
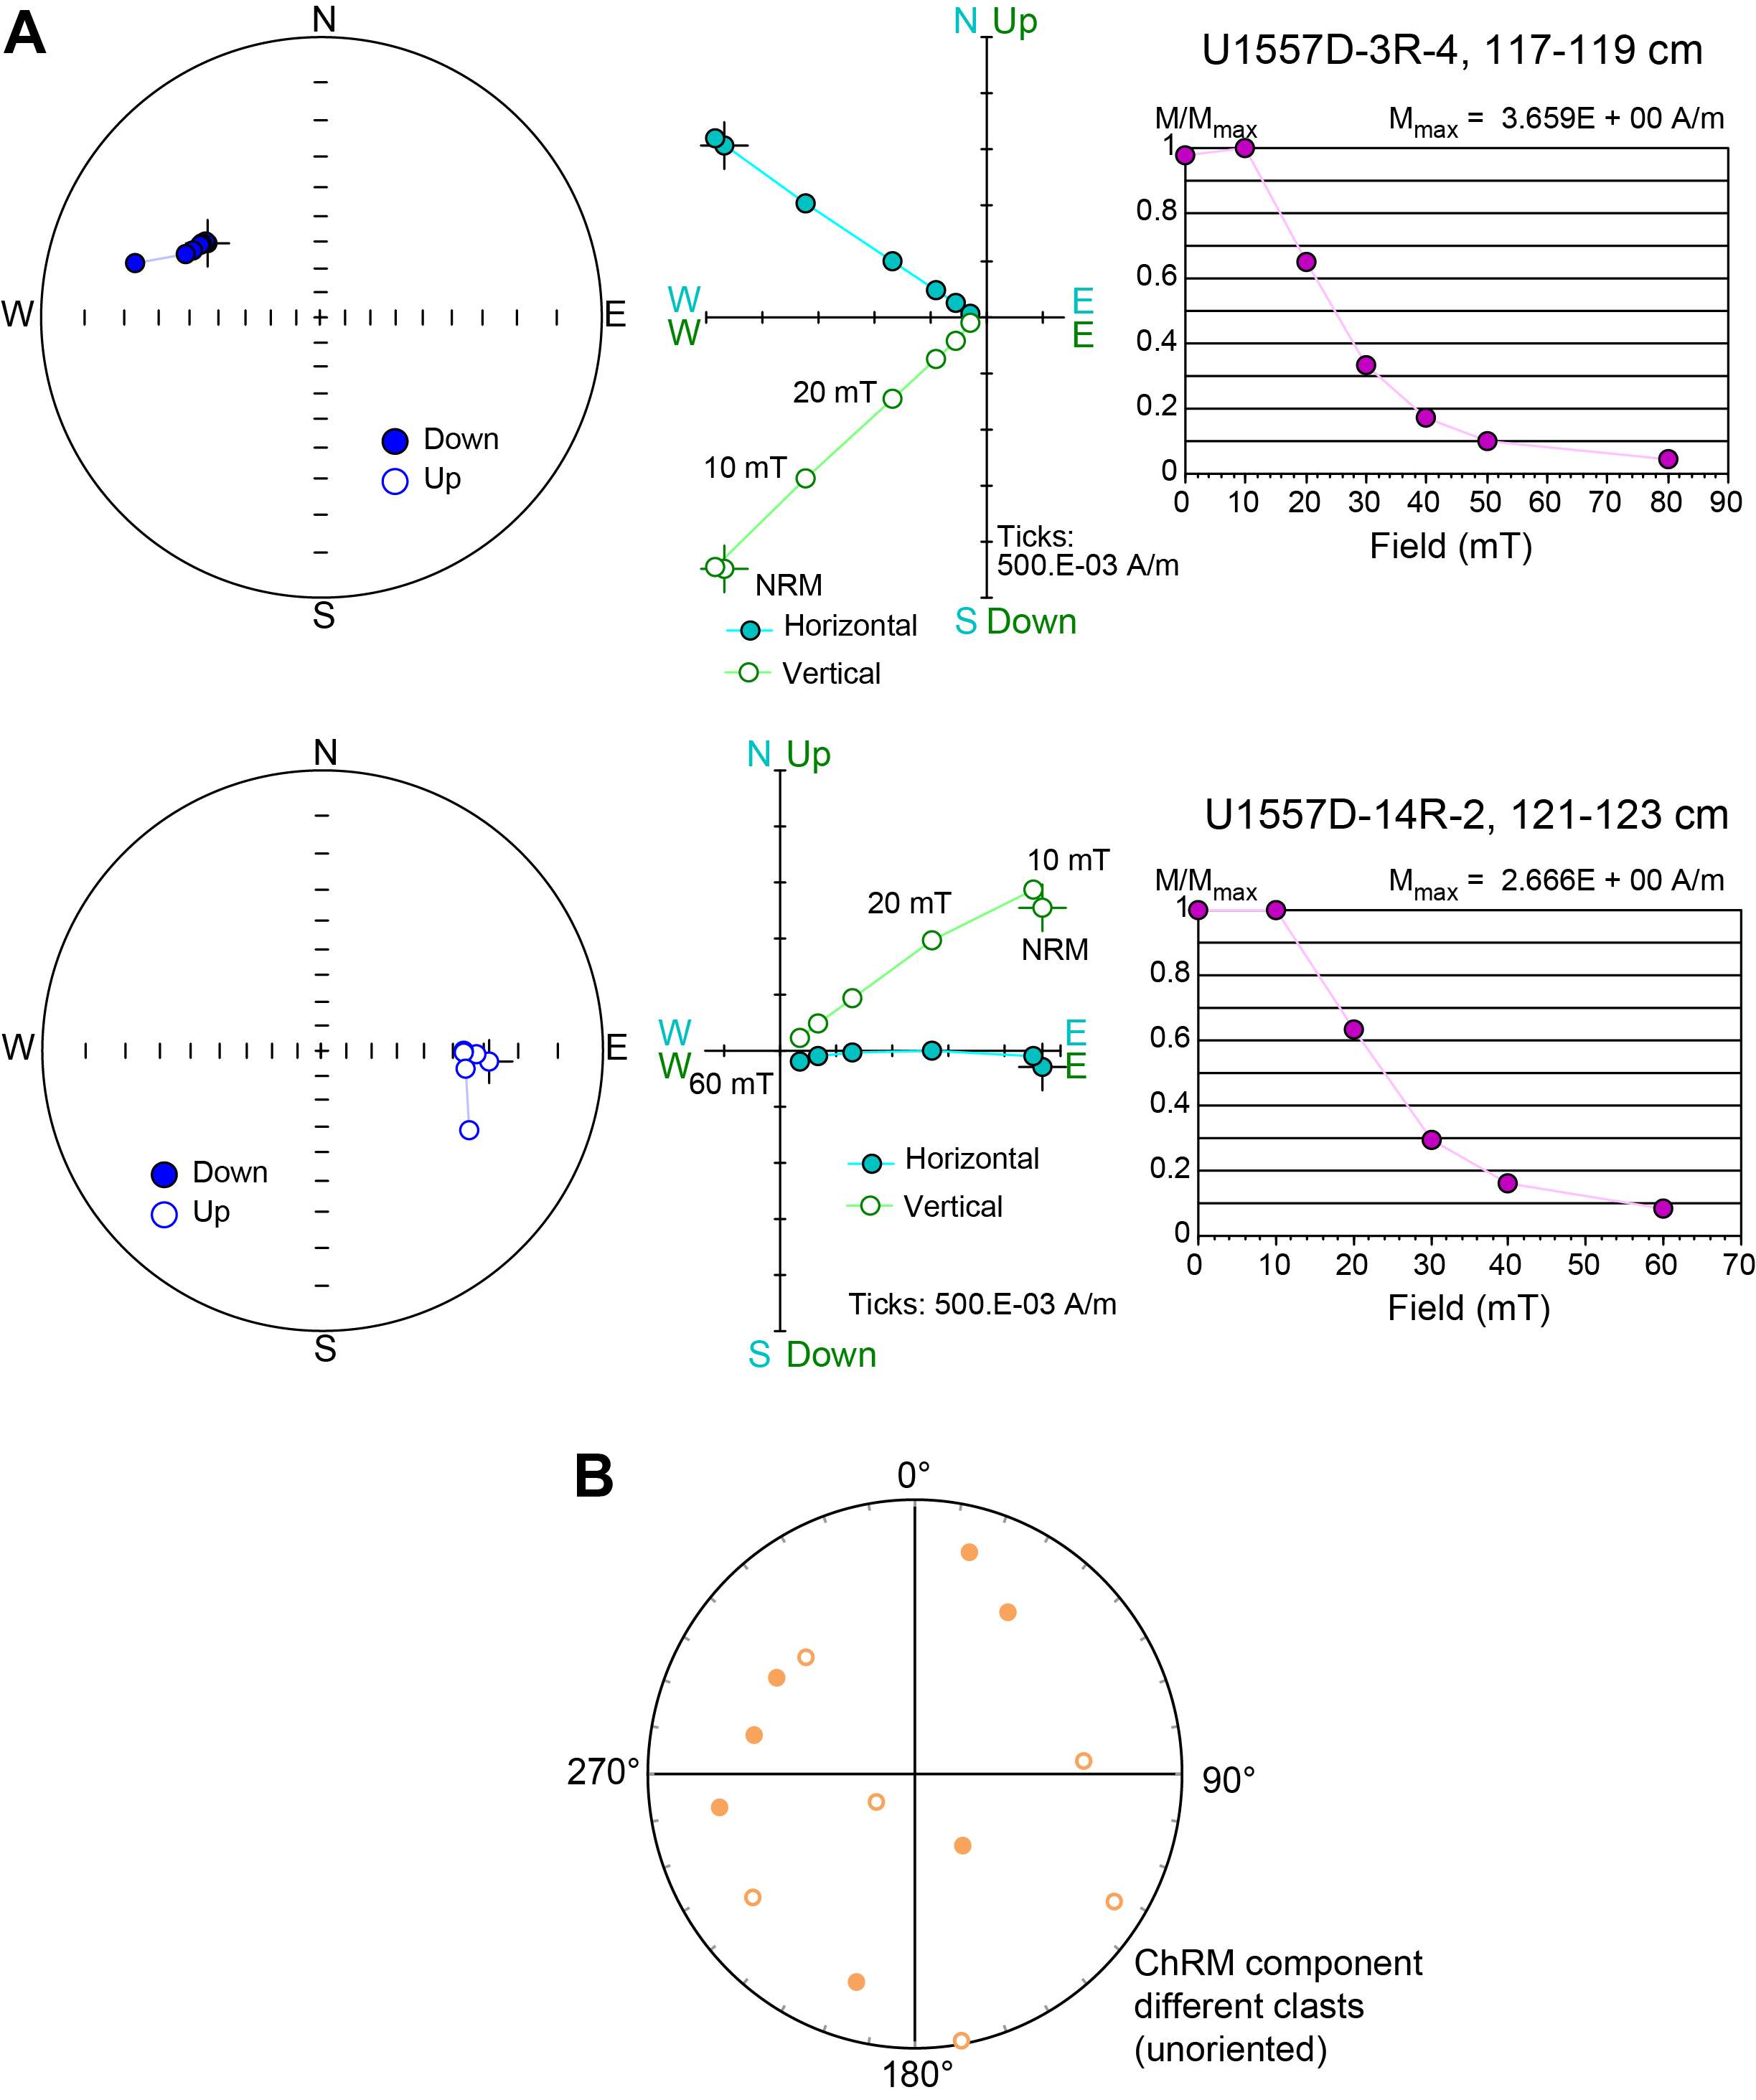
Figure F79. AF demagnetization for discrete basalt clast samples.
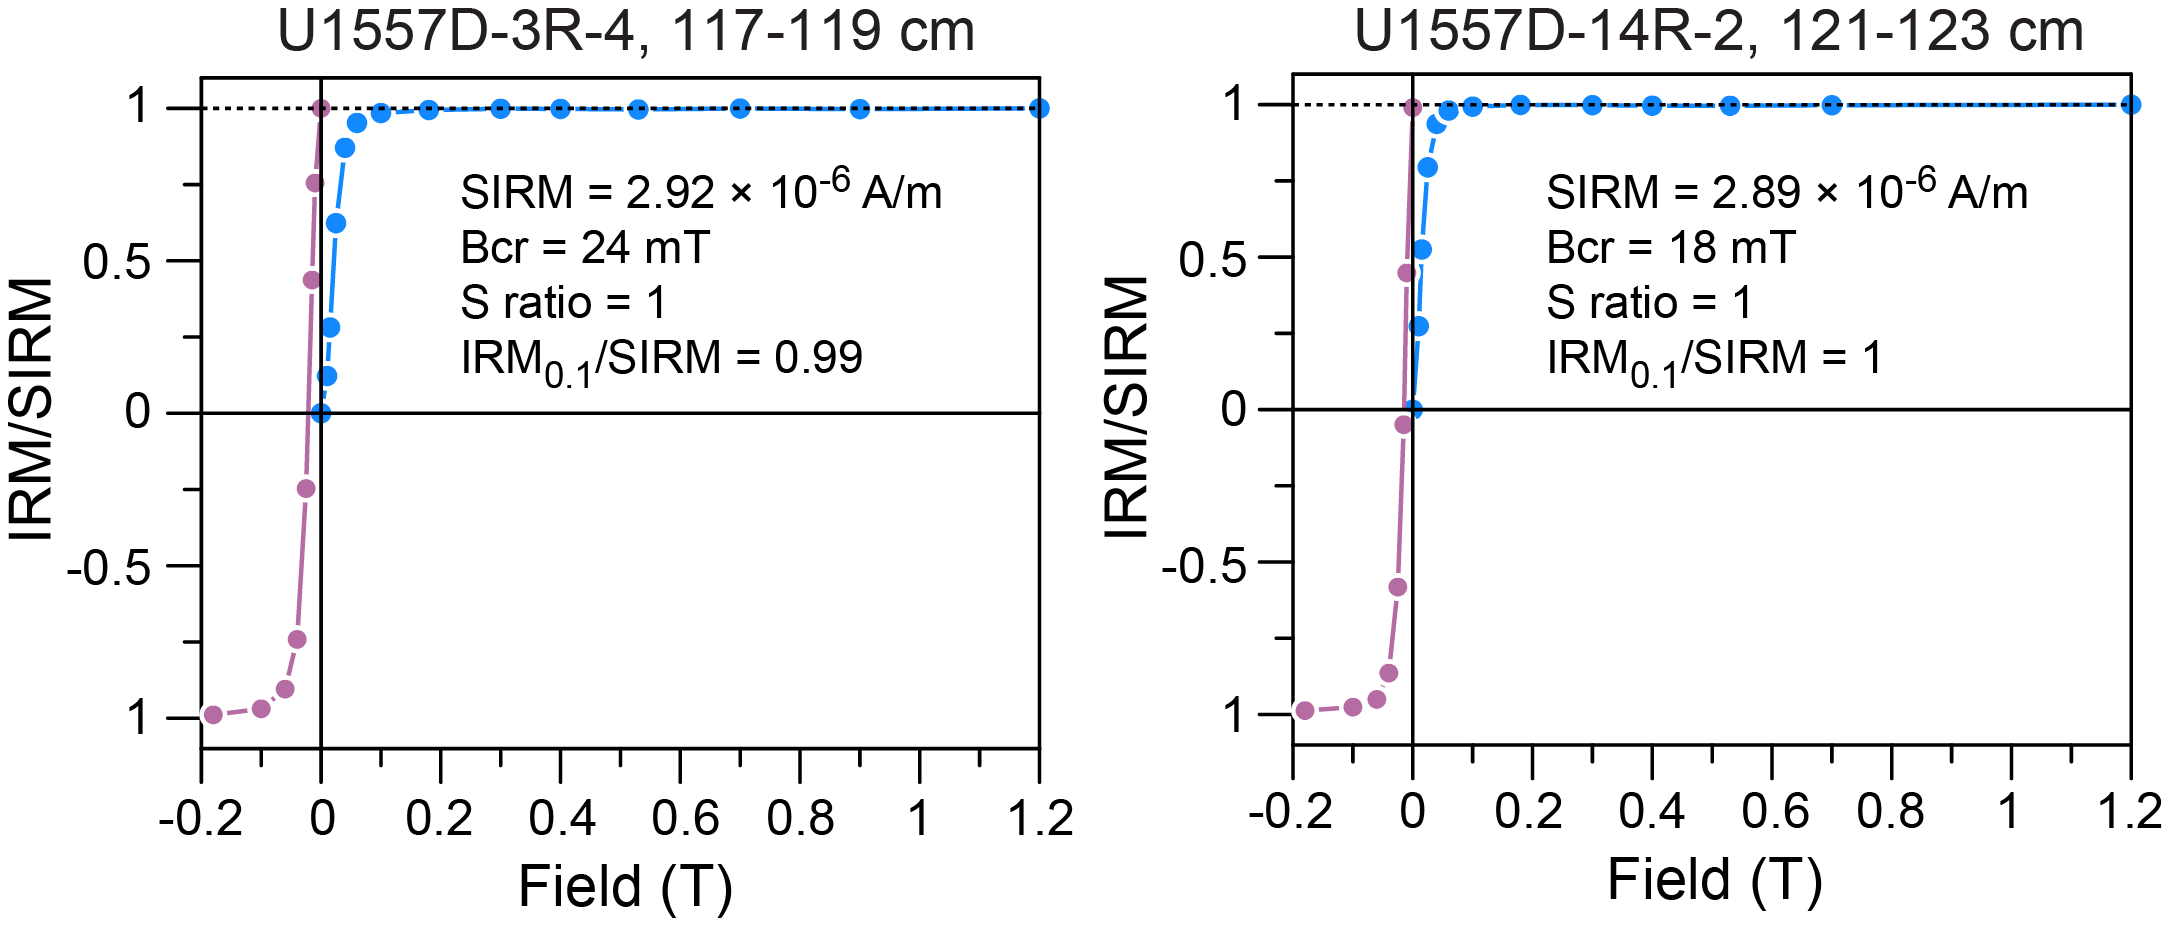
Figure F80. Normalized and backfield IRM for basement rocks.
AMS is routinely used as a petrofabric proxy to determine the preferred orientation of the magnetic mineral assemblage in a sample and was measured on all discrete cubes. AMS indicates the presence of both oblate (planar) and prolate (linear) magnetic susceptibility ellipsoids, but there is no systematic variation in the ellipsoid shape with depth through the breccia sequence. The AMS axes orientations are randomly distributed, suggesting no preferential alignment of clasts and limited transportation.
The conglomerate test was employed to test whether ChRM in the clasts was blocked prior to their emplacement in the sedimentary breccia or if ChRM was reset at a later stage (e.g., following emplacement of the breccia). Clasts that acquired ChRM prior to deposition in a conglomerate (or in this case, breccia) should give random ChRM inclinations and declinations when the clasts are oriented to their final positions in the conglomerate. Because RCB coring results in random rotation of core pieces around the core axis relative to adjacent pieces, the ChRM declinations of discrete samples from different core pieces should be random, irrespective of whether the sample material is a conglomerate. However, if their ChRM inclinations are also random, the samples pass the conglomerate test. In contrast, if samples fail the conglomerate test despite being clearly derived from a breccia, this would have required that the samples experienced remagnetization following emplacement in the breccia.
The ChRM directions of the discrete clast samples from Hole U1557D breccias plot randomly about a stereonet (Figure F79B), indicating the breccia clasts pass the conglomerate test and hence their ChRM was acquired prior to incorporation in the breccia and has remained stable since then.
The soft nature of the ferrimagnetic assemblage in these clasts indicates that the measured magnetic components, acquired prior to deposition in the breccia, have low stability. This in turn suggests these components resulted either from total remagnetization during alteration (e.g., maghemitization) or alternatively that they represent the primary remanent magnetization with very limited overprint. The magnetic data are thus consistent with two quite different alteration histories for the basalts prior to incorporation in the breccias. Additional postexpedition measurements are necessary to resolve the nature of the ChRM. Taken together, the paleomagnetic studies of the breccia clasts indicate there was significant reworking following original acquisition of the magnetic characteristics, but they suggest that no significant secondary magnetic mineral alteration events occurred between clast emplacement in the breccia and core retrieval during Expedition 390.
9. Age model and mass accumulation rates
9.1. Age model and linear sedimentation rates
The age model for Site U1557 is based on calcareous nannoplankton and planktic foraminiferal lowest (base) and highest (top) occurrence datums and paleomagnetic reversal datums from Hole U1557B (Figure F81; Table T12). Magnetostratigraphic reversals were only identified in the uppermost 100 m in Hole U1557B because the switch from APC to XCB coring starting with Core 390C-U1557B-12X resulted in increased drilling disturbance that prevented confident identification of paleomagnetic reversals for the remainder of the hole. Paleomagnetic investigations of sediments were limited to archive-half measurements because no discrete samples were taken during Expedition 390C. Gaps in recovery between Cores 3H and 4H and between Cores 4H and 5H were bridged in the magnetostratigraphy by comparing Hole U1557B magnetic inclination data with that from Hole U1556A, only a few kilometers away from Site U1557, which shows an identical pattern of reversals in the uppermost 100 m of the core (see Paleomagnetism).
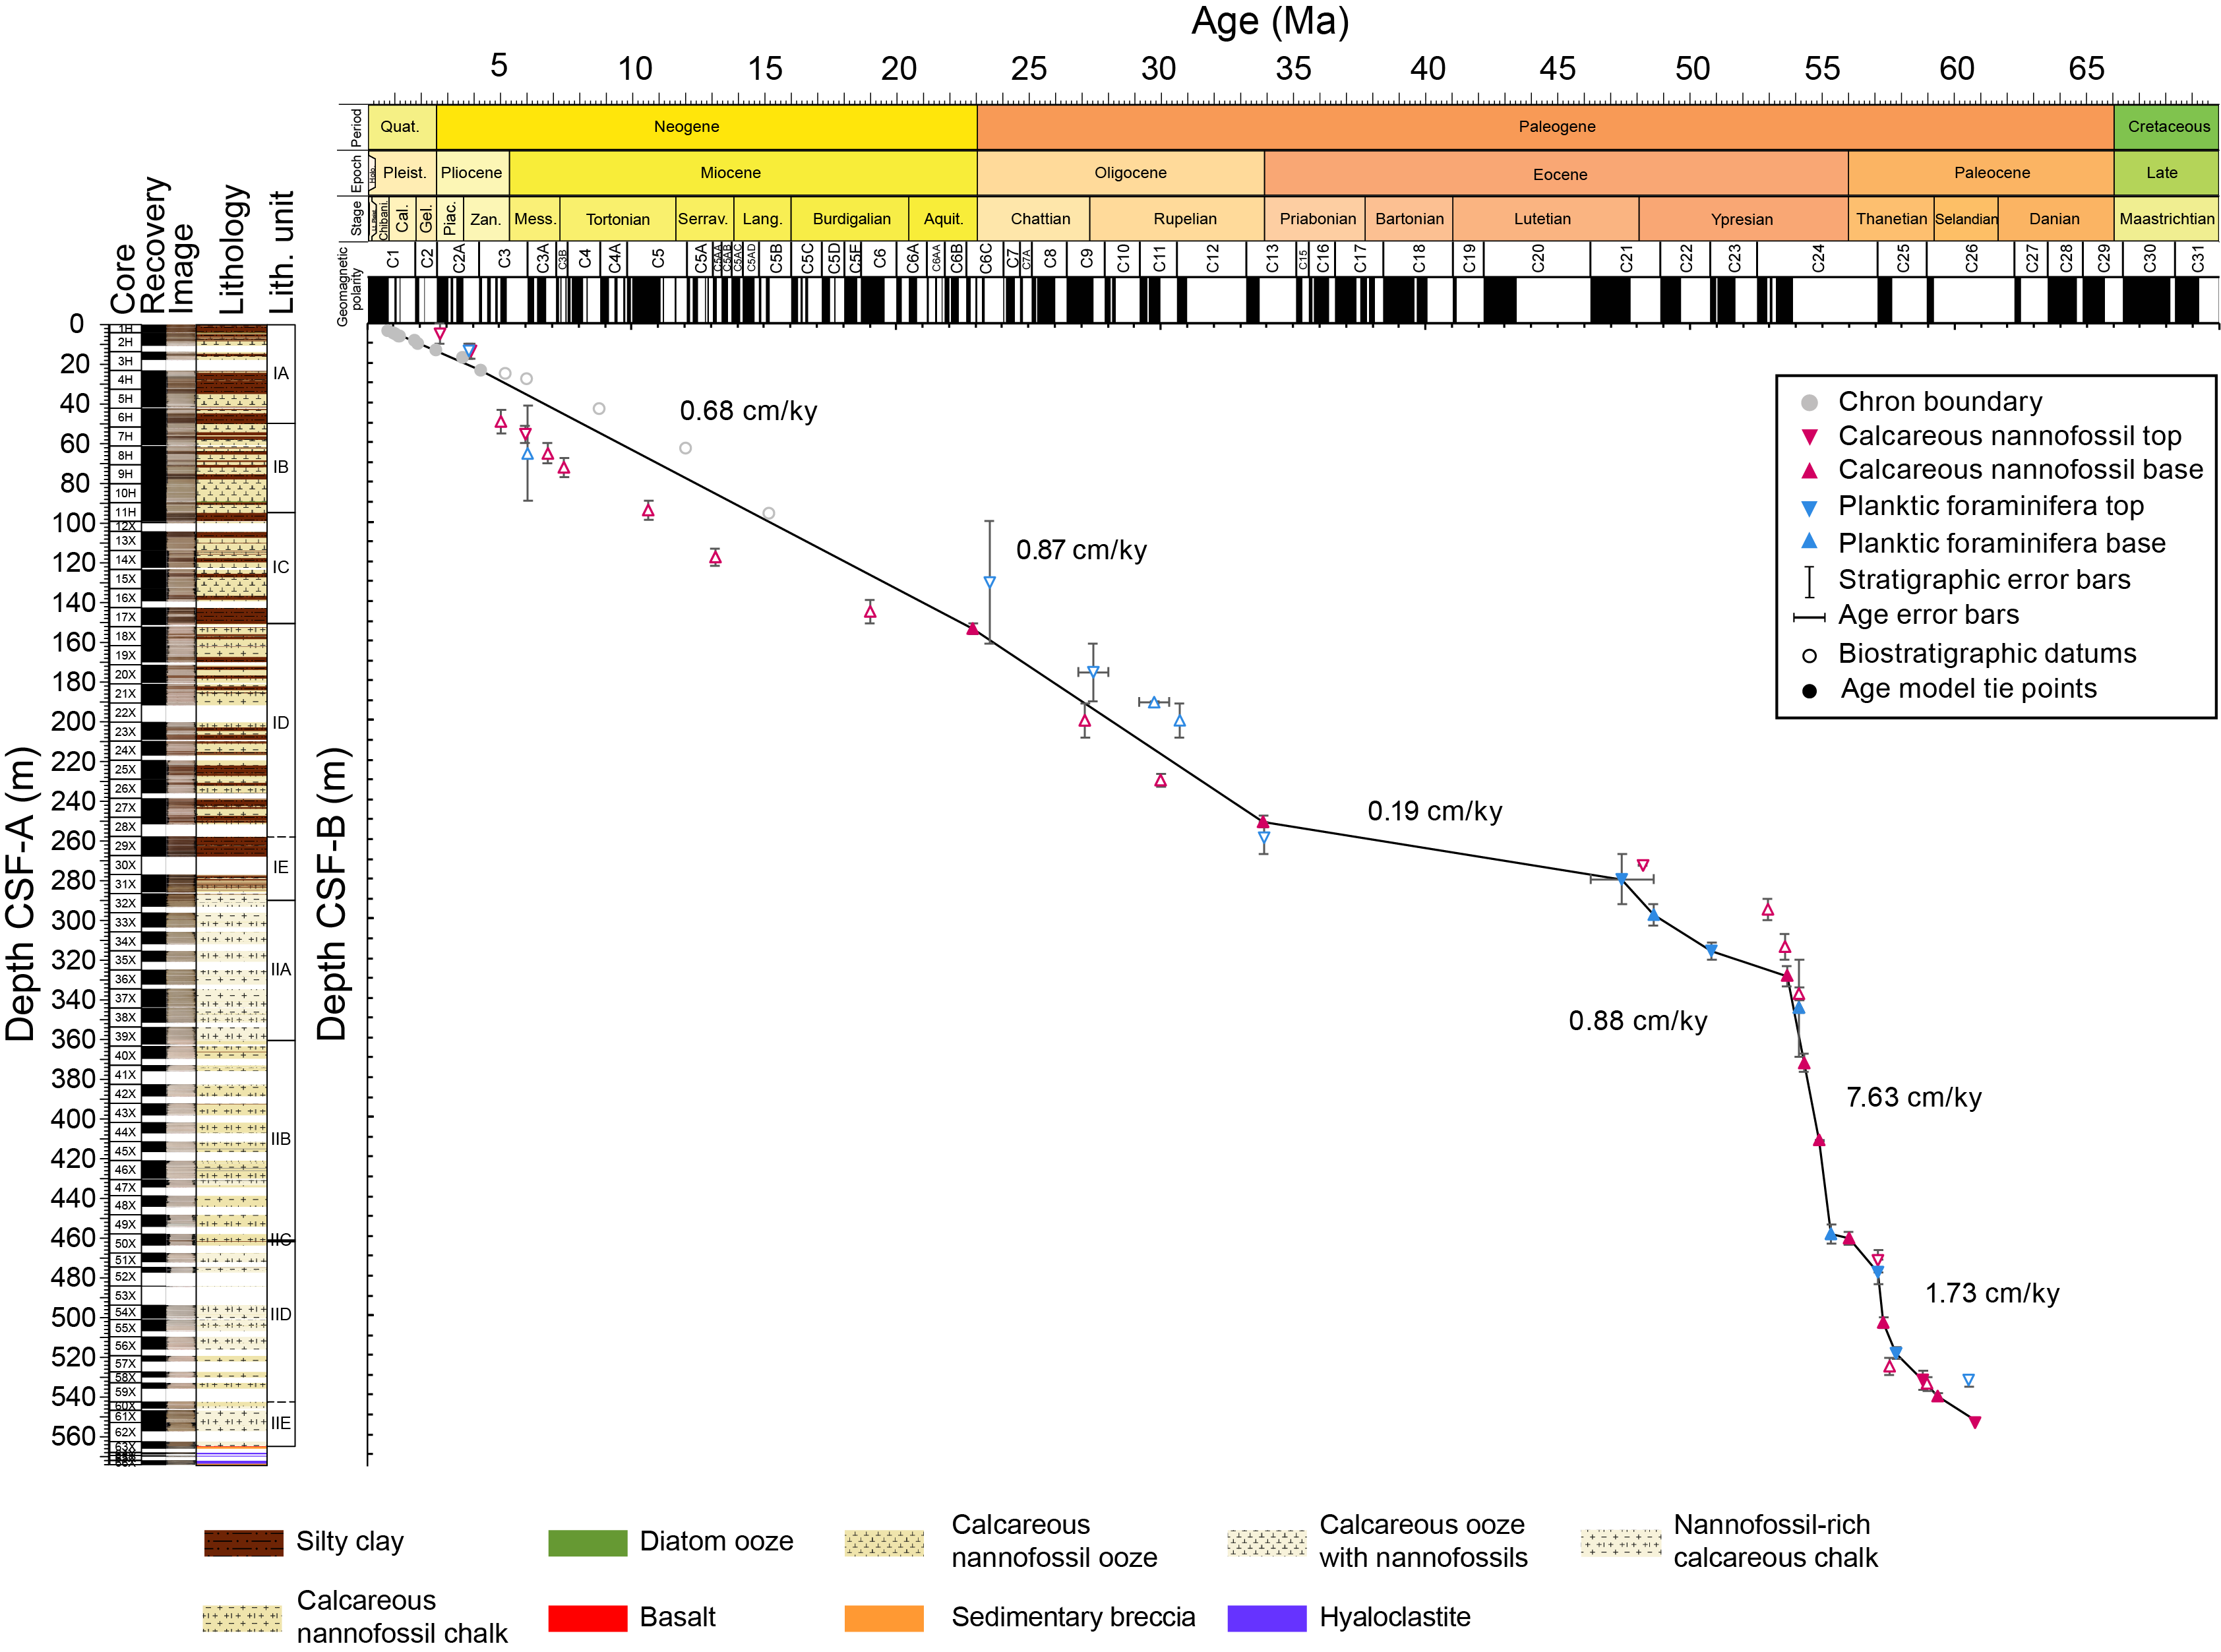
Figure F81. Age-depth model, Hole U1557B.
Planktic foraminifera and calcareous nannoplankton range in abundance from barren to abundant throughout the cored interval but tend to be absent entirely or rare and poorly preserved in the pelagic clays that characterize large intervals of Lithologic Unit I (see Sedimentology and Biostratigraphy). The only planktic foraminiferal samples available were those taken from core catchers collected during Expedition 390C, and these often coincided with pelagic clays that are barren of foraminifera. Planktic foraminiferal populations in the nannofossil oozes that represent the other dominant lithology of Unit I are depauperate, poorly preserved, and often only contain small specimens (Figure F65). As a result, foraminiferal marker species are often missing, and the ones that were identified often have very large stratigraphic error bars (Figure F81) due to the distance between samples with adequately preserved populations. Calcareous nannoplankton also exhibit highly variable preservation in Unit I. However, smear slide samples taken from the archive halves of Hole U1557B allowed for analysis of the higher carbonate lithologies during Expedition 390, which resulted in the identification of additional datums (see Biostratigraphy). In the more carbonate-rich Unit II, preservation and abundance of both fossil groups improves, although several marker species are still absent, likely due to the location of Site U1557 in the midlatitudes, outside the range of some common tropical marker species (e.g., Lam et al., 2022).
These factors make development of the age model complicated. Paleomagnetic reversal boundary datums identified within the upper 23 m were used to create the age model because they correspond well with fossil datums. However, paleomagnetic reversal datums identified between 23 and 100 m CSF-B are consistently offset from calcareous nannoplankton datums at roughly the same depths by 2–3 My near the seafloor and sometimes as much as 6 My by 100 m CSF-B. The consistent diachroneity between calcareous nannoplankton and magnetochron datums leaves us with no clear path for the age model between 23 and 100 m CSF-B, though the calcareous nannoplankton are preferred because assignment of magnetochrons is subjective so different magnetostratigraphic ages are possible and will be investigated in postexpedition work. Likewise, there is a consistent age offset between planktic foraminiferal and calcareous nannoplankton datums in the interval between 100 and 250 m CSF-B, likely due to the sample resolution and preservation issues with planktic foraminifera in this interval. The nannofossils likely provide a more reliable source of information because of the higher sampling resolution and identification of more datums, but the preservation and abundance of neither fossil groups is ideal in Unit I.
To construct the age model, we therefore had to rely on our own judgment more than we would have preferred. Rather than connecting every datum through the uncertain intervals in Unit I, we drew a middle course between the datums and used datums close to this middle line to construct the age model (Figure F81; Table T12). Although we believe this to be the most accurate age model, we emphasize that there are other interpretations of the data that would generate considerably different sample ages. When constructing this age model, datums were selected to avoid age inversions and frequent fluctuations in sedimentation rate.
Linear sedimentation rates (LSRs) fluctuate through the interval, with the highest LSR values in the Eocene. Neogene LSR values are relatively stable, averaging 0.68 cm/ky. The average sedimentation rate increases slightly in the Oligocene to 0.87 cm/ky. Perhaps the most obvious feature of the age model is a large hiatus or condensed interval spanning the middle Eocene to early Oligocene (Figure F81) that has an average sedimentation rate (if sedimentation was continuous) of 0.19 cm/ky. This lithologic unit (Subunit IE) also separates the relatively low sedimentation rates of the Oligocene to recent (Unit I) from the high sedimentation rates of the Paleocene and Eocene (Unit II). The average sedimentation rate directly below Subunit IE is 0.88 cm/ky, nearly identical to that of the Oligocene, but below this in the earliest Eocene, sedimentation rates were significantly higher, averaging 7.63 cm/ky. Late Paleocene sedimentation rates were also relatively elevated, averaging a healthy 1.73 cm/ky.
9.2. Mass accumulation rates
Mass accumulation rates (MARs) for Hole U1557B were calculated using bulk density calculated from gamma ray attenuation (GRA) collected during Whole-Round Multisensor Logger (WRMSL) scans because no shipboard discrete dry bulk density samples were taken during Expedition 390C (see U1557B_MAR.xlsx in AGEMODEL in Supplementary material; also see Age model and mass accumulation rates in the Expedition 390/393 methods chapter [Coggon et al., 2024c]). Because of changes in the physical properties of core material during storage (drying, shrinking, etc.), it is impossible to generate useful discrete measurement data postexpedition. Data presented in Figure F82 are binned in 1 My intervals.
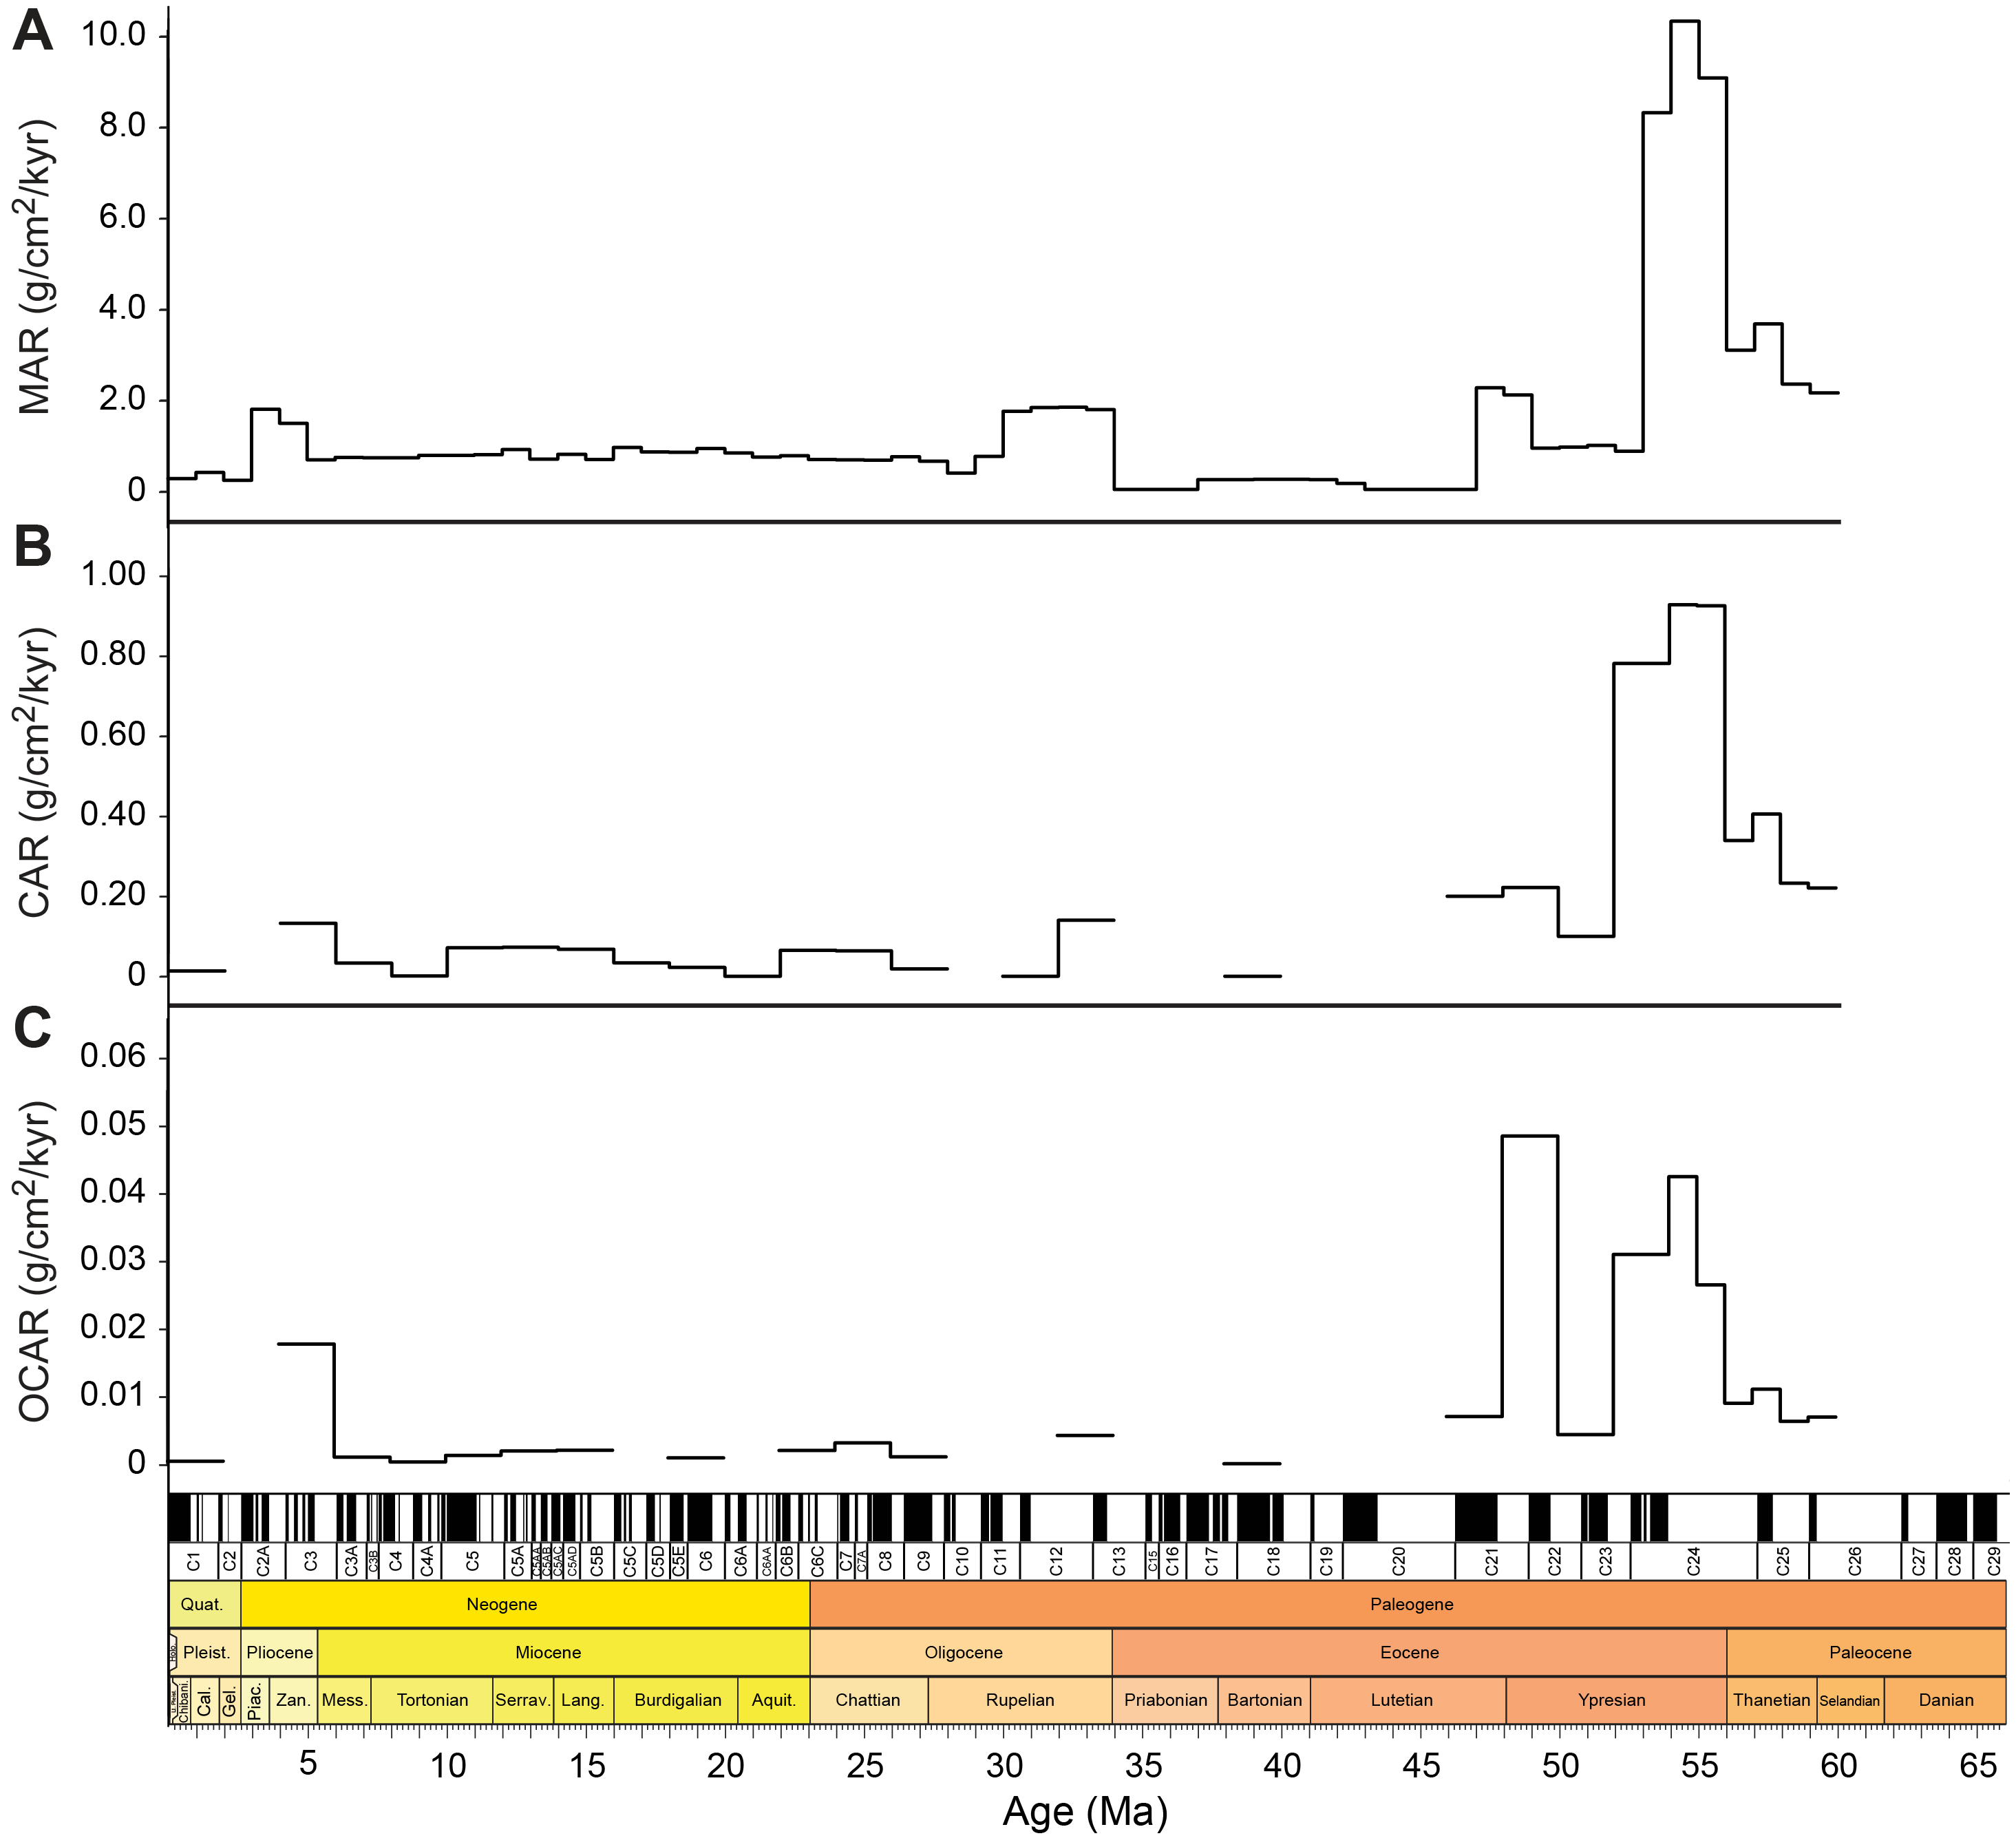
Figure F82. MAR, CAR, and OCAR, Hole U1557B.
MARs at Site U1557 are very high in the late Paleocene/early Eocene (peak of 10.3 g/cm2/ky), relatively high in the early Eocene (between 0.9 and 2.1 g/cm2/ky), and then very low during the condensed interval in the late Eocene (0.2 g/cm2/ky). In Unit I, values are highest in the early Oligocene (1.8 g/cm2/ky) and Early Pliocene (1.4–01.8 g/cm2/ky) and generally hover around 0.7 g/cm2/ky in between. The last 3 My is characterized by very low MARs (0.2 g/cm2/ky).
9.3. Carbonate and organic carbon accumulation rates
Carbonate accumulation rates (CARs) and organic carbon accumulation rates (OCARs) were calculated by multiplying the MAR by the weight percent of carbonate and total organic carbon (TOC), respectively (see Age model and mass accumulation rates in the Expedition 390/393 methods chapter [Coggon et al., 2024c]). Carbonate and organic carbon samples were taken from Hole U1557B IW sample squeeze cakes after the water was extracted during Expedition 390C. Bulk density was calculated from GRA measurements collected during WRMSL scans conducted after the IW whole-round sample was taken. Thus, we do not have carbon and bulk density data from the same samples. Fortunately, all but one IW sample was taken from the bottom of one of the middle sections of each core; for these samples, MAR was interpolated from the adjacent GRA measurements above and below. These measurements were just a few centimeters away from the IW sample, and at that scale at Site U1557, bulk density can vary by a negligible amount of a few tenths of a gram per centimeter cubed. IW Sample 390C-U1557B-41X-2, 126–130 cm (375.61 m CSF-B), was taken from the bottom of a core and separated from the nearest sample below it by a 6.92 m gap in recovery. In this case, we applied the MAR from the sample directly above instead of interpolating. Bin size was increased to 2 My between 0 and 54 Ma because the low sample density and low sedimentation rate meant that many bins were empty of data.
9.3.1. Carbonate accumulation rates
On a first-order basis, CARs mirror MARs in Hole U1557B (Figure F82). This fits with the observation that sedimentation is driven by pelagic deposition of dust diluted by more or less pelagic carbonate. The CAR is highest in the carbonate-rich Lithologic Unit II, with a peak spanning the late Paleocene and early Eocene (0.92 g/cm2/ky). Low sample resolution combined with low sedimentation rates means that most bins in the late Eocene condensed interval have no CAR or OCAR data, although the bin that does have data has a CAR value of 0.000006 g/cm2/ky, appropriately low considering the low sedimentation rate and practically carbonate free sedimentology. In Lithologic Unit I, CAR values range 0.0002–00.14 g/cm2/ky (with peaks in the early Oligocene and Early Pliocene, similar to MAR), and appear largely controlled by the relative proportion of pelagic clay versus carbonate within the bin.
9.3.2. Organic carbon accumulation rates
A surprising result in Hole U1557B is the elevated organic carbon content in Subunit IIB (late Paleocene to early Eocene; Figure F82) (see Geochemistry). TOC values as high as 3 wt% in the early Eocene suggest that this interval was characterized by high organic carbon production and preservation with an OCAR peak near 0.05 g/cm2/ky, which is more than double the abyssal average OCAR during the Late Cretaceous Oceanic Anoxic Event 2 (Owens et al., 2018). The general correspondence of high OCARs with high CARs indicates overall high productivity in surface waters during this time interval. The OCAR is generally low throughout the Neogene and Oligocene, with the highest values reaching 0.004 g/cm2/ky in the Oligocene and 0.017 g/cm2/ky in the Pliocene.
10. Physical properties and downhole measurements
10.1. Sediment
10.1.1. Physical properties
The sediment succession at Site U1557 was cored in two holes during Expedition 390C. Hole U1557A was a missed mudline that penetrated 9.63 m. Coring with the APC system in Hole U1557B proceeded through Core 390C-U1557B-11H, after which the XCB system was deployed from Core 12X to drill deeper into more lithified sediments and recover the sediment/basement interface in Hole U1557B. Site U1557 sediment physical properties measurements included whole-round NGR, GRA bulk density, MS, and compressional wave (P-wave) velocity measured on the WRMSL. During Expedition 390C, measurements of thermal conductivity were made in Hole U1557B (Estes et al., 2021). Discrete sampling for moisture and density (MAD) and P-wave velocity measurements were not carried out during Expedition 390C.
Because sediment cores from Site U1557 were collected and split during Expedition 390C, only the archive halves of Hole U1557A and U1557B cores were on board for analysis during Expedition 390. Discrete samples were not taken from Site U1557 sediment cores for MAD or P-wave velocity during Expedition 390 because after being in storage for 2 y the split sections would not have retained their original moisture content.
10.1.1.1. Natural gamma radiation
NGR was measured at 10 cm intervals on all whole-round core sections that exceeded 50 cm in length. Each measurement reflects integration of two separate 5 min counts (i.e., 10 min of counting per section, consisting of 5 min at each of two positions separated by 10 cm) (see Physical properties and downhole measurements in the Expedition 390/393 methods chapter [Coggon et al., 2024c]). NGR serves as an estimate of the content variability of radioactive elements (e.g., 40K, 238U, and 232Th) in the cored sedimentary section. NGR from marine sediments is especially useful in distinguishing clay-rich intervals from clay-poor carbonate ooze intervals (Dunlea et al., 2013).
NGR shows high-frequency variability in Hole U1557B, ranging 7–50 counts/s shallower than 252 m CSF-B (Figure F83). These variations likely reflect changes in clay content: higher NGR corresponding to the silty clay layers and lower NGR corresponding to the carbonate ooze of Lithologic Unit I (see Sedimentology). Between 257 and 267 m CSF-B, NGR is relatively high and invariable (mean ± 1 standard deviation = 41 ± 1 count/s). This corresponds to a distinctive clay layer in Lithologic Subunit IE in Core 390C-U1557B-29X. Below this layer, NGR decreases and is uniformly lower (mean = 6 counts/s), generally ranging from 3 to <15 counts/s between 267 m CSF-B and the bottom of the sedimentary section at 565 m CSF-B. This interval is dominated by chalk, which is characteristically low in natural radioactivity. There are several sharp positive excursions (up to 31 counts/s) in this interval that generally correspond to thin (centimeter-scale) clay layers. The mean NGR, as well as variability, increases slightly below 525 m CSF-B toward the base of the sediment section (Figure F83).
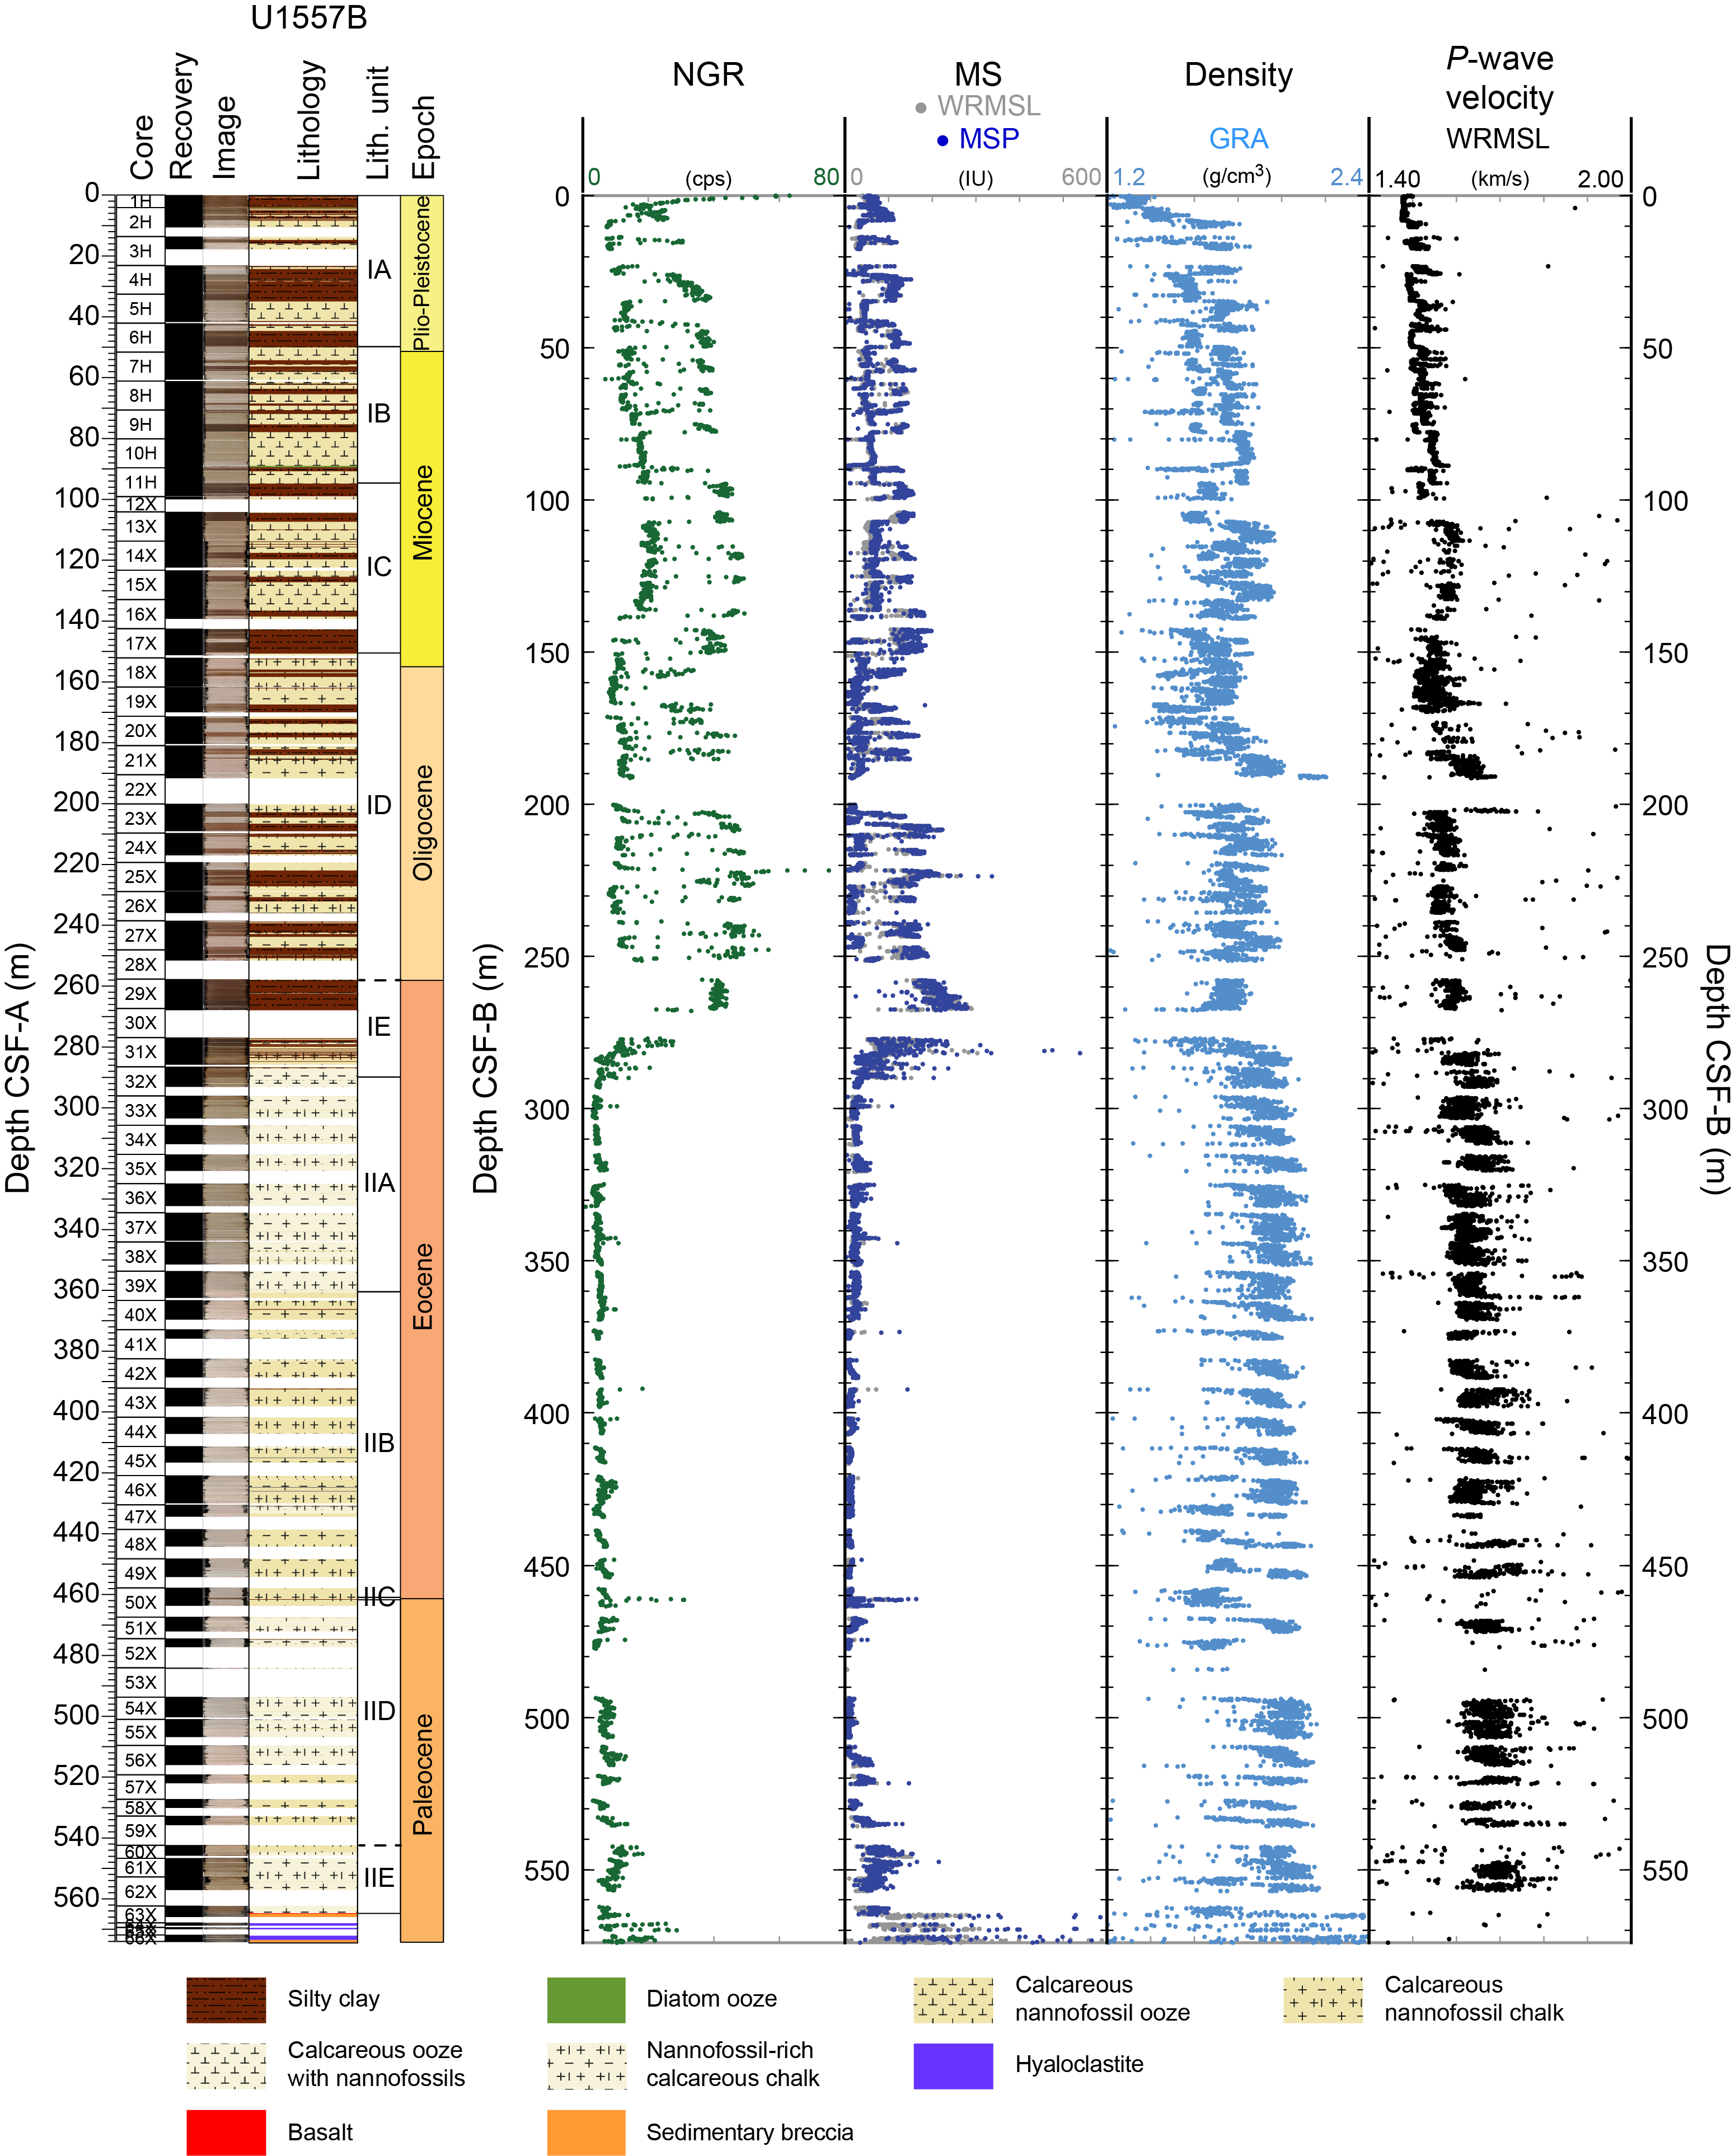
Figure F83. Core physical properties, Hole U1557B.
10.1.1.2. Gamma ray attenuation bulk density
GRA is defined as the fraction of gamma rays that are not absorbed by a material, and this can be used as an approximation for bulk density. Variations in bulk density can reflect changes in mineralogy, composition, and porosity in the sedimentary section. However, drilling disturbance, expansion cracks, incomplete filling of the core liner, or any other disturbance of the cored sediment can produce spurious values not realistic of marine sediment, which is typically about 1–2 g/cm3, depending on lithology and compaction. No data filtering to remove spurious values was done shipboard. Because spurious GRA data points are typically lower than true values, a useful method to reduce the potential influence of spurious data is to consider the upper envelope of the GRA data as a first-order estimate of bulk density and to discount unrealistically low values.
High-frequency trends in bulk density are generally anticorrelated with NGR in the depth interval above 252 m CSF-B. These variations reflect shifts between denser carbonate-rich lithologies and less dense dark clay-rich deposits. Notably, a high-density interval ranging 1.94–2.2 g/cm3 occurs at ~190.4 m CSF-B (Section 390C-U1557B-22X-1) (Figure F83) above a gap in recovery. In Core 31X, bulk densities reach as high as 2 g/cm3 and mark a transition to consistently more dense carbonate material below 281.6 m CSF-B, where values average 1.9 g/cm3 (Figure F83). Drilling disturbance, known as biscuiting, is common in the cores recovered using the XCB coring system (below 99.1 mbsf). Many of the sections recovered from below this depth are reworked and unconsolidated as a result, which may also lead to erratic centimeter-scale fluctuations in density. The most notable example of this disturbance can be seen visually but also in the bulk density data of Cores 54X–56X (see Sedimentology).
10.1.1.3. Magnetic susceptibility
MS is an indicator of the tendency of minerals to become magnetized upon application of a magnetic field and can be considered an approximation of the concentration of magnetic minerals in the formation. Silt and clay-rich sedimentary layers generally include more magnetic minerals than carbonate sedimentary layers; therefore, higher MS typically corresponds to silt and clay lithologies, whereas lower MS typically corresponds to carbonate and siliceous lithologies. MS of cored sediments at Site U1557 was measured using the WRMSL; MSP was measured using the SHMSL. MSP measurements made on split-core sections reflect the same trends as those obtained from the WRMSL; however, MSP is on average 12.22 instrument units (IU) higher than MS determined by the WRMSL (Figure F83).
MS ranged from ~1 to ~300 IU (mean = 54 IU) in Hole U1557B (Figure F83). In the upper ~250 m of the sediment in Hole U1557B, MS alternates between 50 and 150 IU. These high-frequency MS variations likely reflect the same lithologic variability recorded in the NGR and GRA bulk density. Between ~250 and ~275 m CSF-B (Subunit IE; see Sedimentology), a peak in MS of ~300 IU indicates a high concentration of magnetic minerals. Between ~275 and ~500 m CSF-B, MS is low, generally less than ~50 IU, and exhibits much less variability, except for a few distinct peaks that likely reflect the more uniform carbonate chalk–dominated lithology of Lithologic Unit II compared to Lithologic Unit I. Below 500 m CSF-B, MS increases toward the sediment/basement interface, likely due to increasing clay content in these sediments.
10.1.1.4. P-wave velocity
P-wave velocity is a measure of the velocity with which a compressional body wave (P-wave) propagates through a sample. P-wave velocity is directly related to the bulk density, compressibility, and shearability of the material sampled. P-wave velocity is indirectly related to the porosity, mineralogy, and fabric of the interval or lithology represented by the material sampled. P-wave velocity is especially useful for a material control in correlating different scales of data, from regional seismic imaging (at the scale of tens to hundreds of meters) to downhole logs (at the centimeter to meter scale) to core-based data (at the millimeter to centimeter scale).
P-wave velocity measurements made on whole-round core sections using the WRMSL are more reliable in sediment than in basement (see Physical properties and downhole measurements in the Expedition 390/393 methods chapter [Coggon et al., 2024c]), but spurious values still occur. Similar to the GRA measurement, P-wave velocity is adversely affected by drilling disturbance, expansion cracks, incomplete filling of the core liner, or any other disturbance of the cored sediment. Marine sediment P-wave velocity should typically be between 1.48 and ~1.80 km/s, depending on compaction and lithology. Spurious P-wave velocities from the whole-round core section are typically both higher and lower, and the best approximation of true velocity is to use the clustering of values and disregard any outliers.
At Site U1557, P-wave velocity measured with the WRMSL ranges from ~1.48 to ~1.80 km/s (mean = 1.59 km/s when excluding erroneously high or low values). In general, velocity increases with depth and is positively correlated with bulk density (Figure F83).
10.1.1.5. Thermal conductivity
Thermal conductivity is a measure of the potential for conductive heat flow through a material. Thermal conductivity in sediment and basement is affected by the mineralogy, porosity, density, and fabric of the lithology being measured. Measurements of thermal conductivity help develop an understanding of thermal insulation and heat dissipation processes from the underlying igneous crust through the sediment to the ocean. The thermal conductivity of sediment is an essential parameter required to calculate conductive heat flow through marine sediments from in situ temperature measurements. A total of 182 individual thermal conductivity measurements were made at 60 depths during Expedition 390C (Estes et al., 2021), yielding values averaging 1.4 ± 0.25 W/(m·K) (Figure F84A). Three individual measurements are used to calculate an average thermal conductivity for each sample. In general, measurements were taken at a frequency of about one per core on the most representative lithology.
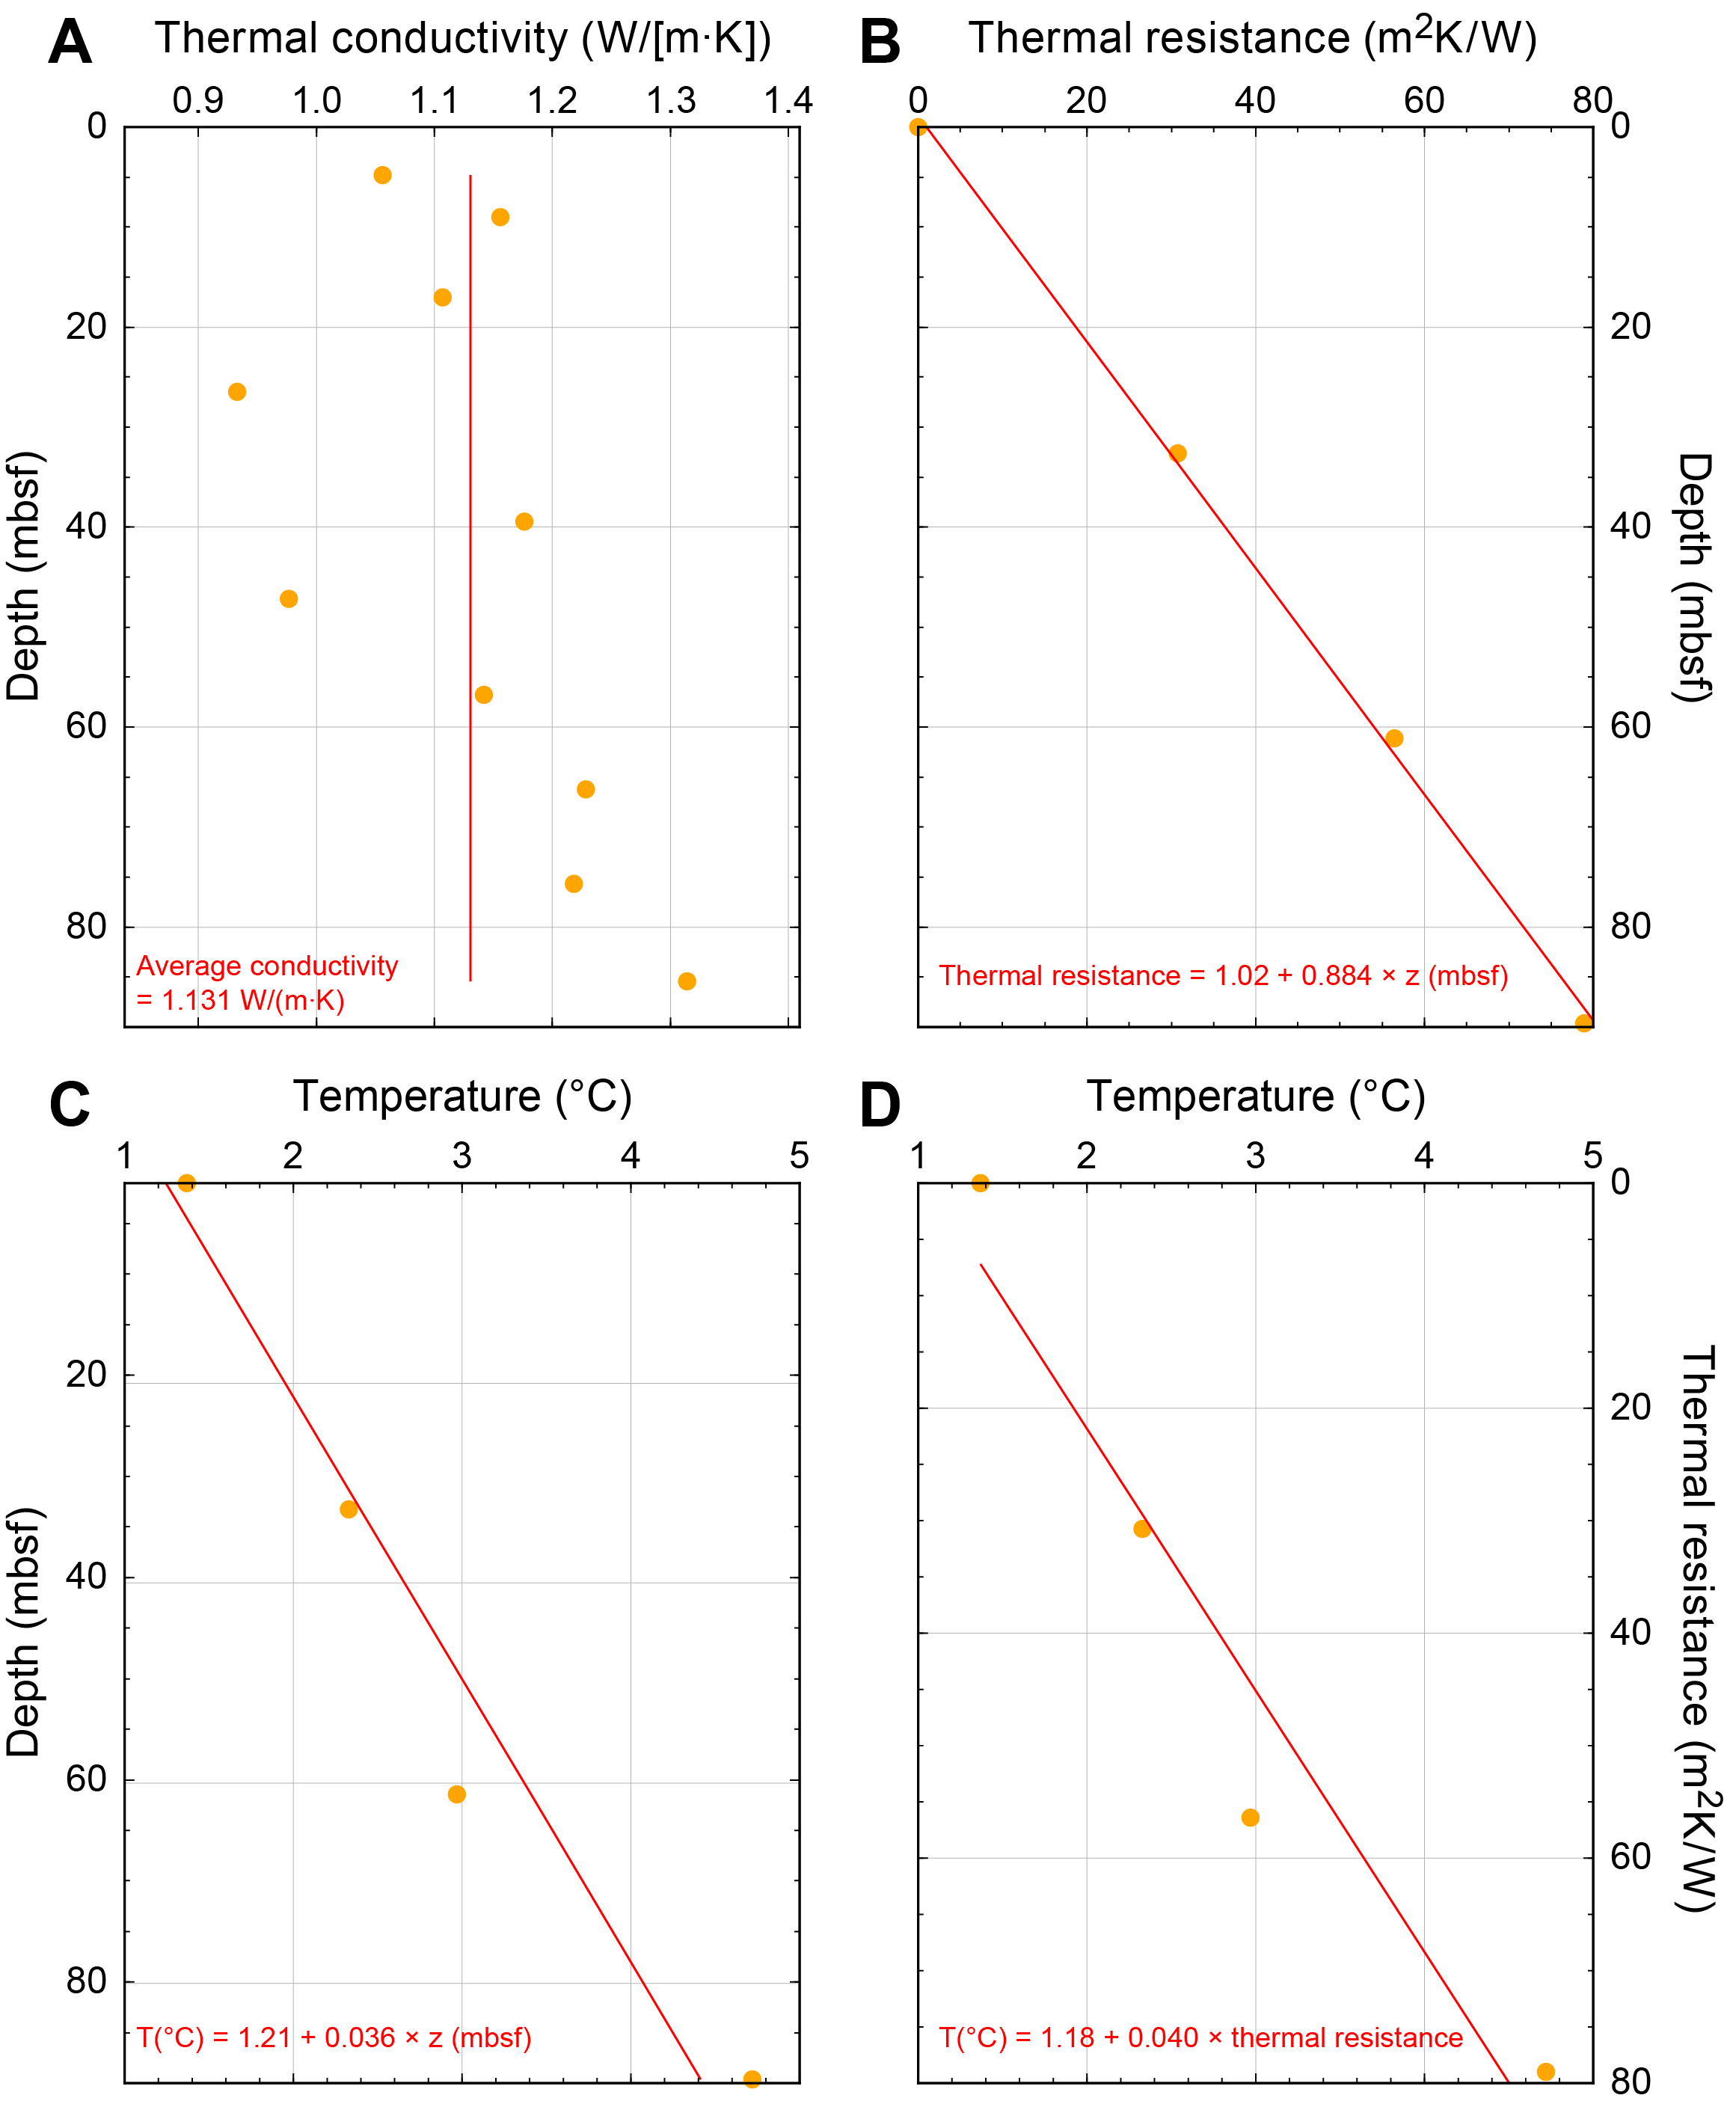
Figure F84. Conductive heat flow estimation.
10.1.2. Stratigraphic correlation
During Expedition 390C, two holes were drilled at Site U1557 using APC and XCB coring techniques: Holes U1557A and U1557B. Hole U1557A consists of a single core that missed the mudline and thus the top of the sediment pile, reaching 9.5 m drilling depth below seafloor (DSF). The mudline was recovered on a second attempt in Hole U1557B, which consists of 66 cores for a total of 574 m DSF. Hole U1557B crossed the uppermost basement at 564 m DSF. A total of 9.6 m and 412 m of sediment were recovered from Holes U1557A and U1557B with recovery of 101% and 73%, respectively.
Physical properties data from Holes U1557A and U1557B were compared to establish a core composite depth below seafloor (CCSF) scale only for the uppermost sediment record. The lack of correspondence in the physical properties between Cores 390C-U1557A-1H and 390C-U1557B-1H suggests at least 4.1 m is missing from the top of Hole U1557A (Figure F85). However, there is good correspondence in bulk density, MS, NGR, and lightness (L*) data between Sections 390C-U1557A-1H-5 and 390C-U1557B-2H-2 (Figure F85). Comparison with core images confirmed that these signals represented transitions between clay- and carbonate-rich layers in both holes. Therefore, a tie point was assigned at 10.8 m CCSF aligning the two holes (Table T13). This shifted Hole U1557B cores down (except Core 390C-U1557B-1H), producing a 4.5 m core gap (4.1–8.6 m CCSF) between Cores 1H and 2H (Table T14). This correlation allowed construction of a partially continuous splice for the upper 15 m at Site U1557 (Figure F85), with a gap present between the bottom of Core 390C-U1557B-1H and the top of Core 390C-U1557A-1H at ~4 m CCSF.
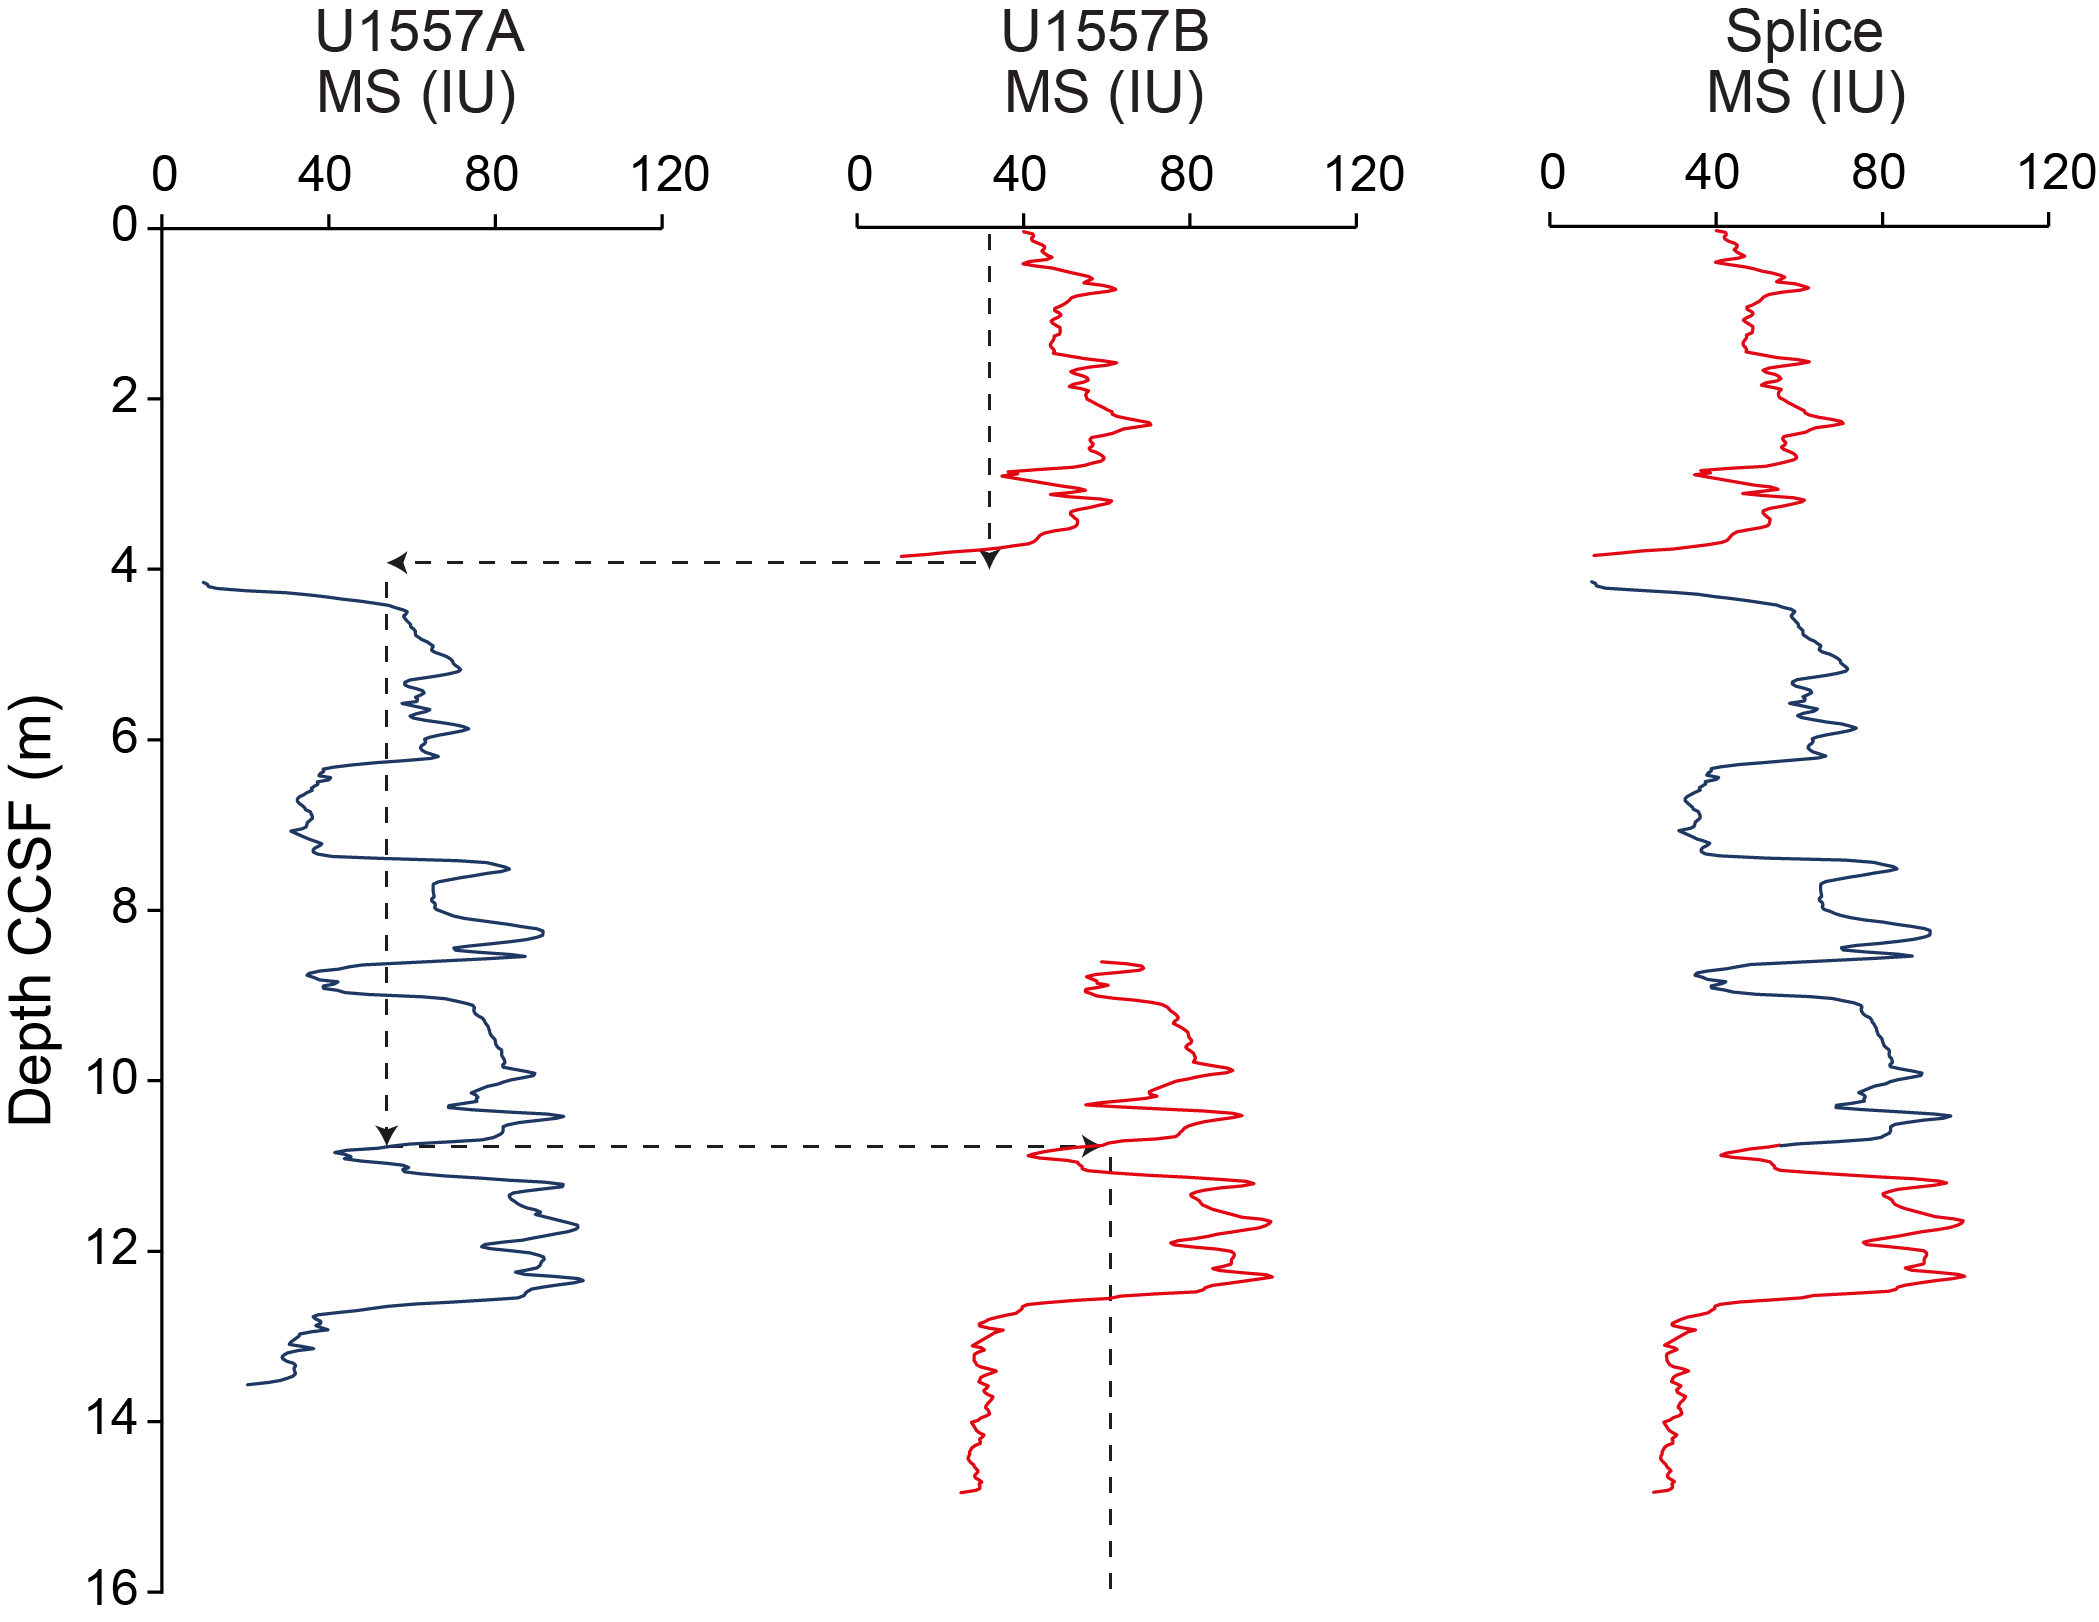
Figure F85. Composite depth scale and splice.
10.1.3. Downhole measurements
10.1.3.1. Downhole temperature
Formation temperature measurements were made at Site U1557 during Expedition 390C using the advanced piston corer temperature (APCT-3) tool (Estes et al., 2021). Three APCT-3 measurements were taken in Hole U1557B (Table T15; Figure F86). Although the records show that the APCT-3 tool could not remain stable during the full length of any of its deployments, each deployment included long enough stable intervals of thermal recovery to calculate reasonable fits to theoretical models and derive formation temperature data, suggesting a geothermal gradient of 36°C/km (Figure F84C).
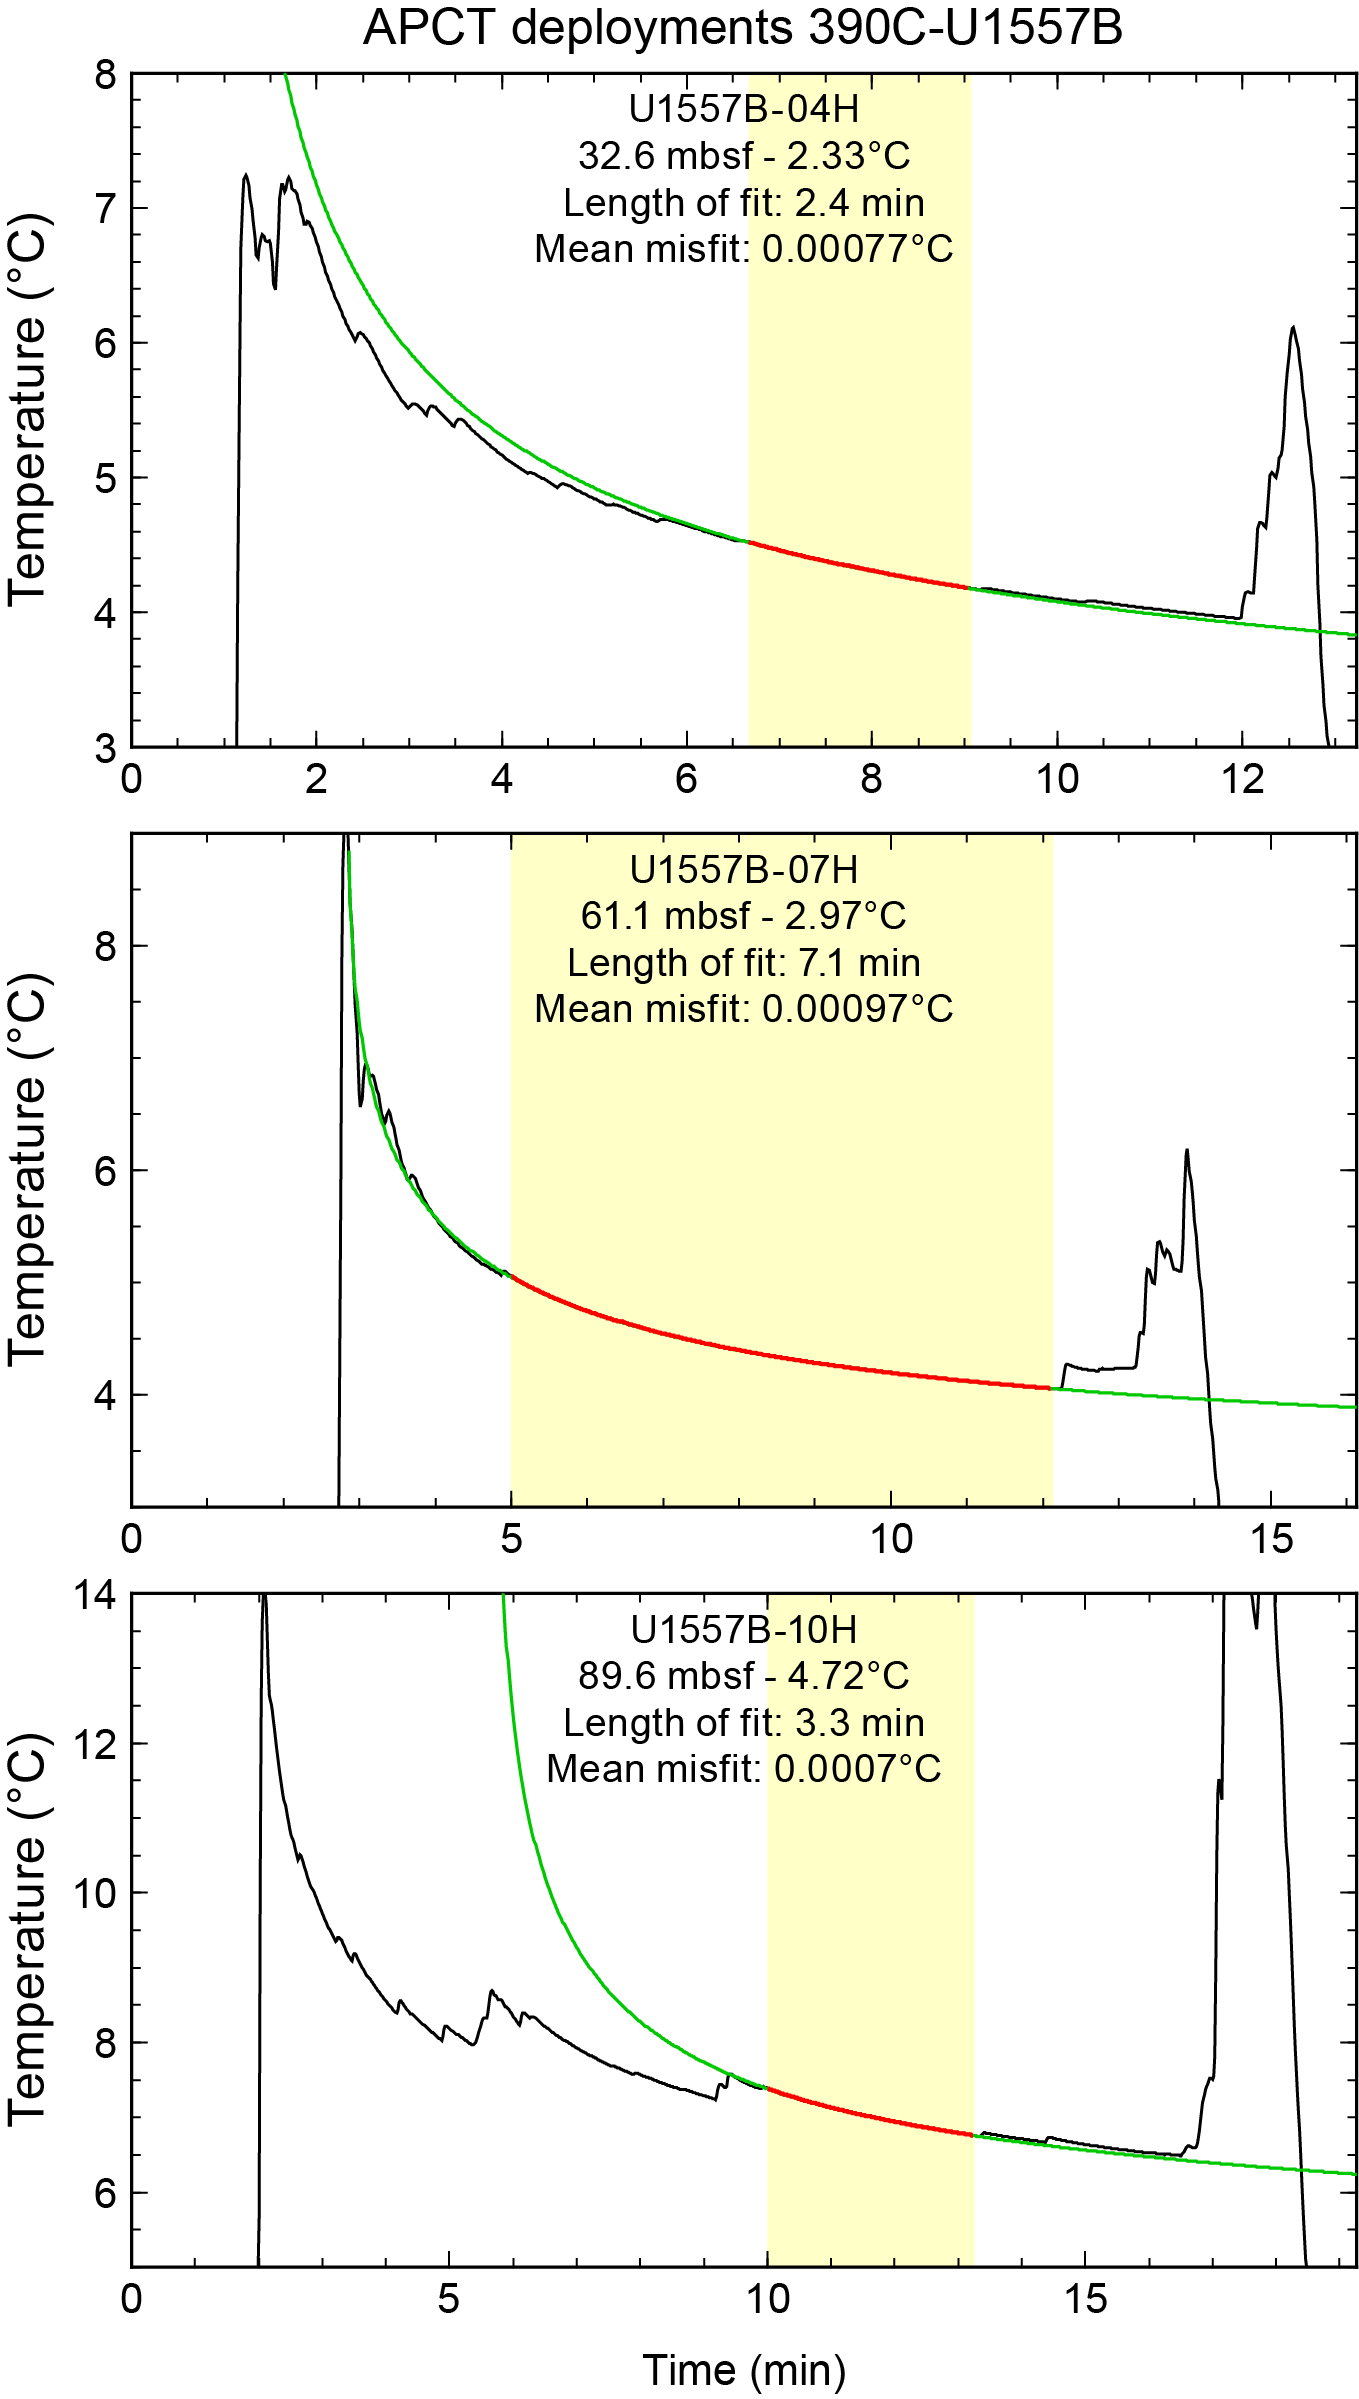
Figure F86. APCT-3 temperature records.
10.1.3.2. Heat flow
Conductive heat flow for Site U1557 was calculated using discrete thermal conductivity measurements to calculate thermal resistance and plotting this versus depth (Figure F84B). This allowed thermal resistance to be calculated at depths coincident with temperature measurements made during APC drilling in Hole U1557B (see Physical properties and downhole measurements in the Expedition 390/393 methods chapter [Coggon et al., 2024c]). The intercept (T0) of a linear trend on a plot of temperature versus thermal resistance, known as a Bullard plot (Pribnow et al., 2000) (e.g., Figure F84D), is the temperature at depth 0 m in the sediment succession (i.e., at the seafloor). The slope of such a regression line is equal to the conductive heat flow, which is calculated to be 40 mW/m2 in Hole U1557B, similar to that observed in nearby Hole U1556A (42 mW/m2). Table T15 summarizes these results.
10.1.3.3. Logging operations
Logging operations for Site U1557 began after the completion of RCB coring in Hole U1557D to a total depth of 684.7 m DSF. In preparation for logging, an additional 50 barrel mud sweep was circulated in the hole to clean out any cuttings, the pipe was raised above the reentry cone, the RCB bit was released on the seafloor, and the borehole was reentered and filled with seawater (see Operations). The drill pipe was raised to 30 m DSF for logging. Sea conditions were moderate, with heave in the 1–2 m range, and the wireline heave compensator was used for the entirety of logging operations.
Because of time limitations, wireline logging operations were limited to a single tool string run in Hole U1557D. The sedimentary section in Hole U1557D was cased during Expeditions 390C and 395E (Estes et al., 2021; Williams et al., 2021) (see Background and objectives). The primary target of wireline logging at this site was the open hole below 572 m DSF in the Site U1557 hard rock section. However, the gamma ray wireline logging tool received adequate signal through casing below the depth of the pipe during logging operations to record spectral gamma ray data from the sedimentary formation. Gamma ray data from wireline logging operations in Hole U1557D provide information about the nature of the sediments at Site U1557 that can be correlated with properties of the sediment cores from Hole U1557B. However, logs recorded through casing were used primarily qualitatively because of the attenuation of the incoming signal. Full detail on wireline logging operations and basement results are provided in the basement section for Site U1557 (see Wireline logging).
10.1.3.4. Logging data through casing
Gamma ray logs recorded the contributions of U, K, and Th to the total gamma ray signal through the cased interval of sediments in Hole U1557D reflect changes in sediment properties, primarily the distinct alternations in lithology between silty clay and nannofossil ooze/chalk that are likely the primary sedimentary characteristic affecting both in situ and core physical properties data at Site U1557. Silty clay layers have higher NGR relative to the carbonate-rich intervals. The pattern of alternating higher and lower gamma ray from downhole logging is also seen in physical properties measurements of cores from Hole U1557B (Figure F83), which enables the downhole gamma ray logs from Hole U1557D to be correlated to the core data from Hole U1557B with a slight depth offset on the order of a few meters (Figure F87). Discrepancies between the drilling core depth and wireline logging depth may occur because of core expansion, incomplete core recovery, incomplete heave compensation, wireline stretch, drill pipe stretch, and tidal changes.
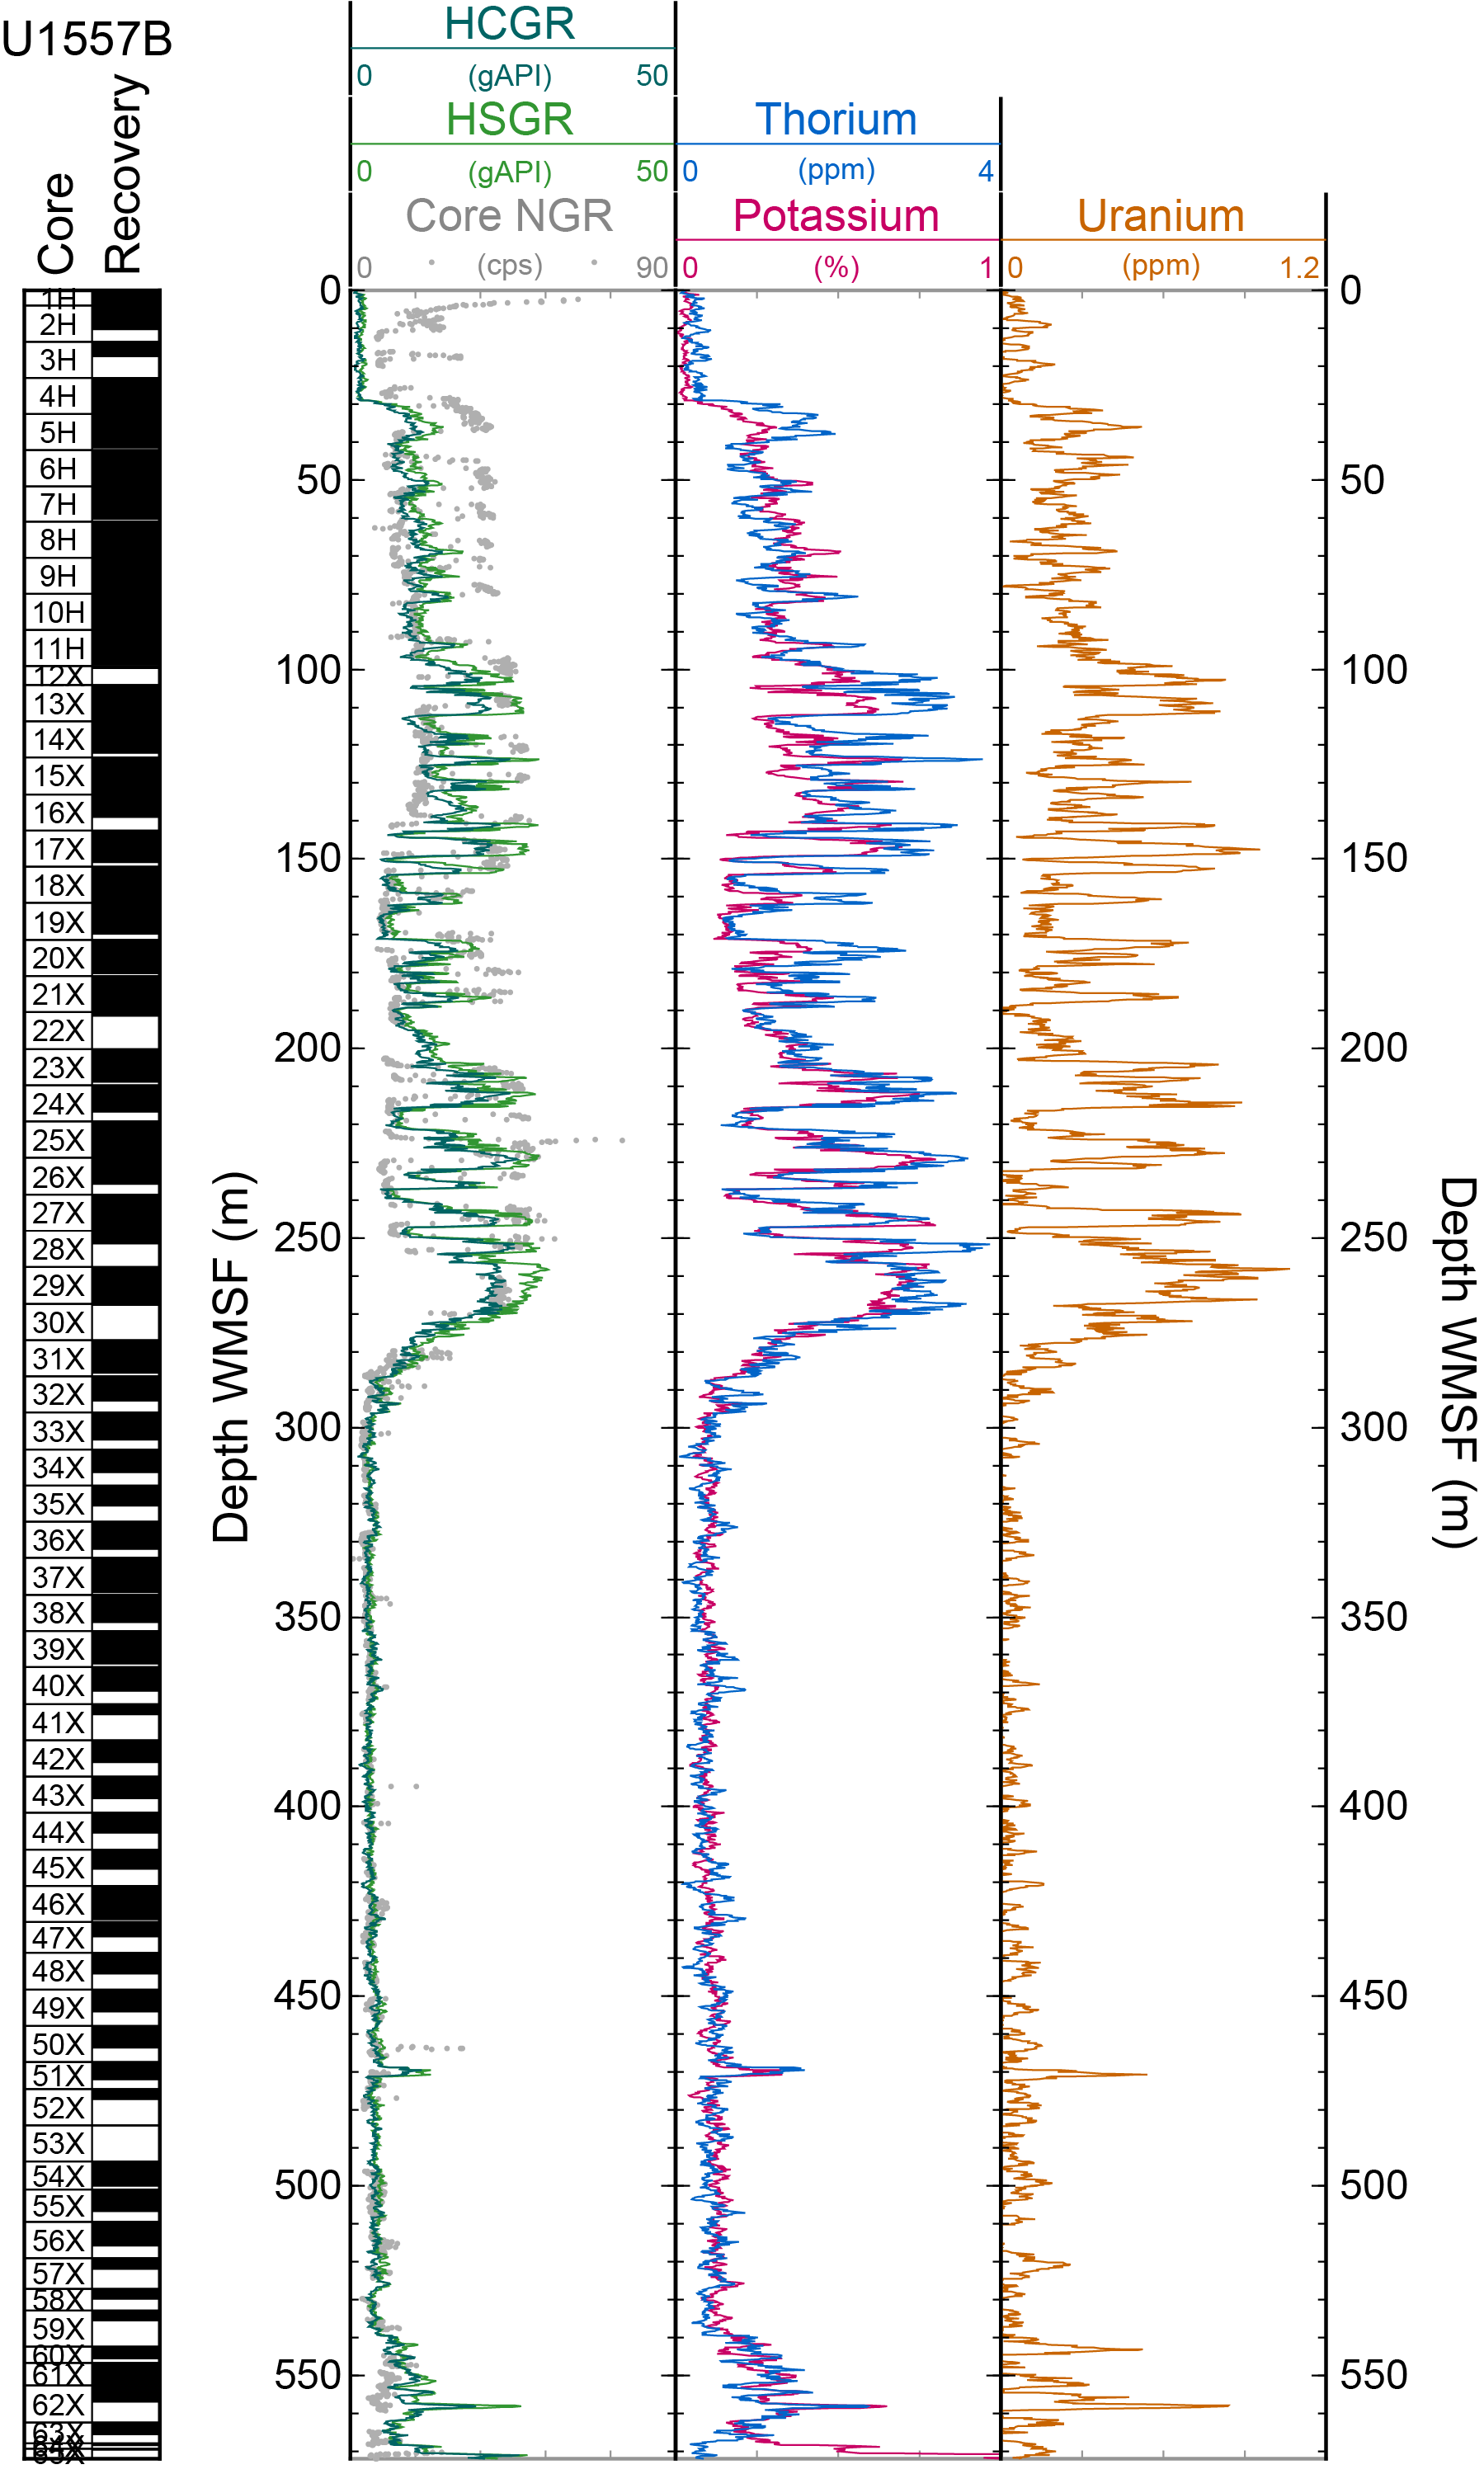
Figure F87. NGR logs recorded in casing, Hole U1557D.
Lithologic unit boundaries correspond to clear changes in core physical properties data, and these boundaries are also evident in gamma ray logs. There is good agreement between core data from Hole U1557B and trends in logging gamma ray data recorded in the cased interval of Hole U1557D below the depth at which the drill pipe was set for wireline logging (29 m WMSF). Between 29 and ~270 m WMSF, the gamma ray log shows clearly defined intervals of higher and lower gamma ray, consistent with the presence of alternating silty clay and ooze/chalk, respectively, in Lithologic Unit I (see Sedimentology). Logging data, which is continuous downhole, resolves both sharp boundaries (e.g., 171 m WMSF) and transitional changes (e.g., 97–102 m WMSF) between silty clay and carbonate-dominated intervals throughout Lithologic Unit I. Gamma ray decreases gradually from 270 to 288 m WMSF with low-amplitude variability. In the interval below 298 m WMSF, which likely corresponds to the Lithologic Unit I/II boundary described in Hole U1557B (see Sedimentology), gamma ray is generally low, consistent with the carbonate-dominated lithology of Lithologic Unit II described in Hole U1557B cores. A local peak in the gamma ray log centered around 470 m WMSF occurs at approximately the same depth as a distinct clay-bearing layer described as being deposited during the PETM (see Lithologic correlations). Gamma ray increases slightly between 540 and 562 m WMSF, with locally elevated values that are consistent with both the presence of sand-sized igneous clasts and organic-rich laminations in Hole U1557B cores. A distinct peak in the gamma ray log at 558 m WMSF may correspond to the first appearance of basalt in Hole U1557D, consistent with the signature of the gamma ray peak in core-based data from Hole U1557B that corresponds to the first appearance of basalt in that hole. The depth of the gamma ray peak in Hole U1557D logs is ~6 m shallower than the first appearance of basalt in Hole U1557B cores, but this could be explained by a number of factors, including slight differences in the basement topography between holes, a gap in core recovery in Hole U1557B (Core 390C-U1557B-62X), and small-scale discrepancies between core and logging depth scales. The return to lower gamma ray below 558 m WMSF at the base of the cased interval suggests that there is an additional interval of carbonate-rich sediment before the appearance of significant basement intervals, further described in Basement in Physical properties and downhole measurements.
Spectral data from the gamma ray logging tool show variations in the relative contributions of the radioactive isotopes of U, K, and Th to the total gamma ray signal (Figure F87). At Site U1557, the total gamma ray signal comes mostly from the radioactive isotopes of potassium, with additional contributions from thorium throughout Lithologic Unit I of the logged sedimentary section. Thorium is a trace element typically associated with clays and heavy minerals, and spectral gamma ray data show relatively higher contributions from thorium in the more clay-rich intervals that define the lithologic unit (Figure F87; see Sedimentology). There is also a contribution from uranium in the higher gamma ray intervals throughout the logged interval, which is likely associated with higher organic carbon in silty clay layers.
10.1.4. Data integration
10.1.4.1. Lithologic correlations
Physical properties data show distinct changes in the sedimentary section cored at Site U1557 that correspond closely with the lithologic units (see Sedimentology). Lithologic Unit I (0–251.53 m CSF-B) exhibits centimeter-scale alternations in NGR, MS, and bulk density that are likely associated with the primary alternating lithologies that characterize that unit. Higher NGR and MS and lower bulk density throughout this interval are associated with silty clays, which contain more naturally radioactive and magnetic minerals, whereas lower NGR and MS and higher bulk density are associated with nannofossil oozes.
MS and GRA bulk density display a distinct change in character at the Unit I/II boundary (Figure F83). A peak in MS and a low in bulk density, indicative of a clay-rich layer, seem to bracket the Unit I/II boundary at 289.84 m CSF-B, which was defined on the basis of sedimentologic observations (see Sedimentology). A gap in Hole U1557B core recovery occurs at the Unit I/II boundary and inhibits more definitive analyses. Converting CSF-B depth to two-way traveltime (TWT) using the depth-averaged velocity of seawater and sediment, the Unit I/II boundary occurs at 7.0 s TWT, which is coincident with a seismic reflector identified by Estep et al. (2020) to represent a regional unconformity.
Physical properties data show distinct variation in Lithologic Unit II (257.7–564.76 m CSF-B). Low NGR and MS below ~275 m CSF-B are representative of the carbonate ooze that dominates the lithology of that unit. Locally elevated NGR in this lithologic unit corresponds to layers with higher silty clay within the calcareous nannofossil oozes (e.g., 422–430 m CSF-B in Core 390C-U1557B-46X) (Figure F83). Elevated NGR may also correspond to intervals with a higher proportion of organic particles (e.g., 510–520 m CSF-B in Core 56X).
10.1.4.2. Carbonate dissolution events
In sedimentary Unit II, three sections (390C-U1557B-37X-6, 40X-2, and 50X-3) show abrupt increases in NGR and MS above respective baseline values (Figure F88). An increase in NGR suggests a greater proportion of clay versus carbonate because of the greater radioactive element content of clays. Sedimentary core descriptions (see Sedimentology; also see Core descriptions) and core images show dark orange layers in these three sections, validating the increased clay content suggested by NGR. Higher MS in the same intervals indicate a greater proportion of magnetic minerals in the sediments, perhaps due to more Fe-bearing minerals hosted in these clay intervals. These abrupt changes in the physical properties occur in carbonate-dominated Unit II, making these short-lived clay intervals stand out as possible carbonate dissolution events associated with shoaling of the CCD at the time of deposition.
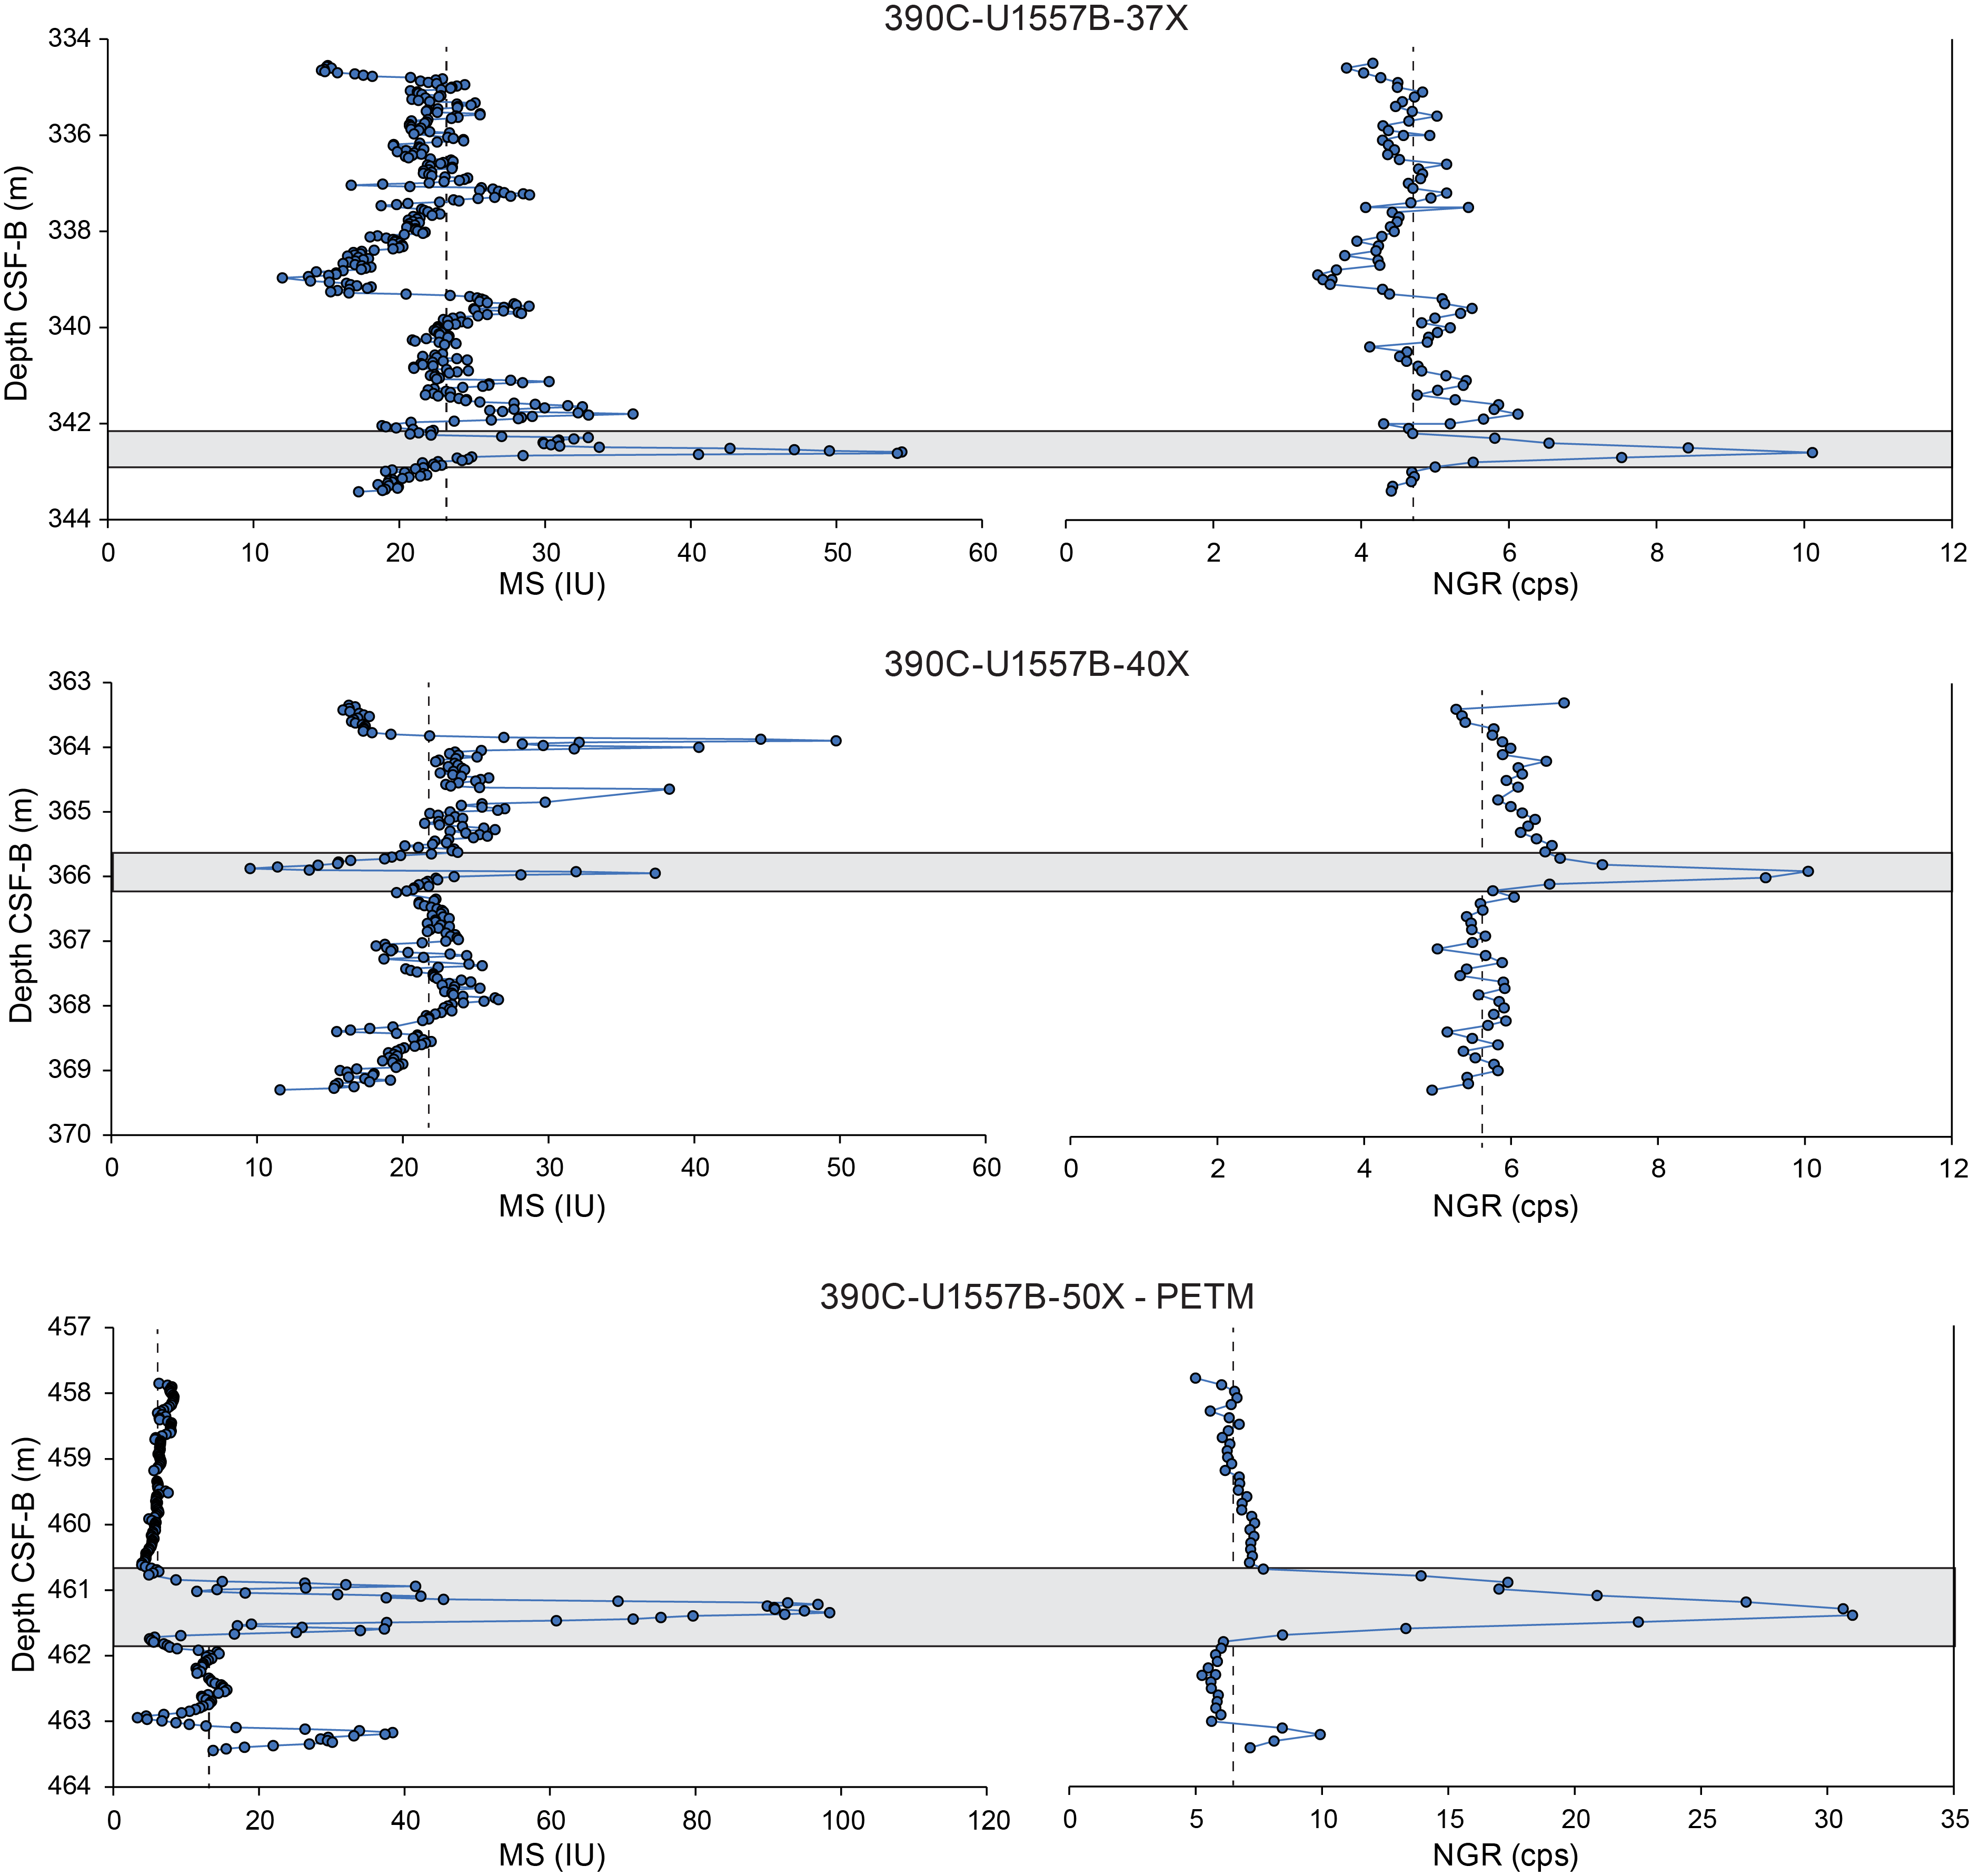
Figure F88. MS and NGR correlation.
The clay-rich interval in Section 390C-U1557B-50X-3 (460.5–462 m CSF-B) is the thickest interval of the three possible carbonate dissolution events and has the highest NGR and MS (Figure F88). In a sample taken from Section 50X-3, 45 cm (461.25 m CSF-B), specimens of Rhomboaster spp., short-lived excursion taxa that lived during the PETM, are present (see Biostratigraphy). The two clay-rich intervals in Sections 37X-6 (342–343 m CSF-B) and 40X-2 (365.5–366.5 m CSF-B) have more condensed clay layers with lower NGR and MS relative to the PETM section, but both are elevated relative to their respective baselines (Figure F88). The lowest occurrence datum for S. radians at Site U1557 occurs at 338.6 m CSF-B in Section 37X-3 and has an age of 54.12 Ma (Gradstein et al., 2020) (see Biostratigraphy). The preliminary Site U1557 age model (see Age model and mass accumulation rates) tentatively points toward three possible carbonate dissolution events during the early Eocene. Similarly, clay layers with high NGR and MS were identified during Ocean Drilling Program Leg 208 at Walvis Ridge in the southeast Atlantic across the Eocene/Paleocene boundary (Shipboard Scientific Party, 2004), confirmed as evidence to support carbonate dissolution during shoaling of the CCD during the PETM by Zachos et al. (2005).
10.2. Basement
10.2.1. Physical properties
Physical properties characterization in the basement section at Site U1557 is based on cores from Holes U1557B and U1557D. The basement sequence at Site U1557 consists of sedimentary breccia composed of basalt and volcanic glass clasts and a matrix of variable proportions of pelagic sediment, calcite, lithic fragments, and zeolites (see Igneous petrology and Alteration petrology). For physical properties characterization, matrix is defined as the material between large clasts, which actually comprises small basalt and altered glass clasts, fine-grained matrix, and/or cement (see Igneous petrology). Whole-round core section measurements included NGR, GRA bulk density, and MS (see Physical properties and downhole measurements). Archive halves of all split-core sections were measured for MSP. A total of 36 discrete sample cubes were taken for P-wave velocity and MAD measurements. Most of these discrete samples were also used for paleomagnetic measurements (see Paleomagnetism). Nondestructive thermal conductivity measurements were made on representative samples (individual pieces) from split cores. Full-circumference, true color images of whole-round core exteriors were recorded with the DMT CoreScan3 system. A summary of the physical properties data from Hole U1557D, which recovered the longest basement interval at this site, is shown in Figure F89.
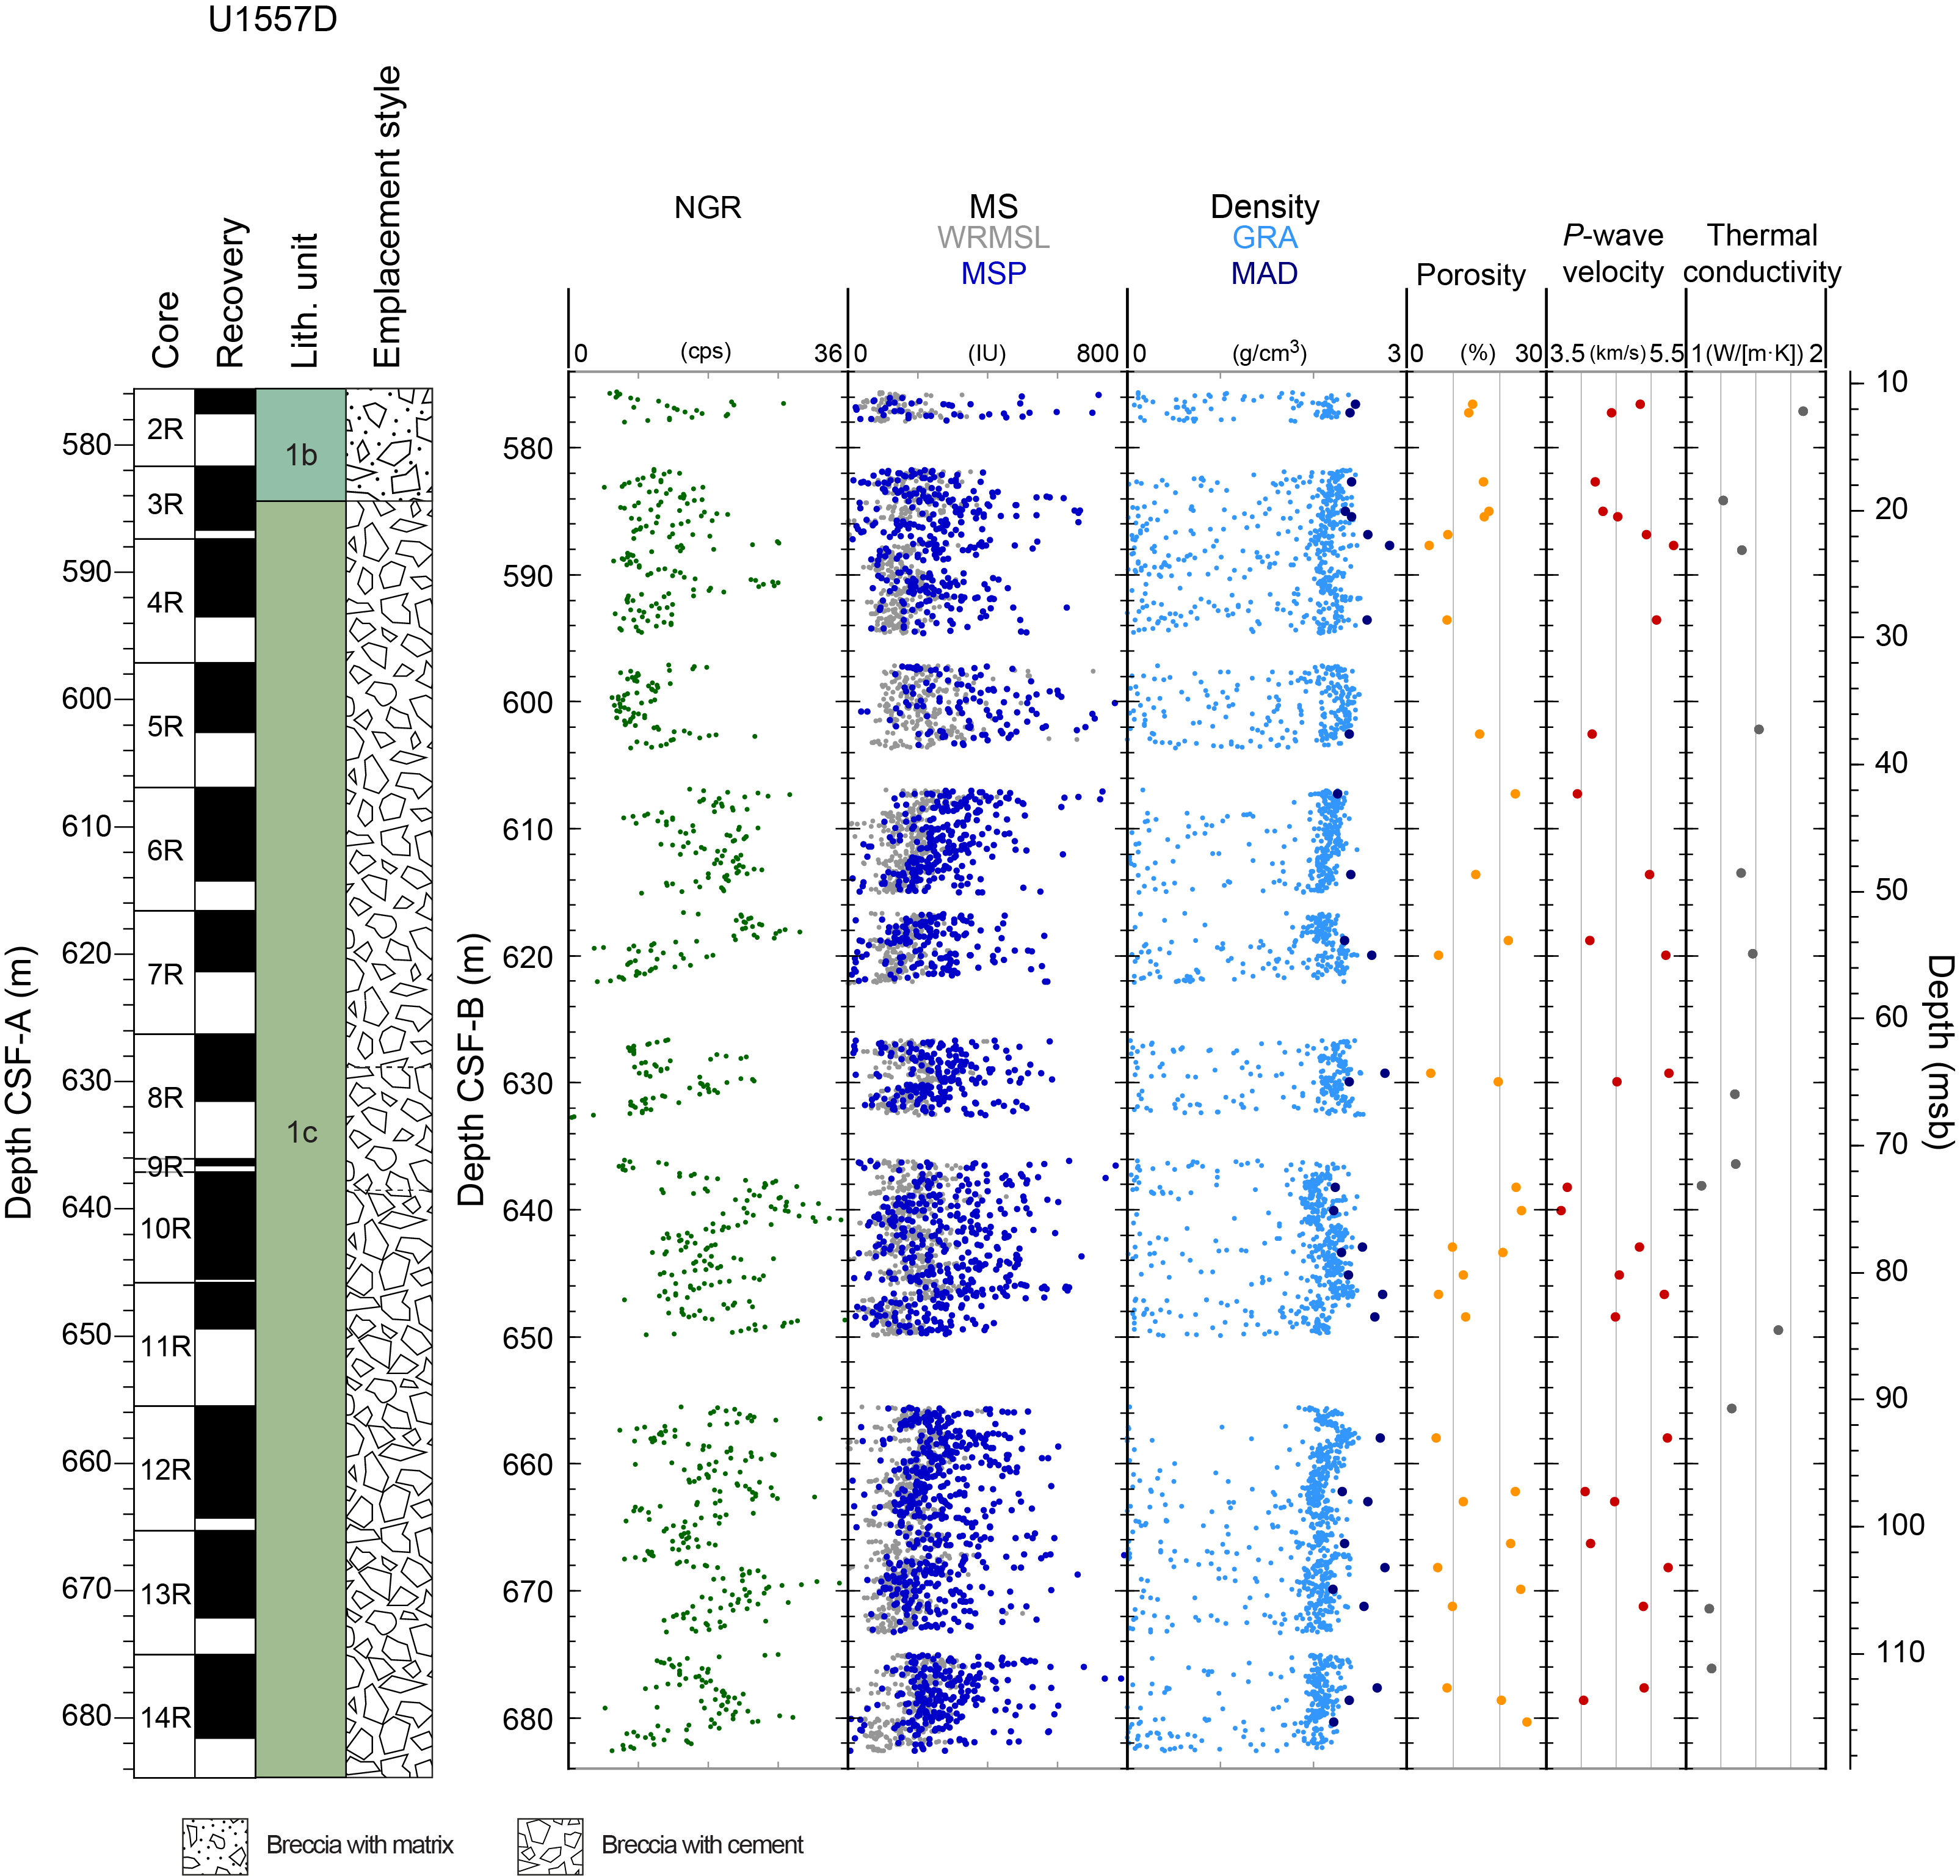
Figure F89. Basement core physical properties data, Hole U1557D.
10.2.1.1. Natural gamma radiation
NGR serves as an estimate of the variability in concentration of radioactive elements (40K, 238U, and 232Th) in the cored basement section. Because radioactive element concentrations are generally low in fresh basalts, potassium added via secondary mineral precipitation is likely to be the main component in the NGR variability (Alt, 1995). Assuming that is the case, NGR may serve as a proxy for alteration in oceanic crust (Bartetzko et al., 2001).
In Hole U1557D, NGR ranges 0.4–35.6 counts/s (mean = 15.9 counts/s) (Figure F89). Because of the lithologically mixed nature of the breccia encountered at Site U1557, scatter in the physical properties data is expected and trends are difficult to distinguish. However, lower NGR appears to coincide with relatively (macroscopically) fresh basalt clasts in the breccia, whereas higher values, particularly above 30 counts/s, coincide with altered glass-bearing, clay-rich intervals (see Igneous petrology). Zeolites commonly form in association with altered glass clasts, and intervals with higher NGR in Hole U1557D may reflect the presence of a potassium-rich end-member such as phillipsite (see Alteration petrology).
10.2.1.2. Gamma ray attenuation bulk density
Variations in bulk density can reflect changes in mineralogy, composition, and porosity within basement units. GRA bulk density from Holes U1557B and U1557D ranges from 0 to ~2.6 g/cm3. Values < 1 g/cm3 are considered spurious because they have a lower density than seawater (~1.03 g/cm3) and are likely associated with irregularly sized core pieces, gaps between individual core pieces, and/or core liner dividers inserted between core bins (see Curatorial core procedures and sampling depth calculations in the Expedition 390/393 methods chapter [Coggon et al., 2024c]). Most of the coherent data cluster at the higher end of the reported range (Figure F89). At Site U1557, there is no major downhole trend in GRA bulk density. However, the basement recovered at Site U1557 was a single unit of breccia >100 m thick (see Igneous petrology), so the compositional difference observed within the breccias (i.e., the different proportions of clast type or matrix type) had very minor influence on the bulk density.
10.2.1.3. Magnetic susceptibility
MS is an indicator of the tendency of minerals to become magnetized upon application of a magnetic field; thus, it can be considered an approximation of the abundance of magnetic minerals within the rock. MS at Site U1557 was measured on whole-round core sections using a pass-through sensor on the WRMSL and on split-core sections using a point-contact sensor on the SHMSL. Both the pass-through and point-contact data are similar in character. MS ranges from 0 to ~800 IU. Whole-round data from Hole U1557D have a mean MS of 168 IU, and discrete data have a mean MS of 277 IU. Figure F89 shows substantial scatter in both measurements, which reflects the mixed composition of basalts and matrix in the breccia.
10.2.1.4. Thermal conductivity
Thermal conductivity measurements in the basement offer a means of calculating potential conductive heat flow through oceanic crust. Thermal conductivity is controlled by basement properties such as chemical composition, porosity, density, and fabric of the basement rocks.
Thermal conductivity in Hole U1557D ranges from 1.84 W/(m·K) in the uppermost core (Section 390-U1557D-2R-2) to 1.11 W/(m·K) in Section 10R-1. Four thermal conductivity measurements were taken below the sediment/basement interface in Hole U1557B, in which the sediment/basement interface was captured with the XCB system, and values were consistent with data from Hole U1557D (Table T16; Figure F90). At 0.26 msb, a thermal conductivity of 2.18 W/(m·K) was determined for a sample from Hole U1557B. The shallowest basement measurement in Hole U1557D was relatively high as well (1.8 W/[m·K]). First-order analysis of core images seemed to indicate that higher thermal conductivity coincides with breccia containing clasts of fresher basalt, whereas samples that contained a higher proportion of more altered basalt had lower conductivity.
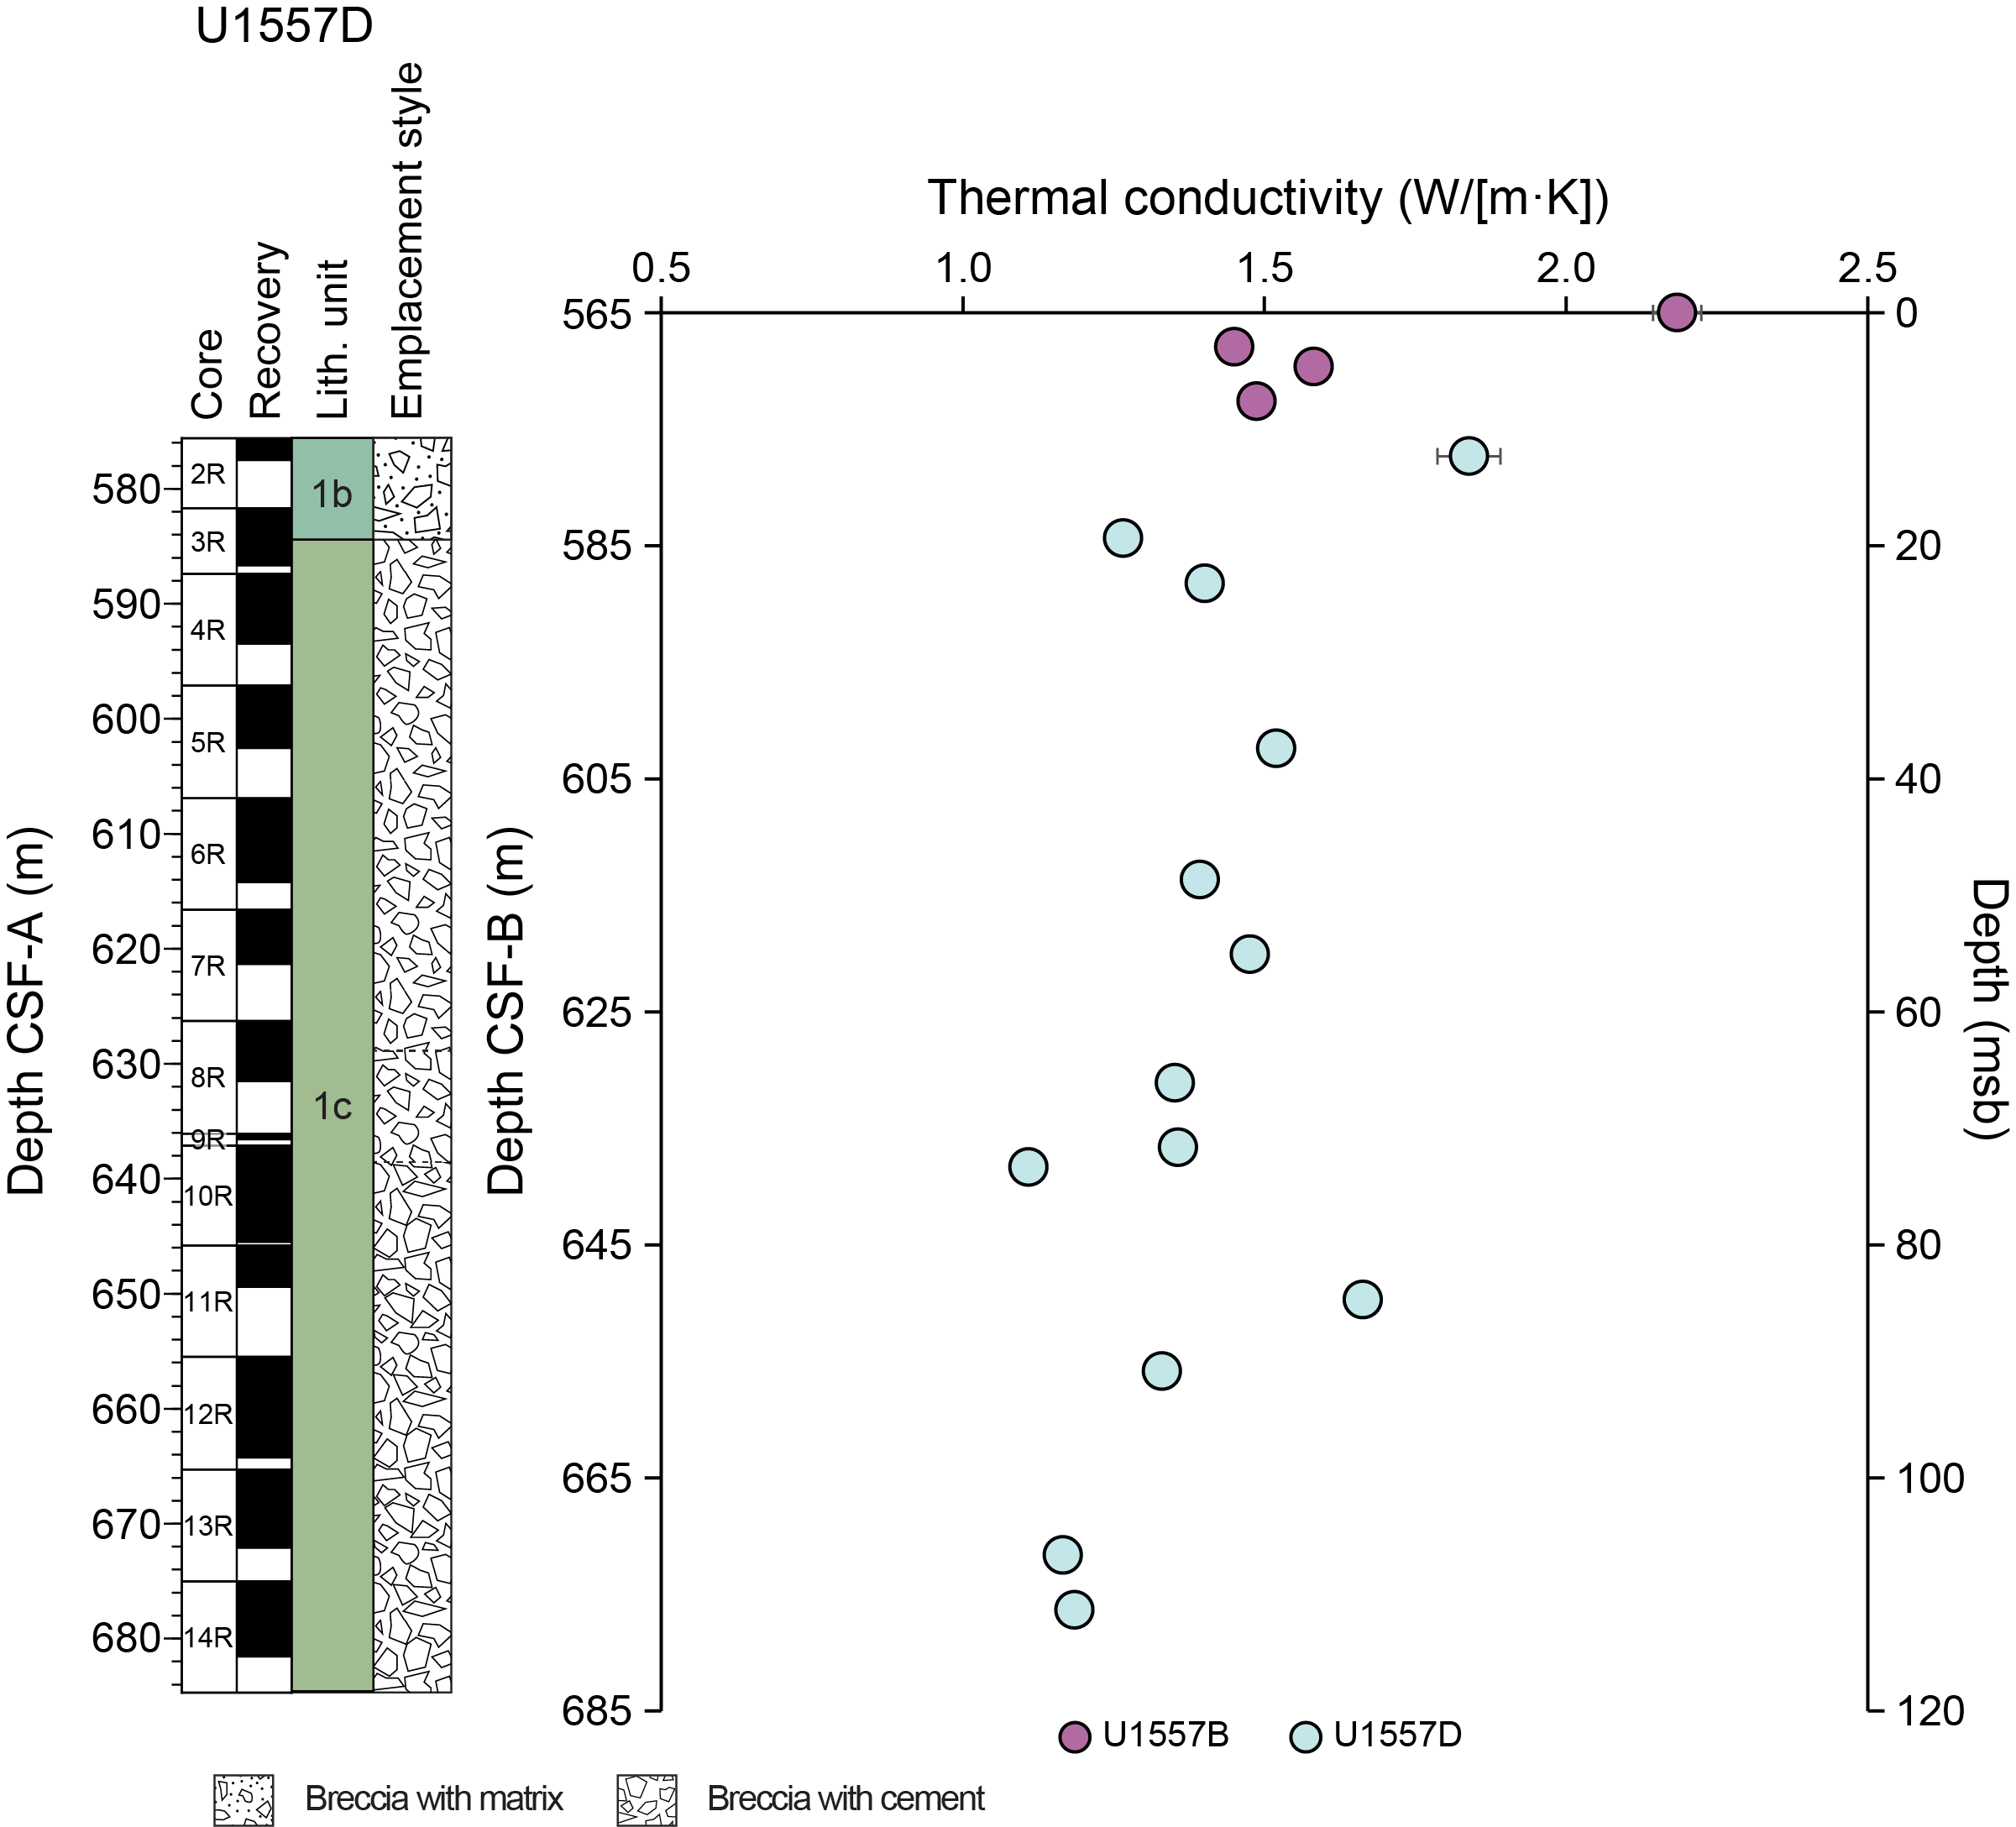
Figure F90. Basement thermal conductivity data, Holes U1557B and U1557D.
10.2.1.5. Moisture and density
MAD procedures include high-precision, high-accuracy measurements of discrete sample mass and volume that allow calculations of the bulk density, grain density, and porosity. Porosity is particularly useful for determining the volume of water that could potentially be stored in the interval or lithology represented by a discrete sample. Bulk density, in part, controls seismic wave velocity. Grain density is related to the mineralogy of the sample, so it is useful for mineralogical analyses and alteration studies.
Discrete samples for MAD analysis were generally taken twice per core and were selected to be representative of both the basalt clasts and the matrix of the breccia recovered at Site U1557. There were intervals within the breccia that contained significant void space that was greater in volume than the 2 cm3 sampling size for the MAD cubes; therefore, MAD porosity measurements are not representative of the total pore space in the formation and should be considered the lower limit of true porosity in the basement material at Site U1557. Four discrete samples were taken from below the sediment/basement interface in Hole U1557B (from Cores 390C-U1557B-63X, 65X, and 66X) that recovered the uppermost volcaniclastic breccia (see Estes et al., 2021). A total of 32 discrete samples were taken from Hole U1557D cores: 16 samples from the basalt clasts and 16 samples from the breccia matrix (defined here as the material between large clasts, which actually comprises small basalt and altered glass clasts, fine-grained matrix, and/or cement; see Igneous petrology). The analyses reported here are of samples from Hole U1557D, in which the majority of the talus breccia recovered at Site U1557 was cored.
The mean porosity of all Hole U1557D discrete samples is 15% (Table T17) (mean clasts = 9%; mean matrix = 21%). The porosity of the clast samples does not change systematically downhole, but the porosity of the matrix samples increases downhole (Figure F91A). A linear regression of porosity as a function of depth for the matrix samples has R2 = 0.54 and a p value = 0.001, indicating a significant relationship.
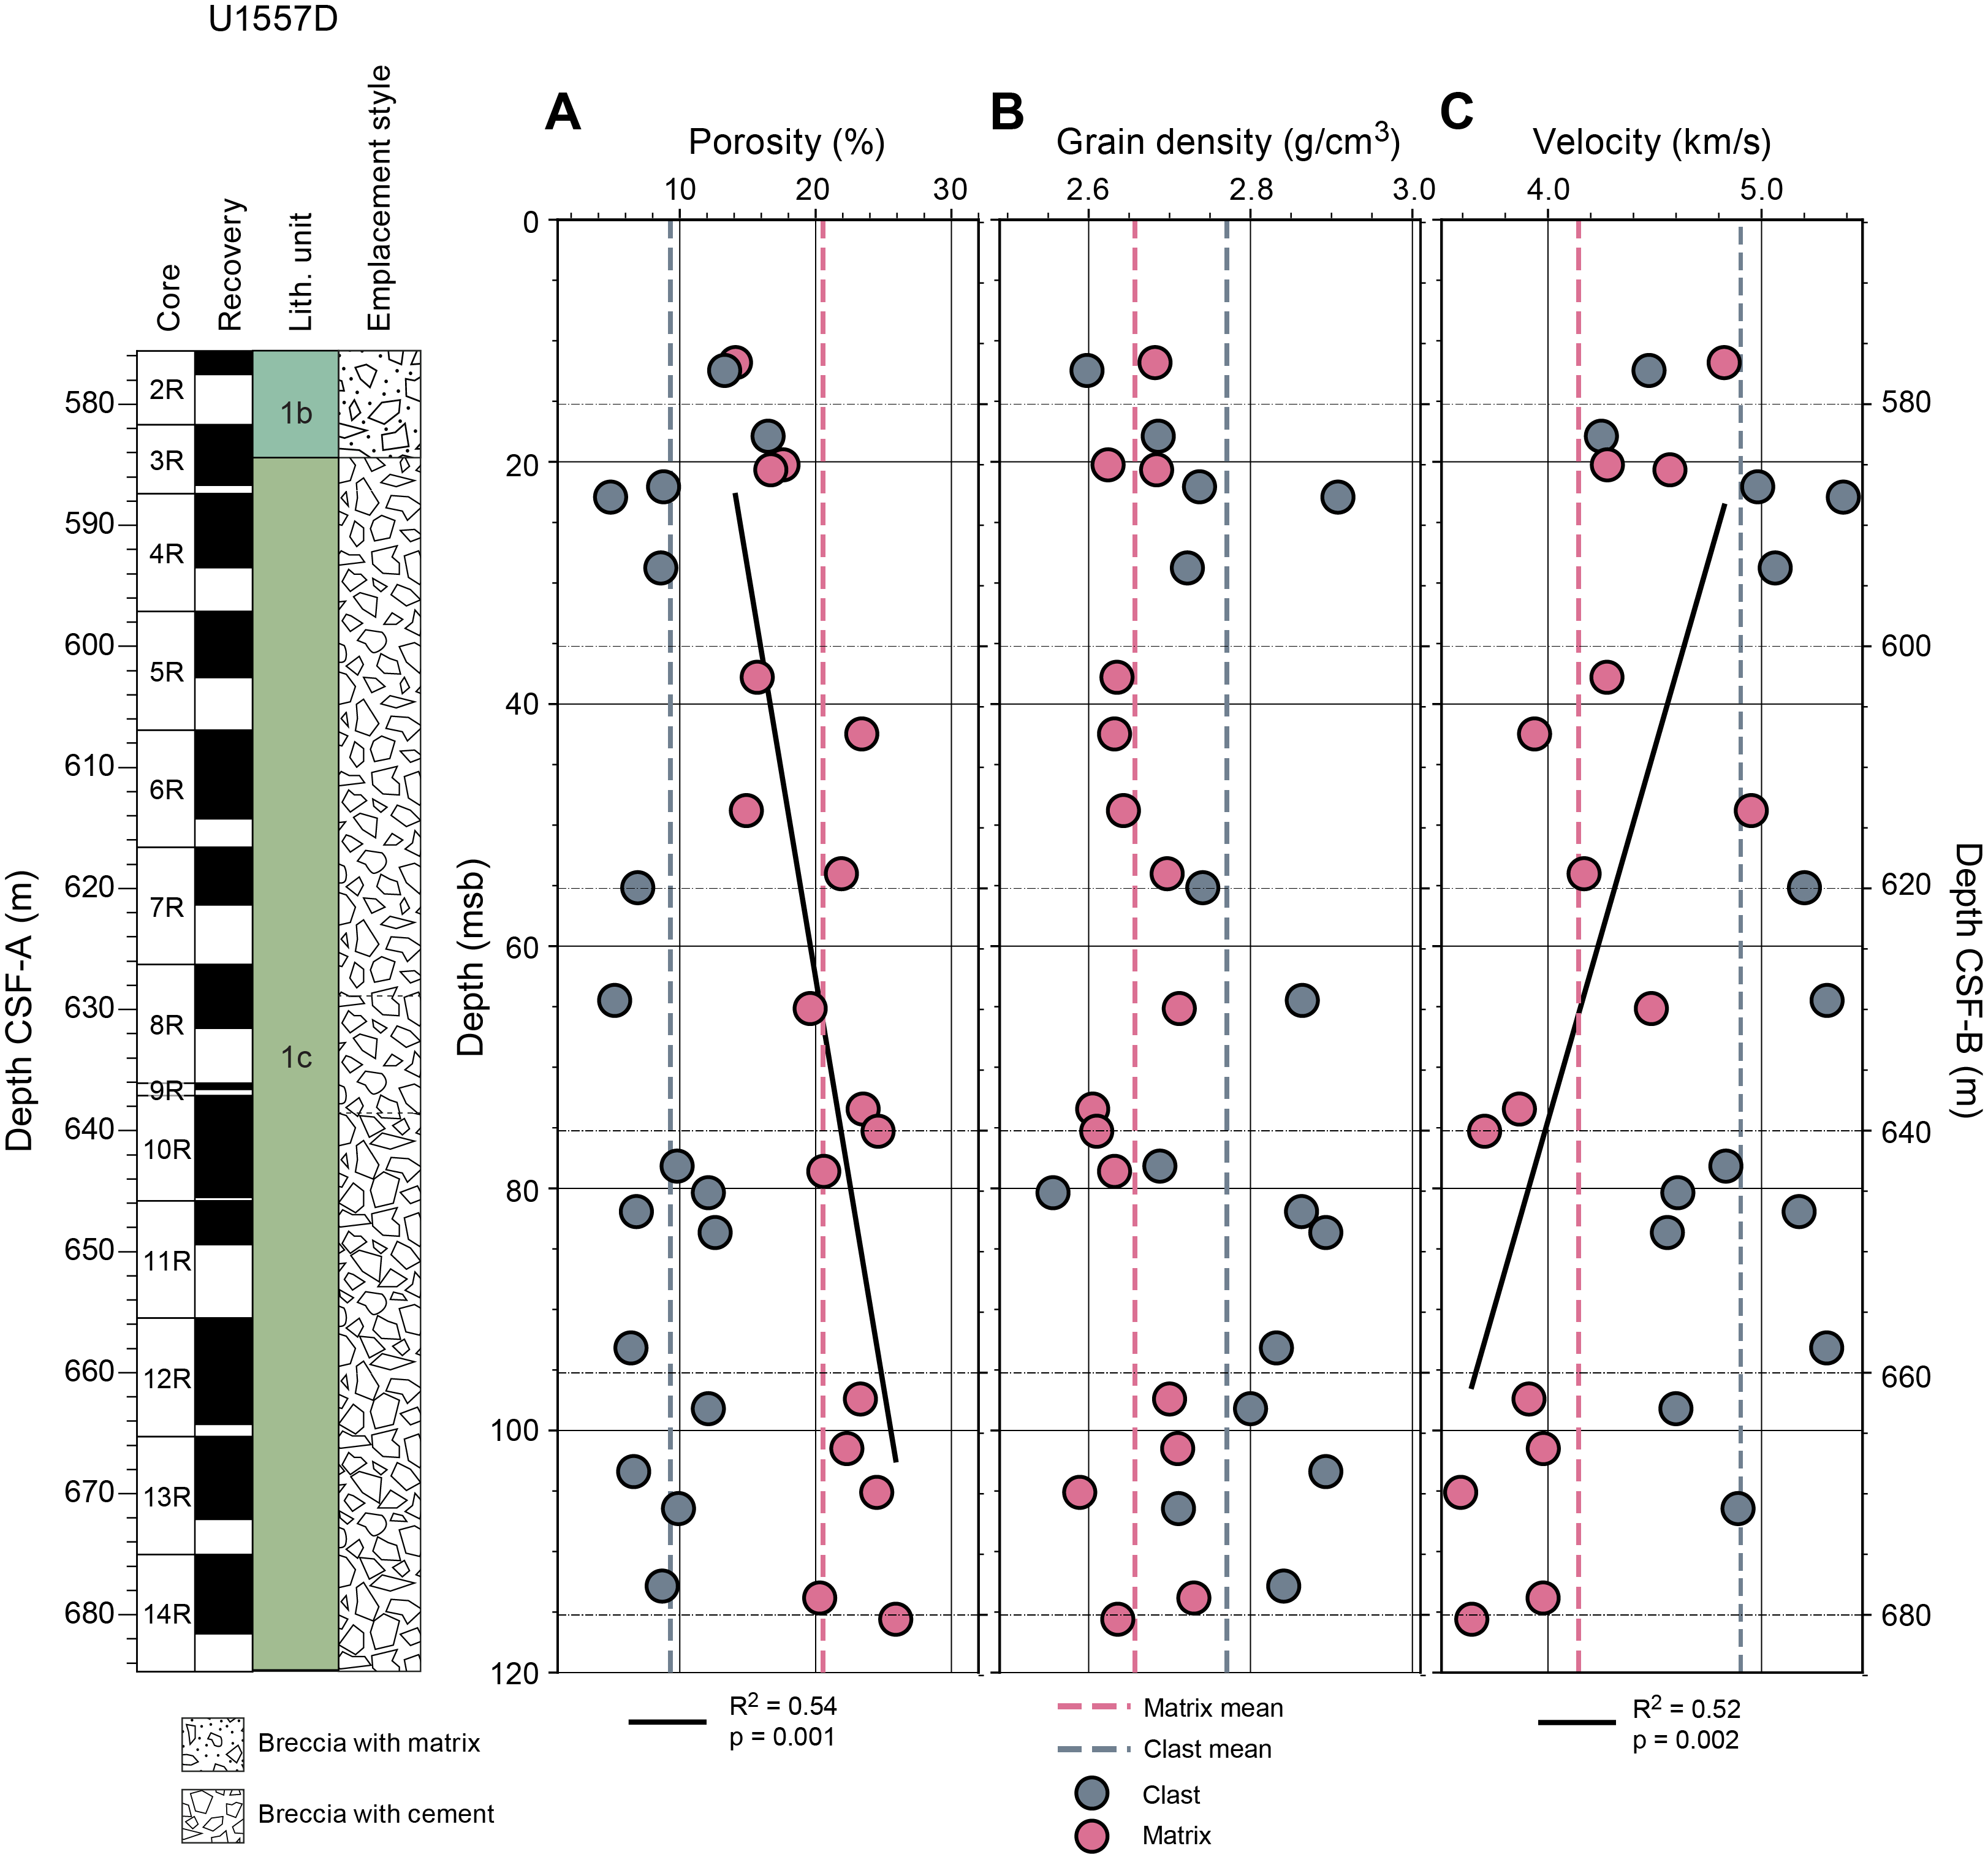
Figure F91. Physical properties of discrete rock samples, Hole U1557D.
The mean grain density of the discrete samples is 2.71 g/cm3 (Table T17) (mean clasts = 2.77 g/cm3; mean matrix = 2.66 g/cm3). Although the grain density of the matrix samples shows little variation from the mean (standard deviation = 0.04 g/cm3), the clast samples show more variation (standard deviation = 0.11 g/cm3) (Figure F91B). The variation in grain density of the clast samples could reflect different basalt types or different degrees of alteration.
10.2.1.6. P-wave velocity
P-wave velocity is the velocity of a seismic compressional wave (P-wave) propagating through a sample. P-wave velocity is directly controlled by the bulk density, compressibility, and shearability of the material sampled and is indirectly related to the porosity, mineralogy, grain fabric, or lithology of a discrete sample. P-wave velocity was measured on the discrete samples used for MAD analyses, allowing direct comparison of porosity and density with velocity. Determining the P-wave velocity of discrete samples is also especially useful when correlating the downhole logging velocities and regional seismic imaging to the core measurements.
P-wave velocity was measured on the x-, y-, and z- axes of the discrete sample cubes, and no evidence of anisotropy was observed. Therefore, the mean three-axis velocity was used for each of the discrete samples (Table T17). The mean P-wave velocity of the clast samples is 4.90 ± 0.36 km/s (±1 standard deviation), and the mean velocity of the matrix samples is 4.14 ± 0.42 km/s. The P-wave velocity of the discrete samples from clasts in the breccia shows little downhole trend (Figure F91C), but the velocity of the discrete samples from the breccia matrix between the larger basalt clasts decreases downhole (Figure F91C). A linear regression with R2 = 0.52 and a p value = 0.002 indicates a clear decrease in velocity with increasing depth for the matrix samples, which is consistent with the observed increase in porosity downhole (Figure F91A).
10.2.2. Digital imaging
Hard rock cores collected at Site U1557 were well consolidated, and pervasive fracturing was rare. This resulted in cylindrical cores particularly suitable for imaging. A total of 99.3% of the recovered material could be scanned on the DMT CoreScan3. Image exposure was also improved compared to Site U1556 because all automatic processing done by the CoreScan3 software was disabled and a blackout curtain was installed to create a more controlled imaging environment. Unlike the section-half images taken using the SHIL (see Core image processing in the Expedition 390/393 methods chapter [Coggon et al., 2024c]), high-resolution images of the whole-round core preserve 3-D geometries of alteration features and greater data coverage (360°) of the original core. Both image data sets could be used for quantifying the proportion of rock types using machine learning and computer vision (Fu et al., 2022), although the high-resolution DMT images collected during Expedition 390 provide a unique suite of images for training machine learning algorithms.
10.2.3. Wireline logging
Three logging runs were initially planned to follow basement coring in Hole U1557D: the triple combo, Formation MicroScanner (FMS)-sonic, and Ultrasonic Borehole Imager tool strings (see Wireline logging operations in the Expedition 390/393 methods chapter [Coggon et al., 2024c]). However, to recover time lost to weather during Site U1557 operations and preserve time for operations at Site U1559, only one logging tool string was run in Hole U1557D (see Operations). The triple combo tool string recorded a primary set of measurements (gamma ray spectroscopy, density, electrical resistivity, and MS) to assess hole conditions and characterize the drilled formation. Drilling conditions prior to completion of coring had been good, the sea state was favorable, and the triple combo was deployed successfully, providing good quality data over two full passes of the drilled breccia interval.
10.2.3.1. Wireline operations
Logging operations for Site U1557 began after completion of RCB coring in Hole U1557D to a total depth of 684.7 m DSF on 17 May 2022. In preparation for logging, a final mud sweep was circulated in the hole, the pipe was raised above the reentry cone, the RCB bit was released on the seafloor, and the borehole was reentered and filled with seawater (see Operations). The drill pipe was raised to 30 m DSF for logging. Sea conditions were moderate, with heave in the 1–2 m range, and the wireline heave compensator was used for the entire logging operation.
The triple combo was rigged up and run into the hole at 0835 h (local time) on 18 May. A downlog was recorded from just above the seafloor (identified by a step in the gamma ray log) to the bottom of the hole at 5711 mbrf. The first upward pass started at 1215 h and continued through the open hole until the entire tool string was pulled back into the casing. The tool string was immediately run back into the hole for the second (main) upward pass. The main pass began at 1250 h at 5711 mbrf and continued up through the casing until the entire tool string passed above the seafloor. The main pass was completed at 1731 h, and the triple combo tool string was returned to the surface. All tools were rigged down by 1815 h, and the drill floor was returned to drilling operations at 1845 h on 18 May.
10.2.3.2. Data overview
A summary of the main data recorded from the triple combo is shown in Figures F92 and F93. The quality of downhole logging data is typically affected by hole diameter. The caliper log in Figure F92 shows that the borehole was in excellent condition with a diameter close to RCB MS size. A larger diameter drill bit was used during the earlier phases of drilling in Hole U1557D when casing was installed (Estes et al., 2021; Williams et al., 2021), which is reflected by the enlarged interval at the top of the basement section (~572–580 m WMSF).
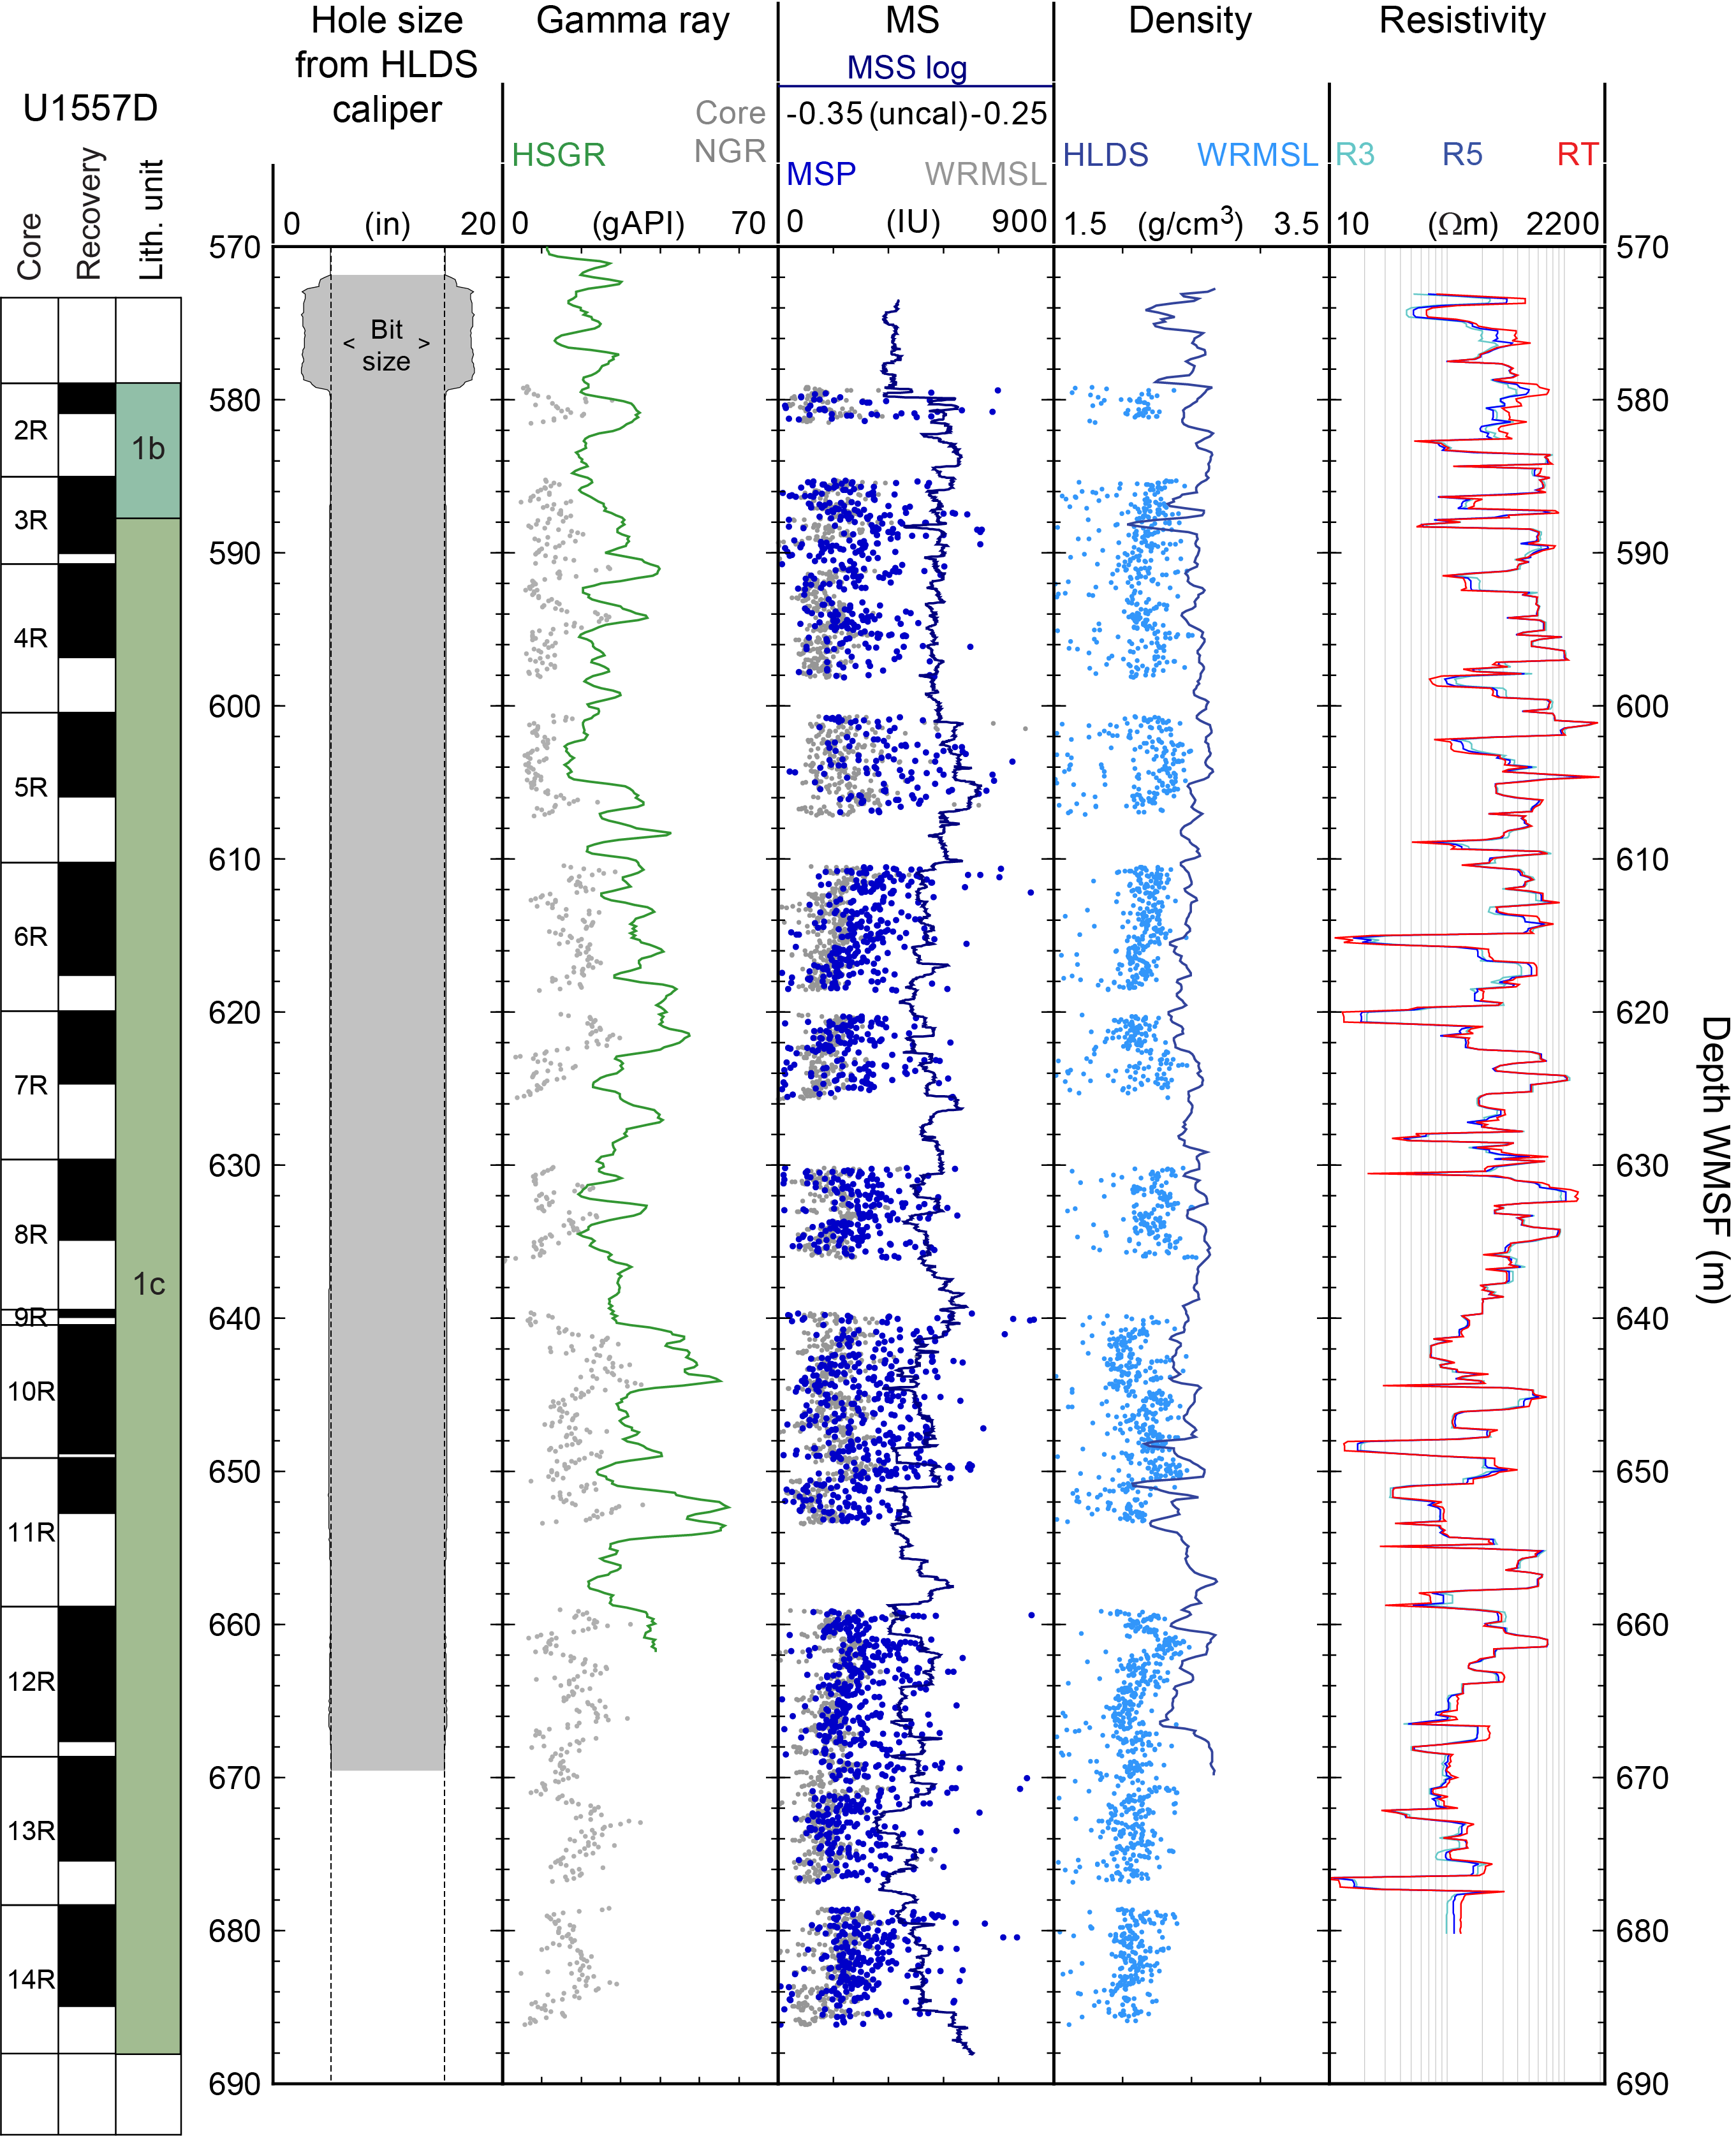
Figure F92. Triple combo logging data.
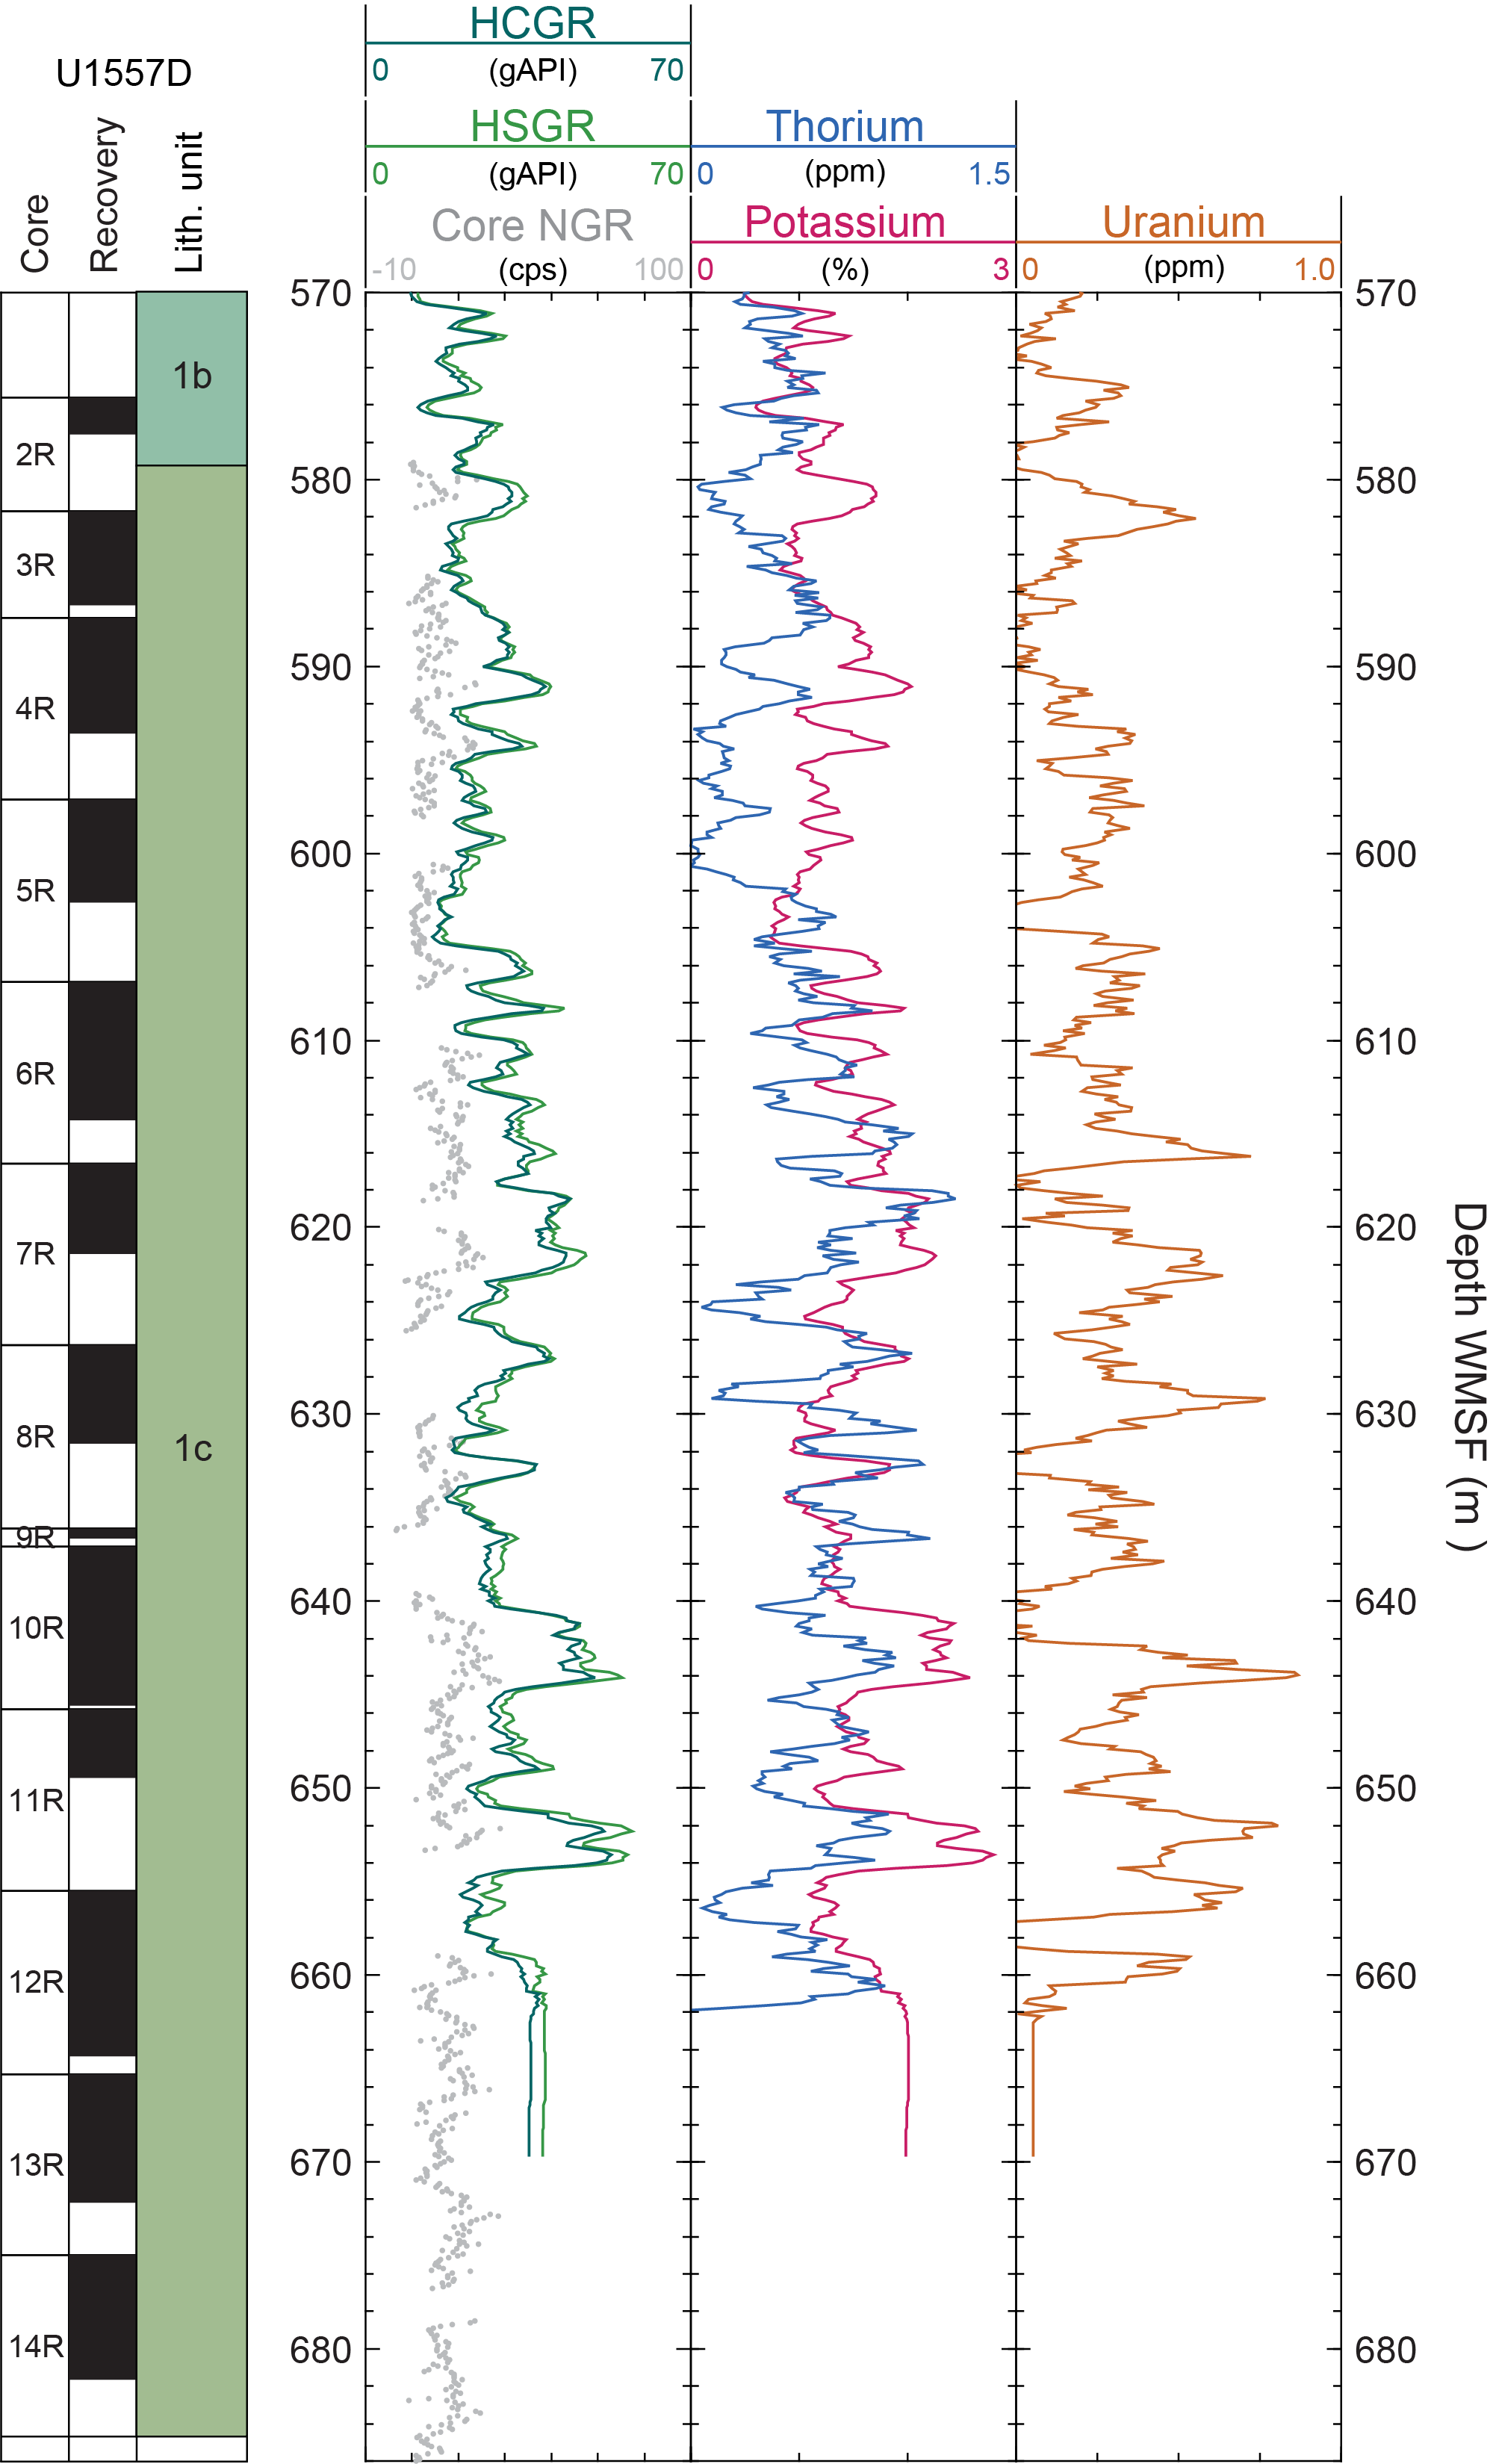
Figure F93. Spectral gamma ray logs.
The quality of the logs can also be assessed by comparison with measurements made on cores from the same hole. Total natural gamma ray from the triple combo shows good agreement with NGR data from cores, with a slight depth offset of a few meters (Figure F92). Discrepancies between the drilling core depth and wireline logging depth may occur because of core expansion, incomplete core recovery, incomplete heave compensation, wireline stretch, drill pipe stretch, and tidal changes. The density log generally follows the upper envelope of the scattered GRA data from core, which are affected by variable core recovery and incomplete filling of the core liner (see Physical properties in Basement). The MS log similarly follows the outer envelope of the scattered MS measurements on both whole-round and half-section cores.
Total gamma ray generally increases with depth in the breccia of Hole U1557D, with local variations on the order of 5–20 gAPI. Two intervals of higher gamma ray (640–644 and 652–654 m WMSF) occur within ±5 m of a fault zone described in Igneous petrology and Alteration petrology (Core 390-U1557D-11R) and may reflect a local increase in clay minerals associated with fault gouge materials. Spectral data show changes in individual contributions of Th, K, and U to the total gamma ray signal (Figure F93), which seems to be driven primarily by the contributions of K and to a lesser extent Th. Detailed core-log correlation of the gamma ray data may allow for more precise spectral characterization of the different breccia styles recovered in Hole U1557D.
The resistivity log indicates that there is significant variability in formation conductivity (5–2000 Ωm) within the breccia interval (Figure F92). The alternating character of the resistivity log is consistent with the presence of open and mineral-filled pore spaces (low resistivity) throughout the breccia lithology. Resistivity is relatively high in Lithologic Subunits 1a and 1b and the top of Subunit 1c (see Igneous petrology). A distinct interval of decreasing resistivity (630–644 m WMSF) coincides with a transition zone in lithology and corresponding transition in alteration (see Alteration petrology; Figure F54). The deepest recovered breccia in Subunit 1c has slightly lower mean resistivity than overlying breccias but the same variable character, alternating between intervals of lower and higher resistivity.
10.2.4. Data integration
10.2.4.1. Image analysis
Perhaps the most interesting feature of the rocks recovered from Site U1557 is that they are dominated by porous breccia, predominantly partially cemented by CaCO3. Estimating the proportion of basalt of different generations as well as the proportion of cement present encasing these clasts will be a valuable means of understanding the alteration history and nature of fluid flow in these ridge flank deposits as they age. High-resolution images captured during Expedition 390 provide a unique data set that enables not only visual estimates of alteration extent but also a means of training machine learning algorithms to automate the quantification of these features (Fu et al., 2022). Core-log integration between DMT images and downhole logging data could also be useful, particularly because recovery was high in the basement sections at Site U1557, which may provide groundtruthing for electrofacies determined from downhole logs (e.g., Tominaga et al., 2009).
10.2.4.2. Discrete sample comparisons
Discrete samples used for MAD and P-wave analyses were classified in terms of their matrix type and color to characterize any relationships or trends within the breccia recovered at Site U1557 (Table T17). Figure F94 shows crossplots of P-wave velocity versus porosity and grain density versus porosity for both samples of breccia matrix (Figure F94A, F94C) and breccia clasts of basalt (Figure F94B, F94D). For the matrix samples (defined here as the material between large clasts, which actually comprises small basalt and altered glass clasts, fine-grained matrix, and/or cement; see Igneous petrology), the dominant composition of the matrix was classified to correspond to petrologic observations (see Igneous petrology and Alteration petrology). In general, matrix composition changed downhole from mostly pelagic sediment at the top to sparry calcite to an authigenic calcite/zeolite mix and finally to a mostly zeolitic composition at the bottom of the hole. The observed porosity increase and velocity decrease downhole (Figure F91A, F91C) therefore correspond to distinct properties for different matrix-sample classes, with pelagic sediment and sparry calcite samples having the highest P-wave velocity and lowest porosity, whereas the samples with more zeolite-rich cements have the lowest P-wave velocity and highest porosity (Figure F94A). The grain density of the matrix samples does not vary systematically with porosity regardless of how porosity varies with matrix classification. Note that the observation that measured porosity increases downhole is contrary to core-based observations that indicate a tendency for calcite cement and vuggy porosity to be higher toward the top of Subunit 1c and compaction to be greater toward the bottom of Subunit 1c (see Igneous petrology; Figure F17). This raises questions regarding the nature of porosity measured for the discrete samples, which was also noted at Site U1556 (see Basement in Physical properties and downhole measurements in the Site U1556 chapter [Coggon et al., 2024a]).
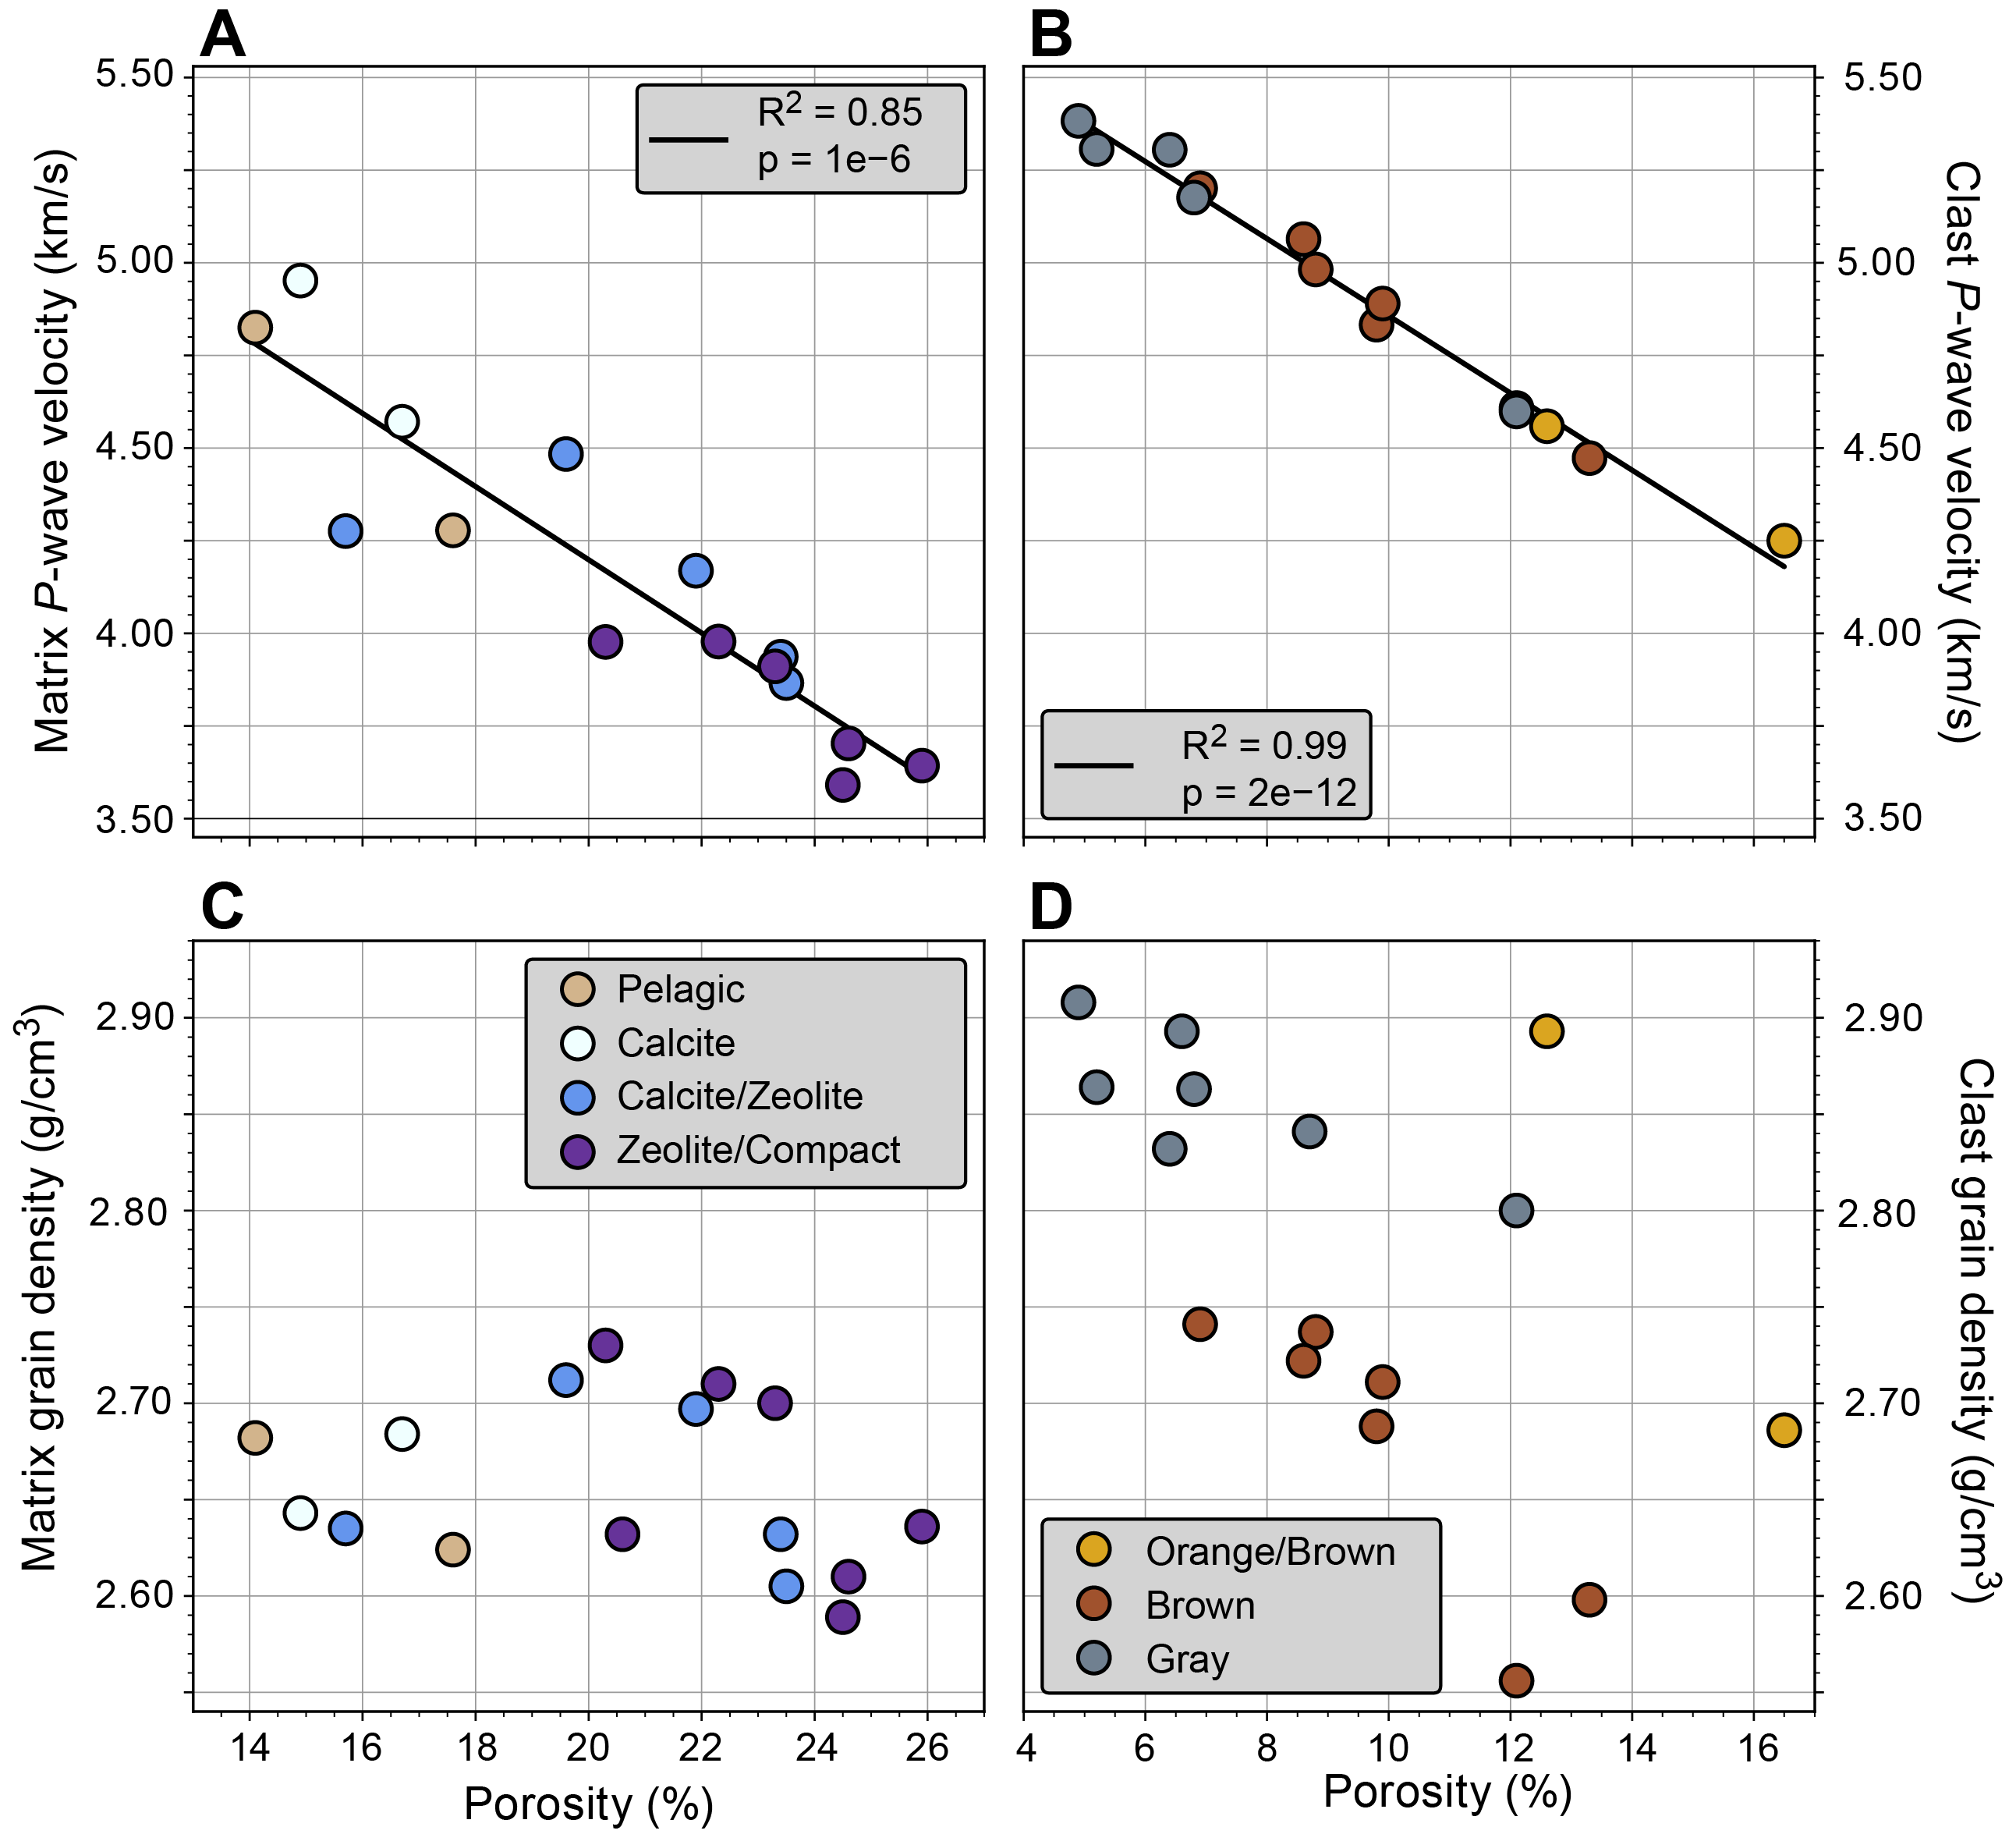
Figure F94. P-wave velocity vs. porosity of basalt clasts and matrix.
The discrete clast samples were classified based on color following the scheme (orange, brown, or gray) used in Hole U1557D macroscopic core descriptions (see Igneous petrology). Although no orange clasts were taken as discrete samples, gray and brown clasts were sampled for physical properties analyses. Additionally, two somewhat anomalous, highly plagioclase phyric clasts with a high degree of background alteration were taken and classified as orange/brown. A very strong correlation exists between porosity and P-wave velocity for the clast samples, illustrating the control porosity plays on seismic velocities (Figure F94B). Generally, gray clasts have the lowest porosity and highest P-wave velocity and brown and orange/brown clasts have the highest porosity and lowest P-wave velocity. Comparing grain density to porosity suggests that the gray clasts are less altered given their higher mean grain density (2.86 g/cm3), whereas the brown clasts are more altered given their lower mean grain density (2.68 g/cm3), regardless of the porosity of either clast classification (Figure F94D). The two clast samples classified as orange/brown have different grain densities, one is more similar to the gray clasts and the other is more similar to the brown clasts.
11. Geochemistry
11.1. Sediment
11.1.1. Interstitial water sampling
The ~564 m sedimentary succession at Site U1557 was cored in Hole U1557B during Expedition 390C, with one sample per core taken for headspace gas analysis and one IW whole-round per core. A mudline sample was taken with Core 390C-U1557B-1H. A total of 61 IW samples were squeezed under laboratory atmosphere from whole-round samples from 0 to 554.2 m core depth below seafloor, Method A (CSF-A). The whole-round sample length was increased from 5 to 10 cm from Core 19X downhole to obtain enough water for shipboard analyses. Sediment lithology alternates between brown silty clays and calcareous nannofossil ooze in Lithologic Unit I and calcareous nannofossil chalk in Unit II (Table T3). No specific lithology was targeted during IW sampling because the pore water profiles of pelagic sediments are usually independent of lithology changes (Hesse and Schacht, 2011). Shipboard analyses of the squeezed IW (see Geochemistry in the Expedition 390/393 methods chapter [Coggon et al., 2024c]) include pH, salinity, alkalinity, major cations and anions (sodium, calcium, magnesium, potassium, chloride, and sulfate) measured by ion chromatography (IC), major and minor elements measured by ICP-AES, and nutrients (phosphate and ammonium) measured by spectrophotometry. Carbonate and total carbon (TC) were subsequently analyzed on the solid residue after IW squeezing (squeeze cakes). All data from shipboard analyses on IW and squeeze cakes are shown in Tables T18 and T19, and select pore water profiles are shown in Figures F95, F96, F97, F98, and F99. Major cations (Na, K, Ca, and Mg) were measured by both ICP-AES and IC. Data from the two methods are very similar for Mg, K, and Ca. We thus present data from both techniques on the same plot and primarily focus on IC data in the discussion for easier comparison with major elemental compositions at other sites. Sodium concentrations from ICP-AES are slightly lower (~470 mM) than the International Association for the Physical Sciences of the Oceans (IAPSO) standard seawater value (480.7 mM); thus, we only discuss sodium IC data in the following sections.
11.1.2. Interstitial water results
Downcore variability of pore water concentrations is controlled by a combination of physical (e.g., vertical and lateral diffusion and/or advection of fluids), geochemical (e.g., sorption and desorption onto clay minerals, calcium carbonate dissolution and recrystallization, and biogenic silica dissolution), and biological processes (e.g., microbial reduction of Mn oxides, Fe oxyhydroxides, and sulfate for organic carbon respiration; Mottl, 1989). Here, we show depth profiles of pore water chemistry from Hole U1557B to identify the reactions that may have occurred during and after sediment deposition.
11.1.2.1. Salinity, chloride, sodium, and potassium
Salinity varies around 34–35 throughout the hole, with lower salinity in intervals at 130–190 and ~250–400 m CSF-A (Table T18). Chloride (Cl) concentrations range 540–595 mM, and sodium (Na) concentrations range 460–509 mM (Figure F95A). Potassium (K) concentrations decrease from 11.4 mM near the seafloor to 6.6 mM at ~262 m CSF-A (Figure F95B). The concentration gradient may be associated with K incorporation during the transformation of smectite into illite; postexpedition research will verify the extent to which this reaction is occurring at Site U1557. Below sediment Unit I, K concentrations increase to a maximum of 11.5 mM at ~510 m CSF-A, below which they decrease again toward ~9.2 mM at the sediment/basement interface (Figure F95C).
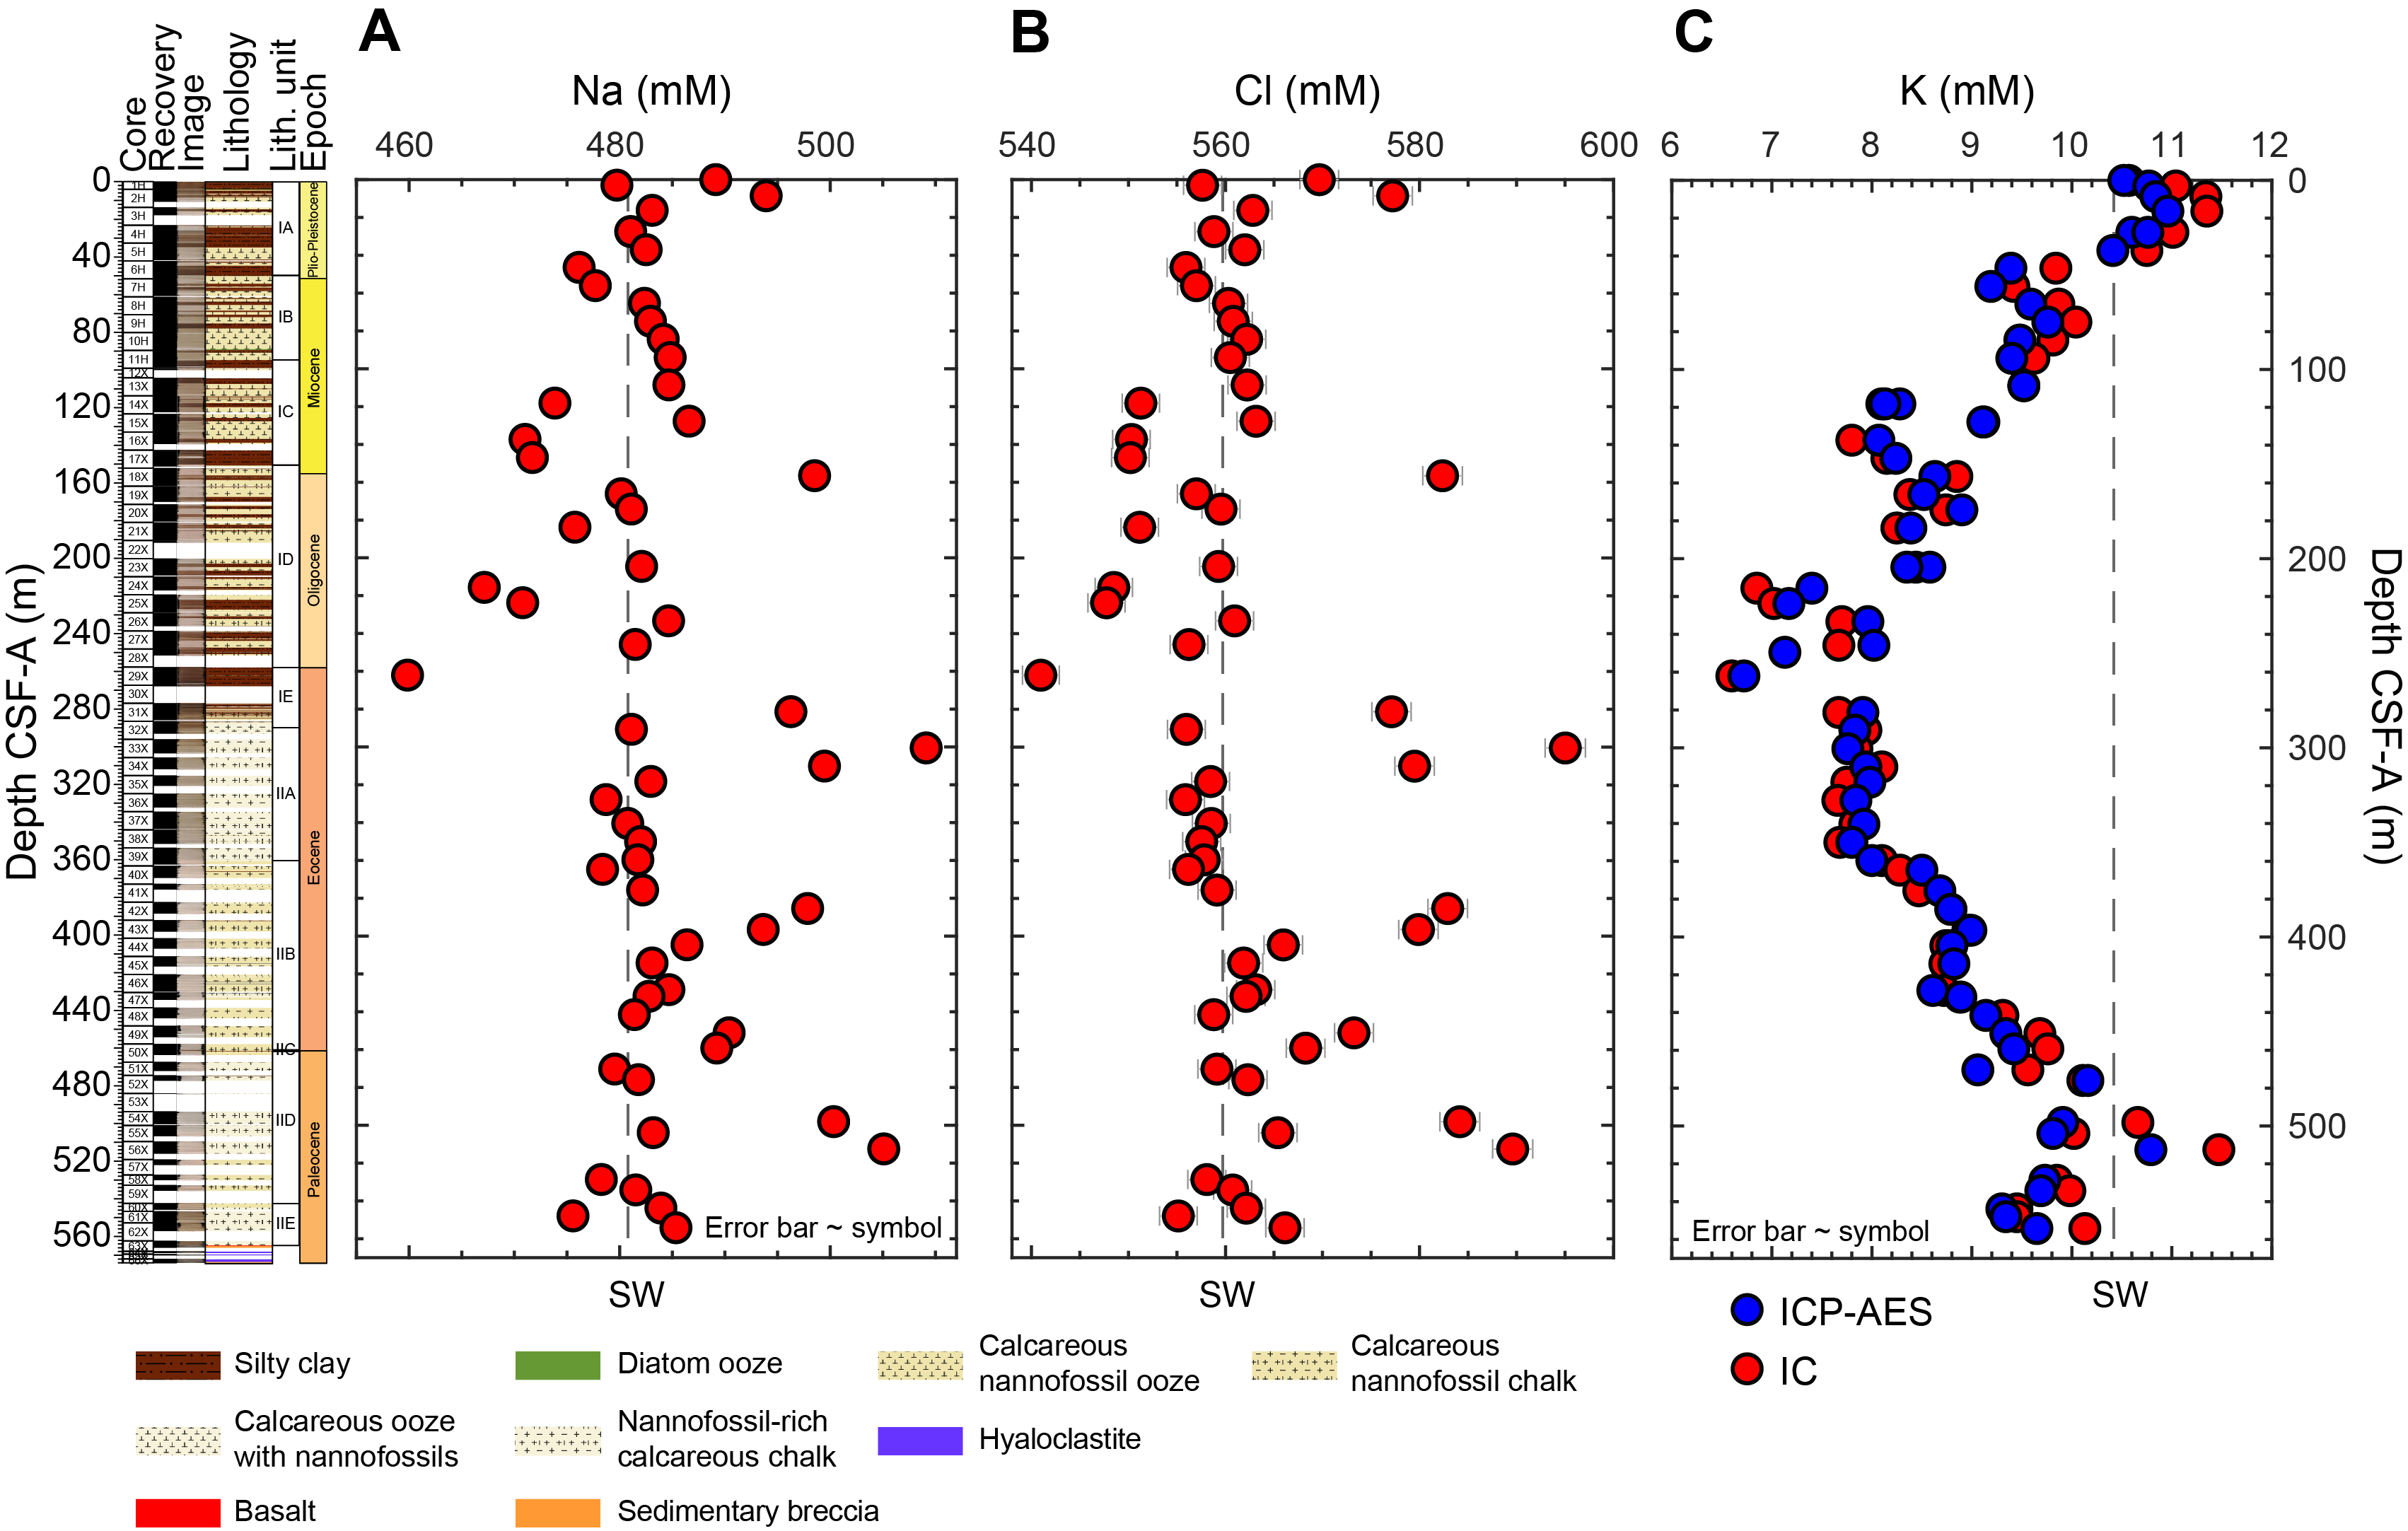
Figure F95. IW Na, Cl, and K.
11.1.2.2. pH, alkalinity, magnesium, calcium, and strontium
The pH value of 8.1 in the mudline of Hole U1557B is consistent with overlying seawater (Figure F96A). Below the mudline, pH is relatively constant at ~7.5 throughout the hole. Alkalinity is relatively uniform throughout the majority of Hole U1557B, ranging 2.2–3.9 mM; however, a maximum value of 12.4 mM occurs just above basement, coinciding with an increase in Ca (see below) and is possibly associated with calcium carbonate dissolution (Figure F96B). In Unit I, magnesium (Mg) concentrations decrease from seawater concentrations (55.07 mM) near the seafloor to 44.3 mM at ~184 m CSF-A (Figure F96C). Below Unit I, Mg concentrations gradually increase to 50.6 mM at ~554 m CSF-A. At the base of the hole, significant variability is observed in Mg concentrations, which range ~41–50 mM at the Subunit ID/IE boundary.
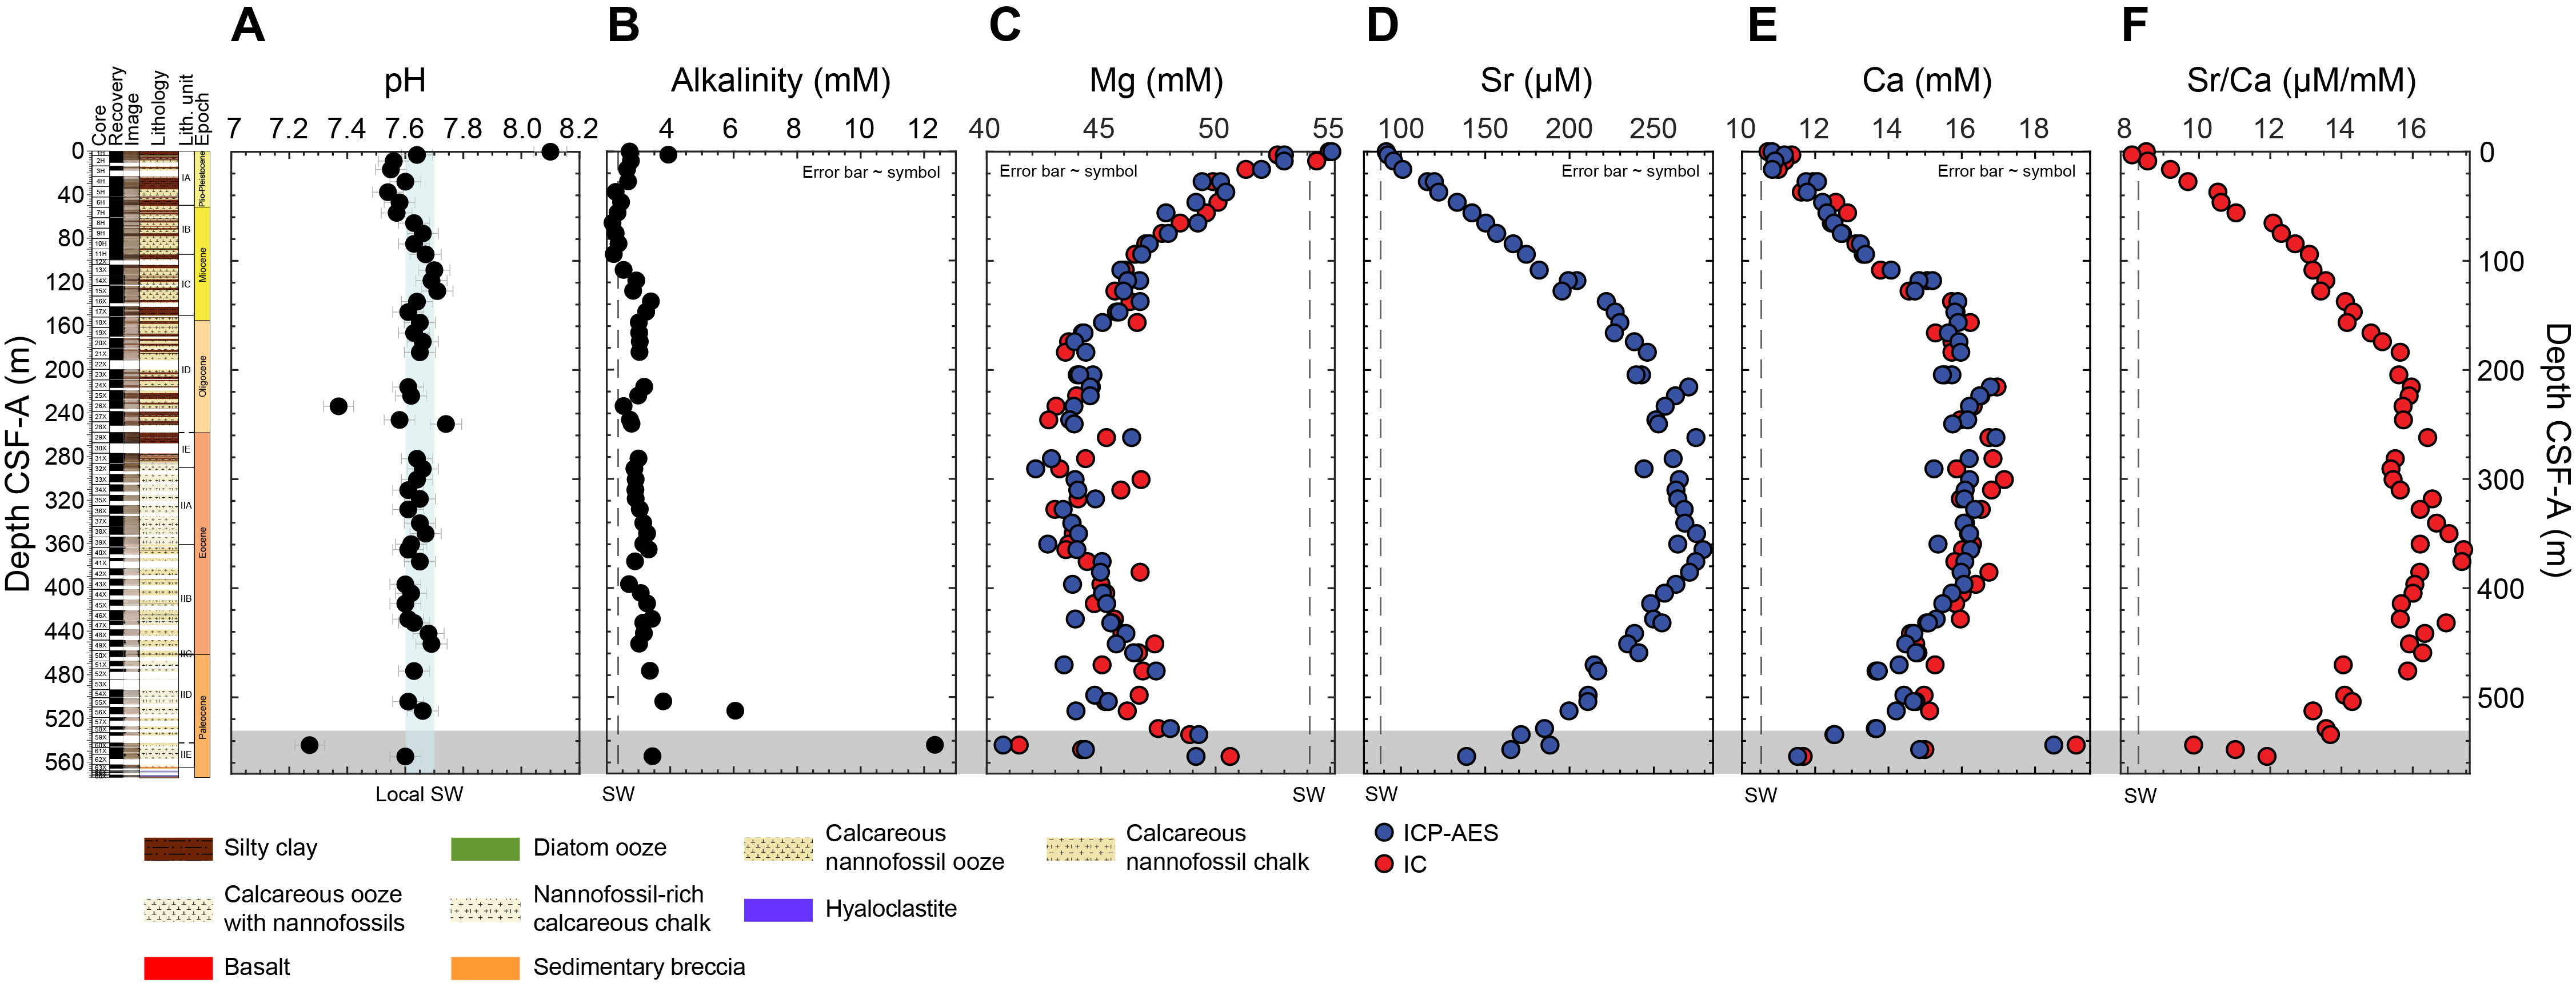
Figure F96. IW pH, alkalinity, Mg, Sr, Ca, and Sr/Ca.
Strontium (Sr) and calcium (Ca) concentration gradients are opposite those observed for Mg and K (Figure F96D, F96E). Sr and Ca concentrations in the mudline sample are 95.6 µM and 10.9 mM, respectively, and increase to 270.6 µM and 16.8 mM at 216 m CSF-A. Sr and Ca concentrations are relatively invariant from 216 to ~400 m CSF-A, below which the concentrations gradually decrease until ~530 m CSF-A. In Subunit IIE, Ca concentrations are highly variable, ranging ~11–18.5 mM. This variance coincides with the chemical variability observed in Mg. Sr/Ca increases from the mudline value (8.5 µM/mM) to ~16 µM/mM near 200 m CSF-A, where it remains until the base of Subunit IIC (Figure F96F). It then decreases toward the basement, with a value of ~9 µM/mM near the sediment/basement interface. Increases in Sr/Ca ratios in the upper ~200 m coincide with decreases in pore water Mg concentrations and are likely a result of recrystallization from low-Mg biogenic carbonate typical of nannofossil ooze to higher Mg diagenetic calcite (e.g., Baker et al., 1982). The decrease in Sr/Ca ratios below ~400 m CSF-A, with ratios returning to the mudline value, may indicate the influence of seawater-like basement fluids in these pore fluids.
11.1.2.3. Boron, lithium, and silica
Boron (B) concentrations range ~400–725 µM in Unit I. The concentration range narrows to 346–478 µM in Unit II (Figure F97A). B concentrations are highly variable below ~500 m CSF-A, ranging 459–1892 µM. In contrast, pore water Li concentrations are generally less variable in Unit I (~27–38 µM), moderately variable in Unit II (33–42 µM), and highly variable below ~500 m CSF-A (~30–90 µM) (Figure F97B; Subunits IID and IIE). Overall, silica (Si) concentrations gradually increase from the surface to the bottom of Hole U1557B with a range of ~21–744 µM. Exceptions include two local maxima in Si content, one at ~3 m CSF-A (~420 µM) and another at ~166 m CSF-A (625 µM). These concentration maxima coincide with a diatom ooze layer in Core 390C-U1557B-1H and diatoms present in smear slides (e.g., Sample 14X-1, 85–87 cm; see Sedimentology), suggesting biogenic silica dissolution. The increase in Si concentrations deeper than ~500 m CSF-A (in Subunits IID and IIE) (Figure F97C) does not coincide with the presence of diatoms or calcareous nannofossil chalk (see Sedimentology). Another possibility for increased Si concentrations in sediments is Si input from basement fluids (e.g., Wheat and MeDuff, 1994; Wells and Ghiorso, 1991); the increase in Si near basement coincides with sharp changes in B, Li, Ca, Sr, sulfate, pH, and alkalinity.
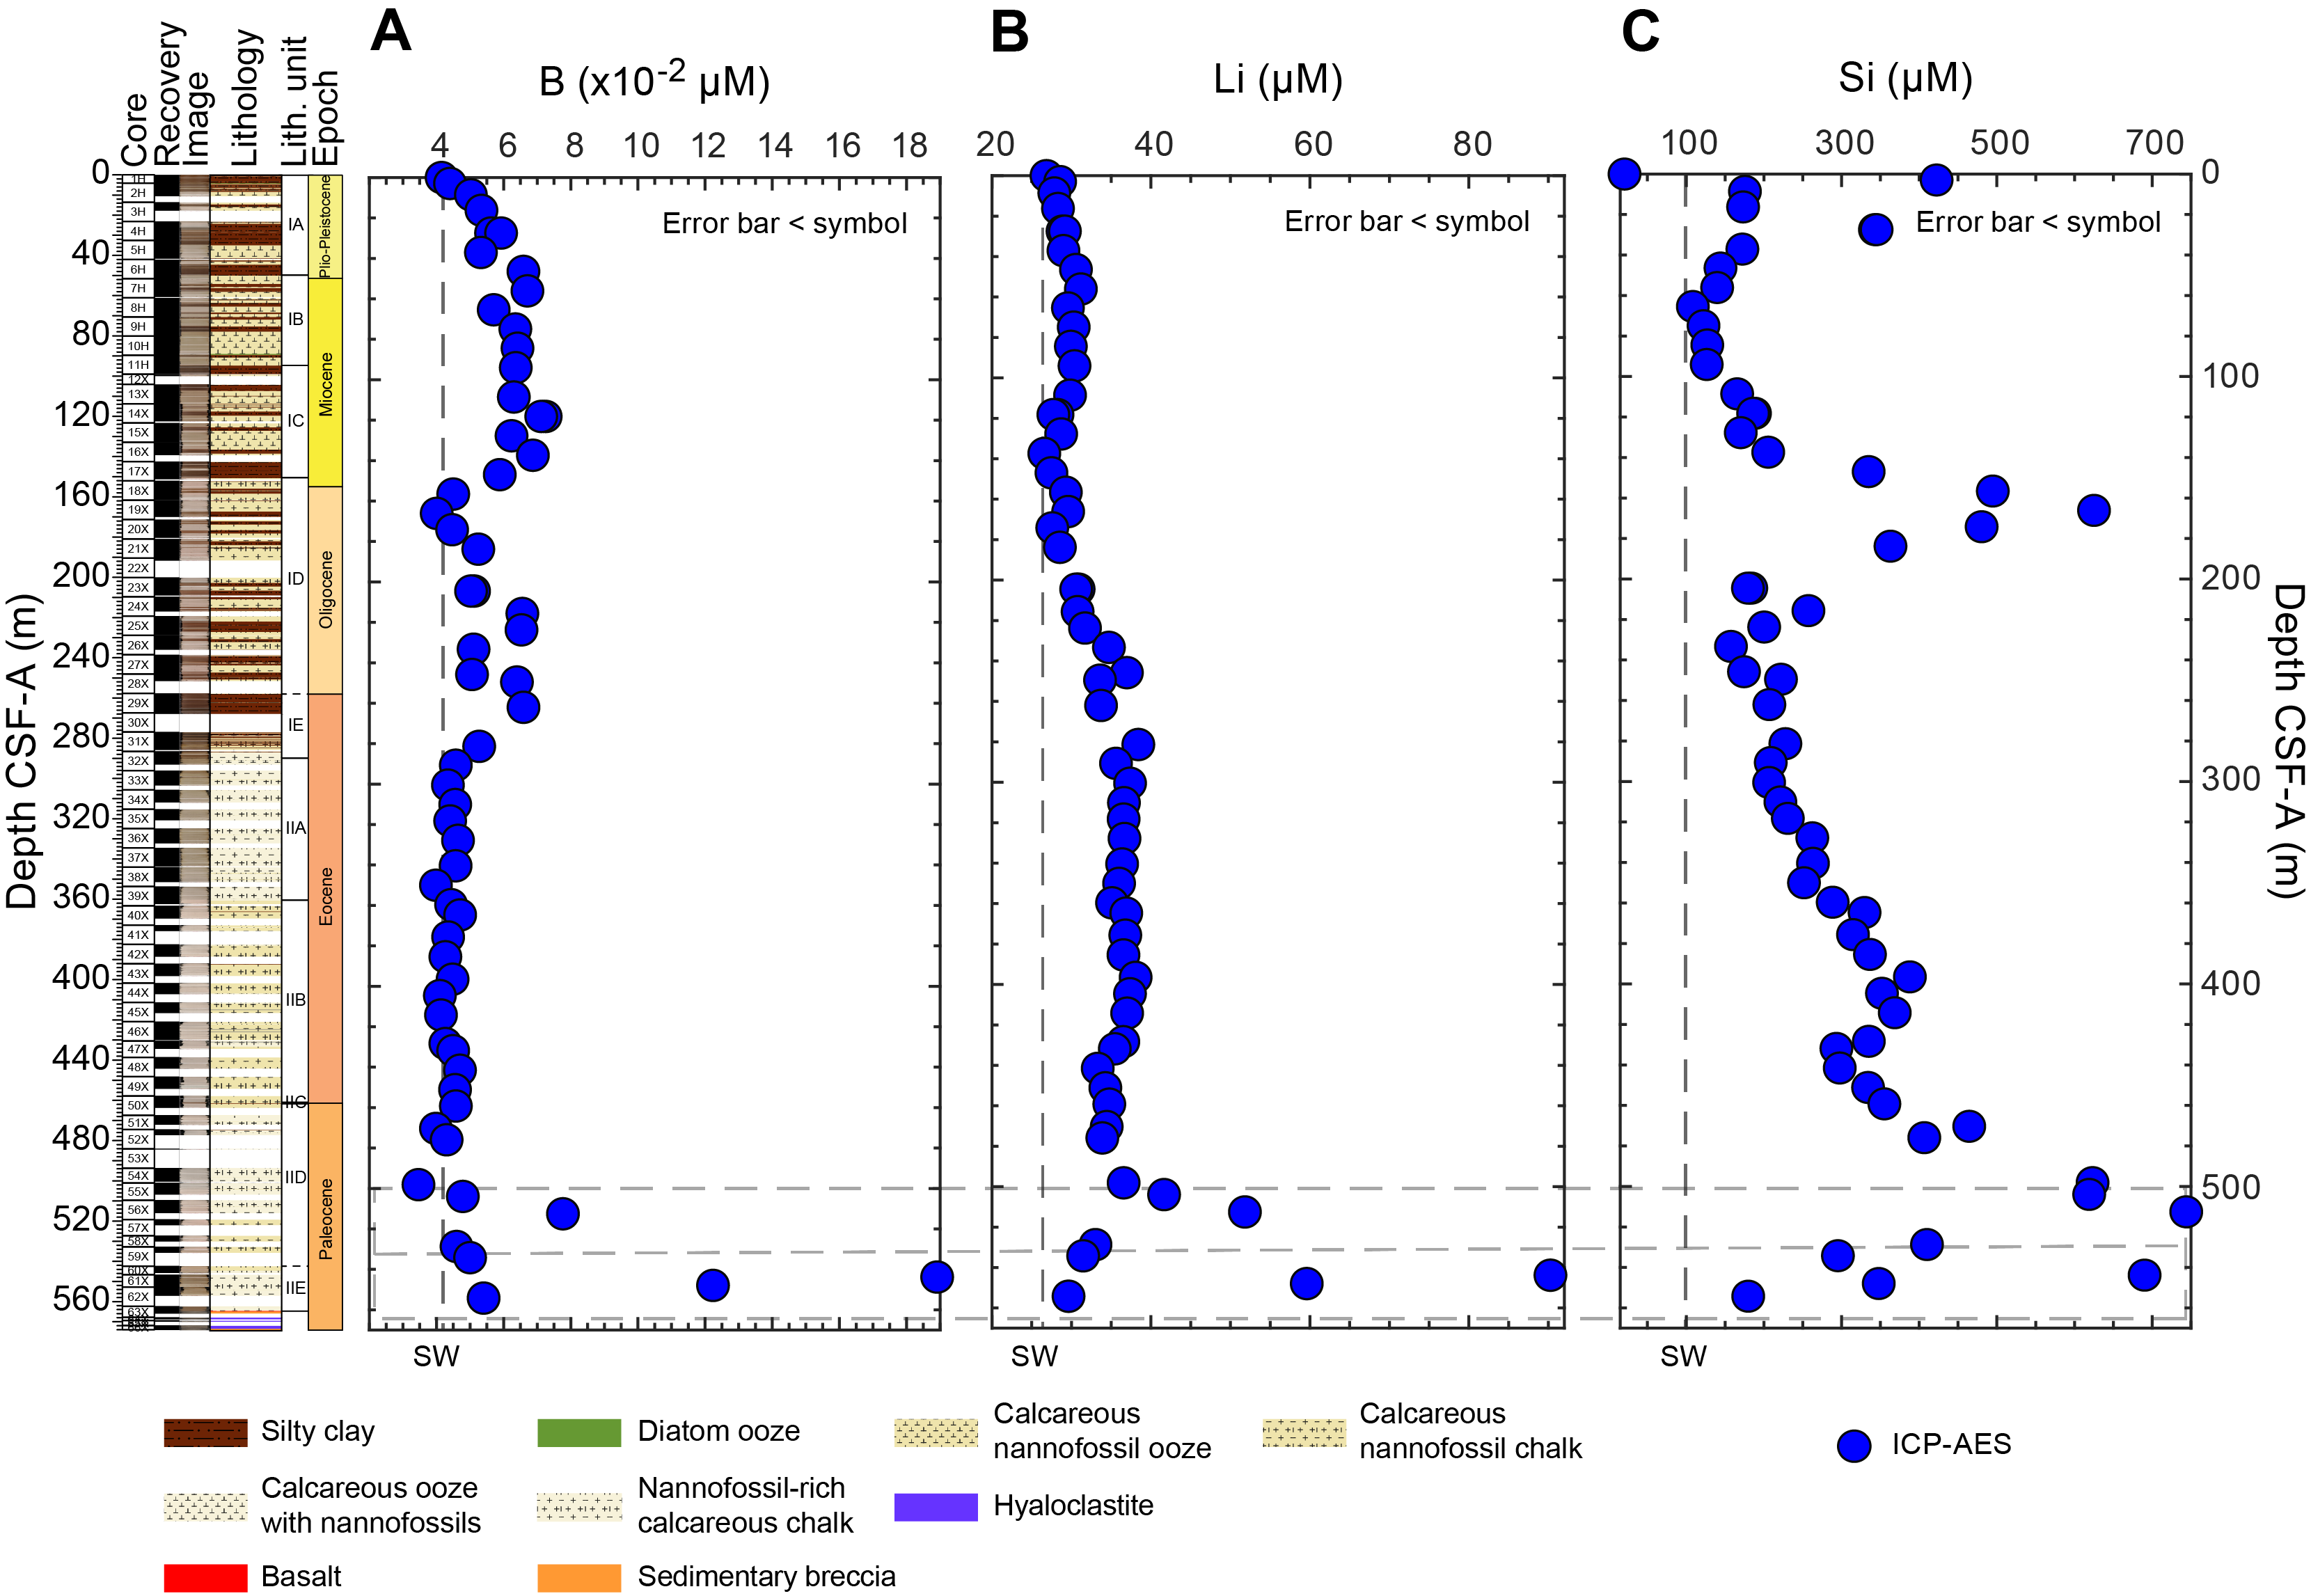
Figure F97. IW B, Li, and Si.
11.1.2.4. Sulfate, manganese, ammonium, and phosphate
Sulfate (SO42−) concentrations decrease from seawater value (~29 mM) at the mudline to 23.8 mM at ~246 m CSF-A (Figure F98A). Although sample-to-sample variability is high below this depth, sulfate concentrations overall gradually increase to ~26 mM at ~450 m CSF-A. Below ~459 m CSF-A, sulfate concentrations are highly variable and include both an increase toward seawater value and a decline to their lowest value of 20 mM at ~540 m CSF-A. Coincident with the decrease in sulfate concentrations in the uppermost ~100 m of Hole U1557B, dissolved Mn concentrations increase to a maximum of ~120 µM at ~27 m CSF-A (Figure F98B), suggesting reduction of Mn oxides and sulfate by organic carbon respiration in reducing pore waters. Broad peaks in Mn concentrations also occur at ~100–190 and ~190–280 m CSF-A, possibly due to continued Mn oxide reduction to dissolved Mn(II) during organic carbon respiration under low-oxygen/anoxic conditions. Below ~280 m CSF-A (near the bottom of Subunit IE), dissolved Mn is uniformly <5 µM. Ammonium (NH4+) concentrations increase linearly from 33.78 µM near the seafloor to 325.76 µM at ~75 m CSF-A (Figure F98C), consistent with production during organic carbon decay. Below this point, ammonium concentrations decrease linearly to 65.6 µM at ~550 m CSF-A. Phosphate (PO43−) varies between 6.2 and 9.0 µM with no clear trend downcore (Figure F98D).
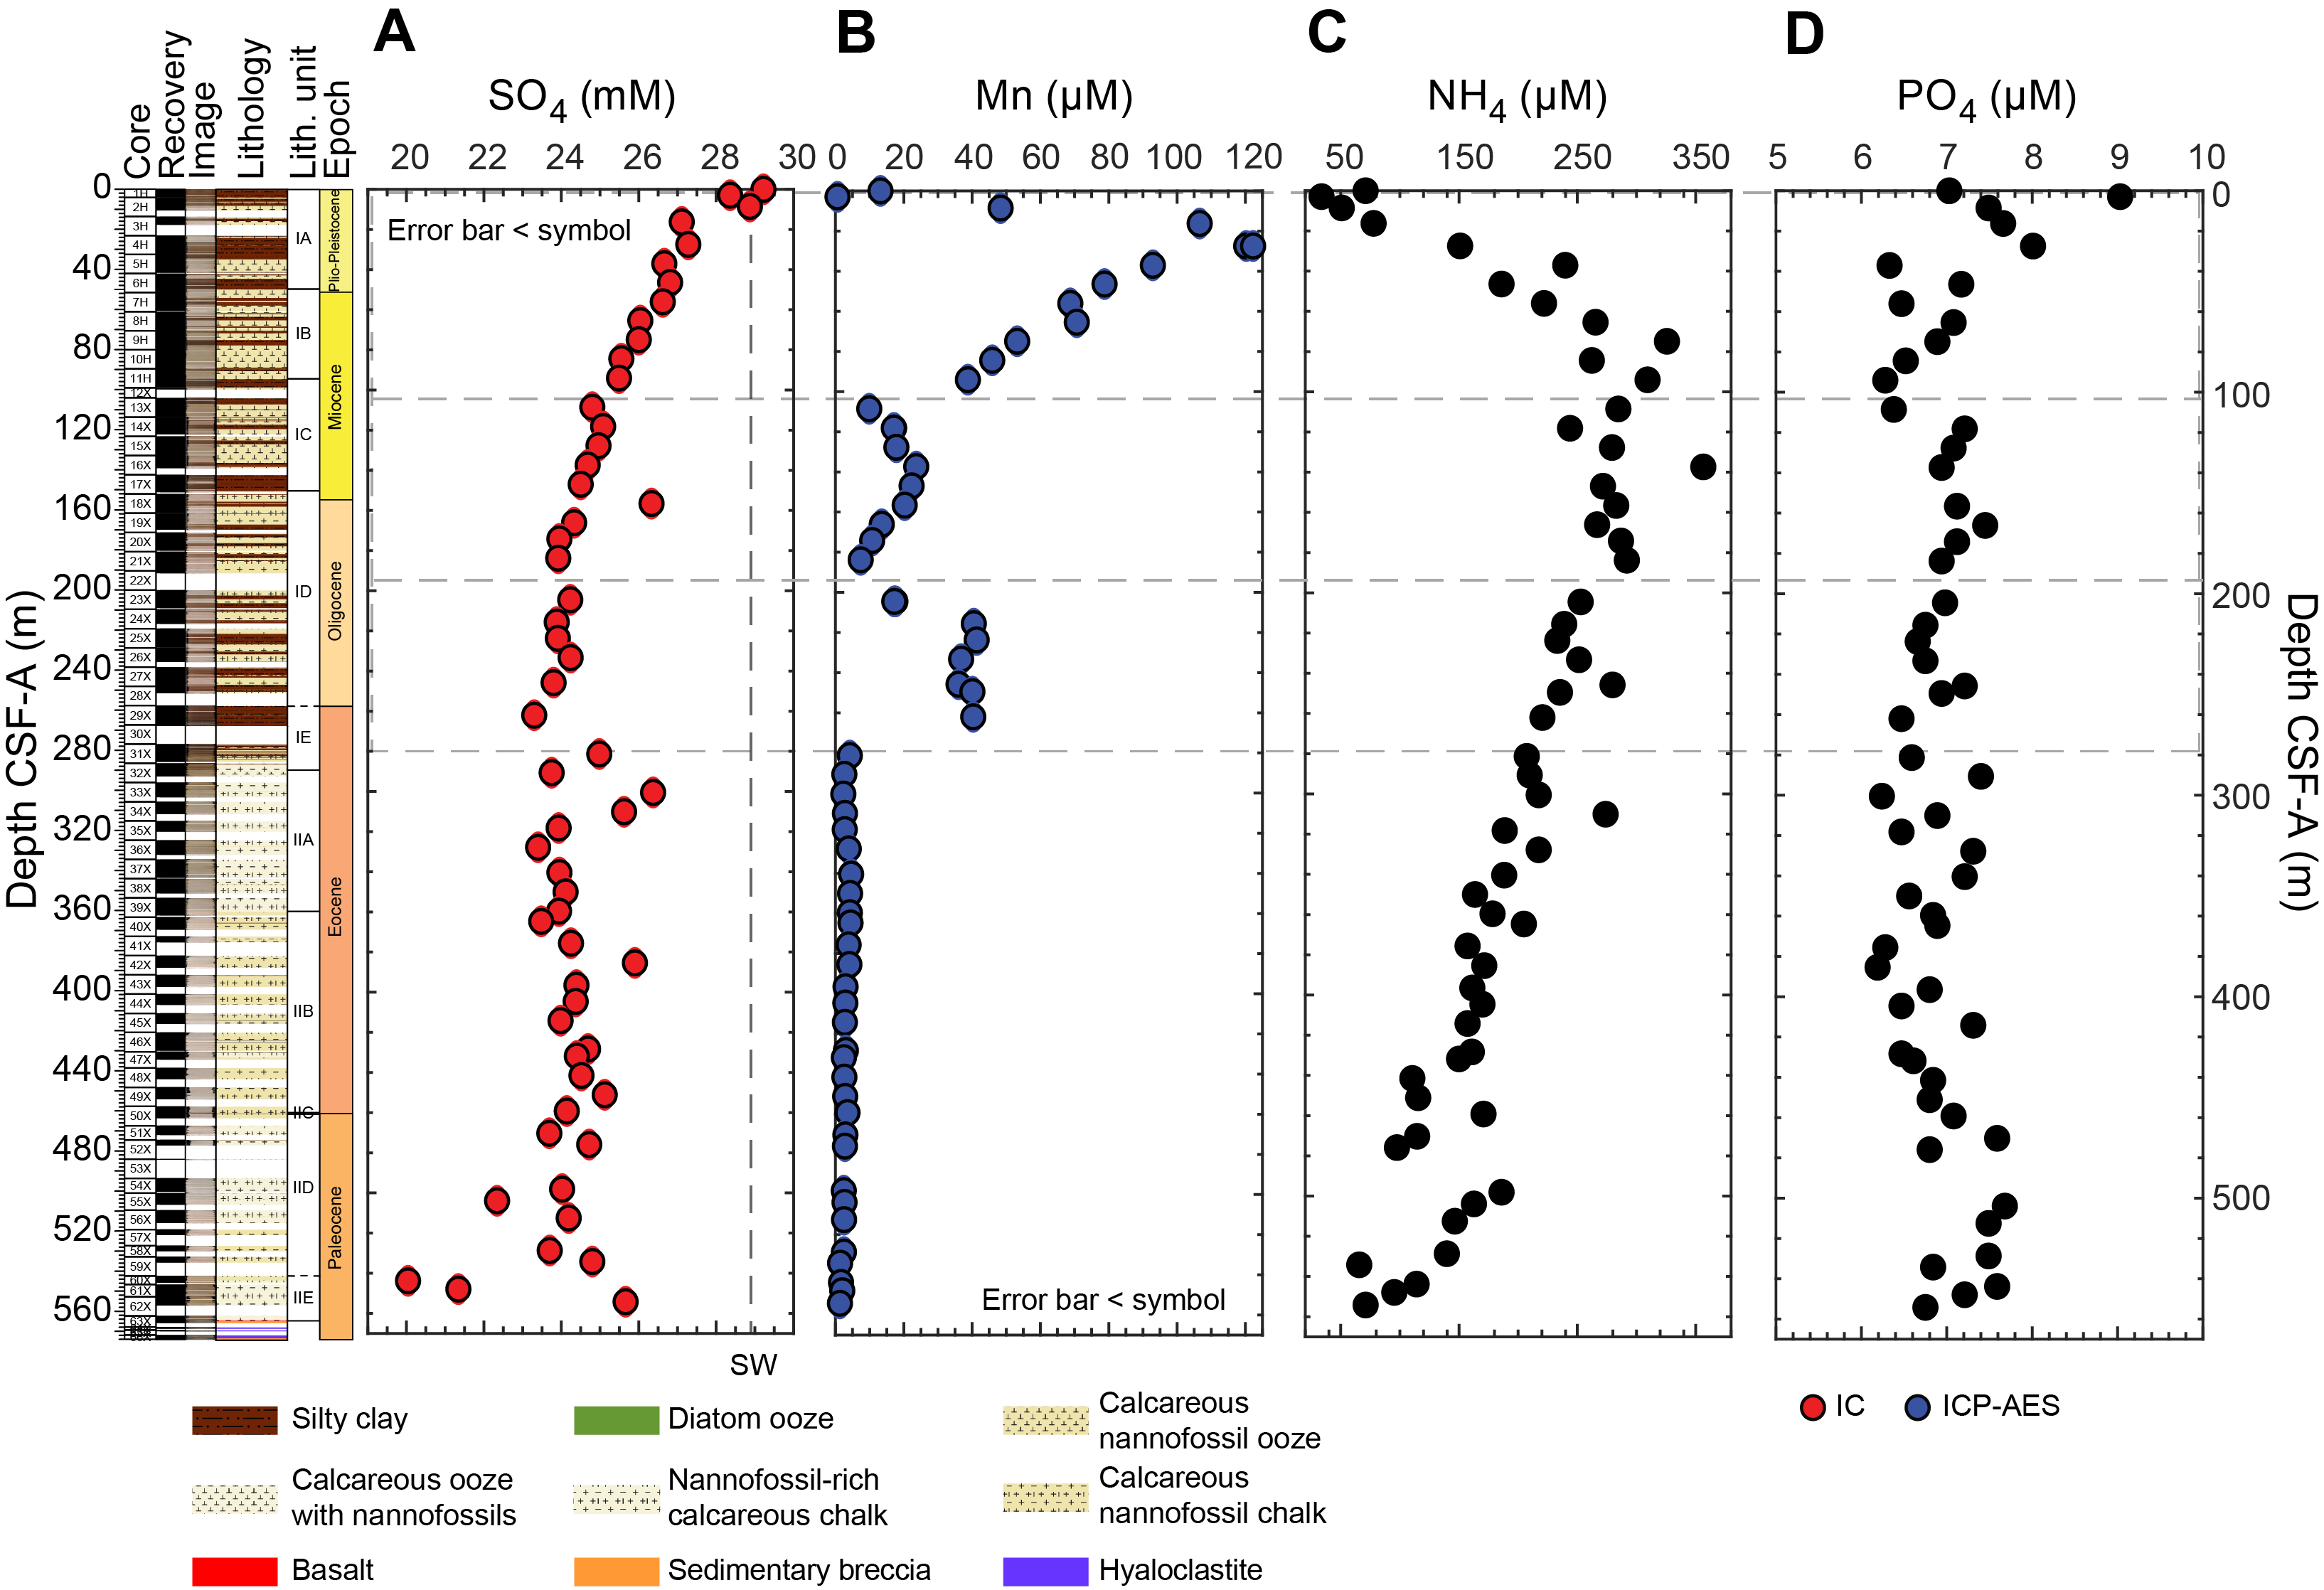
Figure F98. Sulfate, Mn, ammonium, and phosphate.
11.1.3. Sediment bulk geochemistry
11.1.3.1. Calcium carbonate
Calcium carbonate (CaCO3) concentrations were measured once per core from Cores 390C-U1557B-1H through 62X and 65X, except for Cores 12H, 22X, 23X, and 57X, for a total of 56 analyses (Table T19; Figure F99A). The average carbonate content (39.5 ± 34.4 wt%, ±1 standard deviation [σ], n = 25) is highly variable in upper Lithologic Unit I, which is composed of alternating clay and carbonate layers, with a minimum value of 0.13 wt% in a clay layer (Core 29X) and a maximum value of 80.3 wt% in a carbonate layer (Core 26X). Carbonate concentrations were considerably higher through Unit II (average = 83.0 ± 16.1 wt%, ±1σ, n = 31; maximum = 92.1 wt%).
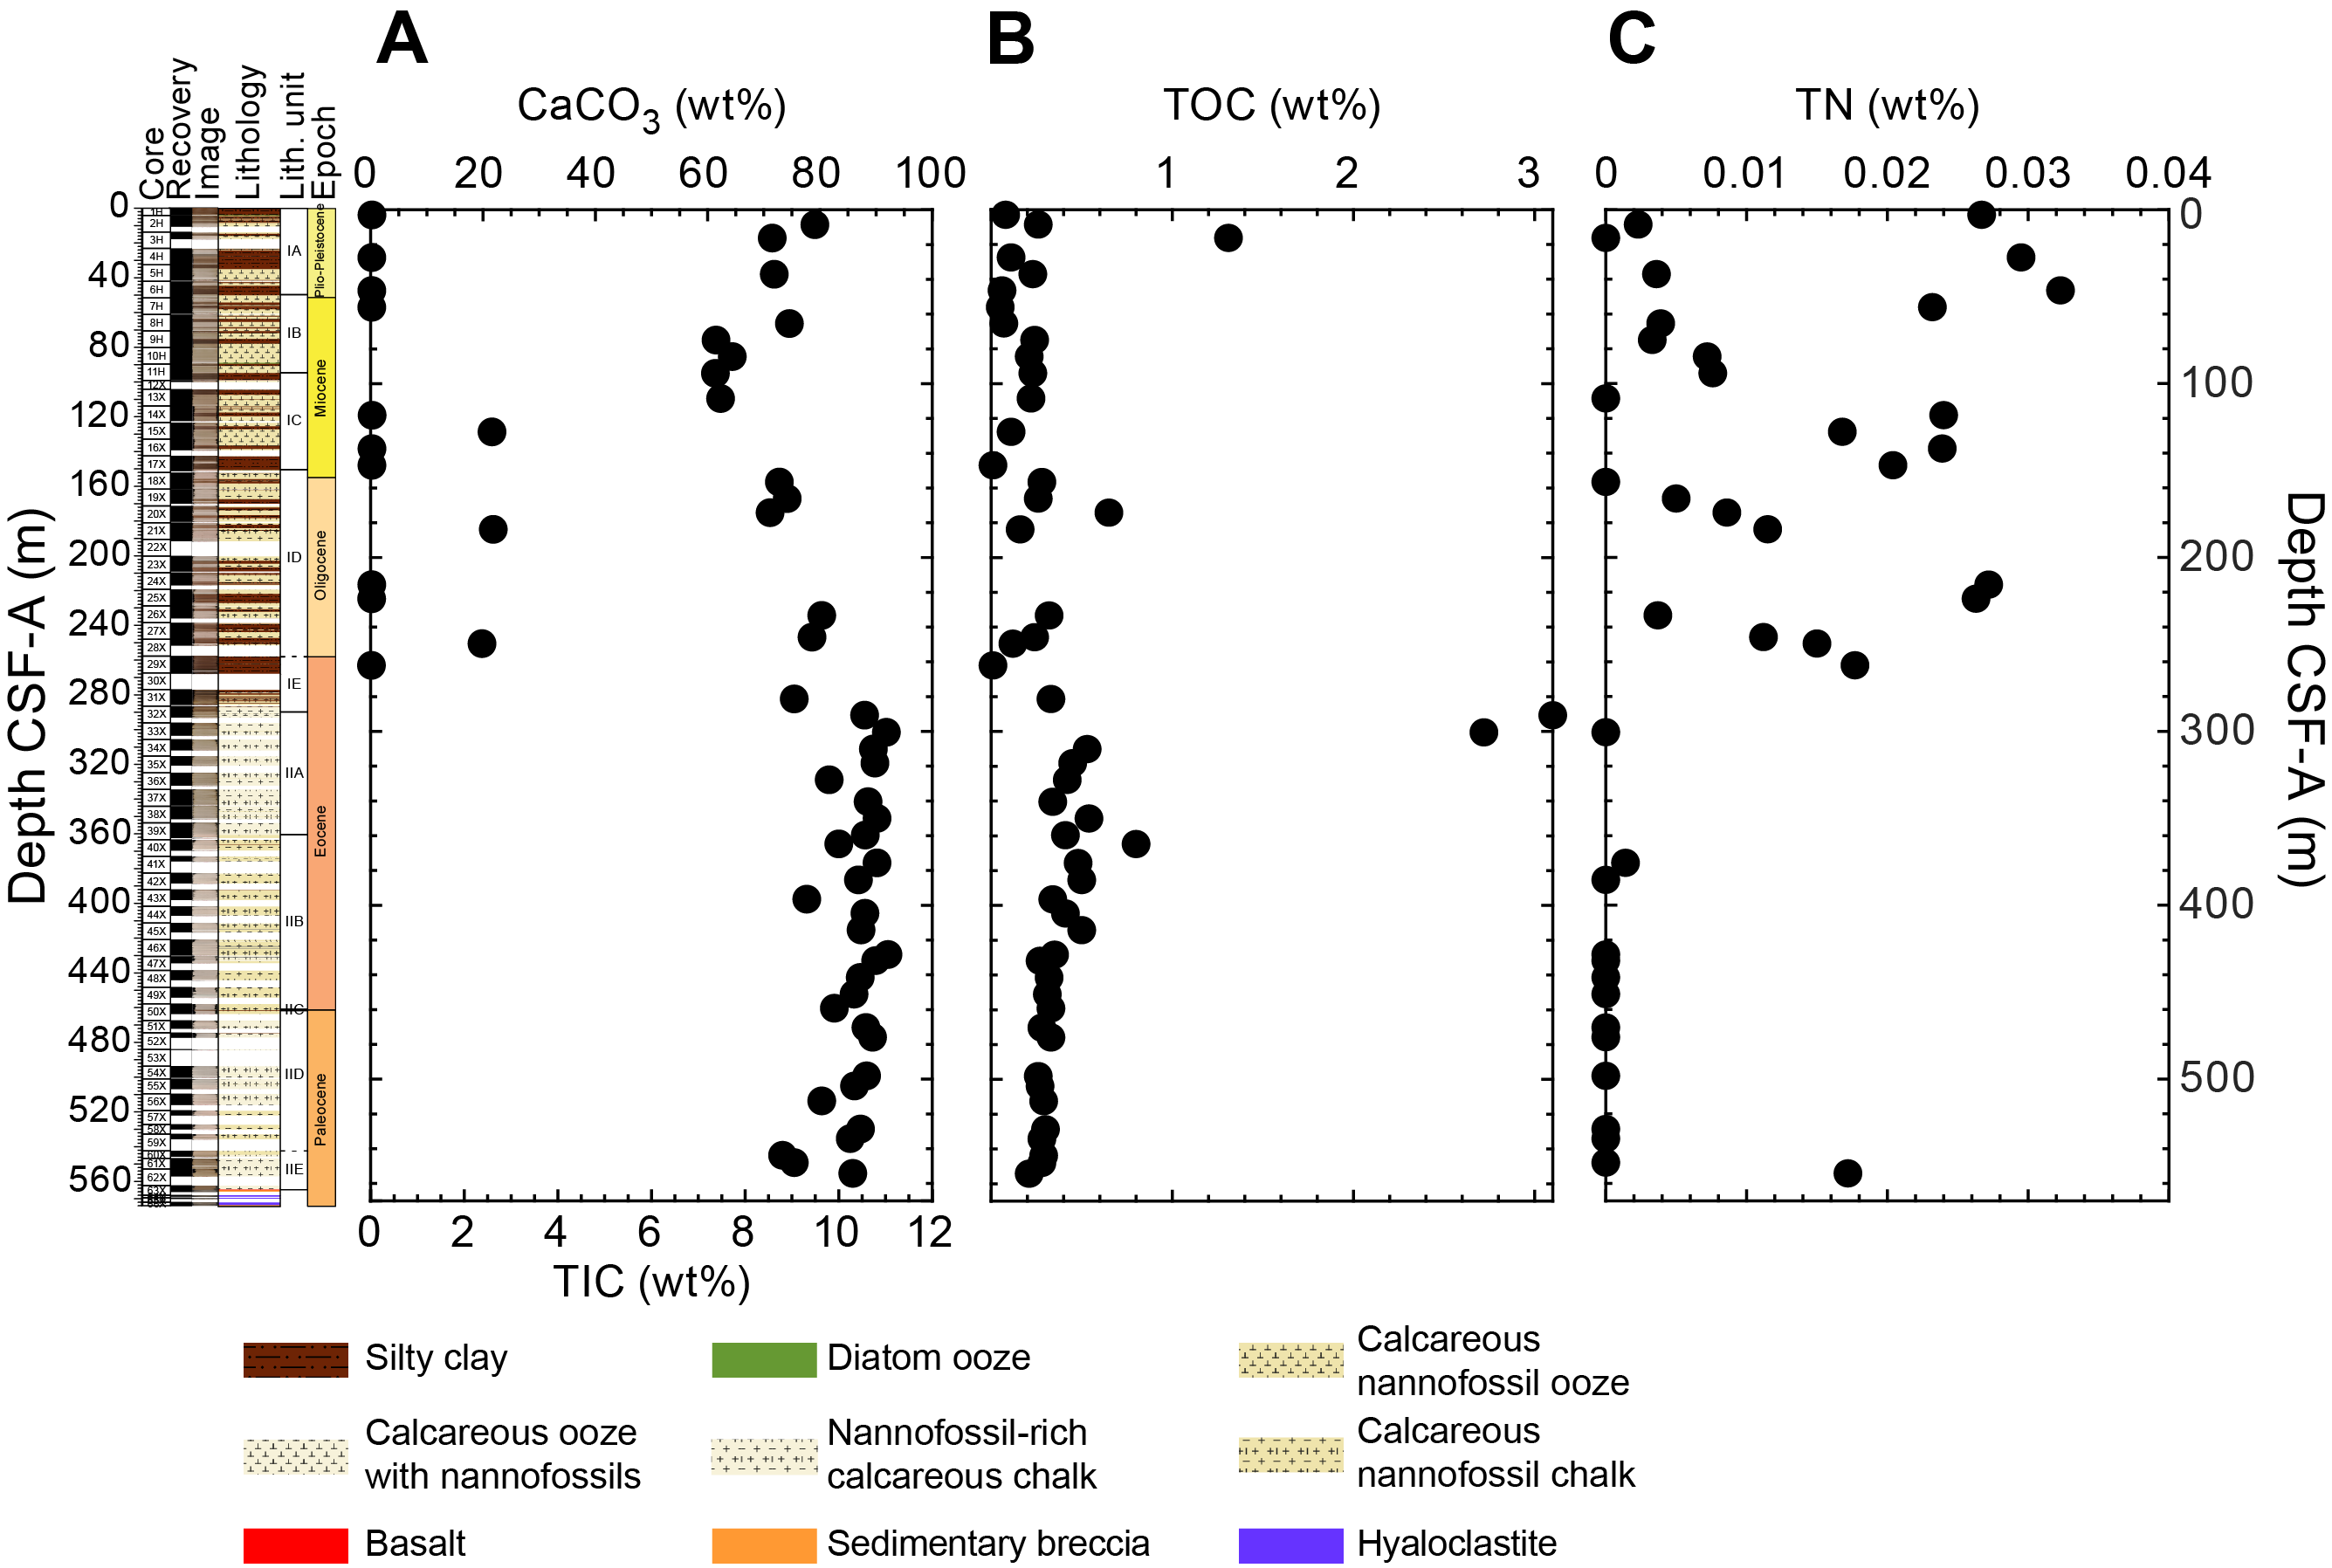
Figure F99. Sediment carbonate, TIC, TOC, and TN.
11.1.3.2. Total organic carbon
TOC was calculated for all samples measured for CaCO3 as the difference between TC and total inorganic carbon (TIC) (see Geochemistry in the Expedition 390/393 methods chapter [Coggon et al., 2024c]). TOC concentrations in Unit I (0.25 ± 0.28 wt%, ±1σ, n = 21) are generally low (<1 wt%, excluding one sample in Core 390C-U1557B-3H) compared to those in Unit II (0.52 ± 0.65 wt%, ±1σ, n = 31) (Table T19; Figure F99B). A maximum of 2.7–3.1 wt% TOC occurs in the upper portion of Unit II at ~291–300 m CSF-A.
11.1.3.3. Total nitrogen
Total nitrogen (TN) content was measured concurrently with the TC analyses for each sample (Table T19). TN concentrations are low throughout Hole U1557B (0.010 ± 0.011 wt%, ±1σ, n = 40) with a range from below the detection limit to 0.032 wt% (Table T19; Figure F99C). Although low, the concentration of TN in Unit I (0.013 ± 0.011 wt%, ±1σ, n = 25) is an order of magnitude higher than the average concentration in Unit II (0.002 ± 0.006 wt%, ±1σ, n = 15). The trend of generally higher TN in Unit I is antithetic to the pattern of higher TOC in Unit II (Figure F100). If organic matter in the sediment is derived from surface productivity, then the relative proportions of TOC and TN should approximate the Redfield ratio (where C:N = 106:12). A regression between TOC and TN would then result in a positive relationship that intersects the origin (Figure F100) (Schubert and Calvert, 2001). Postexpedition research will confirm this deviation from the Redfield ratio and explore possible mechanisms.
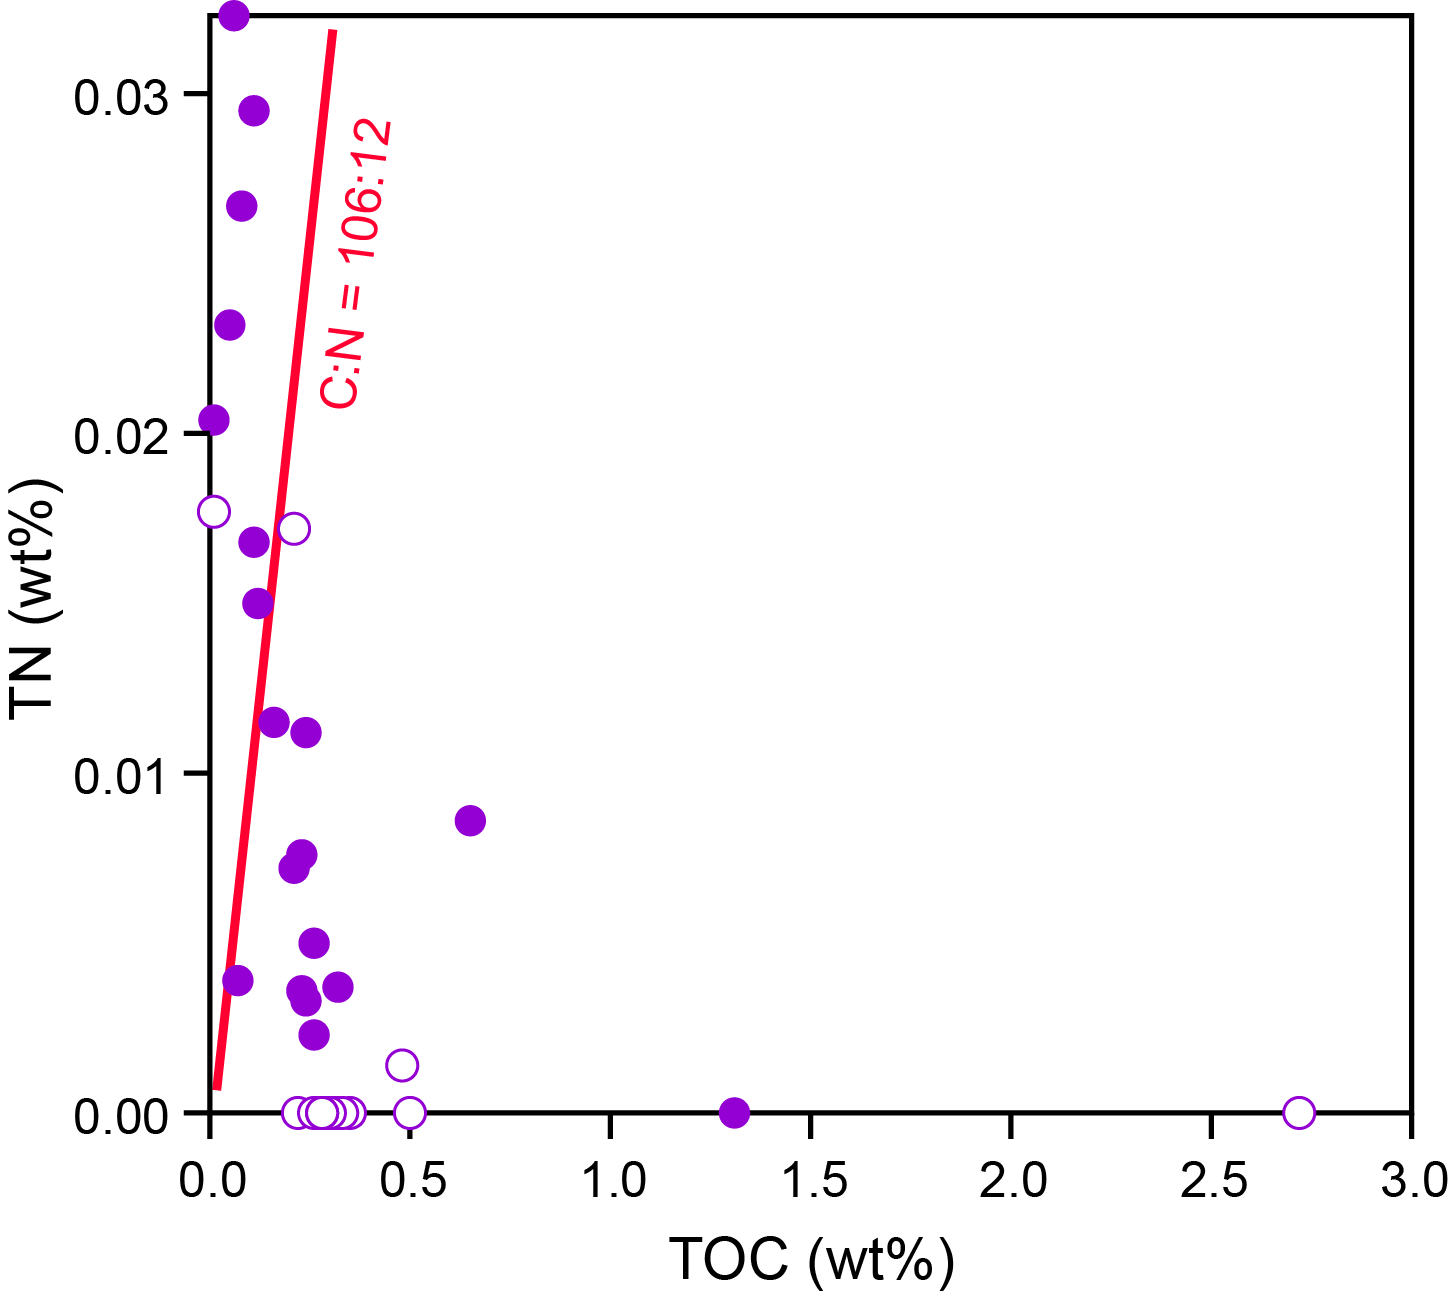
Figure F100. TOC vs. TN.
11.1.4. Sediment gas sampling
Routine safety hydrocarbon measurements were made in Hole U1557B during Expedition 390C (Estes et al., 2021) at a sampling resolution of one analysis per core from Cores 390C-U1557B-1H through 63X (Table T19). No gas was detected in any of the samples.
11.2. Basement
11.2.1. Sampling strategy and sample classification
A 109 m basement succession was cored in Hole U1557D during Expedition 390. Representative samples were taken from the least altered basaltic clasts in the sedimentary breccia in an attempt to obtain a downhole record of compositional variations. Clast lithology includes aphyric, plagioclase-olivine sparsely to moderately phyric, and microcrystalline basalts (see Igneous petrology). The least altered basalt samples were targeted for sampling where possible, although basaltic clasts from breccias in Hole U1557D have all experienced significant and variable degrees of alteration (see Alteration petrology). The sample set was supplemented with basalt samples that exhibited different styles of alteration to investigate the effects of alteration on elemental concentrations. One basalt sample was also taken from the Hole U1557B sediment/basement interface, cored during Expedition 390C and sampled on the ship during Expedition 390 (see Background and objectives).
Because the sampled basalts experienced variable degrees of alteration, they were categorized as follows for simplicity in this chapter (see Alteration petrology):
- Slightly altered basalt: minimal phenocryst and groundmass alteration (i.e., typically <10% of the rock).
- Moderately altered basalt: macroscopic phenocryst and groundmass alteration (i.e., typically 10%–50% of the rock).
- Highly altered basalt: significant macroscopic phenocryst and groundmass alteration (i.e., typically >50% of the rock).
The 21 samples selected include 1 slightly altered basalt, 16 moderately altered basalts, and 4 highly altered basalts, including 1 sample pair taken from different portions of a single basaltic clast in the breccia that display different styles or extents of alteration to investigate alteration effects on the bulk rock composition (Samples 390-U1557D-3R-2, 56.5–58.5 and 58.5–61 cm) (Figure F101). Rocks with thin fresh glassy margins that preserve primary magma compositions and samples of distinct alteration domains will be analyzed postexpedition.
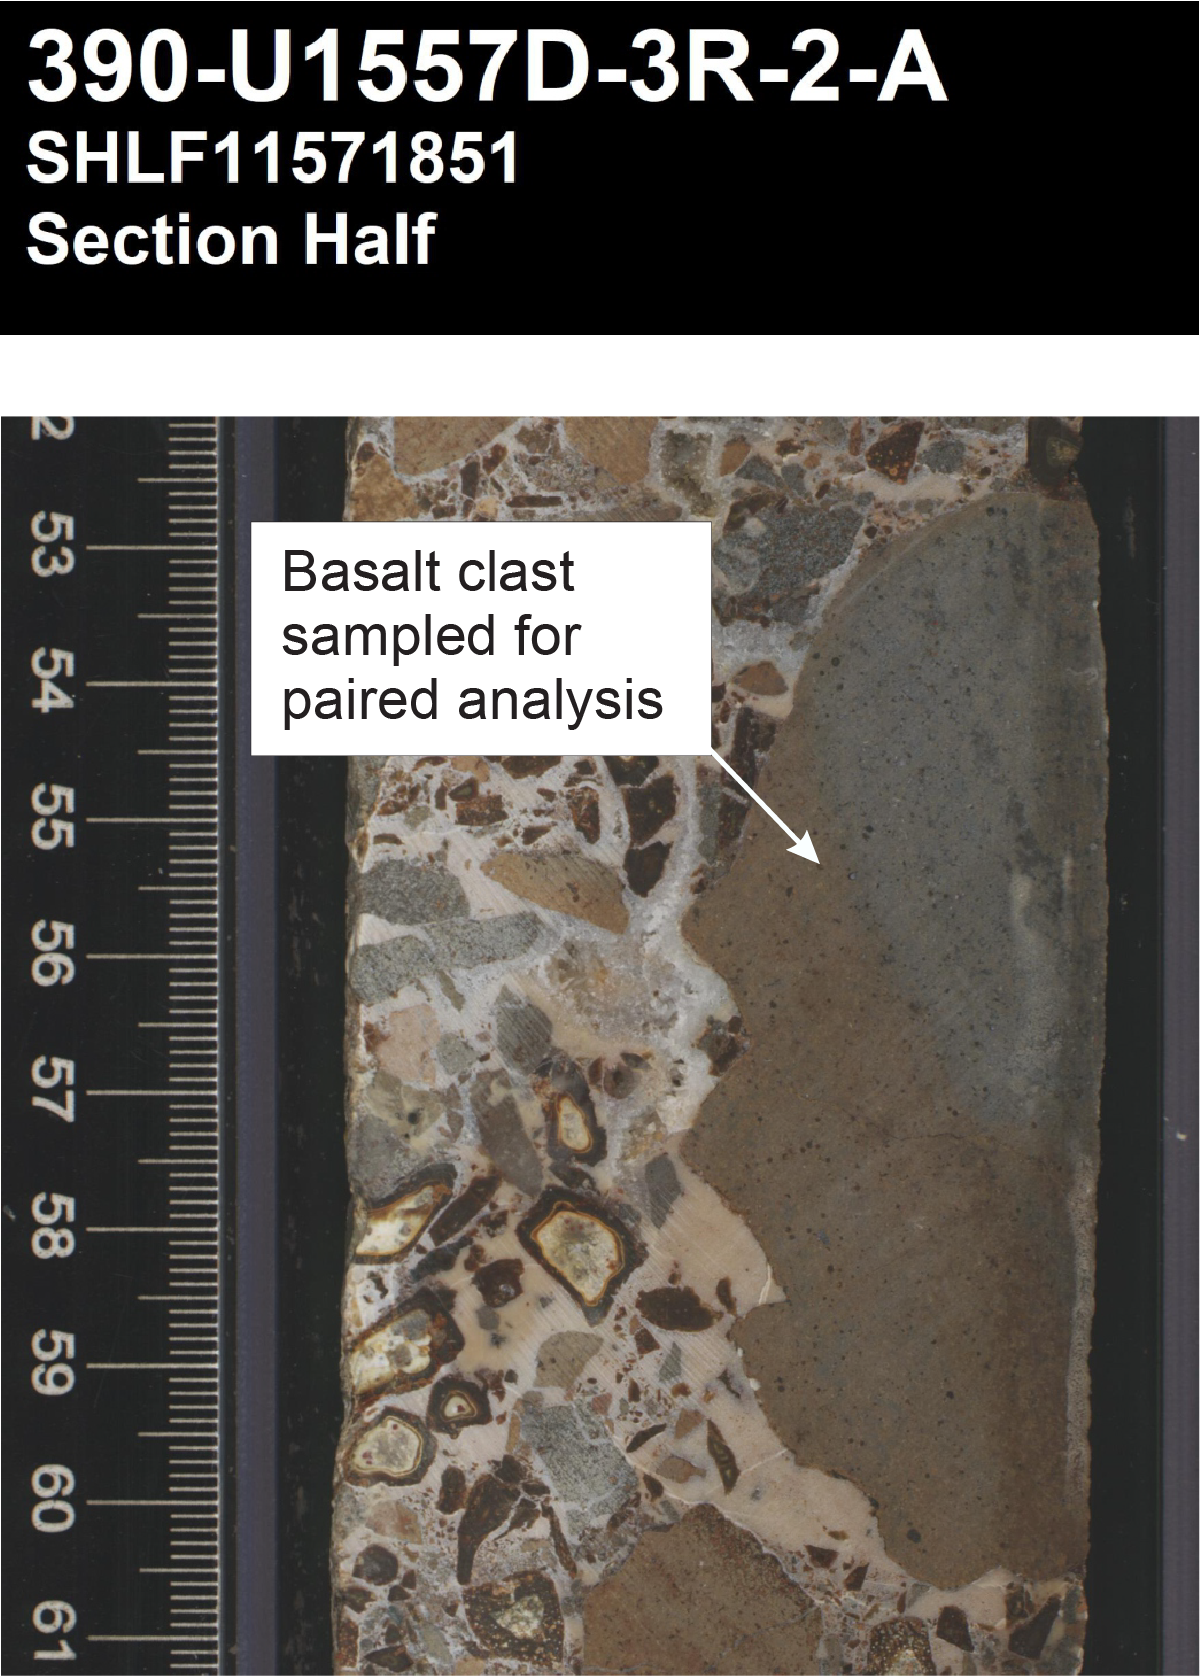
Figure F101. Basalt clast for paired sample analysis.
Loss on ignition (LOI) was first determined on the selected samples by ignition at 1025°C for 4 h, and concentrations of major (SiO2, TiO2, Al2O3, Fe2O3, MnO, MgO, CaO, Na2O, K2O, and P2O5) and minor/trace (Ba, Co, Cr, Cu, Ni, Sc, Sr, V, Zn, and Zr) elements were then measured on the ignited samples using ICP-AES (see Geochemistry in the Expedition 390/393 methods chapter [Coggon et al., 2024c]). Results are reported on a volatile-free basis as weight percent for major element oxides and LOI and as parts per million for minor/trace elements in Table T20. Major oxide analyses were not normalized to 100%.
11.2.2. Lava geochemistry
11.2.2.1. Variations with depth
Figure F102 summarizes the major element variations for the rocks from Site U1557 as a function of depth. The data are predominantly from Hole U1557D, but one sample was analyzed from Hole U1557B. This sample is included for completeness, plotting at the top of each graph. For simplicity, when discussing the data we will refer to a single hole (i.e., Hole U1557D), but the sample from Hole U1557B is included throughout unless otherwise stipulated. For comparison, the compositional range for N-MORB, depleted MORB (D-MORB), E-MORB, and mean MORB from Gale et al. (2013) is shown as a gray bar. As explained in Basement in Geochemistry in the Site U1556 chapter (Coggon et al., 2024a), this means the gray bar is of variable width, reflecting the compositional variation that is observed among these different MORB groups. The gray bar shown for LOI represents the estimated H2O content following the recommendation of Langmuir et al. (2006) (i.e., H2Oest = 1.5 × K2O; it does not account for CO2). Also shown for comparison is the average composition for ocean-island basalt (OIB; black dashed lines) from Sun and McDonough (1989).
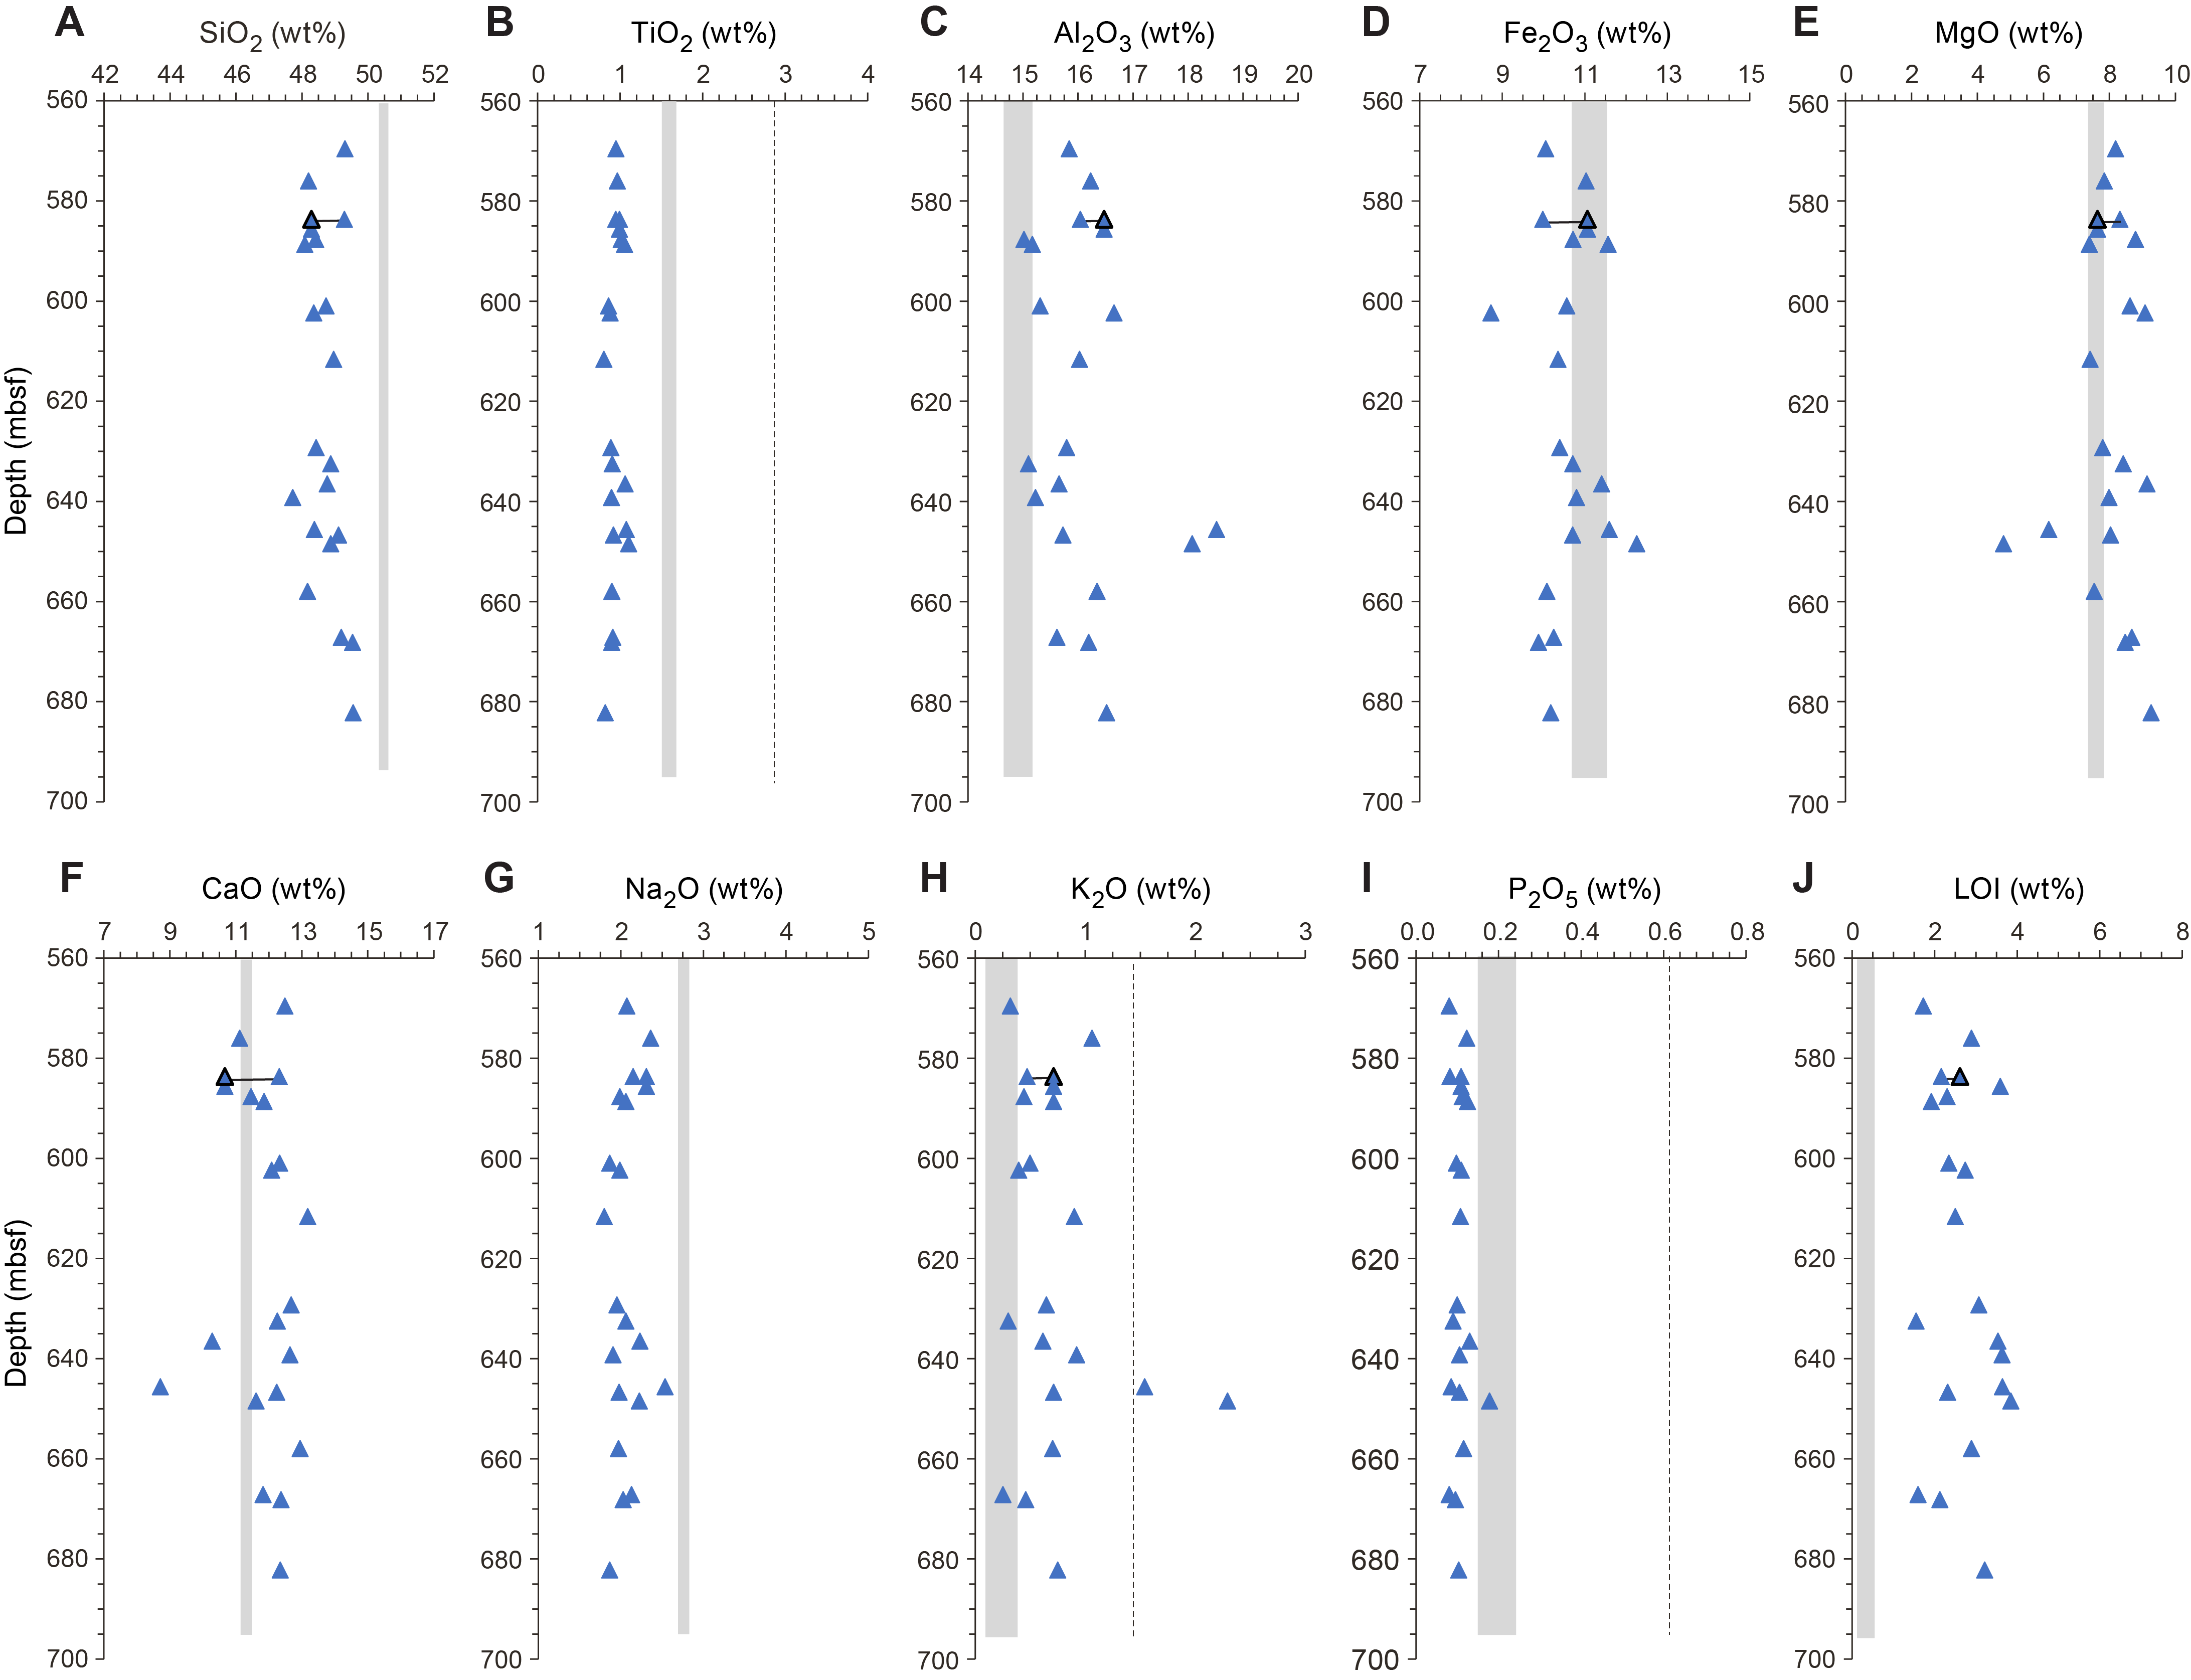
Figure F102. Major element concentrations and LOI.
Figure F102 shows the limited major element variation in basement rocks from the top to the bottom of Hole U1557D. The basalt clasts are compositionally similar to Stratigraphic Sequence C (H-POPP) from Site U1556 (Figure F147 in the Site U1556 chapter [Coggon et al., 2024a]), plotting close to the range of average MORBs but not overlapping the range for D-MORB, N-MORB, E-MORB, and mean MORB for most elements. Unlike the shallower lavas at Site U1556, none of the Site U1557 samples have compositions consistent with OIB (see Basement in Geochemistry in the Site U1556 chapter [Coggon et al., 2024a]).
Instead, the Hole U1557D samples are depleted in incompatible elements such as TiO2, Na2O, and P2O5 (i.e., lower than average MORBs) and enriched in Al2O3, MgO, and CaO (i.e., higher than average MORBs). Two samples (390-U1557D-10R-6, 138–140 cm, and 11R-2, 121–123 cm) deviate from the main group, exhibiting significantly higher Al2O3 and K2O but lower MgO and CaO. These two samples are described as completely altered based on thin section petrography (see Site U1557 thin sections in Core descriptions), suggesting that their compositional distinctiveness reflects hydrothermal alteration processes and not primary magmatic differences.
Trace elements also show limited systematic variation with depth (Figure F103) and reinforce the observation based on major elements that the rocks are depleted relative to average MORB compositions. In common with H-POPP basalts from Site U1556 (Stratigraphic Sequence C; Figure F148 in the Site U1556 chapter [Coggon et al., 2024a]), incompatible trace element concentrations (e.g., Zr and Y) are even lower than average D-MORB, whereas compatible trace element concentrations (e.g., Cr and Ni) are higher than average D-MORB (i.e., the lower and upper boundaries of each gray bar in Figure F103). The transition metals Cu, V, and Sc show variable behavior, and concentrations are predominantly higher than the range of average MORB groups (Figure F103); only Zn predominantly overlaps the range of average MORBs.
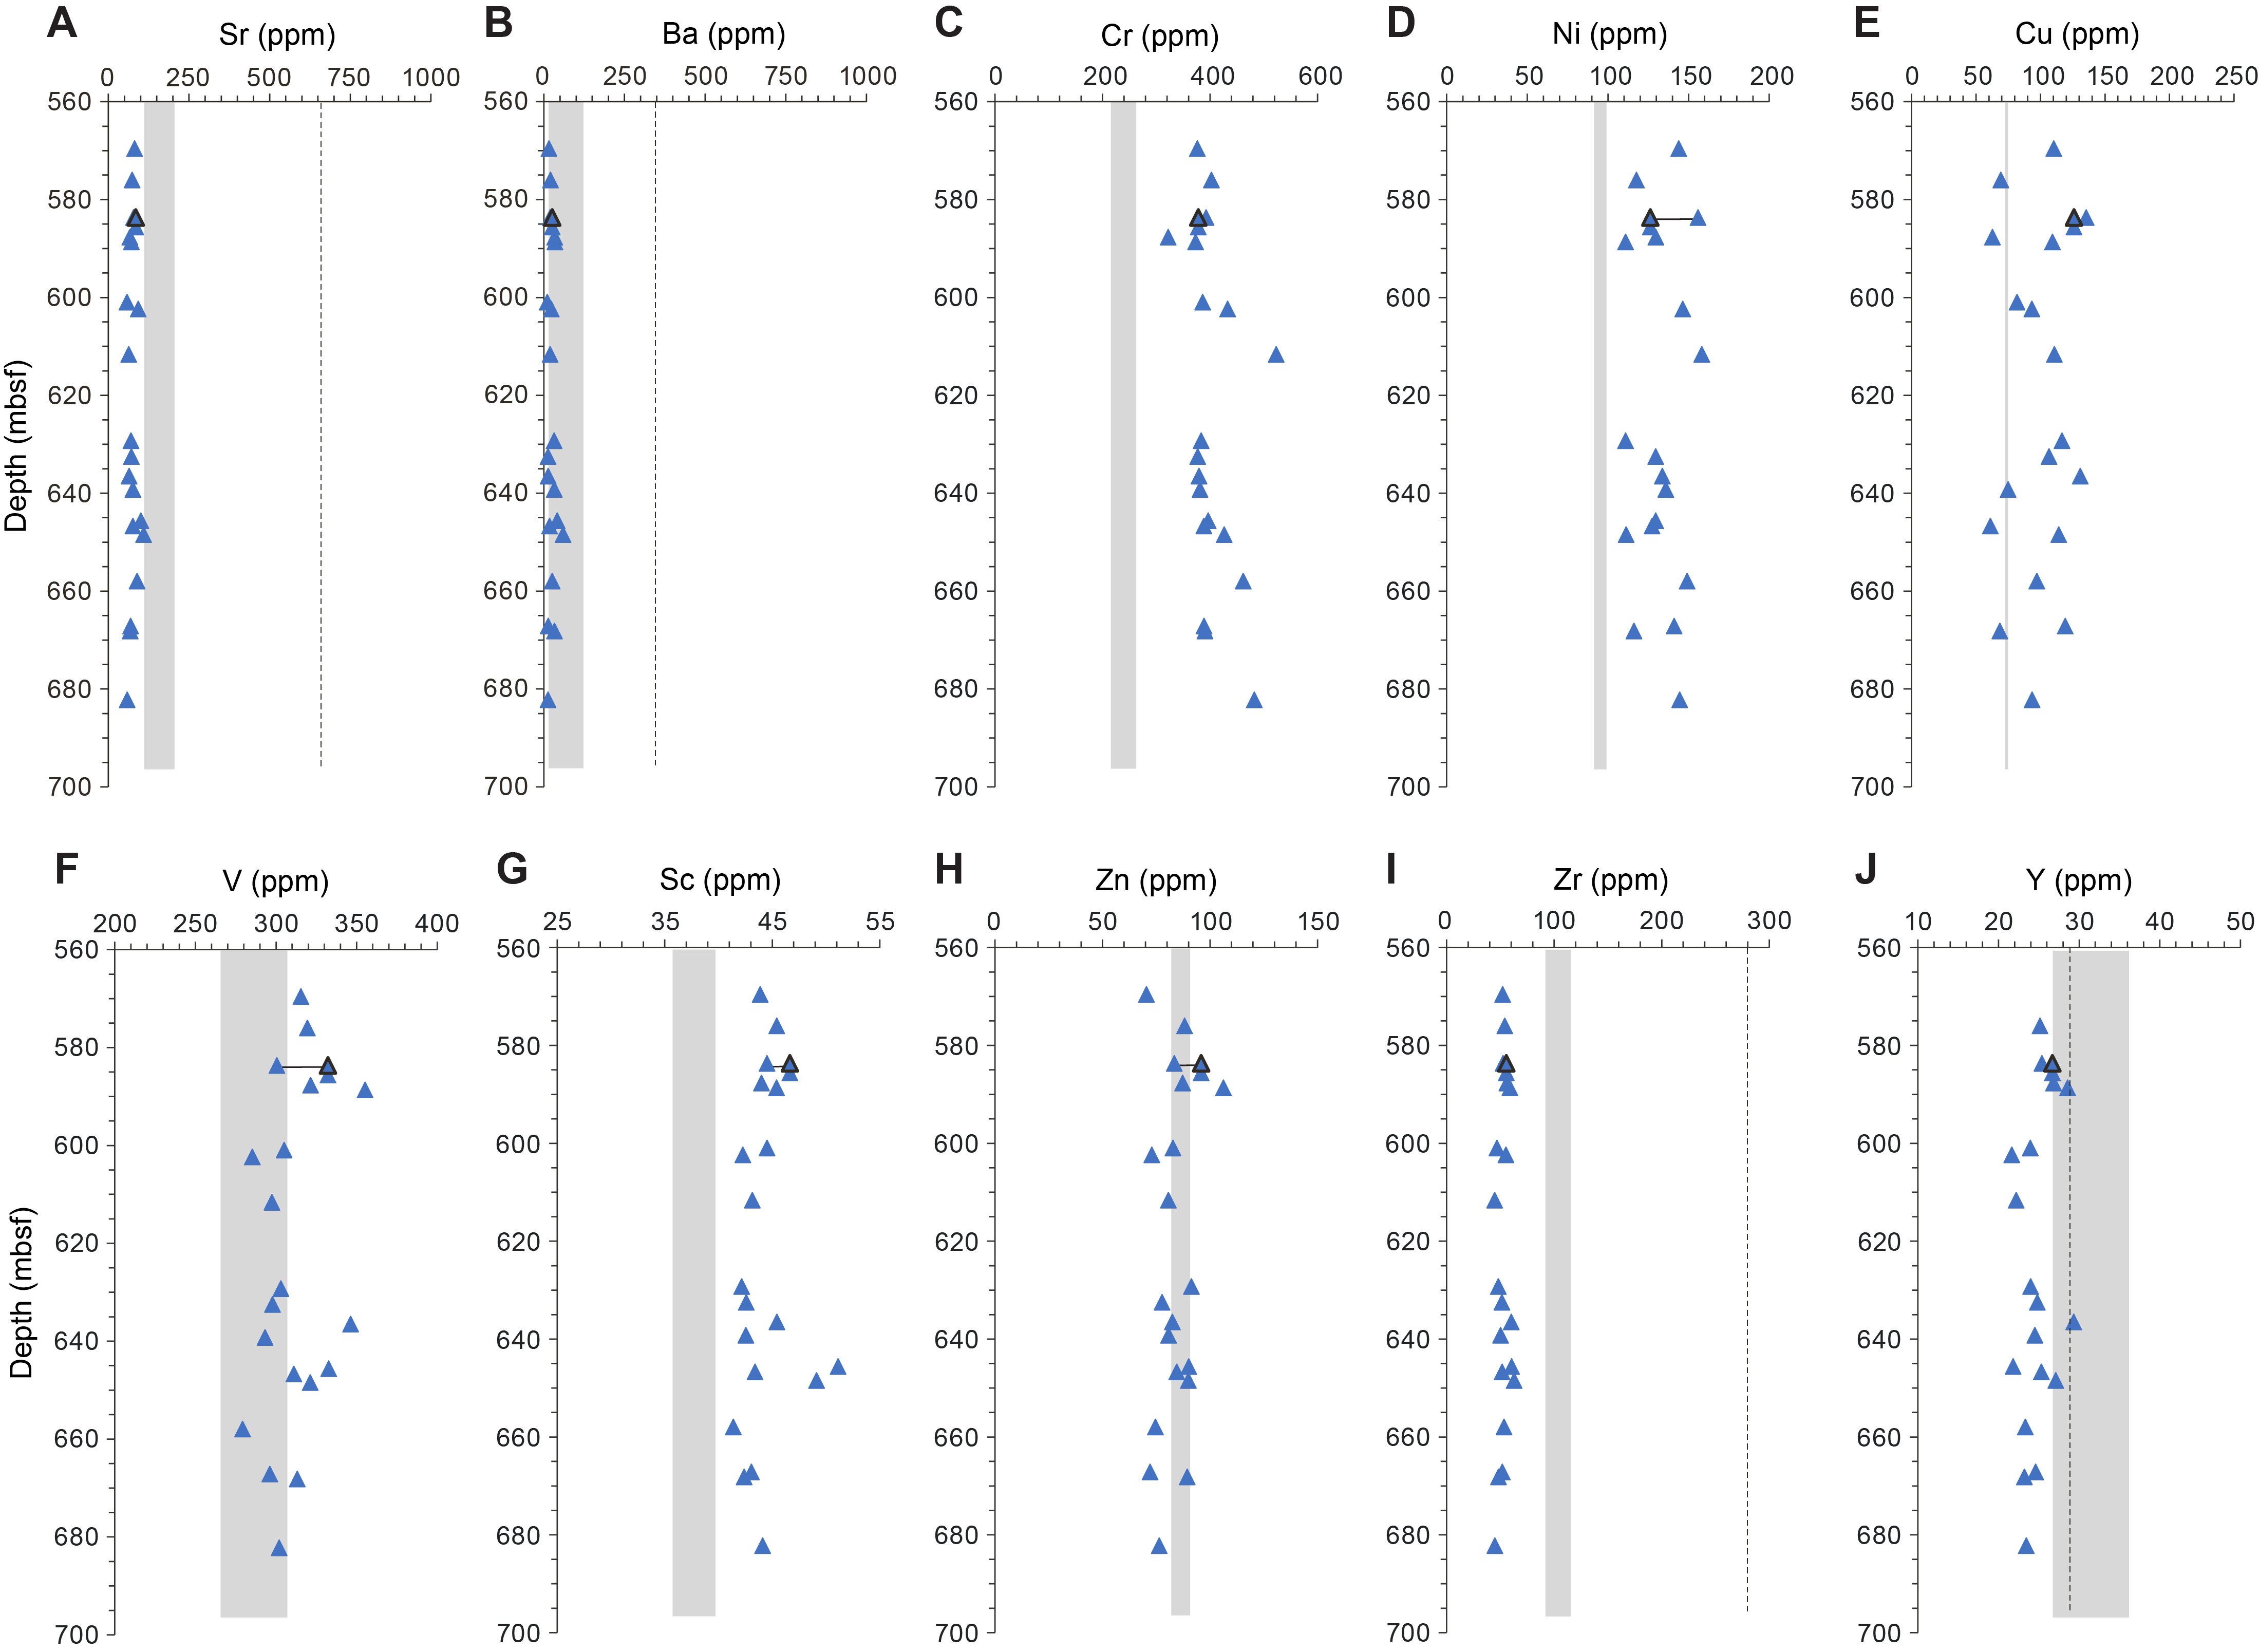
Figure F103. Trace element concentrations.
11.2.2.2. Paired analyses of basalt clasts with variable alteration
Two different portions of a single basalt clast that exhibits differing styles and/or extents of alteration were analyzed to examine the effect of alteration on bulk rock composition. These paired samples are from Samples 390-U1557D-3R-2, 56–59 and 3R-2, 59–61 cm (Figure F101). Based on macroscopic observation, Sample 3R-2, 59–61 cm, is from an orange halo (see Alteration petrology) and is inferred to be more altered than Sample 3R-2, 56–59 cm. Where the compositional difference between the paired samples is large enough to be seen on the downhole plots (Figures F102, F103), the two analyses are linked by a tie line and the more altered sample is outlined by a thick black line. The figures show that for many elements the compositional differences between the two samples are relatively small and within the size of the symbols used. Nonetheless, SiO2, MgO, and CaO are noticeably lower in the more altered portions of the basalt clast and Al2O3, Fe2O3, Sr, and LOI are higher. Transition metals (V, Sc, Cu, and Zn) and high-field-strength elements (HFSE) (Zr and Y) are largely indistinguishable. The alkali elements Na2O and K2O have higher concentrations in the more altered sample. These variations are consistent with those expressed even more strongly by the two completely altered samples described above (i.e., Samples 10R-6, 138–140 cm, and 11R-2, 121–123 cm). They are also consistent with those observed for the paired samples analyzed from Site U1556 (see Basement in Geochemistry in the Site U1556 chapter [Coggon et al., 2024a]).
As noted for samples from Site U1556, the geochemical data indicate that as a result of hydrothermal and/or seafloor alteration basalt samples from Hole U1557D will appear to be more evolved (i.e., lower MgO and higher Fe2O3), more alkaline (i.e., lower SiO2 and generally higher K2O), and possibly more enriched in some trace elements than their original compositions, necessitating care when interpreting primary petrology.
11.2.2.3. Classification
The sampled basalt clasts from Site U1557 are plotted on a total alkalis versus silica (TAS) diagram in Figure F104A. The data show a distribution that ranges from alkaline to subalkaline, although most samples plot in the subalkaline basalt field. Hole U1557D basalts overlap the field for Hole U1556B Stratigraphic Sequence C (H-POPP), but most exhibit higher Na2O + K2O than the rocks from the bottom of Hole U1556B.
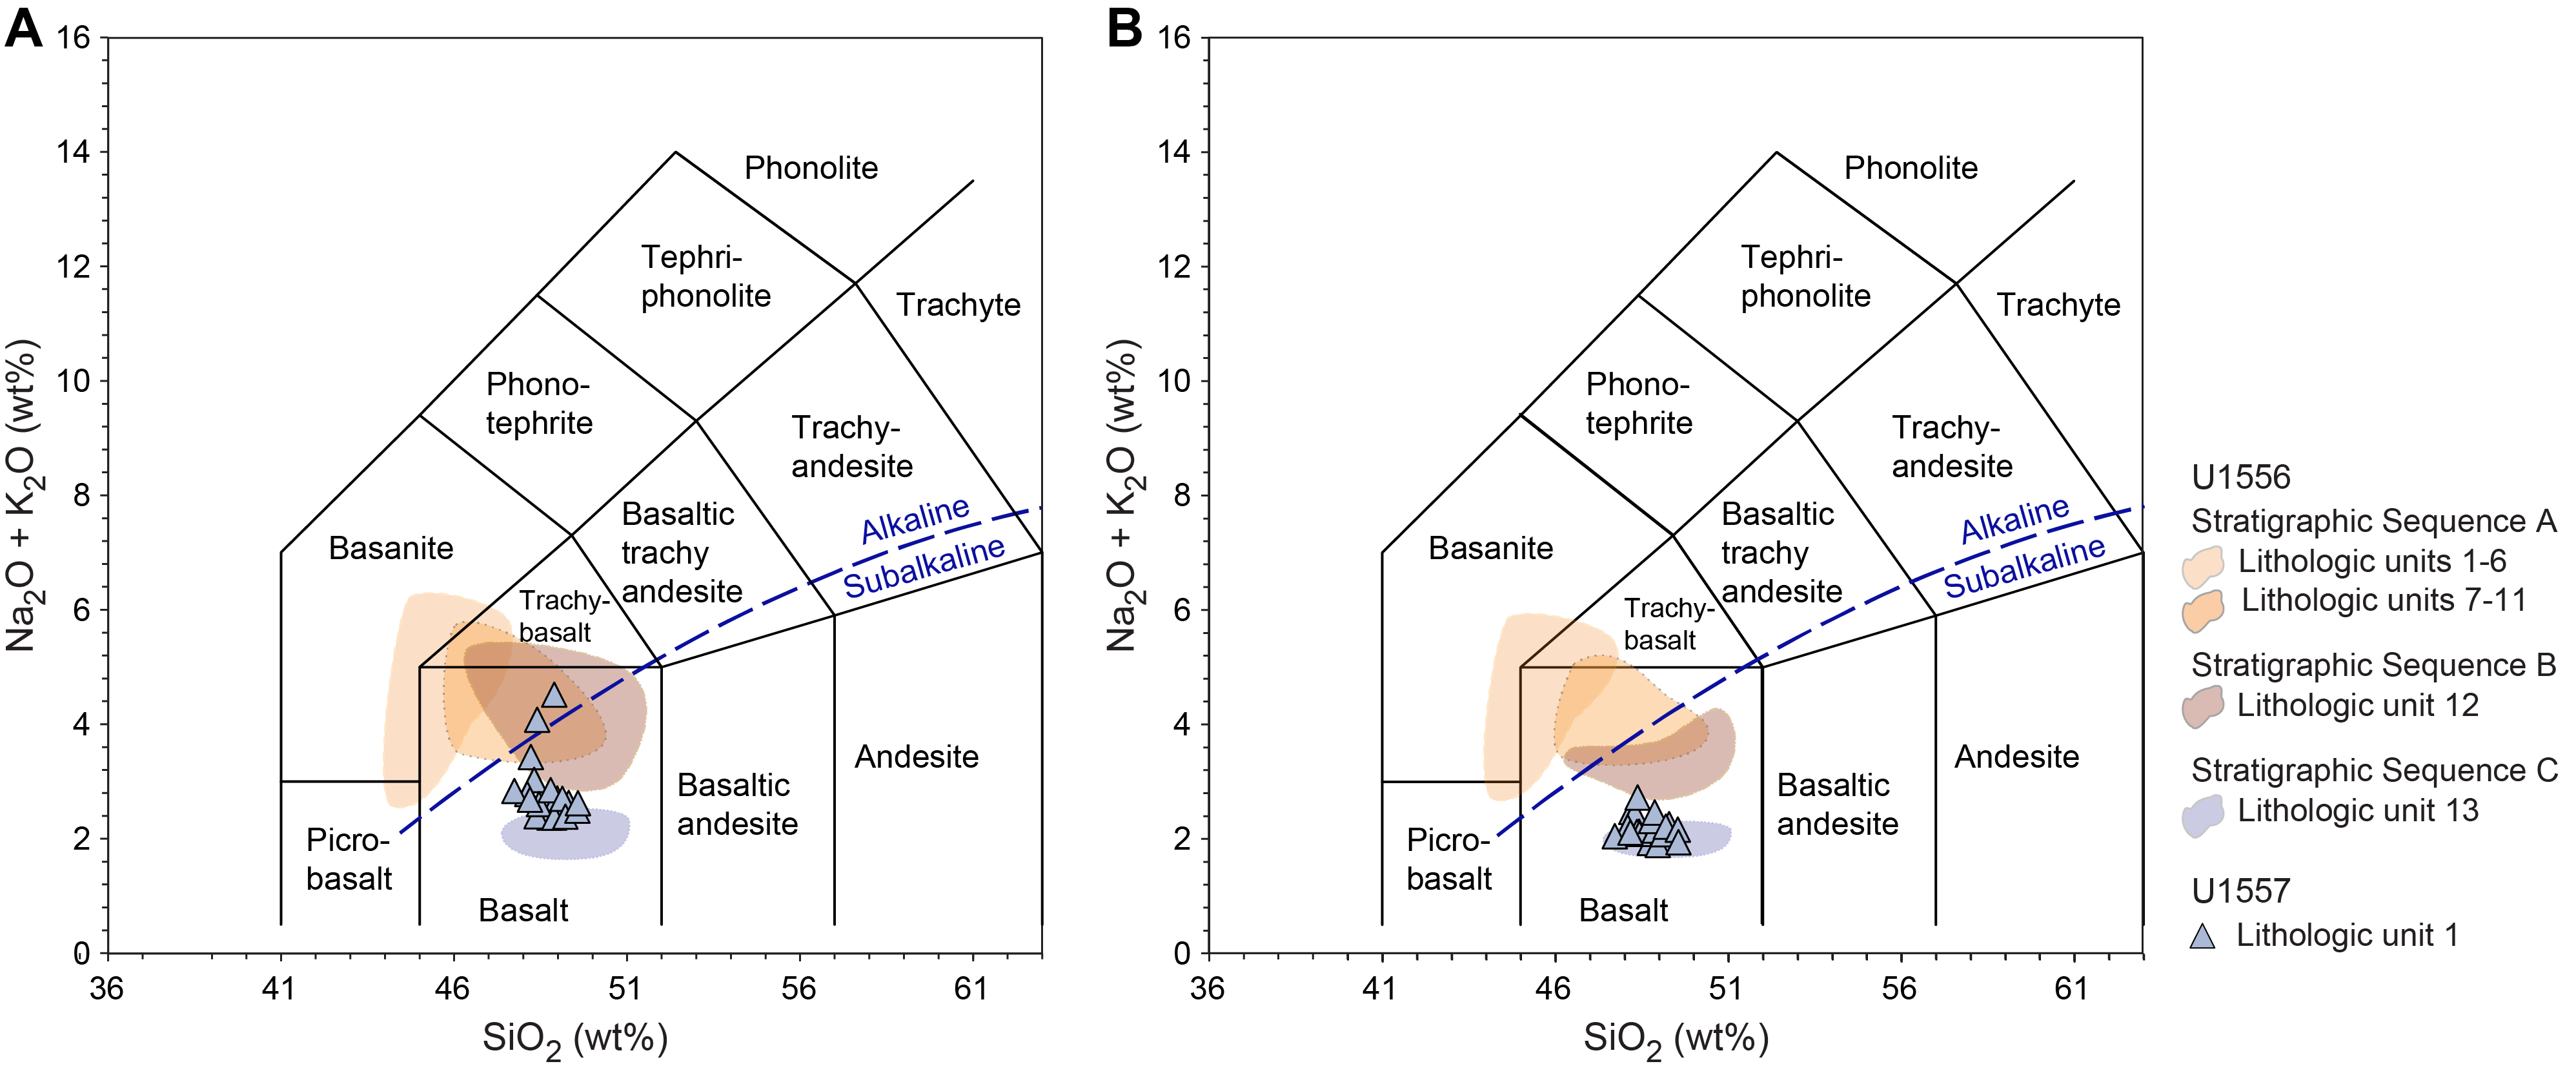
Figure F104. TAS diagram for basalts.
Like the basalts from Site U1556, LOI values are high throughout (1.6–3.9 wt%) (Table T20). Such high LOI values indicate significant degrees of alteration, particularly for subalkaline basalts. As explained in Basement in Geochemistry in the Site U1556 chapter (Coggon et al., 2024a), Gale et al. (2013) estimate that mean MORB has H2O content of only ~0.24 wt%, which is more than an order of magnitude lower than the average for basalts from Site U1557.
The alkali elements are particularly susceptible to hydrothermal alteration, as highlighted in a mean MORB–normalized multielement plot (Figure F105). The figure shows that the average concentration of K2O in Hole U1557D basalts is nearly 4 times that of H-POPP (Stratigraphic Sequence C from Site U1556) and nearly 5 times that of mean MORB. More importantly, it is more than an order of magnitude higher than predicted by the shape of the multielement pattern (i.e., the concentration predicted by projection of the slope of the fluid-immobile trace elements Zr, Ti, and Y that occur to the right of K in the multielement diagram; red dotted line).
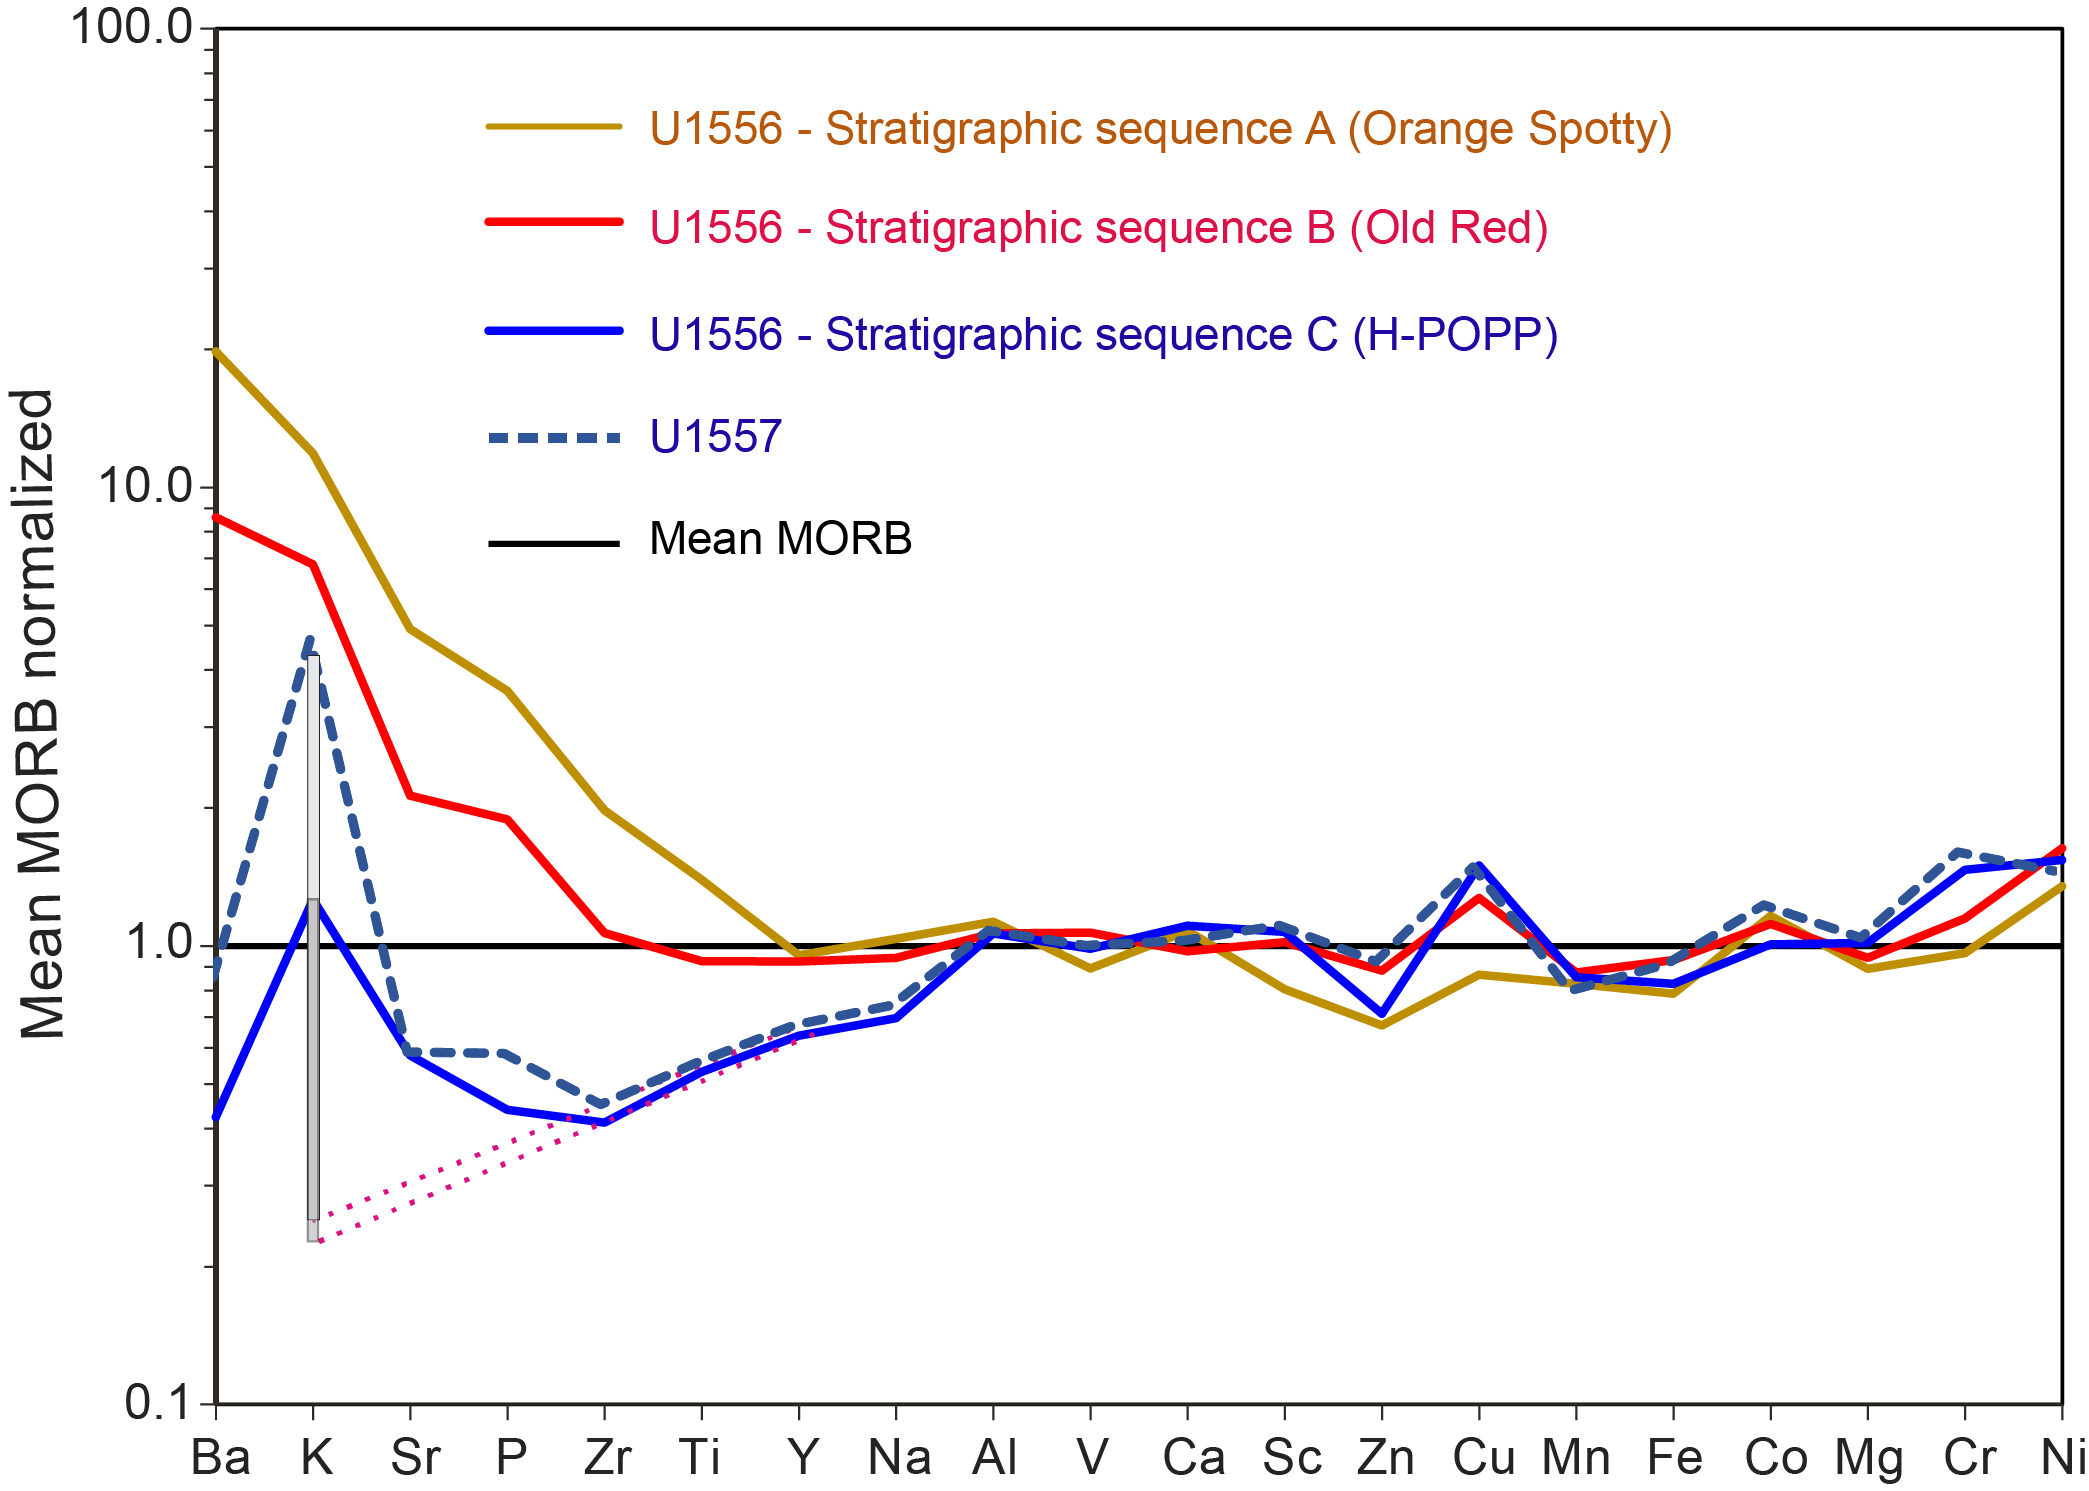
Figure F105. Incompatible trace element diagram.
Using the same approach as that described for Site U1556 basalts, we used the pattern of the multielement plot to apply a correction to the K2O concentration. As noted previously, this approach rests on the assumption that adjacent elements (Ba and Sr) are not affected by alteration. Figure F106 shows Sr, K2O, and Ba concentrations versus silica saturation index (SSI) relative to fields for basalts from Site U1556. A description of the SSI value and how it is calculated is provided in Basement in Geochemistry in the Site U1556 chapter (Coggon et al., 2024a). In common with H-POPP basalts, the basalts from Site U1557 show limited variation in Sr and Ba concentration, but the corresponding SSI values show a much wider range. Indeed, one sample from Site U1557 has an SSI value <1, plotting in the alkaline basalt field. This sample (390-U1557D-11R-2, 121–123 cm) is one of the completely altered basalts flagged in Figures F102 and F103. In contrast to the limited compositional variation shown by Sr and Ba, K2O shows a wide range of values (Figure F106B), and the sample with the lowest SSI value (11R-2, 121–123 cm) also has the highest K2O content. This suggests that the higher degree of alteration, particularly enrichment in K2O, has a greater impact on the calculated SSI value for Site U1557 basalts than seen for the Site U1556 basalts.
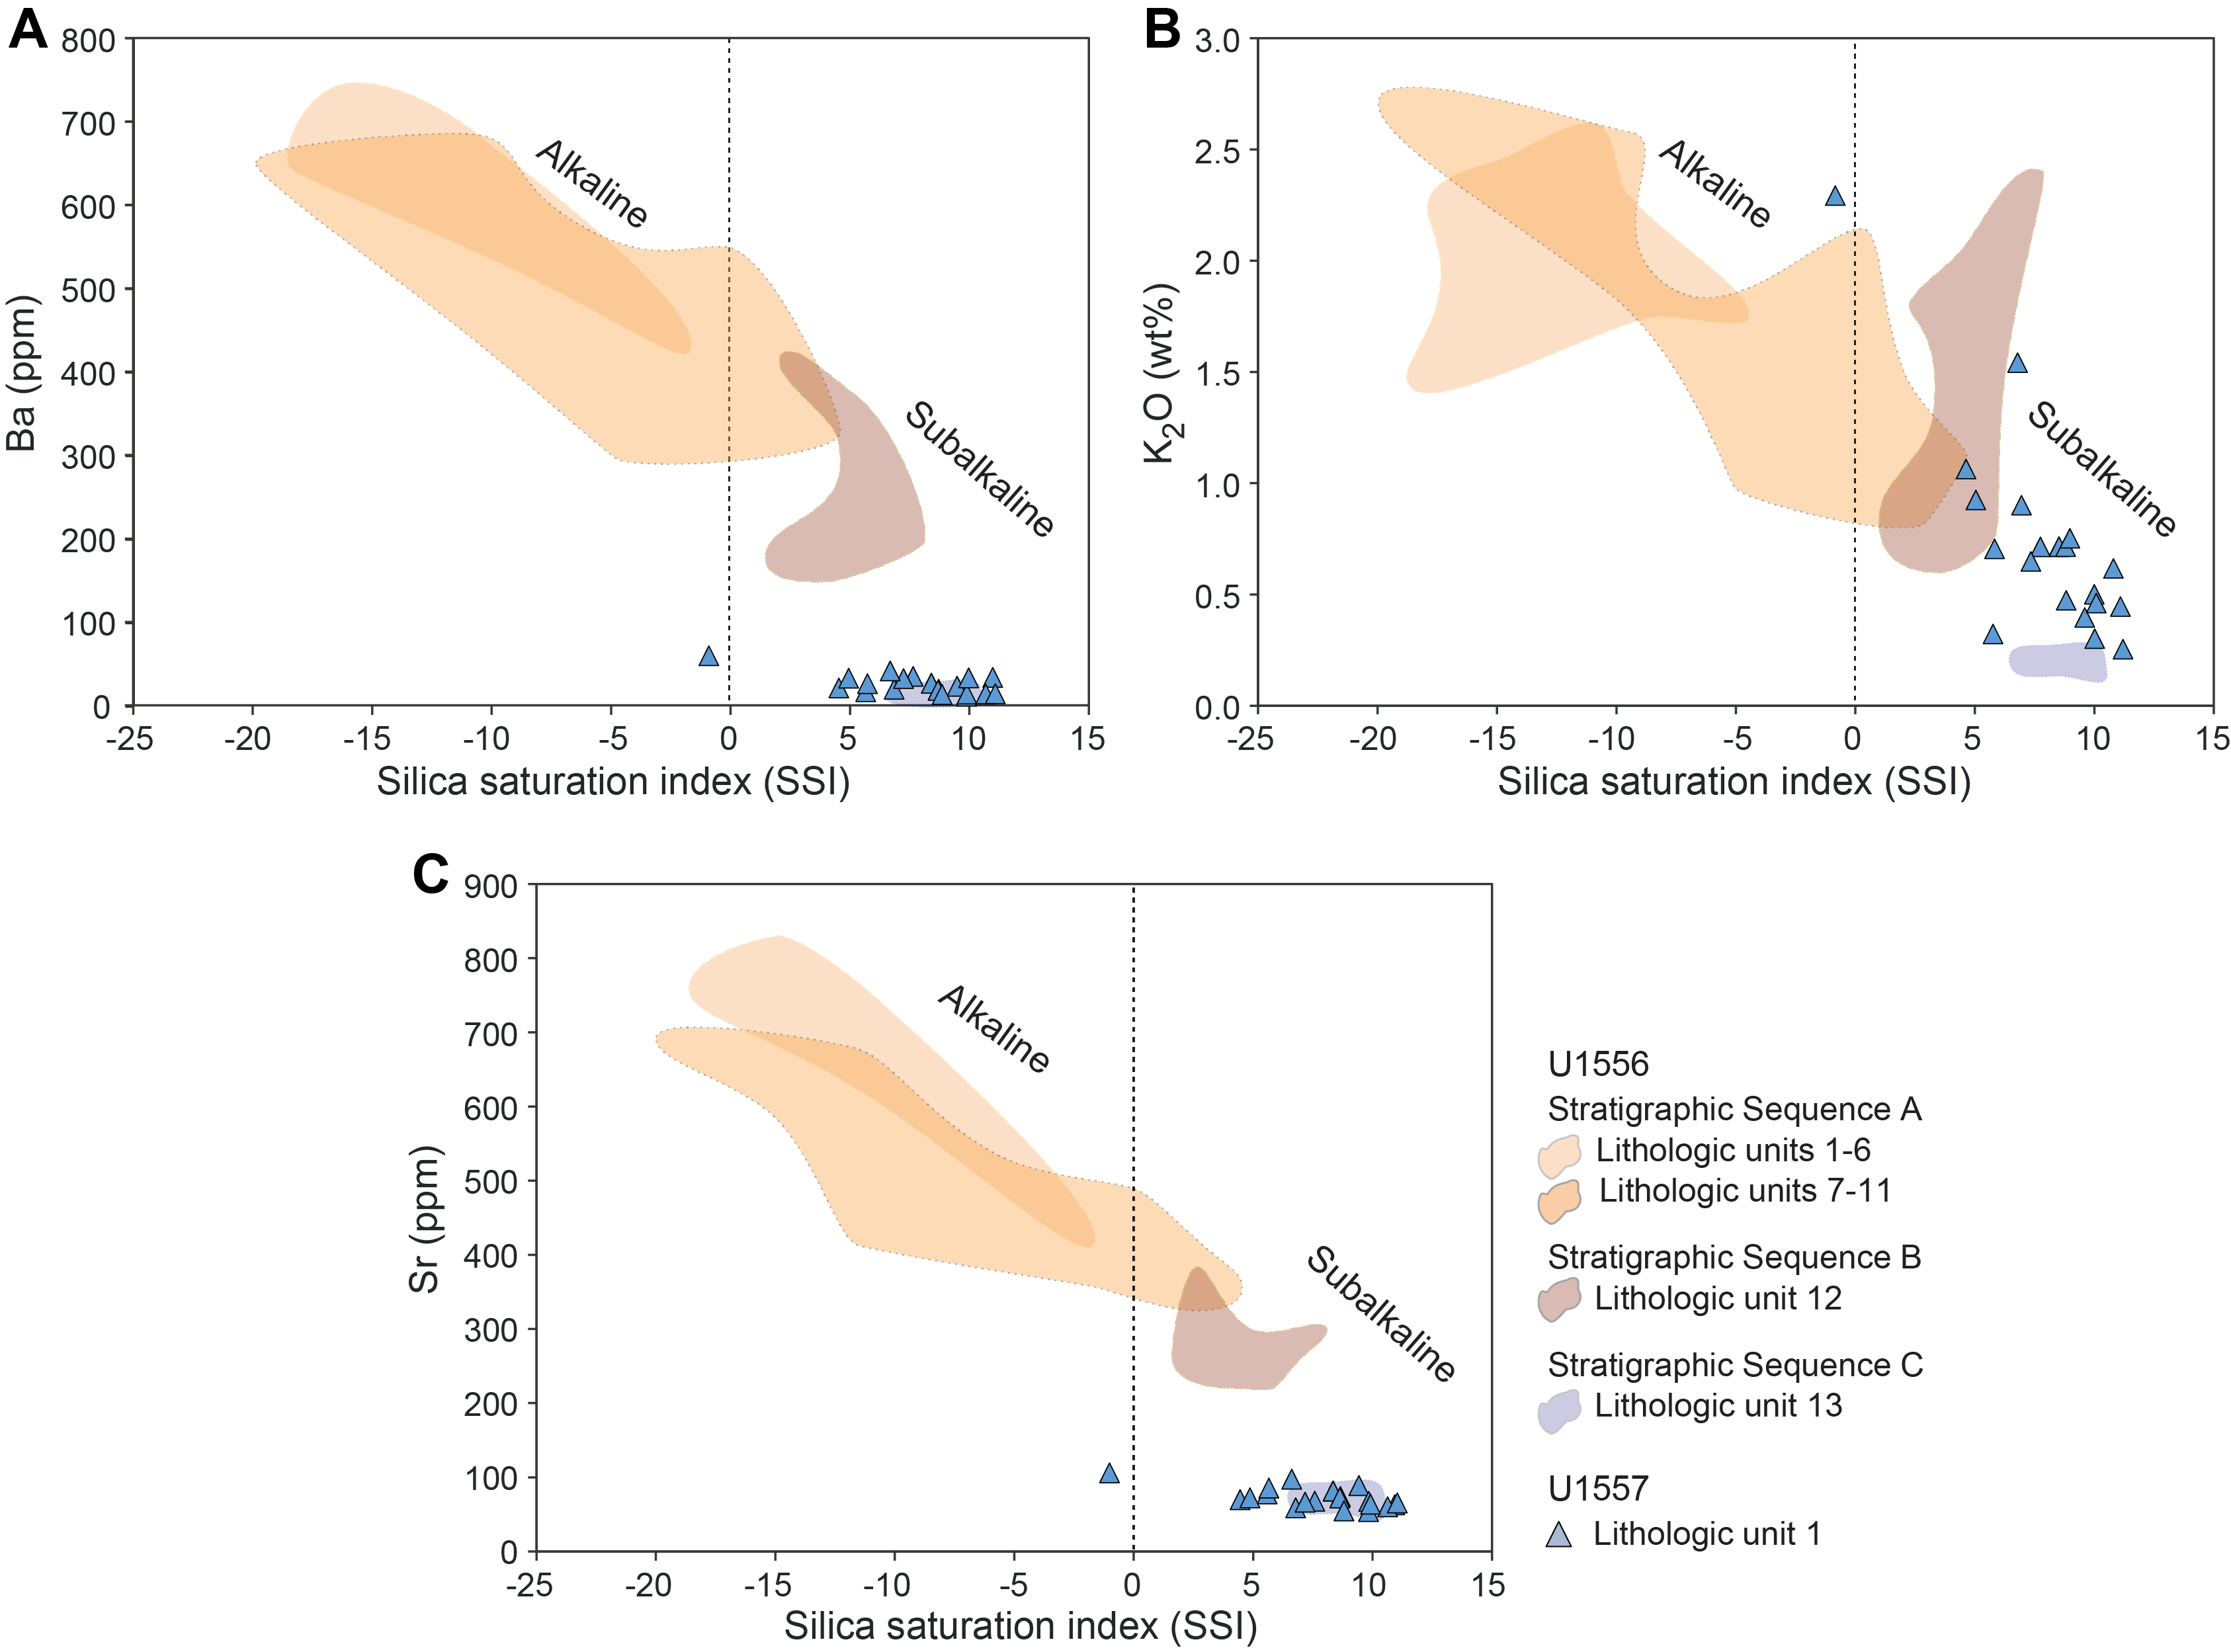
Figure F106. Silica saturation index vs. Ba, K2O, and Sr.
However, the limited ranges in Ba and Sr concentrations (Figure F106A, F106C) suggest that these elements are either largely unaffected by alteration or they have been altered to the same degree for all basalt clasts at Site U1557, regardless of style of alteration. We think the latter is unlikely given the wide variation in K2O (Figure F106B), so for this exercise we assume that their concentrations can be used to at least partially correct for the K2O added during alteration (Figure F105).
Figure F104B shows the distribution of data in the TAS diagram using the corrected K2O contents compared to the fields for corrected data for Stratigraphic Sequences A–C from Site U1556. After correction, all basalts from Site U1557 plot within the subalkaline field and most overlap the field for H-POPP (Stratigraphic Sequence C in Hole U1556B). Prior to correction of the K2O values, classification implied that the lavas at Site U1557 ranged from alkaline to subalkaline, which has significant implications for understanding source composition and degree of partial melting. After K2O correction, all samples plot within the subalkaline field, consistent with a normal MORB-type composition throughout the section.
11.2.2.4. Comparison of basalts from Sites U1557 and U1556
Figure F105 summarizes average compositions for the basalts from Site U1557 relative to the three stratigraphic sequences from Site U1556 on an extended multielement plot, normalized to mean MORB composition of Gale et al. (2013). A first-order observation from this diagram is that the basalts from Site U1557 are similar to H-POPP basalts (Stratigraphic Sequence C in Hole U1556B) and show N-MORB-like compositions for most elements to the right of Na (i.e., concentrations plot near a mean MORB–normalized value of 1) with some variation in the transition metals (Zn, Cu, Mn, and Fe) and elevated concentrations of compatible elements Cr and Ni. However, the most incompatible elements (Ba to Y) show distinct depletion relative to mean MORB except for K. The latter shows a strong positive anomaly relative to adjacent LILEs due to hydrothermal alteration, as discussed above. Collectively, the data for Site U1557 basalts suggest they were derived from a mantle source that was significantly more depleted than normal MORB, indeed, more depleted even than D-MORB (Figures F101, F102), but they have been secondarily enriched in (some) LIL elements, particularly K, by hydrothermal alteration. The ratio of V/Sc, often cited as a sensitive recorder of the oxygen fugacity of MORB-source mantle, averages ~7 for Site U1557 basalts, similar to H-POPP basalts (Stratigraphic Sequence C) from Site U1556, which is within the range for average MORB (6.74 ± 1.11) (Li and Lee, 2004), melting in the spinel lherzolite stability field at slightly below quartz-magnetite-fayalite (Mallmann and O'Neill, 2009). However, other transition metals (i.e., Zn and Cu) show unusual negative and positive anomalies, respectively. These variations are interesting because the differences among D-MORB, N-MORB, and mean MORB averages (Gale et al., 2013) are <3 ppm for both elements, whereas Site U1557 basalts are up to 7 ppm lower and 248 ppm higher in Zn and Cu, respectively, relative to mean MORB. This suggests the variations observed in Site U1557 basalts are due to something other than typical MORB-source melting or magma chamber processes. Whether this is due to secondary alteration processes, unusual source conditions, or possibly analytical uncertainty in the shipboard data will require detailed shore-based research.
Given that all Hole U1557D samples are hydrothermally altered, some significantly so as indicated by their high LOI and K2O contents, we rely on ratios of HFSEs to provide insights into magmatic compositional variations because these ratios are not strongly affected by fractional crystallization or alteration (e.g., Gill and Fitton, 2022). In this context we note that the Zr/TiO2 ratio (parts per million/weight percent) for paired basalt samples from both Holes U1556B (see Table T31 in the Site U1556 chapter [Coggon et al., 2024a]) and U1557D (Table T20) are similar, regardless of the degree of alteration, suggesting this ratio reflects the primary magmatic compositions of the basalts.
The Zr/TiO2 ratios of basalt clasts from Site U1557 are summarized graphically in Figure F107. The data show limited variation in this ratio from the top to the bottom of the hole (56 ± 2 ppm/wt% on average). Unlike the variations in Zr and TiO2 systematics on the basis of pXRF analyses of core archive-half surfaces reported in Igneous petrology, which suggest mobility of Ti in some samples, we do not see comparable mobility for the samples analyzed by ICP-AES. This may be due to our focus on fresher sample material or that a larger volume of rock is homogenized for ICP-AES analysis. Regardless, the limited variation provides confidence that the Zr/TiO2 ratios are representative of the original igneous compositions. The Site U1557 basalt average is slightly higher than that for Hole U1556B Stratigraphic Sequence C (H-POPP; 54 ± 0.6 ppm/wt%). It is similar to the N-MORB composition of Sun and McDonough (1989) (i.e., 58 ppm/wt%) but lower than mean MORB of Gale et al. (2013) (70 ppm/wt%). Of the average values reported by Gale et al. (2013), the Site U1557 basalts are most similar to average D-MORB (i.e., 61 ppm/wt%). The data indicate the Hole U1557D talus pile reflects a stratigraphic sequence of lavas that sampled a relatively homogeneous D-MORB-like mantle source throughout.
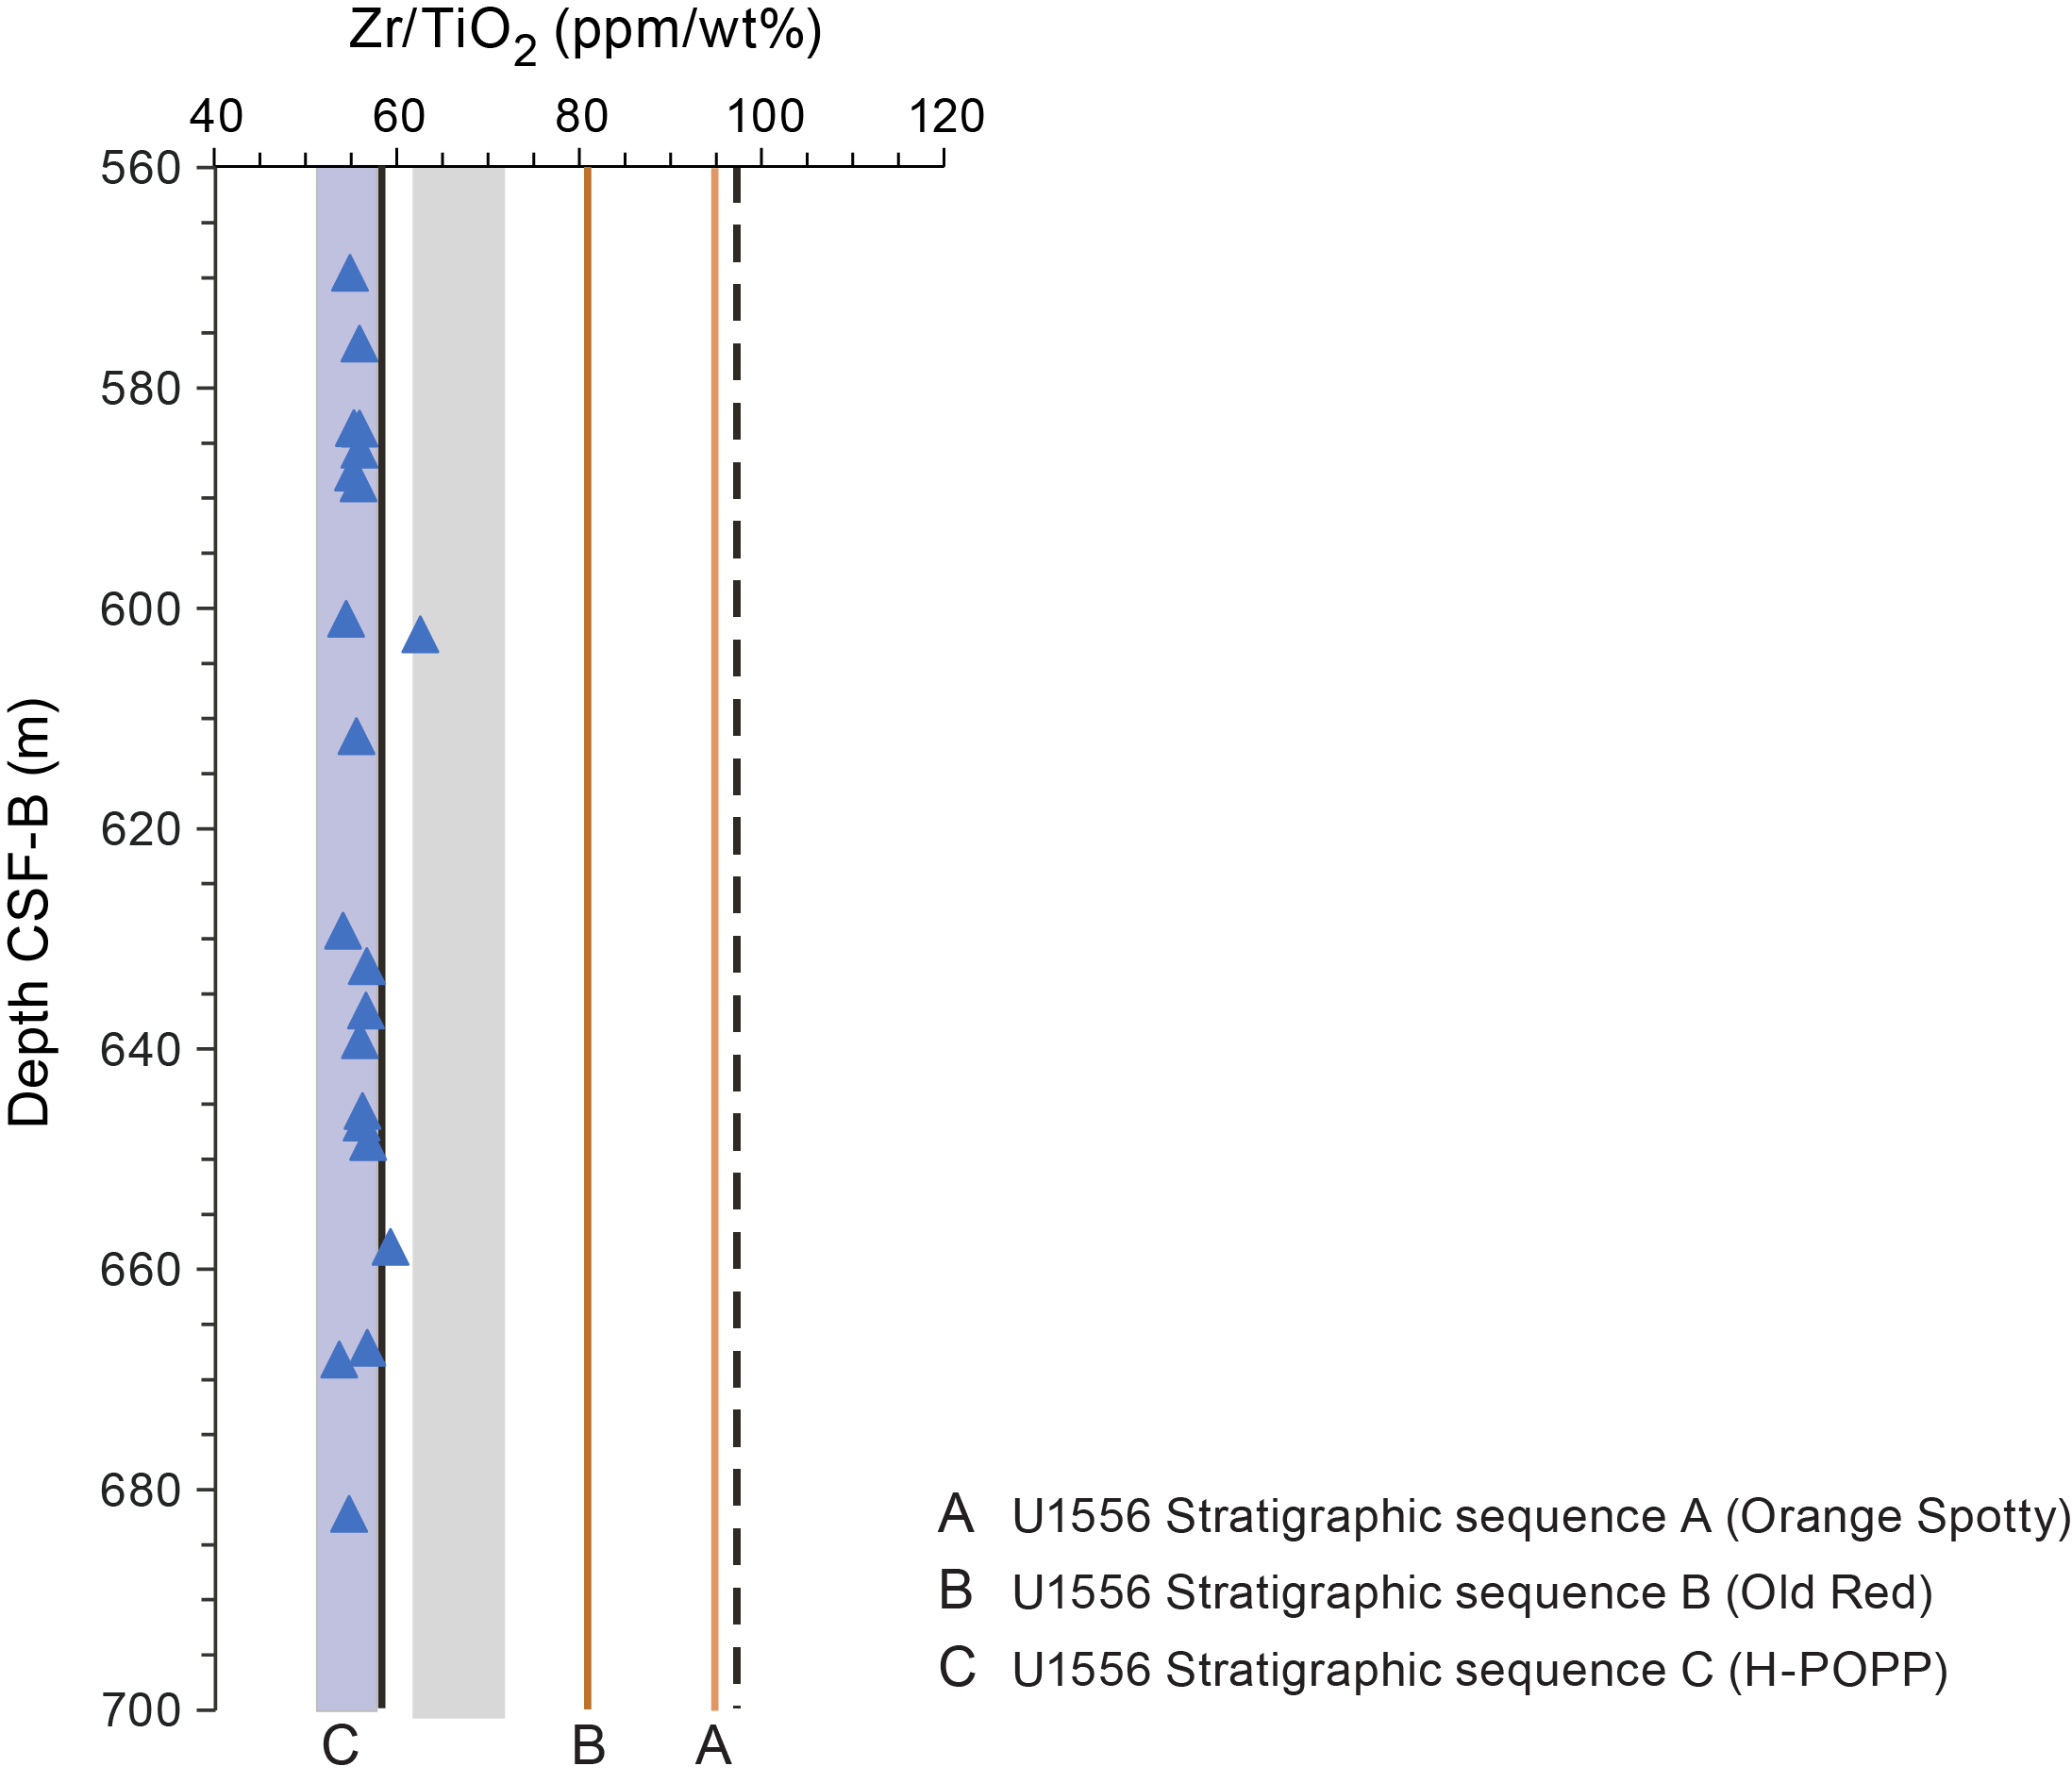
Figure F107. Zr/TiO2 ratios.
12. Microbiology
Microbiology sampling in basement at Site U1557 during Expedition 390 focused on exploring evidence for life using culture-based and culture-independent approaches. For Hole U1557D, sampling efforts aimed at collecting a single whole-round core sample from each 9.5 m advance that would be processed and subsampled for different analyses. The number of subsamples able to be processed for each analysis type depended on the amount of material available from each parent sample (Table T21). The aim was to generate a suite of samples that were representative of the different rock and alteration types that comprise the basement stratigraphy of the site (see Igneous petrology). In total, 12 whole-round samples (8–15 cm long) were collected for microbiological analysis (Figure F108). All of the samples were sedimentary breccia containing clasts of hydrothermally altered basalt and volcanic glass.
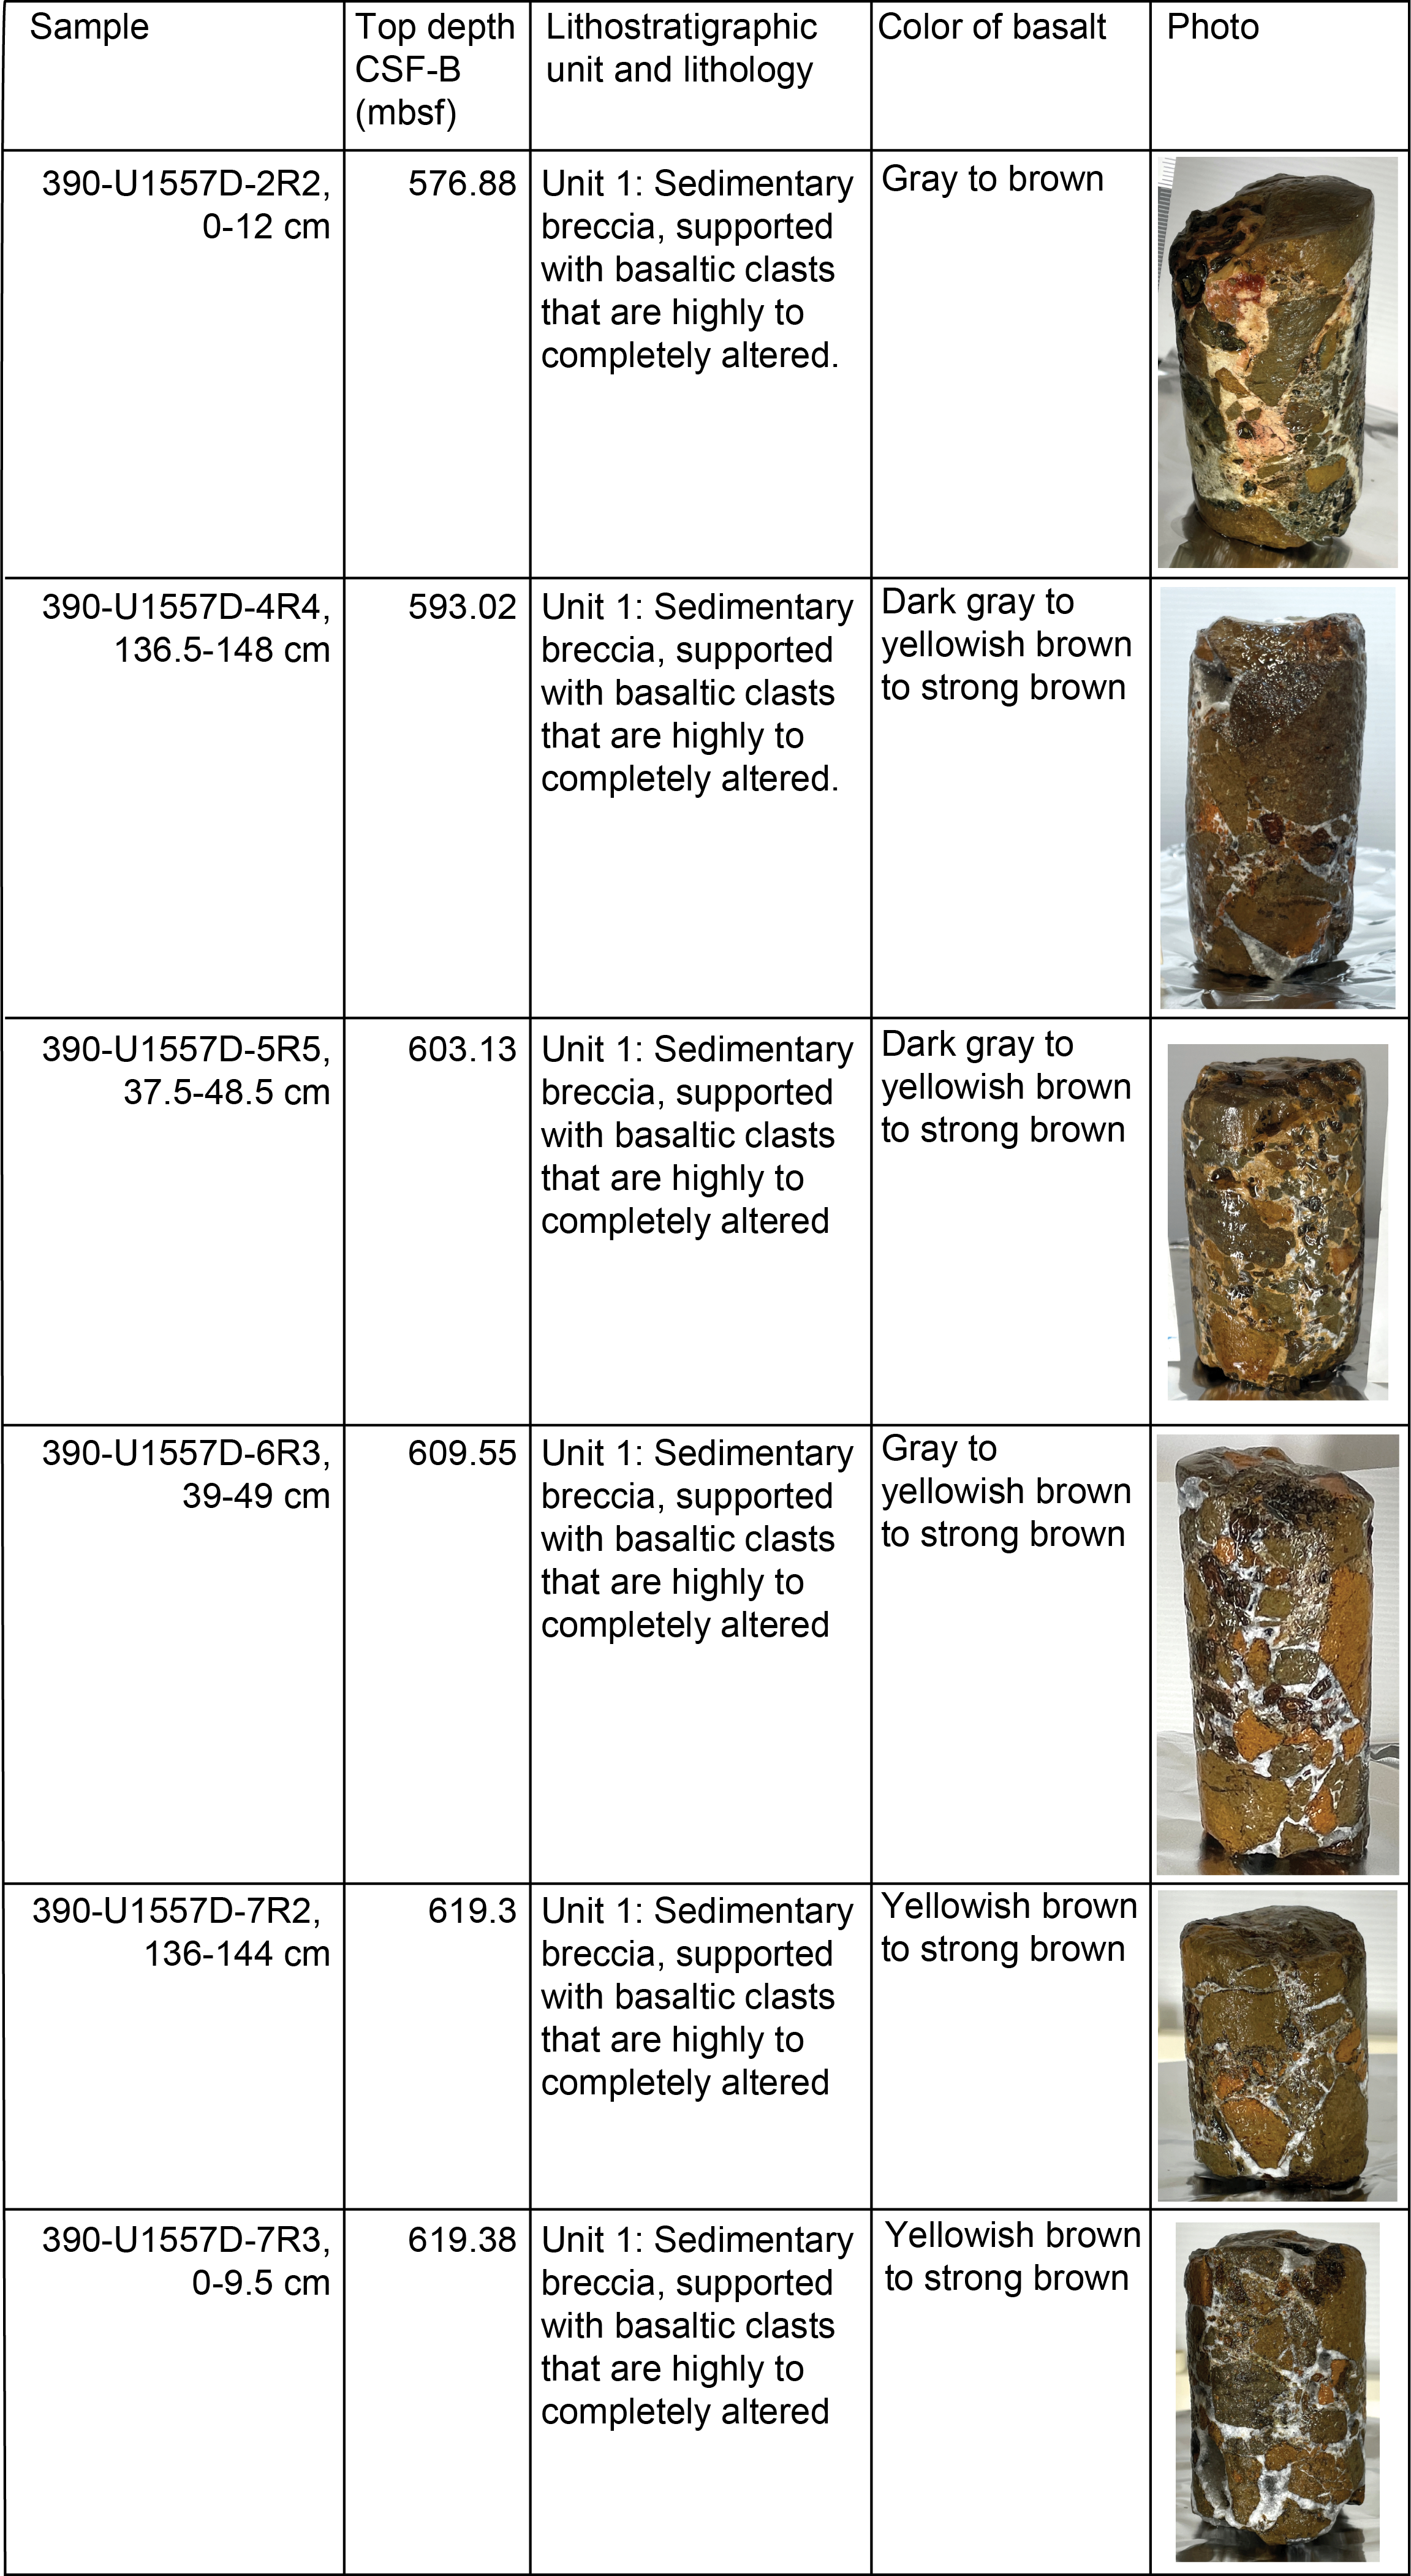
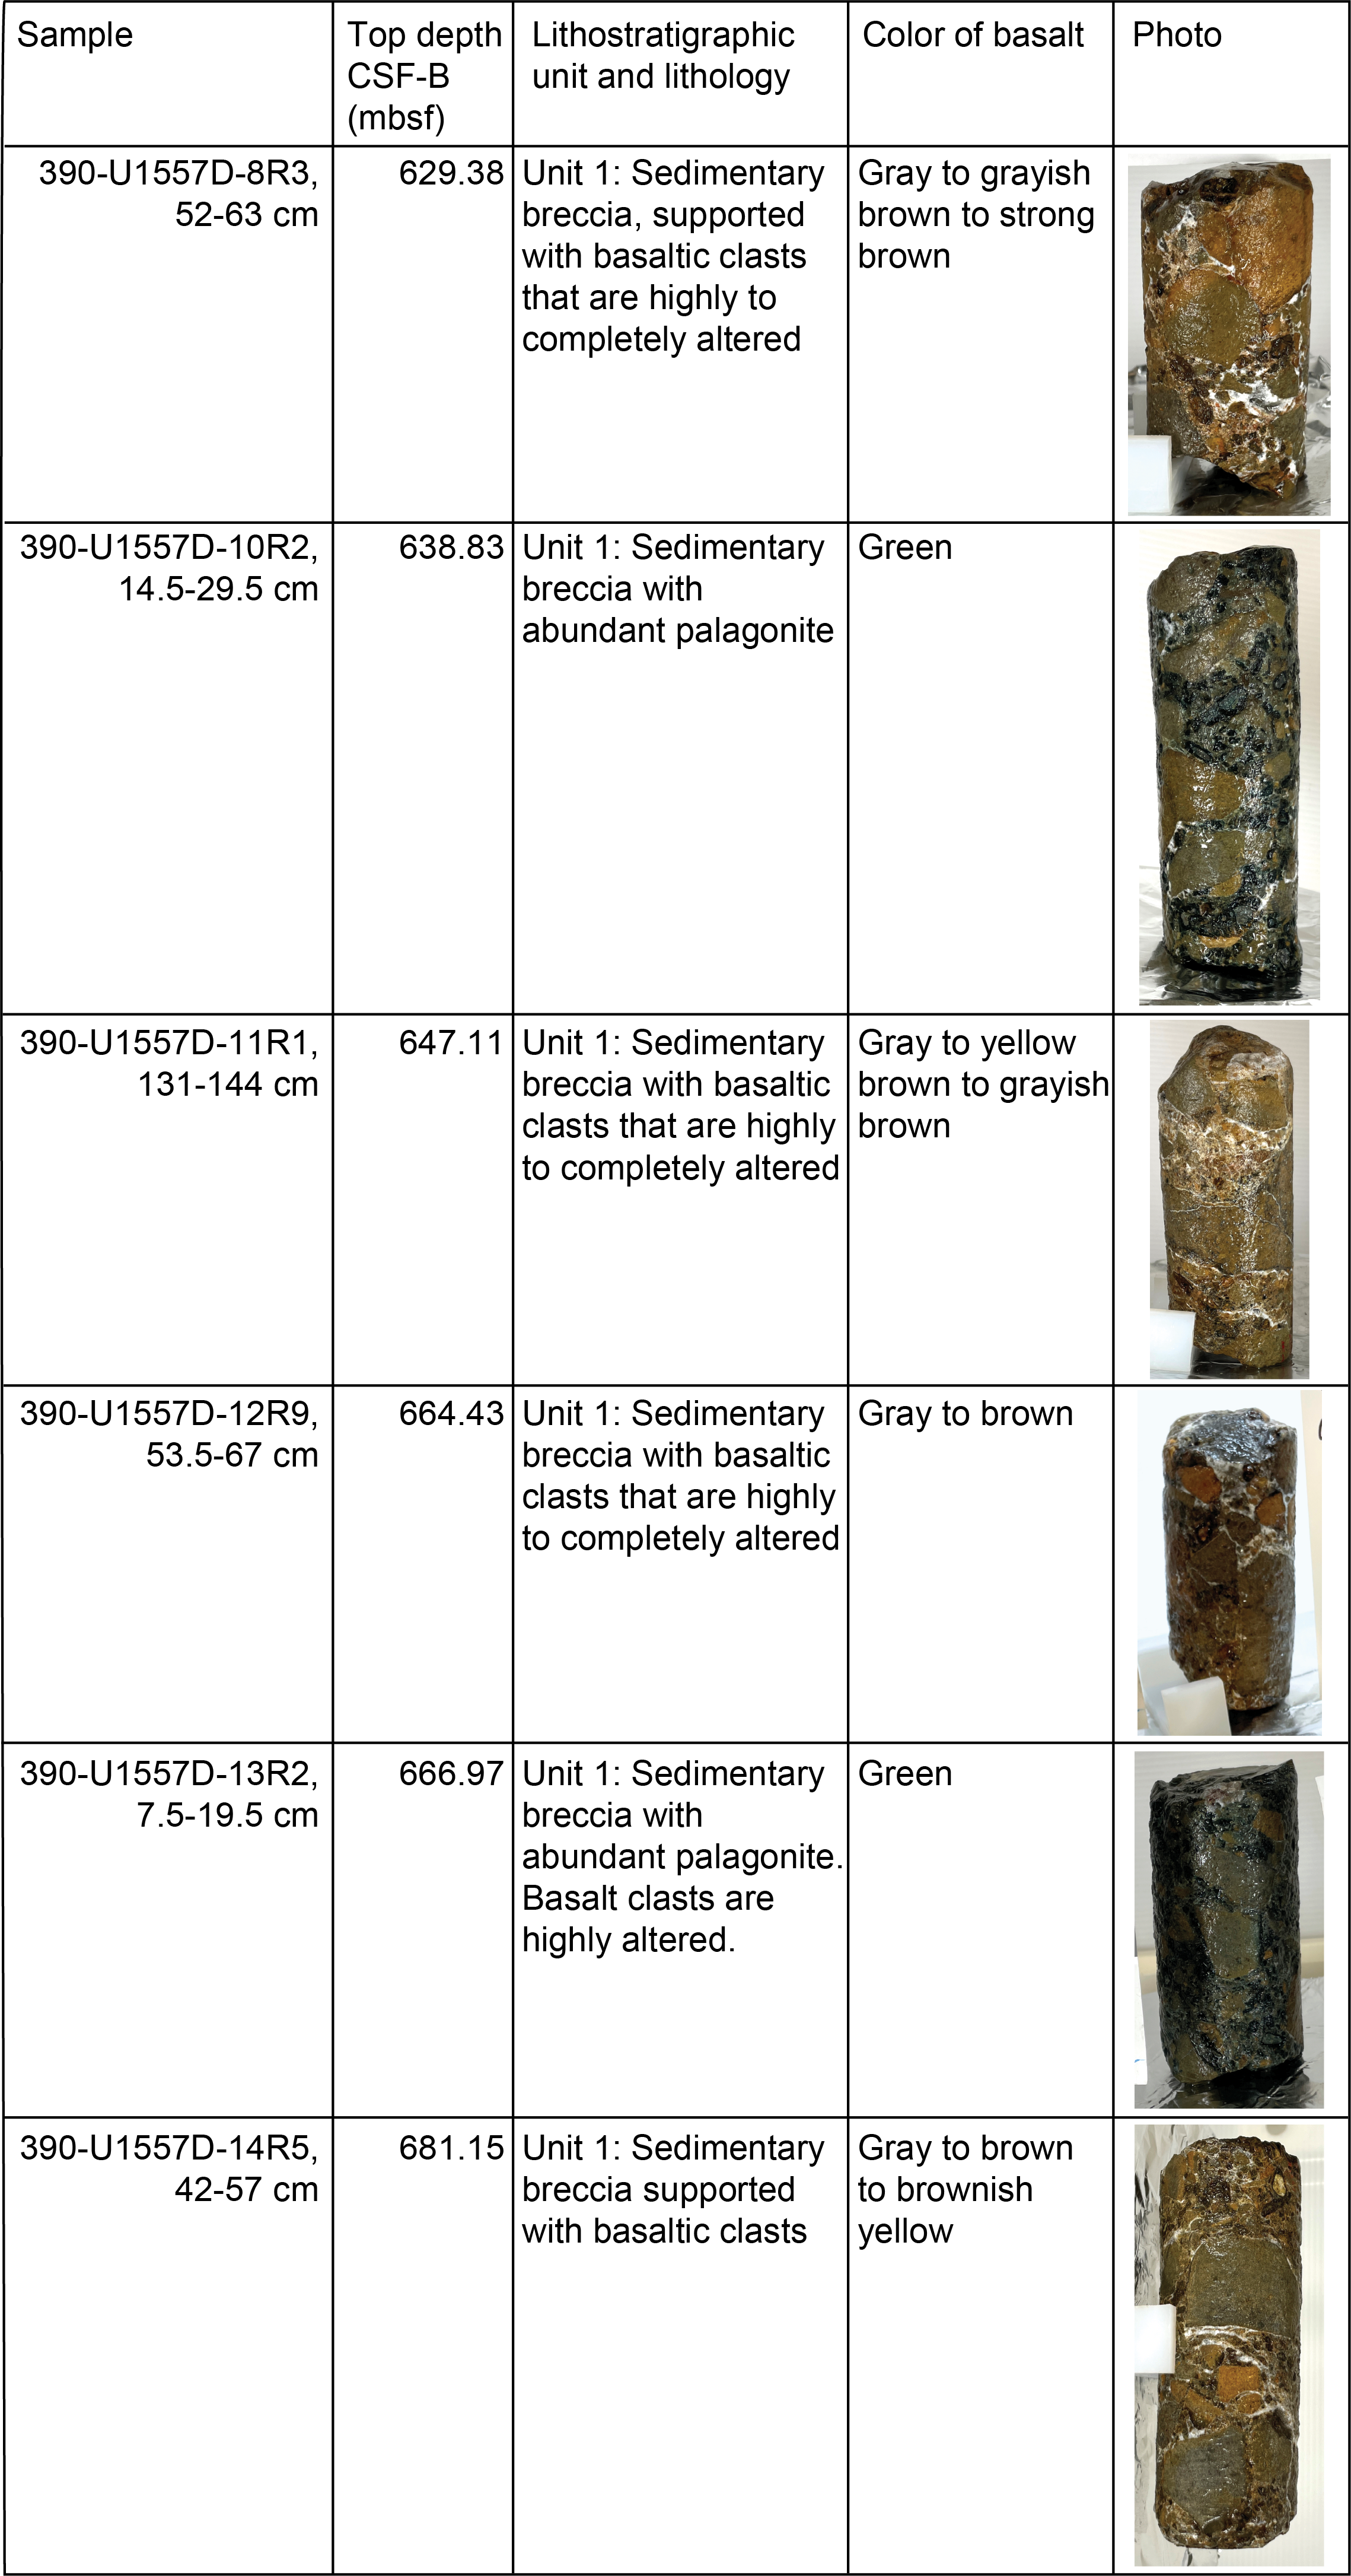
Figure F108. Samples for microbiology research.
12.1. Microbiological sample processing and experiments
12.1.1. Cell counts
A total of 12 samples were processed for cell enumeration. Performing shipboard cell counts on rock samples is difficult and time consuming; therefore, shipboard cell counts were not attempted during Expeditions 390 and 393. Cell count samples were instead broken into small chips and/or powder and preserved for postexpedition analysis in a 20% vol/vol slurry in 5 mL total of rock and 5% Epredia Formal-Fixx in 3× phosphate-buffered solution.
12.1.2. Microbial community structure
A total of 12 samples were preserved for shore-based DNA (polymerase chain reaction [PCR] amplicon-based and metagenomes) and/or RNA (PCR amplicon-based and/or metatranscriptomes) analysis, 8 samples were preserved for single cell genomics, and 7 samples were collected for lipid analysis (Table T21). Material for DNA, RNA, and lipid-based analyses of microbial community composition was collected and preserved following the procedures described in Microbiology in the Expedition 390/393 methods chapter (Coggon et al., 2024c).
12.1.3. Microbial incubation experiments
To attempt to isolate new microbial species that can be characterized and used in future laboratory-based experiments, isolation experiments using enrichment media in Petri dishes were initiated. Samples 390-U1557D-5R-5, 37.5–48.5 cm, and 7R-3, 0–9.5 cm, were used to initiate enrichment experiments on 1/10 ZoBell Marine Agar media (Table T21). This media selects for heterotrophic marine microorganisms and is commonly used to isolate new microorganisms. These culturing experiments were prepared as described in Microbiology in the Expedition 390/393 methods chapter (Coggon et al., 2024c), incubated at 9.5°C with the tops facing down for the duration of Expedition 390, and then shipped to shore for postexpedition research.
To detect the metabolically active microbes in basaltic basement, Samples 390-U1557D-6R-3, 39–49 cm, and 8R-3, 52–63 cm, were used to initiate stable isotope probing (SIP) experiments (Table T21). Similar methods were used to reveal the presence of active microorganisms in sediments as old as 101.5 Ma during Integrated Ocean Drilling Program Expedition 329 to the South Pacific Gyre (Morono et al., 2020). The aim is to determine whether microbial cells are active in the basement at Site U1557, determine growth rate, and quantify how many cells take up C and N substrates. These SIP experiments were conducted according to the procedure outlined in Microbiology in the Expedition 390/393 methods chapter (Coggon et al., 2024c). Samples were incubated at 10°C until shipment to shore at the end of Expedition 390. Individual experimental vials will be killed at three time points (2, 3, and 6 months) prior to analysis.
12.2. Microbiological contamination monitoring
Perfluoromethyldecalin (PFMD) tracer was not run during coring at Site U1557 because of insufficient volume of PFMD available for use at all sites during Expeditions 390 and 393. We chose to forego running tracer specifically at Site U1557 because we expected to recover material similar to what was found at nearby Site U1556 (Figure F108). Although all cores recovered from Hole U1557D comprised sedimentary talus breccia, which is different in regard to total hole composition compared to Hole U1556B, the breccia recovered from Hole U1557D was comparable to that recovered from Hole U1556B and therefore still allows for comparison of trends of contamination in similar lithology across the two holes. Likewise, core pieces with obvious open porosity (centimeter scale) through which drilling fluid would have infiltrated were not sampled for microbiology.
To determine the number of microorganisms present in drilling fluid and also generate a database of potential contaminants, we collected drilling fluid from a pipe on the rig floor three times during coring operations in Hole U1557D: during coring of Core 390-U1557D-2R (586 mbsf), during coring of Core 11R (645 mbsf), and during coring of Core 14R (676 mbsf). Samples were preserved for cell counts, and an additional 500 mL of drilling fluid was filtered onto two separate 0.20 µm pore size, 47 mm diameter filters and frozen at −80°C for shore-based molecular biology analysis to determine the microorganisms present in drilling fluid.
References
Agnini, C., Fornaciari, E., Raffi, I., Catanzariti, R., Pälike, H., Backman, J., and Rio, D., 2014. Biozonation and biochronology of Paleogene calcareous nannofossils from low and middle latitudes. Newsletters on Stratigraphy, 47(2):131–181. https://doi.org/10.1127/0078-0421/2014/0042
Alt, J.C., 1995. Subseafloor processes in mid-ocean ridge hydrothermal systems. In Humphris, S.E., Zierenberg, R.A., Mullineaux, L.S., and Thomson, R.E. (Eds.), Seafloor Hydrothermal Systems: Physical, Chemical, Biological, and Geological Interactions. Geophysical Monograph, 91: 85–114. https://doi.org/10.1029/GM091p0085
Backman, J., Raffi, I., Rio, D., Fornaciari, E., and Pälike, H., 2012. Biozonation and biochronology of Miocene through Pleistocene calcareous nannofossils from low and middle latitudes. Newsletters on Stratigraphy, 45(3):221–244. https://doi.org/10.1127/0078-0421/2012/0022
Baker, P.A., Gieskes, J.M., and Elderfield, H., 1982. Diagenesis of carbonates in deep-sea sediments; evidence from Sr/Ca ratios and interstitial dissolved Sr2+ data. Journal of Sedimentary Research, 52(1):71–82. https://doi.org/10.1306/212F7EE1-2B24-11D7-8648000102C1865D
Bartetzko, A., Pezard, P., Goldberg, D., Sun, Y.-F., and Becker, K., 2001. Volcanic stratigraphy of DSDP/ODP Hole 395A: An interpretation using well-logging data. Marine Geophysical Researches, 22(2):111–127. https://doi.org/10.1023/A:1010359128574
Boyer, T.P., García, H.E., Locarnini, R.A., Zweng, M.M., Mishonov, A.V., Reagan, J.R., Weathers, K.A., Baranova, O.K., Paver, C.R., Seidov, D., and Smolyar, I.V., 2018. World Ocean Atlas 2018. NOAA National Centers for Environmental Information. https://www.ncei.noaa.gov/archive/accession/NCEI-WOA18
Butler, R.F., 1992. Paleomagnetism: Magnetic Domains to Geologic Terranes: Boston (Blackwell Science Publishing). https://www.geo.arizona.edu/Paleomag/
Christeson, G., and Reece, R., 2020. Bathymetric site survey gridded data in support of IODP Expeditions 390 and 393, South Atlantic Transect (MGL1601, CREST). Interdisciplinary Earth Data Alliance (IEDA). https://doi.org/10.26022/IEDA/327528
Christeson, G.L., Goff, J.A., and Reece, R.S., 2019. Synthesis of oceanic crustal structure from two-dimensional seismic profiles. Reviews of Geophysics, 57(2):504–529. https://doi.org/10.1029/2019RG000641
Christeson, G.L., Reece, R.S., Kardell, D.A., Estep, J.D., Fedotova, A., and Goff, J.A., 2020. South Atlantic transect: variations in oceanic crustal structure at 31°S. Geochemistry, Geophysics, Geosystems, 21(7):e2020GC009017. https://doi.org/10.1029/2020GC009017
Coggon, R.M., Sylvan, J.B., Teagle, D.A.H., Reece J., Christeson, G.L., Estes, E.R., Williams, T.J., and the Expedition 390 Scientists, 2022a. Expedition 390 Preliminary Report: South Atlantic Transect 1. International Ocean Discovery Program. https://doi.org/10.14379/iodp.pr.390.2022
Coggon, R.M., Sylvan, J.B., Teagle, D.A.H., Reece, J.S., Christeson, G.L., Estes, E.R., and Williams, T., 2022b. Expedition 390/393 Scientific Prospectus Addendum: South Atlantic Transect. International Ocean Discovery Program. https://doi.org/10.14379/iodp.sp.390393add.2022
Coggon, R.M., Sylvan, J.B., Estes, E.R., Teagle, D.A.H., Reece, J., Williams, T.J., Christeson, G.L., Aizawa, M., Borrelli, C., Bridges, J.D., Carter, E.J., Dinarès-Turell, J., Estep, J.D., Gilhooly, W.P., III, Grant, L.J.C., Kaplan, M.R., Kempton, P.D., Lowery, C.M., McIntyre, A., Routledge, C.M., Slagle, A.L., Takada, M., Tamborrino, L., Wang, Y., Yang, K., Albers, E., Amadori, C., Belgrano, T.M., D'Angelo, T., Doi, N., Evans, A., Guérin, G.M., Harris, M., Hojnacki, V.M., Hong, G., Jin, X., Jonnalagadda, M., Kuwano, D., Labonte, J.M., Lam, A.R., Latas, M., Lu, W., Moal-Darrigade, P., Pekar, S.F., Robustelli Test, C., Ryan, J.G., Santiago Ramos, D., Shchepetkina, A., Villa, A., Wee, S.Y., Widlansky, S.J., Kurz, W., Prakasam, M., Tian, L., Yu, T., and Zhang, G., 2024a. Site U1556. In Coggon, R.M., Teagle, D.A.H., Sylvan, J.B., Reece, J., Estes, E.R., Williams, T.J., Christeson, G.L., and the Expedition 390/393 Scientists, South Atlantic Transect. Proceedings of the International Ocean Discovery Program, 390/393: College Station, TX (International Ocean Discovery Program). https://doi.org/10.14379/iodp.proc.390393.103.2024
Coggon, R.M., Sylvan, J.B., Estes, E.R., Teagle, D.A.H., Reece, J., Williams, T.J., Christeson, G.L., Aizawa, M., Borrelli, C., Bridges, J.D., Carter, E.J., Dinarès-Turell, J., Estep, J.D., Gilhooly, W.P., III, Grant, L.J.C., Kaplan, M.R., Kempton, P.D., Lowery, C.M., McIntyre, A., Routledge, C.M., Slagle, A.L., Takada, M., Tamborrino, L., Wang, Y., Yang, K., Albers, E., Amadori, C., Belgrano, T.M., D'Angelo, T., Doi, N., Evans, A., Guérin, G.M., Harris, M., Hojnacki, V.M., Hong, G., Jin, X., Jonnalagadda, M., Kuwano, D., Labonte, J.M., Lam, A.R., Latas, M., Lu, W., Moal-Darrigade, P., Pekar, S.F., Robustelli Test, C., Ryan, J.G., Santiago Ramos, D., Shchepetkina, A., Villa, A., Wee, S.Y., Widlansky, S.J., Kurz, W., Prakasam, M., Tian, L., Yu, T., and Zhang, G., 2024b. Site U1561. In Coggon, R.M., Teagle, D.A.H., Sylvan, J.B., Reece, J., Estes, E.R., Williams, T.J., Christeson, G.L., and the Expedition 390/393 Scientists, South Atlantic Transect. Proceedings of the International Ocean Discovery Program, 390/393: College Station, TX (International Ocean Discovery Program). https://doi.org/10.14379/iodp.proc.390393.104.2024
Coggon, R.M., Teagle, D.A.H., Sylvan, J.B., Reece, J., Estes, E.R., Williams, T.J., Christeson, G.L., Aizawa, M., Albers, E., Amadori, C., Belgrano, T.M., Borrelli, C., Bridges, J.D., Carter, E.J., D'Angelo, T., Dinarès-Turell, J., Doi, N., Estep, J.D., Evans, A., Gilhooly, W.P., III, Grant, L.J.C., Guérin, G.M., Harris, M., Hojnacki, V.M., Hong, G., Jin, X., Jonnalagadda, M., Kaplan, M.R., Kempton, P.D., Kuwano, D., Labonte, J.M., Lam, A.R., Latas, M., Lowery, C.M., Lu, W., McIntyre, A., Moal-Darrigade, P., Pekar, S.F., Robustelli Test, C., Routledge, C.M., Ryan, J.G., Santiago Ramos, D., Shchepetkina, A., Slagle, A.L., Takada, M., Tamborrino, L., Villa, A., Wang, Y., Wee, S.Y., Widlansky, S.J., Yang, K., Kurz, W., Prakasam, M., Tian, L., Yu, T., and Zhang, G., 2024c. Expedition 390/393 methods. In Coggon, R.M., Teagle, D.A.H., Sylvan, J.B., Reece, J., Estes, E.R., Williams, T.J., Christeson, G.L., and the Expedition 390/393 Scientists, South Atlantic Transect. Proceedings of the International Ocean Discovery Program, 390/393: College Station, TX (International Ocean Discovery Program). https://doi.org/10.14379/iodp.proc.390393.102.2024
Coggon, R.M., Teagle, D.A.H., Sylvan, J.B., Reece, J., Estes, E.R., Williams, T.J., Christeson, G.L., Aizawa, M., Albers, E., Amadori, C., Belgrano, T.M., Borrelli, C., Bridges, J.D., Carter, E.J., D'Angelo, T., Dinarès-Turell, J., Doi, N., Estep, J.D., Evans, A., Gilhooly, W.P., III, Grant, L.J.C., Guérin, G.M., Harris, M., Hojnacki, V.M., Hong, G., Jin, X., Jonnalagadda, M., Kaplan, M.R., Kempton, P.D., Kuwano, D., Labonte, J.M., Lam, A.R., Latas, M., Lowery, C.M., Lu, W., McIntyre, A., Moal-Darrigade, P., Pekar, S.F., Robustelli Test, C., Routledge, C.M., Ryan, J.G., Santiago Ramos, D., Shchepetkina, A., Slagle, A.L., Takada, M., Tamborrino, L., Villa, A., Wang, Y., Wee, S.Y., Widlansky, S.J., Yang, K., Kurz, W., Prakasam, M., Tian, L., Yu, T., and Zhang, G., 2024d. Expedition 390/393 summary. In Coggon, R.M., Teagle, D.A.H., Sylvan, J.B., Reece, J., Estes, E.R., Williams, T.J., Christeson, G.L., and the Expedition 390/393 Scientists, South Atlantic Transect. Proceedings of the International Ocean Discovery Program, 390/393: College Station, TX (International Ocean Discovery Program). https://doi.org/10.14379/iodp.proc.390393.101.2024
Coggon, R.M., Teagle, D.A.H., Sylvan, J.B., Reece, J., Estes, E.R., Williams, T.J., Christeson, G.L., Aizawa, M., Albers, E., Amadori, C., Belgrano, T.M., Borrelli, C., Bridges, J.D., Carter, E.J., D'Angelo, T., Dinarès-Turell, J., Doi, N., Estep, J.D., Evans, A., Gilhooly, W.P., III, Grant, L.J.C., Guérin, G.M., Harris, M., Hojnacki, V.M., Hong, G., Jin, X., Jonnalagadda, M., Kaplan, M.R., Kempton, P.D., Kuwano, D., Labonte, J.M., Lam, A.R., Latas, M., Lowery, C.M., Lu, W., McIntyre, A., Moal-Darrigade, P., Pekar, S.F., Robustelli Test, C., Routledge, C.M., Ryan, J.G., Santiago Ramos, D., Shchepetkina, A., Slagle, A.L., Takada, M., Tamborrino, L., Villa, A., Wang, Y., Wee, S.Y., Widlansky, S.J., Yang, K., Kurz, W., Prakasam, M., Tian, L., Yu, T., and Zhang, G., 2024e. Site U1559. In Coggon, R.M., Teagle, D.A.H., Sylvan, J.B., Reece, J., Estes, E.R., Williams, T.J., Christeson, G.L., and the Expedition 390/393 Scientists, South Atlantic Transect. Proceedings of the International Ocean Discovery Program, 390/393: College Station, TX (International Ocean Discovery Program). https://doi.org/10.14379/iodp.proc.390393.109.2024
Coggon, R.M., Teagle, D.A.H., Sylvan, J.B., Reece, J., Estes, E.R., Williams, T.J., Christeson, G.L., and the Expedition 390/393 Scientists, 2024f. Supplementary material, https://doi.org/10.14379/iodp.proc.390393supp.2024. In Coggon, R.M., Teagle, D.A.H., Sylvan, J.B., Reece, J., Estes, E.R., Williams, T.J., Christeson, G.L., and the Expedition 390/393 Scientists, South Atlantic Transect. Proceedings of the International Ocean Discovery Program, 390/393: College Station, TX (International Ocean Discovery Program).
Corliss, B.H., 1979. Recent deep-sea benthonic for aminiferal distributions in the southeast Indian Ocean: Inferred bottom-water routes and ecological implications. Marine Geology, 31(1):115–138. https://doi.org/10.1016/0025-3227(79)90059-8
Dunlea, A.G., Murray, R.W., Harris, R.N., Vasiliev, M.A., Evans, H., Spivack, A.J., and D'Hondt, S., 2013. Assessment and use of NGR instrumentation on the JOIDES Resolution to quantify U, Th, and K concentrations in marine sediment. Scientific Drilling, 15:57–63. https://doi.org/10.2204/iodp.sd.15.05.2013
Estep, J., Reece, R., Kardell, D.A., Christeson, G.L., and Carlson, R.L., 2019. Seismic Layer 2A: evolution and thickness from 0- to 70-Ma crust in the slow-intermediate spreading South Atlantic. Journal of Geophysical Research: Solid Earth, 124(8):7633–7651. https://doi.org/10.1029/2019JB017302
Estep, J., Reece, R., Kardell, D.A., Perez, N.D., Christeson, G.L., and Carlson, R.L., 2020. Intraplate deformation of oceanic crust near the Rio Grande Rise in the South Atlantic. Tectonophysics, 790:228543. https://doi.org/10.1016/j.tecto.2020.228543
Estes, E.R., Williams, T., Midgley, S., Coggon, R.M., Sylvan, J.B.,Christeson, G.L., Teagle, D.A.H., and the Expedition 390C Scientists, 2021. Expedition 390C Preliminary Report: South Atlantic Transect Reentry Systems. International Ocean Discovery Program. https://doi.org/10.14379/iodp.pr.390C.2021
Fu, D., Su, C., Wang, W., and Yuan, R., 2022. Deep learning based lithology classification of drill core images. PloS One, 17(7):e0270826. https://doi.org/10.1371/journal.pone.0270826
Gale, A., Dalton, C.A., Langmuir, C.H., Su, Y., and Schilling, J.-G., 2013. The mean composition of ocean ridge basalts. Geochemistry, Geophysics, Geosystems, 14(3):489–518. https://doi.org/10.1029/2012GC004334
Gill, R., and Fitton, G., 2022. Igneous Rocks and Processes: A Practical Guide, 2nd Edition: Chichester, UK (John Wiley & Sons, Ltd).
Gradstein, F.M., Ogg, J.G., Schmitz, M.D., and Ogg, G.M. (Eds.), 2020. The Geologic Time Scale 2020: Amsterdam (Elsevier BV). https://doi.org/10.1016/C2020-1-02369-3
Hesse, R., and Schacht, U., 2011. Early diagenesis of deep-sea sediments. In HüNeke, H., and Mulder, T. (Eds.), Deep-Sea Sediments. Developments in Sedimentology, 63: 557–713. https://doi.org/10.1016/B978-0-444-53000-4.00009-3
Holbourn, A., Henderson, A.S., and MacLeod, N., 2013. Atlas of Benthic Foraminifera: United Kingdom (John Wiley & Sons, Ltd.). https://doi.org/10.1002/9781118452493
Kamenetsky, V.S., Crawford, A.J., and Meffre, S., 2001. Factors controlling chemistry of magmatic spinel: an empirical study of associated olivine, Cr-spinel and melt inclusions from primitive rocks. Journal of Petrology, 42(4):655–671. https://doi.org/10.1093/petrology/42.4.655
Kardell, D.A., Christeson, G.L., Estep, J.D., Reece, R.S., and Carlson, R.L., 2019. Long-lasting evolution of Layer 2A in the western South Atlantic: evidence for low-temperature hydrothermal circulation in old oceanic crust. Journal of Geophysical Research: Solid Earth, 124(3):2252–2273. https://doi.org/10.1029/2018JB016925
Kastner, M., 1979. Zeolite minerals. In Burns, R.G. (Ed.), Marine Minerals. Reviews in Mineralogy, 6:111–112.
Kirschvink, J.L., 1980. The least-squares line and plane and the analysis of palaeomagnetic data. Geophysical Journal International, 62(3):699–718. https://doi.org/10.1111/j.1365-246X.1980.tb02601.x
Korenaga, T., and Korenaga, J., 2008. Subsidence of normal oceanic lithosphere, apparent thermal expansivity, and seafloor flattening. Earth and Planetary Science Letters, 268(1):41–51. https://doi.org/10.1016/j.epsl.2007.12.022
Kruber, C., Thorseth, I.H., and Pedersen, R.B., 2008. Seafloor alteration of basaltic glass: textures, geochemistry, and endolithic microorganisms. Geochemistry, Geophysics, Geosystems, 9(12):Q12002. https://doi.org/10.1029/2008GC002119
Lam, A.R., Crundwell, M.P., Leckie, R.M., Albanese, J., and Uzel, J.P., 2022. Diachroneity rules the mid-latitudes: a test case using Late Neogene planktic foraminifera across the Western Pacific. Geosciences, 12(5):190. https://doi.org/10.3390/geosciences12050190
Langmuir, C.H., Bézos, A., Escrig, S., and Parman, S.W., 2006. Chemical systematics and hydrous melting of the mantle in back-arc basins. In Christie, D.M., Fisher, C.R., Lee, S.-M., and Givens, S. (Eds.), Back‐Arc Spreading Systems: Geological, Biological, Chemical, and Physical Interactions. Geophysical Monograph, 166: 87–146. https://doi.org/10.1029/166GM07
Le Maitre, R.W., Steckeisen, A., Zanettin, B., Le Bas, M.J., Bonin, B., and Bateman, P. (Eds.), 2002. Igneous Rocks: A Classification and Glossary of Terms (Second edition): Cambridge, UK (Cambridge University Press). https://doi.org/10.1017/CBO9780511535581
Li, Z.-X.A., and Lee, C.-T.A., 2004. The constancy of upper mantle fO2 through time inferred from V/Sc ratios in basalts. Earth and Planetary Science Letters, 228(3):483–493. https://doi.org/10.1016/j.epsl.2004.10.006
Mackensen, A., Schmiedl, G., Harloff, J., and Giese, M., 1995. Deep-sea foraminifera in the South Atlantic Ocean: ecology and assemblage generation. Micropaleontology, 41(4):342–358. https://doi.org/10.2307/1485808
Mallmann, G., and O'Neill, H.S.C., 2009. The Crystal/Melt Partitioning of V during Mantle Melting as a Function of Oxygen Fugacity Compared with some other Elements (Al, P, Ca, Sc, Ti, Cr, Fe, Ga, Y, Zr and Nb). Journal of Petrology, 50(9):1765–1794. https://doi.org/10.1093/petrology/egp053
Martini, E., 1971. Standard Tertiary and Quaternary calcareous nannoplankton zonation. Proceedings of the Second Planktonic Conference, Roma, 1970:739–785.
Marty, J.C., and Cazenave, A., 1989. Regional variations in subsidence rate of oceanic plates: a global analysis. Earth and Planetary Science Letters, 94(3):301–315. https://doi.org/10.1016/0012-821X(89)90148-9
Miyashiro, A., 1978. Nature of alkalic volcanic rock series. Contributions to Mineralogy and Petrology, 66(1):91–104. https://doi.org/10.1007/BF00376089
Morono, Y., Ito, M., Hoshino, T., Terada, T., Hori, T., Ikehara, M., D'Hondt, S., and Inagaki, F., 2020. Aerobic microbial life persists in oxic marine sediment as old as 101.5 million years. Nature Communications, 11(1):3626. https://doi.org/10.1038/s41467-020-17330-1
Mottl, M.J., 1989. Hydrothermal convection, reaction, and diffusion in sediments on the Costa Rica Rift flank: pore-water evidence from ODP Sites 677 and 678. In Becker, K., Sakai, H., et al., Proceedings of the Ocean Drilling Program, Scientific Results. 111: College Station, TX (Ocean Drilling Program), 195–213. https://doi.org/10.2973/odp.proc.sr.111.125.1989
Olson, P., Reynolds, E., Hinnov, L., and Goswami, A., 2016. Variation of ocean sediment thickness with crustal age. Geochemistry, Geophysics, Geosystems, 17(4):1349–1369. https://doi.org/10.1002/2015GC006143
Olsson, R.K., Berggren, W.A., Hemleben, C., and Huber, B.T., 1999. Atlas of Paleocene Planktonic Foraminifera: Washington, DC (Smithsonian Institution Press). https://doi.org/10.5479/si.00810266.85.1
Owens, J.D., Lyons, T.W., and Lowery, C.M., 2018. Quantifying the missing sink for global organic carbon burial during a Cretaceous oceanic anoxic event. Earth and Planetary Science Letters, 499:83–94. https://doi.org/10.1016/j.epsl.2018.07.021
Parsons, B., and Sclater, J.G., 1977. An analysis of the variation of ocean floor bathymetry and heat flow with age. Journal of Geophysical Research (1896-1977), 82(5):803–827. https://doi.org/10.1029/JB082i005p00803
Pribnow, D.F.C., Kinoshita, M., and Stein, C.A., 2000. Thermal data collection and heat flow recalculations for ODP Legs 101-180: Hannover, Germany (Institute for Joint Geoscientific Research, GGA). http://www-odp.tamu.edu/publications/heatflow/
Reece, R., Christeson, G., Amara, A., Estep, J., Greene, J., Koch, C., Henning, L., Worman, W., and Wright, A., 2016. CREST: Crustal Reflectivity Experiment southern transect South Atlantic multichannel seismic and ocean bottom seismometer experiment, 4 Jan–25 Feb 2016 Cruise Report. http://www.iris.washington.edu/data/reports/2016/16-003/CREST_2016-01-04-2016-02-25_MGL1601_CruiseReport.pdf
Reece, R., and Estep, J., 2019. Processed MCS (PSTM) data from the Mid-Atlantic Ridge (MAR) to the Rio Grande Rise, South Atlantic Ocean, acquired by the R/V Marcus G. Langseth in 2016 (MGL1601) https://doi.org/10.1594/IEDA/500255
Richter, C., Acton, G., Endris, C., and Radsted, M., 2007. Handbook for shipboard paleomagnetists. Ocean Drilling Program Technical Note, 34. https://doi.org/10.2973/odp.tn.34.2007
Ríos, A.F., Resplandy, L., García-Ibáñez, M.I., Fajar, N.M., Velo, A., Padin, X.A., Wanninkhof, R., Steinfeldt, R., Rosón, G., and Pérez, F.F., 2015. Decadal acidification in the water masses of the Atlantic Ocean. Proceedings of the National Academy of Sciences, 112(32):9950–9955. https://doi.org/10.1073/pnas.1504613112
Schubert, C., and Calvert, S., 2001. Nitrogen and carbon isotopic composition of marine and terrestrial organic matter in Arctic Ocean sediments. Deep Sea Research, Part I: Oceanographic Research Papers, 48:789–810. https://doi.org/10.1016/S0967-0637(00)00069-8
Shipboard Scientific Party, 2004. Leg 208 summary. In Zachos, J.C., Kroon, D., Blum, P., et al., Proceedings of the Ocean Drilling Program, Initial Reports. 208: College Station, TX (Ocean Drilling Program). https://doi.org/10.2973/odp.proc.ir.208.101.2004
Spinelli, G.A., Giambalvo, E.R., and Fisher, A.T., 2004. Sediment permeability, distribution, and influence on fluxes in oceanic basement. In Davis, E.E., and Elderfield, H. (Eds.), Hydrogeology of the Oceanic Lithosphere. Cambridge, UK (Cambridge University Press), 151–188.
Straume, E.O., Gaina, C., Medvedev, S., Hochmuth, K., Gohl, K., Whittaker, J.M., Abdul Fattah, R., Doornenbal, J.C., and Hopper, J.R., 2019. GlobSed: updated total sediment thickness in the world's oceans. Geochemistry, Geophysics, Geosystems, 20(4):1756–1772. https://doi.org/10.1029/2018GC008115
Sun, S., and McDonough, W.F., 1989. Chemical and isotopic systematics of oceanic basalts: implications for mantle composition and processes. In Saunders, A.D., and Norry, M.J. (Eds.), Magmatism in the Ocean Basins. Geological Society Special Publication, 42: 313–345. https://doi.org/10.1144/GSL.SP.1989.042.01.19
The Shipboard Scientific Party, 1970. Summary and conclusions. In Maxwell, A.E., et al., Initial Reports of the Deep Sea Drilling Project. 3: Washington, DC (US Government Publishing Company), 441–471. https://doi.org/10.2973/dsdp.proc.3.113.1970
Tjalsma, R.C., and Lohmann, G.P., 1983. Paleocene-Eocene Bathyal and Abyssal Benthic Foraminifera from the Atlantic Ocean. Micropaleontology, Special Publication, 4.
Tominaga, M., Teagle, D.A.H., Alt, J.C., and Umino, S., 2009. Determination of the volcanostratigraphy of oceanic crust formed at superfast spreading ridge; electrofacies analyses of ODP/IODP Hole 1256D. Geochemistry, Geophysics, Geosystems, 10(1):Q01003. https://doi.org/10.1029/2008GC002143
Wade, B.S., Pearson, P.N., Berggren, W.A., and Pälike, H., 2011. Review and revision of Cenozoic tropical planktonic foraminiferal biostratigraphy and calibration to the geomagnetic polarity and astronomical time scale. Earth-Science Reviews, 104(1–3):111–142. https://doi.org/10.1016/j.earscirev.2010.09.003
Walton, A.W., and Schiffman, P., 2003. Alteration of hyaloclastites in the HSDP 2 Phase 1 Drill Core 1: description and paragenesis. Geochemistry, Geophysics, Geosystems, 4(5):8709. https://doi.org/10.1029/2002GC000368
Wells, J.T., and Ghiorso, M.S., 1991. Coupled fluid flow and reaction in mid-ocean ridge hydrothermal systems: the behavior of silica. Geochimica et Cosmochimica Acta, 55(9):2467–2481. https://doi.org/10.1016/0016-7037(91)90366-D
Wheat, C.G., and MeDuff, R.E., 1994. Hydrothermal flow through the Mariana Mounds: dissolution of amorphous silica and degradation of organic matter on a mid-ocean ridge flank. Geochimica et Cosmochimica Acta, 58(11):2461–2475. https://doi.org/10.1016/0016-7037(94)90024-8
Williams, T., Estes, E.R., Rhinehart, B., Coggon, R.M., Sylvan, J.B., Christeson, G.L., and Teagle, D.A.H., 2021. Expedition 395E Preliminary Report: Complete South Atlantic Transect Reentry Systems. International Ocean Discovery Program. https://doi.org/10.14379/iodp.pr.395E.2021
Zachos, J.C., Röhl, U., Schellenberg, S.A., Sluijs, A., Hodell, D.A., Kelly, D.C., Thomas, E., Nicolo, M., Raffi, I., Lourens, L.J., McCarren, H., and Kroon, D., 2005. Rapid acidification of the ocean during the Paleocene-Eocene Thermal Maximum. Science, 308(5728):1611–1615. https://doi.org/10.1126/science.1109004
Zijderveld, J.D.A., 1967. AC demagnetization of rocks: analysis of results. In Runcorn, S.K.C., Creer, K.M., and Collinson, D.W. (Eds.), Methods in Palaeomagnetism. Developments in Solid Earth Geophysics, 3: 254–286. https://doi.org/10.1016/B978-1-4832-2894-5.50049-5