Coggon, R.M., Teagle, D.A.H., Sylvan, J.B., Reece, J., Estes, E.R., Williams, T.J., Christeson, G.L., and the Expedition 390/393 Scientists
Proceedings of the International Ocean Discovery Program Volume 390/393
publications.iodp.org
https://doi.org/10.14379/iodp.proc.390393.109.2024
Site U15591
![]() R.M. Coggon,
R.M. Coggon,
![]() D.A.H. Teagle,
D.A.H. Teagle,
![]() J.B. Sylvan,
J.B. Sylvan,
![]() J. Reece,
J. Reece,
![]() E.R. Estes,
E.R. Estes,
![]() T.J. Williams,
T.J. Williams,
![]() G.L. Christeson,
G.L. Christeson,
![]() M. Aizawa,
M. Aizawa,
![]() E. Albers,
E. Albers,
![]() C. Amadori,
C. Amadori,
![]() T.M. Belgrano,
T.M. Belgrano,
![]() C. Borrelli,
C. Borrelli,
![]() J.D. Bridges,
J.D. Bridges,
![]() E.J. Carter,
E.J. Carter,
![]() T. D'Angelo,
T. D'Angelo,
![]() J. Dinarès-Turell,
J. Dinarès-Turell,
![]() N. Doi,
N. Doi,
![]() J.D. Estep,
J.D. Estep,
![]() A. Evans,
A. Evans,
![]() W.P. Gilhooly III,
W.P. Gilhooly III,
![]() L.J.C. Grant,
L.J.C. Grant,
![]() G.M. Guérin,
G.M. Guérin,
![]() M. Harris,
M. Harris,
![]() V.M. Hojnacki,
V.M. Hojnacki,
![]() G. Hong,
G. Hong,
![]() X. Jin,
X. Jin,
![]() M. Jonnalagadda,
M. Jonnalagadda,
![]() M.R. Kaplan,
M.R. Kaplan,
![]() P.D. Kempton,
P.D. Kempton,
![]() D. Kuwano,
D. Kuwano,
![]() J.M. Labonte,
J.M. Labonte,
![]() A.R. Lam,
A.R. Lam,
![]() M. Latas,
M. Latas,
![]() C.M. Lowery,
C.M. Lowery,
![]() W. Lu,
W. Lu,
![]() A. McIntyre,
A. McIntyre,
![]() P. Moal-Darrigade,
P. Moal-Darrigade,
![]() S.F. Pekar,
S.F. Pekar,
![]() C. Robustelli Test,
C. Robustelli Test,
![]() C.M. Routledge,
C.M. Routledge,
![]() J.G. Ryan,
J.G. Ryan,
![]() D. Santiago Ramos,
D. Santiago Ramos,
![]() A. Shchepetkina,
A. Shchepetkina,
![]() A.L. Slagle,
A.L. Slagle,
![]() M. Takada,
M. Takada,
![]() L. Tamborrino,
L. Tamborrino,
![]() A. Villa,
A. Villa,
![]() Y. Wang,
Y. Wang,
![]() S.Y. Wee,
S.Y. Wee,
![]() S.J. Widlansky,
S.J. Widlansky,
![]() K. Yang,
K. Yang,
![]() W. Kurz,
W. Kurz,
![]() M. Prakasam,
M. Prakasam,
![]() L. Tian,
L. Tian,
![]() T. Yu, and
T. Yu, and
![]() G. Zhang2
G. Zhang2
1 Coggon, R.M., Teagle, D.A.H., Sylvan, J.B., Reece, J., Estes, E.R., Williams, T.J., Christeson, G.L., Aizawa, M., Albers, E., Amadori, C., Belgrano, T.M., Borrelli, C., Bridges, J.D., Carter, E.J., D'Angelo, T., Dinarès-Turell, J., Doi, N., Estep, J.D., Evans, A., Gilhooly, W.P., III, Grant, L.J.C., Guérin, G.M., Harris, M., Hojnacki, V.M., Hong, G., Jin, X., Jonnalagadda, M., Kaplan, M.R., Kempton, P.D., Kuwano, D., Labonte, J.M., Lam, A.R., Latas, M., Lowery, C.M., Lu, W., McIntyre, A., Moal-Darrigade, P., Pekar, S.F., Robustelli Test, C., Routledge, C.M., Ryan, J.G., Santiago Ramos, D., Shchepetkina, A., Slagle, A.L., Takada, M., Tamborrino, L., Villa, A., Wang, Y., Wee, S.Y., Widlansky, S.J., Yang, K., Kurz, W., Prakasam, M., Tian, L., Yu, T., and Zhang, G., 2024. Site U1559. In Coggon, R.M., Teagle, D.A.H., Sylvan, J.B., Reece, J., Estes, E.R., Williams, T.J., Christeson, G.L., and the Expedition 390/393 Scientists, South Atlantic Transect. Proceedings of the International Ocean Discovery Program, 390/393: College Station, TX (International Ocean Discovery Program). https://doi.org/10.14379/iodp.proc.390393.109.2024
2 Expedition 390/393 Scientists' affiliations.
1. Background and objectives
Site U1559 (30°15.6336′S, 15°02.0941′W; proposed Site SATL-13A) is in the central South Atlantic Ocean at a water depth of 3055 meters below sea level (mbsl), ~130 km west of the Mid-Atlantic Ridge (see Figure F1 and Tables T1, T2, all in the Expedition 390/393 summary chapter [Coggon et al., 2024d]) on crust that formed at a slow half-spreading rate of ~17.0 mm/y (Kardell et al., 2019; Christeson et al., 2020) (see Figure F7 in the Expedition 390/393 summary chapter [Coggon et al., 2024d]). With an estimated age of 6.6 Ma, Site U1559 is the youngest location of the South Atlantic Transect (SAT) campaign (International Ocean Discovery Program [IODP] Expeditions 390C, 395E, 390, and 393).
1.1. Geologic setting
Site U1559 is located on the approximately north-south–trending (355) Crustal Reflectivity Experiment Southern Transect (CREST) Seismic Line 01 at Common Depth Point 11923 about 5.7 km south of the main east–west (085) CREST crossing Line 1E/1F and 4.3 km north of the CREST Line 06 profile (Figures F1, F2) (Reece et al., 2016; Reece and Estep, 2019). Interpretation of multichannel seismic and ocean-bottom seismograph data in this region suggests that the thickness of the ocean crust at the site (~5.6 km; Christeson et al., 2020) is at the thinner end of the range of normal ocean crust (6.15 ± 0.93 km; Christeson et al., 2019). At a water depth of 3055 m, Site U1559 is significantly shallower (~200 m) than predicted by simple lithospheric cooling models (see Figure F4 in the Expedition 390/393 summary chapter [Coggon et al., 2024d]) (e.g., Parsons and Sclater, 1977; Korenaga and Korenaga, 2008; Marty and Cazenave, 1989). This difference presumably reflects the location of this site on a relatively elevated feature superimposed on the rugged faulted terrain of the western flank of the southern Mid-Atlantic Ridge.
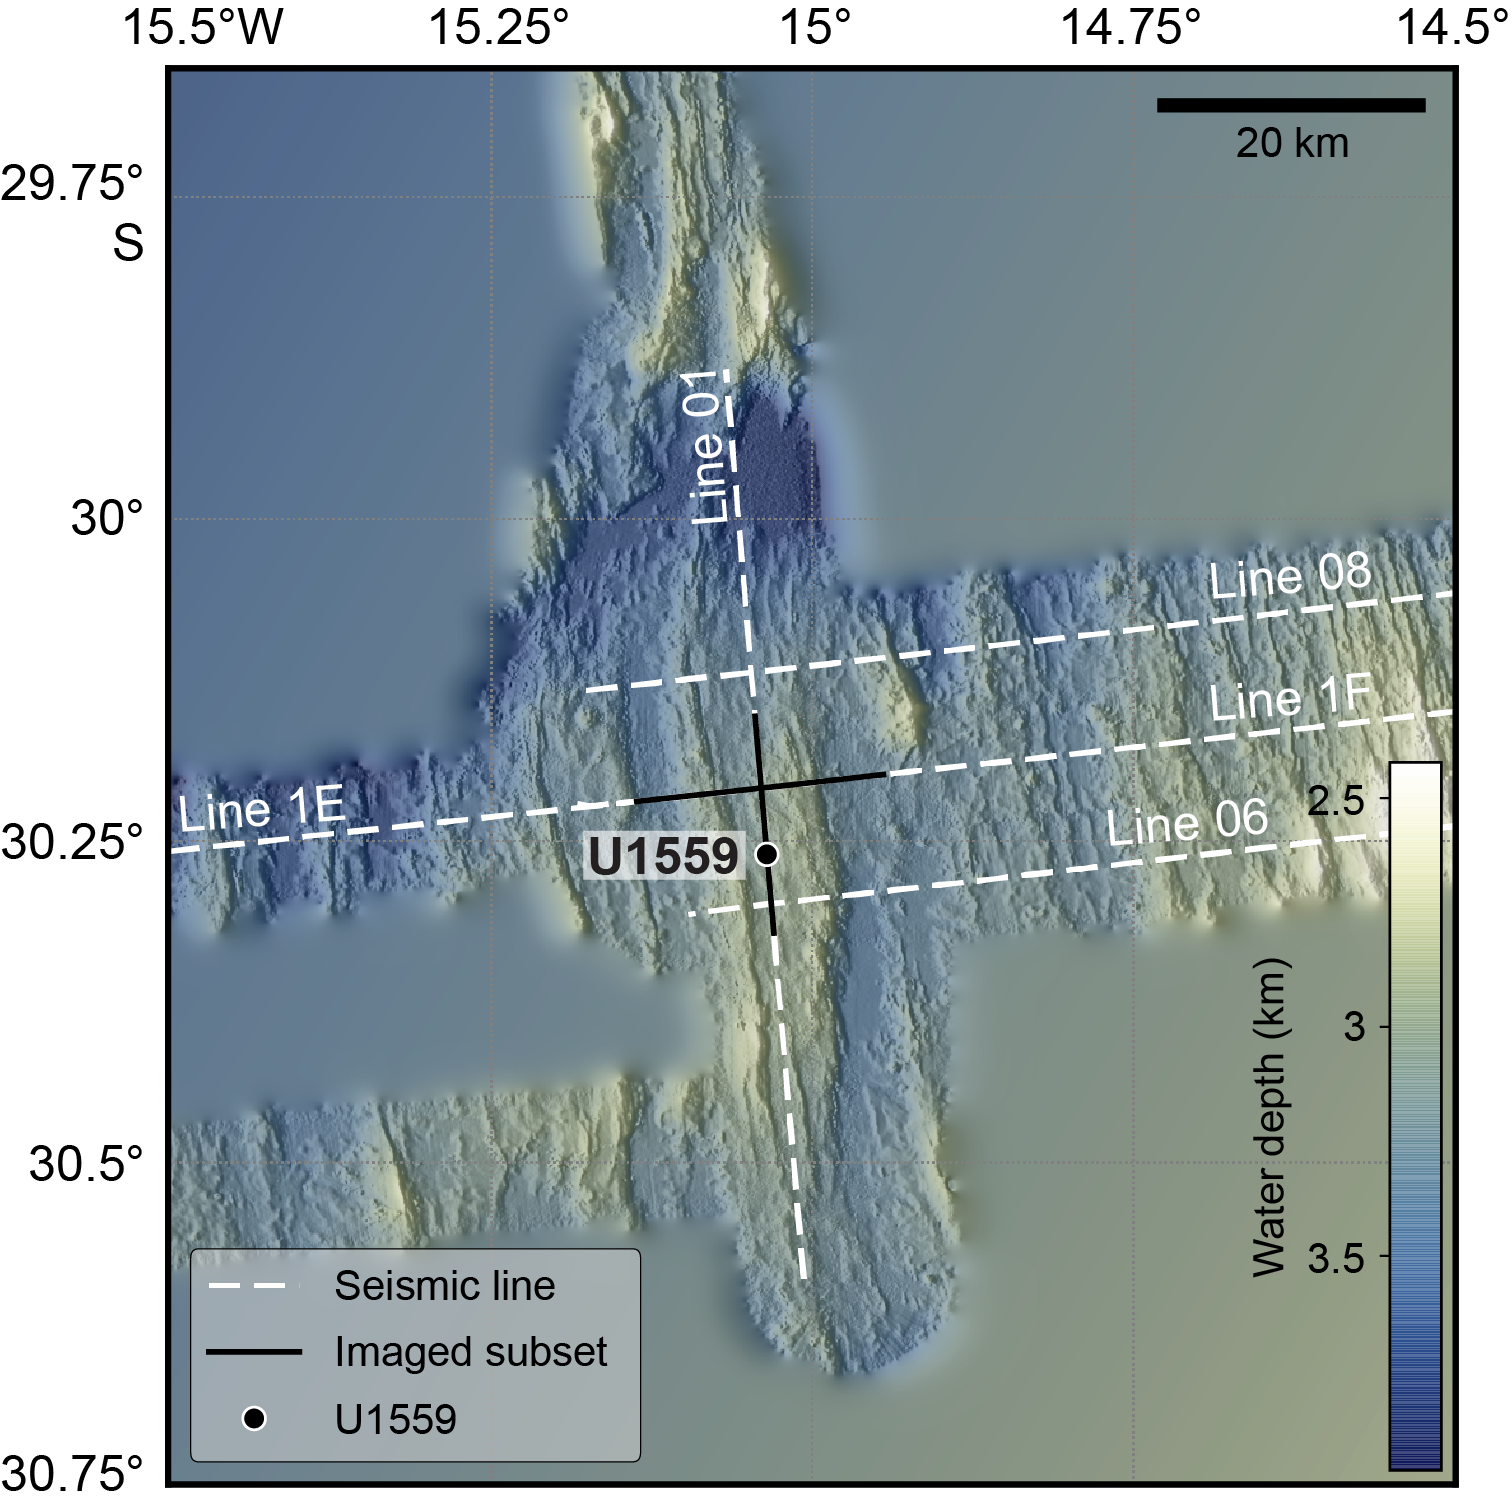
Figure F1. Bathymetric map.
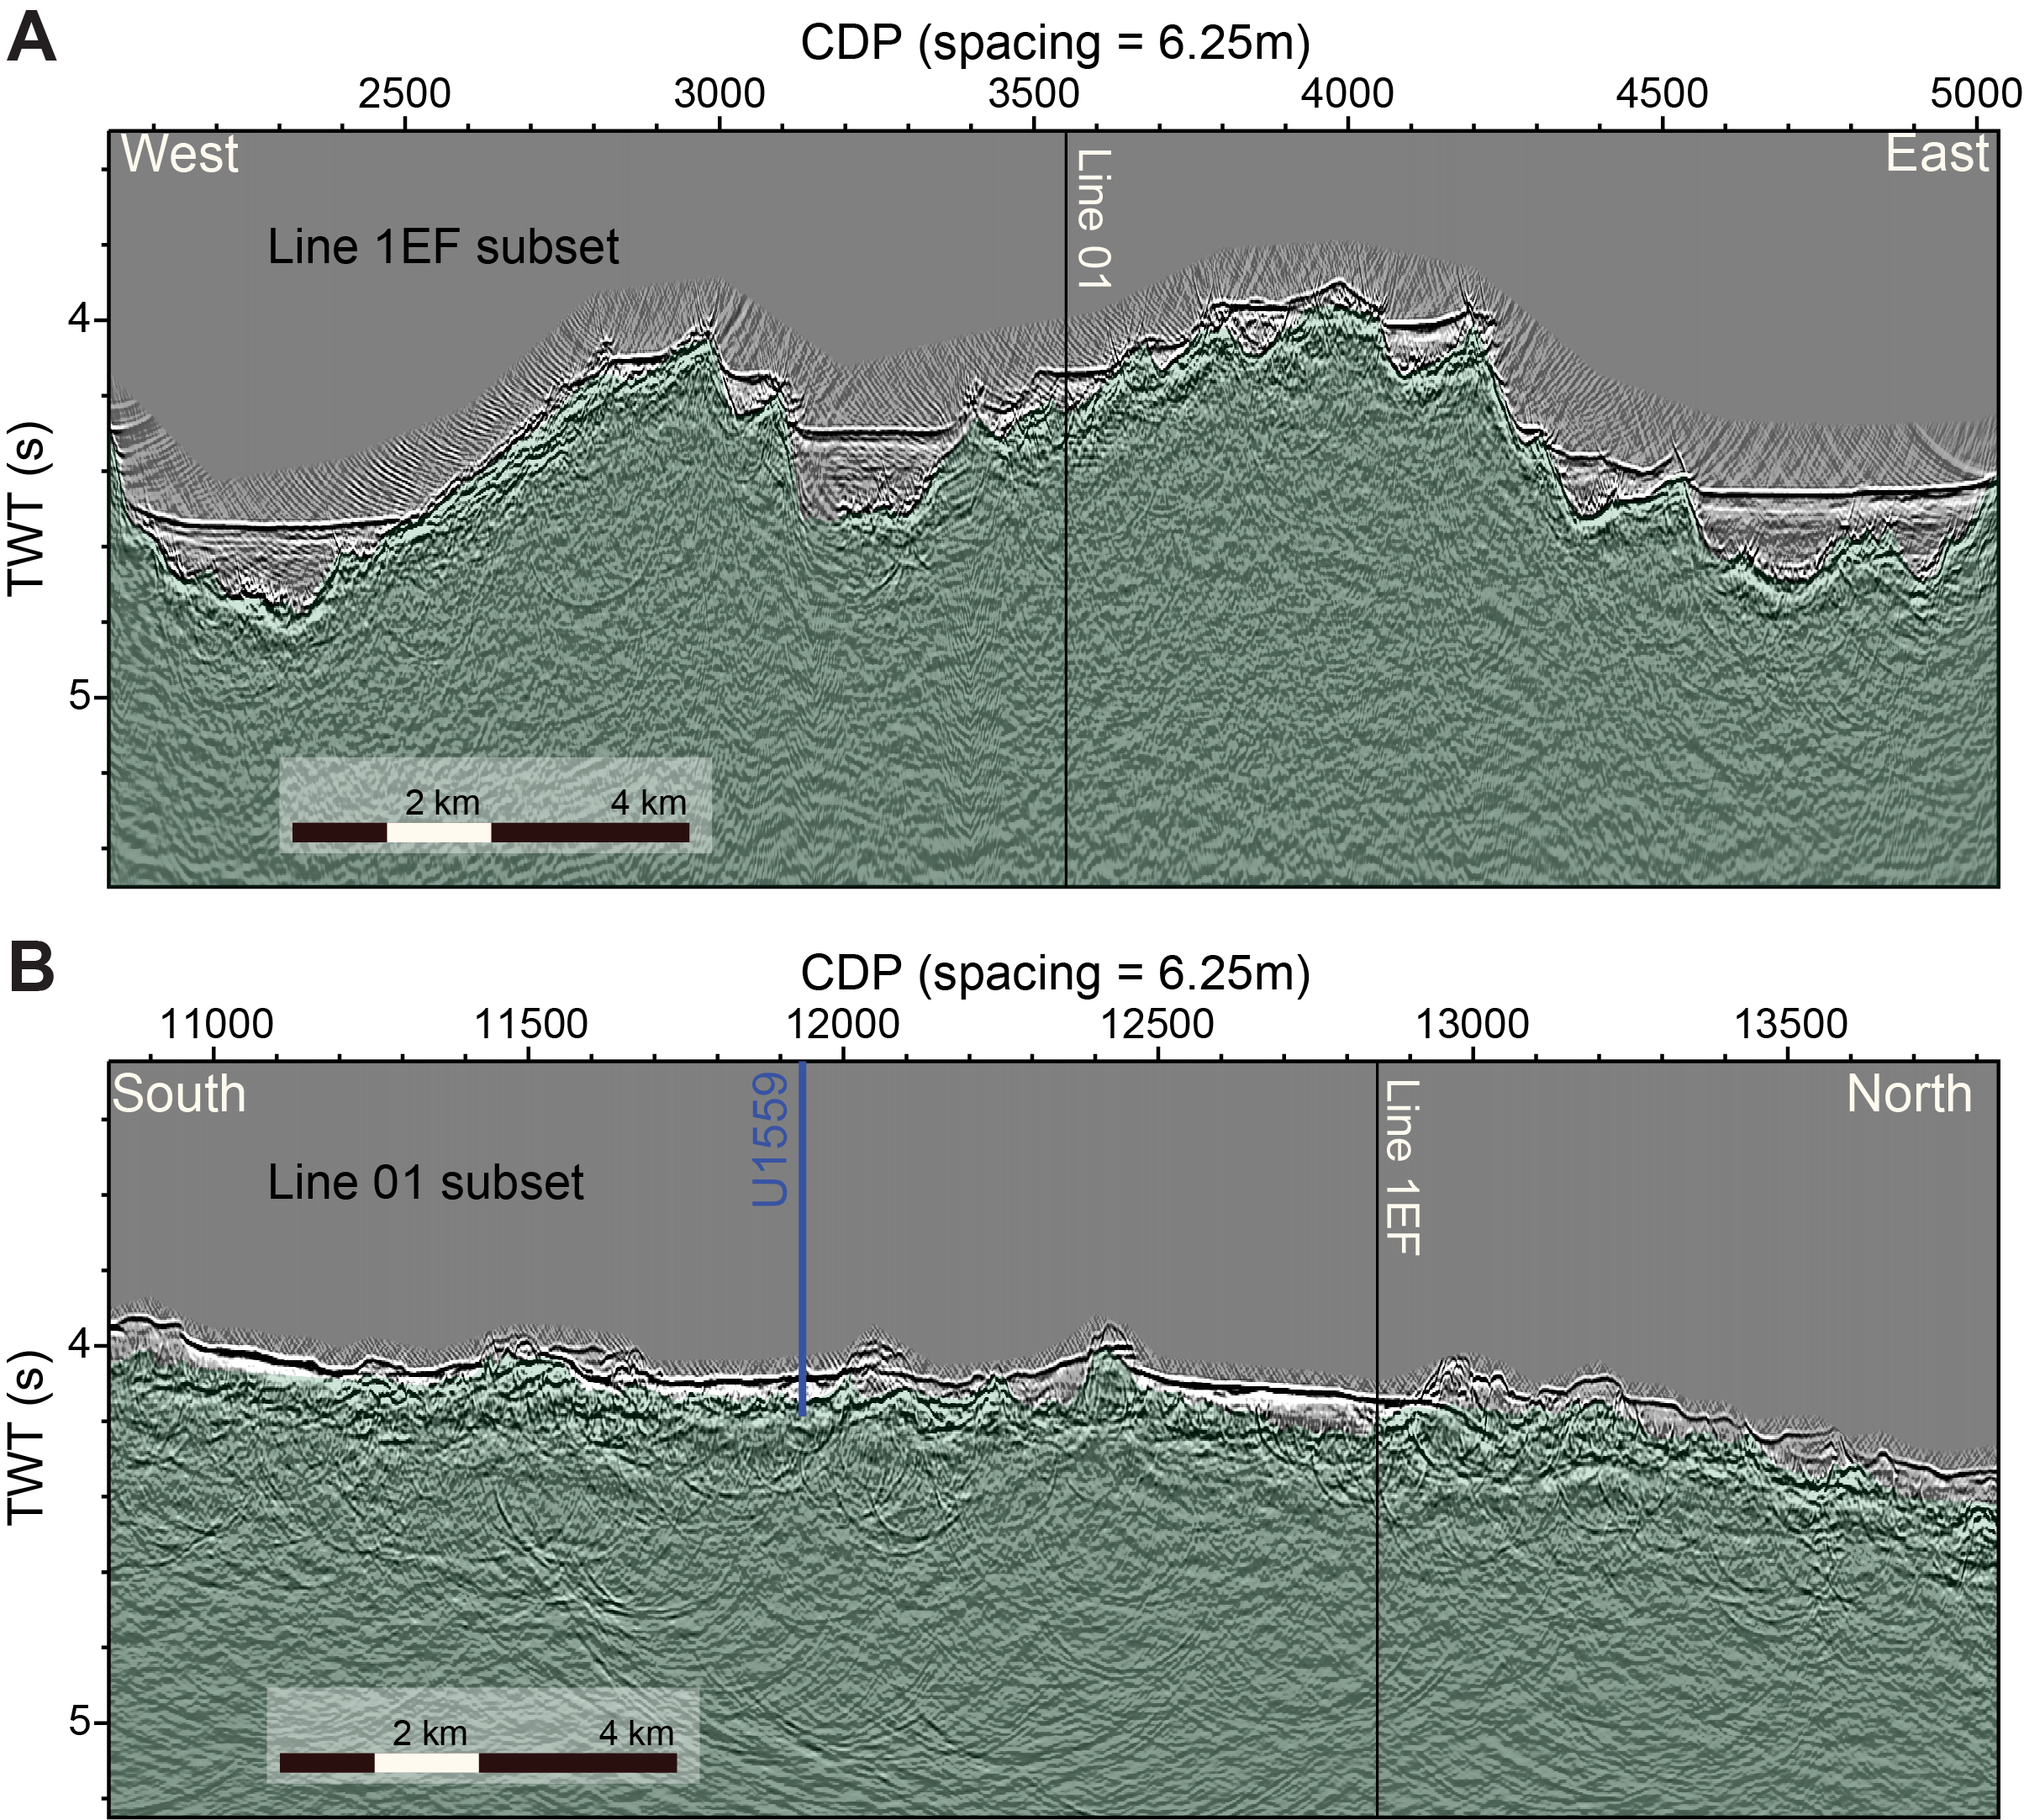
Figure F2. Seismic reflection profiles.
Site U1559 sits on the edge of a near north-south–trending (355), ~5–6 km wide, irregular basin developed between strongly faulted ridges (Figures F1, F2, F3). These subparallel ridges are 30–40 km long and rise 100–200 m above the local seafloor. On the east–west CREST Line 1E/1F profile, a number of 5–10 km wide basins are imaged, each filled with ~250 m of sediment (Figure F2) to a range of bathymetric levels between 3000 and 3500 mbsl (Figure F1). The main basin deepens northward to a nadir at >3900 mbsl. The east–west crossing lines do not pass over Site U1559 directly, but the site appears to occupy a small sediment-filled subbasin perched ~50 m above the main valley floor (Figure F2). The ocean crust at Site U1559 has a sediment cover of 64 m, which is twice the global average overburden thickness for basement of this age (~30 m; Spinelli et al., 2004) and twice the reported mean sediment thickness encountered along CREST Seismic Line 1F for crustal ages between 0 and 7 Ma (34 m; Estep et al., 2019). Sediment cover at Site U1559 does fall within the range given by a recent sedimentation thickness global synthesis, which suggests that ~7 Ma ocean crust should host between 50 and 110 m of sediment (cf. Olson et al., 2016; Straume et al., 2019, and references therein).
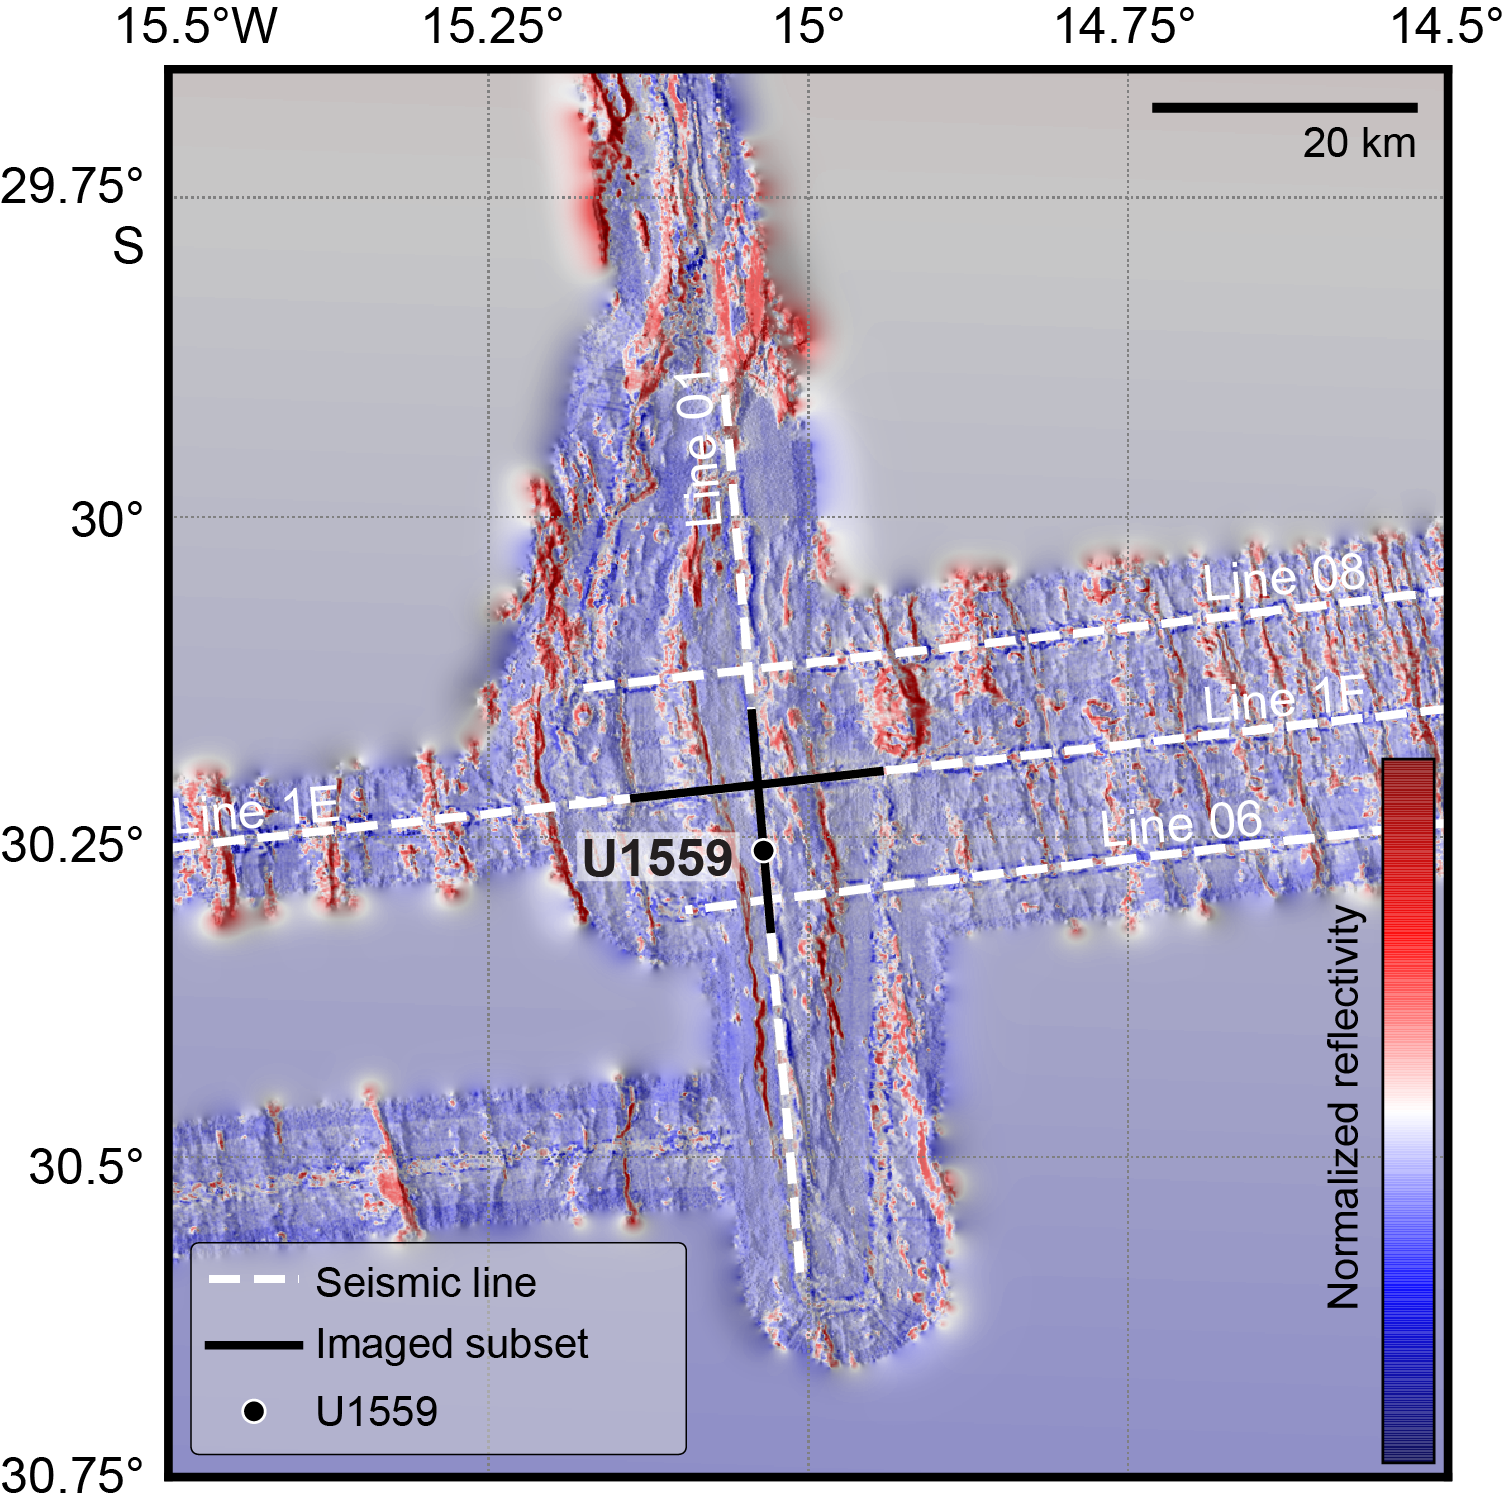
Figure F3. Backscatter reflections.
Backscatter reflections from multibeam profiles (Figure F3) reveal that a significant proportion of the seafloor near Site U1559 is either unsedimented or hosts only thin, discontinuous sediment cover. This may allow ventilation of the volcanic rocks of the upper ocean crust through the ingress of seawater and egress of seawater-derived low-temperature hydrothermal fluids, with consequent impacts on heat flow, sediment pore waters, basement hydrothermal alteration, and microbial communities in both the marine sediments and underlying basalts.
Site U1559 was first occupied during engineering Expedition 390C, during which Hole U1559A was cored using the advanced piston corer (APC) and extended core barrel (XCB) systems to a total depth of 66.2 meters below seafloor (mbsf), penetrating the entire sediment succession and ~2 m into basement (see Table T2 in the Expedition 390/393 summary chapter [Coggon et al., 2024d]) (Estes et al., 2021). After operations in Hole U1559A were complete, a reentry system with 13⅜ inch casing was installed to 55.31 mbsf in Hole U1559B (Figure F4). At the end of Expedition 390C, the total depth of Hole U1559B was 58.9 mbsf, which was shallower than the sediment/basement interface in this hole. The age of Site U1559 was predicted to be ~6.6 Ma based on CREST site survey magnetic data (Kardell et al., 2019) and preliminary biostratigraphy analyses from Hole U1559A sampled during Expedition 390C.
1.2. Objectives
The operational objectives at Site U1559 during Expeditions 390 and 393 were to (1) core two holes with the APC/XCB system to recover the complete sediment succession and sample the sediment/basement interface to collect samples that address the microbiological, geochemical, and paleoceanographic objectives of the SAT expeditions; (2) core 250 m into basement with the rotary core barrel (RCB) system in Hole U1559B to collect material that addresses the petrologic, geochemical, and microbiological objectives of the SAT expeditions; and (3) collect wireline geophysical logging data through the basement sections.
2. Operations
Site U1559 was first visited during Expedition 390C, an engineering leg with the goal of coring a single APC/XCB hole to basement for gas safety monitoring and installing a reentry system with casing in a second hole. These activities were successful, with a single APC/XCB hole (Hole U1559A) cored to 66.2 mbsf, contacting a hard layer at 64.0 mbsf, and a reentry system and casing installed in Hole U1559B to 55.31 mbsf, ~9 m above basement (Table T1; Figure F4; Estes et al., 2021). The site was revisited during both Expeditions 390 and 393, and two additional APC/XCB holes were cored through the sediment column to basement, along with RCB coring in Hole U1559B.
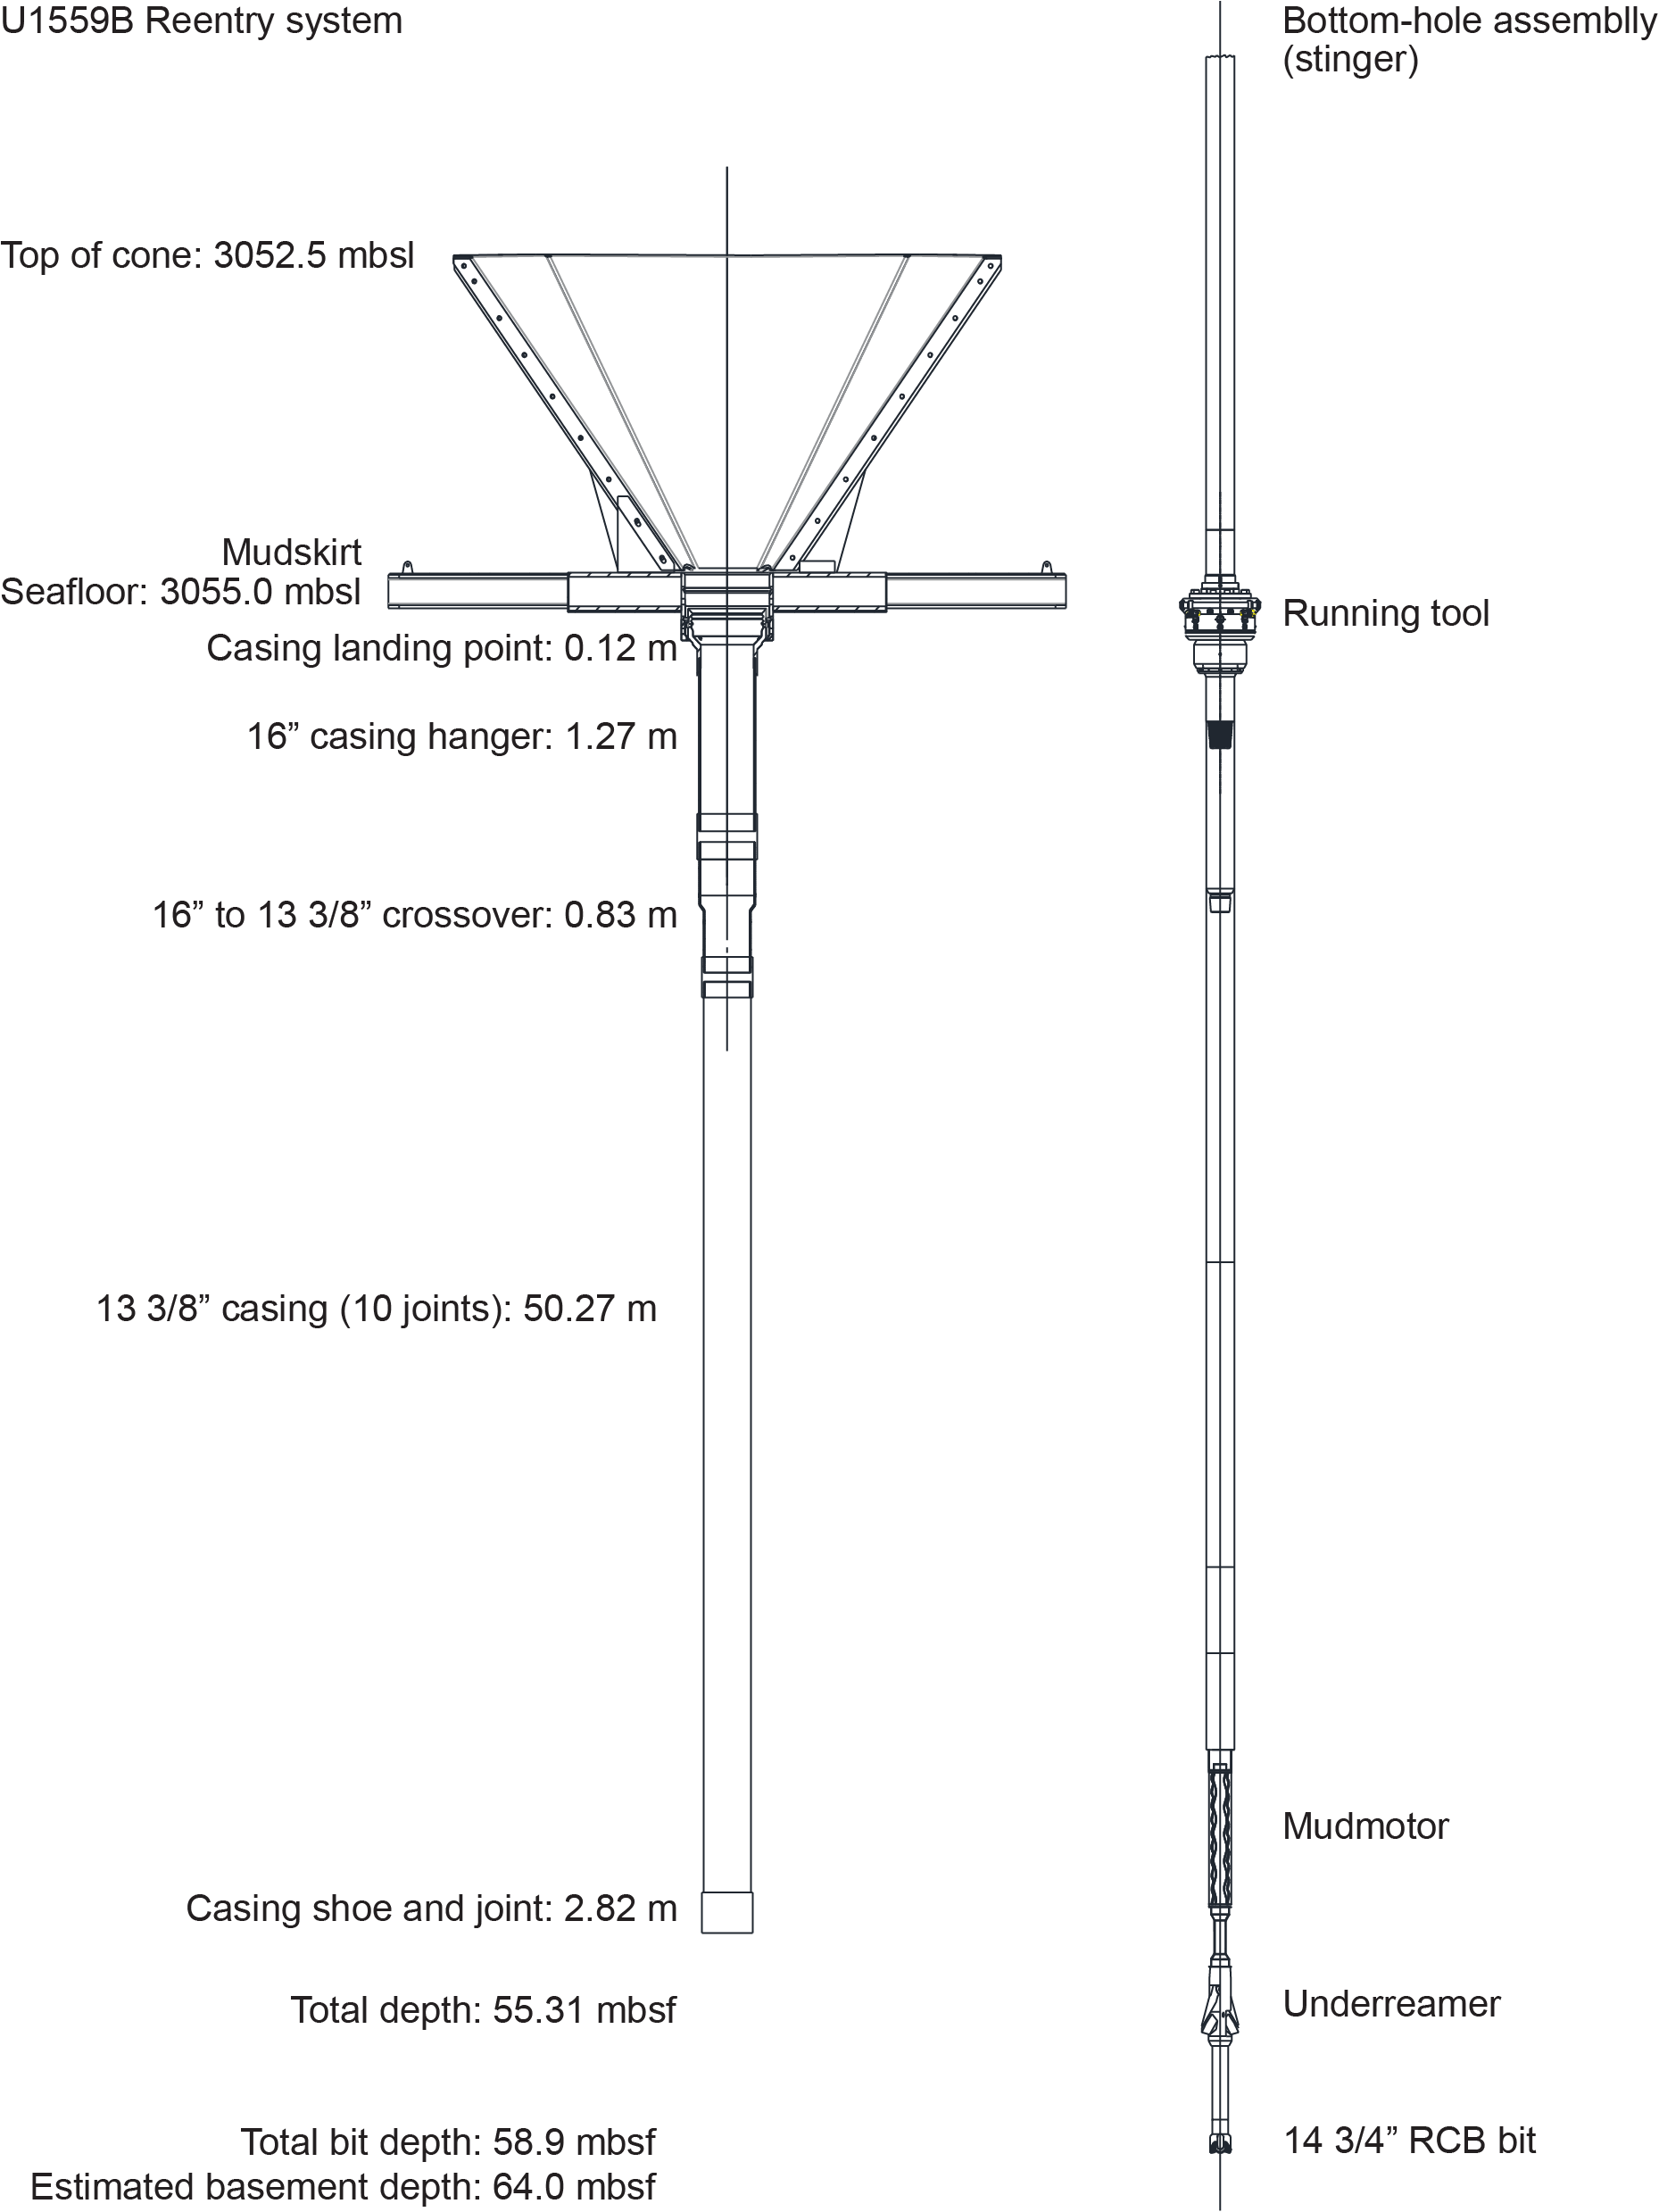
Figure F4. Reentry system, casing, and BHA.
2.1. Expedition 390 Holes U1559C and U1559D
Hole U1559C is located 30 m south of Hole U1559B (Figure F5). The hole was spudded on 22 May 2022 using the APC/XCB system at a water depth of 3058.0 m. Cores 1H–6H advanced to 51.8 mbsf, recovering 52.08 m (100%). Because we expected to penetrate basement in the next core, we transitioned to using the XCB system. Core 7X encountered a hard layer at ~59 mbsf that was assumed to be the sediment/basement contact. However, no basement material was recovered in the core, only 4.82 m of sediment of the 9.1 m advance (57%). We ended coring in Hole U1559C and pulled out of the hole to the seafloor at 1545 h, aiming for better recovery of the sediment/basement interface in Hole U1559D. All Hole U1559C APC cores were oriented; advanced piston corer temperature (APCT-3) tool formation temperature measurements were taken in Cores 4H, 5H, and 6H.
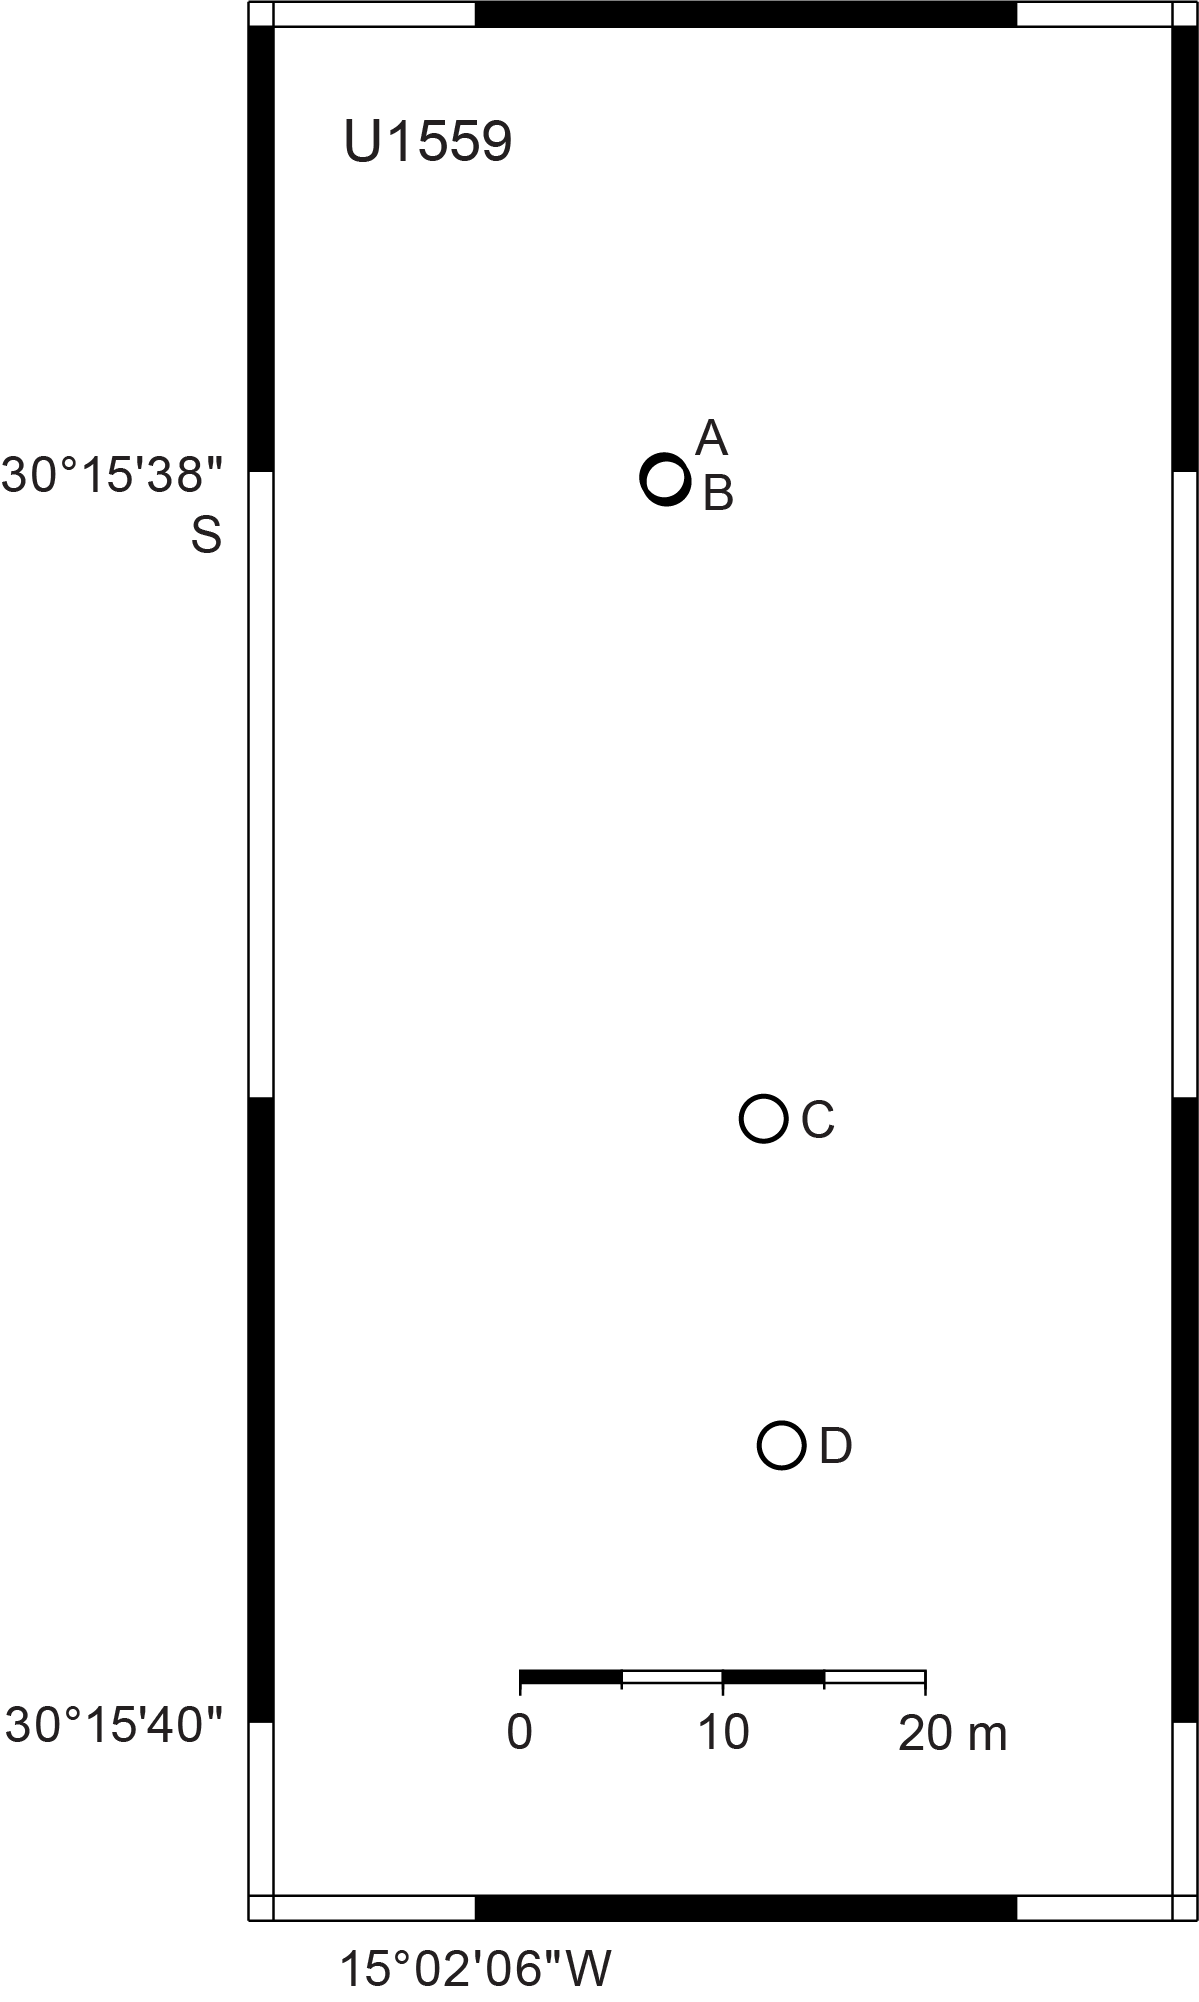
Figure F5. Map of holes drilled.
For Hole U1559D, the vessel was offset 16 m south (Figure F5). Cores 1H–6H advanced to 49.9 mbsf and recovered 42.01 m of sediment (84%). While drilling Core 7X, we contacted a hard layer and recovered some small rubbly pieces of basement. Core 8X advanced 2 m to a final hole depth of 59.4 mbsf and recovered 0.37 m of material (18%). All Hole U1559C APC cores were oriented; the perfluorocarbon microbial contamination tracer was pumped during circulation of drilling fluid. In total, 2.0 days of expedition time was spent coring at Site U1559.
During the pipe trip back to the surface after finishing operations in Hole U1559D, the bearings failed on the forward electromagnetic drawworks brake. The brake was disconnected from the drawworks and isolated. Tripping back to surface was finished using the single remaining brake. However, it was not possible to continue operations at Site U1559 and the decision was made to end operations for Expedition 390.
2.2. Expedition 393 transit
The research vessel (R/V) JOIDES Resolution departed Repair Quay 3 in Cape Town, South Africa, on 11 June 2022, with the last line released at 0949 h. We stopped just outside the harbor to test the 50 kVA uninterruptible power supply (UPS) system under varying levels of electrical load and then started the sea voyage to Site U1559 at 1455 h. Much of the transit was completed at reduced speed because of rough seas and high winds, and at times the heading had to be adjusted. Sea conditions began to improve on 18 June, allowing the ship to increase to full speed for the final 2 days of the transit. The ship completed the 1713 nmi voyage in 7 days and 23 h at an average speed of 9 kt.
2.3. Expedition 393 Hole U1559B
The ship's thrusters were lowered at 1220 h on 19 June 2022, beginning operations in Hole U1559B. An RCB bottom-hole assembly (BHA) was made up and run to 3031 meters below rig floor (mbrf). The top drive was picked up, and a pipe "pig" was pumped through the drill string to clean rust from the inside. The ship maneuvered for reentry into Hole U1559B, which was established and cased during Expedition 390C in November 2020. We reentered Hole U1559B at 0143 h on 20 June and washed down to 58.9 mbsf, the bottom of the existing hole.
Cores 2R–13R penetrated from 58.9 to 107.9 mbsf and recovered 12.82 m (26.2%) (Table T1). Core 2R had no recovery and drilled very quickly, indicating softer sediment above basalt. While drilling Core 3R, the drillers encountered basement at approximately 65 mbsf. Coring proceeded through Core 11R with a rate of penetration of about 1 m/h. In Core 12R, penetration slowed to under 0.5 m/h and recovery decreased. After 9% recovery of distinctively undergauge, poor quality core in Core 13R, it was decided to terminate coring and retrieve the C-4 bit to the ship after 52.9 h of drilling time. There was significant damage to the core guides and bit cones, some of which had been ground down to the bearings, creating a large 20 cm diameter hemispheroidal void where there once were cones and cutting buttons (Figure F6). Similar damage had been seen during recent operations drilling young basalts during IODP Expedition 395C in Holes U1562B and U1554F. Recovery in Hole U1559B was low, and penetration was slow in part because of the fresh and fractured hard young ocean floor basalts being drilled and in part because the ~65 m of sediment cover meant that the BHA extended ~100 m above seafloor, limiting the weight that could be applied to the bit. However, serious bit damage was clearly an issue, probably from early in the drilling. Early diagnosis and identification of warning signs for this style of bit failure require investigation. The ship was secured for transit to Site U1558 and switched from dynamic positioning to cruise mode at 1232 h on 23 June, ending operations at Site U1559.
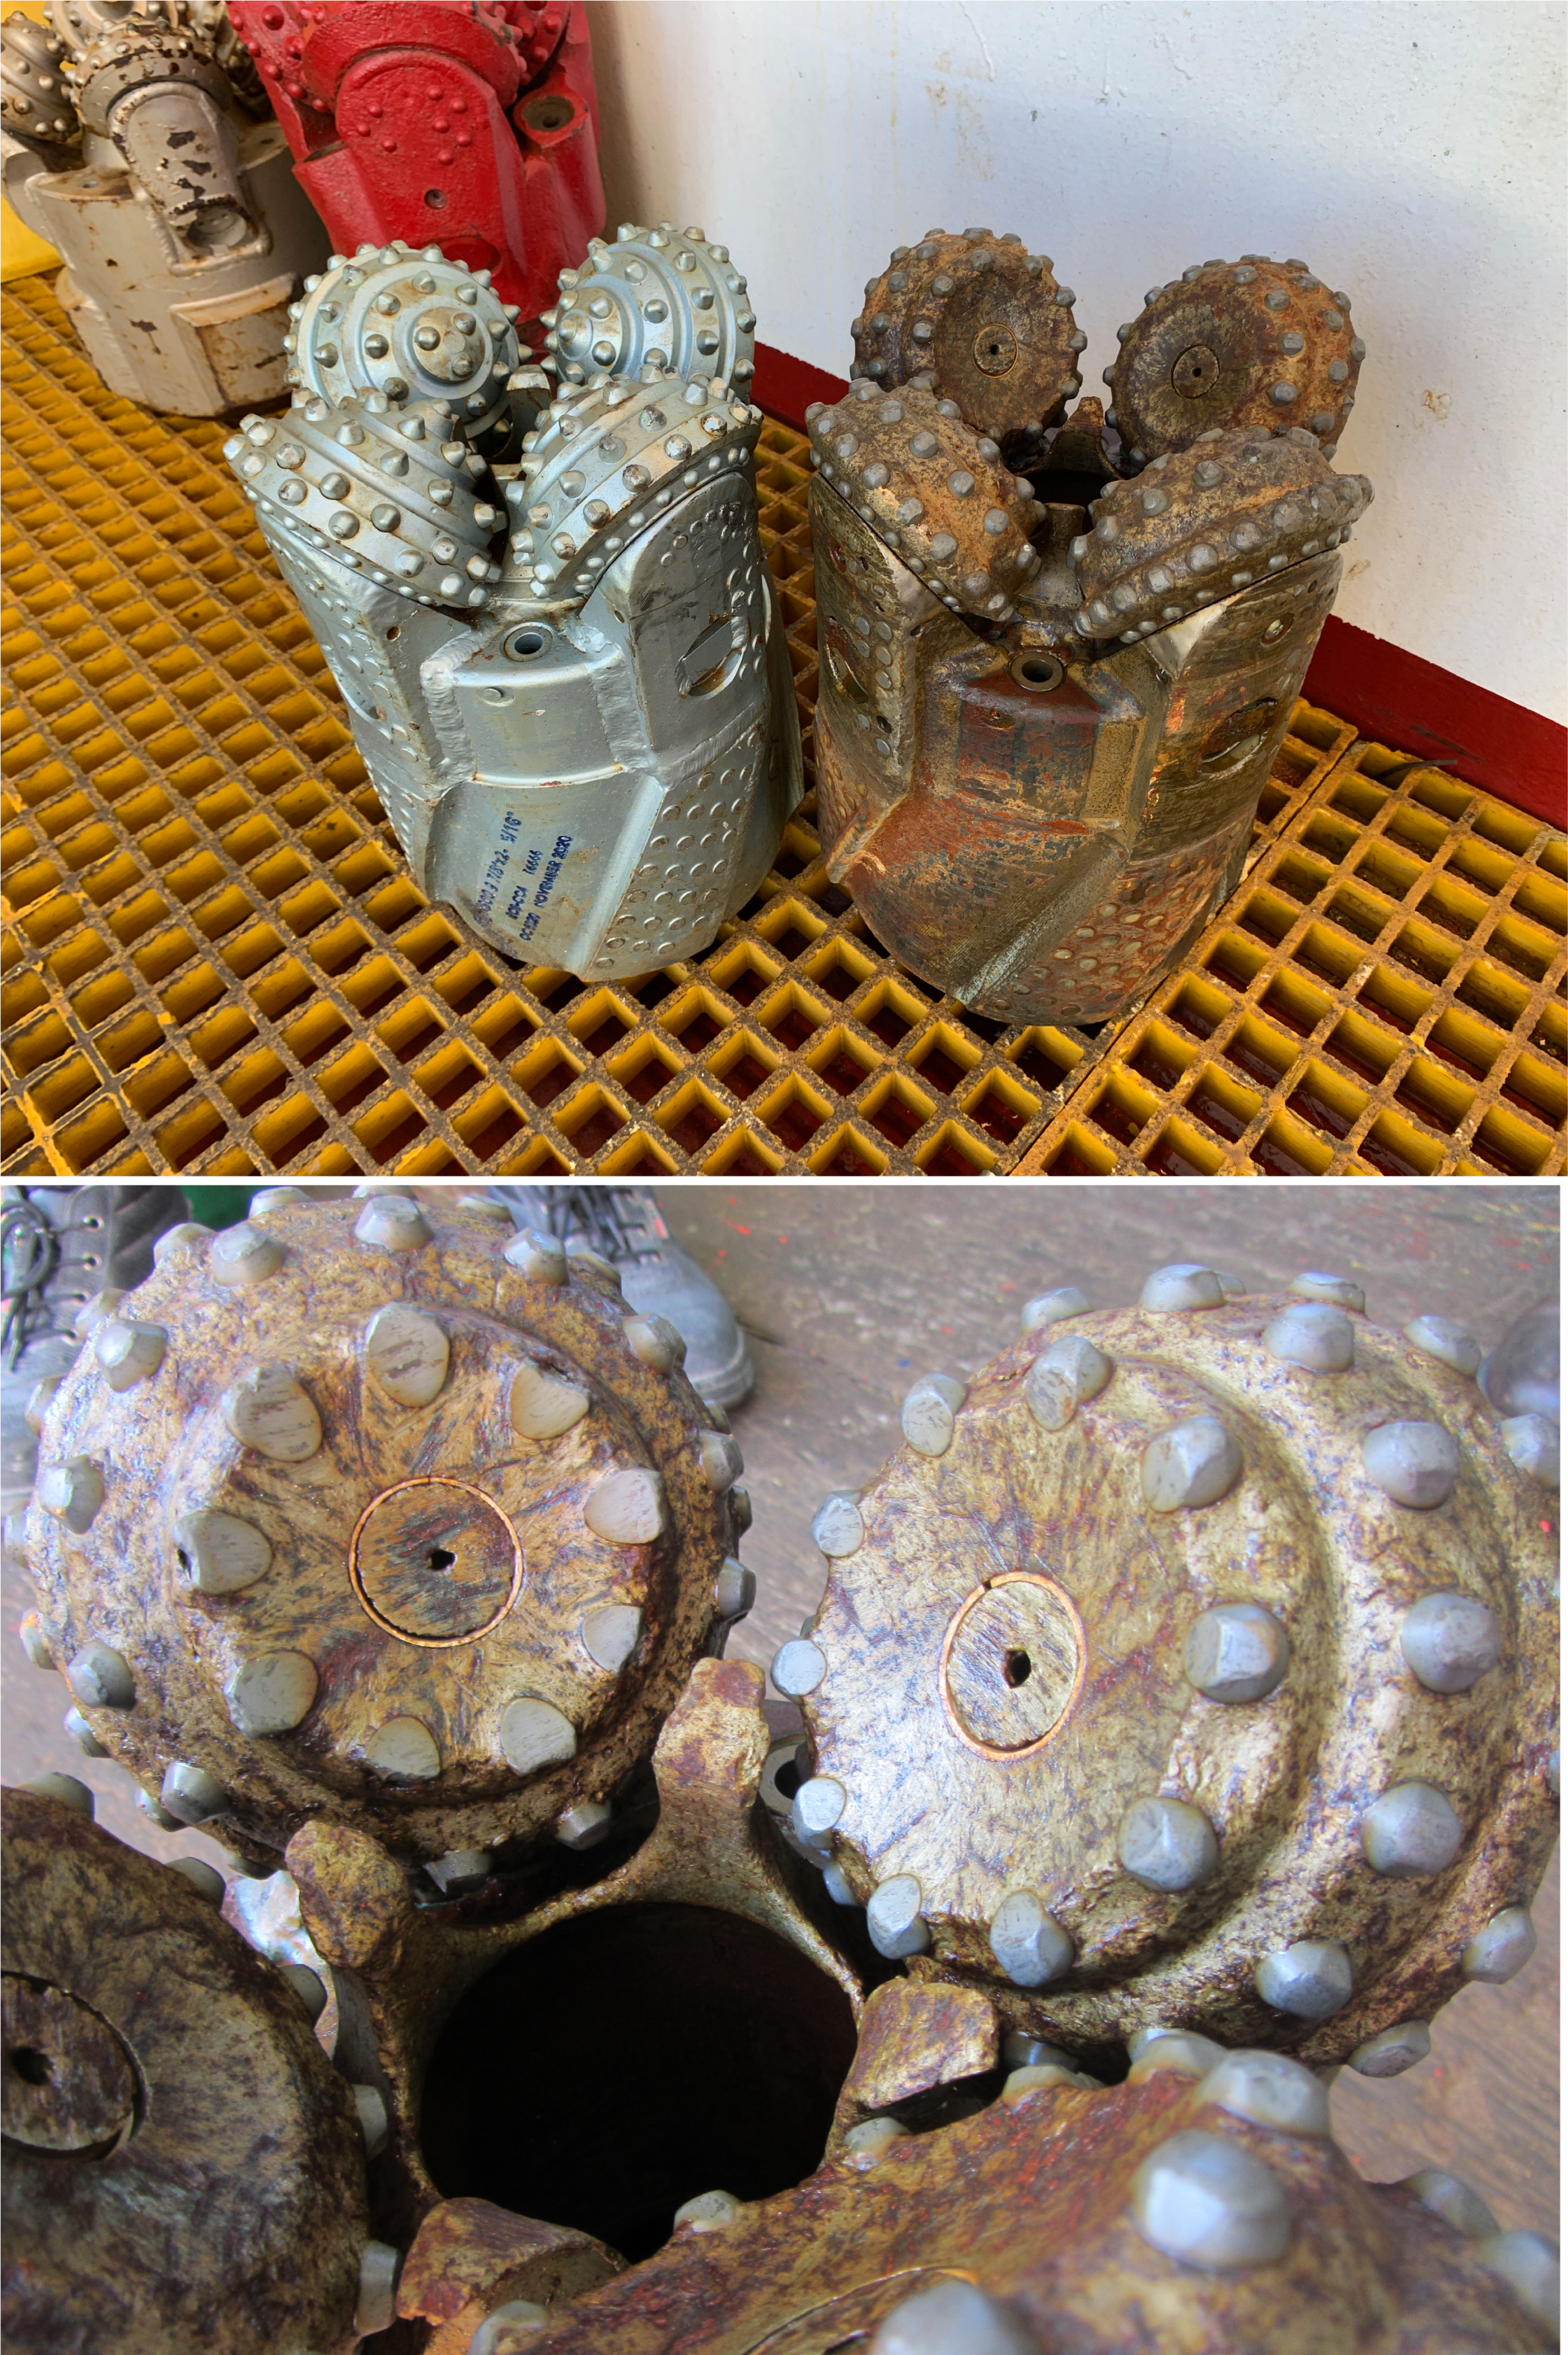
Figure F6. Drill bit and wear on roller-cones and core guides.
Coronavirus Disease 2019 (COVID-19) mitigation protocols were in effect from arrival in Cape Town until 24 June.
3. Stratigraphic unit summary
The cores recovered at Site U1559 during Expeditions 390C and 390 (see Operations) comprise one sedimentary unit overlying a basement unit in which subunits were identified on the basis of macro- and microscopic visual observations combined with mineralogical analyses using XRD, spectral color analyses, and magnetic susceptibility (MS) data (Table T2; Figure F8). Expedition 393 revisited Site U1559 to core Hole U1559B, where a reentry system was installed during Expedition 390C. Drilling reached volcanic basement at 63.89 mbsf in Hole U1559B and penetrated a further 44.1 m into the ocean crust, recovering 12.82 m of volcanic basalt at an average recovery of 26%. The cores recovered from Hole U1559B comprise four main volcanic units and one thin sedimentary unit (Table T5), identified on the basis of macro- and microscopic visual observations informed by the full suite of shipboard instrumentation and analytical techniques, combined with natural gamma radiation (NGR), mineralogical analyses by X-ray diffraction (XRD), carbonate (CARB) data, spectral color analyses, and MS data. The units are numbered from the top of each hole, with units in the sedimentary section designated by Roman numerals (e.g., I and II) and basement units designated by Arabic numerals (e.g., 1 and 2); subunits are designated with letters (e.g., IA, IB, 2A, and 2B).
3.1. Sediment units
The entire (up to ~63 m thick) sedimentary sequence was cored in Holes U1559A, U1559C, and U1559D during Expeditions 390C and 390. The recovered sediments are all calcareous nannofossil ooze with foraminifera (Unit I; Table T2; Figure F8). Because of the generally similar lithologic compositions of Unit I, only member-like subunits were defined based on relatively small changes in the unit's sedimentologic characteristics. For simplicity, these member-like subunits are referred to as subunits throughout this chapter. However, it should be noted that subunits at Site U1559 are defined on the basis of more subtle variations in lithologic composition than subunits at other Expedition 390 SAT sites.
3.2. Volcanic sequences
Only the uppermost few meters of igneous basement were cored during Expeditions 390C and 390 (Holes U1559A and U1559D) because of the mechanical failure of the electromagnetic brake on the rig drawworks that prevented the planned basement coring in reentry Hole U1559B during Expedition 390 (see Operations). The recovered basement rocks (Basement Unit 1) comprise a transitional unit that includes clasts of both basalt (~59 cm of recovered core) and lithified pelagic sediment (~42 cm of recovered core), with the margins of volcanic rocks that chilled against the lithified sediments recovered in some pieces (see Igneous petrology).
During Expedition 393 five lithologic units were identified in Hole U1559B, comprising four main volcanic units and one thin sedimentary unit (Figure F7). The four volcanic units were further divided into seven subunits based on volcanic emplacement style and subtle changes in phenocryst assemblages (Table T5; Figure F7). Note that no brecciated rocks were recovered. The uppermost volcanic rocks are aphyric microcrystalline basalt sheet flows with some planar glassy margins and vuggy vesicular patches (Unit 1). These are underlain by sparsely plagioclase-phyric microcrystalline to fine-grained basalt pillow lavas (Subunit 2A) with common curved and planar glassy margins. Rare fresh olivine phenocrysts are present from 73.9 mbsf (Subunit 2B), and the absence of curved glassy margins below 83.7 mbsf suggest the lowermost lavas of this unit are sheet flows (Subunit 2C). Unit 2 basalts are separated from Unit 4 basalts by a thin layer (~10 cm) of hydrothermally altered indurated calcareous sediment (Unit 3) with altered glass impregnated into both the upper and lower contact (~85.5 mbsf). The directly underlying lavas (Subunit 4A) are sparsely plagioclase-phyric microcrystalline to fine-grained basalt sheet flows with rare olivine phenocrysts, and the absence of glass and relatively coarse holocrystalline grain size suggests emplacement as a sheet flow. Unit 5 (~100.7 mbsf) comprises sparsely plagioclase-phyric microcrystalline to fine-grained basalt sheet and pillow flows with rare olivine and clinopyroxene phenocrysts. The relative abundance of olivine over plagioclase phenocrysts in the final recovered pieces distinguishes Subunit 5B (104.34 mbsf). Despite this variation, distinctive sparse macroscopic plagioclase phenocrysts are common to all of the volcanic units apart from aphyric Unit 1. Together with only modest differences in geochemistry determined by portable X-ray fluorescence (pXRF) analysis, this consistency suggests all of the igneous lithologic units at Site U1559 belong to a single co-magmatic sequence of relatively normal mid-ocean-ridge basalt (N-MORB) with subtle internal variations related to fractional crystallization and other magma chamber processes. The interpretation of significant intervals of sheet flows is somewhat atypical for a slow-spreading ridge. However, given the poor recovery, it is possible some sections of pillow basalts or breccia were not recovered. This potentially biased recovery must be carefully considered by subsequent studies seeking to compare hydrothermal exchange between this hole and others along the SAT.
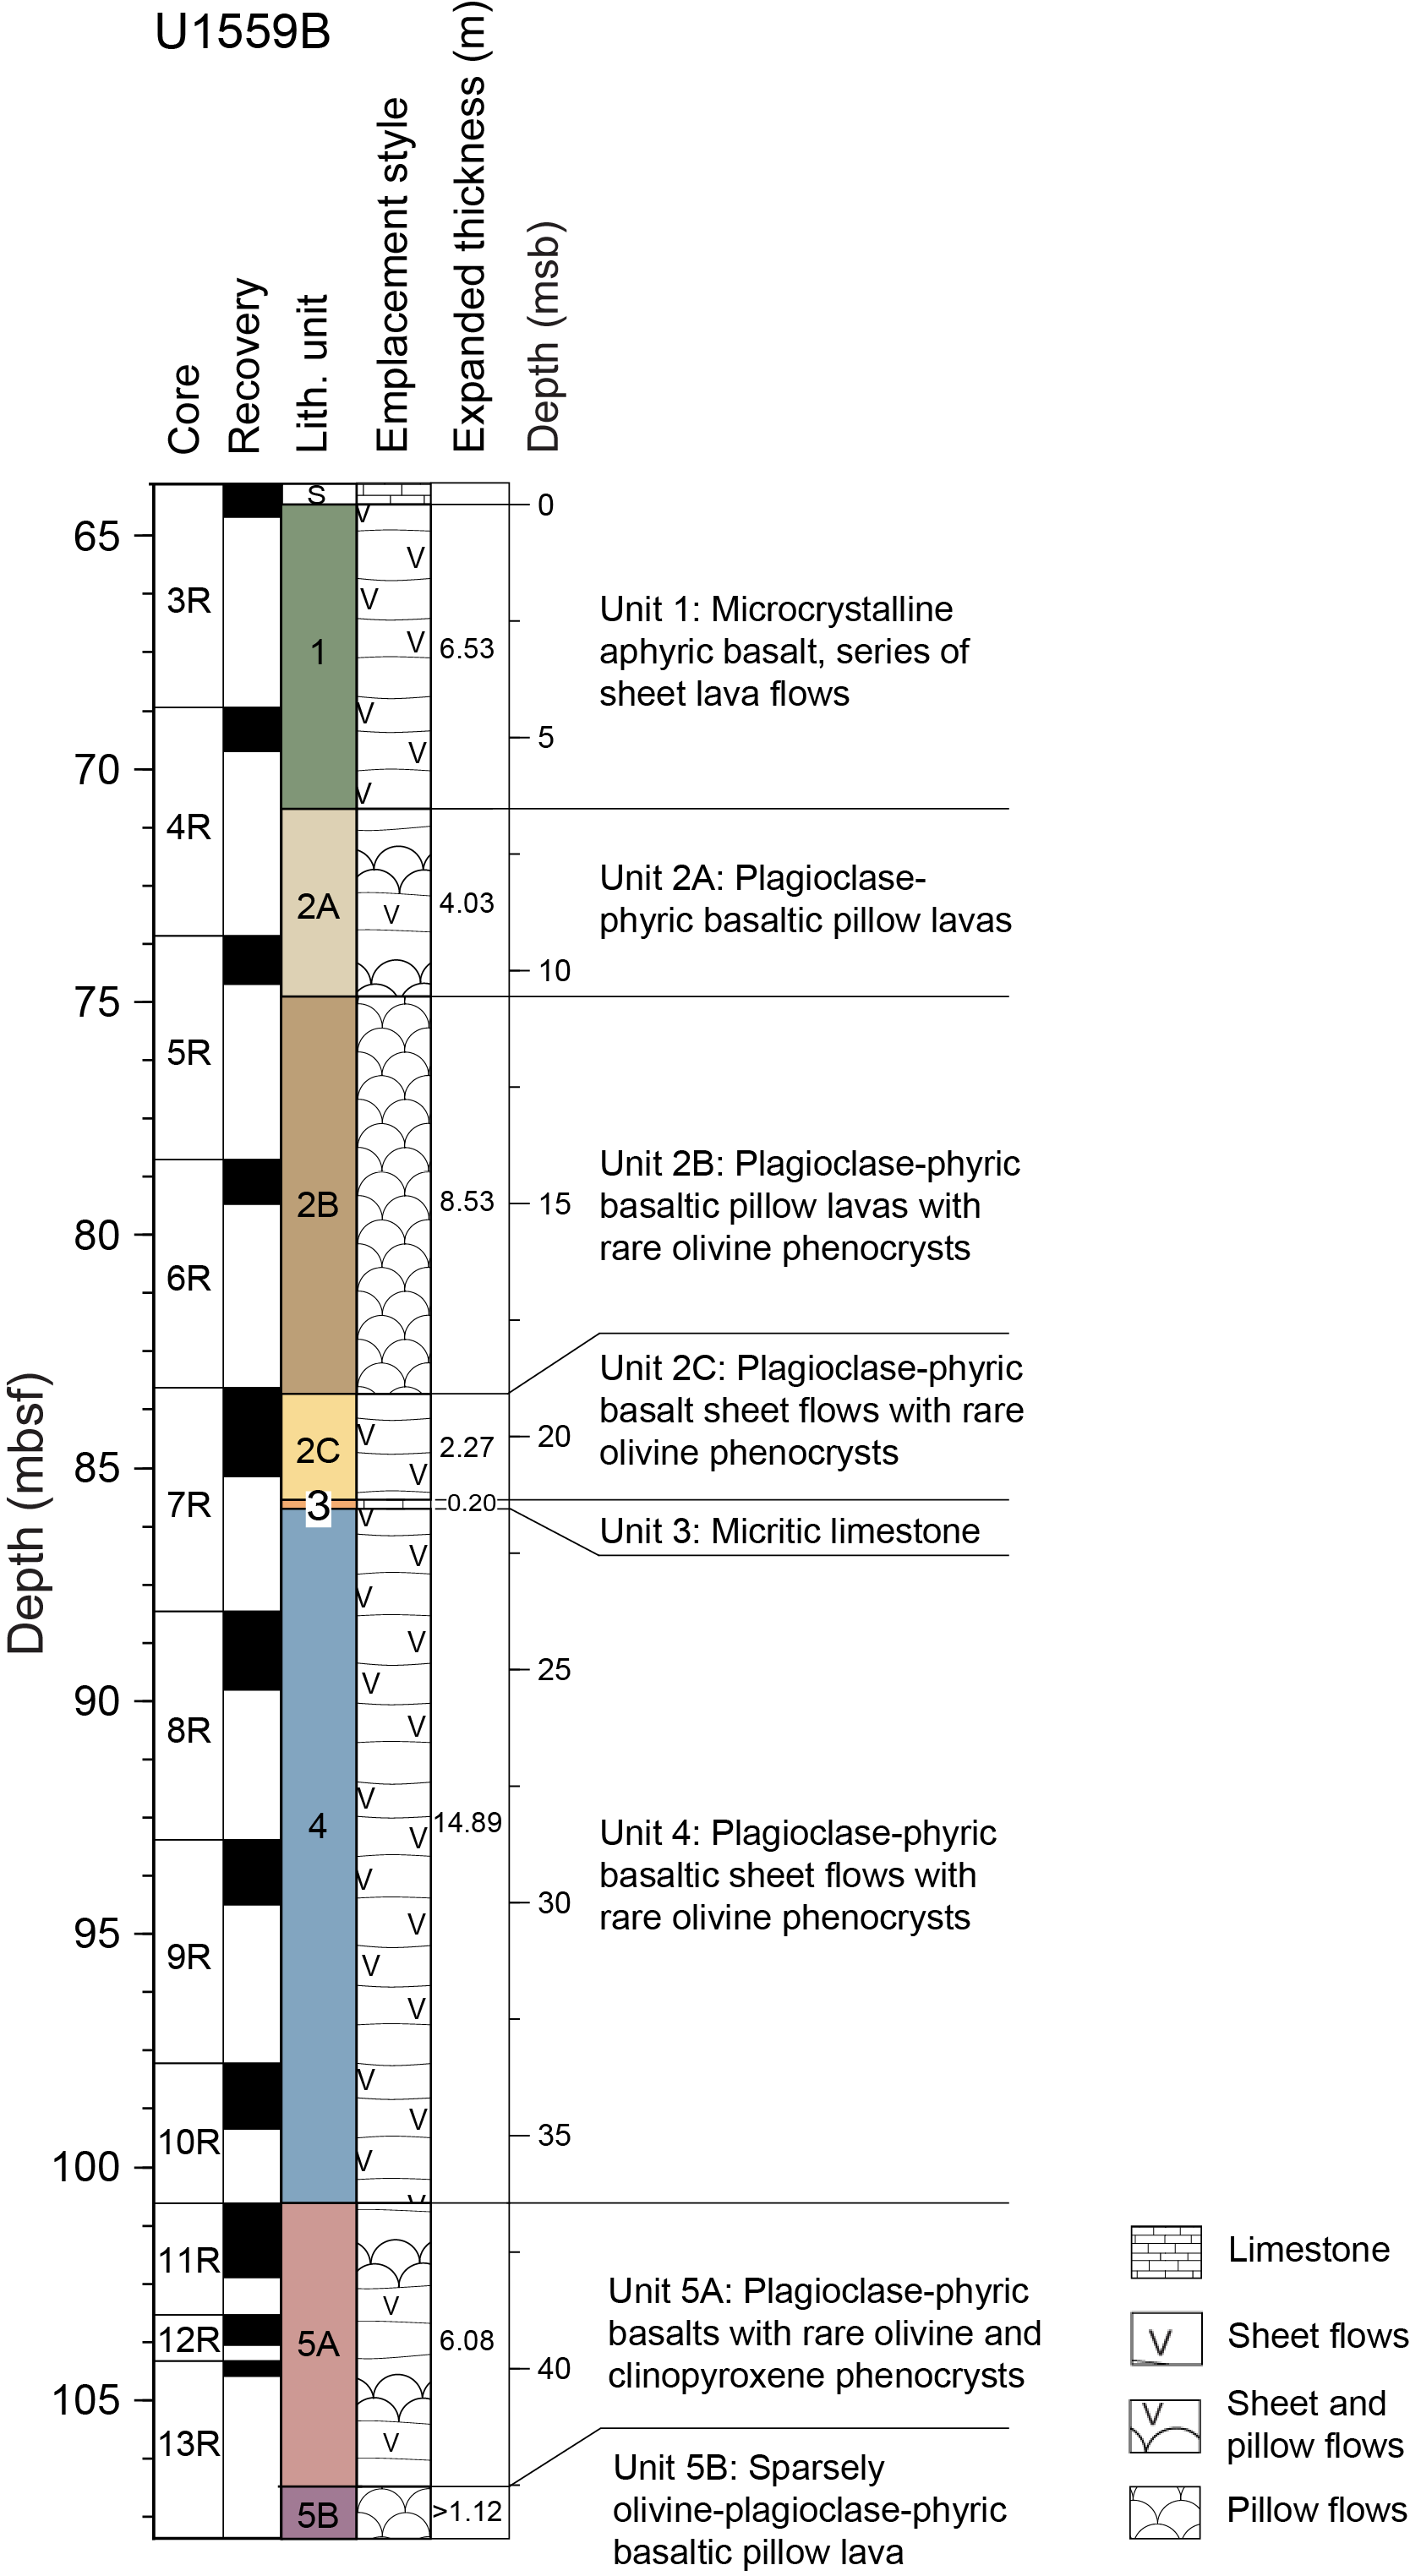
Figure F7. Lithostratigraphic summary, volcanic units.
3.3. Sediment/basement interface
Single cores containing both calcareous sediment and basalt were recovered in Expedition 390C Hole U1559A, Expedition 393 Hole U1559B, and Expedition 390 Hole U1559D, with the deepest sediment recovered above the basement varying between holes from unlithified ooze to indurated calcareous sediment. The sediments overlying the uppermost volcanic rocks (from the base of Unit I) contain a latest Miocene assemblage of calcareous nannoplankton and planktic foraminifera. Alternation of sediment and basalt over a few meters below the shallowest basalt at Site U1559 is consistent with either a sedimentary breccia or intercalation of lavas and sediments at the interface.
3.3.1. Sediment/basement interface depth
In each hole at Site U1559, we defined the sediment/basement interface as the curated depth of the top of the shallowest occurrence of basalt, which is 62.64, 63.89, and 50.98 m core depth below seafloor, Method A (CSF-A) in Holes U1559A, U1559B, and U1559D, respectively (Table T6). Although Hole U1559C did not recover the sediment/basement interface, drilling parameters indicate that it was penetrated. While coring Core 390-U1559C-7X, the drillers observed an abrupt increase in pressure and decrease in penetration rate, both consistent with the drilling parameters observed in the basement intervals of Holes U1559A and U1559D; however, recovery in Core 390-U1559C-7X was lower (53%) than in the cores from the overlying sediment section, and no basement material was recovered (see Operations). Based on the drilling parameters, the sediment/basement interface in Hole U1559C is between 56 and 60.9 mbsf. The depth of the sediment/basement interface therefore varies by >10 m between Holes U1559A, U1559B, U1559C, and U1559D. These differences are interpreted to reflect rough basement topography that is typical of slow spreading rates. This topography results in differences in the basal sediment ages that likely reflect variable accommodation. Older planktic foraminifera and calcareous nannofossil zones are observed in the deepest sample from Hole U1559A, where the sediment/basement interface is 62.64 mbsf, compared with those observed from Hole U1559D, where the sediment/basement interface is shallower (50.98 mbsf).
For stratigraphic correlation between SAT sites and with other sections of upper ocean crust recovered by scientific ocean drilling, we defined a site basement/sediment interface depth for each site. For consistency, this is taken as the curated depth of the top of the shallowest occurrence of basalt in the hole with the greatest basement penetration at each site, which is 63.9 mbsf in Hole U1559B at this site.
4. Sedimentology
Three sediment holes were cored using the APC and XCB systems at Site U1559 (Holes U1559A, U1559C, and U1559D) during Expeditions 390C and 390. All of them penetrated the entire sedimentary column (up to ~62 m thick in Hole U1559A). The sediments recovered at Site U1559 correspond to one main lithology: calcareous nannofossil ooze with foraminifera (CNF) (Figure F8). Visual core descriptions (VCDs) summarize observations recorded in the shipboard DESClogik program including the assessment of sediment color, grain size, sedimentary structures, bioturbation, and drilling disturbance. These parameters were used to define the stratigraphic (member-like) subunits at this site. Sediment colors are defined according to the Munsell Soil chart (color codes are provided in the VCDs). The color of the sediments is mostly very pale brown. Most of the slight color variability (Figure F10) in Site U1559 sediments might reflect small changes in sedimentologic composition (e.g., presence of trace siliciclastic material) and/or micropaleontological composition (e.g., relative abundance of foraminifera, extensive mechanical-bioeroded foraminiferal clasts, and Discoaster sp. nannoliths) (Figure F9). Hole U1559A was cored in November 2020 during Expedition 390C (see Background and objectives) (Estes et al., 2021) but was not described until May 2022 during Expedition 390. Therefore, some color differences between the digital color images and the visual color determinations by Munsell color classification might occur.
We used smear slides (Figure F9) and XRD (Figure F11) to confirm lithologic compositions. In general, the presence of clays can be correlated with MS and the lightness reflectance (L*) parameter, as well as with NGR (see Physical properties and downhole measurements). The bioturbation index (see Sedimentology in the Expedition 390/393 methods chapter [Coggon et al., 2024c]) is generally absent to sparse in Site U1559 sediments. We note that the low variability of sedimentologic composition may have limited the identification of bioturbation tracks, which are typically more prominent in intervals with two distinct lithology colors.
Throughout the three sediment holes at Site U1559, calcareous nannofossil ooze with foraminifera is the main lithologic unit detected. Because of this uniform lithologic composition, only member-like subunits were defined, based on relatively small changes, which include a combination of visual observations of sedimentologic characteristics, microscopic examination of smear slides, and XRD bulk mineralogical analysis (see Sedimentology in the Expedition 390/393 methods chapter [Coggon et al., 2024c]) integrated with MS and color spectral observations (see Physical properties and downhole measurements in the Expedition 390/393 methods chapter [Coggon et al., 2024c]). For simplicity, these member-like subunits are referred to as subunits throughout this chapter. It should be noted, however, that subunits at Site U1559 are defined based on more subtle variations in lithologic composition than subunits recorded at other SAT sites. Ages were assigned to each subunit based on micropaleontological results (see Biostratigraphy) and magnetostratigraphy (see Paleomagnetism).
4.1. Unit description
4.1.1. Unit I
- Intervals: 390C-U1559A-1H-1, 0 cm, to 8X-CC, 13 cm; 390-U1559C-1H-1, 0 cm, to 7X-CC, 20 cm; 390-U1559D-1H-1, 0 cm, to 7X-CC, 9 cm
- Depths: Hole U1559A = 0–62.64 m core depth below seafloor, Method B (CSF-B); Hole U1559C = 0–56.55 m CSF-B; Hole U1559D = 0–50.98 m CSF-B
- Thickness: U1559A = 62.64 m; Hole U1559C = 56.55 m; Hole U1559D = 50.98 m
- Age: Late Miocene (Messinian)–Holocene
- Lithology: calcareous nannofossil ooze with foraminifera
Unit I is composed mainly of calcareous nannofossil ooze with a variable abundance of foraminifera (generally <25% bulk sediment; Figures F8, F9). The bioturbation index is generally absent to sparse (Figure F10). Lithologic contacts in Unit I are generally gradational, bioturbated, or sharp (Figure F10). Drilling disturbance occurs as soupy and/or slurry intervals but is generally low.
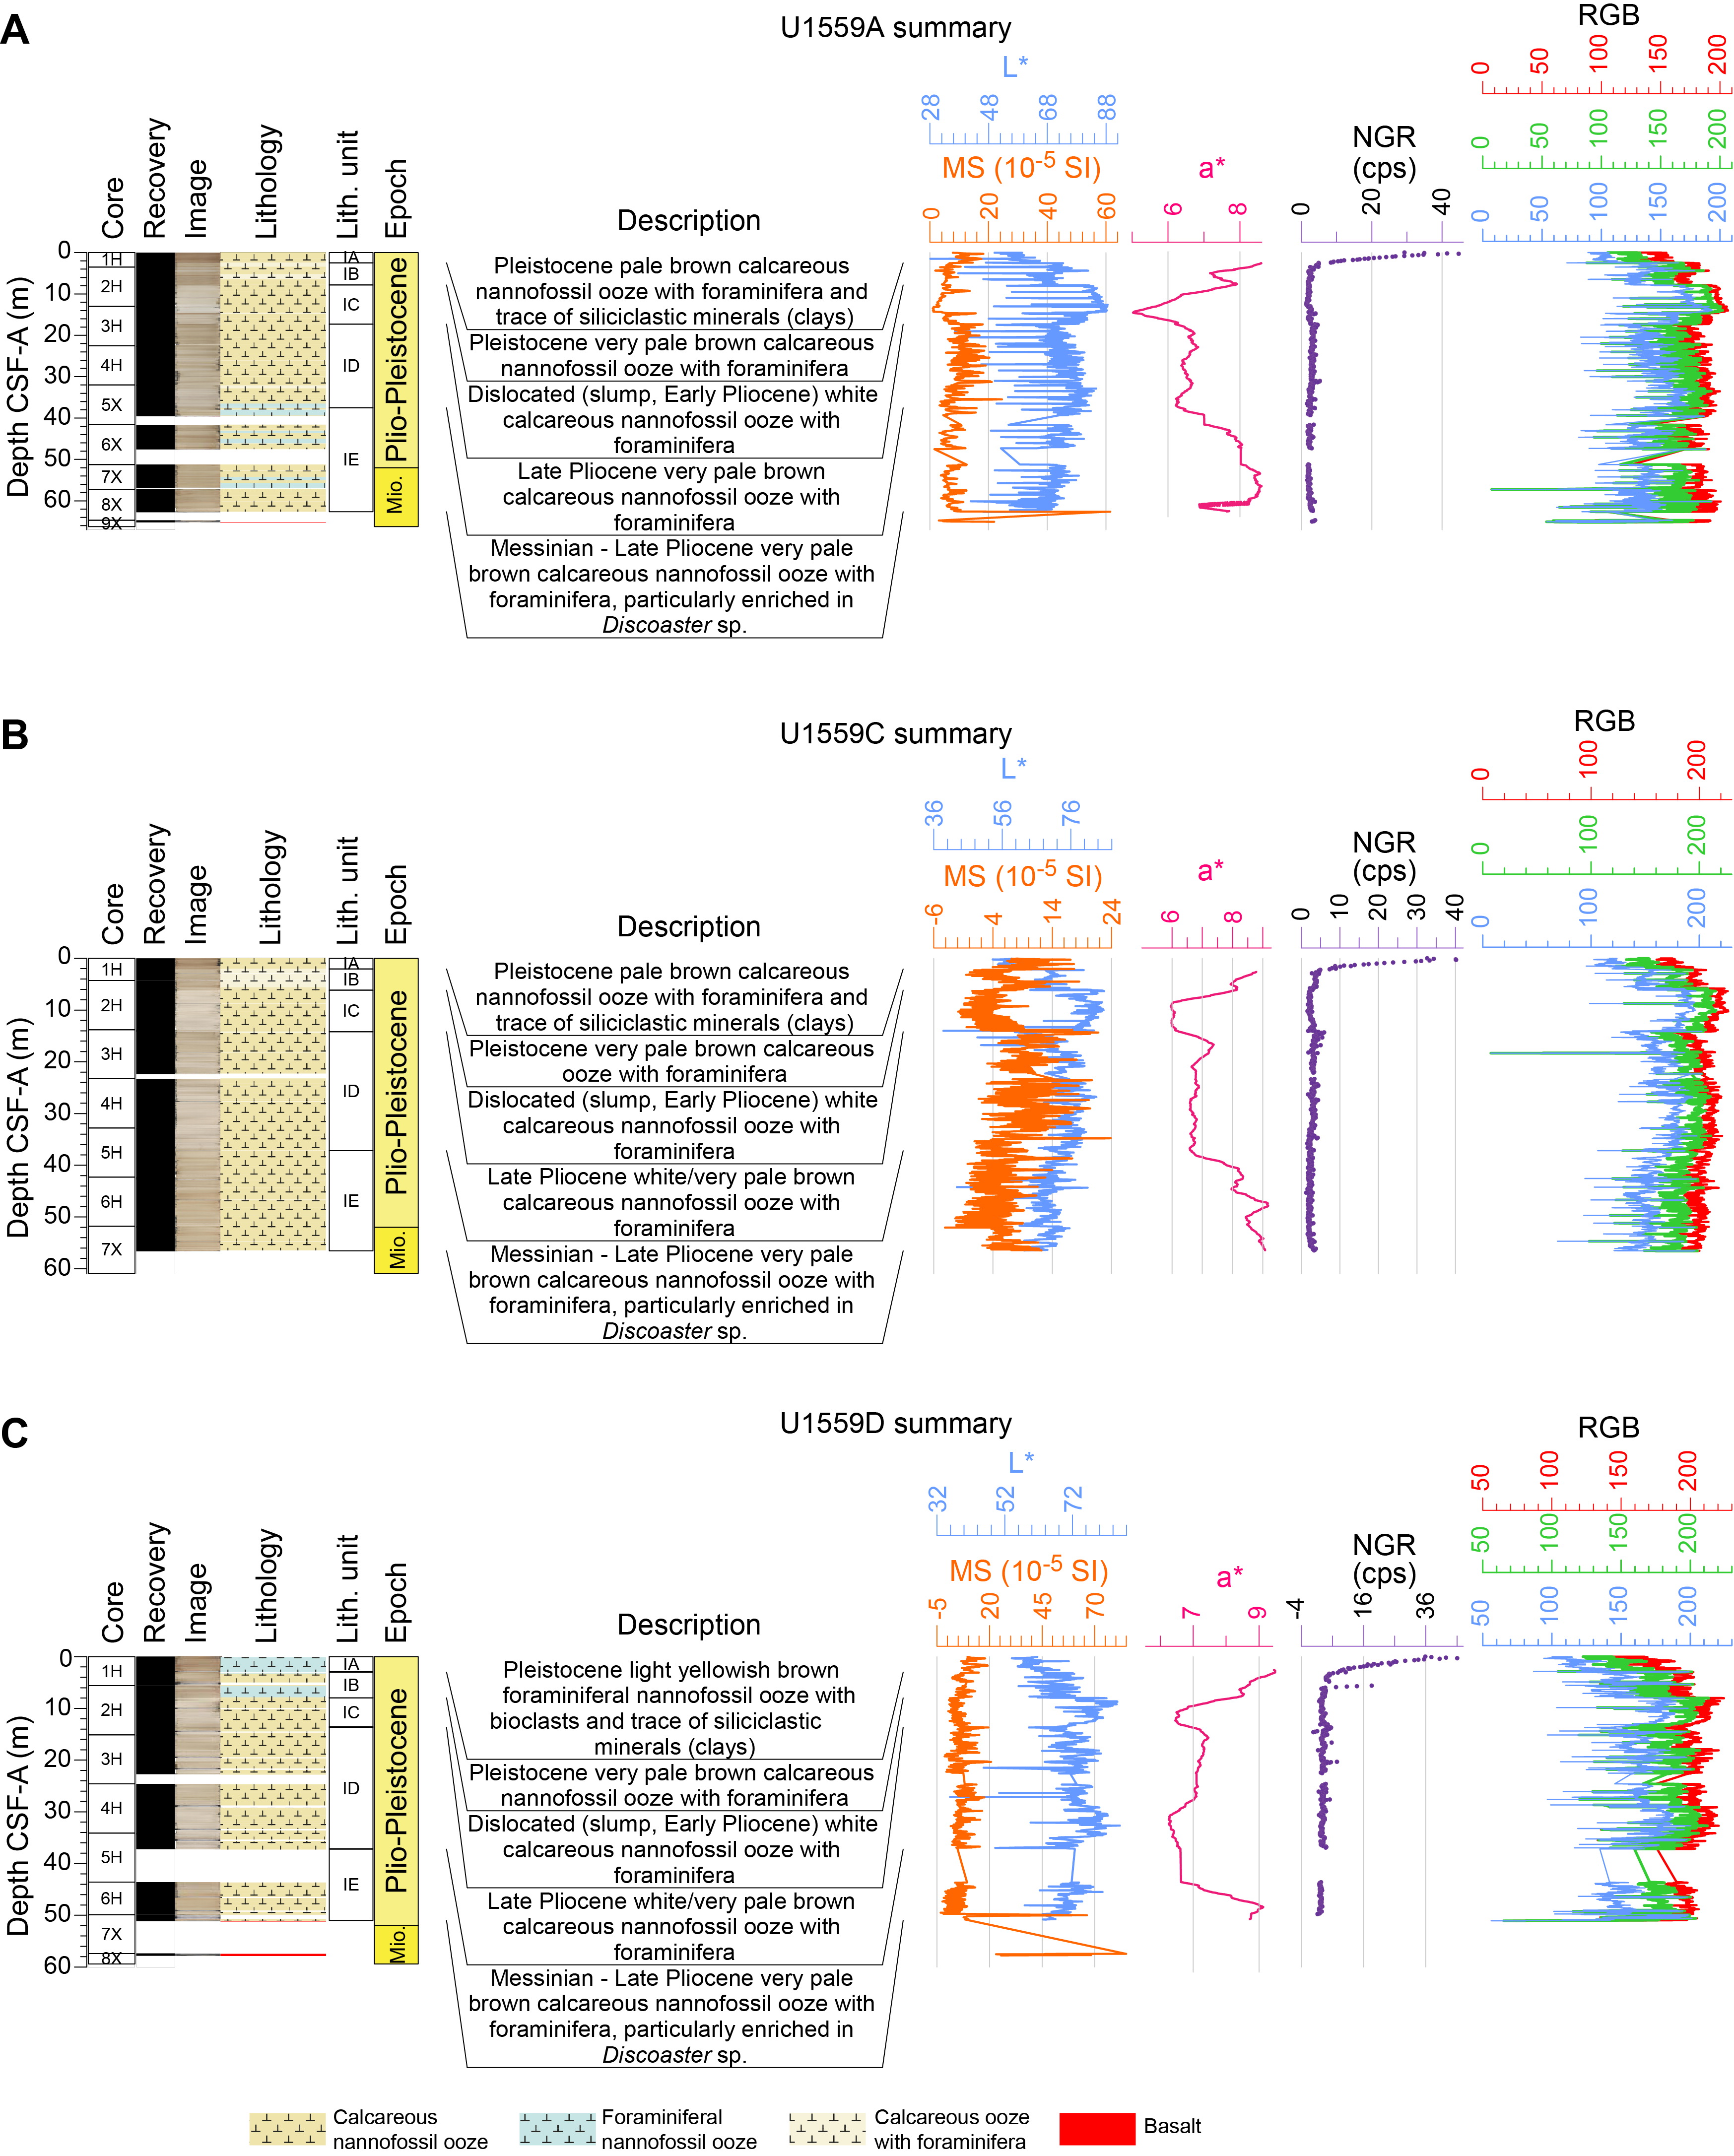
Figure F8. Lithologic summary.
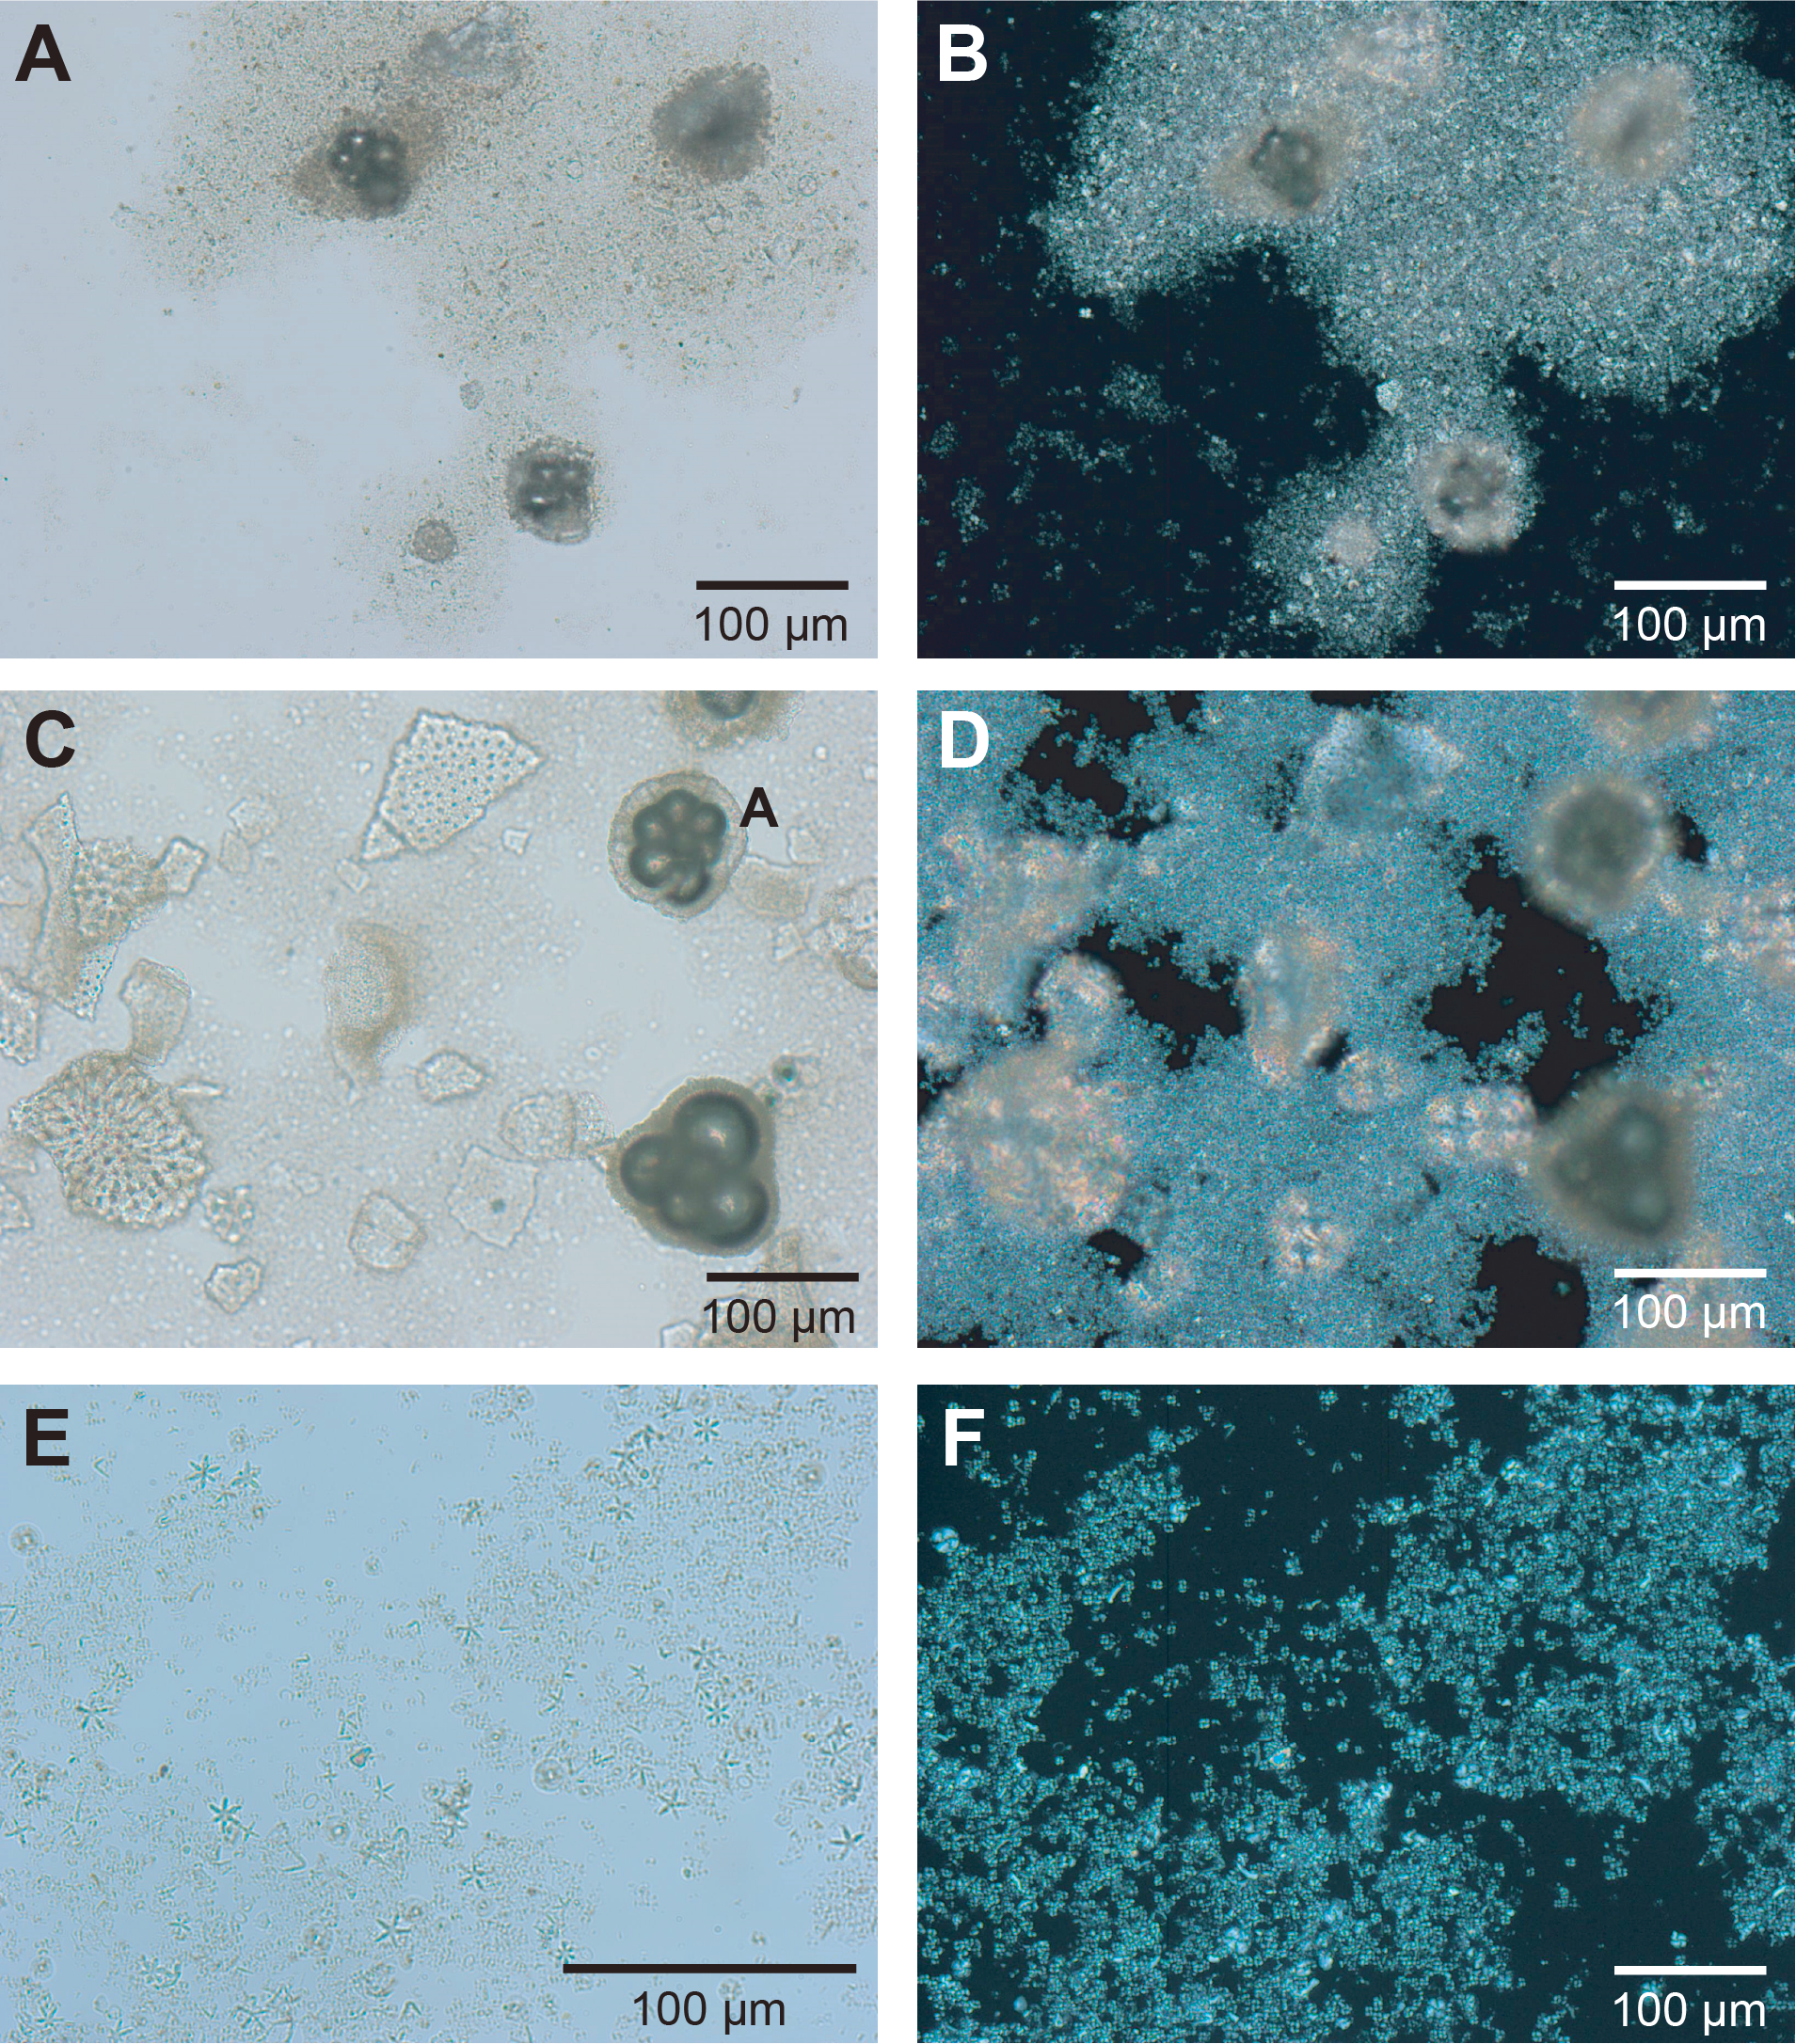
Figure F9. Main sedimentary components.
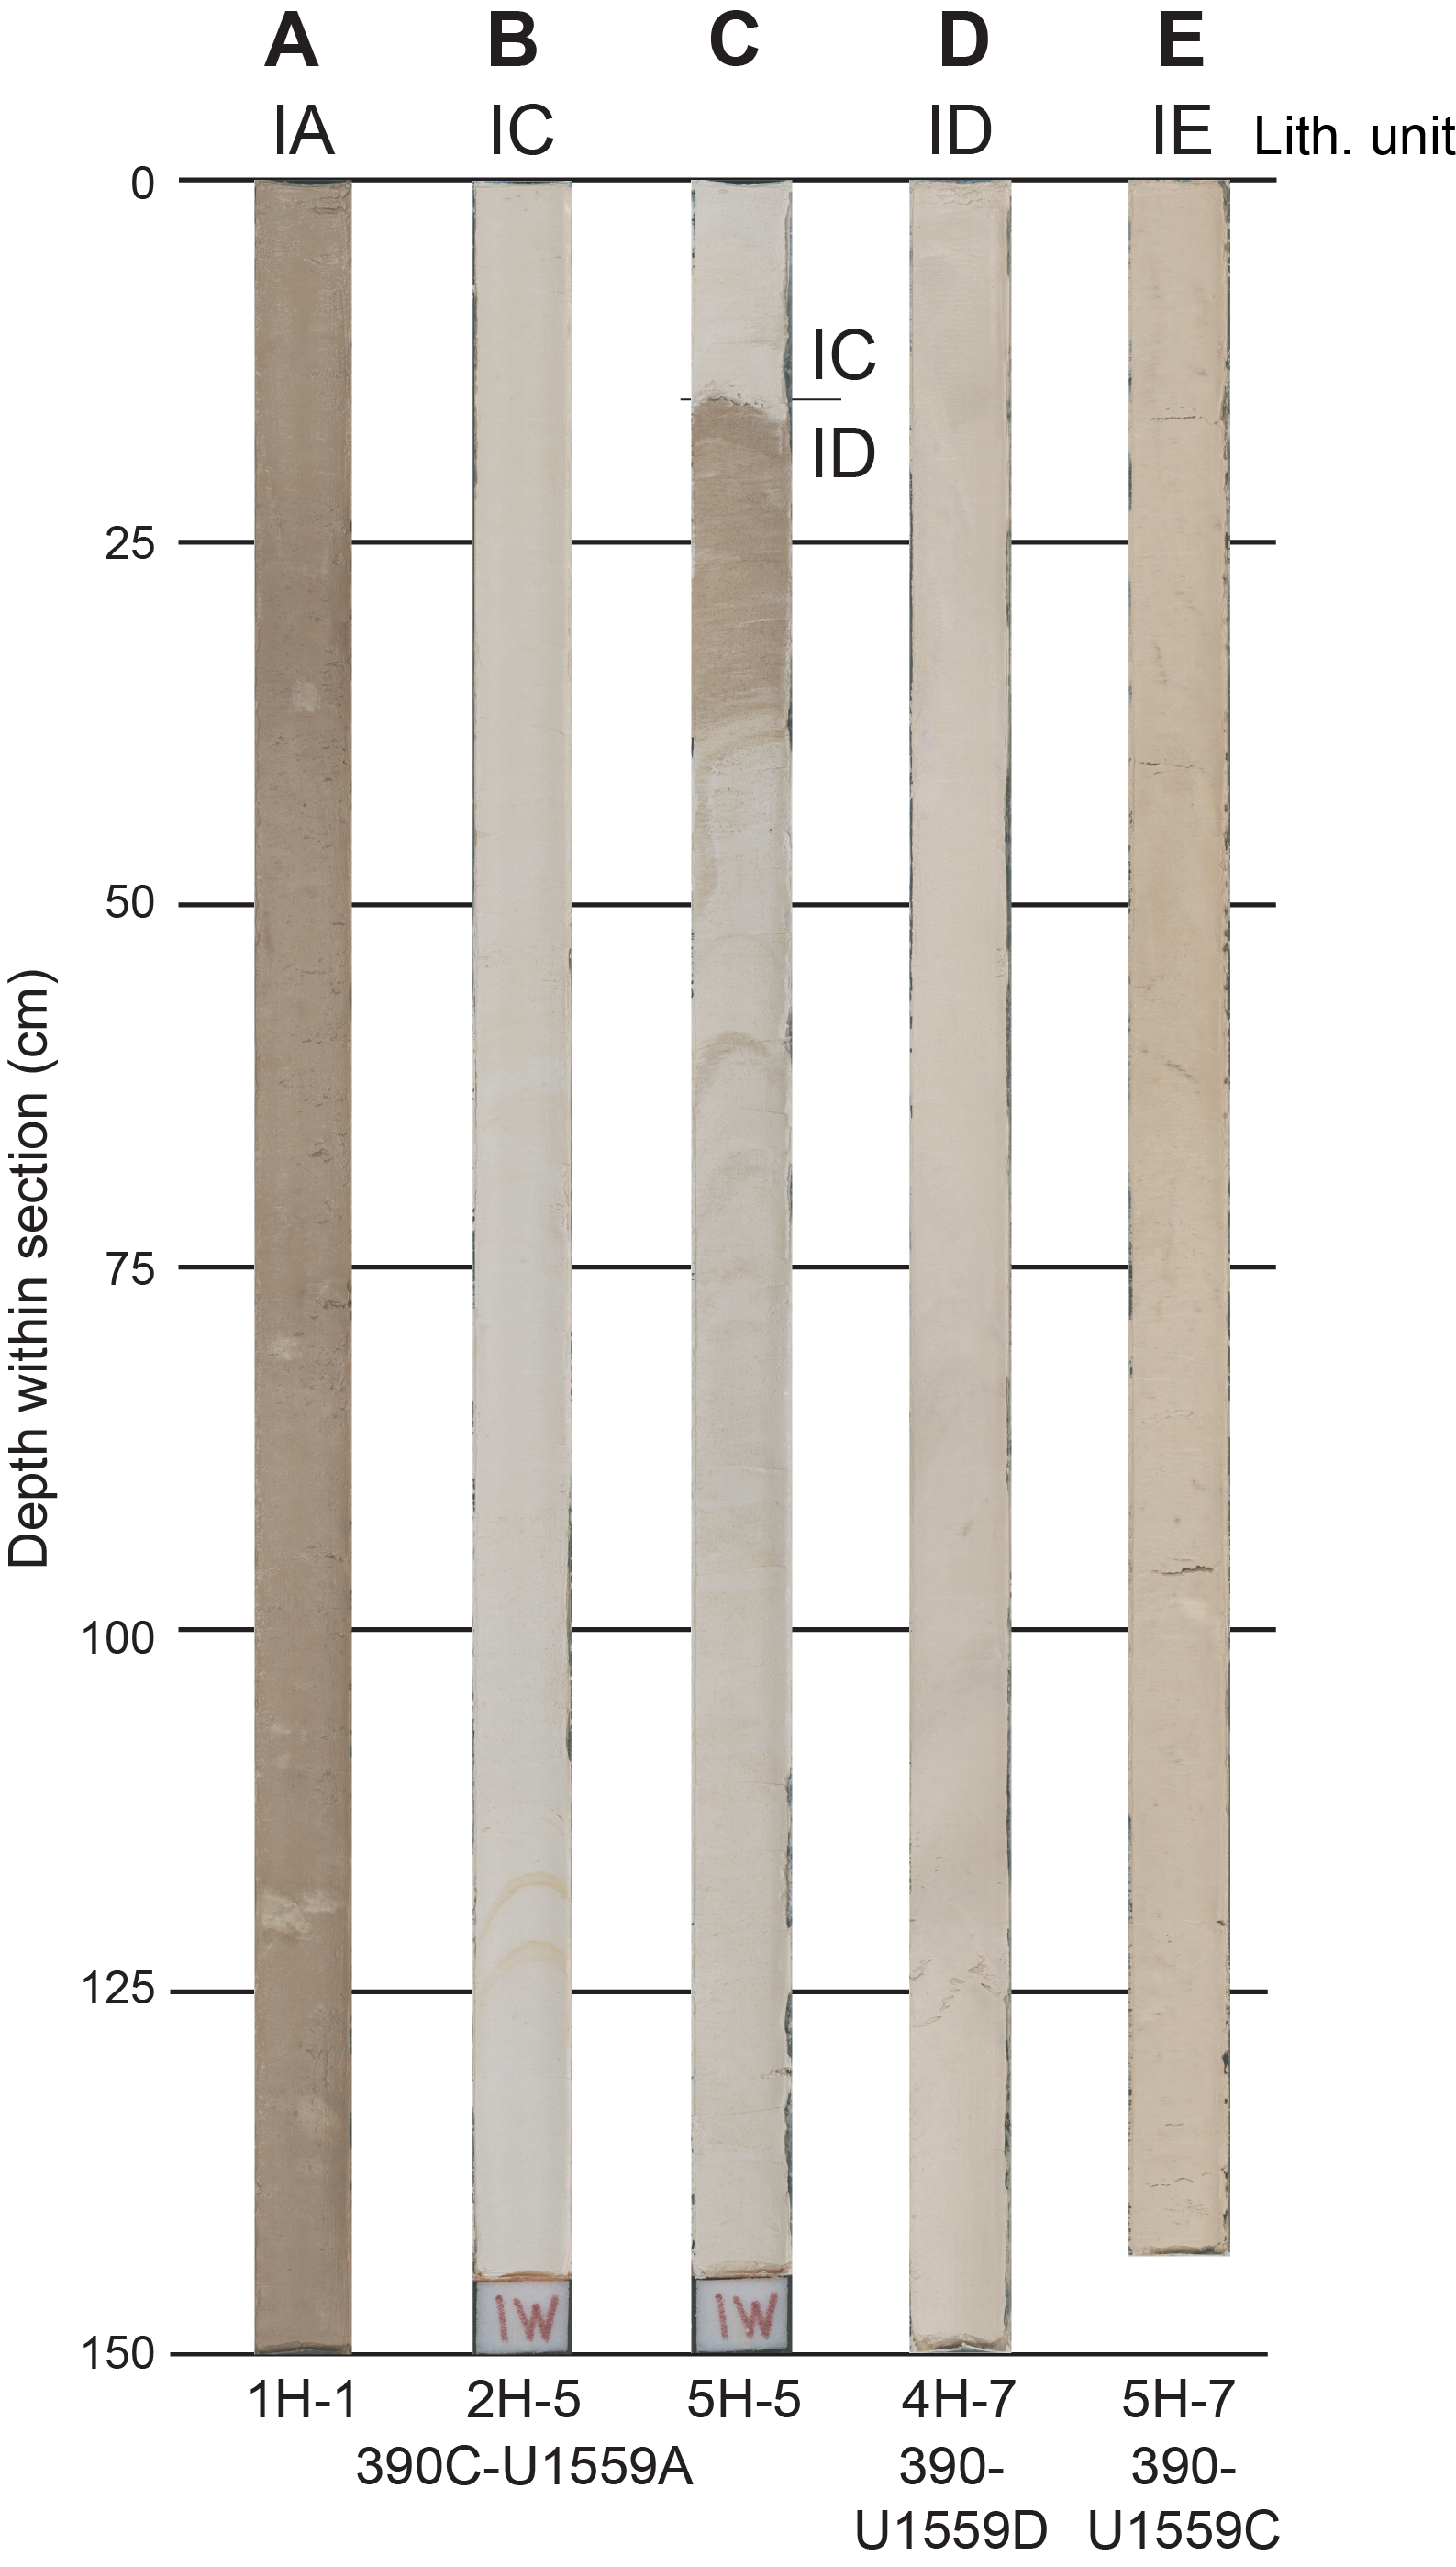
Figure F10. Core sections.
Five subunits are defined by limited changes in colors (see Munsell chart codes in the VCDs in Core descriptions), lithologies, and ages of the CNF:
- Subunit IA: Pleistocene, pale brown (10YR 6/3) CNF with trace siliciclastic material (clays).
- Subunit IB: Pleistocene, very pale brown (10 Y 8/2) CNF with a higher proportion of foraminifera compared to the rest of the Site U1559 sediments (foraminifera also >25% bulk sediment).
- Subunit IC: stratigraphically dislocated white (10YR 8/1) CNF characterized by sharp top/bottom contacts. These sediments incorporate Early Pliocene fossils; hence, this subunit is considered to be dislocated given the age reversal between Subunits ID and IC (see Biostratigraphy). Sharp (erosion-like) contacts define the top and bottom of Subunit IC in all three Site U1559 sediment holes, and there is no macroscopic evidence of internal reworking. However, results from other shipboard investigations (see Physical properties and downhole measurements and Paleomagnetism) suggest Subunit IC contains slumped deposits. Only in Hole U1559A do the sediments of Subunit IC appear to be composed of two distinct dislocated bodies (lower = 14.89–17.28 m CSF-B; upper = 7.85–14.65 m CSF-B) that are split by an interval of pale brown CNF (14.65–14.89 m CSF-B).
- Subunit ID: Late Pliocene, very pale brown (10YR 8/2) CNF.
- Subunit IE: Messinian–Late Pliocene, very pale brown (10YR 7/3) CNF enriched in Discoaster sp. nannofossil and local intervals with a higher abundance of foraminifera. Organic-rich dots are also present in the subunit.
Details of the core intervals, depths, and thickness of these subunits are shown in Table T3.
The lithologic boundary between Unit I and the basement unit is located in intervals 390C-U1559A-8X-CC, 13 cm (62.64 m CSF-B), and 390-U1559D-7X-CC, 9 cm (50.98 m CSF-B), where the first basement lithology (basalt cobbles) was detected in the holes.
4.2. X-ray diffraction
The results of bulk powder XRD analyses are summarized in Figure F11 and Table T4. Samples were collected and analyzed during Expeditions 390C and 390. Differences in mineral assemblages are relatively small with increasing burial depth, with any changes typically <3 wt%. In the three holes, the CNF has an average amount of ~95 wt% calcite. The remaining portion of the sediment is mostly composed of clay minerals (2.9–4.2 wt%) and a small amount of the other siliciclastic minerals (~1 wt% quartz; 0.5 wt% feldspar). Although trace siliciclastic material was observed microscopically in Subunit IA (Figure F9), a downcore change in total clay (weight percent) is only apparent in Hole U1559C (Figure F12), likely because the lower sampling resolution was too low in Holes U1559A and U1559D.
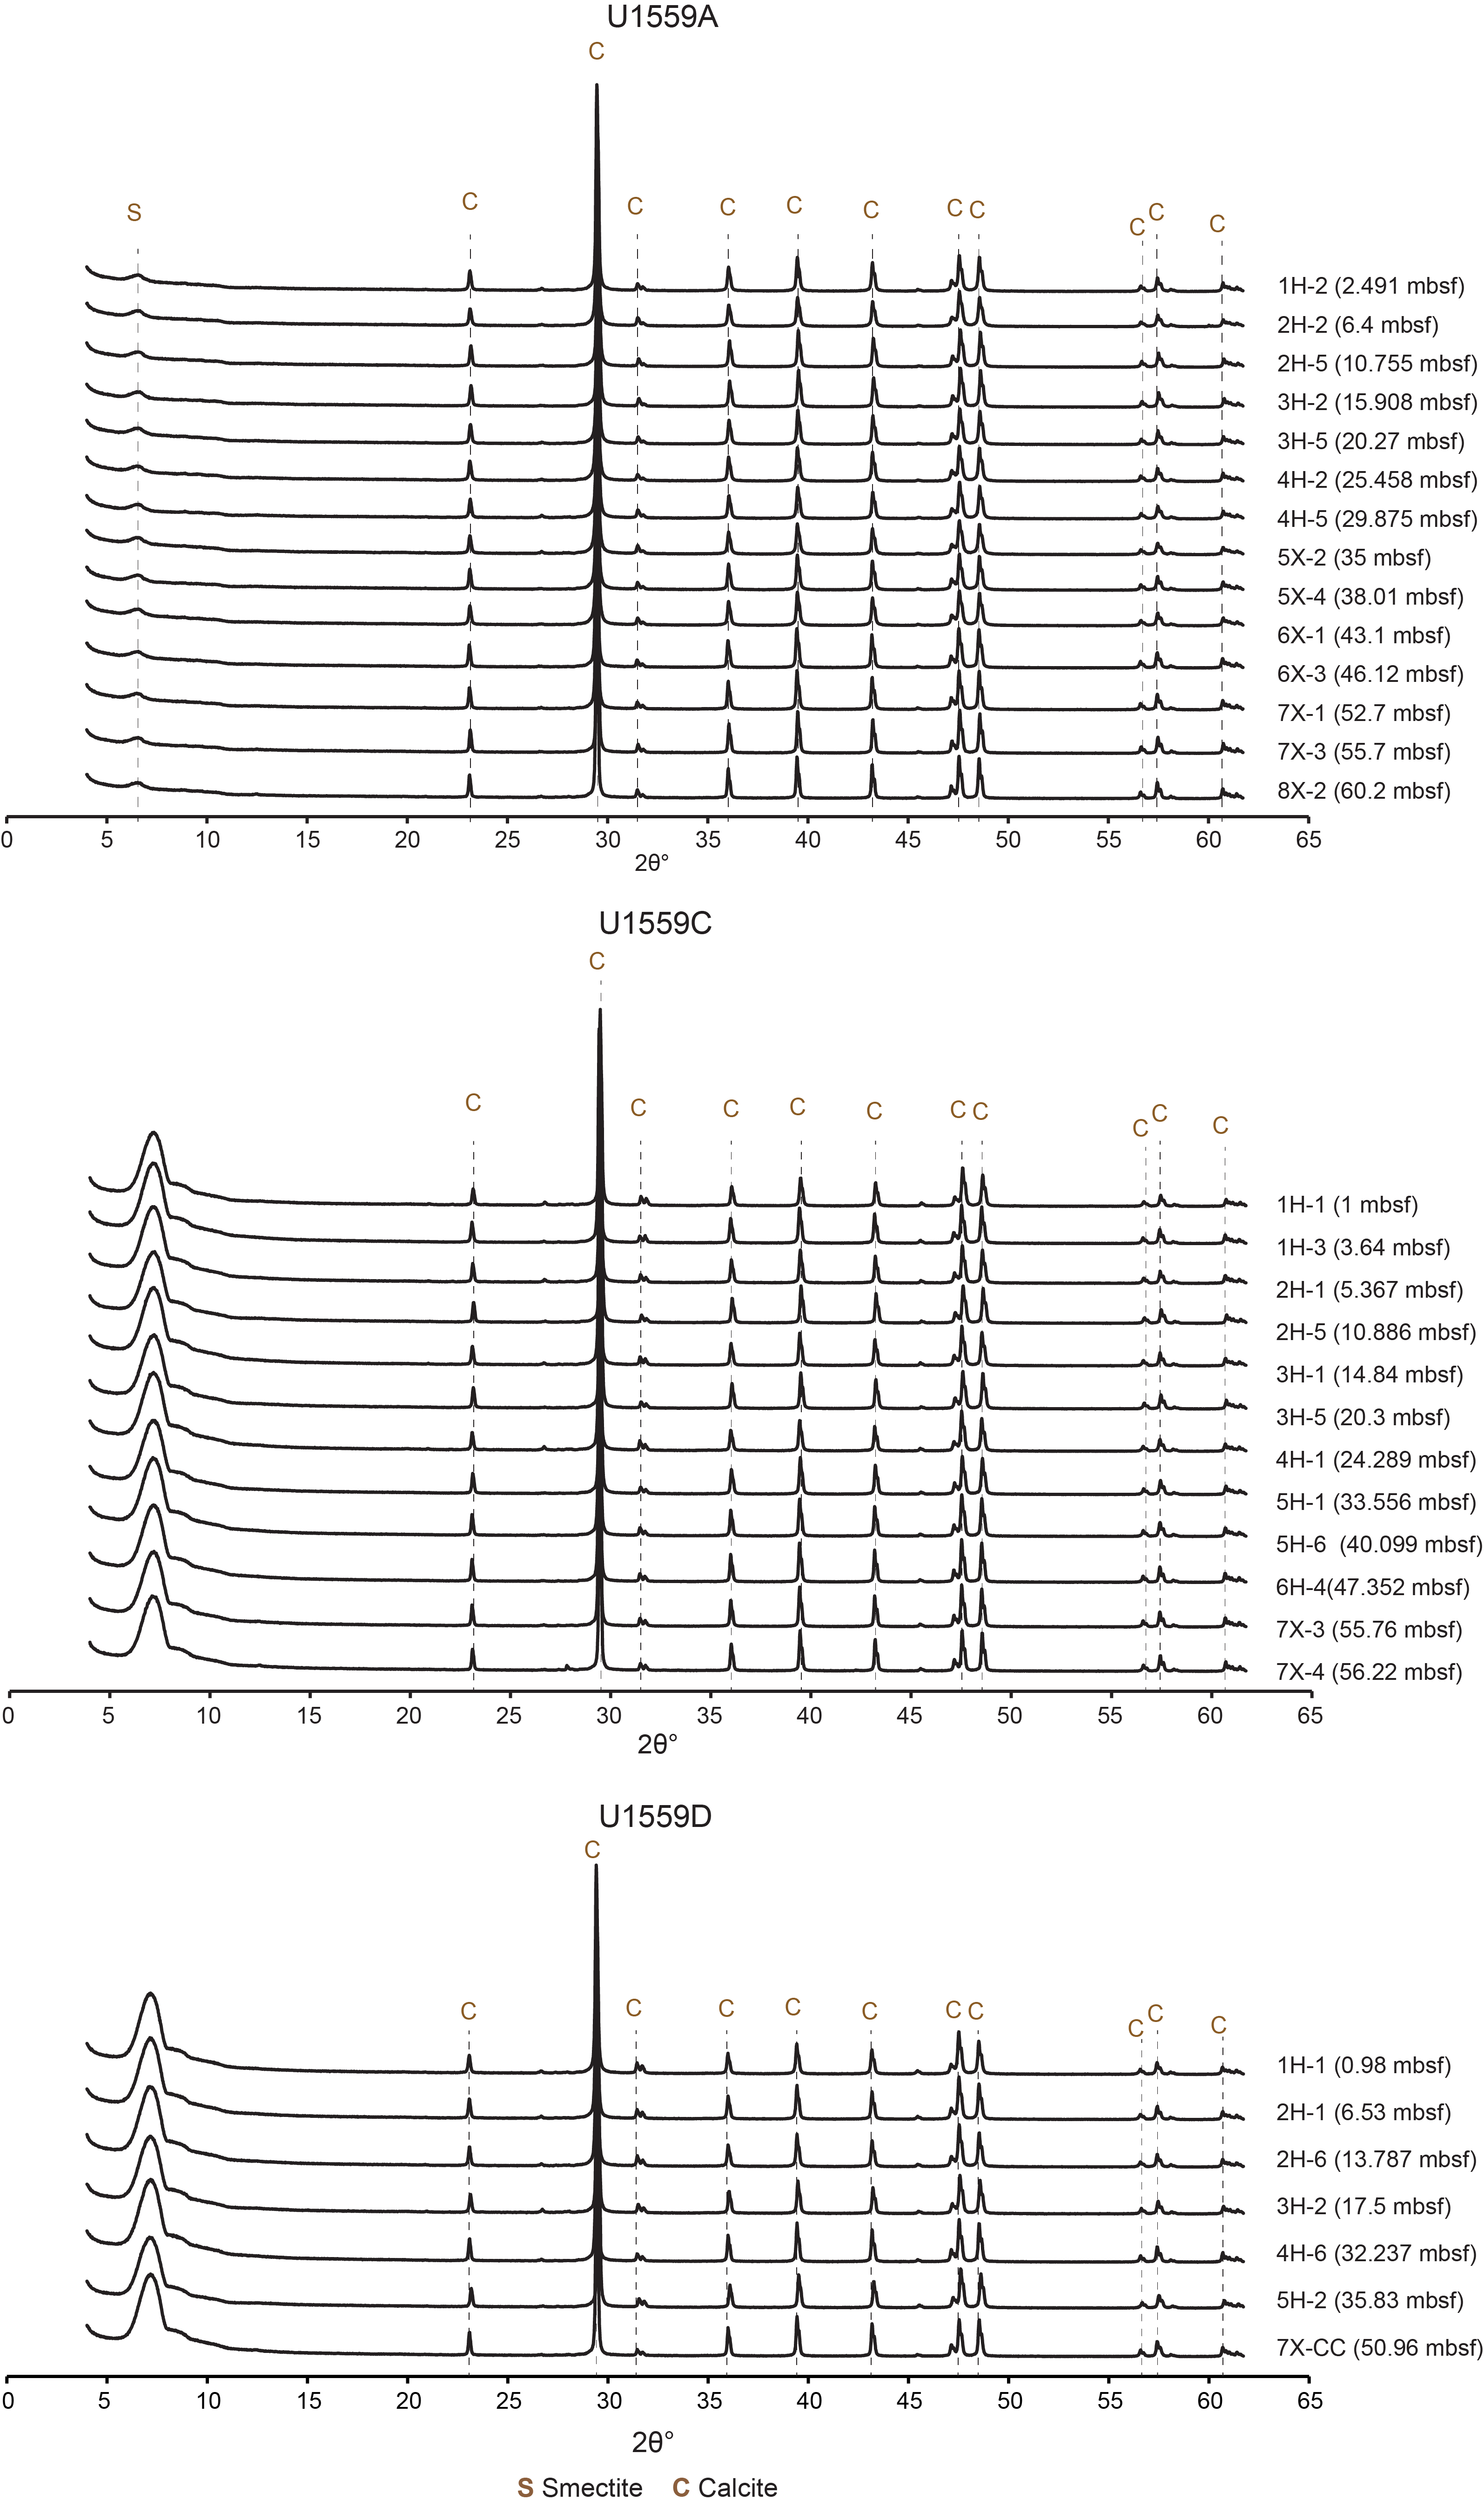
Figure F11. X-ray diffractograms.
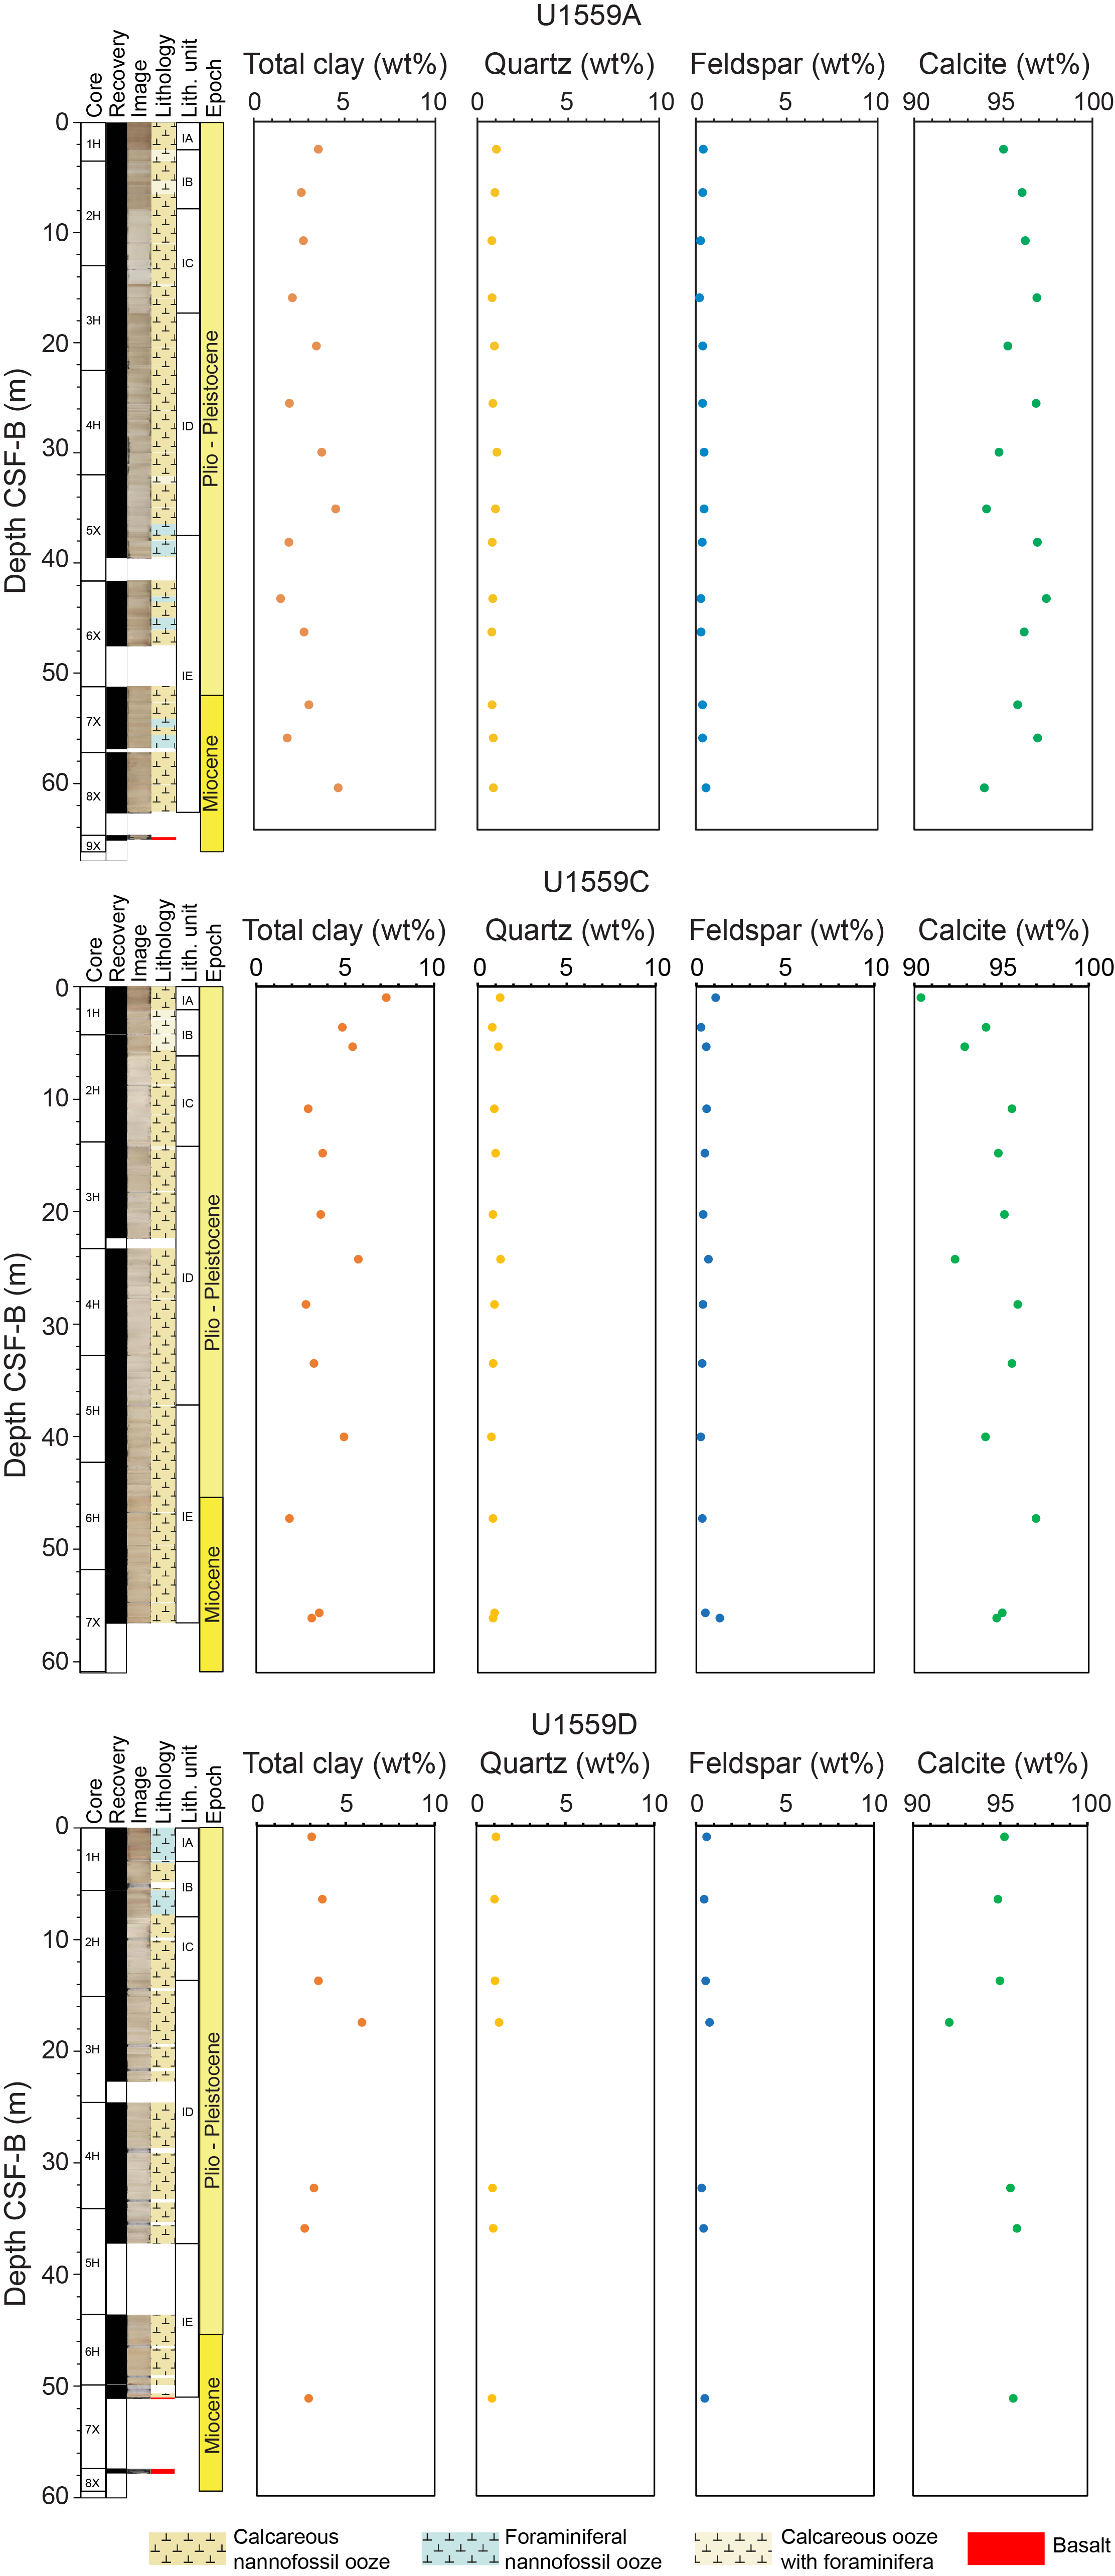
Figure F12. Downhole changes in mineralogy.
The reason for a major difference between the XRD diffractograms of sediments from different holes at Site U1559 (Figure F11) is the occurrence of an artifact in the interval 5.3°–11.3°2θ that is only observed for samples analyzed during Expedition 390 (Holes U1559C and U1559D). Because this was determined to be related to sample processing and not inherent to the samples, this °2θ interval was ignored during quantitative phase analysis.
4.3. Spectrophotometry and point source magnetic susceptibility
Comparisons of spectral data, specifically reflectance, color space (L*a*b*), and point magnetic susceptibility (MSP) measured by the Section Half Multisensor Logger (SHMSL) (see Sedimentology in the Expedition 390/393 methods chapter [Coggon et al., 2024c]), confirm that the subunits in Unit I have different physical properties (Figures F8, F13, F14). Here, we only discuss the data for Holes U1559C and Hole U1559D because the Hole U1559A data are "noisier" (Figure F8A). Distinct spectral data and MS properties for different intervals of the Site U1559 sediment sections are instructive, given the limited macroscopic variability between these cores documented during visual core description (see VCDs in Core descriptions) and the minimal lithologic variability in Unit I (Figure F8). Subunit IA, which is the only interval with microscopically observable clay (Figure F9), has the darkest reflectance compared to the rest of the sedimentary column. Although Subunit IA sediments generally have higher MS than the other subunits, there is overlap with Subunit ID values.
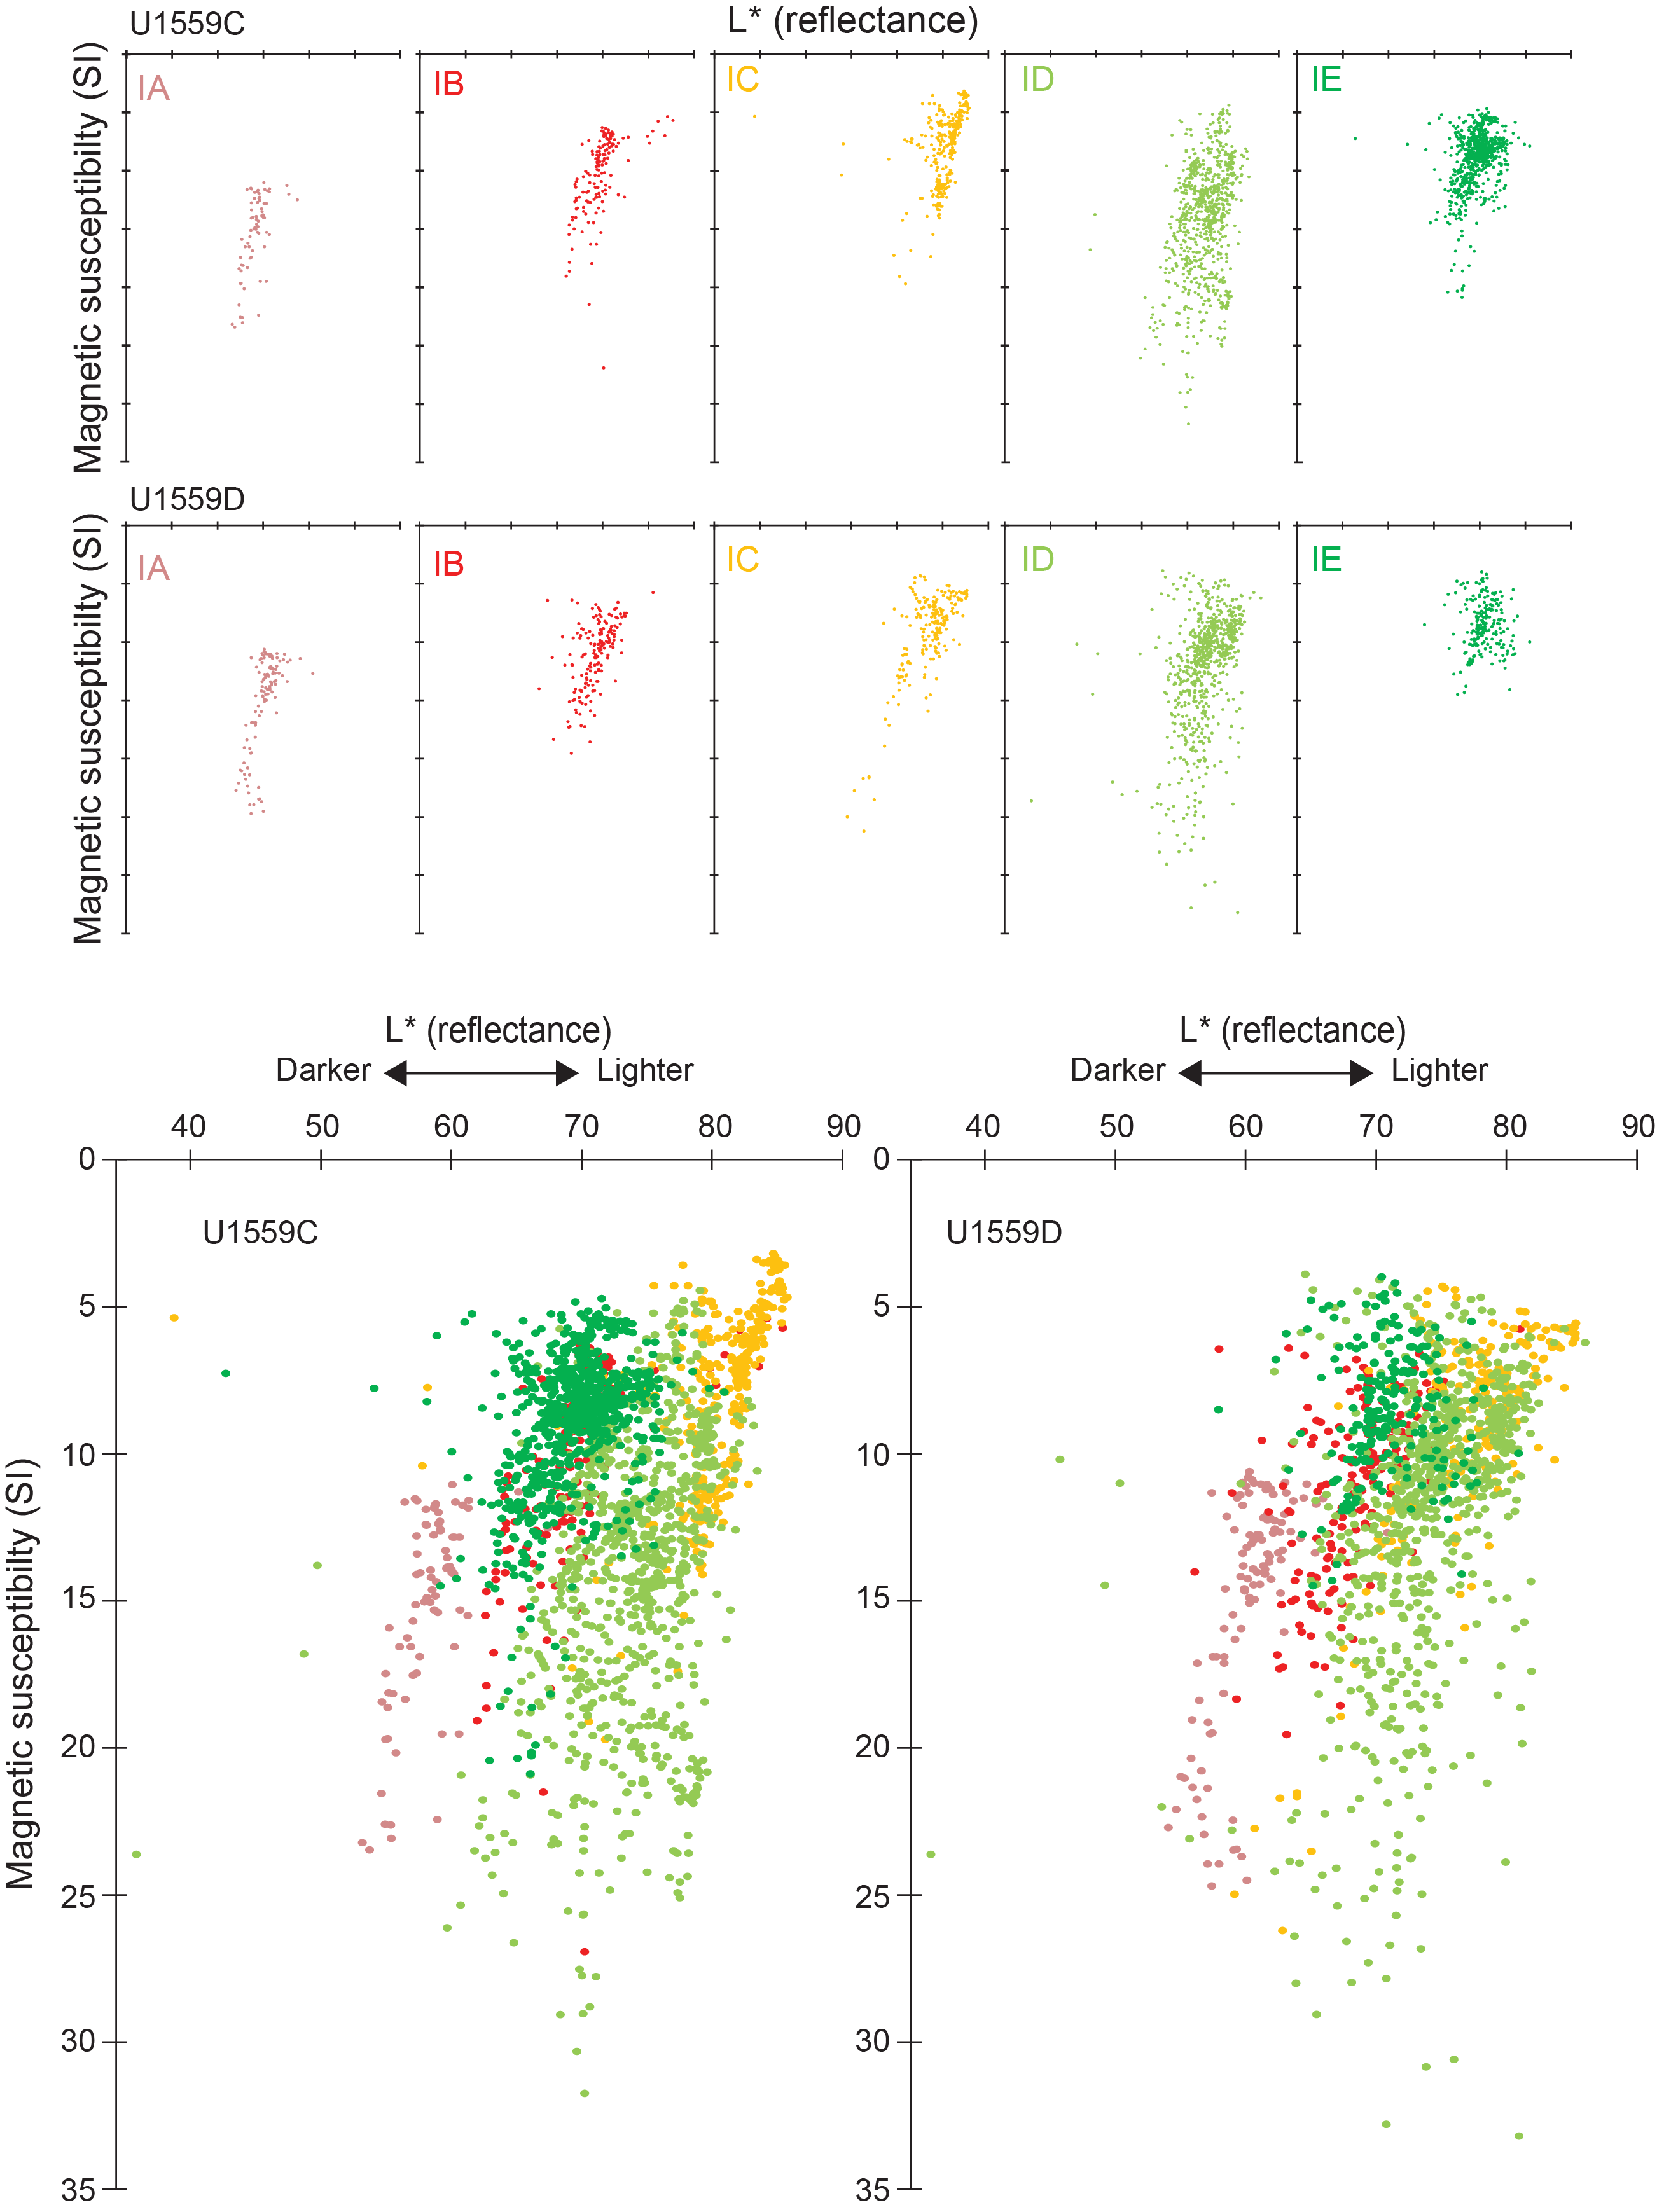
Figure F13. SHMSL MSP and L*.
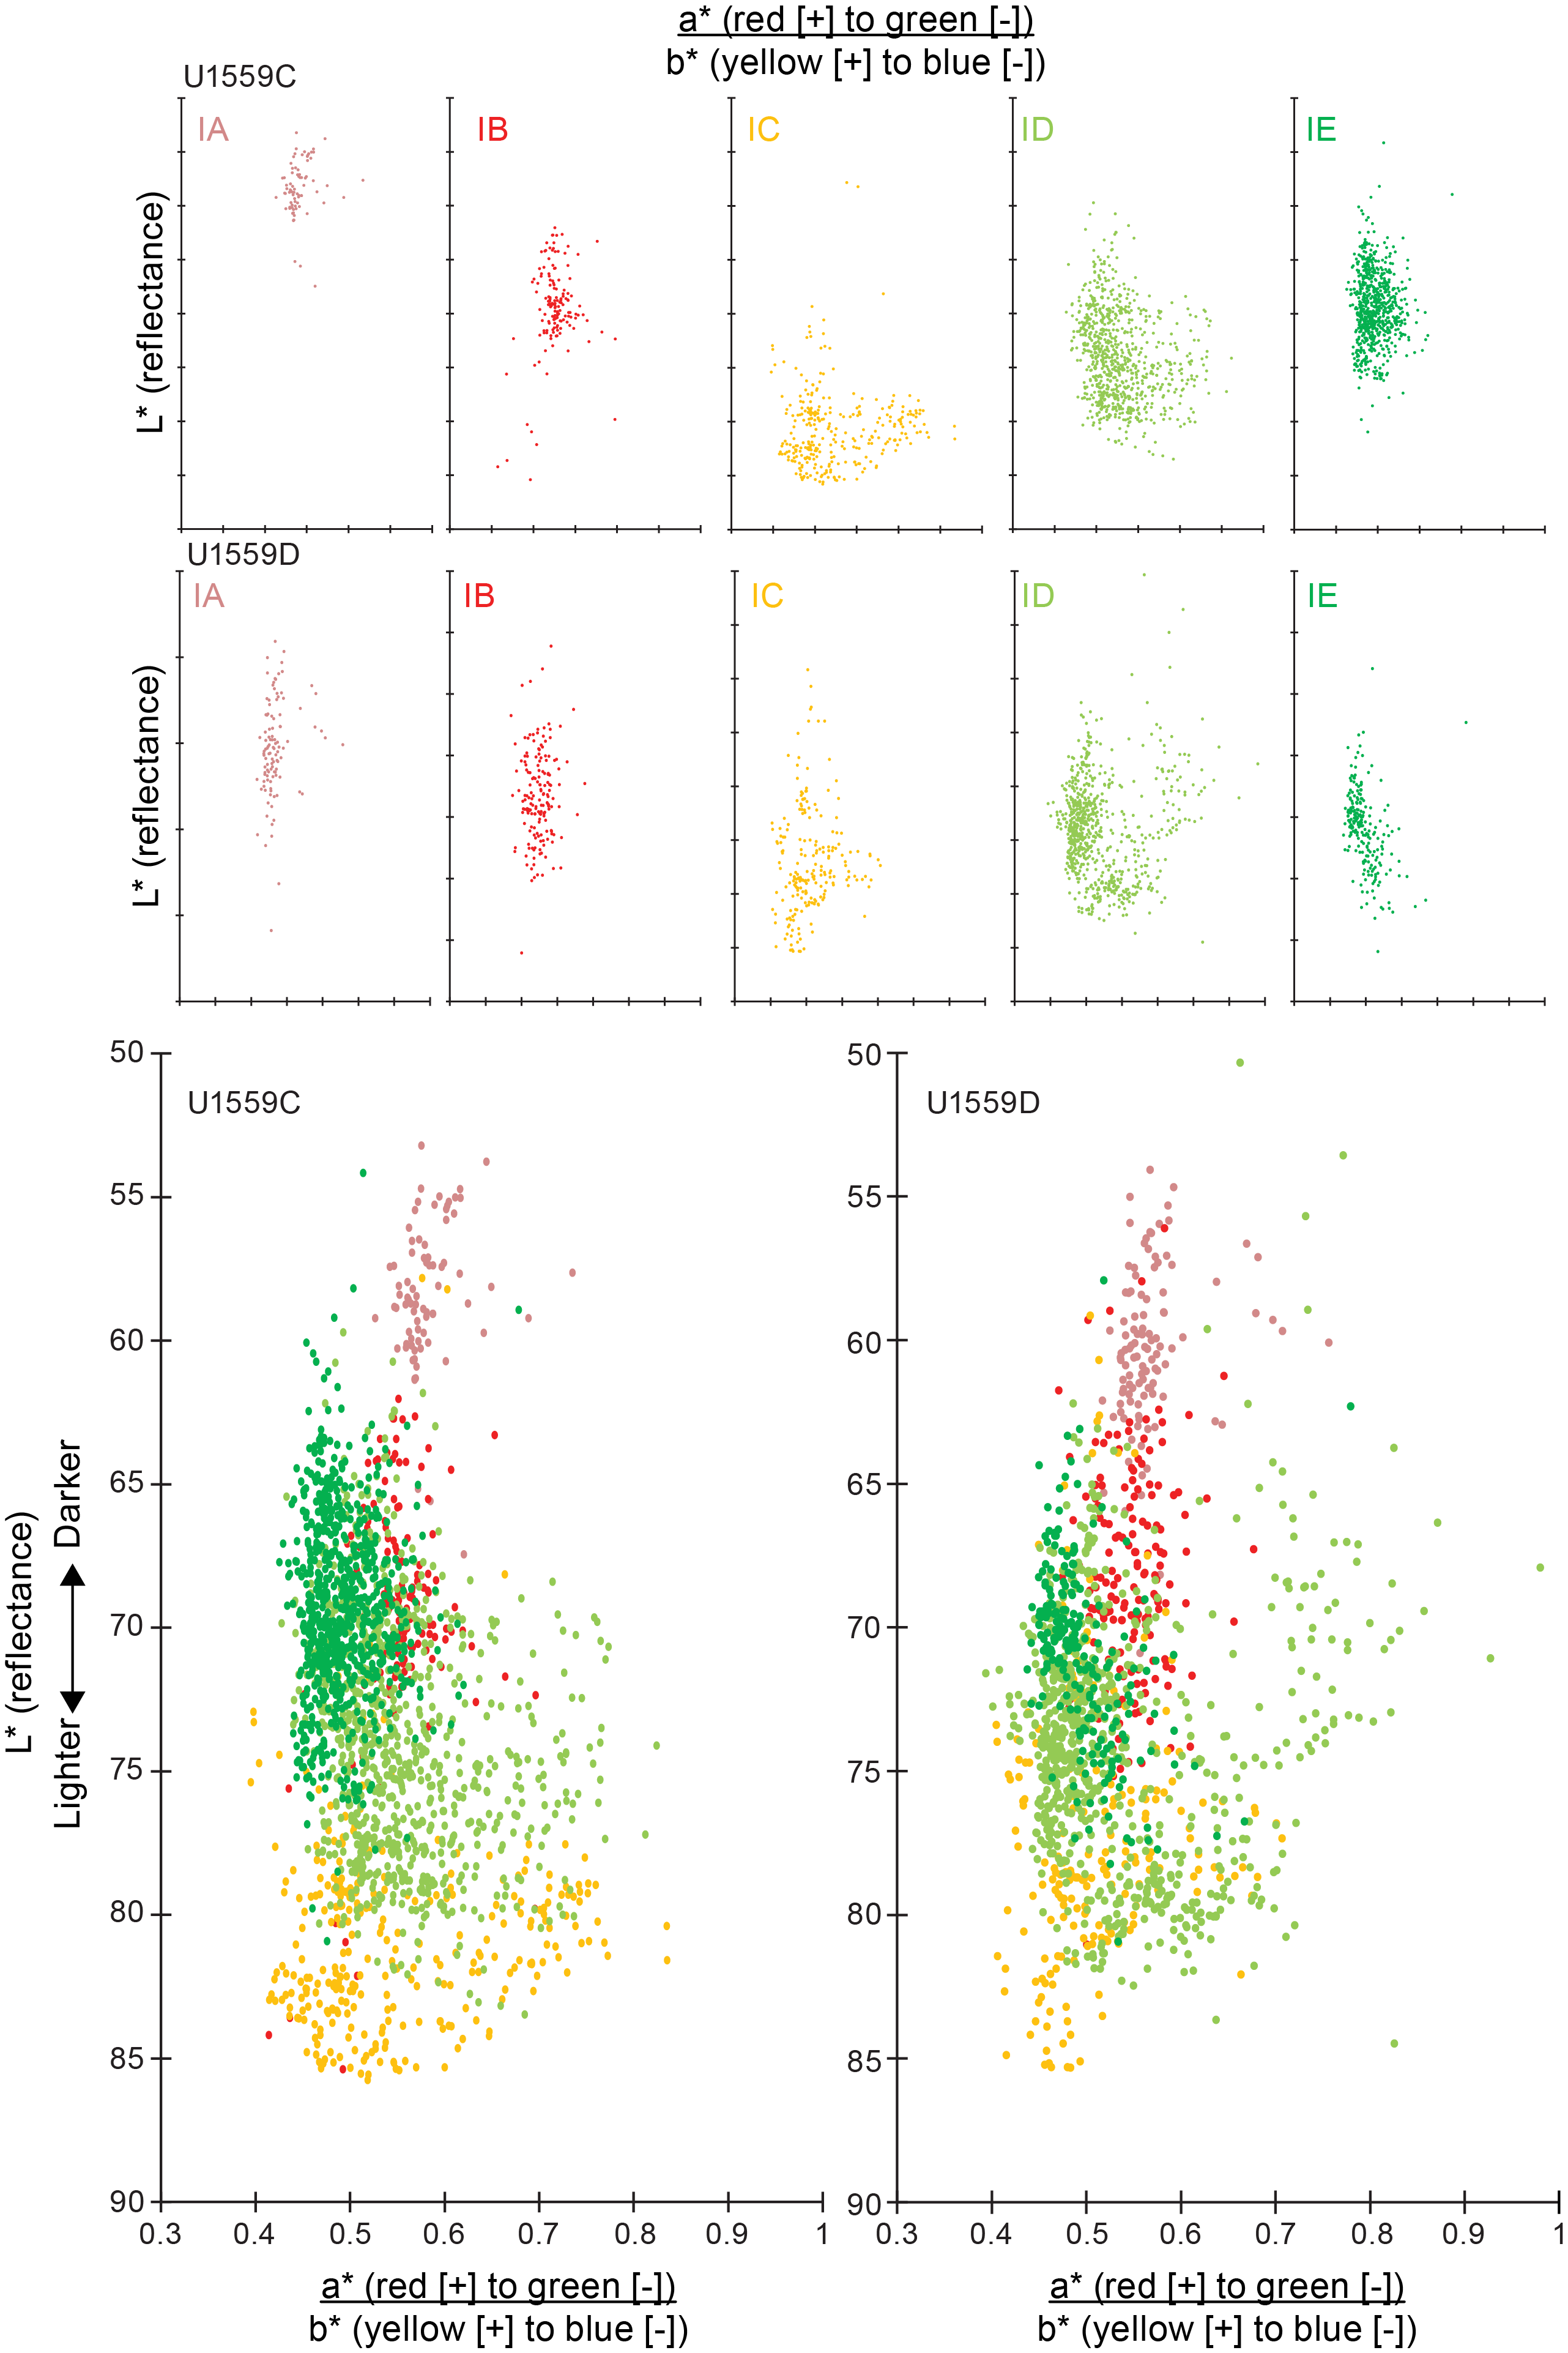
Figure F14. SHMSL color reflectance data.
Subunit IC, the stratigraphically dislocated interval, has distinct high reflectance, low MS, and low a*/b* compared to the other subunits, likely indicative of its allochthonous nature (Figures F13, F14). Subunit IE is composed of the oldest deposits at Site U1559 (Messinian–Late Pliocene) and generally has the lowest MS detected through the sedimentary column. Similar low MS signals were measured in Subunit IC, perhaps due to their partially coeval deposition (see Biostratigraphy).
5. Igneous petrology
Igneous basement was recovered in two holes at Site U1559 during Expeditions 390C and 390. In Hole U1559A, the shallowest occurrence of basalt was in Section 7X-CC, 9 cm (~62.6 mbsf), below which we drilled an additional 2.6 m advance with the XCB system that recovered ~55 cm of rock. In Hole U1559D, the shallowest occurrence of basalt was in Section 8X-CC, 13 cm (~51 mbsf), below which there was an additional 6.9 m cored, recovering ~56 cm of rock.
Expedition 393 Hole U1559B targeted ~6.6 Ma upper oceanic crust, the youngest to be drilled along the SAT. Hole U1559B reached volcanic basement at 65.0 mbsf (drilling depth below seafloor [DSF]) and advanced to 107.9 mbsf, recovering 12.73 m of volcanic basalts for an average recovery of 30%. Because of a combination of relatively fresh and fractured hard young ocean floor basalts with only thin sediment cover that prevented optimal weighting of the bit by the BHA, the recovered core pieces were mostly <5–10 cm in length. This recognition of relatively poor core quality and low recovery is a crucial preface to the following descriptions and must be kept in mind when considering the completeness of the reported results.
The volcanic rocks recovered are aphyric and sparsely plagioclase-phyric basalt pillow lavas and sheet flows. Distinctive plagioclase phenocrysts up to 15 mm in size are a common feature of basalts recovered from nearly the entire hole. Together with limited textural and chemostratigraphic variation (see High-resolution chemostratigraphy), this consistency suggests all of the lithologic units belong to a single co-magmatic sequence of MORB with subtle internal variations related to fractional crystallization and other magma chamber processes.
Unless stated otherwise, all cores, sections, and intervals refer to Hole U1559B. Depths are described in meters below seafloor (mbsf; CSF-A scale) and meters subbasement (msb; CSF-A depth minus basement depth of 63.89 m CSF-A).
This section documents the lithostratigraphy of the volcanic basement at Site U1559 and then summarizes observations and results for the phenocryst phases, groundmass phases, chilled flow margins, and igneous chemostratigraphy as measured by pXRF spectroscopy.
5.1. Lithologic units
The basement volcanic sequence at Site U1559 was divided into four main volcanic units (1, 2, 4, and 5) with Units 2 and 5 divided into three (2A–2C) and two (5A and 5B) subunits, respectively. One thin intravolcanic sediment unit (3) occurs between Units 2 and 4. These units and their thicknesses, emplacement styles, contacts, and descriptions are summarized in Table T5, illustrated in Figure F7, and documented in detail in the following sections. Volcanic emplacement styles were assigned to each unit, with the evidence for doing so presented in the text and summarized in Table T5. However, we emphasize that the emplacement styles are based on sparse and often circumstantial evidence from incompletely recovered core.
5.1.1. Sediment/basement interface
The shallowest occurrences of volcanic rocks and the deepest occurrences of sediment within the sediment/basement interface for all holes at Site U1559 are summarized in Table T6 and illustrated in Figure F15. The overlying sediment column was described during Expedition 390 (see Sedimentology). Single cores containing Messinian pale brown calcareous nannofossil ooze with foraminifera and basalt were recovered in three of the four holes at Site U1559 (Expedition 390C Hole U1559A, Expedition 393 Hole U1559B, and Expedition 390 Hole U1559D; Figure F15). Expedition 390 Hole U1559C did not recover any volcanic basement. Holes U1559A and U1559D recovered or partly recovered the interface.
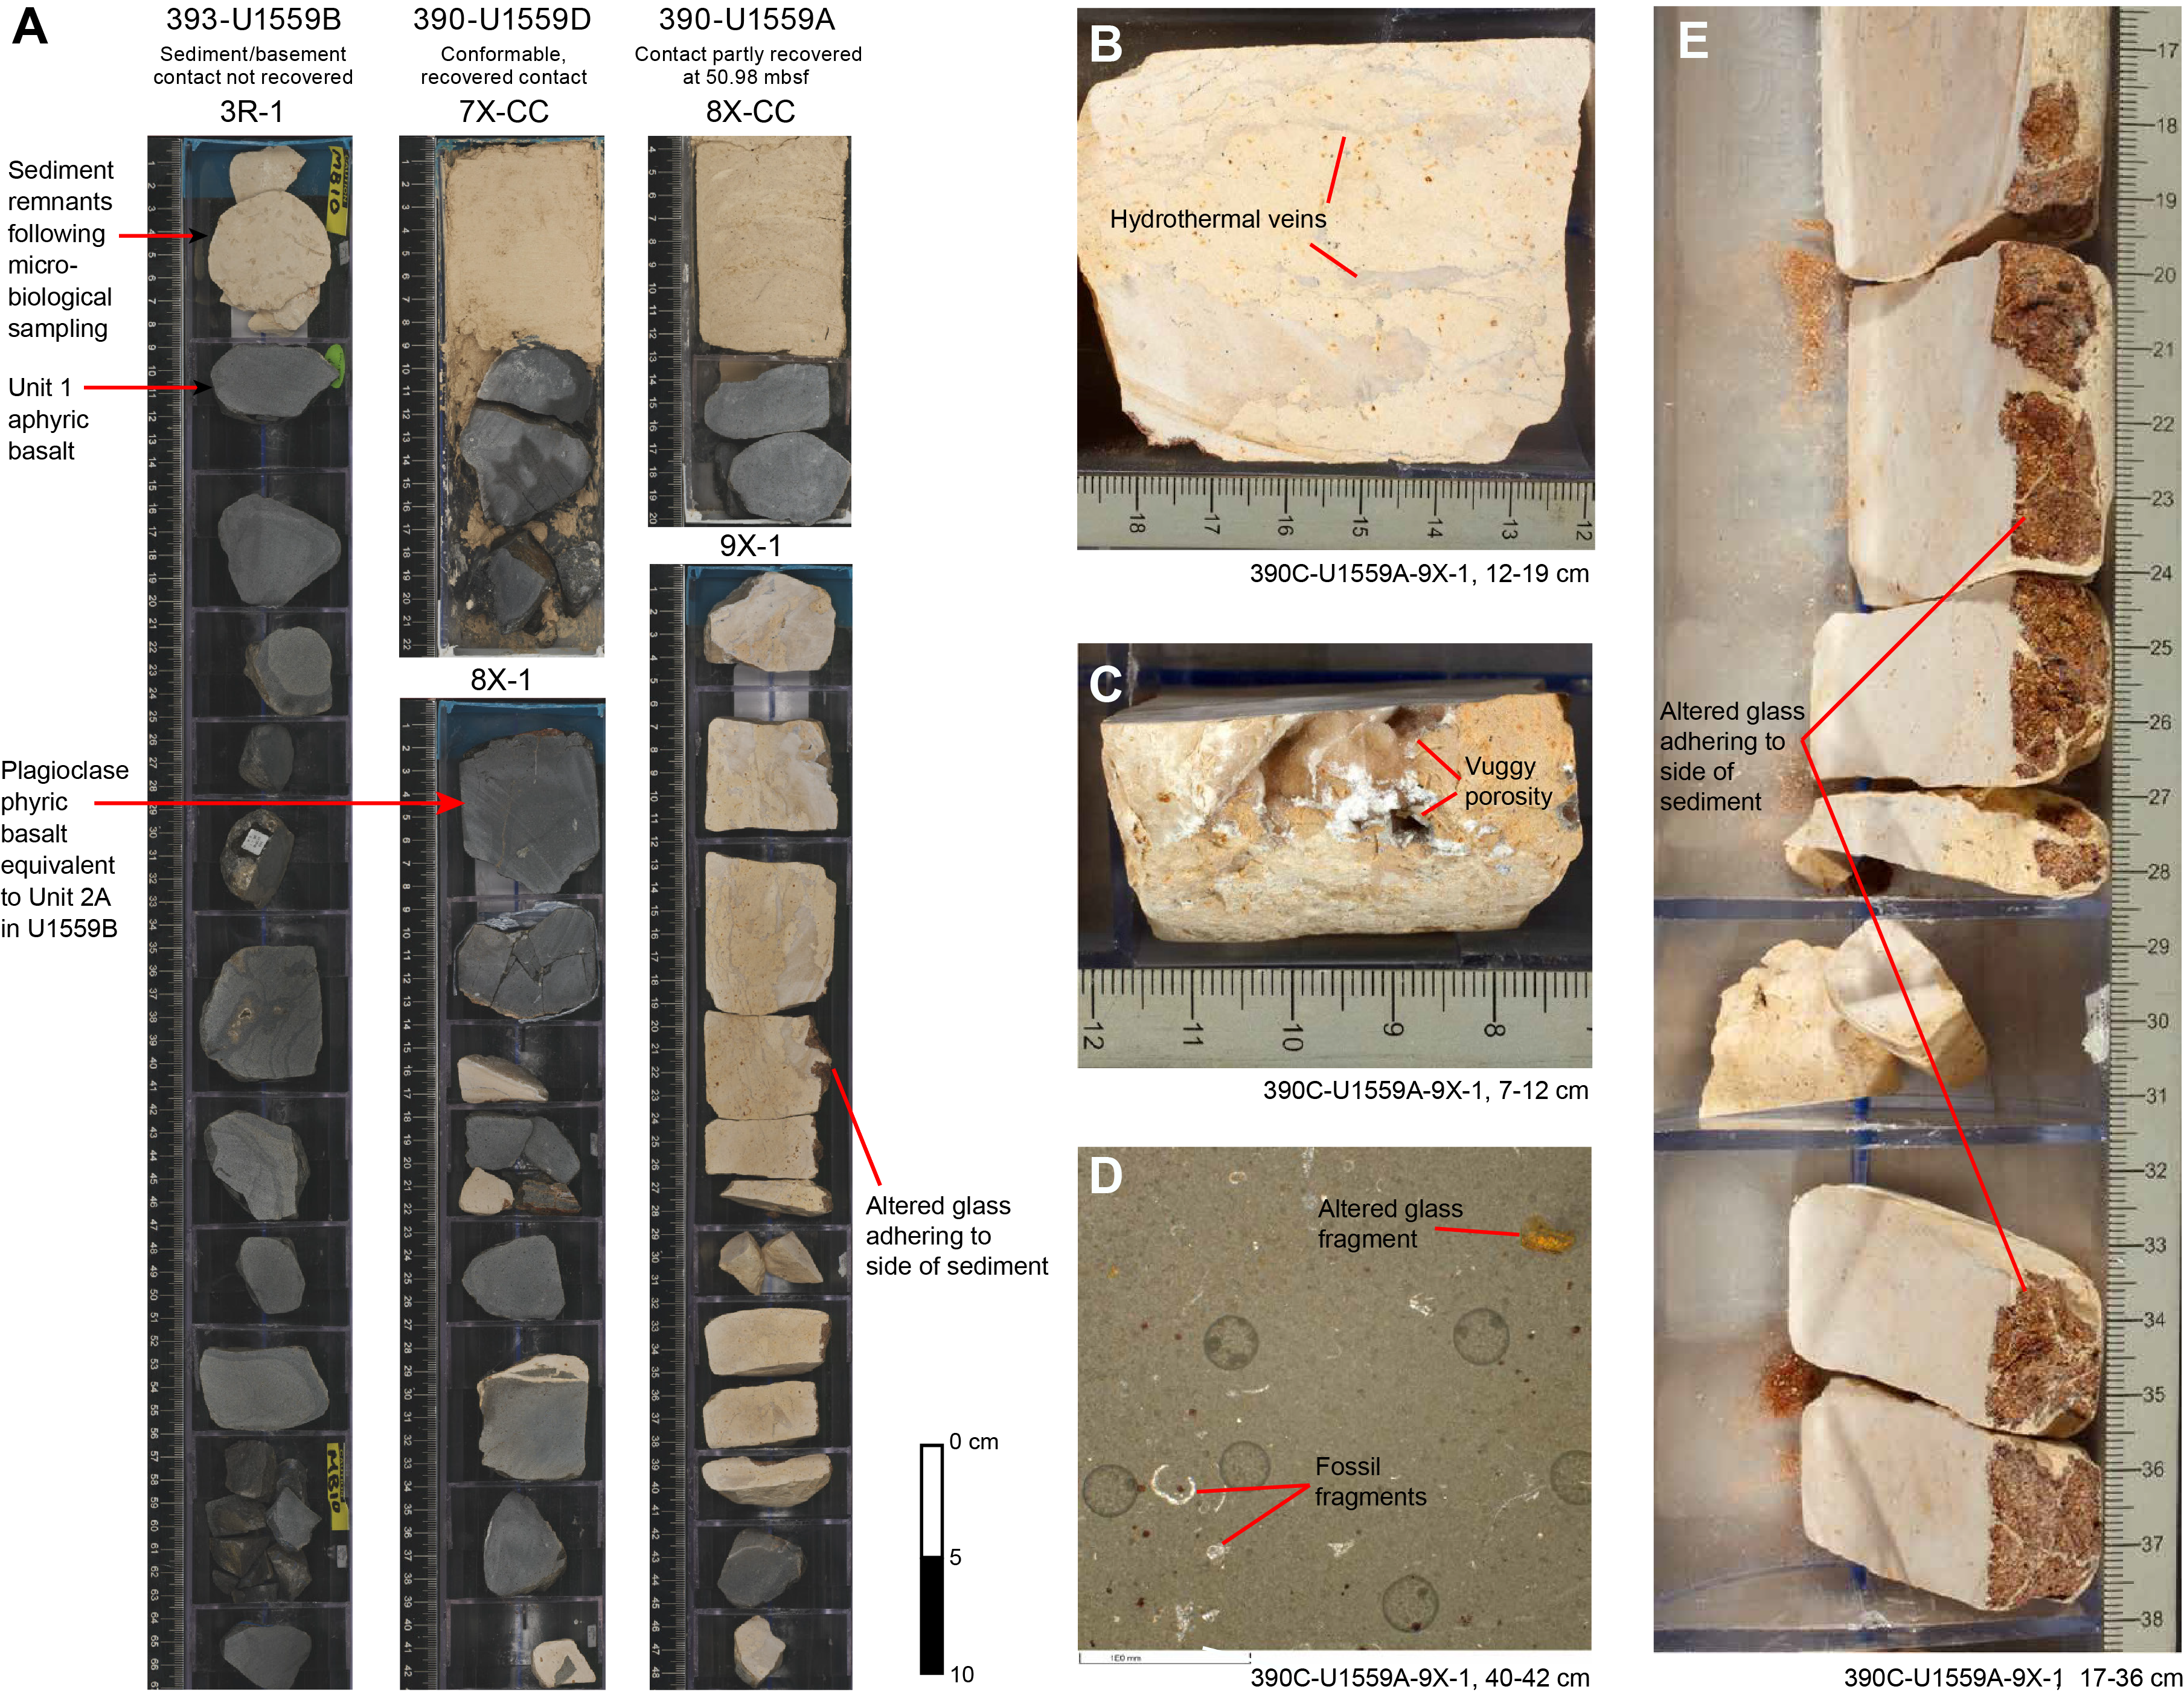
Figure F15. Main sediment/volcanic basement contact.
In Hole U1559A, the shallowest piece of basalt occurs at Section 8X-CC, 13 cm (62.64 mbsf), below partially lithified nannofossil ooze with foraminifera (Figure F15A). Sediment occurs below this again in Section 9X-1, and the deepest sediment in the hole occurs at the bottom of this section at Section 9X-1, 47 cm (65.18 mbsf). Beneath the shallowest basalt occurrence, sediment in Section 9X-1 is indurated calcareous sediment with totally altered remnants of volcanic glass adhering to it (interval 9X-1, 18–28 cm; Figure F15A, F15E). The sediment is cut and recrystallized by hydrothermal calcite veins (Figure F15B), some of which are associated with vuggy porosity (Figure F15C). The difference in depth between the shallowest basalt piece and deepest sediment piece suggests the transition from entirely sediment to entirely volcanic basement in Hole U1559A occurs over a few meters (2.54 m of curated hole depth), which could be interpreted to be either a sedimentary breccia at the top of the basement or interstratification of basalt and sediment.
In Hole U1559D, the sediment at the interface is potentially different, with weakly consolidated ooze in apparently direct, conformable contact with basaltic lavas in the short core catcher Section 7X-CC, 9 cm (50.98 mbsf) (Figures F15A, F16). In the section below, several thin intervals of indurated calcareous sediment in between or cemented to basaltic pieces were recovered (interval 8X-1, 15–42 cm) (Figure F15A). These indurated sediments are similar to the near-interface sediments recovered in Holes U1559A and U1559B. The curated thickness between the shallowest occurrence of basalt and deepest occurrence of sediment in Hole U1559A is 6.42 m. However, this could be substantially less considering the bottom of Section 390-U1559D-7X-CC is 6.28 m above the top of Section 8X-1. Good recovery of the interface in Holes U1559A and U1559D is partly explained by the use of XCB coring, which is less likely to wash away the overlying sediment than RCB coring. Hole U1559B was drilled using an RCB bit, potentially explaining the lack of continuous recovery of the interface. No alternation or interstratification of sediment and basalt was recovered in Hole U1559B, such that the shallowest piece of basalt and deepest piece of sediment within the interface zone are at the same curated depth of 63.89 mbsf. However, it is noted that basement was encountered at 65.0 mbsf during drilling. Once Hole U1559B entered volcanic basement, no further sediment, apart from millimetric veins, was recovered until Unit 3 at 84.43 mbsf (~21 msb; Table T5).
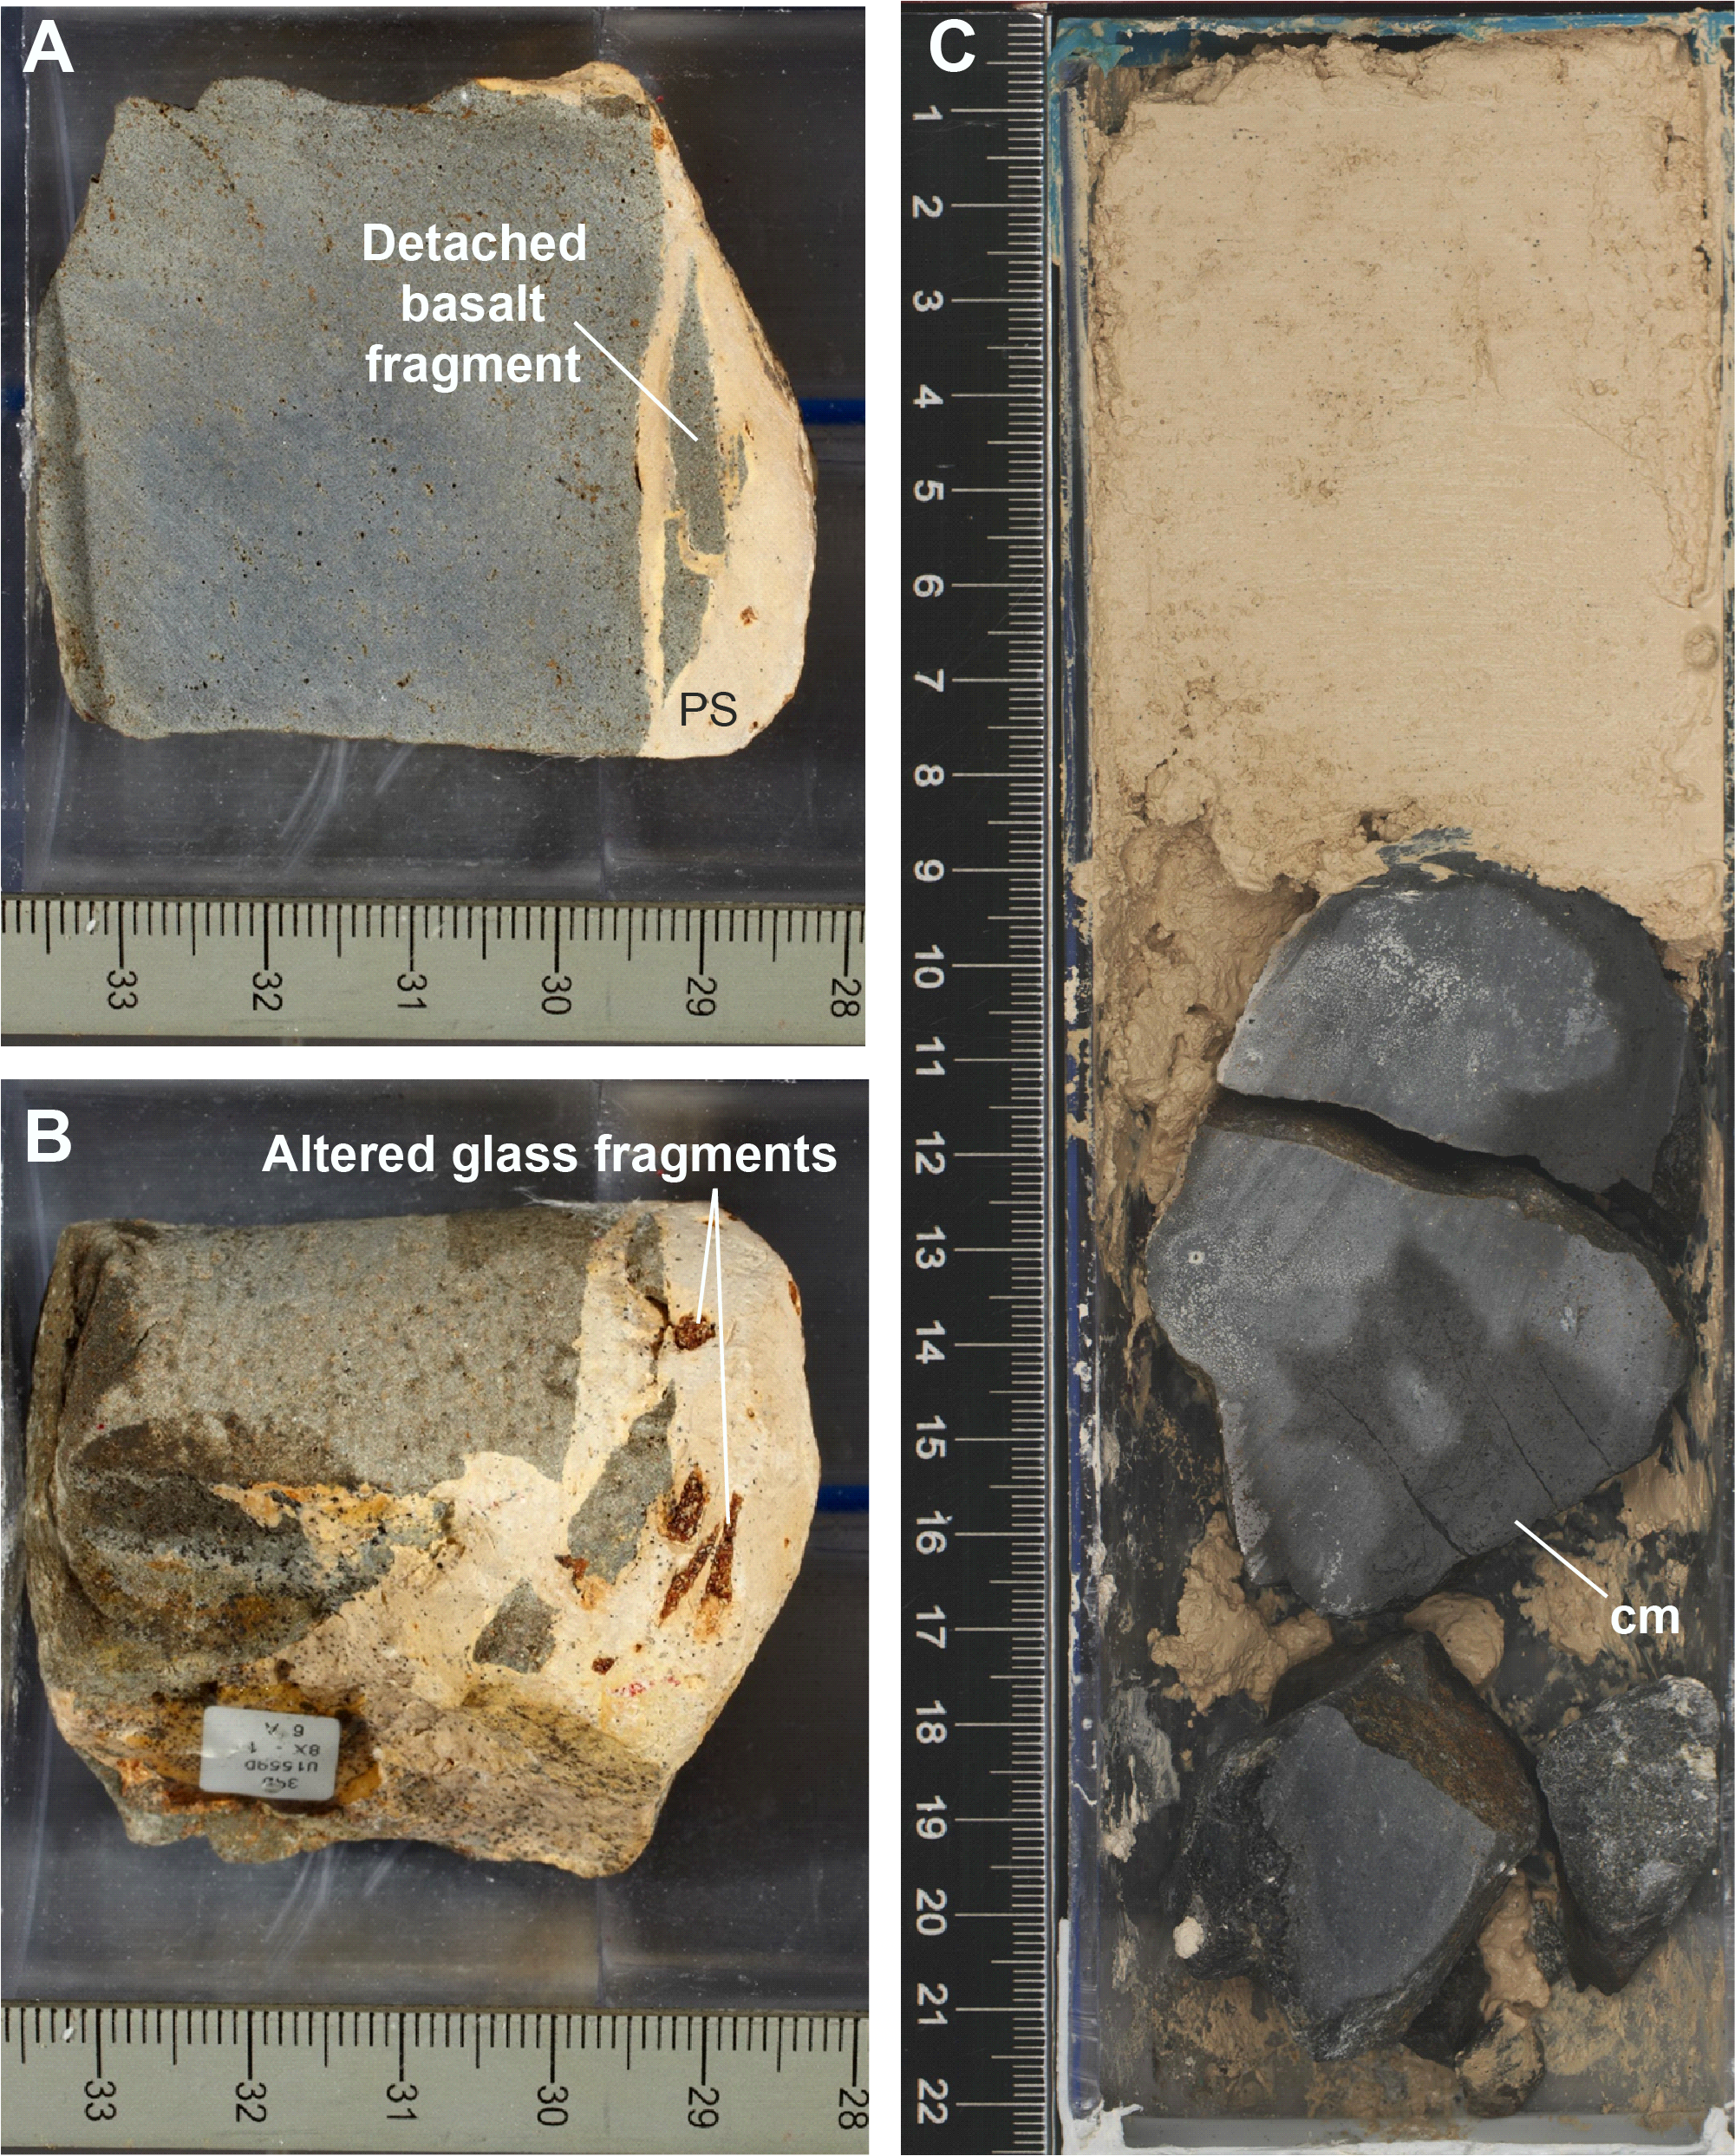
Figure F16. Basalt.
Overall, the three recovered contacts in Holes U1559A and U1559D and the basement encountered during drilling in Hole U1559B show that the shallowest volcanic basement at Site U1559 occurs at ~60–65 mbsf (possibly ranging from 51 to 65 mbsf). For the better recovered interfaces, the transition from entirely sedimentary rocks to entirely volcanic rocks occurs over an interval of up to several meters (Figure F15). Whether this is due to sedimentary breccia at the top of the basement, interstratification of basaltic lava flows and sediment, or whether sediment ooze has been injected into the void space of the volcanic basement is not clear. The sharp sediment/basement interface at 63.89 mbsf in Hole U1559B is taken as the upper contact of the volcanic basement in all further volcanostratigraphic descriptions. Calcite veins and indurated sediments are confined to intervals below the uppermost pieces of basalt in Holes U1559A and U1559D but occur directly above the first basalt pieces in Hole U1559B. Because the interface was poorly recovered in Hole U1559B, this suggests that substantial near-interface hydrothermal circulation did occur but did not penetrate far, or at all, into the overlying sediment pile.
5.1.2. Hole U1559B Unit 1 and equivalent rocks in Holes U1559A and U1559D
Volcanic Unit 1 consists of aphyric microcrystalline basalt sheet flows with an expanded thickness of 6.53 m (Table T5). Unit 1 lies directly beneath the sediment/basement interface and was recovered in Holes U1559B, U1559A, and U1559D. In Hole U1559D, only the small pieces recovered in Section 7X-CC are potentially compatible with Unit 1. Core 8X, starting at 57.4 mbsf, contains typical plagioclase phyric Unit 2 basalts (see Subunit 2A). This shows that Unit 1 has a variable thickness at the top of the Site U1559 volcanic basement.
The absence of phenocrysts in Unit 1 makes it unique among the volcanic rocks recovered at Site U1559 (Figure F17), which otherwise universally contain distinctive millimetric plagioclase phenocrysts. Geochemical analyses of Unit 1 also show it to be distinctly more evolved than the underlying units (see High-resolution chemostratigraphy). The groundmass of Unit 1 is mostly microcrystalline and relatively uniform apart from thin cryptocrystalline chilled margins a few centimeters thick. The groundmass is composed of 20–60 vol% distinctly seriate, modally abundant plagioclase laths that are up to 0.4 mm long but are mostly between 0.1 and 0.2 mm. These are interspersed with ~3% equant, euhedral, commonly fresh green olivine microlites that range between 0.1 and 0.2 mm. Around veins and in halos, olivine groundmass crystals are altered to a characteristic orange mixture of clays and Fe oxyhydroxides (iddingsite). The remainder of the groundmass is dominated by interstitial cryptocrystalline clinopyroxene, typically with plumose quench textures. The microcrystalline grain size, a planar, subhorizontal glassy margin (Section 393-U1559B-4R-1, 47 cm), and a patch of vuggy vesicles (interval 3R-1, 29–40 cm) were taken as evidence in support of volcanic emplacement as thin sheet flows for Unit 1.
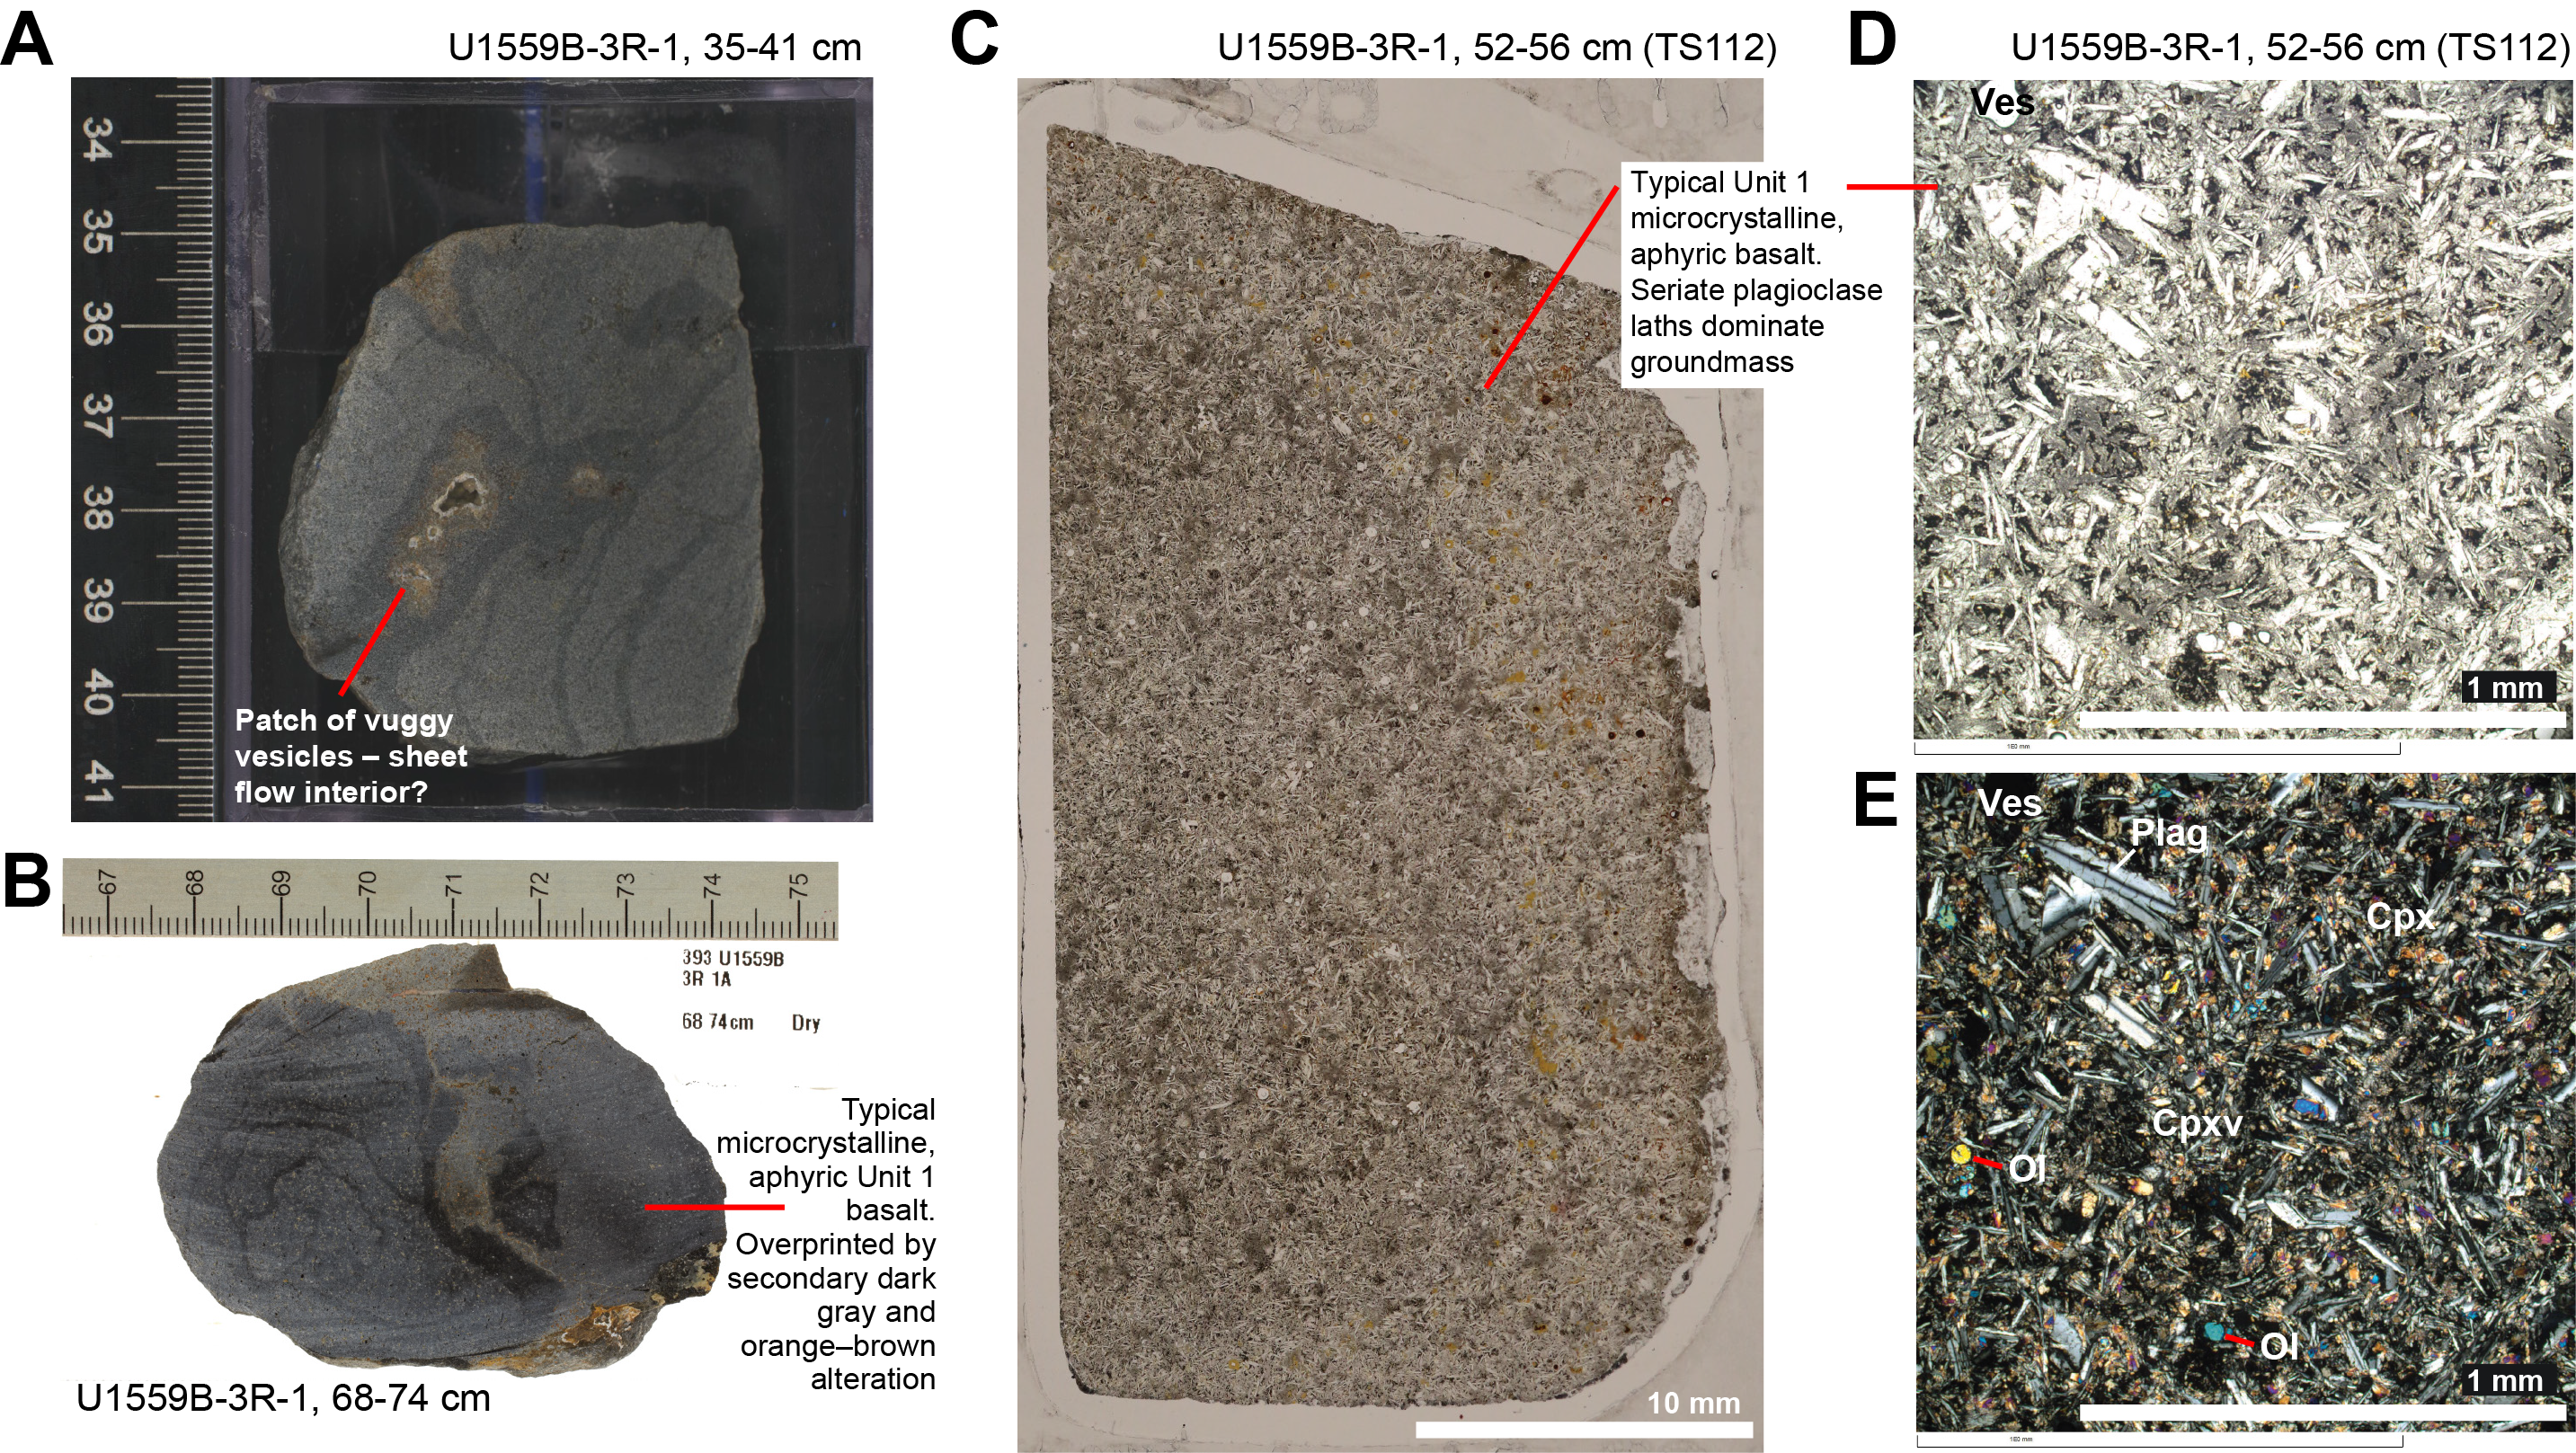
Figure F17. Volcanic Unit 1.
5.1.3. Subunit 2A
Volcanic Subunit 2A consists of sparsely plagioclase-phyric cryptocrystalline to fine-grained basaltic pillow lavas with an expanded thickness of 4.03 m (Table T5). The boundary between Unit 1 and Subunit 2A is defined by the presence of distinctive coarse plagioclase phenocrysts at Section 393-U1559B-4R-1, 45 cm (Figure F18A). The plagioclase phenocrysts are equant to tabular, up to 8 mm in size, and are very sparsely (0.5–1 vol%) set in a variably cryptocrystalline to fine-grained groundmass (Figure F18A–F18E). The groundmass generally consists of plagioclase laths (<0.2–0.4 mm long) and lesser amounts of equant olivine (<0.2 mm) floating in a plumose clinopyroxene matrix. In addition to the plagioclase phenocrysts, common slightly curved glassy margins and variable groundmass grain size, both from piece to piece and within pieces, are defining characteristics of Subunit 2A (Figure F18C). Together, these characteristics support a pillow lava style of emplacement for Subunit 2A.
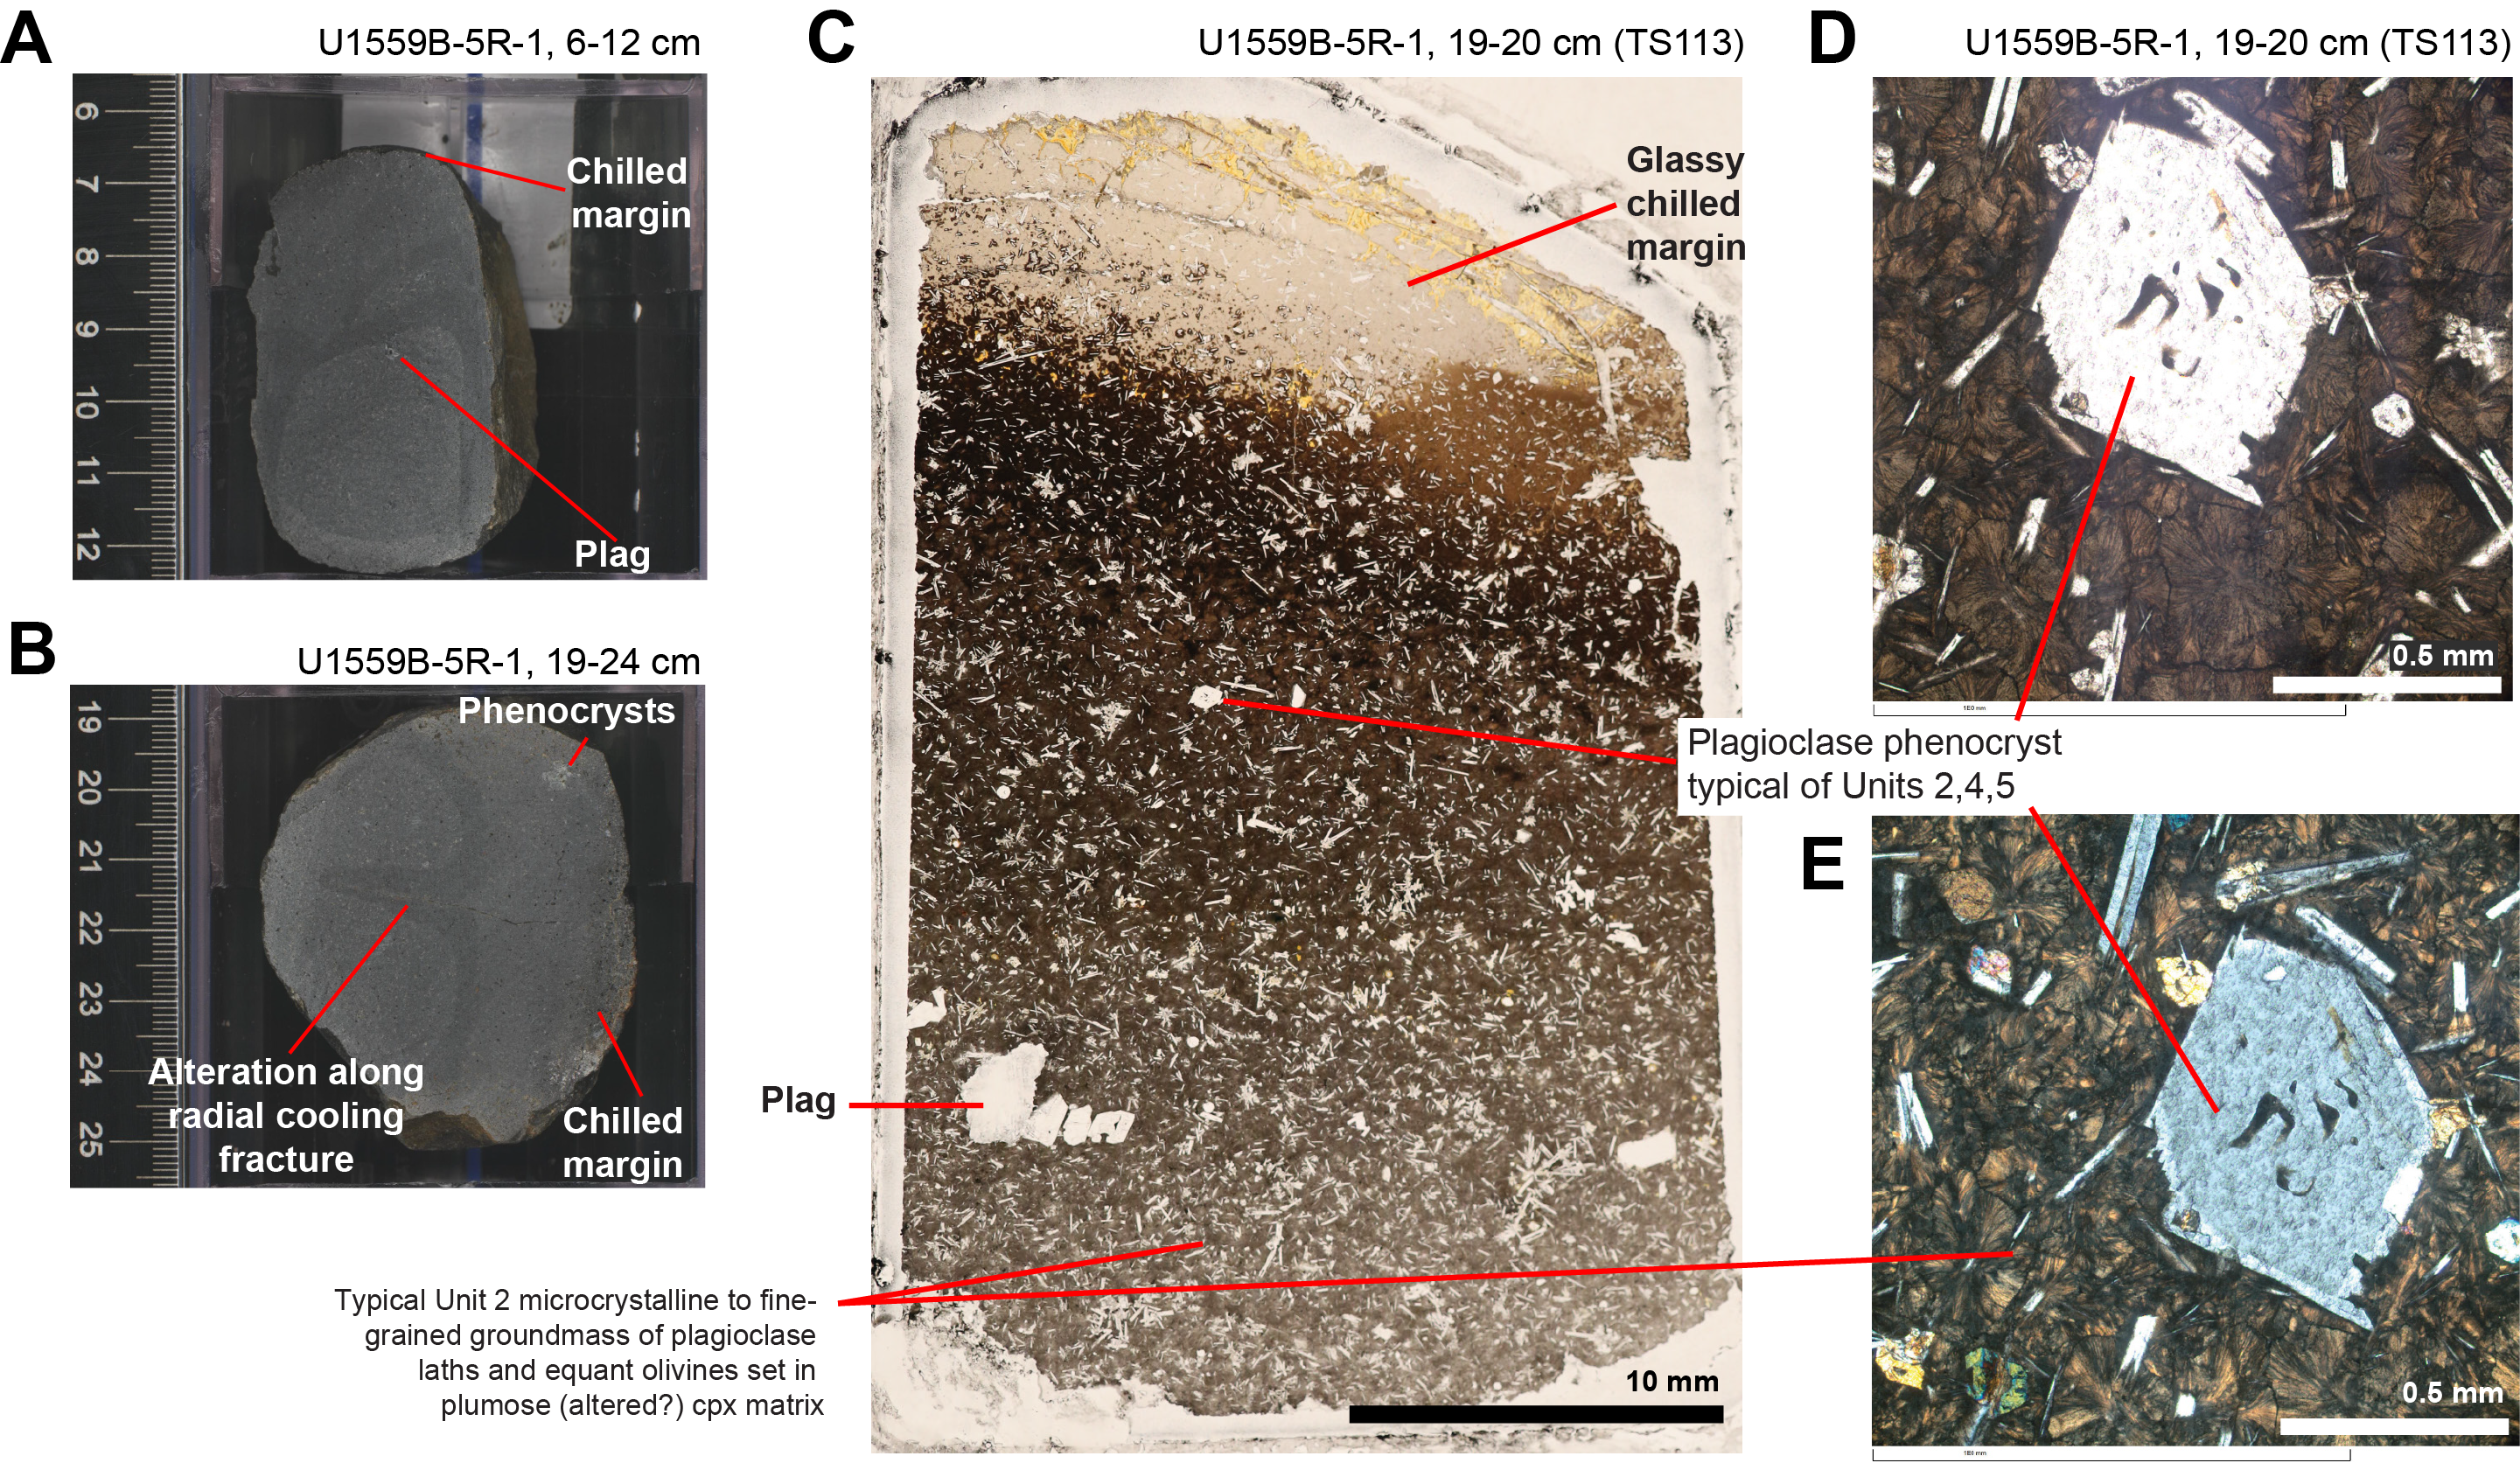
Figure F18. Volcanic Subunit 2A.
5.1.4. Subunit 2B
- Lithology: sparsely plagioclase-phyric basalt sheet and pillow lava flows with rare olivine phenocrysts
Subunit 2B is a sparsely plagioclase-phyric basalt with rare olivine phenocrysts with an expanded unit thickness of 8.53 m. Subunit 2B formed either as thin sheet flows or pillow lavas or potentially as a mixture of these two emplacement styles. The contact between Subunits 2A and 2B was not clearly recovered but occurs at Section 393-U1559B-5R-1, 40 cm, and is defined by the presence of rare (~0.1%) but distinctive fresh olivine phenocrysts in Subunit 2B (e.g., Figure F19A). These olivine phenocrysts are up to 2 mm in size and generally occur as glomerocrysts with plagioclase. Apart from the appearance of rare olivine attachments, plagioclase phenocrysts in Subunit 2B are similar in abundance and character to Subunit 2A; they are as large as 7 mm, subequant, euhedral, and fresh.
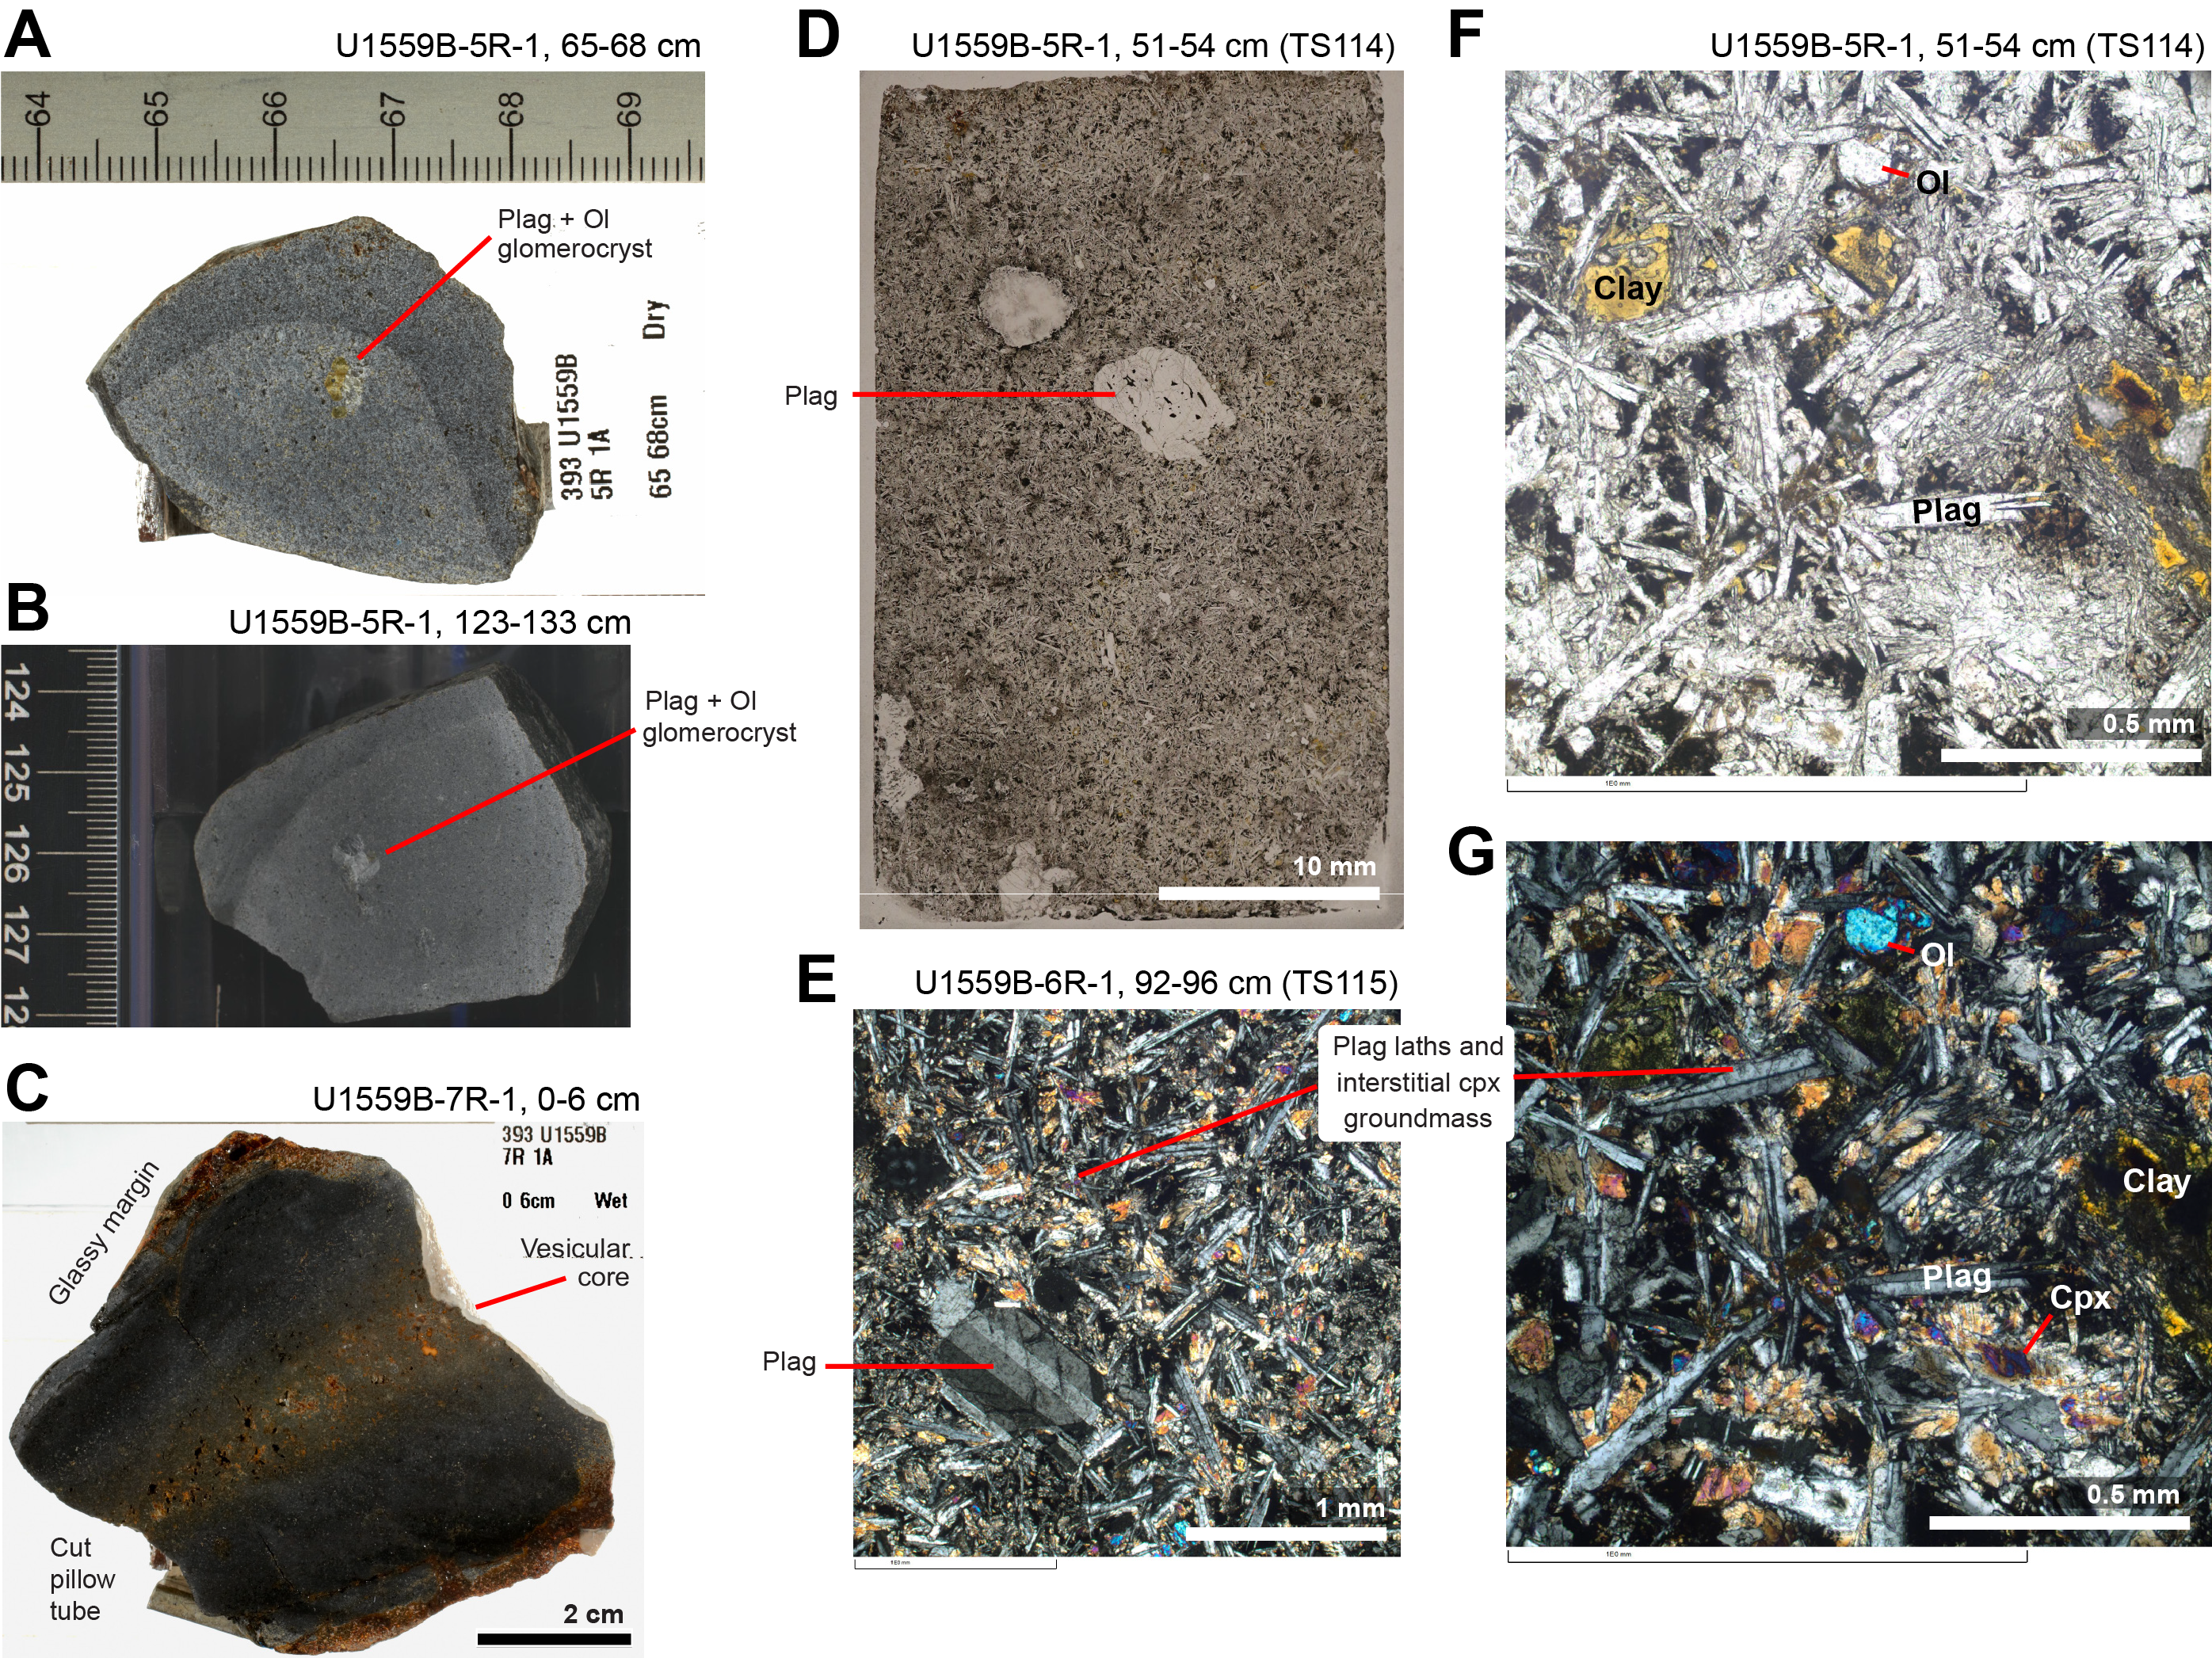
Figure F19. Volcanic Subunit 2B.
Common glassy margins and groundmass that varies from cryptocrystalline to microcrystalline to fine grained (Figure F19A–F19C), both within pieces and between pieces, support a pillow lava emplacement style for Subunit 2B. This classification is further supported by the recovery of a completely glass-encrusted basaltic tube or lobe ~8 cm in diameter at interval 393-U1559B-7R-1, 0–6 cm (83.2 mbsf; Figure F19C).
5.1.5. Subunit 2C
Subunit 2C is a sparsely plagioclase-phyric basalt with rare olivine phenocrysts with an expanded unit thickness of 2.27 m. It is interpreted to consist of one or two relatively thick (0.6–2 m) sheet flows. The contact between Subunits 2C and 2B was not clearly identified but was located at a glassy margin at Section 393-U1559B-7R-1, 7 cm, and defined on the basis of an interpreted change in lava emplacement style. This interpretation is based on the paucity of glass and relatively uniform microcrystalline grain size in Subunit 2C, in contrast to the common glassy and variable grain size in Subunit 2B. Apart from these differences, the phenocryst assemblage is the same between Subunits 2B and 2C, with sparse to very sparse plagioclase phenocrysts as large as 7 mm and with rare <2 mm olivine phenocrysts present in both subunits. The flow interior groundmass of Subunit 2C is coarser and mostly between microcrystalline and fine grained (Figure F20). One patch of vuggy vesicles similar to those in Unit 1 is present in Subunit 2C (interval 7R-1, 64–99 cm; Figure F20A) and interpreted to be coalesced vesicles common to sheet flows along the SAT.
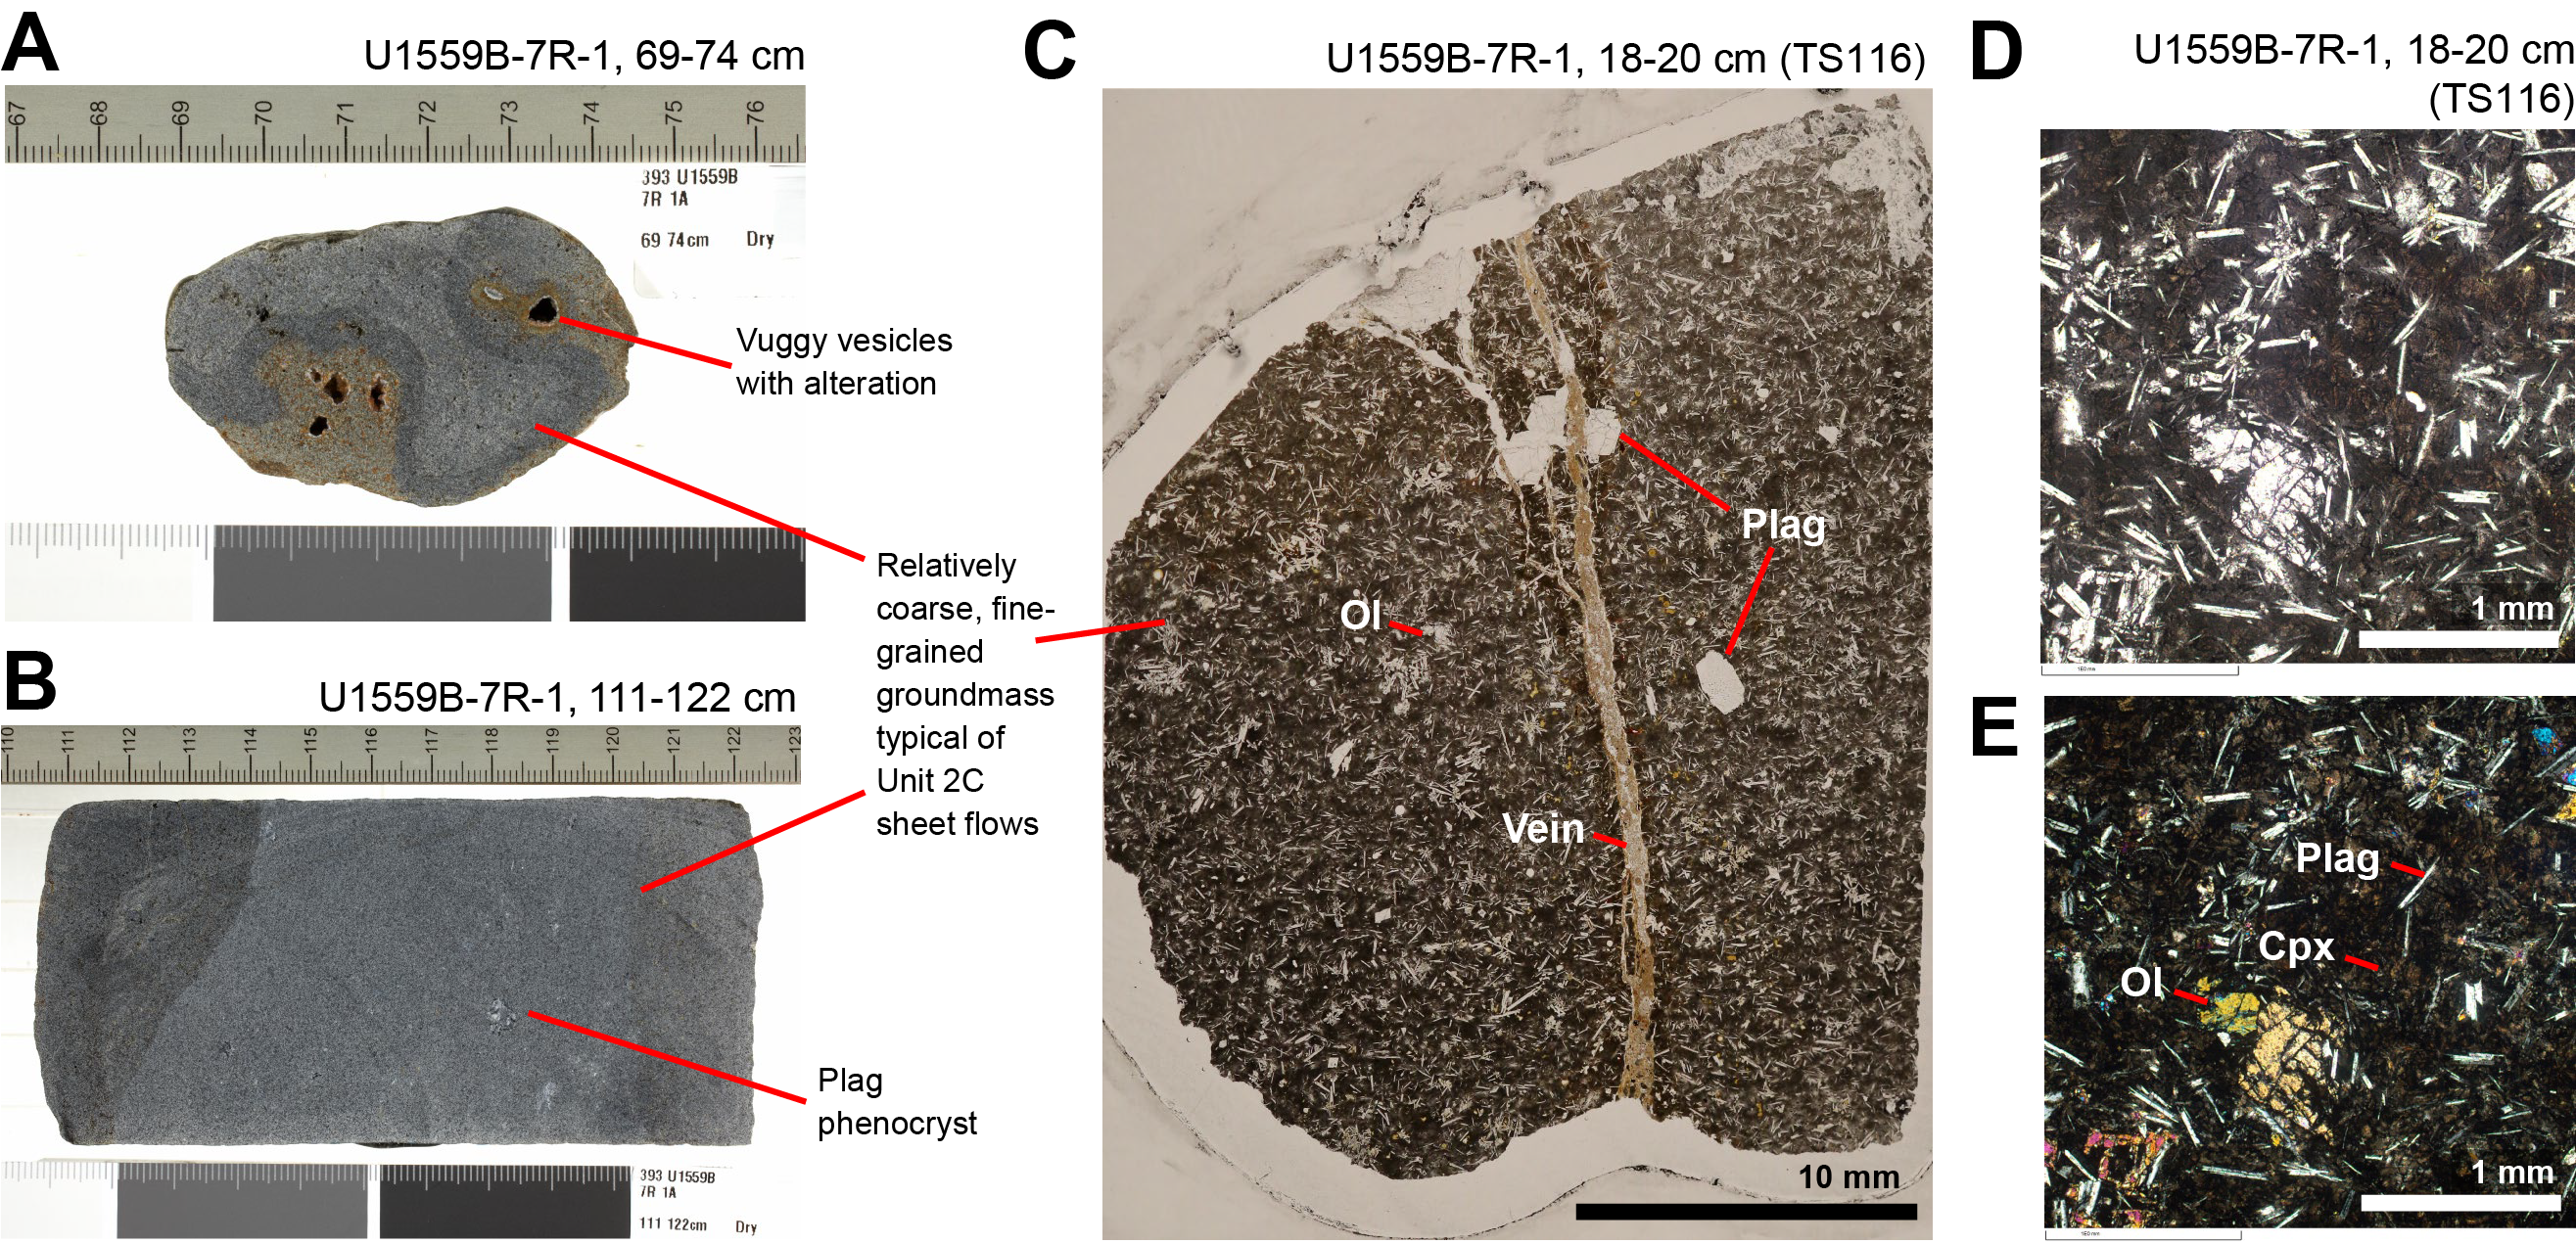
Figure F20. Volcanic Subunit 2C.
5.1.6. Unit 3
Unit 3 is a single ~5 cm tabular piece of indurated calcareous sediment (interval 393-U1559B-7R-1, 123–130 cm; Table T5). Both flat sides of this piece have ~1 mm of completely altered volcanic glass adhering to them (Figure F21A), which is similar to samples from the sediment/basement interface in Section 390C-U1559A-9X-1 (Figure F15E). This shows that volcanic rocks were directly in contact with this sediment both above and below, which fixes the small unit's thickness to ~5 cm (Table T5).
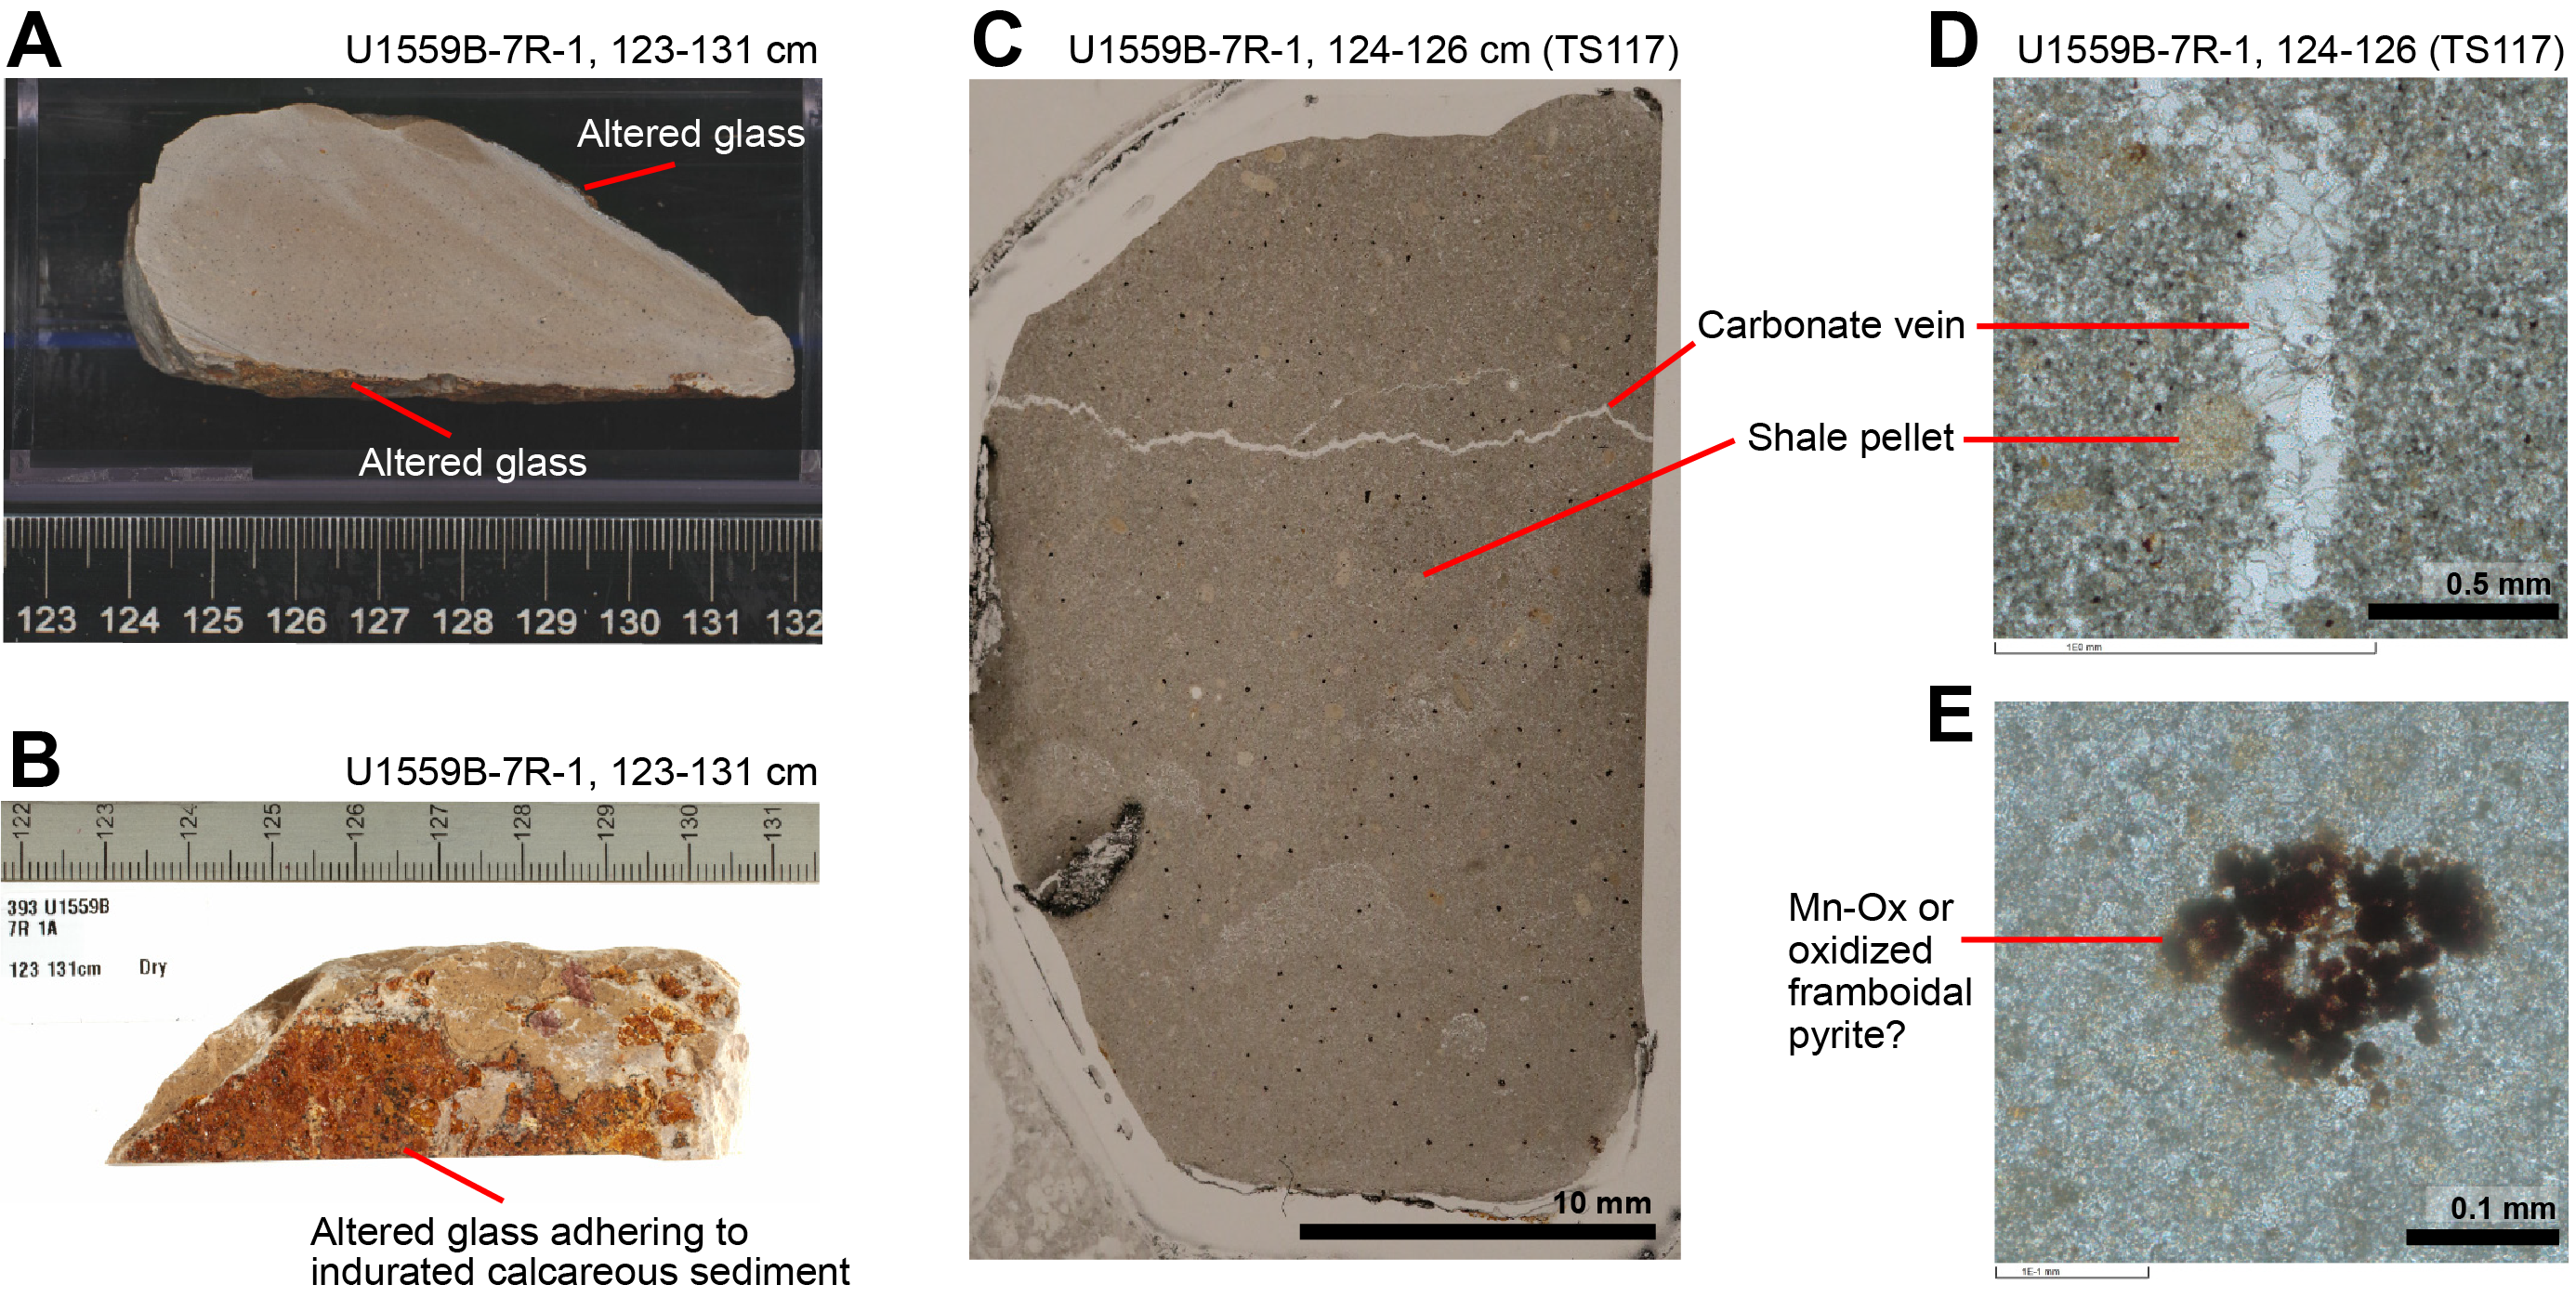
Figure F21. Intervolcanic sedimentary Unit 3.
Two opposing hypotheses exist for the origin of the Unit 3 indurated calcareous sediment: (1) the sediment may have accumulated on the lavas during a short hiatus in volcanism and been baked or hydrothermally altered to its present lithified state or (2) this sediment may have been squeezed as an ooze through connected porosity in the basement from the overlying sediment pile. Considering the lack of other potentially squeezed ooze higher in the hole, the former hypothesis of a conformable sedimentary origin is preferred.
5.1.7. Unit 4
Unit 4 is a sparsely plagioclase-phyric basalt with rare olivine phenocrysts. With an expanded thickness of 14.89 m, Unit 4 is the thickest volcanic unit in Hole U1559B (Table T5). The sharp contact between Units 4 and 3 was partly recovered by the thin glass adhering to one side of the Unit 3 limestone.
Lithologically, Unit 4 is similar to the overlying Subunit 2C. Phenocrysts in Unit 4 consist of sparse coarse plagioclase as large as 9 mm and rare olivine phenocrysts (Figure F22A, F22B). Similar to Subunit 2C and despite being relatively thick, no glass was recovered in Unit 4. Together with changes in grain size from microcrystalline to fine grained over section scales and some uncommon patches of vuggy vesicles (intervals 393-U1559B-8R-1, 0–10 cm, and 9R-2, 5–12 cm), Unit 4 is interpreted to be a series of relatively thick (0.6–2.5 m) sheet flows.
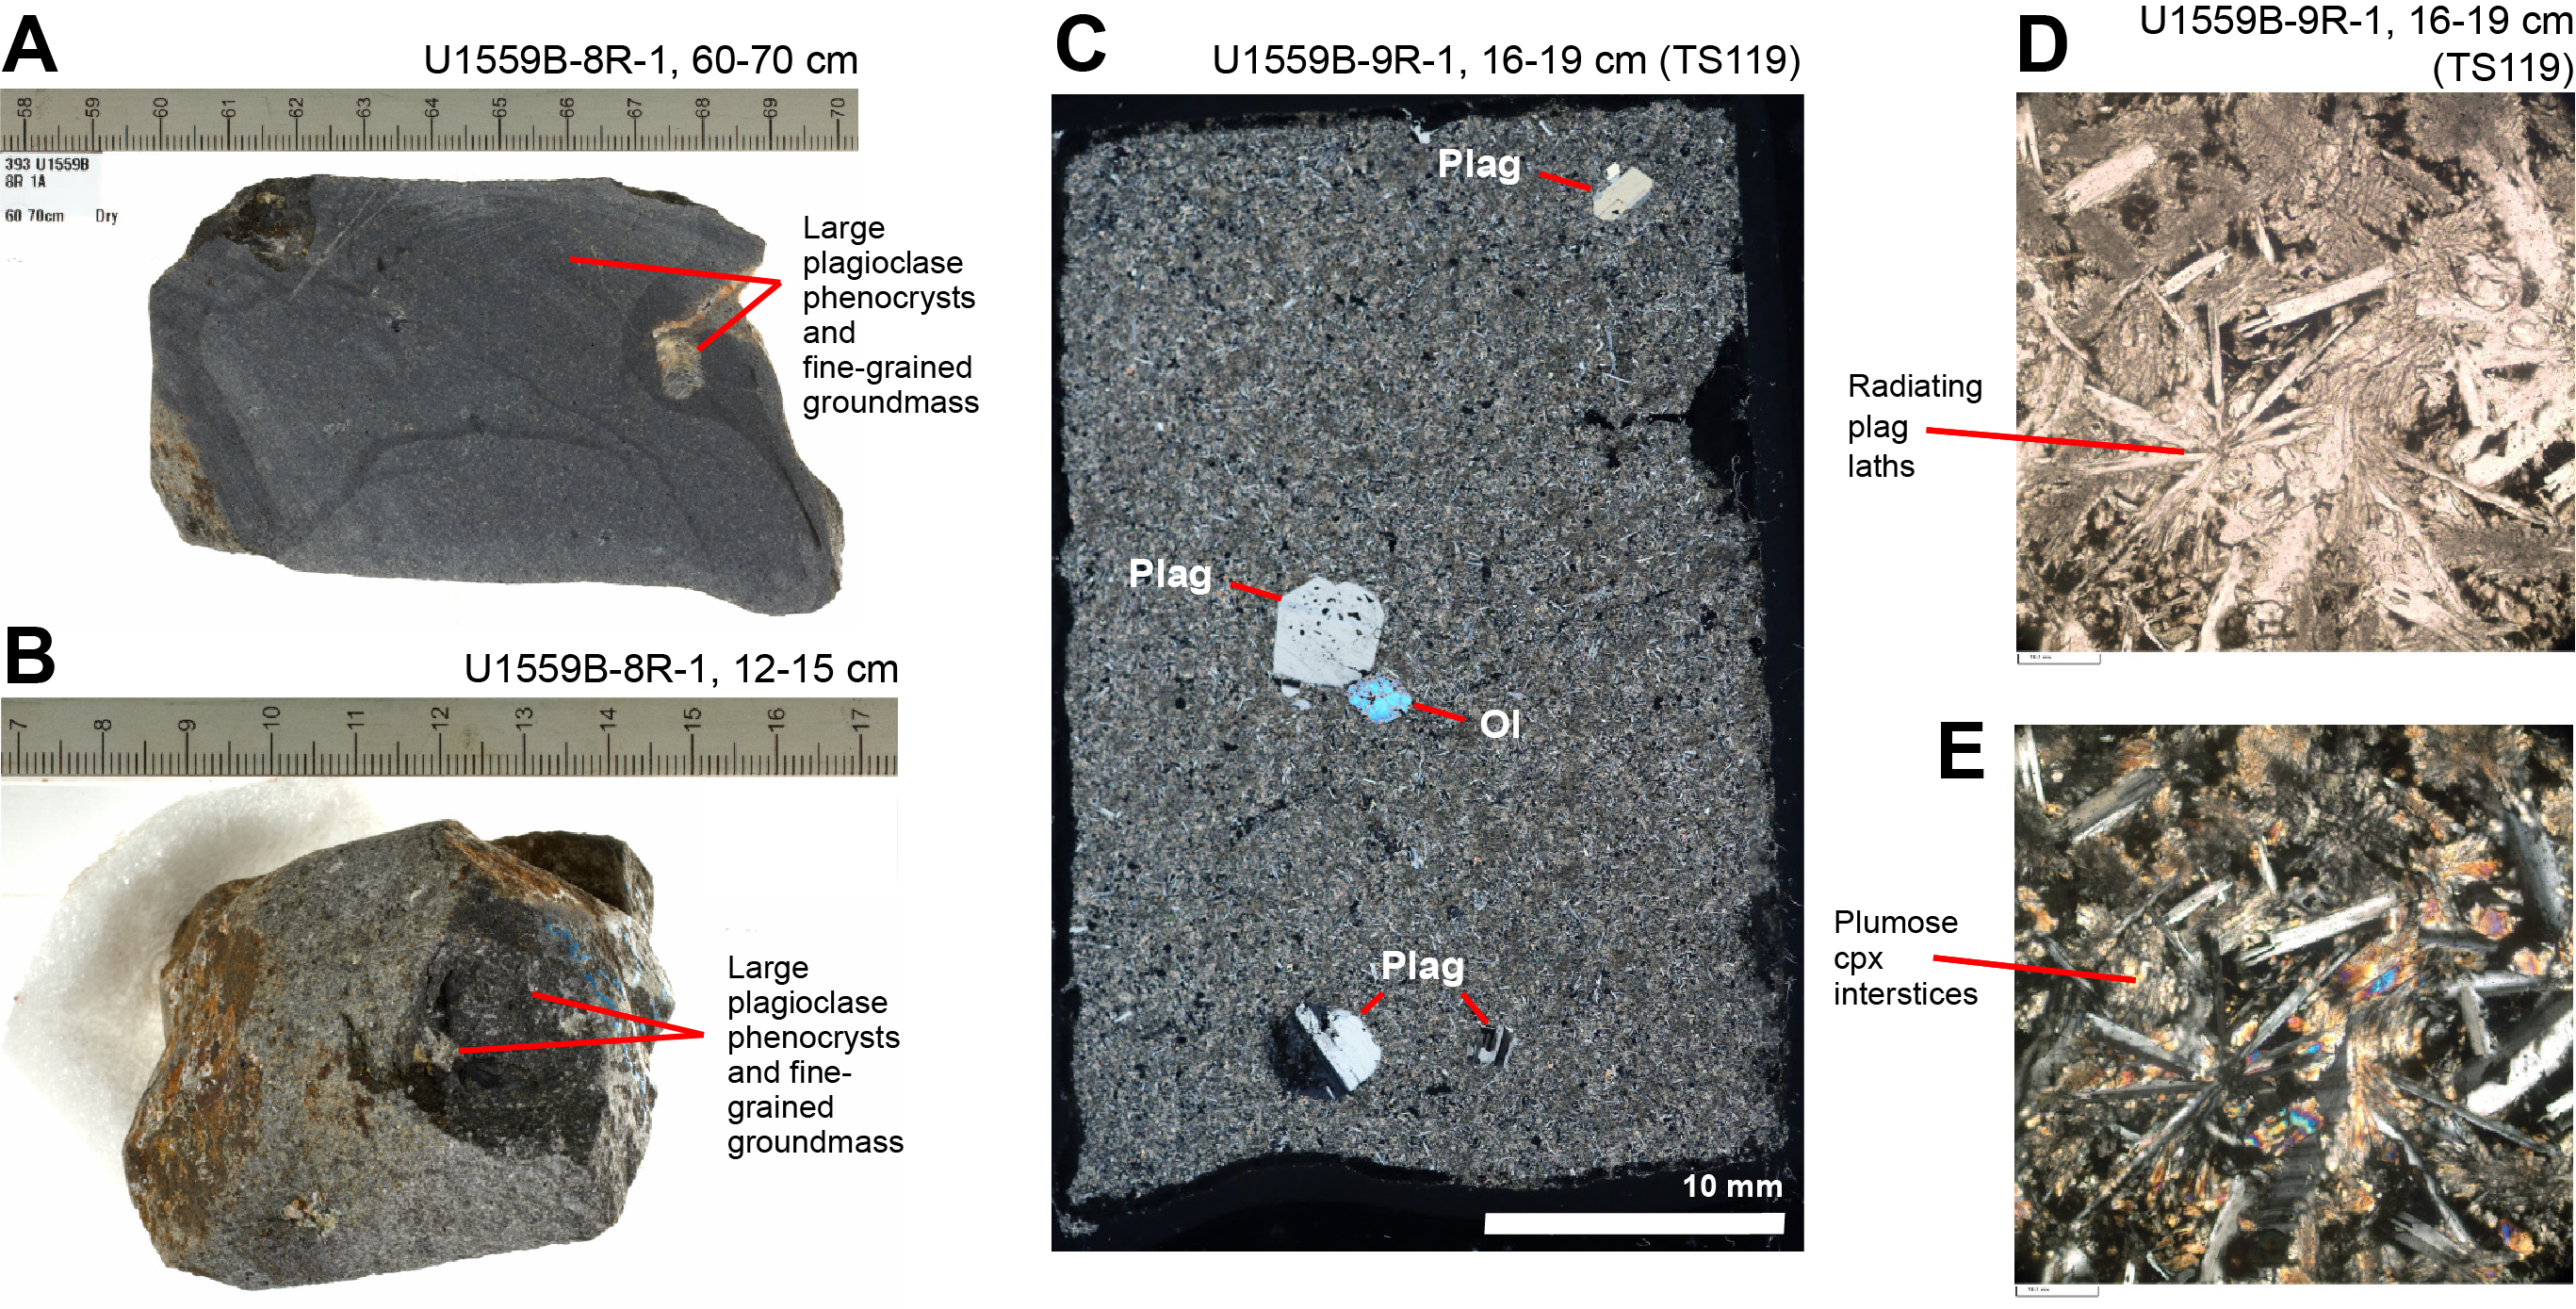
Figure F22. Volcanic Unit 4.
5.1.8. Subunit 5A
- Lithology: sparsely plagioclase-phyric basalt sheet and pillow flows with rare olivine and clinopyroxene phenocrysts
Subunit 5A is a sparsely plagioclase phyric basalt with rare olivine and clinopyroxene phenocrysts, an expanded thickness of 6.08 m (Table T5), and an emplacement style interpreted to be a mixture of pillow and sheet lava flows. The contact between Unit 4 and Subunit 5A was not clearly recovered but was marked at a glassy margin in Section 393-U1559B-11R-1, 0 cm.
The lithologic distinction between Subunit 5A and Unit 4 was made by the presence of extremely sparse (<0.1%), dark brownish gray, euhedral and commonly prismatic clinopyroxenes in Subunit 5A. (Figure F23B). These clinopyroxene phenocrysts are as large as 5 mm but mostly ~2 mm and are typically closely intergrown with plagioclase as glomerocrysts. Subunit 5A also contains two glassy pillow margins and a locally more variable groundmass grain size than Unit 4, with variations from cryptocrystalline to fine grain size within pieces and in consecutive pieces (Figure F23A). There are also intervals of relatively uniform fine grain size (interval 393-U1559B-11R-1, 7–59 cm). Similar to the other units, the groundmass of Subunit 5A consists of 40–80 vol% felty plagioclase laths <0.4 mm long, sparse equant olivine microcrysts of <0.2 mm size with plumose to well-crystallized clinopyroxene interstices and dark mesostasis (Figure F23C–F23E).
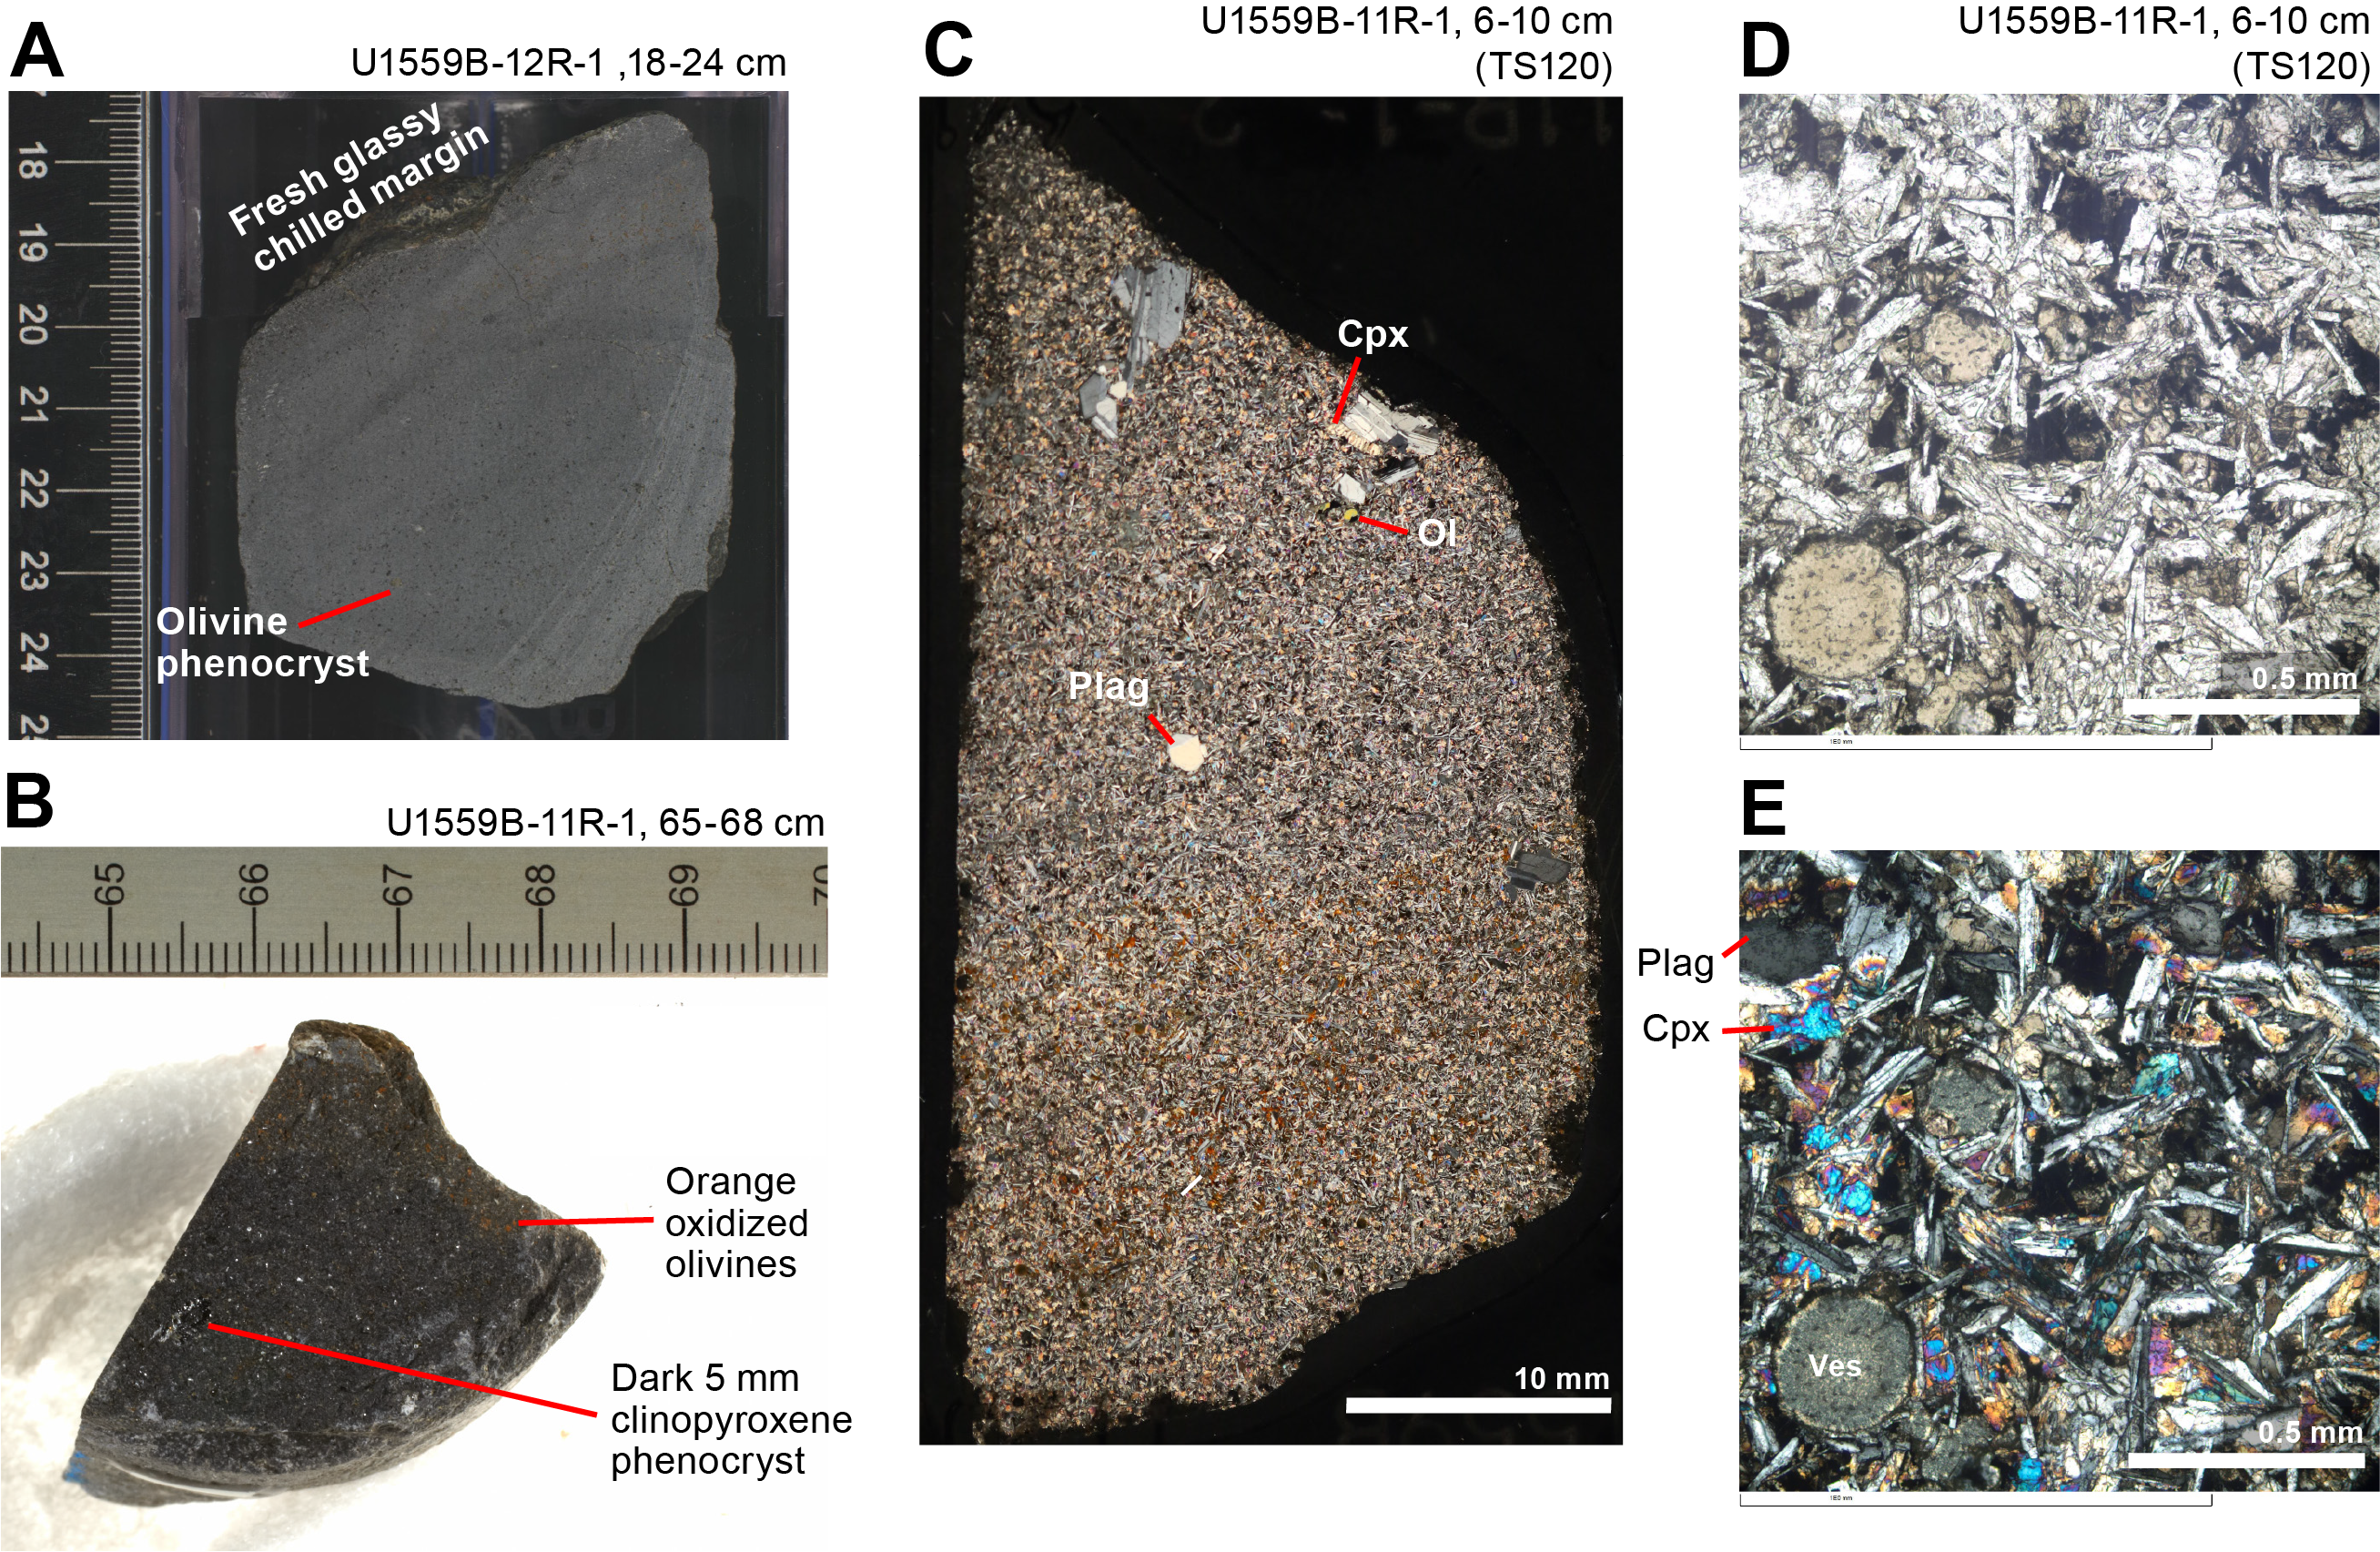
Figure F23. Volcanic Subunit 5A.
The recovery of just two glassy margins within Unit 5 and a combination of both relatively continuous fine grain size over some intervals and variable grain size over others suggests Subunit 5A was emplaced as both pillow and sheet lava flows. The minimum thickness of the sheet flows is estimated at ~60 cm from the summed length of pieces with continuous fine grain size and a maximum of ~2.6 m, which is the expanded distance between the two glassy margins in this unit.
5.1.9. Subunit 5B
A single piece of sparsely olivine-plagioclase phyric basalt pillow lava and a centimeter-sized piece of basalt over the interval 393-U1559B-13R-1, 24–34 cm, are the only two pieces recovered from Subunit 5B (Figure F24). The thickness of Subunit 5B must be greater than the complete pillow lava from which the recovered piece is broken, which is estimated to be around 25 cm, but is otherwise unconstrained. A clear contact between Subunits 5B and 5A was not recovered but was located at the upper glassy margin of the pillow.
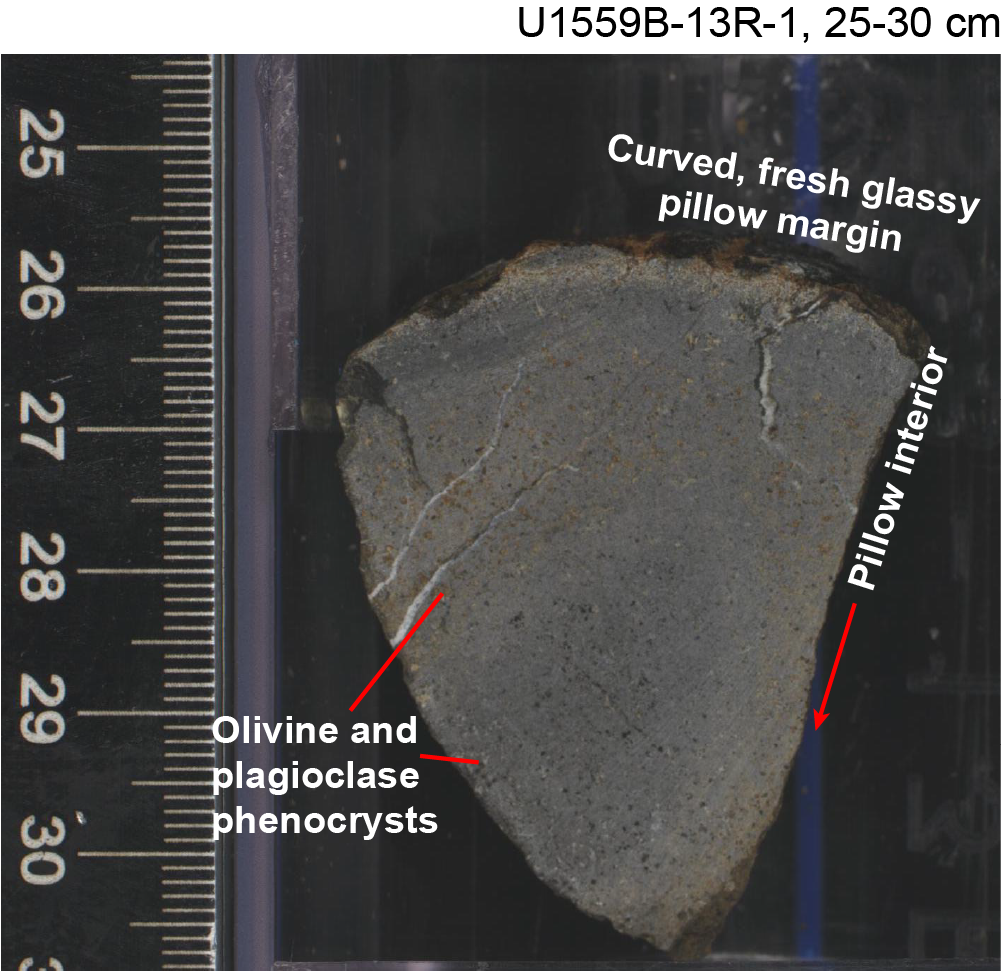
Figure F24. Subunit 5B.
Subunit 5B was differentiated from Subunit 5A on the basis of its sparse (3–5 vol%), small (0.2–0.3 mm) phenocrysts of equant olivine and tabular plagioclase (Figure F24). The only piece recovered from Subunit 5B is clearly a broken piece of pillow lava with a curved margin and bounded by radial cooling cracks (Figure F24).
5.2. Breccias
Beyond incipiently brecciated interpillow hyaloclastites and fragments of basalt in veins that are less than 1 cm thick, no significant breccia was recovered in Hole U1559B. However, the poor recovery in this hole does not preclude the presence in breccias in the volcanostratigraphy at this site.
5.3. Phenocryst phases
Phenocryst mineralogy was the main characteristic by which the volcanic sequence was divided. However, phenocryst mineralogy in Hole U1559B changes only subtly between units; total abundances are mostly <2 vol% and dominated by plagioclase (Figure F25A).
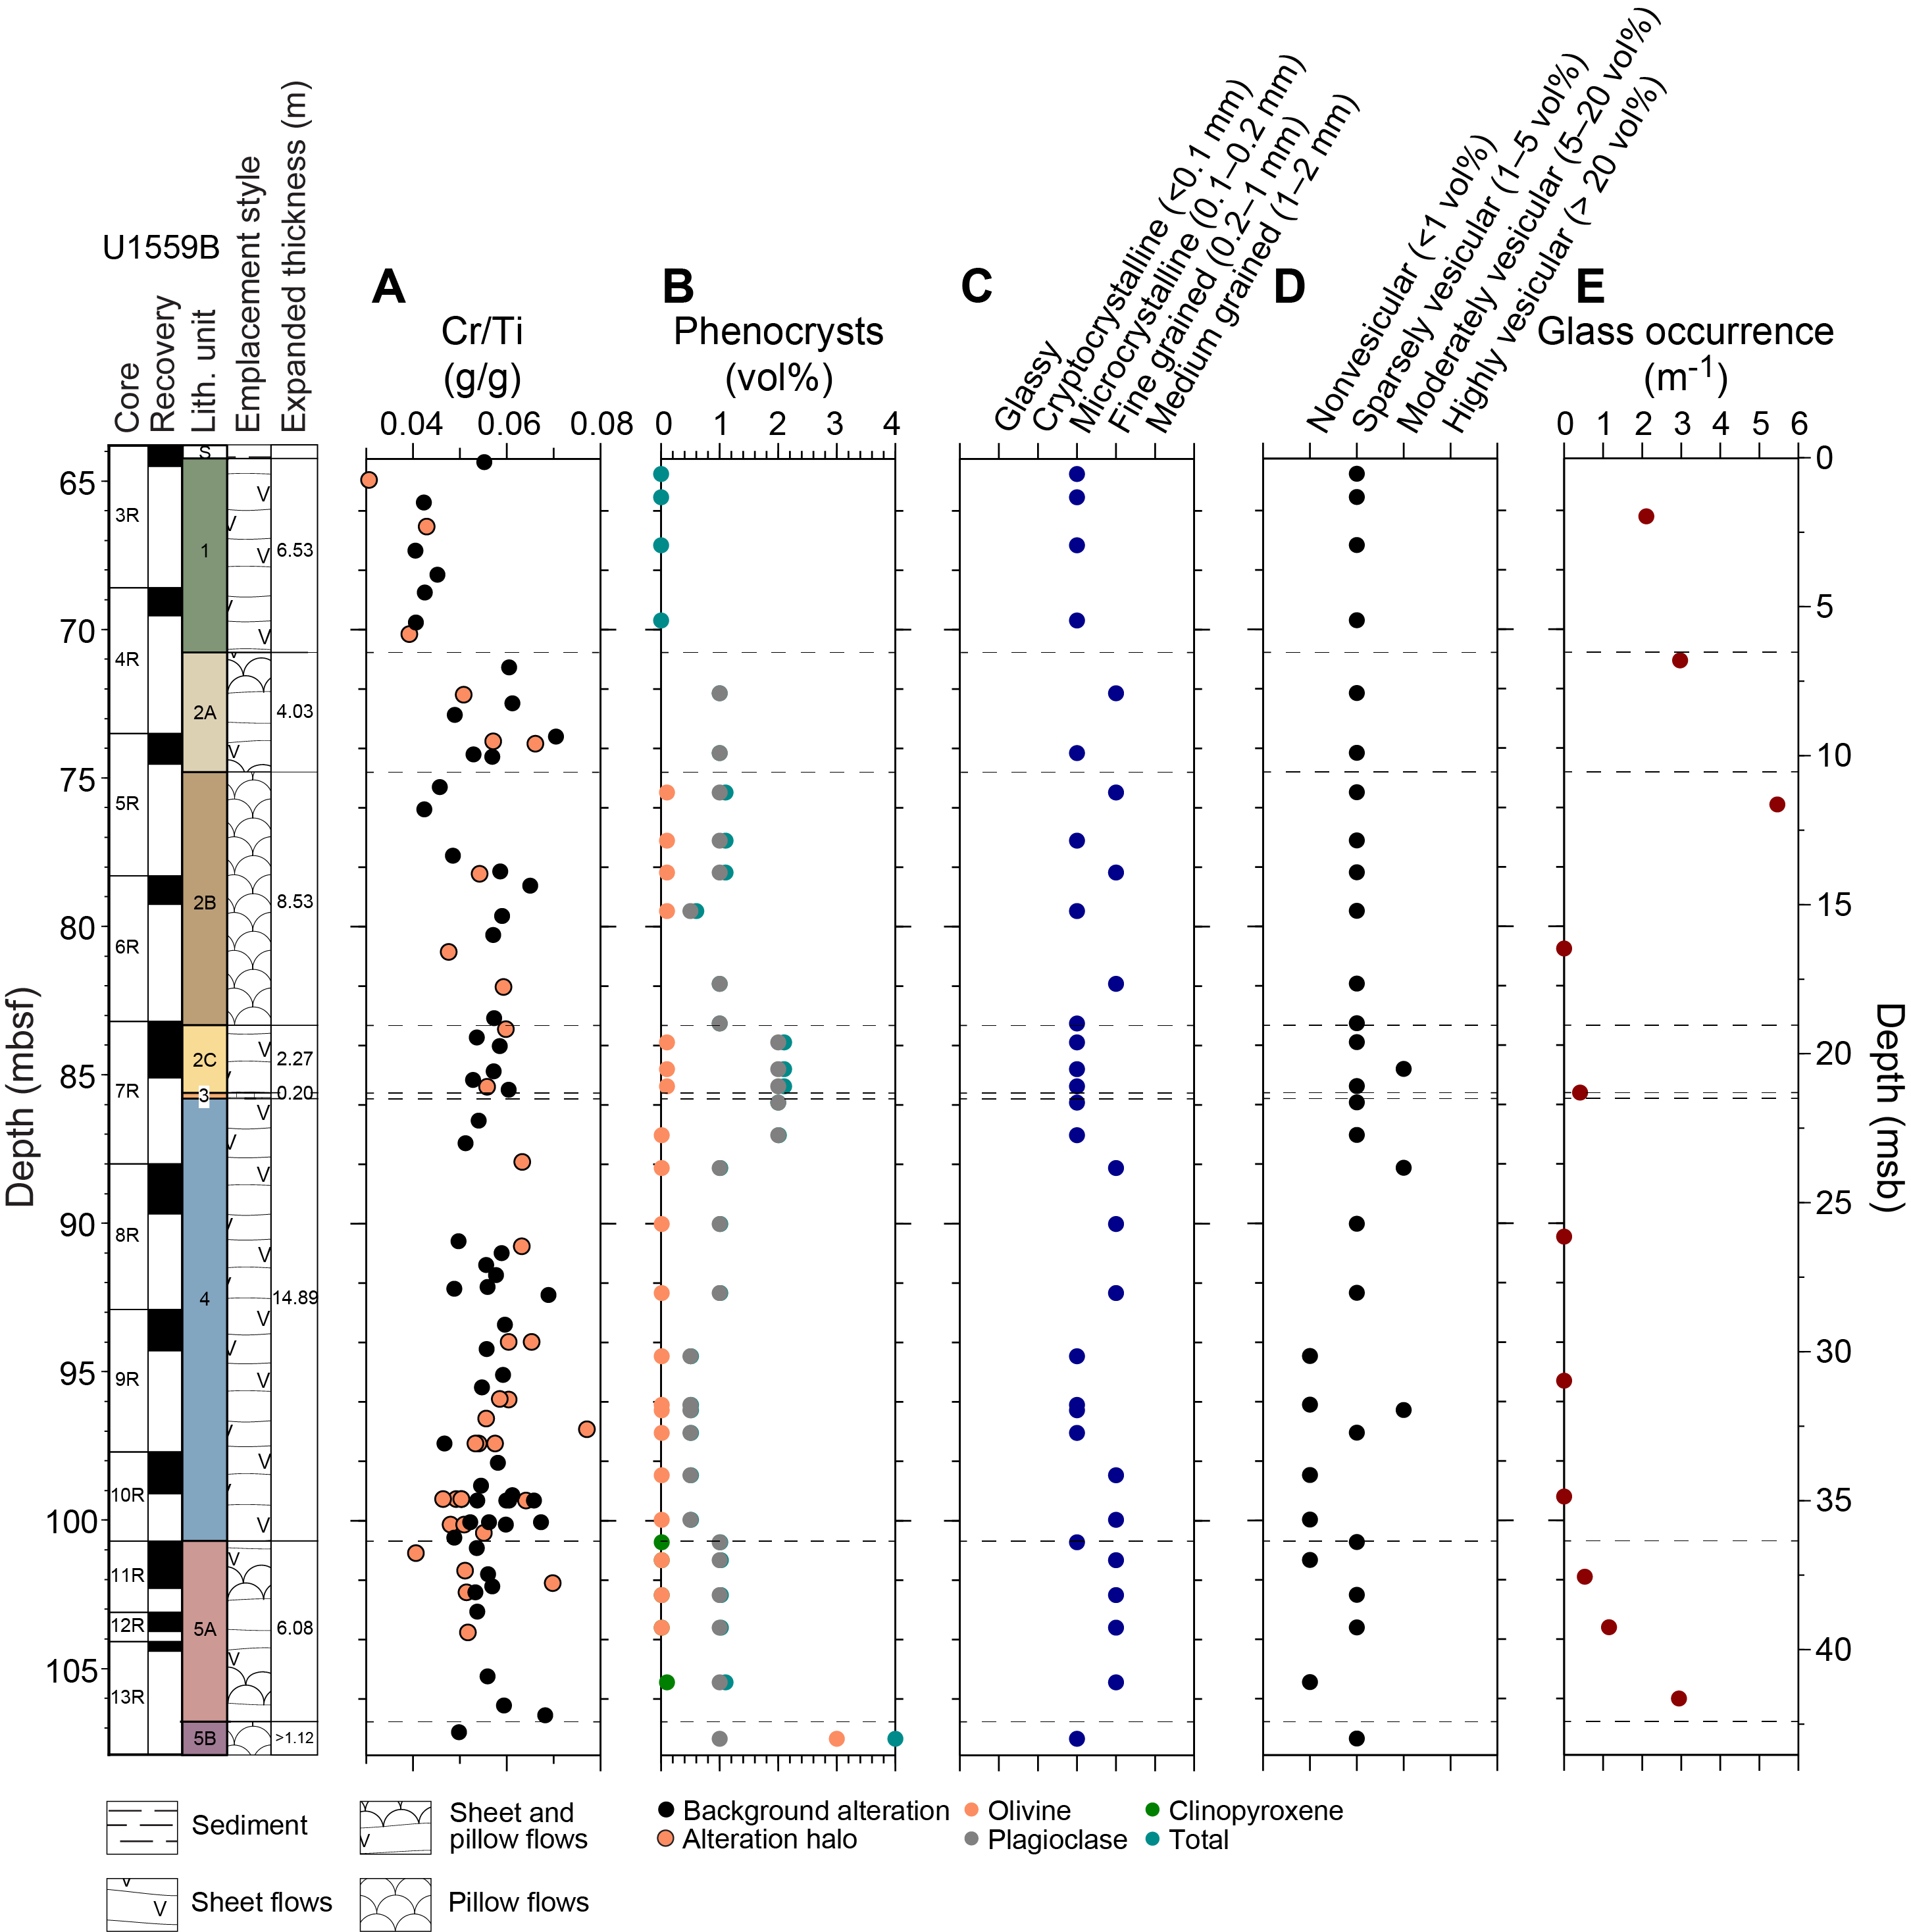
Figure F25. Macroscopic core observations.
5.3.1. Plagioclase
Apart from Unit 1, distinctive macroscopic plagioclase phenocrysts between 1 and 15 mm in length are common to all the volcanic units recovered from Site U1559. These plagioclase phenocrysts occur as single crystals (e.g., Figures F18D, F18E, F22A); glomerocrysts of multiple plagioclase crystals (e.g., Figure F19B); glomerocrysts with olivine in Subunit 2B, Unit 4, and Subunit 5A (e.g., Figure F19A); and glomerocrysts with clinopyroxene in Unit 5 (e.g., Figure F23C). Microscopically, subophitic glomerocrysts with clinopyroxene are relatively common in all of the phenocryst-bearing units.
The plagioclase phenocrysts themselves are generally fresh, equant to tabular, near universally twinned, and commonly exhibit subtle growth zoning. Large plagioclase phenocrysts also commonly contain abundant melt inclusions, a mixture of both glassy and polycrystalline inclusions with bubbles, typically found in the centers of crystals or along primary growth zones. Sieve textures and other less well-developed evidence for disequilibrium resorption of the cores of plagioclase crystals are common.
5.3.2. Olivine
Fresh olivine phenocrysts of 1–3 mm size occur extremely sparsely, with 3–6 examples visible on the external core surface per section in Subunit 2B, Unit 4, and Subunit 5A. No good examples of such coarse olivine were preserved after thin section preparation. Phenocrystic olivine is variably altered and oxidized, especially in dark or brown alteration halos, but fresh examples do occur throughout the hole. In thin section, altered or partially altered olivine pseudomorphs are readily recognizable by their characteristic orange clay–Fe oxyhydroxide alteration and equant, commonly hexagonal shape that is not intergrown with but may be attached to plagioclase phenocrysts. Fresh olivine phenocrysts are typically small (<0.1 mm), with an equant, hexagonal shape, characteristic parallel extinction, high relief along fractures, and conchoidal fracturing. Large examples contain rare ovoid glassy melt inclusions with bubbles.
5.3.3. Clinopyroxene
Macroscopic clinopyroxene phenocrysts are restricted to Unit 5 in Hole U1559B. They occur as both isolated, elongate prismatic crystals a few millimeters long and as complex intergrowths with plagioclase. Macroscopically, they are very dark brown to black with cleavage.
5.4. Groundmass phases
Groundmass mineralogy is relatively consistent throughout Hole U1559B, and the dominant phase is either plagioclase laths (e.g., Figure F19D), interstitial, mostly plumose clinopyroxene (e.g., Figure F18D), or glass (e.g., Figure F18C). Groundmass grain size of lava flow interiors shows variation downhole, fluctuating between cryptocrystalline and fine grained, with sheet flows coarser than pillow lavas (Figure F25). Plagioclase laths are universally unoriented but form radial clusters when the proportion of groundmass plagioclase is particularly high. Groundmass olivine is very similar throughout all volcanic units at Site U1559, occurring as small (0.01–0.2 mm) equant, isolated microlites with slightly varying abundance (1–3 vol%).
Groundmass clinopyroxene varies significantly in habit in response to average grain size changes, presumably resulting from the rapidity of seafloor quenching. In cryptocrystalline to microcrystalline basalts, groundmass clinopyroxene has a plumose texture of dense, feathery fibers (e.g., Figure F18D, F18E). It is only possible to identify these are clinopyroxene in cross-polarized light where the fibers coalesce into crystals at the bases of plumes large enough to exhibit characteristic birefringence colors. In cases where no such small crystals are visible, an inference of clinopyroxene is generally made on the basis of the similar plumose texture and the somewhat similar major element composition of augite to basaltic melt (cf. olivine and plagioclase). Assessing to what extent plumose clinopyroxene groundmass is altered is challenging because it exhibits different shades of brown that are similar to many clay minerals.
In microcrystalline to fine-grained basalts, groundmass clinopyroxene occupies the interstitial space between plagioclase laths (Figure F17E). Where groundmass clinopyroxene is particularly abundant and more coarsely crystalline, this interstitial texture approaches subophitic character with clinopyroxene partially enclosing plagioclase laths (Figure F19D, F19F).
Fe(-Ti) oxides are ubiquitous in Hole U1559B but occur in the groundmass as micrometer-scale single crystals occupying the final interstitial position, either in the mesostasis or at the feathery tips of plumose clinopyroxenes. No primary magmatic sulfides were observed in Hole U1559B despite screening of all sections in reflected light.
5.5. Chilled flow margins
Chilled and glassy flow margins are relatively uncommon in Hole U1559B compared to other SAT sites, with long intervals of sheet flows with no glass recovered (Unit 4) but 1–5 glass occurrences per meter of recovered core in Units 1, 2, and 5 (Figure F25E). Some of these margins are notably planar, and these examples also tend to be thin, transitioning from outer margin to flow interior background grain size over ~1 cm. These were generally interpreted to be sheet flow margins. Other margins were curved and interpreted to be pillow flow margins. These tend to be thicker (>1 cm), perhaps due to more rapid cooling of small pillow flows (Figures F18B, F24).
Complete chilled margins consist of an outer selvage of glass, in which phenocrystic plagioclase, olivine, and clinopyroxene may be sparsely enclosed in glass (Figure F18B). Glassy margins seldom escaped at least incipient alteration to brownish yellow clays along margin-parallel cracks between different bands of the chilled margin.
The transition from glassy flow exterior to holocrystalline flow interior occurs over 1–2 cm. Typically about 1 cm below the exterior surface, interstitial glass gives way to interstitial plumose clinopyroxene. This transition is sharp but extremely irregular in shape, occurring as spherules around microlites that become larger and more common until they coalesce into 100% cryptocrystalline groundmass (Figure F18C).
5.6. High-resolution chemostratigraphy
A total of 97 rock surface locations on the archive halves of Hole U1559B volcanic basement cores were measured by pXRF. These measurements were made at locations with apparently background levels of alteration and also from alteration halos around veins or flow margins. This allowed both primary igneous compositions and chemical perturbations related to hydrothermal alteration to be considered downhole. Of the locations measured, 61 were from the background-level alteration areas and the remaining 36 were from undifferentiated orange, brown, or other types of alteration halos (Table T7).
5.6.1. Variation with depth
Key major and trace element concentrations and ratios are relatively uniform with depth downhole throughout Units 2–5 but change across the Unit 1/2 boundary (Figure F26). Concentrations of the compatible element Cr are lower in Unit 1 than in underlying units, whereas the incompatible elements Ti and Zr are distinctly higher in Unit 1; this is most clearly expressed in Cr/Ti ratio variations (Figure F26A). This difference suggests that the final volcanic episode at Site U1559 recorded by Unit 1 was more evolved than the lower units and corroborates the petrologic identification of the Unit 1/2 boundary. The geochemical uniformity of Units 2–5 is perhaps not surprising, given the distinctive large plagioclase phenocrysts common to these units and only subtle variations in minor phenocrysts. Elevated Ti, Zr, and Fe in the single analysis from Subunit 5B suggests this subunit may have a different composition from Subunit 5A, which would be consistent with its anomalous, olivine-plagioclase-phyric texture.
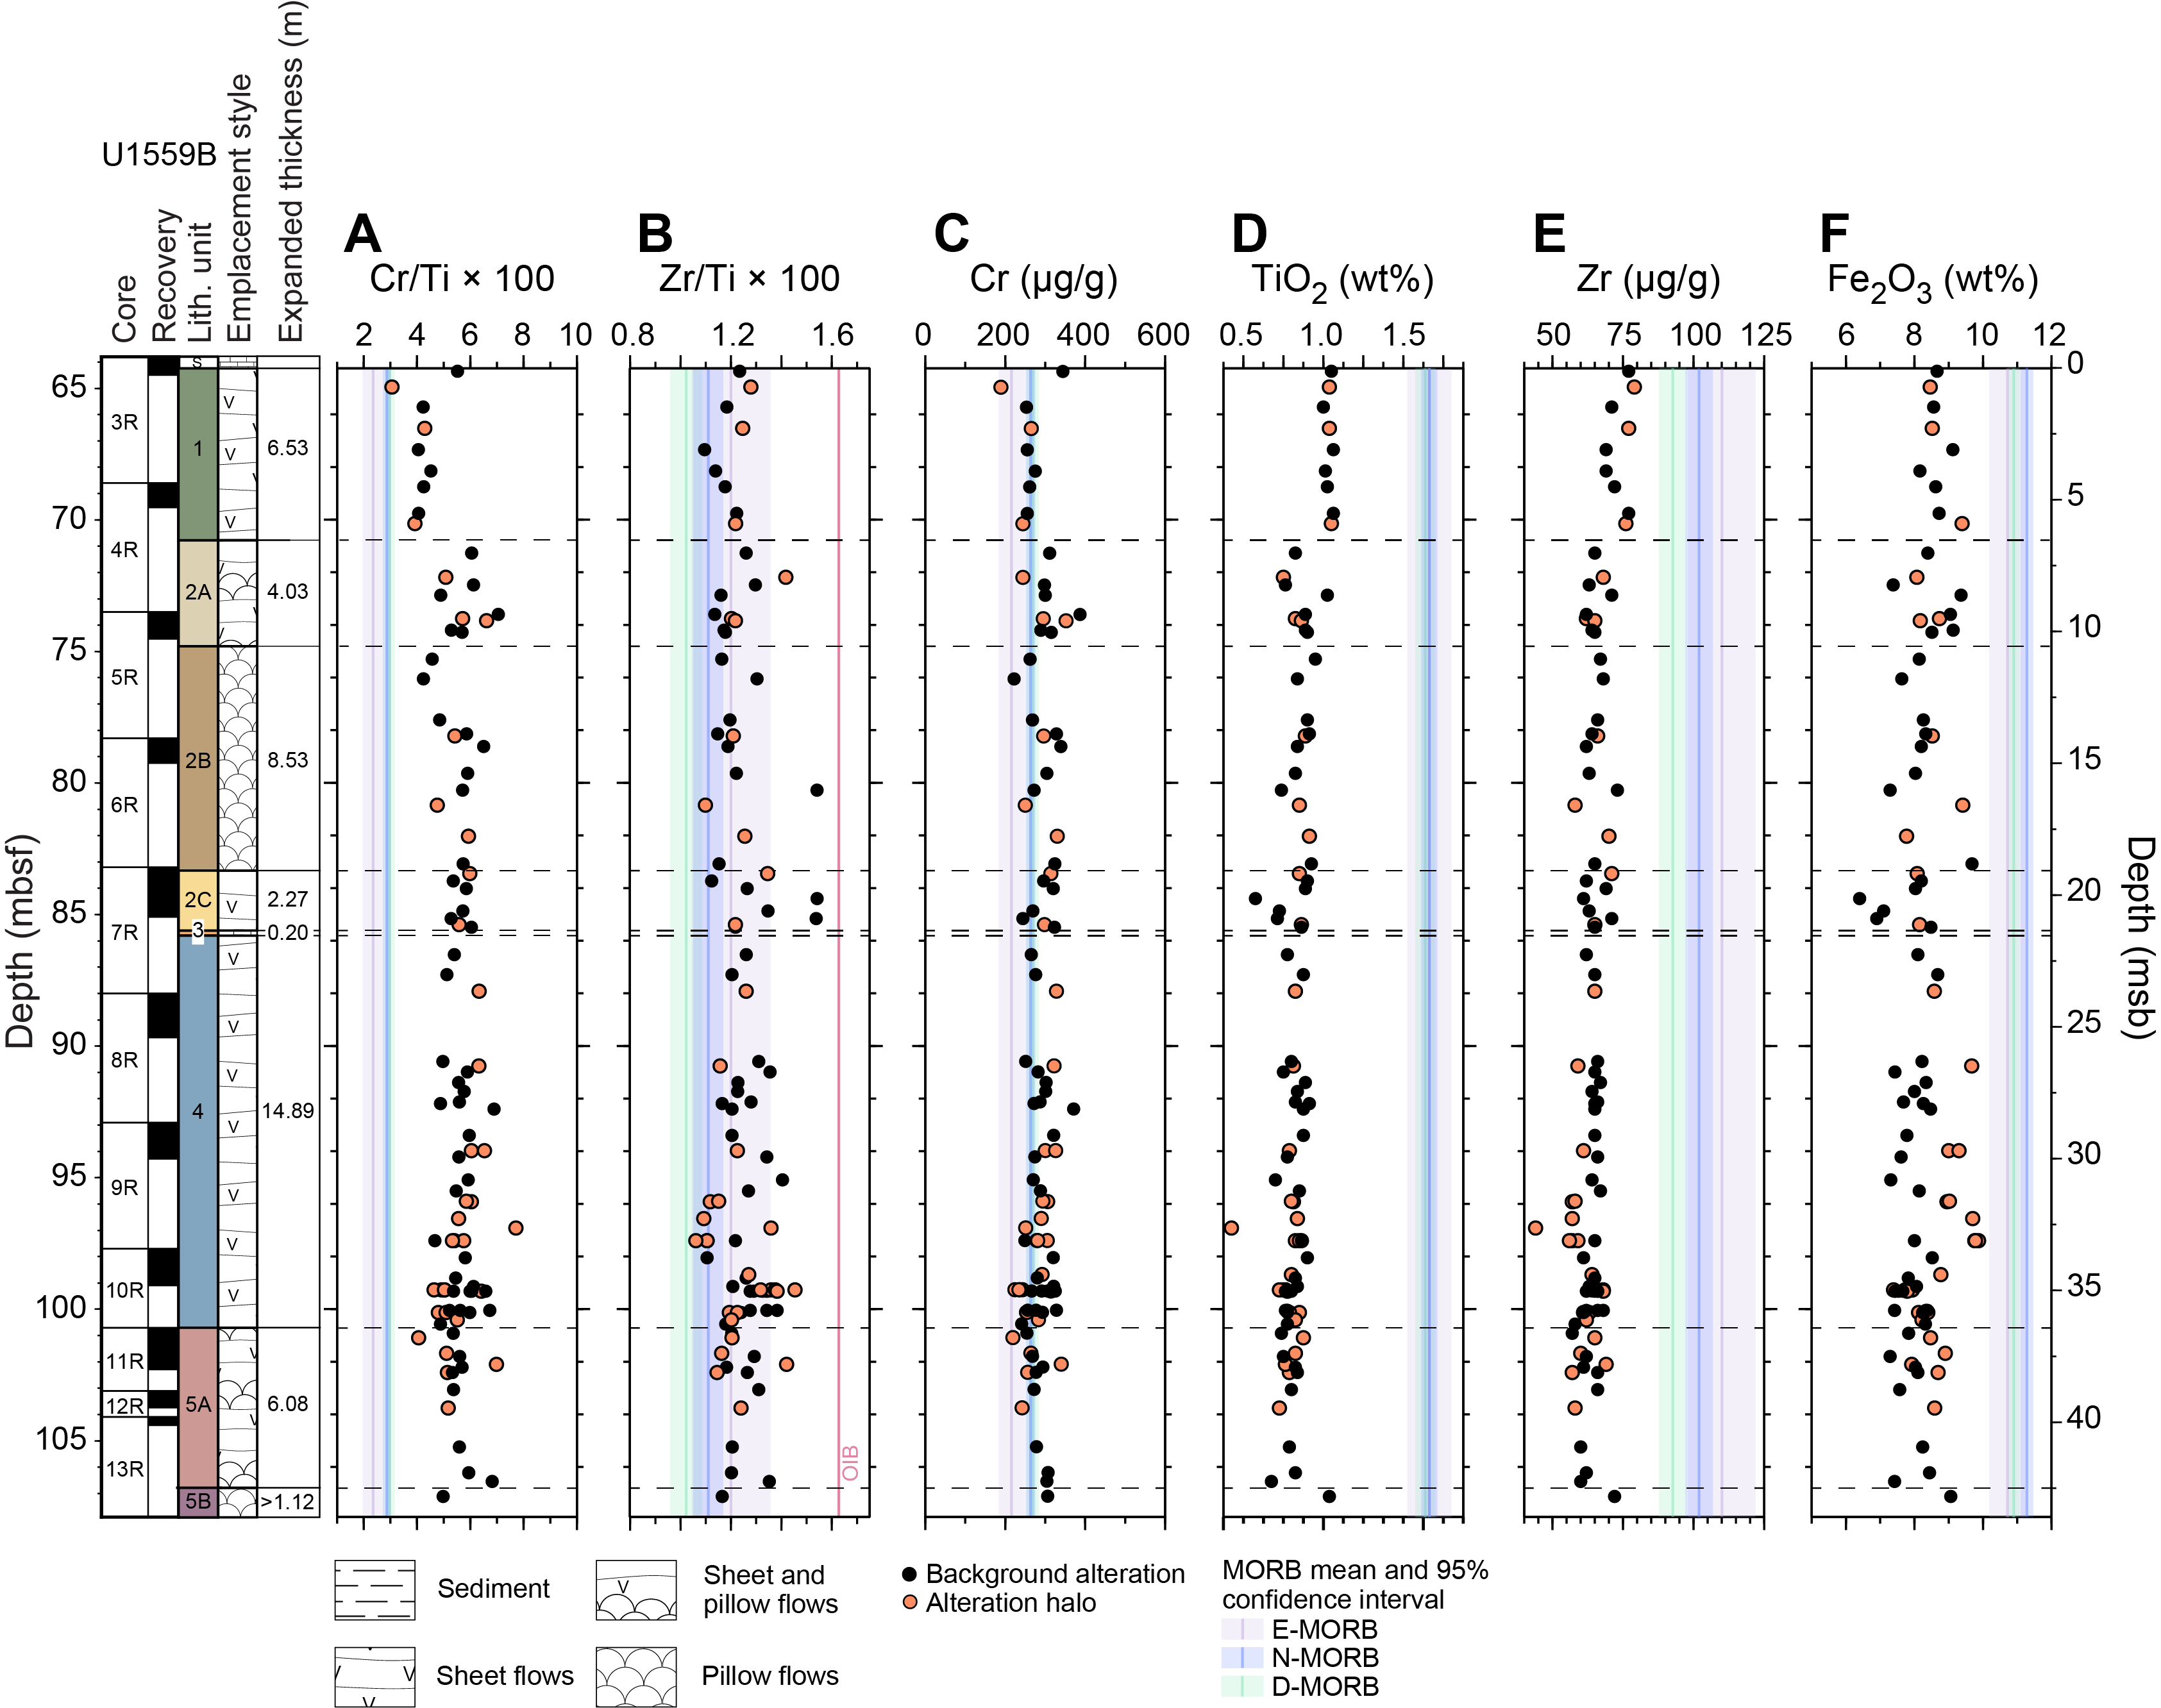
Figure F26. Major and trace element concentrations and ratios.
Zr/Ti ratios are uniform downhole with no major changes across unit boundaries, consistent with a N-MORB-like composition for all the lavas in Hole U1559B (Figure F26B). However, Cr is relatively high and Fe, Ti, and Zr are relatively low in comparison to N-MORB throughout the hole (see Basement in Geochemistry for additional results and interpretation of discrete samples).
5.7. Summary
Both basal sediments and volcanic basement were recovered in Holes U1559D, U1559A, and U1559B. Only Hole U1559B advanced deeply into basement, reaching 107.9 mbsf or 42.9 msb (DSF scale), recovering 12.73 m of volcanic rocks (30%).
The basement was divided into five lithologic units comprising four main volcanic units and one thin sedimentary unit. Two of the four volcanic units were divided into a total of five subunits. These divisions were made on the basis of volcanic emplacement style and mostly subtle changes in phenocryst assemblages.
The interpretation of significant intervals of sheet flows is somewhat atypical for a slow-spreading ridge. Given the poor recovery, however, it is possible some sections of pillow basalts or breccia were not recovered. This potentially biased recovery must be carefully considered by subsequent studies seeking to compare hydrothermal exchange between this hole and other holes along the SAT.
Distinctive sparse macroscopic plagioclase phenocrysts are common to all the volcanic units apart from aphyric Unit 1. The boundary between Units 1 and 2 also corresponds to the only significant step in primary geochemistry downhole, with Unit 1 being higher in Cr and lower in Ti, Zr, and Fe than Units 2–5, indicating the final lavas erupted at Site U1559 (Unit 1) were more evolved than those in the underlying 40 m that was sampled during Expedition 393. Zr/Ti ratios, which overlap with N-MORB, are uniform across all the volcanic units. This consistency suggests that all of the lithologic units in Hole U1559B belong to a single co-magmatic MORB sequence with subtle internal variations related to fractional crystallization and other magma chamber processes.
6. Alteration petrology
The basement rocks recovered from Site U1559 all preserve evidence of reaction to varying extents with seawater-derived hydrothermal fluids. This alteration is manifest as secondary minerals in three main contexts: (1) replacing interstitial mesostasis and glass, (2) replacing groundmass and phenocrysts, and (3) precipitating in open porosity to partially or completely fill fractures (to form veins) and vesicles. These three manifestations occur in a range of spatial contexts in Site U1559 basement, namely background alteration representing fluid/rock reaction that has pervasively permeated the bulk rock and alteration halos that are generally related to previous open porosity that has facilitated more extensive fluid/rock reaction (e.g., around veins and vugs or along igneous margins). The replacement minerals and styles and intensity of alteration, along with the secondary minerals precipitated in veins and vesicles, provide a record of the hydrothermal alteration taking place in the first 6.6 My of crustal aging. There is generally less alteration at Site U1559 compared to other (older) SAT sites.
This section primarily focuses on the cores recovered from Hole U1559B during Expedition 393, but these observations are consistent with alteration observed in the limited amount of basalt from the companion sediment holes that recovered the sediment/basement interface (Expedition 390C Hole U1559A and Expedition 390 Hole U1559D). Hole U1559B is dominated by background alteration with varying types and abundances of halos and veins downhole (Figure F27). No breccias were recovered in Hole U1559B.
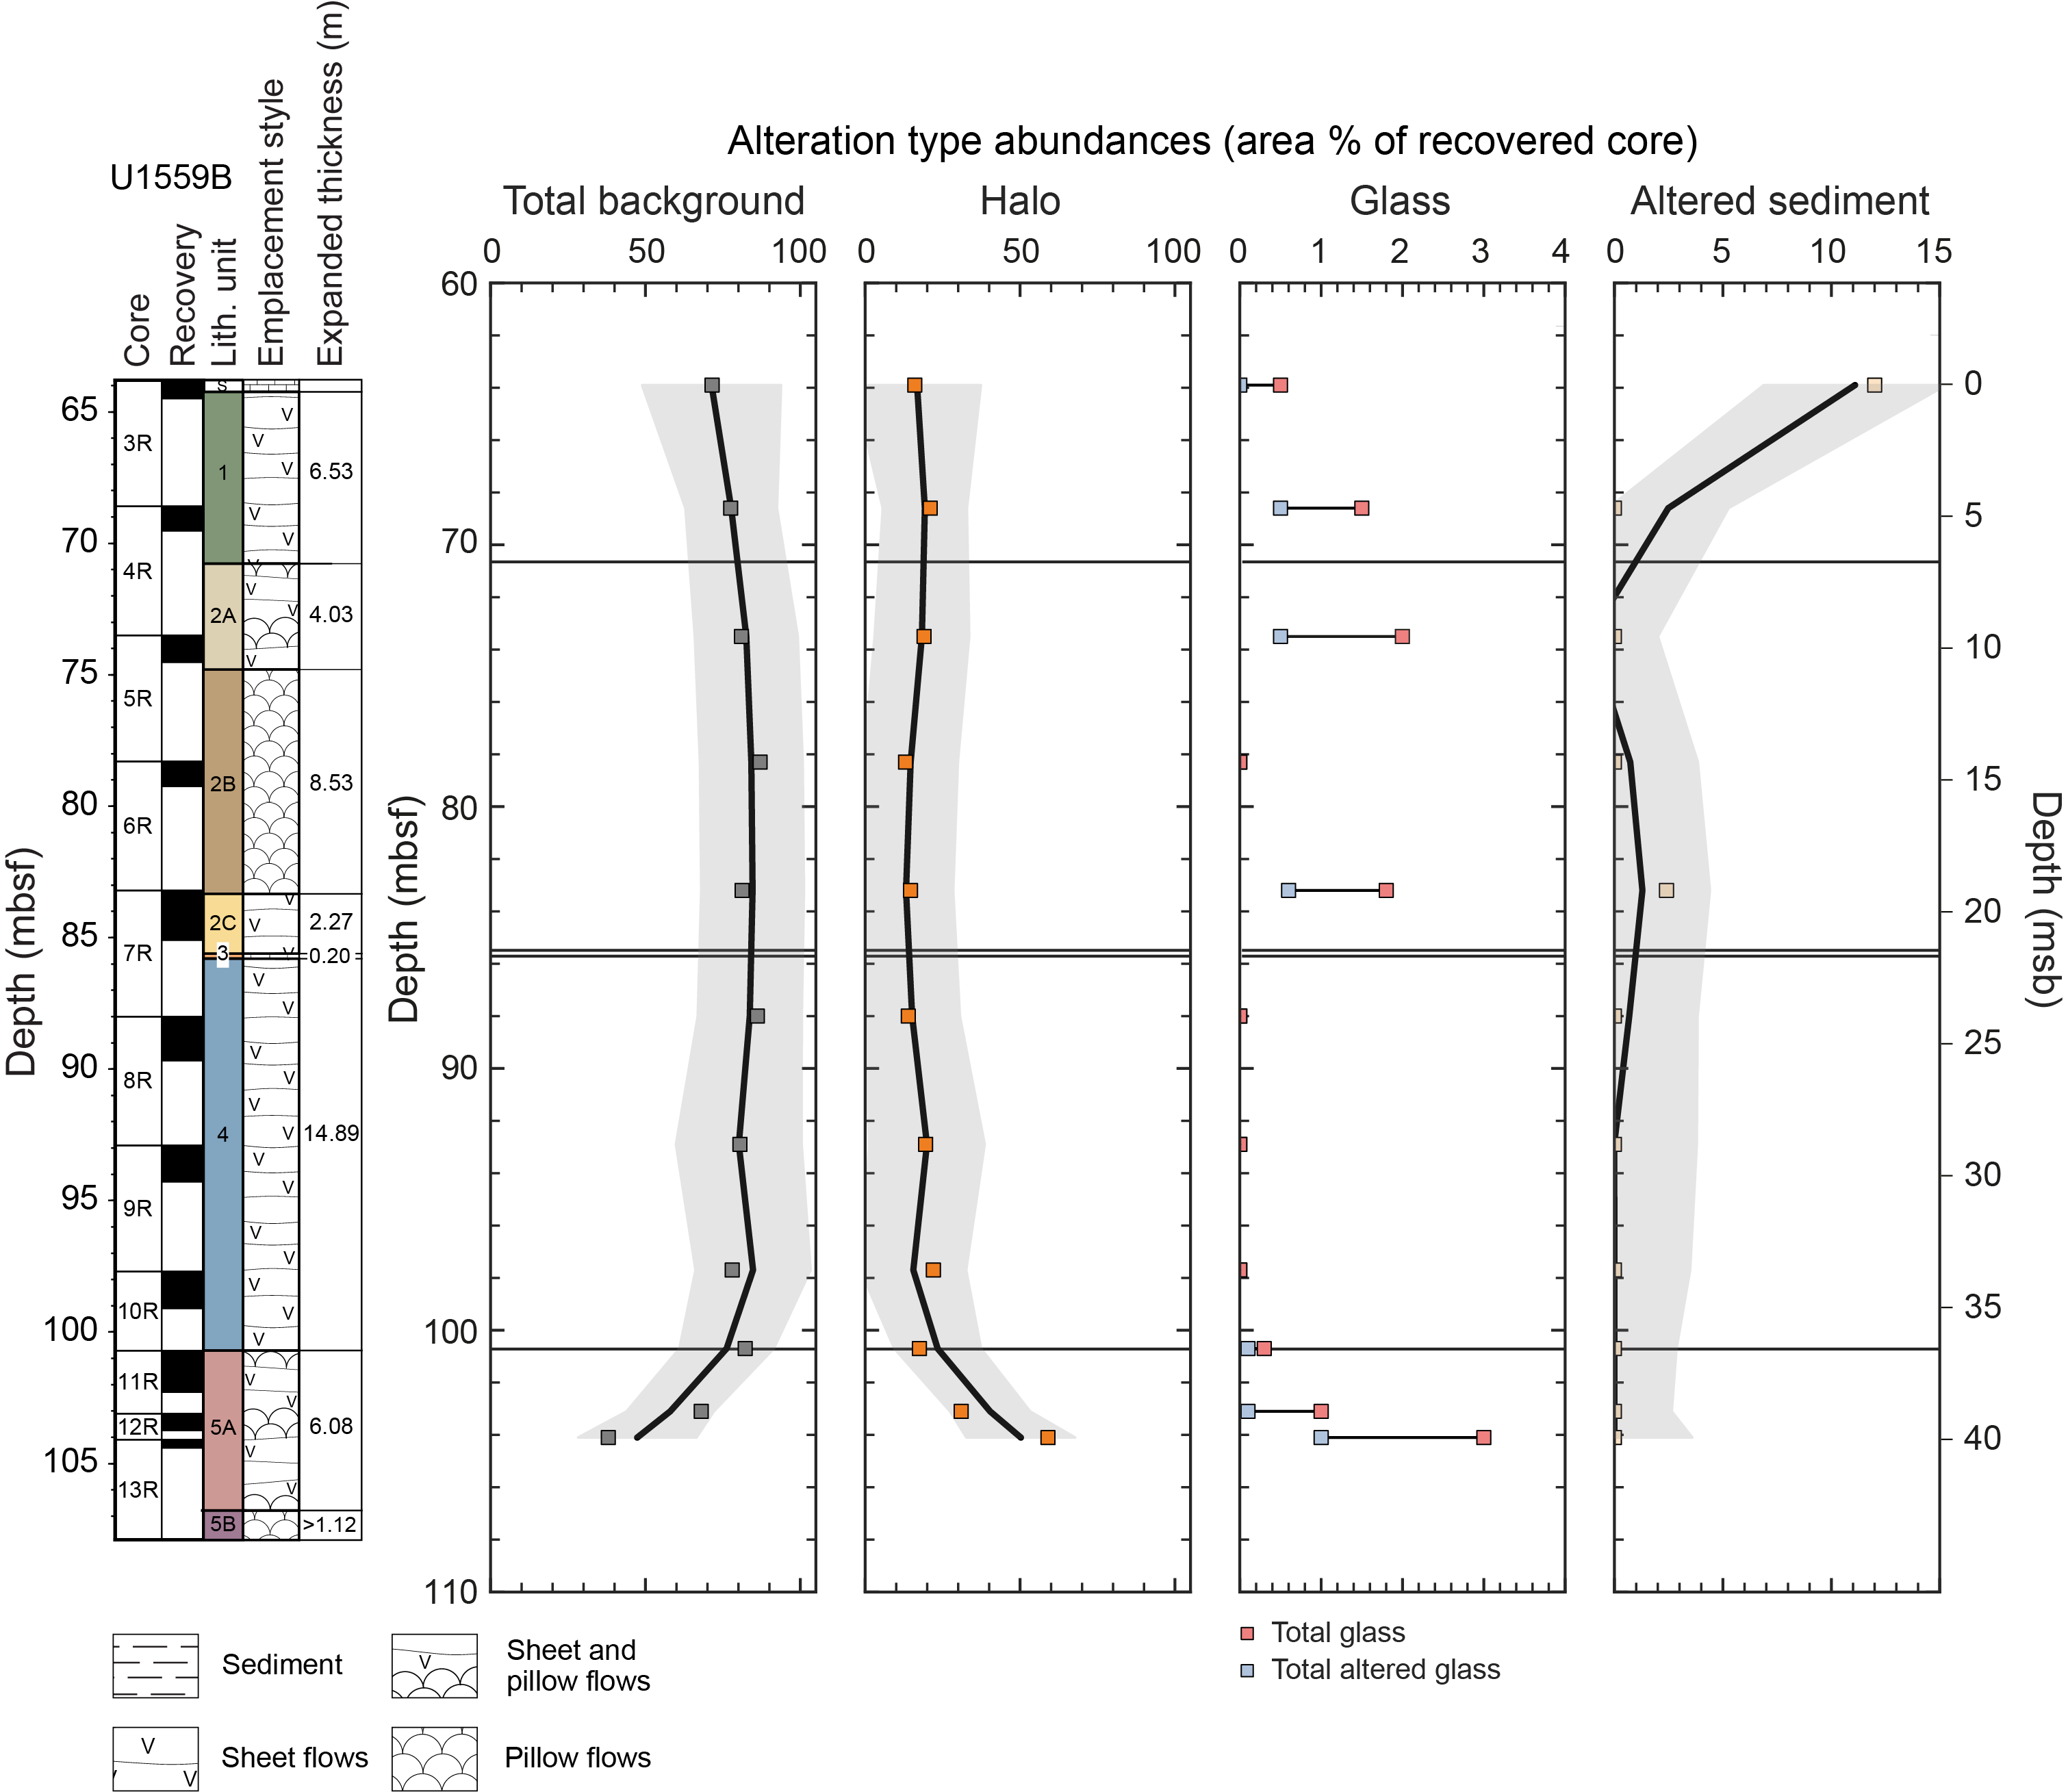
Figure F27. Alteration overview.
6.1. Alteration of glass
Volcanic glass is found at various depths in Hole U1559B (see Igneous petrology for further details) as chilled margins of sheet flows and pillow lavas and as volcanic glass cemented in indurated calcareous sediment at the sediment/basement interface. The latter is also present in the sediment/basement interface recovered in Hole U1559A. In Sections 390C-U1559A-9X-1 and 393-U1559B-7X-CC, there is a vertical chilled contact between basaltic glass and lithified sediment that spans several core pieces (see Igneous petrology) along which the volcanic glass is completely altered to orange clays. Although much of the glass in Hole U1559B is vitreous and impressively fresh, in all cases the glass exhibits partial alteration to a range of clay minerals from orange to dark orange (5YR 5/6 yellowish red, 5YR 6/6 reddish yellow, and 5YR 6/8 reddish yellow). The intensity of alteration is estimated at 10%–50%. A recurring feature with the orange glass alteration is the presence of margin-parallel veins, commonly filled with carbonate phases, which cause the glass to partially delaminate from the chilled margins (Figure F28).
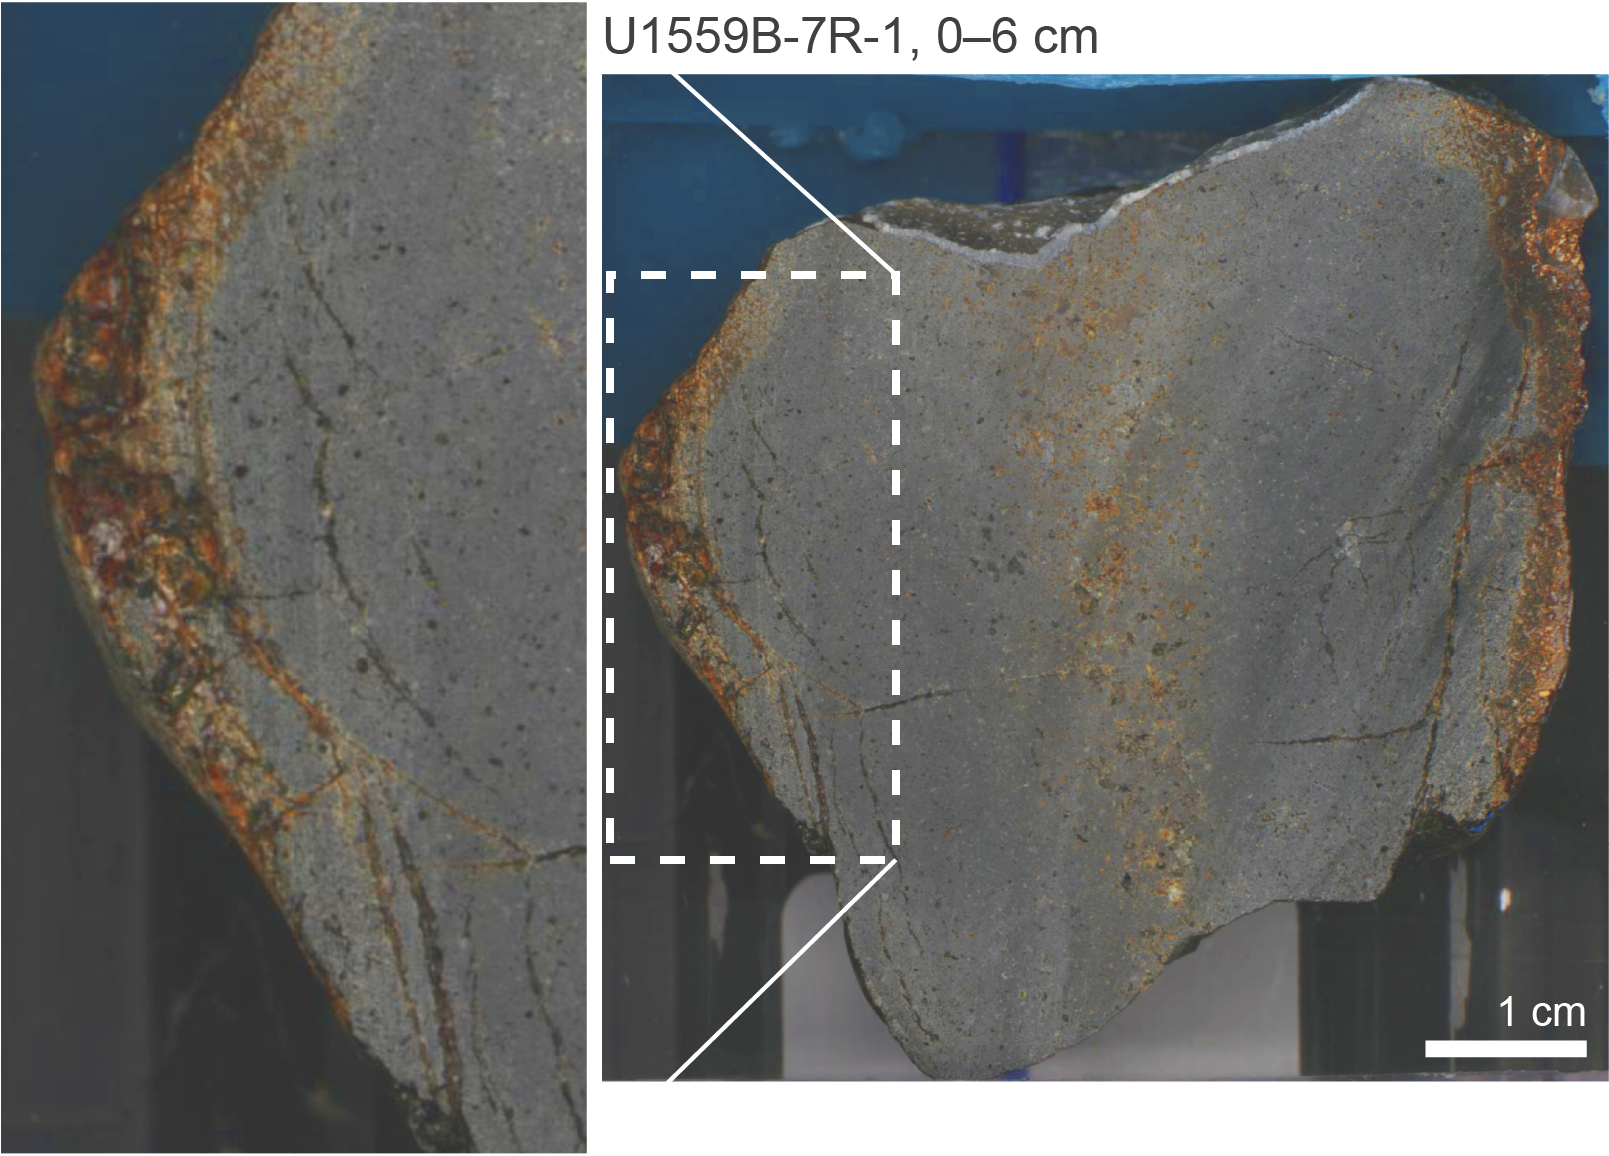
Figure F28. Glassy chilled margin.
6.2. Background alteration
Background alteration in Hole U1559B is ubiquitous and occurs as two types that are distinguished by color: (1) gray background and (2) orange speckled background that arises from the targeted alteration and oxidation of olivine phenocrysts in some lavas. Gray background alteration dominates, whereas orange speckled background alteration occurs most commonly toward the base of the hole (Figure F29) and is generally less intense than orange speckled background found in Holes U1560B, U1583F, U1558D, and U1556B. On average, background alteration represents 77% of the area of the recovered core, with a range of 38%–87% (Figure F27). Below 100 mbsf, the area percentage of background alteration decreases. Throughout this interval, core advances were shorter and recovery was relatively higher, so this is interpreted to be a real decrease. This could either indicate variability in the alteration that has been lost higher in the hole because of low recovery or reflect the change in the relative proportions of background alteration and alteration halos with depth in the hole. The intensity of background alteration (percentage of secondary minerals present) is broadly the same downhole.
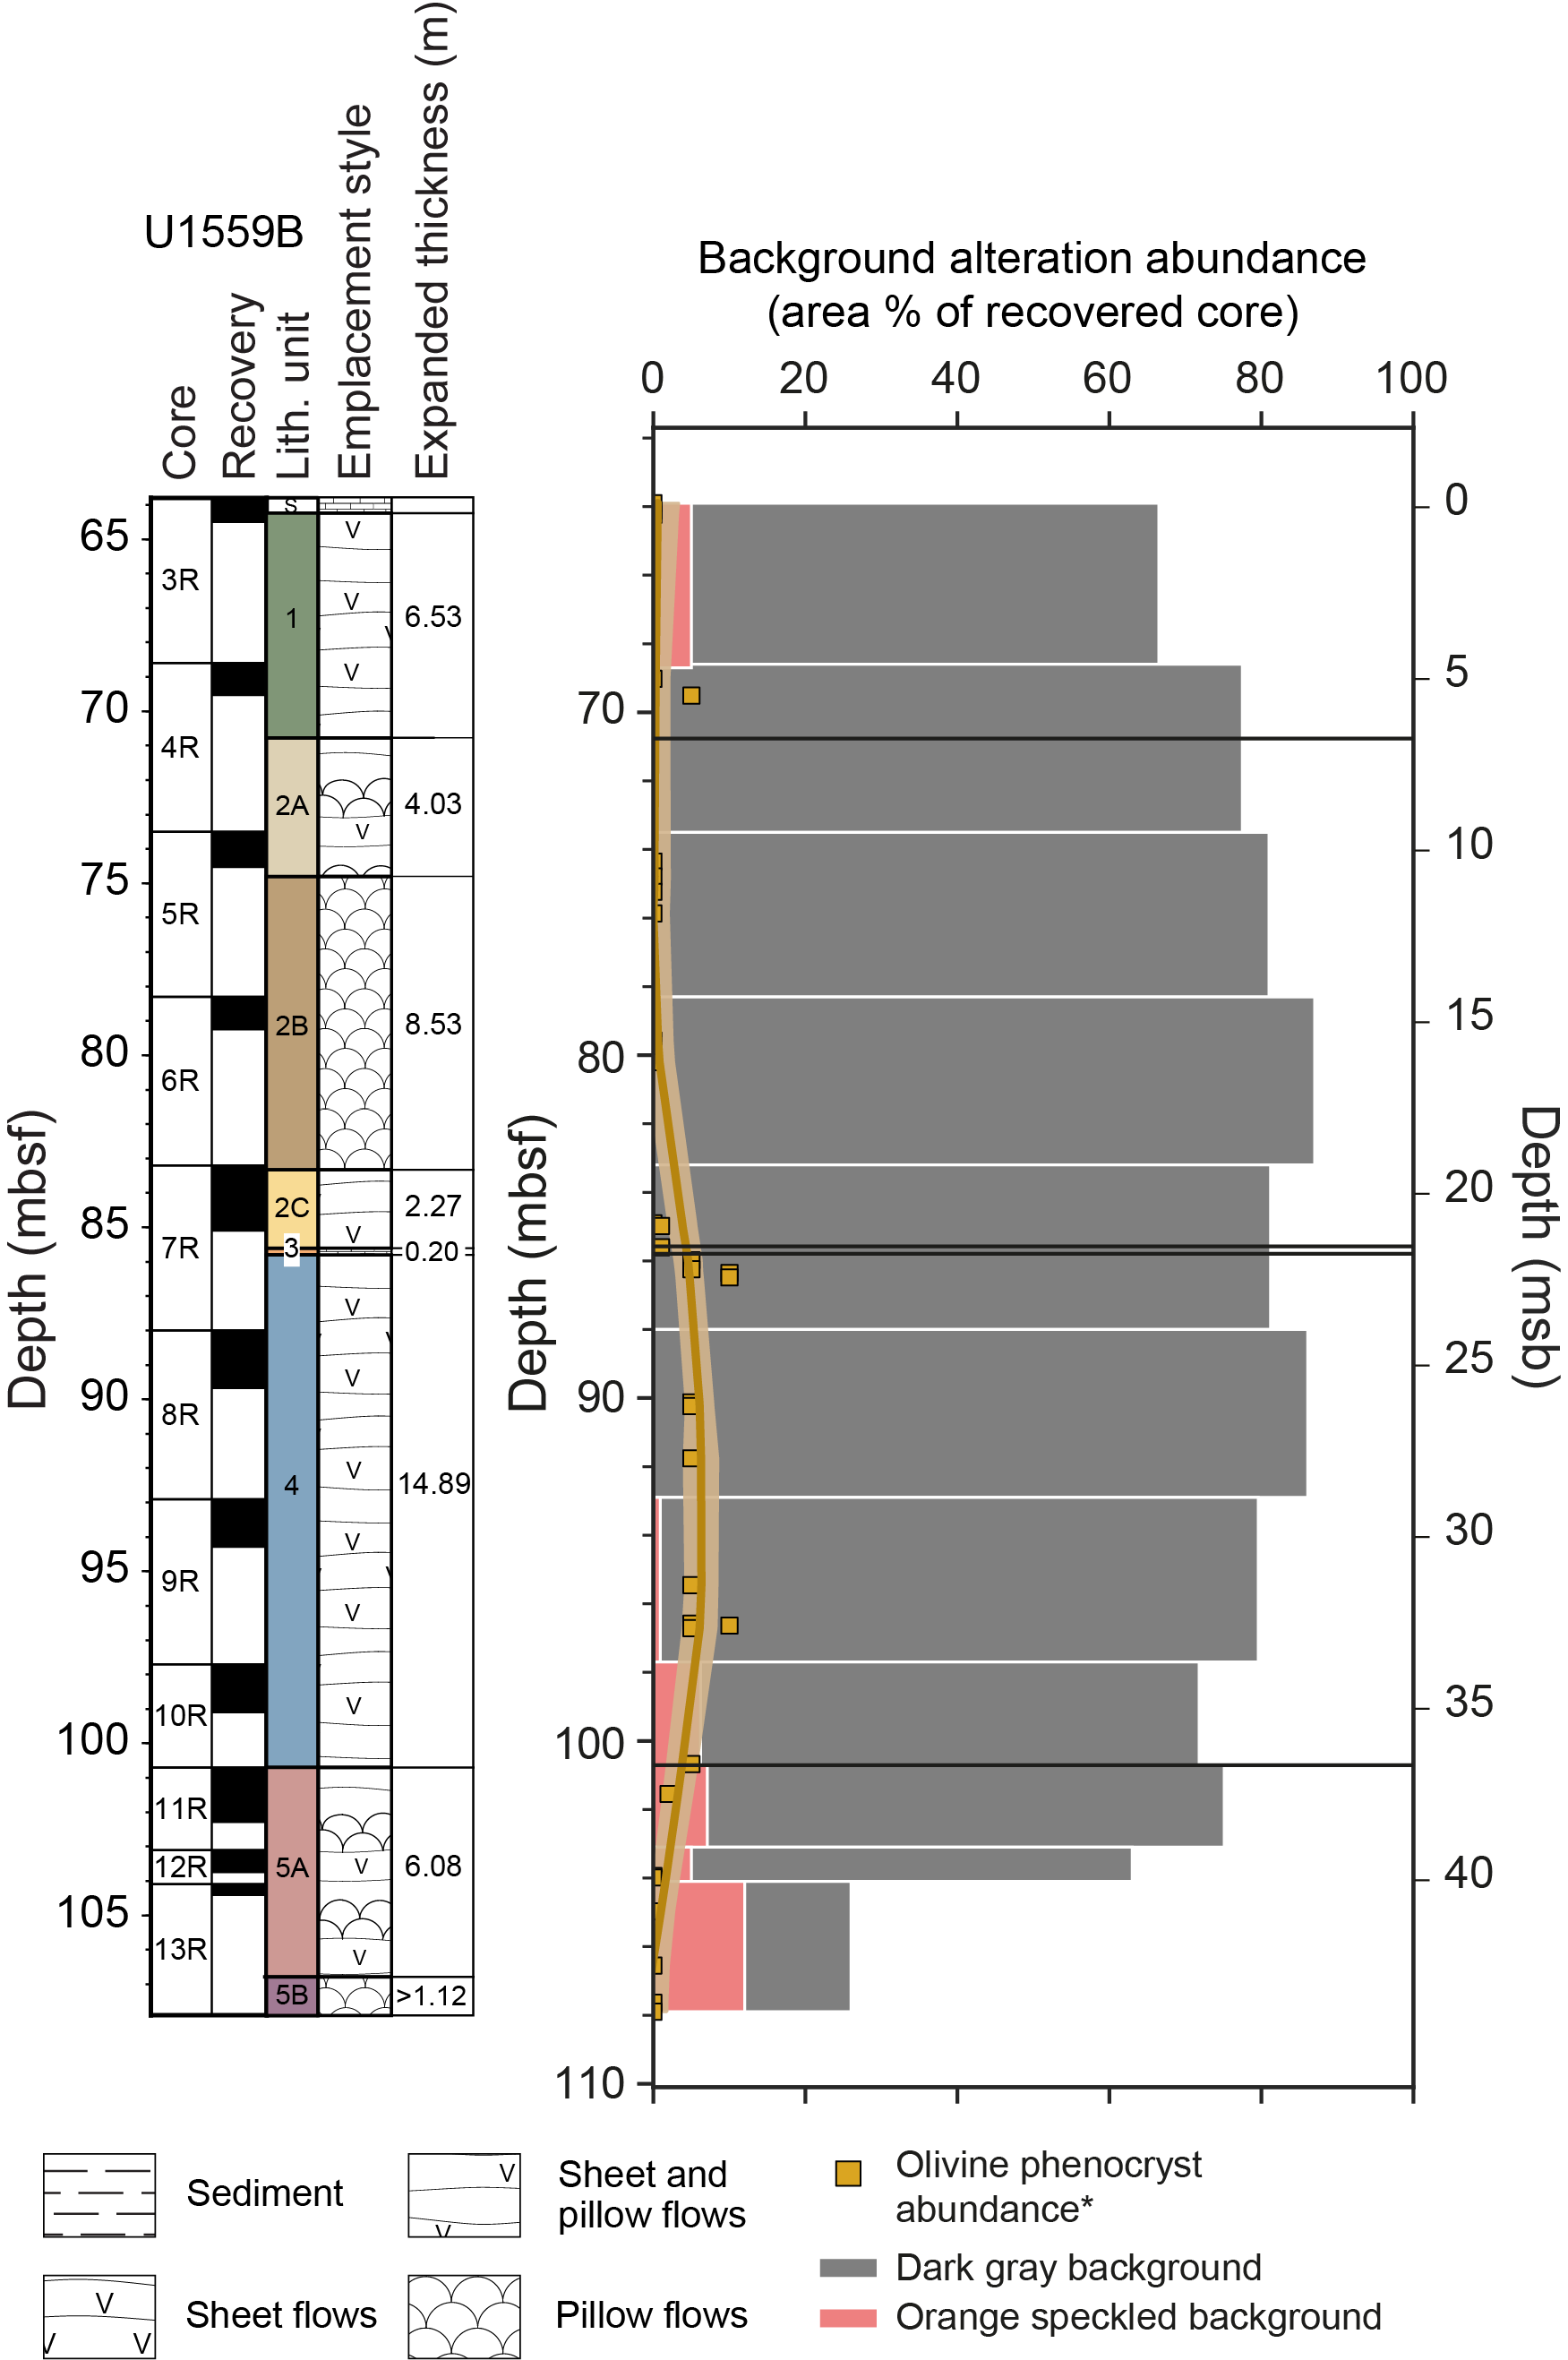
Figure F29. Distribution of background alteration types.
6.2.1. Gray background
Gray background alteration is present in all cores from Hole U1559B and is characterized by a uniform light gray color on a cut surface (GLEY 1 5/N gray) (Figure F30). Macroscopically, no major change in the intensity of alteration is observed in relation to changes in primary igneous lithology or groundmass grain size. Where large plagioclase phenocrysts are present (e.g., Unit 4), some exhibit a dark gray to milky white appearance in hand specimen. In thin section, gray background alteration displays patchy partial alteration of mesostasis and groundmass to brown–dark brown clays, most probably Mg-saponite (Figure F30). Replacement of primary igneous phases is pseudomorphic, and there is little degradation of primary igneous textures. Alteration intensity is relatively uniform throughout all thin sections of background alteration and is visually estimated as 10%–26%. Plagioclase phenocrysts show only rare indications of alteration within regions of background alteration. Rare clinopyroxene phenocrysts are also unaltered in the background. In contrast, olivine phenocrysts display the complete range from minimal alteration to complete pseudomorphic replacement by clays (± Fe oxyhydroxides) and/or, more commonly, calcium carbonate (Figure F31). Vesicles in gray background alteration are mostly unfilled, but where they are partially filled it is most commonly with thin <100 µm lining of clay minerals (Figure F32). In some places, these lined vesicles have calcium carbonate filling the remainder of the vesicle. Pyrite-filled vesicles are present in Section 393-U1559B-9R-2. The overall sequence of fills proceeds from clay lining to clay ± Fe oxyhydroxides to carbonate.
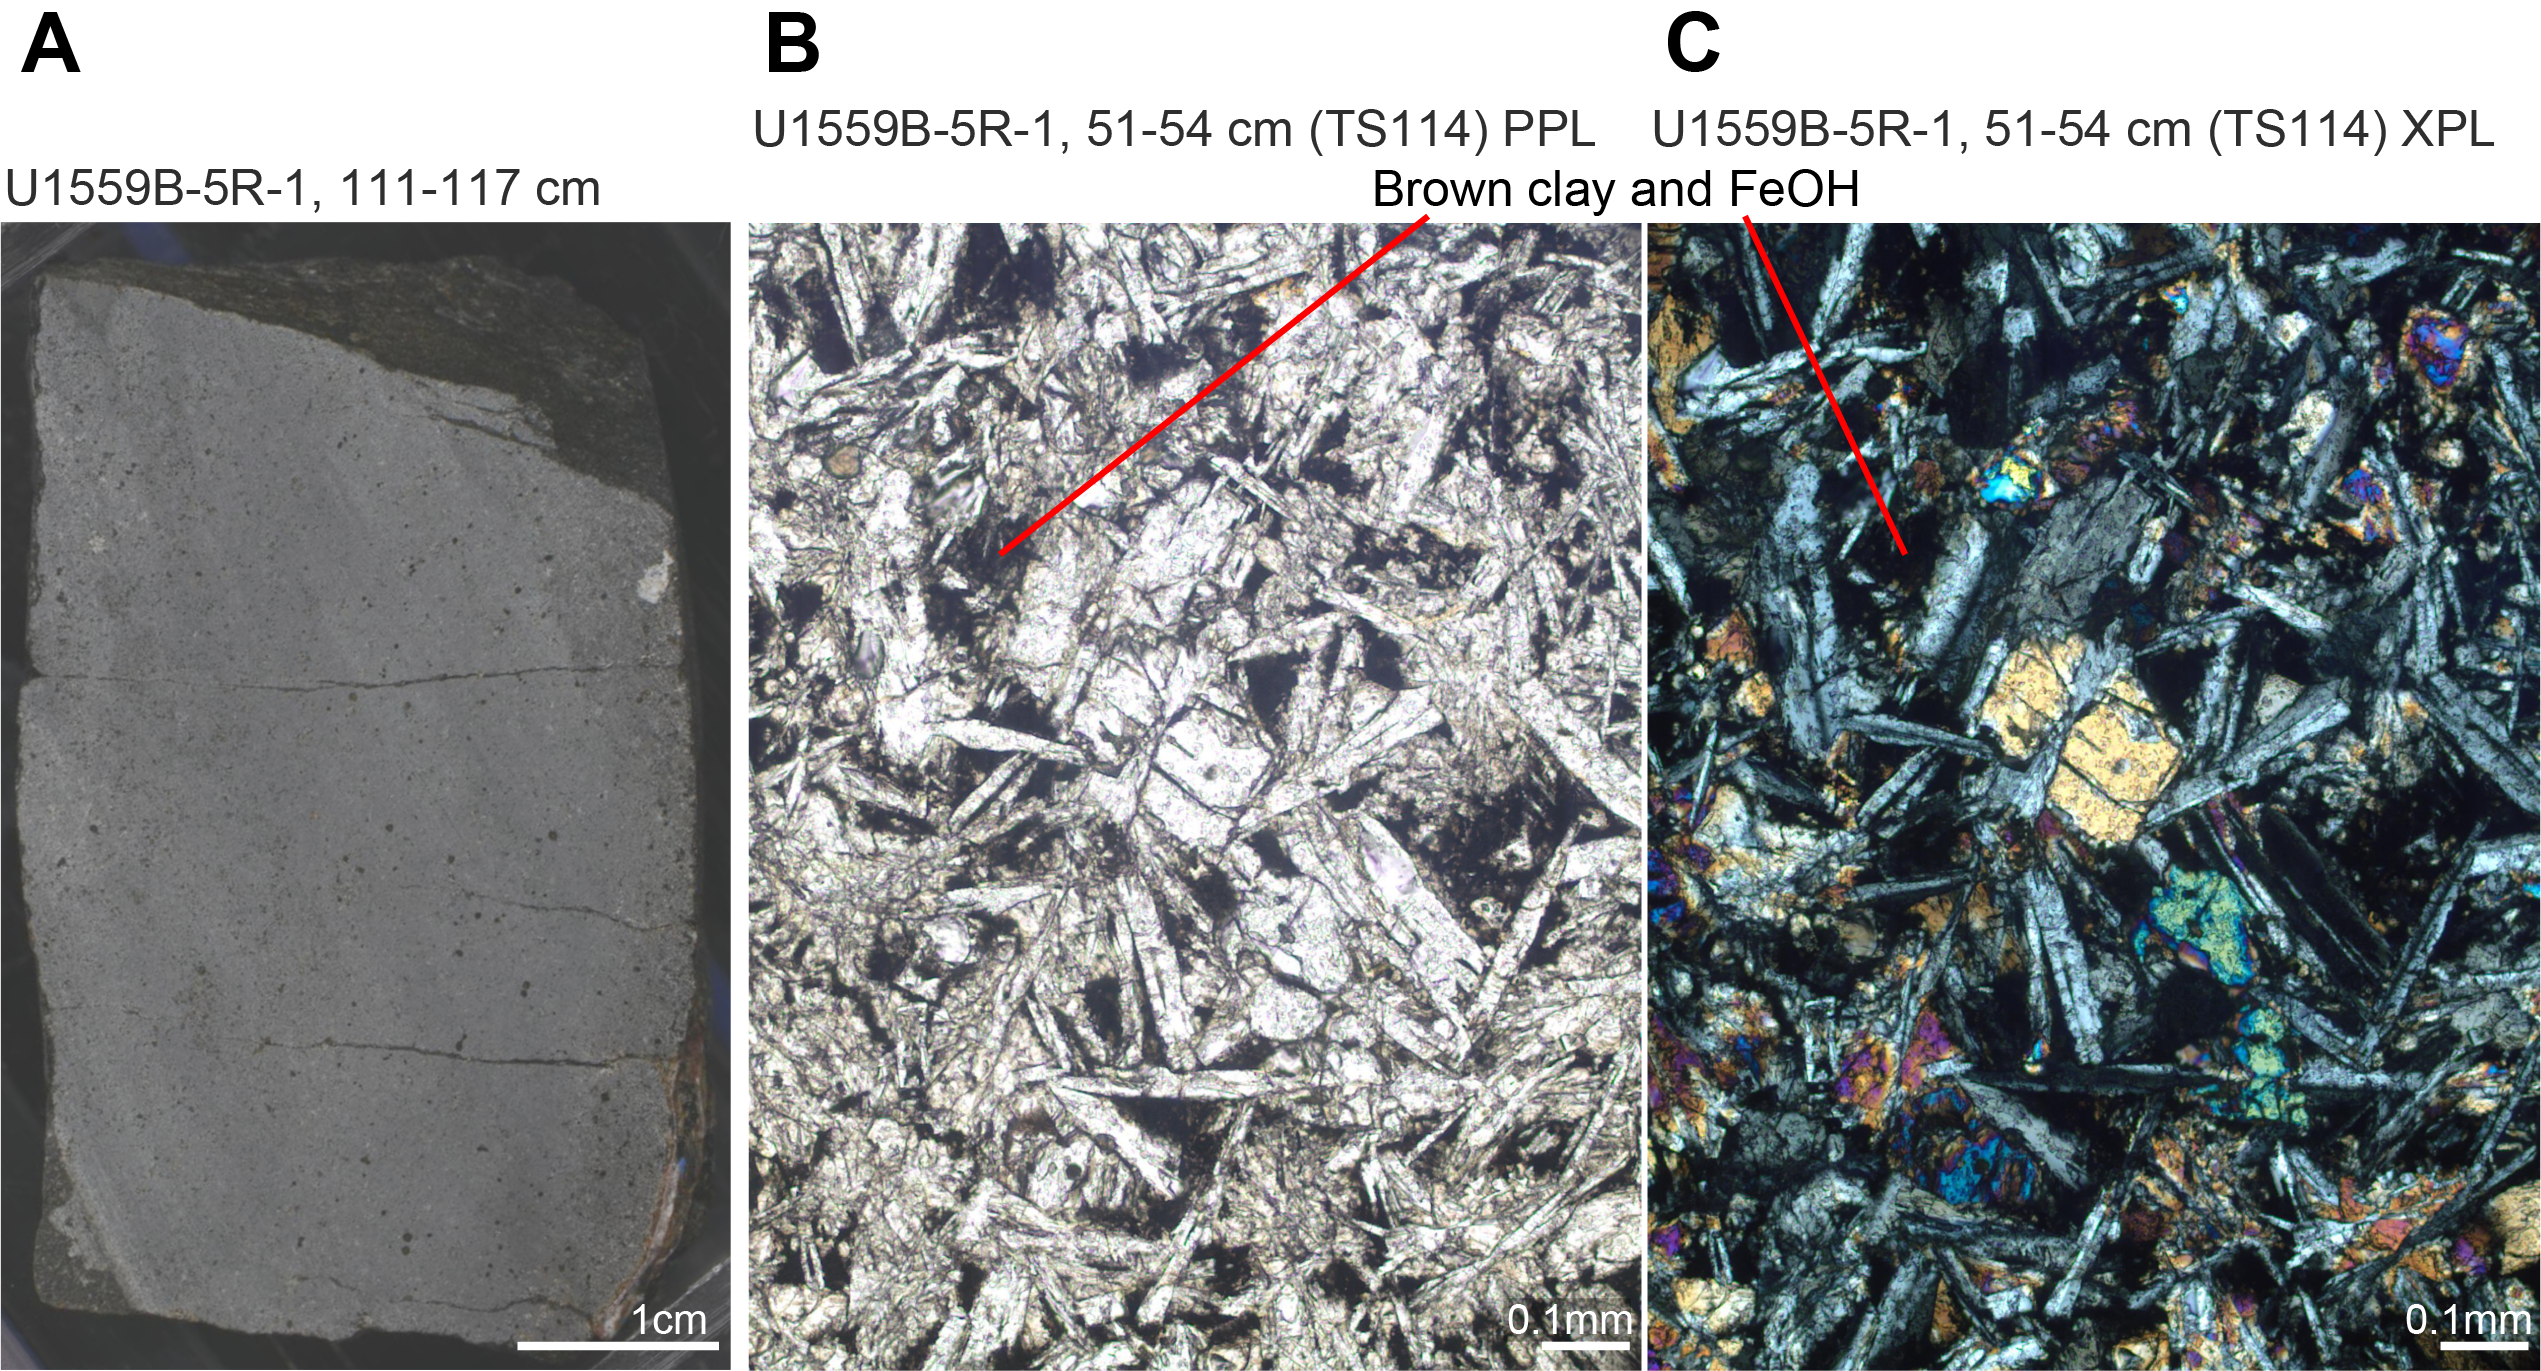
Figure F30. Background alteration.
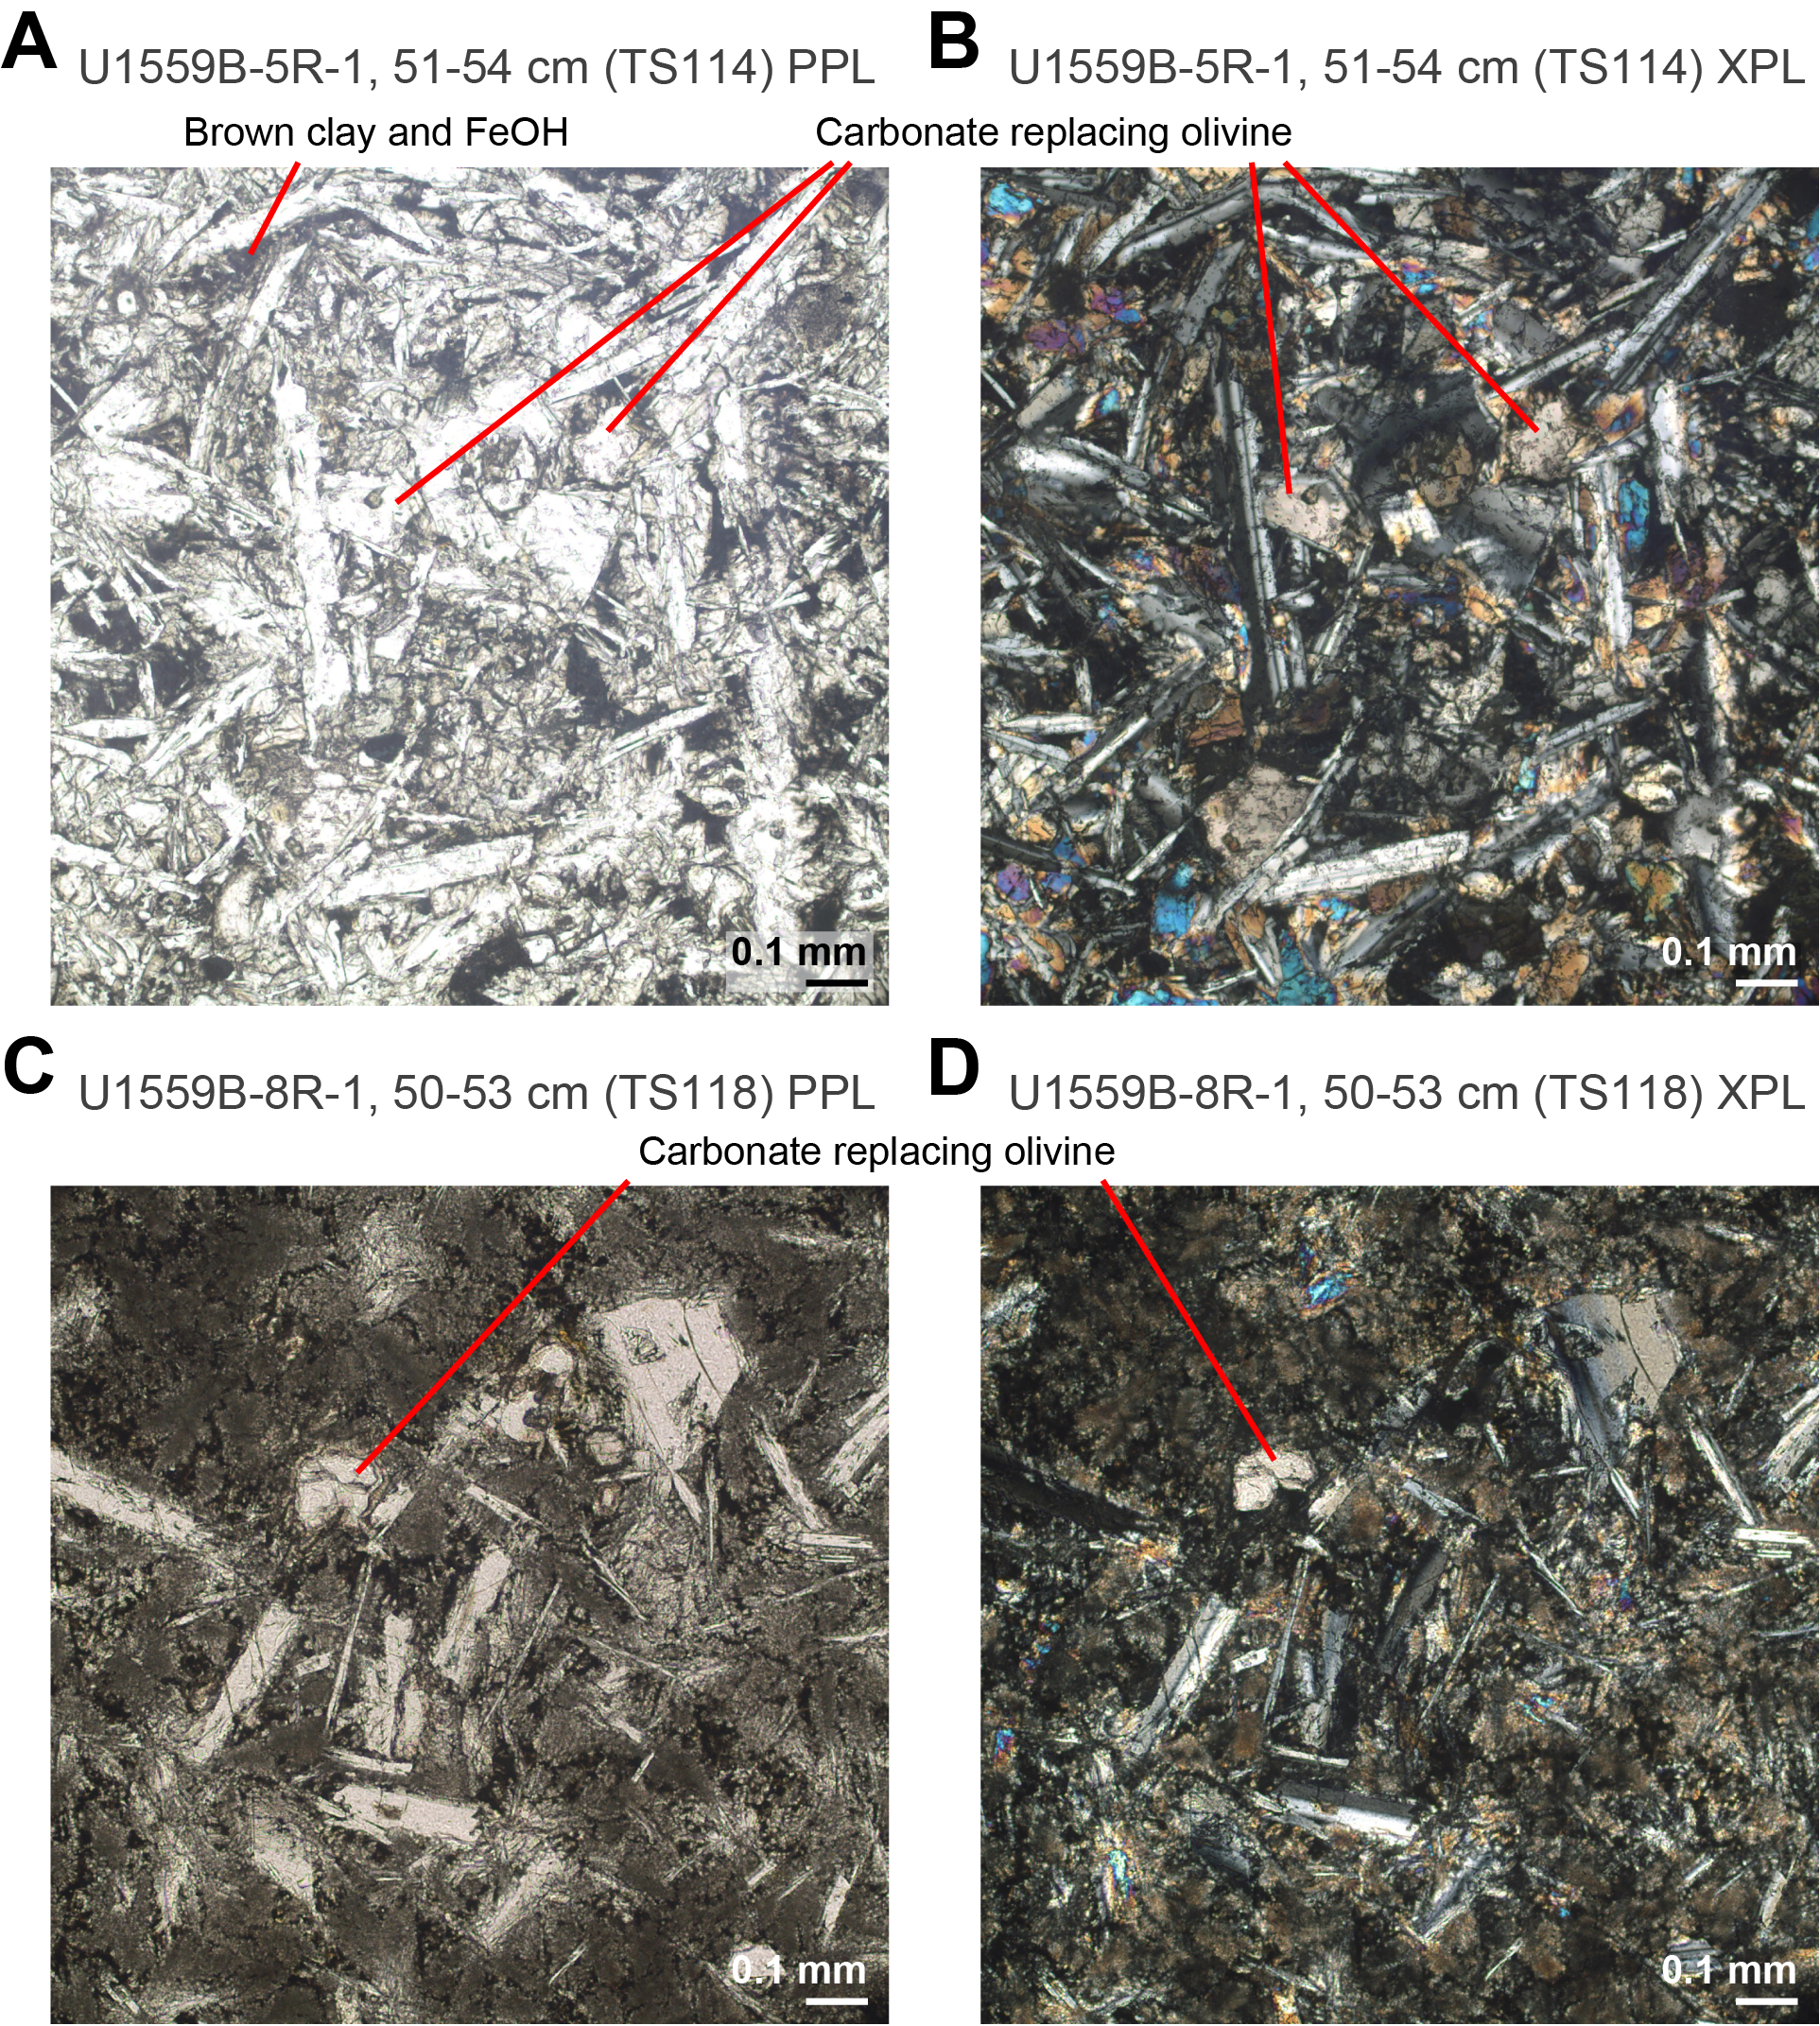
Figure F31. Replacement of groundmass olivine by carbonate.
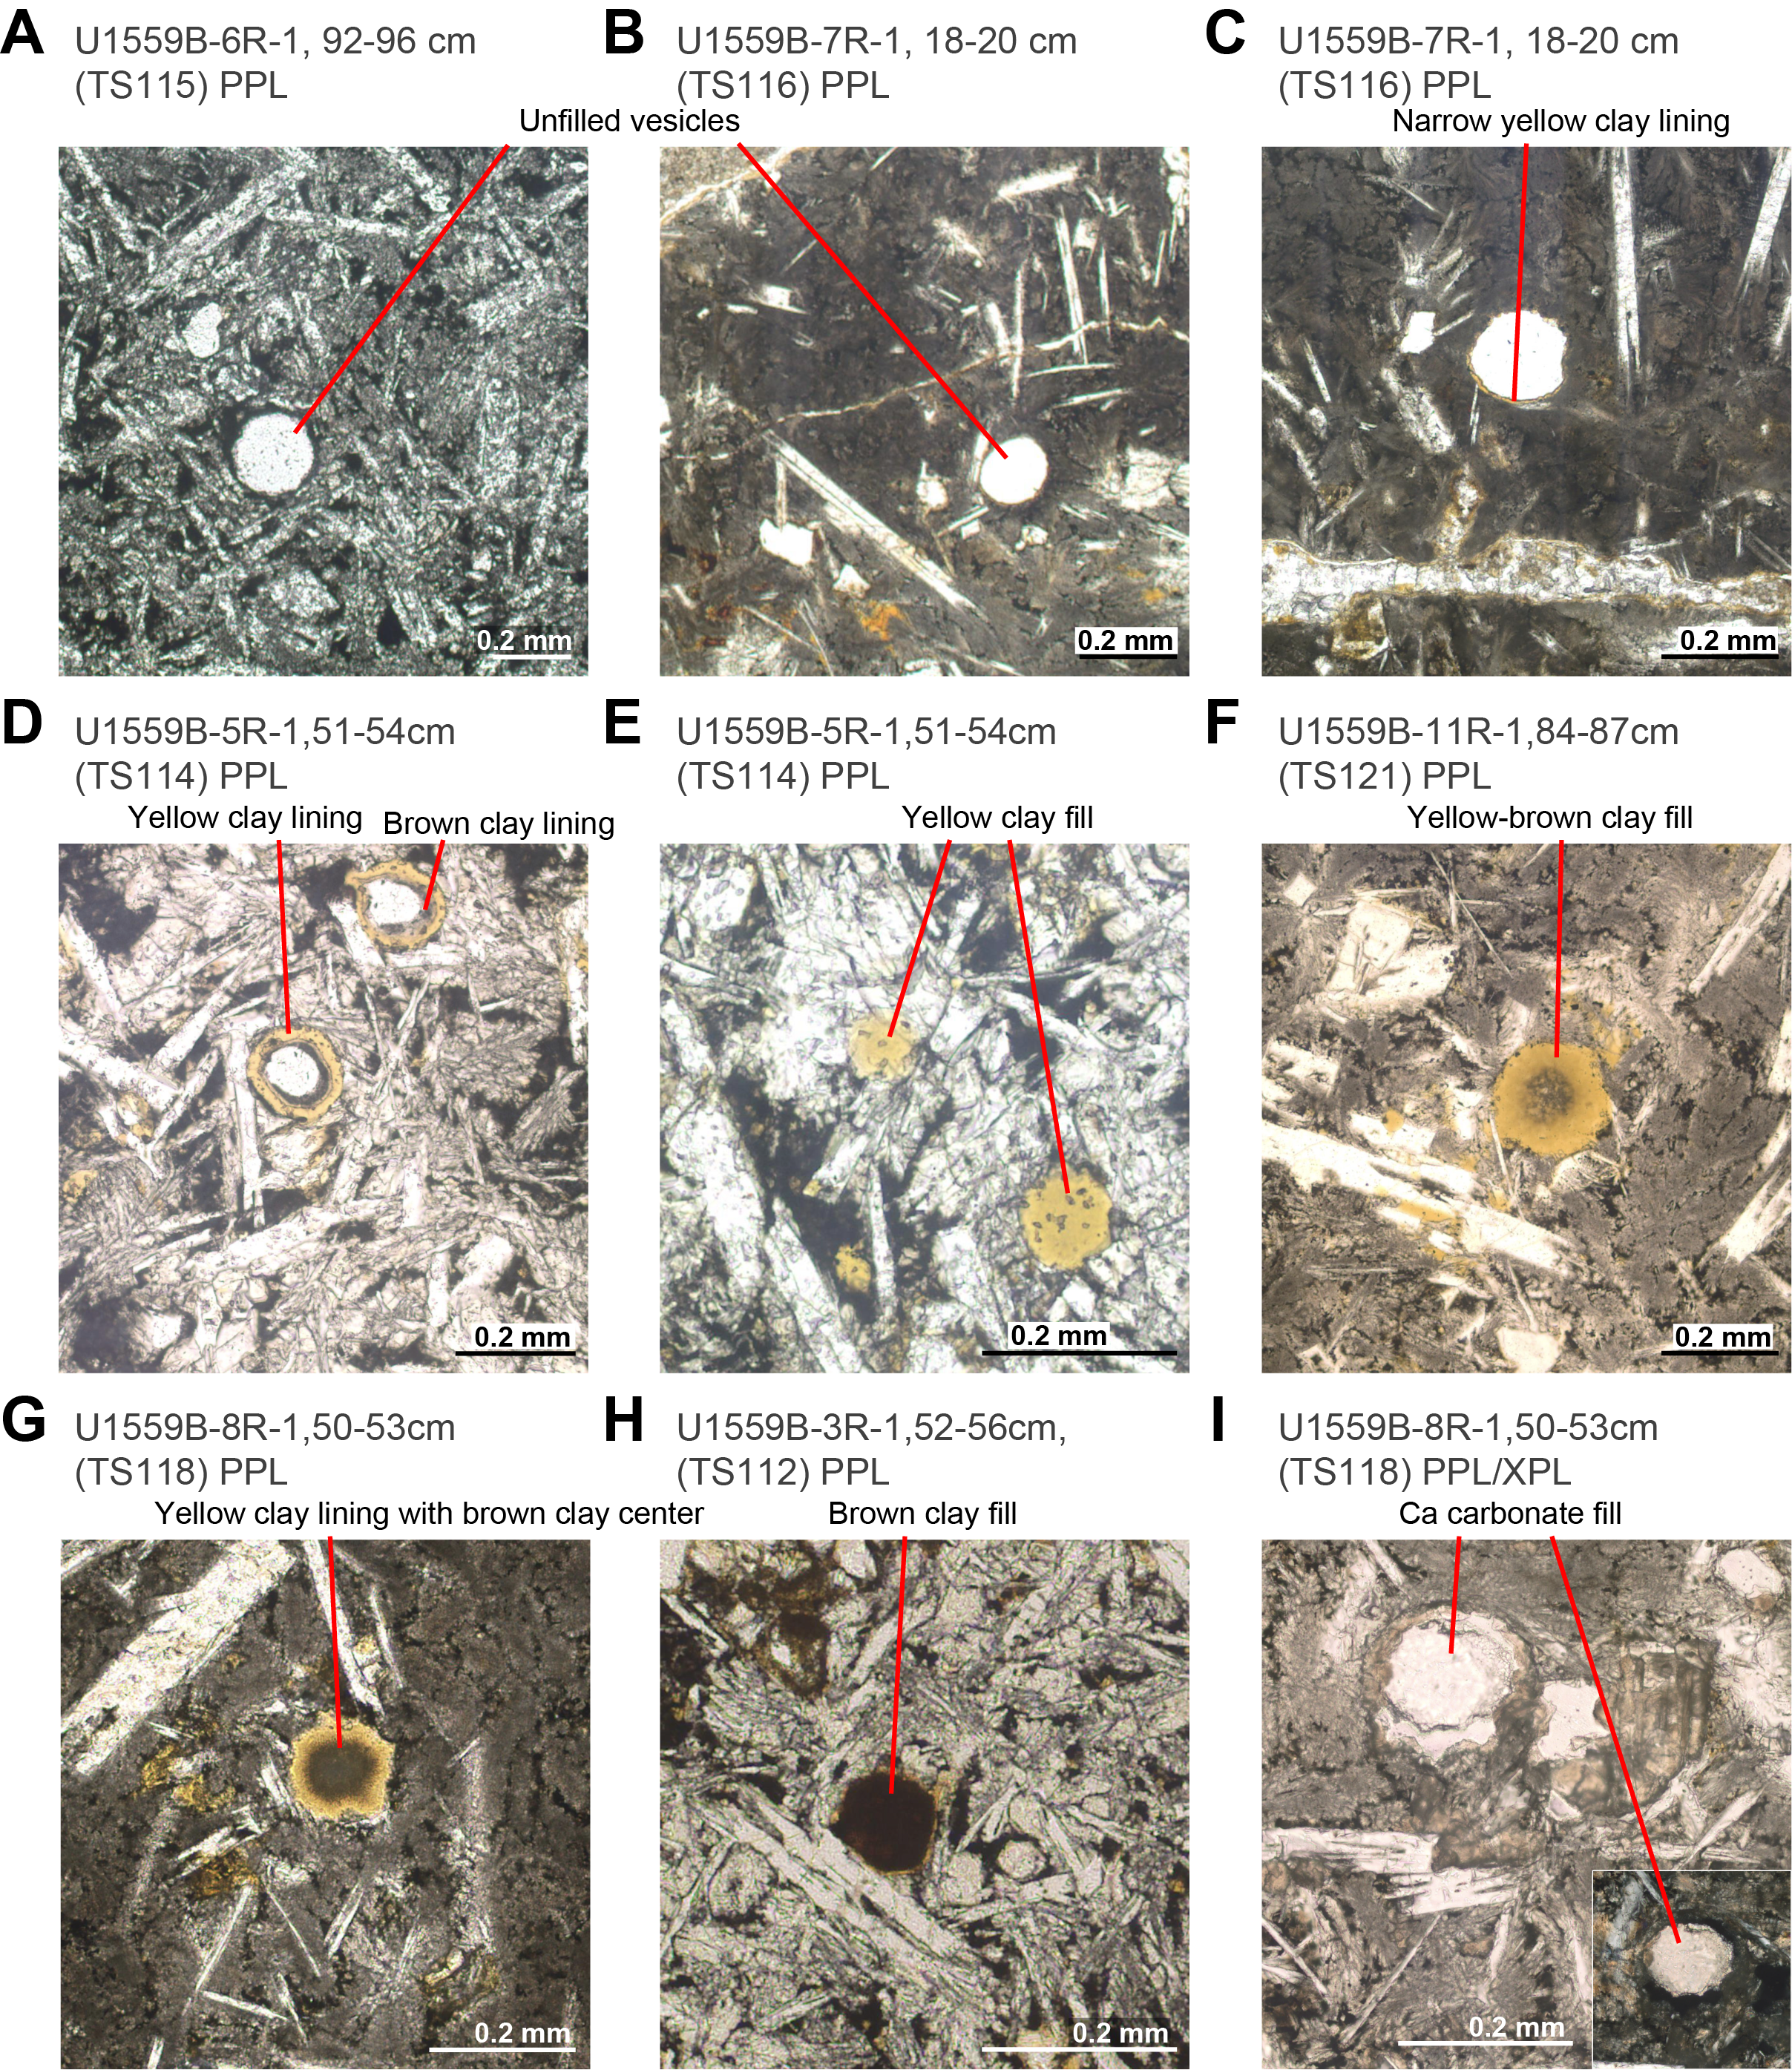
Figure F32. Secondary vesicle fills.
6.2.2. Orange speckled background
Orange speckled background alteration is a subtle variation on the gray background alteration and is only present at the top of the hole in Core 393-U1559B-3R and toward the bottom of the hole in Core 9R and below. Where present, the relative abundance of orange speckled background is low (average = 3%; maximum = 15%). The orange speckling originates from alteration of olivine phenocrysts to clays and Fe oxyhydroxides, but the groundmass alteration is macroscopically very similar to the gray background alteration (Figure F33).
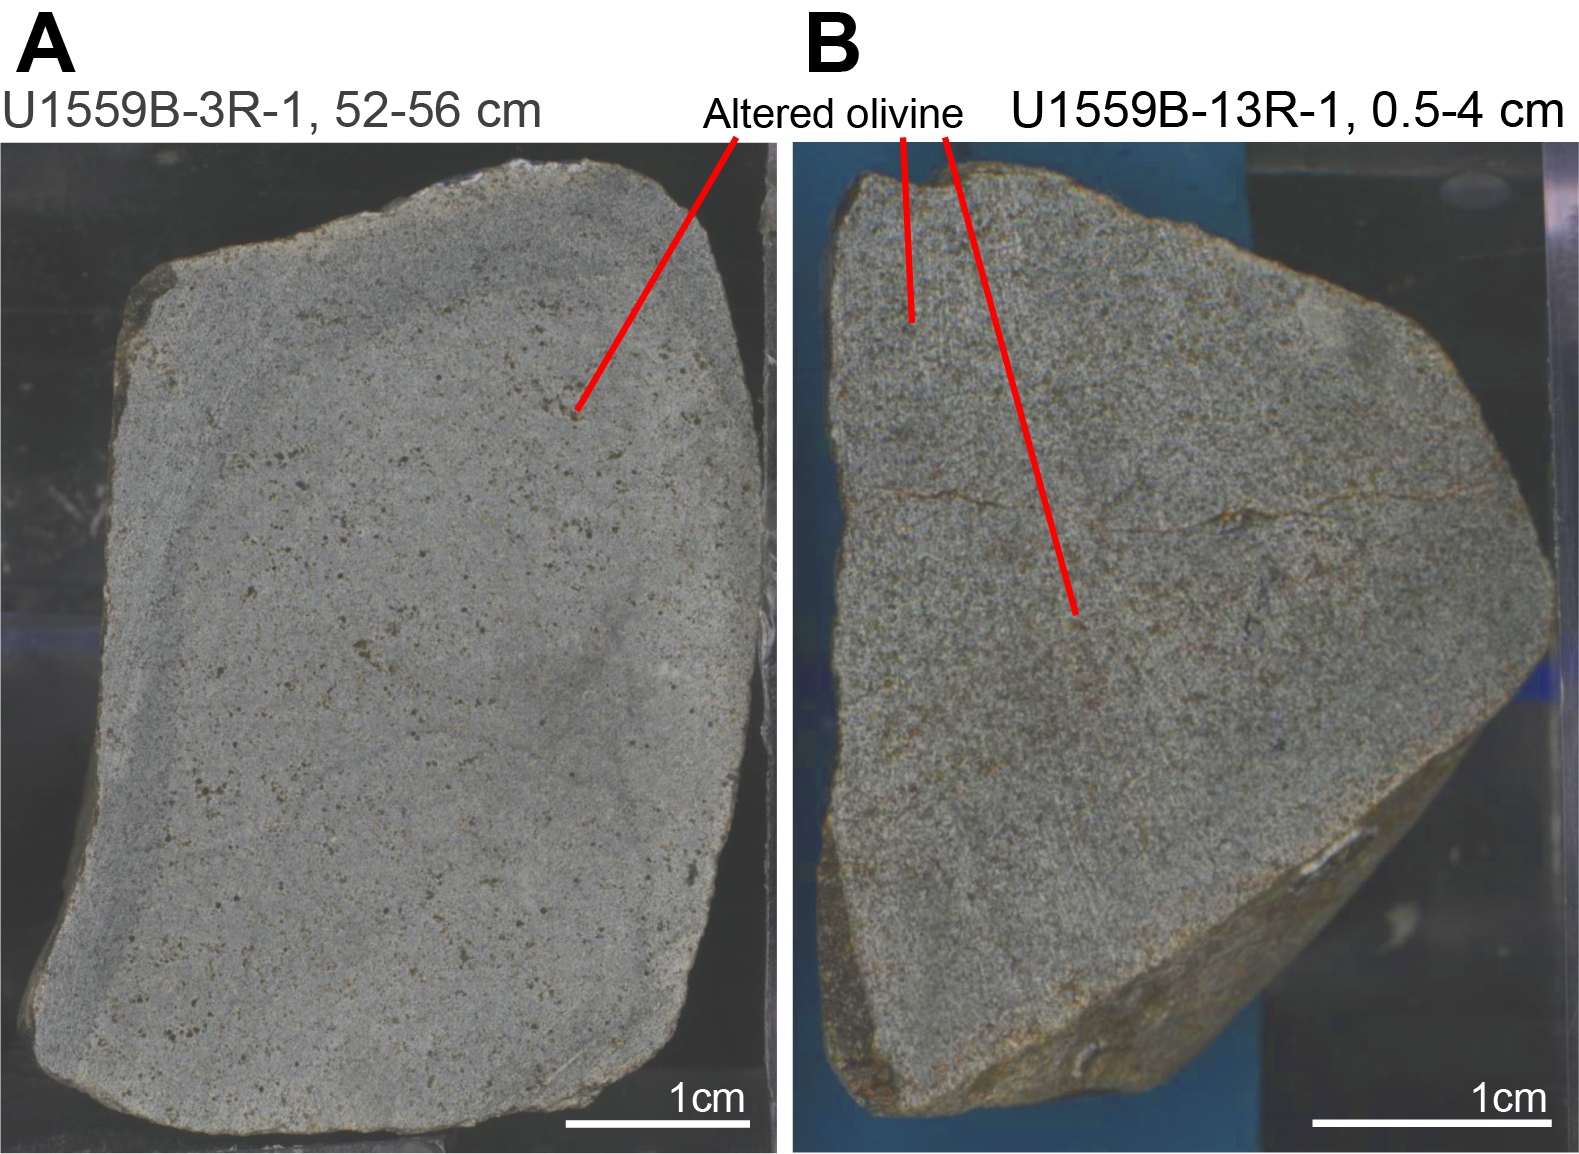
Figure F33. Rare orange speckled background alteration.
6.3. Alteration halos
Alteration halos are a prominent feature in Hole U1559B cores. Halos are recognized macroscopically by color. Three main types of halos were identified: dark gray, light brownish gray, and orange-gray, with one instance of a reddish brown halo in the second to last piece recovered in Hole U1559B (interval 393-U1559B-13R-1, 25–31 cm). Halos on average occupy 22% of the area of the core and locally represent up to 59% of the core (Figure F27). Halos most commonly border veins, where they exhibit a spectrum of morphologies from planar and vein parallel to highly irregular. Halos unassociated with recovered veins commonly form curved and irregular bands. Many of the small pieces of core show alteration halos along all sides of the piece, suggesting that the core fractured along closely spaced (3–5 cm) suborthogonal vein sets. Halos range in size from <1 mm up to several centimeters (half-widths). Generally, the larger halos are unassociated with recovered veins. The composition of the halos changes downhole. Dark gray halos occur throughout the hole, whereas the abundance of light brownish gray halos decreases downhole and are largely absent from Core 10R to the bottom of the hole. This decrease in abundance is mirrored by the appearance and increasing abundance of the orange-gray halos (Figure F34). In alteration halos, the proportion of filled vesicles is 45%–90%, higher than in background alteration. Yellow-orange and orange-brown clays with Fe oxyhydroxides partially to completely fill these vesicles in all halo types. Calcium carbonate does not fill vesicles in alteration halos, which is hypothesized to reflect the high percentage of early fillings such that vesicles are already completely occupied by clay and Fe oxyhydroxides.
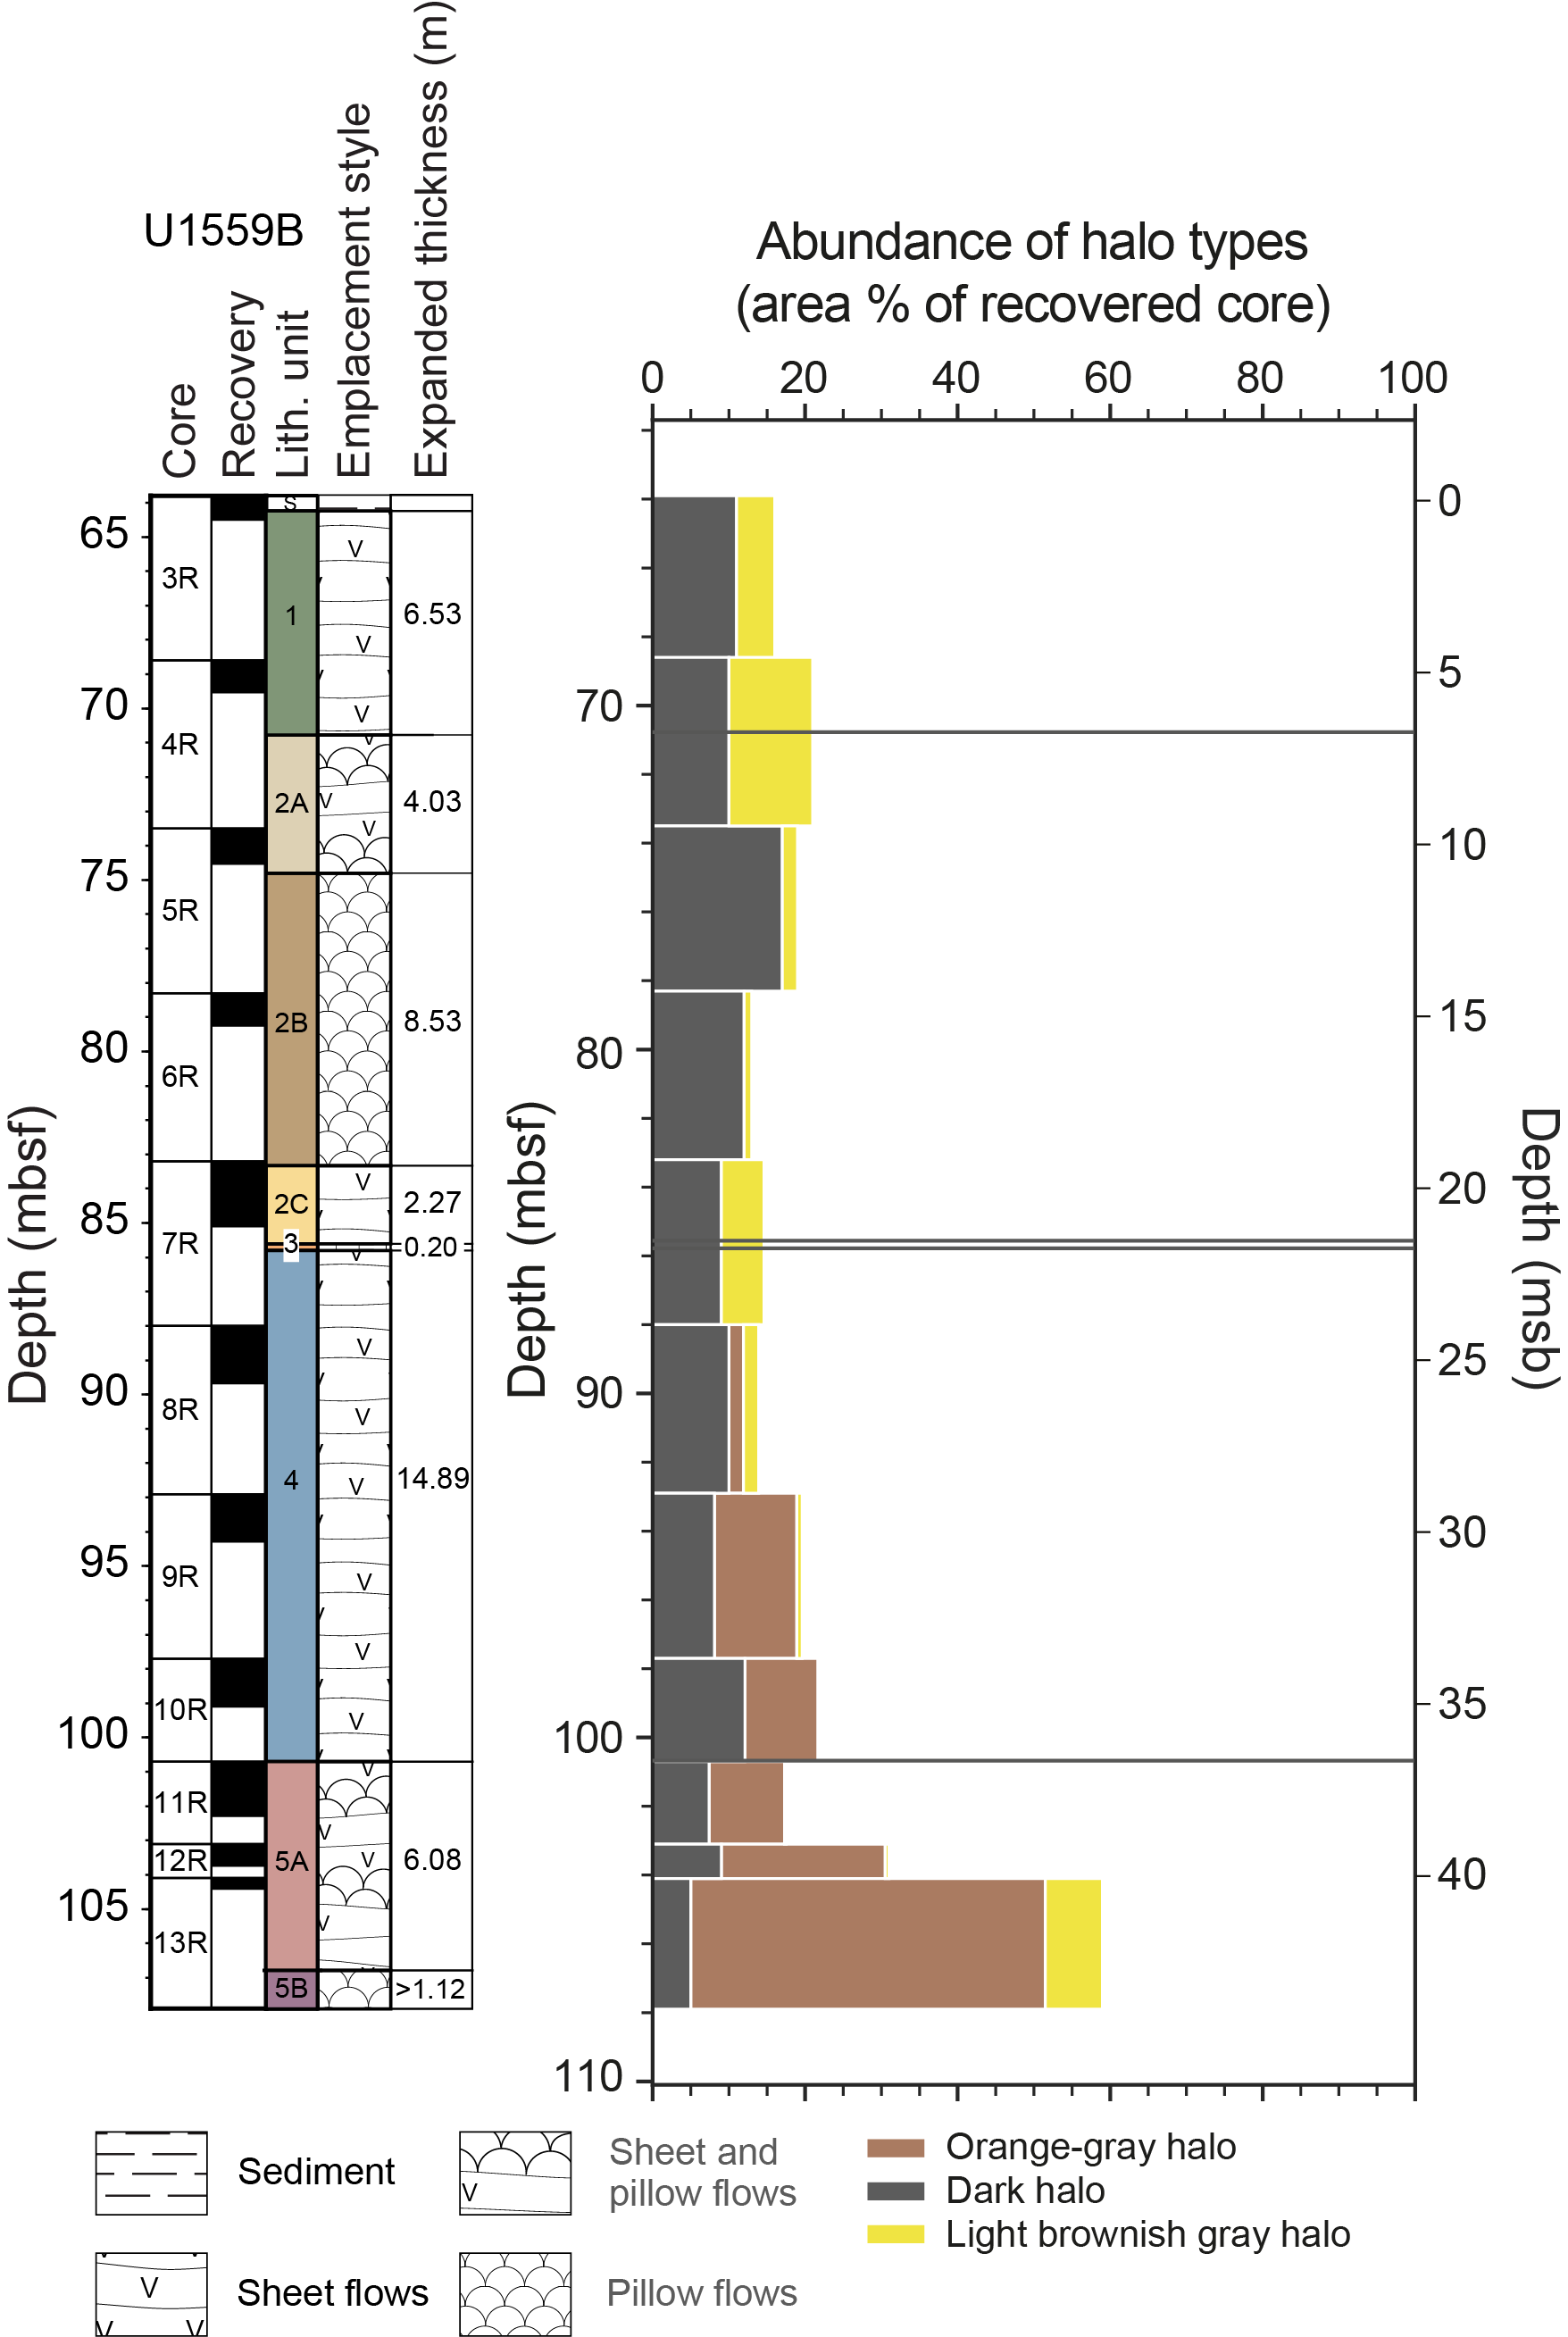
Figure F34. Distribution of halo abundance.
6.3.1. Dark gray halos
Dark gray halos (GLEY 1 5/N gray) are the most abundant halos present in Hole U1559B, occupying on average 10% of the area of the core, with a range of 5%–17%. The dark gray halos are generally <10 mm wide, but wider examples are developed perpendicular to chilled margins (Figure F35). The dark gray halos are either planar or formed of multiple millimeter-sized irregular bands away from clay ± carbonate ± Fe oxyhydroxide veins and core edges, commonly leading to concentric banding on the cut surface (Figure F35). These thin and irregular bands mostly occur in pieces that also contain a slightly larger dark gray halo.
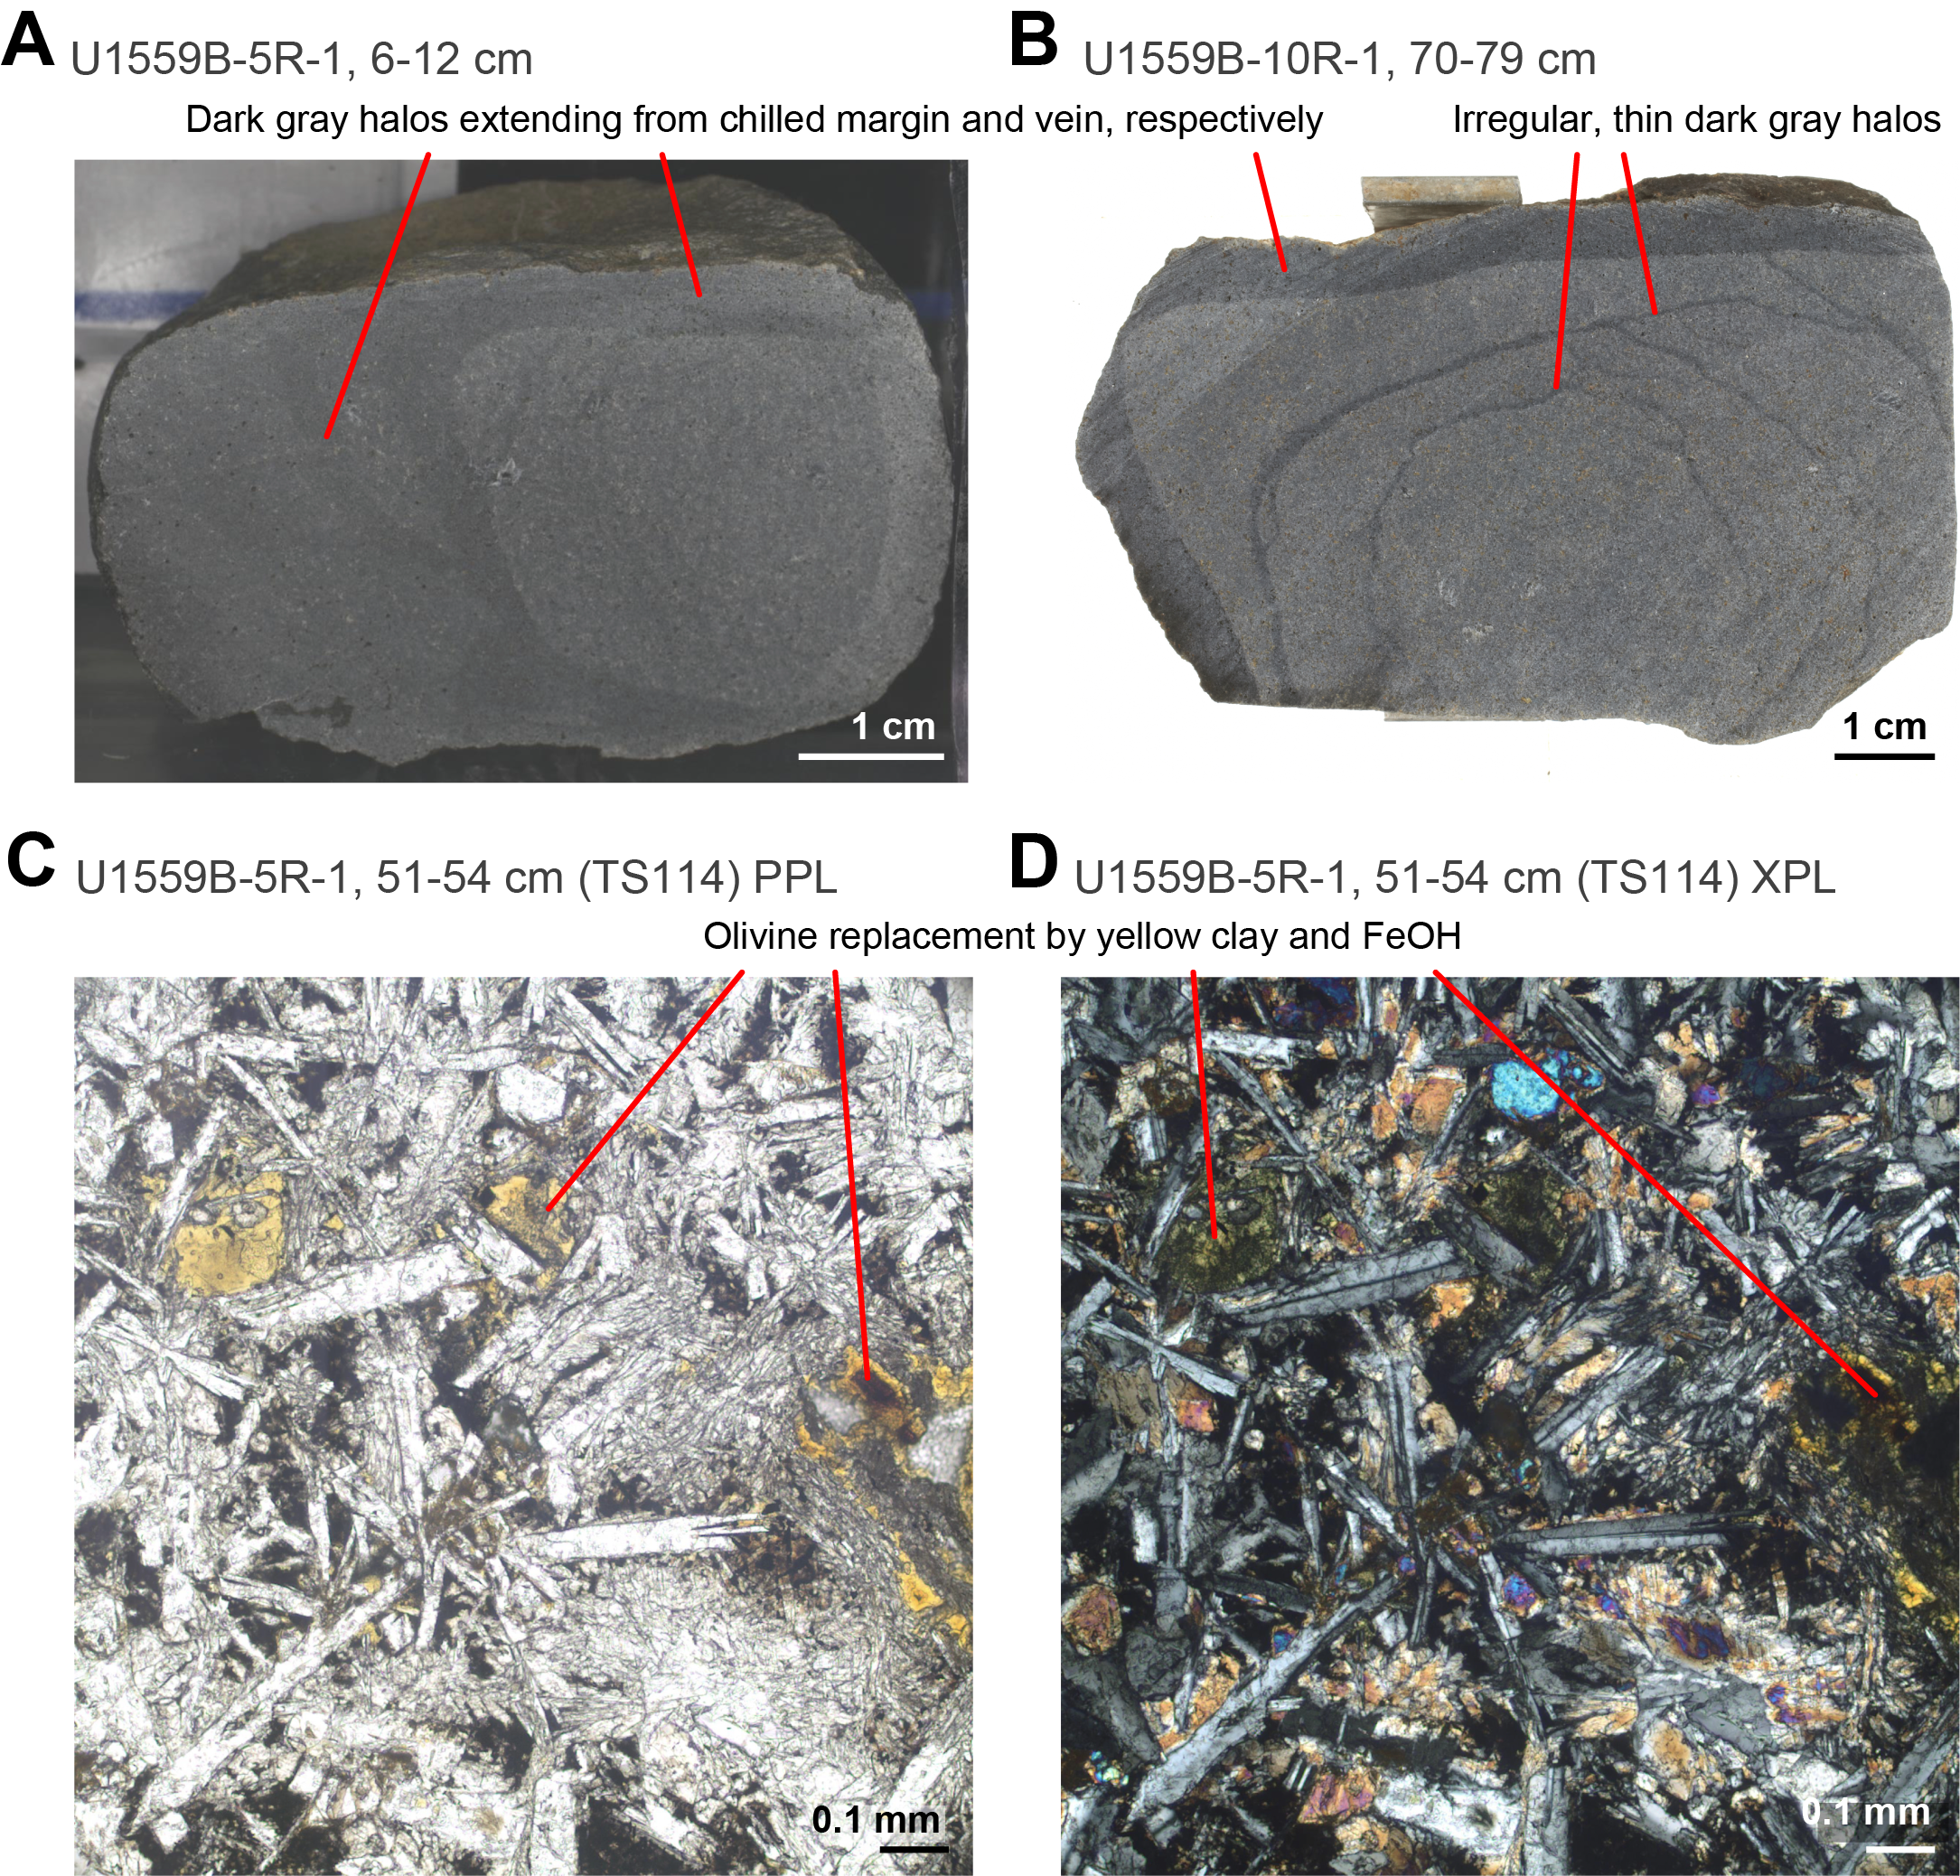
Figure F35. Dark gray halos.
In thin section, the dark gray halos are associated with yellow-orange clays and Fe oxyhydroxides that partially to completely replace mesostasis, some groundmass, olivine phenocrysts, and line or completely fill vesicles (Figure F35C, F35D). Primary igneous textures are preserved. The abundance of secondary minerals is visually estimated at 20%–27%. These secondary minerals and texture are the same regardless of width or whether the halo is associated with a vein or not (Figure F35). The boundary between the dark gray halo and background varies from sharp to gradational. The thin millimeter-sized irregular halos are diffuse in thin section, and they are traced more easily macroscopically with the naked eye (Figure F36).
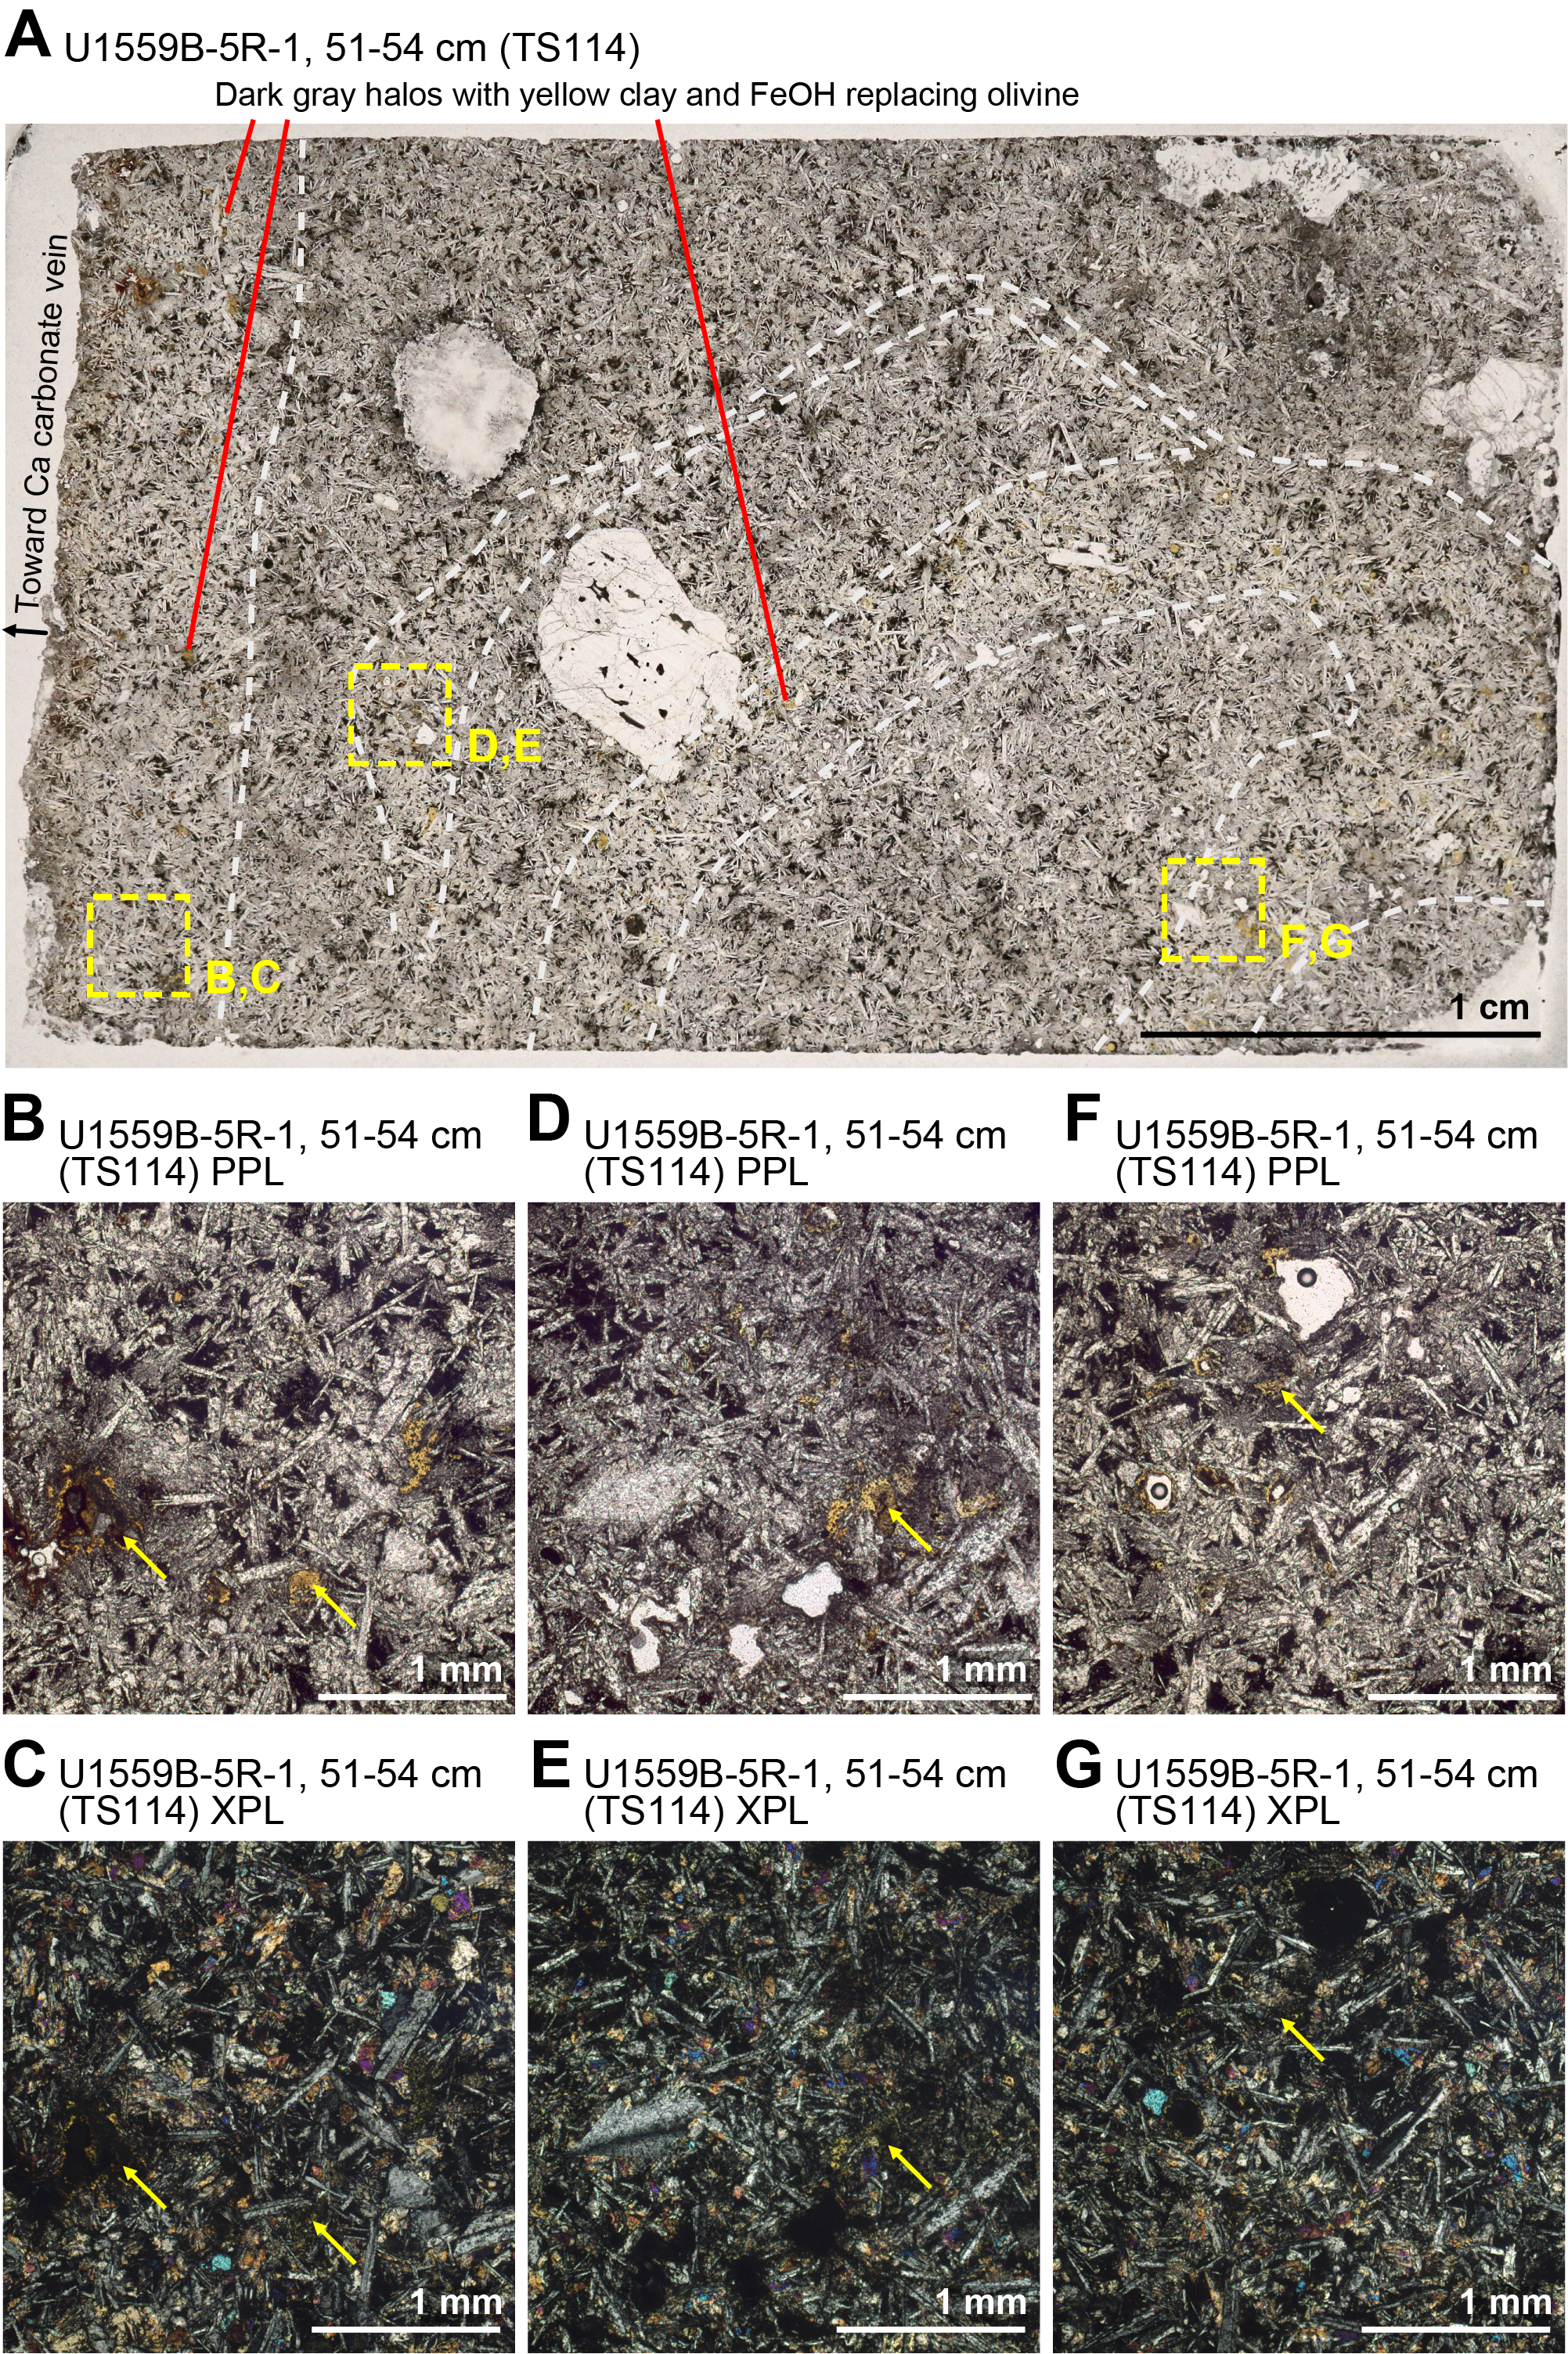
Figure F36. Multiple dark gray halos.
6.3.2. Light brownish gray halos
Light brownish gray halos (10YR 6/2 light brownish gray) occupy on average 3% of the area of the core with a range of 0%–11%. The width of the light brownish gray halos is highly variable from <1 mm bordering some carbonate-bearing veins to irregular centimeter-sized halos bordering different vein types (Figure F37). Light brownish gray halos also surround large vugs. They predominantly occur within dark gray halos where they form the innermost part of the halo next to the vein. This suggests that the light brownish gray halos form after the dark gray halos (see Sequence of halo formation below). Larger vesicles (vugs; 3–10 mm) are present at multiple depths in Hole U1559B and are generally found toward the tops of pieces. Light brownish gray inner halos up to 10 mm border these filled vugs with dark gray outer halos. These vugs commonly exhibit open space–filling mineral precipitation textures (Figure F38) with botryoidal to prismatic forms. XRD and thin section observations confirm the vug fillings to be dominantly calcite with minor phillipsite zeolite (e.g., Sample 393-U1559B-6R-1, 93–94 cm; Table T8).
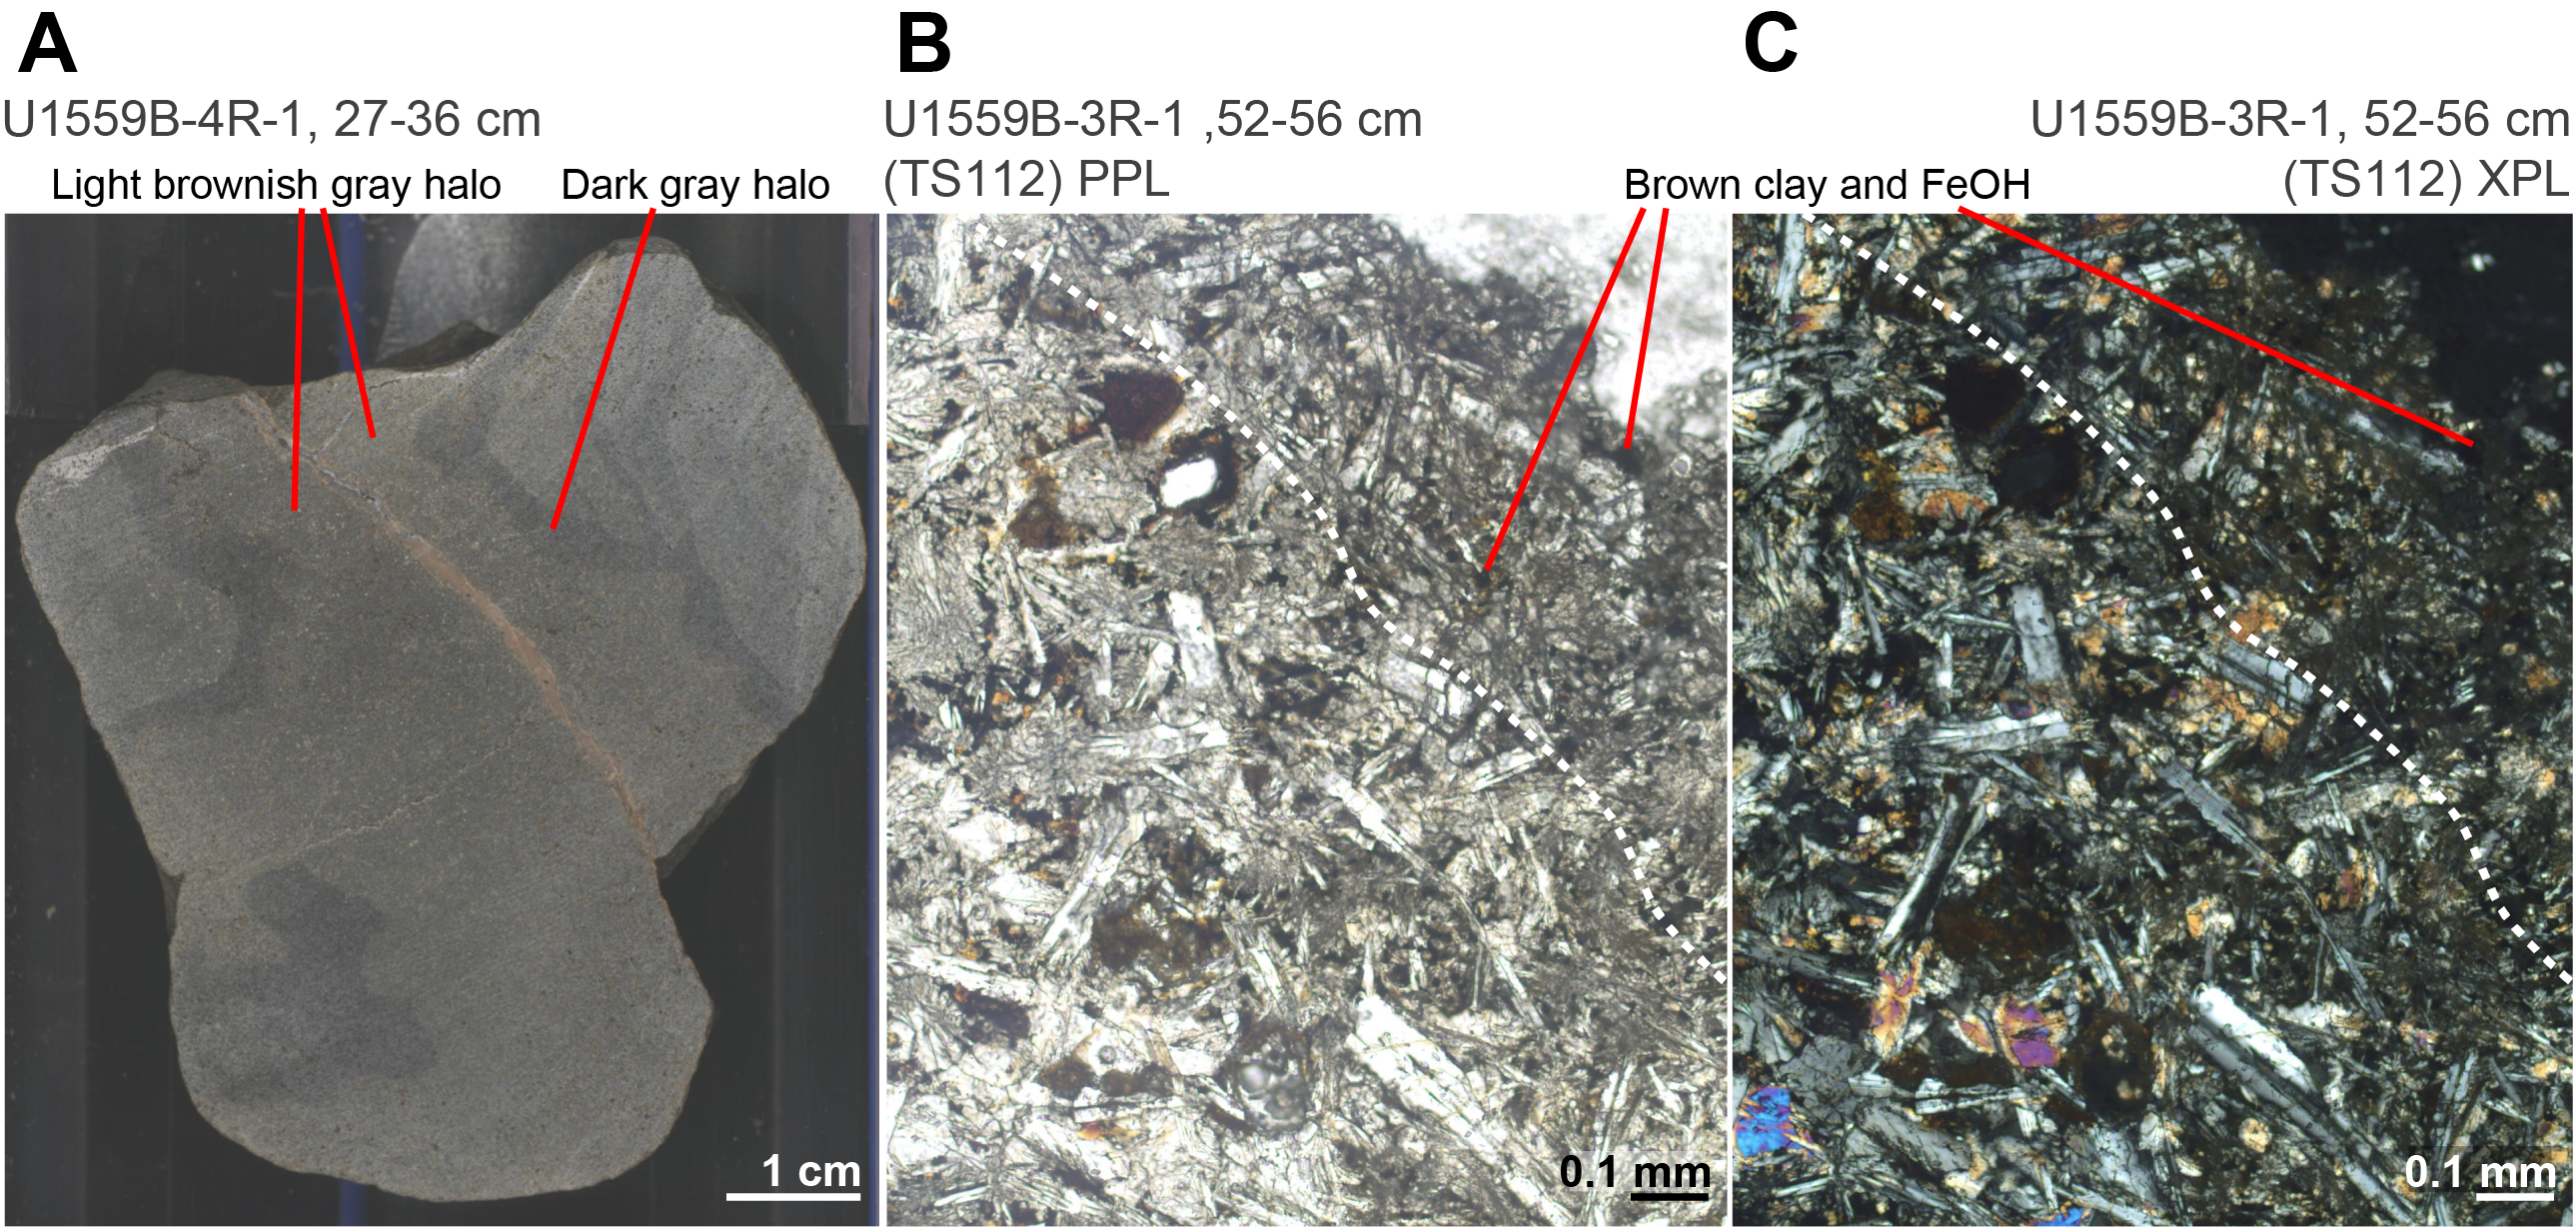
Figure F37. Light brownish gray halos.
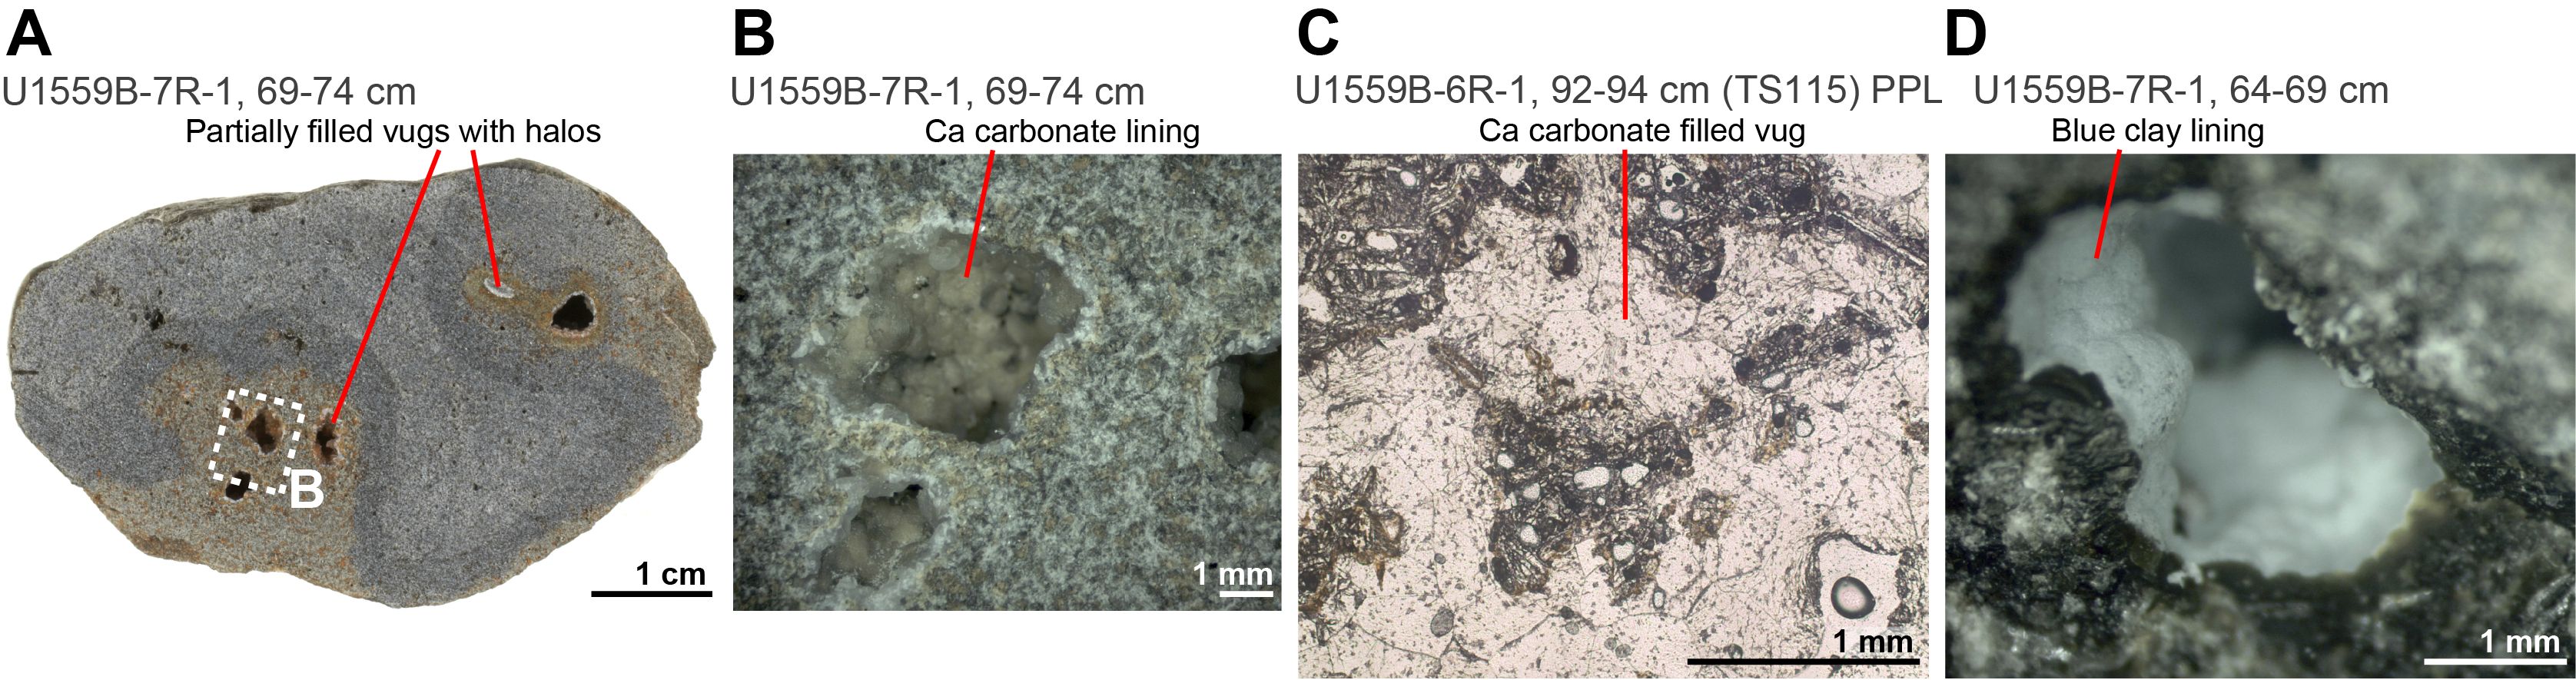
Figure F38. Vug fillings.
In thin section, the light brownish gray halos are darker than gray halos and show some degeneration of primary igneous texture. Plagioclase groundmass and phenocrysts commonly show multiple fractures and appear cloudy in plane-polarized light (Figure F37B) because of dustings of clay minerals. These textures and mineralogical associations are unrelated to the occurrence (bordering veins or vesicles) and the overall width of the halo. Some carbonate veins in thin section have 100–150 µm wide light brownish gray halos. Alteration intensity in this halo type is estimated at 65%–75%, the highest of the three halo types.
6.3.3. Orange-gray halos
The orange-gray halos (5YR 6/1 gray) occur downhole from Core 393-U1559B-7R (Figure F33) and form the widest halos in Hole U1559B. The orange-gray halos are characteristically light orange on the external core surface and in some examples have a prominent orange outer edge to the halo (Figure F39), but on a cut surface they are gray. These halos can be up to 20 mm (half-width) when associated with a vein or >50 mm when unassociated with recovered veins. In some instances, the orange-gray halos consume the full width of the core (58 mm) and show curved contacts with the background basalt (Figure F39).
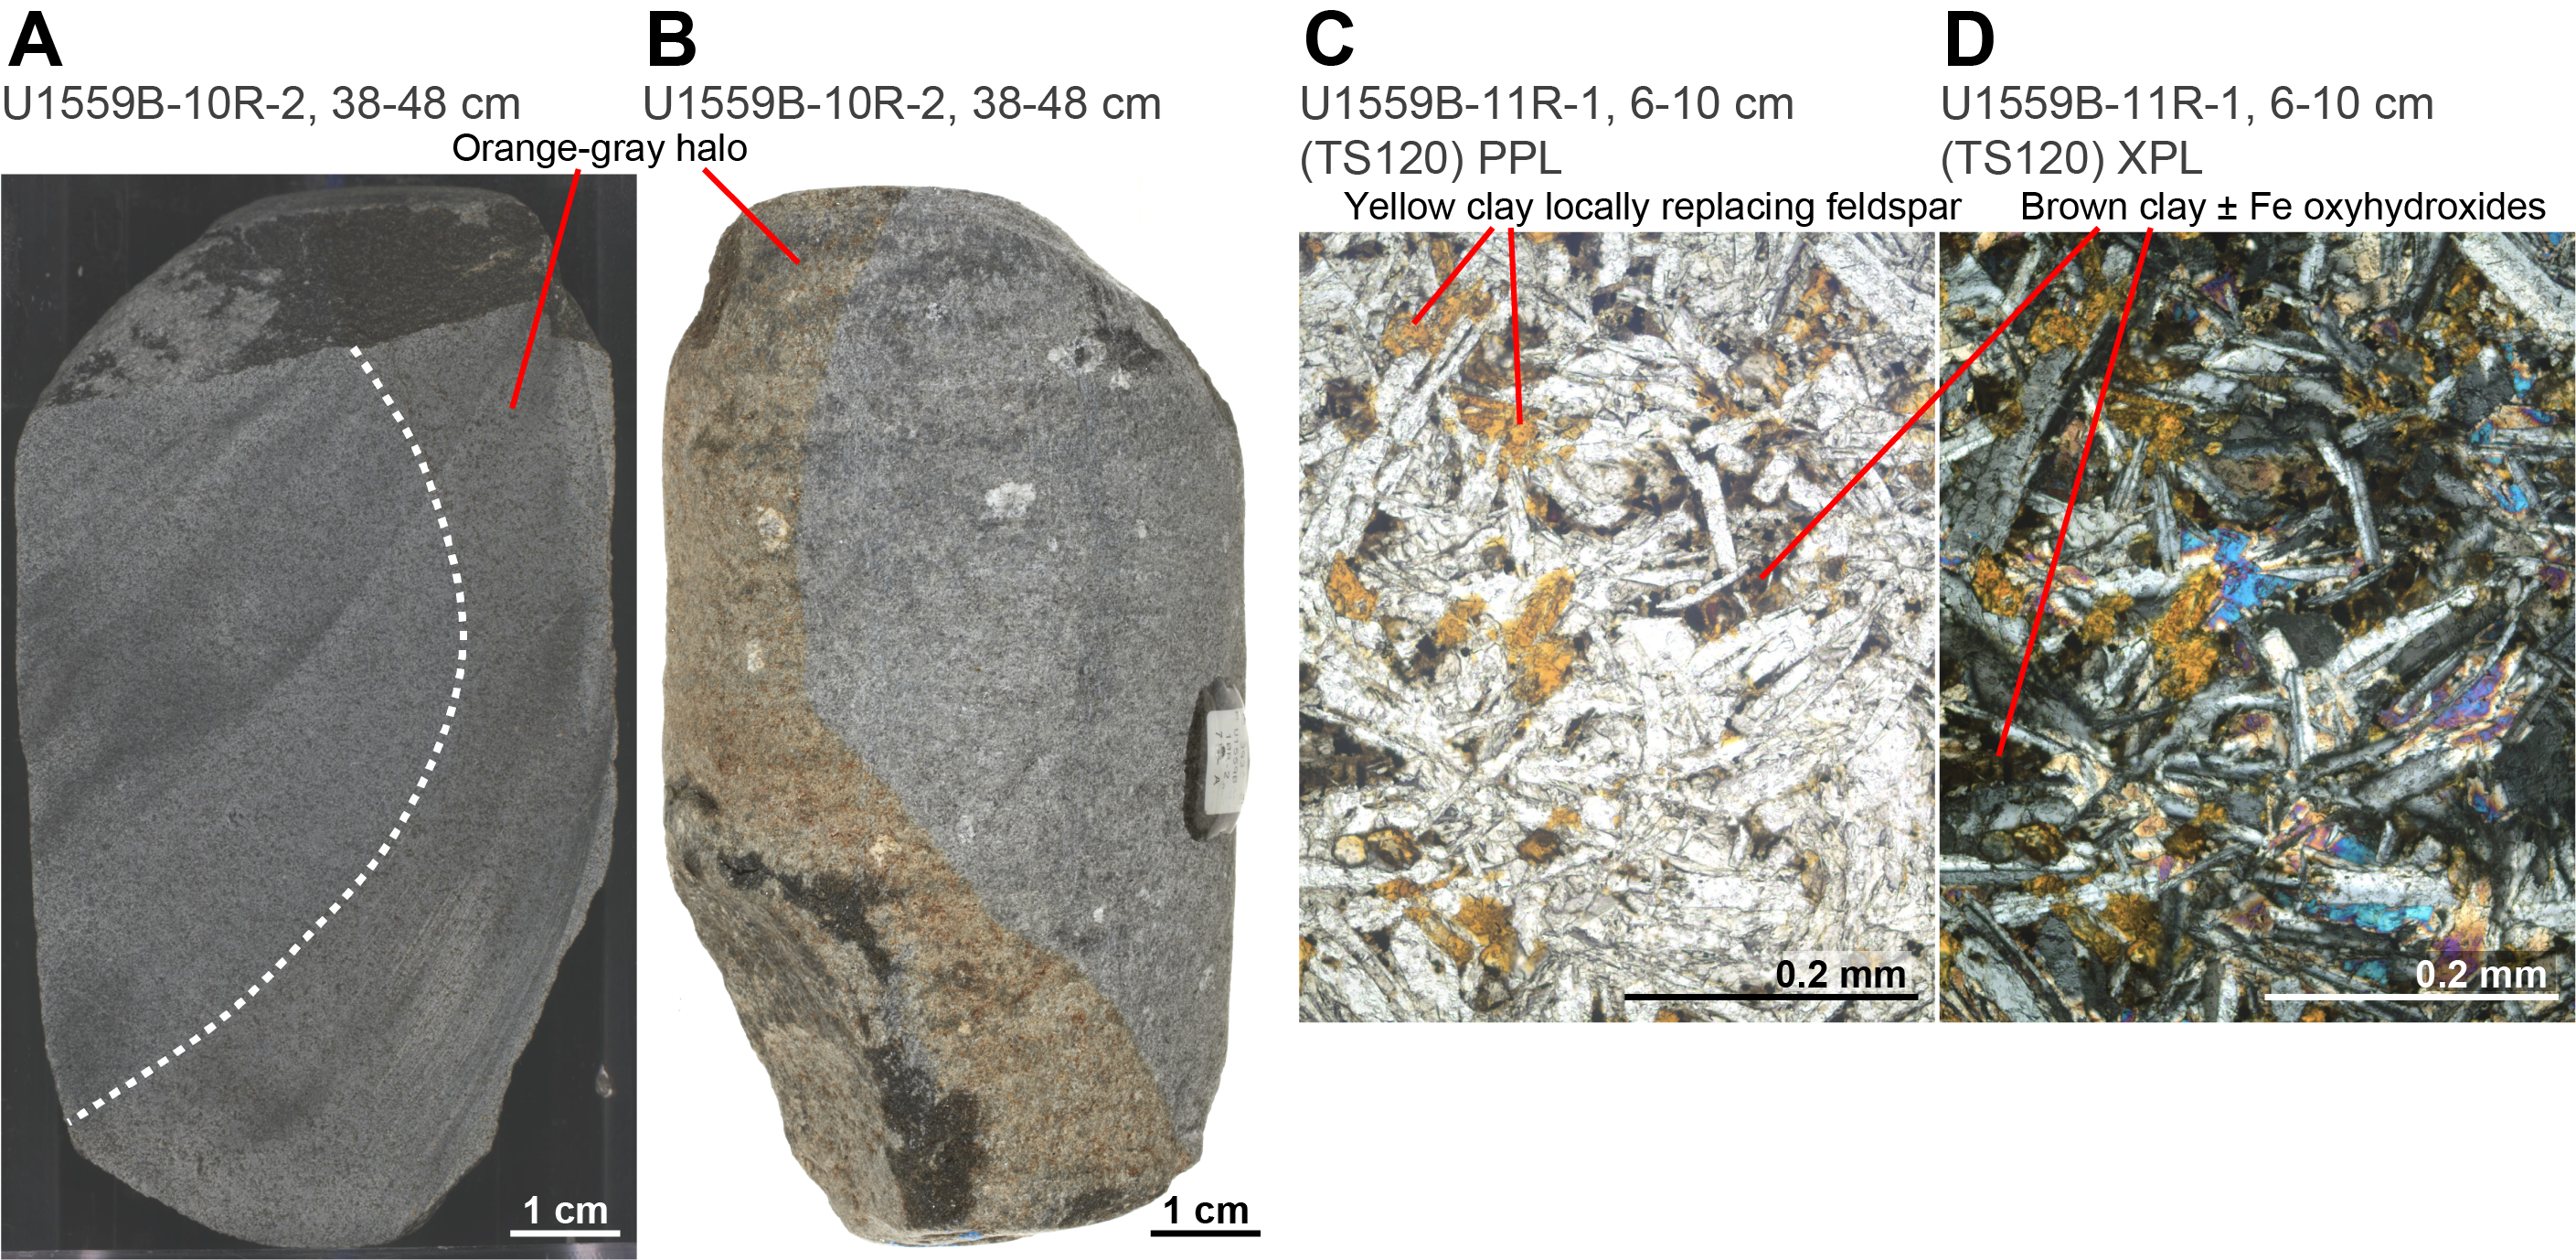
Figure F39. Orange-gray halos.
In thin section, orange-gray halos are dominated by brown clays replacing groundmass and partially replacing plagioclase phenocrysts (Figure F39). Replacement is pseudomorphic with no loss of igneous texture. In one thin section (393-U1559B-11R-1, 6–10 cm, TS120), a tabular clinopyroxene phenocryst shows partial replacement to a platy mineral showing high third-order interference colors; this mineral (possibly talc or muscovite mica) forms 25–200 µm wide bands that crosscut the phenocryst. Alteration intensity in orange-gray halos is estimated at 55%, between the alteration intensity of the other two halo types.
6.3.4. Sequence of halo formation
One of the common features of the alteration halos is the co-occurrence of multiple halo types and multiple generations of the same halo type. Some dark gray halos exhibit multiple thin, irregularly shaped bands that are either solely of this type or present with light brownish gray or, less commonly, orange-gray halos (Figure F40). The orange-gray halos predominantly occur unassociated with other halo types, although two more complex examples are present. Interval 393-U1559B-11R-2, 34.5–50.5 cm, has a complex halo bordering a carbonate-clay vein where the orange-gray halo has overprinted a dark gray halo in two distinct bands. Closest to the vein the orange-gray dominates for several millimeters. This then transitions into the dark gray halo, and then the outermost few millimeters are also of the orange-gray halo type (Figure F40). Interval 7R-2, 92–100 cm, has multiple dark gray halos forming discrete millimeter-sized bands, and between some of these bands irregular areas of light brownish gray occur. The irregularity of the light brownish gray areas in this example demonstrates the complex nonplanar geometries of alteration features that may occur. As in less complex examples, the light brownish gray halos predominantly occur within the dark gray halos.
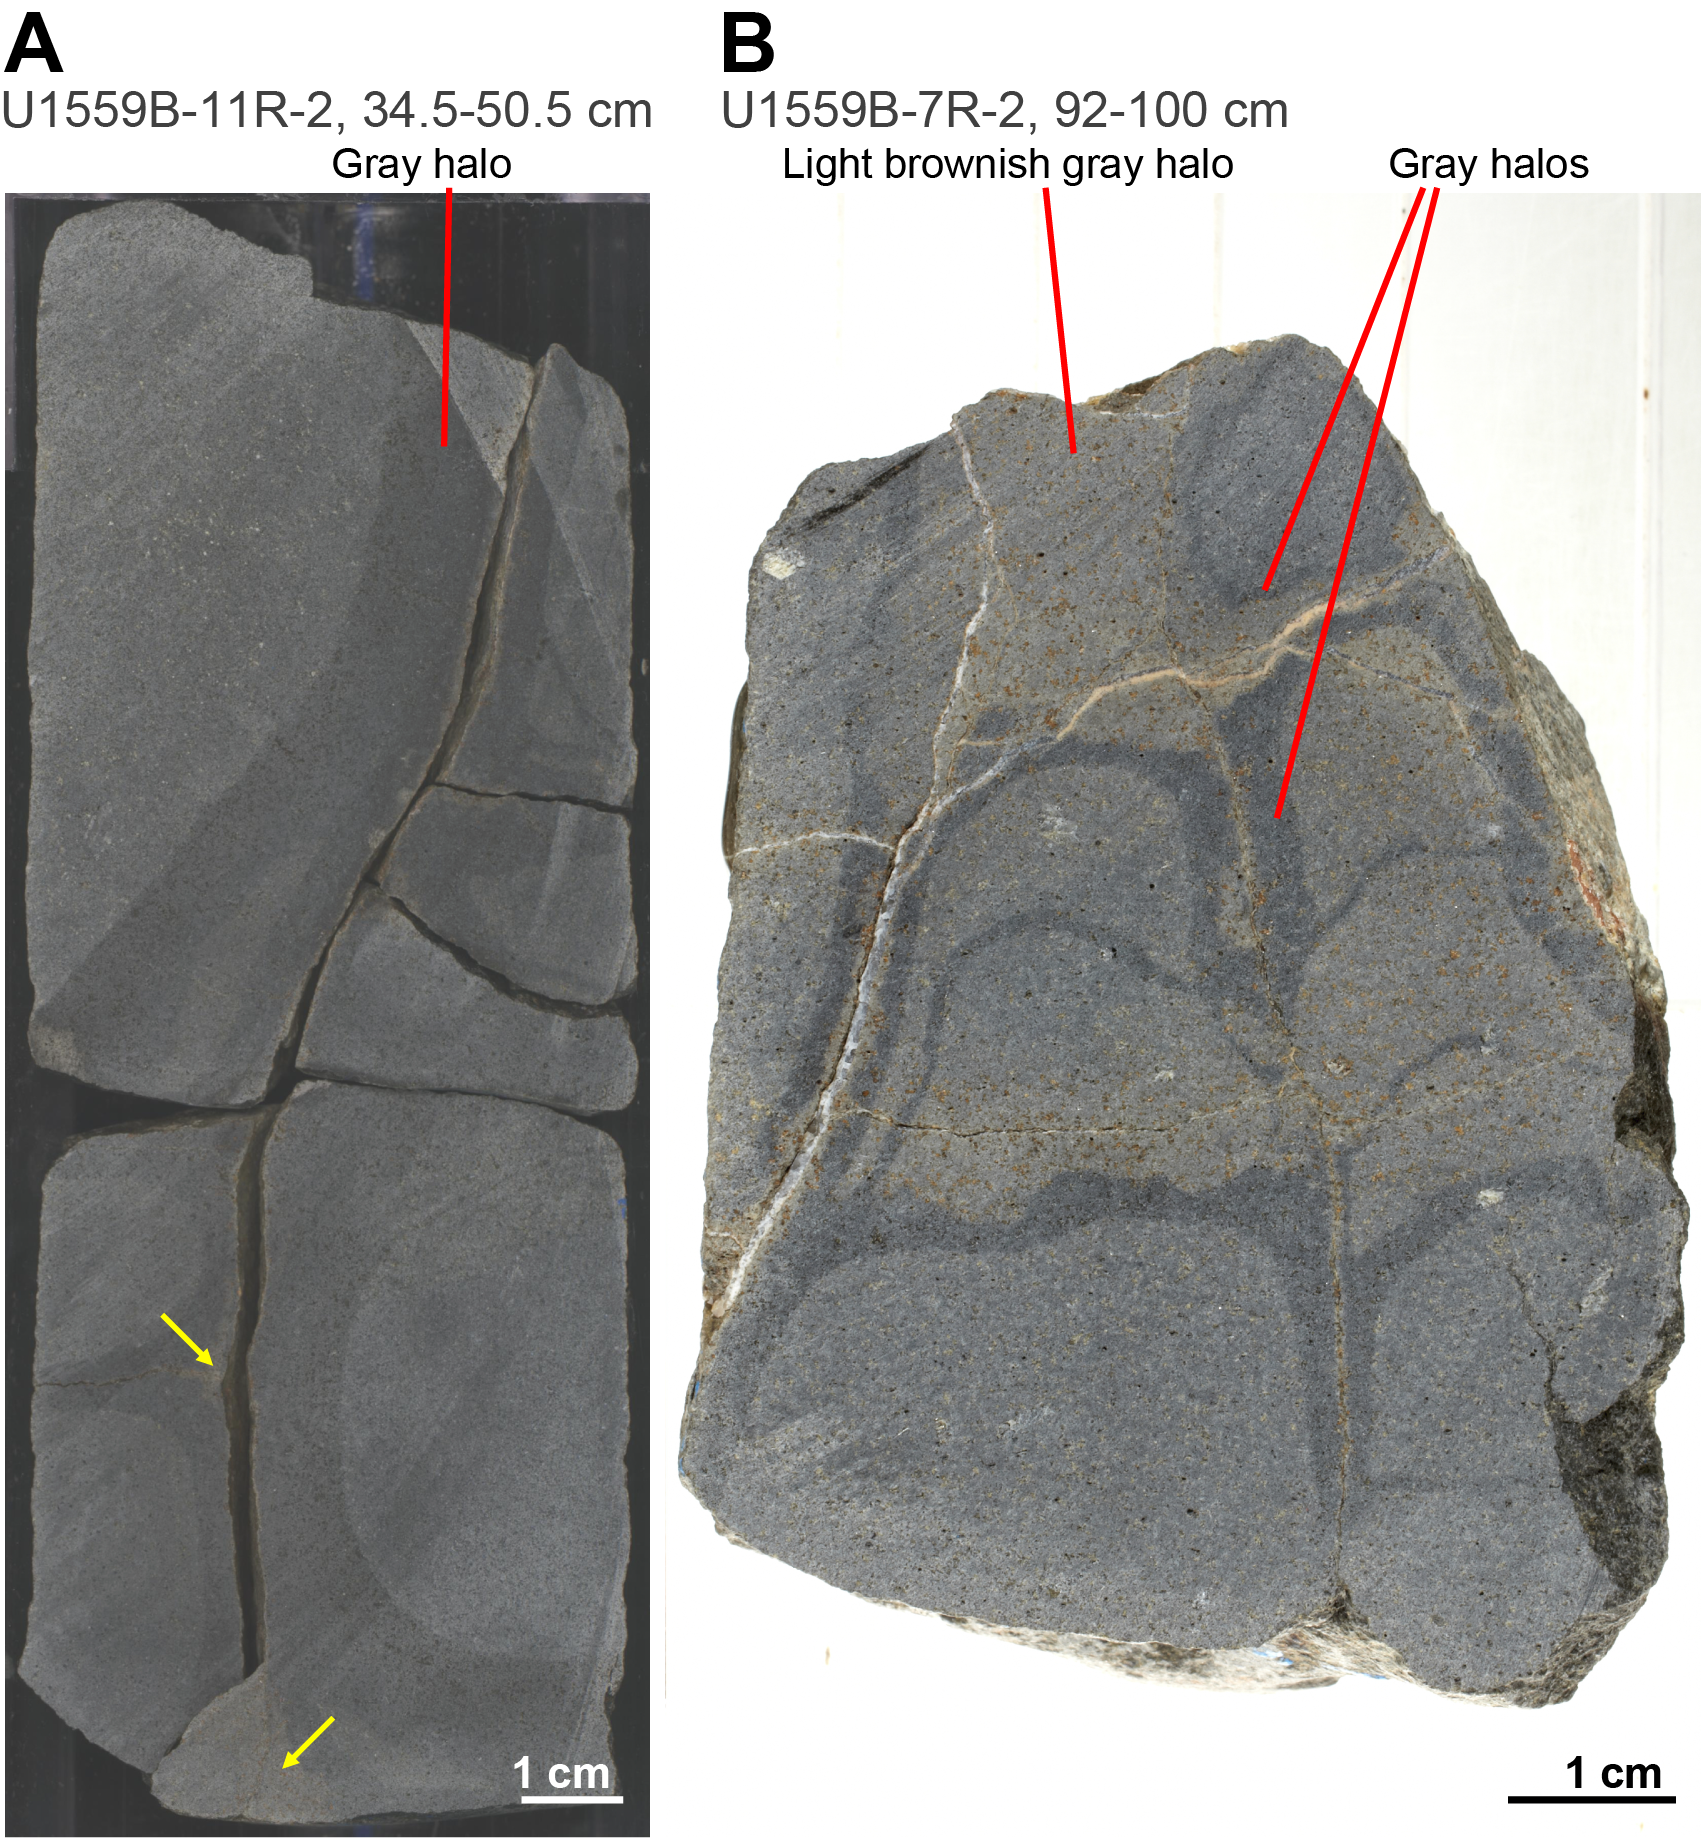
Figure F40. Complex halos.
From these complex halos, it is possible to identify the sequence of halo formation. The dark gray halos are unequivocally the earliest halos to form and are clearly overprinted by both other halo types. The light brownish gray halos and orange-gray halos do not occur in the same piece, preventing a definitive sequence. Based on the similar mineralogy but differing textures of these two halo types, the orange-gray halos are interpreted to represent a less intense version of the light brownish gray halos.
An additional alteration type is observed in interval 393-U1559B-13R-1, 25–30 cm, at the bottom of the hole, where a core piece with a glassy margin displays a more intense orange 4 cm wide alteration halo, hinting that there is more variability in the alteration of the basaltic crust than displayed by the limited recovery in Hole U1559B. This orange alteration is similar to (but less intense than) the orange-reddish yellow alteration commonly observed in the older holes along the SAT (e.g., at Sites U1558 and U1583).
6.4. Veins
Veins are common features in Hole U1559B, with 289 individual veins logged together with a further 11 vein networks. Vein mineralogy includes clays, calcium carbonate, Fe oxyhydroxides, sediment, and rare pyrite (Figure F41). Veins vary from 0.1 to 3 mm; 43% of veins are <1 mm (Figure F42). Calcium carbonate (calcite) precipitates coexist with remobilized and altered indurated calcareous sediments in veins to 88 mbsf (~24 msb; above Core 8R). An XRD diffractogram of indurated calcareous basement materials derived from altered sediment indicates the presence of magnesian calcite with minor phillipsite (Table T8). In some examples, this sediment has ponded in voids toward the bottom of subvertical veins and fills small depressions in inclined irregular shaped veins. Some examples of this material exhibit a polycrystalline texture, suggesting recrystallization has occurred.
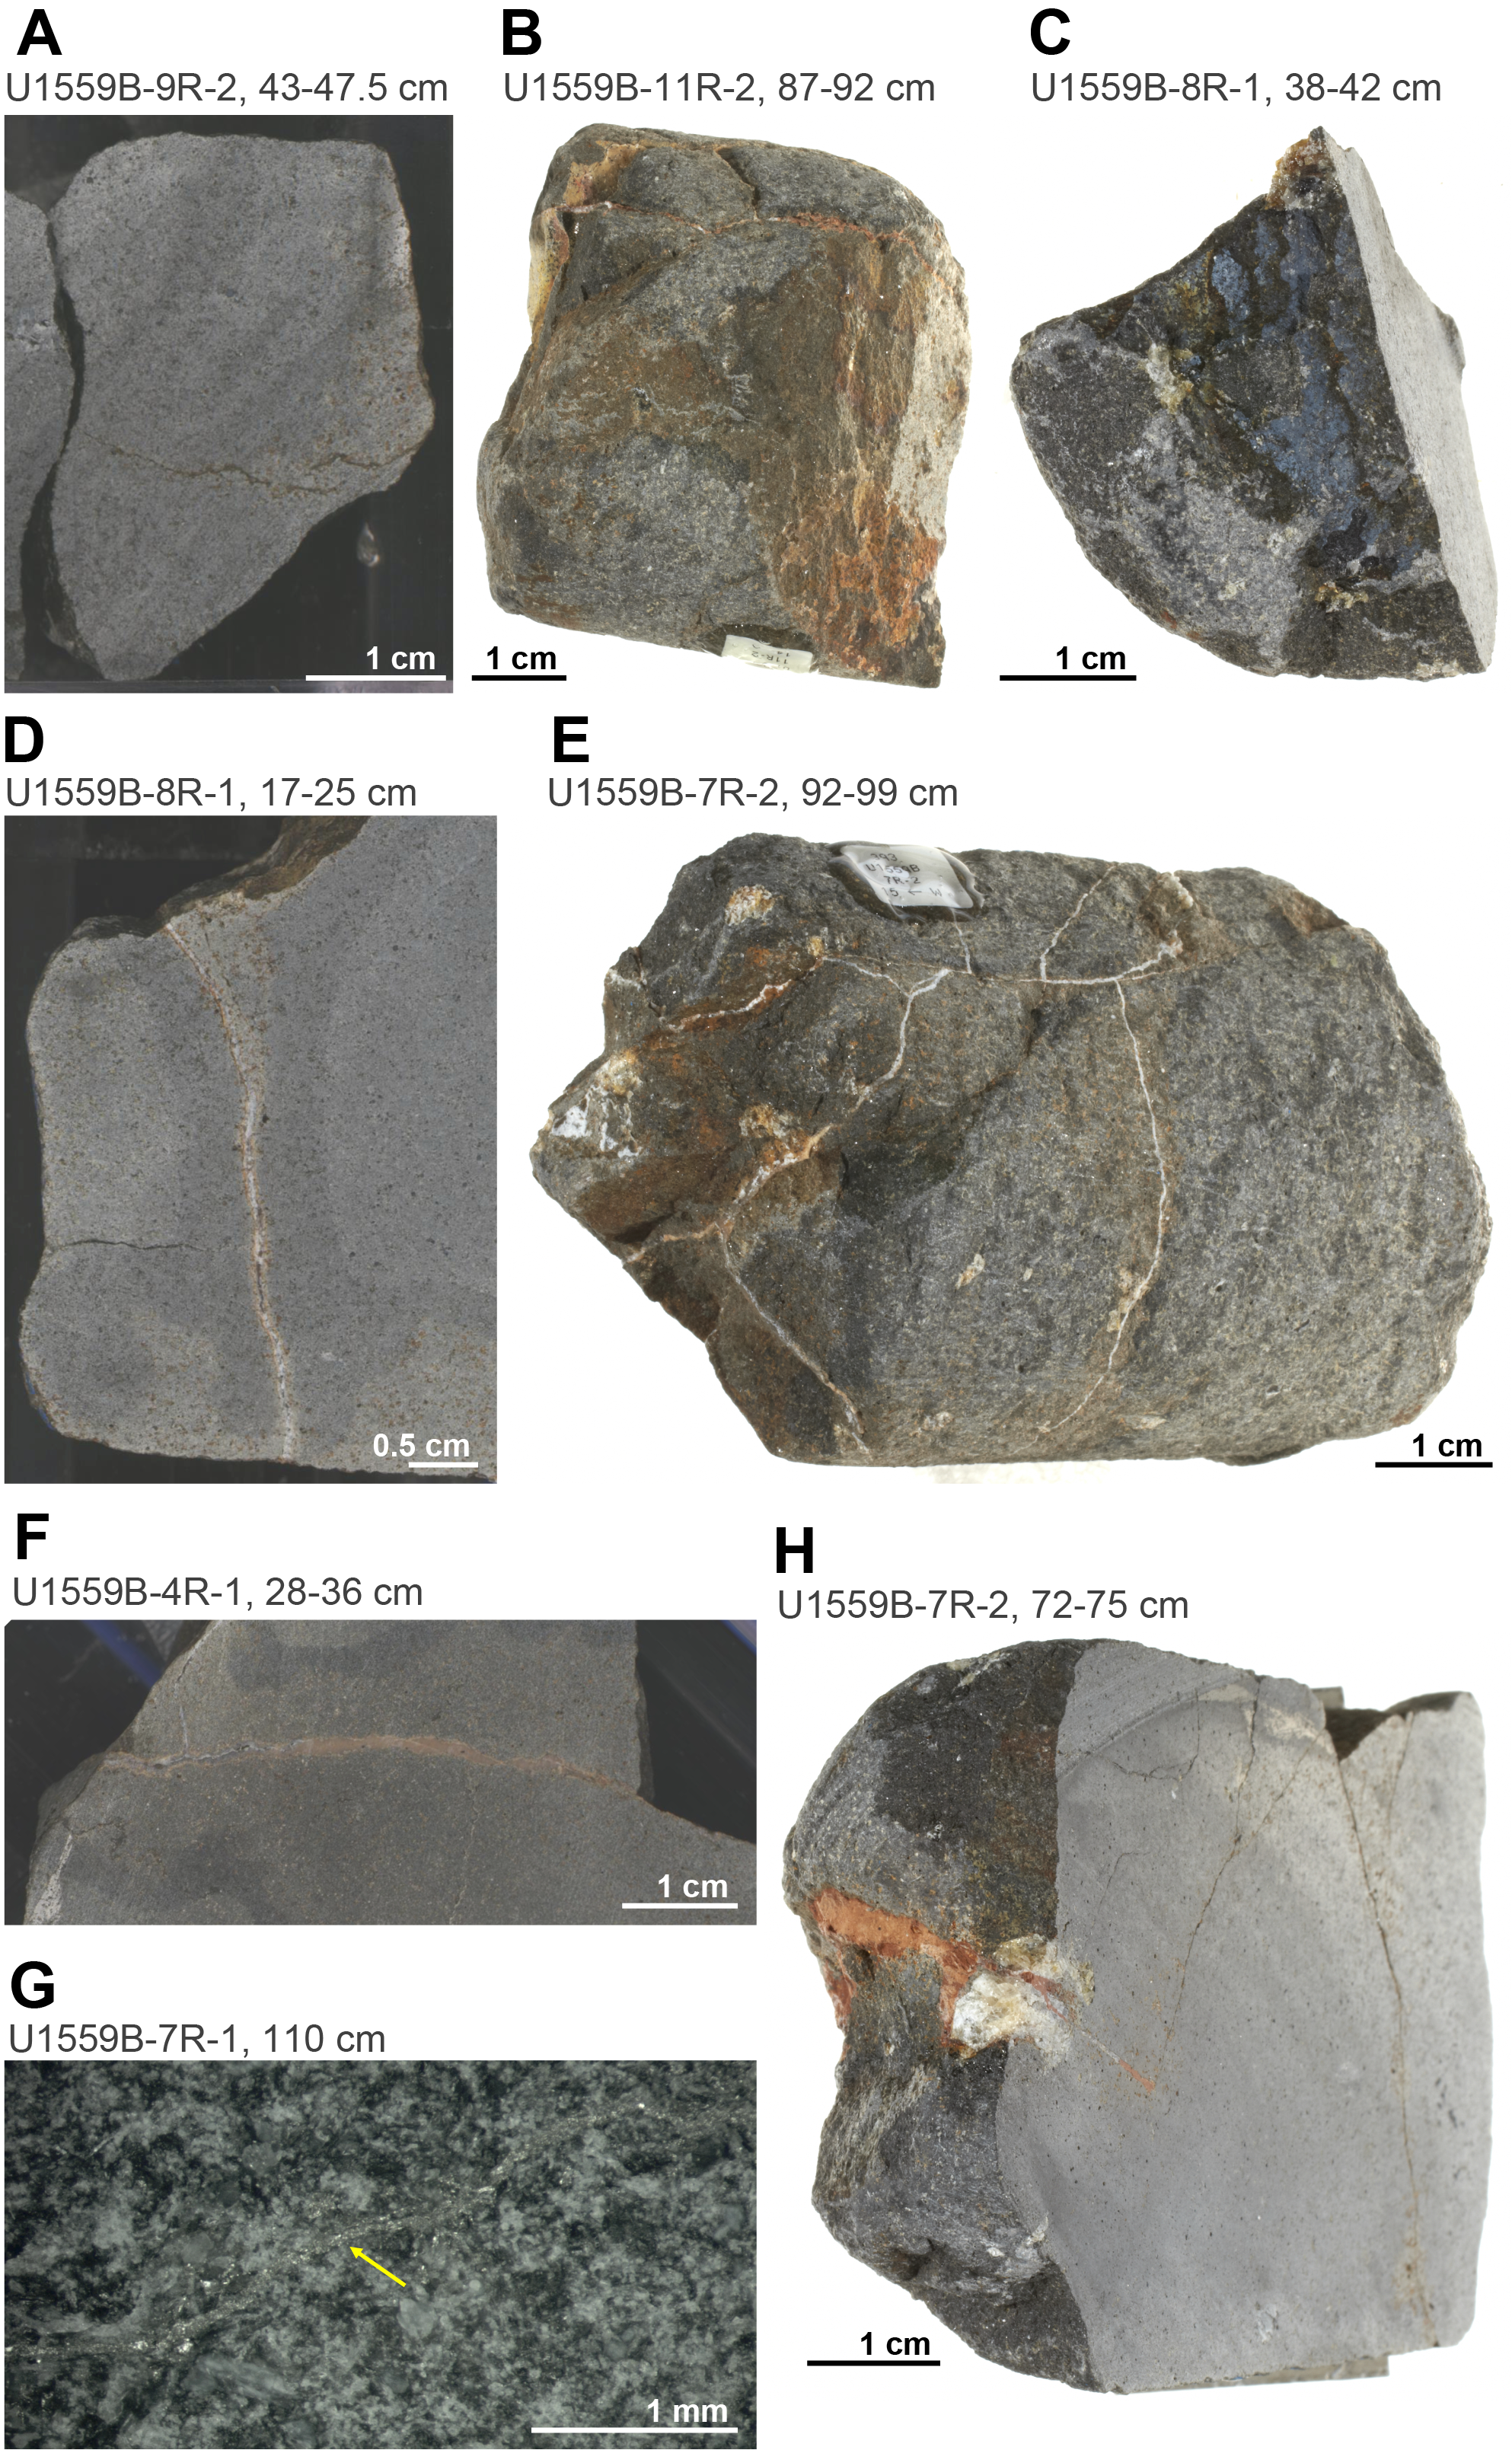
Figure F41. Veins.
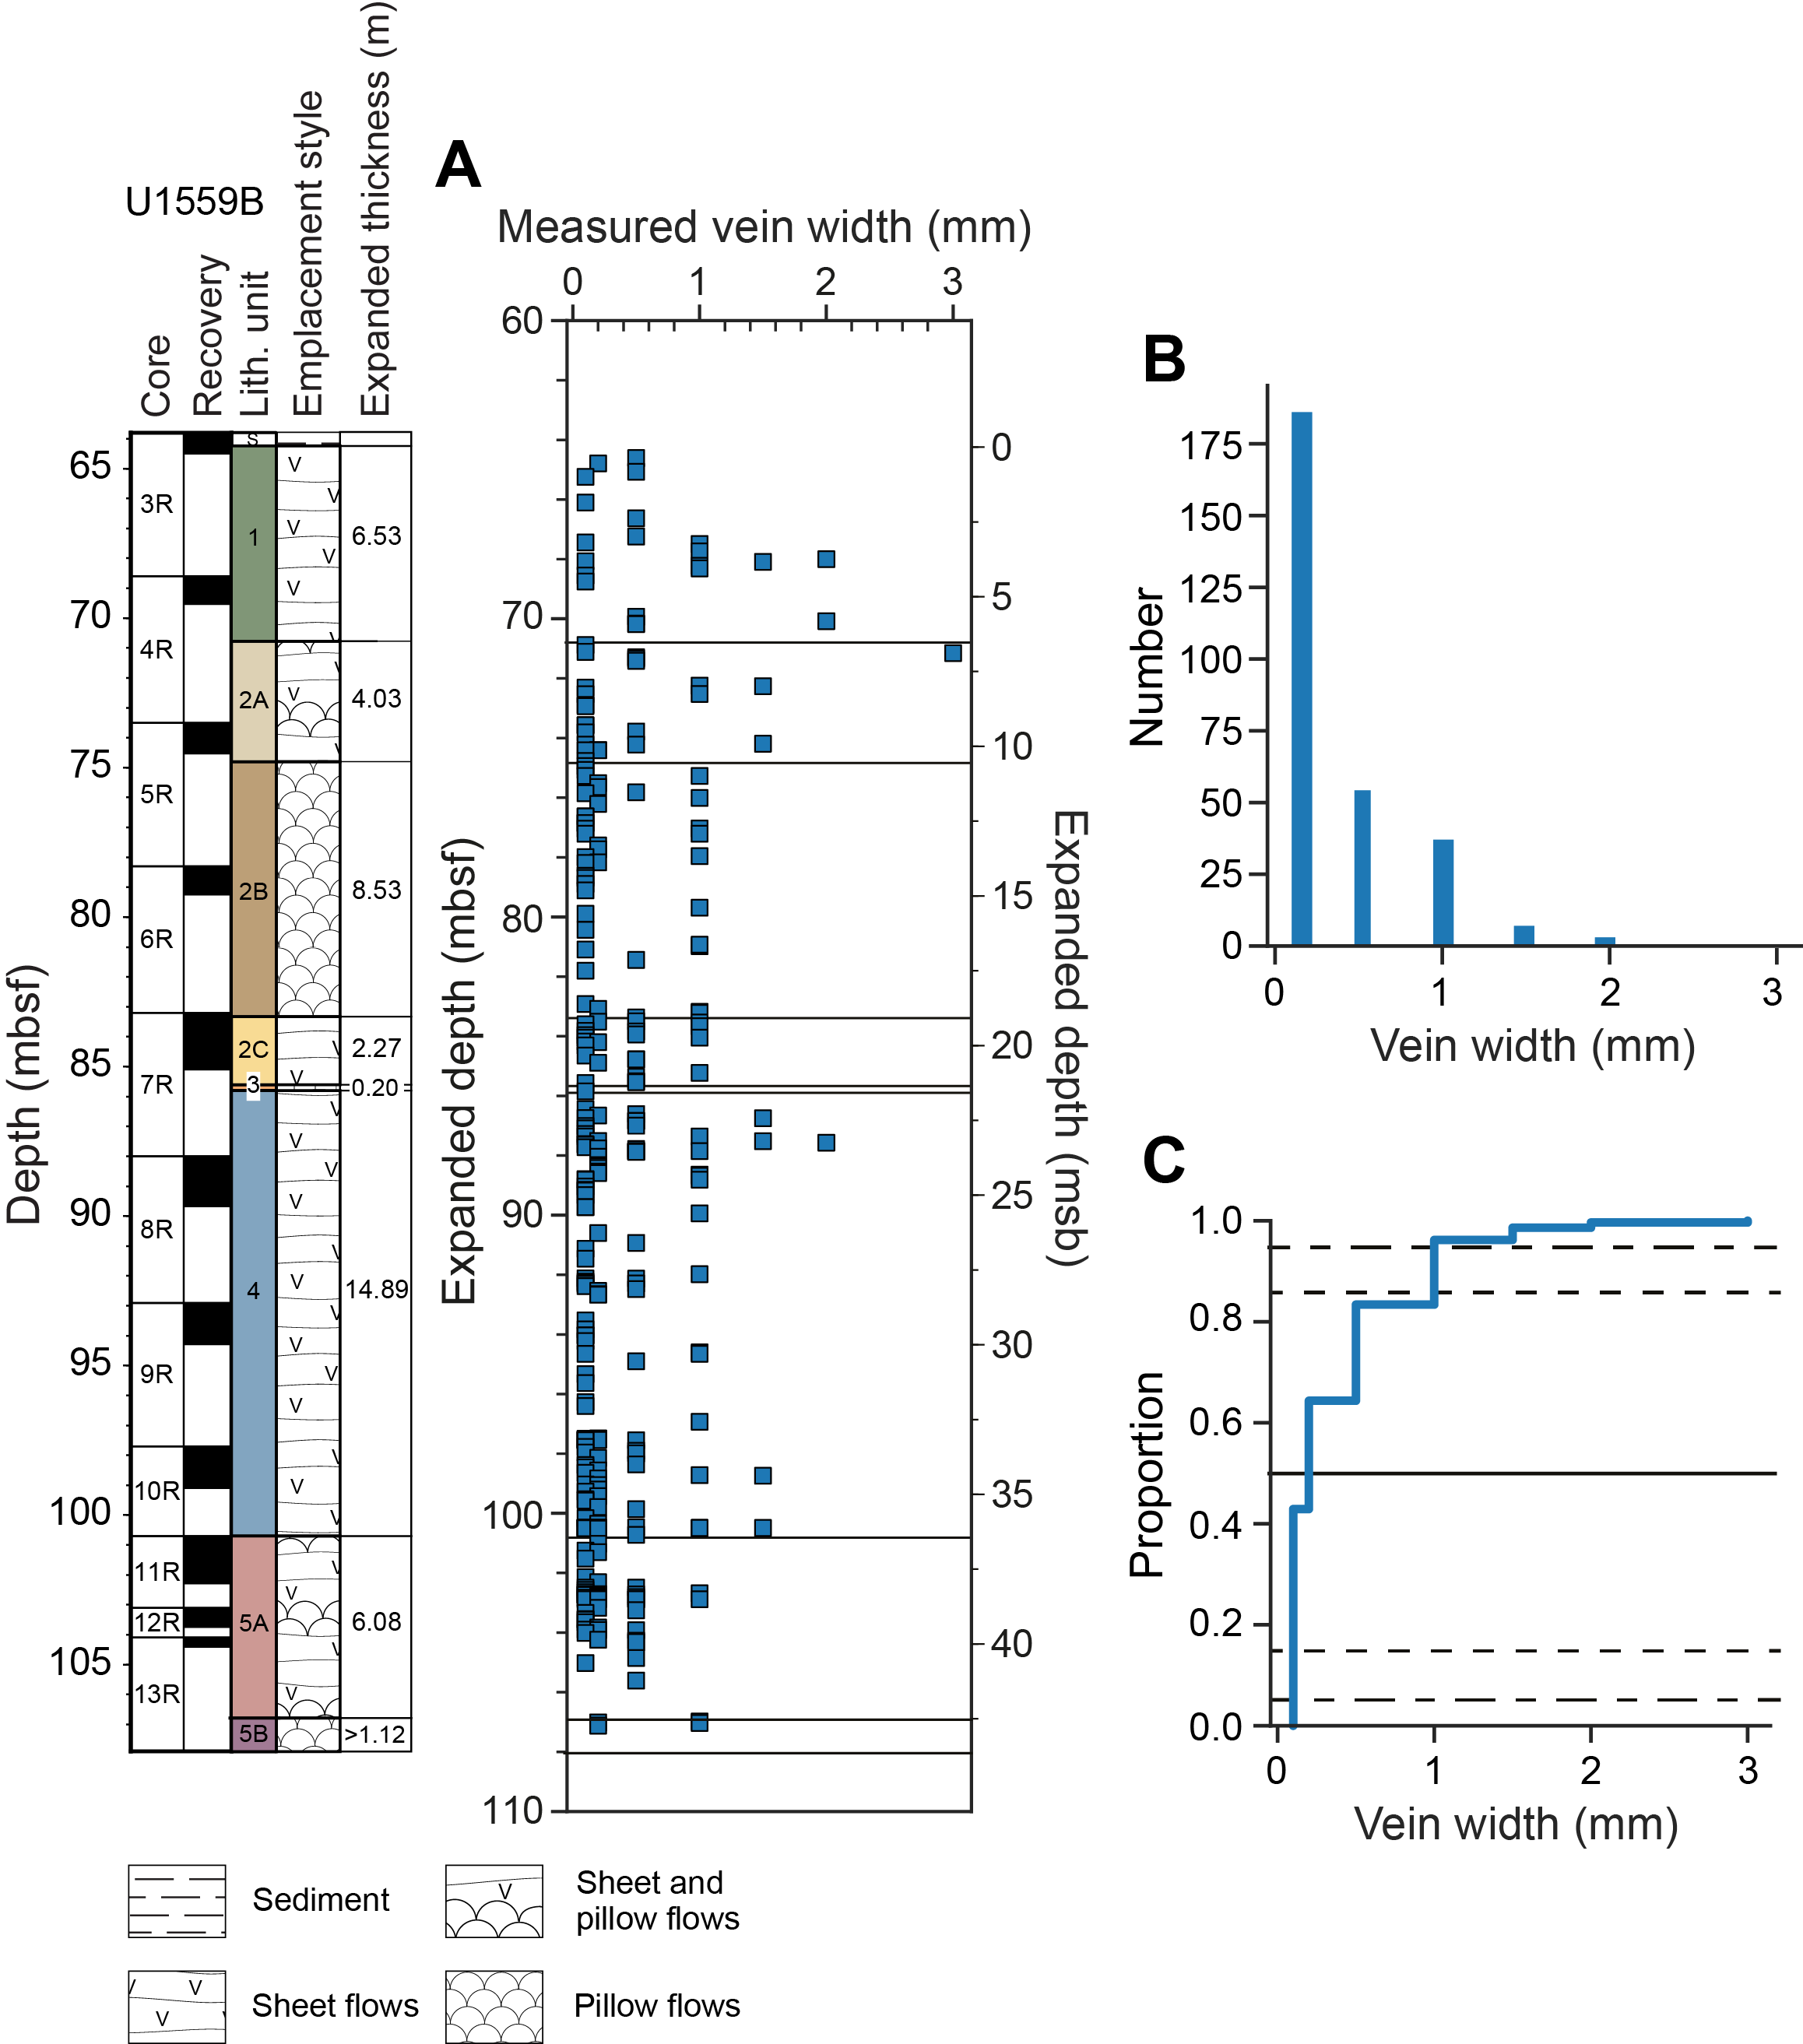
Figure F42. Vein width characteristics.
Hydrothermal veins are distributed throughout Hole U1559B (Figure F42), although larger veins (>1 mm wide) are more abundant within 2 m of igneous boundaries in Subunit 2A and Unit 4. This suggests that the volcanic stratigraphy may be exerting some influence on the geometry of fluid flow (e.g., Harris et al., 2015). The widest veins are filled with calcite, and these display both polycrystalline and crack-seal textures. Calcite does not generally form monomineralic veins; 90% of calcite veins host two or more secondary minerals. In many cases, these minerals occur as sequential crack-seal fillings of the veins. All veins are lined by clay. Clay-only veins are narrow (<0.1 mm), indicating that clay-filled veins are commonly reopened by later episodes of fluid flow and mineral precipitation and grow in width with each opening.
Vein density normalized to core recovery is on average 23 ± 6 (1σ) veins/m (Figure F43) and ranges 15–33 veins/m. There are no discernible changes in vein density with depth or vein filling with depth except for sediment-filled veins, which are more common in the uppermost 20 m of the basement. The three dominant minerals within veins are calcite, clay, and Fe oxyhydroxides, occurring in 199, 236, and 230 veins, respectively. The secondary minerals filling veins represent 1.1% of the volume of the recovered core, and the most volumetrically significant vein fill is calcite (Figure F44), although it occurs in fewer veins than clay and Fe oxyhydroxides. Secondary minerals filling vesicles were excluded from this calculation because the majority of vesicles were unfilled and the rocks are not very vesicular.
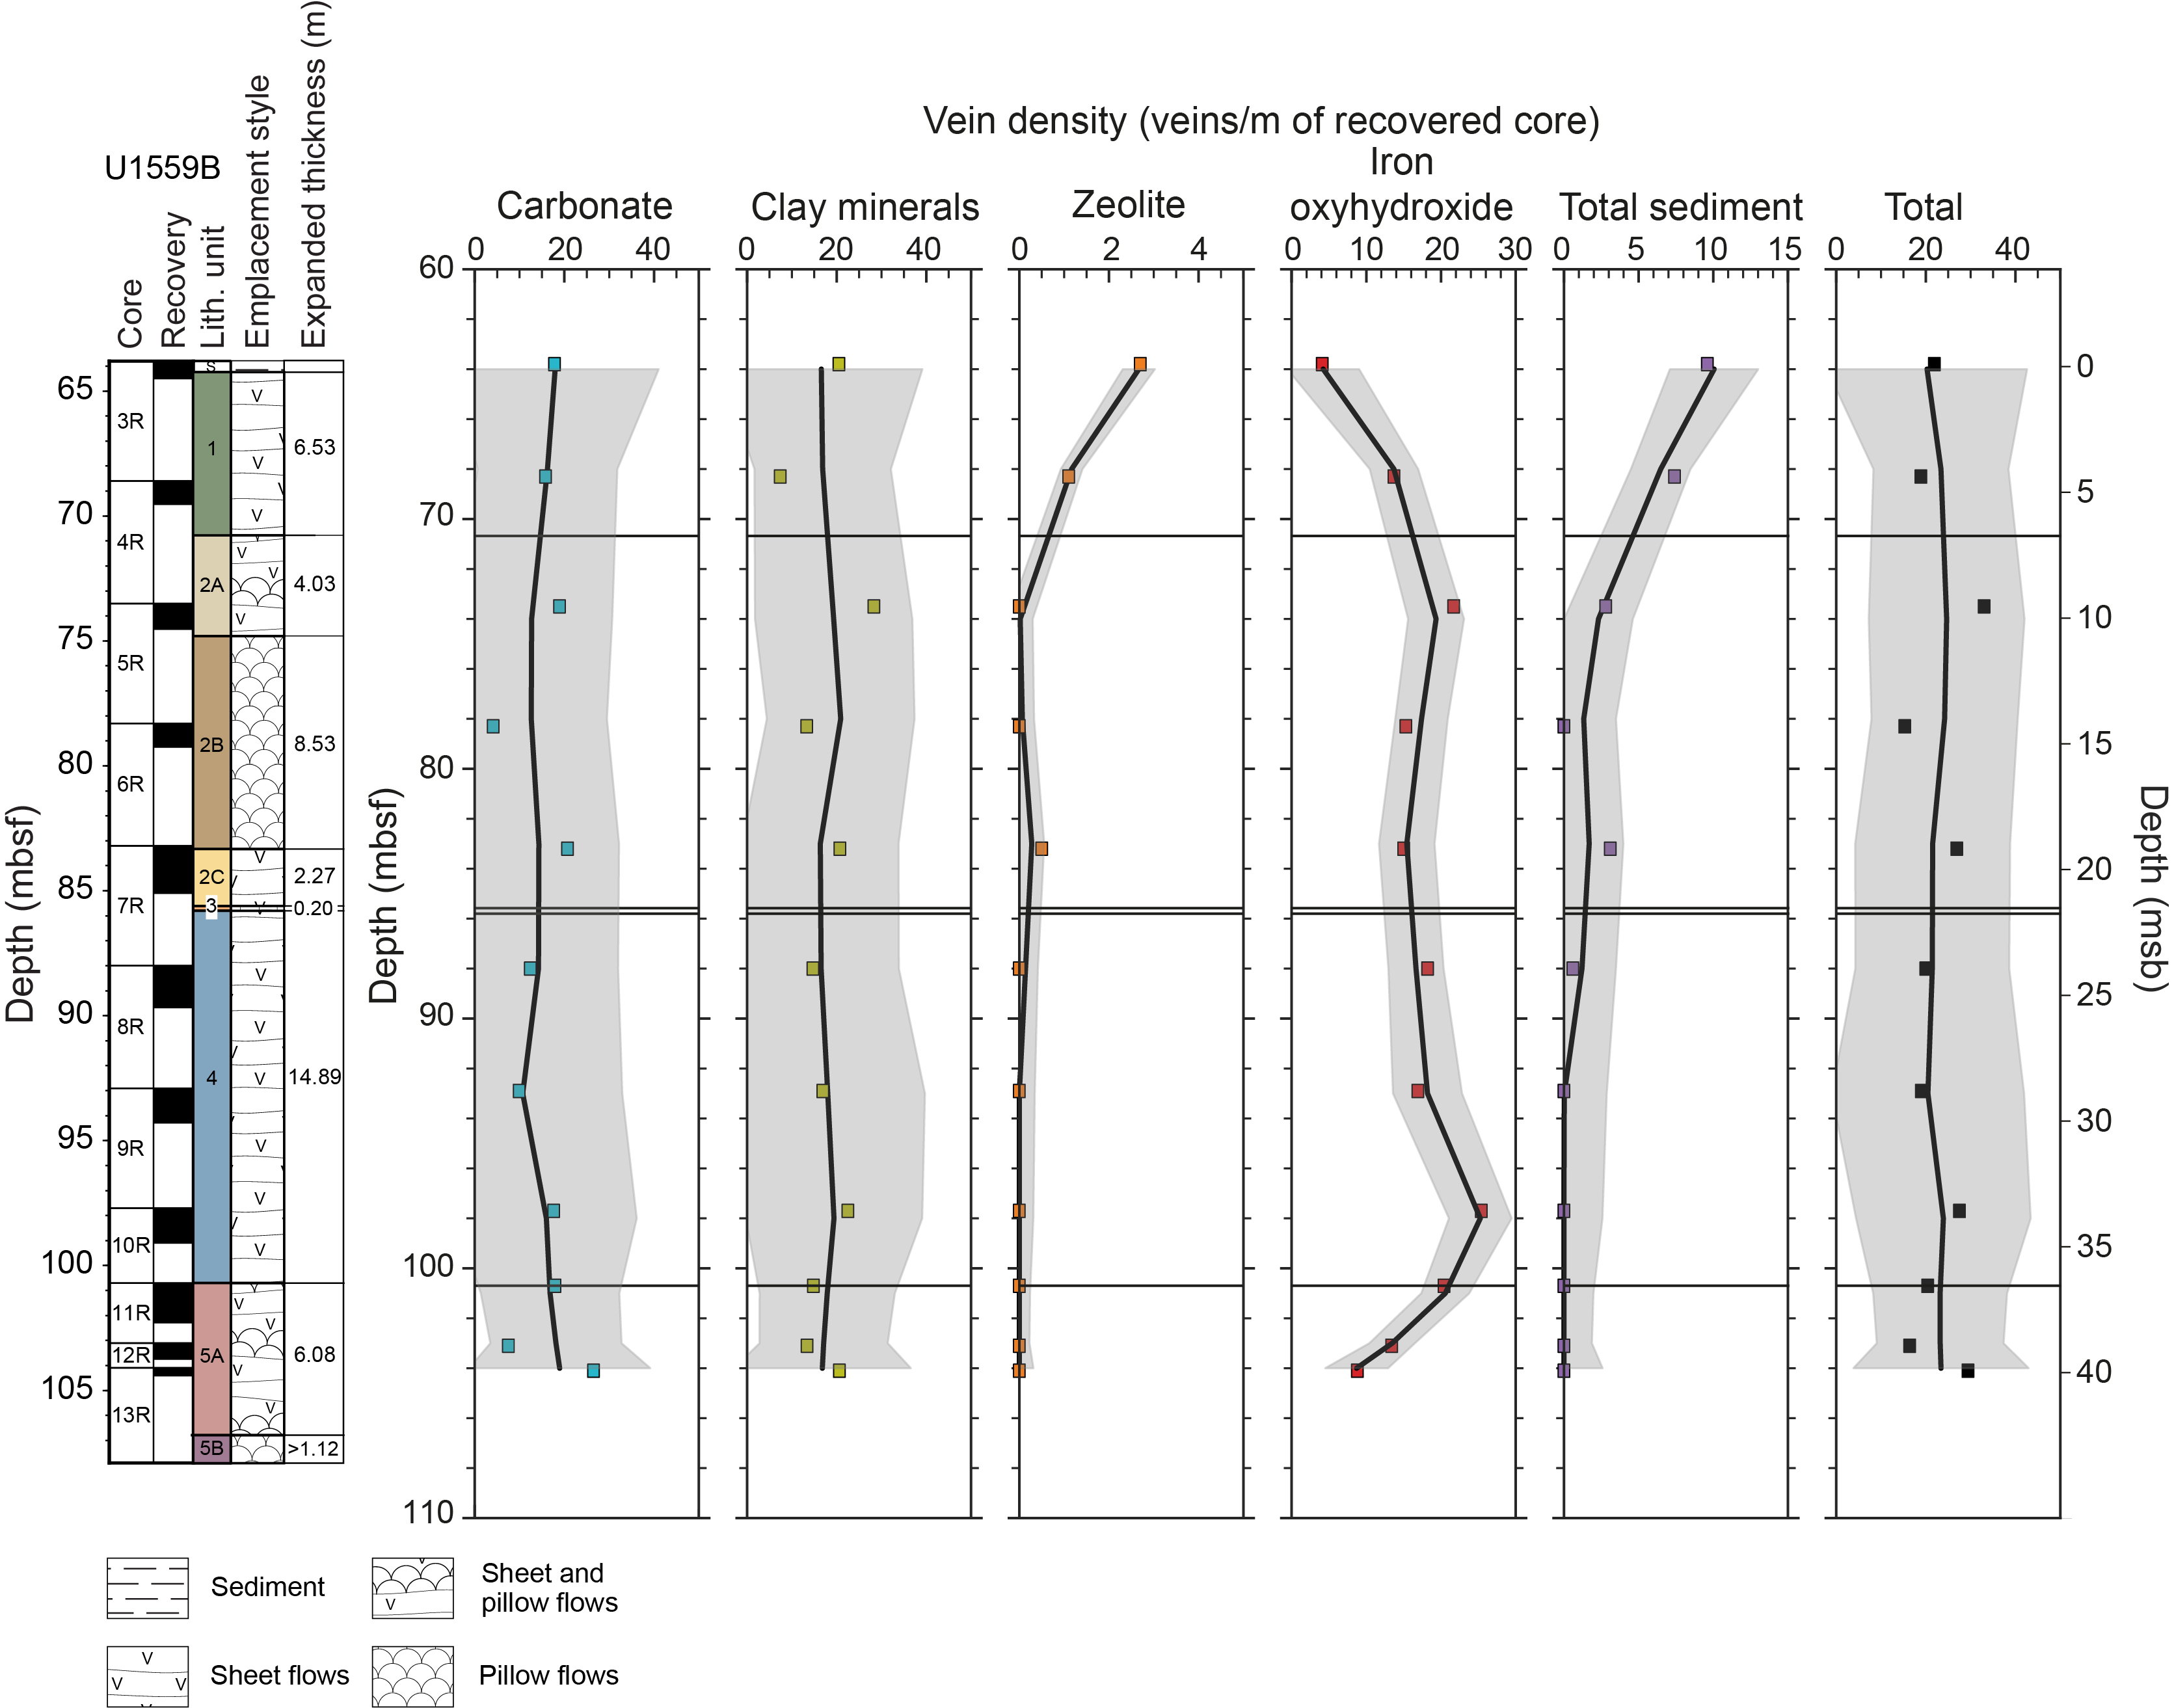
Figure F43. Vein density.
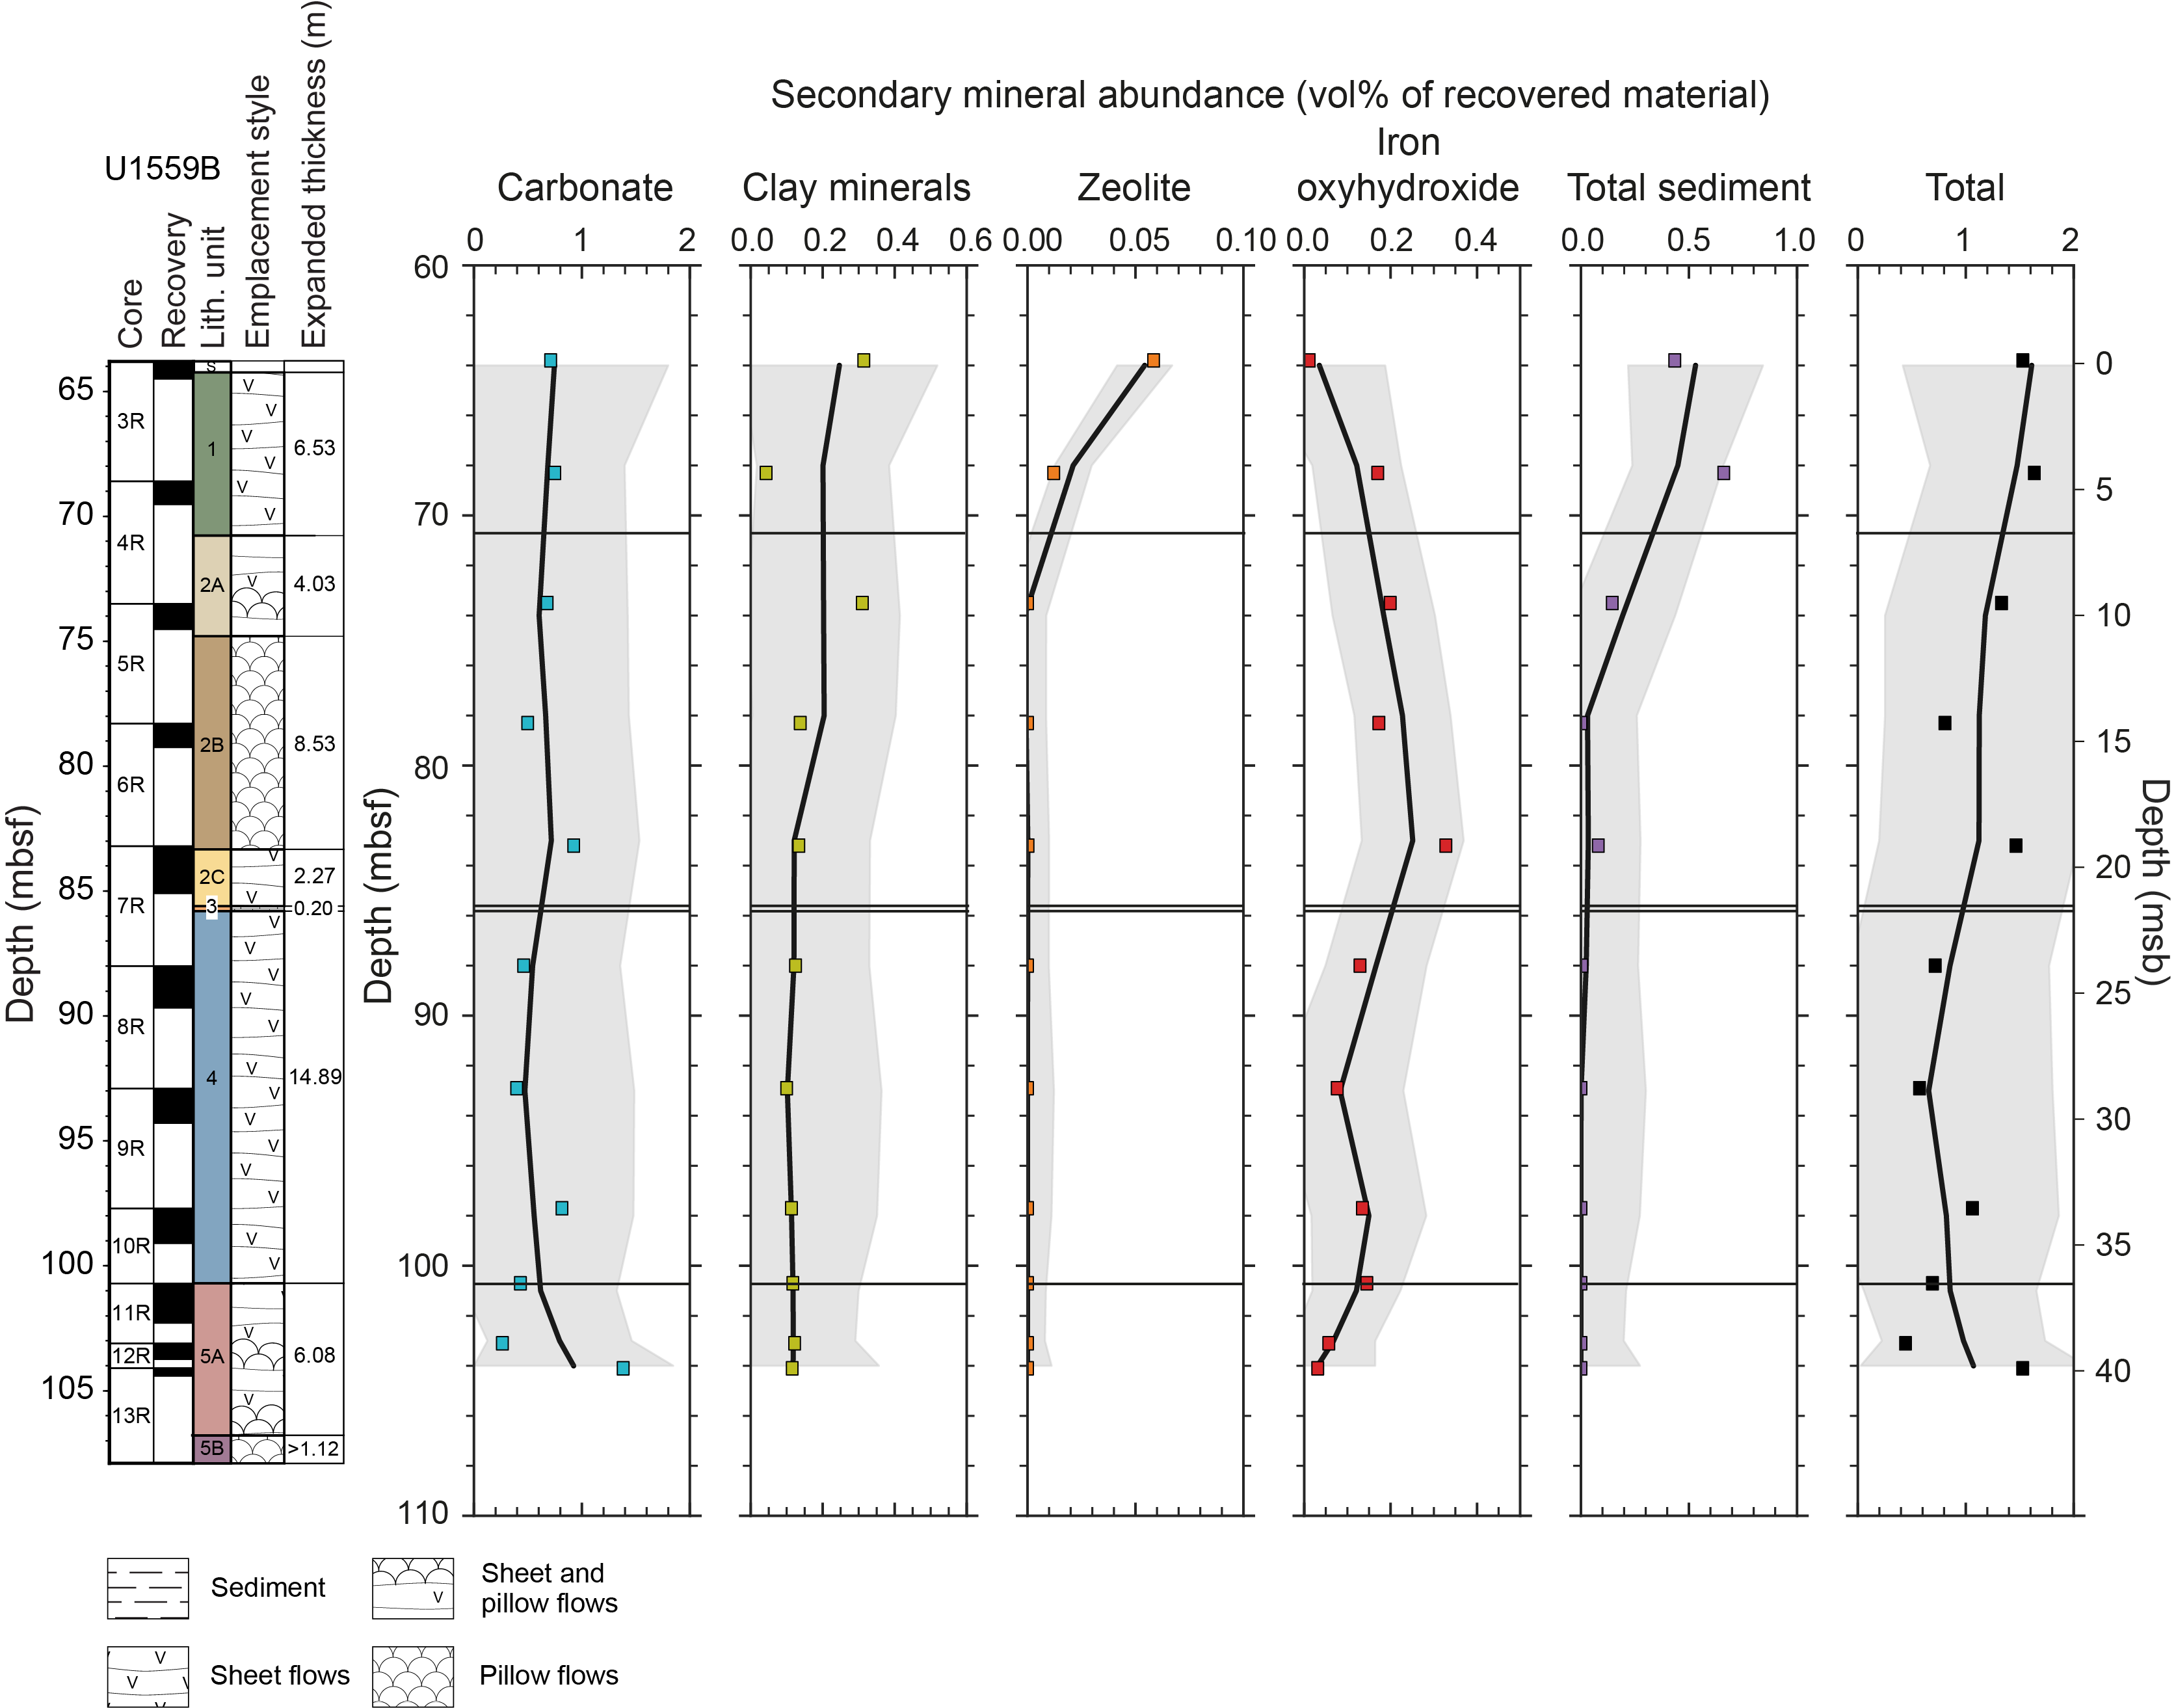
Figure F44. Secondary mineral abundance.
6.5. Structural data
Where possible, the dip and dip direction of veins were measured relative to the core reference frame (see Alteration petrology in the Expedition 390/393 methods chapter [Coggon et al., 2024c]). The orientations of 48 of the 289 veins were measured, and true dip ranges 6°–88° (Figure F45). The range of the measured vein dip angle increases downhole, with veins in Units 4 and 5 showing the widest variation in dip angle (Figure F45A). With low recovery and few oriented pieces, this variation is potentially an artifact of recovery. The distribution of vein dips (Figure F45B) is skewed to moderate to high dip angles (>55°), with very few subhorizontal or gently dipping veins (<30°). There is no apparent relationship between vein dip and vein filling. The distribution of vein widths is similar for nonhaloed and haloed veins (Figure F46A, F46B), and measured vein dip angles are similar for nonhaloed and haloed veins; the greatest number of vein dip angles measured ~60° in both vein types (Figure F46C). All measured nonhaloed vein dip angles are >35° (Figure F46C, F46D).
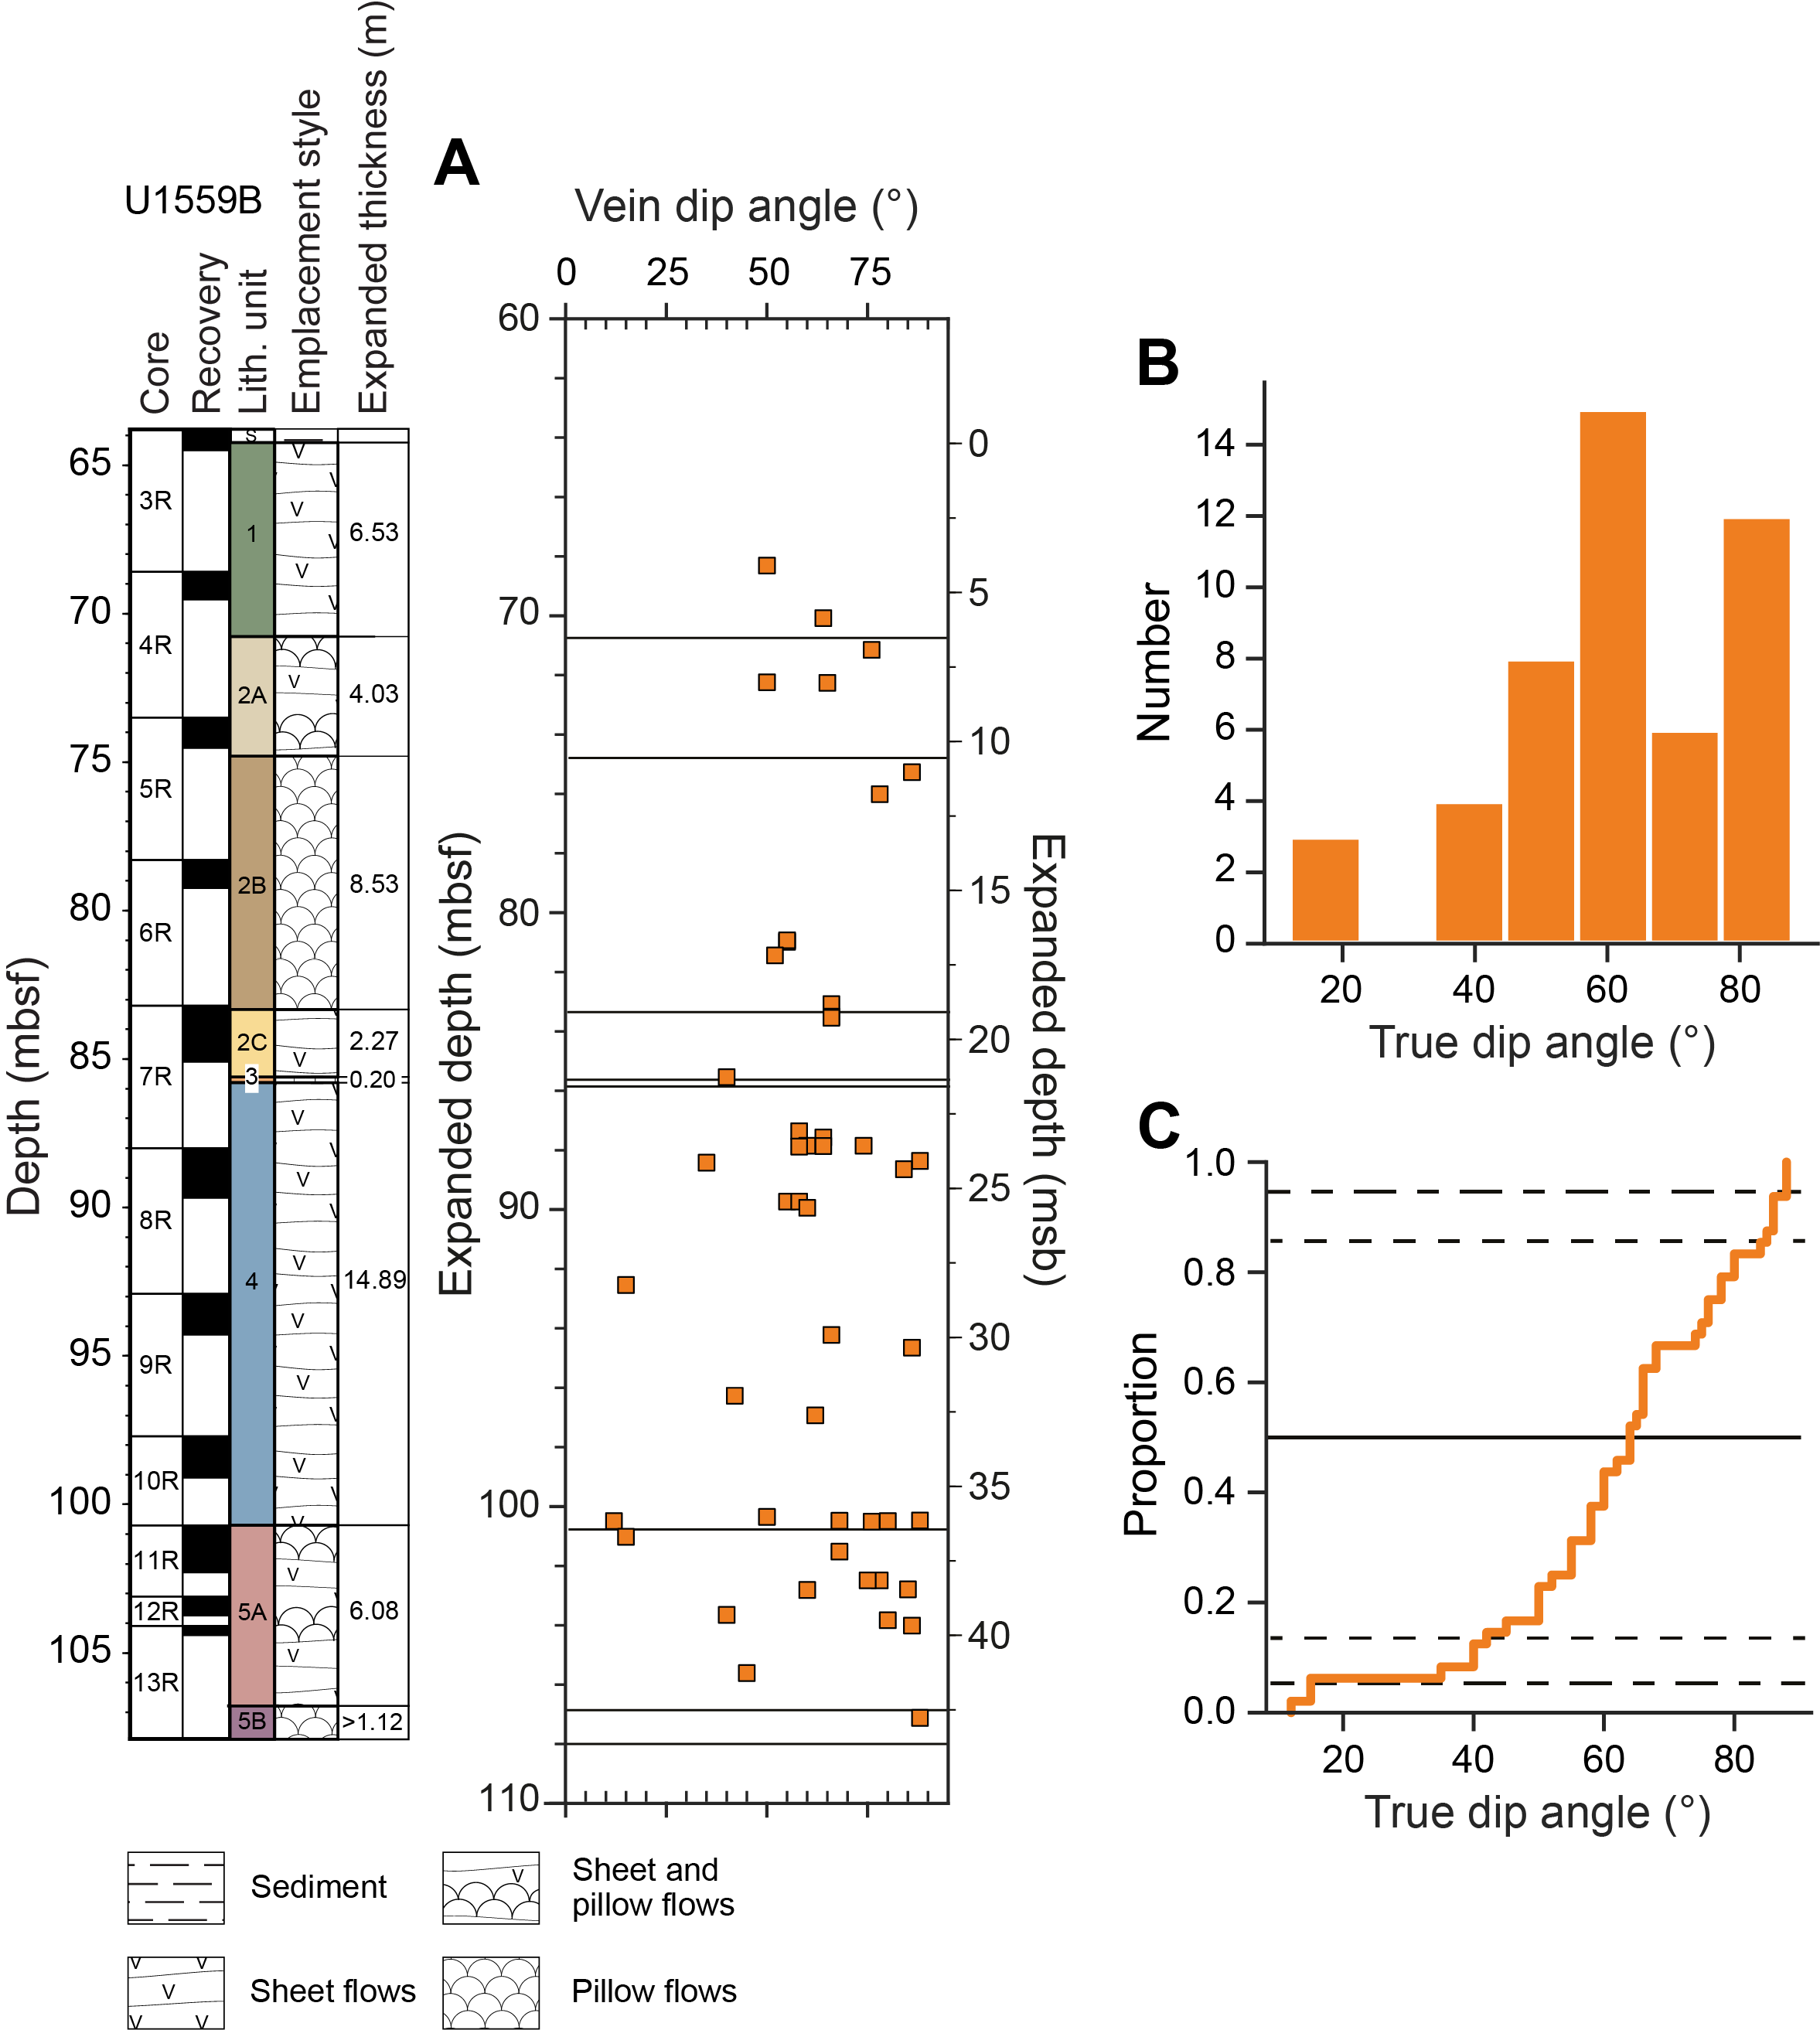
Figure F45. Vein dip angles.
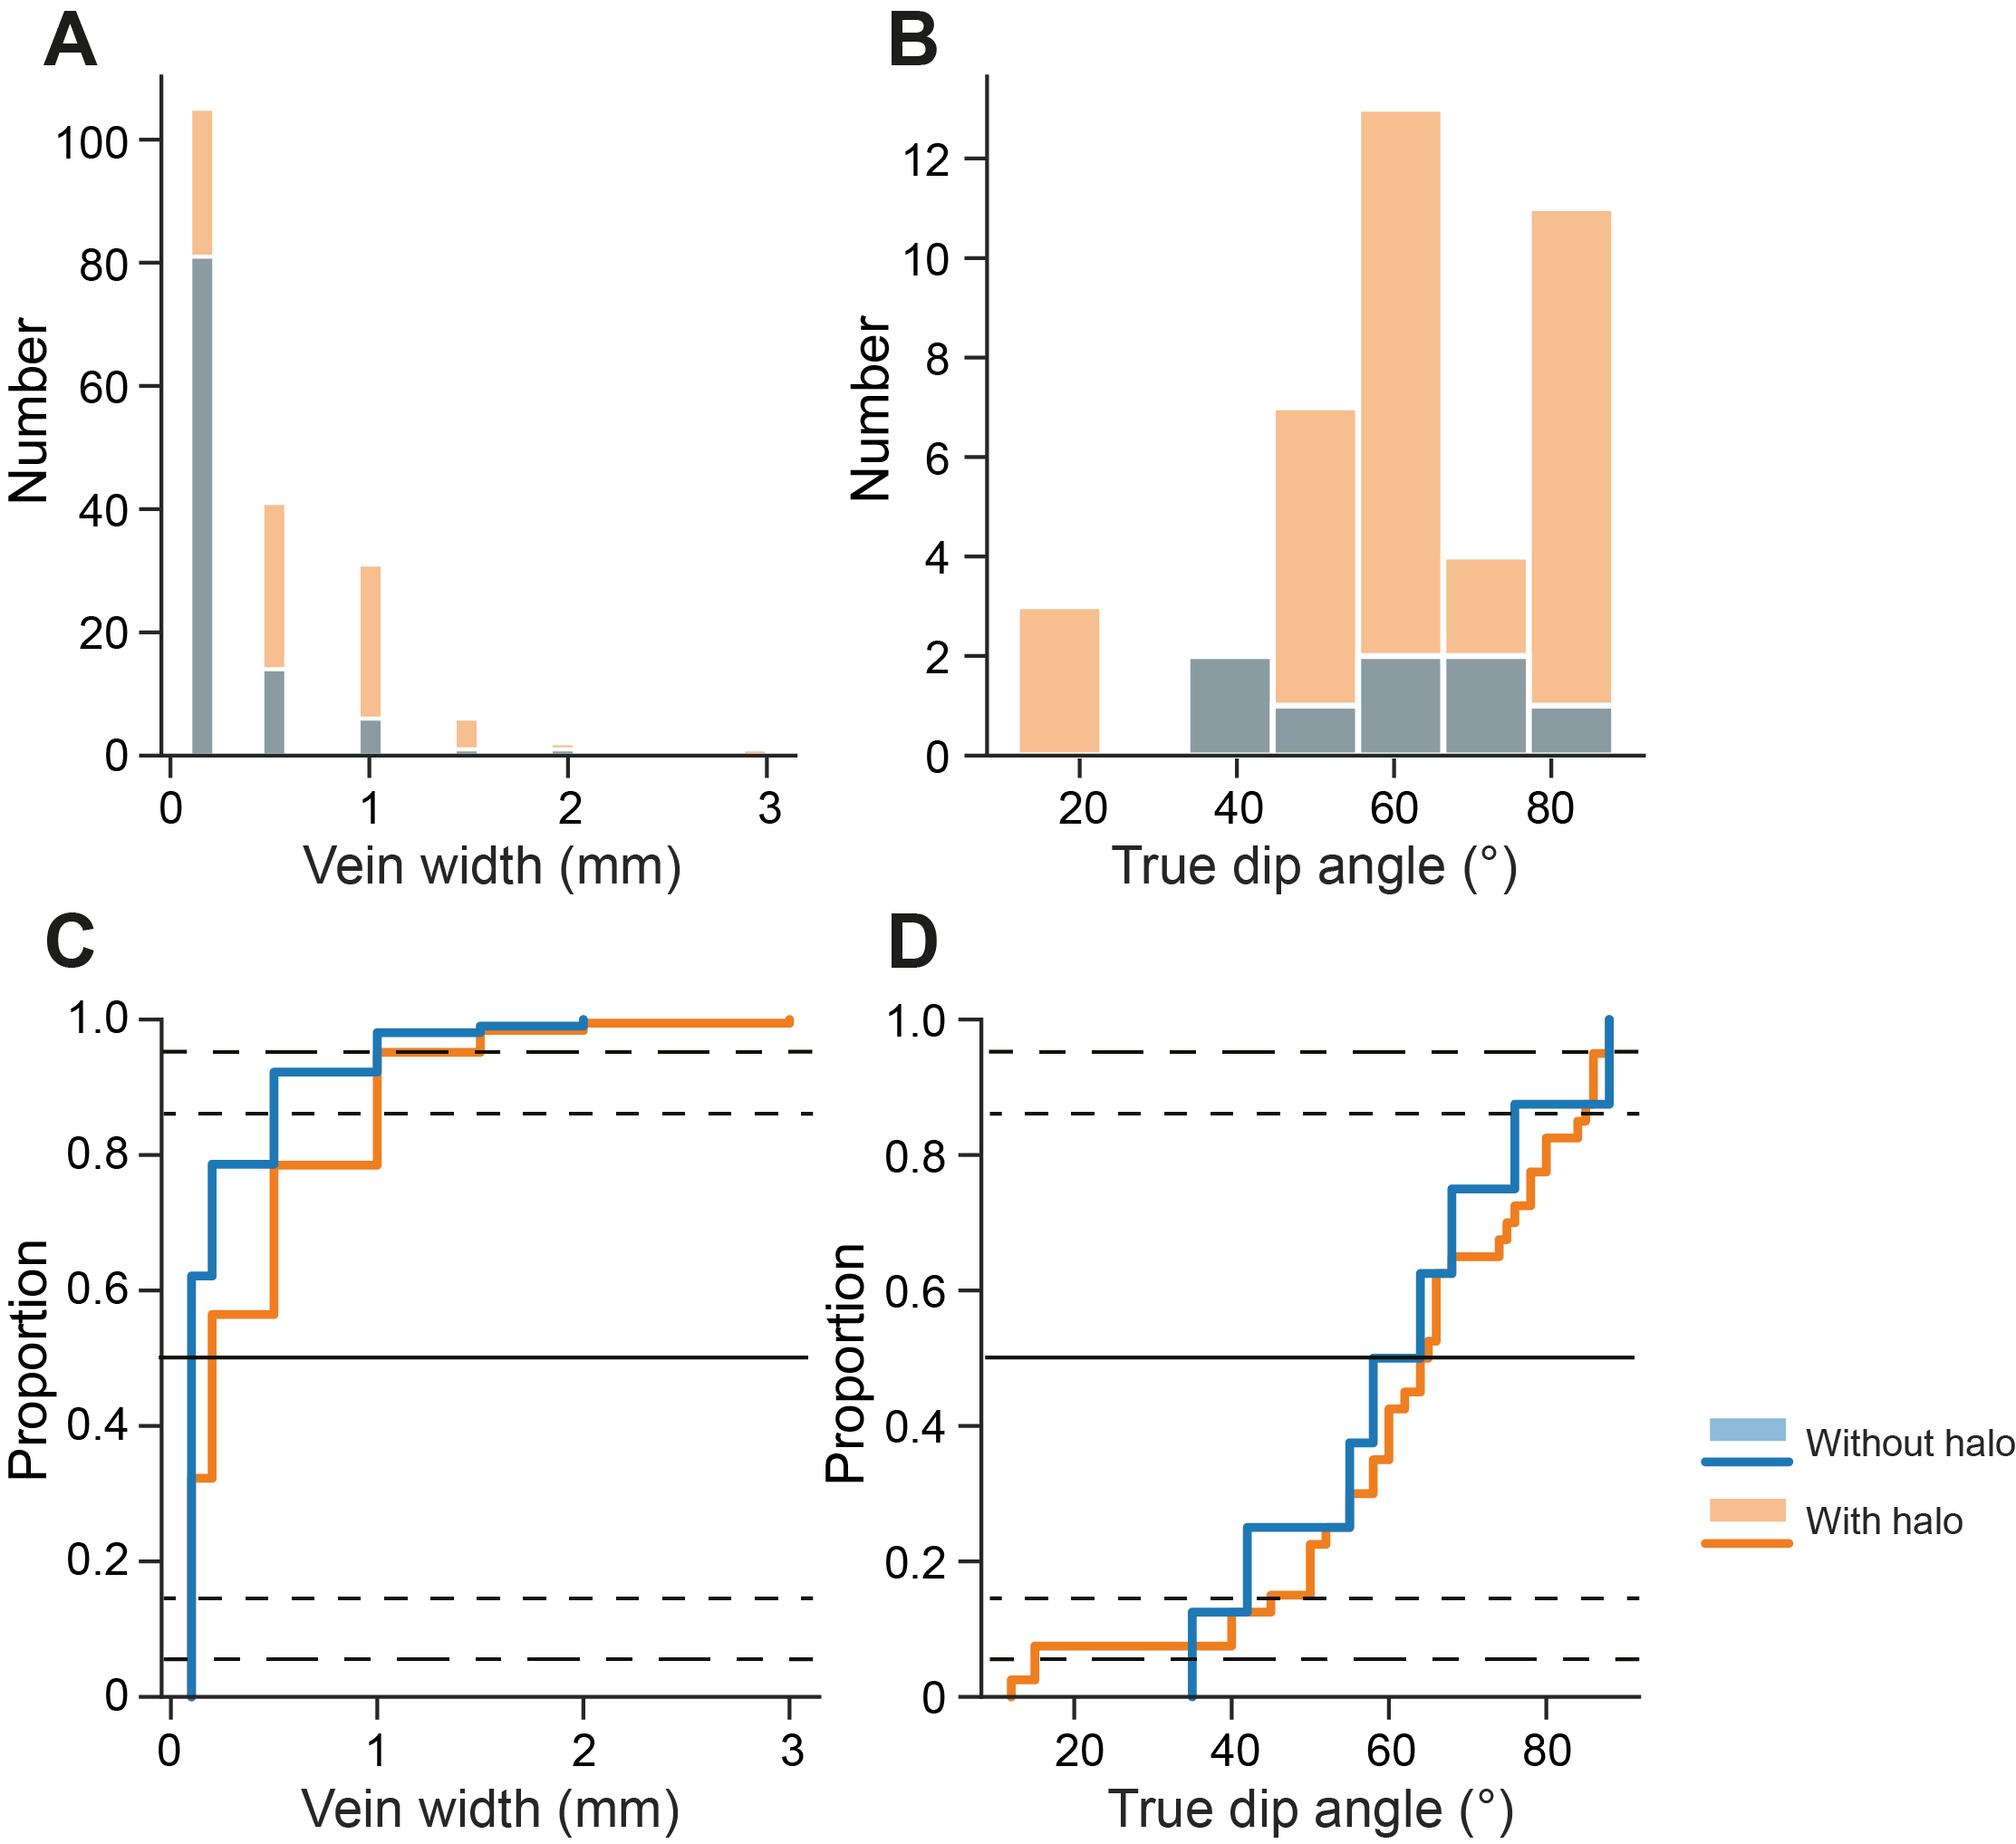
Figure F46. Vein width and dip angle statistics.
6.6. X-ray diffraction
XRD spectra were generated for powdered materials from veins, vugs, bulk rock, and lithified sediment to refine macroscopic observations of primary and secondary mineralogy. Evaluation of the spectra suggests vein and vug fillings to be dominated by (magnesian) calcite and/or phillipsite-Na and other zeolite minerals (Table T8), with feldspar, clinopyroxene, and minor clay components also present. Indurated calcareous sediments are chiefly composed of (magnesian) calcite with minor phillipsite-Na. The results from XRD analyses of bulk rock powders (see U1559B_XRD.xlsx in ALTPET in Supplementary material) reveal mostly calcic to sodic feldspars and clinopyroxene as well as minor olivine, oxides, and additional spectral peaks that indicate the variable presence of clays.
6.7. Summary
Alteration in Hole U1559B is characterized by pervasive gray background alteration with alteration halos throughout the cored interval. The short penetration of Hole U1559B precludes the separation of alteration zones with depth, but a downhole evolution in alteration halo types is present and the recovery of a more oxidized pillow lava fragment at the base of the hole indicates we may have only just begun to capture the full sequence of alteration at this site and crustal age. All alteration is dominated by the formation of yellow-brown clay minerals that predominantly replaces mesostasis and groundmass. Calcite replaces groundmass in some sections, indicating variable fluids and/or conditions of reactions. Three halo types are present, and their abundances vary downhole. Dark gray halos accompanied by light brownish gray halos dominate the cores to 92 mbsf, below which there is an increasing abundance of orange-gray halos. The earliest phase of alteration is the formation of dark gray alteration halos around fractures and veins. These dark gray halos are similar to dark gray or black halos observed in other boreholes that sample the uppermost basement (e.g., Ocean Drilling Program [ODP] Hole 504B; Alt et al., 1996). This is followed by the formation of the light brownish gray and orange-gray halos. Crosscutting relationships are rare, and the sequence of later alteration is determined by crack-seal textures in veins, which suggest that early clay-lined veins are reopened and filled with calcium carbonate.
7. Biostratigraphy
The 50.95–62.47 m thick sedimentary succession at Site U1559 contains a recent to latest Miocene sequence of pelagic ooze. Calcareous nannoplankton and planktic foraminifera are diverse and abundant throughout. Benthic foraminifera are rare throughout the sequence and suggest that Site U1559 was at upper abyssal depths (~2000–3000 m) from the Late Miocene to the Pleistocene. Biostratigraphic zonation is based on analysis of core catcher samples from Holes U1559A (collected during Expedition 390C and examined onshore) and U1559C, as well as two additional samples from the working half of each core from Hole U1559C. A single core catcher sample from Hole U1559D was analyzed to constrain the age of basement in that hole.
The Hole U1559C mudline sample contains a Holocene assemblage of planktic foraminifera. A coherent Late Miocene assemblage within an otherwise Late Pleistocene sequence in Holes U1559A and U1559C marks the presence of a 6–8 m thick slump or sequence of slumps (~8–14 m CSF-B in Hole U1559A and ~6–14 m CSF-B in Hole U1559C). These out-of-place Miocene samples occur within an interval of noticeably lighter colors in the core and a coincident shift in physical properties (particularly P-wave velocity) that delimit the full extent of the slump(s) and allow the same interval to be recognized in Hole U1559D (~8–14 m CSF-B). Interestingly, a nannofossil sample from the lower portion of the slump is not Miocene in age but rather Middle Pleistocene, slightly older than the samples just below the slump. This overturned sequence of ages suggests that the slumped interval is possibly a sequence of slumps redepositing progressively older material. The identification of slumping is not altogether surprising given the basement slope that Site U1559 is located on. It is unclear whether the base of the slump is erosive.
The Early Pleistocene extends to ~32 m CSF-B in both Holes U1559A and U1559C (based on the lowest occurrence of Globorotalia truncatulinoides). Below this depth, multiple calcareous nannoplankton and planktic foraminiferal datums occur within the same samples, indicating either very slow sedimentation or a series of short unconformities spanning the Pliocene that require higher sampling resolution postexpedition to confirm.
An integrated calcareous nannofossil and planktic foraminiferal biozonation for Site U1559 is shown in Figure F47 and summarized in Tables T9, T10, and T11. An age-depth plot of biostratigraphic datums can be found in Figure F65 with datums provided in Tables T25 and T26. A summary of microfossil preservation and abundance is shown in Figure F48.
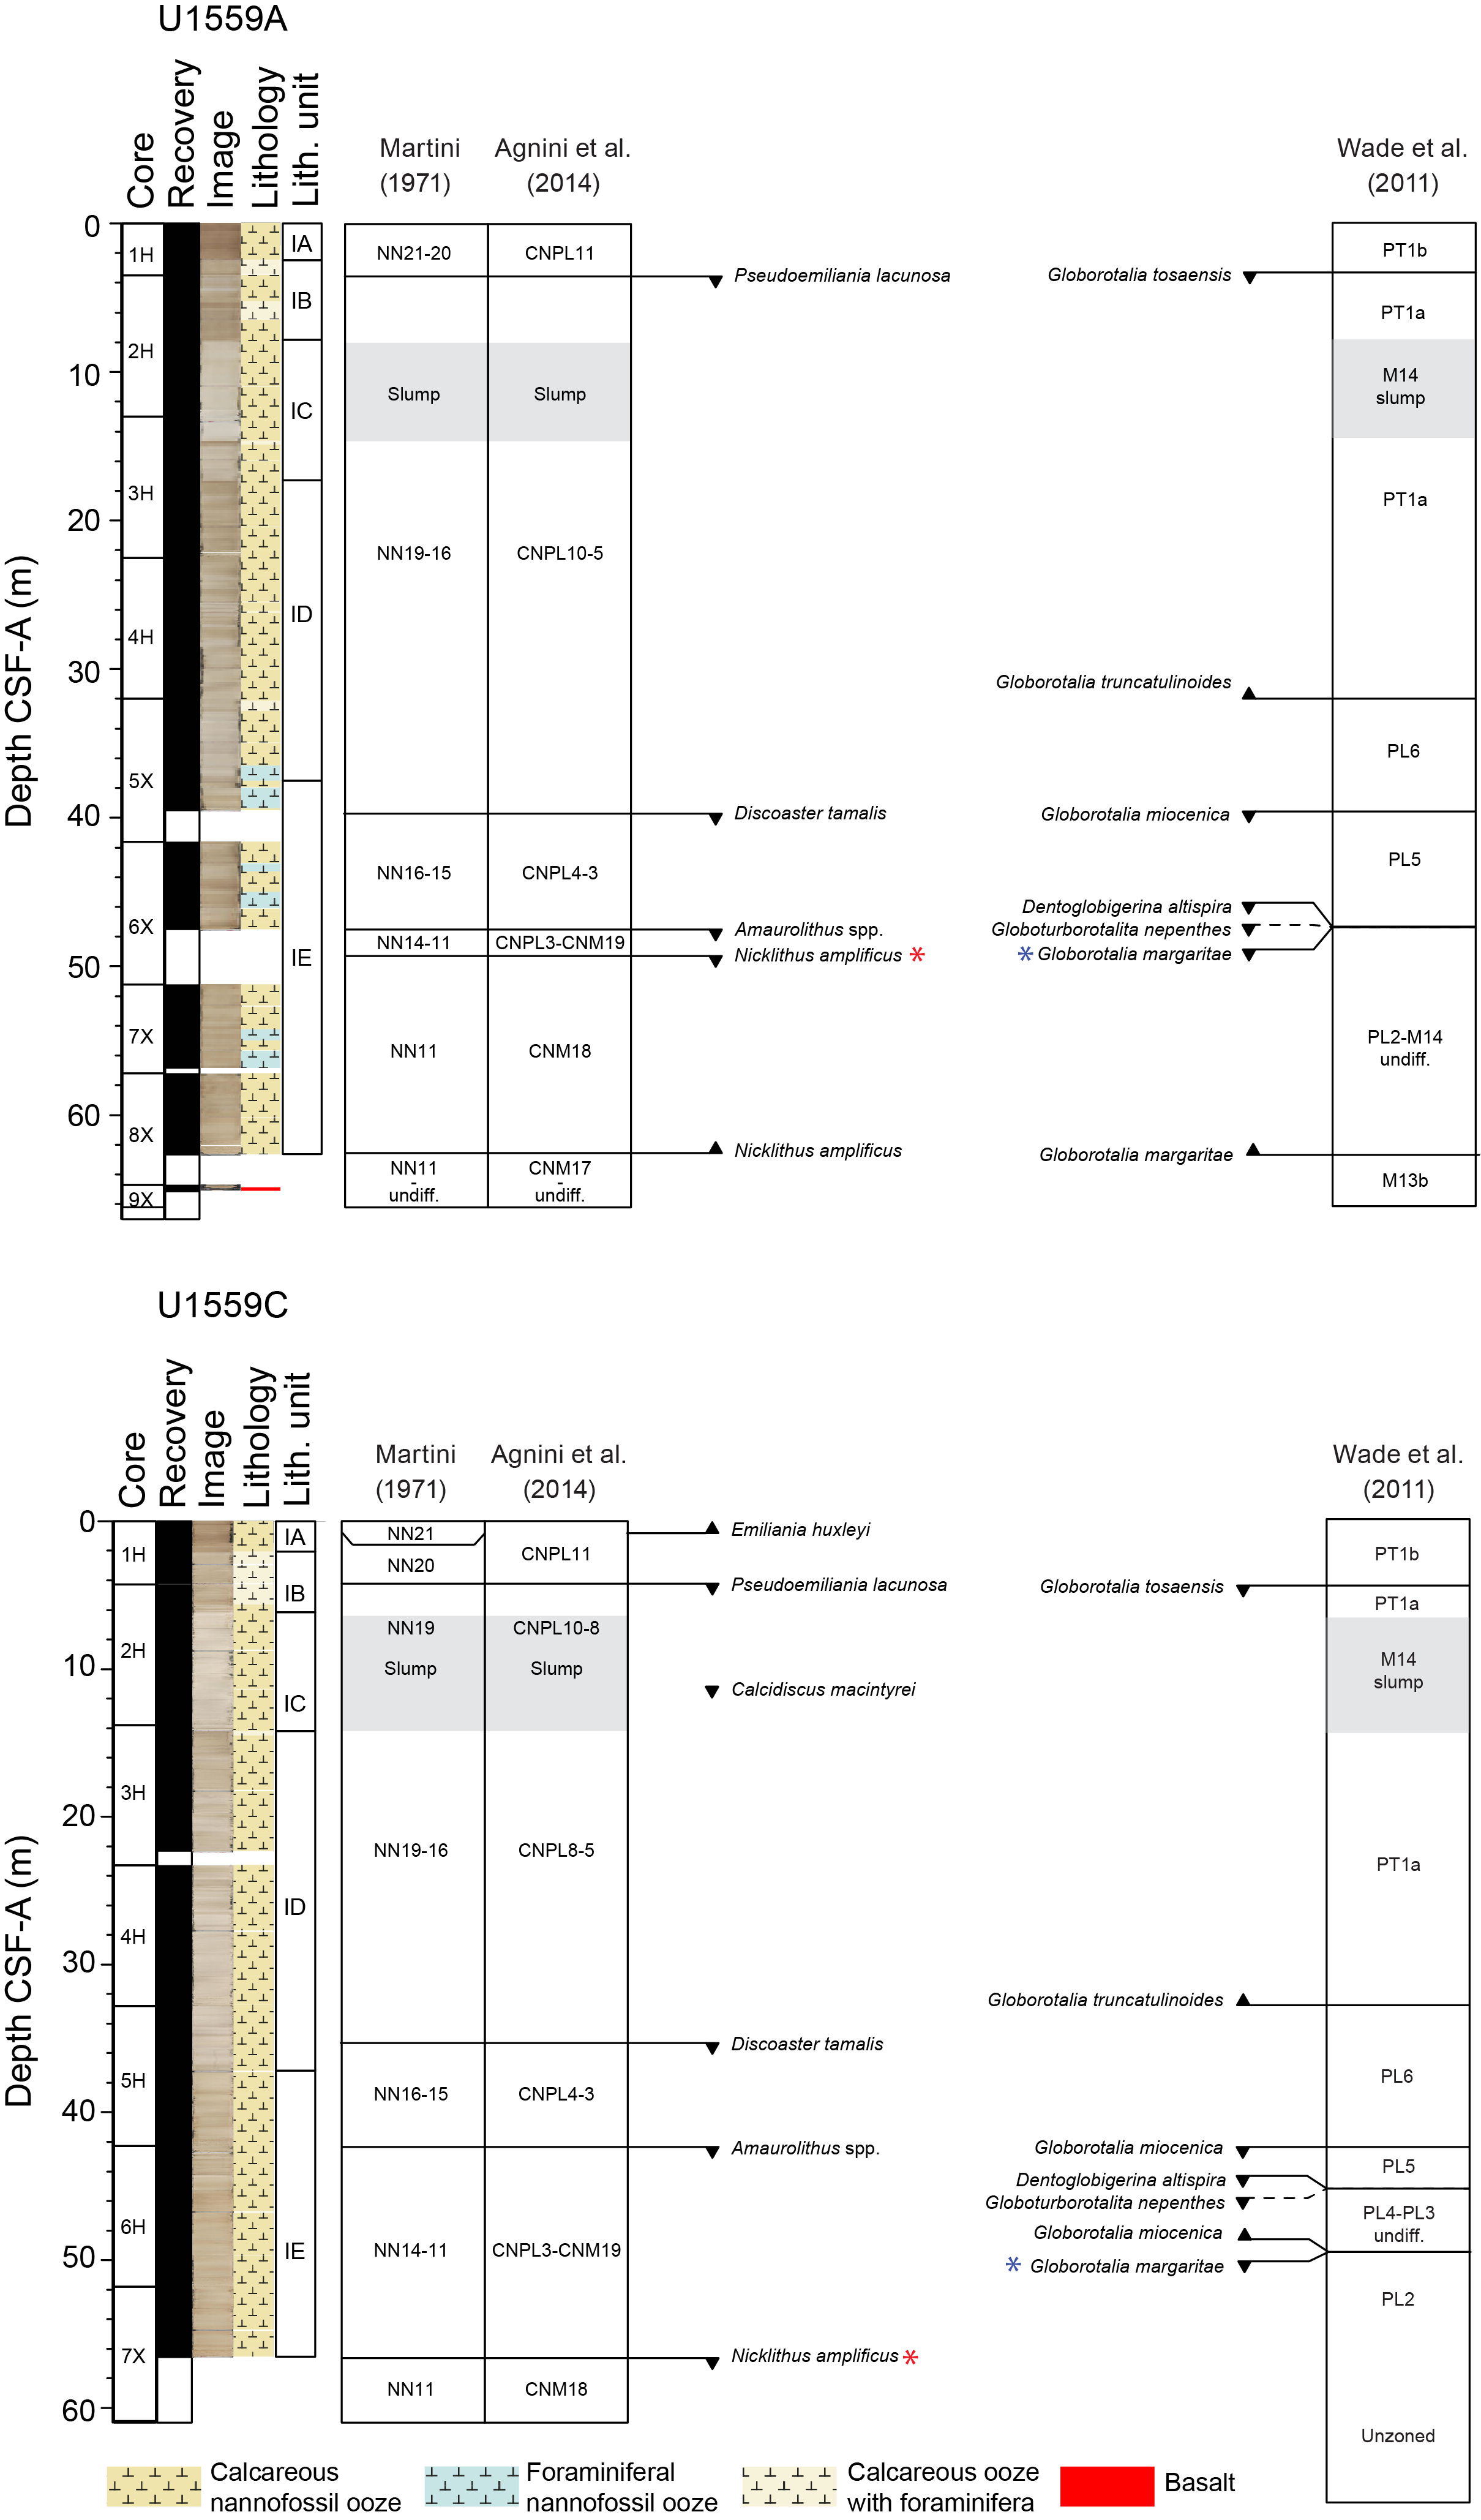
Figure F47. Biostratigraphic zones and datums.
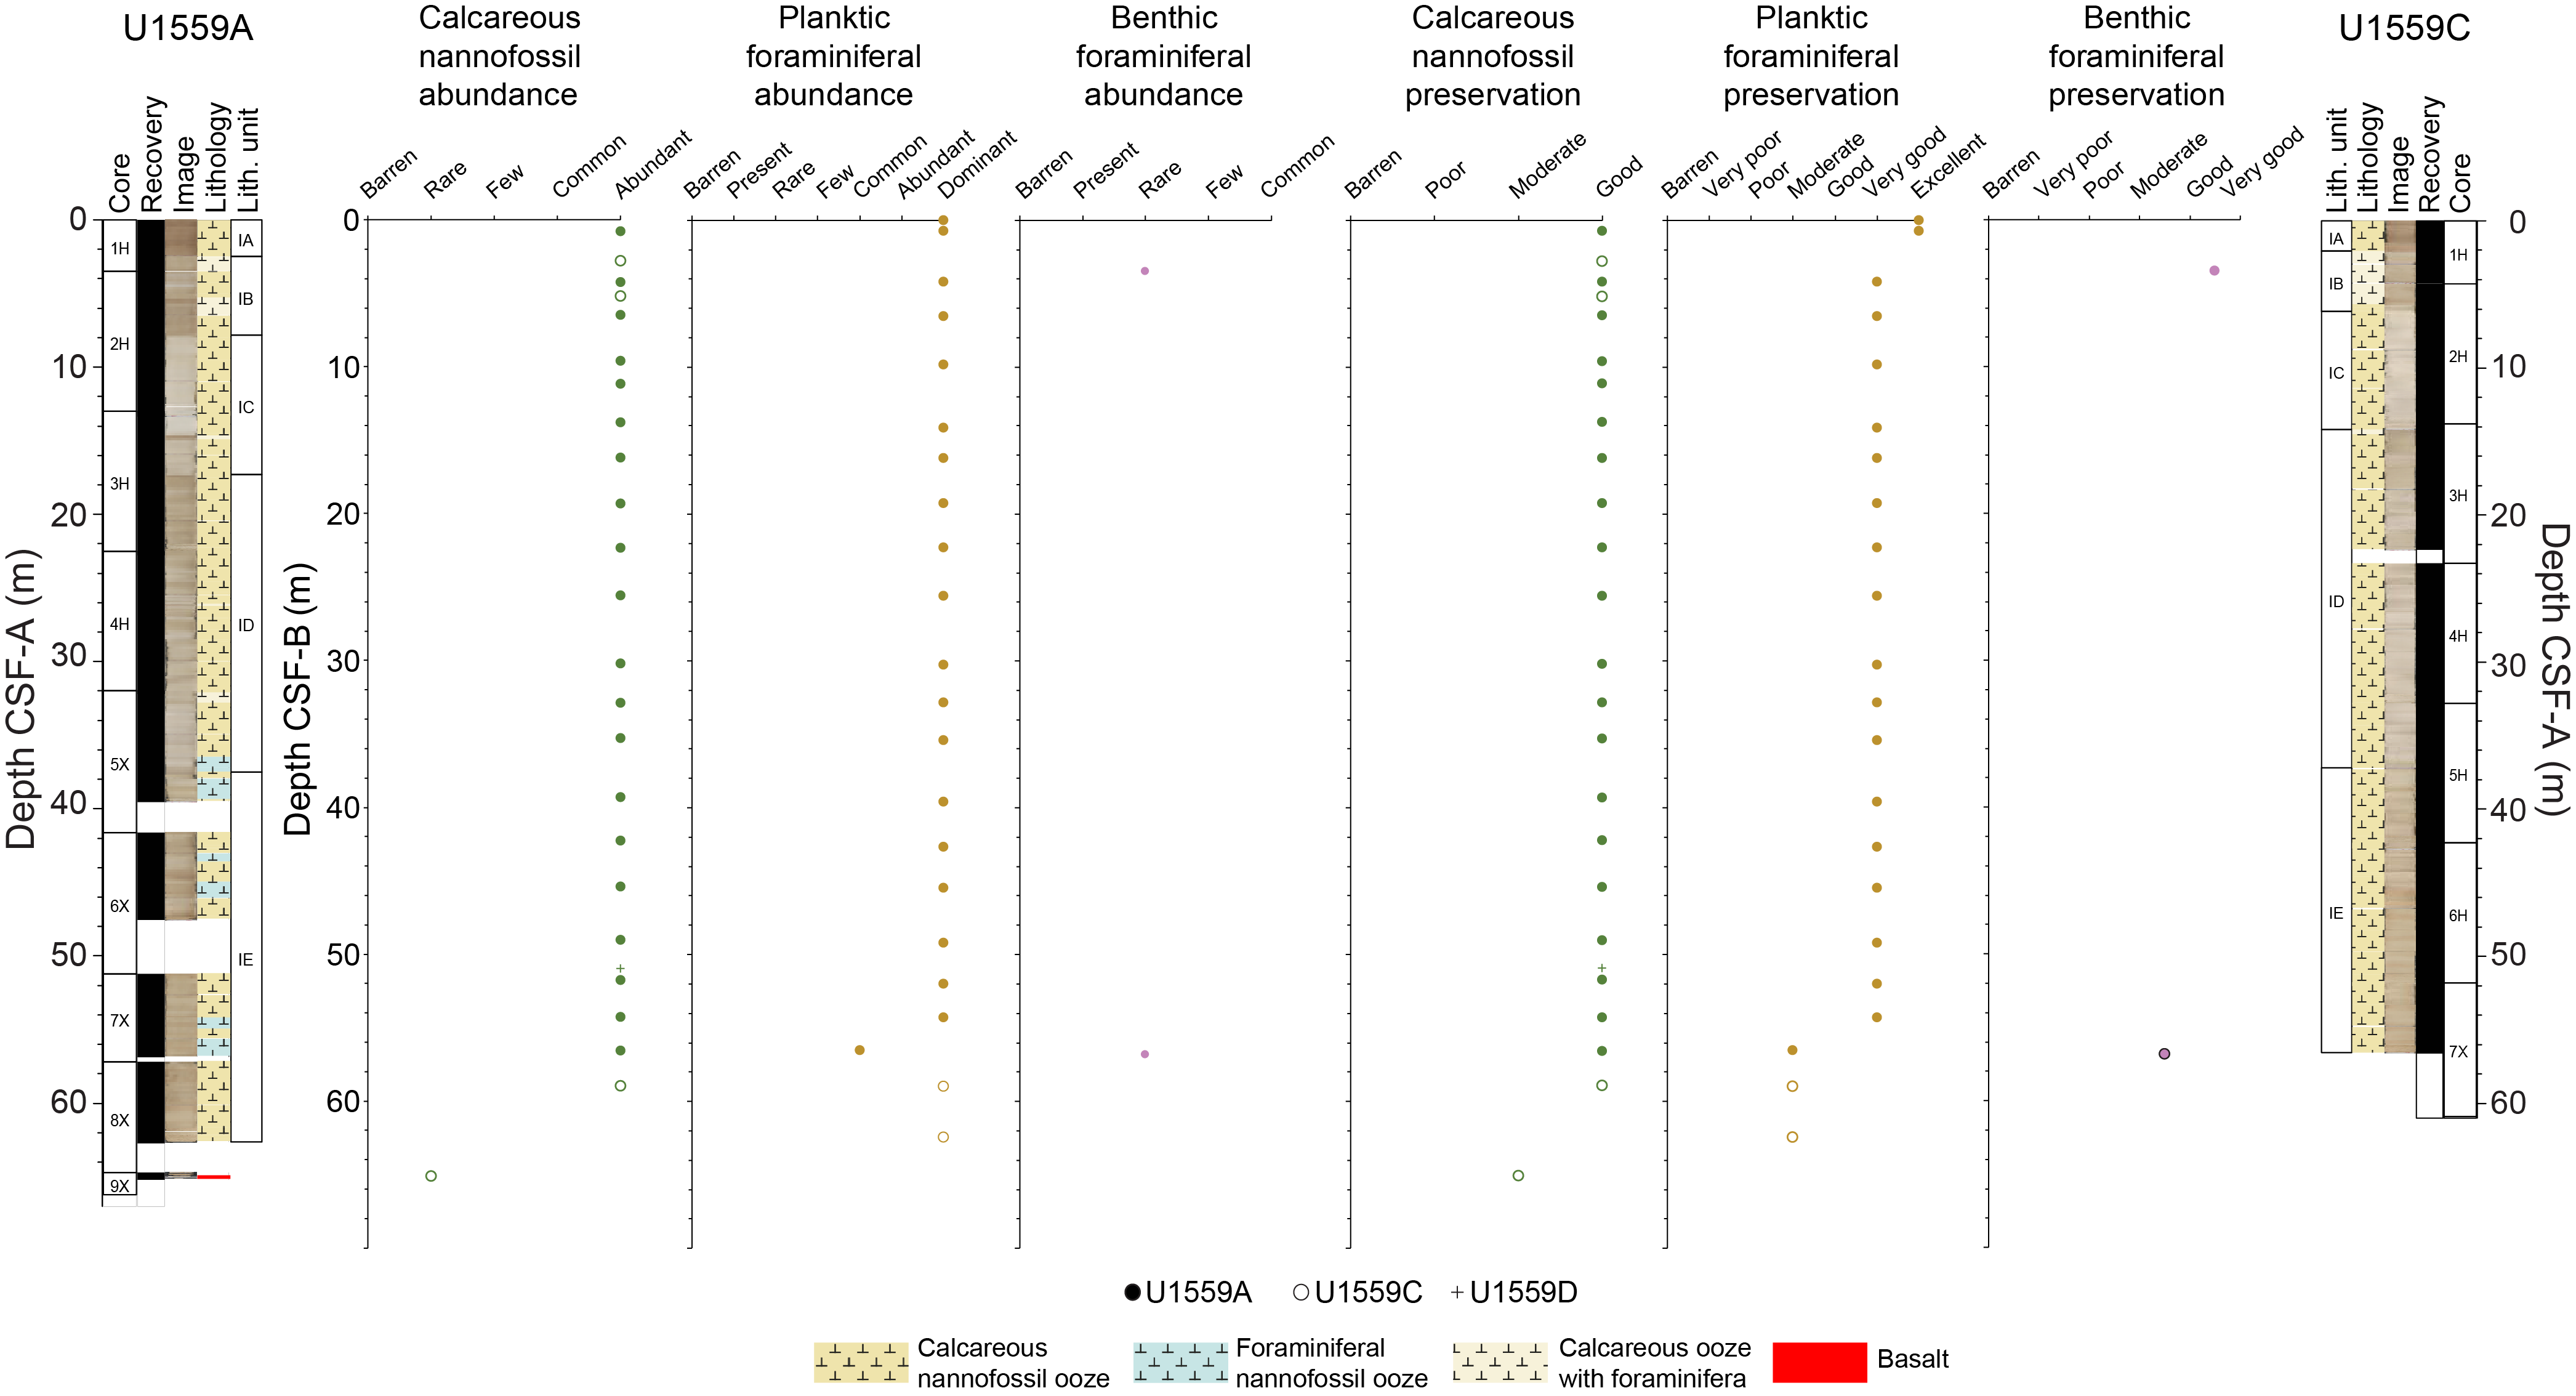
Figure F48. Group abundance and preservation, nannofossils and foraminifera.
7.1. Age of basement
The sediment/basement interface was recovered in Holes U1559A and U1559D. The oldest sample analyzed for biostratigraphy in Hole U1559C (Sample 390-U1559C-7X-CC, 5–10 cm; 56.57 m CSF-B) contains a latest Miocene assemblage dated 5.98–6.09 Ma based on the occurrences of Nicklithus amplificus (range 5.98–6.82 Ma; Gradstein et al., 2020) and Globorotalia margaritae, which has a lowest occurrence of 6.09 Ma (King et al., 2020), but it is unclear how high above basement this sample is because hard material (interpreted to be basement) was encountered when coring Core 8X but no hard rock was recovered despite an advance of up to 2 m (see Operations). The sample directly overlying basement in Hole U1559D (Sample 7X-CC, 6 cm; 50.95 m CSF-B) is ~5.5 m shallower than the deepest sample in Hole U1559C and also contains N. amplificus and G. margaritae. The deepest sediment sample recovered from this site is from Hole U1559A (for planktic foraminiferal Sample 8X-4, 76–78 cm [62.47 m CSF-B]; for calcareous nannoplankton Sample 8X-CC, 12 cm [62.63 m CSF-B]), below the base of G. margaritae but within the range of N. amplificus and must therefore be dated to between 6.09 and 6.82 Ma. The next several calibrated nannofossil and foraminiferal events are the bases of species that are not observed at Site U1559, which prevents any tighter biostratigraphic age constraints. Given the uneven topography of the sediment/basement interface observed across SAT sites, it is not surprising that basal sediment in Hole U1559A is slightly older than that in either Holes U1559C or U1559D, and an age of 6.09–6.82 Ma is close to the expected basement age of 6.6 Ma (see Background and objectives).
7.2. Calcareous nannofossils
All core catcher samples from Holes U1559A and U1559C and a single core catcher from Hole U1559D were examined to establish a calcareous nannofossil biostratigraphy, along with additional samples taken from the split-core sections of both holes to better constrain biohorizons. In Hole U1559A, these samples were taken from the archive half, whereas in Hole U1559C they were paired with planktic foraminiferal samples from the working half. Biostratigraphic datums used for the age-depth model are listed in Tables T25 and T26 and illustrated in Figure F65, and calcareous nannofossil occurrence data are shown in Tables T12, T13, and T14. Note that the distribution chart is biased toward age-diagnostic and other notable taxa; a plate of photomicrographs can be found in Figure F49. Ages recorded are from Gradstein et al. (2020).
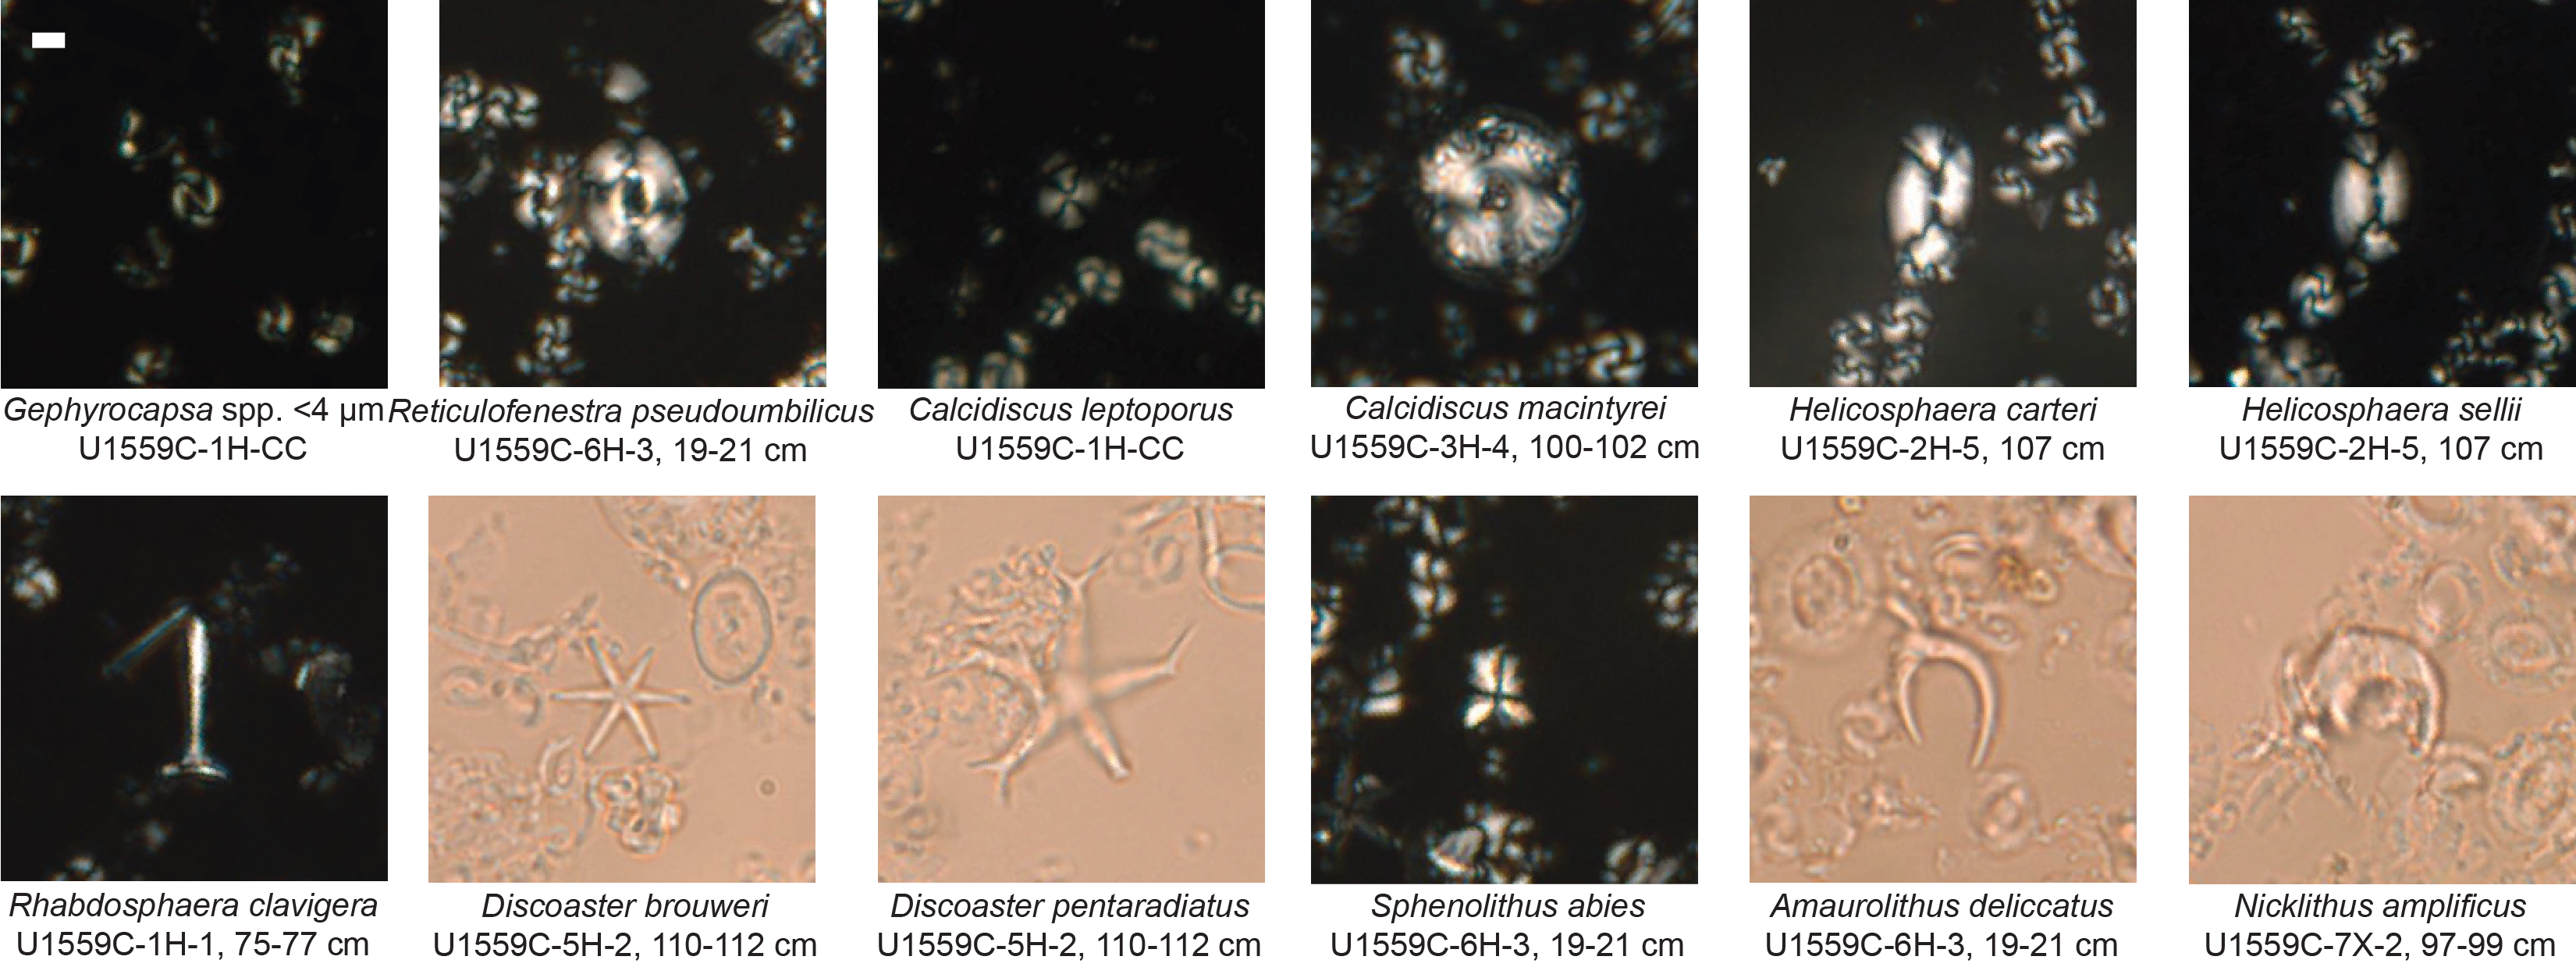
Figure F49. Important and other notable calcareous nannofossil taxa.
Site U1559 comprises entirely carbonate lithology (see Sedimentology), and calcareous nannofossils are abundant and well preserved throughout this site except for the lowermost sample from Hole U1559A, directly overlying the basement, which contains rare nannofossils that are moderately preserved. Lithologic Subunit IC is characterized by an ~8 m slumped section that contains reworked late Neogene assemblages with no in situ taxa observed in Hole U1559A or in the upper ~4 m of Hole U1559C, suggesting that deposition of the reworked material was so rapid that normal background pelagic sedimentation could not be included before further burial. A short interval of normal pelagic sedimentation observed within the slumped unit of Hole U1559C based on the occurrence of Pleistocene nannofossils as well as the absence of reworking suggests this interval could represent Pleistocene sediment being deposited between slumping events.
The presence of Emiliania huxleyi recorded in Sample 390-U1559C-1H-1, 75–77 cm (0.75 m CSF-B), indicates the sediment is Late Pleistocene age, within Zone CNPL11. The absence of E. huxleyi and Pseudoemiliania lacunosa in Sample 390C-U1559A-1H-3, 30 cm (2.79 m CSF-B), indicates Zone CNPL11. The top of Zone CNPL10 is recognized in Samples 390C-U1559A-1H-CC, 0–7 cm (3.43 m CSF-B), and 390-U1559C-1H-CC, 4–9 cm (4.21 m CSF-B), by the globally synchronous event top P. lacunosa (Thierstein et al., 1977).
A distinct change in the nannofossil assemblages below these Late Pleistocene events indicates a slumped interval in Subunit IC (see Sedimentology). Samples 390C-U1559A-2H-2, 24 cm, through 2H-CC, 9–14 cm (5.19–12.95 m CSF-B), and 390-U1559C-2H-2, 75–77 cm, through 2H-CC, 8–13 cm (6.46–13.75 m CSF-B), contain Late Miocene–Early Pliocene taxa including several discoaster species, large reticulofenestrids, and sphenoliths. In Core 390-U1559C-2H, a nannofossil sample taken from a small white bleb (Sample 2H-5, 107 cm; 11.13 m CSF-B) could represent an interval of normal pelagic sedimentation between slumping events because the tops of Calcidiscus macintyrei (1.60 Ma), large Gephyrocapsa spp. (>5.5 µm; 1.25 Ma), and Helicosphaera sellii (1.24 Ma) are all recorded in this sample. Physical properties and sedimentologic evidence indicate that this is still within the slumped interval (see Sedimentology and Sediment in Physical properties and downhole measurements).
Samples 390C-U1559A-5X-CC, 16–21 cm (39.51 m CSF-B), and 390-U1559C-5H-2, 110–112 cm (35.28 m CSF-B), contain the tops of Discoaster tamalis (2.76 Ma), Discoaster surculus (2.53 Ma), and Discoaster brouweri (1.93 Ma), which all occur within Zones CNPL6–CNPL4. Below this, the top of Amaurolithus spp. (3.93 Ma; within Zone CNPL3) is identified in Sample 390C-U1559A-6X-CC, 17–22 cm (47.50 m CSF-B), along with the top of Reticulofenestra pseudoumbilicus (3.82 Ma; top of Zone CNPL3) and Sphenolithus spp. (3.61 Ma; Zone CNPL4), whereas the tops of Amaurolithus spp. and R. pseudoumbilicus are both identified in Sample 390-U1559C-5H-CC, 12–17 cm (42.25 m CSF-B). These events occurring within the same samples indicate either the presence of an unconformity or that sedimentation rates are low enough that the true tops cannot be resolved because of sampling resolution.
The presence of N. amplificus (Zone CNM18) in Samples 390C-U1559A-8X-2, 25–27 cm, through 8X-CC, 12 cm (58.95–62.63 m CSF-B), 390-U1559C-7X-CC, 5–10 cm (56.57 m CSF-B), and 390-U1559D-7X-CC, 6 cm (59.95 m CSF-B), constrains the age of these samples to 5.98–6.82 Ma. These are all the lowermost samples analyzed for each hole at Site U1559, except for Hole U1559A where an additional sample was analyzed in lithified carbonate sediment (Sample 390C-U1559A-9X-11, 39–42 cm; 65.09 m CSF-B); however, this sample did not comprise a representative assemblage and no age-diagnostic taxa were identified. These lowermost biostratigraphic zones correlate well to both planktic foraminiferal zones and magnetostratigraphy as well as to the estimated crustal age for Site U1559 of ~6.6 Ma (see Background and objectives).
7.3. Planktic foraminifera
Core catcher samples were examined for planktic foraminifera from Hole U1559A following Expedition 390C. During Expedition 390, analyses of core catcher samples from Hole U1559C were combined with additional samples from the working half (up to two per core) to improve the age model resolution. Planktic foraminiferal occurrences are summarized in Tables T15, T16, and T17, and key specimens are illustrated in Figure F50. Planktic foraminifera are the dominant feature of sieved residues throughout Hole U1559C, except for the oldest sample, which contains a significant proportion of volcanic glass, altered glass, and what appear to be iron oxide nodules, in addition to Late Miocene foraminifera (Figure F50A, F50B).
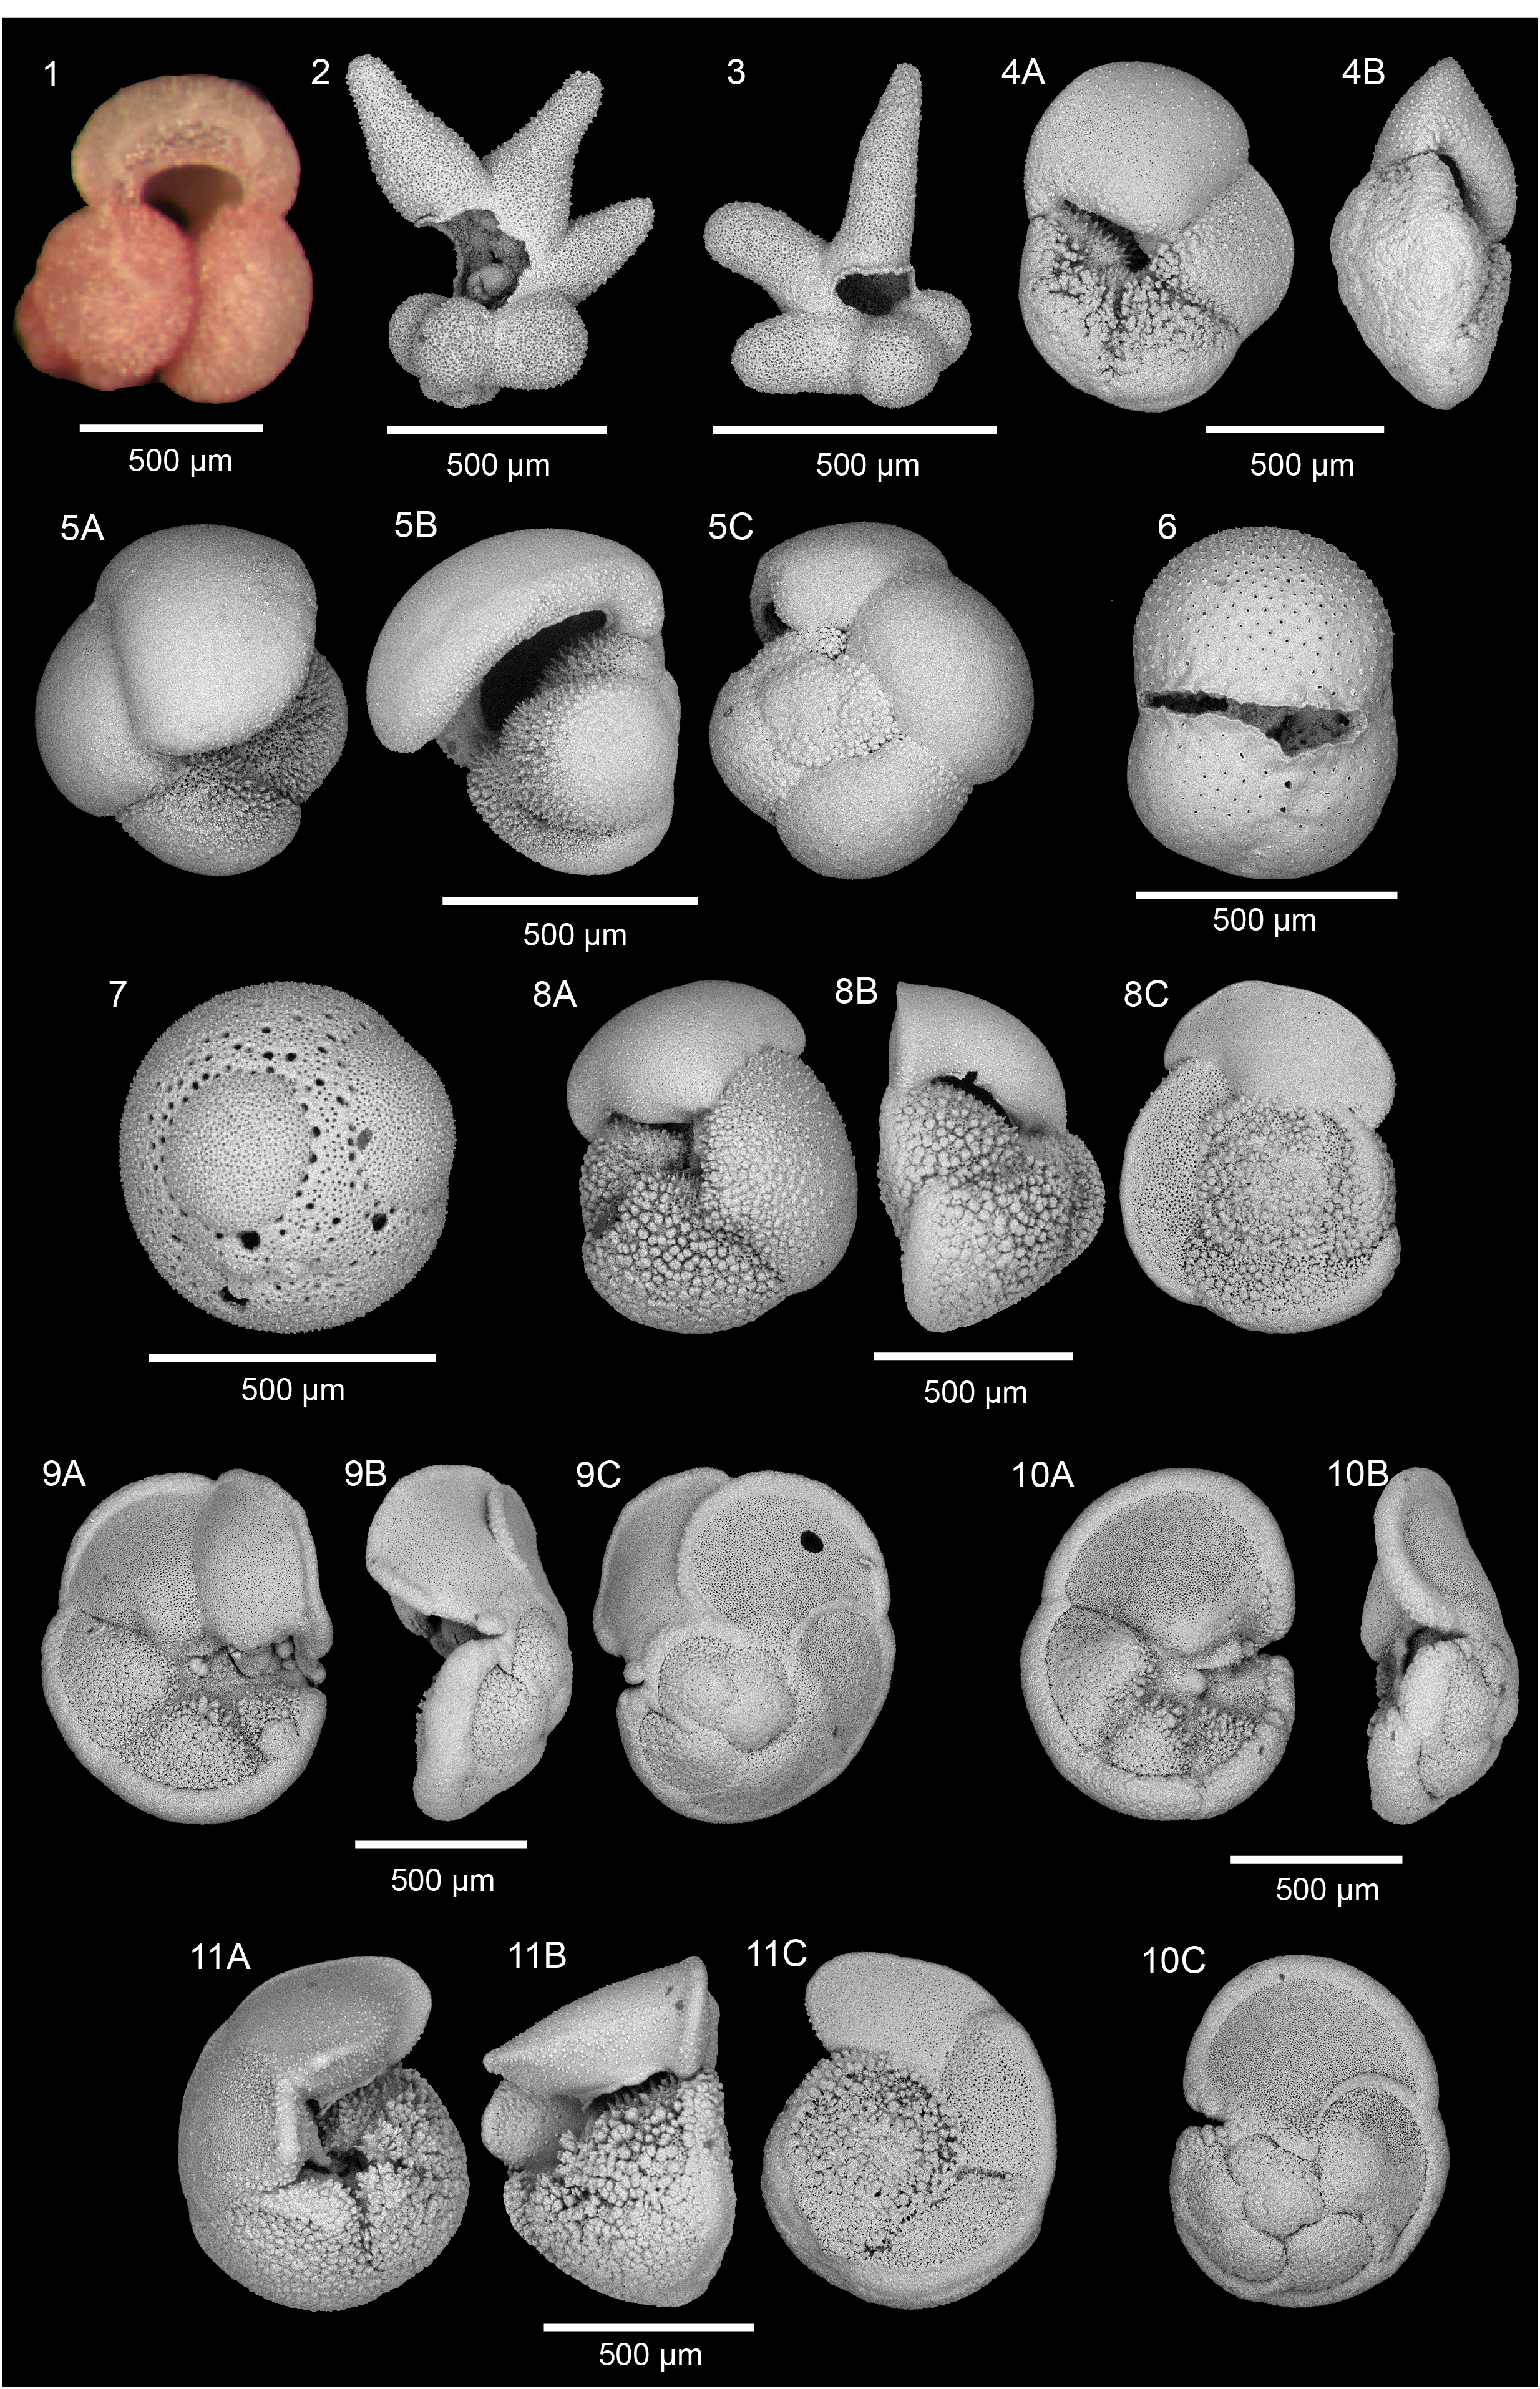
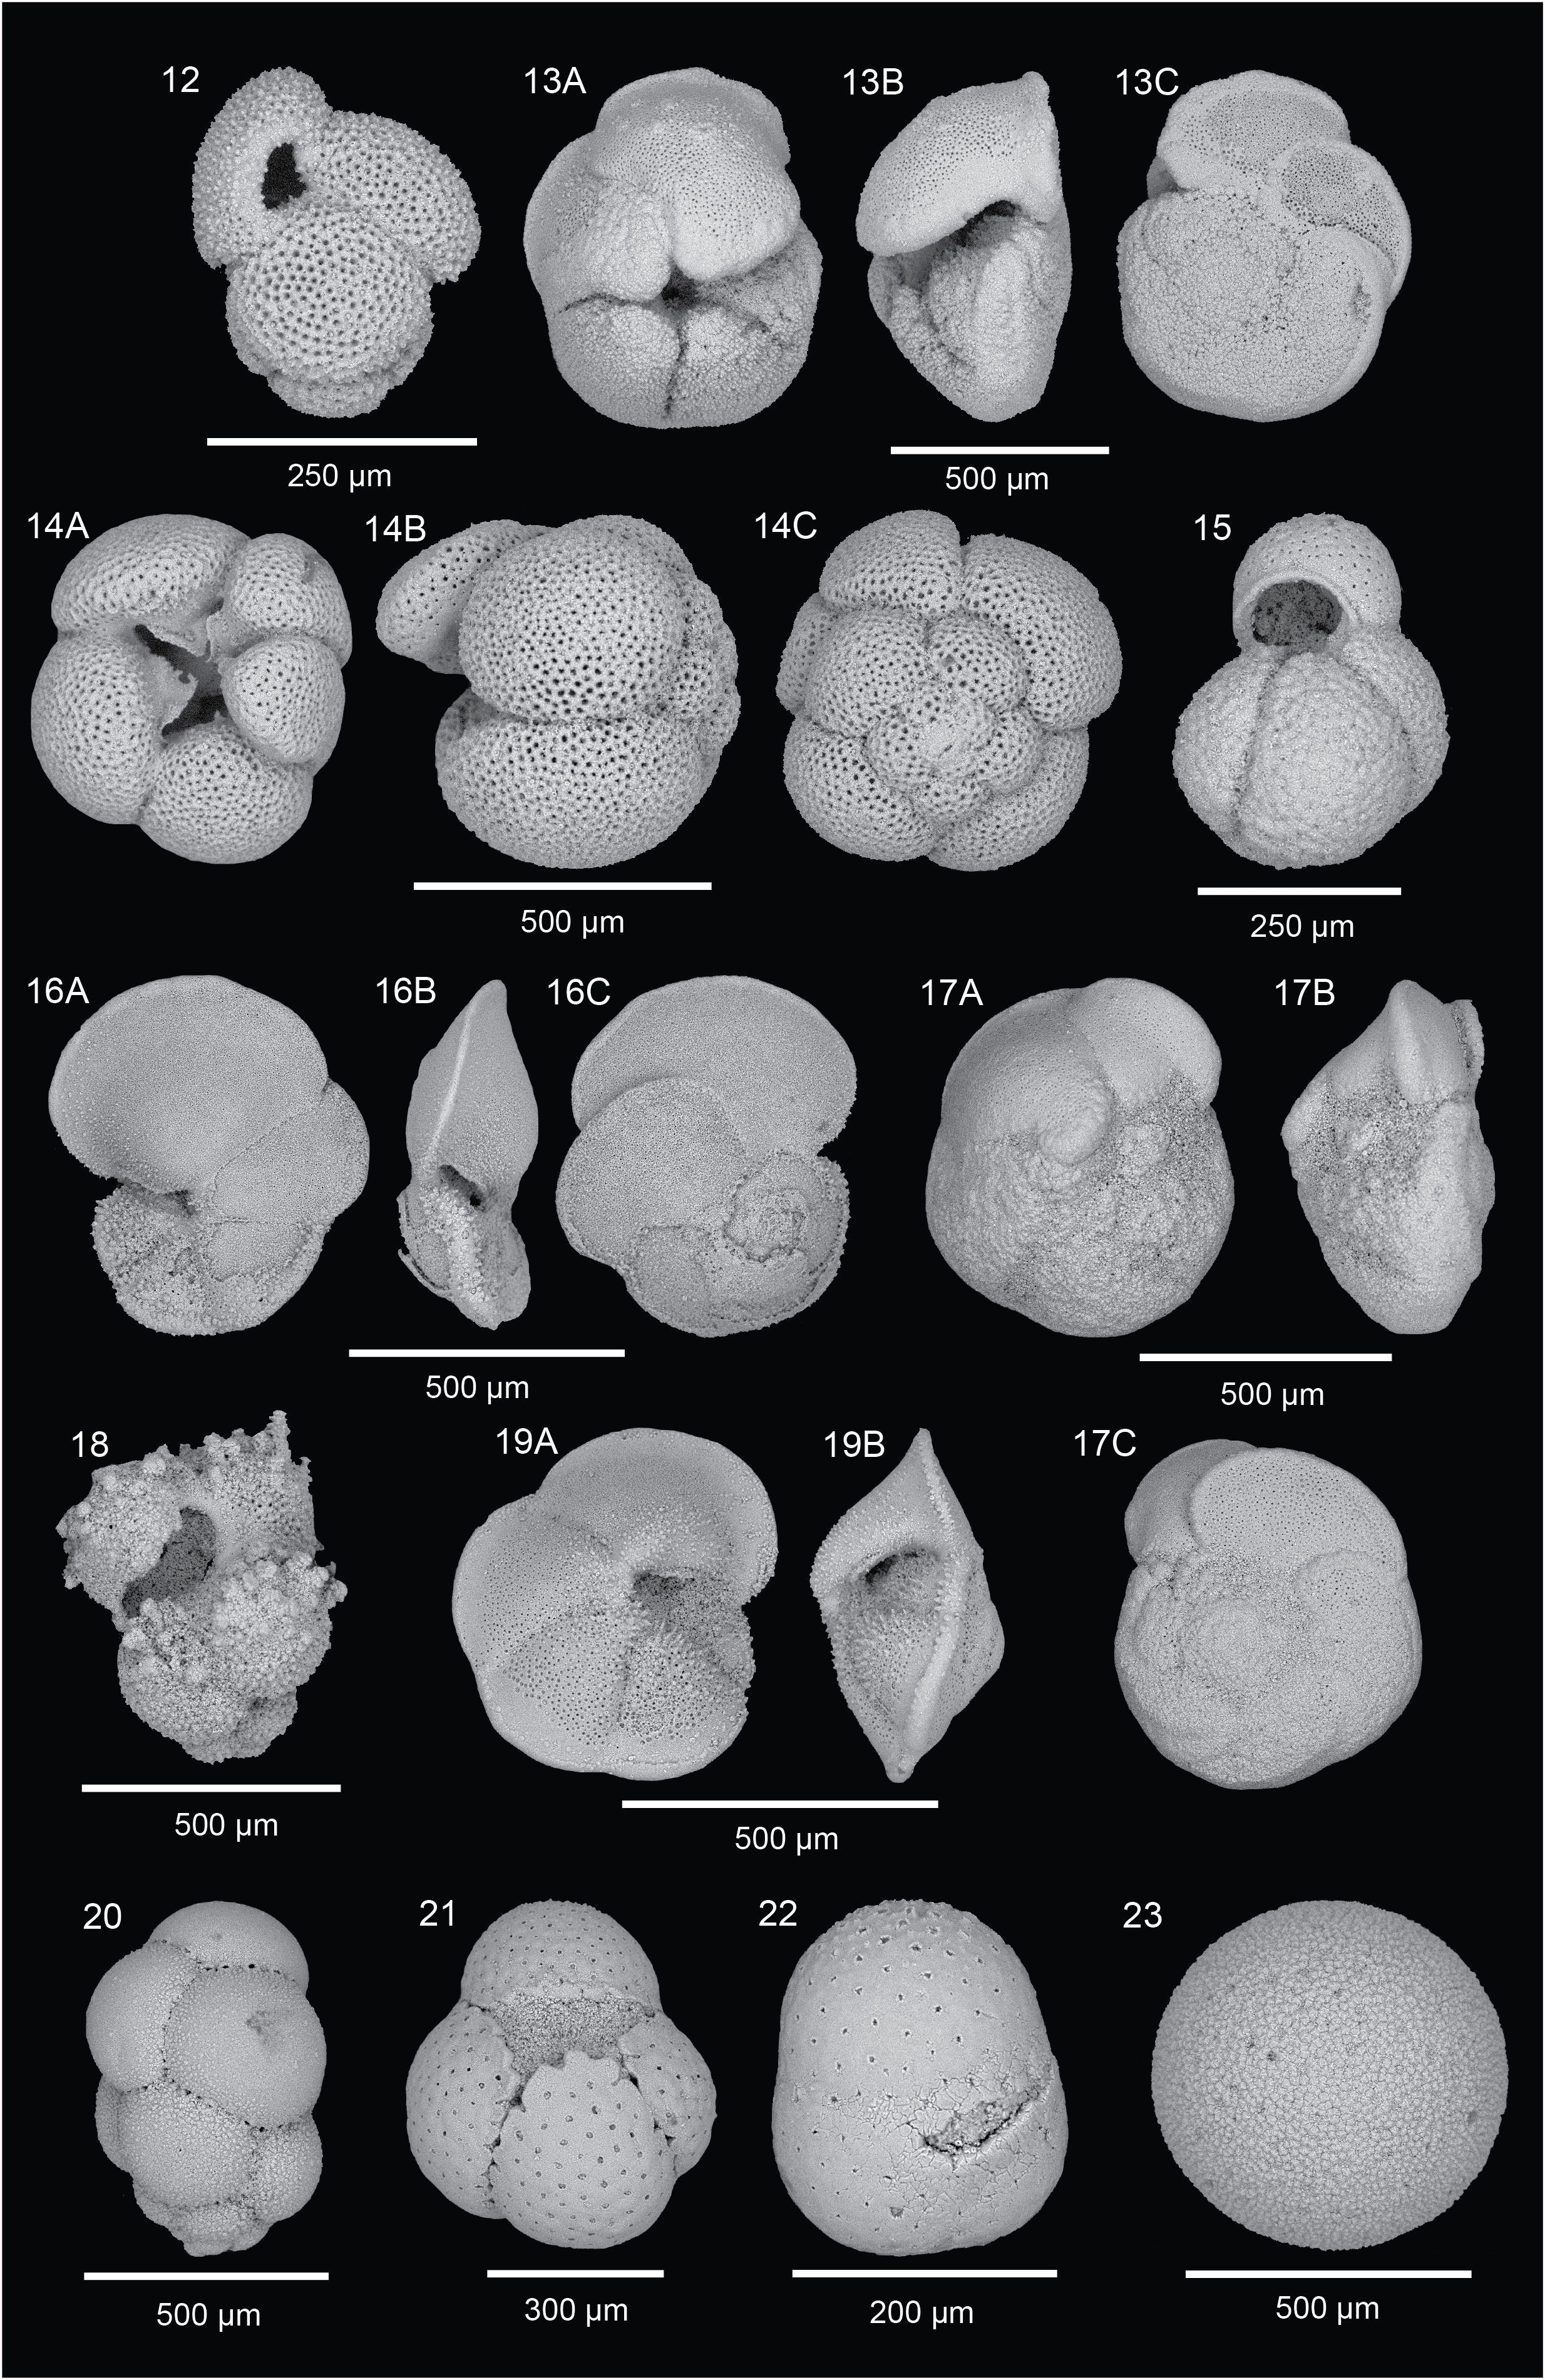
Figure F50. Planktic foraminifera.
Foraminiferal preservation is mostly good throughout the sediments at Site U1559 (Figures F48, F51), although samples near the base of each hole are partially lithified. Foraminifera from these samples show evidence of significant dissolution and recrystallization (Figure F51); it would probably not be wise to use this site for carbonate-based proxy studies of the latest Miocene.
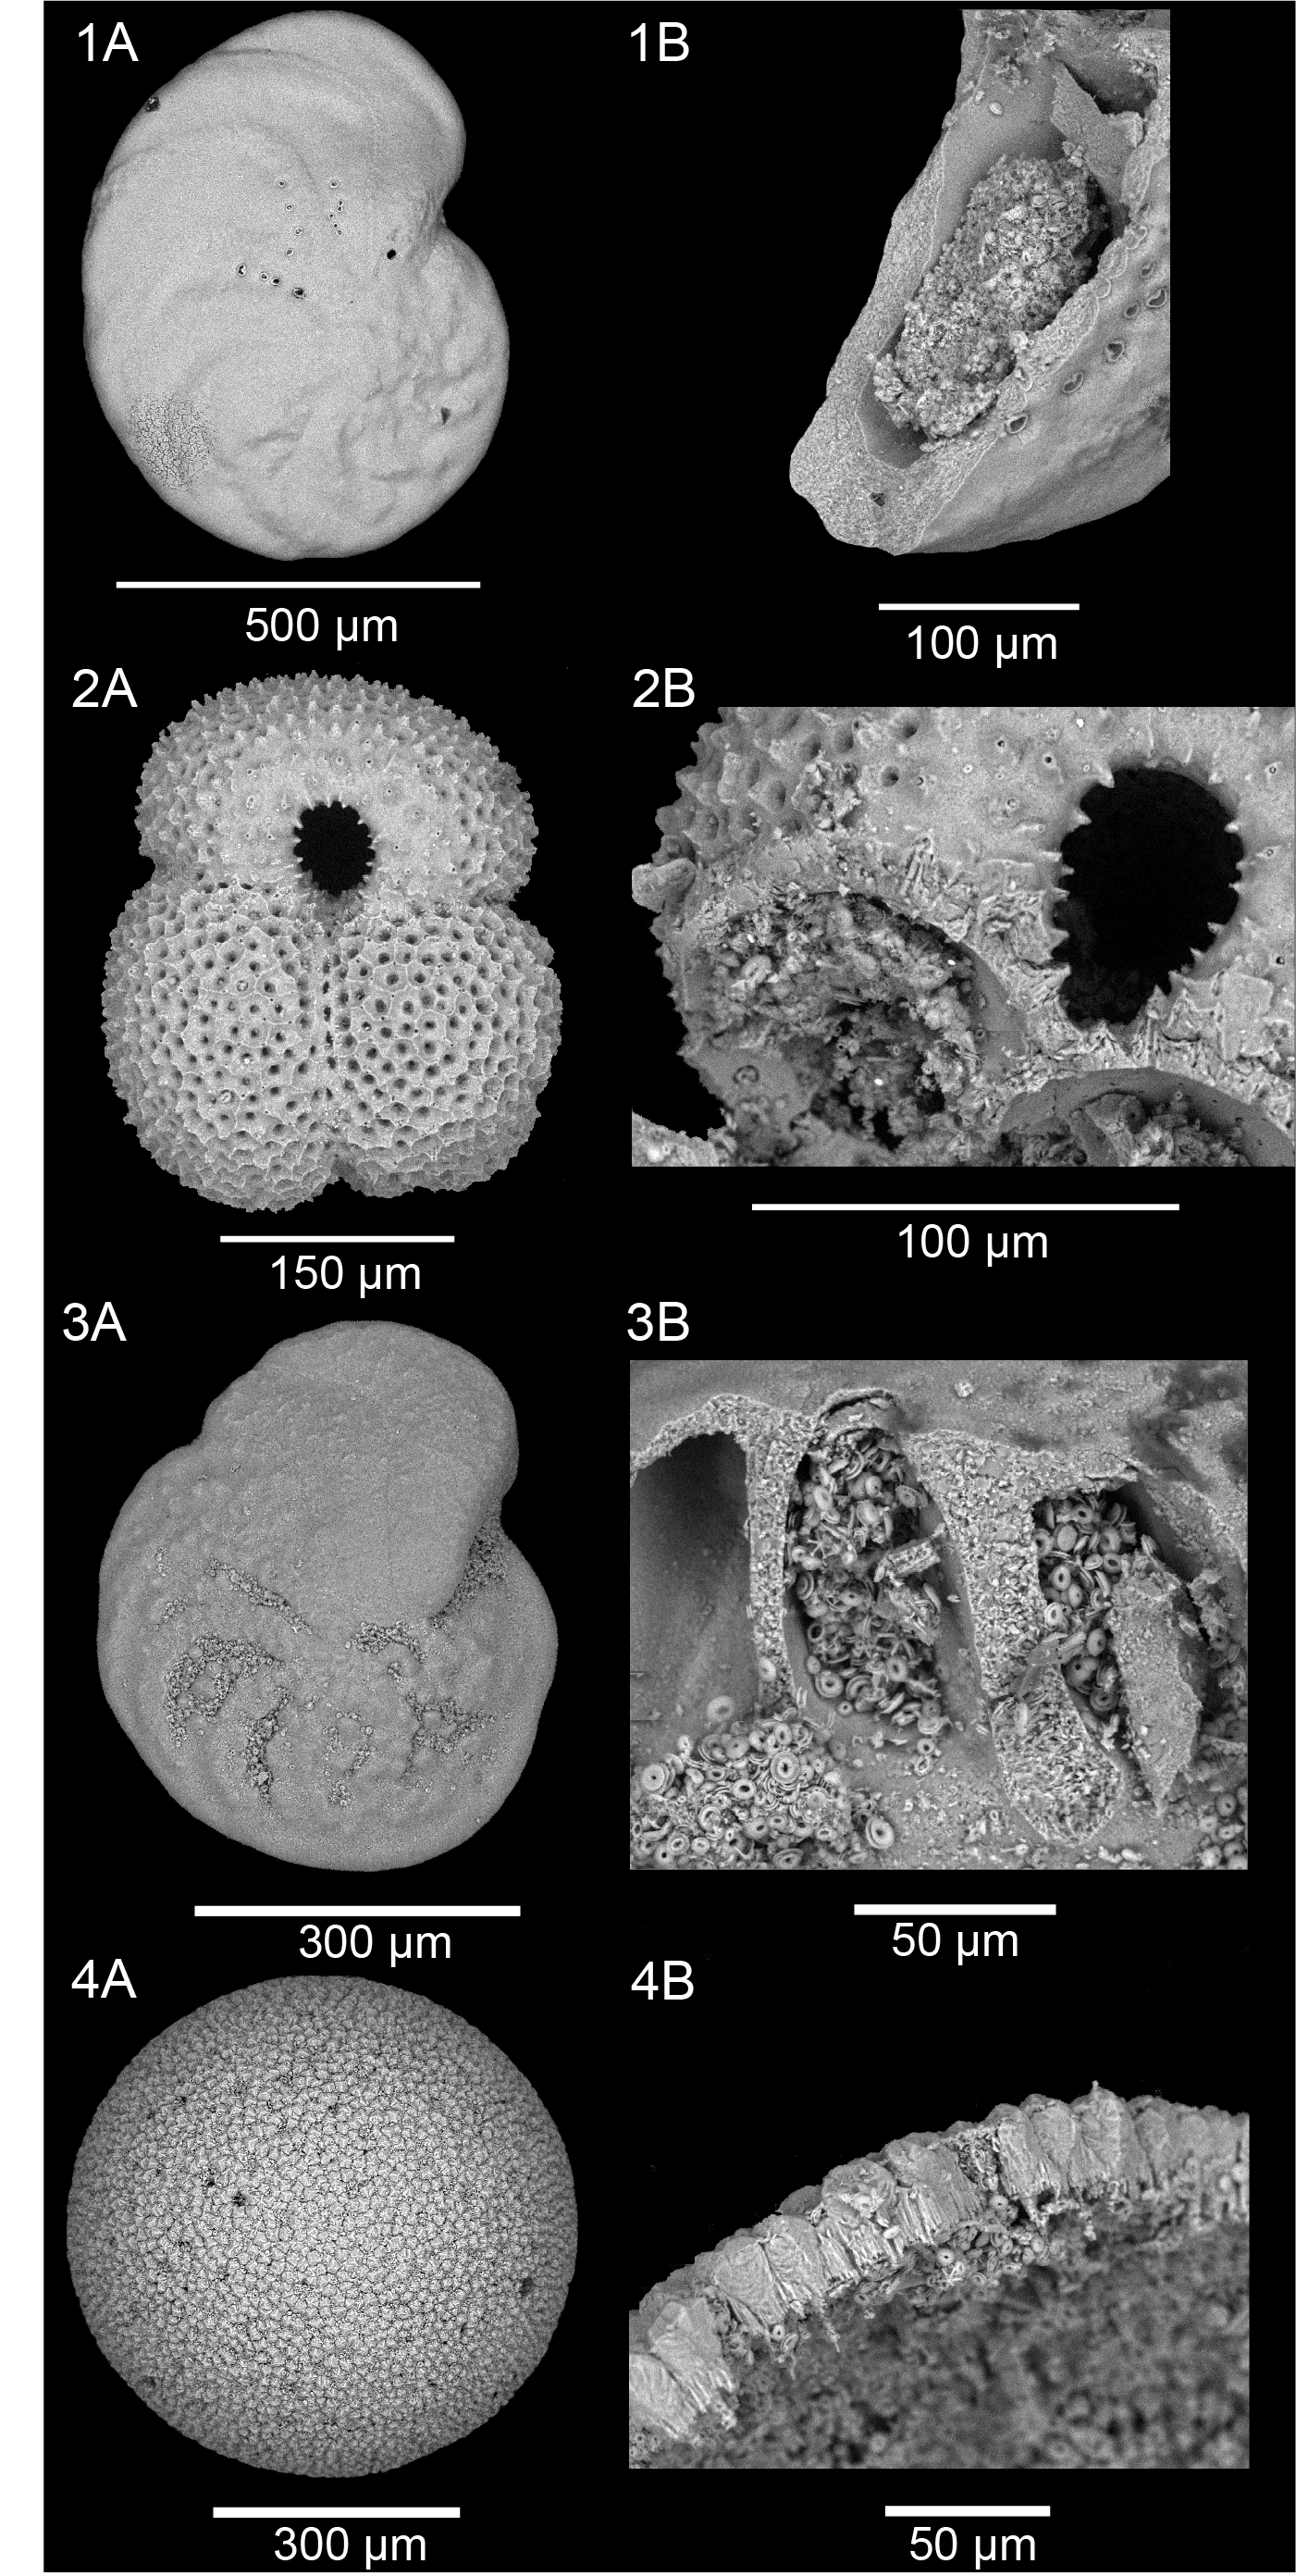
Figure F51. Planktic and benthic foraminifera preservation.
The Hole U1559C mudline sample contains a well-preserved assemblage of recent planktic foraminifera, including Globigerinoides ruber (pink), Beella digitata, Globorotalia hirsuta, and the delicate Hastigerina pelagica; it also contains common taxa that extend deeper into the Pleistocene such as Globoconella inflata, Globorotalia tumida, G. truncatulinoides, Globorotalia crassaformis, Sphaeroidinella dehiscens, and Orbulina universa, as well as rare to few diatoms and radiolarians. The sample below the mudline (390-U1559C-1H-1, 75–77 cm; 0.75 m CSF-B) contains an identical assemblage (without the siliceous fossils) plus Globorotalia flexuosa, a short-lived species that briefly dominates in the Atlantic in the Late Pleistocene (Bolli and Saunders, 1985; Wade et al., 2011). The base of G. hirsuta (0.45 Ma) also occurs in this sample. The following sample (1H-CC, 4–9 cm; 4.21 m CSF-B) contains the top of Globorotalia tosaensis (0.61 Ma).
Below the top of G. tosaensis, the next two samples (2H-2, 75–77 cm, and 2H-4, 100–102 cm; 6.46 and 9.61 m CSF-B, respectively) contain a coherent assemblage of Late Miocene foraminifera including Globoconella conomiozea, Globoconella terminalis, G. margaritae, Globoturborotalita decoraperta, Globoturborotalita nepenthes, and Sphaeroidinellopsis kochi. An identical assemblage was observed in Sample 390C-U1559A-2H-CC, 9–14 cm (13.75 m CSF-B). These samples are interpreted to represent a coherent slump of Late Miocene age material and correspond to an interval of very low P-wave velocity and more brightly colored sediments—properties that delimit the full extent of the slump, which extends from ~8 to 14 m CSF-B in Hole U1559A and from ~6 to 14 m CSF-B in Hole U1559C (see Sedimentology and Sediment in Physical properties and downhole measurements).
Below the slump, assemblages once again return to a typical Pleistocene population including G. inflata, G. tumida, G. tosaensis, G. truncatulinoides, G. crassaformis, Globorotalia viola, and S. dehiscens. Interestingly, G. tumida is not observed below Samples 390C-U1559A-4H-CC, 0–8 cm (31.92 m CSF-B), and 390-U1559C-4H-2, 80–82 cm (25.57 m CSF-B), although these samples are well above the ~9.8 Ma origination of this species (Wade et al., 2011). The lowest occurrence of G. truncatulinoides, which occurs in the Atlantic at 1.92 Ma in Early Pleistocene Zone PL6 (King et al., 2020), was observed in Samples 390C-U1559A-4H-CC, 0–8 cm (31.92 m CSF-B), and 390-U1559C-4H-CC, 13–18 cm (32.75 m CSF-B). Roughly half of the sedimentary succession at Site U1559 is thus Pleistocene, indicating high sedimentation rates even when the 6–8 m slump is removed from calculations.
Below the base of G. truncatulinoides, the underlying three cores contain a rapid succession of Pliocene zones, with consecutive zones often occurring within the same sample (Figure F65). Zonal boundaries are slightly more spread out in the more densely sampled Hole U1559C compared to Hole U1559A, from which only core catchers were sampled (Hole U1559A working halves were not on the ship for sampling during Expedition 390; see Background and objectives); this implies a very low sedimentation rate rather than a series of unconformities, but higher resolution sampling will be necessary to confirm this. The highest occurrence of Globigerinoides extremus, calibrated to 1.97 Ma (King et al., 2020) occurs in the first sample without G. truncatulinoides (Sample 390-U1559C-5H-2, 110–112 cm; 35.29 m CSF-B). The highest occurrence of Globorotalia miocenica, which marks the top of Pliocene–Pleistocene Zone PL5, occurs in Samples 390C-U1559A-5X-CC, 16–21 cm (39.51 m CSF-B), and 390-U1559C-5H-CC, 12–17 cm (42.25 m CSF-B). The next samples downhole (390C-U1559A-6X-CC, 17–22 cm [47.5 m CSF-B], and 390-U1559C-6H-3, 19–21 cm [45.41 m CSF-B]), contain the highest occurrence of Dentoglobigerina altispira, which marks the top of Pliocene Zone PL4, and the lowest occurrence of G. miocenica, which occurs in Zone PL3. It also contains G. nepenthes, a distinctive taxon that marks the top of Zone PL1 and is thus out of place at this level. There is no other evidence for reworking in this sample, and G. nepenthes is found in all subsequent samples downhole. Younger datums occur below this level in both cores, so we are not sure what to make of this anomalously young range. Because of this, we excluded the top of G. nepenthes when constructing the age model. These samples all contain a distinct Pliocene assemblage including S. kochi, Sphaeroidinellopsis seminulina, O. universa, Globorotalia pseudomiocenica, Globorotalia cibaoensis, Globorotalia juanai, G. conomiozea, and G. terminalis in addition to the aforementioned marker taxa.
The top of G. margaritae, which marks the top of Zone PL2, occurs in Samples 390C-U1559A-6X-CC, 17–22 cm (47.50 m CSF-B), and 390-U1559C-6H-5, 100–102 cm (49.06 m CSF-B). The lowest occurrence of this taxon is near the base of the latest Miocene Zone M14 (6.09 Ma). In Holes U1559C and U1559D, G. margaritae extends to the base of the hole, occurring in the oldest sample above basement (Samples 390-U1559C-7X-CC, 5–10 cm [56.55 m CSF-B], and 390-U1559D-7X-CC, 6 cm [50.95 m CSF-B]). In Hole U1559A, however, the deepest sample examined (390C-U1559A-8X-4, 76–78 cm; 62.47 m CSF-B) is below the base of G. margaritae and is therefore definitively latest Miocene in age.
7.4. Benthic foraminifera
Benthic foraminifera were analyzed on shore in two core catcher samples from Hole U1559A collected during engineering Expedition 390C. Abundance, preservation, and assemblage composition is biased toward the analysis of depth-diagnostic calcareous species and other notable calcareous taxa. Benthic foraminiferal preservation and abundance are summarized in Figures F48 and F51. The occurrence of important benthic foraminiferal species is reported in Table T18.
Paleodepth estimates are based on the analysis of Samples 390C-U1559A-1H-CC, 0–7 cm, and 7X-CC, 0–8 cm (3.47 and 56.82 m CSF-B, respectively). In these samples, benthic foraminifera are rare and preservation ranges from very good to good (Sample 1H-CC, 0–7 cm) to good to moderate (Sample 7X-CC, 0–8 cm), with occasional specimens showing excellent or very poor preservation. In Sample 1H-CC, 0–7 cm (3.47 m CSF-B), the benthic foraminiferal assemblage is dominated by Cibicidoides wuellerstorfi and Oridorsalis umbonatus. Other common species include Cibicidoides bradyi, Melonis barleeanus, Pyrgo murrhina, and Uvigerina hispidocostata.
The benthic foraminiferal assemblage in Sample 390C-U1559A-7X-CC, 0–8 cm (56.82 m CSF-B), is similar to what is observed in Sample 1H-CC, 0–7 cm, but with some differences. Sample 7X-CC, 0–8 cm, is dominated by Cibicidoides mundulus, Nuttallides umbonifera, and O. umbonatus. C. wuellerstorfi, Laticarinina pauperata, M. barleeanus, P. murrhina, Pullenia bulloides, and U. hispidocostata are also present.
All species present in the core catcher samples analyzed have a wide bathymetric range (i.e., bathyal to abyssal) (Holbourn et al., 2013; van Morkhoven et al., 1986). However, the absence of species characteristic of bathyal depths (e.g., Bulimina mexicana, Uvigerina hispida, and Uvigerina proboscidea; van Morkhoven et al., 1986) suggests that Site U1559 was restricted to upper abyssal depths (~2000–3000 m) from the Pleistocene to the Late Miocene, which is consistent with the current depth of this site (~3050 m).
8. Paleomagnetism
8.1. Sediment
During Expedition 390C, Cores 390C-U1559A-1H through 7X were split and remanence measurements were made on the archive halves using the superconducting rock magnetometer (SRM) (see Paleomagnetism in the Expedition 390/393 methods chapter [Coggon et al., 2024c]). Cores 390C-U1559A-8X and 9X were split during Expedition 390 (see Curatorial core procedures and sampling depth calculations in the Expedition 390/393 methods chapter [Coggon et al., 2024c]). Core 8X contained the sediment/basement interface. The archive half was measured by SRM during Expedition 390, along with the archive halves of Cores 390-U1559C-1H through 7X and 390-U1559D-1H through 7X. The natural remanent magnetization (NRM) of core sections and the remaining remanence after three alternating field (AF) demagnetization steps (5, 10, and 20 mT) were measured at 2 cm intervals. Hereafter, the intensity/inclination after demagnetization at 20 mT is referred to as the 20 mT intensity/inclination. APC Cores 390-U1559C-1H through 6H and 390-U1559D-1H through 6H were oriented using the Icefield MI-5 core orientation tool. Remanence analyses of archive sections were supplemented with analyses of discrete samples. Discrete sediment sampling was conducted for Sections 390C-U1559A-8X-2 and 8X-4 as well as all cores from Holes U1559C and U1559D, for a total of 26 discrete cubes (Table T19). Here, we use these data primarily to establish a preliminary magnetostratigraphy for the sediment package at Site U1559. Anisotropy of magnetic susceptibility (AMS) was measured on all discrete samples to characterize the fabric. Acquisition of isothermal remanent magnetization (IRM) and backfield IRM experiments were performed on a subset of the discrete samples to characterize the magnetic mineral assemblage.
8.1.1. Results
The average NRM intensity of Hole U1559A sediments is 9.4 × 10⁻³ A/m. Intensities are relatively high in Subunit IA (~5 × 10⁻³ A/m) and decrease downhole through Subunit IB (Figure F52). Intensities are one order of magnitude lower in Subunit IC, which is described as a slumped unit (see Sedimentology and Biostratigraphy). This interval also has the lowest MS in Hole U1559A (see Physical properties and downhole measurements). There is an interval of high intensity in the upper part of Core 390C-U1559A-7X, although there is no corresponding increase in MS or lithologic change that could be correlated to this peak. There is an unrecovered interval in Core 6X above, so there is the possibility that the upper part of Core 7X includes disturbed material. The variations in remanence intensity with depth in Holes U1559C and U1559D are similar to those described for Hole U1559A (Figures F53, F54), with the exception of the high-intensity interval described in Subunit IE, which is not observed in Holes U1559C or U1559D.
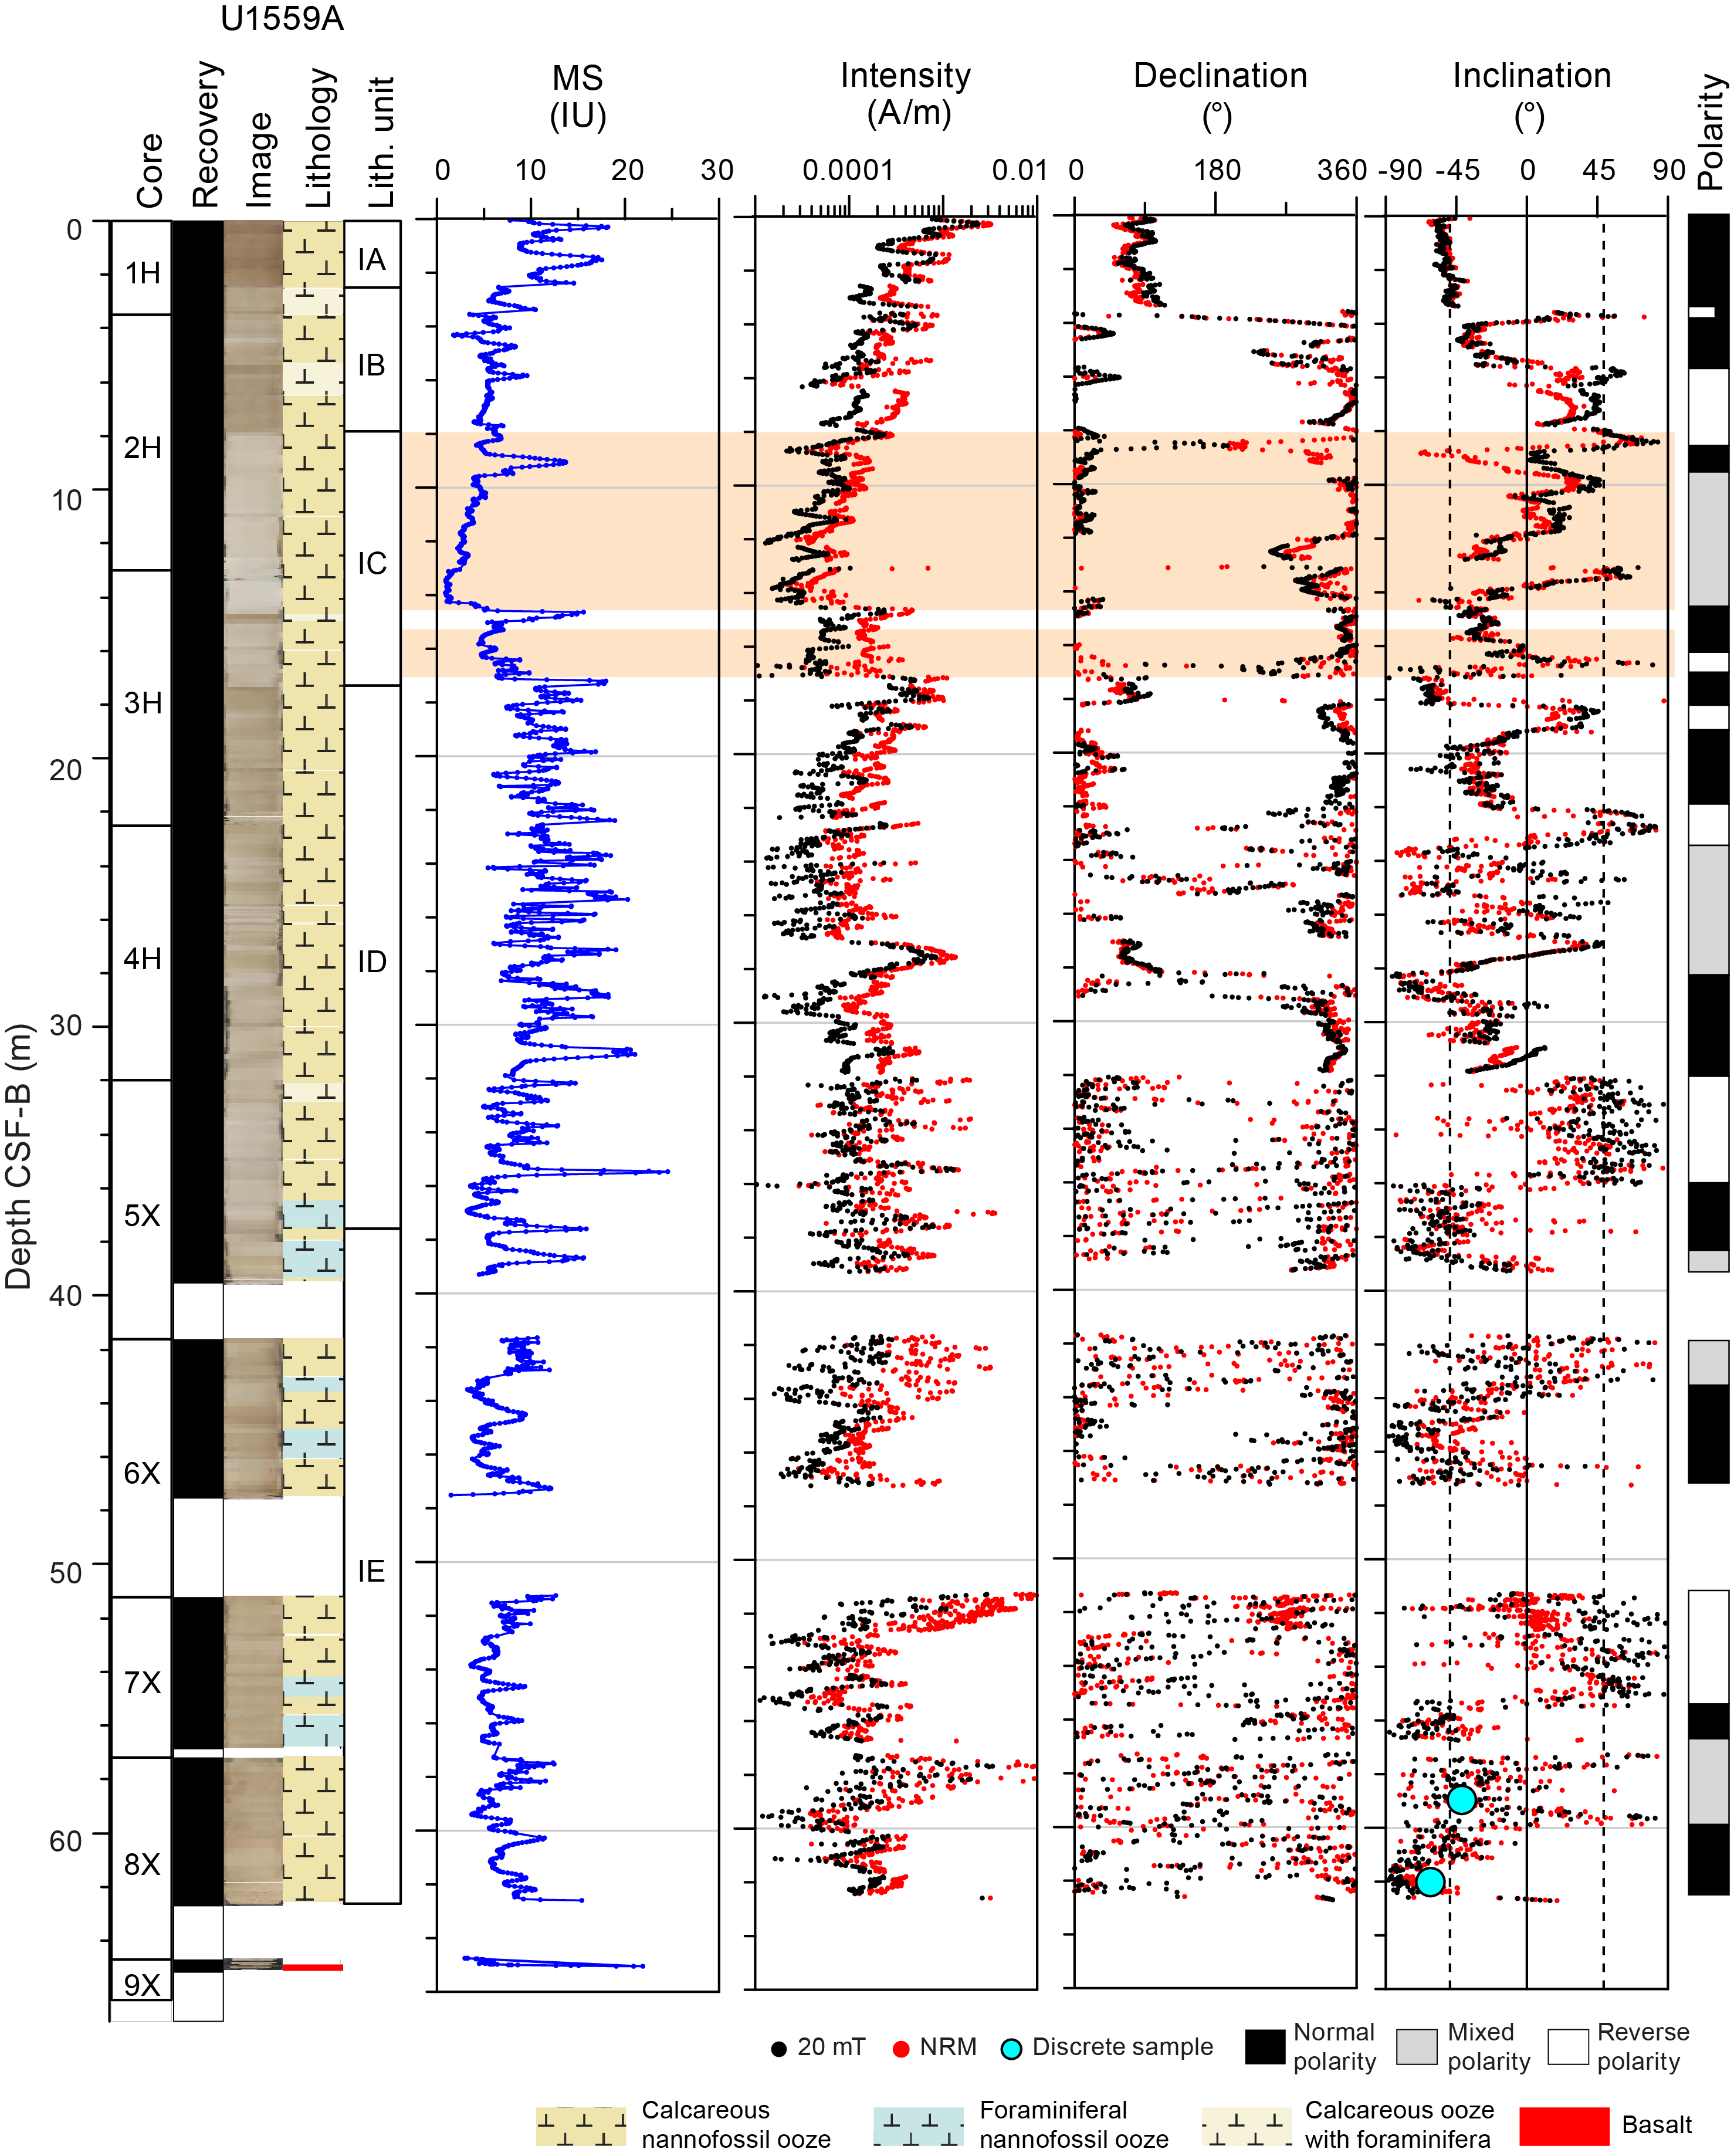
Figure F52. MSP and SRM measurements, Hole U1559A.
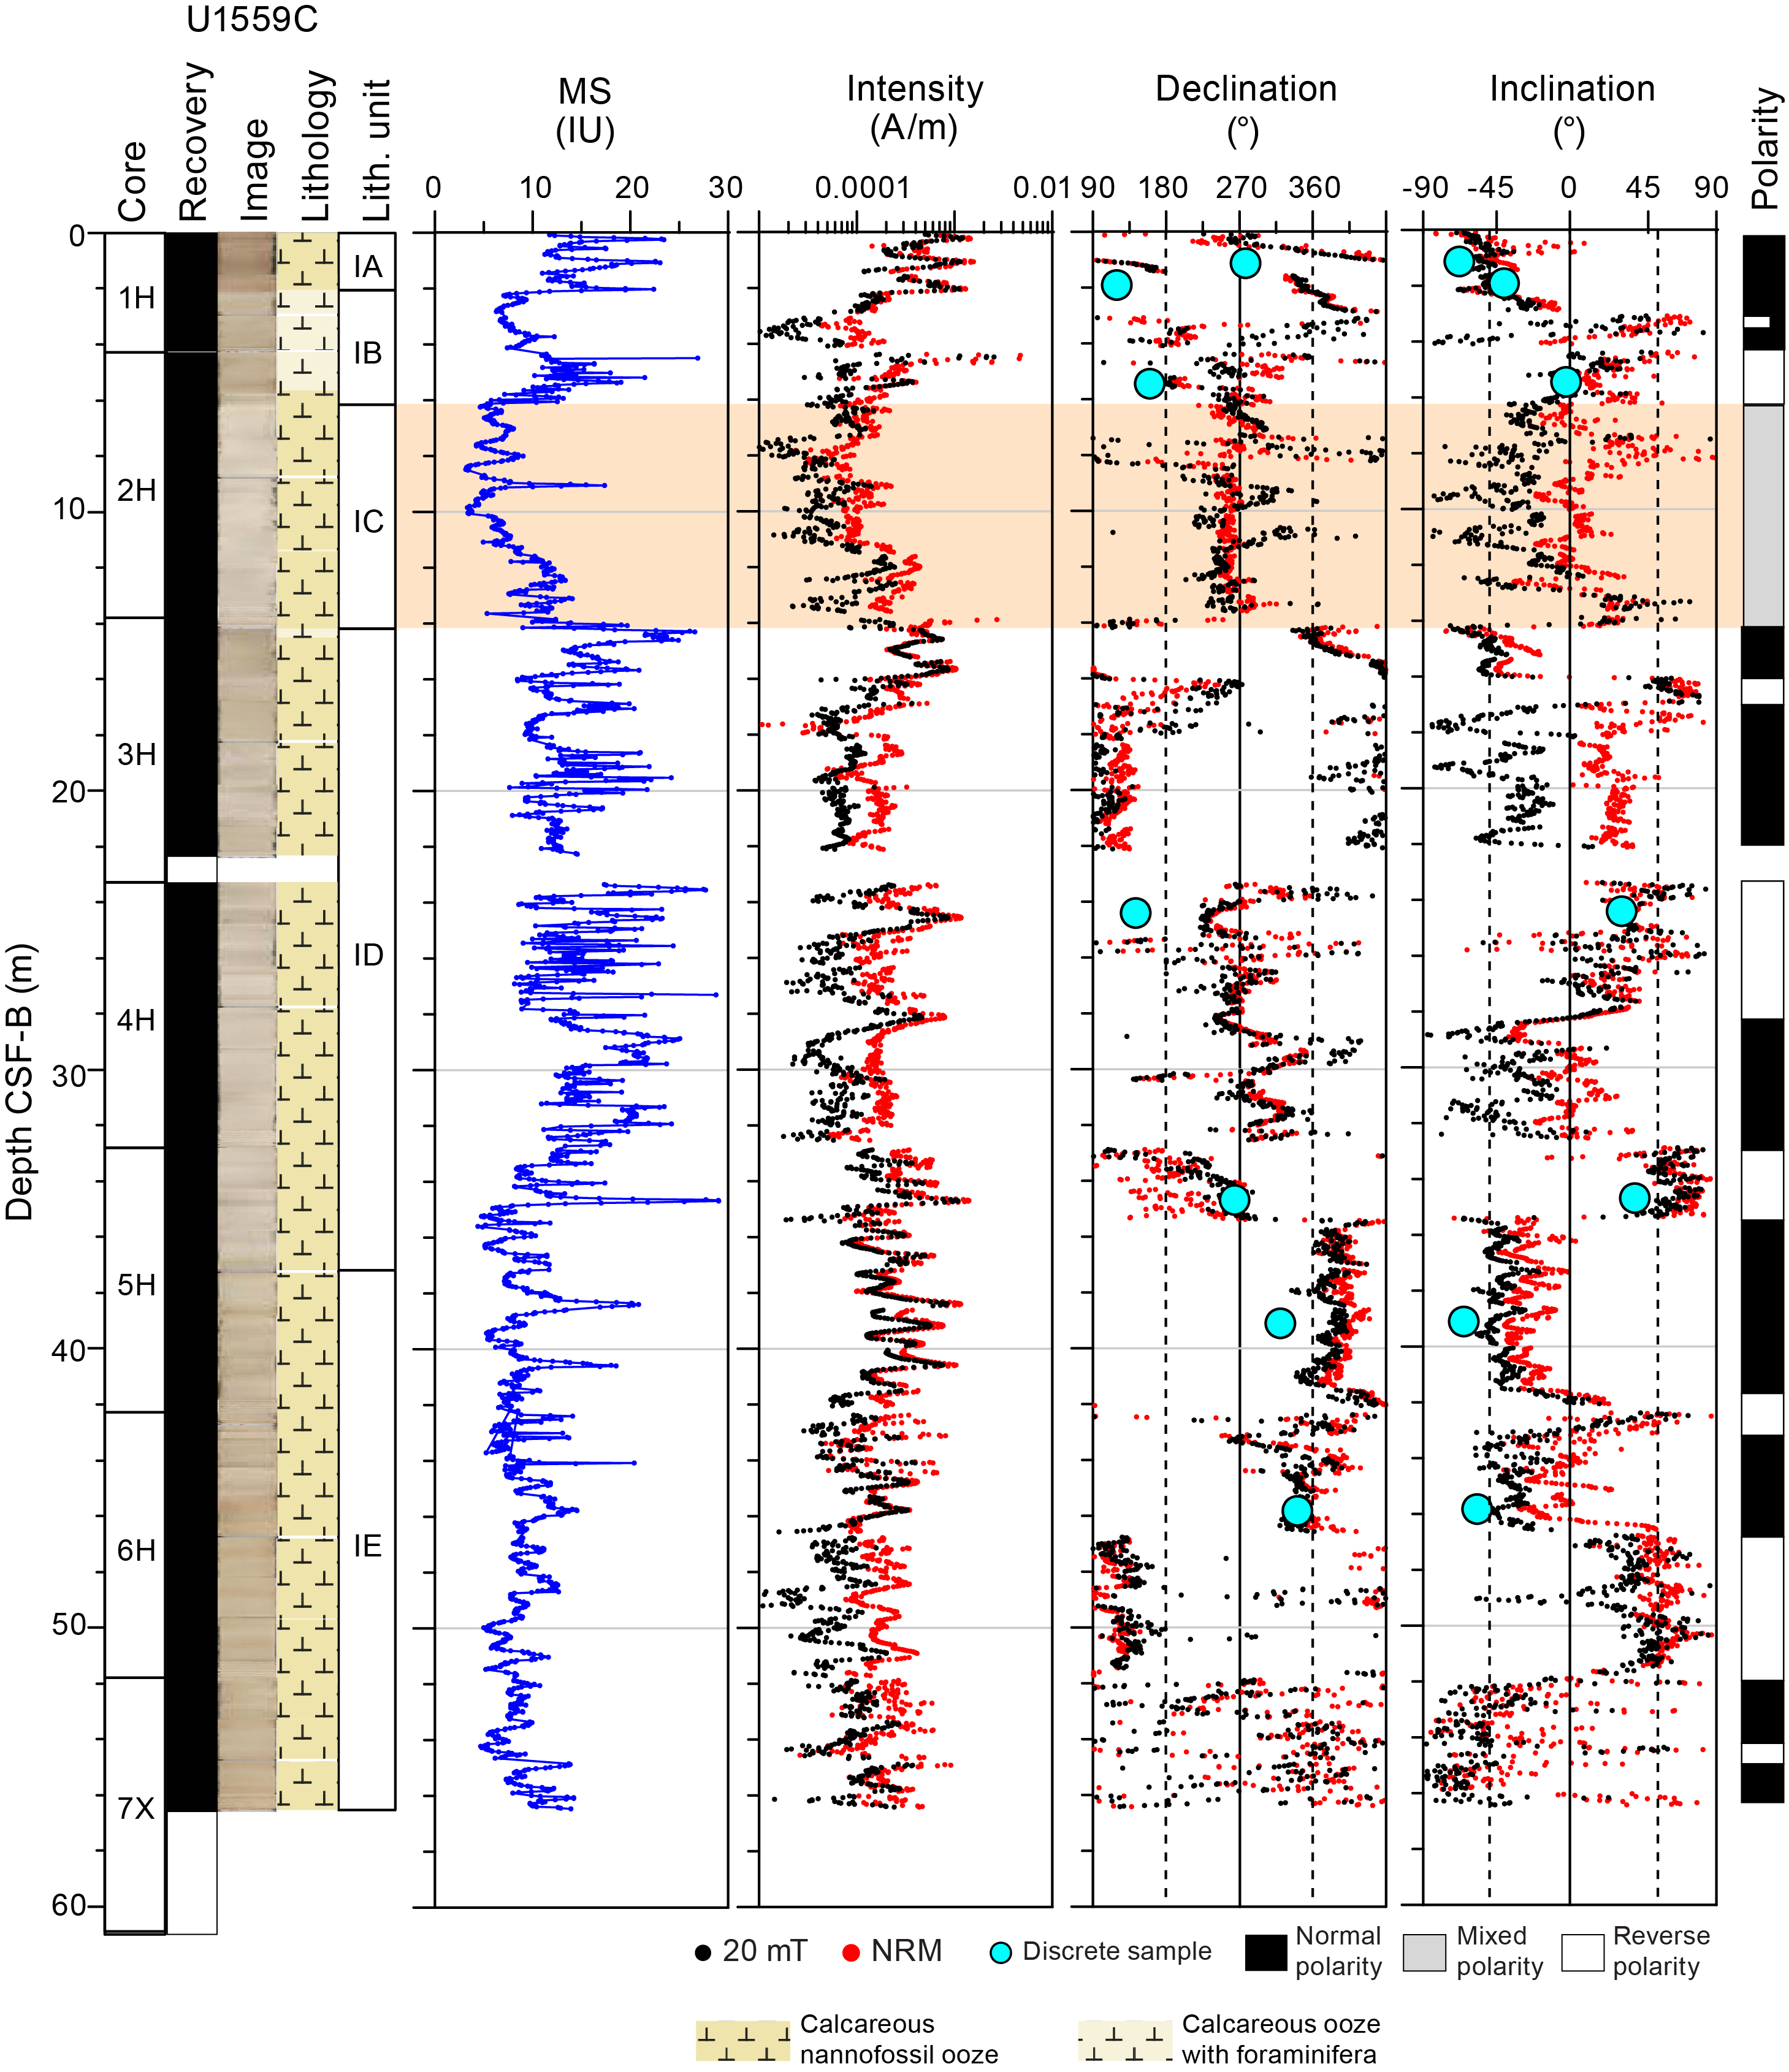
Figure F53. MSP and SRM measurements, Hole U1559C.
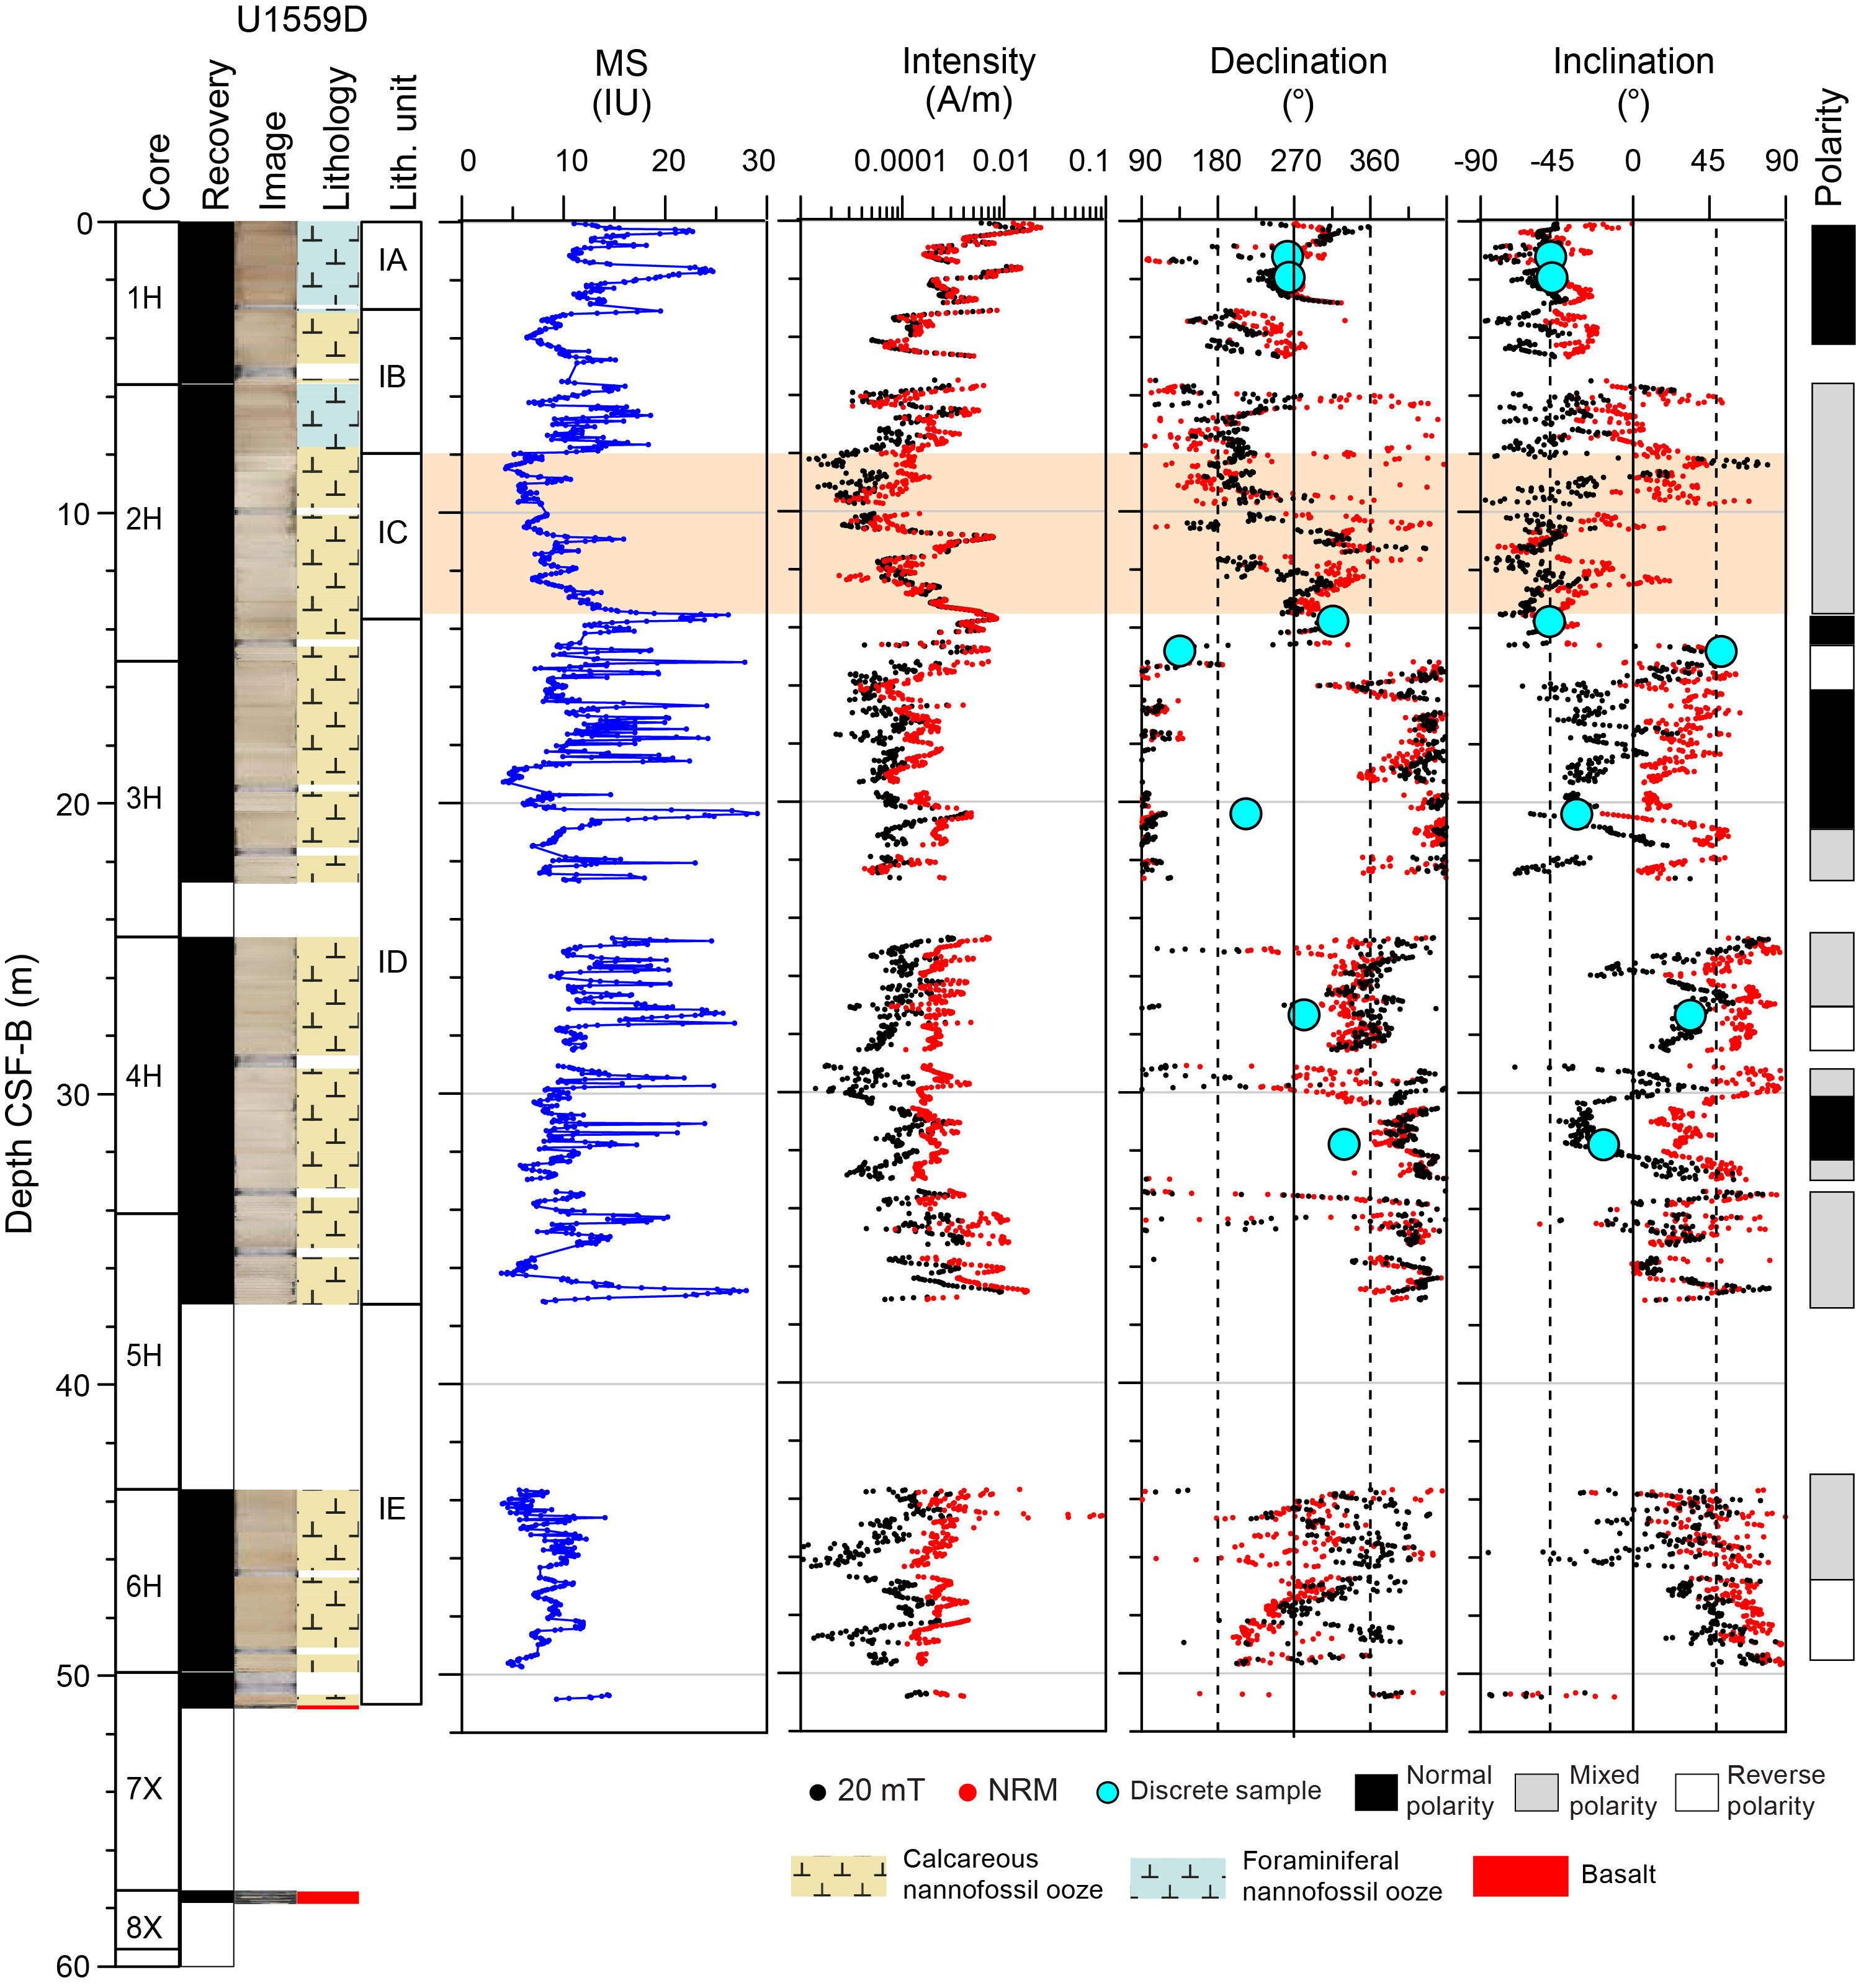
Figure F54. MSP and SRM measurements, Hole U1559D.
In Hole U1559A, the NRM declination and inclination are generally close to the 20 mT declination and inclination in both normal and reversed polarity depth intervals. This suggests that the NRM directions are close to the primary characteristic remanent magnetization (ChRM) with only a very small viscous overprint affecting these sediments. A similar pattern is observed in the NRM and 20 mT data from Hole U1559C except for ~18–22 m CSF-B, in which inclination changes markedly after 20 mT (Figure F53). NRM data and demagnetization behavior in Hole U1559D follow the same characteristics as in Hole U1559C despite the lower core recovery. The XCB coring system produces noticeably noisier inclination data than the APC system, which is particularly obvious in the data from below 30 m CSF-B in Hole U1559A (Figure F52). Despite this, an interpretable polarity record is still present.
The 20 mT inclinations measured in cores from Holes U1559A, U1559C, and U1559D are bimodal, although histograms indicate significant contributions from inclinations between the two peaks (Figure F55). In Hole U1559A, inclinations cluster around −53° and 43° (Figure F55A). Inclinations for Hole U1559C cluster around −41° and 37° and are the shallowest inclinations at this site (Figure F55B). Hole U1559D inclinations cluster around −53° and 34° (Figure F55C). With the exception of the two negative modal inclinations in Holes U1559A and U1559D, the modal inclinations at Site U1559 are much shallower than that expected for a geocentric axial dipole (GAD) at this latitude (±49.1° at 30°S). In addition to the effect of the slumped interval in Subunit IC, smearing of inclinations away from the expected value could result from drilling disturbance in intervals cored with the XCB system, which produces noisier data (e.g., below ~32 m CSF-B in Hole U1559A). Cores from Hole U1559D had both poor recovery and somewhat disturbed and soupy sediments, especially in the upper sections of the cores, which might also have affected inclinations in Hole U1559D.
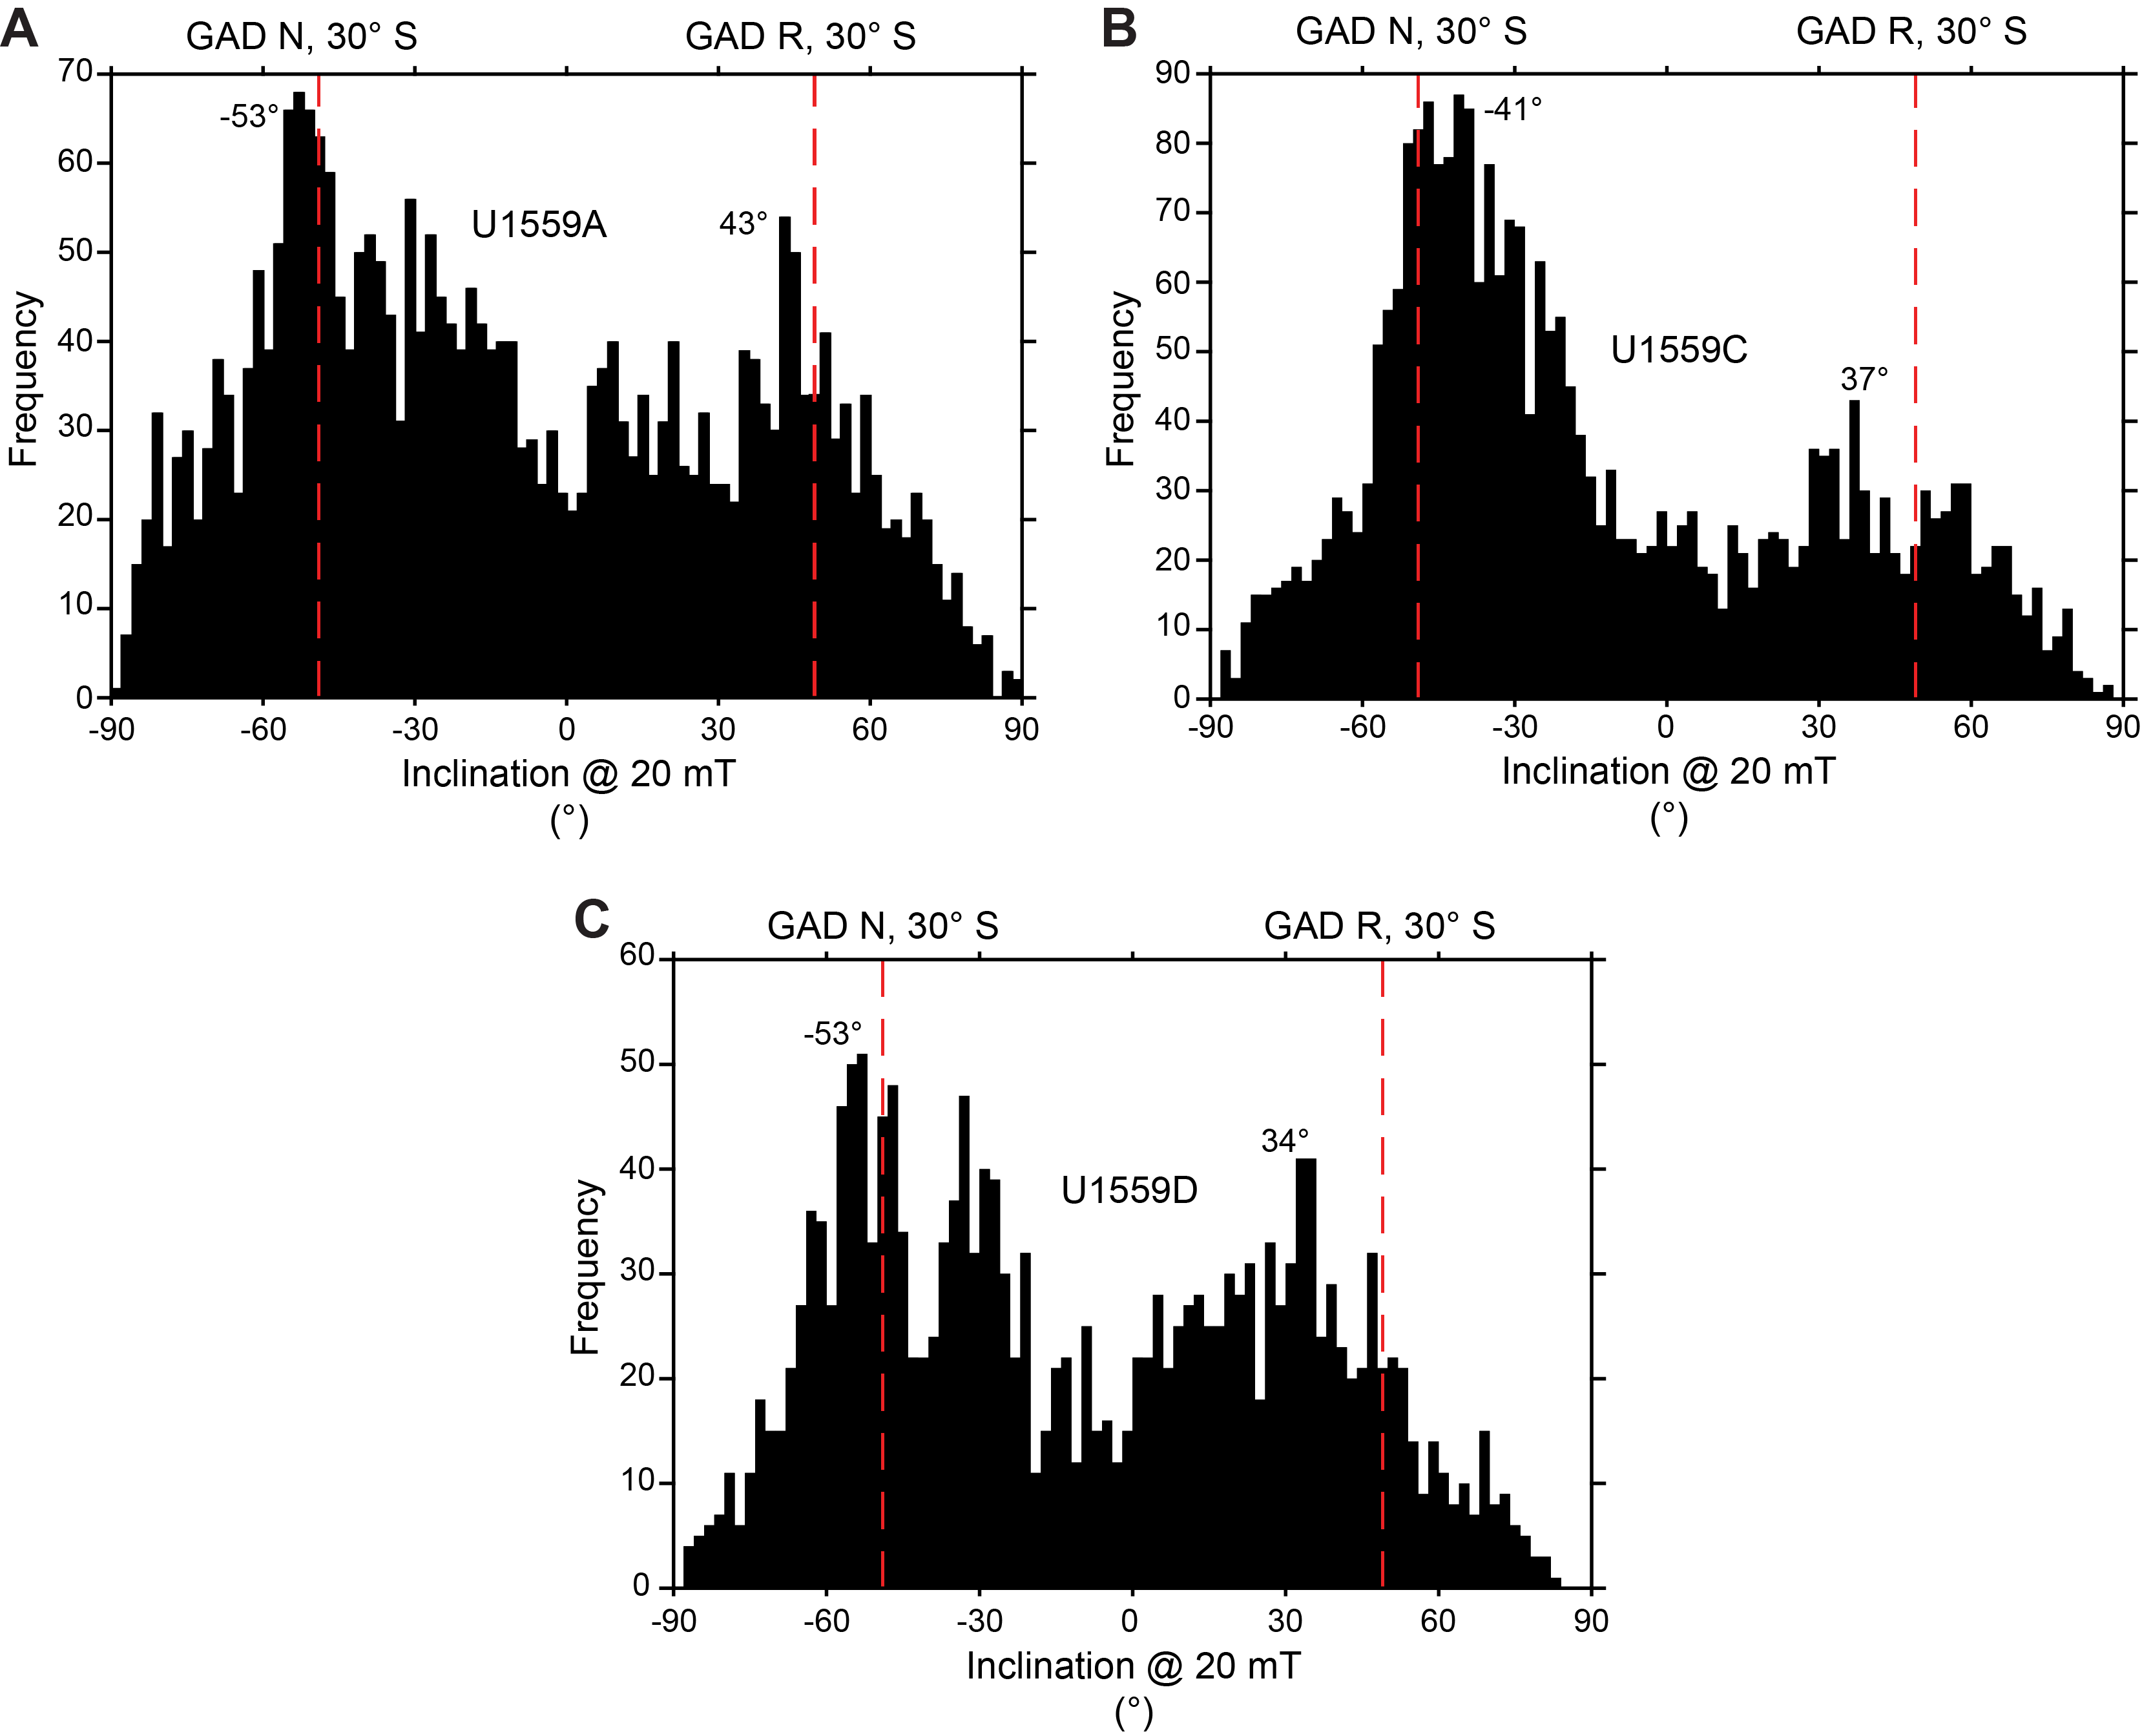
Figure F55. Inclination data after 20 mT AF demagnetization, sediment.
8.1.1.1. Discrete samples
All discrete cubes were AF demagnetized up to 190 mT. By demagnetizing the samples in a stepwise fashion, we are able to determine the ChRM of the sample. Additionally, this demagnetization process helps characterize the dominant magnetic mineral assemblage. IRM experiments contribute additional contextual information regarding the magnetic minerals present. AMS and bulk susceptibility were measured on all discrete cubes.
Of the 26 sediment samples analyzed, only 16 had orthogonal vector plots (OVPs; Zijderveld, 1967) clean enough to contribute to defining the ChRM, with maximum angular deviation angles <15°, typically considered the uppermost threshold for well-defined magnetic field directions (Table T19) (Butler, 1992). The remaining 10 sediment samples display either erratic behavior and could not be fit or the maximum angular deviation angle after fitting was >15°. Examples of clean demagnetization plots from Holes U1559A, U1559C, and U1559D are illustrated in Figure F56. Demagnetization plots decrease smoothly and OVPs display straighter lines to the origin for discrete samples from Hole U1559D, whereas discrete samples from Hole U1559A display more erratic behavior. This is a surprising result, given the aforementioned drilling issues encountered during Hole U1559D core recovery. However, the samples from Hole U1559A have somewhat lower NRM intensities and come from the base of the sedimentary succession in Core 390C-U1559A-8X, where compaction, hydrothermal fluid flow through the basal sediments, and/or drilling disturbance may have affected the remanence or alignment of the grains with the magnetic field. Hole U1559C displays noisy behavior like Hole U1559A.
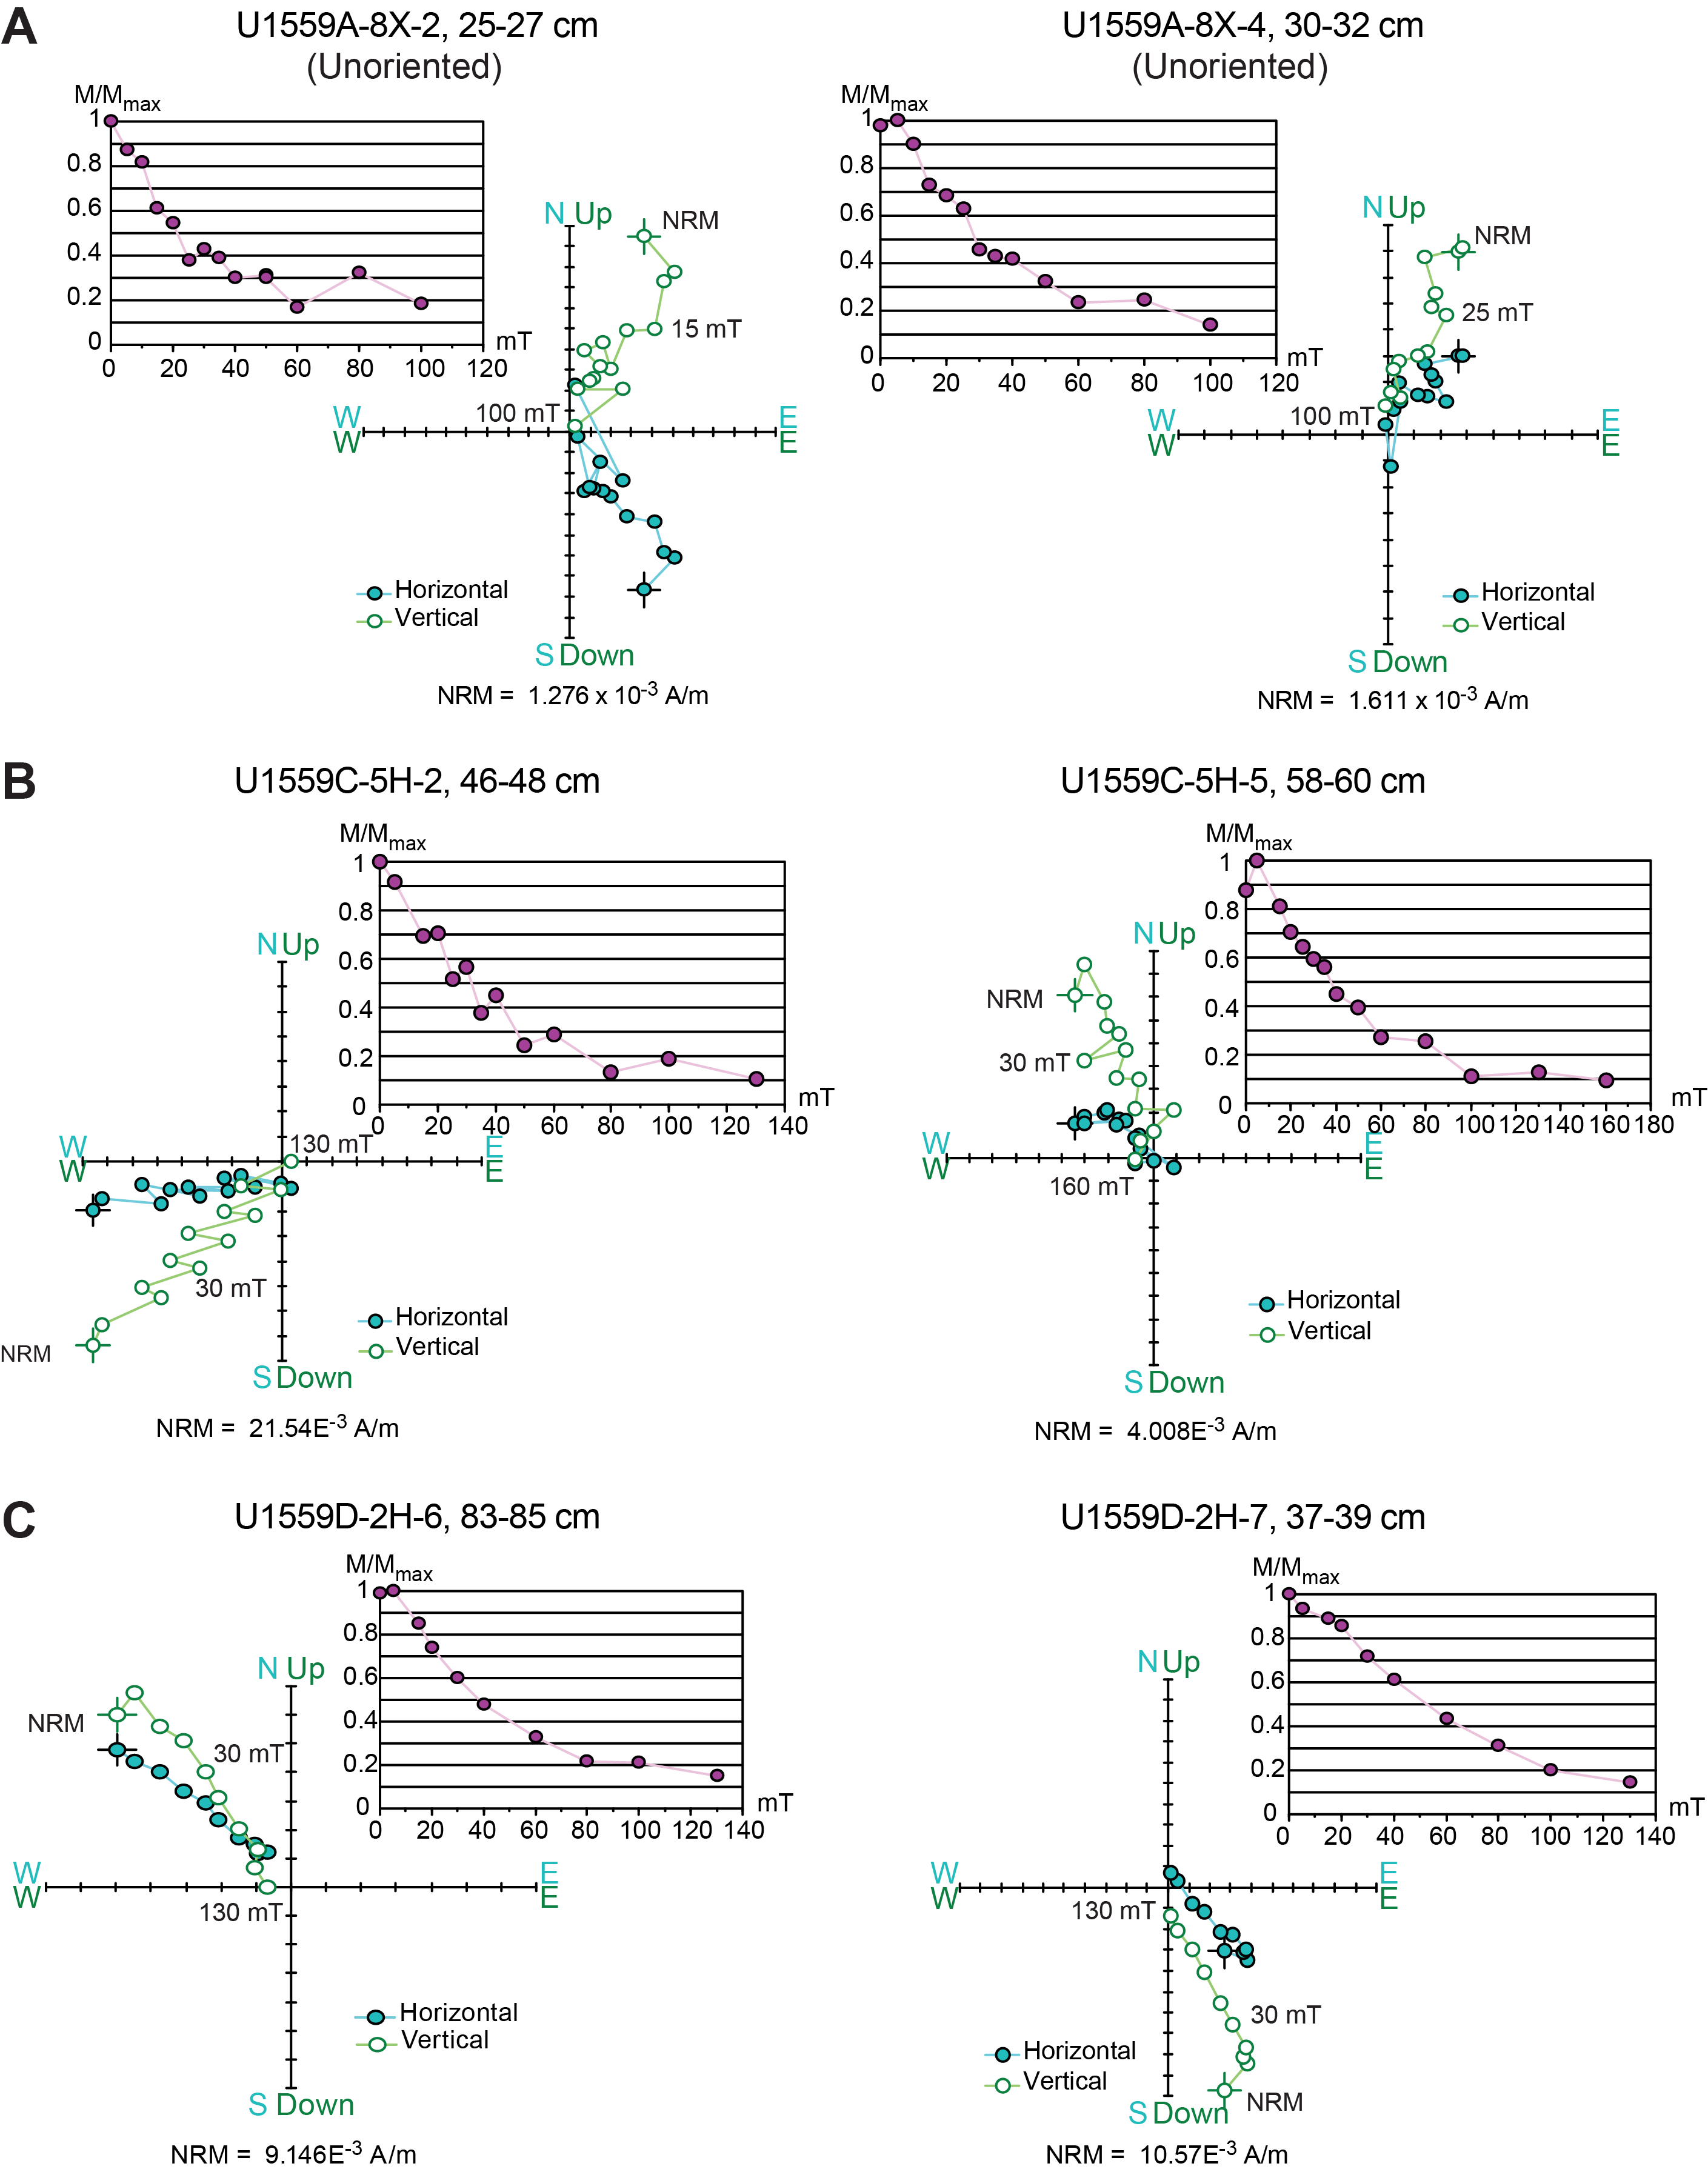
Figure F56. NRM demagnetization for representative samples.
Despite these problems, 16 discrete samples met the maximum angular deviation criteria, and the ChRM inclinations calculated using principal component analysis (PCA) (Kirschvink, 1980) are close to that expected for a GAD at this latitude. Calculated inclinations for Samples 390-U1559D-2H-6, 83–85 cm, and 2H-7, 37–39 cm (Figure F56C), are −49.4° and 51.9°, respectively, and are the two samples with inclinations closest to the GAD inclination. Samples 390C-U1559A-8X-2, 25–27 cm (inclination = −35.5°), and 390-U1559C-5H-2, 46–48 cm (inclination = −39.9°), have shallower inclinations than expected at this latitude. Conversely, the other two samples have inclinations that are notably higher (−61.5° for Sample 390C-U1559A-8X-4, 30–32 cm; −65.1° for Sample 390-U1559C-5H-5, 58–60 cm). The higher inclination for Sample 390C-U1559A-8X-4, 30–32 cm, could be related to compaction, hydrothermal fluid flow, and/or drilling disturbance at the sediment/basement interface. Regardless, calculated ChRM inclinations and declinations (after reorientation; see Paleomagnetism in the Expedition 390/393 methods chapter [Coggon et al., 2024c]) for the discrete samples are in agreement with the measured 20 mT inclinations of the archive halves of cores from Holes U1559A, U1559C, and U1559D and confirm the polarity interpretations for these holes (Figures F52, F53, F54).
8.1.1.2. Magnetostratigraphy
SRM measurements of the archive halves of Holes U1559A, U1559C, and U1559D after AF demagnetization at 20 mT were used to construct a preliminary polarity sequence for each hole (Figures F52, F53, F54). The reorientated 20 mT SRM declinations are not always aligned with the expected 360° or 180° declinations for normal and reversed polarities, respectively, suggesting inaccurate measurements from the orientation tool or incomplete removal of an overprint magnetization. However, the 20 mT inclination data depicts a clear polarity sequence for most intervals, and a polarity stratigraphy for each hole can be determined. Considering the estimated age of the basement (6.6 Ma) (Kardell et al., 2019) and the pattern of the polarity sequence recorded at Site U1559, which mainly derives from Hole U1559C, a tie to the geomagnetic polarity timescale (GPTS; Gradstein et al., 2020) is proposed (Figure F57; Table T20). Note that a similar polarity sequence but with gaps due to unrecovered intervals is seen in Hole U1559A. Unfortunately, in addition to unrecovered intervals, Hole U1559D experienced some drilling issues that lead to disturbed and soupy sediments through some intervals, and the polarity sequence is not as complete as the other two holes at Site U1559. The proposed correlation of the normal polarities at the base of Holes U1559A and U1559C to Miocene Chron C3An is compatible with the crustal age of the basement. The correlation to the GPTS for the sediment package at Site U1559 is guided by the general pattern of reversed and normal magnetozones, although the correlation is tentative and is interrupted by the slumped Subunit IC. Biostratigraphic datums generally agree with the magnetostratigraphic correlation at the base and top of the sequence (see Biostratigraphy and Age model and mass accumulation rate). However, the biostratigraphic and magnetostratigraphic age-depth interpretations significantly differ between 15 and 50 m CSF-B. Alternative magnetostratigraphic correlations might include potential hiatuses or sedimentation rate variations, but at this stage they are not fully resolved.
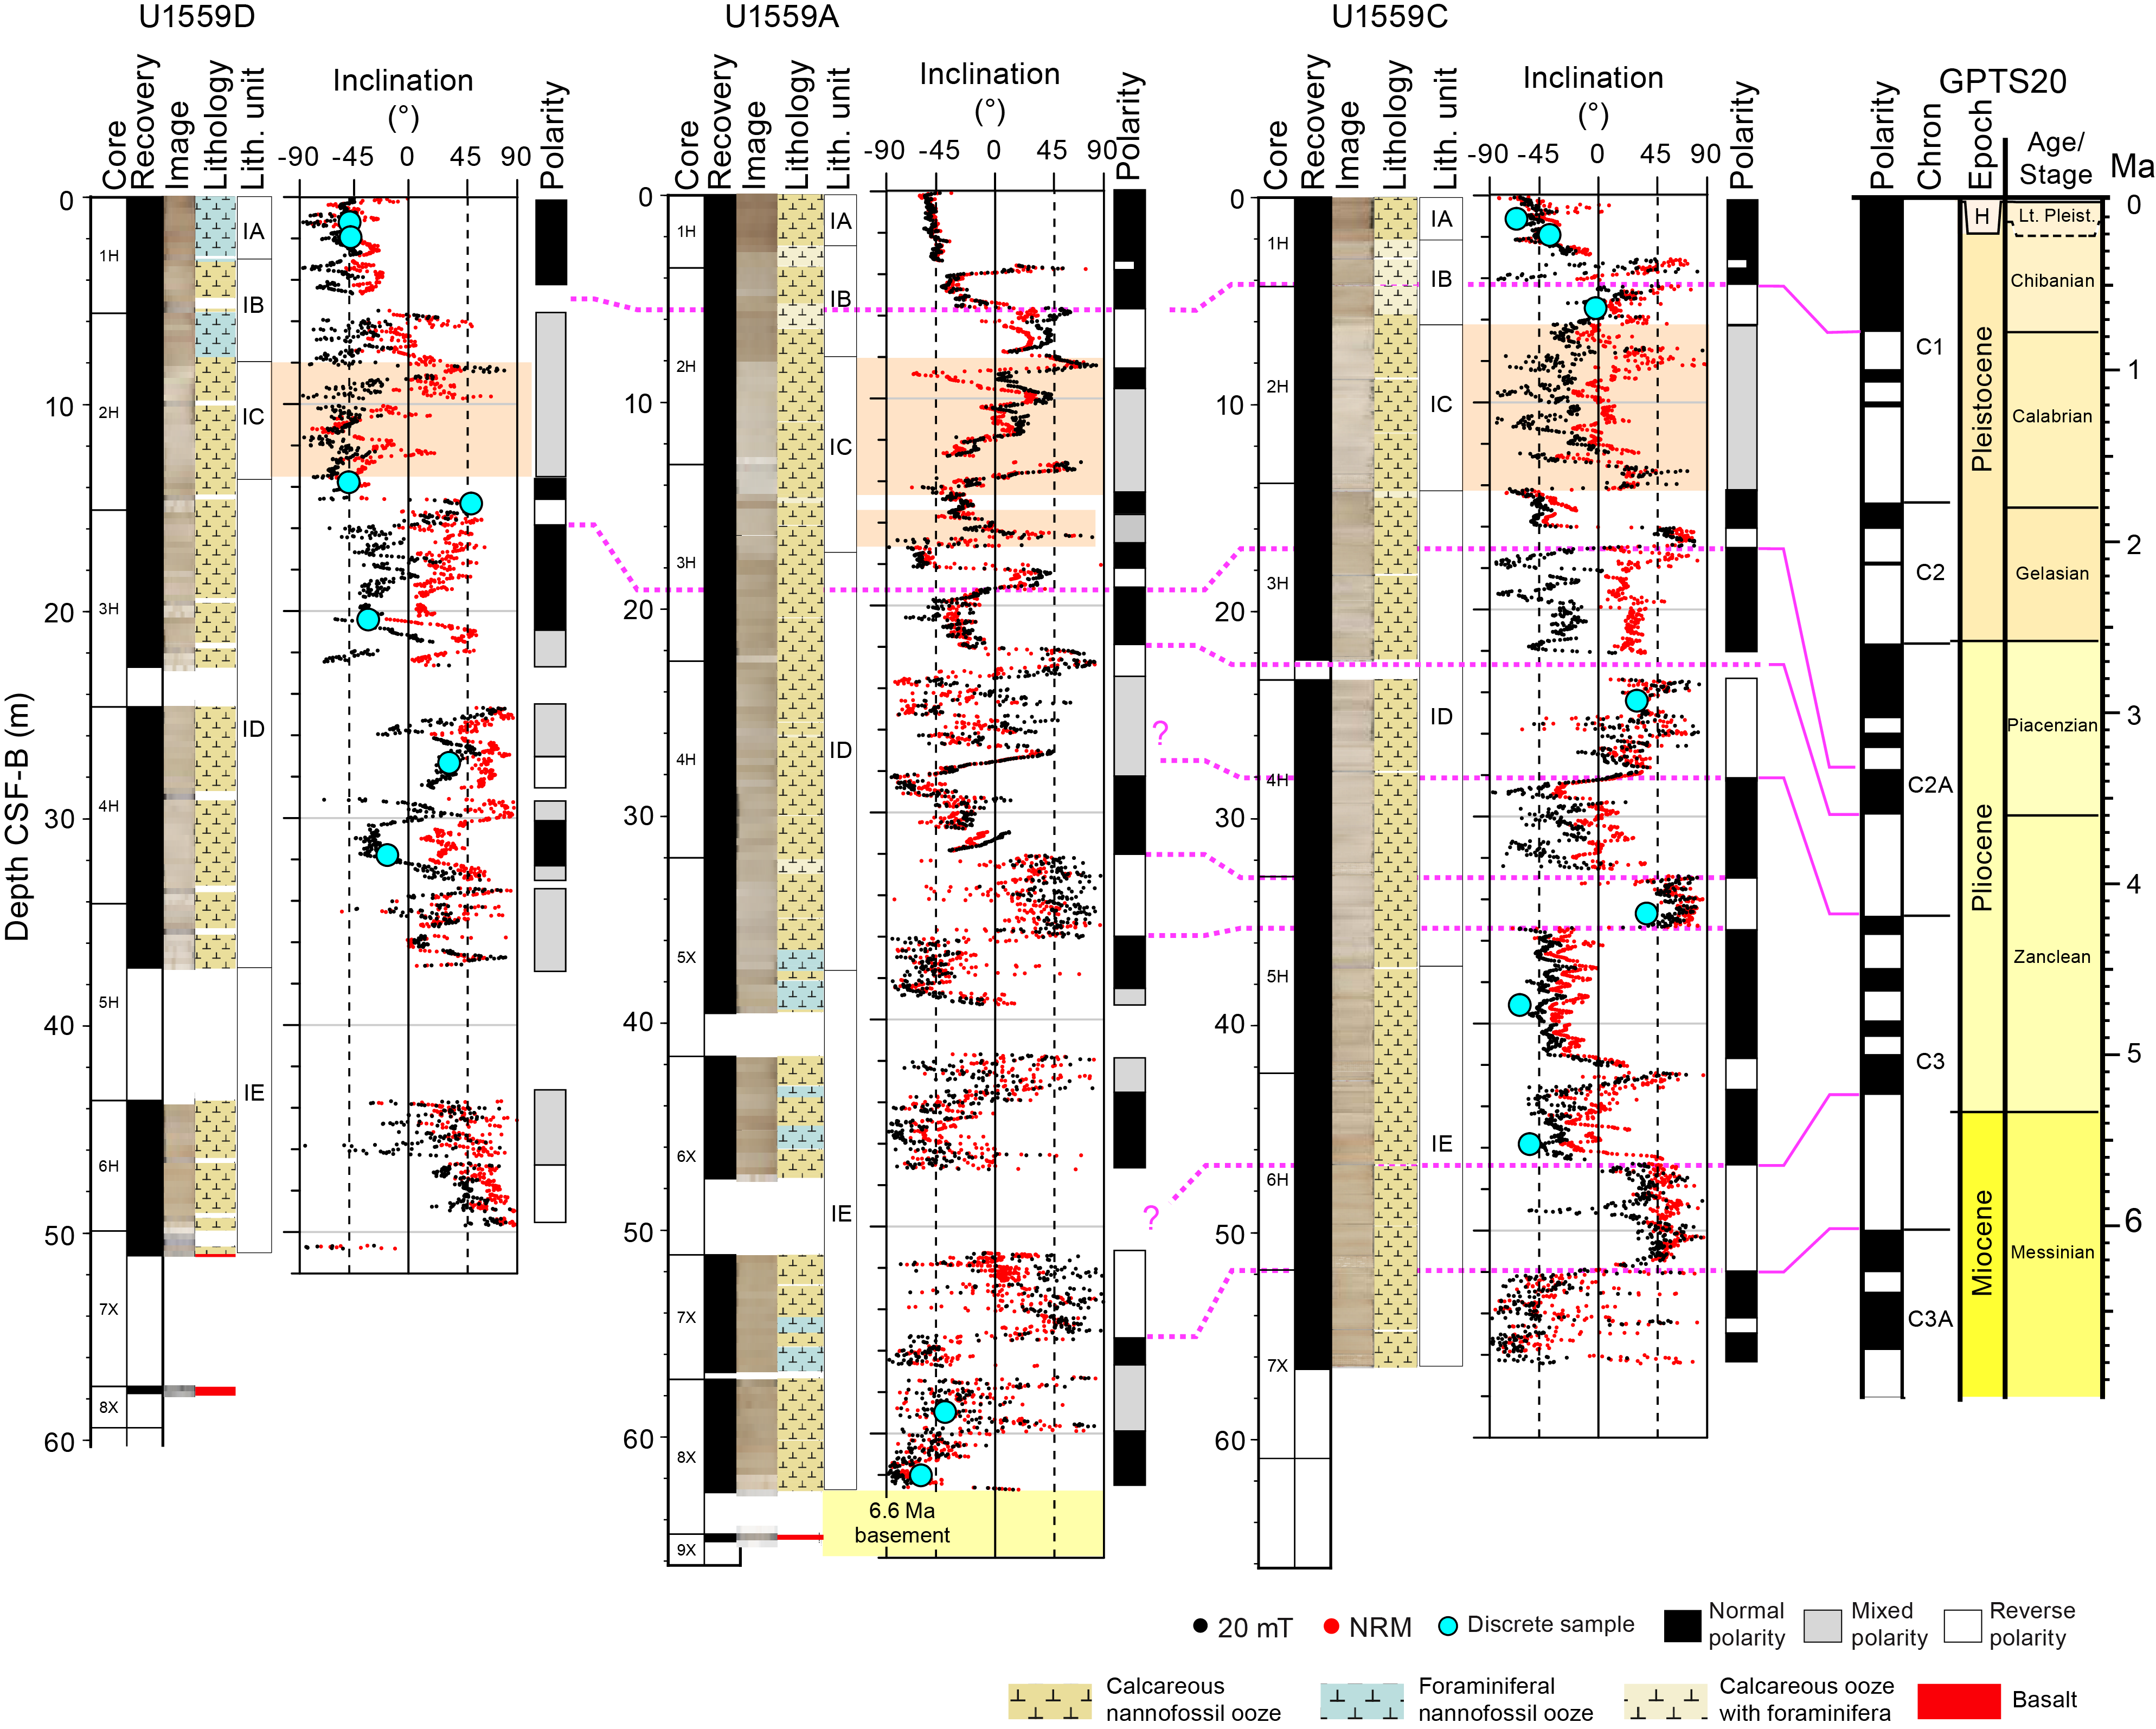
Figure F57. SRM inclination after 20 mT AF demagnetization, sediments.
8.1.1.3. Rock magnetism and anisotropy of magnetic susceptibility
The median destructive fields (MDFs), considered the field at which half of the NRM intensity remains during AF demagnetization, are a first approximation of coercivity and can be employed to place initial constraints on the magnetic mineralogy of Site U1559 sediments. The average MDFs for our discrete sediment samples from Holes U1559A, U1559C, and U1559D are 25, 36, and 30 mT, respectively. These coercivities suggest that stable single-domain to pseudosingle-domain magnetite/titanomagnetite is the predominant magnetic mineral. IRM acquisition up to 1.2 T and backfield IRM experiments further indicate the presence of a low-coercivity ferromagnetic mineral assemblage (Figure F58A). IRM acquisition curves indicate that 80% of the saturation IRM (SIRM) is achieved at 0.1 T and that samples are very nearly saturated at 0.5–0.6 T. The S ratios (IRM−300mT/SIRM), which are usually used as a qualitative proxy for high-coercivity phases like hematite, are around 0.95 (see Paleomagnetism in the Expedition 390/393 methods chapter [Coggon et al., 2024c]), confirming the presence of significant low-coercivity phases.
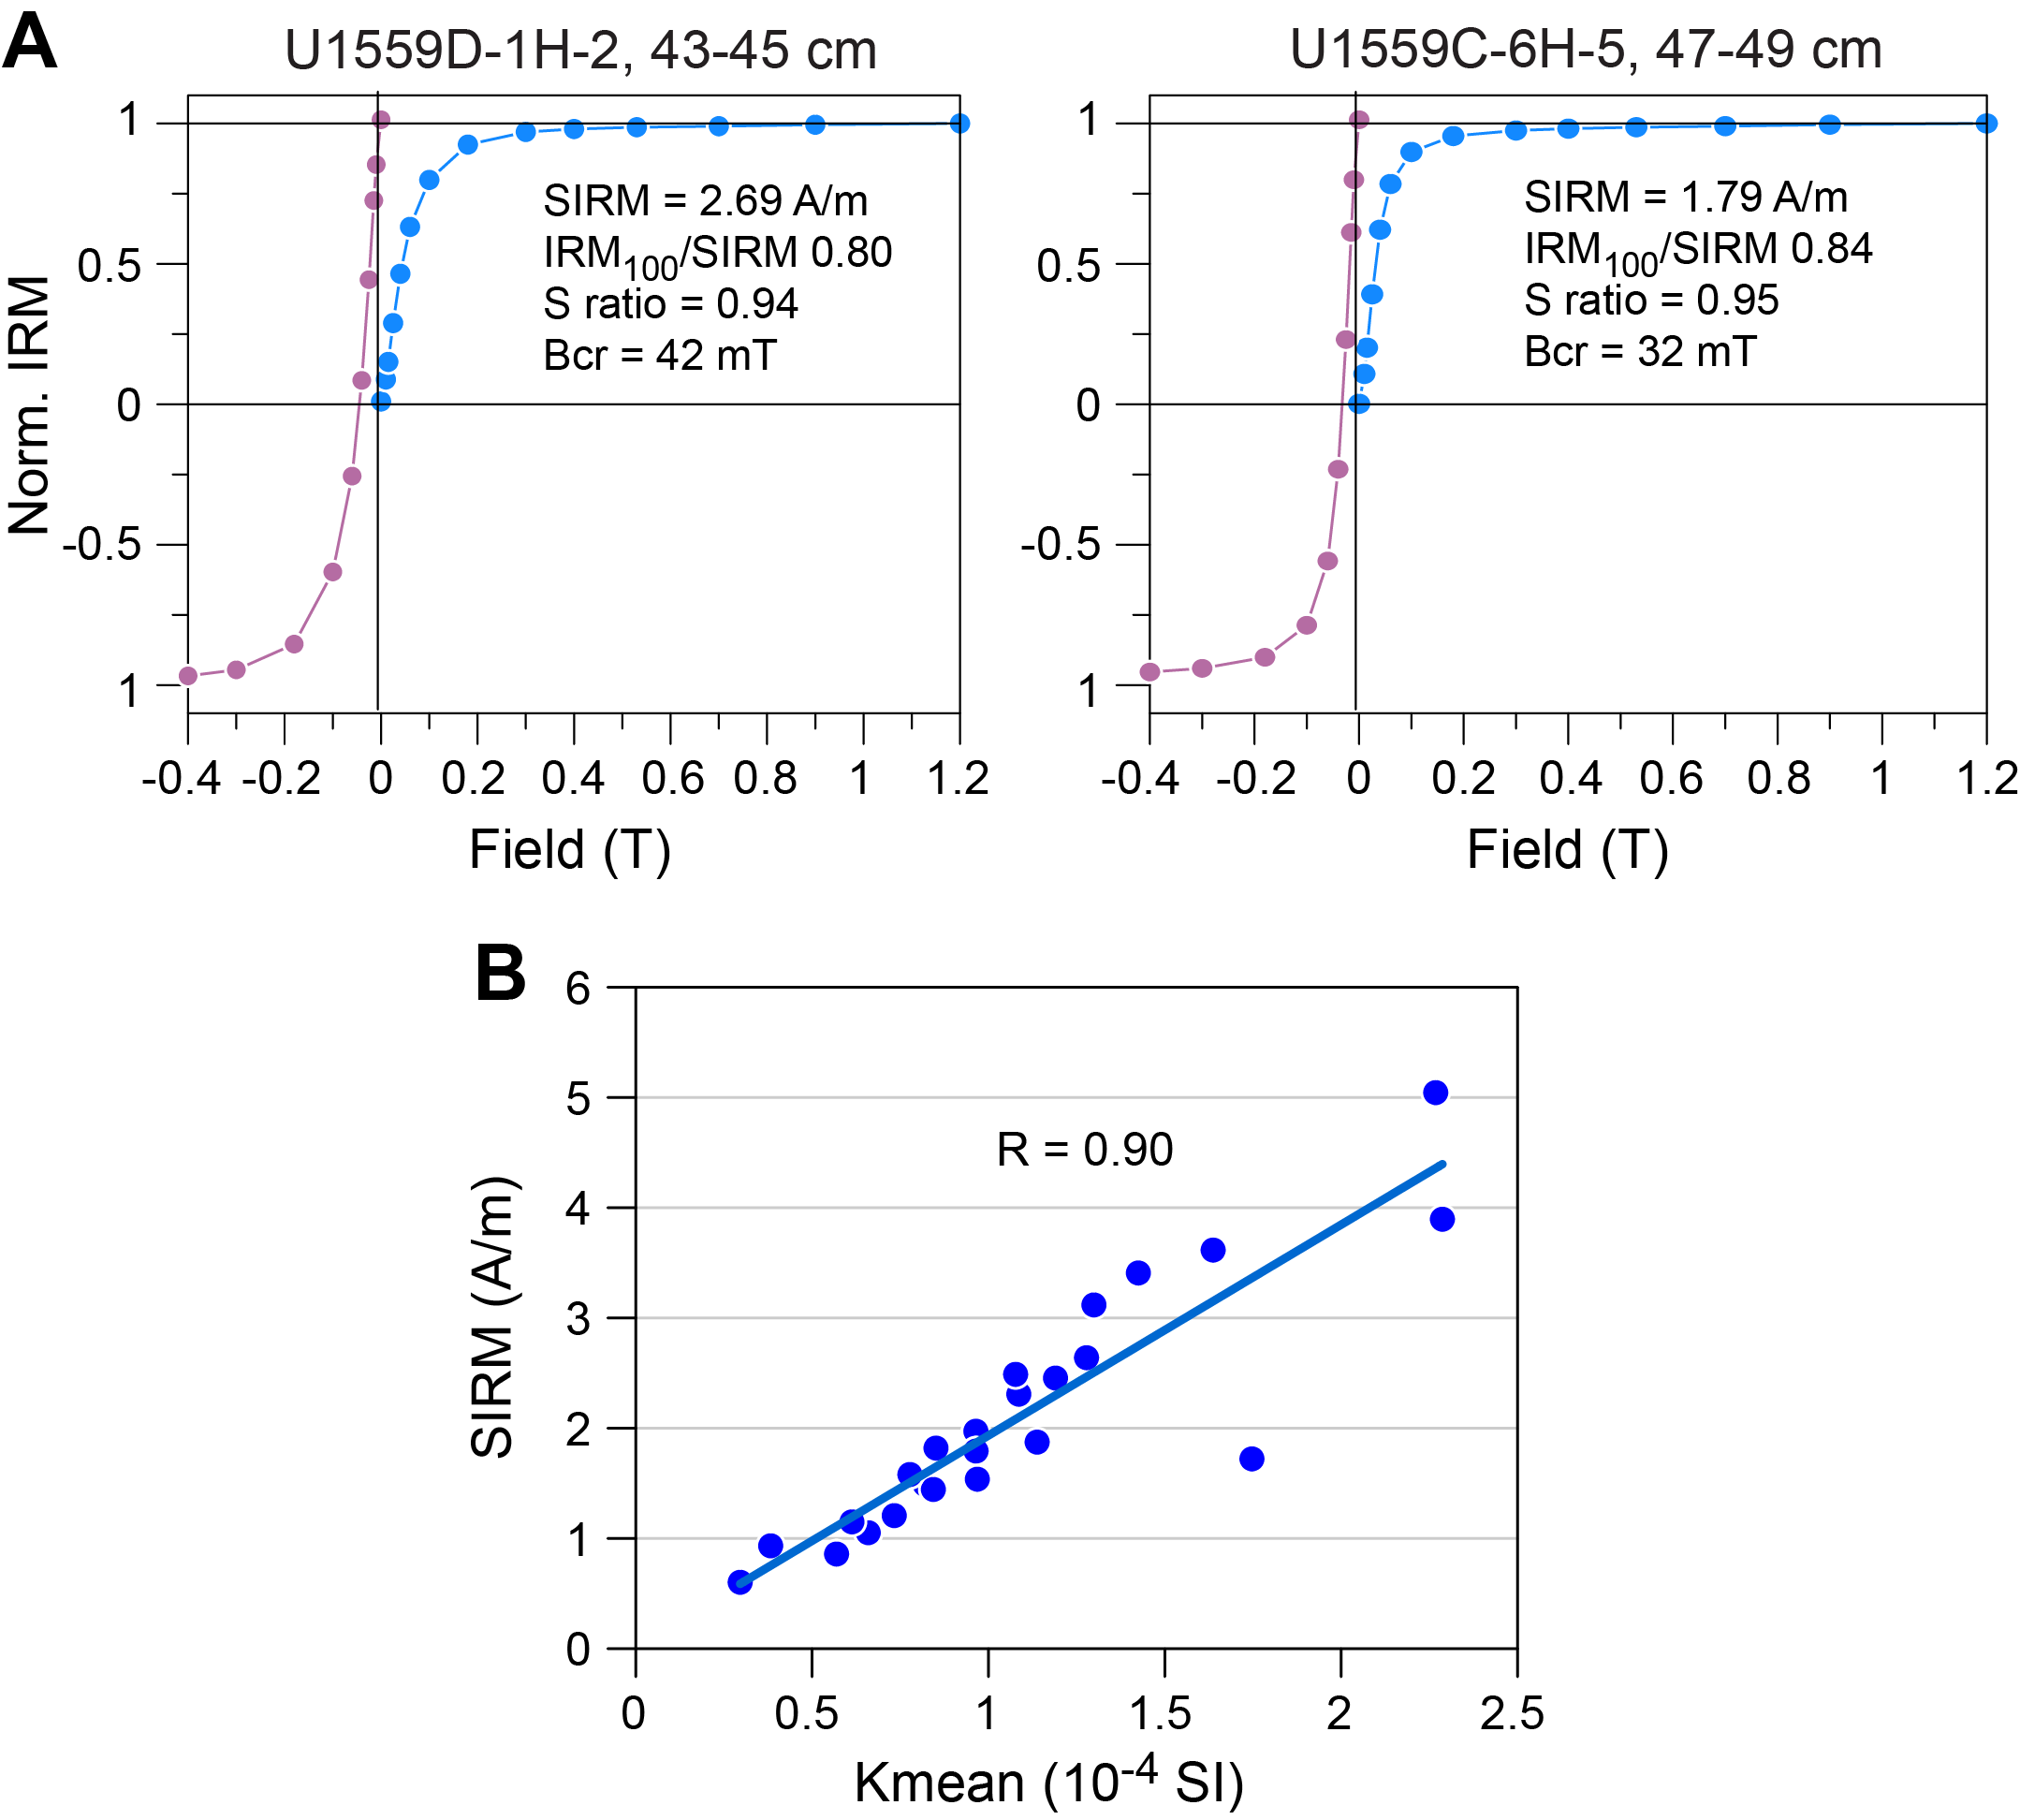
Figure F58. IRM acquisition curves and bulk MS vs. IRM intensity.
AMS measurements were carried out on all discrete sediment samples from Holes U1559C and U1559D for petrofabric characterization. The mean bulk magnetic susceptibility (Km) is 1.11 × 10⁻⁴ SI. A scatterplot of Km versus IRM intensity (Figure F58B) shows a significant correlation (R = 0.90). This correlation indicates that bulk magnetic susceptibility is chiefly controlled by the ferromagnetic assemblage and not the content of paramagnetic phases that would likely be clays in this sedimentary context. A stereonet of the AMS principal axes (Figure F59A) shows that Kmin clusters subhorizontally near the north–south core coordinate direction. Kint and Kmax are broadly distributed in a girdle close to the east–west core coordinate axis with mean Kmax axis dipping ~30°, which could be an indication of a weakly developed tectonic fabric. For meaningful geographic directional data of the AMS principal axes, we selected the discrete cube samples collected from APC cores that were oriented with the Icefield MI-5 core orientation tool (see Paleomagnetism in the Expedition 390/393 methods chapter [Coggon et al., 2024c]) and corrected the AMS directional data accordingly (Figure F59C). Despite the subset of corrected data being limited (only 6 samples were amenable for the correction; Table T21), the spatial distribution of the AMS ellipsoid principal axis can be indicative of a weak deformation fabric with a shallow Kmin axis, oriented northwest–southeast, whereas Kint and Kmax are distributed in a girdle on the plane perpendicular to Kmin. The degree of anisotropy (P) is rather low (most samples have P values of 1.005–1.017) (Figure F59B). The samples are distributed in both the oblate (planar) and prolate (linear) fields, and most samples have shape parameter (T) values in the range −0.5 to 0.5, denoting weak fabric development. More probably, the subvertical fabric shown in Figure F59B could be an artifact of the drilling, core-splitting, and/or discrete sample extraction processes (Yang et al., 2019).
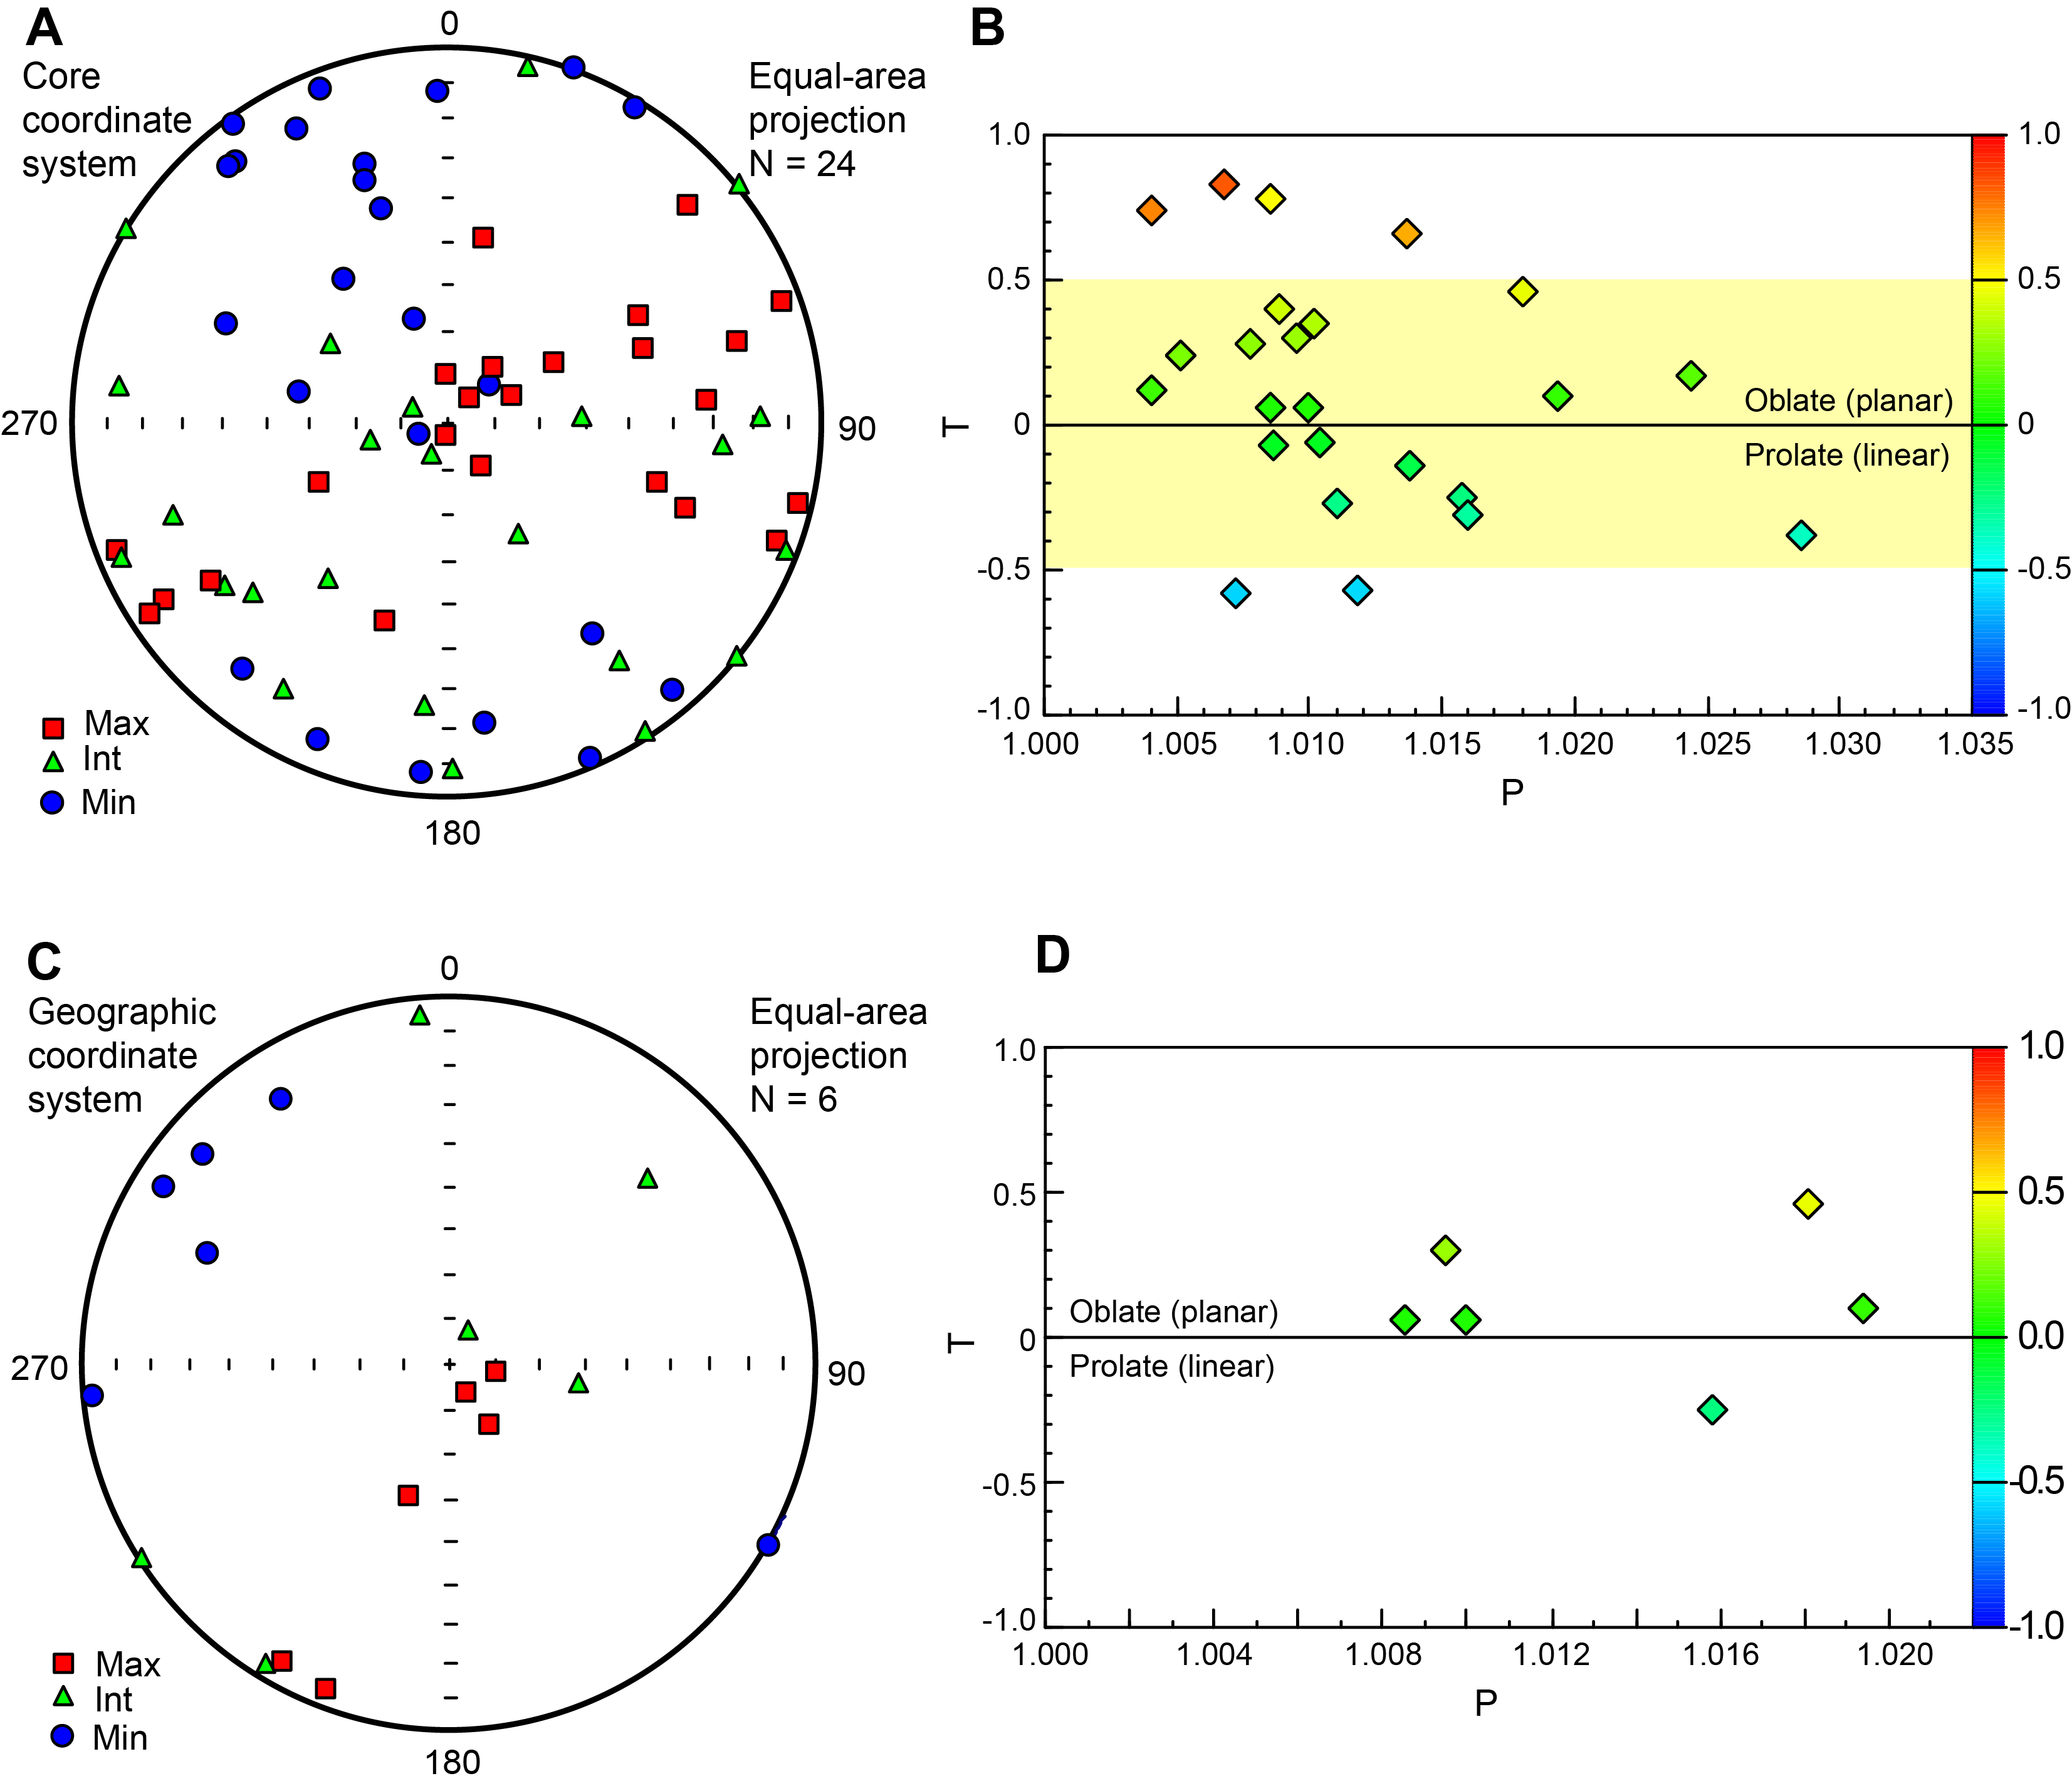
Figure F59. Principal AMS axes, discrete samples.
8.2. Basement
Measurements of the remanent magnetization of basement cores from Hole U1559B were made with the SRM on continuous pieces of the archive-half sections longer than 9 cm (see Paleomagnetism in the Expedition 390/393 methods chapter [Coggon et al., 2024c]). NRM and remanence after AF demagnetization steps (5, 10, and 20 mT) were measured at 2 cm spacing. The core recovery rate in Hole U1559B was poor to moderate (9%–68%), and only a few pieces per core were long enough to be measured in the SRM.
One or two 8 cm3 discrete cubes were taken per core from the working halves of Hole U1559B basement cores for a total of 11 discrete samples throughout the hole. The cubes are mostly unaltered basalts, although some samples include alteration halos. Paleomagnetic studies on discrete samples provided a complementary data set to the SRM data and help characterize the magnetic mineralogy. AF demagnetization and IRM experiments were performed on the samples. In addition, AMS measurements were performed to define the magnetic fabric.
8.2.1. Results
Measurements of NRM and in-line AF demagnetization of Cores 393-U1559B-3R through 13R characterize the remanent magnetization records of the young (~6.6 Ma based on the spreading rates calculated in Kardell et al. [2019]) fresh basalts. AF demagnetization up to 20 mT almost completely removed the viscous remanent magnetization that generally comprises a small portion of the total remanence. In cores recovered by scientific ocean drilling, this viscous overprint is usually induced during RCB drilling. Remanence after 20 mT AF demagnetization will be referred to as 20 mT remanence hereafter. The intensities of NRM and 20 mT remanence of the igneous rocks have mean values of ~3.3 and 1.7 A/m, respectively (Figure F60). Significantly higher NRM intensity was detected in Cores 393-U1559B-10R through 12R, concurrent with the highest MS values (see Discrete samples and Physical properties and downhole measurements). The 20 mT remanence values show positive inclination (reversed geomagnetic polarity for latitude of ~30°S) in all measured intervals of Hole U1559B basement. The overall distribution of inclination is approximately Gaussian instead of bimodal, with values clustered around 38° (Figure F61). This inclination is ~11° shallower than the expected inclination based on the GAD (±49.1° at 30°S).
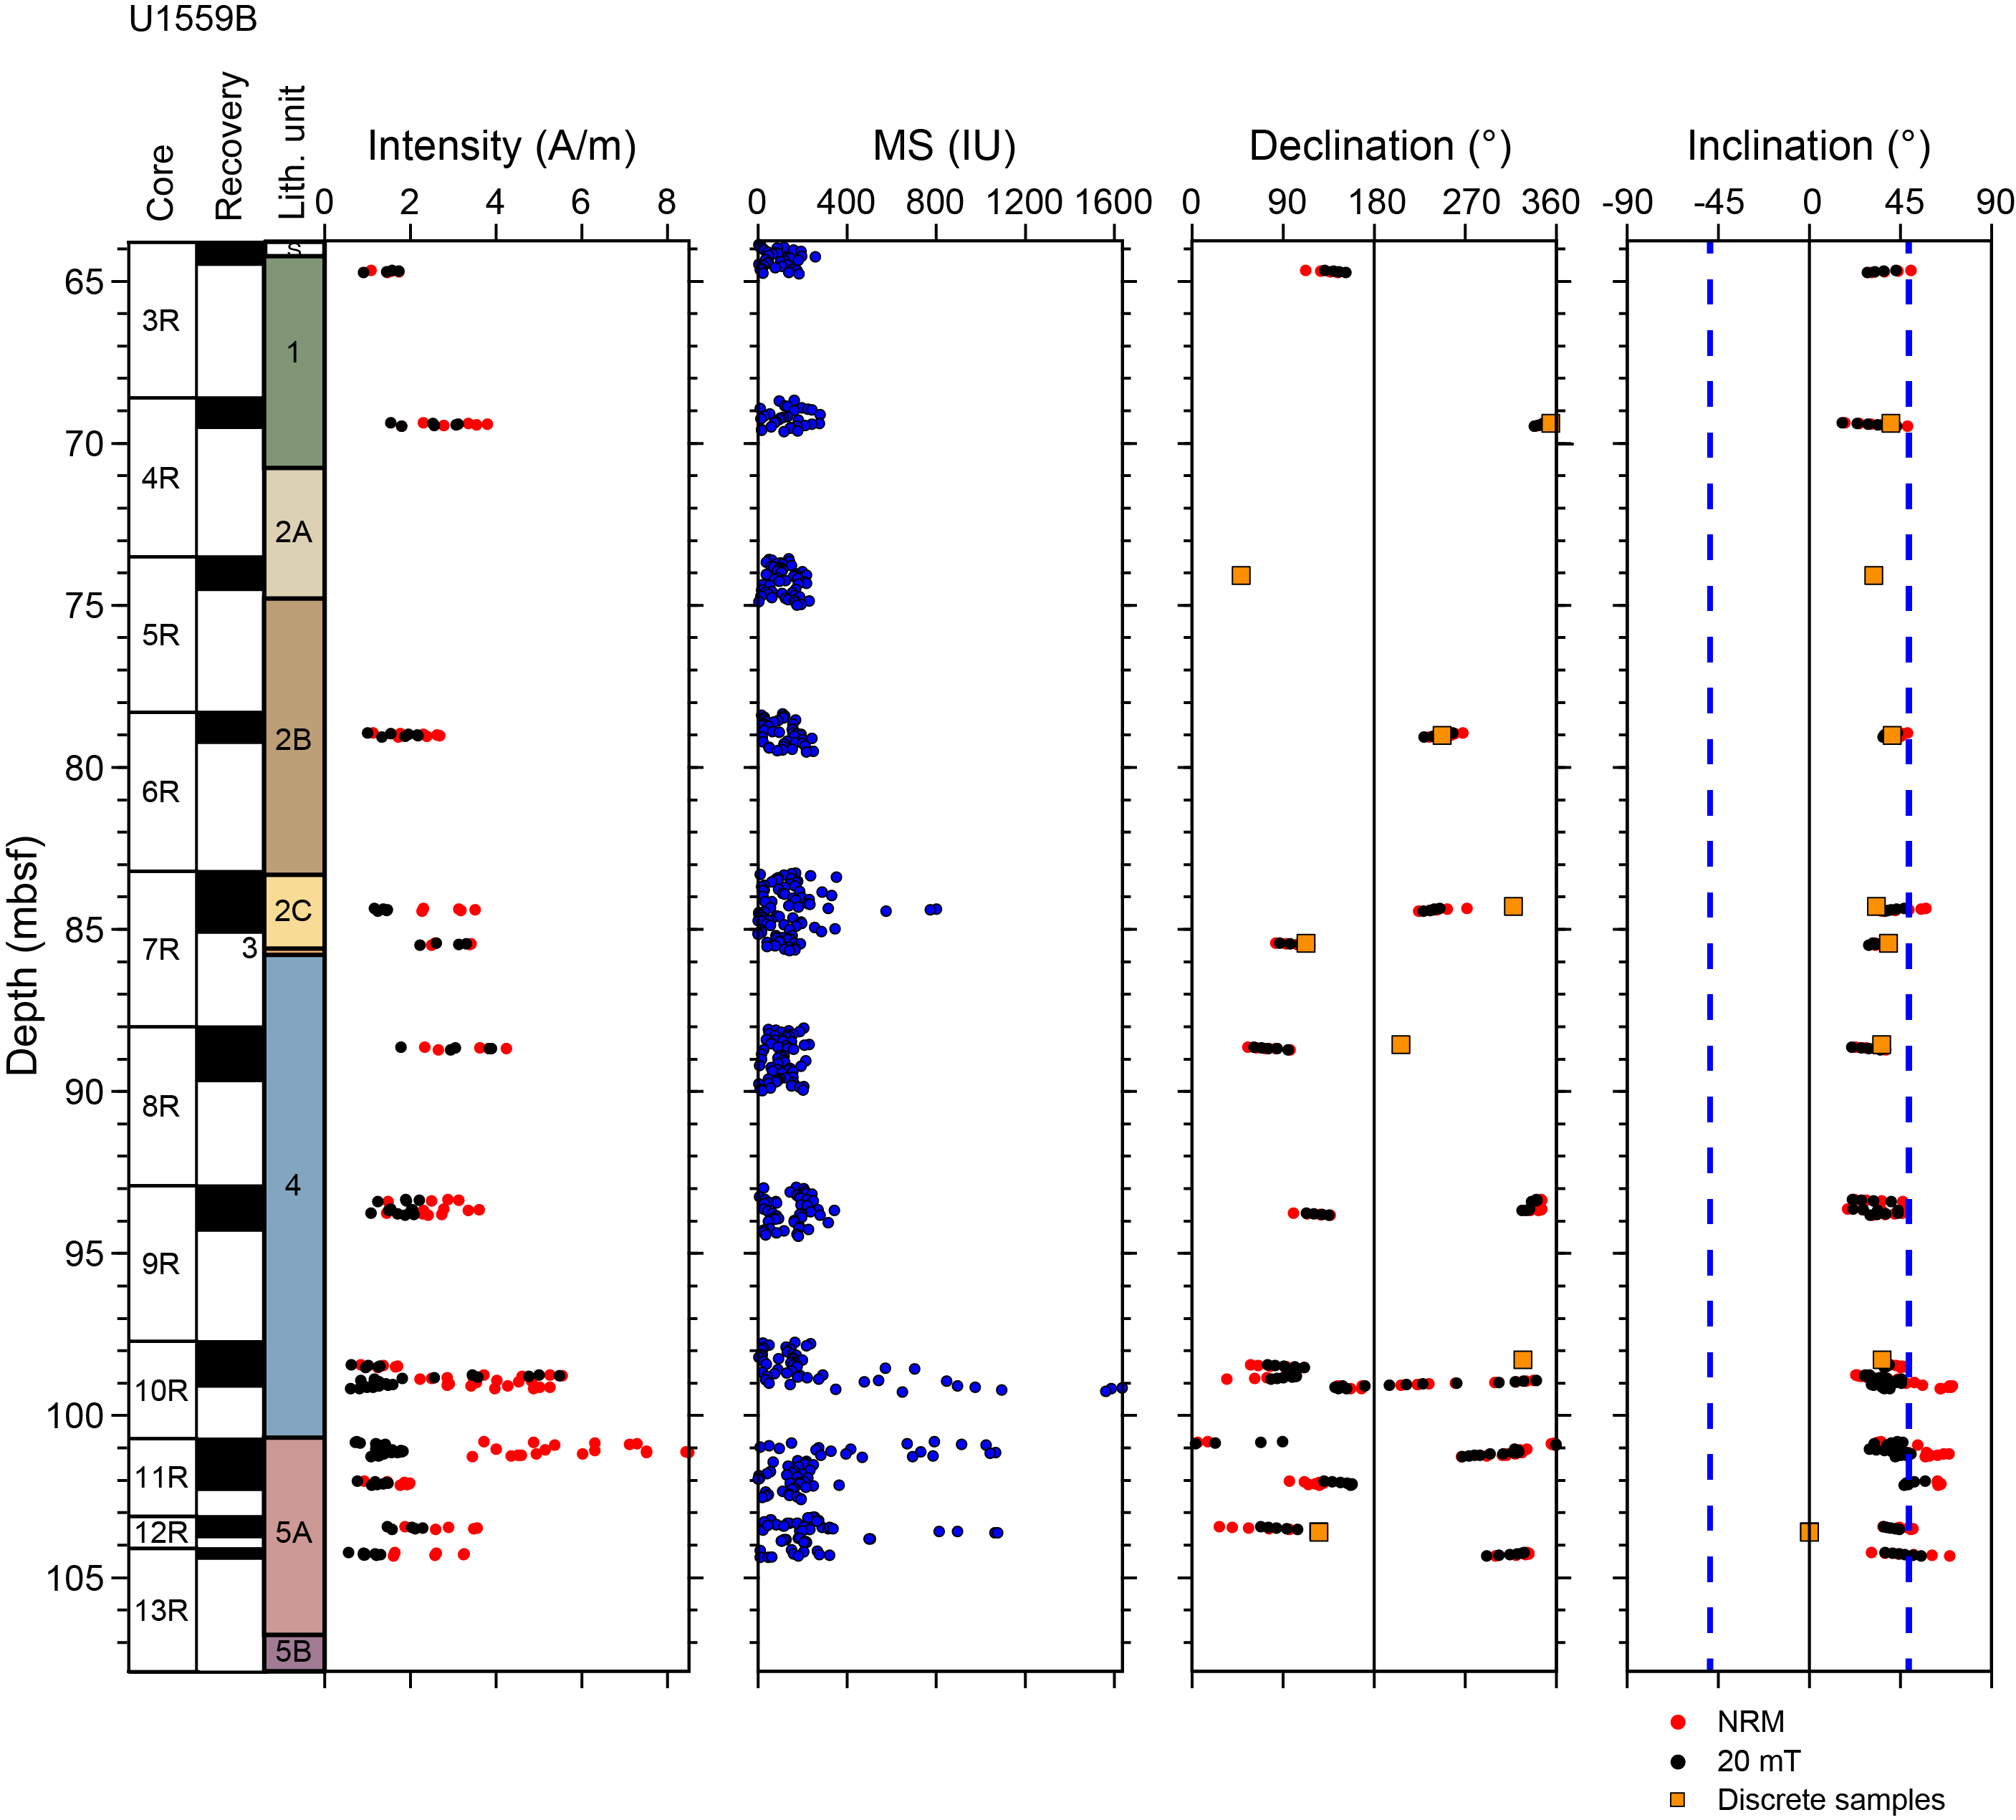
Figure F60. MSP and SRM measurements, Hole U1559B.
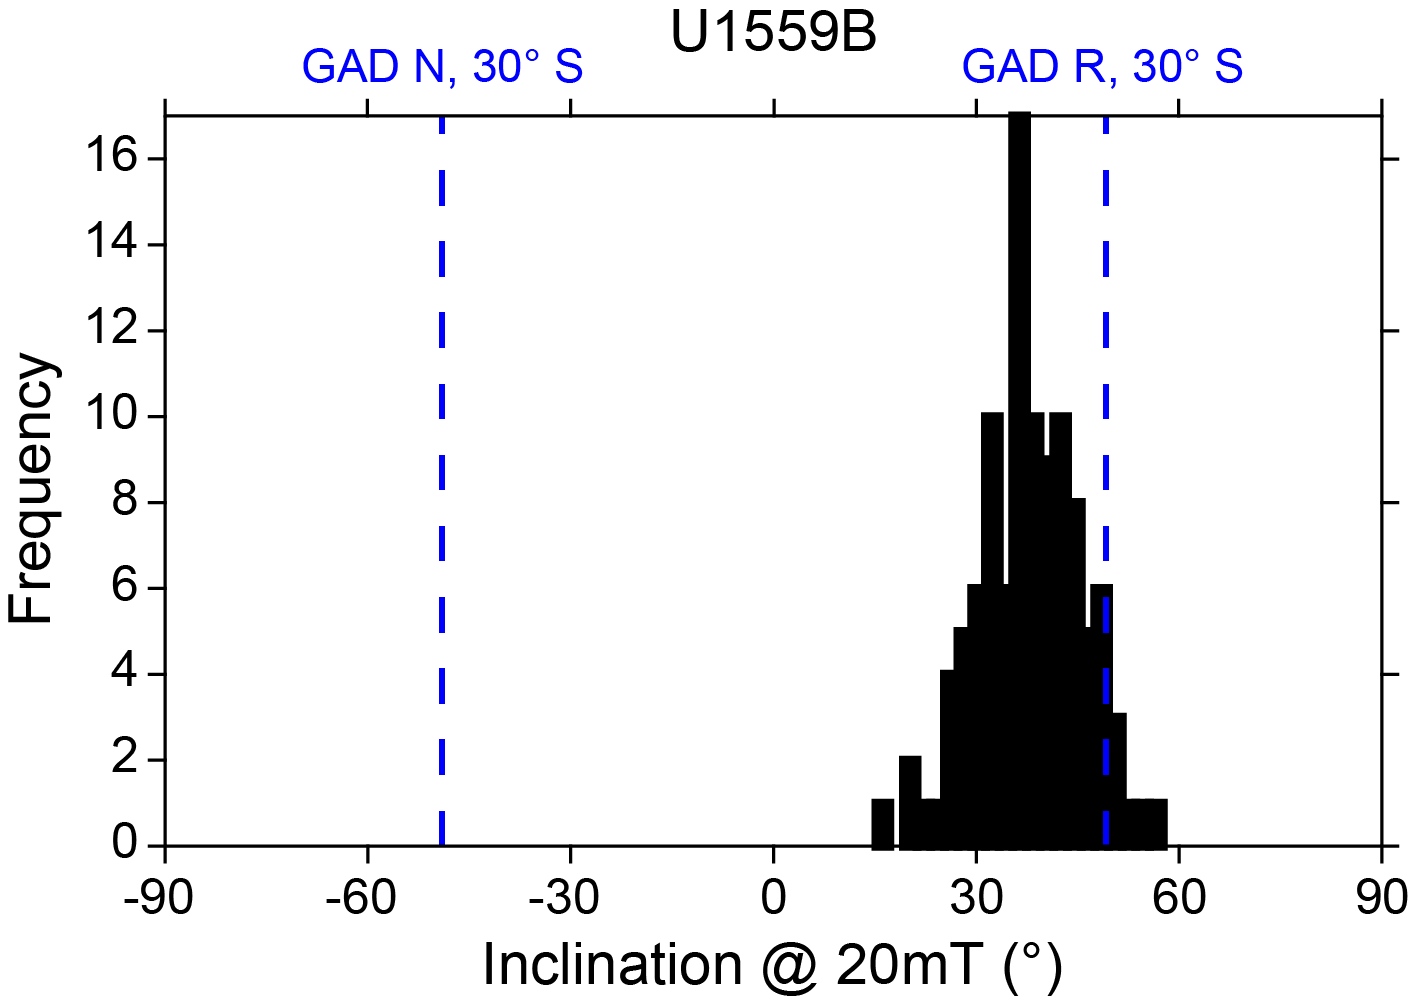
Figure F61. Inclination after 20 mT AF demagnetization, basement.
8.2.1.1. Discrete samples
The 11 discrete cubes from Hole U1559B are mostly homogeneous, relatively fresh basalts. Nine samples displayed varying degrees of alteration halos (Table T22). AF demagnetization up to a maximum of 190 mT was conducted on 9 discrete samples to define the ChRM and constrain the SRM data. Sample 393-U1559B-9R-1, 73–75 cm, was subjected to thermal demagnetization up to 580°C. Samples display similar demagnetization patterns with a clear single component isolated after the 20 mT AF demagnetization step, which represents the ChRM (Figure F62). The calculated components provided maximum angular deviation angles around 0.3°–2.2° that indicate a well-defined ChRM direction (Table T22) (Butler, 1992). Inclinations of the ChRM, calculated with PCA (Kirschvink, 1980), mostly coincide with the inclination measured using the SRM except in samples collected from Core 12R (Figure F60), where less steep inclinations were measured. The positive inclination of the ChRM indicates reversed polarity, opposite to that expected for Site U1559 (~6.6 Ma; Kardell et al., 2019) for the Miocene normal Chron C3An. Considering the biostratigraphic datums and the magnetostratigraphic correlation at the base of the sediment sequence (see Biostratigraphy and Age model and mass accumulation rates), the reversed polarity in the basement rocks suggests a slightly older age for the upper crust at this location, possibly in the underlying reversed polarity Chron C3Ar (6.727–7.104 Ma) (Gradstein et al., 2020).
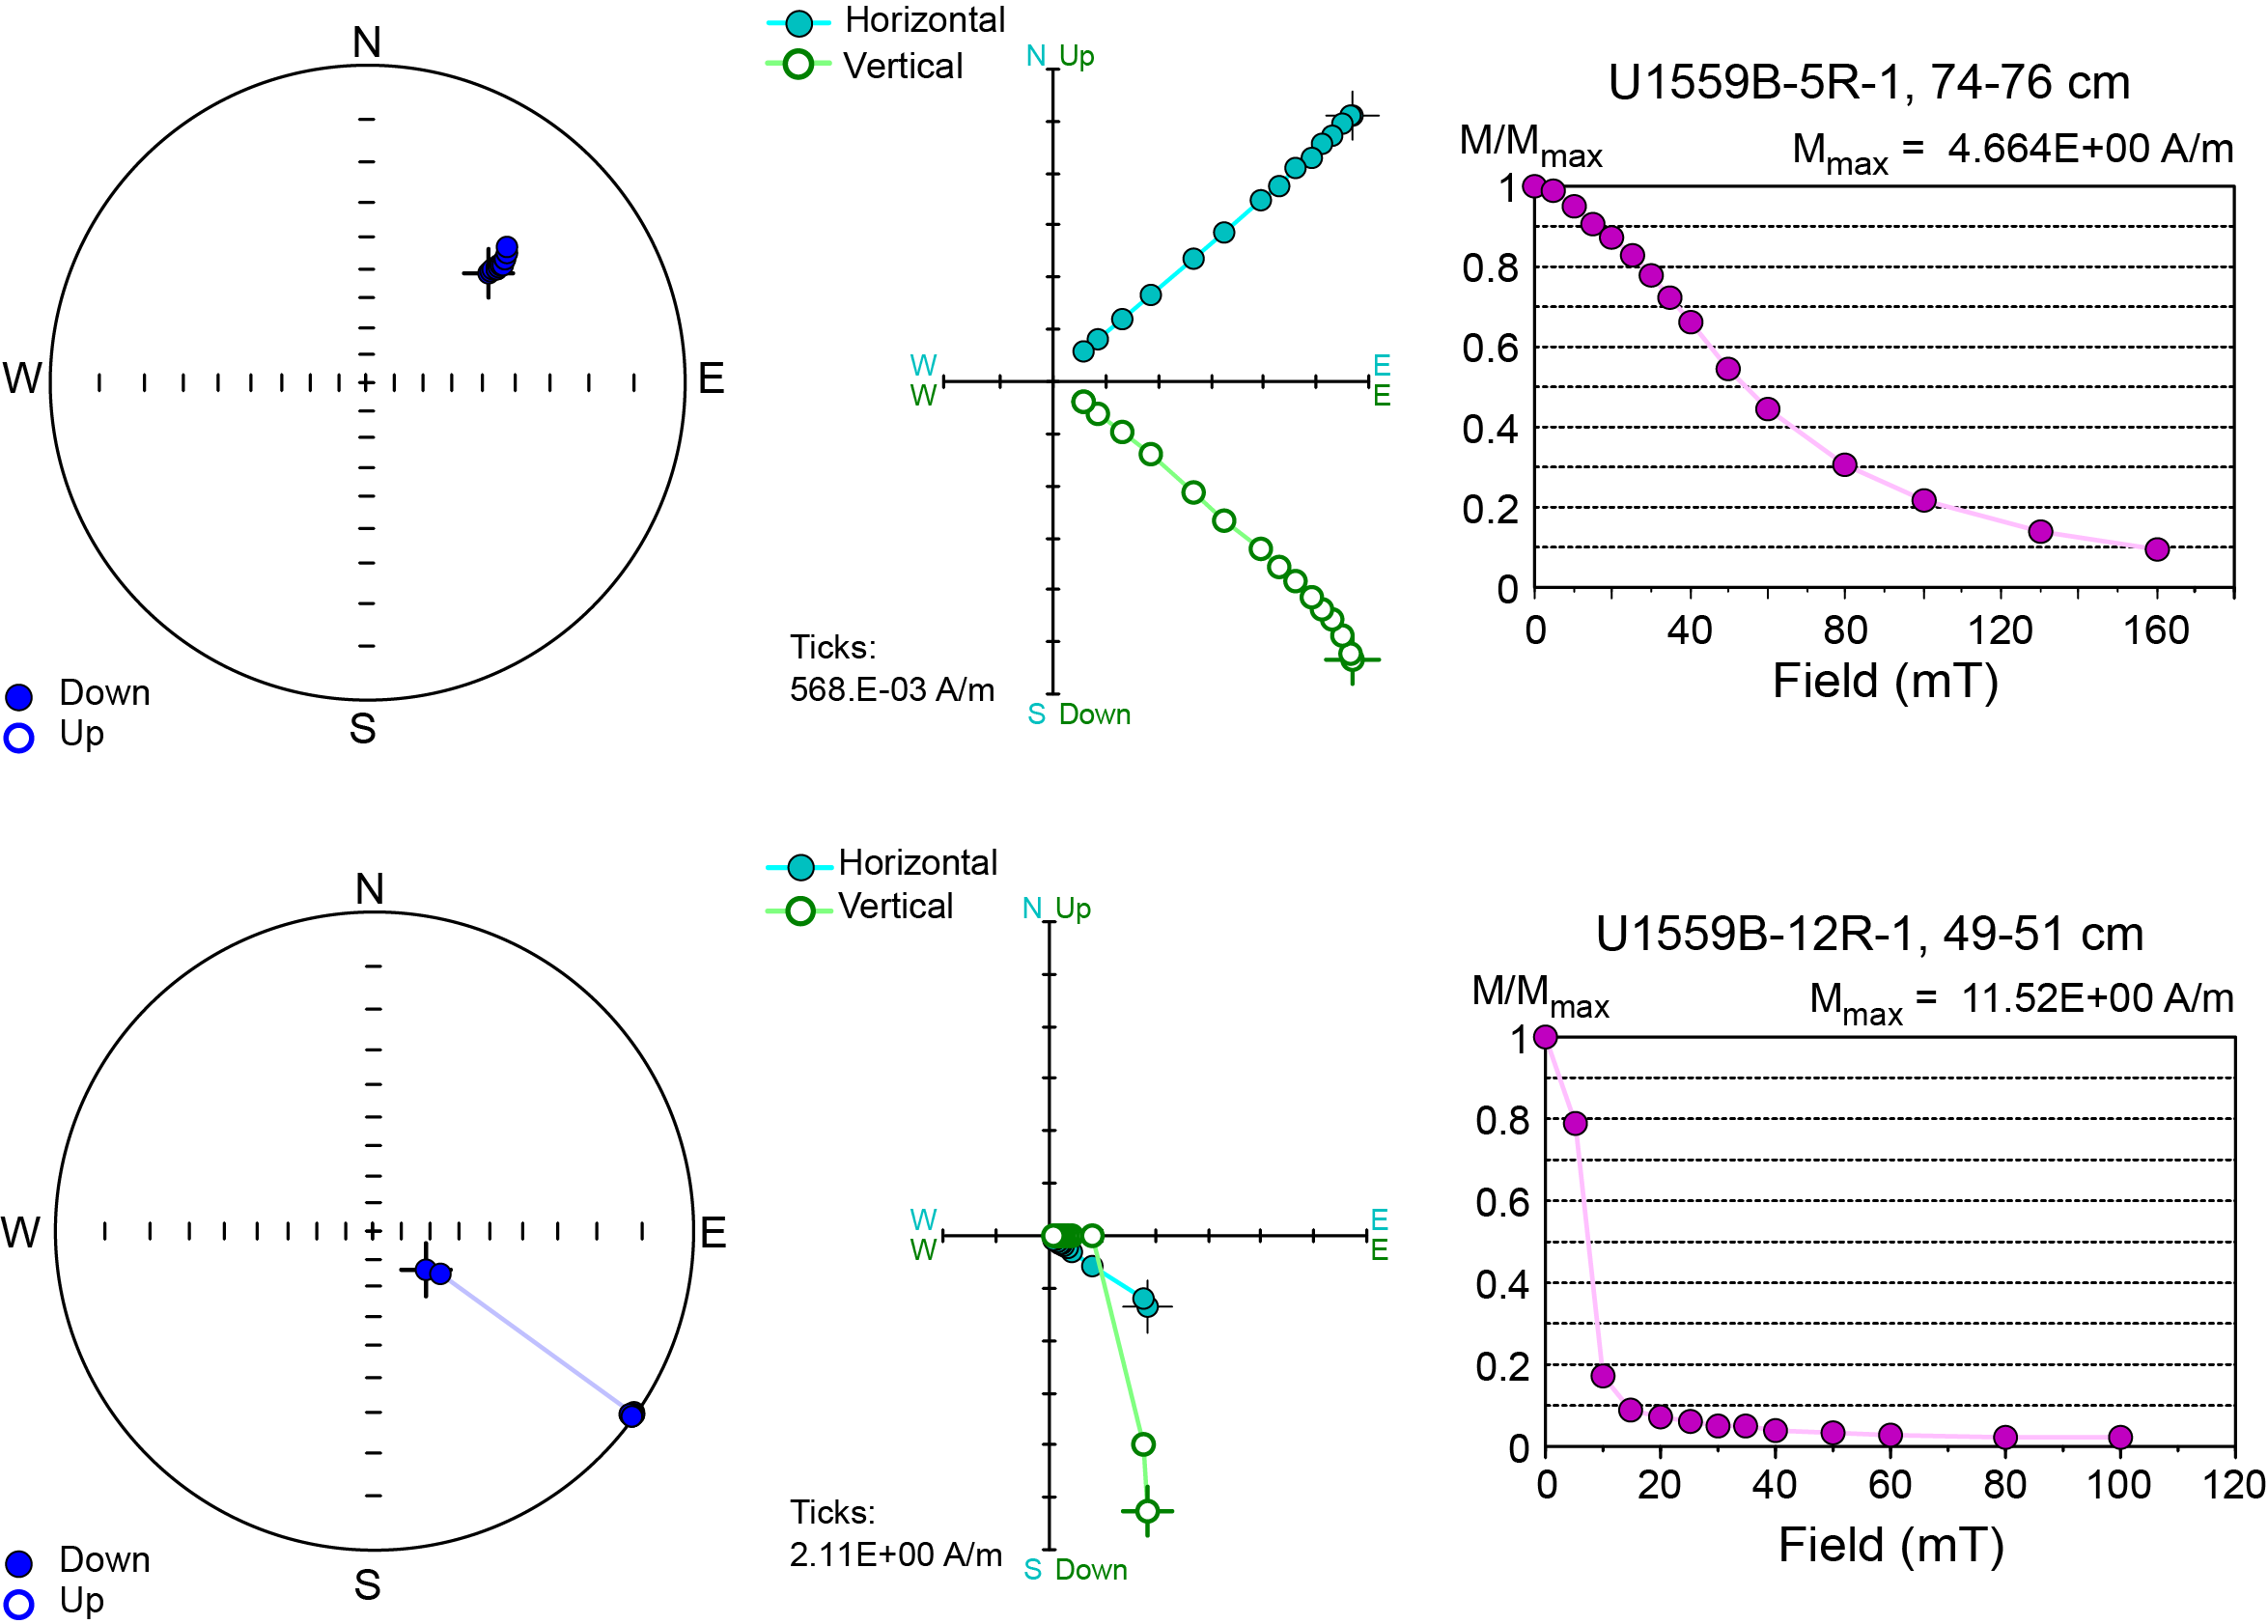
Figure F62. Demagnetization results, discrete basalt samples.
Nearly half of the samples display MDFs higher than 40 mT and required strong fields of more than 100 mT to be fully demagnetized (Figures F62, F63A; Table T23). Two samples collected from Core 393-U1559B-12R show significantly lower MDF, and the majority of the NRM was removed by 20 mT, indicating the dominance of coarser grained low-coercivity phases such as multidomain titanomagnetite or titanomaghemite in Subunit 5A.
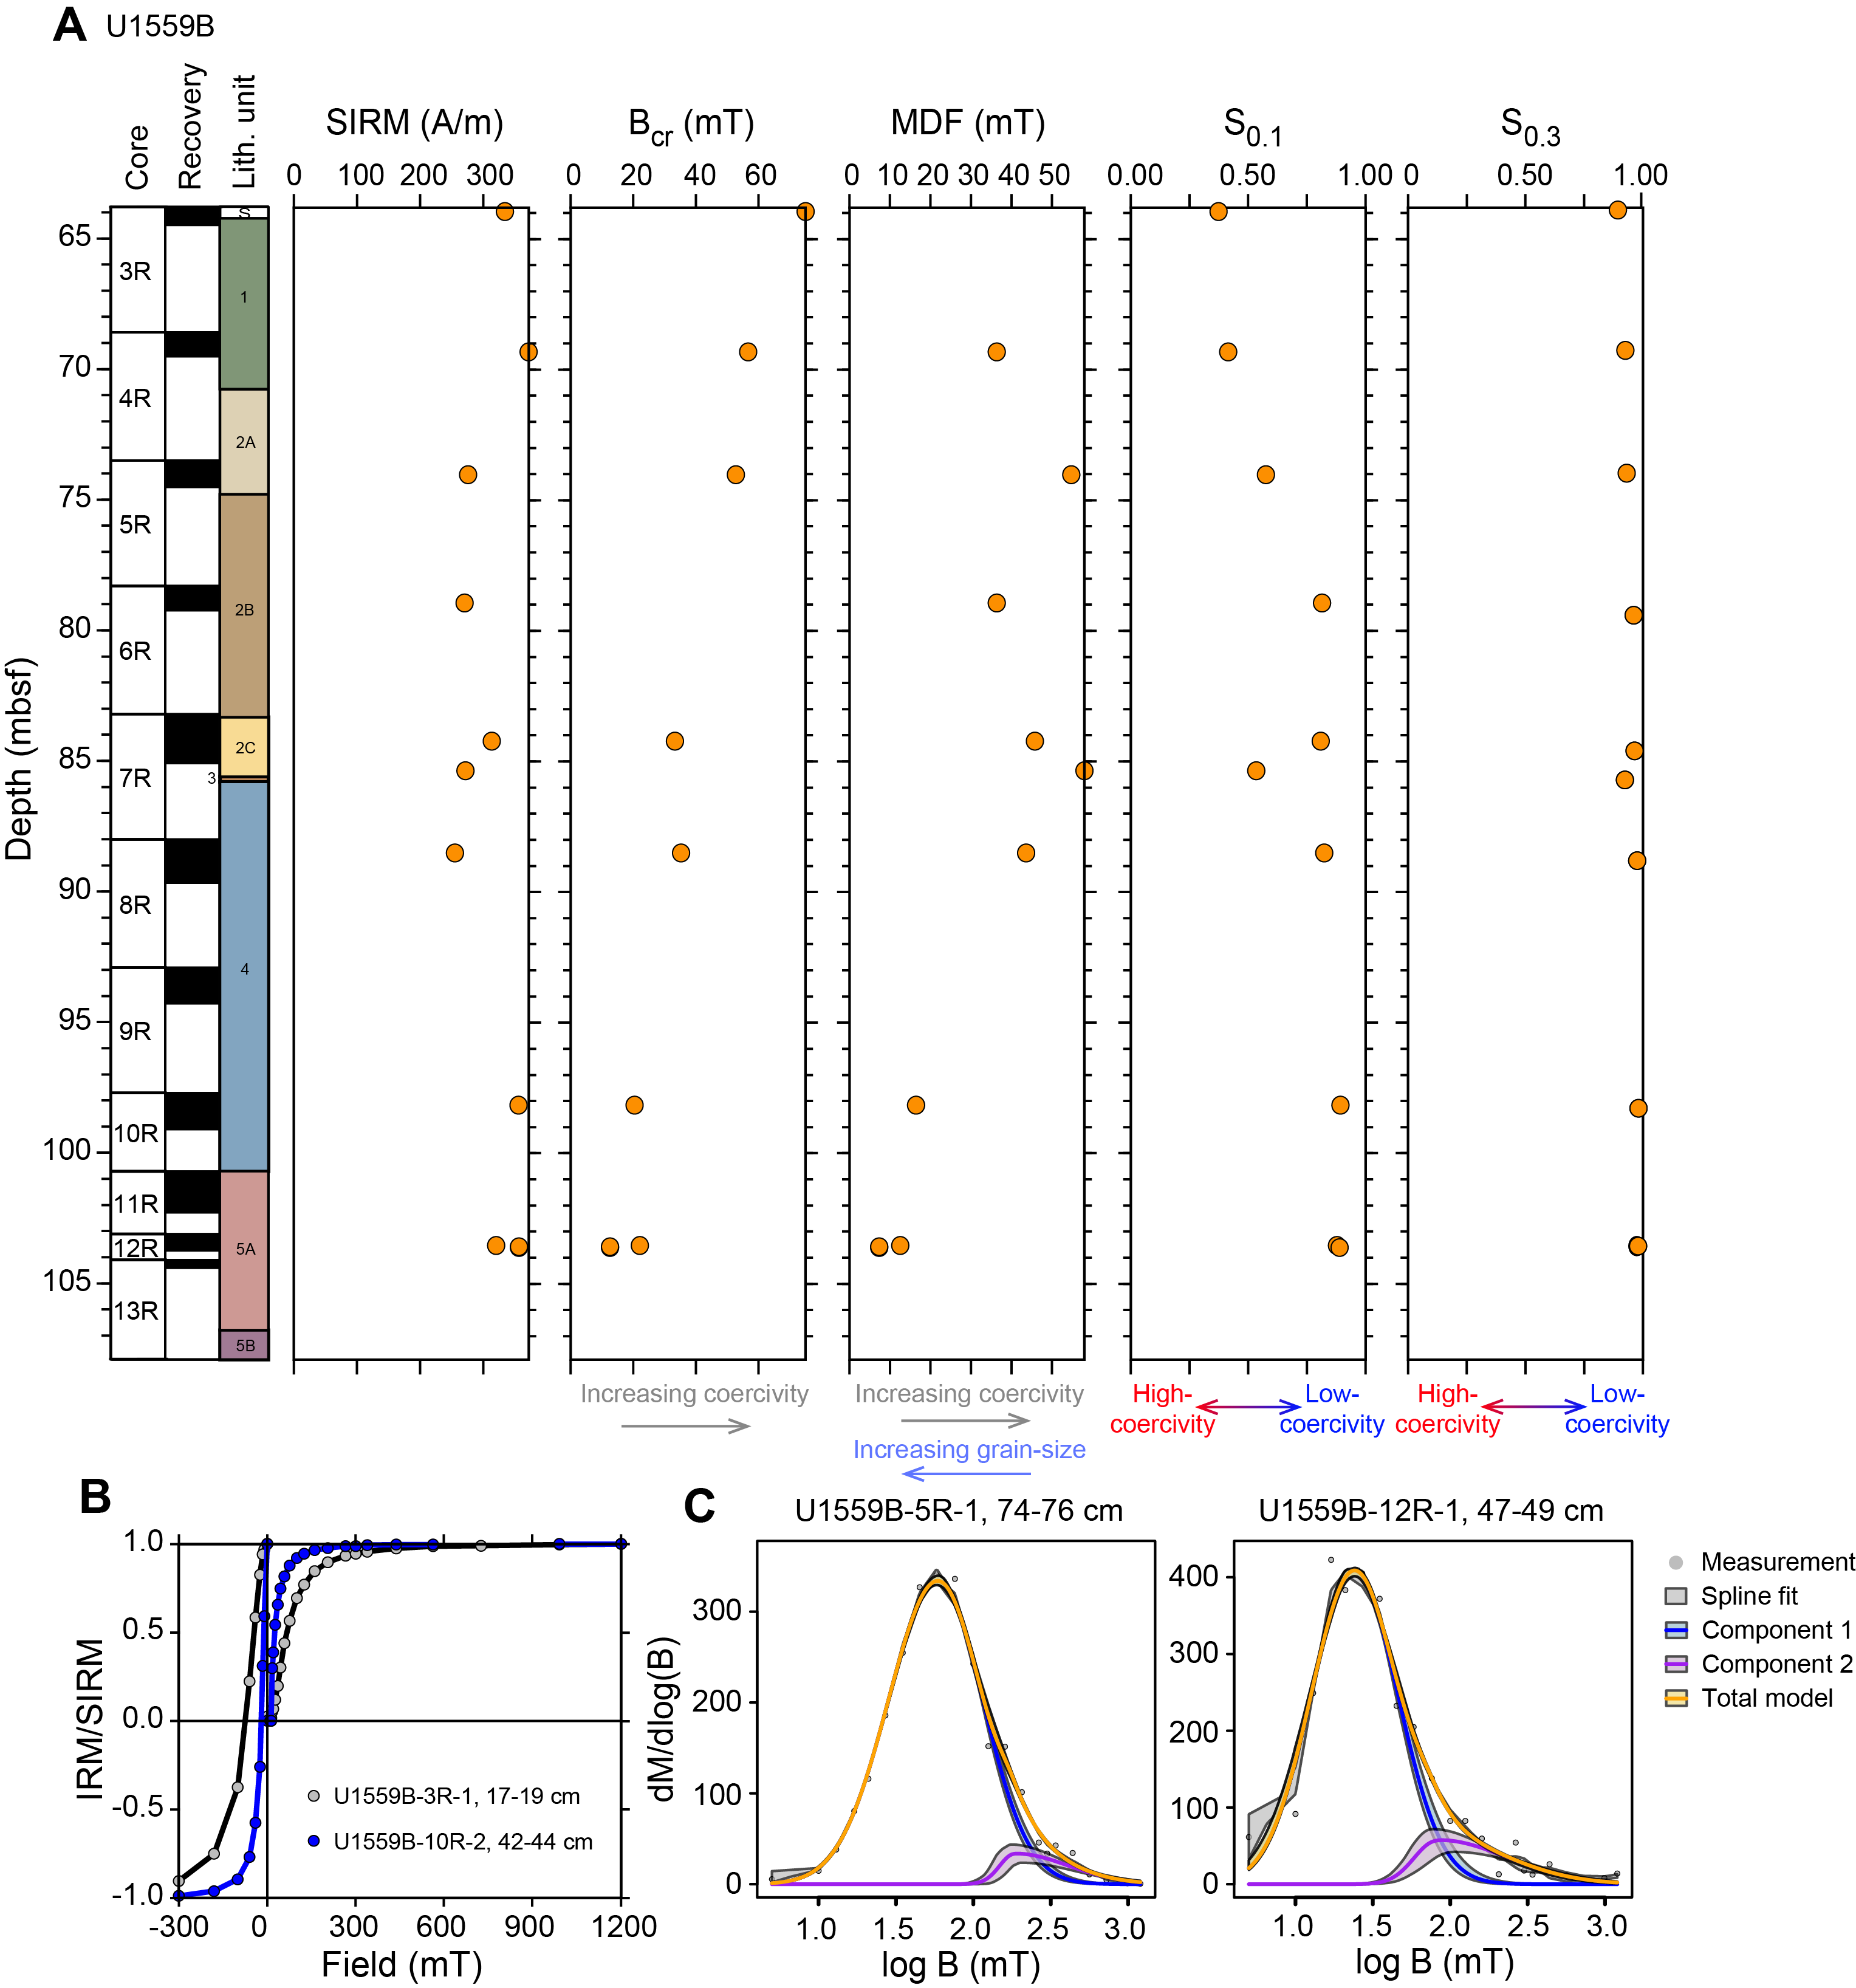
Figure F63. IRM acquisition and coercivity.
Acquisition of IRM and backfield experiments (Figure F63B) were conducted on 10 discrete samples to further clarify the magnetic mineral assemblages. IRM acquisition results show saturation values of 200–400 mT, confirming the dominance of low-coercivity minerals. Deconvolution of the IRM acquisition curves (Figure F63C) results in a best-fit model characterized by two components. A dominant low-coercivity component is characterized by a mean remanence coercivity (Bh) of ~1.70 log10 units, with a minor contribution (5%–20%) from a second component showing higher Bh values of 1.99–2.54 log10 units. The values of Component 1 in Cores 393-U1559B-10R through 12R are significantly lower by ~1.20 log10 units than all of the other samples. Changes with depth are observed also in the coercivity of remanence (Bcr). Samples from intervals deeper than 98 mbsf show low Bcr of ~20 mT that may imply a higher content of coarser grained magnetic minerals (Figure F63A). An IRM100/SIRM ratio (S0.1) has been used to specify the contribution of low-coercivity minerals (e.g., titanomagnetite), whereas the S ratio (S0.3) can be used as a proxy for high-coercivity mineral content (e.g., hematite and/or goethite). S0.3 values are close to 1 on all measured samples, supporting the dominance of low-coercivity components. On the other hand, S0.1 is lower in samples from Cores 393-U1559B-3R through 5R. Such patterns, along with the highest MDF, imply smaller grain size of the magnetic minerals or higher contribution from high-coercivity minerals to the total magnetic signature in these samples.
AMS was measured on all the samples. AMS measurements show a high consistency of axis orientations among samples obtained at different depths (Figure F64A). The resultant magnetic fabric is well defined, with subhorizontal magnetic foliation and predominantly prolate shape of the anisotropy ellipsoid (−1 < T < 0) (Figure F64B; Table T24). No systematic correlation was found between AMS scalar parameters and depth or lithologic units throughout the basement rocks of Hole U1559B (Figure F64C). Only two samples from Core 393-U1559B-12R indicate an oblate magnetic fabric, with Sample 12R-1, 49–51 cm (mostly fresh basalt with dark gray background halo), showing a bulk susceptibility (Km) value that is more than twice as high as that from all of the other samples collected from Hole U1559B. This high value coincides with the high NRM values observed in the SRM measurements.
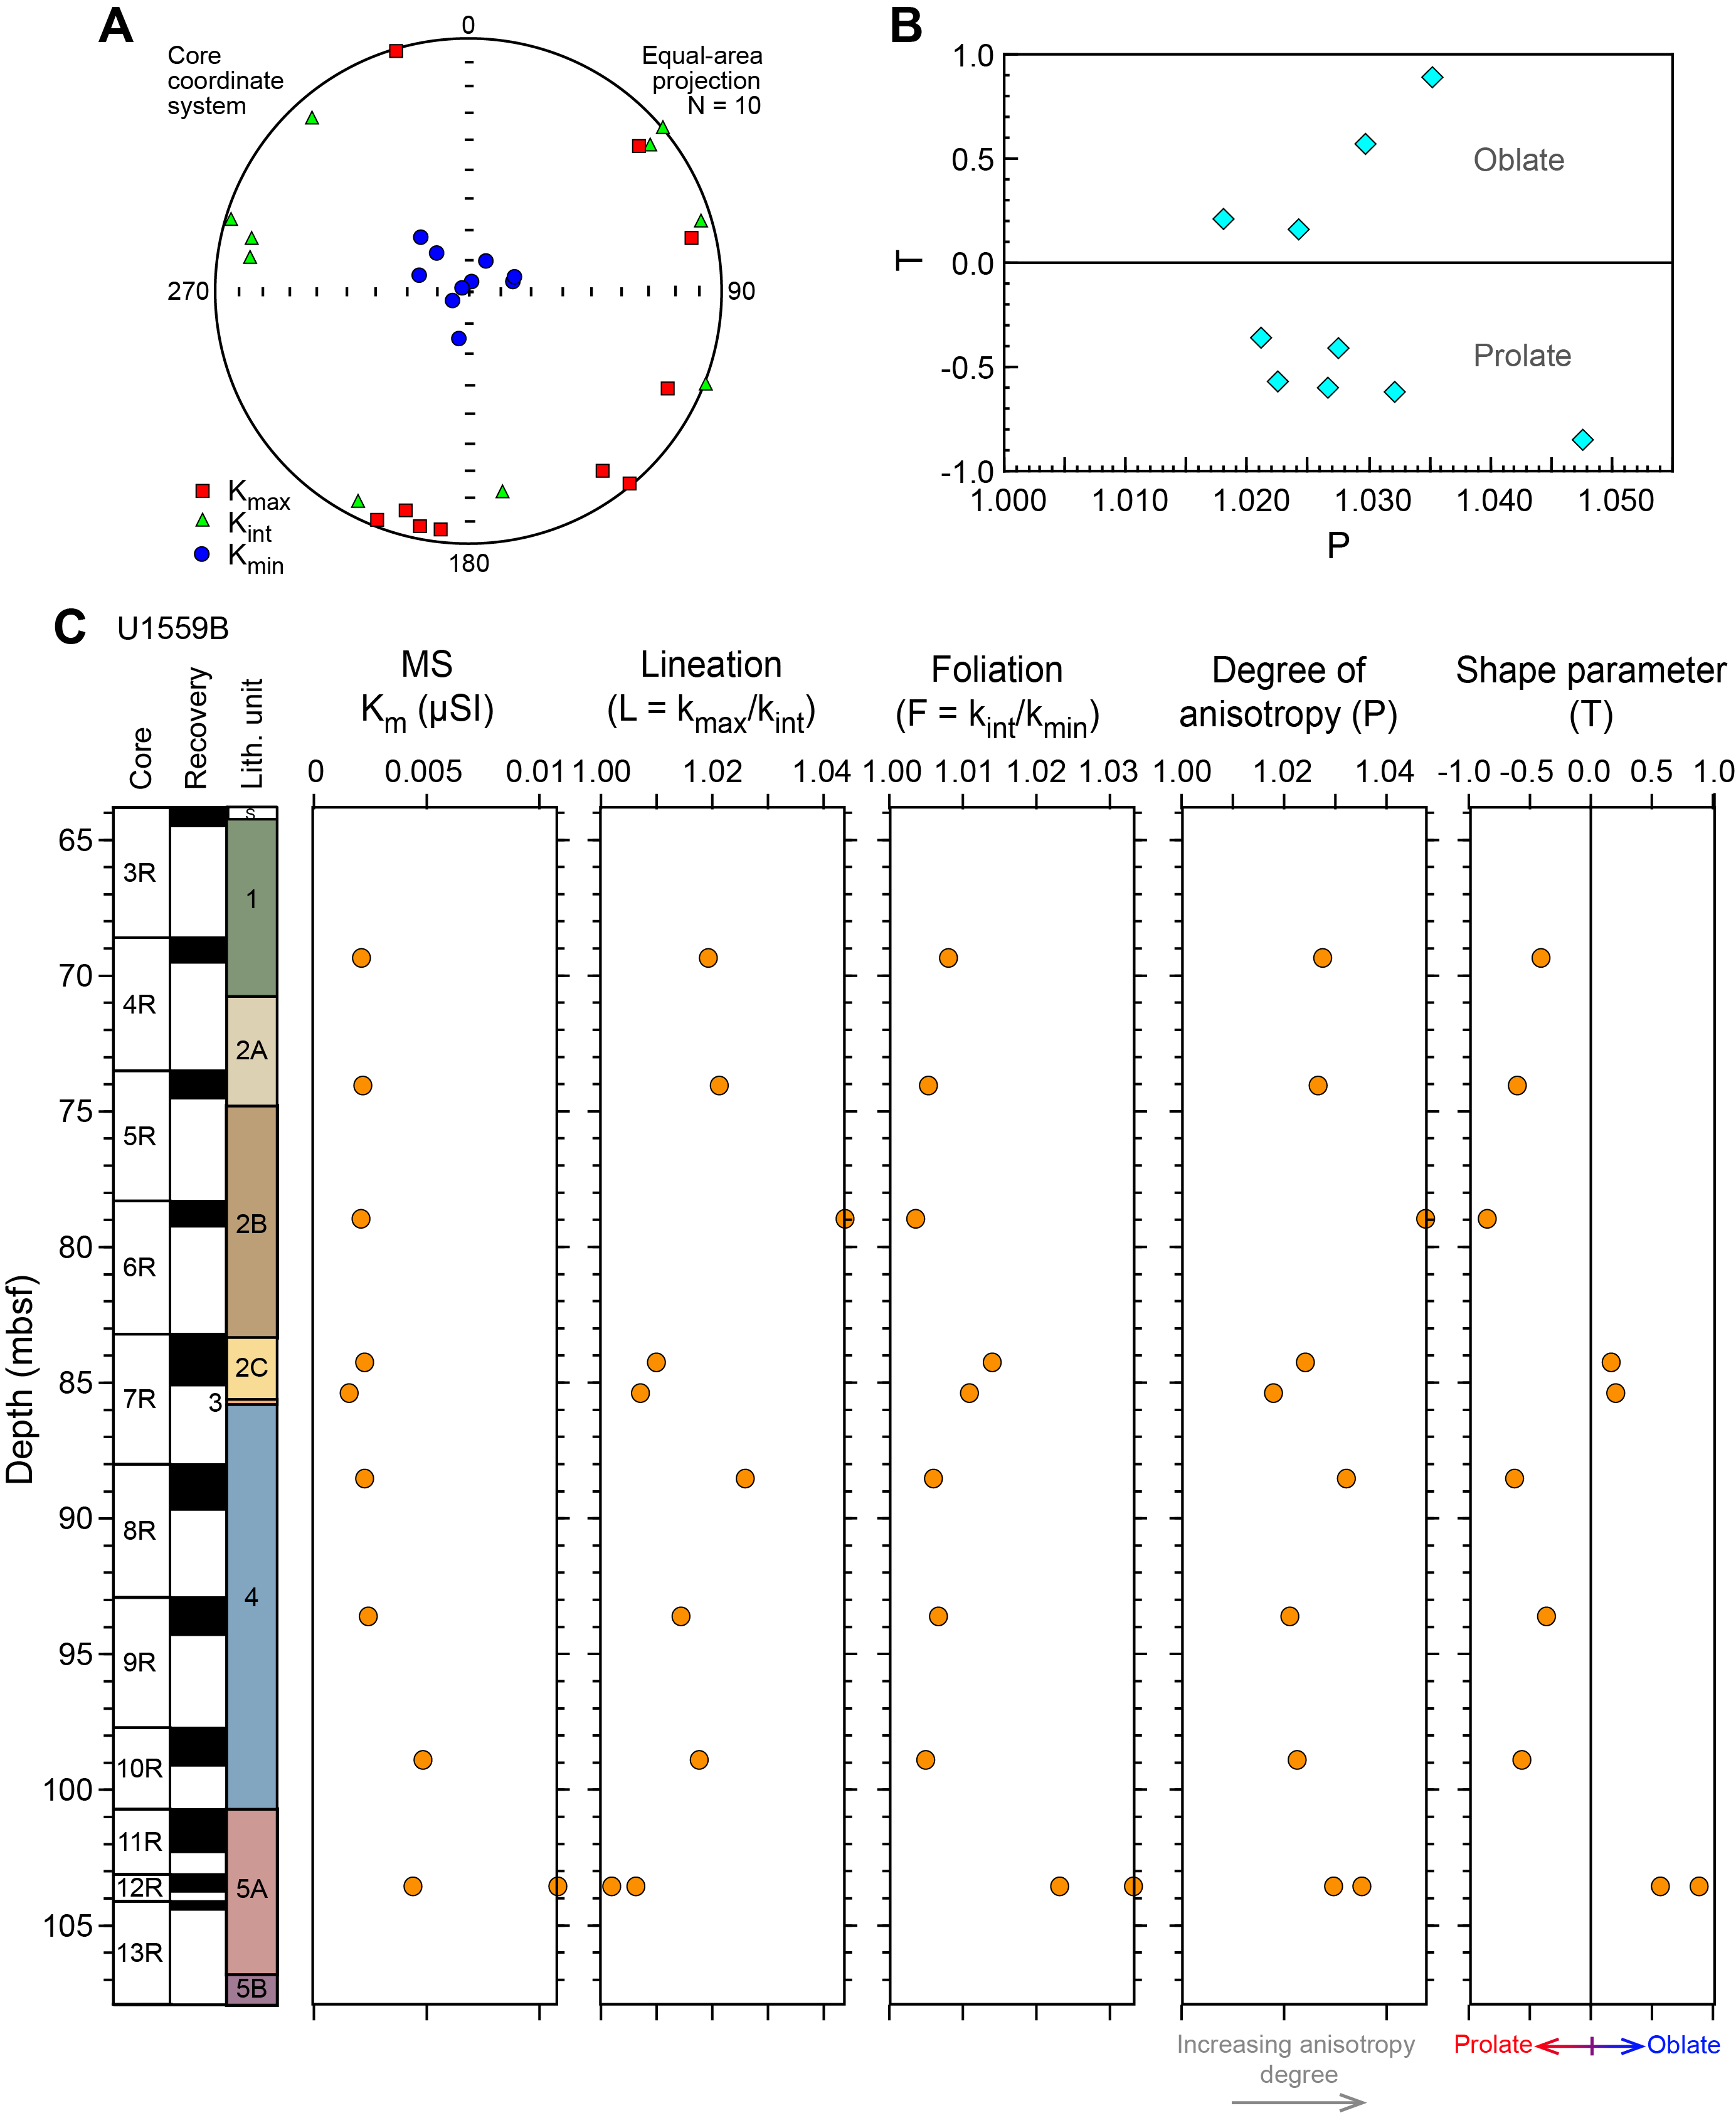
Figure F64. Shape of magnetic susceptibility axes.
9. Age model and mass accumulation rates
9.1. Age model and linear sedimentation rates
The age model for Site U1559 is constructed using calcareous nannoplankton and planktic foraminiferal lowest (base) and highest (top) occurrence datums from Holes U1559A and U1559C (Figure F65; Tables T25, T26). Hole U1559A preserves slightly older sediments above the basement but has a lower sampling resolution (limited to core catchers collected during Expedition 390C; see Background and objectives), leaving the impression of multiple hiatuses. The slightly more spread out datums from the more densely sampled Hole U1559C suggest low sedimentation rate in this interval instead. An age model was not constructed for Hole U1559D, which only had one biostratigraphic sample taken directly above basement (Table T27).
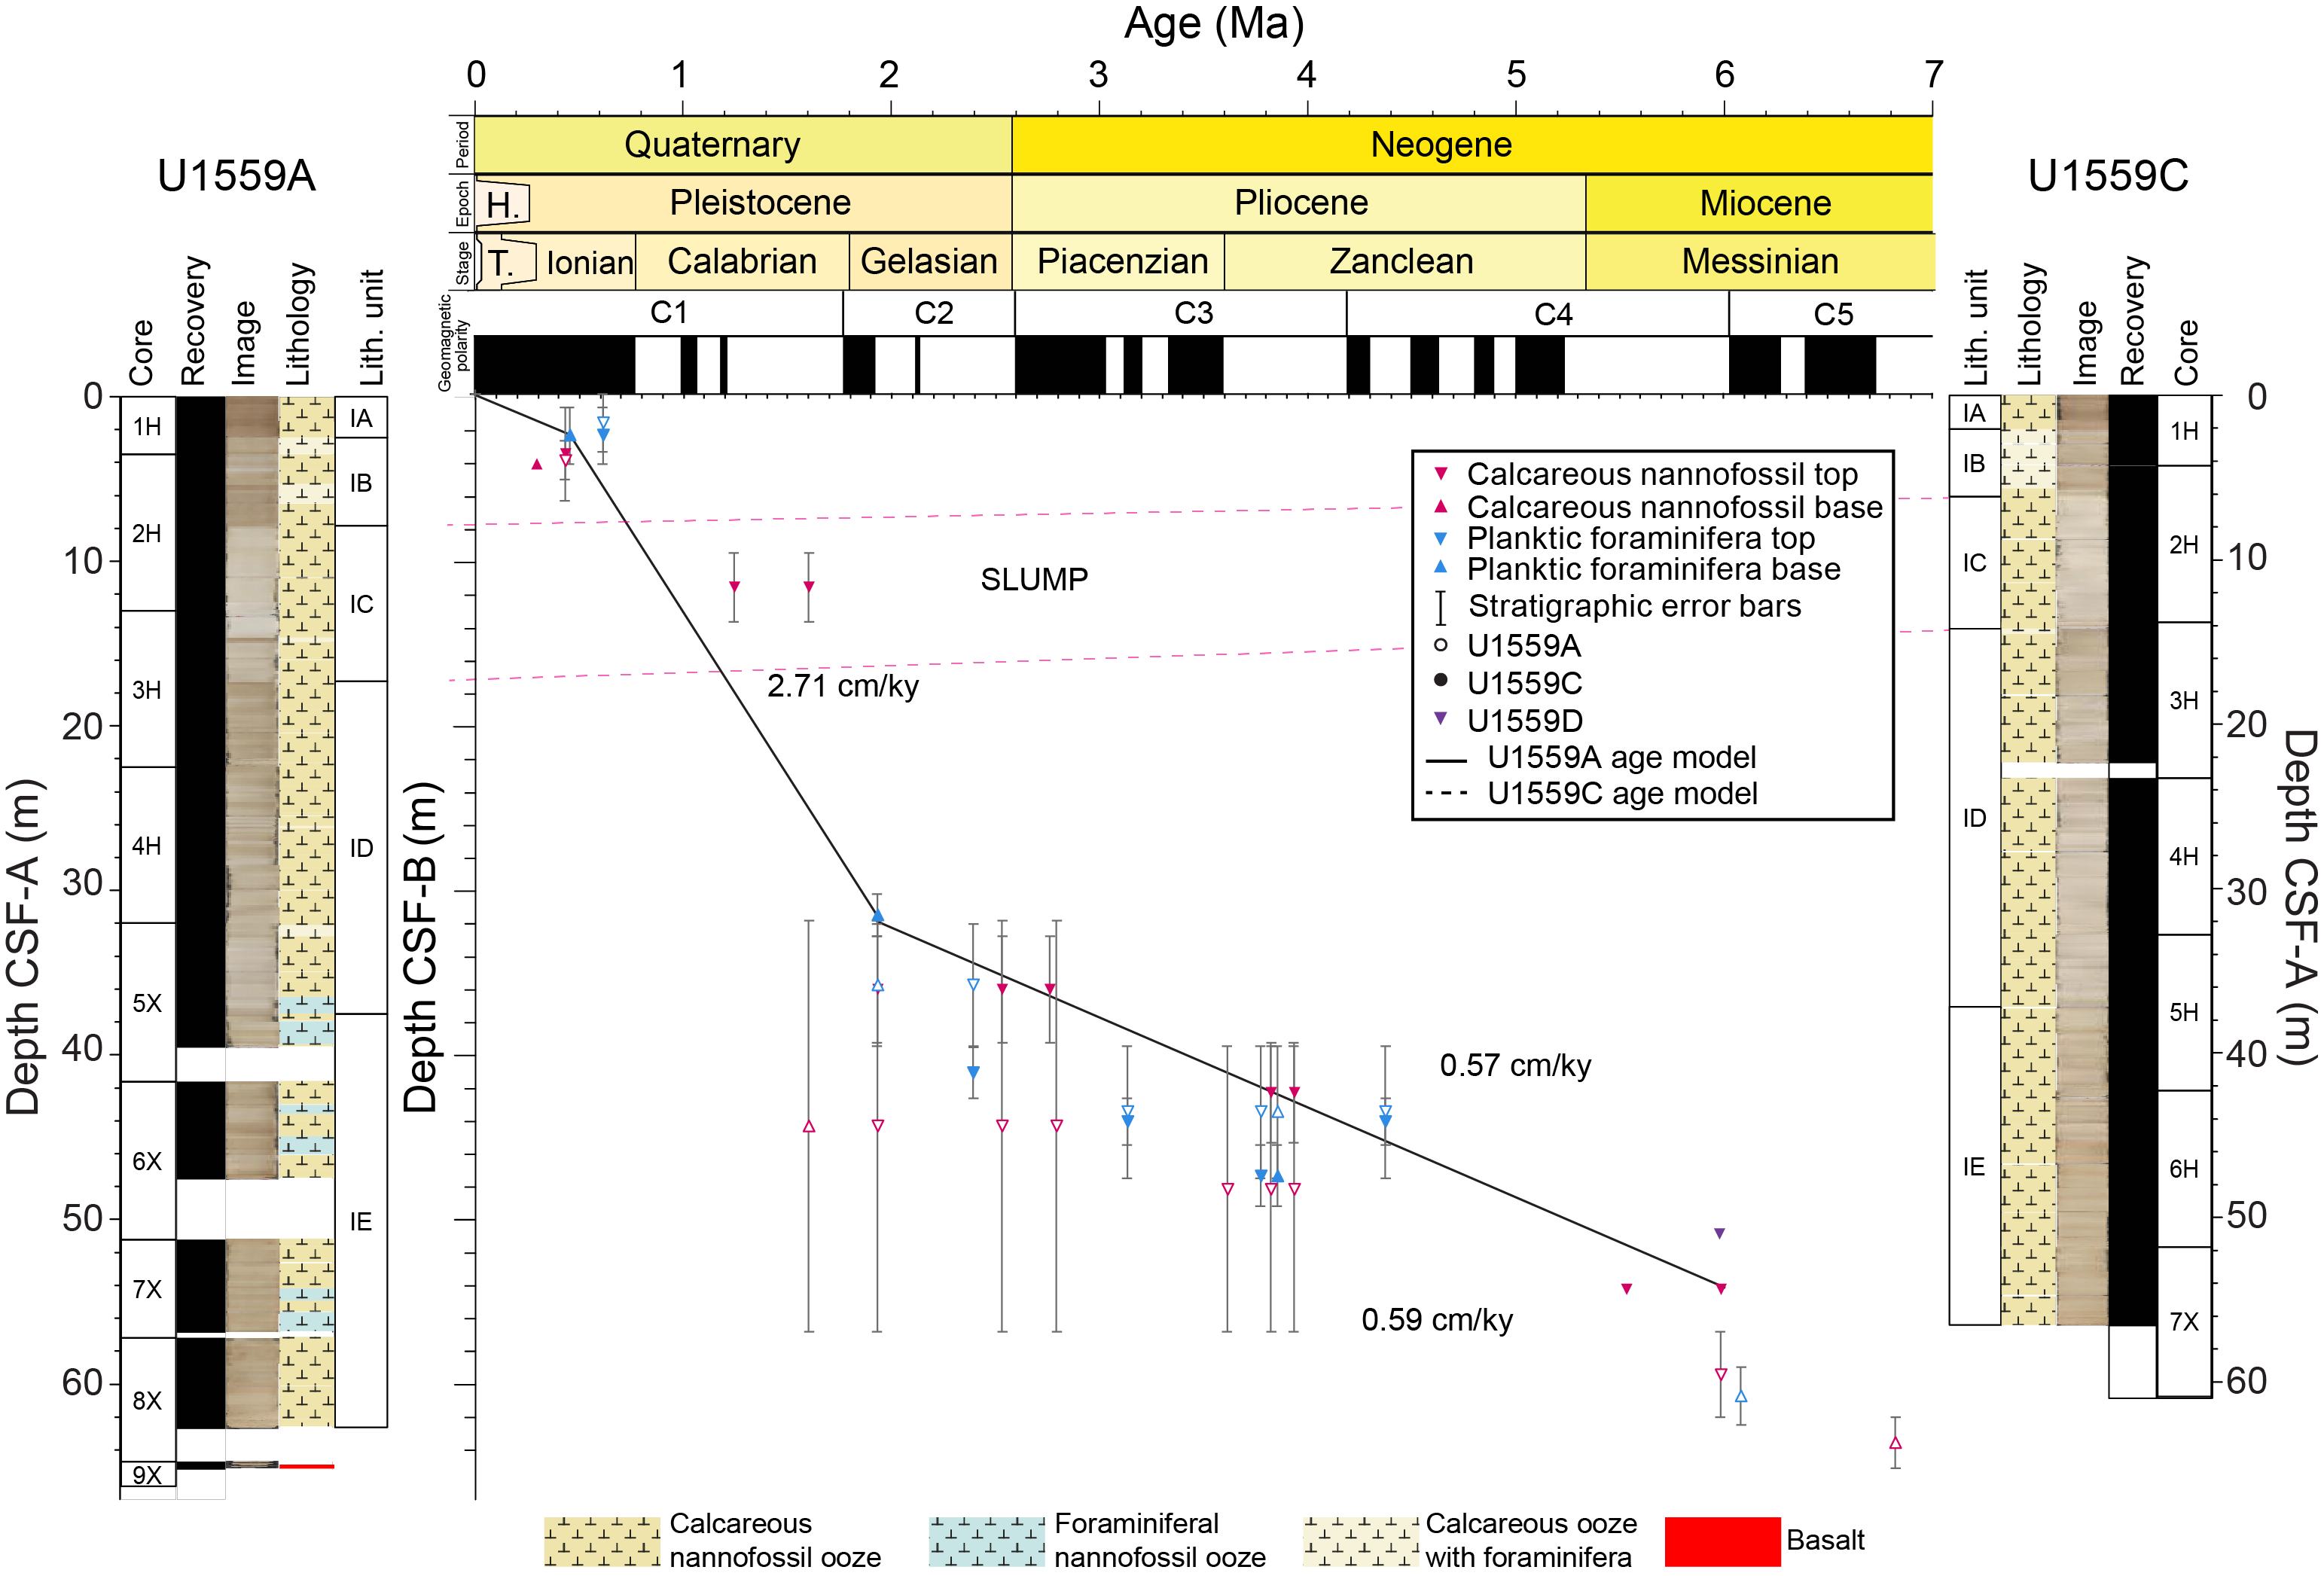
Figure F65. Age-depth model.
Planktic foraminifera and calcareous nannoplankton are abundant and diverse throughout the cored interval, although foraminiferal abundance declines in the indurated samples directly above basement (see Sedimentology and Biostratigraphy). In Hole U1559A, 11 calcareous nannoplankton and 8 planktic foraminiferal bioevents were identified in the Late Miocene to recent sequence. In Hole U1559C, 8 calcareous nannoplankton and 8 planktic foraminiferal bioevents were identified in the Late Miocene to recent sequence. In both holes, both fossil groups appear to be in close agreement, although large depth errors make this difficult to assess. A ~6–8 m thick slump was identified based on the occurrence of a coherent Late Miocene assemblage of calcareous nannoplankton and planktic foraminifera in an otherwise Late Pleistocene succession of sediments (Hole U1559A: ~8–14 m CSF-B; Hole U1559C: ~6–14 m CSF-B) coincident with a change in lithologic and physical properties data (see Biostratigraphy).
A total of six paleomagnetic reversal datums were identified at Site U1559 (Table T20) and correlated to the global magnetic polarity timescale based on pattern matching. Although magnetostratigraphy and biostratigraphy are in agreement on the age of the sediment/basement interface, several Pliocene reversal datums were identified in sediments that are definitively Pleistocene on the basis of planktic foraminiferal and calcareous nannoplankton marker taxa and assemblages. Because there is as much as a ~1 My offset between the microfossil and paleomagnetic datums, these chrons were not used to construct the age model.
Linear sedimentation rates (LSRs) are relatively low throughout the sedimentary succession, irrespective of the slump(s) in the Late Pleistocene. In Hole U1559A, LSRs average 2.71 cm/ky in the Pleistocene (2.25 cm/ky if the slump is removed) and 0.57 cm/ky through the Neogene. In Hole U1559C, LSRs average 1.98 cm/ky in the Quaternary (1.35 cm/ky if the slump is removed) and decrease in the Neogene to an average of 0.59 cm/ky.
9.2. Mass accumulation rates
Mass accumulation rates (MARs) for Holes U1559A and U1559C were calculated using the bulk density from gamma ray attenuation (GRA) measurements collected during Whole-Round Multisensor Logger (WRMSL) scans (see U1559A_MAR.xlsx and U1559C_MAR.xlsx in AGEMODEL in Supplementary material; see also Age model and mass accumulation rates in the Expedition 390/393 methods chapter [Coggon et al., 2024c]). Discrete dry bulk density samples correlate well to the GRA data (see Physical properties and downhole measurements), but the latter have a much higher resolution. Data presented in Figure F66 are binned in 1 My intervals.
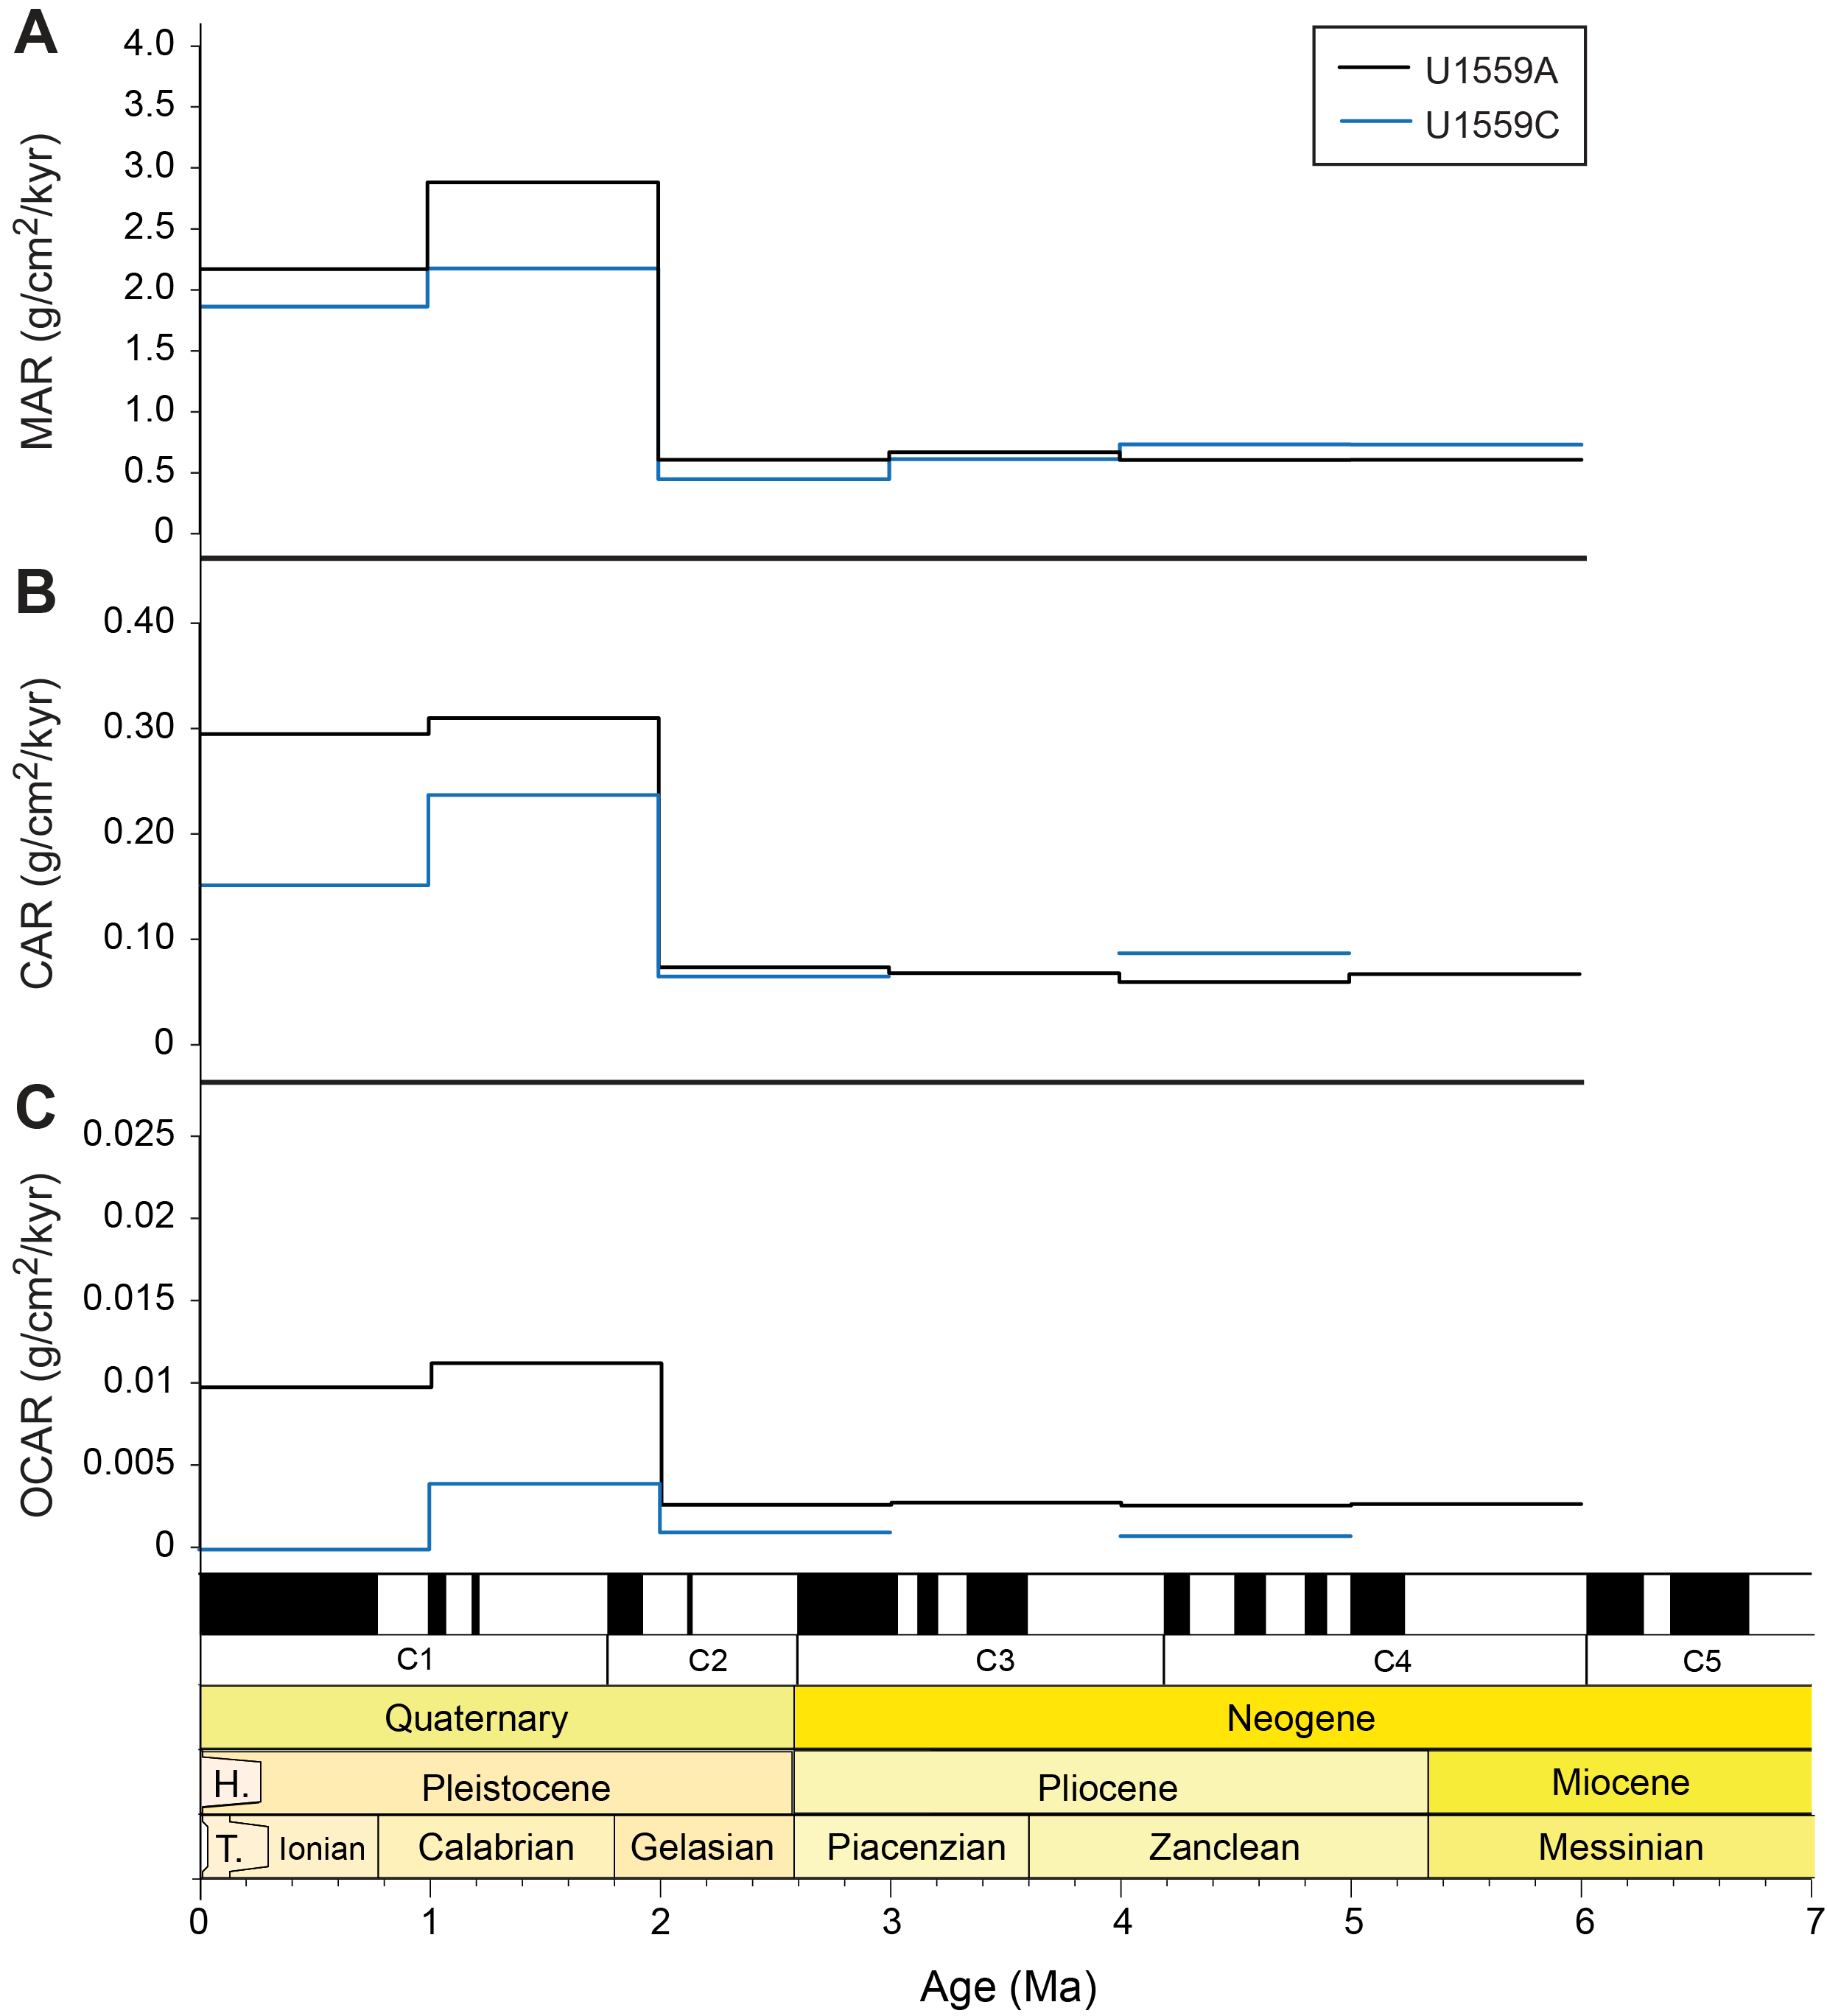
Figure F66. MAR, CAR, and OCAR.
MARs are generally quite low throughout the sedimentary succession at Site U1559 (Figure F66). Values are highest in the Pleistocene (2.9 g/cm2/ky in Hole U1559A and 2.2 g/cm2/ky in Hole U1559C). In the Neogene, MARs hover around 0.6 g/cm2/ky in Hole U1559A and vary from 0.4 to 0.7 g/cm2/ky in Hole U1559C.
9.3. Carbonate and organic carbon accumulation rates
Carbonate accumulation rates (CARs) and organic carbon accumulation rates (OCARs) were calculated by multiplying the MAR by the weight percent of carbonate and total organic carbon (TOC), respectively. One discrete sample for carbonate and organic carbon analysis was taken from the working half of each core. CAR and OCAR data are binned in 1 My intervals (see U1559A_MAR.xlsx and U1559C_MAR.xlsx in AGEMODEL in Supplementary material).
9.3.1. Carbonate accumulation rates
Because there is little variation in the sediment lithology at Site U1559, which is entirely composed of calcareous ooze, CARs are relatively stable but slightly lower in the Neogene compared to the Quaternary (Figure F66). On a first-order basis, CARs mirror MARs in both holes. Neogene CARs range around 0.07 g/cm2/ky in both holes. Quaternary CARs peak at 0.4 g/cm2/ky in Hole U1559A and 0.2 g/cm2/ky in Hole U1559C.
9.3.2. Organic carbon accumulation rates
OCARs are very low at Site U1559 (Figure F66). Neogene OCARs are around 0.002 g/cm2/ky in Hole U1559A and 0.0008 in Hole U1559C. In the Quaternary, OCARs are 0.01 g/cm2/ky in Hole U1559A and 0.004 g/cm2/ky in Hole U1559C.
10. Physical properties and downhole measurements
10.1. Sediment
10.1.1. Physical properties
Physical properties characterization of the sediment section at Site U1559 was primarily based on cores from Hole U1559A collected during Expedition 390C and Holes U1559C and U1559D collected during Expedition 390. Whole-round core section measurements included NGR, GRA bulk density, MS, and compressional wave (P-wave) velocity. Split-core section measurements included MSP, P-wave velocity, moisture and density (MAD), thermal conductivity, and sediment shear and compressional strength.
Because Hole U1559C had the highest recovery (93%) and because Holes U1559A and U1559D had very similar property characteristics, Site U1559 sediment physical properties (Figures F67, F68, F69) are summarized using data from Hole U1559C (Figure F68).
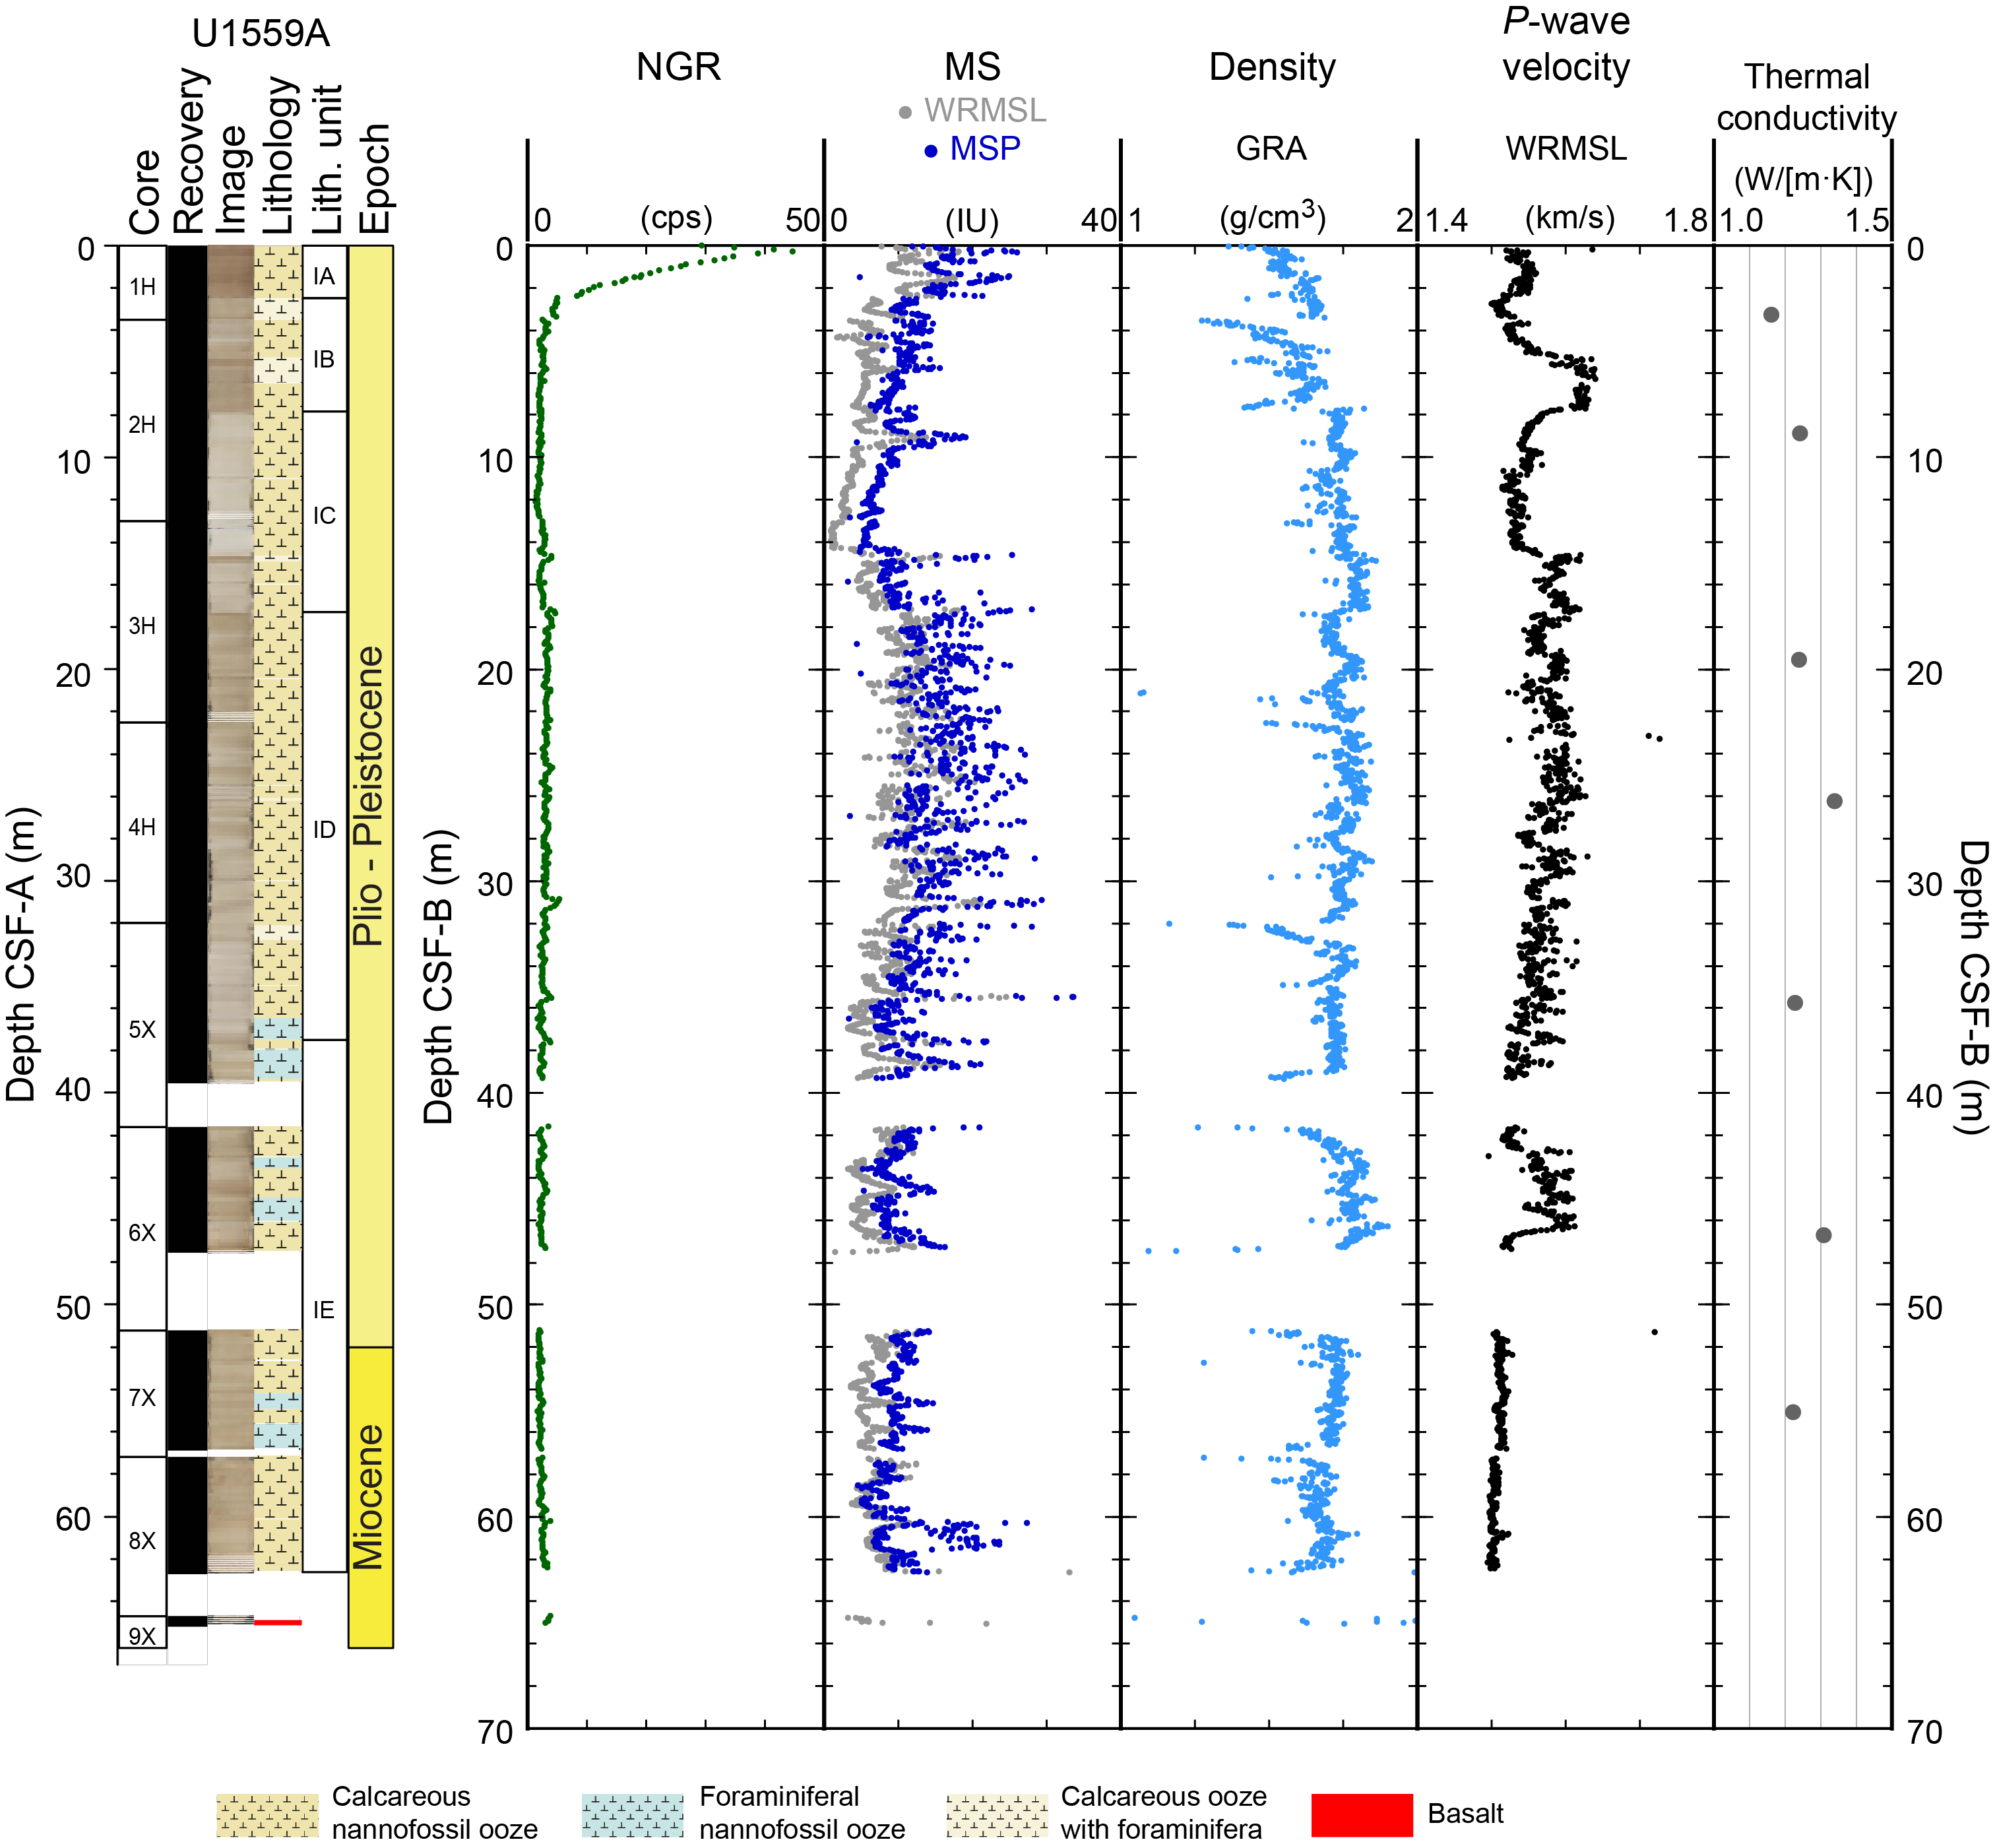
Figure F67. Core physical properties data, Hole U1559A.
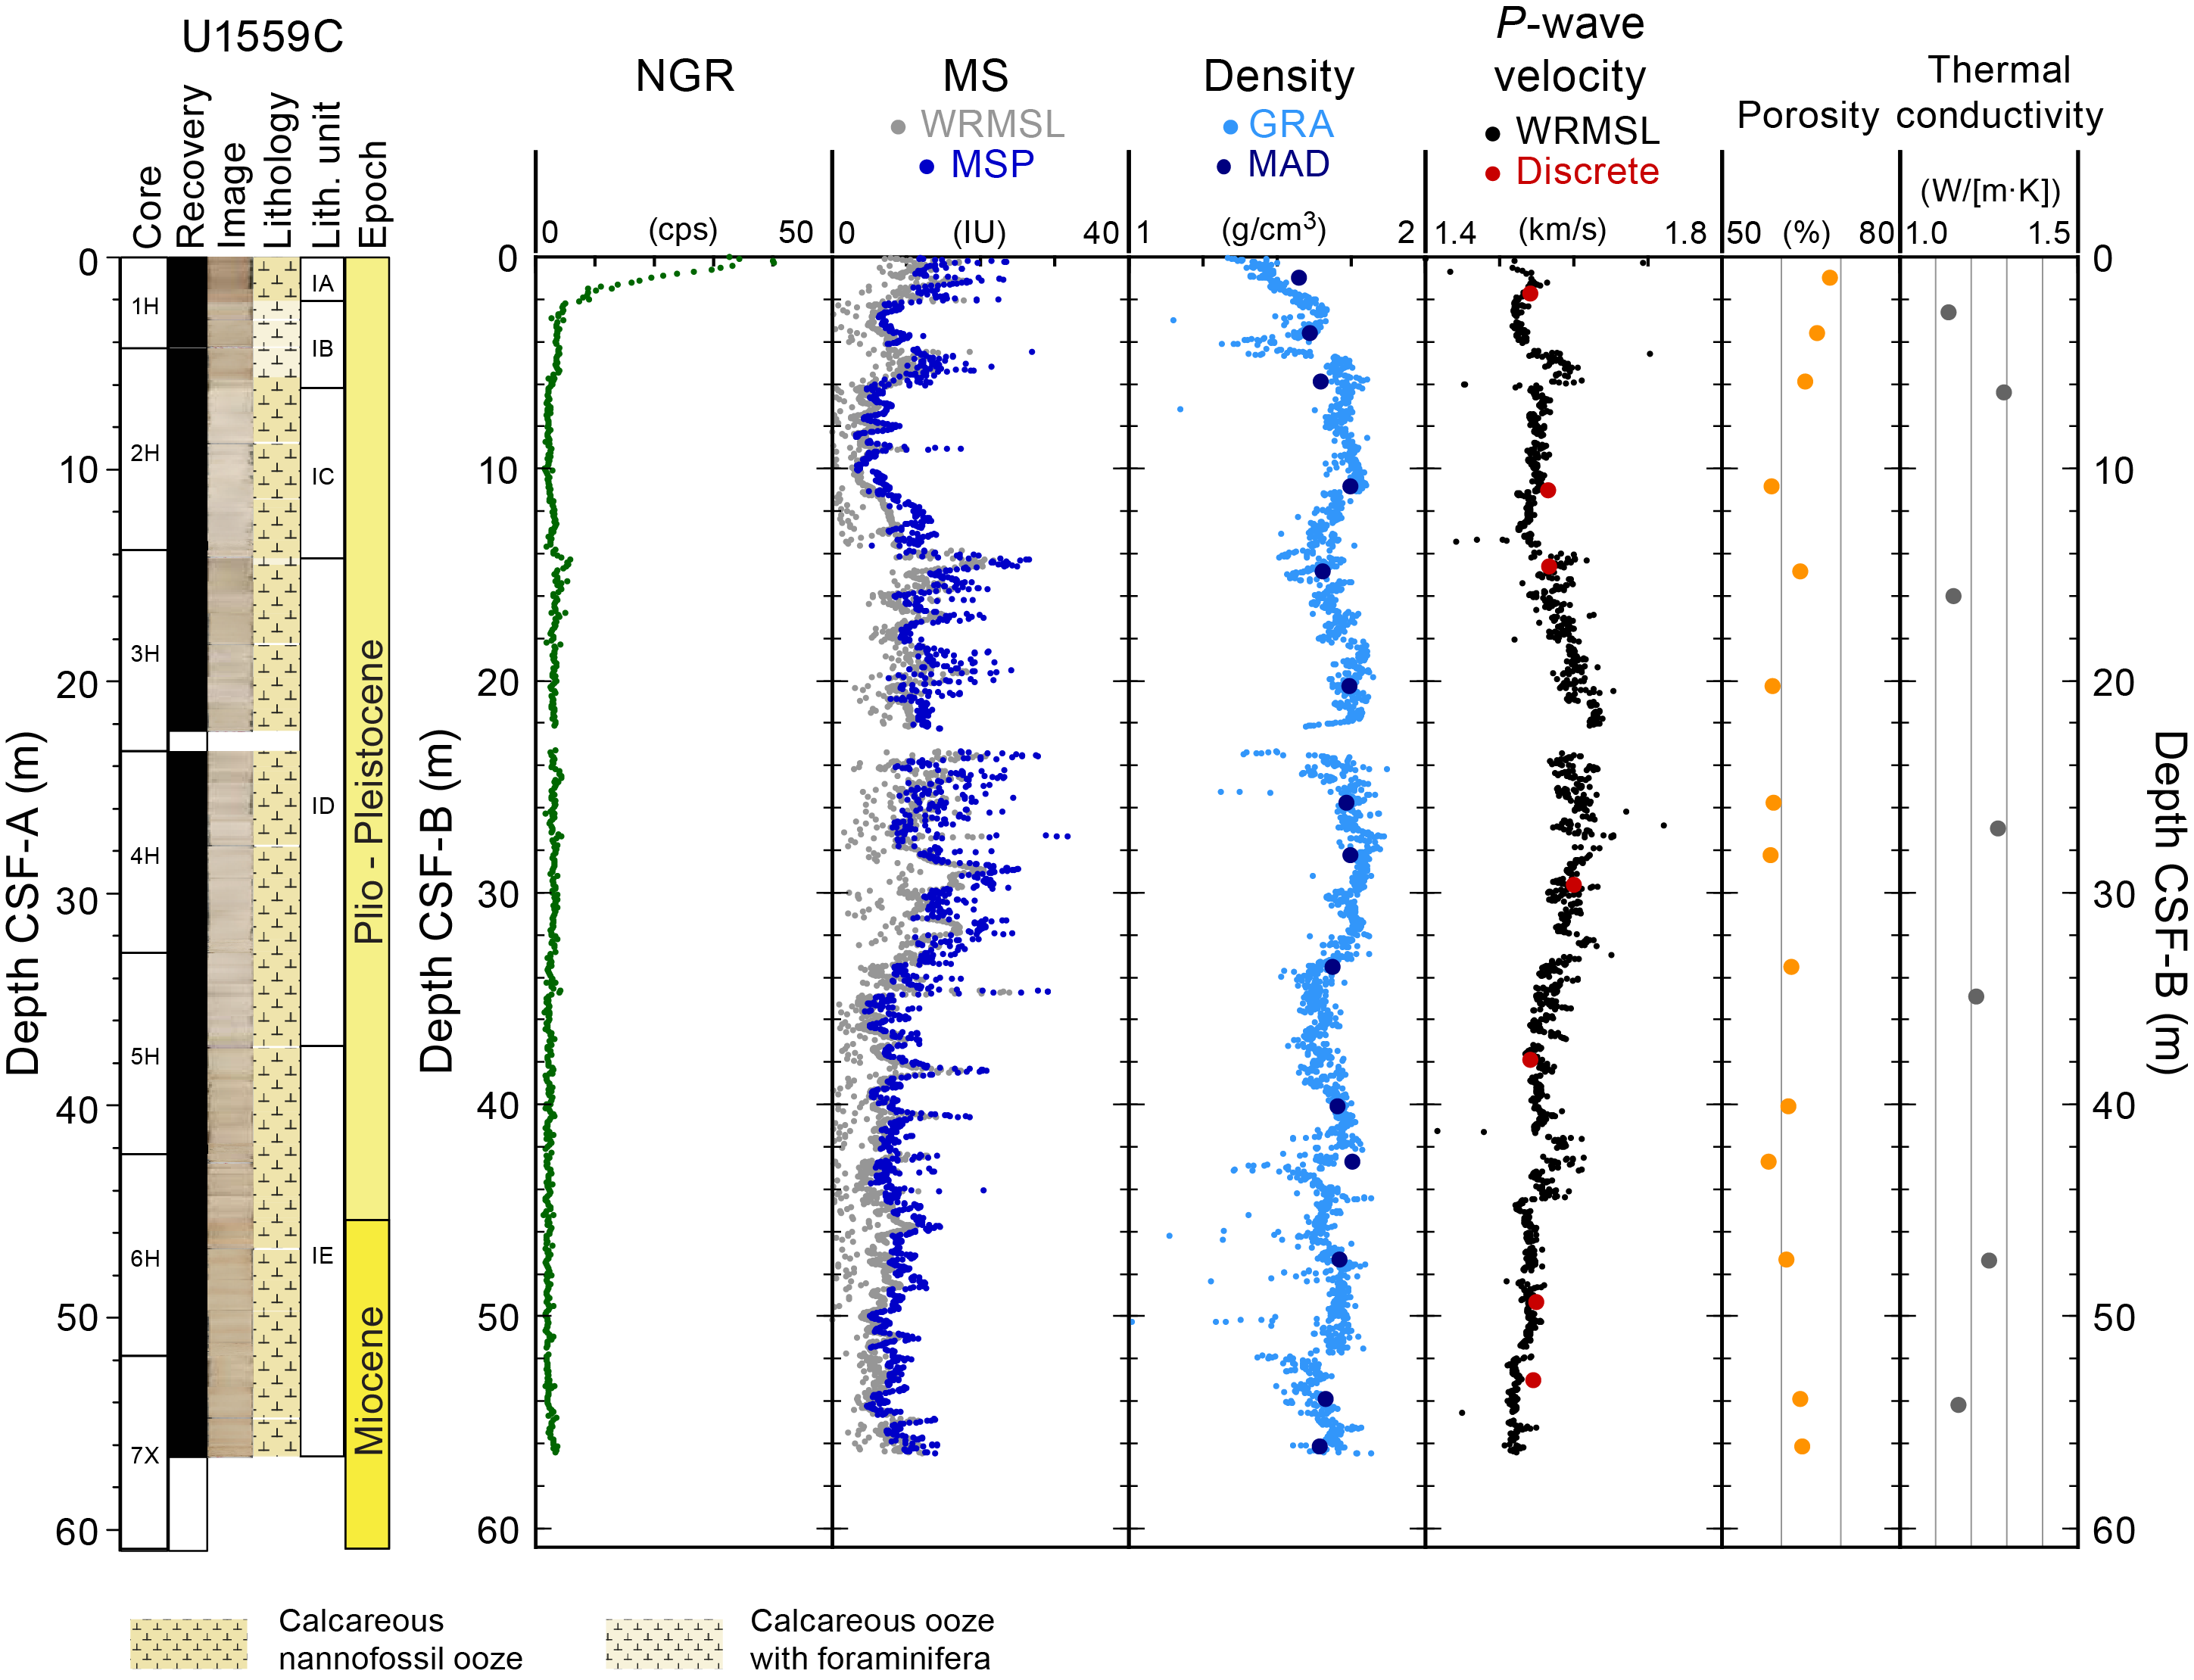
Figure F68. Core physical properties data, Hole U1559C.
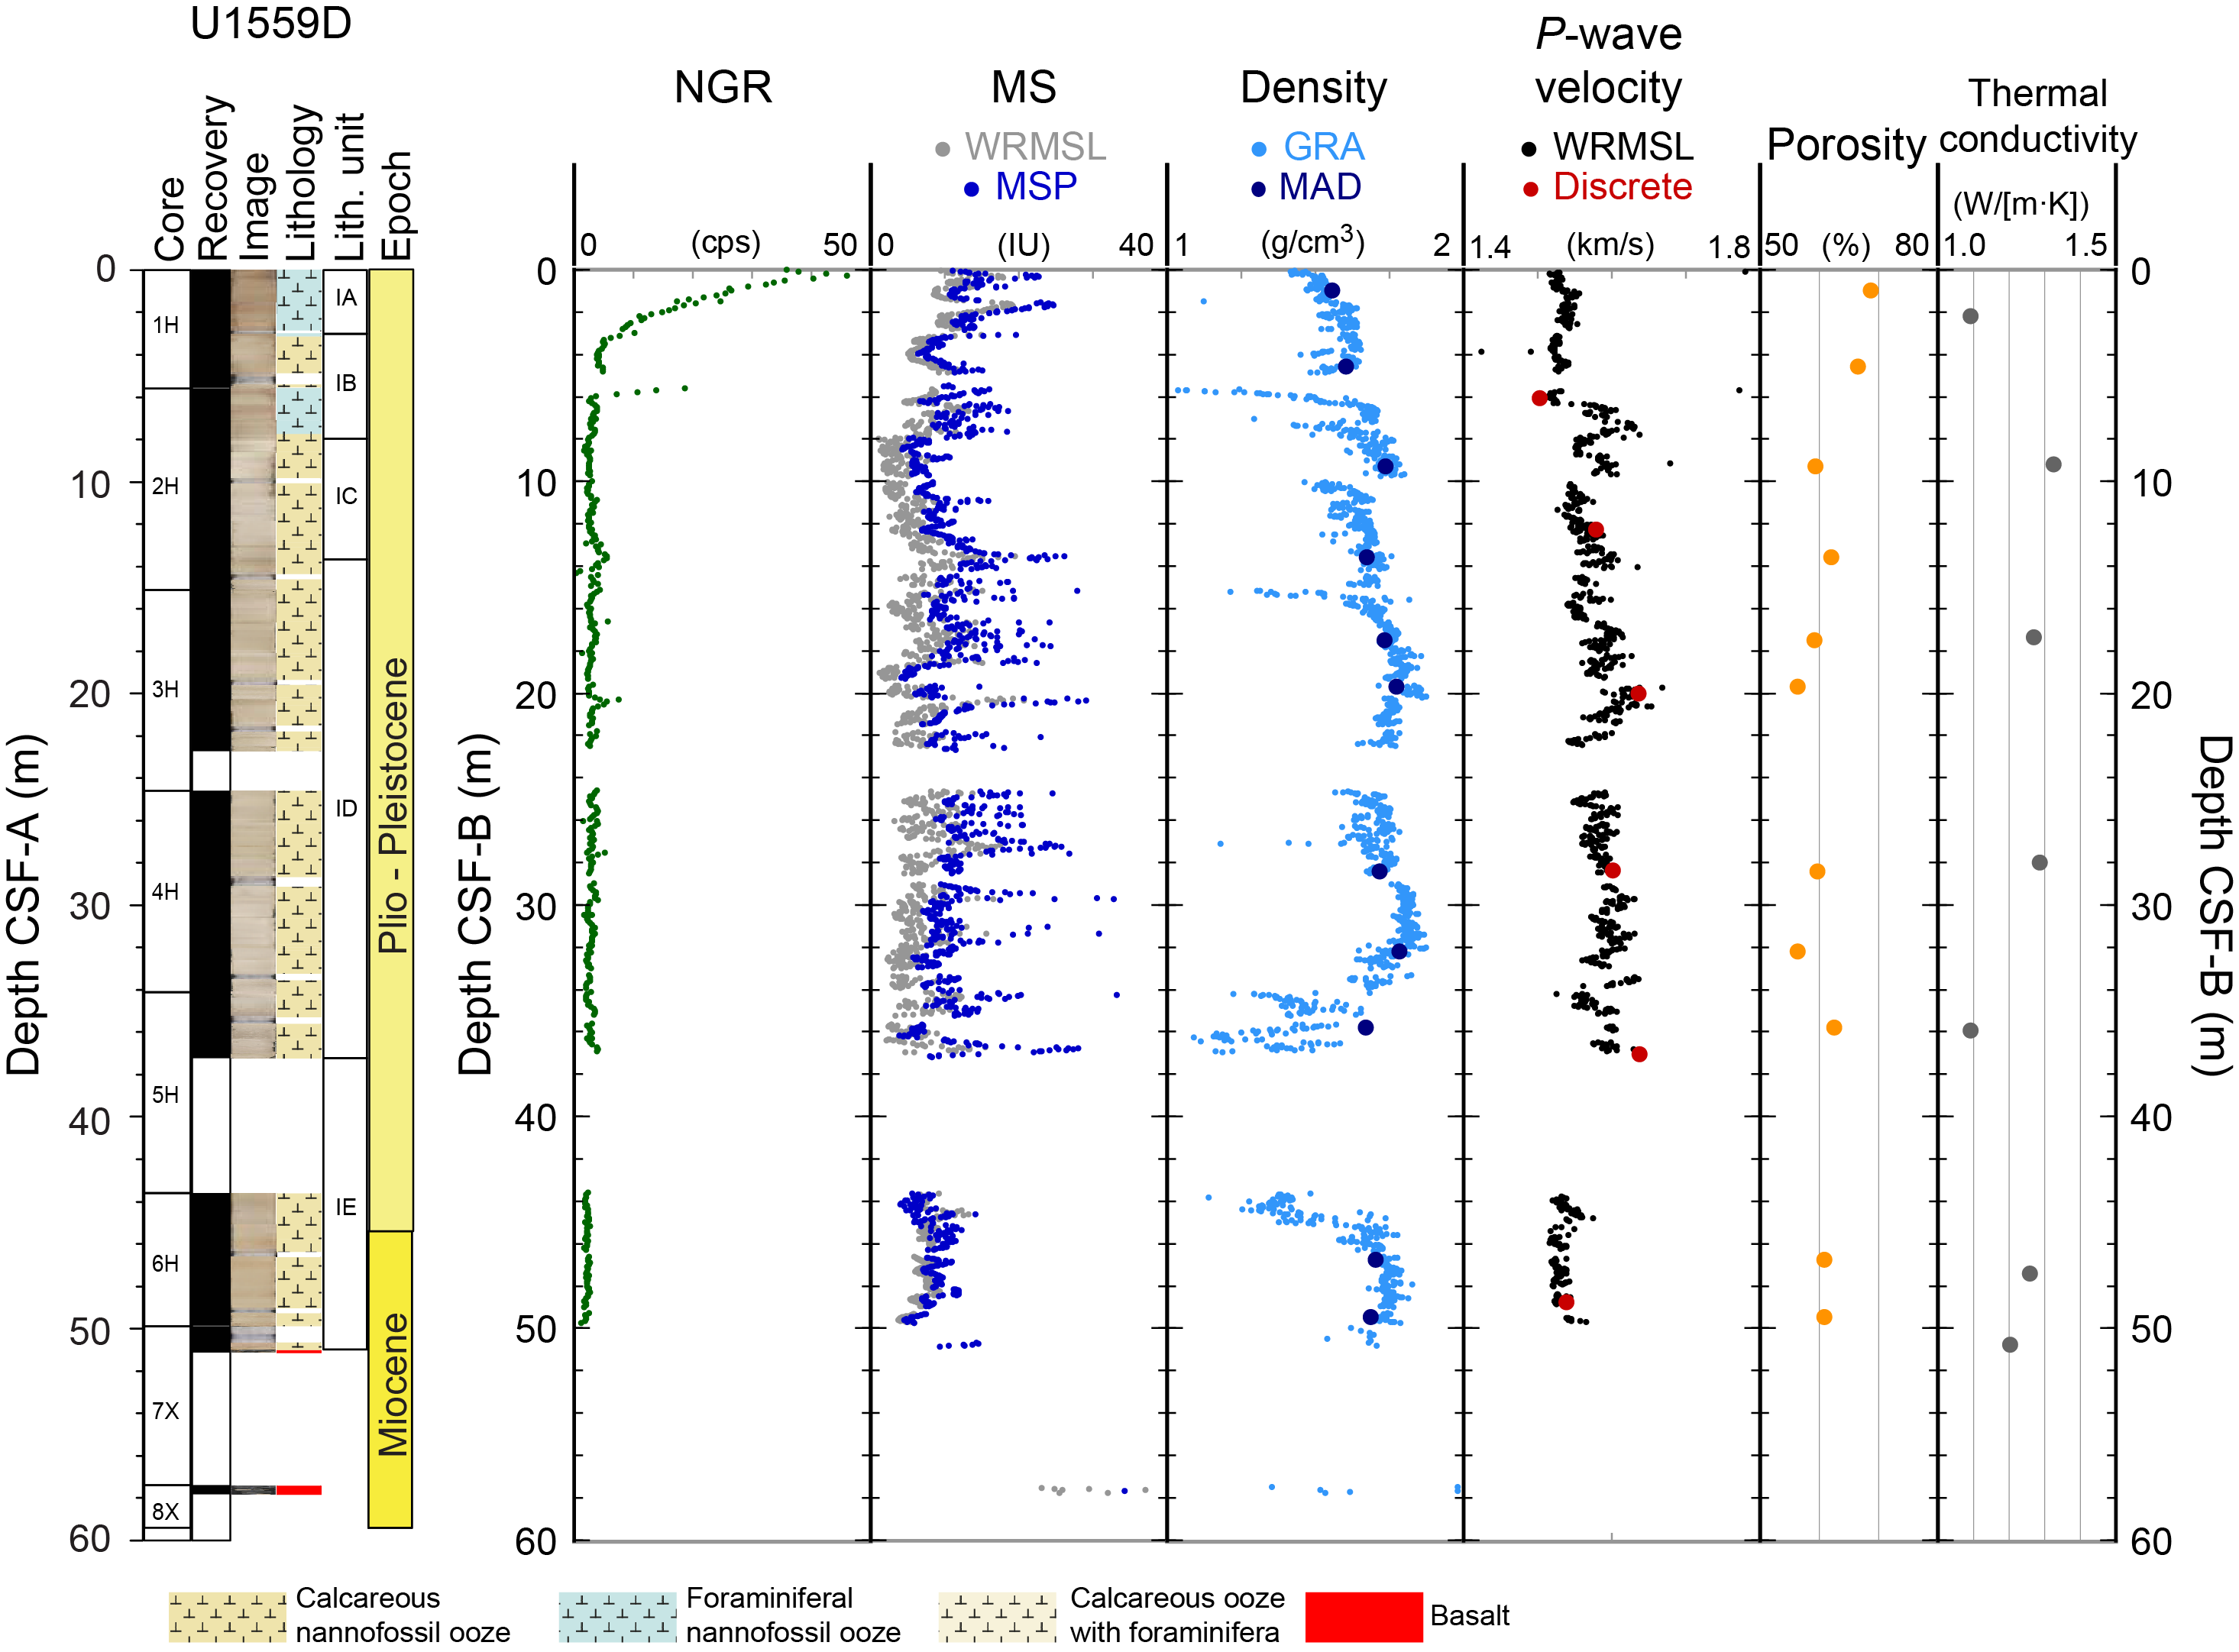
Figure F69. Core physical properties data, Hole U1559D.
10.1.1.1. Natural gamma radiation
NGR was measured at 10 cm intervals on all whole-round core sections that exceeded 50 cm in length; the minimum section length that could be measured was limited by the response function of the sodium iodide detectors (see Physical properties and downhole measurements in the Expedition 390/393 methods chapter [Coggon et al., 2024c]). NGR is a proxy for the concentration of radioactive elements (40K, 238U, and 232Th) in the cored sediment (Dunlea et al., 2013) and is relatively low throughout the carbonate-dominated sediments at Site U1559, ranging 1.25–44.70 counts/s. The highest values occur in the uppermost core and transition to lower values that remain near-constant downhole. The uppermost sediments in all holes drilled at Site U1559 have slightly higher clay content than the sediment below, which is consistent with their higher NGR. Below these clay-dominated sediments, carbonate ooze dominates to the sediment/basement interface (see Sedimentology). Small positive excursions in NGR occur within the carbonate ooze unit, such as at ~35 m CSF-B, and they correlate with sharp peaks in MS, likely reflecting local increases in clay content.
10.1.1.2. Gamma ray attenuation bulk density
GRA bulk density, defined as the fraction of gamma rays that are not absorbed by a material, can be used as an approximation for bulk density. Variations in bulk density can reflect changes in mineralogy, composition, and porosity in the sedimentary section. However, drilling disturbance, expansion cracks, incomplete filling of the core liner, or any other disturbance of the cored sediment can produce spurious values not realistic of marine sediment, which should typically be 1–2 g/cm3 depending on lithology and compaction. No data filtering to remove spurious values was done on the ship. Because spurious bulk density data points are typically lower than true values, a useful approximation of realistic versus spurious data is to consider the upper envelope of the data as a first-order estimate of bulk density and to discount low values.
Bulk density from the sedimentary section at Site U1559 generally increases from approximately 1.3–1.4 g/cm3 at the seafloor to 1.7–1.8 g/cm3 at the sediment/basement interface (Figure F68), which is likely a reflection of compaction due to the increasing load of thicker overlying sediments with depth. Within the uppermost 5–10 m CSF-B, bulk density increases to ~1.7 g/cm3 in all holes, but this overall trend is punctuated by low bulk densities of ~1.4–1.5 g/cm3 in Holes U1559A and U1559C between 4 and 7.7 m CSF-B and between 3.5 and 4.6 m CSF-B, respectively. These intervals of low bulk density likely reflect deposition of the slumped Early Pliocene sediments (see Sedimentology and Biostratigraphy). Downhole, bulk density displays minor variability between 1.6 and 1.8 g/cm3 in all three holes with the exception of the intervals between ~34 and 37 m CSF-B and between 43.5 and 45 m CSF-B in Hole U1559D, in which bulk density ranges 1.1–1.4 g/cm3. These low bulk density intervals are probably associated with slurries in Cores 390-U1559D-5H and 6H caused by drilling disturbance (see Sedimentology; see also Core descriptions) (Figure F69).
Both Expeditions 390C and 390 drilled through the sediment/basement interface recovering uppermost basement rocks within Cores 390C-U1559A-8X and 9X and Core 390-U1559D-7X, respectively. These intervals have apparent GRA bulk densities ranging 1–2.6 g/cm3; the considerable variability in density is an artifact of the measurement, as discussed in the Site U1556 and Site U1557 chapters (see Basement in Physical properties and downhole measurements in the Site U1556 chapter [Coggon et al., 2024a] and Basement in Physical properties and downhole measurements in the Site U1557 chapter [Coggon et al., 2024b]). Clustering of data >1.8 g/cm3 suggests the basement has higher bulk density than the overlying carbonate sediments, as expected. Deeper basement rocks at Site U1559 were drilled during Expedition 393. For track data and discrete measurements, see Basement in Physical properties and downhole measurements.
10.1.1.3. Magnetic susceptibility
MS is an indicator of the tendency of minerals to become magnetized upon application of a magnetic field and can be considered an approximation of the concentration of magnetic minerals in the sediment. Similar to NGR, MS of marine sediments is primarily affected by the proportion of clay minerals in the cored material. Higher MS is generally an indication of clay-rich intervals, and lower MS is generally an indication of clay-poor carbonate ooze intervals. MS of cored sediments at Site U1559 was measured using the WRMSL, and MSP was measured on the SHMSL.
MS of the sedimentary section at Site U1559 from both the WRMSL and SHMSL exhibits very similar characteristics and variation downhole (Figure F68). WRMSL-derived MS ranges 1–25 instrument units (IU) and records high frequency but lower amplitude of variability relative to Sites U1556, U1557, and U1561, reflecting only minor differences in the concentration of magnetic minerals within the carbonates of Unit I (see Sedimentology). Broad-scale downhole variations in MS in Hole U1559C include the following:
- A minor but abrupt increase in MS (from 4 to 12 IU) at ~18 m CSF-B coinciding with the sharp basal contact of the white slumped sediments located in the upper part of Subunit ID (see Sedimentology);
- An interval between ~18 and ~35 m CSF-B of relatively high MS (ranging 10–20 IU); and
- More uniformly low MS (4–12 IU) below 40 m CSF-B throughout Subunit IE (see Sedimentology).
Similar downhole features are observed in Holes U1559A and U1559D, which allowed for downhole stratigraphic correlation.
The uppermost basement recovered in Cores 390C-U1559A-8X and 9X and 390-U1559D-7X have MS ranging from 34 IU to as high as 175 IU, which is consistent with the higher content of magnetic minerals expected in basement rocks compared to the overlying carbonate sediments. For direct comparison with MS from deeper basement rocks, see Basement in Physical properties and downhole measurements.
10.1.1.4. P-wave velocity
P-wave velocity is a measure of the velocity that a compressional body wave (P-wave) propagates through a sample. P-wave velocity is directly related to bulk density, compressibility, and shearability and indirectly related to porosity, mineralogy, and fabric of the material sampled. Shipboard P-wave velocity measurements of the core are especially useful for correlating the downhole logging velocities and the regional seismic imaging to the core.
Discrete P-wave velocity measured on the split-core sections using the Section Half Measurement Gantry (SHMG) (see Physical properties and downhole measurements in the Expedition 390/393 methods chapter [Coggon et al., 2024c]) is generally more accurate because sampling locations unaffected by drilling disturbance can be chosen. Although P-wave velocity measurements on whole-round core sections using the WRMSL are more reliable in sediments than in the basement rocks, spurious values still occur. Similar to the GRA measurement, P-wave velocity will be adversely affected by drilling disturbance, expansion cracks, incomplete filling of the core liner, or any other disturbance of the cored sediment that produces spurious values not realistic of marine sediment (typically between 1.48 and ~1.80 km/s, depending on compaction and lithology). Because spurious P-wave velocity measurements from the WRMSL can be both higher and lower than true values, the best approximation of true velocity is to use the clustering of values and disregard any outliers.
P-wave velocity in the sedimentary section of Hole U1559C increases from ~1.52 km/s near the seafloor to ~1.63 km/s at ~22 m CSF-B (Figure F68). In this interval, relatively high velocities of ~1.60 km/s between ~4 and 6 m CSF-B punctuate the gradual trend of increasing velocity with depth. These anomalously high velocities are also present in Holes U1559A and U1559D and are coincident with the white slumped sediments (see Sedimentology and Biostratigraphy). Below ~22 m CSF-B, P-wave velocity remains uniformly around ~1.60 km/s to ~33 m CSF-B, below which velocity gradually decreases to ~1.52 km/s at the inferred sediment/basement interface at the base of Core 390-U1559C-7X. Slightly higher bulk densities in Subunit ID (see Sedimentology) are coincident with the higher P-wave velocities. This trend suggests that the downhole P-wave velocity variations are a function of lithology. This observation is further supported by the porosity data, which are lowest in Subunit ID, between 20 and 30 m CSF-B (Figure F68).
10.1.1.5. Thermal conductivity
Thermal conductivity is a measure of the potential for conductive heat flow through a material. Thermal conductivity in sediment and basement is affected by the mineralogy, porosity, density, and fabric of the lithology being measured. Measurements of thermal conductivity help develop an understanding of thermal insulation of the ocean crust by sediments and the heat dissipation processes from the crust through the sediment to the ocean.
A total of 7–8 discrete measurements were made in each of Holes U1559A, U1559C, and U1559D at a frequency of ~1 per core. Measurements were made in Site U1559 cores using a needle probe inserted into the unsplit core liner. Representative measurement locations were chosen to reflect the general properties of each core, and wherever possible three individual measurements were used to calculate an average thermal conductivity from each location (see Physical properties and downhole measurements in the Expedition 390/393 methods chapter [Coggon et al., 2024c]). Thermal conductivity in sediments cored at Site U1559 ranges 1.091–1.284 W/(m·K) (Figure F68) with no downhole trend, which is likely due to the uniform carbonate lithology observed in all three sediment holes (see Sedimentology). Thermal conductivity measurements were combined with borehole temperature measurements to estimate the conductive heat flow in Hole U1559C (see Downhole measurements) (Figure F70).
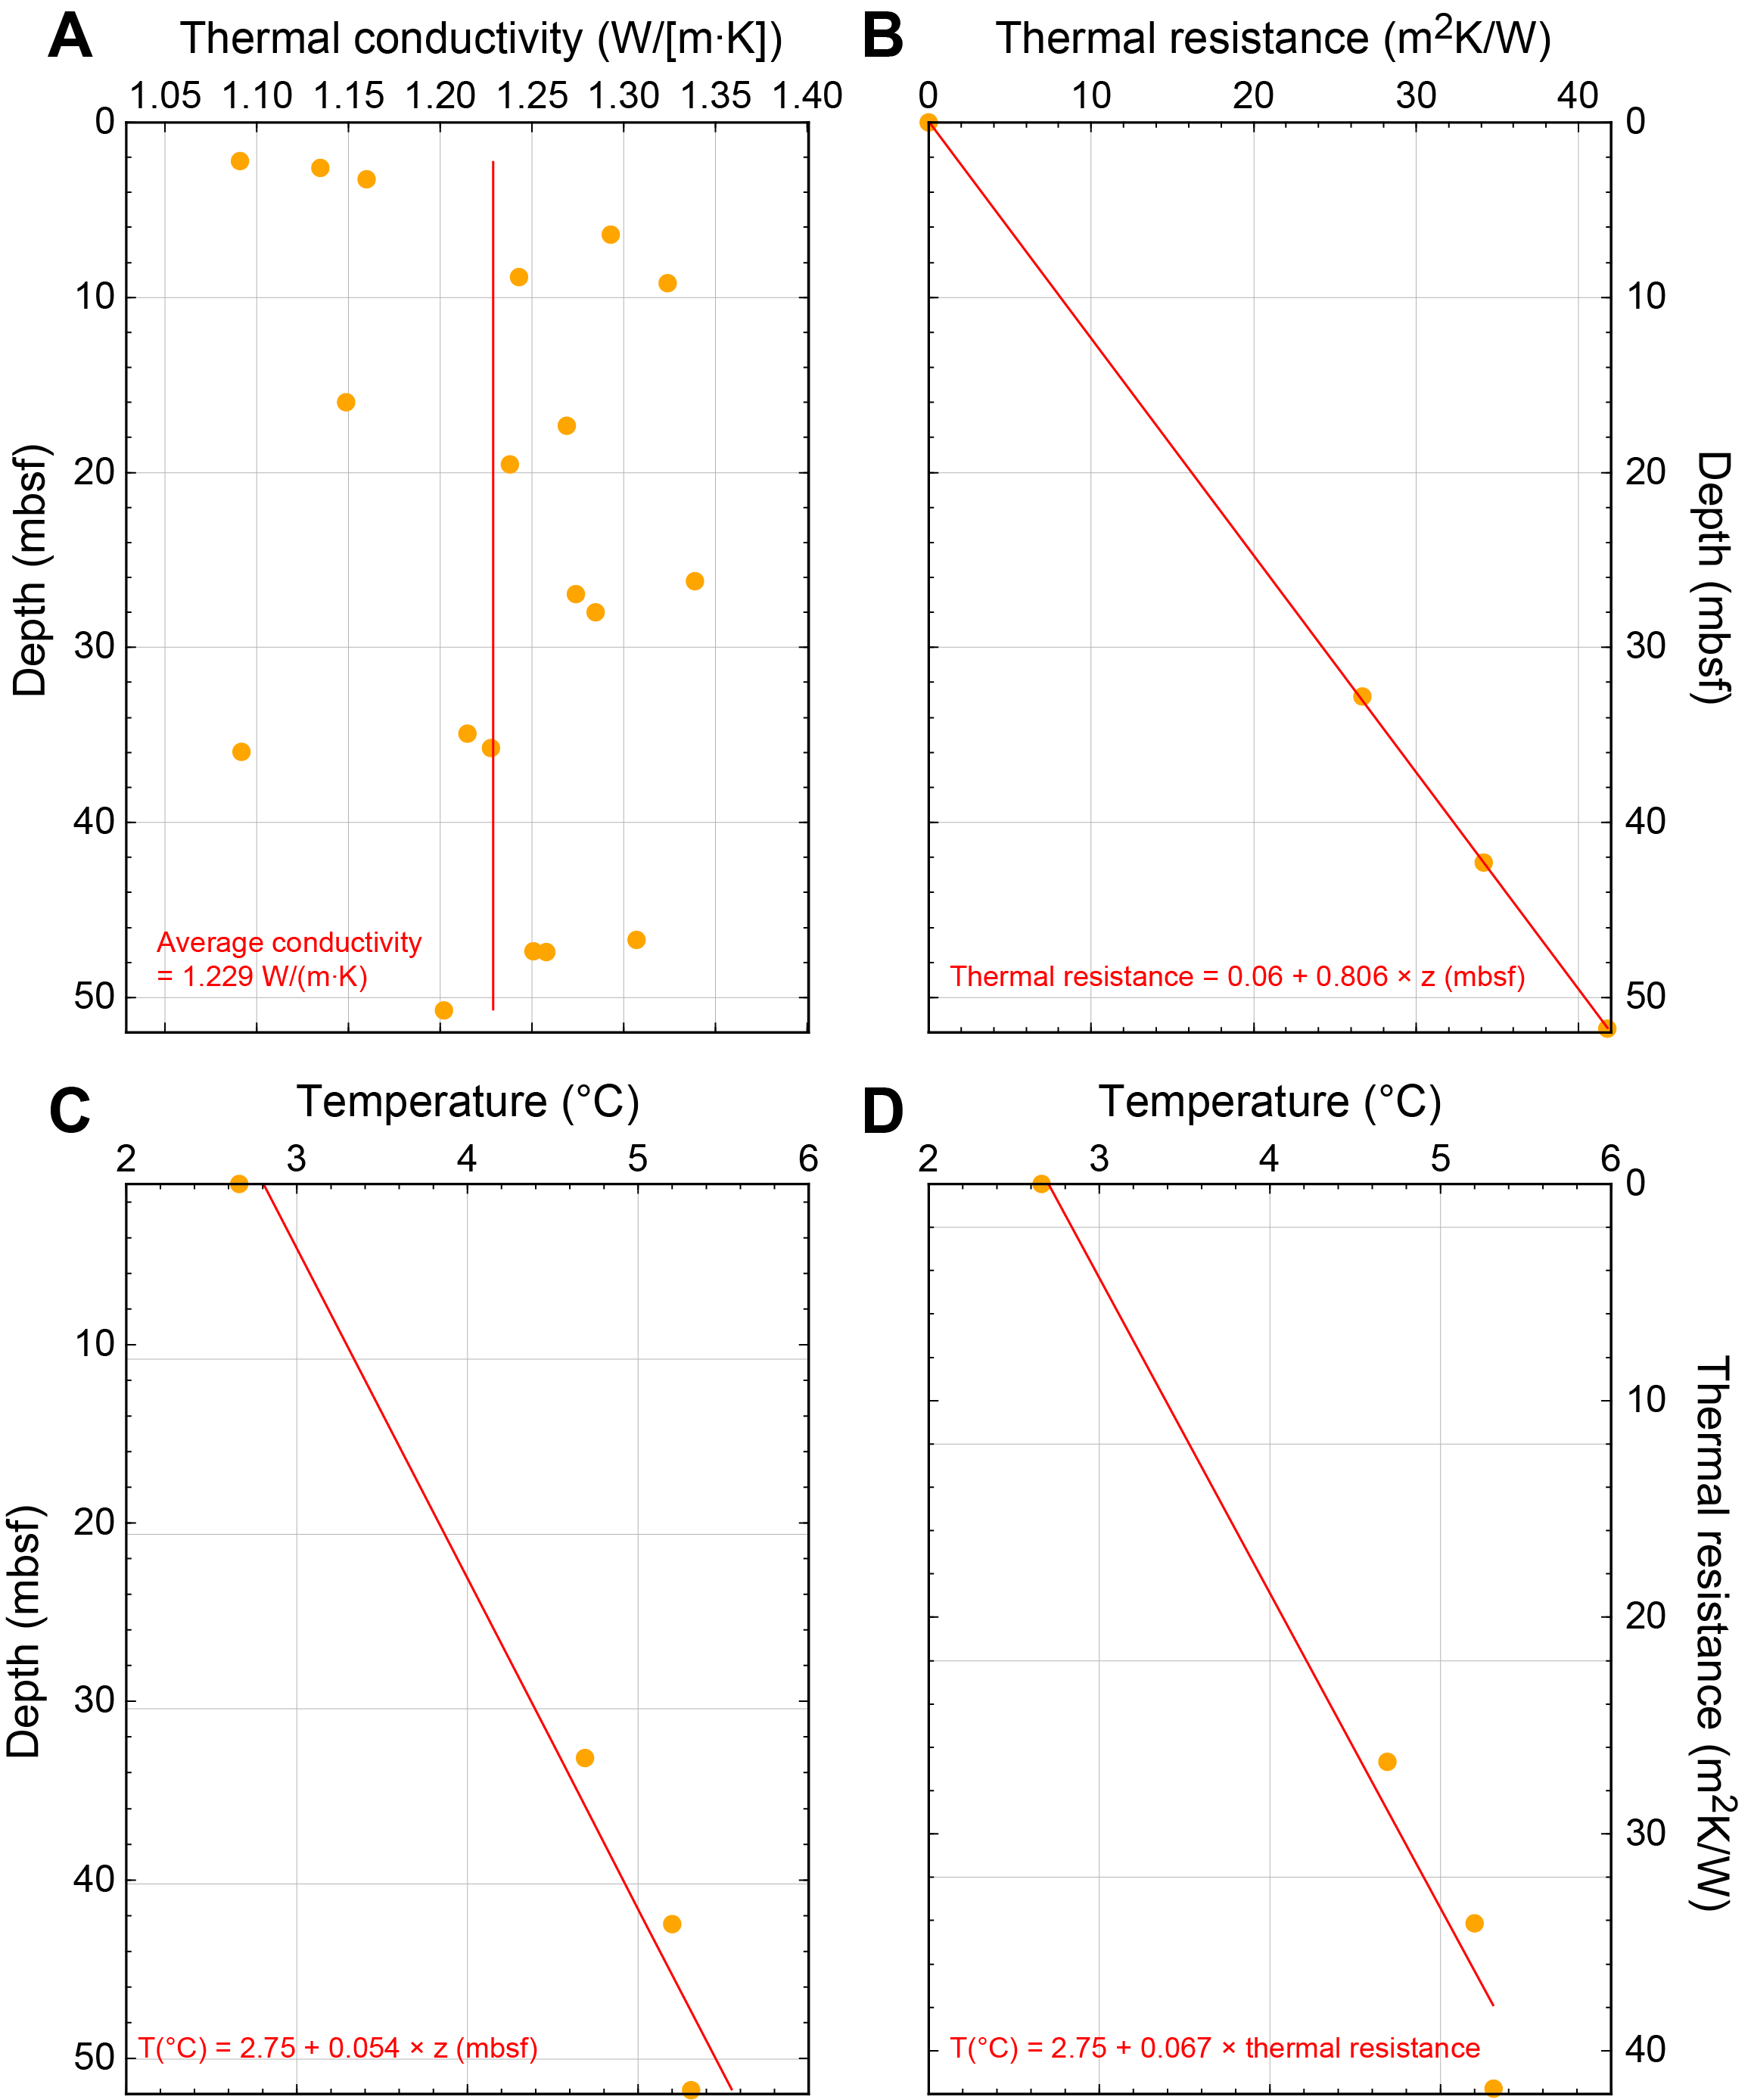
Figure F70. Estimation of conductive heat flow.
10.1.1.6. Moisture and density
MAD measurements include high-precision, high-accuracy calculations of bulk density, grain density, and porosity of discrete samples. Porosity is especially useful for determining the volume of water that can be stored in the rock type represented by a discrete sample. Bulk density is useful for mass accumulation calculations and, in part, controls seismic wave velocity. Grain density is the density of the dry material only (porosity and water content is not considered) and is related to the mineralogy of the sample (see Physical properties and downhole measurements in the Expedition 390/393 methods chapter [Coggon et al., 2024c]). A total of 14 discrete samples from Hole U1559C and 11 discrete samples from Hole U1559D were taken at a frequency of 2 samples per core. Samples were selected to be representative of each core as well as all sedimentary lithologies present downhole. The sedimentary sections in all holes at Site U1559, and hence all MAD samples, comprise only carbonate ooze.
The porosity of Site U1559 sediments decreases downhole from ~68% near the seafloor to ~60% at ~10 m CSF-B (Figures F68, F69). Below this depth, porosity varies between ~56% and ~64% to the bottom of the hole with no systematic decrease with depth. The mean porosities of sediments from Holes U1556C and U1556D are very similar (61.6% and 61.1%, respectively).
Bulk density measured from discrete MAD samples generally compares well with the track data (Figure F68). The good inverse linear correlation between bulk density and porosity (Figure F71A) illustrates that bulk density is likely controlled by porosity. Furthermore, the uniform grain density of the MAD samples seen in Figure F71B suggests that the mineralogy of the sediment is not responsible for the observed changes in bulk density or porosity versus depth (Figure F71C, F71D).
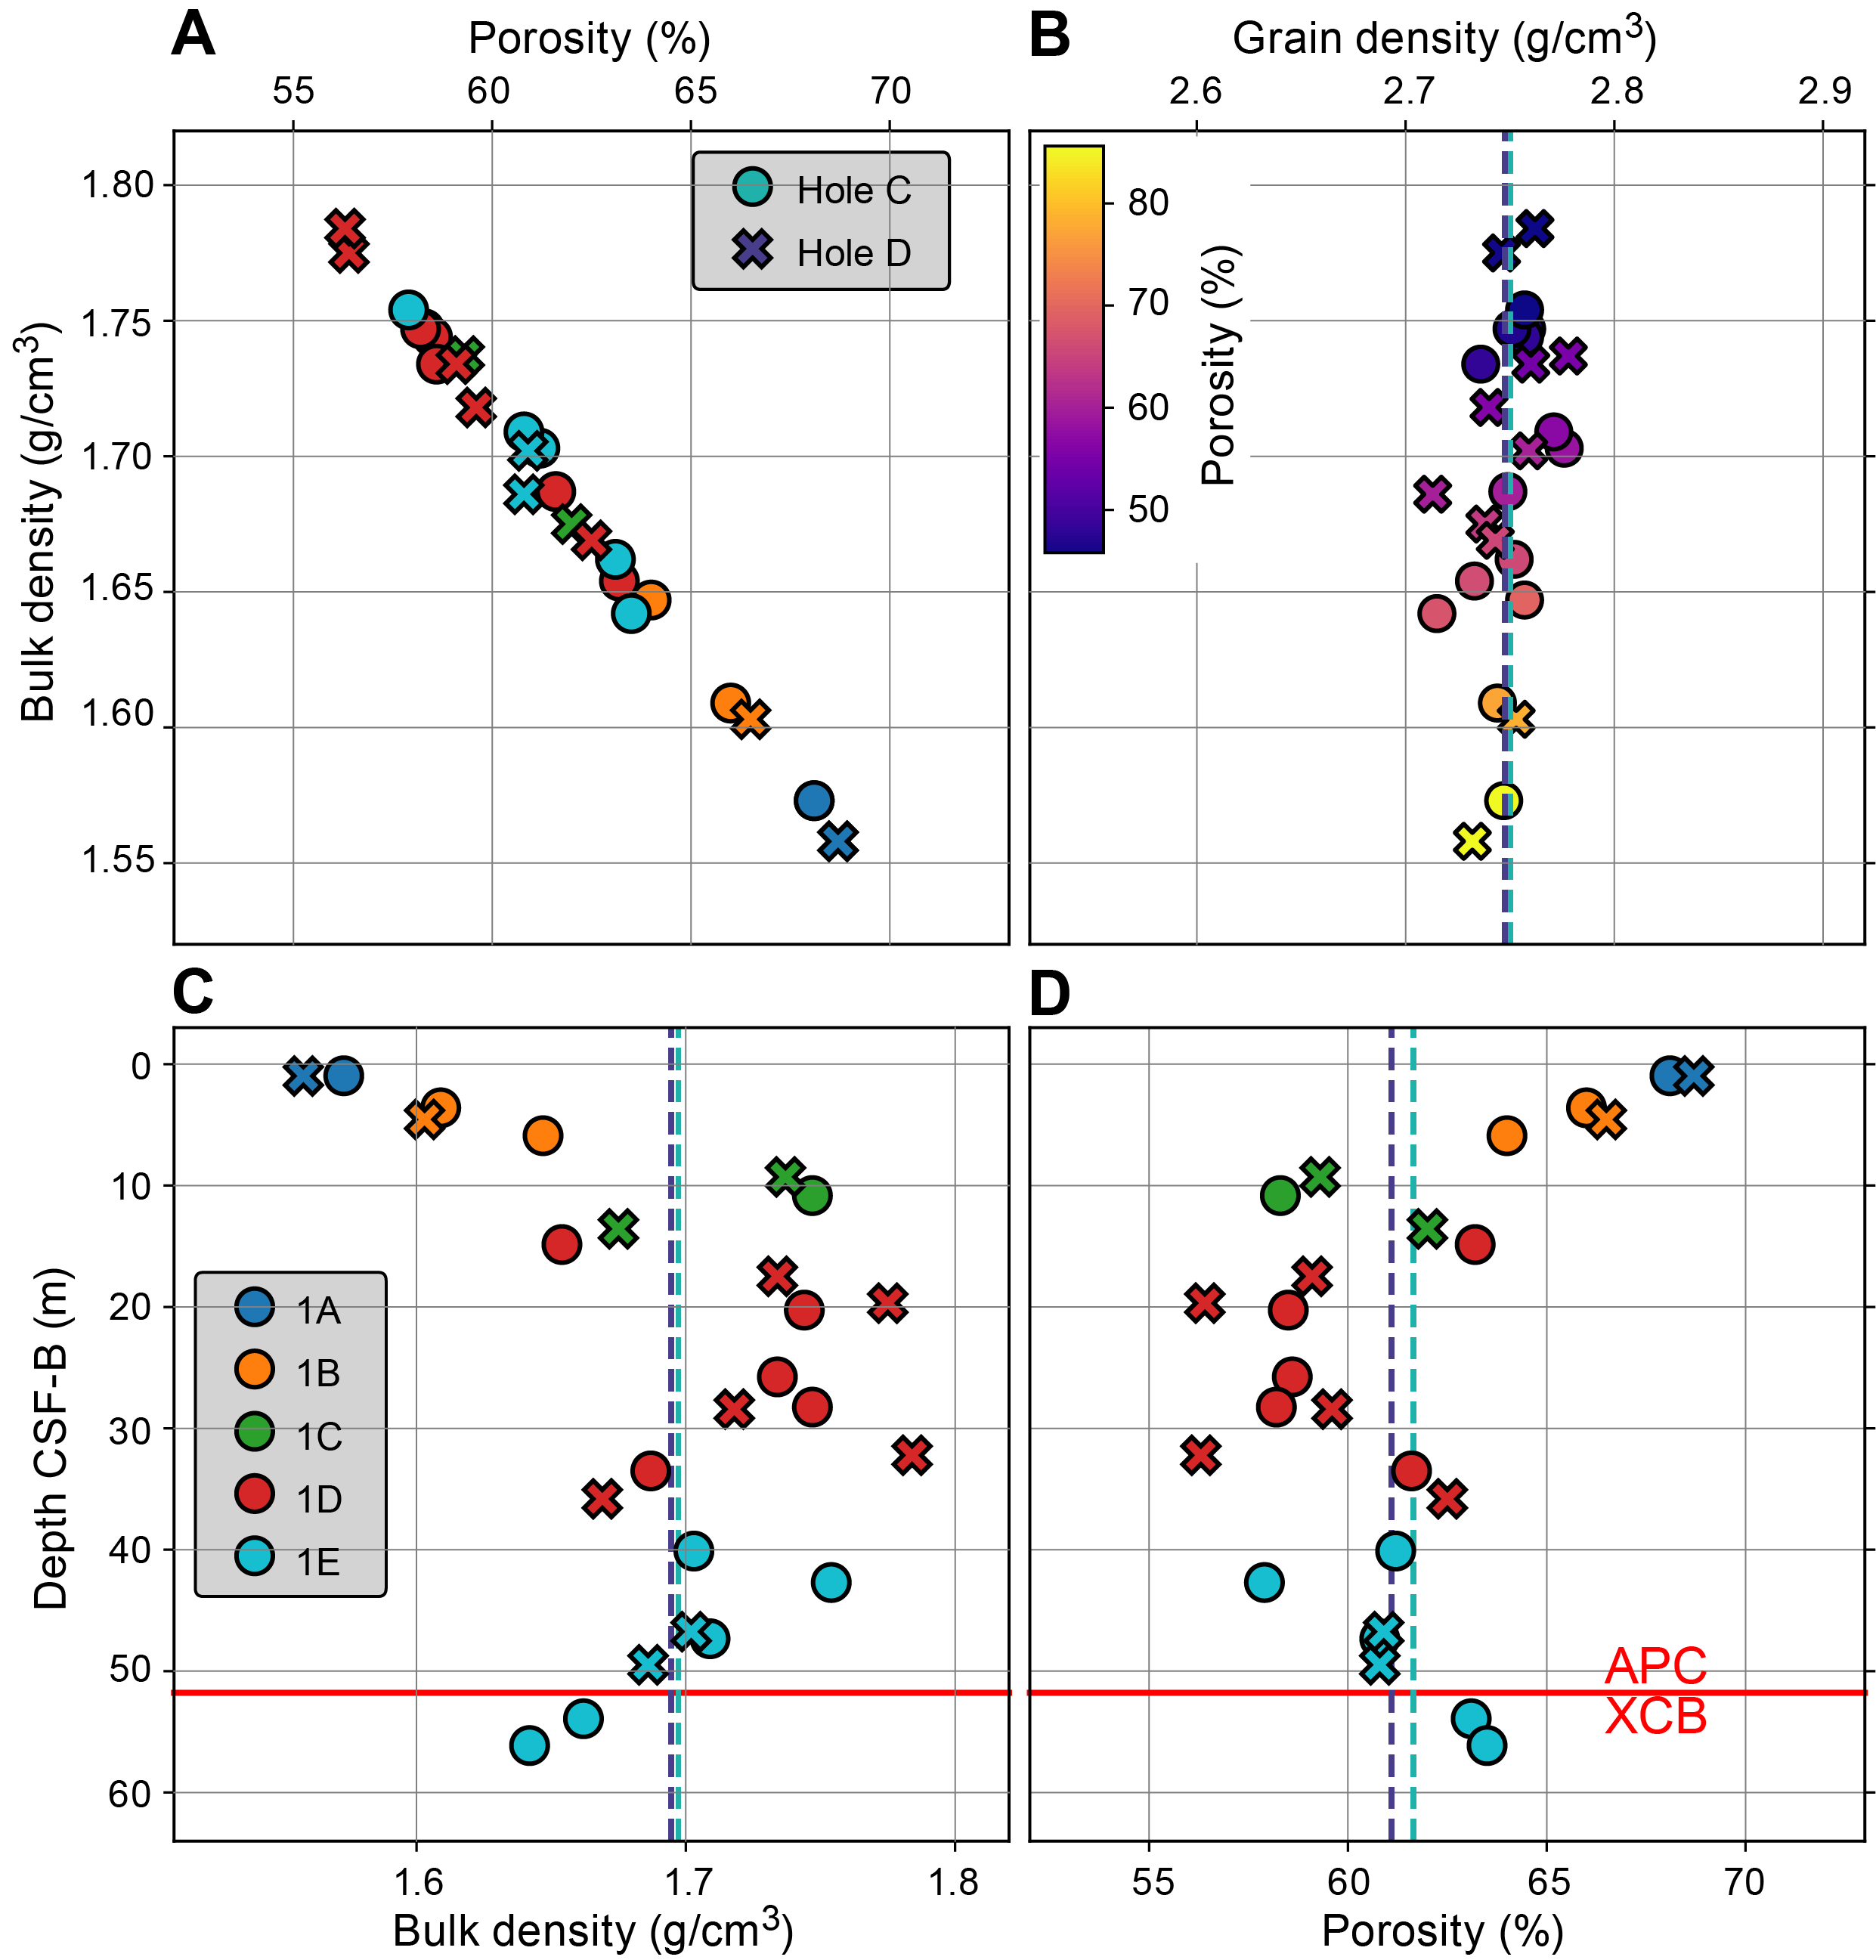
Figure F71. MAD physical properties.
10.1.1.7. Sediment strength
Measurements of both the shear strength and compressional strength of the cored sediment provide estimates of the consolidation, deformability, and stability of marine sediments. The measurements are useful for geotechnical studies of abyssal sediments that may be subject to stress. The shear strength of the sediment cored at Site U1559 was measured once per core on Cores 390-U1559C-1H through 7X and 390-U1559D-1H through 6H. Shear strength increases downhole in both holes from ~6 kN/m2 near the seafloor to ~11 kN/m2 near the sediment/basement interface.
The compressional strength of the sediment cored at Site U1559 was measured once per core on Cores 390-U1559C-1H through 7X and Cores 390-U1559D-1H through 6H. Compressional strength is relatively constant with depth, with a mean of 0.14 kg/cm2 throughout Hole U1559C. The mean compressional strength in Hole U1559D is 0.37 kg/cm2, excluding one anomalously high measurement (1.75 kg/cm2) that would have affected the mean value, given the low number of samples (n = 5).
10.1.2. Stratigraphic correlation
Although recovery of sediments during ocean drilling is generally high, gaps in recovery between individual cores are inevitable. To compensate for this potential loss of stratigraphy, three sediment holes were cored at Site U1559. Hole U1559A was cored during the preliminary engineering Expedition 390C (see Background and objectives), whereas Holes U1559C and U1559D were cored during Expedition 390. Hole U1559A consists of 9 cores to a total depth of 66.2 m DSF, corresponding to a recovery of 88%. Hole U1559C consists of 7 cores to a total of 60.9 m DSF with a high recovery of 93%, and Hole U1559D consists of 8 cores to a depth of 59.4 m DSF and a lower recovery of 73%. The sediment/basement interface was recovered in Holes U1559A and U1559D. In Hole U1559C, an abrupt increase in pressure and decrease in penetration rate, consistent with the drilling parameters observed in the basement intervals in Holes U1559A and U1559D, was observed, but no basement material was recovered (see Operations).
Before coring Hole U1559C, a target shot depth of ~3 m above the predicted seafloor was selected to recover material across core breaks and recovery gaps present in Hole U1559A. Guiding of the downhole coring in Hole U1559C by either advancing or pulling back the drill string before shooting the next core was not carried out to ensure the best possible core quality for oxygen concentration measurements (see Geochemistry). During operations in Hole U1559D, the first shot depth was ~2 m above the predicted seafloor, with the aim of recovering the mudline and more sediments to overlap and close the core gaps between the holes. However, operational issues led to early shooting of the APC system, which restricted guiding of the coring (see Operations). Consequently, no advances or pullbacks were performed during coring of Hole U1559D to adjust the stratigraphic correlation. Regardless, live correlation of Holes U1559C and U1559D with Hole U1559A was still conducted using track data generated by the Special Task Multisensor Logger (STMSL) for Hole U1559C (see Physical properties and downhole measurements in the Expedition 390/393 methods chapter [Coggon et al., 2024c]).
10.1.2.1. Correlation and splice
Physical properties data (e.g., MS and GRA bulk density) from Holes U1559A, U1559C, and U1559D were correlated to establish a core composite depth below seafloor (CCSF) scale at Site U1559 (Figure F72; Table T28). Because carbonate ooze is the sole sedimentary lithology at Site U1559 (Unit I; see Sedimentology), physical properties data display very low variability downhole. However, minor changes in MS and color reflectance data were successfully used to correlate between Site U1559 holes, resulting in an almost continuous spliced record of 71.4 m CCSF to the sediment/basement interface (Figure F72; Table T29). Inclusion of Hole U1559D in the splice was limited because of the lower recovery and because its downhole trends align with Hole U1559A and/or Hole U1559C, so core gaps coincide. Three gaps exist in the shipboard splice where core gaps from all three holes coincide: between Cores 390-U1559C-2H and 390C-U1559A-3H (16.39–16.78 m CCSF), between Cores 390-U1559C-3H and 390C-U1559A-4H (28.79–30.76 m CCSF), and between Cores 390C-U1559A-7X and 390C-U1559A-8X (64.77–66.19 m CCSF). The uppermost splice gap exists because of the lack of similarities in the stratigraphies between the top of Core 390C-U1559A-3H and base of Core 390-U1559C-2H. This is likely because of the slumped white (10YR 8/1) Early Pliocene carbonate (see Sedimentology and Biostratigraphy) recovered in Core 390C-U1559A-3H that is missing in Hole U1559C.
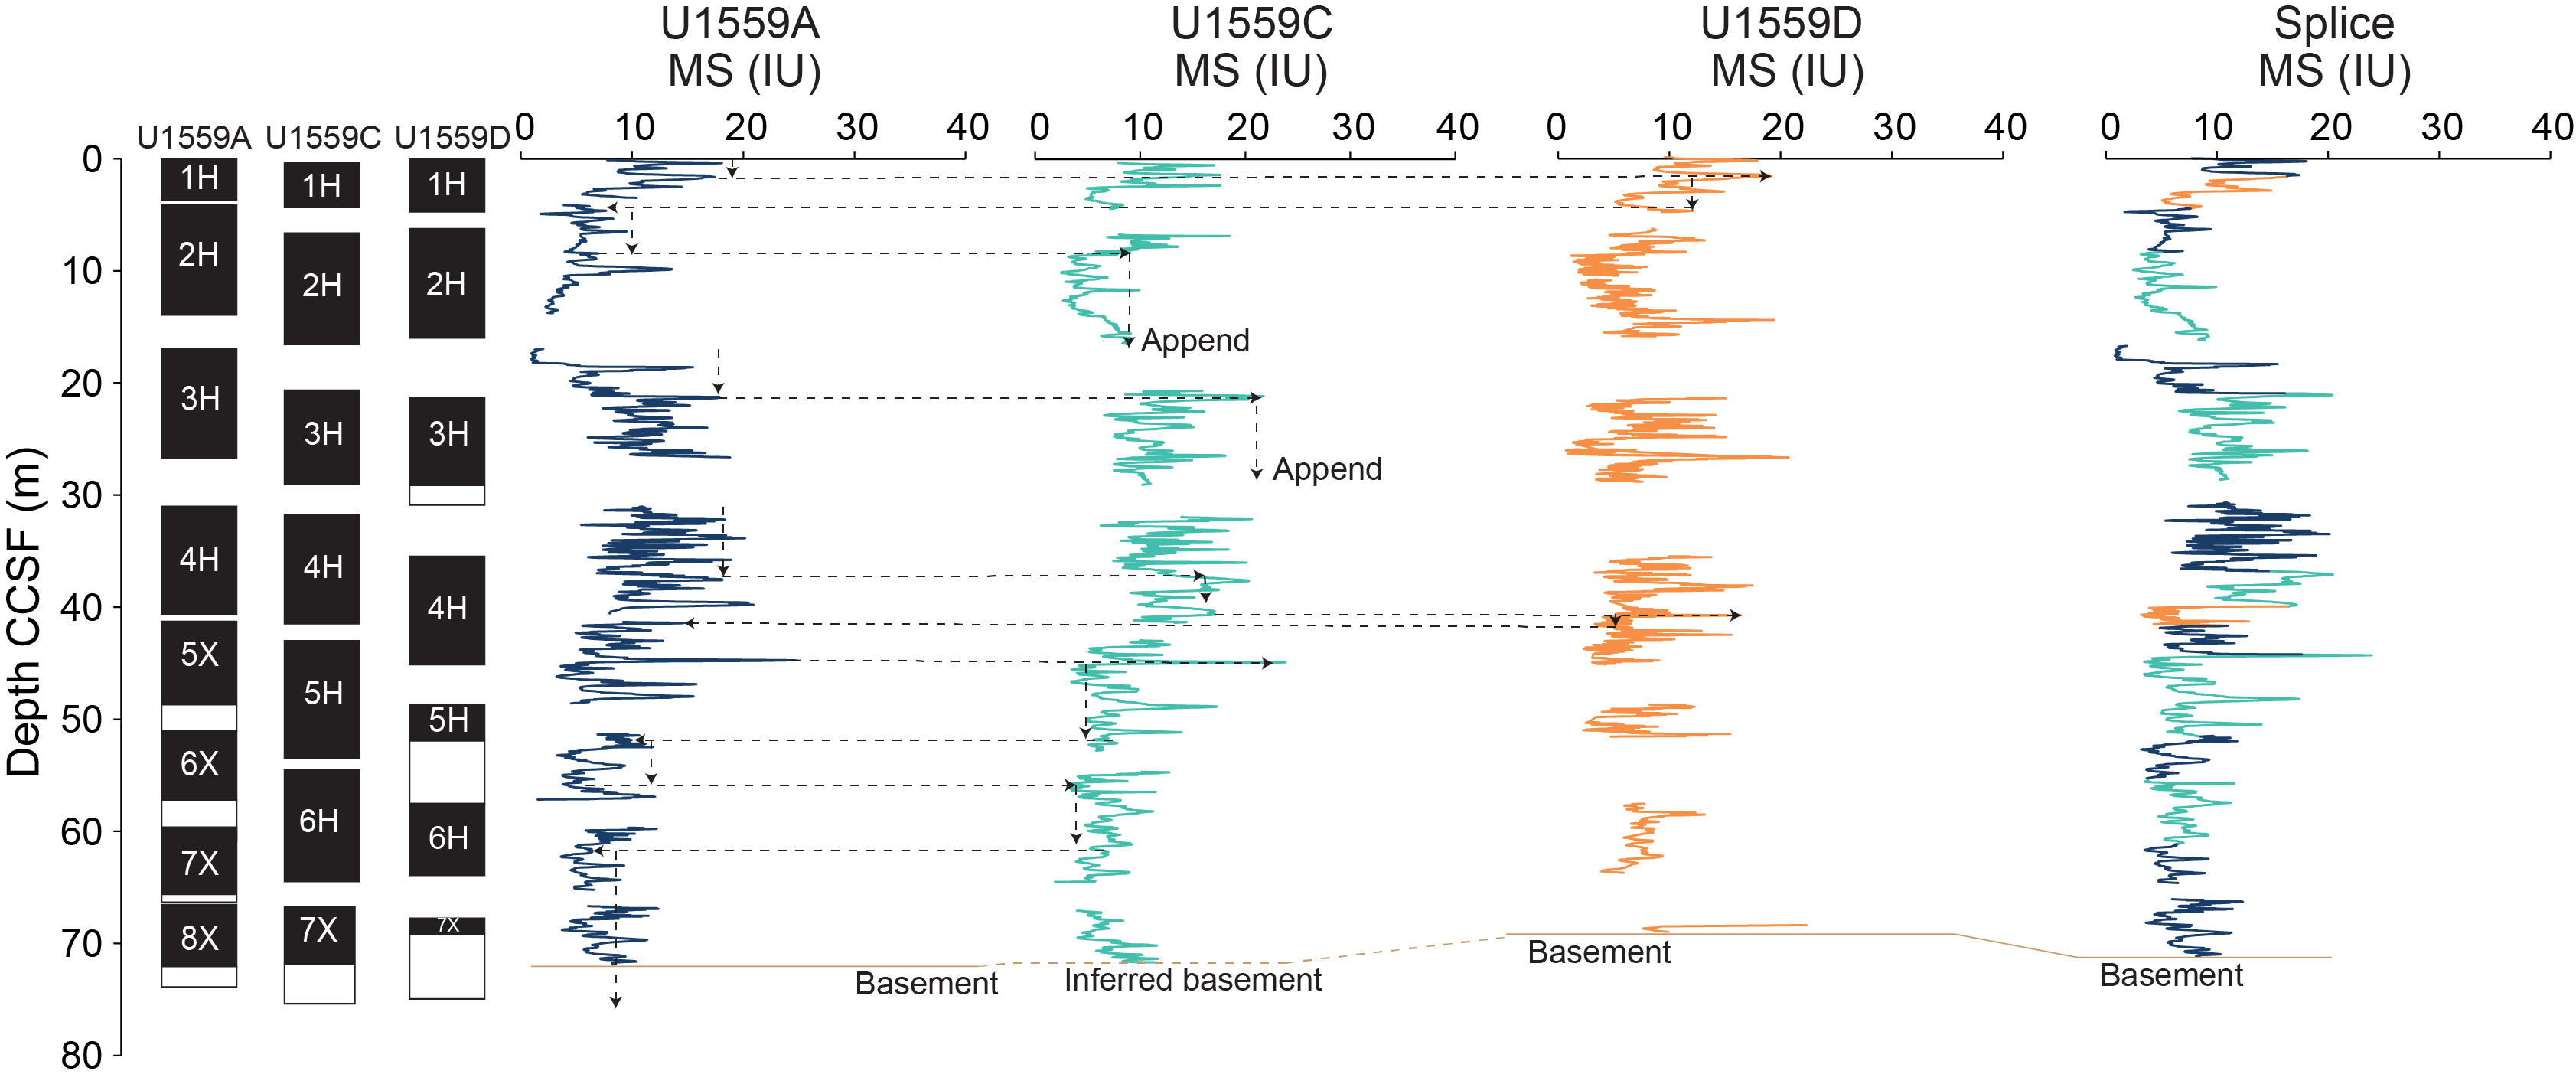
Figure F72. Composite depth scale and splice.
In the lowermost ~10 m of the physical properties data, there is good alignment between cores above the sediment/basement interface. Consequently, a tentative basement tie was made without attempting any shifting or alignment when constructing the splice (Figure F72).
10.1.3. Downhole measurements
10.1.3.1. Downhole temperature
During APC coring in Hole U1559C, in situ formation temperature was measured using an APCT-3 probe located inside the APC coring shoe. During drilling of Cores 4H, 5H, and 6H, the core barrel was shot into the sediment and left for 10–15 min to record the formation temperature (Table T30; Figure F73). Although the data show that the probe could not remain stable during the full length of any of its deployments, the records for Cores 4H and 6H included long enough stable intervals of thermal recovery to calculate reasonable fits to theoretical models and derive formation temperature data at these depths, suggesting that the temperature gradient in Hole U1559C could be as high as 54°C/km (Figure F70C).
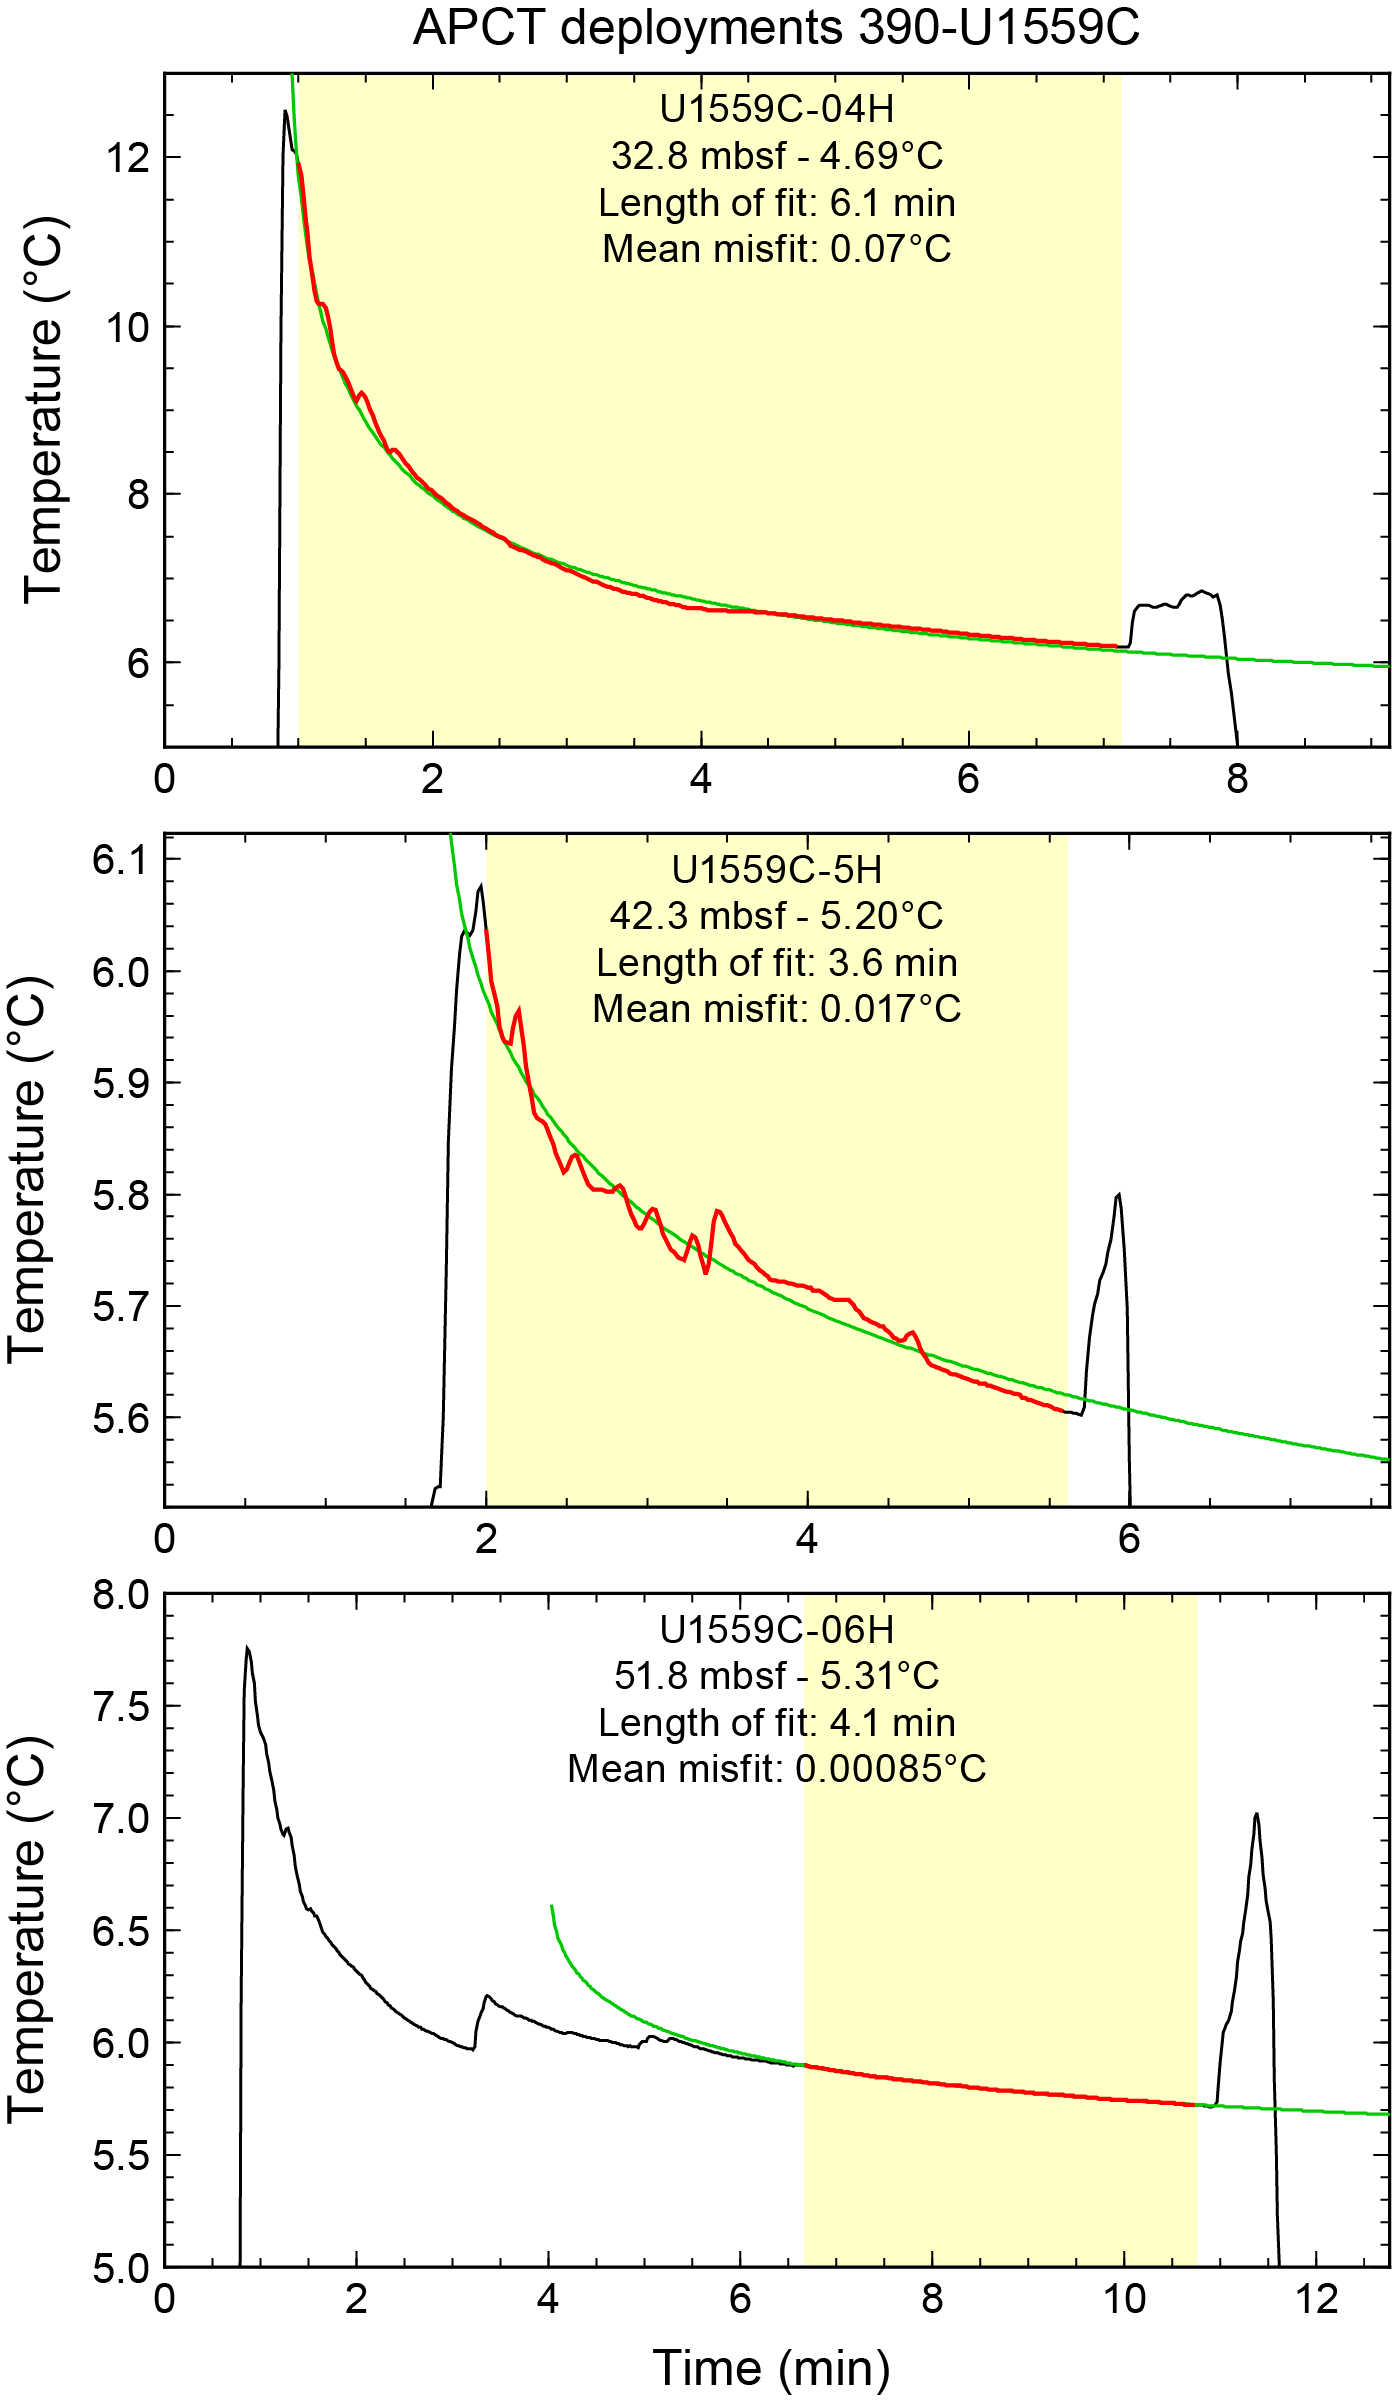
Figure F73. APCT-3 temperature records.
10.1.3.2. Heat flow
Estimates of the conductive heat flow (i.e., the amount of heat conducted through a unit area of the sediment column) can be used to investigate the proportion of heat loss that is conductive and advective from cooling plate models of the total heat flow through the seafloor as a function of crustal age (e.g., Stein and Stein, 1994). The conductive heat flow at Site U1559 was calculated using the Bullard method, which involves first calculating the thermal resistance downhole based on discrete thermal conductivity measurements (Pribnow et al., 2000) (see Physical properties and downhole measurements in the Expedition 390/393 methods chapter [Coggon et al., 2024c]). Once plotted against depth, the thermal resistance at the depths with APCT-3 temperature measurements was inferred (Figure F70B). The intercept (T0) of a linear trend on a plot of temperature versus thermal resistance, known as a Bullard plot (Pribnow et al., 2000) (Figure F70D), is the temperature at depth 0 m in the sediment succession (i.e., at the seafloor). The slope of such a regression line is equal to the conductive heat flow. Based on the Bullard plot estimation, the conductive heat flow throughout the sediment at Site U1559 is calculated to be 67 mW/m2. Table T30 summarizes these data and calculated results.
10.1.4. Data integration
10.1.4.1. Density and porosity versus lithology
The correlation between porosity and bulk density (Figure F71A) is due to the uniform grain density of the carbonate ooze recovered at Site U1559 (Figure F71B). The uppermost discrete samples are taken from Lithologic Subunits IA, IB, and IC (blue, orange, and green, respectively, in Figure F71). These samples record an increase in bulk density and decrease in porosity downhole (Figure F71C, F71D), which is likely a result of increasing consolidation of the sediment with depth. The lowest porosity and highest bulk density were measured in the samples that were taken from Subunit ID (red in Figure F71A, F71C, F71D). The P-wave velocity is also highest between ~22 and ~33 m CSF-B in Subunit ID (Figure F68), which further indicates that there is a lithologic control on the physical properties. The porosity of the lowermost samples from Subunit IE is slightly higher and bulk density is slightly lower compared to the samples from overlying Subunit ID. Because the lowermost two discrete samples were from Core 390-U1559C-7X, which was cored using the XCB system, it is possible that the apparent porosity and bulk density of Subunit IE do not follow the trends with depth observed throughout the upper sediments because the XCB system artificially introduced water into Subunit IE. However, care was taken to sample sediment undisturbed by the XCB coring system, and the five discrete samples from cores acquired using the APC coring system also appear to support the trend in porosity and bulk density with depth. Why Subunit IE would be more porous than Subunit ID is a question that can be explored in postexpedition research.
10.1.4.2. Heat flow and hydrothermal circulation
The shallow geothermal gradient at Site U1559C, and hence the calculated conductive heat flow (67 mW/m2), is not well constrained because only three formation temperature measurements were taken over a narrow depth interval. The expected heat flow for ~6.6 Ma crust, based on the GDH1 model of Stein and Stein (1994), is 204 mW/m2. This is much higher than the observed conductive heat flow at Site U1559, which would indicate that there is still significant advective heat loss occurring in the crust. The value measured at Site U1559 is a little lower than the conductive heat flow in the global compilation of measurements in similarly aged crust (103 ± 80 mW/m2 for 4–9 Ma crust; Stein and Stein, 1994), which is about half the expected total heat flow through crust formed at ~6.6 Ma. These estimates of the geothermal gradient indicate that significant advective heat loss via hydrothermal circulation is occurring at Site U1559. Quantification of the conductive and advective heat flow at this site will be refined postexpedition.
10.2. Basement
At Site U1559, the characterization of physical properties of the 6.6 Ma ocean crustal section is primarily based on cores from Hole U1559B that were recovered during Expedition 393. The uppermost basement was also recovered from Hole U1559A during Expedition 390C and from Hole U1559D during Expedition 390 (see Sediment in Physical properties and downhole measurements; Estes et al., 2021). The basement sequence at Site U1559 consists of basalt and volcanic glass with minor amounts of sediment that all show evidence of hydrothermal alteration (see Igneous petrology and Alteration petrology). Wireline logging was not attempted at Site U1559 because drilling operations stopped before Hole U1559B was deep enough to log.
10.2.1. Physical properties
Whole-round core section measurements included NGR, GRA bulk density, MS, and X-ray imaging. Archive halves of all split-core sections were measured for MSP. A total of 11 discrete sample cubes were taken for P-wave velocity and MAD measurements. All discrete samples were also used for paleomagnetic measurements (see Paleomagnetism). Nondestructive measurements of thermal conductivity were made on 11 representative pieces from working halves of split cores. Full-circumference, true color images of whole-round core exteriors were recorded with the DMT CoreScan3 system. A summary of core section and discrete physical properties data from Hole U1559B is shown in Figure F74 and Tables T31 and T32. We describe and compare the data as a function of depth in meters below seafloor (mbsf; CSF-A scale) and, if specified, in meters subbasement (msb). The averages of all physical properties are represented as arithmetic means with an uncertainty of ±1 standard deviation (1σ) unless stated otherwise.
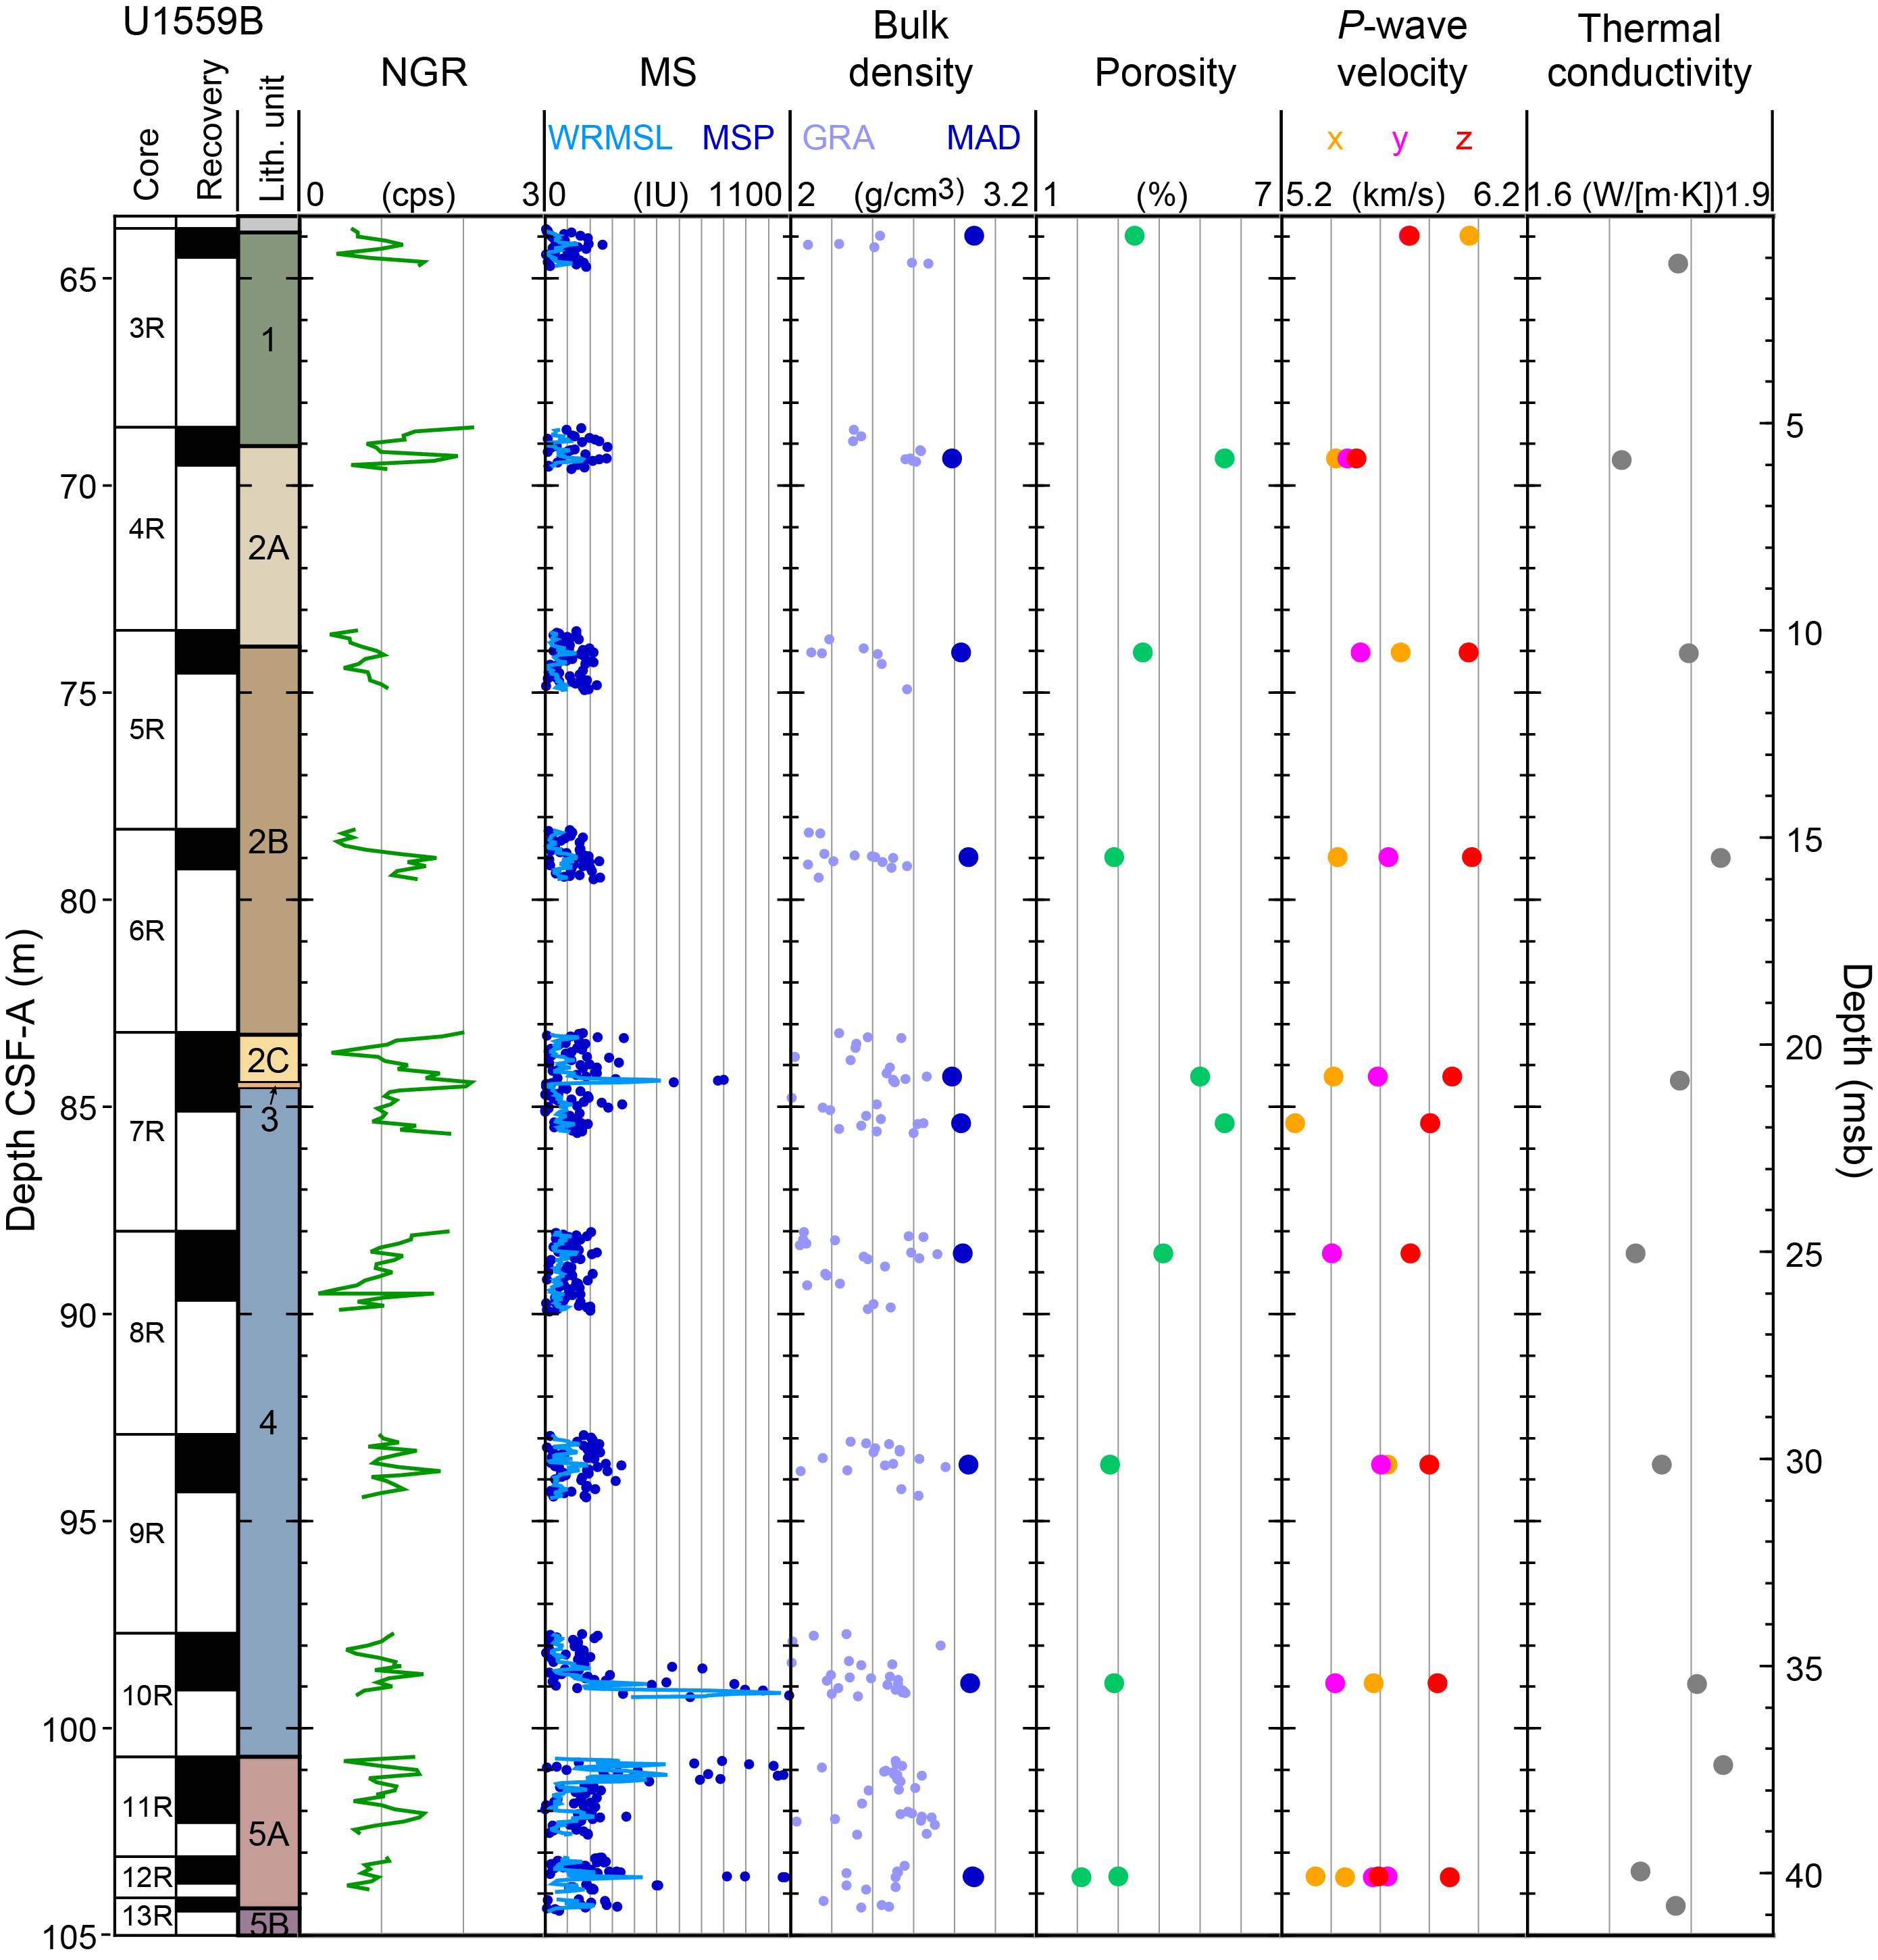
Figure F74. Summary of physical properties, Hole U1559B.
10.2.1.1. Natural gamma radiation
In Hole U1559B, the mean NGR value is 1.05 ± 0.36 counts/s, and NGR ranges 0.2–2.1 counts/s (Figure F74; Table T32). Because of the discontinuous nature of the basement core material recovered from Site U1559, the core-based physical properties data often measure air as well as rock core and therefore often underestimate the actual value, making downhole trends difficult to distinguish. The upper envelope of the data is more likely to be reliable. The low NGR values from Site U1559 are consistent with fresh basalt from other sites along the transect and suggest that the K-clay–rich rock types present at Sites U1556 and U1557 are either absent or not recovered at Site U1559. This matches petrologic observations (see Alteration petrology).
10.2.1.2. Magnetic susceptibility
MS at Site U1559 was measured on whole-round core sections using a pass-through sensor on the WRMSL and on split-core sections using a point-contact sensor (MSP) on the SHMSL. Despite differences in frequency and resolution between the two magnetic susceptibility systems (see Physical properties and downhole measurements in the Expedition 390/393 methods chapter [Coggon et al., 2024c]), the pass-through and point-contact data are similar in character (Figure F74). Whole-round MS data from Hole U1559B ranges 1–1054 IU, with a geometric mean (given the log-normal distribution) of 68.5 ± 112 IU. MSP data range 1–1636 (mean = 97.6 ± 199 IU) (Table T32). There is substantial scatter in both measurements (also shown by the high standard deviations) that reflects the discontinuous nature of the basement recovered. The higher envelope of the data is more likely to be reliable (Figure F74). Four positive spikes (susceptibility >500 IU recorded on both WRMSL and MSP) stand out prominently from the overall low trend at ~84 mbsf (Section 393-U1559B-7R-1), ~99 mbsf (Section 10R-2), ~101 mbsf (Section 11R-1), and ~103 mbsf (Section 12R-1). The shallower spike is clearly generated by Lithologic Unit 3, a thin indurated calcareous sediment layer, whereas the deeper spikes originate from the sheet and pillow flows of Lithologic Subunit 5A.
10.2.1.3. Gamma ray attenuation bulk density
Narrow RCB cores and irregularly shaped pieces that do not fill the core liner, as well as the gaps and dividers between them (see Curatorial core procedures and sampling depth calculations in the Expedition 390/393 methods chapter [Coggon et al., 2024c]), generate multiple GRA bulk density readings that are not representative of the density of the core material. Without a more rigorous way to cull invalid data and based on the more reliable measurements on discrete samples (see Moisture and density below), all density values <2 g/cm3 were excluded from any figure or interpretation (Figure F74). There is no major downhole trend in GRA bulk density at Site U1559, and data points are scattered widely across the range of observed values (2–2.8 g/cm3; geometric mean = 2.39 ± 0.19 g/cm3) (Table T32). The large scatter in GRA density values results from the discontinuous nature of the hard rock core (including empty space and/or rubble zones), as well as from the edge effects of small core pieces.
10.2.1.4. Moisture and density
MAD procedures measure bulk density, grain density, and porosity on discrete samples. Samples for MAD analysis were taken once per core or once per distinct lithology (hence, 2 samples were taken from Cores 393-U1559B-7R and 11R) for a total of 11 discrete samples selected to be representative of the main units and degrees of alteration of the basalts recovered at Site U1559 (Figures F74, F75; Table T31).
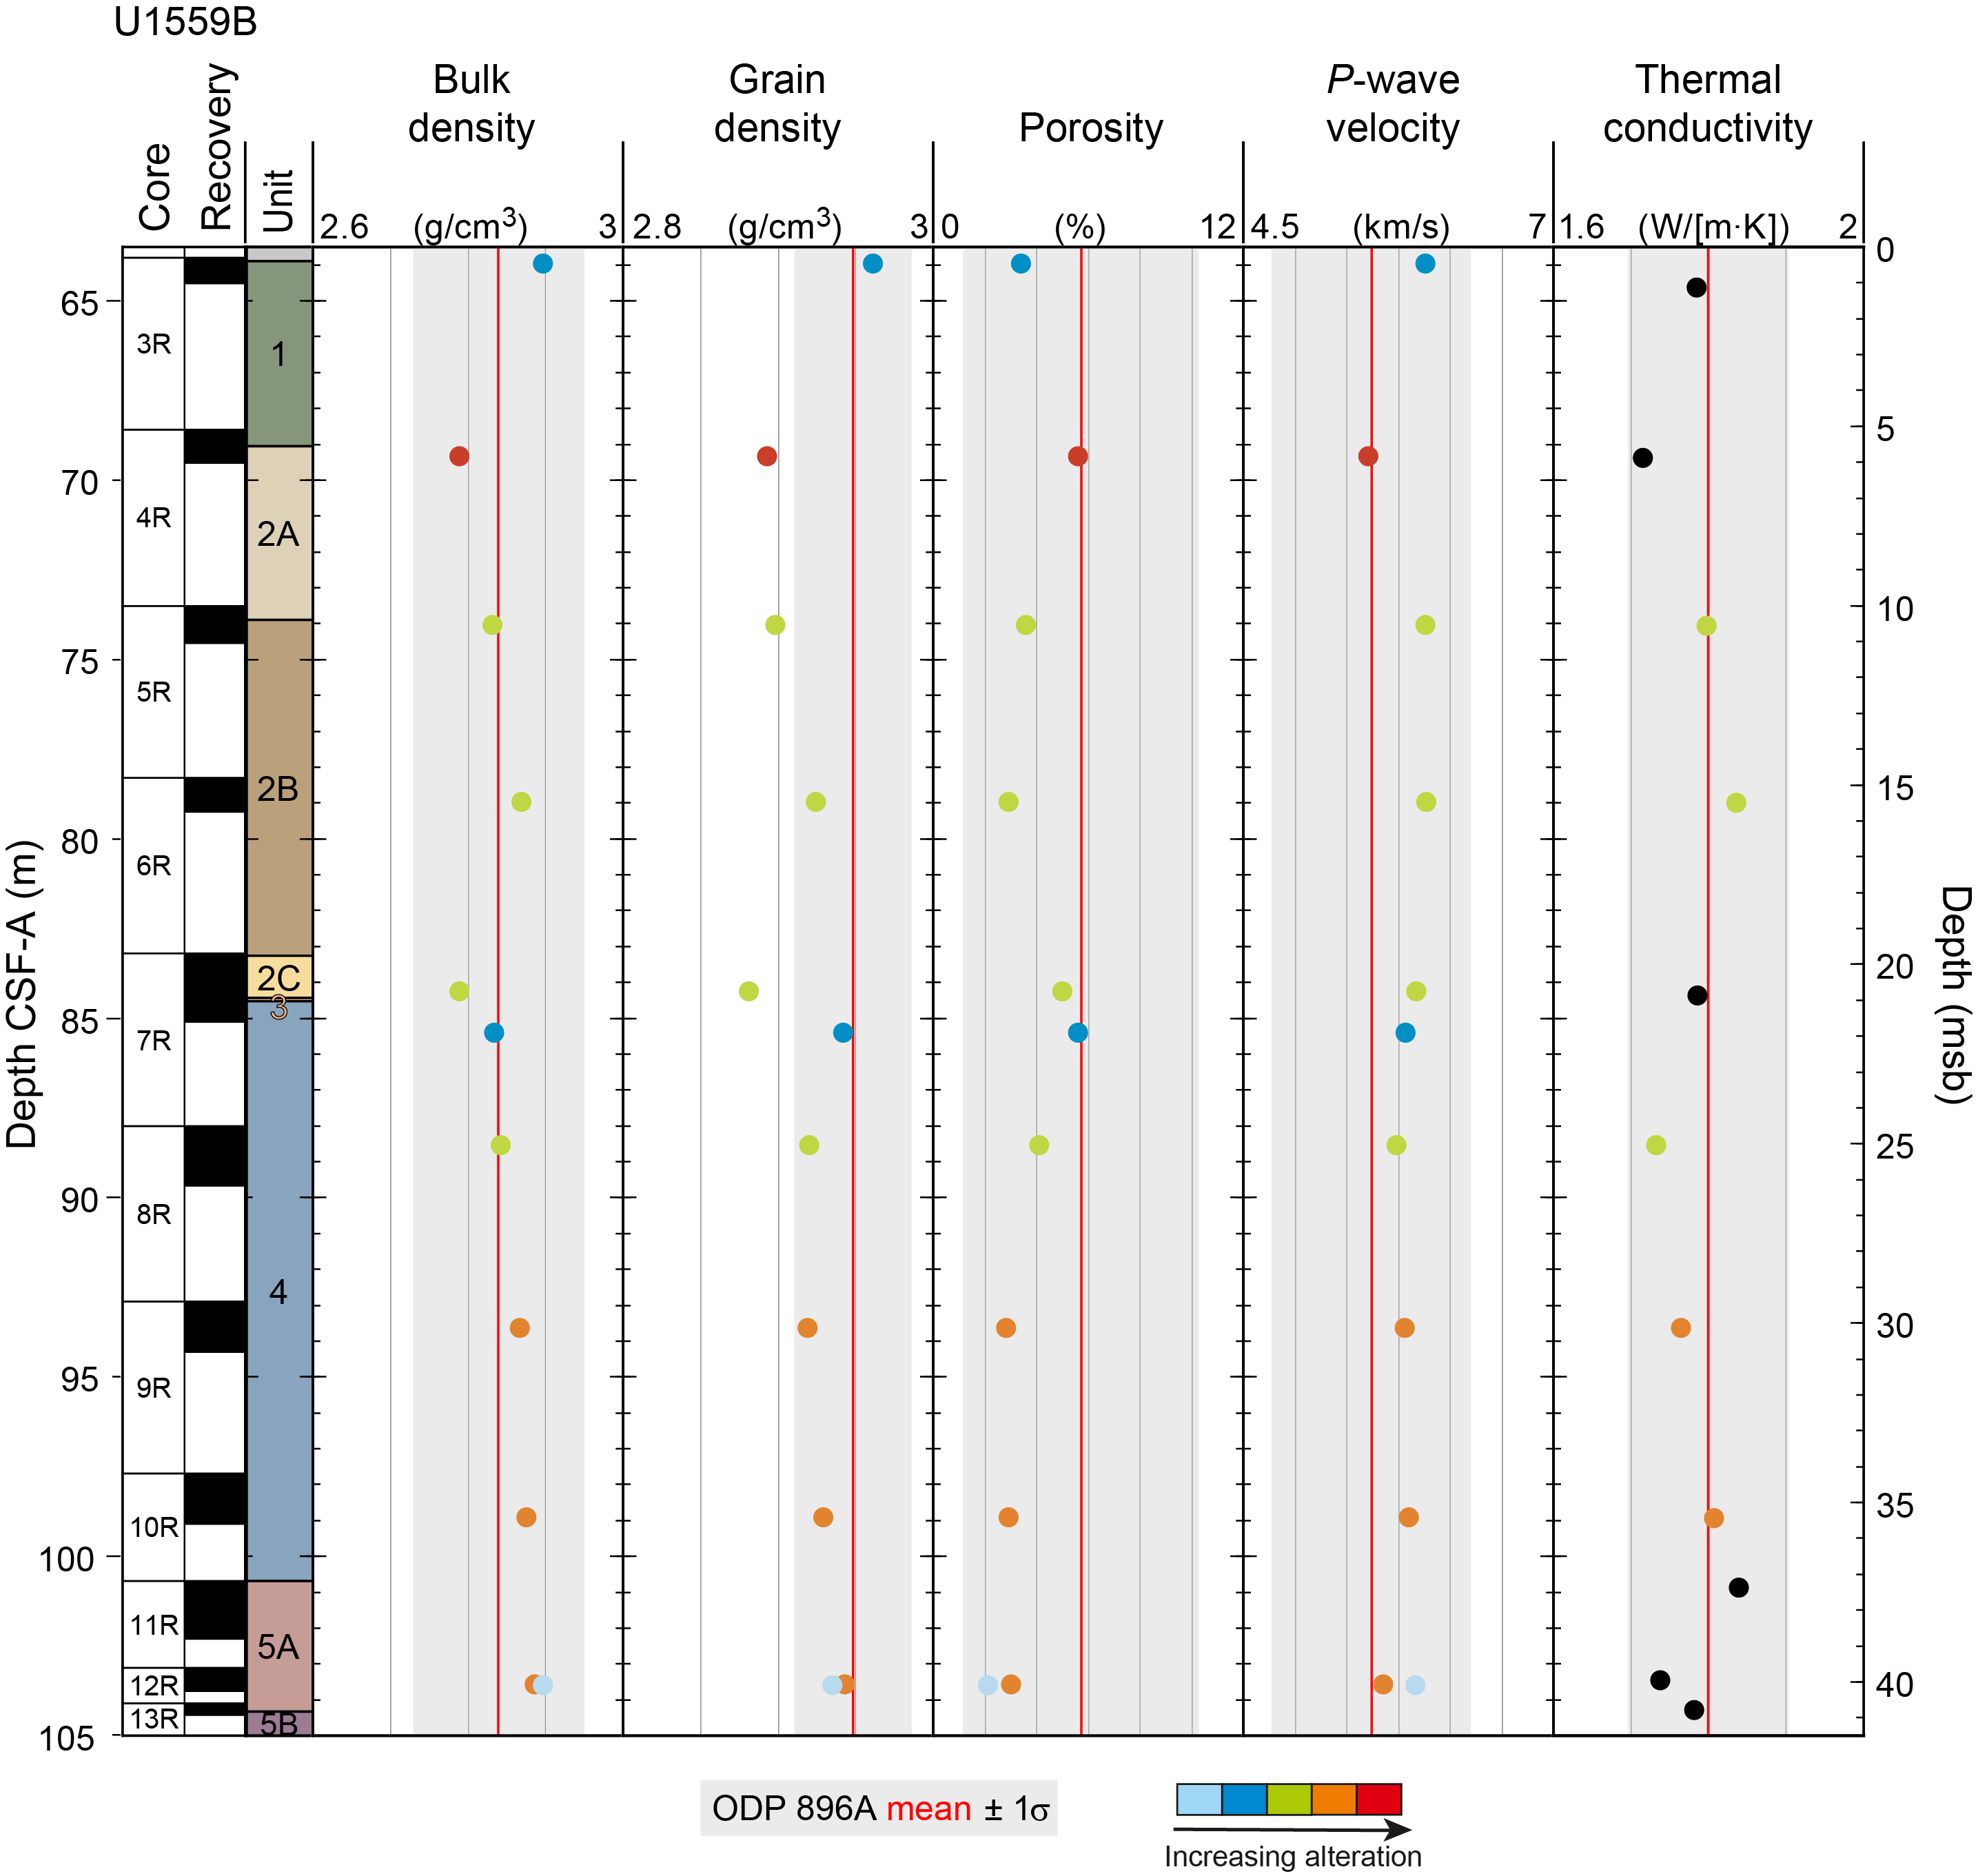
Figure F75. Discrete physical properties, Hole U1559B vs. Hole 896A.
Discrete bulk density and grain density of basalts from Hole U1559B range 2.79–2.90 g/cm3 and 2.88–2.96 g/cm3, respectively (Table T31). The highest grain density (2.96 g/cm3) is measured in the uppermost part of Core 393-U1559B-3R (sheet flows of Unit 1), whereas the lowest (2.88 g/cm3) is from sheet flows in Subunit 2C (Section 7R-1). MAD bulk density measurements are consistently higher than the GRA values (Figure F74; Table T31). The main reasons for the difference are incomplete filling of the core liner by discontinuous core pieces of smaller diameter, generating lower GRA readings, and bias in the selection of MAD samples toward pieces that seem cohesive enough to allow cutting of a cube, which are probably in the higher end of the density values.
The mean porosity of all Hole U1559B discrete samples is 3.71% ± 1.21% (Table T32). The porosity of the basalt emplaced as sheet flows in Unit 1, Subunit 2C, and Unit 4 (mean = 4.18% ± 1.23%) is higher compared to pillow flows, although it varies irregularly from 2.85% in Sample 393-U1559B-10R-2, 42 cm, to 5.56%–5.63% in Samples 4R-1, 74 cm, and 7R-2, 75 cm (Figure F74; Tables T31, T32). Fine-grained basalts emplaced as an alternation of sheet and pillow flows (Subunits 2A and 5A) have lower porosity (mean = 2.87% ± 0.78%; range = 2.06%–3.61%), which is markedly lower than sheet flow porosities. Fine-grained pillow flow basalts are only characterized by one discrete sample in Subunit 2B (2.86% porosity) (Figure F74; Table T31).
10.2.1.5. P-wave velocity
P-wave velocity was measured on the x-, y-, and z-axes of the discrete sample cubes and ranges 5.24–5.97 km/s (Figure F74; Table T31). The standard deviation of the measurements from the three axes vary considerably, 0.04–0.32 km/s (Table T31). Without orientation of the core, the x- and y-directions are arbitrarily defined by the splitting plane and are likely to change from section to section. P-wave velocity along the z-axis is the fastest in most samples (9 of the 11 samples) and ranges 5.50–5.96 km/s. Maximum P-wave velocities correspond to the pillow flows of Subunit 2B. The two samples for which P-wave velocity was the slowest were cored from Unit 4 and Subunit 5A (5.24 and 5.34 km/s, respectively).
The variability in P-wave velocities among the three axes may be associated with physical imperfections of the samples. Because the cubes are cut by hand, geometrical imperfections such as different corner cube angles (leading to slightly nonparallel planes) and/or rough surfaces cannot be avoided. These features can only decrease measured velocity by introducing space between the sample and the transducers. Thus, in the following discussions and correlations, we only consider the fastest measurement for each sample (regardless of its direction) to be the most representative of the formation at that depth.
10.2.1.6. Thermal conductivity
Thermal conductivity in Hole U1559B ranges from a minimum of 1.72 W/(m·K) in Section 393-U1559B-4R-1 (Subunit 2A) to a maximum of 1.84 W/(m·K) in Section 11R-1 in Subunit 5A (Table T31; Figure F74). The average value in Hole U1559B is 1.78 ± 0.04 W/(m·K) (Table T32). Thermal conductivity does not show a correlation with groundmass grain size. Indeed, mean values from fine-grained and microcrystalline basalts are the same, 1.78 ± 0.04 and 1.78 ± 0.02 W/(m·K), respectively (Table T32). Further inspection of correlation between thermal conductivity and the igneous units (see Igneous petrology) has not been attempted because of the low number of analyses in Subunits 2A–2C, with each of them represented by only one discrete sample. There might be a correlation between thermal conductivity values and the emplacement style, but it cannot yet be confirmed with the limited number of measurements available at this site. Average thermal conductivity of sheet flows and mixed sheet and pillow flows are similar, 1.76 ± 0.03 and 1.79 ± 0.03 W/(m·K), respectively. The single pillow flow basalt sample (from Subunit 2B) has the highest value (1.84 ± 0.02 W/[m·K]) (Table T32).
10.2.2. Comparison to ODP Hole 896A
The relatively short interval drilled into basement in Hole U1559B (<50 m) and the incomplete recovery make it difficult to ascertain how representative the measured properties are of the regional oceanic crust. Comparison of the discrete physical properties measurements made in Hole U1559B (MAD, P-wave velocity, and thermal conductivity) with the same type of data from ODP Hole 896A, where similarly aged crust was cored (~7 Ma; ODP Leg 148; Shipboard Scientific Party, 1993), suggests that the range and variability in physical properties of the shallow crust are similar at the two sites (Figure F75). Hole 896A is used as a primary comparison because it is of comparable age and it was drilled >250 m into basement and thoroughly characterized (Shipboard Scientific Party, 1993). The thermal conductivity from Site U1559 agrees with values from Hole 896A (1.80 ± 0.10 W/[m·K]; Shipboard Scientific Party, 1993) (Figure F75), and both are higher than at Sites U1556 (1.51 ± 0.14 W/[m·K]) and U1557 (1.39 ± 0.188 W/[m·K]) in ~61 Ma oceanic crust cored during Expedition 390 (see Basement in Physical properties and downhole measurements in the Site U1556 chapter [Coggon et al., 2024a] and Basement in Physical properties and downhole measurements in the Site U1557 chapter [Coggon et al., 2024b]). This confirms that higher thermal conductivity coincides with younger, less altered basalt and supports the potential for greater heat conduction in the uppermost basement in sites closer to the mid-ocean ridge.
As shown in Figure F75, bulk density, porosity, and P-wave velocity from Hole U1559B are also always within the mean ±1σ of the same physical properties measured in Hole 896A. More advanced and statistically meaningful comparisons should await further drilling and more complete recovery along the SAT.
10.2.3. X-ray imaging
X-ray imaging of basement material can be used to identify primary and secondary features in whole-round cores before they are split (e.g., Kelemen et al., 2020). In igneous rocks, these may be derived from mineralogical variation, vesicularity, fractures and veins, and alteration zones that result in density contrasts. Cores from Hole U1559B were the first basement material cored during Expedition 393, and these were used to determine appropriate X-ray imaging parameters for basement rocks (see Physical properties and downhole measurements in the Expedition 390/393 methods chapter [Coggon et al., 2024c]). During Expedition 393, findings from X-radiographs only provided limited assistance for visual core description because the irregular shape of many pieces dominated the apparent density and, consequently, the images. Also, the contrast-enhanced images of small core pieces showed strong edge effects because of the enhancement algorithm and the density contrast with the surrounding air (Figure F76A).
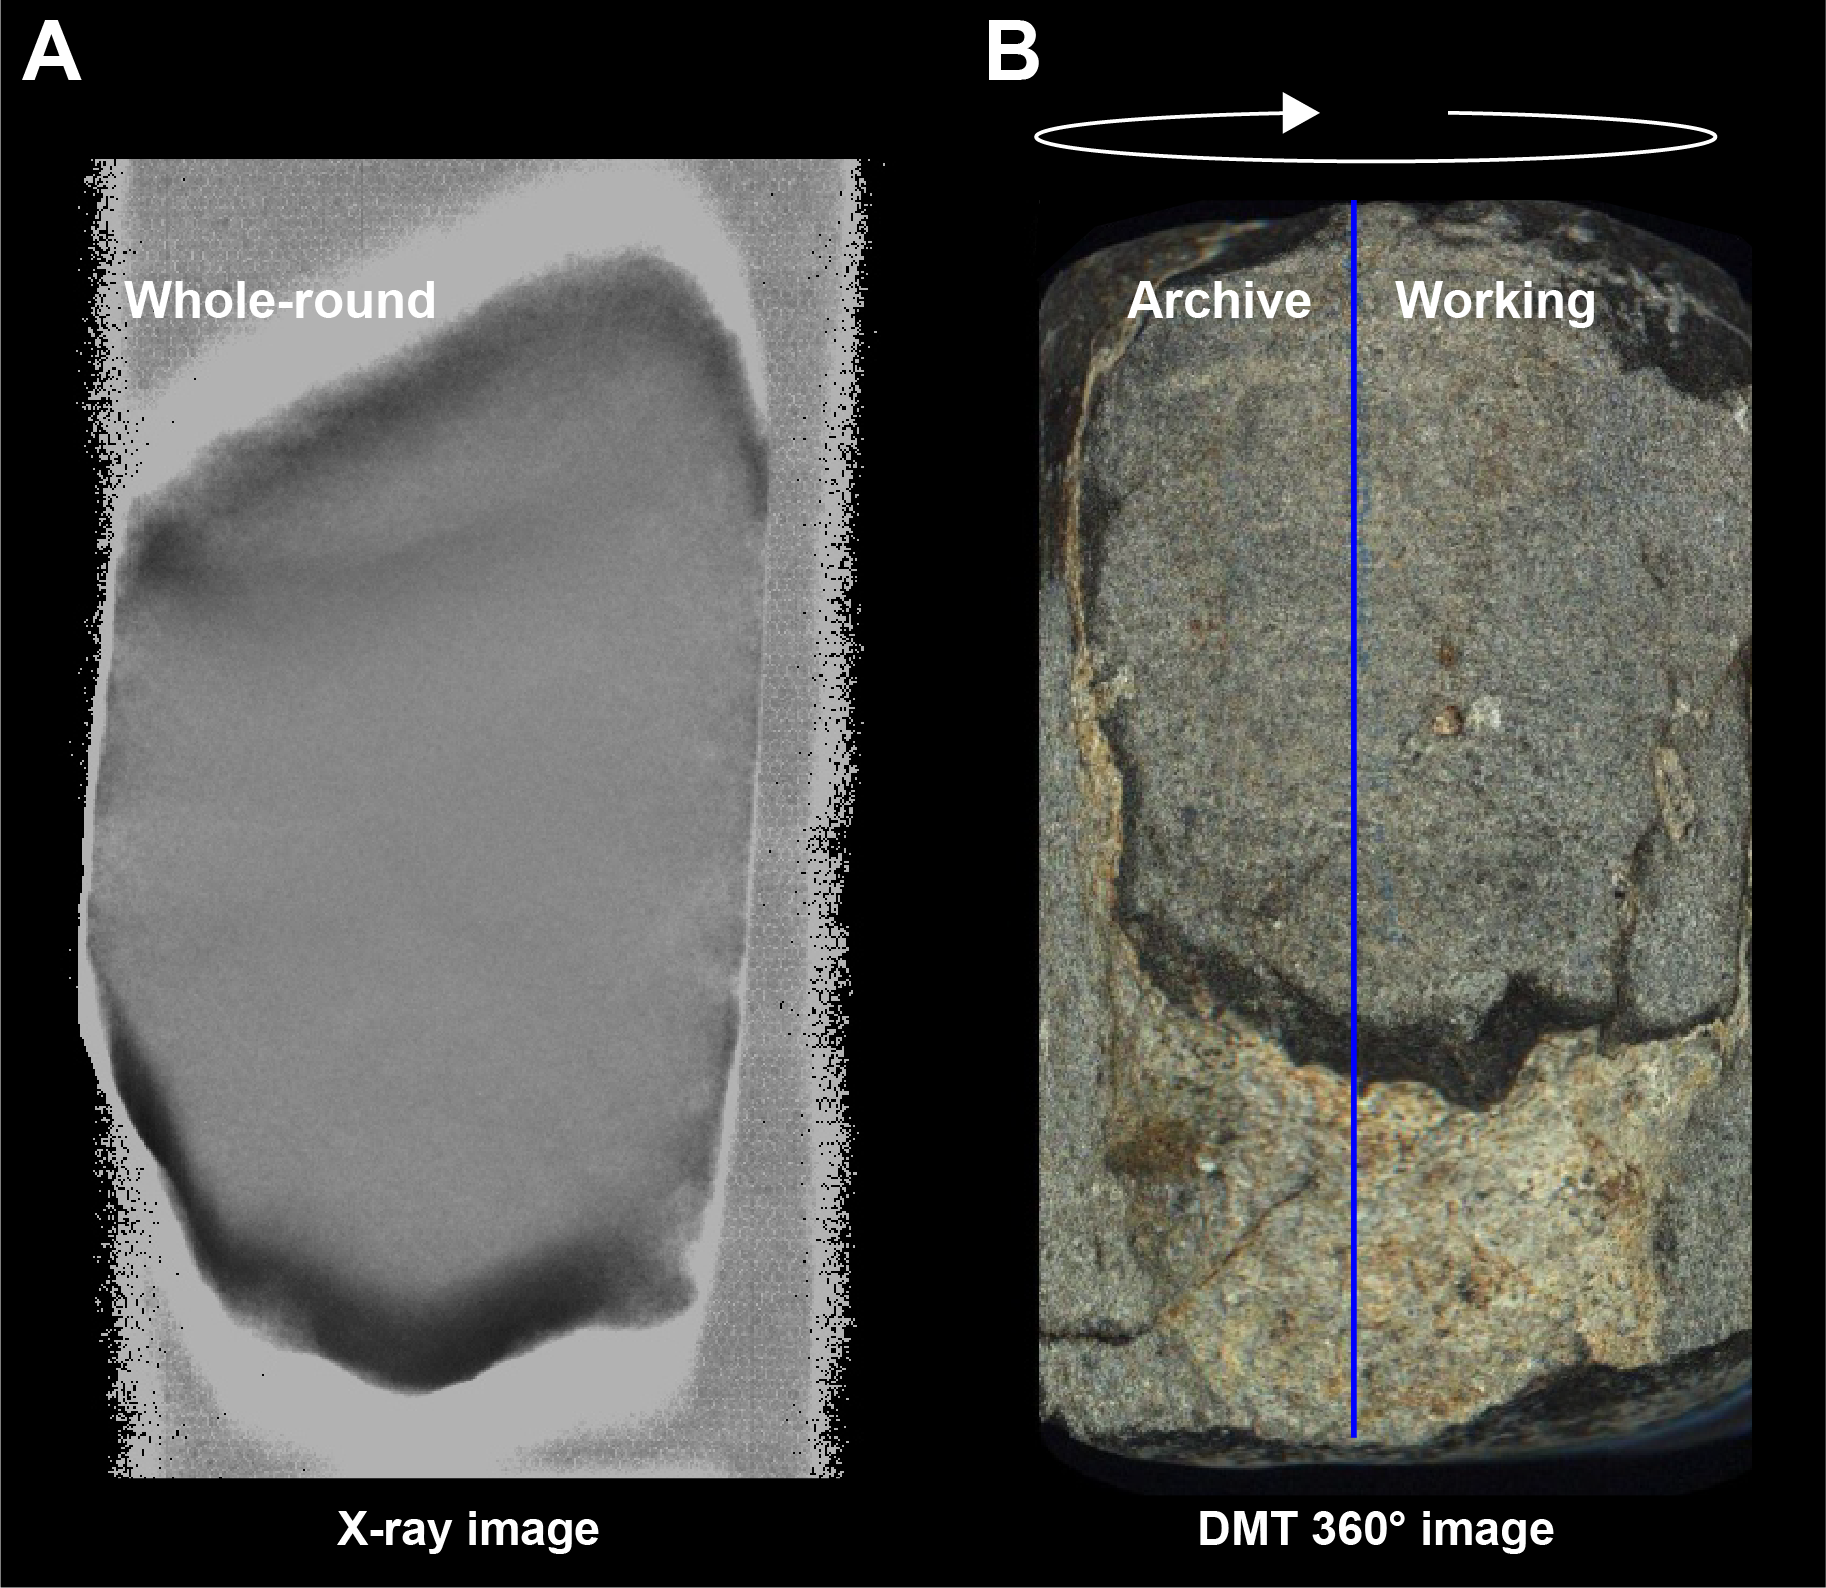
Figure F76. Basalt piece image comparison.
10.2.4. Digital imaging
Hard rock cores collected at Site U1559 were highly fragmented; only a few pieces had the cylindrical shape required for scanning the exterior surface with the DMT CoreScan3 (Figure F76B). Additionally, several hard rock pieces had a noticeable bulge or lip at their base due to poor cutting by the RCB bit that prevented smooth rolling on the DMT scanner. A total of about 30% of the recovered material was scanned. The irregular core pieces at Site U1559 meant that more images have small regions that are out of focus or distorted compared to images from other sites. The remaining areas in these images display a high-resolution image quality (example shown in Figure F76B) that will be useful for postexpedition image analysis.
10.2.5. Data integration
Discrete samples used for MAD and P-wave analyses were classified into five alteration levels based on color (orange, brown, or gray) and the presence of alteration halos following the scheme used in Hole U1559B macroscopic core descriptions (see Igneous petrology and Alteration petrology) (Figure F75). From freshest to most altered basalt recovered at the site, the samples are ordered as follows:
This classification scheme provides an opportunity to compare independently measured physical properties attributes with alteration styles for basalts recovered from Site U1559 (Figure F77).
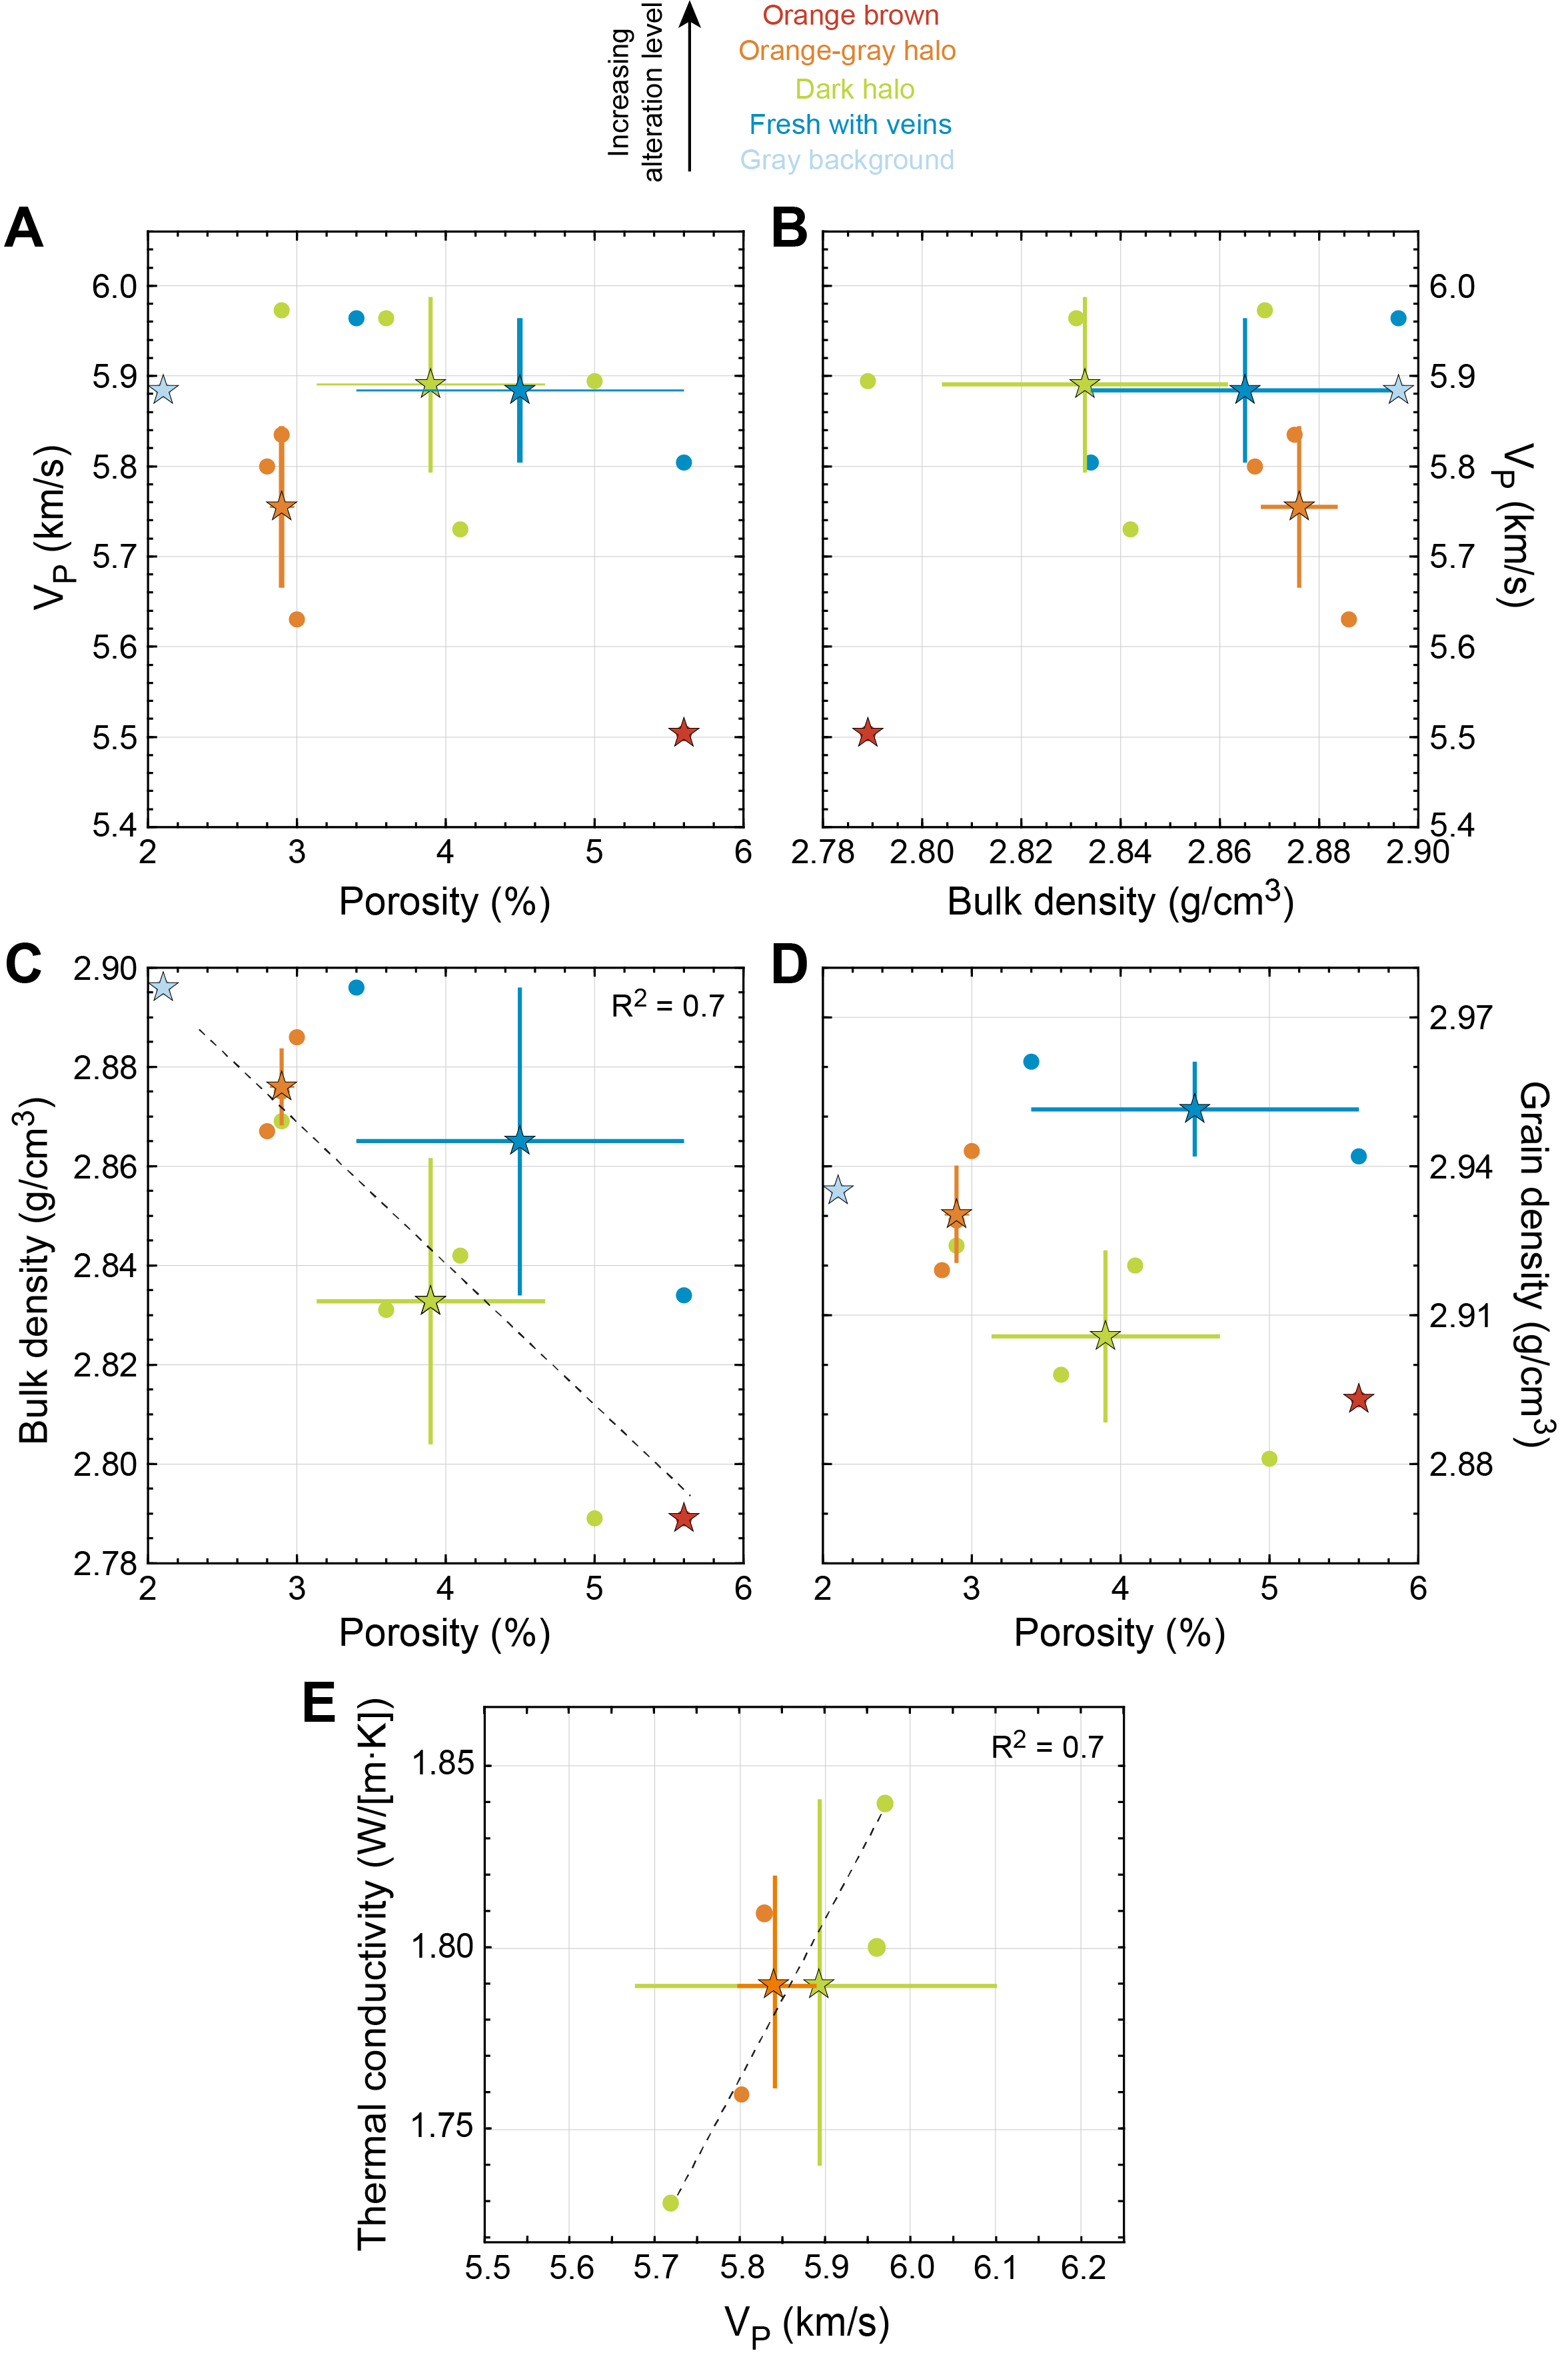
Figure F77. Discrete physical properties, Hole U1559B.
In all crossplots, the most altered sample (orange-brown), recovered in the lower part of Unit 1 (Sample 393-U1559B-4R-1, 74–76 cm), plots in the diagonally opposite quadrant from the least altered sample (gray background) in Subunit 5A (Sample 12R-1, 49–51 cm) (Figure F77; Table T31). P-wave velocity as a function of porosity and bulk density shows no statistically significant correlation or grouping according to alteration level (Figure F77A, F77B). As expected, bulk density and porosity show a negative correlation (R2 = 0.7) (Figure F77C), but there is no correlation between porosity and grain density (Figure F77D). However, the freshest basalts sampled (gray background and fresh with veins) yield higher grain densities, whereas the basalts with dark halo give the lowest grain densities.
Across the SAT, we see a counterintuitive trend where the most altered basalts display the highest porosity (e.g., see Basement in Physical properties and downhole measurements in the Site U1556 chapter [Coggon et al., 2024a]). Interestingly, the sample with the highest porosity from Site U1559 (5.63%; Sample 393-U1559B-7R-2, 75 cm; Unit 4) is also one of the least altered (categorized as fresh, with veins; Table T31). We link this singularity to the fact that the sample contained veins and therefore the high porosity, despite the low alteration, may result from the measurement of voids in the fractures that are not completely sealed by the veins.
Five thermal conductivity measurements were performed on the same basement pieces used for P-wave velocity and MAD. There is a positive linear correlation (R2 = 0.7) between thermal conductivity and P-wave velocity (Figure F77E), but crossplots between thermal conductivity and MAD results yielded no conclusive correlations.
As a whole, alteration level at Site U1559 does not appear to influence clearly the properties measured here, although these preliminary results seem to support the findings at Sites U1556 and U1557 (see Basement in Physical properties and downhole measurements in the Site U1556 chapter [Coggon et al., 2024a] and Basement in Physical properties and downhole measurements in the Site U1557 chapter [Coggon et al., 2024b]). This may result from Hole U1559B being limited to the uppermost 40 m of basement, the small number of samples measured at the site, and the overall fresher basalt recovered from Site U1559.
11. Geochemistry
11.1. Sediment
11.1.1. Interstitial water sampling
Interstitial water (IW) was sampled by squeezing whole-round core sections from Hole U1559A during Expedition 390C and Hole U1559D during Expedition 390. In Hole U1559A, whole-round IW samples were extracted from 5 cm whole rounds at a frequency of two per core with the exception of Cores 390C-U1559A-1H and 8X, where only one IW sample was squeezed. During Expedition 390, squeezed IW samples were taken at a frequency of two per core except for Cores 390-U1559D-5H and 7X, where only one IW was collected because of low core recovery. A total of 15 and 13 IW samples were taken from Holes U1559A and U1559D, respectively. Mudline water from the sediment/water interface in Cores 390C-U1559A-1H and 390-U1559D-1H was also collected and processed. All squeezing occurred under laboratory atmosphere. Rhizon IW samples were taken at a frequency of ~1 per section prior to core splitting from Holes U1559C and U1559D for postexpedition research (see Geochemistry in the Expedition 390/393 methods chapter [Coggon et al., 2024c). Rhizon sampling avoided intervals with obvious drilling disturbance. Shipboard analyses of the squeezed IW from Holes U1559A and U1559D include pH, salinity, alkalinity, major cations and anions (sodium, calcium, magnesium, potassium, chloride, and sulfate) using ion chromatography (IC), major and minor elements using inductively coupled plasma–atomic emission spectrometry (ICP-AES), and nutrients (phosphate and ammonium) using a spectrophotometer (see Geochemistry in the Expedition 390/393 methods chapter [Coggon et al., 2024c]). Carbonate and total carbon (TC) measurements were conducted on the solid sample residues (squeeze cakes) and discrete samples from the working half cores from Holes U1559A, U1559C, and U1559D. The remaining squeezed IW and squeeze cake material were distributed to scientists for postexpedition research. Dissolved oxygen in the pore water was also measured in cores from Holes U1559C and U1559D using PreSens optical oxygen sensors (optodes) at a resolution of ~1.5 m, avoiding intervals with drilling disturbance when identifiable through the core liner (see Geochemistry in the Expedition 390/393 methods chapter [Coggon et al., 2024c]). Oxygen measurements were conducted on sediment cores from Hole U1559C immediately following logging of the core sections on the STMSL, within 30 min of arrival on the catwalk. Because the core sections were not temperature-equilibrated, the temperature probe was inserted into the core section ~20 cm from where the oxygen probe was inserted. For Hole U1559D analyses, the sediment cores were allowed to equilibrate to room temperature for at least 4 h before oxygen measurements to allow comparison to Hole U1556C data, where cores were also allowed to equilibrate to room temperature prior to oxygen measurements (see Geochemistry in the Expedition 390/393 methods chapter [Coggon et al., 2024c]).
All data from shipboard analyses of the squeezed IW, sedimentary carbonate, and TC for Site U1559 sedimentary sections are presented in Tables T33 and T34. Depth profiles of the concentrations of selected elements in the sediment pore waters and sediment compositional data are plotted in Figures F78, F79, F80, F81, and F82. Major cations (Na, K, Ca, and Mg) were measured by both ICP-AES and IC. Here, we report the data set with better accuracy for sulfate on the International Association for the Physical Sciences of the Oceans (IAPSO) standard seawater values, and thus ICP-AES data from Hole U1559A and IC data from Hole U1559D are used for major cations and sulfate, respectively. The following profiles, unless otherwise noted, describe trends observed in both Holes U1559A and U1559D.
11.1.2. Interstitial water chemistry
11.1.2.1. Salinity, chloride, sodium, bromide, and potassium
Pore water salinity is constant at 35 through Site U1559 sediments (Table T33), which is consistent with relatively stable chloride (Cl) concentrations (Hole U1559A: 566–612 mM; Hole U1559D: 560–576 mM) (Figure F78B). There is an offset between the pore water Na concentrations in the two holes (Hole U1559A: 457–472 mM; Hole U1559D: 469–490 mM), but both profiles indicate uniform concentrations downhole (Figure F78A). Bromide (Br) concentrations (only measured in Hole U1559D) are 0.85–0.87 mM; the maximum value occurs near the sediment/basement interface (Figure F78C). Pore water potassium (K) concentrations are also relatively invariant, ranging from ~10 mM in the mudline water to ~11 and ~11.5 mM in Holes U1559A and U1559D, respectively (Figure F78D).
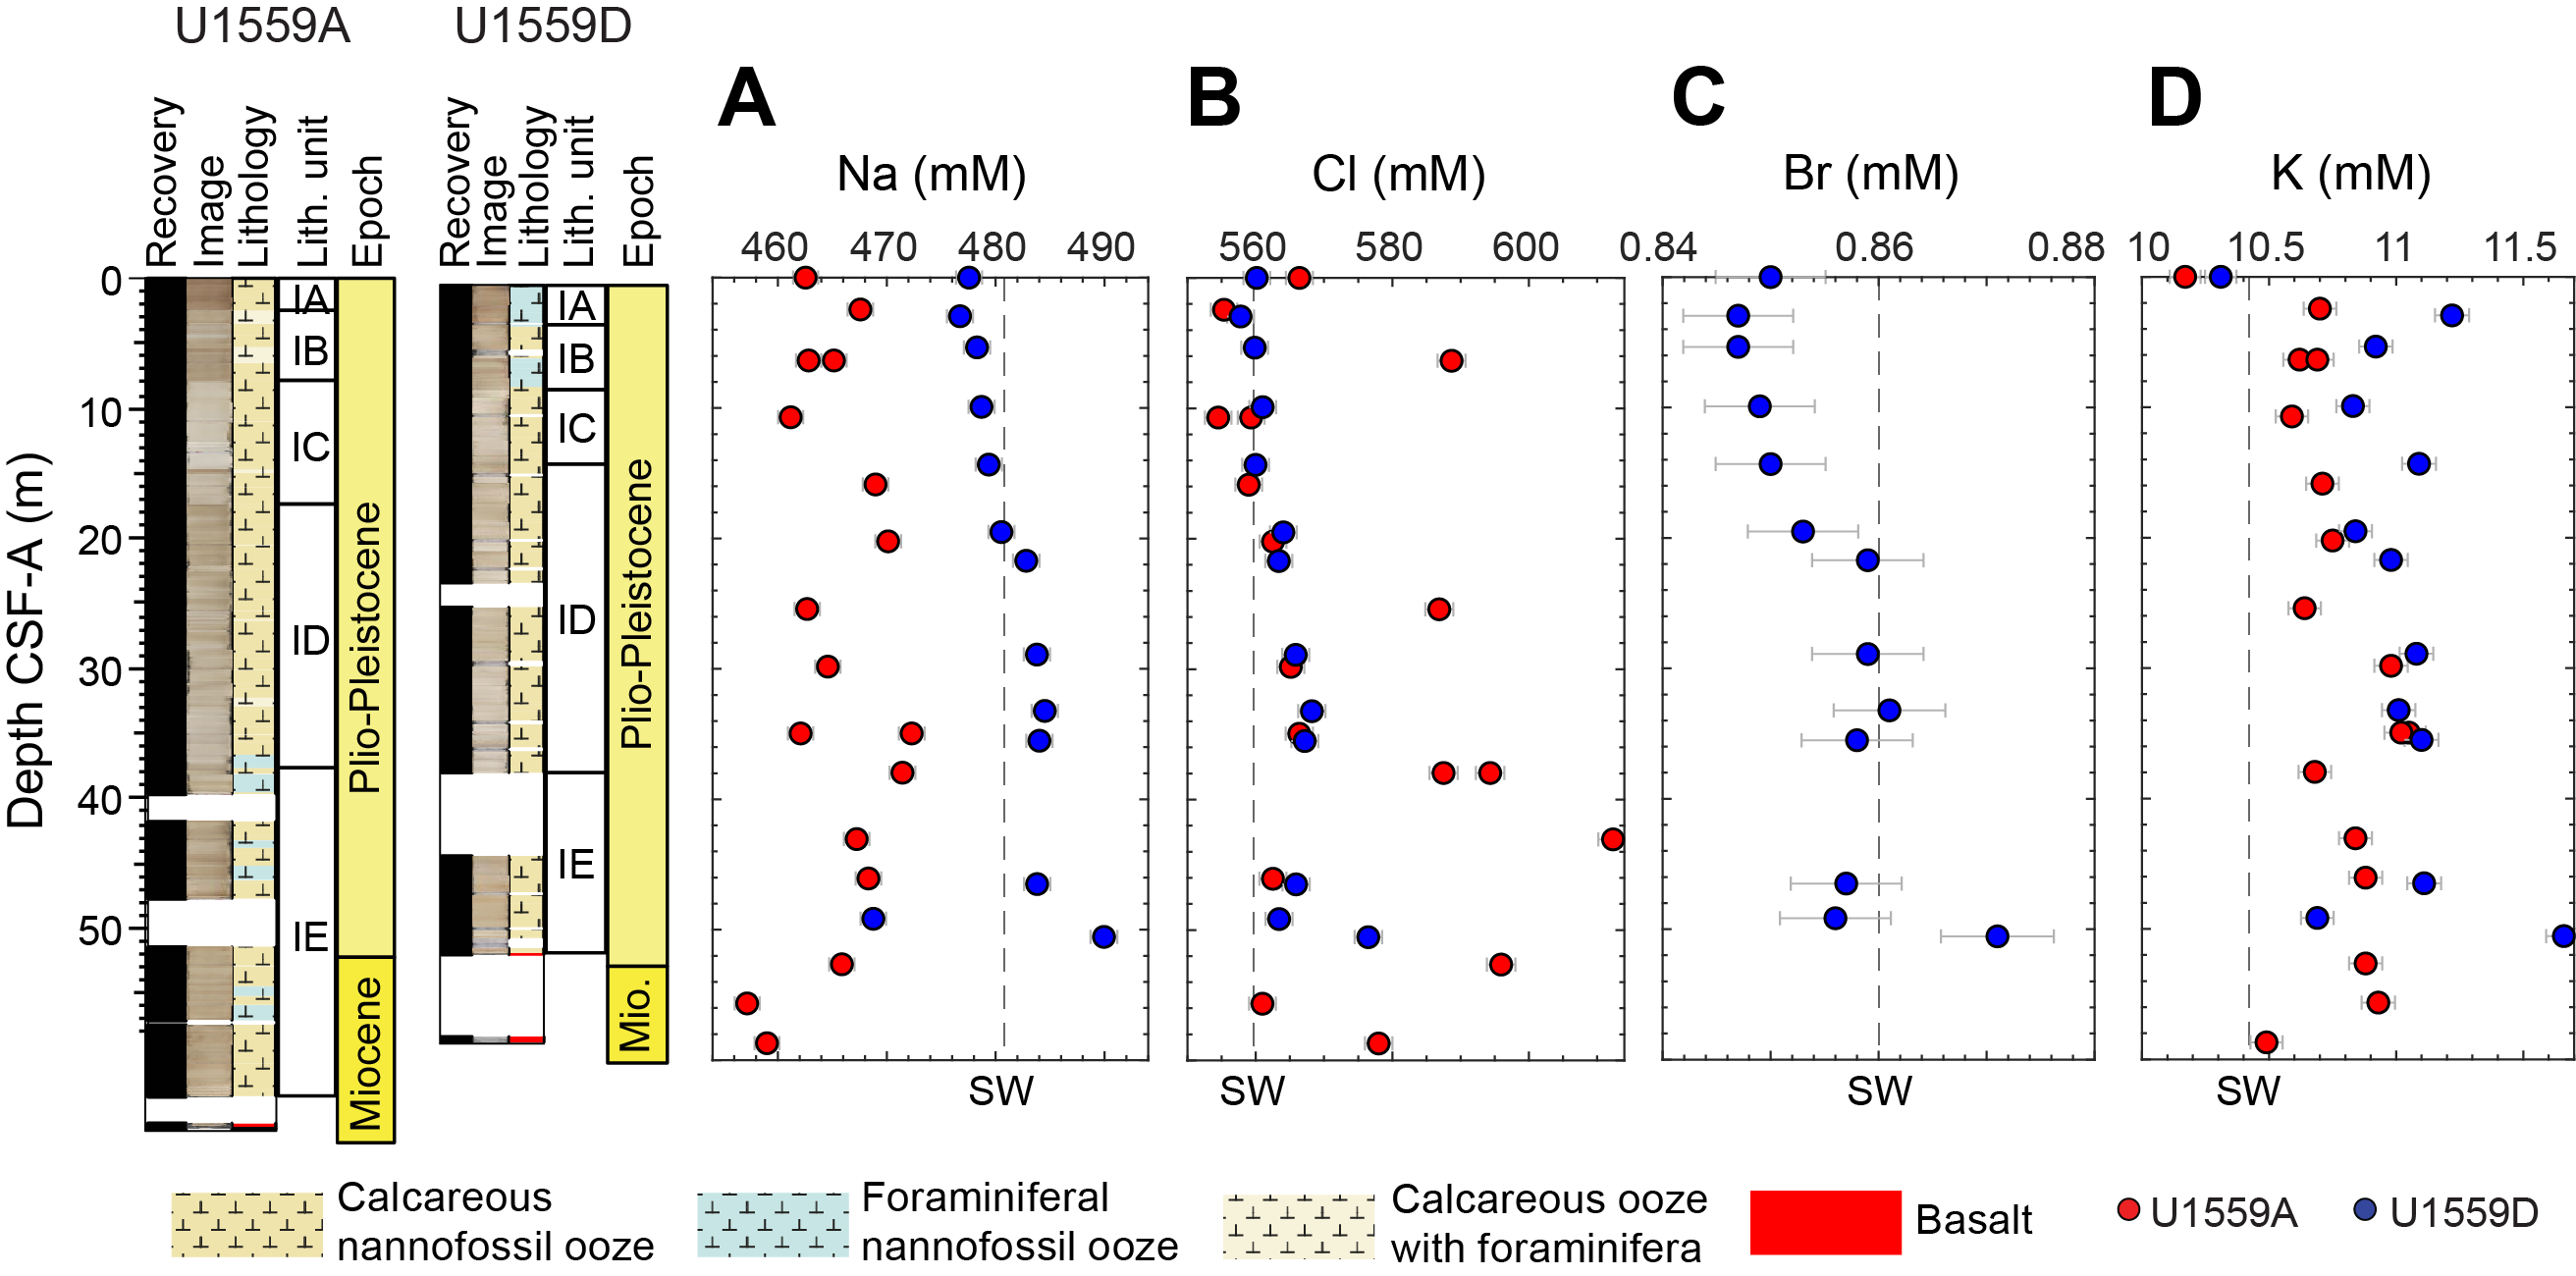
Figure F78. IW sodium, chloride, bromide, and potassium.
11.1.2.2. pH, alkalinity, calcium, magnesium, and strontium
The highest measured pH value occurs in the mudline samples from Site U1559 (Hole U1559A: 7.8; Hole U1559D: 7.7), below which pH decreases to ~7.6 with some variability (± ~0.05) downhole (Figure F79A). Alkalinity increases from ~2.3 mM in the mudline sample to ~2.7–2.8 mM at ~3 m CSF-A, below which alkalinity values are relatively uniform until ~38 m CSF-A (Subunit ID/IE boundary; see Sedimentology) (Figure F79B). A gradual decline in alkalinity close to the sediment/basement interface is observed in both holes. Calcium (Ca) concentrations are relatively invariant at ~10.7 mM in Hole U1559A and ~11 mM in Hole U1559D to ~38 m CSF-A, below which they decline gradually toward the basement (Figure F79C). Magnesium (Mg) concentrations increase in Hole U1559D from Subunit IA to Subunit ID to a maximum concentration of 55.4 µM at the interface between Subunits ID and IE, below which there are only three values that are scattered (Figure F79D). Mg in Hole U1559A displays no apparent trend downhole. Strontium (Sr) concentrations increase between the seafloor and 38 m CSF-A (Subunit ID/IE boundary; see Sedimentology) in both holes and then decline toward the sediment/basement interface (Figure F79E). Because of differences in the basement topography, the Hole U1559D sediment cover is ~10 m thinner than that for Hole U1559A (see Stratigraphic unit summary), and thus the curvatures near the bottom of the Sr profiles are slightly different. Sr/Ca ratios in both holes (Figure F79F) are generally higher than the value in the mudline sample, indicative of calcium carbonate recrystallization (Baker et al., 1982; Elderfield and Gieskes, 1982).
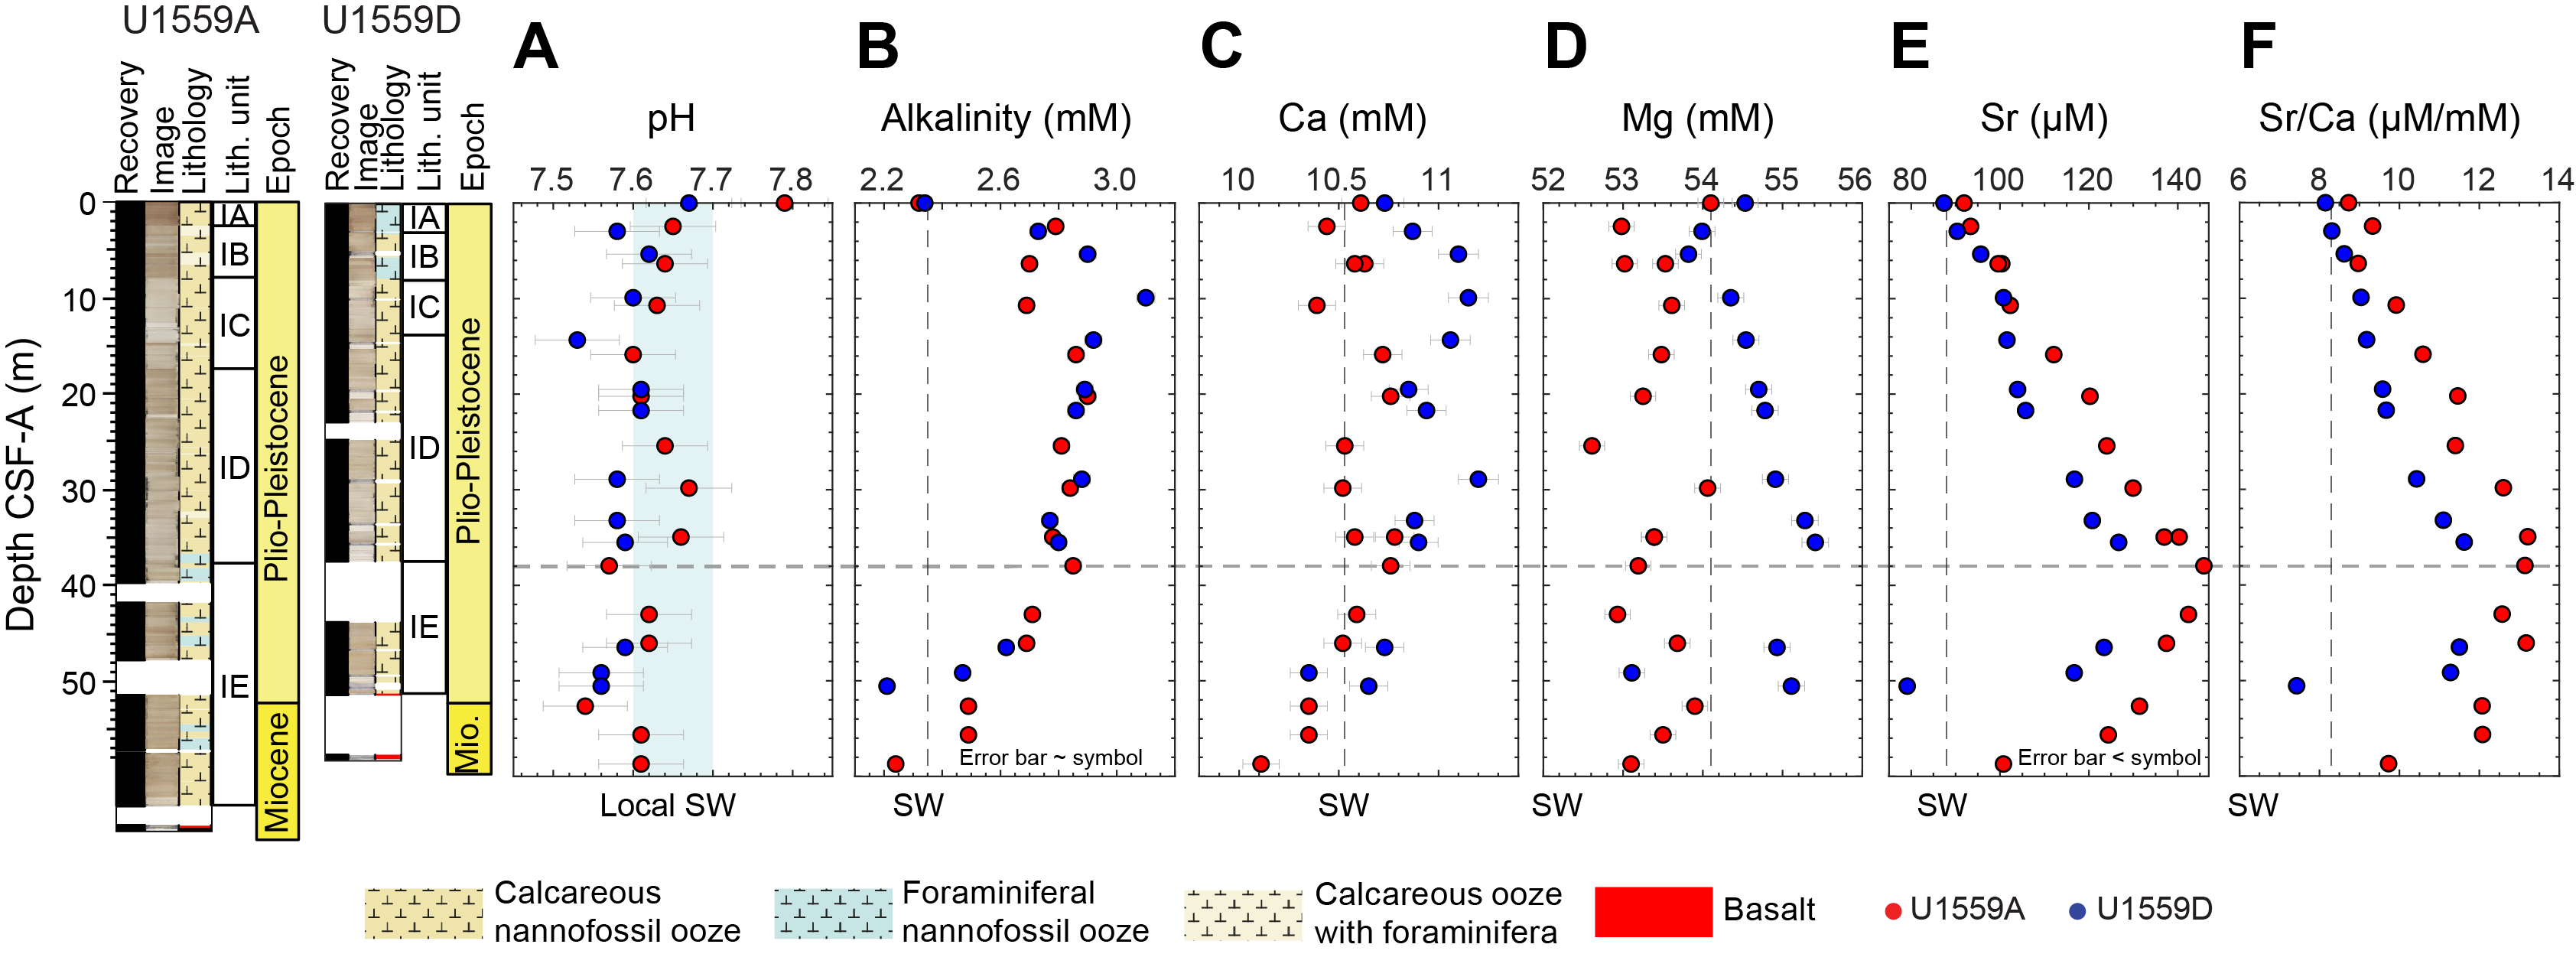
Figure F79. IW pH, alkalinity, calcium, magnesium, strontium, and Sr/Ca.
11.1.2.3. Boron, lithium, and silica
Both boron (B) (Hole U1559A) and lithium (Li) pore water concentrations generally increase downhole (Figure F80A, F80B). In Hole U1559A, the lowest B concentration occurs in the mudline sample (~410 µM), below which there is a gradual increase to ~470–480 µM toward the basement. However, near the sediment/basement interface, B concentrations appear to decrease (deeper than ~53 m CSF-A in Hole U1559A and deeper than ~47 m CSF-A in Hole U1559D), with a more prominent change from ~470 to ~430 µM in Hole U1559D. Similarly, Li concentrations increase from mudline values of 24.9 µM in Hole U1559A) or 26.7 µM in Hole U1559D to 27.6 µM near the basement (Figure F80B). A decline in Li is also observed below 47 m CSF-A in Hole U1559D, but Li does not change near the basement in Hole U1559A. Dissolved Si is lowest (~50 µM) in the mudline, relatively uniform (~130–180 µM) up to ~50 m CSF-A, and increases to ~200 µM toward the sediment/basement interface (Figure F80C). Such an increase in Si is unlikely to be due to biogenic silica dissolution because no diatoms or other siliceous microfossils were found in this interval (see Sedimentology).
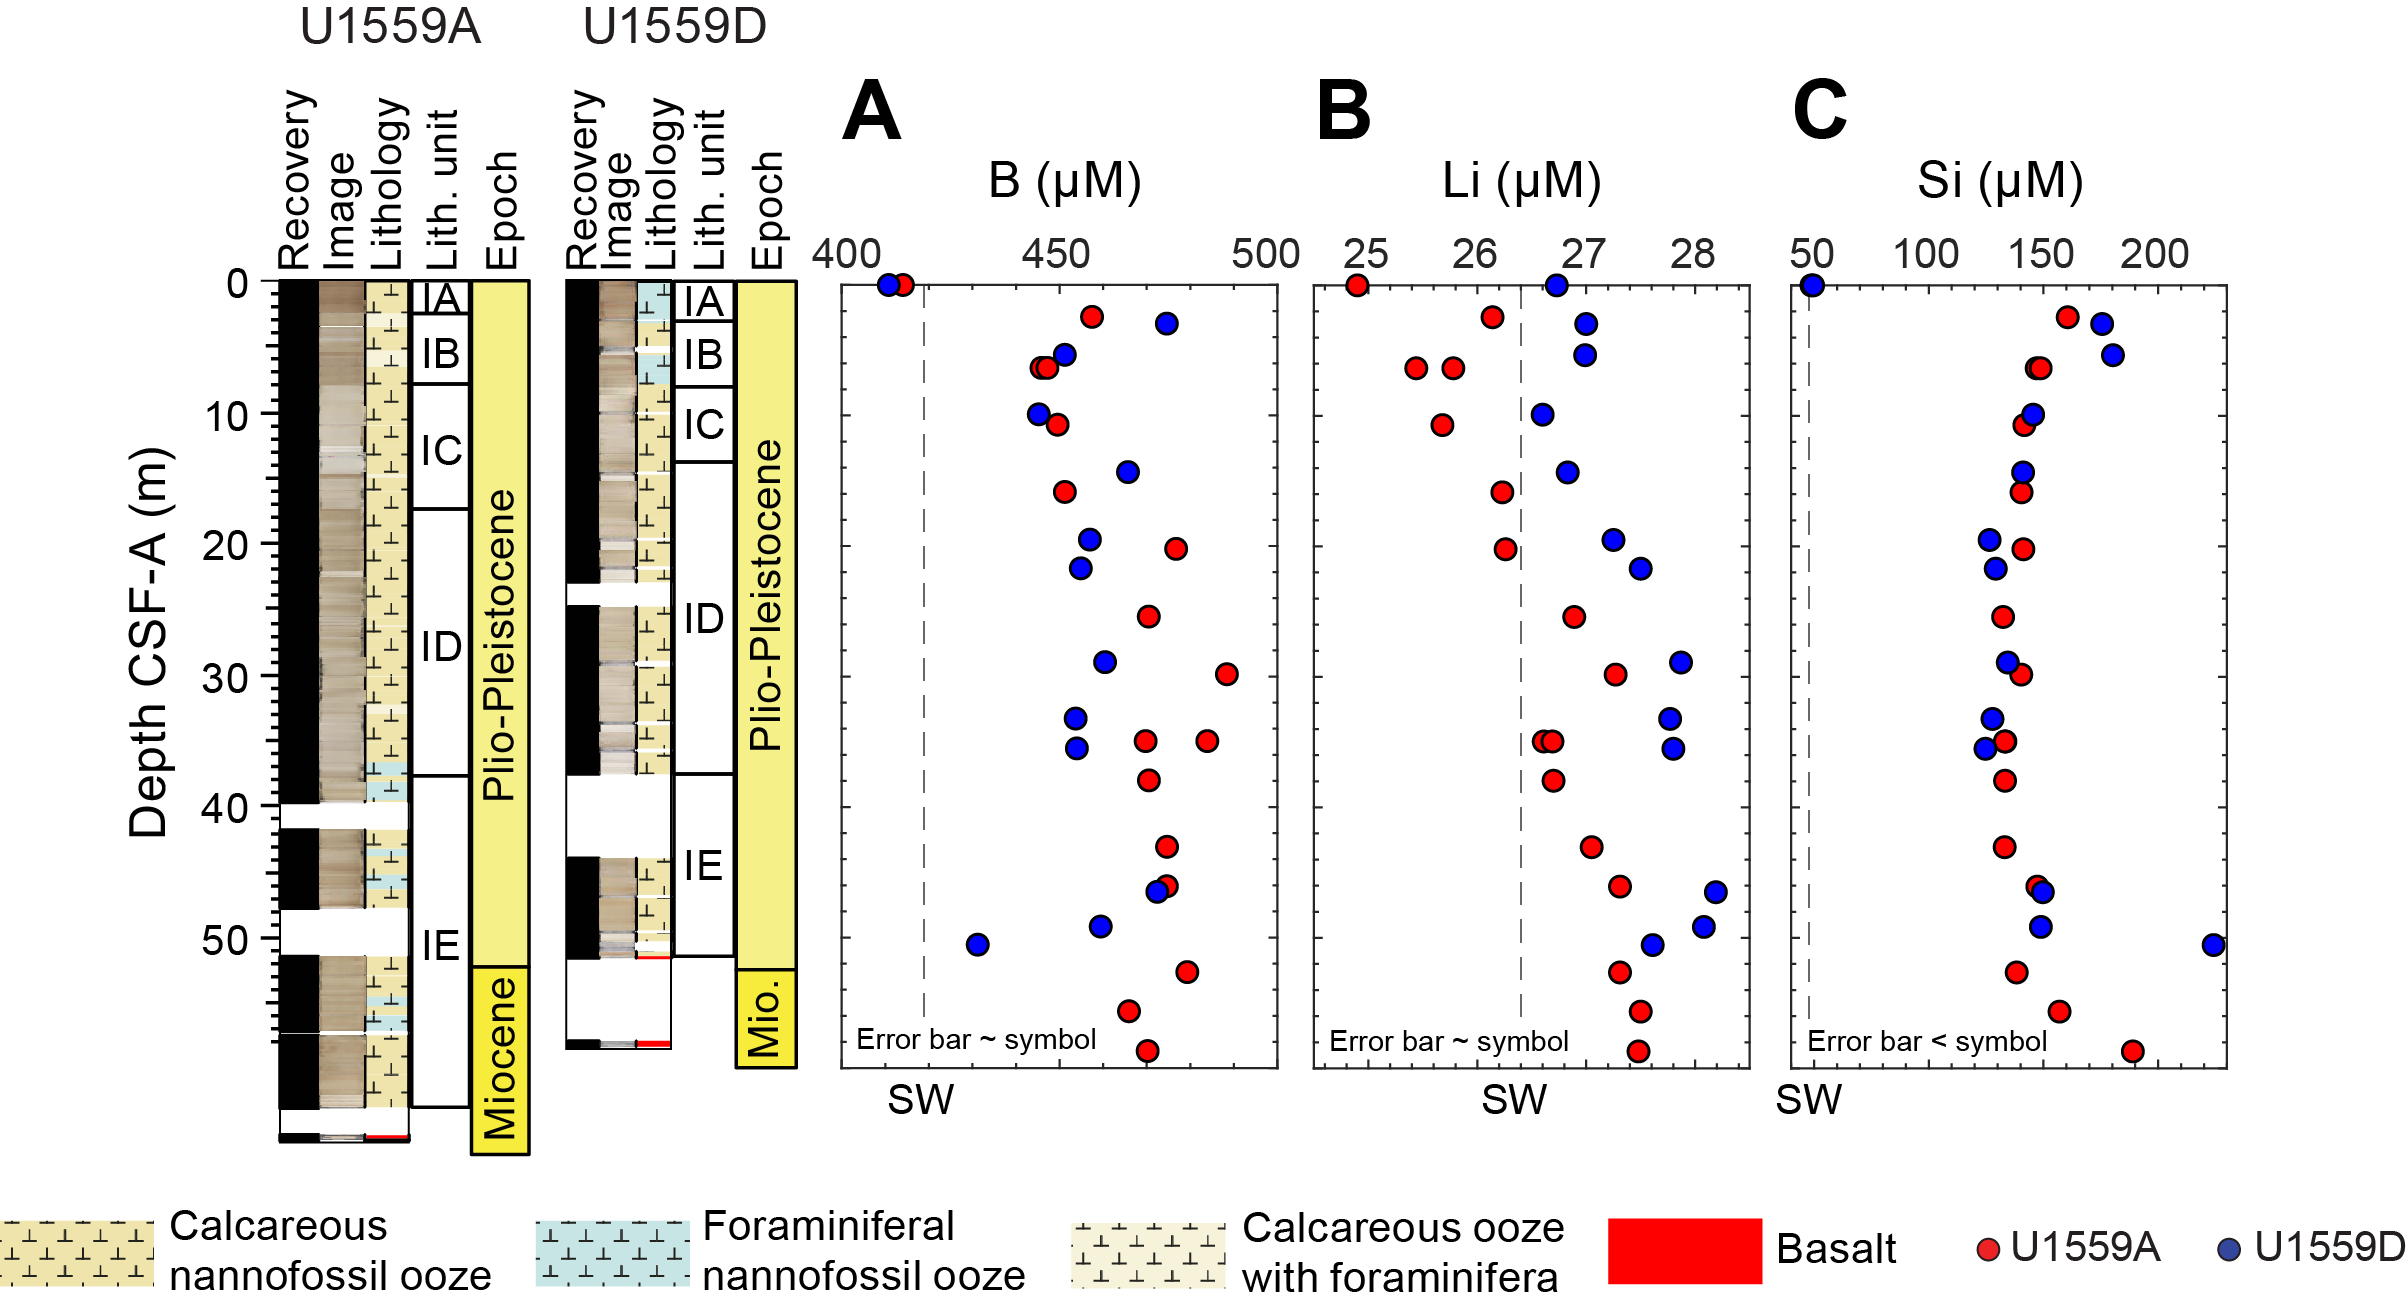
Figure F80. IW boron, lithium, and silica.
11.1.2.4. Sulfate, manganese, ammonium, and phosphate
Sulfate (SO42−) profiles have a ~1 mM offset between Holes U1559A and U1559D, but the data reveal similar trends with depth in both holes (Figure F81A). Sulfate concentrations decrease from near-seawater values (Hole U1559A: 29.6 mM; Hole U1559D: 28.2 mM) in the mudline sample to ~27 mM (Hole U1559A) and 28.4 mM (Hole U1559D) within the uppermost 10 m in both holes. Below this depth, sulfate concentrations are generally stable (~27–29 mM) throughout the sediment column except for a decrease to ~25.5 mM at the bottom of Hole U1559D. This decreased concentration near the sediment/basement interface may be influenced by mixing with basement fluid (e.g., Wheat et al., 2000), although more data are required to confirm this inference.
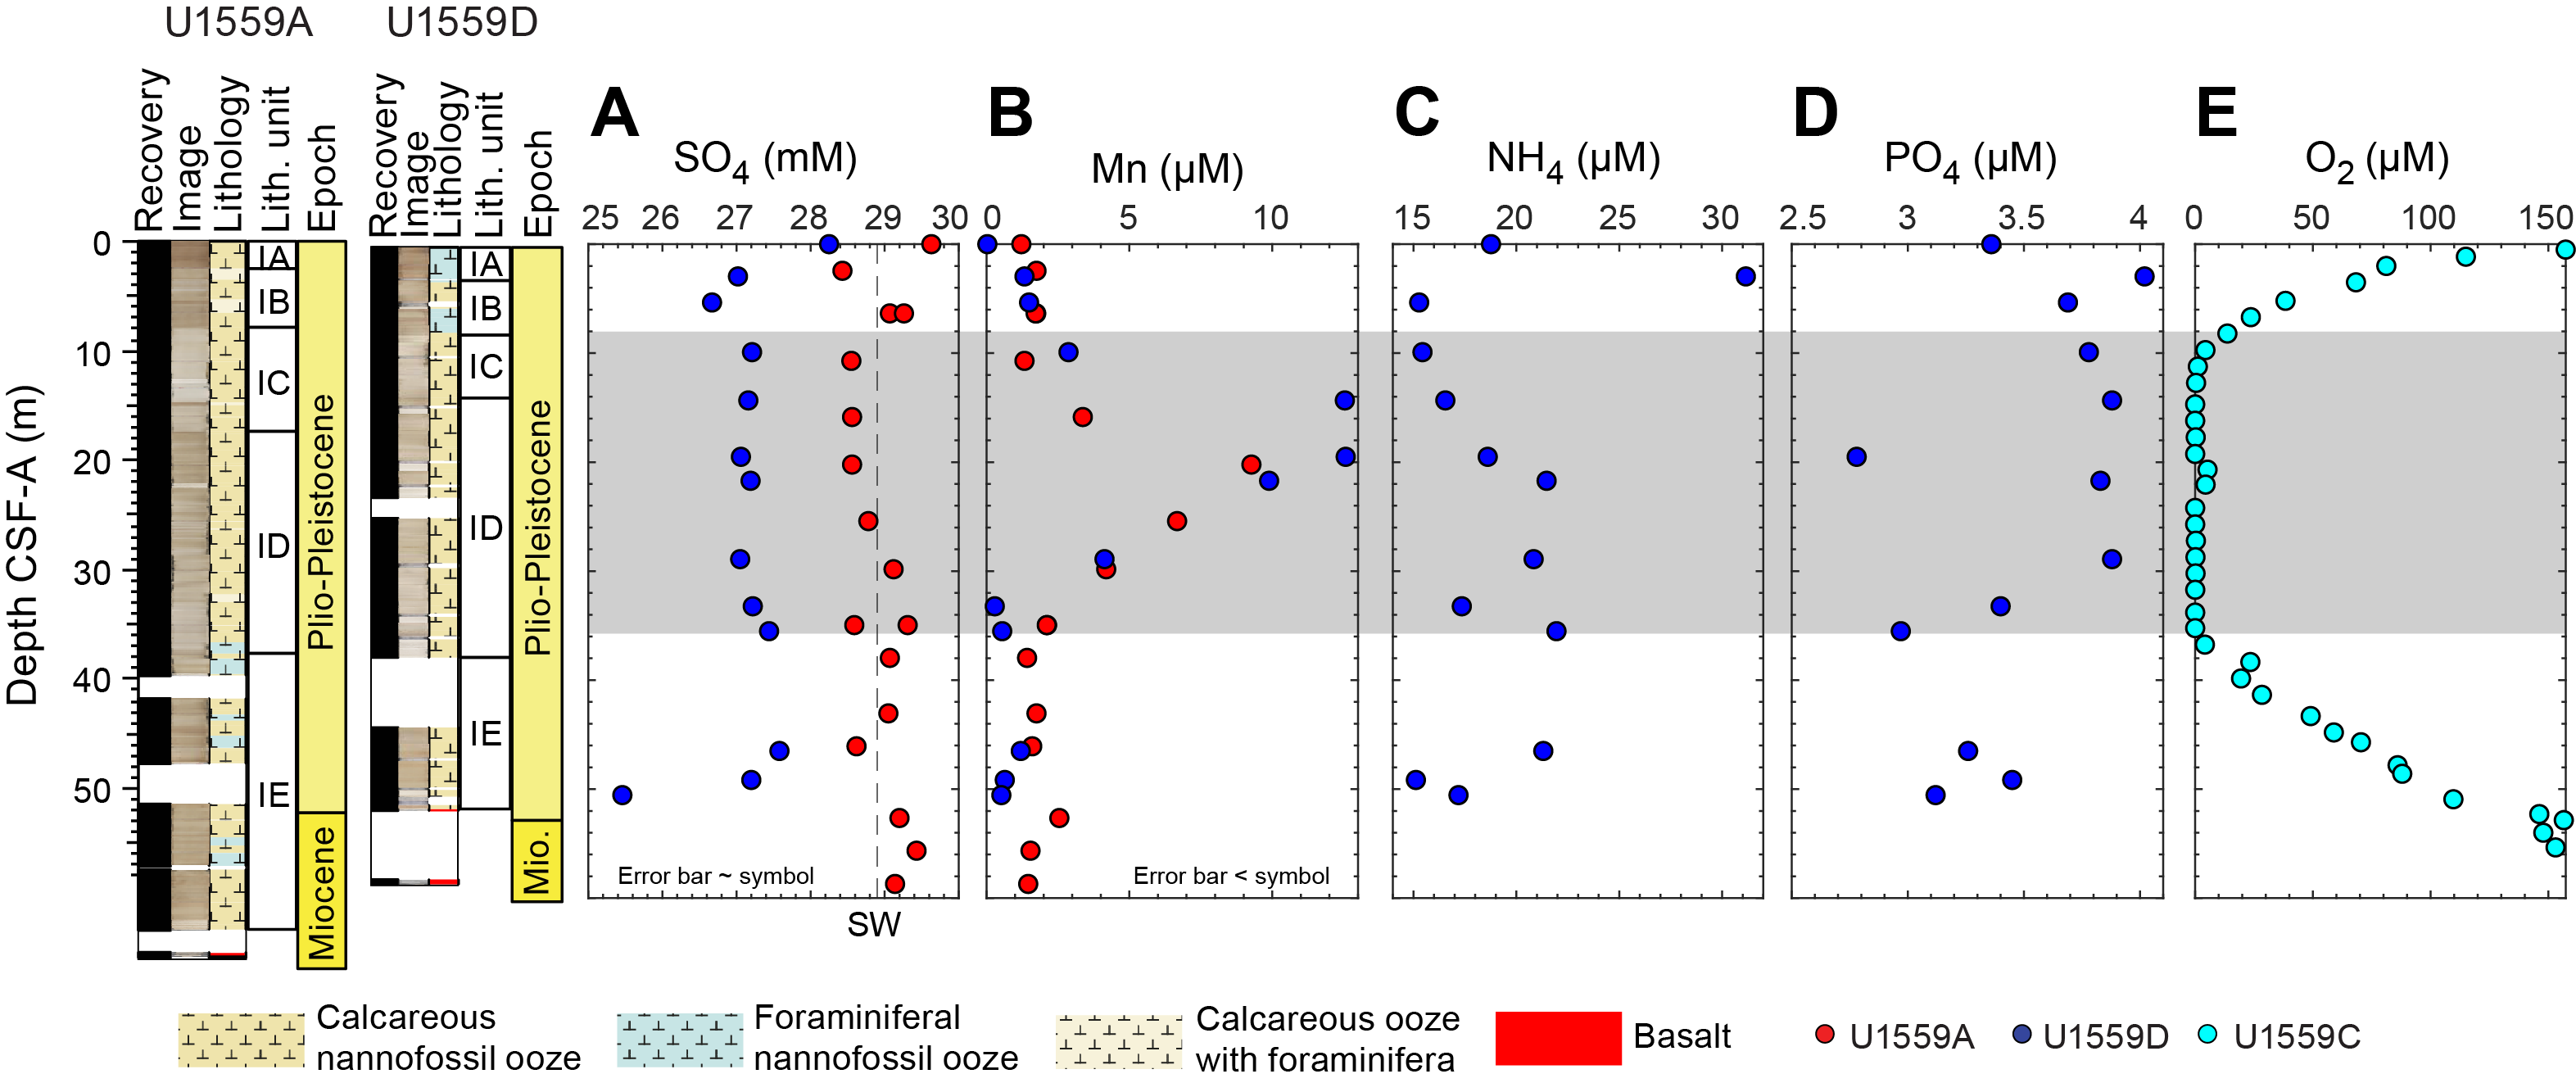
Figure F81. IW sulfate, manganese, ammonium, phosphate, and oxygen.
In both holes, manganese concentrations increase from <0.1 µM in the mudline sample to ~10–12 µM at 20 m CSF-A, below which pore water Mn decreases toward the basement, with values ranging from below detection limit to 2 µM (Figure F81B). Ammonium concentrations are generally low, ranging ~15–31 µM, with overall higher concentrations between 10 and 50 m CSF-A (Figure F81C). Phosphate concentrations are highly variable at ~2.8–4.0 µM with no clear trend downhole (Figure F81D).
11.1.2.5. Oxygen
Oxygen is the pore water constituent measured with the highest reduction potential and is the first molecule reduced during microbial degradation of organic matter. Its profile provides insight into subseafloor biogeochemical and microbial processes. For Hole U1559C, oxygen was measured within ~30 min of the core arriving on the catwalk. This method generated a profile that is significantly less noisy than that generated from Hole U1556C cores, for which oxygen was measured sometimes up to 12 h later. During analysis of Hole U1559D cores, oxygen was measured twice per core after the Physical Properties team had run the cores through all of their whole-round logger analyses (see Geochemistry in the Expedition 390/393 methods chapter [Coggon et al., 2024c]). This order resulted in oxygen measurements occurring 4–6 h after the core arrived on the catwalk. Compared to Hole U1559C (Figure F81E), the oxygen profile from Hole U1559D is more erratic but does reveal the same pattern (Table T35). It should be noted, however, that Hole U1559D sediments were heavily disturbed during coring, which may have resulted in introduction of oxygen to core interiors; this is a potential compounding influence in addition to the extra time taken prior to making the oxygen measurements compared to Hole U1559C.
11.1.3. Organic geochemistry
11.1.3.1. Calcium carbonate
Calcium carbonate (CaCO3) concentrations (Figure F82A) were measured on IW squeeze cakes at a frequency of one per core in Cores 390C-U1559A-1H through 8X and two per core in Cores 2H–7X, for a total of 14 analyses. Carbonate concentration in Hole U1559C was measured on the working halves of Cores 390-U1559C-1H through 7X, which were sampled once per core for a total of 7 analyses. In Hole U1559D, a total of 12 sediment samples were analyzed; samples were taken at a frequency of two per core in Cores 390-U1559D-1H through 4H and 6H and once per core in Cores 5H and 7X. Average carbonate content in all holes (93.1 ± 2.33 wt%, ±1σ, n = 33) was highly uniform downhole, which is consistent with the overall homogeneous lithology composed of calcareous nannofossil ooze.
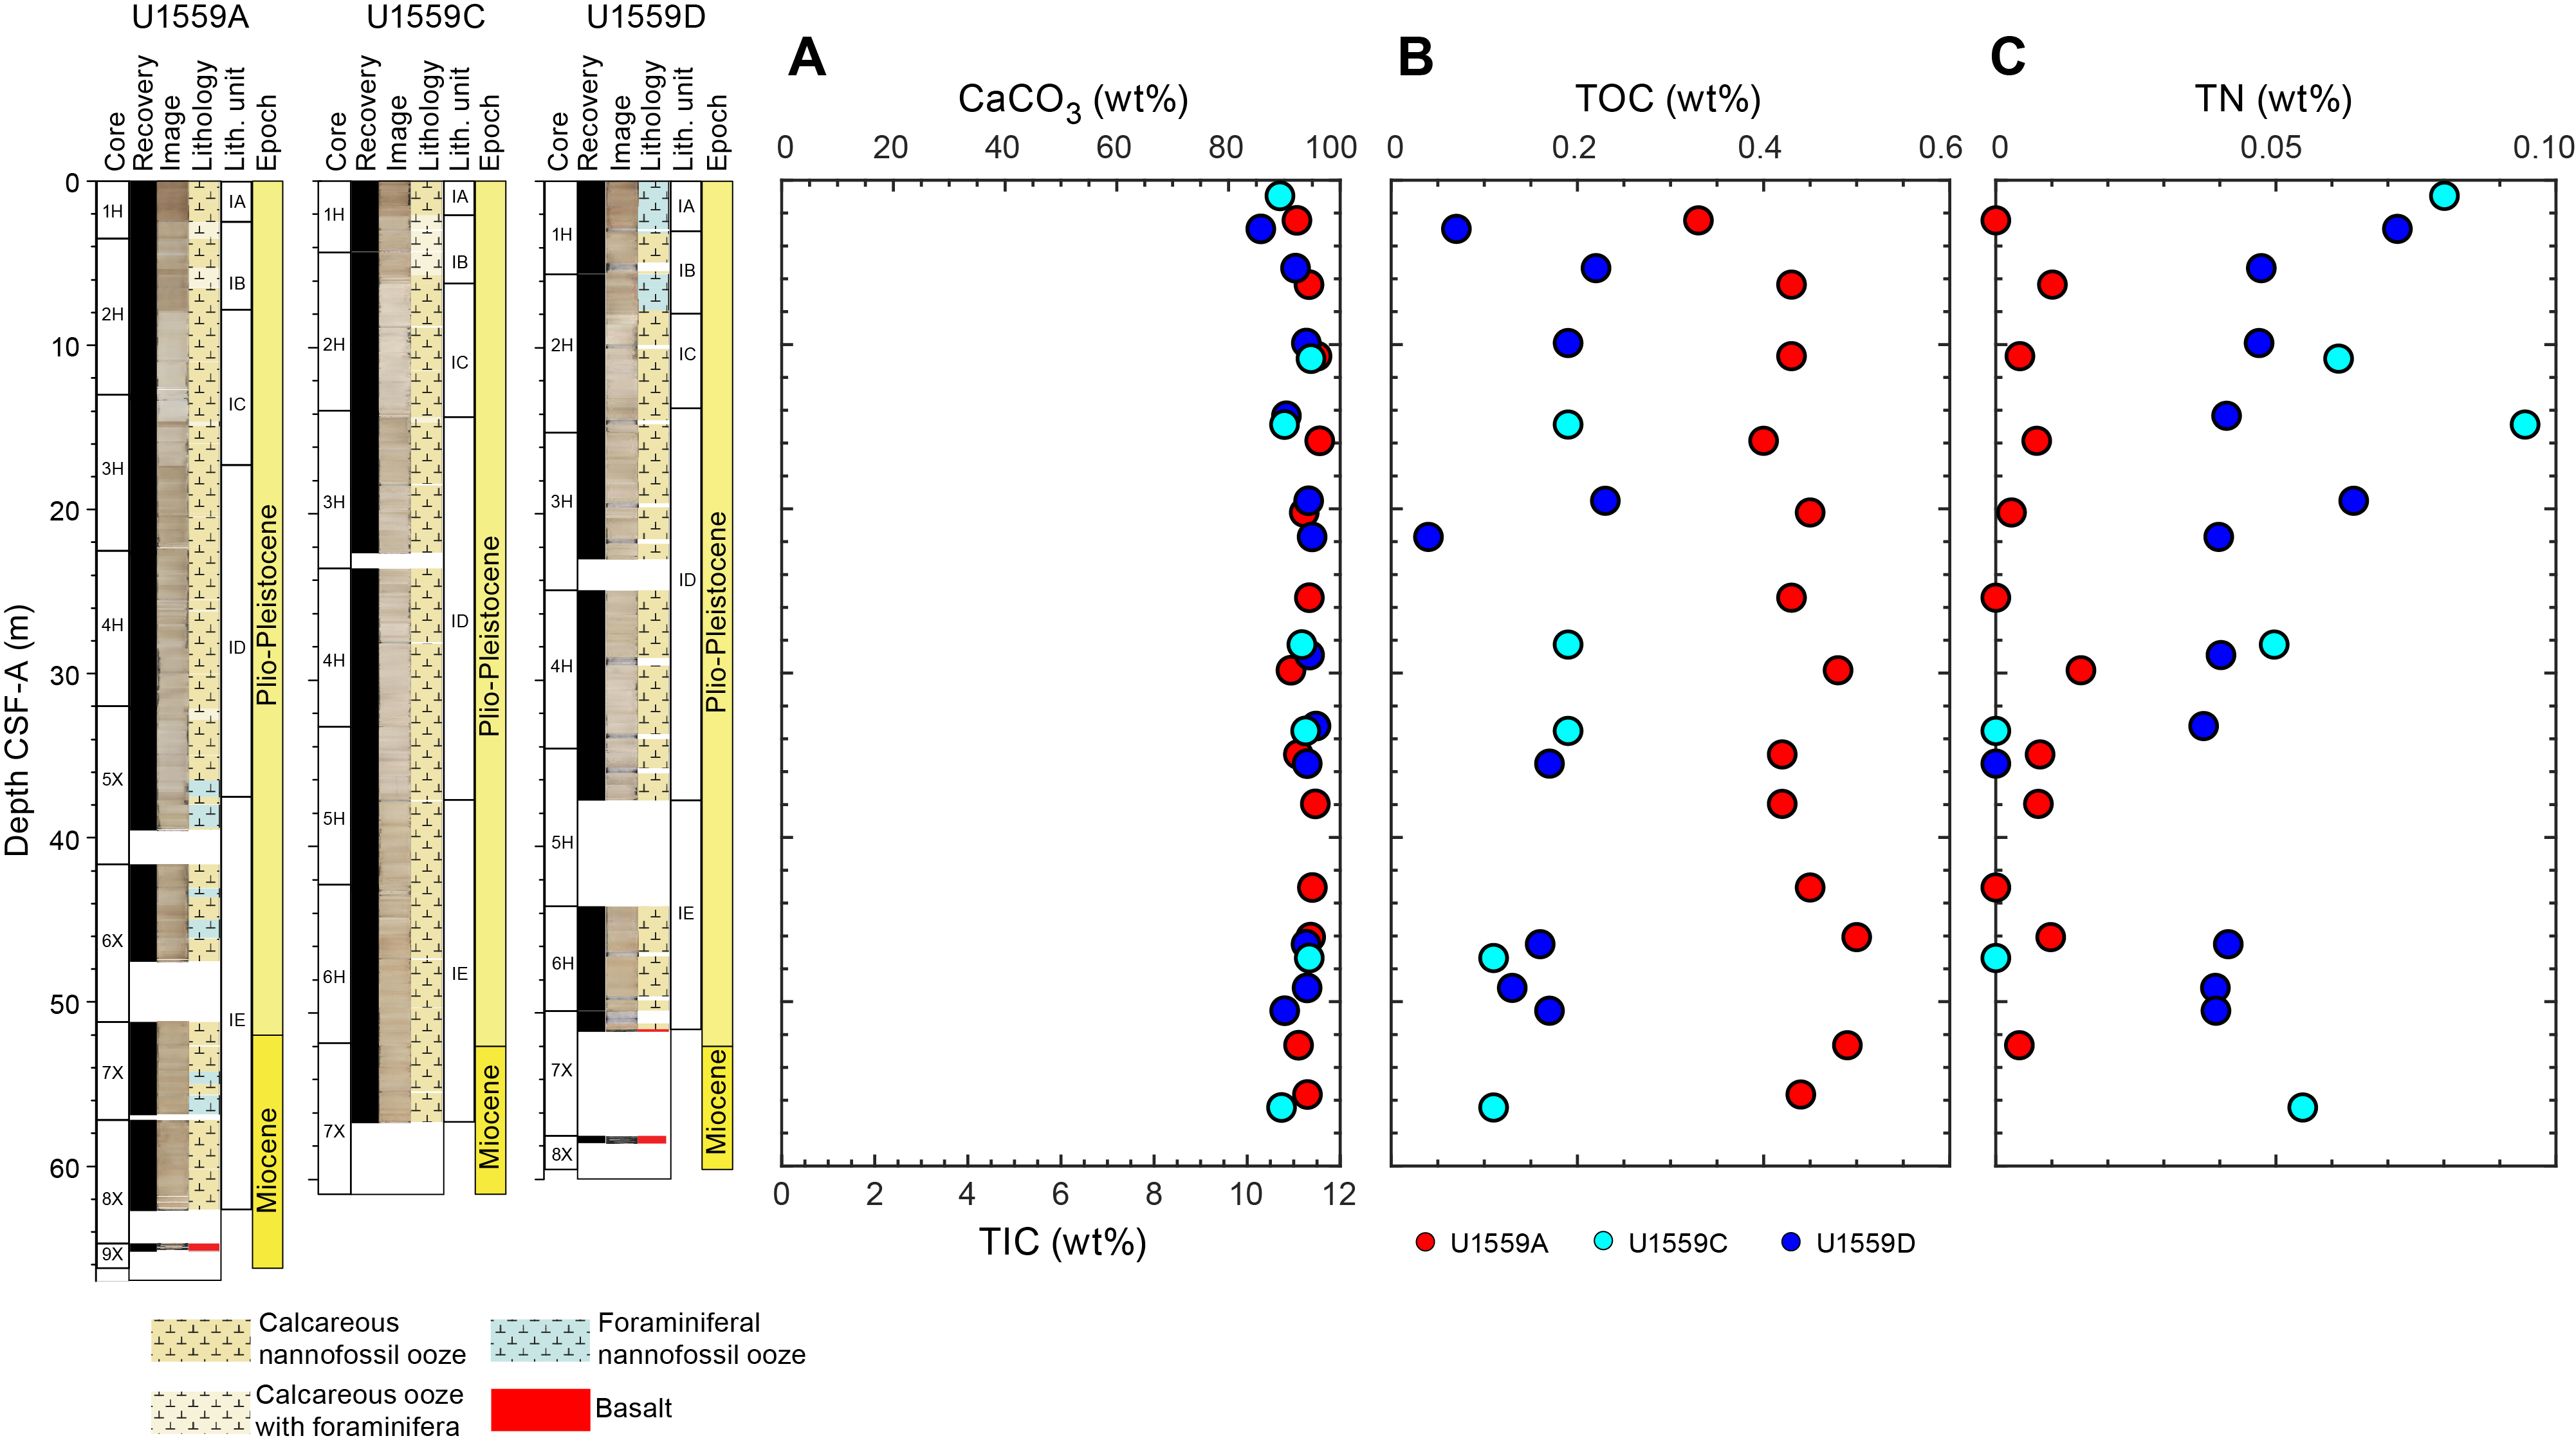
Figure F82. Calcium carbonate, TIC, TOC, and TN.
11.1.3.2. Total organic carbon and nitrogen
TOC was calculated for all samples measured for CaCO3 as the difference between TC and total inorganic carbon (see Geochemistry in the Expedition 390/393 methods chapter [Coggon et al., 2024c). TOC concentrations (Figure F82B) are invariant downcore; however, concentrations in Hole U1559A (0.44 ± 0.04 wt%, ±1σ, n = 14) are higher than the average in Holes U1559C and U1559D (0.16 ± 0.06 wt%, ±1σ, n = 14). In contrast, total nitrogen concentrations in Hole U1559A (0.006 ± 0.005 wt%, ±1σ, n = 13) are lower than those in Holes U1559C and U1559D (0.04 ± 0.03 wt%, ±1σ, n = 19) (Figure F82C). Total sulfur in all samples is below detection limit and not reported here.
11.1.4. Sediment gas sampling
Routine safety hydrocarbon measurements were made in Hole U1559A during Expedition 390C and in Hole U1559D during Expedition 390 (Coggon et al., 2022) at a sampling resolution of one analysis per core until contact with basement (Table T34). No gas was detected in any of the samples.
11.2. Basement
Expedition 393 deepened Hole U1559B to a total depth of 107.9 mbsf, encountering basement at 65 mbsf and penetrating 42.9 m of volcanic rocks with low recovery (~26%). The rocks recovered are slightly to moderately altered, ~6.6 Ma basalts representing five distinguishable igneous units (see Igneous petrology). Seven basalt samples were selected for shipboard study that included both solution analysis by ICP-AES and direct analyses of sample powders by pXRF. An additional Site U1559 sample from the sediment/basalt interface was characterized during Expedition 390. Two rock samples from Hole U1559B were cut, mounted, and analyzed as check standards for high spatial resolution pXRF analyses directly on the split surfaces of hard rock cores during Expedition 393.
11.2.1. Basement rock sampling and geochemical analysis
The geochemical samples selected represented typical material from each of the magmatic units identified by the Igneous and Alteration Petrology teams. Geochemical samples were taken adjacent to other sampling (thin sections, PMAG, XRD, and MAD) to generate integrated data on these materials. A split of each freshly made sample powder was placed in a powder mount for pXRF analysis, and each sample was measured by the pXRF scanner three times (see Geochemistry in the Expedition 390/393 methods chapter [Coggon et al., 2024c]). ICP-AES measurements were completed on ignited oxidized samples that had undergone loss on ignition (LOI) determinations. The ICP-AES data are reported on a volatile-free basis.
11.2.2. Bulk chemical compositions and trace element abundances
Table T36 lists the shipboard geochemical data collected on samples from Site U1559 by ICP-AES analysis, and Table T37 presents pXRF data collected for these samples from powder mounts. The Site U1559 samples selected for full geochemical analysis show considerable compositional uniformity. In Figure F83, Site U1559 data are plotted on the total alkali versus silica classification diagram of Le Bas et al. (1986). The Site U1559 samples fall in the basalt field, and per the basalt classification scheme of Yoder and Tilley (1962) they are tholeiites and olivine tholeiites. In Figure F84, we plot the Site U1559 samples on the Shervais (1982) vanadium versus Ti/1000 tectonic classification diagram, where they fall in the MORB field. Our Site U1559 data points differ from many of the samples recovered at Site U1556 (~61.2 Ma) during Expedition 390, which have high TiO2, and thus trend into the field for intraplate basalts. They also differ from basalt samples from Site U1557 (~61.2 Ma), which have lower Ti and largely plot in the arc field. Our pXRF results for Hole U1559B powders and sample surfaces extend into the arc field at higher V contents but are similar in TiO2 to the ICP-AES results.
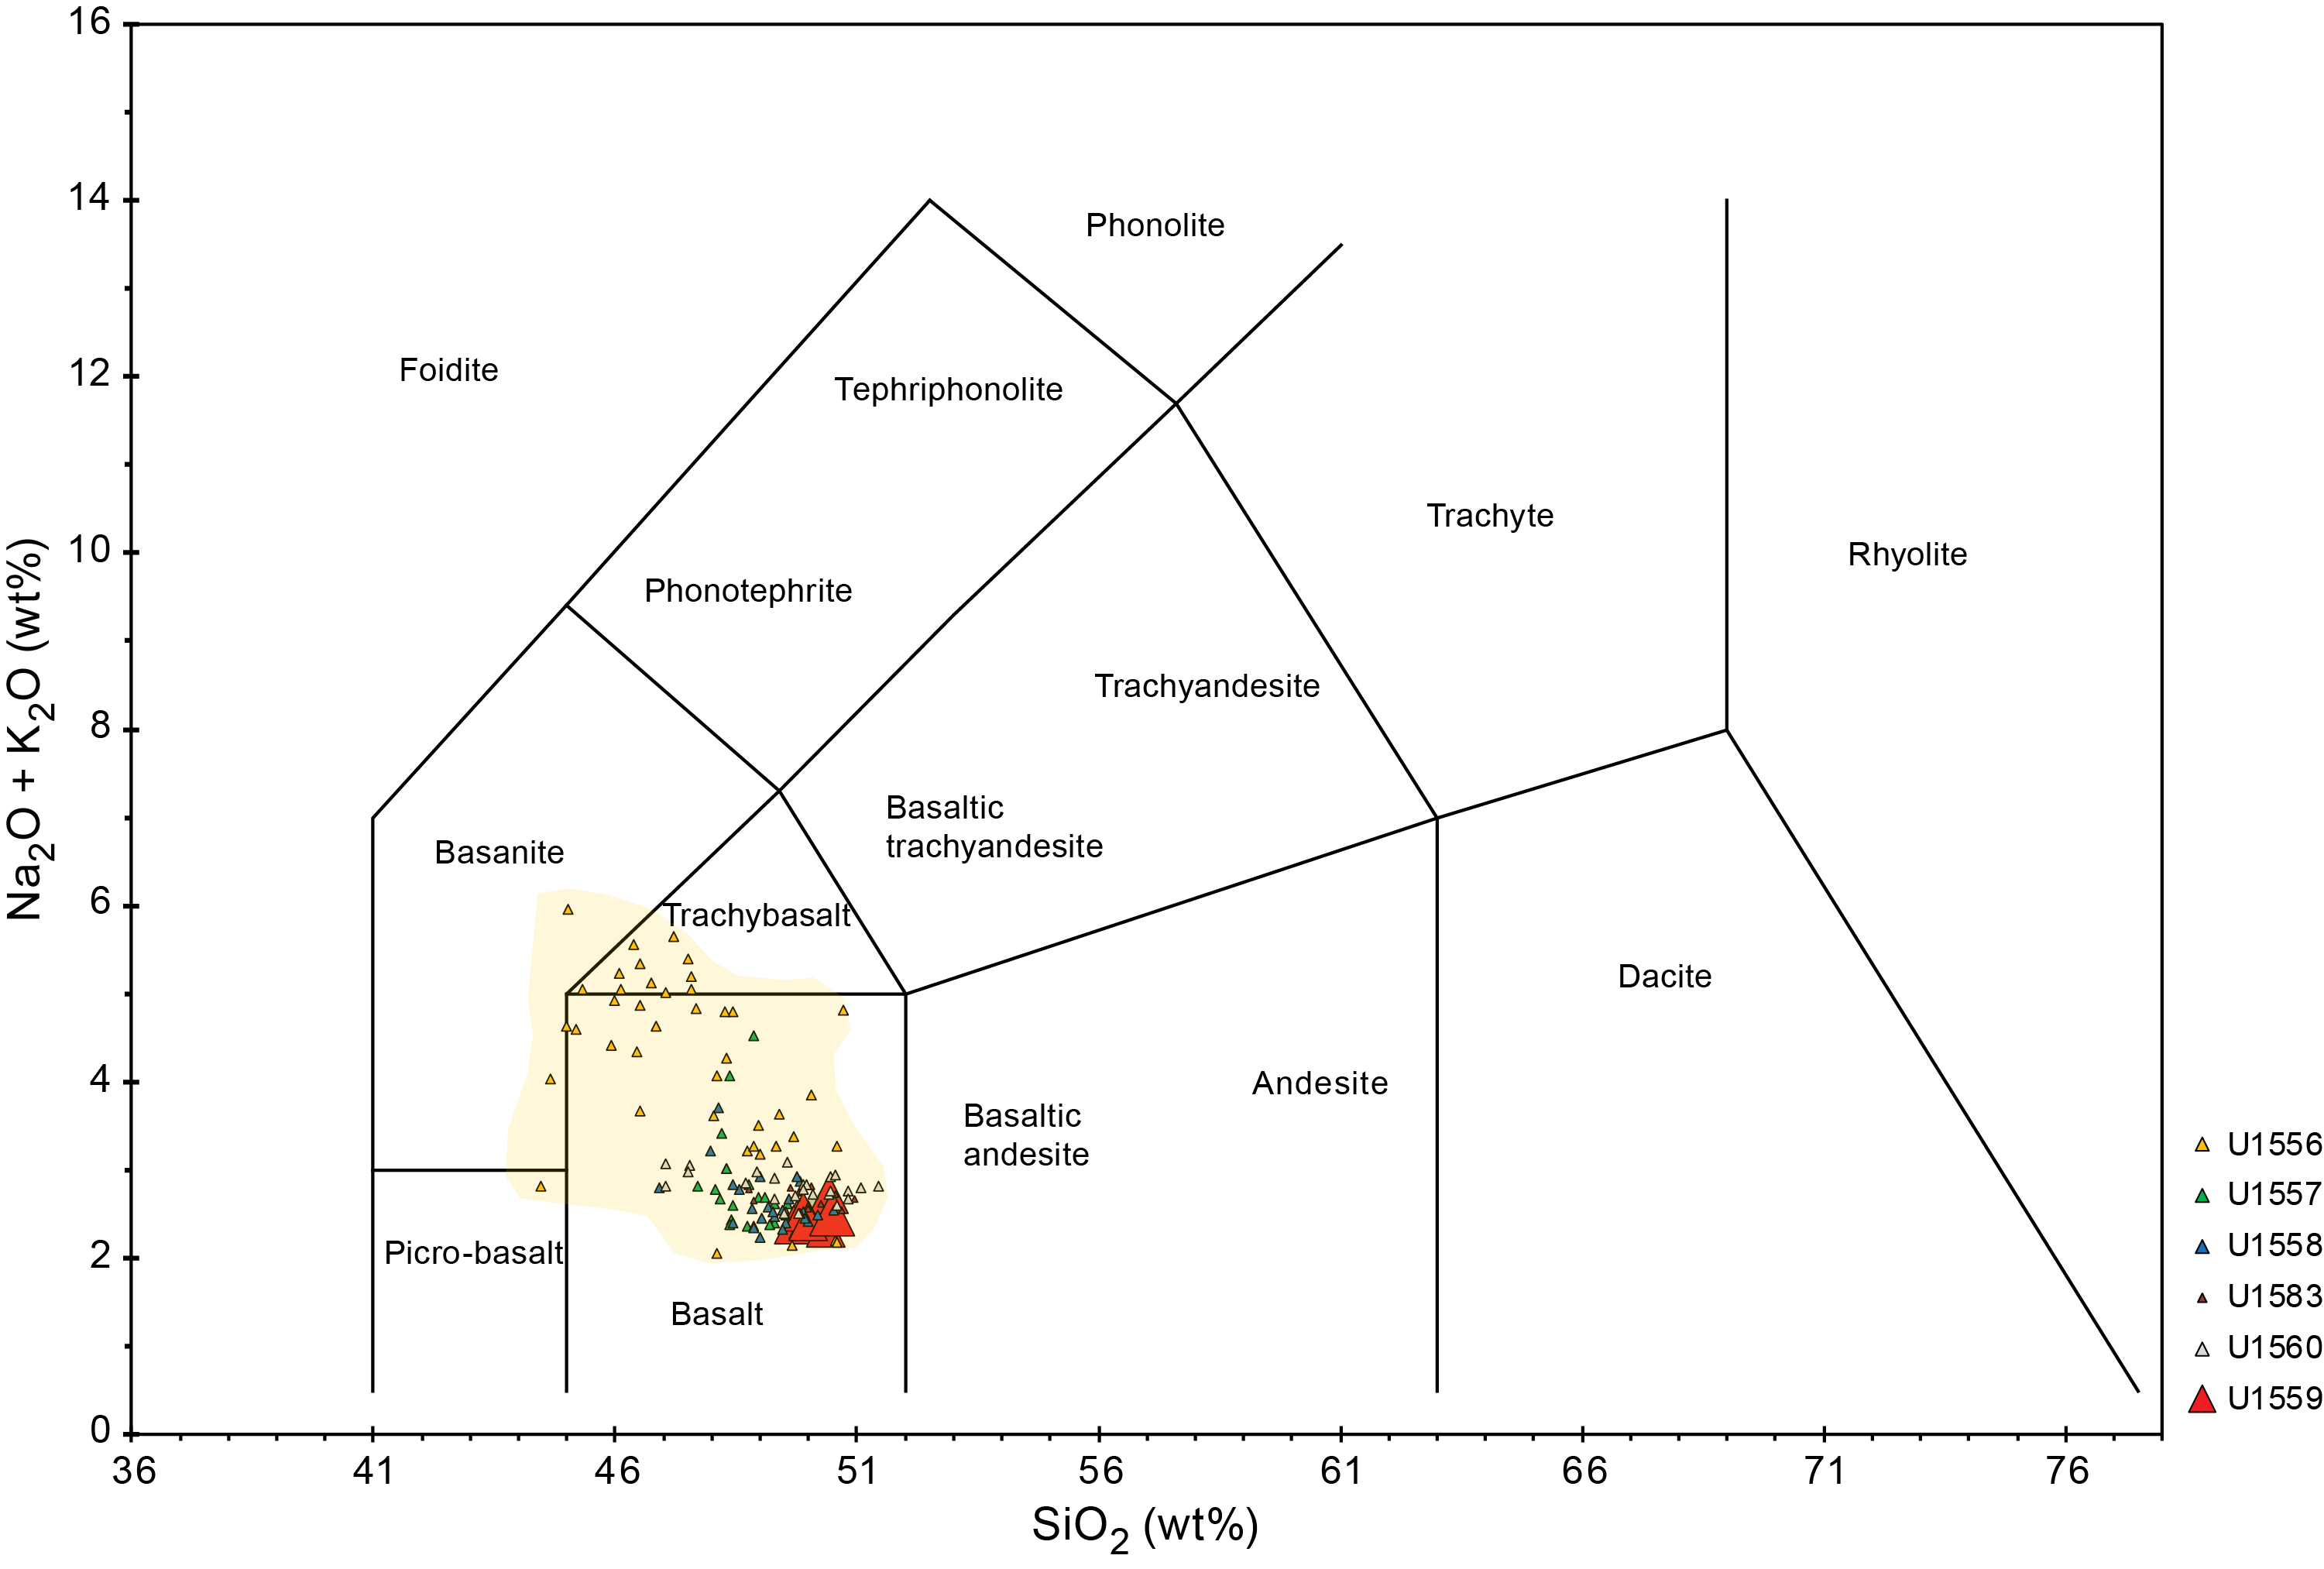
Figure F83. Total alkali vs. silica diagram.
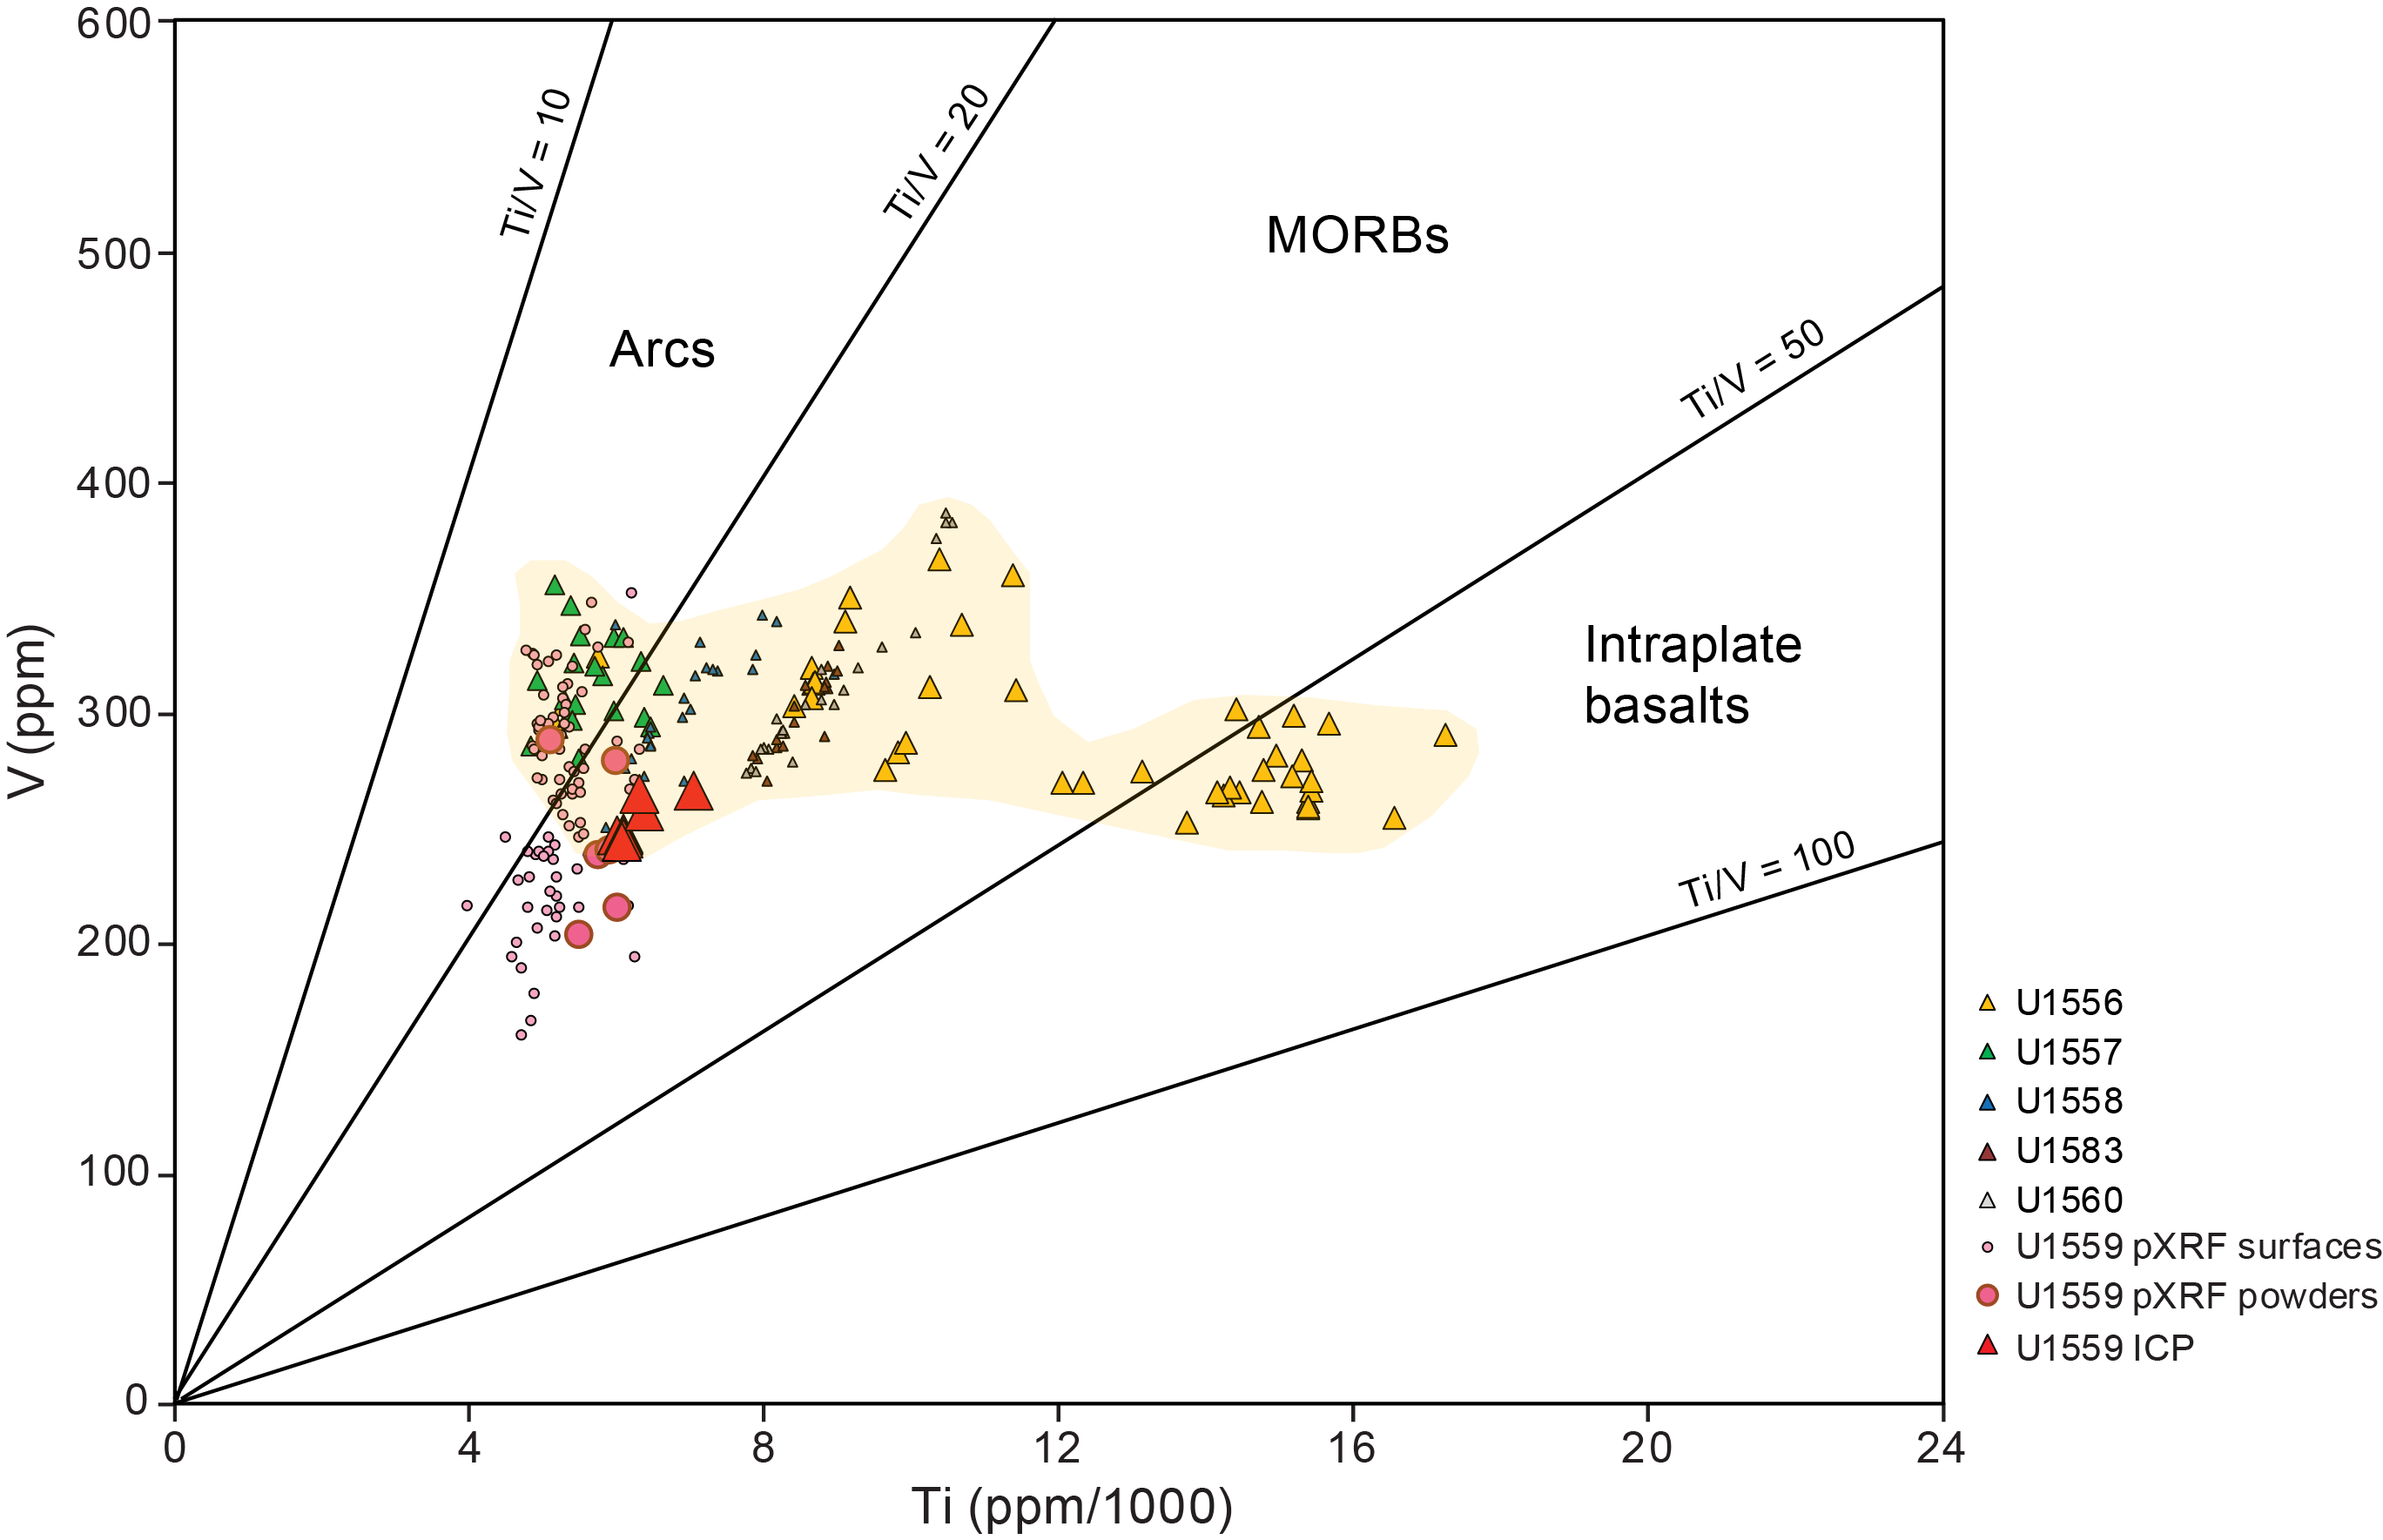
Figure F84. V vs. Ti/1000 tectonic classification diagram.
Figure F85 shows downhole plots for several of the major elements analyzed by ICP-AES and pXRF. TiO2 and CaO show great uniformity downhole, across all of the lithologic units identified (see Igneous petrology; Figure F7), indicating that these lavas likely had similar sources, and reflect formation through largely similar extents of melting and shallow-level basaltic crystallization. K2O concentrations can be particularly sensitive to exchanges with seawater, and Figure F85C shows evidence for greater K uptake deeper in the hole, below the sedimentary horizon identified in Unit 3. Even in the least K-enriched Site U1559 samples, the data range to higher K2O compared to recent data for fresh 26°S Mid-Atlantic Ridge glasses (Marschall et al., 2017; 0.067 ± 0.012 wt%). This variability is particularly evident in the pXRF data from Hole U1559B core surfaces, which reach values >0.3 wt% K2O. MgO concentrations in altered rocks can show considerable variability due to remobilization on the seafloor (e.g., Donnelly et al., 1980; Flower et al., 1980), but none of the examined Site U1559 basalts show clear evidence for such effects, falling entirely within the range of MgO contents encountered in fresh South Atlantic basalts.
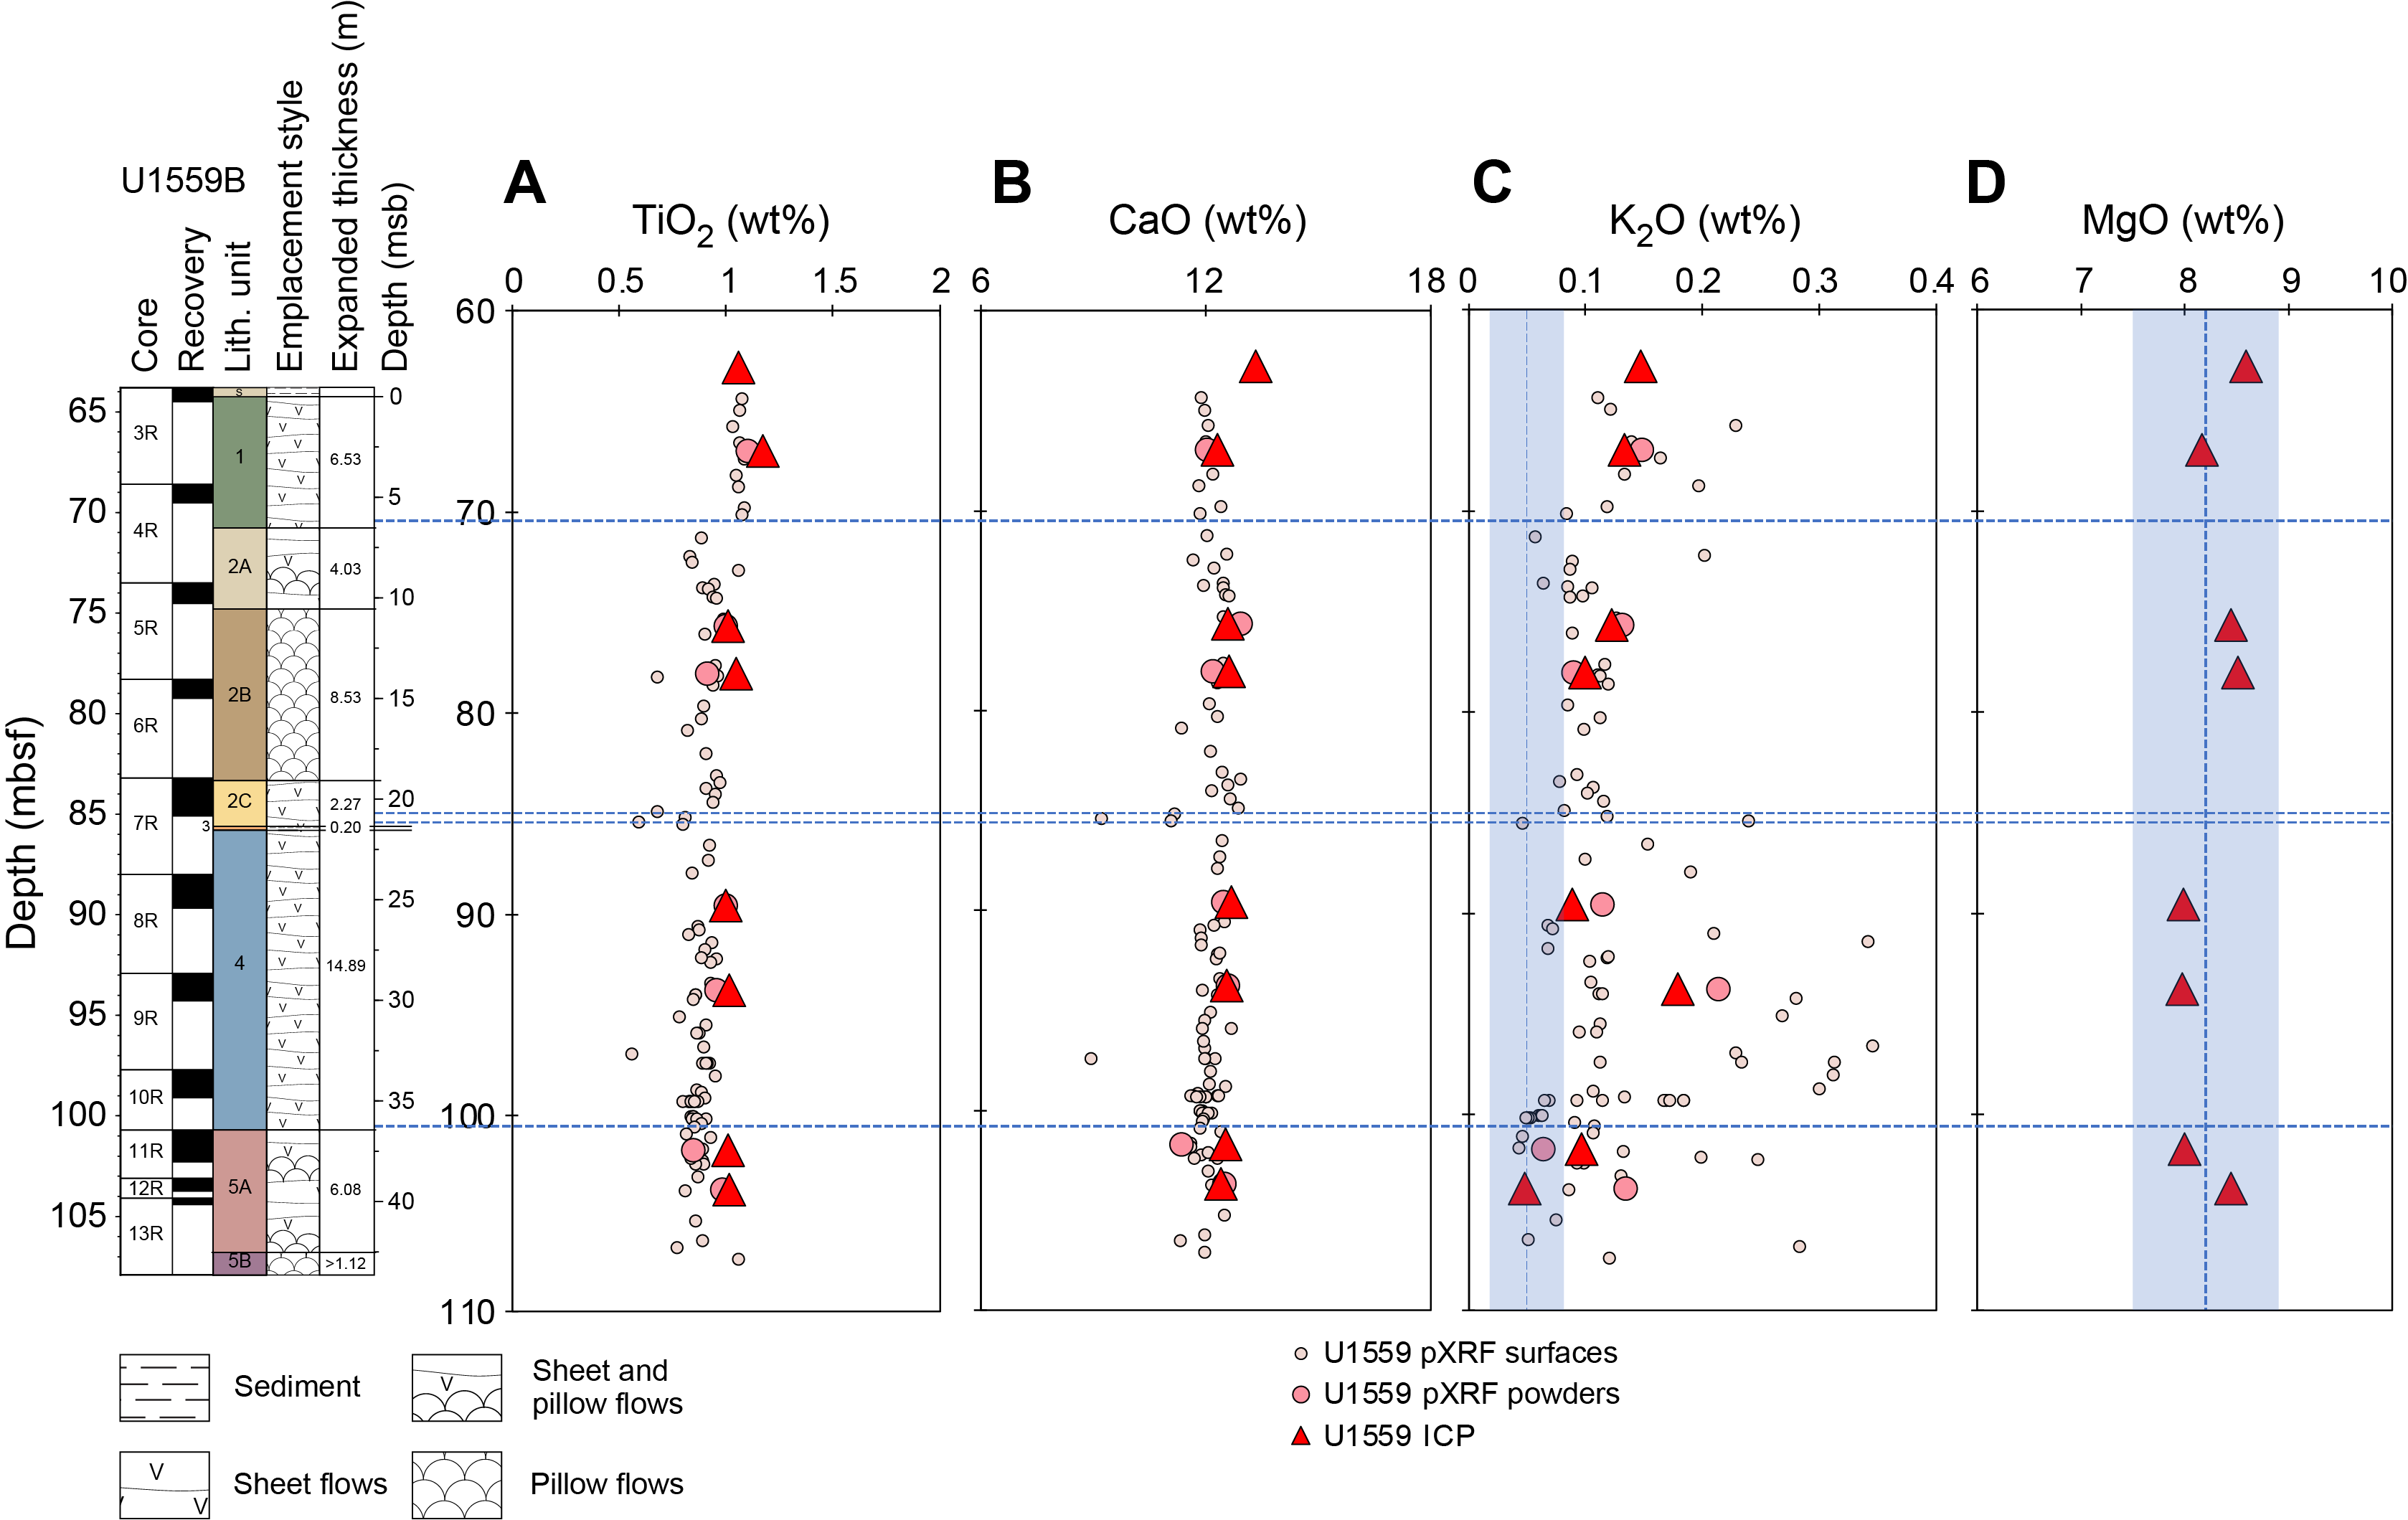
Figure F85. TiO2, CaO, K2O, and MgO.
The comparatively less-modified nature of the ~6.6 Ma Site U1559 samples is evident in Figure F86, which plots K/Zr ratios versus Cr/TiO2 ratios. On this diagram, we compare the Site U1559 samples to basalts recovered at Sites U1556 and U1557 during Expedition 390 and to data from fresh South Atlantic MORBs compiled through the EarthChem Portal and from Marschall et al. (2017). Cr/TiO2 ratios can serve as an alteration-resistant proxy for MgO, and it can also distinguish among basalts derived from different mantle sources. The likely involvement of a Ti-enriched intraplate mantle source is evident in the lower Cr/TiO2 lavas of the Site U1556 suite compared to the Site U1559 suite and the basalts from the Hole U1557D volcanic breccias. Nearly all the samples from Site U1556 and U1557 samples have K/Zr > 50, whereas Site U1559 samples have K/Zr of 6.5–25, pointing to far lower degrees of K enrichment, most likely due to less seawater-related chemical alteration. The Site U1559 basalts overlap extensively with the field for South Atlantic MORBs but are largely higher in K/Zr than MORB glasses from Mid-Atlantic Ridge 26°S, indicating some secondary K enrichment. Additionally, the Site U1559 lavas trend toward higher Cr/TiO2 ratios than most South Atlantic MORBs, suggesting either more primitive compositions or a more depleted mantle source.
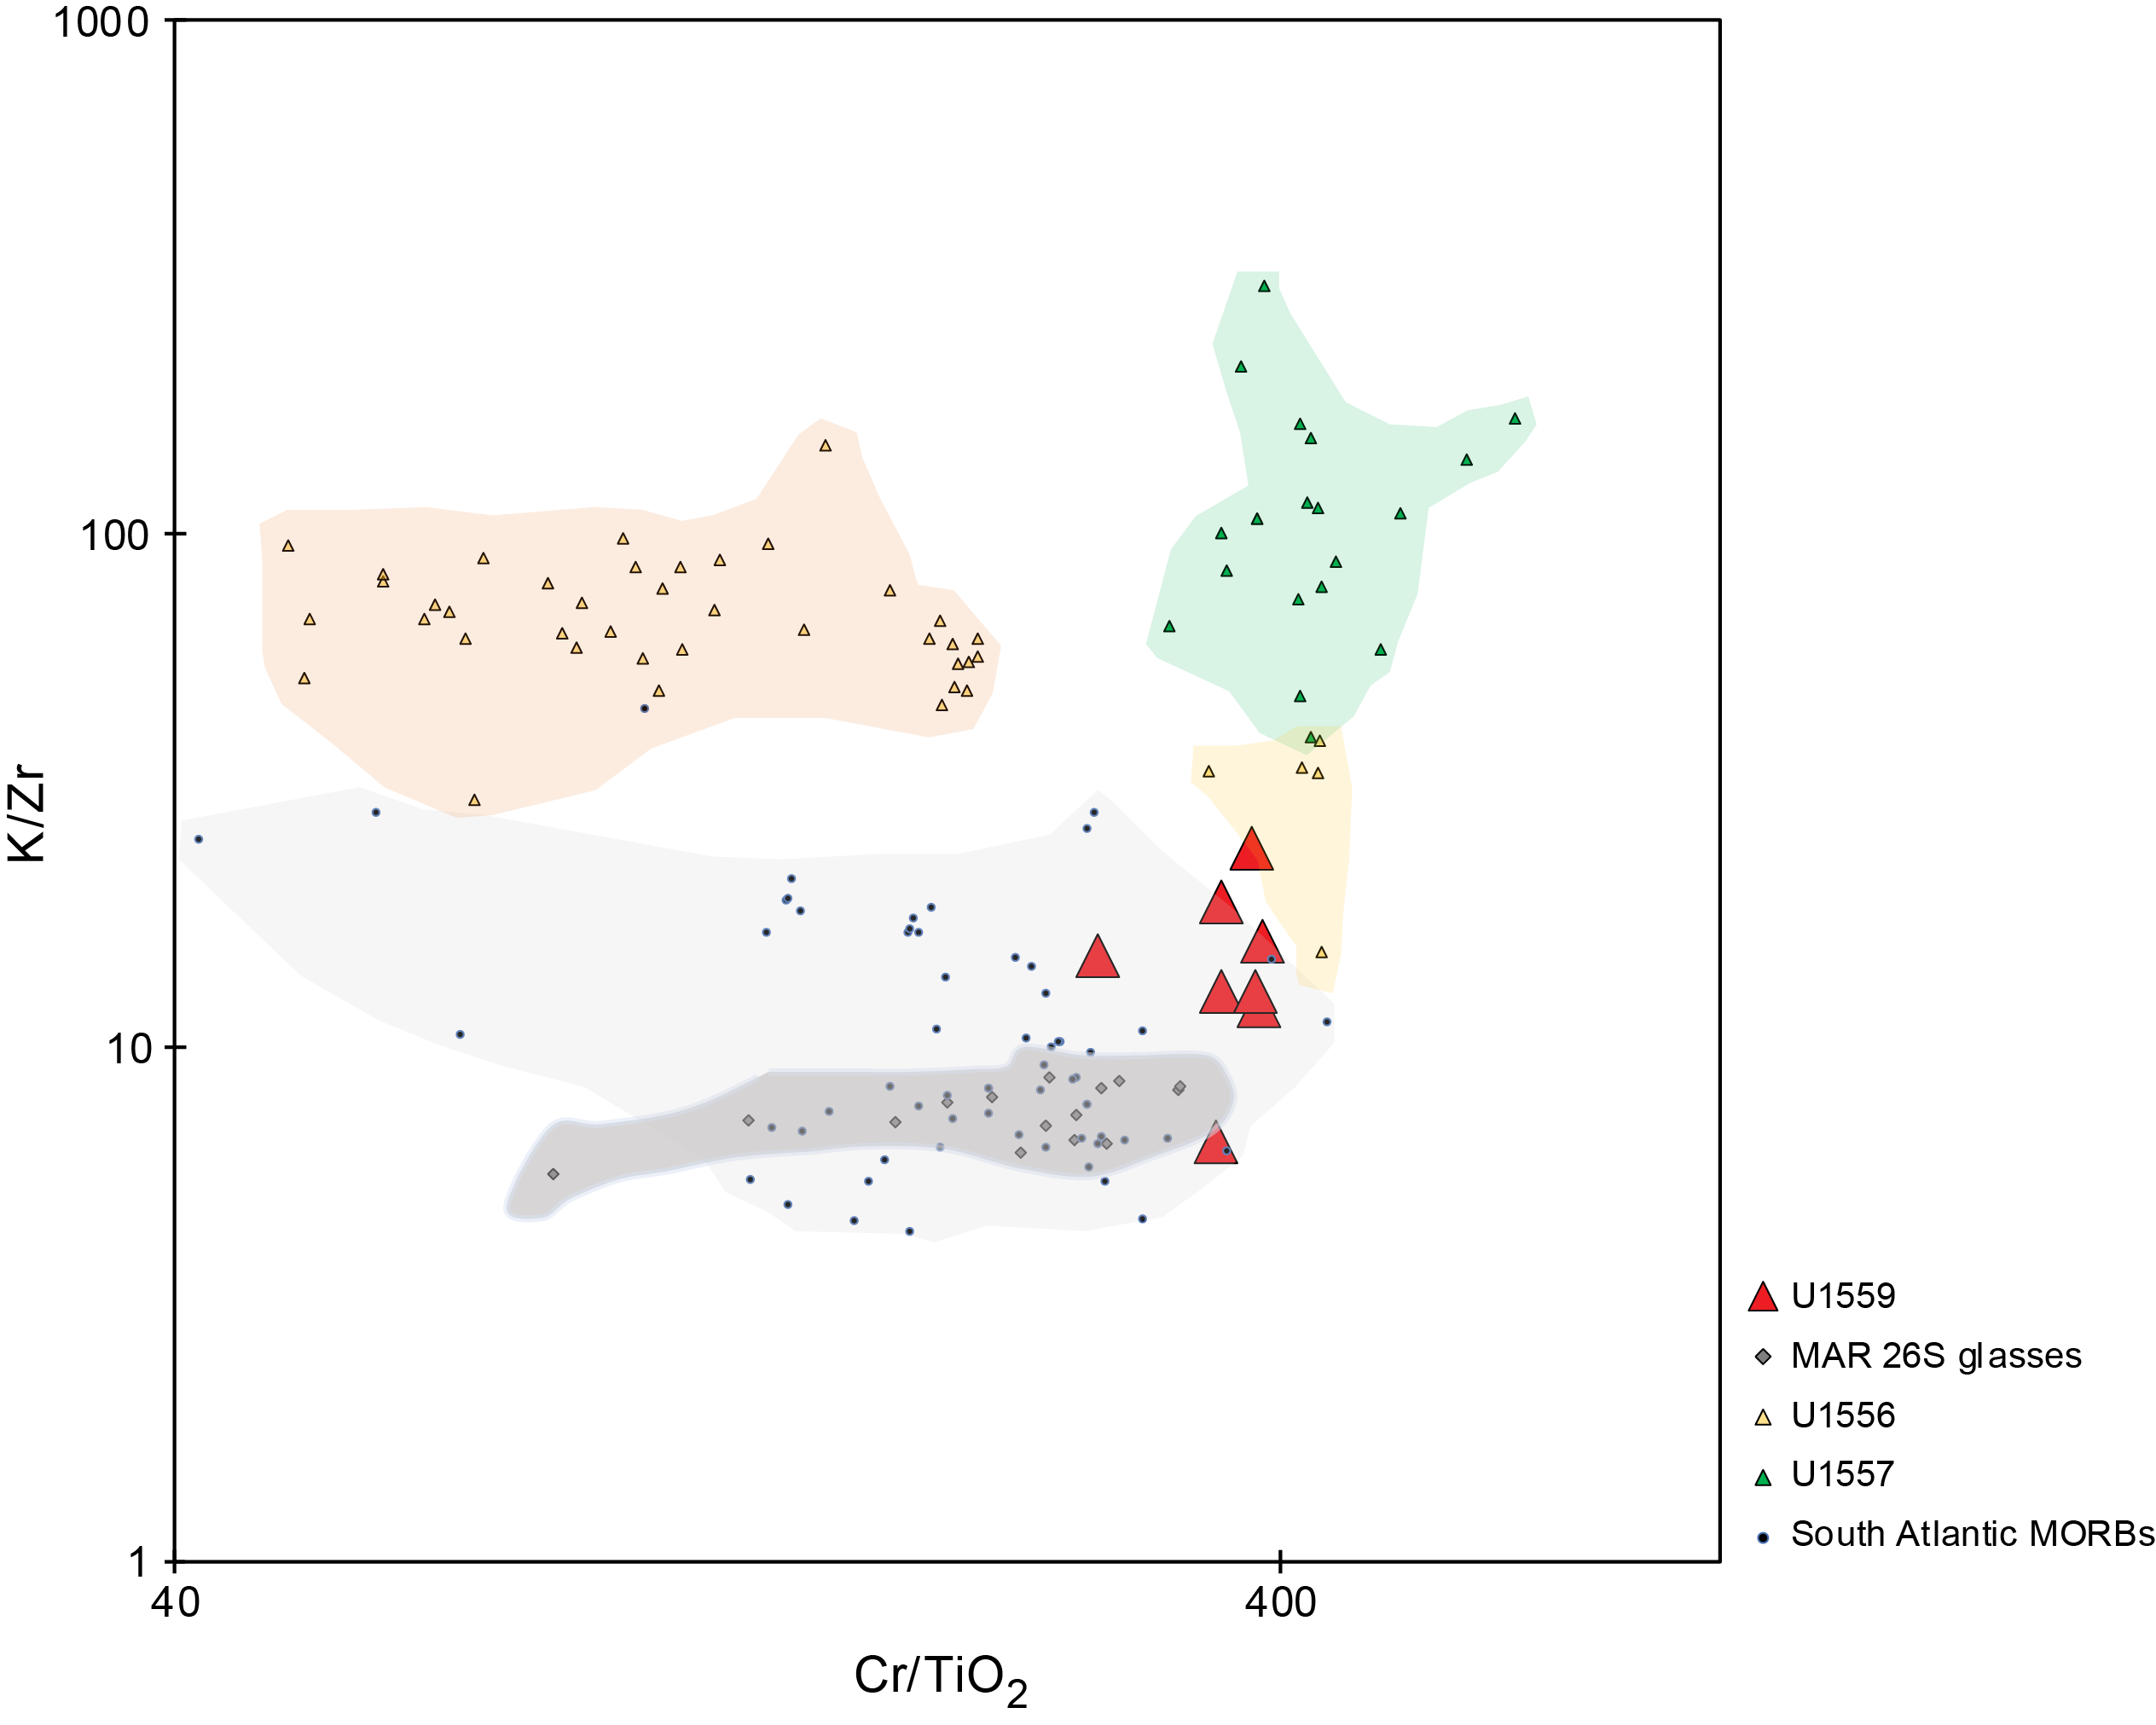
Figure F86. K/Zr vs. Cr/TiO2.
12. Microbiology
12.1. Sediment
Microbiology sampling in sediment from Site U1559 during Expedition 390 focused on exploring evidence for life in the sediments using culture-based and culture-independent approaches. From Hole U1559D, 10 standard microbiology whole rounds and 23 personal whole-round samples (5–20 cm long) were collected for microbiological analysis. At least three whole-round core samples were collected from each 9.5 m advance, with each one processed and subsampled for different analyses (Table T38).
12.1.1. Microbiological sample processing and experiments
12.1.1.1. Cell and viral counts
Nine samples were processed for cell and virus enumeration. Performing shipboard cell count samples is difficult because of the time required for sample processing and other shipboard tests. Therefore, shipboard cell counts were not attempted during the SAT expeditions. Instead, samples were preserved for postexpedition analysis in a 20% vol/vol slurry of 5 mL total of sediment and 5% Epredia Formal-Fixx in 3× phosphate buffered solution. Samples were taken in duplicate to enable cross-calibration of cell counts between different laboratories. A third sample was preserved for virus enumeration.
12.1.1.2. Microbial community structure
Samples were processed for shore-based analysis as follows (Table T38):
- 10 samples for polymerase chain reaction (PCR) amplicon-based analysis (from DNA and RNA),
- 9 samples for single-cell genomics,
- 3 samples for viral metagenomics,
- 4 samples for sediment metagenomics,
- 2 samples for anaerobic enrichments, and
- 4 samples for high-throughput culturing.
Material for DNA and RNA analyses of microbial community composition, which will be performed as part of postexpedition research, was collected and preserved following the procedures described in Microbiology in the Expedition 390/393 methods chapter (Coggon et al., 2024c). Whole-round samples to be subsampled for anaerobic enrichments were brought from the core receiving platform to the anaerobic chamber in the walk-in cold room in the microbiology laboratory for subsampling to prevent exposure to oxygen. Samples from these whole-round cores were placed in sterile vials and sealed with thick rubber stoppers to prevent oxygen exchange, packed with Anaeropack oxygen absorbers, and stored at 4°C. These whole-round samples were selected from depths assumed to be anaerobic based on the oxygen profiles of Hole U1559C (see Geochemistry).
12.1.1.3. Microbial incubation experiments
To attempt to isolate new microbial species that can be characterized and used in future laboratory-based experiments, experiments on Petri dishes with 1/10 ZoBell Marine Agar media were initiated from seven 5 cm3 sediment samples (Table T38). These culturing experiments were executed as described in Microbiology in the Expedition 390/393 methods chapter (Coggon et al., 2024c), and the Petri dishes were then incubated at 9.5°C with the tops facing down for the duration of Expedition 390 and then shipped to shore for postexpedition research.
To determine preferred carbon (C) and nitrogen (N) sources used by metabolically active microorganisms in subseafloor sediments, samples from three depths were used to initiate stable isotope probing experiments (Table T38). Samples for these experiments were chosen from the depths assumed to be either aerobic or anaerobic based on the oxygen profiles of Hole U1559C at this site (see Geochemistry). The experiments were done following protocols described in Microbiology in the Expedition 390/393 methods chapter (Coggon et al., 2024c).
The rate of microbially mediated sulfate reduction was determined by the addition of radiolabeled (35S) sulfate to a subset of 10 sediment samples at a sampling resolution of approximately one sample every 5–10 m of core (Table T38). For these experiments, whole-round samples were brought from the core receiving platform to the anaerobic chamber in the walk-in cold room in the microbiology laboratory and subsampled in the anaerobic hood to prevent exposure to oxygen, which would inhibit sulfate-reducing microorganisms. Once the whole-round sample was inside the anaerobic chamber, the outer centimeter of the core was removed using autoclaved ceramic knives, and the remaining core was transferred to gas-tight bags, flushed with N2 gas, heat sealed, and stored at ~4°C until prepared for radiotracer additions. Sulfate-reduction experiments were conducted as indicated in Microbiology in the Expedition 390/393 methods chapter (Coggon et al., 2024c).
12.1.2. Microbiological contamination monitoring
Drilling fluid and mud sweeps are potential sources of contamination to cores collected for microbiology analysis. To determine the extent of contamination from drilling fluid of microbiology samples, the perfluorocarbon tracer perfluoromethyldecalin (PFMD) was injected into drilling fluids during circulation throughout coring operations in Hole U1559D. Samples were collected from both the exterior and interior of whole-round cores selected for microbiology analysis to quantify the presence of PFMD. Ideally, PFMD is detected on the exterior of whole rounds, indicating successful delivery, but not in the interior portions (i.e., the portion from which microbiological samples are prepared) because detection of PFMD in the whole-round interior would indicate intrusion of drilling fluid. Exterior samples for PFMD analysis were collected from nine samples, coinciding with those for which cell counts and DNA/RNA samples were collected (Table T39).
PFMD was mainly detected in the exterior samples, with a mean concentration of 2.3 ng PFMD/g core and a median concentration of 0.65 ng PFMD/g sediment (Figure F87). For the whole-round interior (microbiology) samples, the mean PFMD concentration was 0.053 ng PFMD/g sediment and the median concentration was zero. The PFMD concentration was 0 g PFMD/g sediment for seven of the nine microbiology samples analyzed. APC coring is acknowledged to have a lower risk for contamination (Lever et al., 2006; Sylvan et al., 2021).
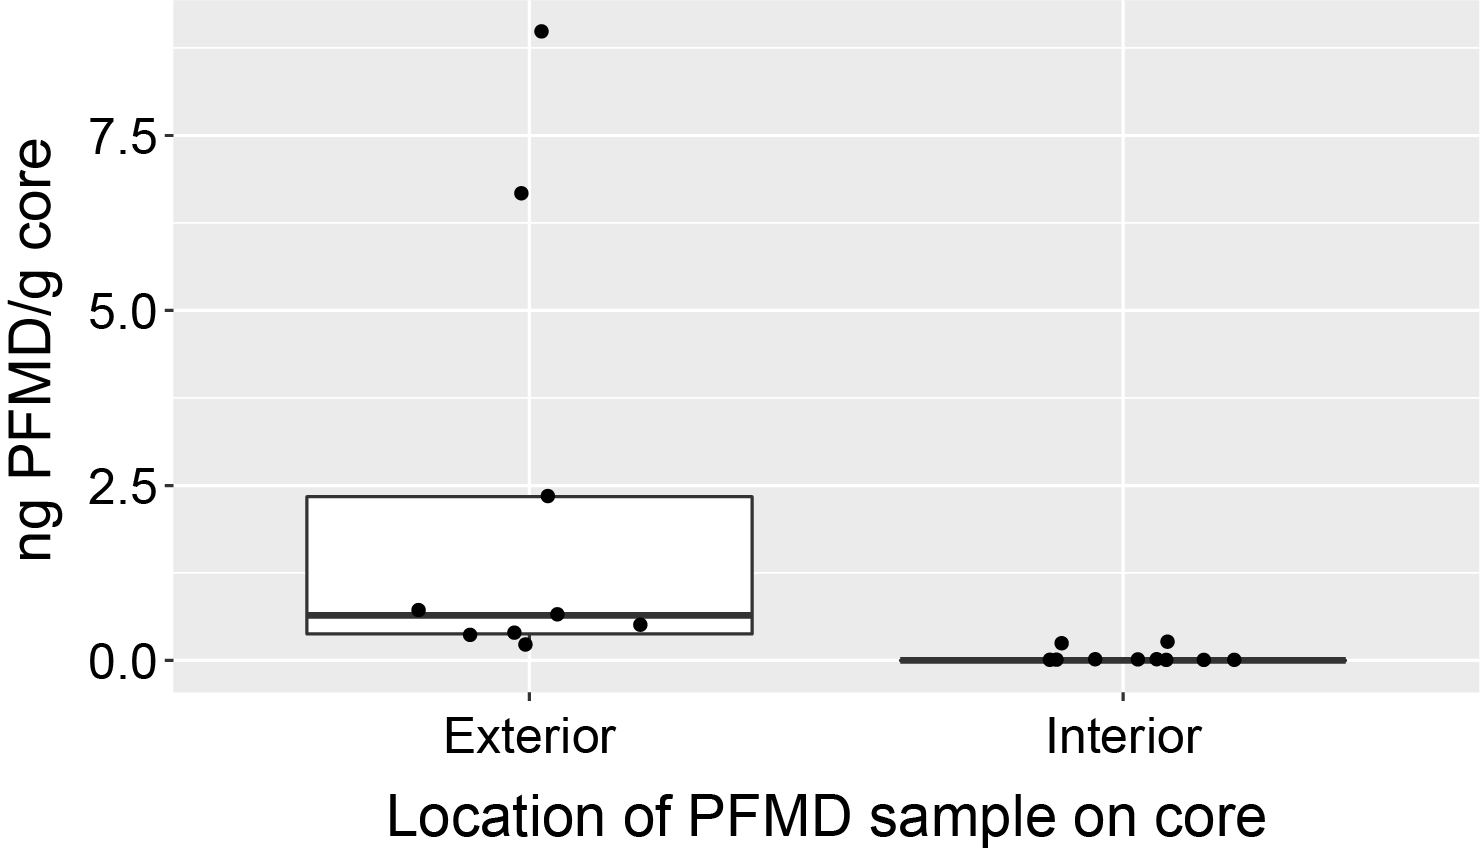
Figure F87. PFMD data by sample location.
12.2. Basement
Microbiology sampling in basement of Hole U1559B focused on culture-based and culture-independent approaches to characterize microbial communities and their activity in the volcanic rocks. Sampling efforts focused on collecting a single whole-round core sample from each 9.5 m advance that would be processed and subsampled for different analyses, as described below. The poor recovery in Hole U1559B (26%) and the reduced alteration intensity because of the young age of the oceanic crust resulted in collection of whole-round samples <10 cm long, which are otherwise undesirable but were collected when longer whole rounds were not available. In total, nine whole-round samples (5–13 cm long) were collected for microbiological analyses (Figure F88):
- Micritic limestone with rare millimeter-sized altered glass fragments (1 sample);
- Aphyric, crypto- to microcrystalline basalt (2 samples);
- Sparsely plagioclase-phyric, microcrystalline basalt with fresh olivine microcrysts (1 sample);
- Sparsely plagioclase-phyric, microcrystalline basalt with rare olivine phenocrysts (3 samples); and
- Sparsely plagioclase-phyric fine-grained to microcrystalline basalt with rare olivine and clinopyroxene phenocrysts (1 sample).
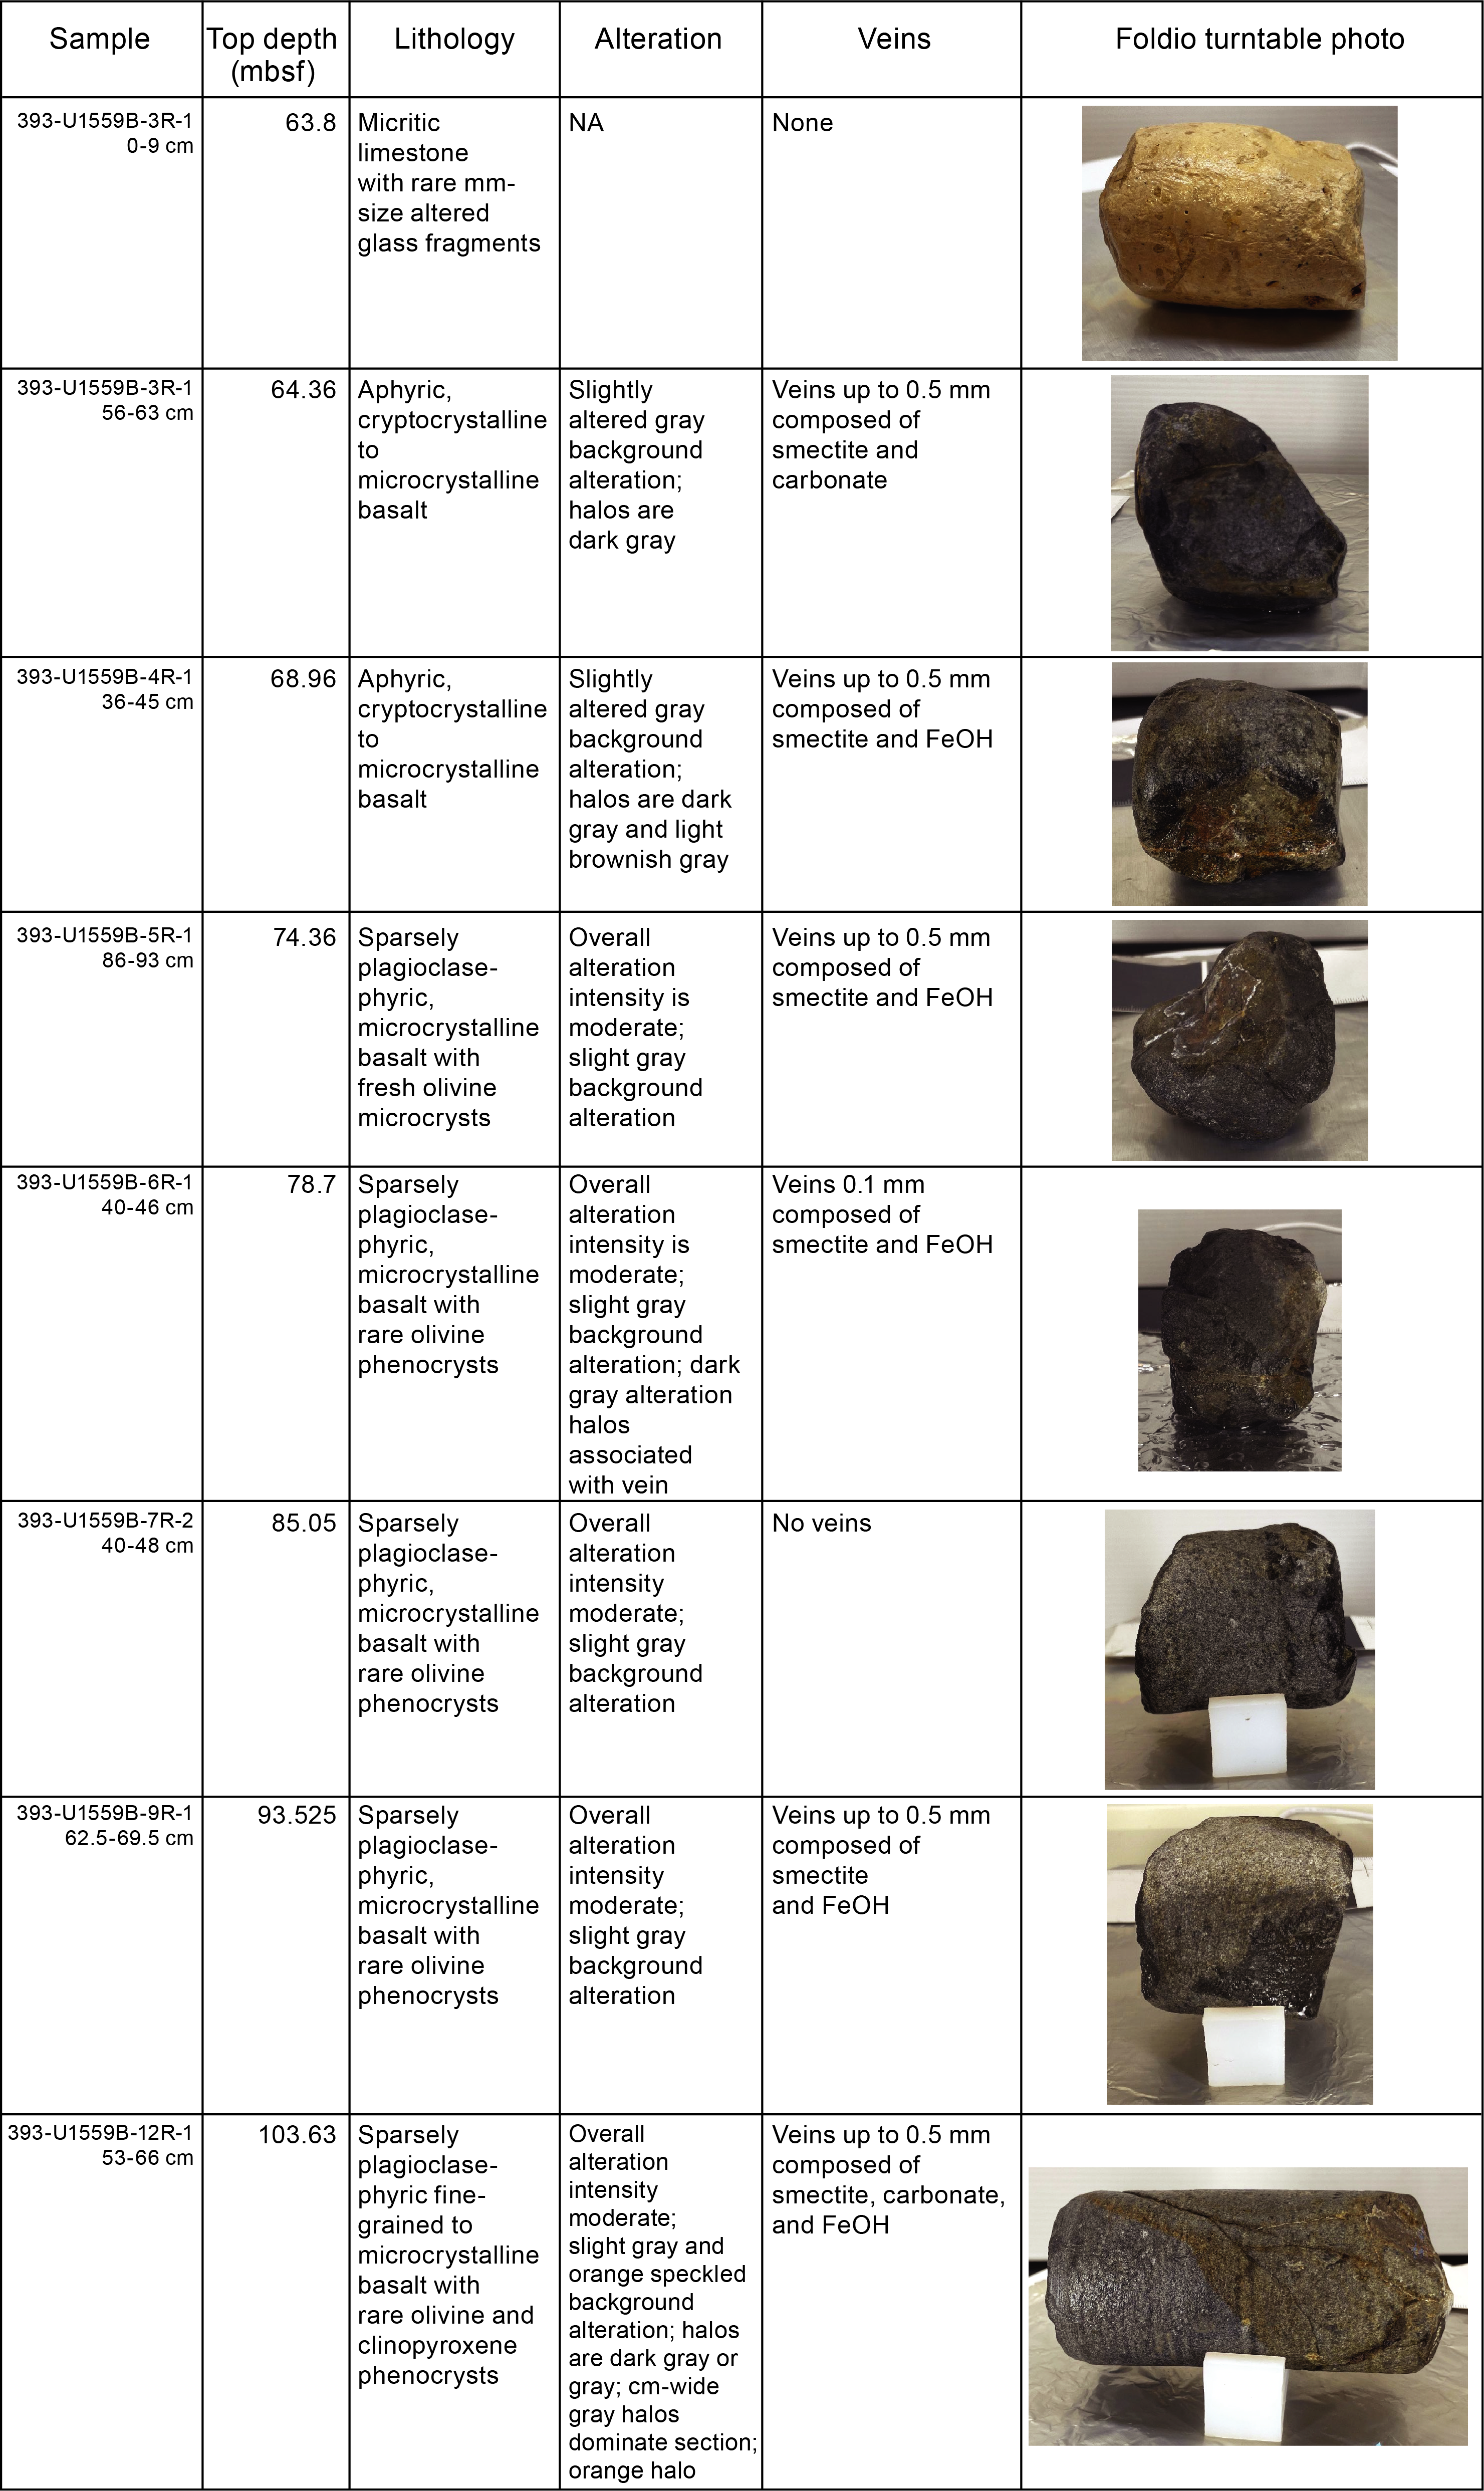
Figure F88. Samples for microbiology research.
After the exteriors of whole-round pieces were removed to avoid material that was contaminated during the coring process (see Microbiology in the Expedition 390/393 methods chapter [Coggon et al., 2024c]), the remaining material was split into samples that were prepared for different personal shore-based microbiological analyses. The number of samples depended on the amount of material available from each whole round (Table T40).
12.2.1. Microbiological sample processing and experiments
12.2.1.1. Cell and viral counts
Eight samples were processed for cell and virus enumeration. Performing shipboard cell counts on rock samples is difficult because of the time required to separate cells from rock material in addition to the time required for sample processing and other shipboard tests. Therefore, shipboard cell counts were not attempted during the SAT expeditions. Cell count samples were instead broken into small chips and/or powder and preserved for postexpedition analyses (1 cm3 sample in 4 mL of 4% paraformaldehyde in 100 mM phosphate-buffered saline [PBS]). Duplicate cell count samples were prepared for all samples to perform and compare the measurements independently in two different laboratories. A third sample was collected from Sample 393-U1559B-1R-1, 0–9 cm, to additionally allow for viral counts.
12.2.1.2. Microbial community structure
Basement samples were processed for shore-based analysis as follows (Table T40):
- 8 samples DNA (PCR amplicon-based and metagenomes) and/or RNA (PCR amplicon-based and/or metatranscriptomes) analysis,
- 8 samples for single-cell genomics, and
- 8 samples for lipid analysis.
Material for DNA, RNA, and lipid-based analyses of microbial community composition was collected and preserved for postexpedition research following the procedures described in Microbiology in the Expedition 390/393 methods chapter (Coggon et al., 2024c).
12.2.1.3. Microbial incubation experiments
To determine the extent of viral activity (see Microbiology in the Expedition 390/393 methods chapter [Coggon et al., 2024c]), Sample 393-U1559B-3R-1, 0–9 cm, was used to initiate shipboard virus-induced microbial mortality and prophage induction experiments. Approximately 18 g of basalt was crushed to a fine grit with a sterilized hammer inside a rock box and then the particles were resuspended in 40 mL of autoclaved surface seawater. Subsamples of 1 mL were collected after 0, 3, 6, 12, 24, and 48 h and then 7 and 14 days.
The seawater that was used to dilute the rock was collected upon arrival at Site U1559 on 19 June 2022 using a cleaned bucket attached to a line. This surface seawater was filtered through a 0.22 µm polyethersulfone (PES) membrane twice and autoclaved. The pH was 7.99 after autoclaving, and the salinity was 37.
Another set of crushed rocks from the interior of Samples 393-U1559B-3R-1, 0–9 cm, and 3R-1, 56–63 cm, were used in an ammonium enrichment incubation experiment (see Microbiology in the Expedition 390/393 methods chapter [Coggon et al., 2024c]). These vials are incubated at 4°C for 6 months before extracting the contents for shore-based analysis at Texas A&M University (USA).
12.2.2. Microbiological contamination monitoring
Drilling fluid and mud sweeps are potential sources of contamination to cores collected for microbiology analysis (Sylvan et al., 2021). To determine the extent of contamination of microbiological samples, the perfluorocarbon tracer PFMD was injected into drilling fluid at a rate of 0.5 mL/min during circulation in Hole U1559B. PFMD was pumped for the entirety of drilling operations in Hole U1559B. Microbiologists then collected samples from both the exterior and interior of core intervals selected for microbiology analysis to quantify the presence of PFMD. Ideally, PFMD is detected on the exterior, indicating successful delivery down the drill string to the core exterior, but not in the interior portions of core whole rounds from where the microbiological samples are prepared. Detection of PFMD in the whole-round interior would indicate intrusion of drilling fluid and hence potential microbial contamination.
Eight of the nine whole-round samples were tested for contamination (Tables T40, T41). For each whole-round sample, a piece of the exterior of the rock was taken after the rock was rinsed and cleaned with ethanol, which lowered the PFMD concentration detected but can also validate the cleaning process. An interior piece was also collected for PFMD analysis to determine if any tracer infiltrated the interior of the cores. In all cases except for Sample 393-U1559D-6R-1, 40–46 cm, for both interior and exterior samples, the tracer was not detected in the samples (Figure F89). These low measurements could be due to (1) the amount of sample in each vial being too low, (2) the tracer being fully removed during the cleaning process, or (3) insufficient tracer in the drilling fluid. For the subsequent holes drilled during Expedition 393 (Sites U1558 and U1583), we increased the size of rock samples to increase the amount of measured tracer and also assayed small pieces of rubble from the core catchers that were in direct contact with drilling fluids.
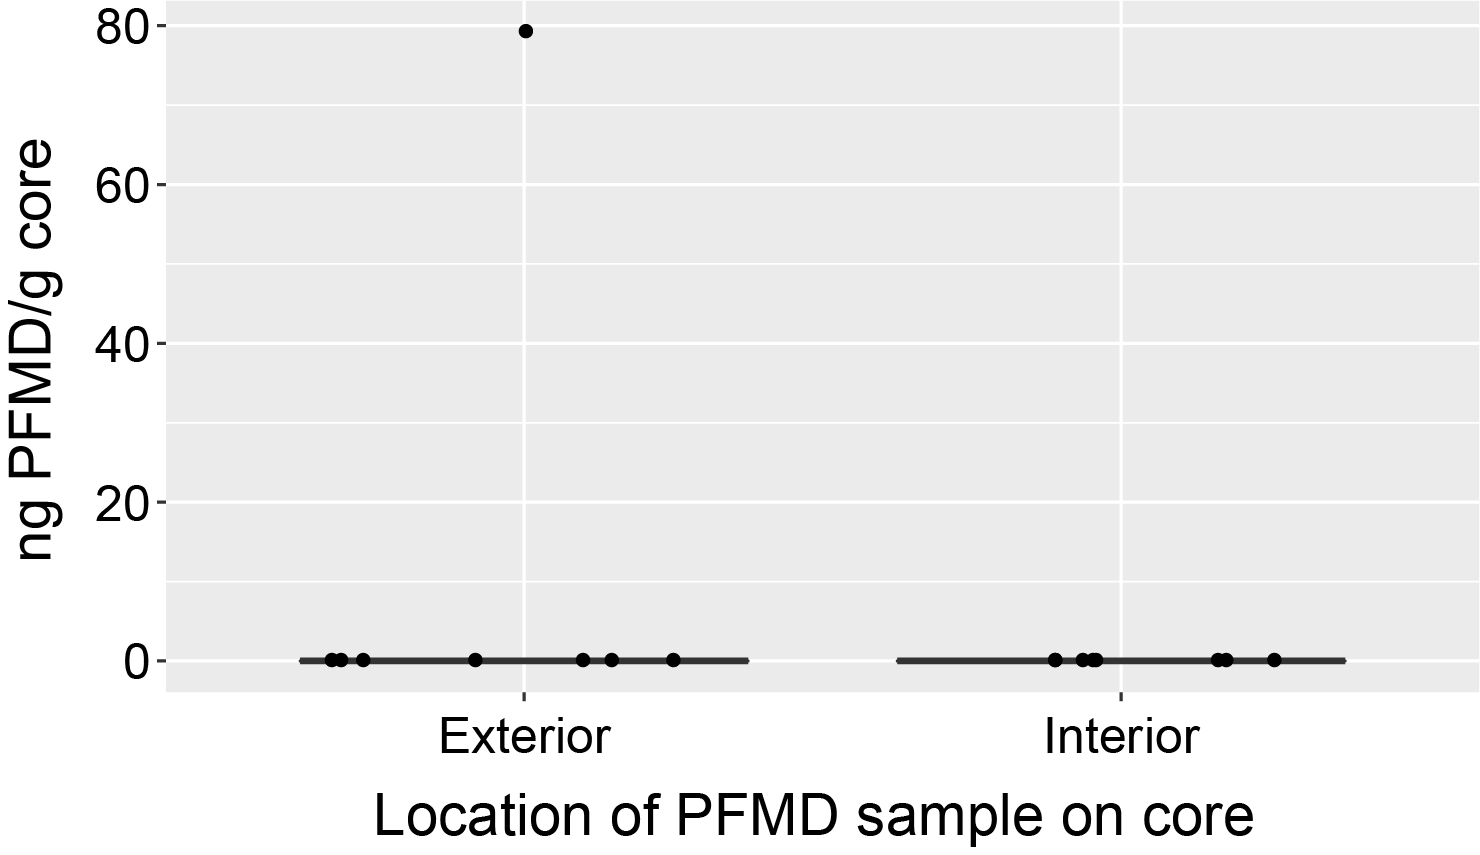
Figure F89. PFMD tracer concentrations.
To determine the number of microorganisms present in drilling fluid and also generate a database of potential contaminants, we collected one sample of drilling fluid from a pipe on the rig floor at the end of coring operations in Hole U1559B. Samples were collected for cell counts (1 mL of drilling fluid in 4 mL of 4% paraformaldehyde in 100 mM PBS), and 500 mL of drilling fluid was filtered onto one 0.22 µm pore size 47 mm diameter filter and frozen at −80°C for shore-based molecular biology analysis.
References
Agnini, C., Fornaciari, E., Raffi, I., Catanzariti, R., Pälike, H., Backman, J., and Rio, D., 2014. Biozonation and biochronology of Paleogene calcareous nannofossils from low and middle latitudes. Newsletters on Stratigraphy, 47(2):131–181. https://doi.org/10.1127/0078-0421/2014/0042
Alt, J.C., Teagle, D.A.H., Laverne, C., Vanko, D.A., Bach, W., Honnorez, J., Becker, K., Ayadi, M., and Pezard, P.A., 1996. Ridge flank alteration of upper ocean crust in the eastern Pacific: synthesis of results for volcanic rocks of holes 504B and 896A. In Alt, J.C., Kinoshita, H., Stokking, L.B., and Michael, P.J. (Eds.), Proceedings of the Ocean Drilling Program, Scientific Results. 148: College Station, TX (Ocean Drilling Program), 435–450. https://doi.org/10.2973/odp.proc.sr.148.150.1996
Baker, P.A., Gieskes, J.M., and Elderfield, H., 1982. Diagenesis of carbonates in deep-sea sediments; evidence from Sr/Ca ratios and interstitial dissolved Sr2+ data. Journal of Sedimentary Research, 52(1):71–82. https://doi.org/10.1306/212F7EE1-2B24-11D7-8648000102C1865D
Bolli, H.M., and Saunders, J.B., 1985. Oligocene to Holocene low latitude planktic foraminifera. In Bolli, H.M., Saunders, J.B., and Perch-Nielsen, K. (Eds.), Planktic Foraminifera, Calcareous Nannofossils and Calpionellids. Plankton Stratigraphy, 1: 155–262.
Boyer, T.P., García, H.E., Locarnini, R.A., Zweng, M.M., Mishonov, A.V., Reagan, J.R., Weathers, K.A., Baranova, O.K., Paver, C.R., Seidov, D., and Smolyar, I.V., 2018. World Ocean Atlas 2018. NOAA National Centers for Environmental Information. https://www.ncei.noaa.gov/archive/accession/NCEI-WOA18
Butler, R.F., 1992. Paleomagnetism: Magnetic Domains and Geologic Terranes: Oxford, England (Blackwell).
Christeson, G., and Reece, R., 2020. Bathymetric site survey gridded data in support of IODP Expeditions 390 and 393, South Atlantic Transect (MGL1601, CREST). Interdisciplinary Earth Data Alliance (IEDA). https://doi.org/10.26022/IEDA/327528
Christeson, G.L., Goff, J.A., and Reece, R.S., 2019. Synthesis of oceanic crustal structure from two-dimensional seismic profiles. Reviews of Geophysics, 57(2):504–529. https://doi.org/10.1029/2019RG000641
Christeson, G.L., Reece, R.S., Kardell, D.A., Estep, J.D., Fedotova, A., and Goff, J.A., 2020. South Atlantic transect: variations in oceanic crustal structure at 31°S. Geochemistry, Geophysics, Geosystems, 21(7):e2020GC009017. https://doi.org/10.1029/2020GC009017
Coggon, R.M., Sylvan, J.B., Teagle, D.A.H., Reece J., Christeson, G.L., Estes, E.R., Williams, T.J., and the Expedition 390 Scientists, 2022. Expedition 390 Preliminary Report: South Atlantic Transect 1. International Ocean Discovery Program. https://doi.org/10.14379/iodp.pr.390.2022
Coggon, R.M., Sylvan, J.B., Estes, E.R., Teagle, D.A.H., Reece, J., Williams, T.J., Christeson, G.L., Aizawa, M., Borrelli, C., Bridges, J.D., Carter, E.J., Dinarès-Turell, J., Estep, J.D., Gilhooly, W.P., III, Grant, L.J.C., Kaplan, M.R., Kempton, P.D., Lowery, C.M., McIntyre, A., Routledge, C.M., Slagle, A.L., Takada, M., Tamborrino, L., Wang, Y., Yang, K., Albers, E., Amadori, C., Belgrano, T.M., D'Angelo, T., Doi, N., Evans, A., Guérin, G.M., Harris, M., Hojnacki, V.M., Hong, G., Jin, X., Jonnalagadda, M., Kuwano, D., Labonte, J.M., Lam, A.R., Latas, M., Lu, W., Moal-Darrigade, P., Pekar, S.F., Robustelli Test, C., Ryan, J.G., Santiago Ramos, D., Shchepetkina, A., Villa, A., Wee, S.Y., Widlansky, S.J., Kurz, W., Prakasam, M., Tian, L., Yu, T., and Zhang, G., 2024a. Site U1556. In Coggon, R.M., Teagle, D.A.H., Sylvan, J.B., Reece, J., Estes, E.R., Williams, T.J., Christeson, G.L., and the Expedition 390/393 Scientists, South Atlantic Transect. Proceedings of the International Ocean Discovery Program, 390/393: College Station, TX (International Ocean Discovery Program). https://doi.org/10.14379/iodp.proc.390393.103.2024
Coggon, R.M., Sylvan, J.B., Estes, E.R., Teagle, D.A.H., Reece, J., Williams, T.J., Christeson, G.L., Aizawa, M., Borrelli, C., Bridges, J.D., Carter, E.J., Dinarès-Turell, J., Estep, J.D., Gilhooly, W.P., III, Grant, L.J.C., Kaplan, M.R., Kempton, P.D., Lowery, C.M., McIntyre, A., Routledge, C.M., Slagle, A.L., Takada, M., Tamborrino, L., Wang, Y., Yang, K., Albers, E., Amadori, C., Belgrano, T.M., D'Angelo, T., Doi, N., Evans, A., Guérin, G.M., Harris, M., Hojnacki, V.M., Hong, G., Jin, X., Jonnalagadda, M., Kuwano, D., Labonte, J.M., Lam, A.R., Latas, M., Lu, W., Moal-Darrigade, P., Pekar, S.F., Robustelli Test, C., Ryan, J.G., Santiago Ramos, D., Shchepetkina, A., Villa, A., Wee, S.Y., Widlansky, S.J., Kurz, W., Prakasam, M., Tian, L., Yu, T., and Zhang, G., 2024b. Site U1557. In Coggon, R.M., Teagle, D.A.H., Sylvan, J.B., Reece, J., Estes, E.R., Williams, T.J., Christeson, G.L., and the Expedition 390/393 Scientists, South Atlantic Transect. Proceedings of the International Ocean Discovery Program, 390/393: College Station, TX (International Ocean Discovery Program). https://doi.org/10.14379/iodp.proc.390393.105.2024
Coggon, R.M., Teagle, D.A.H., Sylvan, J.B., Reece, J., Estes, E.R., Williams, T.J., Christeson, G.L., Aizawa, M., Albers, E., Amadori, C., Belgrano, T.M., Borrelli, C., Bridges, J.D., Carter, E.J., D'Angelo, T., Dinarès-Turell, J., Doi, N., Estep, J.D., Evans, A., Gilhooly, W.P., III, Grant, L.J.C., Guérin, G.M., Harris, M., Hojnacki, V.M., Hong, G., Jin, X., Jonnalagadda, M., Kaplan, M.R., Kempton, P.D., Kuwano, D., Labonte, J.M., Lam, A.R., Latas, M., Lowery, C.M., Lu, W., McIntyre, A., Moal-Darrigade, P., Pekar, S.F., Robustelli Test, C., Routledge, C.M., Ryan, J.G., Santiago Ramos, D., Shchepetkina, A., Slagle, A.L., Takada, M., Tamborrino, L., Villa, A., Wang, Y., Wee, S.Y., Widlansky, S.J., Yang, K., Kurz, W., Prakasam, M., Tian, L., Yu, T., and Zhang, G., 2024c. Expedition 390/393 methods. In Coggon, R.M., Teagle, D.A.H., Sylvan, J.B., Reece, J., Estes, E.R., Williams, T.J., Christeson, G.L., and the Expedition 390/393 Scientists, South Atlantic Transect. Proceedings of the International Ocean Discovery Program, 390/393: College Station, TX (International Ocean Discovery Program). https://doi.org/10.14379/iodp.proc.390393.102.2024
Coggon, R.M., Teagle, D.A.H., Sylvan, J.B., Reece, J., Estes, E.R., Williams, T.J., Christeson, G.L., Aizawa, M., Albers, E., Amadori, C., Belgrano, T.M., Borrelli, C., Bridges, J.D., Carter, E.J., D'Angelo, T., Dinarès-Turell, J., Doi, N., Estep, J.D., Evans, A., Gilhooly, W.P., III, Grant, L.J.C., Guérin, G.M., Harris, M., Hojnacki, V.M., Hong, G., Jin, X., Jonnalagadda, M., Kaplan, M.R., Kempton, P.D., Kuwano, D., Labonte, J.M., Lam, A.R., Latas, M., Lowery, C.M., Lu, W., McIntyre, A., Moal-Darrigade, P., Pekar, S.F., Robustelli Test, C., Routledge, C.M., Ryan, J.G., Santiago Ramos, D., Shchepetkina, A., Slagle, A.L., Takada, M., Tamborrino, L., Villa, A., Wang, Y., Wee, S.Y., Widlansky, S.J., Yang, K., Kurz, W., Prakasam, M., Tian, L., Yu, T., and Zhang, G., 2024d. Expedition 390/393 summary. In Coggon, R.M., Teagle, D.A.H., Sylvan, J.B., Reece, J., Estes, E.R., Williams, T.J., Christeson, G.L., and the Expedition 390/393 Scientists, South Atlantic Transect. Proceedings of the International Ocean Discovery Program, 390/393: College Station, TX (International Ocean Discovery Program). https://doi.org/10.14379/iodp.proc.390393.101.2024
Coggon, R.M., Teagle, D.A.H., Sylvan, J.B., Reece, J., Estes, E.R., Williams, T.J., Christeson, G.L., and the Expedition 390/393 Scientists, 2024e. Supplementary material, https://doi.org/10.14379/iodp.proc.390393supp.2024. In Coggon, R.M., Teagle, D.A.H., Sylvan, J.B., Reece, J., Estes, E.R., Williams, T.J., Christeson, G.L., and the Expedition 390/393 Scientists, South Atlantic Transect. Proceedings of the International Ocean Discovery Program, 390/393: College Station, TX (International Ocean Discovery Program).
Constable, C., and Tauxe, L., 1990. The bootstrap for magnetic susceptibility tensors. Journal of Geophysical Research: Solid Earth, 95(B6):8383–8395. https://doi.org/10.1029/JB095iB06p08383
Donnelly, T.W., Thompson, G., and Salisbury, M.H., 1980. The chemistry of altered basalts at Site 417, Deep Sea Drilling Project Leg 51. In Donnelly, T., Francheteau, J., Bryan, W., Robinson, P., Flower, M., Salisbury, M., et al., Initial Reports of the Deep Sea Drilling Project. 51/52/53: Washington, DC (US Government Printing Office), 1319–1330. https://doi.org/10.2973/dsdp.proc.515253.154.1980
Dunlea, A.G., Murray, R.W., Harris, R.N., Vasiliev, M.A., Evans, H., Spivack, A.J., and D'Hondt, S., 2013. Assessment and use of NGR instrumentation on the JOIDES Resolution to quantify U, Th, and K concentrations in marine sediment. Scientific Drilling, 15:57–63. https://doi.org/10.2204/iodp.sd.15.05.2013
Elderfield, H., and Gieskes, J.M., 1982. Sr isotopes in interstitial waters of marine sediments from Deep Sea Drilling Project cores. Nature, 300(5892):493–497. https://doi.org/10.1038/300493a0
Estep, J., Reece, R., Kardell, D.A., Christeson, G.L., and Carlson, R.L., 2019. Seismic Layer 2A: evolution and thickness from 0- to 70-Ma crust in the slow-intermediate spreading South Atlantic. Journal of Geophysical Research: Solid Earth, 124(8):7633–7651. https://doi.org/10.1029/2019JB017302
Estes, E.R., Williams, T., Midgley, S., Coggon, R.M., Sylvan, J.B.,Christeson, G.L., Teagle, D.A.H., and the Expedition 390C Scientists, 2021. Expedition 390C Preliminary Report: South Atlantic Transect Reentry Systems. International Ocean Discovery Program. https://doi.org/10.14379/iodp.pr.390C.2021
Flower, M.F.J., Ohnmacht, W., Robinson, P.T., Marriner, G., and Schmincke, H.U., 1980. Lithologic and chemical stratigraphy at Deep Sea Drilling Project Sites 417 and 418. Legs 51, 52, 53, Part 2 of the cruises of the drilling vessel Glomar Challenger, San Juan, Puerto Rico to San Juan, Puerto Rico, November 1976-April 1977, 51:939. http://hdl.handle.net/10.2973/dsdp.proc.515253.121.1980
Gale, A., Dalton, C.A., Langmuir, C.H., Su, Y., and Schilling, J.-G., 2013. The mean composition of ocean ridge basalts. Geochemistry, Geophysics, Geosystems, 14(3):489–518. https://doi.org/10.1029/2012GC004334
Gradstein, F.M., Ogg, J.G., Schmitz, M.D., and Ogg, G.M. (Eds.), 2020. The Geologic Time Scale 2020: Amsterdam (Elsevier BV). https://doi.org/10.1016/C2020-1-02369-3
Harris, M., Coggon, R.M., Smith-Duque, C.E., Cooper, M.J., Milton, J.A., and Teagle, D.A.H., 2015. Channelling of hydrothermal fluids during the accretion and evolution of the upper oceanic crust: Sr isotope evidence from ODP Hole 1256D. Earth and Planetary Science Letters, 416:56–66. https://doi.org/10.1016/j.epsl.2015.01.042
Holbourn, A., Henderson, A.S., and MacLeod, N., 2013. Atlas of Benthic Foraminifera: United Kingdom (John Wiley & Sons, Ltd.). https://doi.org/10.1002/9781118452493
Jelinek, V., 1981. Characterization of the magnetic fabric of rocks. Tectonophysics, 79(3–4):T63–T67. https://doi.org/10.1016/0040-1951(81)90110-4
Kardell, D.A., Christeson, G.L., Estep, J.D., Reece, R.S., and Carlson, R.L., 2019. Long-lasting evolution of Layer 2A in the western South Atlantic: evidence for low-temperature hydrothermal circulation in old oceanic crust. Journal of Geophysical Research: Solid Earth, 124(3):2252–2273. https://doi.org/10.1029/2018JB016925
Kelemen, P.B., Matter, J.M., Teagle, D.A.H., Coggon, J.A., and the Oman Drilling Project Science Team, 2020. Methods and explanatory notes. In Kelemen, P.B., Matter, J.M., Teagle, D.A.H., Coggon, J.A., et al., Proceedings of the Oman Drilling Project: College Station, TX (International Ocean Discovery Program). https://doi.org/10.14379/OmanDP.proc.103.2020
Kelley, K.A., Kingsley, R., and Schilling, J.-G., 2013. Composition of plume-influenced mid-ocean ridge lavas and glasses from the Mid-Atlantic Ridge, East Pacific Rise, Galápagos spreading center, and Gulf of Aden. Geochemistry, Geophysics, Geosystems, 14(1):223–242. https://doi.org/10.1002/ggge.20049
Kendrick, M.A., Hémond, C., Kamenetsky, V.S., Danyushevsky, L., Devey, C.W., Rodemann, T., Jackson, M.G., and Perfit, M.R., 2017. Seawater cycled throughout Earth's mantle in partially serpentinized lithosphere. Nature Geoscience, 10(3):222–228. https://doi.org/10.1038/ngeo2902
King, D.J., Wade, B.S., Liska, R.D., and Miller, C.G., 2020. A review of the importance of the Caribbean region in Oligo-Miocene low latitude planktonic foraminiferal biostratigraphy and the implications for modern biogeochronological schemes. Earth-Science Reviews, 202:102968. https://doi.org/10.1016/j.earscirev.2019.102968
Kirschvink, J.L., 1980. The least-squares line and plane and the analysis of palaeomagnetic data. Geophysical Journal International, 62(3):699–718. https://doi.org/10.1111/j.1365-246X.1980.tb02601.x
Korenaga, T., and Korenaga, J., 2008. Subsidence of normal oceanic lithosphere, apparent thermal expansivity, and seafloor flattening. Earth and Planetary Science Letters, 268(1):41–51. https://doi.org/10.1016/j.epsl.2007.12.022
Le Bas, M.J., Le Maitre, R.W., Streickeisen, A., Zanettin, B., the IUGS Subcommission on the Systematics of Igneous Rocks, 1986. A chemical classification of volcanic rocks based on the total alkali-silica diagram. Journal of Petrology, 27(3):745–750. https://doi.org/10.1093/petrology/27.3.745
Le Roux, P.J., 2000. The geochemistry of selected mid-ocean ridge basalts from the Southern mid-Atlantic ridge (40°–55°S) [PhD dissertation]. University of Cape Town, Cape Town, South Africa. http://hdl.handle.net/11427/4207
Lever, M.A., Alperin, M., Engelen, B., Inagaki, F., Nakagawa, S., Steinsbu, B.O., and Teske, A., 2006. Trends in basalt and sediment core contamination during IODP Expedition 301. Geomicrobiology Journal, 23(7):517–530. https://doi.org/10.1080/01490450600897245
Marschall, H.R., Wanless, V.D., Shimizu, N., Pogge von Strandmann, P.A.E., Elliott, T., and Monteleone, B.D., 2017. The boron and lithium isotopic composition of mid-ocean ridge basalts and the mantle. Geochimica et Cosmochimica Acta, 207:102–138. https://doi.org/10.1016/j.gca.2017.03.028
Martini, E., 1971. Standard Tertiary and Quaternary calcareous nannoplankton zonation. Proceedings of the Second Planktonic Conference, Roma, 1970:739–785.
Marty, J.C., and Cazenave, A., 1989. Regional variations in subsidence rate of oceanic plates: a global analysis. Earth and Planetary Science Letters, 94(3):301–315. https://doi.org/10.1016/0012-821X(89)90148-9
Maxbauer, D.P., Feinberg, J.M., and Fox, D.L., 2016. MAX UnMix: a web application for unmixing magnetic coercivity distributions. Computers & Geosciences, 95:140–145. https://doi.org/10.1016/j.cageo.2016.07.009
Michael, P.J., and Graham, D.W., 2015. The behavior and concentration of CO2 in the suboceanic mantle: inferences from undegassed ocean ridge and ocean island basalts. Lithos, 236–237:338–351. https://doi.org/10.1016/j.lithos.2015.08.020
Olson, P., Reynolds, E., Hinnov, L., and Goswami, A., 2016. Variation of ocean sediment thickness with crustal age. Geochemistry, Geophysics, Geosystems, 17(4):1349–1369. https://doi.org/10.1002/2015GC006143
Parsons, B., and Sclater, J.G., 1977. An analysis of the variation of ocean floor bathymetry and heat flow with age. Journal of Geophysical Research (1896-1977), 82(5):803–827. https://doi.org/10.1029/JB082i005p00803
Paulick, H., Münker, C., and Schuth, S., 2010. The influence of small-scale mantle heterogeneities on Mid-Ocean Ridge volcanism: evidence from the southern Mid-Atlantic Ridge (7°30′S to 11°30′S) and Ascension Island. Earth and Planetary Science Letters, 296(3–4):299–310. https://doi.org/10.1016/j.epsl.2010.05.009
Pribnow, D.F.C., Kinoshita, M., and Stein, C.A., 2000. Thermal data collection and heat flow recalculations for ODP Legs 101-180: Hannover, Germany (Institute for Joint Geoscientific Research, GGA). http://www-odp.tamu.edu/publications/heatflow/
Reece, R., Christeson, G., Amara, A., Estep, J., Greene, J., Koch, C., Henning, L., Worman, W., and Wright, A., 2016. CREST: Crustal Reflectivity Experiment southern transect South Atlantic multichannel seismic and ocean bottom seismometer experiment, 4 Jan–25 Feb 2016 Cruise Report. http://www.iris.washington.edu/data/reports/2016/16-003/CREST_2016-01-04-2016-02-25_MGL1601_CruiseReport.pdf
Reece, R., and Estep, J., 2019. Processed MCS (PSTM) data from the Mid-Atlantic Ridge (MAR) to the Rio Grande Rise, South Atlantic Ocean, acquired by the R/V Marcus G. Langseth in 2016 (MGL1601) https://doi.org/10.1594/IEDA/500255
Reekie, C.D.J., Jenner, F.E., Smythe, D.J., Hauri, E.H., Bullock, E.S., and Williams, H.M., 2019. Sulfide resorption during crustal ascent and degassing of oceanic plateau basalts. Nature Communications, 10(1):82. https://doi.org/10.1038/s41467-018-08001-3
Ríos, A.F., Resplandy, L., García-Ibáñez, M.I., Fajar, N.M., Velo, A., Padin, X.A., Wanninkhof, R., Steinfeldt, R., Rosón, G., and Pérez, F.F., 2015. Decadal acidification in the water masses of the Atlantic Ocean. Proceedings of the National Academy of Sciences, 112(32):9950–9955. https://doi.org/10.1073/pnas.1504613112
Shervais, J.W., 1982. Ti-V plots and the petrogenesis of modern and ophiolitic lavas. Earth and Planetary Science Letters, 59(1):101–118. https://doi.org/10.1016/0012-821X(82)90120-0
Shipboard Scientific Party, 1993. Site 896. In Alt, J.C., Kinoshita, H., Stokking, L.B., et al., Proceedings of the Ocean Drilling Program, Initial Reports, 148. College Station, TX (Ocean Drilling Program), 123–192. https://doi.org/10.2973/odp.proc.ir.148.103.1993
Spinelli, G.A., Giambalvo, E.R., and Fisher, A.T., 2004. Sediment permeability, distribution, and influence on fluxes in oceanic basement. In Davis, E.E., and Elderfield, H. (Eds.), Hydrogeology of the Oceanic Lithosphere. Cambridge, UK (Cambridge University Press), 151–188.
Stein, C.A., and Stein, S., 1994. Constraints on hydrothermal heat flux through the oceanic lithosphere from global heat flow. Journal of Geophysical Research: Solid Earth, 99(B2):3081–3095. https://doi.org/10.1029/93JB02222
Straume, E.O., Gaina, C., Medvedev, S., Hochmuth, K., Gohl, K., Whittaker, J.M., Abdul Fattah, R., Doornenbal, J.C., and Hopper, J.R., 2019. GlobSed: updated total sediment thickness in the world's oceans. Geochemistry, Geophysics, Geosystems, 20(4):1756–1772. https://doi.org/10.1029/2018GC008115
Sylvan, J.B., Estes, E.R., Bogus, K., Colwell, F.S., Orcutt, B.N., and Smith, D.C, 2021. Technical Note 4: Recommendations for microbiological sampling and contamination tracer use aboard the JOIDES Resolution following 20 years of IODP deep biosphere research. International Ocean Discovery Program. https://doi.org/10.14379/iodp.tn.4.2021
Thierstein, H.R., Geitzenauer, K.R., Molfino, B., and Shackleton, N.J., 1977. Global synchroneity of late Quaternary coccolith datum levels validation by oxygen isotopes. Geology, 5(7):400–404. https://doi.org/10.1130/0091-7613(1977)5<400:GSOLQC>2.0.CO;2
van der Zwan, F.M., Devey, C.W., Hansteen, T.H., Almeev, R.R., Augustin, N., Frische, M., Haase, K.M., Basaham, A., and Snow, J.E., 2017. Lower crustal hydrothermal circulation at slow-spreading ridges: evidence from chlorine in Arctic and South Atlantic basalt glasses and melt inclusions. Contributions to Mineralogy and Petrology, 172(11):97. https://doi.org/10.1007/s00410-017-1418-1
van Morkhoven, F.M., Berggren, W.A., and Edwards, A.S., 1986. Cenozoic cosmopolitan deep-water benthic foraminifera. Bulletin des centres de Recherches exploration-production elf-aquitaine, 11.
Wade, B.S., Pearson, P.N., Berggren, W.A., and Pälike, H., 2011. Review and revision of Cenozoic tropical planktonic foraminiferal biostratigraphy and calibration to the geomagnetic polarity and astronomical time scale. Earth-Science Reviews, 104(1–3):111–142. https://doi.org/10.1016/j.earscirev.2010.09.003
Wheat, C.G., Elderfield, H., Mottl, M.J., and Monnin, C., 2000. Chemical composition of basement fluids within an oceanic ridge flank: Implications for along-strike and across-strike hydrothermal circulation. Journal of Geophysical Research: Solid Earth, 105(B6):13437–13447. https://doi.org/10.1029/2000JB900070
Yang, S., Humayun, M., and Salters, V.J.M., 2018. Elemental systematics in MORB glasses from the Mid-Atlantic Ridge. Geochemistry, Geophysics, Geosystems, 19(11):4236–4259. https://doi.org/10.1029/2018GC007593
Yang, T., Zhao, X., Petronotis, K., Dekkers, M.J., and Xu, H., 2019. Anisotropy of magnetic susceptibility (AMS) of sediments from Holes U1480E and U1480H, IODP Expedition 362: sedimentary or artificial origin and implications for paleomagnetic studies. Geochemistry, Geophysics, Geosystems, 20(11):5192–5215. https://doi.org/10.1029/2019GC008721
Yoder, H.S., Jr., and Tilley, C.E., 1962. Origin of basalt magmas: an experimental study of natural and synthetic rock xystems. Journal of Petrology, 3(3):342–532. https://doi.org/10.1093/petrology/3.3.342
Zijderveld, J.D.A., 1967. AC demagnetization of rocks: analysis of results. In Runcorn, S.K.C., Creer, K.M., and Collinson, D.W. (Eds.), Methods in Palaeomagnetism. Developments in Solid Earth Geophysics, 3: 254–286. https://doi.org/10.1016/B978-1-4832-2894-5.50049-5