Coggon, R.M., Teagle, D.A.H., Sylvan, J.B., Reece, J., Estes, E.R., Williams, T.J., Christeson, G.L., and the Expedition 390/393 Scientists
Proceedings of the International Ocean Discovery Program Volume 390/393
publications.iodp.org
https://doi.org/10.14379/iodp.proc.390393.107.2024
Site U15831
![]() D.A.H. Teagle,
D.A.H. Teagle,
![]() J. Reece,
J. Reece,
![]() T.J. Williams,
T.J. Williams,
![]() R.M. Coggon,
R.M. Coggon,
![]() J.B. Sylvan,
J.B. Sylvan,
![]() E.R. Estes,
E.R. Estes,
![]() G.L. Christeson,
G.L. Christeson,
![]() M. Aizawa,
M. Aizawa,
![]() E. Albers,
E. Albers,
![]() C. Amadori,
C. Amadori,
![]() T.M. Belgrano,
T.M. Belgrano,
![]() C. Borrelli,
C. Borrelli,
![]() J.D. Bridges,
J.D. Bridges,
![]() E.J. Carter,
E.J. Carter,
![]() T. D'Angelo,
T. D'Angelo,
![]() J. Dinarès-Turell,
J. Dinarès-Turell,
![]() N. Doi,
N. Doi,
![]() J.D. Estep,
J.D. Estep,
![]() A. Evans,
A. Evans,
![]() W.P. Gilhooly III,
W.P. Gilhooly III,
![]() L.J.C. Grant,
L.J.C. Grant,
![]() G.M. Guérin,
G.M. Guérin,
![]() M. Harris,
M. Harris,
![]() V.M. Hojnacki,
V.M. Hojnacki,
![]() G. Hong,
G. Hong,
![]() X. Jin,
X. Jin,
![]() M. Jonnalagadda,
M. Jonnalagadda,
![]() M.R. Kaplan,
M.R. Kaplan,
![]() P.D. Kempton,
P.D. Kempton,
![]() D. Kuwano,
D. Kuwano,
![]() J.M. Labonte,
J.M. Labonte,
![]() A.R. Lam,
A.R. Lam,
![]() M. Latas,
M. Latas,
![]() C.M. Lowery,
C.M. Lowery,
![]() W. Lu,
W. Lu,
![]() A. McIntyre,
A. McIntyre,
![]() P. Moal-Darrigade,
P. Moal-Darrigade,
![]() S.F. Pekar,
S.F. Pekar,
![]() C. Robustelli Test,
C. Robustelli Test,
![]() C.M. Routledge,
C.M. Routledge,
![]() J.G. Ryan,
J.G. Ryan,
![]() D. Santiago Ramos,
D. Santiago Ramos,
![]() A. Shchepetkina,
A. Shchepetkina,
![]() A.L. Slagle,
A.L. Slagle,
![]() M. Takada,
M. Takada,
![]() L. Tamborrino,
L. Tamborrino,
![]() A. Villa,
A. Villa,
![]() Y. Wang,
Y. Wang,
![]() S.Y. Wee,
S.Y. Wee,
![]() S.J. Widlansky,
S.J. Widlansky,
![]() K. Yang,
K. Yang,
![]() W. Kurz,
W. Kurz,
![]() M. Prakasam,
M. Prakasam,
![]() L. Tian,
L. Tian,
![]() T. Yu, and
T. Yu, and
![]() G. Zhang2
G. Zhang2
1 Teagle, D.A.H., Reece, J., Williams, T.J., Coggon, R.M., Sylvan, J.B., Estes, E.R., Christeson, G.L., Albers, E., Amadori, C., Belgrano, T.M., D'Angelo, T., Doi, N., Evans, A., Guérin, G.M., Harris, M., Hojnacki, V.M., Hong, G., Jin, X., Jonnalagadda, M., Kuwano, D., Labonte, J.M., Lam, A.R., Latas, M., Lu, W., Moal-Darrigade, P., Pekar, S.F., Robustelli Test, C., Ryan, J.G., Santiago Ramos, D., Shchepetkina, A., Villa, A., Wee, S.Y., Widlansky, S.J., Aizawa, M., Borrelli, C., Bridges, J.D., Carter, E.J., Dinarès-Turell, J., Estep, J.D., Gilhooly, W.P., III, Grant, L.J.C., Kaplan, M.R., Kempton, P.D., Lowery, C.M., McIntyre, A., Routledge, C.M., Slagle, A.L., Takada, M., Tamborrino, L., Wang, Y., Yang, K., Kurz, W., Prakasam, M., Tian, L., Yu, T., and Zhang, G., 2024. Site U1583. In Coggon, R.M., Teagle, D.A.H., Sylvan, J.B., Reece, J., Estes, E.R., Williams, T.J., Christeson, G.L., and the Expedition 390/393 Scientists, South Atlantic Transect. Proceedings of the International Ocean Discovery Program, 390/393: College Station, TX (International Ocean Discovery Program). https://doi.org/10.14379/iodp.proc.390393.107.2024
2 Expedition 390/393 Scientists' affiliations.
1. Background and objectives
Site U1583 (30°42.6175′S, 20°26.0336′W; proposed Site SATL-33B) is in the central South Atlantic Ocean at a water depth of ~4210 meters below sea level (mbsl), ~652 km west of the Mid-Atlantic Ridge (see Figure F1 and Tables T1, T2, all in the Expedition 390/393 summary chapter [Coggon et al., 2024b]) on crust that formed at an intermediate half spreading rate of ~24 mm/y, which is close to the highest spreading rate in the study region (Kardell et al., 2019; Christeson et al., 2020) (see Figure F7 in the Expedition 390/393 summary chapter [Coggon et al., 2024b]). With an estimated age of 30.6 Ma, Site U1583 is close to the median age of the South Atlantic Transect (SAT) campaign (International Ocean Discovery Program [IODP] Expeditions 390C, 395E, 390, and 393), and it is closest to the geographic midpoint.
1.1. Geologic setting
Unlike other sites visited during the SAT expeditions, Site U1583 is a new site occupied only during Expedition 393. It is located on the north-south–trending (355) Crustal Reflectivity Experiment Southern Transect (CREST) seismic crossing Line 03 at Common Depth Point 12300 about 3.3 km south of the main east–west (085) CREST Seismic Line 1C/1D (Figures F1, F2) (Reece et al., 2016; Reece and Estep, 2019). Interpretation of multichannel seismic and ocean-bottom seismograph data in this region suggests that the ocean crust is slightly thicker at the site (~7 km; Christeson et al., 2020) than normal ocean crust (6.15 ± 0.93 km; Christeson et al., 2019) and is associated with a peak in seamount density. At a water depth of 4210 m, Site U1583 falls within the depth range predicted by simple lithospheric cooling models (see Figure F4 in the Expedition 390/393 summary chapter [Coggon et al., 2024b]) (e.g., Parsons and Sclater, 1977; Korenaga and Korenaga, 2008; Marty and Cazenave, 1989), unlike neighboring Sites U1558 and U1559, which are shallower than predicted because of their location on elevated features. Site U1583, in contrast, lacks the rugged basement topography present near Sites U1558 and U1559.
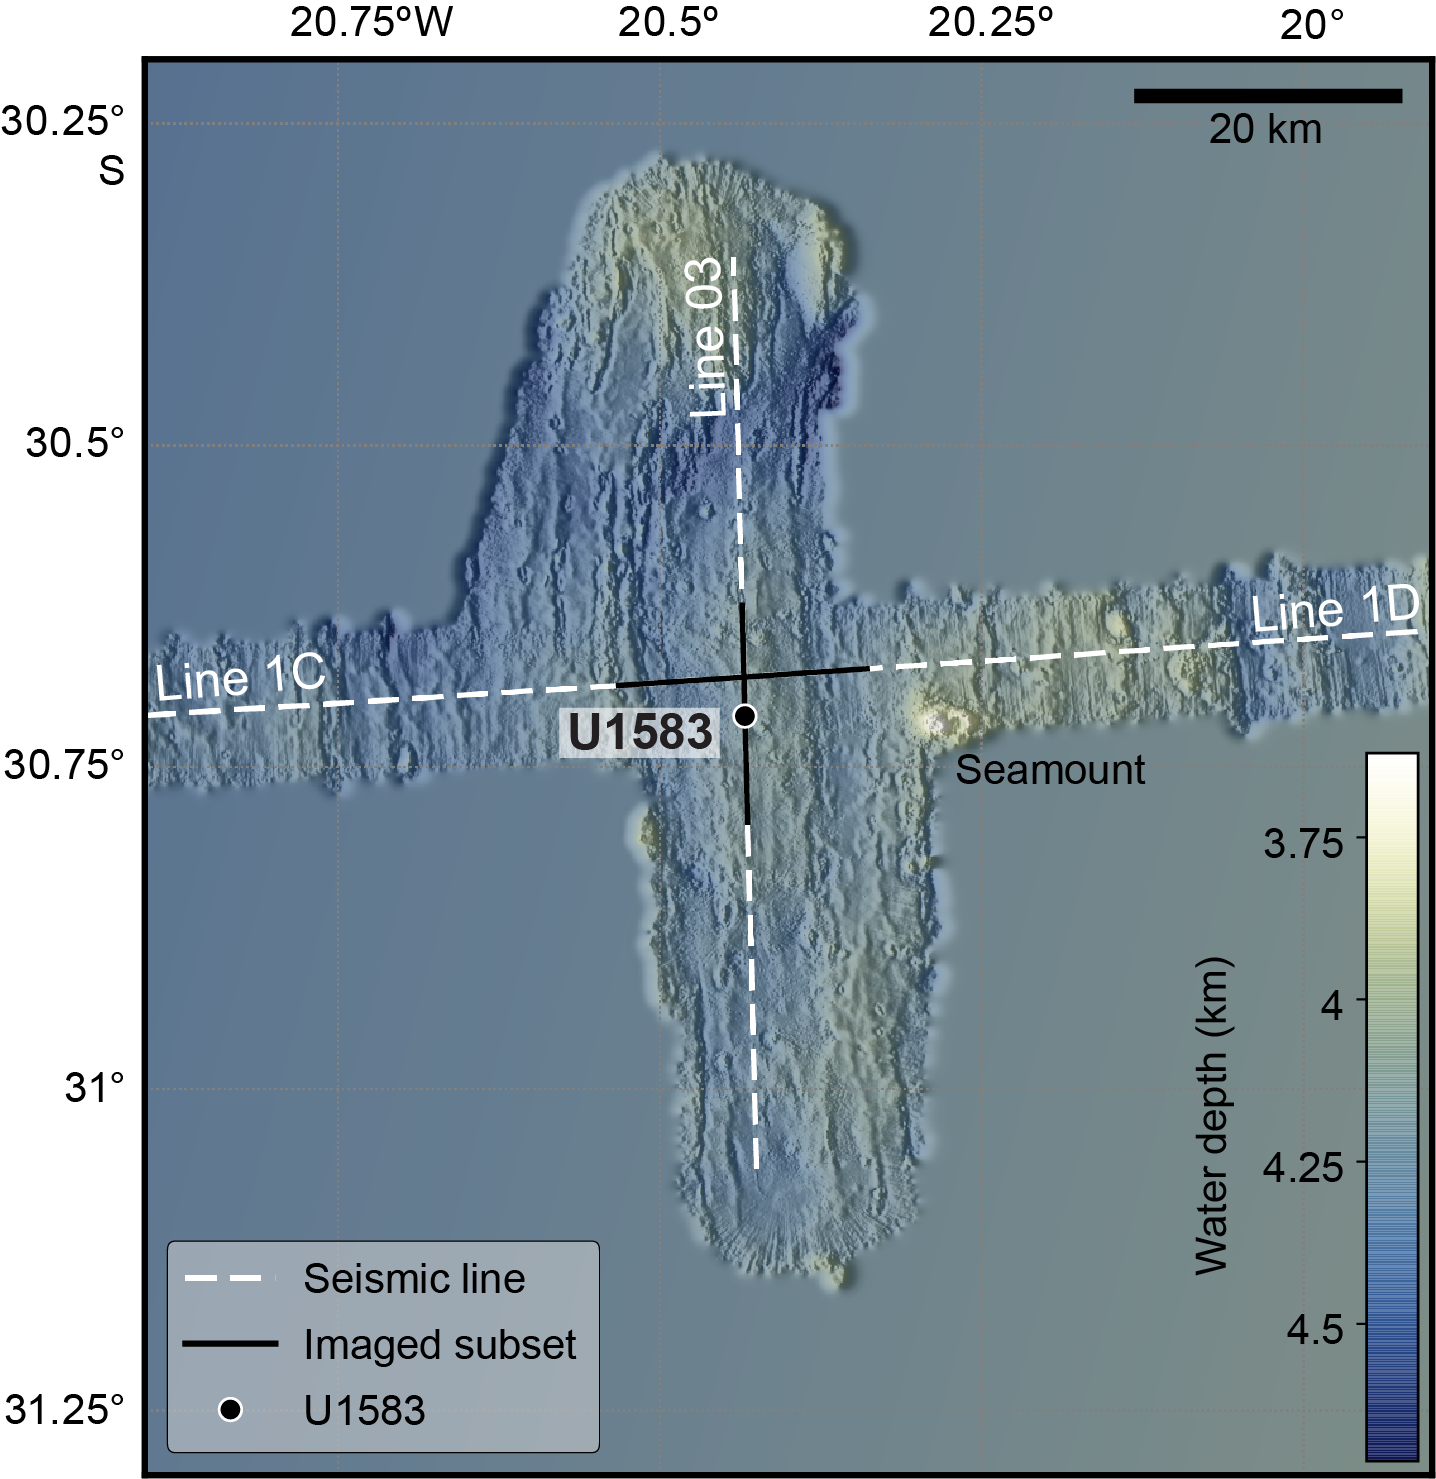
Figure F1. Bathymetric map.
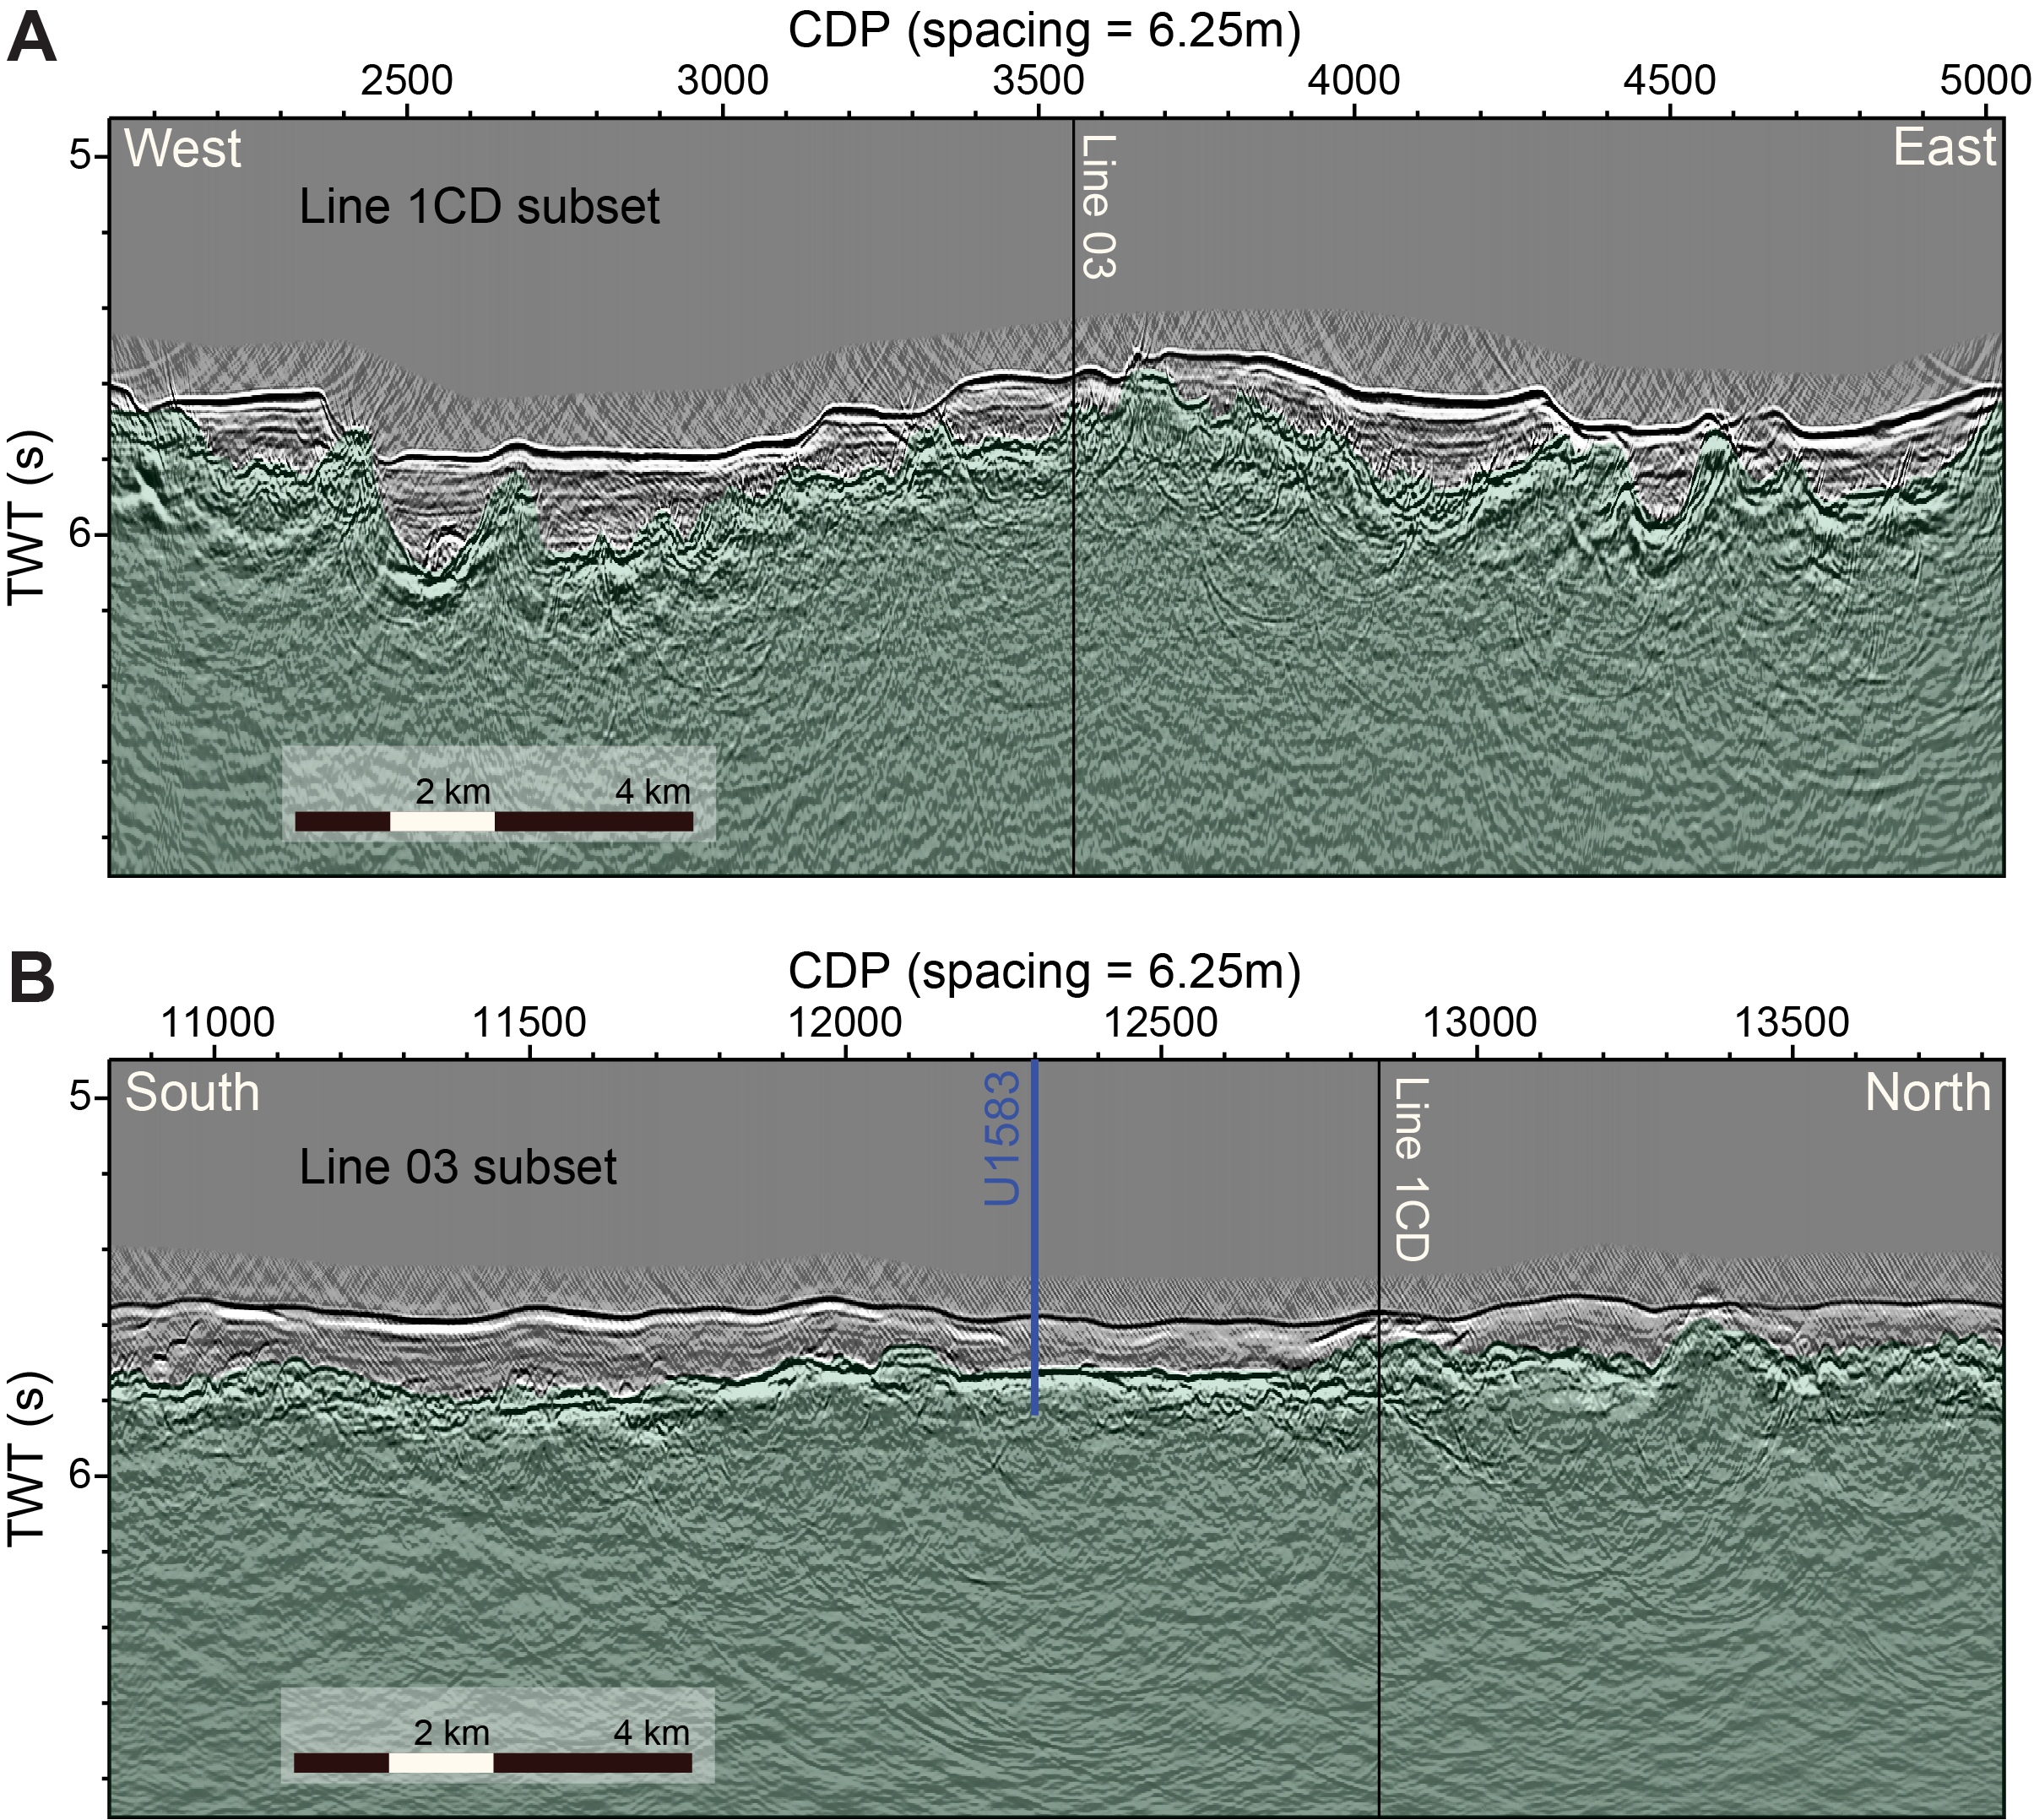
Figure F2. Seismic reflection profiles.
Site U1583 sits near the top of a ~180 m high (above regional seafloor), 30 km long, near north-south–trending (359), 10 km wide basement ridge (Figures F1, F2, F3). This basement ridge is one of many subparallel and 30–40 km long ridges, and it is continuously draped with sediments. Along the north-south–trending CREST Line 03 profile, sediment thickness increases from 30 m at the intersection with the main east–west CREST Seismic Line 1 to 300 m at the southern end of the line (Figure F2B). The sediment thickness at Site U1583 is 106 m, which is close to the global average overburden thickness for basement of this age (~125 m; Spinelli et al., 2004; cf. Olson et al., 2016; Straume et al., 2019) and the mean sediment thickness encountered along CREST Seismic Lines 1C (31–48 Ma) and 1D (15–31 Ma) of 131 and 85 m, respectively (Estep et al., 2019).
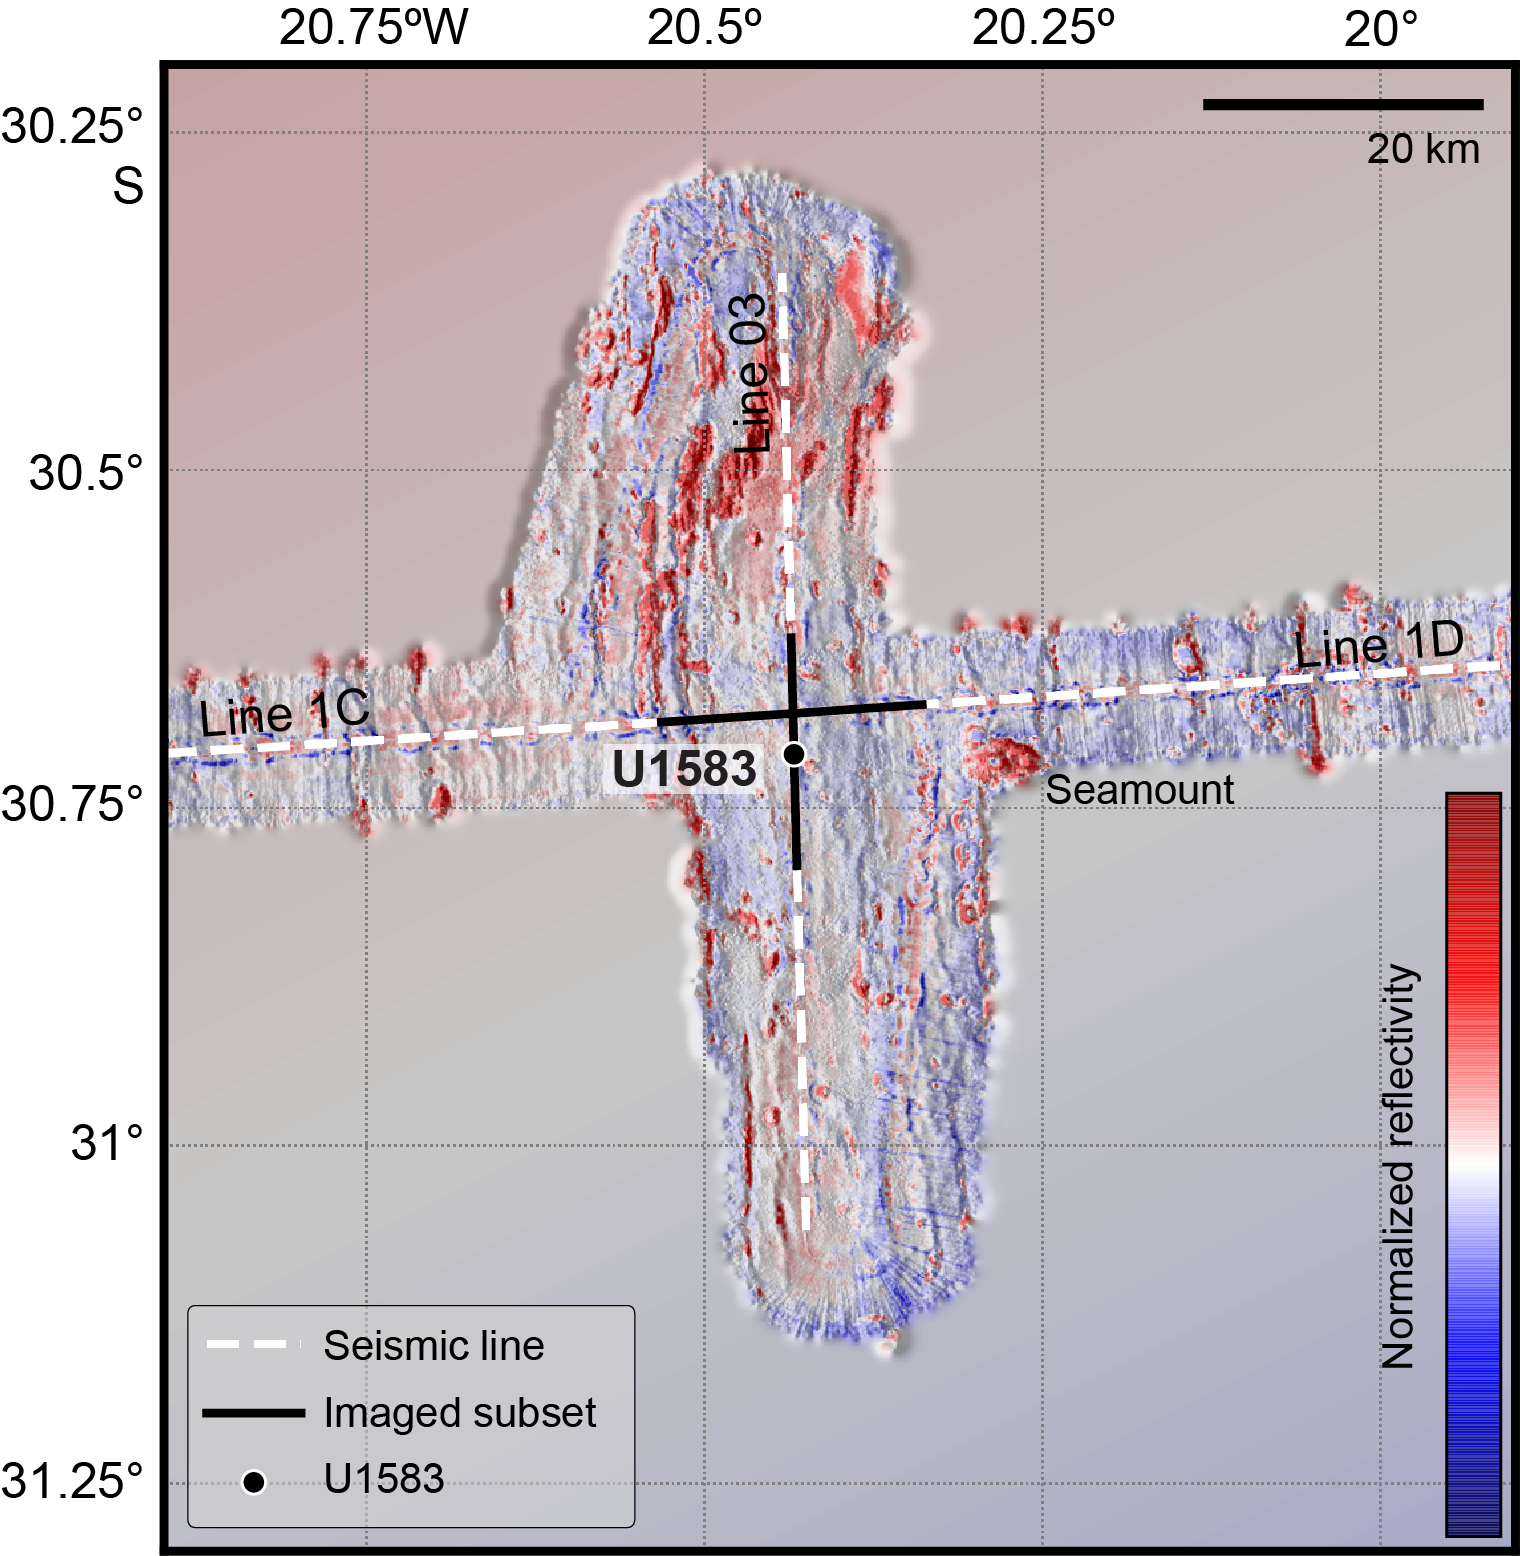
Figure F3. Backscatter reflections.
Basement topography is much smoother along the long north–south axis of the Site U1583 ridge than across the profile (Figure F2). The seismic reflector interpreted to be the sediment/basement interface has a very strong and subhorizontal signature for distances of ~2.5 km north and ~5 km south of Site U1583. This strong reflector gradually deepens to the south, resulting in the increased sediment thickness. In contrast, along the east-west–trending CREST Line 1C/1D profile, a number of 1 km wide subbasins are imaged across both flanks of the basement ridge, separated by elevated features above the main basement level and each filled with ~160 to ~300 m of sediment (Figure F2A). These subbasins and elevated features are continuously draped with sediments.
The basement ridge on which Site U1583 is located plunges toward the north and creates a basin with water depths around ~4500 m (Figure F1). Backscatter reflections from multibeam profiles (Figure F3) reveal that a significant proportion of the seafloor near Site U1583 is blanketed by continuous sediment cover, which is in contrast to the other sites along the SAT. Therefore, ventilation of the volcanic rocks of the upper ocean crust through the ingress of seawater and egress of seawater-derived low-temperature hydrothermal fluids may be reduced compared to other sites. However, the unique presence of seamounts near Site U1583, which agrees with an observed peak in seamount density at 28–40 Ma along the SAT (Christeson et al., 2020), may influence the local fluid flow system with consequent impacts on heat flow, sediment pore waters, basement hydrothermal alteration, and microbial communities in both the marine sediments and underlying basalts. One large seamount forms a prominent feature on the local bathymetric and backscatter maps (Figures F1, F3). This seamount is ~17 km east of Site U1583, is ~5 km in diameter, and rises to ~3.7 km below sea level (Figures F1). High normalized reflectivity indicates very thin or no sediment cover (Figure F3).
1.2. Objectives
The operational objectives at Site U1583 during Expedition 393 were to (1) core the entire sediment section and a few meters into basement with the advanced piston corer (APC) and extended core barrel (XCB) systems in two holes to collect material that address the paleoceanographic, paleoclimate, and microbiological objectives of the SAT expeditions; (2) core 250 m into basement with the rotary core barrel (RCB) system in a third hole to collect material that addresses the petrologic, geochemical, and microbiological objectives of the SAT expeditions; and (3) collect wireline geophysical logging data through the basement section.
2. Operations
2.1. Transit
At 0530 h on 5 July 2022, we started the 227 nmi transit to Site U1583 from Site U1558. The transit took 21.5 h at an average speed of 10.6 kt, and we arrived on site at 0300 h on 6 July.
2.2. Holes U1583A and U1583B
The ship switched to dynamic positioning mode at 0315 h on 6 July 2022, beginning operations in Hole U1583A. On site, we noted a 41 m seafloor depth discrepancy between the ship's precision depth recorder (PDR) 12 kHz estimate of 4234 mbsl and the estimate from the preexpedition seismic survey of 4193 mbsl in the Scientific Prospectus (Coggon et al., 2020). Sea conditions were rough, and ship heave was 3–4 m. The APC/XCB bottom-hole assembly (BHA) was made up and lowered to 4228.5 mbsl, 4.5 m above the PDR estimated depth. At 1030 h, led by Captain Tom Hartt, the Expedition 393 Science Party and others available on board held a short celebration of the life of Professor Dick Kroon (1957–2022) (see KROON in Supplementary material).
At 1545 h, we started Hole U1583A. Core 1H recovered 9.14 m of sediment, indicating that the bit was below the seafloor when the piston was shot, so the mudline depth could not be determined (Table T1). At 1715 h, we started Hole U1583B at approximately the same geographic location (Figure F4) with the drill bit 5 m shallower; however, Core 1H was similarly full, recovering 9.38 m of sediment, so the mudline depth again could not be determined.
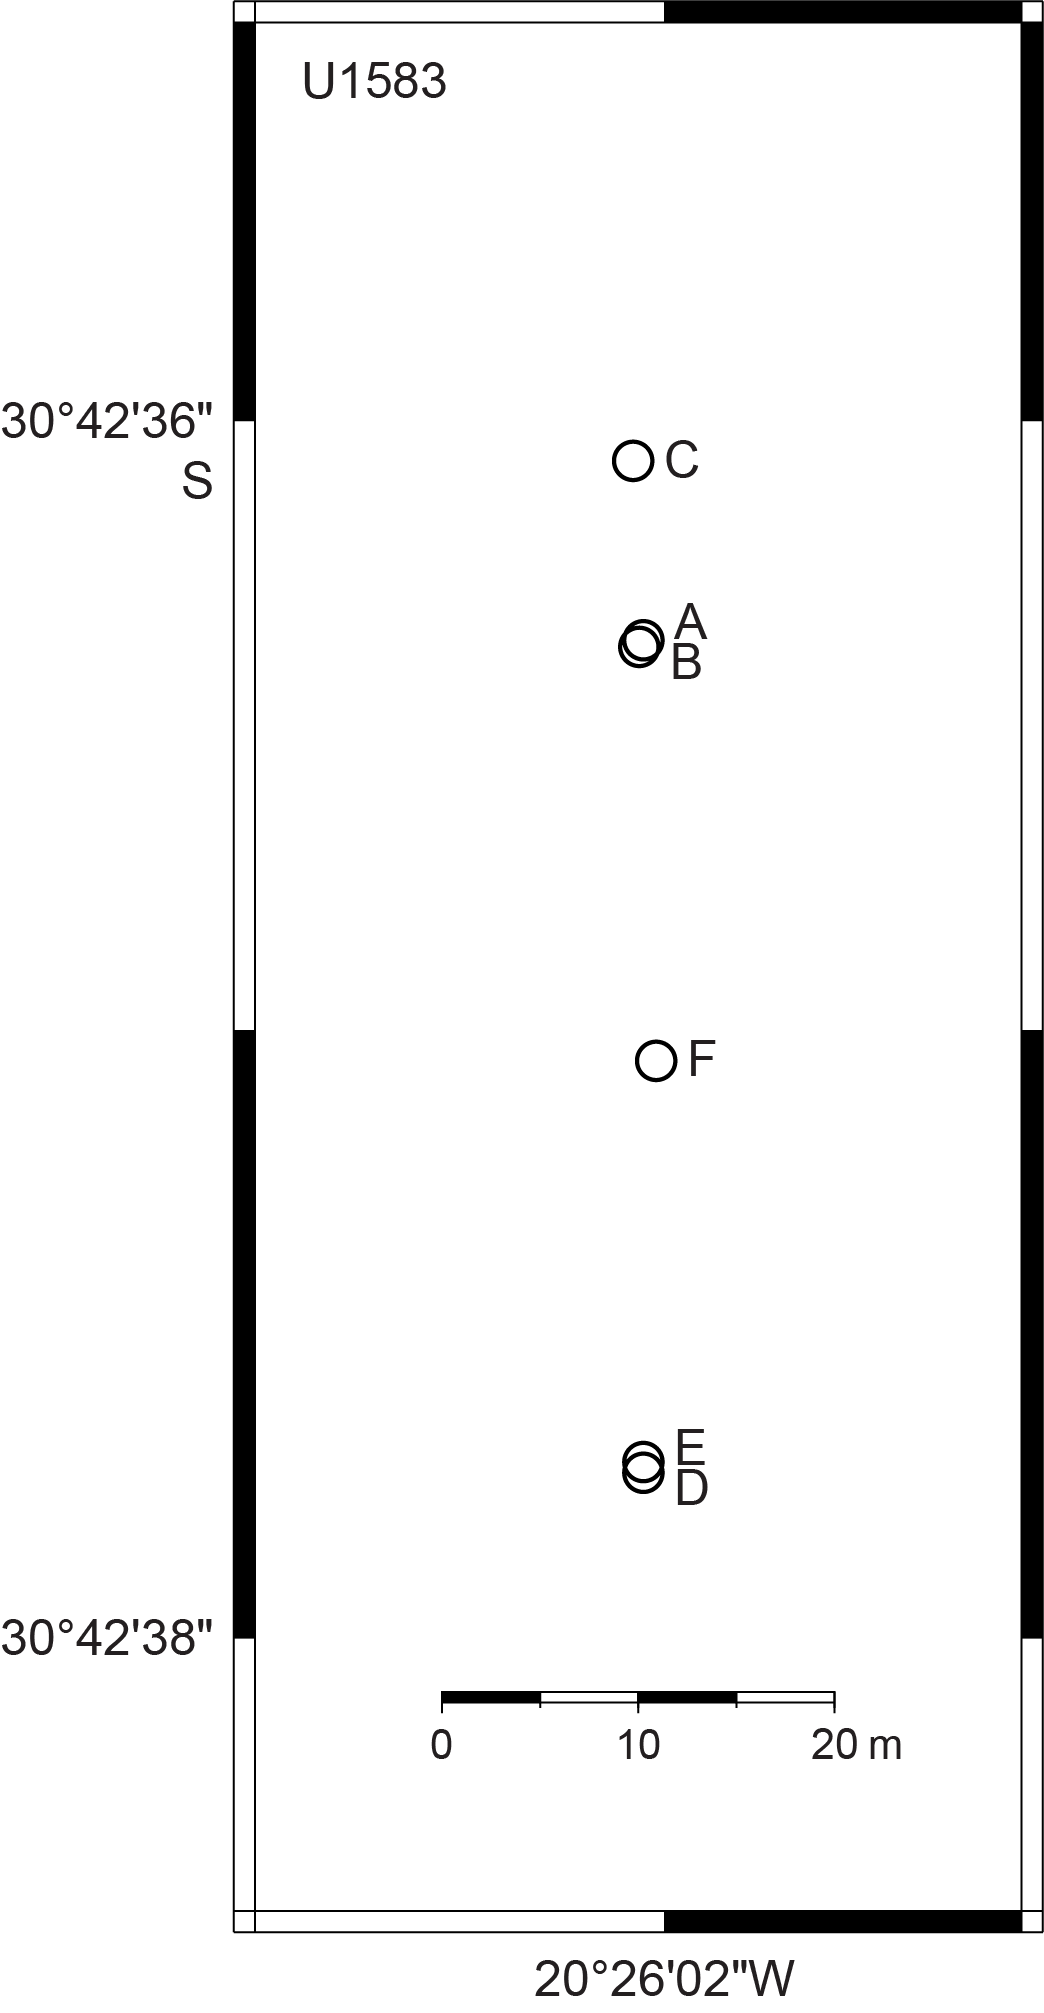
Figure F4. Map of holes drilled.
2.3. Hole U1583C
The bit was raised 10 m shallower than the Hole U1583B shooting depth to 4213.5 mbsl, and the ship moved 10 m north (Figure F4). At 1845 h on 6 July 2022, we started Hole U1583C, and Core 1H recovered 8.5 m of sediment, giving an apparent mudline at 4214.6 mbsl (we did not know at the time that this core was also shot from below the mudline). Coring continued with the full-length APC system with the Icefield MI-5 core orientation tool run on each core. Temperature measurements were taken on Cores 4H, 7H, and 10H. Core 12H hit hard rock when it was fired, based on some damage to the cutting edge of the APC shoe. Basement contact was subsequently confirmed when the bit encountered hard formation 2 m below the top of Core 12H at 104.5 meters below seafloor (mbsf). Core 12H recovered 8.02 m of sediment, an apparent 401% recovery, most of which was disturbed sucked-in sediment and is not in place. This basement depth was ~33.5 m shallower than expected from the site survey seismic interpretation of basement depth at ~138 mbsf. Cores 1H–12H penetrated from 0 to 104.5 mbsf and recovered 108.3 m (103%).
The XCB coring system was then deployed for Core 393-U1583C-13X, which penetrated 3 m to 107.5 mbsf and recovered 1.9 m of fresh microcrystalline basalt (63%). The bit was then pulled out of the hole, clearing the seafloor at 1540 h on 7 July, ending Hole U1583C.
2.4. Hole U1583D
We started Hole U1583D 50 m south of Hole U1583C and 20 m south of the preexpedition site coordinates, which we reserved for hard rock coring in Hole U1583F. All holes at this site are located on a north–south line (Figure F4) because the site sits on the edge of a north-south–trending basin and the basement depth was anticipated to be more uniform in this direction compared to the east–west direction. Core 393-U1583D-1H recovered 10.04 m of sediment, and the mudline depth could not be determined. Coring was terminated, and Hole U1583D ended at 1730 h on 7 July 2022.
2.5. Hole U1583E
We raised the bit 5 m to 4204.5 mbsl, and at 1835 h on 7 July 2022 we started Hole U1583E in the same location as Hole U1583D. Core 393-U1583E-1H recovered 4.03 m of sediment, placing the mudline at 4210.0 mbsl. This seafloor depth was 24 m shallower than the PDR depth and 17 m deeper than the depth predicted from the preexpedition seismic survey. The difference from the seismic survey depth is consistent with observations at Sites U1556–U1560 along the transect, where mudline seafloor depths are deeper by 8–21 m than the depth estimated from the seismic survey. While retrieving Core 2H, the core winch weight indicator showed that the core barrel became detached from the core winch line. An overshot was made up using a core catcher and a RCB core barrel. The barrel was lowered, and the APC core barrel was retrieved. Coring continued through Core 12H at 105.2 mbsf. All cores were full-length APC cores, and the Icefield MI-5 core orientation tool was run on all but two cores (3H and 4H). Temperature measurements were taken on Cores 3H and 8H.
After cutting Core 393-U1583E-12H, the APC core barrel could not be pulled back into the BHA. From 1230 to 1545 h on 8 July, we tried to free the barrel by pumping and washing over it, but it would not move. We decided to deploy the Kinley wireline cutter and crimper to cut the winch core line just above the APC corer. The Kinley wireline cutter and crimper was deployed at 1610 h, and the hammer/actuator was deployed at 1640 h. However, based on the core winch line tension, the Kinley wireline cutter and crimper had stopped before reaching the bottom of the drill string and cut part way down. Approximately 1560 m of core winch line was pulled up to the ship, and we then started to raise the pipe. The drill pipe was pulled out of the hole to 2562 meters below rig floor (mbrf) when the severing tool was found in Stand 83. A second Kinley wireline cutter and crimper was deployed in an effort to sever the remaining core winch line from the sinker bar assembly. This was unsuccessful, and the rig crew continued to pull the drill string out of the hole, cutting and removing the remaining core winch line at each stand. The second severing tool was found at the top of Stand 55. The rig crew continued to pull the drill string to the surface, cutting and removing the core winch line as before. The bit reached the rig floor at 0435 h on 10 July, ending Hole U1583E. The rig floor team then disassembled the lower part of the BHA and found that the APC core barrel assembly had stuck in the landing saver sub because a shear pin had become wedged between the landing seat and the core barrel. The APC cutting shoe was undamaged, showing that it had not hit basement, and Core 12H recovered 6.1 m of sediment after a long trip to the surface. Cores 1H–12H penetrated from the seafloor to 105.2 m and recovered 105.2 m (100%).
2.6. Hole U1583F
We started Hole U1583F 20 m north of Hole U1583E, and it became the center location of all holes at this site. At 1000 h on 10 July 2022, we began assembling the RCB BHA with a C-7 bit and then lowered it to 4174 mbsl, where we paused to slip and cut the drill line and pick up the top drive. At 0030 h on 11 July, we started Hole U1583F and washed down through most of the sediment column to 101 mbsf (drilled interval 11). Core 2R penetrated from 101.0 to 109.5 mbsf and recovered 6.4 m (76%) of clayey nannofossil ooze. At the start of drilling Core 3R, hard formation was noted by the drillers at 109.7 mbsf, and the formation was subsequently confirmed to be basalt. Coring continued through Core 8R at 142.9 mbsf. With a hole in basement established, a free-fall funnel (named in honor of Professor Dick Kroon; see KROON in Supplementary material) was deployed (Figure F5) at 1450 h on 12 July to aid in reentry for downhole logging or for a bit change, which was still a possibility at the time. Coring continued with a typical RCB half-core advance of 4.8/4.9 m. To test for microbiological contamination, perfluoromethyldecalin (PFMD) tracer was run continuously in the drilling fluid until the supply was exhausted on Core 12R. From Core 12R, there was as much as 3 m of backfill in the hole after each core, and the drill string experienced high torque at times. It was uncertain whether the fill resulted from cuttings not being completely cleared from the hole or whether new material was falling down from the borehole wall. We ran 30–60 bbl mud sweeps after every core to flush out the cuttings. The last five cores (Cores 25R–29R) averaged only 7% recovery and the bit had been run for ~73 h of drilling time, so coring was terminated at 1230 h on 16 July after recovering Core 29R. Basement Cores 3R–29R penetrated from 109.5 to 239.5 mbsf and recovered 39.4 m (30%).
Figure F5. Free-fall funnel.
To prepare for wireline logging in Hole U1583F, we ran a 75 bbl mud sweep and released the RCB bit at the bottom of the hole. We set the end of the pipe at 102.8 mbsf in sediment ~7 m above the basalt flow that forms the uppermost basement to avoid the risk of dislodging rock pieces while the logging tools were below that depth. At 1730 h, we began to rig up the triple combo logging tool string, consisting of natural gamma radiation, neutron porosity, density, and electrical resistivity tools. Because of the hole conditions and ~3 m ship heave, which is high for logging, the density tool source and magnetic susceptibility tool were not included in the tool string, and the density tool was used only for the caliper log of the borehole diameter. The tool string was lowered down the pipe, but at ~540 mbsl it developed an electrical fault and had to be raised back to the ship. The fault was found in the electrical resistivity tool (the lowermost tool of the tool string), which was then replaced with the backup resistivity tool.
We started to lower the triple combo from the rig floor again at 0045 h on 17 July. Logs were recorded on the downward pass, and the tool string reached 237 mbsf, within 3 m of the bottom of the hole. Two logging passes were run in the open hole. During the first pass, the wireline heave compensator (WHC) cut out about halfway up the open hole but logging continued to the top of basement. While descending for the second pass, the tool string encountered an obstruction at 182 mbsf and could not pass below it. We raised the triple combo to the rig floor, disassembled it, and assembled the Formation MicroScanner (FMS)-sonic tool string. We lowered the FMS-sonic tool string to 182 mbsf and made a logging pass up to the top of basement at 109.5 mbsf. At that point, we found that the tool string could not go back down into basement, and overpull of approximately 8000 lb was observed when trying to pull the tool string back into the drill pipe. After pumping to remove any potential obstruction, the tool string still could not enter the pipe. Finally, we rotated the pipe 180°, and the tool string could be pulled in. When the tool string reached the rig floor, it was discovered that the FMS tool caliper arms had been damaged and one was missing. By 0000 h, we had disassembled the FMS-sonic tool string, ending downhole logging operations in Hole U1583F. The difficult borehole conditions and continuing high heave did not allow for the planned logging with the Ultrasonic Borehole Imager (UBI) tool string. We raised the pipe from 102.8 mbsf, clearing the seafloor at 0035 h on 18 July. The BHA reached the ship at 0645 h and was disassembled. The rig floor was secured for transit by 0840 h, and we raised the thrusters and began the transit to Site U1560.
3. Stratigraphic unit summary
At Site U1583, we recovered 108.3 m of sediment and 1.89 m of volcanic rock in Hole U1583C and 105.2 m of sediment in Hole U1583E before RCB coring in Hole U1583F penetrated 8.5 m of sediment and ~130 m of volcanic formations (39.4 m volcanic rock retrieved; ~30% recovery) from the uppermost ocean crust (total depth = 239.5 mbsf). The cores recovered from the six holes (U1583A–U1583F) record four major sedimentary units (Figure F6) overlying seven basement units (Figure F7). The units are numbered from the top of the holes, with units in the sedimentary section designated by Roman numerals (e.g., I and II) and units in the basement designated by Arabic numerals (e.g., 1 and 2); subunits are designated with letters (e.g., IA, IB, 2A, and 2B).
3.1. Sediment units
Biogenic and siliciclastic sediments were recovered from three holes cored at Site U1583. Biogenic sediments consist primarily of calcareous nannofossil ooze with varying amounts of clay and foraminifera. Intervals with siliciclastic sediments are represented by clays with variable nannofossil and foraminifera content. Four lithostratigraphic units (I–IV) are defined (Figure F6; Table T2). Unit I is composed of 3 m of Pliocene/Pleistocene sediments, consisting of interbedded nannofossil-rich clay with foraminifera and clayey nannofossil ooze, and was only recovered in Hole U1583E. Unit II is composed of up to 11.3 m of Pliocene/Pleistocene sediments, predominantly beds of nannofossil ooze with clay and foraminifera interbedded with beds of nannofossil ooze with clay. Unit III consists of up to 11.9 m of clay and nannofossil ooze with varying amounts of clay. Unit IV is divided into three subunits (IVA–IVC; see Sedimentology). Subunit IVA is up to 64.4 m thick and consists of nannofossil ooze with clay and varying amounts of foraminifera. Subunit IVB comprises up to 6.1 m of nannofossil ooze with clay and decimeter-thick beds of calcareous ooze. Subunit IVC is up to 24.4 m thick and consists of nannofossil ooze with clay and varying amounts of foraminifera.
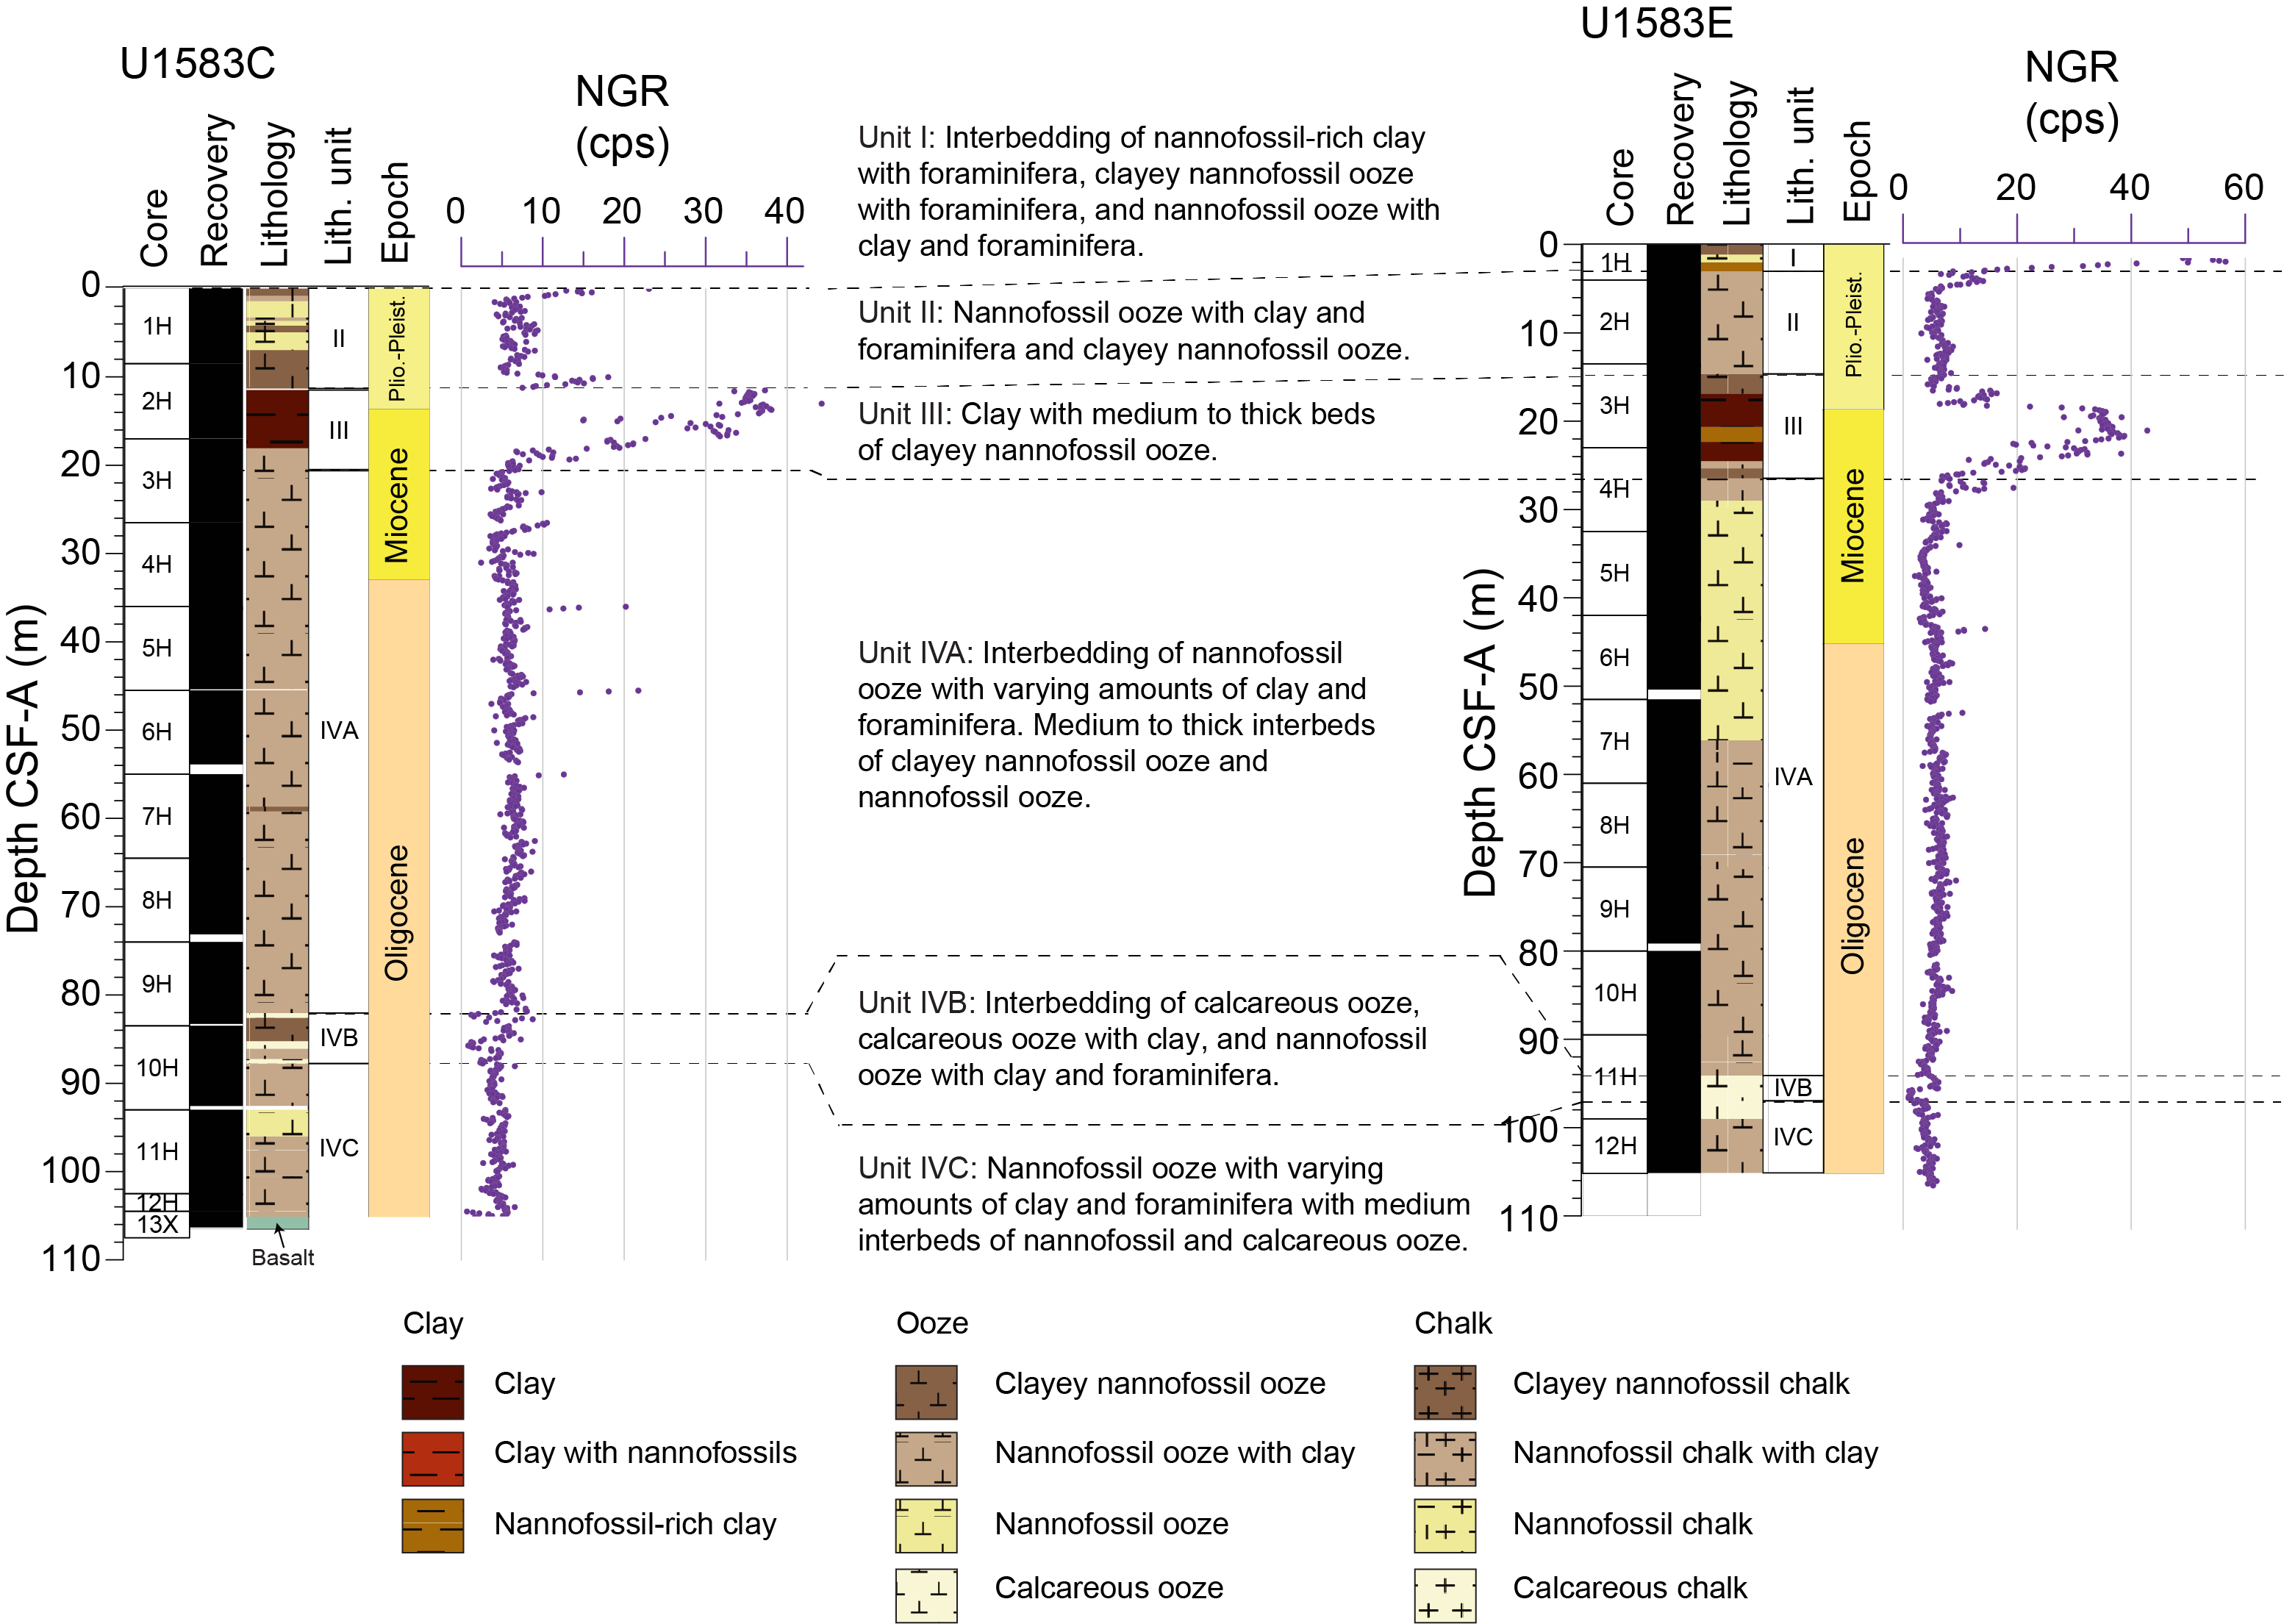
Figure F6. Lithostratigraphic summary, sediment units.
3.2. Volcanic sequences
Both Holes U1583C and U1583F intersected a ~11 m thick massive lava flow at 107.5 and 109.7 mbsf, respectively, which is about 30 m shallower than predicted by seismic site surveys (Kardell et al., 2019). Only Hole U1583F advanced deeply into basement, reaching 239.6 mbsf or 129.8 meters subbasement (msb) with ~30% average recovery (Figure F7; Table T4).
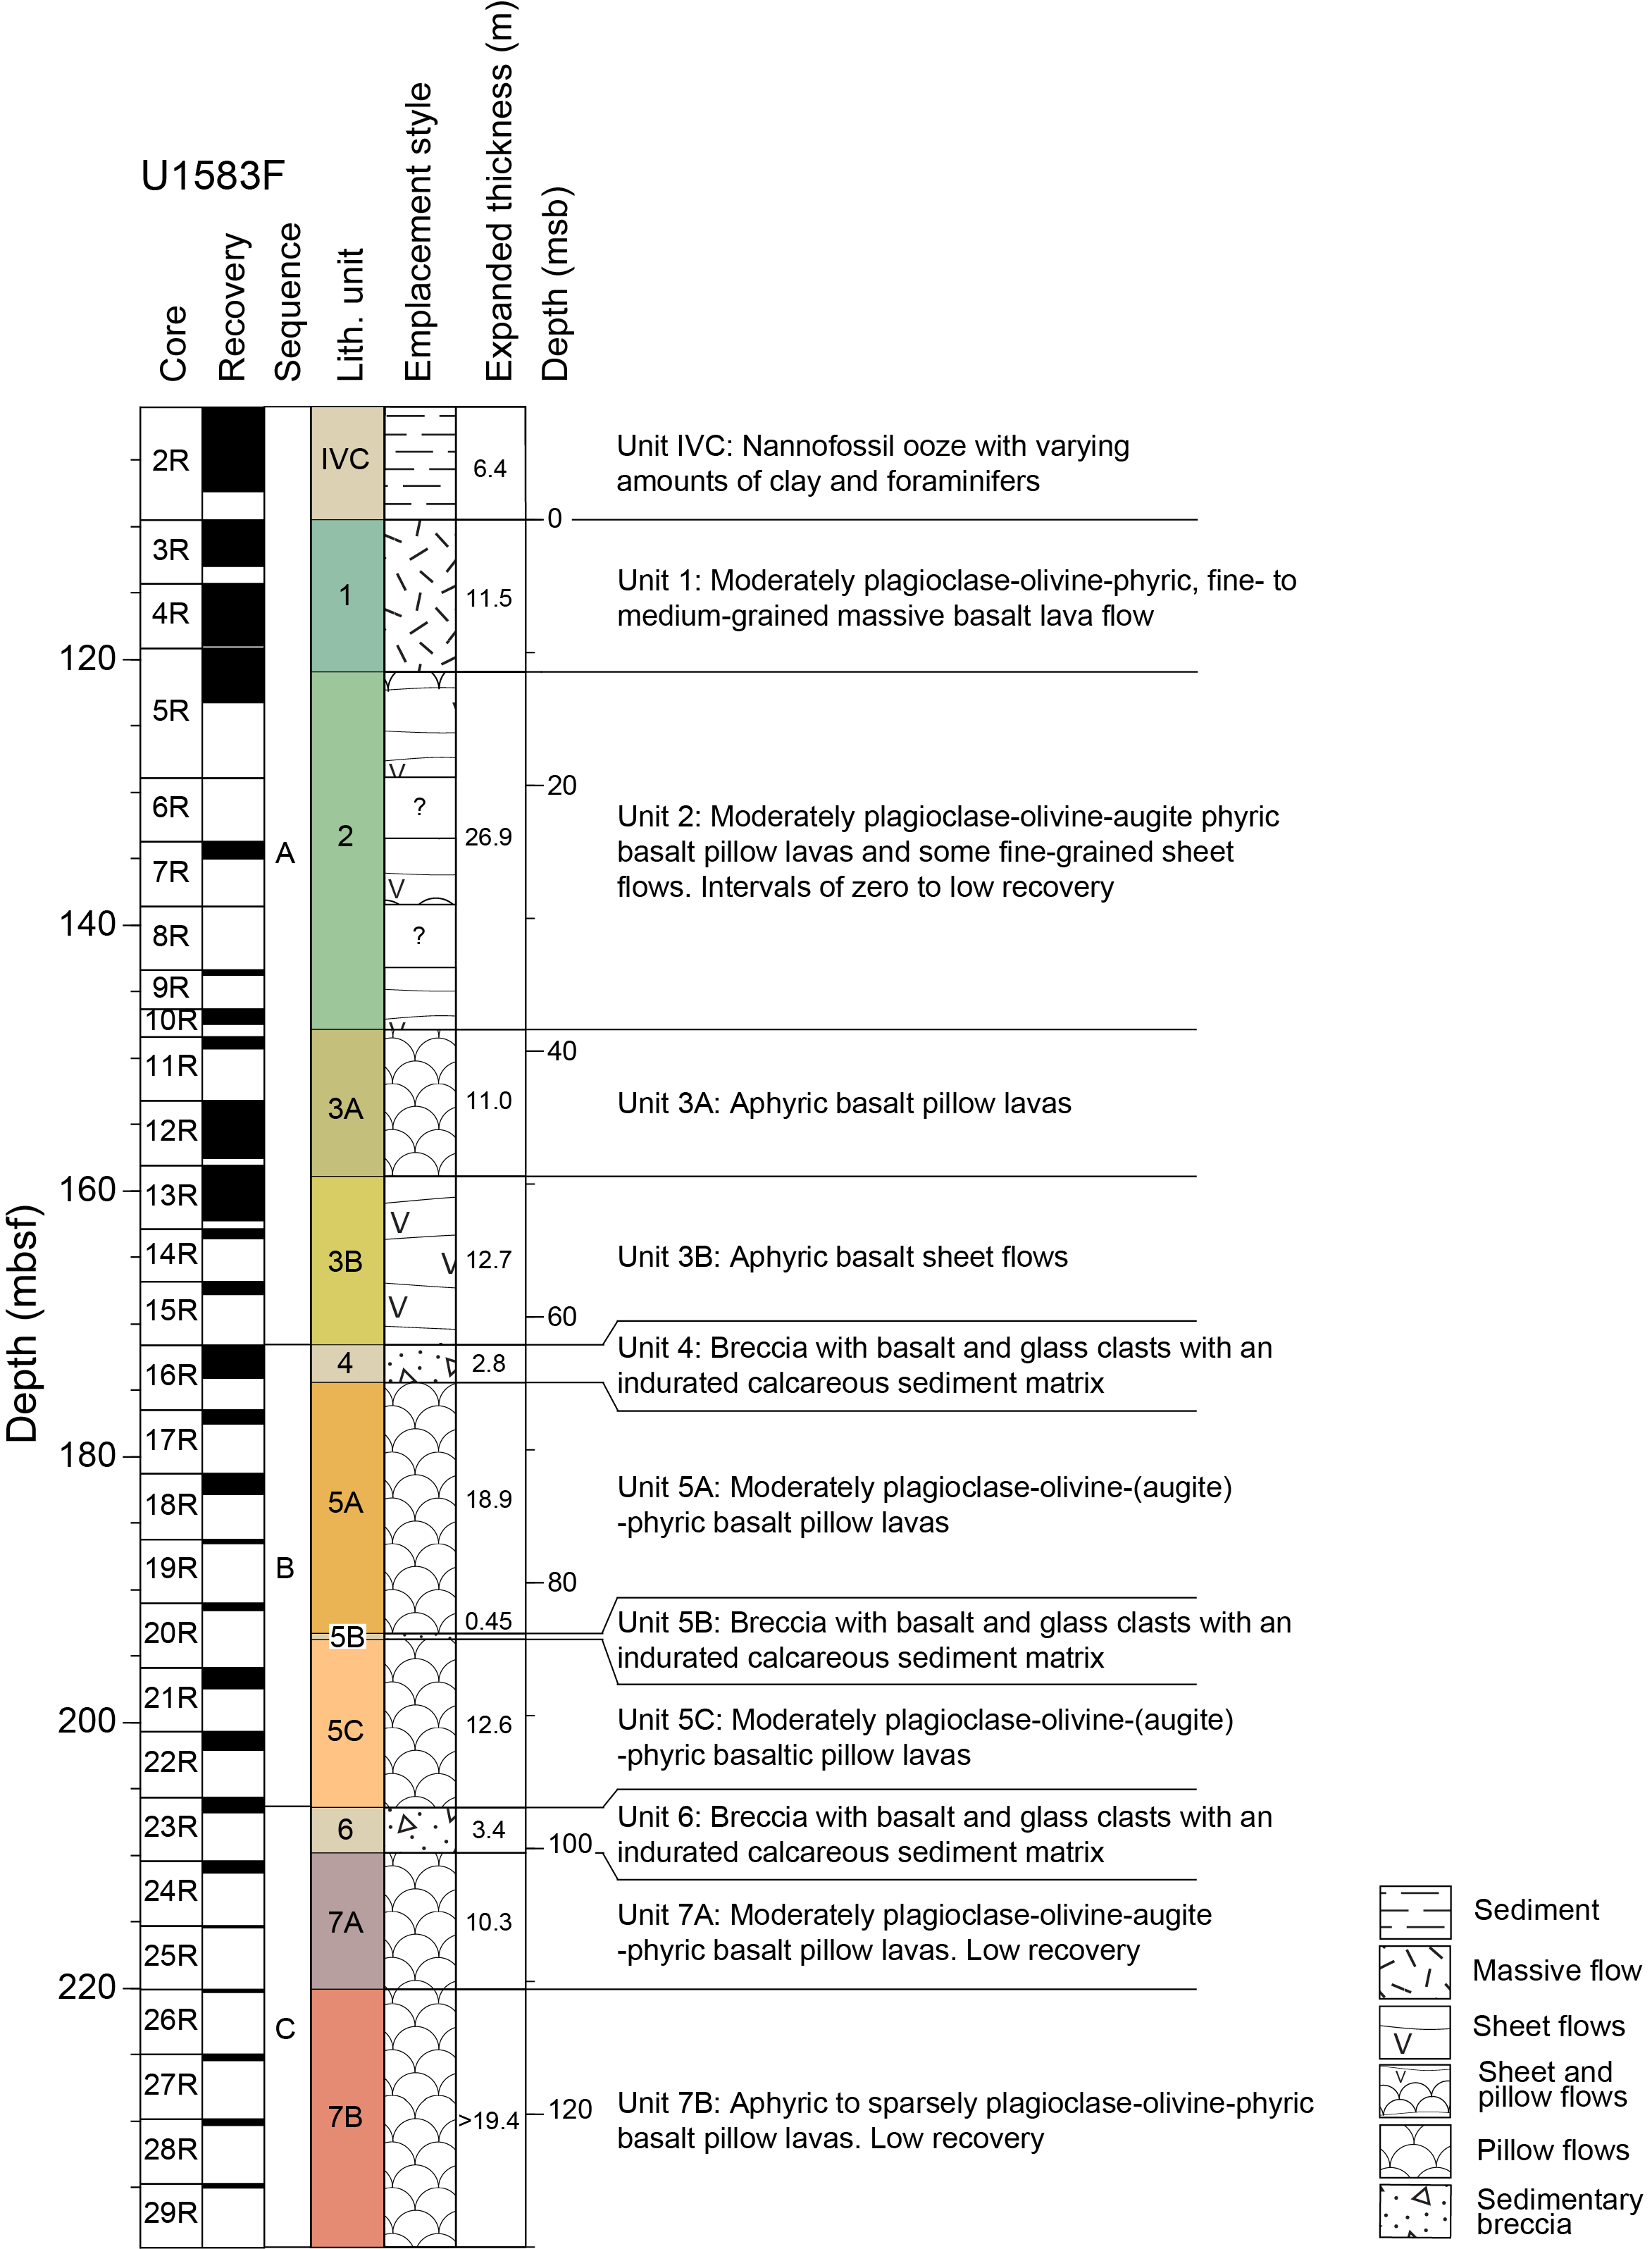
Figure F7. Lithostratigraphic summary, volcanic units.
Hole U1583F intersected three volcanic sequences (A, B, and C), with 62, 35, and 33 m expanded thicknesses, respectively, separated by two sedimentary breccia units (4 and 6) with thicknesses estimated between 0.8 and 3.4 m (Figure F7; Table T4). The upper Sequence A (109.7–171.6 mbsf) consists of Unit 1, which is an 11 m thick massive lava flow; Unit 2, which is made of moderately phyric pillow lavas and sheet flows; and Unit 3, which is composed of aphyric pillow lavas and sheet flows that are markedly more primitive than all of the other units in the hole (Table T4). The middle Sequence B is capped by sedimentary breccia Unit 4 and additionally consists of moderately phyric pillow basalts (Subunits 5A and 5C) and another thin breccia horizon (Subunit 5B). The lower Sequence C is again capped by a sedimentary breccia (Unit 6) above sparsely to moderately phyric pillow basalts that are chemically and lithologically similar to Sequence B. Volcanic clasts within the sedimentary breccias (Units 4 and 6) are consistent with derivation from the immediately underlying lava flows (Subunits 5A and 7A).
Lava composition assessed by portable X-ray fluorescence (pXRF) varies both gradationally and in a stepwise fashion across petrologically defined unit boundaries. Incompatible element concentrations and Zr/Ti ratios are consistent with a relatively primitive, normal mid-ocean-ridge basalt (N-MORB)-like composition for the lavas at Site U1583. In contrast to the sequence stratigraphy defined by the presence of sedimentary breccias, pXRF measurements reveal that Unit 3 has a uniquely primitive composition in Hole U1583F, splitting the hole into three major chemostratigraphic packages: Igneous Units 1 and 2, 3, and 5–7.
3.3. Sediment/basement interface
Expedition 393 Holes U1583C and U1583F recovered basement volcanic rocks that were encountered ~30 m shallower than predicted from the seismic site survey (Coggon et al., 2020) at 107.5 and 109.7 mbsf (drilling depth below seafloor [DSF] scale), respectively. The interface was not recovered in either hole; however, based on what was recovered, it is thought to consist of sediments of unknown lithification directly overlying the glassy, chilled top of a massive lava flow that extends over the entire site. The depth at which basement was encountered during drilling of the deepest hole (U1583F) at 109.7 mbsf (DSF scale) is taken as the sediment/basement interface depth for Site U1583.
4. Sedimentology
Two of the six holes at Site U1583 cored the majority of the sediment section: Hole U1583C missed the mudline but was cored to basement and Hole U1583E recovered the mudline but was stopped a few meters above basement (Figure F8). Hole U1583F recovered 6.43 m of sediments in Core 2R above the sediment/basement interface (Figure F8) before changing to RCB coring in this hole. Holes U1583A, U1583B, and U1583D all missed the mudline and were single-core holes (Figure F8). The uppermost sediments are represented by Pliocene–Pleistocene nannofossil ooze with clay (see Age model and mass accumulation rates for the ages) underlain by a condensed Pleistocene to Middle Miocene interval consisting of clay and nannofossil-rich clay, below which Middle Miocene to Oligocene nannofossil oozes with clay and varying foraminiferal abundances were recovered. The clay-rich interval is interpreted to reflect a change in the seafloor position relative to the carbonate compensation depth (CCD), which could be due to deepening of the CCD with time and/or thermal or tectonic movement of the basement at this location. In contrast, the nannofossil oozes were deposited when the CCD was deeper than the seafloor.
The sediments are divided into four lithostratigraphic units (I–IV; youngest to oldest) based on sediment composition in smear slides and visual core description (Figures F8, F9, F10, F11, F12, F13). The lowermost unit is divided into three subunits (IVA–IVC) based on the appearance of white calcareous ooze, which divides the two sections of nannofossil ooze with varying amounts of clay and foraminifera. This division is supported by macroscopic and microscopic interpretations as well as CaCO3 weight percent and other physical properties data.
4.1. Unit descriptions
4.1.1. Unit I
- Intervals: 393-U1583D-1H-1, 0 cm, to 1H-1, 99 cm; 393-U1583E-1H-1, 0 cm, to 1H-2, 150 cm
- Depths: Hole U1583D = 0.0–1.0 m core depth below seafloor, Method A (CSF-A); Hole U1583E = 0.0–3.0 m CSF-A
- Thickness: Hole U1583D = >1.0 m; Hole U1583E = 3.0 m
- Age: Pliocene–Pleistocene
- Lithology: interbedded nannofossil-rich clay with foraminifera and nannofossil ooze with clay and foraminifera
Lithostratigraphic Unit I is composed of centimeter- to decimeter-scale interbeds of brown nannofossil-rich clay with foraminifera, light brown clayey nannofossil ooze with foraminifera, and pink nannofossil ooze with clay and foraminifera (Figures F8, F9, F10, F11, F12). The characteristic high mud content of this unit is supported by high natural gamma radiation (NGR) and low light reflectance values (Figure F9). This unit was partially recovered in Hole U1583D (0–1.0 m) and fully recovered in Hole U1583E.
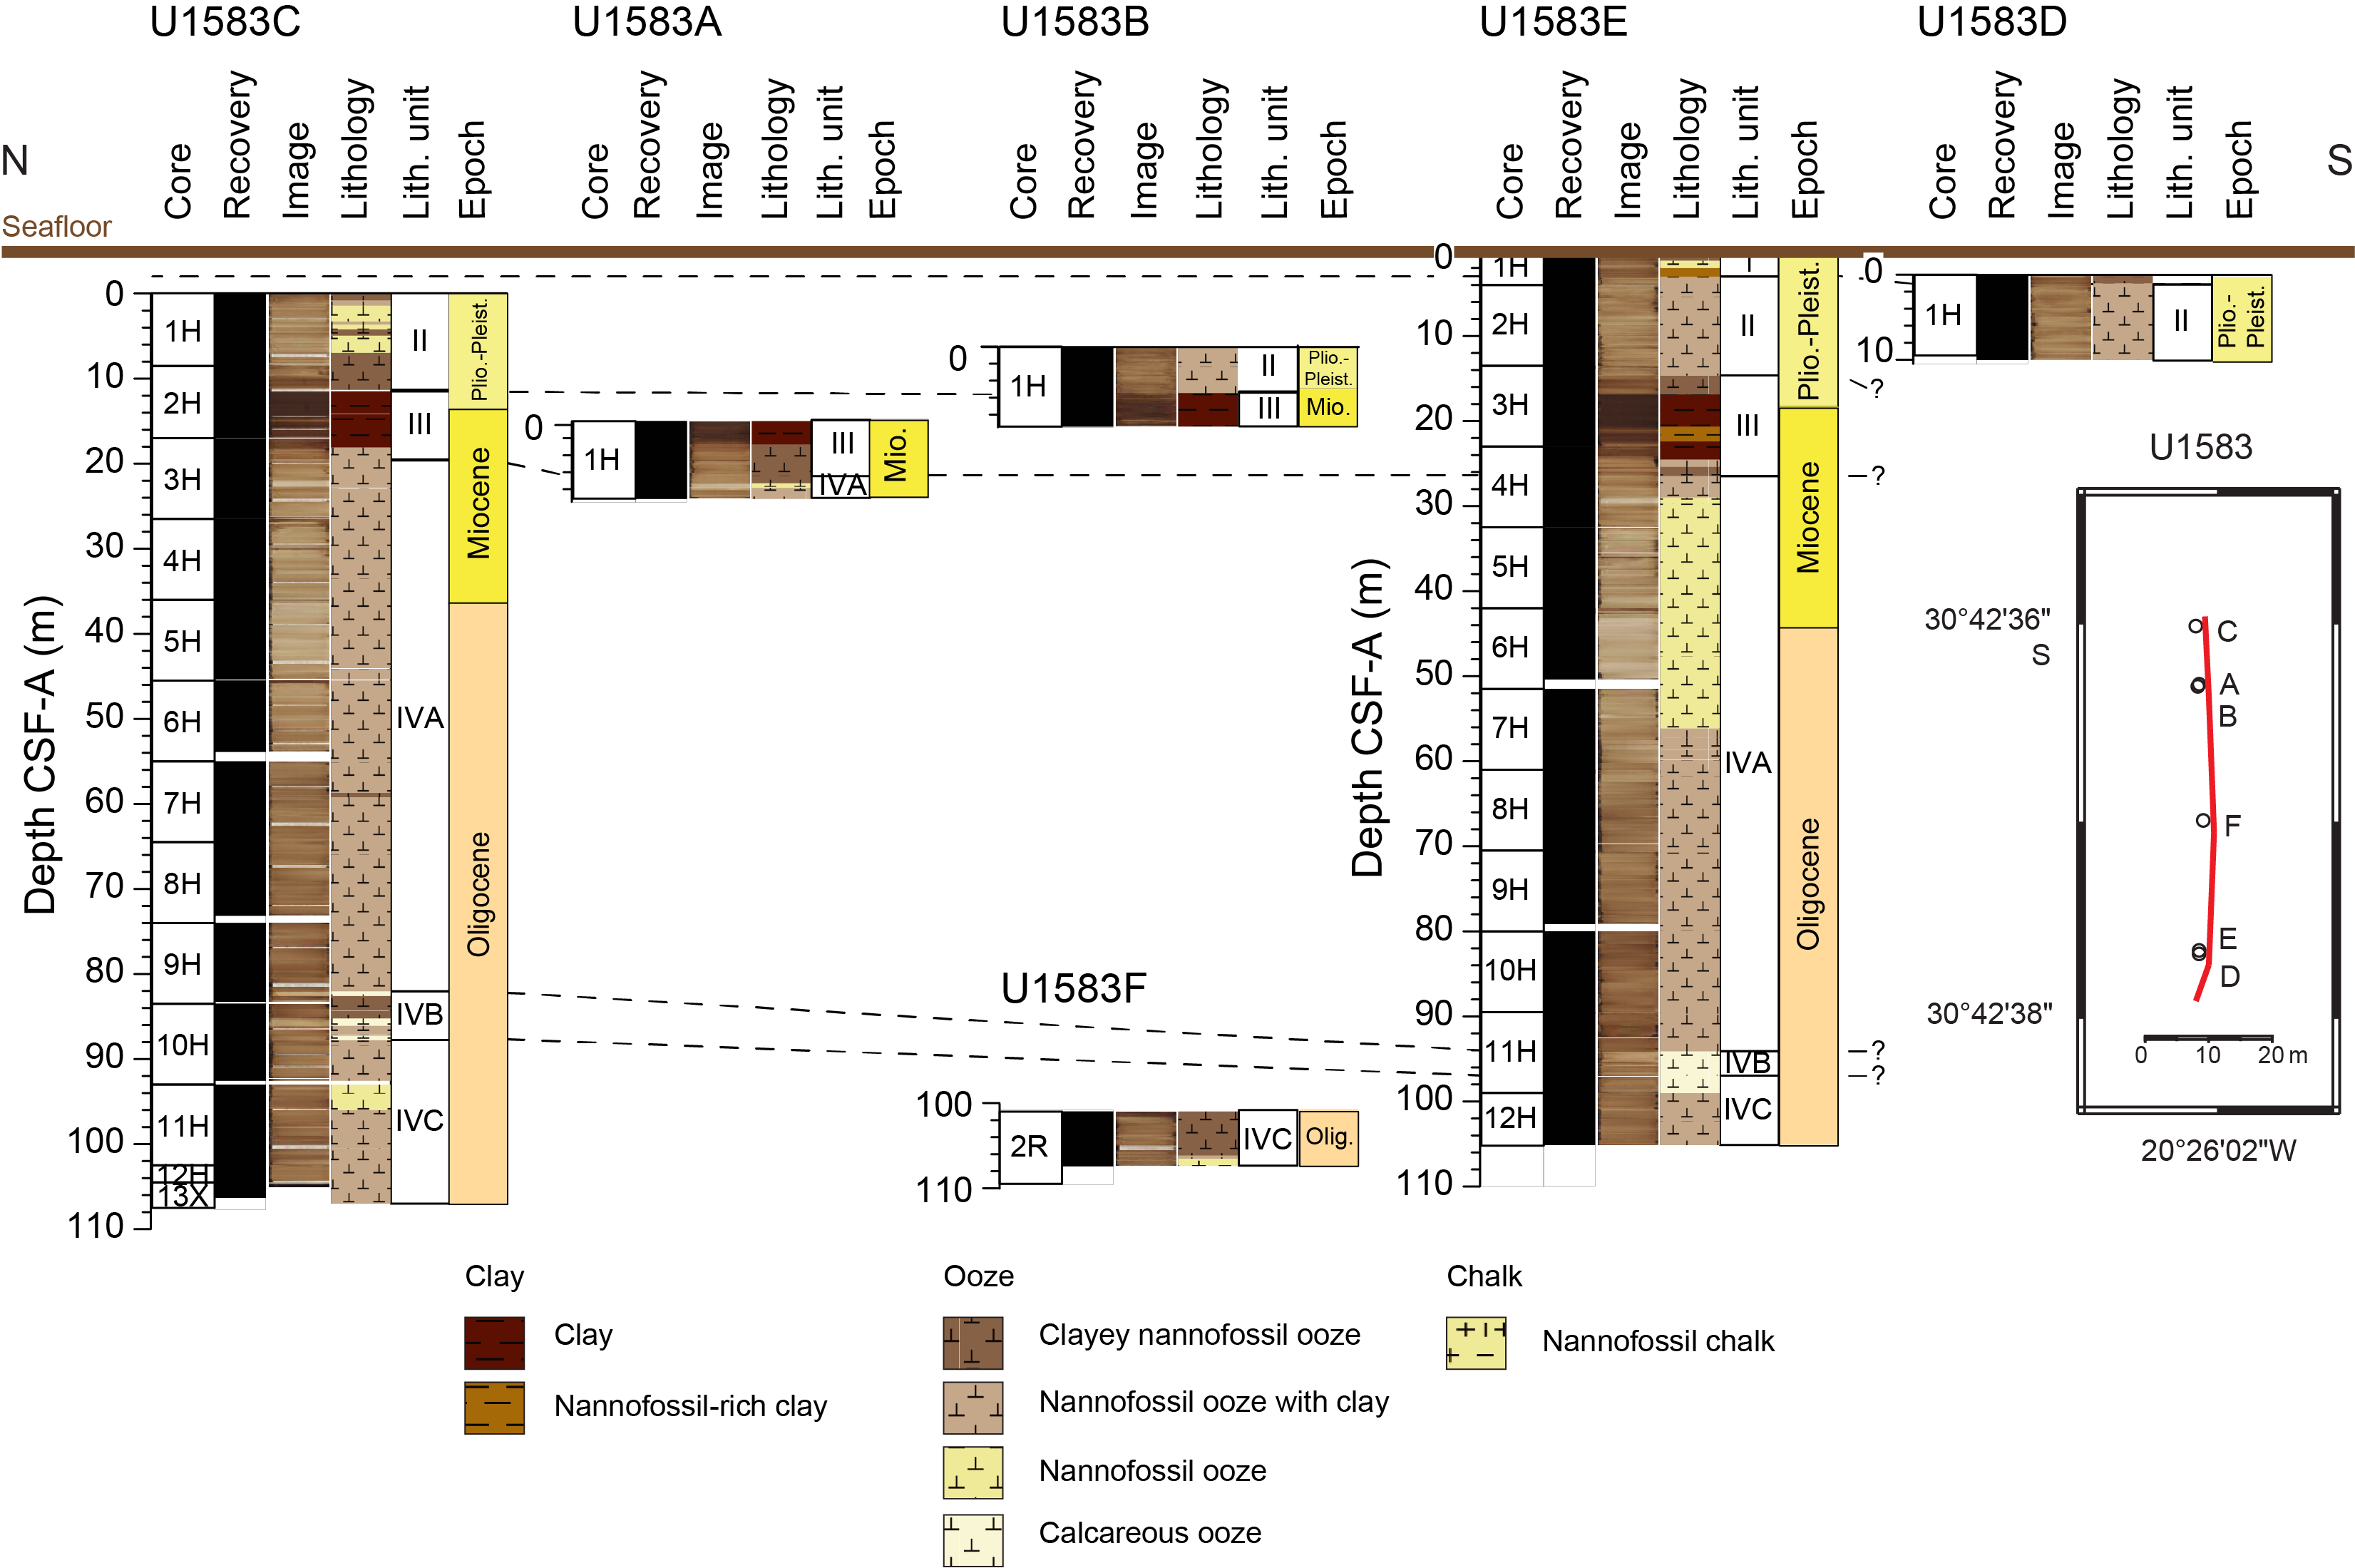
Figure F8. Lithologic correlation of sediment holes.
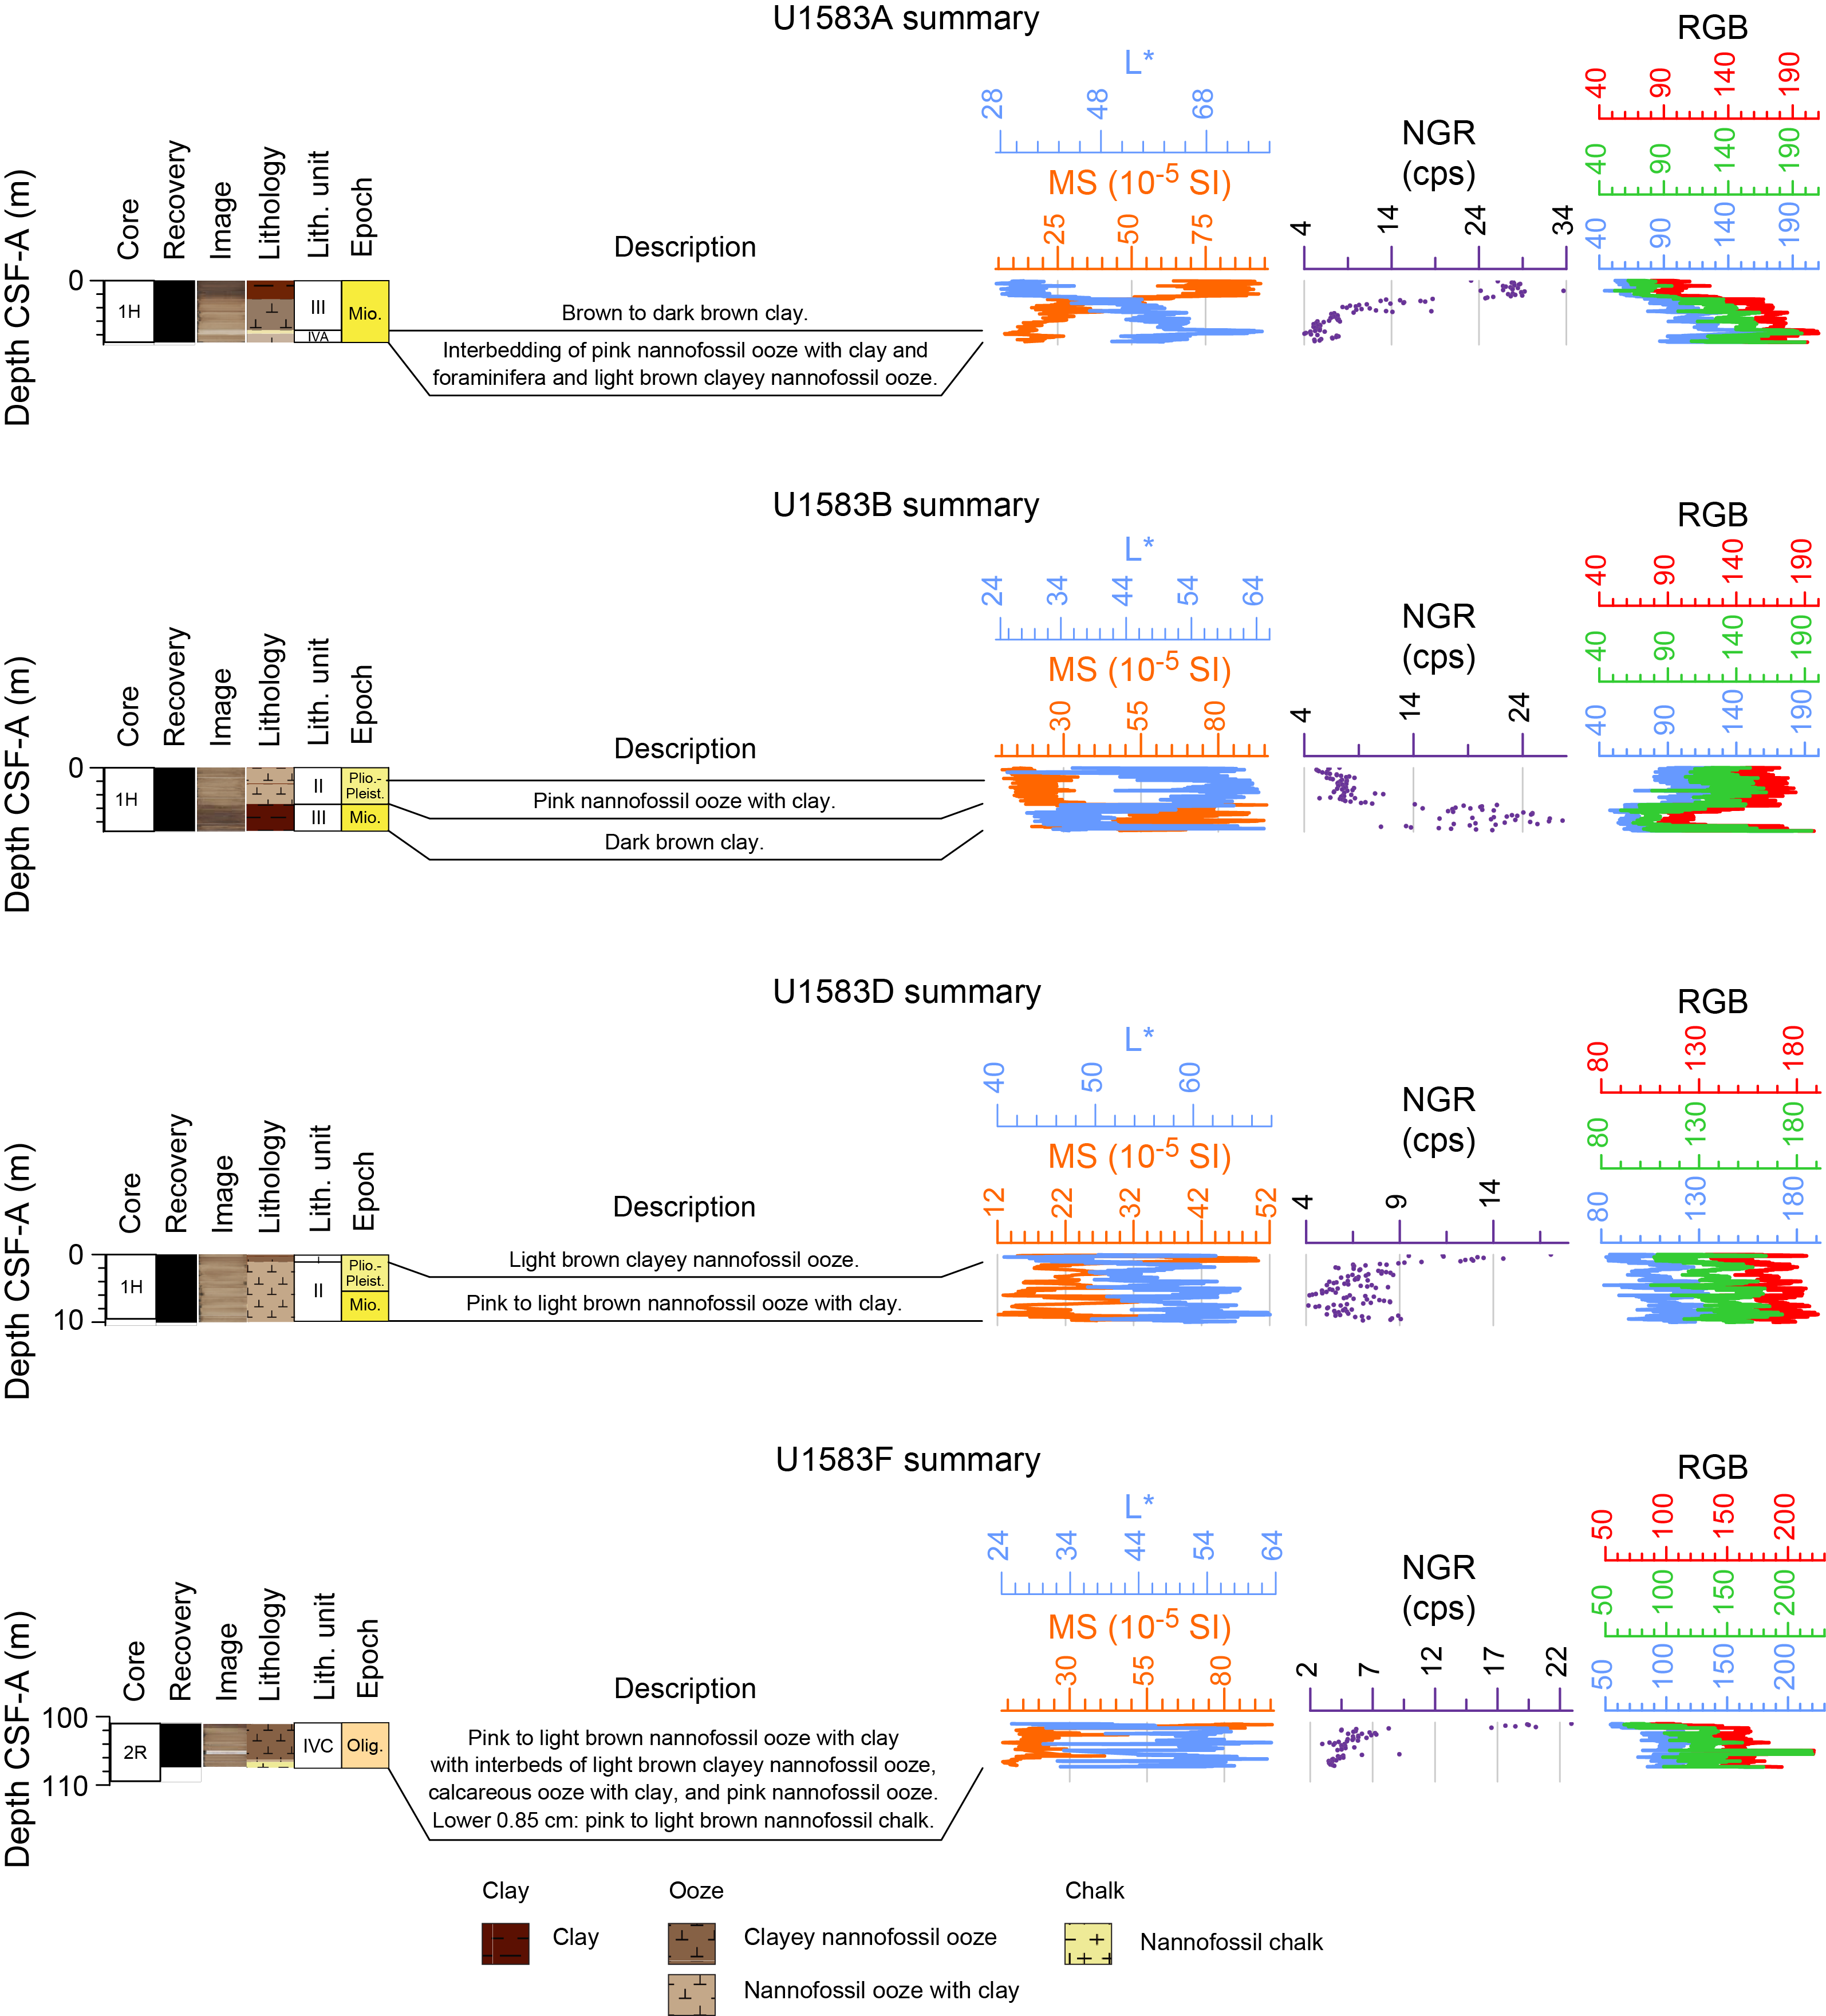
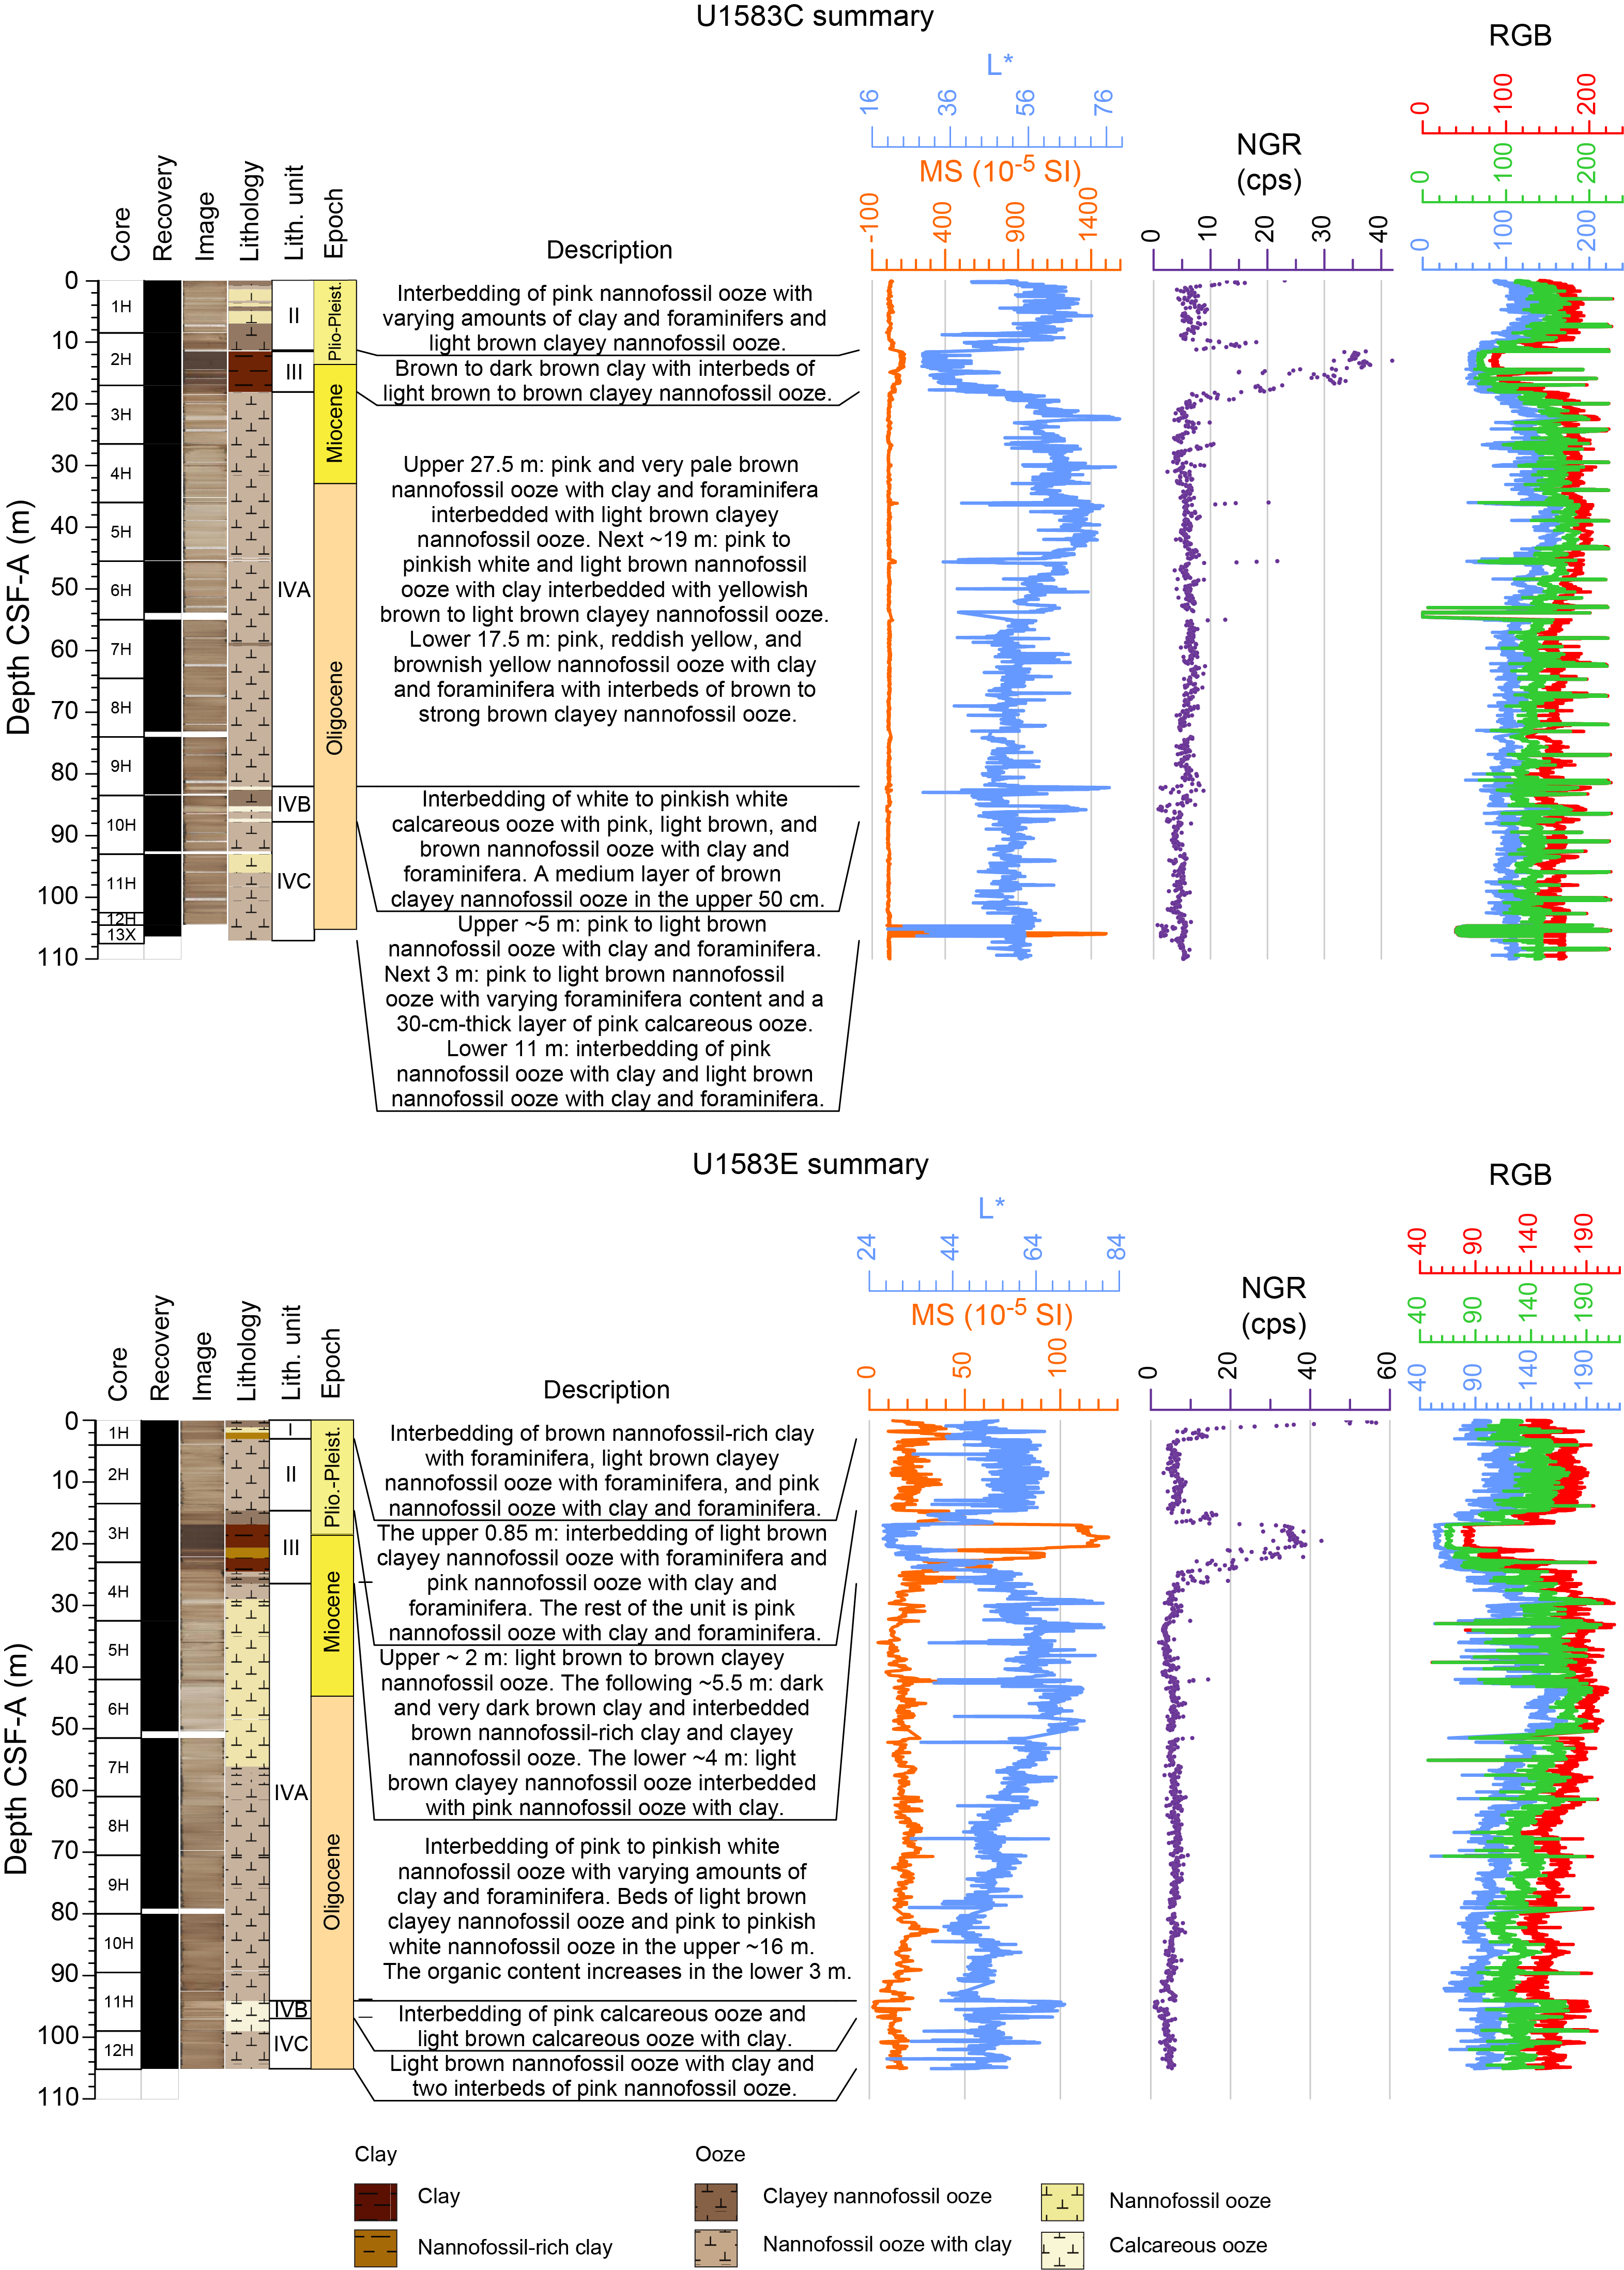
Figure F9. Lithologic summaries.
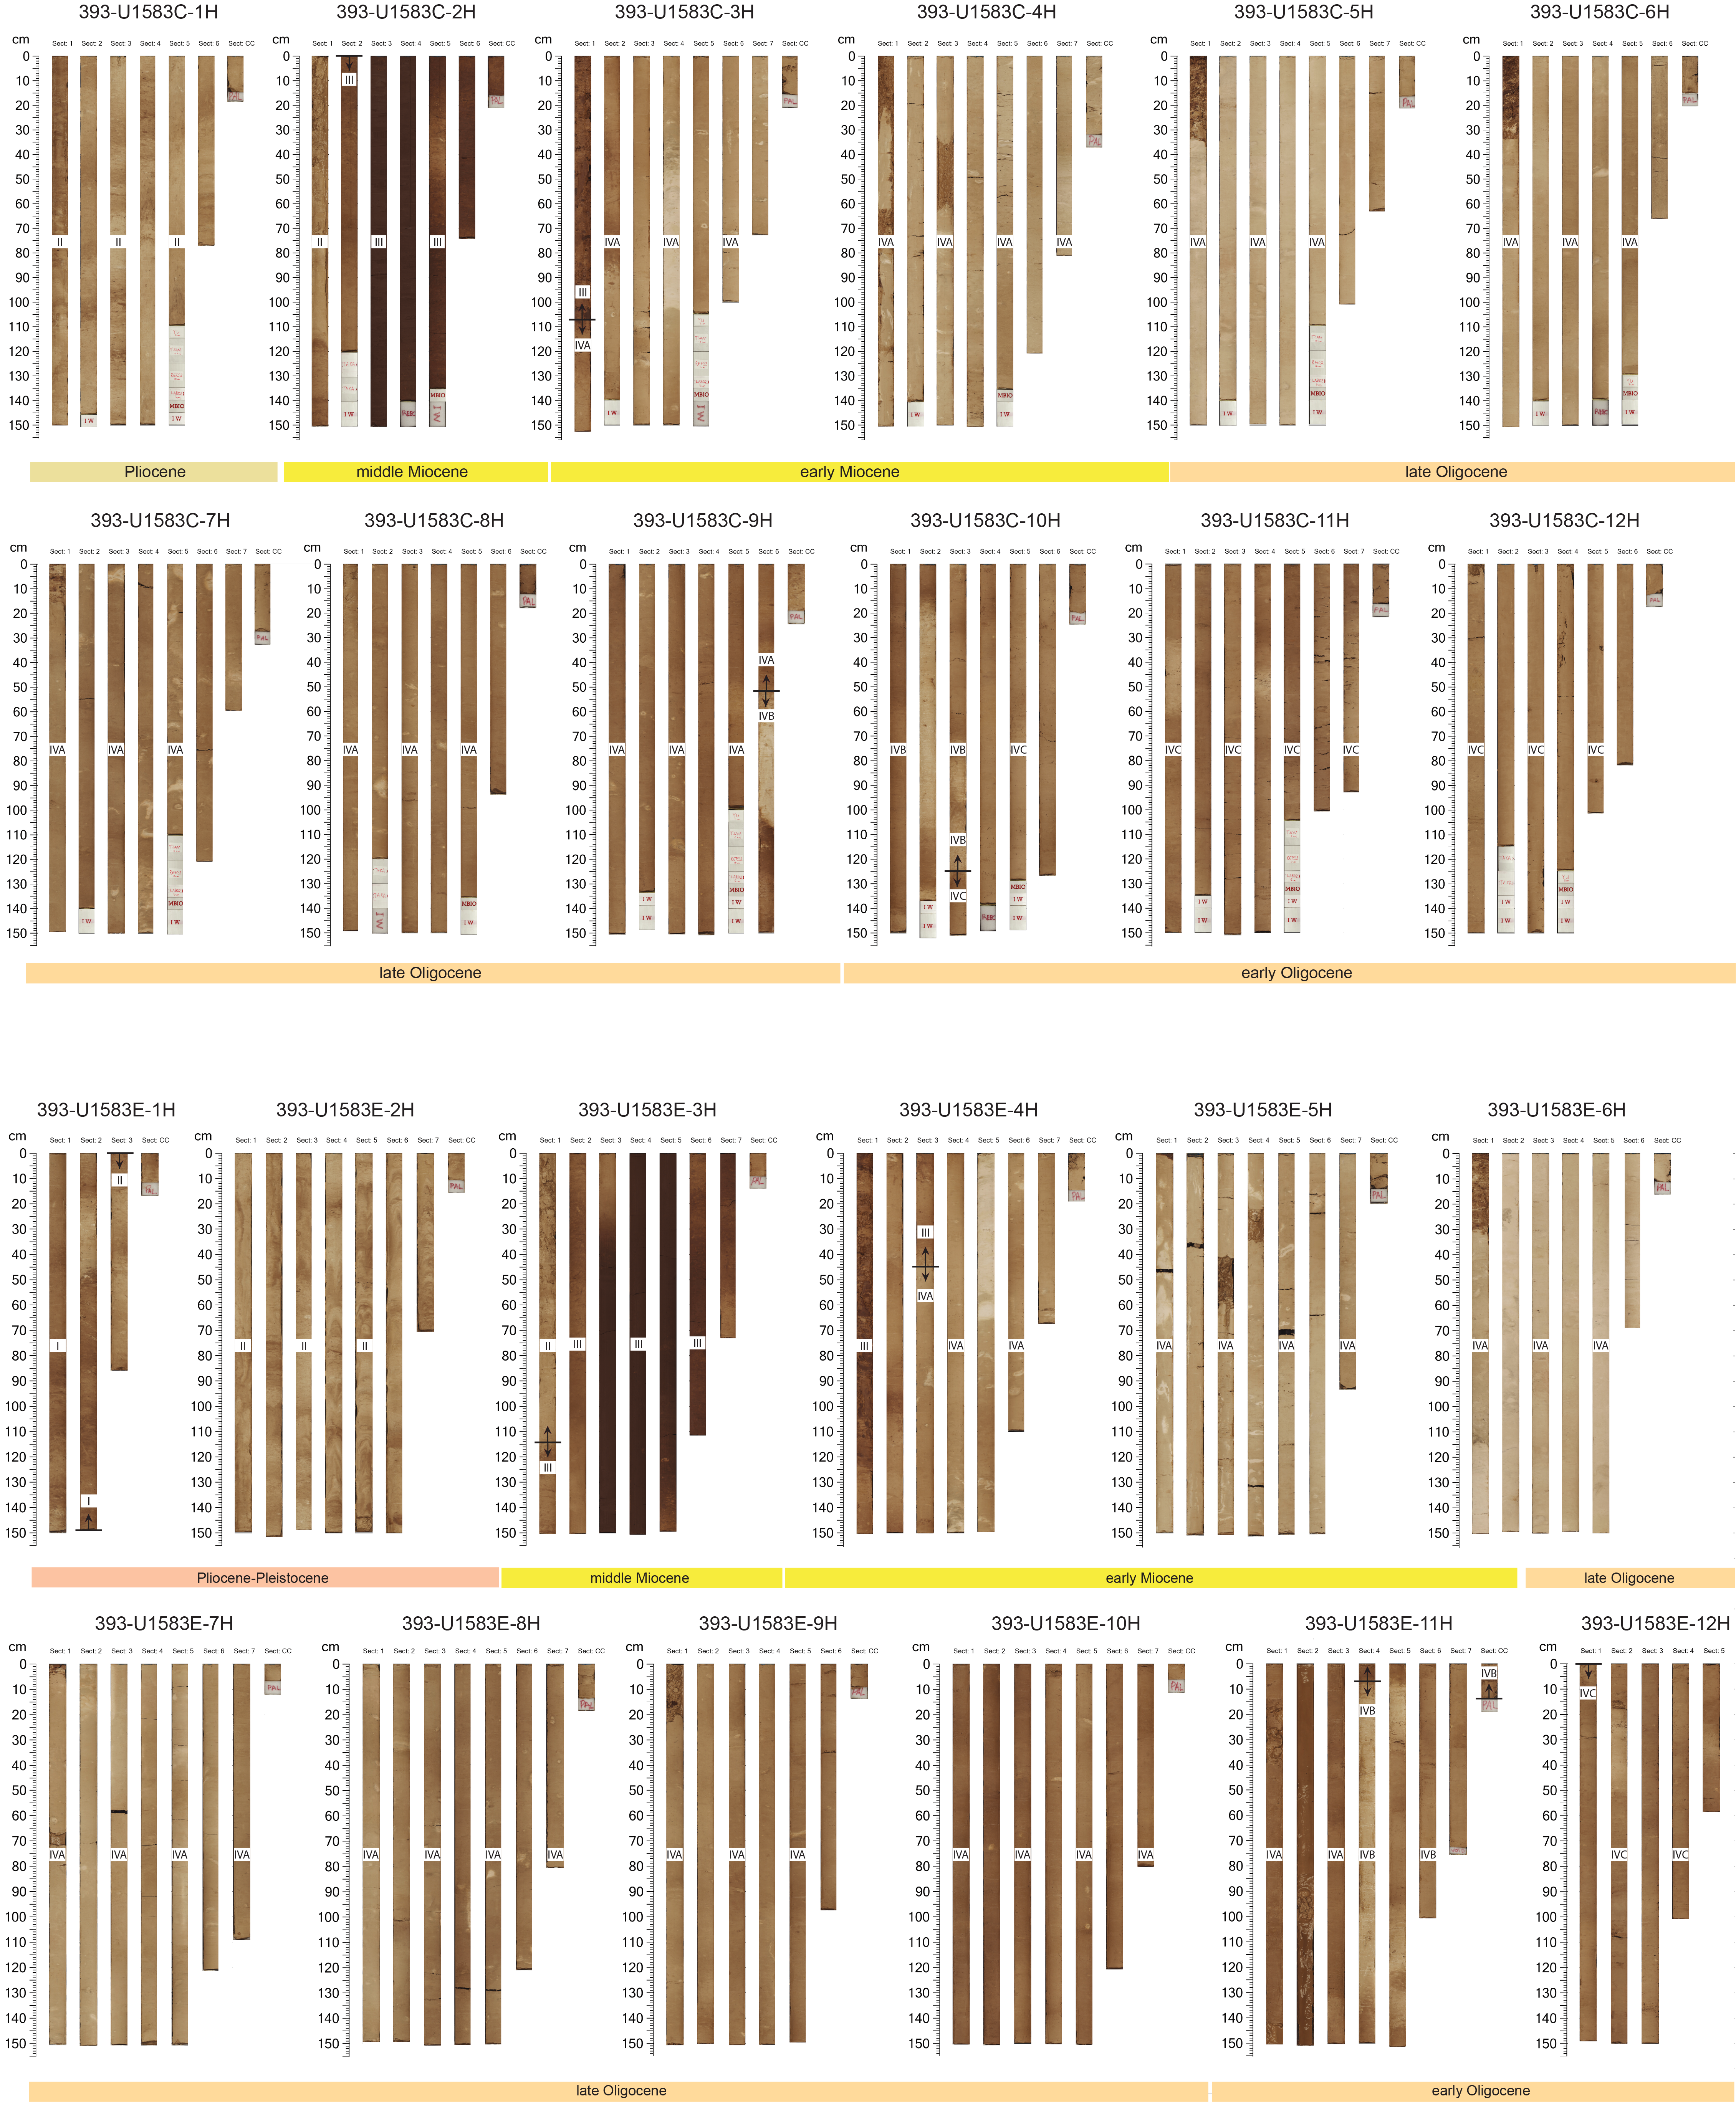
Figure F10. Ages and units.
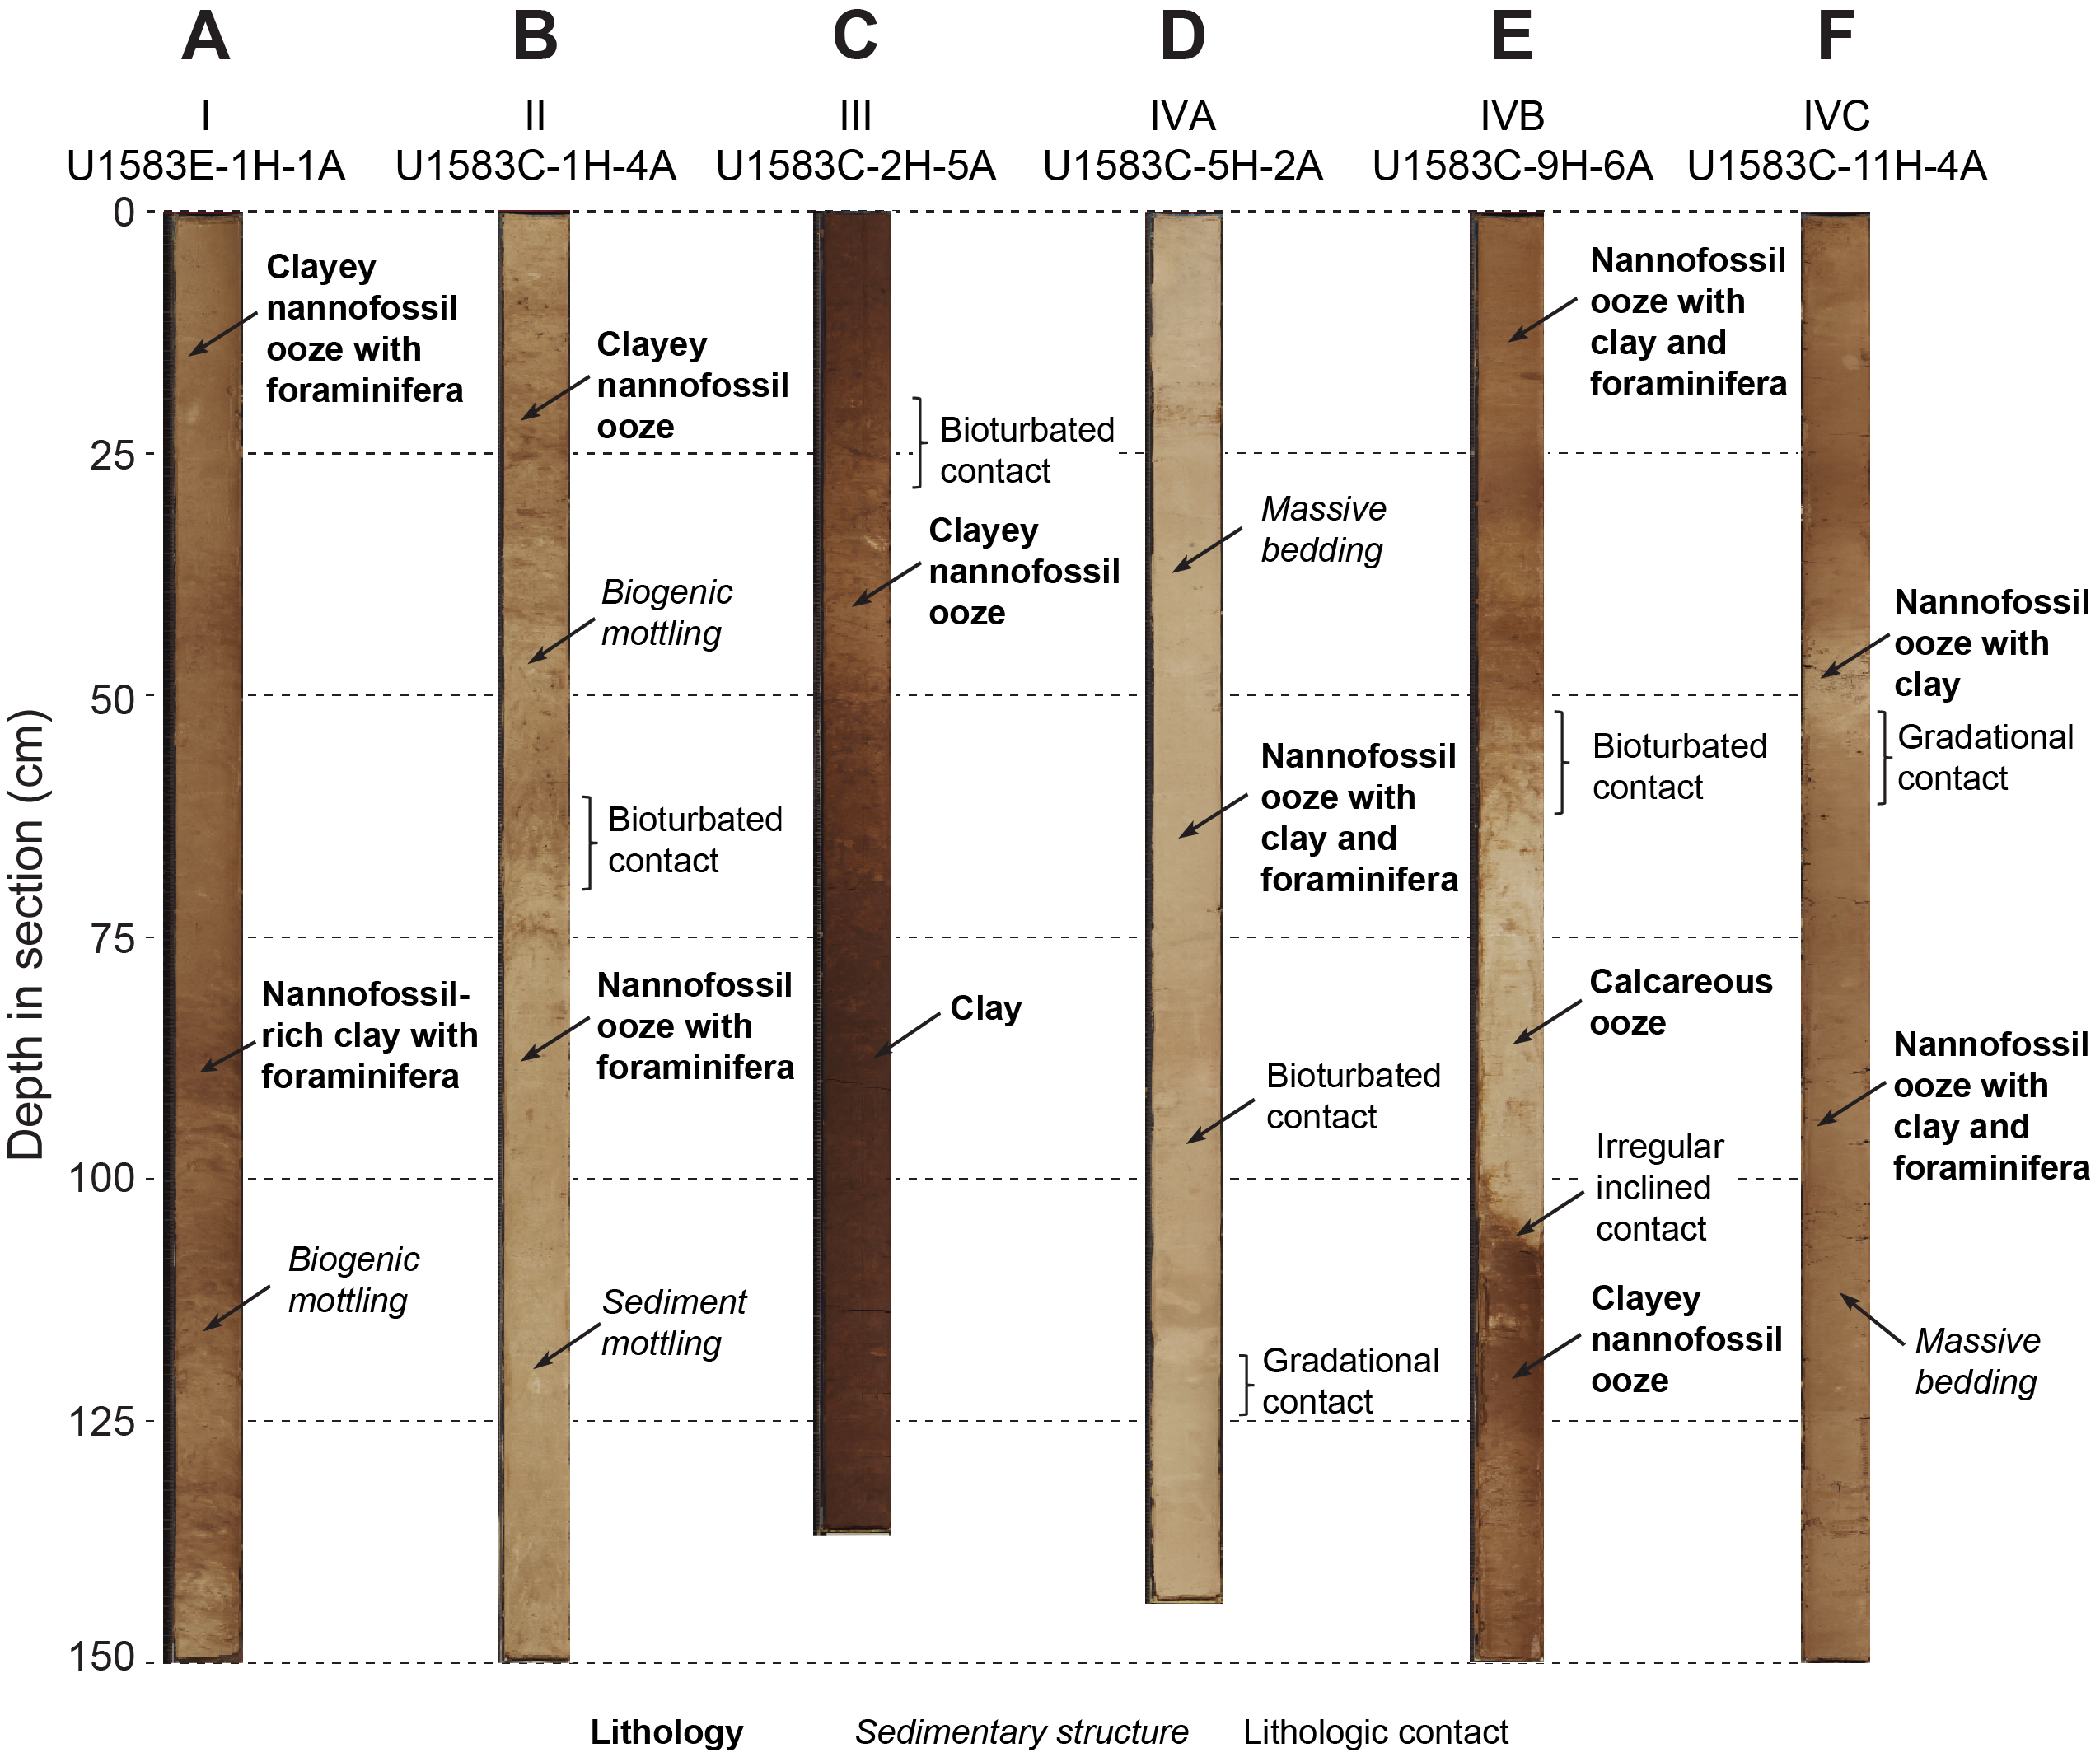
Figure F11. Typical lithologies of each unit.
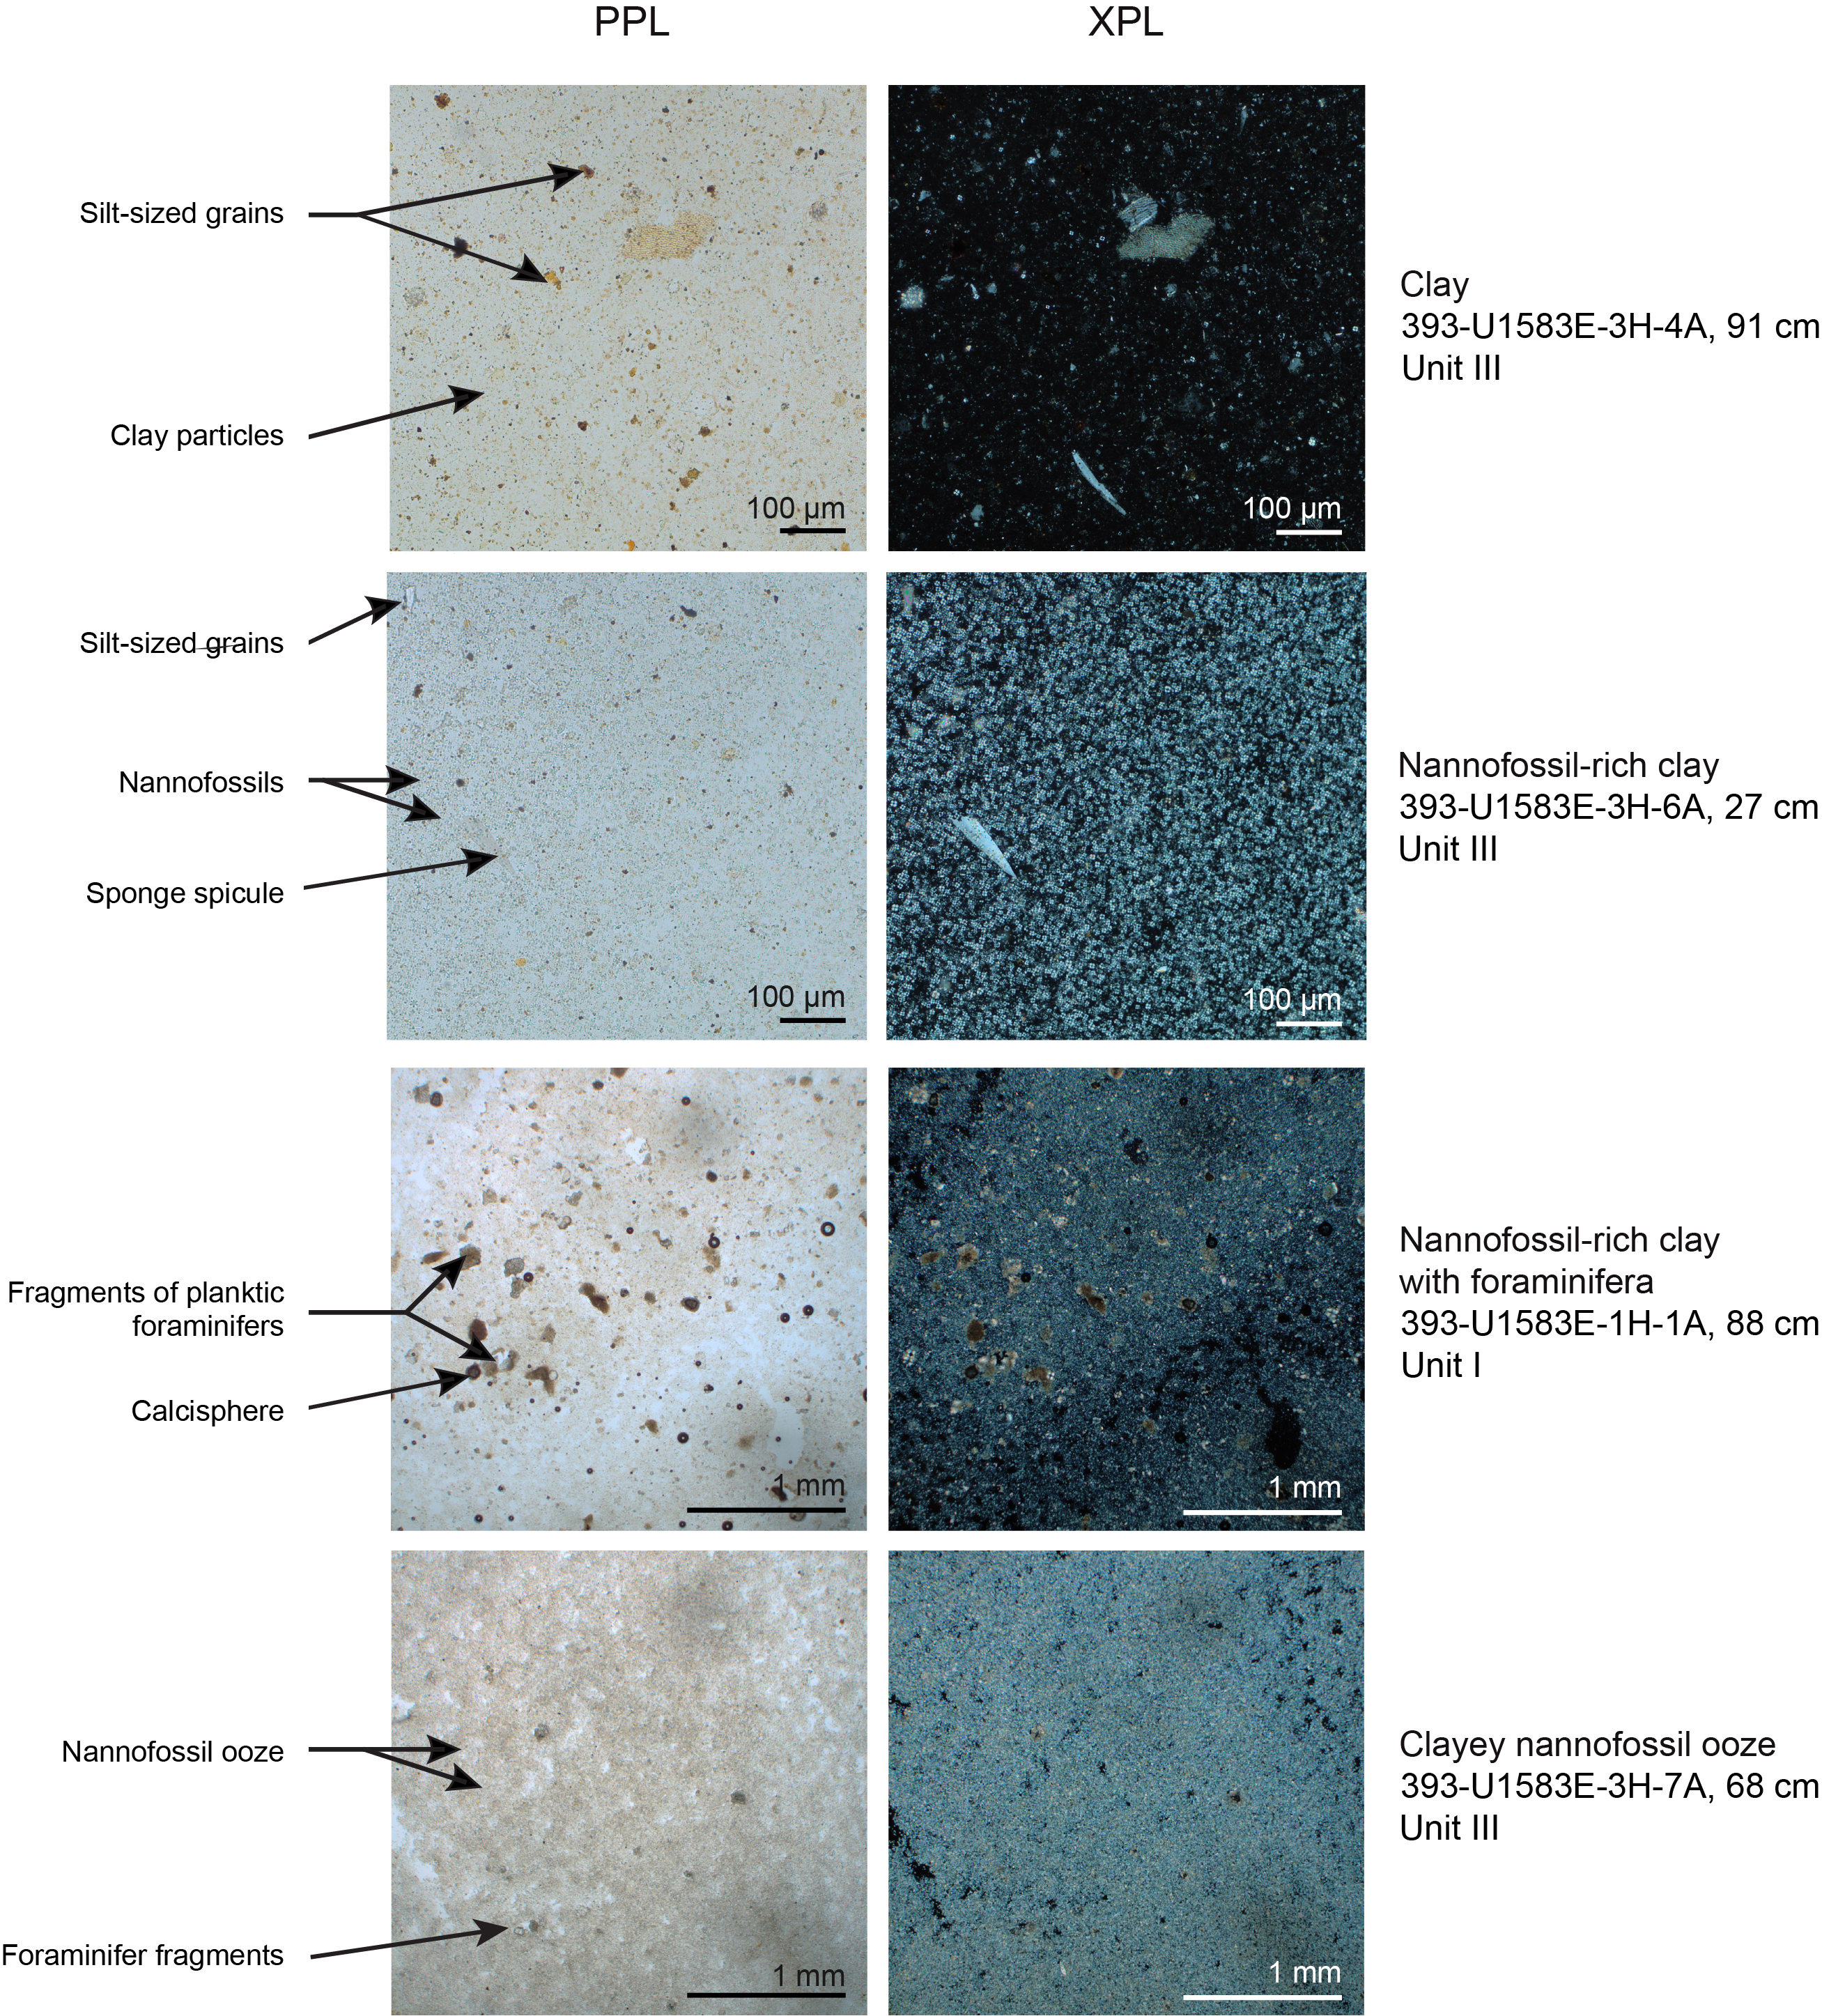
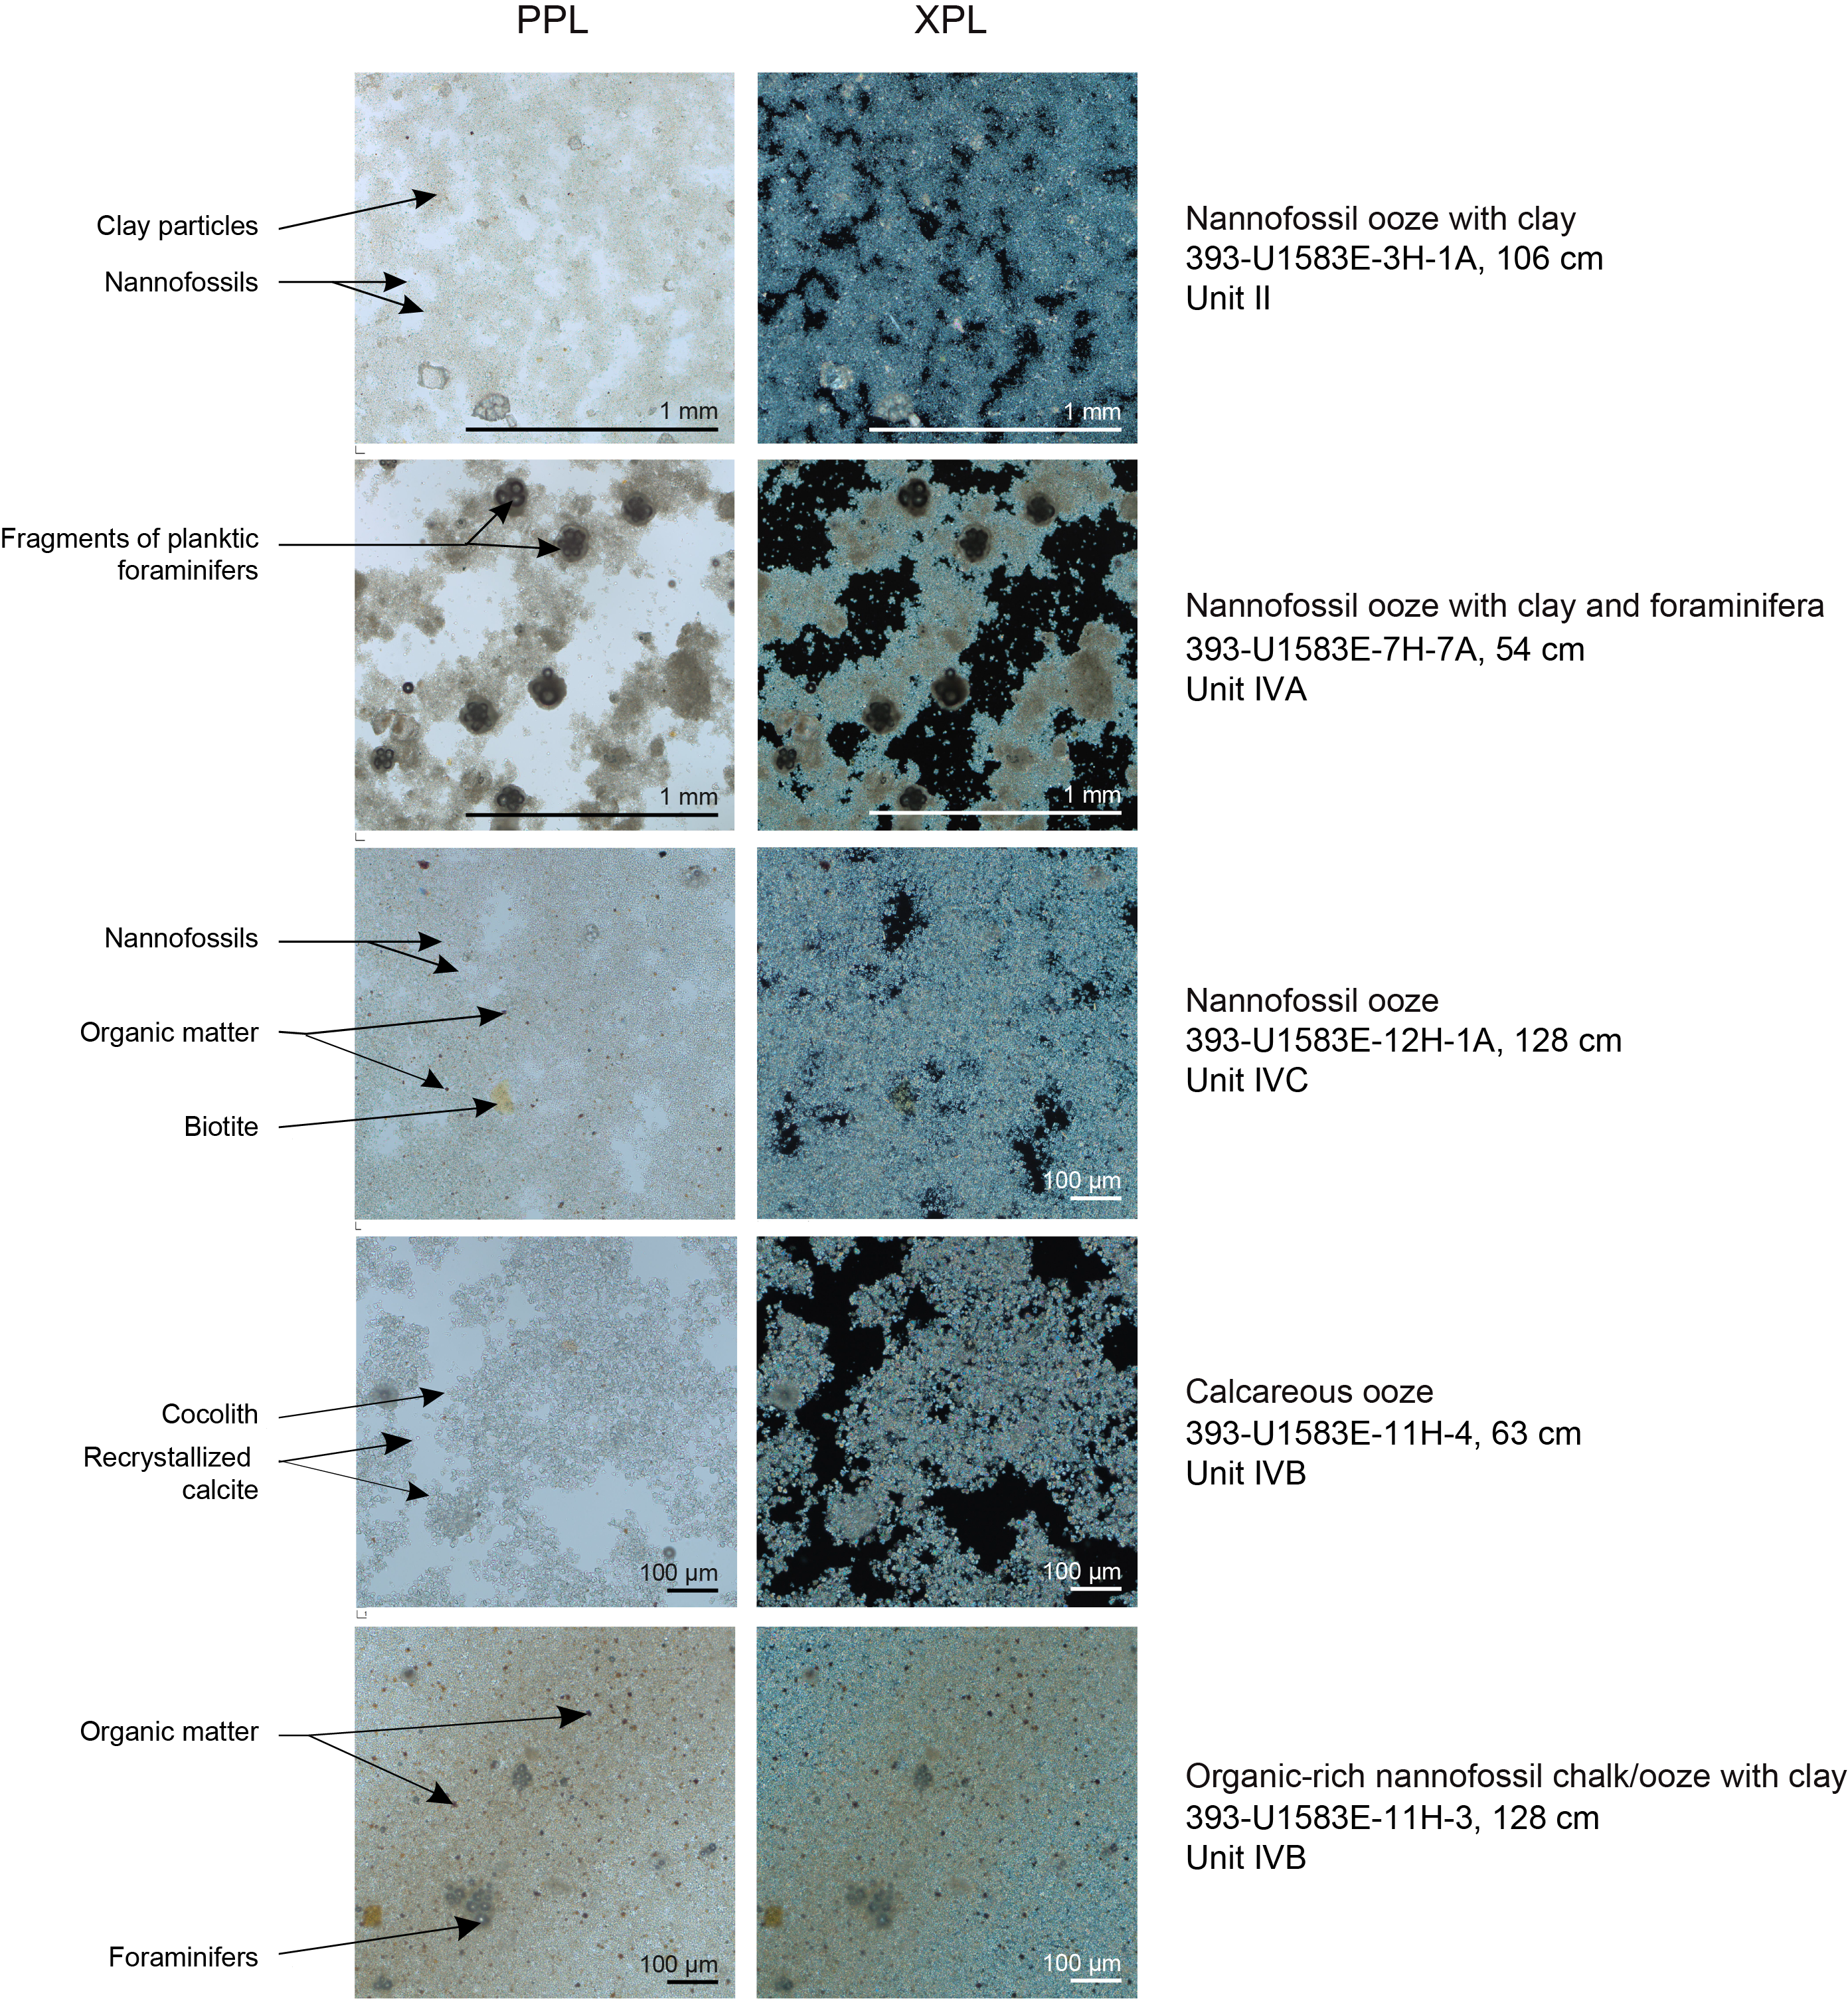
Figure F12. Principal sediment types.
Lithologic contacts in Unit I are bioturbated and horizontal. Mottling is the dominant sedimentary structure (Figure F11). Biogenic mottling is common, with distinct ichnofossils identified that include Planolites, Thalassinoides, Skolithos, and Zoophycos (Figure F13). Bioturbation intensity is absent to intense (bioturbation index [BI] = 0–5). Ichnofossil diversity ranges 1–3 ichnogenera, with a maximum diameter ranging 4–12 mm (Figure F13).
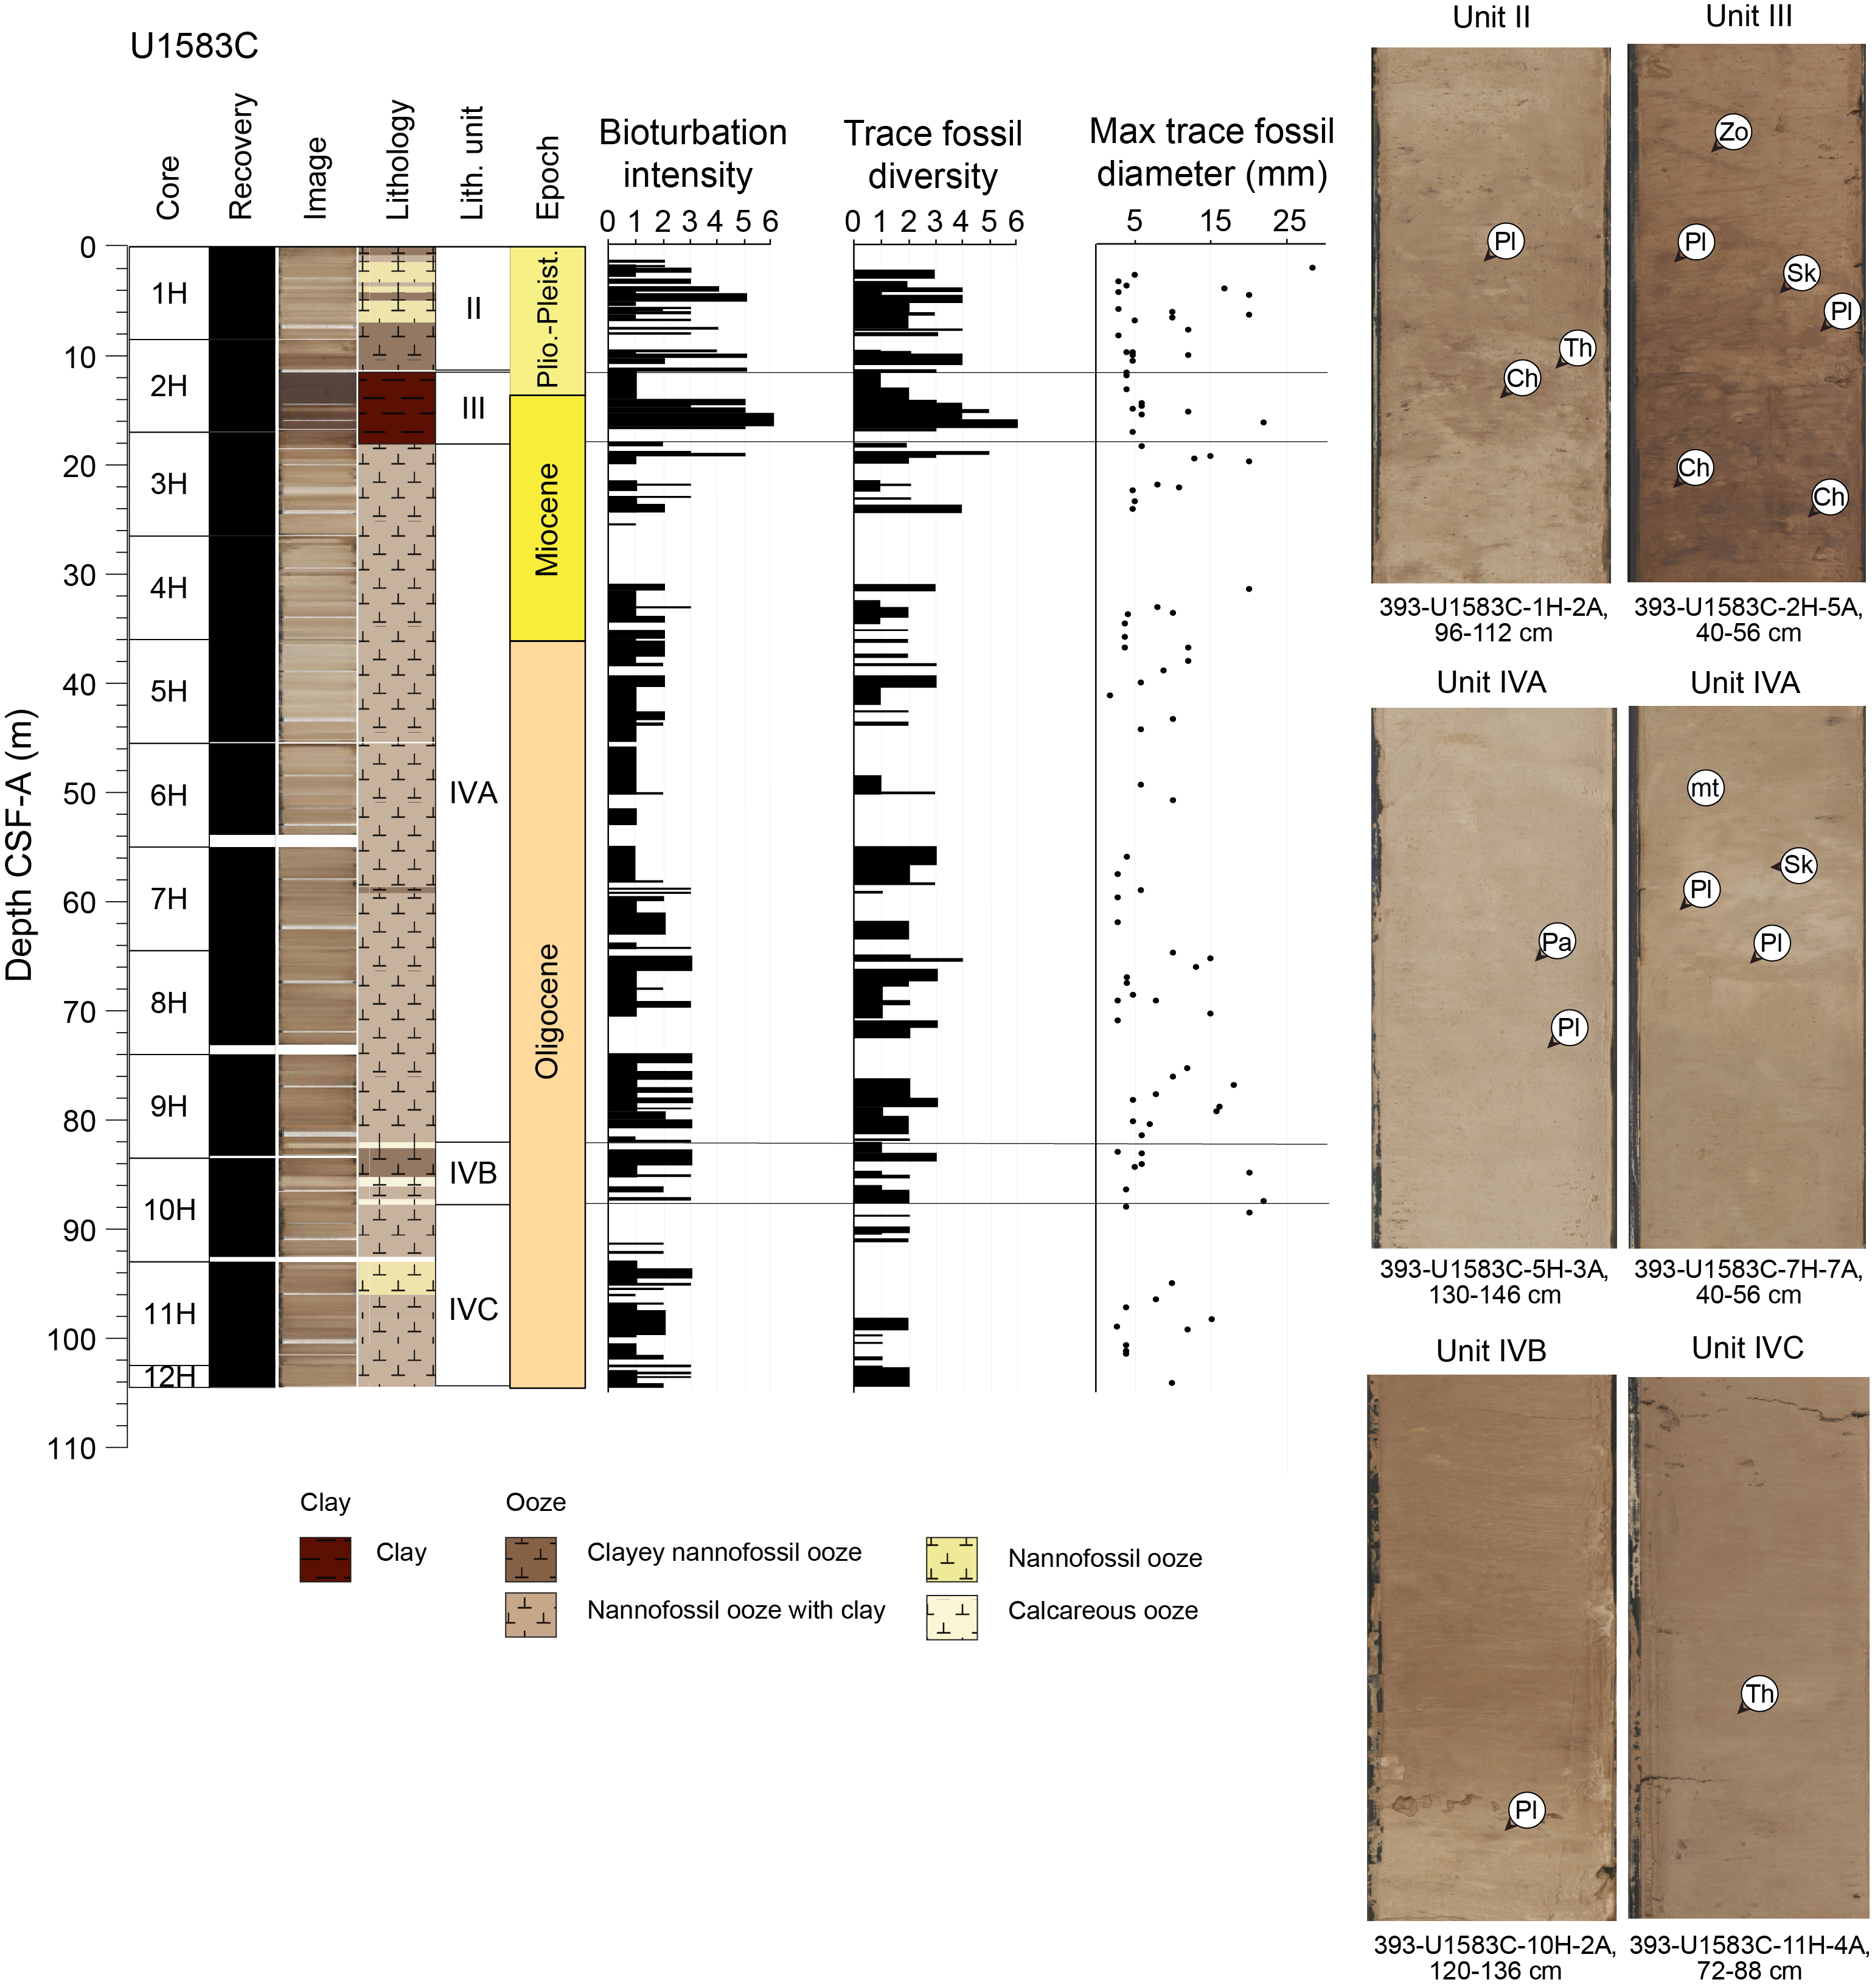
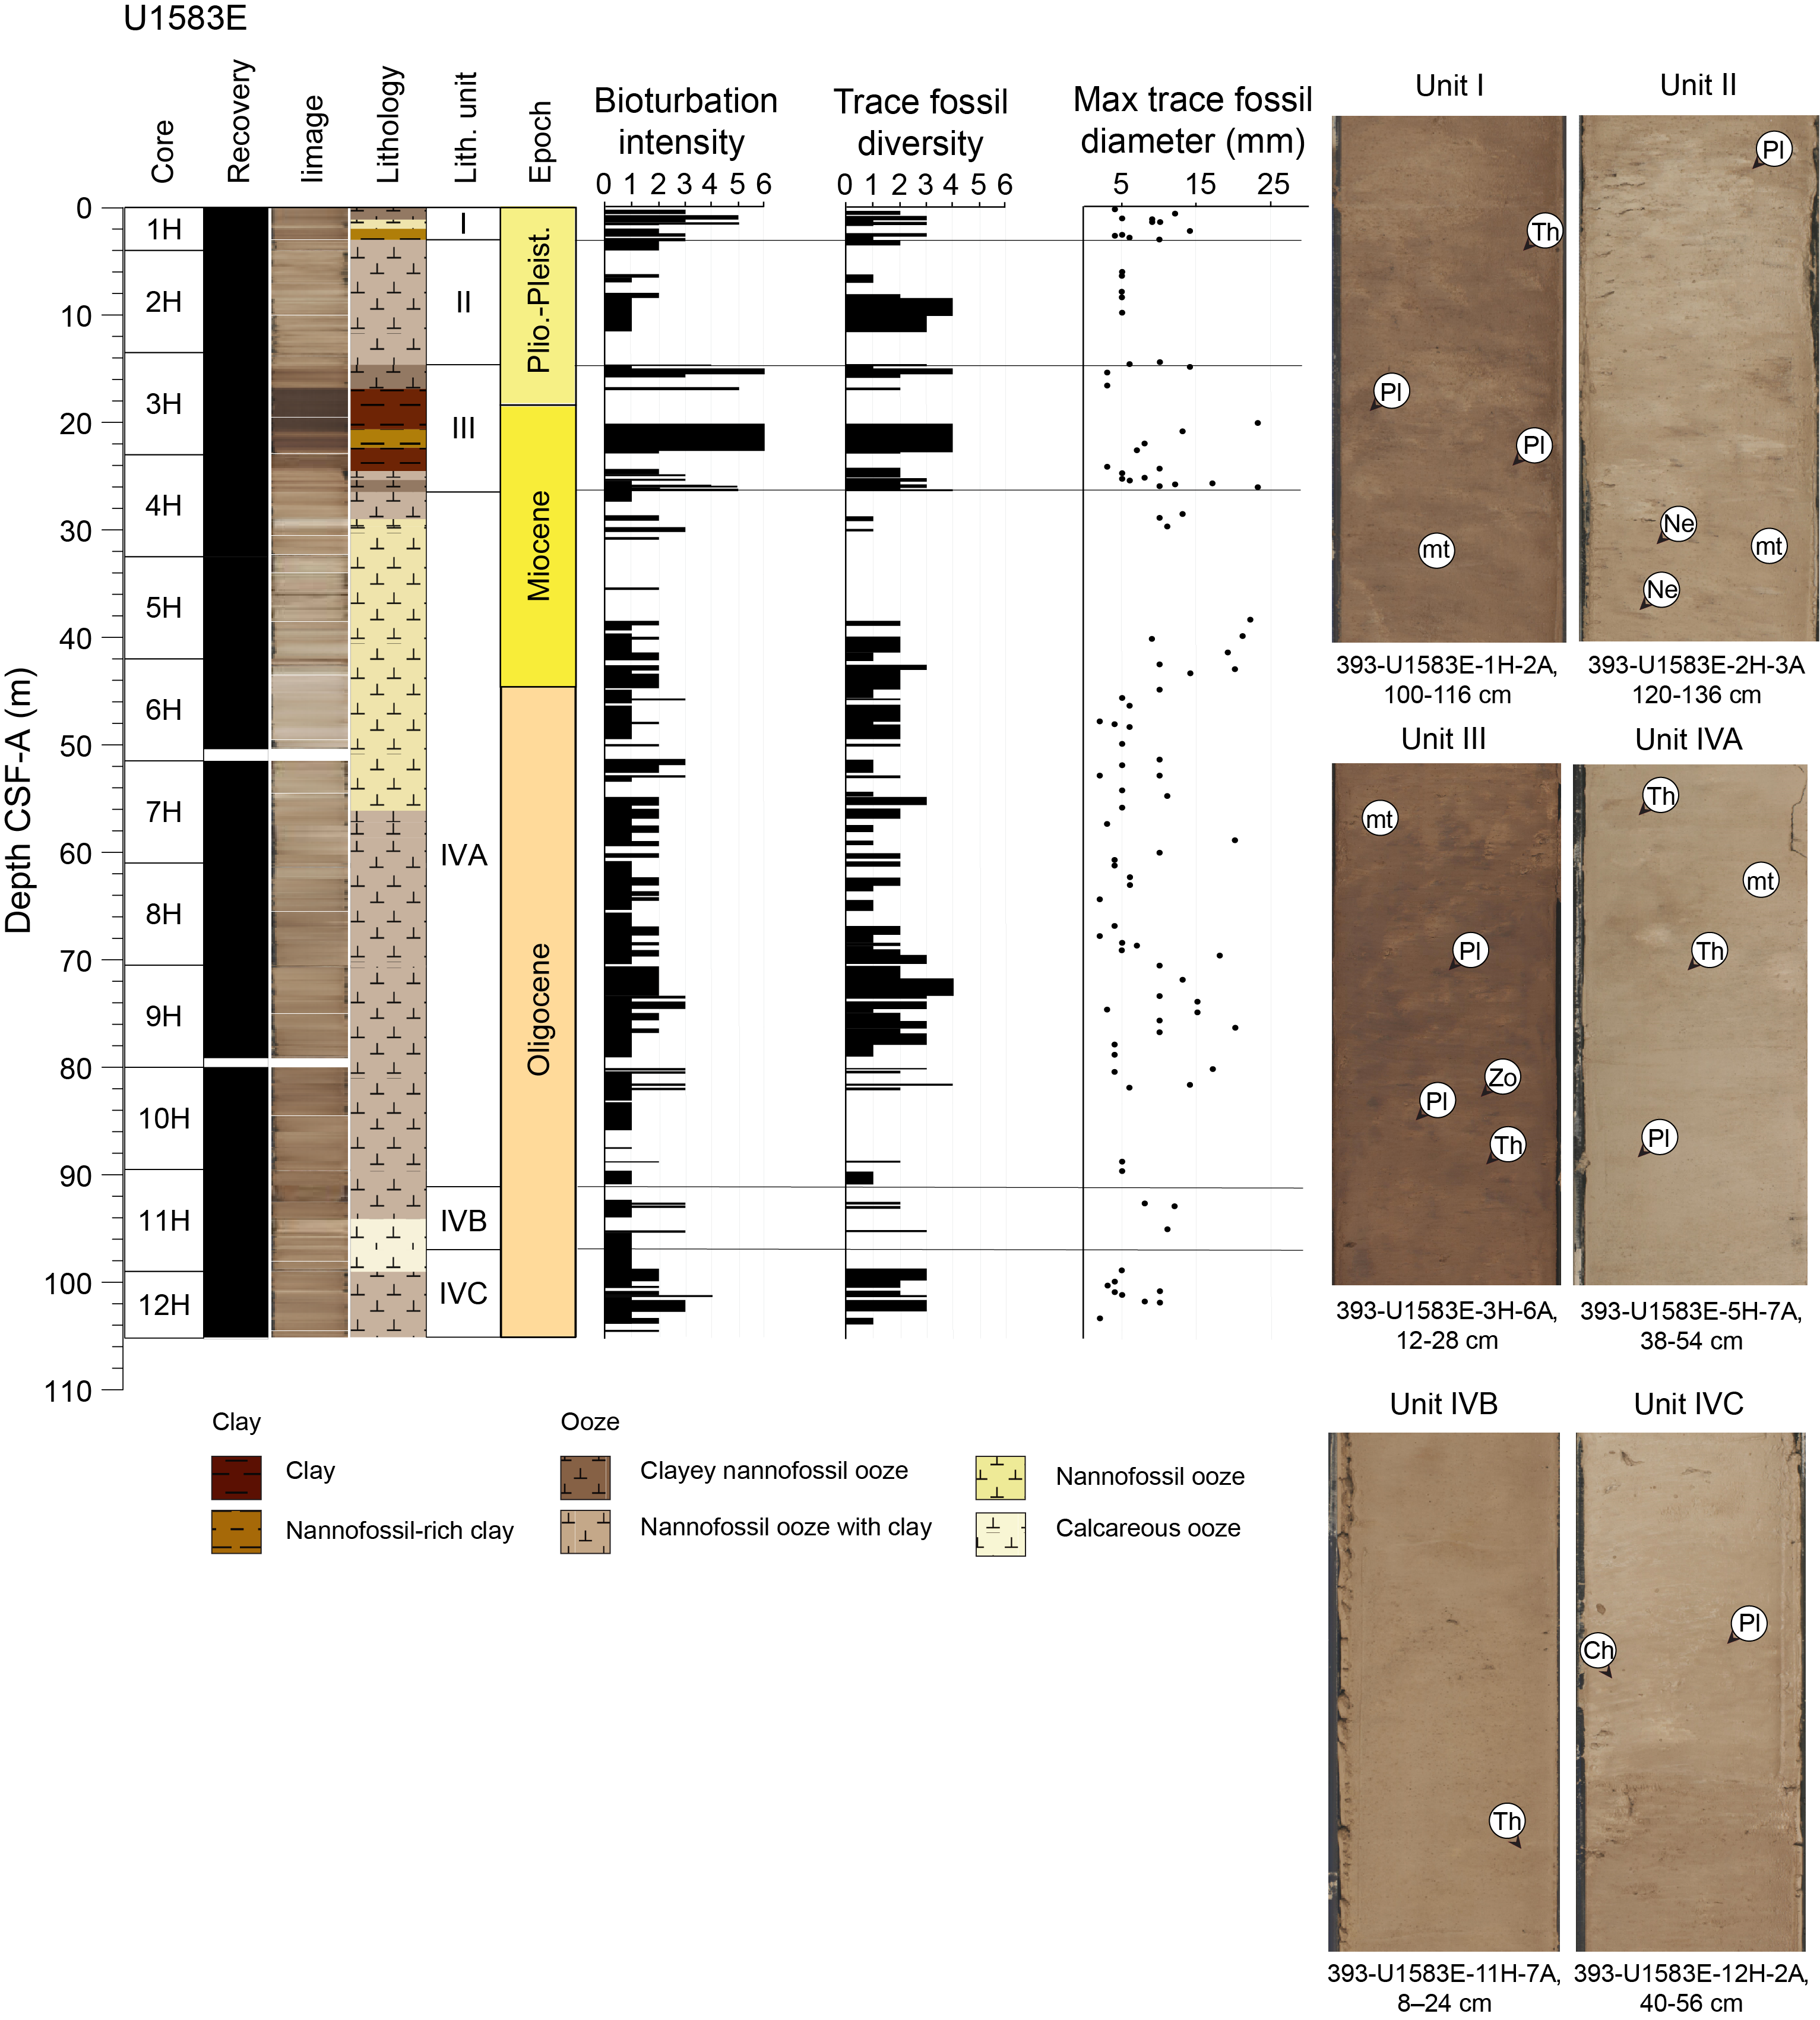
Figure F13. Typical trace fossil assemblages for each unit.
The primary minerals identified using bulk X-ray diffraction (XRD) in Unit I include calcite, quartz, plagioclase, and clay minerals such as illite, smectite, and chlorite (Figure F14; Table T3). Calcite and quartz form the main peaks in this unit, with the calcite peak being the largest. In the clay-rich beds, feldspar, illite, and chlorite are present. The smectite peak at 5.6°2θ is identified in all samples of this unit.
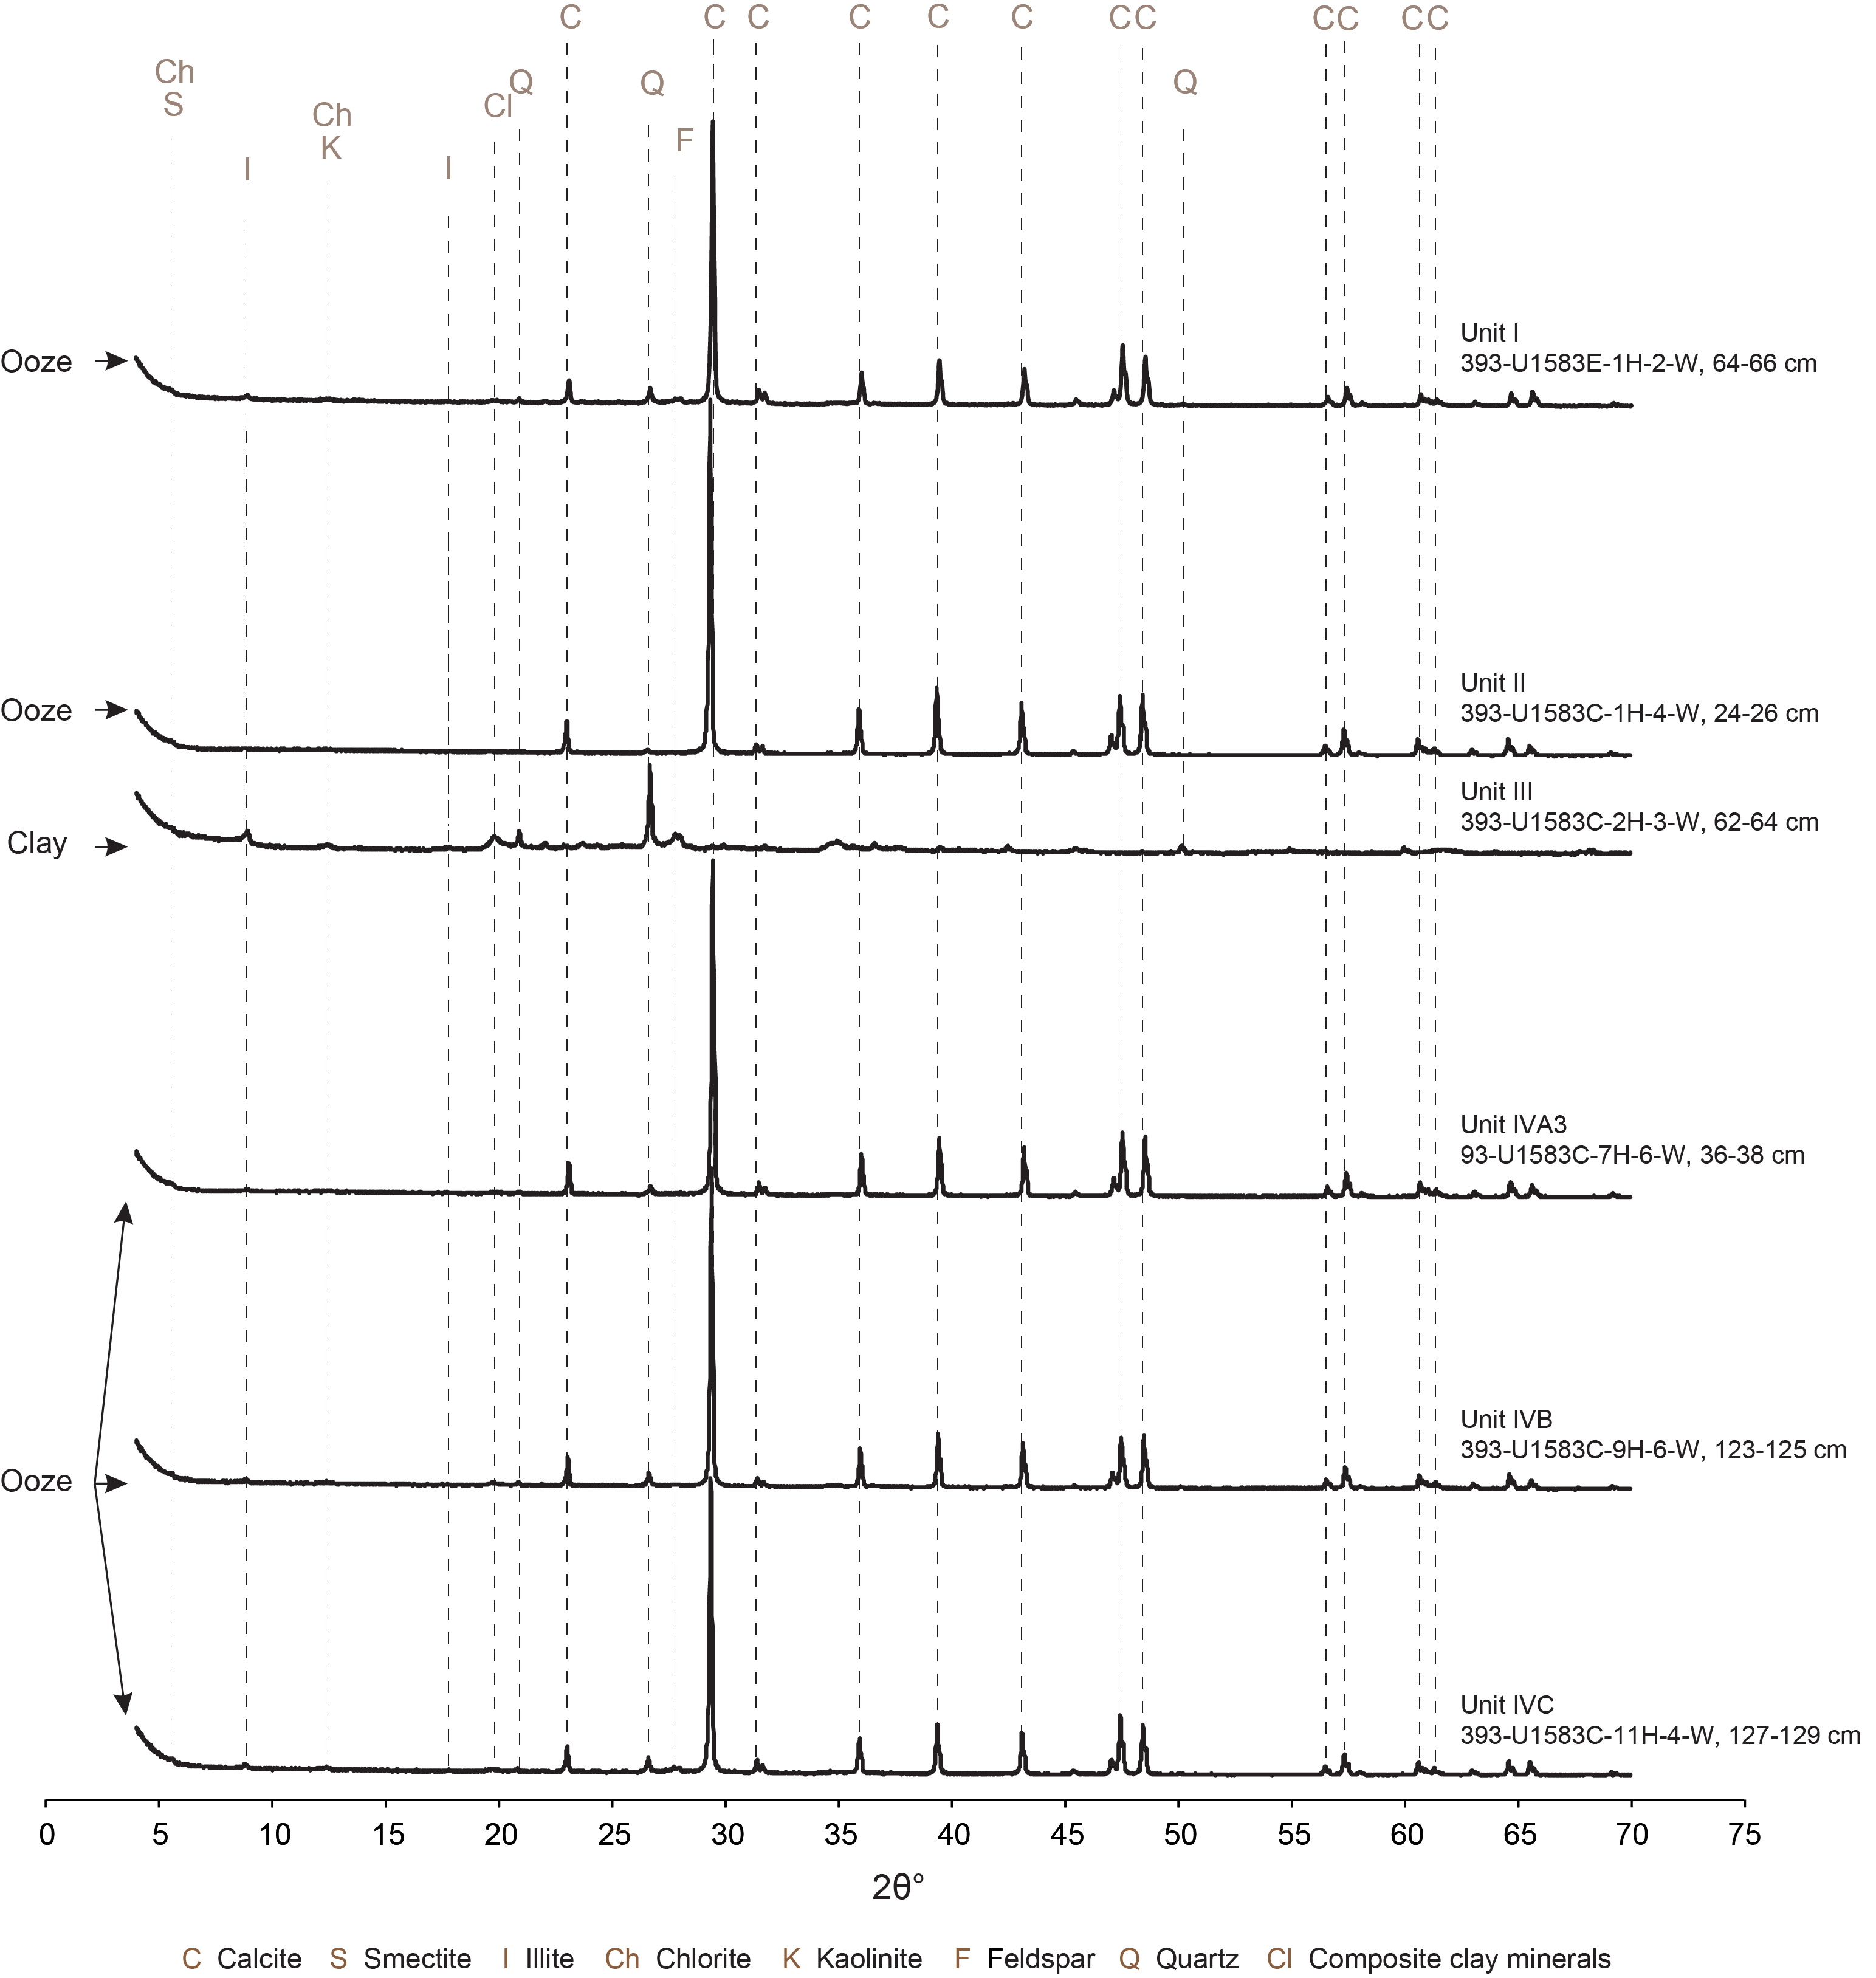
Figure F14. X-ray diffractograms.
The lithologic boundary between Units I and II is marked by an abrupt decrease in clay content and a brightening in sediment color coupled with a decrease in magnetic susceptibility (MS) (Figure F9).
4.1.2. Unit II
- Intervals: 393-U1583B-1H-1, 0 cm, to 1H-4, 60 cm; 393-U1583C-1H-1, 0 cm, to 2H-2, 135 cm; 393-U1583D-1H-1, 99 cm, to 1H-CC, 22 cm; 393-U1583E-1H-2, 150 cm, to 3H-1, 114 cm
- Depths: Hole U1583B = 0.0–0.9 m CSF-A; Hole U1583C = 0.0–11.3 m CSF-A; Hole U1583D = 1.0–10.0 m CSF-A; Hole U1583E = 3.0–14.6 m CSF-A
- Thickness: Hole U1583B = >0.9 cm; Hole U1583C = >11.3 m; Hole U1583D = >9.0 m; Hole U1583E = 11.6 m
- Age: Pliocene–Pleistocene
- Lithology: nannofossil ooze with varying amounts of clay and foraminifera
Lithostratigraphic Unit II consists of interbedded pink nannofossil ooze with varying amounts of clay and foraminifera with light brown clayey nannofossil ooze (Figures F8, F9, F10, F11, F12, F13). Low NGR values, relatively low MS, and high reflectance data (L*) characterize this unit (Figure F9). The foraminifera content generally ranges between 10% and 25% except in darker intervals, such as light brown nannofossil ooze with clay and clayey nannofossil ooze, where foraminifera content falls below 10%. In the lowermost 1.5 m of this unit, the sediment darkens to brown as clay content increases. This increase is supported by an increase in NGR and higher MS values coupled with lower light reflectance (L*) values (Figure F9). This increase in clay and decrease in carbonate content is interpreted to reflect a change in the seafloor position relative to the CCD. Here specifically, this could be deepening of the CCD with time and/or thermal or tectonic movement of the basement.
Mottling and massive bedding are the primary sedimentary structures (Figures F11, F13). Pinkish white halos (2–2.5 cm) and rare small black blebs (probably iron or manganese oxides) are present throughout this unit. Biogenic mottling is common, with bioturbation intensity ranging from absent to intense (BI = 0–5). Distinct ichnogenera were identified and include Planolites, Thalassinoides, Chondrites, and more rarely Skolithos and Nereites (Figure F13). Ichnogenera diversity ranges 1–4, with the maximum ichnofossil diameter ranging 3–28 mm (Figure F13).
The primary minerals identified with bulk XRD in Unit II include calcite, quartz, plagioclase, and clay minerals such as illite and smectite (Figure F14; Table T3). Calcite and quartz form the dominant peaks, with calcite having the largest peak.
Severe drilling disturbances occurred in large portions of Unit II. These disturbances resulted in complete disruption of more than half of the sediments in Core 393-U1583E-2H. The lithologic boundary between Units II and III is marked by an abrupt lithologic change from light brown nannofossil ooze with clay and foraminifera above to dark brown clay below, which is interpreted to be an abrupt deepening of the CCD with time across this unit boundary and/or thermal or tectonic movement of the basement (Figures F8, F9).
4.1.3. Unit III
- Intervals: 393-U1583A-1H-1, 0 cm, to 1H-1, 122 cm; 393-U1583B-1H-4, 60 cm, to 1H-CC, 14 cm; 393-U1583C-2H-2, 135 cm, to 3H-2, 86 cm; 393-U1583E-3H-1, 114 cm, to 4H-3, 45 cm
- Depths: Hole U1583A = 0.0–1.2 m CSF-A; Hole U1583B = 4.5–9.4 m CSF-A; Hole U1583C = 11.35–19.4 m CSF-A; Hole U1583E = 14.6–26.5 m CSF-A
- Thickness: Hole U1583A = >1.2 m; Hole U1583B = >4.9 m; Hole U1583C = 8.0 m; Hole U1583E = 11.8 m
- Age: Middle to Early Miocene
- Lithology: clay with varying amounts of nannofossils and clayey nannofossil ooze
Lithostratigraphic Unit III in Hole U1583C consists of brown to dark brown clay with interbeds of light brown to brown clayey nannofossil ooze (Figures F8, F9, F10, F11, F12, F13). Foraminifera content is consistently below 10%. Its composition is more complex in Hole U1583E, where the upper ~2 m is light brown to brown clayey nannofossil ooze and the underlying ~5.5 m is predominantly dark to very dark brown clay with interbedded brown nannofossil-rich clay and clayey nannofossil ooze. The lowermost ~4 m consists of light brown clayey nannofossil ooze with decimeter-scale beds of pink nannofossil ooze with clay.
Lithologic contacts are bioturbated to gradational. Bedding is massive, and mottling is common in this unit. In addition, rare, small (0.5 cm) black blebs occur. (probably the manganese/iron oxides identified by XRD; Table T3) Bioturbation intensity in Unit III ranges from absent to intense (BI = 0–5), with distinct ichnogenera identified as Planolites, Skolithos, Chondrites, Zoophycos, and more rarely Thalassinoides, Helminthopsis, and Phycosiphon (Figure F13). Trace fossil diversity ranges 1–6, and the maximum ichnofossil diameter ranges 3–23 mm (Figure F13).
The primary minerals identified with bulk XRD in Unit III include quartz, feldspar, plagioclase, and clay minerals such as illite, smectite, kaolinite, and chlorite (Figure F14; Table T3). Calcite and quartz form the main peaks in this unit, where the calcite peak is the largest. In the clay-prone beds, quartz, illite, and feldspars form the dominant peaks.
The boundary between Unit III and Subunit IVA is characterized by a dramatic decrease in clay content, an increase in MS, and lighter sediment colors (Figure F8, F9, F10), which is interpreted to be a change in the seafloor position relative to the CCD. Here specifically, this could be an abrupt shallowing of the CCD with time across this unit boundary and/or thermal or tectonic movement of the basement.
4.1.4. Unit IV
- Intervals: 393-U1583A-1H-2, 122 cm, to 1H-CC, 19 cm; 393-U1583C-3H-2, 86 cm, to 12H-CC, 17 cm; 393-U1583E-4H-3, 45 cm, to 12H-5, 59 cm; 393-U1583F-2R-1, 0 cm, to 2R-CC, 19 cm
- Depths: Hole U1583A = 2.7–9.1 m CSF-A; Hole U1583C = 18.1–110.2 m CSF-A; Hole U1583E = 26.5–105.1 m CSF-A; Hole U1583F = 101.0–107.4 m CSF-A
- Thickness: Hole U1583A = 6.4 m; Hole U1583C = 90.9 m; Hole U1583E = 78.6 m; Hole U1583F = 6.4 m
- Age: Early Miocene to early Oligocene
- Lithology: nannofossil ooze with varying clay and foraminifera content
Lithostratigraphic Unit IV is predominantly composed of pink to pinkish white nannofossil ooze with varying amounts of clay and foraminifera (Figures F8, F9, F10, F11, F12, F13). Foraminiferal abundances generally range from rare (<10%) to common (10%–25%). Several decimeter-thick beds of calcareous ooze occur between 82.0 and 87.8 m CSF-A in Hole U1583C and between 90.9 m and 97.0 m CSF-A in Hole U1583E.
Lithologic contacts in Unit IV are typically gradational to bioturbated, horizontal to inclined, and curved (the latter two may be due to slight drilling disturbances). Massive bedding is dominant in the upper ~30 m in this unit, with mottling dominating the lower part (Figure F11). No discernible breaks in the lithology and no hiatuses were identified (see Biostratigraphy). Biogenic mottling is common throughout this unit, with the bioturbation index ranging from absent to complete (BI = 0–6) and averaging between sparse and moderate (BI = 1–3) (Figure F13). In addition, distinct ichnogenera identified in this unit include Planolites, Thalassinoides, Chondrites, Zoophycos, Skolithos, and more rarely Palaeophycus and Arenicolites (Figure F13).
XRD and CARB data indicate uniform mineralogy in Unit IV. Calcite dominates the mineral assemblage with terrigenous minerals such as quartz, plagioclase, and clay minerals constituting minor components of this unit (Figure F14; Table T3). The smectite peak at 5.6°2θ remains fairly constant throughout Unit IV. Slight variations in relative peak intensities of quartz, feldspar, illite, kaolinite, and chlorite suggest minor changes in the relative amount of the other terrigenous components.
Unit IV is divided into three subunits (IVA–IVC) that are described below.
4.1.4.1. Subunit IVA
- Intervals: 393-U1583A-1H-2, 122 cm, to 1H-CC, 19 cm; 393-U1583C-3H-2, 86 cm, to 9H-6, 51 cm; 393-U1583E-4H-3, 45 cm, to 11H-4, 7 cm
- Depths: Hole U1583A = 2.7–9.1 m CSF-A; Hole U1583C = 19.4–82.0 m CSF-A; Hole U1583E = 26.5–90.9 m CSF-A
- Thickness: Hole U1583A = 6.4 m; Hole U1583C = 62.6 m; Hole U1583E = 64.5 m
- Age: Early Miocene to early Oligocene
- Lithology: nannofossil ooze with varying clay and foraminifera content
The upper 27.5 m in Hole U1583C and ~35 m in Hole U1583E of Subunit IVA are pink and very pale brown nannofossil ooze with clay and foraminifera with centimeter-scale interbeds of light brown clayey nannofossil ooze (Figures F10, F12). The underlying ~19 m in Hole U1583C and ~10 m in Hole U1583E constitute pink to pinkish white, very pale brown, light yellowish brown, and light brown nannofossil ooze with clay interbedded with centimeter- to decimeter-scale yellowish brown to light brown clayey nannofossil ooze (Figures F10, F12). The lower 17.5 m in Hole U1583C and ~23 m in Hole U1583E predominantly consist of pink, reddish yellow, and brownish yellow nannofossil ooze with clay and foraminifera with centimeter-scale interbeds of brown to dark brown clayey nannofossil ooze (Figure F12). Foraminifera content varies in this subunit: common (10%–25%) in the upper 27.5 m in Hole U1583C and ~35 m in Hole U1583E, rare (<10%) in the middle ~19 m in Hole U1583C and ~10 m in Hole U1583E, and common (10%–25%) again in the lower 17.5 m in Hole U1583C and ~23 m in Hole U1583E.
Most lithologic contacts are gradational, although the lower contacts of clayey nannofossil ooze beds can be sharp to irregular. The bedding is typically massive, and mottling is common (Figure F11). Pinkish white halos and lenses (2–4 cm in diameter) sporadically occur throughout Subunit IVA. Ichnofossils were identified within decimeter-thick beds and include Thalassinoides, Planolites, Skolithos, Chondrites, and rarely Arenicolites and Zoophycos (Figure F13). Bioturbation intensity varies from absent to intense (BI = 0–5) and is predominantly sparse to moderate (BI = 1–3) (Figure F13). Ichnofossil diversity ranges 1–4 ichnogenera and averages 2. The maximum trace fossil diameter ranges 2–22 mm (Figure F13).
XRD and carbonate (CARB) data indicate that calcite and quartz are the main minerals constituting Subunit IVA, with calcite being the most abundant (Figure F14; Table T3). The irregular presence of plagioclase (27.8°–28.0°2θ) and kaolinite (~12.4°–19.8°2θ) peaks suggests changes in the relative amount of these minerals throughout this subunit. Illite is present in all samples, although variations in illite peak intensities at ~8.9°2θ may indicate changes in the abundance of this mineral.
Drilling disturbances occurred within this subunit in Hole U1583E that resulted in severely destroyed sediments, primarily in the upper decimeters to 1 m of Sections 393-U1583E-6H-1, 7H-1, and 9H-1 as well as in Section 5H-1 through Core 4H. The boundary between Subunits IVA and IVB is defined by the first occurrence of white calcareous beds and a decrease in foraminiferal abundances.
4.1.4.2. Subunit IVB
- Intervals: 393-U1583C-9H-6, 51 cm, to 10H-3, 123 cm; 393-U1583E-11H-4, 7 cm, to 11H-CC, 20 cm
- Depths: Hole U1583C = 82.0–87.8 m CSF-A; Hole U1583E = 90.9–97.0 m CSF-A
- Thickness: Hole U1583C = 5.7 m; Hole U1583E = 6.0 m
- Age: early Oligocene
- Lithology: alternating calcareous ooze and nannofossil ooze with clay and foraminifera
Subunit IVB represents decimeter- to meter-thick interbedding of white to pinkish white calcareous ooze with pink, light brown, and brown nannofossil ooze with clay and foraminifera (Figures F10, F11, F12). In addition, decimeter-thick beds of brown nannofossil ooze with clay occur between the two upper calcareous ooze beds. Foraminiferal content is <10% for the calcareous ooze and the brown nannofossil ooze with clay and ranges between 10% and 25% for the pink and light brown nannofossil ooze with clay and foraminifera.
Lithologic contacts between the light brown nannofossil ooze with clay and calcareous ooze and brown nannofossil ooze with clay are typically sharp, often curved likely due to drilling disturbance (Figure F11), and rarely bioturbated. In contrast, color changes from pink to light brown nannofossil ooze with clay are gradational. The decimeter- to meter-thick beds of darker (e.g., brown versus light brown) nannofossil ooze with clay appear to contain organic particles based on smear slide observations (Figure F12). In addition, NGR values remain relatively low for these brown sediments compared to the sediments with a similar Munsell color (i.e., brown; 7.5YR 5/4) at Site U1558. For example, a similar lithology and color (brown; 7.5YR 5/4) at Site U1558 occurs between 111.9 and 112.4 m CSF-A (interval 393-U1558F-16F-2, 0 cm, to 16F-2, 50 cm) and contains NGR values ranging 13–29 counts/s (see Physical properties and downhole measurements in the Site U1558 chapter [Teagle et al., 2024a]). In comparison, NGR values for this brown nannofossil ooze with clay at Site U1583 range 2–6 counts/s (Figure F9; see Physical properties and downhole measurements). In addition, the CaCO3 weight percent value for this brown interval in Hole U1583C remains relatively high (72 wt%). We hypothesize that 1–10 wt% disseminated organic matter may cause darker coloration of the sediments.
Mottling and massive bedding are common in this subunit. Biogenic mottling is pervasive, with the bioturbation index ranging from absent to moderate (BI = 0–3). Distinct ichnogenera are present and include Planolites, Skolithos, Thalassinoides, Chondrites, and rarely Palaeophycus (Figure F13). Diversity ranges 1–3, and the maximum trace fossil diameter ranges 4–22 mm (Figure F13). The boundary between Subunits IVB and IVC is based on the last occurrence of the white to pinkish white calcareous ooze.
XRD and CARB data (see Geochemistry) indicate that calcareous ooze beds of Subunit IVB contain predominantly calcite (CaCO3 = 97 wt%) with low smectite, illite, and quartz contents (Figure F14; Table T3).
4.1.4.3. Subunit IVC
- Intervals: 393-U1583C-10H-3, 123 cm, to 12H-CC, 17 cm; 393-U1583E-11H-CC, 20 cm, to 12H-5, 59 cm; 393-U1583F-2R-1, 0 cm, to 2R-CC, 19 cm
- Depths: Hole U1583C = 87.8–110.2 m CSF-A; Hole U1583E = 97.0–105.1 m CSF-A; Hole U1583F = 101.0–107.4 m CSF-A
- Thickness: Hole U1583C = 22.8 m; Hole U1583E = 7.2 m; Hole U1583F = 6.4 m
- Age: early Oligocene
- Lithology: nannofossil ooze with varying amounts of clay and foraminifera
The upper ~5 m of Subunit IVC consists of pink to light brown nannofossil ooze with clay and foraminifera (Figures F8, F9, F10, F11, F12). The underlying 3 m contains pink to light brown nannofossil ooze with varying foraminifera content and a 30 cm thick layer of pink calcareous ooze in Hole U1583C and two decimeter-scale interbeds of pink nannofossil ooze in Hole U1583E (Figure F12). The lower 11 m shows interbedding of pink nannofossil ooze with clay and light brown nannofossil ooze with clay and foraminifera (Figure F12).
Although lithologic contacts are typically gradational over many decimeters, the upper contacts of the pink sediments contain sharp boundaries. Slight color variations are present throughout Subunit IVC, but the color changes are commonly subtle and fall within one Munsell color. Bedding is massive throughout this subunit (Figure F11). Two 1 cm thick semilithified beds occur in Sections 393-U1583E-12H-2, 106 cm, and 12H-3, 134 cm. Biogenic mottling is abundant, with bioturbation intensity ranging from absent to high (BI = 0–4). Distinct ichnogenera include Planolites, Chondrites, Skolithos, Thalassinoides, and rarely Arenicolites (Figure F13). Trace fossil diversity ranges 1–3, and the maximum diameter ranges 2–22 mm (Figure F13).
Drilling disturbances affect parts of this subunit in Holes U1583C and U1583E. In Core 393-U1583C-12H, drilling disturbances manifest as midcore flow-in and destroyed sediments in Sections 12H-2 through 12H-CC. There was only a 2 m advance between the top of Core 12H and the basement interface at the top of Core 13X, so very little of the 8 m of recovered sediment in Core 12H is in place. Sediments were also severely disturbed to destroyed in the upper sections of Cores 393-U1583E-5H and 11H.
XRD and CARB data (see Geochemistry) indicate that calcite is the major component of Subunit IVC. Quartz, illite, and kaolinite are present irregularly throughout this subunit, whereas feldspars are absent (Figure F14; Table T3).
5. Igneous petrology
Hole U1583F targeted ~30.6 Ma upper oceanic crust along the SAT. Hole U1583F reached volcanic basement at 109.7 mbsf and penetrated a further 129.8 m, reaching 295.5 mbsf and recovering 45.79 m of core for an average basement recovery of 35% (Figure F7; Table T4). Recovery was generally higher in the upper part of the hole, with an average of 46% (ranging 0%–96%) between Cores 393-U1583F-2R and 13R (0–50 msb). Recovery steadily dropped for the remainder of the hole to an average of 19% between Cores 14R and 29R (50–130 msb). Overall, this recovery was sufficient for preliminary unit boundaries, lava types, and volcanic emplacement styles to be determined with confidence throughout most of the hole but inadequate for many other science goals.
Unless stated otherwise, all cores, sections, and intervals refer to Hole U1583F. Depths are described in meters below seafloor (mbsf; on CSF-A scale) and meters subbasement (msb; CSF-A depth minus 109.7 m). Sample, interval, and contact depths are curated depths unless stated otherwise. This section documents the lithostratigraphy of the volcanic basement at Site U1583 and then summarizes observations and results for the phenocryst phases, breccias, and igneous chemostratigraphy as measured by pXRF.
5.1. Lithostratigraphic units
The basement volcanic sequence at Site U1583 is divided into three main eruptive sequences and seven main volcanic and intravolcanic breccia units. Unit 3 is divided into two subunits (3A and 3B), Unit 5 is divided into three subunits (5A–5C), and Unit 7 is divided into two subunits (7A and 7B). These units and their thicknesses, emplacement styles, contacts, and lithologic details are summarized in Table T4, illustrated in Figure F7, and documented in detail in this section.
5.1.1. Sediment/basement interface
The shallowest occurrences of volcanic rocks and the deepest occurrences of sediment within the sediment/basement interface for all holes at Site U1583 are summarized in Table T5 and illustrated in Figure F15. Only Holes U1583C and U1583F recovered basement volcanic rocks, with Holes U1583A, U1583B, U1583D, and U1583E not advancing to sufficient depths.
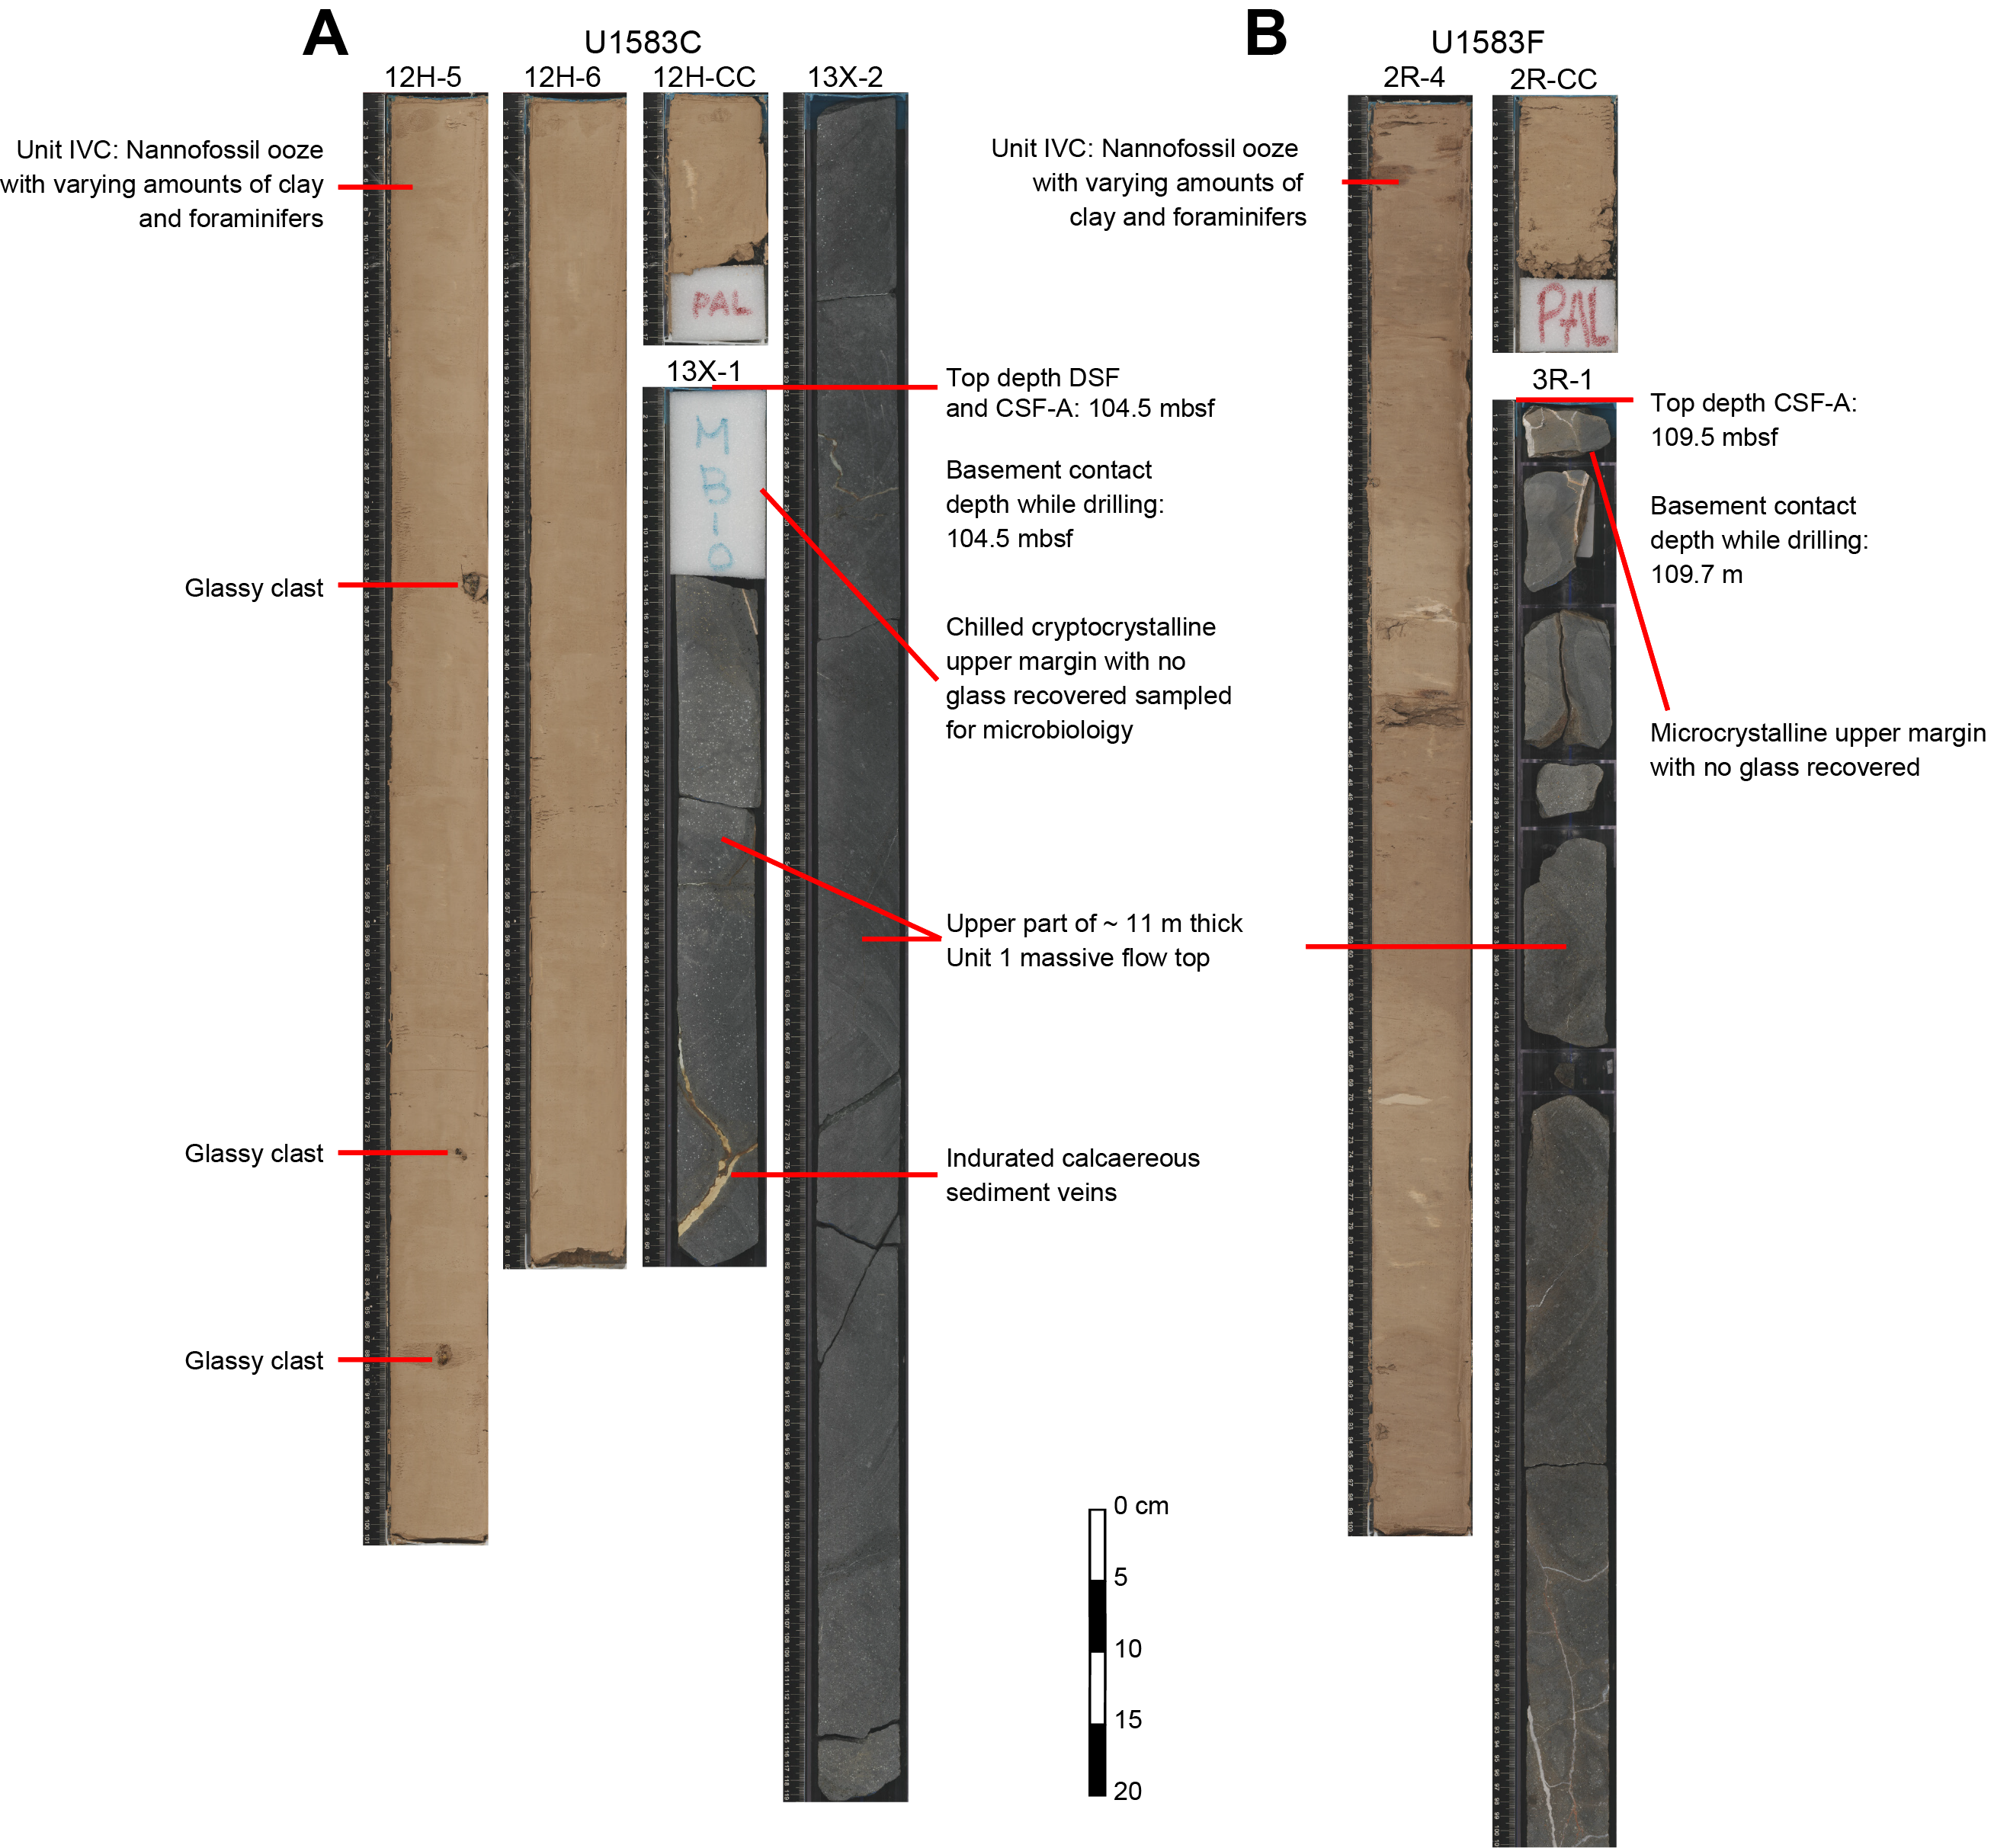
Figure F15. Sediment/volcanic basement interface.
Volcanic basement was encountered ~30 m shallower than predicted from the seismic site survey in both Holes U1583C and U1583F at 107.5 and 109.7 mbsf, respectively, whereas the estimated sediment thickness was 138 m (e.g., Coggon et al., 2020; Kardell et al., 2019). In Hole U1583C, this discrepancy resulted in an APC core being fired close to the sediment/basement interface, which was neither penetrated nor recovered, and resulted in several meters of sediment getting sucked into the APC core along with some small fragments of altered glass from the top of basement (interval 393-U1583C-12H-5, 33–35 cm; Figure F15A). After changing to XCB drilling, the chilled cryptocrystalline top and several meters of continuous Unit 1 massive lava flow were recovered in the subsequent core (Figure F15A).
In Hole U1583F, the sediment/basement interface was also not continuously recovered but the chilled microcrystalline top of the Unit 1 massive flow was recovered. By comparison to other flows drilled along the transect, the sediment/basement interface is inferred to be within tens of centimeters of the flow top. No single cores containing both sediment and basalt were recovered in any of the holes at Site U1583. However, veins of indurated calcareous sediment are present in the uppermost sections of both Holes U1583C and U1583F (e.g., intervals 393-U1583C-13X-1, 45–60 cm, and 393-U1583F-3R-1, 0–11 cm; Figure F15).
5.1.2. Division of volcanic sequences
The volcanic basement at Site U1583 was divided into three eruptive sequences (A–C; Figure F7; Table T4). This division was made principally based on the presence of two sedimentary breccias, with their upper contacts at 171.6 mbsf (62.10 msb; Unit 4) and 205.83 mbsf (96.33 msb). These breccias are interpreted to have accumulated during volcanic hiatuses and are described in detail below.
5.1.3. Sequence A
Volcanic Sequence A consists of Units 1–3, which have relatively diverse lithologies and emplacement styles, ranging from aphyric to moderately phyric basalts and from pillow lavas to an ~11 m thick massive flow (Table T4; Figure F7).
5.1.3.1. Unit 1
Unit 1 is the uppermost volcanic unit at Site U1583, and it consists of an ~11.2 m thick massive lava flow that was intersected by both of the holes that reached basement (Figure F15). The Unit 1 massive flow consists of moderately plagioclase(-olivine) phyric basalt with a fine- to medium-grained interior groundmass, much of which is relatively fresh (e.g., Figure F16E, F16F).
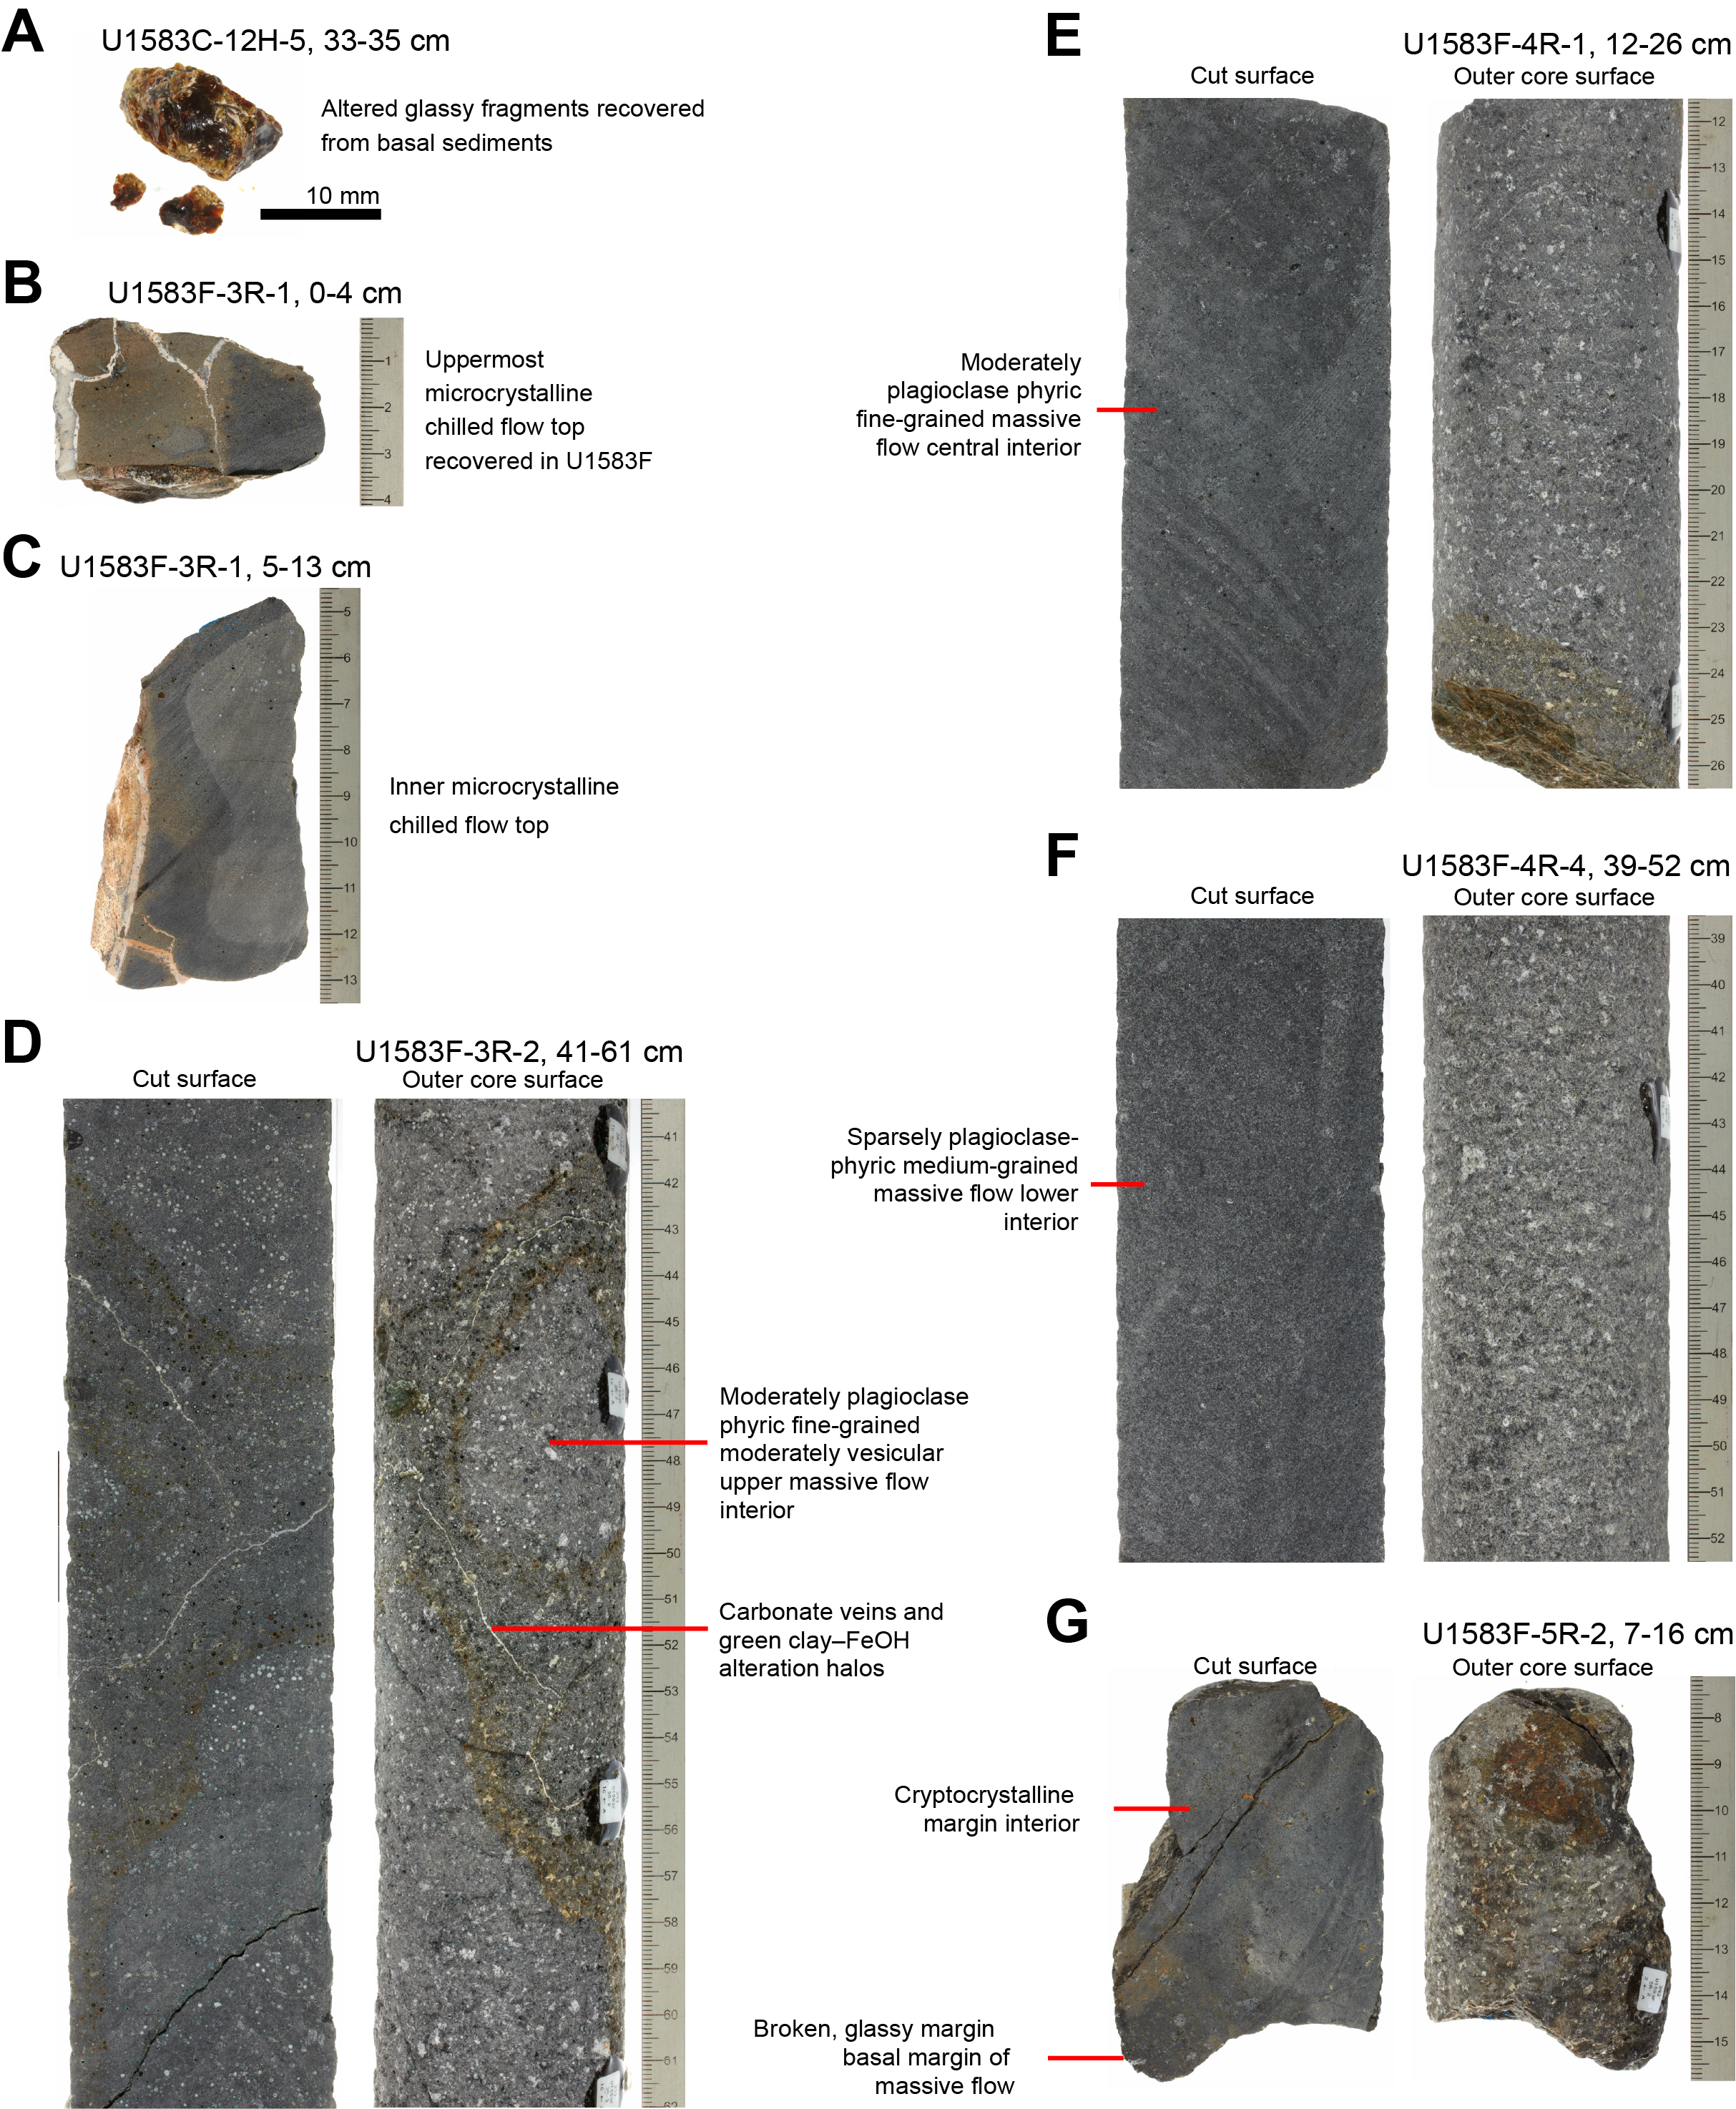
Figure F16. Unit 1 massive lava flow and glass near sediment/basement interface.
Emplacement as a single massive lava flow rather than a sill or a series of sheet flows was deduced from several lines of evidence. Firstly, the unit is situated at the top of the volcanic section, and no sediments are present in the well-recovered core beneath Unit 1 (Section 393-U1583F-5R-2). Secondly, the textural gradations related to cooling of the unit are asymmetric, with a deeply chilled cryptocrystalline upper margin and a variolitic upper flow interior (Figure F16). From this flow top, the groundmass grades to medium grain size over ~7 m, reaching a peak around ⅔ to ¾ of the way down through the flow (Figure F17). The transition from medium grain size back to the lower glassy margin occurs over ~1.5 m. This asymmetric textural gradation suggests that the top of this flow cooled more rapidly than the bottom, which is consistent with its top being emplaced into seawater and the base being emplaced onto rock.
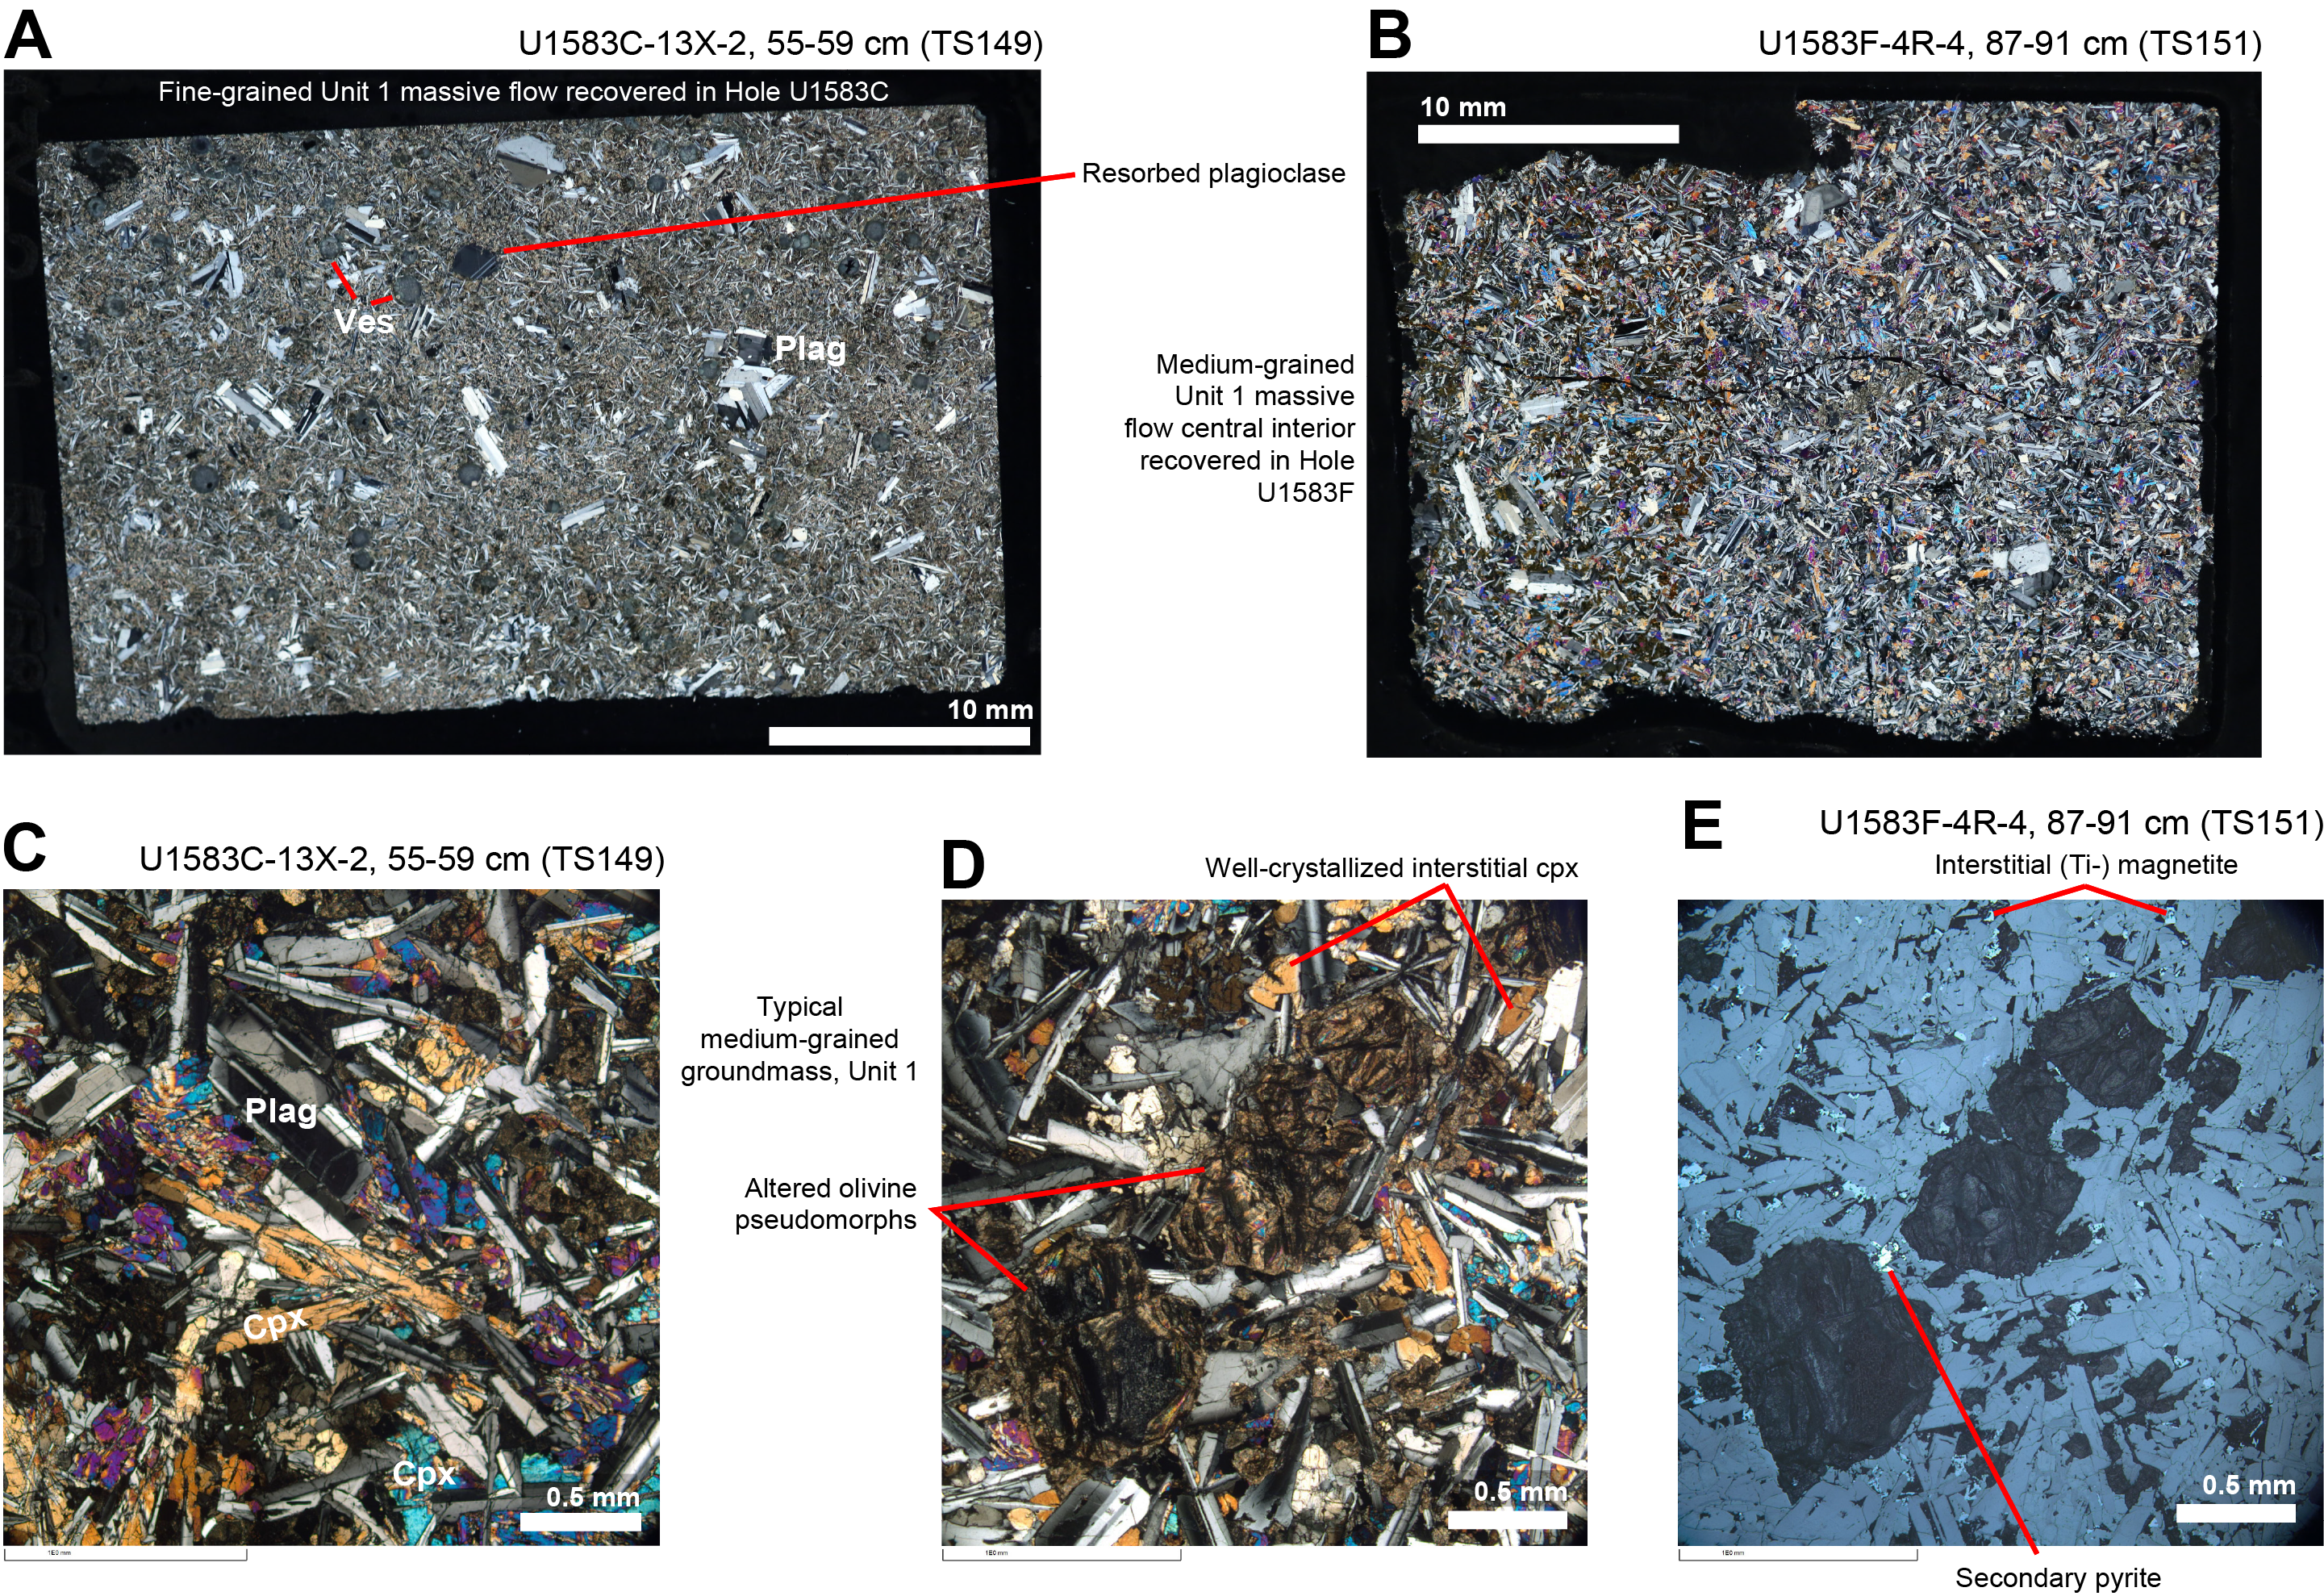
Figure F17. Unit 1 massive lava flow.
The upper interior of the flow, starting from ~10 cm below the top of the uppermost recovered basalt piece (interval 393-U1583F-3R-1, 10–50 cm) is moderately vesicular with spherical vesicles. These are interpreted to record magmatic volatiles that exsolved from lower in the flow upon emplacement and, having migrated upward, became trapped under the chilled flow top (Figure F16D).
5.1.3.2. Unit 2
Volcanic Unit 2 is a 27 m thick unit of moderately plagioclase-olivine-phyric pillow and sheet lava flows (Table T4). The upper part of Unit 2 (120–124 mbsf; Sections 393-U1583F-5R-2 and 5R-3) is composed of pillow lavas that are 30–60 cm thick, with numerous glassy margins that are fresh, dipping, and commonly curved (Figure F18A). The central part of Unit 2 (124–135 mbsf; Sections 5R-4 through 7R-1) contains a series of ~1 m thick sheet or possibly large pillow flows, with long intervals of continuous fine-grained flow interiors. The lower part of Unit 2 (135–146 mbsf; Sections 8R-1 through 10R-1) is again emplaced as pillow lavas, as indicated by greater variation in grain size and common glassy margins.
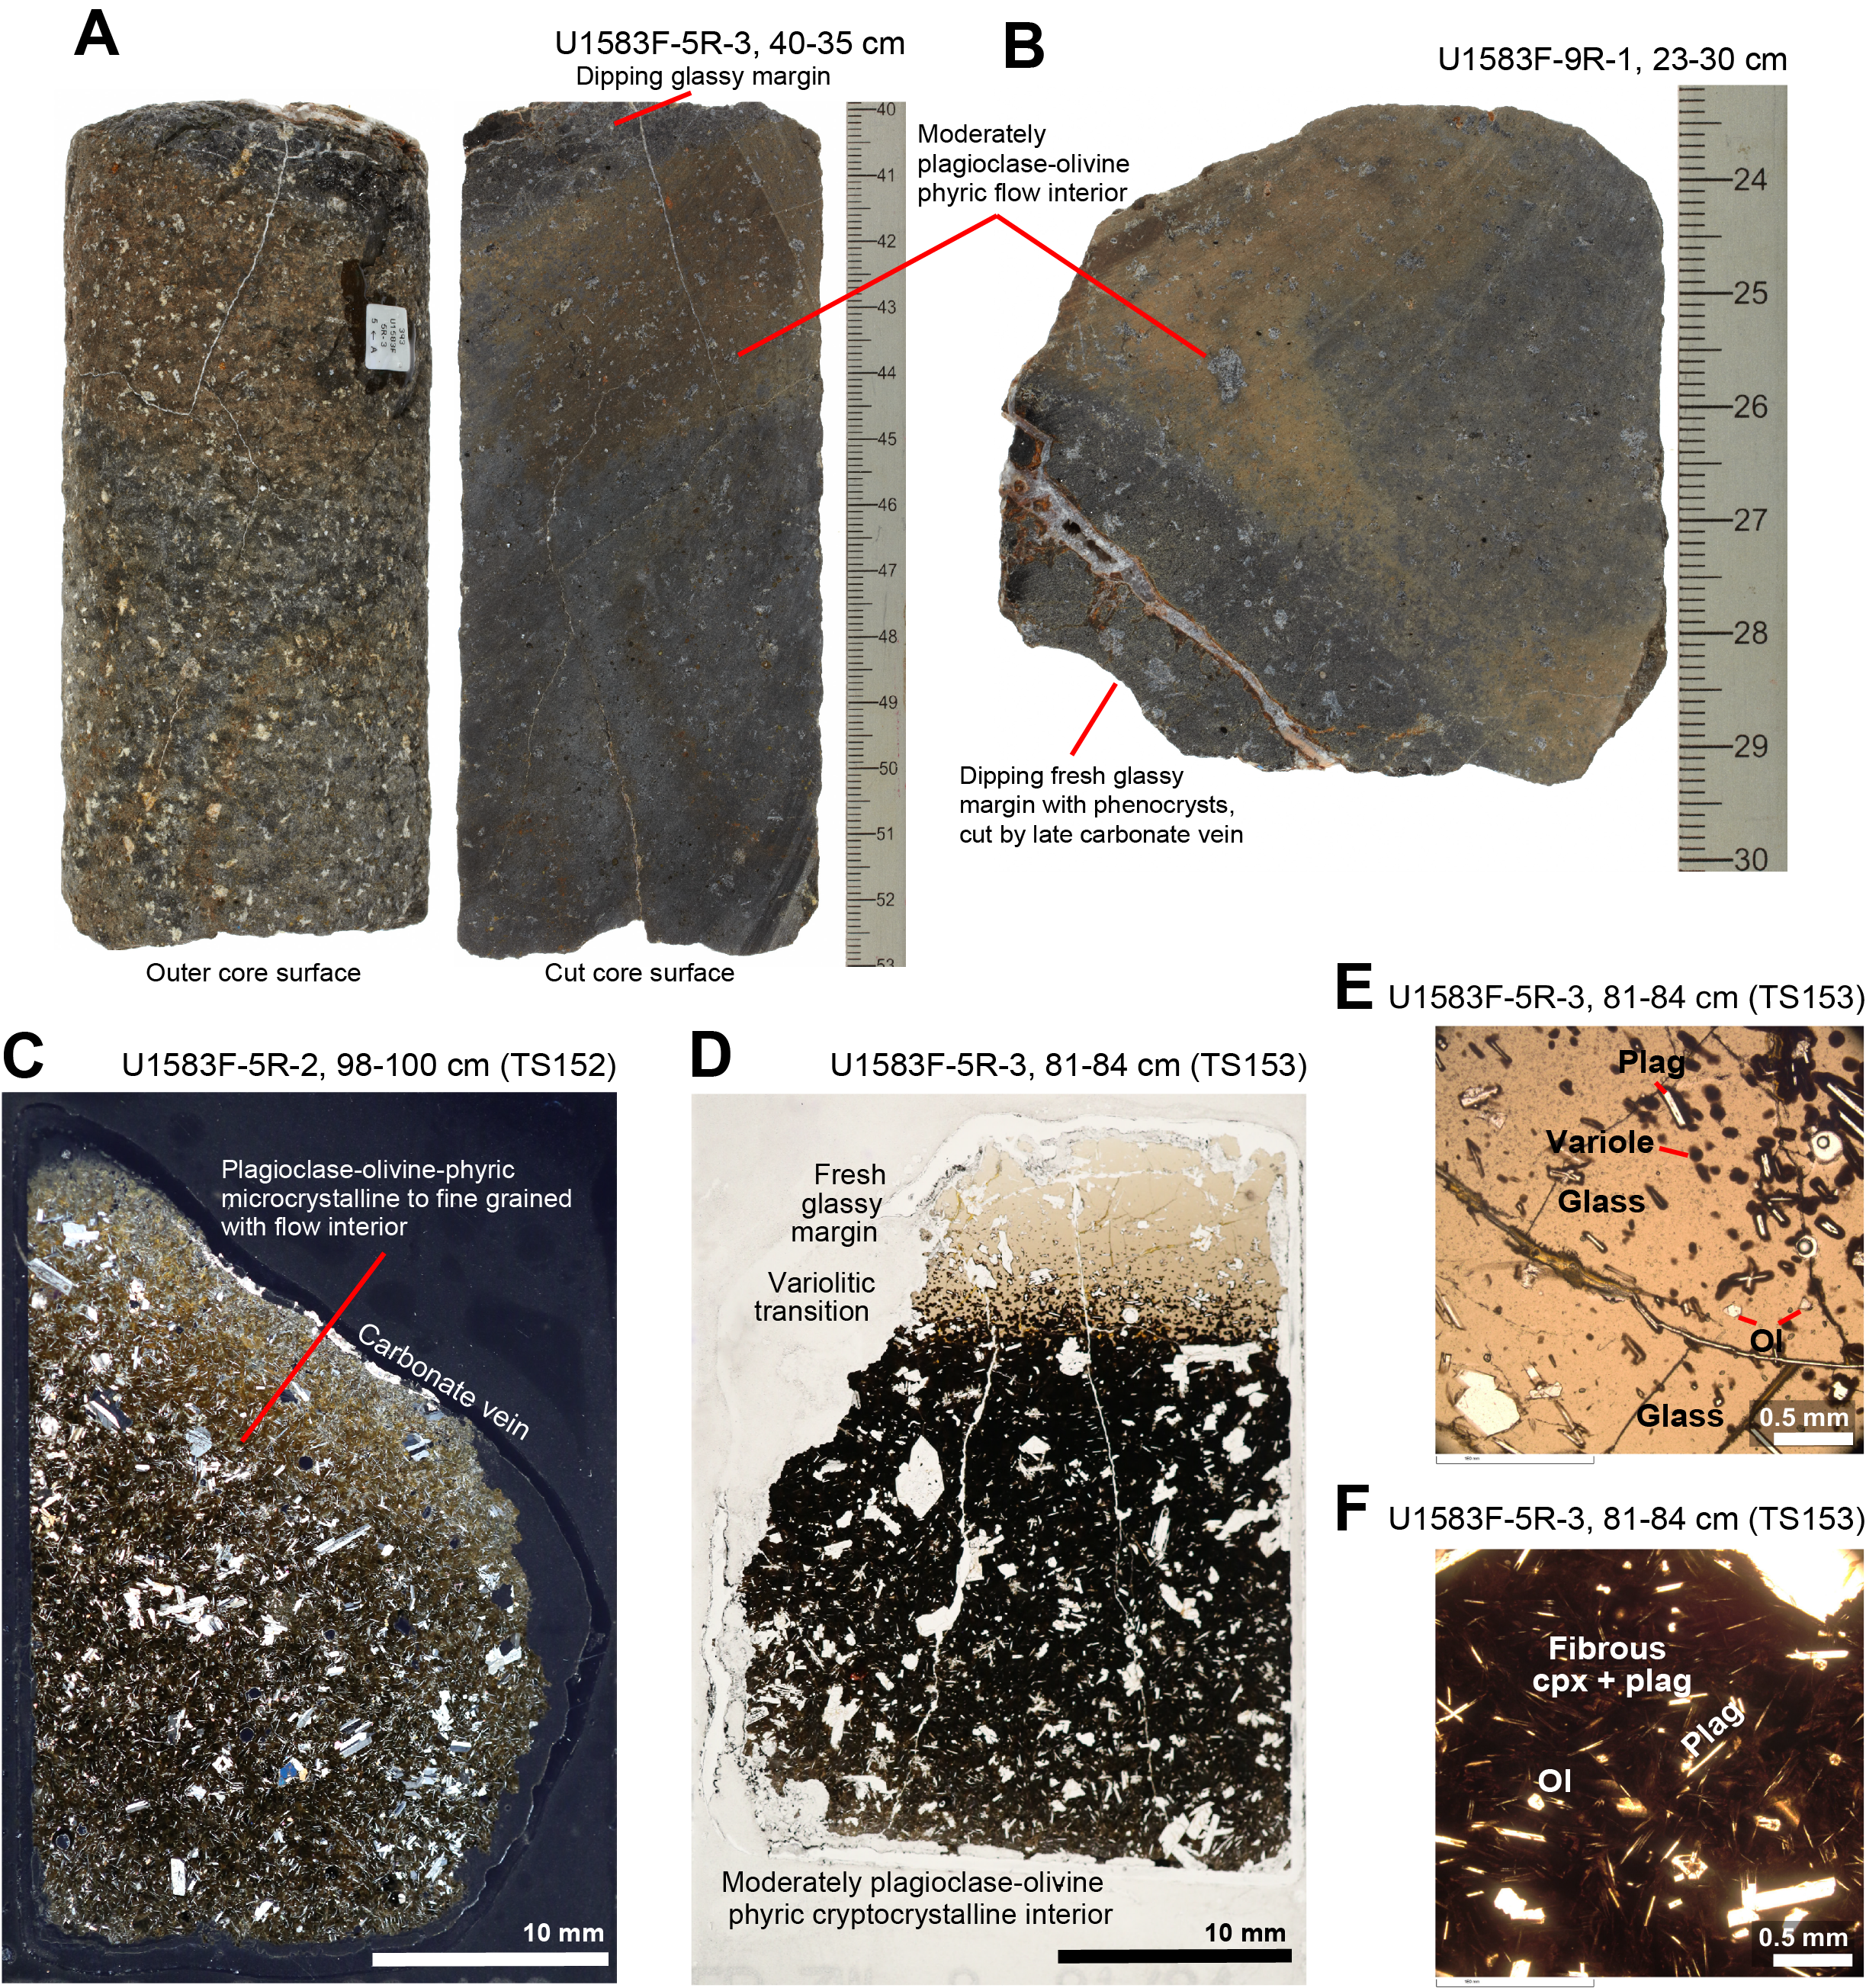
Figure F18. Volcanic Unit 2.
Core 393-U1583F-6R had 1% recovery, and Core 8R was skunked (0% recovery). Both of these cores are entirely within Unit 2. Except for the difference in recovery, there is no evidence from the cores recovered that these very poorly recovered intervals contain different rock types from the rest of Unit 2. Further examination of wireline and rate of penetration logs may elucidate whether breccias or some other difficult-to-recover lithology were missed over these intervals (question marks in Figure F7).
Like much of the Sequence A lavas, except for the Unit 1 massive flow, the interiors of Unit 2 pillow lavas exhibit characteristically microcrystalline or even fine-grained groundmass up to within a few centimeters of the chilled margins (Figure F18C). Where they were well recovered, these margins are relatively thick (1–2 cm), fresh, and contain the same phenocrysts as the flow interiors (Figure F18B, F18D, F18E). These glassy margins grade from exterior glass with phenocrysts through a spherulitic transition into a cryptocrystalline groundmass of extremely fine, fibrous minerals (clinopyroxene and plagioclase?) (Figure F18E, F18F).
Despite these differences in emplacement style, phenocryst character is relatively consistent through Unit 2, dominated by ~1 mm plagioclase (3–6 mod%), with lesser amounts of 0.5 mm olivine (~0.5–1 mod%) that is variably fresh and pale green or altered to pale clay. Some olivine grains are altered to orange clay + Fe oxyhydroxide. In addition, there are extremely sparse but distinctive black, prismatic augite phenocrysts (0.1%–0.5%; 0.3–1 mm).
5.1.3.3. Subunit 3A
Subunit 3A has an expanded thickness of 11 m and is composed of aphyric basalt pillow lavas and rare sheet flows that are 0.3–1 m thick (Table T4). The glassy margins of Unit 3 are typically thinner than those in Unit 2, and the flow interiors are distinctly variolitic within ~20 cm of the rim (Figure F19A, F19D). Although they are classified as aphyric, Subunit 3A lavas have between 0.1% and 0.5% plagioclase phenocrysts (e.g., Figure F19C) as well as rare (0%–0.3%) olivine and augite phenocrysts, with fresh olivine present in the upper part of the unit.
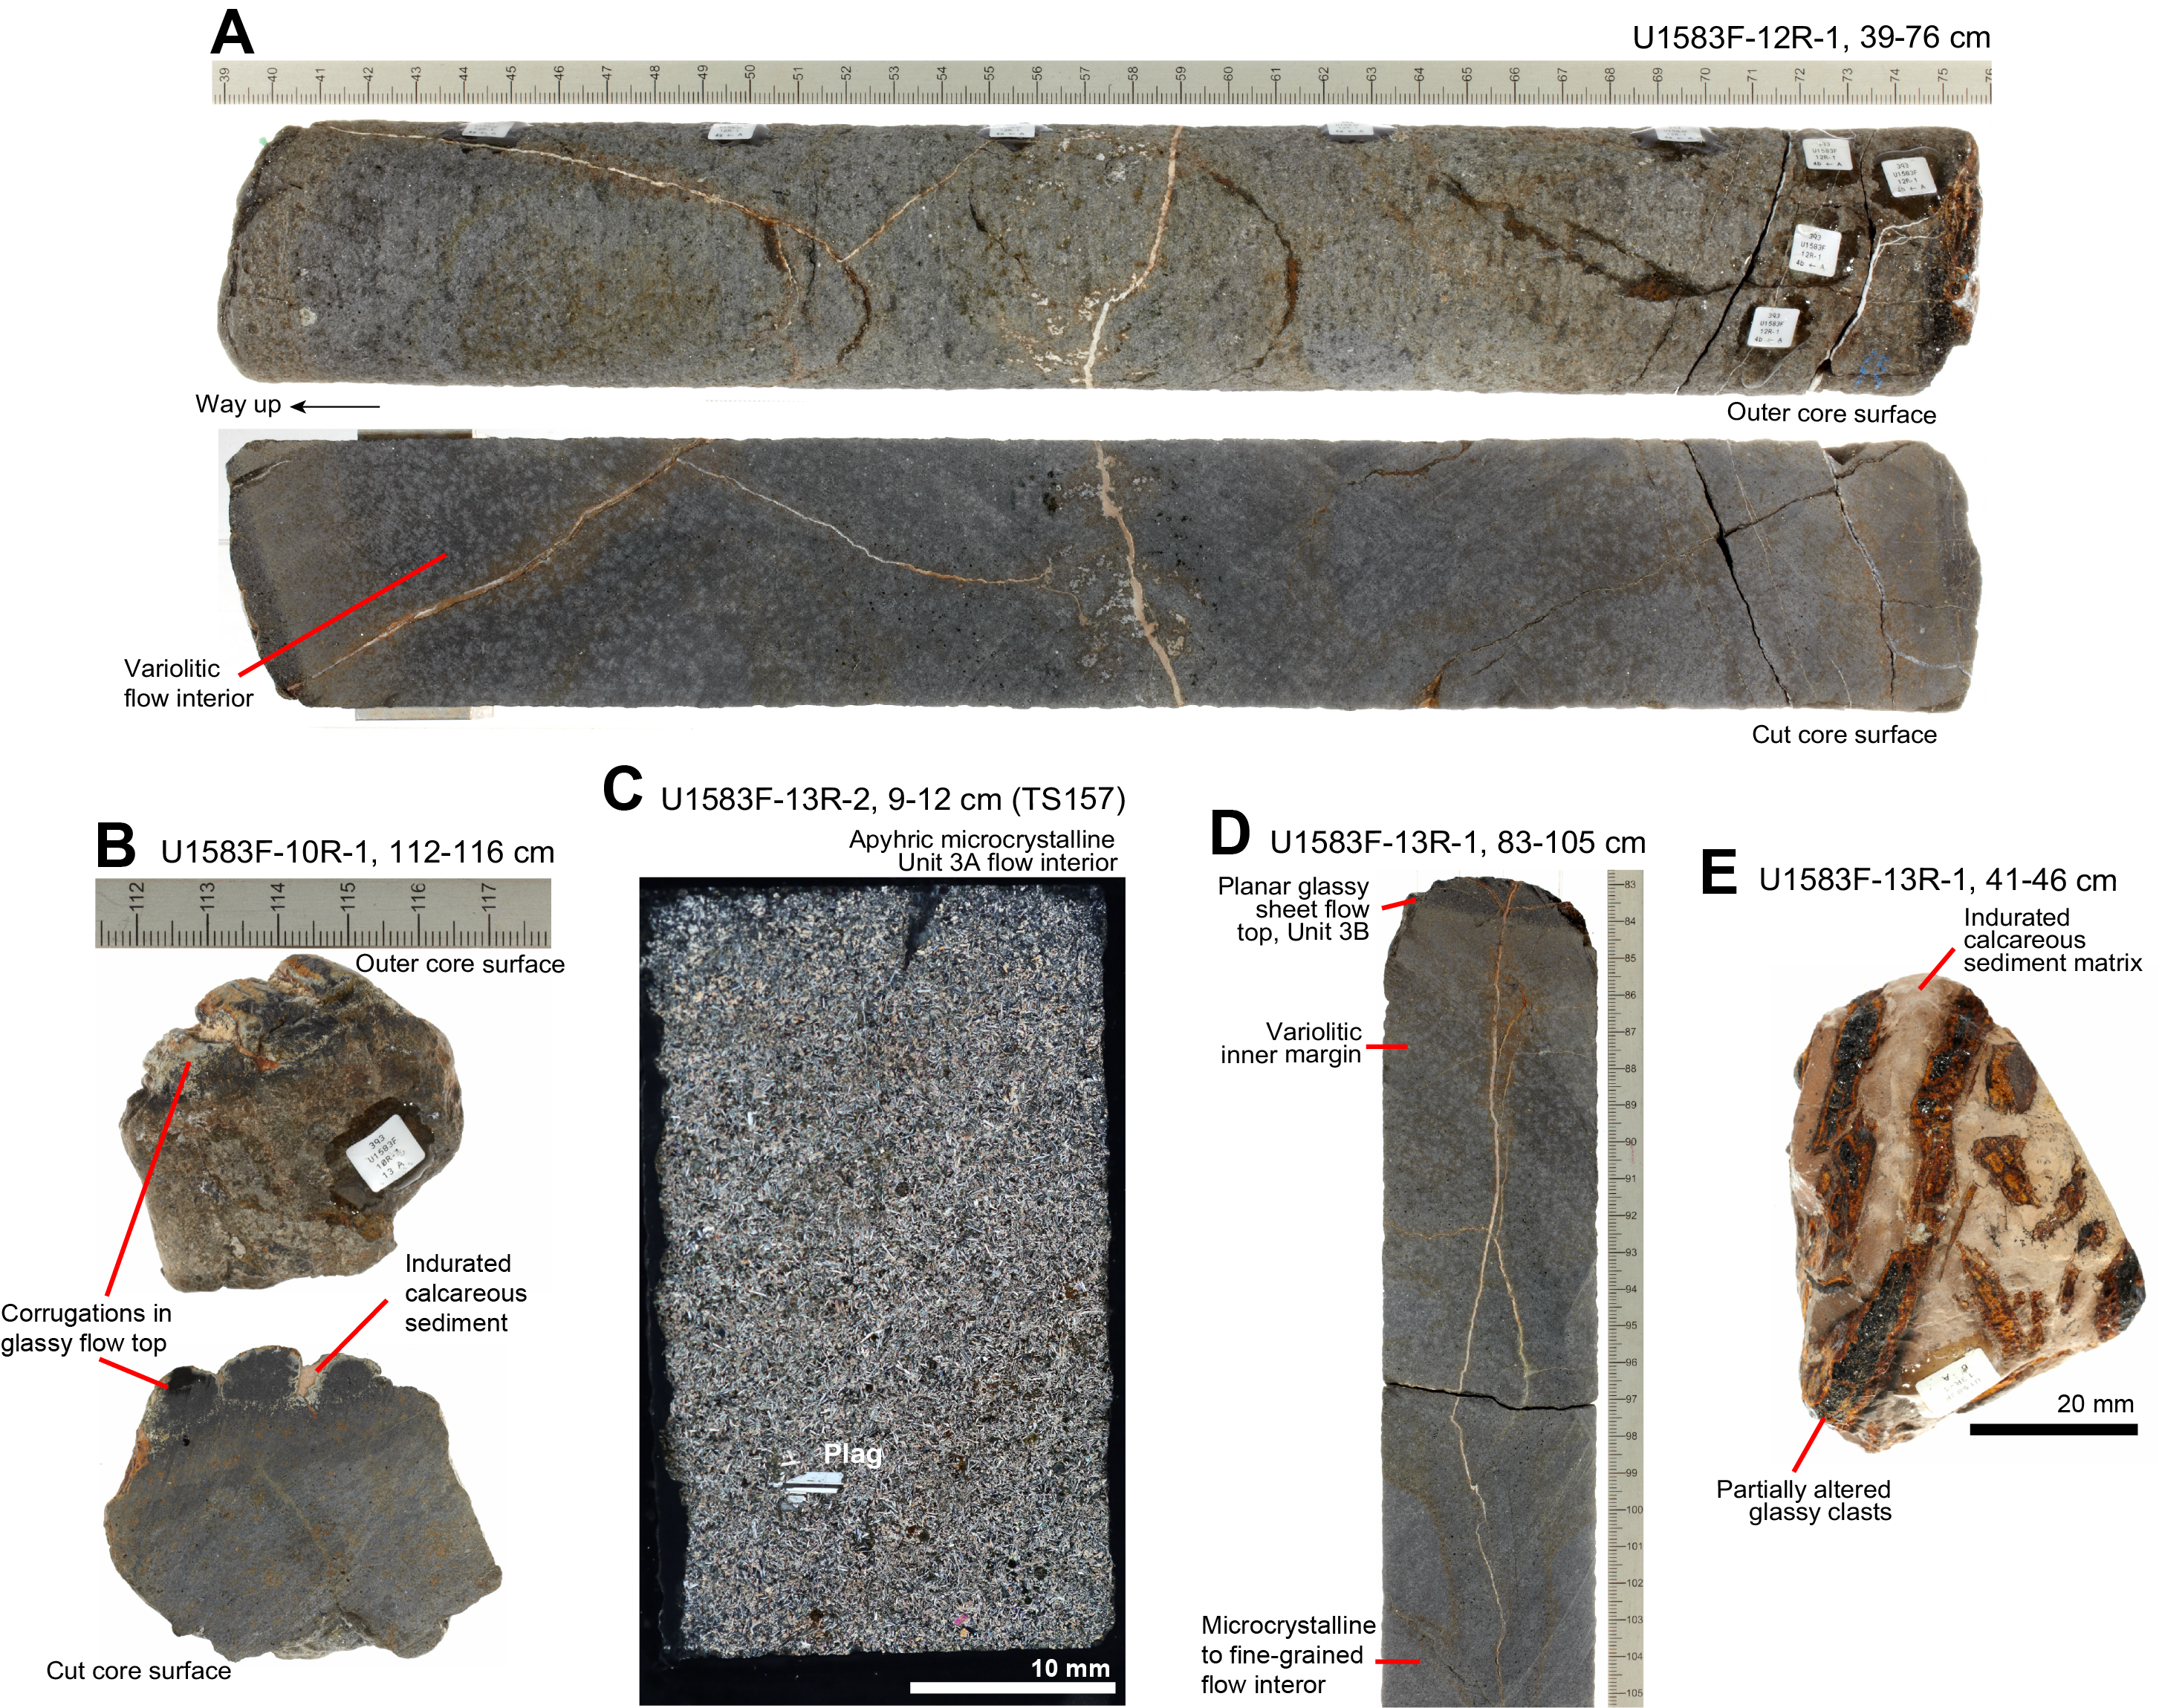
Figure F19. Volcanic Unit 3.
One unique feature of Subunit 3A is that its uppermost flow has a corrugated glassy flow top similar to the upper surface of pahoehoe lavas (e.g., Figure F19B). All the Subunit 3A basalts have a low abundance (0.5%–1%) of small (mode = 0.2–0.3 mm) spherical vesicles, mostly filled with clay of varying color. An interflow breccia was recovered from Subunit 3A at interval 393-U1583F-13R-1, 41–46 cm, that includes glassy clasts in an indurated calcareous sediment matrix (Figure F19E).
5.1.3.4. Subunit 3B
Subunit 3B is lithologically similar to Subunit 3A but consists of aphyric basalt sheet flows instead of pillow lavas, with three continuously recovered flows having thicknesses of 80, 120, and 130 cm and the unit having a total expanded thickness of 12.7 m (Table T4). These sheet flows have gently dipping, planar glassy margins and fine-grained interiors, with similarly variolitic inner margins to Subunit 3A (Figure F19D). The similar lithology but contrasting emplacement style between Subunits 3A and 3B affords an excellent opportunity to test the effects of emplacement style and grain size on physical and magnetic properties (see Basement in Physical properties and downhole measurements and Basement in Paleomagnetism).
5.1.4. Sequence B
- Lithology: moderately plagioclase-olivine-(augite)-phyric basalt pillow lavas and sedimentary breccia
The boundary between Volcanic Sequences A and B occurs at the top of sedimentary breccia Unit 4 (Section 393-U1583F-16R, 0 cm; 171.6 mbsf; 62.1 msb) and is interpreted to coincide with a short hiatus in volcanism at Site U1583 (Figure F7). All the lavas of Sequence B belong to Unit 5 and have a relatively uniform lithology of moderately plagioclase-olivine-(augite)-phyric microcrystalline basalt and emplacement style of pillow lavas.
5.1.4.1. Unit 4
Unit 4 is a well-recovered sedimentary breccia in Core 393-U1583F-16R with a minimum thickness of 1.8 m and an expanded thickness of 2.8 m, situated between 171.6 and 173.8 mbsf (62.1–64.3 msb) at the boundary between volcanic Sequences A and B (Table T4). The breccia consists of large broken basalt clasts and smaller altered glass clasts in an indurated calcareous sediment matrix, cemented to varying extents by coarsely crystalline carbonate (Figure F20). The basalt and glass clasts in Unit 4 are all moderately plagioclase-olivine phyric (Figure F20A, F20B, F20D) and hence derive from the underlying Unit 5 basalts with similar lithologic characteristics and rather than from the overlying aphyric basalts. This assertion is supported by pXRF analyses of breccia clasts (see High-resolution chemostratigraphy). This, as well as the angularity of the clasts and the indurated sedimentary carbonate matrix, shows that Unit 4 is a sedimentary breccia formed on the seafloor probably by the self-collapse and disaggregation of local volcanic outcrops, as has been observed in hummocky terrains along the modern Mid-Atlantic Ridge (e.g., Smith and Cann, 1990; Yeo et al., 2012).
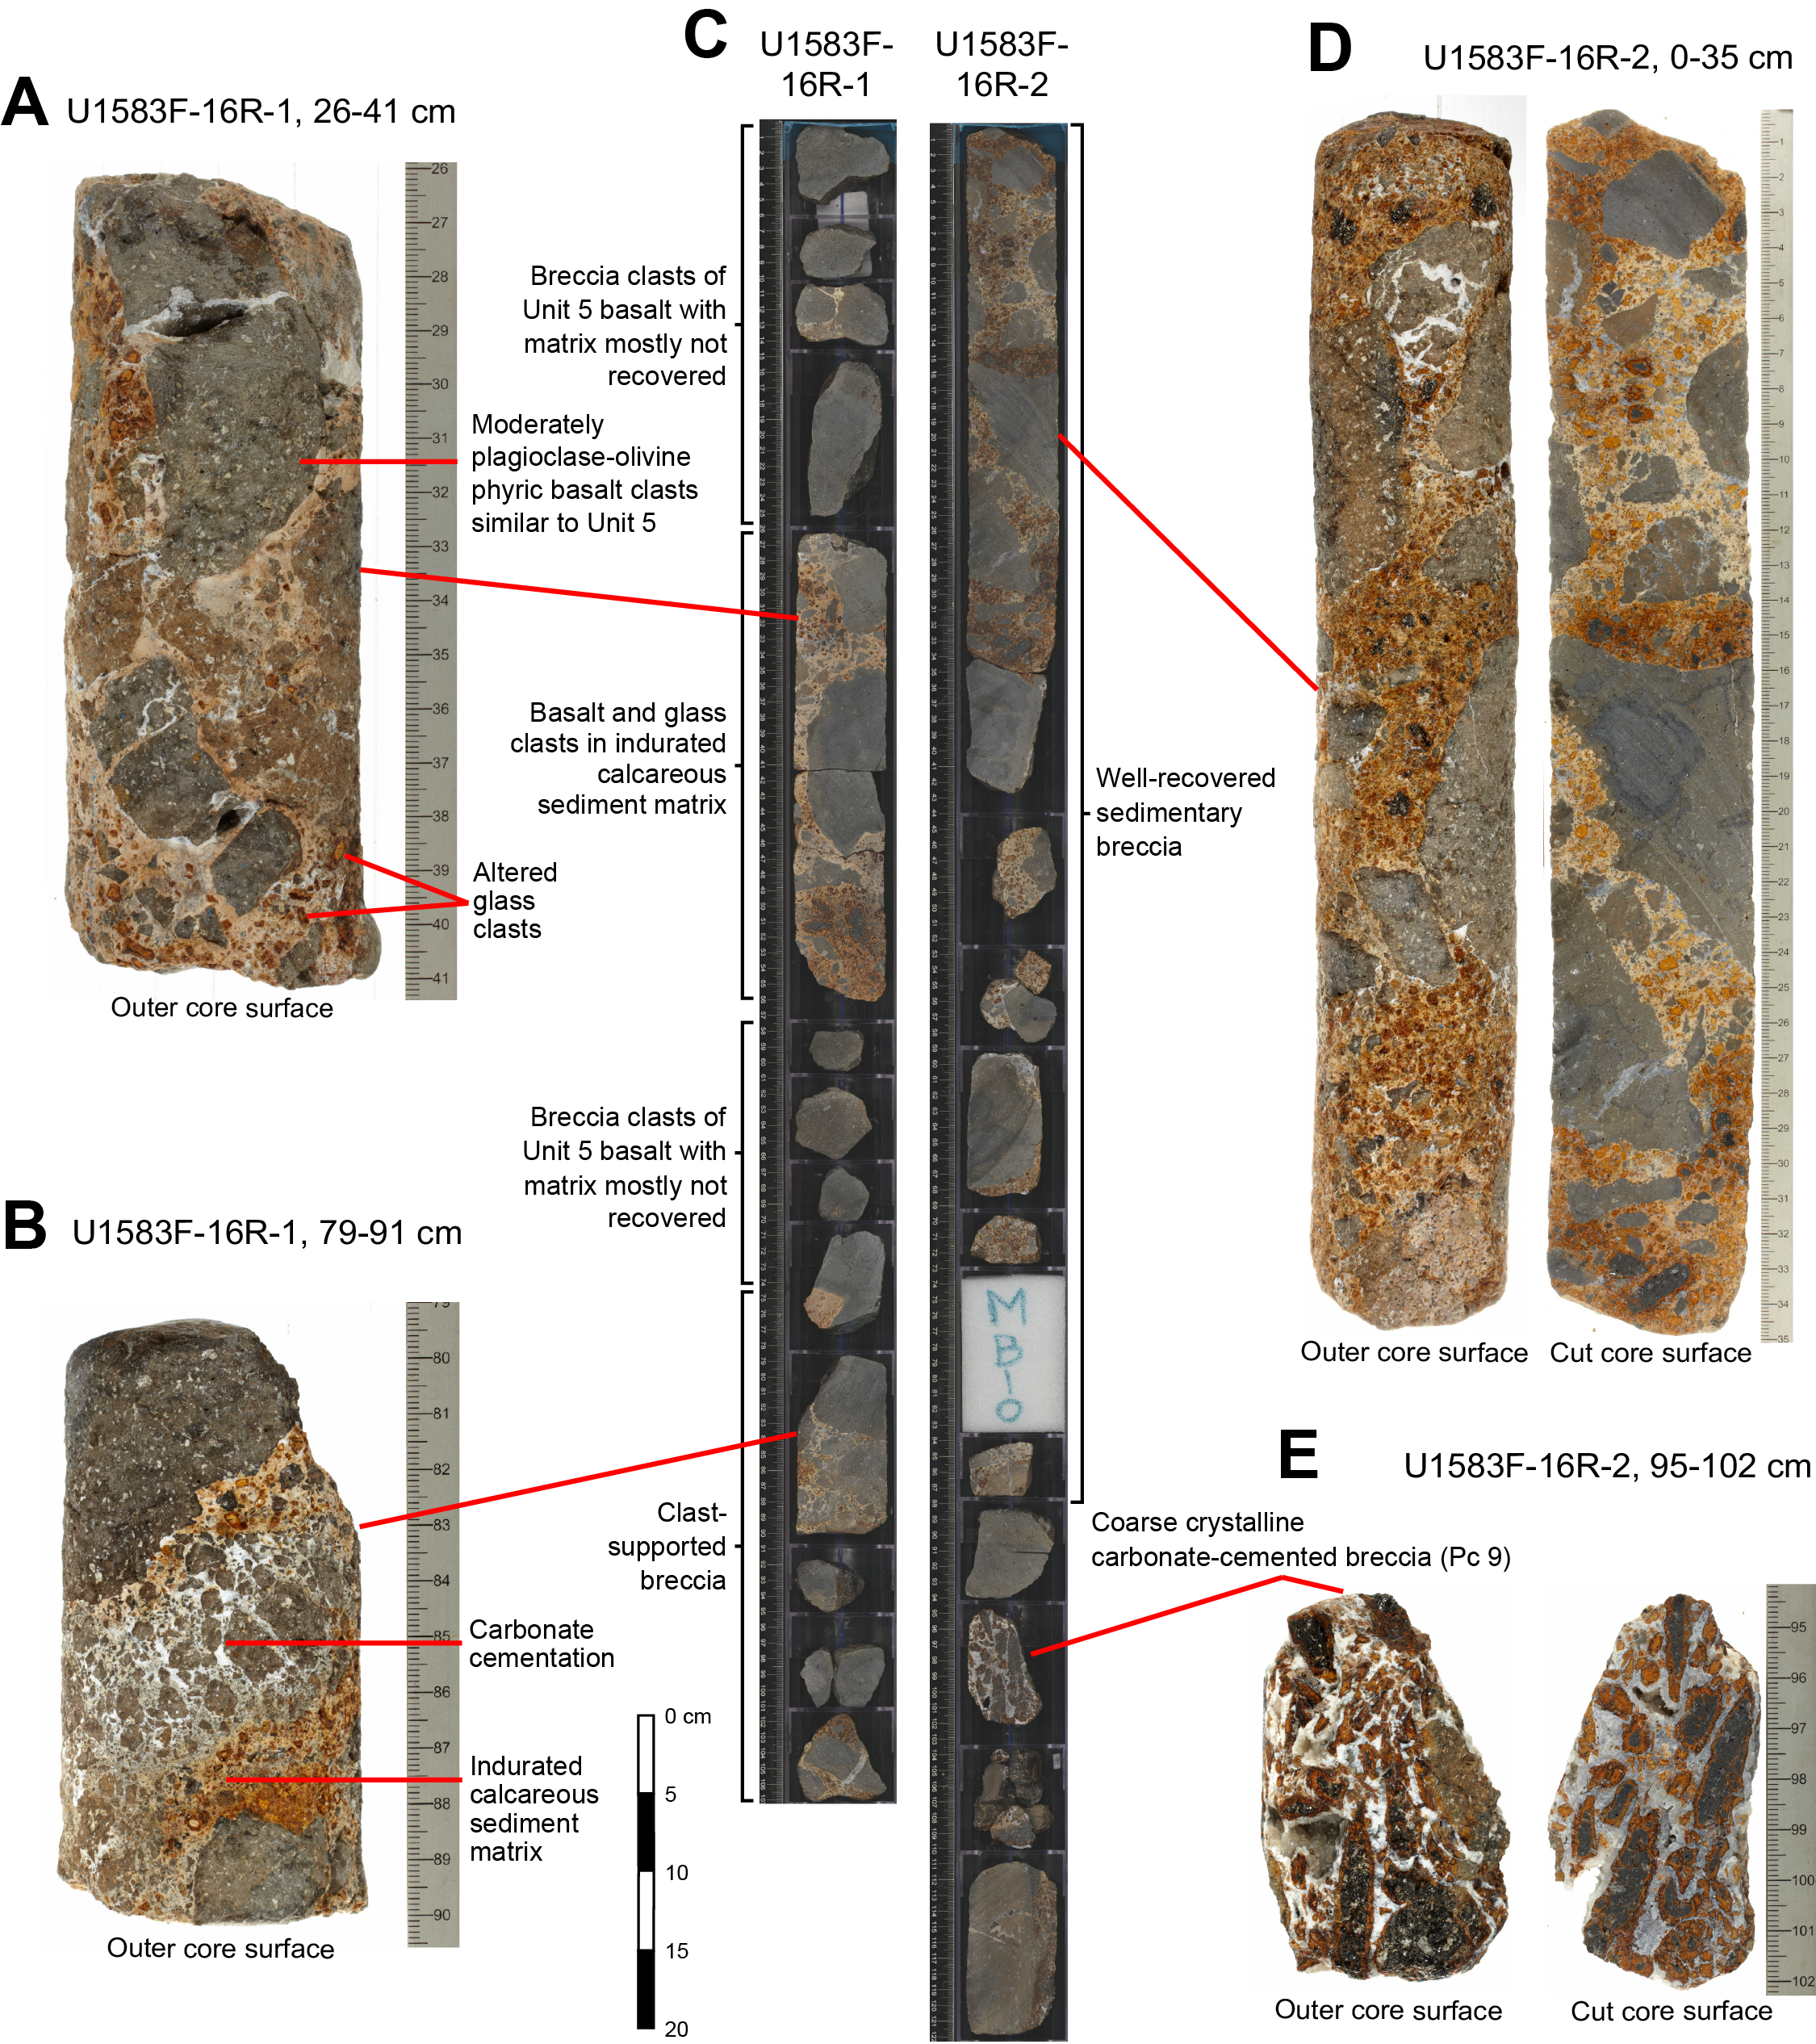
Figure F20. Unit 4 sedimentary breccia and Sequence A/B boundary.
The estimated thickness of Unit 4 is greater than the sum of the continuous breccia pieces because the pieces of basalt above the well-recovered breccia are interpreted to be breccia clasts that have lost their matrix during drilling (interval 393-U1583F-16R-1, 0–26 cm). This interpretation is based on the moderately plagioclase-olivine-phyric texture of these clasts, which matches the clasts in the underlying well-recovered breccia but not the overlying aphyric Unit 3 lavas. The pieces are also well within the size range of the clasts in the well-recovered breccia intervals, and one has a veneer of sediment adhering to a broken basalt surface (interval 16R-1, 0–6 cm), which would be consistent with relict matrix.
One anomalous breccia piece from Unit 4 has a much higher proportion of glassy clasts and no sedimentary matrix but instead a coarse crystalline carbonate cement (Figure F20E).
5.1.4.2. Subunits 5A–5C
Unit 5 consists of three subunits (5A–5C) with a total expanded thickness of 32 m (Table T4). The lavas of Unit 5 are lithologically uniform, moderately plagioclase-olivine-phyric lavas with rare augite phenocrysts. Curved glassy margins with varying dips were commonly recovered, indicating emplacement as pillow lavas (Figure F21A, F21C). Unit 5 was divided because of the recovery of a ~16 cm piece of sedimentary breccia of basalt and altered glassy clasts in a matrix of indurated calcareous sediment at interval 393-U1583F-20R-1, 33–43 cm (191.36 mbsf; 81.9 msb), that is similar in character to the Unit 4 breccias (Figure F21A, F21C). The expanded thickness of Subunit 5B is 0.45 m, so it is a permissibly significant breccia horizon (Table T4).
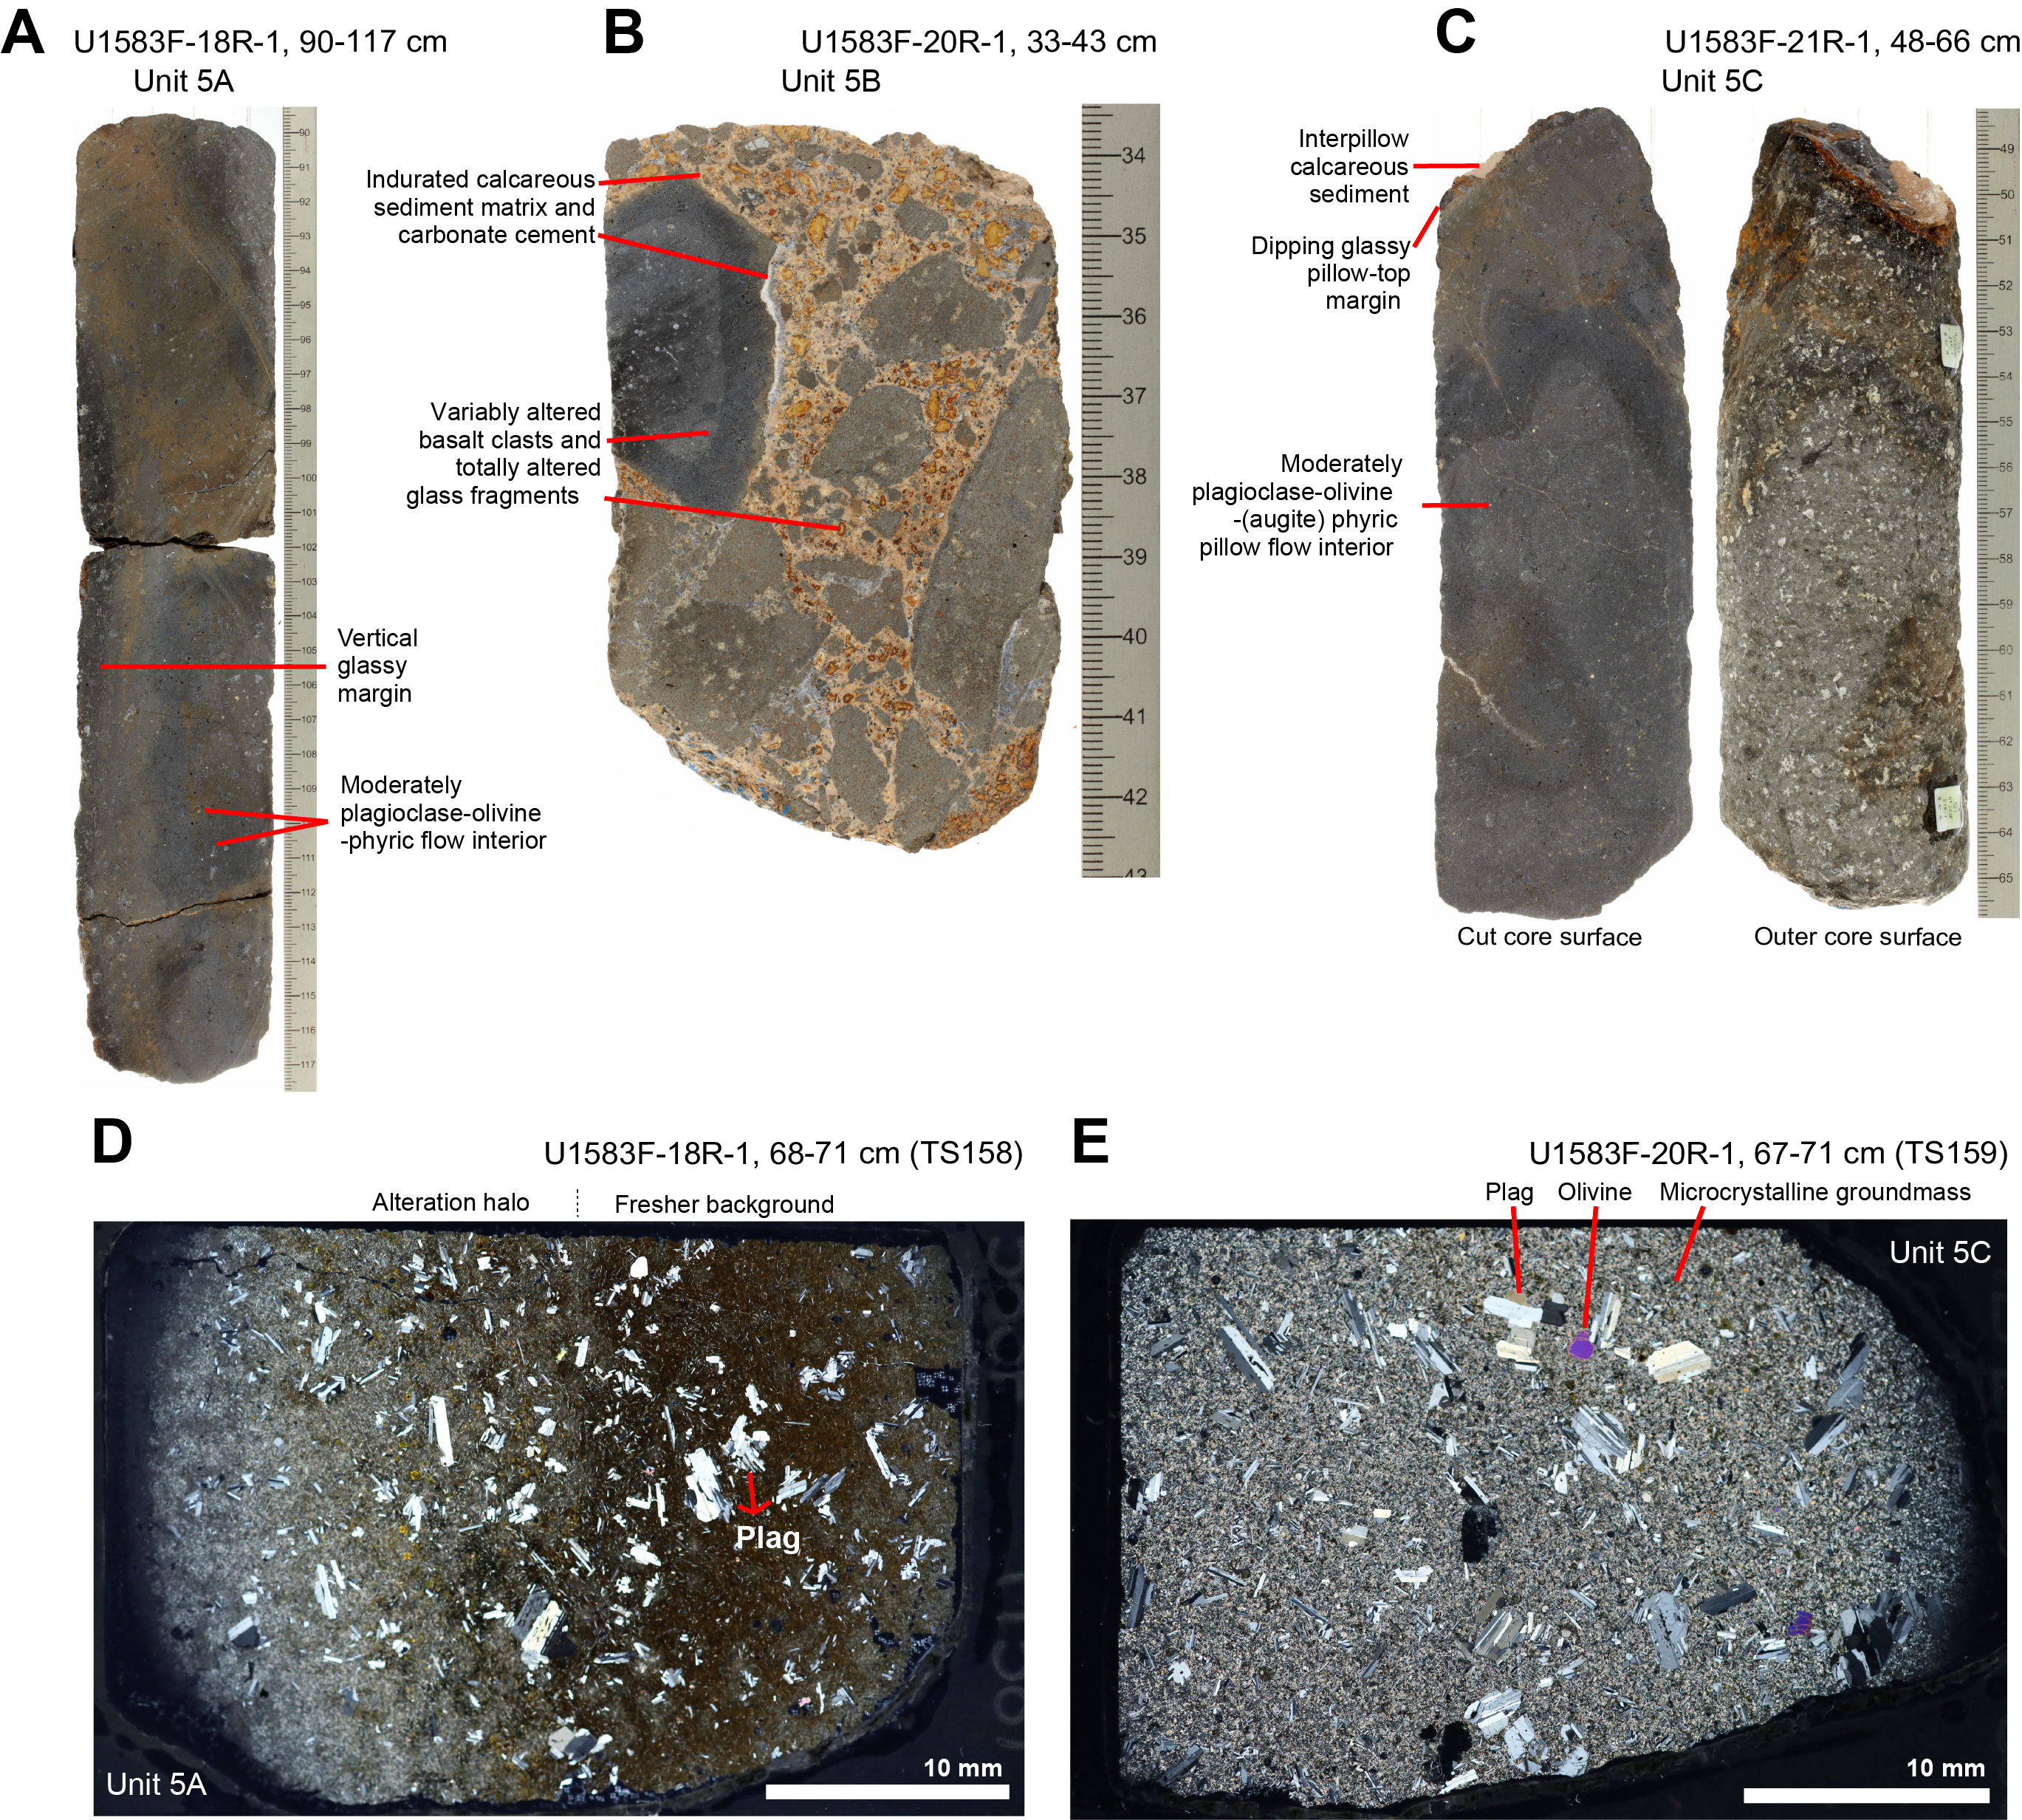
Figure F21. Volcanic Unit 5.
The lavas of Unit 5 are relatively plagioclase-phyric, with 4%–6% plagioclase, 0.5%–1% olivine mostly altered to orange clay and Fe oxyhydroxide, and some intervals with 0.2%–1% black augite phenocrysts that are commonly subophitic with plagioclase. The flow interior groundmass for Unit 5 pillow lavas is typically microcrystalline, with plagioclase laths that are weakly oriented (e.g., Figure F21D, F21E).
5.1.5. Sequence C
5.1.5.1. Unit 6
- Lithology: breccia of basalt and glass clasts in an indurated calcareous sediment matrix with intervening lava
Unit 6 consists of breccias with basalt and glassy clasts in an indurated calcareous sediment matrix with a possible intervening lava flow (Figure F22A). This package has a total expanded thickness of 3.4 m (Table T4). The top of the Unit 6 breccias at 205.83 mbsf (96.33 msb) marks the boundary between Sequences B and C (Section 393-U1583F-23R-1, 23 cm).
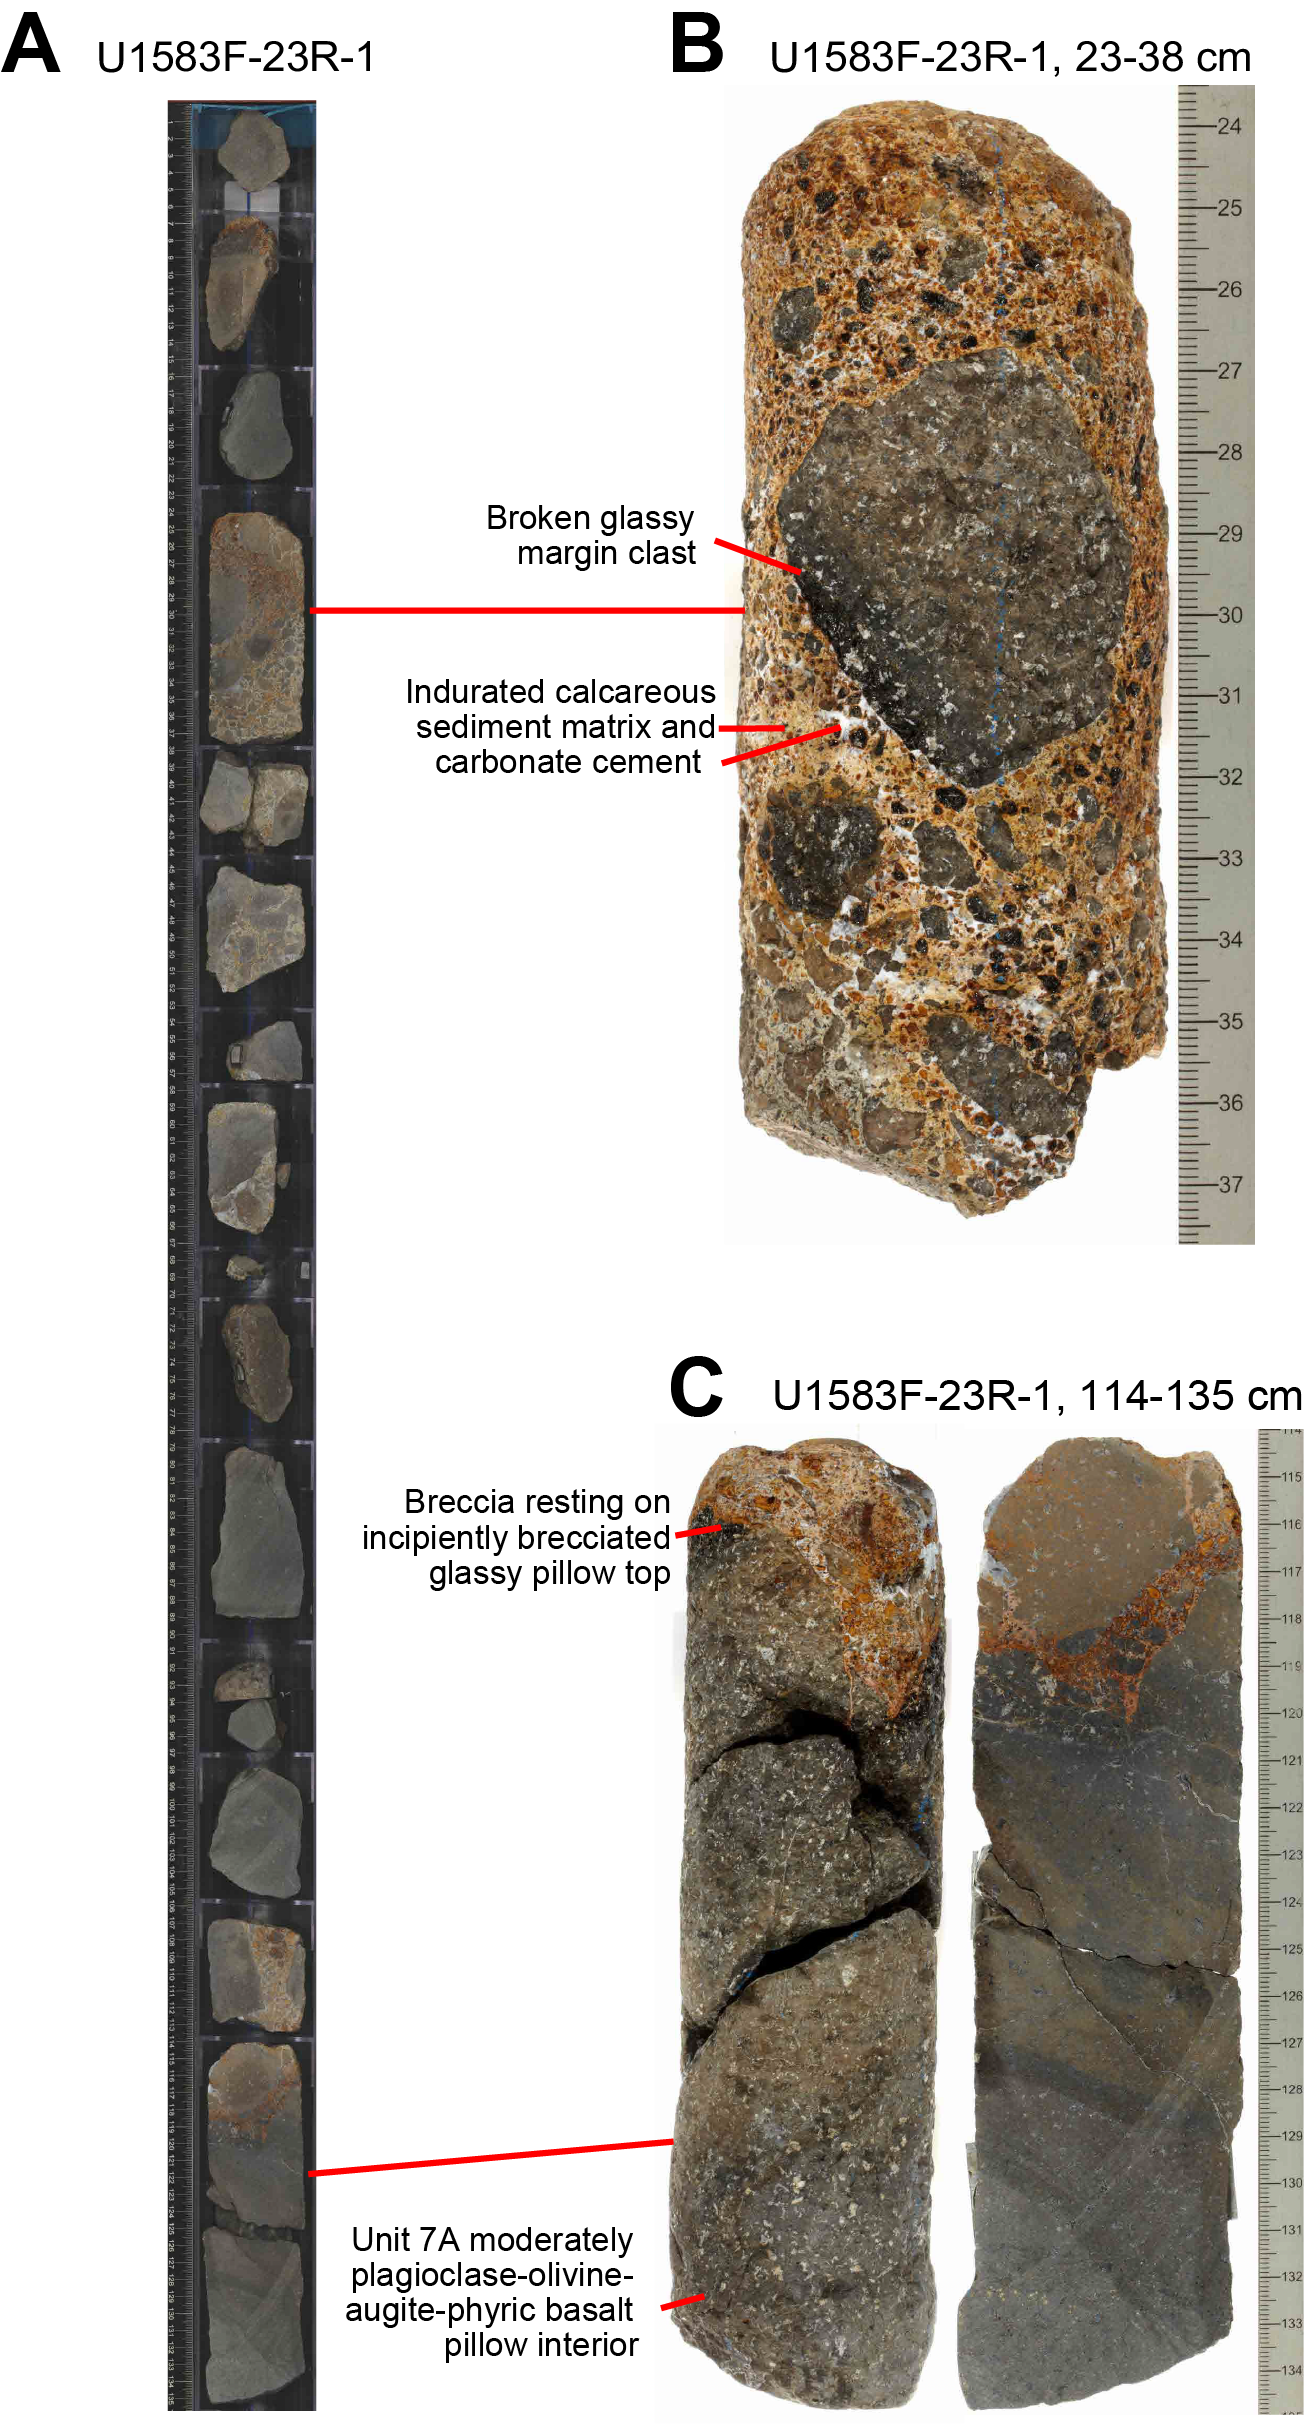
Figure F22. Basalt and sedimentary breccia Unit 6.
The Unit 6 breccias are clast supported, with clasts of moderately plagioclase-phyric, microcrystalline to cryptocrystalline basalt, some with glassy margins, and variably fresh to altered glass (Figure F22B). These clasts are set in a yellowish, pale brown (Munsell 2.5Y 7/3) matrix of indurated calcareous sediment that is variably altered yellowish red (5YR 5/8) with black (Mn?) oxide spots. The matrix also has a component of comminuted and altered glass that contributes to the variegation in color (Figure F22B, F22C). Given the sedimentary matrix and the denser packing of clasts above the basal contact of the breccia (Figure F22C), these breccias are interpreted to be of the same origin as the breccias in Unit 4 and Subunit 5B. They are inferred to have accumulated during a pause in volcanism in which outcrops of Unit 7 lavas collapsed onto a seafloor upon which sediment was progressively accumulating.
The continuously recovered basal contact of the Unit 6 breccias with the Unit 7 lavas is unique among the breccia units recovered in Hole U1583F (Figure F22C). This contact shows the breccias accumulated above a fractured and broken surface rather than intact pillows. In the center of the unit (interval 393-U1583F-23R-1, 70–106 cm), there are four pieces of lava without adhering matrix. There is no evidence to suggest these are breccia clasts parted from their matrix during drilling, so these are interpreted to be an intervening lava flow. Recovery is relatively low for Core 23R-1 (24%); therefore, using expanded contact depths and assuming the interval mentioned above is a lava flow, the total thickness of breccia in Unit 6 is 2.2 m and intervening lava is 1.3 m. Judging from the size and lithology of these pieces of intervening lava; however, it is still permissible that these are breccia clasts, in which case the total thickness of breccia in Unit 6 would be the same as the 3.4 m expanded thickness as the entire unit.
These two contrasting interpretations may have significant consequences for calculations of hydrothermal exchanges in Hole U1583F and could be further tested by examination of the paleomagnetic inclination of the oriented clasts and the limited wireline logging carried out in this hole.
5.1.5.2. Subunit 7A
Subunit 7A consists of moderately plagioclase-olivine-augite-phyric basalt pillow lavas. Recovery of curved glassy margins is common, and pillow interiors range from cryptocrystalline to microcrystalline (Figure F23). The subunit has an expanded thickness of 10.3 m (Table T4).
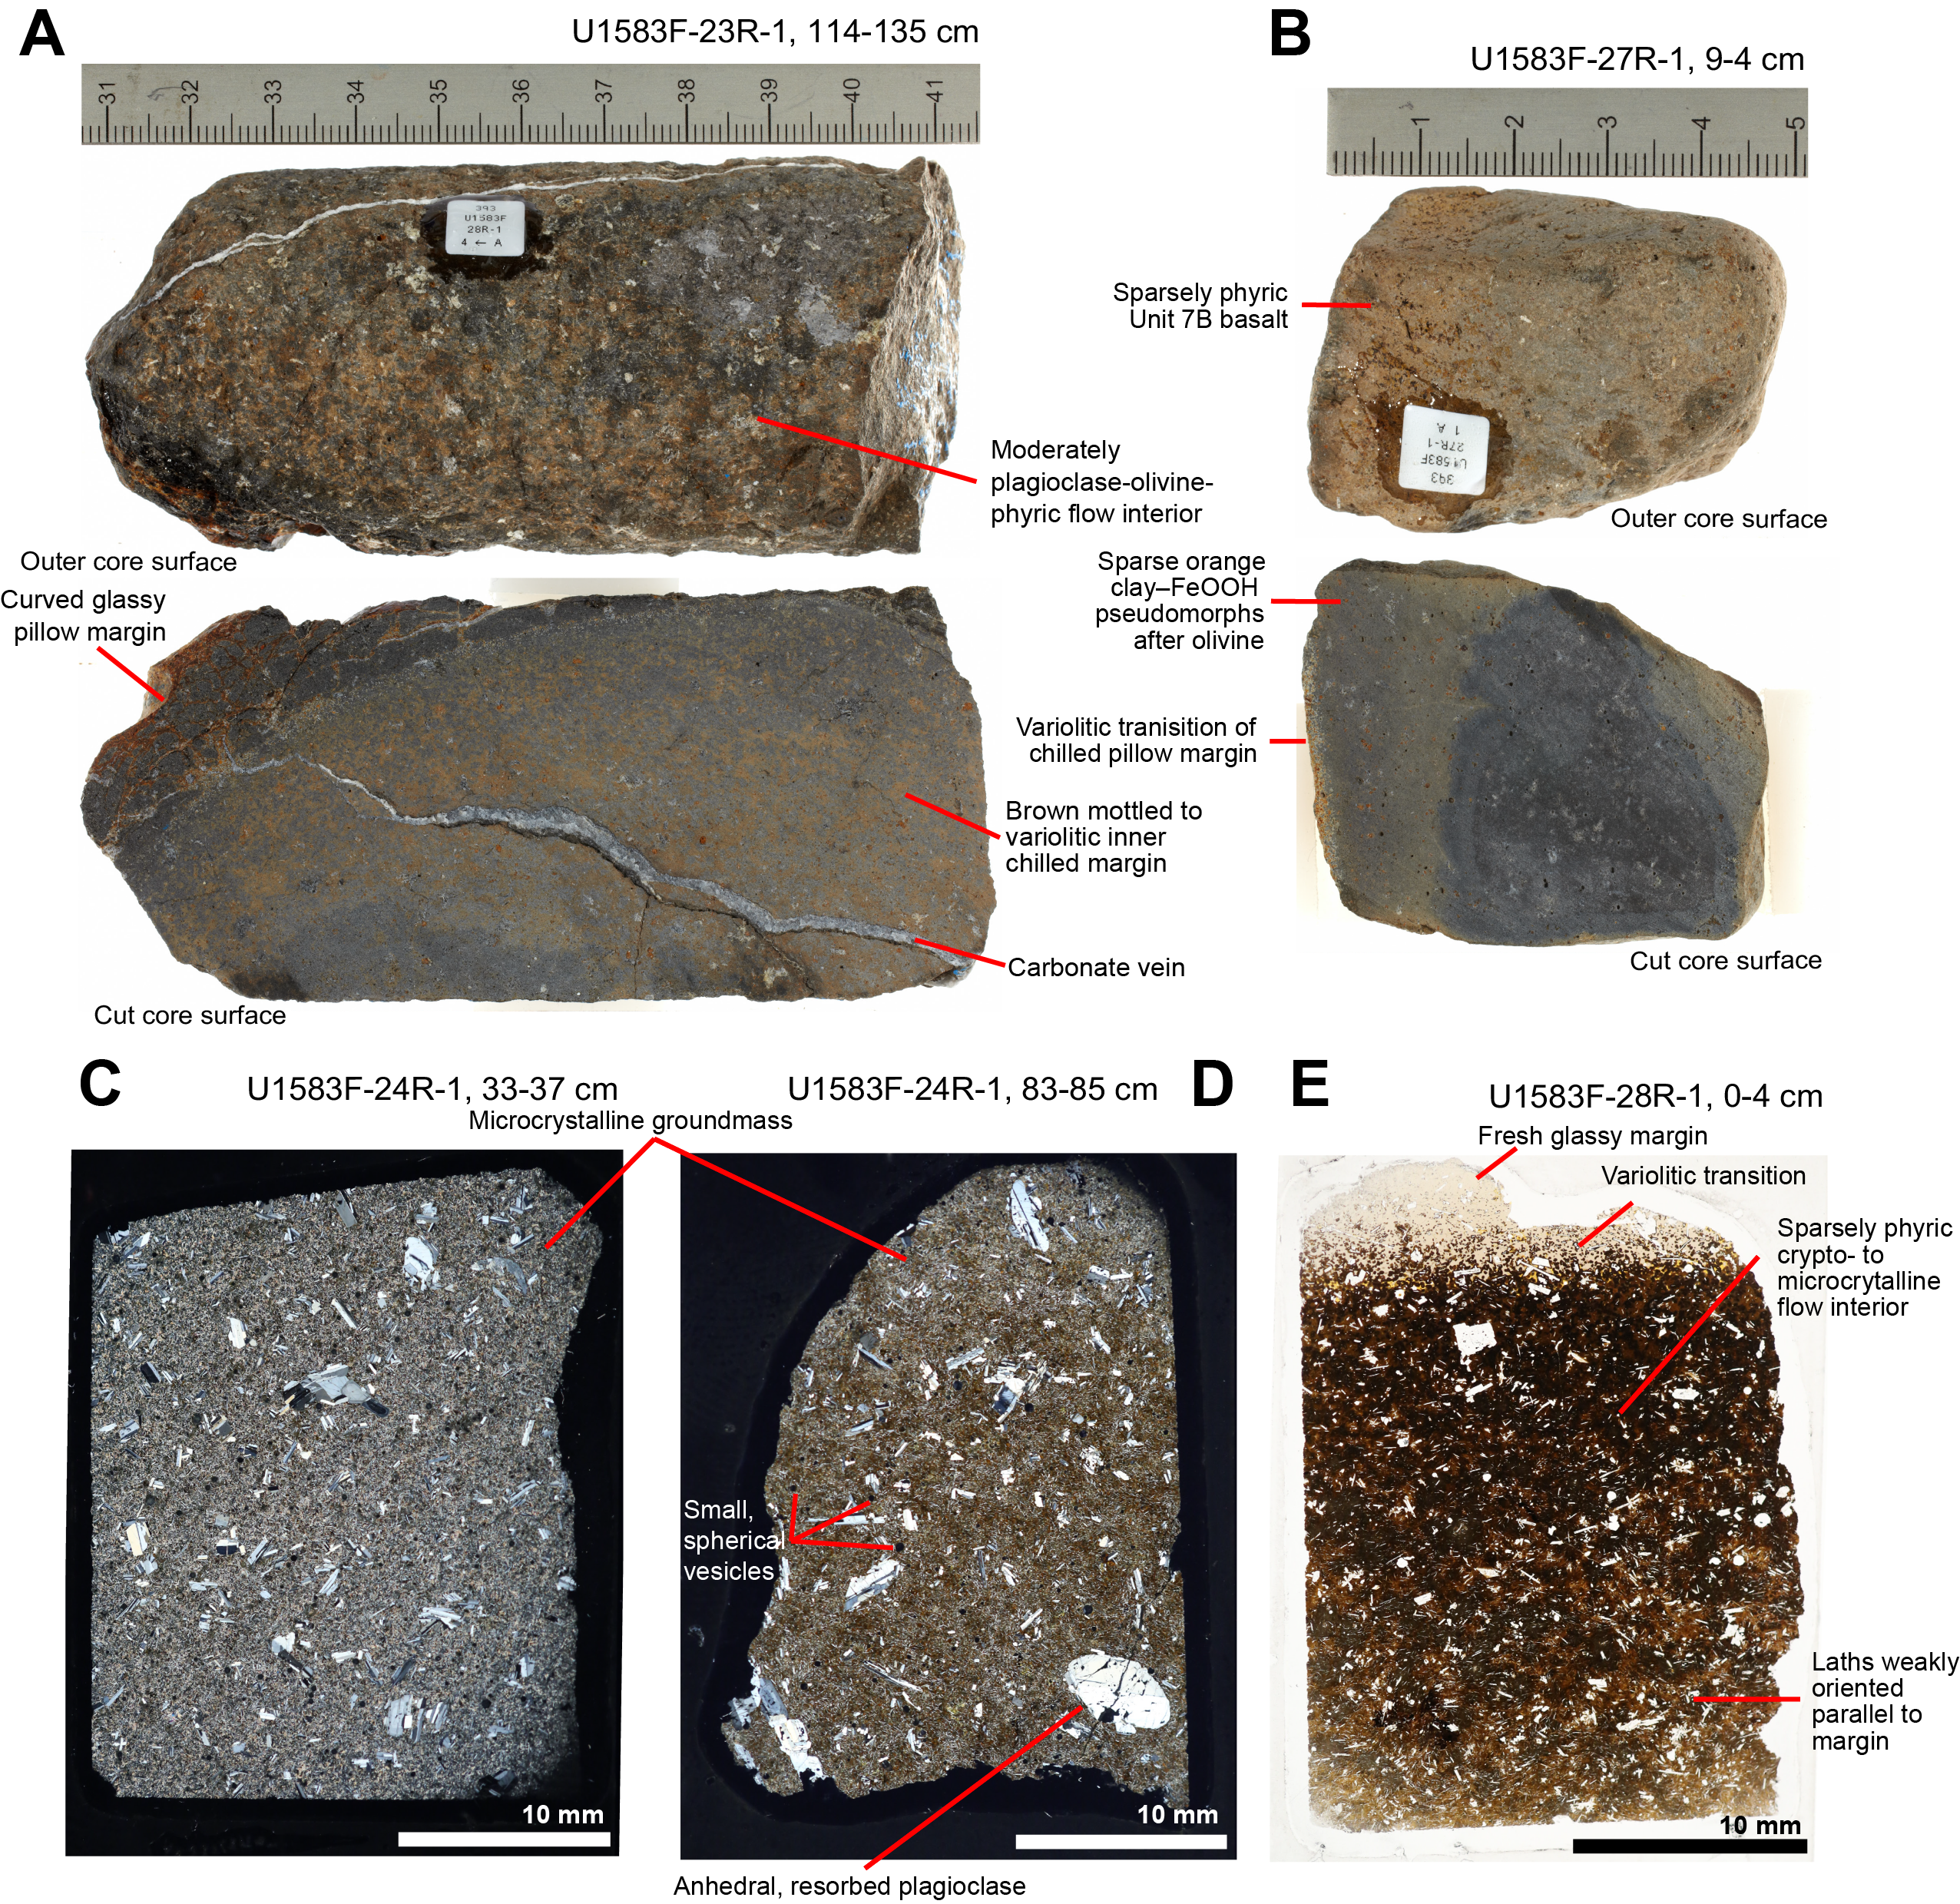
Figure F23. Volcanic Unit 7.
Only 10% of Unit 7 was recovered by coring, which is low for Hole U1583F and hints that, in addition to pillow lavas, less durable rock types such as breccia were preferentially not recovered. Of the material recovered, the Subunit 7A pillow lavas have 3%–4% plagioclase phenocrysts, 0.3%–1% olivine phenocrysts, and the variable presence of 0.5%–1% black augite phenocrysts. Olivine phenocrysts are entirely altered to orange mixtures of clay and Fe oxyhydroxides. Common glassy margins, several of which are curved, indicate emplacement of Subunit 7A as pillow lavas. These pillows typically have mottled to variolitic inner margins, with this texture accentuated by brown clay alteration (Figure F23A, F23D). In thin section, plagioclase is the dominant phenocryst, with larger crystals commonly having anhedral, resorbed rims (Figure F23D). These are set in a groundmass of plagioclase laths and olivine microlites with interstitial plumose or fibrous clinopyroxene, with sparse (0.5%–1%) 0.1–0.5 mm spherical vesicles (Figure F23C, F23D).
5.1.5.3. Subunit 7B
Subunit 7B lavas were the deepest rocks recovered in Hole U1583F and consist of aphyric to sparsely plagioclase-olivine-phyric basalt pillow lavas with an expanded unit thickness of at least 19.4 m (Table T4). The reduction in total phenocryst abundance from 4%–6% in Subunit 7A to 2%–4% in the uppermost rocks of Subunit 7B occurs gradually over Cores 393-U1583F-25R and 26R (Figure F24B). However, in the lower portions of Subunit 7B (below Section 27R-1, 0 cm), the modal abundance of small, 0.1–1 mm olivine phenocrysts increases to the same level as plagioclase (2%), which is unique for Hole U1583F.
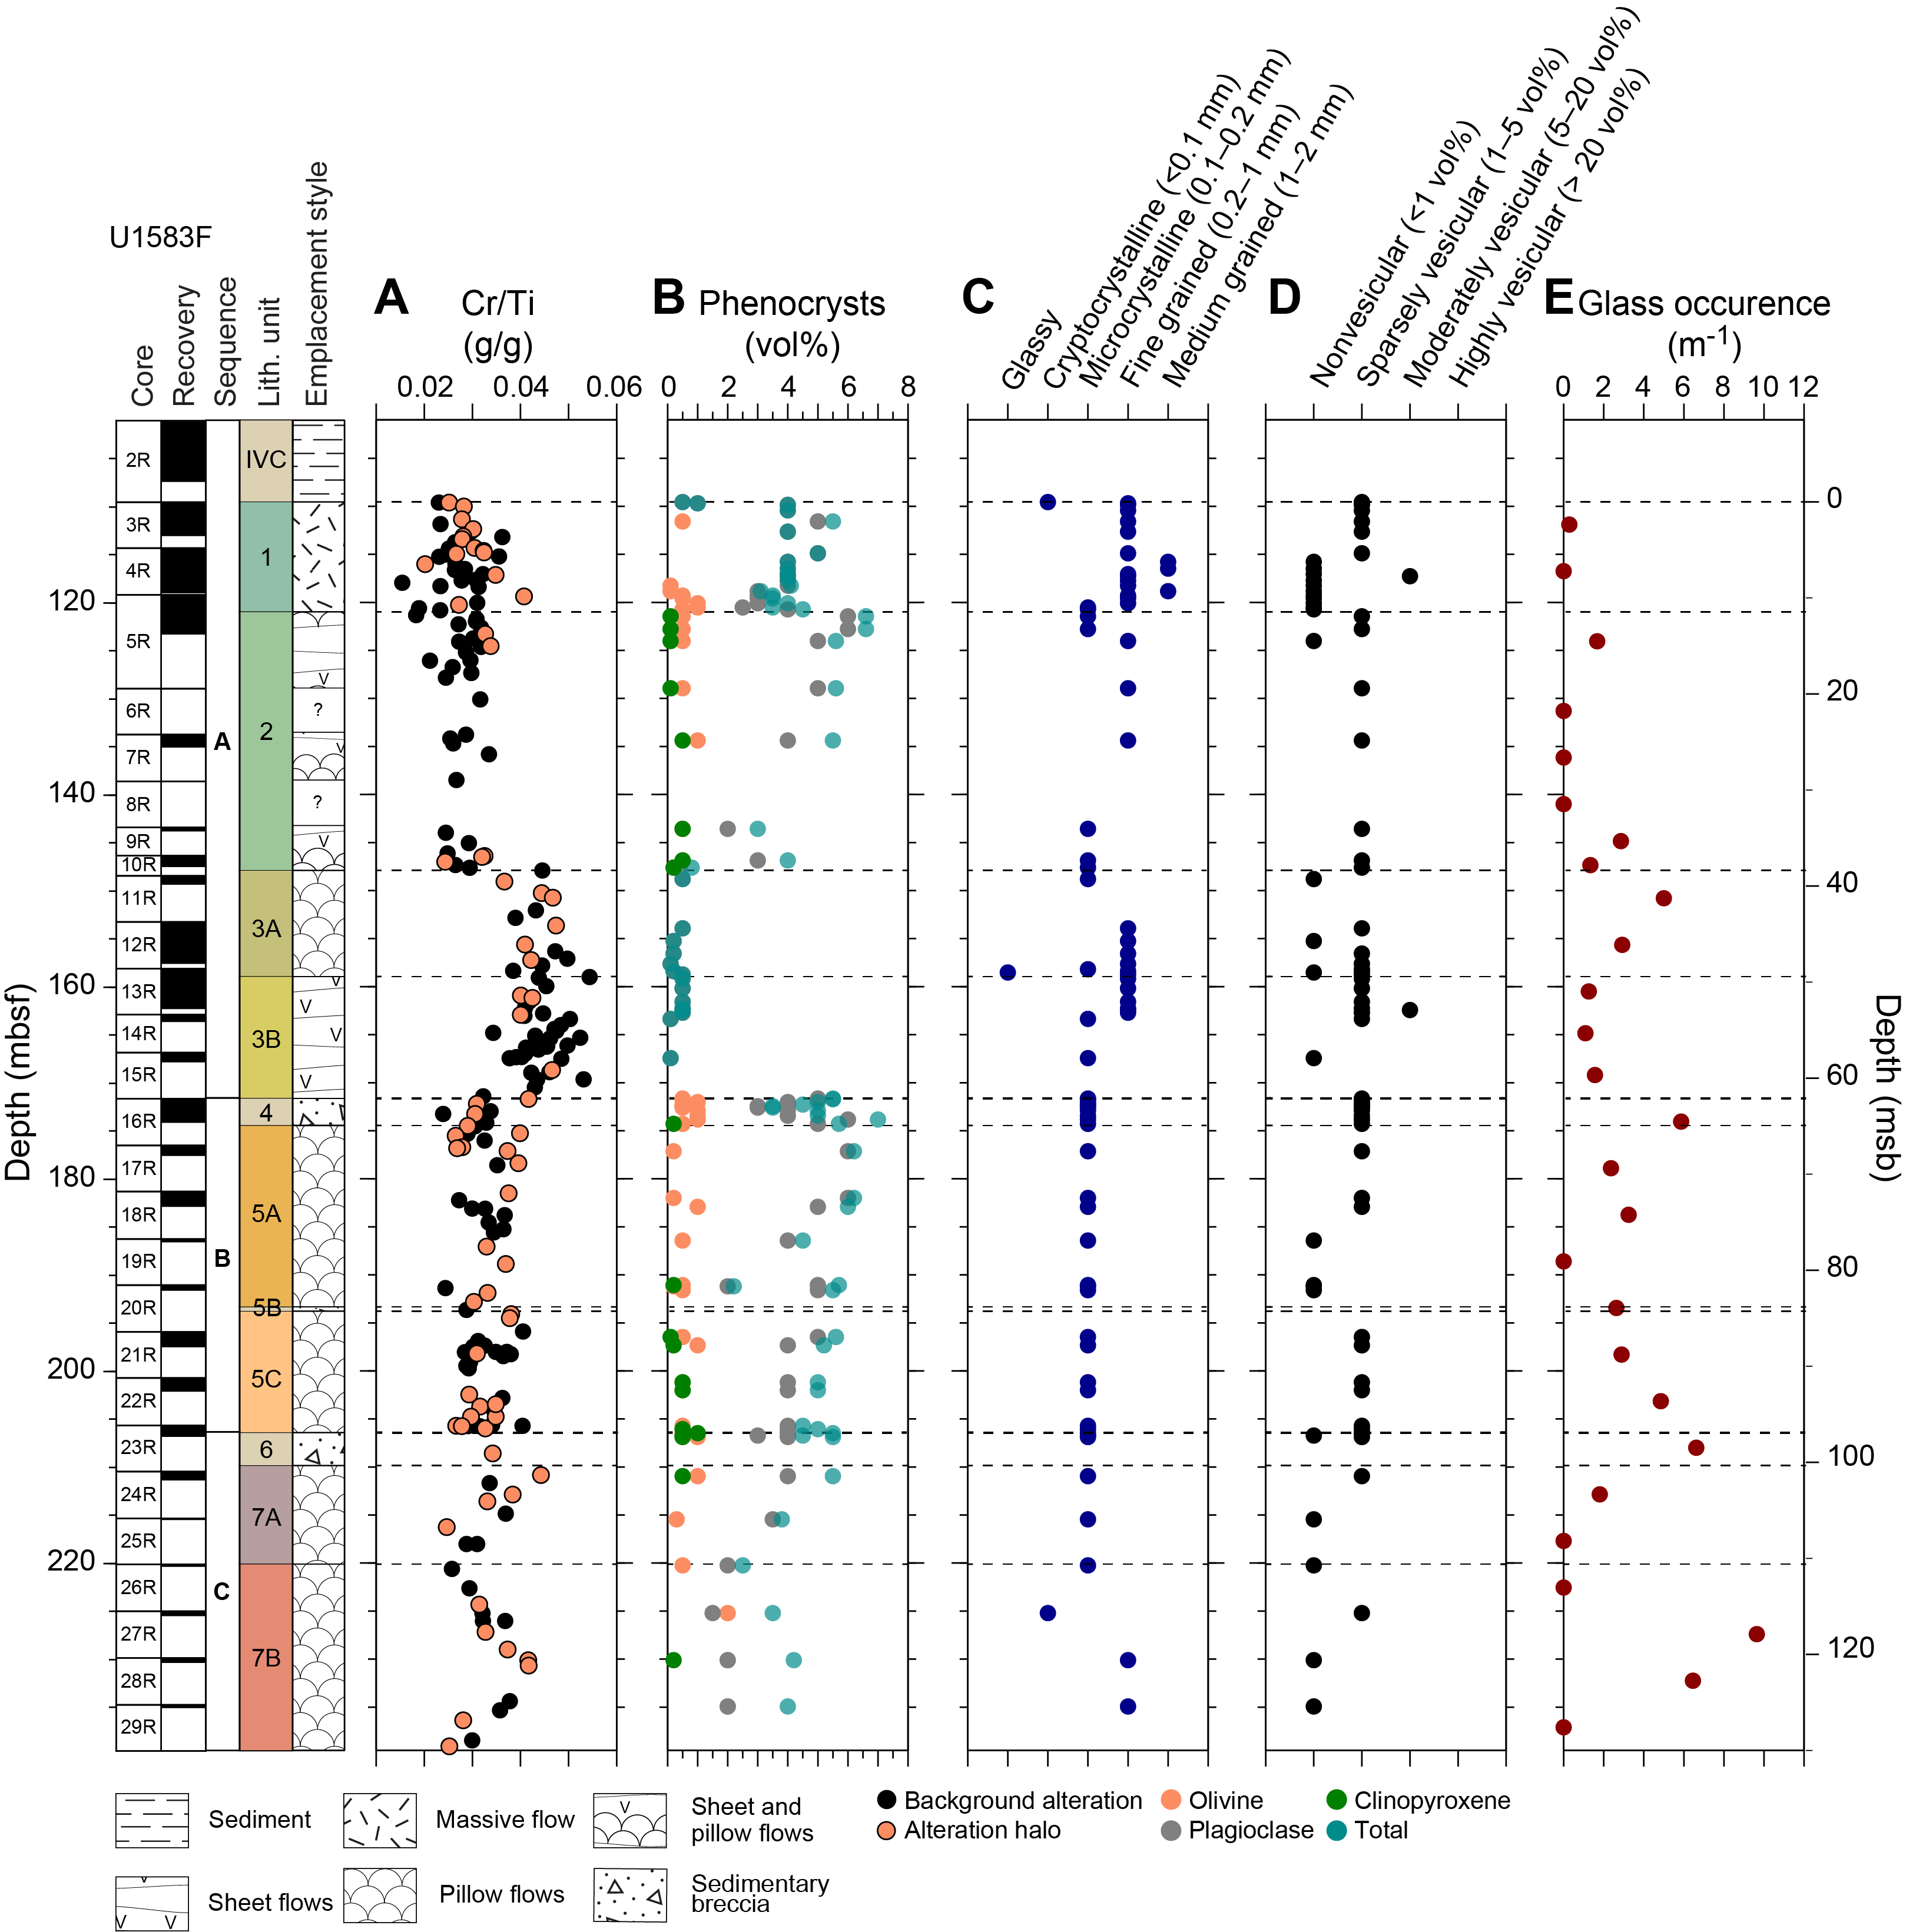
Figure F24. Macroscopic core observations.
Apart from these subtle variations in low-level phenocryst abundances, lavas through Subunits 7A and 7B are lithologically similar, with Subunit 7B also having augite phenocrysts; fresh, curved glassy margins; and mottled to variolitic pillow interiors (Figure F23B, F23E). Cores 393-U1583F-27R and 28R have the highest numbers of glasses per meter of recovered core in Hole U1583F (Figure F24E). The final cores of Subunit 7B have poor recovery, but lavas recovered have a fine-grained groundmass and glassy margins are uncommon (Cores 28R and 29R). This may indicate lava emplacement as large pillows or sheet flows toward the bottom of the hole. However, recovery was insufficient for a confident assignment of emplacement style for lowermost Subunit 7B.
5.2. Phenocryst phases
Phenocryst assemblages in Hole U1583F were relatively uniform, with plagioclase mostly being the dominant phase over olivine. Macroscopically identifiable augite occurs only in some of the most phenocryst-rich rocks. However, the abundance of phenocrysts varies characteristically between the units, ranging from <1% (aphyric) in Unit 3 to 6%–7% in Units 2 and 5 (Figure F24). This variation in phenocryst abundance is paralleled by Cr/Ti variation downhole, with the uniquely aphyric Unit 3 also having the highest Cr/Ti in Hole U1583F (Figure F24).
Unit 7 exhibits a particularly interesting relationship between phenocryst abundance and lava composition, with a zigzag downhole pattern in Cr/Ti that is roughly paralleled by total phenocryst abundance, with the low point for both occurring at the Subunit 7A/7B boundary (Figure F24).
Some of the larger plagioclase phenocrysts observed in thin section in Hole U1583F are anhedral and exhibit rounded, resorbed corners (e.g., Figures F17A, F23D). This is evidence for disequilibrium between the phenocrysts and the melt that transported them to the surface. However, most plagioclase and olivine phenocrysts are euhedral, so this effect must have been limited or perhaps occurred to a single population of phenocrysts deeper in the magmatic system.
5.3. Breccias
Hole U1583F recovered two main breccia units (4 and 6) as well as thinner breccias of similar character in Subunit 5B. These breccias have angular basalt and altered glass clasts that are either clearly or permissibly derived from the underlying volcanic unit, set in a matrix of indurated calcareous sediment. These features indicate that the breccias are sedimentary in nature, formed during hiatuses in volcanism by collapse of seafloor pillow lava outcrops, with broken pillow clasts and margins falling into and sedimented by background carbonate sedimentation on or near the ridge axis (e.g., Yeo et al., 2012). It is difficult to rule out that some proportion of this apparently sedimentary matrix may be a very fine hydrothermal precipitate, as documented at Site U1557, but future petrographic analysis should resolve this. According to the sedimentary interpretation, these breccias should mark paleoseafloor horizons, comparable to those encountered in Hole U1558D. These rocks and the underlying lavas present compelling targets for investigating multistage seafloor weathering in sequentially accreted slow-spreading crust. It is also possible that Cores 393-U1583F-6R and 8R, with 1% and 0% recovery in Unit 2, failed to sample breccia or other difficult-to-recover rock types. Wireline and drilling data are required to better estimate the nature of the missing >99% of basement core in these intervals.
5.4. High-resolution chemostratigraphy
The cut surfaces of the archive halves from Hole U1583F were measured by pXRF for selected elemental concentrations in 207 locations. These measurements were made at locations with background levels of alteration, selected from the most visibly fresh rock present, alteration halos around veins or flow margins, and breccia matrix with variable amounts of altered glass. This allows both primary igneous compositions and chemical perturbations by hydrothermal alteration to be considered downhole. Of the 207 locations measured, 133 were from the background areas, 65 were from undifferentiated alteration halos, and 9 were from breccia matrix, which are provided at the end of Table T6 but not plotted together with the basalt analyses in Figure F25. Shipboard analyses of whole-rock samples by inductively coupled plasma–atomic emission spectroscopy (ICP-AES) are additionally plotted for comparison to the pXRF data, which compare favorably for the utilized elements, with only TiO2 being significantly lower for pXRF measurements relative to ICP-AES. This suggests the TiO2 pXRF calibration curves could be refined or the influence of phenocrysts considered in future work. Given relative standard deviations of <6% measured on rock standard surfaces over the course of Expedition 393 for TiO2 (see Geochemistry in the Expedition 390/393 methods chapter [Coggon et al., 2024a]), the relative variation between 1 and 1.5 wt% in Hole U1583F should nevertheless be considered with confidence.
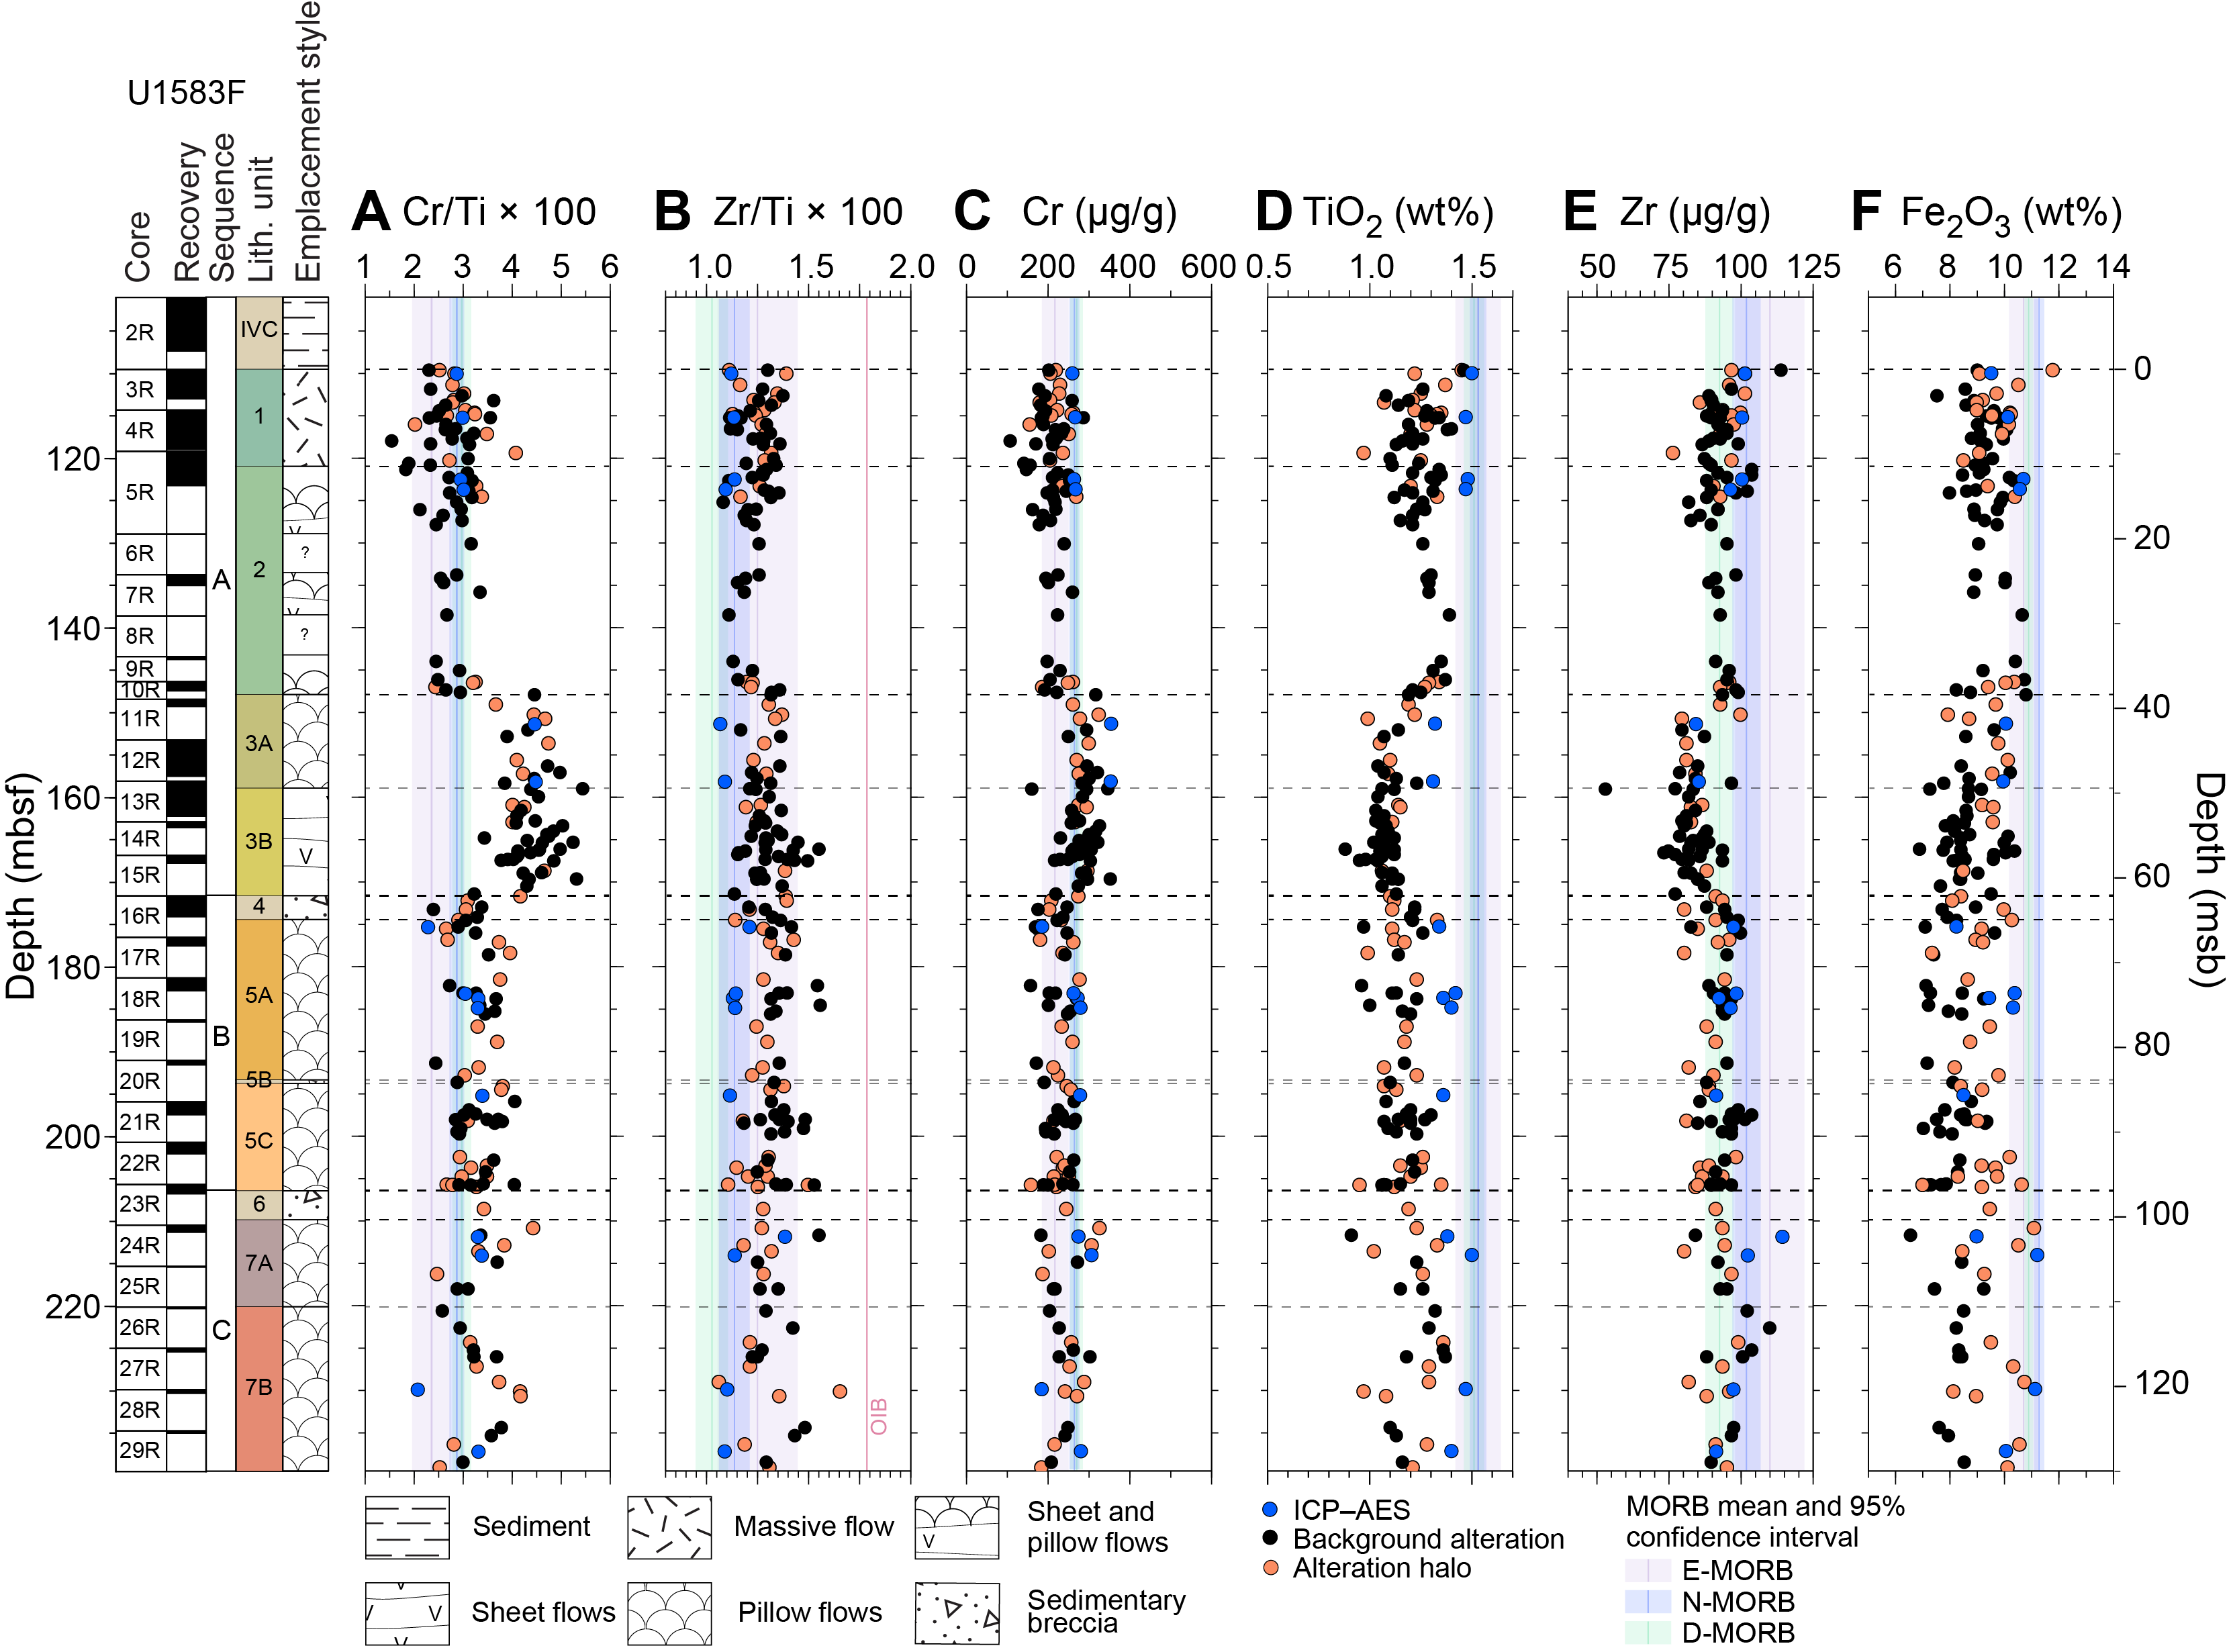
Figure F25. Major and trace element concentrations and ratios.
5.4.1. Variation with depth and similarities between sites
Figure F25 shows variation in key major element oxides and trace elements with depth for Hole U1583F, both measured by pXRF on split core surfaces (Table T6) and by ICP-AES on powdered discrete whole rock samples (Table T35).
The volcanic rocks at Site U1583 are split into three main chemostratigraphic groups, with their transitions at the top of Unit 4 (Sequence A/B boundary) and the top of Unit 3 (Figure F25). No major compositional change occurs across the Sequence B/C boundary. The three chemostratigraphic groups are principally defined by the high Cr and low Ti and Zr composition of the Unit 3 lavas relative to all the other lavas above and below. These relatively high concentrations of compatible Cr and low concentrations of incompatible Ti and Zr at relatively constant Zr/Ti indicates Unit 3 is potentially less fractionated than the other magmatic units at Site U1583.
Unit 3 is also the least rich in phenocrysts (Figure F24A, F24B). This coincidence of high Cr/Ti and low phenocryst abundance occurring as the second major chemostratigraphic unit in the hole closely parallels the volcanostratigraphy of Holes U1558D and U1560A (see Figure F30 in the Site U1558 chapter [Teagle et al., 2024a] and Figure F27 in the Site U1560 chapter [Teagle et al., 2024b]). Holes U1583F and U1560B also have massive lava flows of comparable 6–11 m thickness in the uppermost chemostratigraphic unit (Figure F7; see Figure F7 in the Site U1560 chapter [Teagle et al., 2024b]).
The volcanostratigraphic similarities between these holes provide an excellent opportunity for assessment of ridge flank hydrothermal maturation, offering a like-for-like comparison in terms of protolith compositions and emplacement styles between 15 and 50 Ma.
Looking at the Hole U1583F chemostratigraphy in more detail, the transition from Unit 3 to Unit 2 is gradational, with anticorrelated Cr and Ti changing over Cores 393-U1583F-9R through 11R (145–155 mbsf; Figure F25C, F25D). As mentioned in the Unit 7 description, Cr/Ti values follow a zigzag pattern through Unit 7, possibly recording a pulsation between the eruption of more and less evolved lavas within this unit (Figure F25A).
Another interesting feature in the downhole pXRF data are the higher Fe concentrations in alteration halos relative to the fresher background rocks for samples below ~80 msb (Figure F25F). A similar Fe enrichment in halos over background compositions is seen in Hole U1558D starting at 100 msb and Hole U1560B starting at 110 msb. Ratios of Zr/Ti are scattered but relatively uniform downhole in Hole U1583F, with compositions within the N-MORB to enriched MORB (E-MORB) range, similar to lavas in Hole U1558D (Figure F25).
5.5. Summary
Site U1583 was established in ~30.6 Ma crust during Expedition 393, and Holes U1583C and U1583F recovered volcanic basement. These holes both intersected a ~11 m thick massive lava flow at 107.5 and 109.7 mbsf, respectively, ~30 m shallower than predicted by seismic site surveys (Kardell et al., 2019). Only Hole U1583F advanced deeply into basement, reaching 239.6 mbsf (129.8 msb) and recovering 45.8 m of basement lavas and breccias for a total recovery of 35% (Figure F7; Table T4).
Hole U1583F intersected three volcanic sequences (A, B, and C) with 62, 35, and 33 m expanded thicknesses, respectively, separated by two sedimentary breccia units (4 and 6) with thicknesses estimated between 0.8 and 3.4 m (Table T4). The upper Sequence A (109.7–171.6 mbsf) consists of Unit 1, which is an 11 m thick massive lava flow; Unit 2, which is a package of moderately phyric pillow lavas and sheet flows; and aphyric Unit 3, which is less evolved than all the other units in the hole (Table T4; Figure F25). The middle Sequence B consists of moderately phyric pillow basalts and a thin breccia horizon and is capped by the sedimentary breccia of Unit 4. The lower Sequence C is again capped by a sedimentary breccia (Unit 6) that lies above sparsely to moderately phyric pillow basalts that are chemically and lithologically similar to Sequence B (Figure F25).
Lava composition assessed by pXRF varies downhole both gradually and in a stepwise fashion across petrologically defined unit boundaries (Figure F25). Zr/Ti ratios are consistent with a N-MORB-like composition for the lavas at Site U1583. In contrast to the sequence stratigraphy defined by the presence of sedimentary breccias, pXRF measurements reveal that Unit 3 has one of the least fractionated compositions in Hole U1583F, splitting the hole into three main chemostratigraphic packages: Igneous Units 1 and 2, 3, and 5–7.
6. Alteration petrology
The basement rocks recovered from Site U1583 all preserve evidence of reaction with seawater-derived hydrothermal fluids to varying extents. This alteration is manifest as secondary minerals in three main contexts: (1) replacing interstitial mesostasis and glass, (2) replacing groundmass and phenocrysts, and (3) precipitating in open porosity to partially or completely fill fractures to form veins and vesicles. These three manifestations occur in a range of spatial contexts in Site U1583 basement, namely background alteration representing fluid-rock reaction that has pervasively permeated the bulk rock along grain boundaries and alteration halos that are generally related to previous open porosity that has facilitated channeled fluid flow and more extensive fluid–wall rock reaction (e.g., around veins and vugs or along igneous margins). In addition, the breccias recovered from Site U1583 record extensive alteration of clasts and matrix and are cemented by secondary minerals. The replacement minerals, styles, and intensity of alteration, along with the secondary minerals precipitated in veins, vesicles, and breccias, provide a record of the hydrothermal alteration taking place in 30 My of crustal aging. This section focuses on Hole U1583F, although similar alteration features were observed in the basement recovered by XCB coring in Hole U1583A.
Overall, Hole U1583F is characterized by low-temperature alteration downhole with changing abundance and types of alteration halos and background alteration that are also accompanied by changes in the secondary minerals precipitating in veins (Figure F26).
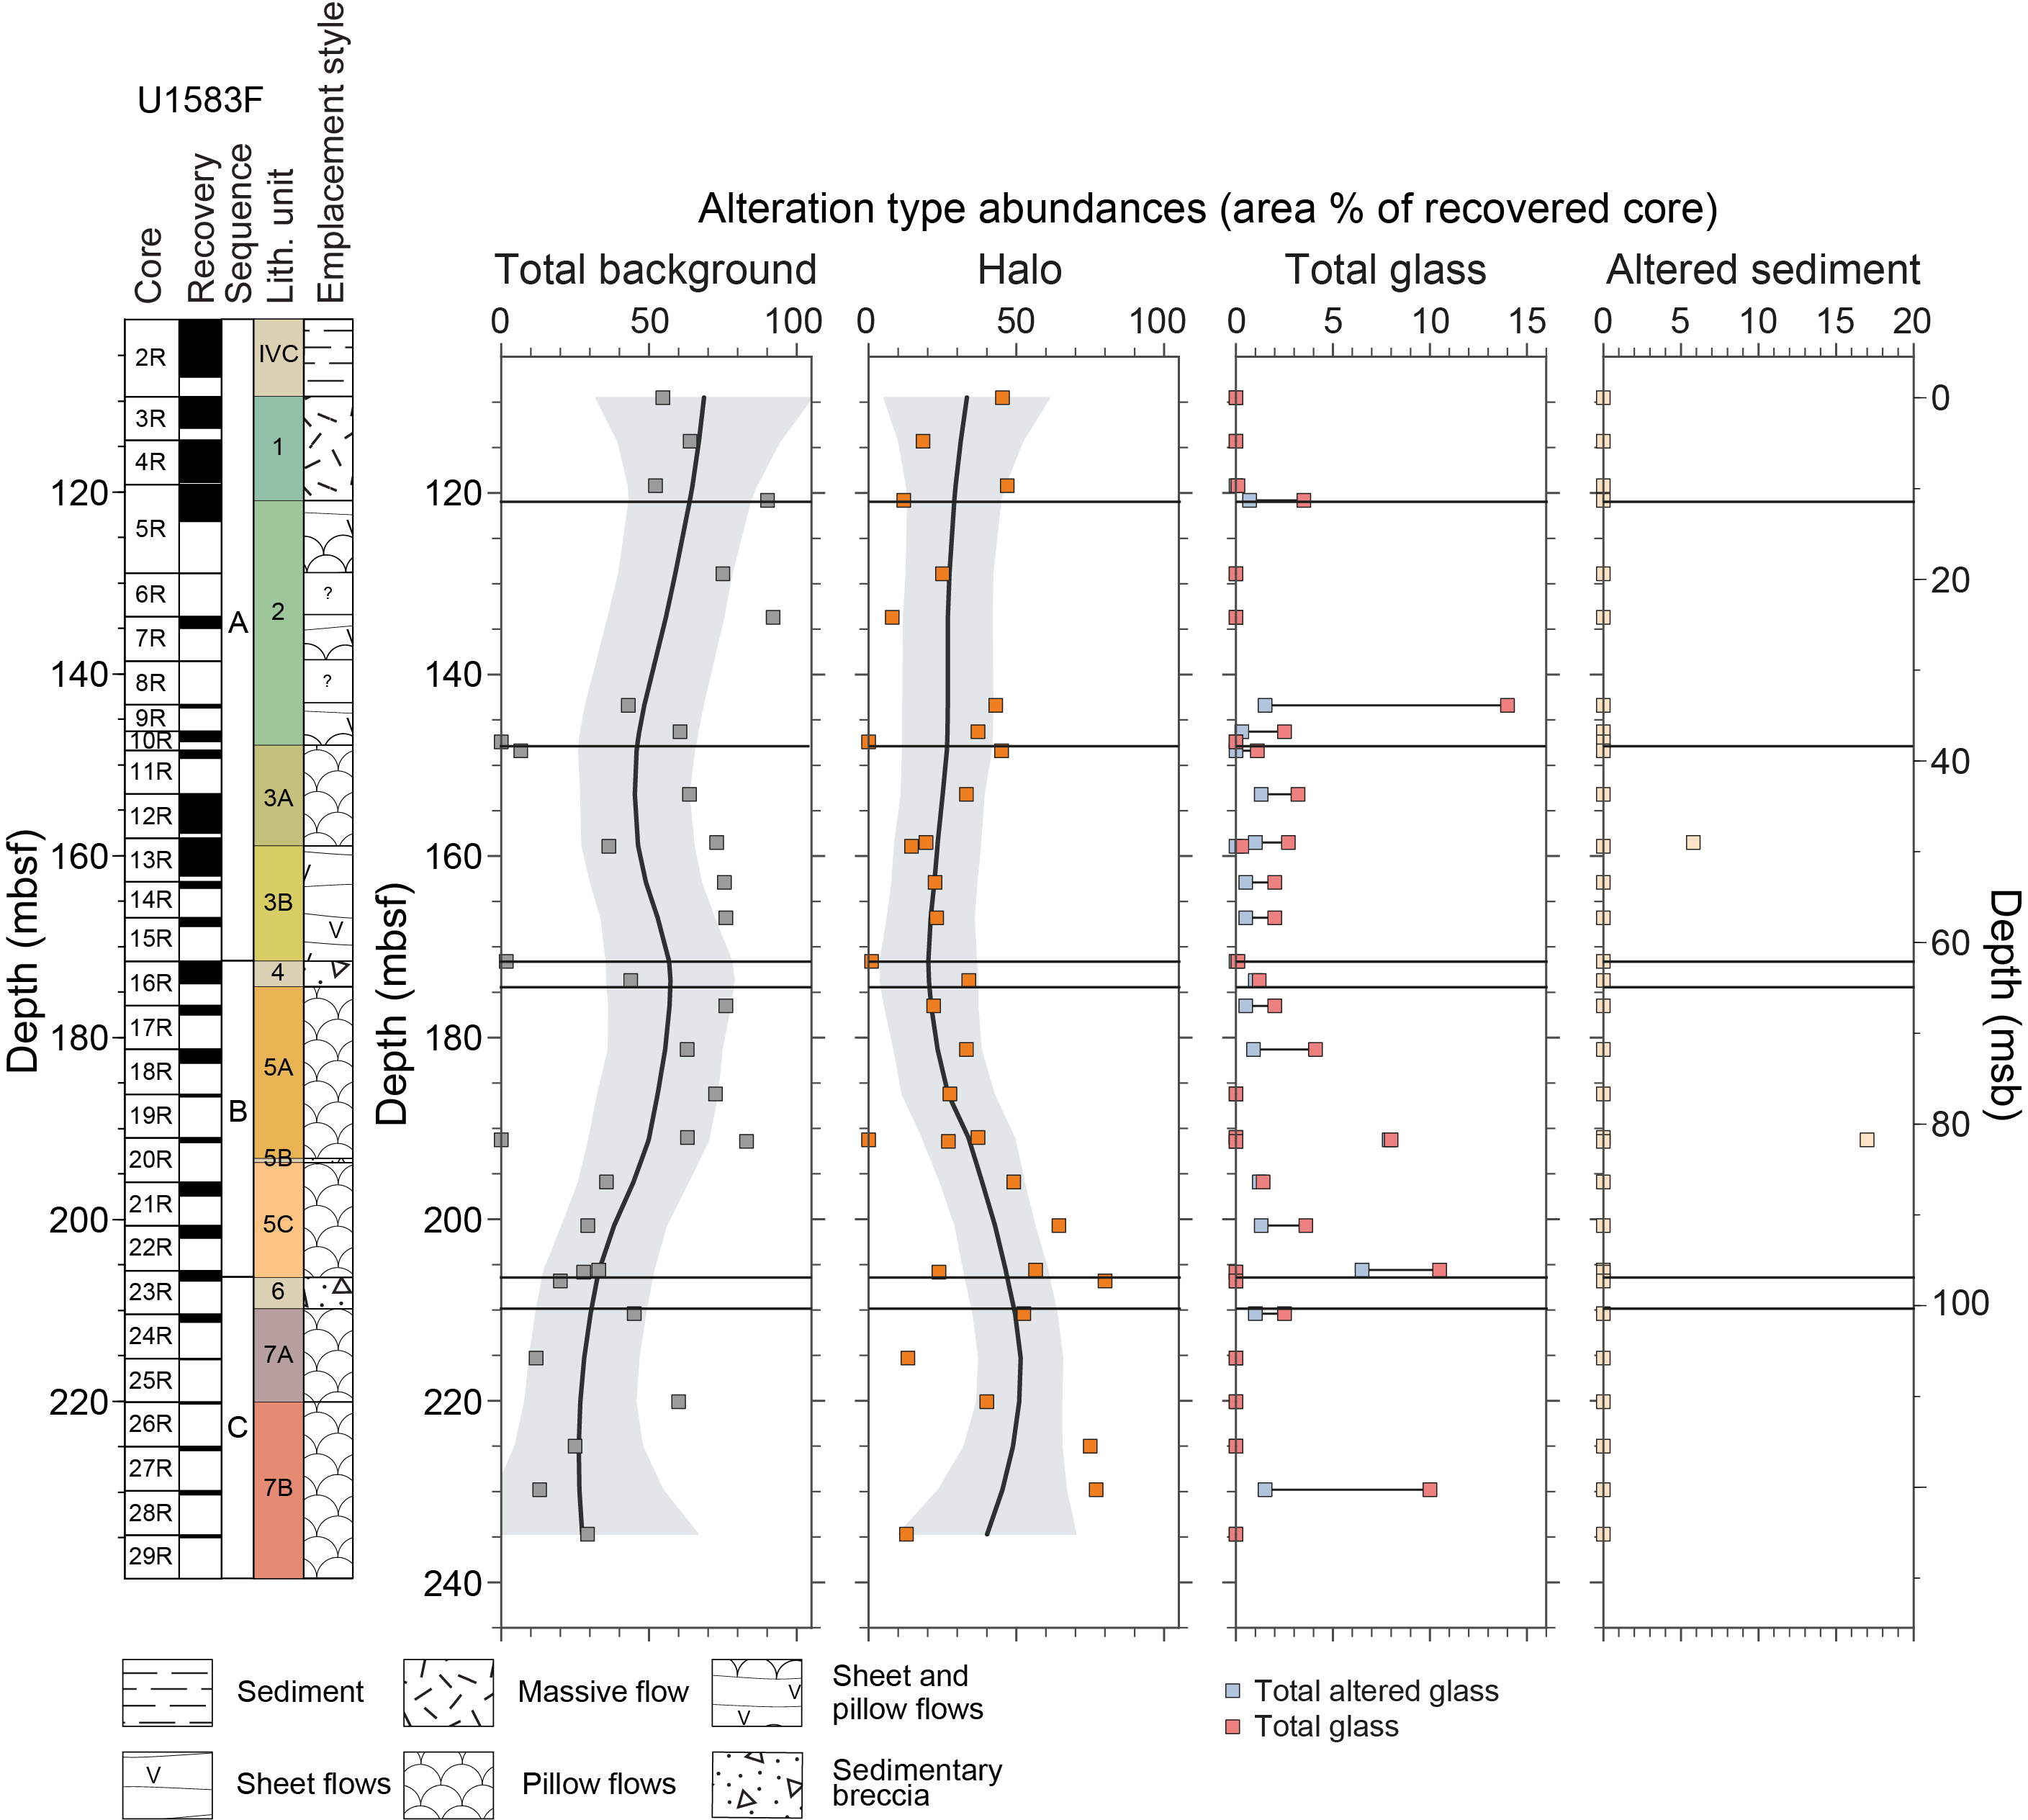
Figure F26. Alteration abundance.
6.1. Alteration of glass
Volcanic glass associated with chilled margins and breccias is present throughout most of Hole U1583F and shows a full spectrum of alteration from fresh to completely altered to clay minerals. The intervals with the highest percent abundance of glass (Figure F26) (e.g., Sections 393-U1583F-9R-1 and 28R-1) also have the highest abundance of fresh glass, but this percentage is skewed by the recovery of thick (>1 cm) glassy margins in short sections rather than intervals with many chilled margins. In some chilled margins, where altered, glass is uniformly altered to orange clays (5YR 4/6 yellowish red) (Figure F27) but to varying extents of replacement. In breccias, glass alters to clays with a range of colors from orange to green with increasing replacement by clay minerals (see Breccia).
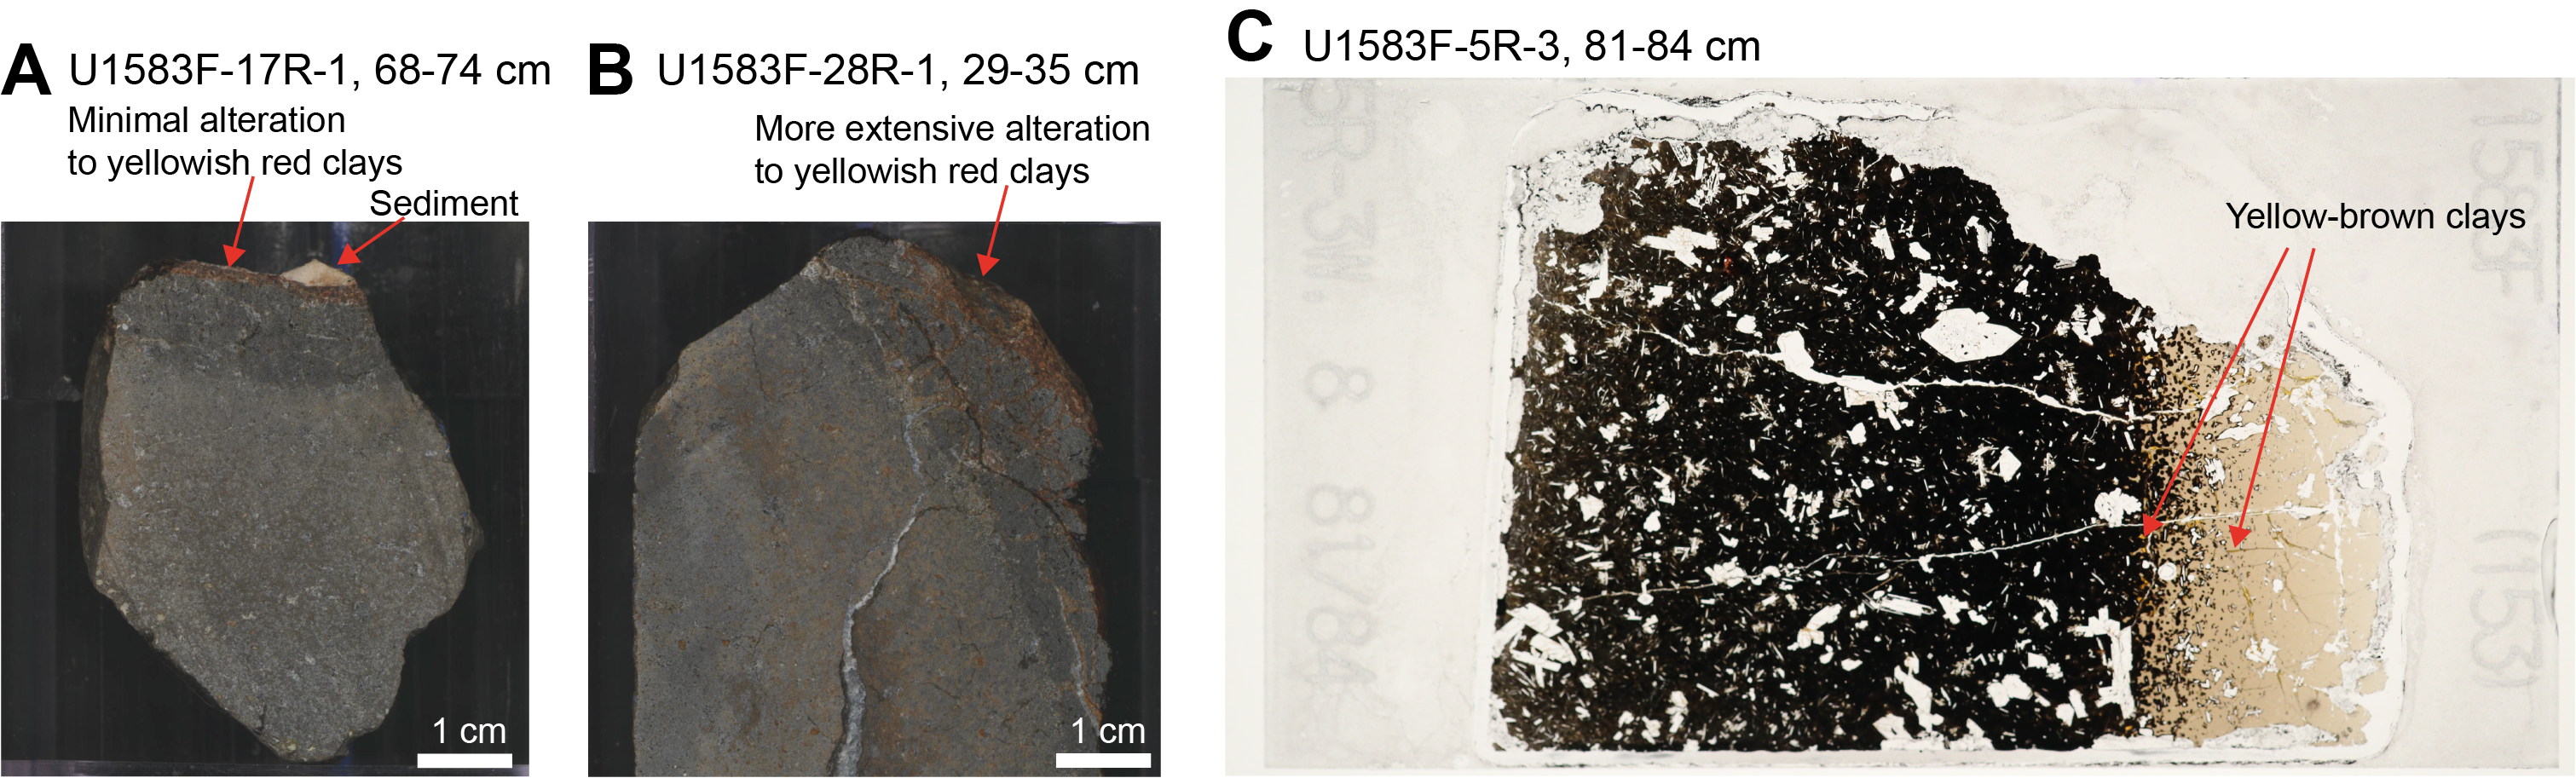
Figure F27. Glass alteration along chilled margins.
6.2. Background alteration
Background alteration is present throughout Hole U1583F and occurs in two types: gray background and mottled gray chilled margin background. Orange speckled background (recognized by the replacement of olivine to clays + Fe oxyhydroxides) is absent from this hole (Figure F28). Background alteration occupies 11%–90% of the area of the cores and shows a marked change in abundance downhole. Above 195.9 mbsf, background alteration is the dominant alteration type, occupying an average area of ~60% of the core. Below this depth, the background alteration area decreases to 30% on average. This shift is mirrored by the downhole increase in abundance of alteration halos.
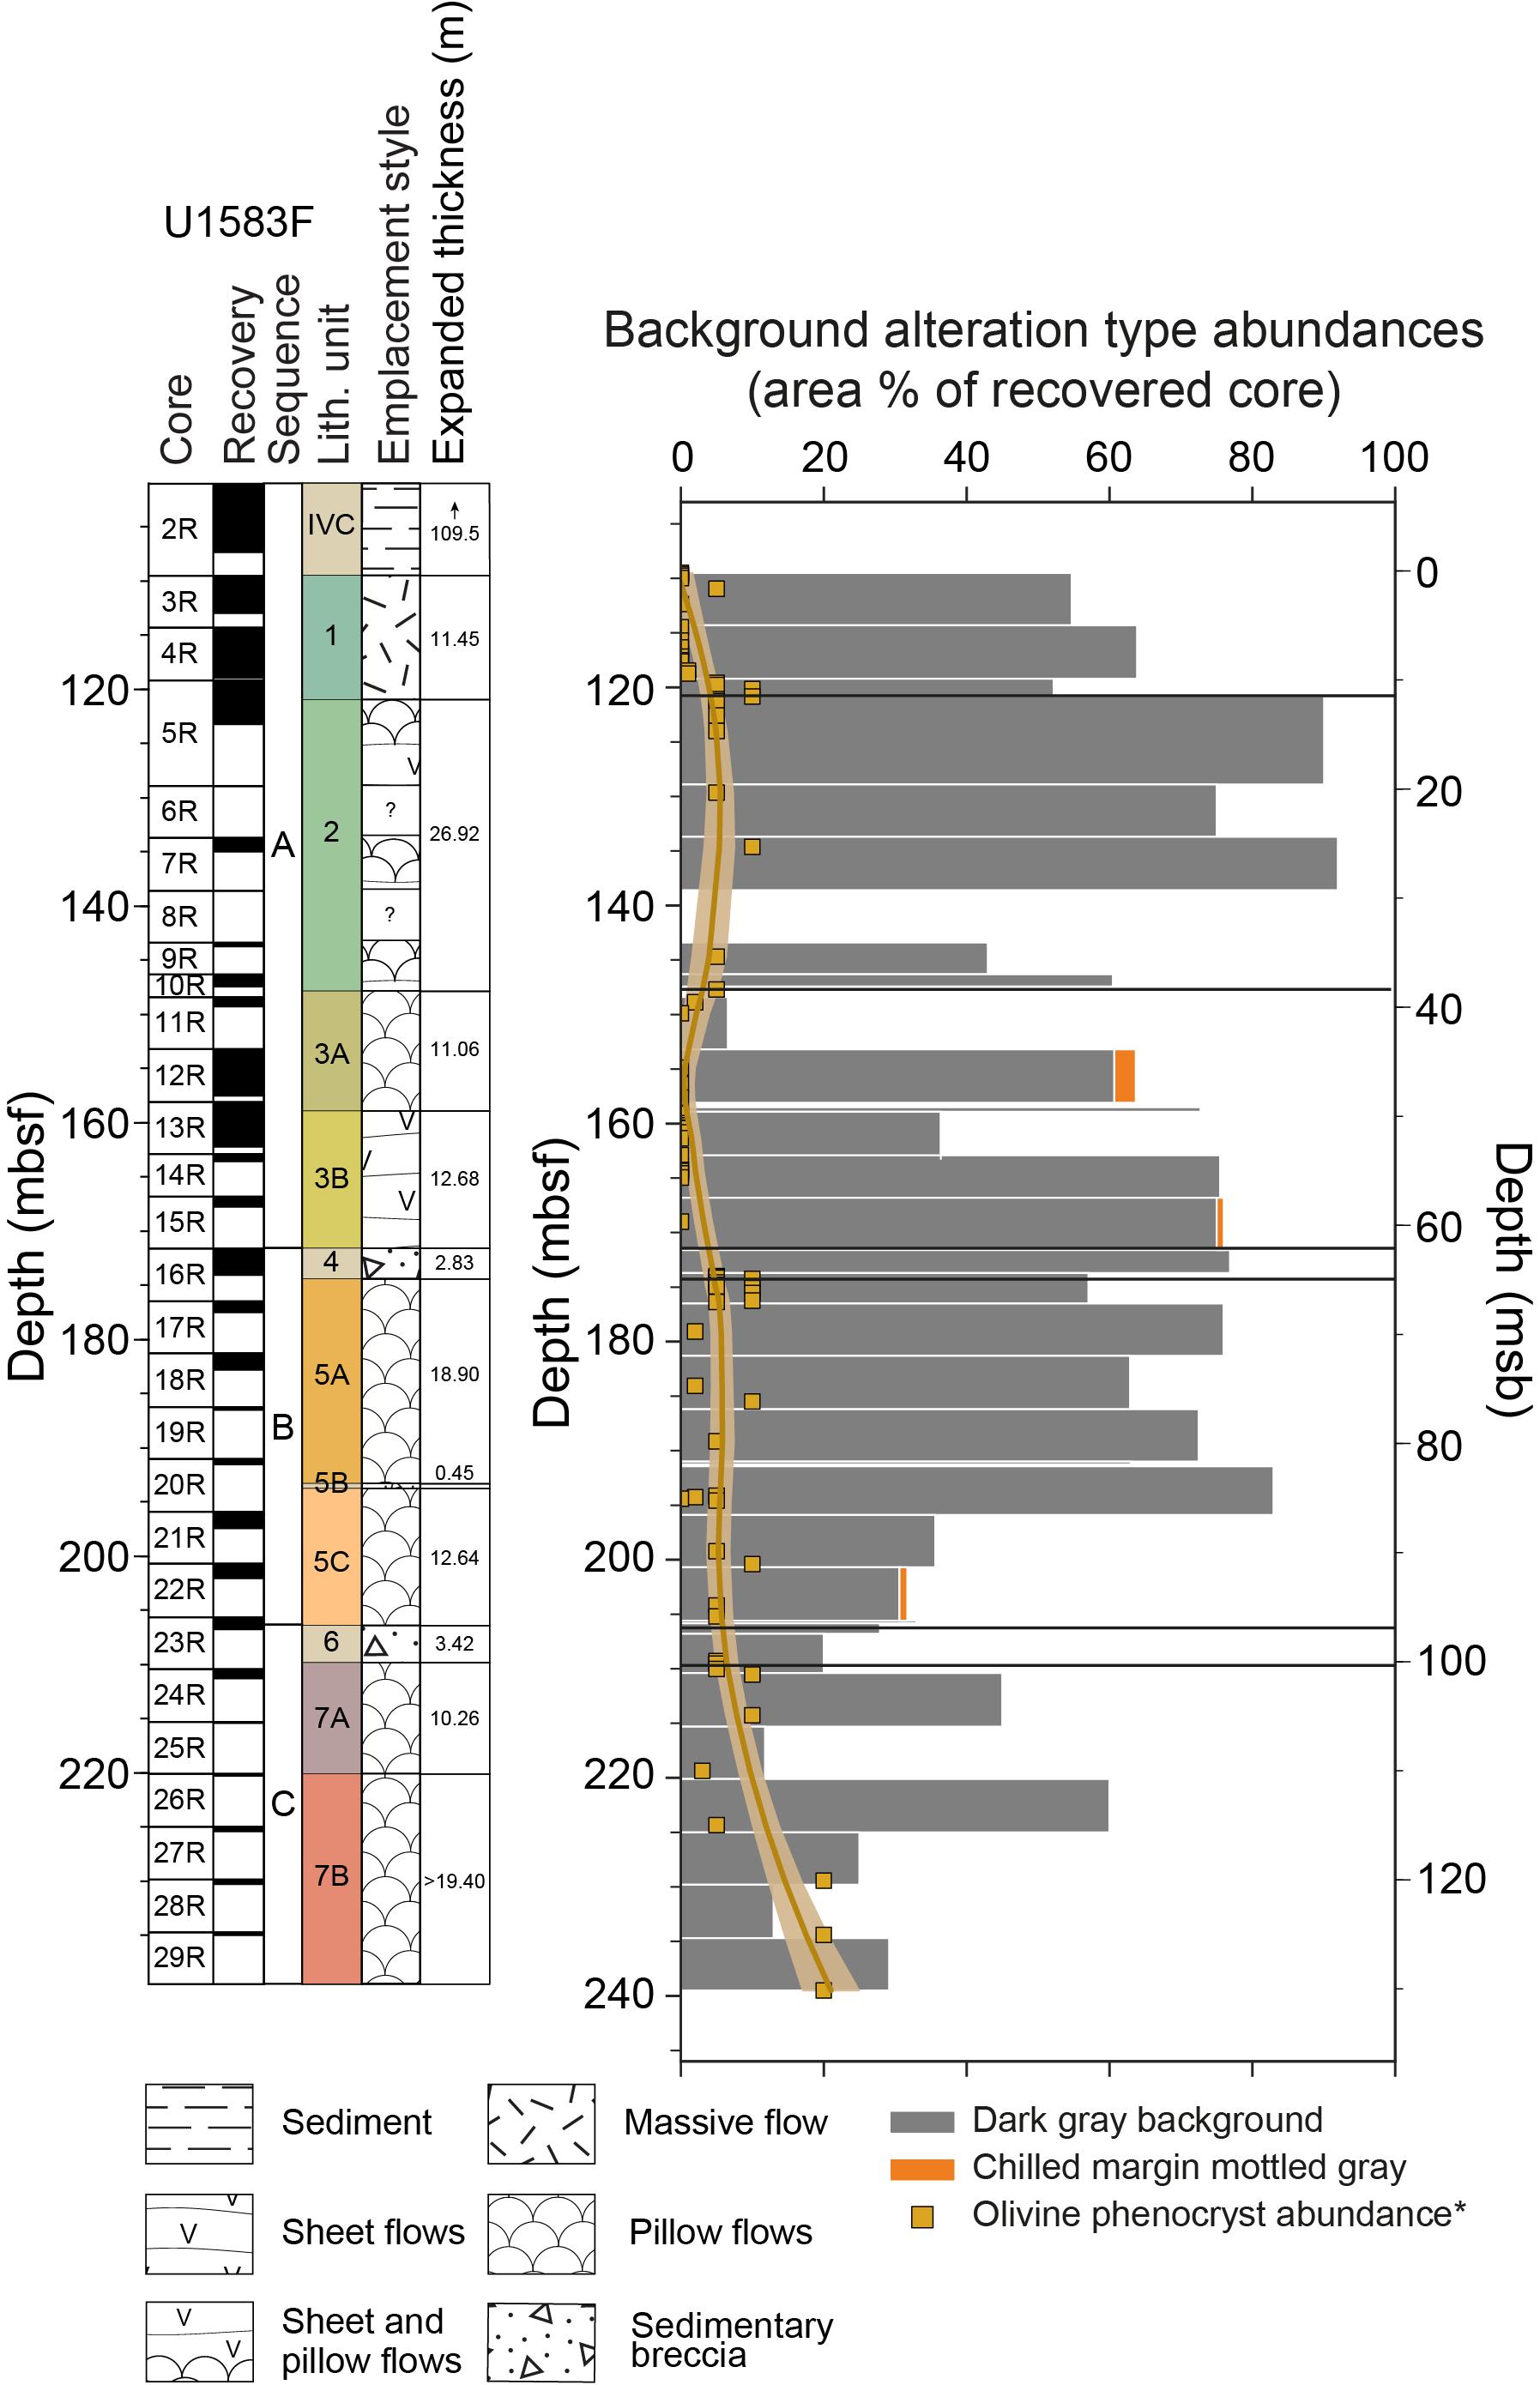
Figure F28. Distribution of background alteration types.
6.2.1. Gray background
Gray background dominates the background alteration, is similar to Sites U1559, U1558, and U1560, and is commonly associated with a uniform texture and color (GLEY 1 5/N) (Figure F29). In contrast to Sites U1559 and U1558, the background alteration in Hole U1583F shows greater variation in color and texture. Color ranges from gray (GLEY 1 5/N) to dark gray (5YR 4/1) to very dark gray (2.5Y 3/1), with the latter occurring in one-third of the logged intervals. The very dark gray color is browner and typically associated with a more patchy, commonly mottled, appearance (Figure F29). Alteration is primarily focused on the replacement of mesostasis and groundmass, but examples of plagioclase phenocrysts altering to white to creamish clays are present. Olivine phenocrysts are variably altered to clays (of varying colors) ± Fe oxyhydroxides. The orange speckled background is not found in Hole U1583F because of this variation in olivine alteration (cf. Hole U1558D).
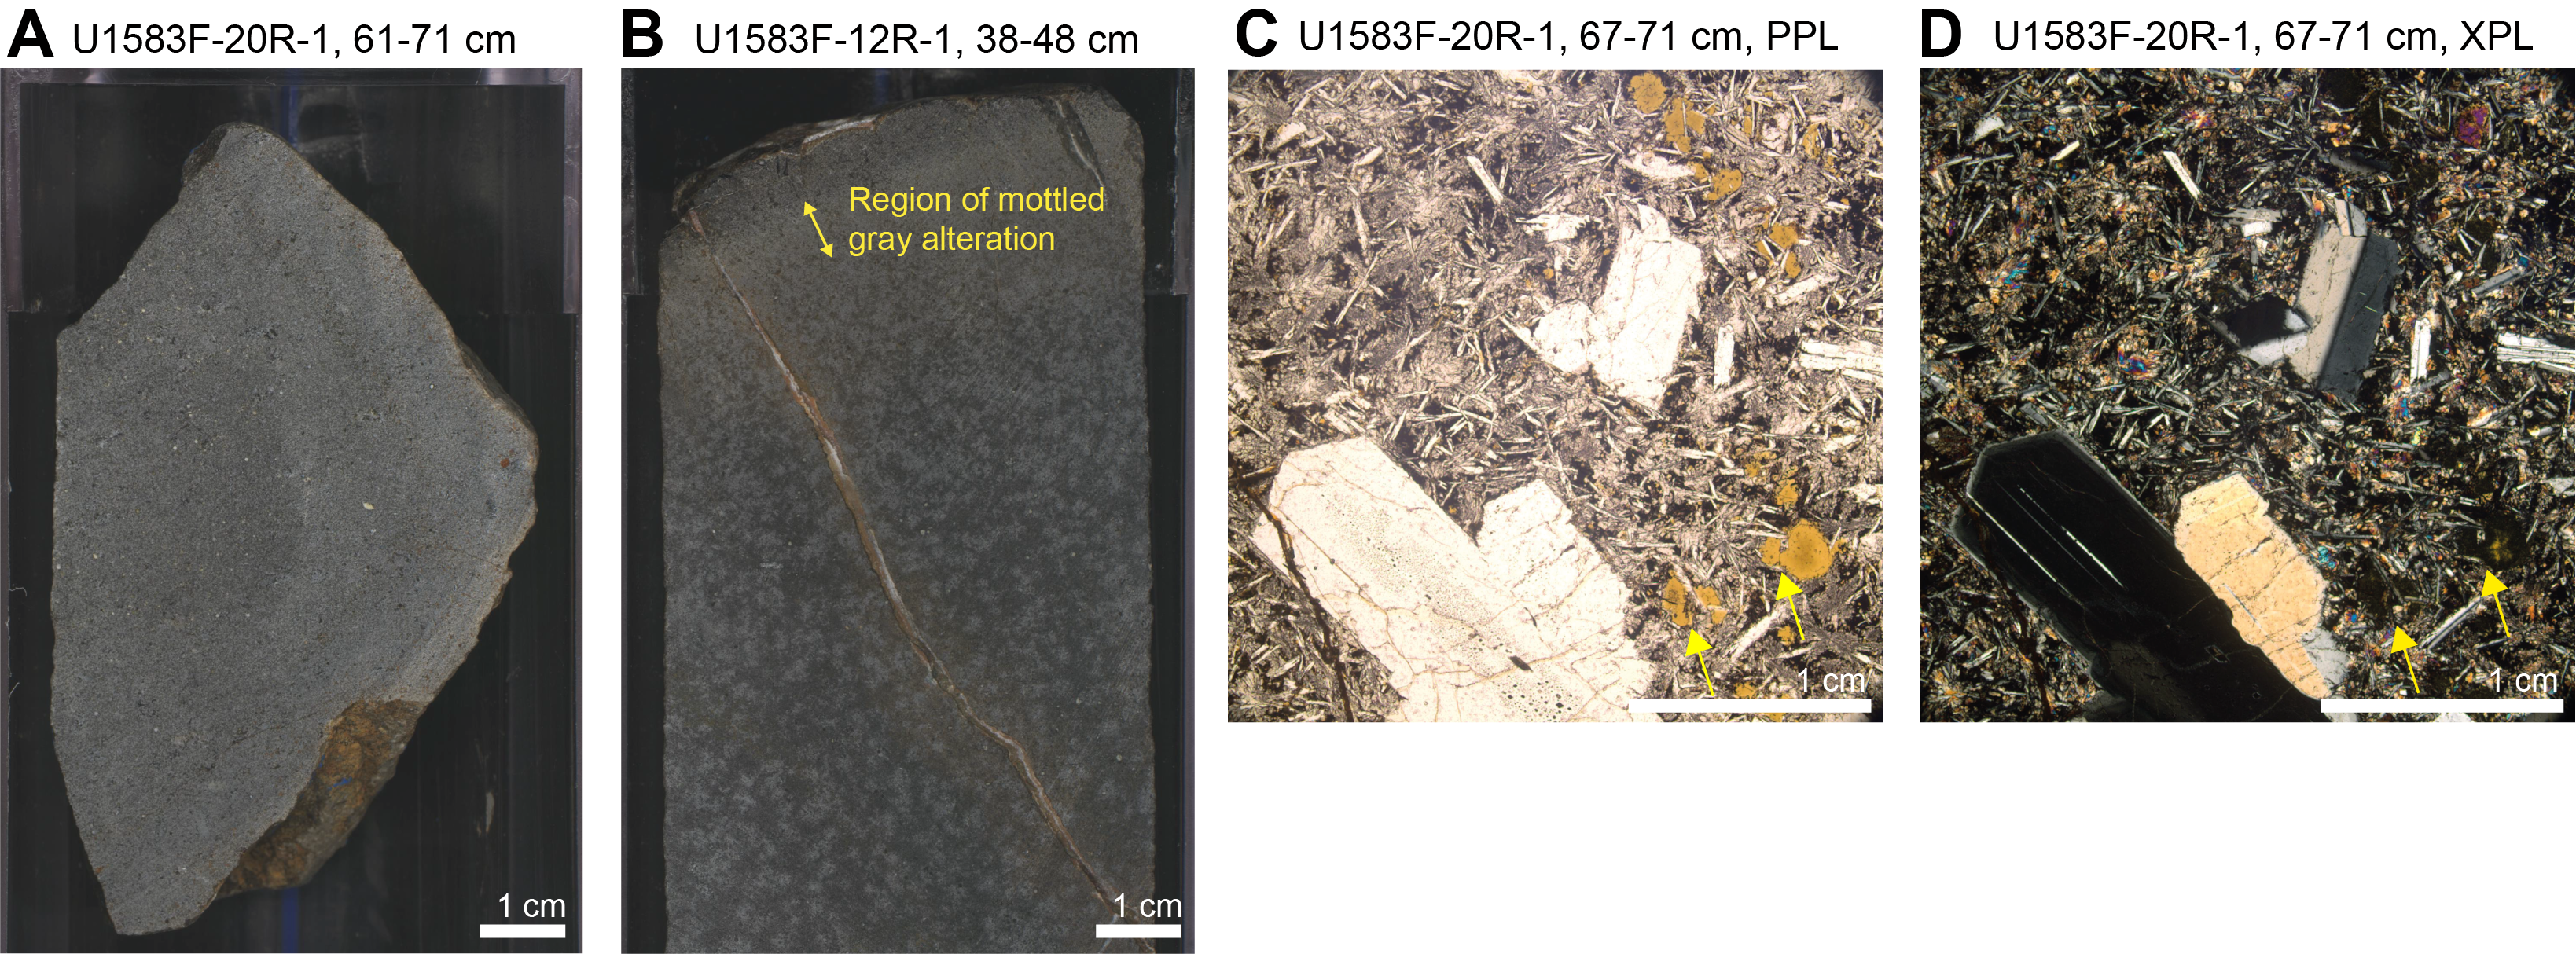
Figure F29. Background alteration.
In thin section, yellow-brown clays replace mesostasis and groundmass in areas of background alteration (Figure F29). The abundance of secondary minerals is variable from 11% to 78%, with most of examples between 11% and 28% in thin sections. Vesicles are filled to varying amounts (10%–100% filled) with yellow-brown and green clays, calcium carbonate, and/or zeolites.
6.2.2. Mottled gray chilled margin background
In Hole U1583F, pillow lava chilled margins show a distinct zone of alteration that lies between the glassy margin and the cryptocrystalline pillow interior and highlights the transition in crystallinity away from the glassy margin. This zone is characteristically mottled gray and varies in width from 2 to 20 mm. This zone is commonly overprinted by later orange alteration halos. It is most pronounced in pillow lavas that display a patchy to variolitic texture in the core of the pillow, suggesting that the gray mottling is related to groundmass texture (Figure F29).
6.3. Alteration halos
Halo alteration in Hole U1583F is more complex than in Holes U1559B or U1558D and shows different but similarly variable halo alteration to Site U1560. Halos show greater variation in color, some are multilayered, and some show more diffuse boundaries, but in general the alteration is commonly of lower intensity. Downhole, the area abundance of halos varies at core level, from 11% to 80%, and there is a prominent shift in abundance partway through Subunit 5C at 195.9 mbsf (Figure F30). Above 195.9 mbsf, the average area of a core occupied by halos is 27%, whereas below 195.9 mbsf this increases to 50%. This increase in halo abundance is represented by the increase in abundance of brown and orange halos (Figure F30).
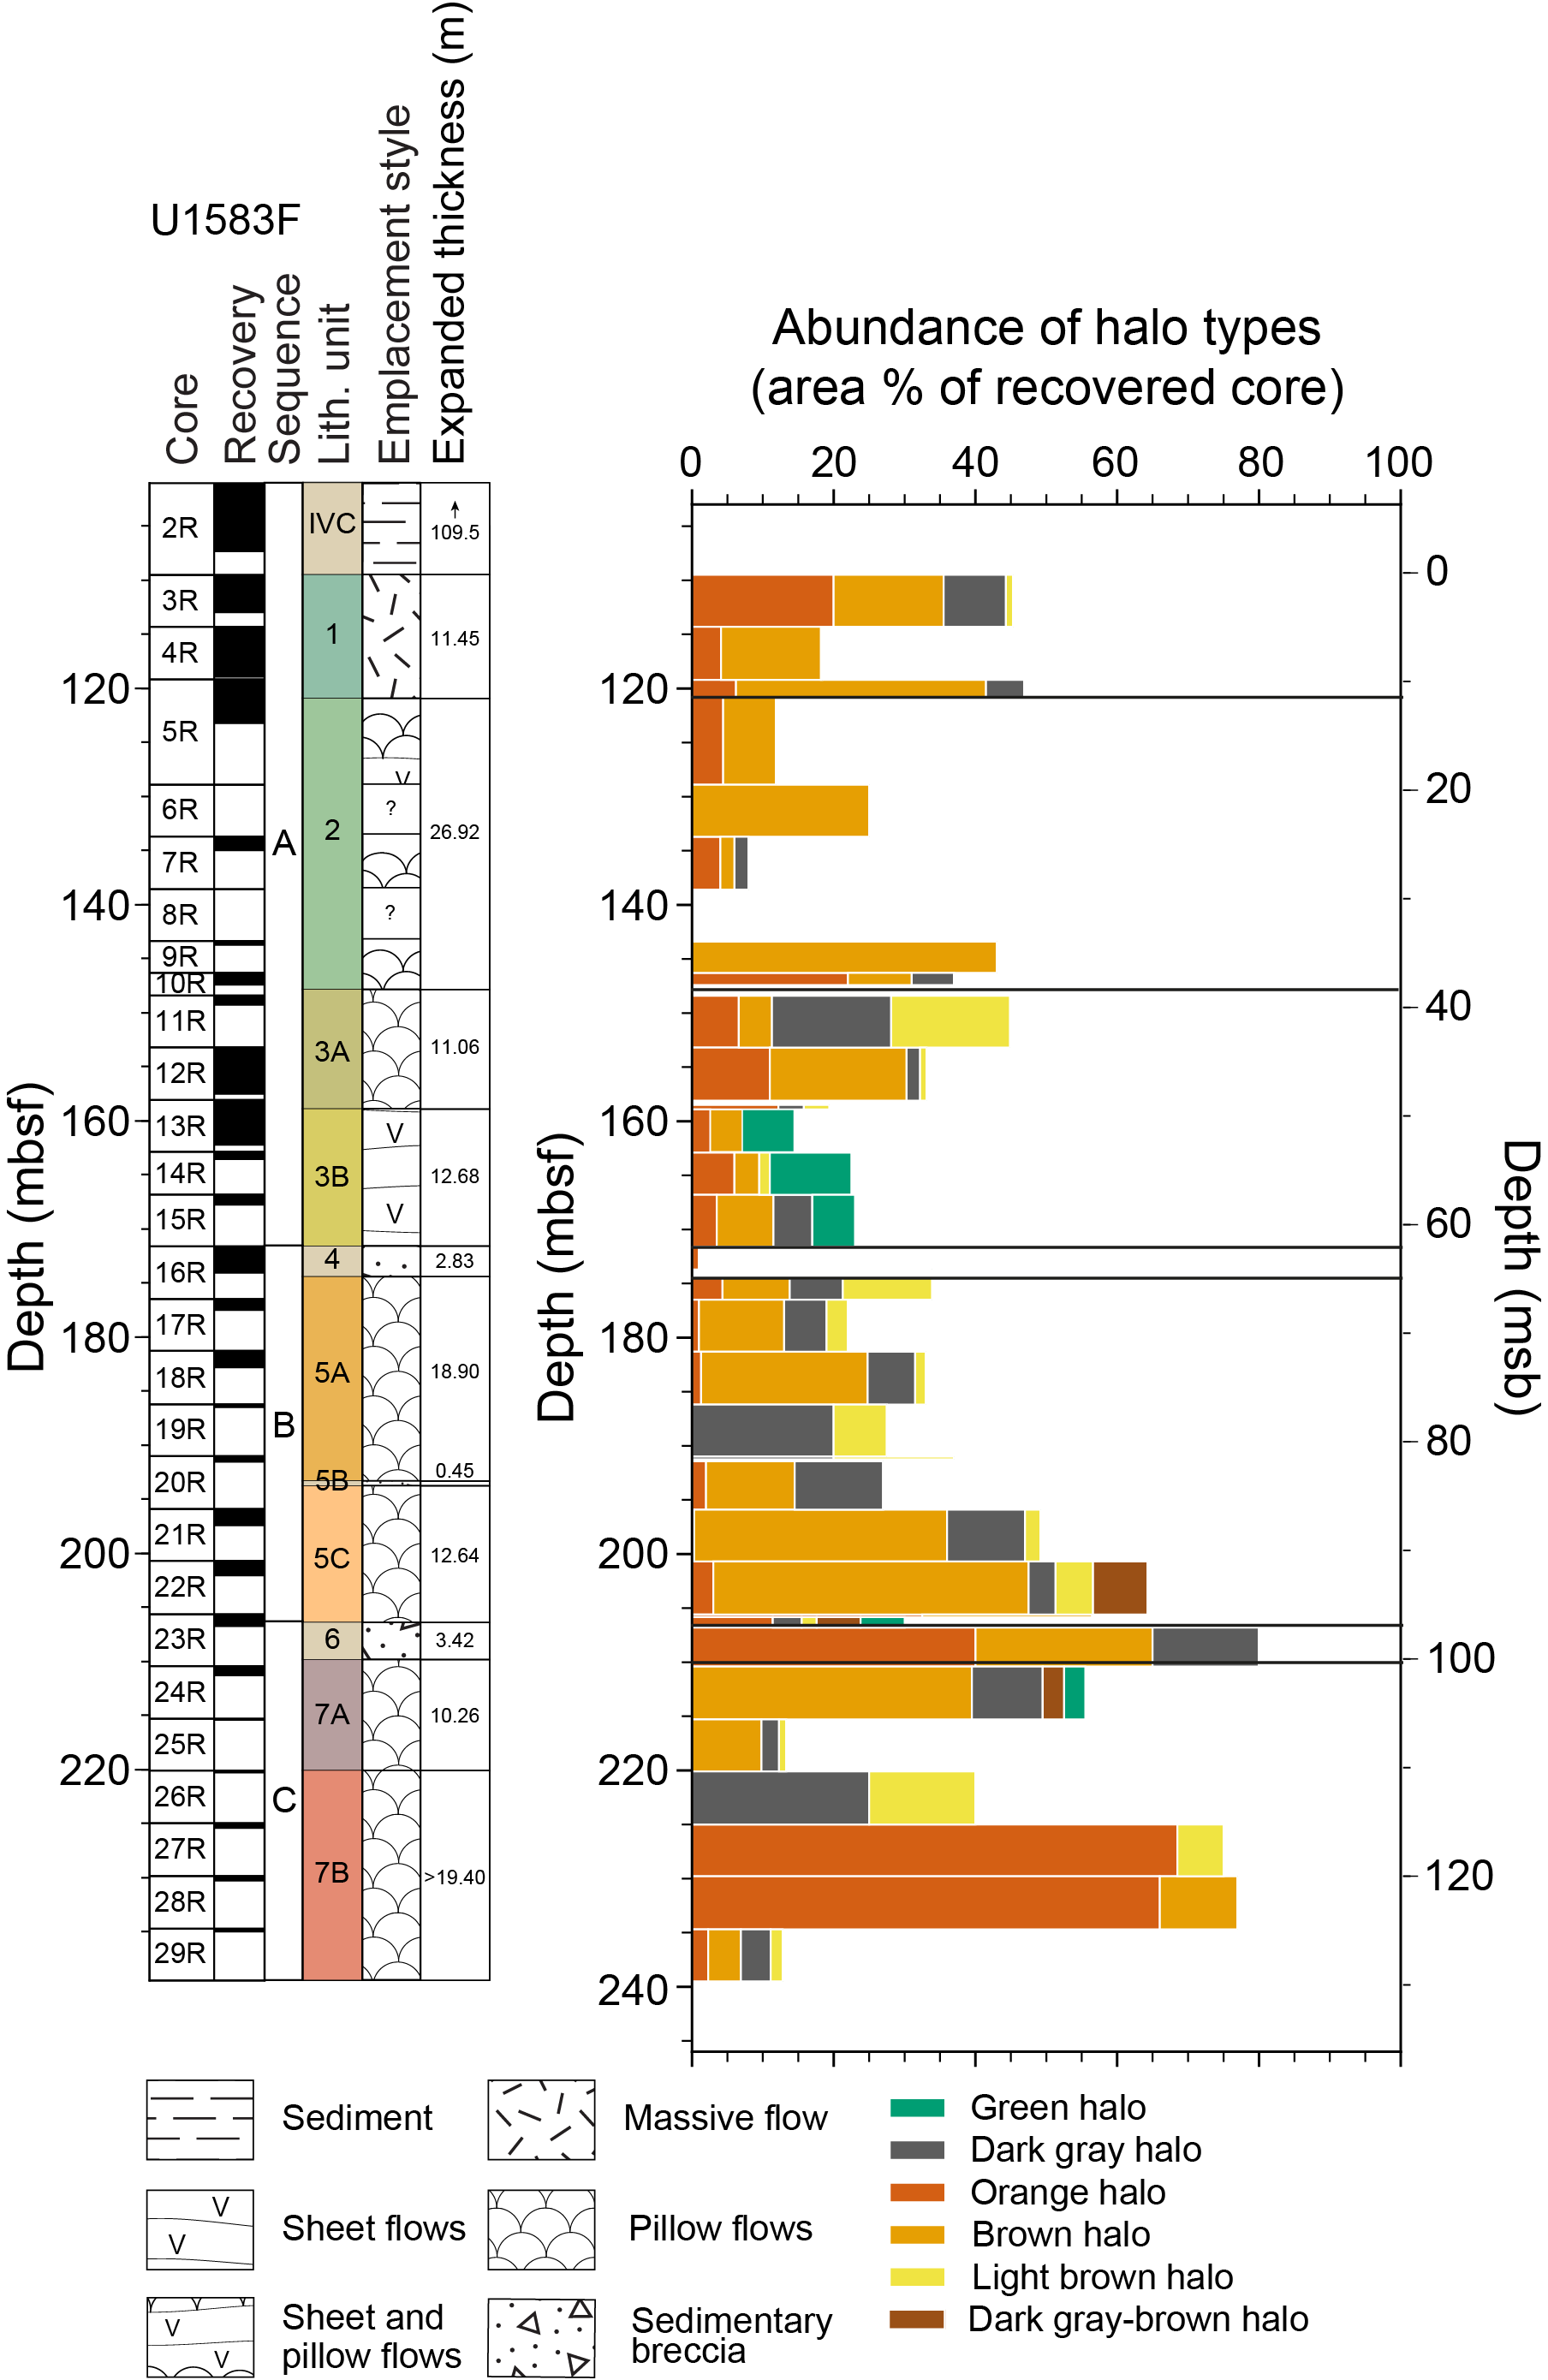
Figure F30. Area abundance of alteration halo types.
6.3.1. Dark gray halos
Dark gray halos are found in most but not all cores (Figure F30) and at core level represent 6.1% of the cut surface. Dark gray halos (GLEY 1 4/N), typical of other holes along the SAT, are present and almost always occur as a single band of halo (average width = 4.3–5.3 mm; maximum = 26 mm; Table T7). The multiple millimeter-sized dark gray halos seen in the other SAT holes (e.g., Hole U1558D) are rarely present in Hole U1583F and only occur in Section 393-U1583F-20R-1. Some dark gray halos also exhibit a distinct color (GLEY 2 4/10B dark bluish gray) in addition to the GLEY 1 4/N seen at other sites.
Dark gray halos occur with many other halo types. They are almost always present with the light brownish gray halos that are common in Holes U1559B, U1558D, and U1560B. Another combination present is the dark bluish gray halo together with orange halos, first appearing in Sample 393-U1583F-10R-1, 104 cm (Figure F31). The dark bluish gray variety of the dark halos also co-occurs in multicolored halos (see Multiple layer halos). In thin section, the dark gray halos have abundant yellow-brown clay as the principal alteration mineral.
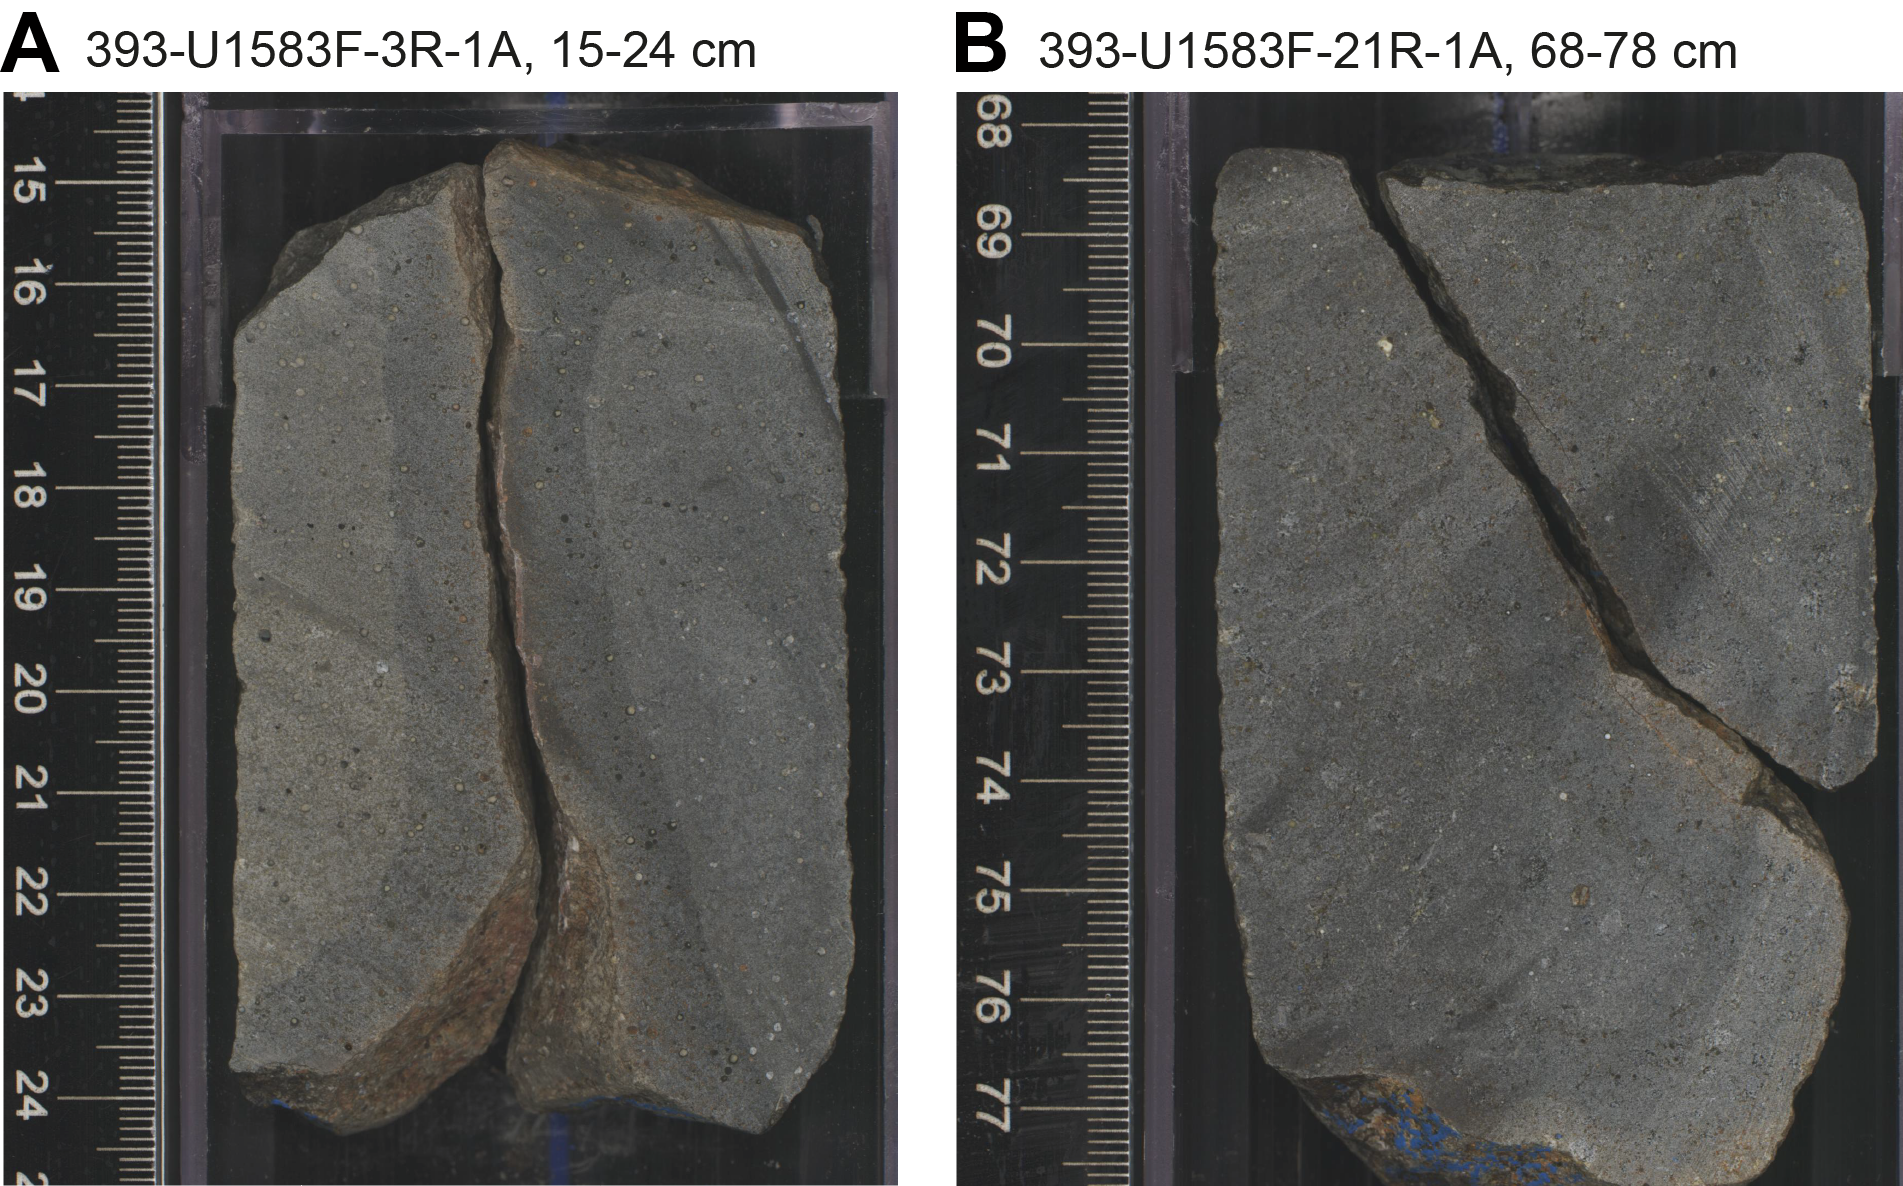
Figure F31. Dark gray halos.
6.3.2. Light brownish gray halos
The light brownish gray halos are present in half of the core intervals but on average occupy only 3% of the area of a core. They are absent between 114.3 and 148.4 mbsf. They are light brownish gray (10YR 6/2) and most commonly occur with dark gray halos (Figure F32). Light brownish gray halos have also developed around vugs.
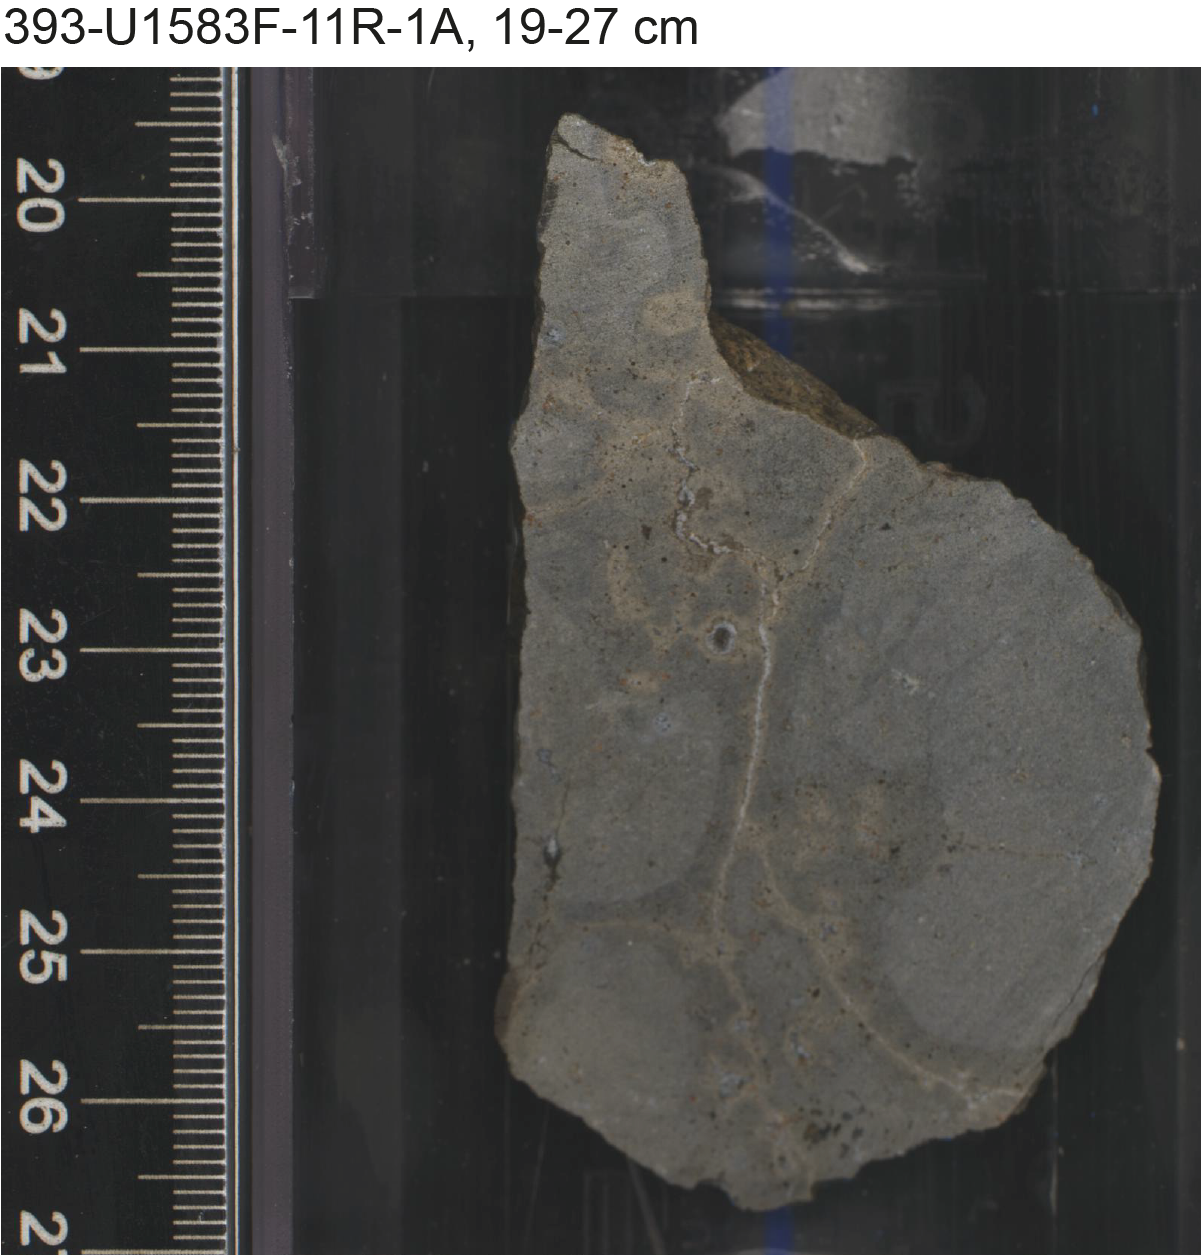
Figure F32. Light brownish gray halos.
6.3.3. Brown halos
Brown halos are present in most cores and show a strong variation in abundance downhole in Hole U1583F. Above 195 mbsf, brown halo abundance is on average 12% of the area of the core, and between 195 and 215 mbsf, brown halo abundance peaks at 24%–48% before decreasing sharply to 0%–11% (Figure F30). The brown halos show a range of colors (7.5YR 5/2 brown, 7.5YR 5/3 brown, 10YR 5/3 brown, 10YR 6/4 light yellowish brown, and 10YR 4/1 dark gray), likely reflecting a range of intensities of replacement of olivine and oxidation of iron (Figure F33). The dark gray variety (10YR 4/1) is only present within the brown halo peak between 195 and 215 mbsf (Figure F31), where it exhibits the strongest brown tone and is interpreted to be the most intense example of brown alteration. This halo type occurs only in discrete pieces that are entirely composed of brown halo and do not have any preserved veins or margins that indicate the origin of the alteration.
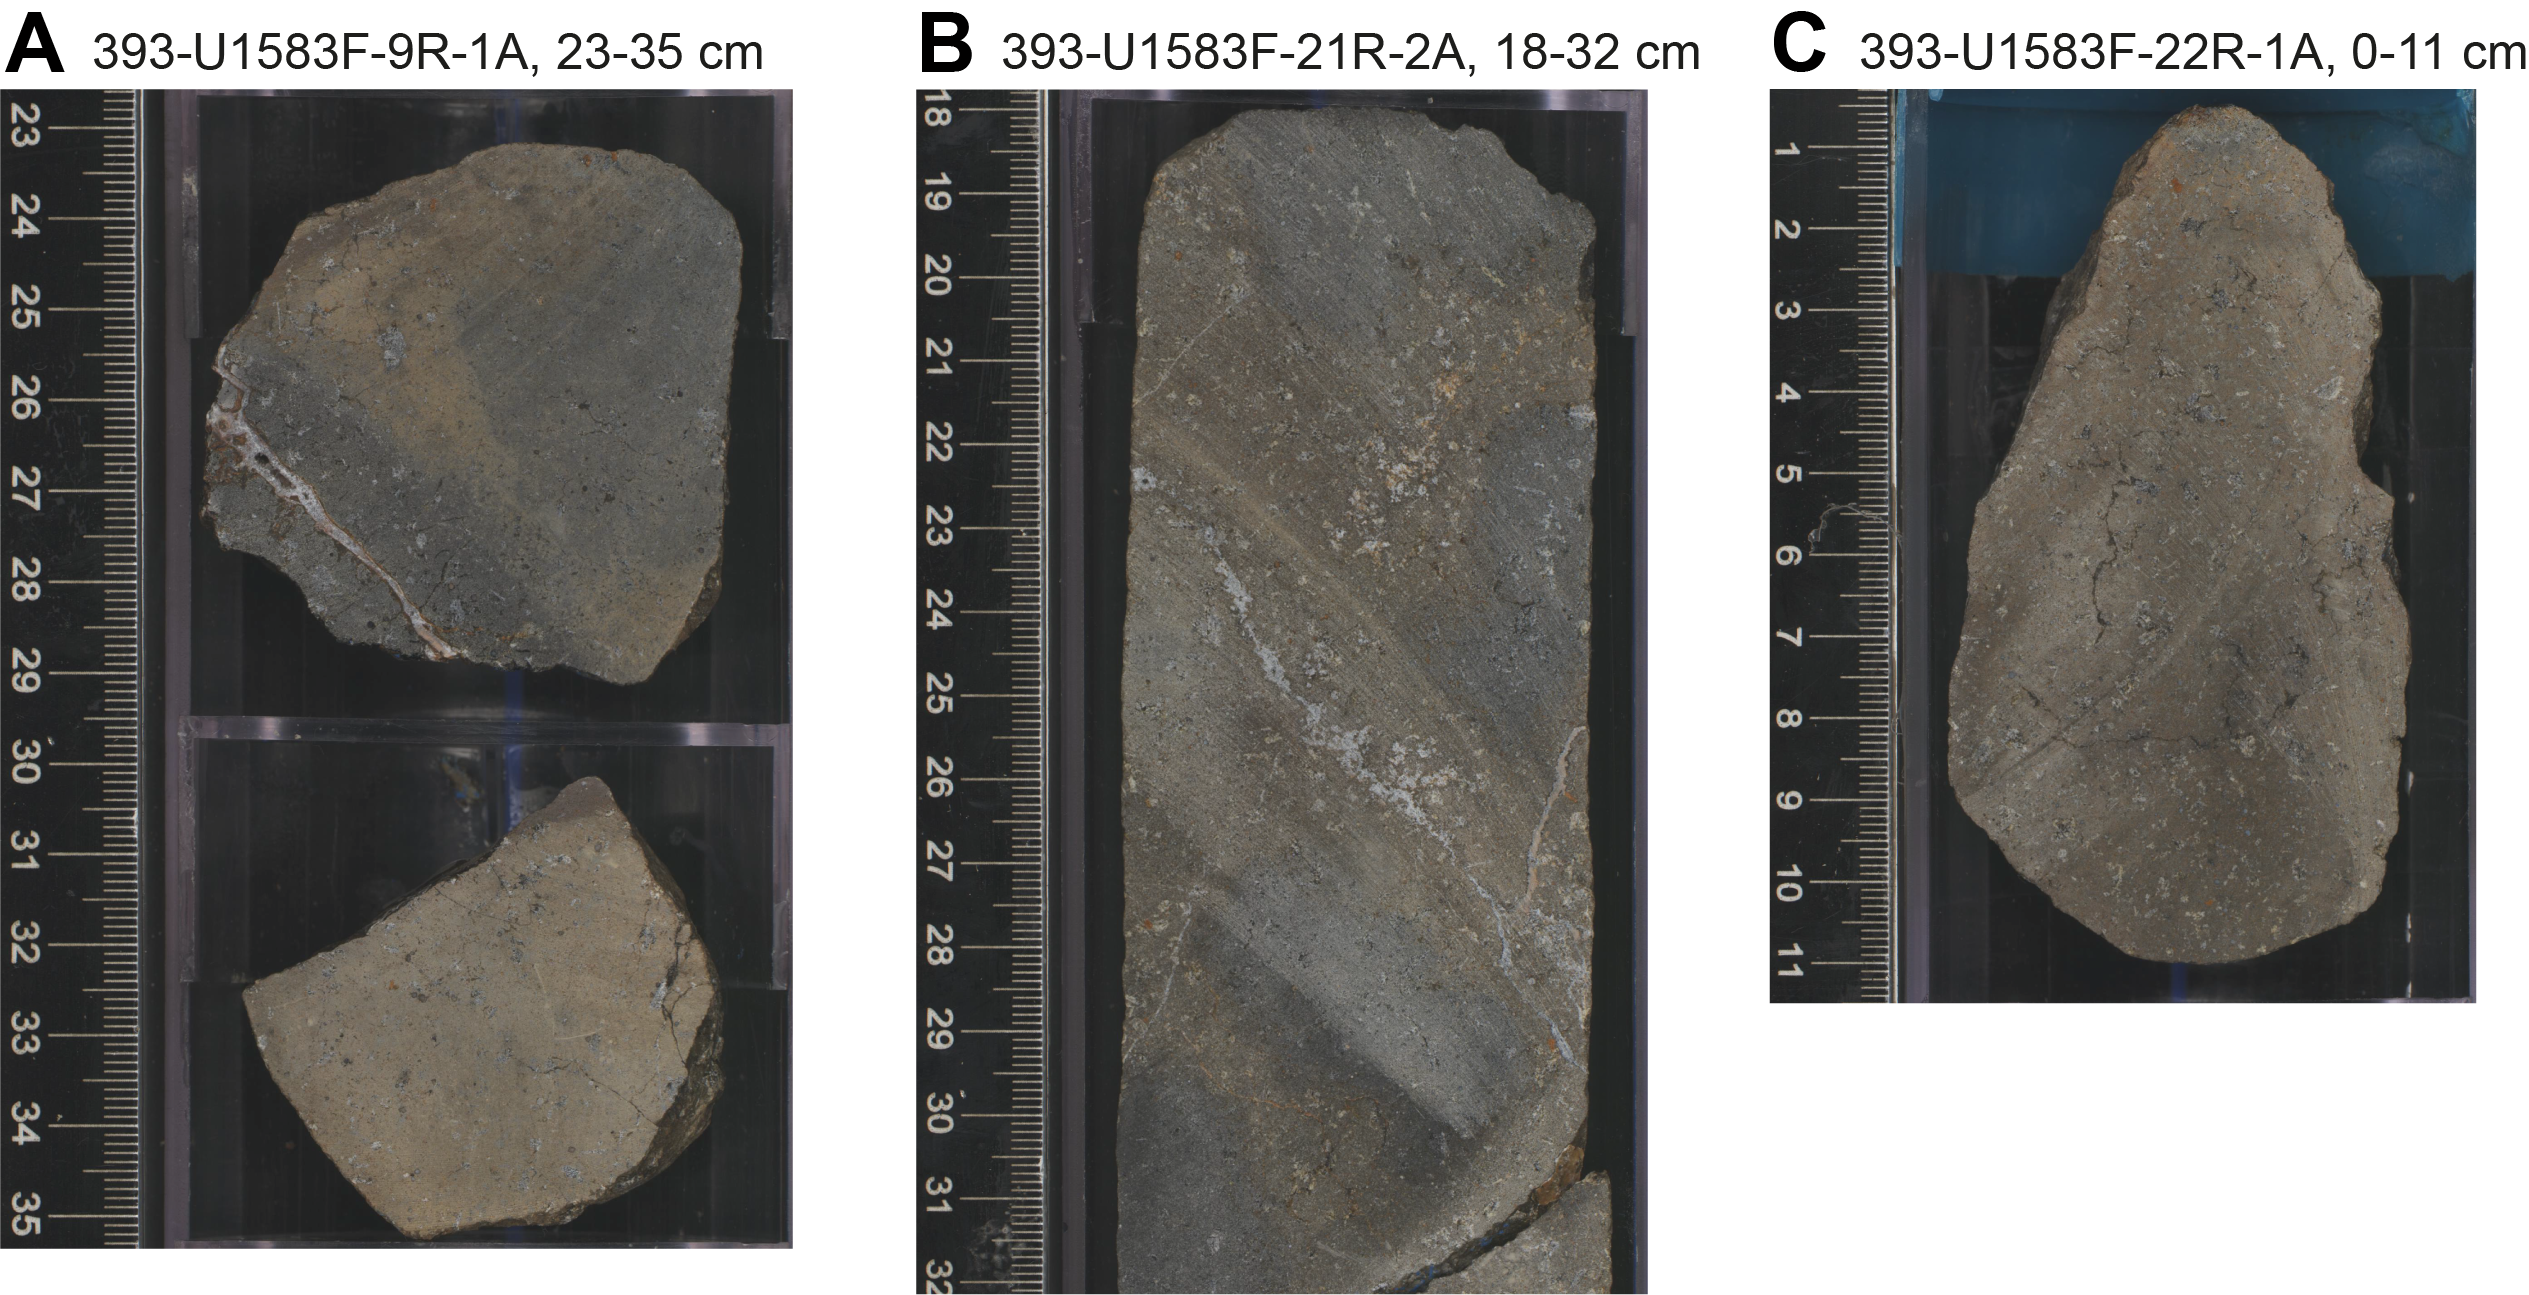
Figure F33. Brown halo types.
When bordering veins that are actually recovered, the brown halos generally occur as a single halo although some display a dark bluish gray outer halo. Brown halos have an average half-width of ~12 mm (Table T7). Brown halos also occur as alteration zones extending from chilled margins into the groundmass of host lava flow. In this setting, the halos are thicker (up to 40 mm) and show both sharp and gradational boundaries with the background alteration.
The brown halos host vesicles that are filled by either multiple minerals (e.g., clay + Fe oxyhydroxide) or clay of different colors such that the vesicles display concentric layering. Common pairings of vesicle fill include lining of Fe oxyhydroxide with a green clay center or a variably colored clay lining with a carbonate central filling.
6.3.4. Orange halos
Orange halos occur in most cores, but they have the most variable abundance of all halo types in Hole U1583F (Figure F30). Orange halos show a peak in area abundance in the first basement core (393-U1583F-3R) before remaining at relatively low abundances (0%–22%, mostly <10%) to 205 mbsf (the top of Unit 6), below which the abundance of orange halos is higher, and this style of halo is dominant in Subunit 7B (up to 68.5% of a core). The orange halos are either reddish brown (5YR 5/4) or reddish yellow (5YR 6/6), with the latter shade more abundant below 205 mbsf. The orange color originates from the formation of clays and Fe oxyhydroxides. The orange halos, similar to the brown halos, occur bordering veins and vugs and as alteration zones extending from chilled margins (Figure F34). When bordering recovered veins, they have an average half-width of 4.7 mm and are reddish brown (5YR 5/4) (Table T7). These vein-related orange halos appear diffuse, with the majority of the halo characterized by low intensity of replacement. However, a very prominent and sharp outer edge shows up clearly on a wet surface. Reddish brown halos also occur in the multihalos (see Multiple layer halos).
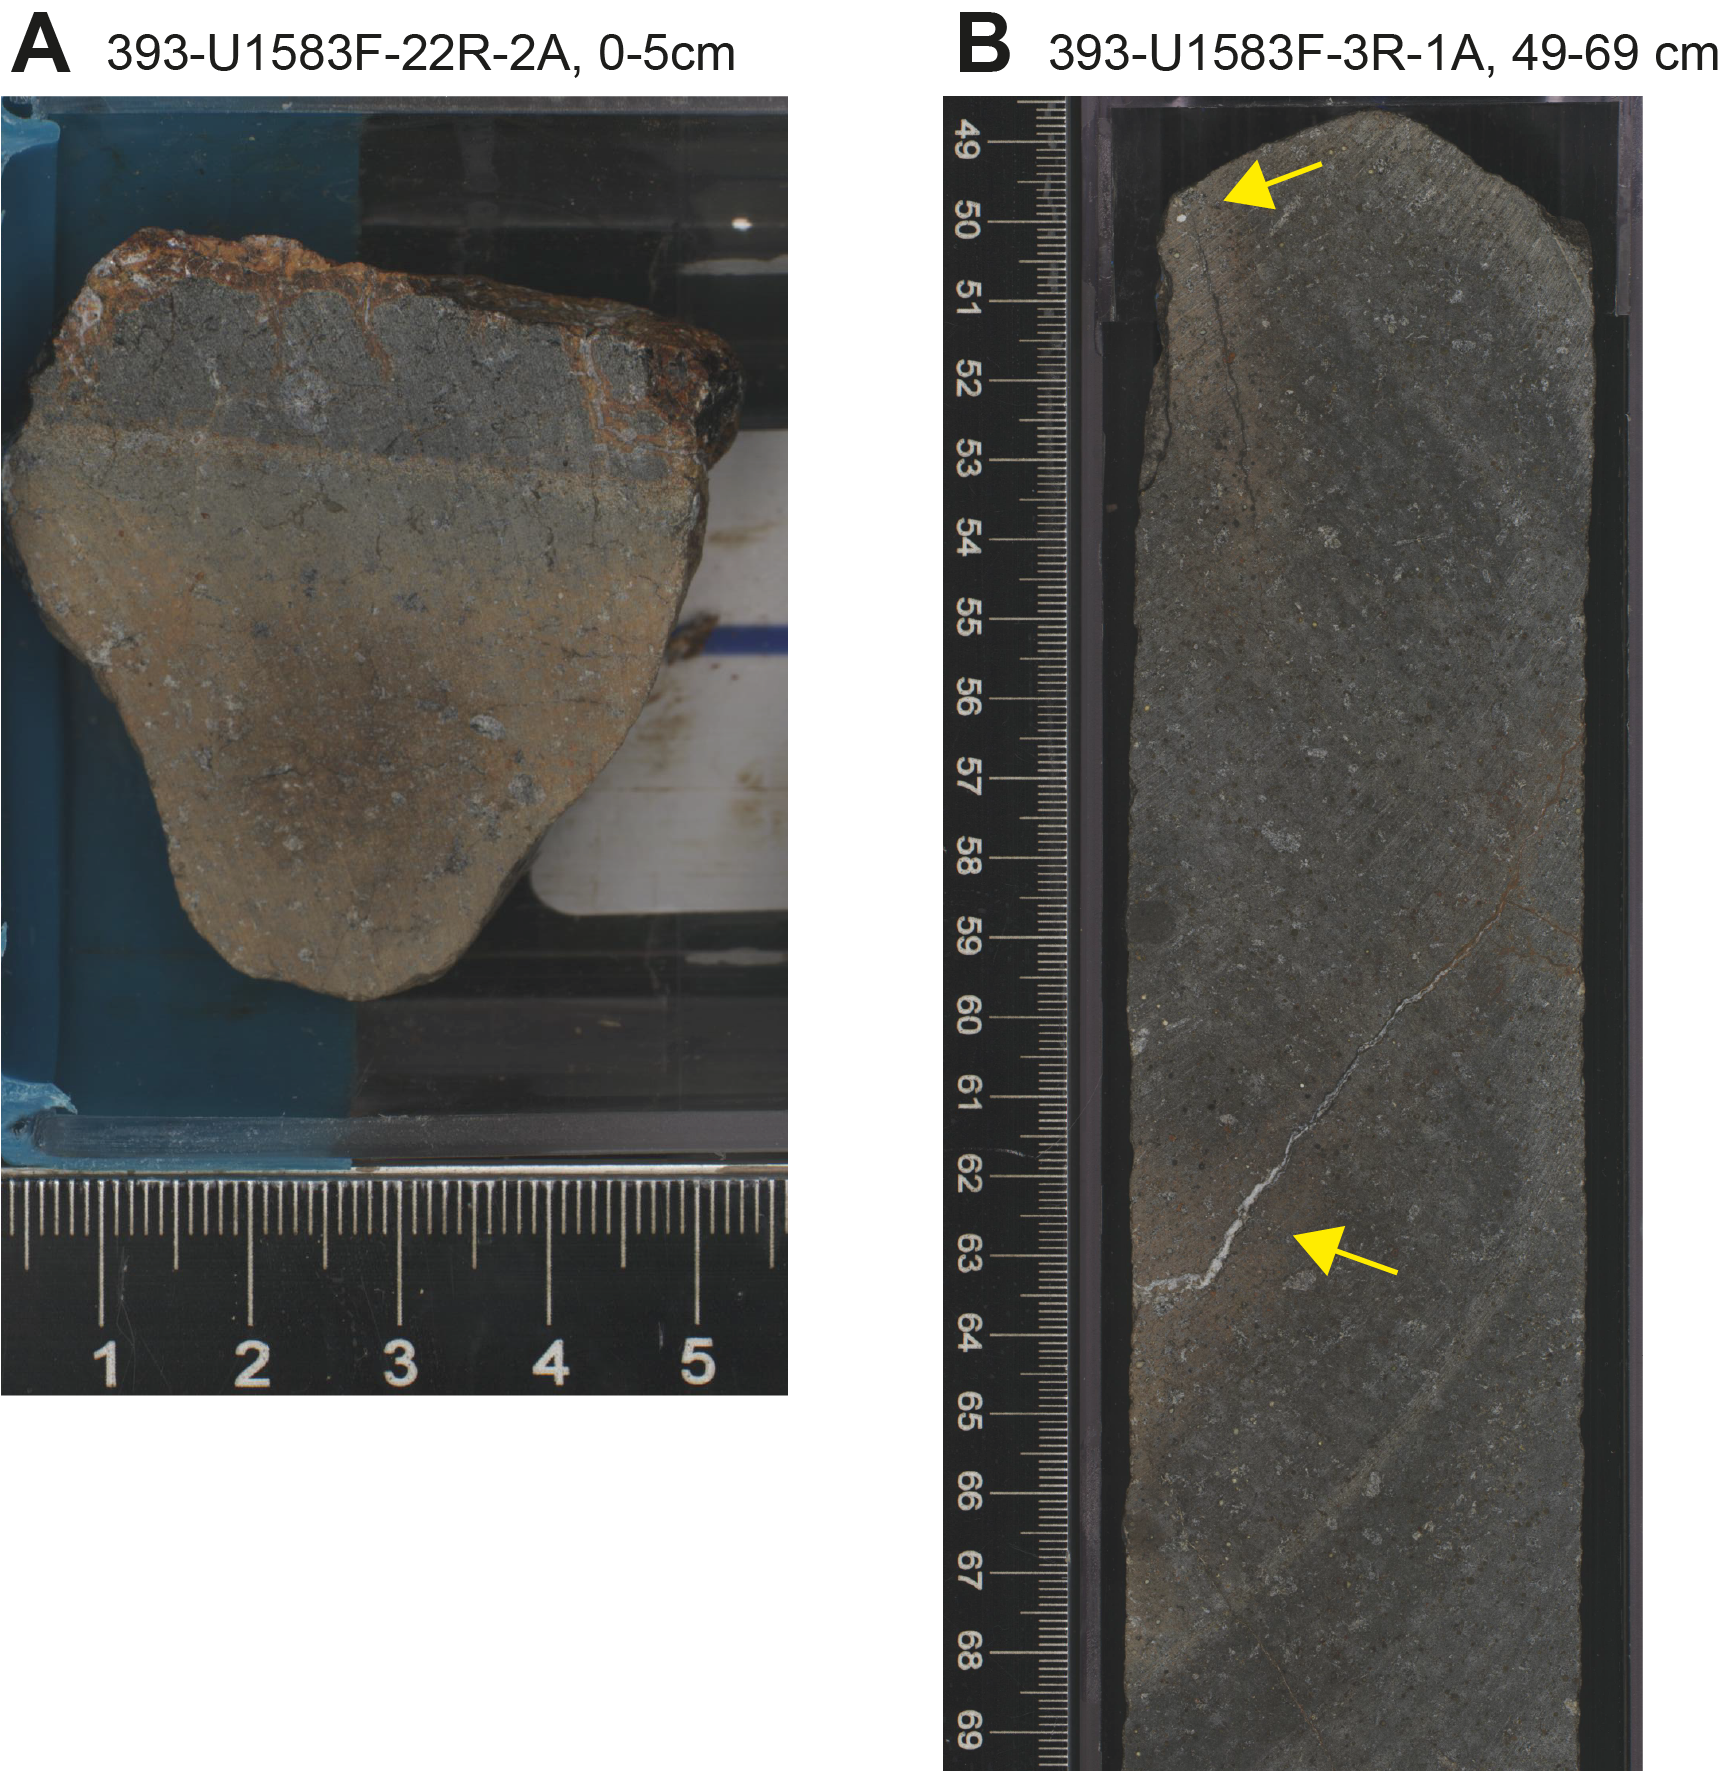
Figure F34. Orange halo types.
Vesicles are generally more filled in orange halos, typically with Fe oxyhydroxides ± clays partially to completely filling the vesicles. Where more than one mineral fills a vesicle, the Fe oxyhydroxide forms the lining, indicating early formation.
6.3.5. Multiple layer halos
Multiple layer halos, or multihalos, are defined as halo color combinations that always occur together, typically as narrow bands. The colors present in multihalos mostly fall into halo colors (orange, brown, and dark gray) seen elsewhere in Hole U1583F, with the exception of greenish gray halos that are only present in multihalos. Hole U1583F has multihalos with 3 or 4 different halo colors; some of these combinations are unique to this hole. For example, dark bluish gray–reddish brown halos occur throughout most of the hole, most commonly the reddish brown forms the inner halo but some reversed examples exist. In a few examples, the reddish brown forms 2 layers separated by a band of dark bluish gray (Figure F35). In contrast, some of the multihalo types are found within specific zones in Hole U1583F. The multihalos of greenish gray–reddish brown–light yellowish brown–dark bluish gray halos occur mostly in the sheet flows of Subunit 3B (158–171 mbsf). These halos most commonly border veins that have variable mineral fillings along the length of the vein, from green clay to Fe oxyhydroxide ± clay rich compositions. These veins have sharp boundaries between these compositional changes that can be traced around the core to mimic the halo boundaries. Similar to the reddish brown halos described above (see Orange halos), a key characteristic of these multilayered halos is that they are diffuse for most of the halo but have sharp boundaries where the replacement to various clay ± Fe oxyhydroxides is concentrated. The secondary minerals creating the various colors are best displayed in the sequential fill of vesicles. As expected, the greenish gray halos host green clay filled vesicles and the redder the halo the more yellow-orange clay + Fe oxyhydroxide fills vesicles. In interval 393-U1583F-13R-2, 117–132 cm, there is a multihalo around a carbonate + Fe oxyhydroxide vein that is locally overprinted by light yellowish brown halos, indicating multiple phases of fluid/rock reactions (Figure F35).
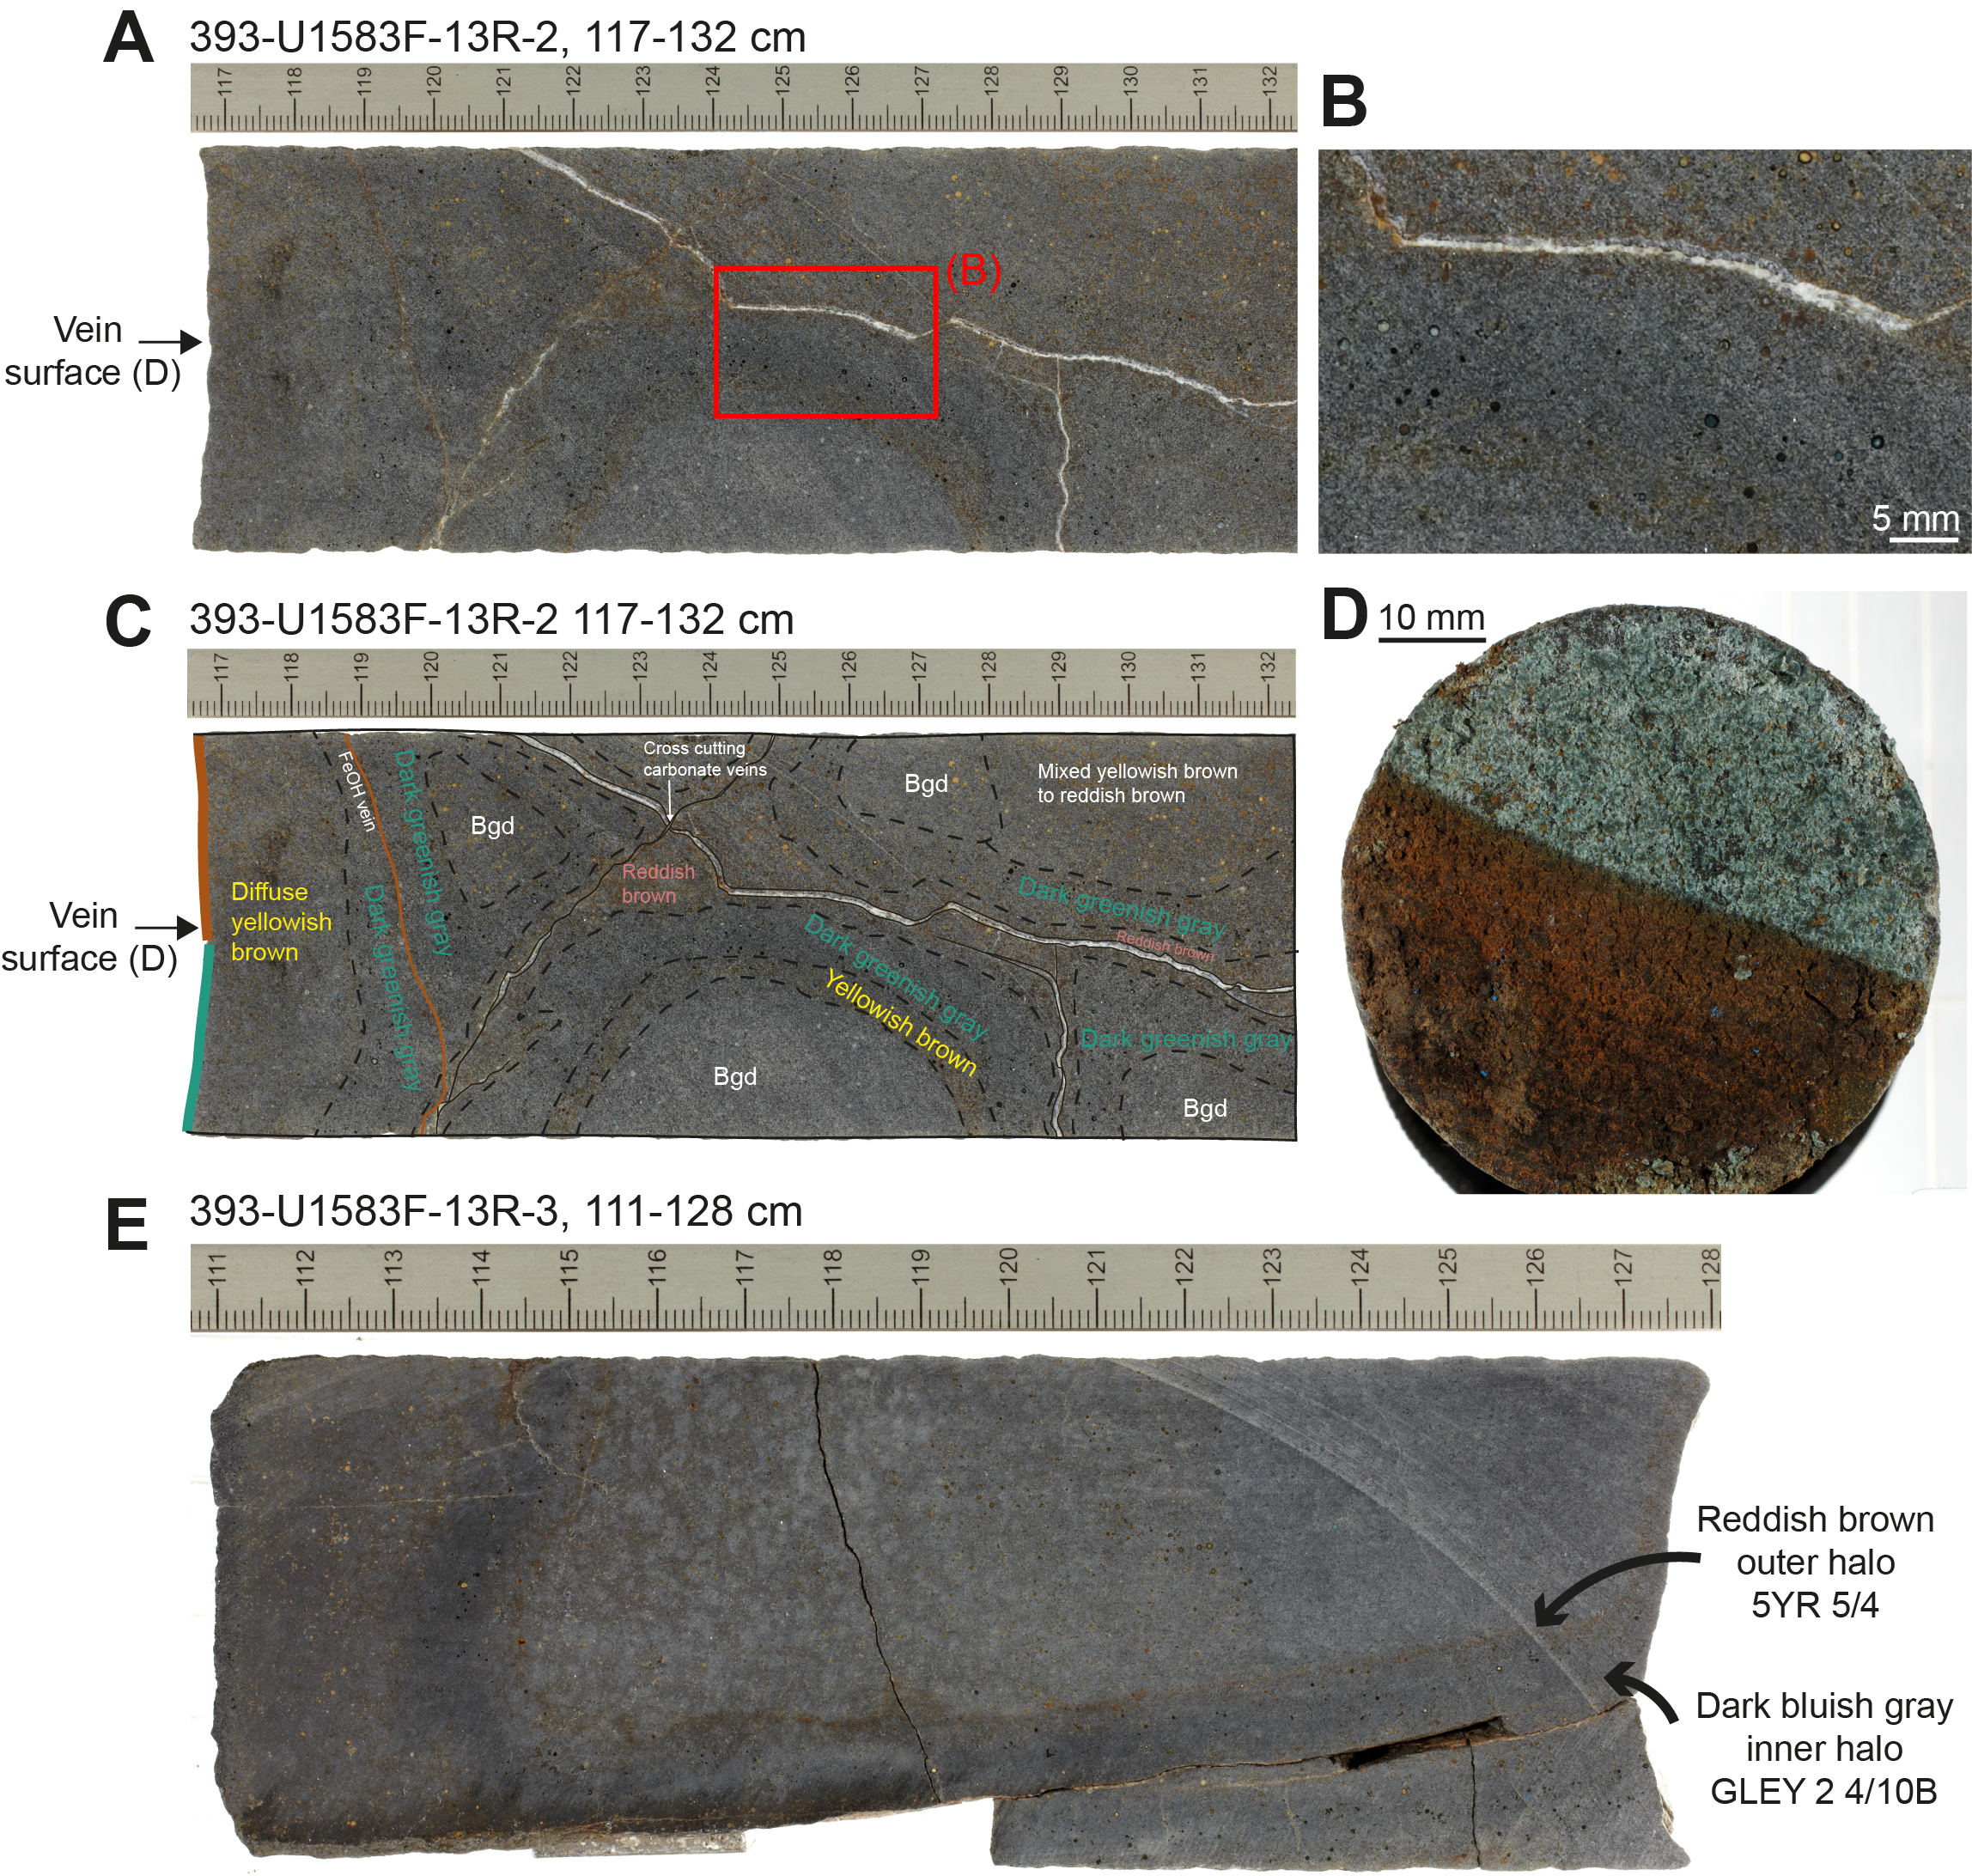
Figure F35. Multihalo types.
6.4. Breccia
Breccia was recovered in two main units in Hole U1583F (Units 4 and 6), with smaller occurrences in Subunit 5B (Figure F26). They are interpreted to represent paleoseafloor horizons (see Igneous petrology). These breccias are fragmented rock types that have undergone multiple stages of fluid/rock reaction and because of their high porosity, likely act as important loci for fluid/rock exchange in the uppermost basement. The breccias in Hole U1583F contain previously hydrothermally altered clasts including abundant volcanic glass, variable matrixes of indurated calcareous sediment and comminuted rock, and cements of calcium carbonate and/or zeolites. They also preserve evidence of postformation hydrothermal alteration by the presence of overprinting hydrothermal veins, commonly filling open space.
6.4.1. Clast alteration: basalt
The basaltic clasts in the Hole U1583F breccias have all undergone hydrothermal alteration to varying extents, and based on the variability of alteration and the truncation of alteration halos, this alteration is interpreted to predate the formation of the breccia (Figure F36). The clasts contain a mixture of background alteration (GLEY 1 5/N or 2.5Y 3/1) and almost the full spectrum of alteration halos recovered in Hole U1583F (dark gray, light brownish gray, brown, and orange). The only halo type not observed in breccia clasts are multihalos. The ratio of background to halo within clasts is highly variable from 80:20 up to 10:90. The overall intensity of alteration within the basaltic clast is estimated between 20% and 60%, reflecting the large range in background:halo ratio. The basaltic clasts contain vesicles variably filled with clay ± carbonate ± Fe oxyhydroxides, assemblages that are also consistent with the rest of Hole U1583F. In some places, fragments of carbonate vein are present within clasts but whether such veins crosscut or predate the matrix is unclear.
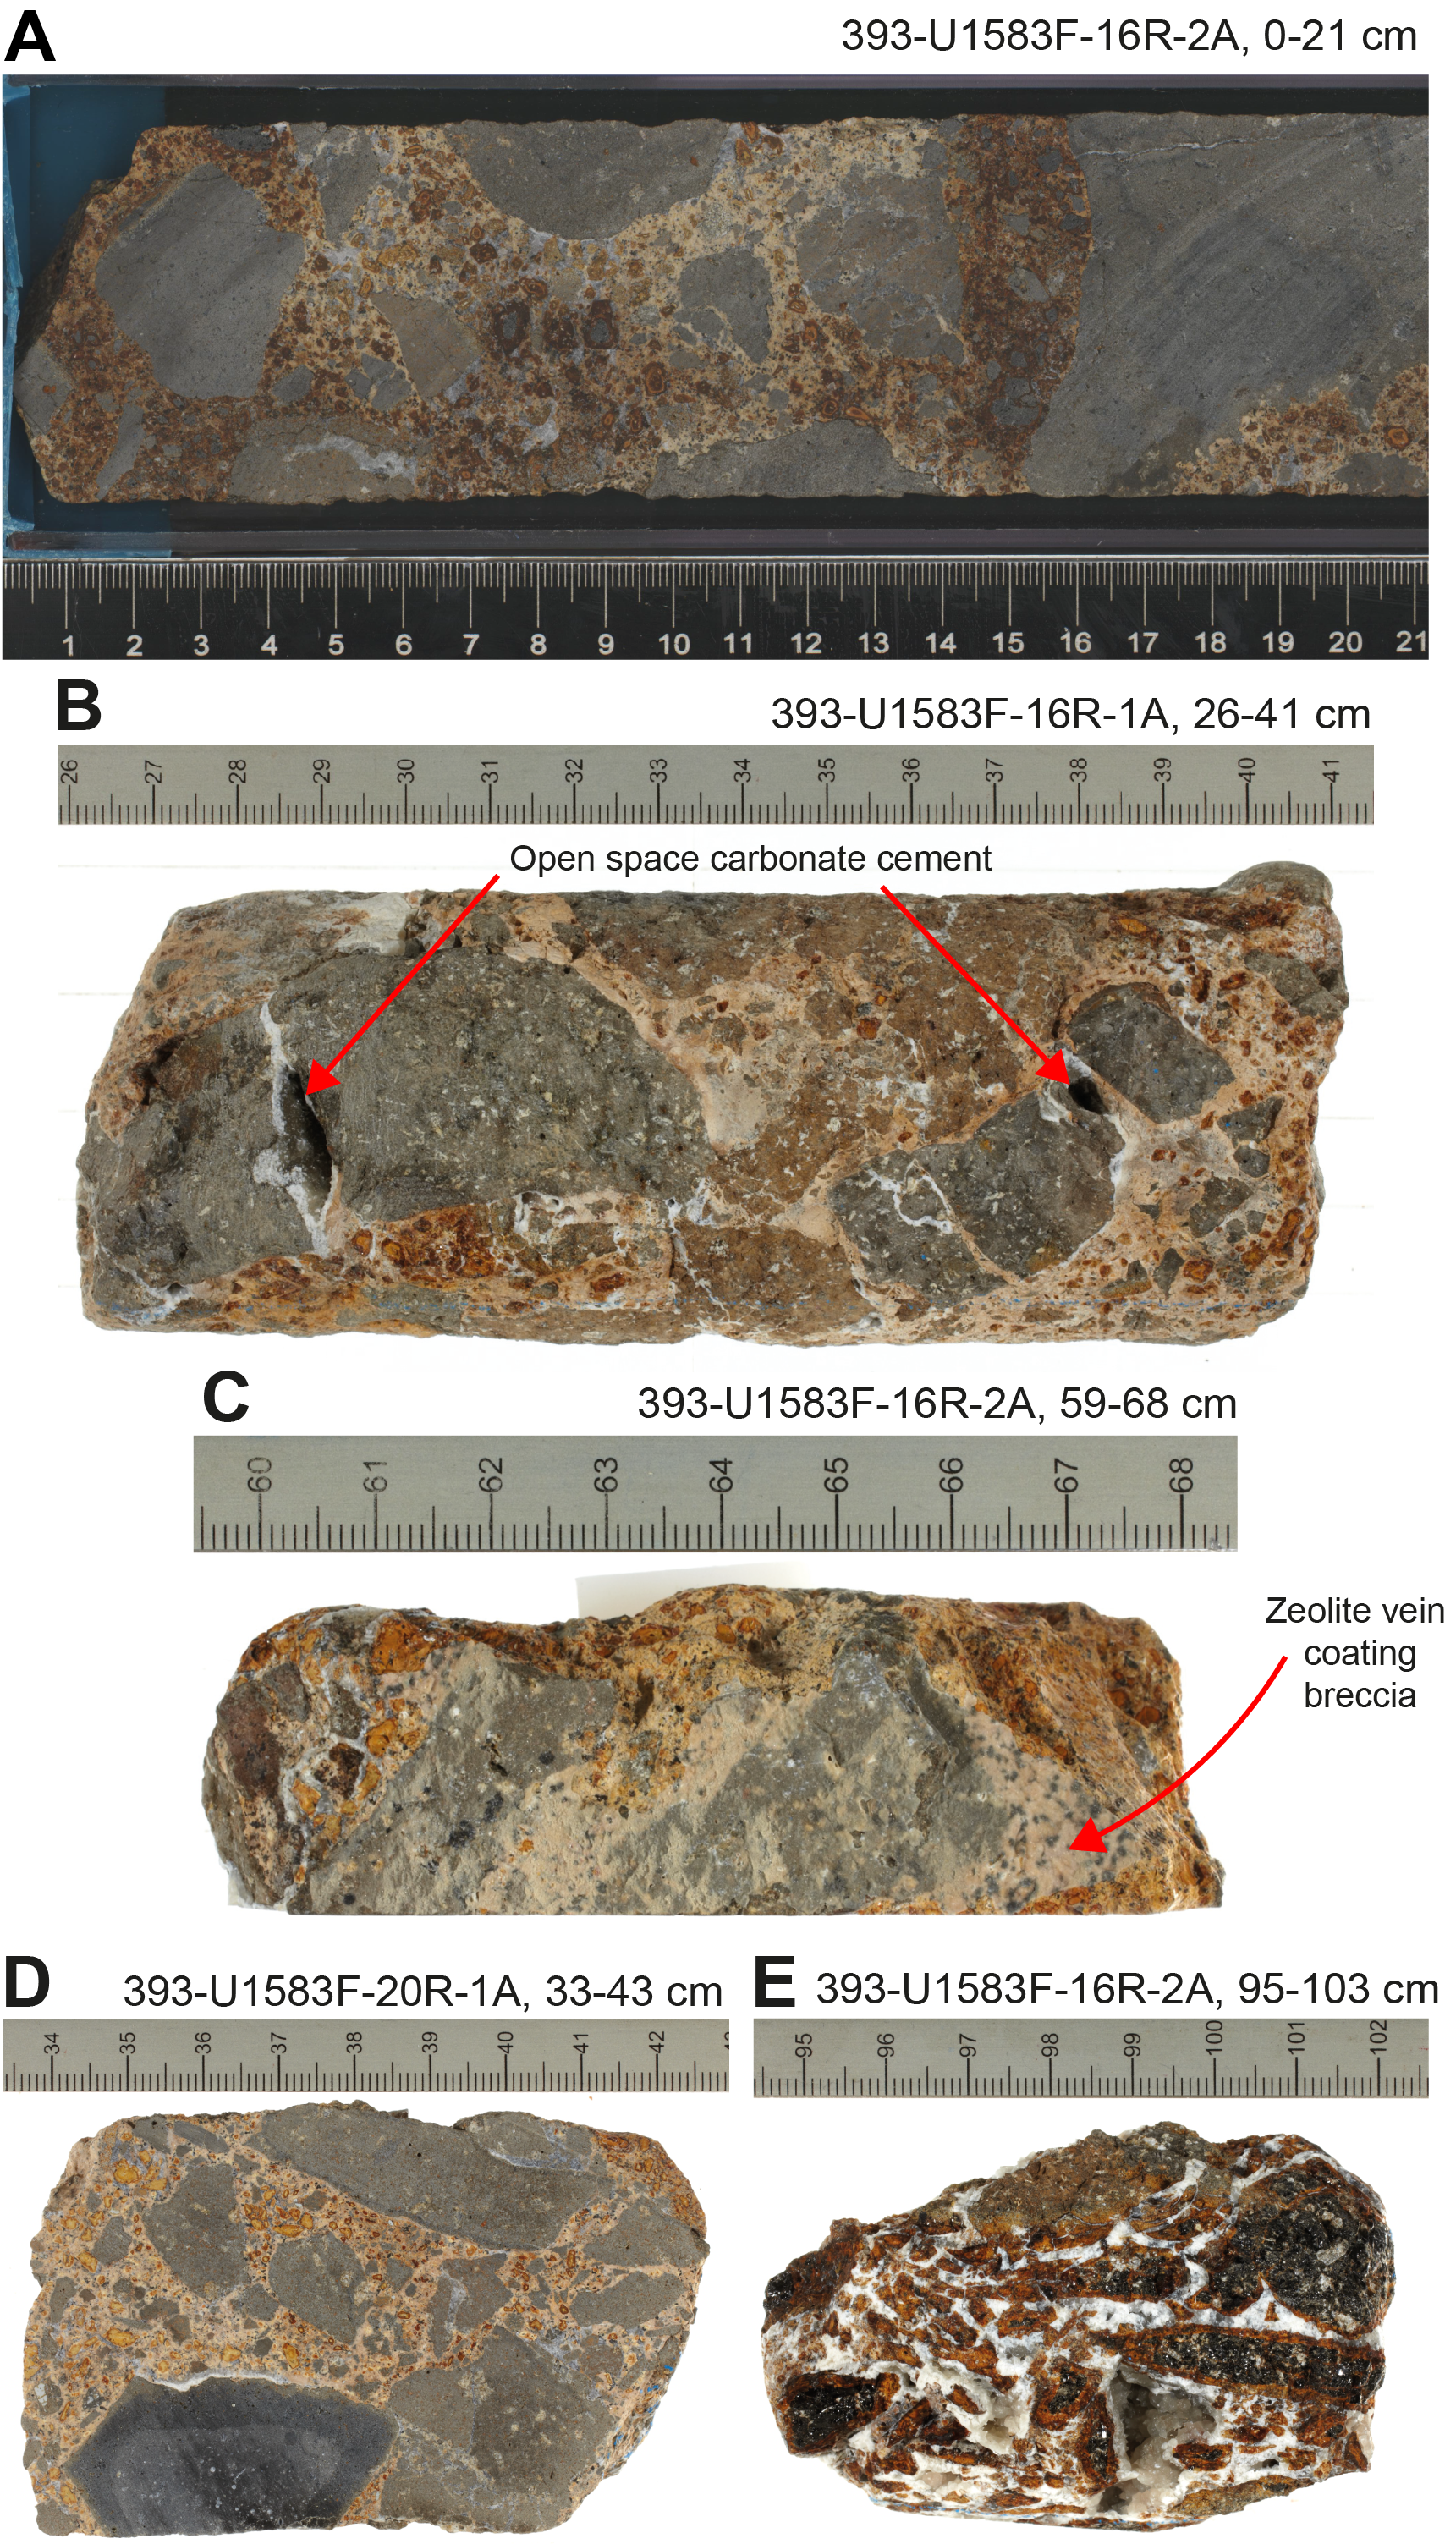
Figure F36. Breccias.
6.4.2. Clast alteration: volcanic glass
Clasts of volcanic glass range from <1 mm up to 20 mm, and the extent of alteration of the glass to clay minerals is broadly correlated with clast size. The larger glass clasts typically display 1–2 mm wide alteration rims (5YR 5/4 reddish brown) and preserve at least some fresh glass in the core of the clast. The smaller glass clasts are completely replaced by clay minerals of varying colors (5YR 5/8 and 5YR 4/6 yellowish red and 10YR 7/6 yellow) (Figure F36).
6.4.3. Matrix alteration
The matrix in Hole U1583F breccias is a mixture of predominantly indurated calcareous sediment with minor fragments of volcanic glass. These altered sediments display a range of colors from white to pink and textures from clastic to micritic (see Igneous petrology). In thin section, there is strong evidence for the recrystallization of the sediment and dissolution and reprecipitation of biogenic calcareous and siliceous materials (Figure F37).
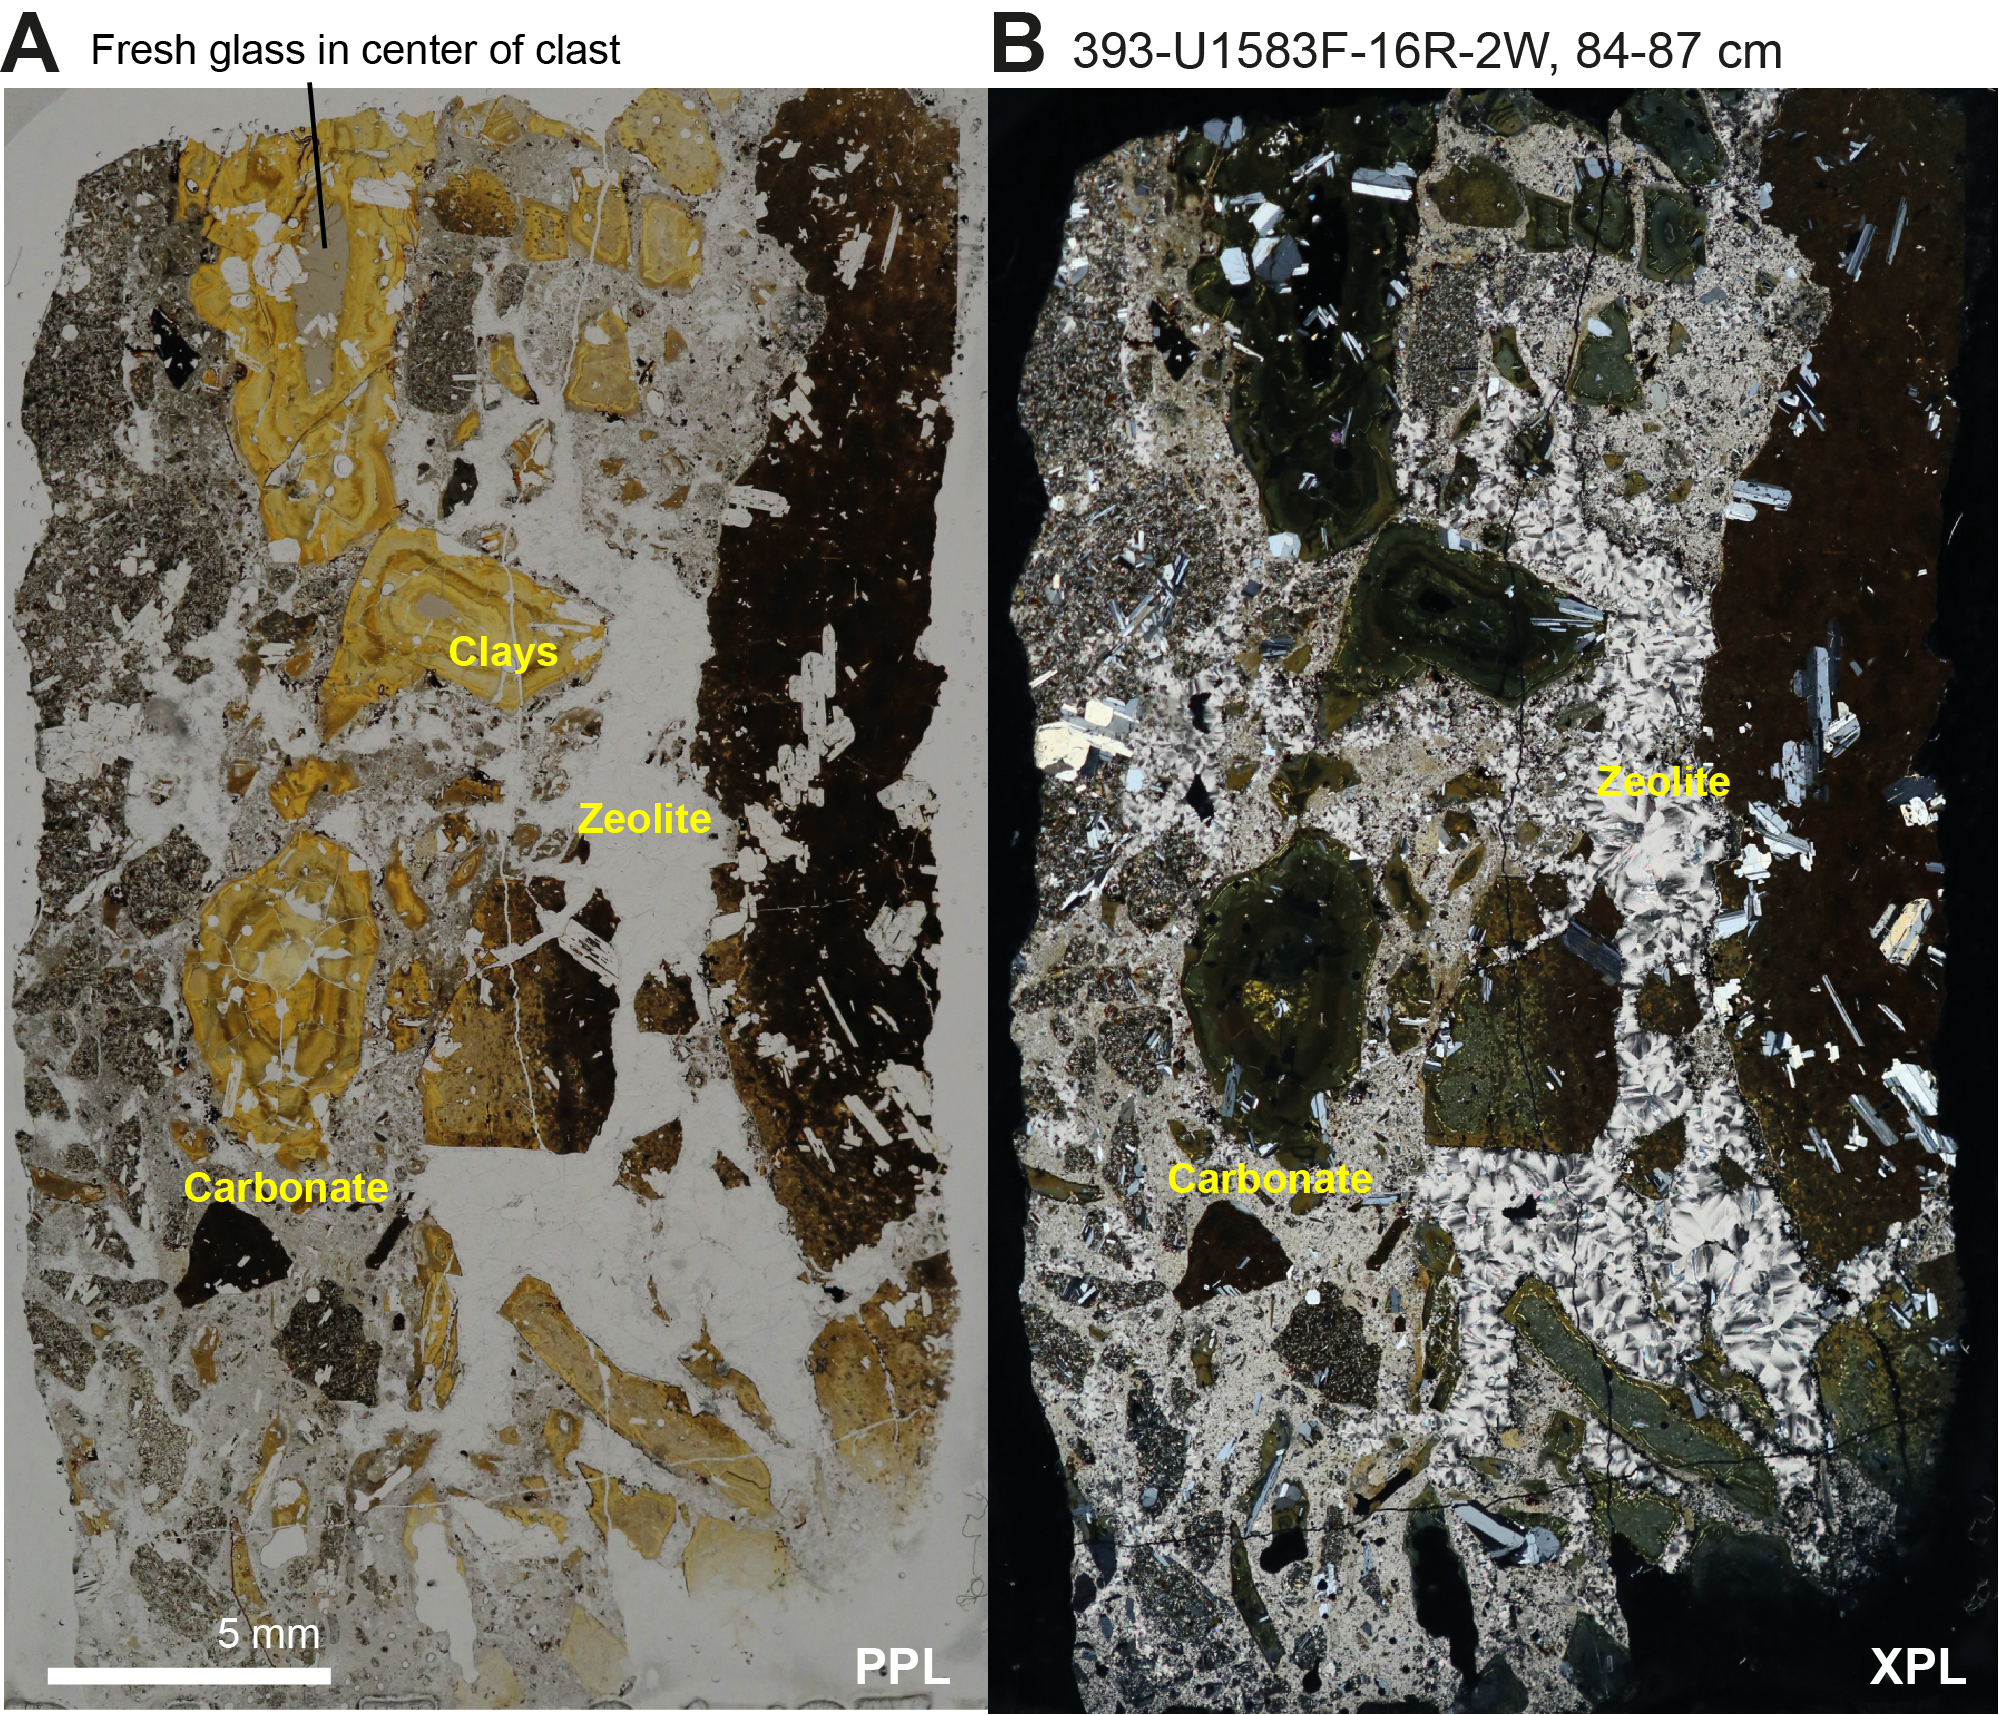
Figure F37. Altered glass clasts extensively replaced by clay minerals.
6.4.4. Cement
Secondary minerals (calcite and phillipsite; see Table T8) have precipitated in the pore space between clasts and the matrix. Residual open space may represent dissolution cavities or original porosity. In most breccia pieces, the volume of cement is low and is typically less than 5% of the volume of the interval. There are some examples where the cement is more abundant (e.g., interval 393-U1583F-16R-2, 94.5–103.5 cm; Figure F36), and in these cases it is dominated by calcite. Zeolites also occur in some cements as thin (<1 mm) coatings on the external surfaces of breccia clasts, indicating that the formation of zeolites occurred over a prolonged time, spanning syn- and postbreccia formation.
6.5. Veins
Hydrothermal veins occur throughout Hole U1583F and provide a record of the precipitation of secondary mineral assemblages from seawater-derived hydrothermal fluids. The mineralogy and physical characteristics of 1144 veins were logged, including structural orientations for 429 veins. A total of 363 veins are associated with at least a single alteration halo. The width of veins ranges 0.1–7 mm and generally yields a geometric distribution, with a median value of 0.2 +1/−0.1 mm (1σ equivalent), mean of 0.4 mm, and mode of 0.1 mm (Figure F38). Downhole total vein density varies between 10 and 44 veins/m of recovered core with a median and mean of 28 veins/m (Figure F39). The volume of core occupied by veins is 1.3% (Figure F40).
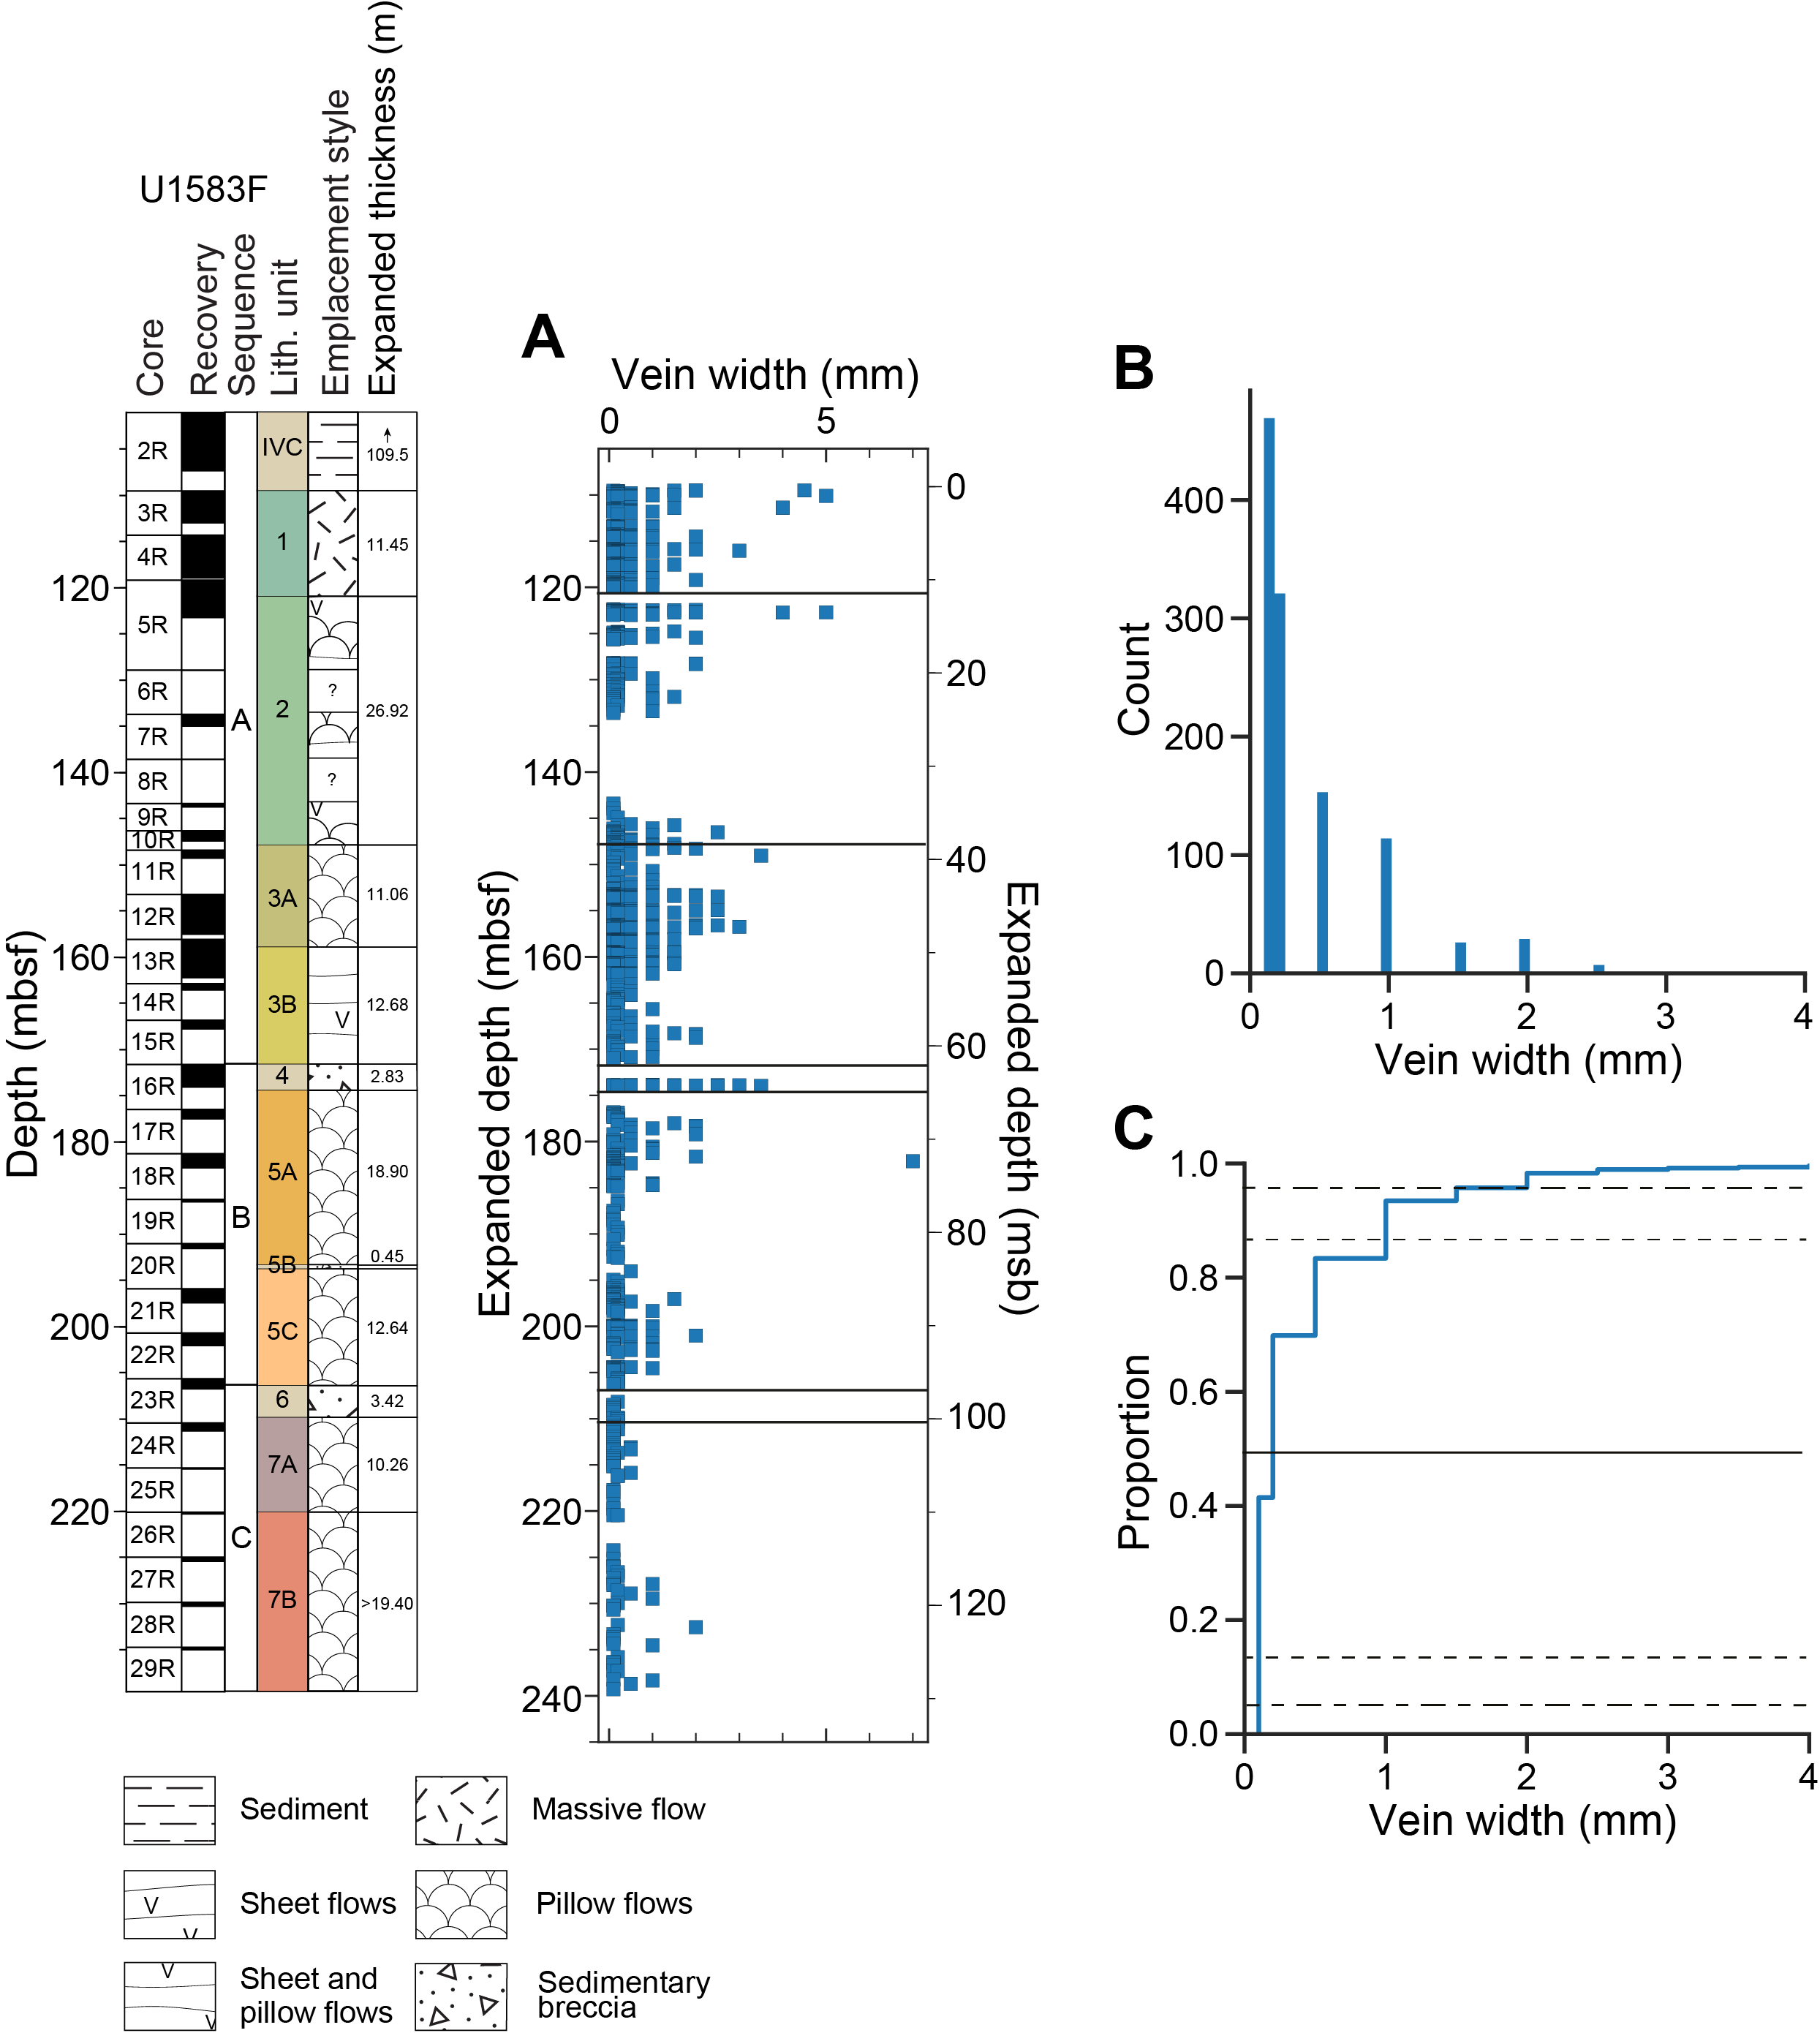
Figure F38. Vein width characteristics.
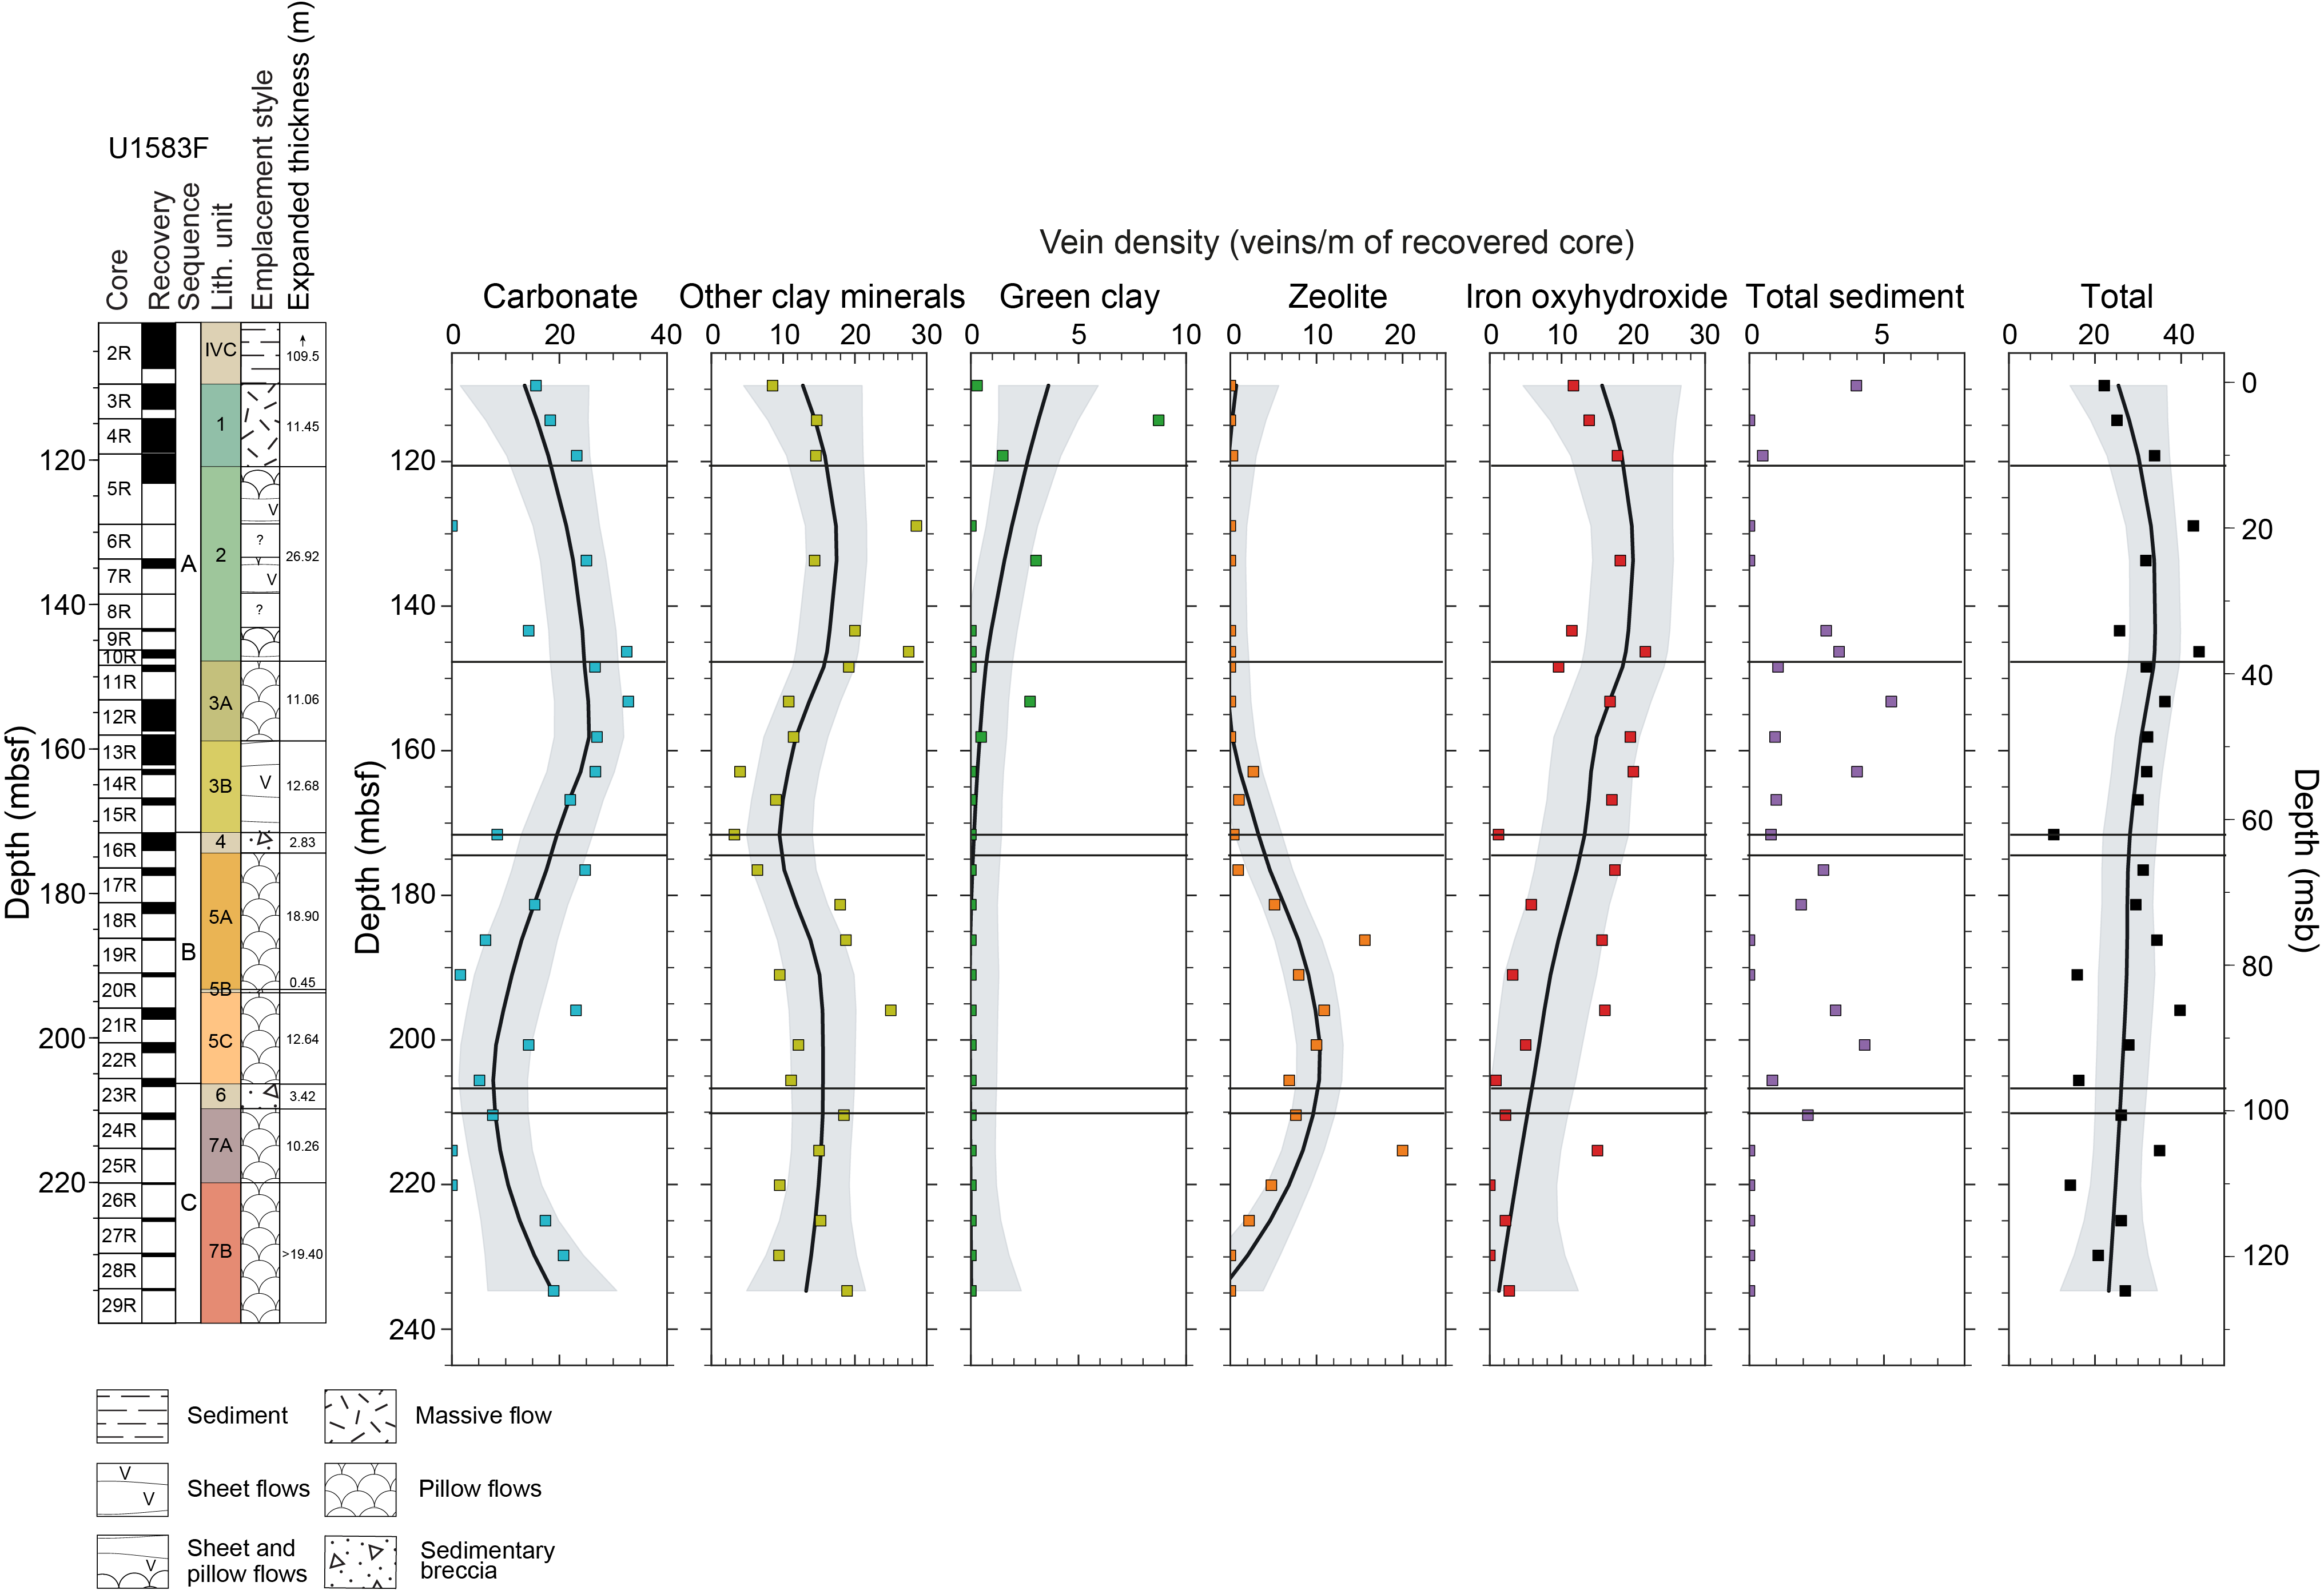
Figure F39. Vein density per meter normalized to core recovery.
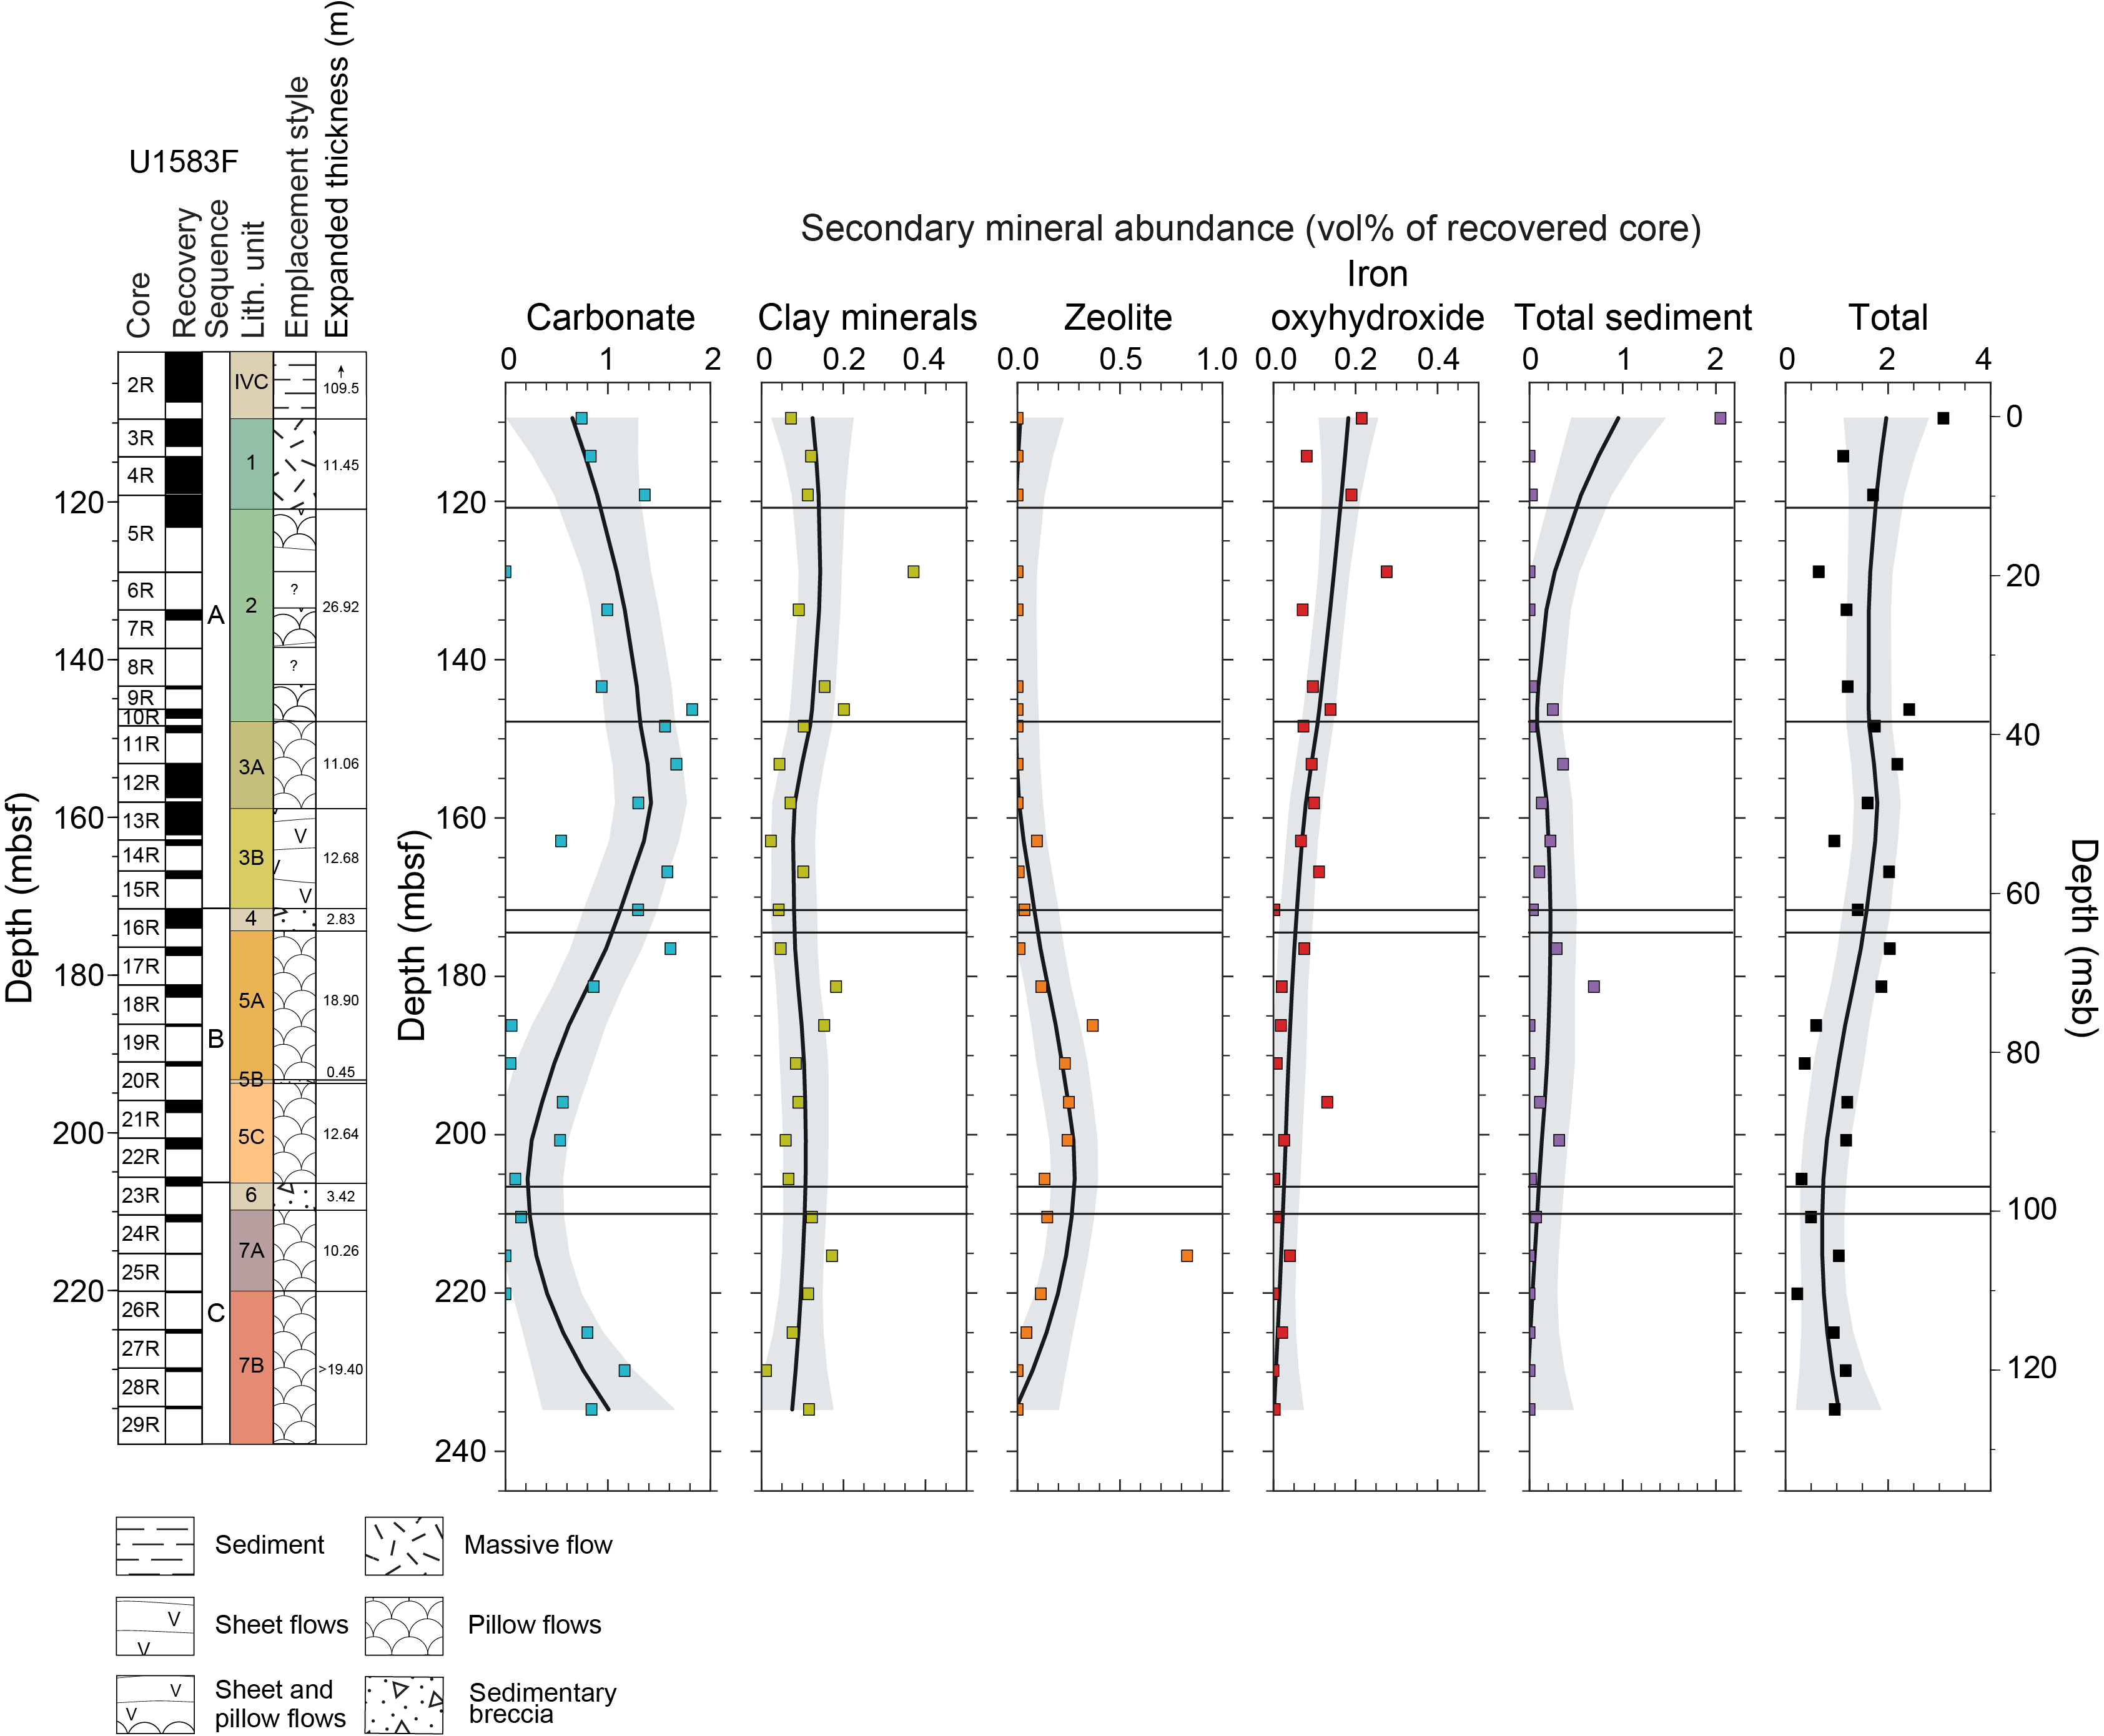
Figure F40. Secondary mineral abundance.
The occurrence and abundance of secondary minerals in veins vary downhole with the total volume percentage of core filled by veins decreasing downhole (Figure F40). Secondary minerals filling veins include calcium carbonate, clays, zeolites, Fe oxyhydroxides, and sediment (Figures F41, F42; Table T8). Approximately 34% of all veins are filled with one mineral type, 52% are filled with two minerals, and 14% are filled with three or four mineral types. Calcium carbonate + clay is the dominant mineral vein assemblage. XRD analysis indicates aragonite in Core 393-U1583F-4R, but in the remainder of Hole U1583F XRD analysis indicates that the carbonate present is calcite. The distribution of calcium carbonate veins is variable downhole with higher abundance in Unit 3 (148–171 mbsf) and lower abundance in Unit 5 (174–207 mbsf) (Figure F40). The abundance of Fe oxyhydroxide ± orange clay veins decreases with depth, and they are absent in some cores below 170 mbsf (Figure F40). Zeolite, in particular phillipsite, first occurs in veins at 160 mbsf, and is most abundant in Unit 5. Zeolite veins are generally associated with chilled margins, forming discrete <3 mm wide crack-seal syntaxial veins and as coatings on fresh and altered glass (Figures F41, F42). In contrast to calcium carbonate, Fe oxyhydroxide, and zeolite veins, the abundance of clay minerals in veins is generally uniform downhole (Figure F40). Sediment vein abundance is highest in Unit 1, and its occurrence is variable downhole, forming irregular veins up to 7 mm wide (Figure F40). Secondary mineral abundance and vein density generally co-vary downhole for all minerals (Figures F39, F40).
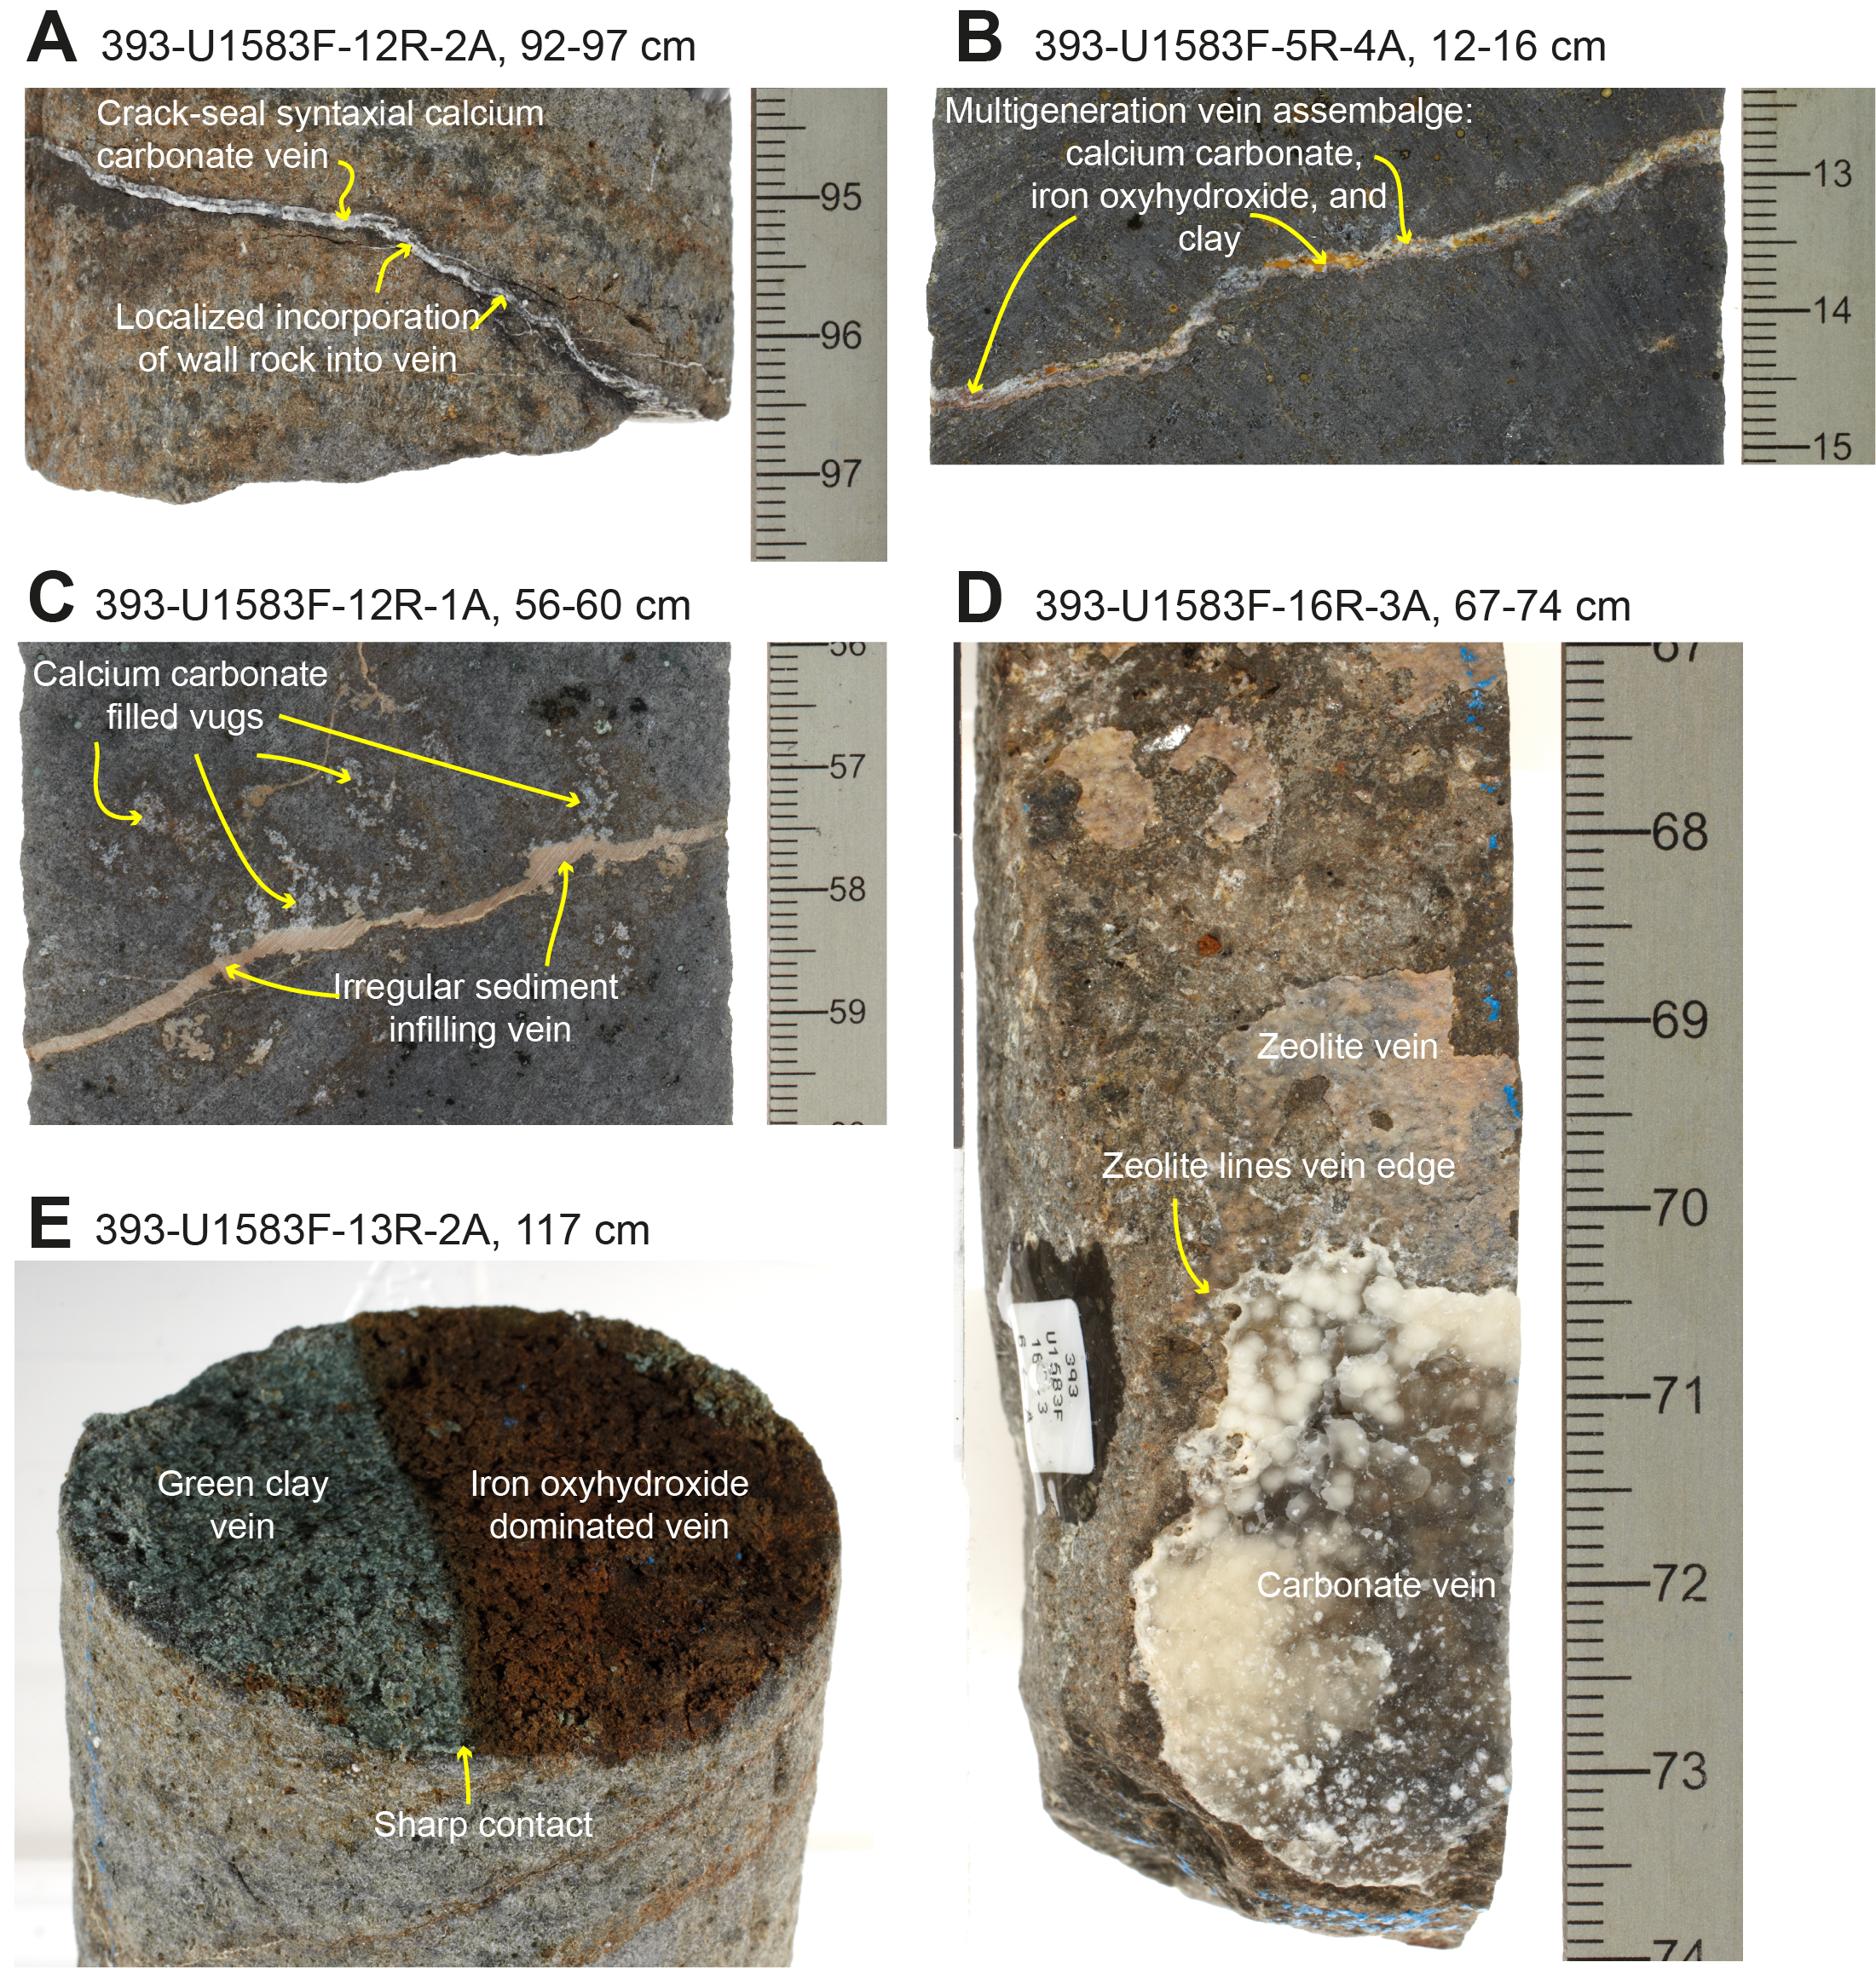
Figure F41. Typical vein assemblages.
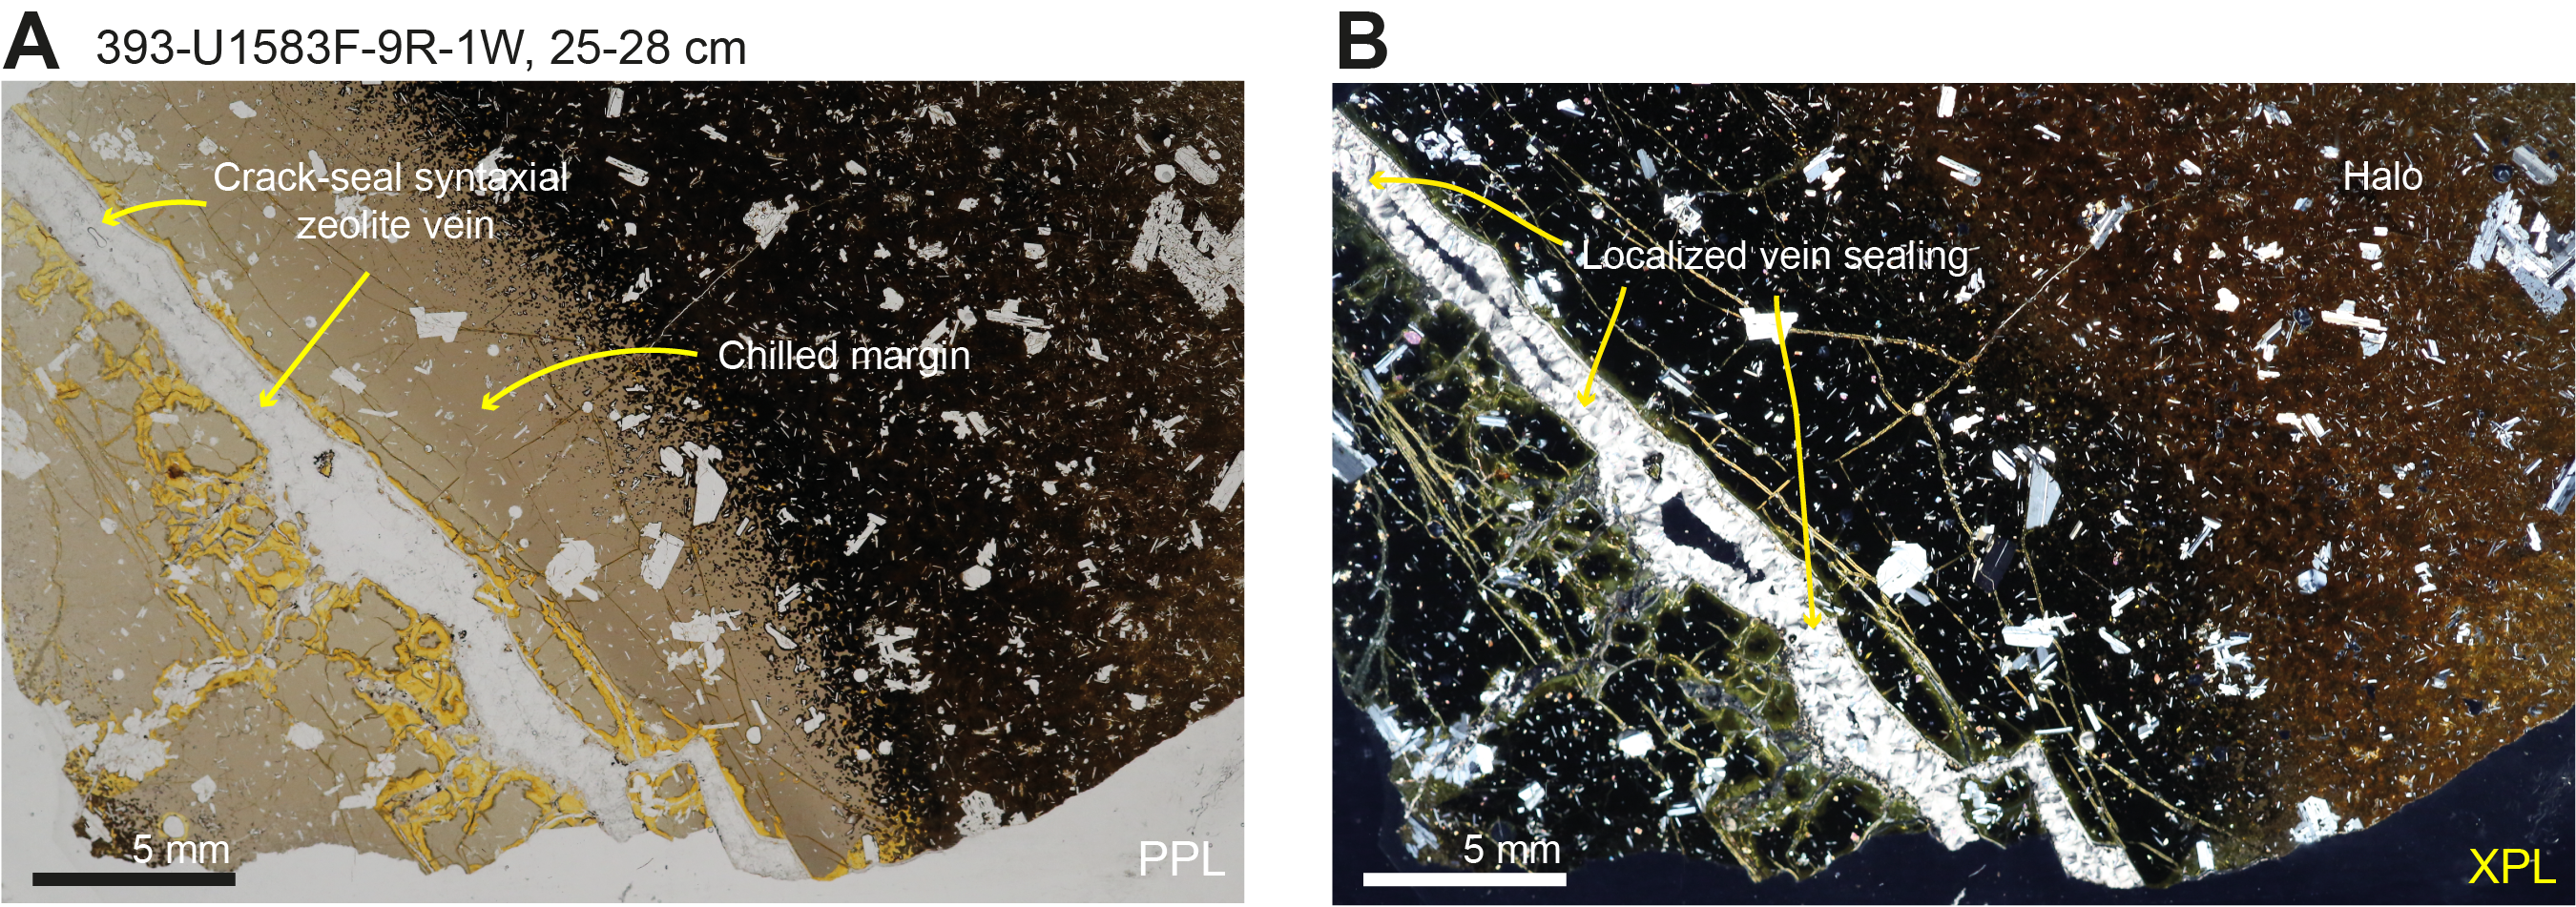
Figure F42. Internal structure of zeolite vein.
Vein textures indicate that 64% of veins in Hole U1583F display some evidence of multiple episodes of fracturing and precipitation as multiple mineral types occur within a single discrete vein (Figures F41, F42). Occurrences of veins that display clear crosscutting relationships are rare, and no systematic relationship occurs between calcium carbonate, Fe hydroxide, and clay veins or fillings.
In some occurrences of green clay veins, the composition of vein filling material changes along the vein with a discrete contact between green clay and clay + Fe oxyhydroxide; this change is associated with the changing characteristics of the associated halo (Figure F41E; e.g., intervals 393-U1583F-13R-2, 115.5–116 cm, and 13R-2, 39.5–40 cm). The distribution of measured vein widths does not vary between vein type, with a broadly geometric distribution occurring for all vein types (Figure F43).
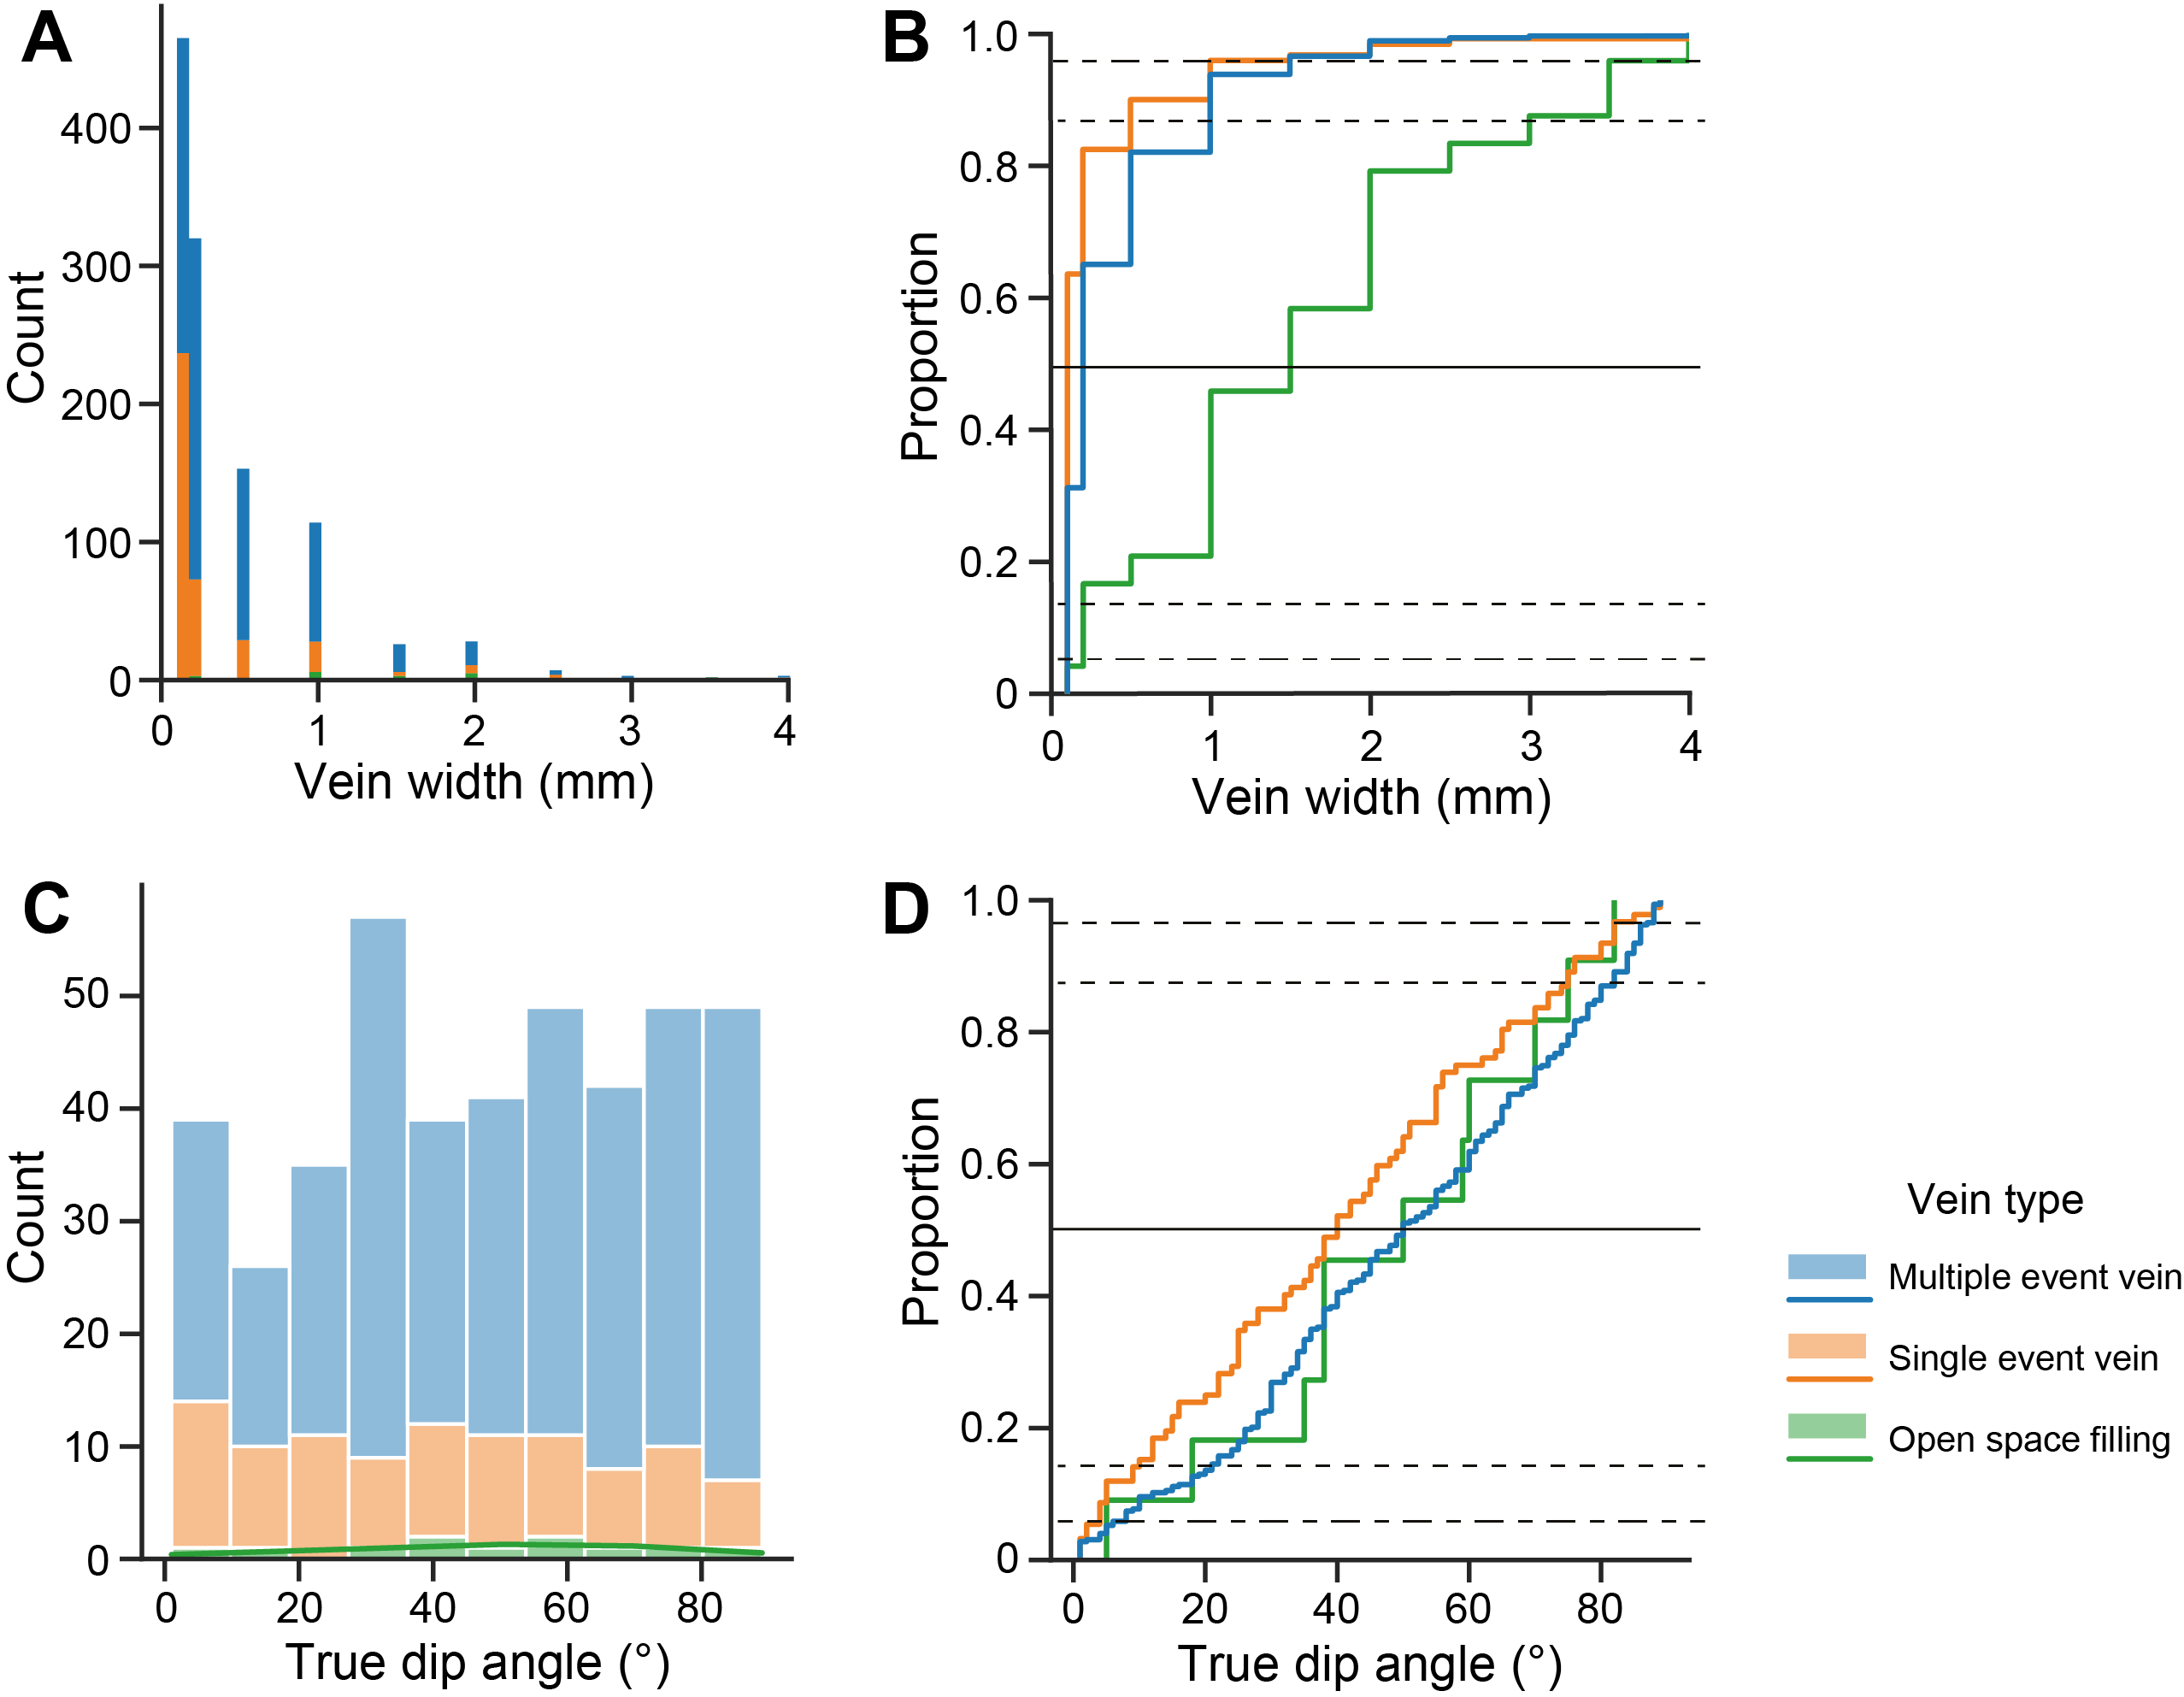
Figure F43. Vein width and dip angle statistics.
The vein width distribution of veins associated with a halo is broadly log normal and contrasts with the generally geometric distribution of veins that are not associated with a halo (Figure F44).
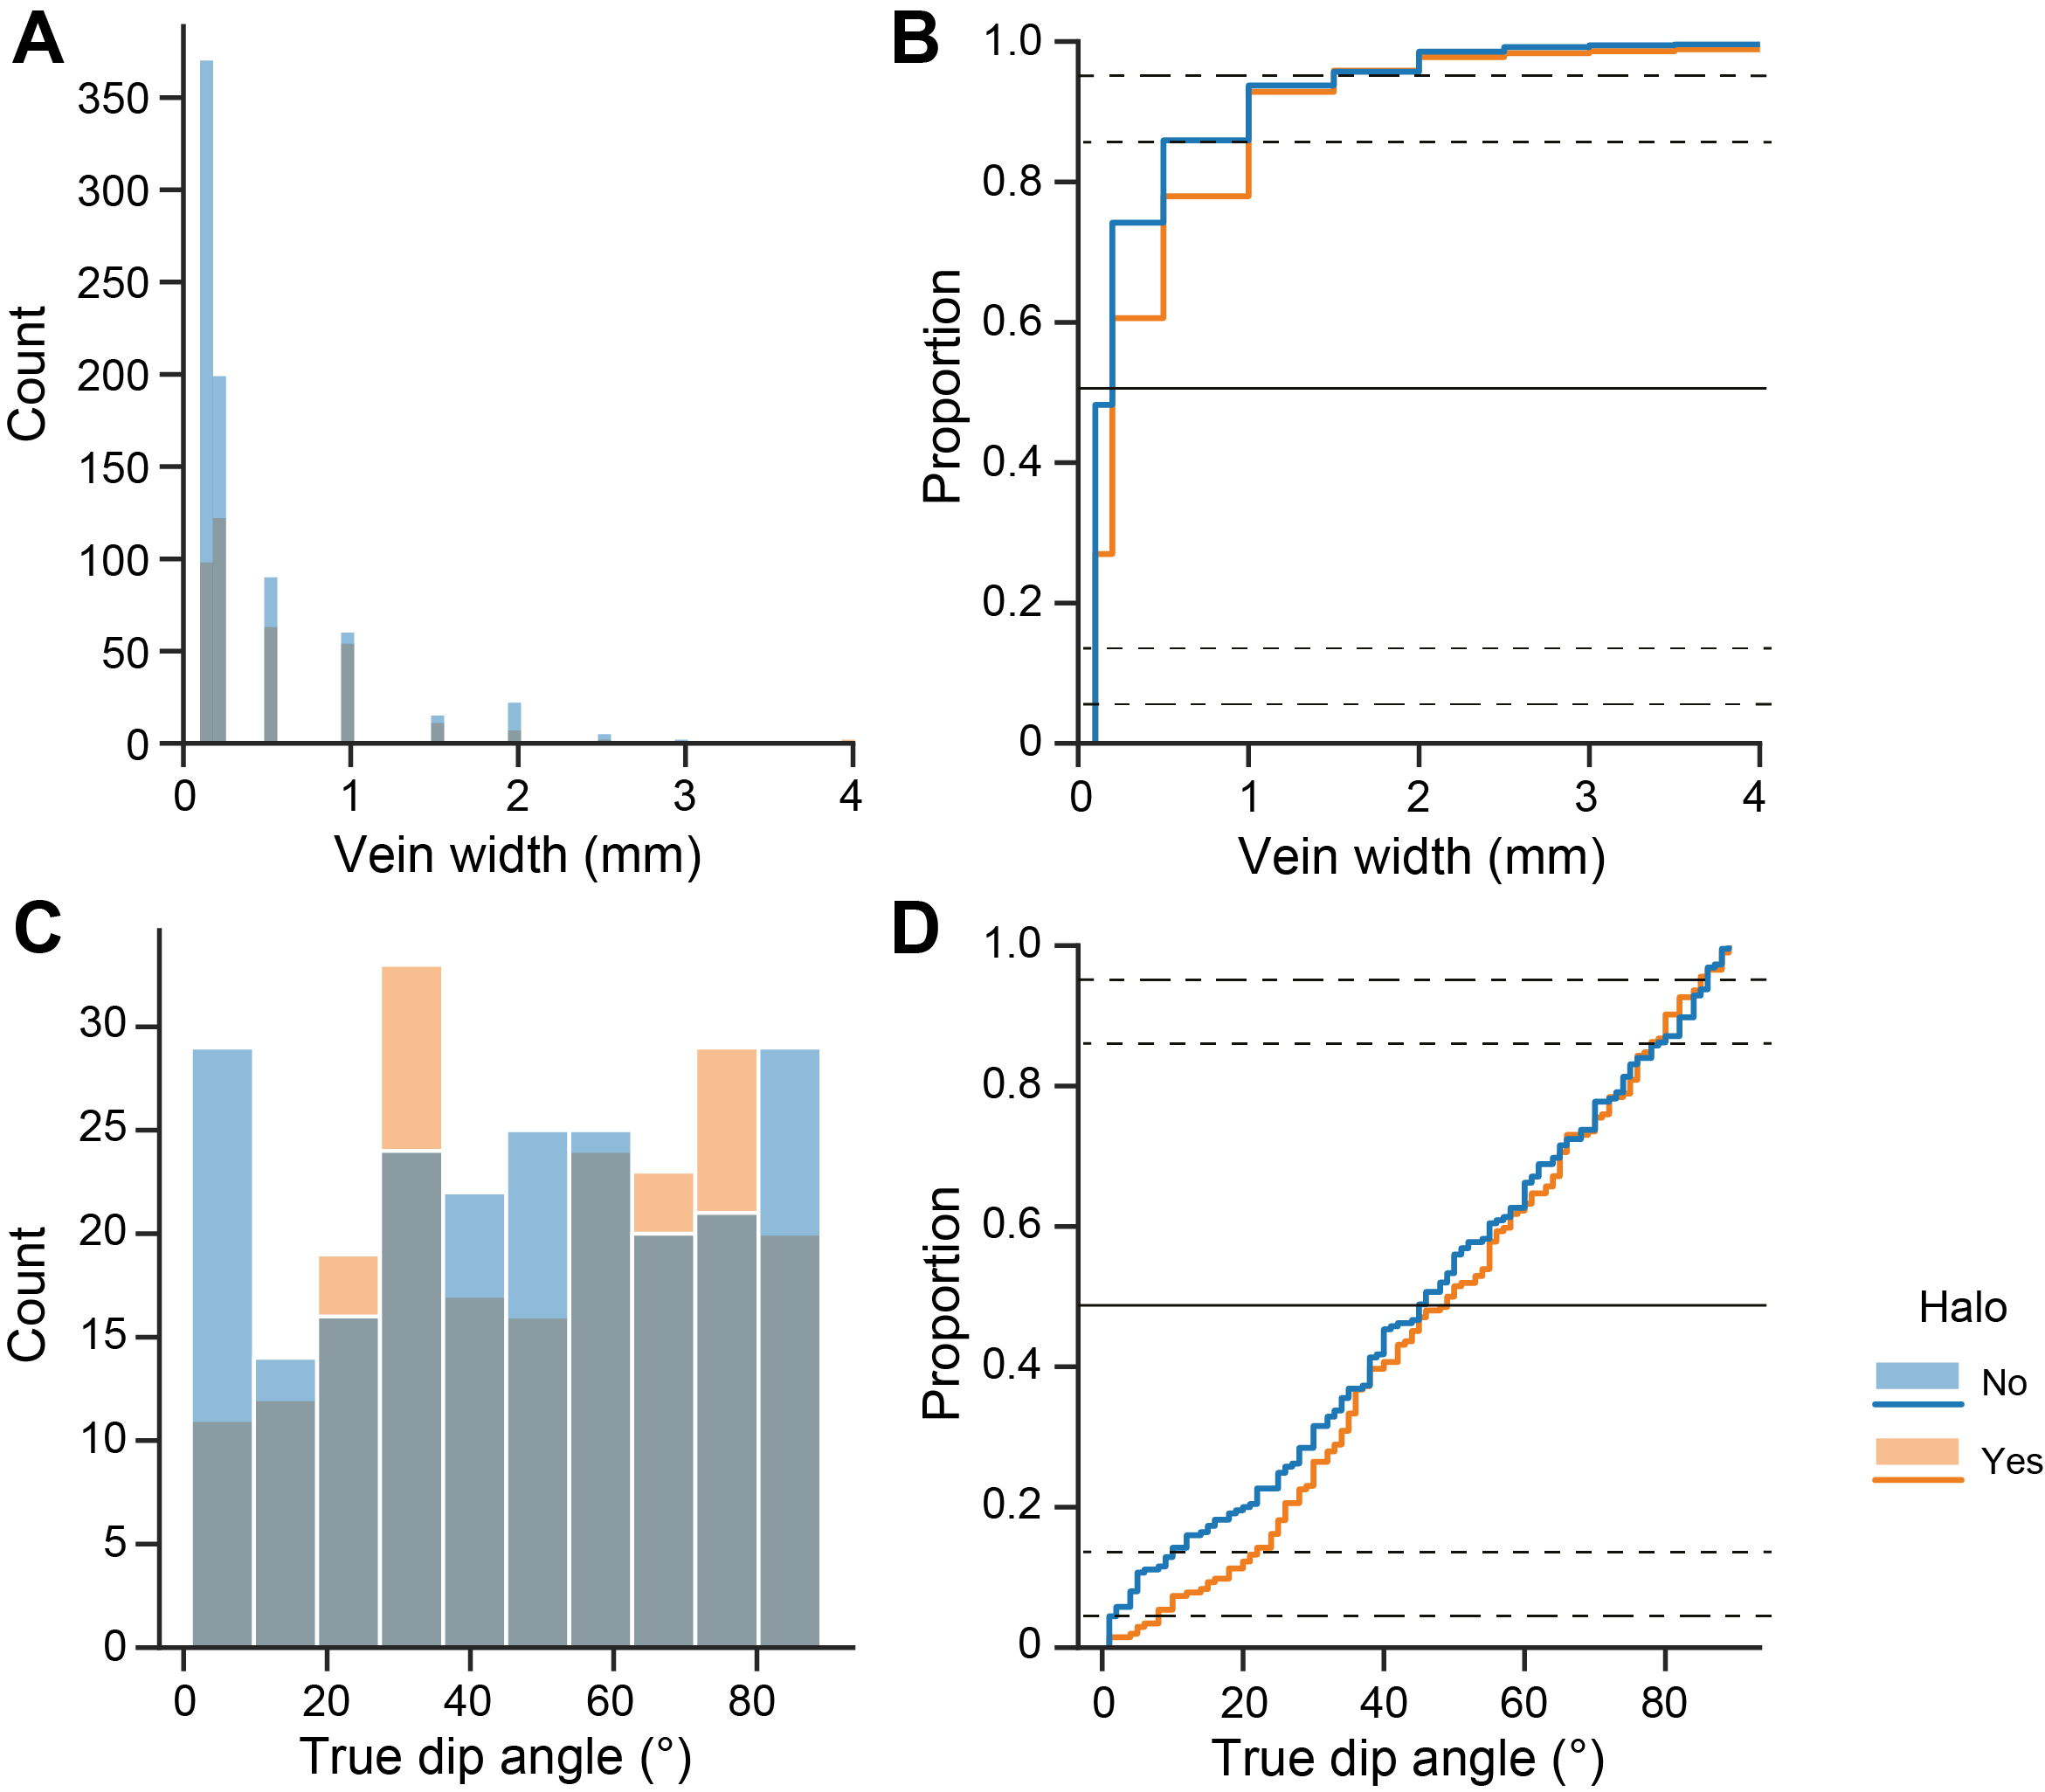
Figure F44. Vein width and dip angle statistics by halo association.
6.6. Structural data
The dip direction and dip angle of ~40% of logged veins were measured with true dip angles ranging 1°–89° (Figure F45). The median and mean vein true dip angle of measured veins is 48° (Figure F45). The distribution of all measured vein true dip angles generally yields a multimodal distribution (Figure F45). No systematic relationship between true vein dip angle and depth occurs (Figure F45). The true vein dip angle of single event veins generally yields a uniform distribution (Figure F43). Multiple event veins are the dominant vein type and display a broadly multimodal distribution with most orientated veins occurring at 30° dip angle (Figure F43). Measured true dip angles of veins associated with and without a halo yield similar multimodal distributions with little variation between veins associated with and without a halo (Figure F43).
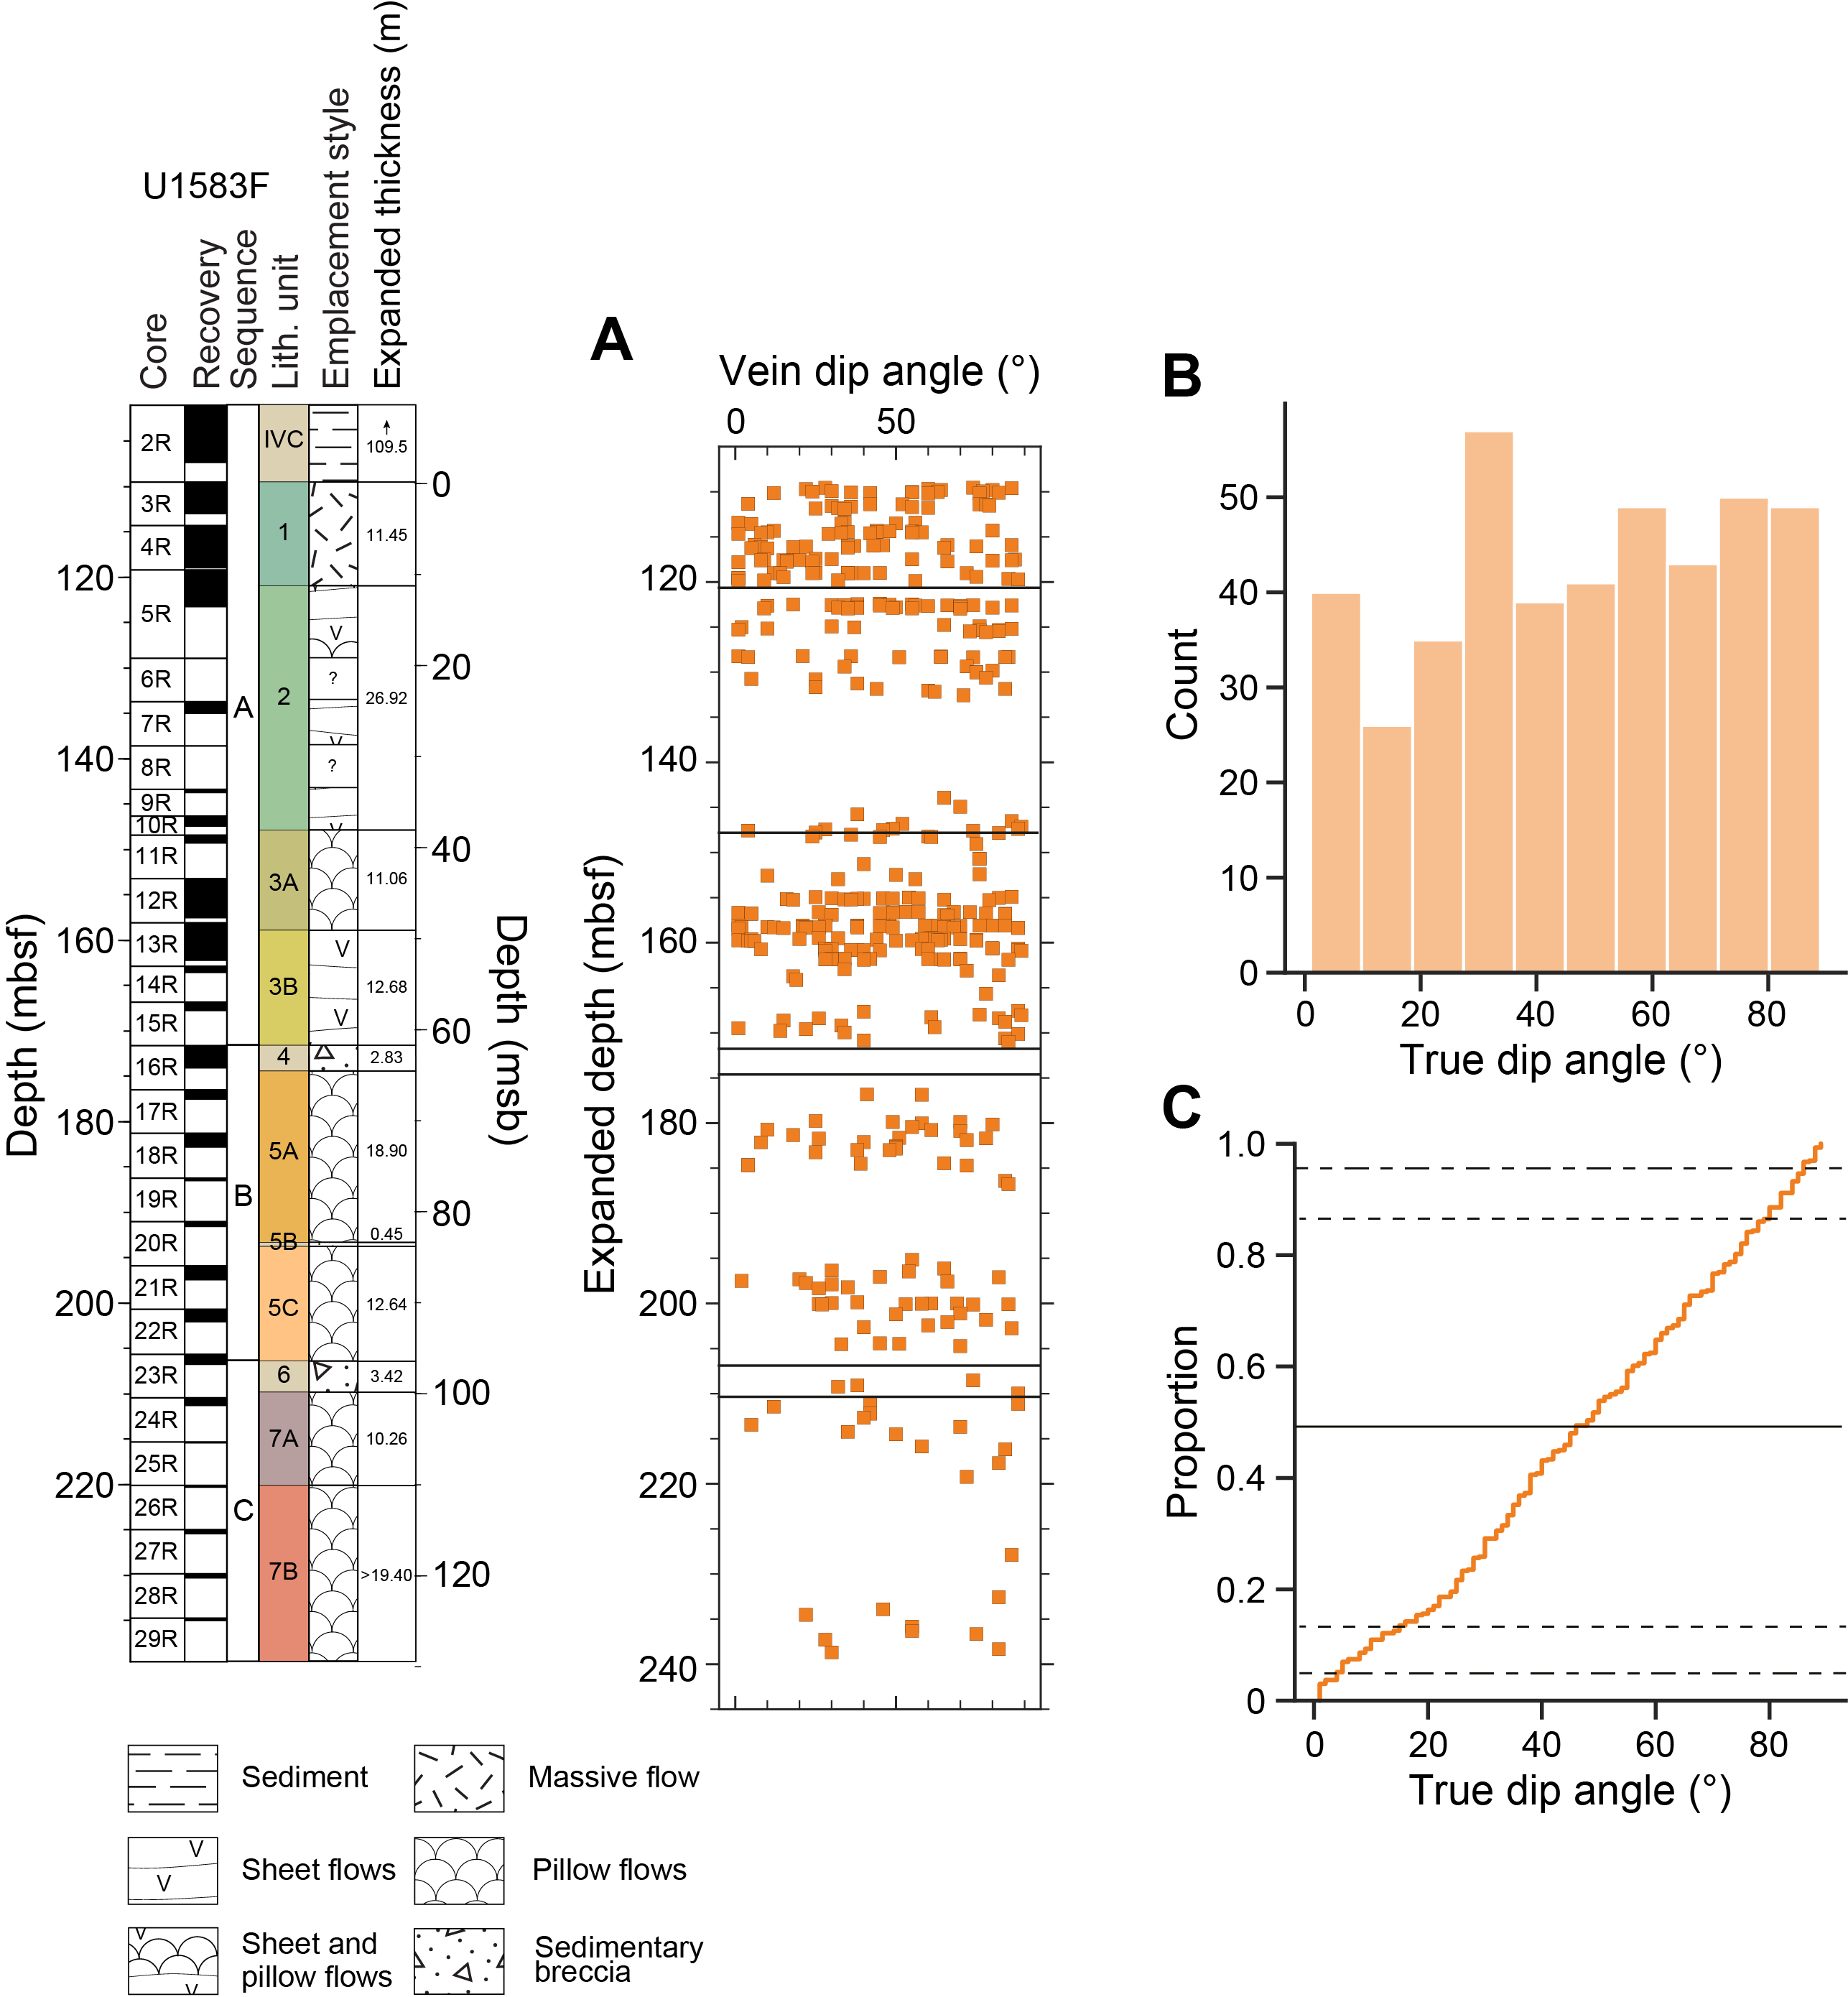
Figure F45. Vein dip angles.
6.7. XRD
XRD spectra were generated for alteration products and precipitates as well as strongly altered and recrystallized sedimentary material collected from veins and vugs, interpillow breccias, microbiology (MBIO) samples, and altered rock clasts in sediment cores (Table T8). XRD results for vein and vug fillings reveal mainly (magnesian) calcite, Na-phillipsite, and/or feldspar, with minor clay components, aragonite, clinopyroxene, oxides, and sepiolite. Additional peaks suggest the presence of other phyllosilicates, K-bearing feldspar, and possibly chamosite. Hydrothermal vein precipitates in Sections 393-U1583F-4R-3 and 4R-4 contain both calcite and aragonite. Samples from interpillow breccias are dominated by (magnesian) calcite, feldspar, and clinopyroxene with minor zeolite and possibly chlorite. XRD spectra from MBIO samples reveal (magnesian) calcite, Na-phillipsite, clays, feldspar, and goethite. The spectra of two altered basalt clasts in sediment Core 12H imply the presence of feldspar and zeolites. The evaluation of bulk rock powder spectra suggests dominantly calcic to sodic feldspars and clinopyroxene as well as minor amounts of olivine, Fe oxides, and additional spectral peaks that indicate the variable presence of clays and calcite (see U1583F_XRD.xlsx in ALTPET in Supplementary material).
6.8. Summary
Hole U1583F records fluid/rock reactions over the full range of spatial contexts expected for the uppermost basement. The secondary minerals forming, predominantly various clays, carbonate and Fe oxyhydroxides, are consistent with reactions at low temperatures with seawater-derived fluids. In Hole U1583F, it is possible to identify zones of alteration that have distinct characteristics (Figure F46). In the uppermost 70 m of the hole, background alteration dominates, and cores are characterized by the presence of green clay filling vesicles (in background and alteration halos) and a generally low abundance of alteration halos (generally less than 30% of the area of the core). This zone also hosts the most calcium carbonate, and carbonate abundance increases downhole through this zone. From 40 to 70 msb, the multihalos appear and exhibit diffuse but also sharp halo sequences that are variably mutually overprinting. These multihalos are best displayed by the changing sequences of vesicle infill. Below 70 msb, green clay filled vesicles are absent and the abundance of carbonate filled veins decreases. These changes are accompanied by a greater proportion of halos, and the abundance of brown halos increases downhole. Below 95 msb, orange halos are most common and there is a slight increase in the abundance of carbonate veins.
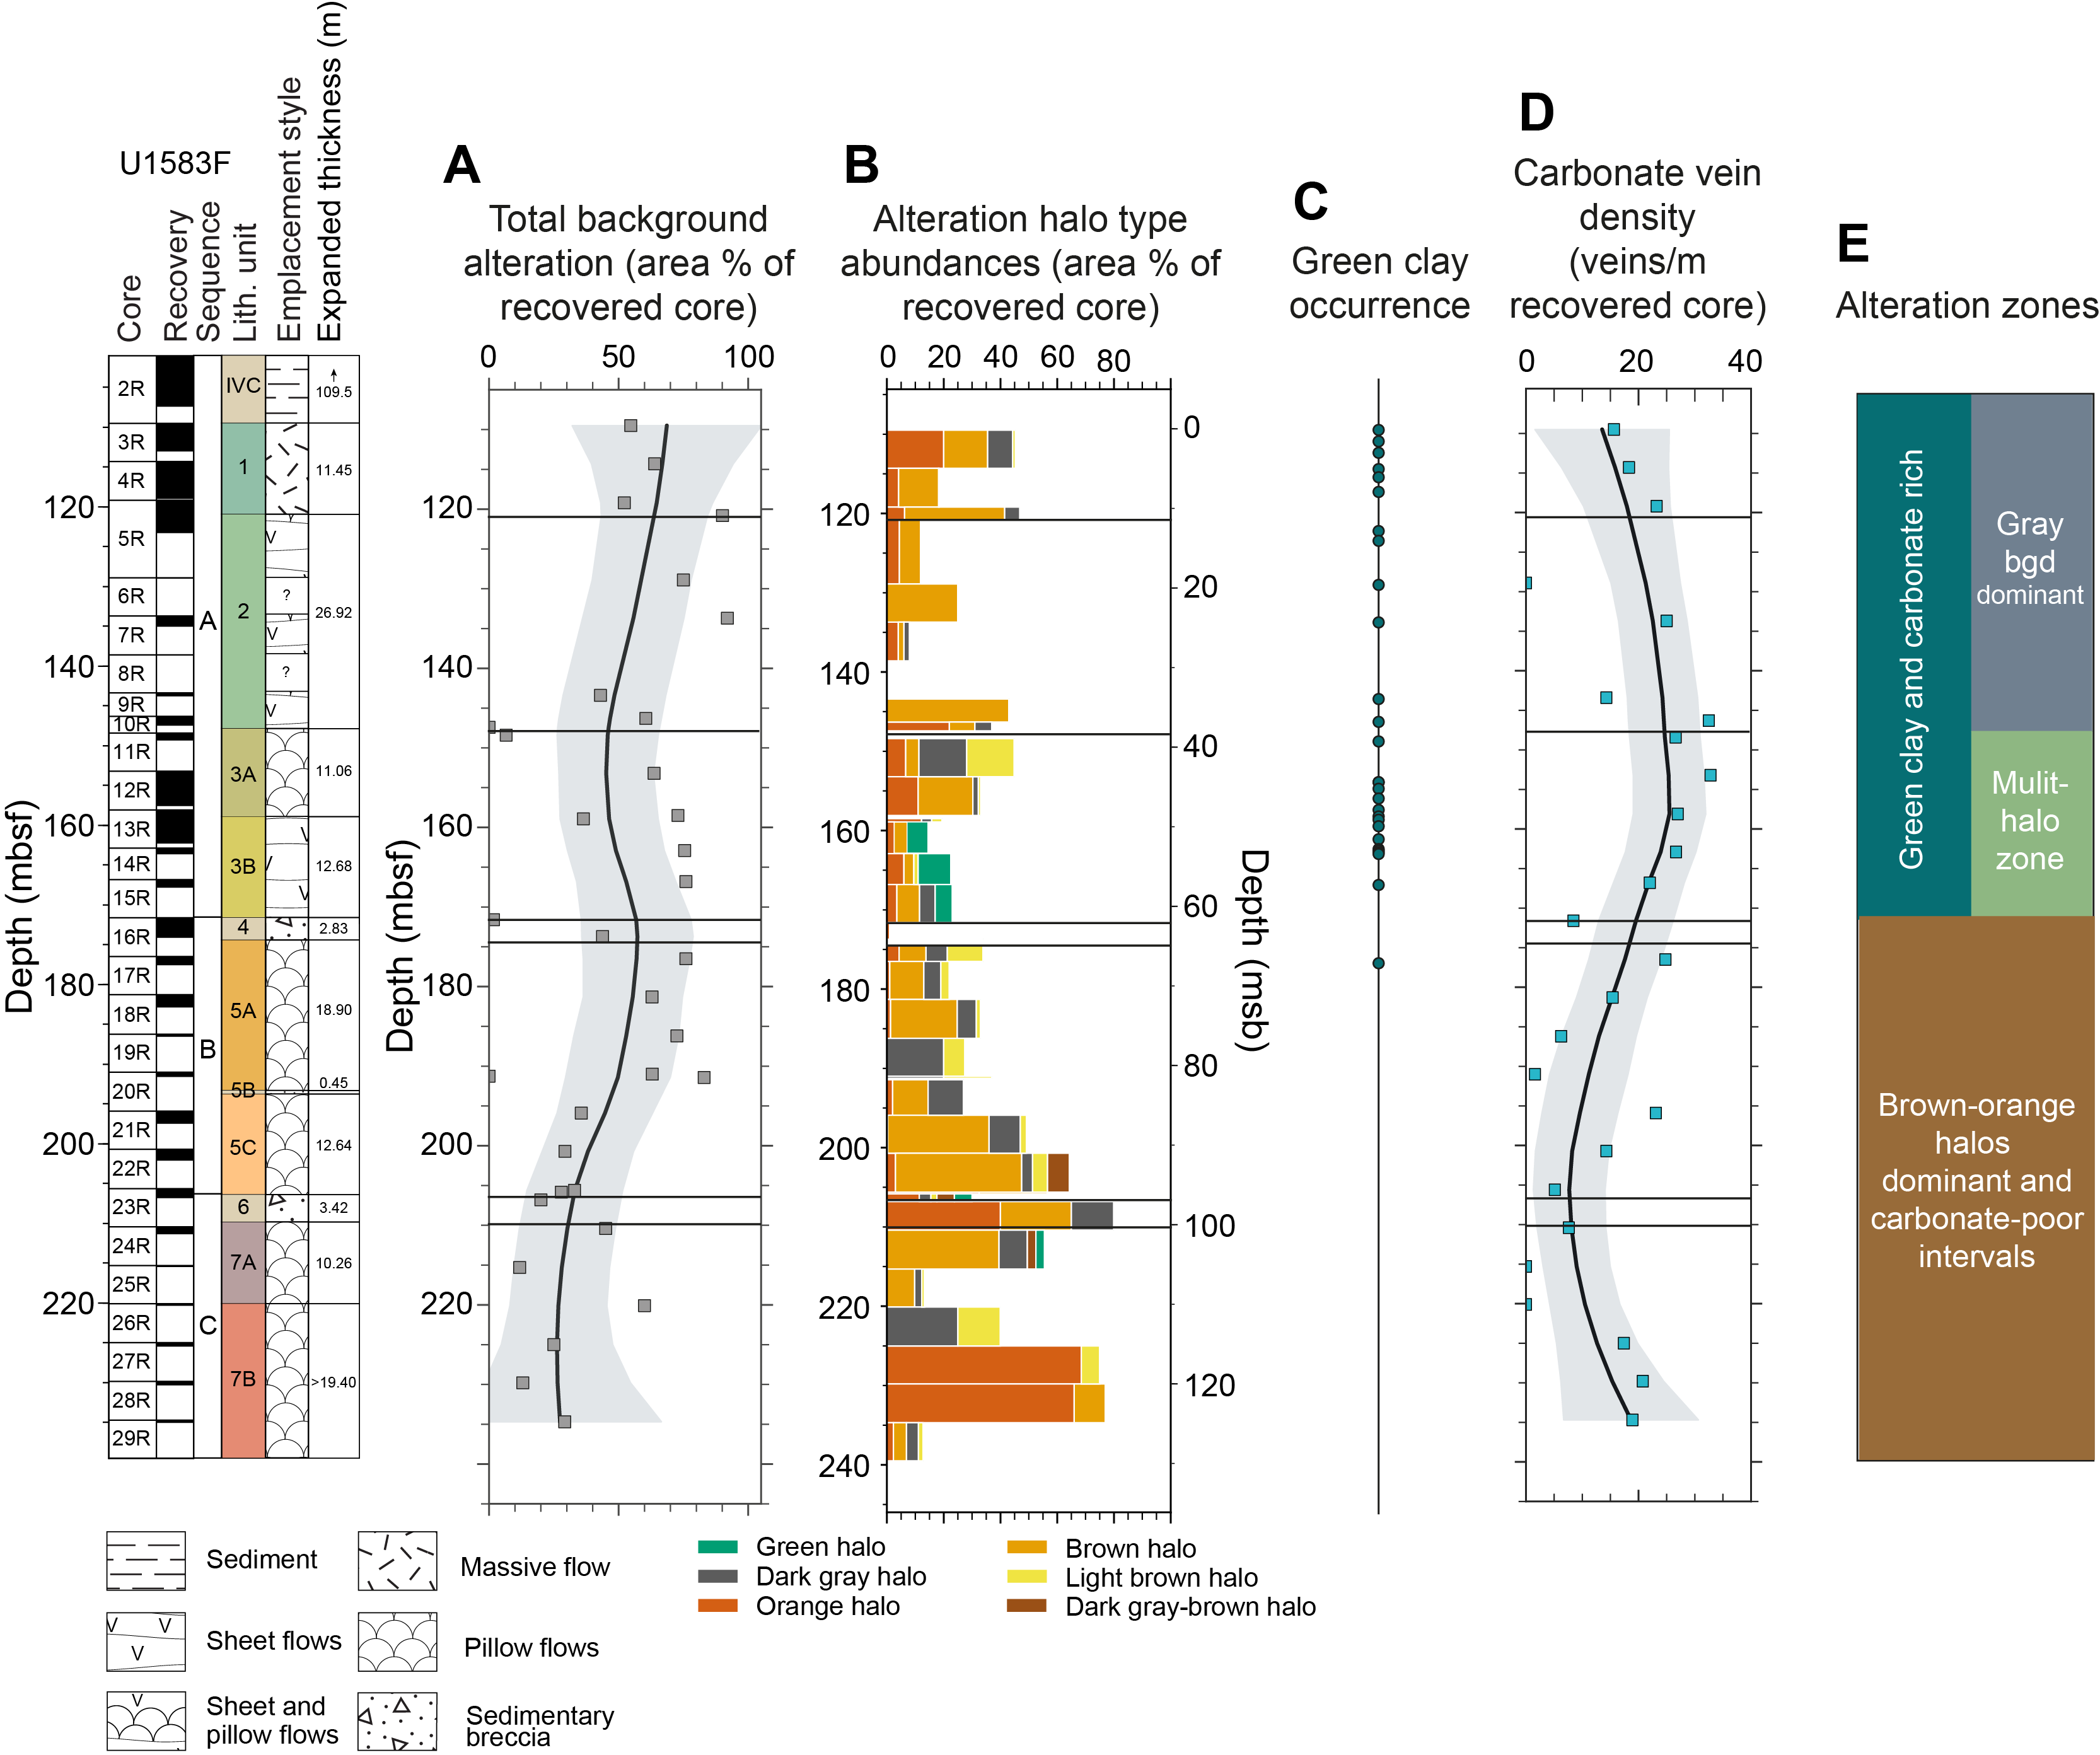
Figure F46. Alteration zones.
7. Biostratigraphy
The sedimentary succession of pelagic nannofossil oozes and clays at Site U1583 ranges in age from early Oligocene to Late Pleistocene. The integrated calcareous nannoplankton and planktic foraminiferal biozonation for Site U1583 is summarized in Figure F47 and Tables T9 and T10. The age-depth table and plots of biohorizons and paleomagnetic reversals for Holes U1583C and U1583E can be found in Age model and mass accumulation rates (Tables T21, T22; Figures F65, F66). Benthic foraminifera were not analyzed at this site.
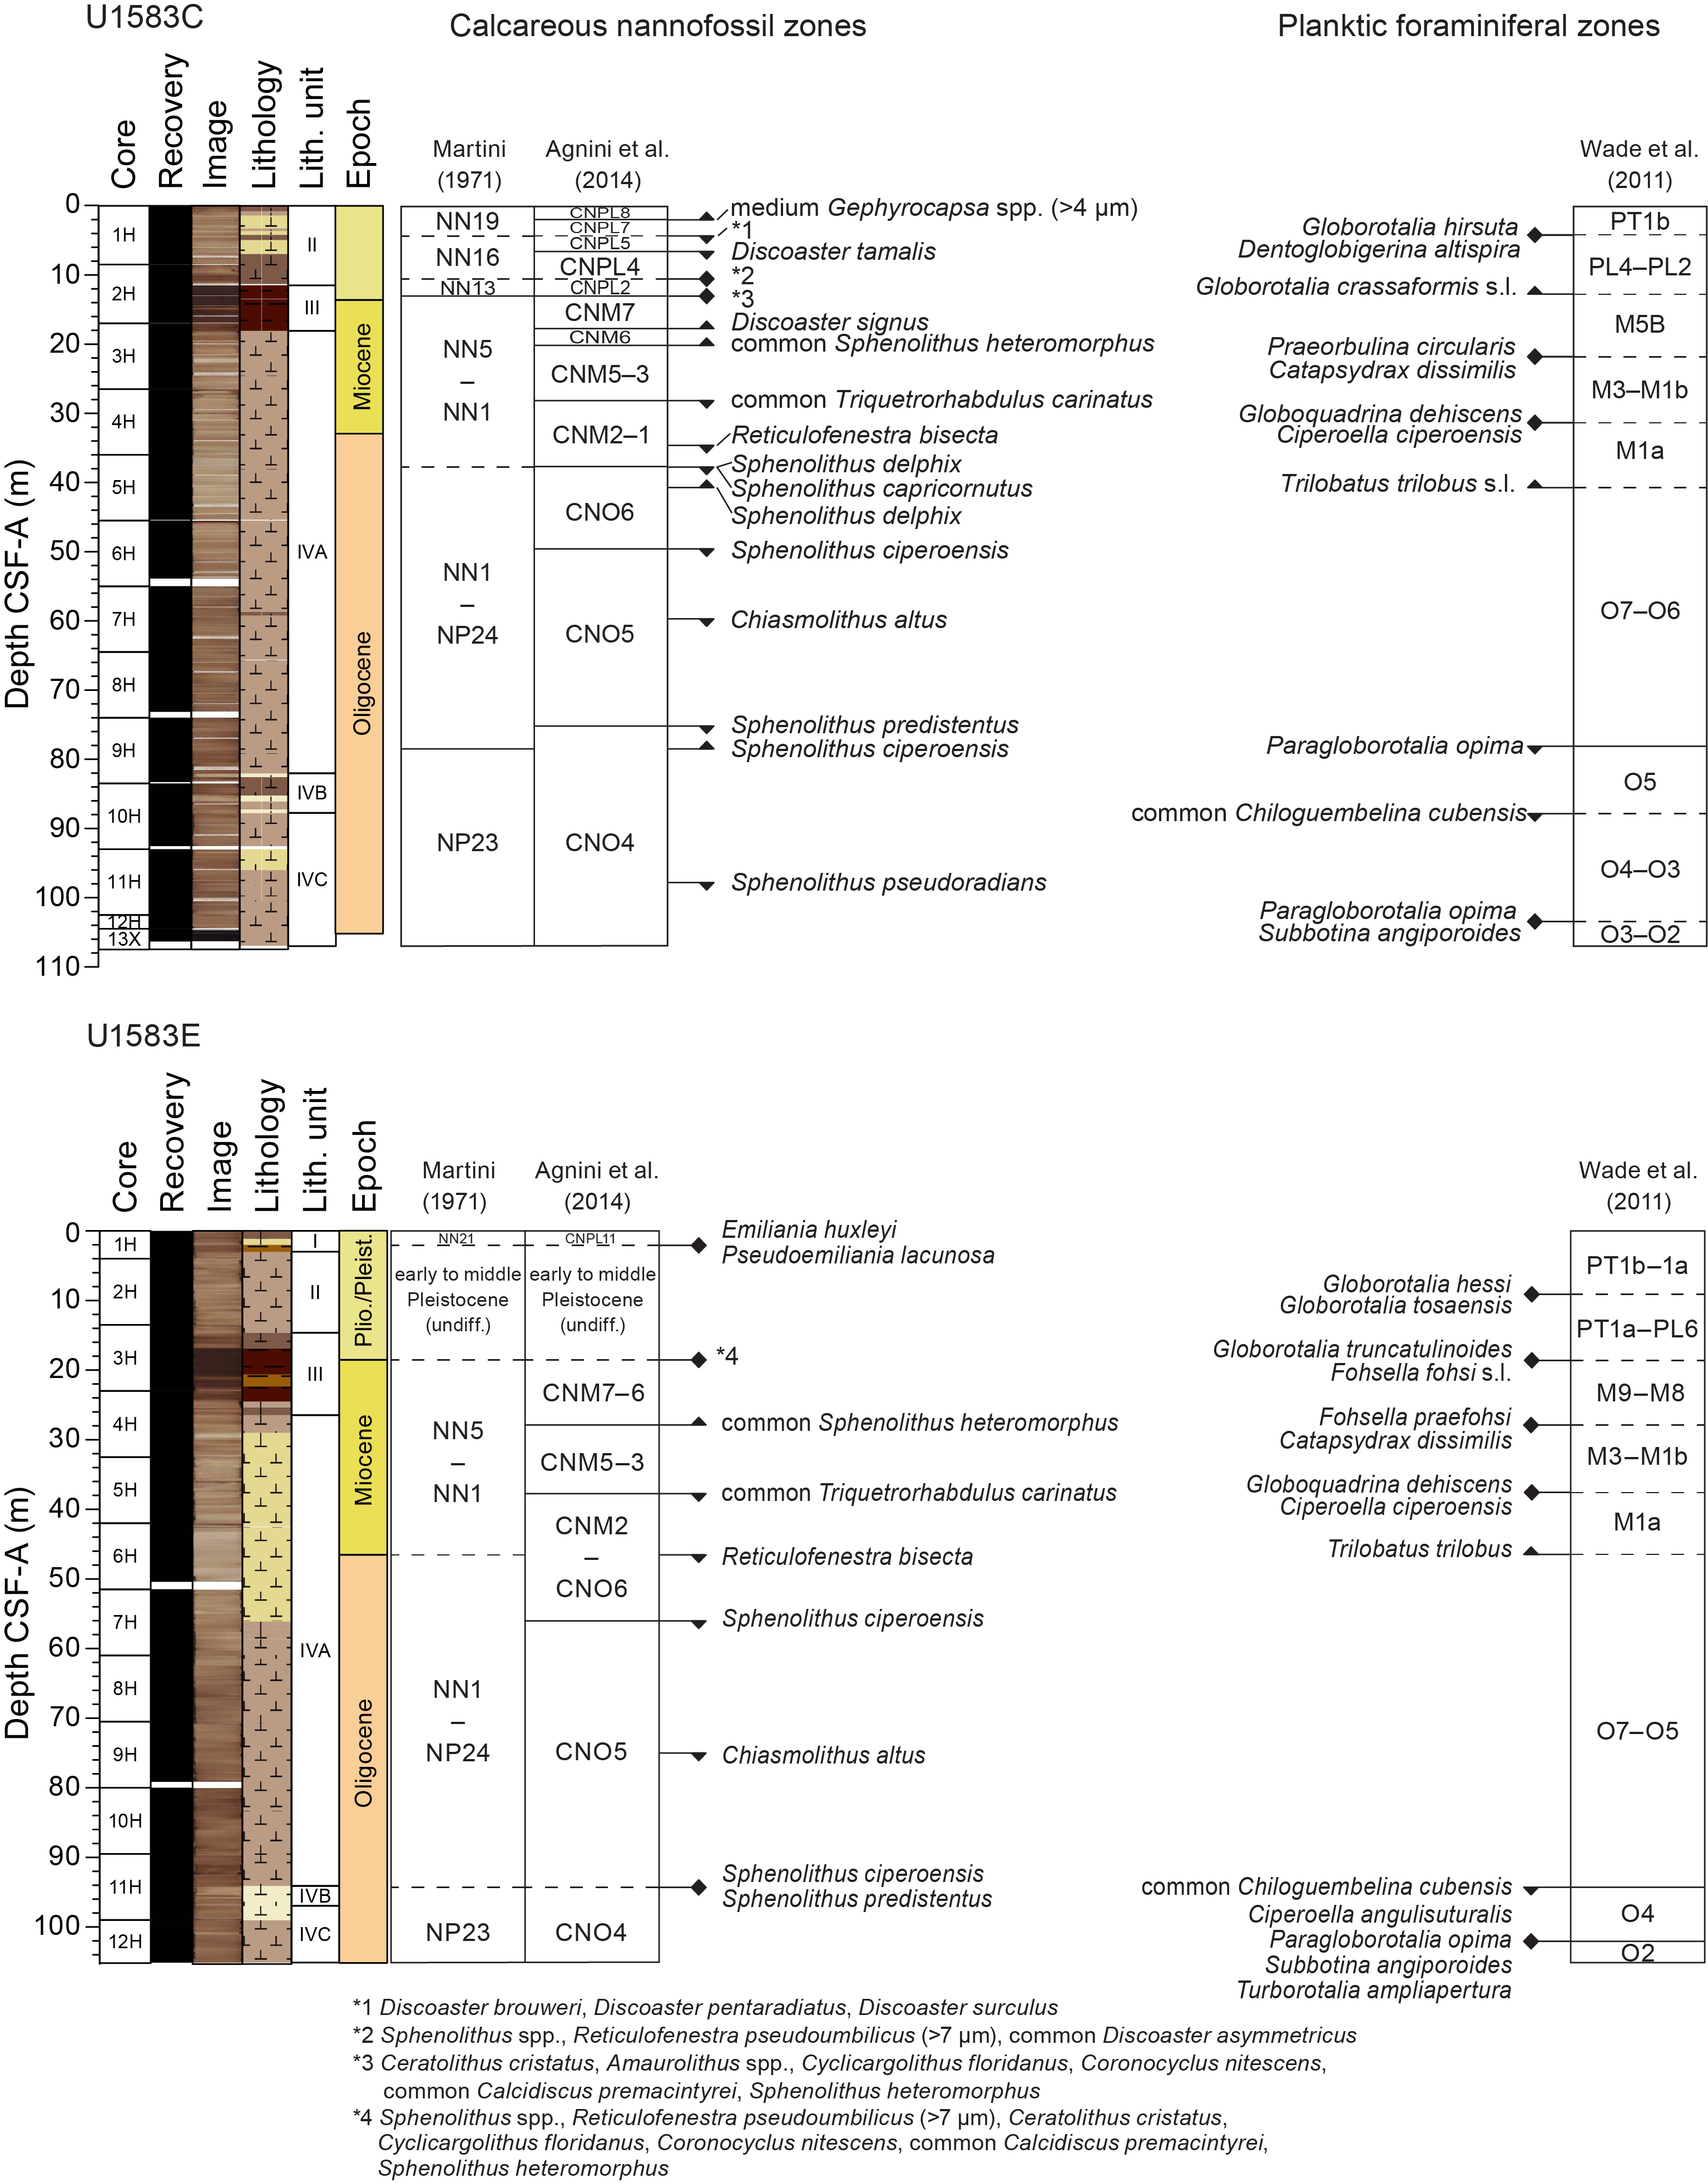
Figure F47. Biostratigraphic zones and datums.
All core catcher samples from Holes U1583C and U1583E were analyzed, and two additional samples were taken from the working halves of Hole U1583C to refine the nannofossil biostratigraphy. These samples were selected to avoid clay-rich intervals and maximize microfossil diversity.
In the mudline sample from Hole U1583C, planktic foraminiferal assemblages consist of extant and Late Pleistocene species, whereas the calcareous nannofossil assemblages indicate an Early Pleistocene age. In contrast, the mudline sample from Hole U1583E contains modern assemblages of both planktic foraminifera and calcareous nannoplankton. Pliocene to Pleistocene sediments are found above 11.14 m core depth below seafloor, Method B (CSF-B), in Hole U1583C and 13.46 m CSF-B in Hole U1583E. A condensed interval, mainly composed of dark clay (Lithostratigraphic Unit III; see Sedimentology), spans ~9 My across the Miocene/Pliocene boundary and measures ~6.5 m thick in Hole U1583C and 11.83 m thick in Hole U1583E. Early Middle Miocene fossils span 14.84–35.97 m CSF-B in Hole U1583C and 22.95–41.96 m CSF-B in Hole U1583E. The Oligocene/Miocene boundary in Hole U1583C occurs in Core 393-U1583C-5H, and in Hole U1583E it occurs in Core 393-U1583E-6H, as inferred from calcareous nannofossil biostratigraphy. Oligocene sediments are ~71 m thick in Hole U1583C and ~54 m thick in Hole U1558E.
7.1. Age of basement
Three indurated calcareous sediment samples from directly above and within the lava flows recovered from Hole U1583F were analyzed, but no nannofossils were observed because of poor preservation. The most robust age determination is observed in the deepest sediment samples from Holes U1583C (Sample 393-U1583C-12H-CC, 12–17 cm; 104.58 m CSF-B) and U1583E (Sample 393-U1583E-12H-CC, 0–1 cm; 105.12 m CSF-B), both of which contain the calcareous nannofossil species Sphenolithus distentus, suggesting that sediments near the sediment/basement interface are younger than 30.0 Ma. Planktic foraminiferal assemblages in the same two samples contain Subbotina angiporoides and record the disappearance of Paragloborotalia opima, suggesting an age older than 30.8 Ma. These results are in good agreement with the projected crustal age of ~30.6 Ma at Site U1583 (see Background and objectives).
7.2. Calcareous nannofossils
We examined all core catcher samples from Holes U1583C and U1583E to establish the calcareous nannofossil biostratigraphy and analyzed additional smear slide samples from the working halves of Hole U1583C to refine biohorizons. Nannofossil distributions are displayed in Tables T11 and T12, which summarize the occurrences of age-diagnostic and other notable taxa. Calcareous nannofossil preservation and abundances are illustrated in Figure F48, and photomicrographs of key calcareous nannofossil specimens from Site U1583 are presented in Figure F49. At Site U1583, nannofossils are generally abundant, but their preservation varies from poor to good depending on lithology (Figure F48). In nannofossil-rich samples (Lithostratigraphic Units I and II and Subunits IVA and IVC; see Sedimentology), nannofossils are generally abundant with moderate to good preservation. In contrast, nannofossils are common to abundant with poor to moderate preservation in clay-rich intervals (Unit III) and calcareous ooze (Subunit IVB).
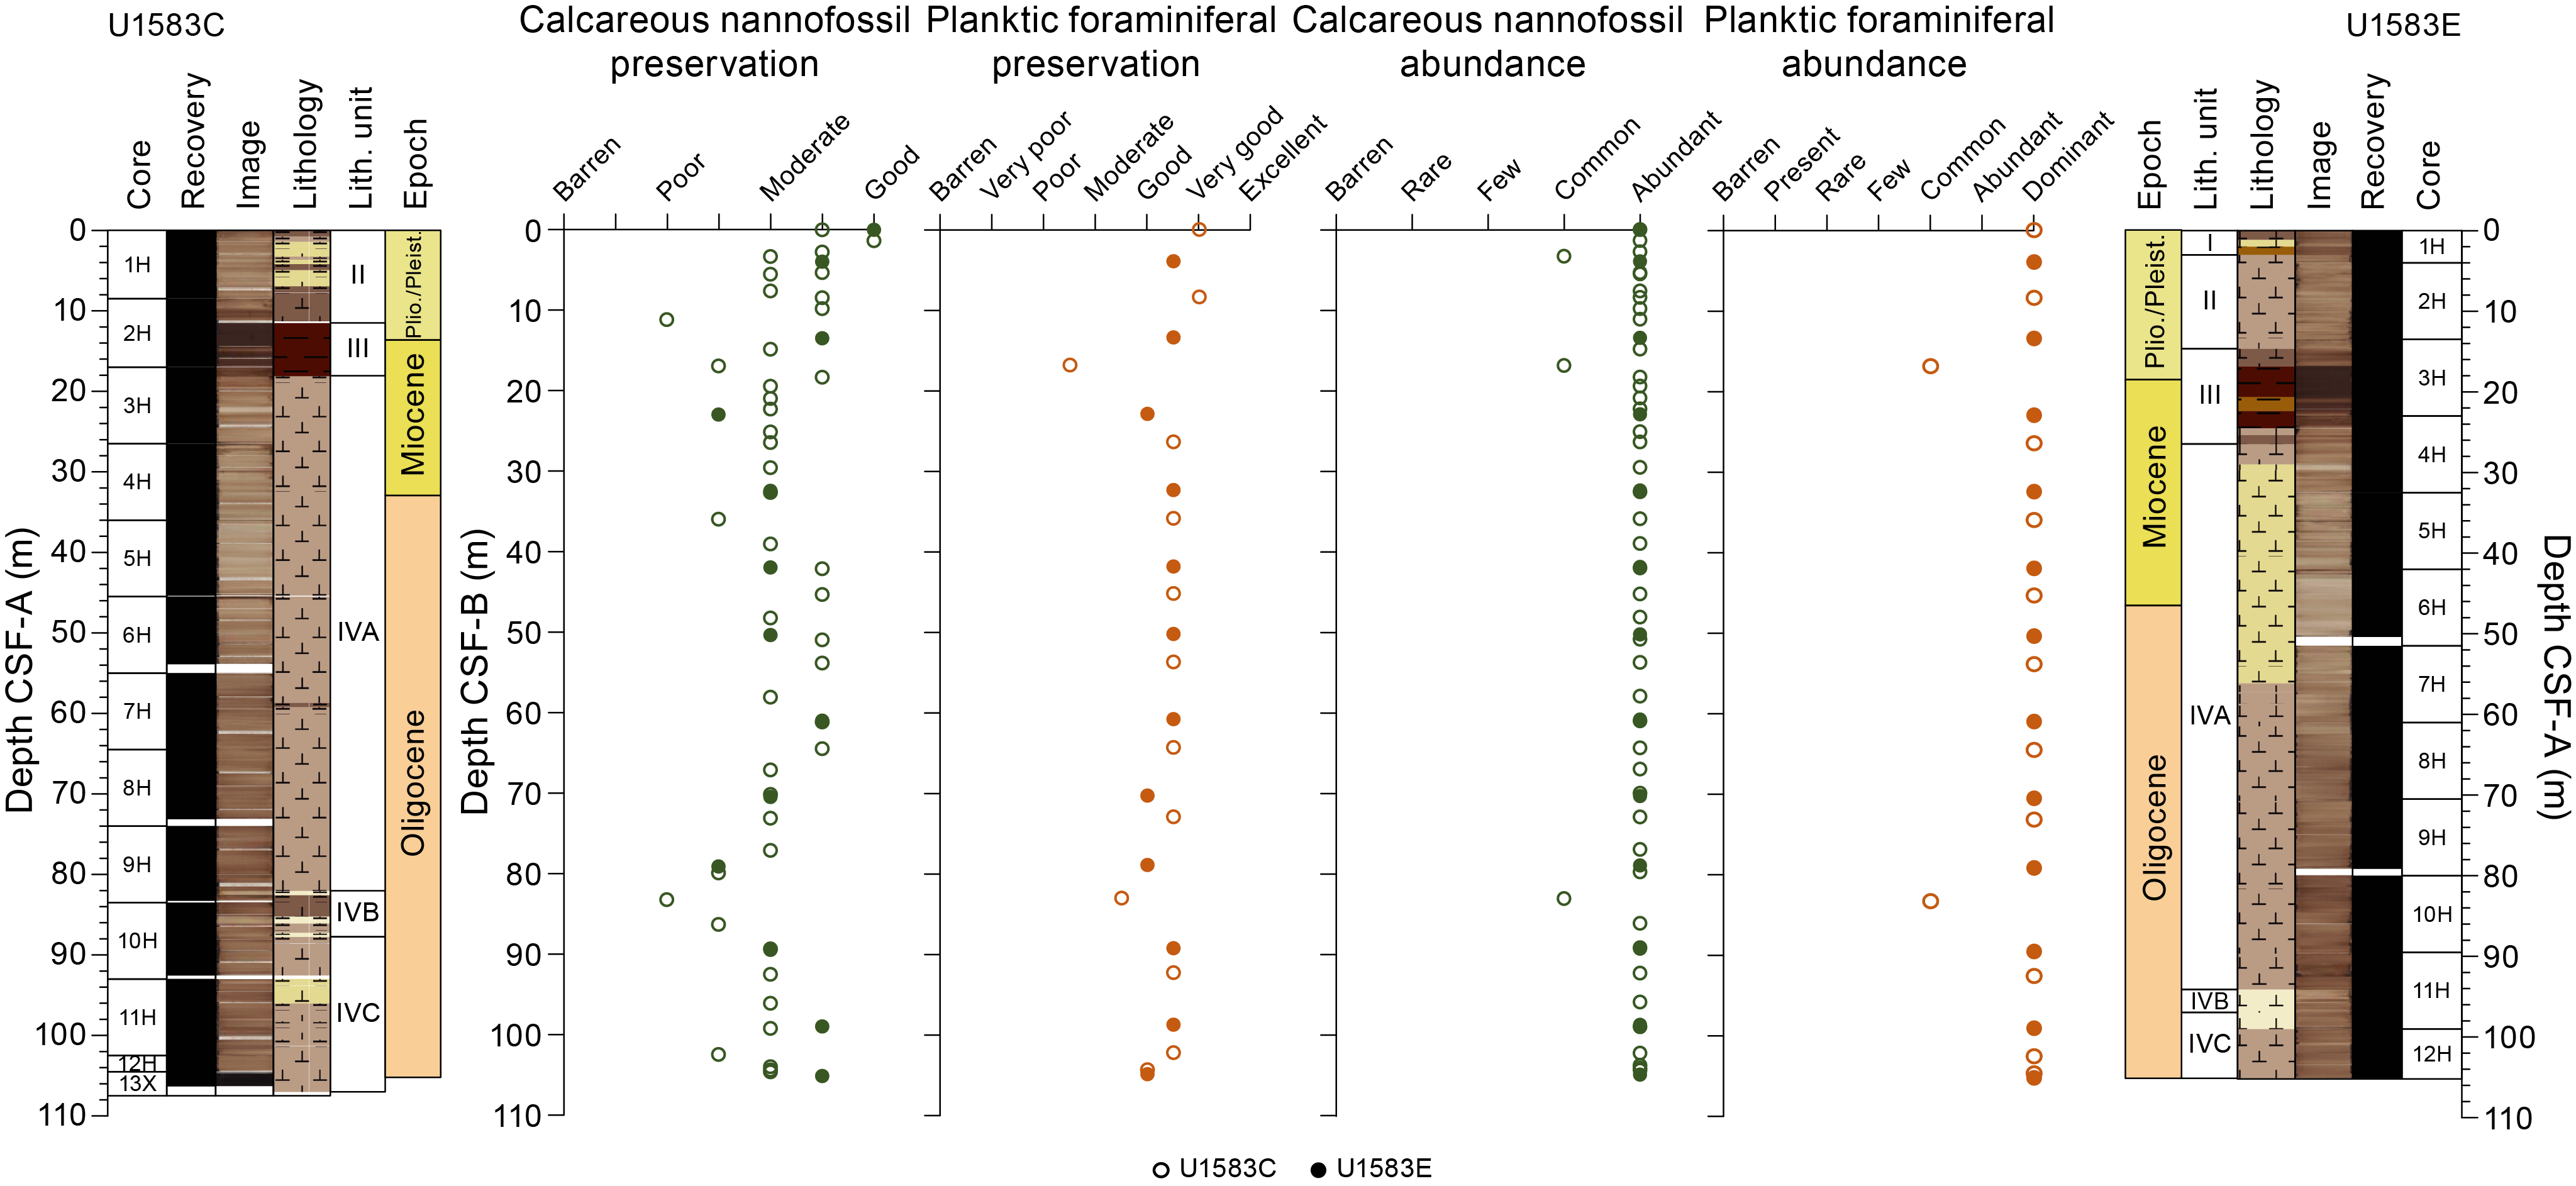
Figure F48. Group abundance and preservation, nannofossils and foraminifera.
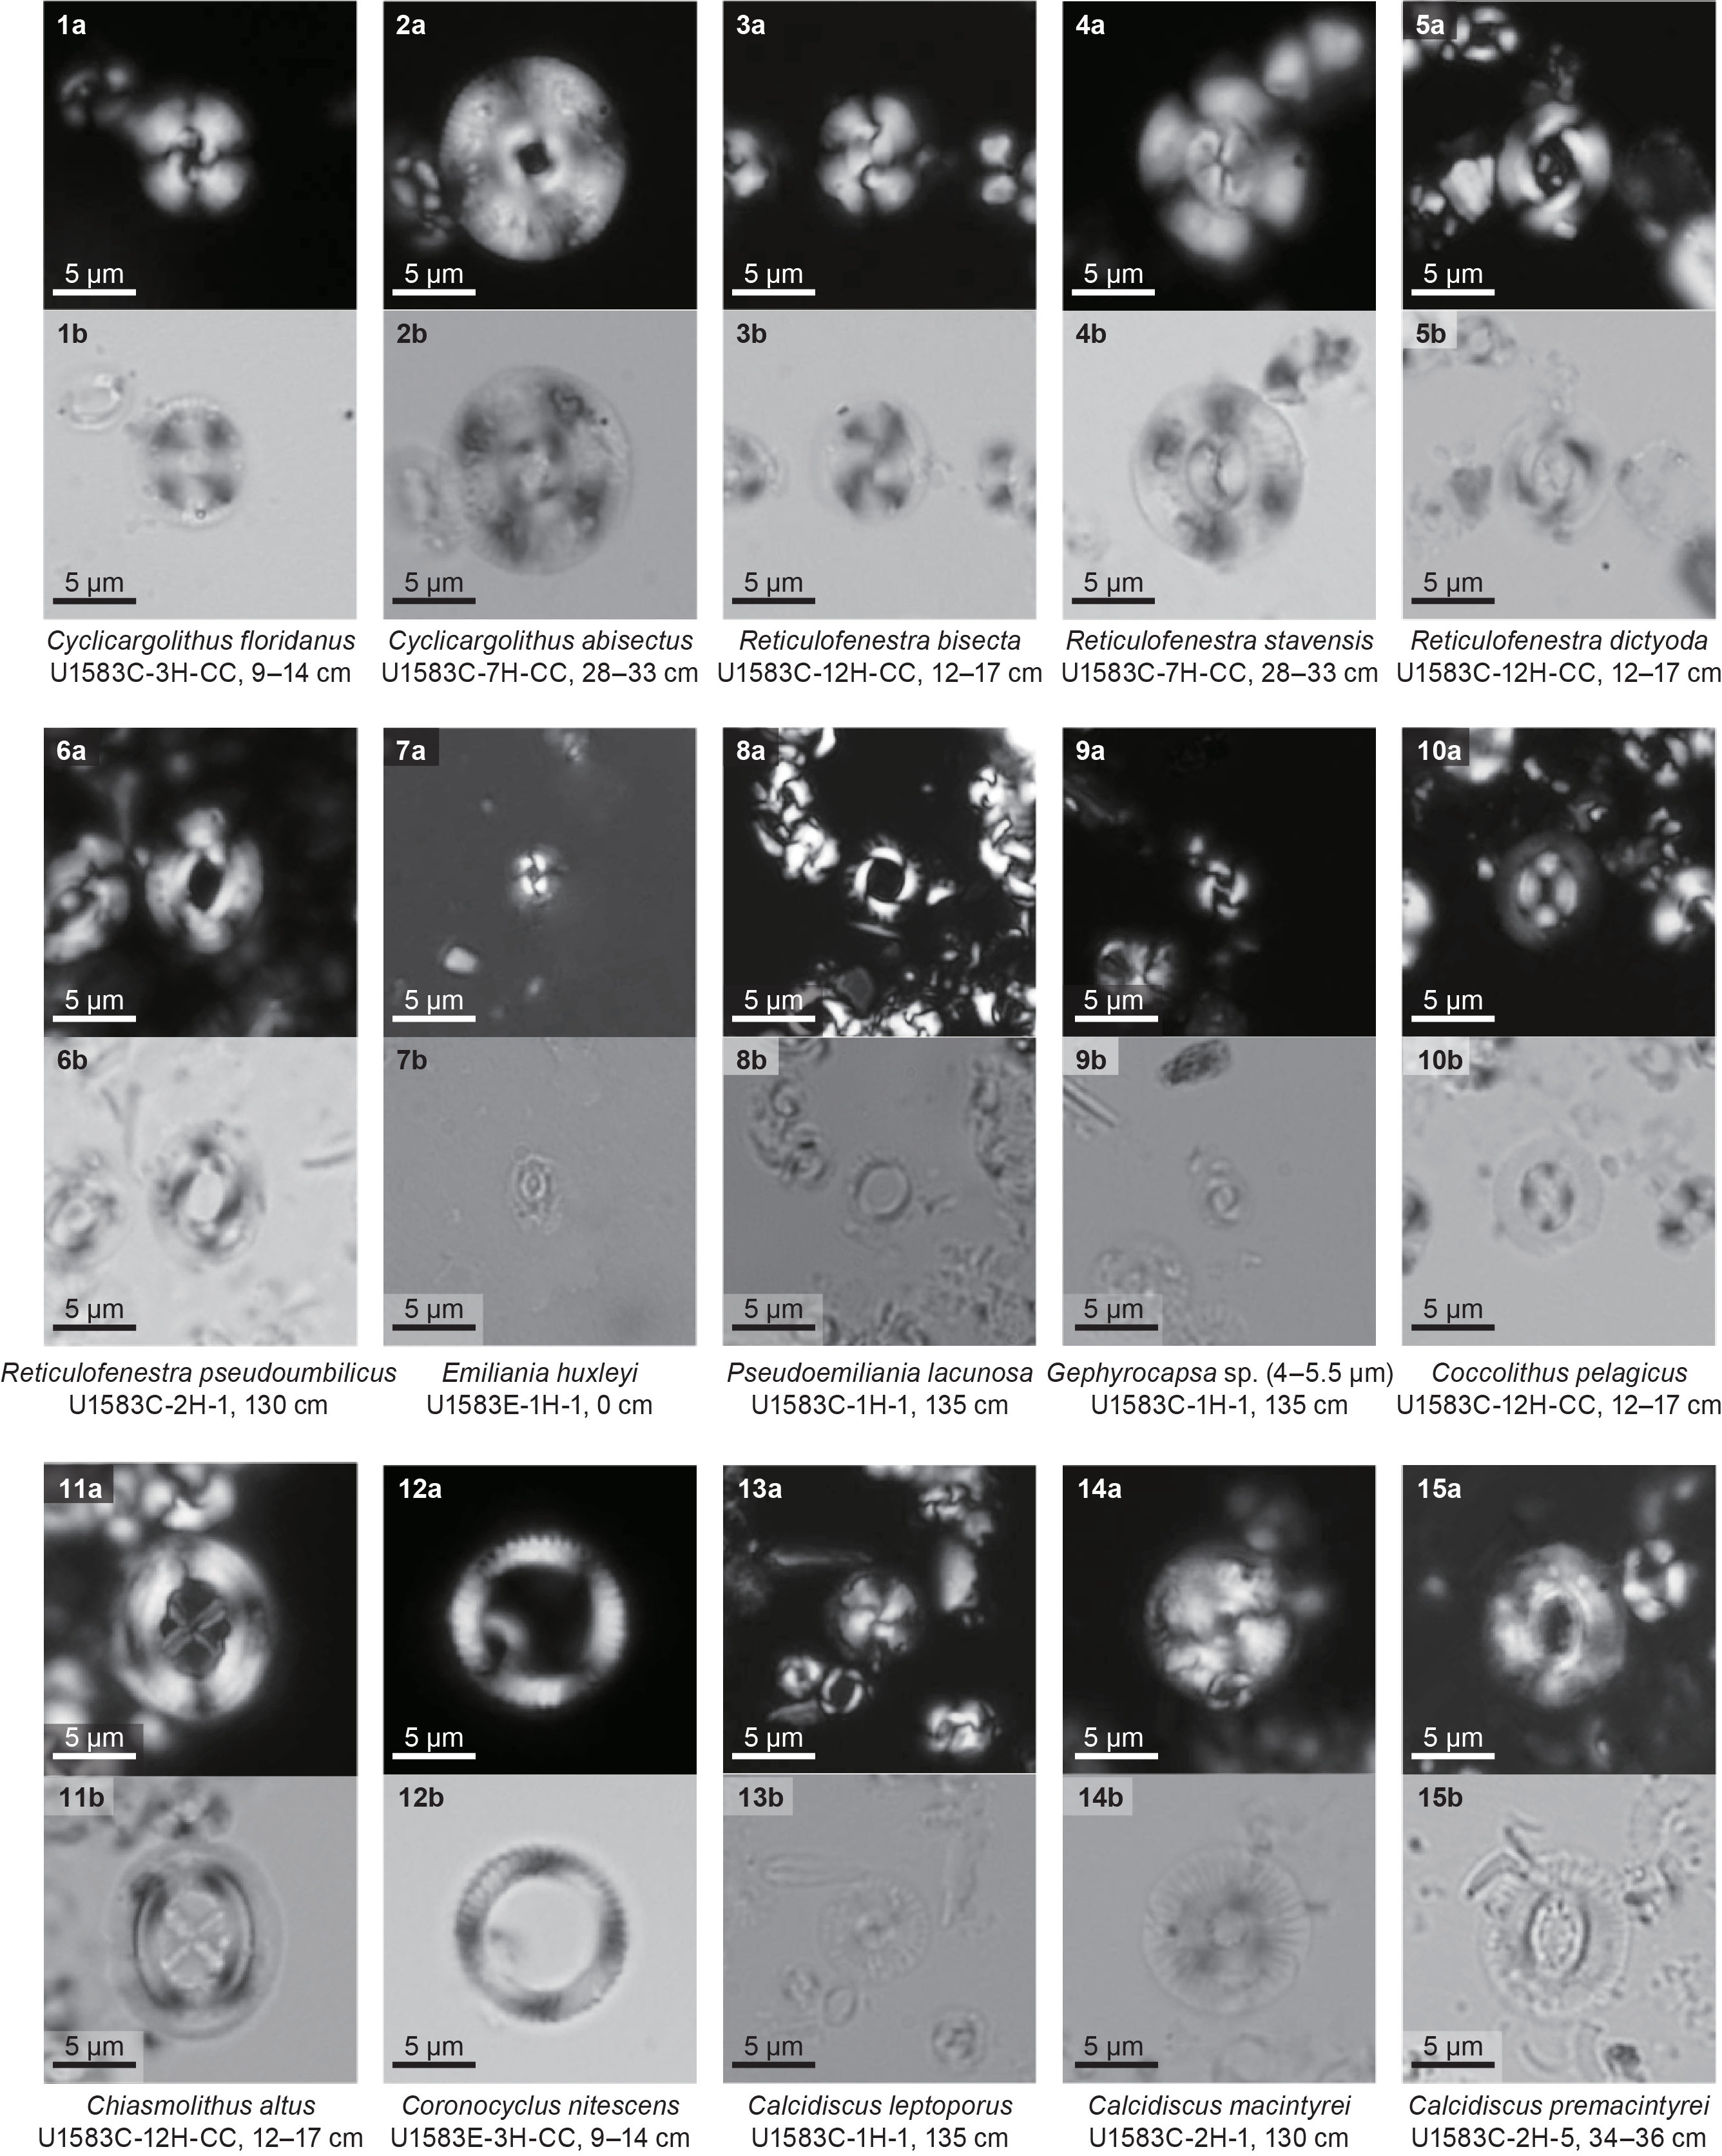
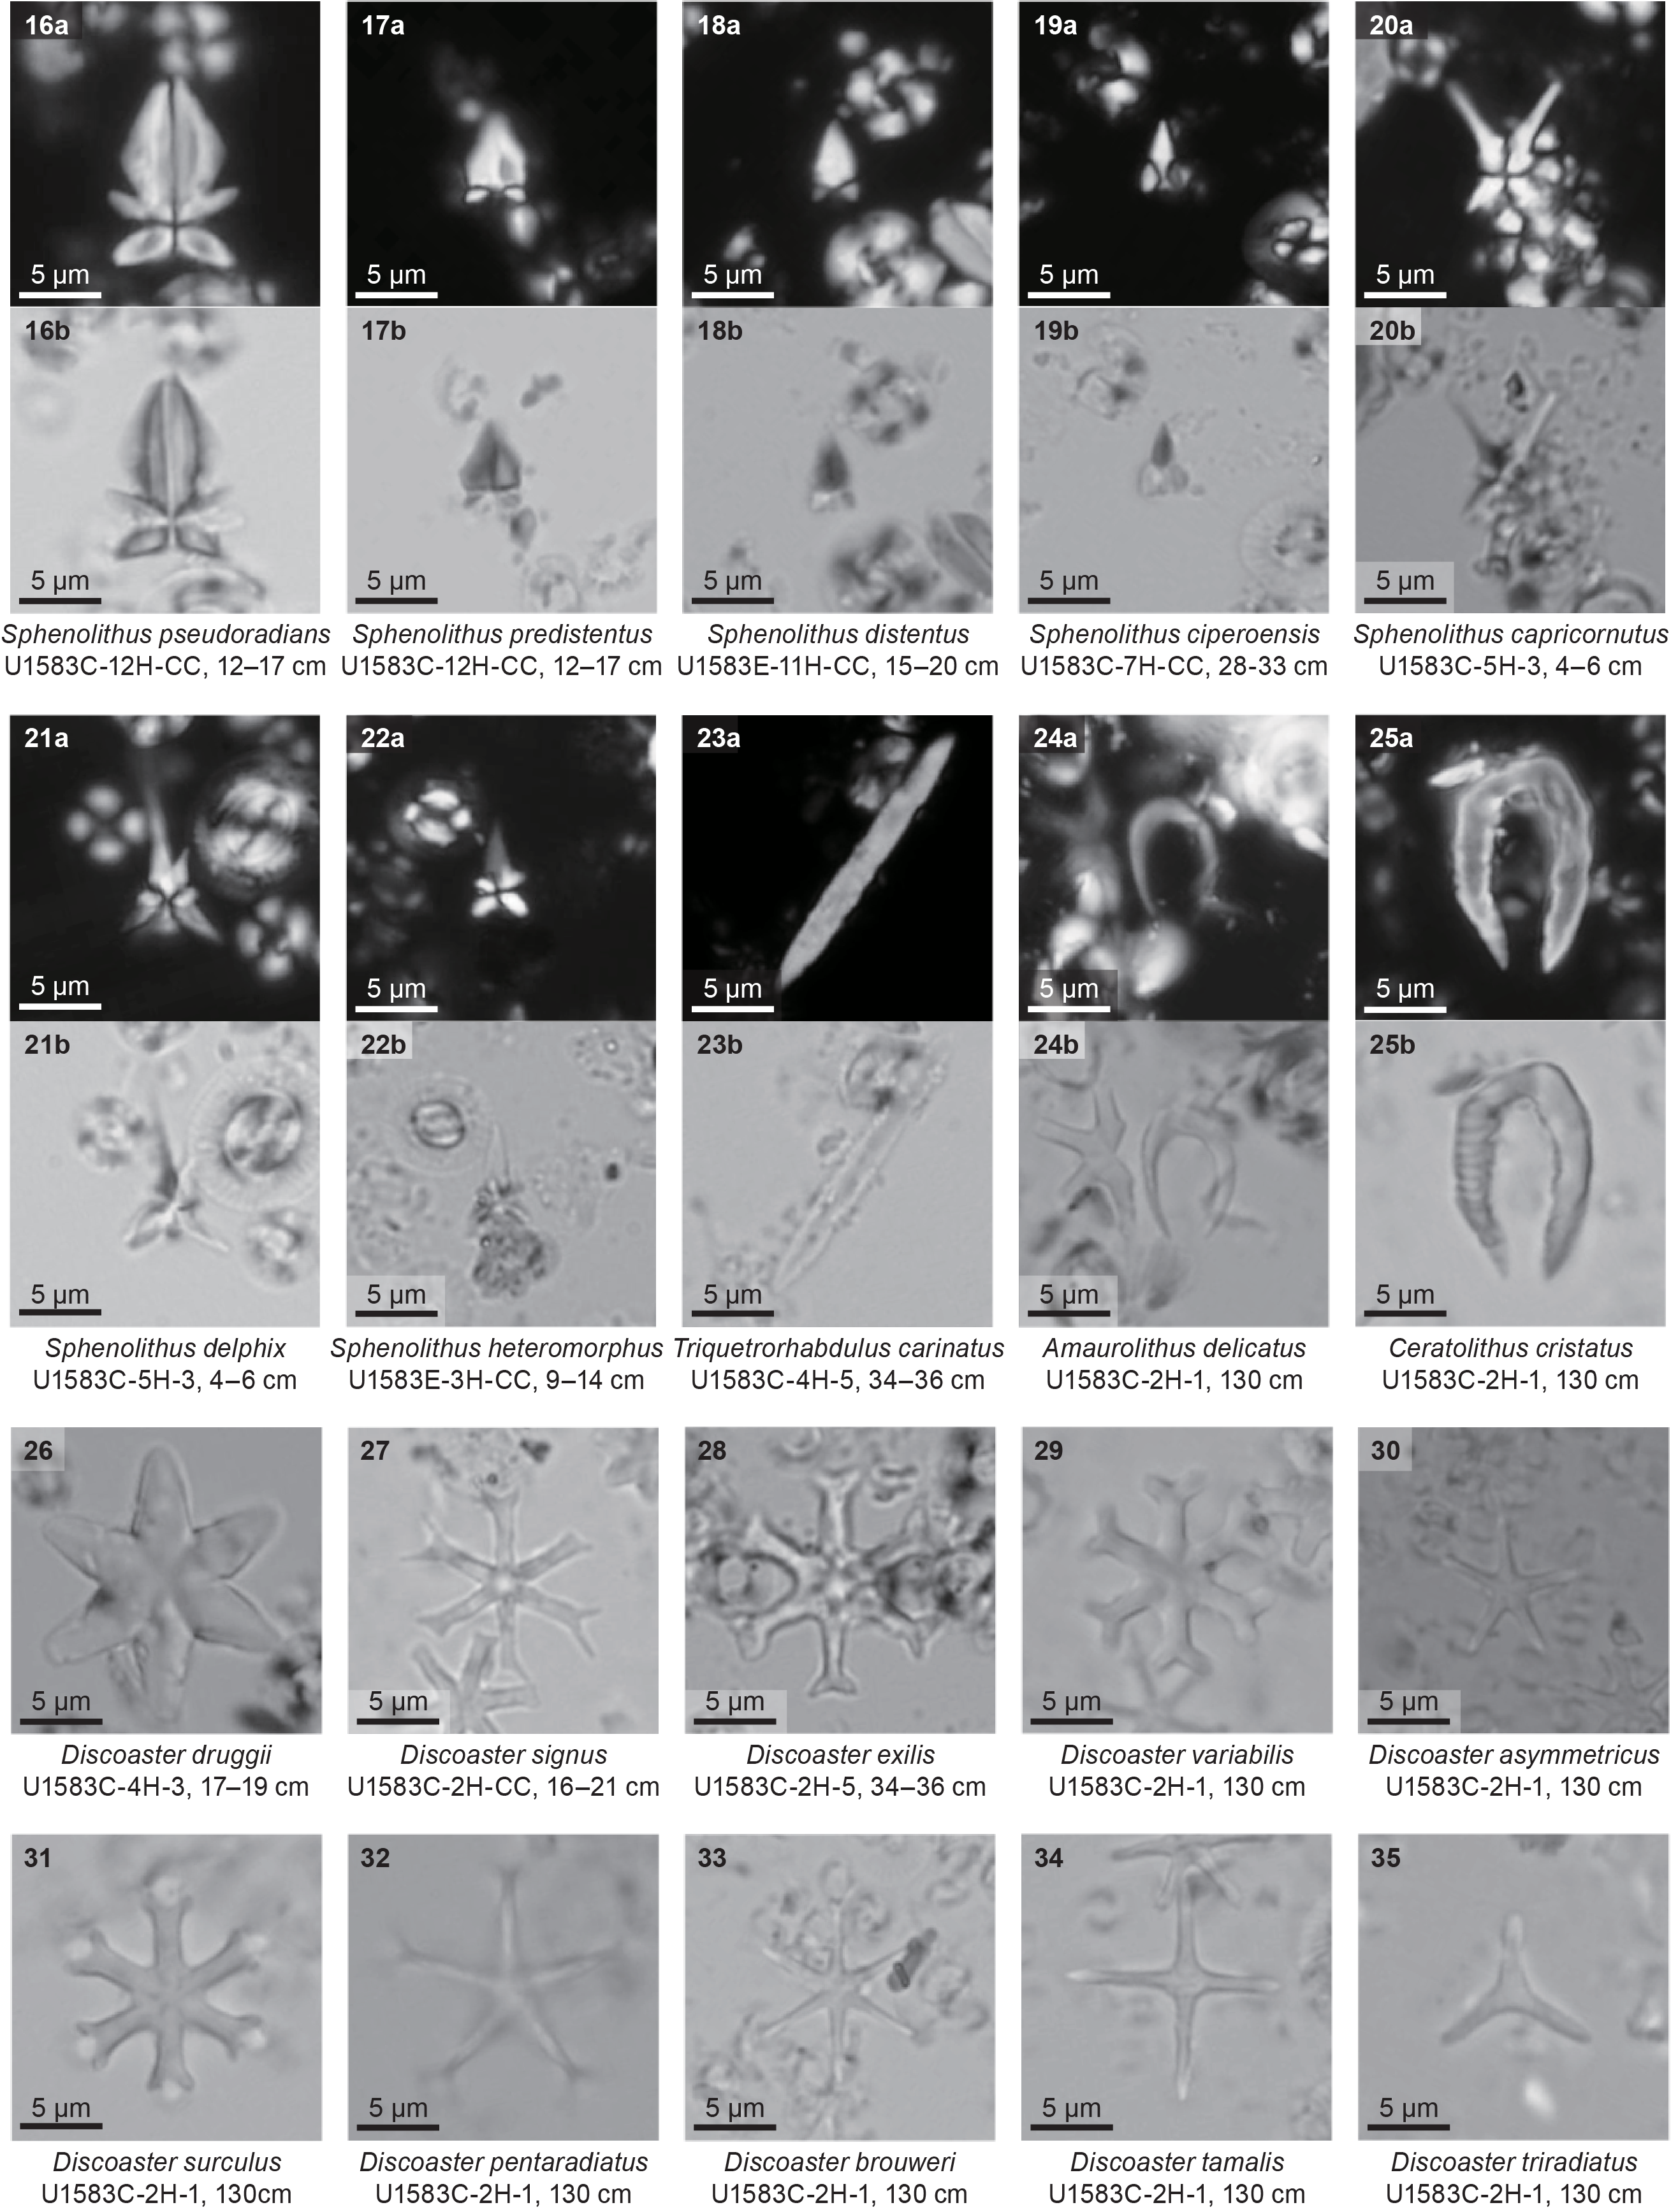
Figure F49. Important and notable nannofossil taxa.
The mudline sample from Hole U1583C contains the extant taxon Emiliania huxleyi (indicative of Zone CNPL11), which indicates that the seafloor is younger than 0.29 Ma. From the seafloor to the lowest sample above the dark brown clay unit (Lithostratigraphic Unit II) (Samples 393-U1583C-2H-2, 114–116 cm [11.14 m CSF-B], and 393-U1583E-2H-CC, 11–16 cm [13.47 m CSF-B]), assemblages represent Pliocene and Pleistocene Zones CNPL1–CNPL11. Pseudoemiliania lacunosa occurs in the first sediment sample from both holes (Samples 393-U1583C-1H-1, 135 cm, and 393-U1583E-1H-CC, 12–17 cm; 1.35 and 3.95 m CSF-B, respectively), which indicates that the sediment is older than 0.43 Ma (below Zone CNPL10). In Hole U1583C, the base of medium-sized Gephyrocapsa spp. (4–5.5 µm; top of Zone CNPL7) is recorded in Sample 393-U1583C-1H-1, 135 cm (1.35 m CSF-B). Three biohorizons are recorded in Sample 1H-4, 83 cm (5.33 m CSF-B): the top of Discoaster brouweri (1.93 Ma), the top of Discoaster pentaradiatus (2.39 Ma), and the top of Discoaster surculus (2.53 Ma). The wide age range likely reflects the slow sedimentation rate in this interval, and the true tops of these datums are likely spread out between samples. Below this, the top of Discoaster tamalis (2.76 Ma; top of Zone CNPL4) is identified in Sample 1H-6, 11–13 cm (7.61 m CSF-B). The next useful biohorizons are the top of Sphenolithus spp., the top of Reticulofenestra pseudoumbilicus (>7 µm; base of Zone CNPL4), and the base common of Discoaster asymmetricus (top of Zone CNPL2), which were all observed in Samples 2H-1, 130 cm, and 2H-2, 114–116 cm (9.80–11.14 m CSF-B in Hole U1583C).
Below the dark brown clay (Lithostratigraphic Unit II), Samples 393-U1583C-2H-5, 34–36 cm (14.84 m CSF-B), and 393-U1583E-3H-CC, 9–14 cm (22.95 m CSF-B), are assigned to the Middle Miocene. In Hole U1583C, six bioevents including the base of Ceratolithus cristatus (5.08 Ma), the base of Amaurolithus spp. (7.45 Ma), the top of Cyclicargolithus floridanus (11.85 Ma), the top of Coronocyclus nitescens (12.45 Ma), the top common of Calcidiscus premacintyrei (12.57 Ma), and the top of Sphenolithus heteromorphus (13.66 Ma) are identified in Samples 393-U1583C-2H-2, 114–116 cm, and 2H-5, 34–36 cm (11.14–14.84 m CSF-B). In Hole U1583E, seven biohorizons including the top of Sphenolithus spp. (3.61 Ma), the top of R. pseudoumbilicus (>7 µm; 3.82 Ma), the base of Ceratolithus cristatus (5.08 Ma), the top of C. floridanus (11.85 Ma), the top of C. nitescens (12.45 Ma), the top common of C. premacintyrei (12.57 Ma), and the top of S. heteromorphus (13.66 Ma) are identified between Samples 393-U1583E-2H-CC, 11–16 cm, and 3H-CC, 9–14 cm (13.46–22.95 m CSF-B). The lithology of these intervals is mainly clay-rich sediment (Unit III; see Sedimentology); thus, we interpret these intervals in both holes (11.14–14.84 m CSF-B in Hole U1583C and 13.46–22.95 m CSF-B in Hole U1583E) to be a condensed interval spanning ~9 My that encompasses nannofossil Zones CNPL1–CNM8 and the Pliocene/Miocene boundary.
The Early–Middle Miocene (Zones CNM7–CNM1) is recognized between 14.84 and 35.97 m CSF-B in Hole U1583C and between 22.95 and 41.96 m CSF-B in Hole U1583E. The base of Discoaster signus (top of Zone CNM6) is located in Sample 393-U1583C-2H-CC, 16–21 cm (16.90 m CSF-B), and the base common of S. heteromorphus is identified in Samples 393-U1583C-3H-2, 91 cm (19.44 m CSF-B), and 393-U1583E-3H-CC, 9–14 cm (22.95 m CSF-B). Below this biohorizon, the top common of Triquetrorhabdulus carinatus is recorded in Samples 393-U1583C-4H-3, 17–19 cm (29.56 m CSF-B), and 393-U1583E-5H-CC, 15–20 cm (41.96 m CSF-B).
The Oligocene/Miocene boundary is constrained by the top of the short-ranging and distinctive sphenolith taxa Sphenolithus delphix, identified in Sample 393-U1583C-5H-3, 4–6 cm (39.04 m CSF-B), along with the top of Sphenolithus capricornutus in Hole U1583C. These taxa are not identified in Hole U1583E, likely due to sample resolution, and thus the Oligocene/Miocene boundary is approximated based on the top of Reticulofenestra bisecta in Sample 6H-CC, 11–16 cm (50.34 m CSF-B). However, in Hole U1583C the top of R. bisecta (23.13 Ma) is recorded above the top of S. delphix (23.11 Ma), suggesting that the top of R. bisecta might be diachronous in the South Atlantic Ocean. The top of Sphenolithus ciperoensis (top of Zone CNO5) is identified in Samples 393-U1583C-6H-4, 93–95 cm (50.95 m CSF-B), and 393-U1583E-7H-CC, 7–12 cm (60.96 m CSF-B). Within Zone CNO5, the top of Chiasmolithus altus is recorded in Samples 393-U1583C-7H-5, 20–22 cm (61.12 m CSF-B), and 393-U1583E-9H-CC, 9–14 cm (79.09 m CSF-B). The top of Zone CNO4 is recognized in Samples 393-U1583C-9H-3, 9–11 cm, and 393-U1583E-11H-CC, 15–20 cm (77.09 and 98.95 m CSF-B, respectively), by the top of Sphenolithus predistentus. Below this interval, the base of S. ciperoensis is identified in Samples 393-U1583C-9H-3, 9–11 cm (77.09 m CSF-B), and 393-U1583E-10H-CC, 7–12 cm (89.45 m CSF-B), and in Hole U1583C, the top of Sphenolithus pseudoradians (within Zone CNO4) is identified in Sample 393-U1583C-11H-5, 29–31 cm (99.19 m CSF-B). The deepest samples examined at Site U1583 contain Sphenolithus distentus, which constrains the sediment to younger than 30.0 Ma and corresponds well to both the planktic foraminiferal biostratigraphy and the estimated crustal age for Site U1583 of ~30.6 Ma (see Background and objectives).
7.3. Planktic foraminifera
Mudline and core catcher samples from Holes U1583C and U1583E were analyzed for planktic foraminifera. A summary of planktic foraminiferal biostratigraphy is presented in Figure F47. Planktic foraminifera are abundant throughout the sedimentary sequence, and preservation is mostly very good to good (Tables T13, T14). Detailed preservation and abundance data are presented in Figure F48. Significant specimens of planktic foraminifera are illustrated in Figure F50.
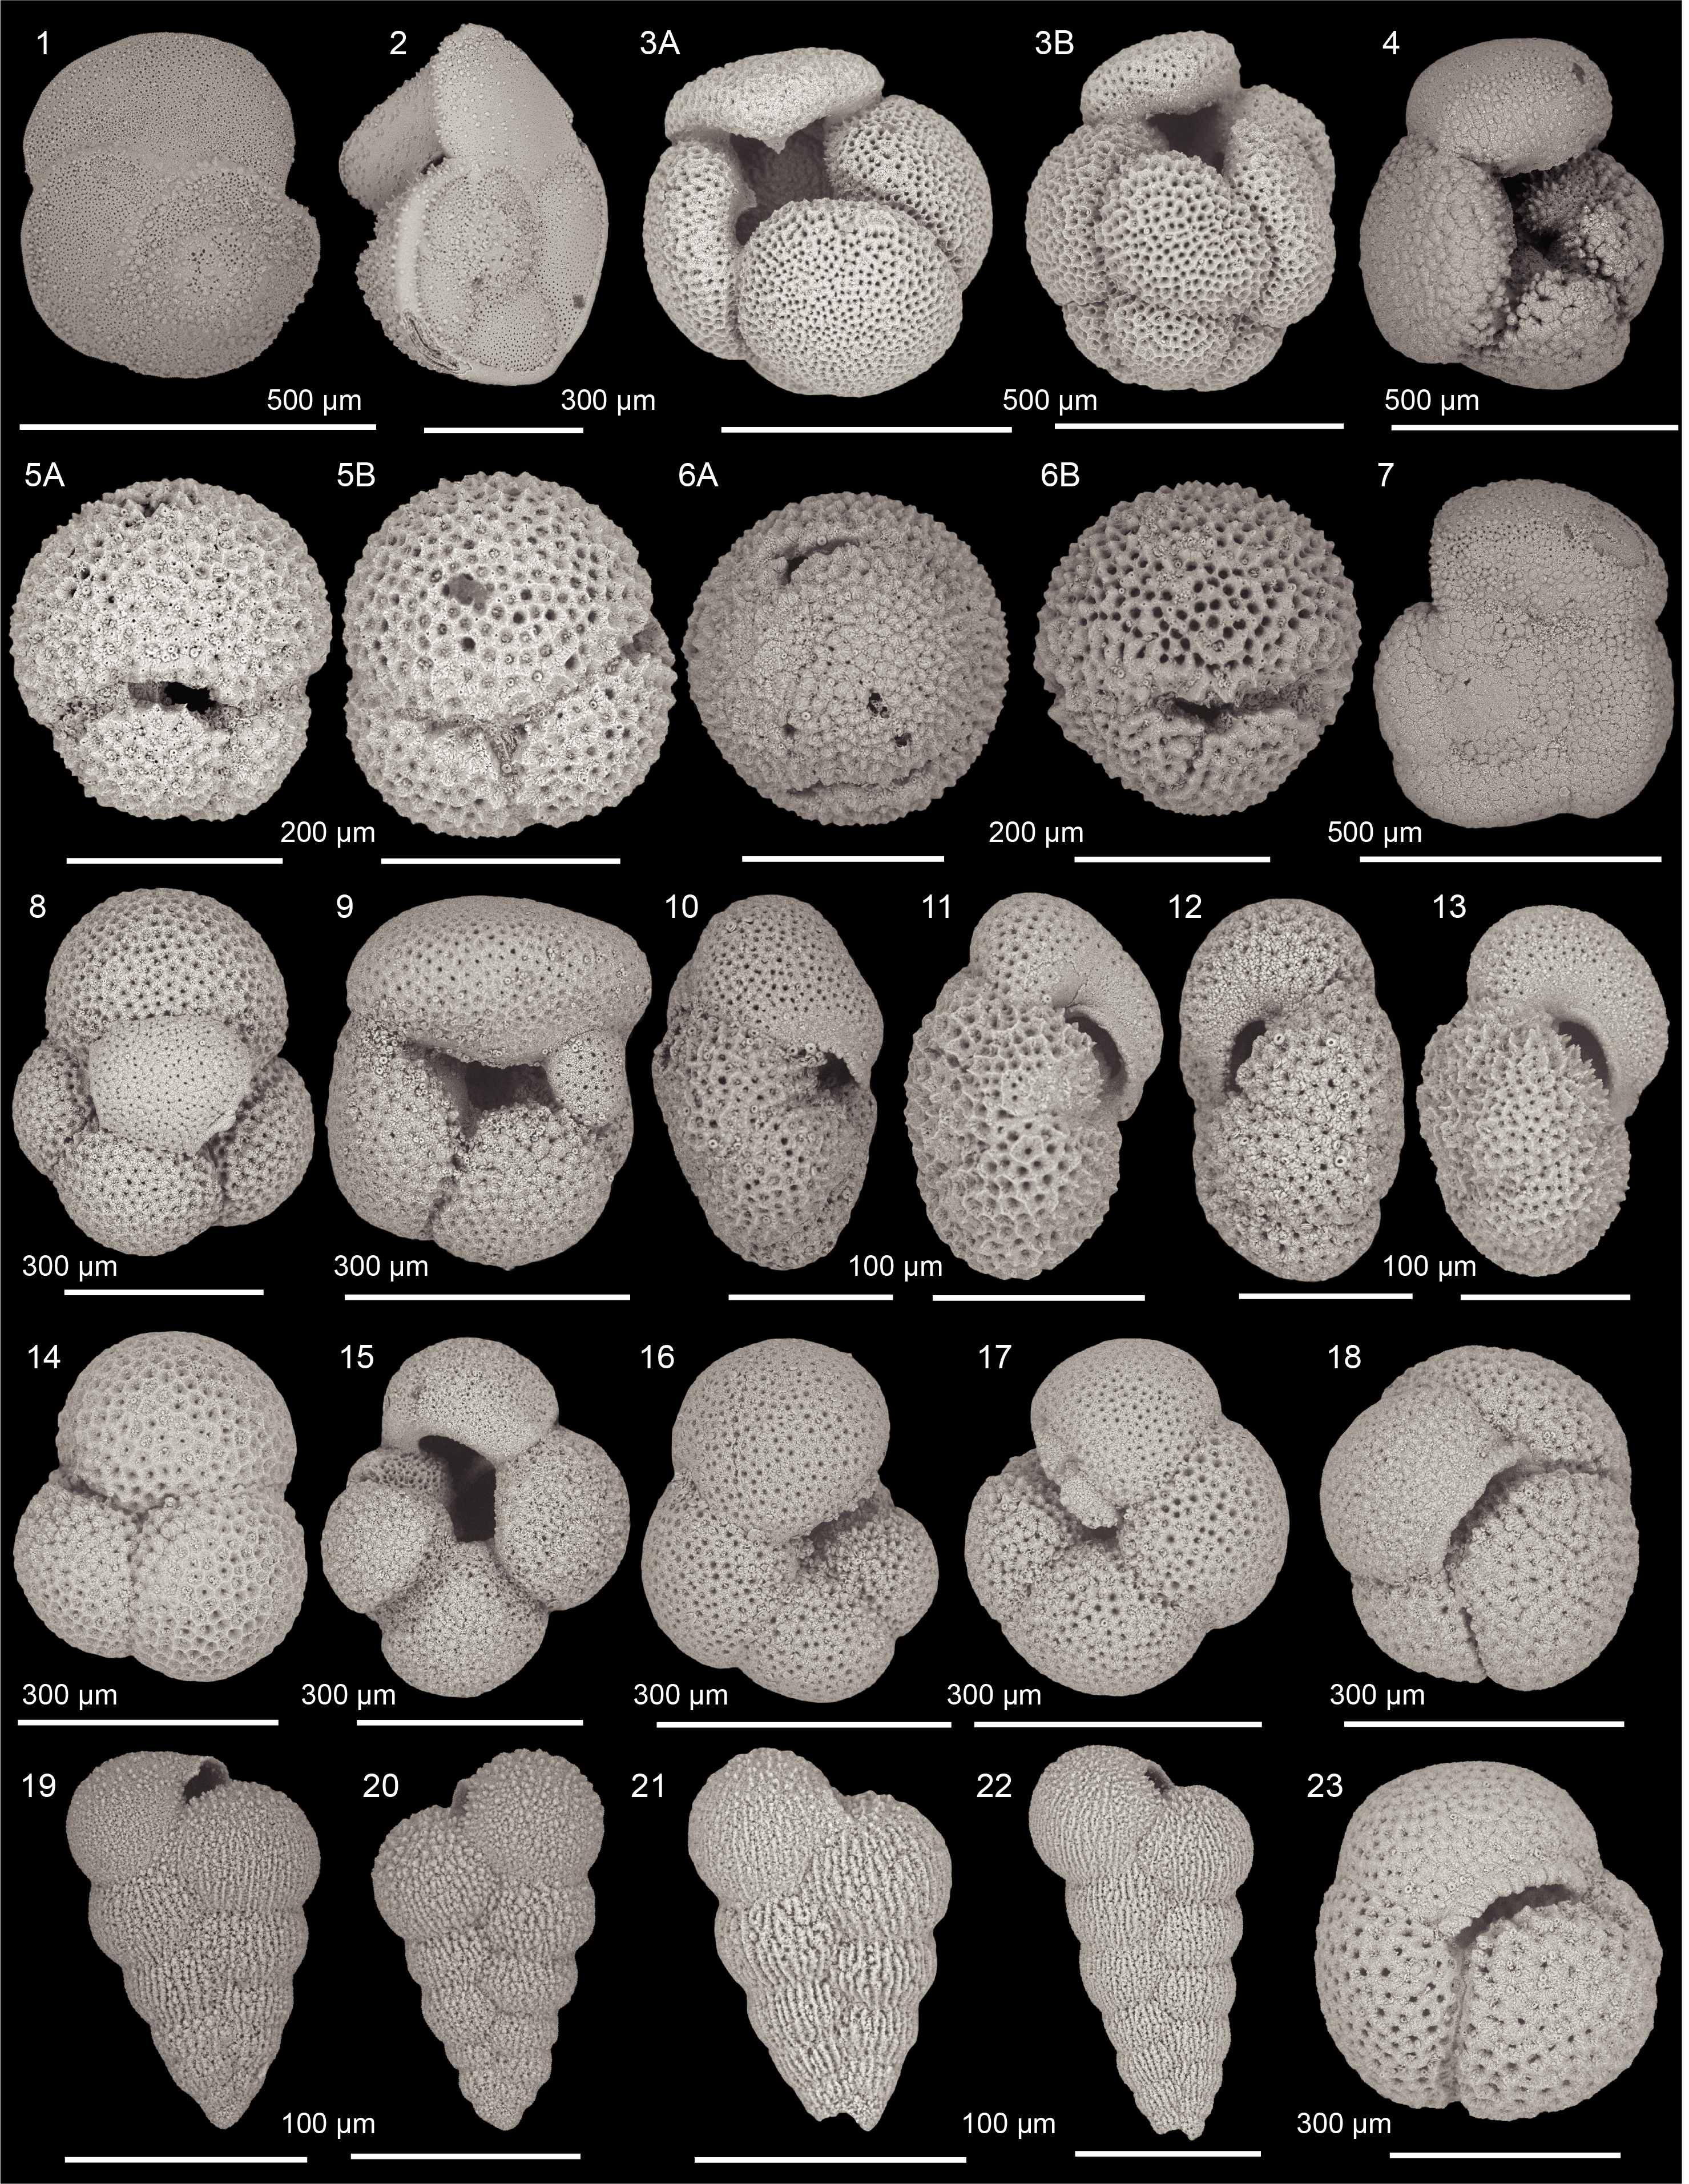
Figure F50. Important and other notable foraminiferal taxa.
The Hole U1583C mudline sample contains a characteristic modern to Pleistocene planktic foraminiferal assemblage, including the marker species Globorotalia hirsuta, which has a lowest occurrence at 0.45 Ma near the base of Zone PT1b. The assemblage in the Hole U1583E mudline sample is characterized by signs of dissolution and increased fragmentation of calcareous microfossils. This assemblage is tentatively interpreted to be modern based on the presence of relatively long ranging but extant taxa such as Orbulina universa, Globoconella inflata, and Globigerinoides truncatulinoides.
Sample 393-U1583E-1H-CC, 12–17 cm (3.95 m CSF-B), contains an Upper Pleistocene assemblage characterized by the presence of Globorotalia hessi, which has a base within Zone PT1a (0.74 Ma), and the absence of G. hirsuta, which has a base in Zone PT1b (0.45 Ma). Sample 2H-CC, 11–16 cm (13.46 m CSF-B), is assigned to Zones PT1a–PL6 undifferentiated based on the co-occurrence of Globorotalia tosaensis and G. truncatulinoides.
The first evidence for Pliocene sediments in Hole U1583C comes from Sample 393-U1583C-1H-CC, 14–19 cm (8.42 m CSF-B), which contains the first occurrences of Dentoglobigerina altispira (which marks the top of Zone PL4, 3.0 Ma) and Globorotalia crassaformis, and extant species with a lowest occurrence near the base of Zone PL2. In adjacent Hole U1583E, we did not identify any Pliocene-age sediments. The next sample analyzed, Sample 393-U1583E-3H-CC, 9–14 cm (22.95 m CSF-B), contains Middle Miocene taxa, suggesting a condensed interval between 13.50 and 22.95 m CSF-B driven by low sedimentation rates and/or changes in the depth of the CCD.
Sample 393-U1583E-3H-CC, 9–14 cm (22.95 m CSF-B), is assigned to Zones M9–M8 undifferentiated based on the occurrence of the distinctive Middle Miocene taxon Fohsella praefohsi. In Hole U1583C, Sample 393-U1583C-2H-CC, 16–21 cm (16.90 m CSF-B), contains a population of the similarly distinctive Early to Middle Miocene genus Praeorbulina species, including P. glomerosa, P. circularis, and P. curva. The base of Praeorbulina circularis, calibrated at 15.98 Ma, in conjunction with the absence of Orbulina suturalis (marker taxa for the base of Zone M6 at 15.12 Ma), allows us to assign this sample to Zone M5b.
Samples 393-U1583C-3H-CC, 16–21 cm (26.42 CSF-B), and 393-U1583E-4H-CC, 14–19 cm (32.44 m CSF-B), are placed in Early Miocene Zones M3–M1b undifferentiated in the sedimentary sequences of both holes. This zonal assignment is based on the co-occurrence of Catapsydrax dissimilis and Globoquadrina dehiscens. The top of C. dissimilis marks the top of Zone M3 at 17.51 Ma, whereas the base of G. dehiscens occurs at the base of Zone M1b (22.50 Ma).
Samples 393-U1583C-4H-CC, 32–37 cm (35.97 m CSF-B), and 393-U1583E-5H-CC, 15–20 cm (41.96 m CSF-B), are assigned to Early Miocene Zone M1a based on the co-occurrences of Ciperoella ciperoensis and Trilobatus trilobus. The top of C. ciperoensis (22.81 Ma) and the base of T. trilobus (22.88 Ma) both occur within Zone M1a, giving a tight age constraint for these sediments in adjacent holes.
The four consecutive core catcher samples below this in Hole U1583C (Samples 393-U1583C-5H-CC, 15–20 cm, through 8H-CC, 13–18 cm; 45.31–73.08 m CSF-B) and five core catcher samples in Hole U1583E (Samples 393-U1583E-6H-CC, 11–16 cm, through 10H-CC, 7–12 cm; 50.34–89.45 m CSF-B) are dominated by long-ranging taxa (e.g., Catapsydrax dissimilis and Catapsydrax unicavus) and lack any age-diagnostic species, precluding confident zonal assignments. However, considering that in both holes this interval falls below the base of T. trilobus, it is likely late Oligocene.
The planktic foraminiferal assemblage in Sample 393-U1583C-9H-CC, 20–25 cm (83.22 m CSF-B), contains Paragloborotalia opima, indicating that these sediments are mid-Oligocene in age. The top of P. opima marks the top of Zone O5 at 27.3 Ma and provides an upper age constraint for the sample. The absence of Chiloguembelina cubensis, which occurs deeper in the hole, confirms the assignment of this sample to Zone O5 (27.3–28.3 Ma).
The highest common occurrence of C. cubensis (28.3 Ma), the marker bioevent for the top of Zone O4, is recorded in large numbers of the nominate taxon in Sample 393-U1583C-10H-CC, 20–25 cm (92.49 m CSF-B). This event, combined with the absence of Subbotina angiporoides, which is found farther downhole, allows us to assign this sample to Zones O4–O3 undifferentiated. In Hole U1583E, Sample 393-U1583E-11H-CC, 15–20 cm (98.95 m CSF-B), records the highest common occurrence of C. cubensis (28.3 Ma) along with the base of Ciperoella angulisuturalis (29.5 Ma), which places this sample firmly within Zone O4. The lowermost sample analyzed, Sample 393-U1583E-12H-CC, 0–1 cm (105.12 m CSF-B), contains rare specimens of S. angiporoides and Turborotalia ampliapertura. The top of T. ampliapertura marks the top of Zone O2, with the zonal assignment for this sample supported by the absence of Paragloborotalia opima, the base of which is typically placed within the same zone and calibrated to 30.8 Ma. In Hole U1583C, the lowermost Sample 393-U1583C-12H-CC, 12–17 cm (104.58 m CSF-B), contains common S. angiporoides and no P. opima. The base of P. opima is therefore recognized in the core catcher sample above (Sample 393-U1583C-11H-CC, 17–22 cm; 102.45 m CSF-B). The top of S. angiporoides occurs within Zone O3 at 30.1 Ma and, combined with the absence of P. opima, allows us to assign Sample 12H-CC, 12–17 cm, to Zones O3–O2 undifferentiated.
7.4. Benthic foraminifera
Benthic foraminifera were not analyzed at Site U1583.
8. Paleomagnetism
8.1. Sediment
Remanent magnetization was measured at 2 cm spacing using the superconducting rock magnetometer (SRM) on the archive halves of the sediment core sections from Holes U1583C and U1583E and the single sediment core from Hole U1583F (Core 393-U1583F-2R). Remanence was measured before and after alternating field (AF) demagnetization at three field strength steps of 5, 10, and 20 mT (see Paleomagnetism in the Expedition 390/393 methods chapter [Coggon et al., 2024a]) to isolate the characteristic remanent magnetization (ChRM). Strongly disturbed intervals (~3% of the total core length) were excluded from the measurements to avoid unreliable results. If a section was heavily disturbed for more than 50% of its extent, the entire section was not measured (e.g., Sections 393-U1583E-1H-1, 3H-1, and 11H-2). Two discrete samples (7 cm3 J-cubes) per core were taken from working halves of Hole U1583C (see Paleomagnetism in the Expedition 390/393 methods chapter [Coggon et al., 2024a]), and one sample was also taken from above the sediment/basement interface in Hole U1583F. Remanence before and after AF demagnetization and anisotropy of magnetic susceptibility (AMS) were measured on a total of 25 discrete samples. Acquisition of isothermal remanent magnetization (IRM) was performed on 8 selected samples (at least once per lithostratigraphic unit/subunit). To establish the magnetostratigraphy at Site U1583, magnetic polarities were analyzed using the results from both Holes U1583C and U1583E.
8.1.1. Results
The natural remanent magnetization (NRM) intensities of sediment cores from Holes U1583C and U1583E are generally on the order of 10−2 A/m, and 20 mT intensities are mainly between 10−4 and 10−3 A/m; both holes show similar variations in remanence intensity. Significant differences between NRM and 20 mT remanence intensity are observed in Cores 393-U1583C-2H and 393-U1583E-3H, which are associated with an increase in MS due to the presence of a clay-rich interval (Unit III) (Figures F51, F52). In Core 393-U1583C-12H, 20 mT remanence values <10-4 A/m are recorded, and the remanence intensity decreases from 10−3 to 10−5 A/m after the 5 mT step; the near-complete loss of the primary remanent magnetization confirms that this core is highly disturbed (see Operations). Clear positive and negative polarities in the 20 mT inclination are visible in both Holes U1583C and U1583E that can be dated by magnetostratigraphic correlation to polarity chrons in the geomagnetic polarity timescale (GPTS) (see Magnetostratigraphy and Age model and sedimentation rates). The 20 mT inclination values have a bimodal distribution in both holes, where values are clustered around +57° and −54° in Hole U1583C and clusters are seen around +59° and −51° in Hole U1583E (Figure F53). These angles are slightly steeper than the inclination expected based on the geocentric axial dipole (GAD; ±49.1° at 30°S).
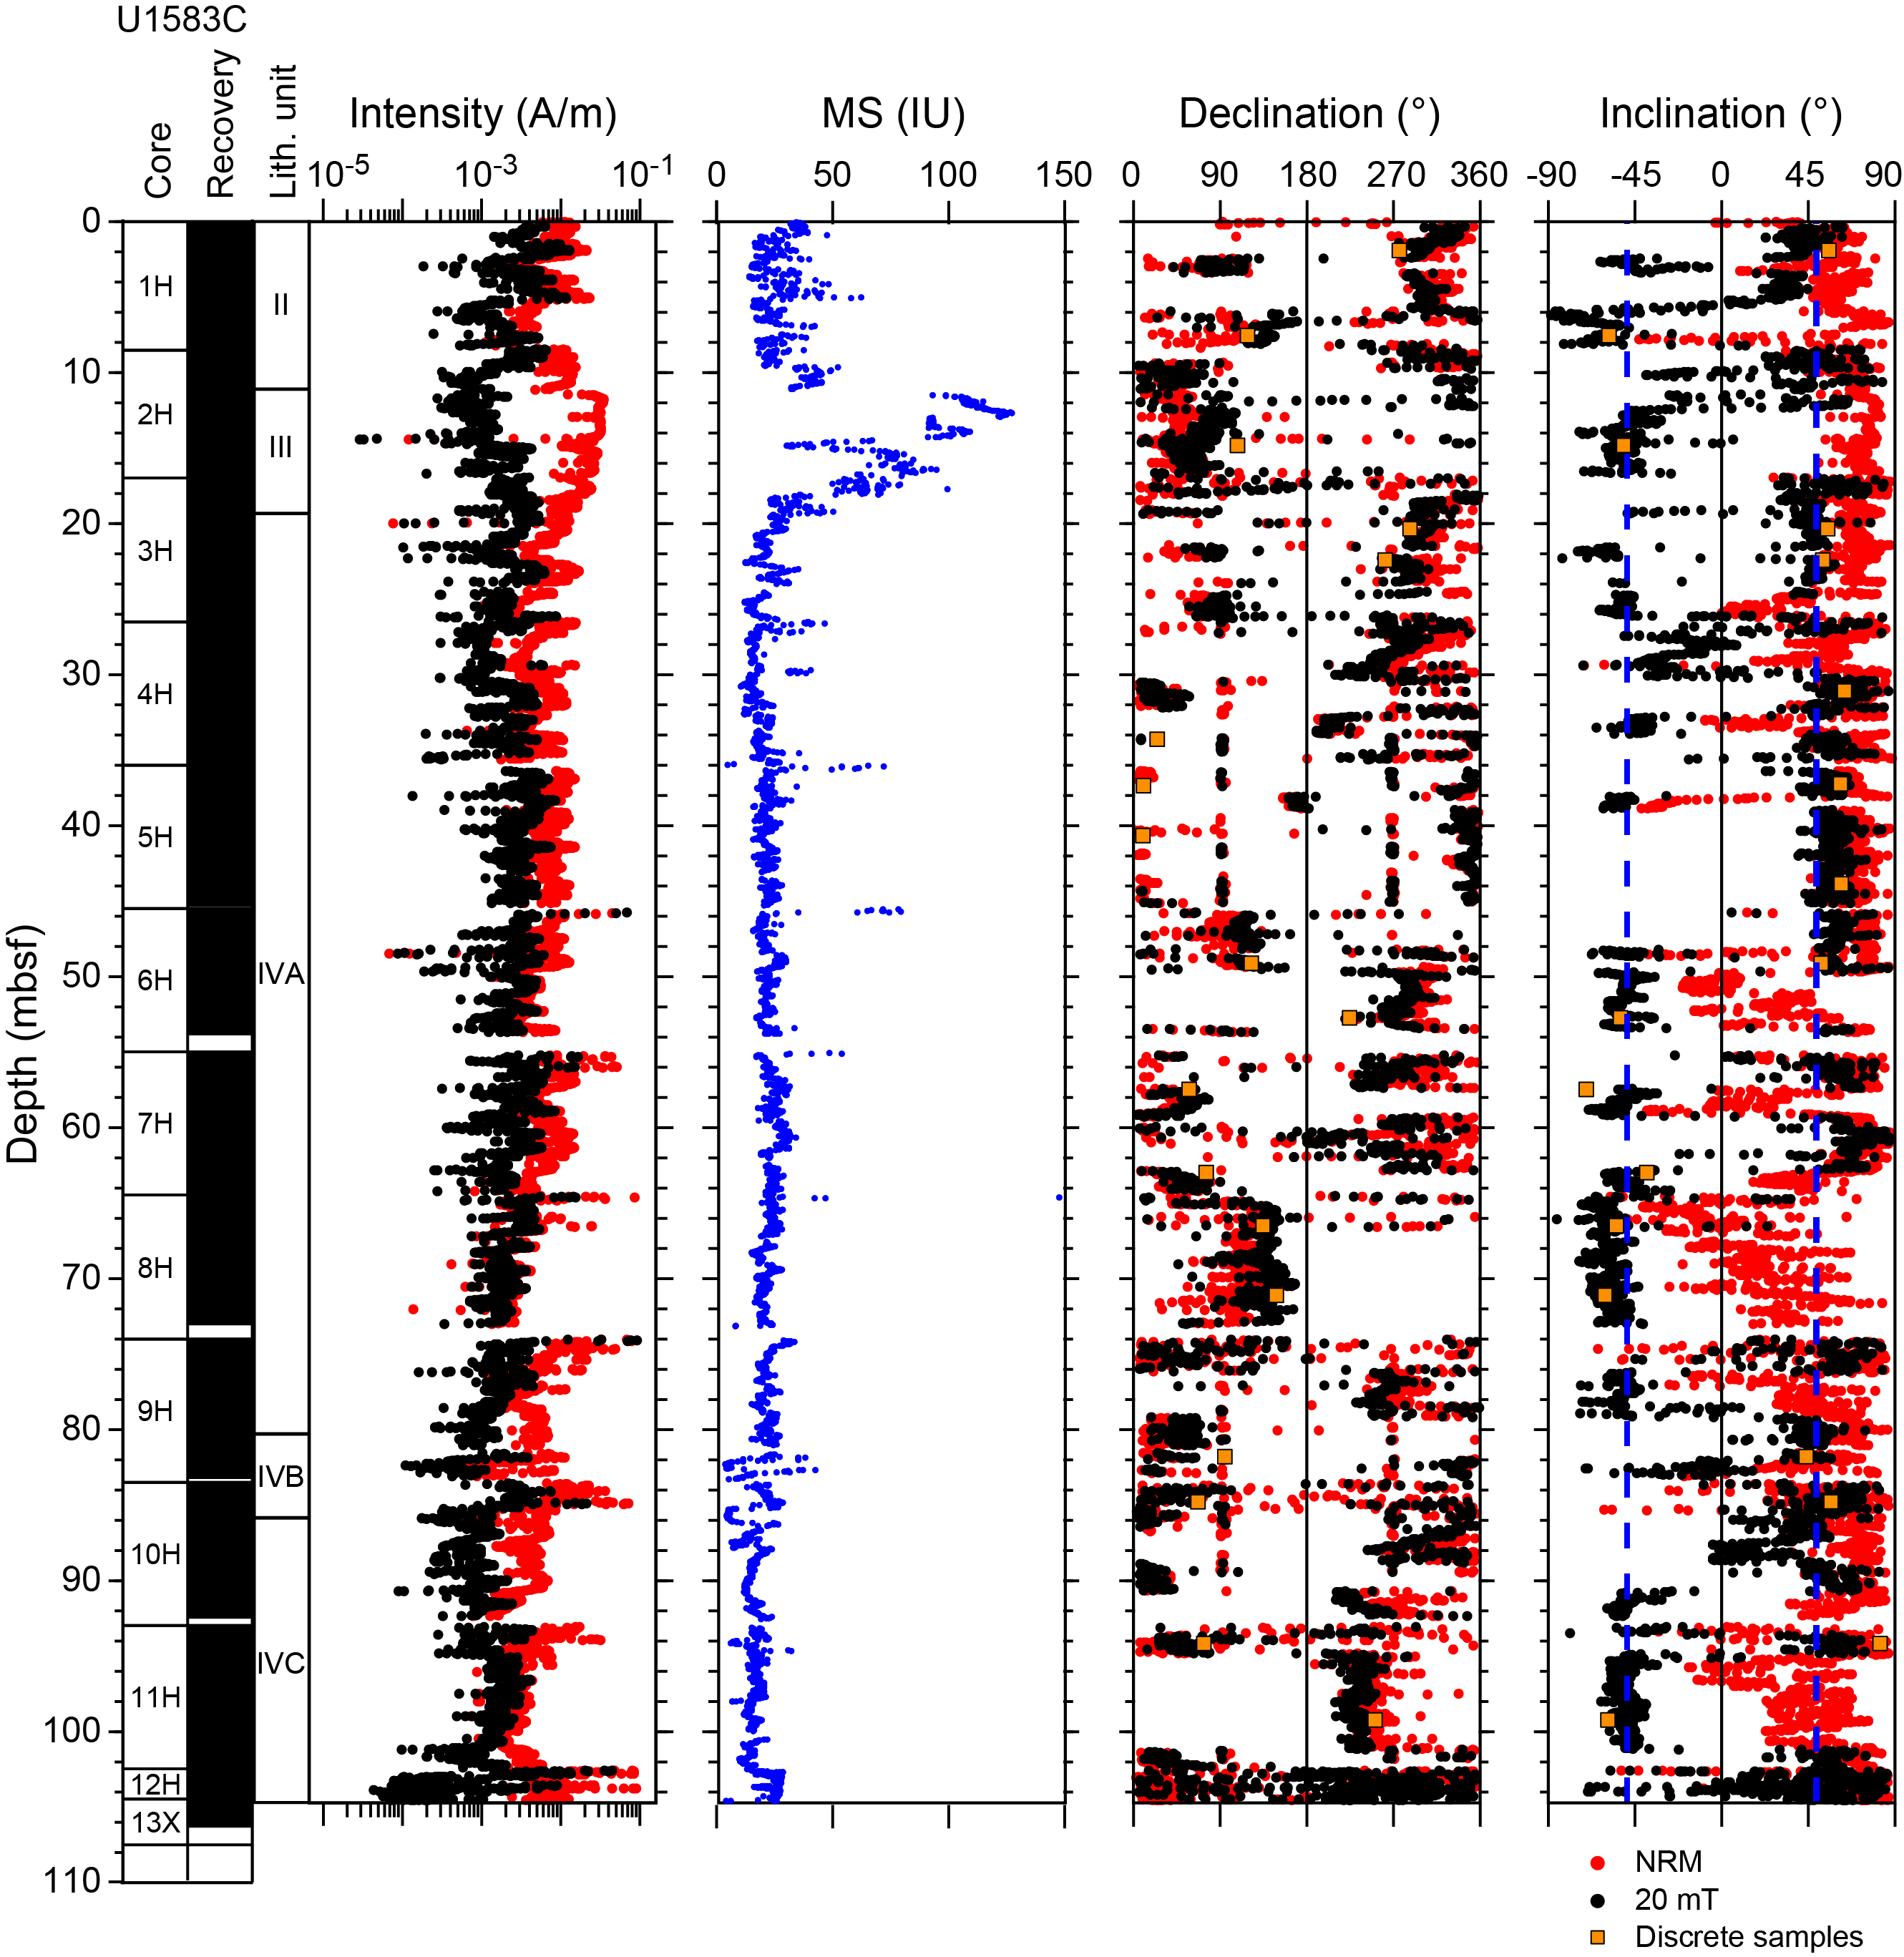
Figure F51. MSP and SRM measurements in sediments, Hole U1583C.
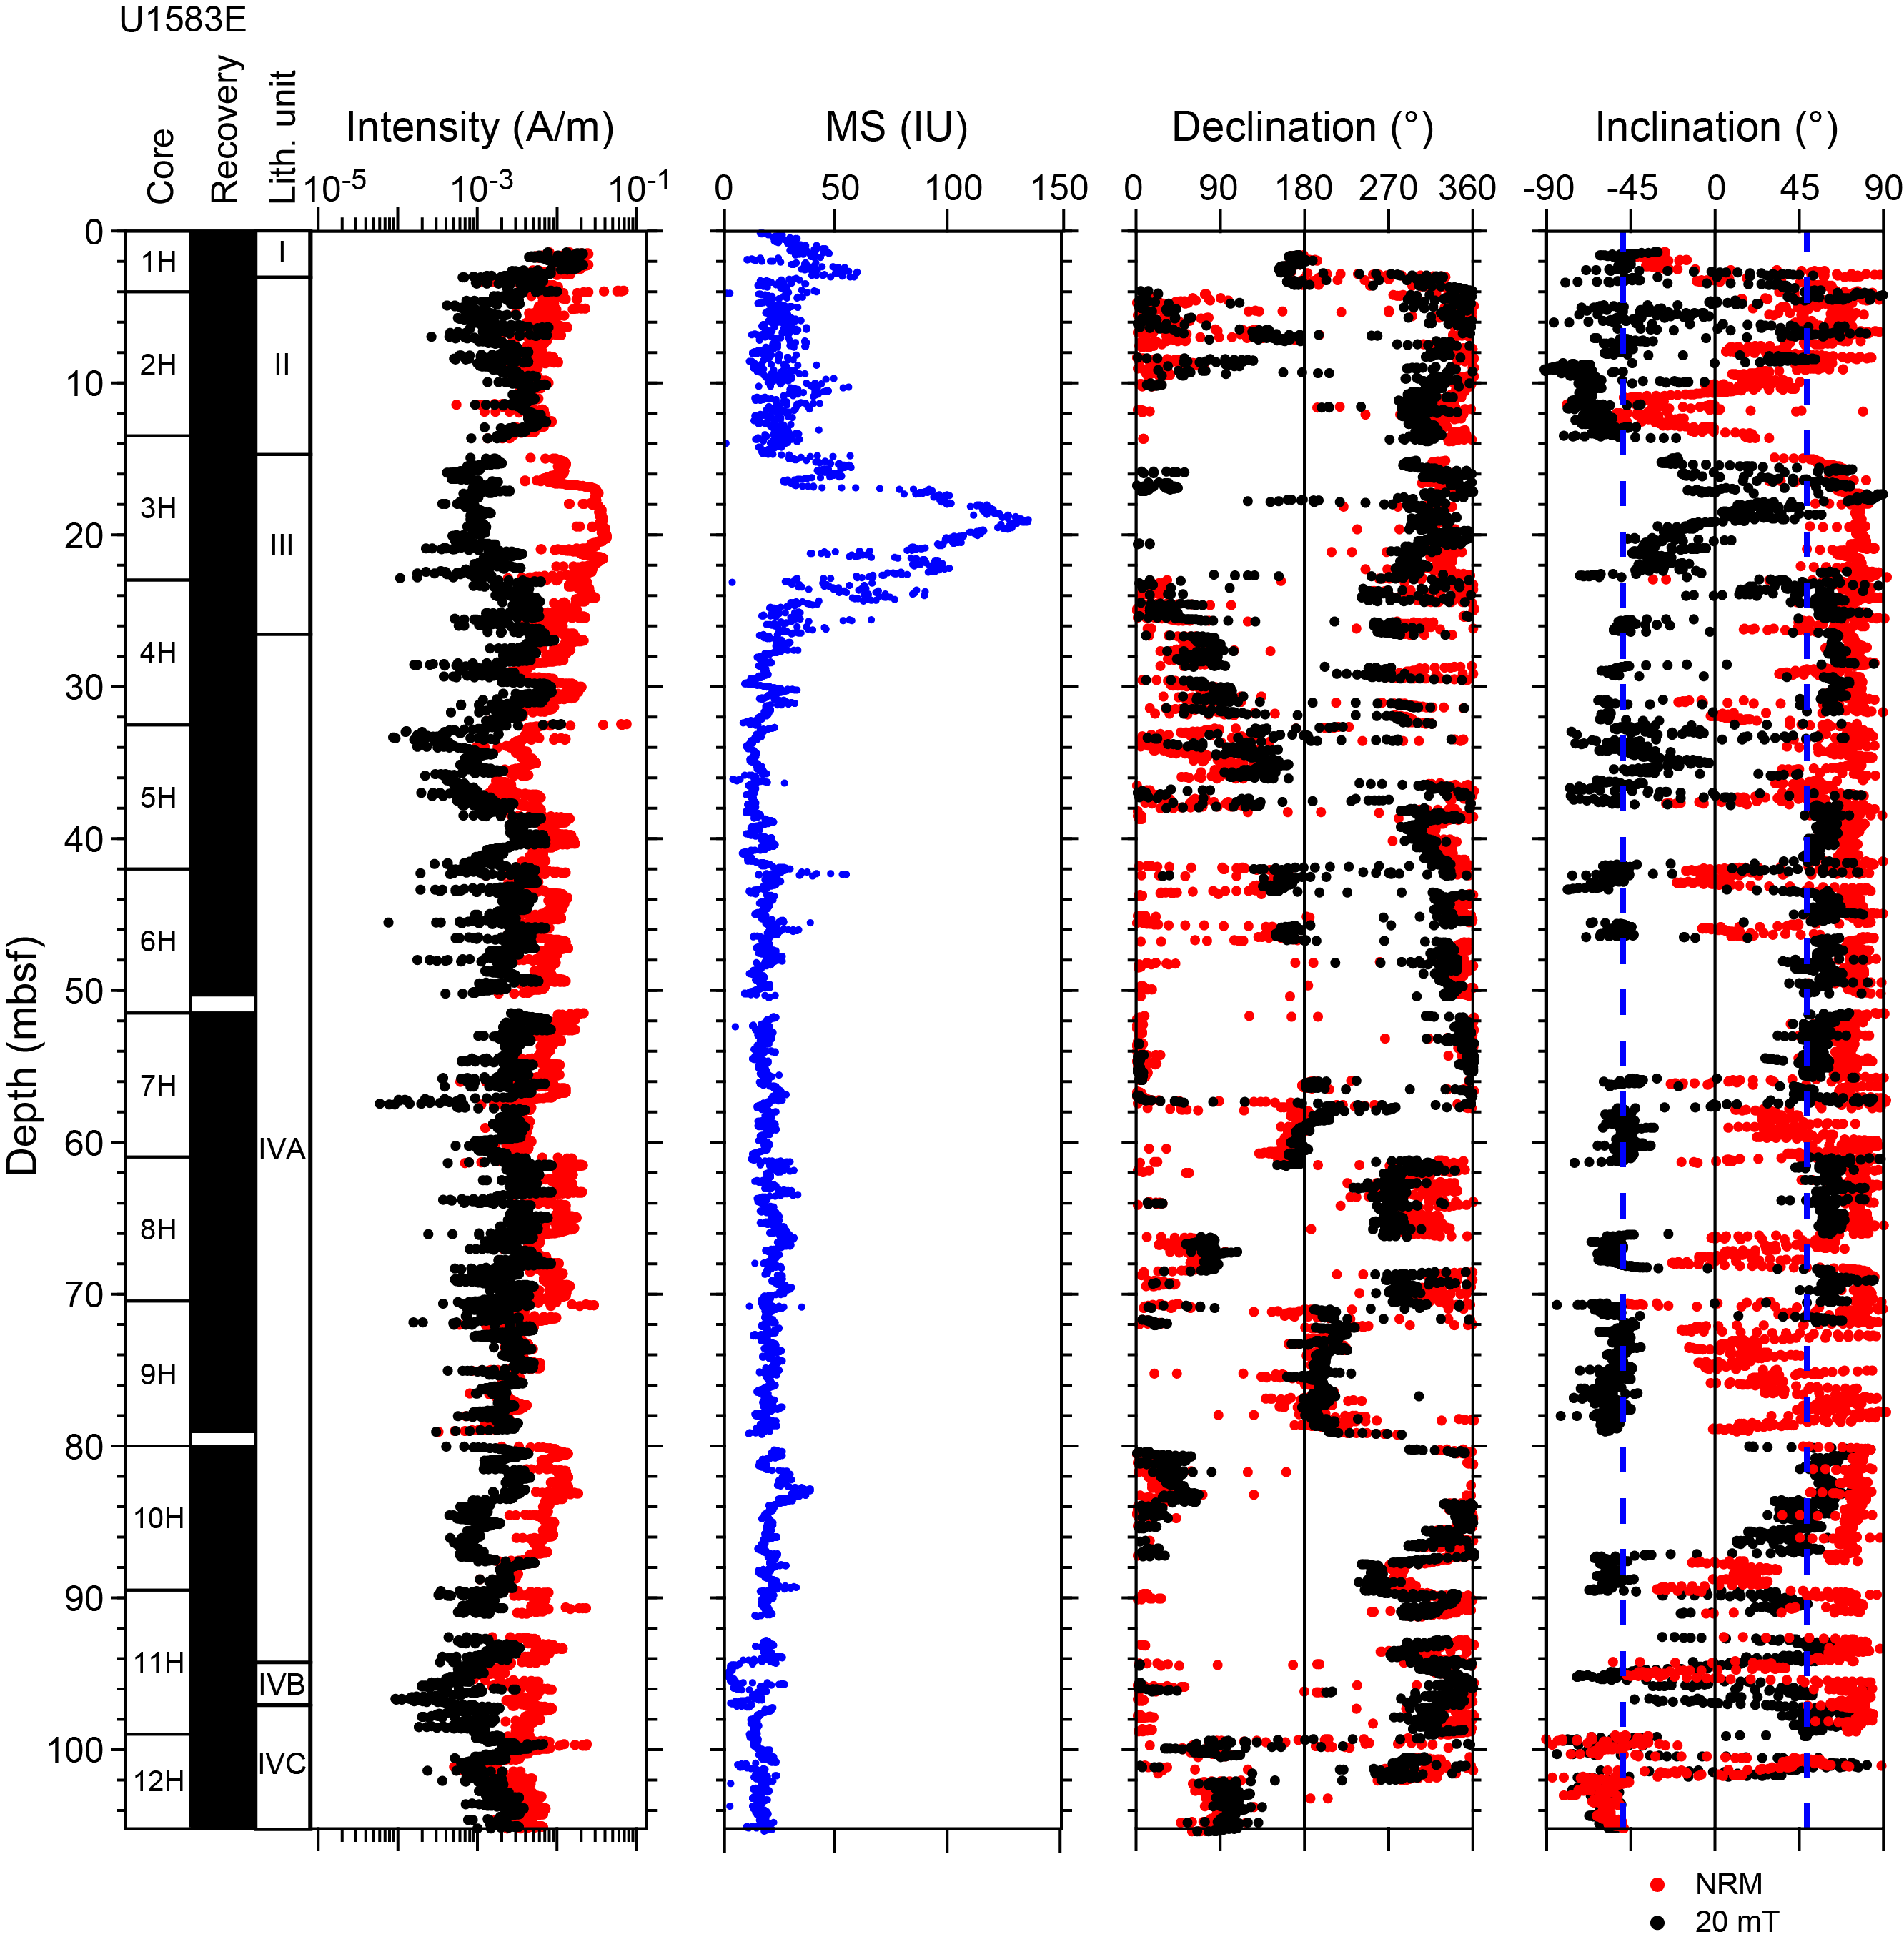
Figure F52. MSP and SRM measurements in sediments, Hole U1583E.
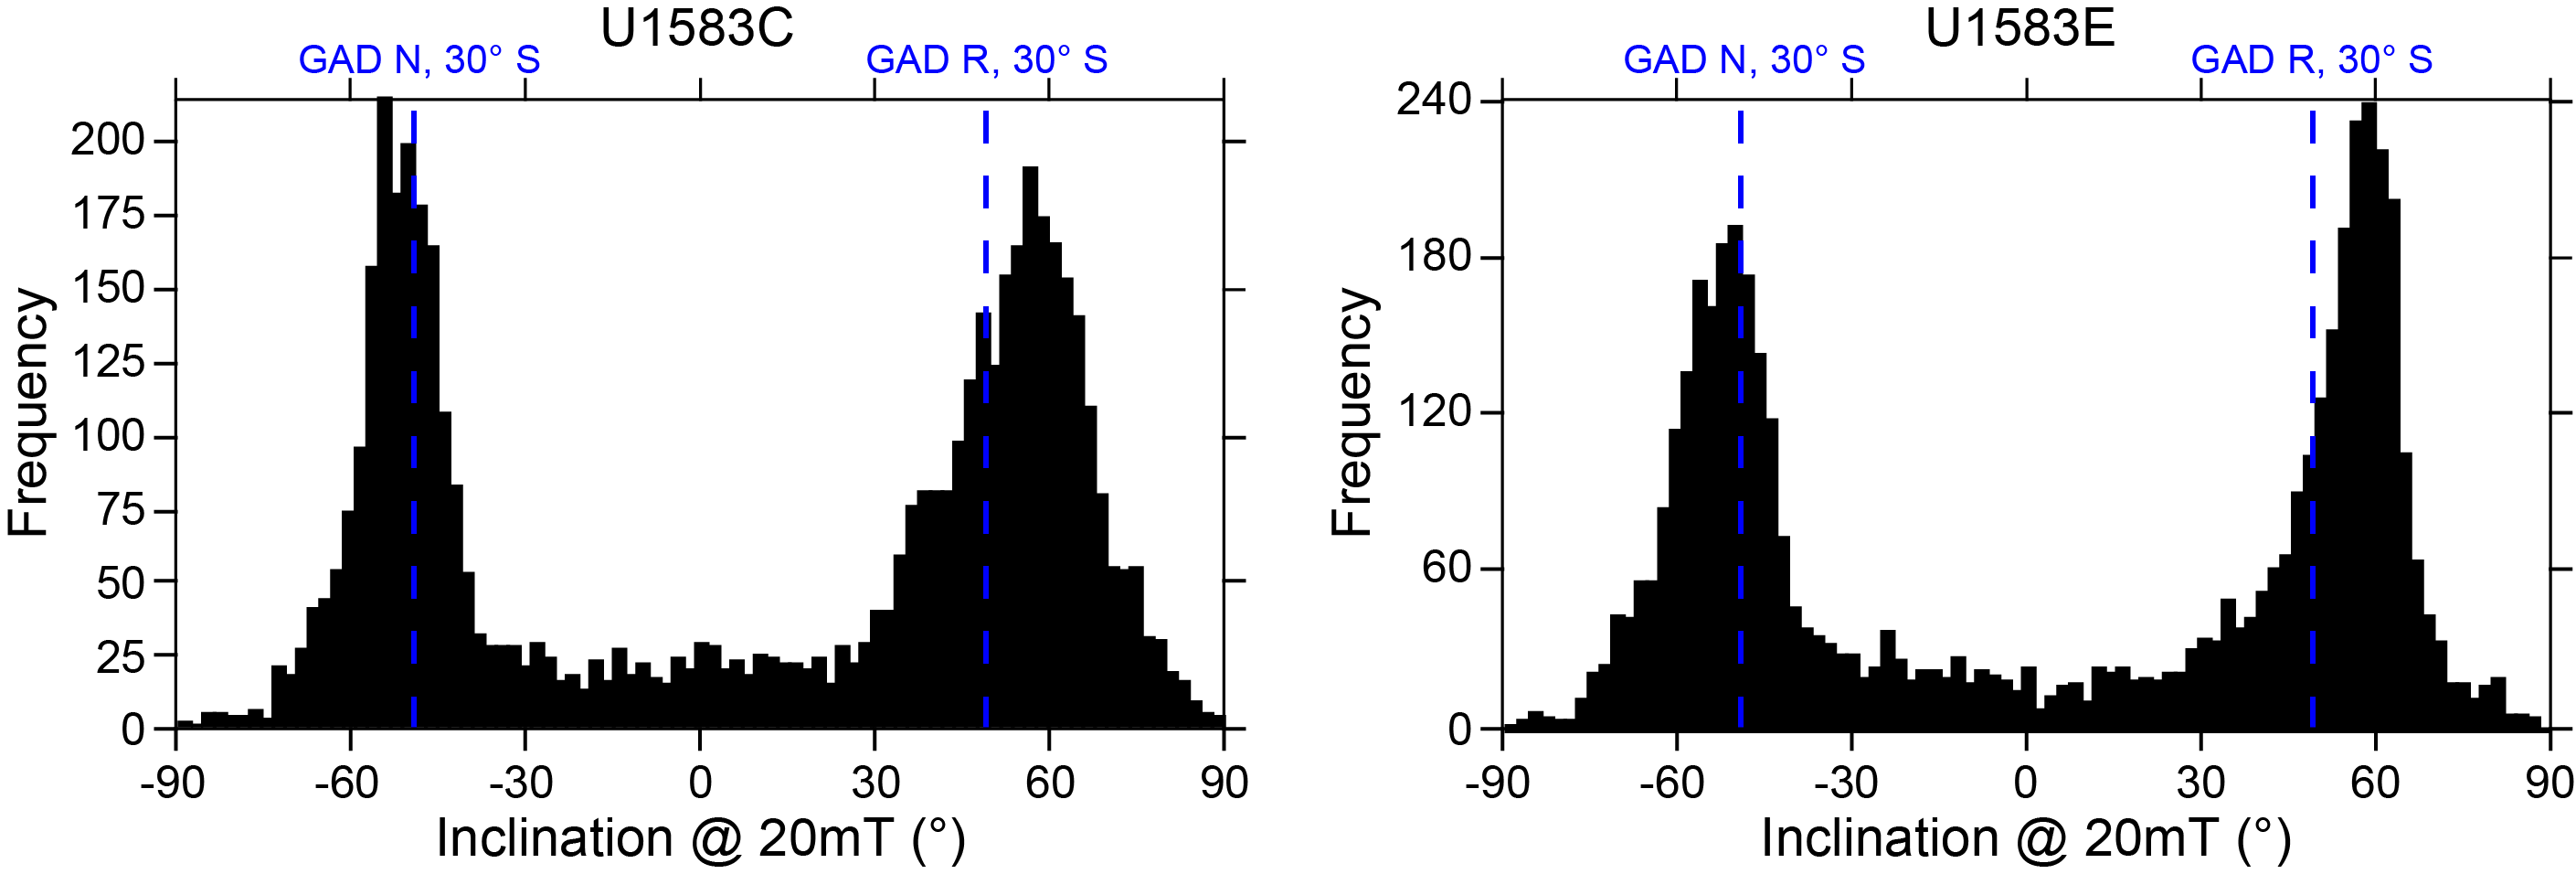
Figure F53. Inclination after 20 mT AF for sediments.
8.1.1.1. Discrete samples
We collected two discrete cubes per core from Hole U1583C, sampling each lithostratigraphic unit/subunit (see Sedimentology; Table T15). To isolate the ChRM and better constrain the SRM data, samples were subjected to AF demagnetization up to a maximum of 130 mT. The majority of the samples show a single remanent magnetization component after the 5 mT AF demagnetization step with maximum angular deviation angles spanning 2.2°–14.8° (Table T15; Figure F54). These values are below the maximum cutoff of 15° (Butler, 1992), and consequently the detected ChRM components are considered well defined in the selected samples. Six of the samples displayed noisy orthogonal vector plots, but no lithologic correlation regarding the stability of ChRM could be observed. Data disturbance in those samples is mostly related to the drilling process, in particular for the two samples taken from Core 393-U1583C-12H. Nevertheless, the ChRM inclinations and declinations obtained from discrete measurements coincide with the SRM data (Figure F51), supporting the Site U1583 SRM data and the polarity assignments.
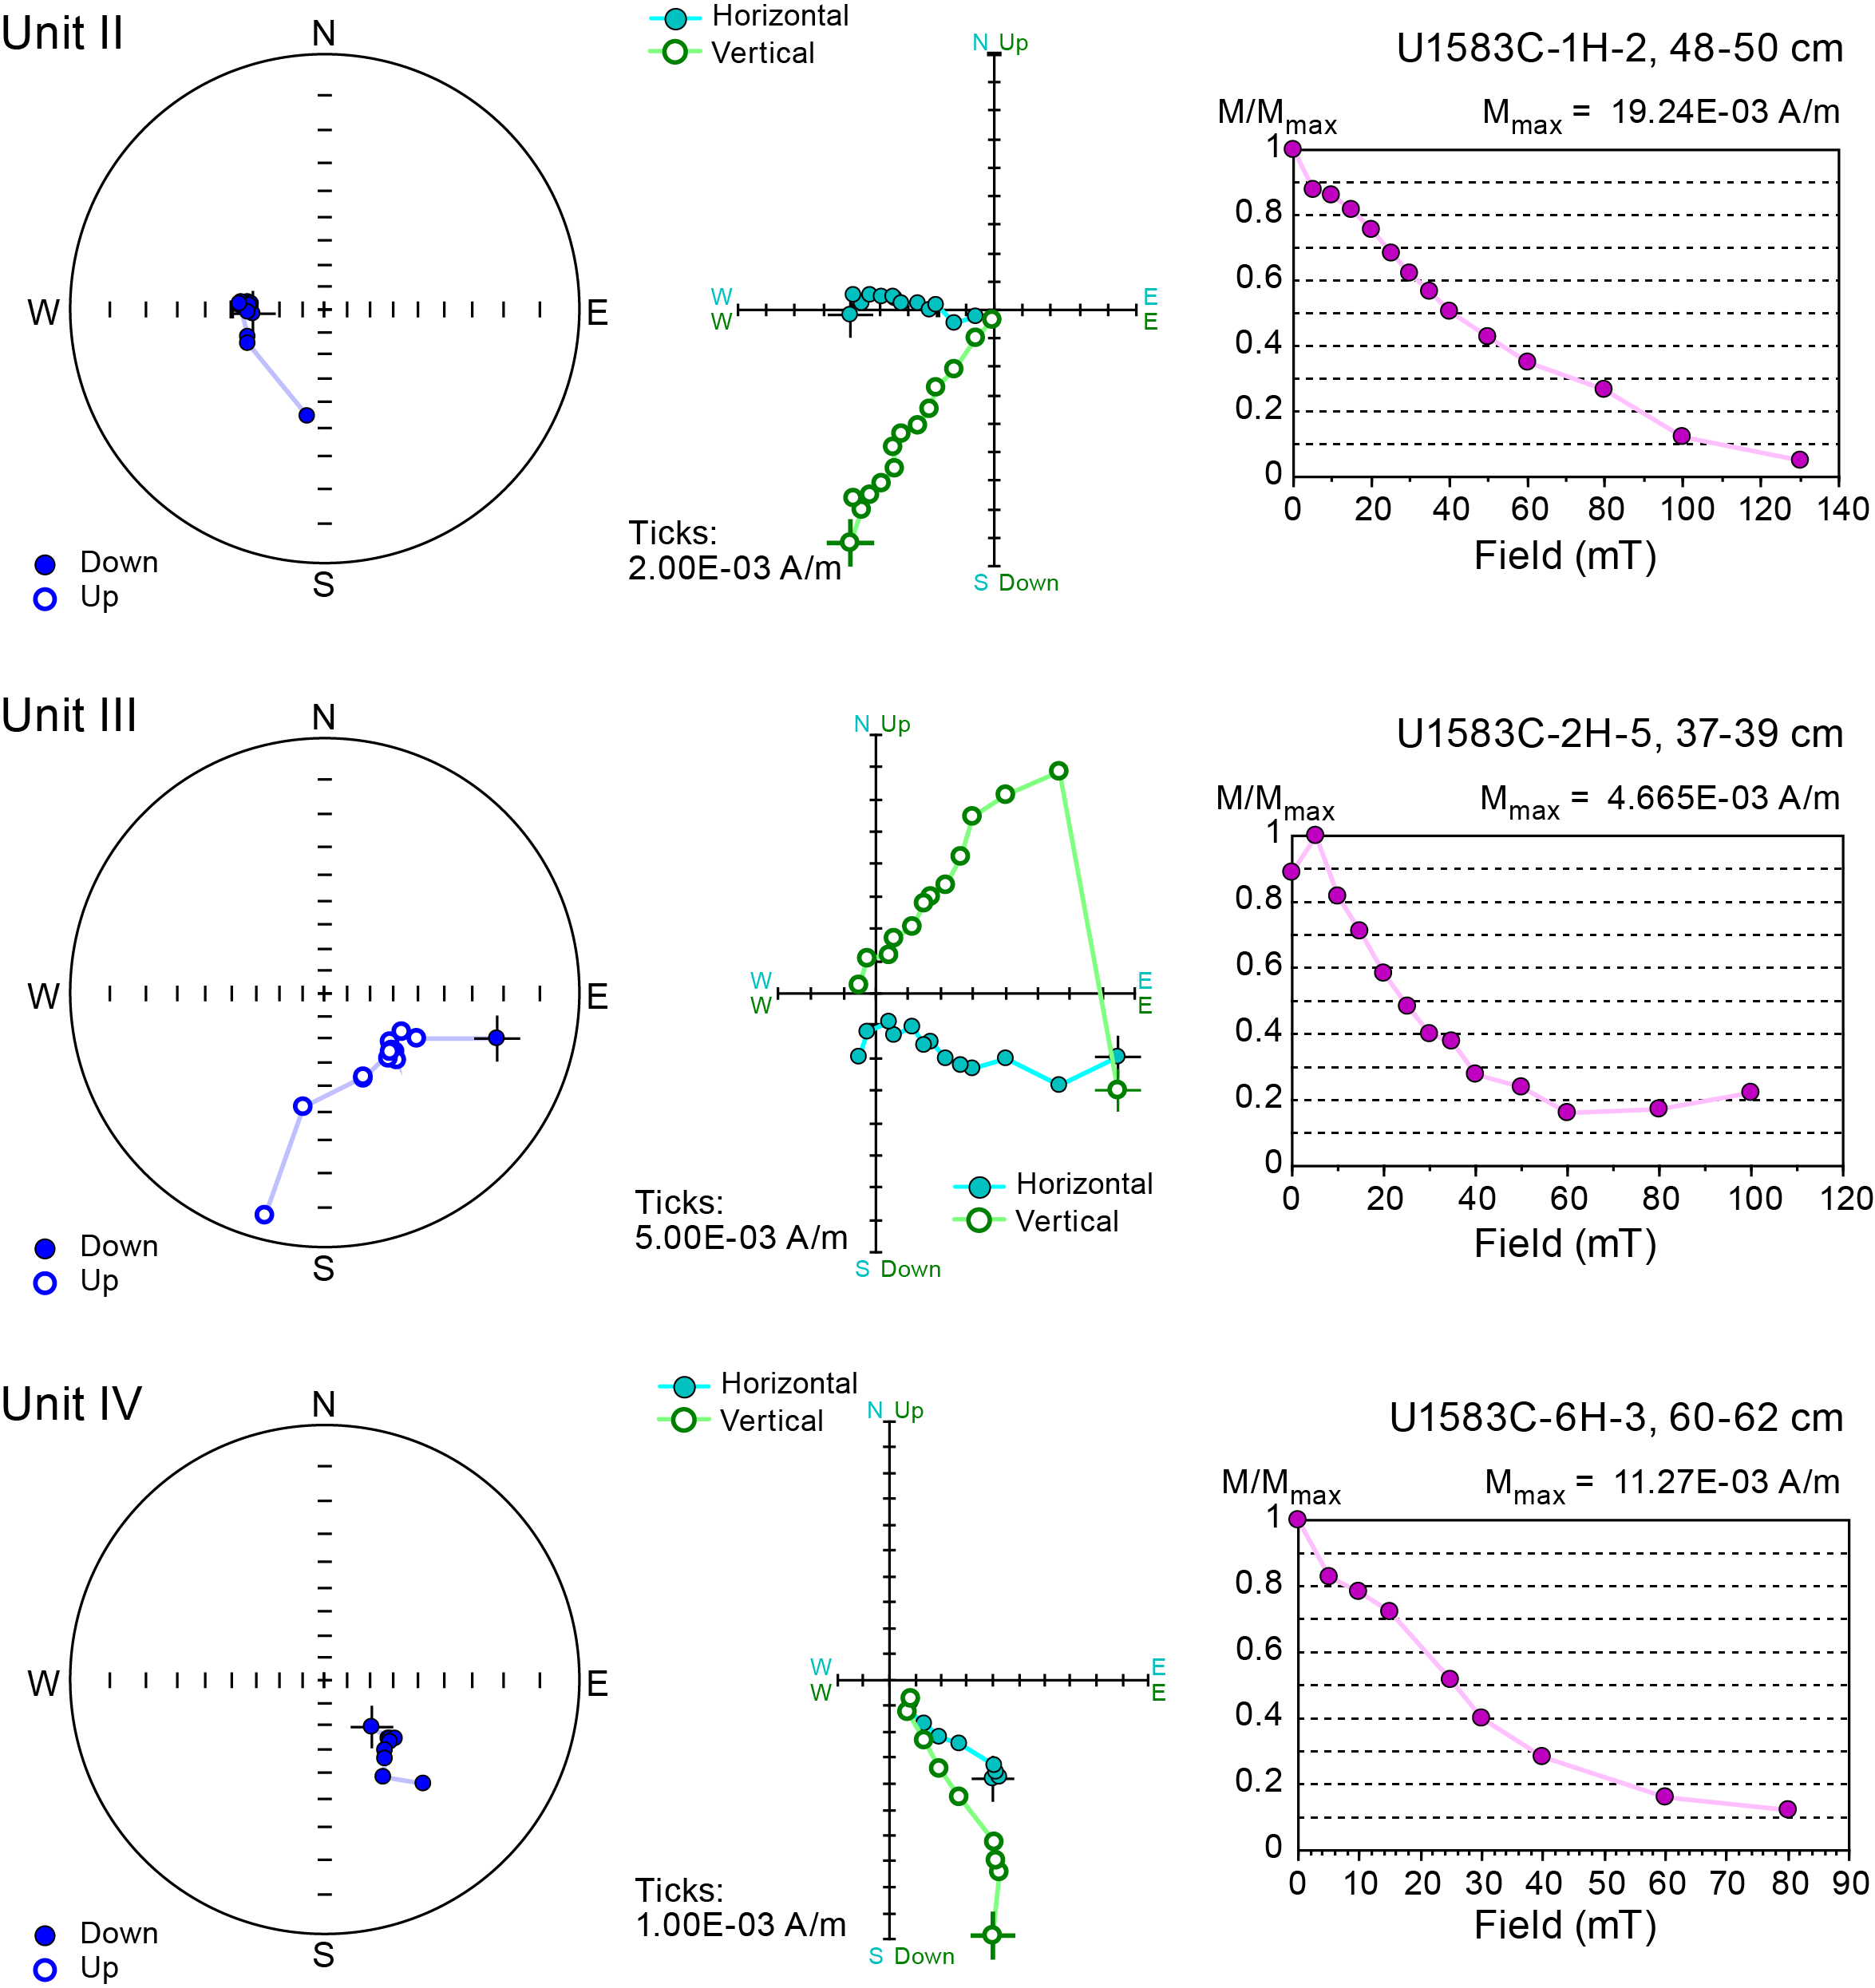
Figure F54. AF demagnetization results for each lithostratigraphic unit.
Magnetic mineralogy was characterized by performing acquisition of IRM and backfield experiments (Figure F55A) on 1 or 2 samples per lithostratigraphic unit/subunit. In both nannofossil ooze and clay-rich units, IRM saturates around 300 mT, revealing the dominance of low-coercivity minerals. The intensity of saturation IRM (SIRM) is significantly higher in Unit III (Table T16). The unmixing of the IRM acquisition curves (Figure F55B) shows different best-fit models for the clay-rich Unit III and the nannofossil ooze (Units I, II, and IV). Unit III reveals the presence of two low- to intermediate-coercivity components, with mean remanence coercivity (Bh) of ~1.6 and ~2.3 log10 units, and a low (<5%) contribution of a third high-coercivity fraction. In contrast, nannofossil ooze shows a dominant low-coercivity component of ~1.57 log10 units and a minor to absent content of high-coercivity minerals.
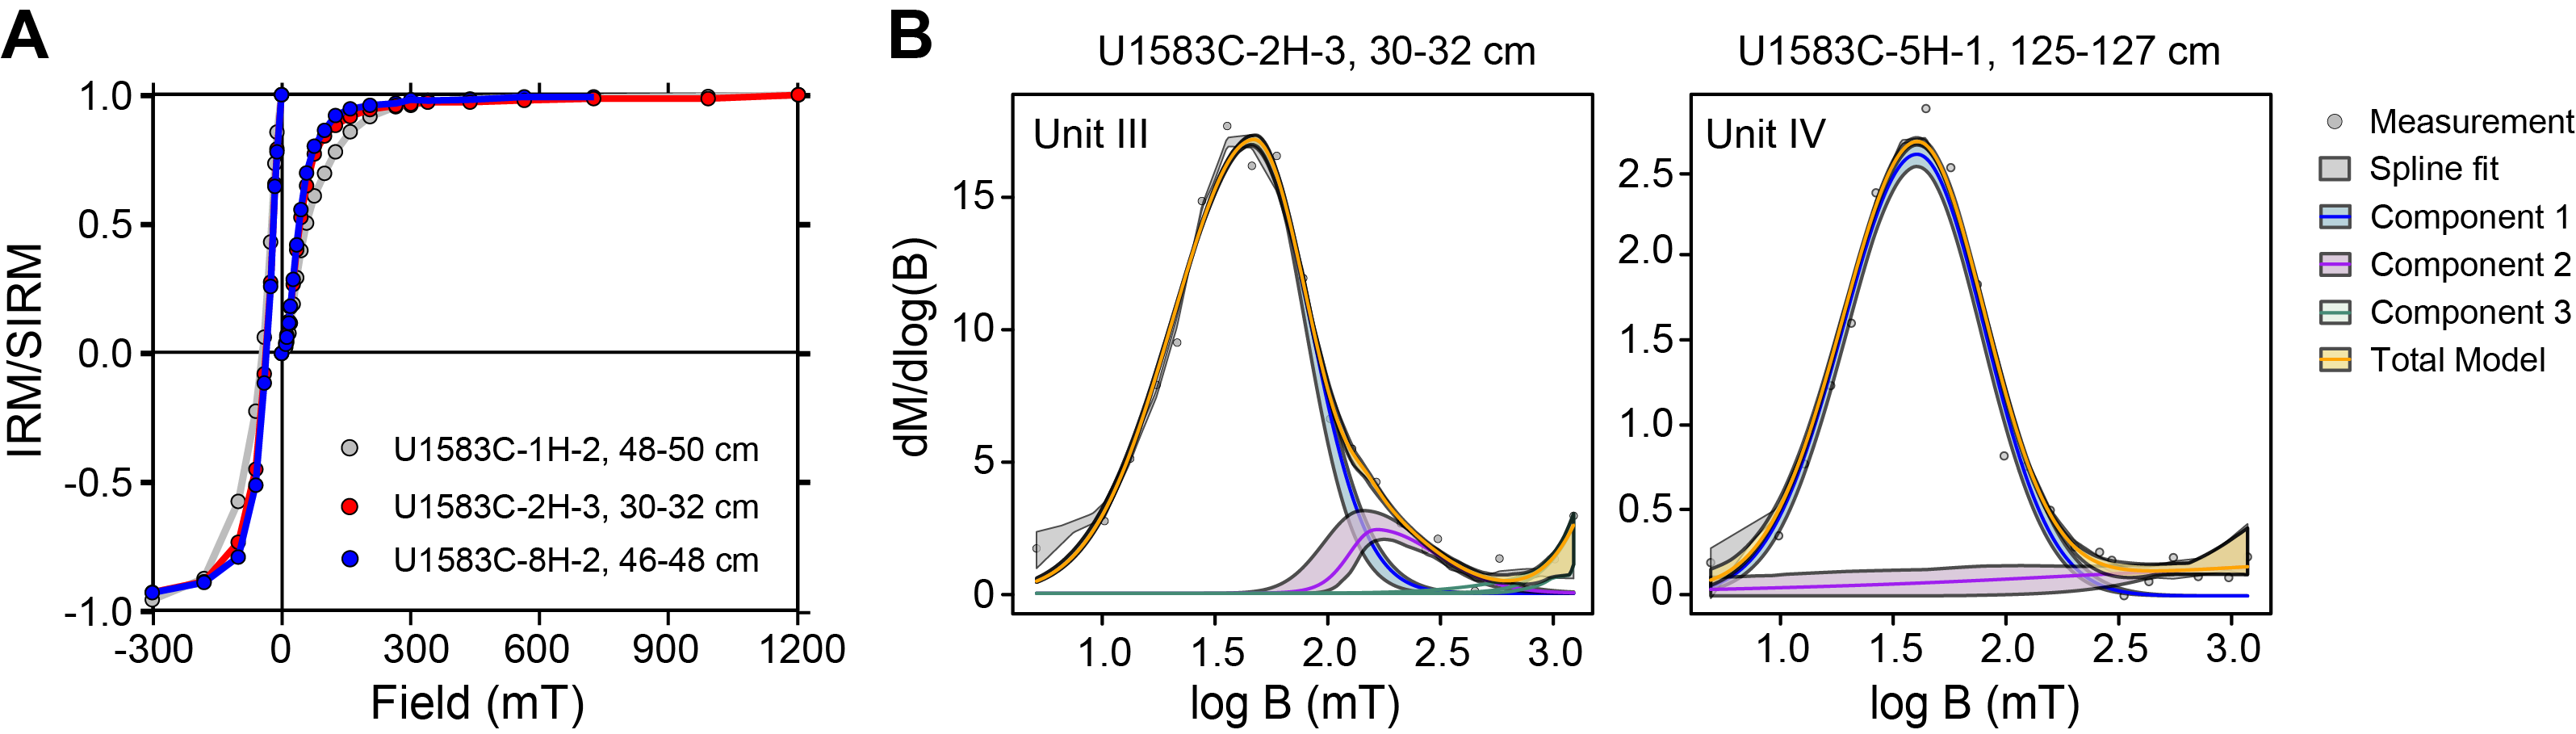
Figure F55. SIRM acquisition curves and coercivity distribution, Hole U1583C.
Both the S ratio (S0.3) and IRM100/SIRM ratio (S0.1) of all measured samples display values close to 1, typical of low-coercivity minerals, with no variations with depth and between lithostratigraphic units/subunits (Table T16; Figure F56). This implies that each unit/subunit is dominated by low-coercivity magnetic minerals (e.g., magnetite), as supported by coercivity of remanence (Bcr) values <50 mT (Table T16; Figure F56).
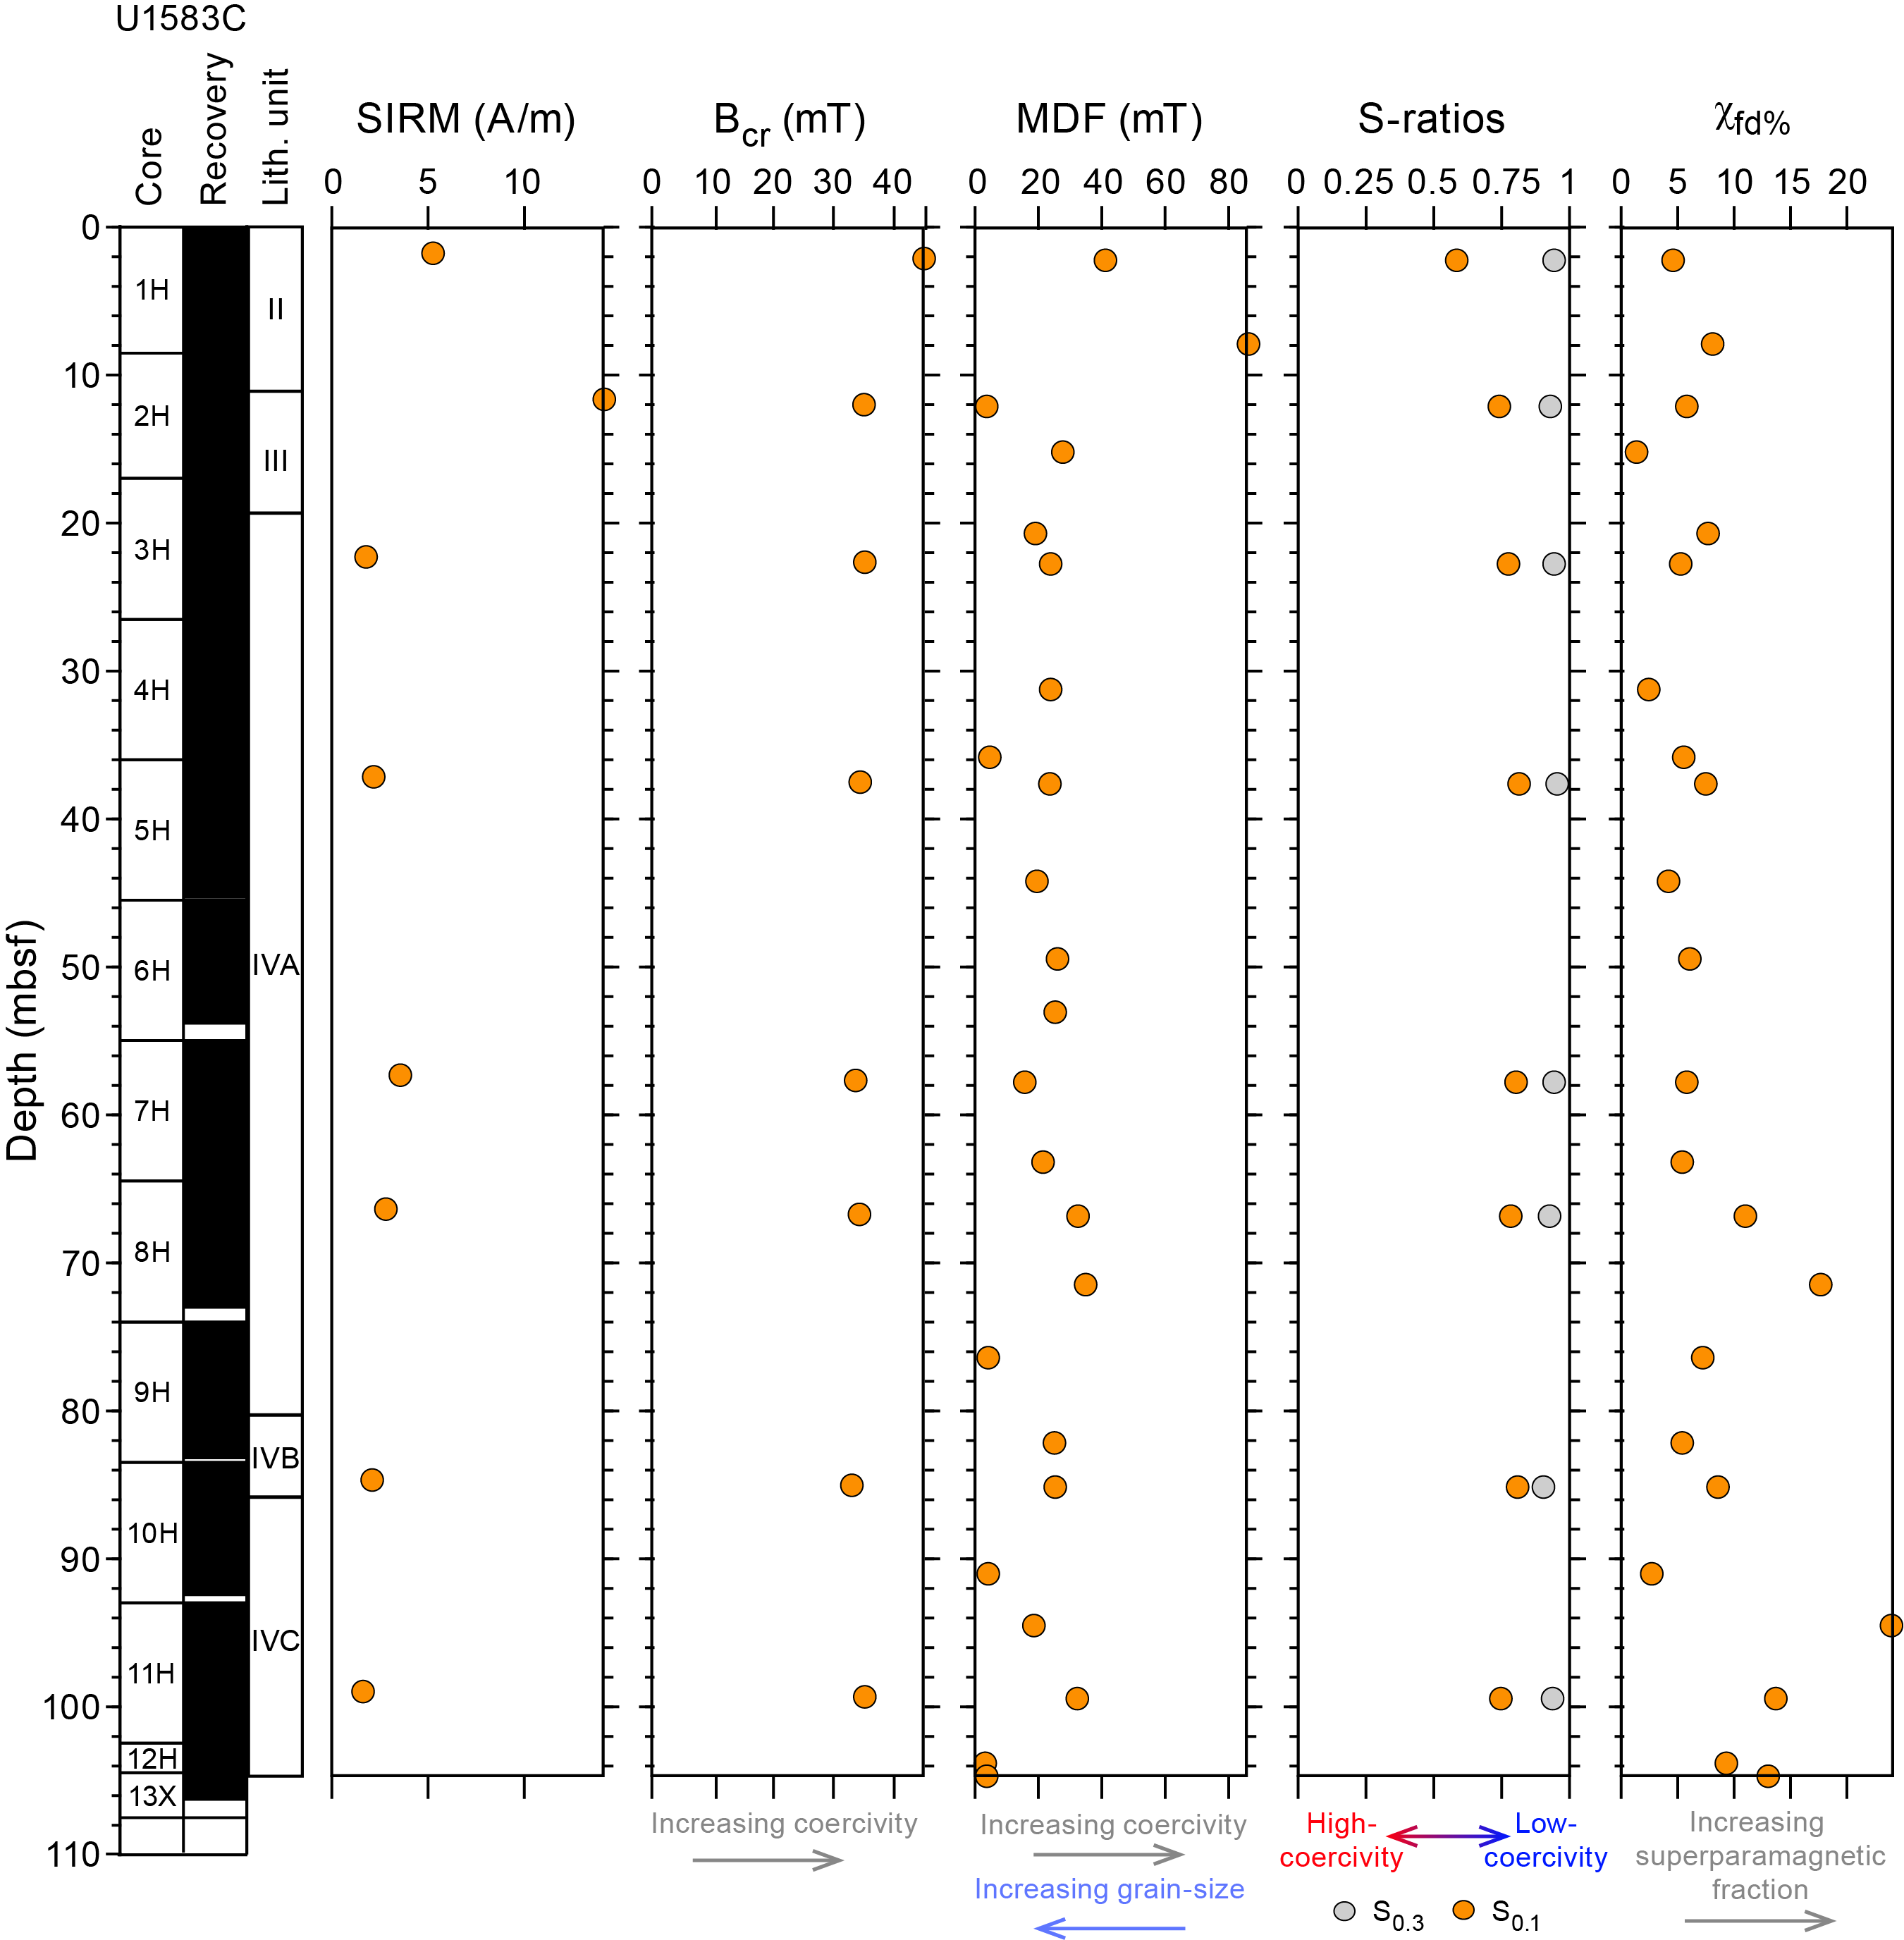
Figure F56. Magnetic mineralogy data.
AMS measurements show two different trends in the magnetic fabric with either a subvertical or a subhorizontal magnetic foliation (Figure F57A). Samples showing subhorizontal magnetic foliation correspond to typical oblate sedimentary fabric (Figure F57). In contrast, the presence of samples characterized by a subvertical magnetic foliation might be related to either soft-sediment deformation or upward-arching beds due to drilling disturbance (Yang et al., 2019). No particular correlation of the two different patterns can be related to lithologic changes at this stage. The degree of anisotropy (P) varies between 1.006 and 1.045, and the shape parameter (T) indicates the dominance of oblate fabric throughout the hole (Figures F57B, F58; Table T17). Bulk susceptibility (Km) generally remains low, <2.5 × 10⁻⁴ (SI). However, higher values >9 × 10⁻⁴ (SI) were measured at the top of Unit III because of the high clay content (Figure F58; Table T17). No clear correlation exists between P and T, though higher values are generally observed in the middle of Subunit IVA between 30 and 50 m CSF-A.
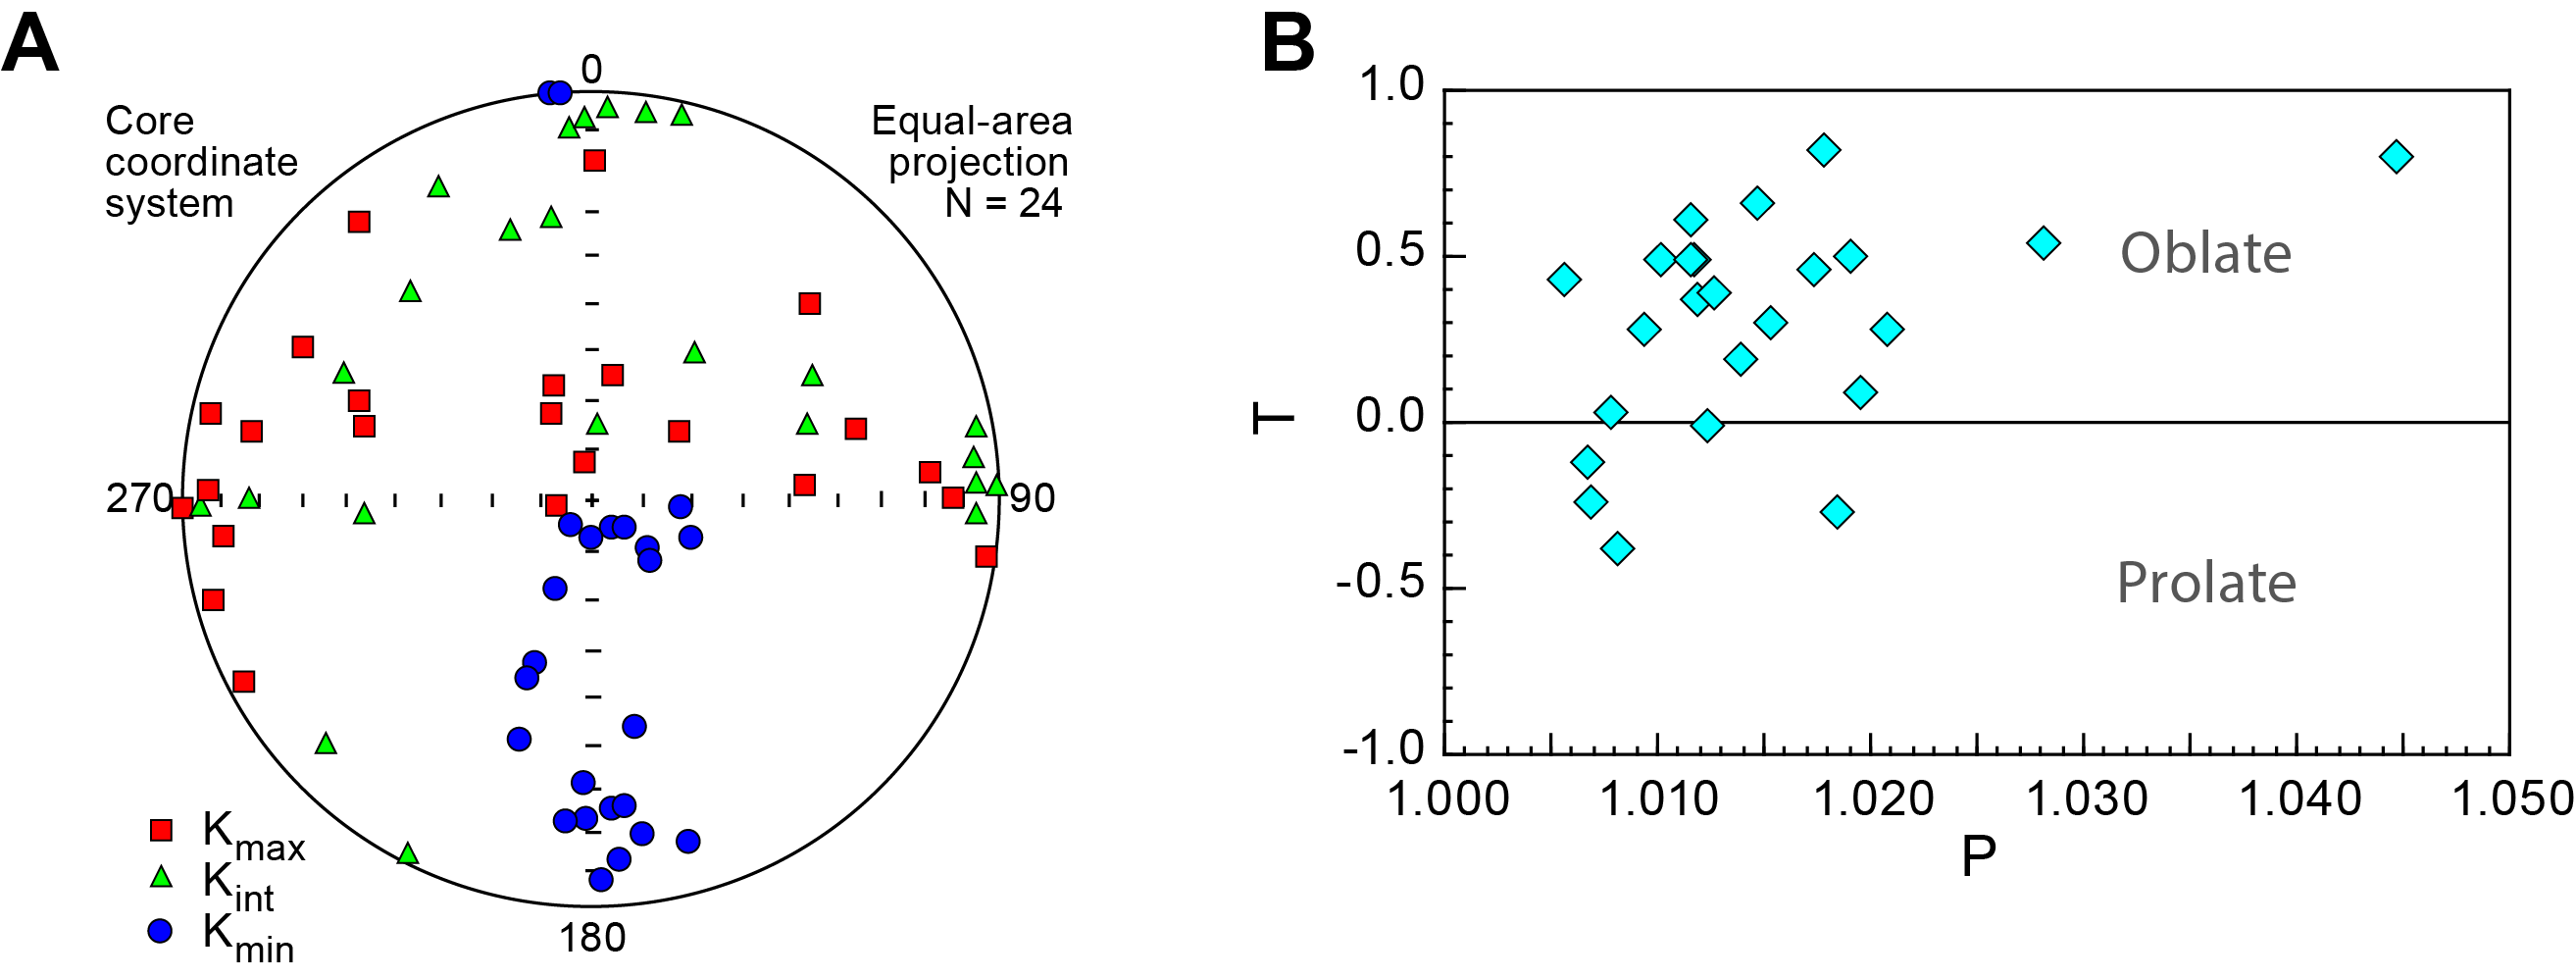
Figure F57. Principal magnetic susceptibility axes, discrete sediment samples.
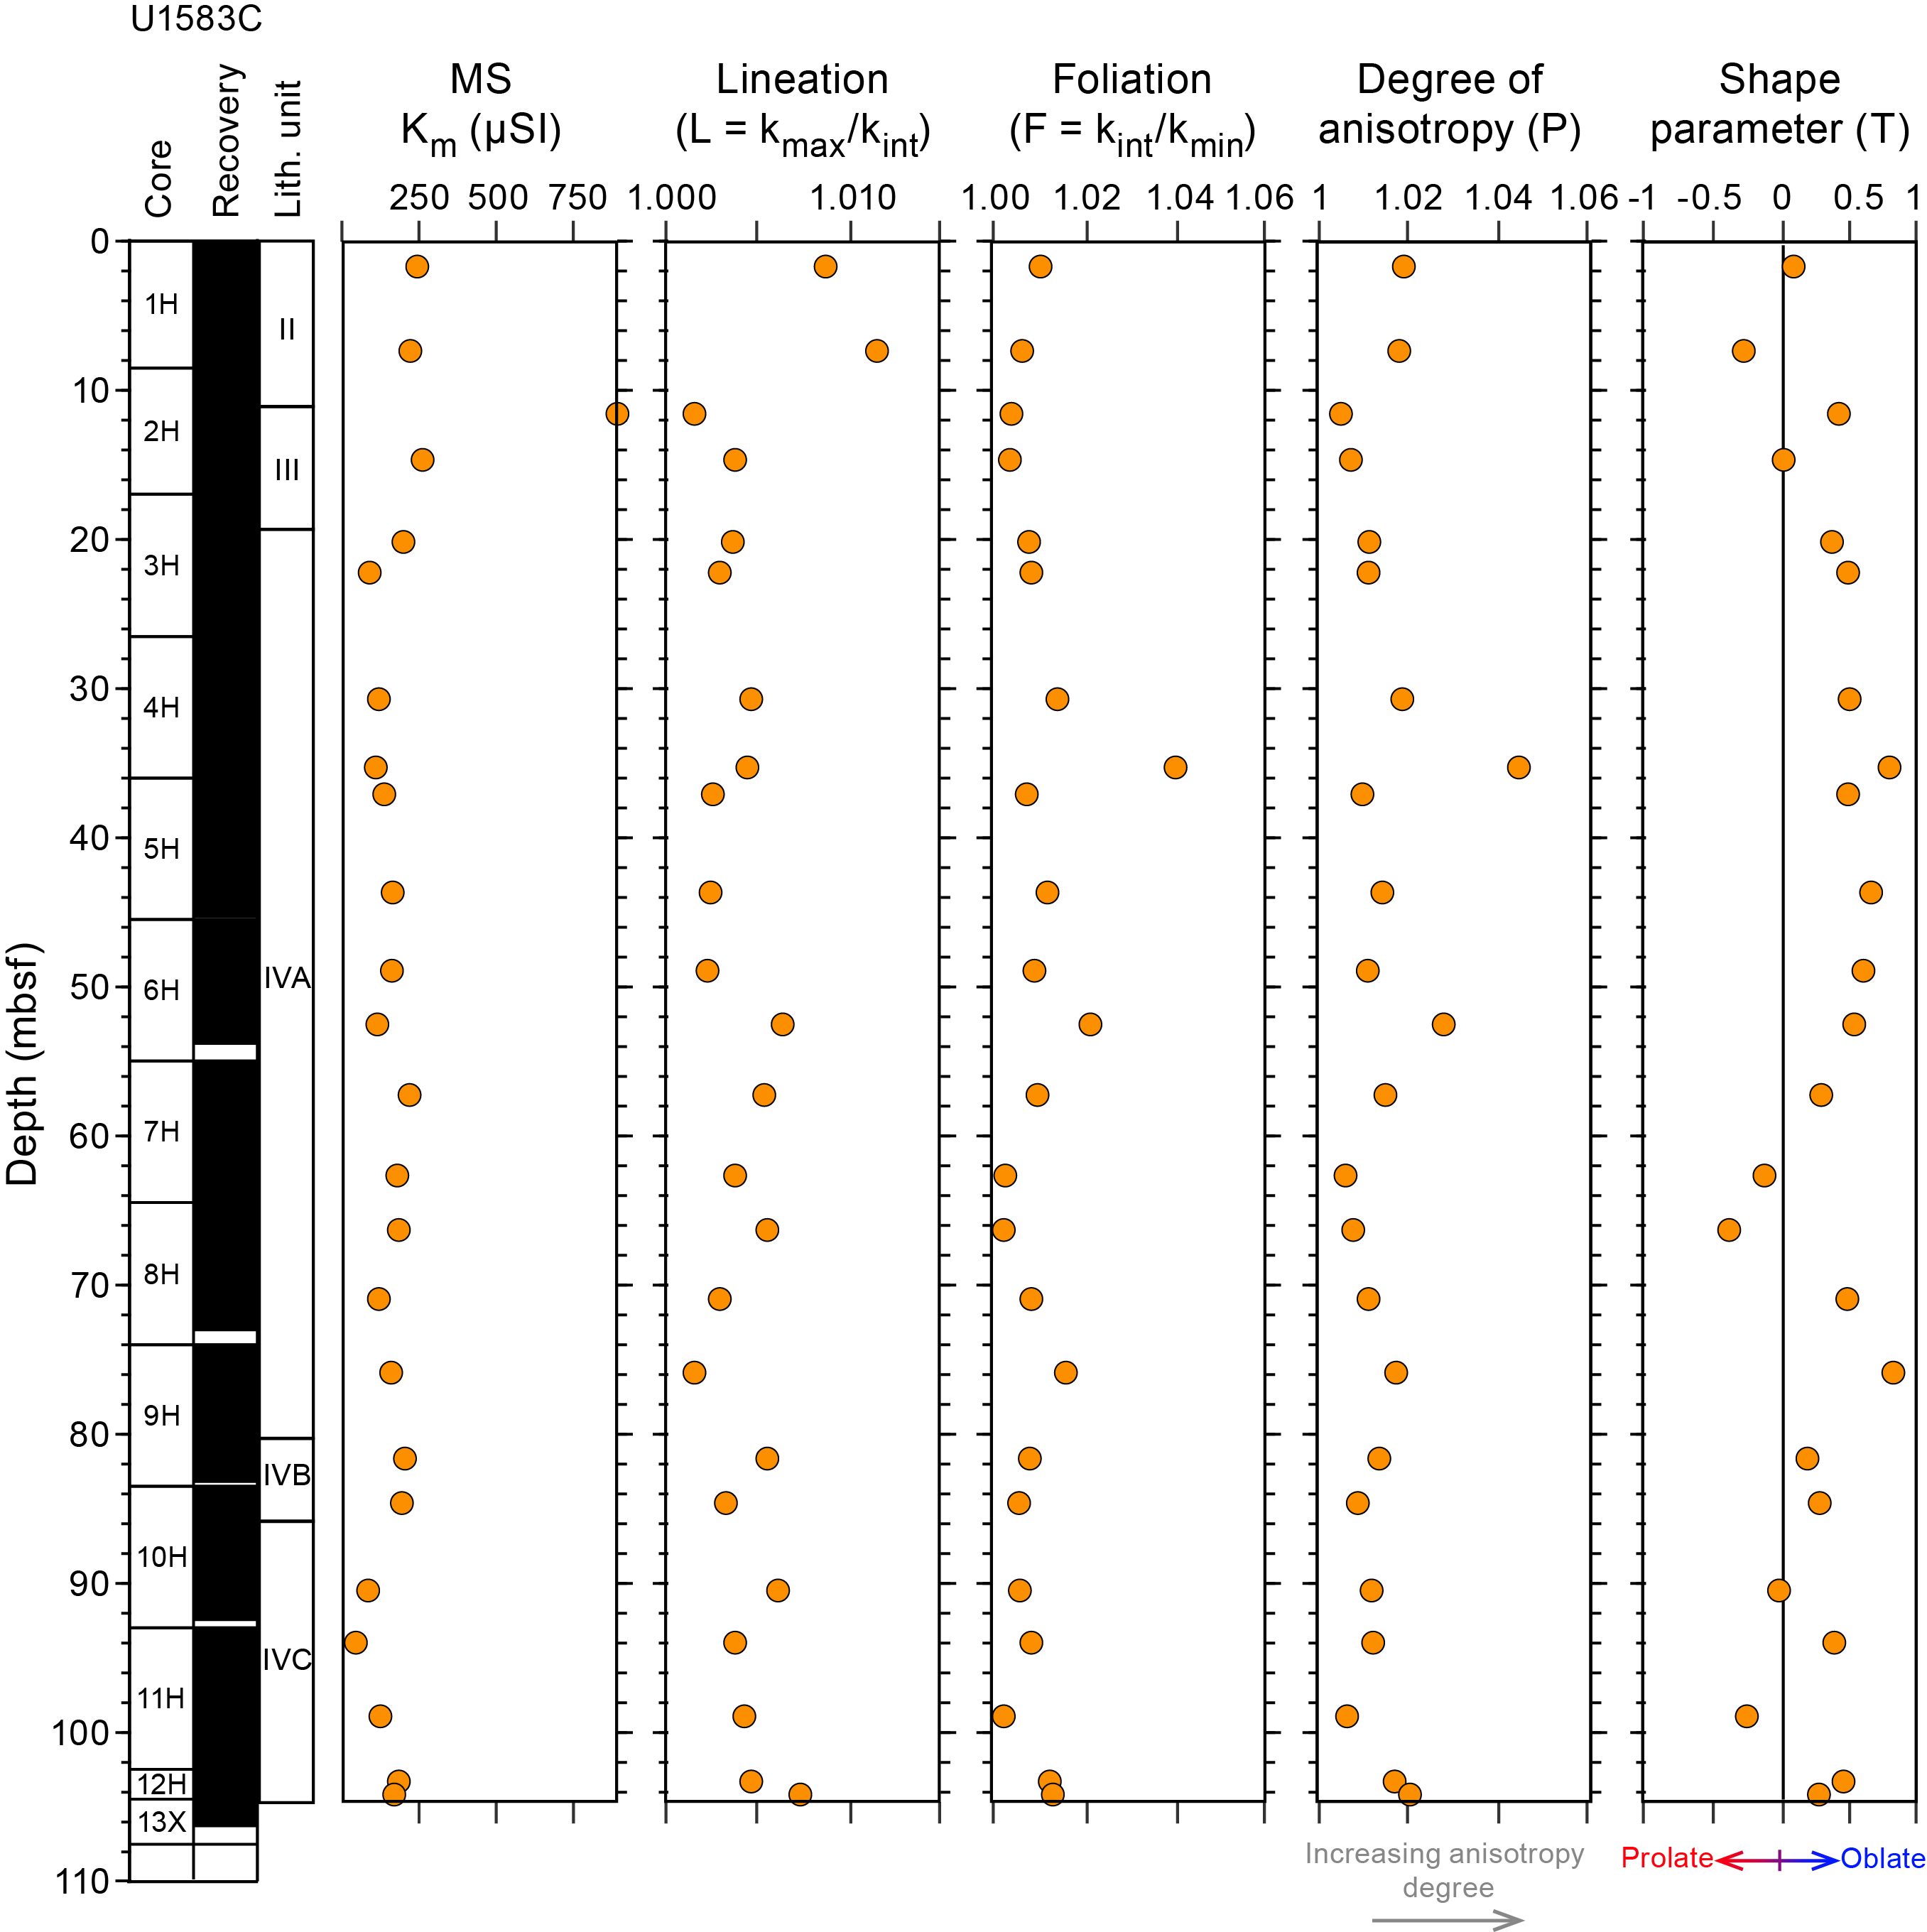
Figure F58. Bulk susceptibility and AMS parameters.
8.1.1.2. Magnetostratigraphy
Remanence measurements made on sediment archive halves from Holes U1583C and U1583E were used to define the polarity sequence for Site U1583. Our interpretations are based on the remanence inclination sign at the 20 mT demagnetization step, the length of the polarity intervals, and the biostratigraphic datums based on both nannofossils and foraminifera (see Biostratigraphy). Where gaps and/or condensed levels were present, our observations were integrated and correlated with physical properties to form the spliced inclination reversal stratigraphy (see Physical properties and downhole measurements). Despite the moderate to significant drilling disturbance in some intervals (e.g., Section 393-U1583C-4H-1, Core 393-U1583E-5H, and Section 393-U1583E-11H-1), the high resolution of the biostratigraphic observations supported a preliminary tie to the GPTS (Gradstein et al., 2020) with high level of confidence (Figure F59). The uppermost sediment package in Hole U1583E (to 6 m CSF-A) contains the Brunhes, Matuyama, and Jaramillo Chrons, which are absent from Hole U1583C. Below 6 m CSF-A, the polarity reversals in Hole U1583E show similar patterns to those in Hole U1583C and can be unambiguously correlated. Inclinations from ChRM calculated for discrete samples confirm the values measured from the SRM (Figure F51), supporting the polarity interpretations. The interval between ~10 and 20 m CSF-A corresponds to a clay-rich condensed level (Unit III) (see Biostratigraphy and Age model and accumulation rates), which limits the correlation of the normal and reversed polarity patterns at that depth with the GPTS. Based on the biostratigraphic datums, the first reversed interval below the clay-rich unit was observed in Cores 393-U1583C-3H and 393-U1583E-4H and was correlated to Chron C5Br at the base of the Langhian (15.99 Ma) (Gradstein et al., 2020). At Site U1583, the Oligocene/Miocene boundary occurs within Subunit IVA at ~40 m CSF-A in Hole U1583C and at ~45 m CSF-A in Hole U1583E. Paleomagnetic results at the bottom of the sediment package, above the sediment/basement interface (between 100 and 110 m CSF-A), were placed in Chron C11r (29.970–30.591 Ma) (Gradstein et al., 2020) for Hole U1583C and Chron Cr11.2n (29.527–29.970 Ma) (Gradstein et al., 2020) for Hole U1583E. The relative ages of those chrons agree with the estimated basement age of ~30.6 Ma (Kardell et al., 2019).
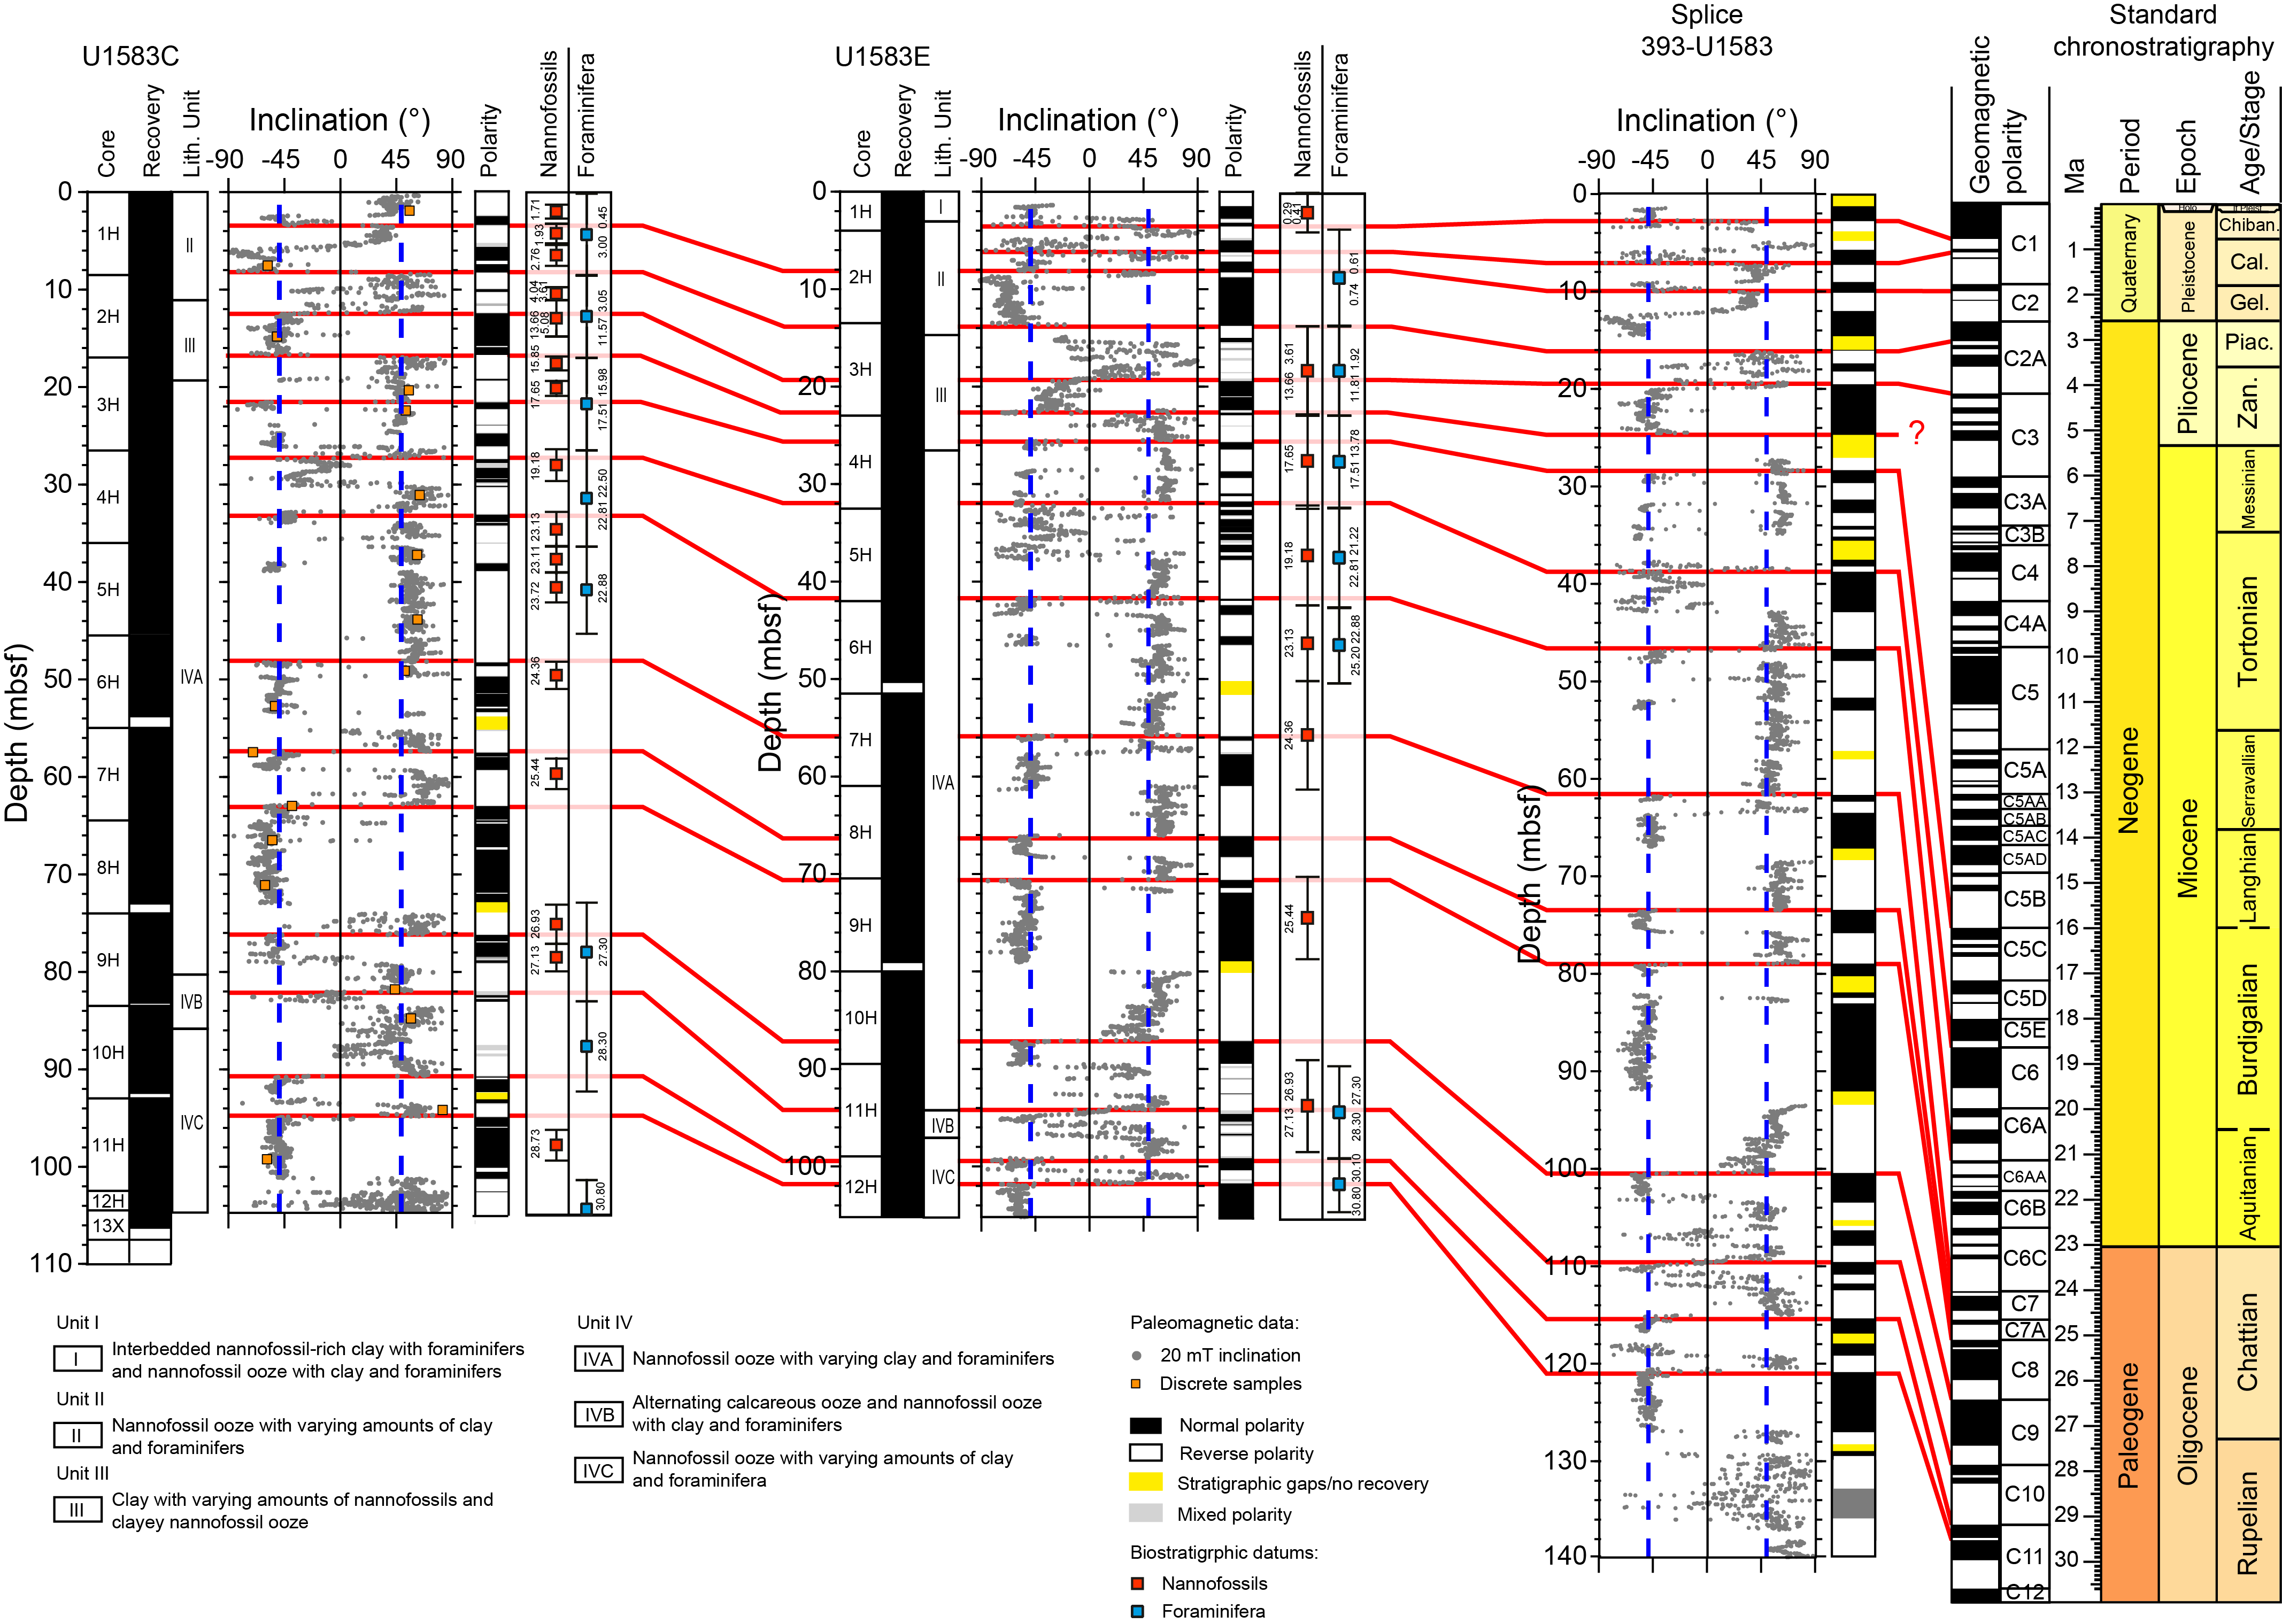
Figure F59. Inclination measurements after 20 mT with splice.
8.2. Basement
Continuous magnetic remanence properties of basement cores from Hole U1583F were measured at 2 cm spacing using the SRM on archive-half pieces longer than 9 cm (see Paleomagnetism in the Expedition 390/393 methods chapter [Coggon et al., 2024a]) before and after AF demagnetization at three different steps (5, 10, and 20 mT). The amount of data collected varied depending on the core recovery rate in Hole U1583F (0%–96%). High measurement density was achieved for Cores 393-U1583F-3R through 5R and 12R–14R, where recovery was relatively high. Cores lacking pieces longer than 9 cm, such as Cores 9R, 20R, and 25R–27R, were not measured by the SRM to avoid the collection of spurious data because of edge effects.
About one 8 cm3 cube per core was sampled from the working halves of Hole U1583F basement cores. A total of 20 cubes were taken predominantly from fresh background basalt pieces, although some samples displayed a range of hydrothermal alteration style and intensity (Table T18). Two additional nonoriented samples were taken from sedimentary breccia in Cores 393-U1583F-16R and 23R for magnetic mineralogy experiments. The main goal of paleomagnetic studies on discrete samples was to characterize the magnetic signature of basement rocks and, preliminarily, the magnetic mineralogy. Both AF demagnetization and IRM experiments were performed. In addition, AMS measurements were made to define the magnetic fabric of the different igneous units.
8.2.1. Results
Measurements of NRM and in-line AF demagnetization of Cores 393-U1583F-2R through 29R characterize the remanent magnetization records of ~30.6 Ma basalts (Kardell et al., 2019). AF demagnetization up to 20 mT removed most of the viscous magnetization, leading to the detection of the primary remanent components. Remanence after the 20 mT AF demagnetization step will be referred to as 20 mT remanence hereafter. The intensities of NRM and 20 mT remanence of the basalts display mean values around 2.7 and 1.4 A/m, respectively (Figure F60). Significantly higher NRM intensity was detected in Cores 3R–5R and 13R, which correlates with higher susceptibility values. The 20 mT remanence values predominantly show positive inclinations in measured intervals (Figure F60), indicating reversed geomagnetic polarity at this latitude (30°S). Values are clustered around 45° (Figure F61) and agree with the calculated GAD (±49.1°). Based on the age of the sediments at the sediment/basement interface (see Age model and sedimentation rates), the basement at Site U1583 is placed in reversed Chron C11r with a basal age of 30.59 Ma (Gradstein et al., 2020). However, Sections 3R-1, 4R-3, 16R-2, and 23R-1 show shallow (less than +20°) to negative 20 mT inclination values (Figures F60, F61). These differences in inclination were mainly detected in breccias or intervals with evidence of high-coercivity minerals (see magnetic mineralogy description in Discrete samples below). In those intervals, the 20 mT AF demagnetization step may not be sufficient to reveal the ChRM. Alternatively, those changes in the 20 mT inclination might be related to alteration and overprinting of the primary remanent magnetization by a secondary component.
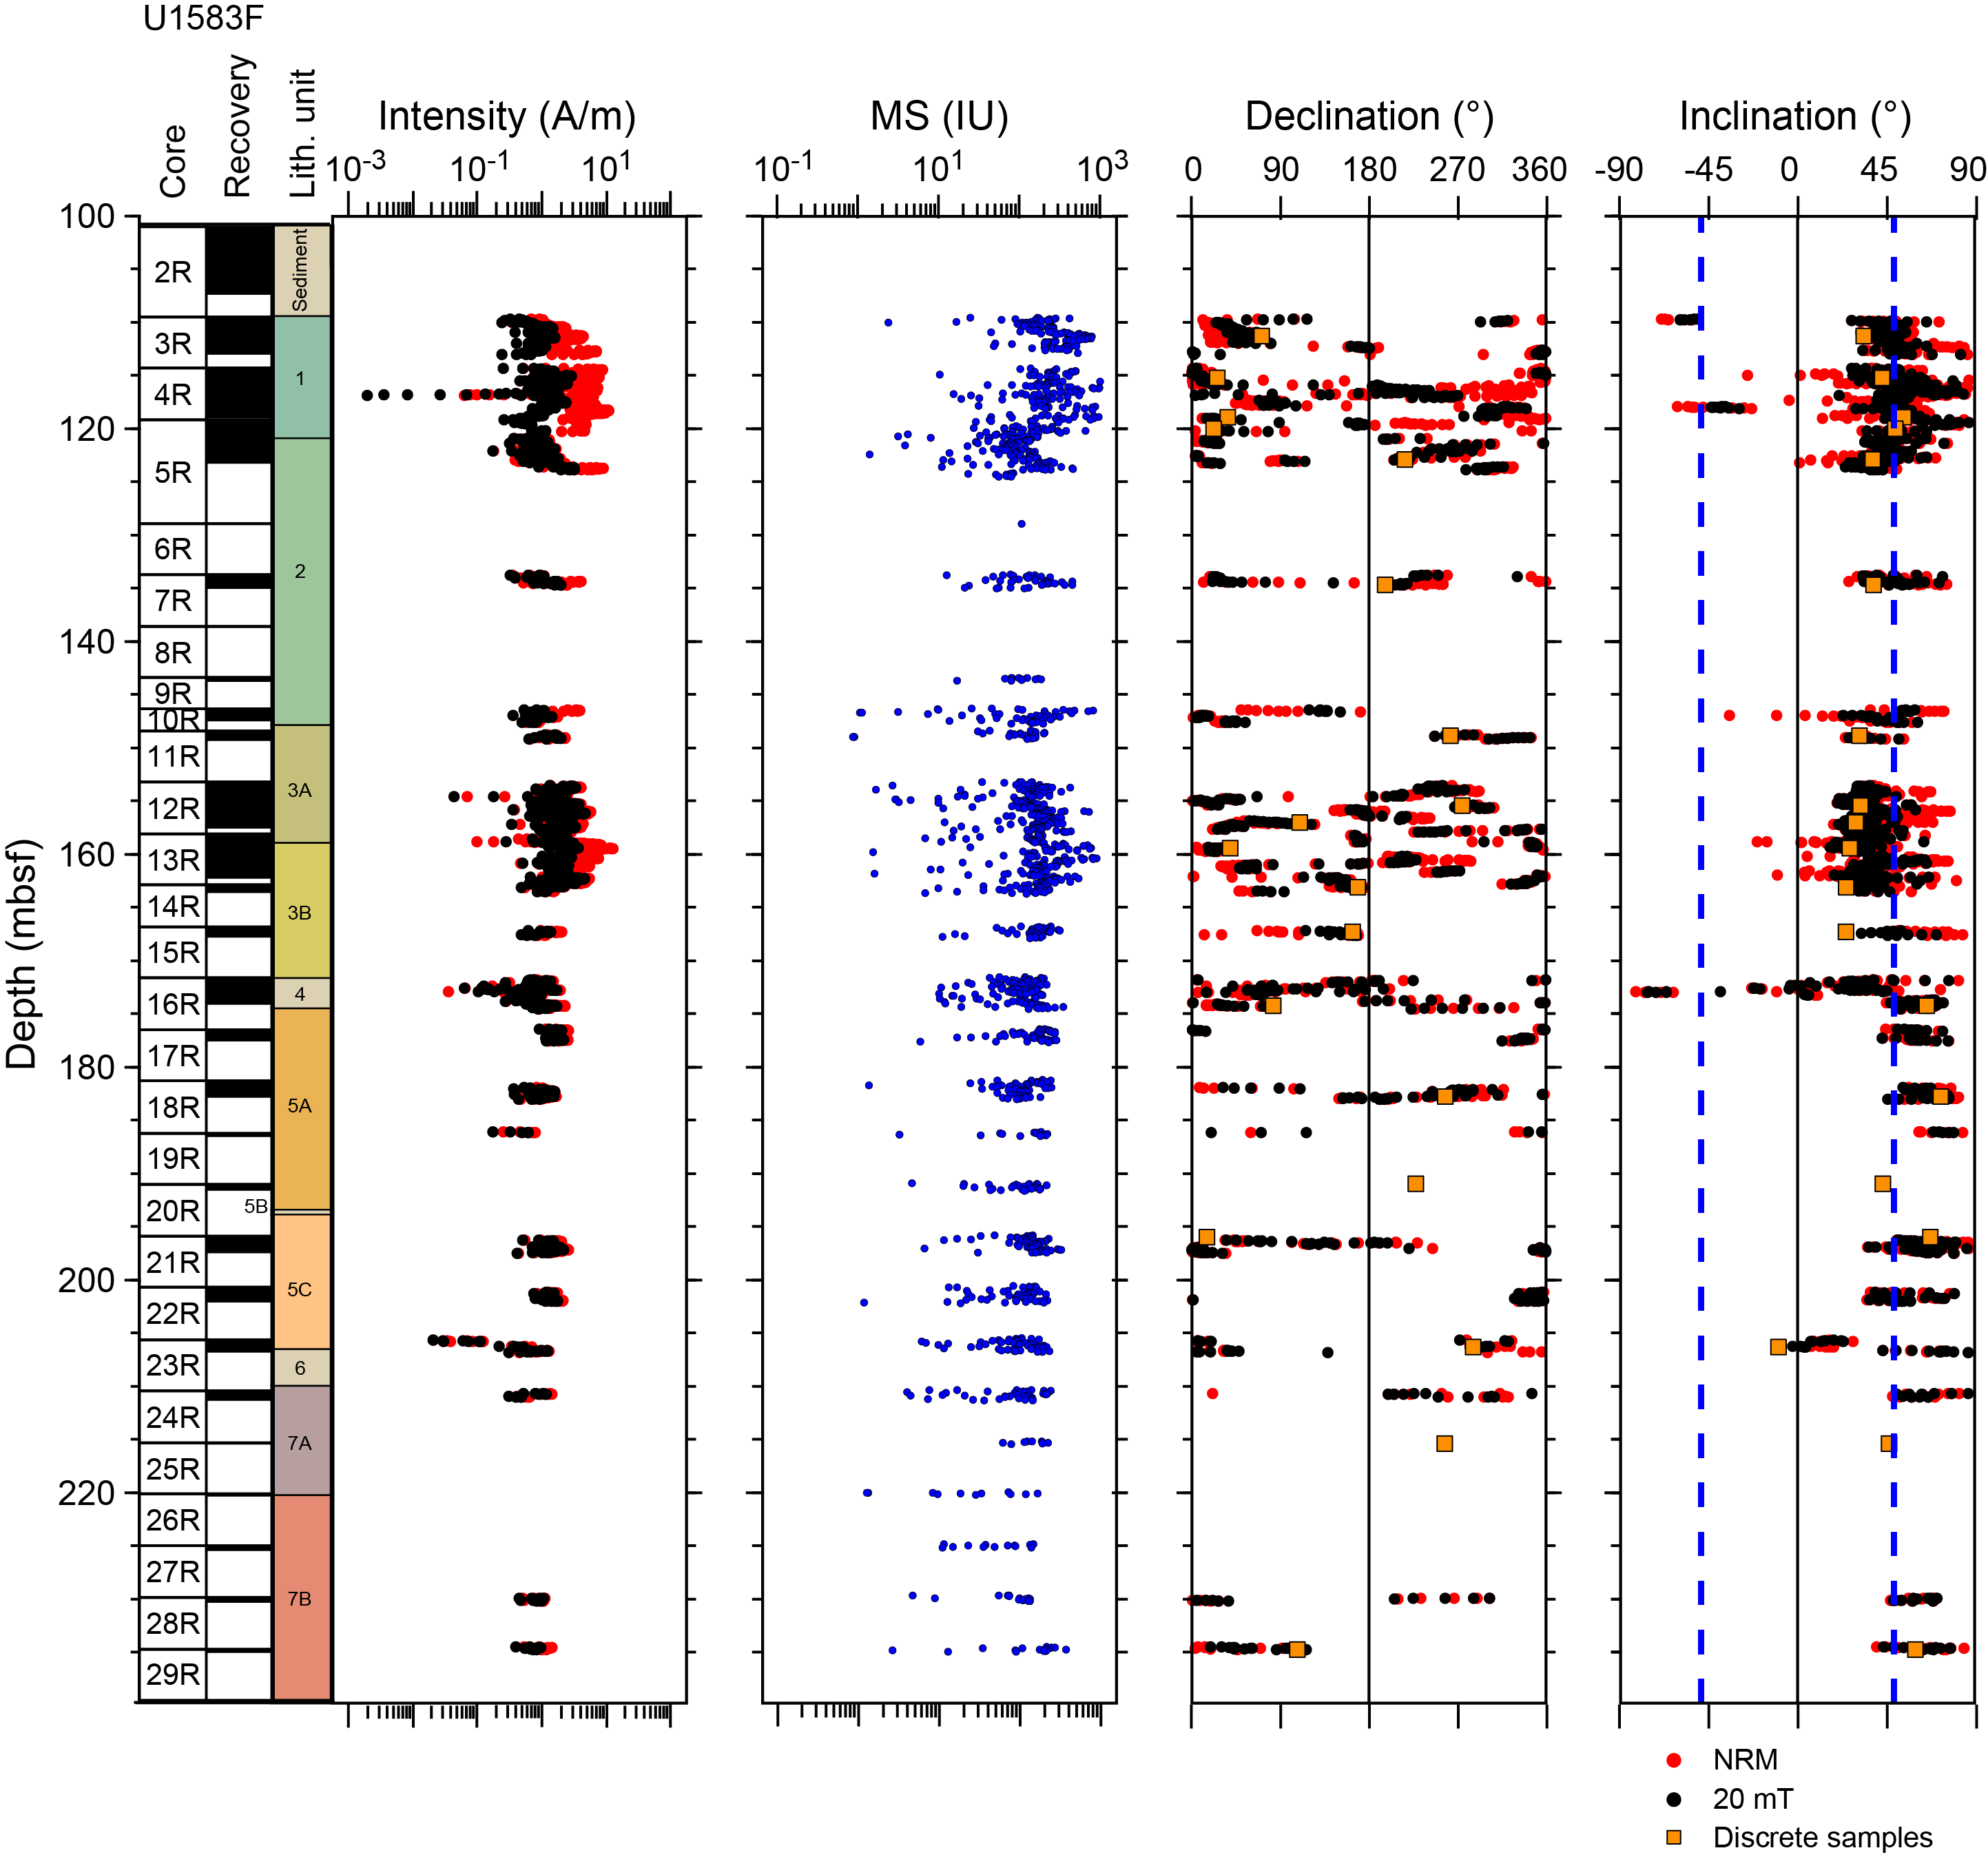
Figure F60. MSP and SRM measurements from volcanic rocks.
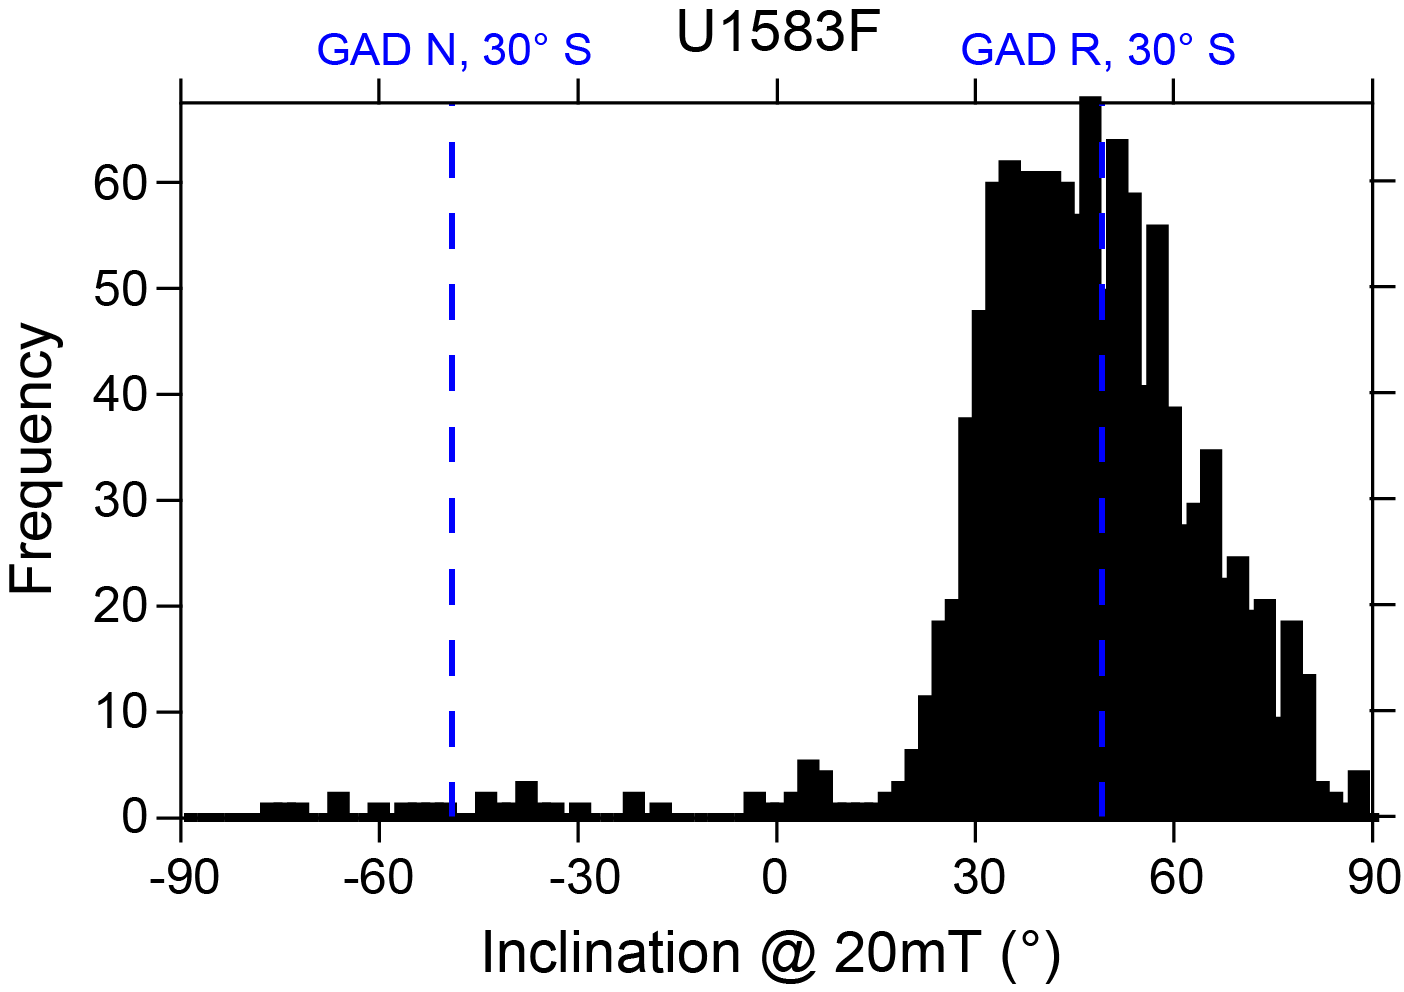
Figure F61. Inclination after 20 mT AF for volcanic rocks.
8.2.1.1. Discrete samples
AF demagnetization up to a maximum of 190 mT was conducted on all of the discrete samples to isolate the ChRM, define the presence of secondary components, and provide constraints on the SRM data. After cleaning the drilling overprint with the 5 mT AF demagnetization step, most samples display a single component converging to the origin of the Zijderveld diagram (Figure F62A) that represents the ChRM. However, some samples such as Sample 393-U1583F-20R-1, 8–10 cm (Figure F62B), show a more stable secondary component, with the ChRM revealed after the 25 mT step. Those samples also display higher values of the median destructive fields (MDFs), which indicate decrease of magnetic mineral grain size or a greater contribution of high-coercivity minerals such as hematite or goethite. Overall, the principal components derived from the discrete samples displayed maximum angular deviation angles of 0.3°–14.8°, with most samples showing values less than 3.7°, which indicates that ChRM directions are mostly well defined (Table T18) (Butler, 1992). Both inclinations and declinations of the ChRM are consistent with the values measured on the SRM (Figure F60).
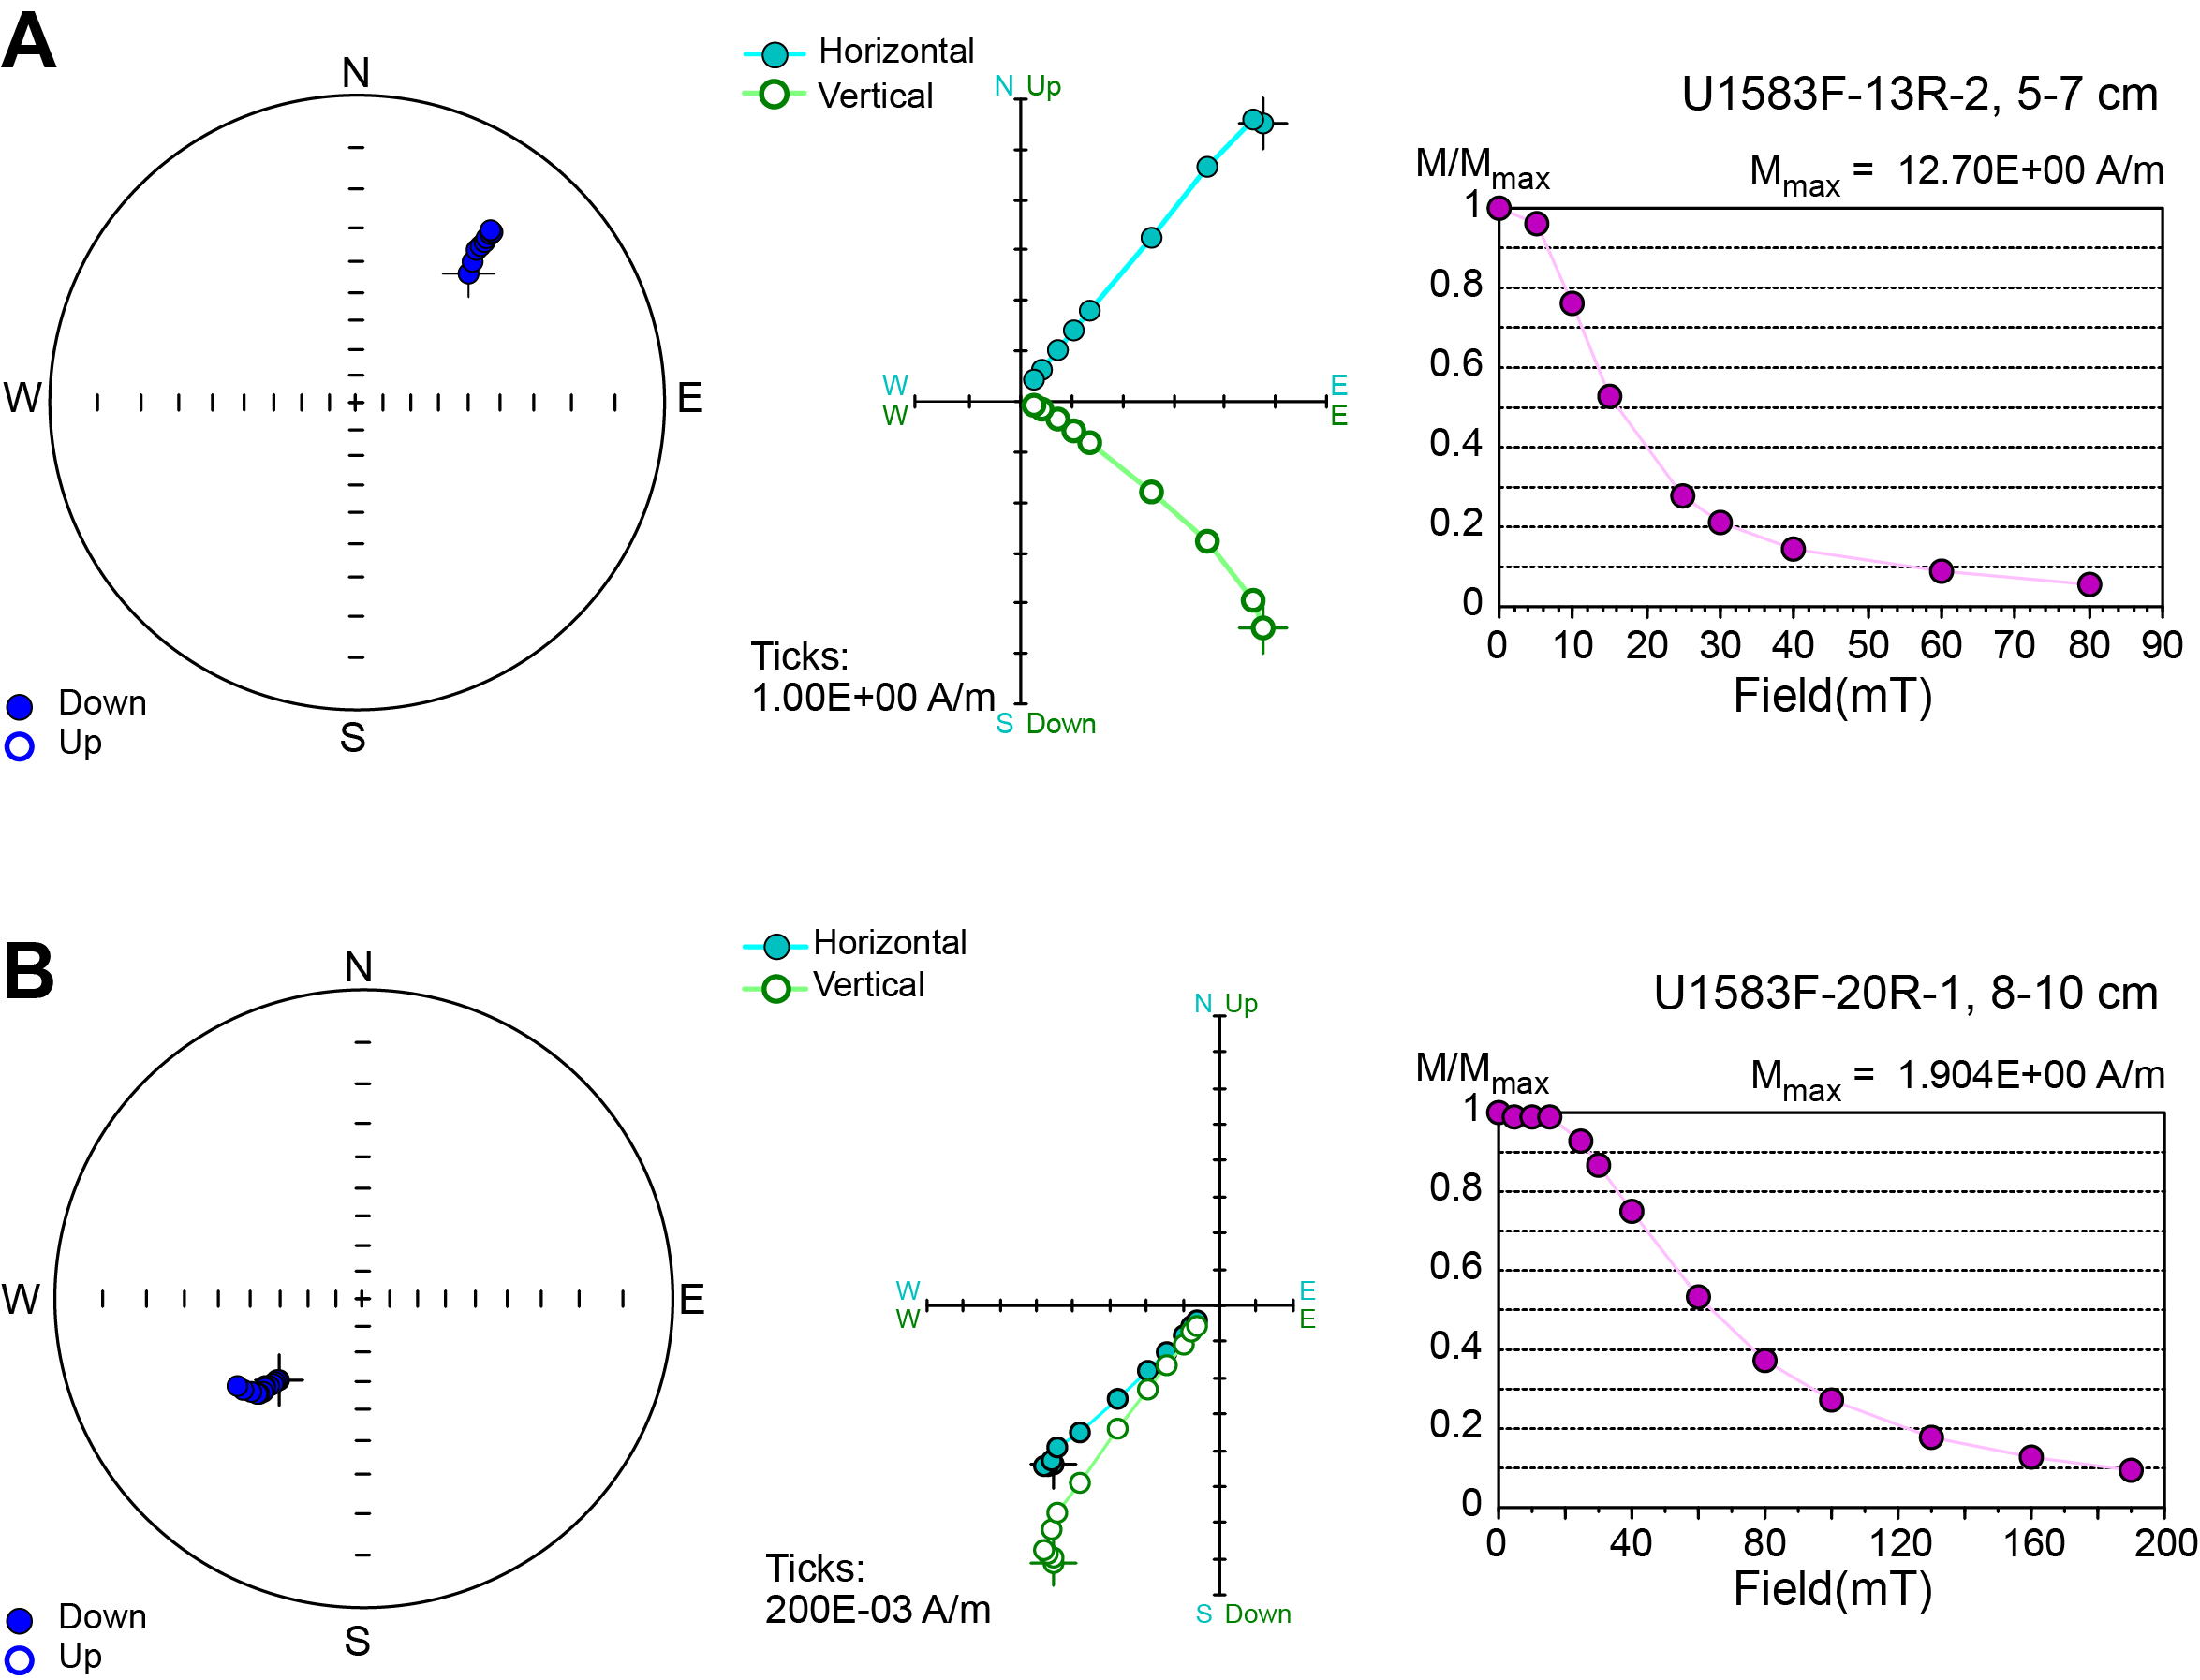
Figure F62. AF demagnetization results, representative discrete samples.
To further clarify the influence of the magnetic mineralogy on the stability of the ChRM and define the possible relationships with igneous units and alteration types, acquisition of IRM and backfield experiments were conducted on 18 discrete samples. Most of the samples show an IRM acquisition curve that saturated around 100–300 mT (Figure F63A), indicating the dominance of low-coercivity minerals such as magnetite or maghemite. A few altered basalts and the breccias (Sample 393-U1583F-16R-2, 53–58 cm) do not reach saturation at the maximum applied field of 1200 mT, suggesting a significant contribution of high-coercivity minerals (e.g., hematite). Deconvolution of the IRM acquisition curves (Figure F63B) confirms the presence of different mixtures of high- and low-coercivity minerals within the volcanic rocks at Site U1583. Most of the samples show 2 low-coercivity components characterized by mean remanence coercivity (Bh) < 2 log10 units. In contrast, the samples that do not saturate at 1200 mT show the presence of a high-coercivity component (Bh > 2.5 log10 units) that contributes ~30% of the total SIRM. Those samples are also characterized by high values of coercivity of remanence (Bcr) (e.g., samples from Sections 5R-3 and 16R-2; Figure F63C). The different contributions from intermediate- to high-coercivity minerals are highlighted by values of the IRM100/SIRM (S0.1) ratios of 0–0.50 and S ratio (S0.3) of ~0.75 (Figure F63C; Table T19). In particular, lower values of S0.1 and S0.3 were detected for breccia samples of Units 4 and 6 and basalts from Subunits 5A–7B, which are more strongly hydrothermally altered. Additionally, discrete samples display a wide range of MDFs (4–77 mT) (Table T19; Figure F63C), indicating broad and variable ranges in magnetic mineral grain size and coercivity. Two samples collected from Core 4R show significantly lower MDF (<5 mT), implying that the main magnetic carriers in Unit 1 (massive flow) are coarser grained multidomain magnetite (Table T19). In contrast, samples from the pillow lava show values consistent with the dominance of finer grained single-domain magnetite. The highest MDF values are associated with the top of Unit 2 and the breccia (Unit 4), where high-coercivity minerals were detected.
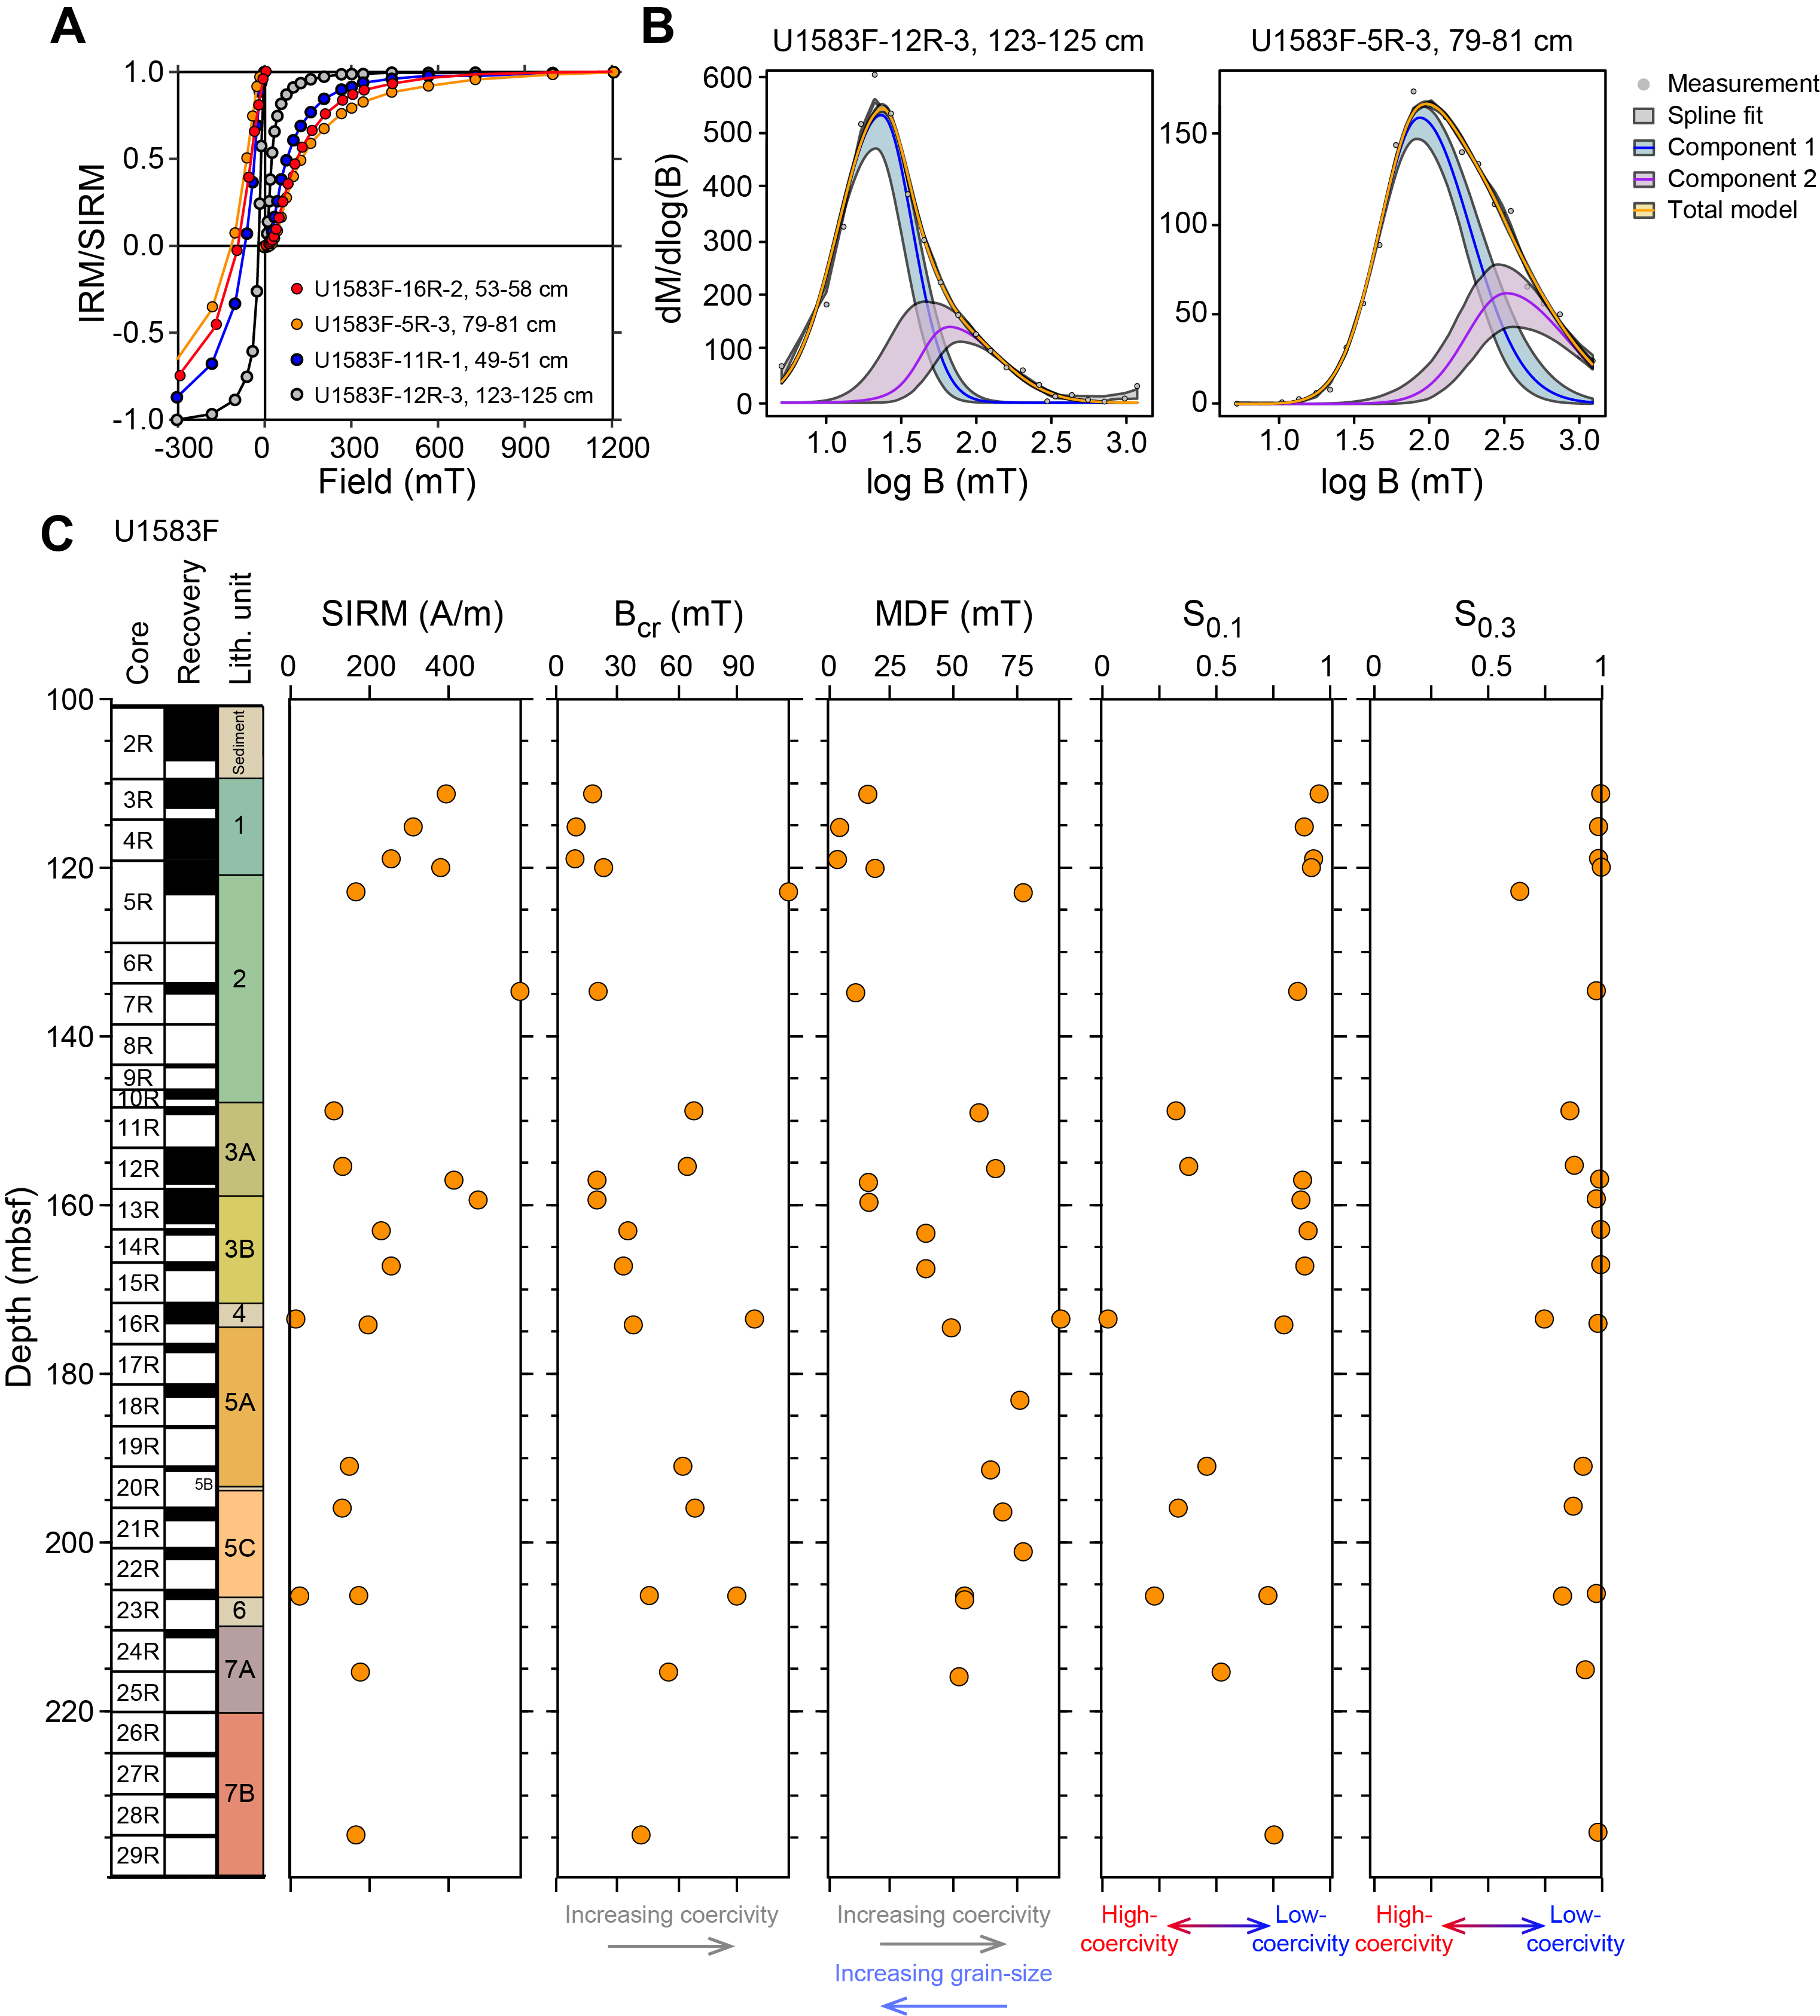
Figure F63. SIRM acquisition curves and coercivity distribution, Hole U1583F.
AMS shows high variability in the principal magnetic susceptibility axis (Figure F64A). In particular, samples from Unit 1 show prolate magnetic fabric with a well-clustered subhorizontal magnetic lineation (Kmax) (Figure F64A, F64B; Table T20). Samples from Units 2 and 3 (Cores 393-U1583F-7R through 15R) are characterized by subhorizontal magnetic foliation with slightly prolate susceptibility ellipsoid shape (−0.5 < T < 0). Those units also show increased values in the degree of anisotropy (P), with highest values at the top of Subunit 3B, suggesting a preferred orientation of magnetic minerals in the sheet flows.
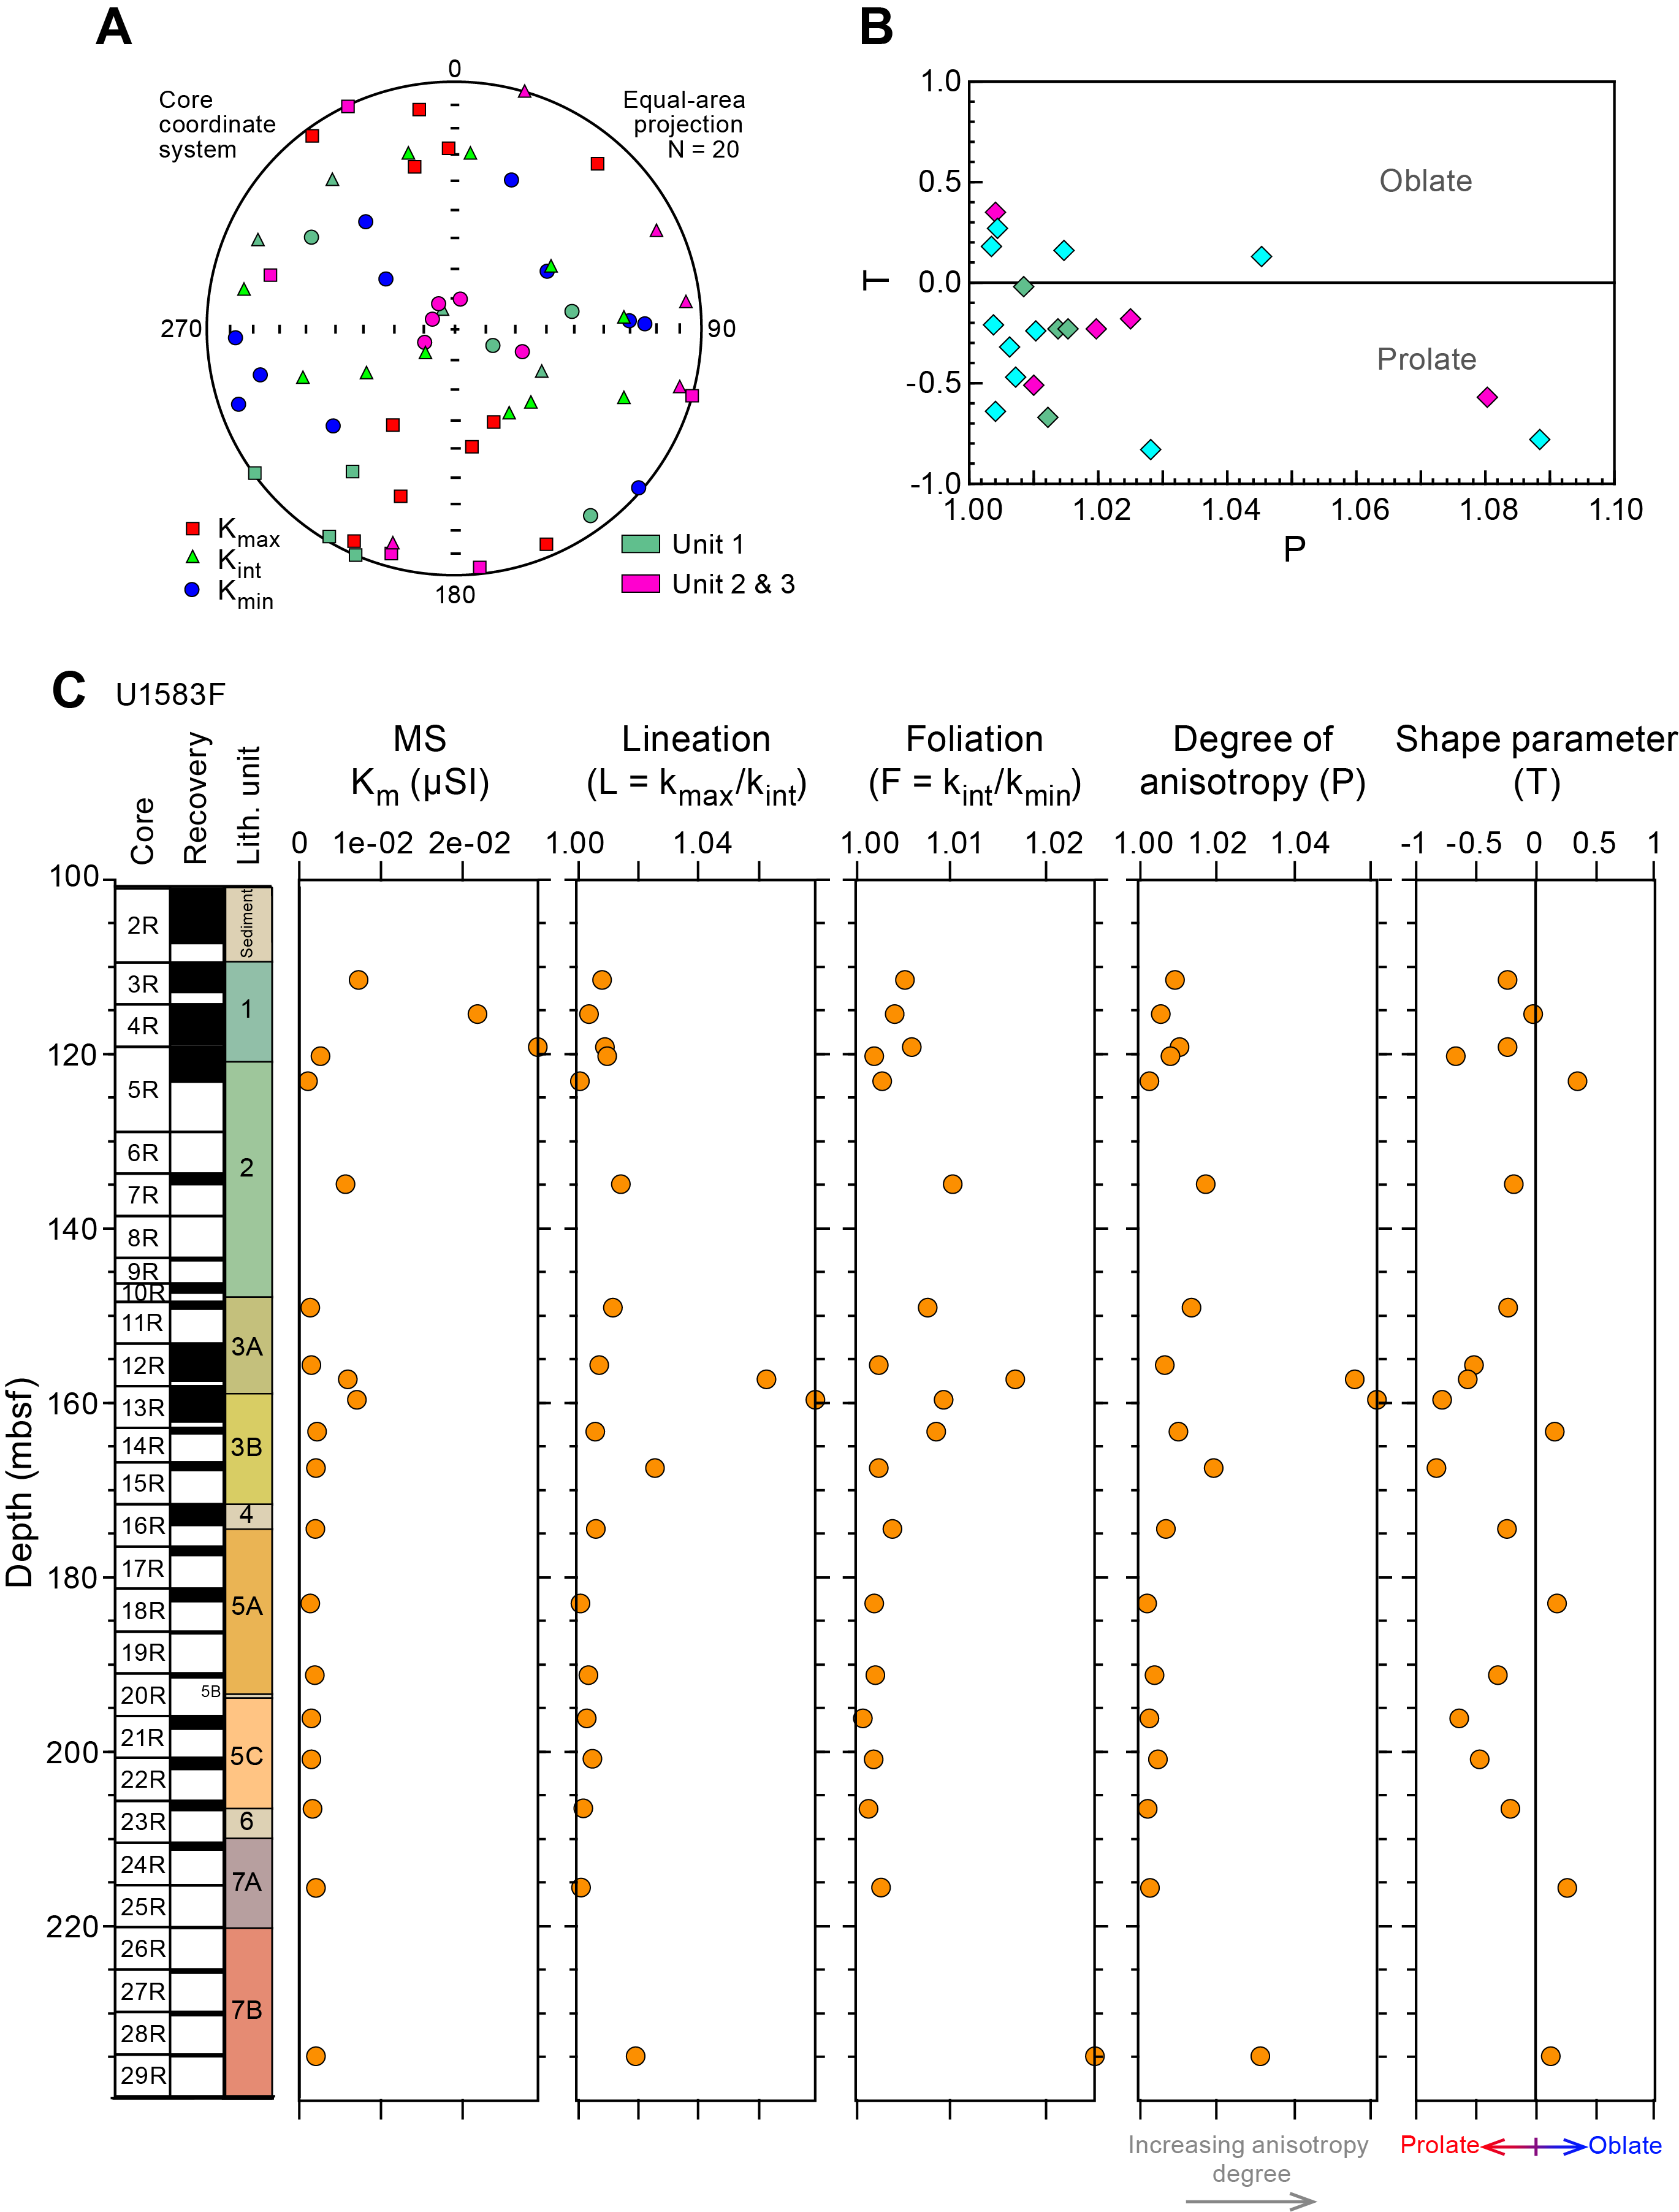
Figure F64. Principal magnetic susceptibility axes, T vs. P, Km, and AMS parameters.
9. Age model and mass accumulation rates
9.1. Age model and linear sedimentation rates
The age model for Site U1583 is based on calcareous nannoplankton and planktic foraminiferal lowest (base) and highest (top) occurrence datums and paleomagnetic reversal datums from Holes U1583C and U1583E (Tables T21, T22; Figures F65, F66). Planktic foraminifera and calcareous nannoplankton occur throughout the cored sediments. We identified 11 planktic foraminiferal and 27 calcareous nannoplankton bioevents in Hole U1583C and 22 planktic foraminiferal and 16 calcareous nannoplankton bioevents in Hole U1583E (Figures F65, F66). We also identified 36 and 34 magnetic reversal boundaries from Holes U1583C and U1583E, respectively.
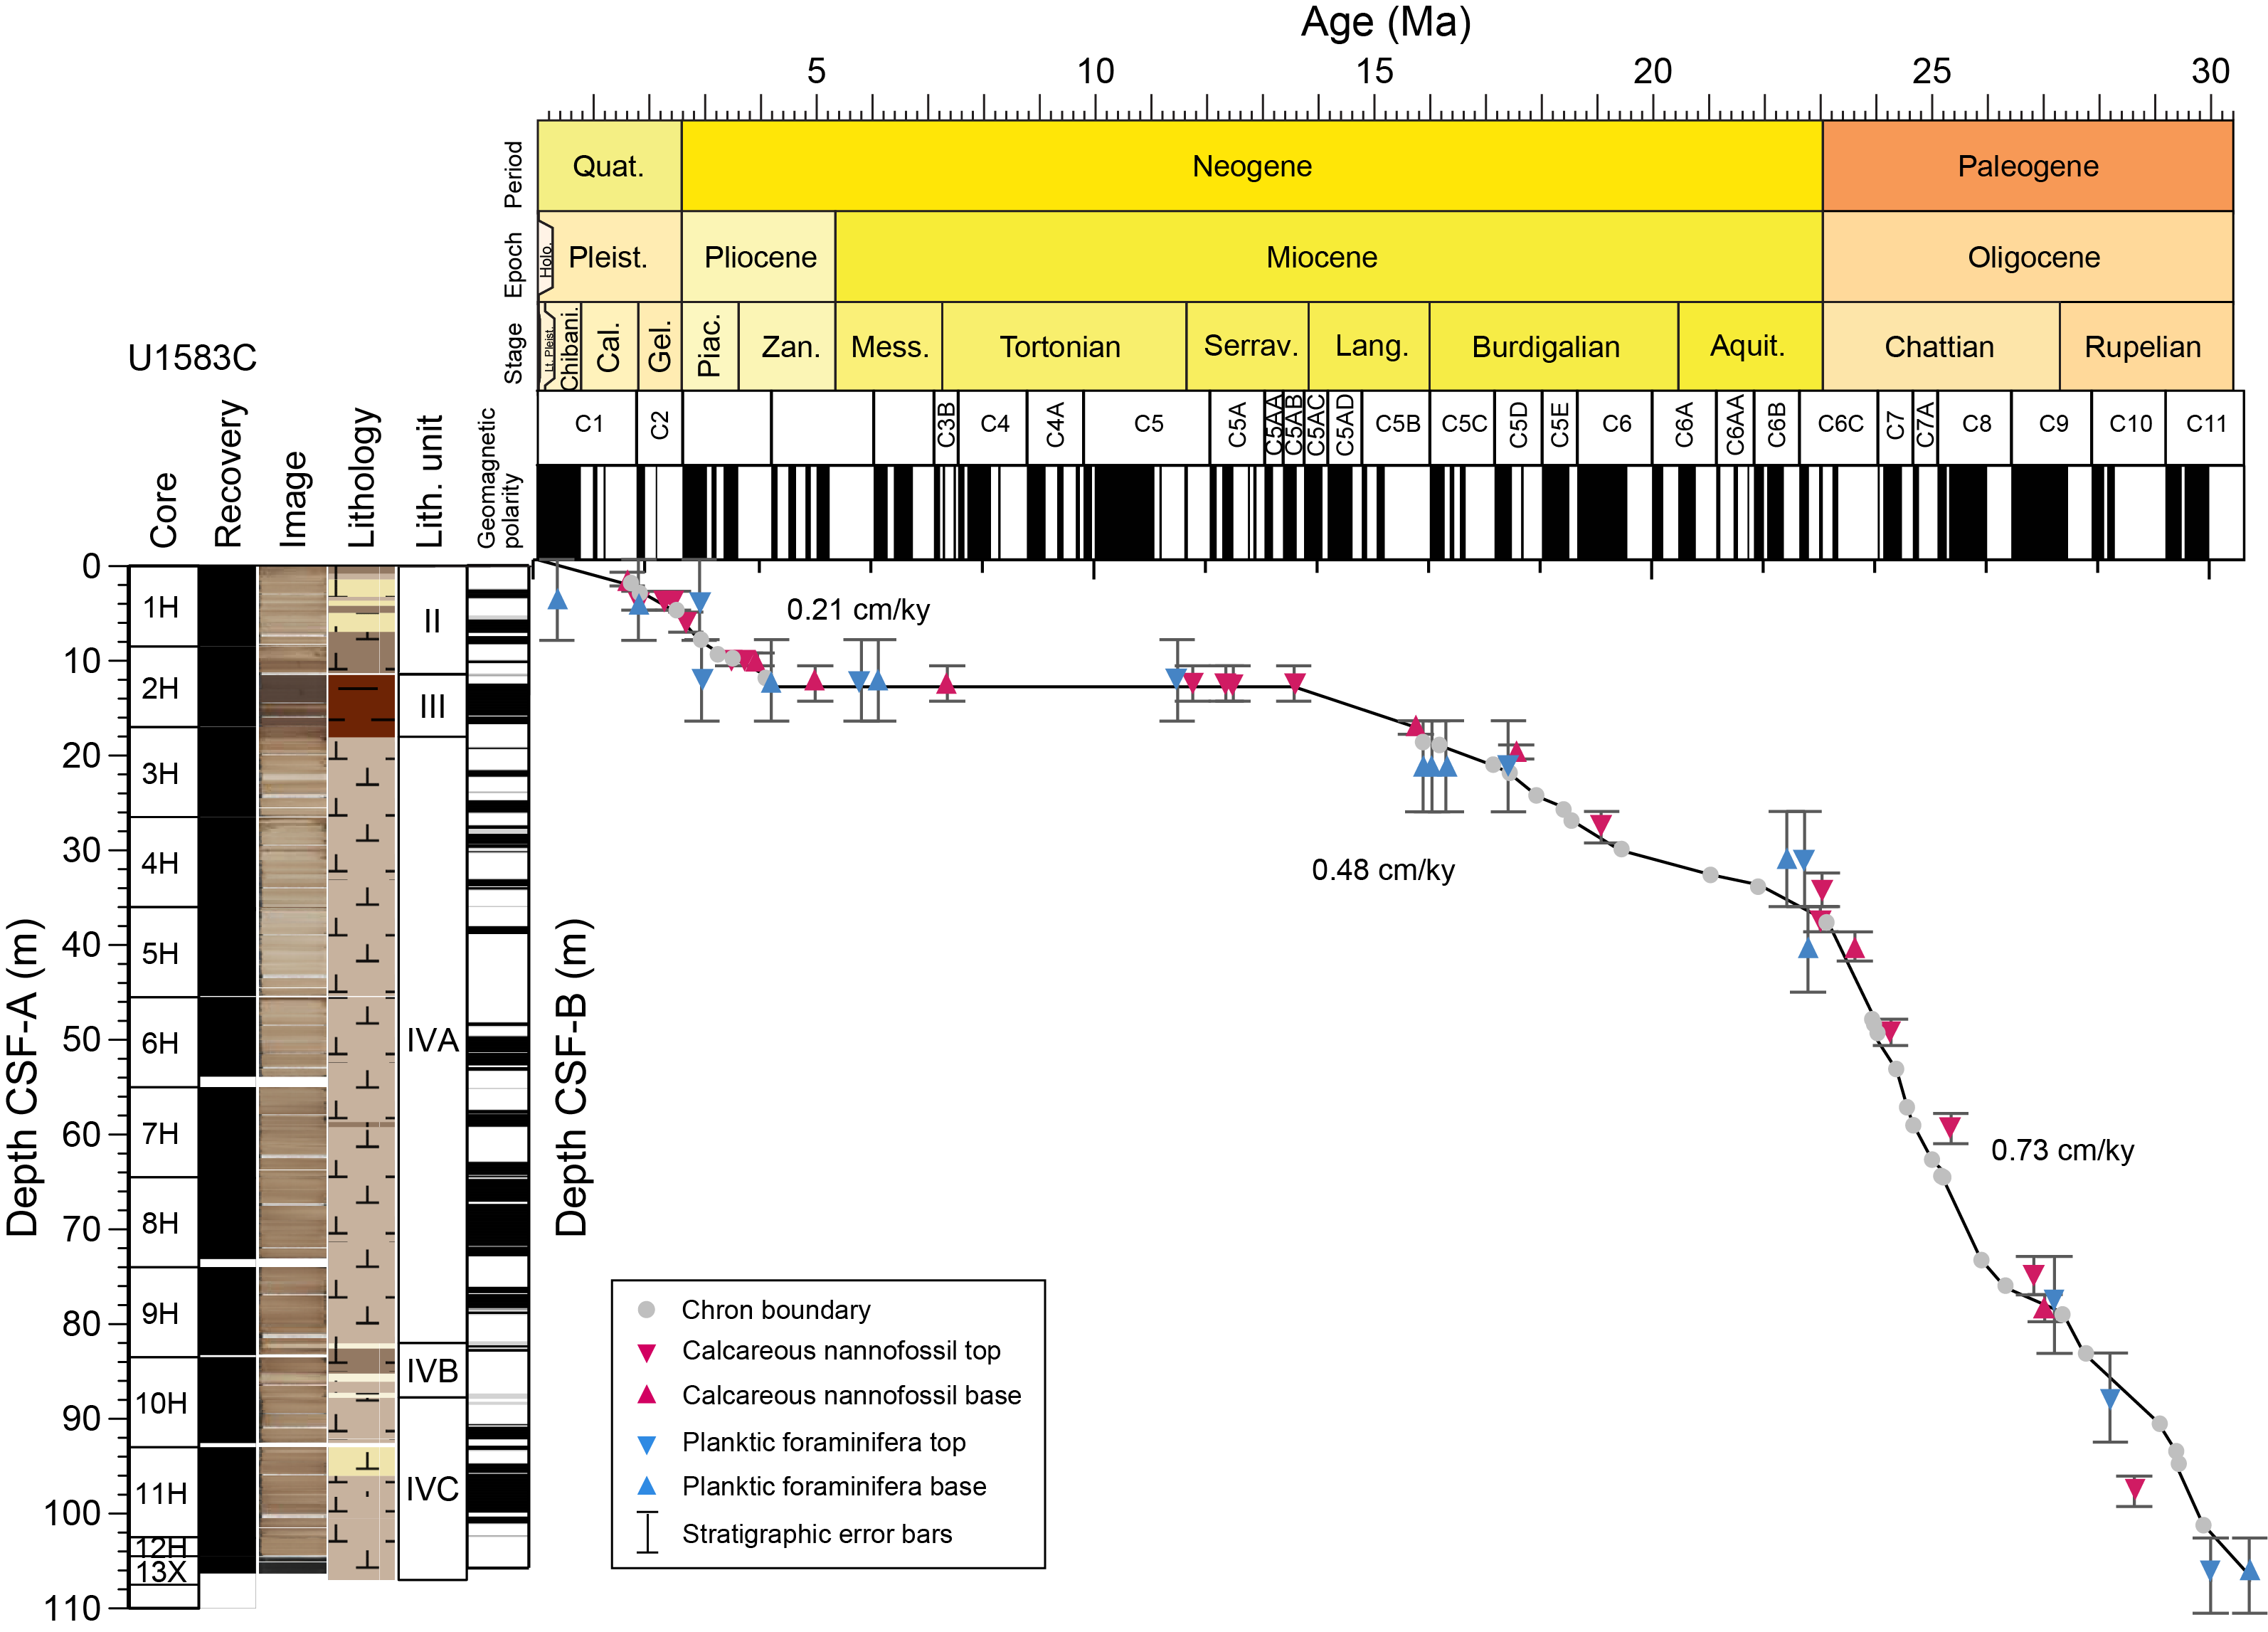
Figure F65. Age-depth model, Hole U1583C.
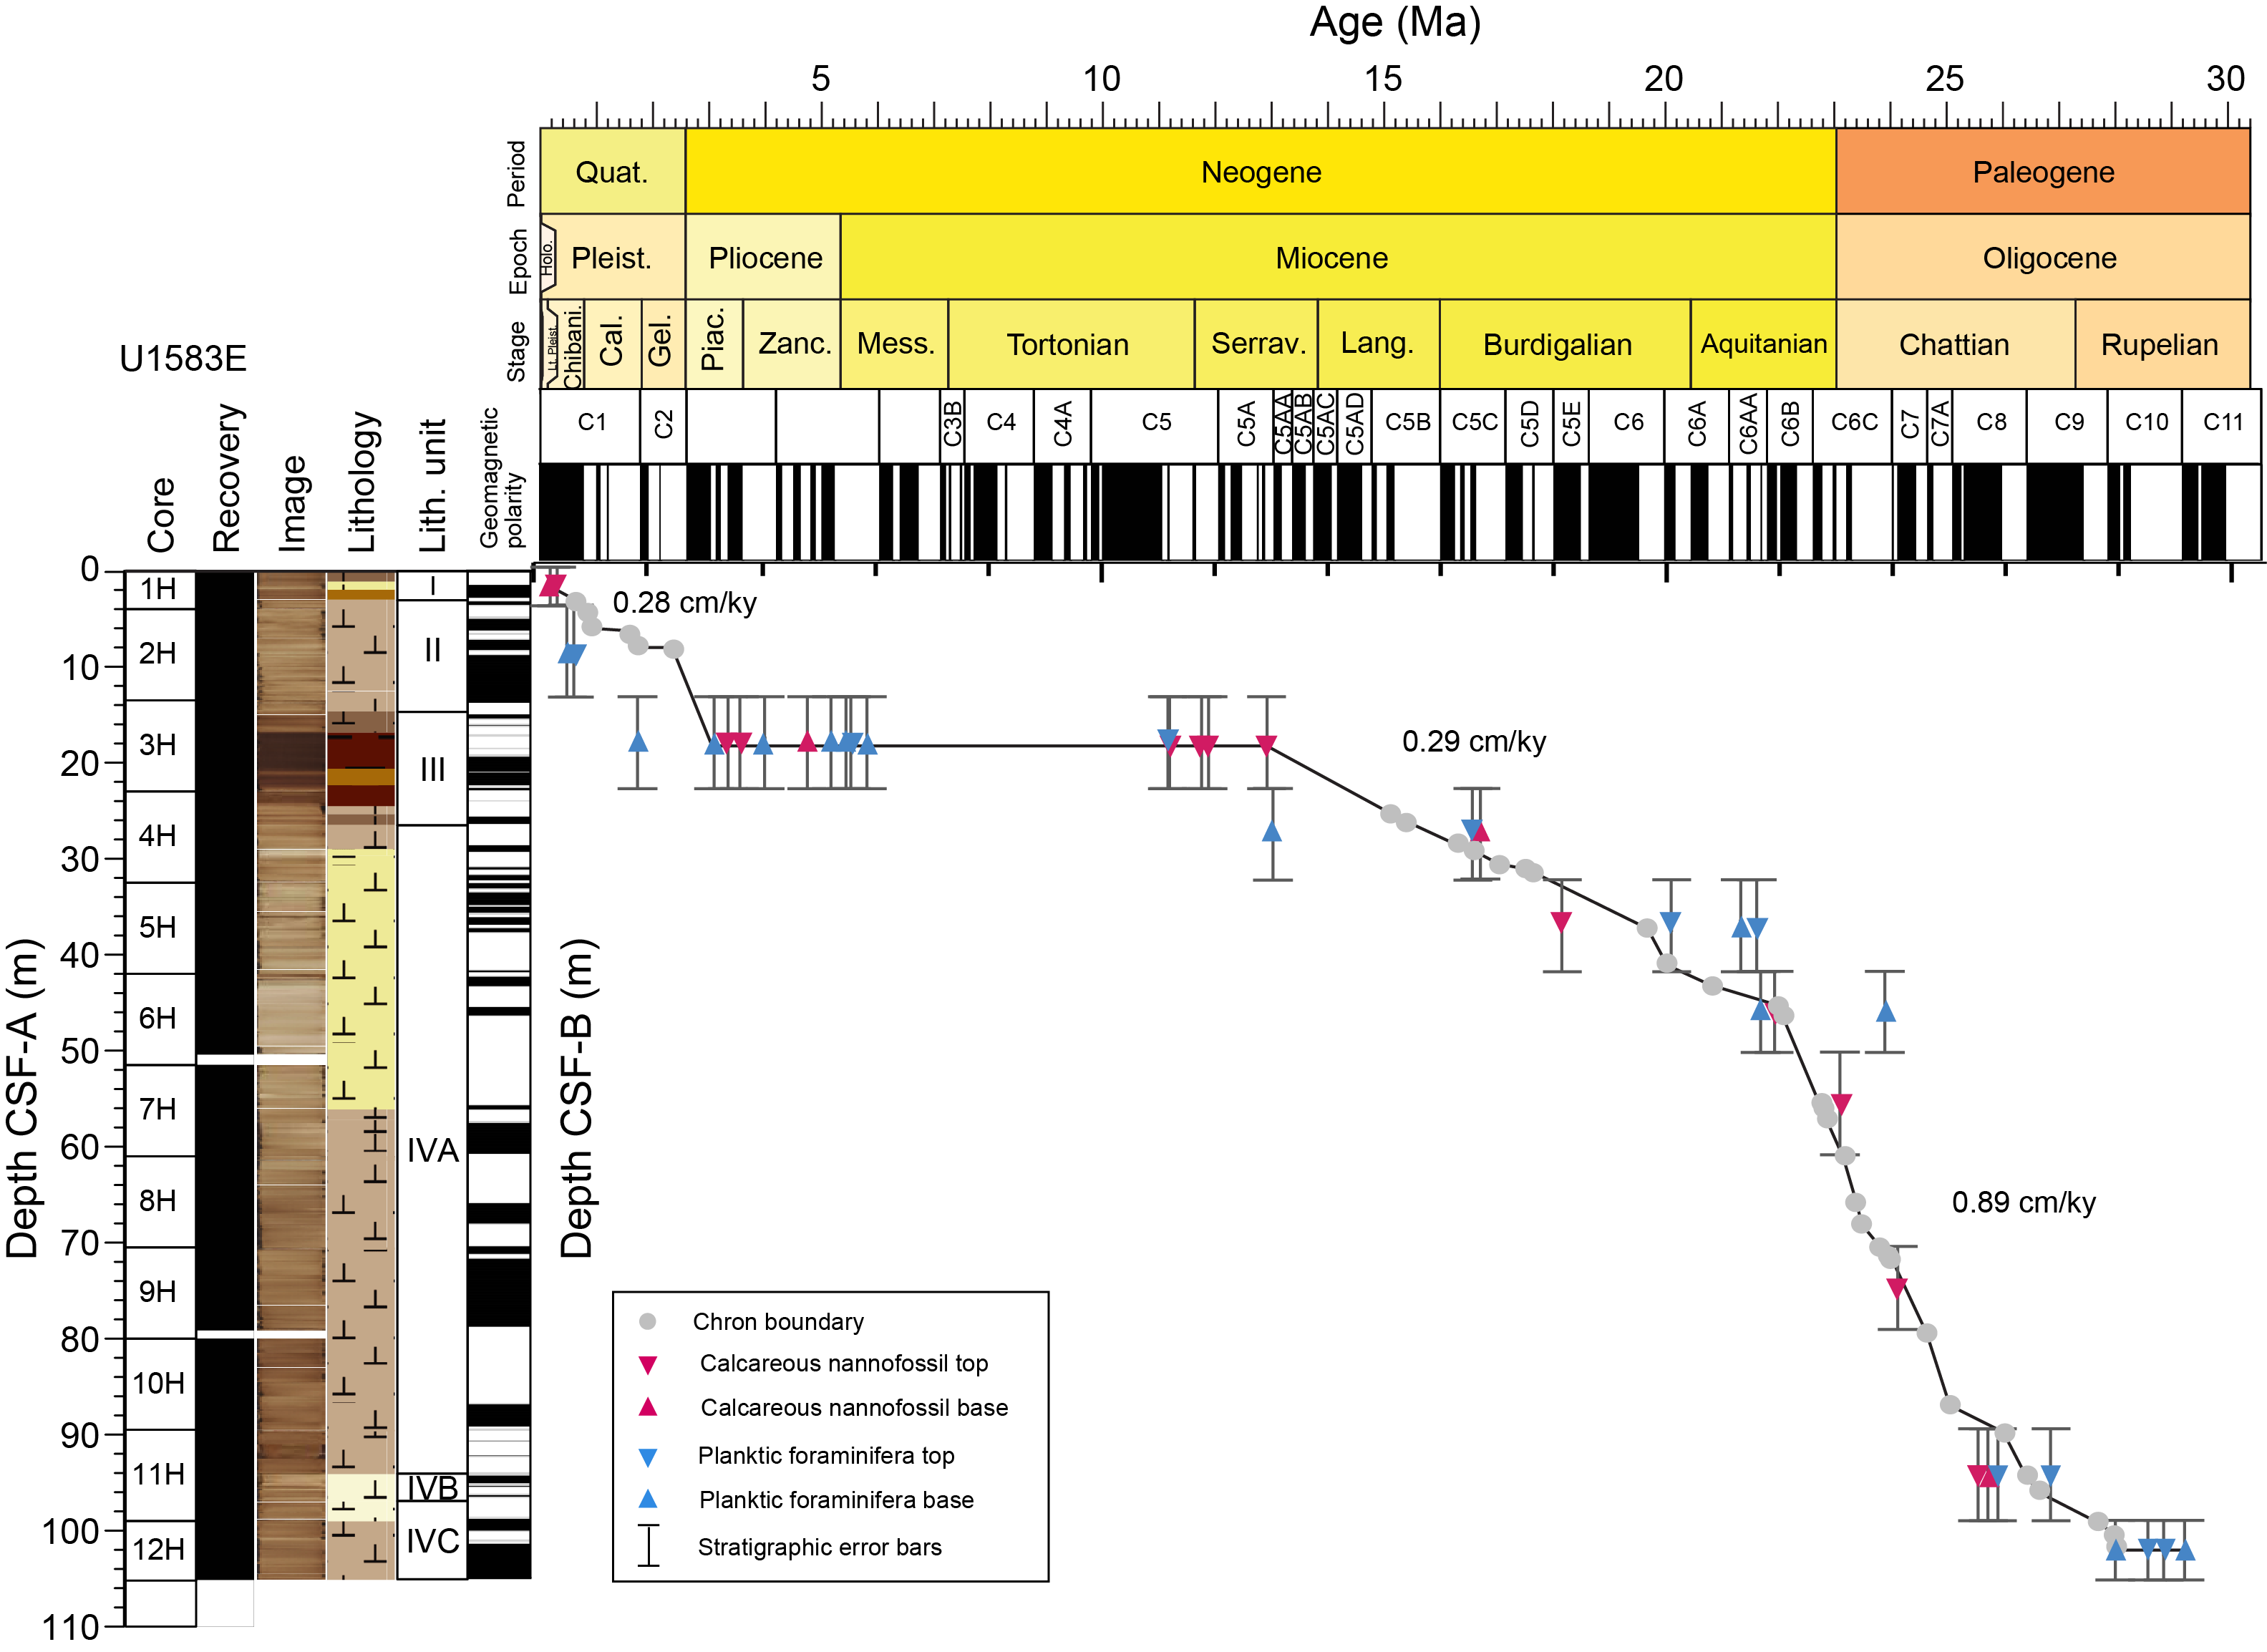
Figure F66. Age-depth model, Hole U1583E.
There is agreement between fossil datums and paleomagnetic reversal datums in both holes, with a few exceptions. In Hole U1583C, some planktic foraminiferal datums lie ~1.6 to ~1.2 My outside of the calcareous nannofossil and magnetic reversal boundaries in the Oligocene and earliest Miocene. In Hole U1583E, planktic foraminiferal datums lie outside of the calcareous nannofossil and magnetic reversal boundaries by ~1.8 to ~1.6 My in the Pleistocene and 2.8 to ~0.6 My in the Oligocene to Miocene. As with other sites on the SAT (e.g., see Biostratigraphy and Age model and mass accumulation rates both in the Site U1558 chapter [Teagle et al., 2024a]), such differences may be attributed to species' diachroneity between our midlatitude sites and the tropical/subtropical sites at which these datums were calibrated (Wade et al., 2011; King et al., 2020; Lam et al., 2022). Because planktic foraminifera are relatively well preserved at Site U1583 and some of the asynchronous datums are bases, such age offsets cannot be fully explained by mixing or reworking, and further investigation of this diachroneity will require careful postexpedition work.
A major hiatus that spans from the Middle Miocene to Pliocene (~13–3 Ma) occurs in both holes. Linear sedimentation rates (LSRs) were calculated using microfossil datums as well as paleomagnetic reversal boundaries. Datums used to construct the age model are indicated with asterisks in Tables T21 and T22. Rates are variable in both holes. Average sedimentation rates are low above and below the unconformity, with values in the Pleistocene of 0.22 and 0.28 cm/ky (in Holes U1583C and U1583E, respectively) and in the Lower Miocene of and 0.47 cm/ky in Hole U1583C and 0.29 cm/ky in Hole U1583E. Average sedimentation rates are highest in the Oligocene (0.73 cm/ky in Hole U1583C and 0.89 cm/ky in Hole U1583E).
9.2. Mass accumulation rates
Mass accumulation rates (MARs), were calculated for Hole U1583C using the LSRs and dry bulk density calculated from gamma ray attenuation (GRA) measurements collected during Whole-Round Multisensor Logger (WRMSL) scans (see Age model and mass accumulation rates in the Expedition 390/393 methods chapter [Coggon et al., 2024a]; see also U1583_MAR.xlsx in AGEMODEL in Supplementary material). A hiatus or condensed interval that occurs from the Late Miocene to Pliocene (see Biostratigraphy) results in an extended interval of MAR values of zero in Hole U1583C. The data presented in Figure F67 are binned into 1 My intervals. Carbonate and organic carbon measurements were not taken from Hole U1583E, so MARs were not calculated for this hole.
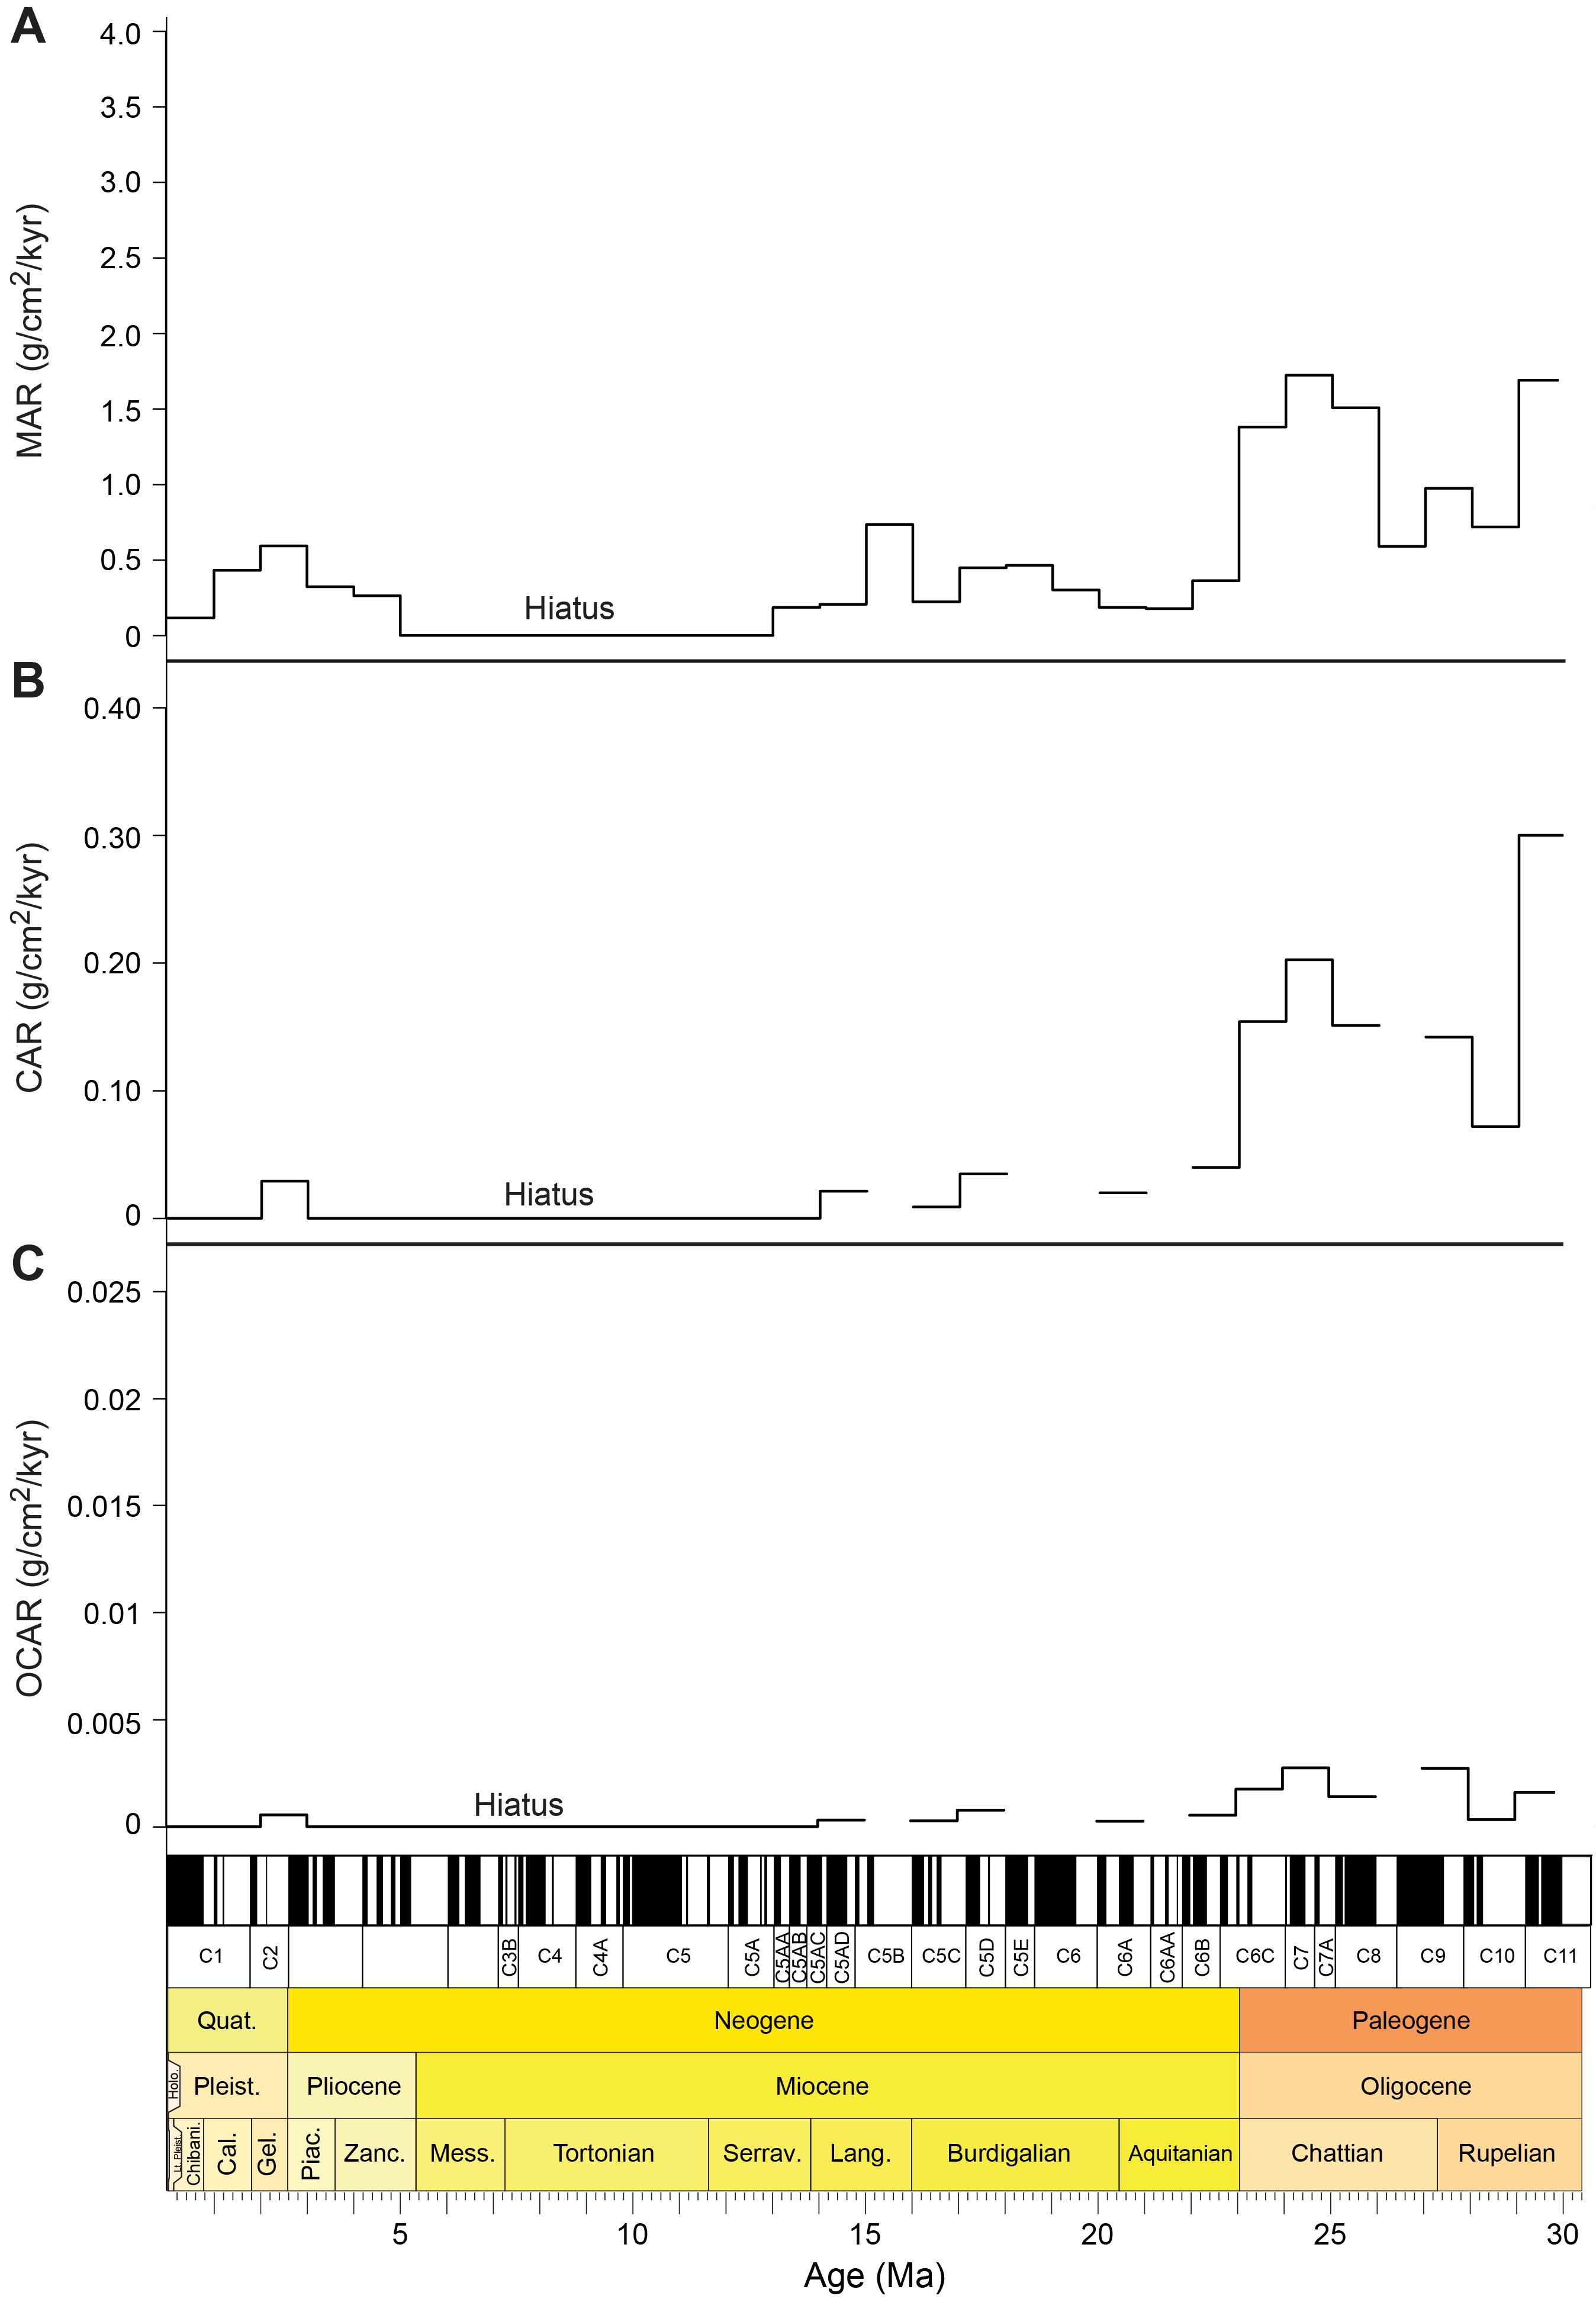
Figure F67. MAR, CAR, and OCAR.
MARs vary throughout the sedimentary succession in Hole U1583C (Figure F67A). MARs are highest in the Oligocene and earliest Miocene, with a peak around 1.7 g/cm2/ky. Values are much lower in the rest of the Miocene and Pliocene–Pleistocene. Below the unconformity in the Early Miocene, values range 0.2–0.7 g/cm2/ky. In the Pliocene–Pleistocene above the unconformity, MAR values range 0.1–0.6 g/cm2/ky.
9.3. Carbonate and organic carbon accumulation rates
Carbonate accumulation rates (CARs) and organic carbon accumulation rates (OCARs) in Hole U1583C were calculated by multiplying MARs by %CaCO3 and weight percent total organic carbon (TOC). In Hole U1583C, carbonate content and TOC was measured from interstitial water (IW) squeeze cakes, with an additional discrete sample taken from most cores. The data presented in Figure F67 are binned into 1 My intervals.
CARs broadly follow trends in MARs and are highest for the Oligocene, with values ranging 0.08–0.30 g/cm2/ky (Figure F67). Neogene and Quaternary CARs are lower, with values ranging 0.0001–0.04 g/cm2/ky. OCARs are extremely low through the sedimentary section at Site U1583, with peak values of 0.003 g/cm2/ky in the Oligocene (Figure F67). OCARs are lowest in the Neogene and Quaternary, with values ranging 0.0003–0.0008 g/cm2/ky.
10. Physical properties and downhole measurements
10.1. Sediment
Physical properties characterization of the sediment sequence at Site U1583 was primarily based on cores from Holes U1583C and U1583E. Hole U1583E was the only one to recover a clear mudline. Holes U1583A, U1583B, and U1583D were single-core holes abandoned immediately after missing the mudline. Although physical properties measurements were performed on cores from Holes U1583A, U1583B, and U1583D, these results are not discussed here or included in the stratigraphic correlation. Shipboard stratigraphic correlation only later determined that Hole U1583C had also missed the mudline and did not sample the uppermost 5.6 m of Unit I (see Sedimentology) at Site U1583 (see Stratigraphic correlation), corresponding to Pliocene–Pleistocene (see Age model and sedimentation rates). Hole U1583F was drilled without coring through 101 m of sediment before starting RCB coring and encountered basement at 109.5 mbsf. Unfortunately, an intact sediment/volcanic rock interface was not recovered.
Whole-round core section measurements from Hole U1583C, comprising NGR, GRA bulk density, MS (including point magnetic susceptibility [MSP] on the Section Half Multisensor Logger [SHMSL]), and P-wave velocity, are shown in Figure F68. Split-core section measurements such as P-wave velocity, thermal conductivity, and sediment shear and compressional strength are shown in Figure F69. A total of 24 discrete sediment samples were taken from the working halves for moisture and density (MAD) analysis (Table T23), and select discrete samples were taken for measurements of thermal conductivity, sediment strength, and P-wave velocity (Figure F69; Table T24). Track measurements were made on cores from both holes (Figures F68, F70), but discrete measurements were only made on cores from Hole U1583C (Figures F68, F69). The NGR, GRA, MS, and P-wave velocity data from both holes display similar features (see Stratigraphic correlation), and consequently, the descriptions of Site U1583 sediment physical properties are predominantly based on Hole U1583C. Because Lithostratigraphic Unit I was only recovered in Hole U1583E and not in Hole U1583C, we describe the whole-round track data (NGR, GRA, MS, and P-wave velocity) of Unit I in Hole U1583E (Figure F70). Unless otherwise specified, we use the uncompressed CSF-A depth scale (mbsf) to show data from each hole. Mean values of all physical properties are represented with ranges of ±1 standard deviation in Table T25.
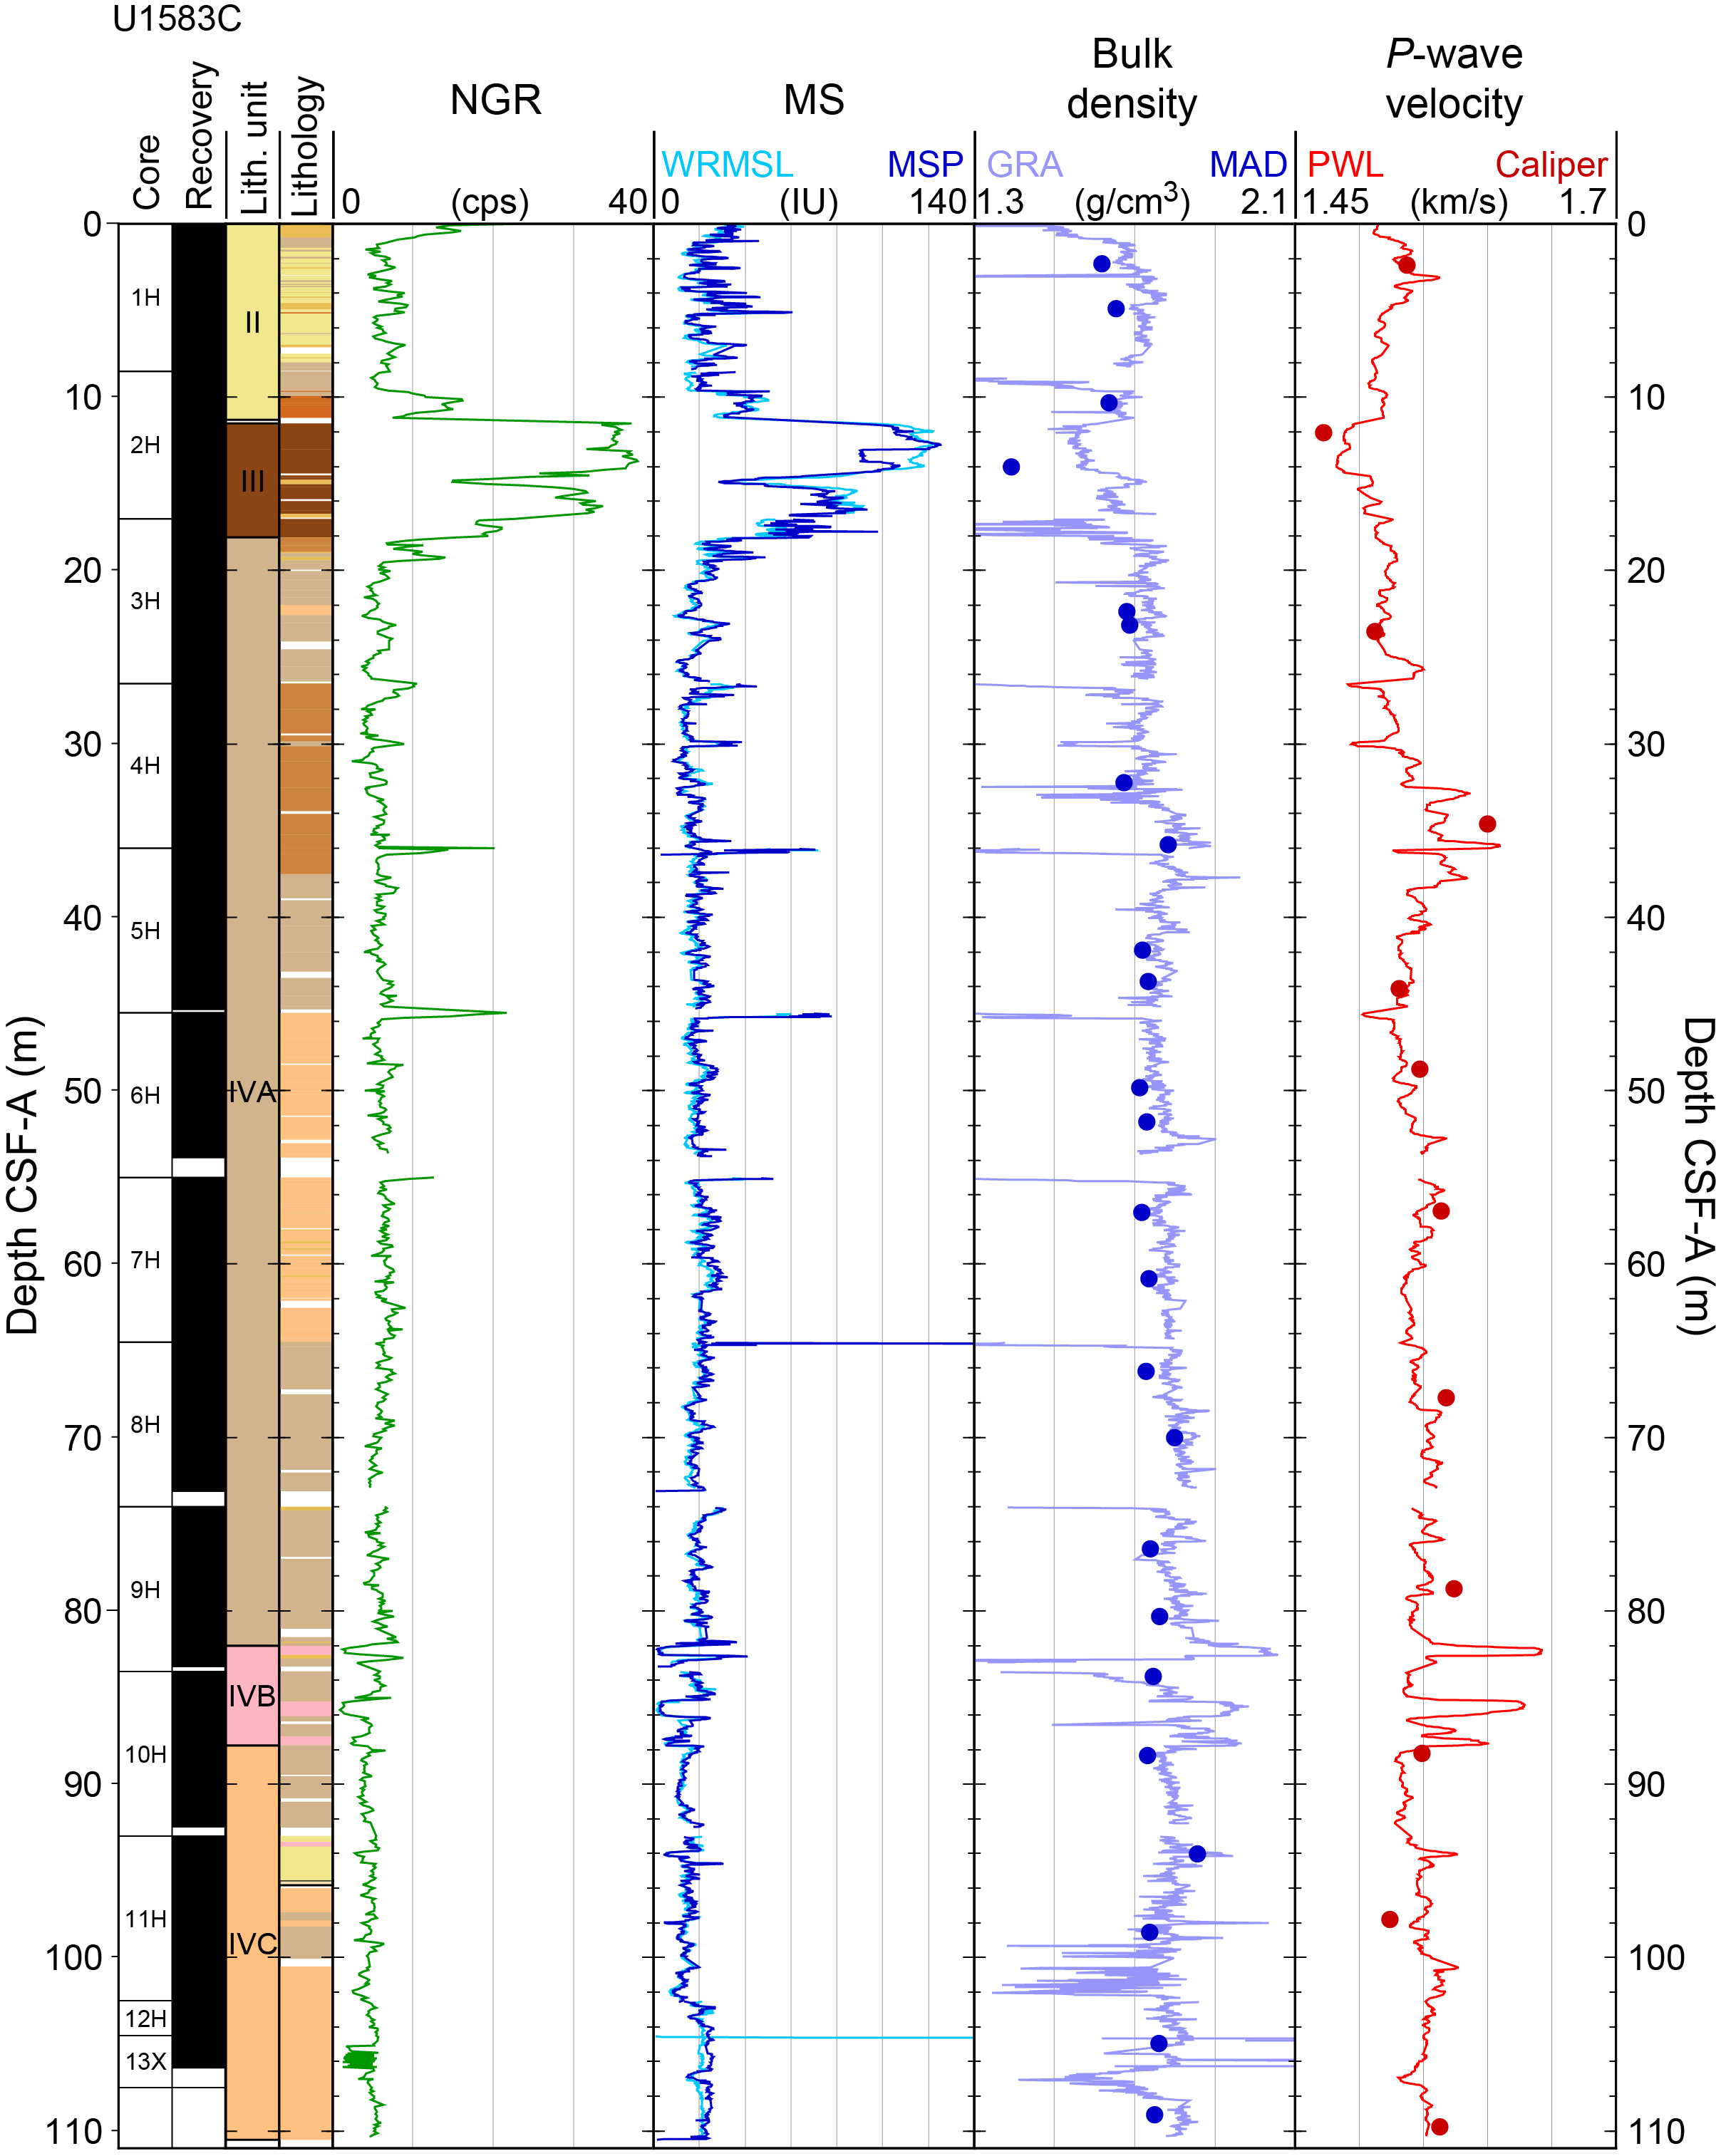
Figure F68. Track physical properties, Hole U1583C.
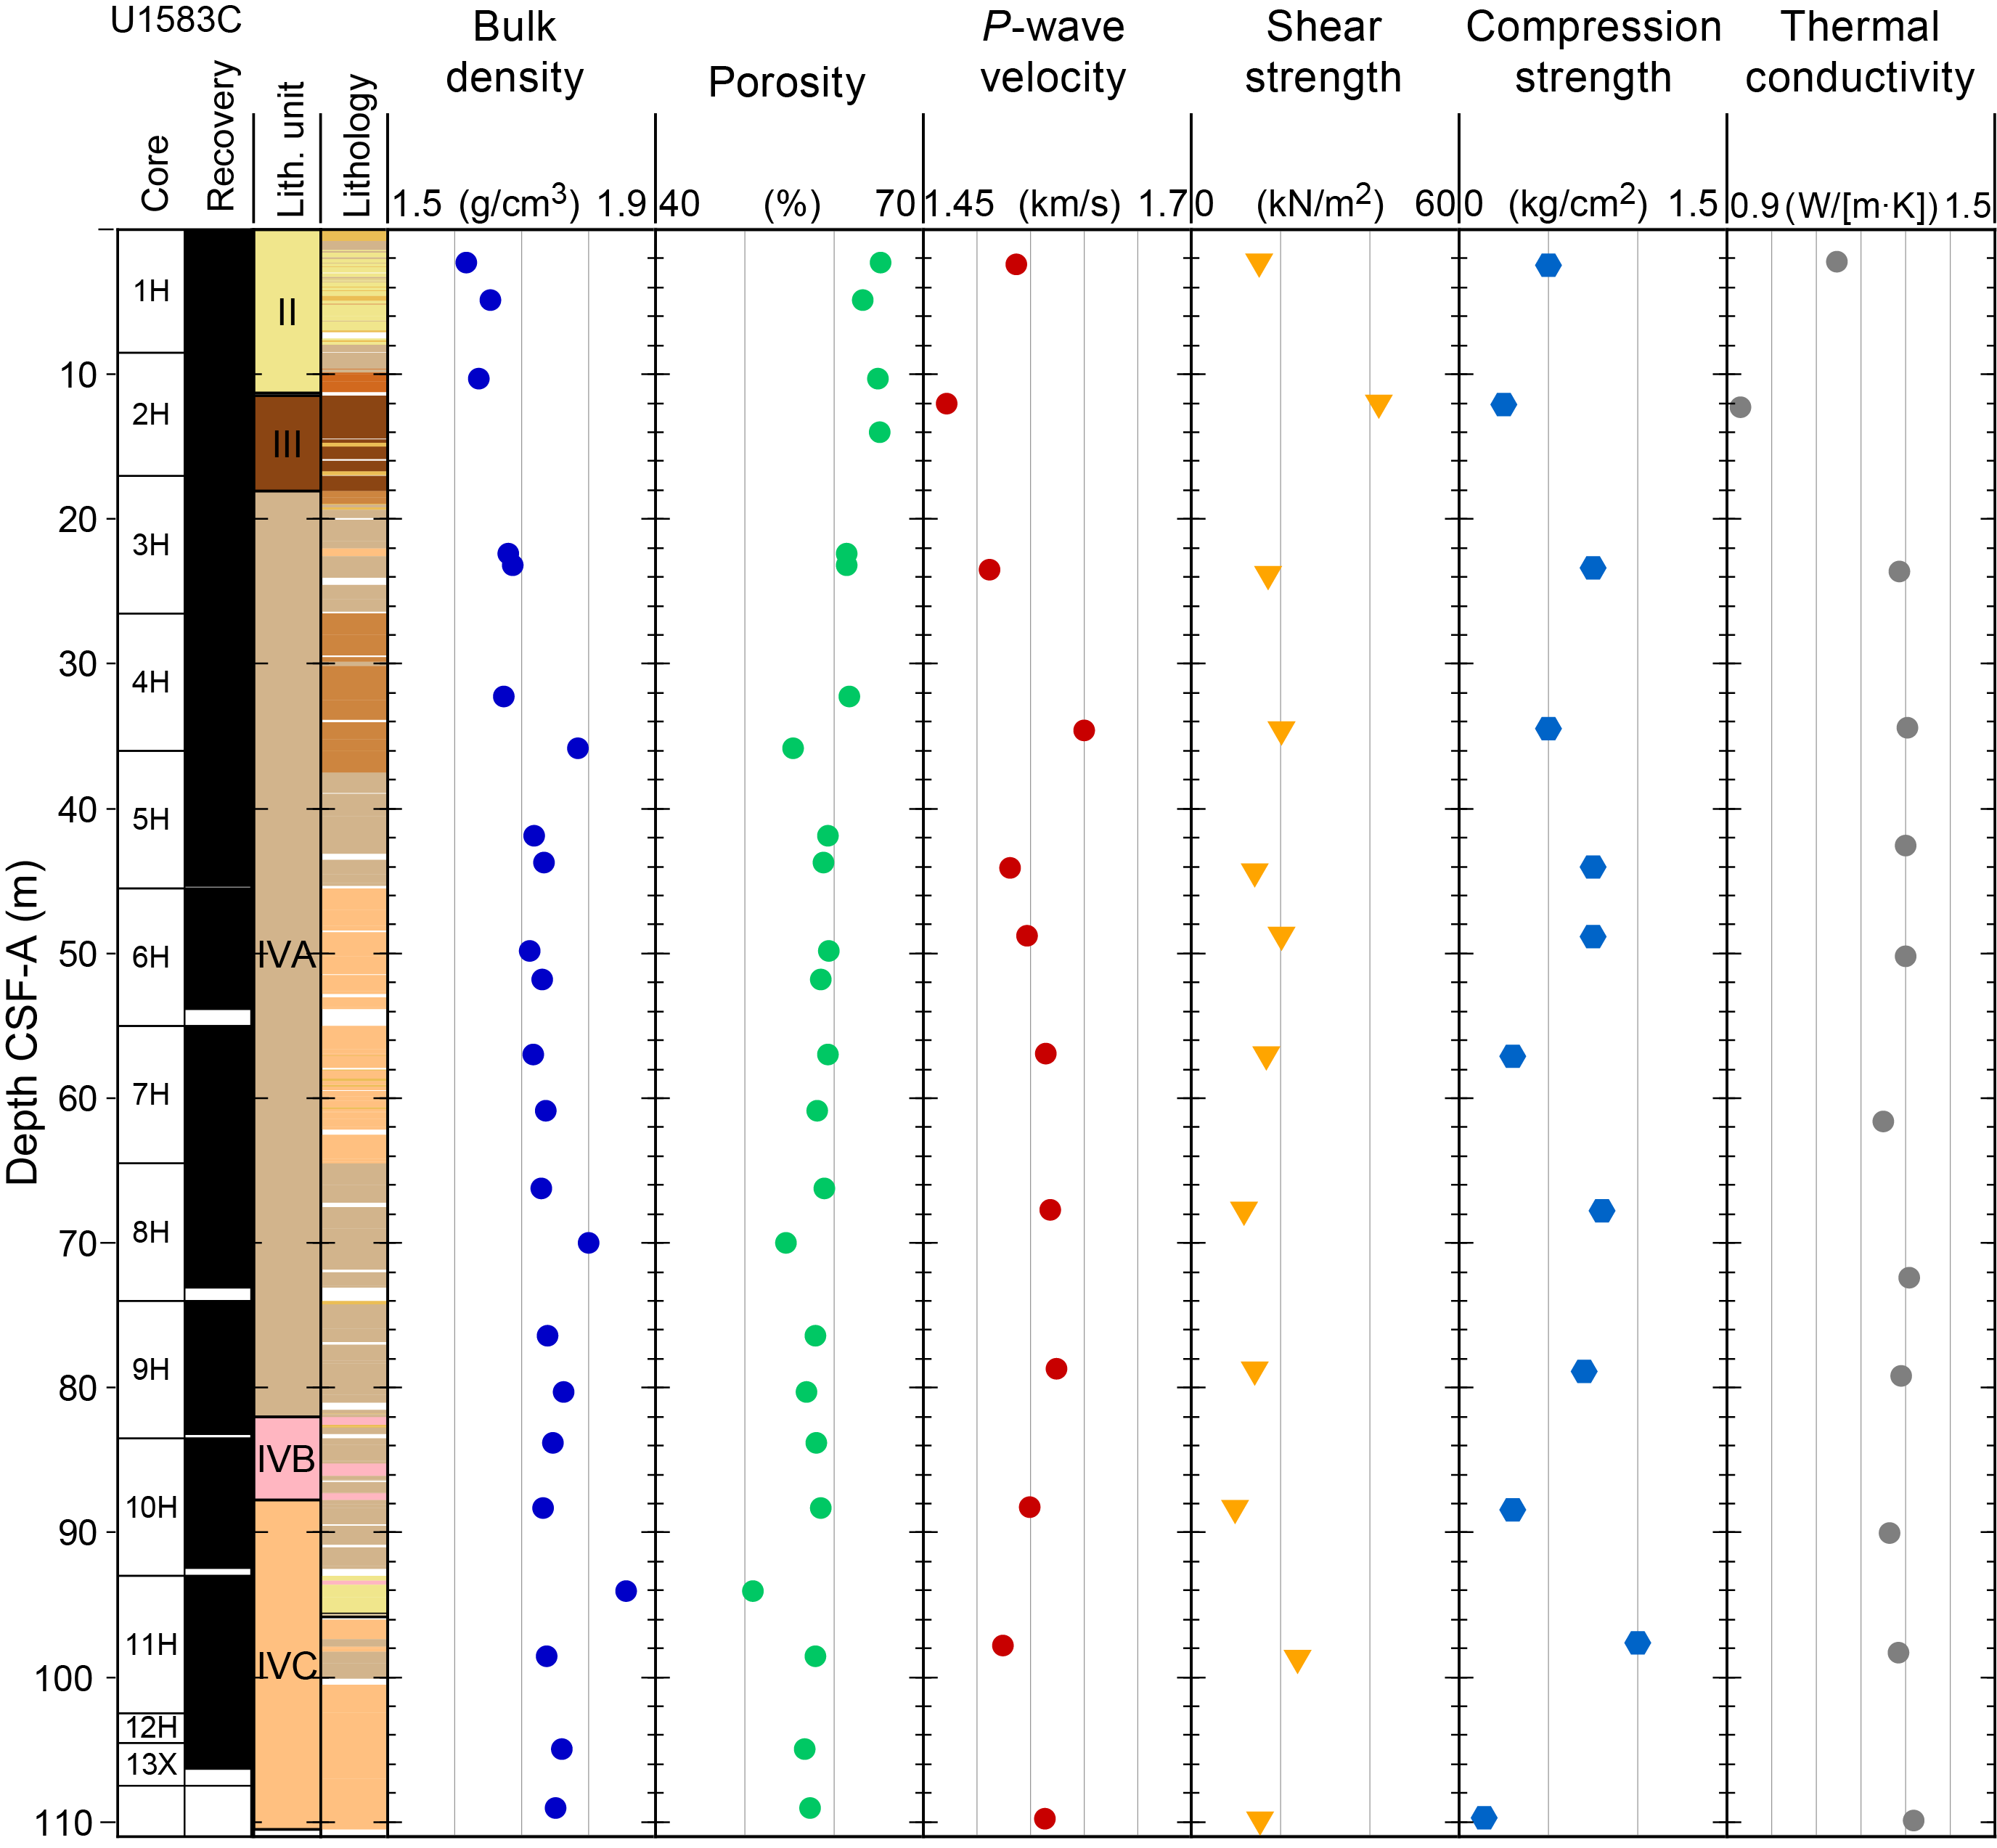
Figure F69. Discrete physical properties, Hole U1583C.
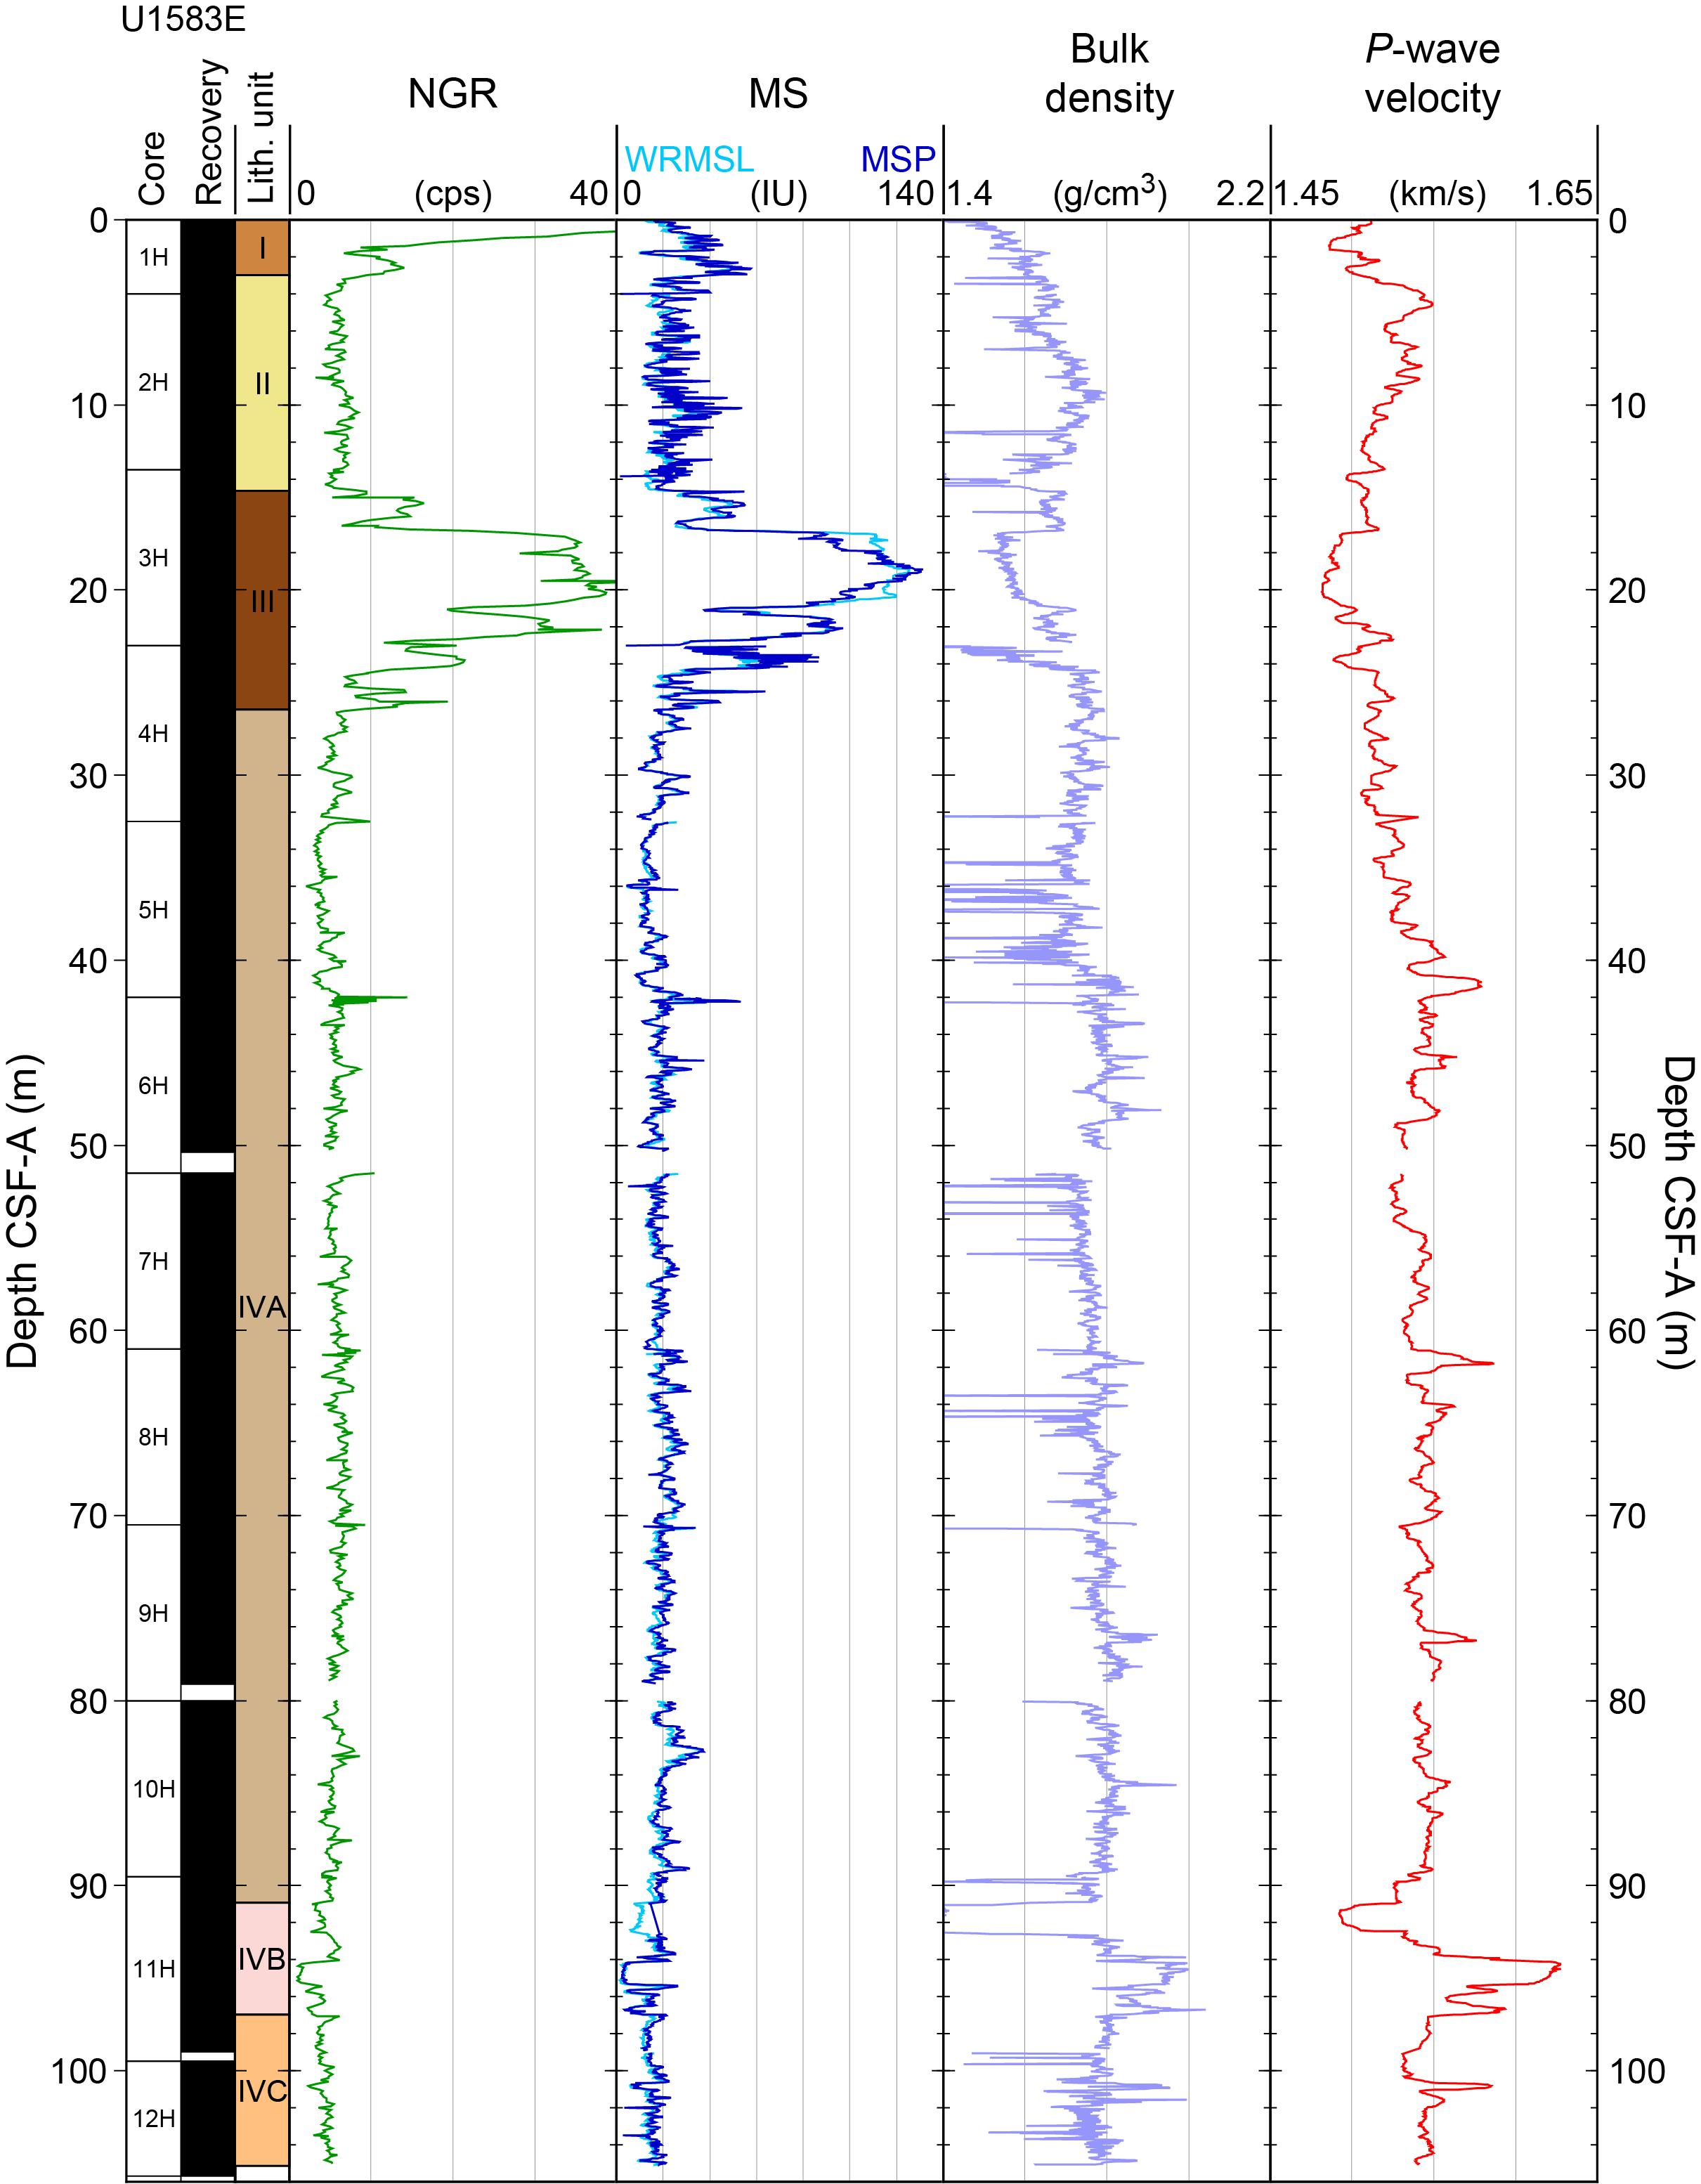
Figure F70. Track physical properties, Hole U1583E.
10.1.1. Physical properties
10.1.1.1. Natural gamma radiation
NGR ranges 1–38 counts/s throughout the sedimentary section in Hole U1583C (Figure F68). NGR shows a sharp decrease from 57 to 7 counts/s in Unit I in Hole U1583E, reflecting nannofossil-rich clay intervals. NGR is relatively low in Unit II (0–11.3 mbsf in Hole U1583C) and ranges 4–18 counts/s (mean = 8 ± 3 counts/s), but Unit III yields high counts throughout (range = 15–42 counts/s; mean = 27 ± 10 counts/s) (Table T25). A similar interval of relatively high NGR values was also detected in Hole U1583E (mean = 23 ± 11 counts/s) and is one of the key tie points for stratigraphic correlation (see Stratigraphic correlation). These high NGR values reflect layers of brown clay-rich sediment (see Sedimentology). NGR returns to low values and stays relatively stable in Subunits IVA (mean = 6 ± 2 counts/s), IVB (mean = 4 ± 2 counts/s), and IVC (mean = 4 ± 1 counts/s), which are typical values for nannofossil ooze layers at this site (Table T25).
NGR total activity can also be expressed in terms of the elemental concentrations of K, U, and Th. Gamma ray total spectrum was deconvolved using a shipboard Matlab routine retrofitted to process the data from Holes U1583C and U1583E (Figures F71, F72, respectively), where the concentration of potassium is measured in weight percent (wt%) and the other two elements are measured in parts per million (ppm). Elemental concentrations display trends that are all similar to the NGR total counts, with only some minor changes in relative concentrations among the components. There is no indication of independent behavior from any of the individual elemental components.
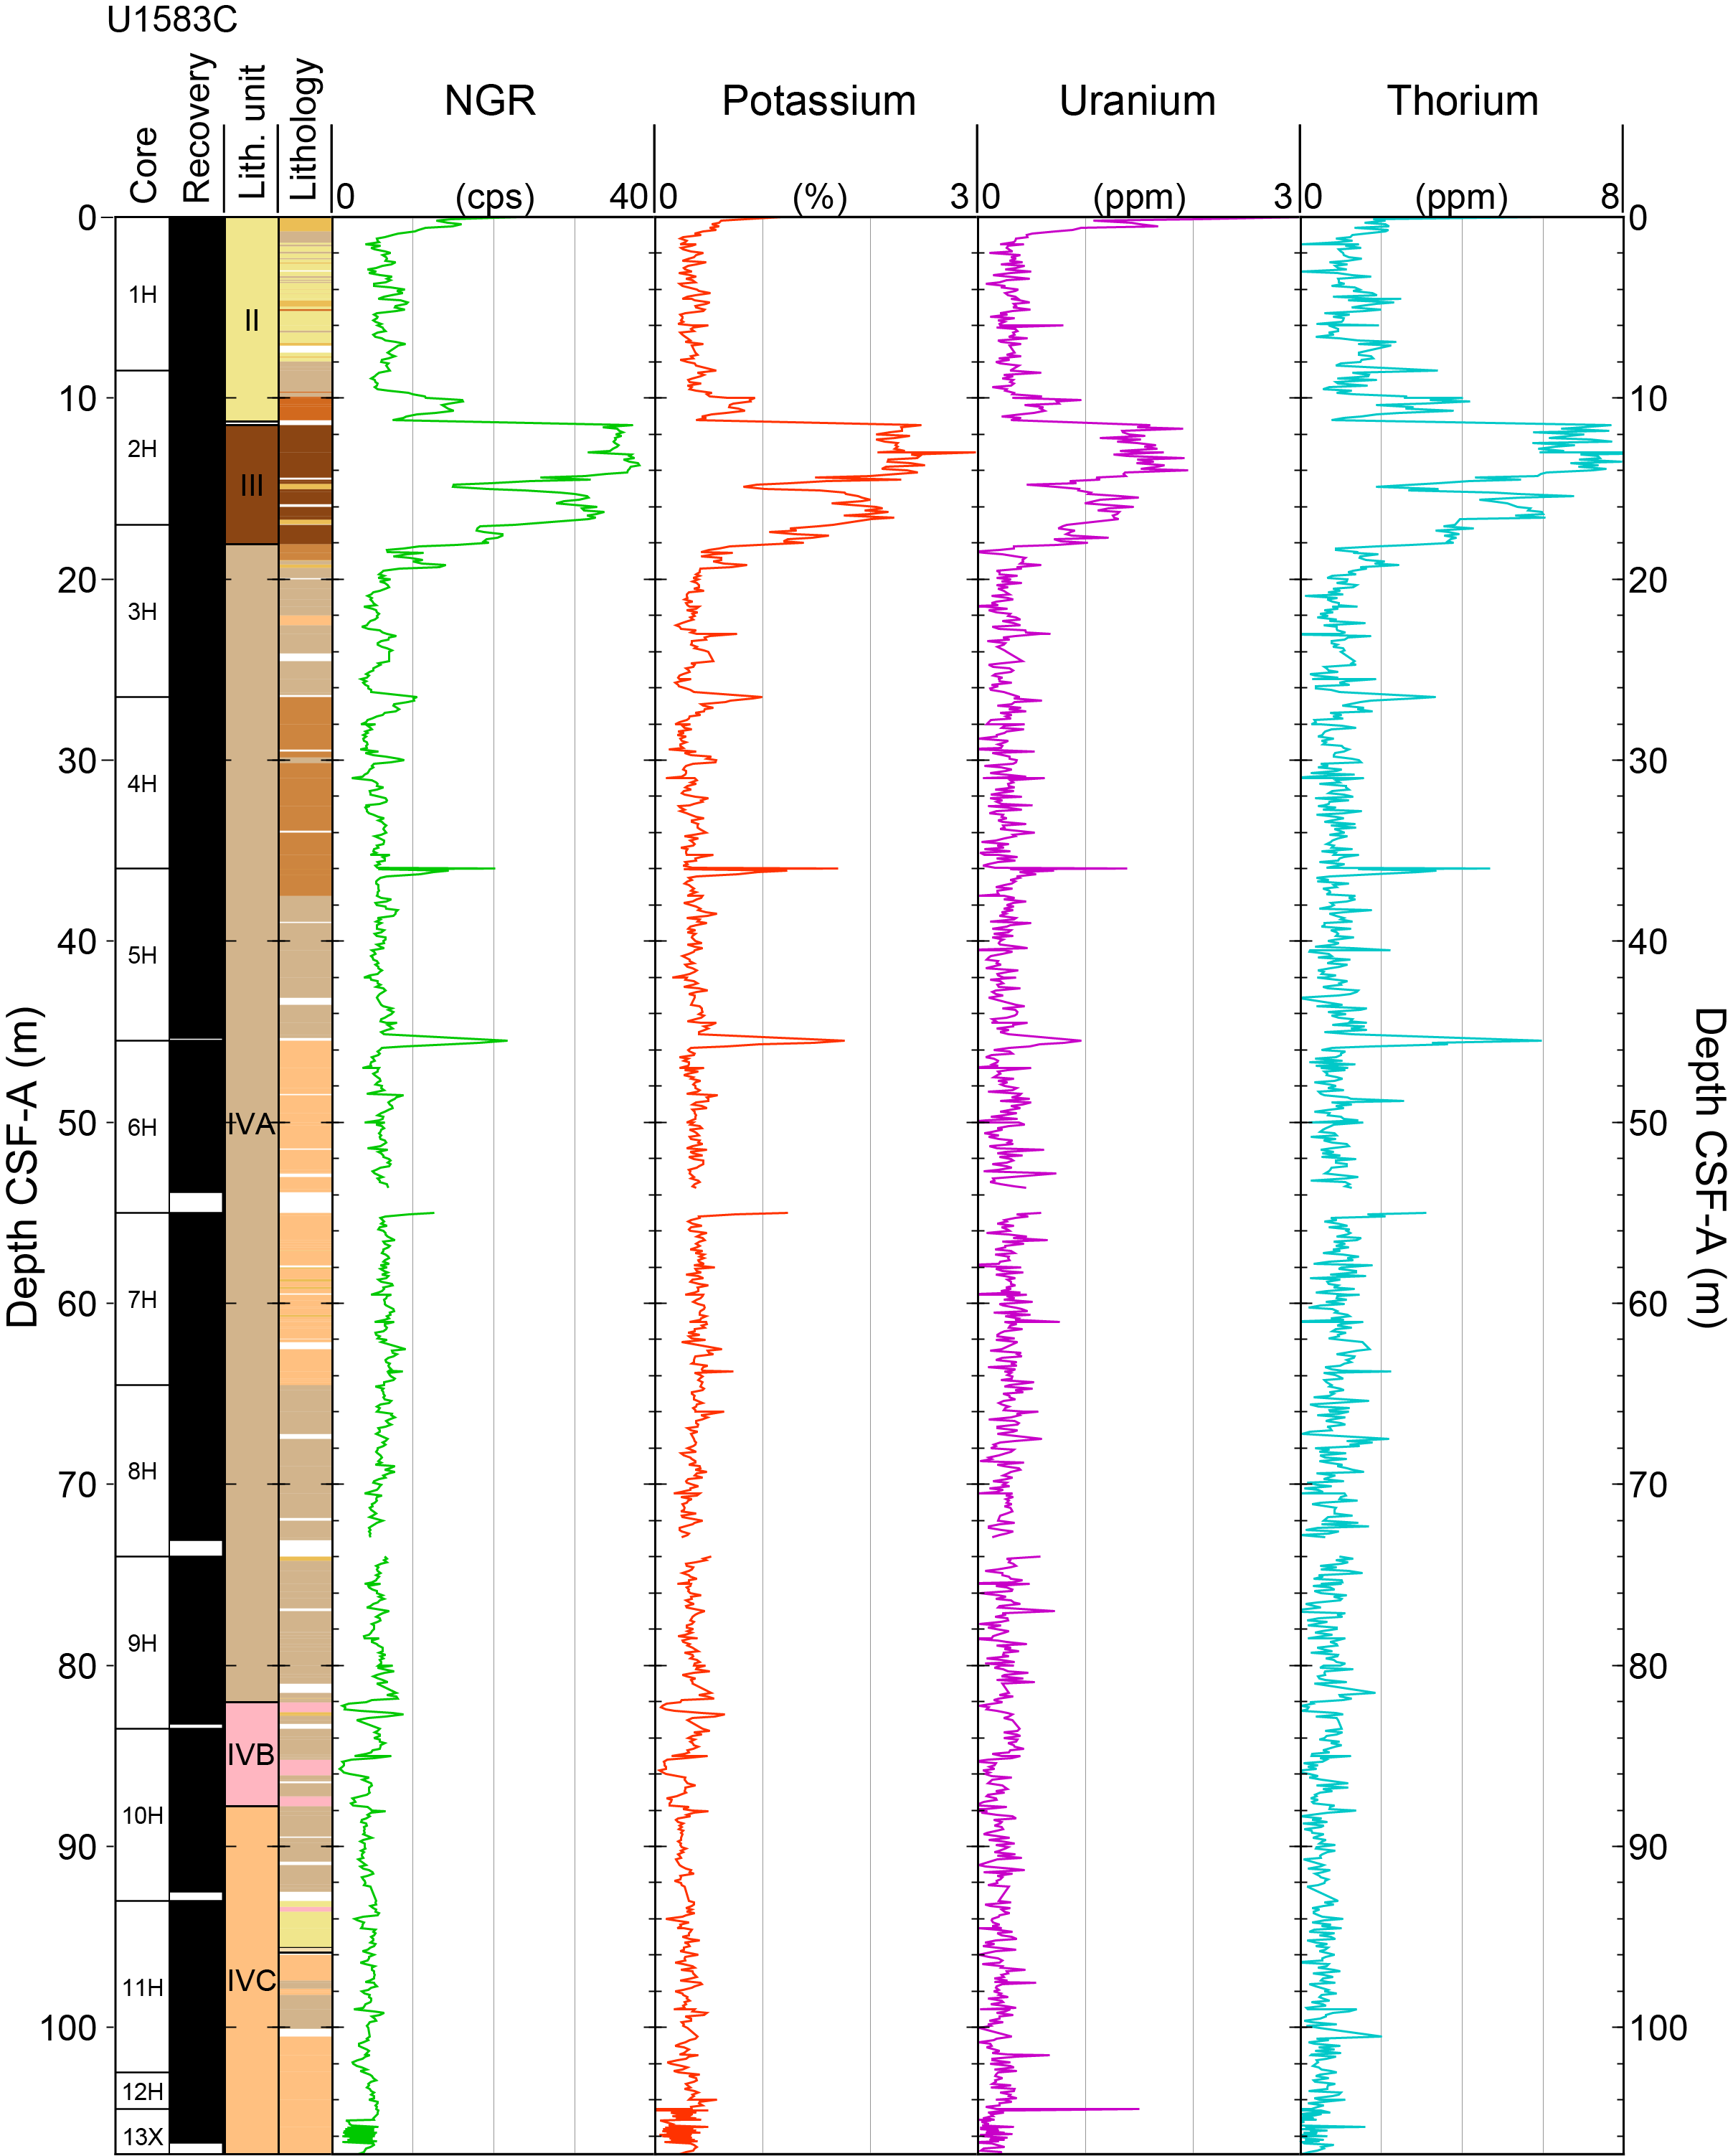
Figure F71. K, U, and Th from NGR, Hole U1583C.
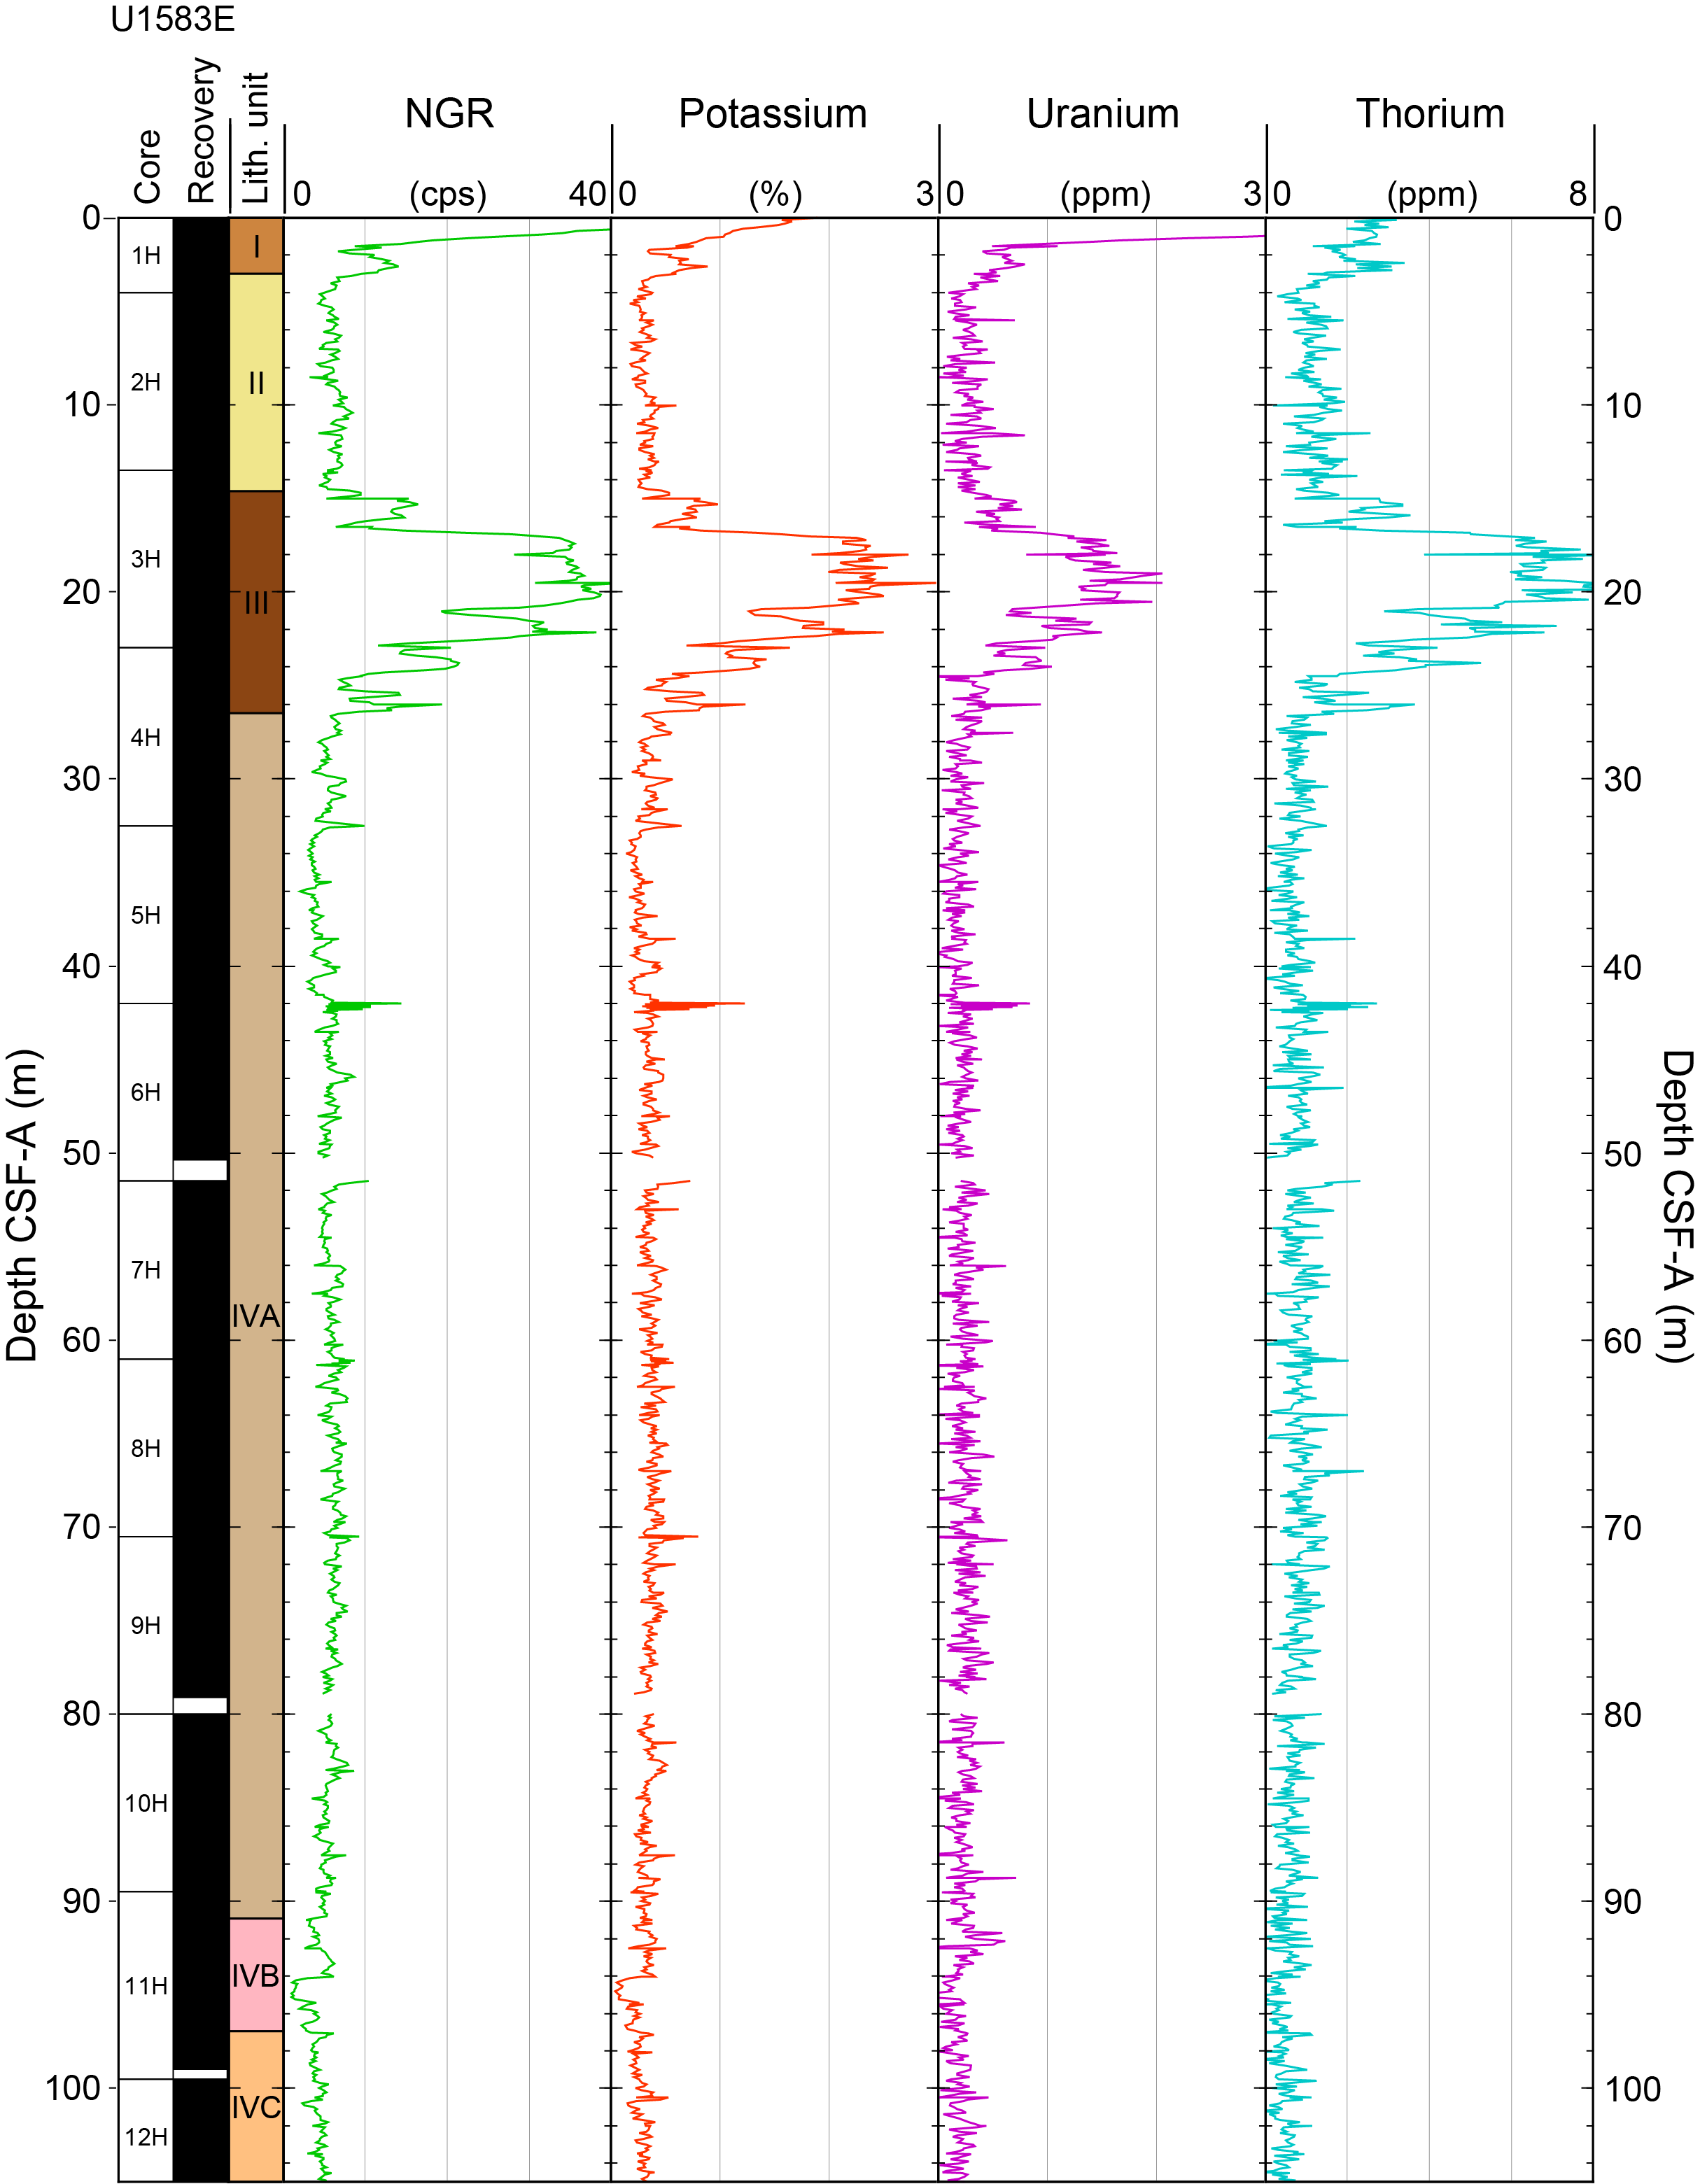
Figure F72. K, U, and Th from NGR, Hole U1583E.
10.1.1.2. Magnetic susceptibility
MS measured by WRMSL and MSP methods records similar downhole trends and magnitudes in both holes (range = 1–122 instrument units [IU]) (Figures F68, F70). MS shows a downhole trend similar to the NGR records over the entire hole, with the highest values in Unit III (range = 30–122 IU; mean = 78 ± 34 IU). MS is relatively higher and more variable in Units I and II (mean = 30 ± 10 and 24 ± 9 IU, respectively; Unit I was measured only in Hole U1583E) compared to Subunits IVA (mean = 19 ± 4 IU), IVB (mean = 12 ± 8 IU), and IVC (mean = 16 ± 4 IU) (Figures F68, F70; Table T25). Several abrupt peaks >40 IU are found at the top of Cores 393-U1583C-5H, 6H, 7H, 8H, and 13X (this one only shown in WRMSL) that are probably due to material falling from the shallower high-susceptibility interval while retrieving the previous core rather than to in-place formation variations. Similar peaks observed at the same depths in the NGR record could have the same origin. These were considered as outliers (as well as any data above the 140 IU cutoff) and therefore removed from statistics calculations. These peaks were not used in stratigraphic correlation. The higher MS values in Unit III correspond to brown clay-rich layers, whereas the relatively low values in Units I, II, and IV reflect the nannofossil ooze sediments.
10.1.1.3. Gamma ray attenuation bulk density
Bulk density from GRA ranges 1.0–2.0 g/cm3 (Figures F68, F70); however, we cut off values <1.3 g/cm3 for Hole U1583C and <1.4 g/cm3 for Hole U1583E for the purpose of plotting and calculations and because they are all related to edges and cracks in the sediment or incomplete filling of the core liner, where a mixture of sediment and air is measured in both.
GRA density for Hole U1583C shows an overall mean of 1.8 ± 0.1 g/cm3 and displays consistently lower values in Unit III (1.6 ± 0.1 g/cm3) (Table T25), corresponding to the clay-rich interval. Bulk density shows an overall gradual increase downhole (Figures F68, F70) because of increasing consolidation of sediments with depth.
10.1.1.4. Moisture and density
MAD analysis investigated 24 discrete samples with generally two samples per core chosen to represent all the lithologies encountered (Figure F69; Tables T23, T25). Porosity of the sedimentary section shows an overall decreasing trend from 65% at the seafloor to 55% at ~40 mbsf in Subunit IVA and stays relatively uniform (50%–60%) from 40 to 110 mbsf near the sediment/basement interface (Figure F69). The overall mean for porosity is 59% ± 3% (Table T25) with similar values in Units II and III (mean = 64% ± 1% for Unit II; only 1 sample in Unit III at 65%) and somewhat slightly lower values in Unit IV, decreasing with depth because of sediment compaction (Table T25). Porosity measurements for Unit I are missing because Unit I was only cored in Hole U1583E, where no discrete samples were taken.
GRA and MAD methods show good agreement between bulk density trends (Figure F68), although slightly lower values from the MAD method potentially reflect sediment expansion after splitting and subsequent water loss.
10.1.1.5. P-wave velocity
P-wave velocity data are consistent between the WRMSL and caliper methods (Figures F68, F69) and range 1.45–1.72 km/s (mean = 1.54 ± 0.03 km/s) (Table T25). P-wave velocity from the WRMSL P-wave logger (PWL) is relatively lower in Units I (mean = 1.50 ± 0.01 km/s) and III (mean = 1.50 ± 0.02 km/s) compared to the other two units (means: Unit II = 1.52 ± 0.02 km/s, Subunit IVA = 1.54 ± 0.19 km/s, Subunit IVB = 1.57 ± 0.04 km/s, and Subunit IVC = 1.55 ± 0.02 km/s) (Table T25). The overall downhole increasing trend imitates the bulk density trend, both of which are likely due to increasing amounts of mechanical and potentially chemical compaction.
10.1.1.6. Sediment strength
Shear strength ranges from 10 to 42 kg/cm2 in all samples (mean = 18 ± 8 kN/cm2) (Figure F69; Tables T24, T25). Shear strength is relatively uniform in Unit II and Subunits IVA–IVC (15–16 kN/cm2); the highest value of 42 kN/cm2 is in Unit III. Compressional strength scatters from 0.1 to 1.0 kg/cm2 (mean = 0.6 ± 0.3 kg/cm2) throughout the sedimentary sections without any apparent downhole trend (Table T25).
10.1.1.7. Thermal conductivity
Twelve discrete thermal conductivity measurements, approximately one per core, were conducted on representative lithologies from Hole U1583C (Figure F69) using the half-space heating puck on split section halves (see Physical properties and downhole measurements in the Expedition 390/393 methods chapter [Coggon et al., 2024a]). Thermal conductivity ranges 0.93–1.32 W/(m·K) throughout all sections (Table T24) (mean = 1.25 ± 0.11 W/[m·K]) (Table T25). Thermal conductivity is relatively low in Unit II (1.14 W/[m·K]), with the lowest measurements taken in Unit III (0.93 W/[m·K]), and increases to 1.29 ± 0.02 W/(m·K) throughout the Unit IV subunits (Table T25).
10.1.2. Lithostratigraphic unit comparison
Four physical properties (P-wave velocity, GRA bulk density, MS, and NGR) are grouped by lithostratigraphic units (see Sedimentology) and compared in Figure F73. P-wave velocity (VP) shows a negative power law correlation with NGR (R2 = 0.4), with measurements from Unit IV spanning the full range of P-wave velocity and the lower range of NGR values (Figure F73A). Data from Subunit IVB stands out in the highest P-wave velocity range, whereas samples from Unit III display the widest range of NGR and relatively uniform P-wave velocity near ~1.50 km/s. P-wave velocity shows a general positive linear correlation with GRA bulk density (R2 = 0.5), with Unit III falling into the lower bulk density and lower P-wave velocity component (Figure F73B). Negative power law correlation is found between GRA bulk density and NGR values (R2 = 0.4); samples from Unit III are easily distinguished from other units due to higher NGR values and the majority of samples showing GRA mean density of ~1.6 g/cm3 (Figure F73C). A strong positive linear correlation (R2 = 0.9) is found between NGR and MS (Figure F73D), reflecting their similar downhole trends in Figure F68. Samples from Unit III fall into the higher MS and higher NGR component, whereas data from the other three units cluster toward lower MS and lower NGR values. Overall in track data, Unit III stands out due to high NGR and MS, likely reflecting the higher clay content intervals.
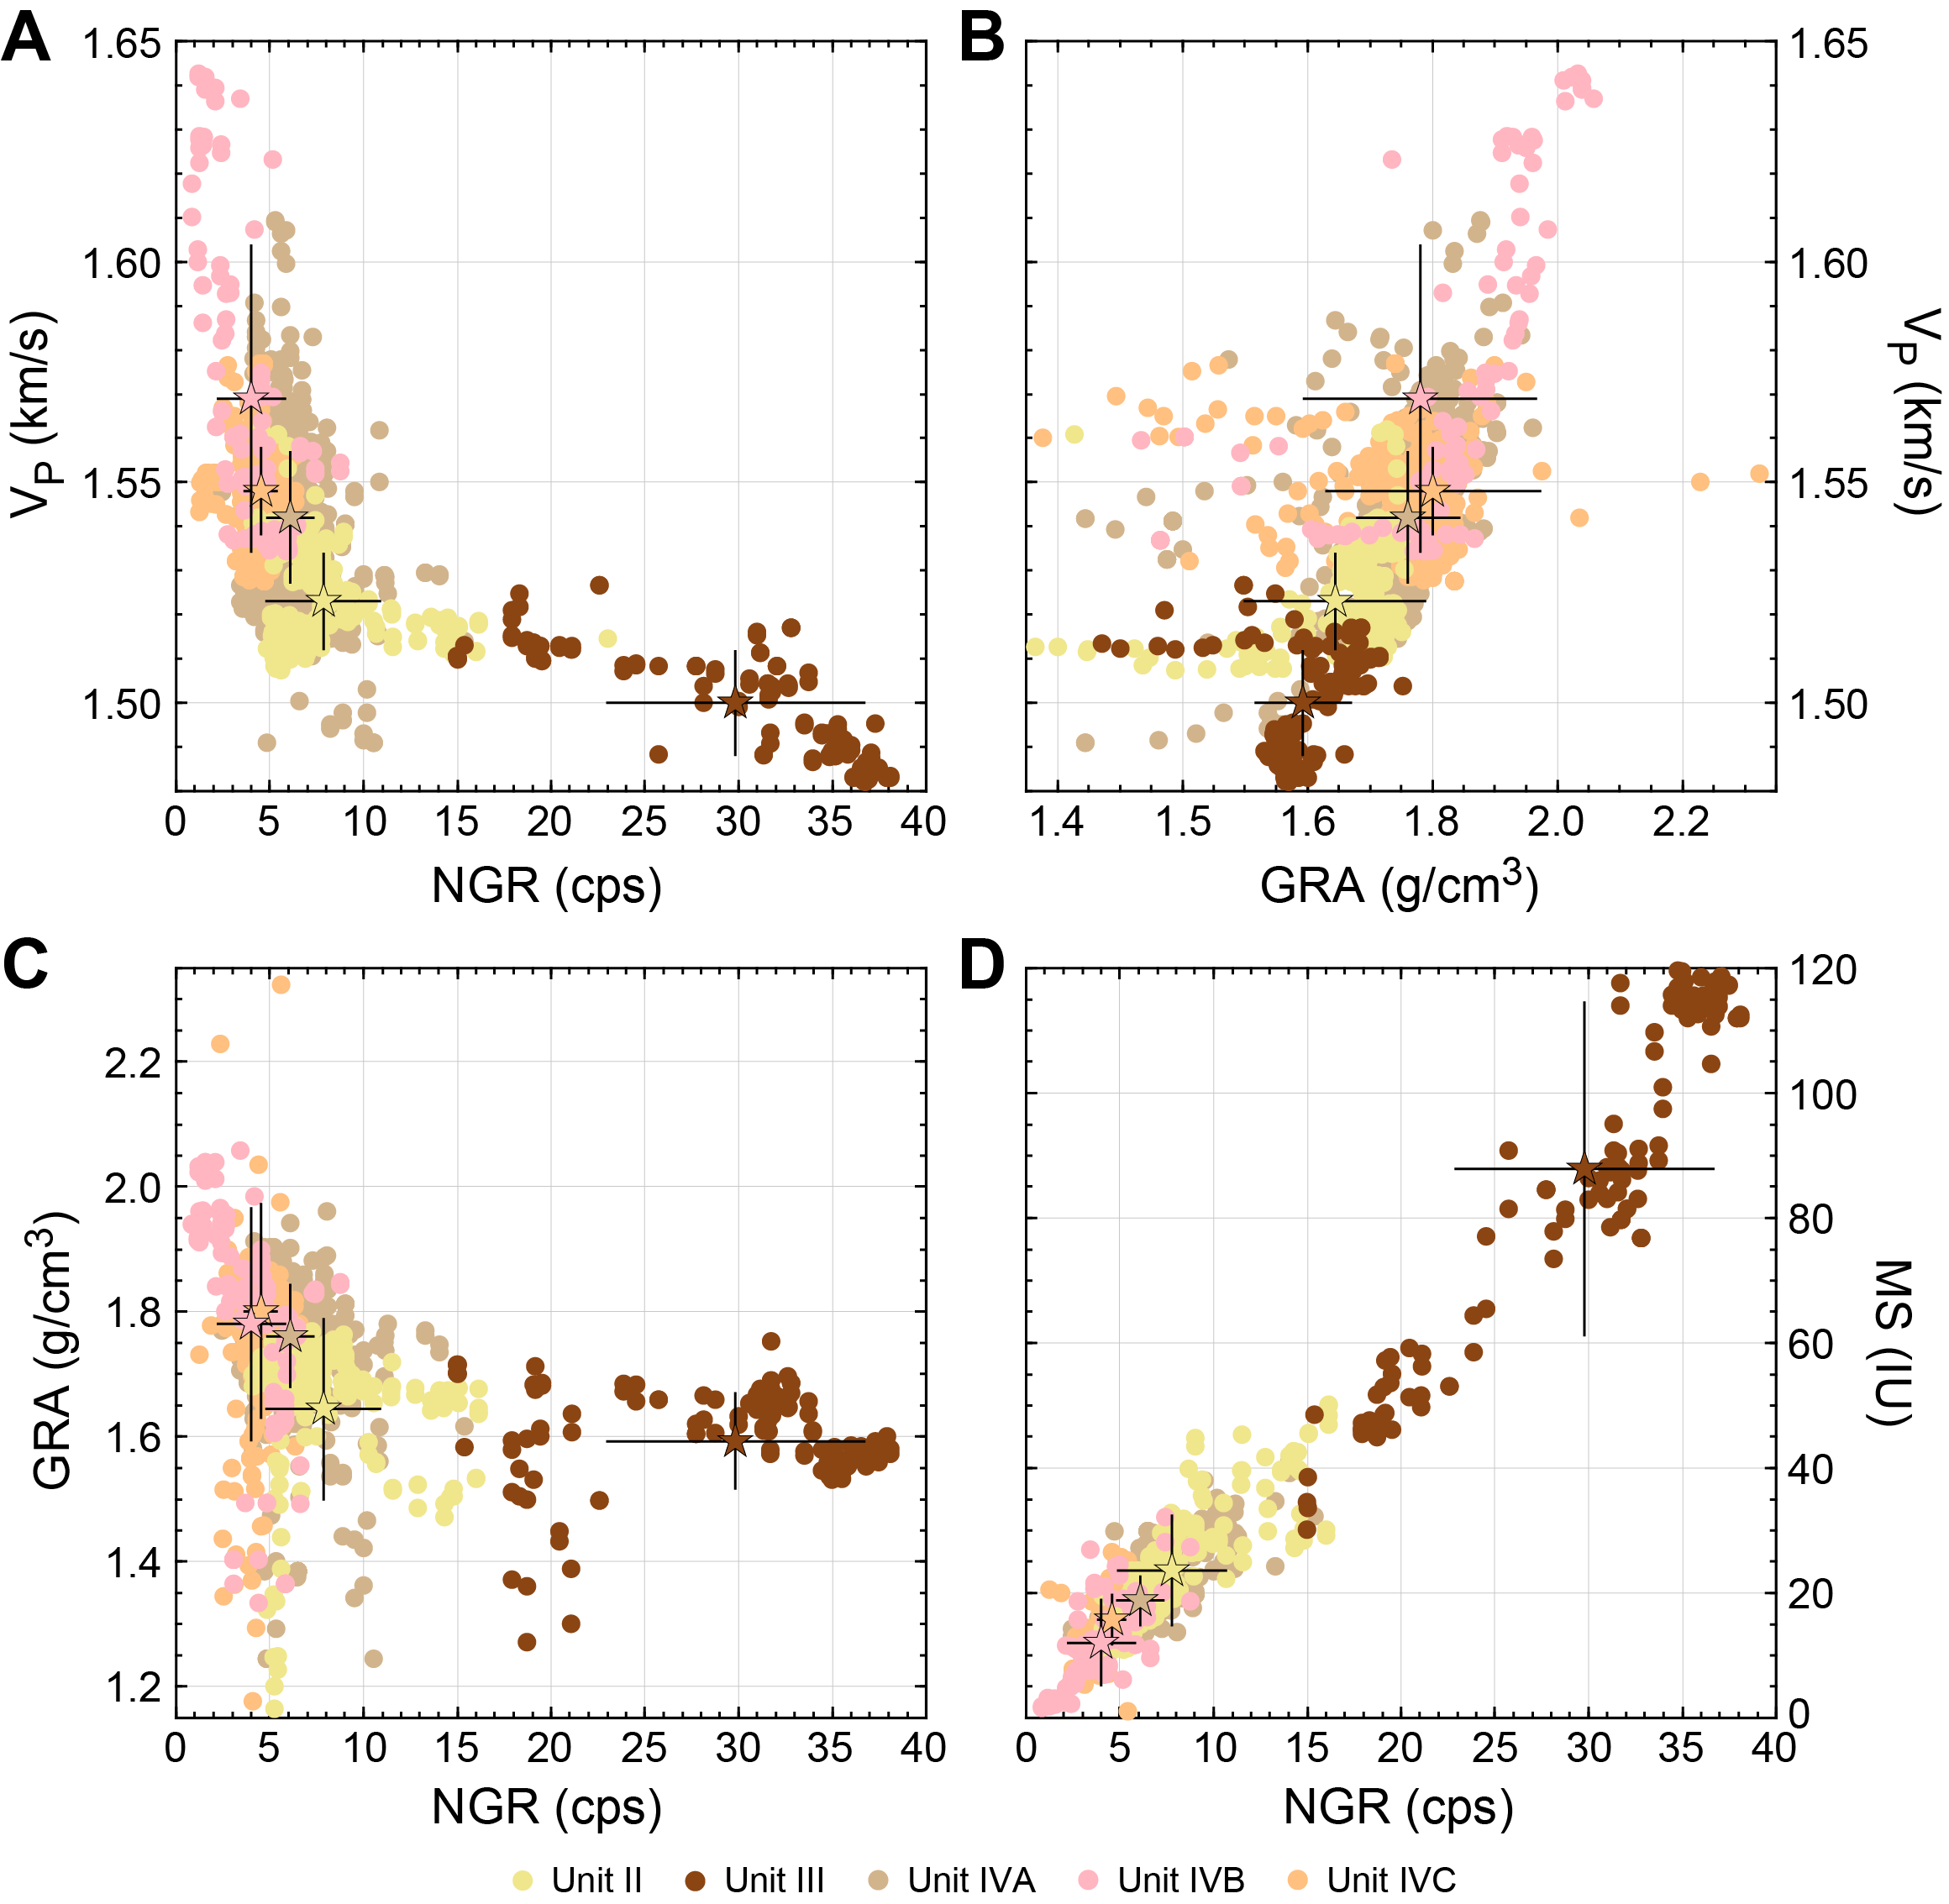
Figure F73. Sediment samples by lithostratigraphic units.
A similar comparison is shown in Figure F74, where the parameters are compared by section-by-section sedimentary classification (see Sedimentology) instead of lithostratigraphic unit. The interpretation is the same, with the differences in clay content driving the most significant variations, but it narrows the influence of each type of lithology and illustrates the finer scale variability that can be seen in each unit (Figure F68), such as the lower gamma ray in the calcareous ooze layers in Subunit IVB or in layers of clayey nannofossil ooze in Unit III.
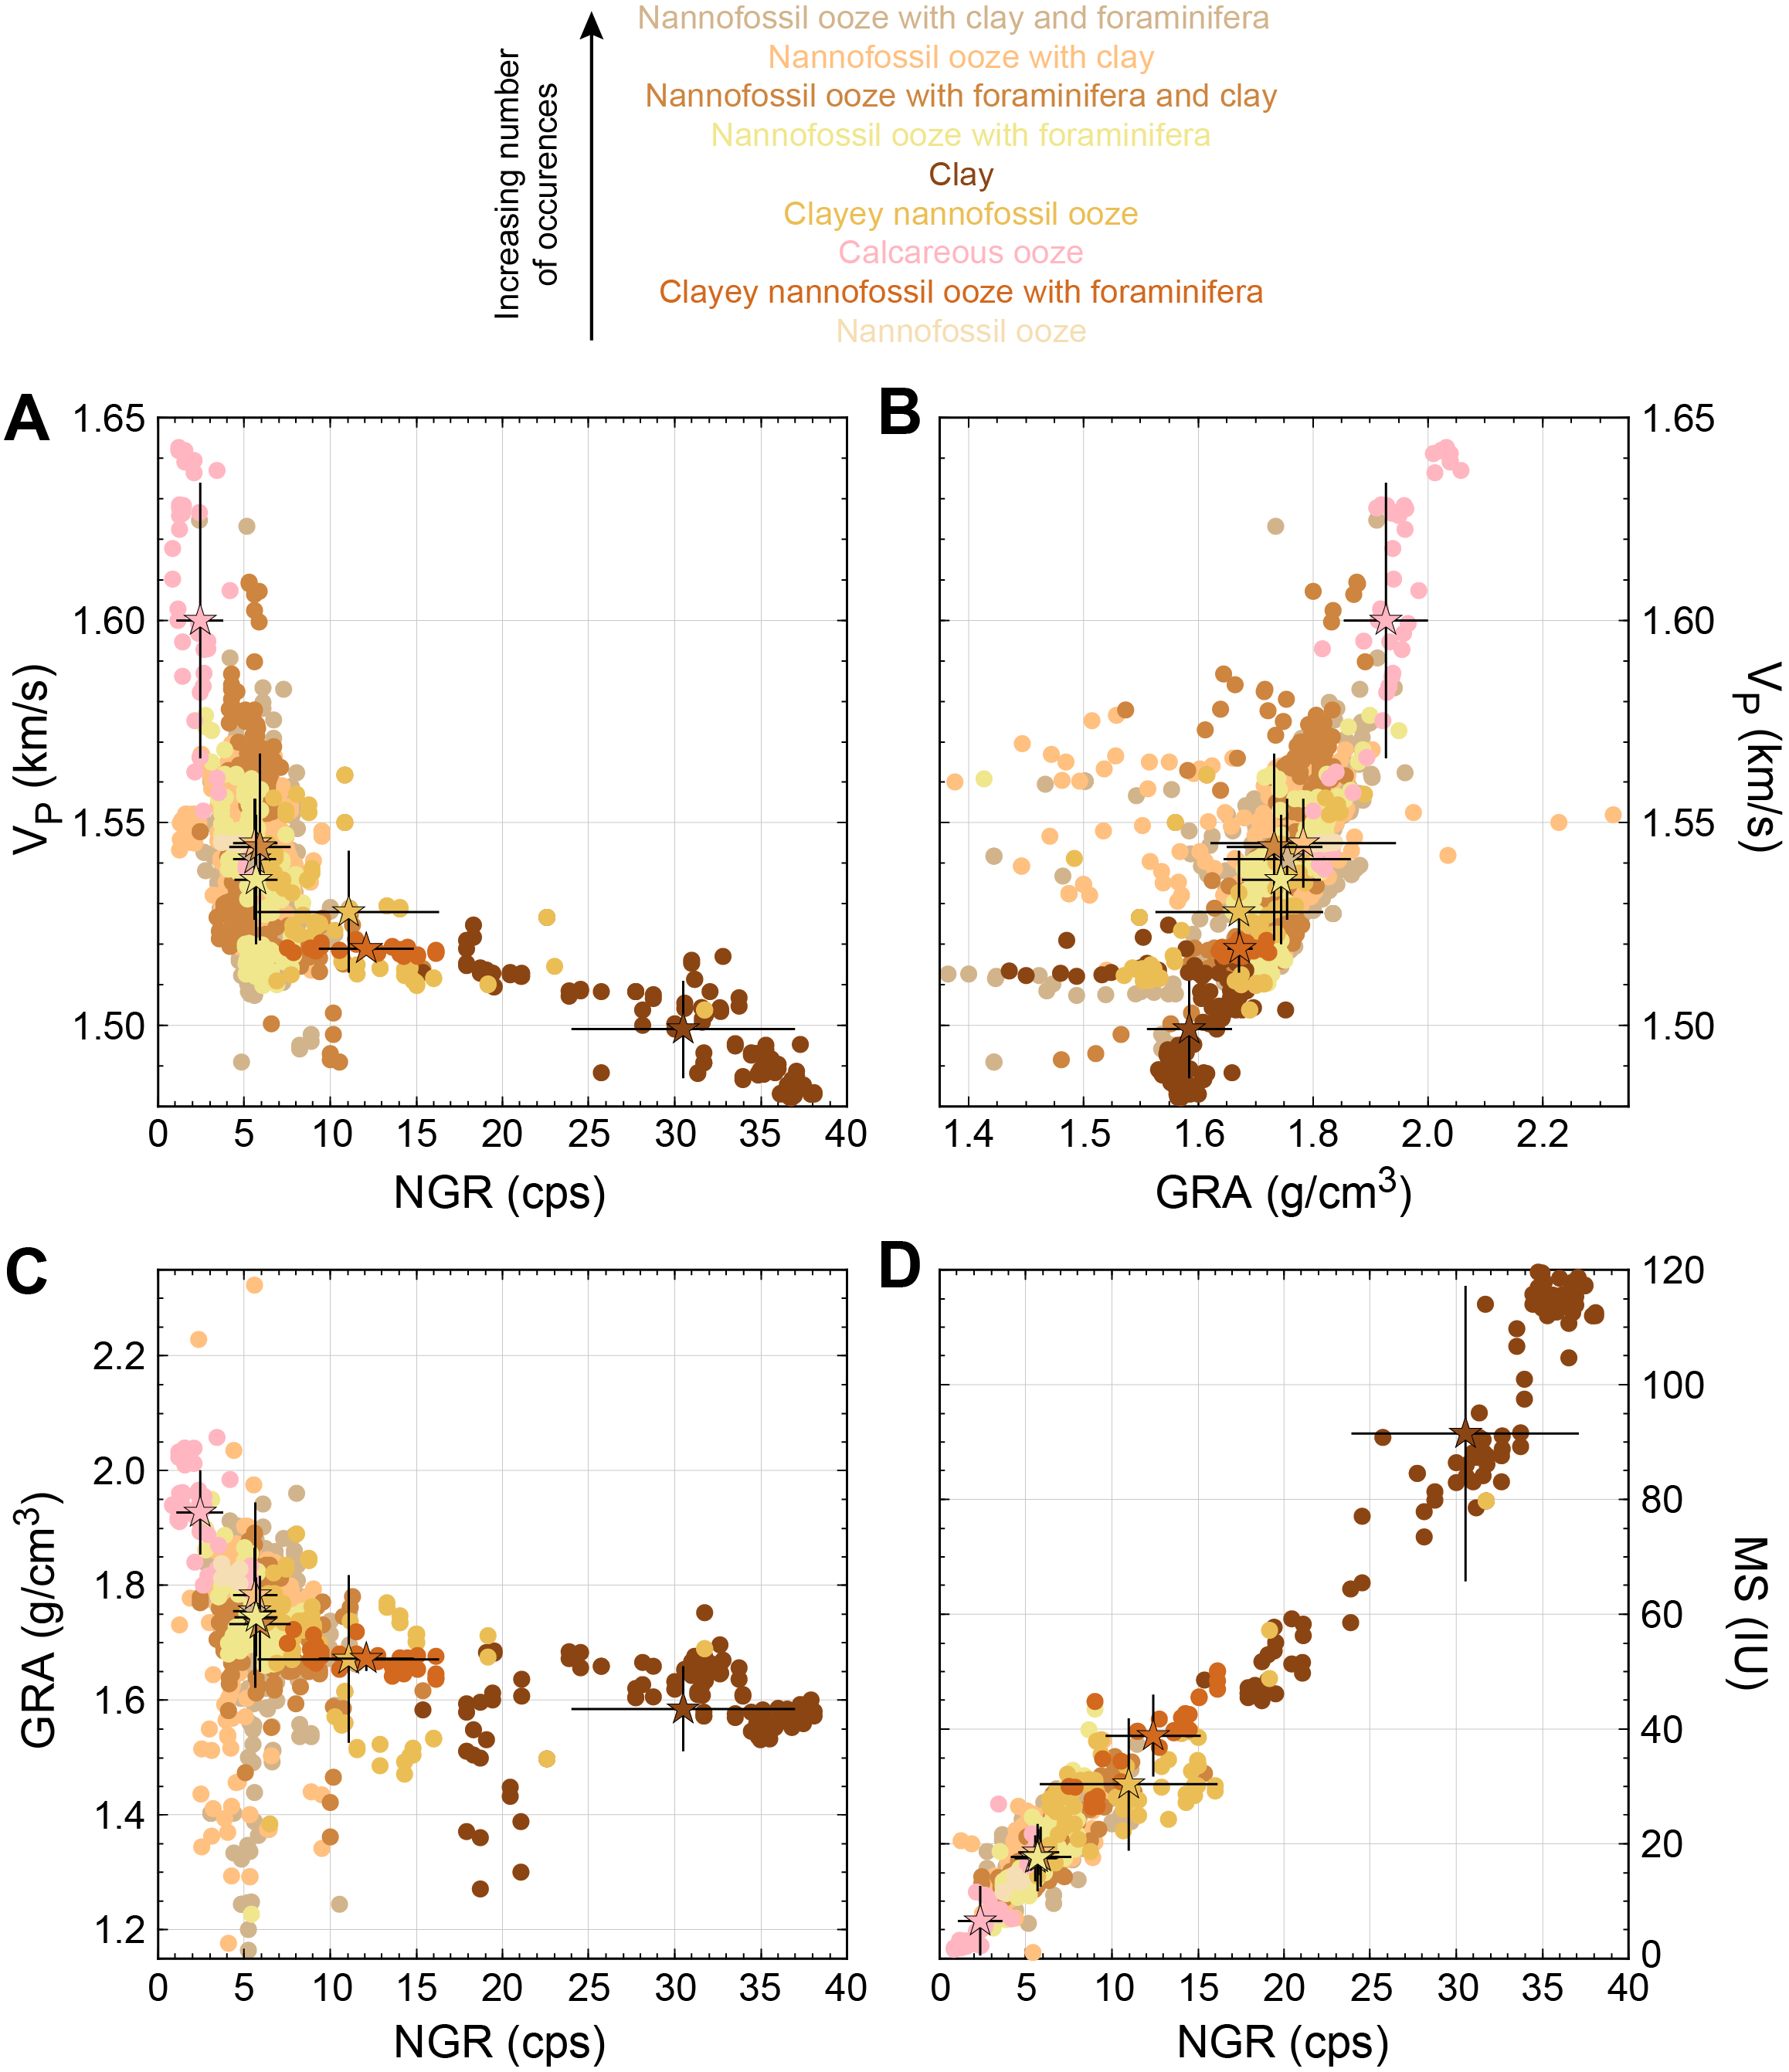
Figure F74. Sediment samples by lithology.
10.1.3. X-ray imaging
Sediment cores from Holes U1583C and U1583E were scanned with the X-Ray Logger (XMAN), and images were used to assist core description. For example, in interval 393-U1583C-2H-5, 40–56 cm, several ichnofossils were identified (see Sedimentology) from the X-ray images and the core photos (Figure F75A). In another example, interval 393-U1583E-12H-1, 5–6 cm, dark spots in the X-ray images were identified as relatively dense carbonate nodules (Figure F75B). However, not all features in X-ray images are primary sedimentologic features. For example, the irregular bands and bubble-like shapes seen in interval 393-U1583C-1H-1, 12–22 cm, are drilling disturbance rather than bioturbation (Figure F75C). The X-ray images are useful for identifying fall-in at the top of cores, and other drilling-related deformation.
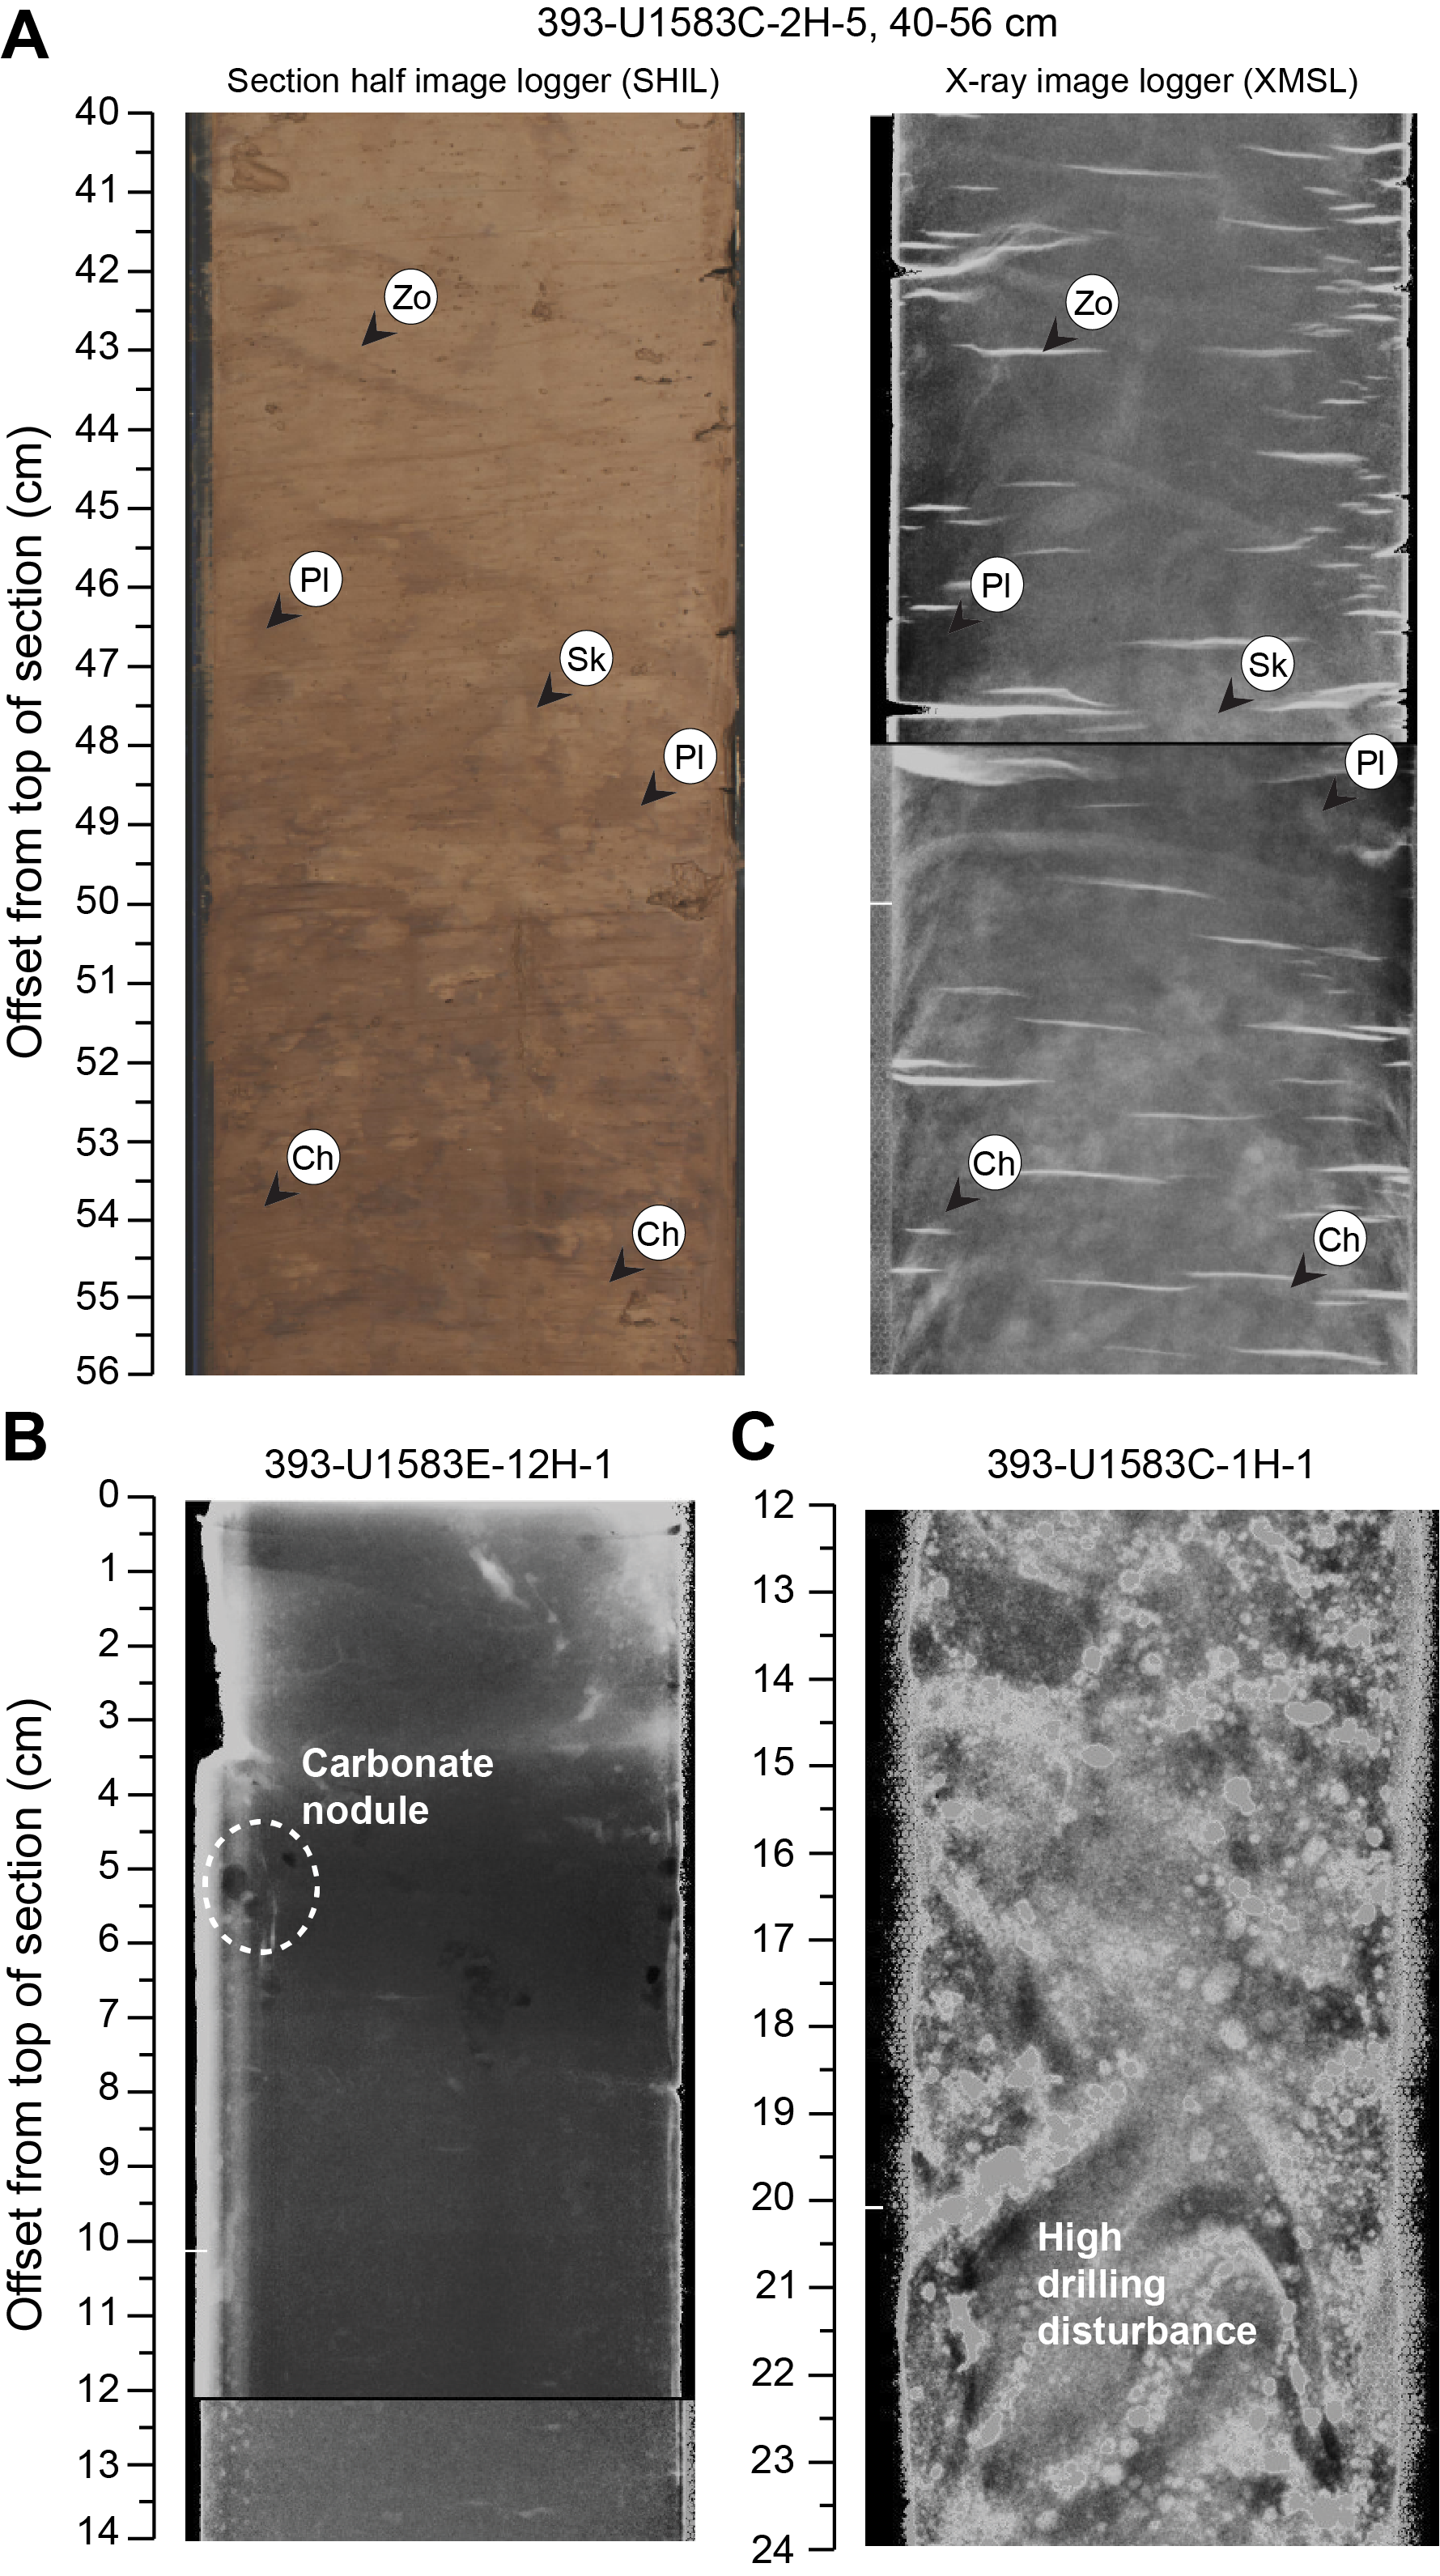
Figure F75. SHIL and XMAN images.
10.1.4. Downhole measurements
10.1.4.1. Downhole temperature
During APC coring in Holes U1583C and U1583E, the advanced piston corer temperature (APCT-3) probe was used to measure in situ formation temperature at selected depths, typically ~30 m apart. The APCT-3 tool was deployed while coring Cores 393-U1583C-4H, 7H, and 10H, as well as Cores 393-U1583E-5H and 8H (Table T26). Figure F76 shows for each deployment the intervals in the temperature records that were used to estimate formation temperature by finding a best fit for a theoretical model to the temperature decay as a function of time as it recovers from the frictional heating generated when entering the formation.
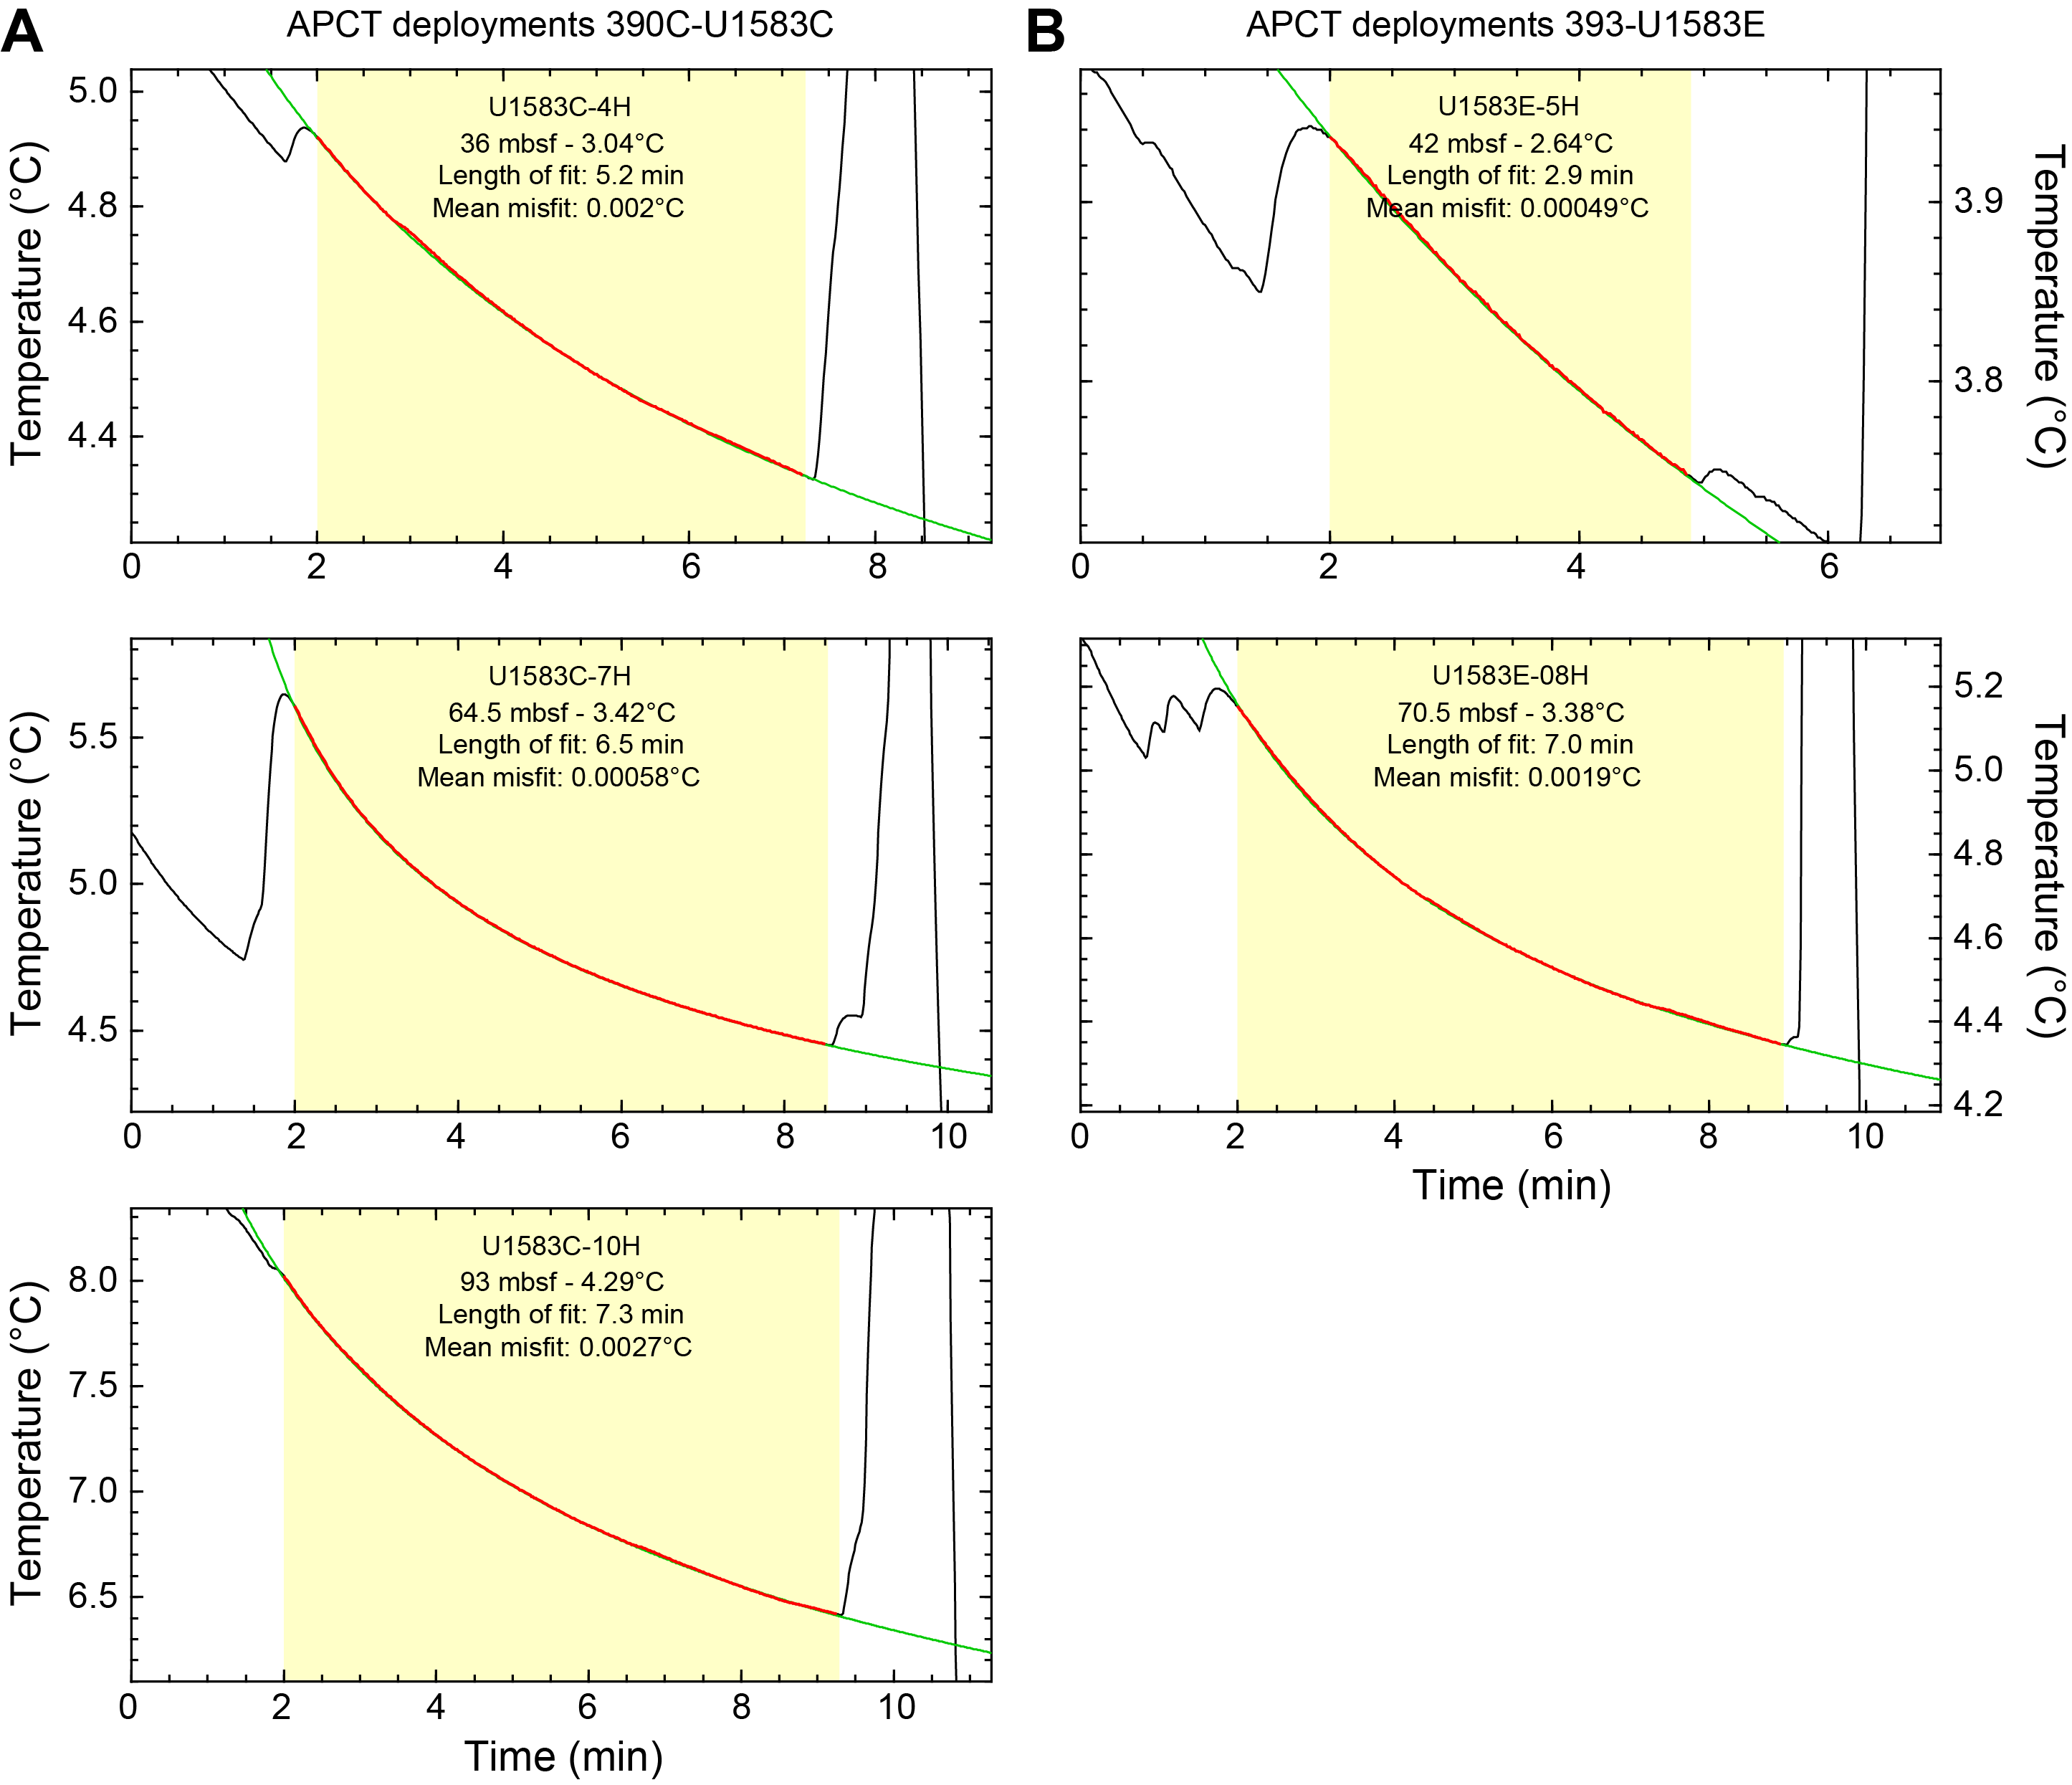
Figure F76. APCT-3 temperature.
10.1.4.2. Heat flow
Although the temperature records show that most of the temperature stations were stable for only a few minutes (the shallower cores in particular: 393-U1583C-4H and 393-U1583E-5H; Figure F76), the resulting temperatures define a steadily increasing temperature profile with a least-squares linear fit gradient of 25°C/km (Figure F77C).
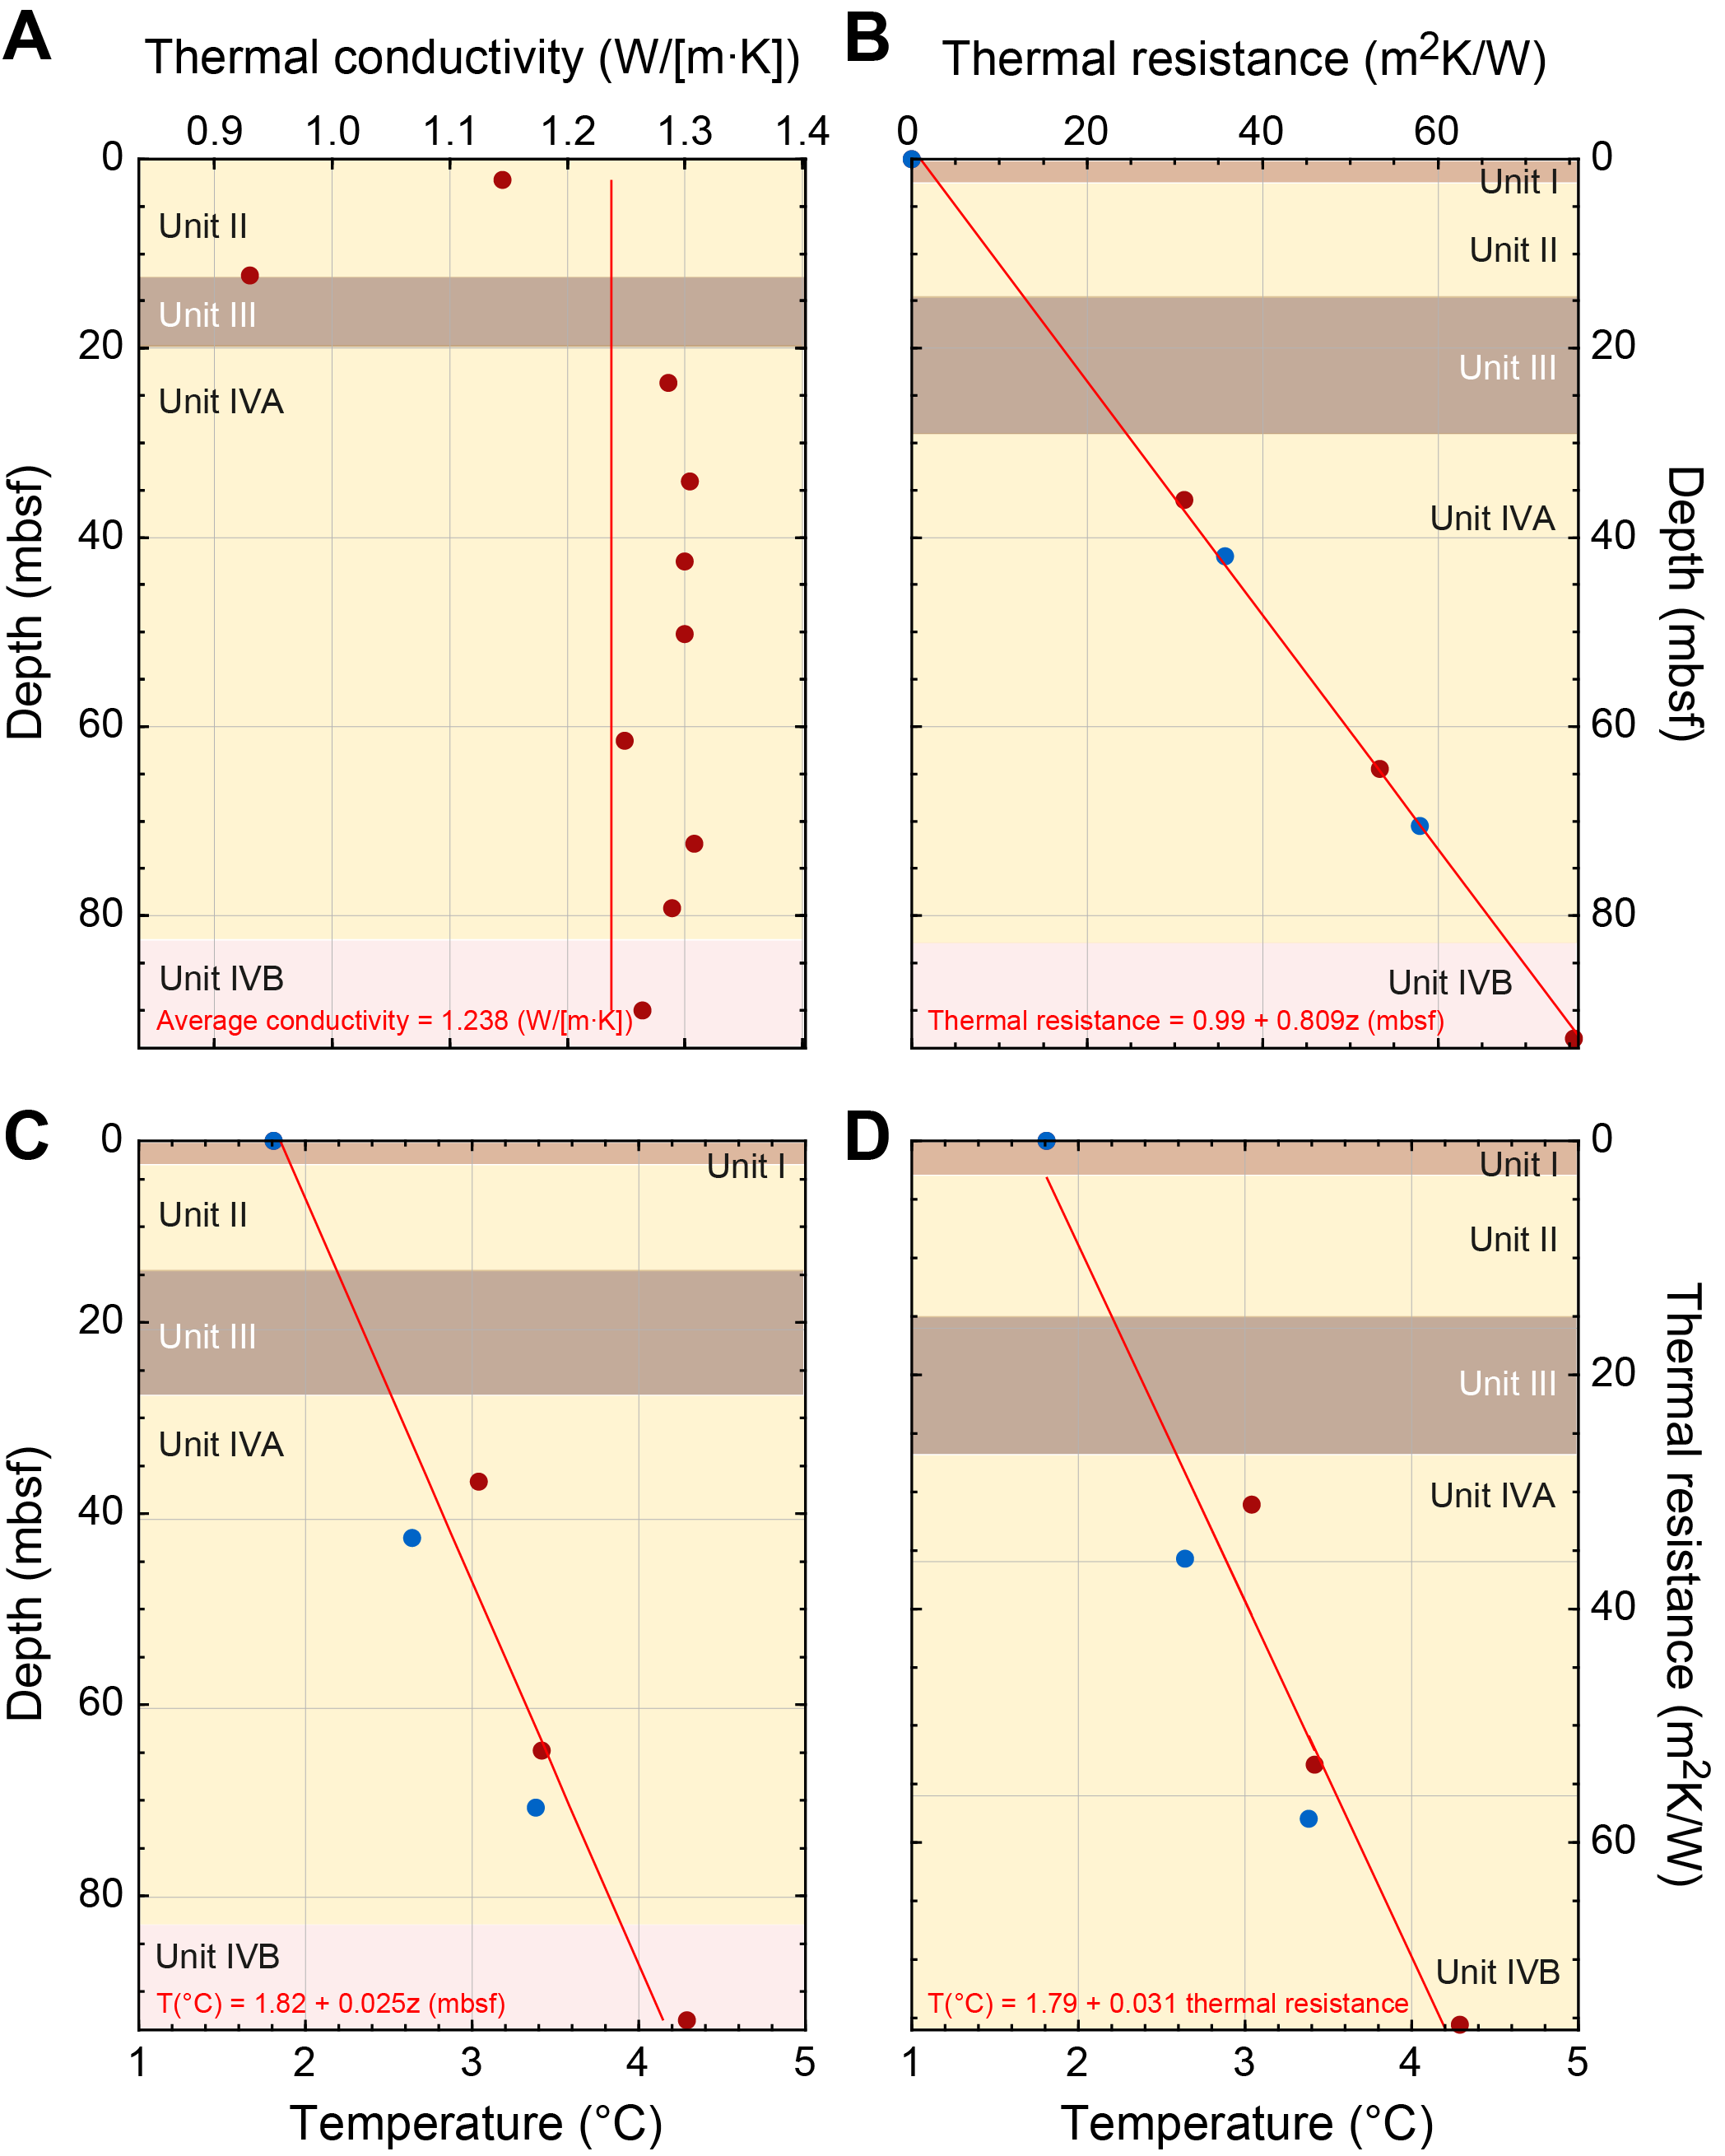
Figure F77. Estimation of conductive heat flow.
A simple estimate of the vertical conductive heat flow can be made from the product of this gradient and the mean thermal conductivity (1.24 W/[m·K]; Figure F77A) measured on the cores recovered over this interval: 31 mW/m2.
Another measure of the conductive heat flow can be established with a Bullard plot (see Physical properties and downhole measurements in the Expedition 390/393 methods chapter [Coggon et al., 2024a]). The heat flow estimate defined by the slope of the least-squares linear fit to the Site U1583 temperature data as a function of thermal resistance is 31 mW/m2 (Figure F77D), identical to the previous estimate.
Table T27 summarizes these results as well as the results of the same calculation for each hole. It confirms that both holes display very similar temperature gradient and conductive heat flow values, all about half of the 60 mW/m2 value estimated for 30 Ma Southern Atlantic crust (Sclater et al., 1980) or simple plate cooling models (e.g., Stein and Stein, 1992). However, our results are similar to the geographically nearest heat flow measurement in the global heat flow compilation (29 and 37 mW/m2; see Fuchs et al., 2021). The significant differences between our measurements of the conductive heat flow in the sediments and the predictions probably result from extensive hydrothermal advection in the crust in this region facilitated by numerous volcanic outcrops and discontinuous sediment blankets (e.g., Kardell et al., 2021).
10.1.5. Stratigraphic correlation
At Site U1583, five holes were cored using the APC system (Holes U1583A–U1583E) (Figure F8; see Operations) to recover the mudline, which was successfully intercepted only in Hole U1583E. A total of 110.10 and 105.15 m of sediments were recovered from Holes U1583C and U1583E, respectively (Figure F78). Cores 393-U1583C-12H and 13X were not considered for correlation and are not shown in the spliced section because Core 12H recovered 8.02 m after only 2 m of drill bit advancement, equal to 401% of core recovery (see Operations). This coring artifact is due to suck-in of sediment after hitting basement at the bottom of the hole. Core 13X was 1.8 m of fine-grained basalt recovered by XCB coring.
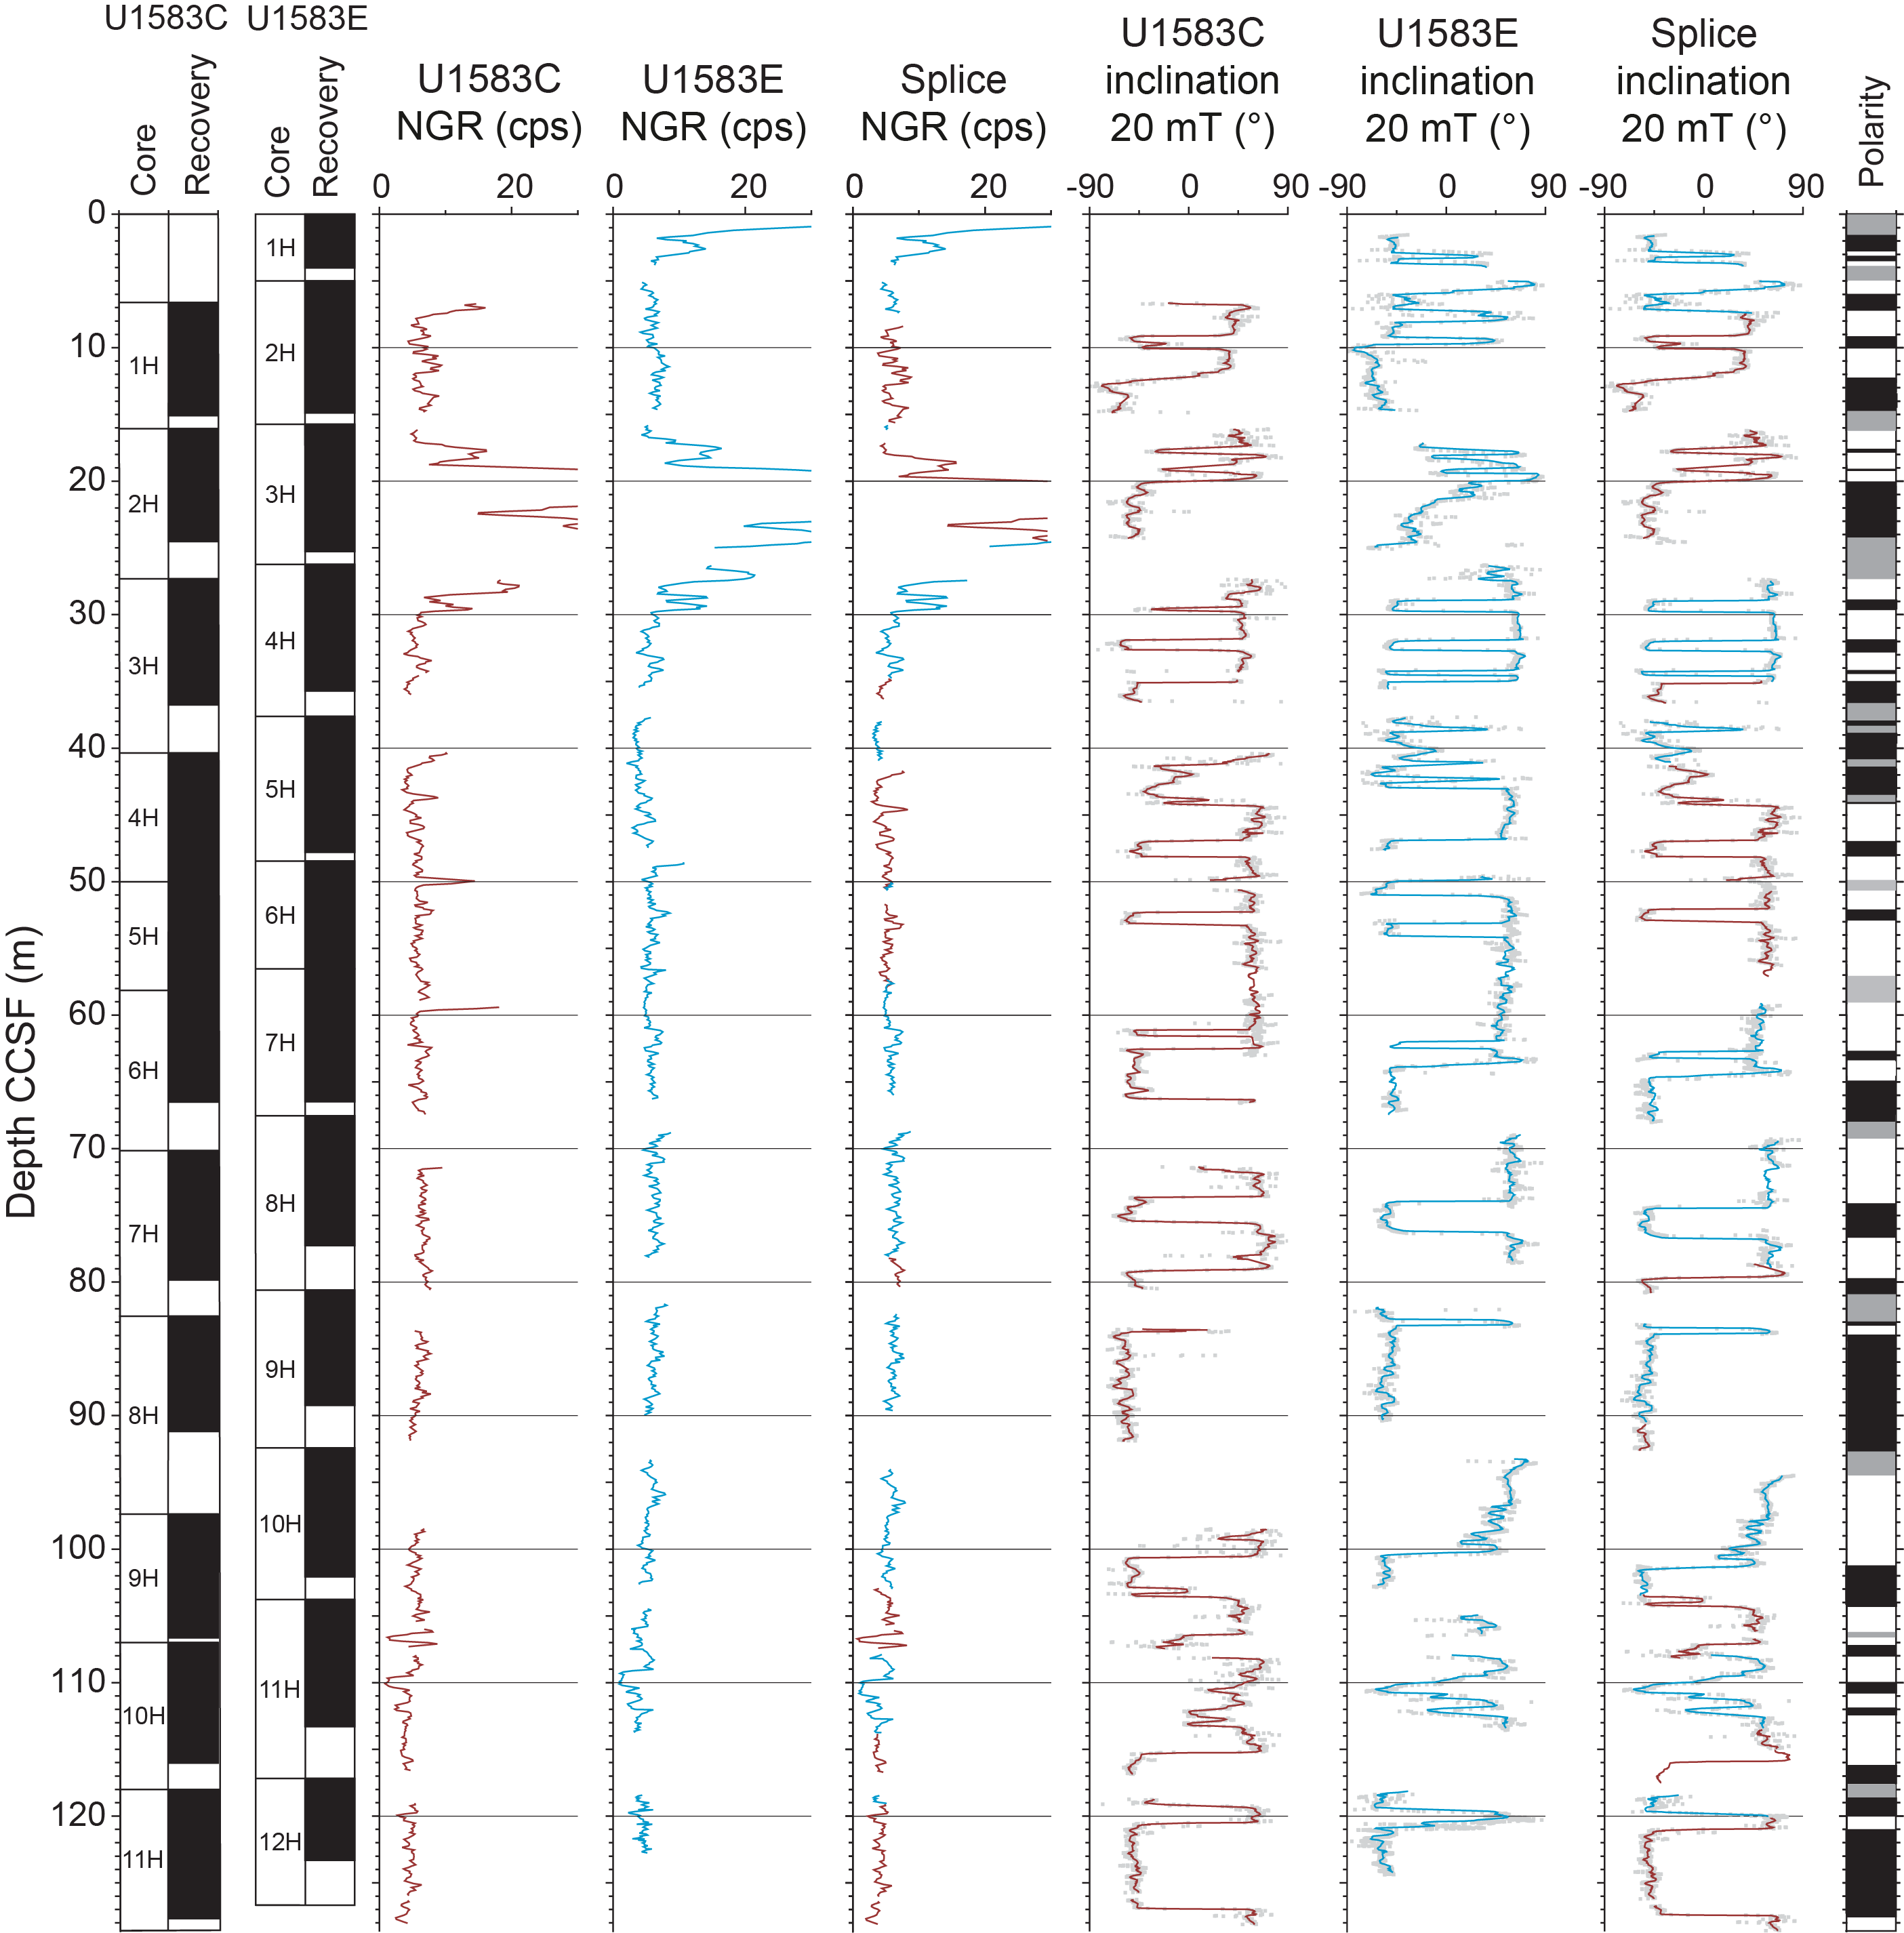
Figure F78. Composite depth scale and splice.
10.1.5.1. Correlation and splice
Physical properties data such as MS (by Special Task Multisensor Logger [STMSL]), GRA, NGR, and magnetic inclination (after the 20 mT AF demagnetization step, see Paleomagnetism) from Holes U1583C and U1583E were correlated to establish a composite depth scale (core composite depth below seafloor [CCSF]) for Site U1583 (Figure F78; Tables T28, T29). Correlation from Site U1583 resulted in a spliced record of 129 m CCSF, with a total core gap of ~17 m (Figure F78). Correlations allowed us to identify an initial 5.6 m vertical difference between the top of Hole U1583E (i.e., mudline) and the top of Hole U1583C, which is missing the uppermost Unit I (see Sedimentology) (Figure F78).
Generally, paleomagnetic inclination provided a useful data set for stratigraphic correlation because the positive/negative inclination patterns are less ambiguous to correlate compared to physical properties track data, especially as the latter show no distinctive MS or NGR pattern from ~30 CCSF to the bottom of the hole, because Subunits IVA–IVC are similar lithologies (light-colored nannofossil ooze with clay; see Sedimentology) (Figures F68, F70). In both holes, numerous intervals are affected by severe drilling disturbance or fall-in effects that often occur at the top of the first section of the cores (e.g., 393-U1583E-2H, 3H, 4H, 6H, 9H, and 11H) and/or within the core sections (393-U1583C-4H-3 and 393-U1583E-5H-3, 11H-2). Disturbed layers were also identified by means of X-ray images and sedimentologic description coupled with linescan images (Figure F75) and eventually excluded from the splice.
Only in a few cases it was possible to overlap the stratigraphic records between the two holes and establish a continuous splice (e.g., 38–57 and 95–117 m CCSF; Figure F78). In the case of aligned core gaps between holes, cores below the gap are no longer tied to the anchor core, but they produce floating sections on the CCSF. Such floating ties were denoted in the affine table as "SET," assuming a constant growth rate of the difference between mbsf and CCSF (Table T29). Despite that, some distinctive stratigraphic layers were found to be thicker in Hole U1583E, on the order of 0.3 to 2 m difference with respect to their equivalent in Hole U1583C. We also chose to add 1 m between floating cores to include the unknown missing thickness due to incomplete recovery and the ~10% of expansion mainly due to decompression of the sediments as they are brought to atmospheric pressure or stretching that occurs as part of the coring process (see Physical properties and downhole measurements in the Expedition 390/393 methods chapter [Coggon et al., 2024a]).
Figure F78 also shows the splice of paleomagnetic inclination (see Paleomagnetism), which can be interpreted as a synthetic polarity scale and integrated with bioevents to create the age model at Site U1583 (see Age model and sedimentation rates).
10.2. Basement
Petrophysical characterization of the ocean crustal section at Site U1583 is primarily based on cores from Hole U1583F that were recovered during Expedition 393. A total of 1.89 m of basalt was also recovered from the bottom of Hole U1583C (Core 13X). A clear sediment/basement interface was not recovered in either hole. Wireline logging in Hole U1583F was also completed after finishing basement coring.
10.2.1. Physical properties
Whole-round core section measurements included NGR, GRA bulk density, and MS. Archive halves of all split-core sections were measured for MSP. X-ray imaging was performed on selected sections with breccia to better characterize their structure. A total of 23 discrete sample cubes were taken for compressional wave (P-wave) velocity and MAD measurements, including two samples of breccia (Table T30). All discrete samples were also used for paleomagnetic measurements (see Basement in Paleomagnetism). Thermal conductivity measurements were made on 26 individual pieces from working halves of split cores. Full-circumference, true color images of whole-round core exteriors were recorded with the DMT CoreScan3 system. Approximately 77% of the basement material recovered from Site U1583 could be scanned on the DMT system, including 91% of the basement material from Hole U1583C and 76% of the material from Hole U1583F. An additional ~0.85 m (total) of cylindrical, oriented pieces was used for microbiological sampling in Holes U1583C and U1583F and removed from the cores before scanning took place (see Microbiology). A summary of core section and discrete physical properties data from Hole U1583F is shown in Figure F79 and Tables T30 and T31. All depths in the tables and figures are in meters below seafloor (mbsf; equivalent to CSF-A depth scale; see Introduction in the Expedition 390/393 methods chapter [Coggon et al., 2024a]), and the means of all physical properties are arithmetic means represented with uncertainty of ±1 standard deviation (1σ).
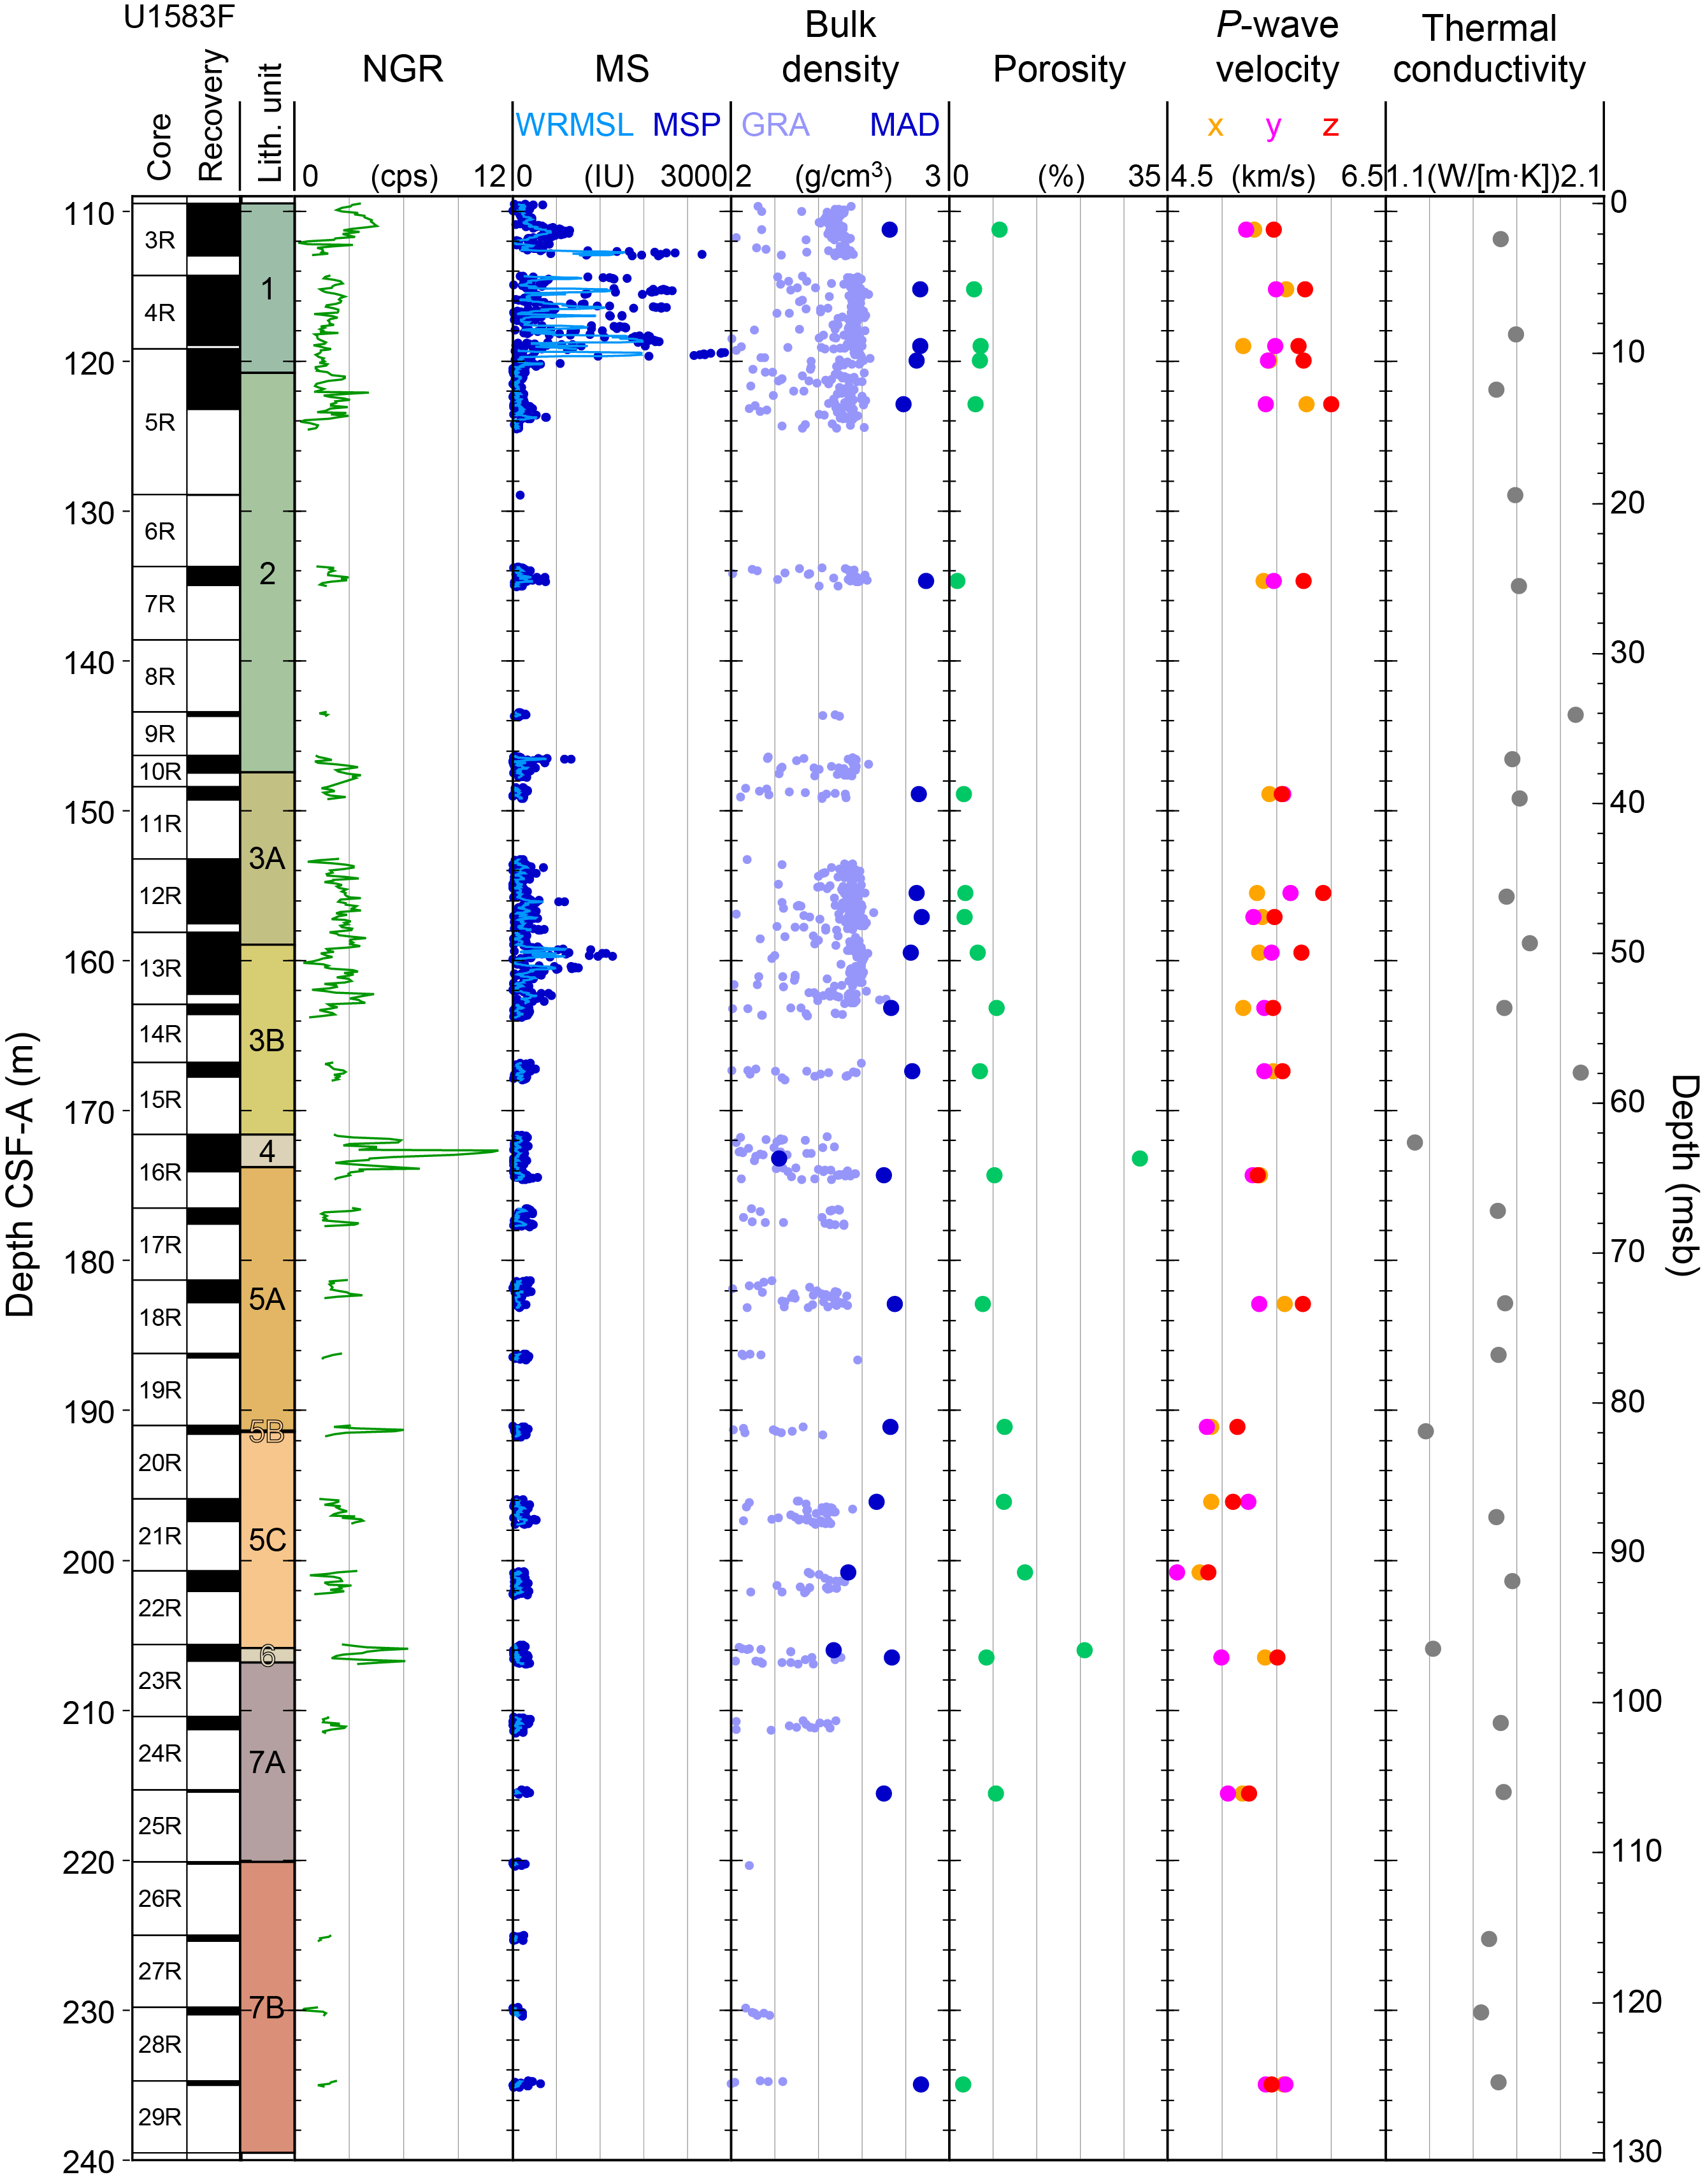
Figure F79. Physical properties, Hole U1583F.
10.2.1.1. Natural gamma radiation
In Hole U1583F, mean NGR is 2.4 ± 1.2 counts/s (range = 0.2–11.2 counts/s) (Figure F79; Table T31). The highest NGR is associated with sedimentary breccias in Units 4 and 6 (mean = 5.1 ± 2.7 and 4 ± 1.5 counts/s, respectively). In Unit 1 (109.5–120.81 mbsf), NGR values are highest in the uppermost ~3 m (~4 counts/s) compared to ~2 counts/s in the lower ~7 m of the unit. Basaltic Units 2, 3, 5, and 7 all show relatively low NGR (mean = 1.9 ± 0.7, 2.4 ± 0.7, 2.6 ± 1.0, and 1.8 ± 0.6 counts/s, respectively). Lithostratigraphic units that are characterized as primarily massive flows, sheet flows, or pillow flows all have a similar mean NGR of ~2.2 counts/s and overlap within ±1 standard deviation, suggesting that emplacement style does not have a strong influence on this property (Table T31).
10.2.1.2. Magnetic susceptibility
MS measured using both WRMSL and MSP methods show similar downhole trends; however, the amplitude of these changes varies between the two methods (WRMSL range = 0–1782 IU; MSP range = 1–2910 IU). The lower WRMSL values generally result from core gaps and irregular shaped/small core pieces (heavily influencing the continuous measurements), and potentially from the differences in frequency and resolution between the two magnetic susceptibility systems (see Physical properties and downhole measurements in the Expedition 390/393 methods chapter [Coggon et al., 2024a]). MS is highest in the single massive flow making up Unit 1 (MSP mean = 610 ± 686 IU), and the values are highly variable within the unit (Table T31). There is another smaller peak in MS in Unit 3, and this unit has the second highest mean magnetic susceptibility (MSP mean = 196 ± 178 IU). MS values are generally similar (less than ~110 IU) in other units and show smaller variations (Table T31). Sheet flows show the second highest MS after the massive flow (MSP mean = 247 ± 229 IU). MS is relatively low in pillow lavas (MSP mean = 132 ± 88 IU) and lowest in the sedimentary breccias (MSP mean = 97± 55 IU).
10.2.1.3. Gamma ray attenuation bulk density
GRA bulk density ranges 2.00–2.71 g/cm3 (mean = 2.44 ± 0.16 g/cm3) and shows a slight decrease downhole (Figure F79; Table T31). Bulk density values <2 g/cm3 were culled from figures and interpretations, as these likely represent gaps due to incomplete filling of the core liner and are not representative of the recovered material. The highest bulk density values measured from GRA are consistently ~0.2 g/cm3 lower than those measured from MAD, largely due to these gap effects. Given the mineral constituents and the low porosity of basalts, a mean GRA density of 2.44 g/cm3 is unrealistically low, but the general trends of the upper envelope of GRA values may be interpretable, so far as the discontinuous recovery allows. MAD samples may also be biased toward higher density lithologies, as they are selected from cohesive pieces that can withstand being cut into cubes (see Physical properties and downhole measurements in the Expedition 390/393 methods chapter [Coggon et al., 2024a]). GRA bulk density is slightly higher in Units 1–3 (~2.7 g/cm3) compared to Units 4–7 (~2.5 g/cm3), though this may be influenced by the lower core recovery in the lower part of Hole U1583F (Figure F79; Table T31).
10.2.1.4. P-wave velocity
P-wave velocity ranges 4.03–5.77 km/s along the x-axis, 4.59–5.62 km/s along the y-axis, and 4.87–6.00 km/s along the z-axis. All three velocities measured for each sample are shown in Figure F79 and Table T30; however, only the highest value measured for each sample is used to calculate mean velocities (Table T31) because these are considered most representative of the true formation velocity (see Physical properties and downhole measurements in the Expedition 390/393 methods chapter [Coggon et al., 2024a]).
Maximum P-wave velocity is relatively high through Unit 1 (5.62 ± 0.17 km/s), Unit 2 (5.87 ± 0.18 km/s), and Unit 3 (5.62 ± 0.18 km/s) compared to those in Unit 5 (5.24 ± 0.33 km/s), Unit 6 (4.77 ± 1.04 km/s, or 5.5 km/s for the single basalt sample in this unit), and Unit 7 (5.41 ± 0.23 km/s) (Figures F79, F80; Table T31). The lowest P-wave velocities are seen in sedimentary breccia (4.06 ± 0.03 km/s), whereas massive, sheet, and pillow flow basalts all have a mean P-wave velocity within the range of 5.37–5.62 km/s (Figure F81; Table T31). Of the basaltic samples, the highest and lowest P-wave velocities were measured in pillow basalts (mean = 5.52 ± 0.40 km/s) (Figure F81; Tables T30, T31). The massive flow has the highest mean P-wave velocity (5.62 ± 0.17 km/s), followed by sheet flows (5.60 ± 0.13 km/s), pillow flows, and then lava flows with uncertain emplacement styles (5.37 ± 0.21 km/s) (Figure F81).
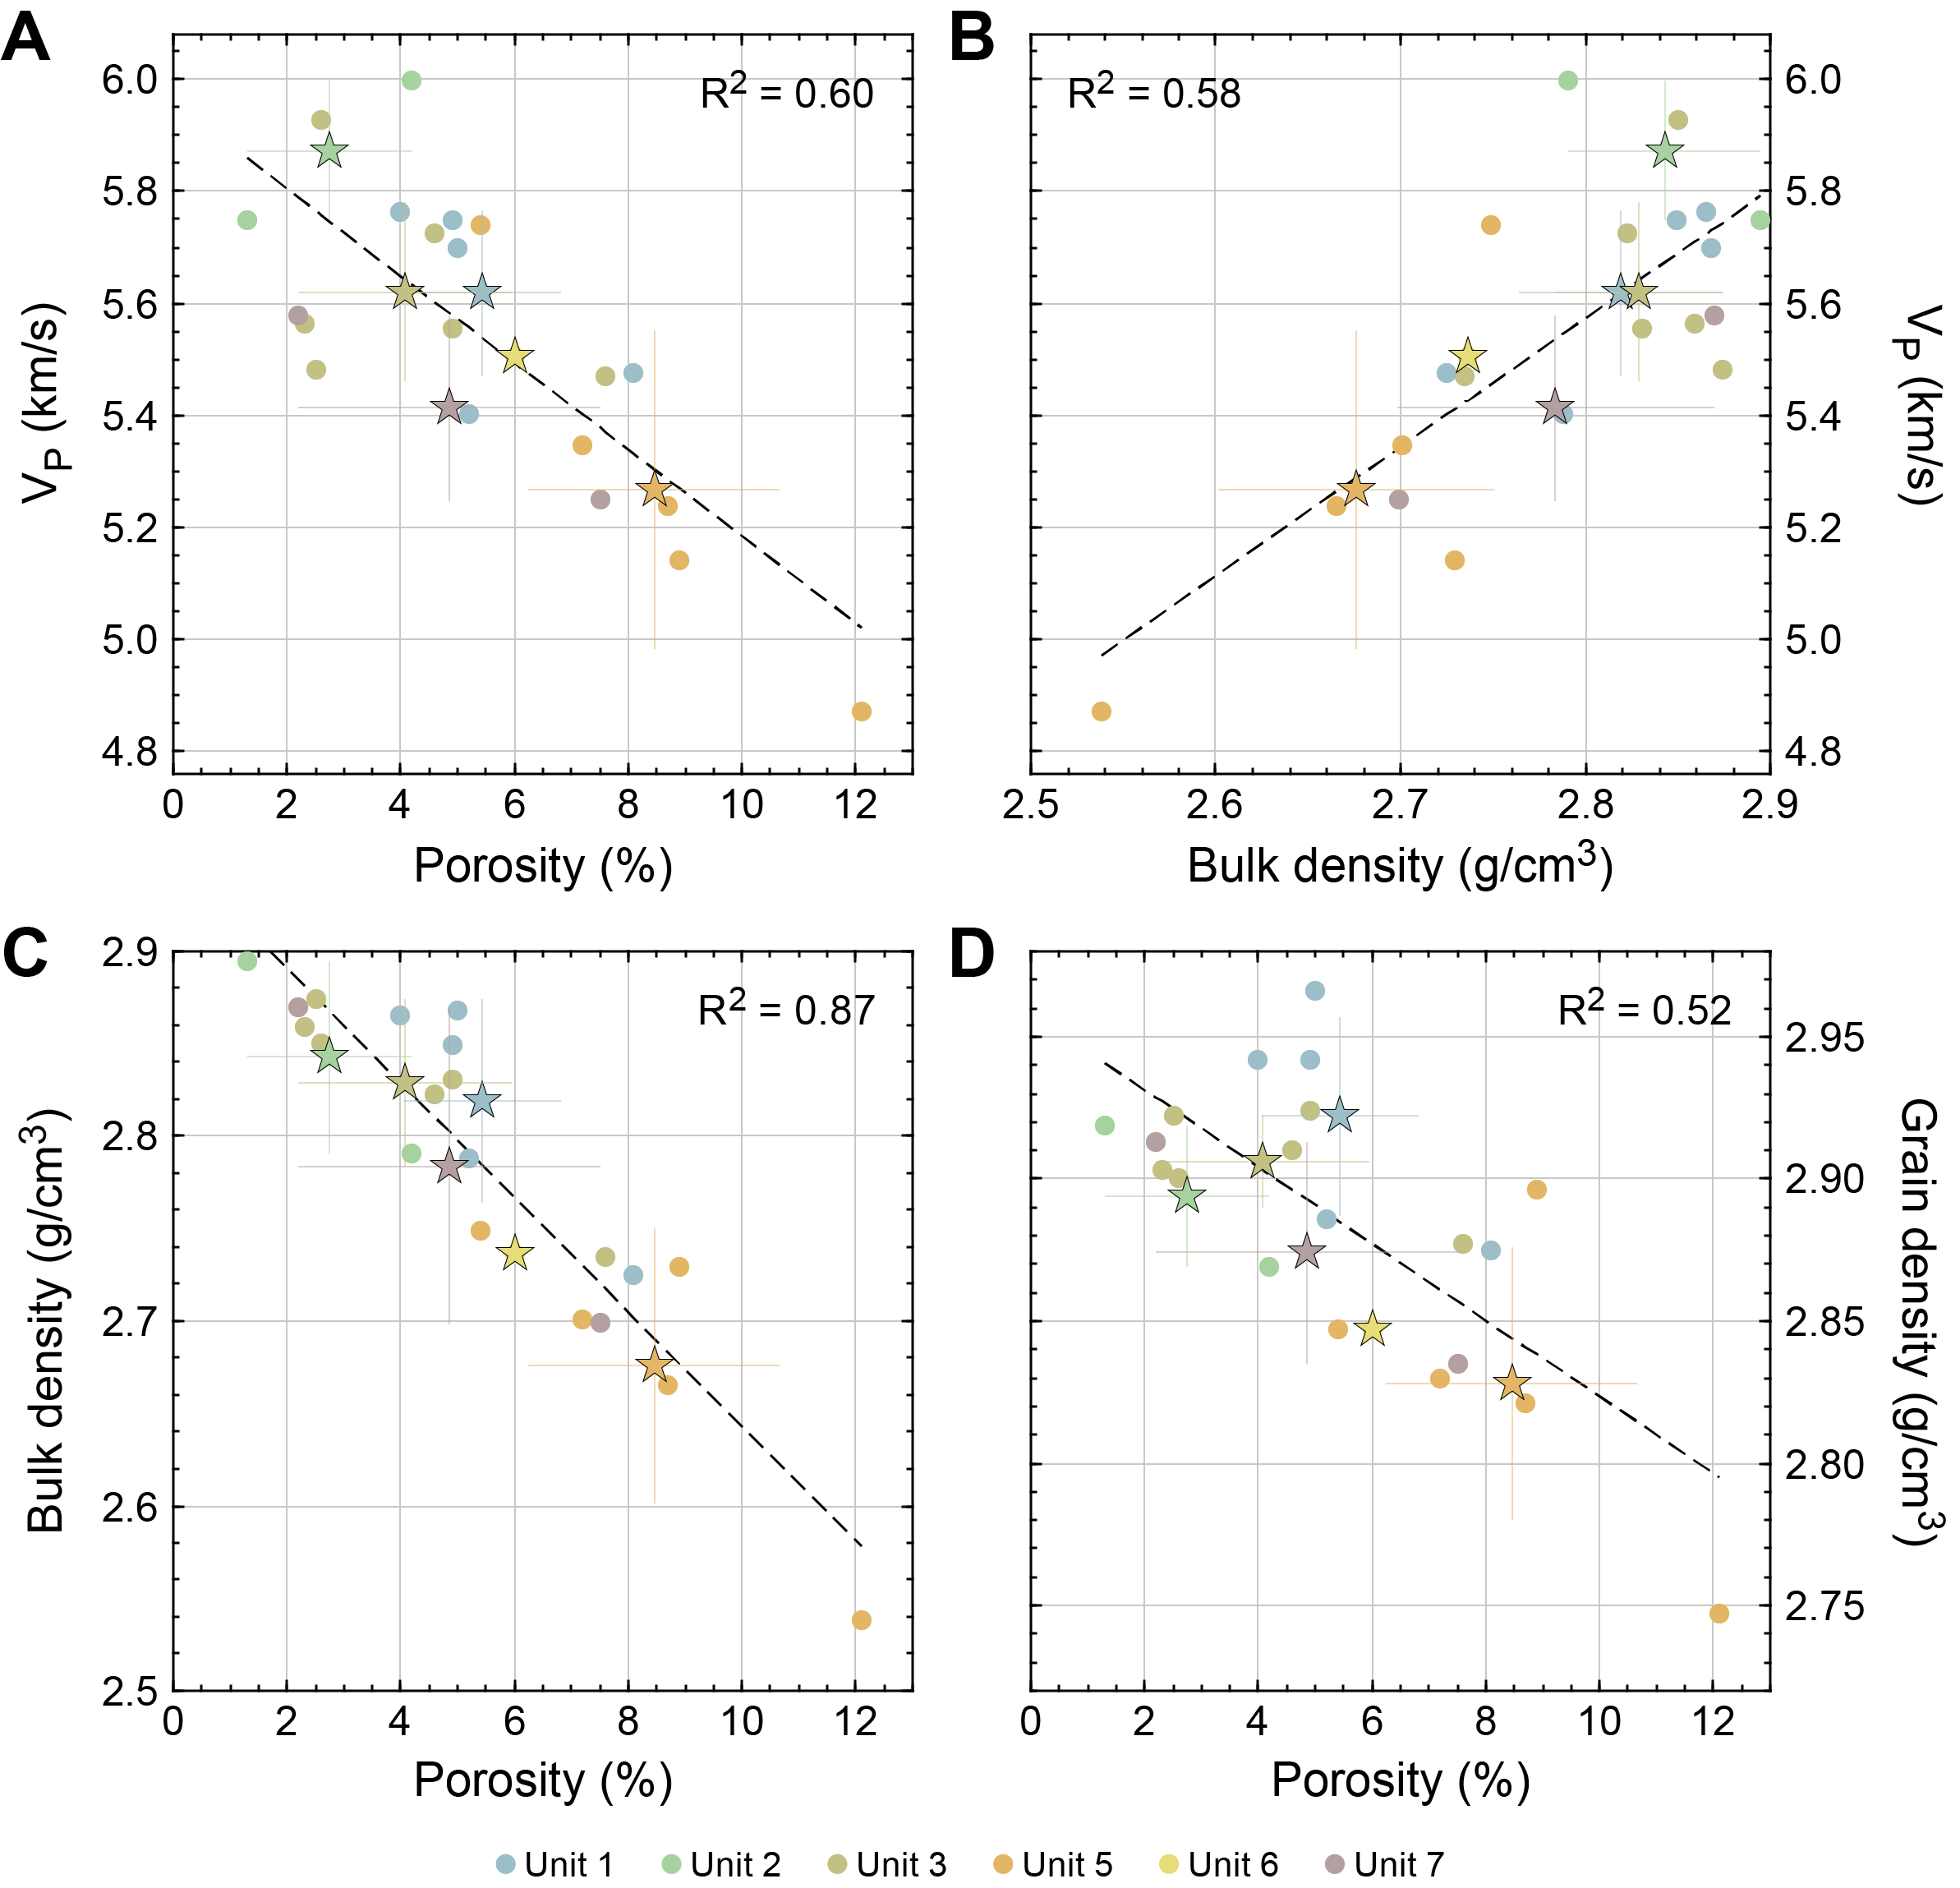
Figure F80. Basalt physical properties by lithostratigraphic unit.
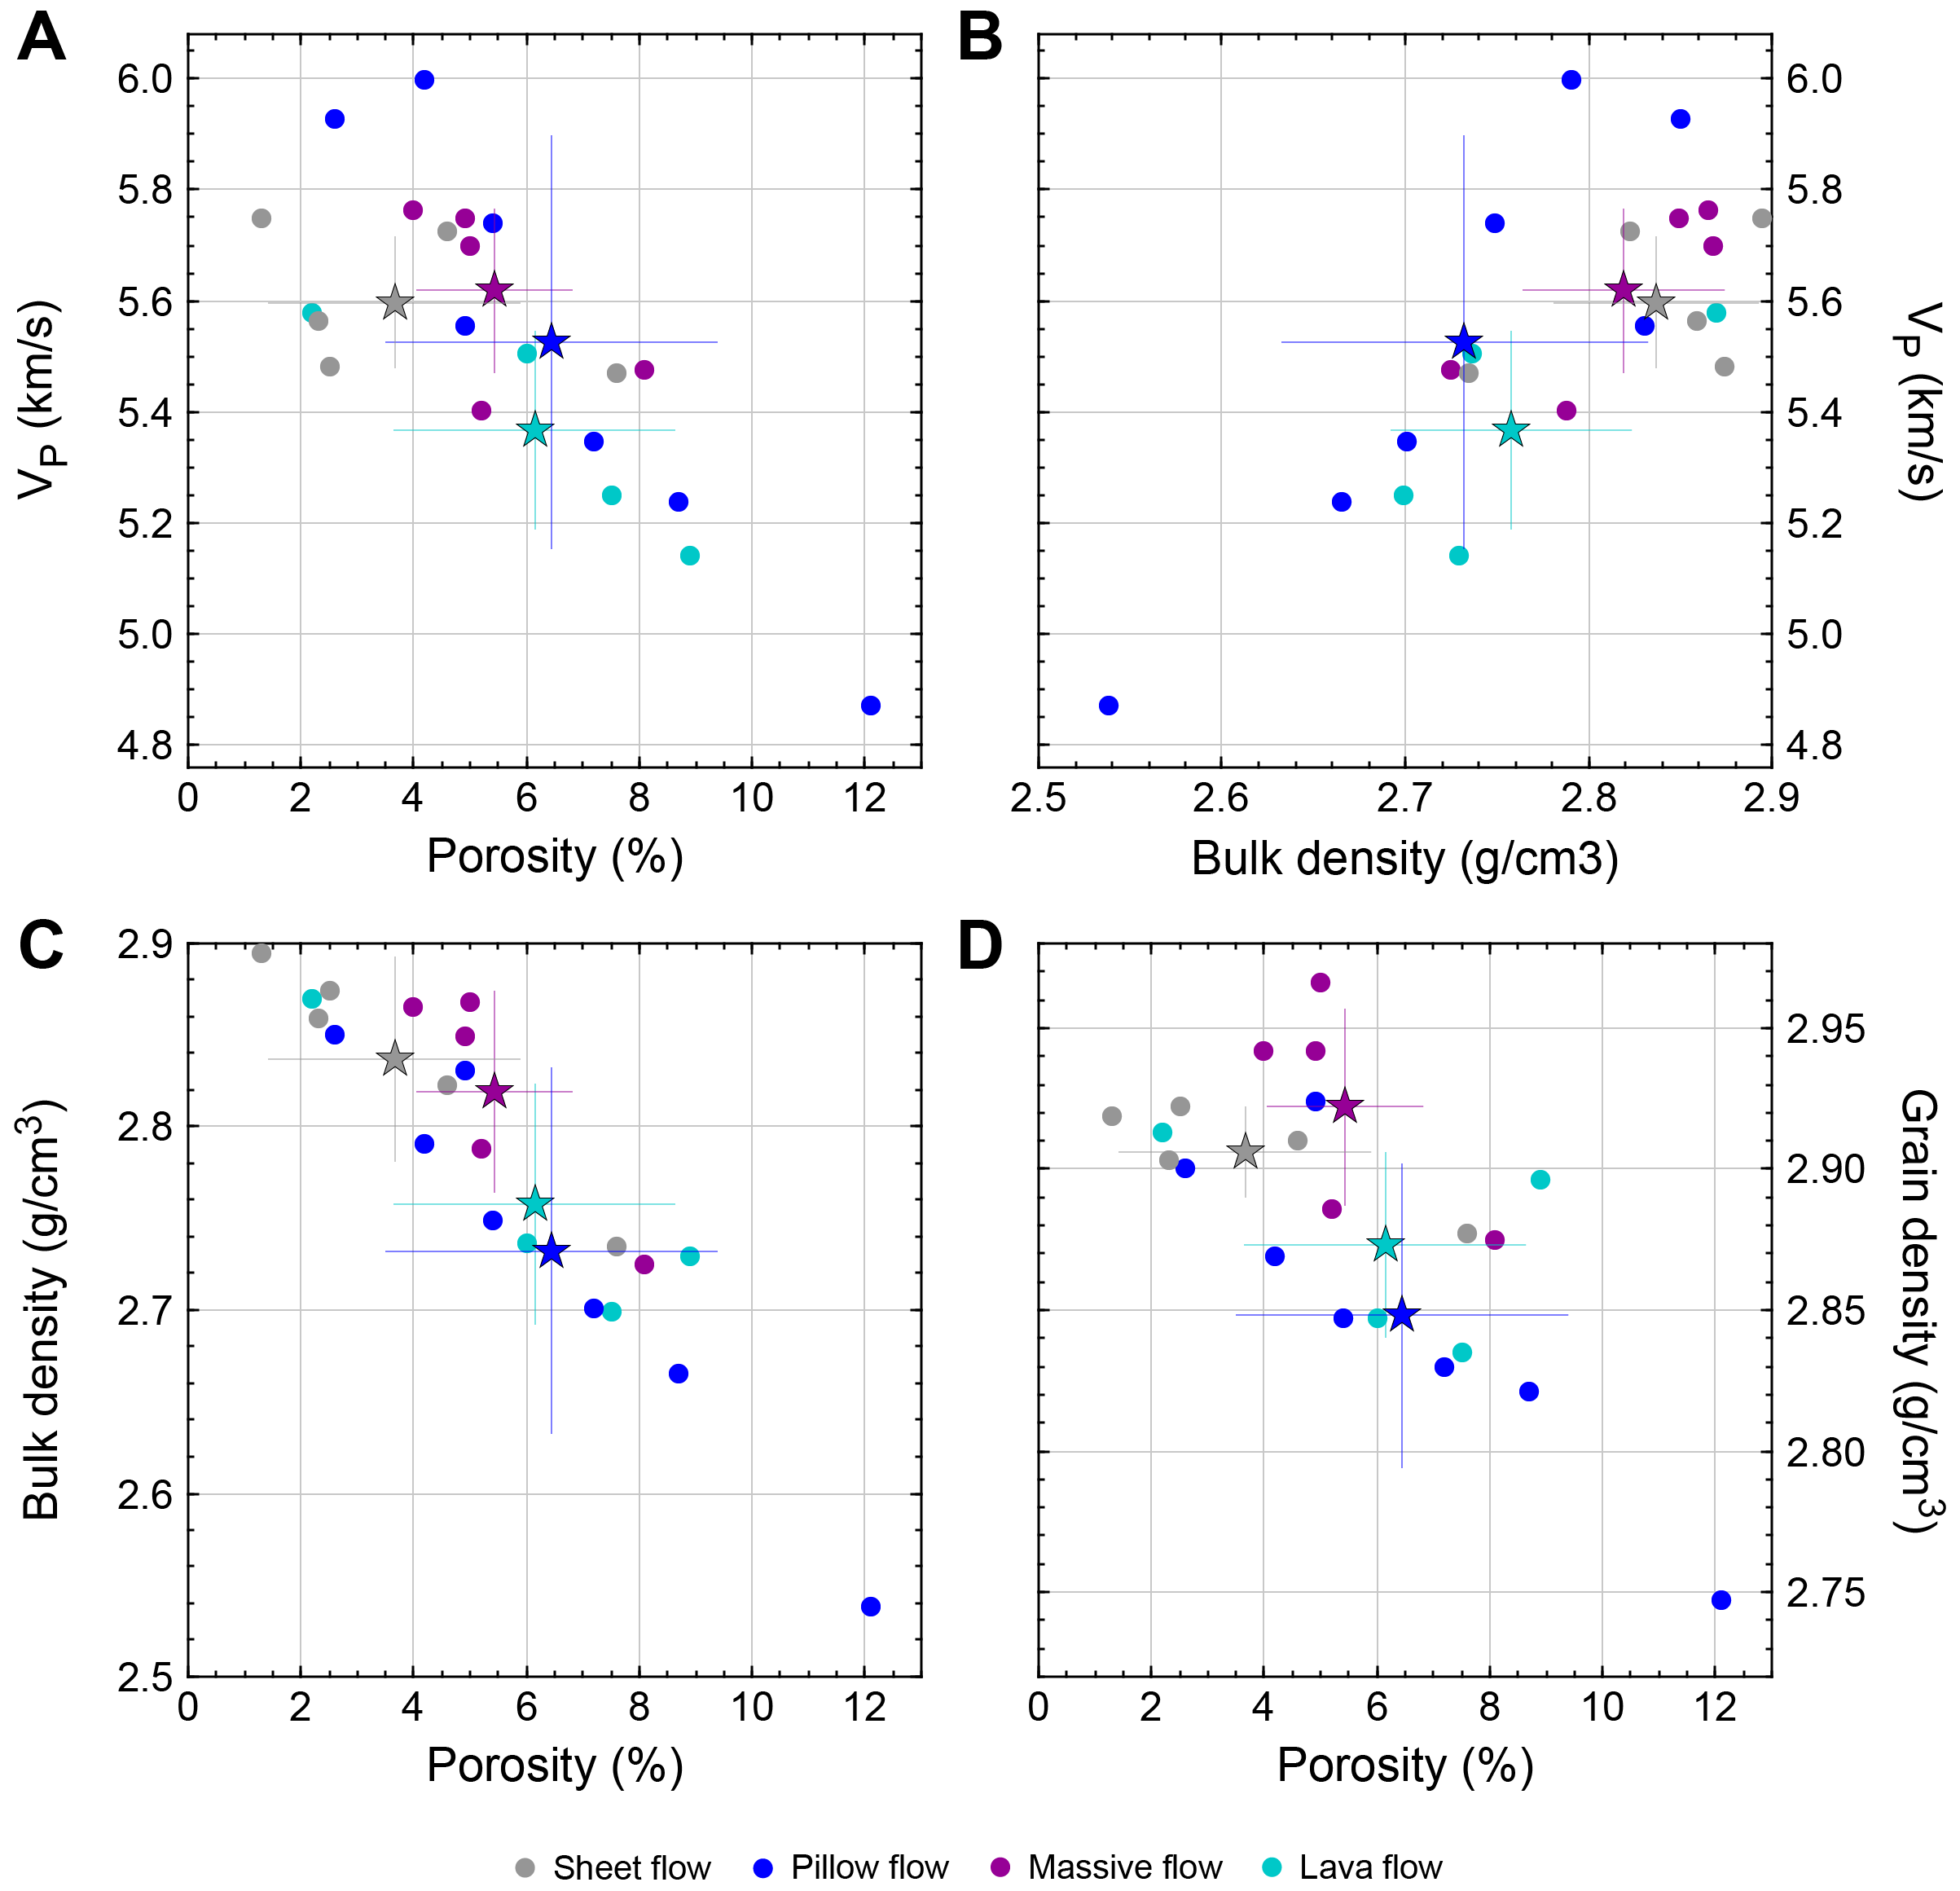
Figure F81. Basalt physical properties by emplacement style.
P-wave velocity does not show a clear trend with increasing groundmass grain size (Figure F82). The highest P-wave velocity is seen in cryptocrystalline basalts, which have a mean velocity (5.70 ± 0.30 km/s) equivalent to the sole medium grained basalt sample (393-U1583F-4R-4, 85 cm). The velocities of fine-grained basalts cluster close to this group, whereas microcrystalline basalts show a lower mean P-wave velocity (5.37 ± 0.26 km/s) and are spread over a wide range of values (4.87–5.75 km/s) (Figure F82; Table T30).
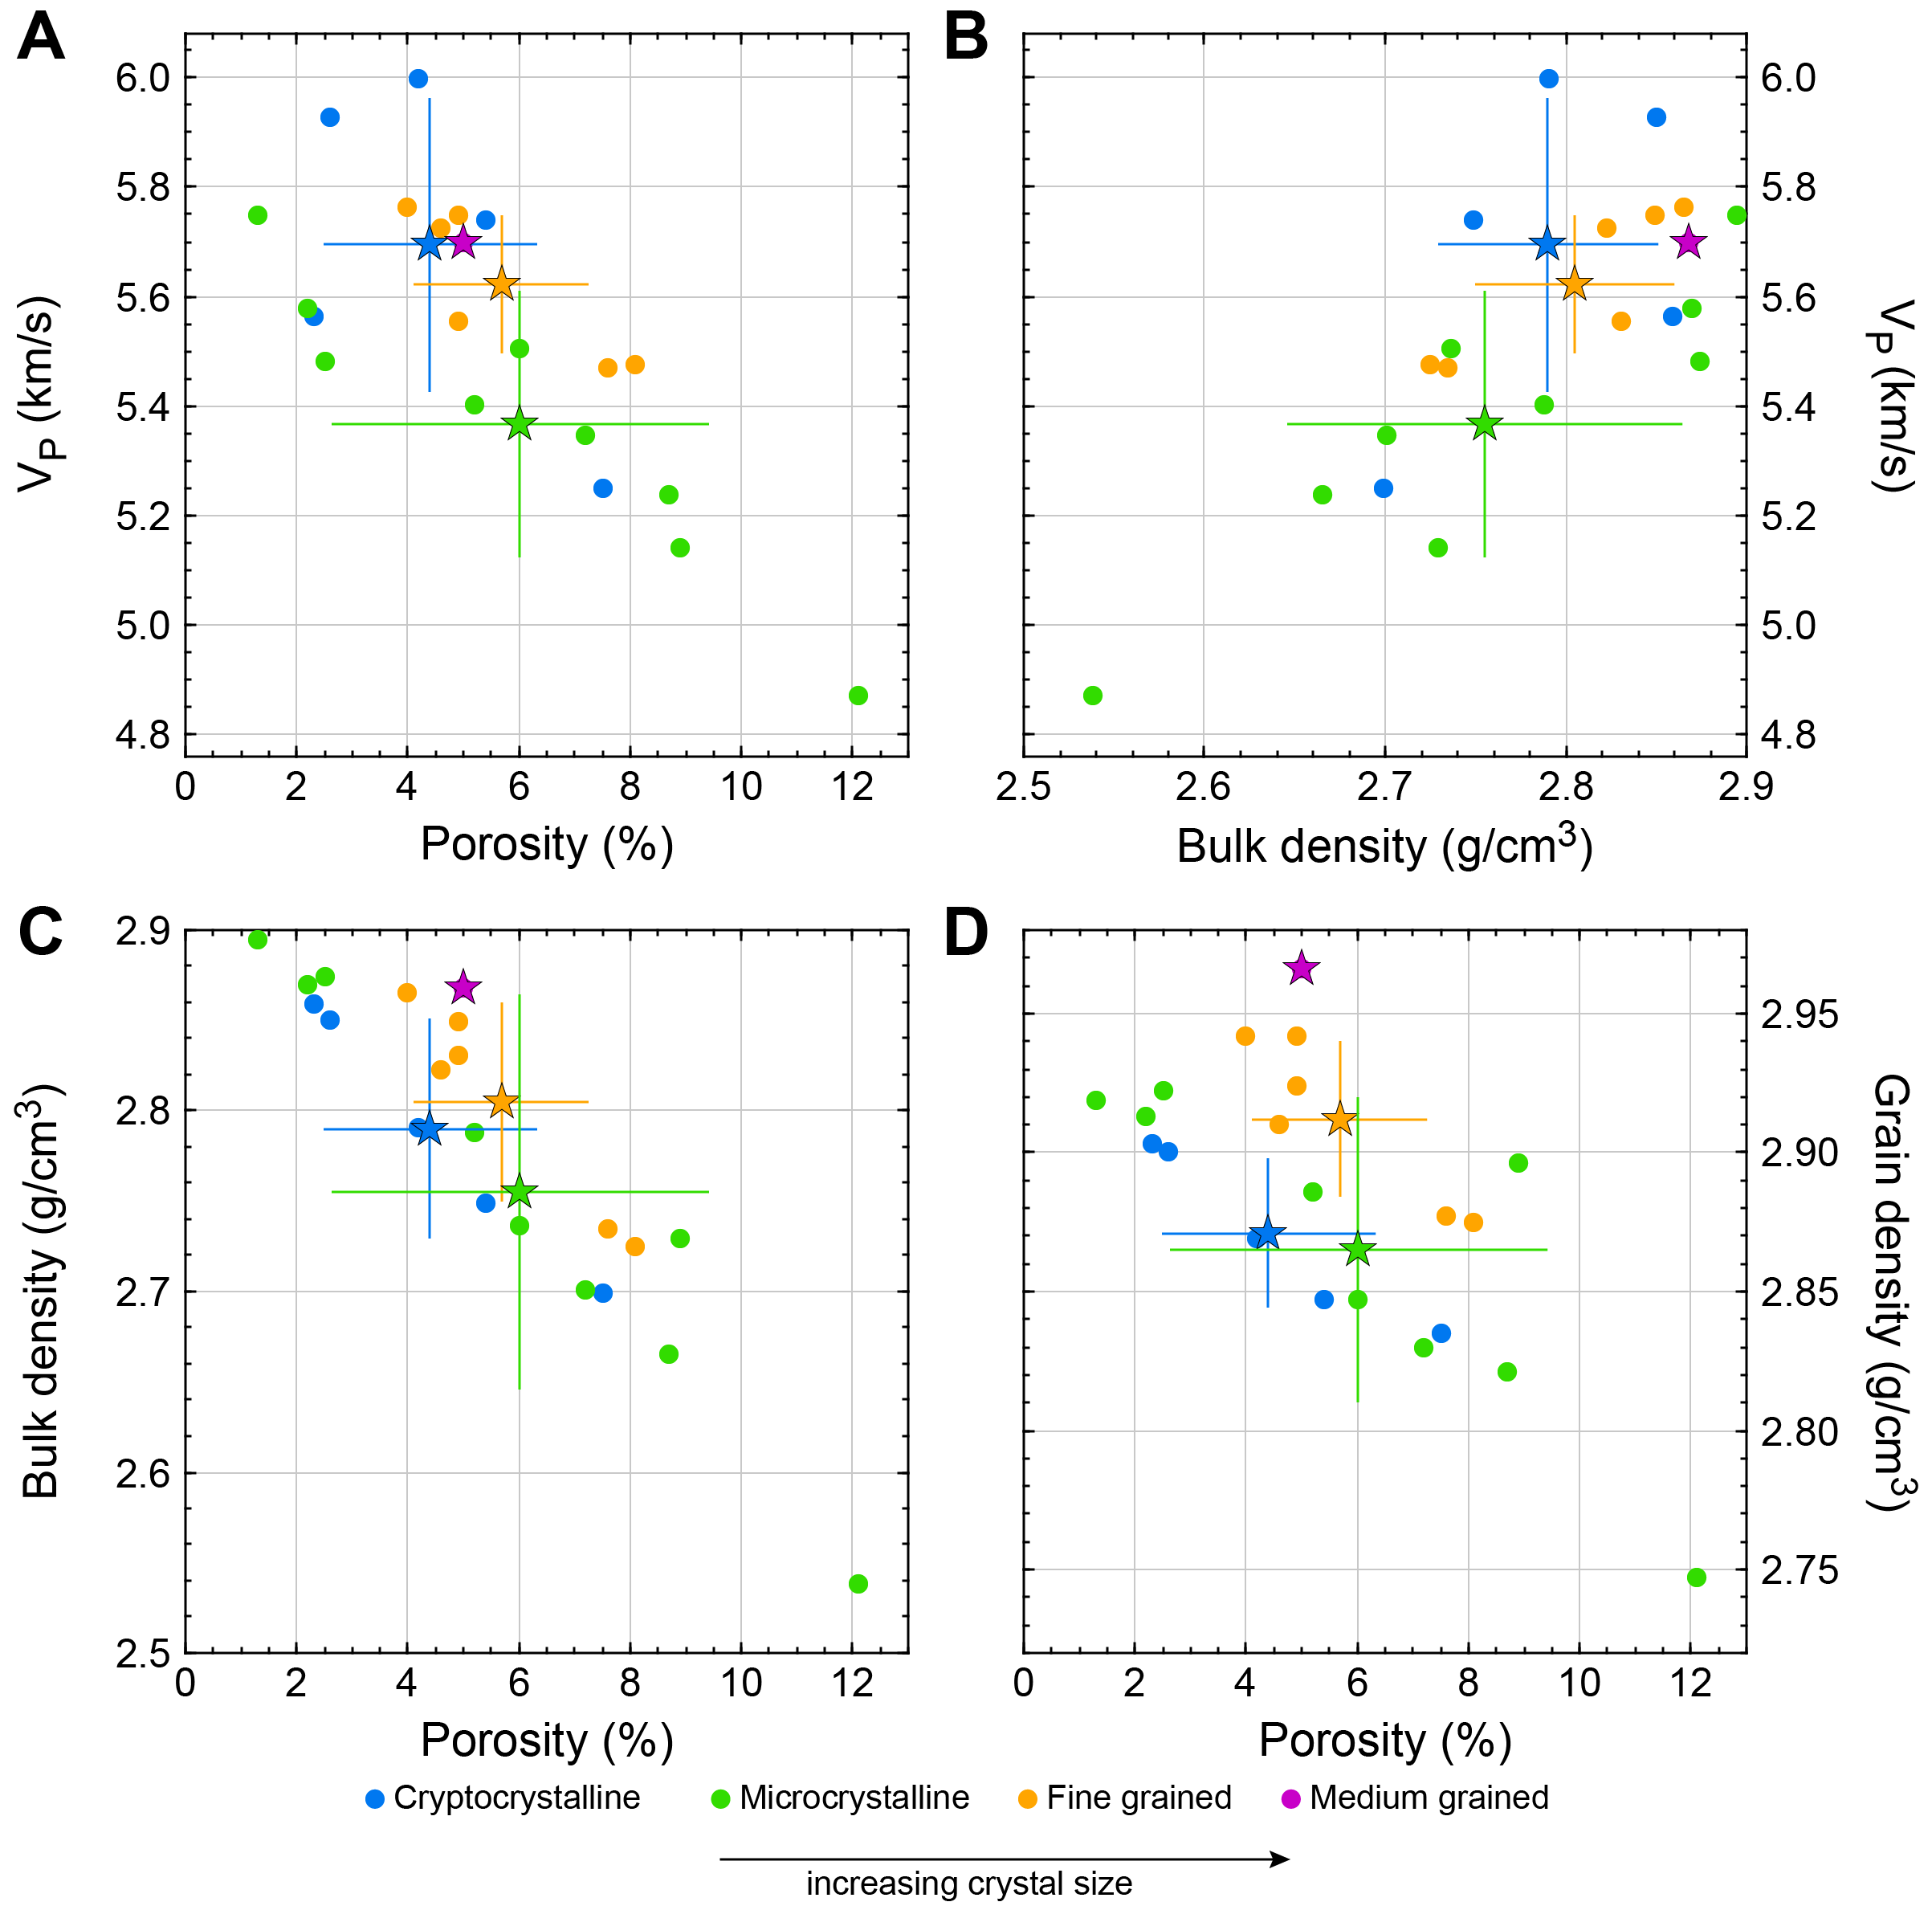
Figure F82. Basalt physical properties by groundmass grain size.
10.2.1.5. Moisture and density
The bulk density of discrete samples from MAD analysis ranges 2.22–2.90 g/cm3 (mean = 2.74 ± 0.16 g/cm3). Lithostratigraphic Units 1–3 have similar mean MAD bulk densities of ~2.83 g/cm3 (Figure F80; Table T31). Unit 4 has the lowest overall bulk density (2.22 g/cm3), though this is represented by only a single breccia sample (Table T30). Unit 6 has a relatively low mean bulk density of 2.60 ± 0.19 g/cm3, reflecting the mixture of basalt and breccia in this unit, but the MAD bulk density of the single basalt sample in the unit (2.74 g/cm3) is between the mean values of surrounding Units 5 and 7 (Figure F80; Table T31). Massive flows and sheet flows have the highest bulk and grain densities of the different emplacement styles, although sheet flows have a slightly higher mean bulk density, whereas massive flows have a slightly higher mean grain density (Figure F81; Table T31). Similar to P-wave velocity, changes in density do not change consistently with increasing groundmass grain size (Figure F82). Mean bulk and grain densities decrease with decreasing grain size, from medium grained to fine grained to cryptocrystalline and down to microcrystalline basalt (Figure F82; Table T31).
Porosity values show a wide range of 1.3%–30.6% throughout the Hole U1583F volcanic section. Porosity is the highest in a fragment of a matrix-supported breccia sample in Unit 4 (1 sample; 30.6%) and in Unit 6 (mean = 13.8% ± 11.1%), which is also predominantly represented by sedimentary breccias, and much lower (generally < 10%) in the other five basaltic units (Tables T30, T31). Considering only basalts, the highest porosities are measured in pillow flows (2.6%–12.1%; mean = 6.44% ± 3.19%) (Figure F81). Lava flows with an uncertain emplacement style have a similar mean porosity (6.15% ± 2.89%), followed by massive flows (5.44% ± 1.56%), and the lowest mean porosity is seen in sheet flows (3.66% ± 2.51%) (Figure F81; Table T31). In terms of grain size, microcrystalline basalts have the highest mean porosity but also span the full range of porosities measured, while cryptocrystalline basalts have the lowest mean porosity. Despite the wide range of observed porosities, the mean values for the different groundmass grain size categories all cluster at ~4%–6% (Figure F82).
10.2.1.6. Thermal conductivity
Thermal conductivity ranges 1.20–2.00 W/(m·K) (mean = 1.63 ± 0.17 W/[m·K]) (Figure F79; Table T31). Thermal conductivity values are lowest in the sedimentary breccias of Unit 4 (one sample; 1.23 W/[m·K]) and Unit 6 (one sample; 1.32 W/[m·K]) and show higher mean values (1.6–1.7 W/[m·K]) in units identified as basalts (Table T30). Thermal conductivity does not vary significantly with emplacement style; massive flows, sheet flows, pillow flows, and lava flows with uncertain emplacement all show mean conductivities ~1.67 W/(m·K) (Figure F79; Table T31).
10.2.2. Data integration
Several clear relationships between the discrete physical properties (P-wave velocity, porosity, bulk density, and grain density) become apparent when considering Figures F80, F81, and F82. Considering only basalts, we find inverse relationships between P-wave velocity and porosity (R2 = 0.60), bulk density and porosity (R2 = 0.87), and grain density and porosity (R2 = 0.52) and a positive correlation between bulk density and P-wave velocity (R2 = 0.58). Despite showing some variation with respect to different basalt emplacement styles and groundmass grain sizes, these properties alone do not account for the wide range of observed density, porosity, and P-wave velocity seen in the samples.
Discrete samples used for MAD and P-wave analyses were grouped by alteration level as a way to evaluate the role alteration plays in driving the observed variation in physical properties. This classification was based on color, texture, and presence of alteration halos, following the scheme used in macroscopic core descriptions (see Igneous petrology and Alteration petrology). Eight levels of alteration, from freshest to most altered, are sequenced as follows: (1) gray background; (2) background with vesicles filled by clay (white-green); (3) background with higher clay (yellow-brown), vesicles, and groundmass; (4) patchy background; (5) background with dark gray halo or dark bluish gray halo; (6) background with reddish brown halo; (7) background with brown halo; and (8) brown halo. Breccias were not included in this classification.
P-wave velocity, porosity, and density all show a consistent relationship with basalt alteration level, where increased alteration level generally corresponds to higher porosity and lower P-wave velocity, bulk density, and grain density, though there is some scatter around each trend (Figure F83). Samples with gray background, patchy background, and background with reddish brown halo all tend to cluster close together in terms of their bulk and grain densities and porosity but show different P-wave velocities (Figure F83). The sample with the highest alteration level (brown halo) consistently plots far from the main cluster of samples and has the highest porosity and lowest P-wave velocity, bulk density, and grain density (Figure F83). Sample grain density should decrease in more strongly altered samples because basalt (typical density of ~3.0 g/cm3) alteration to less dense clay minerals (e.g., saponite; ~2.3 g/cm3) progressively reduces the grain density. Similarly, porosity is expected to decrease as the alteration level increases because pore space (e.g., cracks or vesicles) is filled with secondary clay minerals or cement. However, results at sites across the SAT show an opposite, thus counterintuitive trend, suggesting the measurements of porous volume in the most altered samples do not reflect the true porosity of the basement rock. Postexpedition work is needed to address this problem.
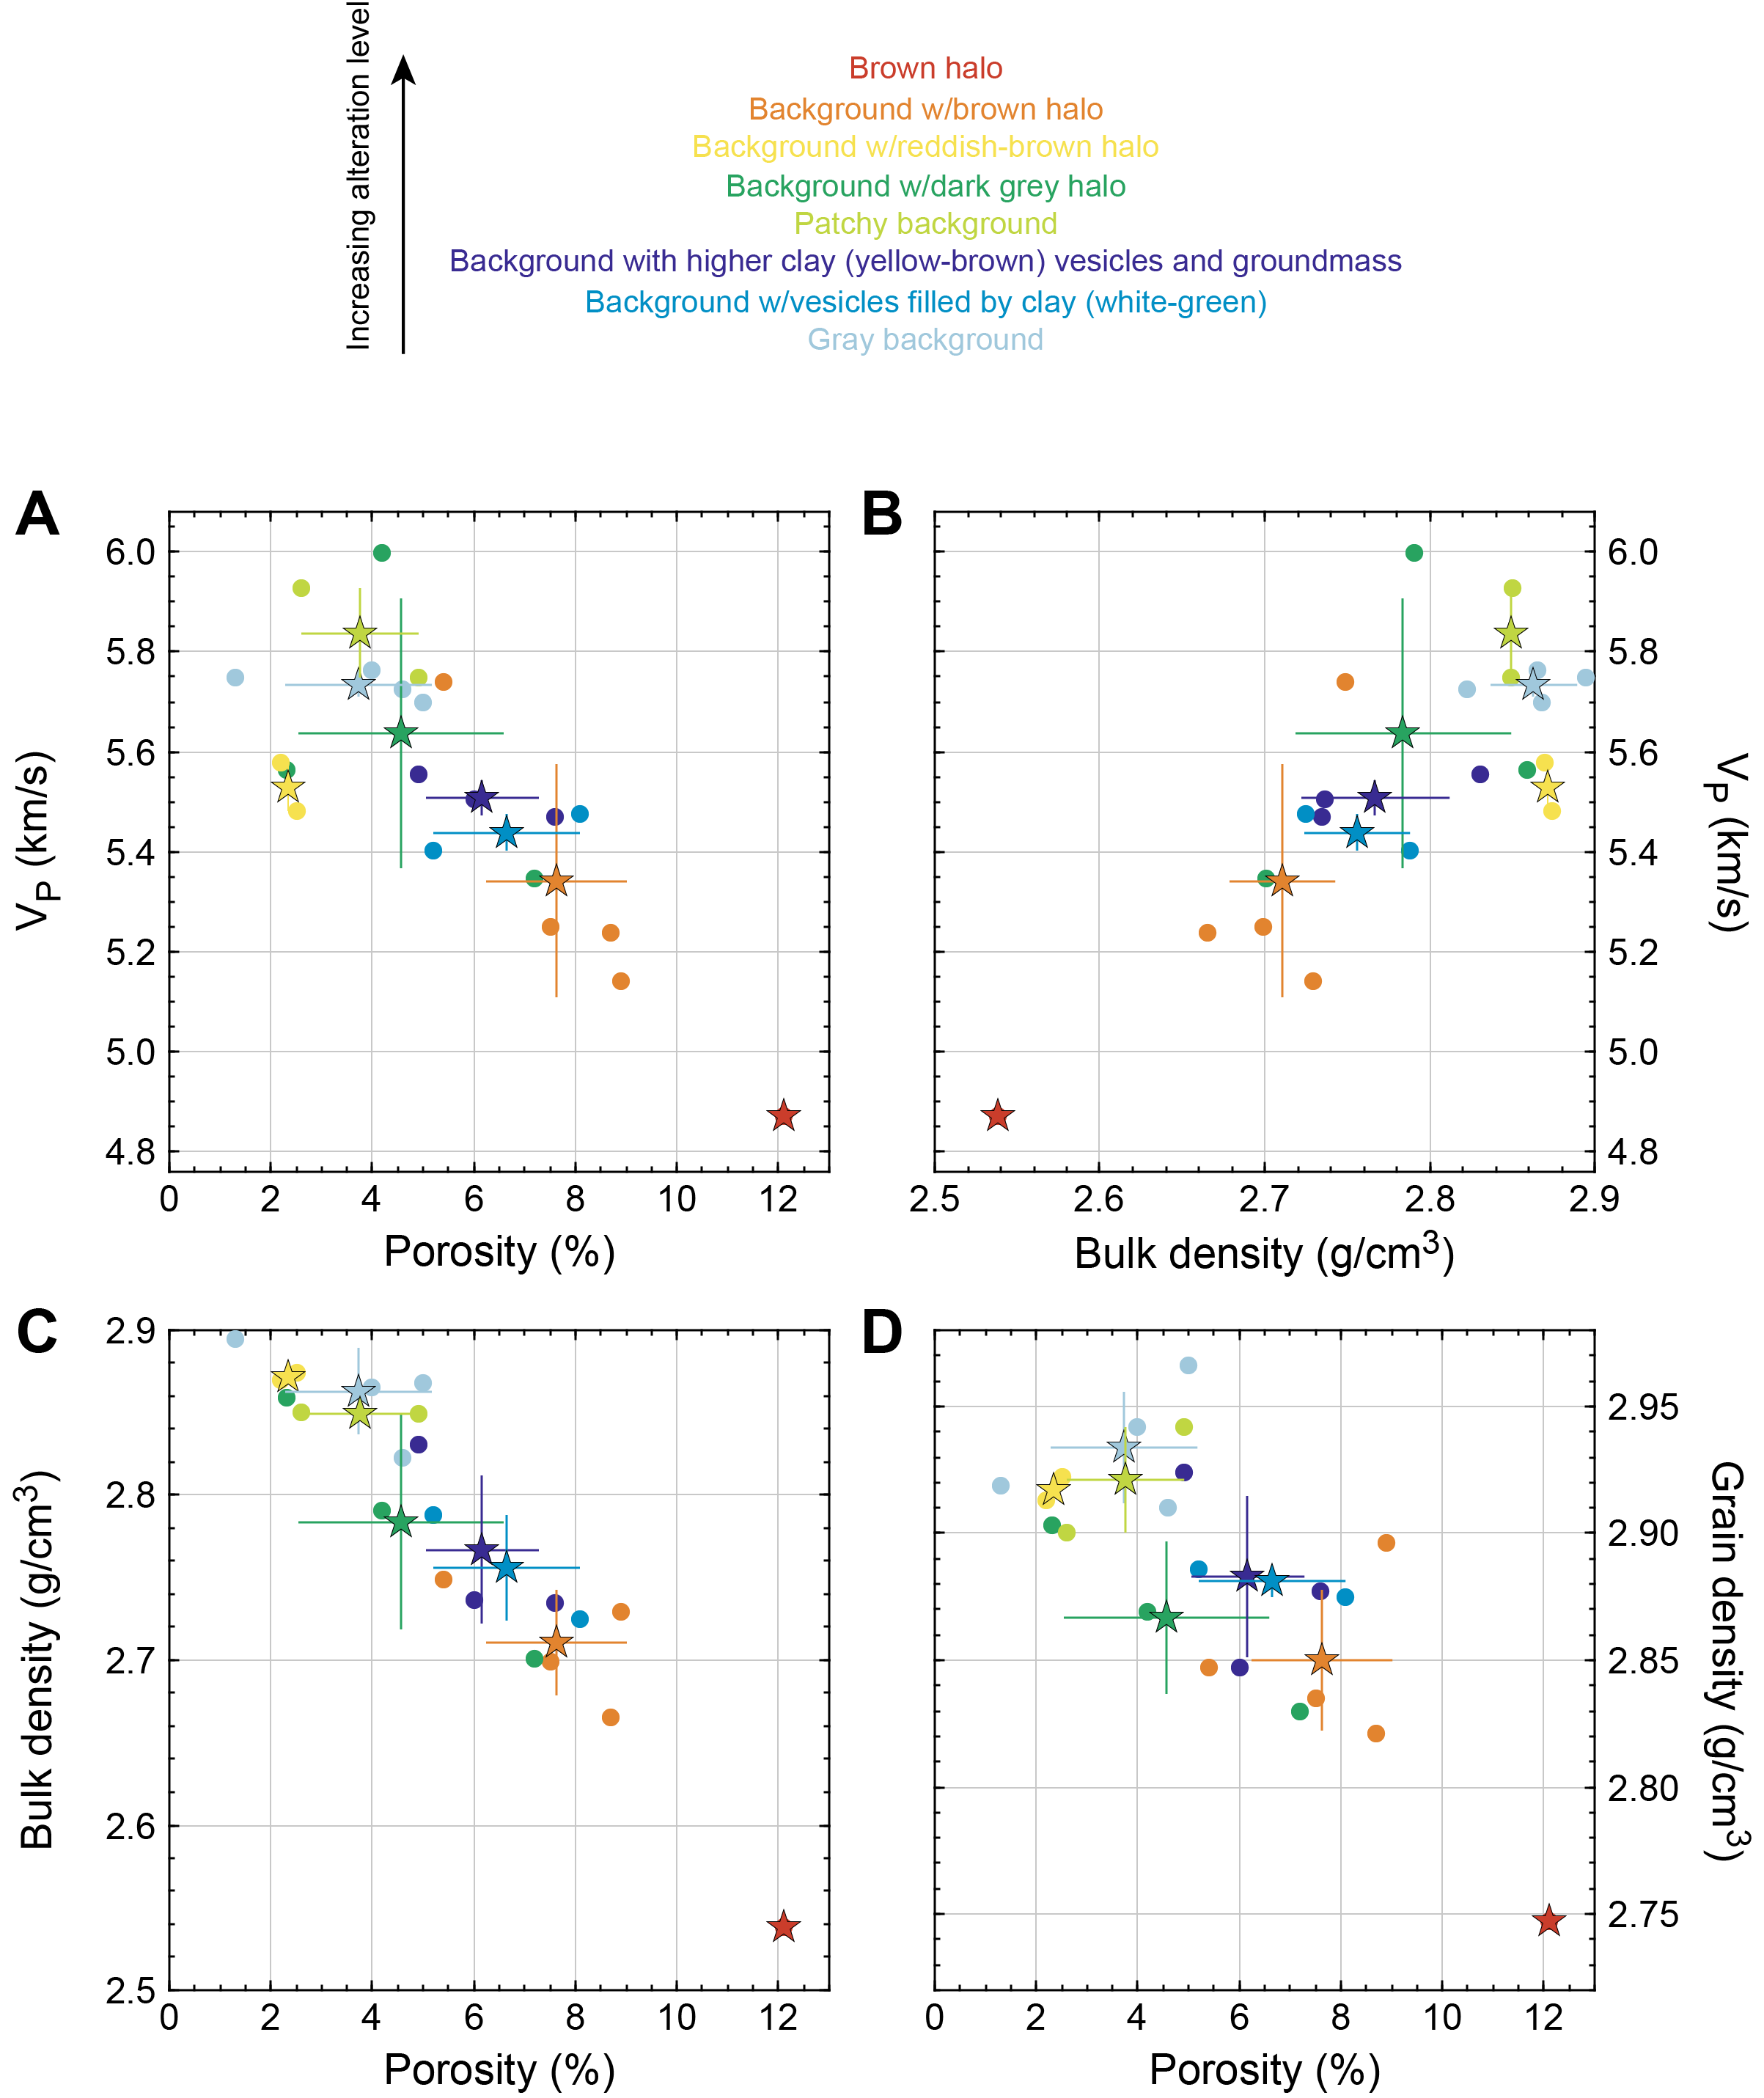
Figure F83. Basalt physical properties by alteration level.
As a whole, physical properties trends correspond to an increasing alteration level with depth in Hole U1583F, where Subunits 5A–7B tend to show higher levels of alteration compared to Units 1–3 (Figure F84).
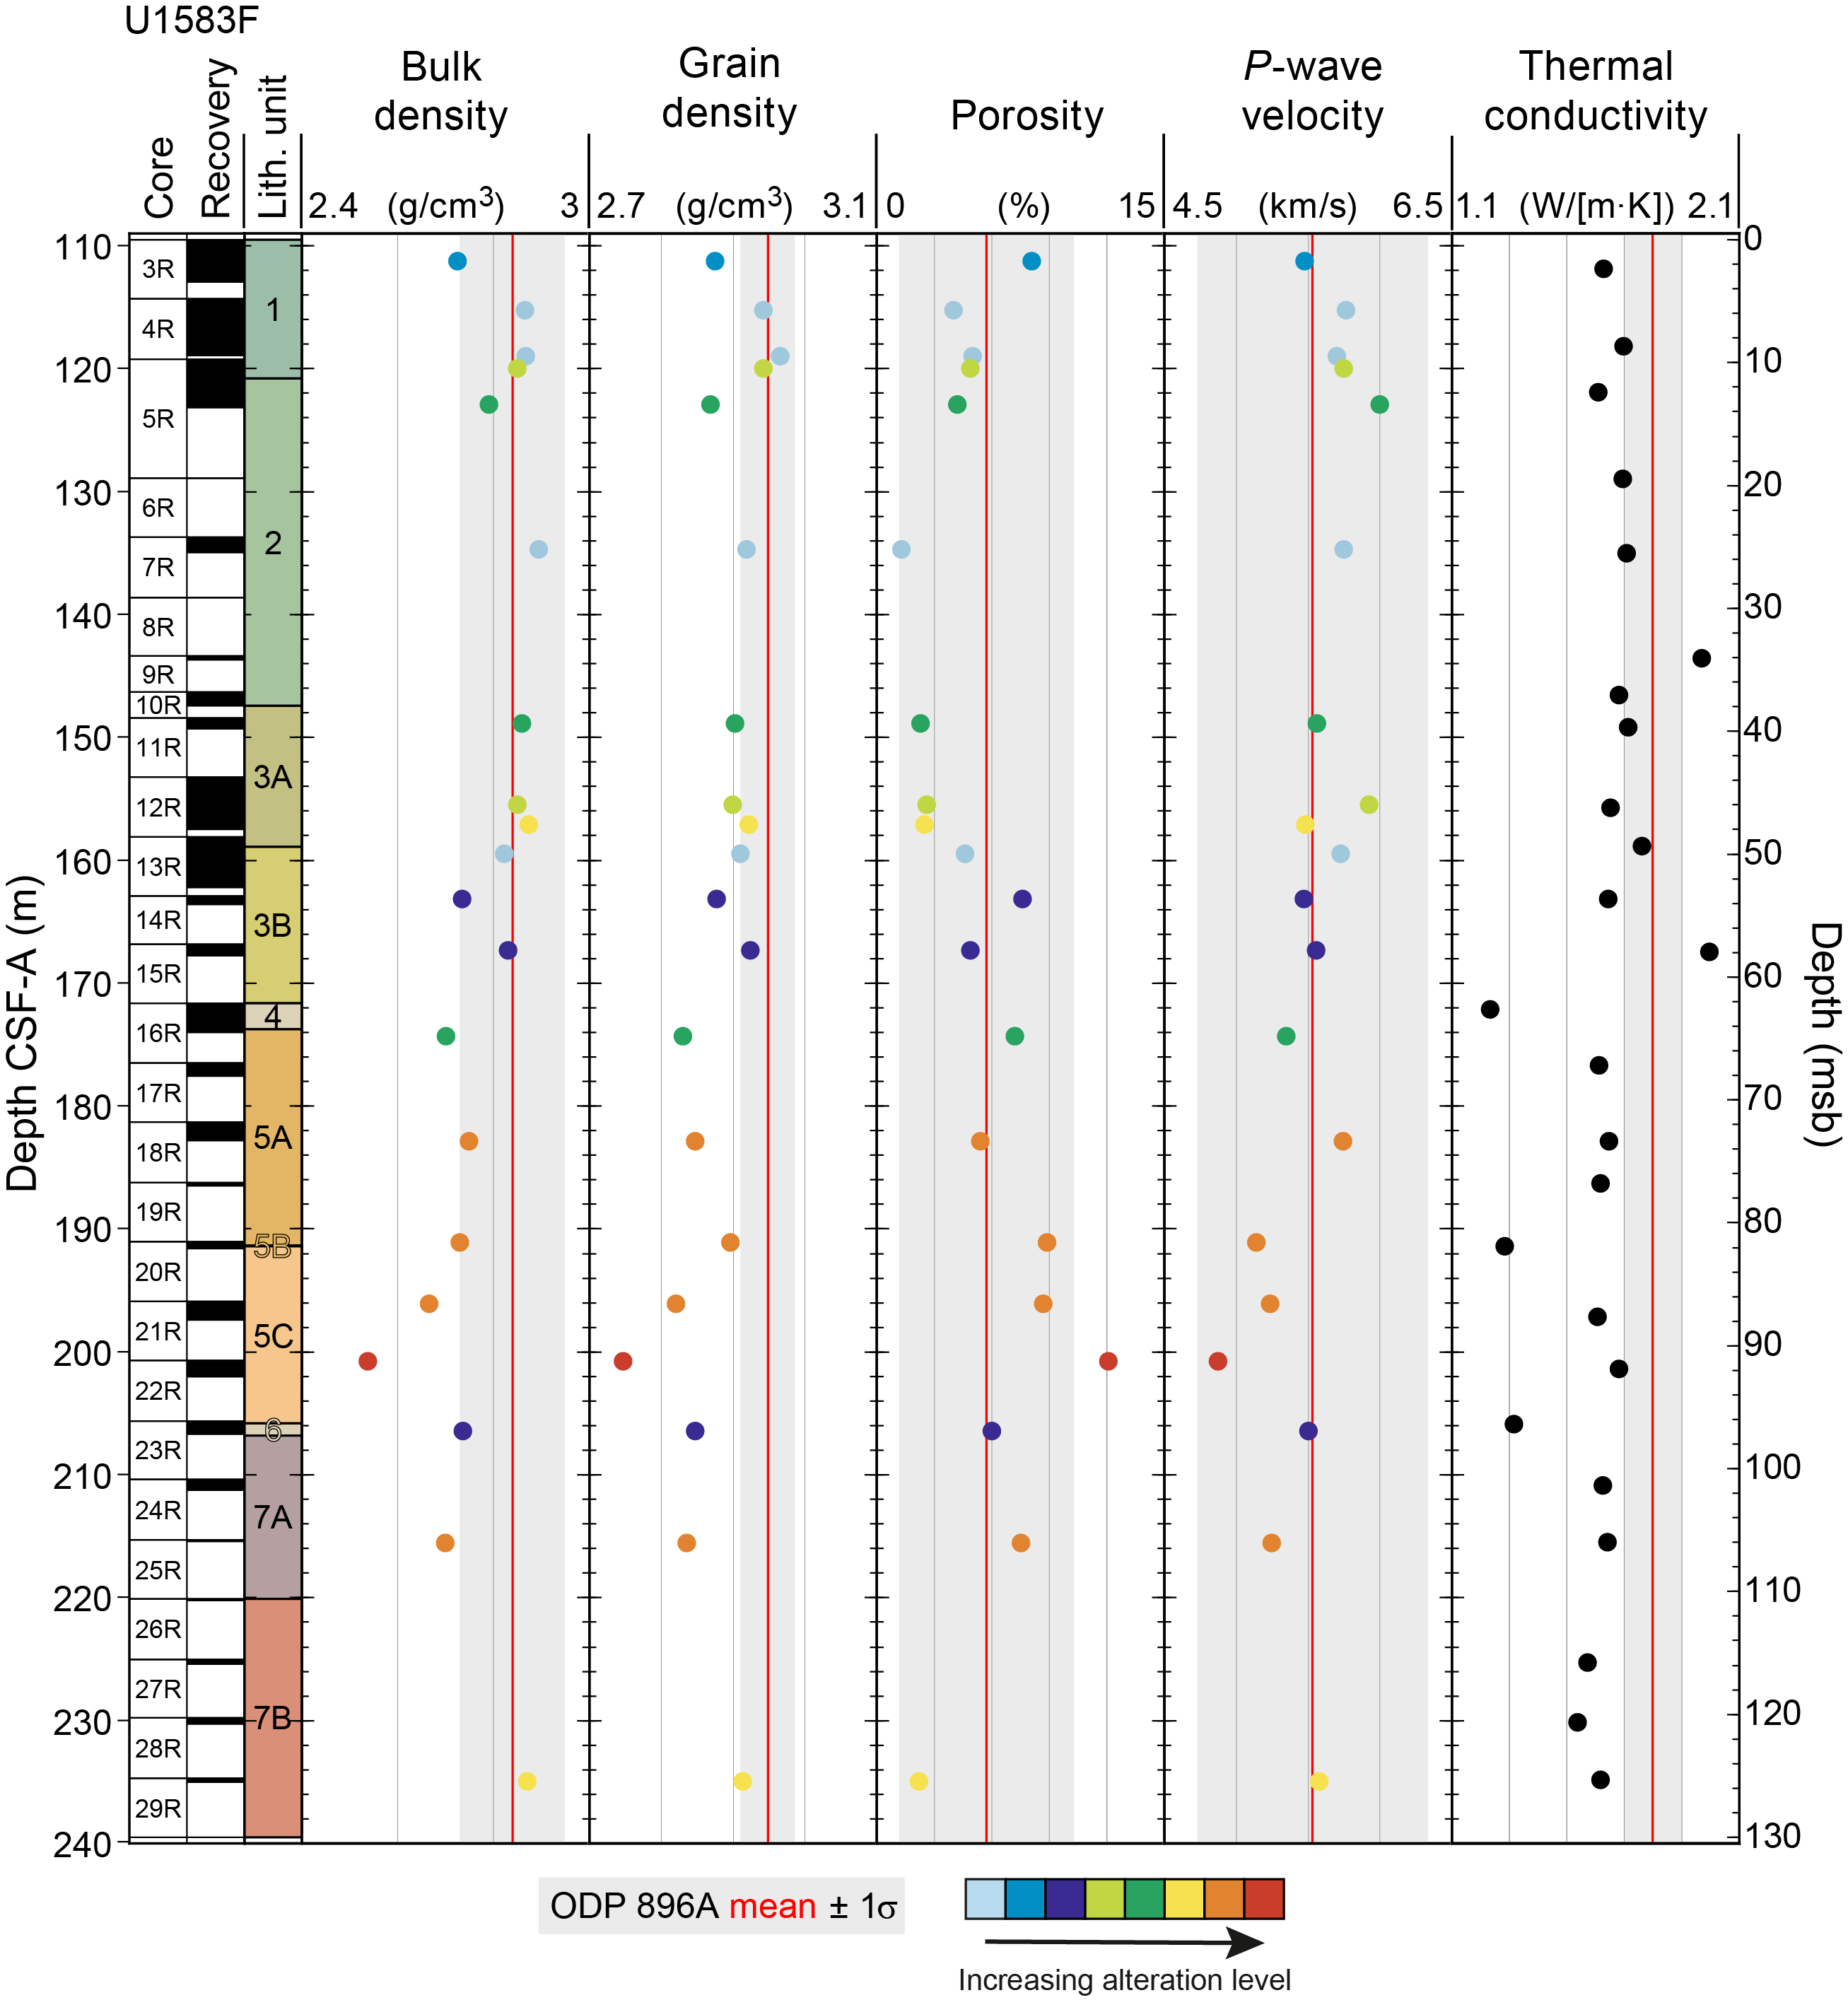
Figure F84. Discrete physical properties, Holes U1583F and 896A.
10.2.3. Comparison to ODP Hole 896A
Physical properties from discrete samples at Site U1583 were compared to data from Ocean Drilling Program (ODP) Hole 896A (~7 Ma; Shipboard Scientific Party, 1993), which was used as a reference site that allows us to compare results across the SAT to young oceanic crust produced at an intermediate spreading rate ridge. Physical properties data from Hole 896A encompass the range of basalt alteration levels that were sampled from these Site U1583 cores (see Physical properties and downhole measurements in the Expedition 390/393 methods chapter [Coggon et al., 2024a]) (Figure F84). Lithostratigraphic Units 1–3 and Subunit 7B tend to overlap well with the range from Hole 896A in terms of bulk density and grain density. These intervals are also generally associated with fresher basalts in Hole U1583F (Figure F84). Most samples in Subunits 3B–7A diverge from the reference values for young basalt from Hole 896A. Hole 896A shows a wide range of P-wave velocity, and all velocities from Hole U1583F fall within ±1σ of the mean of Hole 896A. Hole 896A also shows a wide range of porosity that encompasses all but the most altered basalt sample from Hole U1583F (Figure F84). The mean thermal conductivity in Hole U1583F (1.63 ± 0.17 W/[m·K]) is lower by ~0.1–0.2 W/(m·K) than the mean thermal conductivity in Hole 896A (1.8 ± 0.11 W/[m·K]) and significantly lower (by ~0.5 W/[m·K]) in the sedimentary breccias from Unit 4, Subunit 5B, and Unit 6.
10.2.4. Wireline logging
After completion of basement coring in Hole U1583F, three logging runs were considered. A first run with the triple combo tool string would record the most basic measurements (resistivity, gamma ray spectroscopy, neutron log) and evaluate hole conditions. If the conditions for logging (hole size and sea state) were favorable, it would be followed by the FMS-sonic tool string (sonic velocity and electrical images) and the Ultrasonic Borehole Imager (UBI; acoustic images of the borehole wall). As part of the triple combo, the Hostile Environment Litho-Density Sonde (HLDS) was run only for caliper and without a source because of concerns about hole stability; while coring, it was noted that cuttings did not seem to get properly flushed, and there were a few questionable intervals, making the use of the source an unnecessary risk.
Eventually, only the triple combo reached the bottom of the hole, and the FMS-sonic tool string was able to record images in the upper ~60 m of basement.
10.2.4.1. Wireline operations
Preparation for logging started at 1730 h (local time, UTC − 2 h) on 16 July 2022 after completion of coring and release of the bit at the bottom of the hole.
The triple combo was built and run into the hole (RIH) at 2040 h. After some issues with telemetry, the tools were brought back to the surface for troubleshooting, and RIH resumed at 0130 h on 17 July with a replacement High-Resolution Laterolog Array (HRLA) sonde. Some distance above the seafloor (4221.5 mbrf), the tools started recording a partial set of data (downlog) until reaching ~5 m off the bottom of the hole (4456 mbrf; 234.5 mbsf), and then started a first upward pass at 0410 h. This first pass was briefly interrupted with the bottom of the tool at ~4394 mbrf when the WHC stopped functioning and the caliper was closed while troubleshooting the failure. The WHC failed to restart, but heave was moderate and the caliper was reopened until completion of the pass at 4365 mbrf. When trying to return to the bottom of the hole for a second pass, we failed to go deeper than 4400 mbrf (~177 mbsf). The second pass started from that depth at 0555 h and was complete after identifying the seafloor with the gamma ray log at 4222.5 mbrf. The tools were back on the rig floor at 0915 h.
Because hole conditions above 170 mbsf seemed satisfactory and the ~60 m open interval encompassed several volcanic units with poor recovery, it was decided to attempt a run with the FMS-sonic tool string. Operations were delayed by a simultaneous vibration isolated television camera survey; the completed tool string was RIH at 1205 h, and a downlog for gamma ray and sonic logs started at 1530 h, shortly before crossing the seafloor. The string also failed to go deeper than 4400 mbrf (~177 mbsf), and the uplog started from that depth at 1556 h. Soon after, one of the FMS arms displayed signs of failure, possibly after hitting some hard ledge(s) during the downlog, but the other arms were recording properly. The pass was stopped with the bottom of the tool and the shallowest images at 4330 mbrf (~110 mbsf, close to the top of the basement). But when trying to record a second pass, it proved impossible to return into the basement, or, when that failed, to bring the tool string fully back inside the pipe. After several hours of effort, the string was brought to the surface with one FMS arm missing and the others damaged; no further logging operations were attempted. Logging tools and equipment were stored, and the rig floor resumed normal operations by midnight on 17 July.
10.2.4.2. Data overview
Summaries of the main data recorded during the triple combo and FMS-sonic runs are shown in Figures F85 and F86, respectively. The caliper log in Figure F85 is a combination of the two upward passes of the triple combo with the caliper open, and it shows that the hole appeared in generally good condition, most notably in the interval above ~170 m wireline log matched depth below seafloor (WMSF) that was targeted for the FMS run. The dramatically asymmetric FMS calipers in Figure F86 illustrate the failure of one of the arms at the beginning of the image acquisition.
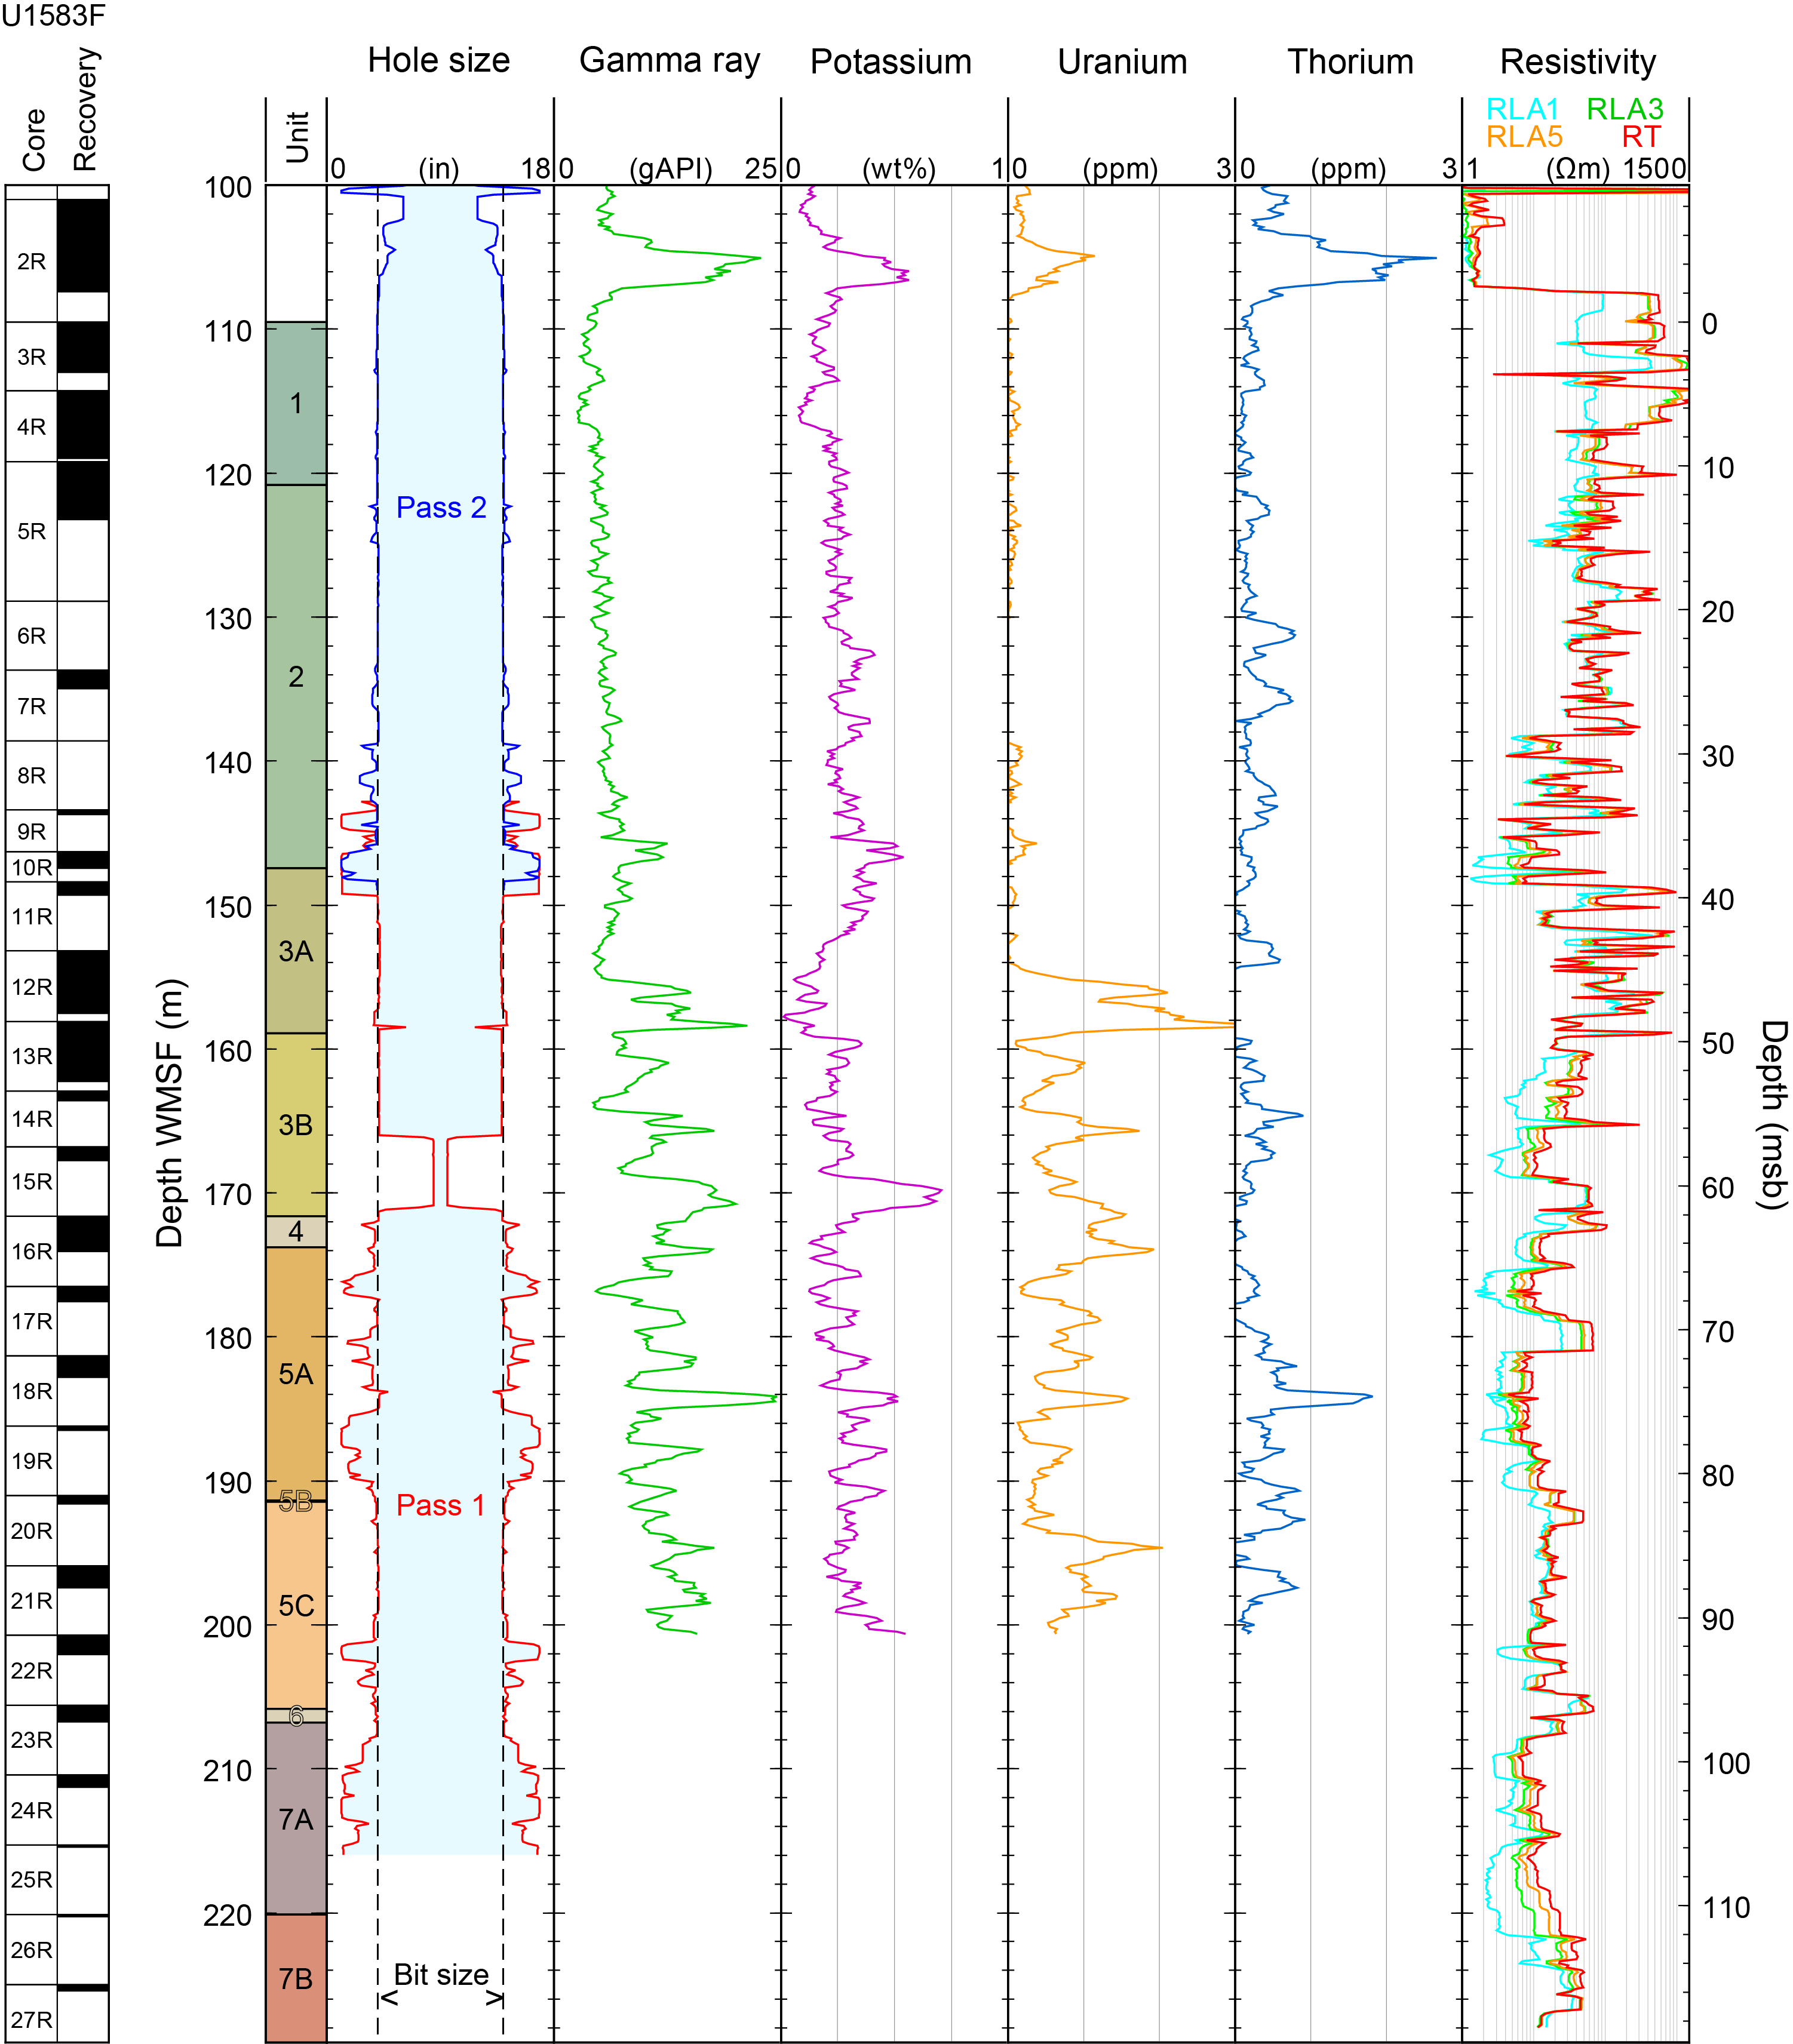
Figure F85. Triple combo logging data.
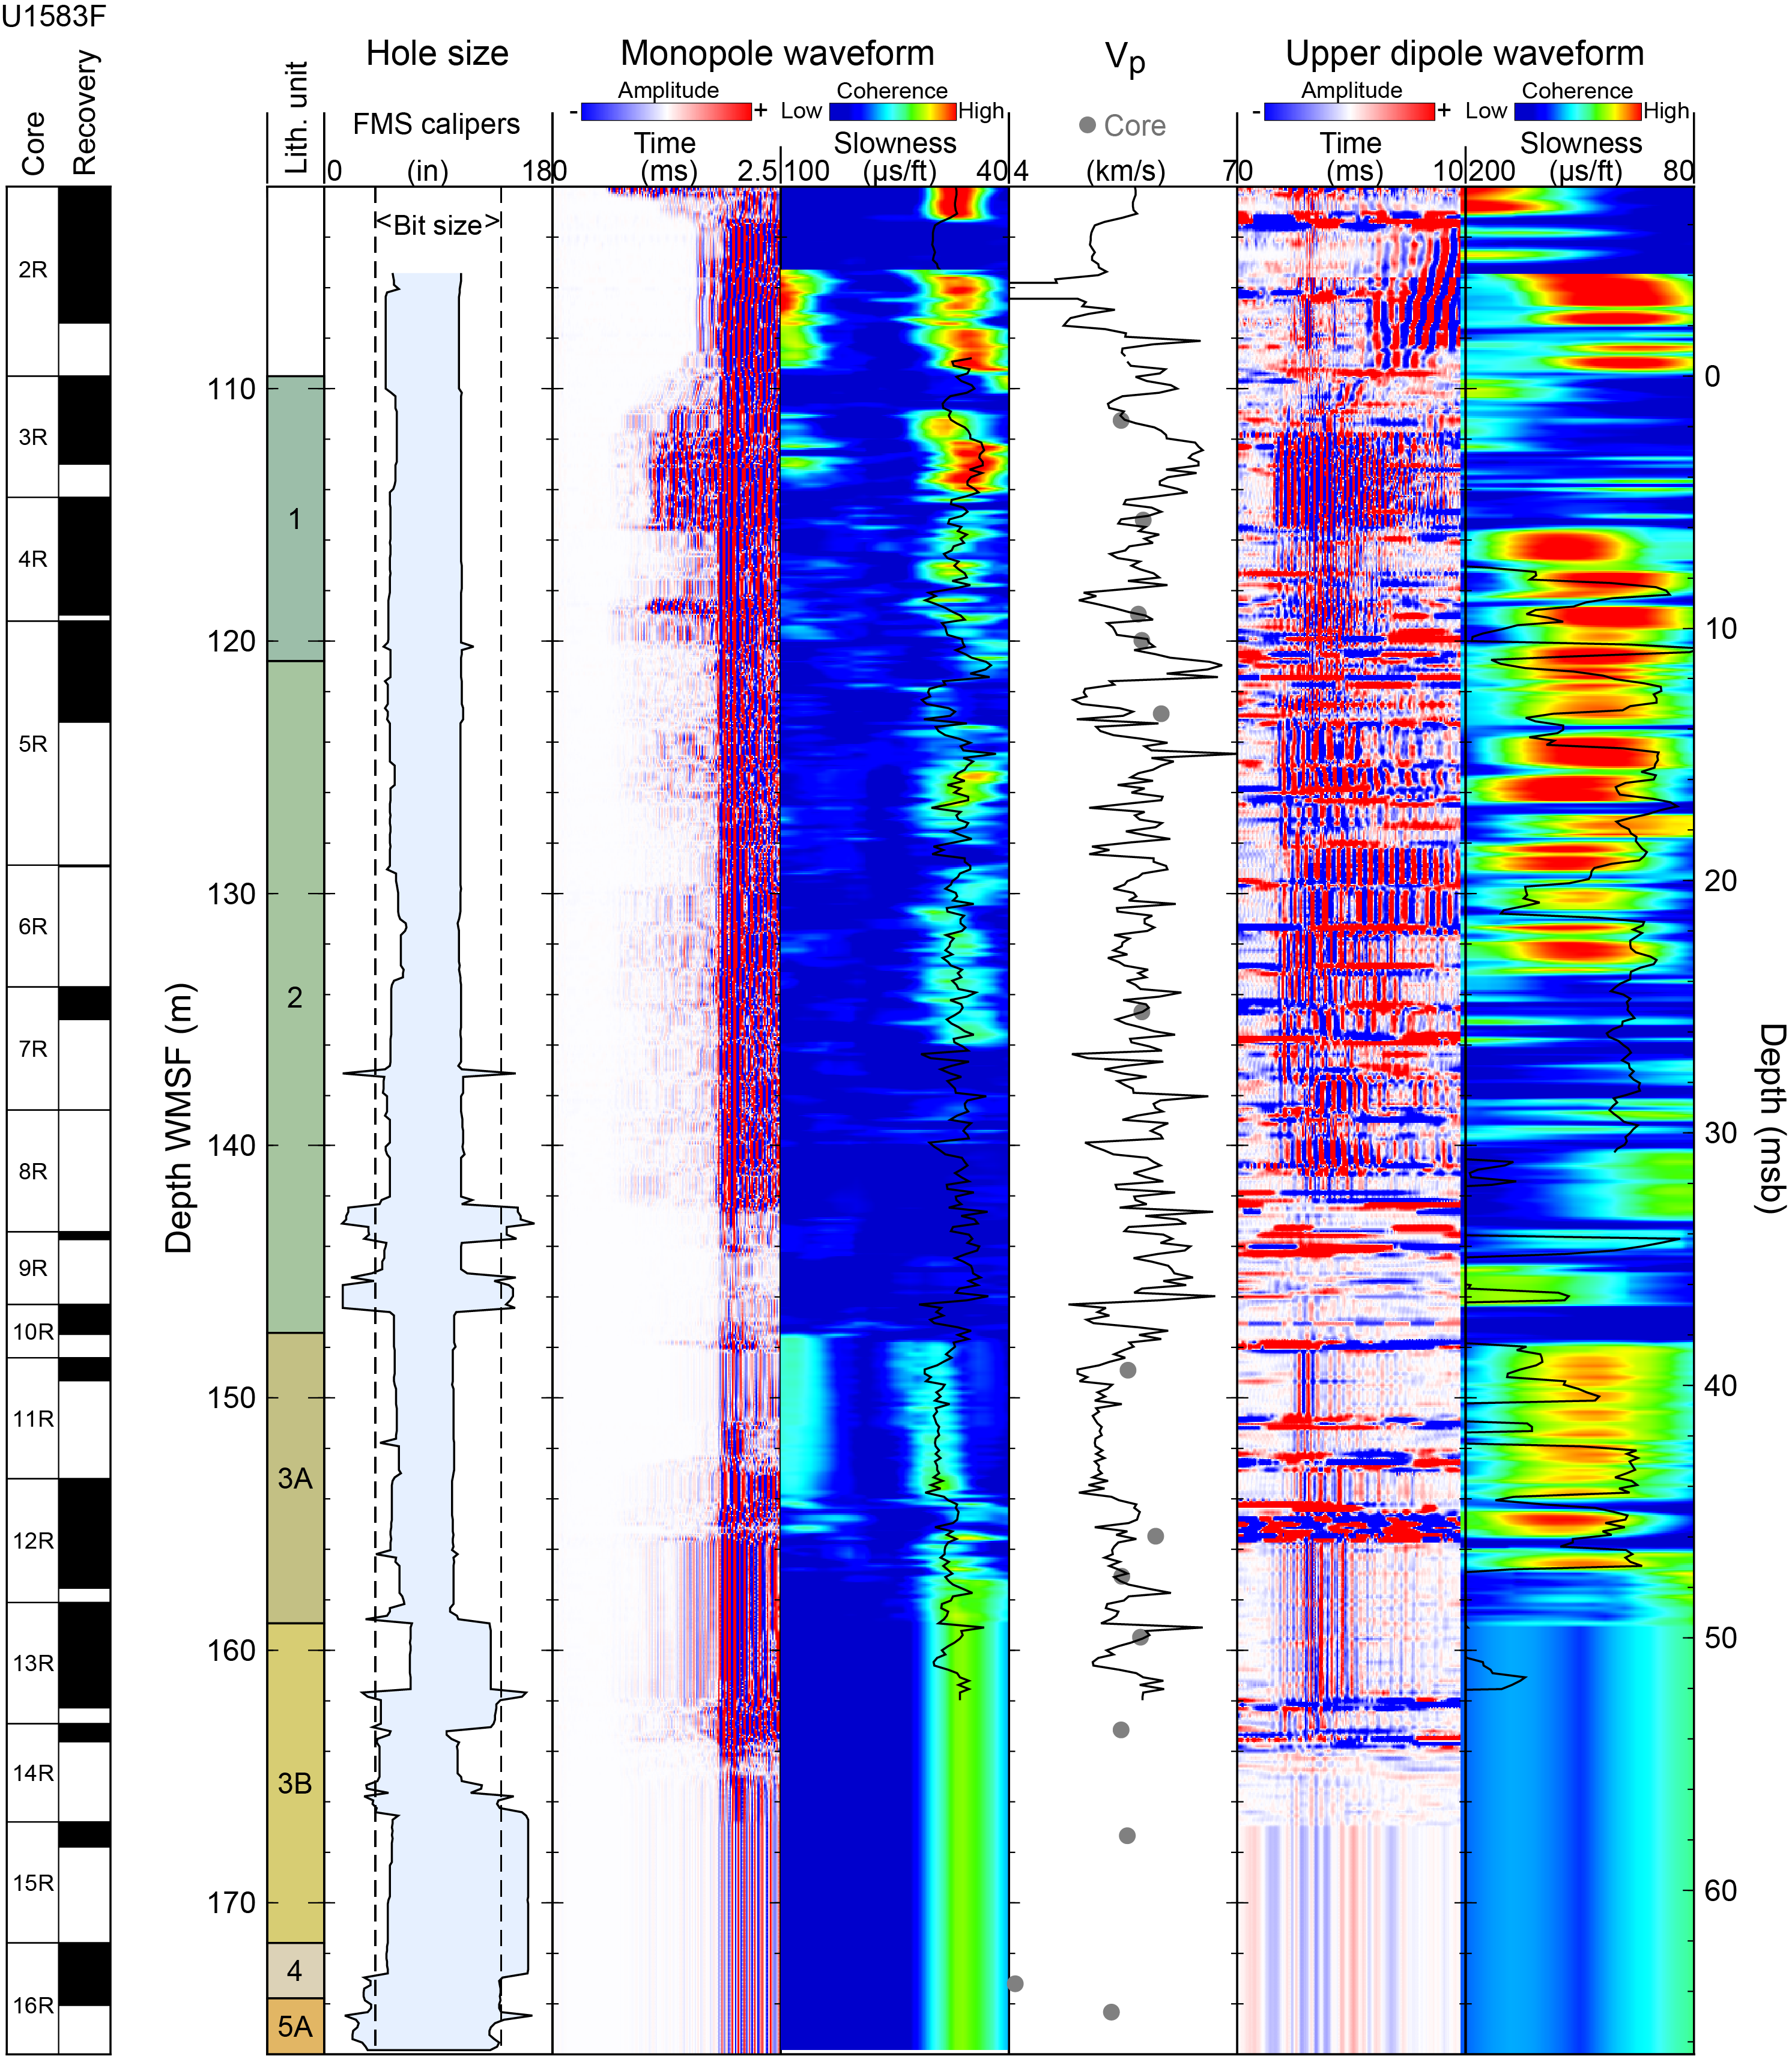
Figure F86. FMS-sonic logging data.
The gamma ray tools are at the top of the string and could not reach the deepest ~30 m of the hole (Figure F85). When the downlog stopped, the data that had been measured over the ~40 m length of the tool string were, in error, not recorded by the acquisition system. As a result, the resistivity data recorded at the beginning of the first uplog are the only logging data of any kind from the deepest ~30 m of Hole U1583F.
The main variations in the resistivity log generally correspond to the various volcanic units identified by the shipboard petrologists (see Igneous petrology). The sharp increase in resistivity at 108 m WMSF is a clear indication of the top of the basement, and Volcanic Unit 1 seems to coincide with a ~10 m thick interval with the highest resistivity values recorded over the interval logged. Resistivity gradually decreases with depth in Unit 2, then increases and becomes highly variable in Subunit 3A, possibly delineating individual flows. Resistivity decreases with depth through Subunits 3B–5A, is mostly uniform around 100 Ωm in Subunit 5C, and below a drop that may be related to Unit 6, gradually increases with depth through Unit 7.
In several intervals, mostly below 160 m WMSF, the resistivity measurement with the shallower penetration (RLA1) is significantly lower than the deeper (RLA5) or "true" values. In most of these intervals, the caliper shows an enlarged hole, and the decoupling between the resistivity readings mostly indicates the failure of the shallower measurement to capture the formation resistivity. In intervals with apparent good hole conditions (in Unit 1 or at 160–165 m WMSF, possibly through 170 m WMSF without caliper reading), it could indicate predominantly subvertical fractures in the formation that provide more conductive (less resistive) paths for the shallower currents.
Natural gamma ray increases slightly downhole through Units 1 and 2, following a trend mostly controlled by the potassium content (Figure F85). However, below 155 m WMSF (in Volcanic Subunit 3A) an apparent increase in uranium content and significant variability in the uranium values seem to dominate the natural radioactivity in the lower half of the interval logged.
In Figure F86, compressional velocity displays significant variability along a slightly increasing trend with depth and agrees well with the core sample measurements, but despite high apparent coherence, the sonic acquisition failed to extract reliable shear sonic velocity from either the monopole or dipole waveforms, which will require postexpedition reprocessing.
10.2.4.3. Data quality
Figure F87 shows the data recorded through the pipe by the two gamma ray tools that were part of the two tool strings: the Hostile Environment Natural Gamma Ray Sonde (HNGS) and the Enhanced Digital Telemetry Cartridge (EDTC). One of the main purposes of recording these data is to identify the step in gamma ray at the seafloor and provide a reference depth for the logging data. The triple combo downlog, the very first pass to cross the seafloor, suggested a depth of 4222.5 mbrf, about 1 m deeper than the driller estimate. This depth was confirmed by the following passes, but the gradual increase in gamma ray readings over time in the subsequent passes made identification of the seafloor more difficult. At this point this increase in radiation with time can only be explained by formation material falling in the space between the pipe and the borehole wall.
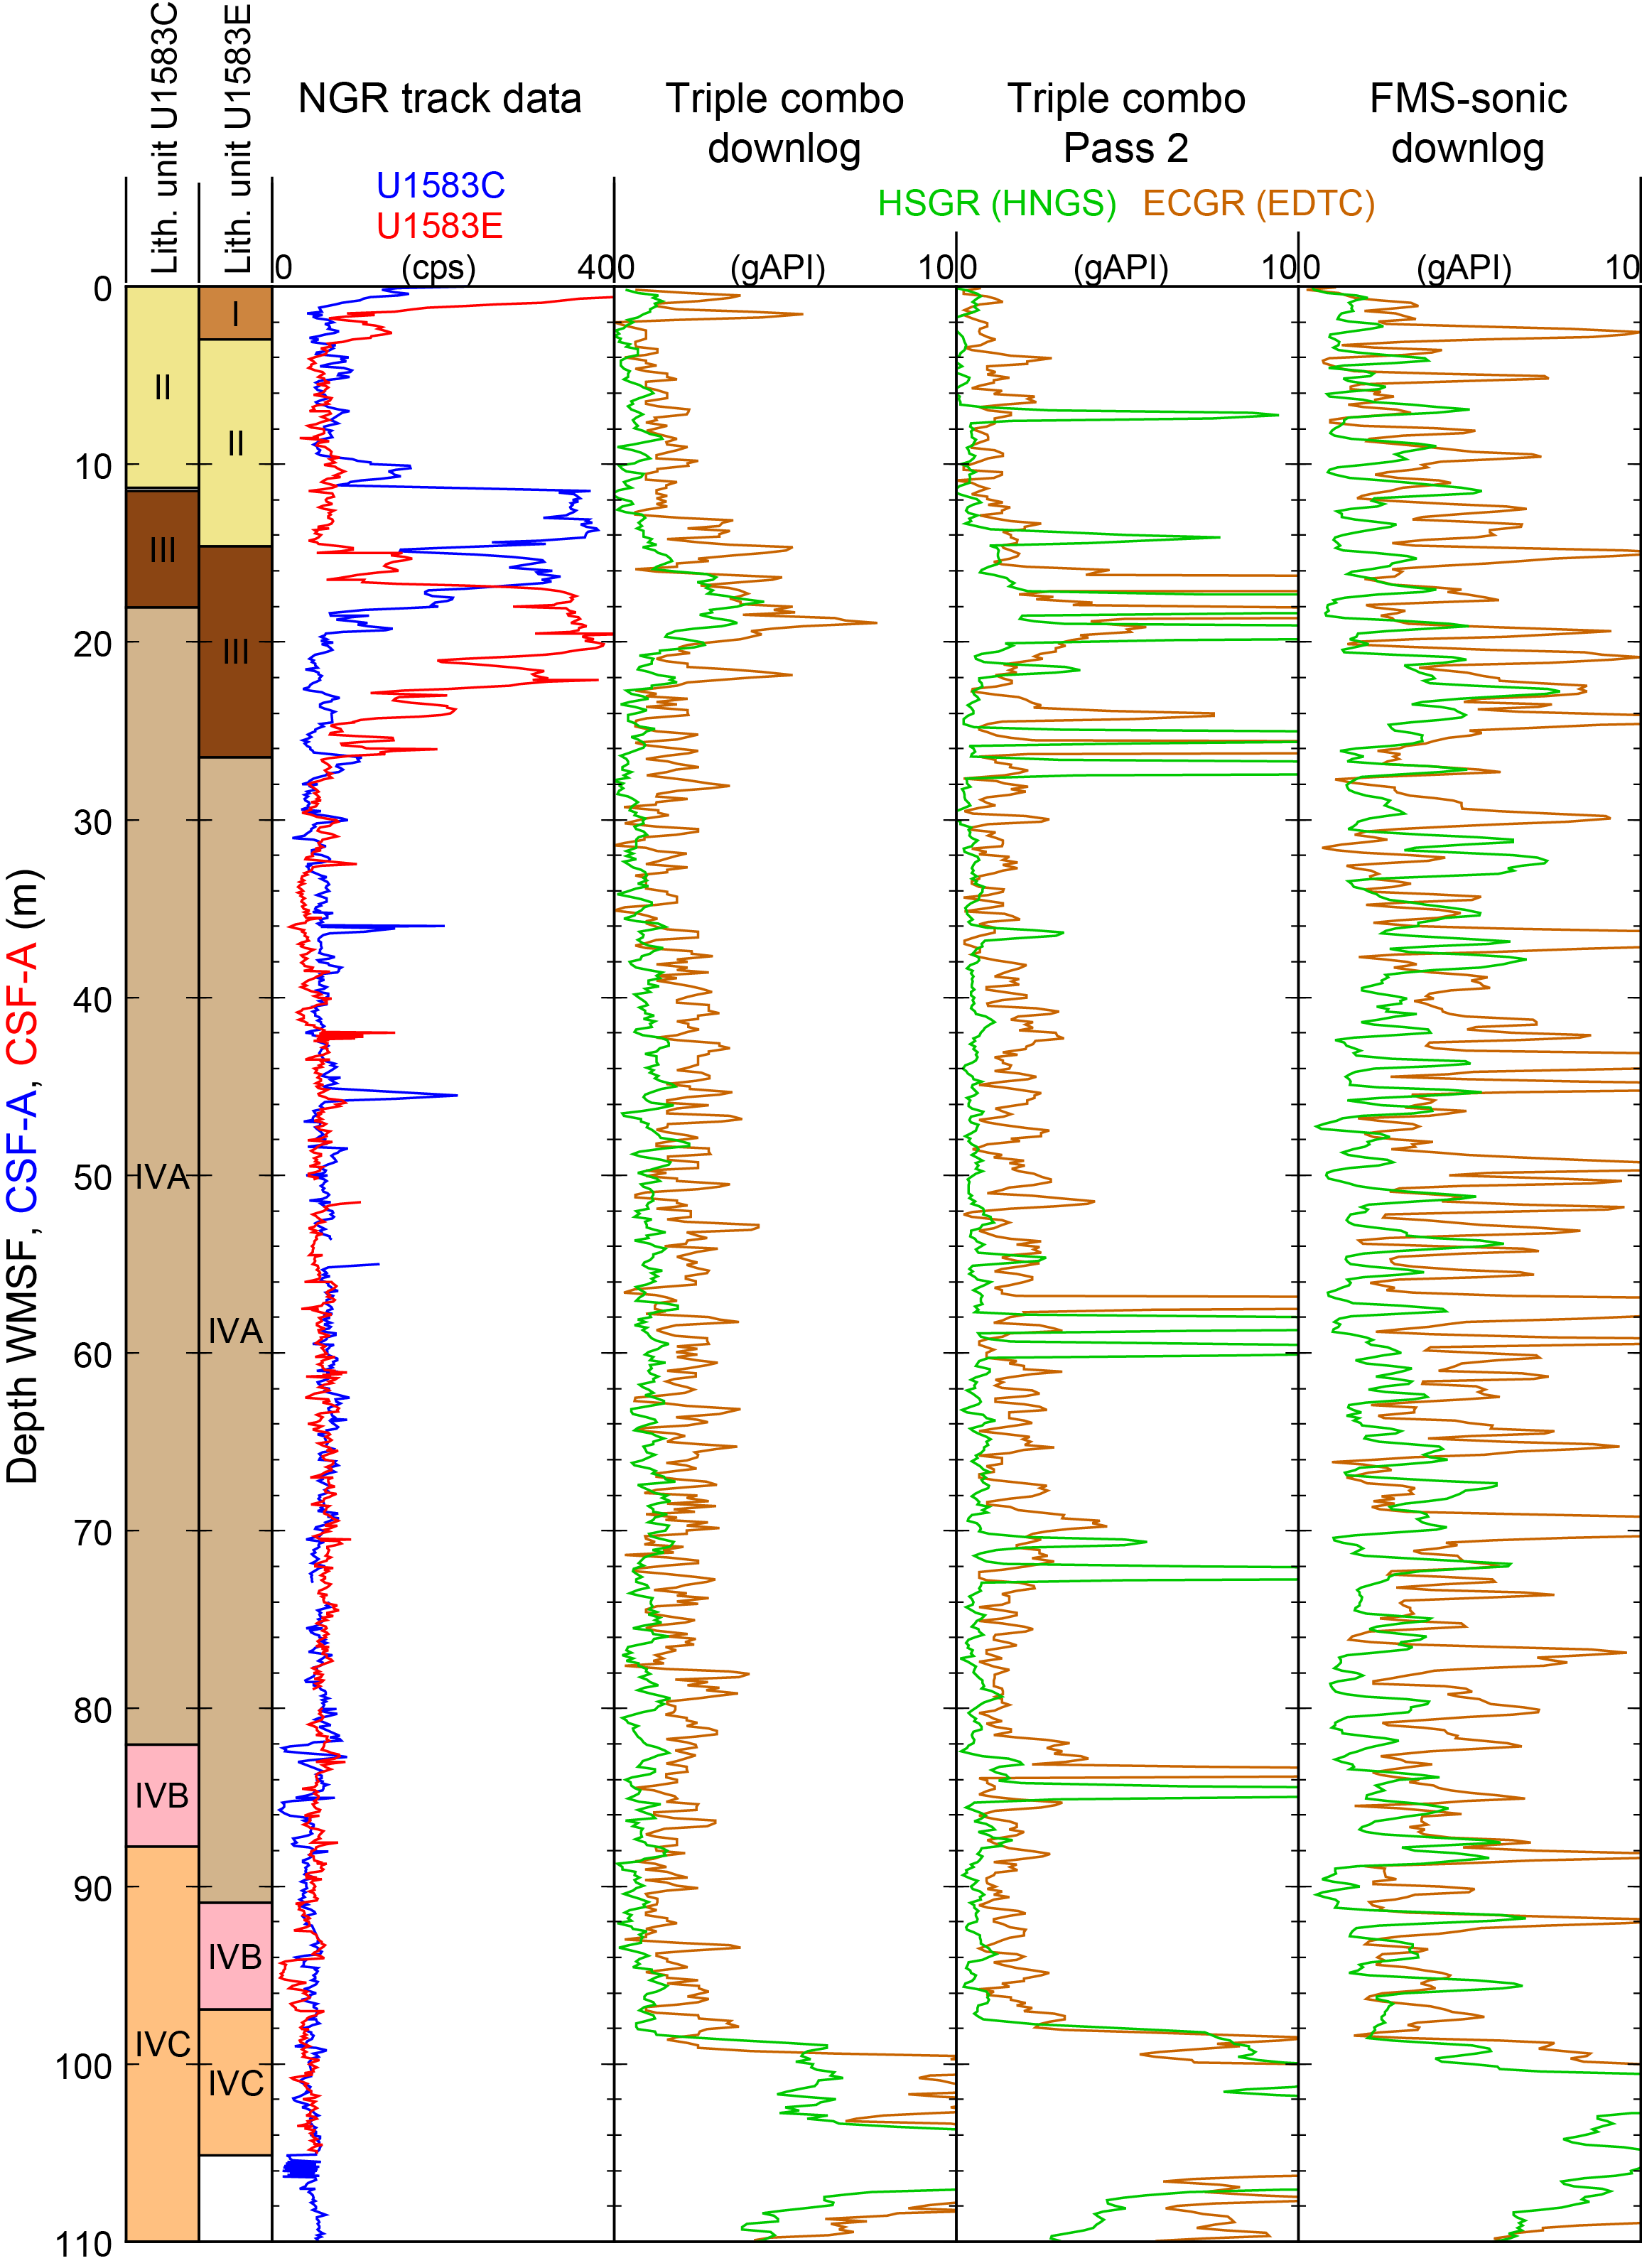
Figure F87. Gamma ray logs compared with NGR track data.
Although attenuated by the drill pipe, most passes, and most clearly the downlog from the triple combo, captured the high gamma ray values associated with clay-rich Lithostratigraphic Unit III between ~12 and 22 m WMSF. Figure F87 illustrates the differences in the depth where this unit was identified in the three holes where it was encountered: this interval sits between the two high gamma ray intervals in NGR core logging values from Holes U1583C and U1583E, between 10–20 m CSF-A and ~15–25 m CSF-A, respectively. These discrepancies come partly from the difficulty to get a clean mudline in deep water and with significant heave, both from logging and coring, but also possibly from local stratigraphic differences at a site with measurable bathymetric variations.
Other factors affecting the logging data and their depth at Site U1583 are illustrated in Figure F88. The true resistivity measured during the three passes with the triple combo are displayed alongside the tension measured at the top of the tool string during each pass. Comparison between the different resistivity logs shows similar general trends but significant differences in the depth or thickness of features that could represent separate flows or distinct lithologies. Without acceleration measurements, tension is the only indication of the tool motion, and the figure shows at least two places where the data may have been affected by unexpected changes. During the downlog, the tool appears to have stopped momentarily at ~146 m WMSF, likely resulting in some squeezing and stretching of apparent features above and below this depth. A more consequential event was the WHC failure during the first pass. It forced us to close the caliper at ~170 m WMSF but also forced the tool string to stop and, when it restarted, to merely smear the logs in the interval between 182 and ~170 mbsf. The WHC failure also likely affected the depth tie that was established on the rig floor before the tools started going down. While these two instances are the most apparent, the motion of both tool strings seems to have been affected by the irregular hole size and probably some hard ledges, and one should afford some flexibility while trying to match features between passes or between log and core data.
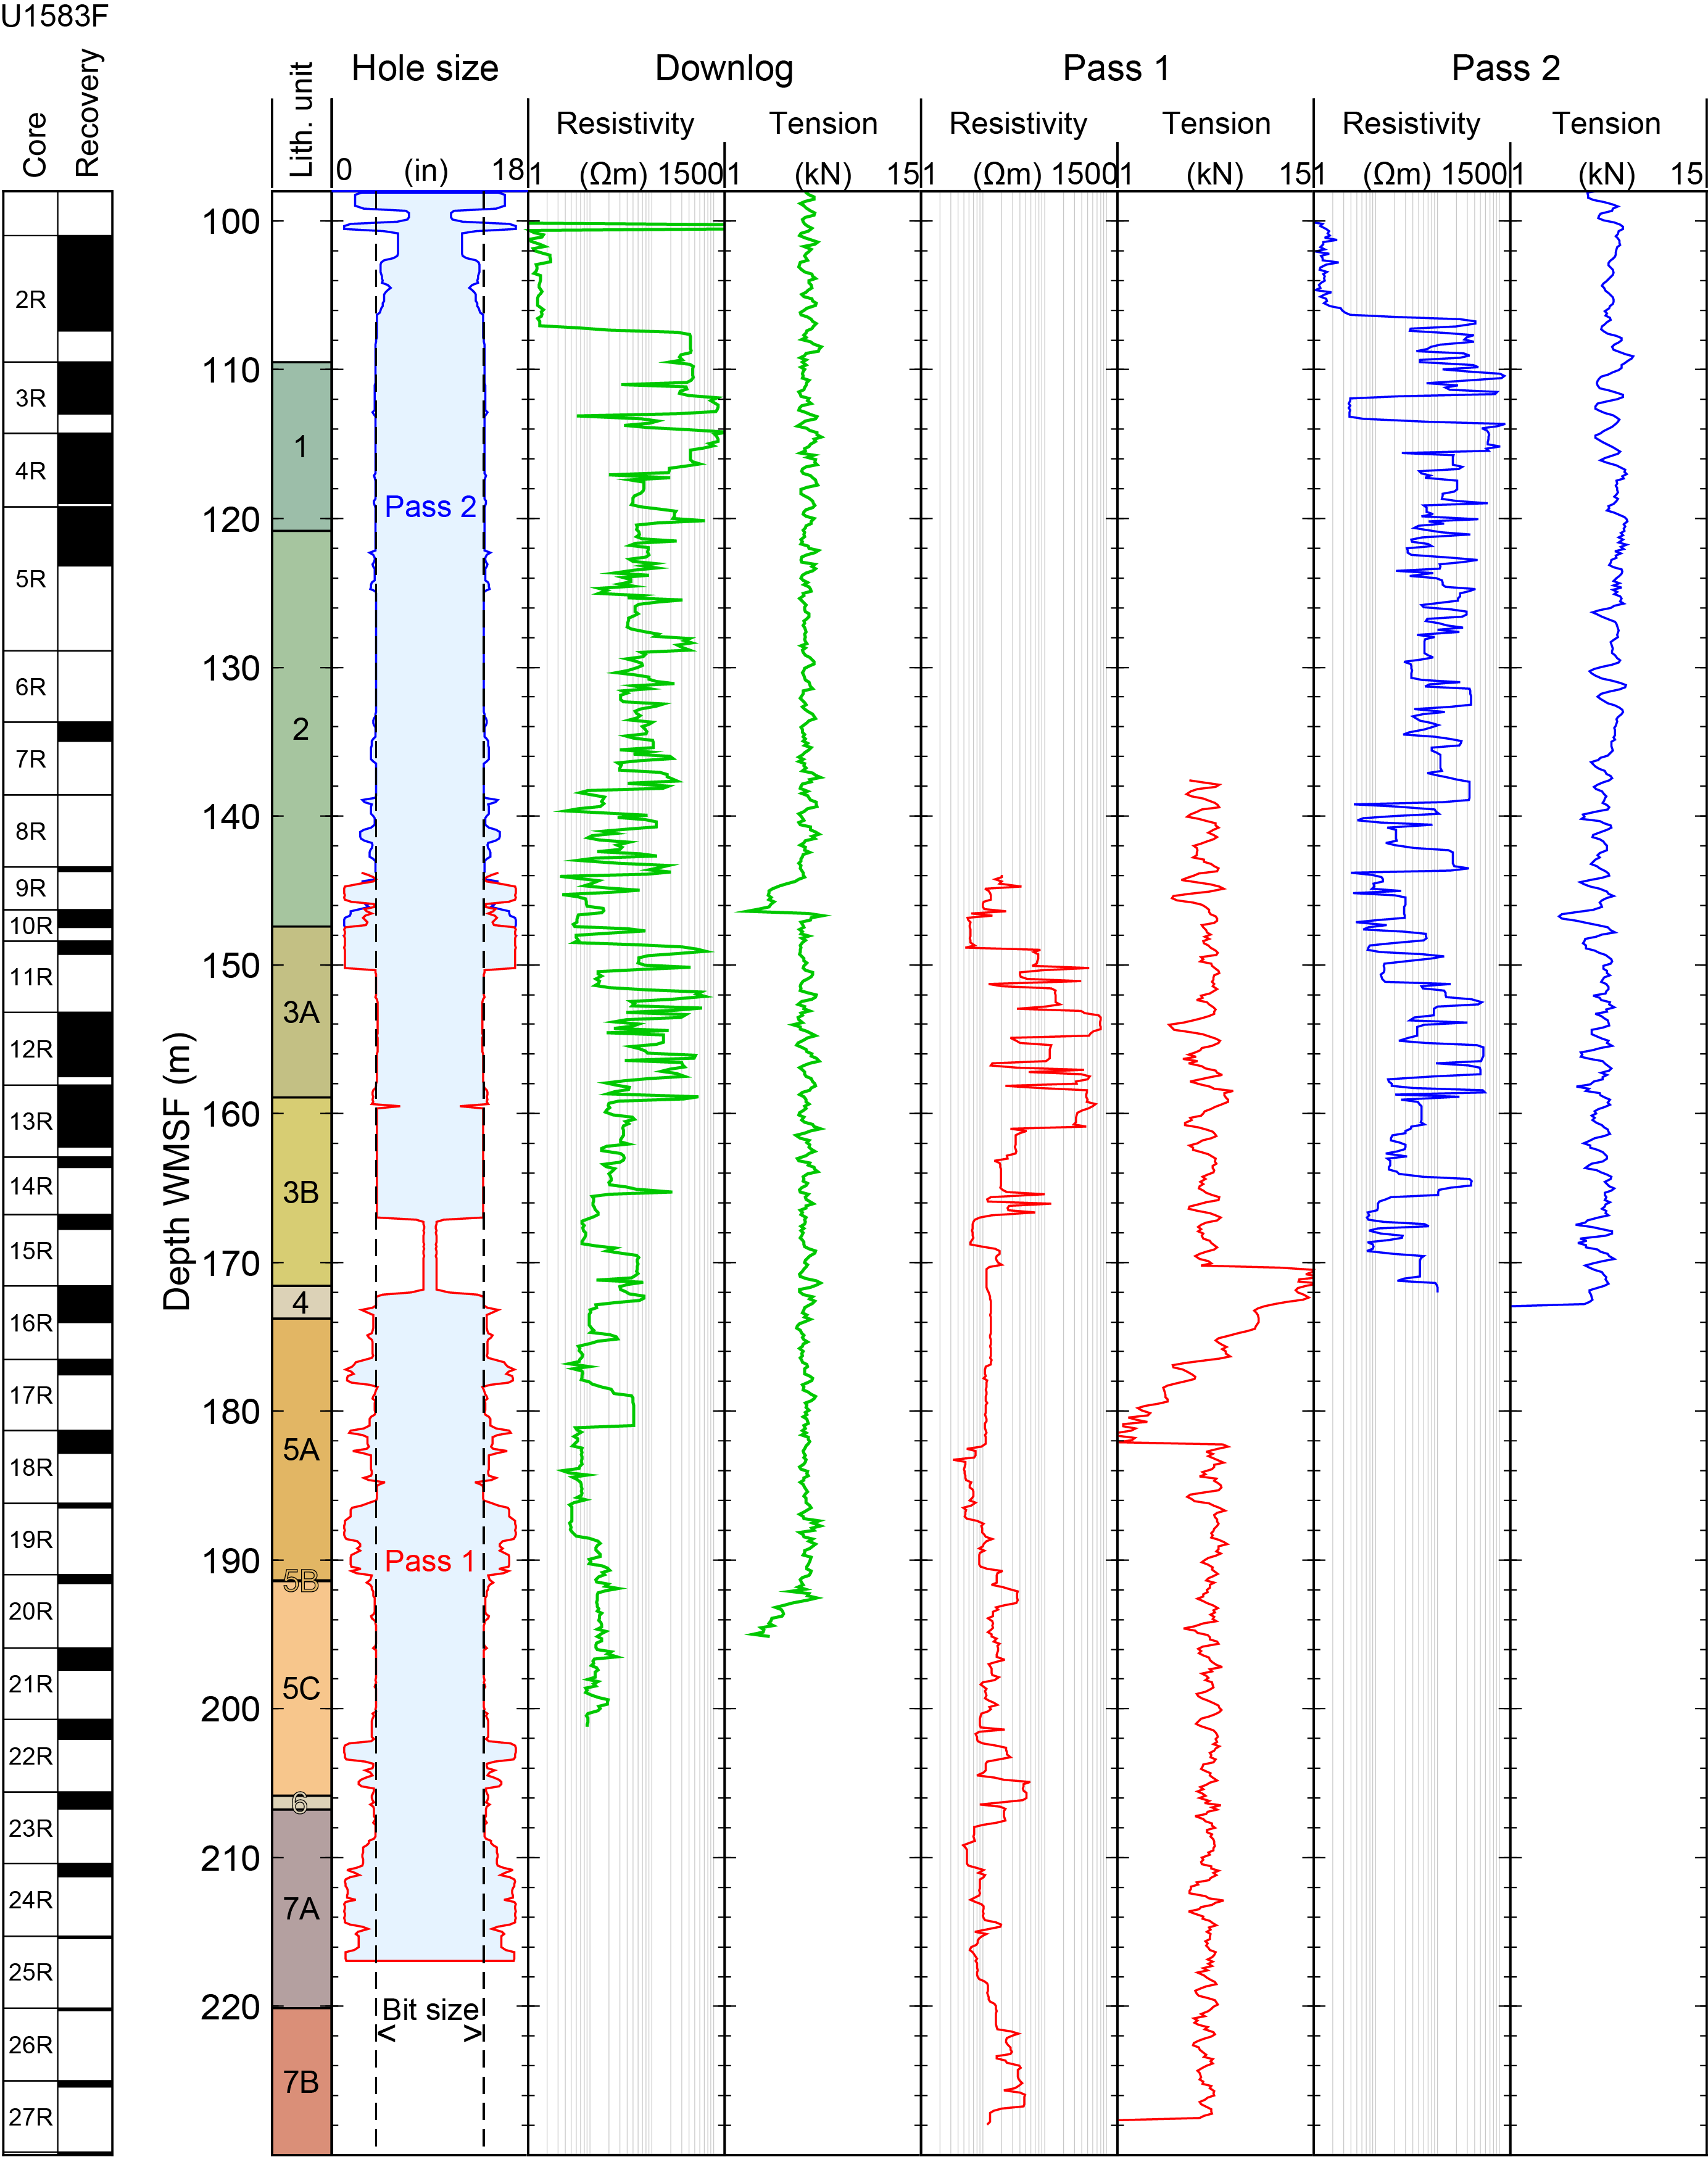
Figure F88. Resistivity logs and cable tension compared with caliper logs.
10.2.4.4. Data integration
Despite the difficulties and some reservations, the hole quality was good in many places, and the logs should provide insight into the petrophysical properties of the basement at Site U1583 and help constrain the interpretation and position or orientation of features observed in the recovered cores.
Figure F89 shows what could be the signature in the FMS electrical images of a vein observed in one of the shallowest basement cores. The subvertical dark (conductive) feature in the pad oriented to the north, most visible in the dynamically enhanced image, could be created by a vein observed in Sections 393-U1583F-3R-1 and 3R-2 in Volcanic Unit 1. The different vertical extent between the vein in the core and the pattern in the images is the manifestation of the difference in diameter between the core (2.31 inches) and the borehole (10 inches). The FMS image needed to be shifted upward by ~1.7 m to create a visual match, and there is a possibility that the image may be of a different vein, but such an offset could be explained by the incomplete recovery of Core 3R and can be expected in the conditions the data were recorded. If it is not the same vein, the FMS image could suggest the existence in that interval of a network of similarly oriented veins to those recovered in the core.
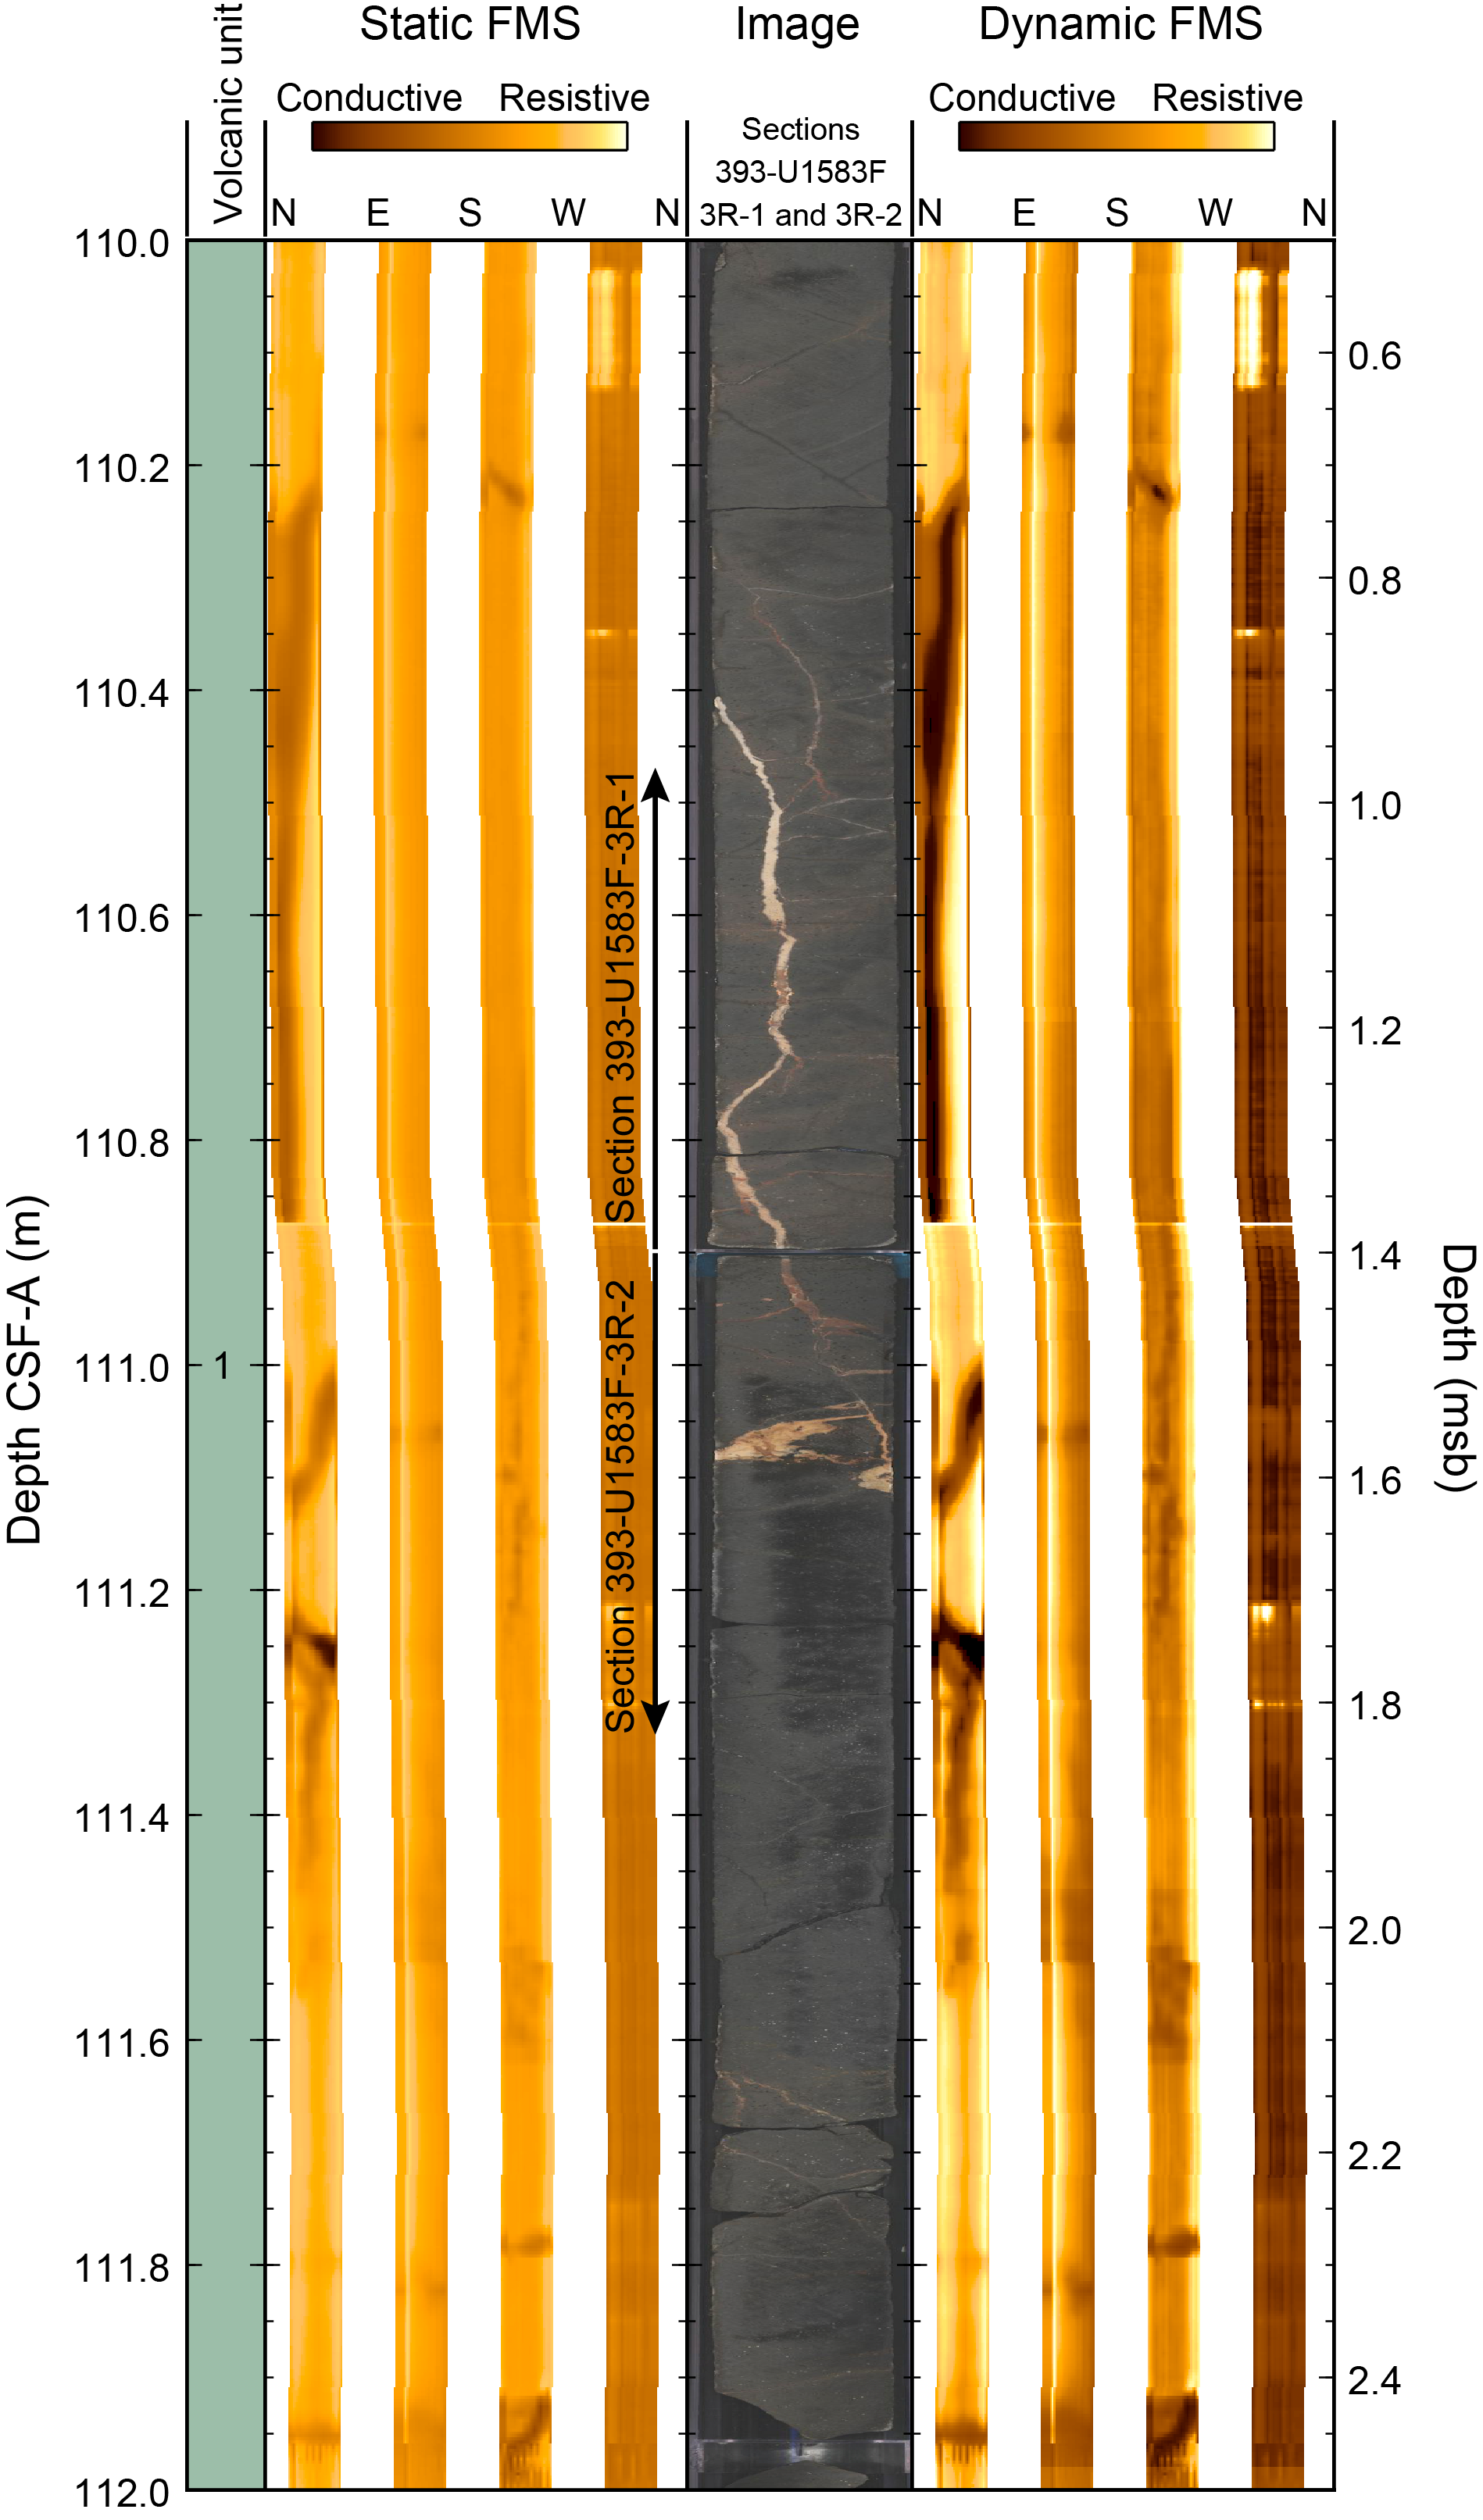
Figure F89. FMS electrical images compared with SHIL core images.
11. Geochemistry
11.1. Sediment
11.1.1. Interstitial water and mudline sampling
During sediment coring in Hole U1583C, IW was extracted by squeezing whole-round sediment cores under laboratory atmosphere and by in situ Rhizon sampling (see Geochemistry in the Expedition 390/393 methods chapter [Coggon et al., 2024a]). Sampling frequency for squeezed IW was twice per core from Cores 393-U1583C-1H through 12H, for a total of 24 samples. Rhizon sampling was performed in Cores 1H–12H at a frequency of one sample per section for Sections 1 through 6 (72 samples total). A mudline water sample was collected in Hole U1583E, and an additional IW sample was collected in Hole U1583F near the sediment/basement interface (105.37 m CSF-A) (Table T32). Splits of Rhizon-sampled and squeezed IW fluids and IW solid residues (squeeze cakes) were saved for shipboard analyses and postexpedition research. For Hole U1583C, oxygen was measured in situ after the cores were run through the STMSL, roughly within 30 min of the core arriving on the catwalk (see Geochemistry in the Expedition 390/393 methods chapter [Coggon et al., 2024a]). Sampling frequency was 2–6 measurements per core in Cores 1H–12H.
Both squeezed and Rhizon-sampled IW, along with the mudline, were analyzed for major cations (Na, Mg, K, and Ca) and anions (Cl, Br, and SO4) by ion chromatography (IC). Only squeezed IW samples and the mudline were analyzed for minor elements (by ICP-AES) and nutrients (by spectrophotometry). Tables T32, T33, and T34 present all shipboard analyses for pore water and sediment samples from Site U1583. Selected concentration profiles are illustrated in Figures F90, F91, F92, F93, F94, and F95. Pore fluid concentration trends discussed in the following sections are based on squeezed IW data, unless otherwise noted, and lithostratigraphic units include Units II and III and Subunits IVA–IVC (Unit I was not recovered in Hole U1583C). Moving averages (3–5 points) are provided for those elements that show considerable offset in concentration trends between squeezed IW and Rhizon-sampled fluids. Seawater reference values are based on Ríos et al. (2015) for pH, Sarmiento et al. (2007) for Si, and the International Association for the Physical Sciences of the Oceans (IAPSO) standard for alkalinity, salinity, Na, Cl, Br, Ca, Mg, Sr, Sr/Ca, B, Li, K, and SO4.
11.1.2. Interstitial water geochemistry
11.1.2.1. Salinity, sodium, chloride, and bromide
Although mudline (i.e., bottom seawater, 0 m CSF-A) and pore water salinities in Hole U1583C are uniform at the seawater value (35) (Table T32), downhole concentrations of Na, Cl, and Br change relative to the mudline (Figure F90). From 0 to 29.41 m CSF-A (Units II and III and the top of Subunit IVA), pore water concentrations increase beyond analytical uncertainty for Na (479–489 mM), Cl (557–567 mM), and Br (0.85–0.87). Following a slight decrease at 29.41–33.62 m CSF-A, all concentrations remain above the seawater value throughout Subunits IVA (nannofossil ooze with clay and foraminifera) and IVB (calcareous and nannofossil ooze with clay and foraminifera) (Na = 485 ± 4 mM, Cl = 564 ± 5 mM, and Br = 0.86 ± 0.01, 2σ, n = 12).
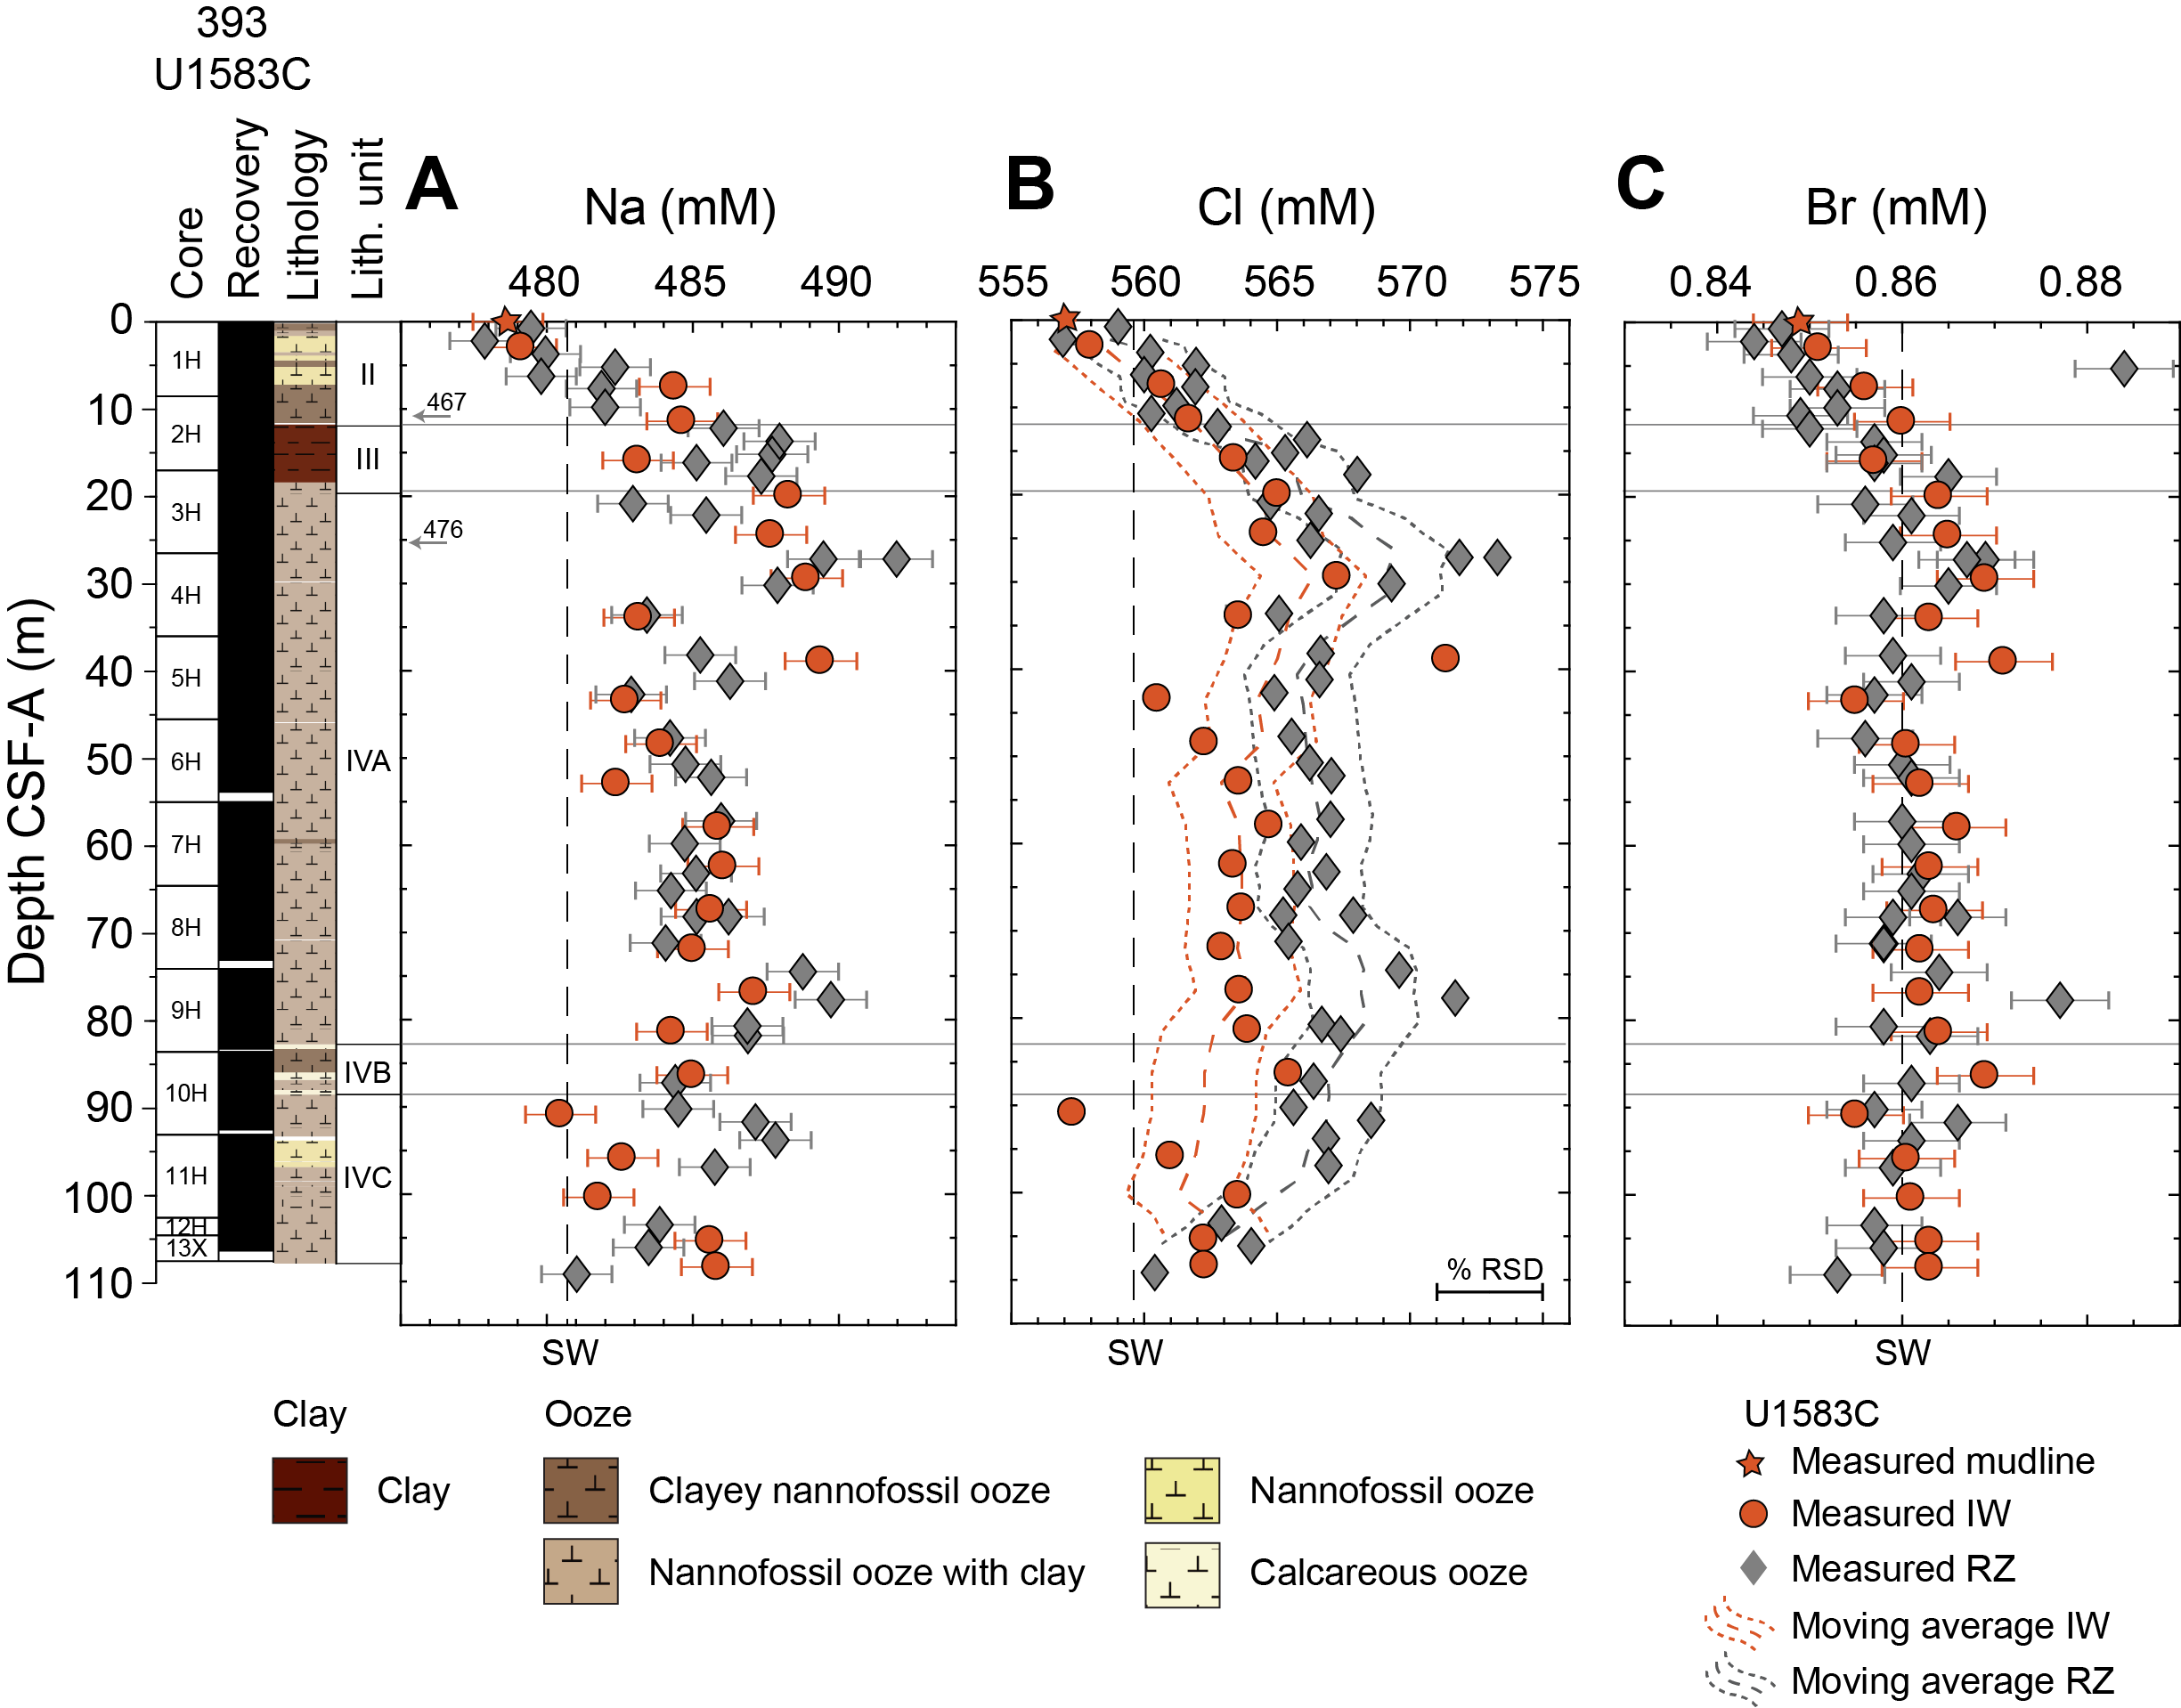
Figure F90. IW sodium, chloride, and bromide.
A gradual "freshening" is observed in Subunit IVC (nannofossil ooze with clay and foraminifera), with pore fluid concentrations returning to seawater values at the bottom of the hole. This freshening trend is most apparent in the Rhizon Cl concentrations but is not present in the Br data from either sampling technique. This may result from differences in analytical precision (0.5%, 0.7%, and 1.2% relative standard deviation [RSD] for Na, Cl, and Br, respectively), and/or from disturbances associated with XCB sampling.
Na/Cl and Br/Cl ratios remain similar to those in seawater (0.86 and 1.5 × 10⁻³, respectively), suggesting that the absolute changes in the concentration of these elements are likely a result of small shifts in local salinity. Finally, agreement between Rhizon-sampled and squeezed IW is best for Na and Br, whereas there are significant differences in measured Cl concentrations in fluids sampled from deeper than 29.41 m CSF-A. This contrasts our results from Hole U1558F, where both sampling techniques showed excellent concentration match.
11.1.2.2. pH and alkalinity
Hole U1583C pore fluid pH is overall uniform over the interval between 2.95 and 57.91 m CSF-A, with an average value (7.5 ± 0.1, 2σ, n = 13) slightly lower than the range for local bottom seawater (7.6–7.7; Ríos et al., 2015) (Figure F91A). Below this interval, measured pH increases gradually and reaches values as high as 7.8 at ~100 m CSF-A (Subunit IVC). The two deepest IW samples stand out from this increasing trend and have pH values (7.7) within the seawater range. This offset coincides with drilling disturbances observed below Section 393-U1583C-12H-2 (see Sedimentology).
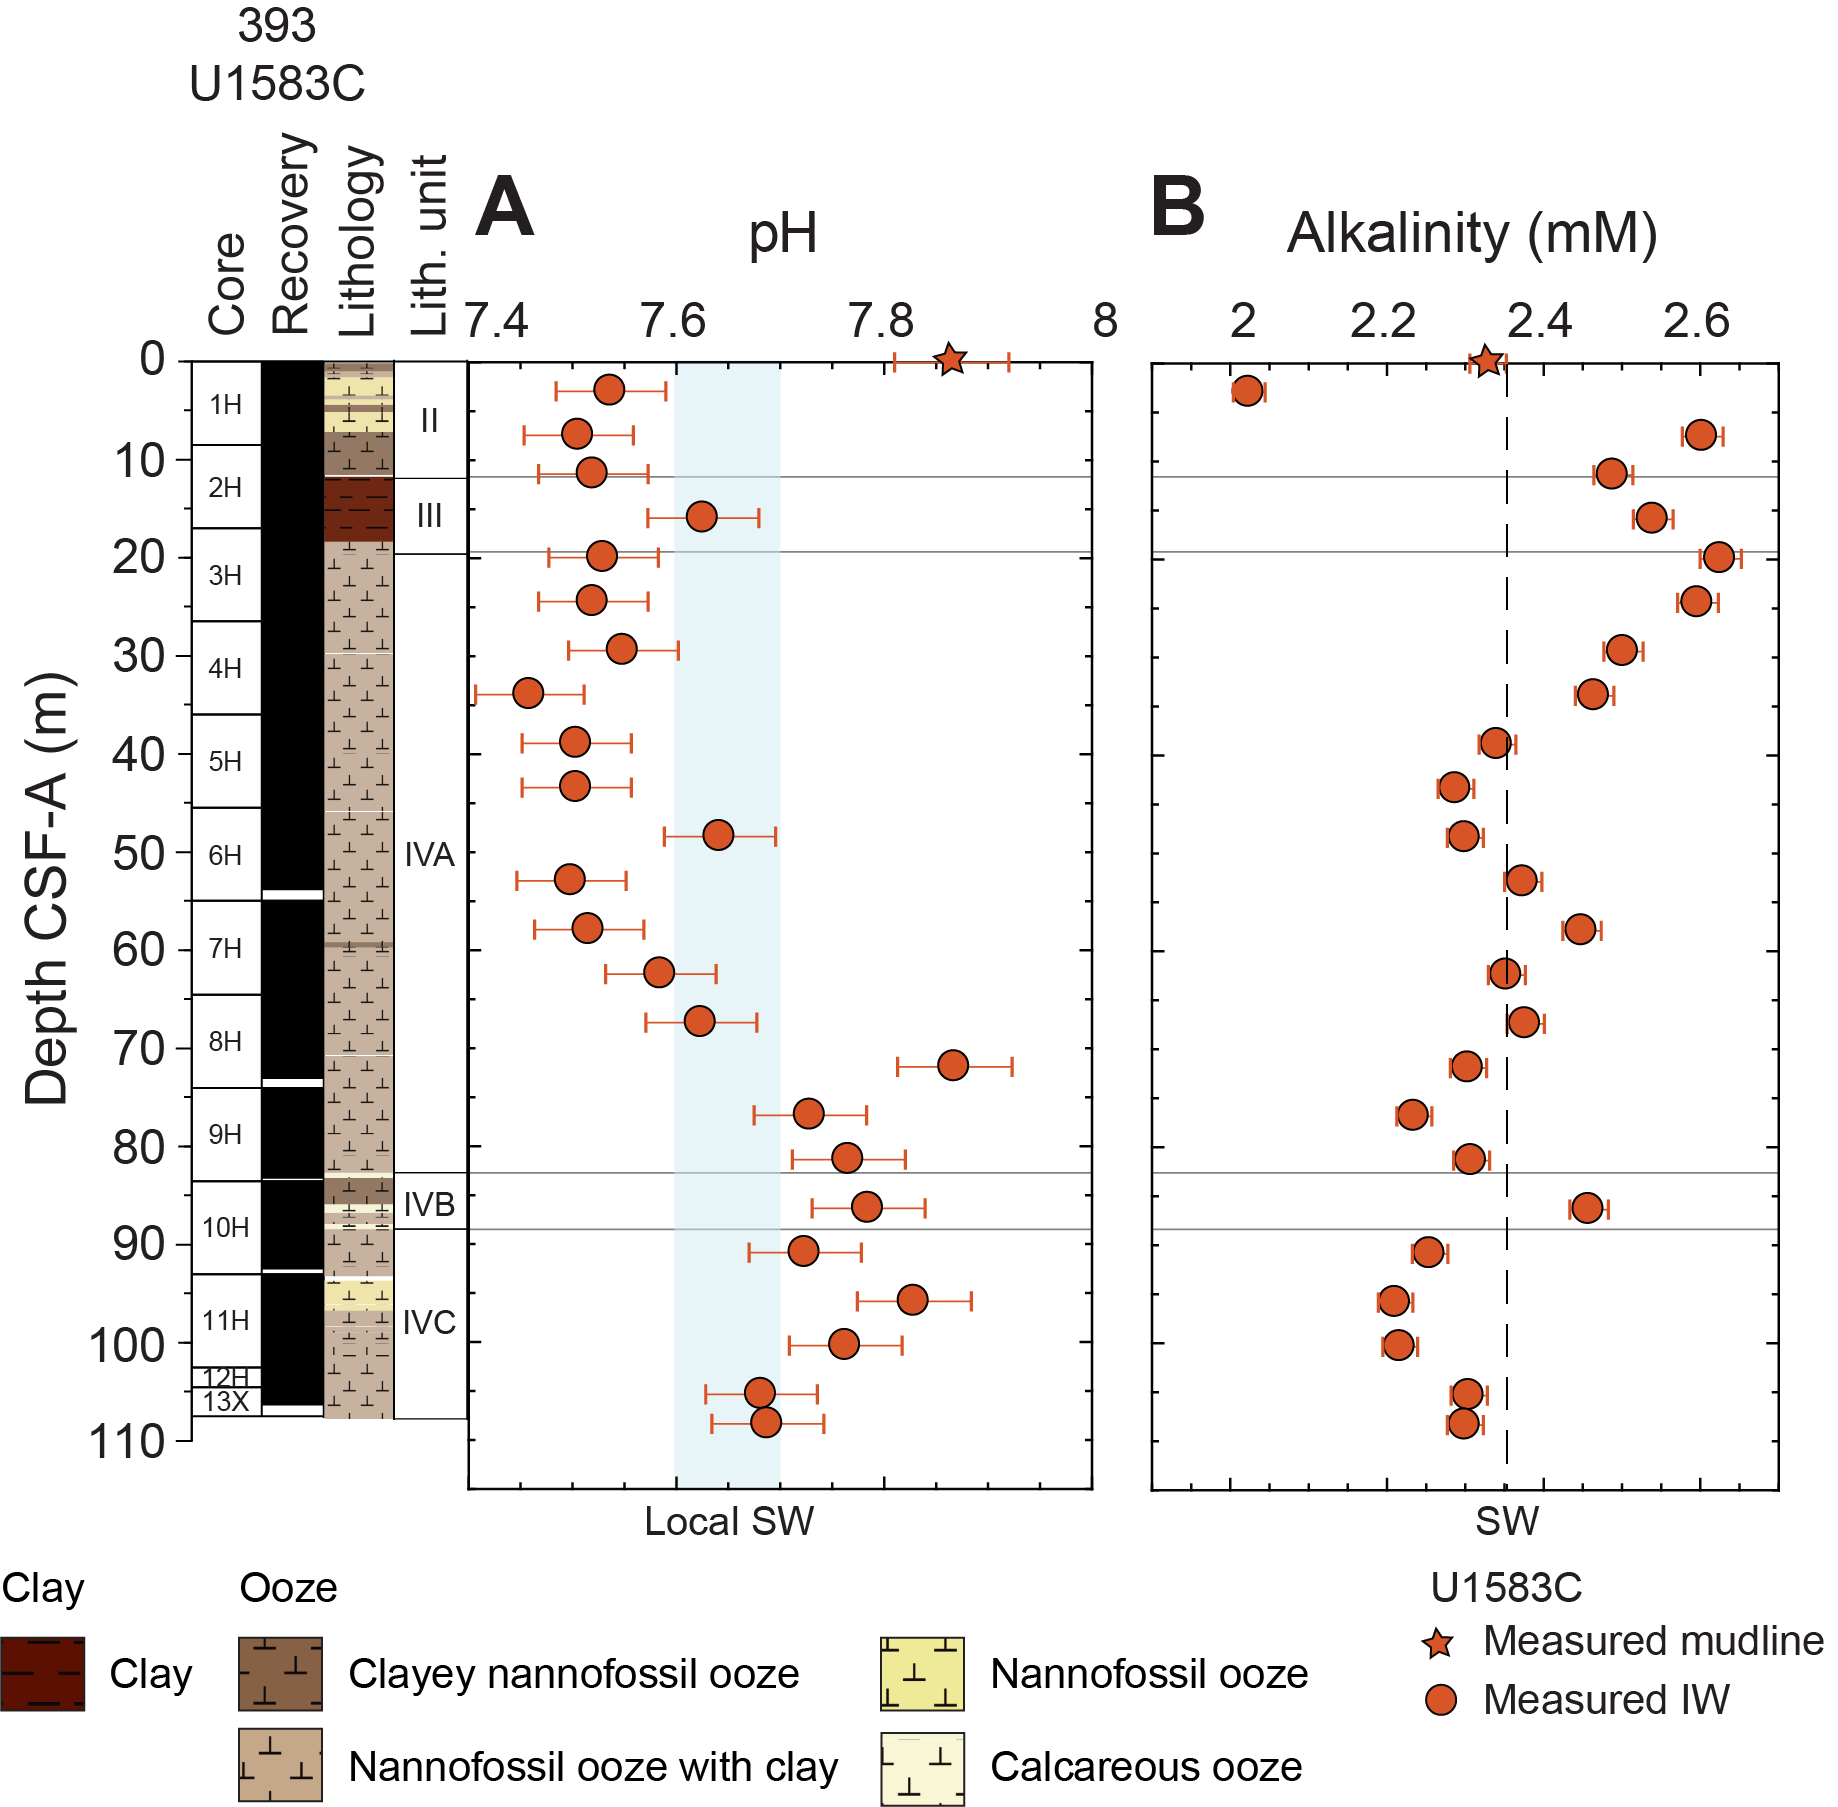
Figure F91. IW pH and alkalinity.
Alkalinity is highly variable throughout Hole U1583C (Figure F91B). Values decrease between the mudline (2.3 mM) and 2.95 m CSF-A (2.0 mM) and then increase to 2.5 mM between Units II (nannofossil ooze with clay and foraminifera) and III (clay with nannofossils and clayey nannofossil ooze). In Subunit IVA (nannofossil ooze with clay and foraminifera), alkalinity shows an overall decrease with the exception of a short interval at 43.41–57.91 m CSF-A (2.3–2.4 mM). At the boundary between Subunits IVA and IVB (calcareous and nannofossil oozes with clays and foraminifera), alkalinity increases from 2.2 mM at 76.85 m CSF-A to 2.5 mM at 86.36 m CSF-A. Values drop within the first 10 m of Subunit IVC (2.2–2.3 mM) and, as in the case of pH, the two deepest samples are offset from the overlying fluids and have alkalinity values closer to that of seawater (2.3 mM). Some degree of covariance is observed between pore fluid Ca concentrations and alkalinity in Hole U1583C (R2 = 0.44). This relationship is likely a result of biogenic carbonate dissolution and reprecipitation of inorganic calcite, which act as source and sink, respectively, of both Ca and alkalinity in marine sediments (e.g., Hein et al., 1979; Schrag et al., 2013; Turchyn et al., 2021).
11.1.2.3. Calcium, magnesium, strontium, and Sr/Ca
Relative to the mudline, the first squeezed IW measured in Hole U1583C (2.95 m CSF-A) has lower Ca (10.2 mM) and Mg (53.1 mM) concentrations and higher Sr (93.7 µM) and Sr/Ca ratio (9.2 µM/mM) (Figure F92). Following this initial drop in Ca concentrations, values increase to 10.8 mM (24.43 m CSF-A) throughout Units II (nannofossil ooze with clay and foraminifera), III (clay with nannofossils and clayey nannofossil ooze), and the first ~6 m of Subunit IVA (nannofossil ooze with clay and foraminifera) (Figure F92A). In Subunit IVA, Ca concentrations decrease again between 24.43 and 33.92 m CSF-A (10.8–10.2 mM) and become relatively uniform between ~34 and 100 m CSF-A (10.3 ± 0.3, 2σ, n = 14). The clear exceptions to this concentration uniformity are observed in Subunit IVB (calcareous and nannofossil oozes with clays and foraminifera), where the one measured pore fluid shows considerably higher Ca content (10.7 mM at 86.36 m CSF-A), and in the two deepest pore fluid samples, which approach seawater Ca concentration (10.6 ± 0.4 mM, 2σ, n = 55). Moving averages for squeezed IW and Rhizon-sampled fluids show offsets of up to ~0.5 mM in Ca concentrations, with Rhizon values persistently lower than those obtained from squeezed samples. However, trends overall are similar between the two data sets with the exception of the interval ~20–25 m CSF-A (top of Subunit IVA) and below 100 m CSF-A.
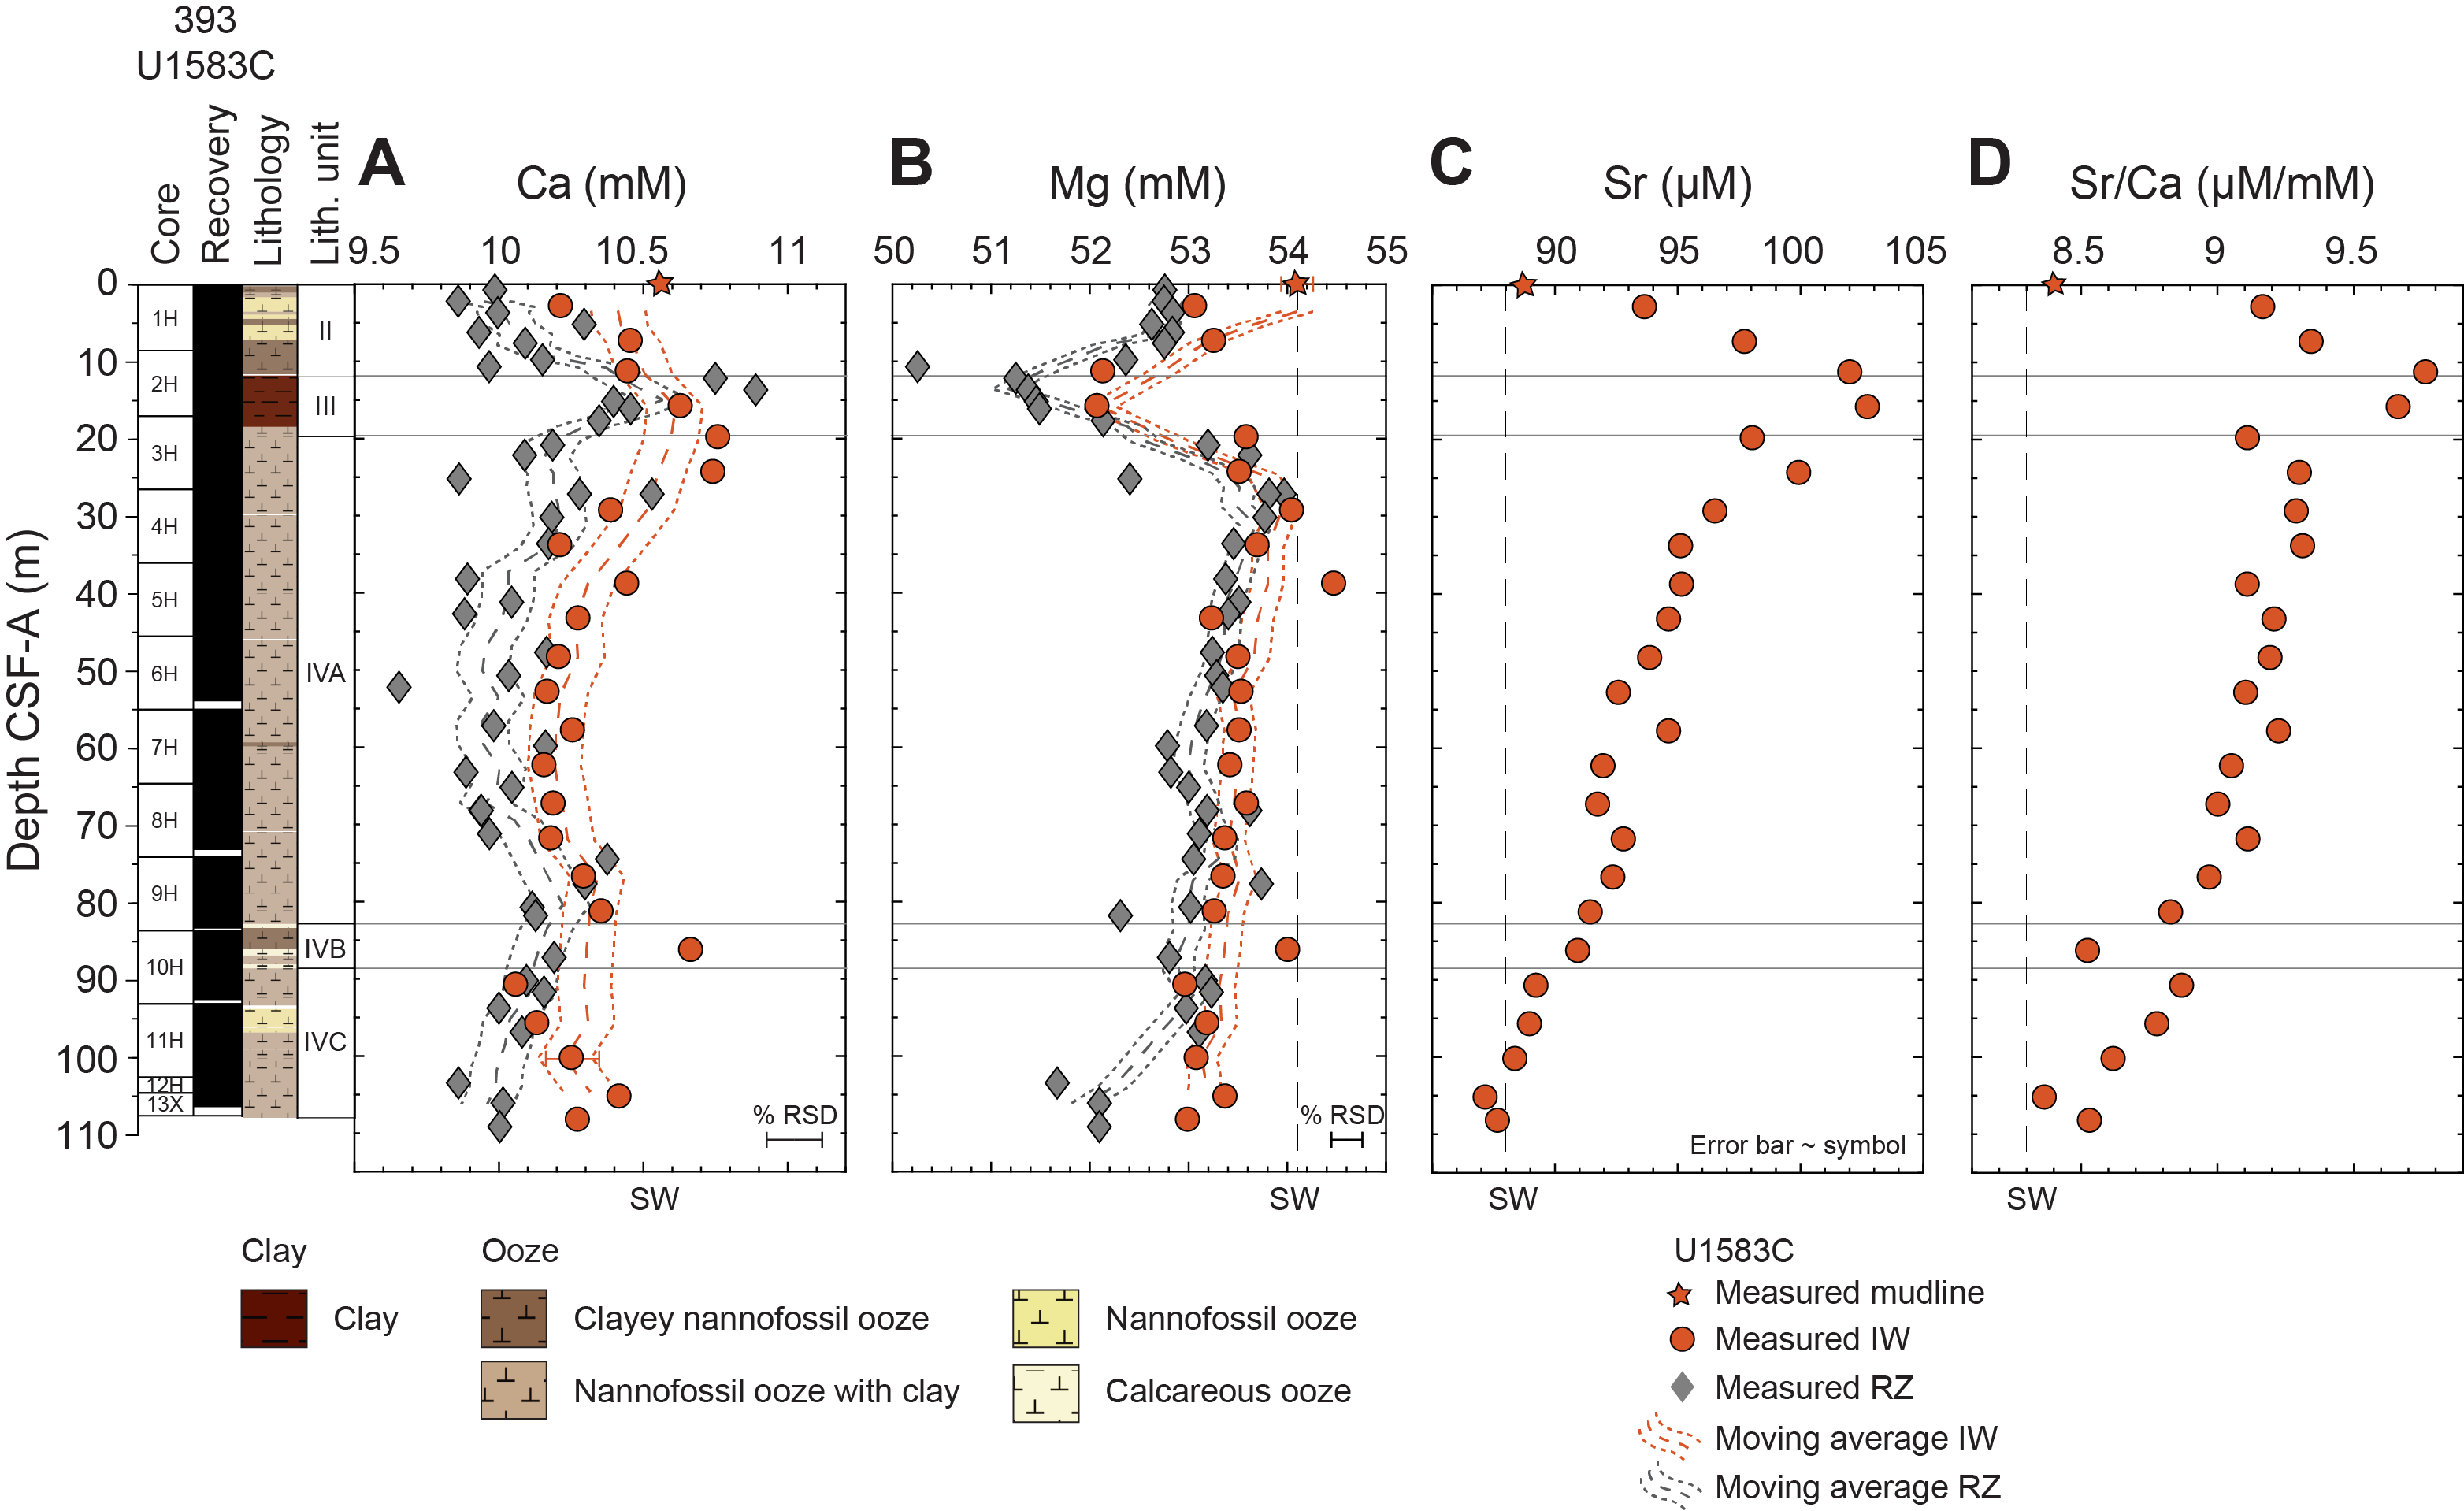
Figure F92. IW calcium, magnesium, strontium, and Sr/Ca ratios.
Measured Mg concentrations in Hole U1583C decrease from near-seawater mudline values throughout Units II and III (53.1–52.1 mM at 2.95–15.90 m CSF-A) before increasing to 54.1 mM over the uppermost ~10 m of Subunit IVA (Figure F92B). Similar to what is observed in the Ca profile, Mg concentrations become overall uniform from ~34 to 100 m CSF-A (53.5 ± 0.8 mM, 2σ, n = 14). Again, Subunit IVB stands out, with a measured Mg concentration (54.0 mM at 86.36 m CSF-A; squeezed IW) similar to seawater value (53.9 mM ± 0.7, 2σ, n = 55) and much higher than the fluids directly above and below. Squeezed IW fluids in Subunit IVC are relatively uniform (53.1 ± 0.5 mM, 2σ, n = 5). Similar to the Ca profile, Rhizon-sampled pore fluids show persistently lower Mg concentrations compared to squeezed samples. For example, the Mg decrease in Unit III is more pronounced in the Rhizon data set, yielding a moving average as low as 51.2 mM at ~14 m CSF-A. Concentration trends in Subunit IVA are similar between the data sets, and Rhizon-sampled fluids remain largely uniform between Subunits IVA and IVB. Below 100 m CSF-A, Rhizon fluids decrease in concentration (52.0 ± 0.6 mM, 2σ, n = 3).
Sr concentrations and Sr/Ca ratios follow very similar depth profiles. Both Sr (93.7–102.8 µM) and Sr/Ca (9.2–9.7 µM/mM) increase throughout Units II and III and show a broad decrease throughout Unit IV (Sr: 102.8–88.4 mM, Sr/Ca: 9.7–8.6 µM/mM) to the bottom of the hole (Figure F92C, F92D). As in the case of Ca and Mg, pore-fluid Sr/Ca ratio in Subunit IVB is significantly offset from surrounding fluids (8.5 µM/mM).
The correlation between Ca and alkalinity observed in Hole U1583C (see pH and alkalinity) provides strong evidence for the influence of carbonate diagenesis on the chemistry of these pore fluids. Sr/Ca ratios that are above the seawater value are consistent with biogenic carbonate dissolution, which appears to be most pronounced in Unit III. This observation is in line with the high detrital clay content reported for this unit and calcium carbonate abundances <1 wt% at ~12 m CSF-A (Table T33). In Unit II and Subunit IVA, the persistently high Sr/Ca ratios, along with Ca and Mg concentrations that are uniformly below the seawater values, provide evidence for recrystallization from low-Mg biogenic carbonate typical of nannofossil ooze to higher-Mg diagenetic calcite (e.g., Baker et al., 1982; Higgins and Schrag, 2012). Subunit IVC marks a gradual shift toward seawater values of Sr and Sr/Ca ratios, suggesting the potential influence of seawater-like fluids at this interval.
11.1.2.4. Boron, lithium, silica, and potassium
High to moderate concentration increases (relative to the mudline) are observed for B (67%), Li (10%), Si (78%), and K (17%) in Hole U1583C Units II (nannofossil ooze with clay and foraminifera) and III (clay with nannofossils and clayey nannofossil ooze) (Figure F93). Following this initial increase, pore fluid concentrations of these elements continue to change as a function of depth and sediment composition.
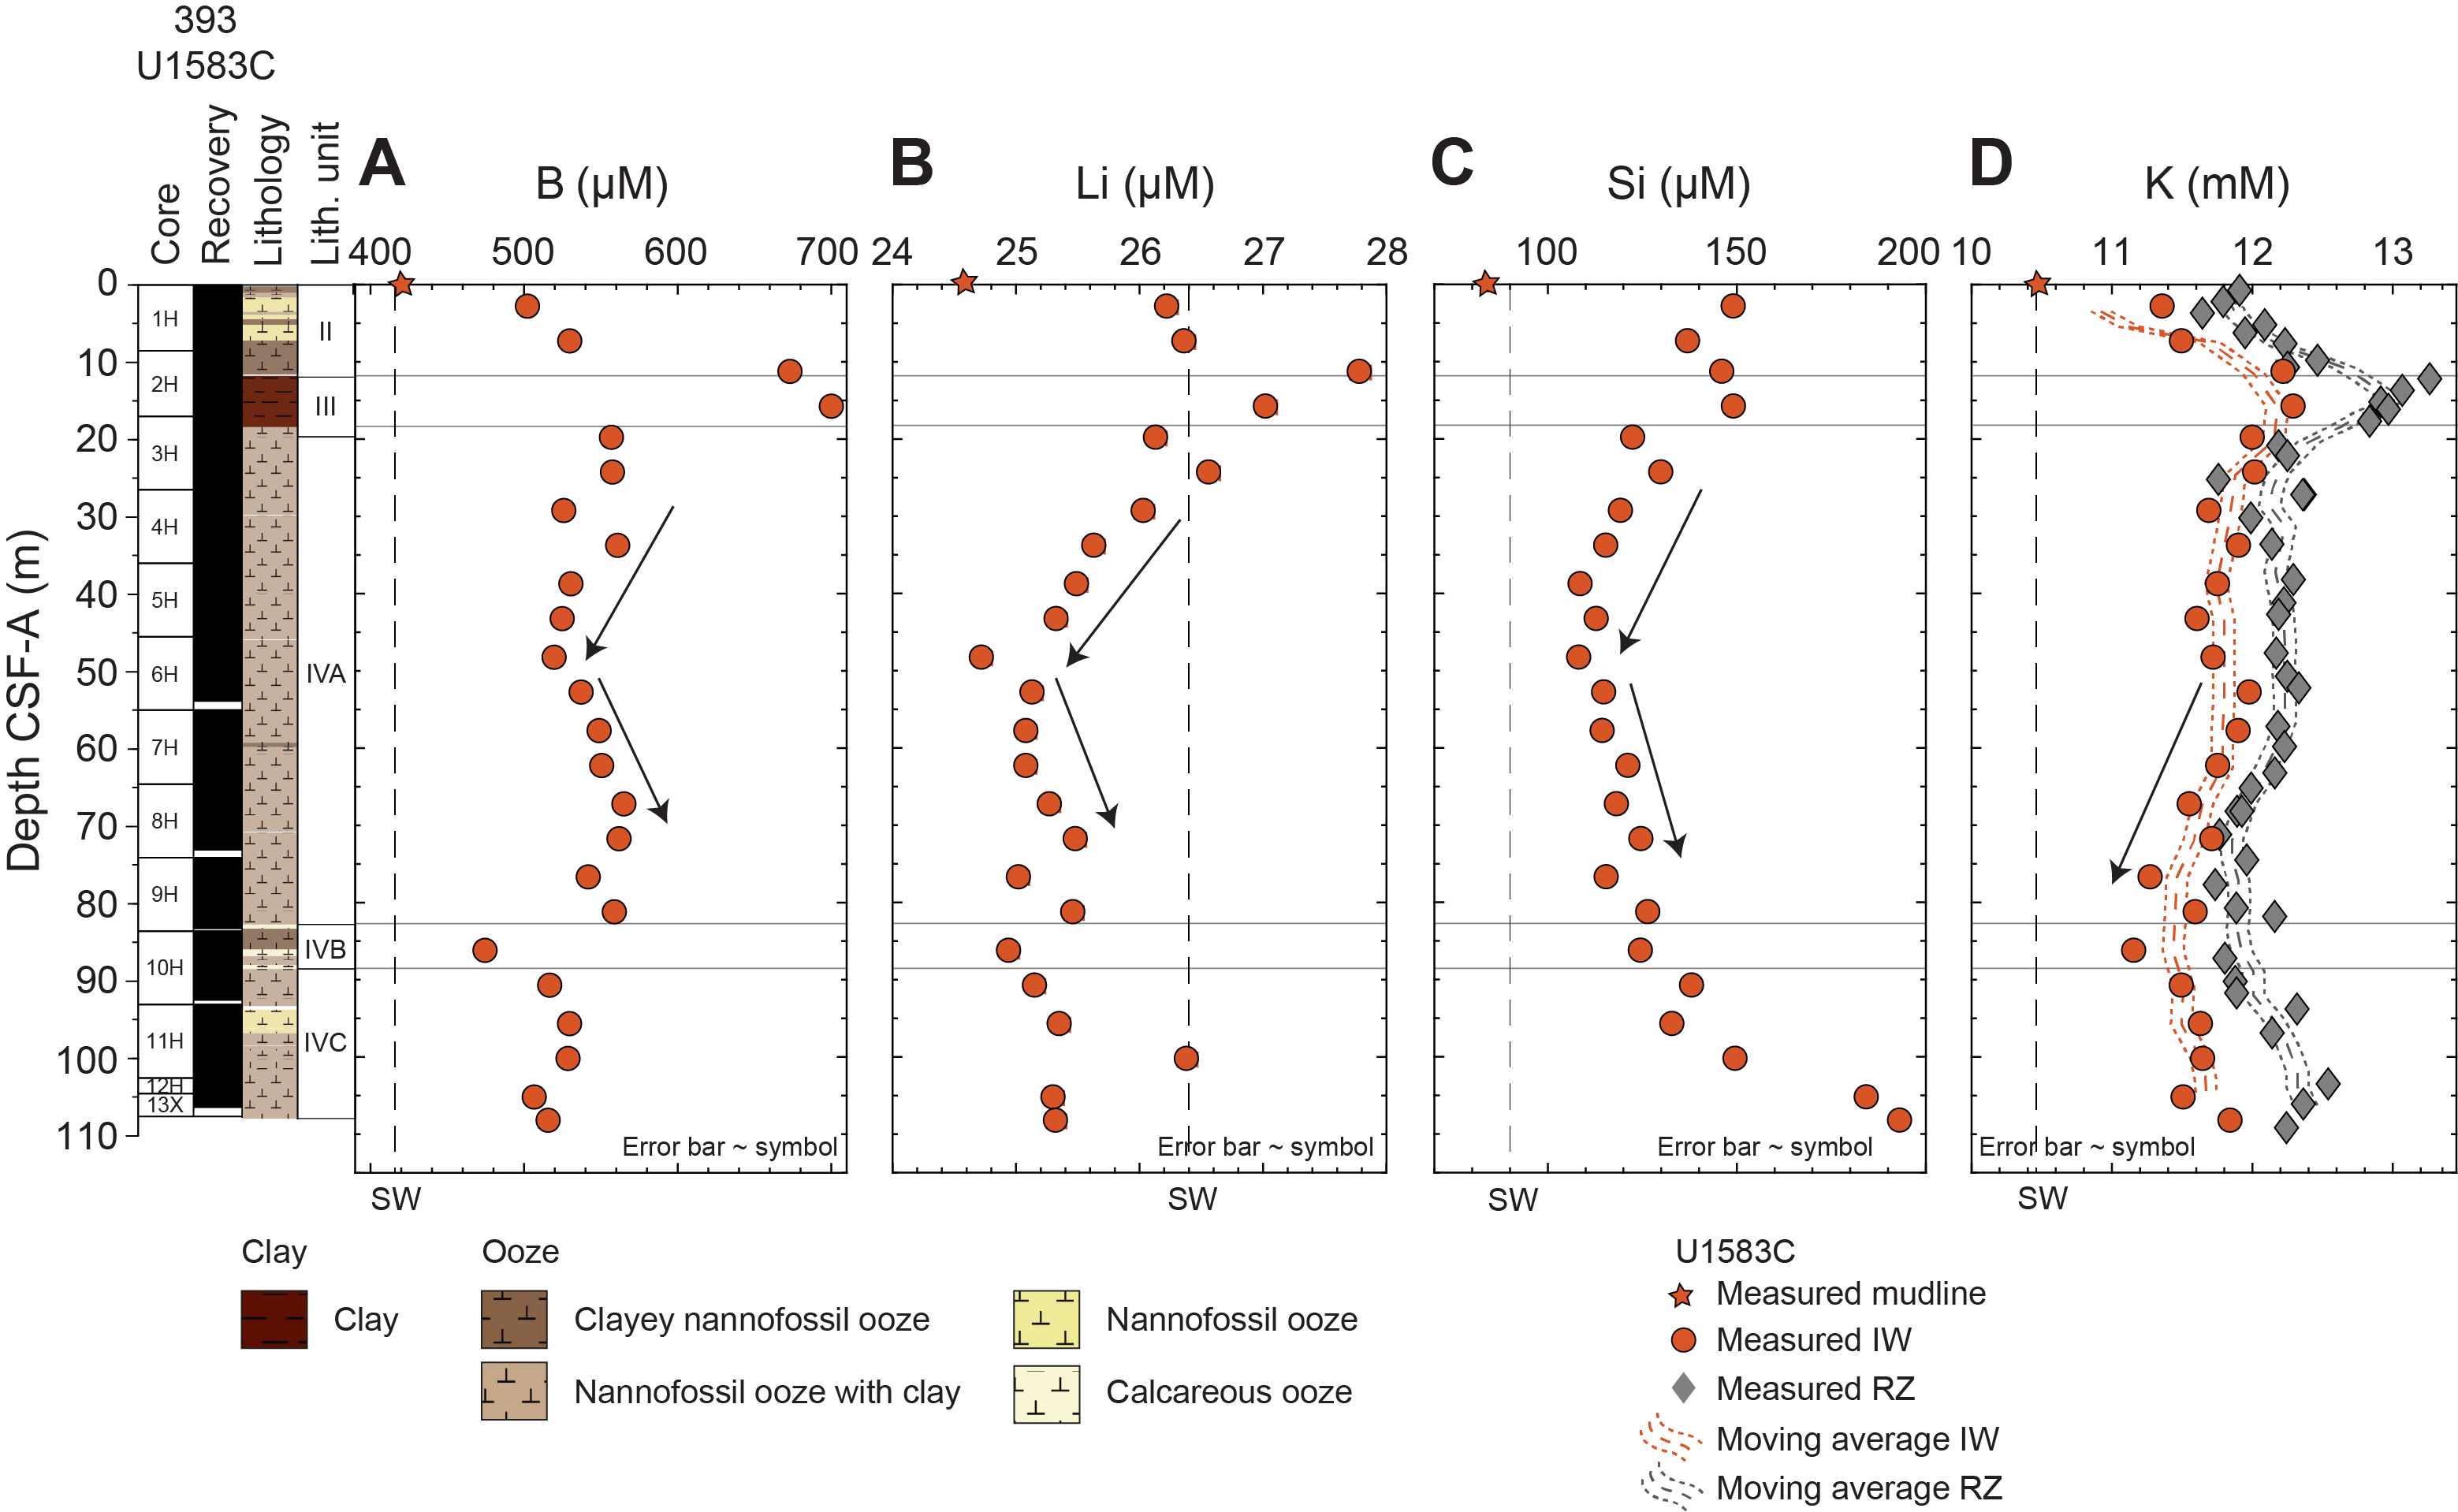
Figure F93. IW boron, lithium, silicon, and potassium.
Between 15.9 m and 48.41 m CSF-A, corresponding to the upper section of Subunit IVA (nannofossil ooze with clay and foraminifera), concentration decreases are observed for B (700.9–520.4 µM), Li (27.0–24.7 µM), Si (149.4–108.5 µM), and K (12.3–11.8 mM). Whereas measured K values continue to decrease throughout Subunit IVA (52.92–81.37 m CSF-A), concentrations increase for B (538–560 µM), Li (25.1–25.5 µM), and Si (115.1–126.8 µM). In Subunit IVB (calcareous and nannofossil oozes with clay and foraminifera), B, Li, and K show measurable decreases in concentrations, whereas Si remains similar to concentrations in Subunit IVA. In the lowermost Subunit IVC (nannofossil ooze with clay and foraminifera), pore fluid concentrations of all elements increase. The two deepest pore fluid samples are again distinct in their chemical composition compared to overlying fluids and seawater, which cannot be explained by contamination due to drilling disturbance. Moving averages for K concentrations in squeezed IW and Rhizon-sampled fluids show similar trends, although Rhizon values are persistently higher than squeezed IW samples (up to 0.6 mM offset in Unit III and Subunit IVC).
The most noticeable changes in the concentrations of B, Li, Si, and K in Hole U1583C coincide with unit boundaries and are likely controlled by variations in lithology. For example, Unit III is marked by a significant decrease in calcium carbonate content (<1 wt% at 12.12 m CSF-A; Table T34) and a spike in natural gamma ray (>40 counts/s; Figure F8), consistent with the presence of detrital silicate phases such as quartz, feldspars, and clays detected by XRD (see Sedimentology). Diagenetic reactions involving these silicate components, in addition to biogenic silica, are likely responsible for the large increases observed in B, Li, Si, and K values across this interval. In addition, the concentration changes observed within Subunit IVA (48.41–52.92 m CSF-A) coincide with a transition in the composition of clayey nannofossil oozes, which vary from light brown at 18.07–45.57 m CSF-A to brown and strong brown below ~64.5 m CSF-A (see Sedimentology). Si concentrations, in particular, show an inflection point at ~50 m CSF-A, and the increase in Si observed between ~50 and 110 m CSF-A points to Si-sourcing reactions within the sediments.
11.1.2.5. Sulfate, ammonium, and manganese
Sulfate (SO4) concentrations decrease between the mudline (28.7 mM) and the first measured pore fluid (27.3 mM) at 2.95 m CSF-A in Unit II (nannofossil ooze with clay and foraminifera) but then increase with depth to 28.1 mM at 19.93 m CSF-A in Unit III (clay with nannofossils and clayey nannofossil ooze) and into Subunit IVA (nannofossil ooze with clay and foraminifera) (Figure F94A). Concentrations show a broad decrease (28.1–27.7 mM) in Subunit IVA before a change is observed (27.7–28.2 mM) at the transition from Subunit IVA to IVB (calcareous and nannofossil oozes with clays and foraminifera). Pore fluid SO4 values decrease to 27.5 mM at the top of Subunit IVC (90.87 m CSF-A) and reach 27.8 mM toward the bottom of the hole (108.36 m CSF-A). Although sulfate-reducing bacteria are obligate anaerobes and pore fluids in Hole U1583C remain oxic throughout (see Oxygen; Figure F94D), sulfate reduction taking place in reduced microniches within the sediment column (Jørgensen, 1977) might explain the subtle changes in SO4 concentrations observed here. Despite some overlap between the moving averages from squeezed IW and Rhizon-sampled fluids, SO4 concentrations in the Rhizon sample set are overall lower than those measured in squeezed IW from similar depths.
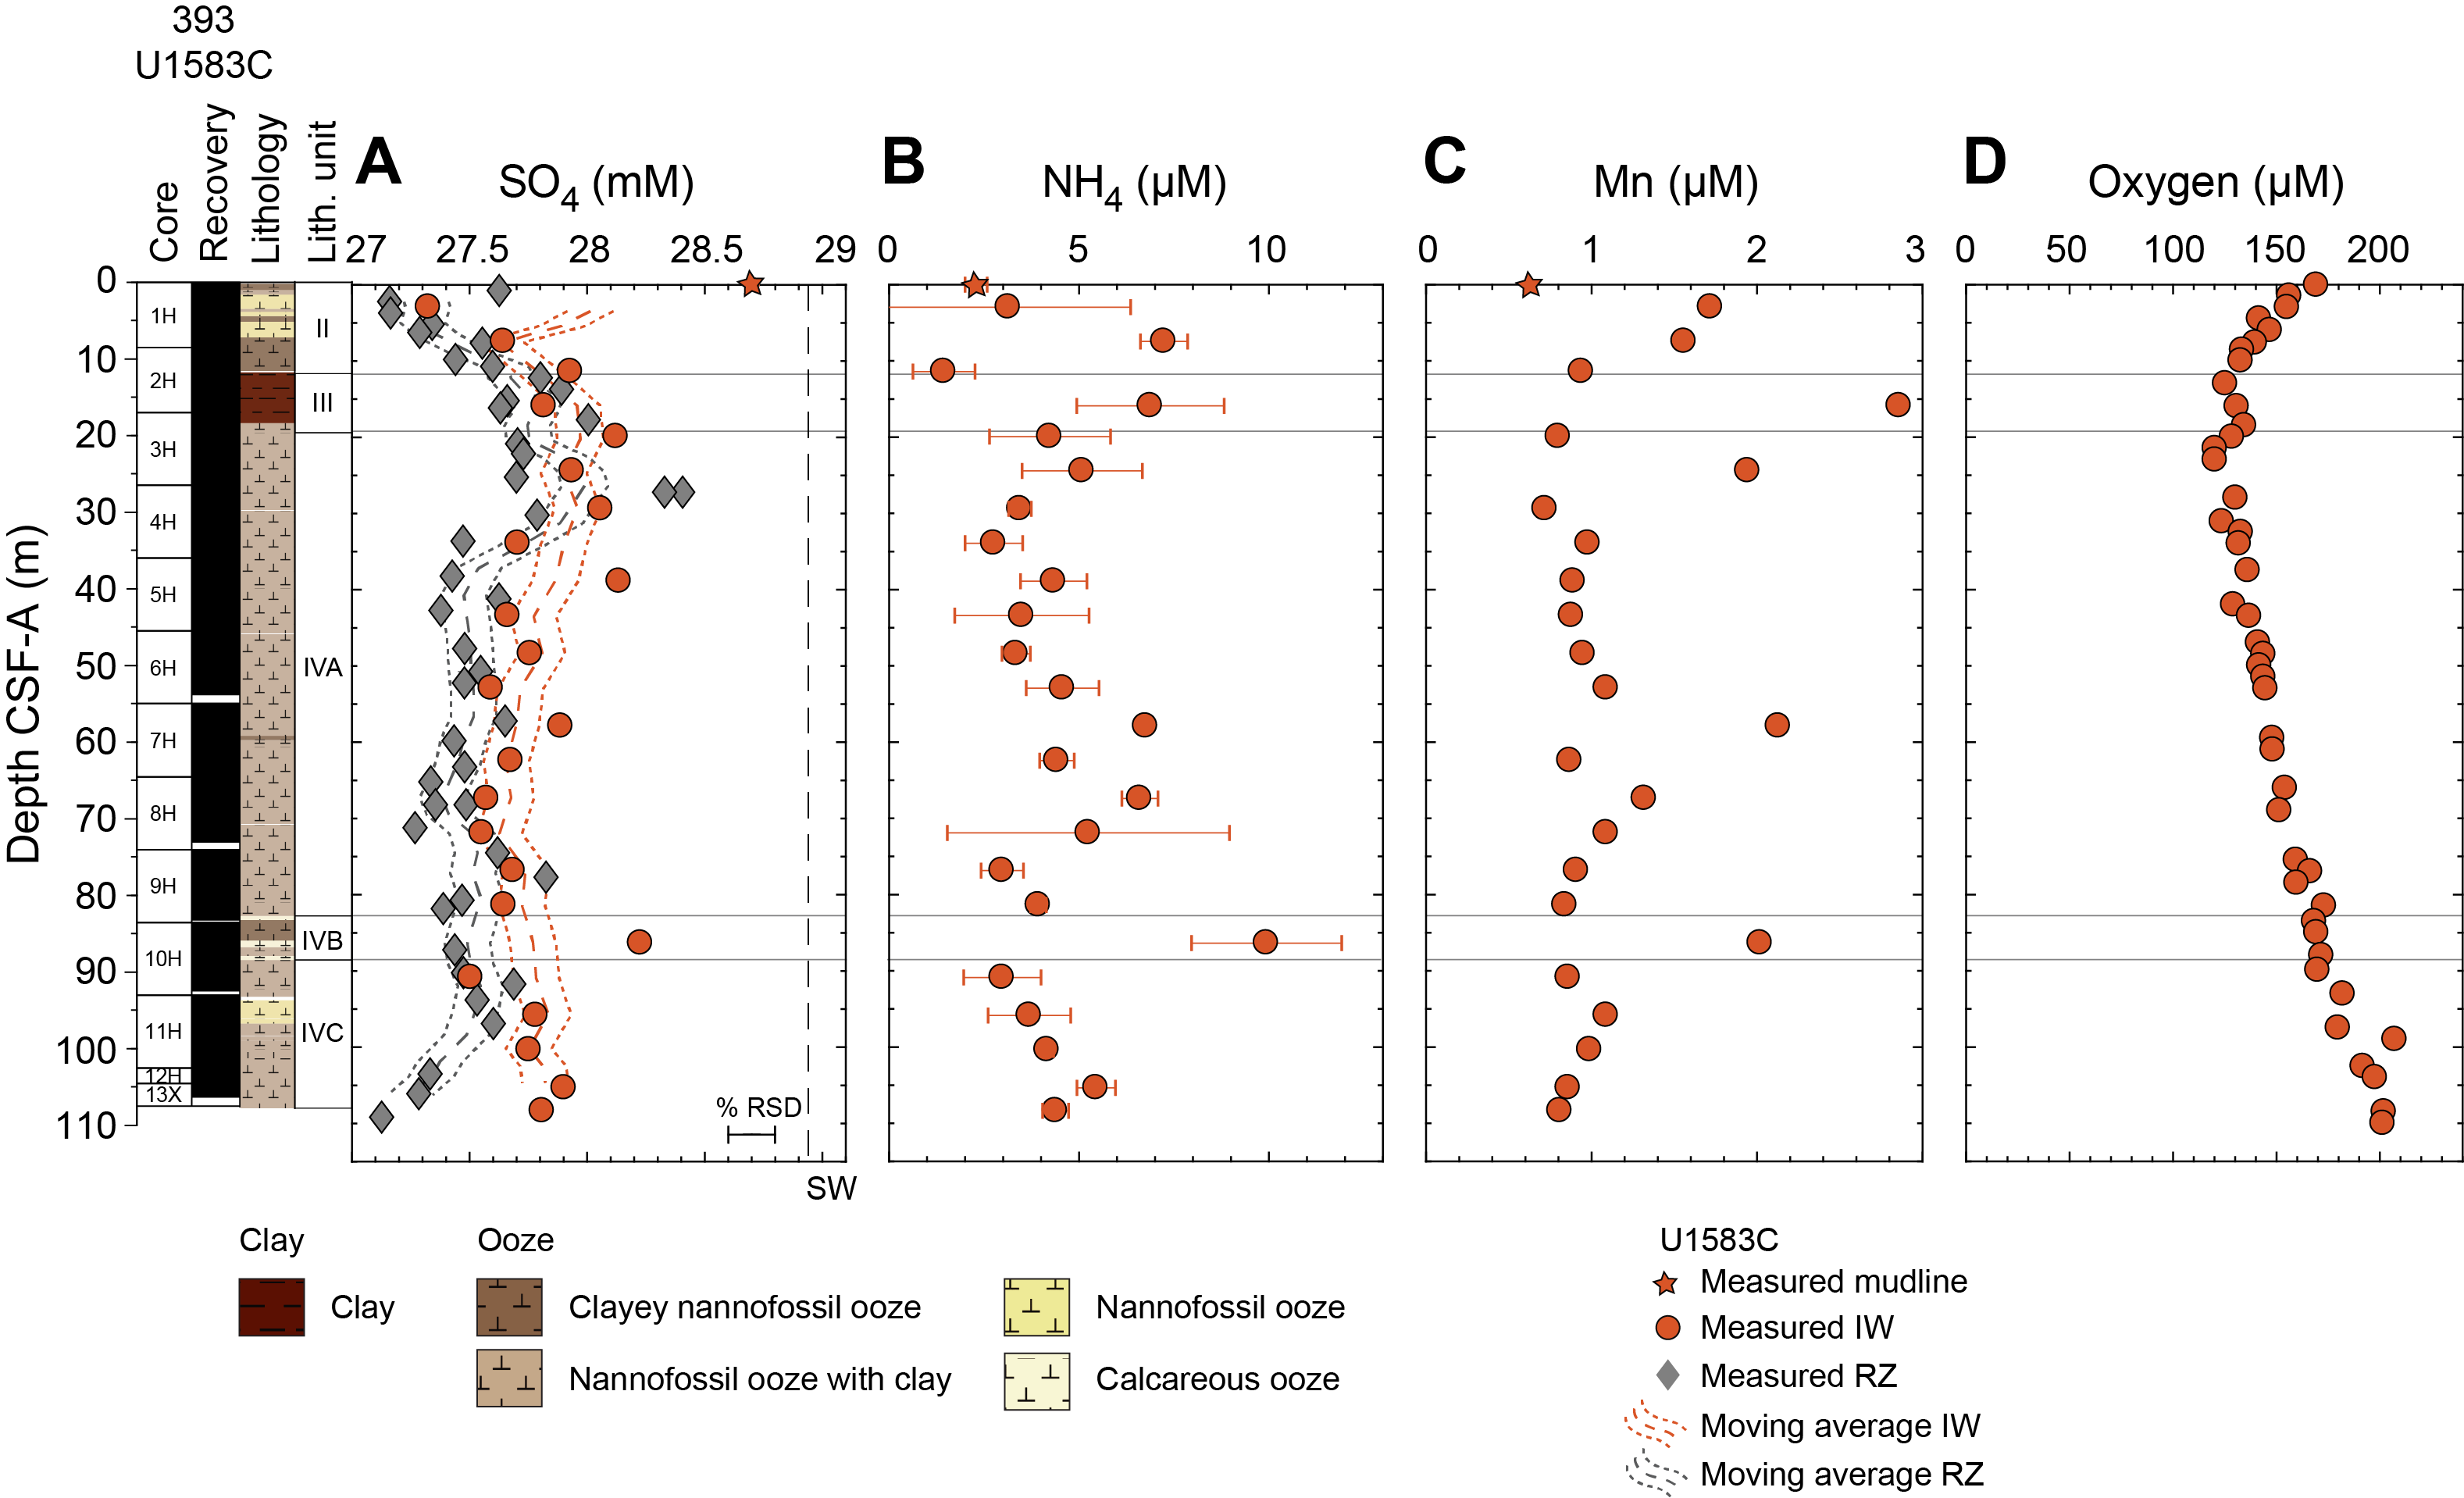
Figure F94. IW sulfate, ammonium, manganese, and oxygen.
Ammonium (NH4; 3–17 µM) and Mn (0.63–2.86 µM) concentrations remain overall similar to the mudline values in Hole U1583C except for a few intervals (Figure F94B, F94C). Specifically, both NH4 and Mn peak in Unit III, at concentrations up to 7 and 2.86 µM, respectively. Similarly, concentrations rise above background levels in Subunit IVB (NH4 = 10 µM and Mn = 2.02 µM), where sedimentary organic matter contents are highest (up to ~0.35 wt%; Figure F95).
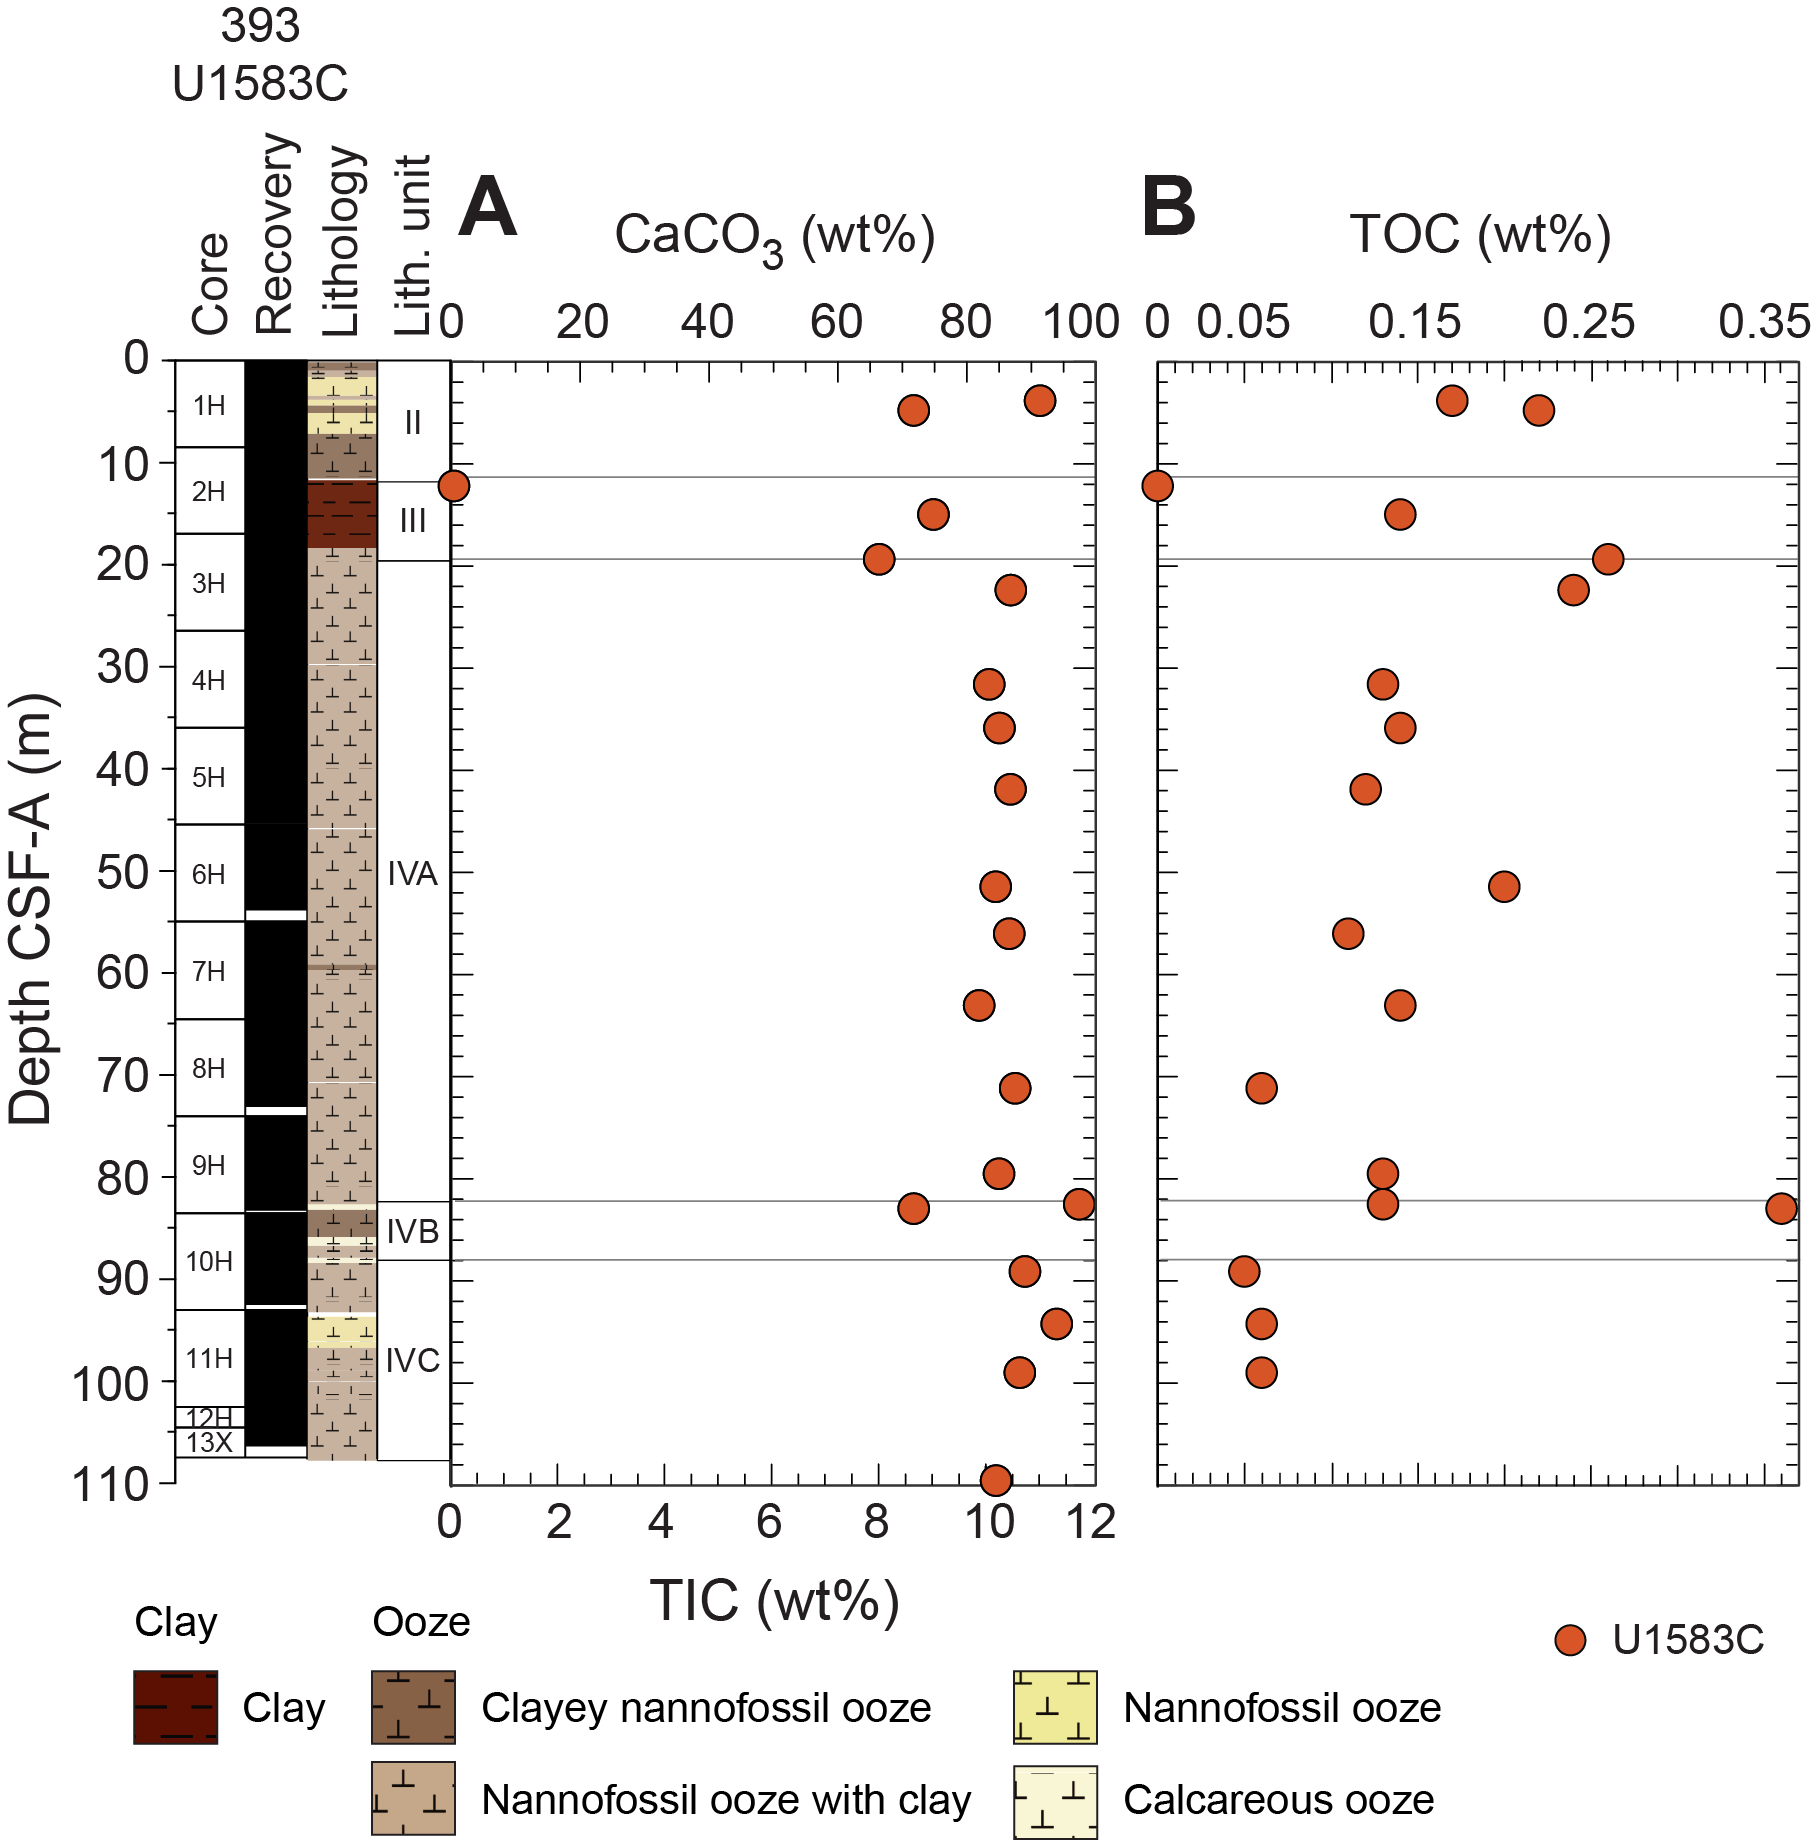
Figure F95. Sediment carbonate, TIC, and TOC.
11.1.2.6. Oxygen
Oxygen is the pore water constituent measured with the highest reduction potential and is the first molecule reduced during microbial degradation of organic matter. Its profile provides insight into subseafloor biogeochemical and microbial processes. Oxygen concentrations in Hole U1583C decrease from a mudline concentration of ~170 µM to ~125 µM at the base of Unit II (nannofossil ooze with clay and foraminifera) at ~11 m CSF-A (Table T33; Figure F94D). There is a slight increase through Unit III (clay with nannofossils and clayey nannofossil ooze) to ~136 µM before O2 concentrations decrease again to ~120 µM in the uppermost sediments of Subunit IVA (nannofossil ooze with clay and foraminifera). Between ~23 m CSF-A and the bottom of the hole, there is a tight, near-monotonic increase in oxygen concentrations up to ~202 µM in the lowermost sample at ~108 m CSF-A (Figure F94D), albeit with greater scatter in measurements taken in Subunit IVC (88–110 m CSF-A; nannofossil ooze with clay and foraminifera).
11.1.3. Sediment sampling
During Expedition 393, sediment samples from Hole U1583C were selected by the sedimentologists from core working halves for measurement of carbon and nitrogen contents (see Geochemistry in the Expedition 390/393 methods chapter [Coggon et al., 2024a]). One sample per core was analyzed in Cores 393-U1583C-5H, 6H, 8H, 10H, and 12H; two samples per core were analyzed in Cores 1H–4H, 7H, 11H; and three samples were analyzed in Core 9H. In total, 20 samples were taken at Site U1583, all from Hole U1583C (Table T34). In addition, sediment was sampled from whole-round cores on the catwalk for headspace hydrocarbon gas analyses (see Geochemistry in the Expedition 390/393 methods chapter [Coggon et al., 2024a]). These samples were taken at the top of Section 3 in Cores 1H–12H. In total, 12 samples were analyzed for hydrocarbons at Site U1583, all from Hole U1583C (Table T34). Concentrations of all hydrocarbons were near or below detection limit (1 ppmv for methane and 0 for all other hydrocarbons; 1.23 ± 1.74 ppmv, 2σ, n = 12) and will not be discussed further.
11.1.4. Sediment bulk geochemistry
11.1.4.1. Calcium carbonate
The calcium carbonate content of sediments is high throughout Hole U1583C (84 ± 39 wt%, 2σ, n = 20) with the exception of a single sediment sample in Unit III (12.12 m CSF-A; clay with nannofossils and clayey nannofossil ooze) that contains <1 wt% carbonate. In Unit II (nannofossil ooze with clay and foraminifera), two samples yield carbonate contents of 91 and 72 wt%. In contrast, Unit III (clay with nannofossils and clayey nannofossil ooze; ~11.5–18 m CSF-A) contains roughly no calcium carbonate in the uppermost sediment sampled (12.12 m CSF-A), consistent with the predominantly dark brown clay lithology that dominates the unit, although a deeper sample in this unit has ~75 wt% CaCO3. The brown to light brown interbedded clayey nannofossil ooze of Unit III sampled in the middle of the unit (75 wt%, n = 1) resembles near-average values for Hole U1583C. Subunit IVA (nannofossil ooze with clay and foraminifera) has the lowest average CaCO3 values within Unit IV (~18–82 m CSF-A; 83 ± 12 wt%, 2σ, n = 10). The transition to Subunit IVB (calcareous and nannofossil oozes with clay and foraminifera) is marked by a peak in calcium carbonate (97 wt%) for a sample collected from a white calcareous ooze layer, although a neighboring sample from a clayey nannofossil ooze layer in the same subunit has ~72 wt%. Calcium carbonate values in Subunit IVB range 72–97 wt% (~82–88 m CSF-A; n = 2). Subunit IVC (nannofossil ooze with clay and foraminifera; deeper than 88 m CSF-A) has the highest average carbonate values within Unit IV (89 ± 7 wt%, 2σ, n = 4).
11.1.4.2. Total organic carbon and nitrogen
TOC was calculated for all samples measured for CaCO3 (n = 20) as the difference between total carbon (TC) and total inorganic carbon (see Geochemistry in the Expedition 390/393 methods chapter [Coggon et al., 2024a]). TOC concentrations (Figure F95) in Hole U1583C average 0.15 ± 0.15 wt% (2σ, n = 20). In Unit II (nannofossil ooze with clay and foraminifera), the two measured samples are fairly uniform (0.17–0.22 wt%). TOC concentrations decrease into Unit III (clay with nannofossils and clayey nannofossil ooze), which is marked by a data point at the top of the unit that is below detection limit (due to a very low TC content of 0.06 wt%). A second sample was taken from the brown to light brown clayey nannofossil ooze interbed in Unit III (0.14 wt%), which resembles near-average values for the entire Hole U1583C (~0.15 wt%). Unit IV has the greatest variability in average TOC concentrations (0.14 ± 0.16 wt%, 2σ, n = 16) in comparison to each unit and relative to the entire hole. The sampled sediment at the top of Subunit IVA (nannofossil ooze with clay and foraminifera) has the highest TOC (0.26 wt%), and values gradually decrease to as low as 0.06 wt% toward the bottom of the subunit (unit average = 0.15 ± 0.10 wt%, 2σ, n = 10). The overall decrease in TOC in Subunit IVA is also observed in the SO4 profile and is consistent with organic matter remineralization through sulfate reduction. The two samples from Subunit IVB (calcareous and nannofossil oozes with clay and foraminifera) show considerable variability. The calcareous ooze sample (82.32 m CSF-A) has TOC content (0.13 wt%) similar to the average value for Hole U1583C, whereas the clayey nannofossil ooze sample (82.75 m CSF-A) shows a higher TOC value of 0.36 wt%. Subunit IVC (nannofossil ooze with clay and foraminifera) has the lowest average TOC concentration (0.07 ± 0.03 wt%, ±2σ, n = 4) in Unit IV.
Total nitrogen concentrations were measured in all samples analyzed for CaCO3 (n = 20). TN concentrations in Hole U1583C are below detection limits (Table T34; see Table T9 in the Expedition 390/393 methods chapter [Coggon et al., 2024a]), and are not discussed further. Total sulfur and total hydrogen were not measured.
11.2. Basement
During Expedition 393, ~134 m of slightly to moderately altered ~30.6 Ma basalts were recovered from Hole U1583F, representing seven distinguishable volcanostratigraphic units (see Igneous petrology). A total of 17 volcanic rock samples were selected for shipboard geochemical analyses: 16 basalts, and Unit 4 breccia fill Sample 393-U1583F-16R-2, 73–83 cm (Figure F7). Analytical studies included solution analysis by ICP-AES, loss on ignition (LOI) measurements, and direct analyses of sample powders by pXRF (Tables T35, T36).
11.2.1. Basement rock sampling and geochemical analysis
The geochemical samples selected represented typical material from each of the igneous/volcanostratigraphic units identified (Table T4). Geochemical samples were taken adjacent to other sampling (thin sections, PMAG, XRD, etc.) to generate integrated data on these materials. A ~2 g split of each freshly made sample powder was placed in a powder mount for pXRF analysis, and each sample was measured in triplicate with that instrument (see Geochemistry in the Expedition 390/393 methods chapter [Coggon et al., 2024a]). ICP-AES measurements were completed on oxidized samples after the completion of LOI determinations, so ICP-AES data are reported on a volatile-free basis.
11.2.2. Bulk chemical compositions and trace element abundances
Table T35 lists the shipboard geochemical data collected on Site U1583 samples by ICP-AES analysis (including LOI determinations), and Table T36 presents pXRF data collected for these samples from powder mounts. Supplementary pXRF analyses performed directly on the core cut surfaces are in Table T6. In Figure F96, the Site U1583 data are plotted on the total alkali versus silica classification diagram of Le Bas et al. (1986). As with the samples from other SAT sites, Site U1583 samples fall in the basalt field. By the Yoder and Tilley (1962) basalt classification scheme, the Site U1583 basalts are all tholeiites or olivine tholeiites. Increases in alkalies and/or losses of Mg related to alteration do not appear to have impacted their normative compositions (Table T35).
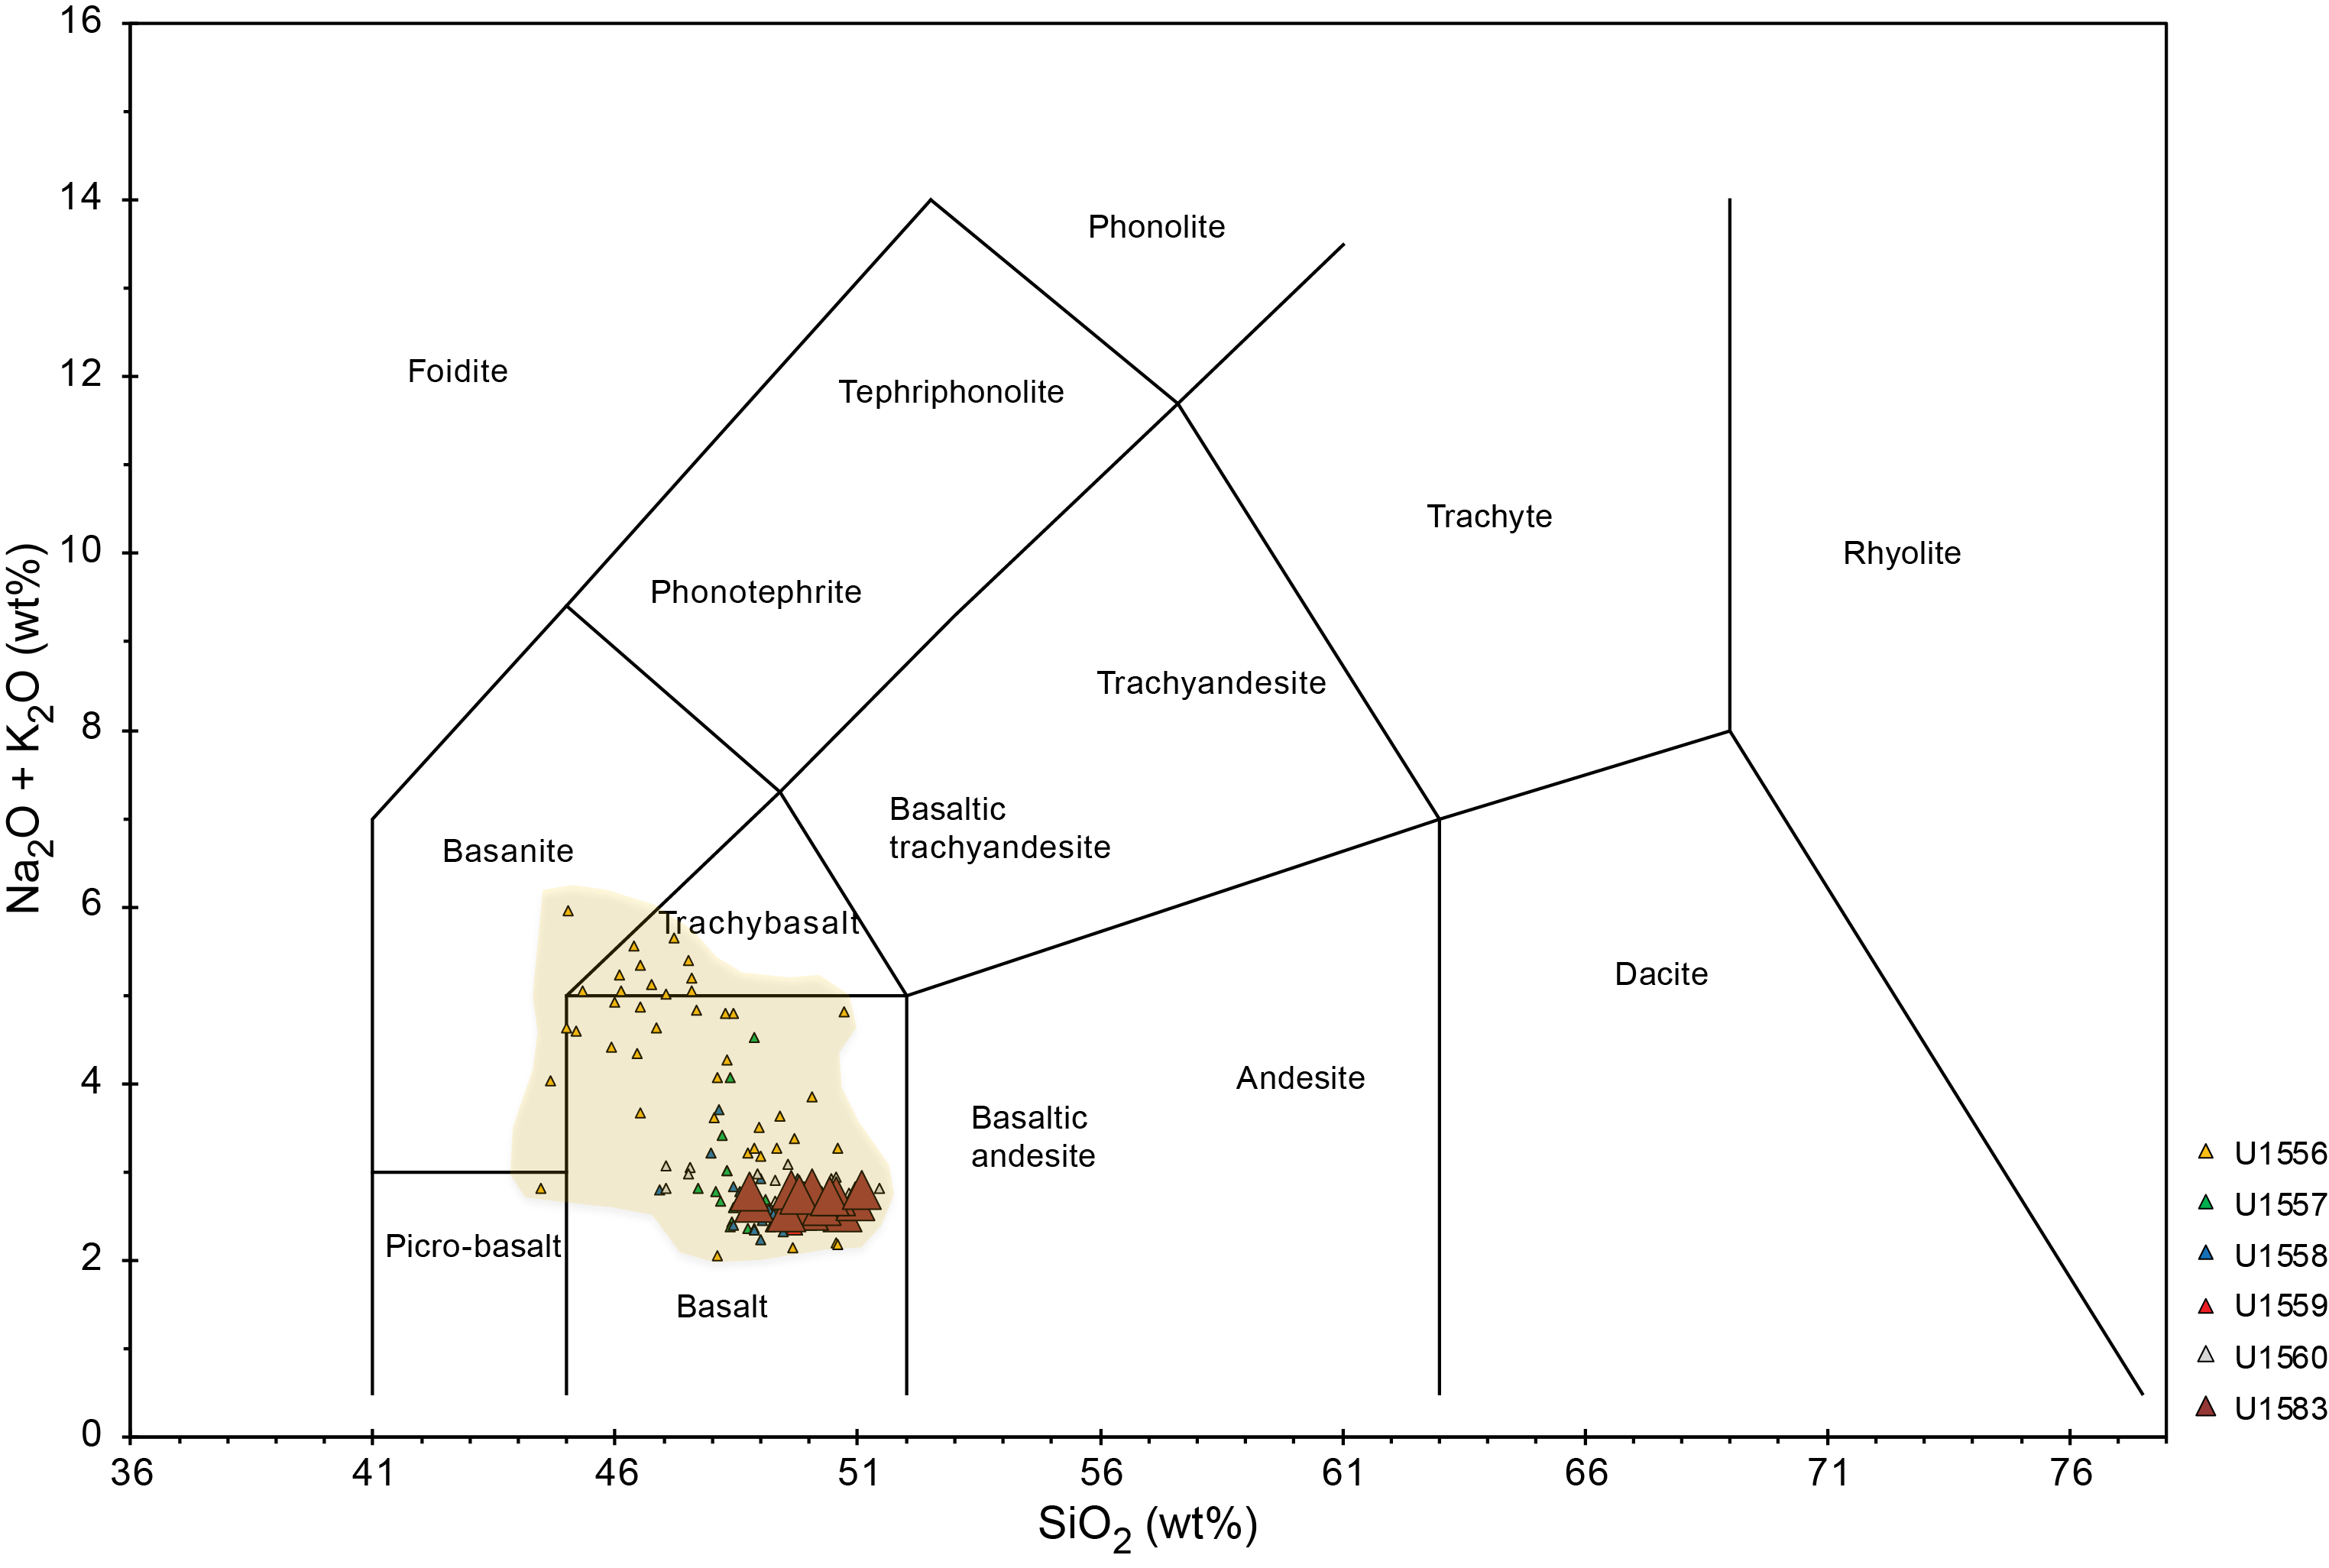
Figure F96. Total alkalis vs. silica diagram.
In Figure F97, Sr versus TiO2, the Site U1583 samples cluster near the center of the range for published South Atlantic MORB data, as compiled from the EarthChem Portal. The U1583 basalts range to higher Sr and Ti concentrations than the MORB-like basalts from the older SAT sites (Sites U1558, U1557, and Stratigraphic Sequence C from Site U1556) and the younger basalts recovered at Site U1559.
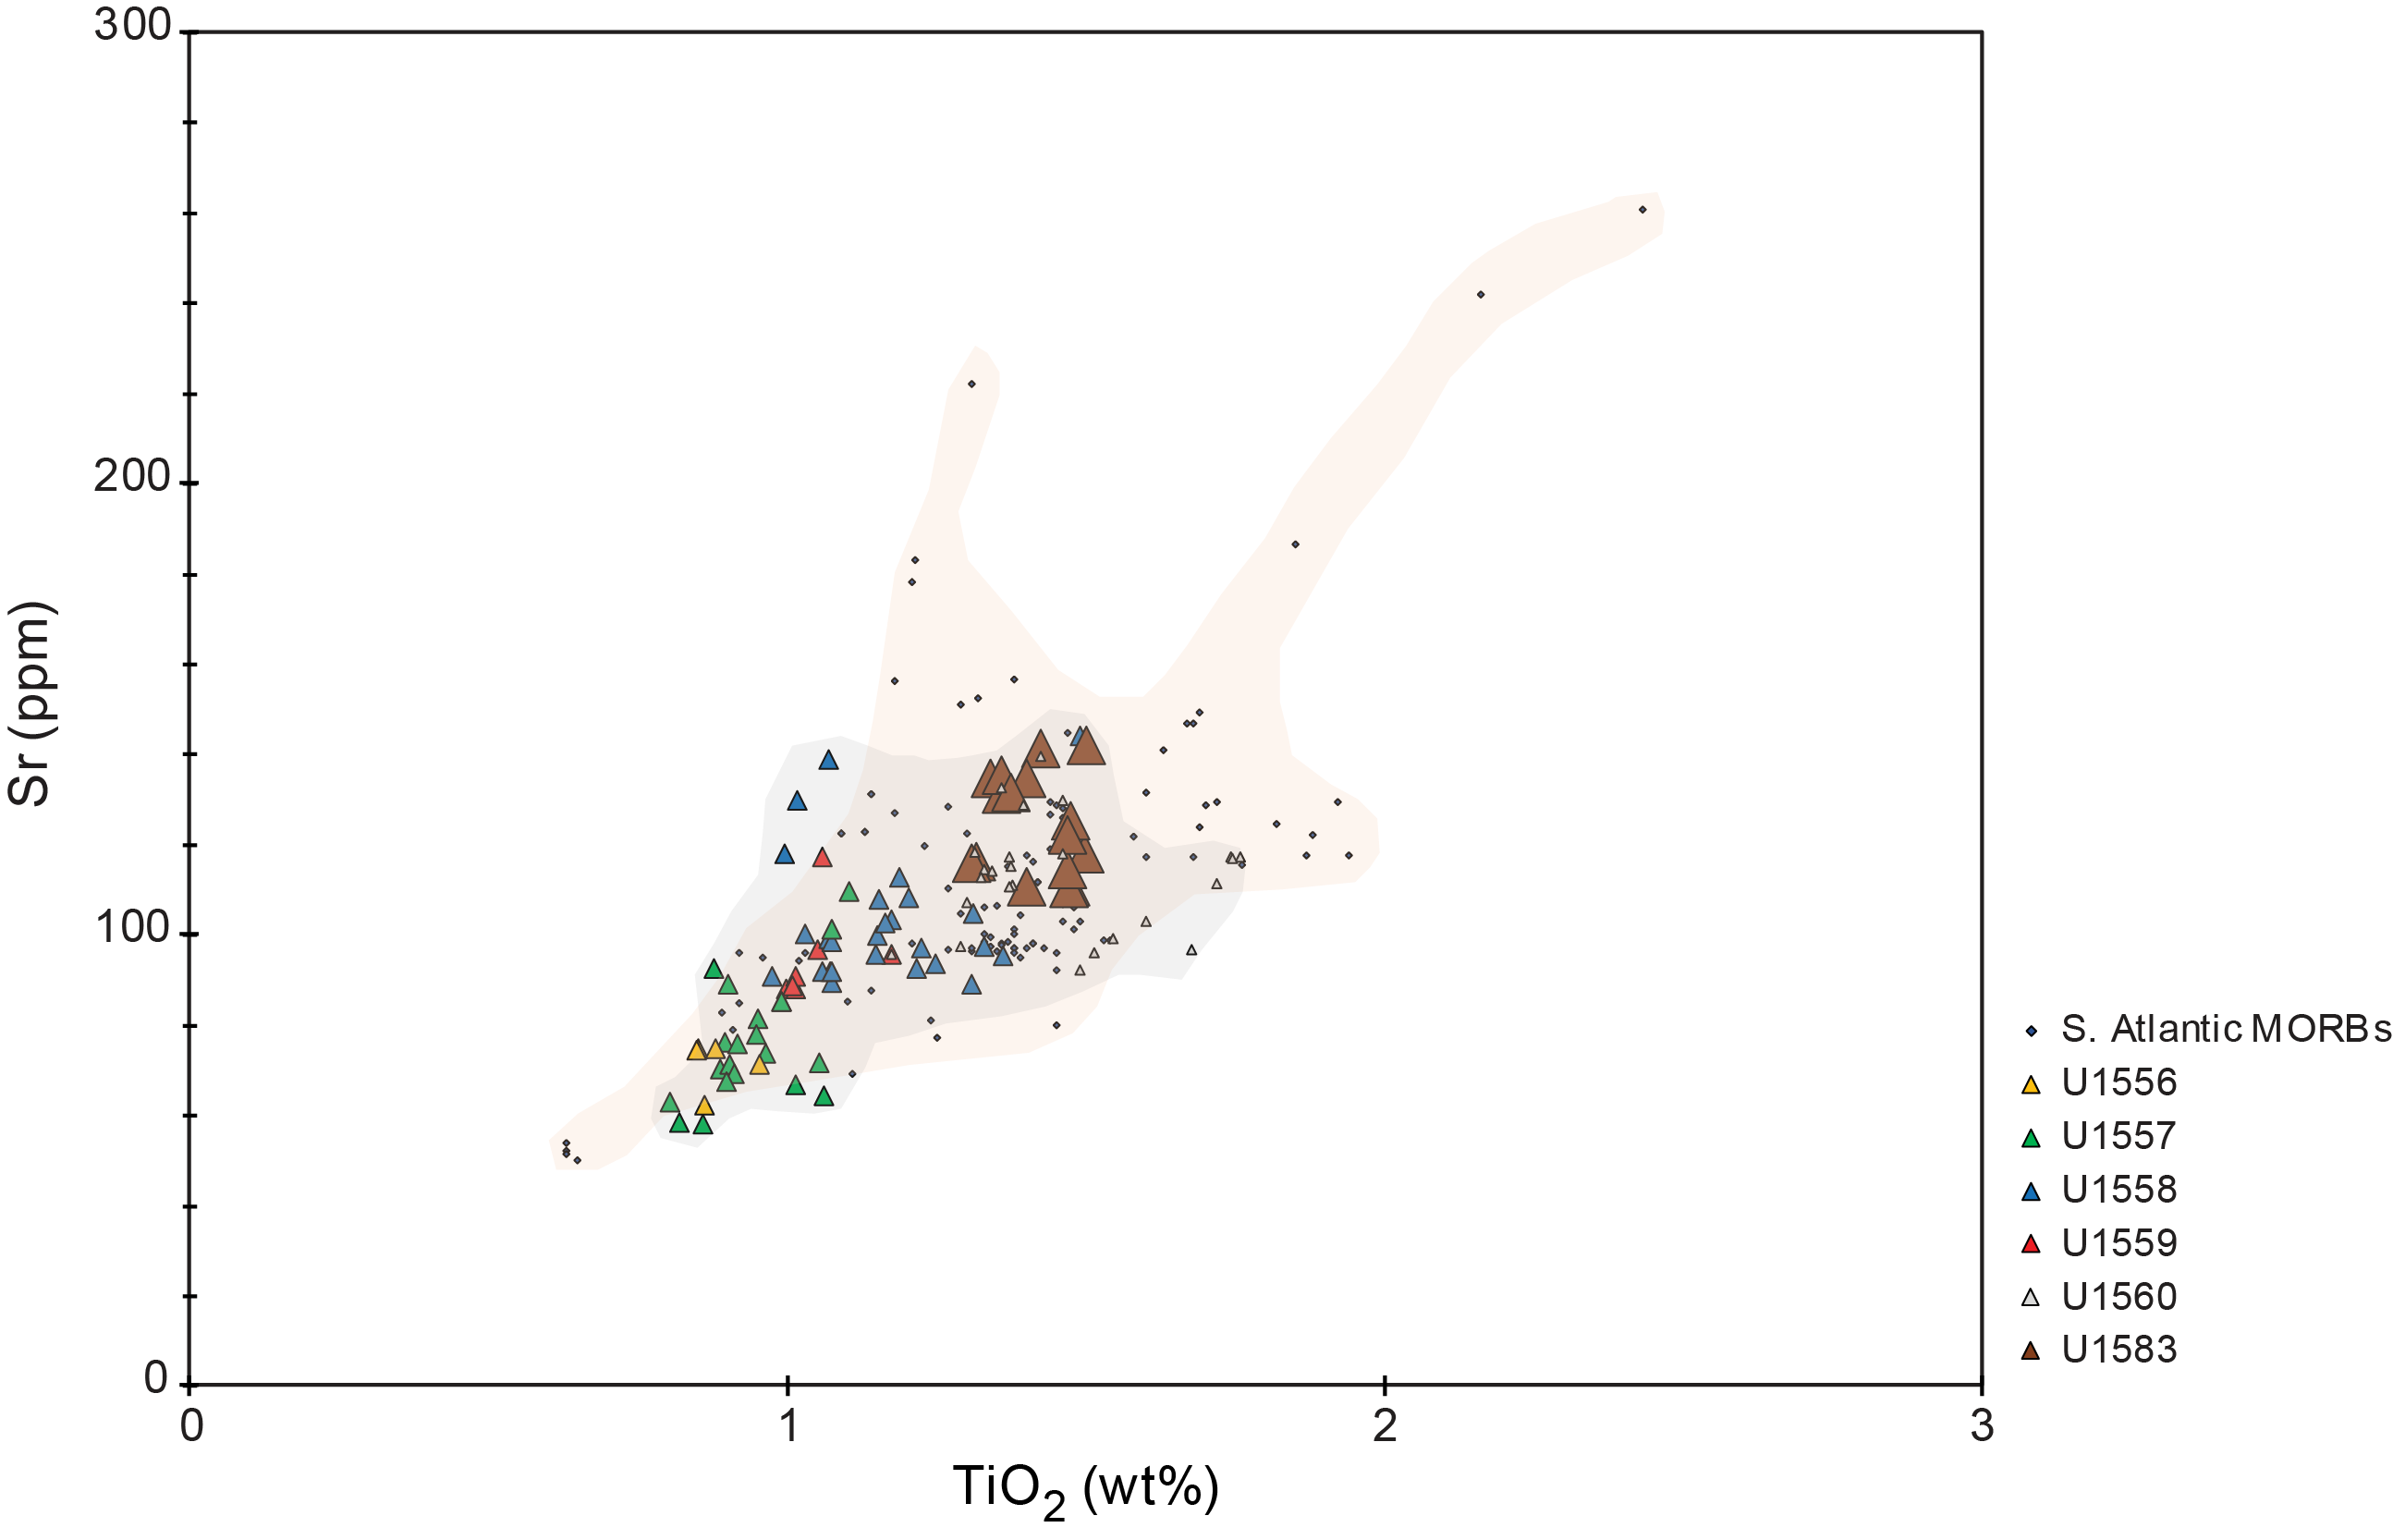
Figure F97. Sr vs. TiO2.
Figure F98 presents downhole plots for Site U1583 basalts. Although the Site U1583 samples appear relatively uniform in terms of CaO, trace elements like Sr and especially TiO2 record variability that maps to many of the lithologic boundaries identified (see Igneous petrology). TiO2 appears particularly sensitive to lithologic changes at a fine scale; pXRF data from U1583 samples suggest regions with different TiO2 concentrations in Units 1 and 2, and overall these data document a marked dropoff in the TiO2 content of the basalts in Unit 3. These changes likely relate to changes in the parental magma composition, suggesting the occurrence of more compositionally diverse eruptions on shorter timescales than have been seen in other SAT sites. Also observable in the TiO2 data are narrow low-abundance horizons proximal to unit boundaries, which may indicate transitions into volcanic-sedimentary breccias, such as in Units 4 and 6, and zones of interpillow sediment or volcanic-sedimentary breccias, such as between Subunits 3A and 3B.
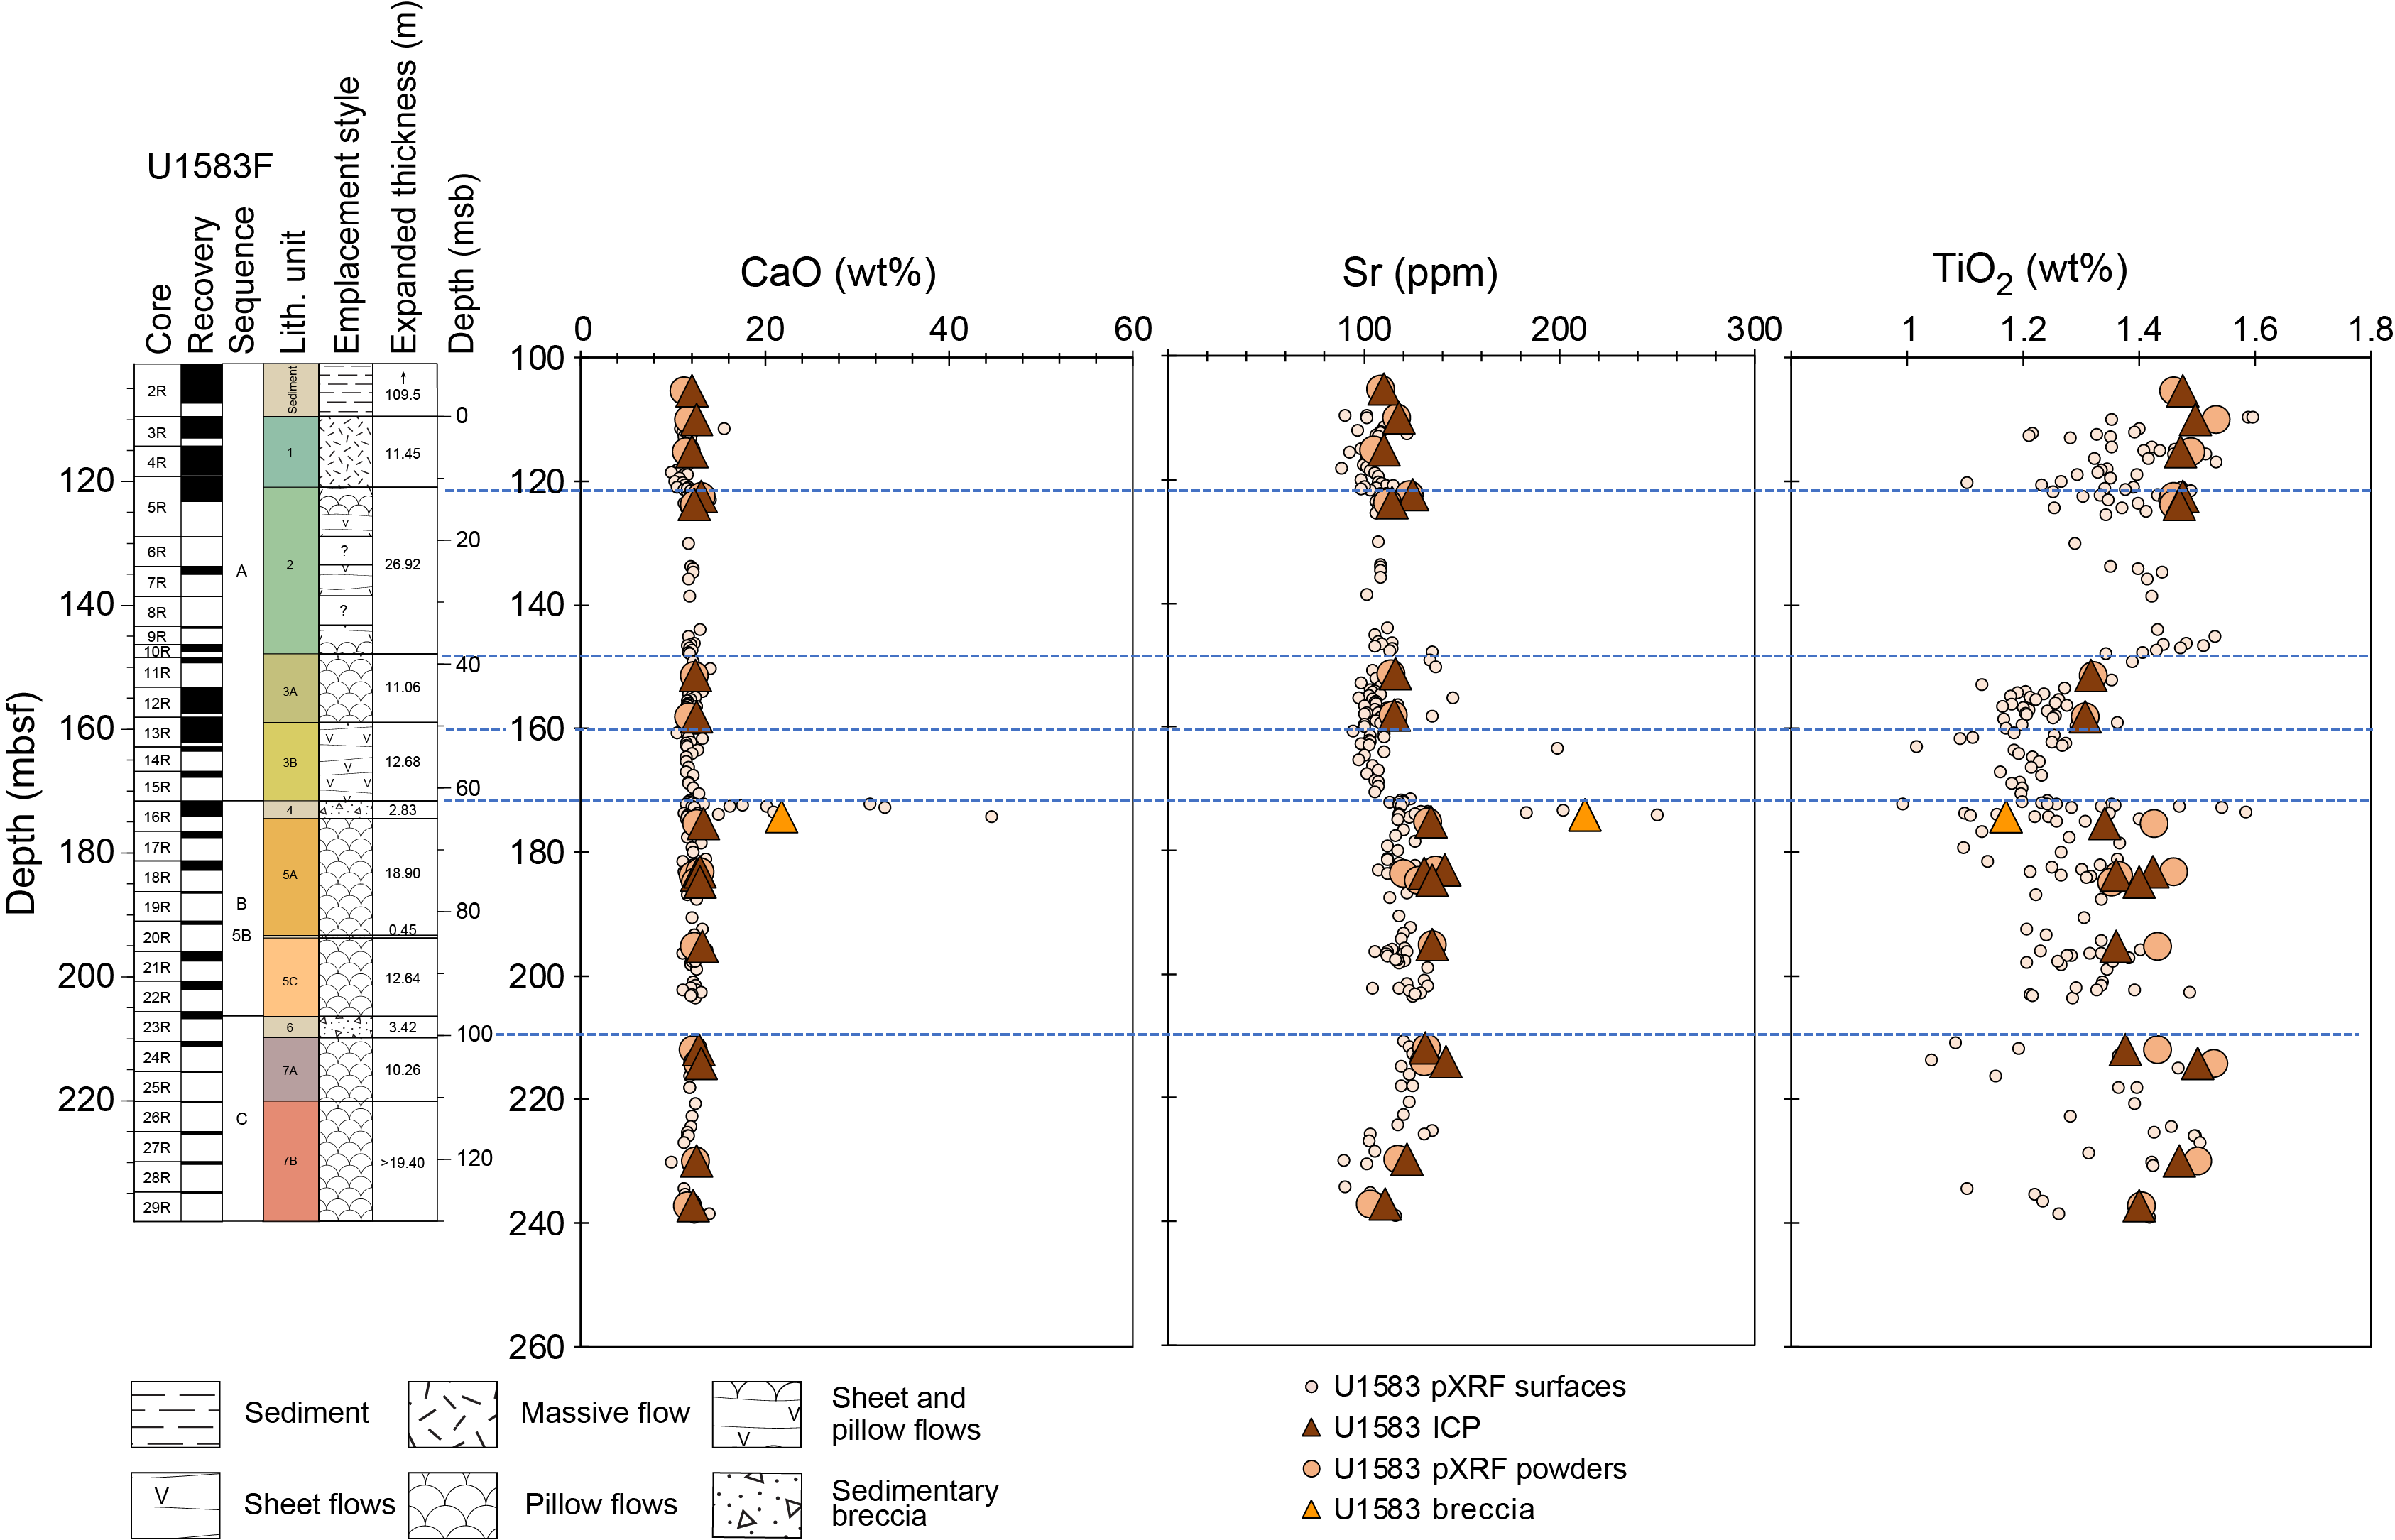
Figure F98. Major elements.
11.2.3. Alteration and differentiation effects
In Figure F99, the downhole variations in K2O and MgO give insights into alteration effects at Site U1583. Although K2O contents are overall lower than seen in Site U1558 basalts, concentrations are still generally higher than those of fresh MORB. A broad pattern of K2O increase downhole is evident in measurements on both sample surfaces and rock powders, punctuated by narrow zones of high K2O in the volcanic-sedimentary breccia zones. MgO contents show marked changes downhole at Site U1583, with the uppermost basalt cores (down to Unit 4, at ~170 mbsf) showing generally higher MgO contents, whereas below Unit 4, MgO contents become highly variable and are in some samples strongly depleted relative to fresh Atlantic MORBs. These differences correlate with lithologic changes downhole. The section above the Unit 4 breccias includes abundant basaltic sheet flows, including a thick (>11 m), fine- to medium-grained massive flow at the top of the sequence. In contrast, below Unit 4 microcrystalline pillow lavas dominate (see Igneous petrology). The lowest MgO values we measured are in close proximity to the lower boundaries of sedimentary breccias in Units 4 and 6. In both cases, MgO contents increase (and K2O contents decrease) in the basaltic rocks immediately below these intervals. This pattern suggests a relationship between MgO (and to a lesser extent, K2O) concentrations and proximity to the breccias, which may represent ancient exposed seafloor or possibly permeable zones where seawater-basalt exchanges are enhanced.
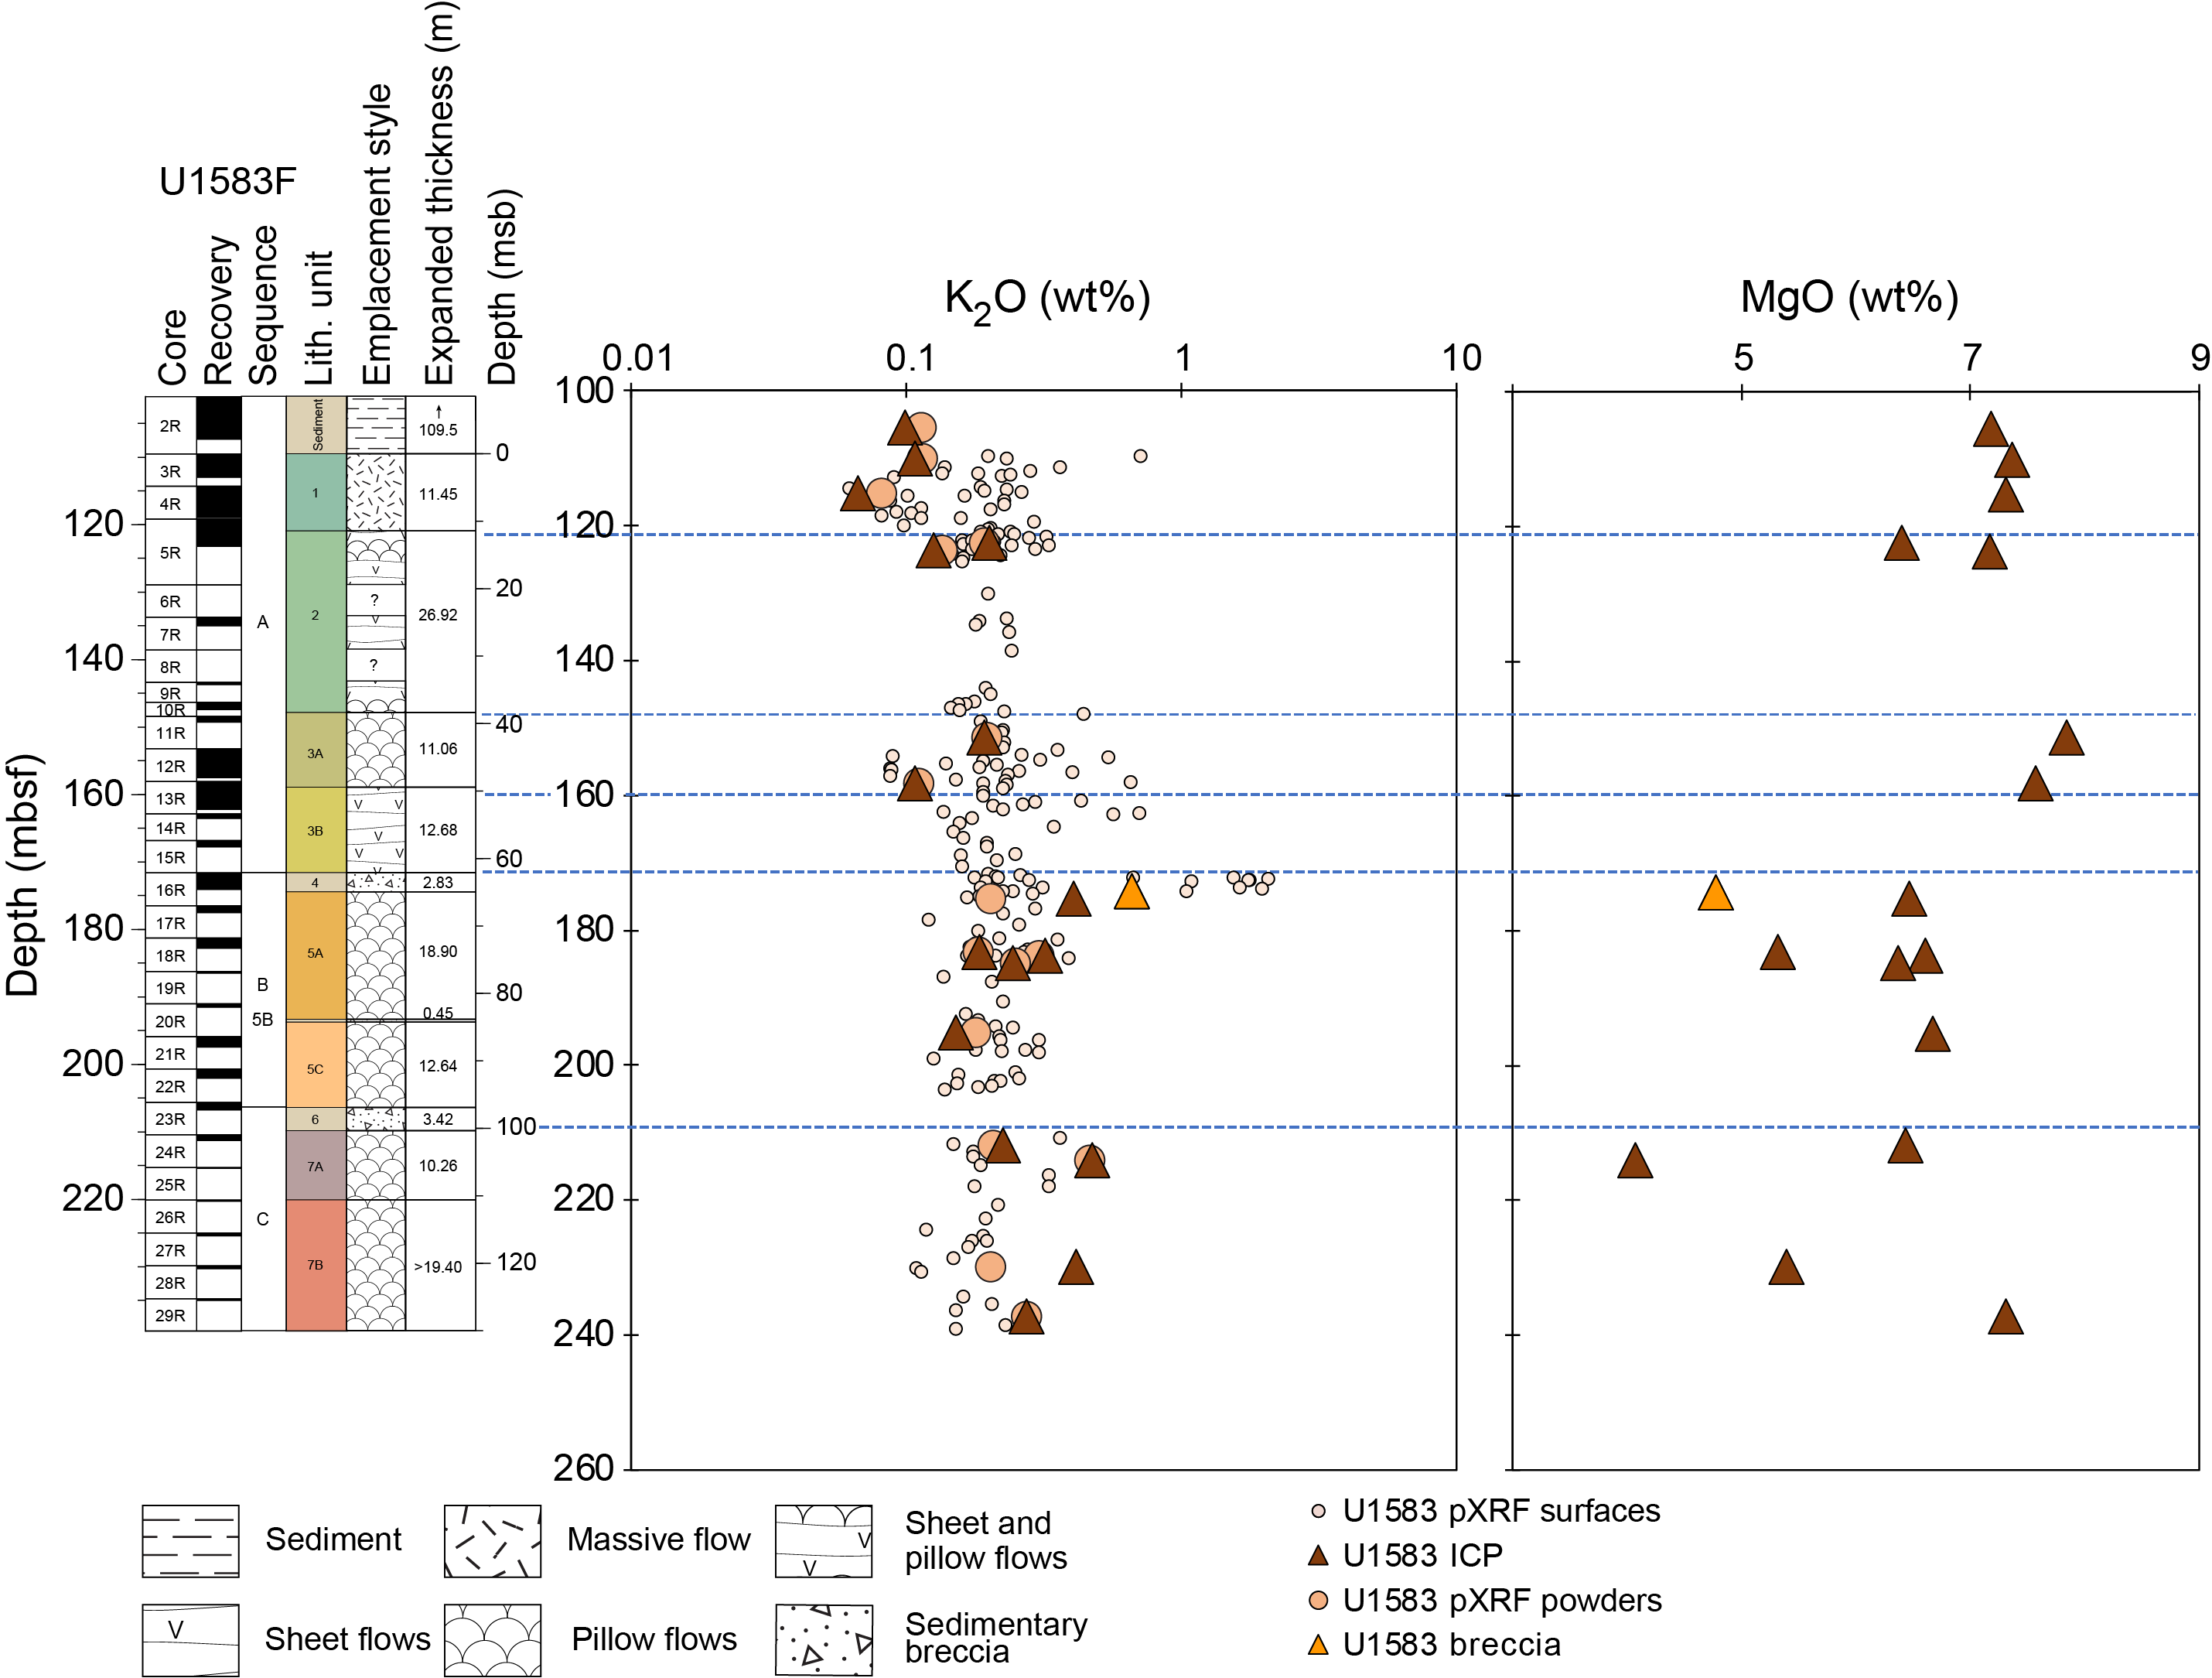
Figure F99. K2O and MgO.
In terms of measures of overall K enrichment, the Site U1583 samples span a range in K/Zr ratios that fall between those seen in the older SAT basalts to values like those encountered in the younger Site U1559 lavas (Figure F100). The Site U1583 suite spans a range in Cr/TiO2 ratios consistent with the downhole variability observed in Figure F98. Lower Cr/TiO2 ratios in the Site U1583 basalts are consistent with these lavas being more differentiated, (i.e., they are lower in Cr at MORB-like TiO2 contents) as opposed to indicating any kind of change in the compositions of their mantle sources.
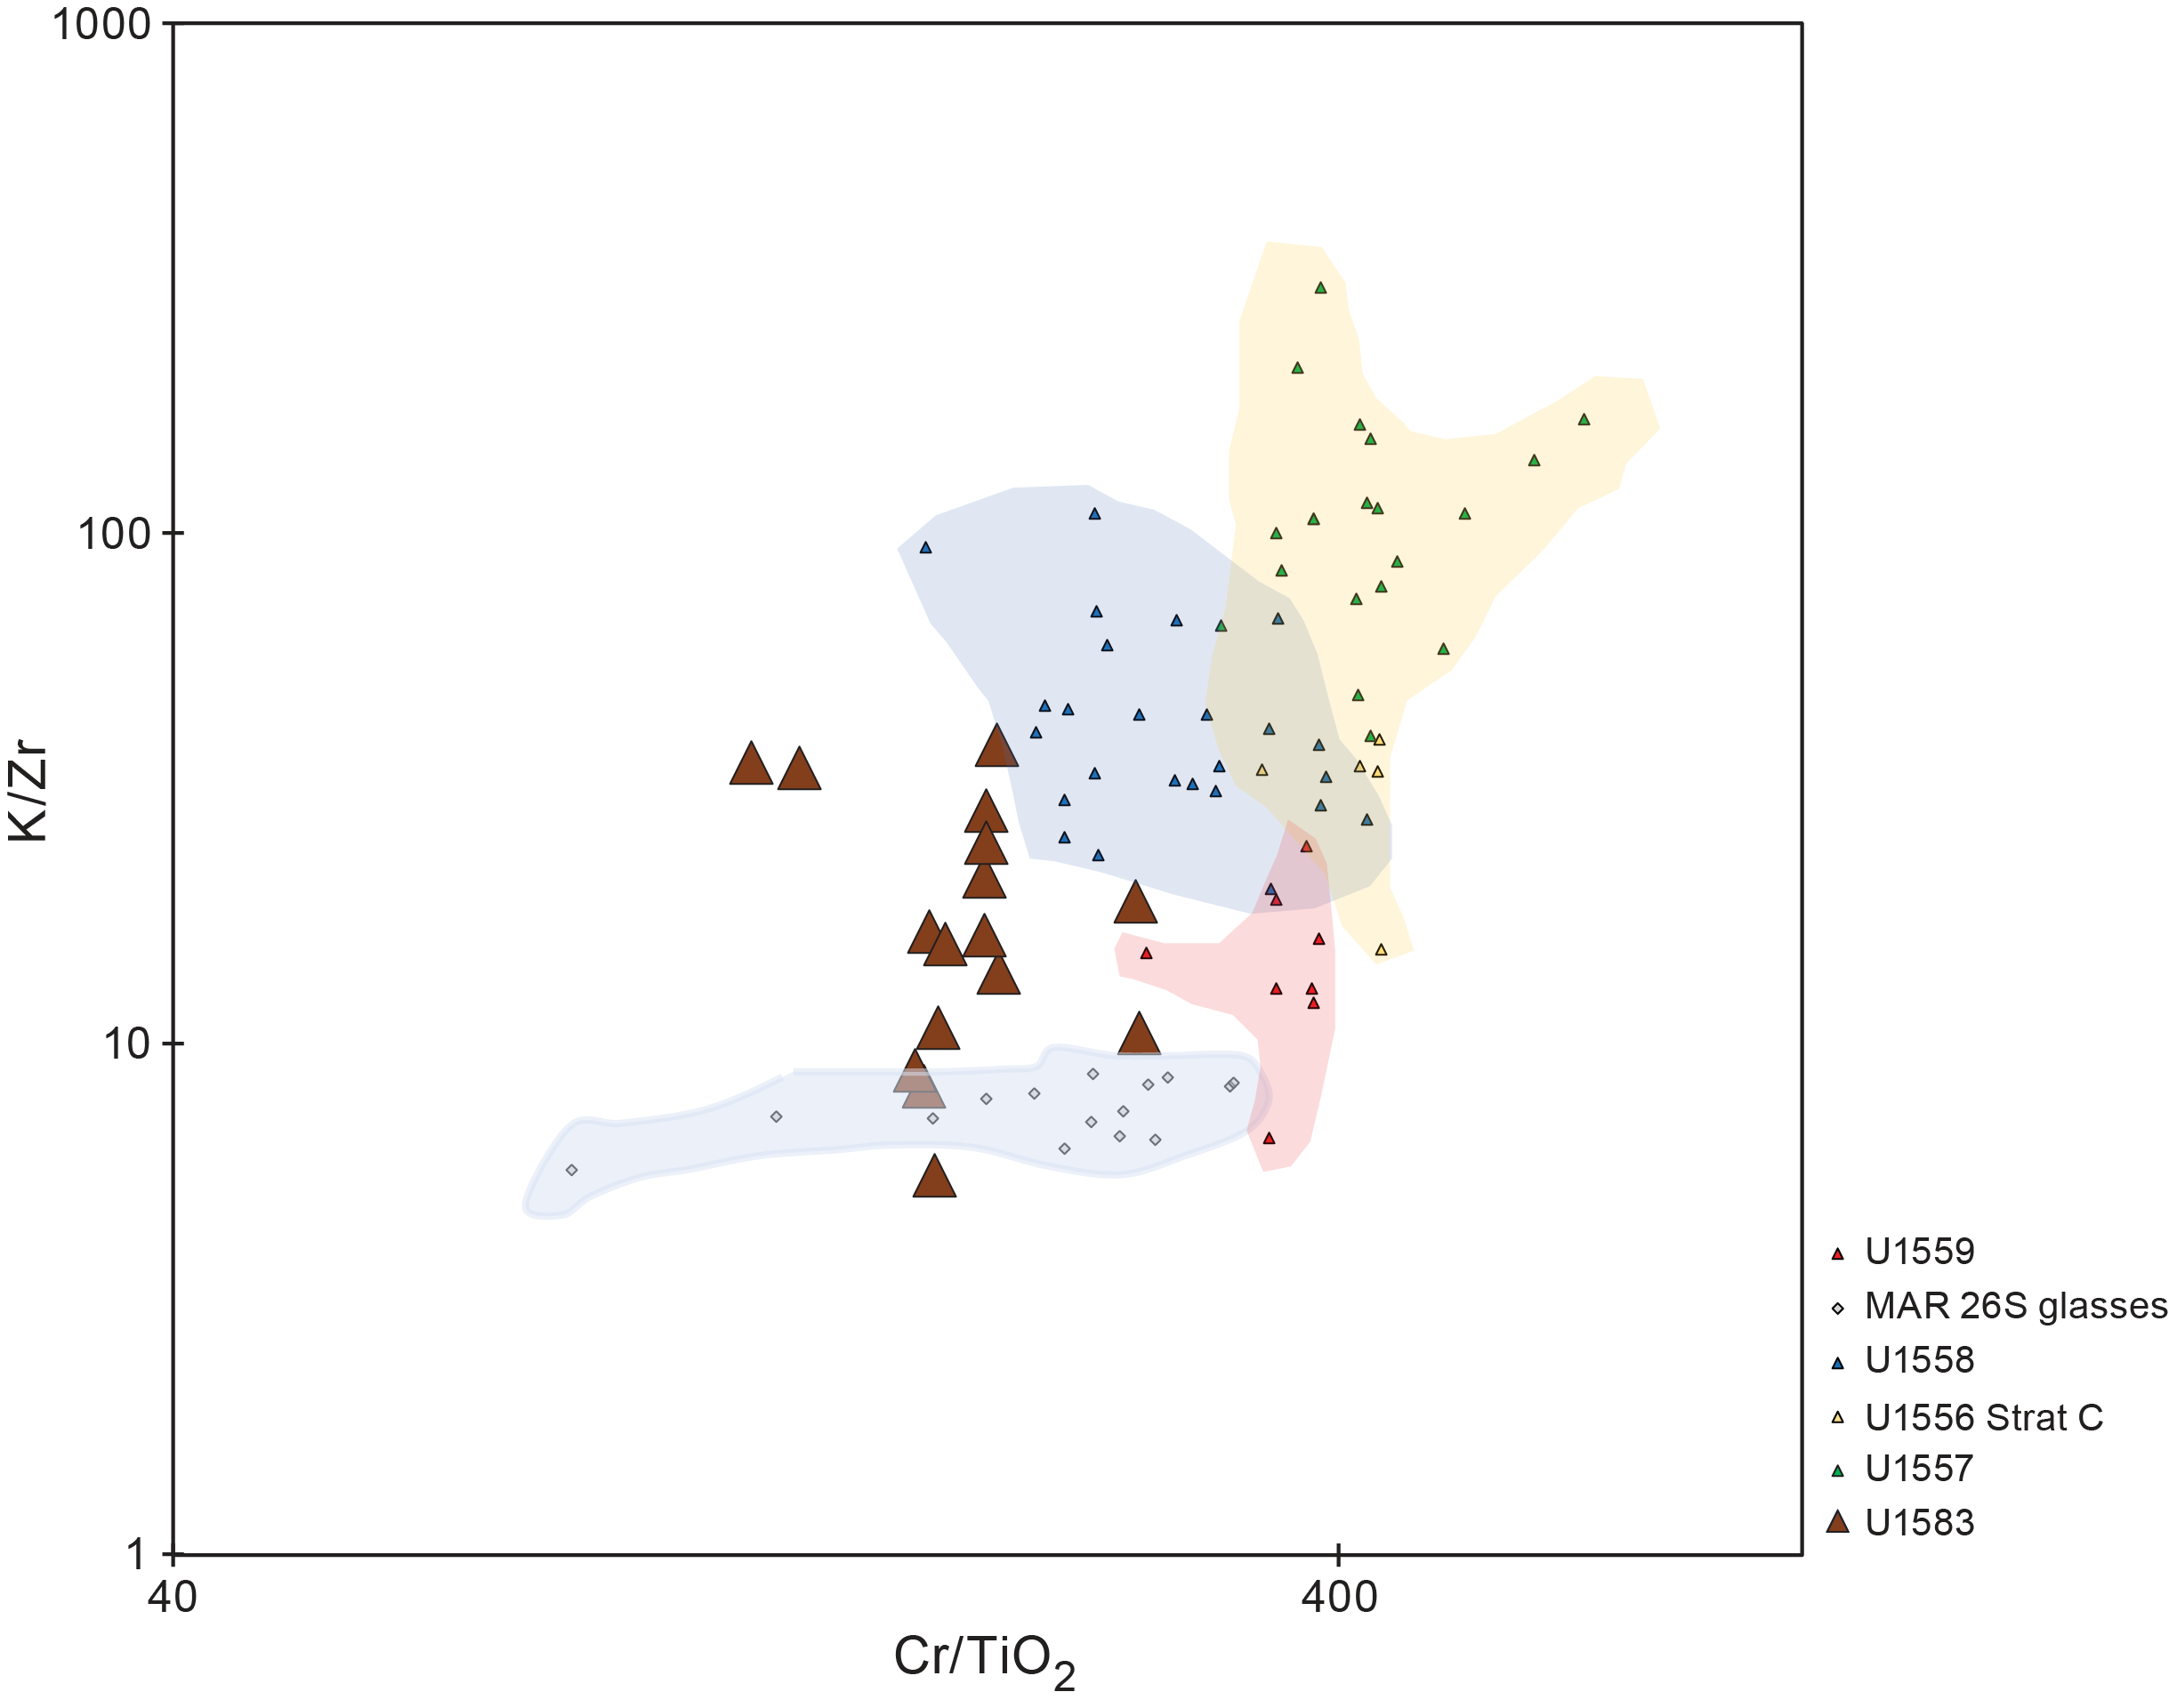
Figure F100. K/Zr vs. Cr/TiO2.
11.2.4. Immobile trace element systematics and MORB magmatic processes
Figures F101 and F102 plot the Site U1583 data on the Zr/Y versus Zr tectonic discrimination diagram of Pearce and Norry (1979) and the V versus Ti/1000 discrimination diagram of Shervais (1982). Although these diagrams are more commonly used to assay the likely tectonic origins of continental mafic rocks, they can also be used as a means for discerning among MORB magmatic suites in terms of parameters such as their mean extents of crystallization or comparative extents of melting. On Figure F101, the Site U1583 basalts have, on average, higher Zr contents and higher Zr/Y than do the basalts in either the Site U1558 or Site U1559 sample suites. As noted above, this is consistent with the Site U1583 lavas being somewhat more differentiated than basalts from these other sites, which may be related to differences in their extents of fractional crystallization before eruption. Figure F102 provides some additional detail on the likely magmatic evolution of Site U1583 basalts. Looking specifically at our higher precision ICP-AES data, the Site U1583 lavas form a positively sloped linear trend, consistent with fractional crystallization effects, which would proportionally increase (or in the case of oxide phases, decrease) magmatic Ti and V abundances. The data from Sites U1558 and U1559 also fall along quasilinear arrays, most likely reflecting crystallization effects. However, the Site U1583 data trend reflects a higher Ti/V ratio than do the trends for the Site U1558 or Site U1559 samples. This difference is probably not crystallization related, given the strong linear correlation of the data. A possible origin for these differences are variations in the mean extent of partial melting involved in generating the parental magmas for each of these suites because differences in the bulk partition coefficients for vanadium and titanium mean these elements can fractionate relative to one another during mantle melting processes. An additional possibility to consider is variation in mantle source composition, although Ti/V ratios normally show only limited variations in MORB systems (e.g., Shervais, 1982, 2022).
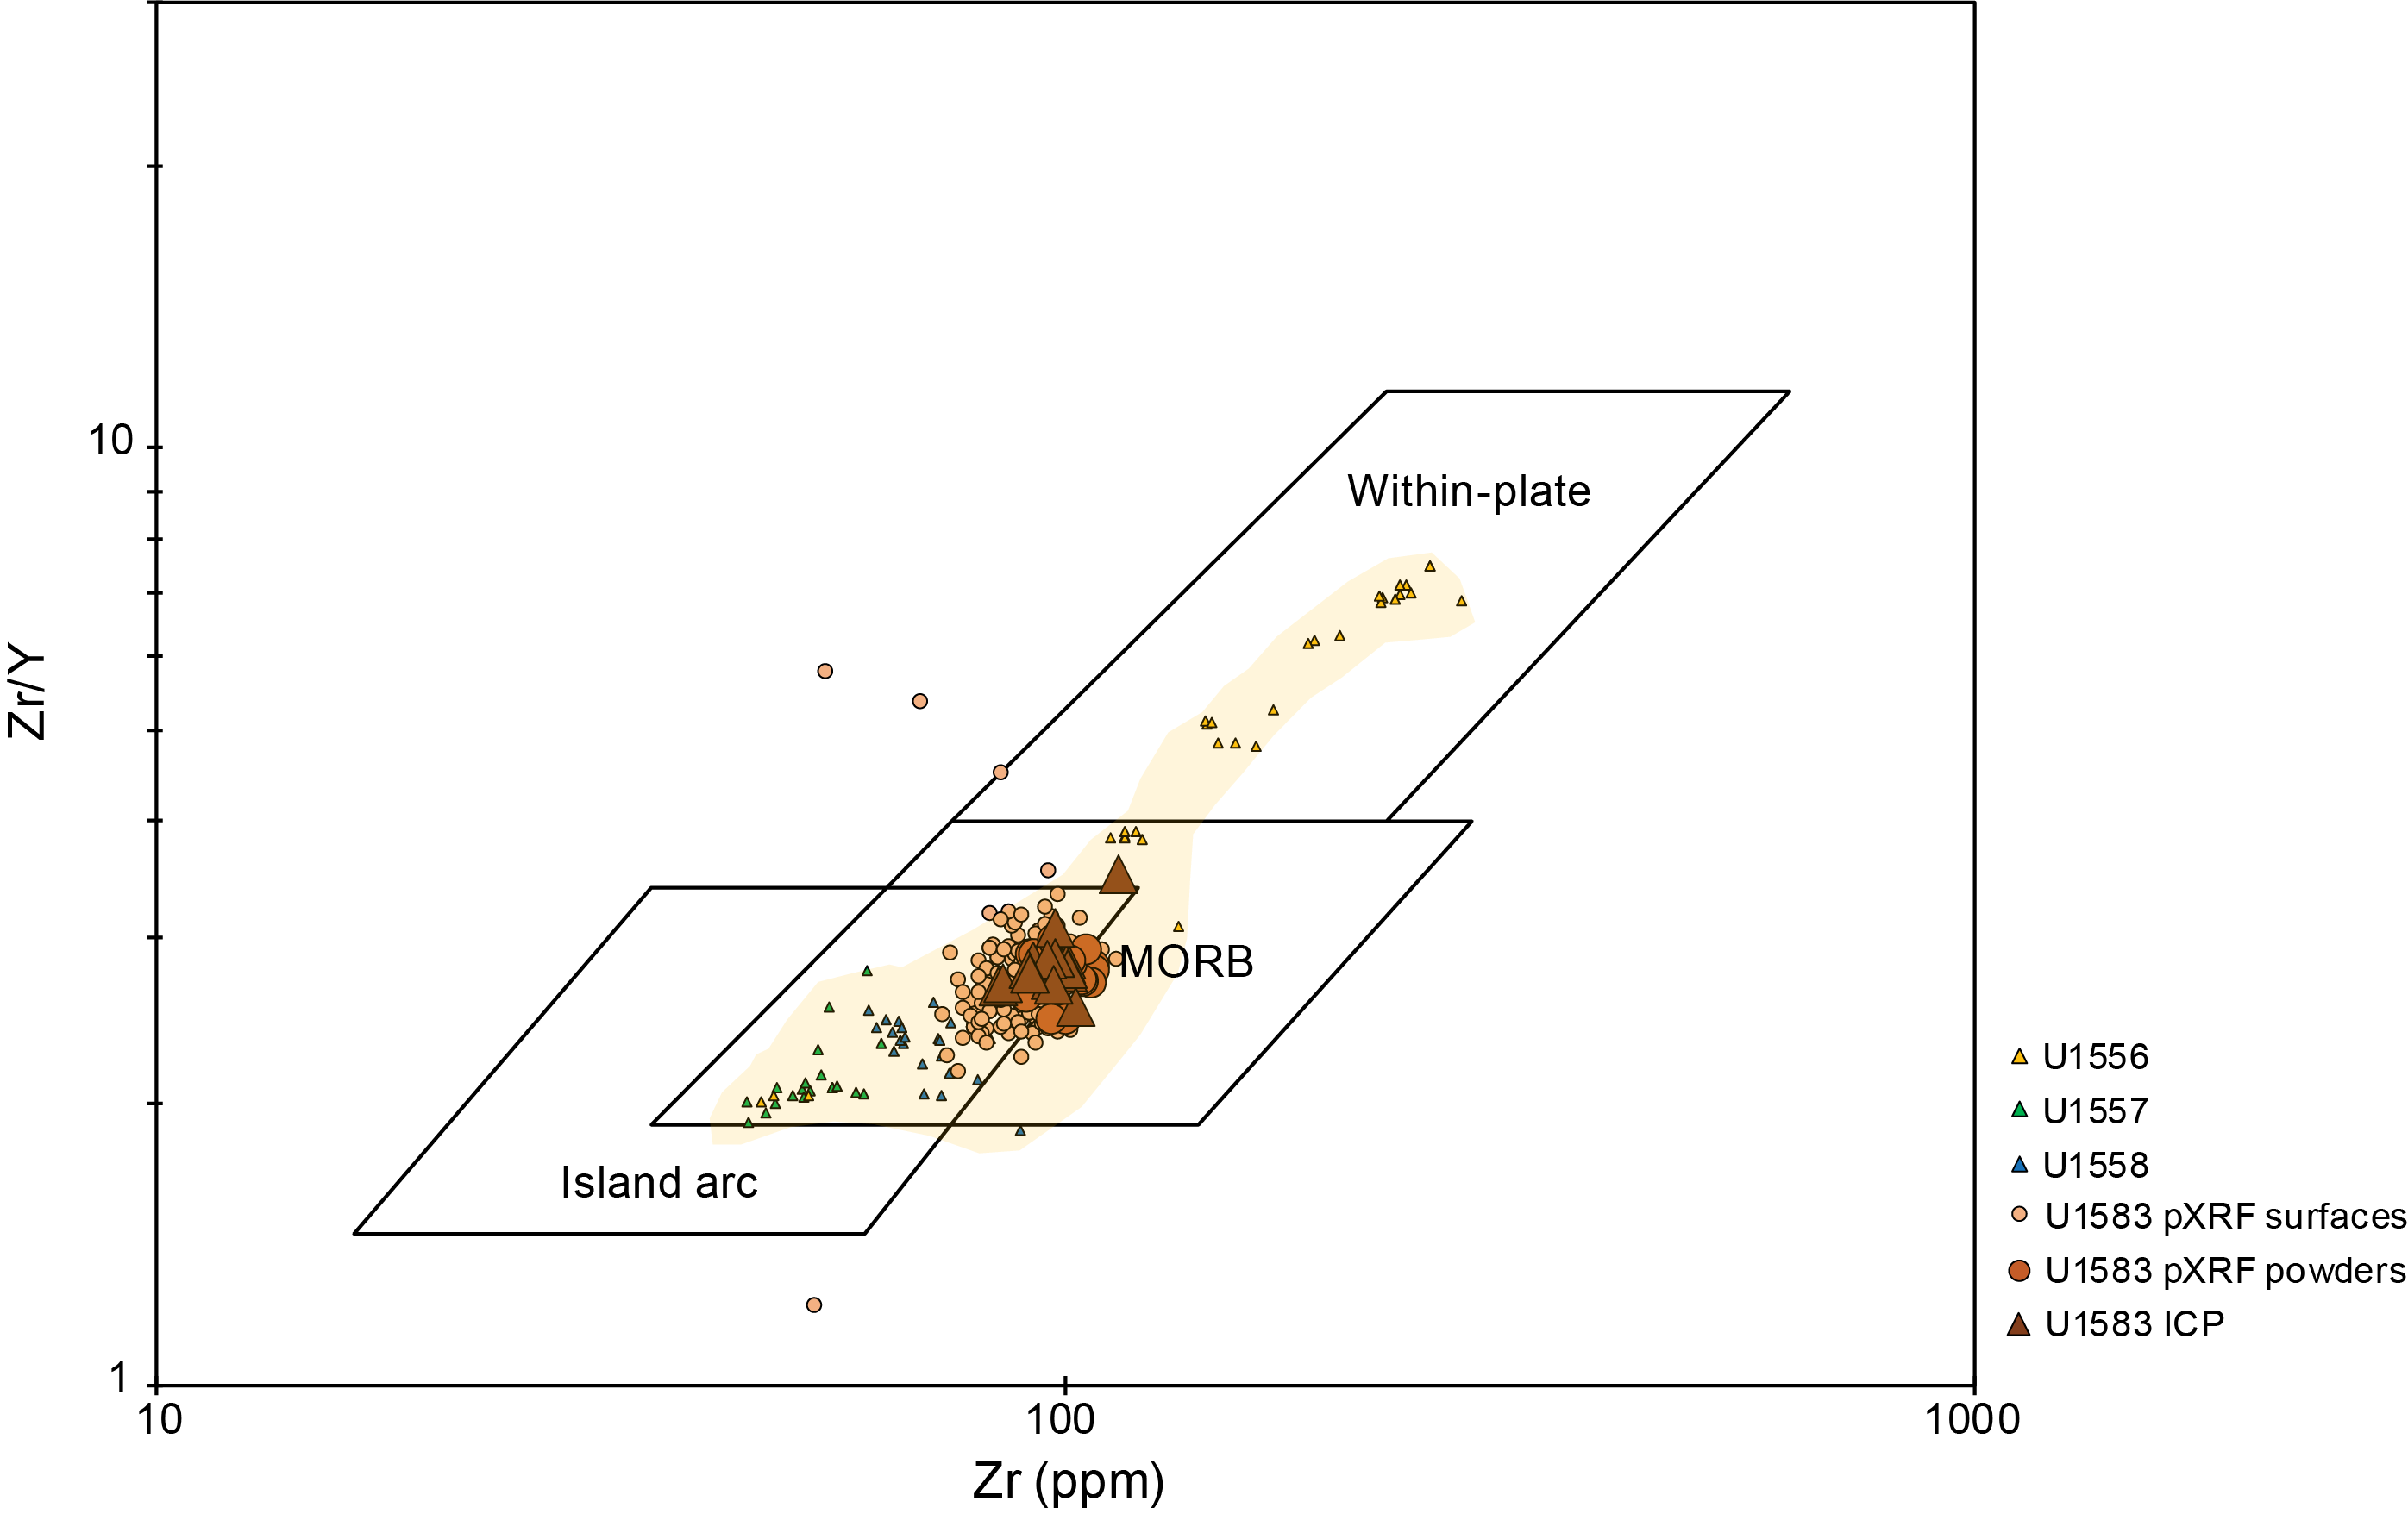
Figure F101. Zr/Y vs. Zr.
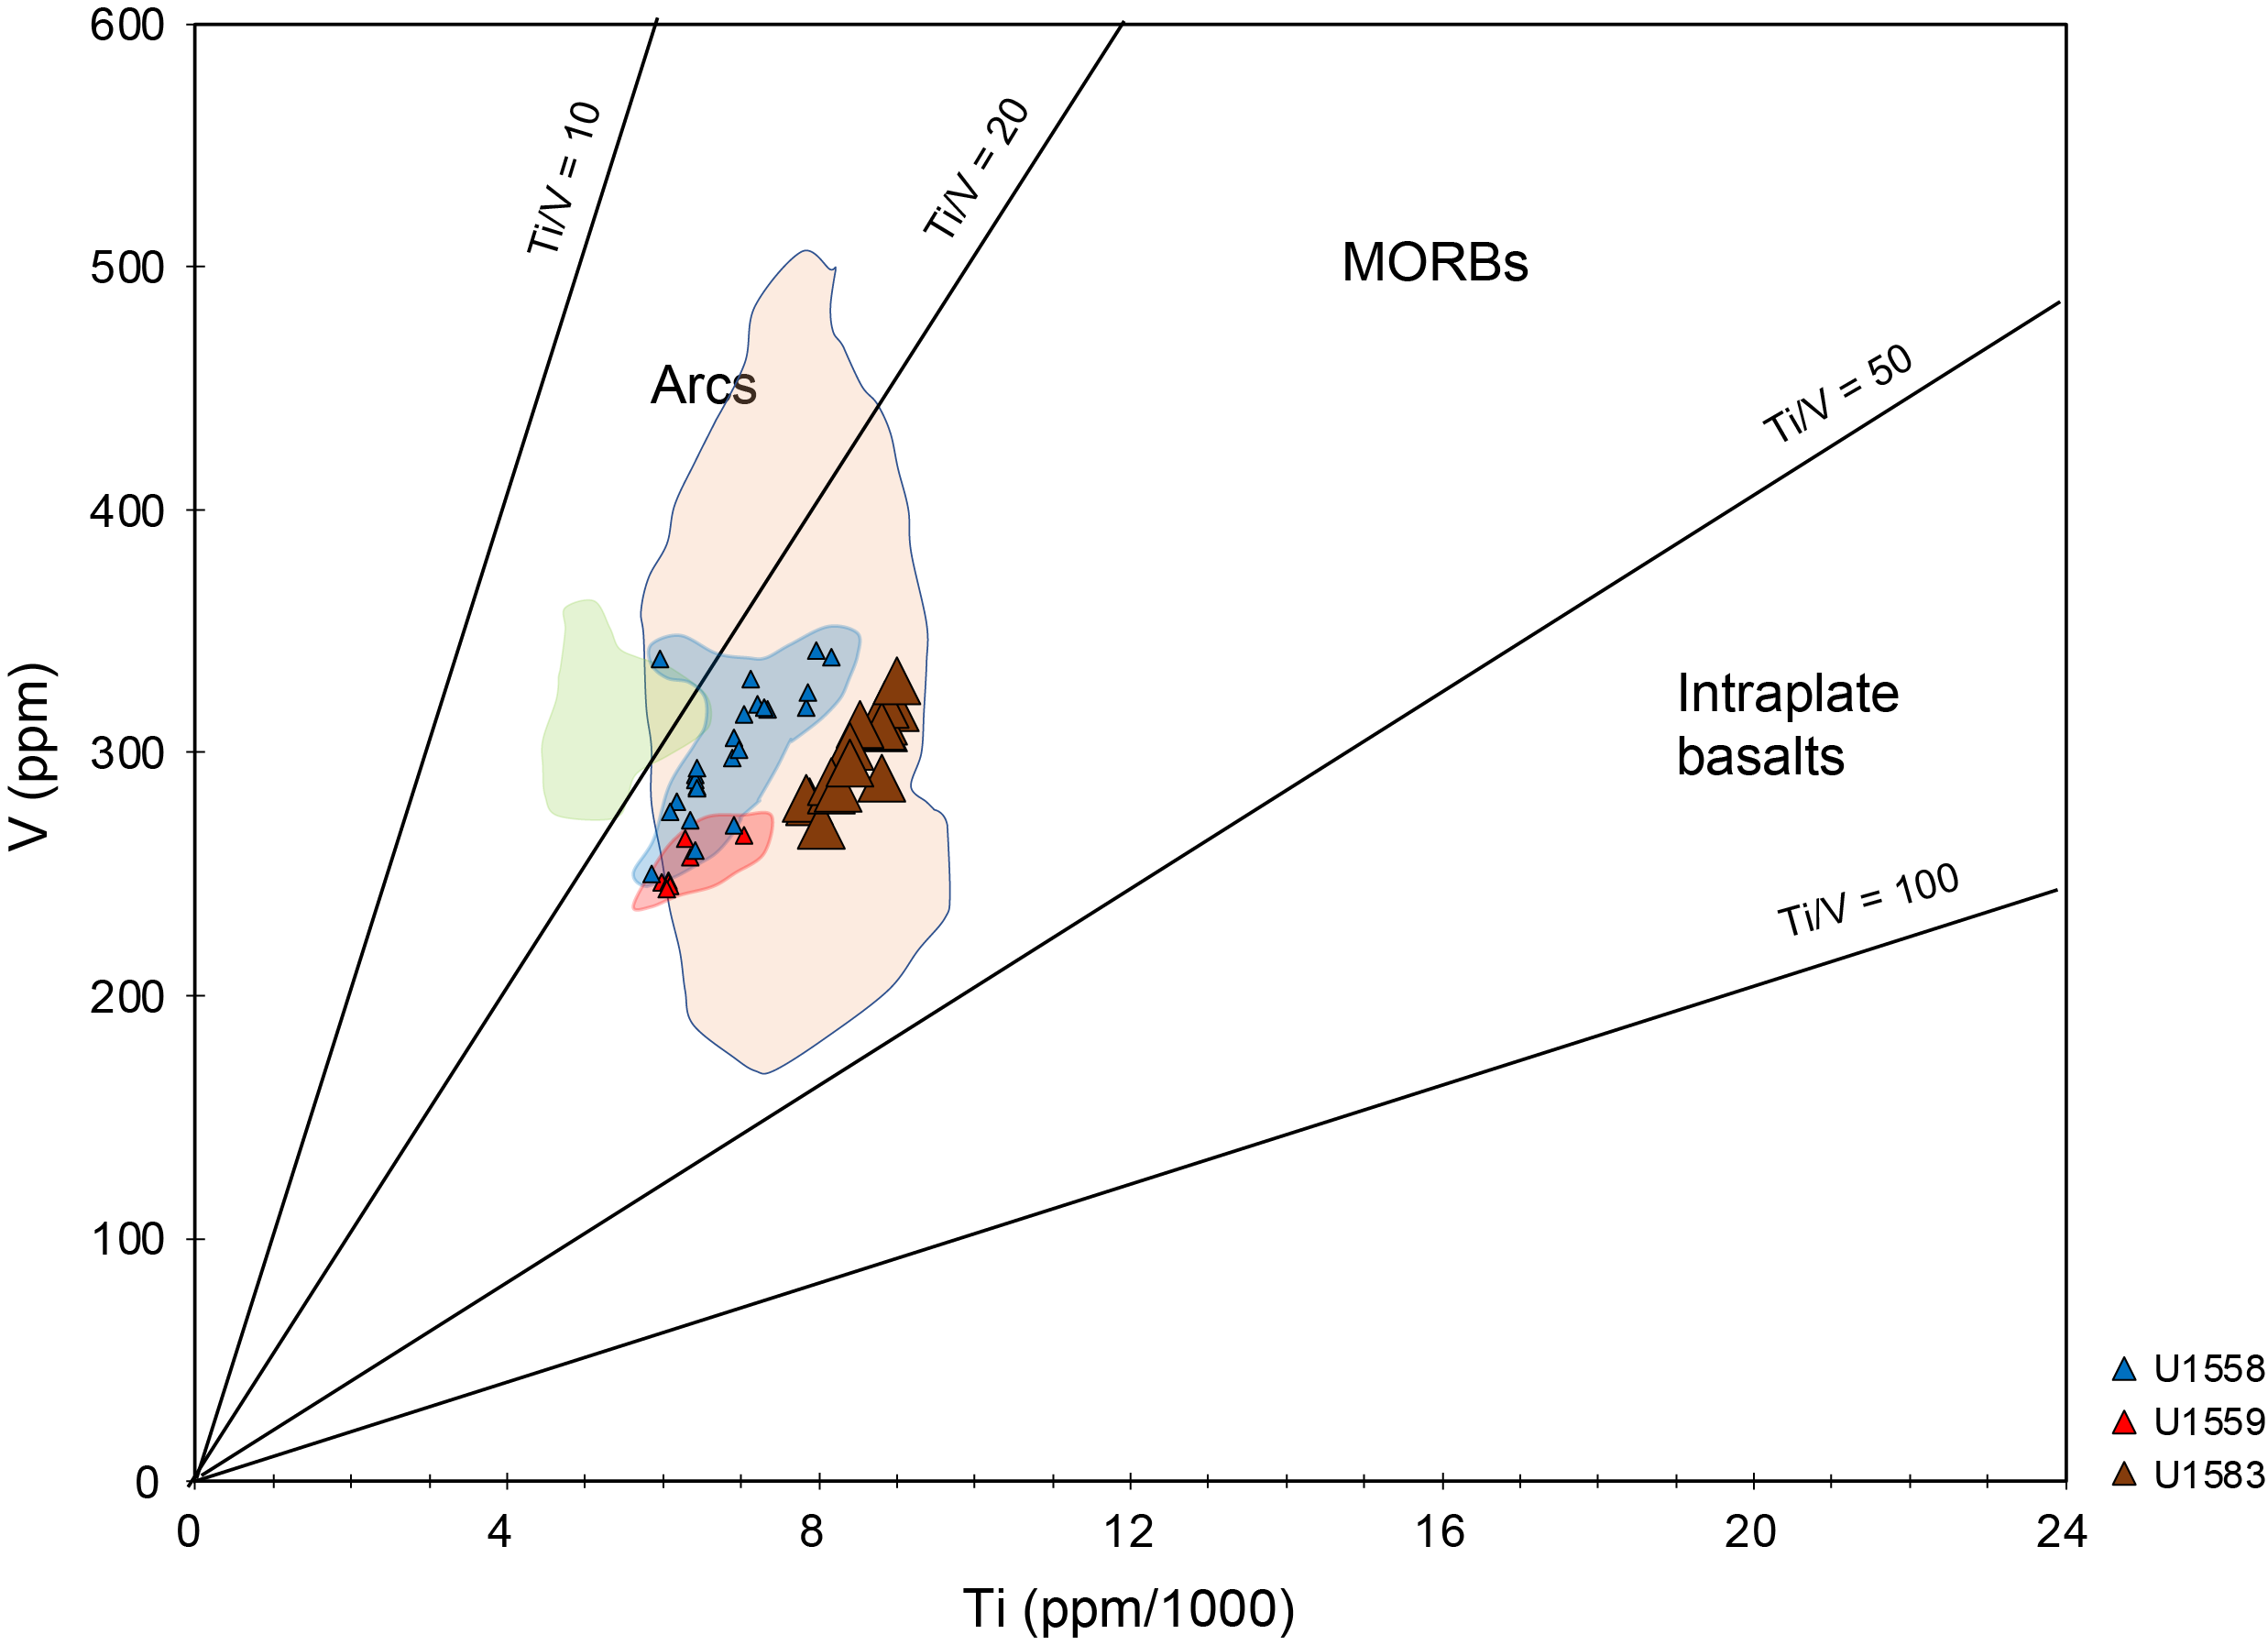
Figure F102. V vs. Ti/1000.
12. Microbiology
12.1. Sediment
Microbiology sampling from sediments in Hole U1583C during Expedition 393 focused on exploring evidence for life in the sediments and at the sediment/basement interface using culture-based and culture-independent approaches. One standard microbiology whole-round sample (5–10 cm long) was collected from each 9.5 m core. These whole-round samples were subsampled for various microbiological analyses to be performed by different shipboard and shore-based scientists, as described below (Table T37). Additional personal whole-round cores for specialized shore-based analyses were also taken (Table T37). An additional whole-round sample that included both standard and personal microbiology samples was taken in the sediment of Hole U1583F prior to basement drilling at the sediment/basement interface (Table T37). In summary, 13 standard microbiology whole rounds were sampled for shipboard analysis and an additional 33 whole rounds were taken for personal shore-based analyses.
12.1.1. Microbiological sample processing and experiments
12.1.1.1. Cell and viral counts
Subsamples for cell counts were taken in duplicate from every standard microbiology whole round except for Sample 393-U1583C-12H-4. An additional cell count subsample was taken in each of the seven cores that were sampled for viral metagenomic analysis to perform viral counts on those core sections. Performing shipboard cell and viral counts is difficult because of the time required for sample processing; therefore, shipboard cell counts were not attempted during the SAT expeditions; instead, samples were preserved for postexpedition analyses by diluting 1 cm3 in 4 mL of 4% paraformaldehyde in 100 mM phosphate-buffered saline (PBS). Samples were taken in replicates to enable cross-calibration of cell counts between different laboratories. A third sample was collected from samples where samples for viral metagenomics were also collected.
12.1.1.2. Microbial community structure
From the standard microbiology whole rounds, 24 samples were preserved for shore-based polymerase chain reaction [PCR] amplicon-based analysis (from DNA and RNA), 13 samples were preserved for single-cell genomics, 11 samples for viral production experiments, and 11 samples for high-throughput culturing. Additional personal whole rounds (5–10 cm long) were taken and preserved: seven samples for viral metagenomics, seven samples for metagenomics, six samples for stable isotope probing experiments, seven samples for lipid analysis, and six samples for characterization of Archaea (Table T37). All samples were preserved as described in Microbiology in the Expedition 390/393 methods chapter (Coggon et al., 2024a).
12.1.1.3. Microbial incubation experiments
To determine the extent of viral activity, virus-induced microbial mortality and prophage induction experiments were performed (see Microbiology in the Expedition 390/393 methods chapter [Coggon et al., 2024a]) using 10 cm3 from the standard microbiology samples from Cores 393-U1583C-1H, 5H, and 11H (see Table T37 for specific sections and depths) to initiate experiments. These samples were chosen to represent a range of oxygen and nutrient concentrations throughout the hole. Duplicate samples were incubated at room temperature (~18°C), and 1 mL duplicate subsamples were collected after 0, 3, 6, 12, 24, and 48 h and then 7 and 14 days. The seawater that was used to dilute 1 cm3 sediment consisted of 0.22 µm filtered and autoclaved deep seawater collected using a Niskin bottle attached to the subsea camera system frame on 28 June 2022 at a depth of 4333 m. The pH of the deep water upon collection was 7.54.
12.1.2. Microbiological contamination monitoring
To determine the number of microorganisms present in drilling mud fluid and also generate a database of potential contaminants, 25 mL of drilling fluid was collected from the standpipe on the rig floor at the beginning of coring operations in Hole U1583C. This drilling fluid was frozen at −80°C for shore-based molecular biology analysis to determine the microorganisms present in drilling fluid.
12.2. Basement
Microbiology sampling in basement of Hole U1583F during Expedition 393 focused on exploring evidence for life in volcanic basement and at the sediment/basement interface using culture-based and culture-independent approaches. For Hole U1583F, sampling efforts aimed to collect one ~10 to 15 cm whole-round core sample from each ~9.5 m advance. To maintain acceptable levels of core recovery, drilling generally proceeded with 4.8 or 4.9 m RCB half-core advances. In practice, this meant taking microbiological samples from alternating cores, although this varied depending on adequate recovery and core characteristics as well as the geologic characteristics of interest. The whole-round cores selected were photographed immediately in the splitting room from overhead, in context with adjacent core pieces. They were then processed and subsampled for different microbiological analyses, with the goal of generating a suite of subsamples that were representative of the different rock and alteration types that comprise the volcanic basement stratigraphy at Site U1583 (see Igneous petrology and Alteration petrology). Preference was given to core pieces with evidence of alteration or fracturing because the presence of these features indicates past fluid flow and potential avenues for current fluid ingress, which is a prerequisite for delivery of microorganisms to subseafloor basement. In total, 10 whole-round samples (11–17 cm long) were collected for microbiological analyses (Figure F103). The rock types sampled were moderately plagioclase-olivine phyric, subtly variolitic massive basalt (2 whole rounds); moderately plagioclase-olivine-clinopyroxene phyric, fine-grained basalt with glassy margin (1 whole round); sparsely plagioclase-olivine-clinopyroxene phyric, microcrystalline basalt with glassy margin (1 whole round); aphyric fine-grained basalt (2 whole rounds); basaltic breccia with limestone matrix (1 whole round); moderately plagioclase-olivine phyric, microcrystalline basalt (1 whole round); moderately plagioclase-olivine-augite phyric, microcrystalline basalt (1 whole round); and sparsely olivine-plagioclase phyric, fine-grained basalt with glassy margin (1 whole round) (Figure F103; see Igneous petrology). In addition, one whole-round sample was obtained from Core 393-U1583C-13X of aphyric basalt close to the boundary with the lowermost overlying sediments.
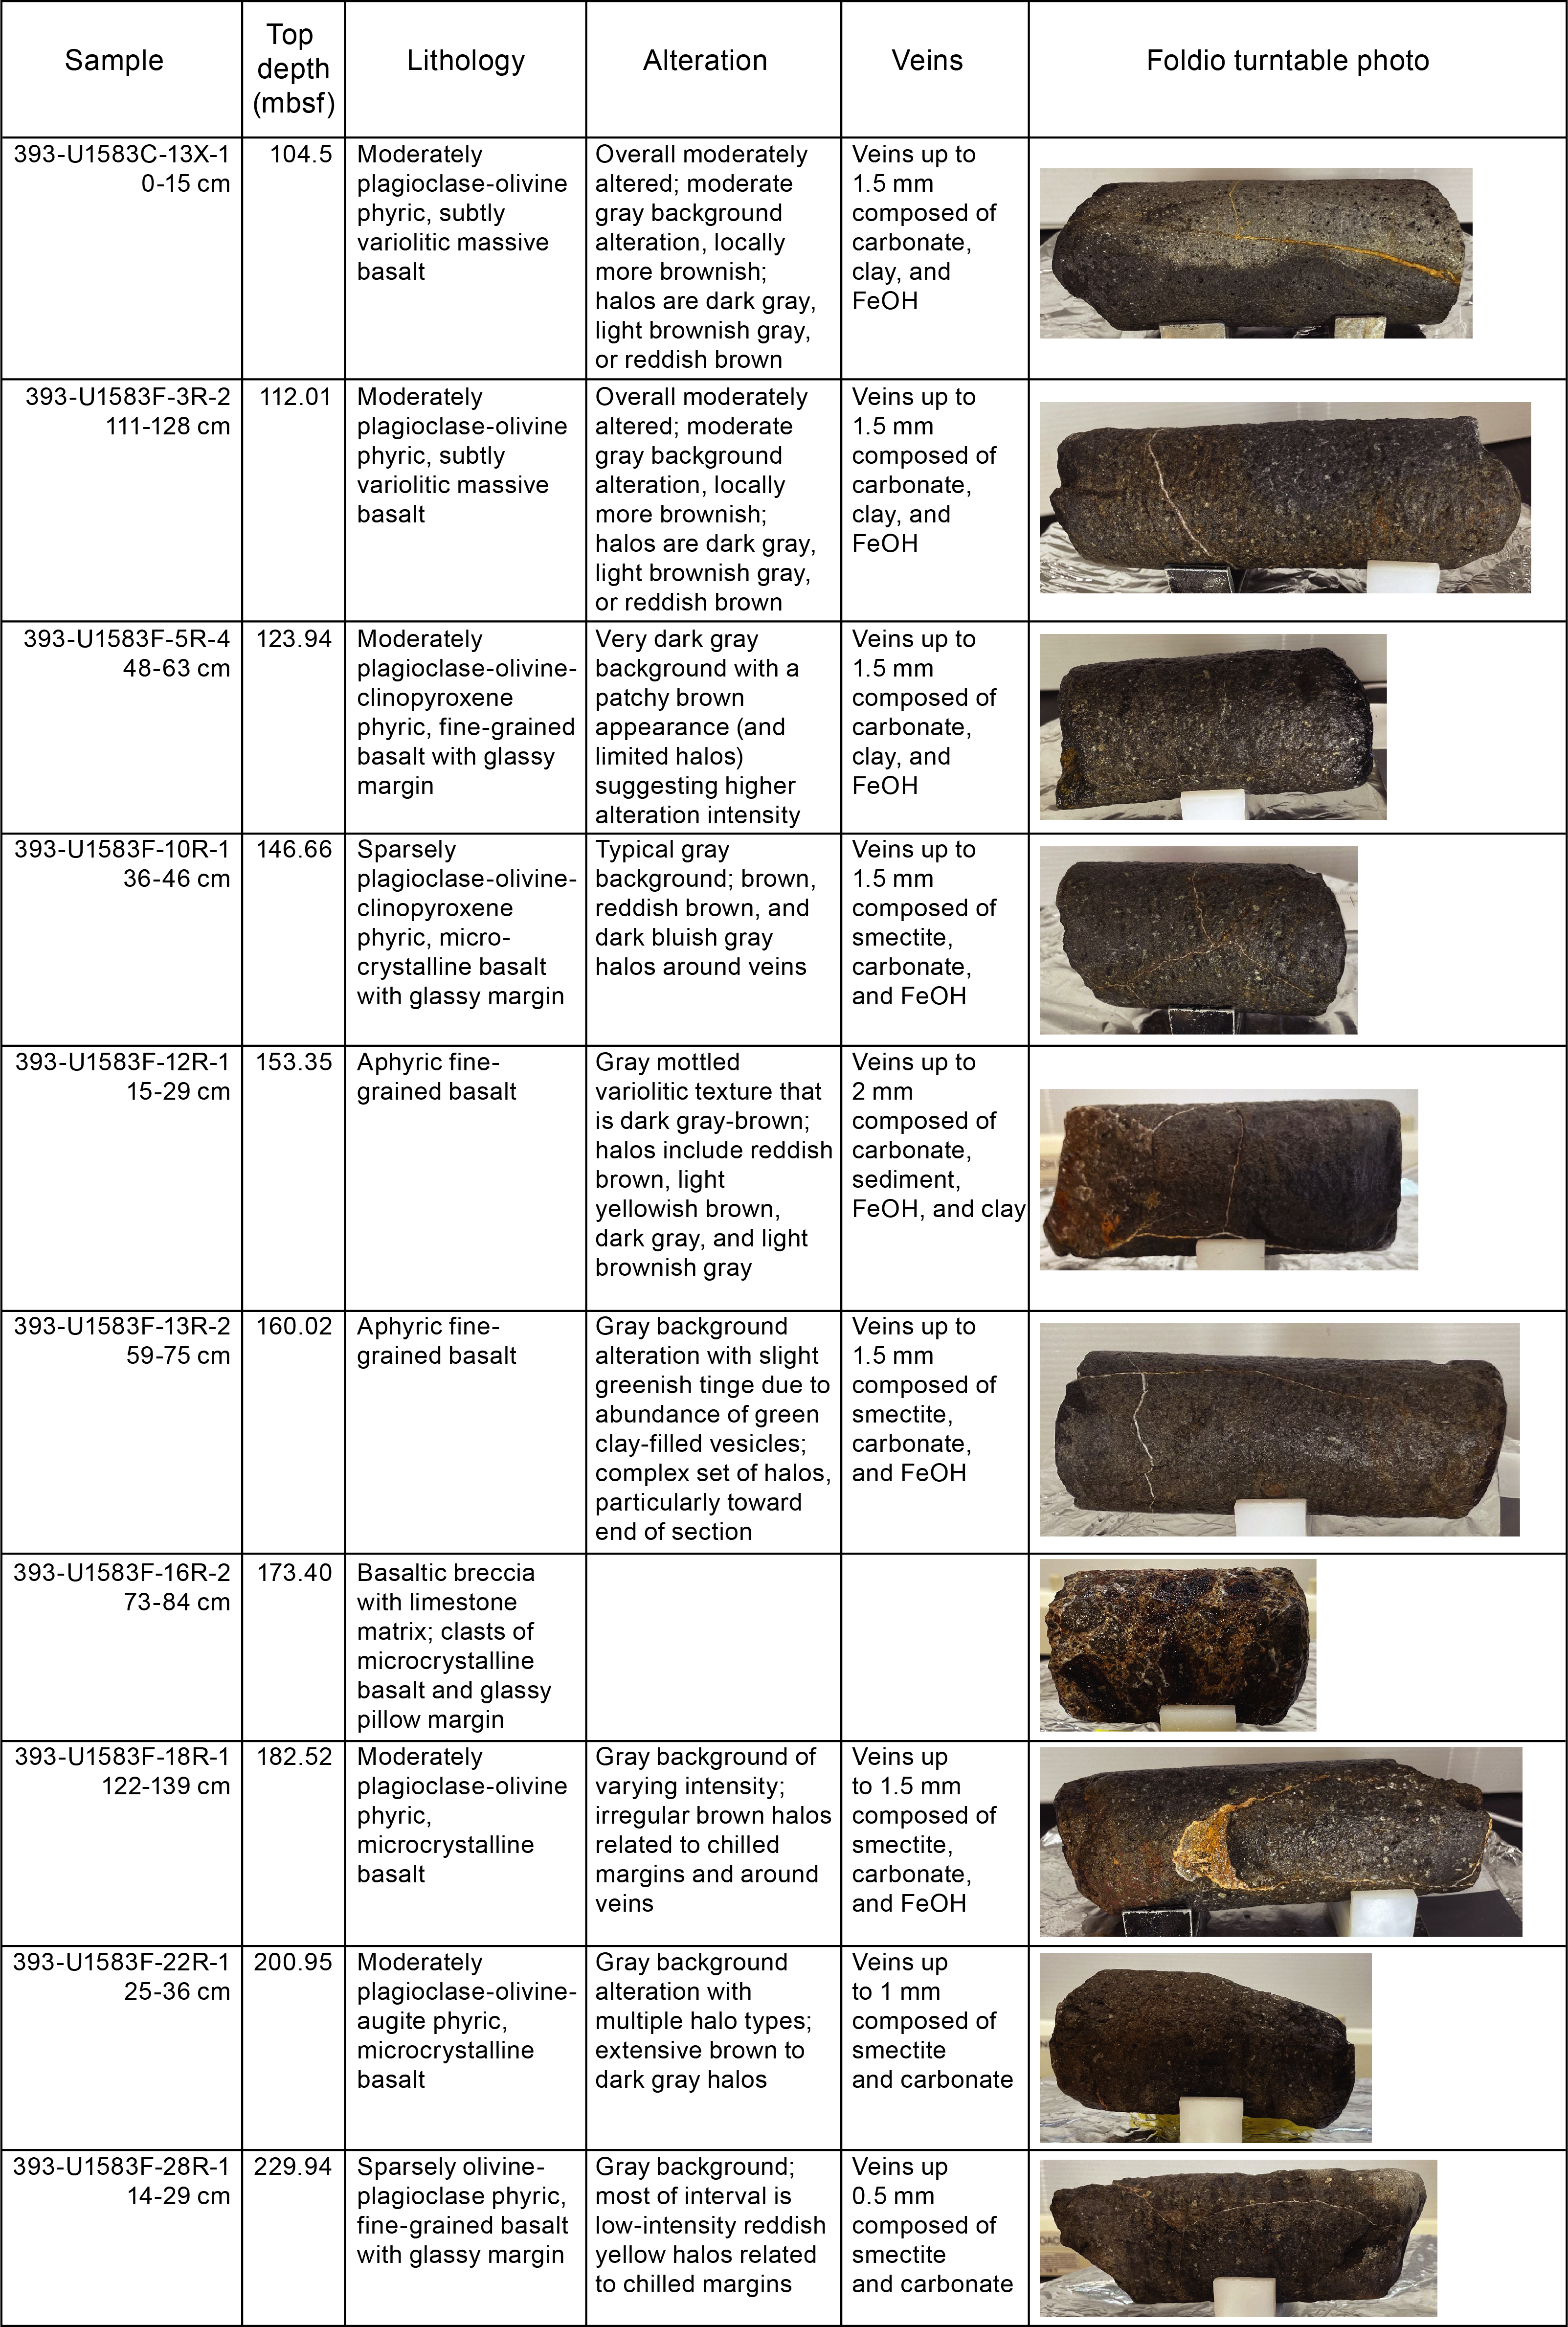
Figure F103. Samples for microbiology research.
After the exteriors of whole-round pieces were removed to avoid material contaminated during coring (see Microbiology in the Expedition 390/393 methods chapter [Coggon et al., 2024a]), the remaining material was split into subsamples that were prepared for different microbiological analyses. The number of subsamples depended on the amount of material available from each "parent" whole-round sample (Table T38).
12.2.1. Microbiological sample processing and experiments
12.2.1.1. Cell and viral counts
A total of 10 samples were processed for cell and/or viral counts. Performing shipboard cell counts on rock samples is difficult because of the time required to separate cells from rock material in addition to the time required for sample processing of other shipboard tests. Therefore, shipboard cell counts were not attempted during the SAT expeditions. Cell count samples were instead broken into small chips and/or powder and preserved for postexpedition analyses (1 cm3 sample in 4 mL of 4% paraformaldehyde in 100 mM PBS). Duplicate cell count samples were prepared for all samples so that the measurements could be performed independently in two different laboratories. When samples were taken for viral metagenomics, a third replicate was added to allow for viral counts.
12.2.1.2. Microbial community structure
A total of 10 samples were processed for shore-based DNA (PCR amplicon based and metagenomes) and/or RNA (PCR amplicon based and/or metatranscriptomes) analysis, 10 samples were preserved for single cell genomics, and 10 samples were collected for lipid analysis (Table T38). Material for DNA, RNA, and lipid-based analyses of microbial community composition, which will be performed as postexpedition research, was collected and preserved following the procedures described in Microbiology in the Expedition 390/393 methods chapter [Coggon et al., 2024a].
12.2.1.3. Microbial incubation experiments
To study nitrogen cycling at the sediment/basement interface, basement samples from Sections 393-U1583C-13X-1 and 393-U1583F-3R-2 from the inner core were used in an ammonium enrichment incubation experiment (see Microbiology in the Expedition 390/393 methods chapter [Coggon et al., 2024a]). Briefly, ~9 g of rock crushed with a sterile Diamonite mortar and pestle was diluted in 50 mL vials with deep seawater that had been filtered through a 0.22 µm pore size filter to achieve a final volume of 40 mL. The seawater was a mixture of seawater collected from Hole U1583F on 17 July 2022 (~4200 mbsl) and from Hole U1560B on 23 July (~3700 mbsl) using a Niskin bottle attached to the subsea camera system frame. The goal of this setup is to investigate if ammonium addition increases cell abundance and to identify the microorganisms that are translationally active. These vials will be incubated at 4°C for 6 months before shore-based analysis at Texas A&M University (USA).
12.2.2. Microbiological contamination monitoring
Circulation of drilling fluid and mud is a potential source of contamination of cores collected for microbiology analysis (Sylvan et al., 2021). To determine the extent of contamination of microbiology samples, the perfluorocarbon tracer PFMD was injected into drilling fluid at a rate of 0.5 mL/min during circulation in Hole U1583F until the supply of PFMD solution was exhausted, which occurred after drilling Core 393-U1583F-12R. Samples were collected from both the exterior (section directly in contact with drilling fluids; removed during processing) and interior (the part subsampled for postexpedition analyses) of core intervals selected for microbiology analysis to quantify the presence of PFMD. Ideally, PFMD is detected on the exterior, indicating successful delivery down the drill string to the core as it is collected, but not in the interior portions of whole rounds from where the microbiological samples are subsampled. Detection of PFMD in the whole-round interior would indicate intrusion of drilling fluid and hence potential contamination.
When possible, small (<2 cm) exterior samples for PFMD analysis were collected from rubble and core fragments in intervals from which a microbiology sample was collected (Tables T38, T39). These samples were chosen after the core was laid out in the splitting room, targeting rubble and small pieces in the core catcher that were most likely in contact with drilling fluid but not of high interest for further scientific analysis because of their small size. When no small rubble was available, a piece of the exterior of the microbiological sample was taken after the rock was rinsed and cleaned with ethanol, which may remove or dilute the PFMD and lead to lower detected concentrations but also validates the cleaning process. PFMD was detected from a majority of the exterior samples (rubble and cleaned exterior pieces), with an average concentration of 38.6 ppb PFMD/g core and a median concentration of 27.4 ppb PFMD/g rock (Figure F104).
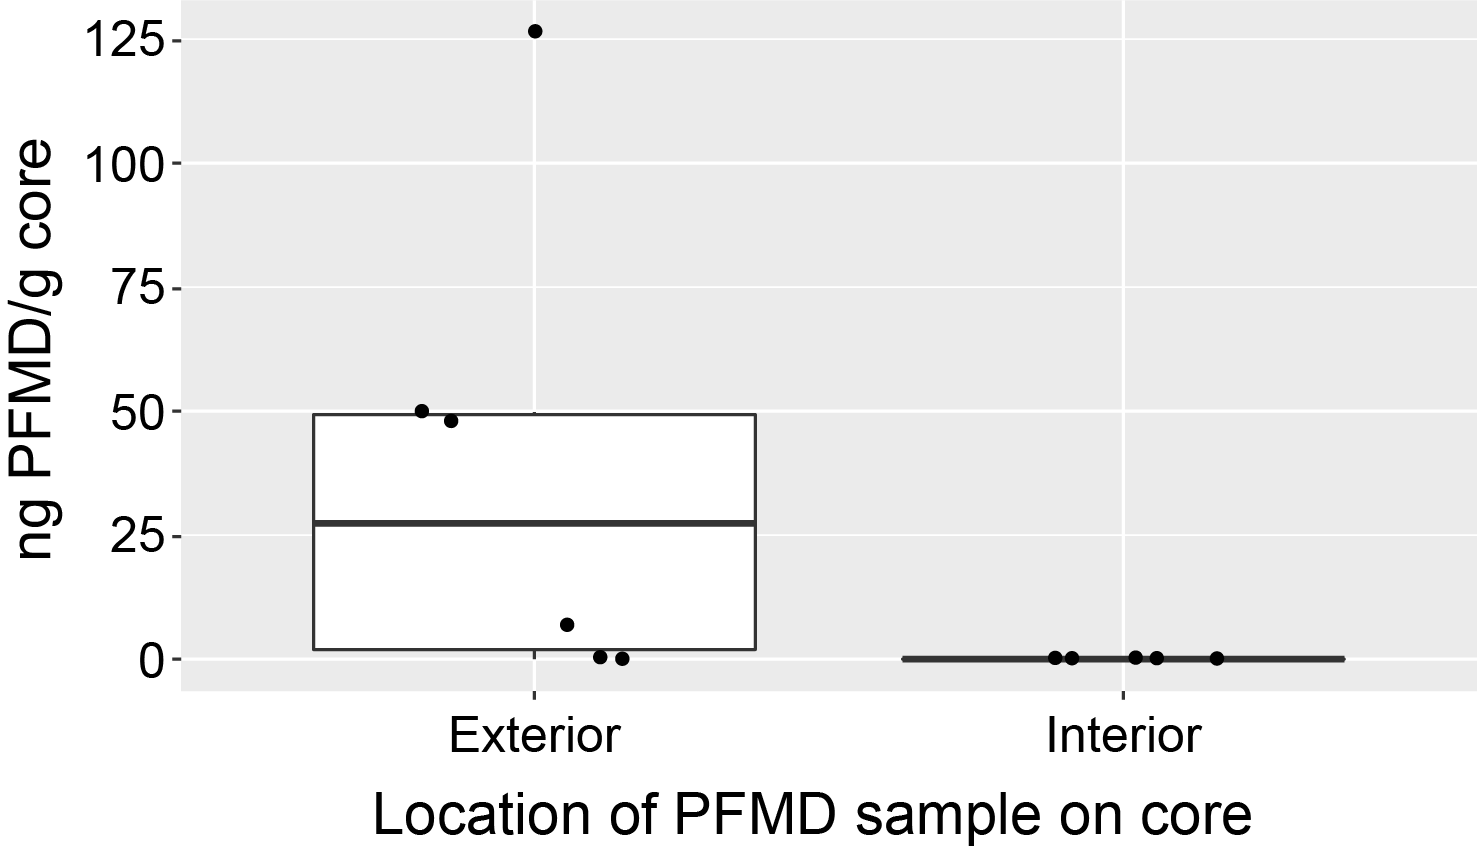
Figure F104. PFMD tracer concentrations.
No tracer was detected in the interior microbiology samples, suggesting no to minimal contamination of the samples from drilling fluid.
To determine the number of microorganisms present in drilling fluid and also generate a database of potential contaminants, we collected one sample of drilling fluid from a drill pipe on the rig floor at the end of coring operations in Hole U1583F. Samples were collected for cell counts (1 mL of drilling fluid in 4 mL of 4% paraformaldehyde in 100 mM PBS), and 500 mL of drilling fluid was filtered onto one 0.22 µm pore size 47 mm diameter filter and frozen at −80°C for shore-based molecular biology analysis to determine the microorganisms present in drilling fluid.
References
Agnini, C., Fornaciari, E., Raffi, I., Catanzariti, R., Pälike, H., Backman, J., and Rio, D., 2014. Biozonation and biochronology of Paleogene calcareous nannofossils from low and middle latitudes. Newsletters on Stratigraphy, 47(2):131–181. https://doi.org/10.1127/0078-0421/2014/0042
Backman, J., Raffi, I., Rio, D., Fornaciari, E., and Pälike, H., 2012. Biozonation and biochronology of Miocene through Pleistocene calcareous nannofossils from low and middle latitudes. Newsletters on Stratigraphy, 45(3):221–244. https://doi.org/10.1127/0078-0421/2012/0022
Baker, P.A., Gieskes, J.M., and Elderfield, H., 1982. Diagenesis of carbonates in deep-sea sediments; evidence from Sr/Ca ratios and interstitial dissolved Sr2+ data. Journal of Sedimentary Research, 52(1):71–82. https://doi.org/10.1306/212F7EE1-2B24-11D7-8648000102C1865D
Butler, R.F., 1992. Paleomagnetism: Magnetic Domains and Geologic Terranes: Oxford, England (Blackwell).
Christeson, G., and Reece, R., 2020. Bathymetric site survey gridded data in support of IODP Expeditions 390 and 393, South Atlantic Transect (MGL1601, CREST). Interdisciplinary Earth Data Alliance (IEDA). https://doi.org/10.26022/IEDA/327528
Christeson, G.L., Goff, J.A., and Reece, R.S., 2019. Synthesis of oceanic crustal structure from two-dimensional seismic profiles. Reviews of Geophysics, 57(2):504–529. https://doi.org/10.1029/2019RG000641
Christeson, G.L., Reece, R.S., Kardell, D.A., Estep, J.D., Fedotova, A., and Goff, J.A., 2020. South Atlantic transect: variations in oceanic crustal structure at 31°S. Geochemistry, Geophysics, Geosystems, 21(7):e2020GC009017. https://doi.org/10.1029/2020GC009017
Coggon, R.M., Christeson, G.L., Sylvan, J.B., Teagle, D.A.H., Estes, E., Williams, T., and Alvarez Zarikian, C.A., 2020. Expedition 390/393 Scientific Prospectus: The South Atlantic Transect. International Ocean Discovery Program. https://doi.org/10.14379/iodp.sp.390393.2020
Coggon, R.M., Teagle, D.A.H., Sylvan, J.B., Reece, J., Estes, E.R., Williams, T.J., Christeson, G.L., Aizawa, M., Albers, E., Amadori, C., Belgrano, T.M., Borrelli, C., Bridges, J.D., Carter, E.J., D'Angelo, T., Dinarès-Turell, J., Doi, N., Estep, J.D., Evans, A., Gilhooly, W.P., III, Grant, L.J.C., Guérin, G.M., Harris, M., Hojnacki, V.M., Hong, G., Jin, X., Jonnalagadda, M., Kaplan, M.R., Kempton, P.D., Kuwano, D., Labonte, J.M., Lam, A.R., Latas, M., Lowery, C.M., Lu, W., McIntyre, A., Moal-Darrigade, P., Pekar, S.F., Robustelli Test, C., Routledge, C.M., Ryan, J.G., Santiago Ramos, D., Shchepetkina, A., Slagle, A.L., Takada, M., Tamborrino, L., Villa, A., Wang, Y., Wee, S.Y., Widlansky, S.J., Yang, K., Kurz, W., Prakasam, M., Tian, L., Yu, T., and Zhang, G., 2024a. Expedition 390/393 methods. In Coggon, R.M., Teagle, D.A.H., Sylvan, J.B., Reece, J., Estes, E.R., Williams, T.J., Christeson, G.L., and the Expedition 390/393 Scientists, South Atlantic Transect. Proceedings of the International Ocean Discovery Program, 390/393: College Station, TX (International Ocean Discovery Program). https://doi.org/10.14379/iodp.proc.390393.102.2024
Coggon, R.M., Teagle, D.A.H., Sylvan, J.B., Reece, J., Estes, E.R., Williams, T.J., Christeson, G.L., Aizawa, M., Albers, E., Amadori, C., Belgrano, T.M., Borrelli, C., Bridges, J.D., Carter, E.J., D'Angelo, T., Dinarès-Turell, J., Doi, N., Estep, J.D., Evans, A., Gilhooly, W.P., III, Grant, L.J.C., Guérin, G.M., Harris, M., Hojnacki, V.M., Hong, G., Jin, X., Jonnalagadda, M., Kaplan, M.R., Kempton, P.D., Kuwano, D., Labonte, J.M., Lam, A.R., Latas, M., Lowery, C.M., Lu, W., McIntyre, A., Moal-Darrigade, P., Pekar, S.F., Robustelli Test, C., Routledge, C.M., Ryan, J.G., Santiago Ramos, D., Shchepetkina, A., Slagle, A.L., Takada, M., Tamborrino, L., Villa, A., Wang, Y., Wee, S.Y., Widlansky, S.J., Yang, K., Kurz, W., Prakasam, M., Tian, L., Yu, T., and Zhang, G., 2024b. Expedition 390/393 summary. In Coggon, R.M., Teagle, D.A.H., Sylvan, J.B., Reece, J., Estes, E.R., Williams, T.J., Christeson, G.L., and the Expedition 390/393 Scientists, South Atlantic Transect. Proceedings of the International Ocean Discovery Program, 390/393: College Station, TX (International Ocean Discovery Program). https://doi.org/10.14379/iodp.proc.390393.101.2024
Coggon, R.M., Teagle, D.A.H., Sylvan, J.B., Reece, J., Estes, E.R., Williams, T.J., Christeson, G.L., and the Expedition 390/393 Scientists, 2024c. Supplementary material, https://doi.org/10.14379/iodp.proc.390393supp.2024. In Coggon, R.M., Teagle, D.A.H., Sylvan, J.B., Reece, J., Estes, E.R., Williams, T.J., Christeson, G.L., and the Expedition 390/393 Scientists, South Atlantic Transect. Proceedings of the International Ocean Discovery Program, 390/393: College Station, TX (International Ocean Discovery Program).
Estep, J., Reece, R., Kardell, D.A., Christeson, G.L., and Carlson, R.L., 2019. Seismic Layer 2A: evolution and thickness from 0- to 70-Ma crust in the slow-intermediate spreading South Atlantic. Journal of Geophysical Research: Solid Earth, 124(8):7633–7651. https://doi.org/10.1029/2019JB017302
Fuchs, S., Norden, B., and the International Heat Flow Commission, 2021. The Global Heat Flow Database. GFZ Data Services. https://doi.org/10.5880/fidgeo.2021.014
Gale, A., Dalton, C.A., Langmuir, C.H., Su, Y., and Schilling, J.-G., 2013. The mean composition of ocean ridge basalts. Geochemistry, Geophysics, Geosystems, 14(3):489–518. https://doi.org/10.1029/2012GC004334
Gradstein, F.M., Ogg, J.G., Schmitz, M.D., and Ogg, G.M. (Eds.), 2020. The Geologic Time Scale 2020: Amsterdam (Elsevier BV). https://doi.org/10.1016/C2020-1-02369-3
Hein, J.R., O'Neil, J.R., and Jones, M.G., 1979. Origin of authigenic carbonates in sediment from the deep Bering Sea. Sedimentology, 26(5):681–705. https://doi.org/10.1111/j.1365-3091.1979.tb00937.x
Higgins, J.A., and Schrag, D.P., 2012. Records of Neogene seawater chemistry and diagenesis in deep-sea carbonate sediments and pore fluids. Earth and Planetary Science Letters, 357–358:386–396. https://doi.org/10.1016/j.epsl.2012.08.030
Jelinek, V., 1981. Characterization of the magnetic fabric of rocks. Tectonophysics, 79(3–4):T63–T67. https://doi.org/10.1016/0040-1951(81)90110-4
Jørgensen, B.B., 1977. Bacterial sulfate reduction within reduced microniches of oxidized marine sediments. Marine Biology, 41(1):7–17. https://doi.org/10.1007/BF00390576
Kardell, D.A., Christeson, G.L., Estep, J.D., Reece, R.S., and Carlson, R.L., 2019. Long-lasting evolution of Layer 2A in the western South Atlantic: evidence for low-temperature hydrothermal circulation in old oceanic crust. Journal of Geophysical Research: Solid Earth, 124(3):2252–2273. https://doi.org/10.1029/2018JB016925
Kardell, D.A., Zhao, Z., Ramos, E.J., Estep, J., Christeson, G.L., Reece, R.S., and Hesse, M.A., 2021. Hydrothermal models constrained by fine-scale seismic velocities confirm hydrothermal cooling of 7–63 Ma South Atlantic crust. Journal of Geophysical Research: Solid Earth, 126(6):e2020JB021612. https://doi.org/10.1029/2020JB021612
Kelley, K.A., Kingsley, R., and Schilling, J.-G., 2013. Composition of plume-influenced mid-ocean ridge lavas and glasses from the Mid-Atlantic Ridge, East Pacific Rise, Galápagos spreading center, and Gulf of Aden. Geochemistry, Geophysics, Geosystems, 14(1):223–242. https://doi.org/10.1002/ggge.20049
Kendrick, M.A., Hémond, C., Kamenetsky, V.S., Danyushevsky, L., Devey, C.W., Rodemann, T., Jackson, M.G., and Perfit, M.R., 2017. Seawater cycled throughout Earth's mantle in partially serpentinized lithosphere. Nature Geoscience, 10(3):222–228. https://doi.org/10.1038/ngeo2902
King, D.J., Wade, B.S., Liska, R.D., and Miller, C.G., 2020. A review of the importance of the Caribbean region in Oligo-Miocene low latitude planktonic foraminiferal biostratigraphy and the implications for modern biogeochronological schemes. Earth-Science Reviews, 202:102968. https://doi.org/10.1016/j.earscirev.2019.102968
Korenaga, T., and Korenaga, J., 2008. Subsidence of normal oceanic lithosphere, apparent thermal expansivity, and seafloor flattening. Earth and Planetary Science Letters, 268(1):41–51. https://doi.org/10.1016/j.epsl.2007.12.022
Lam, A.R., Crundwell, M.P., Leckie, R.M., Albanese, J., and Uzel, J.P., 2022. Diachroneity rules the mid-latitudes: a test case using Late Neogene planktic foraminifera across the Western Pacific. Geosciences, 12(5):190. https://doi.org/10.3390/geosciences12050190
Le Bas, M.J., Le Maitre, R. W., Streickeisen, A., Zanettin, B., the IUGS Subcommission on the Systematics of Igneous Rocks, 1986. A chemical classification of volcanic rocks based on the total alkali-silica diagram. Journal of Petrology, 27(3):745–750. https://doi.org/10.1093/petrology/27.3.745
Le Roux, P.J., 2000. The geochemistry of selected mid-ocean ridge basalts from the Southern mid-Atlantic ridge (40°–55°S) [PhD dissertation]. University of Cape Town, Cape Town, South Africa. http://hdl.handle.net/11427/4207
Marschall, H.R., Wanless, V.D., Shimizu, N., Pogge von Strandmann, P.A.E., Elliott, T., and Monteleone, B.D., 2017. The boron and lithium isotopic composition of mid-ocean ridge basalts and the mantle. Geochimica et Cosmochimica Acta, 207:102–138. https://doi.org/10.1016/j.gca.2017.03.028
Martini, E., 1971. Standard Tertiary and Quaternary calcareous nannoplankton zonation. Proceedings of the Second Planktonic Conference, Roma, 1970:739–785.
Marty, J.C., and Cazenave, A., 1989. Regional variations in subsidence rate of oceanic plates: a global analysis. Earth and Planetary Science Letters, 94(3):301–315. https://doi.org/10.1016/0012-821X(89)90148-9
Maxbauer, D.P., Feinberg, J.M., and Fox, D.L., 2016. MAX UnMix: a web application for unmixing magnetic coercivity distributions. Computers & Geosciences, 95:140–145. https://doi.org/10.1016/j.cageo.2016.07.009
Michael, P.J., and Graham, D.W., 2015. The behavior and concentration of CO2 in the suboceanic mantle: inferences from undegassed ocean ridge and ocean island basalts. Lithos, 236–237:338–351. https://doi.org/10.1016/j.lithos.2015.08.020
Olson, P., Reynolds, E., Hinnov, L., and Goswami, A., 2016. Variation of ocean sediment thickness with crustal age. Geochemistry, Geophysics, Geosystems, 17(4):1349–1369. https://doi.org/10.1002/2015GC006143
Parsons, B., and Sclater, J.G., 1977. An analysis of the variation of ocean floor bathymetry and heat flow with age. Journal of Geophysical Research (1896-1977), 82(5):803–827. https://doi.org/10.1029/JB082i005p00803
Paulick, H., Münker, C., and Schuth, S., 2010. The influence of small-scale mantle heterogeneities on Mid-Ocean Ridge volcanism: evidence from the southern Mid-Atlantic Ridge (7°30′S to 11°30′S) and Ascension Island. Earth and Planetary Science Letters, 296(3–4):299–310. https://doi.org/10.1016/j.epsl.2010.05.009
Pearce, J.A., and Norry, M.J., 1979. Petrogenetic implications of Ti, Zr, Y, and Nb variations in volcanic rocks. Contributions to Mineralogy and Petrology, 69(1):33–47. https://doi.org/10.1007/BF00375192
Reece, R., Christeson, G., Amara, A., Estep, J., Greene, J., Koch, C., Henning, L., Worman, W., and Wright, A., 2016. CREST: Crustal Reflectivity Experiment southern transect South Atlantic multichannel seismic and ocean bottom seismometer experiment, 4 Jan–25 Feb 2016 Cruise Report. http://www.iris.washington.edu/data/reports/2016/16-003/CREST_2016-01-04-2016-02-25_MGL1601_CruiseReport.pdf
Reece, R., and Estep, J., 2019. Processed MCS (PSTM) data from the Mid-Atlantic Ridge (MAR) to the Rio Grande Rise, South Atlantic Ocean, acquired by the R/V Marcus G. Langseth in 2016 (MGL1601) https://doi.org/10.1594/IEDA/500255
Reekie, C.D.J., Jenner, F.E., Smythe, D.J., Hauri, E.H., Bullock, E.S., and Williams, H.M., 2019. Sulfide resorption during crustal ascent and degassing of oceanic plateau basalts. Nature Communications, 10(1):82. https://doi.org/10.1038/s41467-018-08001-3
Ríos, A.F., Resplandy, L., García-Ibáñez, M.I., Fajar, N.M., Velo, A., Padin, X.A., Wanninkhof, R., Steinfeldt, R., Rosón, G., and Pérez, F.F., 2015. Decadal acidification in the water masses of the Atlantic Ocean. Proceedings of the National Academy of Sciences, 112(32):9950–9955. https://doi.org/10.1073/pnas.1504613112
Sarmiento, J.L., Simeon, J., Gnanadesikan, A., Gruber, N., Key, R.M., and Schlitzer, R., 2007. Deep ocean biogeochemistry of silicic acid and nitrate. Global Biogeochemical Cycles, 21(1). https://doi.org/10.1029/2006GB002720
Schrag, D.P., Higgins, J.A., Macdonald, F.A., and Johnston, D.T., 2013. Authigenic carbonate and the history of the global carbon cycle. Science, 339(6119):540–543. https://doi.org/10.1126/science.1229578
Sclater, J.G., Jaupart, C., and Galson, D., 1980. The heat flow through oceanic and continental crust and the heat loss of the Earth. Reviews of Geophysics, 18(1):269-311. https://doi.org/10.1029/RG018i001p00269
Shervais, J.W., 1982. Ti-V plots and the petrogenesis of modern and ophiolitic lavas. Earth and Planetary Science Letters, 59(1):101–118. https://doi.org/10.1016/0012-821X(82)90120-0
Shervais, J.W., 2022. The petrogenesis of modern and ophiolitic lavas reconsidered: Ti-V and Nb-Th. Geoscience Frontiers, 13(2):101319. https://doi.org/10.1016/j.gsf.2021.101319
Shipboard Scientific Party, 1993. Site 896. In Alt, J.C., Kinoshita, H., Stokking, L.B., et al., Proceedings of the Ocean Drilling Program, Initial Reports, 148. College Station, TX (Ocean Drilling Program), 123–192. https://doi.org/10.2973/odp.proc.ir.148.103.1993
Smith, D.K., and Cann, J.R., 1990. Hundreds of small volcanoes on the median valley floor of the Mid-Atlantic Ridge at 24–30° N. Nature, 348(6297):152–155. https://doi.org/10.1038/348152a0
Spinelli, G.A., Giambalvo, E.R., and Fisher, A.T., 2004. Sediment permeability, distribution, and influence on fluxes in oceanic basement. In Davis, E.E., and Elderfield, H. (Eds.), Hydrogeology of the Oceanic Lithosphere. Cambridge, UK (Cambridge University Press), 151–188.
Stein, C.A., and Stein, S., 1992. A model for the global variation in oceanic depth and heat flow with lithospheric age. Nature, 359(6391):123–129. https://doi.org/10.1038/359123a0
Straume, E.O., Gaina, C., Medvedev, S., Hochmuth, K., Gohl, K., Whittaker, J.M., Abdul Fattah, R., Doornenbal, J.C., and Hopper, J.R., 2019. GlobSed: updated total sediment thickness in the world's oceans. Geochemistry, Geophysics, Geosystems, 20(4):1756–1772. https://doi.org/10.1029/2018GC008115
Sylvan, J.B., Estes, E.R., Bogus, K., Colwell, F.S., Orcutt, B.N., and Smith, D.C, 2021. Technical Note 4: Recommendations for microbiological sampling and contamination tracer use aboard the JOIDES Resolution following 20 years of IODP deep biosphere research. International Ocean Discovery Program. https://doi.org/10.14379/iodp.tn.4.2021
Teagle, D.A.H., Reece, J., Williams, T.J., Coggon, R.M., Sylvan, J.B., Estes, E.R., Christeson, G.L., Albers, E., Amadori, C., Belgrano, T.M., D'Angelo, T., Doi, N., Evans, A., Guérin, G.M., Harris, M., Hojnacki, V.M., Hong, G., Jin, X., Jonnalagadda, M., Kuwano, D., Labonte, J.M., Lam, A.R., Latas, M., Lu, W., Moal-Darrigade, P., Pekar, S.F., Robustelli Test, C., Ryan, J.G., Santiago Ramos, D., Shchepetkina, A., Villa, A., Wee, S.Y., Widlansky, S.J., Aizawa, M., Borrelli, C., Bridges, J.D., Carter, E.J., Dinarès-Turell, J., Estep, J.D., Gilhooly, W.P., III, Grant, L.J.C., Kaplan, M.R., Kempton, P.D., Lowery, C.M., McIntyre, A., Routledge, C.M., Slagle, A.L., Takada, M., Tamborrino, L., Wang, Y., Yang, K., Kurz, W., Prakasam, M., Tian, L., Yu, T., and Zhang, G., 2024a. Site U1558. In Coggon, R.M., Teagle, D.A.H., Sylvan, J.B., Reece, J., Estes, E.R., Williams, T.J., Christeson, G.L., and the Expedition 390/393 Scientists, South Atlantic Transect. Proceedings of the International Ocean Discovery Program, 390/393: College Station, TX (International Ocean Discovery Program). https://doi.org/10.14379/iodp.proc.390393.106.2024
Teagle, D.A.H., Reece, J., Williams, T.J., Coggon, R.M., Sylvan, J.B., Estes, E.R., Christeson, G.L., Albers, E., Amadori, C., Belgrano, T.M., D'Angelo, T., Doi, N., Evans, A., Guérin, G.M., Harris, M., Hojnacki, V.M., Hong, G., Jin, X., Jonnalagadda, M., Kuwano, D., Labonte, J.M., Lam, A.R., Latas, M., Lu, W., Moal-Darrigade, P., Pekar, S.F., Robustelli Test, C., Ryan, J.G., Santiago Ramos, D., Shchepetkina, A., Villa, A., Wee, S.Y., Widlansky, S.J., Aizawa, M., Borrelli, C., Bridges, J.D., Carter, E.J., Dinarès-Turell, J., Estep, J.D., Gilhooly, W.P., III, Grant, L.J.C., Kaplan, M.R., Kempton, P.D., Lowery, C.M., McIntyre, A., Routledge, C.M., Slagle, A.L., Takada, M., Tamborrino, L., Wang, Y., Yang, K., Kurz, W., Prakasam, M., Tian, L., Yu, T., and Zhang, G., 2024b. Site U1560. In Coggon, R.M., Teagle, D.A.H., Sylvan, J.B., Reece, J., Estes, E.R., Williams, T.J., Christeson, G.L., and the Expedition 390/393 Scientists, South Atlantic Transect. Proceedings of the International Ocean Discovery Program, 390/393: College Station, TX (International Ocean Discovery Program). https://doi.org/10.14379/iodp.proc.390393.108.2024
Turchyn, A.V., Bradbury, H.J., Walker, K., and Sun, X., 2021. Controls on the precipitation of carbonate minerals within marine sediments. Frontiers in Earth Science, 9:618311. https://doi.org/10.3389/feart.2021.618311
van der Zwan, F.M., Devey, C.W., Hansteen, T.H., Almeev, R.R., Augustin, N., Frische, M., Haase, K.M., Basaham, A., and Snow, J.E., 2017. Lower crustal hydrothermal circulation at slow-spreading ridges: evidence from chlorine in Arctic and South Atlantic basalt glasses and melt inclusions. Contributions to Mineralogy and Petrology, 172(11):97. https://doi.org/10.1007/s00410-017-1418-1
Wade, B.S., Pearson, P.N., Berggren, W.A., and Pälike, H., 2011. Review and revision of Cenozoic tropical planktonic foraminiferal biostratigraphy and calibration to the geomagnetic polarity and astronomical time scale. Earth-Science Reviews, 104(1–3):111–142. https://doi.org/10.1016/j.earscirev.2010.09.003
Yang, S., Humayun, M., and Salters, V.J.M., 2018. Elemental systematics in MORB glasses from the Mid-Atlantic Ridge. Geochemistry, Geophysics, Geosystems, 19(11):4236–4259. https://doi.org/10.1029/2018GC007593
Yang, T., Zhao, X., Petronotis, K., Dekkers, M.J., and Xu, H., 2019. Anisotropy of magnetic susceptibility (AMS) of sediments from Holes U1480E and U1480H, IODP Expedition 362: sedimentary or artificial origin and implications for paleomagnetic studies. Geochemistry, Geophysics, Geosystems, 20(11):5192–5215. https://doi.org/10.1029/2019GC008721
Yeo, I., Searle, R.C., Achenbach, K.L., Le Bas, T.P., and Murton, B.J., 2012. Eruptive hummocks: building blocks of the upper ocean crust. Geology, 40(1):91–94. https://doi.org/10.1130/G31892.1
Yoder, H.S., Jr., and Tilley, C.E., 1962. Origin of basalt magmas: an experimental study of natural and synthetic rock xystems. Journal of Petrology, 3(3):342–532. https://doi.org/10.1093/petrology/3.3.342
Zijderveld, J.D.A., 1967. AC demagnetization of rocks: analysis of results. In Runcorn, S.K.C., Creer, K.M., and Collinson, D.W. (Eds.), Methods in Palaeomagnetism. Developments in Solid Earth Geophysics, 3: 254–286. https://doi.org/10.1016/B978-1-4832-2894-5.50049-5