Coggon, R.M., Teagle, D.A.H., Sylvan, J.B., Reece, J., Estes, E.R., Williams, T.J., Christeson, G.L., and the Expedition 390/393 Scientists
Proceedings of the International Ocean Discovery Program Volume 390/393
publications.iodp.org
https://doi.org/10.14379/iodp.proc.390393.108.2024
Site U15601
![]() D.A.H. Teagle,
D.A.H. Teagle,
![]() J. Reece,
J. Reece,
![]() T.J. Williams,
T.J. Williams,
![]() R.M. Coggon,
R.M. Coggon,
![]() J.B. Sylvan,
J.B. Sylvan,
![]() E.R. Estes,
E.R. Estes,
![]() G.L. Christeson,
G.L. Christeson,
![]() E. Albers,
E. Albers,
![]() C. Amadori,
C. Amadori,
![]() T.M. Belgrano,
T.M. Belgrano,
![]() T. D'Angelo,
T. D'Angelo,
![]() N. Doi,
N. Doi,
![]() A. Evans,
A. Evans,
![]() G.M. Guérin,
G.M. Guérin,
![]() M. Harris,
M. Harris,
![]() V.M. Hojnacki,
V.M. Hojnacki,
![]() G. Hong,
G. Hong,
![]() X. Jin,
X. Jin,
![]() M. Jonnalagadda,
M. Jonnalagadda,
![]() D. Kuwano,
D. Kuwano,
![]() J.M. Labonte,
J.M. Labonte,
![]() A.R. Lam,
A.R. Lam,
![]() M. Latas,
M. Latas,
![]() W. Lu,
W. Lu,
![]() P. Moal-Darrigade,
P. Moal-Darrigade,
![]() S.F. Pekar,
S.F. Pekar,
![]() C. Robustelli Test,
C. Robustelli Test,
![]() J.G. Ryan,
J.G. Ryan,
![]() D. Santiago Ramos,
D. Santiago Ramos,
![]() A. Shchepetkina,
A. Shchepetkina,
![]() A. Villa,
A. Villa,
![]() S.Y. Wee,
S.Y. Wee,
![]() S.J. Widlansky,
S.J. Widlansky,
![]() M. Aizawa,
M. Aizawa,
![]() C. Borrelli,
C. Borrelli,
![]() J.D. Bridges,
J.D. Bridges,
![]() E.J. Carter,
E.J. Carter,
![]() J. Dinarès-Turell,
J. Dinarès-Turell,
![]() J.D. Estep,
J.D. Estep,
![]() W.P. Gilhooly III,
W.P. Gilhooly III,
![]() L.J.C. Grant,
L.J.C. Grant,
![]() M.R. Kaplan,
M.R. Kaplan,
![]() P.D. Kempton,
P.D. Kempton,
![]() C.M. Lowery,
C.M. Lowery,
![]() A. McIntyre,
A. McIntyre,
![]() C.M. Routledge,
C.M. Routledge,
![]() A.L. Slagle,
A.L. Slagle,
![]() M. Takada,
M. Takada,
![]() L. Tamborrino,
L. Tamborrino,
![]() Y. Wang,
Y. Wang,
![]() K. Yang,
K. Yang,
![]() W. Kurz,
W. Kurz,
![]() M. Prakasam,
M. Prakasam,
![]() L. Tian,
L. Tian,
![]() T. Yu, and
T. Yu, and
![]() G. Zhang2
G. Zhang2
1 Teagle, D.A.H., Reece, J., Williams, T.J., Coggon, R.M., Sylvan, J.B., Estes, E.R., Christeson, G.L., Albers, E., Amadori, C., Belgrano, T.M., D'Angelo, T., Doi, N., Evans, A., Guérin, G.M., Harris, M., Hojnacki, V.M., Hong, G., Jin, X., Jonnalagadda, M., Kuwano, D., Labonte, J.M., Lam, A.R., Latas, M., Lu, W., Moal-Darrigade, P., Pekar, S.F., Robustelli Test, C., Ryan, J.G., Santiago Ramos, D., Shchepetkina, A., Villa, A., Wee, S.Y., Widlansky, S.J., Aizawa, M., Borrelli, C., Bridges, J.D., Carter, E.J., Dinarès-Turell, J., Estep, J.D., Gilhooly, W.P., III, Grant, L.J.C., Kaplan, M.R., Kempton, P.D., Lowery, C.M., McIntyre, A., Routledge, C.M., Slagle, A.L., Takada, M., Tamborrino, L., Wang, Y., Yang, K., Kurz, W., Prakasam, M., Tian, L., Yu, T., and Zhang, G., 2024. Site U1560. In Coggon, R.M., Teagle, D.A.H., Sylvan, J.B., Reece, J., Estes, E.R., Williams, T.J., Christeson, G.L., and the Expedition 390/393 Scientists, South Atlantic Transect. Proceedings of the International Ocean Discovery Program, 390/393: College Station, TX (International Ocean Discovery Program). https://doi.org/10.14379/iodp.proc.390393.108.2024
2 Expedition 390/393 Scientists' affiliations.
1. Background and objectives
Site U1560 (30°24.2057′S, 16°55.3702′W; proposed Site SATL-25A) is in the central South Atlantic Ocean at a water depth of ~3723 meters below sea level (mbsl), ~315 km west of the Mid-Atlantic Ridge in the low-productivity South Atlantic Gyre (see Figure F1 and Tables T1, T2, all in the Expedition 390/393 summary chapter [Coggon et al., 2024b]). The crust formed at an intermediate half spreading rate of ~25.5 mm/y, which is the highest spreading rate in the study region (Kardell et al., 2019; Christeson et al., 2020) (see Figure F7 in the Expedition 390/393 summary chapter [Coggon et al., 2024b]). With an estimated age of 15.2 Ma, Site U1560 is the second youngest location of the South Atlantic Transect (SAT) campaign (International Ocean Discovery Program [IODP] Expeditions 390C, 395E, 390, and 393). Site U1560 is similar in age but is in a contrasting environment to the deep drilling at Ocean Drilling Program (ODP)/Integrated Ocean Drilling Program superfast Site 1256 (Wilson et al., 2006; Expedition 309/312 Scientists, 2006; Expedition 335 Scientists, 2012), which is on crust that formed at the East Pacific Rise during an episode of superfast spreading rate in a region of high pelagic productivity and rapid sedimentation (Shipboard Scientific Party, 2003).
1.1. Geologic setting
Site U1560 is located on the approximately north-south–trending Crustal Reflectivity Experiment Southern Transect (CREST) Seismic Line 02 at Common Depth Point 12770 about 0.4 km south of the west-east–trending CREST crossing Line 1D/1E (Figures F1, F2) (Reece et al., 2016; Reece and Estep, 2019). Site U1560 sits in a perched ~1.5 km wide (east–west) sediment-filled basin that sits along an irregular, north-northwest striking, undulating >200 m high basement ridge (Figures F1, F2). This ridge shows along-strike variations from sharp narrow ridges to the north to broad, more domal elevated regions to the south (Figure F1) reminiscent of axial highs in the more magmatically robust portions of the modern southern Mid-Atlantic Ridge around 30°S (Devey, 2014). Site U1560 sits in a deeper saddle of this ridge at the inflection of a small dextral deviation where ridge fabric steps eastward by 1–2 km before continuing more linearly to the north (Figure F1).
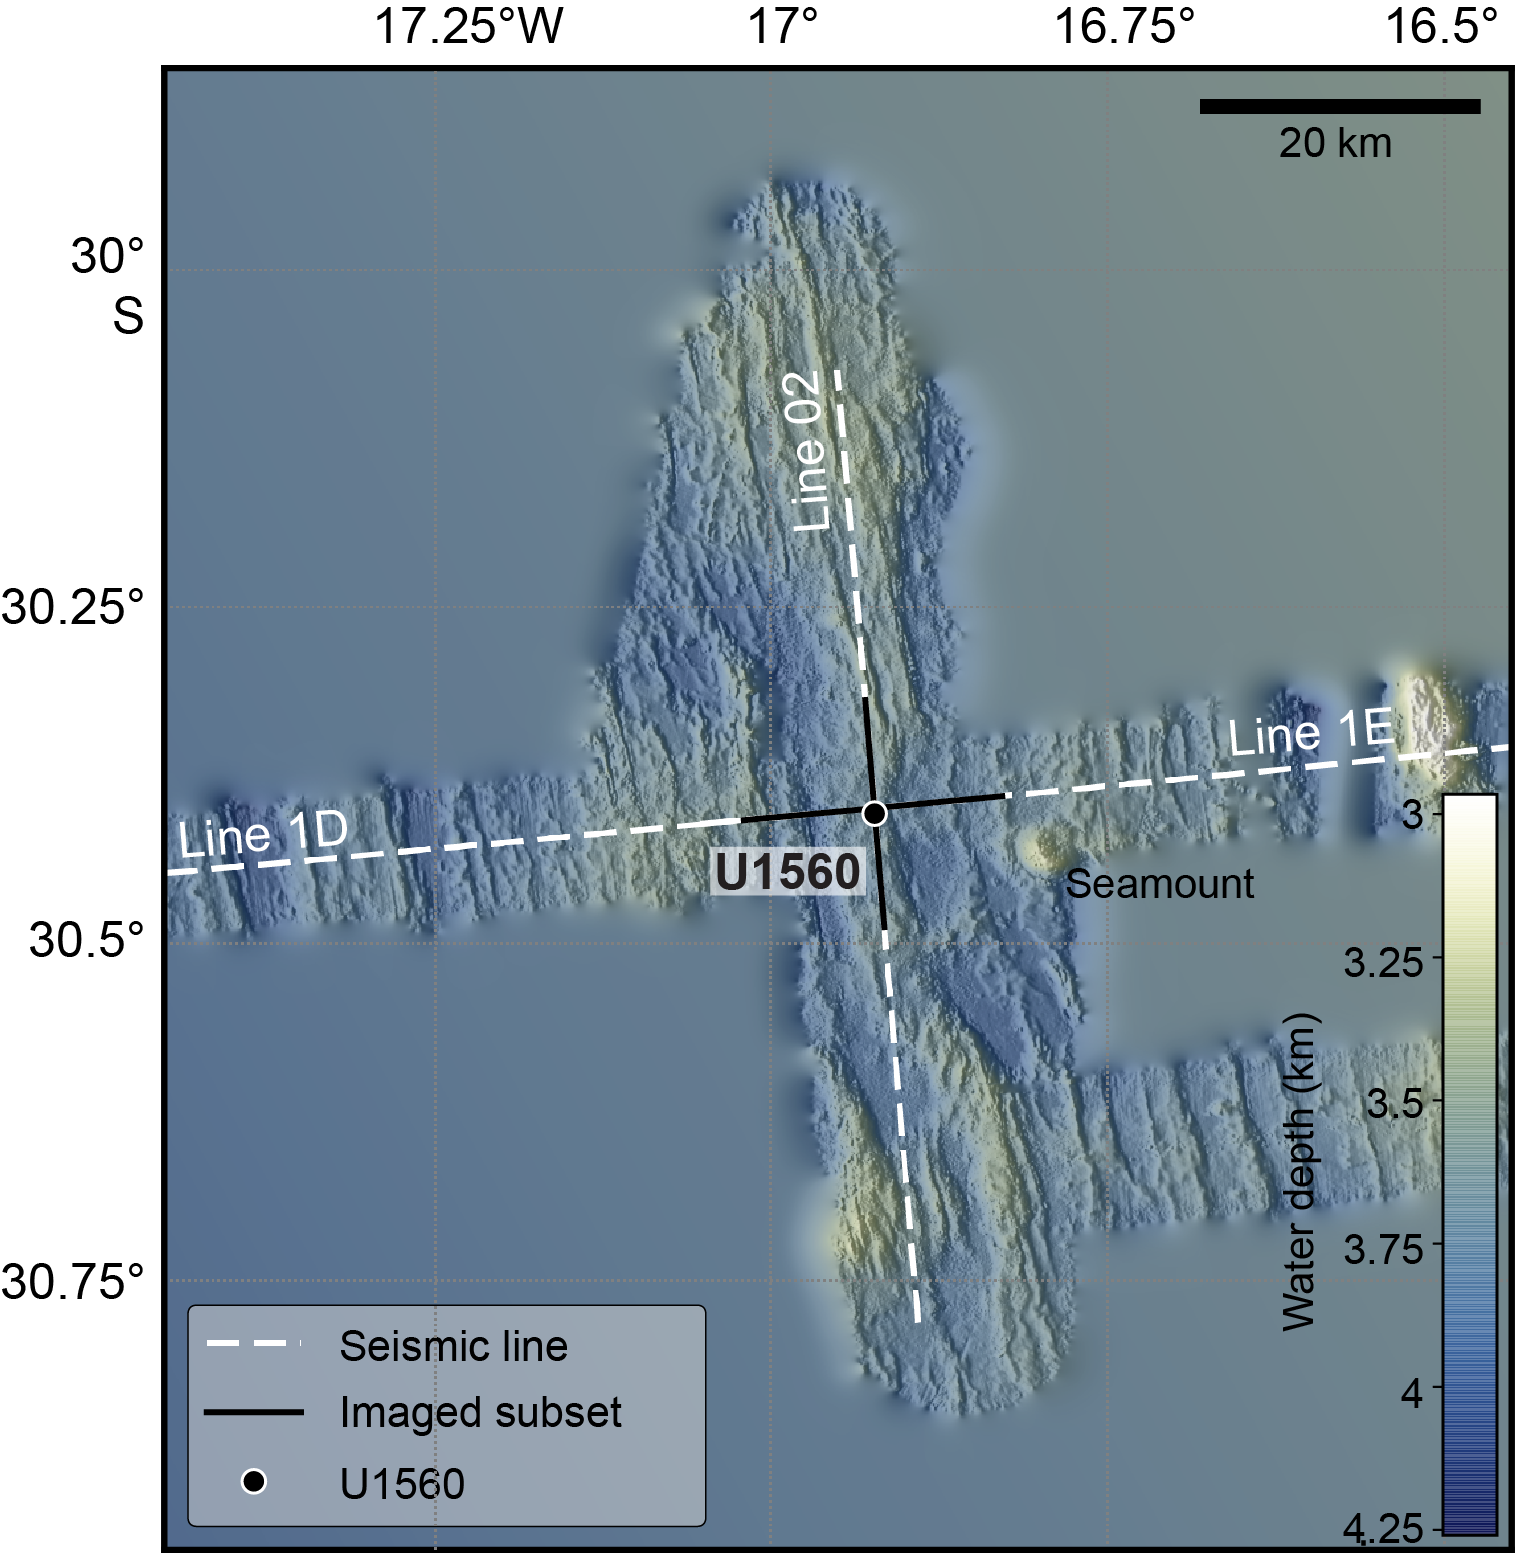
Figure F1. Bathymetric map.
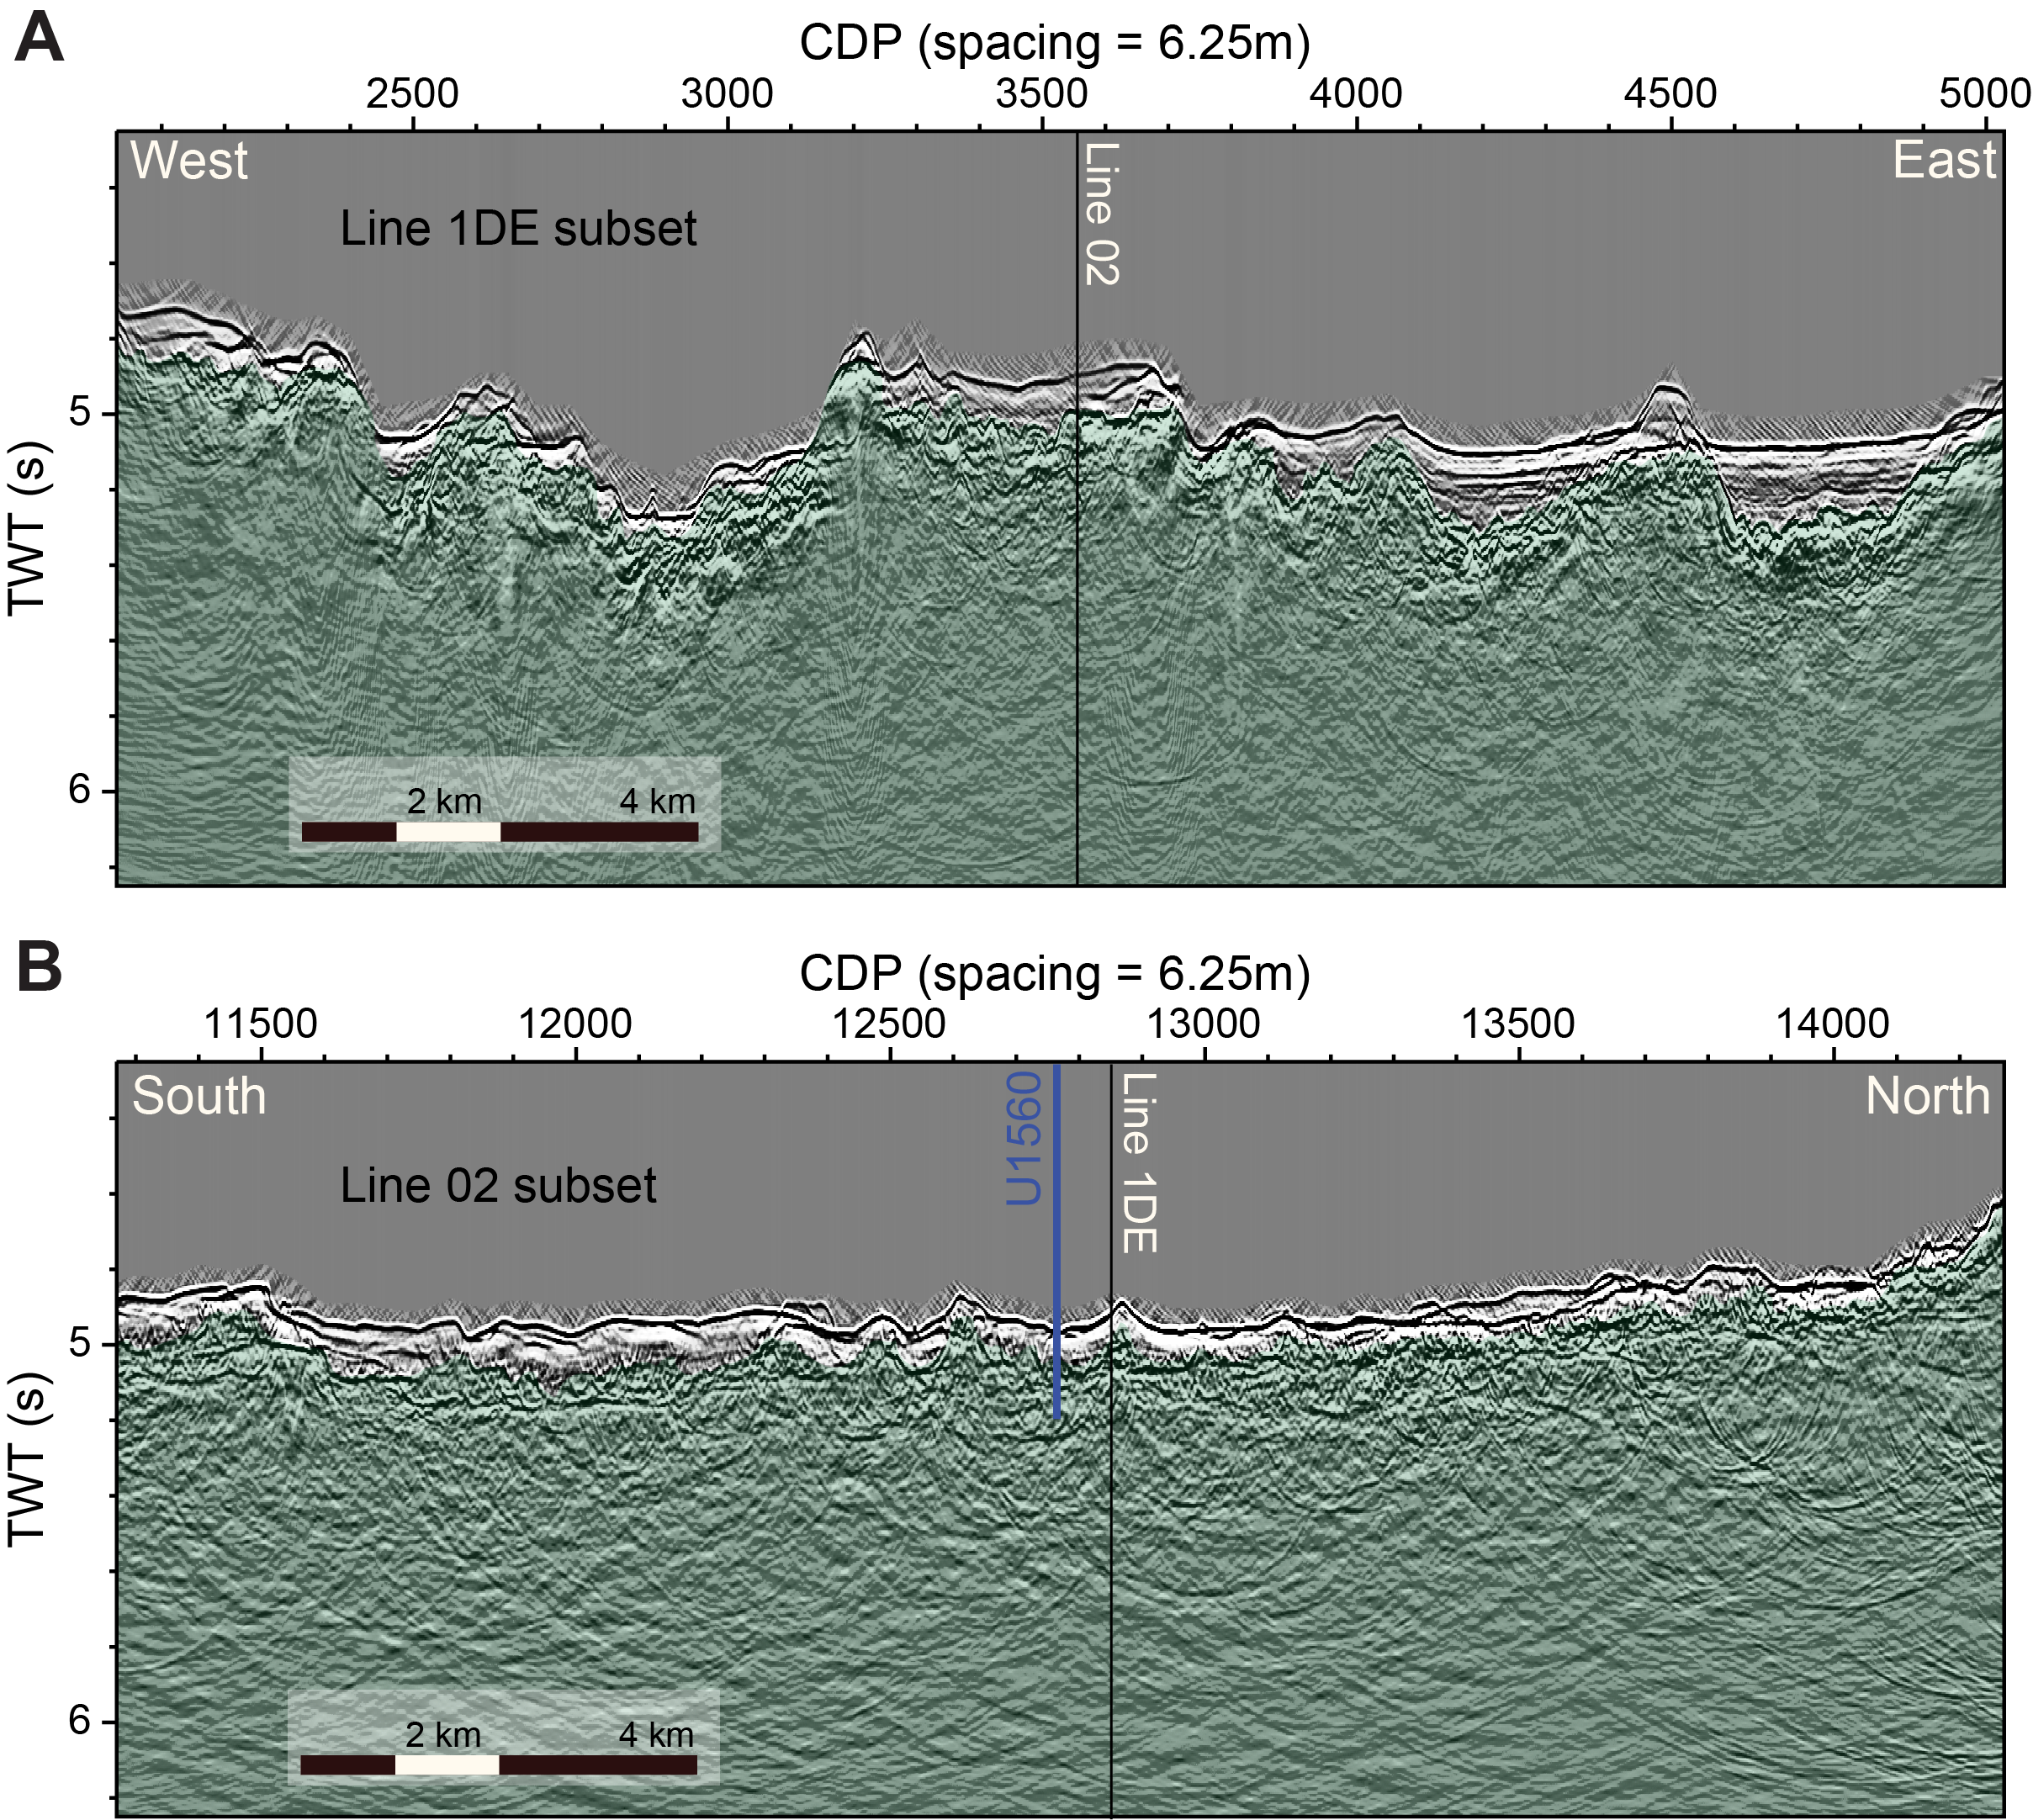
Figure F2. Seismic reflection profiles.
Small seamounts are not as common in the Site U1560 region as they are at Site U1583, but intriguingly, there is also a major seamount about 14 km east-southeast of the CREST crossing point (Figure F1). This feature is ~5 km in diameter and rises to ~3.5 km below sea level, about ~500 m above the surrounding sediment blanket (Figure F1). High normalized reflectivity, especially along the southern flank of the seamount, indicates very thin or no sediment cover (Figure F3).
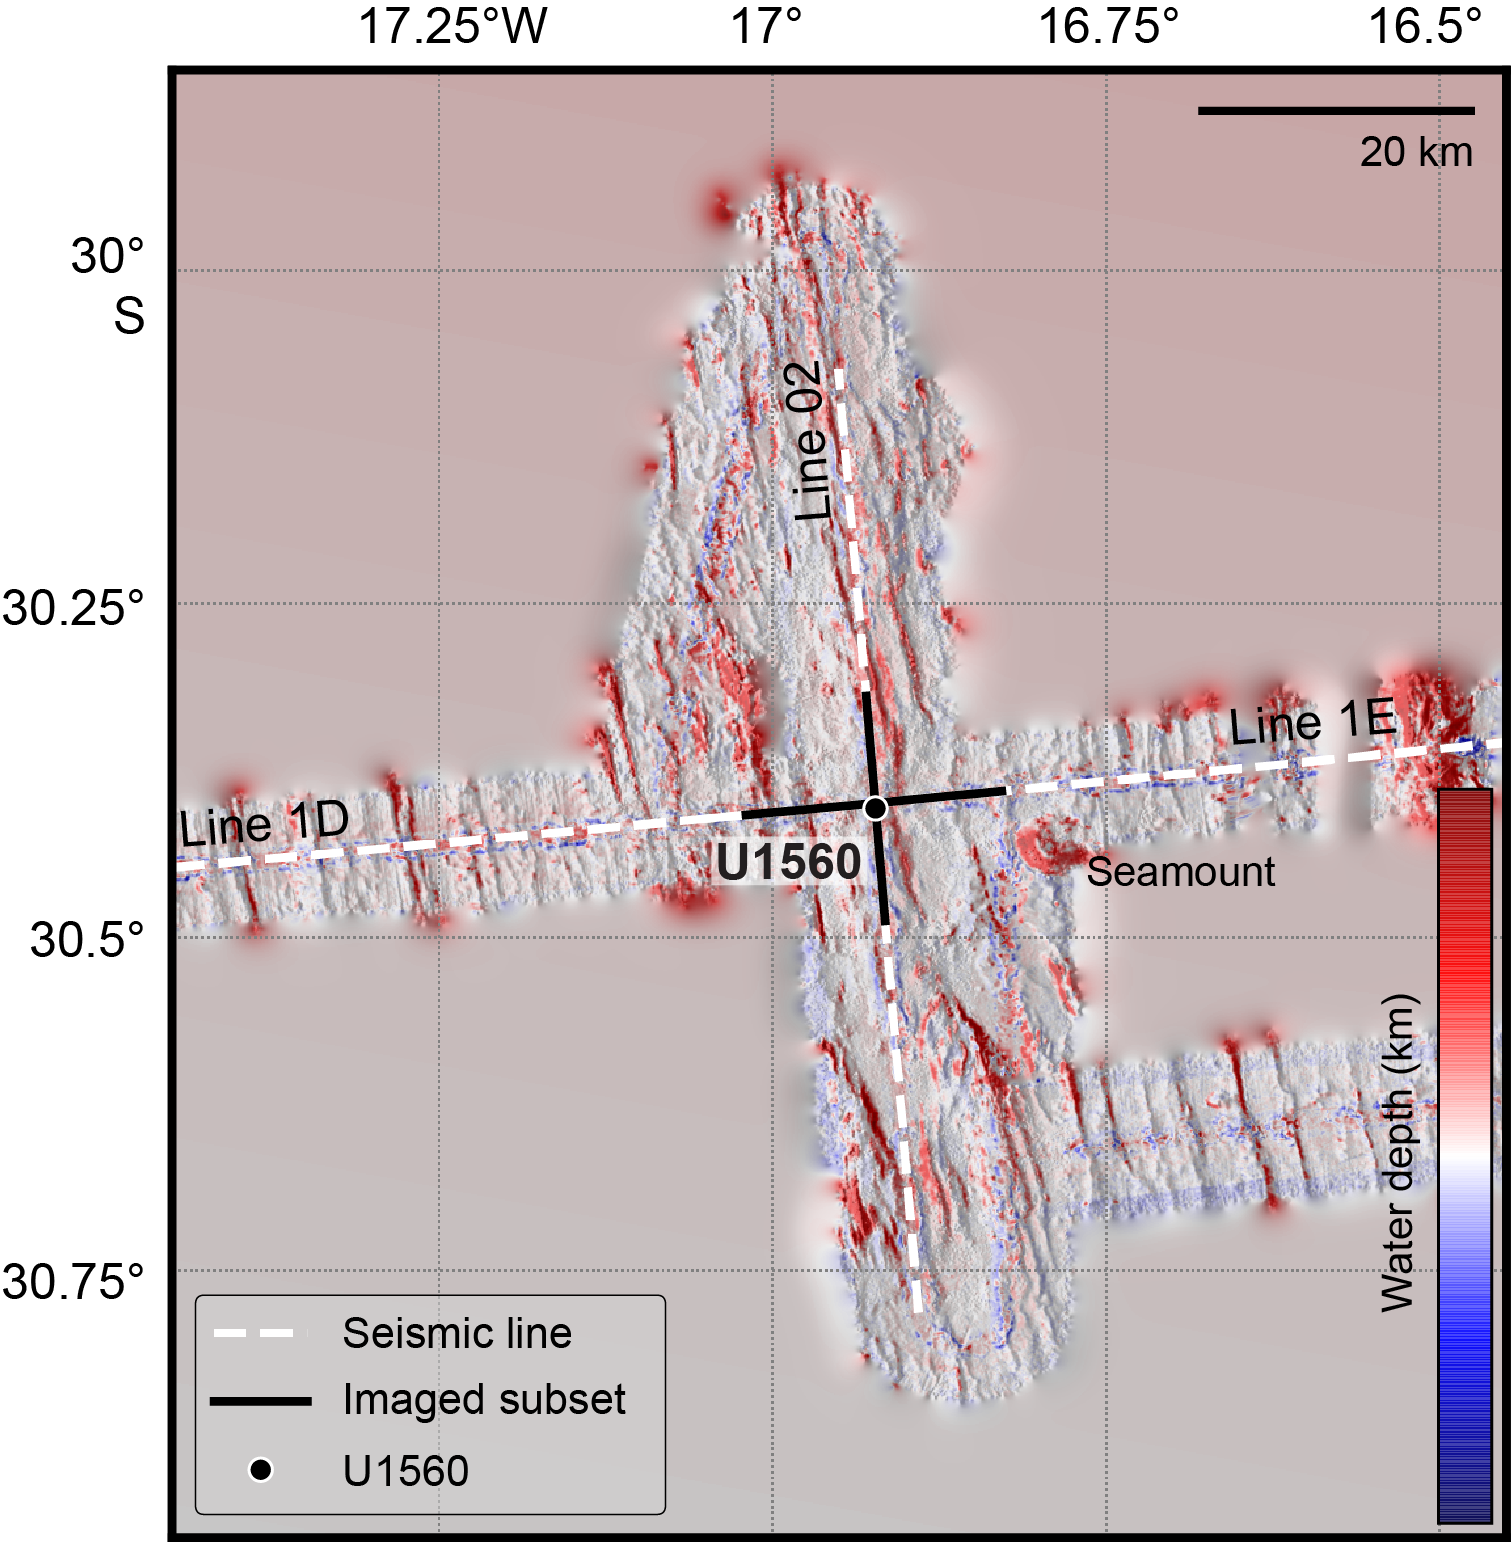
Figure F3. Backscatter reflections.
Seismic observations suggest that the ocean crust at Site U1560 has a sediment cover of 120 m (Reece et al., 2016; Reece and Estep, 2019), which is thicker than the global average overburden thickness for basement of this age (~50 m; Spinelli et al., 2004; see Figure F3 in the Expedition 390/393 summary chapter [Coggon et al., 2024b]) and thicker than the mean sediment thickness encountered along CREST Seismic Lines 1D (15–31 Ma) and 1E (7–15 Ma) of 85 and 72 m, respectively (Estep et al., 2019). However, a recent sedimentation thickness global synthesis suggests that ~15 Ma ocean crust should host between 100 and 190 m of sediment (Straume et al., 2019; Olson et al., 2016), although there are very large ranges in global and regional estimates of sediment thickness with crustal age. In reality, the sediments covering these basement highs are not draped flat across them but instead follow the topography of the basement highs. This pattern is not reflected in the models.
Backscatter reflections from multibeam profiles (Figure F3) reveal that a significant proportion of the seafloor near Site U1560 boasts continuous sediment cover, which is in contrast to other sites along the SAT. Therefore, ventilation of the volcanic rocks of the upper ocean crust through the ingress of seawater and egress of seawater-derived low-temperature hydrothermal fluids may be reduced compared to other sites. However, the presence of seamounts near Site U1560 may influence the local fluid flow system with consequent impacts on heat flow, sediment pore waters, basement hydrothermal alteration, and microbial communities in both the marine sediments and underlying basalts.
Site U1560 was first occupied during Expedition 395E engineering operations, during which Hole U1560A was cored using the advanced piston corer (APC) and extended core barrel (XCB) systems to a total depth of 122.5 meters below seafloor (mbsf), penetrating the entire sediment succession and ~2.3 m into basement (Figure F5; Table T1) (see Table T2 and Figure F15, both in the Expedition 390/393 summary chapter [Coggon et al., 2024b]) (Williams et al., 2021). Following operations in Hole U1560A, Hole U1560B was drilled to 124 mbsf, and a reentry system with 10¾ inch casing was installed in Hole U1560B that was subsequently secured with 10 bbl of 15 lb/gal cement (Figure F4) (Williams et al., 2021). Although the pilot drill bit showed wear, the underreamer cutters were in excellent condition, suggesting that the underreamer and casing had not reached volcanic rocks. The sediment/basement interface at Site U1560 is irregular and varies by at least 9 m. Holes U1560A and U1560B reached basalts at 120.2 and ~123 mbsf, respectively, but Hole U1560C, which was drilled during Expedition 393, encountered volcanic rocks at 129 mbsf (see Table T2 in the Expedition 390/393 summary chapter [Coggon et al., 2024b]).
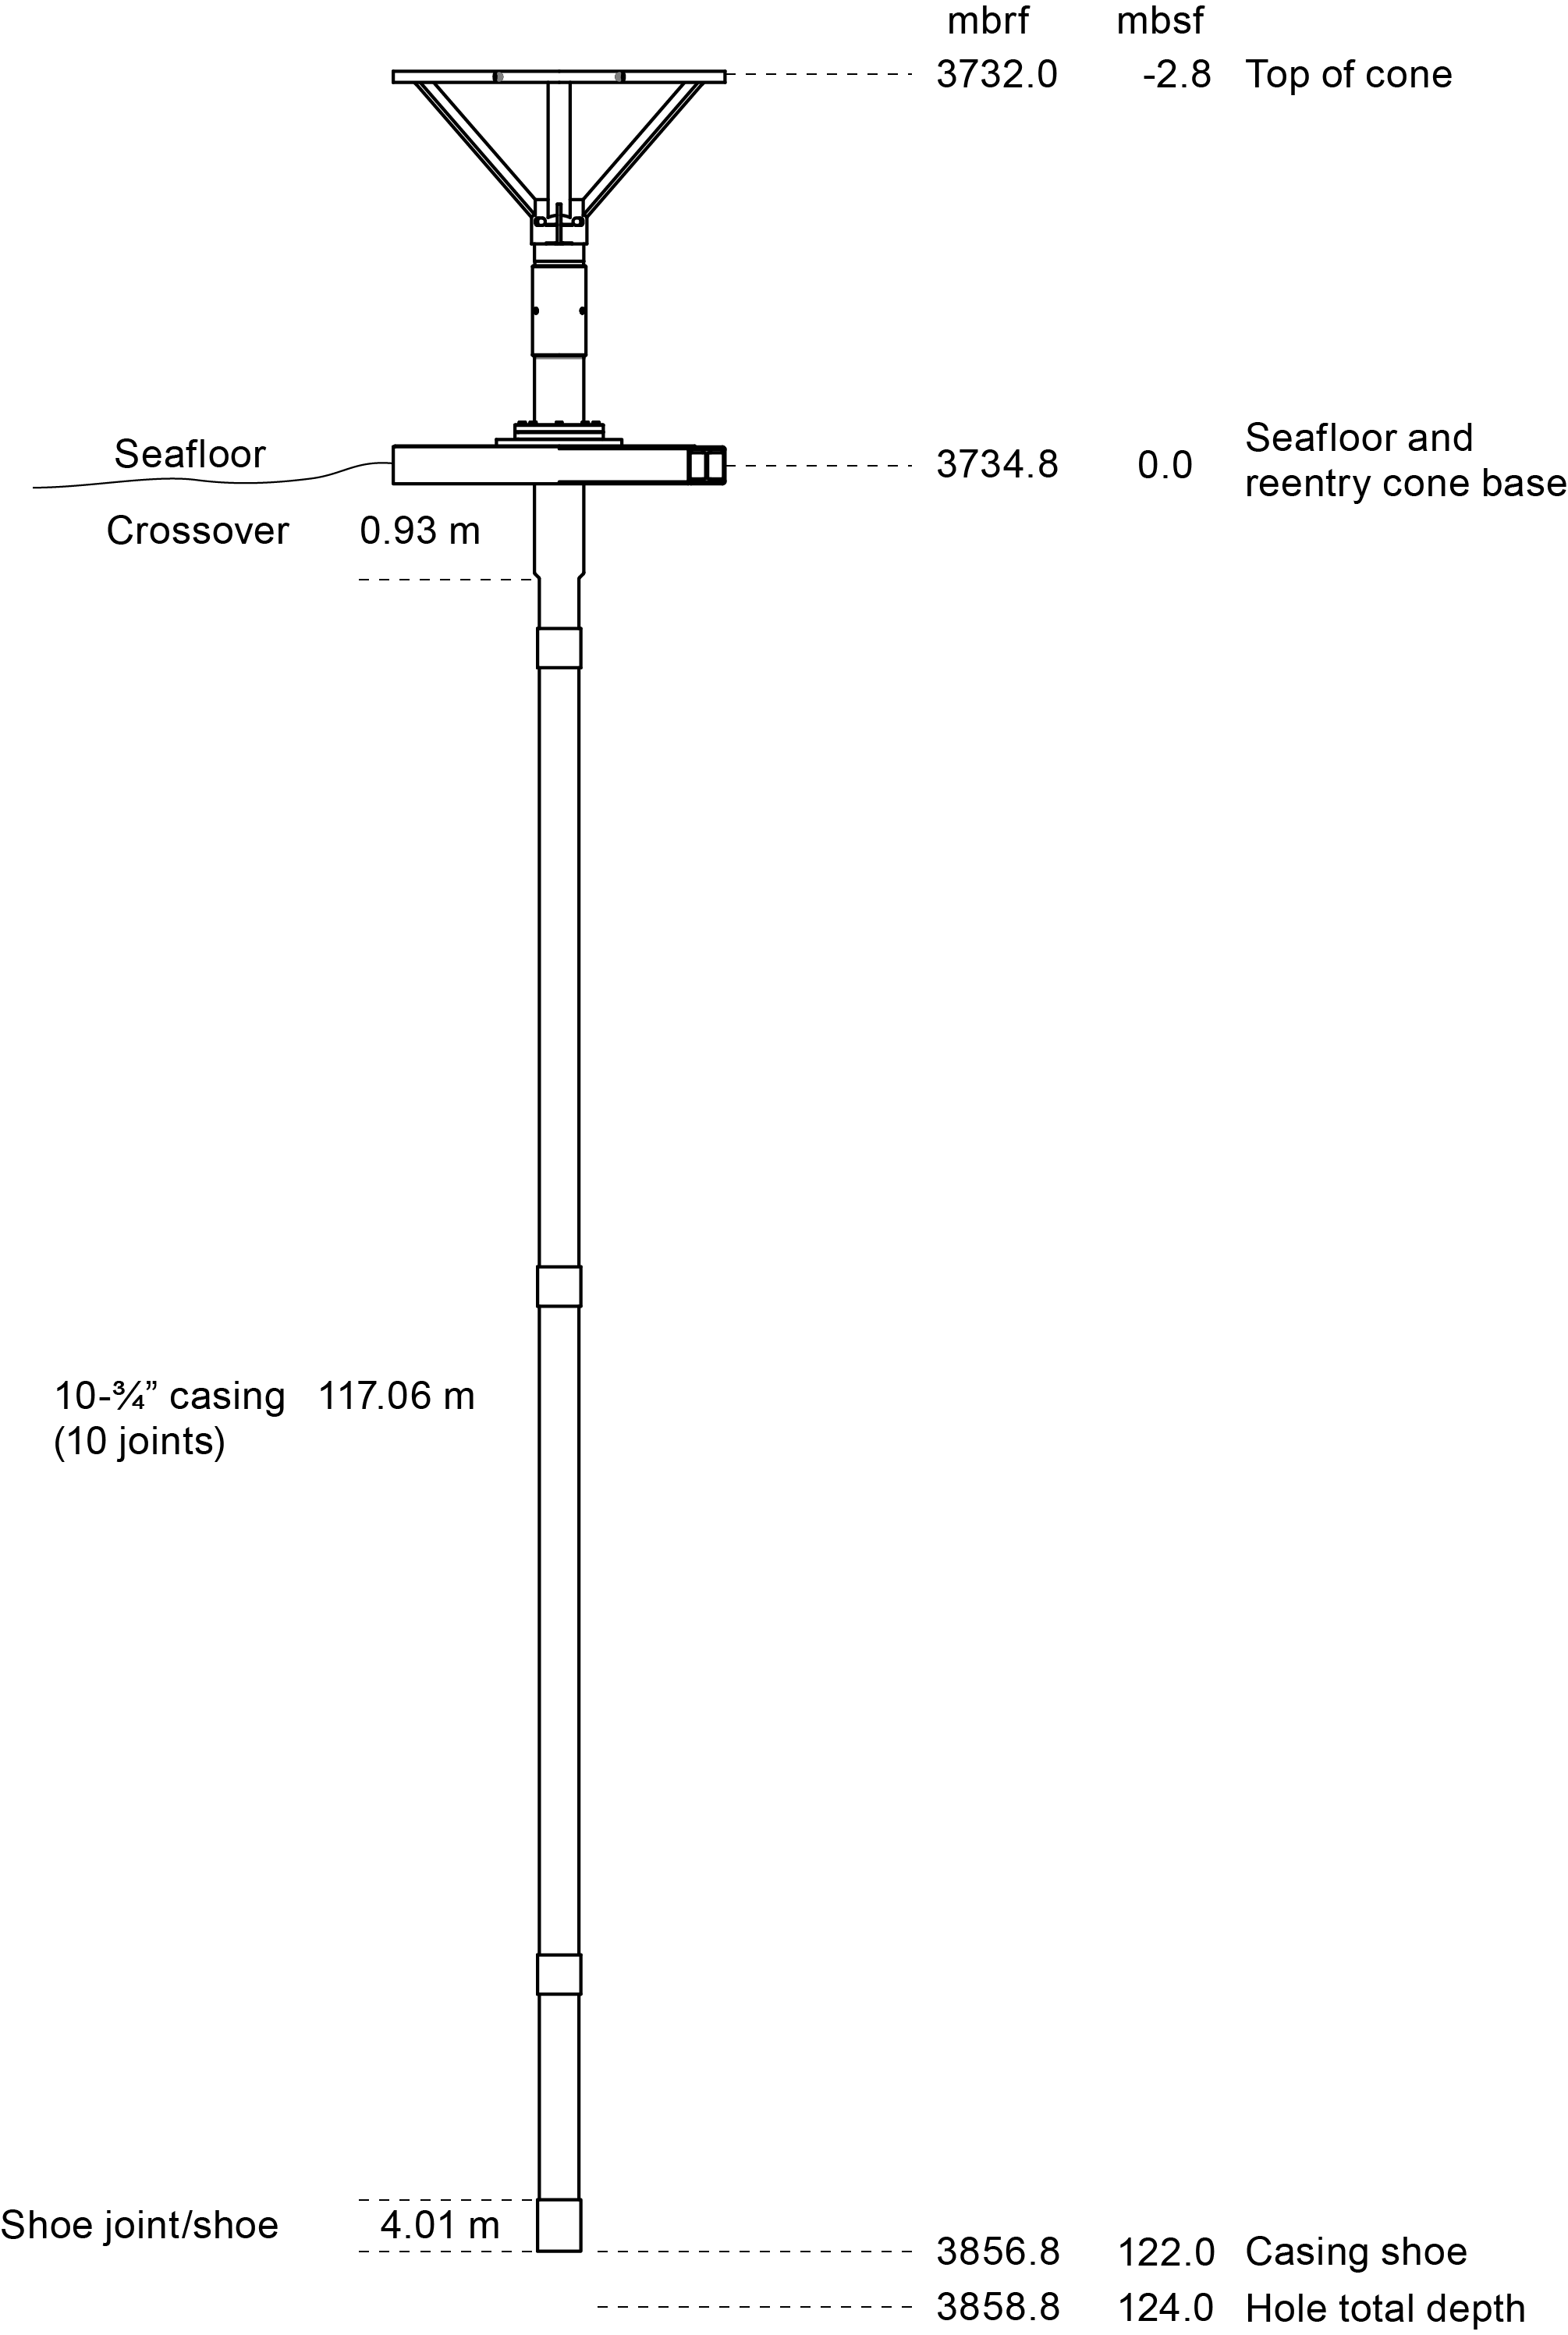
Figure F4. Reentry system.
Site U1560 is estimated to be ~15.2 Ma based on CREST site survey magnetic data (Kardell et al., 2019). Preliminary biostratigraphy analysis (nannofossils and planktic foraminifera) of cores sampled during Expedition 395E suggest that the lowermost sediments in Hole U1560A are Middle Miocene (~14 Ma).
1.2. Objectives
The operational objectives at Site U1560 during Expedition 393 were to (1) core the entire sediment section and a few meters into basement with the APC/XCB system in Hole U1560C to collect material that addresses the paleoceanographic, paleoclimate, and microbiological objectives of the SAT expeditions; (2) core 250 m into basement with the rotary core barrel (RCB) system in Hole U1560B to collect material that addresses the petrologic, geochemical, and microbiological objectives of the SAT expeditions; and (3) collect wireline geophysical logging data through the basement section.
2. Operations
Site U1560 was previously occupied in April 2021 during Expedition 395E with objectives to confirm the depth to basement by coring, conduct gas safety measurements, and set a reentry system consisting of a reentry cone and 10¾ inch casing (Figure F4) (Williams et al., 2021). Hole U1560A was cored with the APC and XCB systems to 122.5 mbsf, finding the sediment/basement contact at 120.2 mbsf. The drill bit and casing assembly was drilled into Hole U1560B, setting the casing shoe at 122.0 mbsf and the base of the hole at 124.0 mbsf. Although the drill bit showed signs of wear, the underreamer and casing were in excellent condition, and consequently the top of basement in Hole U1560B was defined to be between those depths (~123 mbsf). Ten barrels of 15 lb/gal cement were pumped with the intention to fill the base of the hole and pipe to ~100 mbsf. Hole U1560C, which was drilled during Expedition 393, encountered volcanic rocks at 129 mbsf, indicating significant basement topography over ~10 m.
2.1. Transit
The ship completed the 187 nmi voyage from Site U1583 to Site U1560 in 16 h at an average speed of 11.3 kt, arriving at 0130 h on 19 July 2022.
2.2. Hole U1560B
At 0130 h on 19 July 2022, we lowered the thrusters and started operations in Hole U1560B. We assembled the RCB bottom-hole assembly (BHA) with a new C-7 bit and lowered it to 3714 mbsl. Guided by the subsea camera images, we reentered Hole U1560B at 0920 h on 19 July and lowered the bit to 124 mbsf, the base of the existing hole. No set cement was found by drilling except for a small 5 cm roller at the top of Core 393-U1560B-2R. A turbid greenish cloud issued from the reentry cone on reentry.
We started coring in Hole U1560B at 1215 h on 19 July. Cores 2R–21R penetrated volcanic basement from 124.0 to 219.2 mbsf, recovering 38.4 m (40%) (Table T1). Ship heave reached greater than 4 m at times. In Cores 8R–18R, there was between 0.5 and 4 m of fill (sometimes hard, sometimes soft), overlapping a zone of low recovery in Cores 7R–15R. Mud sweeps of 30–60 bbl were made after most cores to flush out the fill. All cores were half-length (4.8–4.9 m). After cutting Core 21R, the bit completed 52.3 h of drilling time. It was still cutting in-gauge, good recovery cores but would not last to the intended target depth; therefore, at 2325 h on 22 July, we started to raise the pipe to change to a new bit. There was 5,000–10,000 lb of overpull at 128 mbsf (~5 meters subbasement [msb]), so the drillers rotated through this area to clear the tight spot. We deployed the subsea camera to observe the BHA coming out of the reentry cone, and the bit cleared the seafloor at 0250 h on 23 July. The BHA was racked in the derrick, the used bit and mechanical bit release (MBR) were removed, and a new MBR with a new C-7 bit and BHA was made up. At 1030 h, we started lowering the new bit to the seafloor.
We redeployed the subsea camera and reentered Hole U1560B at 1955 h. We found 1 m of soft fill and restarted coring from 219.2 mbsf at 0030 h on 24 July. Cores 22R–41R penetrated from 219.2 to 316.2 mbsf and recovered 36.35 m (37%). There was 0.5–2 m of fill after cutting Cores 33R–41R, and no fill was reported for the rest of the hole. There were no problems with torque, and a 30–60 bbl mud sweep was run after every core to flush out cuttings. At 2320 h on 26 July, the decision was made to stop coring to leave time for downhole logging and a sediment hole at this site.
With ship heave increasing through the day to an extent where it would have not only posed problems for the downhole logging tools but also would provide poor quality data, it was decided not to drop the RCB bit on the seafloor for logging. Instead, we decided to change to an APC/XCB polycrystalline diamond compact (PDC) bit and log through that to give time for the heavy seas to subside, as forecasted. The RCB bit was raised to the ship, clearing the seafloor at 0225 h on 27 July and the rig floor at 0905 h. The bit, MBR, and RCB parts of the BHA were removed and replaced with an APC/XCB BHA. The RCB bit had been used for 42.5 drilling hours and had some wear to the inner teeth but was otherwise in good condition. We replaced it with a PDC bit for APC/XCB coring rather than the typical APC/XCB roller-cone bit because the narrower diameter of the PDC bit (9⅞ inch compared to 11⁷⁄₁₆ inch) would allow it to reenter casing in Hole U1560B for downhole logging. The lockable float valve (LFV) was locked open to allow the logging tools to pass through.
From 1115 h, we lowered the bit to the seafloor and deployed the subsea camera to guide reentry. At 1755 h, we reentered Hole U1560B and set the bit at 27.7 mbsf in the casing for downhole logging. From 2025 h, we assembled the triple combo downhole logging tool string, consisting of magnetic susceptibility, electrical resistivity, density, neutron porosity, and natural gamma tools. During drilling, hole conditions had not caused excessive torque, and no tight spots were observed while raising the RCB bit, so the hole seemed to be in good condition for logging. Therefore, the density tool source and the magnetic susceptibility tool were included in the tool string, unlike in Hole U1583F. We lowered the tool string down the pipe, reaching the base of the hole (316 mbsf), and recording logging data down from the seafloor. The tool string completed one upward pass in the open hole (316–122 mbsf) and a second pass from 316 mbsf through the open hole and casing to the seafloor. The triple combo was raised back to the ship, and the Formation MicroScanner (FMS)-sonic tool string was assembled. At 0645 h on 28 July, we started to lower it down the pipe. The bottom of the tool was kept 5 m off the bottom of the hole (311 mbsf) to prevent damage to the bottom part of the FMS tool. The tool made two upward passes in the open hole. After the second pass, one of the caliper arms would not fully close, remaining open 0.2 inch and causing difficulty when bringing the tool into the base of the BHA. However, we were able to bring the tool string to the surface without damage. We assembled the Ultrasonic Borehole Imager (UBI) tool string, and at 1545 h we lowered it down the pipe. This tool string also reached 311 mbsf and made two upward passes in the open hole, and it was back on the rig floor at 2245 h. We rigged down the Schlumberger logging equipment and started pulling the bit out of Hole U1560B, clearing the seafloor at 2355 h.
In summary, Cores 393-U1560B-2R through 41R penetrated from 124.0 to 316.2 mbsf (192.2 m of basement rocks), recovering 74.8 m (39%). Of the two C-7 RCB bits deployed in Hole U1560B, the first bit drilled for 52.3 h over a 95.2 m interval with 38.44 m of recovery (40%) and the second bit drilled for 42.5 h over a 97.0 m interval recovering 36.35 m of basalt (38%). A total of 9.9 days (238.5 h) were spent on operations in Hole U1560B.
2.3. Hole U1560C
The ship was offset 10 m north in preparation for coring Hole U1560C (Figure F5). An XCB core barrel was deployed to close the LFV in the BHA, which had been set open for the previous day's downhole logging. The bit was set at 3721.7 mbsl, and we started Hole U1560C at 0245 h on 29 July 2022. Core 1H recovered 6.5 m of sediment, placing the mudline depth at 3724.7 mbsl. To correct the stratigraphic overlap with cores from Hole U1560A, which were cored in April 2021 during Expedition 395E, we drilled ahead 2.0 m from 16.0 mbsf (drilled interval 393-U1560C-31). Cores 1H–15F penetrated from the seafloor to 112.8 mbsf and recovered 111.9 m (101%) of nannofossil ooze with varying amounts of clay and foraminifera. Advanced piston corer temperature (APCT-3) tool measurements were made on Cores 5H, 8H, and 11H. While taking the Core 11H APCT-3 measurement, the APC core barrel became stuck in the formation, and it required three drillover attempts and 160,000 lb of overpull to free it. The APC piston rods had twisted during the process, and as a result we switched over to half-length APC (HLAPC) coring from Core 12F. The drill crew worked between cores to straighten the piston rods for the full-length tool.
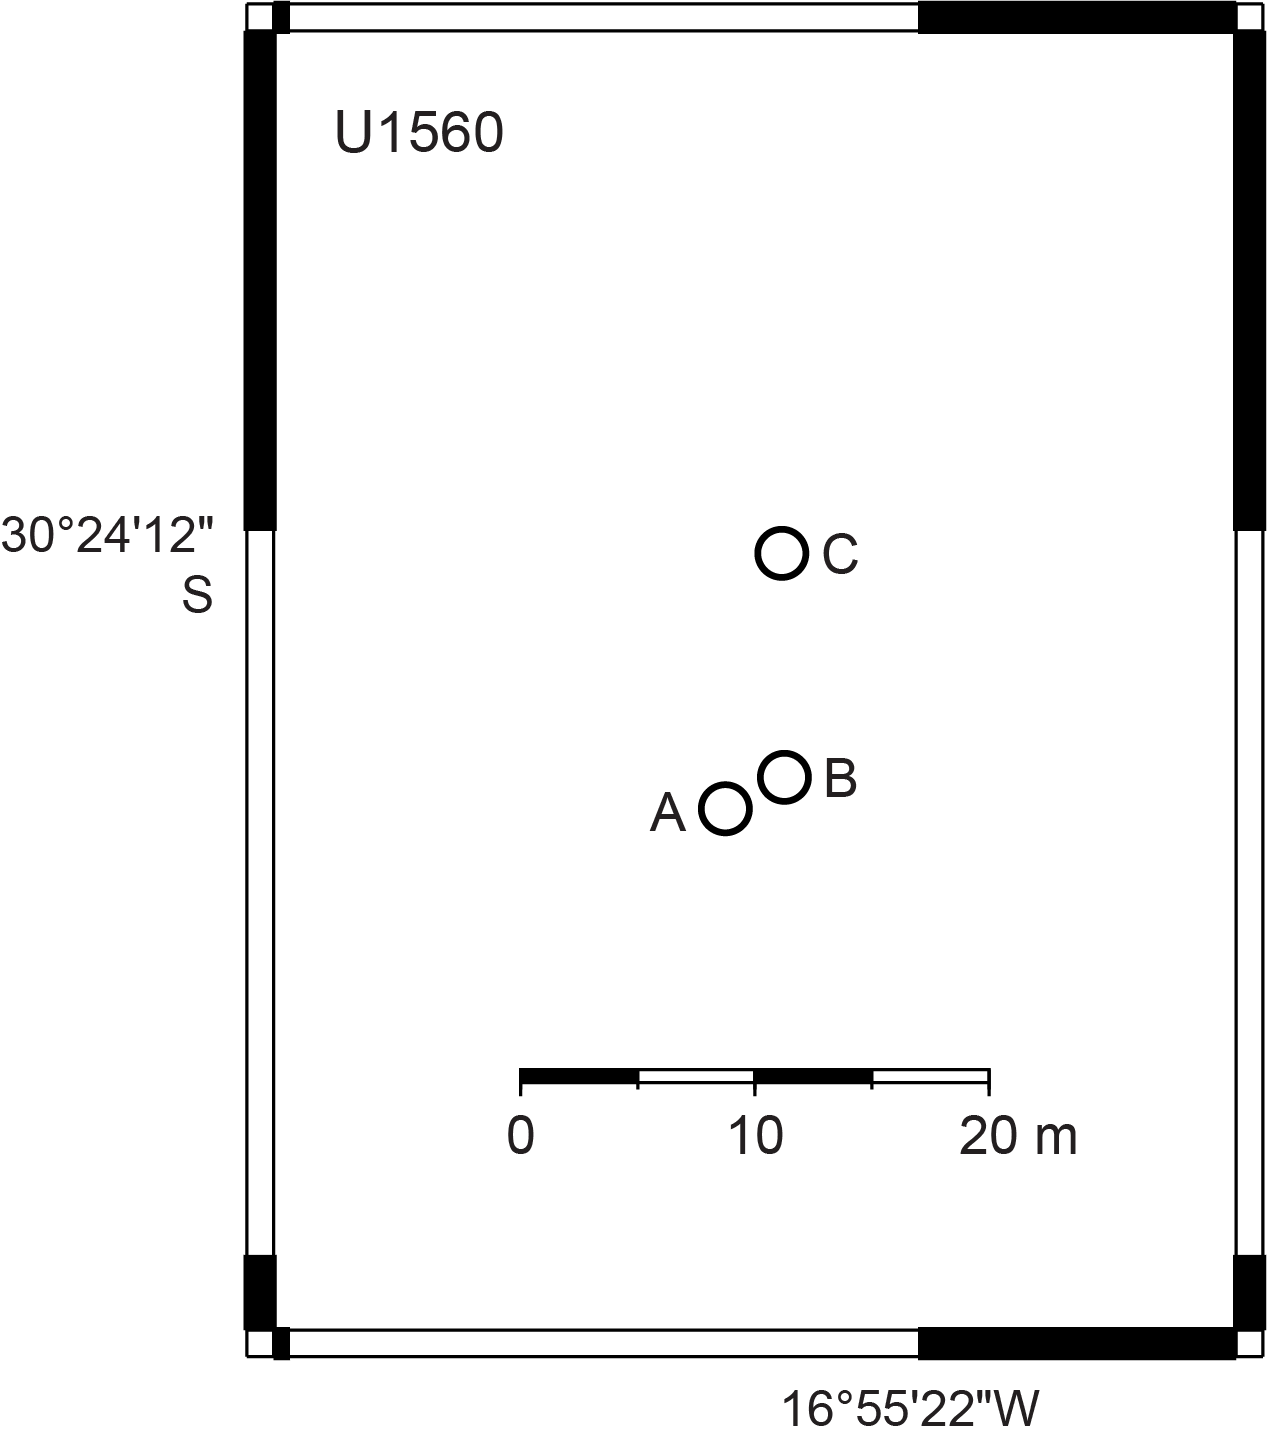
Figure F5. Map of holes drilled.
After Core 393-U1560C-16F reached 117.5 mbsf, we switched to the XCB coring system in anticipation of reaching basement at approximately the depth it was found in Holes U1560A (120.2 mbsf) and U1560B (~123 mbsf). Basement was eventually encountered at 129.0 mbsf in Hole U1560C, 9.8 m deeper than in Hole U1560A. The two holes are only 10 m lateral distance apart, and the difference in basement depth reflects the rugged basement surface topography that is typical of slow/intermediate spreading rate ridges. Core 393-U1560C-18X drilled a further 0.3 m into the basement and recovered two ~5 cm pieces of basalt. It was the last core of the expedition. Cores 1H–18X cored from the seafloor to 129.3 mbsf and recovered 122.75 m (96%). Nonmagnetic core barrels were used on all APC and HLAPC cores, and all full-length APC cores were oriented using the Icefield MI-5 core orientation tool.
From 0530 h on 29 July, the rig floor team coated the core line and then raised the bit to the ship, clearing the seafloor at 0900 h and the rig floor at 1655 h. The BHA was disassembled and stowed for transit, and 115 ft of drill line was slipped and cut. We raised the thrusters and started the transit to Cape Town, South Africa, at 1930 h.
3. Stratigraphic unit summary
At Site U1560, we recovered 119.4 and 127.4 m of sediment in Holes U1560A and U1560C, respectively. Drilling in Hole U1560B penetrated 192.2 m of volcanic formations (~75 m volcanic rock retrieved; ~39% recovery) from the uppermost ocean crust (total depth = 316.2 mbsf). The cores recovered from the two holes (U1560A and U1560C) record 1 major sedimentary unit that was divided into 5 subunits (Figure F6) overlying 6 basement units (with 15 subunits). The units are numbered from the top of the hole, with units in the sedimentary section designated by Roman numerals (e.g., I and II) and units in the basement (volcanic units) designated by Arabic numerals (e.g., 1 and 2); subunits are designated with letters (e.g., IA, IB, 2A, and 2B).
3.1. Sediment units
Biogenic and minor amounts of siliciclastic sediments were recovered from two holes (U1560A and U1560C, cored during Expeditions 395E and 393, respectively). Biogenic sediments consist primarily of calcareous nannofossil ooze with varying amounts of clay and foraminifera. Intervals with siliciclastic sediments include rare to common clays with variable nannofossil and foraminifera content. A single sedimentary lithostratigraphic unit (I) was defined at Site U1560 and is divided into five subunits (Figure F6; Table T2). Subunit IA extends from the top of the hole to 49.5 m core depth below seafloor, Method A (CSF-A), in Hole U1560A and 51.3 m CSF-A in Hole U1560C. It is Pleistocene to Late Miocene pinkish white, pink, light brown, and rarely light reddish brown nannofossil ooze with variable amounts of clay and foraminifera. Subunit IB extends from 49.5 to 61.0 m CSF-A in Hole U1560A and from 51.3 to 61.2 m CSF-A in Hole U1560C. It is Late Miocene in age and comprises pink, pale brown, and light brown to dark brown nannofossil ooze with clay interbedded with 10–30 cm thick beds of pinkish white, pink, and pinkish gray nannofossil ooze. Subunit IC extends from 61.0 to 85.4 m CSF-A in Hole U1560A and from 61.2 to 89.3 m in CSF-A in Hole U1560C and consists of Late Miocene pink to light brown nannofossil ooze with varying foraminifera content interbedded with light brown to reddish yellow and light brown nannofossil ooze with clay. Subunit ID extends from 85.4 to 96.4 m CSF-A in Hole U1560A and from 89.3 to 98.9 m CSF-A in Hole U1560C. It consists of Late to Middle Miocene pink, light brown, and brown nannofossil ooze with clay interbedded with medium–thick beds of brown clayey nannofossil ooze. Subunit IE extends from 96.4 and 98.9 m CSF-A in Holes U1560A and U1560C, respectively, to the sediment/basement interface. It consists of Middle Miocene pink, light brown, and brown nannofossil ooze with foraminifera and variable amounts of clay interbedded with brown to dark brown organic carbon–bearing nannofossil ooze with clay, brown to dark brown clayey organic carbon bearing nannofossil ooze, and 10–30 cm thick beds of pink nannofossil ooze.
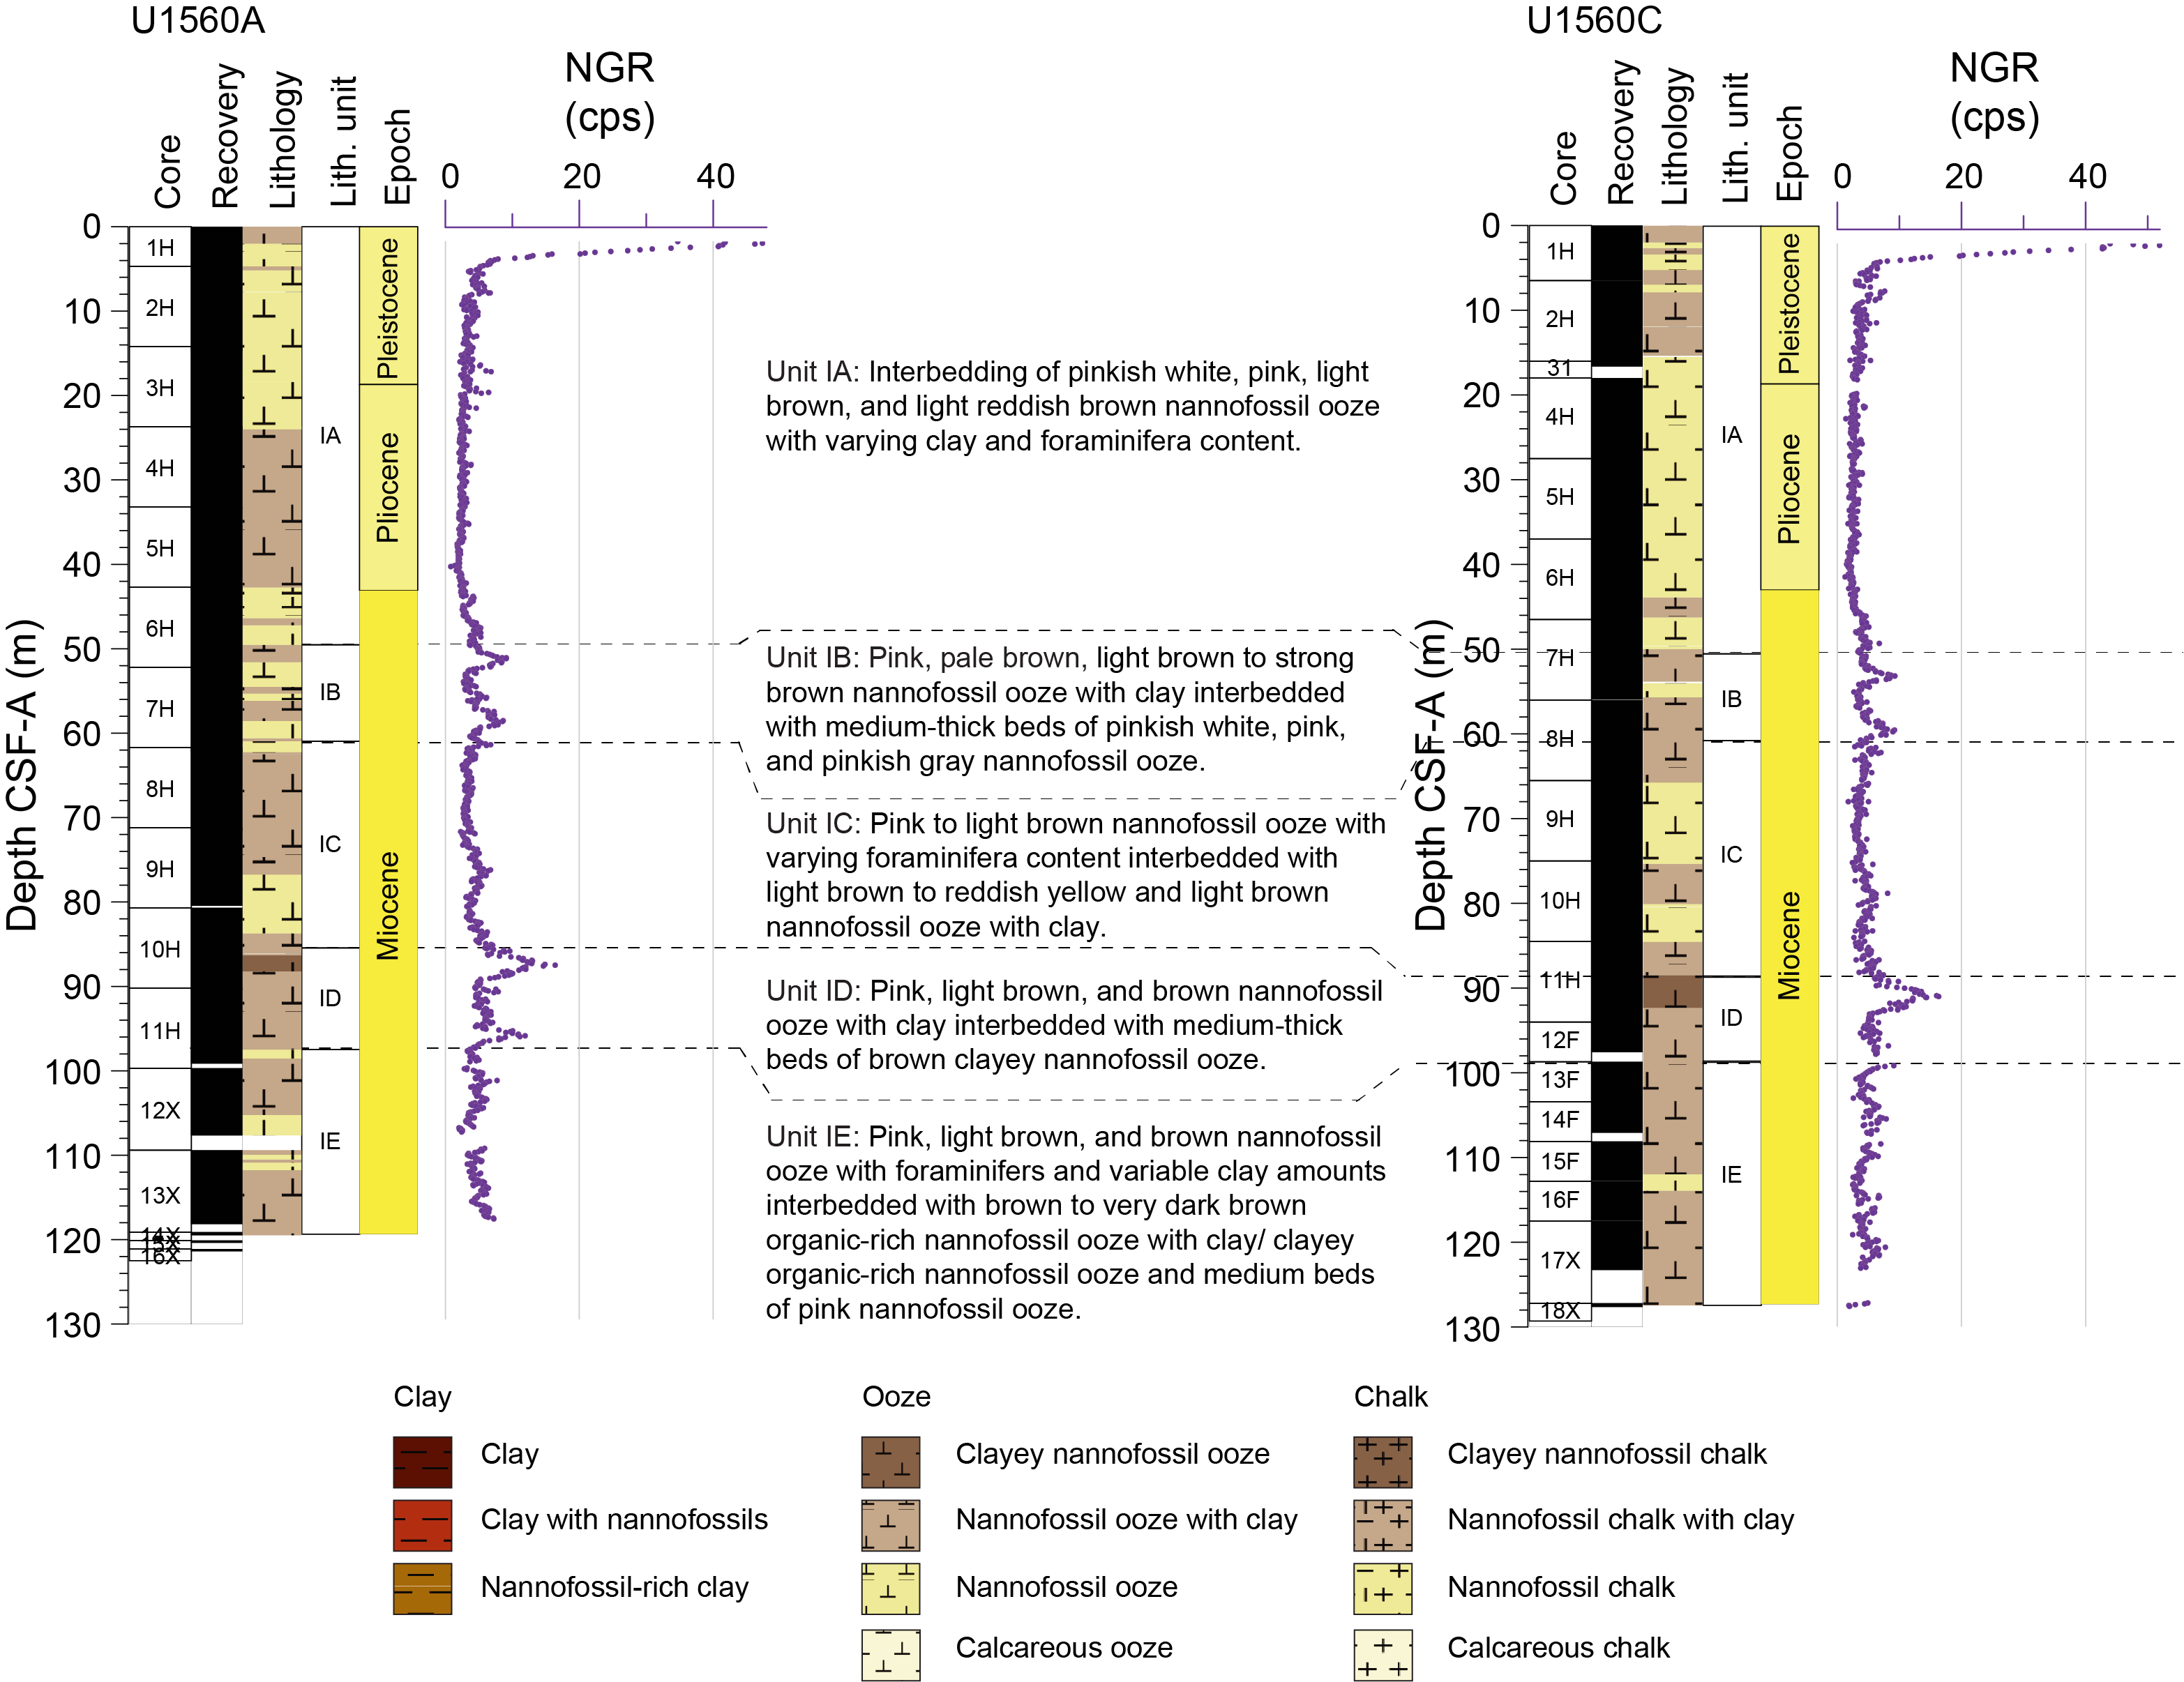
Figure F6. Lithostratigraphic summary, sediment units.
3.2. Volcanic sequences
Expedition 395E Hole U1560A and Expedition 393 Holes U1560B and U1560C all recovered volcanic basement, but only Hole U1560B penetrated deeply into basement. During Expedition 393, we cored from the Expedition 395E Hole U1560B pilot bit depth at 124.0 mbsf, advancing a further 192.2 m to 316.2 mbsf and recovering ~75 m of basalt, for an average recovery of 39% (Figure F7; Table T6). This recovery was generally sufficient for unit boundaries, lava types, and volcanic emplacement styles to be determined with confidence throughout most of the hole, although low to zero core recovery in critical parts of the sequence means some important transitions were not recovered (e.g., Core 393-U1560B-7R; 147–153 mbsf). Similarly, the extent of sedimentary breccias and other fragile and broken formations from throughout the hole remain uncertain. Some clarification may come from the careful analysis of drilling and wireline logging information and paleomagnetic conglomerate tests.
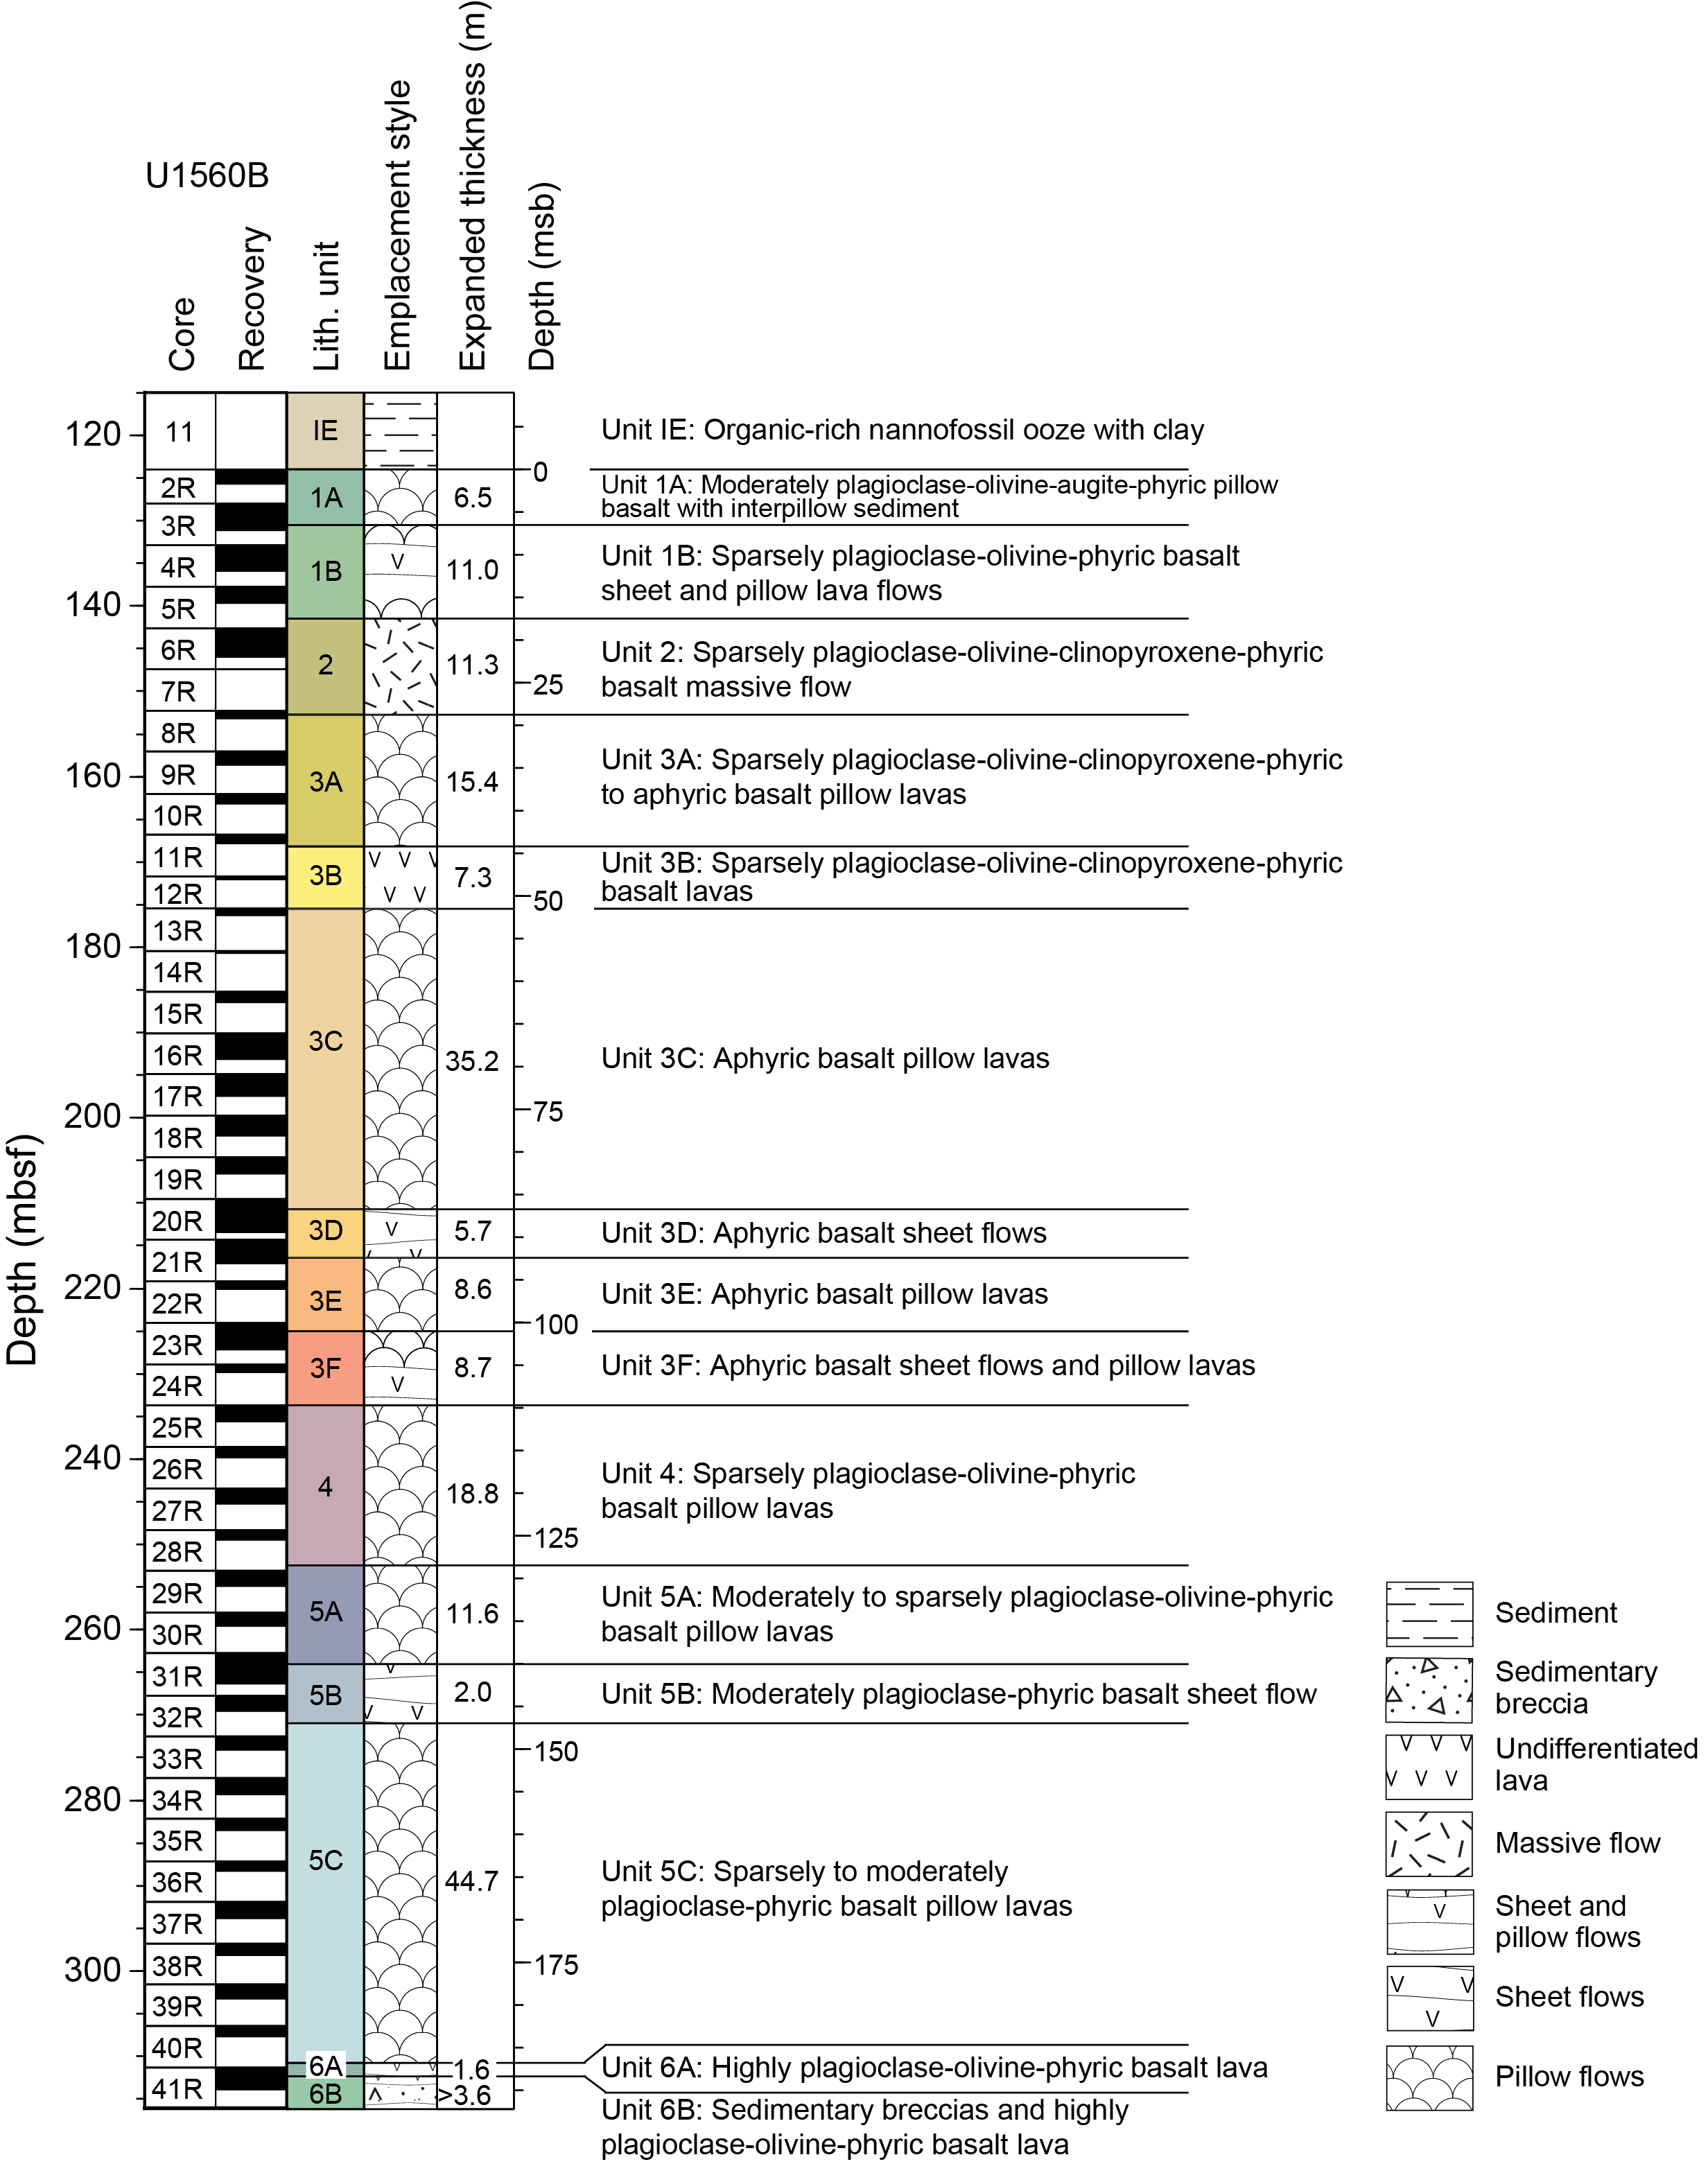
Figure F7. Lithostratigraphic summary, volcanic units.
In Hole U1560B, we recovered a main volcanic sequence composed of 6 volcanic units, comprising 15 subunits. Unit 1 directly underlies basal sedimentary Subunit IE and consists of sparsely to moderately plagioclase-olivine-phyric pillow lavas with some intervening sheet flows and interpillow sediments near the interface. Unit 2 is a sparsely plagioclase-olivine-augite-phyric massive flow, with a fine- to medium-grained interior between 6 and 11 m thick depending on the unrecovered material in Core 393-U1560B-7R. Unit 3 consists mostly of pillow lavas with phenocryst abundances that grade from sparsely phyric to aphyric. Unit 3 is the most primitive unit in Hole U1560B in terms of Cr/Ti ratios. Unit 4 consists of sparsely plagioclase-olivine-phyric basalt pillow lavas with a composition transitional between Unit 3 and Unit 5. Subunits 5A and 5C consist of moderately to sparsely plagioclase-olivine-phyric pillow lavas and are separated by two to three sheet lava flows (Subunit 5B). Basalts in Unit 6 are highly plagioclase-olivine-clinopyroxene-phyric and may provide a relatively fresh protolith for comparison with other, more strongly altered highly phenocryst-rich basalts recovered at other sites along the SAT. Hole U1560B ends in Subunit 6B, which contains highly plagioclase-olivine-clinopyroxene phyric lavas and two tantalizing sedimentary breccias of basalt and glass clasts in a matrix of indurated calcareous sediment and hyaloclastite.
Lava composition assessed by portable X-ray fluorescence (pXRF) varies significantly downhole, with geochemical boundaries largely corresponding to the petrologically defined boundaries. Incompatible element concentrations and Zr/Ti ratios are mostly consistent with a normal mid-ocean-ridge basalt (N-MORB)-like composition for the lavas at Site U1560, although higher Zr/Ti in Subunits 3A and 3B and Unit 6 nudge toward enriched mid-ocean-ridge basalt (E-MORB) and warrant further investigation. The recurring sequence of chemostratigraphic units, with a central primitive aphyric lava unit, as was noted for Sites U1558 and U1583, is also present at Site U1560.
3.3. Sediment/basement interface
Holes U1560A–U1560C reached volcanic basement between 121.5 and 129 mbsf (drilling depth below seafloor [DSF] scale), but none of these holes recovered a sediment/basement interface within a single core. The depth at which basement was encountered during drilling of the deepest hole (U1560B) at 124 mbsf (DSF scale) is taken as the sediment/basement interface depth for Site U1560. The deepest sediment above the basement recovered in all holes was organic-rich nannofossil ooze, and indurated calcareous sediment was only recovered in small pieces between lava flows near the interface in Hole U1560B, suggesting a sharp transition from sediment to lava flows.
4. Sedimentology
Expedition 395E Hole U1560A and Expedition 393 Hole U1560C cored the complete sediment section to basement and recovered 119.4 and 127.4 m of sediments, respectively. The recovered sediments are Pleistocene to Middle Miocene in age and consist mainly of nannofossil ooze with varying clay and foraminiferal abundances. The lowermost sediment in Holes U1560A and U1560C from Sections 395E-U1560A-13X-4, 70 cm, and 393-U1560C-13F-1, 0 cm, to the sediment/basement interfaces contain thin to thick beds of organic carbon–bearing nannofossil ooze (up to 1.4 wt% organic carbon).
The sediments form one lithostratigraphic unit that is divided into five subunits (IA–IE; youngest to oldest) (Figures F8, F9, F10, F11, F15). These divisions are supported by macroscopic and microscopic interpretations as well as X-ray diffraction (XRD) data, CaCO3 weight percent, and other physical properties measurements.
4.1. Unit descriptions
4.1.1. Unit I
- Intervals: 395E-U1560A-1H-1, 0 cm, to 14X-1, 38 cm; 393-U1560C-1H-1, 0 cm, to 18X-1, 23 cm
- Depths: Hole U1560A = 0.0–119.4 m CSF-A; Hole U1560C = 0.0–127.4 m CSF-A
- Thickness: Hole U1560A = 119.4 m; Hole U1560C = 127.4 m
- Age: Pleistocene–Middle Miocene
- Lithology: nannofossil ooze with varying clay and foraminifera content
Lithostratigraphic Unit I is predominantly composed of pinkish white, pink, pinkish gray, and light brown nannofossil ooze with variable amounts of clay and foraminifera, whereas the lower section contains beds of brown clayey nannofossil ooze, light brown to brown organic carbon-bearing nannofossil ooze with clay (up to 1.4 wt% organic carbon), and brown to very dark brown clayey organic carbon–bearing nannofossil ooze (Figures F8, F9, F10, F11). Foraminifera are common (10%–25%) in the upper 42.5 m and in the lower 22 m in Hole U1560A, whereas in Hole U1560C, foraminifera are common (10%–25%) to abundant (25%–50%) only in the upper ~44 m but less common (10%–25%) overall. Lithologic contacts are horizontal, inclined, and rarely curved, ranging from gradational to bioturbated. Sedimentary structures predominantly constitute massive bedding and mottling, with distinct ichnogenera observed in decimeter-thick beds throughout this unit, including but not limited to Planolites, Skolithos, Arenicolites, Thalassinoides, Chondrites, Palaeophycus, Nereites, Palaeophycus, and Zoophycos. Bioturbation is absent to intense (bioturbation index [BI] = 0–5). Ichnofossil diversity ranges 1–4 ichnogenera, with the maximum trace fossil diameter ranging 1–30 mm (Figure F12).
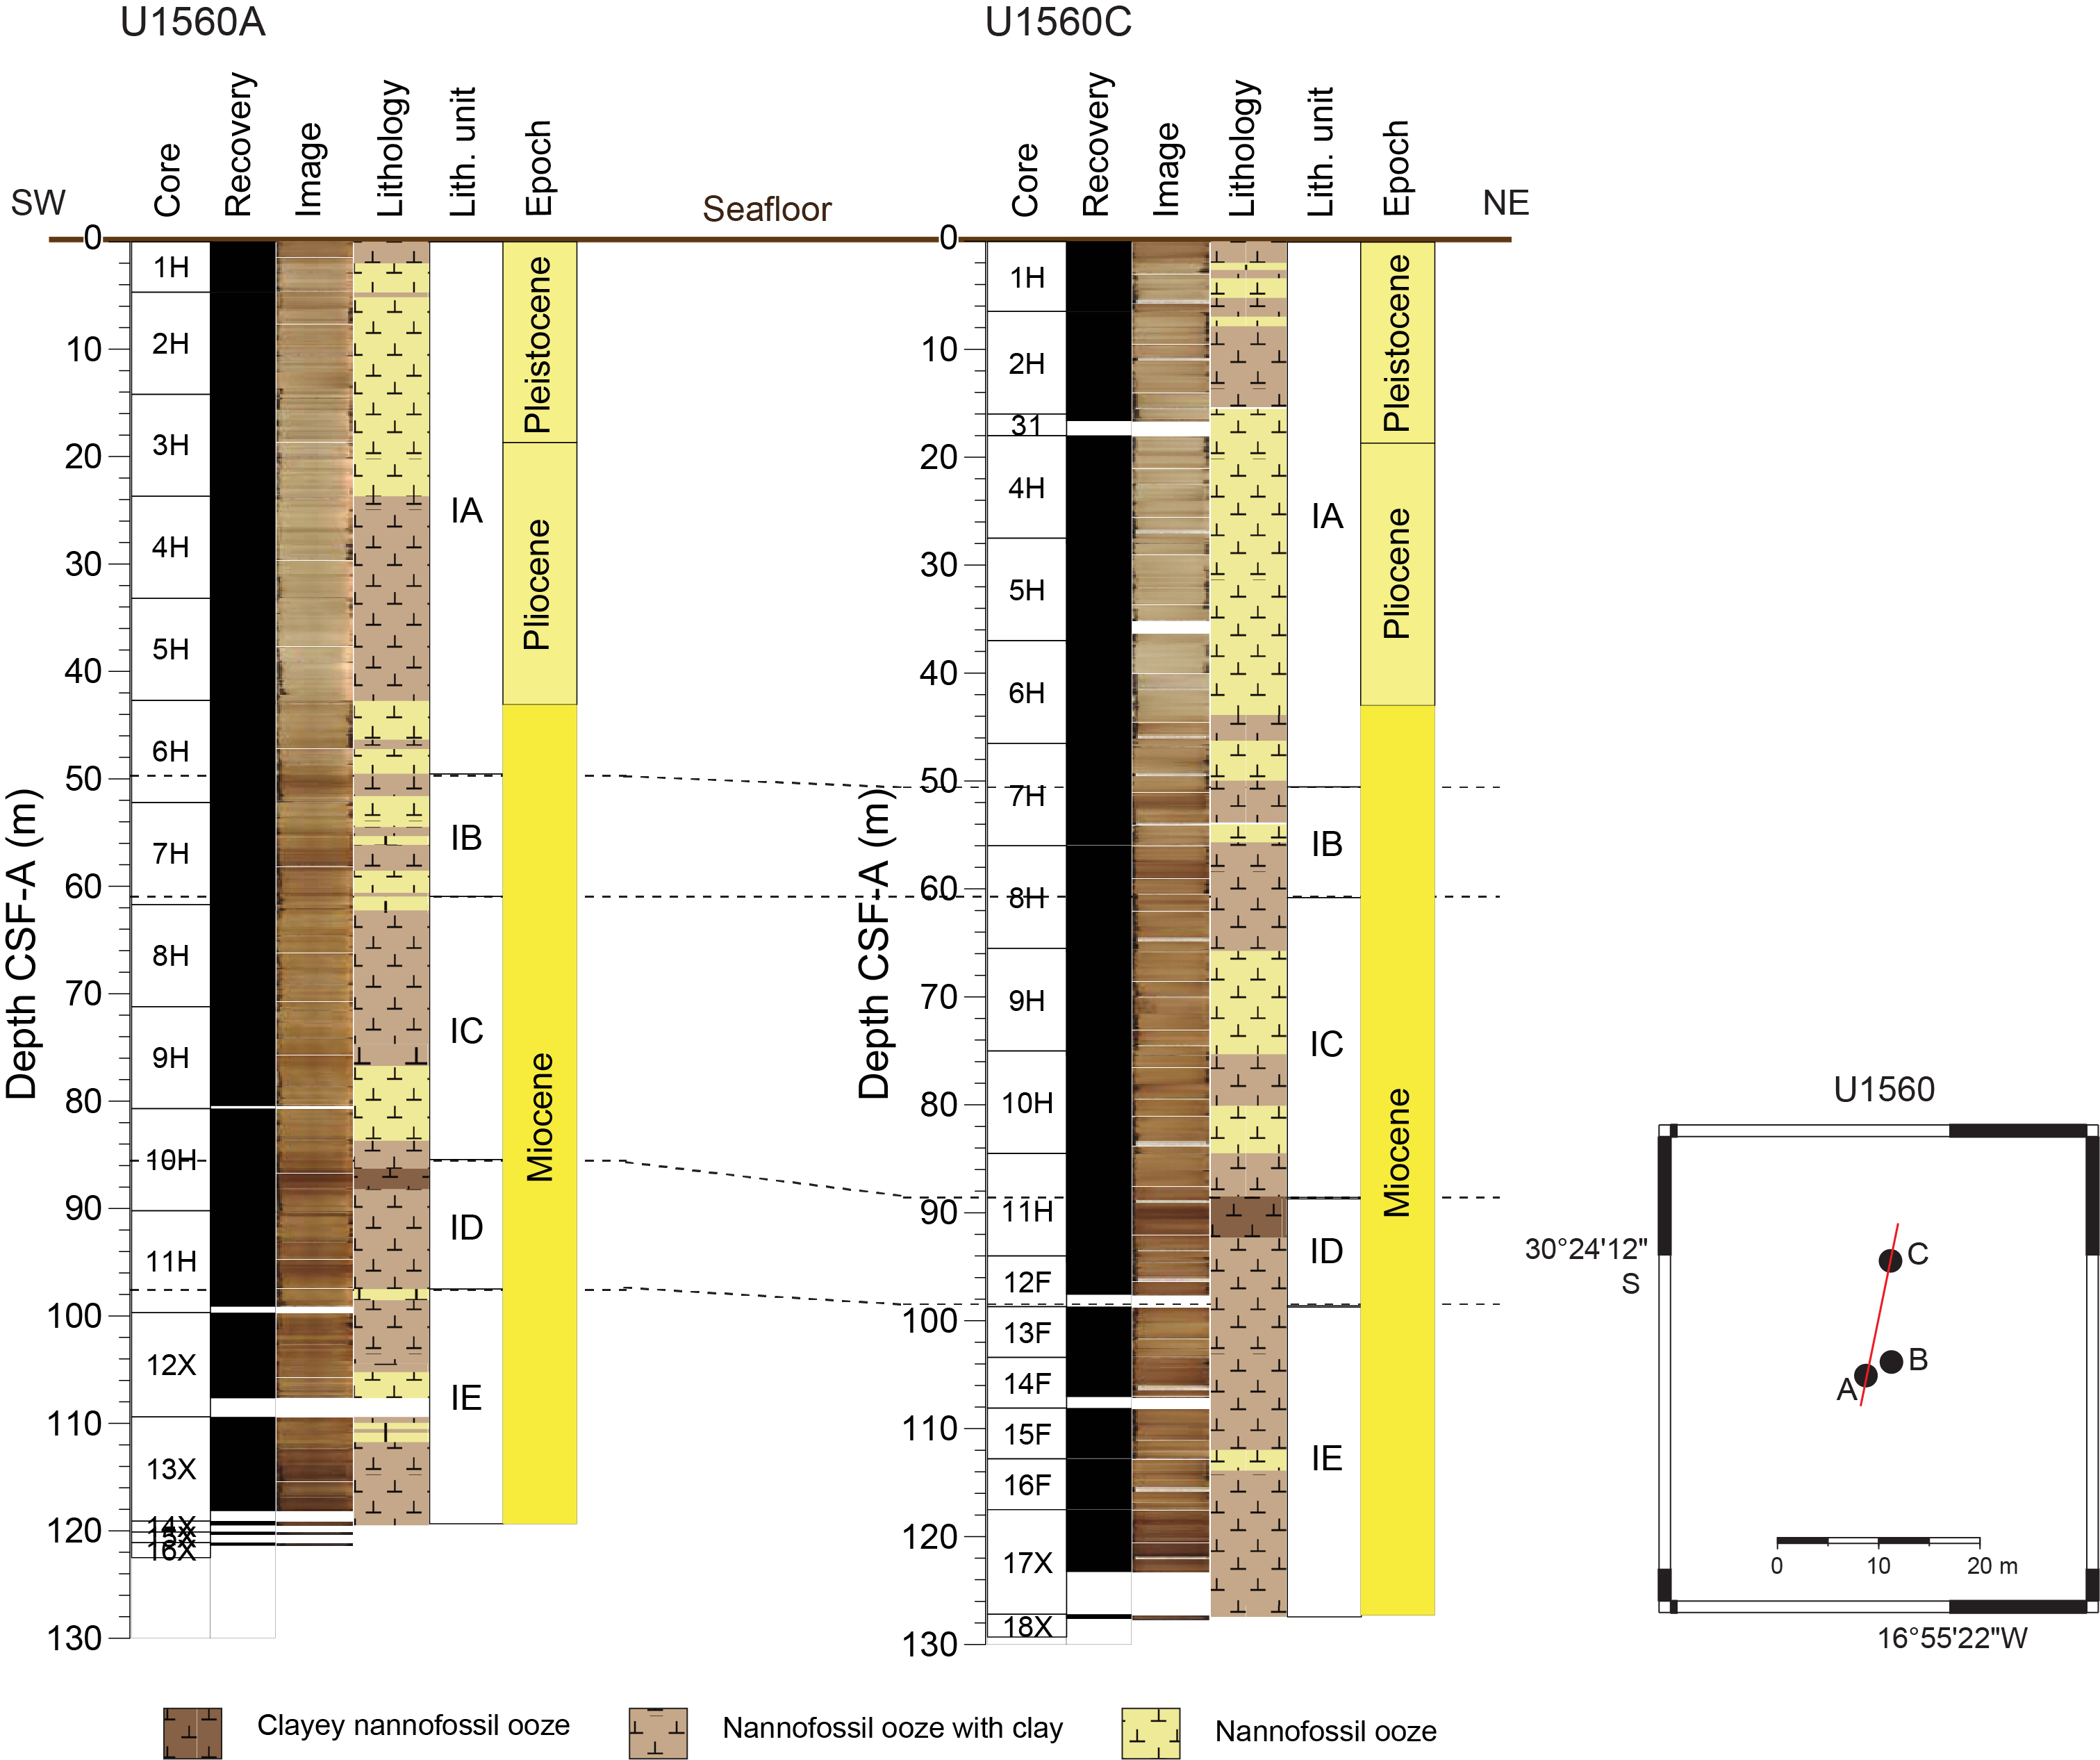
Figure F8. Lithologic correlation of sediment holes.
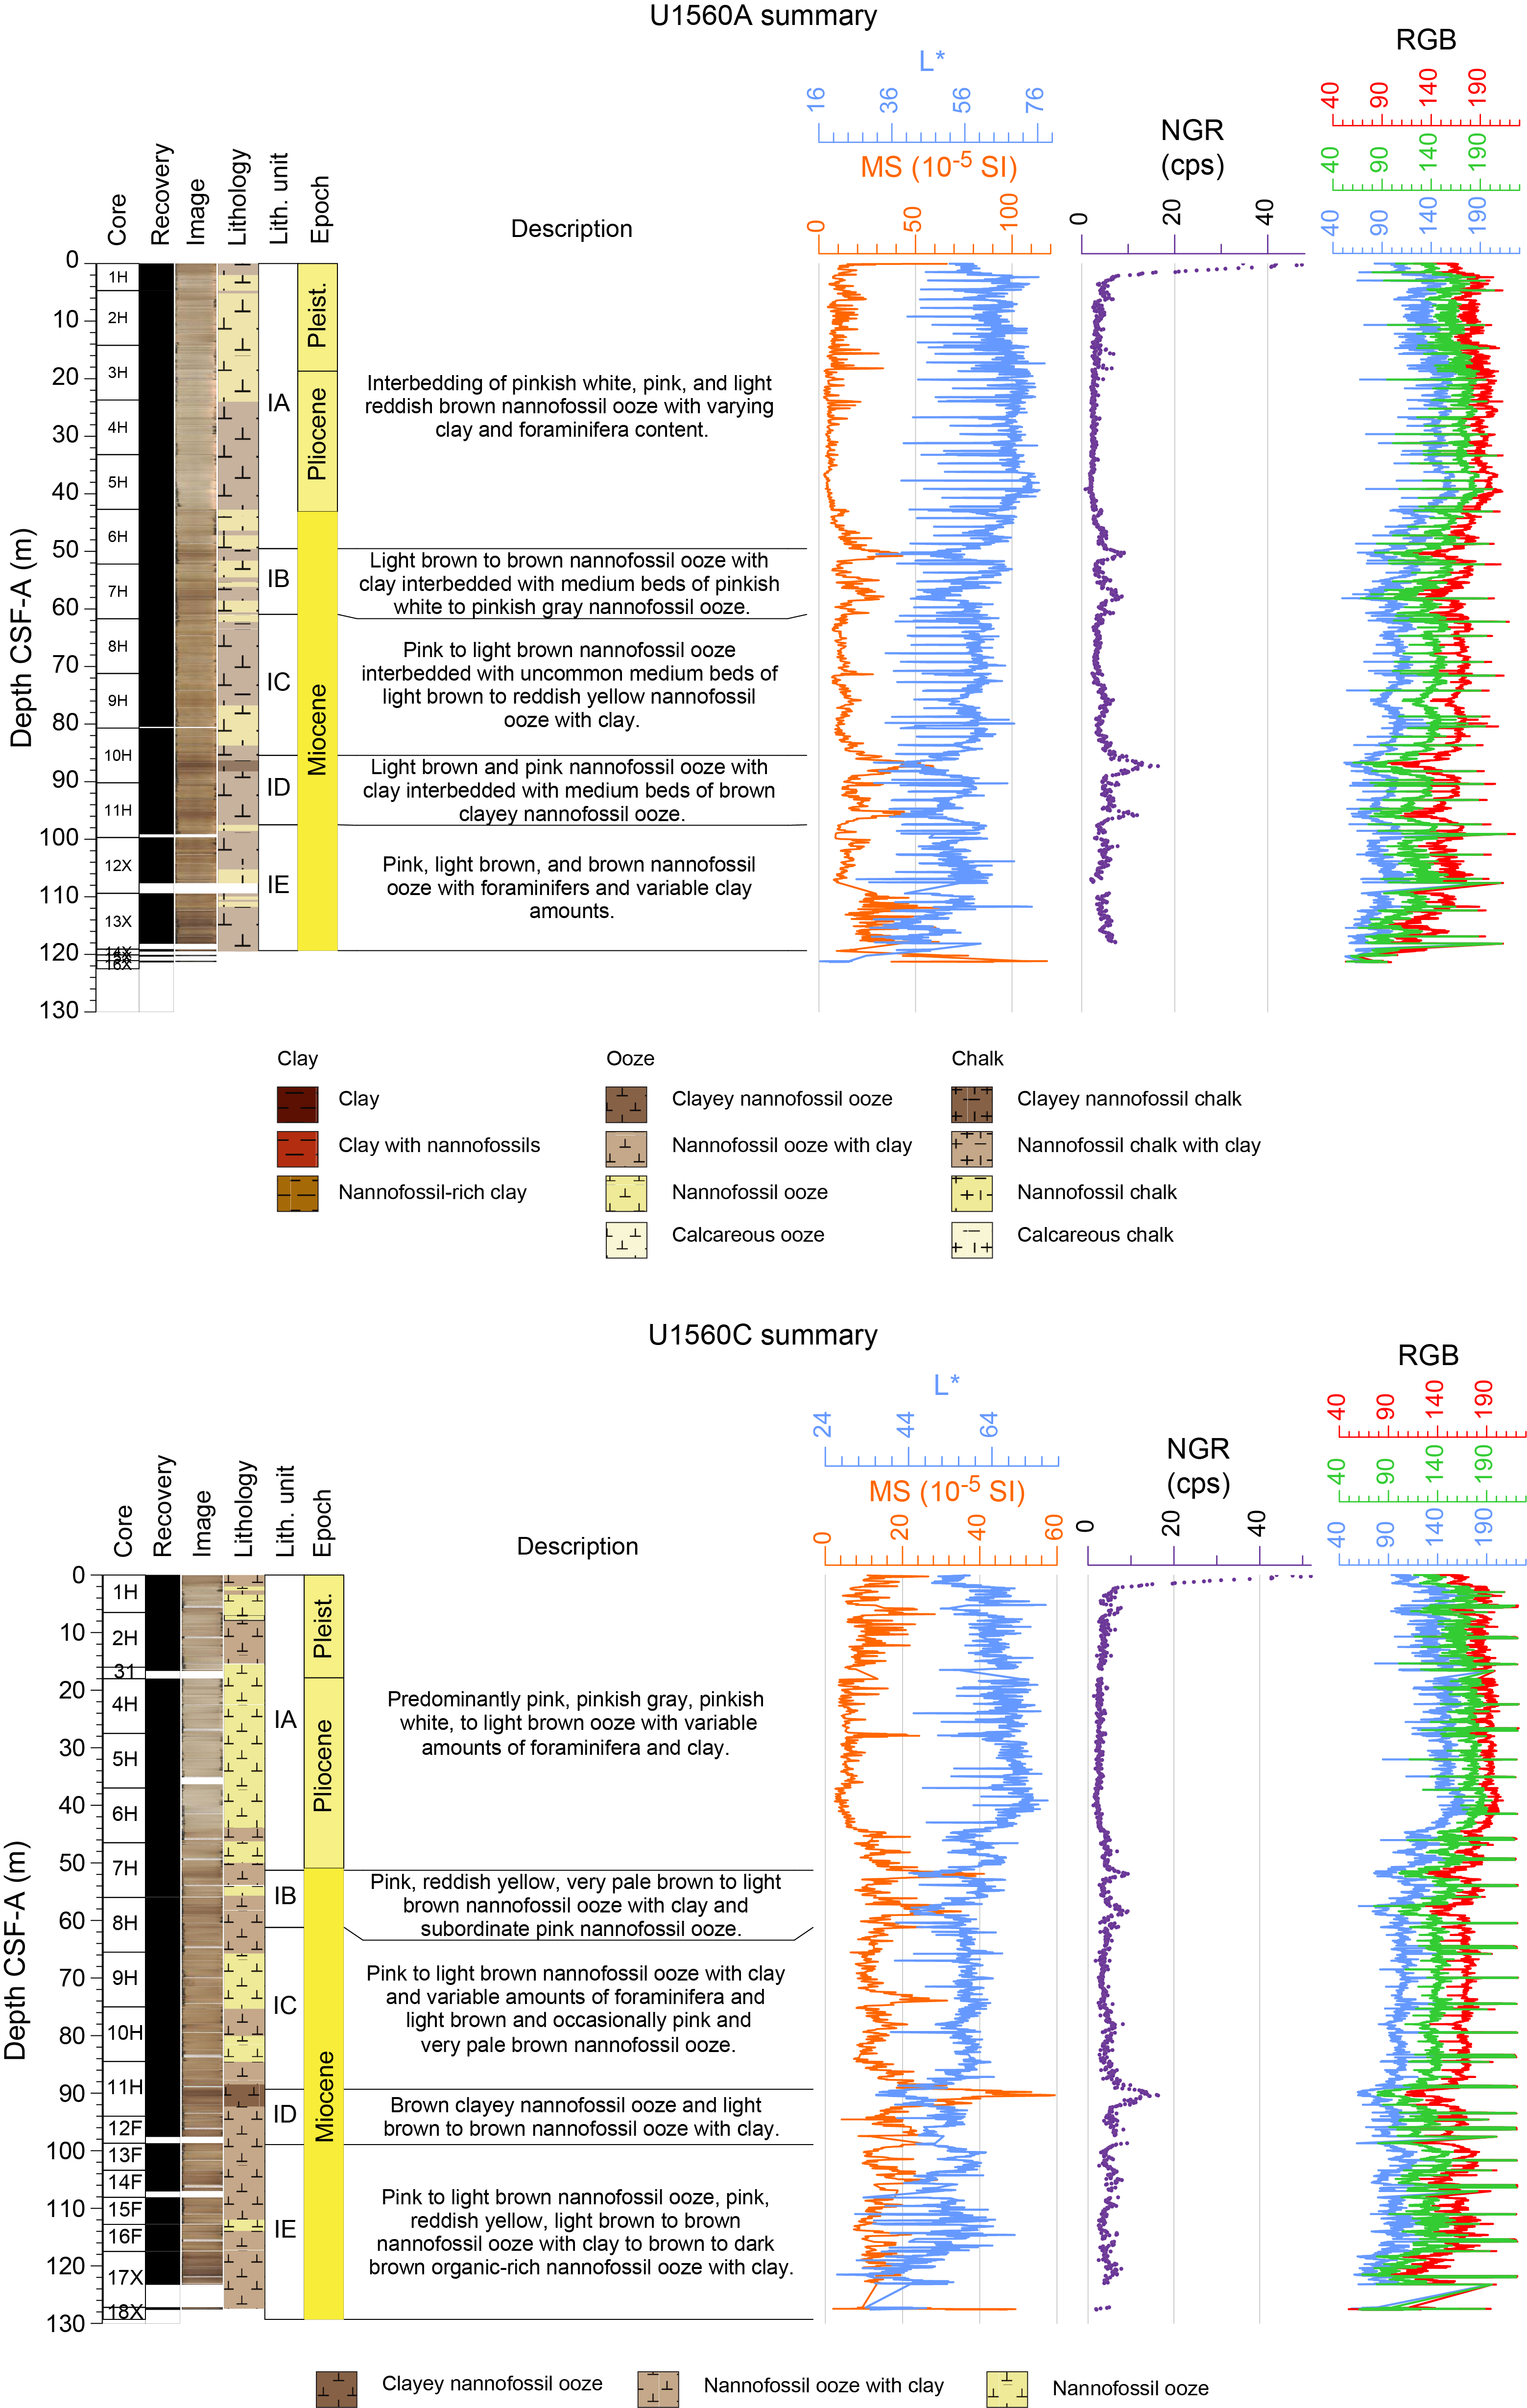
Figure F9. Lithologic summaries.
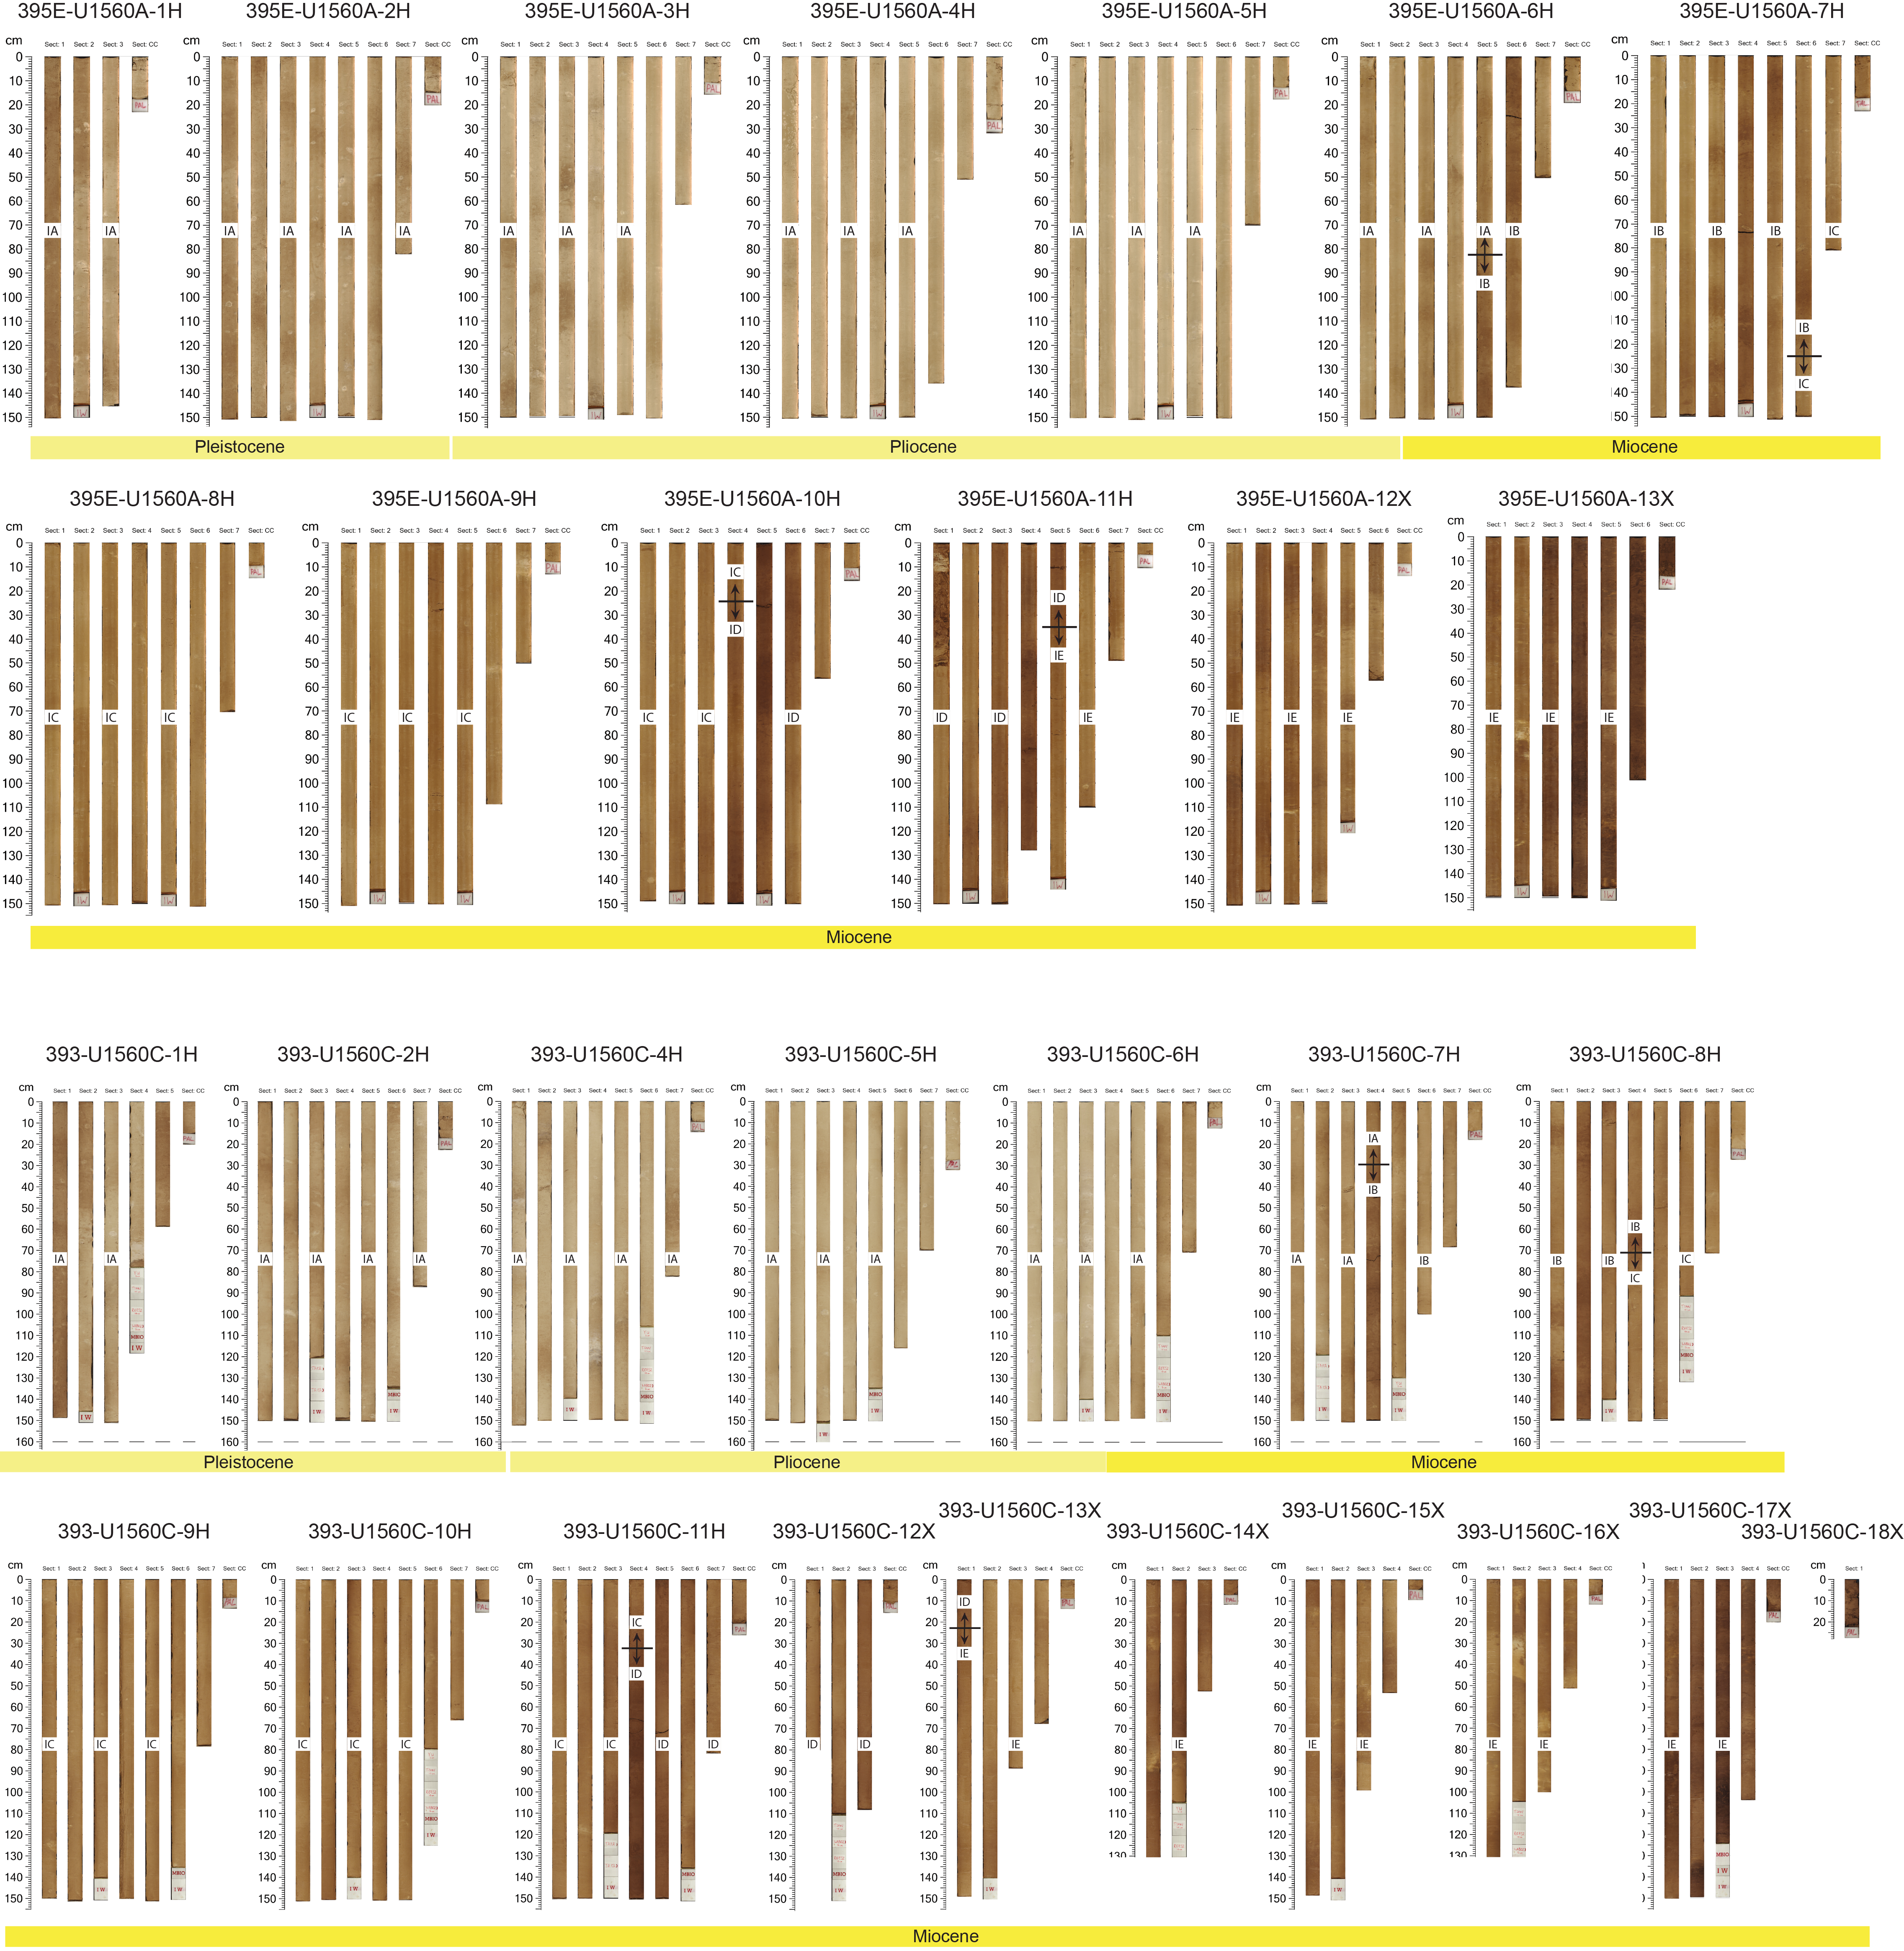
Figure F10. Ages and units.
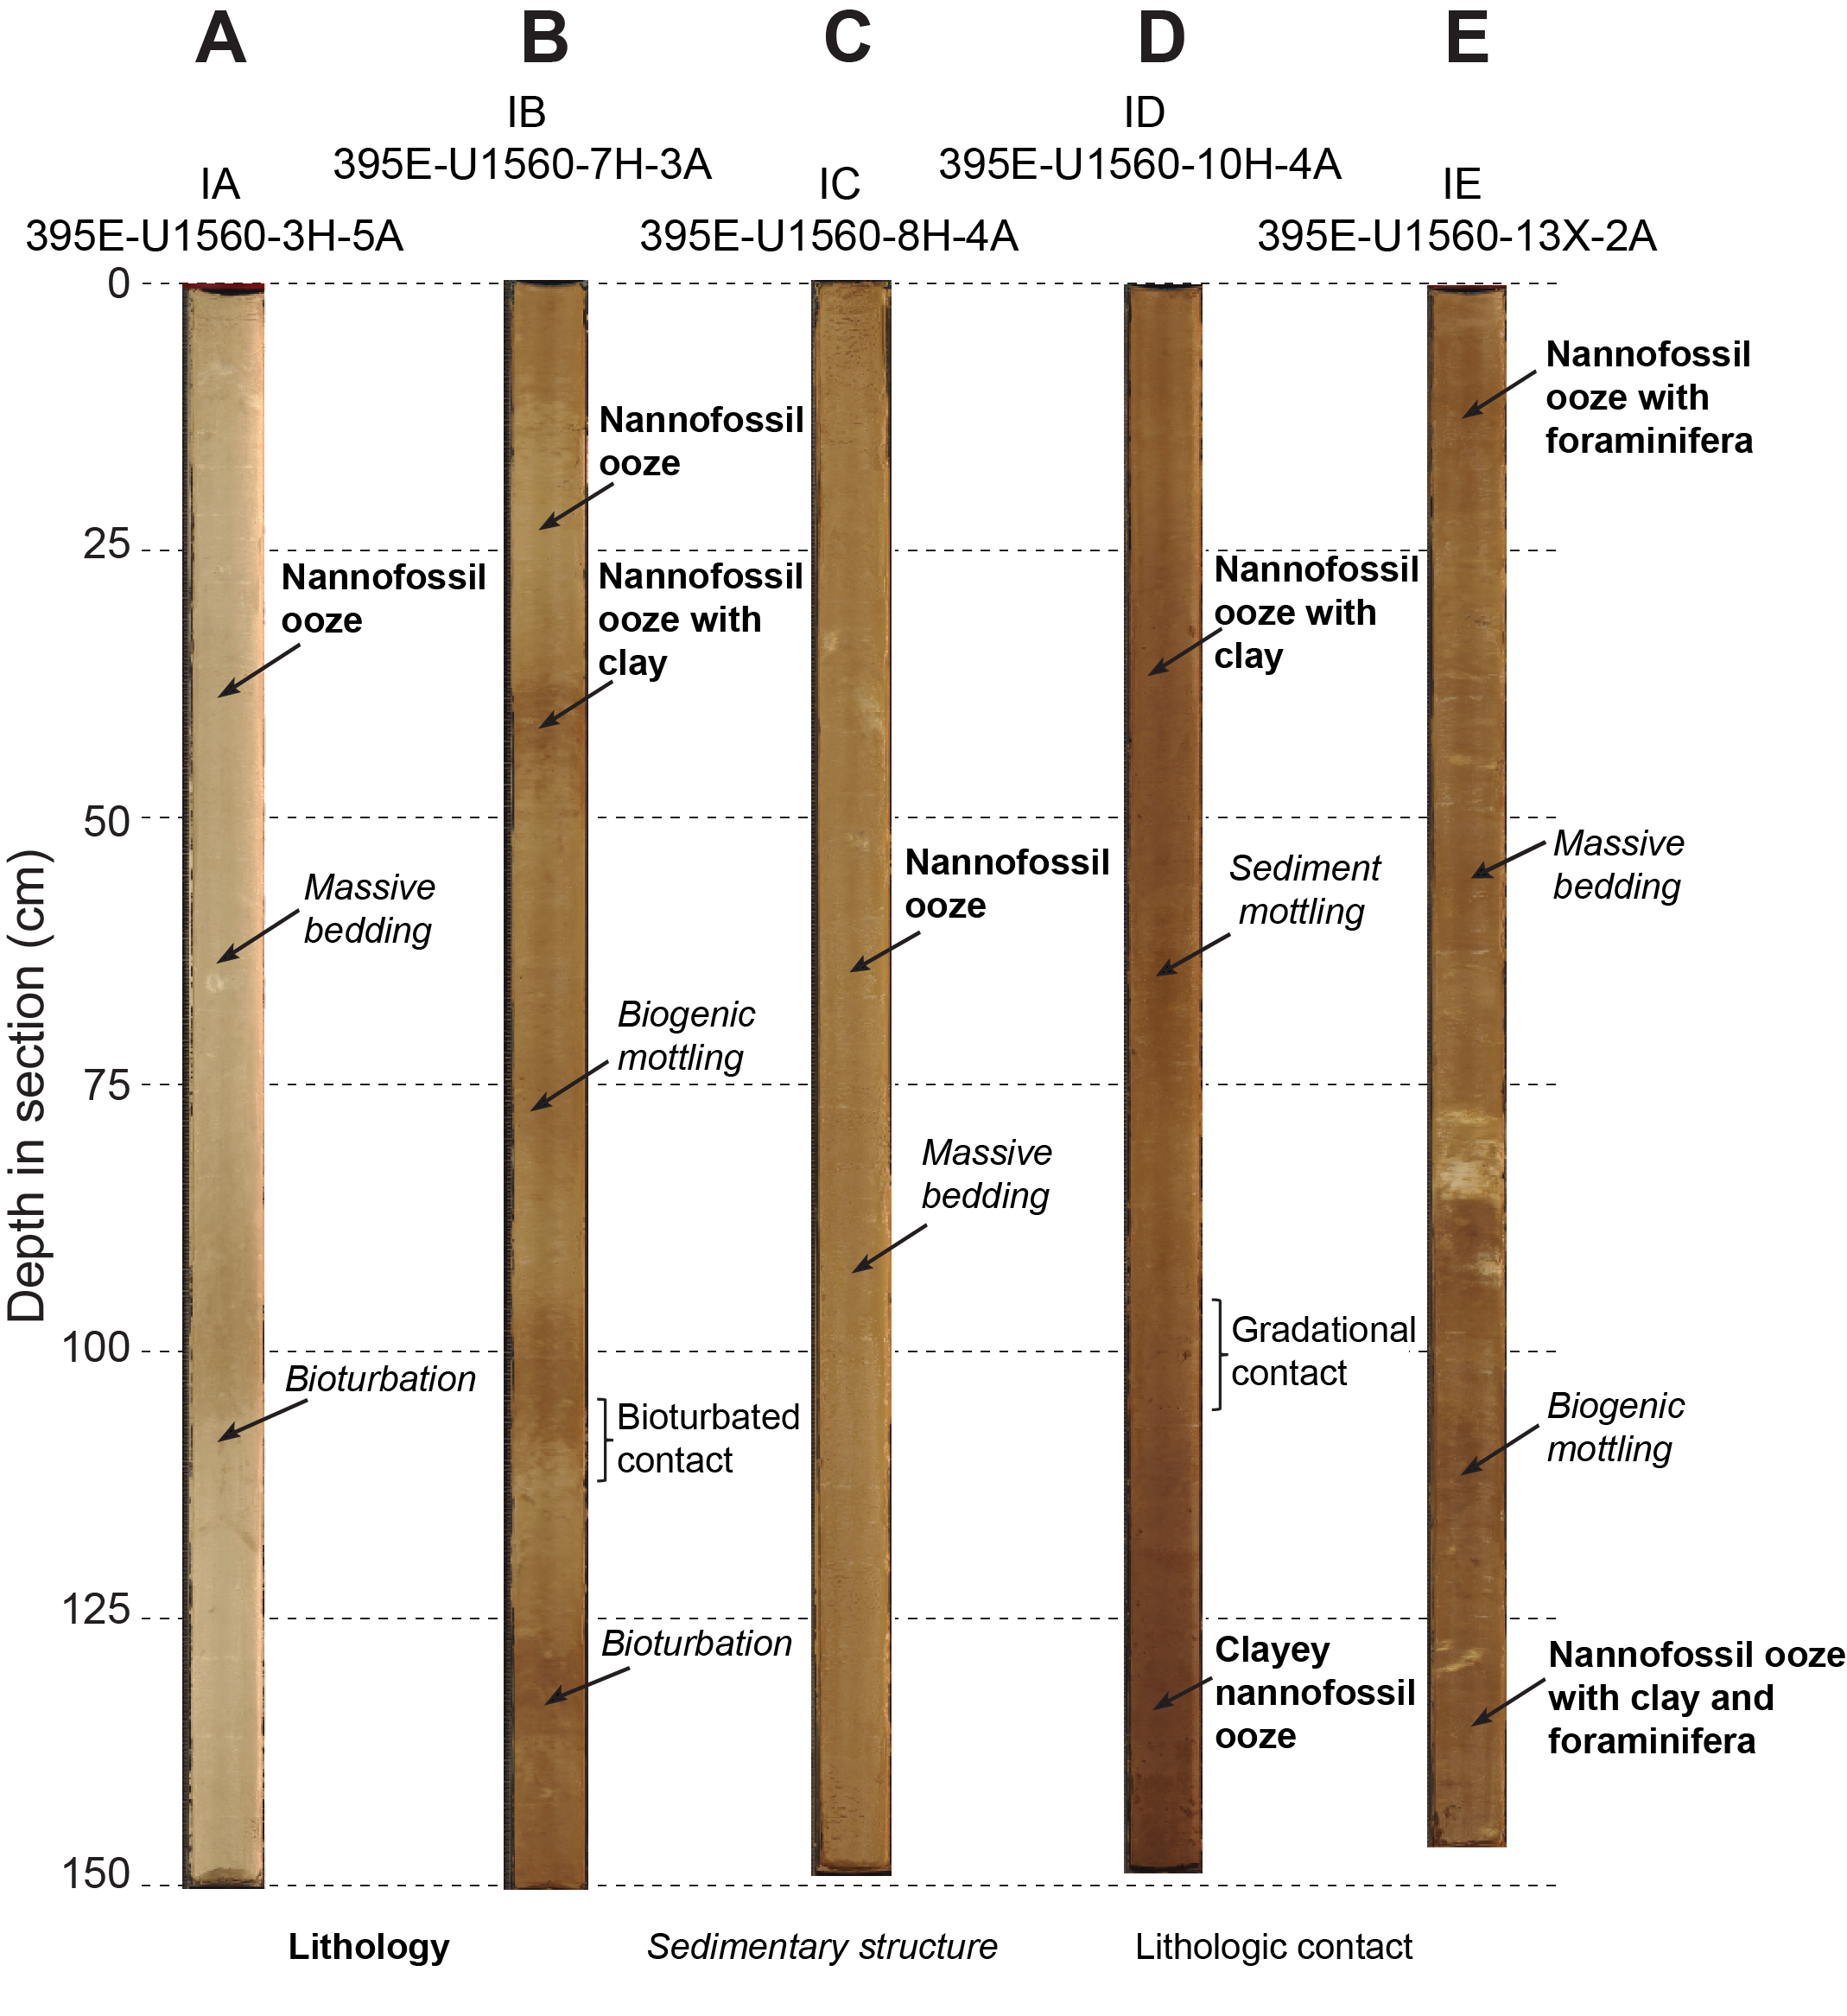
Figure F11. Typical lithologies of each unit.
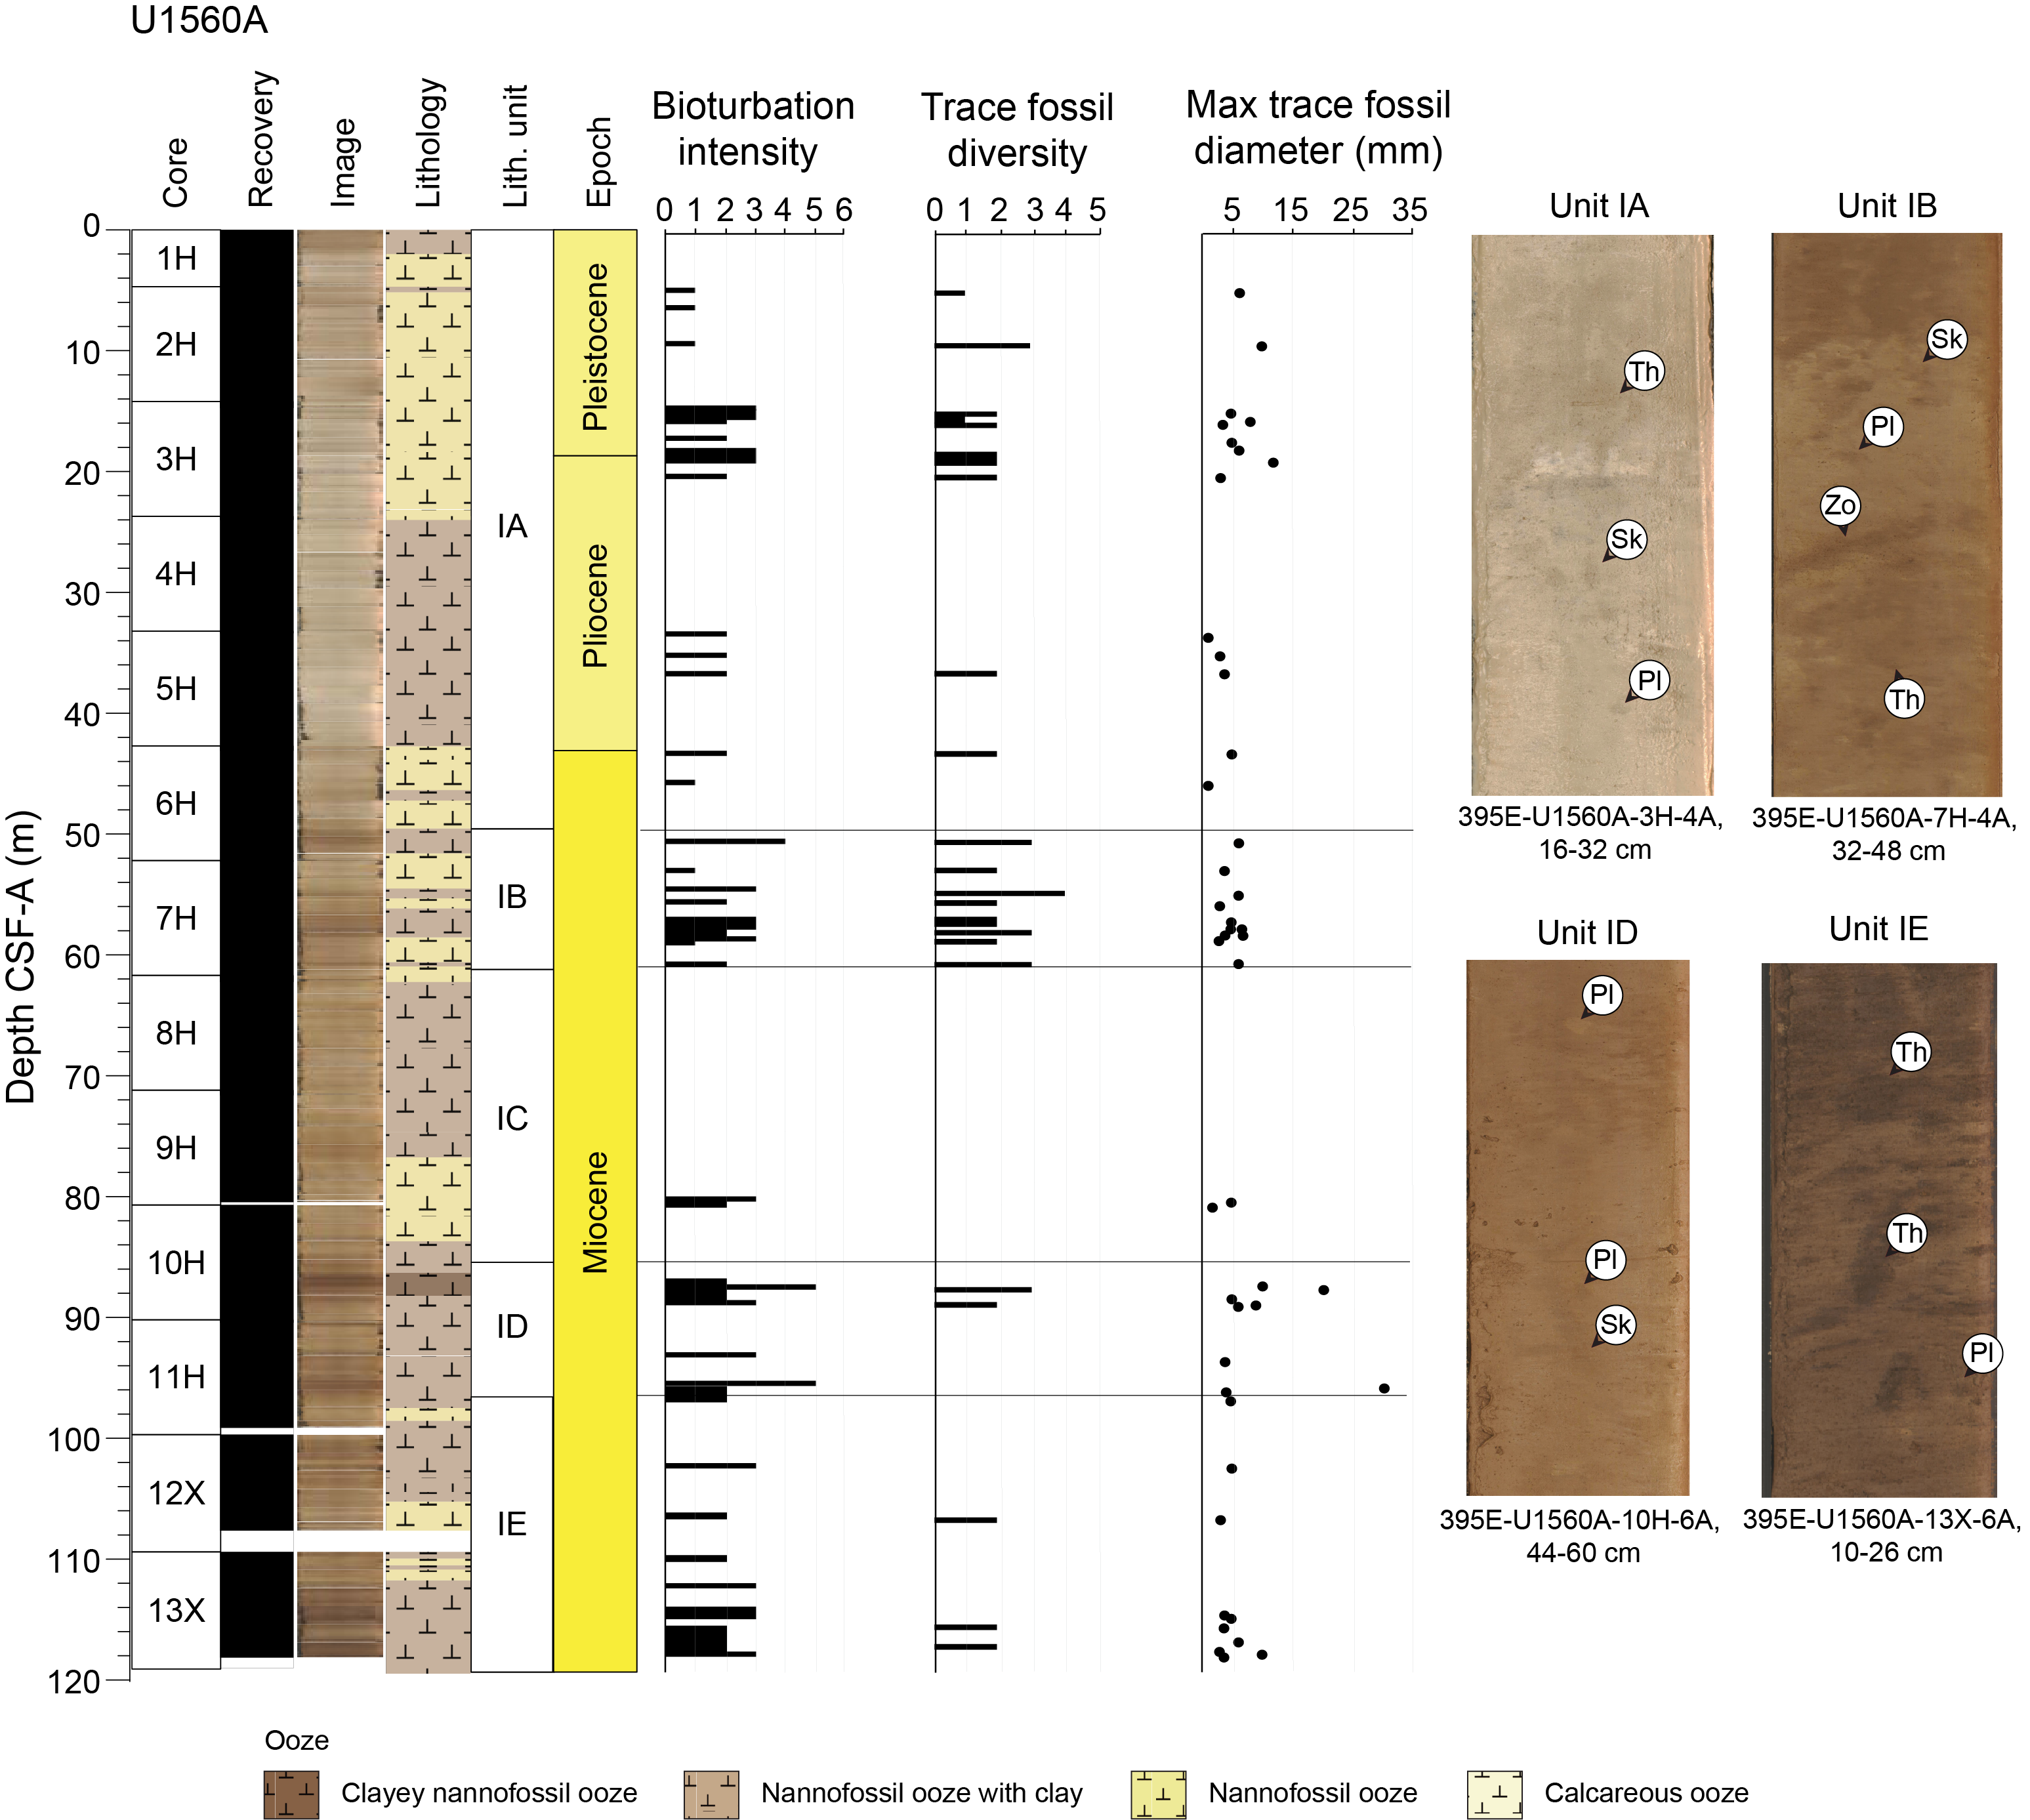
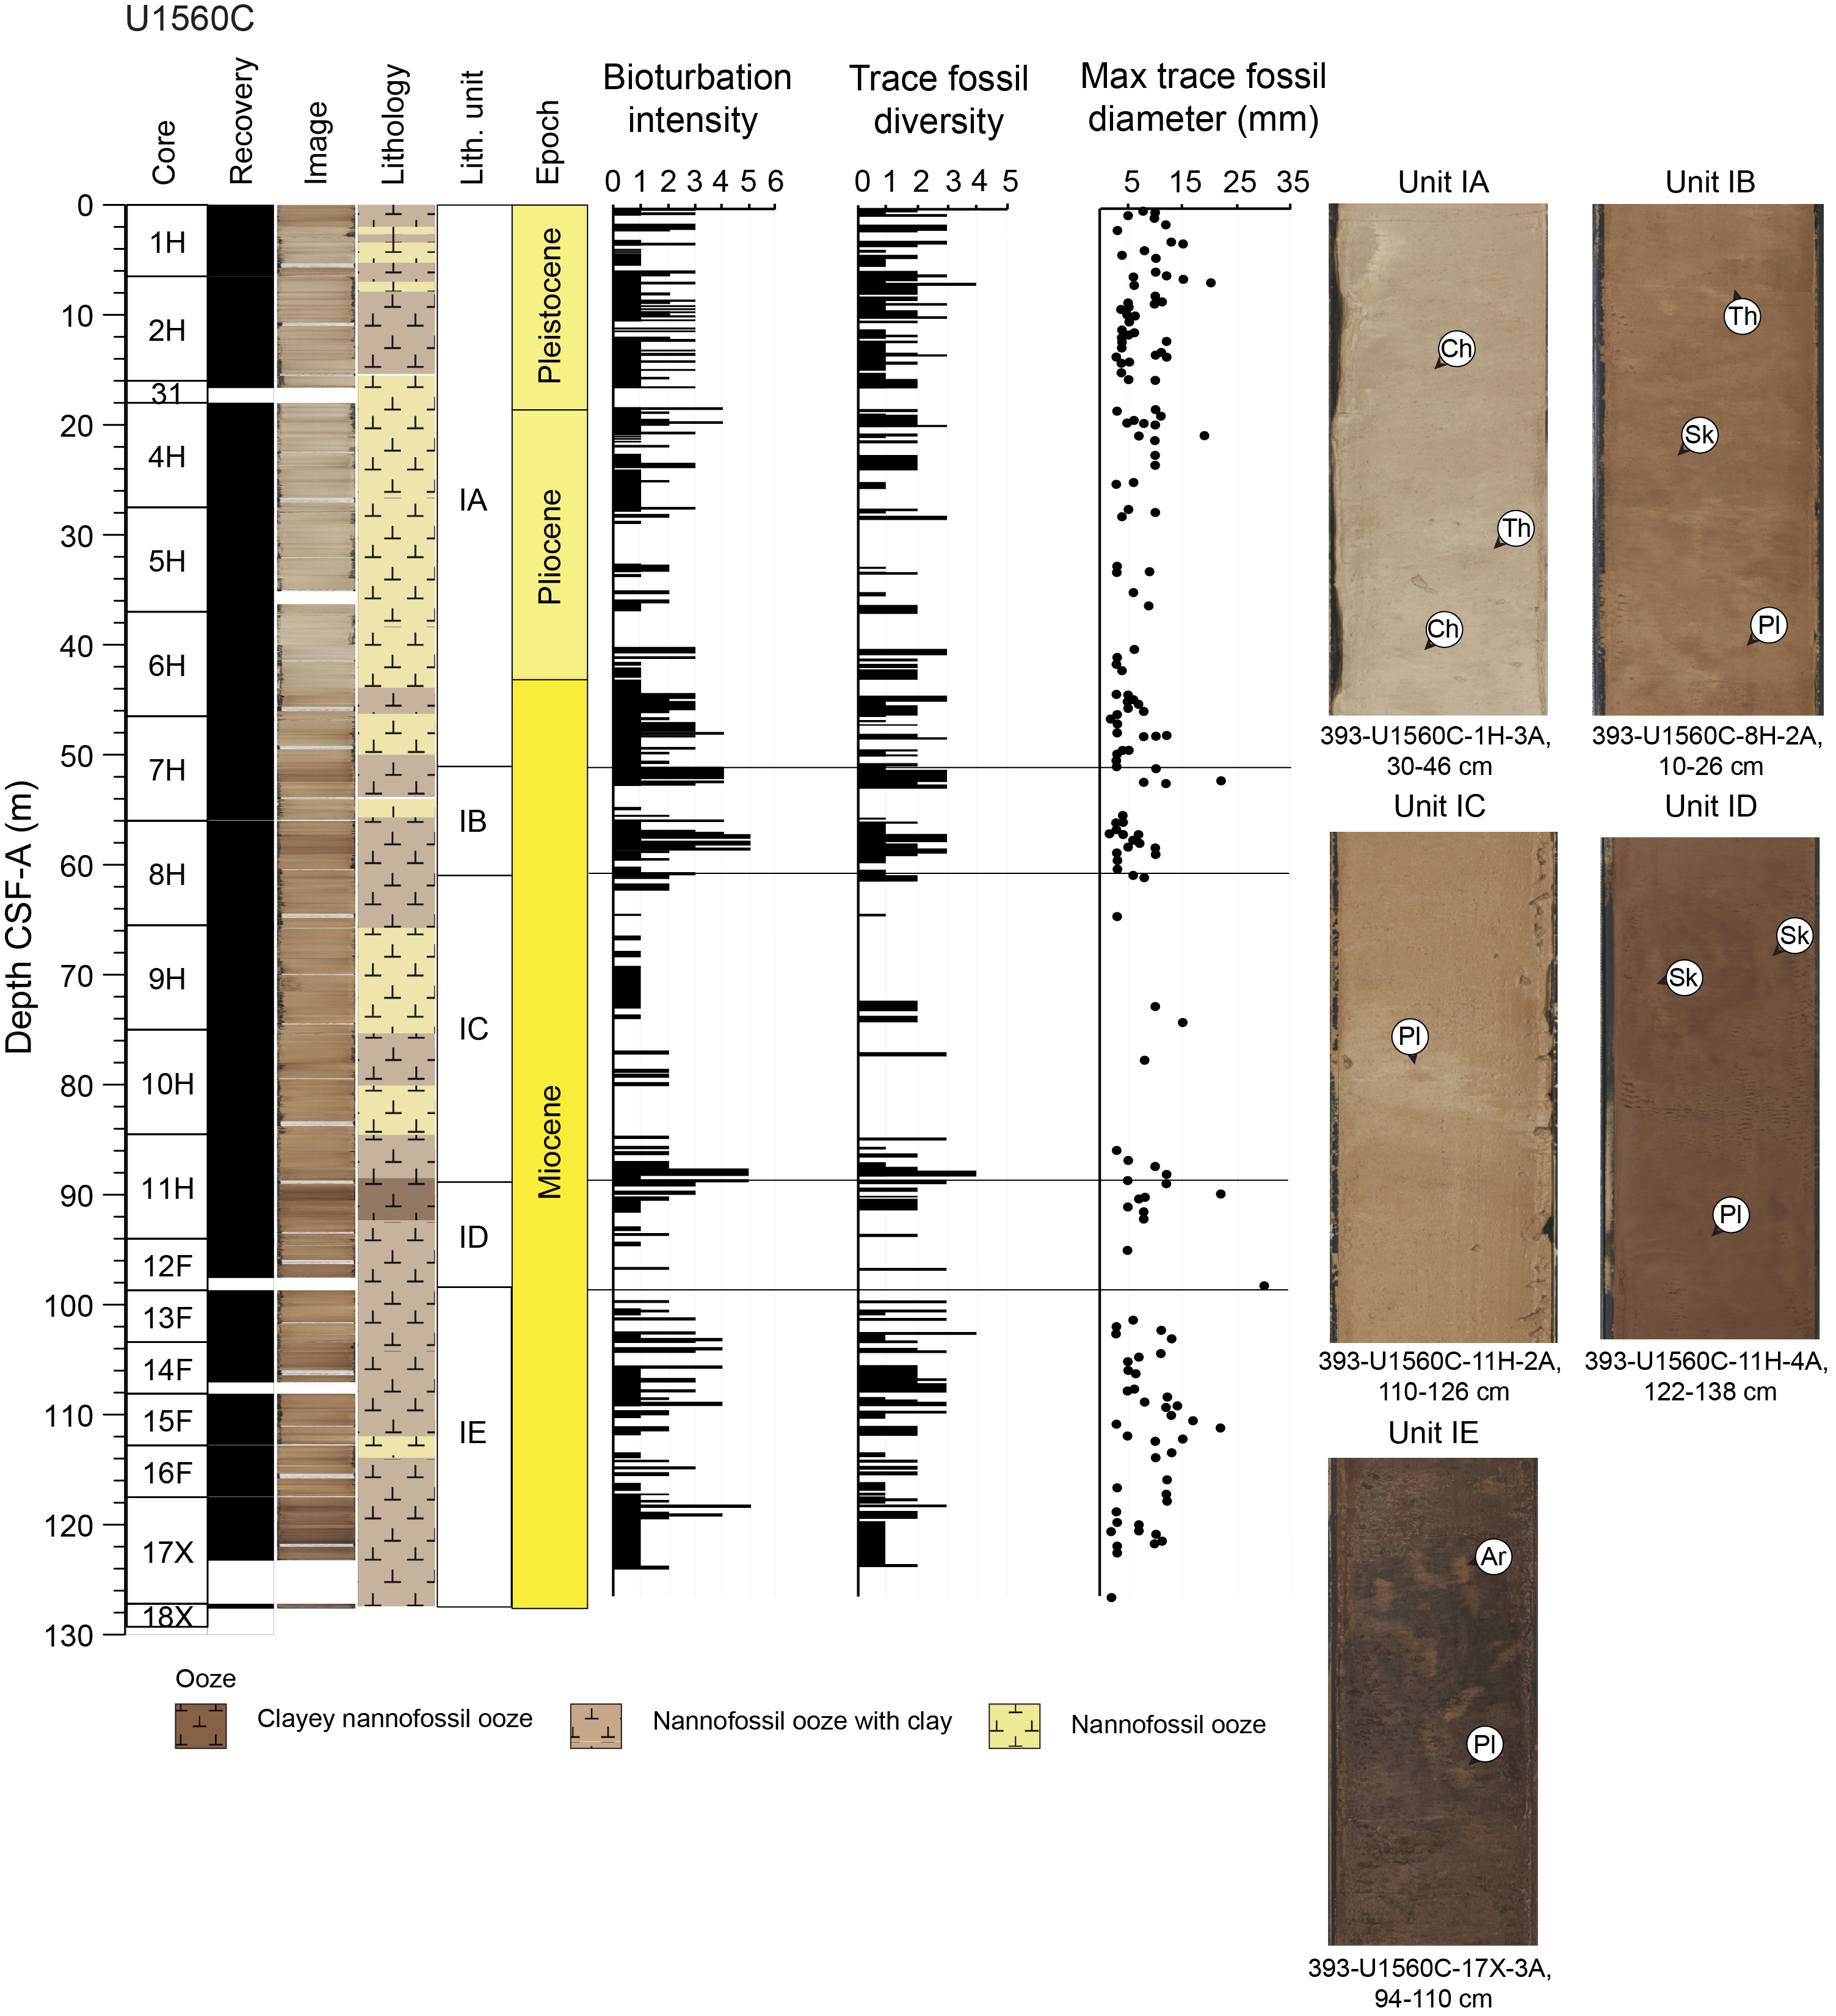
Figure F12. Typical trace fossils.
The main minerals identified with bulk XRD in Unit I include calcite, quartz, plagioclase, and clay minerals such as smectite, illite, and kaolinite (Figures F13, F14; Tables T3, T4, T5). Calcite forms the dominant peaks, but variations of minor components' peak intensities suggest changes in the relative amount of siliciclastic minerals. Unit I has a relatively homogeneous mineral composition with 88–96 wt% calcite (supported by 81–95 wt% CaCO3; see Geochemistry), 3–9 wt% total clay minerals, 1–2 wt% quartz, and 0–1 wt% feldspar (Figure F14; Tables T3, T4). In this deep marine environment, the predominance of calcite indicates essentially pelagic sedimentation deposited above the calcite compensation depth (CCD) with very little terrigenous input of airborne material.
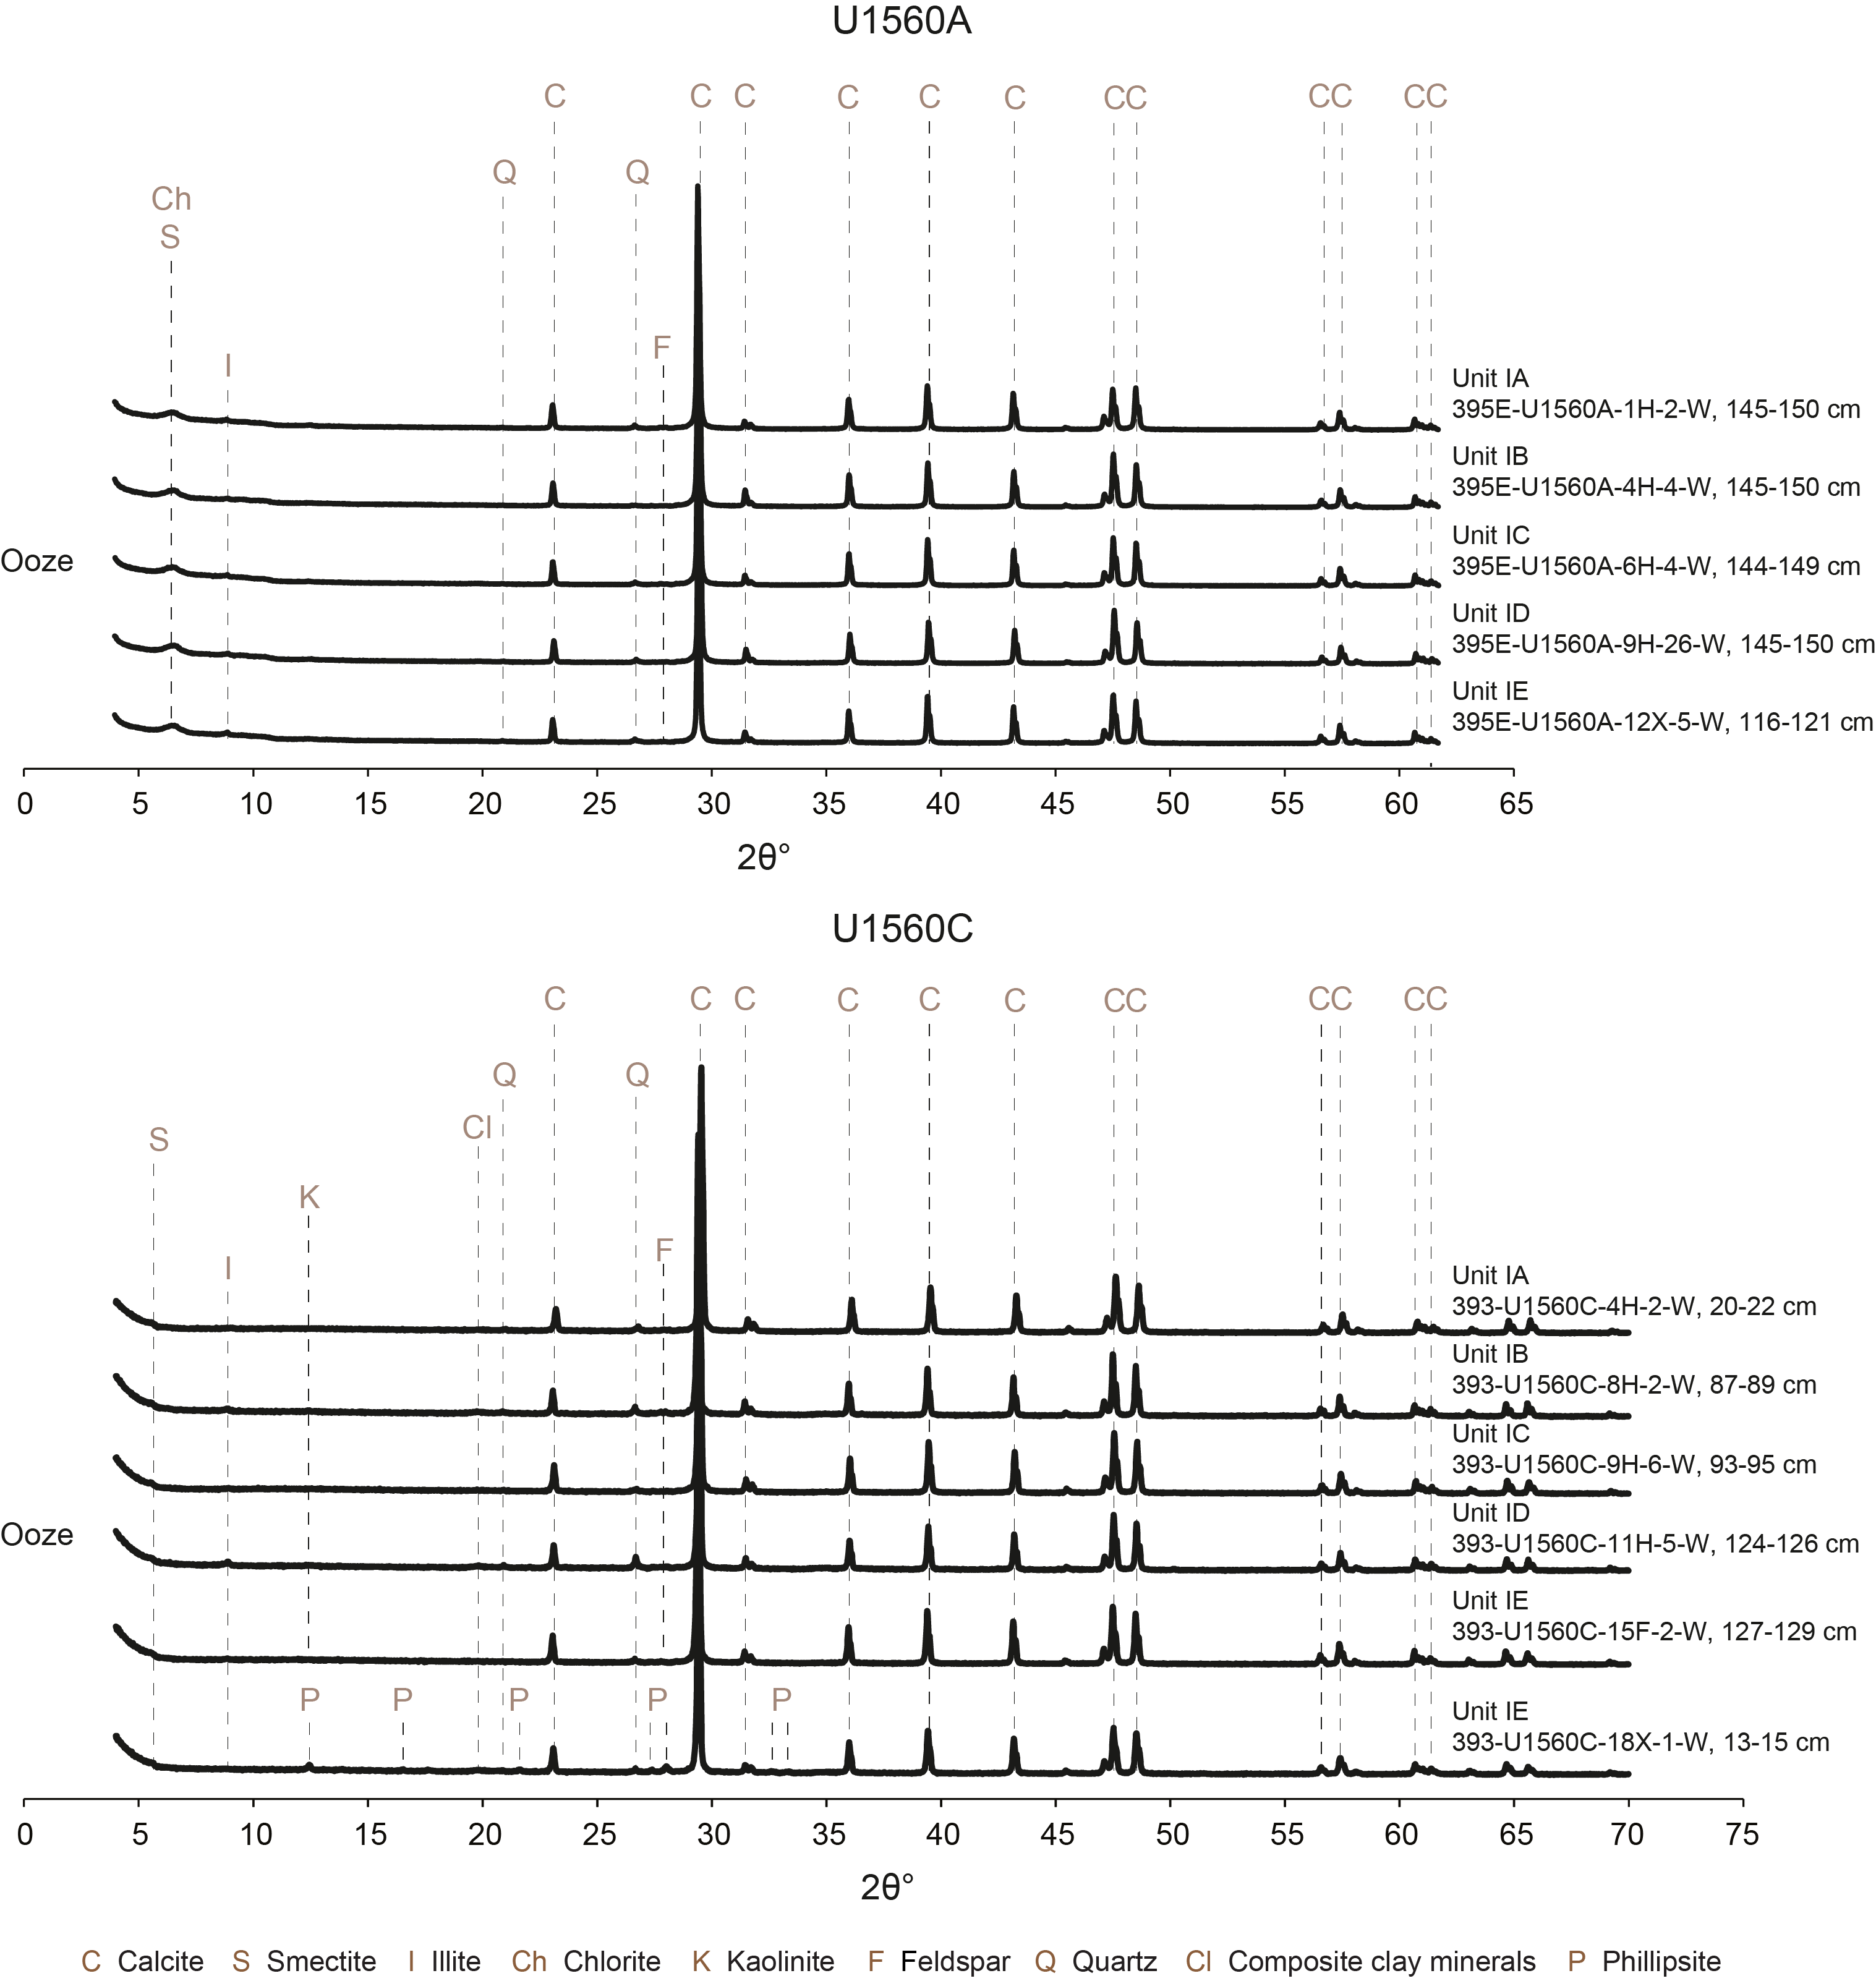
Figure F13. X-ray diffractograms.
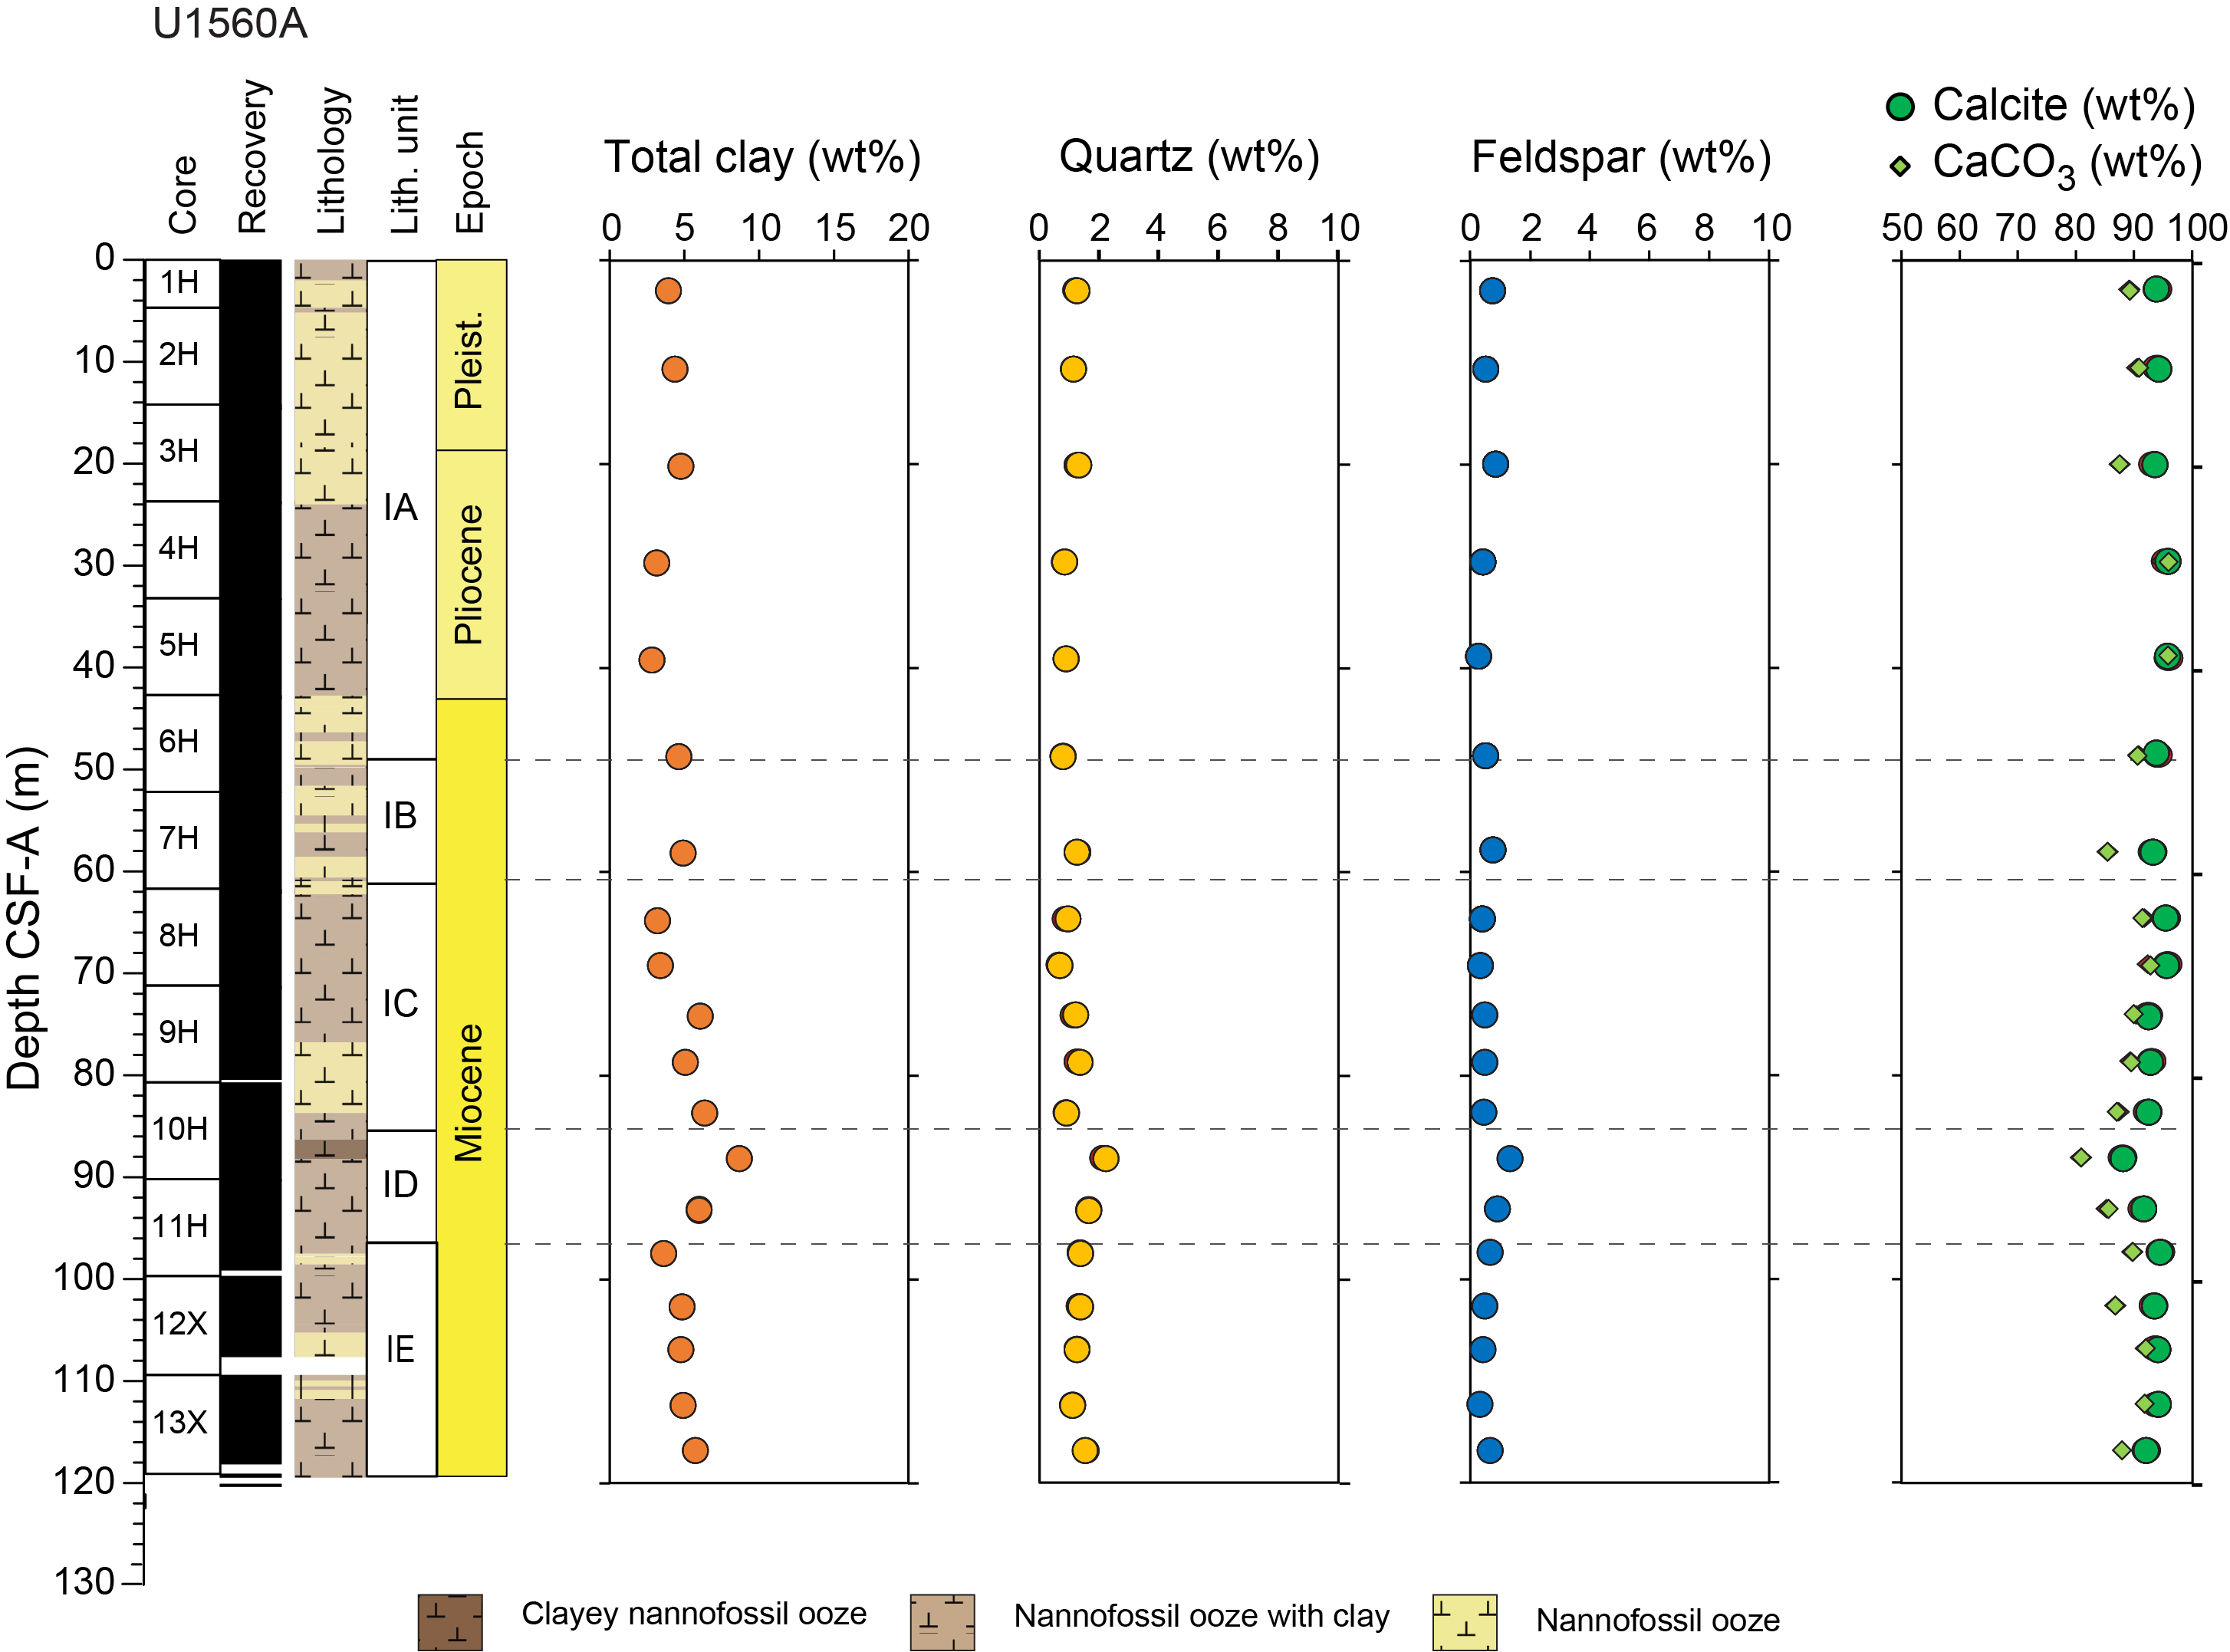
Figure F14. Changes in mineralogy.
4.1.1.1. Subunit IA
- Intervals: 395E-U1560A-1H-1, 0 cm, to 6H-5, 82 cm; 393-U1560C-1H-1, 0 cm, to 7H-4, 27.5 cm
- Depths: Hole U1560A = 0.0–49.5 m CSF-A; Hole U1560C = 0.0–51.3 m CSF-A
- Thickness: Hole U1560A = 49.5 m; Hole U1560C = 51.3 m
- Age: Pleistocene–Late Miocene
- Lithology: interbedding of nannofossil ooze with varying clay and foraminifera content
Lithostratigraphic Subunit IA in Hole U1560A consists of interbedded pinkish white nannofossil ooze with foraminifera and pinkish white, pink, and rare light reddish brown nannofossil ooze with low amounts of clay. In Hole U1560C, Subunit IA is represented by interbedded white to pinkish white foraminiferal nannofossil ooze and pink to light brown foraminiferal nannofossil ooze with clay (Figures F8, F9, F10, F11, F15). Light sediment colors, decreasing natural gamma radiation (NGR) and magnetic susceptibility (MS), and an increase in reflectance (L*) characterize this subunit (Figure F9). In addition, foraminiferal abundances are common (10%–25%) in Hole U1560A and common to abundant (10%–50%) in Hole U1560C. Color banding at the decimeter scale (40–60 cm spacing) is pervasive throughout Subunit IA; these changes are reflected in the MS and NGR data. Lithologic contacts are mainly bioturbated, and a few are gradational and sharp. Small (1–2 cm) pinkish white halos and rare small black blebs (probably iron or manganese oxides) are present irregularly throughout this unit. Sedimentary structures are restricted to mottling with uncommon tracks and trails. Biogenic mottling occurs in discrete decimeter-thick beds, with bioturbation intensity ranging from absent to high (BI = 0–4) and predominantly sparse to moderate (BI = 1–3). In addition, distinct ichnogenera were identified: Planolites, Thalassinoides, Skolithos, Arenicolites, and rarer Chondrites, Nereites, Palaeophycus, and Zoophycos. Ichnogenera diversity ranges 1–4, with the maximum ichnofossil diameter ranging 1–20 mm (Figure F12).
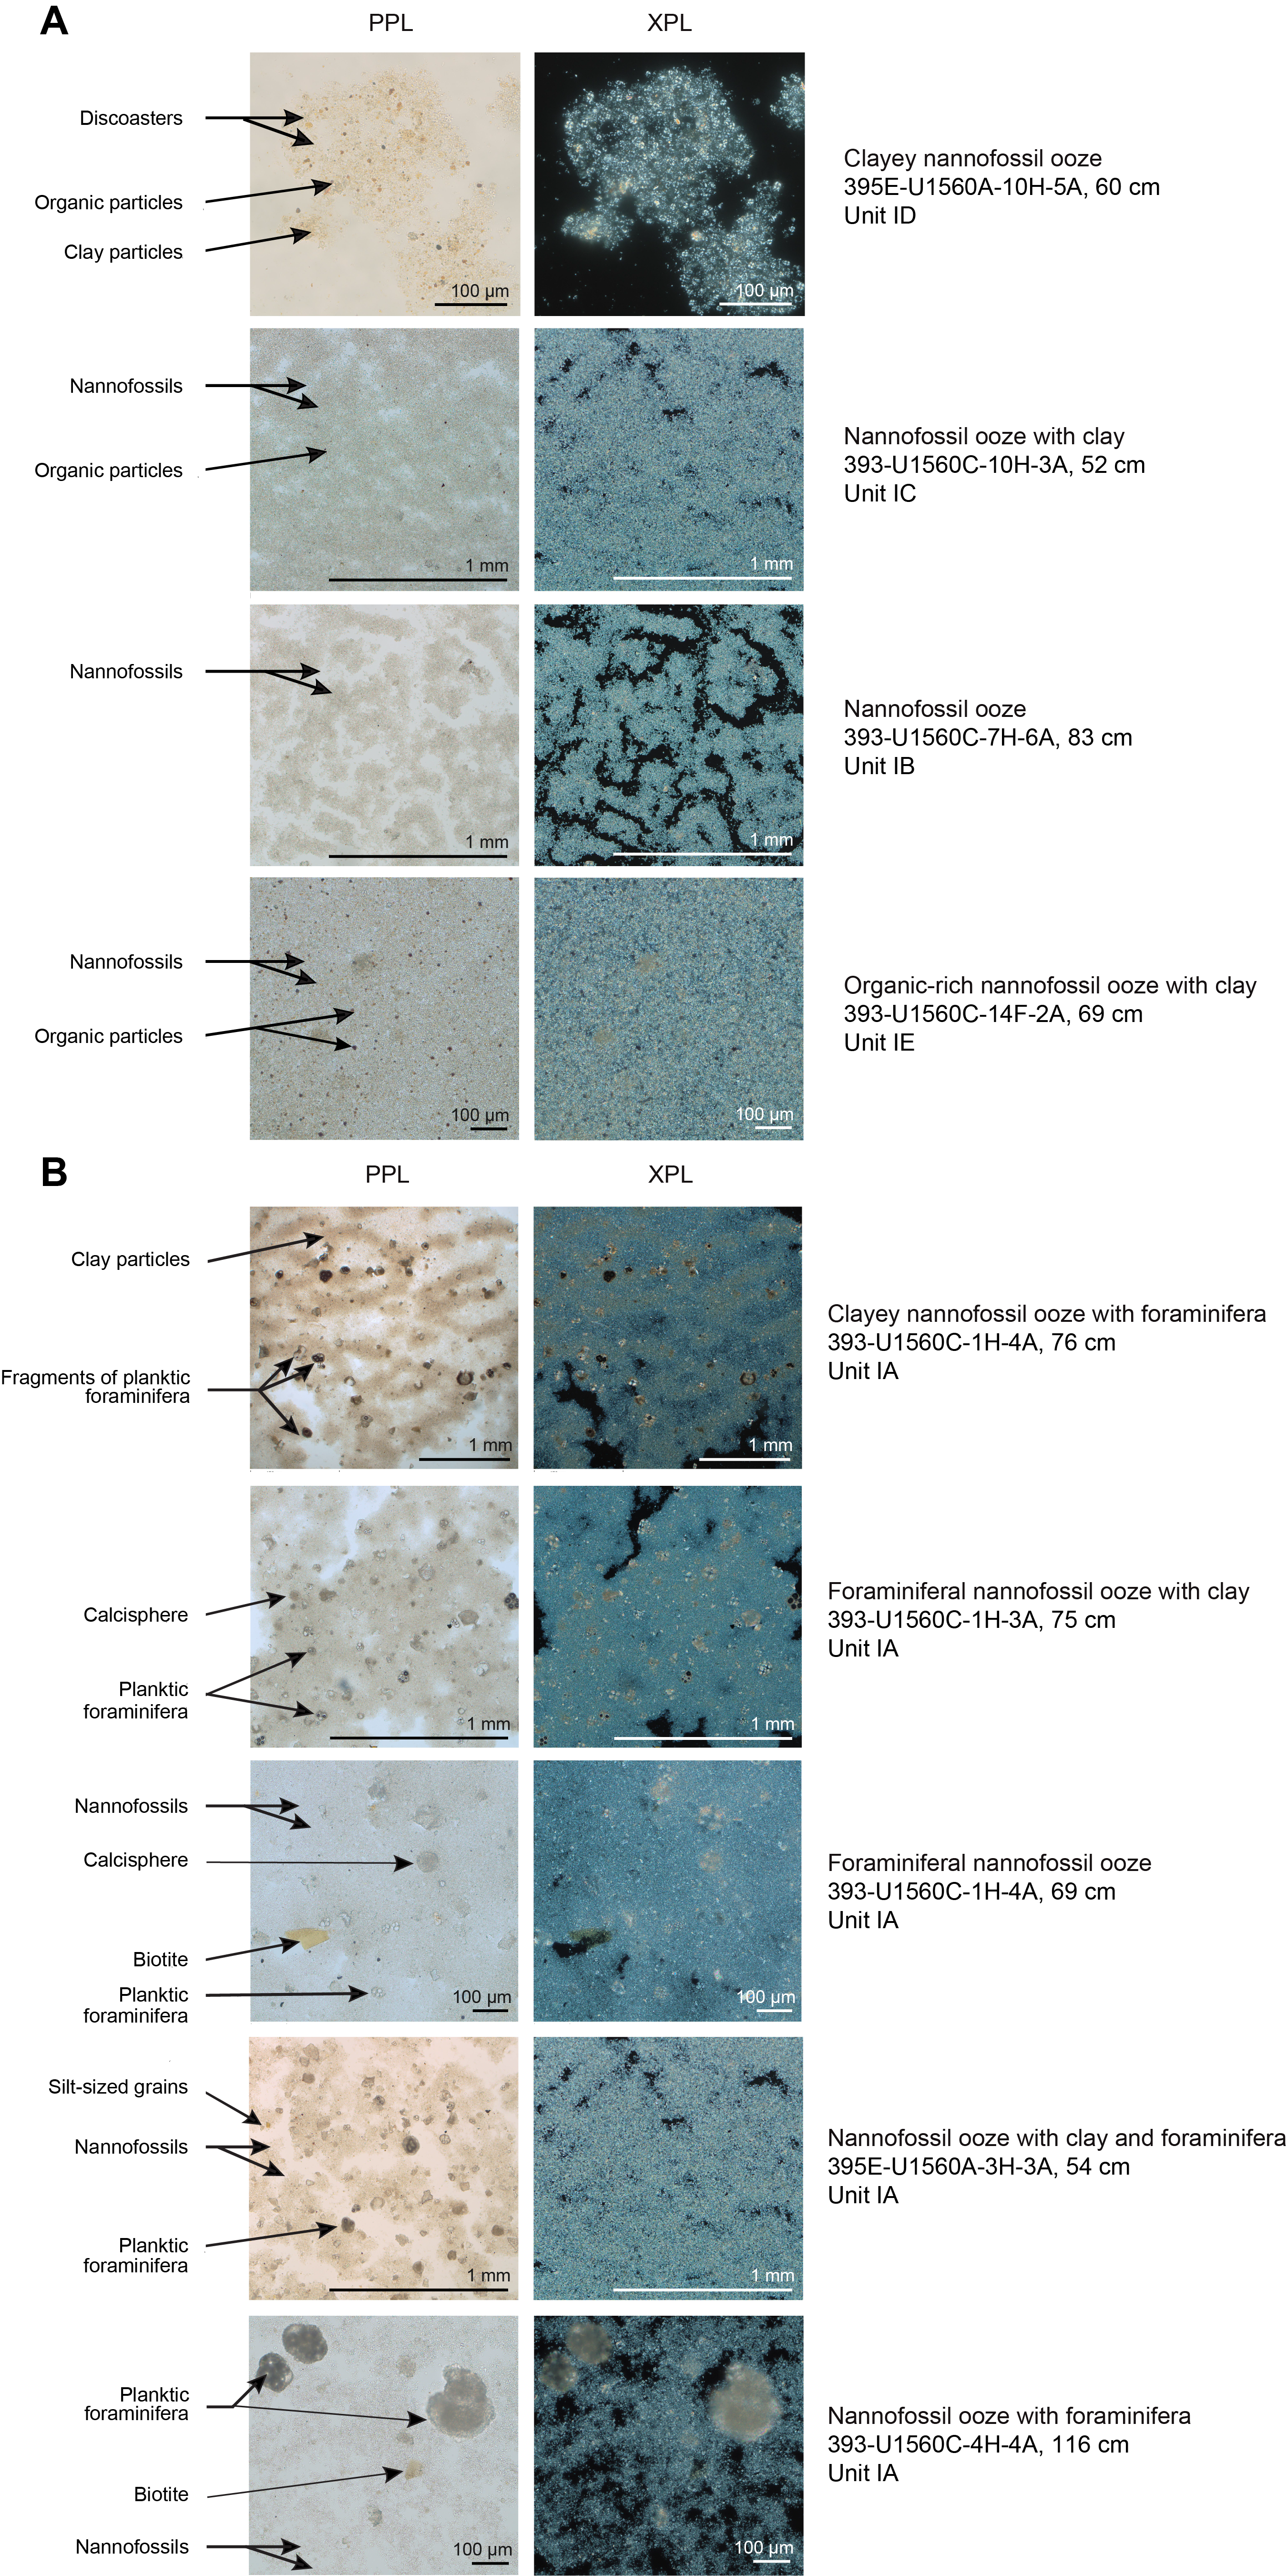
Figure F15. Principal sediment types.
The primary minerals identified with bulk XRD in Subunit IA are calcite, quartz, feldspar, and clay minerals including smectite and illite (Figure F13; Tables T3, T4, T5), where calcite has the largest peak observed. The primary mineral composition of Subunit IA contains 93–96 wt% calcite (supported by 88–95 wt% CaCO3; see Geochemistry), 3–5 wt% total clay minerals, 1 wt% quartz, and 0–1 wt% feldspar (Figure F14; Table T3).
The boundary between Subunits IA and IB is marked by a lithologic and color change from pinkish white nannofossil ooze to reddish yellow and brown nannofossil ooze with clay. In addition, increases in NGR and MS values occur coupled with a decrease in light reflectance (L*). Except for a 5 cm interval of fractured sediment at the top of Core 395E-U1560A-4H, no drilling disturbances were observed in this subunit.
4.1.1.2. Subunit IB
- Intervals: 395E-U1560A-6H-5, 82 cm, to 7H-6, 125 cm; 393-U1560C-7H-4, 27.5 cm, to 8H-4, 71 cm
- Depths: Hole U1560A = 49.5–61.0 m CSF-A; Hole U1560C = 51.3–61.2 m CSF-A
- Thickness: Hole U1560A = 11.5 m; Hole U1560C = 10.0 m
- Age: Late Miocene
- Lithology: nannofossil ooze with clay interbedded with nannofossil ooze
Lithostratigraphic Subunit IB consists of very pale brown, light brown, reddish yellow, and brown nannofossil ooze with clay interbedded with decimeter-thick pinkish white, pinkish gray, and pink nannofossil ooze (Figures F8, F9, F10, F11, F15). Foraminiferal content is uniformly less than 10%, except for interval 393-U1560C-8H-2A, 77.5–96 cm, where foraminifera are common (10%–25%). Color banding is present throughout this subunit on a scale of 40–60 cm. Lithologic contacts are horizontal to subhorizontal, bioturbated, and rarely gradational. Sediment mottling and distinct ichnofossils are common in this subunit. Bioturbation intensity ranges from absent to intense (BI = 0–5) and is predominantly sparse to low (BI = 1–2). Biogenic mottling occurs within decimeter-scale beds and is associated with Planolites, Thalassinoides, Skolithos, Arenicolites, and more rarely Chondrites, Zoophycos, Palaeophycus, and Nereites. Ichnogenera diversity ranges 1–4, and the maximum trace fossil diameter ranges 3–22 mm (Figure F12).
The primary minerals identified with bulk XRD in Subunit IB include calcite, quartz, and clay minerals (Figure F13; Tables T3, T4), and calcite is the dominant peak. For clay minerals, smectite, illite, and kaolinite peaks were identified (Table T5). The primary mineral composition of Subunit IB is 93 wt% calcite, 5 wt% total clay minerals, 1 wt% quartz, and 1 wt% feldspar (Figure F14; Tables T3, T4). Note that the CaCO3 content measured with coulometry on a co-located sample indicates a slightly lower carbonate content (85 wt% CaCO3; see Geochemistry) than the XRD-based semiquantitative estimate.
The boundary between Subunits IB and IC is characterized by changes in color and lithology from light brown nannofossil ooze with clay above to pinkish gray nannofossil ooze below. These changes are associated with a decrease in NGR and MS values as well as an increase in light reflectance (L*) data. These changes are interpreted to reflect a change in the seafloor position relative to the CCD. Here specifically, this could be shallowing of the CCD with time and/or thermal or tectonic movement of the basement.
4.1.1.3. Subunit IC
- Intervals: 395E-U1560A-7H-6, 125 cm, to 10H-4, 24 cm; 393-U1560C-8H-4, 71 cm, to 11H-4, 32 cm
- Depths: Hole U1560A = 61.0–85.4 m CSF-A; Hole U1560C = 61.2–89.3 m CSF-A
- Thickness: Hole U1560A = 24.4 m; Hole U1560C = 28.1 m
- Age: Late Miocene
- Lithology: interbedding of nannofossil ooze with varying foraminifera content and nannofossil ooze with clay
Lithostratigraphic Subunit IC is predominantly composed of pink to light brown nannofossil ooze interbedded with a few decimeter- (Hole U1560A) to meter-scale (Hole U1560C) beds of pink, very pale brown, light brown, and reddish yellow nannofossil ooze with clay (Figures F8, F9, F10, F11, F15). Foraminifera are generally rare (<10%), except between Sections 393-U1560C-10H-4, 56 cm, and 10H-CC, 84.6 cm, and in interval 11H-3, 57–92 cm, where they reach over 25%. Decimeter-scale subtle color banding that occurs throughout this subunit is reflected in NGR and MS data (Figure F9). White blebs (<2 cm) of sediment of lighter color but similar composition to sediment above and below are rare in abundance. Lithologic boundaries are typically horizontal and gradational, although some are sharp.
Massive bedding is the predominant sedimentary structure, whereas biogenic mottling is rare. In the bioturbated beds, bioturbation intensity ranges from absent to moderate (BI = 0–3) and is predominantly absent to sparse (BI = 0–1). A few distinct ichnofossils were identified, such as Planolites, Thalassinoides, Skolithos, and rarely Chondrites. The ichnofossil diversity ranges 1–3, and the maximum trace fossil diameter ranges 2–15 mm (Figure F12).
XRD and carbonate (CARB) data indicate that Subunit IC contains predominantly calcite; terrigenous minerals such as clay minerals, quartz, and feldspars constitute the minor components of this subunit (Figure F13; Tables T3, T4). Smectite and illite are present in all samples, although variations in illite peak intensities at ~8.9°2θ may suggest changes in the abundance of this mineral (Table T5). The primary mineral composition of Subunit IC is 92–96 wt% calcite (supported by 87–92 wt% CaCO3; see Geochemistry), 3–6 wt% total clay minerals, 1 wt% quartz, and 0–1 wt% feldspar (Figure F14; Tables T3, T4).
The boundary between Subunits IC and ID is characterized by changes in color and lithology from pinkish white nannofossil ooze with variable clay and foraminifera content above to brown clayey nannofossil ooze to light brown nannofossil ooze with clay below. These changes are associated with increases in NGR and MS values as well as a decrease in light reflectance (L*) data. These changes are interpreted to reflect a change in the seafloor position relative to the CCD. Here specifically, this could be deepening of the CCD with time and/or thermal or tectonic movement of the basement.
4.1.1.4. Subunit ID
- Intervals: 395E-U1560A-10H-4, 24 cm, to 11H-5, 35 cm; 393-U1560C-11H-4, 32 cm, to 13F-1, 23 cm
- Depths: Hole U1560A = 85.4–96.4 m CSF-A; Hole U1560C = 89.3–98.9 m CSF-A
- Thickness: Hole U1560A = 11.0 m; Hole U1560C = 9.6 m
- Age: Late to Middle Miocene
- Lithology: nannofossil ooze with clay interbedded with clayey nannofossil ooze
Subunit ID consists of pink, light brown, and brown nannofossil ooze with clay interbedded with decimeter- to meter-thick brown clayey nannofossil ooze (Figures F8, F9, F10, F11, F15). The deepest ~20 cm of this subunit in Hole U1560C consists of brown organic carbon-bearing (up to 1.4 wt% organic carbon) nannofossil ooze with clay (Figure F15A). Foraminifera are rare (<8%). Massive bedding and mottling predominate, and subtle color changes occur over decimeter- to meter-scale beds. Lithologic contacts are horizontal, gradational, and bioturbated. Biogenic mottling occurs in decimeter-thick beds, with bioturbation intensity ranging from absent to intense (BI = 0–5) and predominantly sparse to moderate (BI = 1–3). Distinct ichnogenera identified in this subunit include Skolithos, Planolites, Thalassinoides, more rarely Palaeophycus and Chondrites, and possibly Phycosiphon. The ichnofossil diversity ranges 1–4, and the maximum trace fossil diameter ranges 4–30 mm (Figure F12).
XRD and CARB data indicate that Subunit ID contains more terrigenous particles than the rest of Unit I. While calcite remains the dominant peak, additional smaller peaks indicate the presence of minor components such as clay minerals (illite, smectite, and kaolinite), quartz, and feldspars at Site U1560 (Figure F13; Table T5). The primary mineral composition of Subunit ID is 88–94 wt% calcite, 3–9 wt% total clay minerals, 1–2 wt% quartz, and 0–1 wt% feldspar (Figure F14; Tables T3, T4). CARB data support XRD data, indicating that this subunit shows the lowest carbonate content at Site U1560. Although the carbonate contents measured by coulometry on co-located samples with XRD samples follow the same trend with depth, they are slightly lower (80–89 wt%) (see Geochemistry) than bulk XRD results.
The boundary between Subunits ID and IE is based on changes in color and lithology from brown to light brown nannofossil ooze with clay above to pink nannofossil ooze with foraminifera below. These changes are accompanied by decreases in NGR and MS values and an increase in light reflectance (L*) data. These changes are interpreted to reflect a change in the seafloor position relative to the CCD. Here specifically, this could be shallowing of the CCD with time and/or thermal or tectonic movement of the basement.
4.1.1.5. Subunit IE
- Intervals: 395E-U1560A-11H-5, 35 cm, to 14X-1, 38 cm; 393-U1560C-13F-1, 23 cm, to 18X-1, 23 cm
- Depths: Hole U1560A = 96.4–119.4 m CSF-A; Hole U1560C = 98.9–127.4 m CSF-A
- Thickness: Hole U1560A = 23.0 m; Hole U1560C = 28.5 m
- Age: Middle Miocene
- Lithology: nannofossil ooze with foraminifera and varying clay amounts
Subunit IE in Hole U1560A consists of pink, light brown to brown nannofossil ooze with foraminifera and variable amounts of clay and thick beds of brown organic carbon–bearing nannofossil ooze with clay and foraminifera. In Hole U1560C, this subunit comprises pink, light brown, reddish yellow, and brown nannofossil ooze with clay, brown to dark brown organic carbon–bearing nannofossil ooze with clay, and medium beds of white to pink nannofossil ooze and very dark brown clayey organic carbon–bearing nannofossil ooze (Figures F8, F9, F10, F11, F15). Foraminiferal content typically ranges 10%–25% in Hole U1560A and is less than 10% in Hole U1560C. Subtle color banding is present in Cores 395E-U1560A-12X and 13X, occurring at the decimeter to meter scale and reflected in the NGR and MS data (Figure F9). Lithologic contacts are horizontal, subhorizontal, rarely curved, gradational to bioturbated, and rarely planar. Both mottling and massive bedding are common. Bioturbation intensity ranges from absent to intense (BI = 0–5) and is predominantly sparse to low (BI = 1–2). Bioturbation occurs in some decimeter-thick beds and includes Planolites, Thalassinoides, Arenicolites, and more rarely Zoophycos, Chondrites, Palaeophycus, and Skolithos. Diversity ranges 1–4 ichnogenera, and the maximum trace fossil diameter ranges 2–22 mm (Figure F12).
XRD and CARB data indicate that the composition of Subunit IE is homogeneous and contains predominantly calcite. Terrigenous minerals such as clay minerals, quartz, and feldspars form minor components of this subunit (Figure F13; Tables T3, T4). The irregular presence of illite (~8.9°–19.8°2θ) and kaolinite (~12.4°–19.8°2θ) peaks suggests changes in the relative amounts of these minerals throughout this subunit (Table T5). The peak at ~5.6°2θ characteristic for smectite is present in all samples (Table T5). The primary mineral composition of Subunit IE is 92–94 wt% calcite (supported by 87–92 wt% CaCO3; see Geochemistry), 5–6 wt% total clay minerals, 1–2 wt% quartz, and 0–1 wt% feldspar (Figure F14; Tables T3, T4). Interval 393-U1560C-18X-1, 13–15 cm, is located 20 cm above the sediment/basement interface and contains phillipsite, most likely derived from alteration of the underlying basalts (Figure F13; Table T5).
5. Igneous petrology
Site U1560 targeted ~15.2 Ma upper oceanic crust along the SAT. Expedition 395E Hole U1560A and Expedition 393 Holes U1560B and U1560C all recovered volcanic basement, but only Hole U1560B penetrated deeply into basement, reaching the interface at 124.0 mbsf, advancing a further 192.2 m to 316.2 mbsf, and recovering 75 m of core for an average recovery of 39% (Figure F7; Table T6). Holes U1560A and U1560B tagged basement with XCB coring at 121.5 and 129.0 mbsf, respectively (Table T7). Recovery was relatively consistent throughout Hole U1560B, with one interval of lower recovery between Cores 393-U1560B-7R and 15R (147–185 mbsf; average recovery = 18%). Overall, this recovery was sufficient for unit boundaries, lava types, and volcanic emplacement styles to be determined with confidence throughout most of the hole.
Unless stated otherwise, all cores, sections, and intervals refer to Hole U1560B. Depths are described in meters below seafloor (mbsf; CSF-A scale) and meters subbasement (msb; CSF-A depth minus 124 m). Sample, interval, and contact depths are curated depths unless mentioned otherwise. This section documents the lithostratigraphy of the volcanic basement at Site U1560 and then summarizes observations and results for the phenocryst phases, breccias, and igneous chemostratigraphy as measured by pXRF.
5.1. Lithostratigraphic units
The basement volcanic sequence at Site U1560 is divided into six main volcanic and intravolcanic breccia units. Unit 1 is divided into two subunits (1A and 1B), Unit 3 is divided into six subunits (3A–3F), Unit 5 is divided into three subunits (5A–5C), and Unit 6 is divided into two subunits (6A and 6B). These units and their thicknesses, emplacement styles, contacts, and lithologic details are summarized in Table T6, illustrated in Figure F7, and documented in detail in this section.
5.1.1. Sediment/basement interface
The shallowest occurrences of volcanic rocks and the deepest occurrences of sediment within the sediment/basement interface for all holes at Site U1560 are summarized in Table T7 and illustrated in Figure F16. Holes U1560A–U1560C all reached and recovered volcanic basement, but none of these cores preserved a coherent continuous sediment/basement interface (Figure F16).
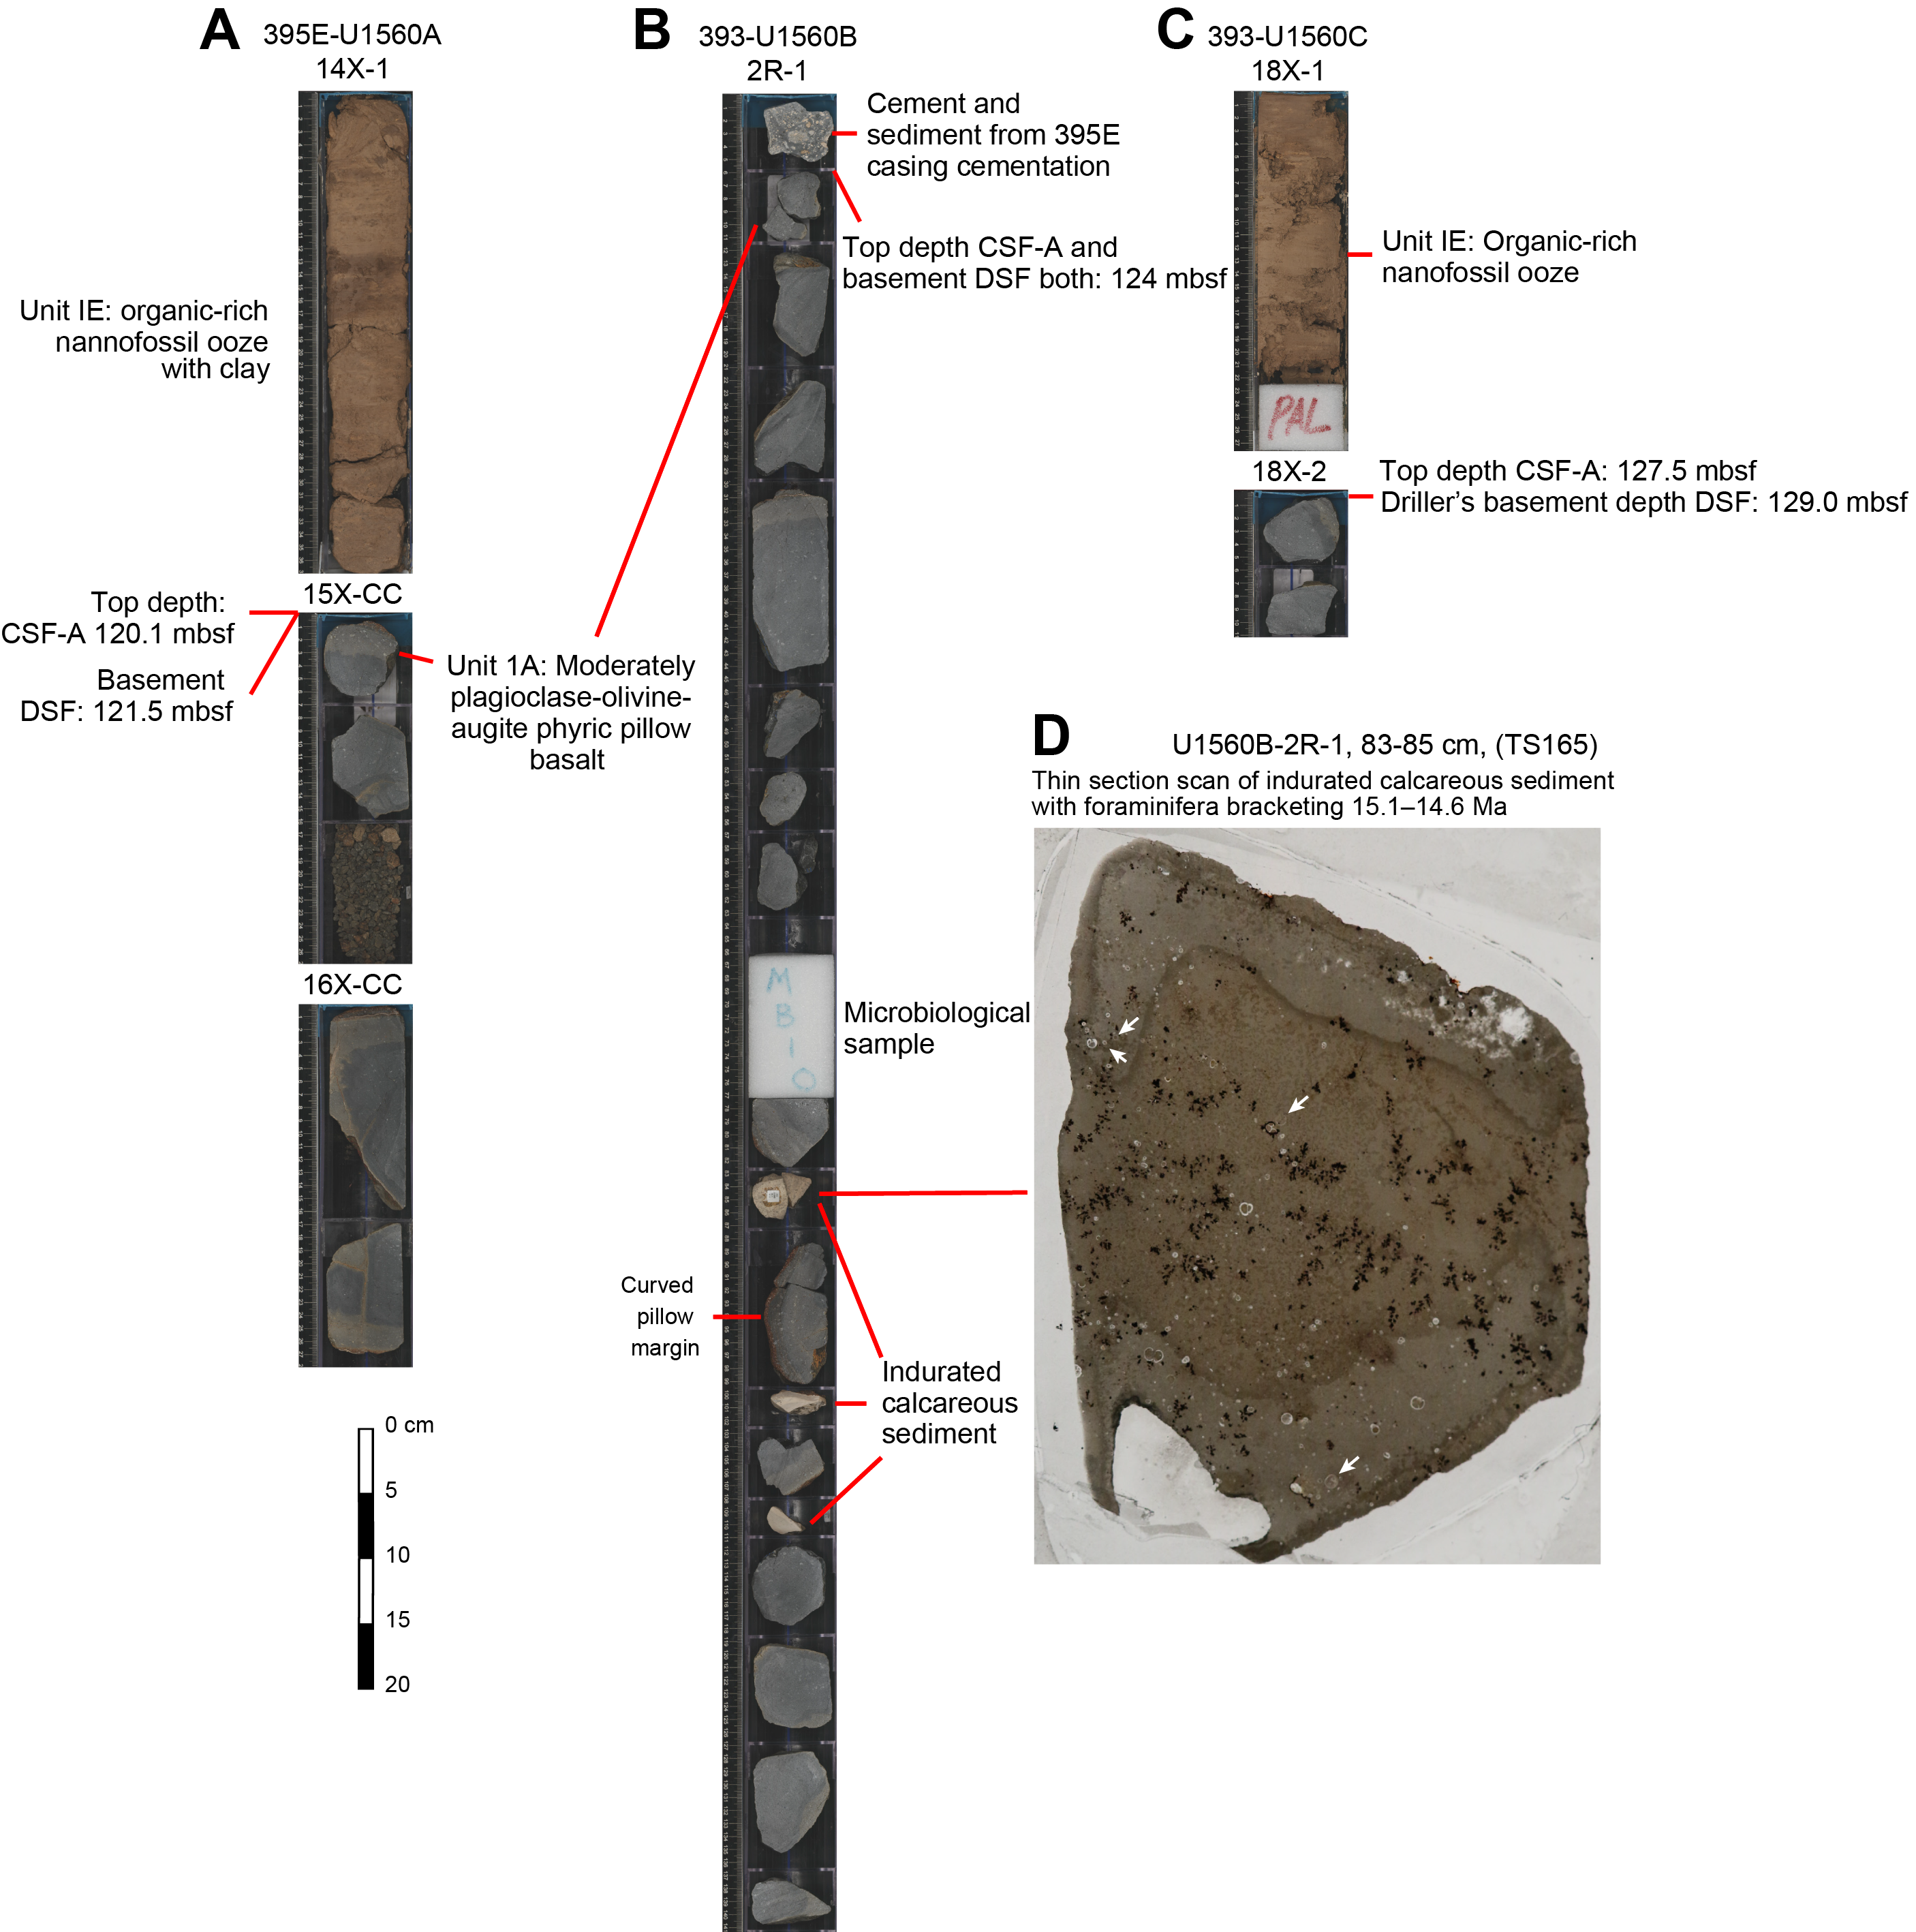
Figure F16. Sediment/volcanic basement interface.
Hole U1560B recovered three pieces of indurated calcareous sediment within 1.1 m of the shallowest volcanic piece at intervals 2R-1, 85 cm; 2R-1, 101 cm; and 2R-1, 109 cm (Figure F16). Micropaleontological analysis of Sample 2R-1, 83–85 cm (thin section [TS]165), from this sediment revealed preserved planktic foraminifera tests (Figure F16C). Among the taxa identified were Orbulina spp., Praeorbulina spp., and Trilobatus sicanus. The presence of Orbulina spp. gives a maximum age of 15.1 Ma, the first appearance of this genus. The Praeorbulina genus is constrained between 14.3 and 16.3 Ma. T. sicanus was also identified with an extinction age calibrated to 14.6 Ma. This brackets the age of Sample 2R-1, 83–85 cm, to between 14.6 and 15.1 Ma, which is close to the predicted crustal age of 15.2 Ma.
5.1.2. Subunit 1A
- Lithology: moderately plagioclase-olivine-augite-phyric basalt pillow lavas with interpillow sediment
Subunit 1A, the uppermost volcanic unit at Site U1560, was recovered in Holes U1560A–U1560C and consists of moderately plagioclase-olivine-augite-phyric basalt pillow lavas with interpillow sediments. Subunit 1A has an expanded thickness of 6.5 m (Table T6).
Common glassy margins, including one well-recovered curved example, show that Subunit 1A was emplaced as pillow lavas with cryptocrystalline to microcrystalline flow interiors (Figure F17A–F17C). The wedge shape of pieces of indurated calcareous interpillow sediment within a few meters of the sediment interface, described in Sediment/basement interface, further supports emplacement of Subunit 1A as pillow lavas (Figure F16B).
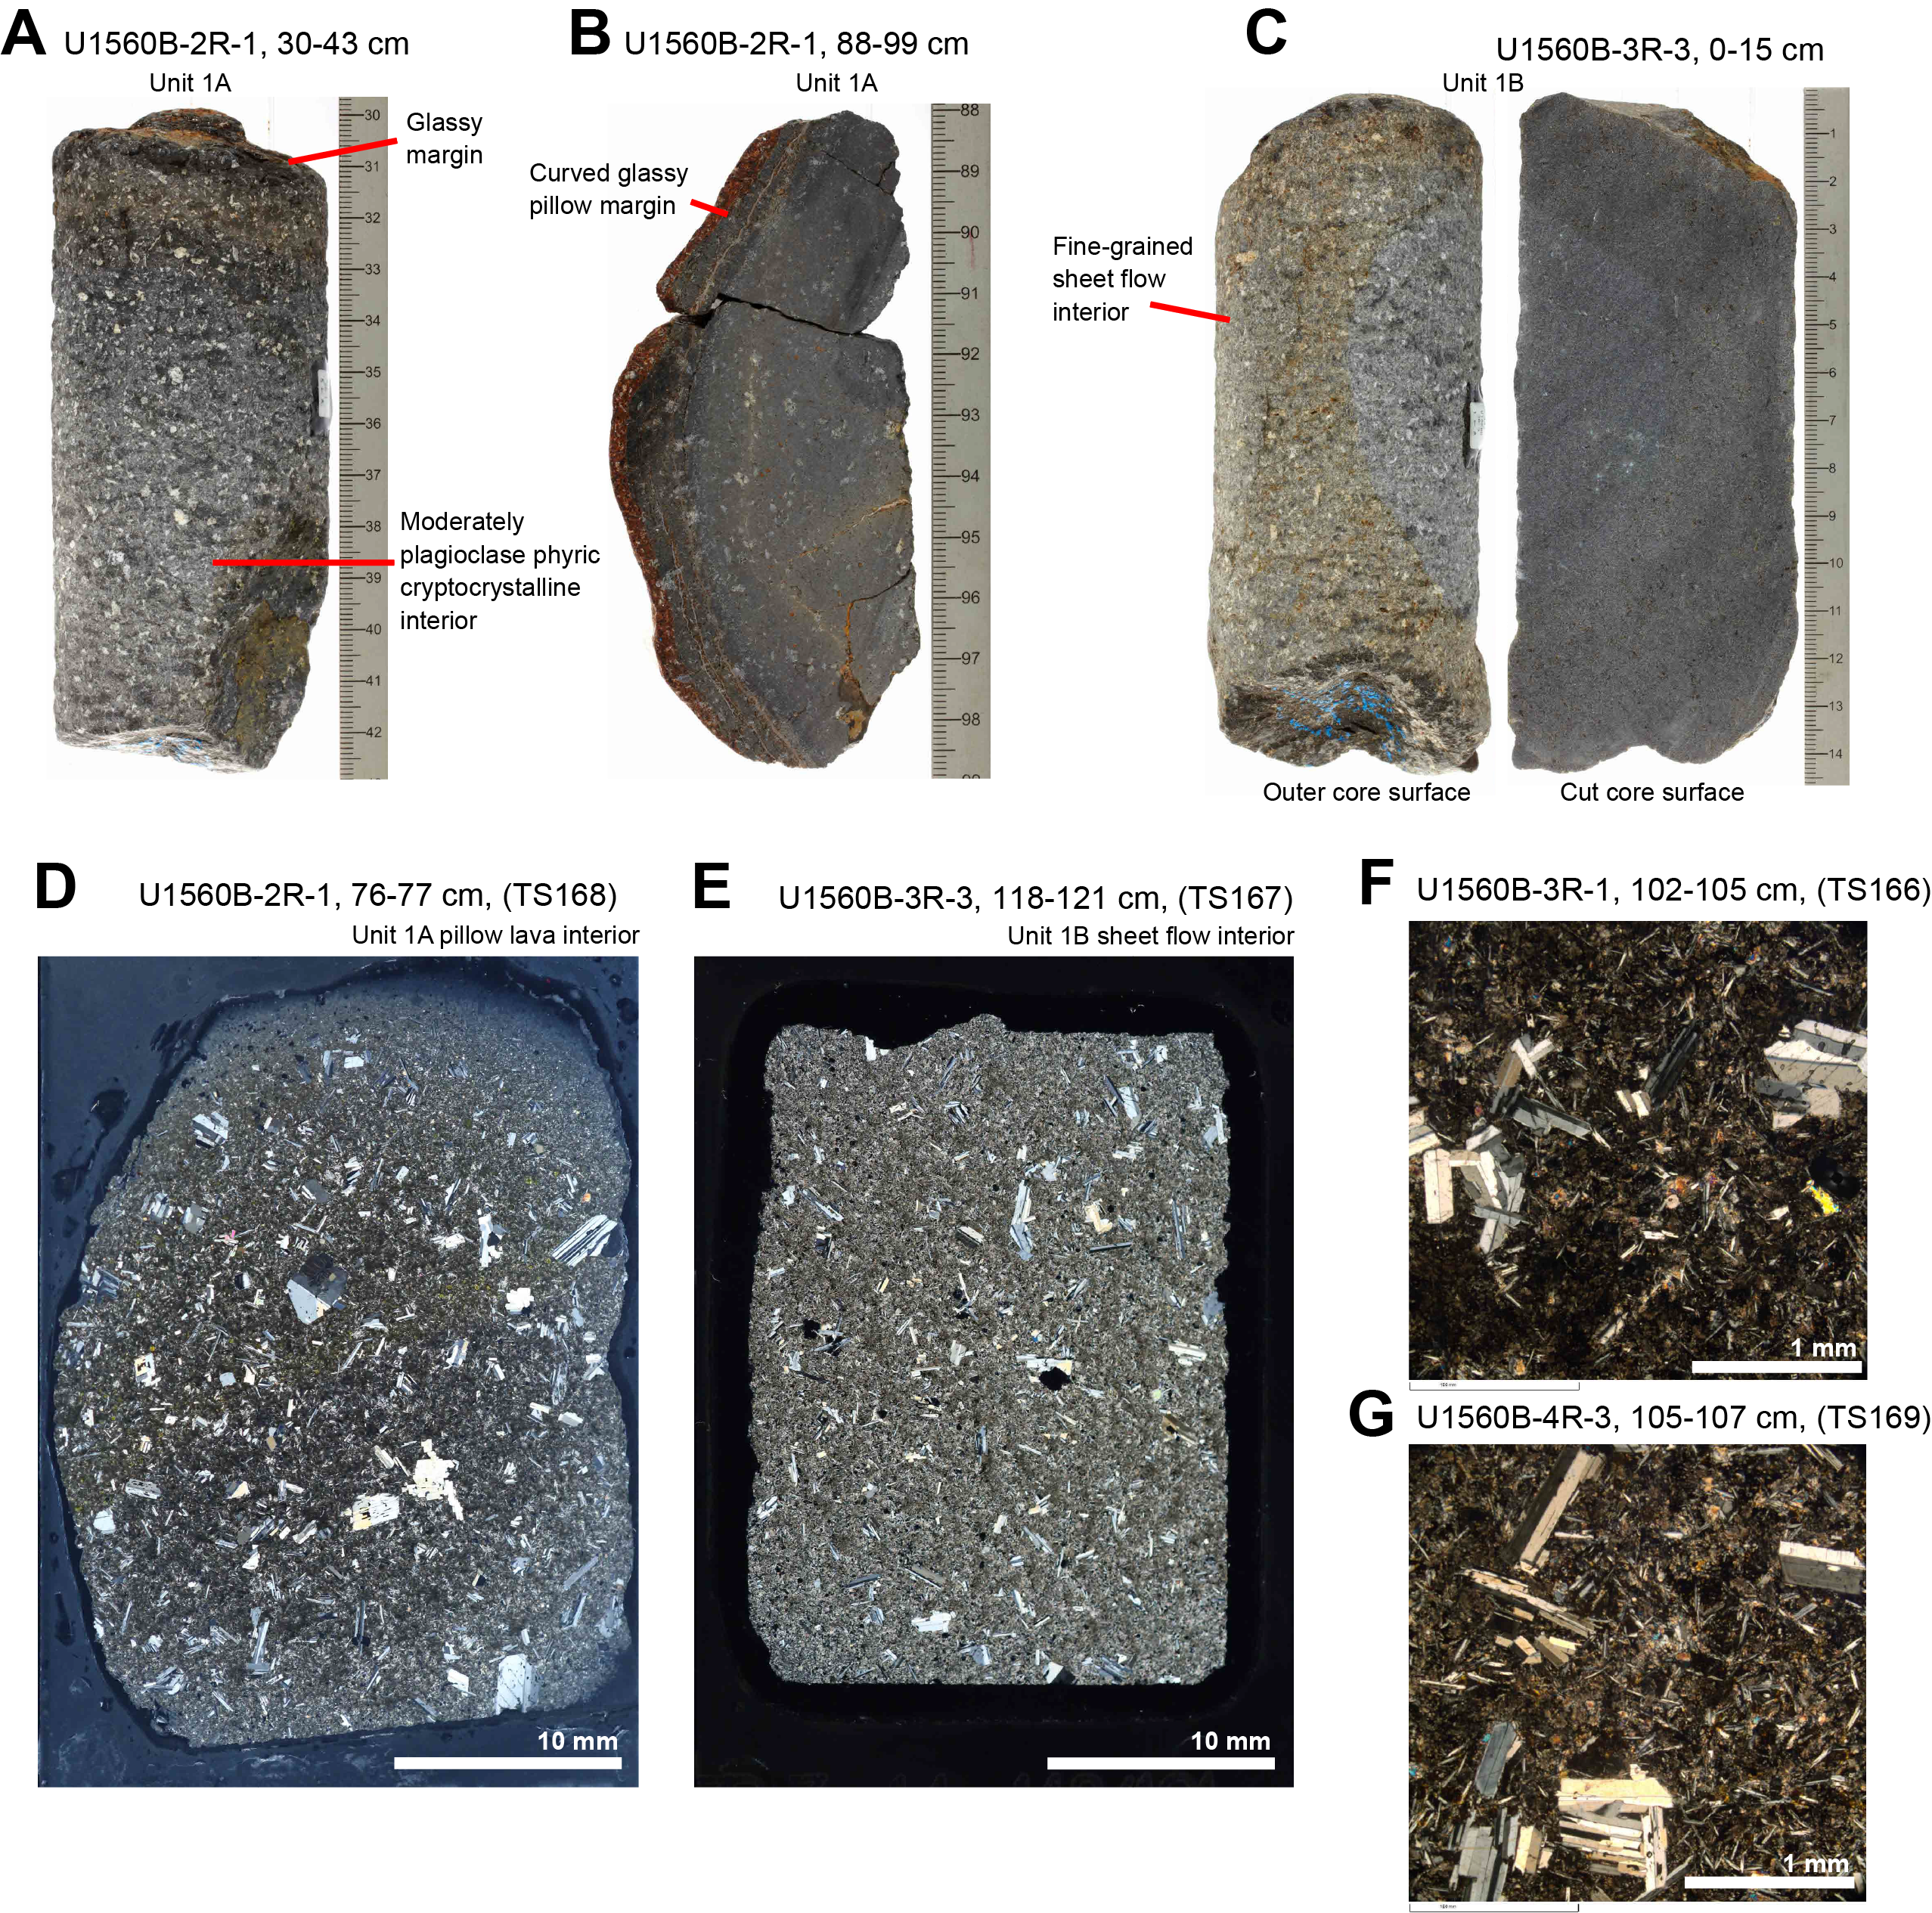
Figure F17. Volcanic Unit 1 massive lava.
5.1.3. Subunit 1B
Subunit 1B consists of sparsely plagioclase-olivine-phyric basalt sheet and pillow lava flows with a total expanded thickness of 11 m (Table T6). At least three 1–1.5 m thick sheet flows were identified in Subunit 1B. The top of Subunit 1B is marked by a 150 cm textually continuous sheet flow, of which the upper cryptocrystalline margin was recovered (Section 393-U1560B-3R-2, 71 cm). The groundmass of the interior of this sheet flow and other examples in Subunit 1B is microcrystalline to fine grained (Figure F17E).
5.1.4. Unit 2
Unit 2 consists of a single, sparsely plagioclase-olivine-augite-phyric basalt massive flow, with a fine- to medium-grained interior groundmass and an estimated thickness between 6 and 11 m (Table T6; Figure F18). No rock was recovered in Core 393-U1560B-7R, so the minimum thickness is based on the possibility that Unit 2 stops at the end of Core 6R. The upper end of the possible range is given from the occurrence of two pieces of massive flow basalt in interval 8R-1, 0–15 cm, that are lithologically identical to the basalt recovered in Core 6R (Figure F18C). However, these pieces are both unoriented and small enough to have caved in from higher in the hole. An interval of oversized hole at the top of Core 7R measured by downhole calipers (see Basement in Physical properties and downhole measurements) suggests that the interval where Core 7R was drilled is probably not lithologically continuous with the overlying massive flow, so the thinner ~6 m thickness is considered more likely. Units 1 and 2 also have normal polarity natural magnetic remanence inclinations, which contrasts with the reversed polarity of Units 3–6. This reversal would be consistent with a volcanic hiatus, allowing sediments to accumulate above Unit 3 that were not recovered. The fresh portions of the Unit 2 massive flow have high MS, which may aid in interpretation of downhole logging data (see Basement in Paleomagnetism for more details).
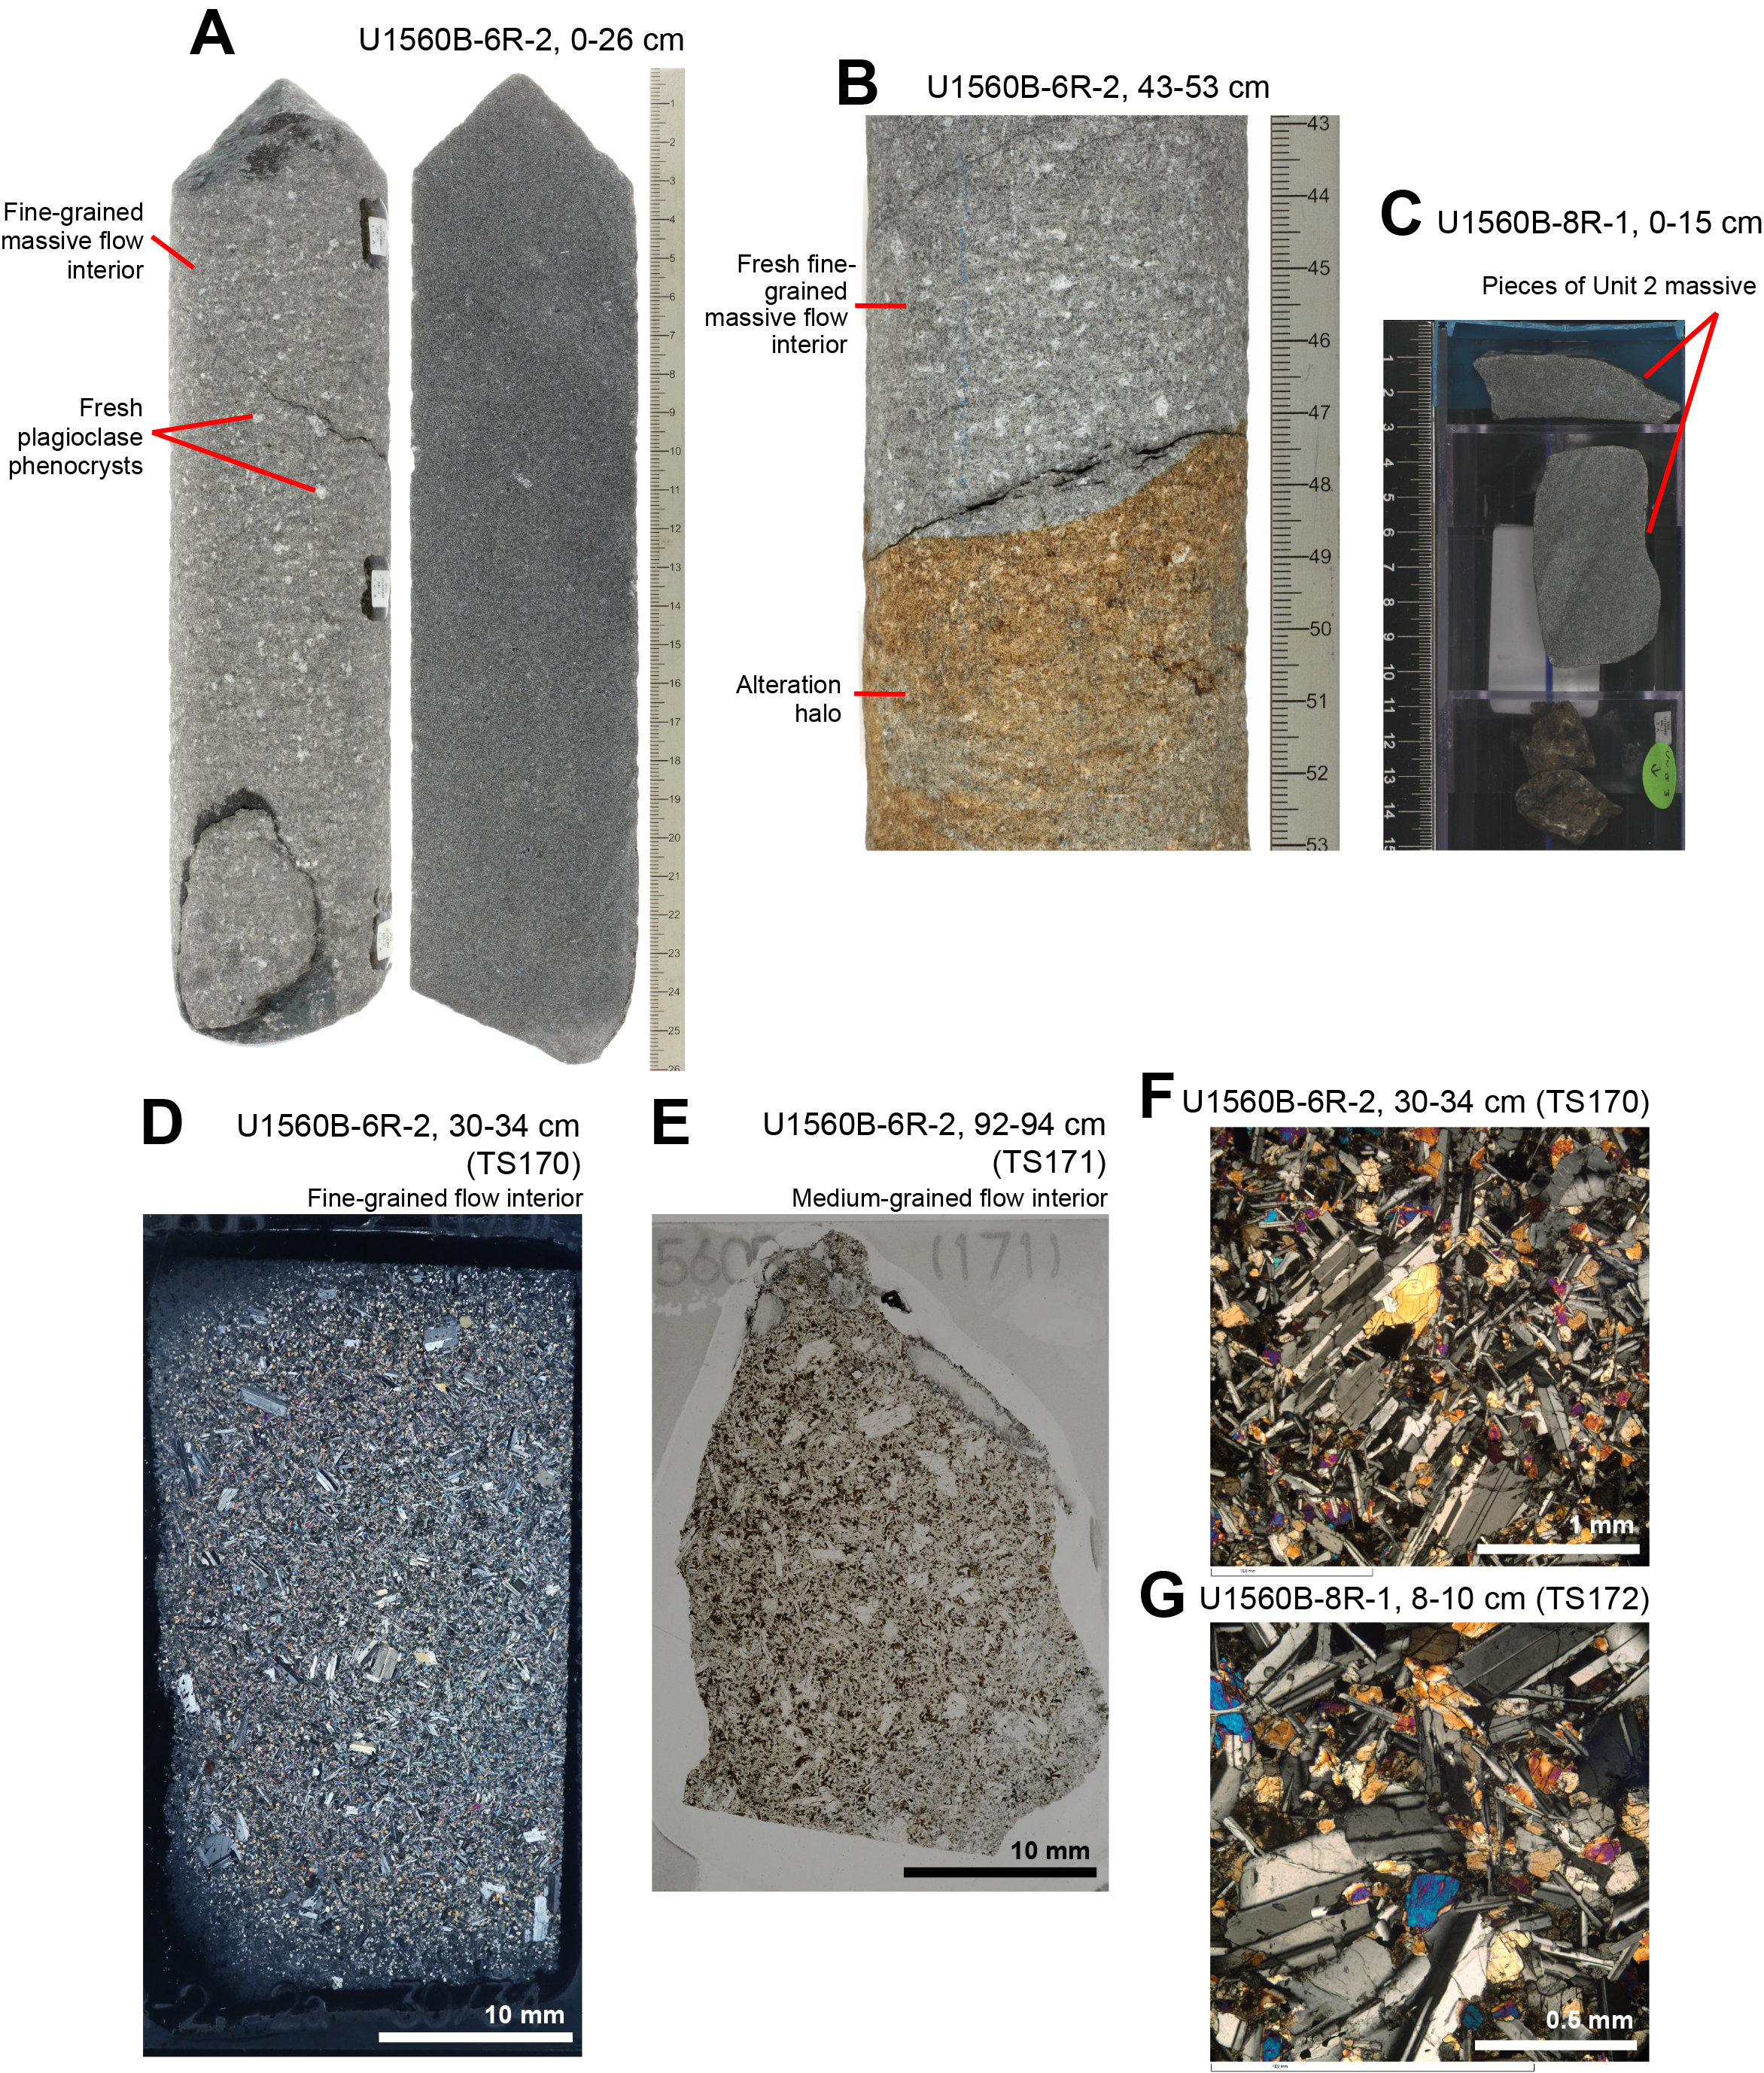
Figure F18. Unit 2 massive lava flow.
5.1.5. Subunits 3A–3C
Phenocryst abundance drops gradually from the top to the base of Unit 3. Subunit 3A consists of sparsely plagioclase-olivine-augite-phyric basalt pillow lavas with a typically cryptocrystalline groundmass. Subunit 3A has an expanded thickness of 15.4 m (Table T6), and common glassy margins indicate emplacement as pillow lavas (Figure F7).
Subunit 3B contains lithologically similar pillow lavas to Subunit 3A but with more pronounced variolitic and mottled textures and the addition of some pieces of microcrystalline to fine-grained basalt of uncertain emplacement style (Figure F19B). These coarser grained basalts may be sheet or larger pillow flows but could also feasibly be feeder dikes for the overlying lavas, the assessment of which may be revealed by careful examination of the pXRF analyses for these basalts.
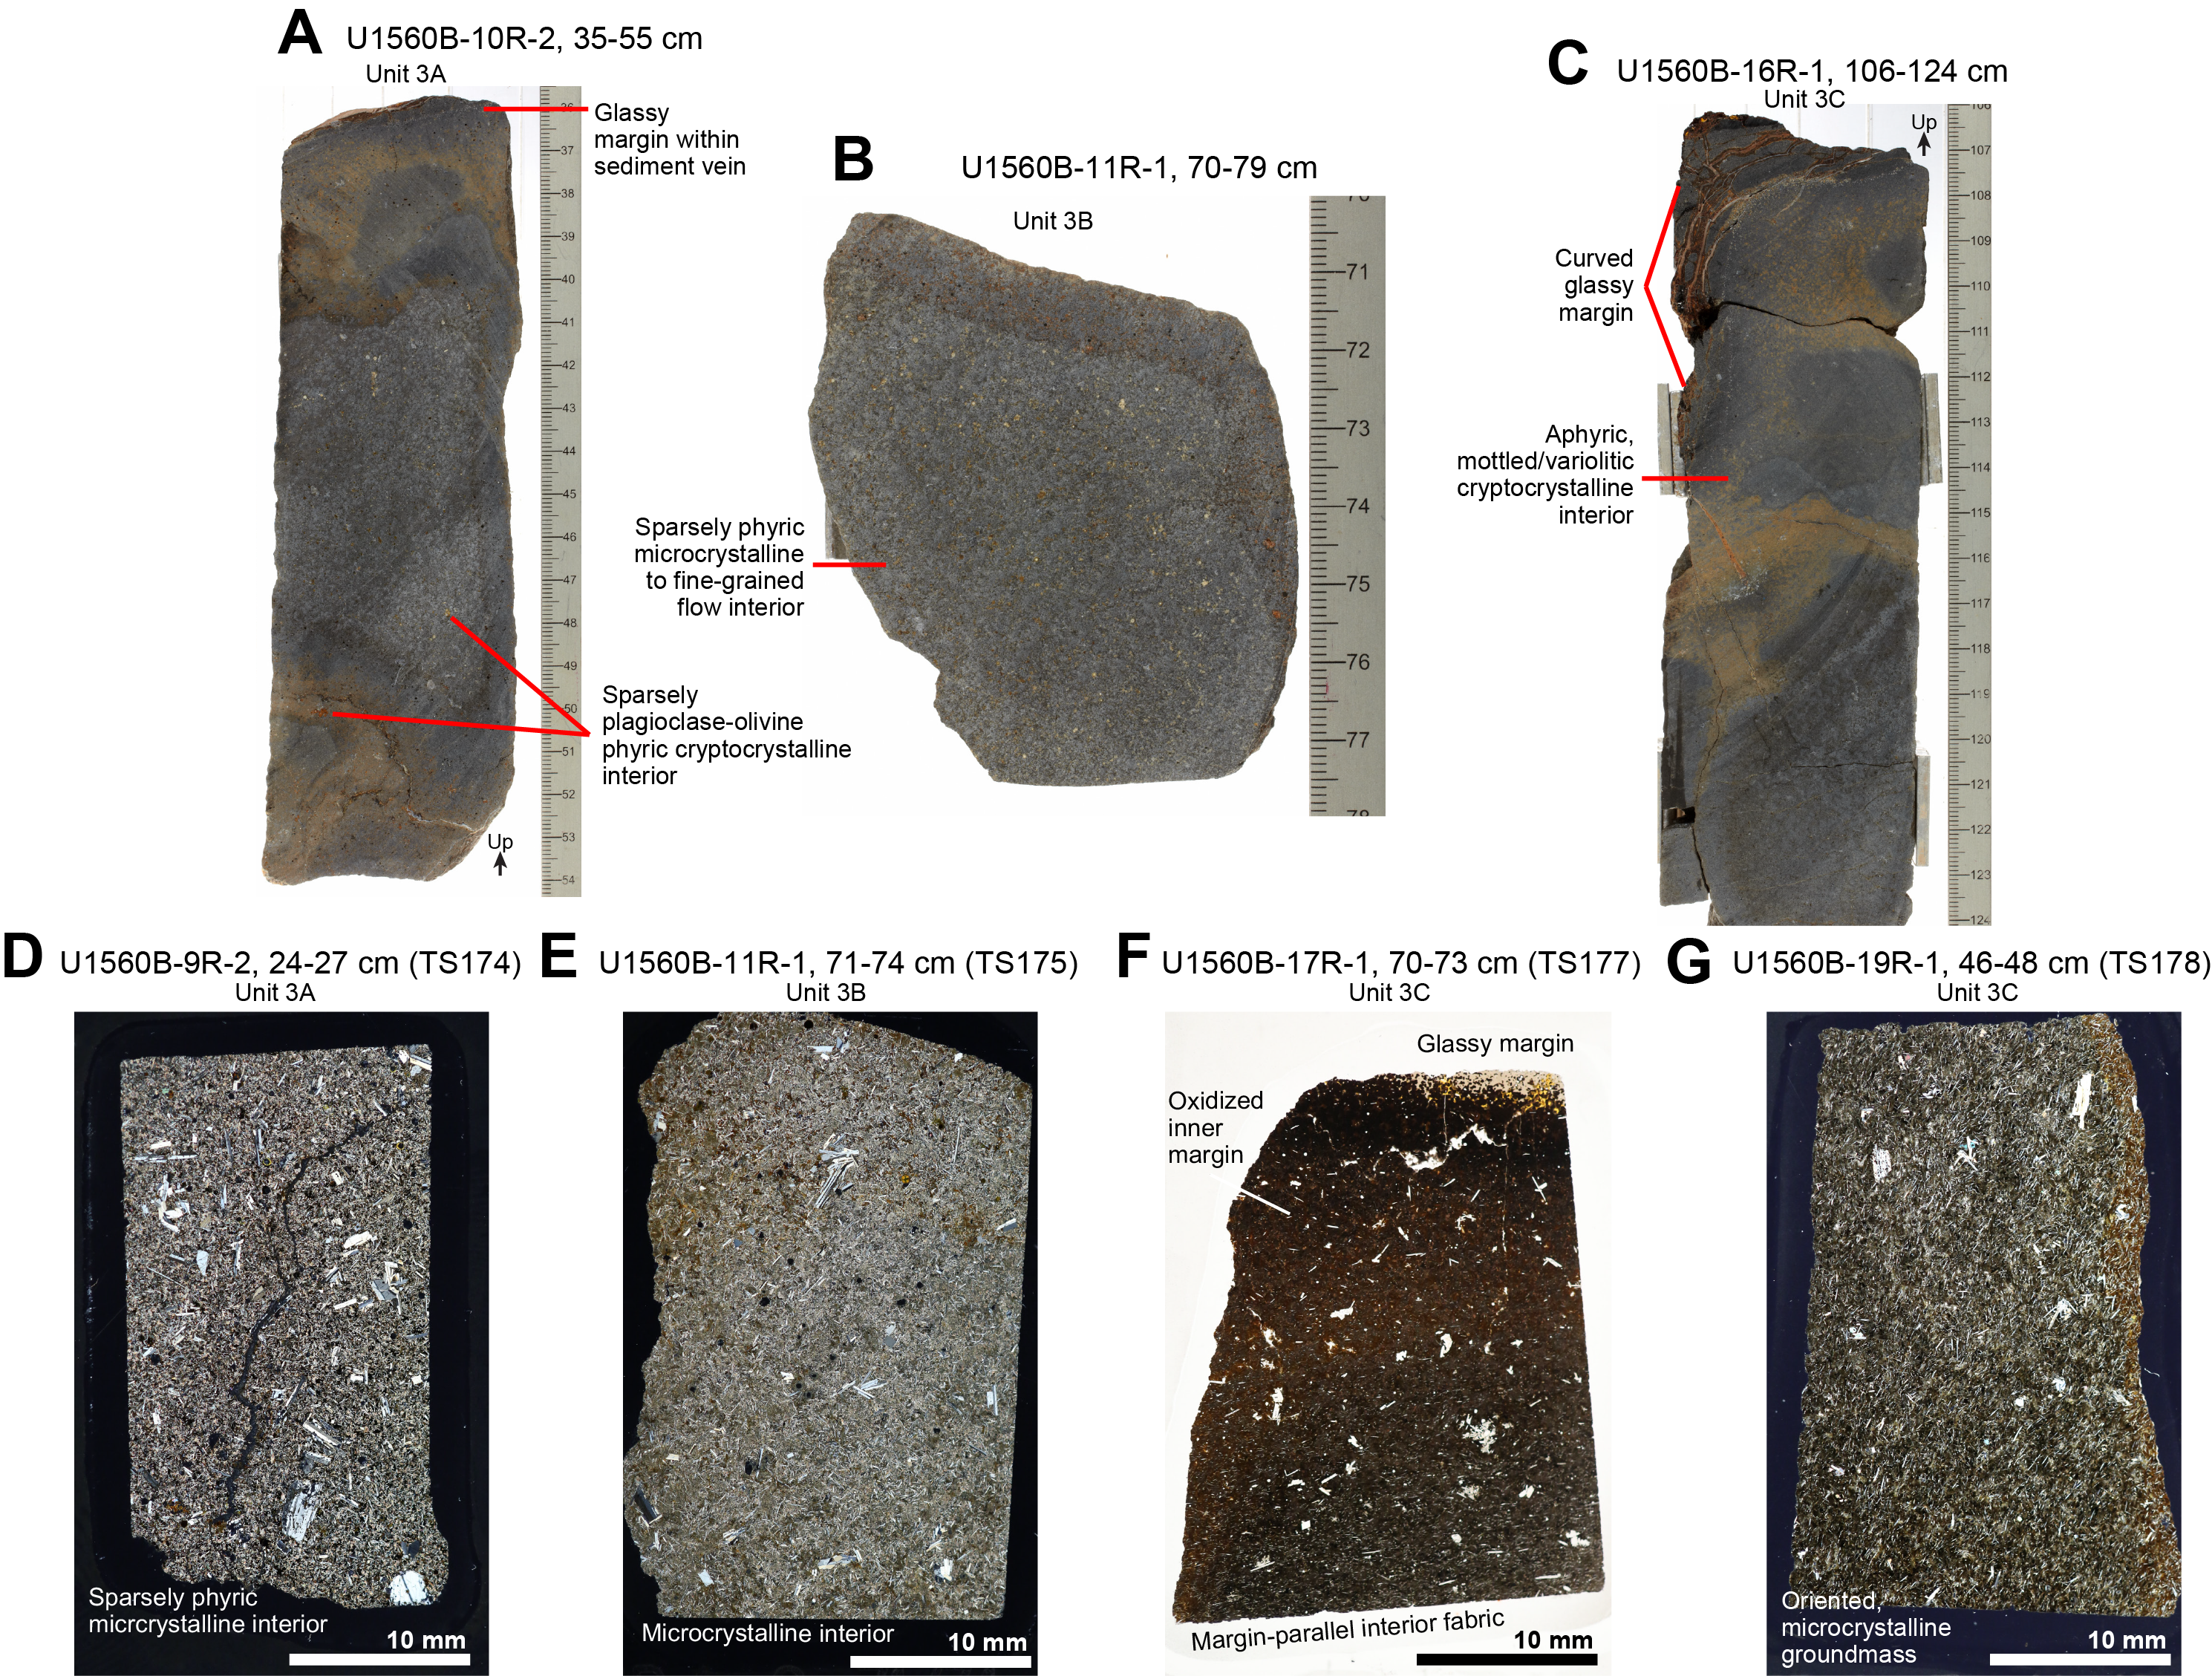
Figure F19. Volcanic Subunits 3A–3C.
Subunit 3C consists of aphyric pillow basalts with recovery of curved glassy pillow margins and a variably mottled cryptocrystalline to microcrystalline groundmass (Figure F19C, F19F, F19G).
5.1.6. Subunits 3D–3F
Subunit 3D consists of distinctly aphyric, fine-grained basalt sheet flows that are each 90–130 cm thick and has a total subunit expanded thickness of 5.7 m (Table T6; Figure F20A, F20B, F20F). Several vuggy intervals in the sheet flows are lined or filled with secondary minerals, including zeolite and bluish green clay (Figure F20B).
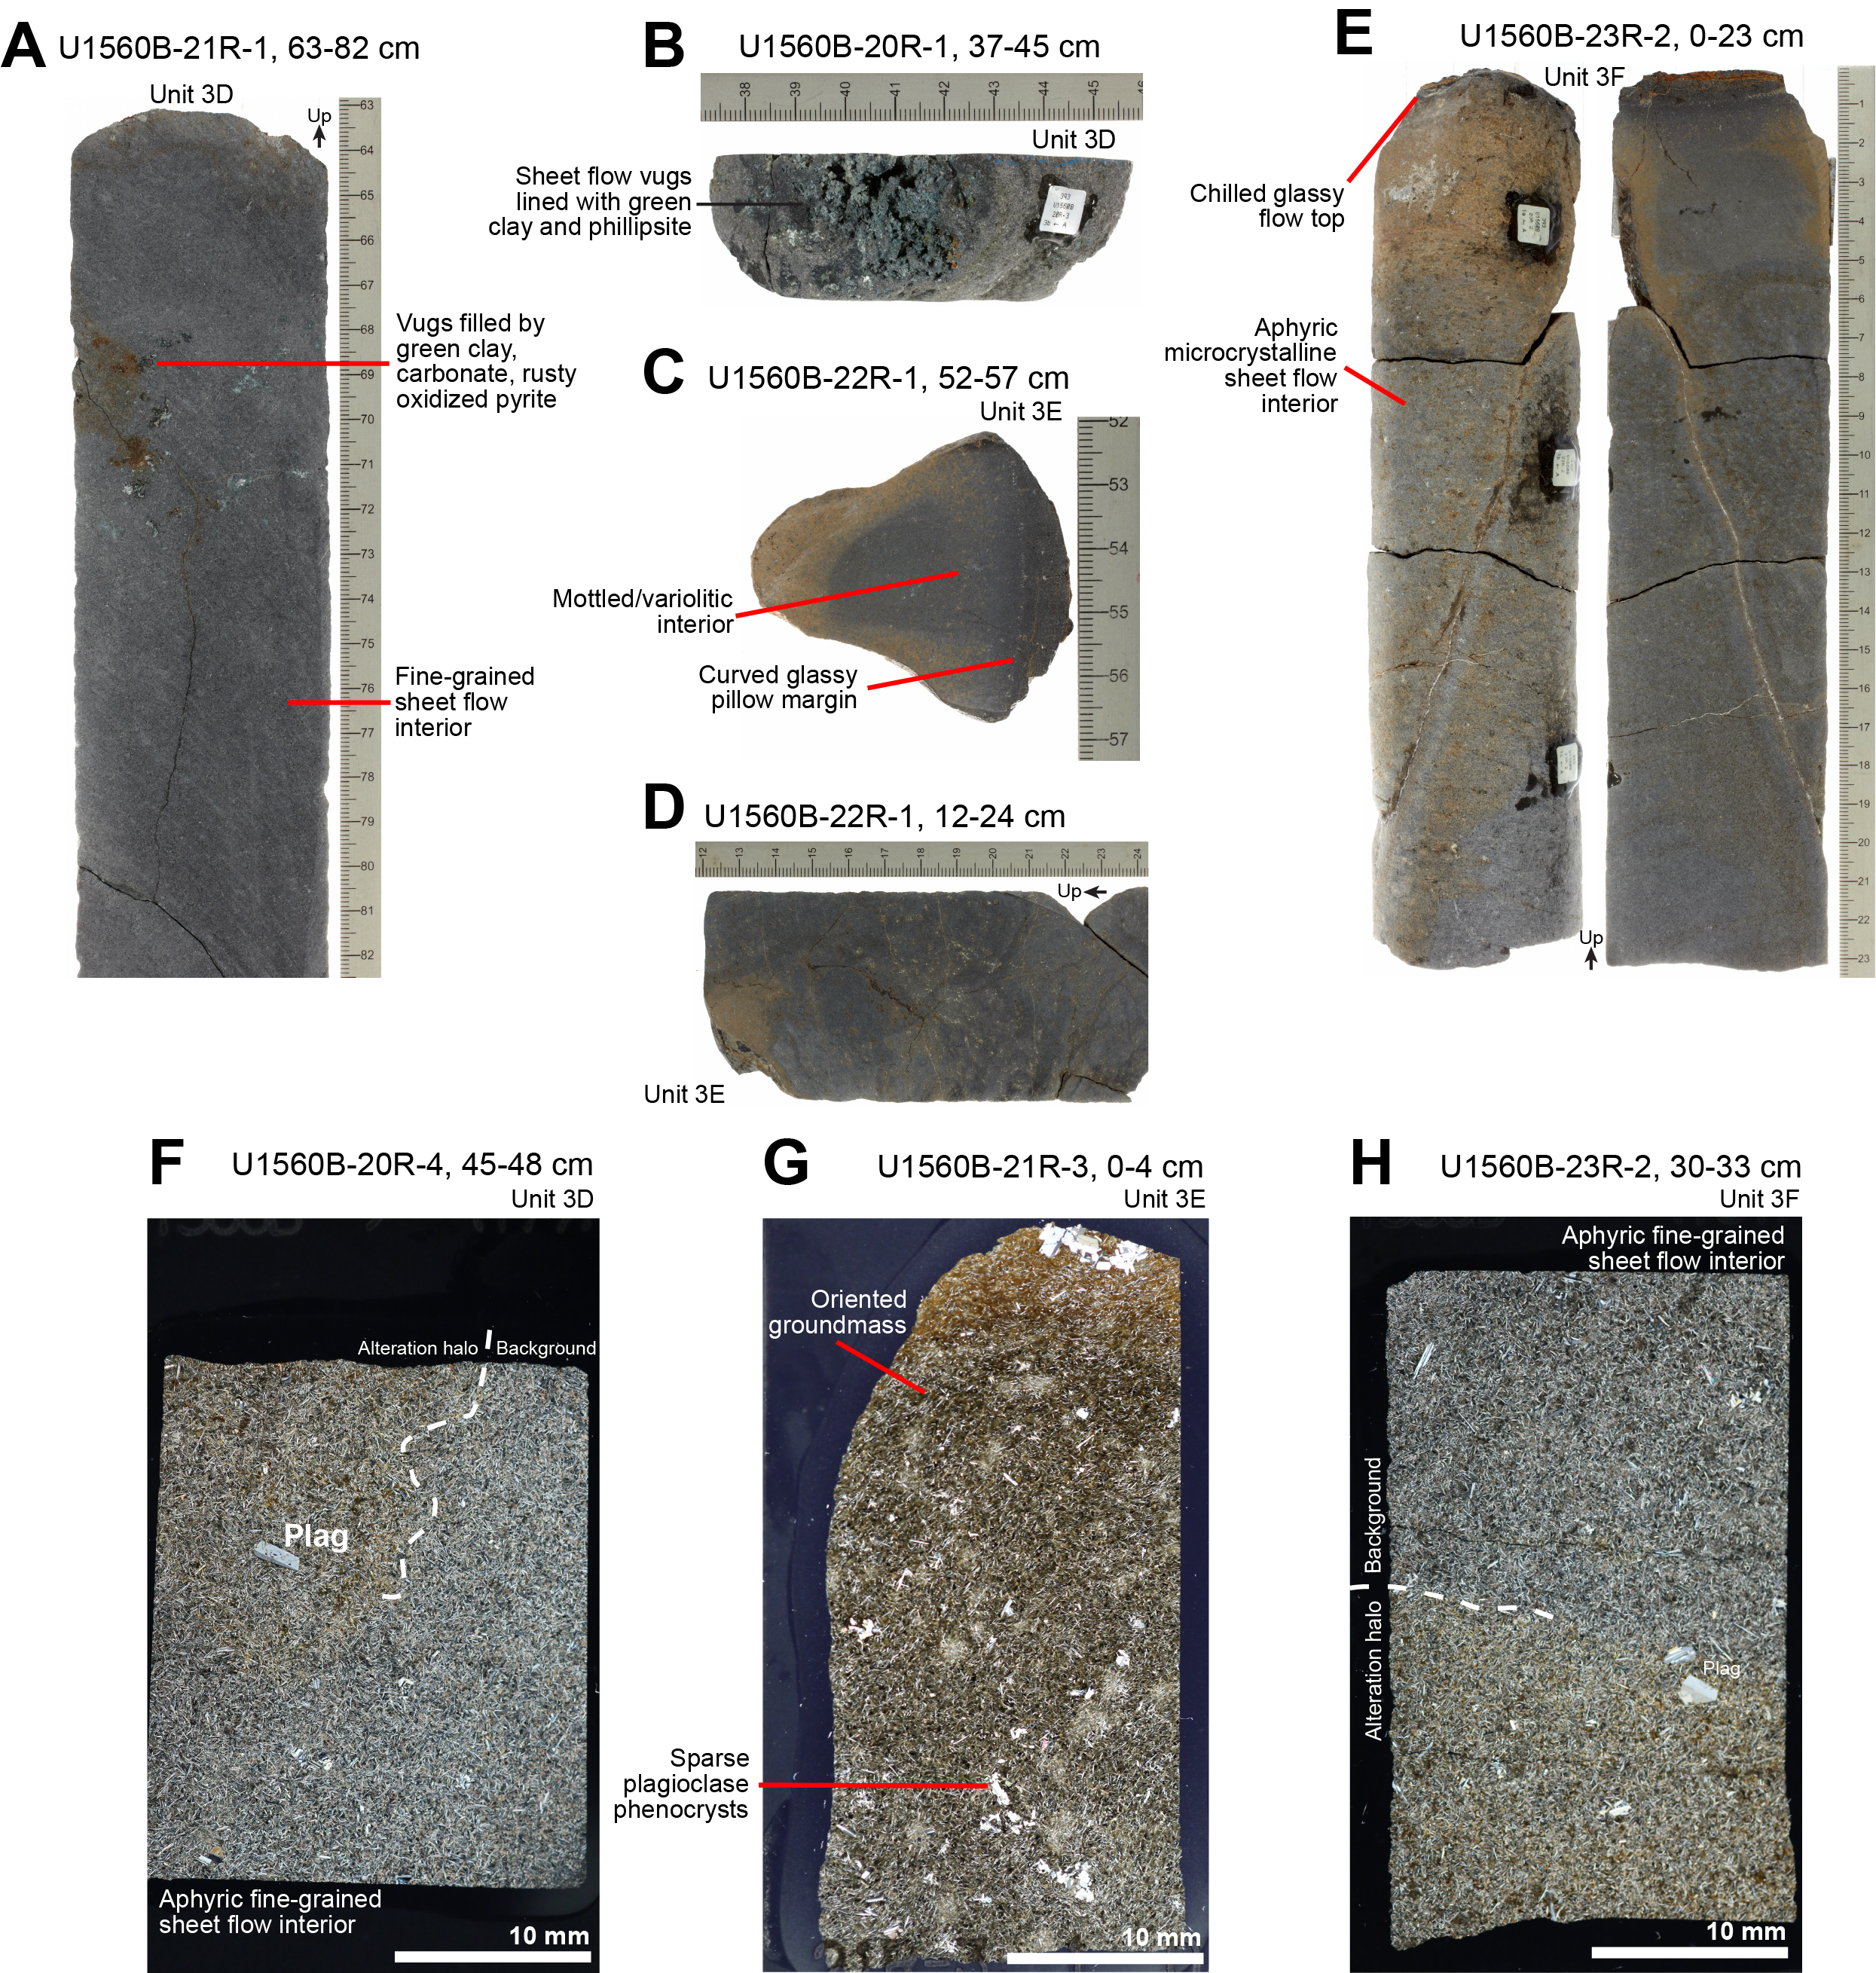
Figure F20. Volcanic Subunits 3D–3F.
Subunit 3E has an expanded thickness of 8.6 m and is lithologically similar to Subunit 3C, consisting of aphyric cryptocrystalline to microcrystalline pillow lavas (Figure F20C, F20G). Subunit 3F is lithologically similar to the other aphyric Unit 3 pillow lava units but is emplaced as at least two microcrystalline sheet flows of ~50 cm and >150 cm intersected thickness (Table T6; Figure F20E, F20H).
5.1.7. Unit 4
Unit 4 consists of lithologically uniform, sparsely plagioclase-olivine-phyric basalt pillow lavas with distinctly variable degrees of alteration and fracturing (Figure F21). Unit 4 has an expanded thickness of 18.8 m (Table T6), and recovery of some steeply dipping glassy margins suggests it was emplaced as pillow lavas. Some intervals of Unit 4 are remarkably fresh, and these tend to have dense networks of unfilled fractures (e.g., Figure F21B).
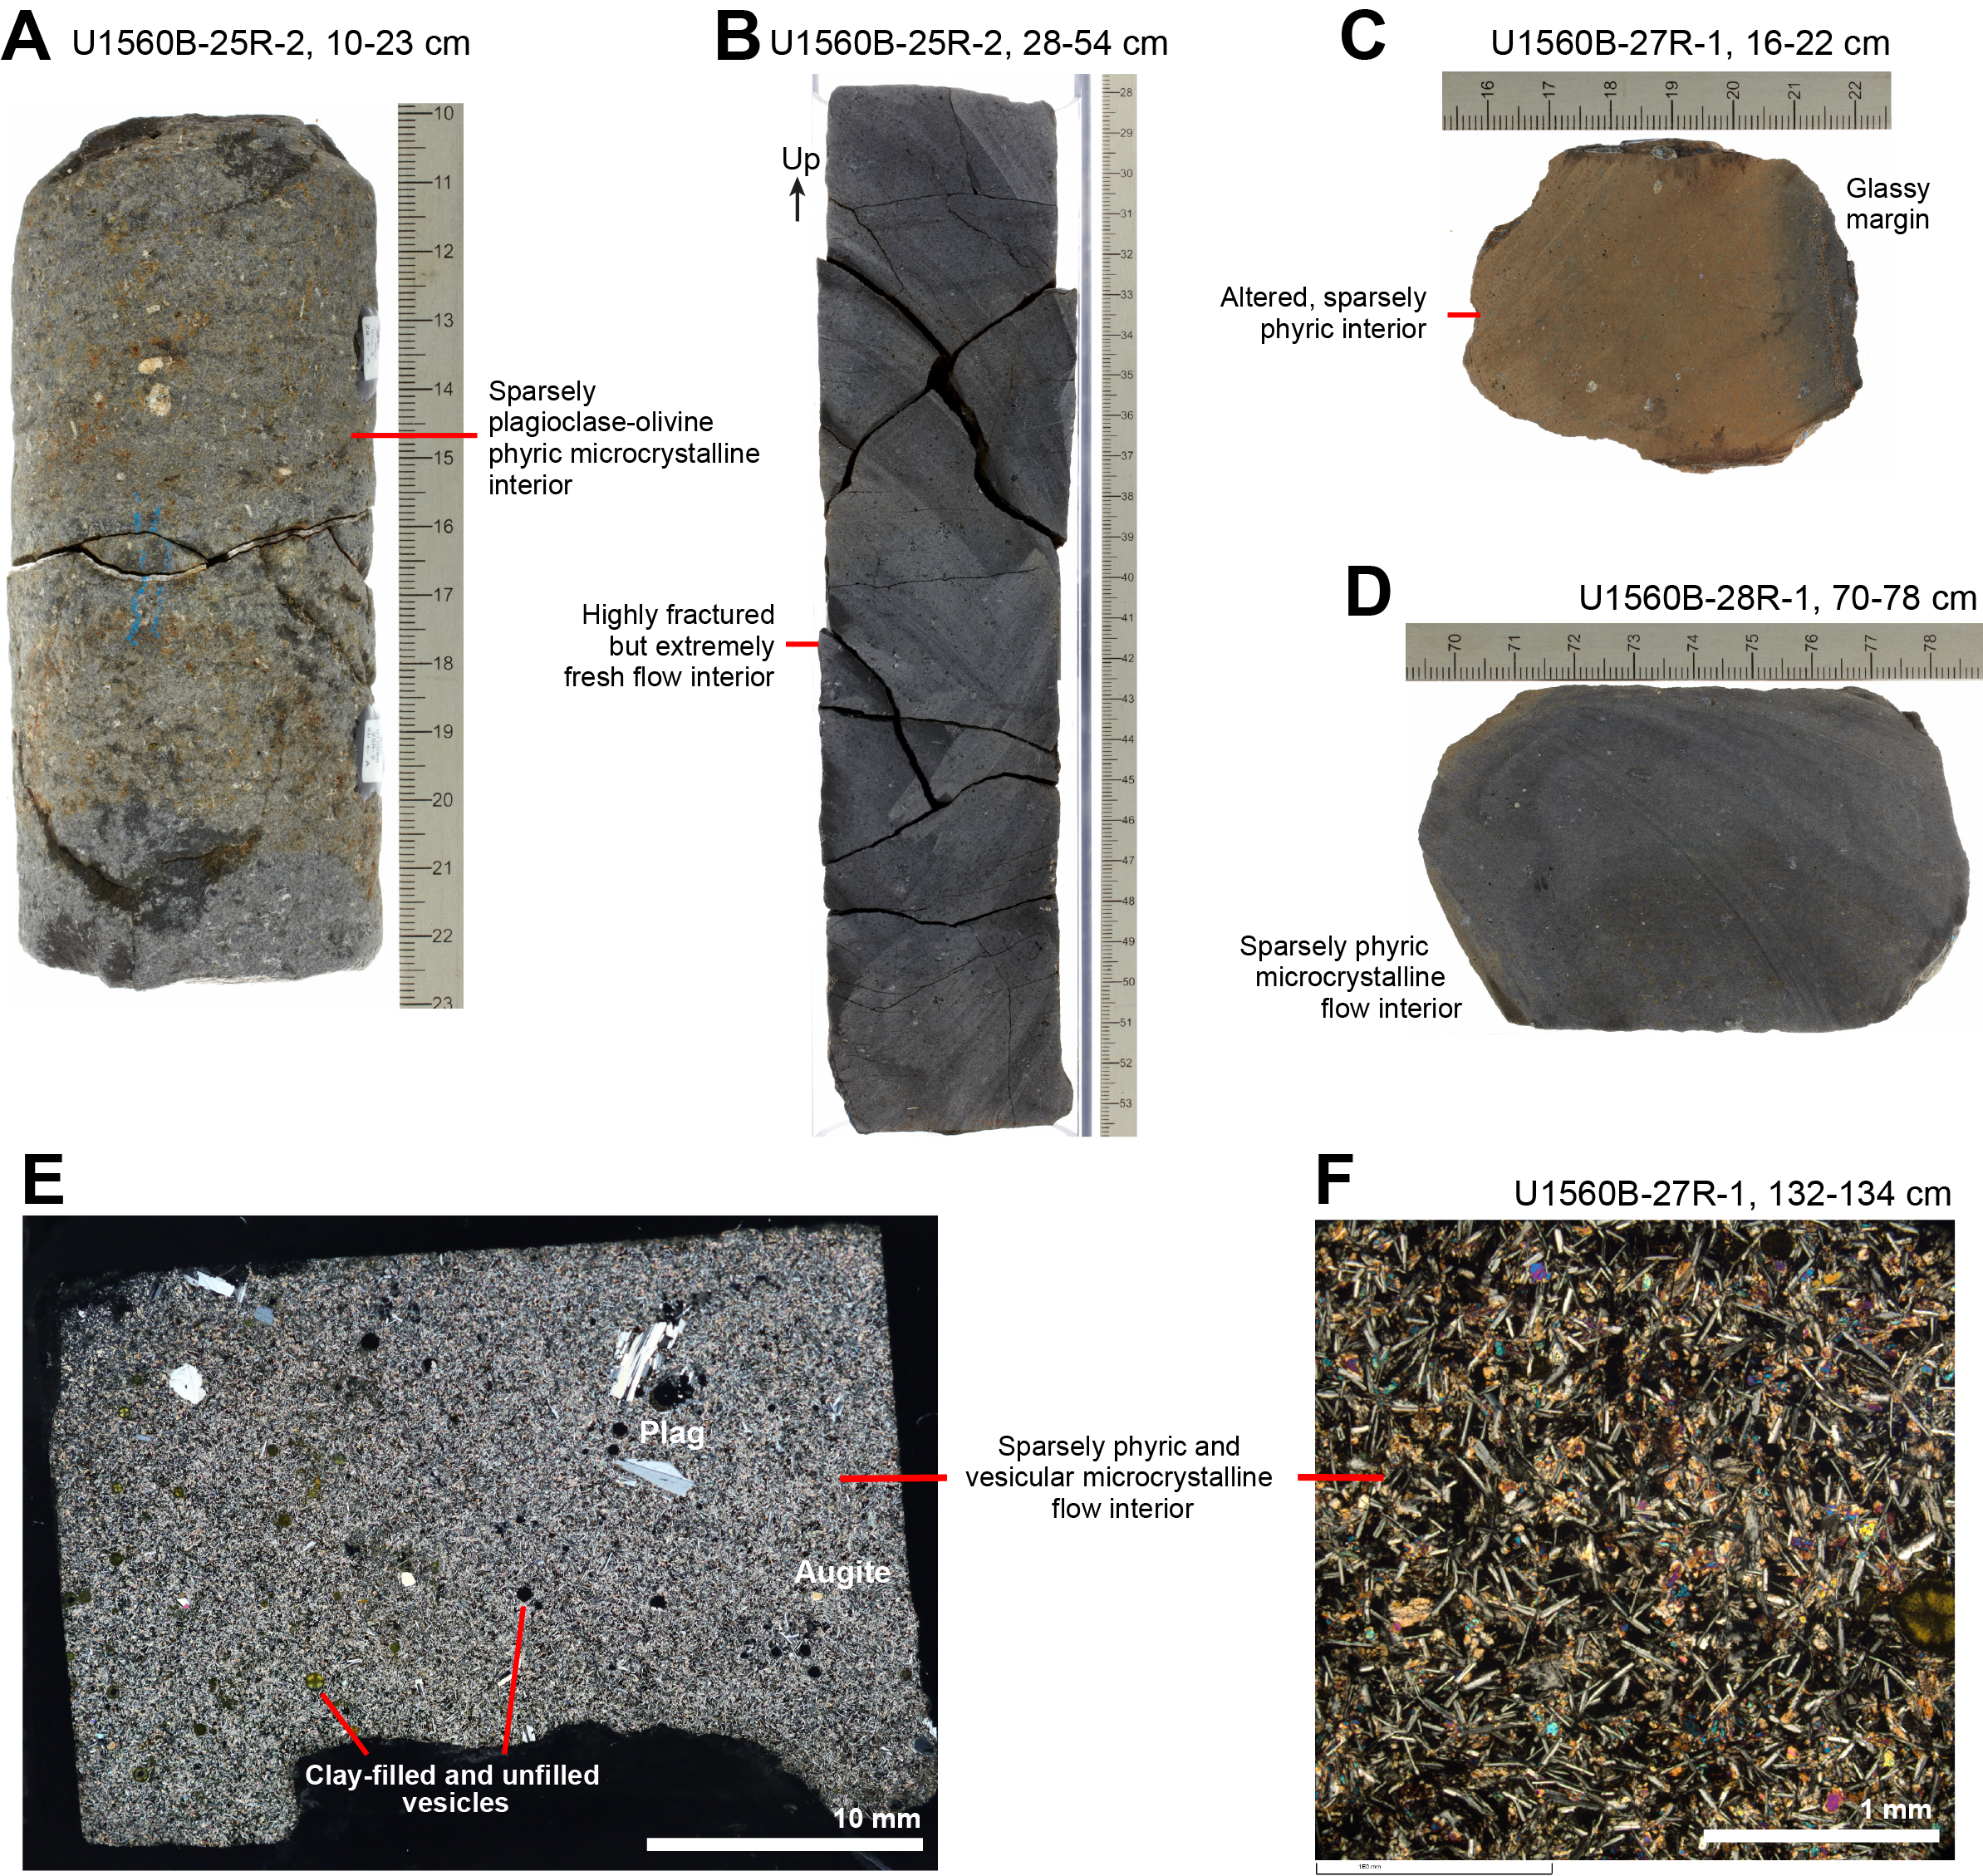
Figure F21. Volcanic Unit 4.
5.1.8. Subunits 5A–5C
Subunit 5A consists of moderately plagioclase-olivine-phyric basalt pillow lavas with relatively uniform lithology over an expanded thickness of 11.6 m (Figure F22; Table T6). Common steeply dipping margins indicate emplacement as pillow lavas, and one piece of hyaloclastite breccia adhering to basalt was also recovered (Figure F22A, F22B).
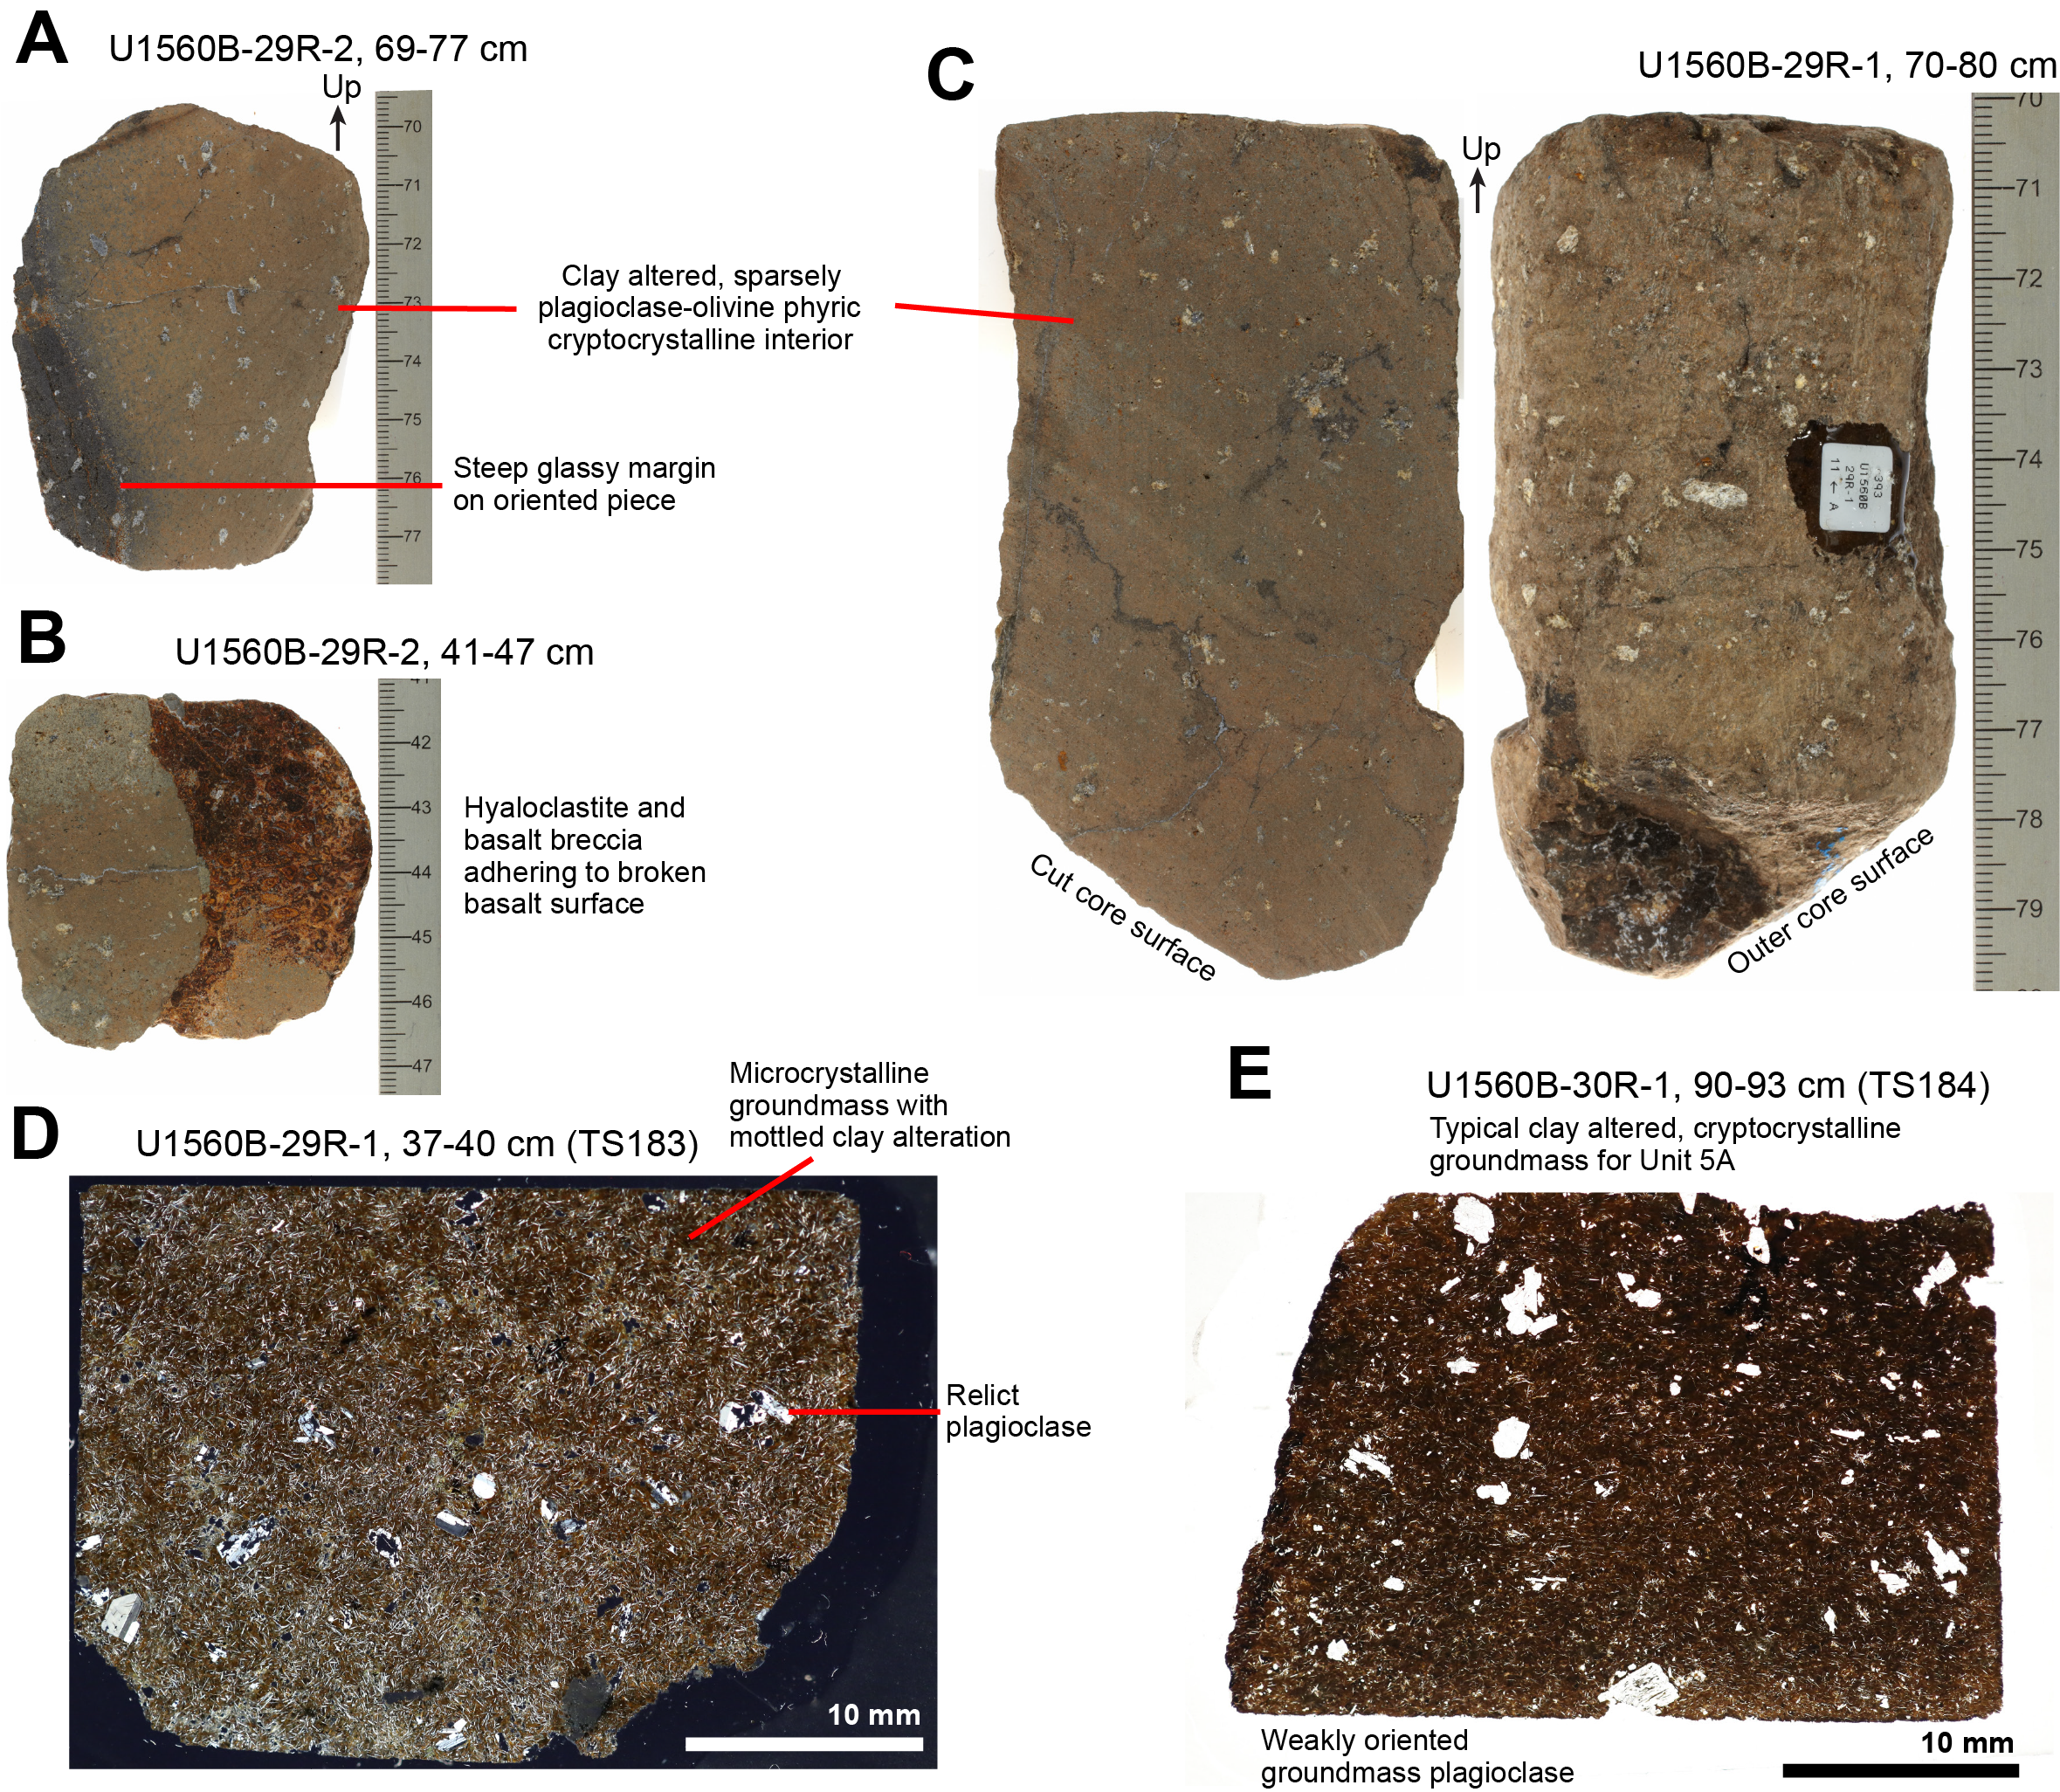
Figure F22. Volcanic Subunit 5A.
Subunit 5B consists of a single, well-recovered sheet flow with an expanded thickness of 1.6 m (Table T6; Figure F23A). The Subunit 5B sheet flow is moderately plagioclase-phyric with a well-recovered glassy top and a relatively fresh, fine-grained interior (Figure F23B–F23E).
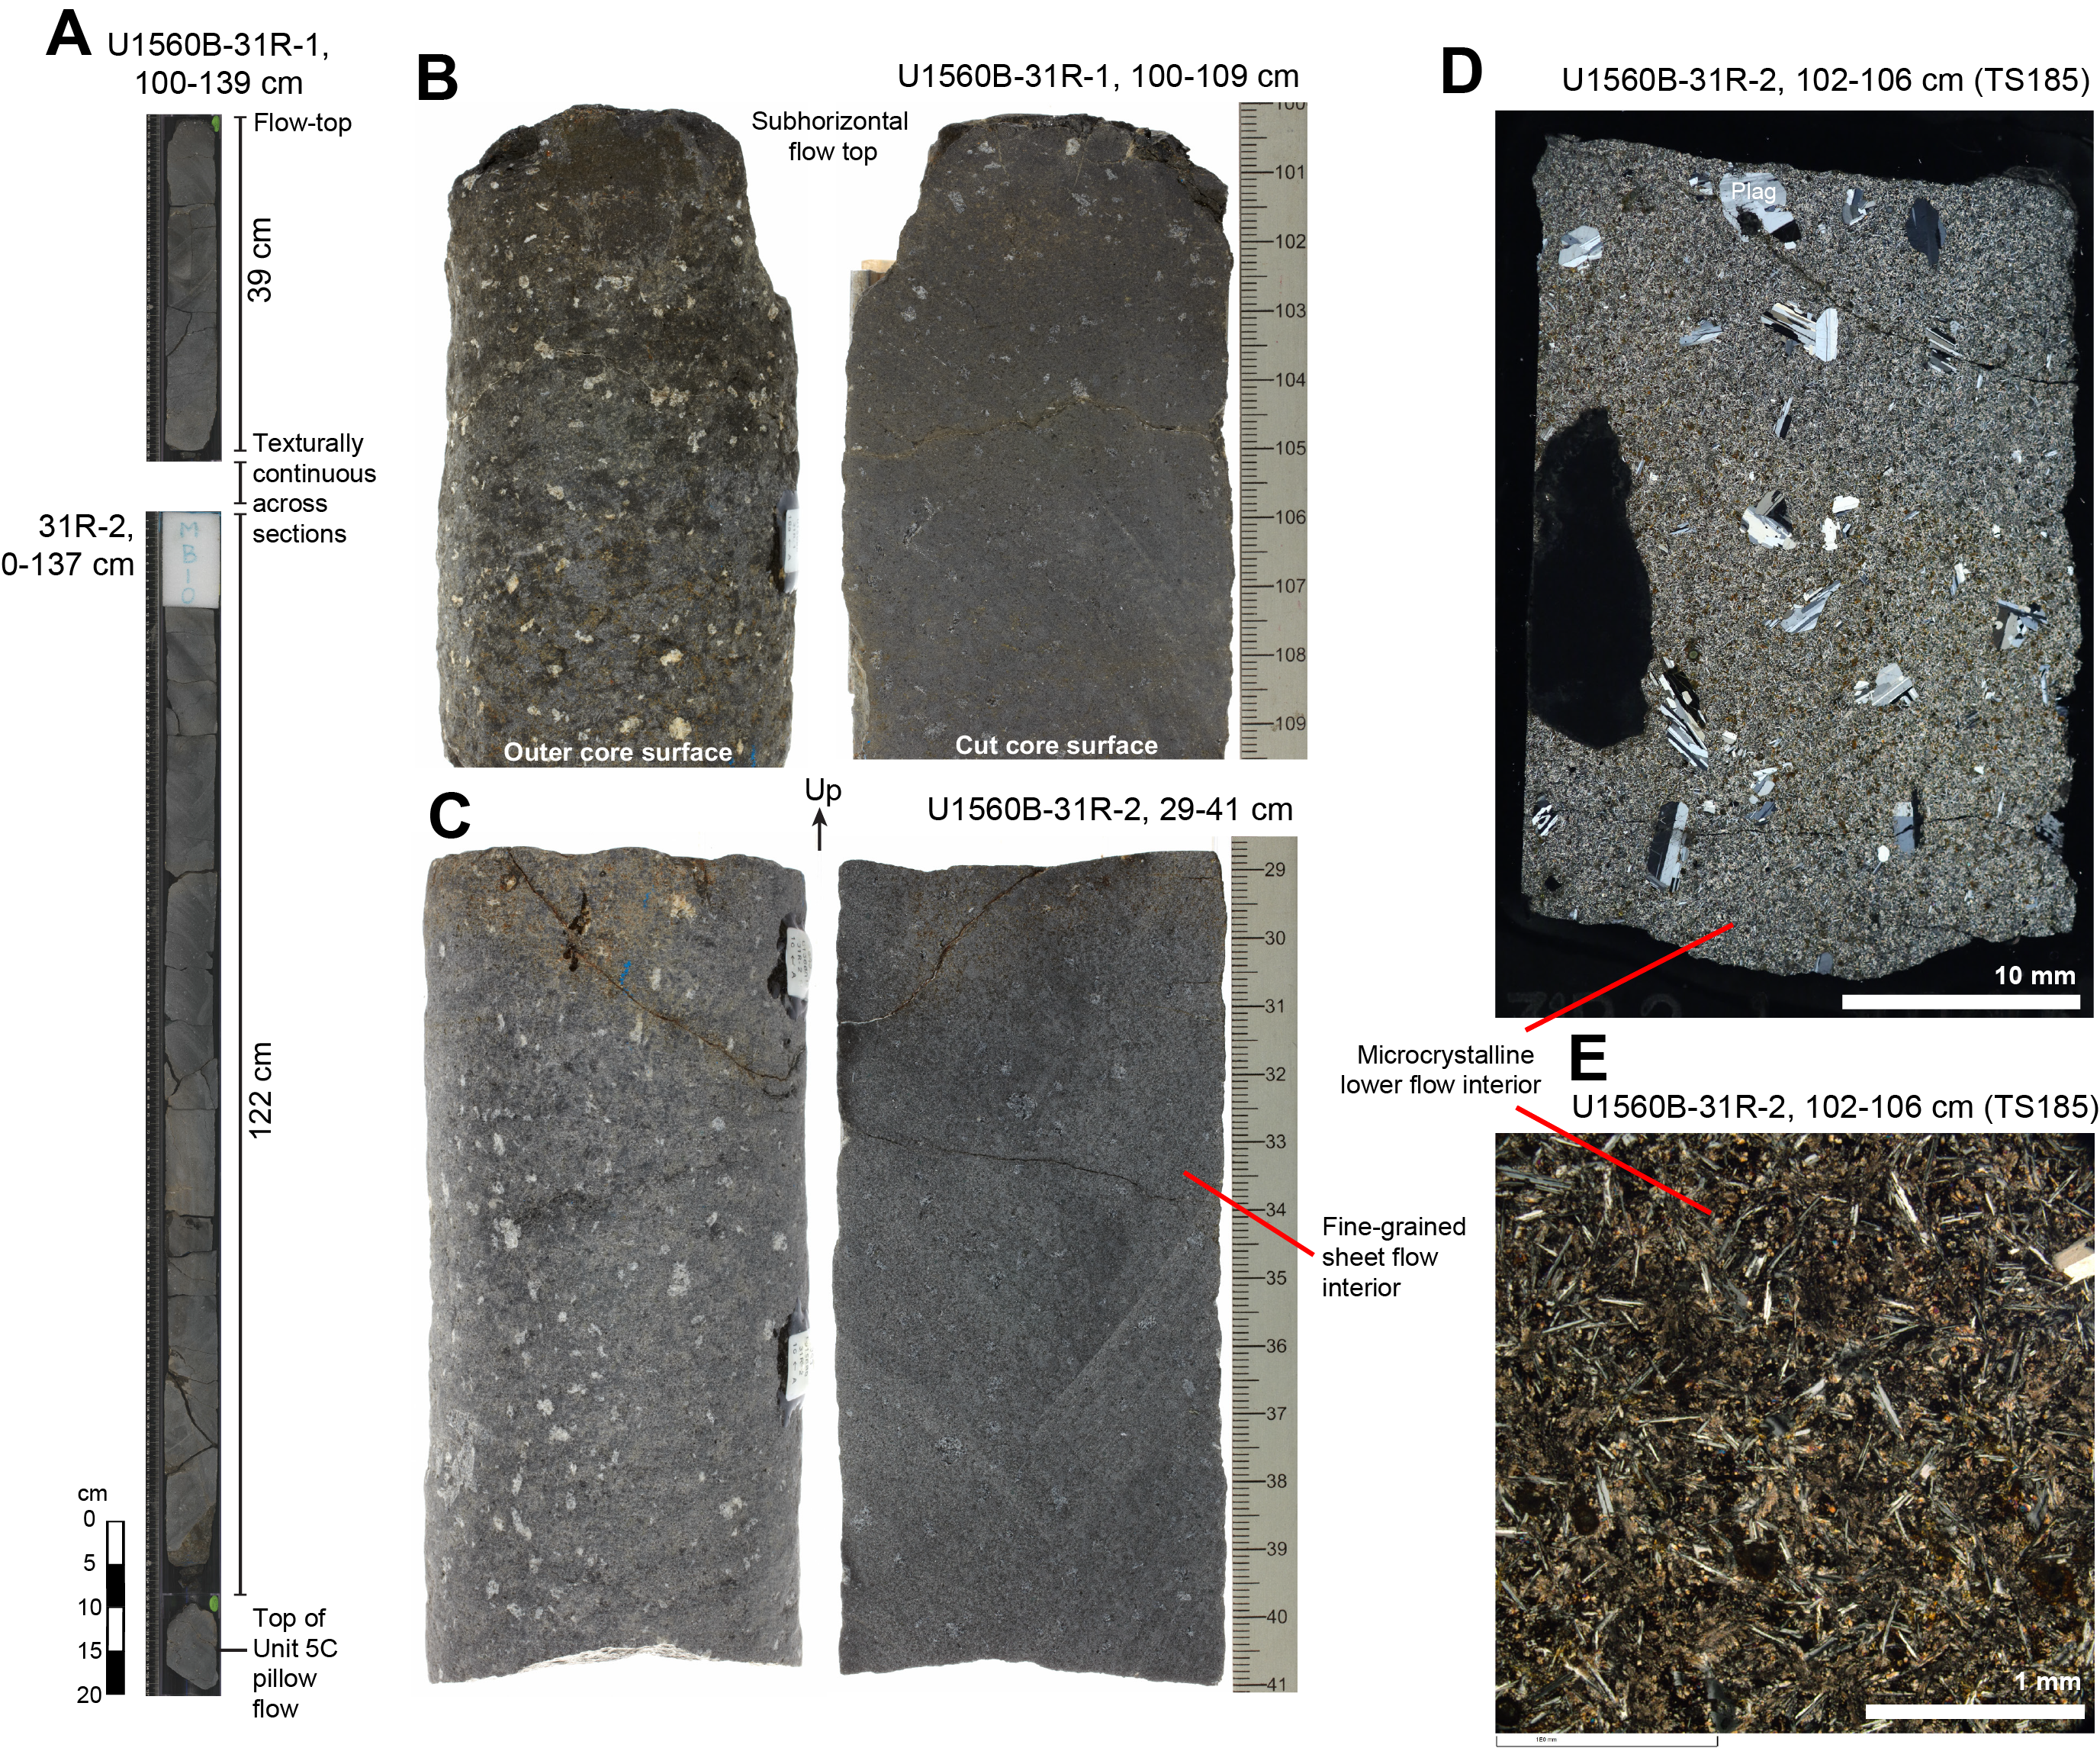
Figure F23. Single sheet flow volcanic Subunit 5B.
Subunit 5C is the thickest volcanic subunit in Hole U1560B, with a thickness between 40.3 and 44.7 m. This unit has a similar lithology to Subunit 5A, moderately plagioclase-olivine-phyric pillow lavas, generally with a cryptocrystalline to microcrystalline groundmass and high degrees of brown clay alteration (Figure F24). Subunit 5C contains a basaltic breccia with subrounded basalt clasts in a matrix of comminuted and altered basalt (interval 36R-1, 65–67 cm; Figure F24C). The only sediment in the piece is a vein in the wall rock that may be unrelated to the brecciation. The absence of glassy clasts and calcareous sediment matrix in this breccia makes it unique among those recovered during Expedition 393 and suggests it was subseafloor when it formed.
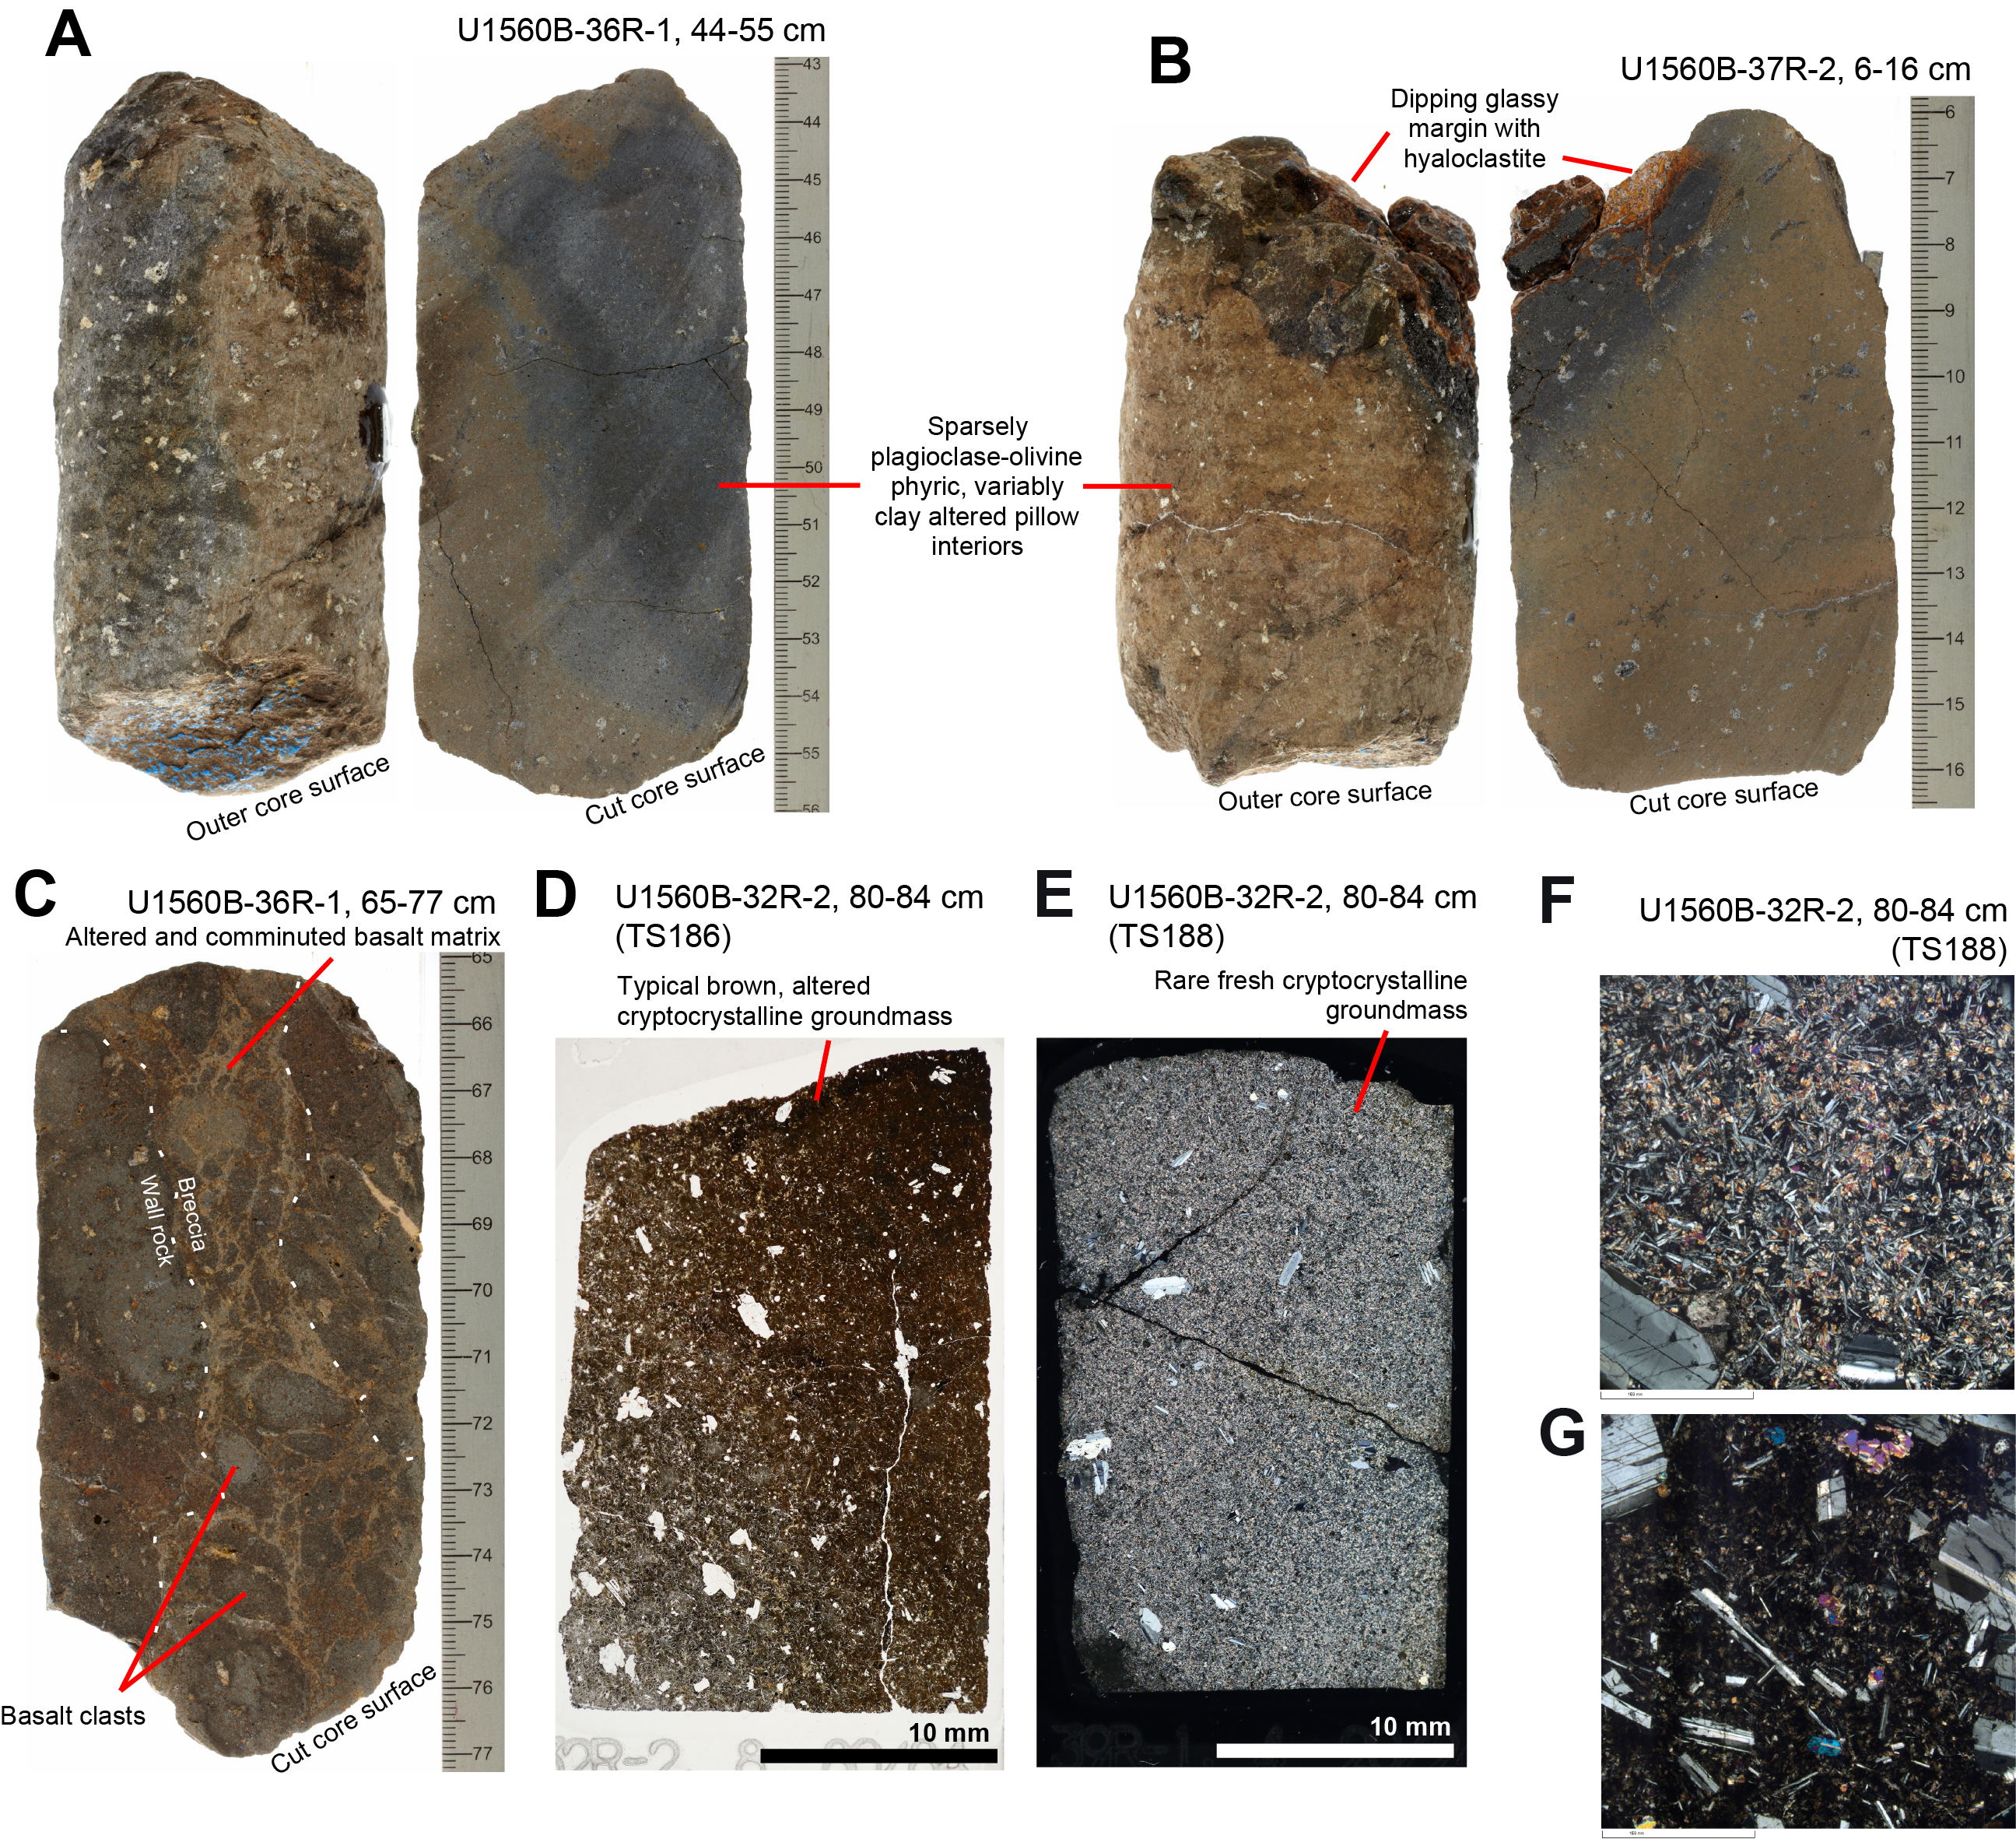
Figure F24. Volcanic Subunit 5C.
5.1.9. Subunit 6A
Subunit 6A consists of highly plagioclase-olivine-clinopyroxene-phyric basalt that is distinctly different from the overlying volcanic units because of its high proportion of phenocrysts (Figure F25). Subunit 6A has an expanded thickness of 1.6 m, with the base of this unit being marked by the breccias in Subunit 6B.
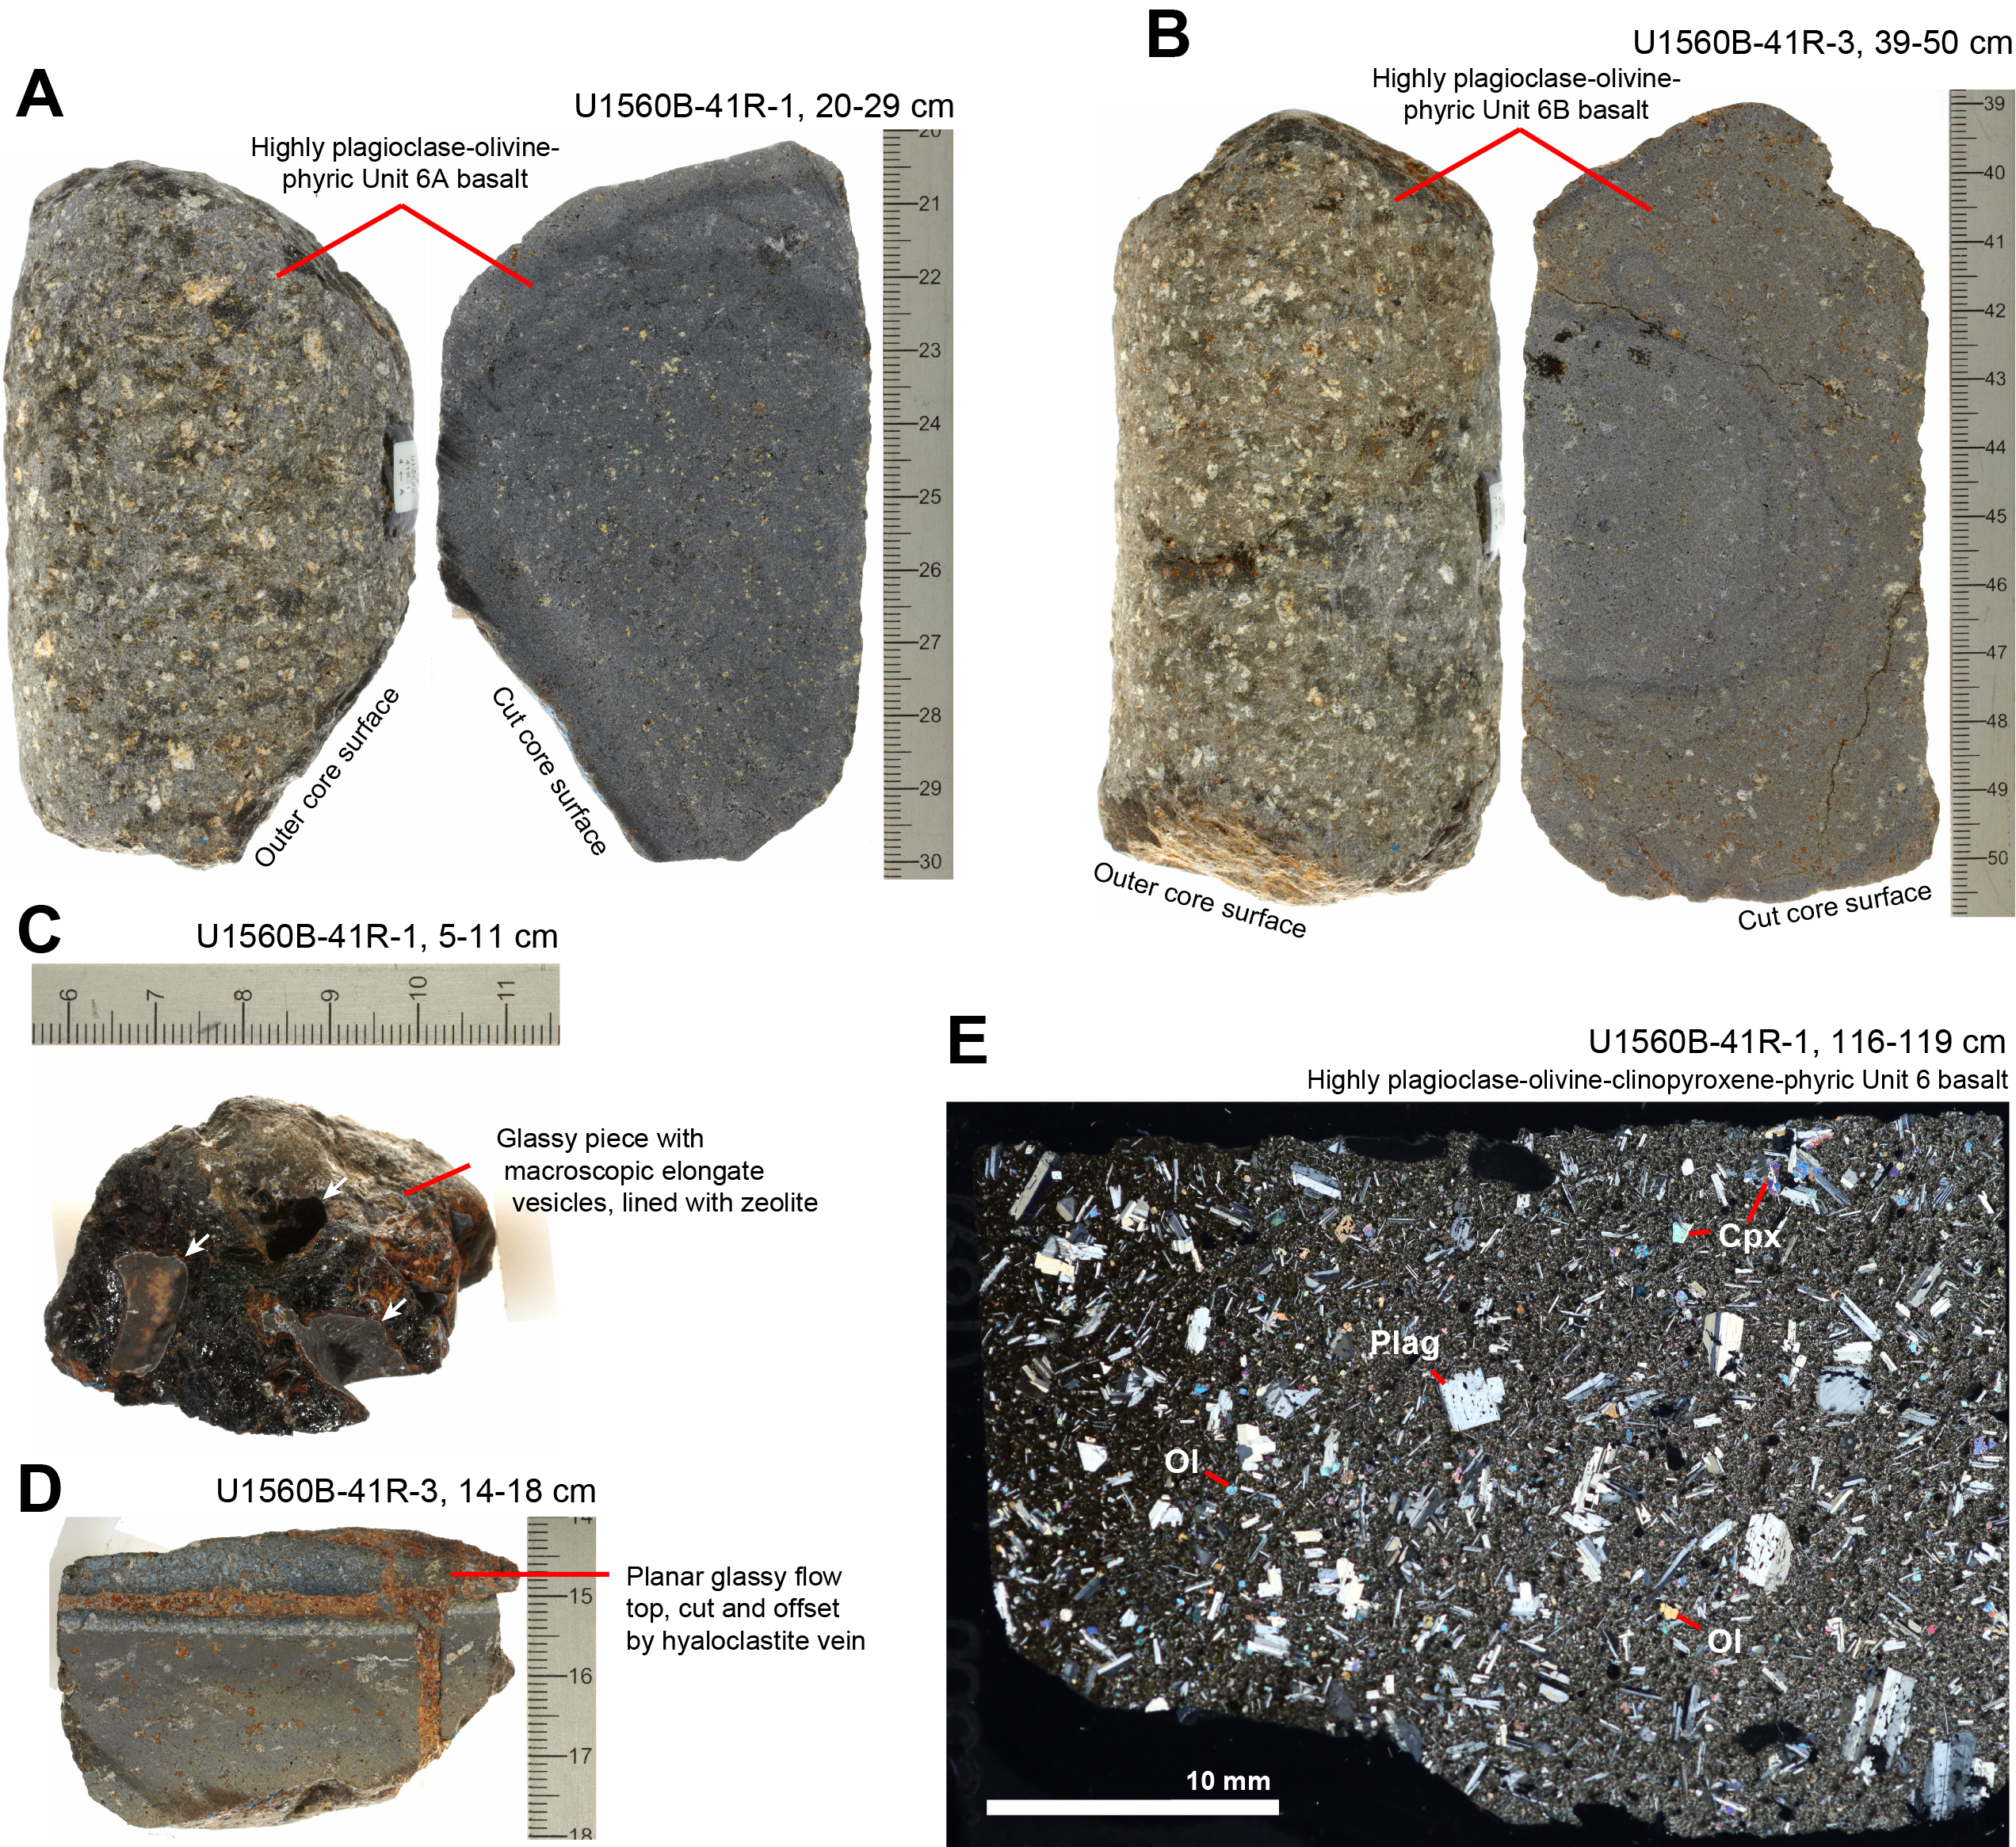
Figure F25. Basalts and glass, volcanic Subunits 6A and 6B.
Up to 10 vol% plagioclase and 5 vol% variably fresh olivine phenocrysts are macroscopically characteristic of all Unit 6 basalts. Thin section observations reveal the additional presence of clinopyroxene, mainly as subophitic glomerocryst components together with plagioclase (Figure F25E). These rocks may represent a relatively fresh protolith for comparison with other highly phyric basalts recovered along the SAT. Glassy margins are relatively uncommon in Unit 6, but almost all that were recovered are remarkably planar, suggesting emplacement as sheet lava flows (Figure F25D). The only exception to this was the nearly entirely glass piece at interval 393-U1560B-41R-1, 5–11 cm, that contains unusually large and elongate vesicles (Figure F25C).
5.1.10. Subunit 6B
Subunit 6B is marked by a well-recovered sedimentary breccia at Section 393-U1560B-41R-1, 73–113 cm (Figure F26). Subunit 6B comprises two of these breccia intervals as well as intervening highly plagioclase-olivine-clinopyroxene-phyric basalt lavas that are lithologically identical to Subunit 6A.
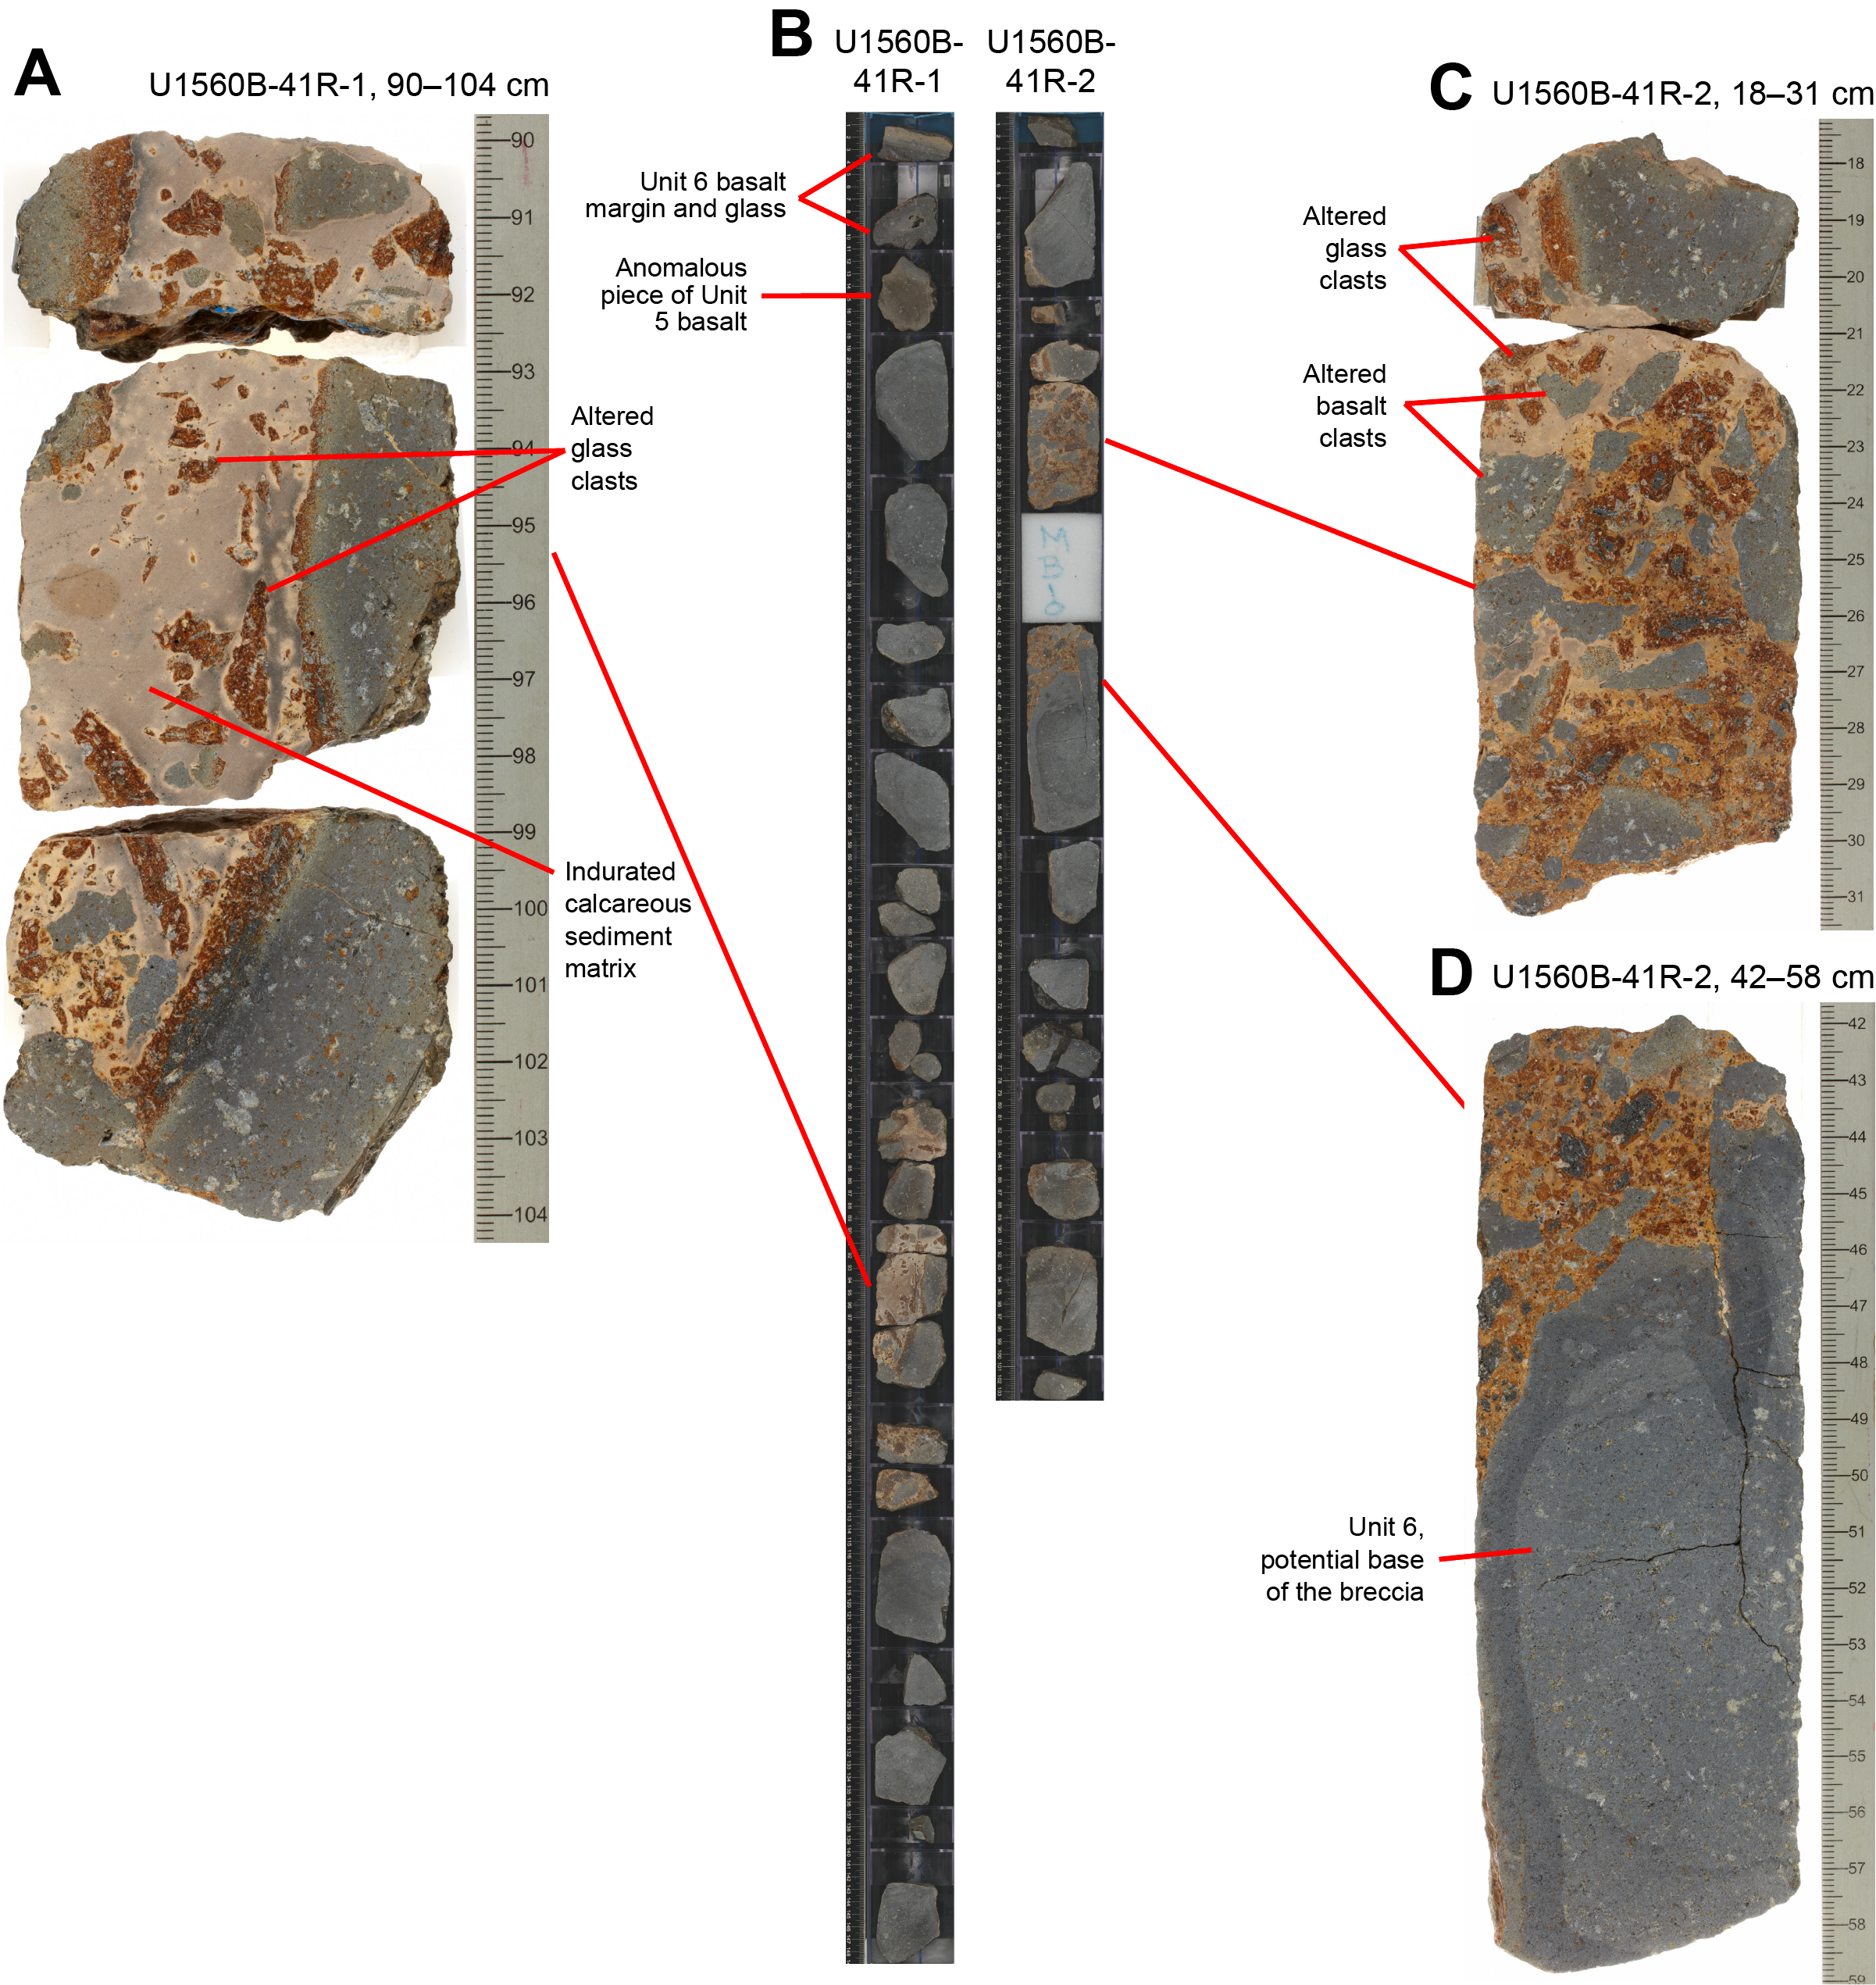
Figure F26. Sedimentary breccias in Subunit 6B.
The upper breccia interval contains mostly spalled and broken altered glassy clasts with lesser amounts of broken phenocryst-rich basalt clasts supported by a pinkish gray (7.5 Y 6/1) matrix of indurated calcareous sediment (Figure F26A). The lower breccia interval contains a mixture of angular, highly plagioclase-olivine-clinopyroxene-phyric Unit 6 basalt clasts with irregular edges and variably altered glassy clasts set in a matrix of indurated calcareous sediment that becomes progressively more hyaloclastite rich toward its base. This contact of breccia with the underlying basalt is apparently well recovered: breccia against a broken and irregular lava surface with no vestige of a glassy margin (Figure F26D). It is also possible, however, that this lower basalt is a large clast, with the breccia below unrecovered.
Hole U1560B ends in Subunit 6B, so the minimum expanded thickness of the subunit is 3.6 m. Applying the Core 393-U1560B-41R expansion factor to the 79 cm combined thickness of recovered sedimentary breccia yields an expanded breccia thickness of 1.15 m within the 3.6 m of recovered and expanded Subunit 6B.
Other sedimentary breccias recovered from the SAT commonly occur at lithologic boundaries between the under- and overlying basalts. This is not the case for the Unit 6 breccias because there are several meters of highly phyric lavas recovered above the sedimentary breccias. It remains a remote possibility that all of the Subunit 6A basalts above the breccias are in fact breccia clasts liberated from their matrix during drilling. This would considerably increase the stratigraphic thickness of the breccia because it would extend into the overlying Core 393-U1560B-40R. However, there is no macroscopic evidence in the cores to suggest this is the case, except that all the basalt pieces in Unit 6 are all of comparable size (~5–15 cm) to the clasts in breccias recovered along the SAT. Performing a conglomerate test on the primary magnetic remanence directions of oriented pieces in Subunit 6A above and below the breccia may allow this hypothesis to be tested.
5.2. Phenocrysts
Phenocryst assemblages and abundances vary characteristically between volcanic units in Hole U1560B. Phenocryst abundances reduce gradually from Unit 1 to aphyric Unit 3, increase sharply at the Unit 3/4 boundary, and increase again at the Unit 5/6 boundary (Figure F27B). As in Holes U1558D and U1583F, the second major chemostratigraphic unit of the hole has the highest Cr/Ti and is an aphyric basalt among otherwise phyric units. In Hole U1560B, the negative correlation between phenocryst load and Cr/Ti ratio is clearly seen in transitional Subunit 3A (Figure F27B).
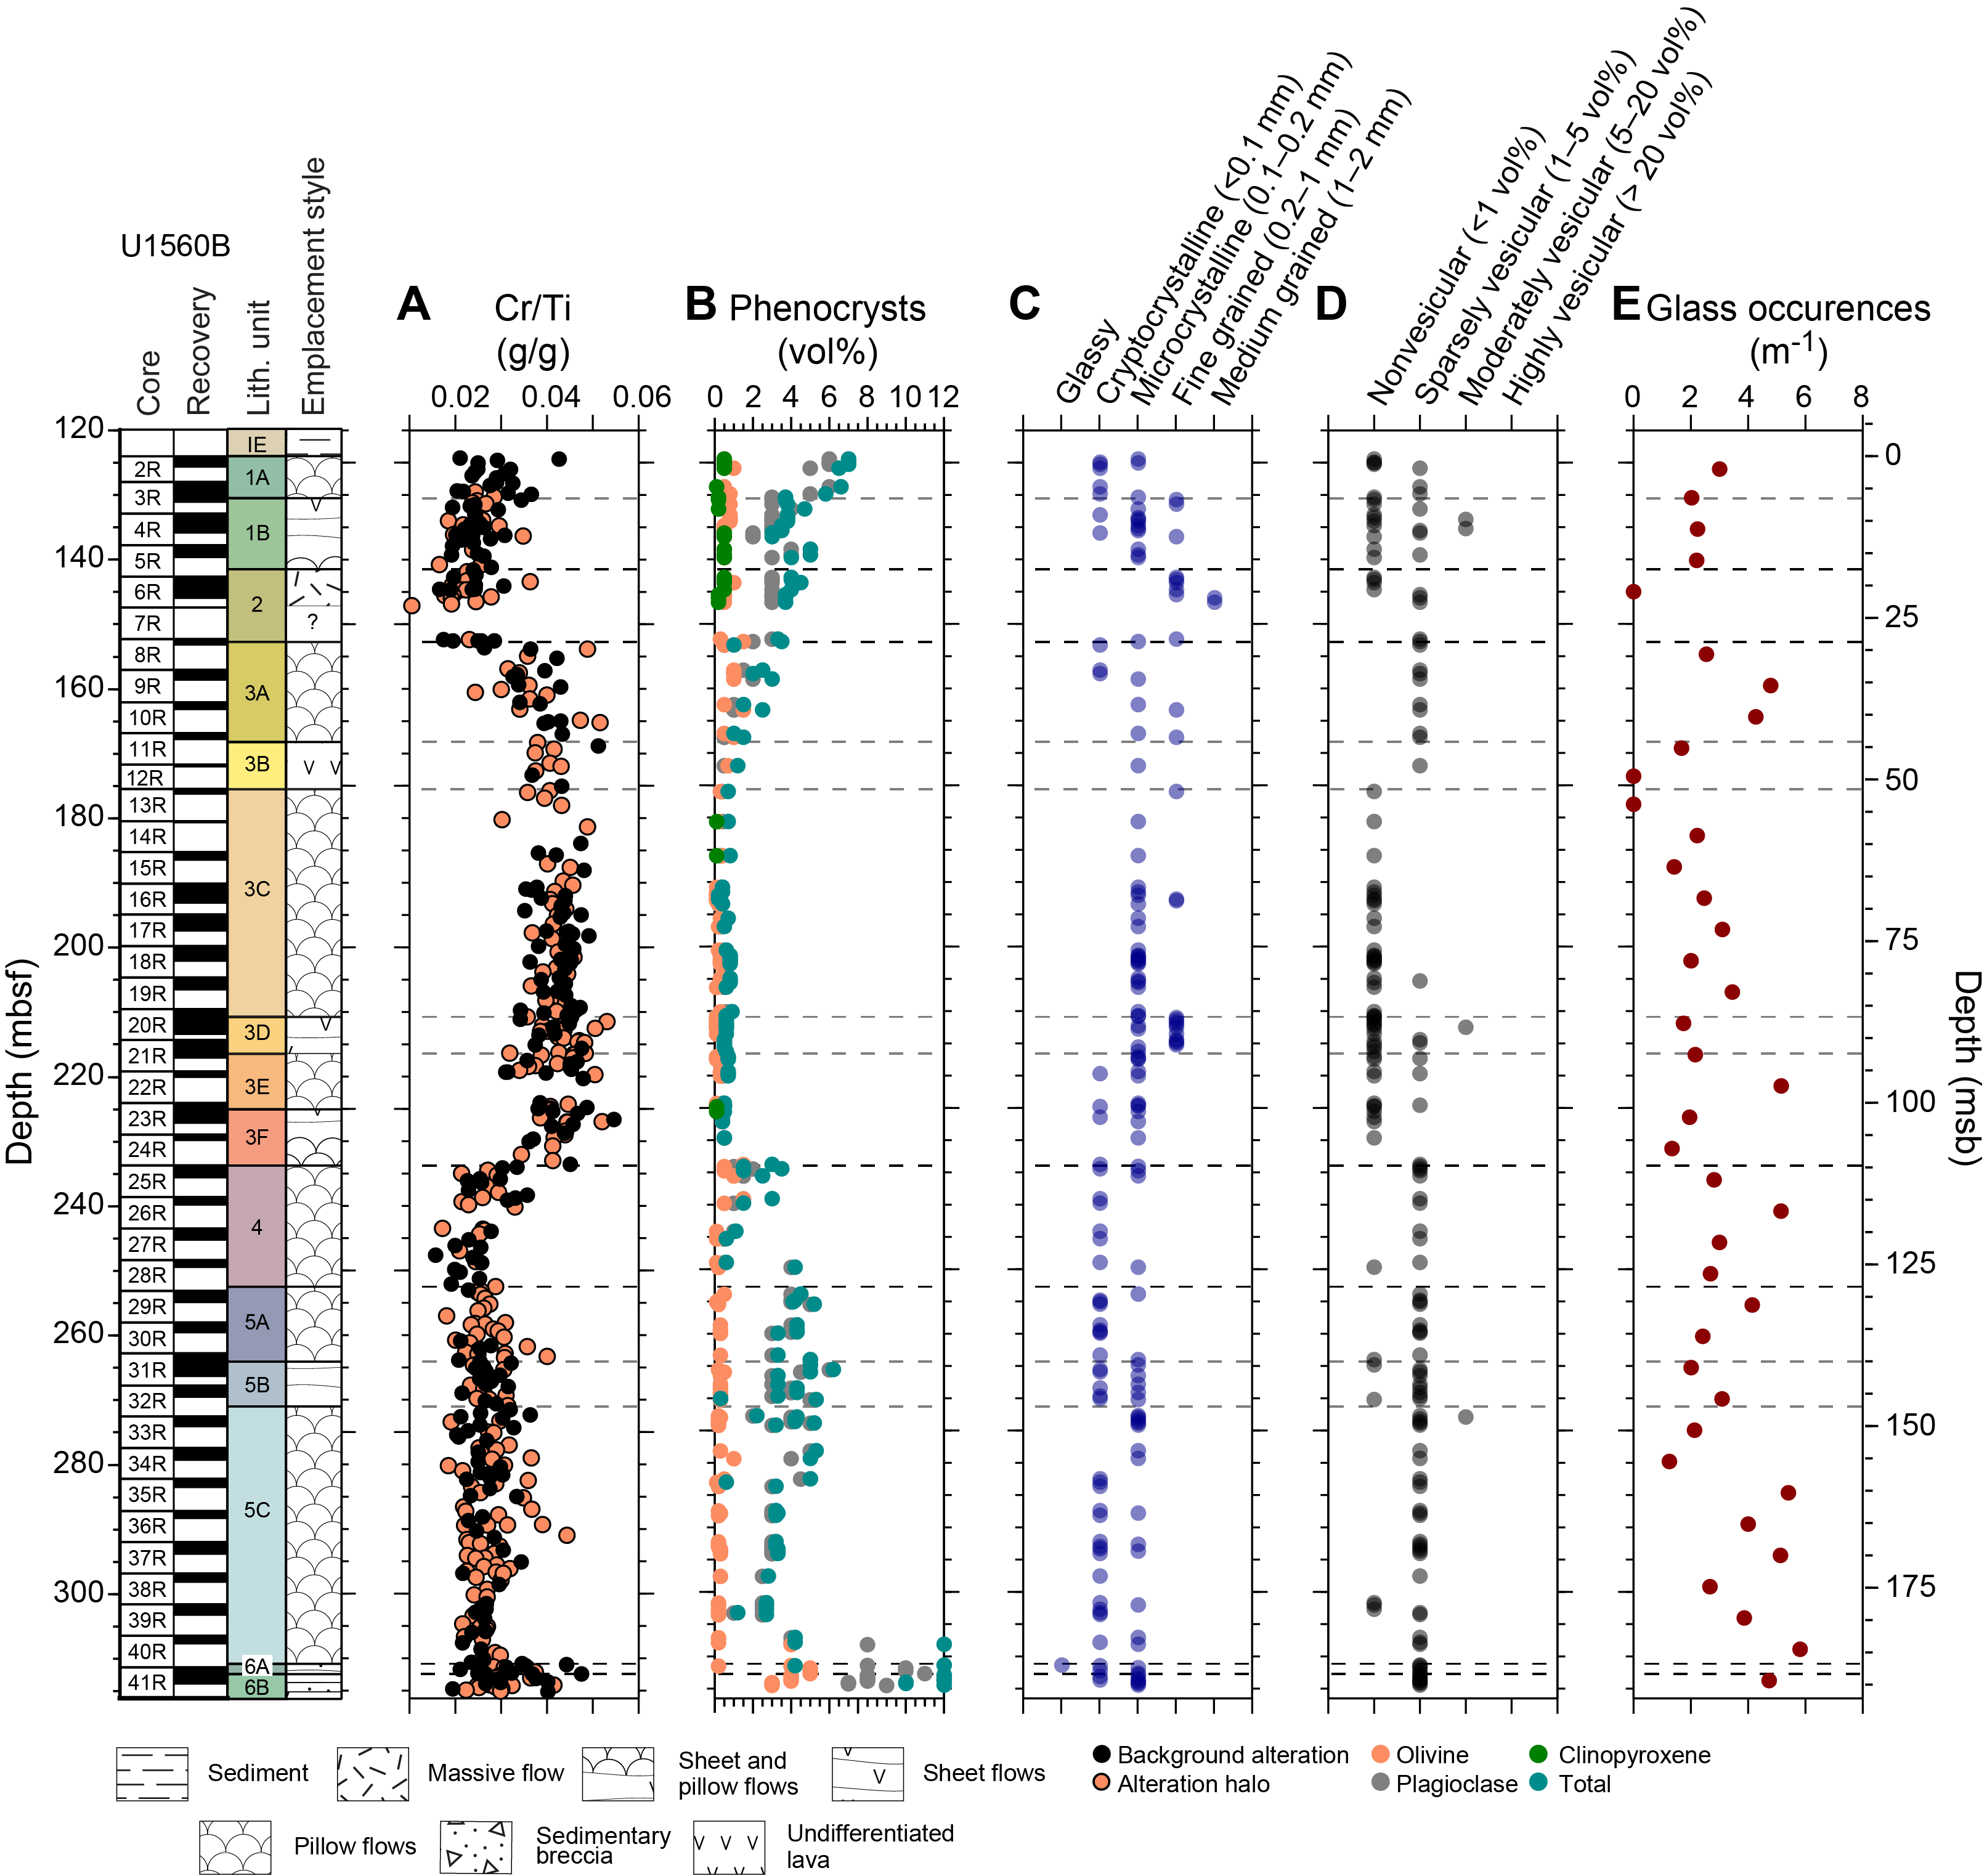
Figure F27. Macroscopic core observations.
5.3. Breccias
Three types of breccias were recovered in Hole U1560B: small pieces of hyaloclastite breccia (e.g., Figure F22B), one example of basaltic breccia with subrounded basalt clasts and no glass or sediment component (Figure F24C), and sedimentary breccias near the bottom of the hole in Subunit 6B (Figure F26). In the Subunit 6B breccias, greater thicknesses than estimated from expanded depths are possible because of the preferential loss of breccia during drilling.
Core 393-U1560B-7R did not recover any rock. However, preliminary wireline logging observations suggest the rock beneath massive flow Unit 2 is different from the lavas within the flow. This leaves open the possibility that breccias or sediments occur at ~147–152 mbsf. This will require careful consideration of the wireline logging and drilling data to confirm.
5.4. High-resolution chemostratigraphy
The cut surfaces of the archive section halves of Hole U1560B were measured at 496 locations by pXRF. These measurements were made on core surfaces with background levels of alteration, selected from the most visibly fresh rock present, alteration halos around veins or flow margins, breccia clasts, and breccia matrix with variable amounts of sediment and altered glass. This allows both primary igneous compositions and chemical perturbations by hydrothermal alteration to be considered downhole. Of the 496 locations measured, 239 locations were from the background areas, 246 locations were from undifferentiated alteration halos, and 11 locations were from breccia matrix (Table T8).
5.4.1. Variation with depth
Figure F28 shows variation in key major element oxides and trace elements with depth in Hole U1560B, both measured by pXRF on split-core surfaces (Table T8) and by inductively coupled plasma–atomic emission spectroscopy (ICP-AES) on powdered whole-rock samples (Table T36). Only analyses of basalts, including breccia clasts, are plotted on the figure.
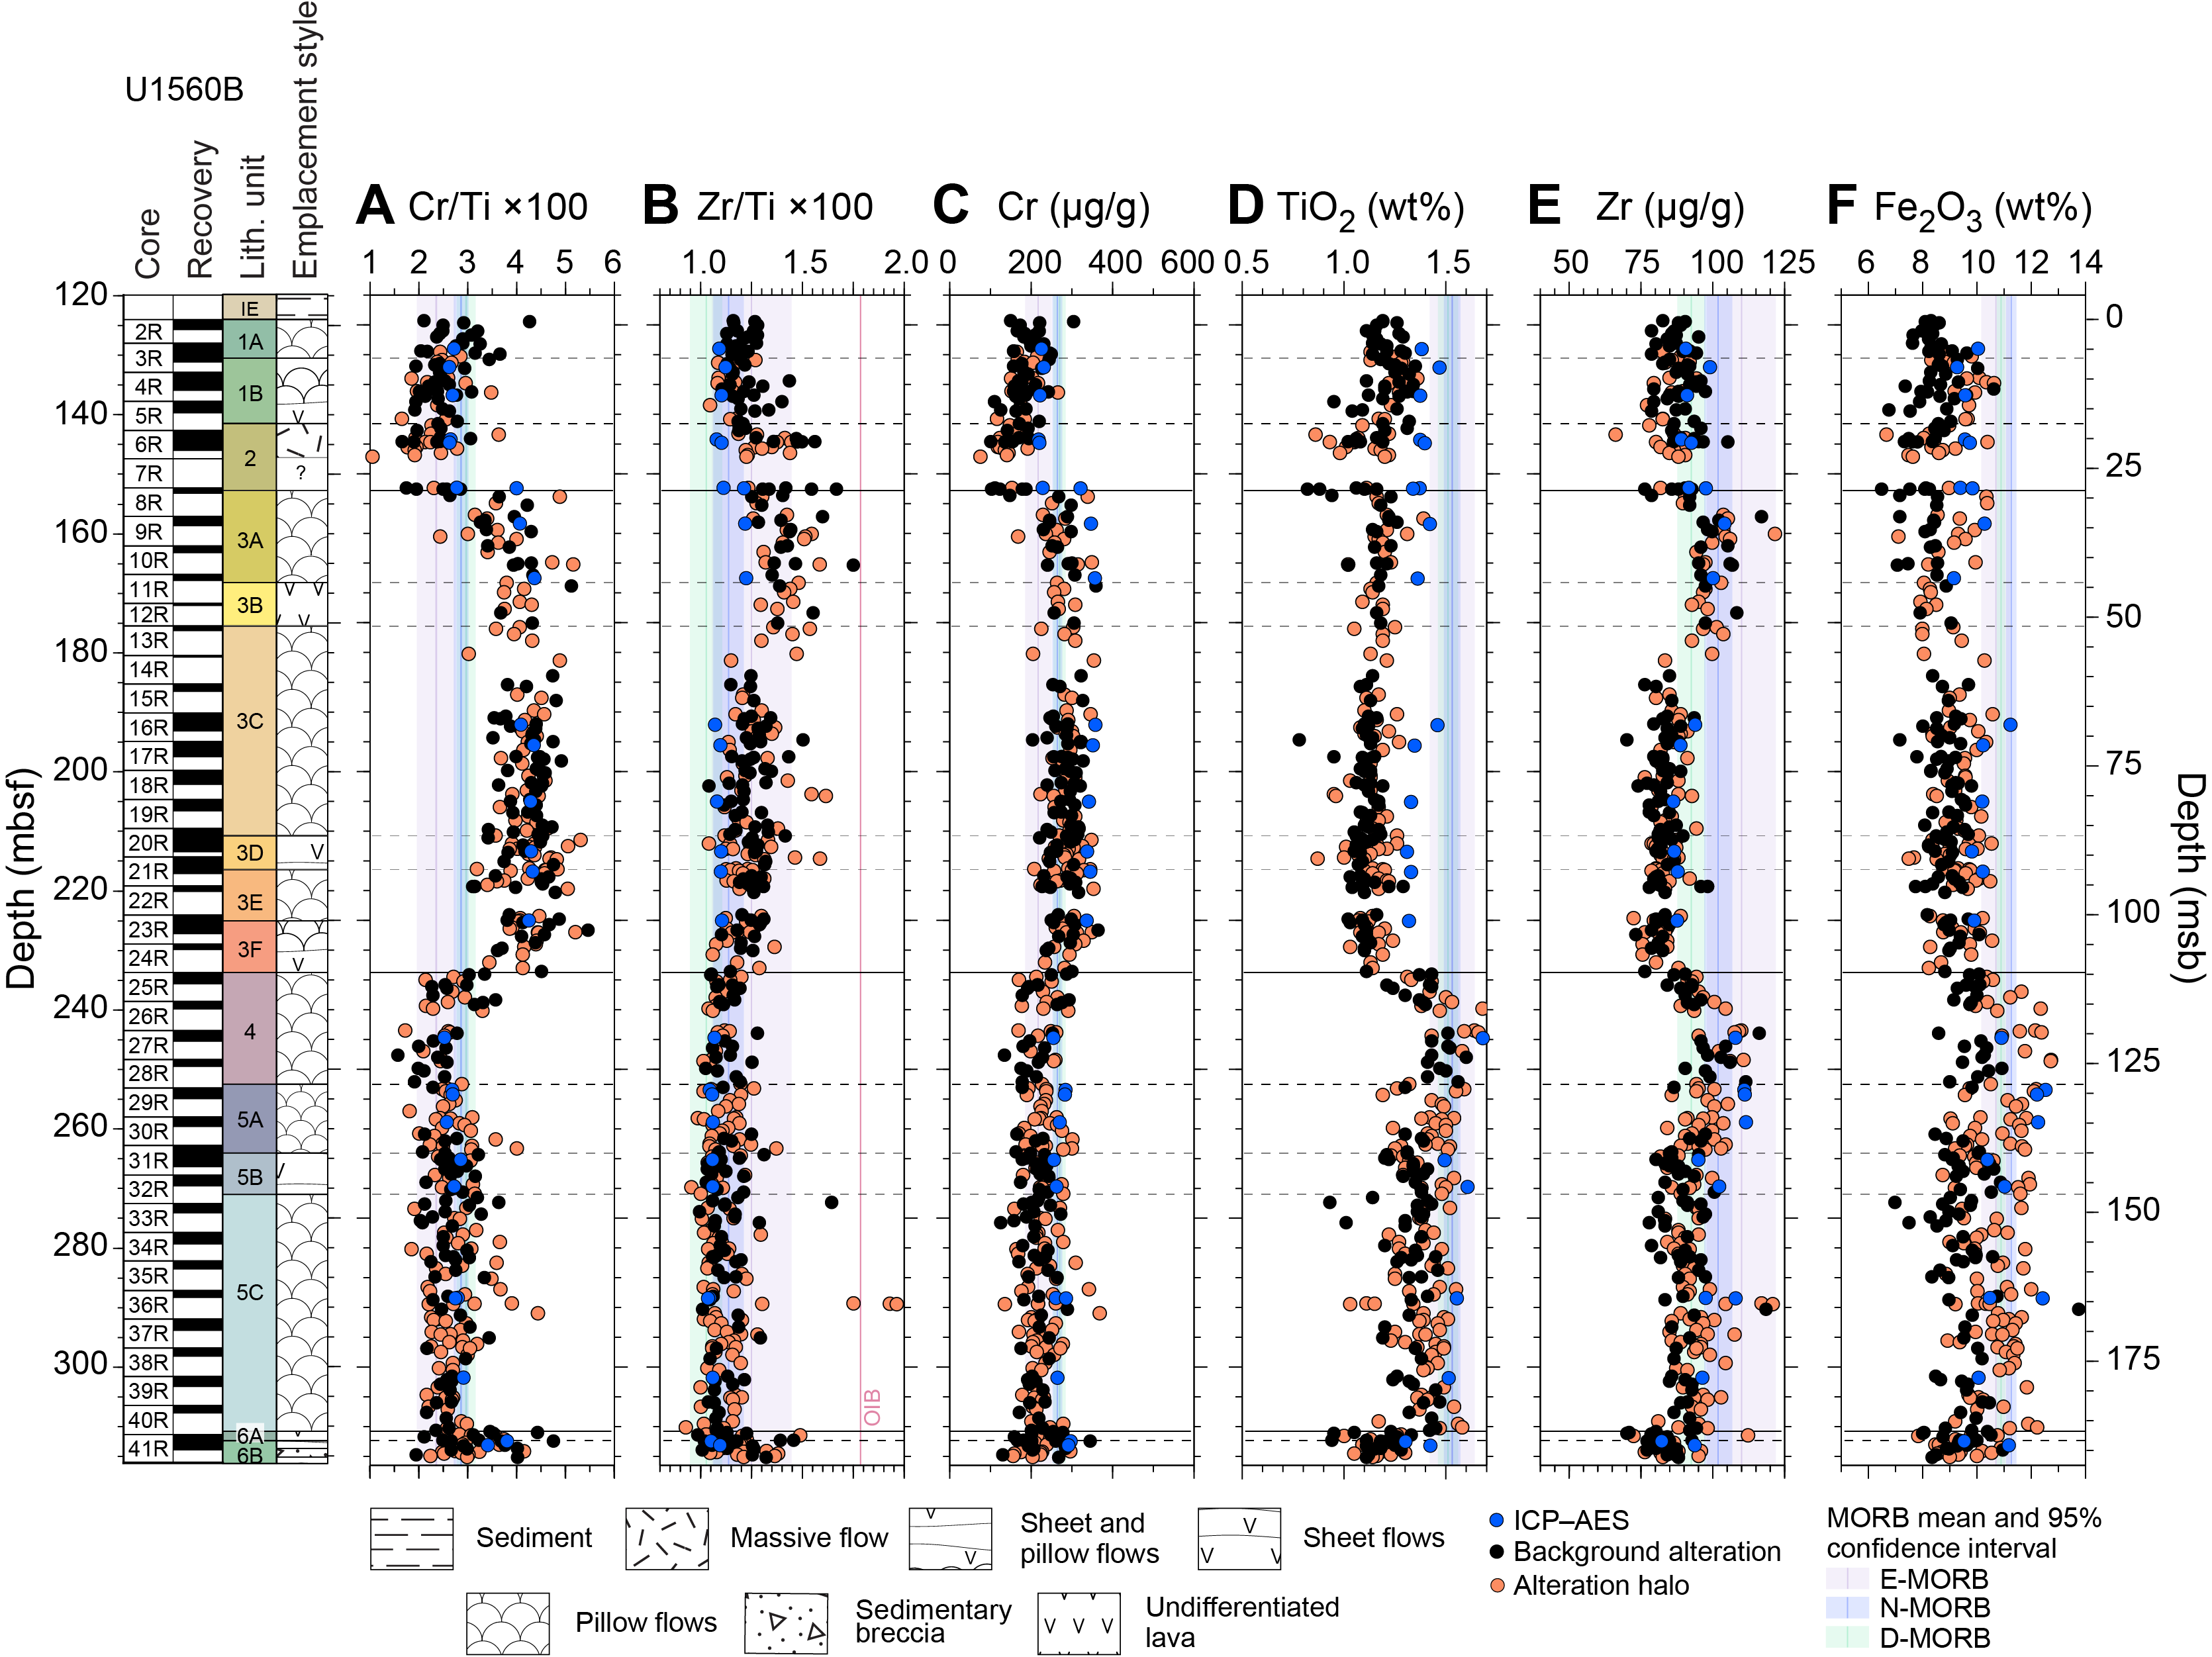
Figure F28. Major and trace element concentrations.
The volcanic rocks at Site U1560 are divided into four main chemostratigraphic groups (solid lines in Figure F28), with the transitions between each group at the tops of Units 3, 4, and 6. These chemical boundaries correspond well with the lithologic changes documented in the previous sections (Figures F27, F28).
Unit 6 has scattered but high Cr/Ti, suggesting it may be less evolved than the other units. This scattering in core surface composition measured by pXRF is typical of highly phyric lavas along the SAT because of the ~1 cm2 analytical footprint of the instrument (Figure F25). Unit 6 also has Zr/Ti scattered toward higher values in the pXRF data, but comparison with whole-rock ICP-AES results suggests this may be an artifact related to the abundance of phenocrysts in this unit (see Basement in Geochemistry).
Unit 5 evolved to progressively higher Ti and Zr and lower Cr/Ti over the course of its eruption, culminating in the relatively high Ti-Zr Unit 4 lavas, which have the highest TiO2 concentrations measured during Expedition 393. These high Ti-Zr contents and associated low Cr/Ti ratios reverse their trend in the middle of Unit 4 toward less evolved compositions linearly over ~25 m. This transition is accompanied by a reduction in phenocryst abundance and vesicularity at the Unit 4/3 boundary.
Unit 3 has the highest Cr and lowest Zr and Ti in Hole U1560B, suggesting it is the least evolved, with Cr/Ti ratios also elevated above average mid-ocean-ridge basalt (MORB) compositions (Figure F28A). A step in Zr in Unit 3 is not clearly paralleled by any other elements, resulting in a step in Zr/Ti ratios to E-MORB or higher values.
The massive flow Unit 2 and the overlying Unit 1 lavas fall along the same compositional trend toward progressively higher Cr/Ti, less evolved compositions up through these units (Figure F28A). The two fine-grained basalt pieces at the top of Section 393-U1560B-8R-1 (Figure F18C), which based on their lithology are thought to derive from the Unit 2 massive flow, were measured repeatedly and have compositions consistent with Unit 2 but not with Unit 3. Whether these pieces caved in from above or were drilled from the Core 8R depth is presently open and discussed in Unit 2.
Most Unit 1–5 Zr/Ti ratios in Hole U1560B vary within the range of N-MORB to E-MORB. The most significant steps occur from Unit 6 to Unit 5 and from Subunit 3C to Subunit 3B, which warrants further investigation with regard to parental melt composition and the effects of different fractionating phases on Zr/Ti ratios.
5.5. Summary
Site U1560 targeted ~15.1 Ma upper oceanic crust along the SAT and was drilled during Expeditions 395E and 393. Holes U1560A–U1560C all recovered volcanic basement, but only Hole U1560B penetrated deeply into basement, reaching the sediment/basement interface at 124.0 mbsf, advancing a further 192.2 m to 316.2 mbsf, and recovering ~75 m of basalt, for an average recovery of 39% (Figure F7; Table T6). This recovery was generally sufficient for unit boundaries, lava types, and volcanic emplacement styles to be determined with confidence throughout most of the hole, but the extent of sedimentary breccias at the bottom of the hole and the rock type between 147 and 153 mbsf, where no core was recovered, remain uncertain. Some clarification may come from analysis of drilling and wireline logging information and paleomagnetic conglomerate tests.
Hole U1560B recovered one main volcanic sequence composed of six main volcanic units. Unit 1 underlies basal sedimentary Subunit IE and consists of sparsely to moderately plagioclase-olivine-phyric pillow lavas with some intervening sheet flows and interpillow sediments near the interface. Unit 2 is a sparsely plagioclase-olivine-augite-phyric massive flow, with a fine- to medium-grained interior and a thickness between 6 and 11 m. Preliminary operational, wireline logging, and paleomagnetic evidence suggest that the Unit 2 flow is closer to 6 m thick and that it overlies a sedimentary or breccia unit representing a volcanic hiatus that was not recognizable from core description alone (see Basement in Physical properties and downhole measurements and Basement in Paleomagnetism).
Unit 3 consists mostly of pillow lavas with phenocryst abundances that grade from sparsely phyric to aphyric down through the upper unit. Unit 3 is also the least evolved unit in Hole U1560B in terms of Cr/Ti ratio. Unit 4 consists of sparsely plagioclase-olivine-phyric basalt pillow lavas with a composition transitional between Units 3 and 5. Subunits 5A and 5C consist of moderately to sparsely plagioclase-olivine-phyric pillow lavas, separated by two to three sheet lava flows (Subunit 5B). Basalts in Unit 6 are highly plagioclase-olivine-clinopyroxene-phyric and may represent a relatively fresh protolith for comparison with other more altered highly phyric basalts recovered at older sites along the SAT. Hole U1560B ends in Subunit 6B, which contains highly plagioclase-olivine-clinopyroxene-phyric lavas and two sedimentary breccia intervals of basalt and glass clasts in a matrix of indurated calcareous sediment and hyaloclastite.
Lava composition assessed by pXRF varies significantly downhole, with geochemical boundaries largely corresponding to petrologically defined boundaries (Figures F27, F28). Incompatible element concentrations and Zr/Ti ratios are mostly consistent with an N-MORB-like composition for the lavas at Site U1560, although higher Zr/Ti in Subunits 3A and 3B and Unit 6 nudge toward E-MORB and warrant further investigation. The recurring sequence of chemostratigraphic units with a less evolved, aphyric lava unit that was noted for Sites U1558 and U1583 is also present at Site U1560.
The sedimentary breccias that occur in the lowermost few meters of the hole represent excellent targets for the study of hydrothermal exchange and microbial activity in the deep subsurface, with lithologically similar breccias recovered in both Holes U1558D and U1583F.
Hole U1560B was drilled well with good borehole conditions, allowing for multiple passes of wireline logging tools, which should prove helpful in refining the volcanostratigraphy presented here. The hole penetrated to nearly 200 msb in N-MORB-like ocean crust, has casing and a reentry cone, and ended in a scientifically interesting phenocryst-rich lava unit with two sedimentary breccias recovered over a half-length core. For all these reasons, as well as its comparable age to Hole 1256D in superfast spread crust of the East Pacific Rise, Hole U1560B presents a compelling target for future deepening into the lower oceanic crust.
6. Alteration petrology
The basement rocks recovered from Site U1560 all preserve evidence of reaction with seawater-derived hydrothermal fluids to varying extents. This alteration is manifest as secondary minerals in three main contexts: (1) replacing interstitial mesostasis and glass, (2) replacing groundmass and phenocrysts, and (3) precipitating in open porosity to partially or completely fill fractures and voids to form veins and vesicles. These three manifestations occur in a range of spatial contexts in Site U1560 basement, namely background alteration representing fluid/rock reaction that has pervasively permeated the bulk rock and alteration halos that are related to previous open porosity that has facilitated more extensive fluid/rock reaction (e.g., around veins and vugs or along igneous margins). In addition, the breccias recovered from Site U1560 also record extensive alteration of clasts and matrix and are cemented by secondary minerals. The replacement minerals, styles, and intensity of alteration, along with the secondary minerals precipitated in veins, vesicles, and breccias, provide a record of the hydrothermal alteration taking place in 15 My of crustal aging. This section focuses on Hole U1560B, but similar alteration features are present in the small amounts of igneous rock recovered by XCB coring in Holes U1560A and U1560C.
Overall, Hole U1560B is characterized by low-temperature alteration downhole with changing abundances and types of alteration halos and background alteration that are also accompanied by changes in the secondary minerals precipitating in veins and vesicles (Figure F29).
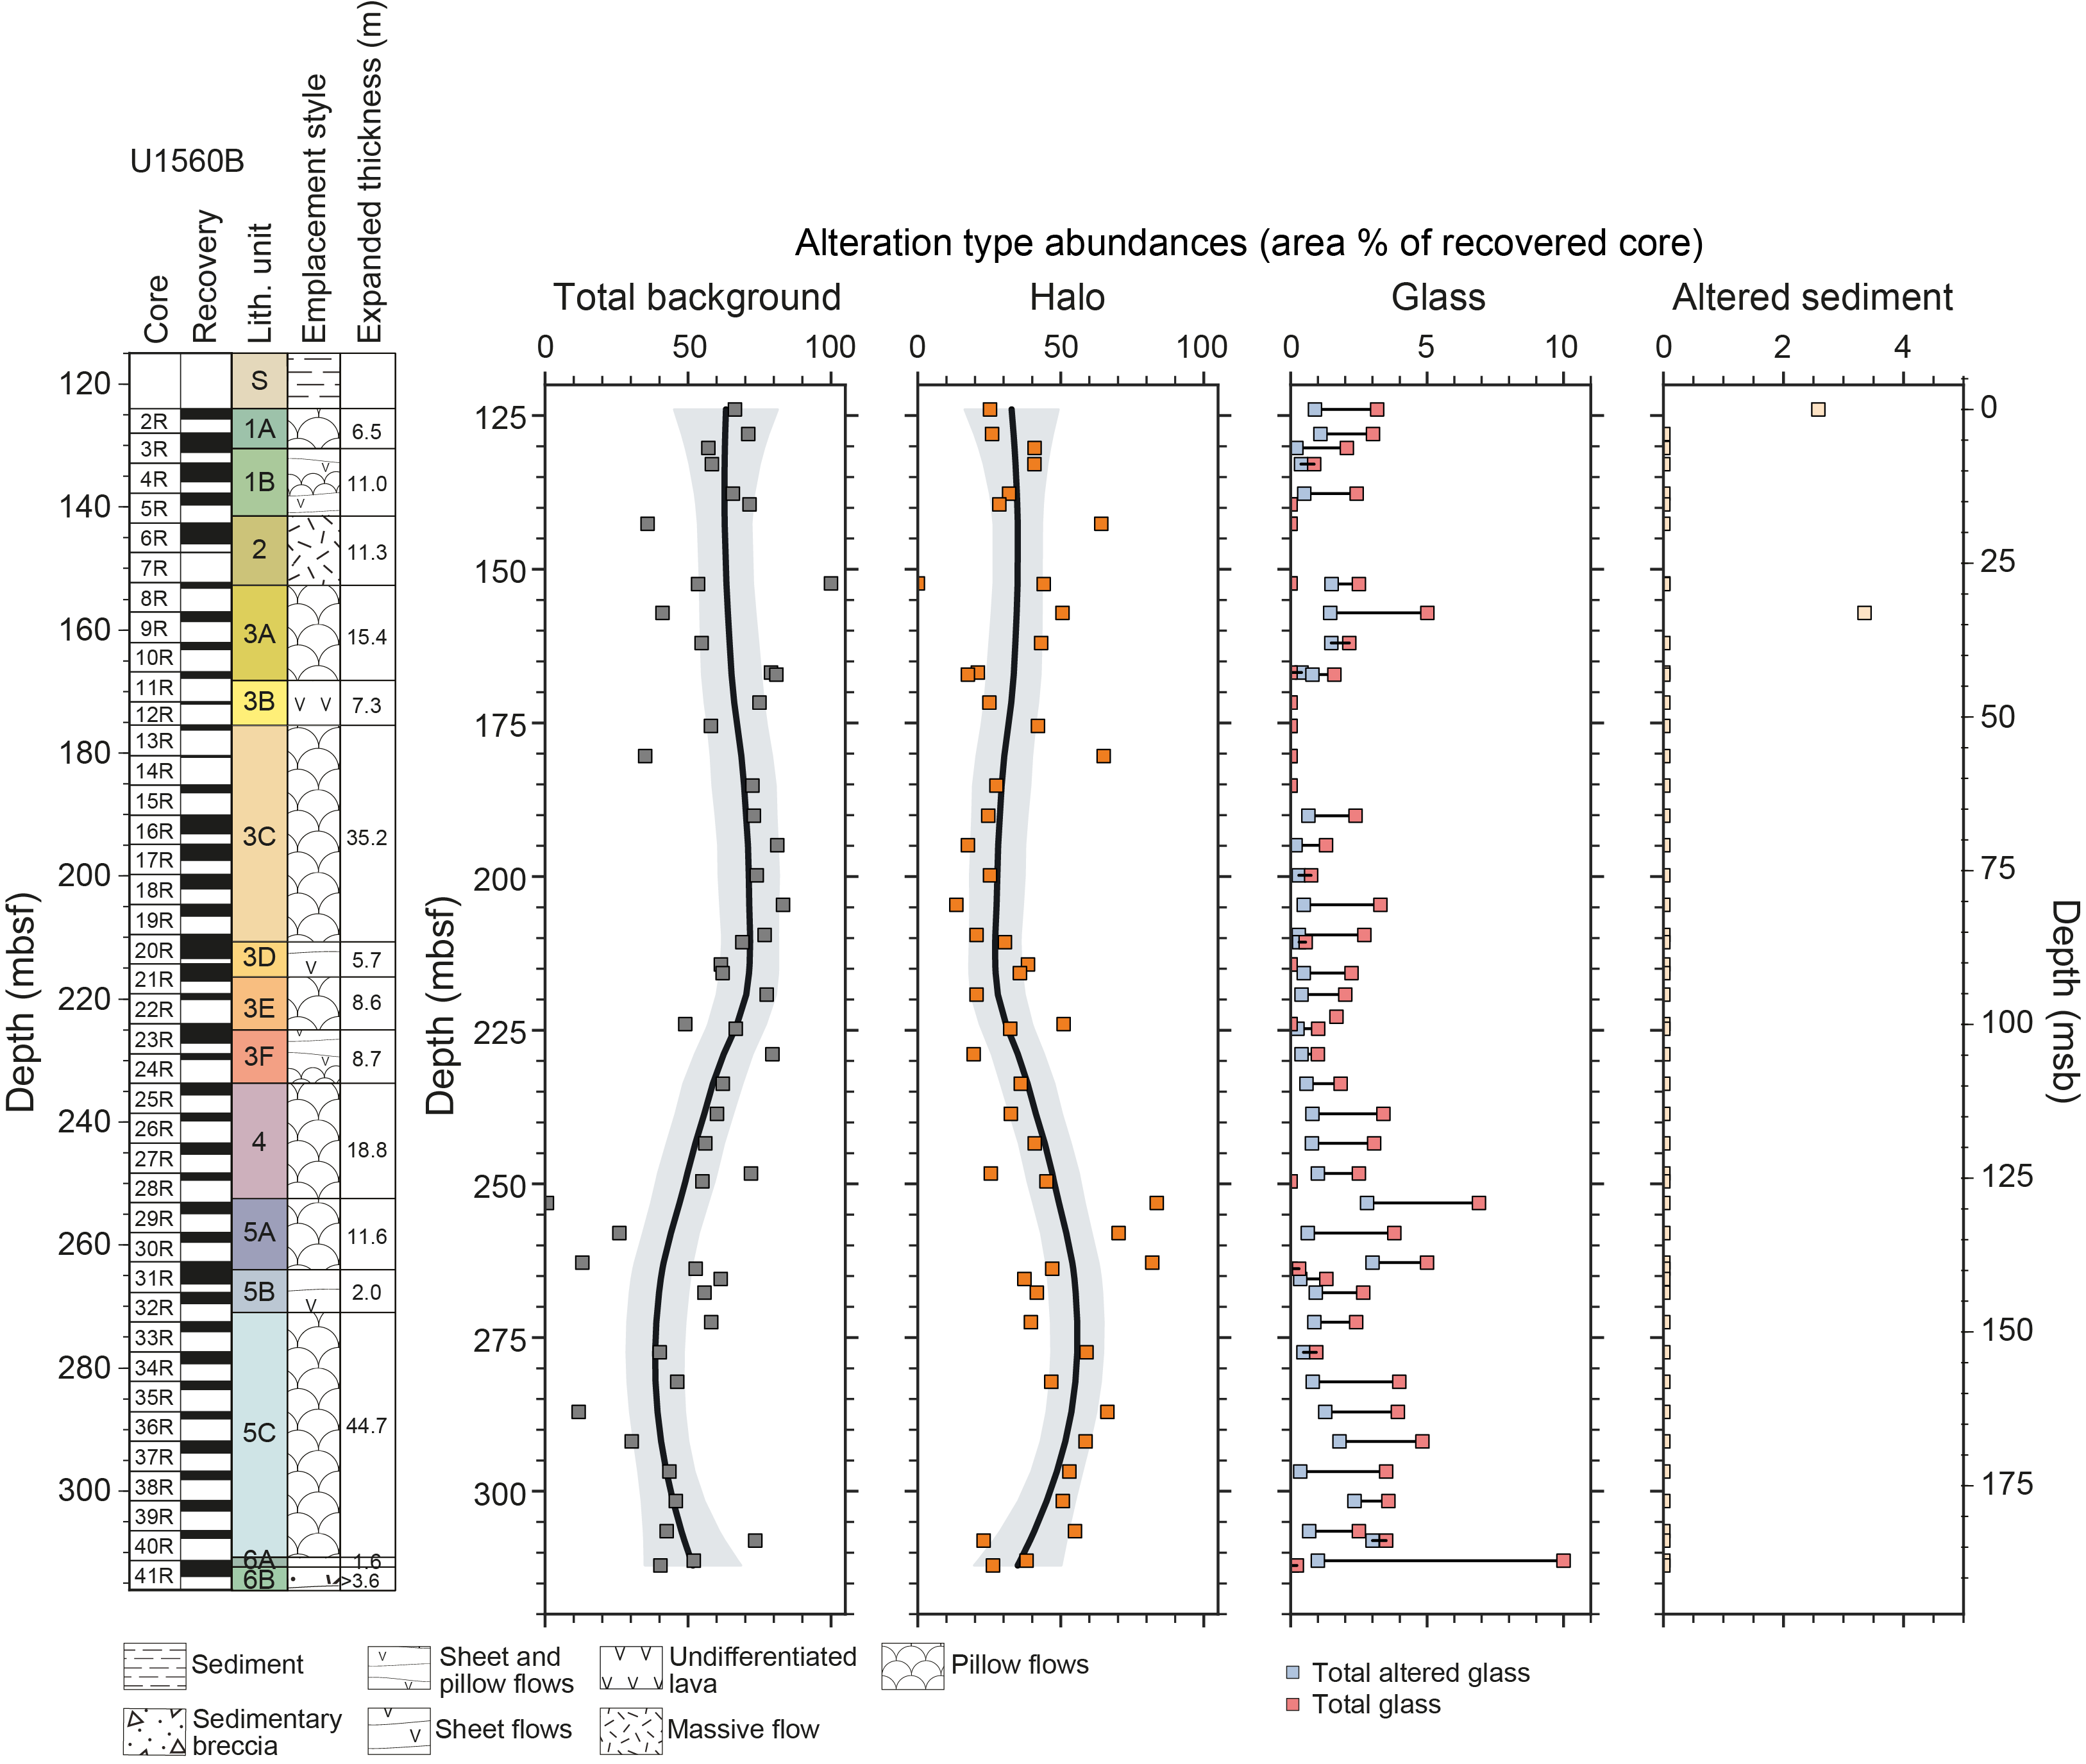
Figure F29. Alteration abundance.
6.1. Alteration of glass
Volcanic glass associated with chilled margins and breccias is present throughout most of Hole U1560B and shows a full spectrum of alteration from fresh to completely altered to clay minerals. On average, the core contains 2.2 vol% glass that is on average 30% altered (Figure F29). In chilled margins, glass is altered to varying degrees by replacement to orange clays (5YR 4/6 yellowish red) (Figure F30). In breccias, glass alters to clays with a range of colors (see Breccia). Sample 393-U1560B-41R-1, 7–11 cm, has large elongate, pipe-like vesicles up to several centimeters long that are all coated with a thin (0.1–0.2 mm) layer of zeolites, but the glass itself remains vitreous.
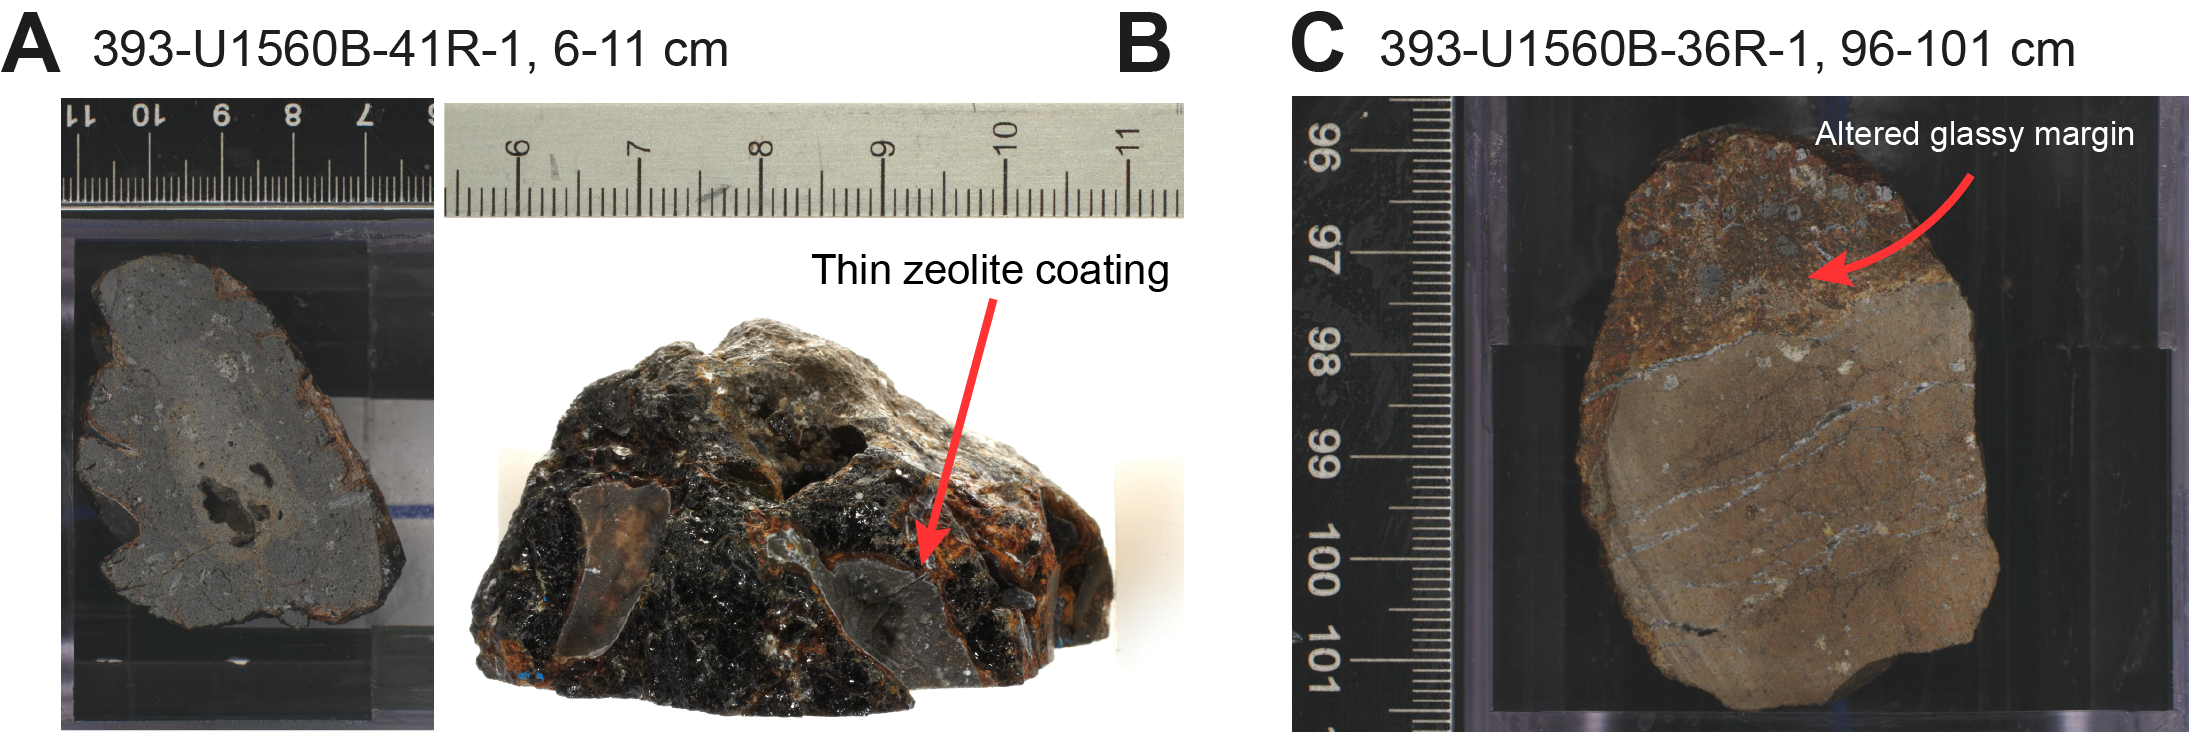
Figure F30. Glass alteration along chilled margins.
6.2. Background alteration
Background alteration is present throughout Hole U1560B and is almost exclusively gray background. Orange speckled background (recognized by the replacement of olivine by clays + Fe oxyhydroxides) is absent from this hole, and mottled gray chilled margin alteration is rare (Figure F31). Background alteration occupies <1%–100% of the area of the cores. Above 180 mbsf, the proportion of background alteration varies between 36% and 100% and is more uniform between 180 and 224 mbsf (13%–36%). Below 224 mbsf, the proportion of background starts to decrease, with the decrease becoming most pronounced below 253.1 mbsf where the proportion in each core also becomes more variable. This more pronounced decrease is broadly consistent with the beginning of Subunit 5A.
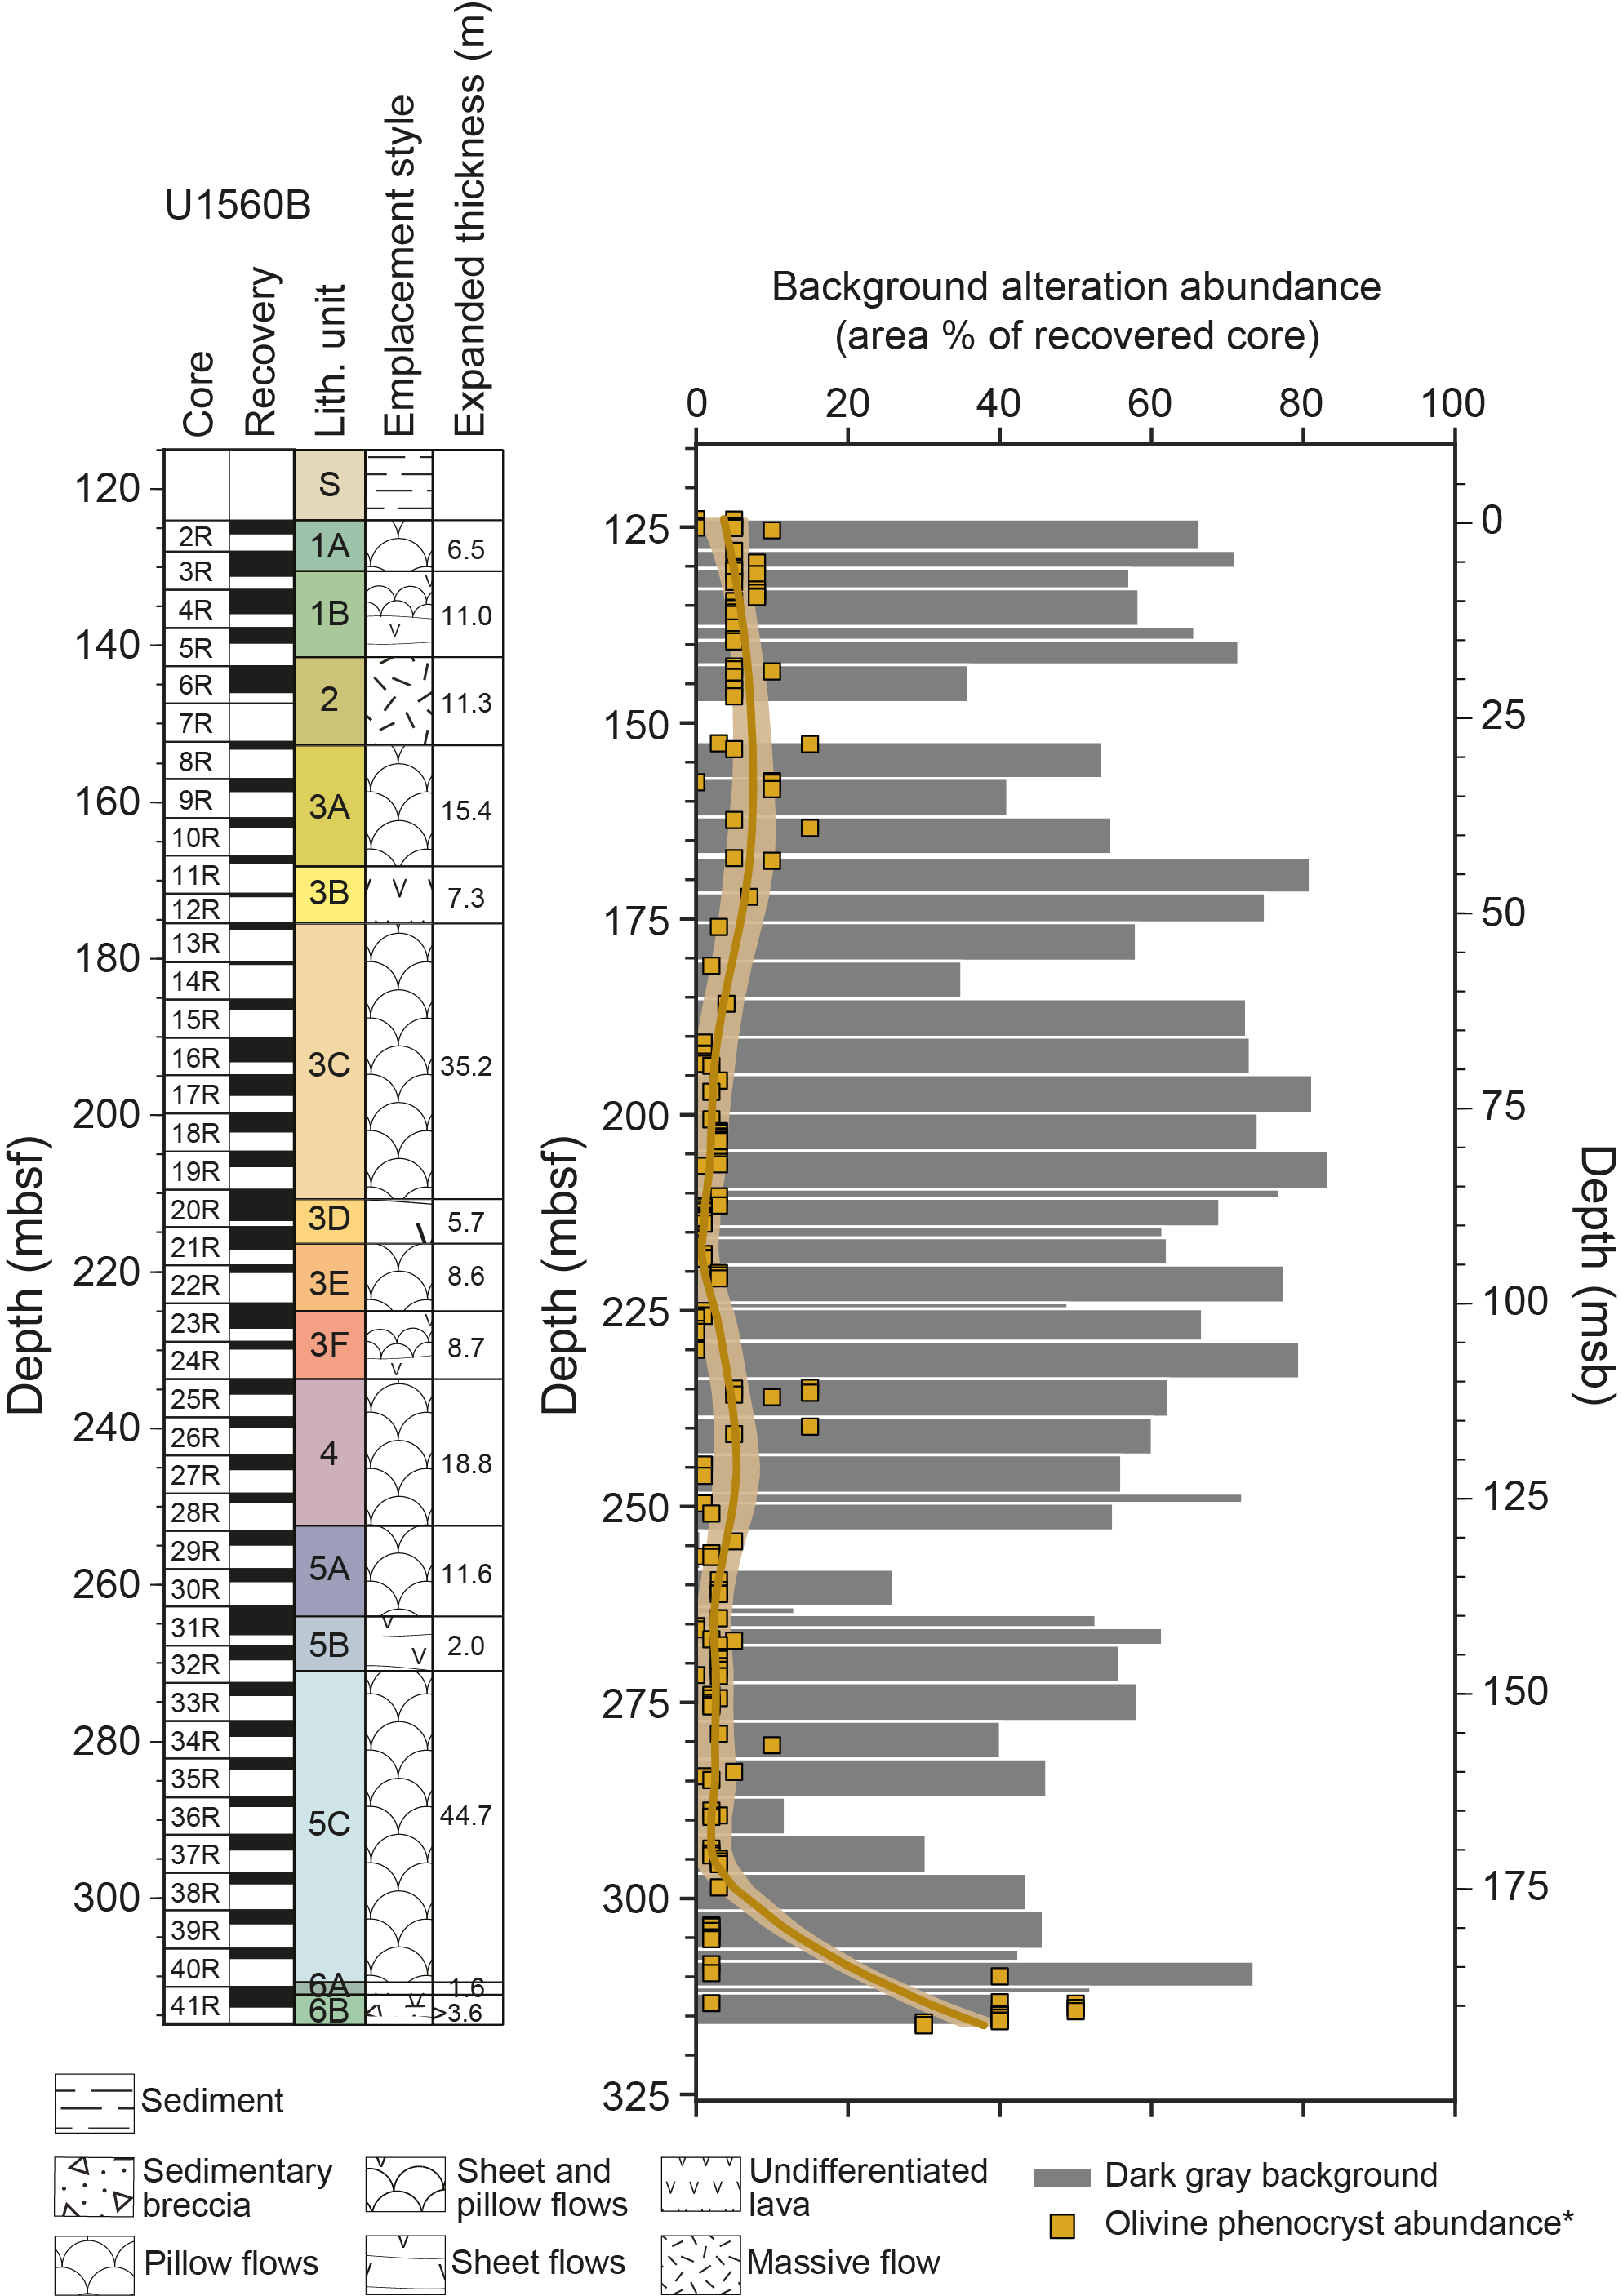
Figure F31. Distribution of background alteration types.
6.2.1. Gray background
Gray background dominates background alteration similar to Sites U1559, U1583, and U1558 and is commonly associated with a very uniform texture and gray color (GLEY 1 5/N) (Figure F32), although there is some variability in the color and texture in the background. Color ranges from gray (GLEY 1 5/N, GLEY 1 6/N, 10YR 5/1, and 2.5Y 5/1) to dark gray (2.5Y 4/1), with the latter mostly occurring between 201 and 225 mbsf, where the dark gray color accompanies patchy brown (clay) alteration (Figure F32). A second interval associated with patchy to mottled background is present between 287 and 307 mbsf, where again there is brown clay mixed through the background. Alteration is primarily through replacement of mesostasis and groundmass, but examples of plagioclase phenocrysts altering to white to creamish clays are present throughout much of the hole. Olivine phenocrysts are variably altered to clays (of varying colors) ± Fe oxyhydroxides. The orange speckled background is not found in Hole U1560B because of this variation in olivine alteration.
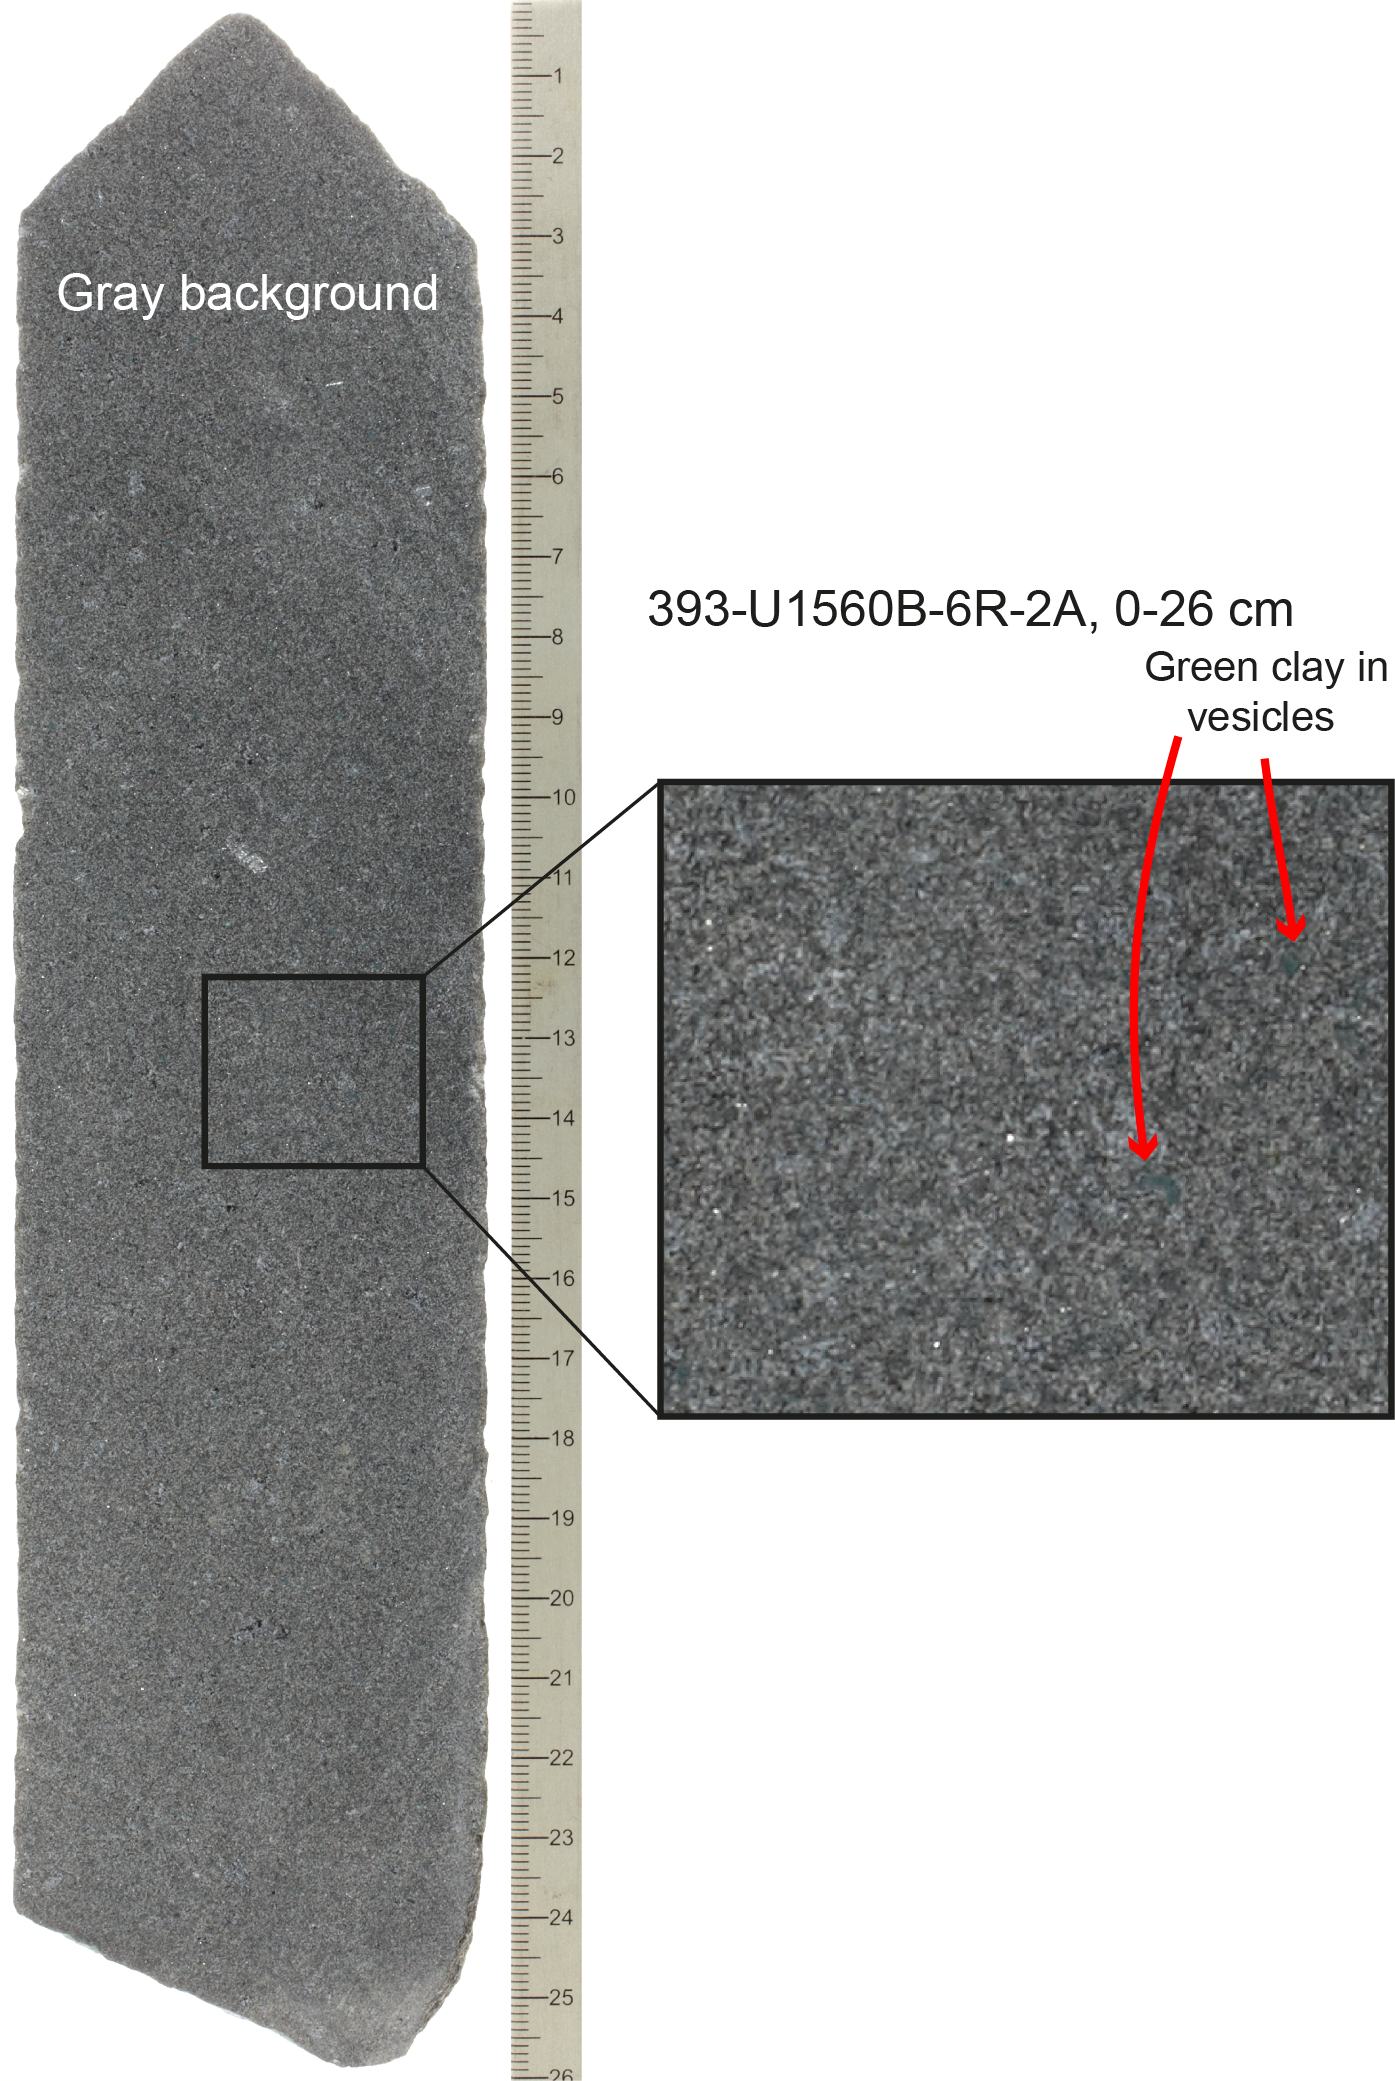
Figure F32. Background alteration.
In thin section, yellow-brown clays replace mesostasis and groundmass in areas of background alteration (Figure F33). In some examples, carbonate is also found replacing groundmass in background. The abundance of secondary minerals is variable from 11% to 78%, with most thin sections between 11% and 18%. Vesicles are filled to varying amounts (0%–100% filled) with clays (yellow-brown and green), carbonate, or zeolites. Green clays filling vesicles are predominantly restricted to massive/sheet flows.
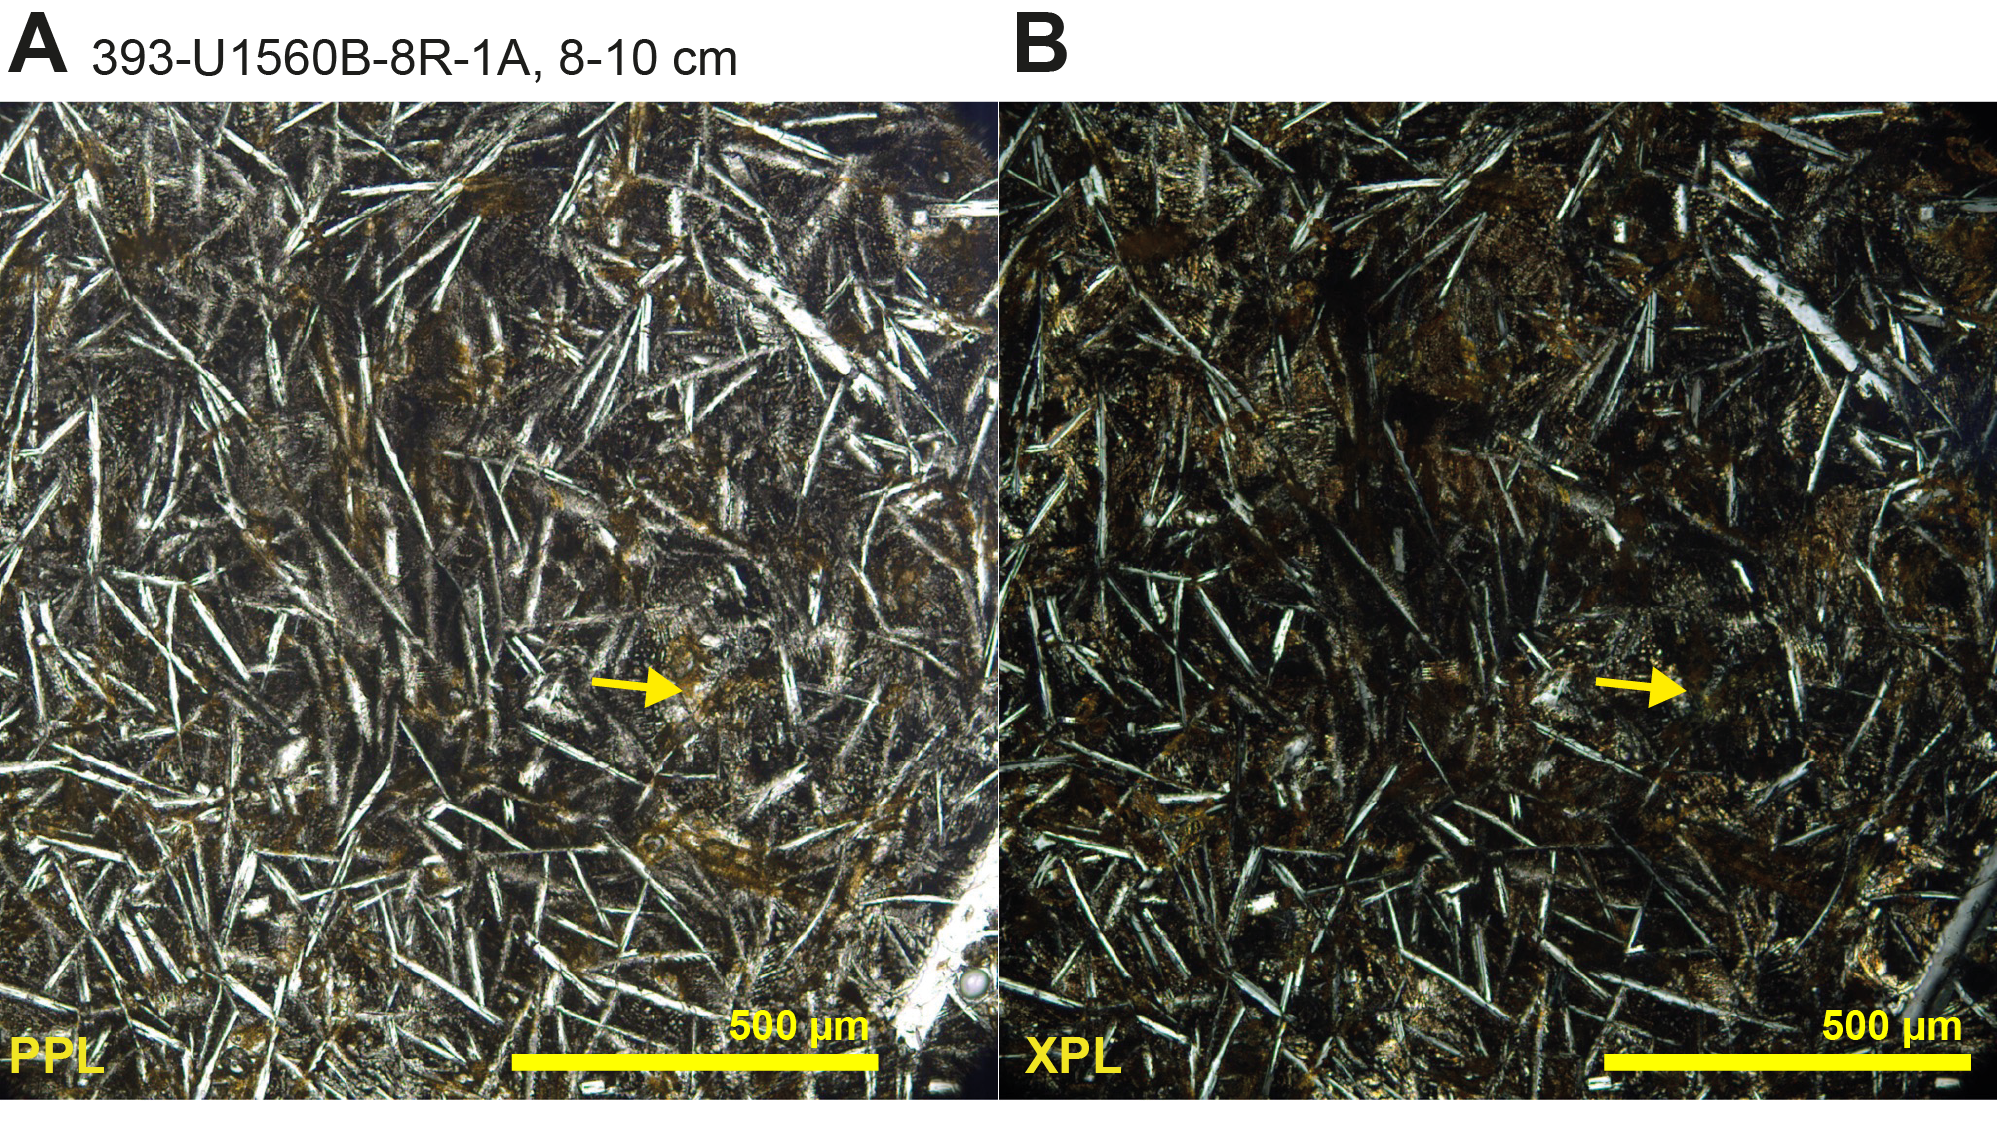
Figure F33. Replacement of groundmass by yellow-brown clay minerals.
6.3. Alteration halos
Halo alteration in Hole U1560B is variable and manifest by different colors and intensities. Halos form along veins, chilled margins, vugs, and vesicles as well as around such features not recovered by coring. One of the distinctive characteristics of the Hole U1560B halos is the preservation of overprinting relationships that preserve unambiguous sequences of fluid/rock reaction. Downhole, the abundance of halos varies at core level from 13% to 84%, but there is a prominent change in halo abundance from the top of Subunit 5A at 249.6 mbsf (Figure F34). Above 249.6 mbsf, the average area of a core occupied by halos is 33%; below 249.6 mbsf, this increases to 52%. This increase in halo abundance is driven by the increase in the abundance of brown halos.
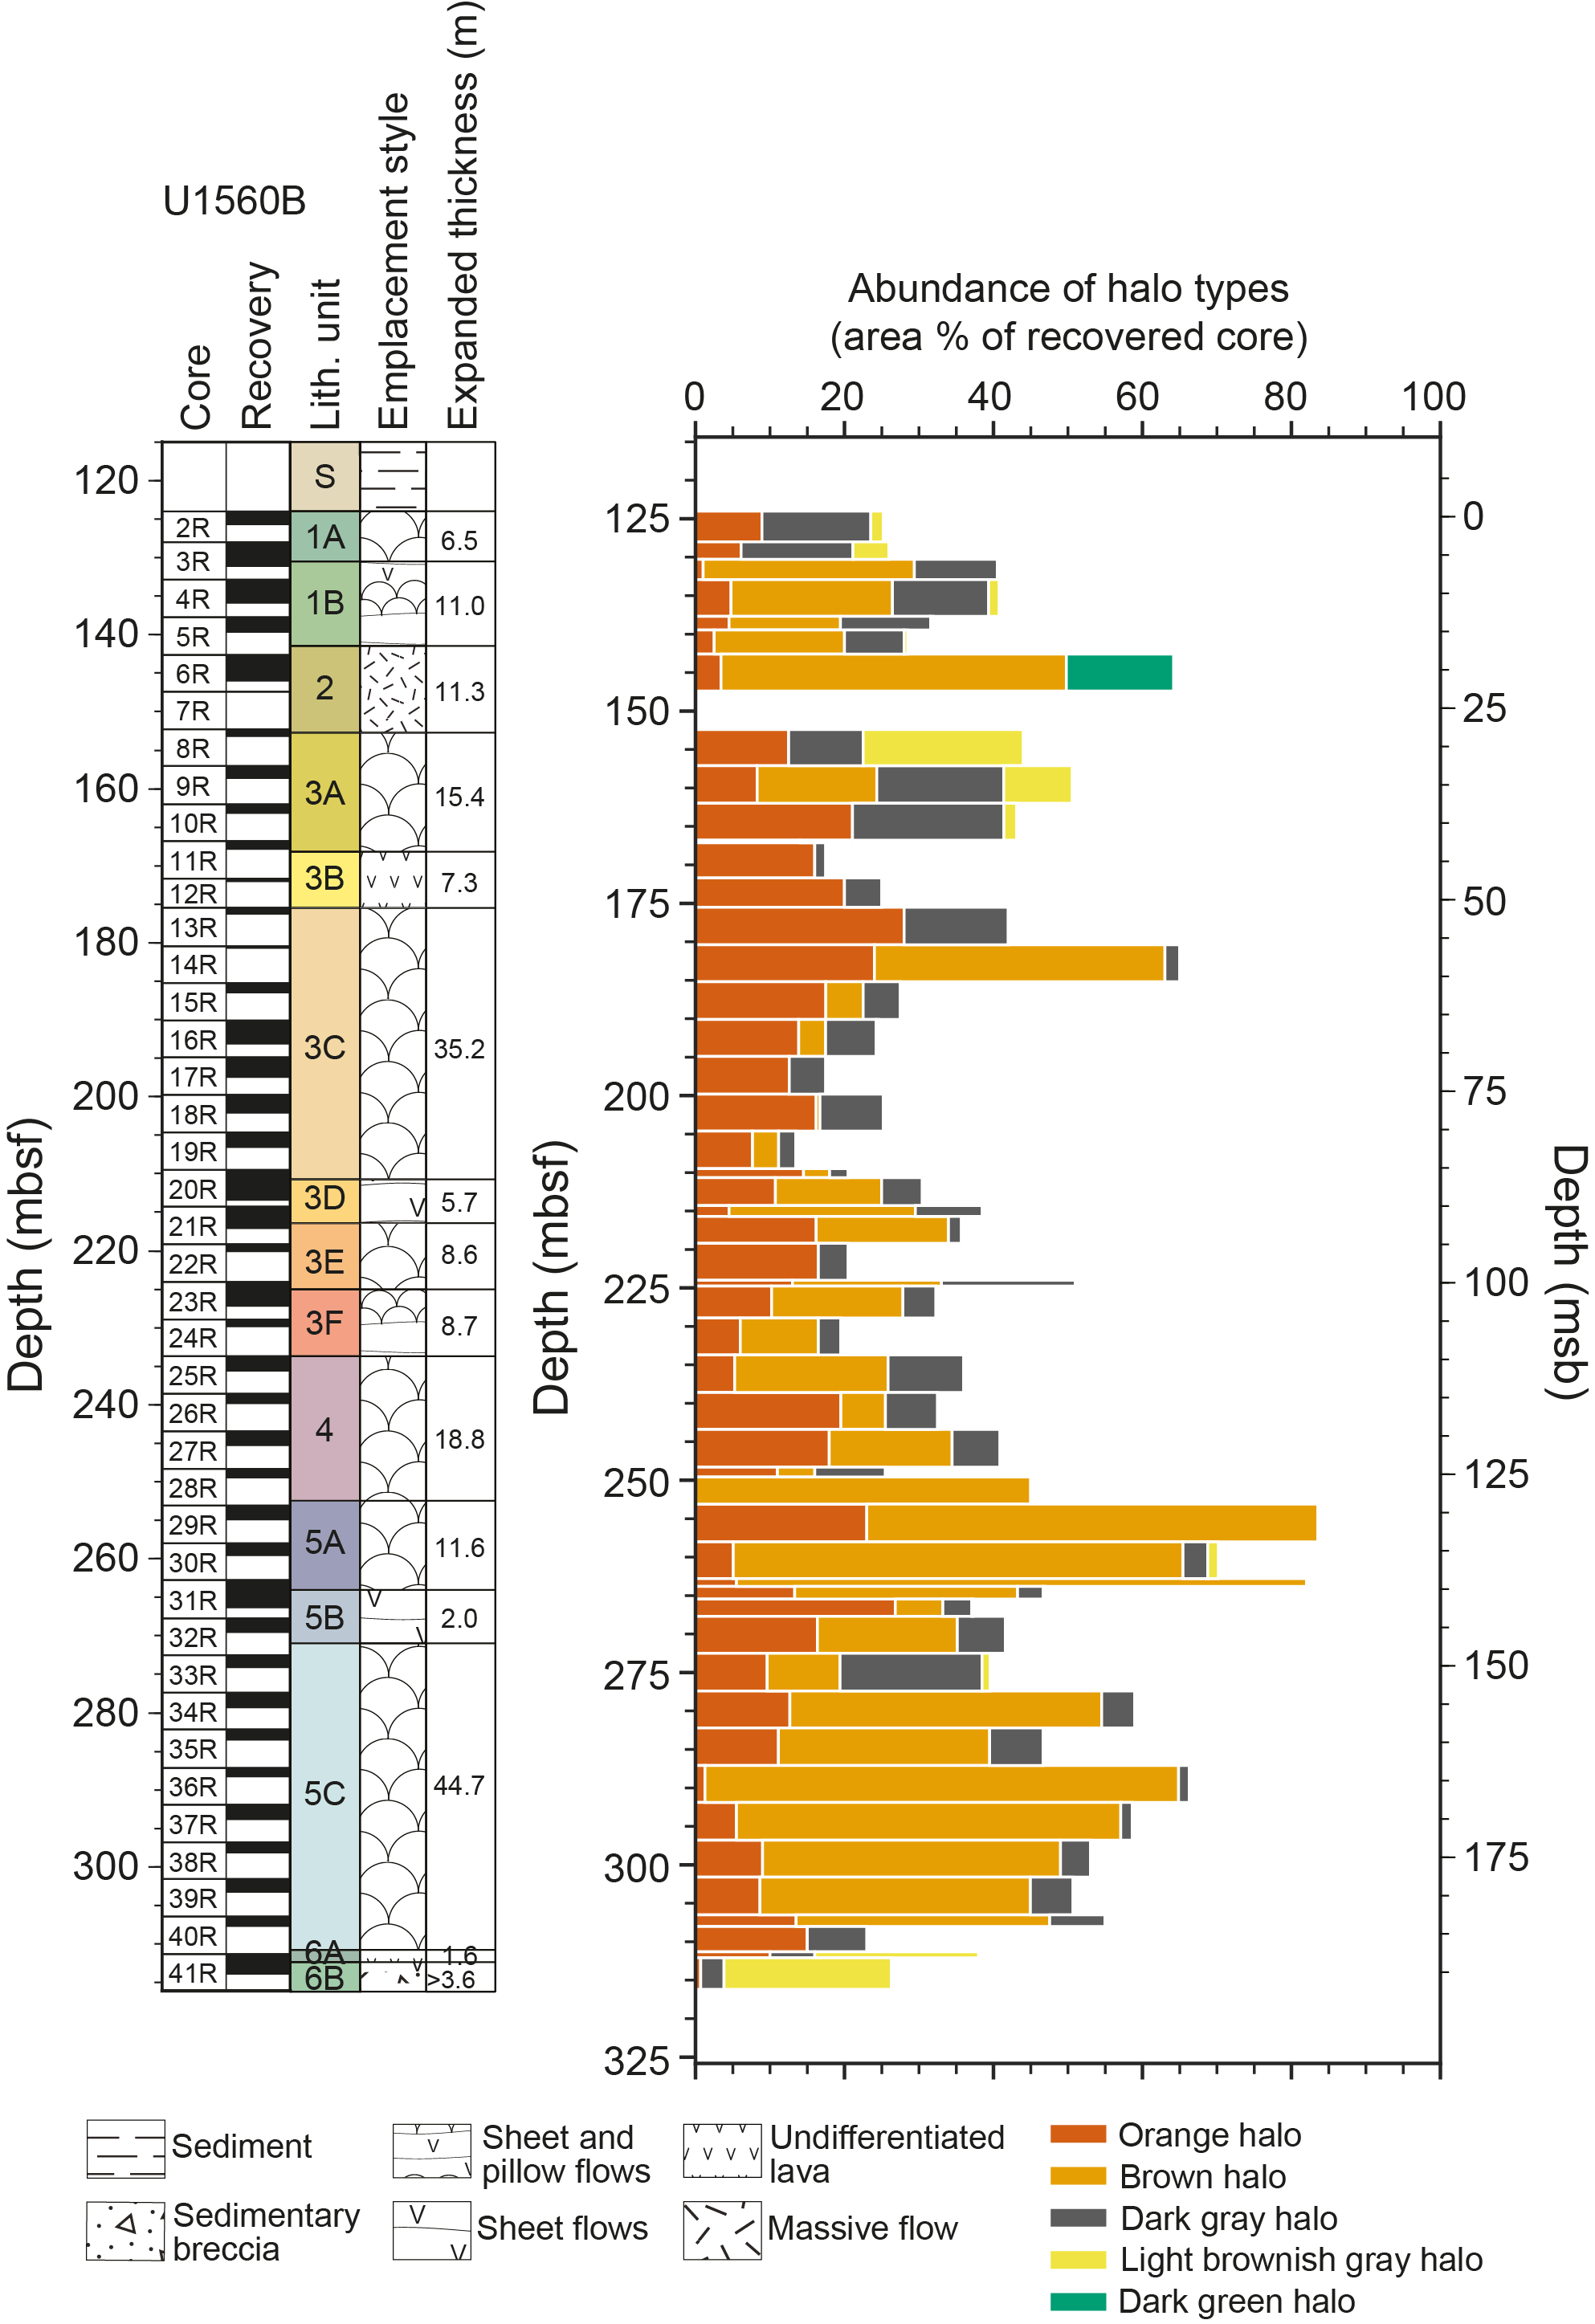
Figure F34. Area abundance of alteration halo types.
6.3.1. Dark gray halos
Dark gray halos are found in almost all cores (Figure F34) and on average represent 6.8% of the area of each core. Dark gray halos are either dark gray (GLEY 1 4/N) or dark bluish gray (GLEY 2 4/10B). The dark gray halos occur both as single bands (average width ~5 mm depending on exact color shade; maximum = 28 mm; Table T9) and as multiple millimeter-sized dark gray halos (Figure F35). However, multiple-band halos are less well developed and less intense than in Hole U1559B. The dark gray halos can change from predominantly dark bluish gray (GLEY 2 4/10B) to dark gray (GLEY 1 5/N). The dark gray halos commonly occur with other halos and mostly occur as the outermost halo. As well as being present as just dark gray halos, they pair with the light brownish gray halos and orange halos (both as reddish brown and reddish yellow) throughout Hole U1560B to form halos of multiple colors. In thin section, the dark gray halos have variable abundances of yellow-brown clays (in plane-polarized light).
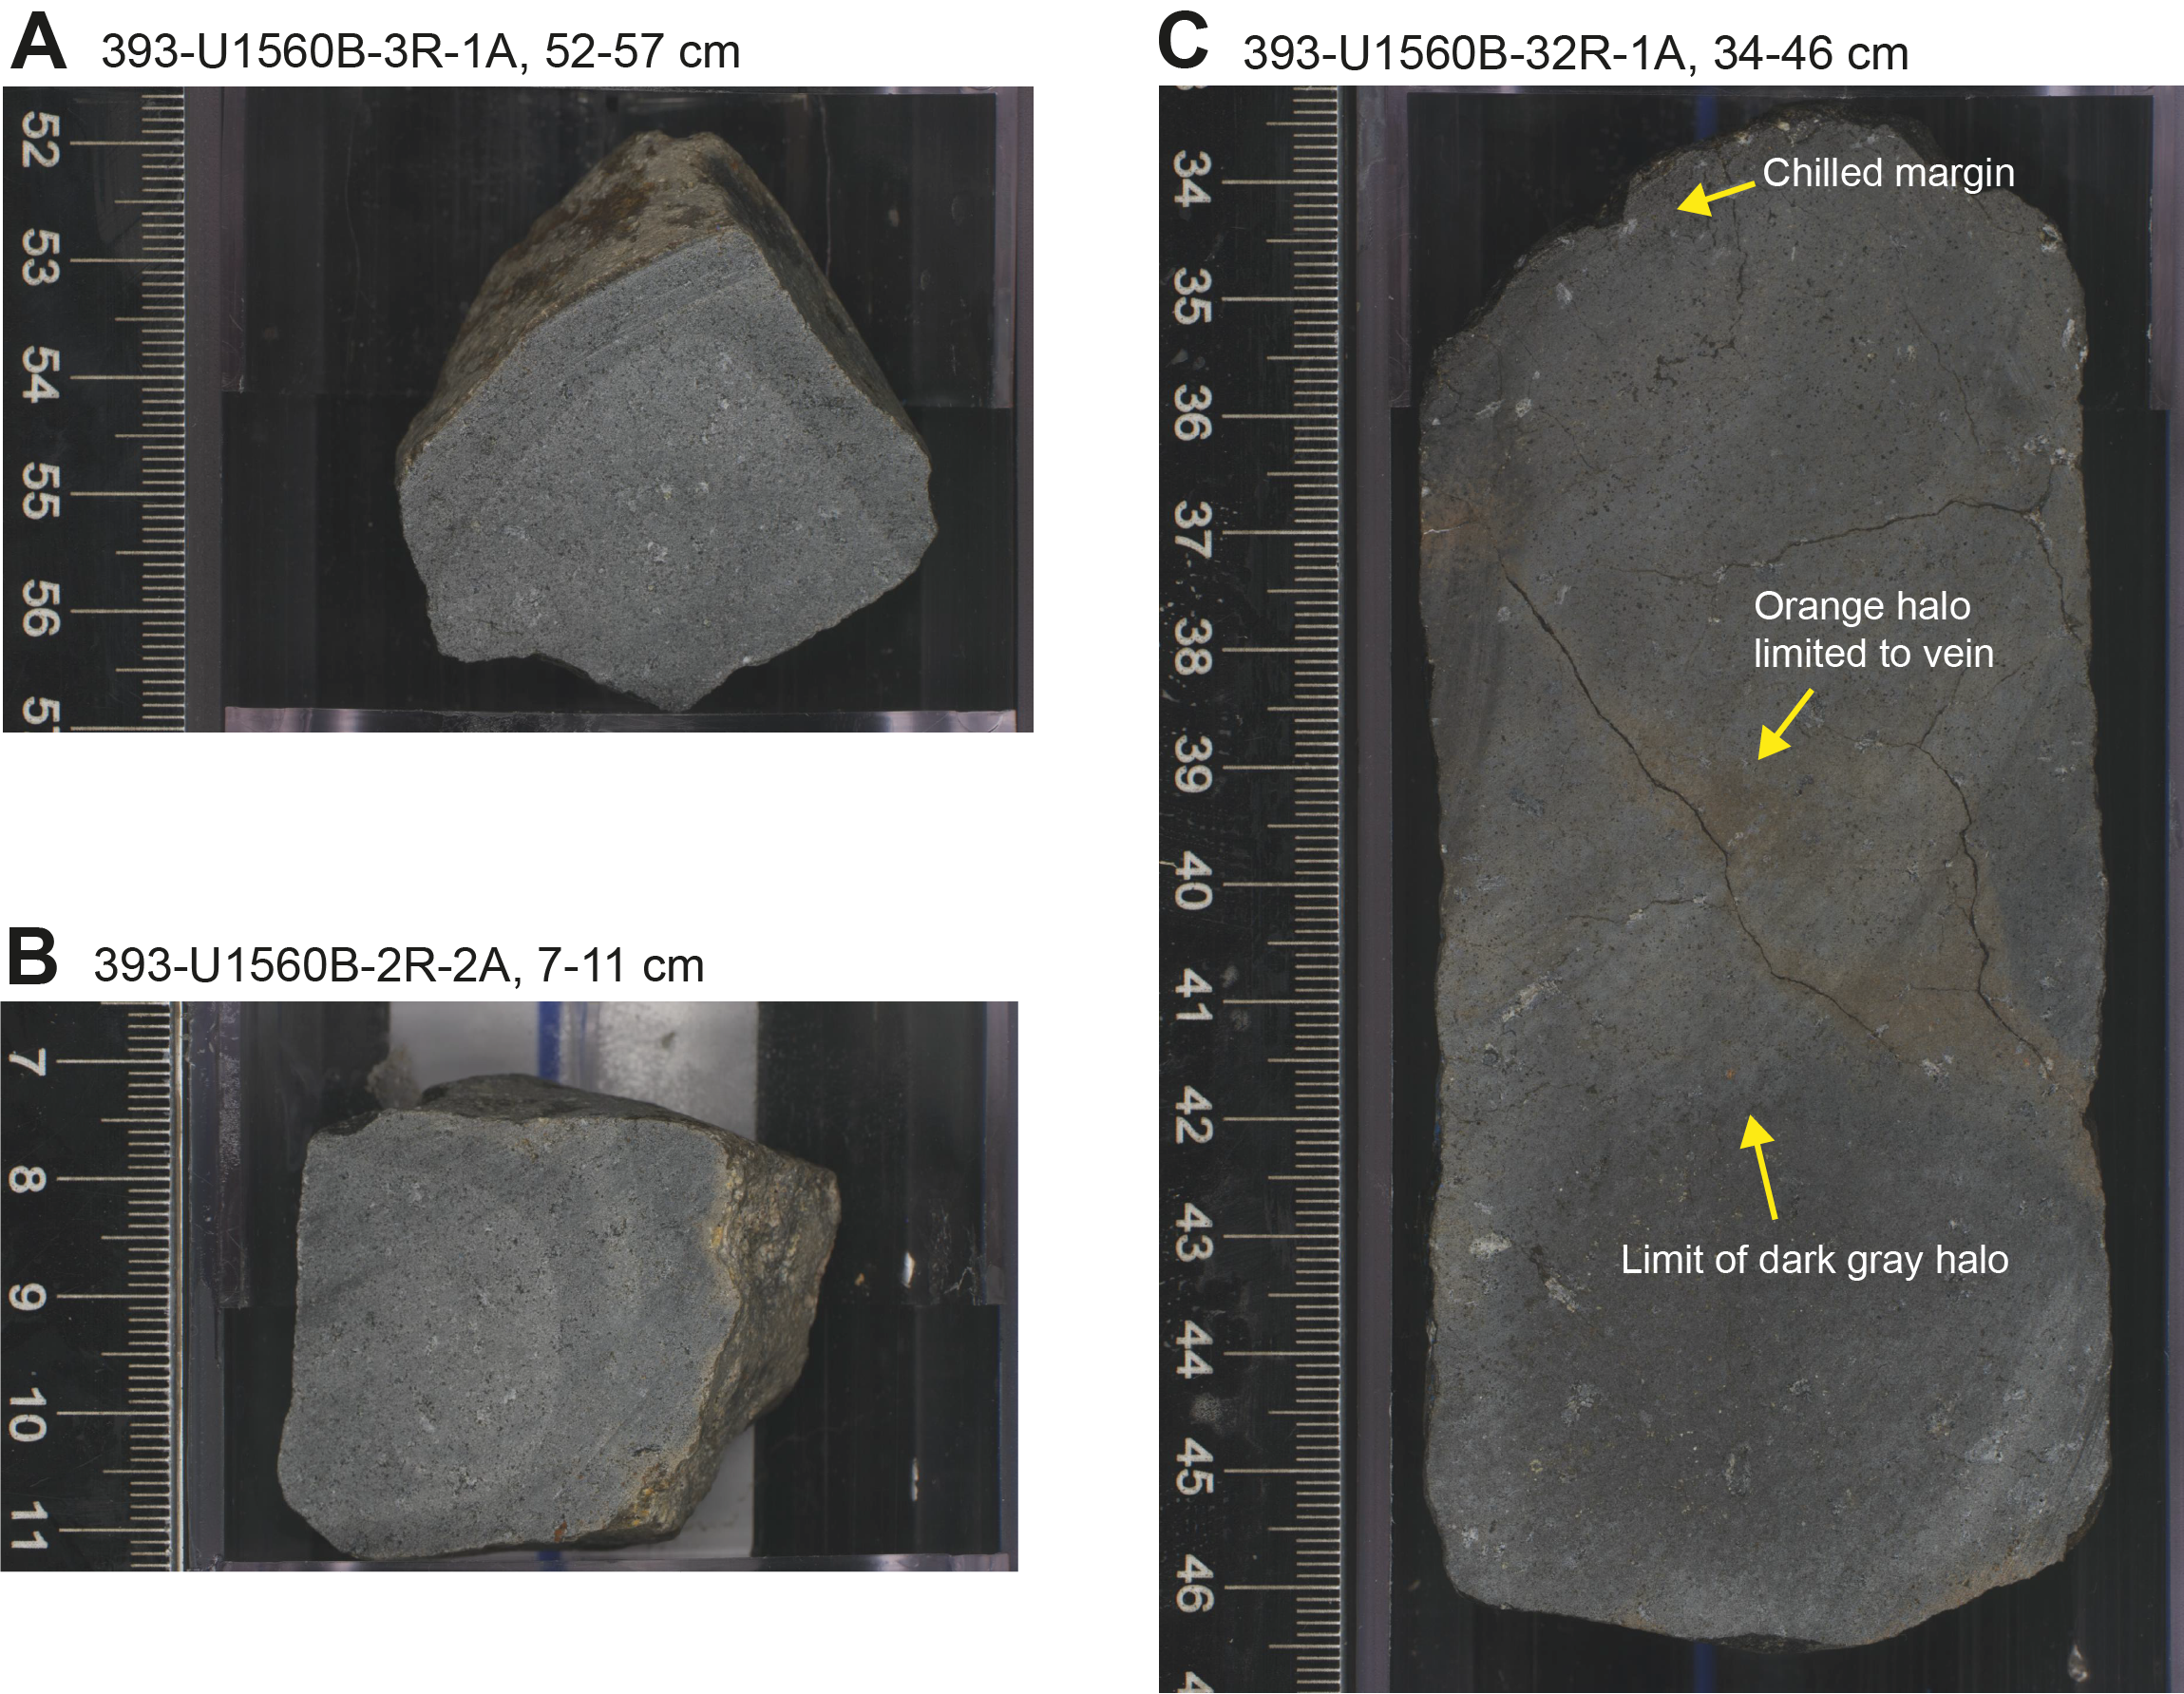
Figure F35. Dark gray halos.
6.3.2. Light brownish gray halos
Light brownish gray halos are irregularly present throughout Hole U1560B but are more common at the top and bottom of the hole (Figure F34). This halo type is light brownish gray (10YR 6/2), and they exclusively form adjacent to dark gray halos (both dark gray and dark bluish gray) (Figure F36). They also occur as halos around vugs together with dark gray halos. The limited occurrence of this halo type may be a consequence of the dominance of the more strongly altered brown halos, some of which have similar associations with the dark gray halos and vugs, and may represent more intensely altered versions of the light brownish halos.
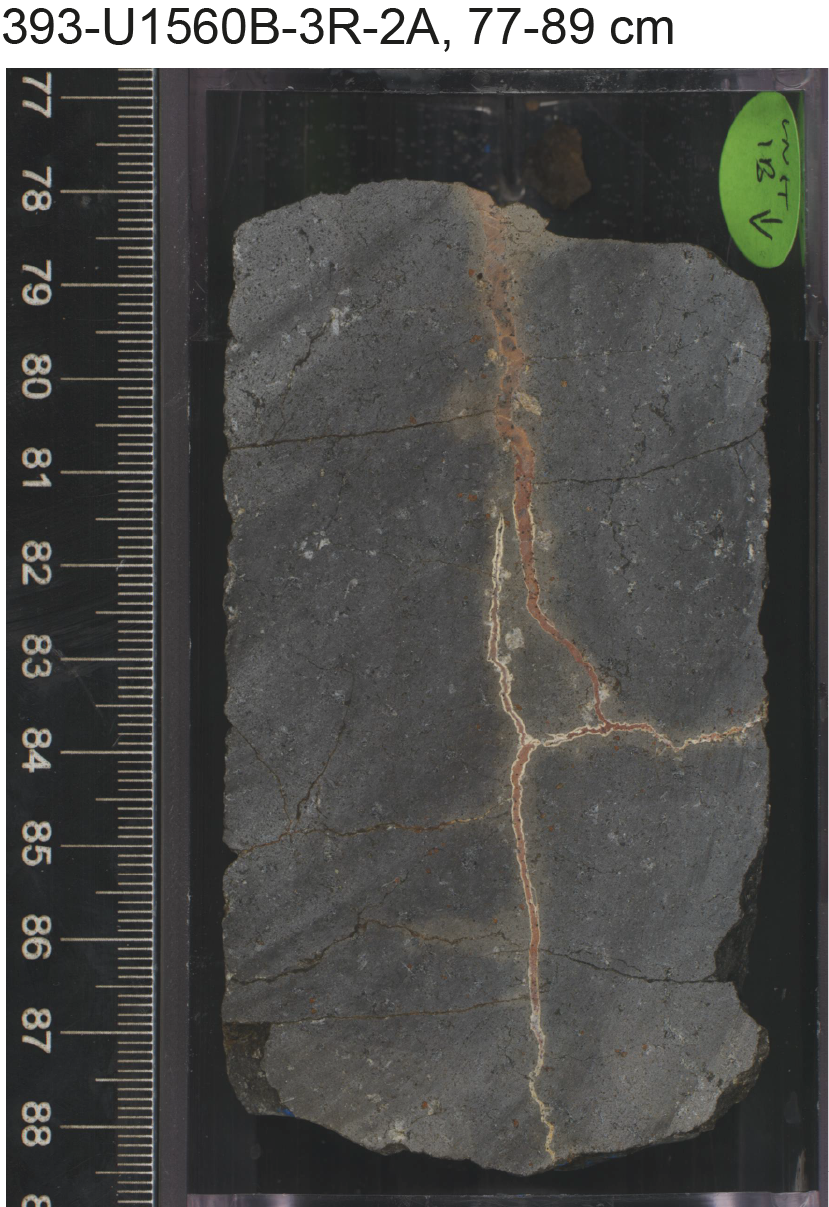
Figure F36. Light brownish gray halos.
6.3.3. Brown halos
Brown alteration halos are present throughout most of Hole U1560B but are notably absent from the very top and bottom of the hole and from 162 to 180 mbsf, although core recovery is low in the latter interval (Figure F34). The abundance of brown halos defines one of the most distinctive changes in alteration downhole, with the persistent increase in brown halo abundance deeper than 250 mbsf driving the overall increase in halo abundance downhole. Beneath 250 mbsf, brown halos occupy 40% of the area of the cores.
The brown halos show a wide range of colors (2.5Y 5/1 gray, 2.5Y 5/2 grayish brown, 10YR 5/2 grayish brown, 10YR 3/2 very dark grayish brown, 10YR 4/2 dark grayish brown, and 10YR 4/3 brown), likely reflecting a range of intensities of replacement (Figure F37). The brown color varies within a section and within pieces (Figure F37), and some show a patchy appearance. There are some intervals downhole where particular shades of brown are more prevalent (e.g., between 267 and 308 mbsf very dark grayish brown and dark grayish brown shades dominate the brown halos). Further sampling and mineralogical analyses of the secondary minerals are required to explore the cause of the color variation and to better understand whether these subtle changes reflect changing characteristics of fluid/rock reaction.
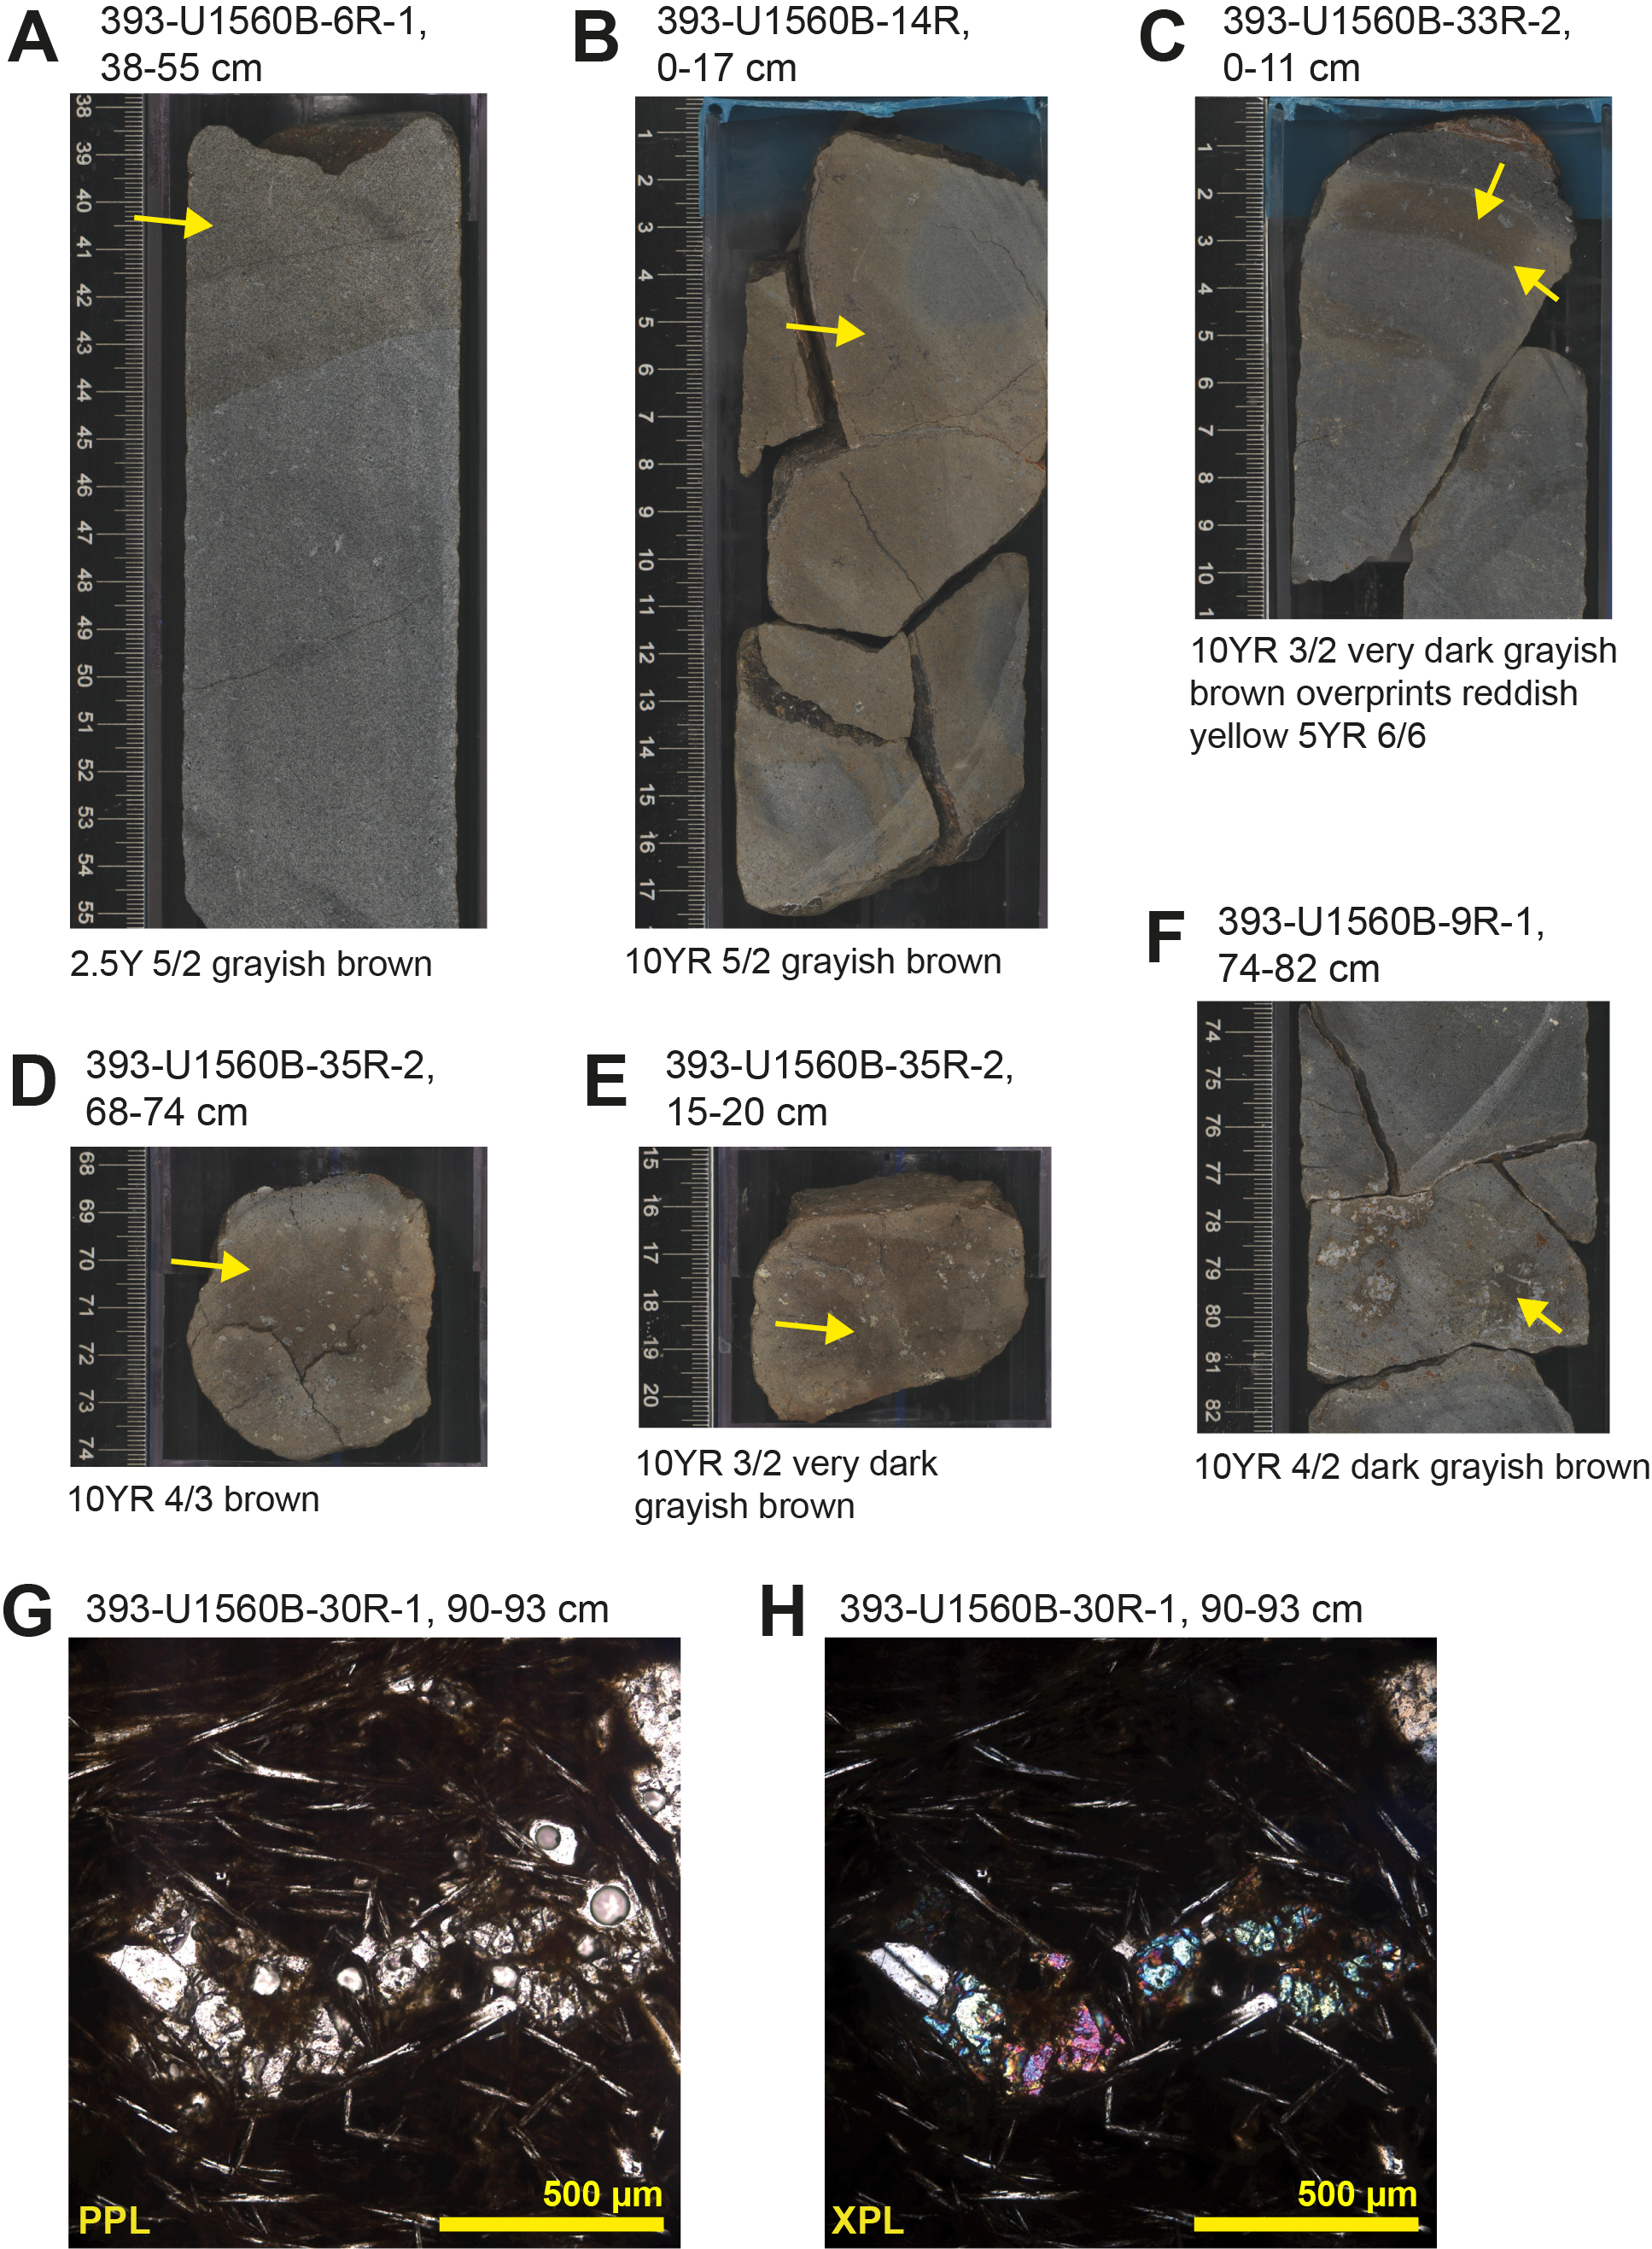
Figure F37. Brown halo types.
In thin section, the brown halos are composed of brown-orange and yellow-brown clay minerals that replace groundmass and some microphenocrysts (Figure F37G, F37H), with secondary mineral abundances between 30% and 70%.
When bordering recovered veins, the brown halos mostly occur as a single halo although some have dark bluish gray outer halos. Brown halos have an average half-width of ~28 mm (Table T9). The outer boundaries of single brown halos with the background alteration are typically diffuse and gradational. Brown halos have a less clear association with chilled margins than in other holes. Brown halo alteration does occur close to chilled margins but does not form continuous alteration from the margin. Instead, the brown halos appear to represent a transition in alteration intensity toward the more intensely altered orange halos. This close association between brown and orange halos is also manifest by the development of patchy to mottled textures with grayish brown halos mixed with reddish yellow halos.
The brown halos host vesicles that are filled with either multiple minerals (e.g., clay + Fe oxyhydroxide) or evolving clay compositions such that the vesicles display concentric layered textures.
6.3.4. Orange halos
Orange halos are present in almost all cores in Hole U1560B (Figure F38). Orange halo abundance varies downhole, with smooth cycles of increasing then decreasing abundance over 50–75 m. Orange halo abundance peaks at ~175 and ~260 mbsf (Figure F34). The average abundance of orange halos is ~11% in a core with a maximum of 28%. The orange halos are either reddish brown (5YR 5/4), reddish yellow (5YR 6/6), or gray (5YR 6/1). Gray (5YR 6/1) is the lowest intensity orange halo observed during Expedition 393 of the SAT (Sites U1558, U1583, U1560, and U1559). This halo color is found as alteration zones extending from chilled margins and is the only margin alteration front to consistently preserve incomplete overprinting relationships such that parts of the dark gray halos are still visible (Figure F38). The orange color originates from the formation of clays and staining by Fe oxyhydroxides. In the less intense orange halos, there is an orange speckled appearance due to the early alteration of olivine and/or iron staining of plagioclase.
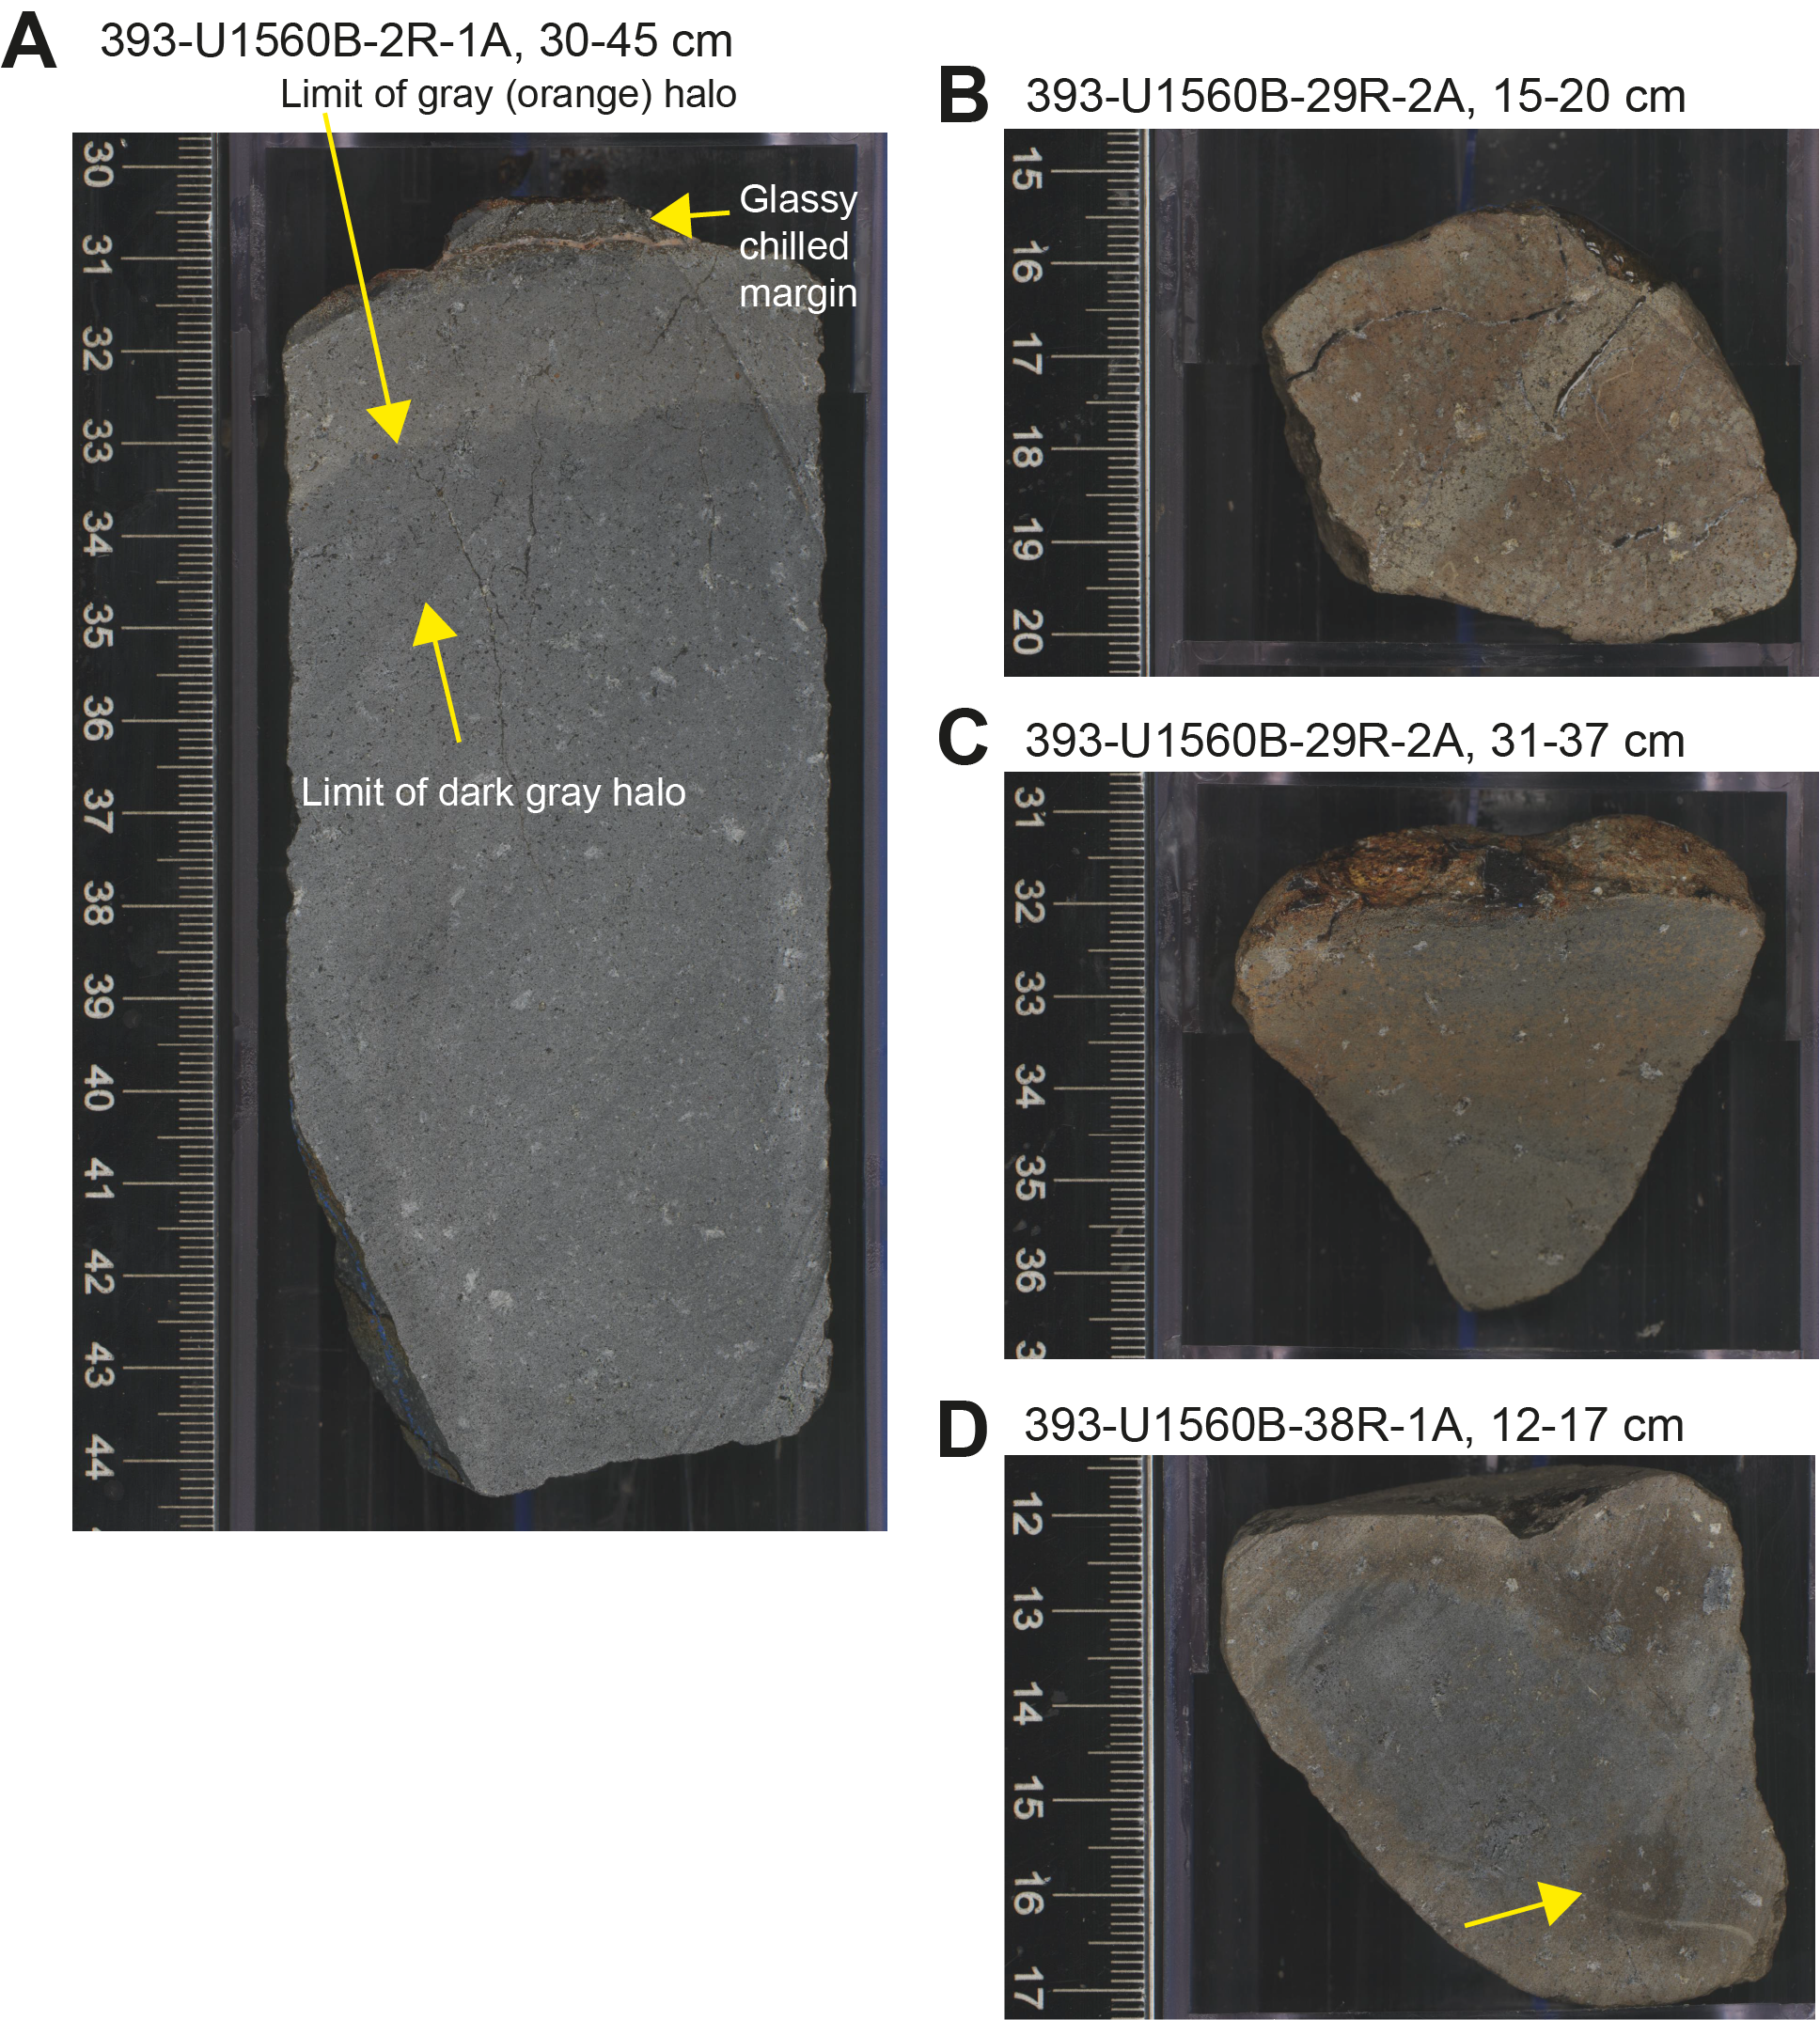
Figure F38. Orange halo types.
The orange halos occur bordering veins and vugs and as alteration zones extending from chilled margins (Figure F38). When bordering recovered veins, they have an average half-width of ~12 mm and are either reddish brown (5YR 5/4) or reddish yellow (5YR 6/6). These two colors exist along a spectrum, with the reddish yellow essentially representing a paler version of the reddish brown, and some halos show both colors. The reddish brown halos typically occur as either inner or outer halos to dark gray or dark bluish gray halos (Figure F38), and in some examples there is a sequence of reddish brown-dark gray-reddish brown, suggesting multiple overprinting phases of fluid/rock reaction. The boundaries of the orange halos around veins are typically sharp, in contrast to the more diffuse brown halos.
Vesicles are more completely filled within orange halos relative to background alteration, this trend is also seen in other halos. Vesicles in orange halos are partially to completely filled with clay minerals.
6.3.5. Dark green halos
Dark greenish gray halos are only found in Core 393-U1560B-6R within the massive flow of Unit 2. The dark greenish gray halos (GLEY 1 4/10GY) form part of a series of complex halos within the massive flow that overall have a brown color and show a variety of textures. The dark greenish gray parts of these halos are positioned between and at the outer edge of grayish brown (2.5Y 5/2) overprinting halos (Figure F39). The green color reflects the abundance of green clay in vesicles and groundmass.
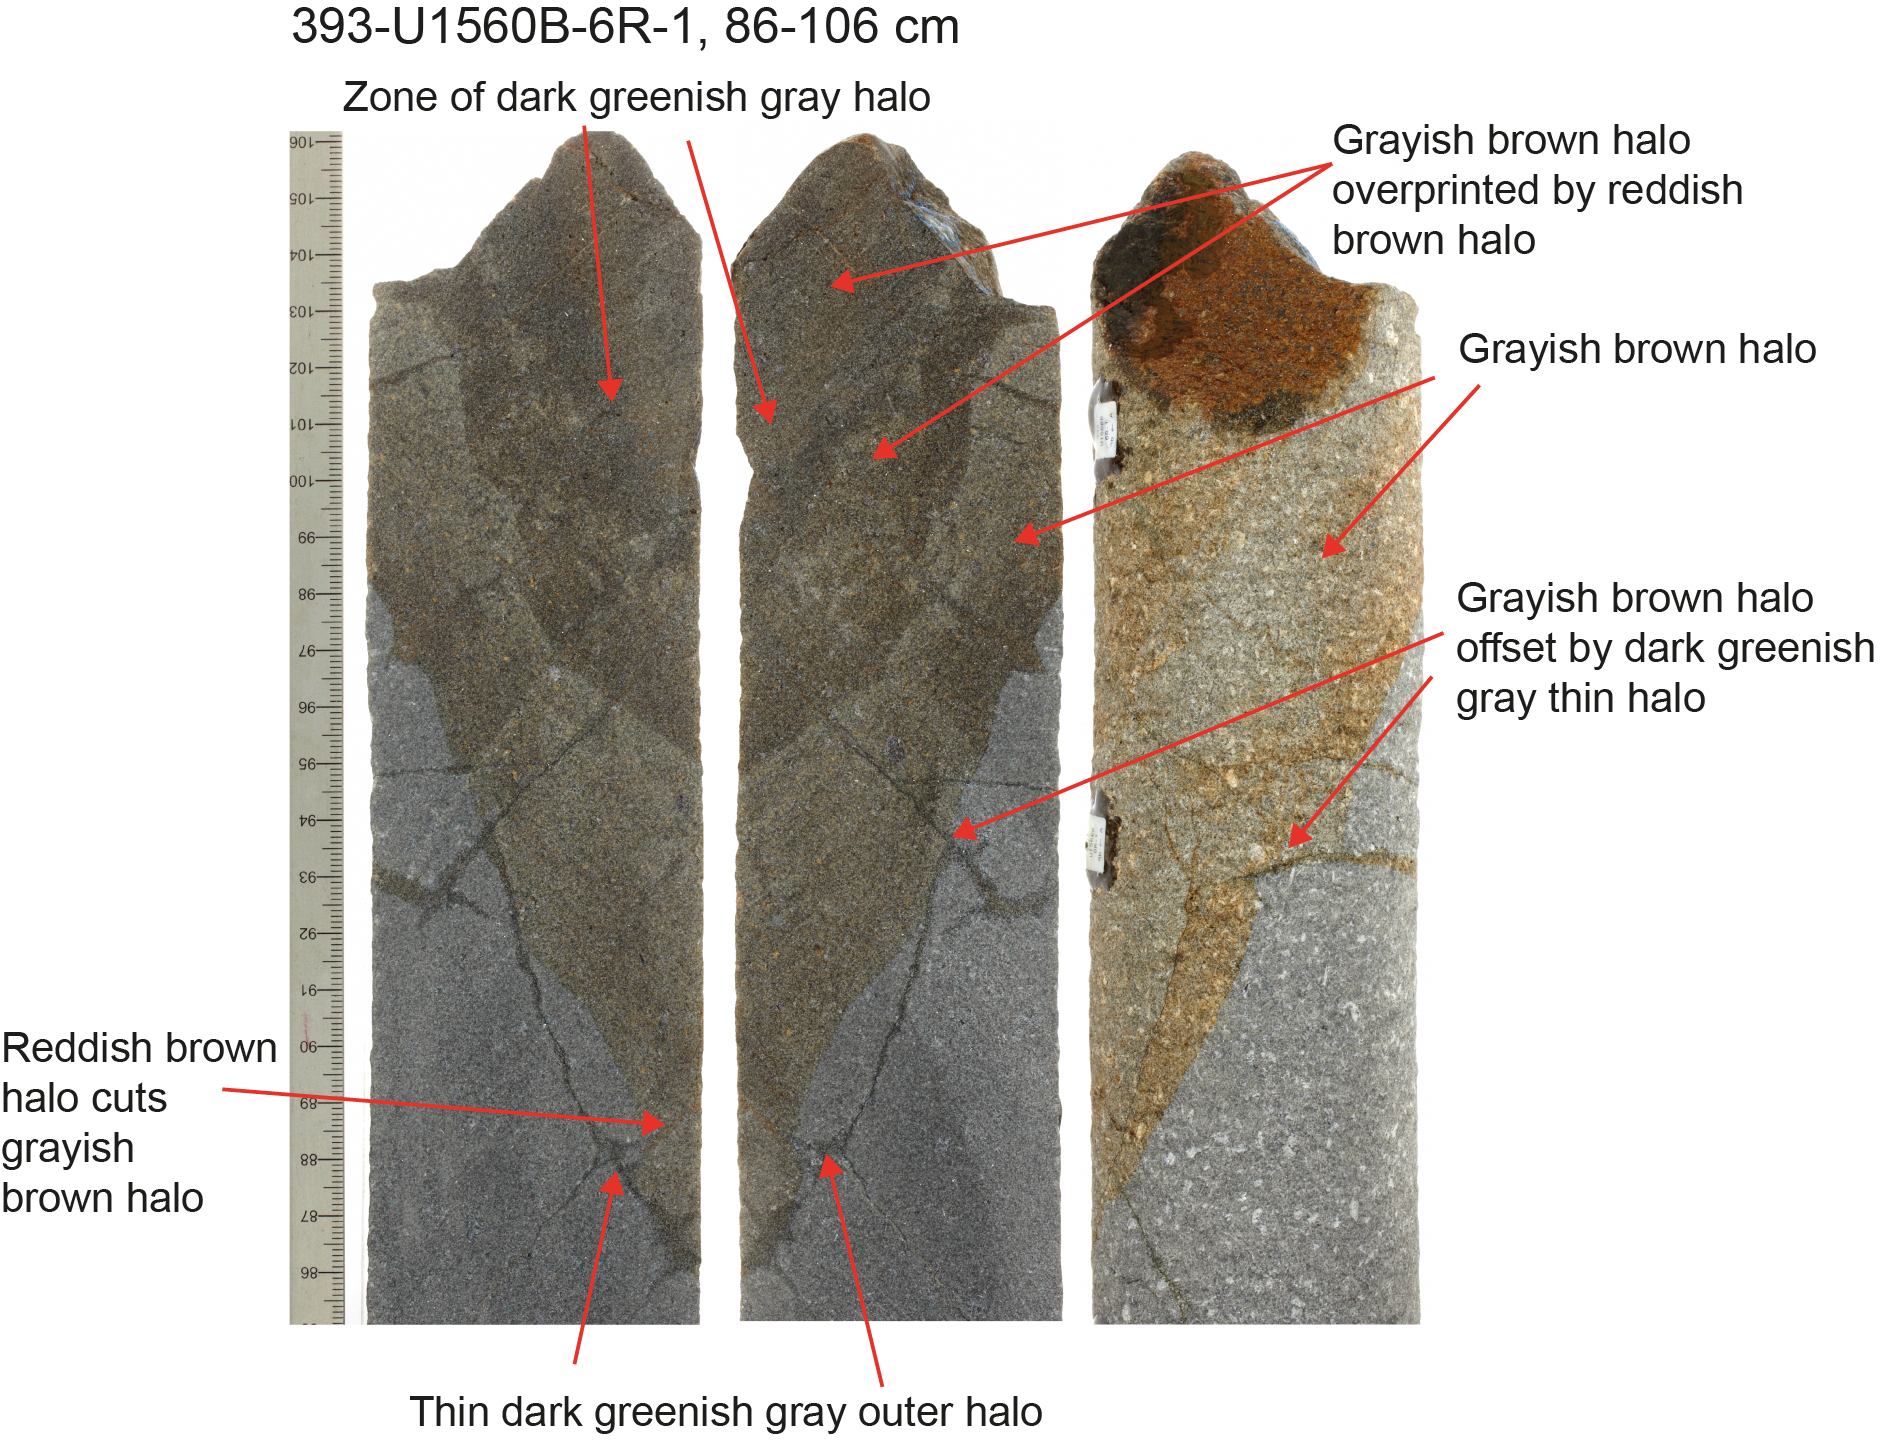
Figure F39. Greenish gray halos in grayish brown and reddish brown halos.
6.3.6. Overprinting relationships and development of halos
Hole U1560B recovered excellent clear examples of overprinting relationships that either confirm observations from other SAT sites or show definitive sequences that are not seen elsewhere. Brown halos locally overprint orange halos (e.g., Section 393-U1560B-38R-1), a relationship that is unique to Hole U1560B (Figure F38). Dark gray halos are in all cases the earliest halo to form, and in Hole U1560B they are overprinted by all other halo types. Of particular note in Hole U1560B is the preservation of dark gray halos associated with alteration zones extending from chilled margins that have no other halo types present (Figure F35). This relationship was not observed at other Expedition 393 sites, where the dark gray halos preserved near chilled margins are commonly associated with orange halos. The least intense orange halos (5YR 6/1 gray) clearly overprint dark gray halos, with bands of the dark gray halo clearly visible away from chilled margins (Figure F35). These combined observations indicate that dark gray halos have most likely been lost to pervasive overprinting at older crustal ages and demonstrate the value of investigating alteration along an age transect to unravel the time-integrated record preserved at older sites. The complex halo sequences present in the massive flow in Core 6R (Figure F39) provide evidence for multiple generations of fluid flow, albeit with different fluid compositions and along different closely spaced pathways compared to fluid flow through the pillow lavas.
6.4. Breccia
Breccias of various types and volumes were recovered in Hole U1560B, including small pieces of hyaloclastite adhered to glassy margins, pieces of magmatic breccia, and sedimentary breccias (see Igneous petrology). Each of these types displays variation in the type and extent of clast alteration and the composition of the matrix and cement (Figure F40).
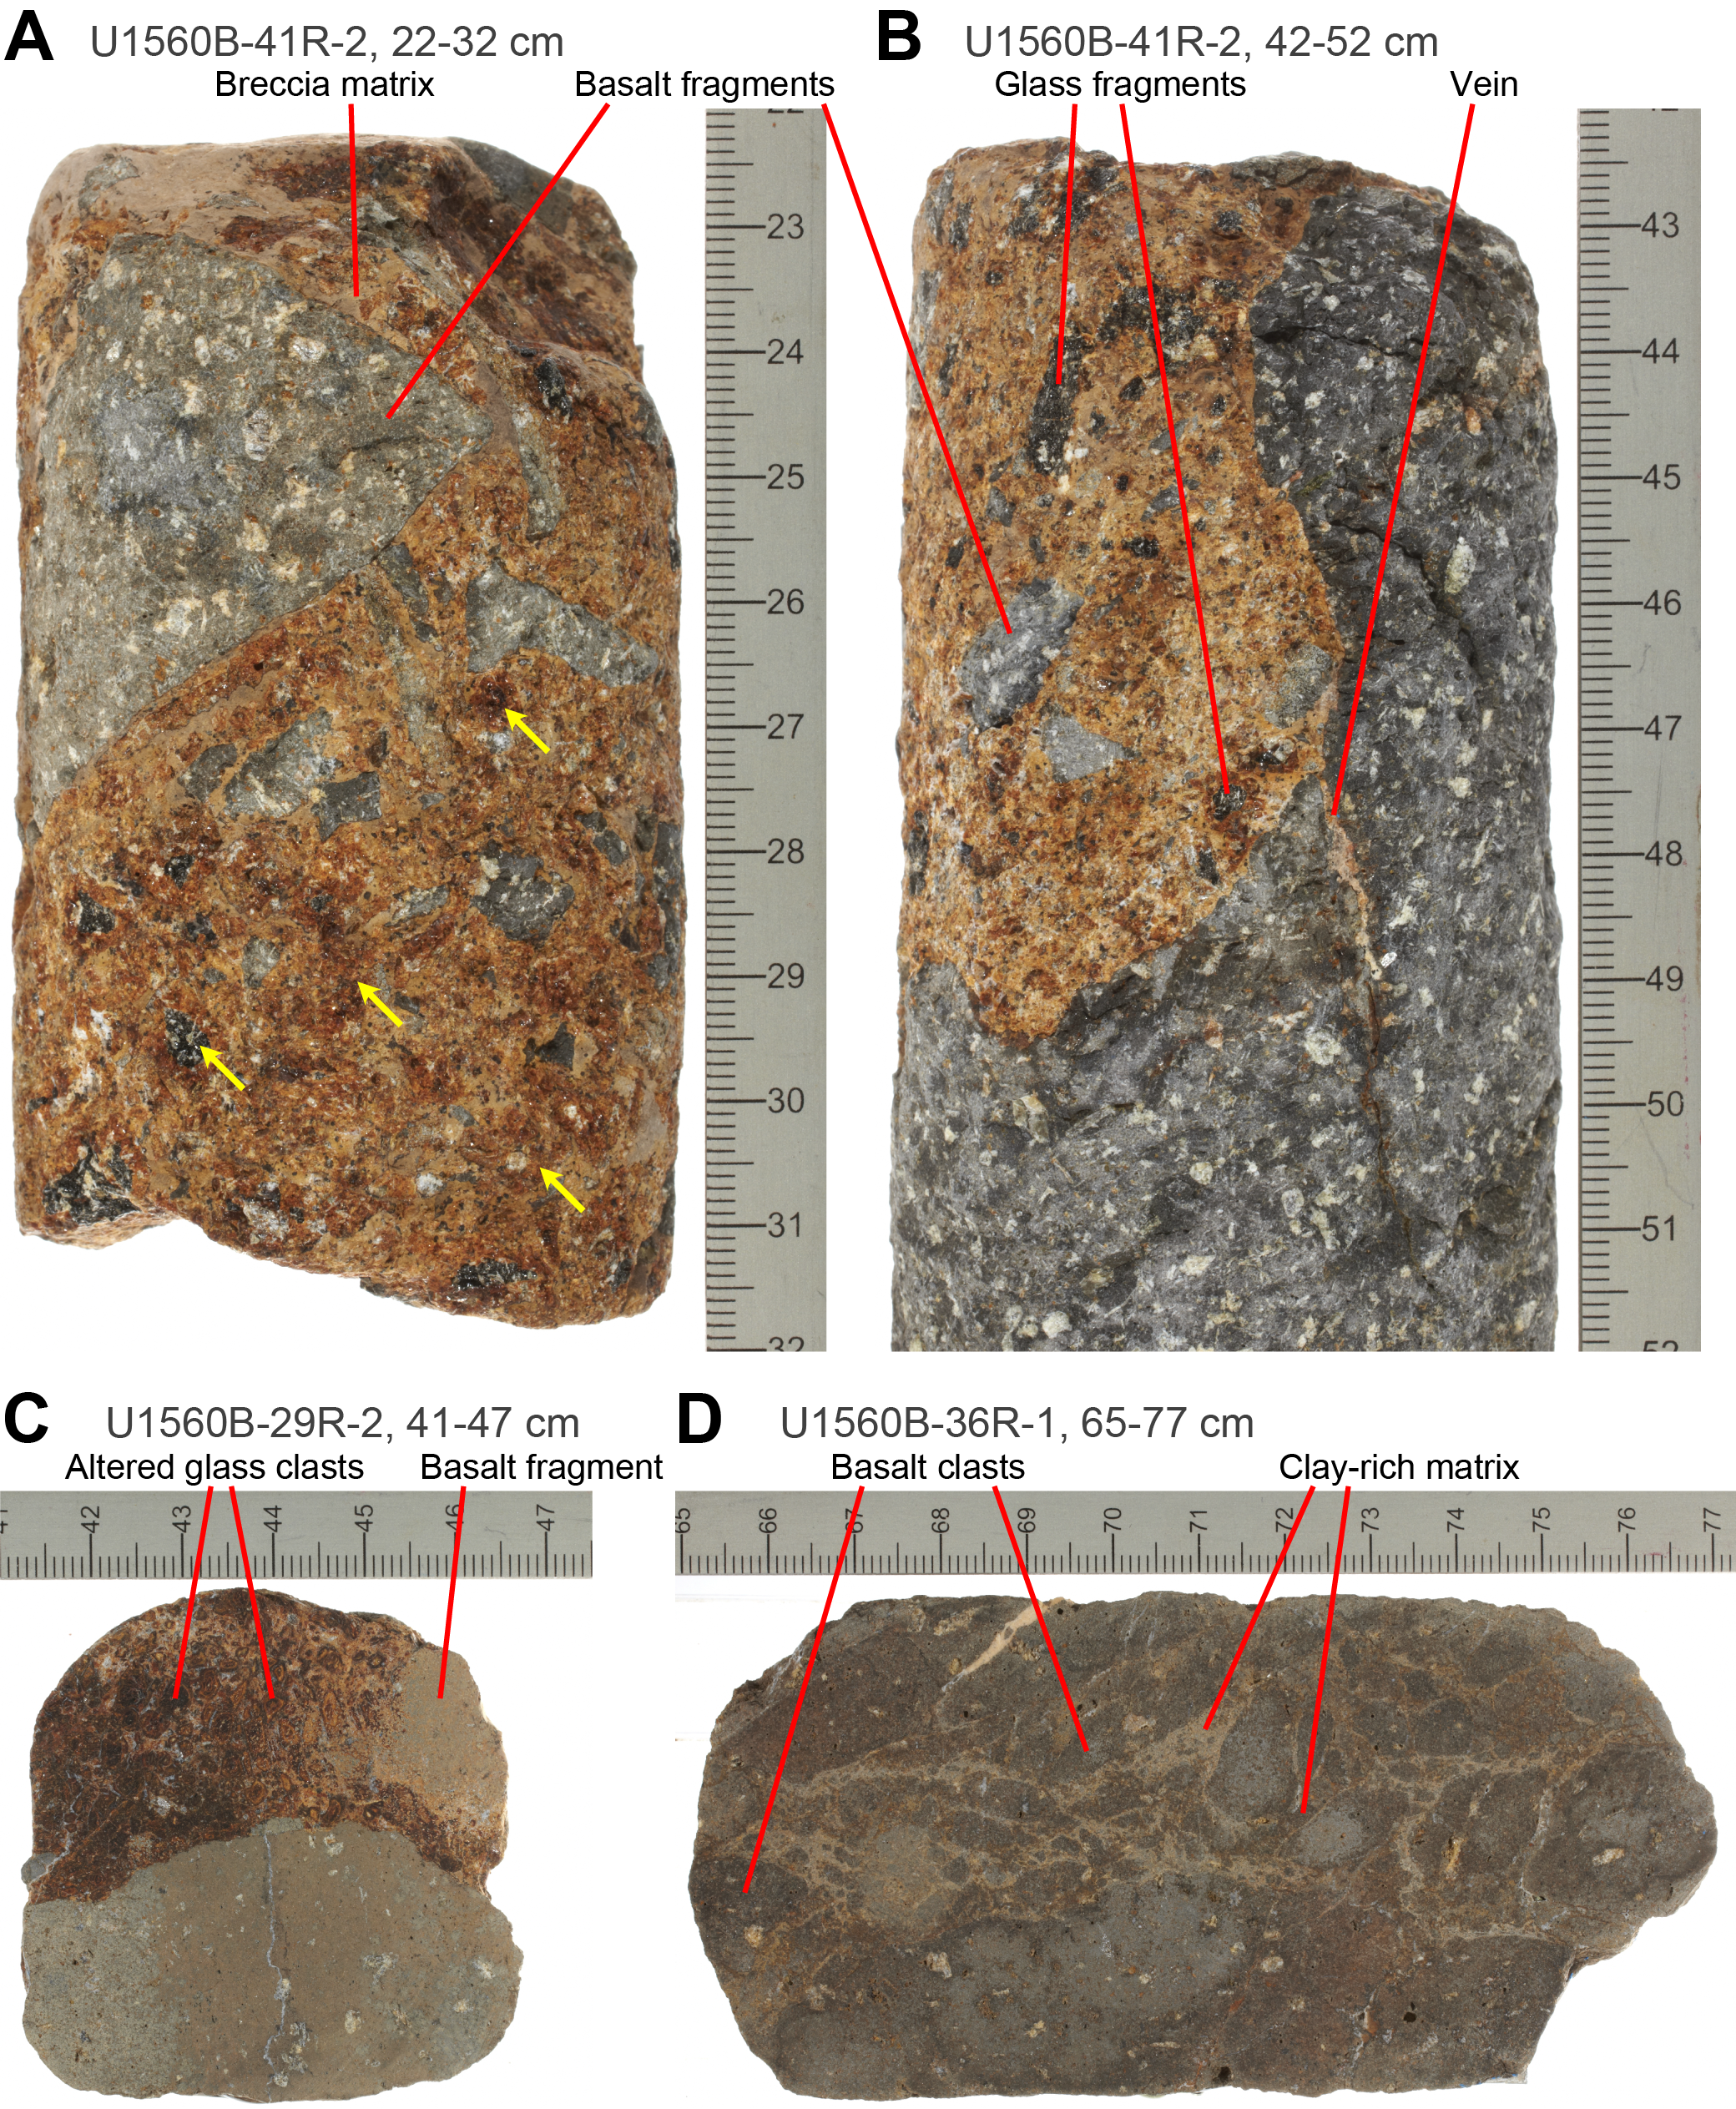
Figure F40. Breccias.
6.4.1. Hyaloclastite breccia
Small pieces of hyaloclastite were recovered in Hole U1560B, and in some cases they adhered to glassy margins. The pieces are characterized by almost complete alteration of the glass clasts to clays displaying a range of colors (5YR 3/4 dark reddish brown, 5YR 4/4 reddish brown, 5YR 5/6 yellowish red, and 5YR 6/8 reddish yellow). Small clasts of basalt preserve no background alteration, show only halo alteration (e.g., grayish brown halo), and indicate fragmentation of previously altered basalt has taken place. The hyaloclastites have as much as 25% matrix of fine-grained, fragmented altered glass, and no sediment component is observed. A small cement component (up to 5%) composed of zeolites forms a network of veins through the hyaloclastite (Table T10).
6.4.2. Magmatic breccia
Clast-dominated breccias with clast lithologies consistent with the underlying lavas were recovered in Core 393-U1560B-36R (see Igneous petrology). These breccias contain clasts of basalt that have the same alteration style and intensity as the host rock. Sample 36R-1, 61–77 cm, has clasts altered to grayish brown (10YR 4/2) mottled with reddish yellow (5YR 6/6) halos (Figure F40). The clasts are highly altered (minimum intensity estimated at 80%). Some of the smaller (centimeter-sized) clasts show more altered edges (up to several millimeters) than the core of the clast and may indicate that some clast alteration postdates brecciation. Because this breccia does not involve any transport of clasts, rounding of the clasts must also reflect reaction with fluids and partial dissolution of the clast edges.
6.4.3. Sedimentary breccia: basalt clast alteration
The basaltic clasts in these breccias (interval 393-U1560B-41R-1, 73–113 cm, and 41R-2, 12–89 cm) have all undergone hydrothermal alteration to varying extents, and based on the variability of alteration displayed, these changes are interpreted to predate formation of the breccia (see Igneous petrology), with no indication of later overprinting. The clasts contain a mixture of background alteration (GLEY 1 5/N or 2.5Y 3/1) and predominantly grayish brown halos of a range of colors (2.5Y 5/1, 2.5Y 6/1, and 10YR 5/2). These halos host variably altered phenocrysts that are altered to orange clays ± Fe oxyhydroxides. Alteration intensity of the clasts are estimated at 30%–45% replacement to secondary minerals. The ratio of background to halo within clasts is dominated by halo alteration, with background representing a maximum of 20% of the clast area.
6.4.4. Sedimentary breccia: volcanic glass clast alteration
Clasts of volcanic glass of a range of sizes from <1 mm up to 35 mm are present in these samples (intervals 393-U1560B-41R-1, 73–113 cm, and 41R-2, 12–89 cm). The extent of alteration of the glass to clay minerals broadly correlates with clast size. The larger glass clasts typically display 3–5 mm wide alteration rims (5YR 5/4 reddish brown) and preserve at least some fresh glass in the core of the clast. The smaller glass clasts are completely replaced to clay minerals of varying colors (yellowish red: 5YR 3/4, 5YR 5/6, and 5YR 4/6) (Figure F40).
6.4.5. Sedimentary breccia: matrix alteration
The matrix in the Hole U1560B sedimentary breccias is a mixture of indurated calcareous sediment and volcanic glass, with sediment dominating most breccia pieces. This sediment shows a range of colors and textures (see Igneous petrology).
6.4.6. Sedimentary breccia: cement
The proportion of secondary minerals forming a precipitated cement is low (<5% and typically 1%–2%) in Hole U1560B sedimentary breccias. Where present, the cement is composed of zeolites.
6.5. Veins
Hydrothermal veins are ubiquitous throughout Hole U1560B and provide a record of precipitation of secondary mineral assemblages from seawater-derived hydrothermal fluids. A total of 2663 veins were logged for mineral fillings and physical characteristics. The structural orientation of 1126 veins was measured. The width of logged veins varies between <0.1 and 3.5 mm and broadly yields a geometric distribution, with a median value of 0.1 + 0.2/− 0.1 mm (1σ equivalent), mean of 0.2 mm, and mode of 0.1 mm (Figure F41). Vein density (veins per meter of recovered core) varies downhole, ranging 16–53 veins/m with a median and mean of 34 ± 8 veins/m (1σ equivalent) (Figure F42). The volume of core occupied by veins varies between 0.4% and 1.5% downhole with a mean of 0.9% ± 0.3% (1σ equivalent) (Figure F43).
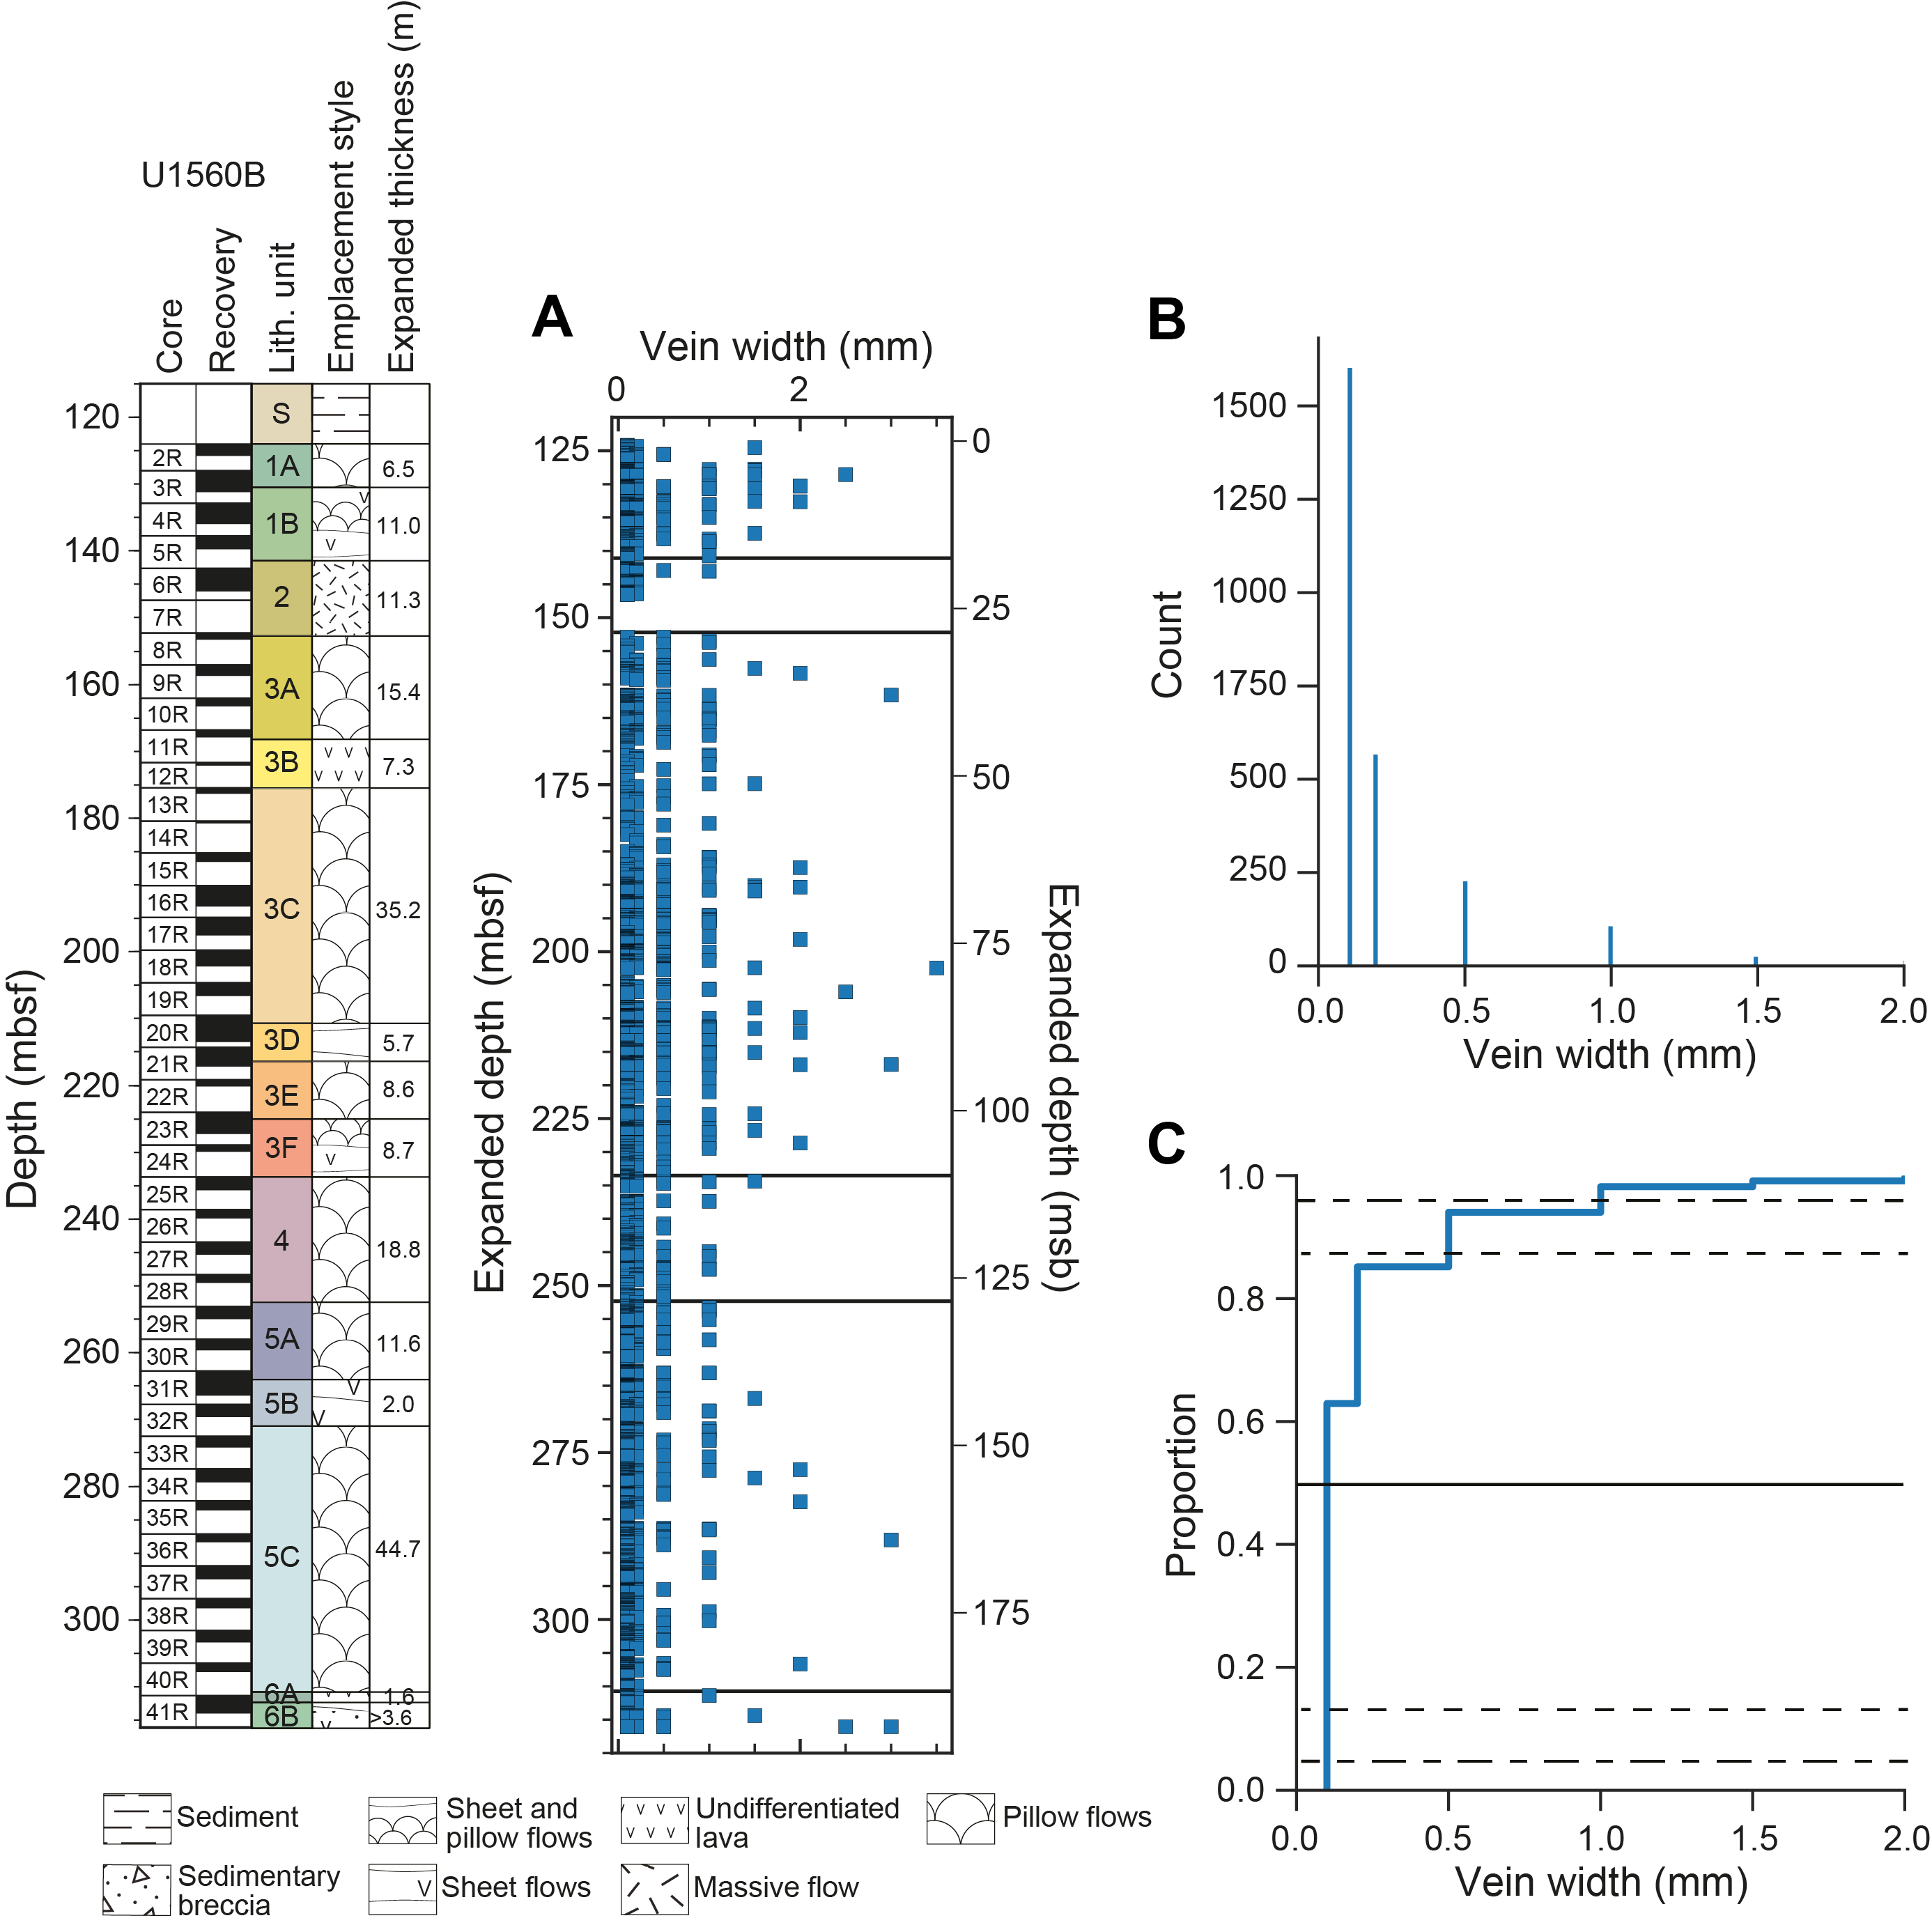
Figure F41. Vein width characteristics.
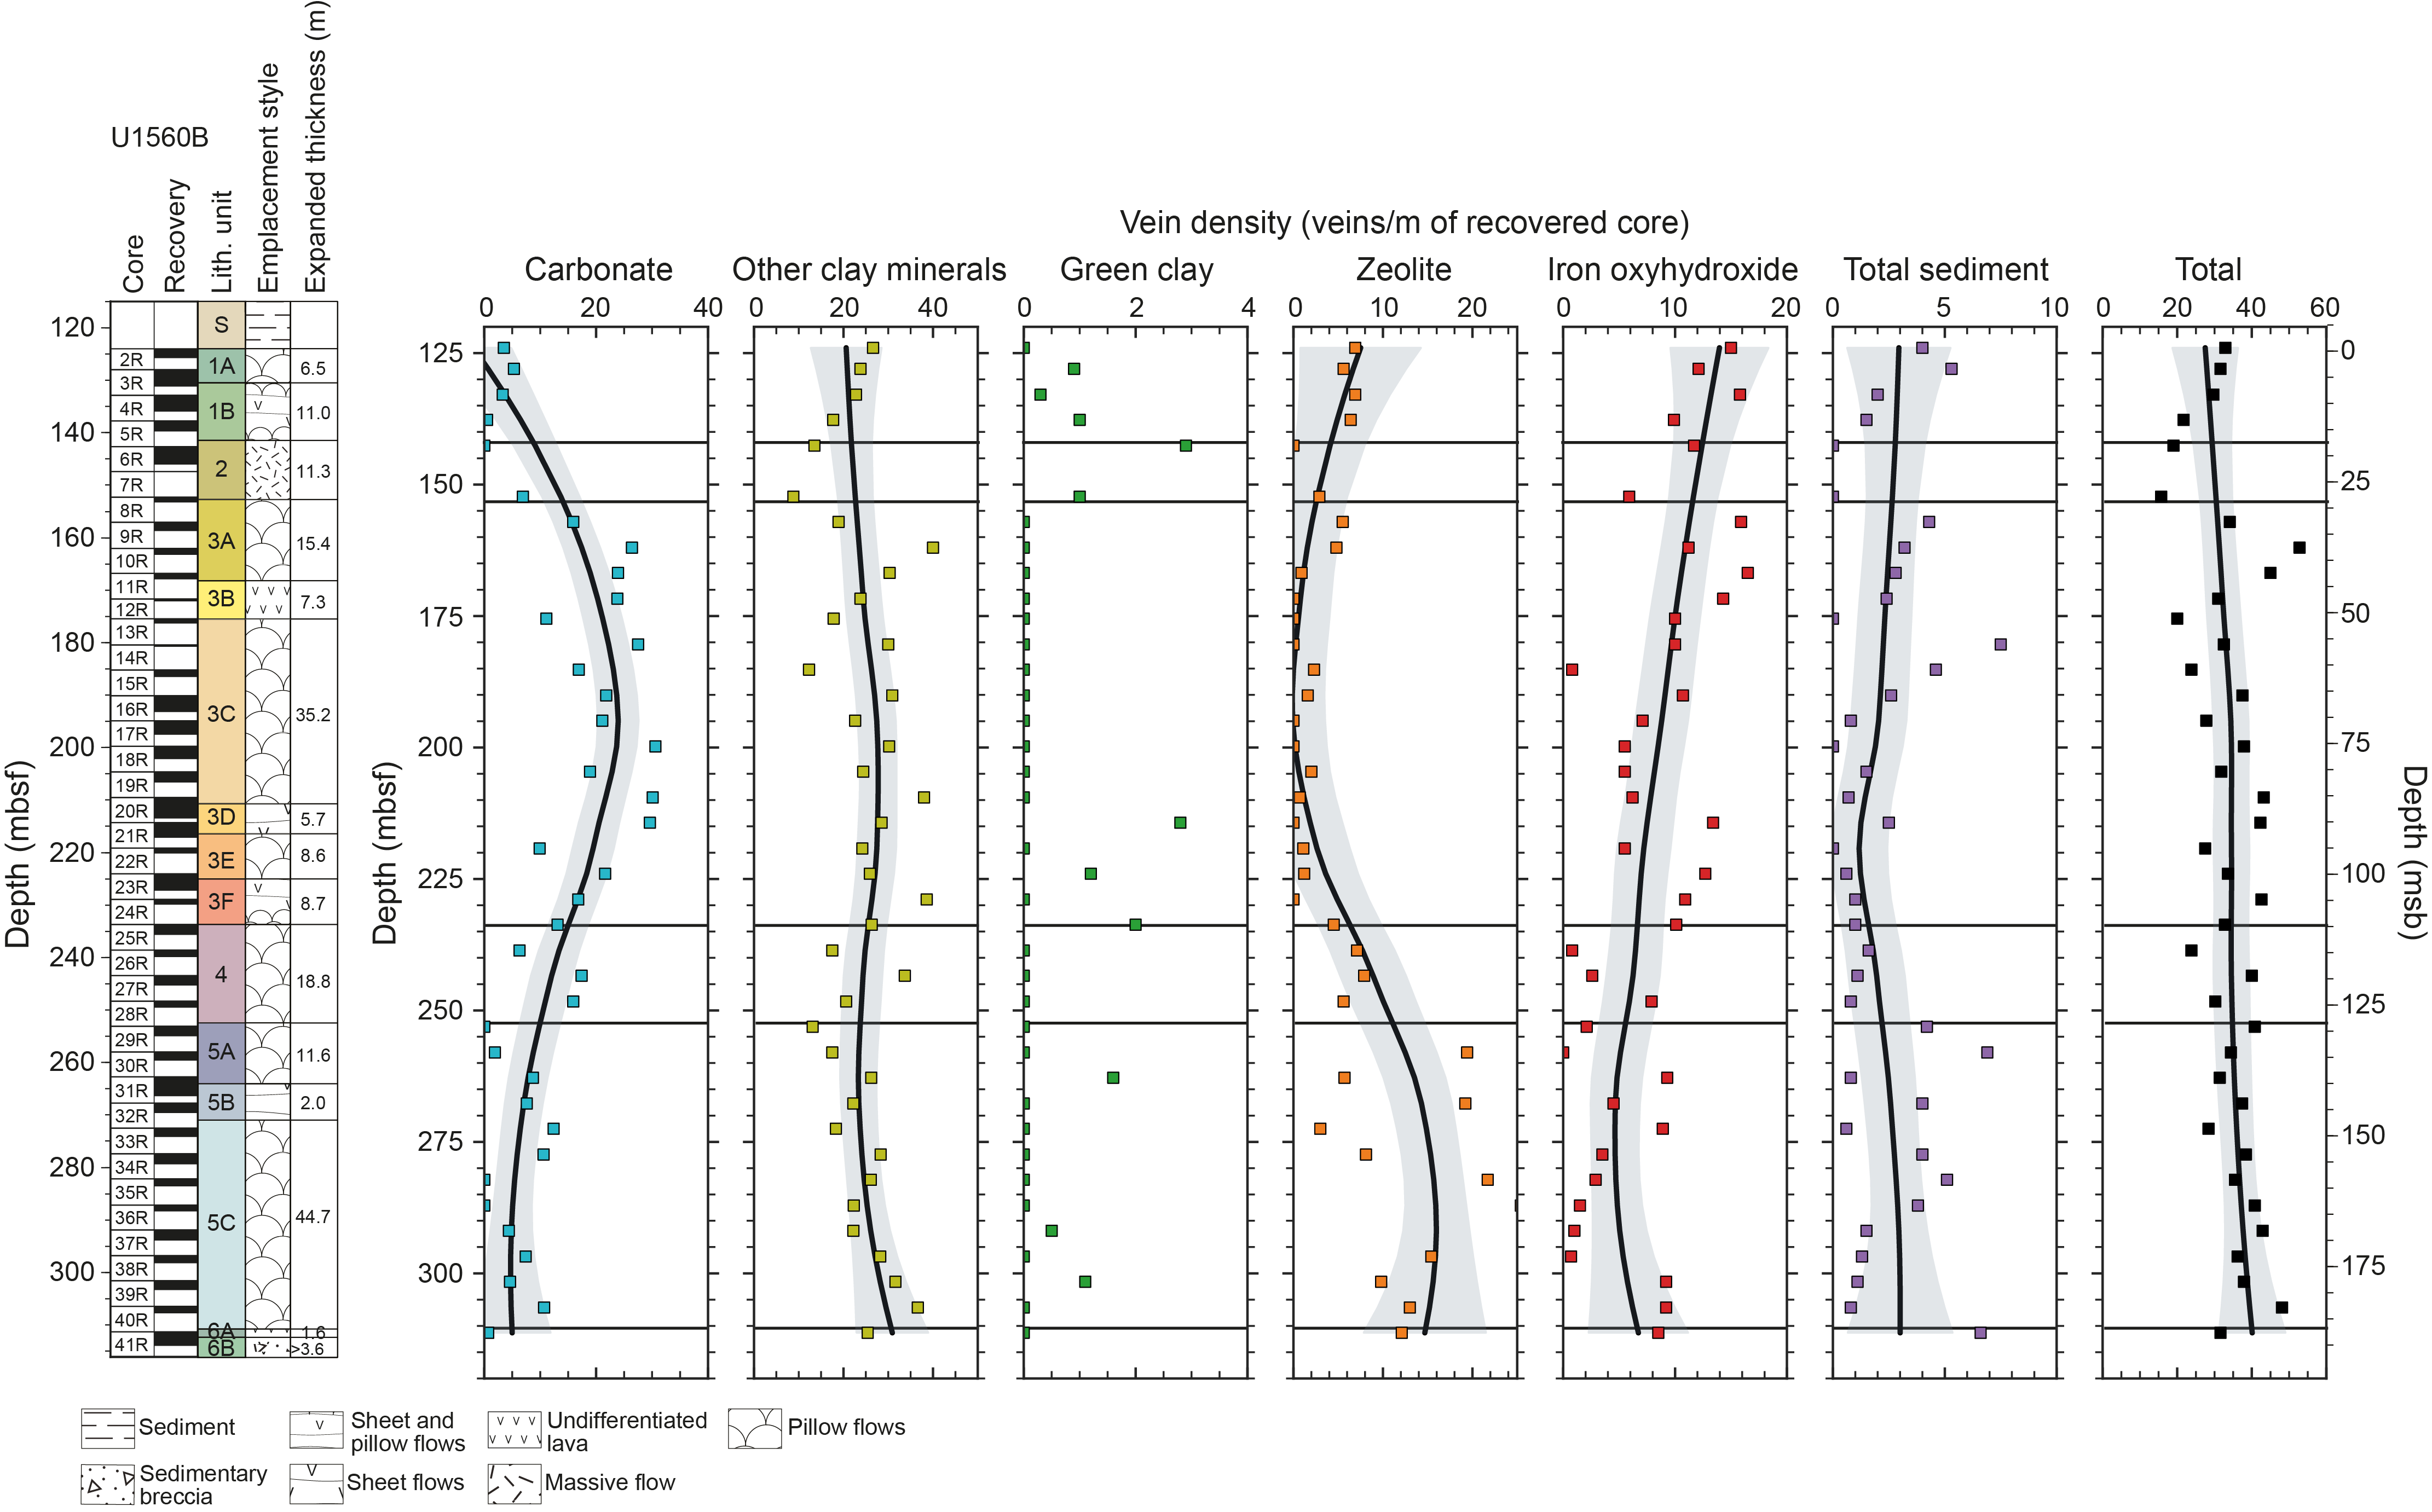
Figure F42. Vein density normalized to core recovery.
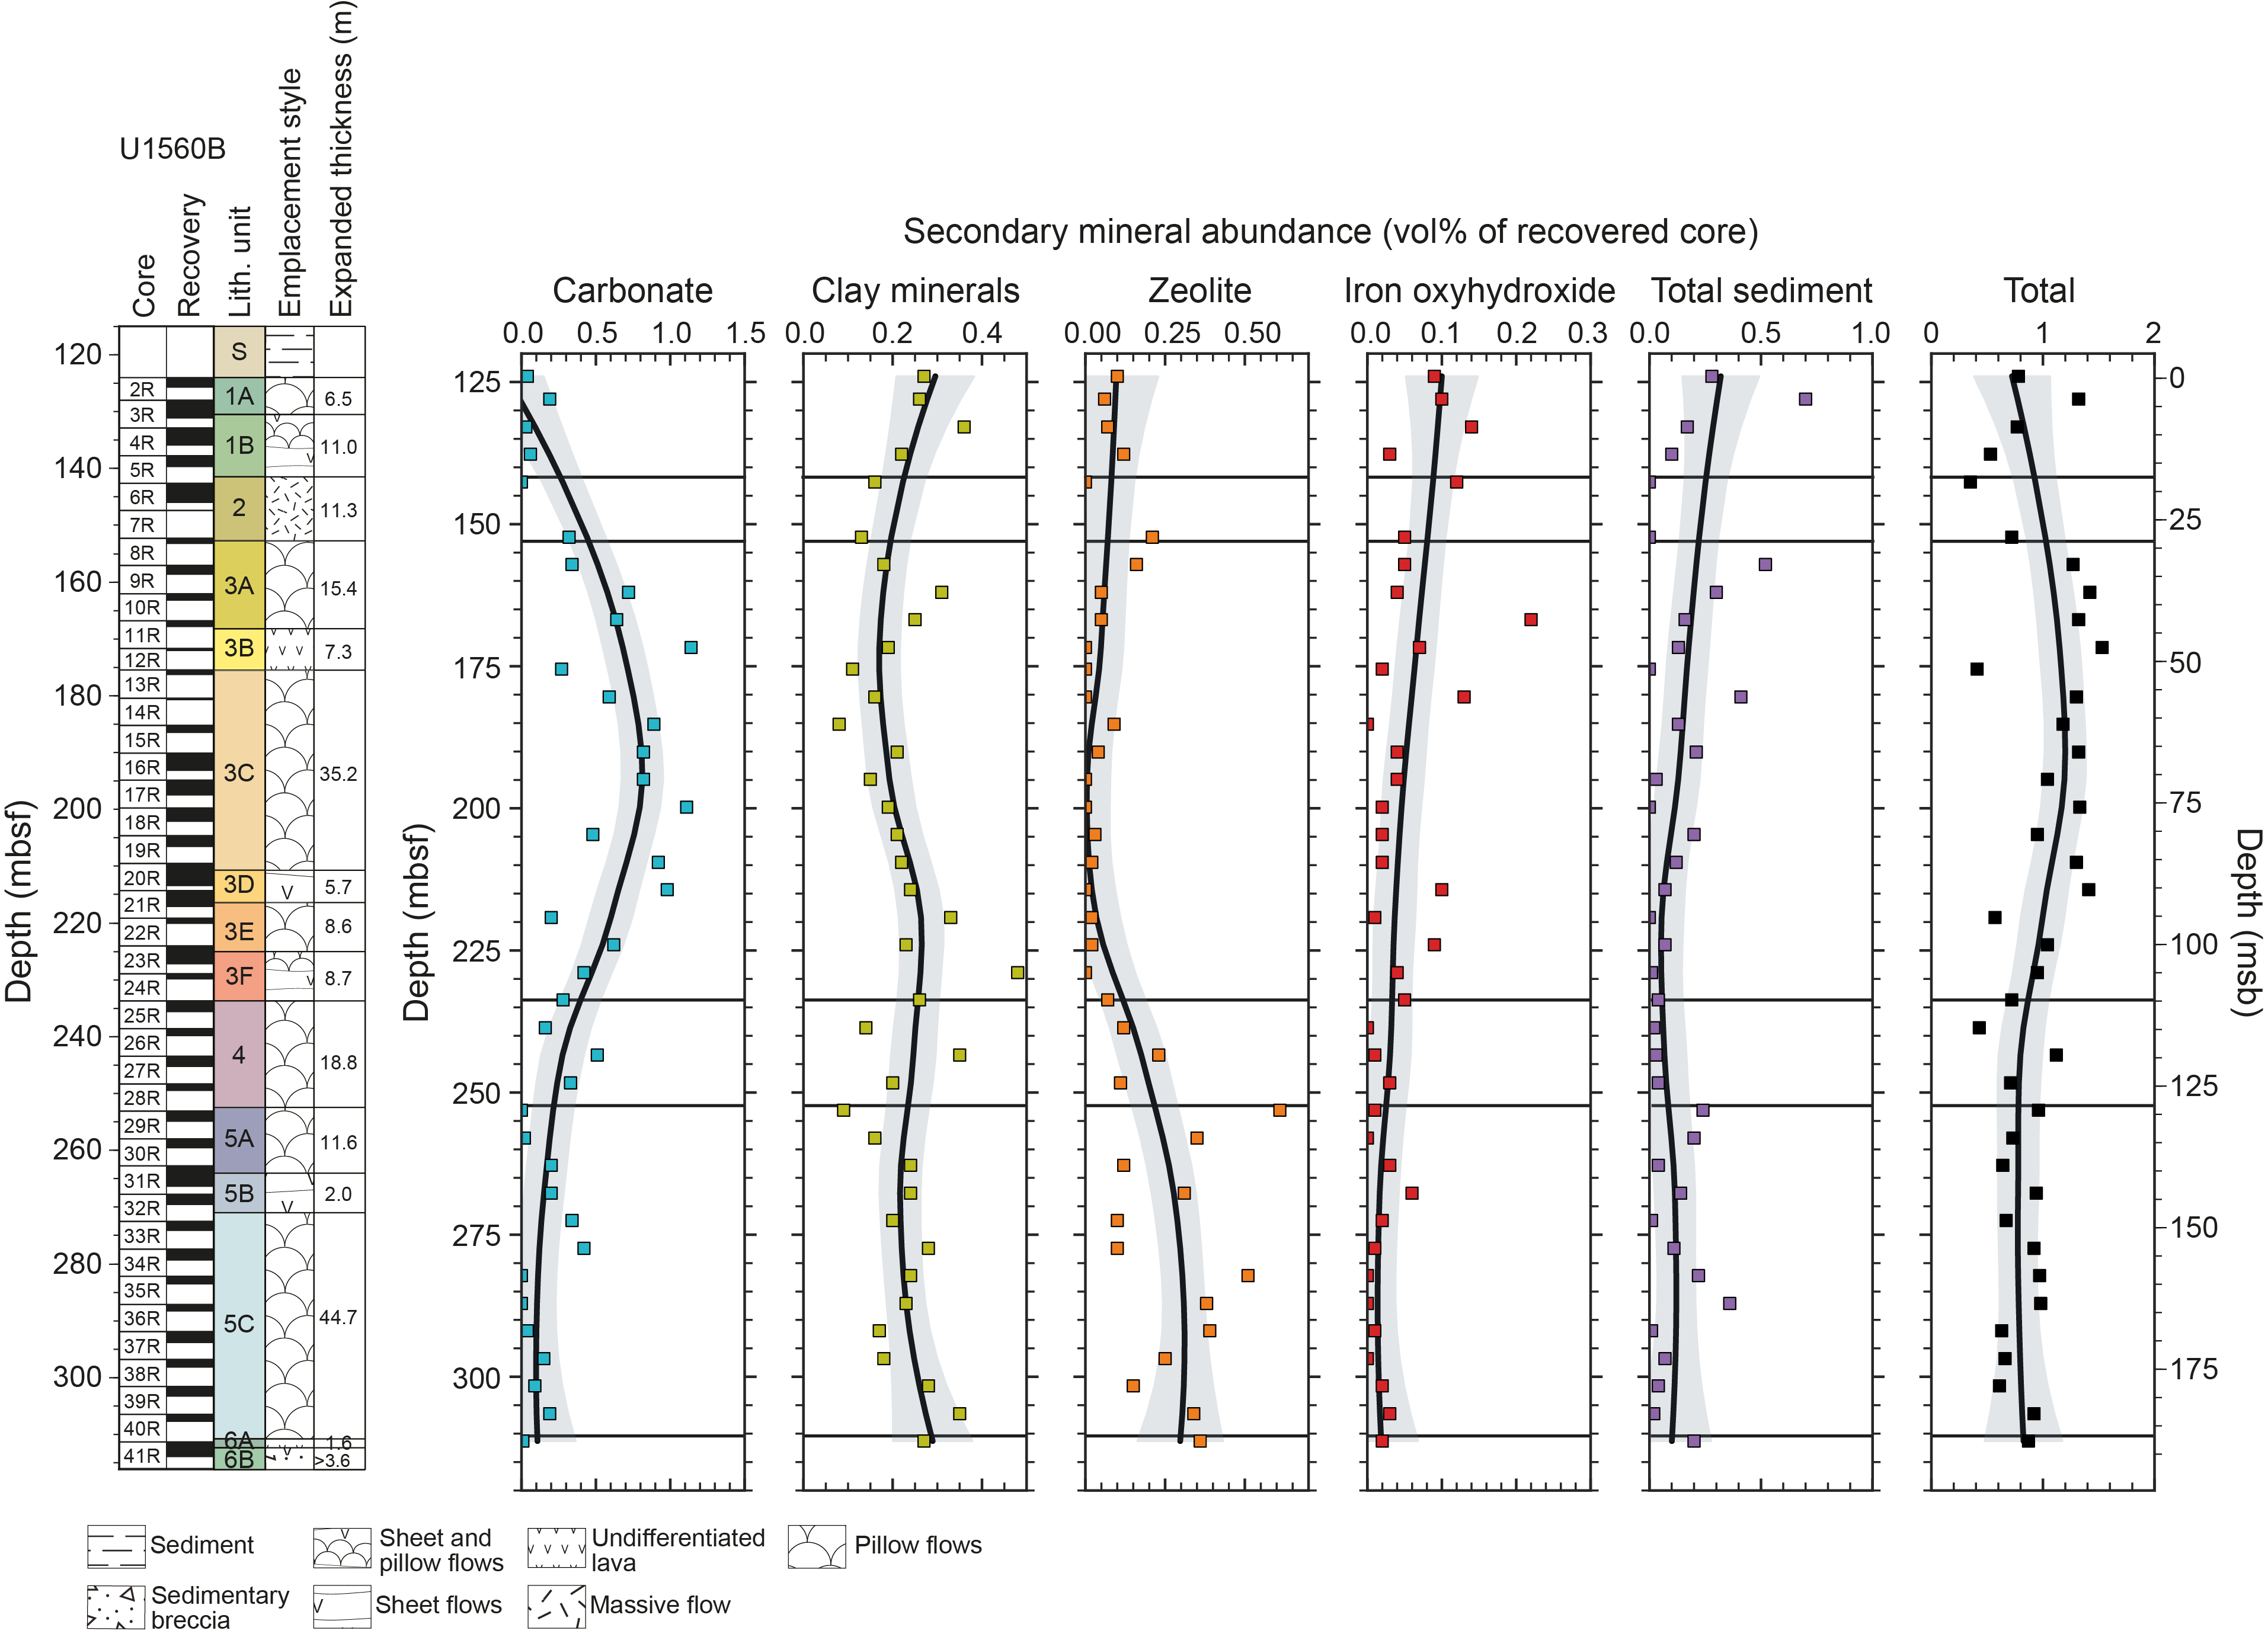
Figure F43. Secondary mineral volume percent.
Secondary mineral vein fillings include calcium carbonate, clays, zeolite, Fe oxyhydroxide, and sediment (Figures F44, F45, F46). Approximately 45% of all veins are filled with one mineral, 45% are filled with two minerals, and 10% are filled with three or four mineral types. Clay minerals are the dominant mineral vein assemblage; ~70% of veins yield a component of clay as a vein filling mineral type. The abundance of clay minerals is generally uniform downhole (Figure F43). The volume percentage of clay veins varies between 0.1% and 0.5% downhole, with a mean value of 0.2% ± 0.1% (1σ equivalent). In contrast to clay mineral veins, the occurrence and abundance of calcium carbonate veins is variable throughout Hole U1560B with some cores in Units 1, 2, and 5 devoid of calcium carbonate veins. Calcium carbonate veins most commonly occur in Unit 3 (153–234 mbsf), where the volume percentage increases from 0.3% to 1.1% at 200 mbsf and decreases to 0.3% at the Unit 3/4 boundary (234 mbsf). The total carbonate vein volume percentage for Hole U1560B is generally dominated by calcium carbonate veins within Unit 3 (Figure F43). Zeolite vein abundance and distribution is variable throughout Hole U1560B, and most occur in Units 4–6 (deeper than 234 mbsf). Zeolites are absent from some cores in Units 2 and 3 (Figure F43). The abundance of Fe oxyhydroxide veins progressively decreases with depth (Figure F43). Sediment veins occur as irregular <3.5 mm wide veins (Figure F46). Their abundance decreases downhole. Sediment veins are most common in Unit 1 but are absent from Units 2 and 4. The occurrence and abundance of green clay is generally restricted to massive and large sheet flows, where the vein density is mostly higher (Figure F42). Green clay veins also occur in the intervals that host green clay filled vesicles (see Background alteration). Vein density and secondary mineral abundance generally covary downhole for all mineral types (Figures F42, F43).
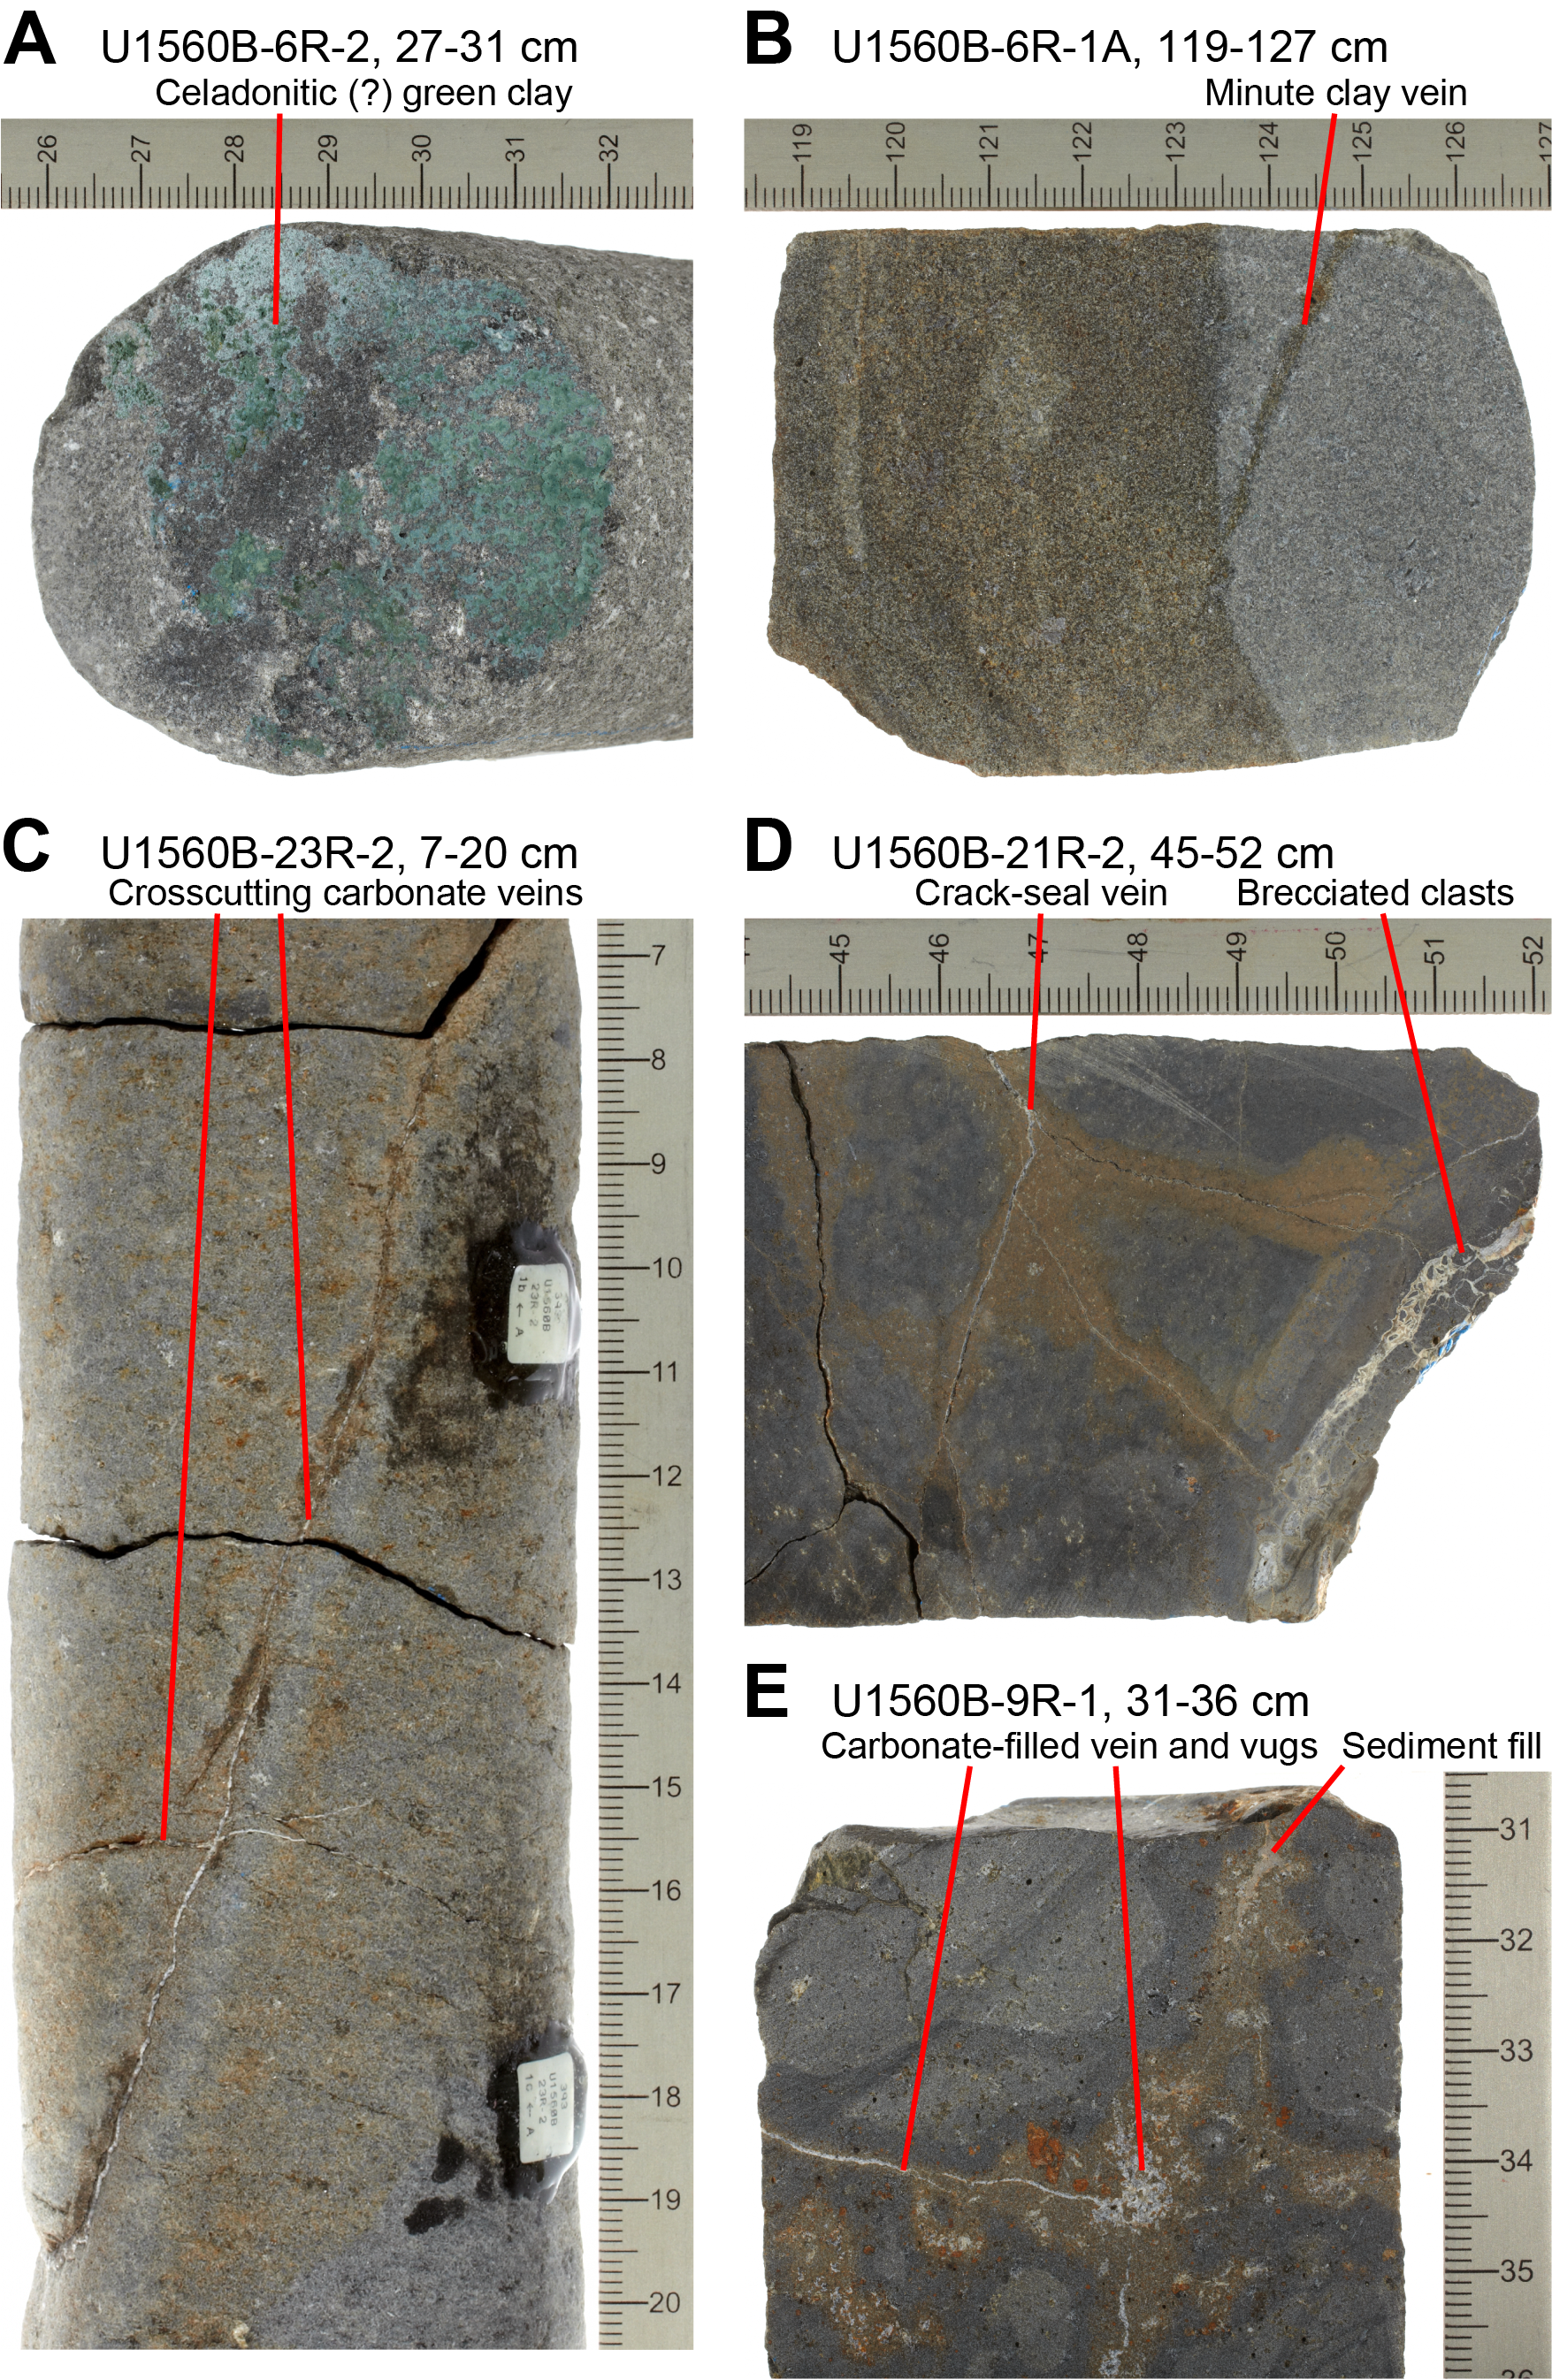
Figure F44. Vein types.
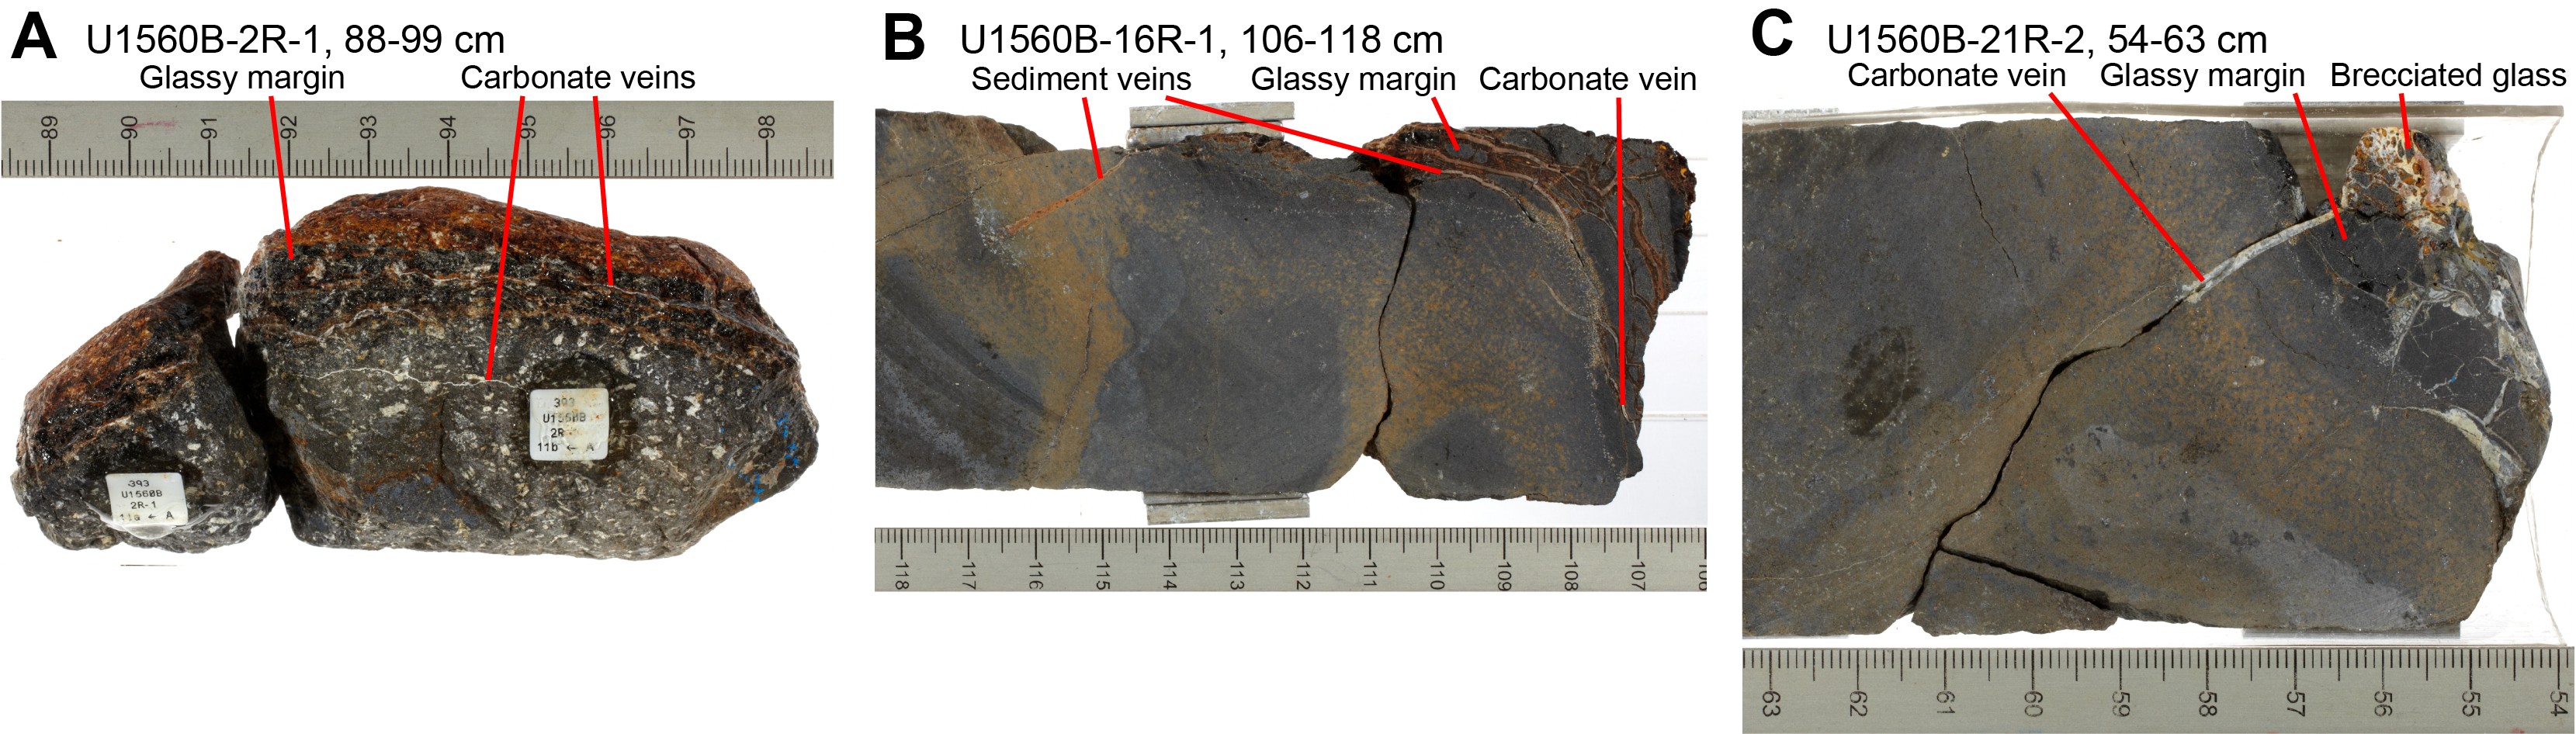
Figure F45. Veins in glassy margins.
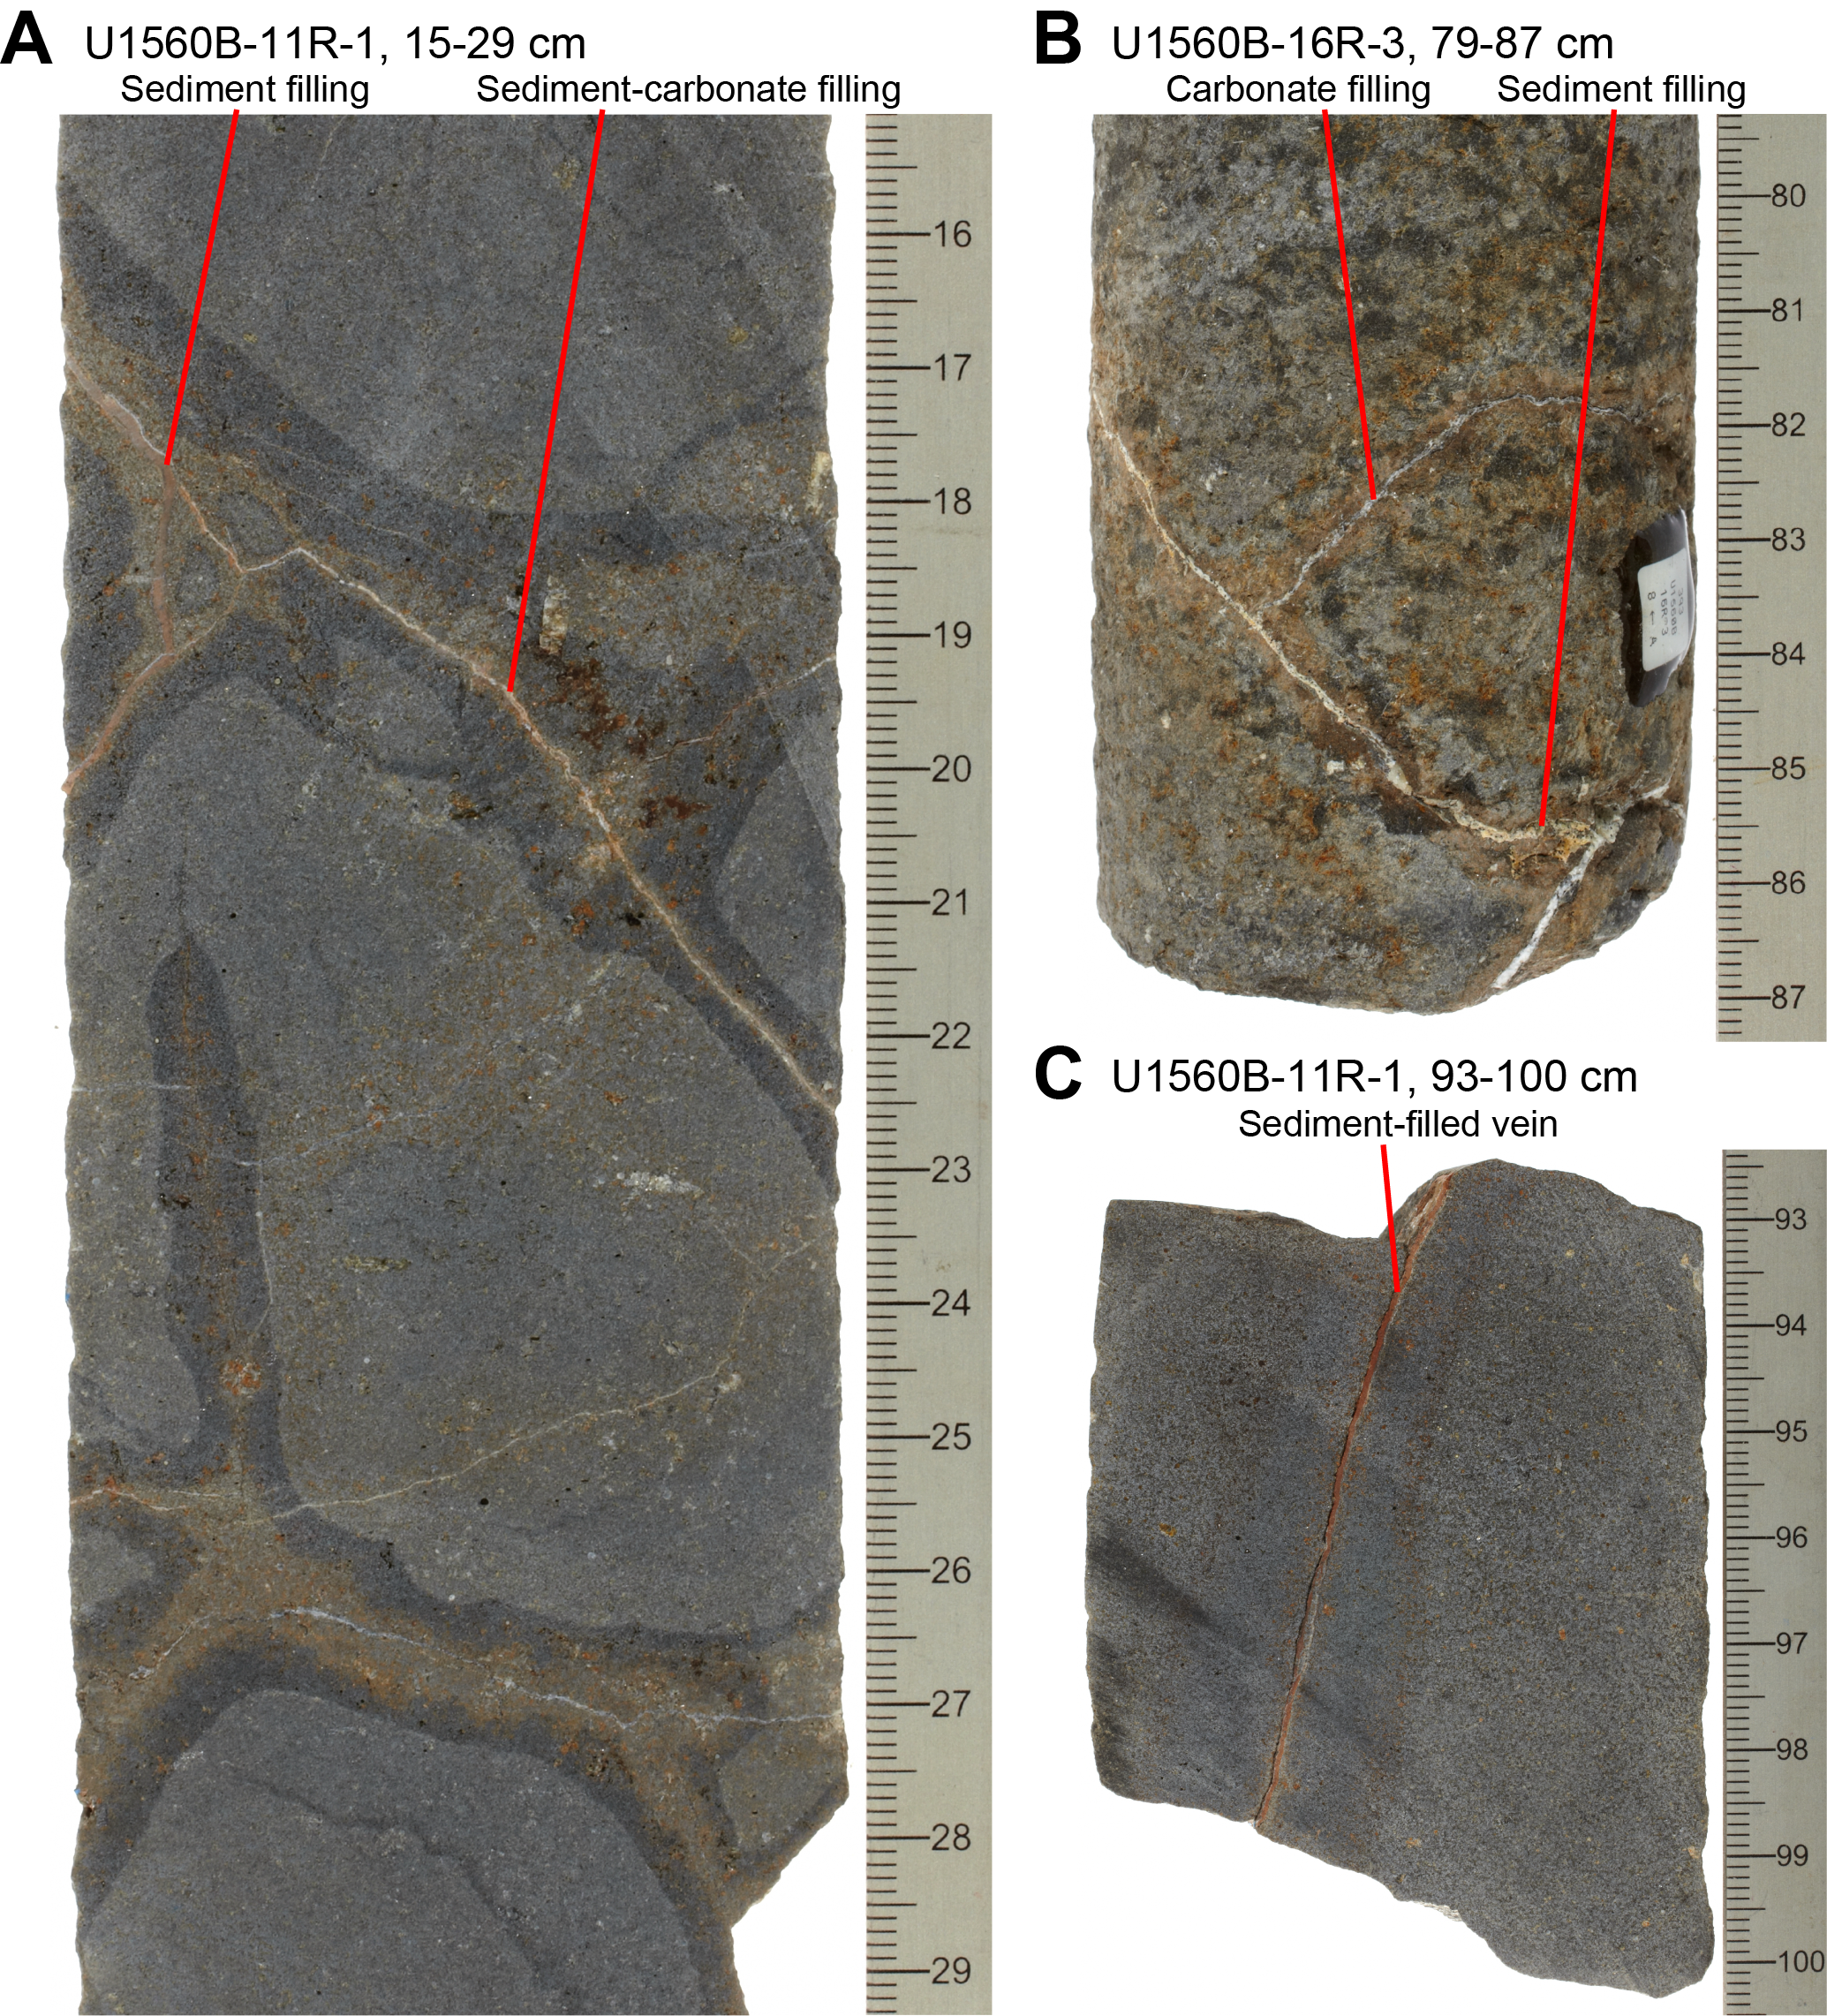
Figure F46. Metamorphosed sediment-filled veins.
Vein textures indicate that 54% of veins in Hole U1560B display some evidence of multiple episodes of fracturing and precipitation as multiple mineral types occur within a single discrete vein (Figure F44). Occurrences of veins that display clear crosscutting relationships are rare, and there is no systematic relationship between clay, calcium carbonate, iron hydroxide, and zeolite veins (Figure F44), indicating these phases are mutually crosscutting. Measured vein widths yield a broadly geometric distribution, with the proportion of single event veins relative to multiple generation veins decreasing with greater vein widths (Figure F47B). In addition, the proportion of veins associated with a halo relative to veins not associated with a halo increases with increasing vein width (Figure F48B).
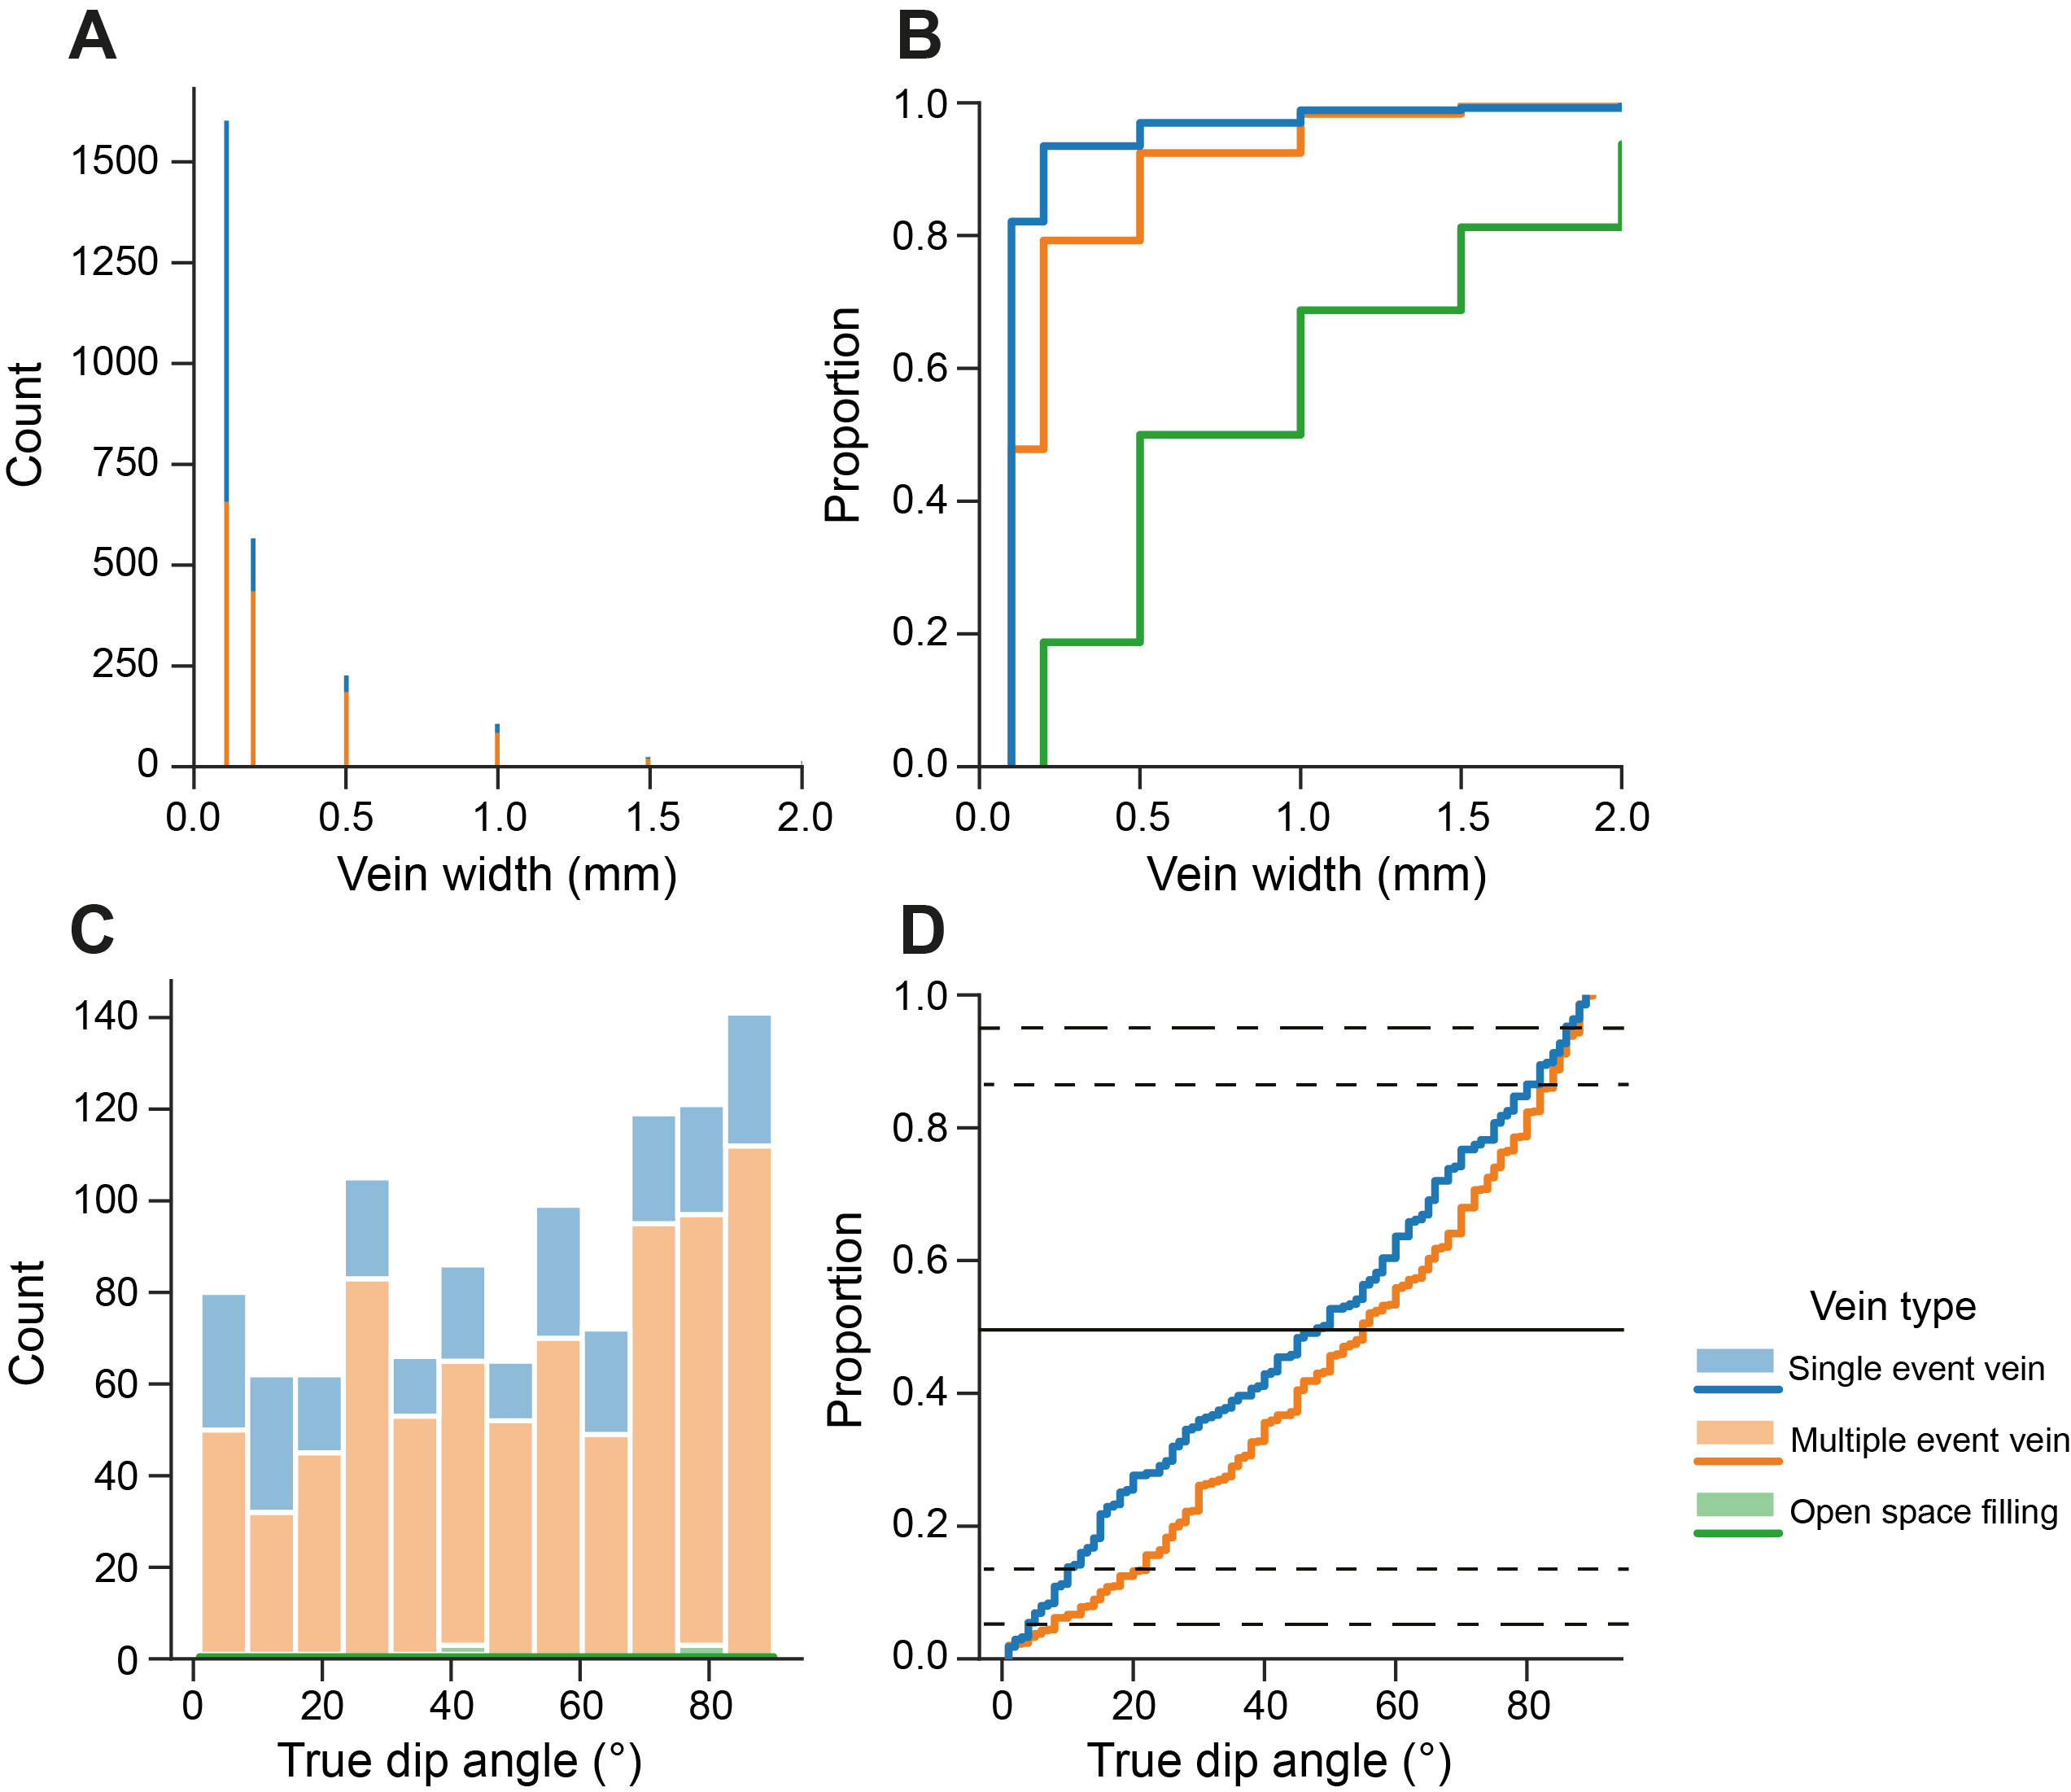
Figure F47. Vein width and dip angle statistics.
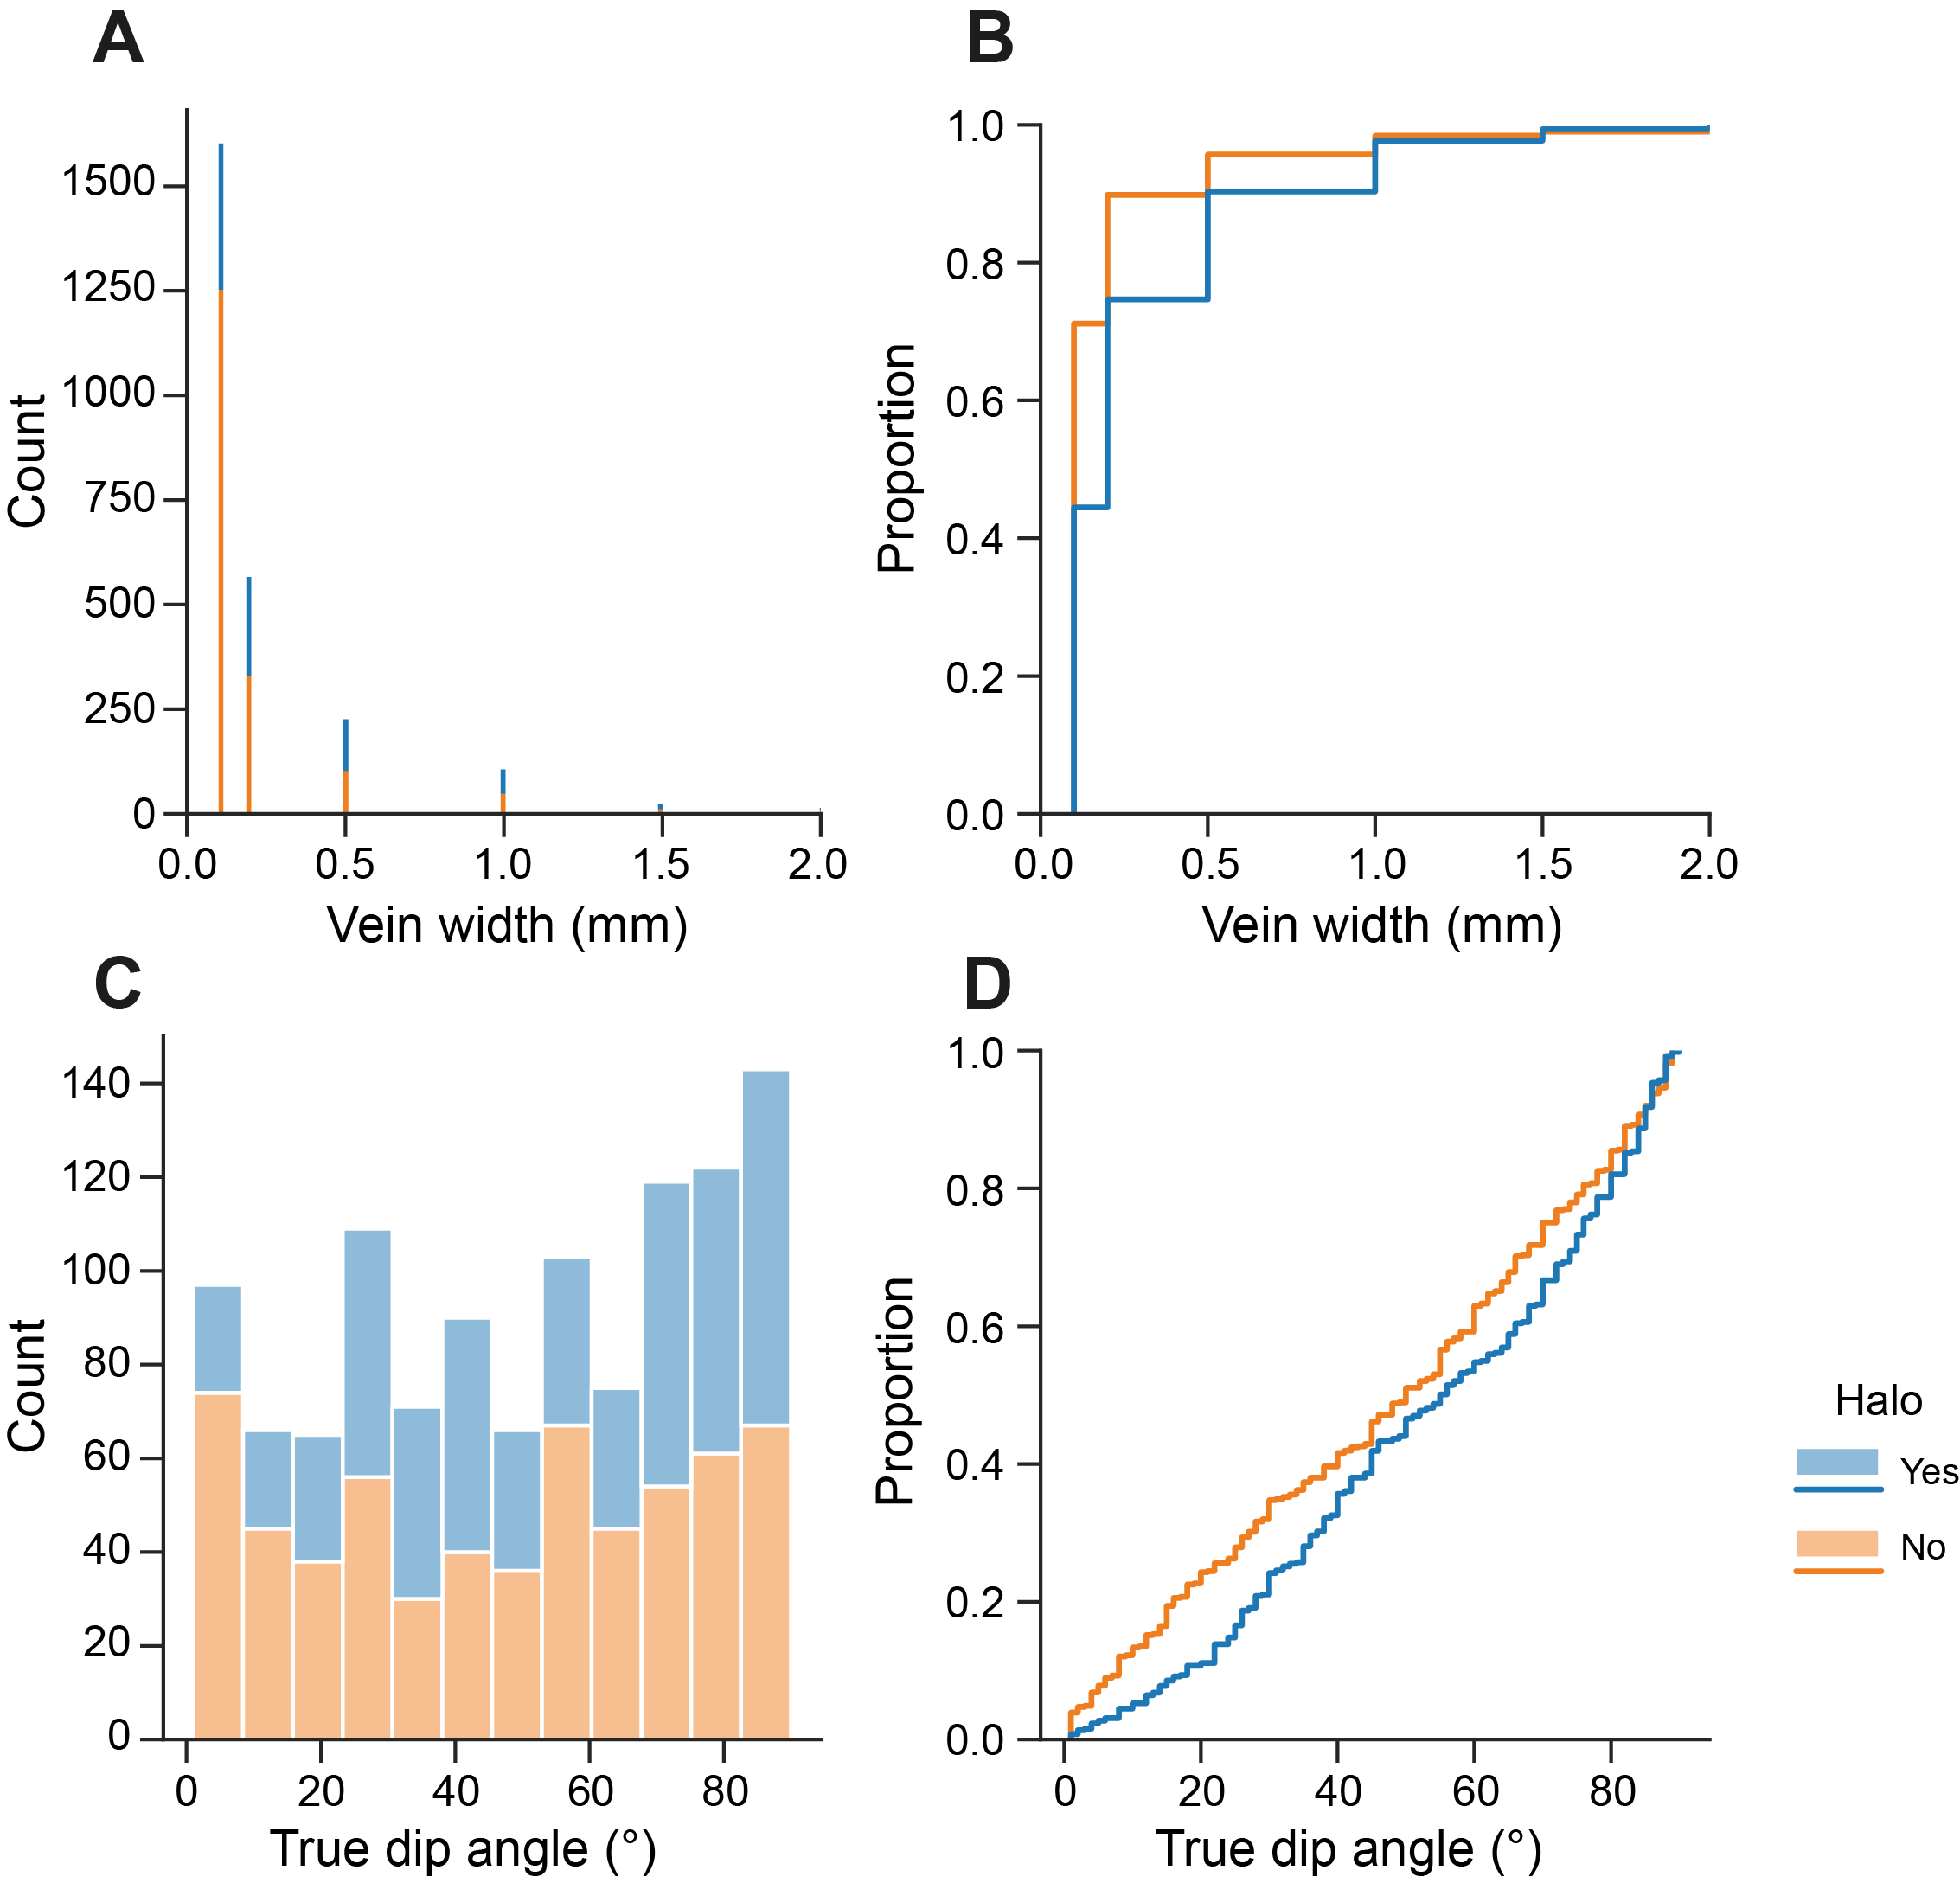
Figure F48. Vein width and dip angle by halo association.
6.6. Structural data
The dip direction and dip angle of ~43% of logged veins were measured; true dip angles range 1°–89° (Figure F49). The median and mean vein true dip angle of measured veins are 50° and 52°, respectively, with a mode of 88°, and no systematic relationship between true vein dip angle and depth occurs. The distribution of all measured vein true dip angles generally yields a skewed distribution with most orientated veins occurring at high to subvertical dip angles (~65°–89°). Multiple-event veins and single-event veins yield similar skewed distributions (Figure F47). Likewise, true dip angles of measured veins associated with a halo also show a skewed distribution (Figure F48). In contrast, veins not associated with a halo display a weakly bimodal distribution with a first mode occurring at gentle dip angles <20° and a second mode at high dip angles 55°–89° (Figure F48).
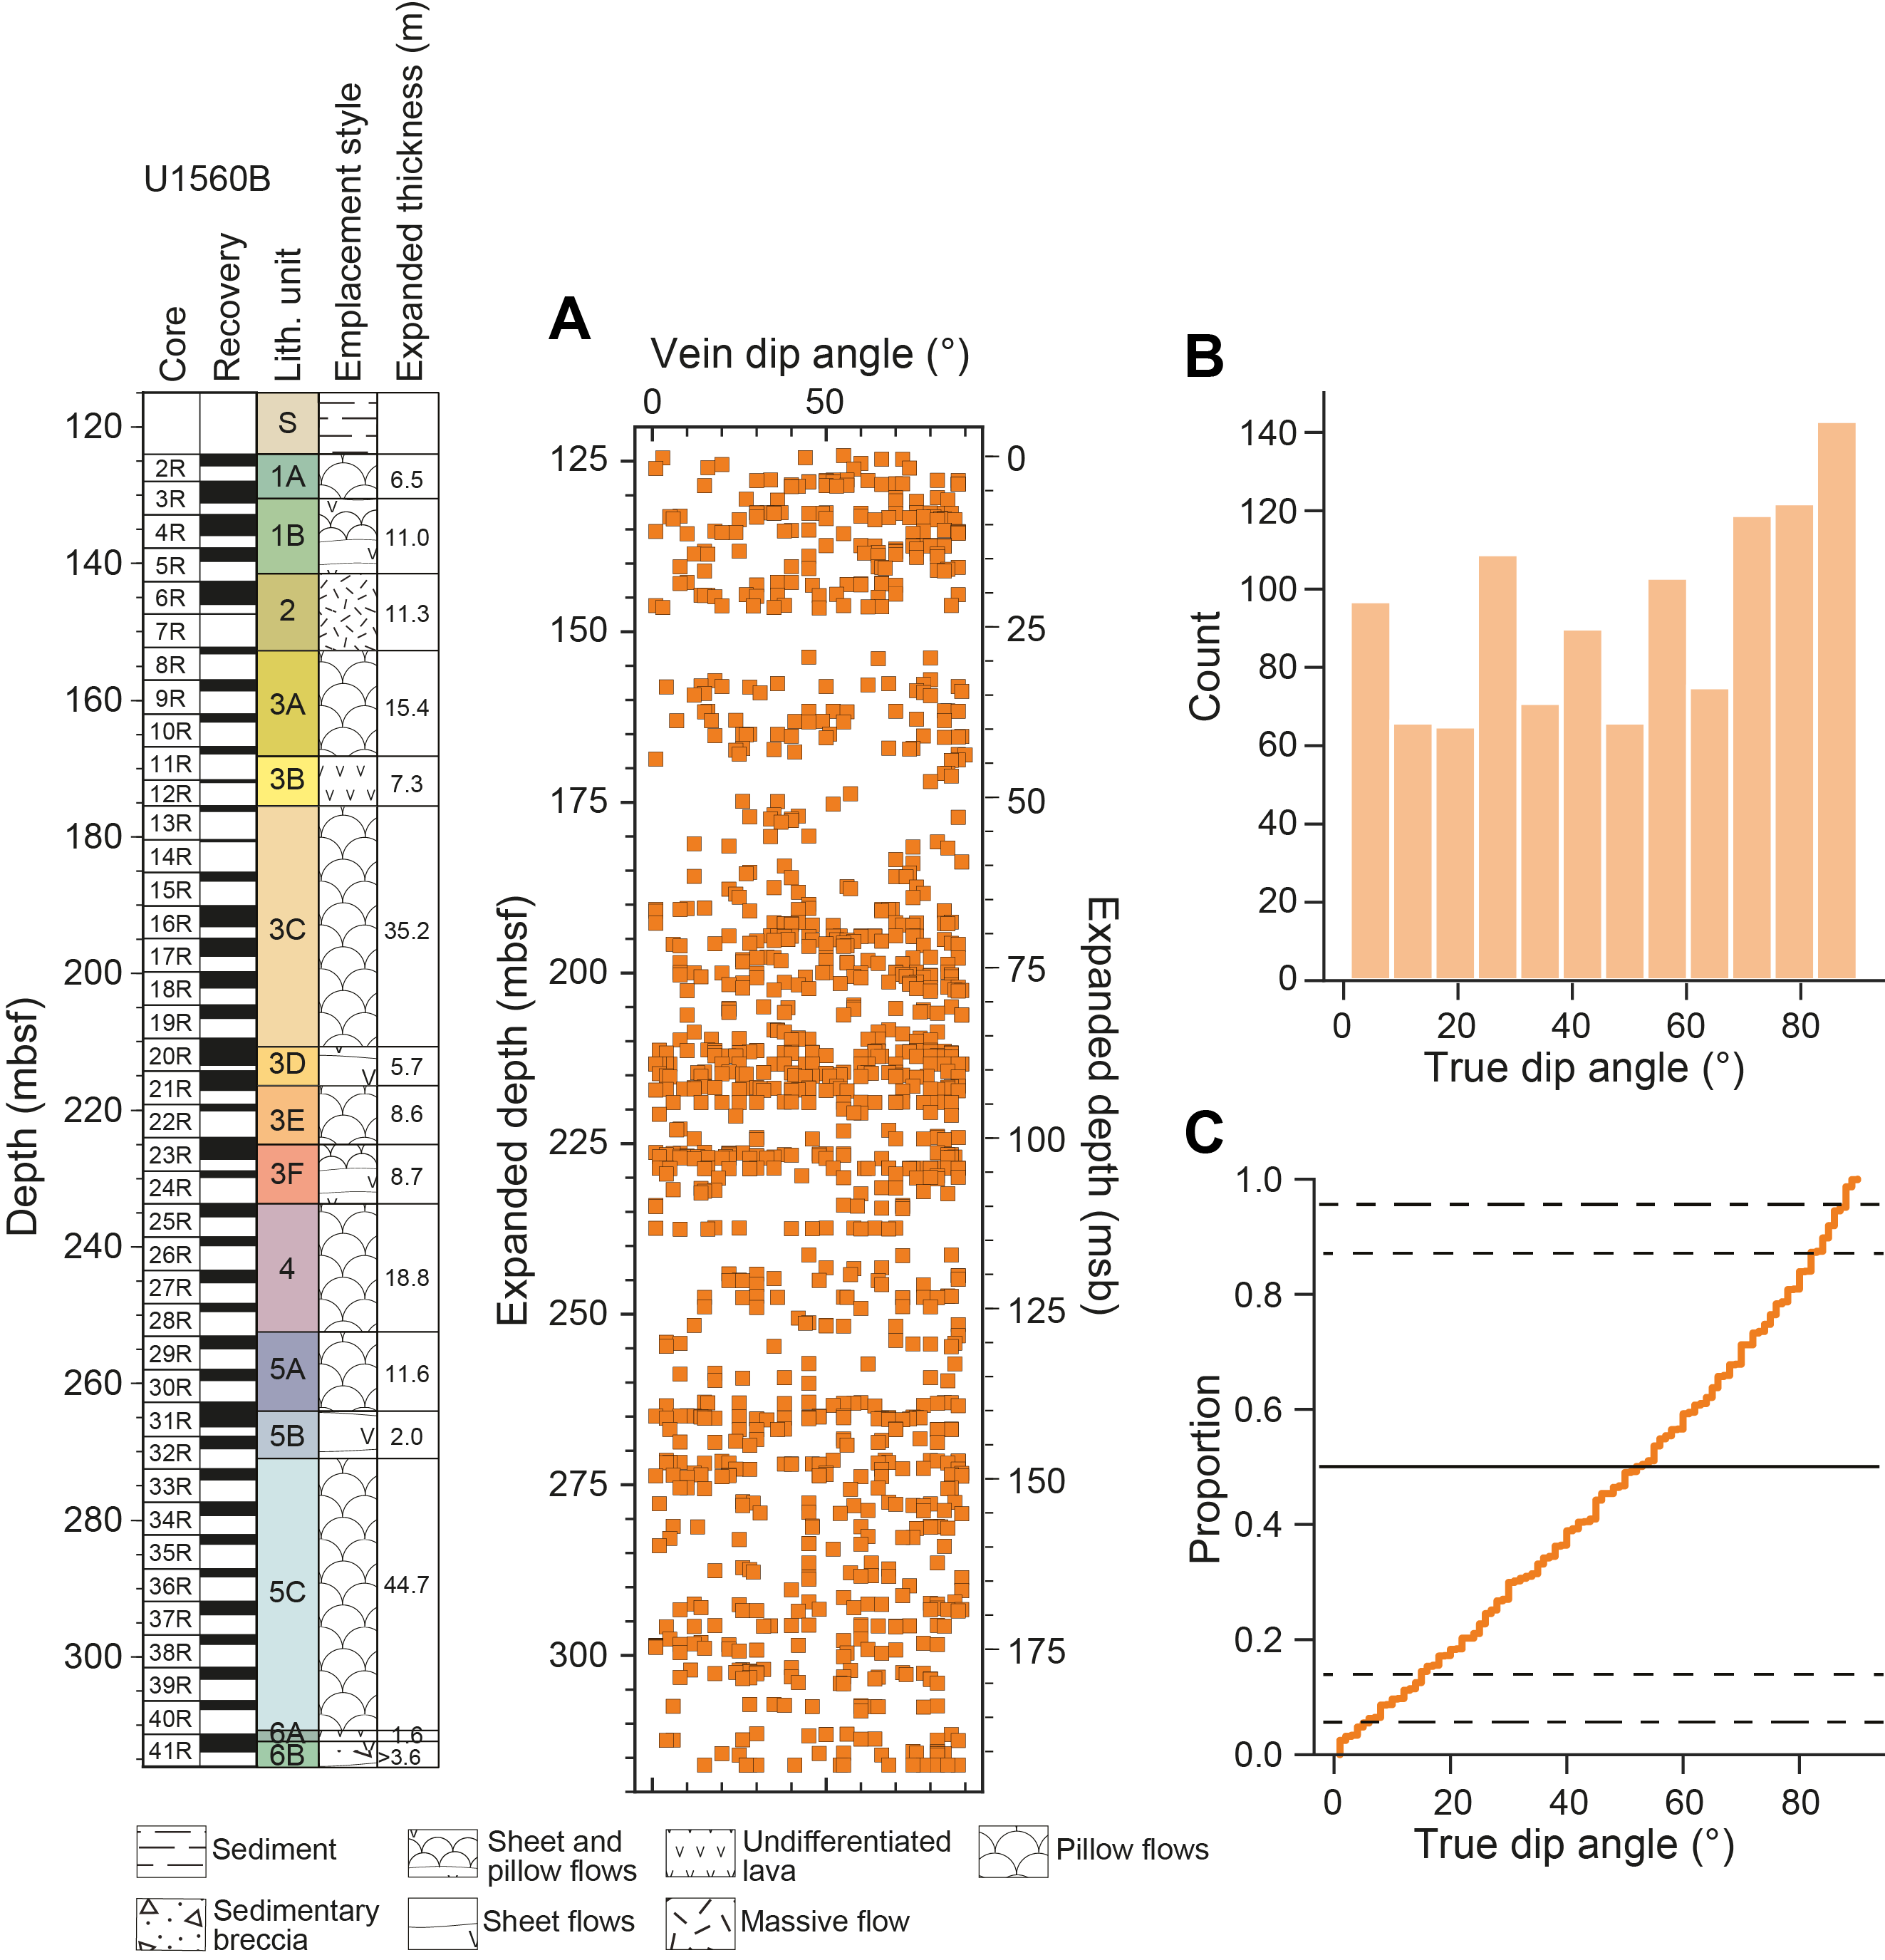
Figure F49. Vein dip angles.
6.7. X-ray diffraction
XRD spectra were generated for alteration products and precipitates collected from veins and vugs, MBIO samples, and ICP-AES samples (Table T10; see U1560B_XRD.xlsx in ALTPET in Supplementary material). XRD results for vein fillings reveal mainly (magnesian) calcite, phillipsite-Na, vermiculite and chamosite, and/or clinopyroxene and feldspar, with minor other clays, aragonite, goethite, and other zeolites. Samples from veins containing metamorphosed sediment are mainly composed of phillipsite-Na and minor other zeolites as well as magnesian calcite and vermiculite. Vug fillings are dominantly calcite and/or zeolites. Spectra from MBIO samples reveal mainly magnesian calcite with additional phillipsite-Na, vermiculite, and zeolites. The evaluation of bulk rock powder spectra suggests dominantly calcic to sodic feldspars and clinopyroxene as well as minor amounts of olivine, Fe oxides, and additional spectral peaks that indicate the variable presence of clays (see U1560B_XRD.xlsx in ALTPET in Supplementary material).
6.8. Summary
Hole U1560B records fluid/rock reactions over the range of spatial contexts expected for uppermost basement, albeit with limited recovery of breccias. The secondary minerals forming (predominantly various clays, carbonate, Fe oxyhydroxides, and zeolites) are consistent with reactions at low temperatures with seawater-derived fluids. In Hole U1560B, it is possible to identify zones of alteration that have specific characteristics (Figure F50) that reflect the changing dominance of vein mineral fill and halo alteration style. The uppermost 25 m of volcanic rocks in Hole U1560B is characterized by the presence of green clay filling vesicles (in background and in alteration halos in massive flows), a generally low abundance of alteration halos (generally <20% of the area of the core) with gray background alteration dominating, and relatively low carbonate vein abundance. From 25 to 125 msb, the proportion of halos remains similar but orange halos dominate the overall halo abundance. This zone in Hole U1560B also hosts the most carbonate veins. Green clay is restricted to massive flows. From below 125 msb, a marked increase in halo abundance and concurrent drop in background alteration abundance is driven by the rapid appearance of significant volumes of brown halos. These brown halos are variable in their intensity over a range of scales. The lowermost part of the hole (below 125 msb) is carbonate vein poor, but zeolite veins are more abundant than higher in the section. This overall change in alteration characteristics is in part controlled by the volcanic architecture of the upper crust, such as the association of green clay with massive flows, but also reflects hiatuses in volcanism that exposed parts of the crust to direct contact with seawater for prolonged periods of time as recorded by the brown halo zones.
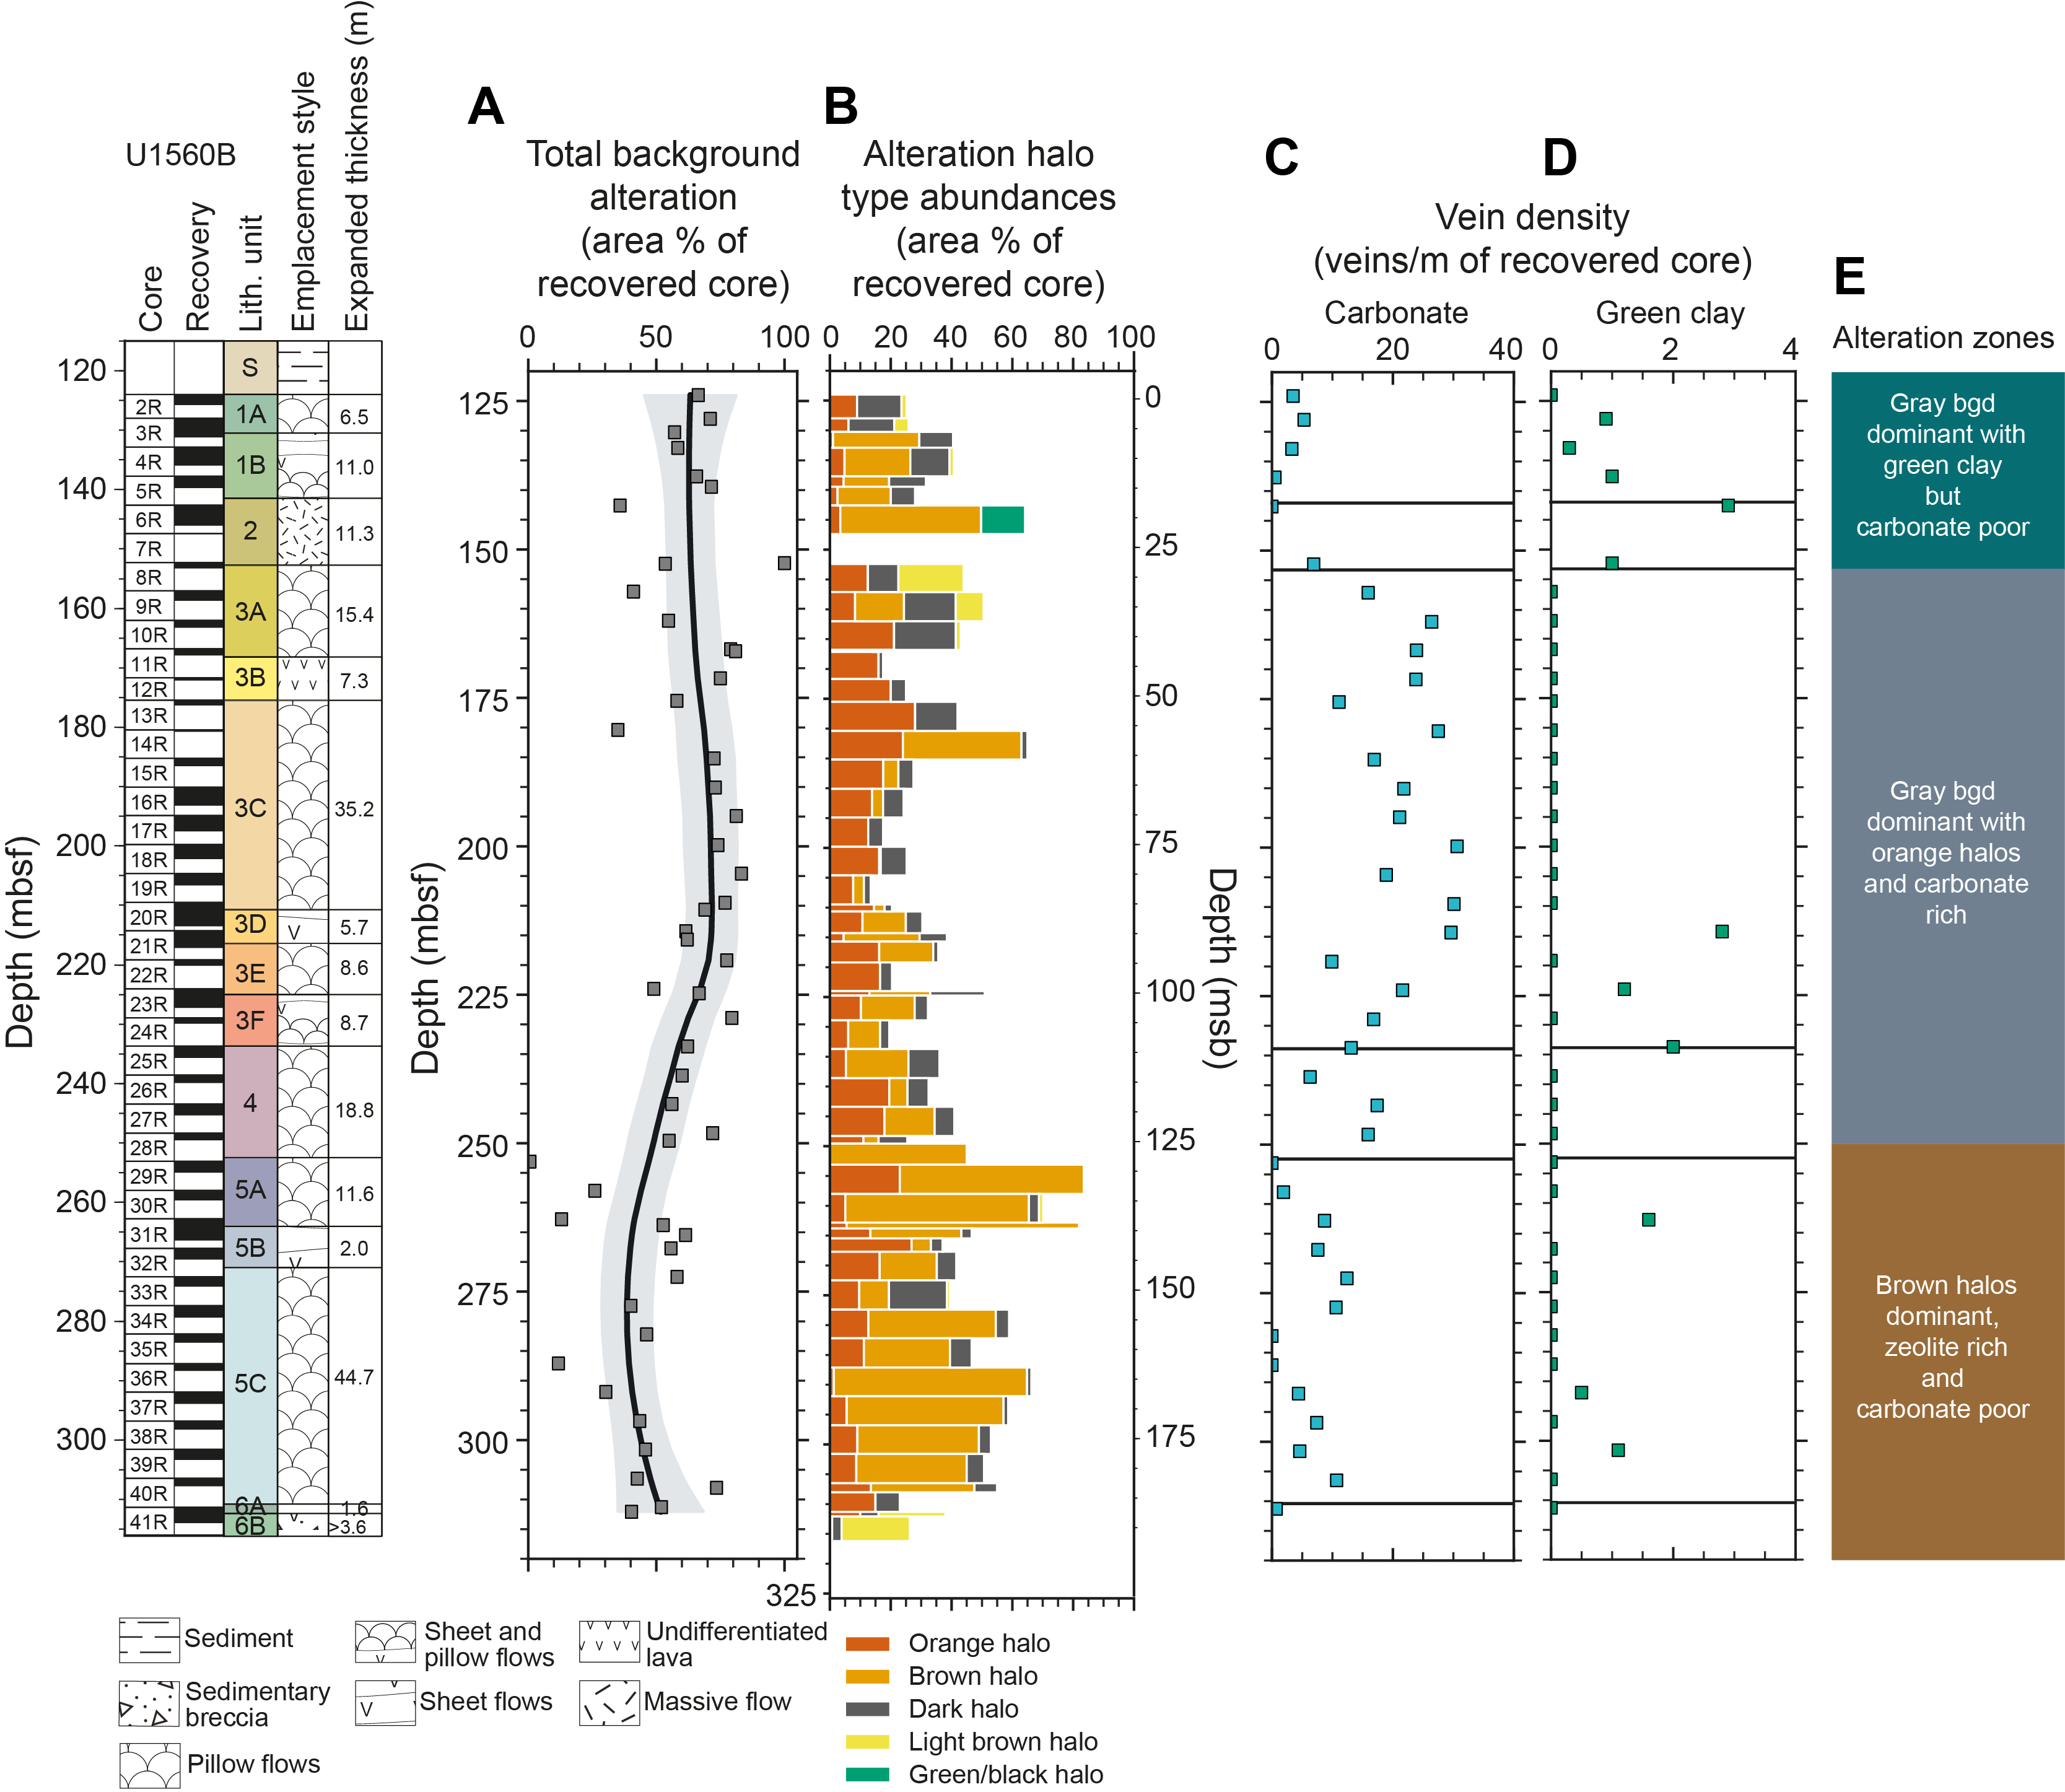
Figure F50. Key alteration characteristics.
7. Biostratigraphy
Sedimentary successions recovered from Holes U1560A and U1560C contain a Middle Miocene to Late Pleistocene sequence of pelagic nannofossil ooze with clay (see Sedimentology). The integrated calcareous nannofossil and planktic foraminiferal biozonation for Site U1560 is summarized in Figure F51 and Tables T11 and T12. The age-depth table and plots of biohorizons and paleomagnetic reversals for Site U1560 can be found in Age model and mass accumulation rates (Tables T24, T25; Figures F71, F72).
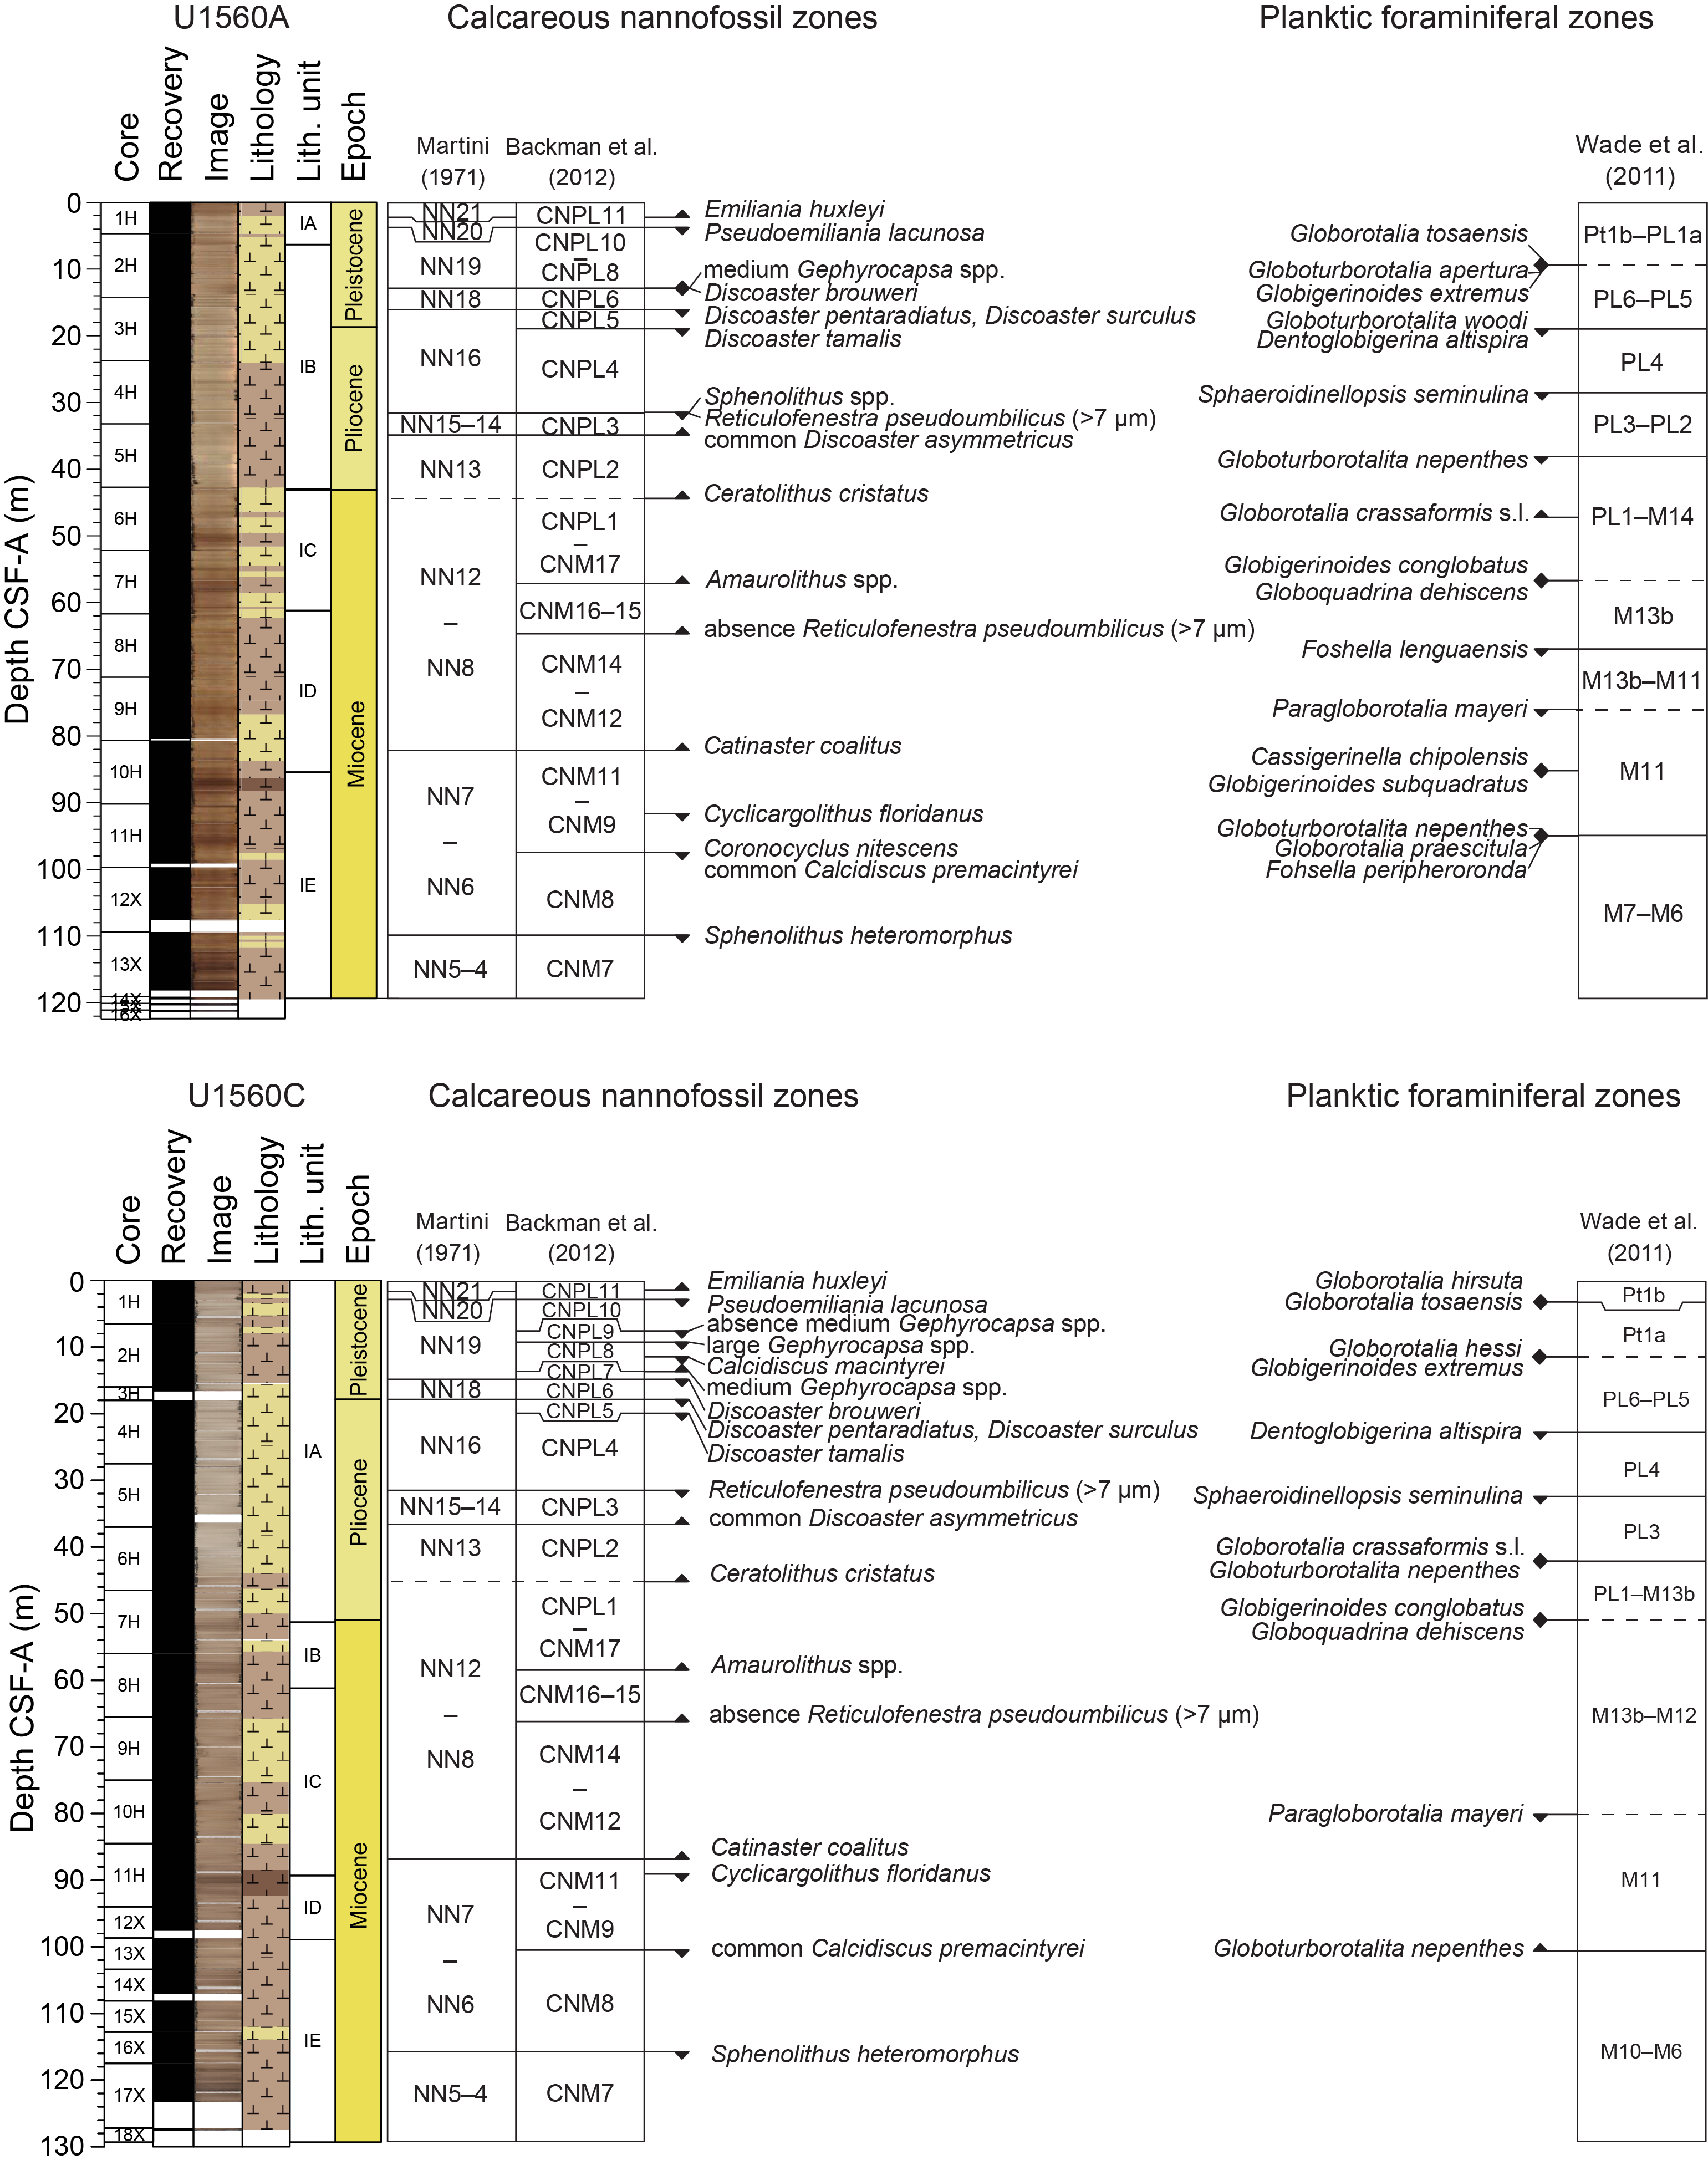
Figure F51. Biostratigraphic zones and datums.
Samples analyzed from Hole U1560A were core catcher samples sent to the science party micropaleontologists on shore following Expedition 395E (see Background and objectives). Additional nannofossil smear slides were taken shipboard during Expedition 393 from the archive halves of Hole U1560A cores. Samples analyzed from Hole U1560C came from core catchers, and an additional two samples per core were taken from working halves during Expedition 393. These additional samples were collected from nannofossil ooze intervals, avoiding clay-rich intervals where possible to ensure maximal microfossil diversity.
The Hole U1560C mudline sample contains Late Pleistocene to recent planktic foraminifera; ages based on nannofossils could not be determined because of contamination. The Pliocene/Pleistocene boundary occurs at ~20 m CSF-B in both holes. The Miocene/Pliocene boundary could not be determined precisely because index species were absent in both microfossil groups. Thus, this boundary is approximated by the Early Pliocene nannofossil bioevent base of Ceratolithus cristatus (5.08 Ma) recorded at a depth of ~43 m CSF-B. The boundary between the Late and Middle Miocene occurs around 70 m CSF-B based on nannofossil datums.
Benthic foraminifera are present throughout Hole U1560A and indicate an abyssal paleodepth from the Middle Miocene to the Late Pleistocene.
7.1. Age of basement
Two indurated calcareous sediment samples from volcanic basement in Hole U1560B were examined for nannofossils, but these samples included recrystallized calcite and no nannofossils were identified. The most accurate age determination using nannofossils was conducted on the deepest sediment samples from Hole U1560A (14X-1, 35 cm; 119.45 m CSF-B) and U1560C (18X-1, 25–30 cm; 127.45 m CSF-B), both of which contain Sphenolithus heteromorphus and Discoaster signus, suggesting that sediments near the sediment/basement interface are 13.66–15.85 Ma, which is in good agreement with the estimated basement age of ~15.2 Ma (see Background and objectives).
The most refined estimates for the basement age come from analysis of thin section Sample 393-U1560B-2R-1, 83–85 cm, which is described as indurated calcareous interpillow sediment (see Sedimentology). The sample contained preserved planktic foraminiferal tests, including Orbulina spp., Praeorbulina spp., and T. sicanus (Figure F52). The presence of Orbulina spp. indicates the maximum age can be no older than 15.1 Ma (Wade et al., 2011), which marks the first appearance of this genus, whereas the genus Praeorbulina is constrained to 14.3–16.3 Ma (Wade et al., 2011). The oldest age constraints for the sample can be further refined using ages of T. sicanus, whose extinction event (top) is calibrated to 14.4 Ma (Wade et al., 2011). This constrains the age of the sampled sediments to between 14.4–15.1 Ma. These results are in good agreement with the projected crustal age of ~15.2 Ma at Site U1560 (see Background and objectives).
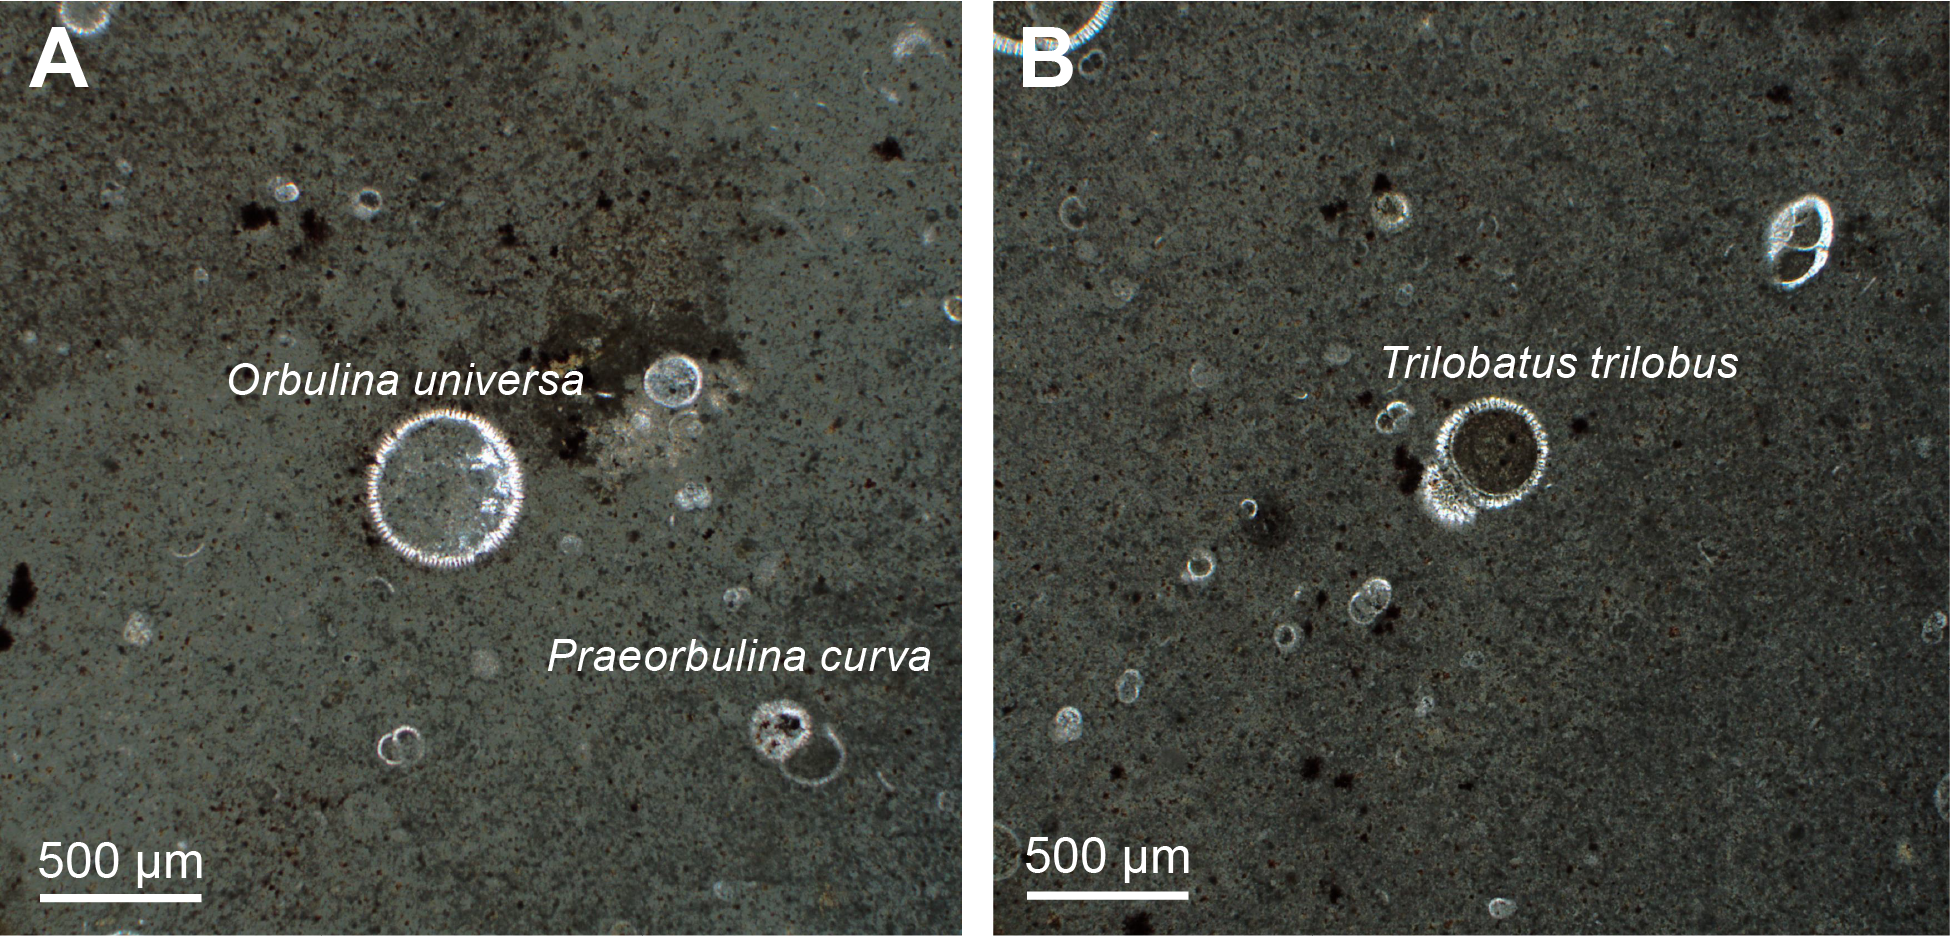
Figure F52. Age diagnostic taxa.
7.2. Calcareous nannofossils
We analyzed all core catcher samples from Holes U1560A and U1560C to establish the calcareous nannofossil biostratigraphy for this site. Additional smear slide samples were taken from split-core sections of both holes. In Hole U1560A, these samples were taken from the archive half, whereas smear slide samples were collected from the working half in Hole U1560C. The calcareous nannofossil distribution chart mainly features age-diagnostic and other notable taxa (Tables T13, T14), and photomicrographs of several nannofossil specimens are shown in Figure F53.
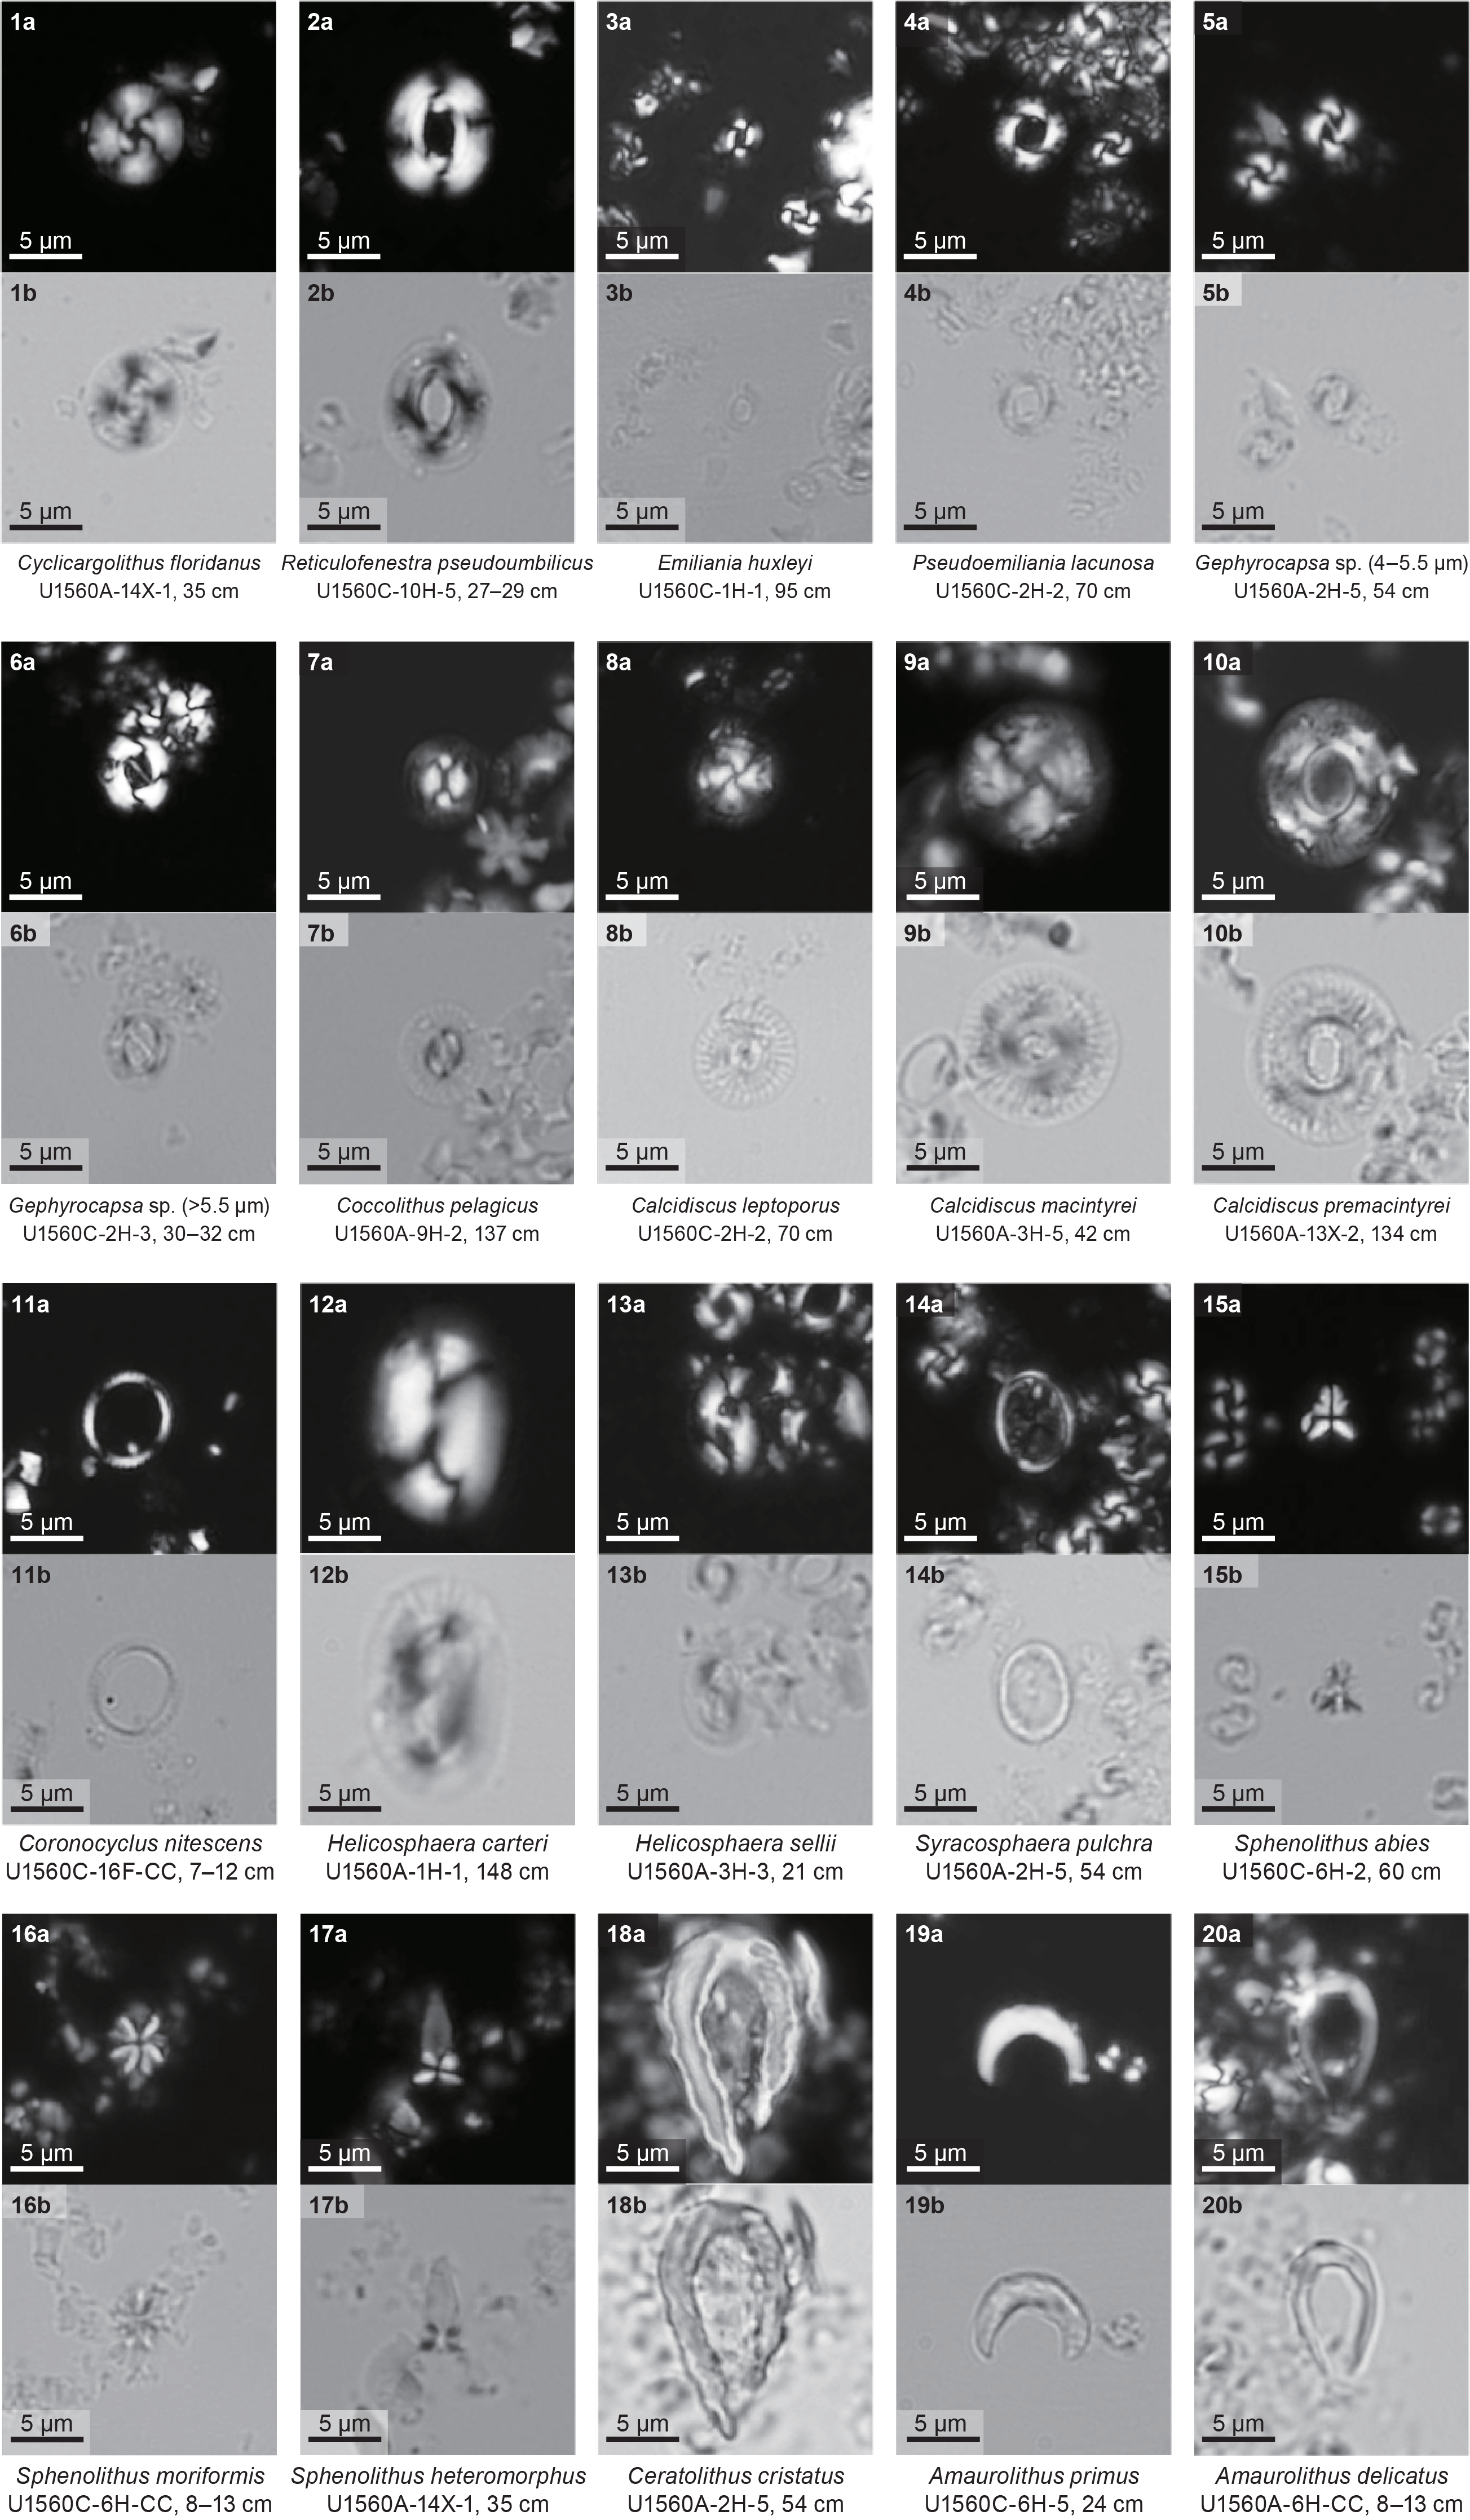
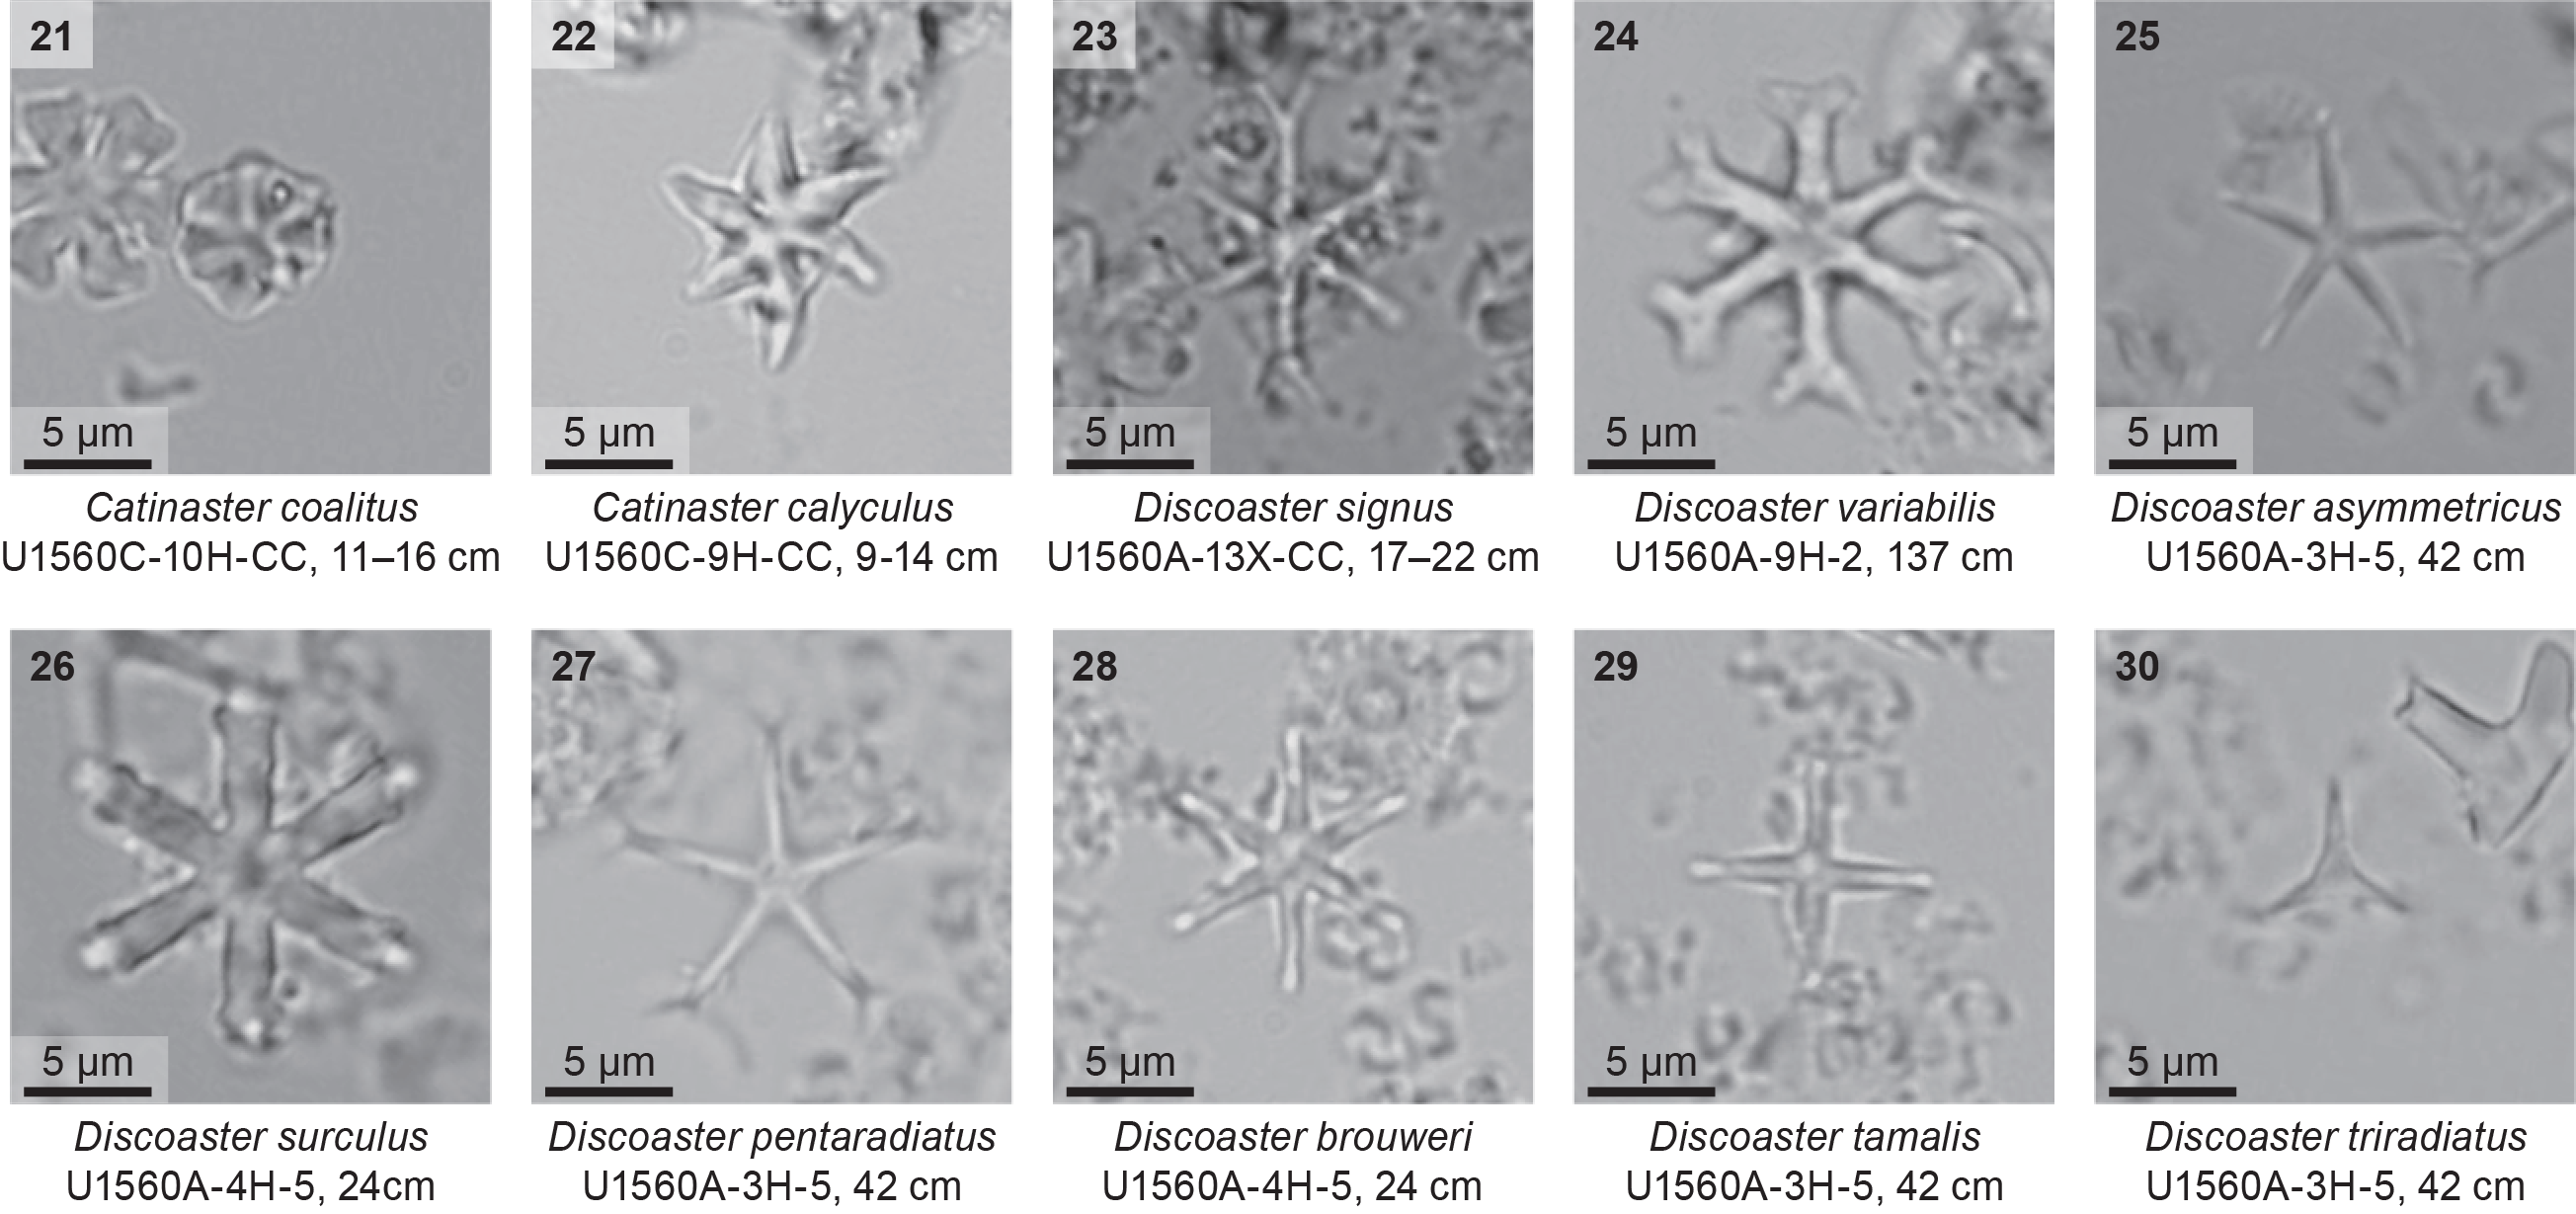
Figure F53. Important and notable nannofossil taxa.
Calcareous nannofossils are generally abundant throughout the site, and their preservation varies from poor to good (Figure F54). In Lithostratigraphic Subunits IA and IB (see Sedimentology), nannofossils are moderately to well preserved, whereas the preservation deteriorates to moderate to poor in Lithostratigraphic Subunits IC, ID, and IE.
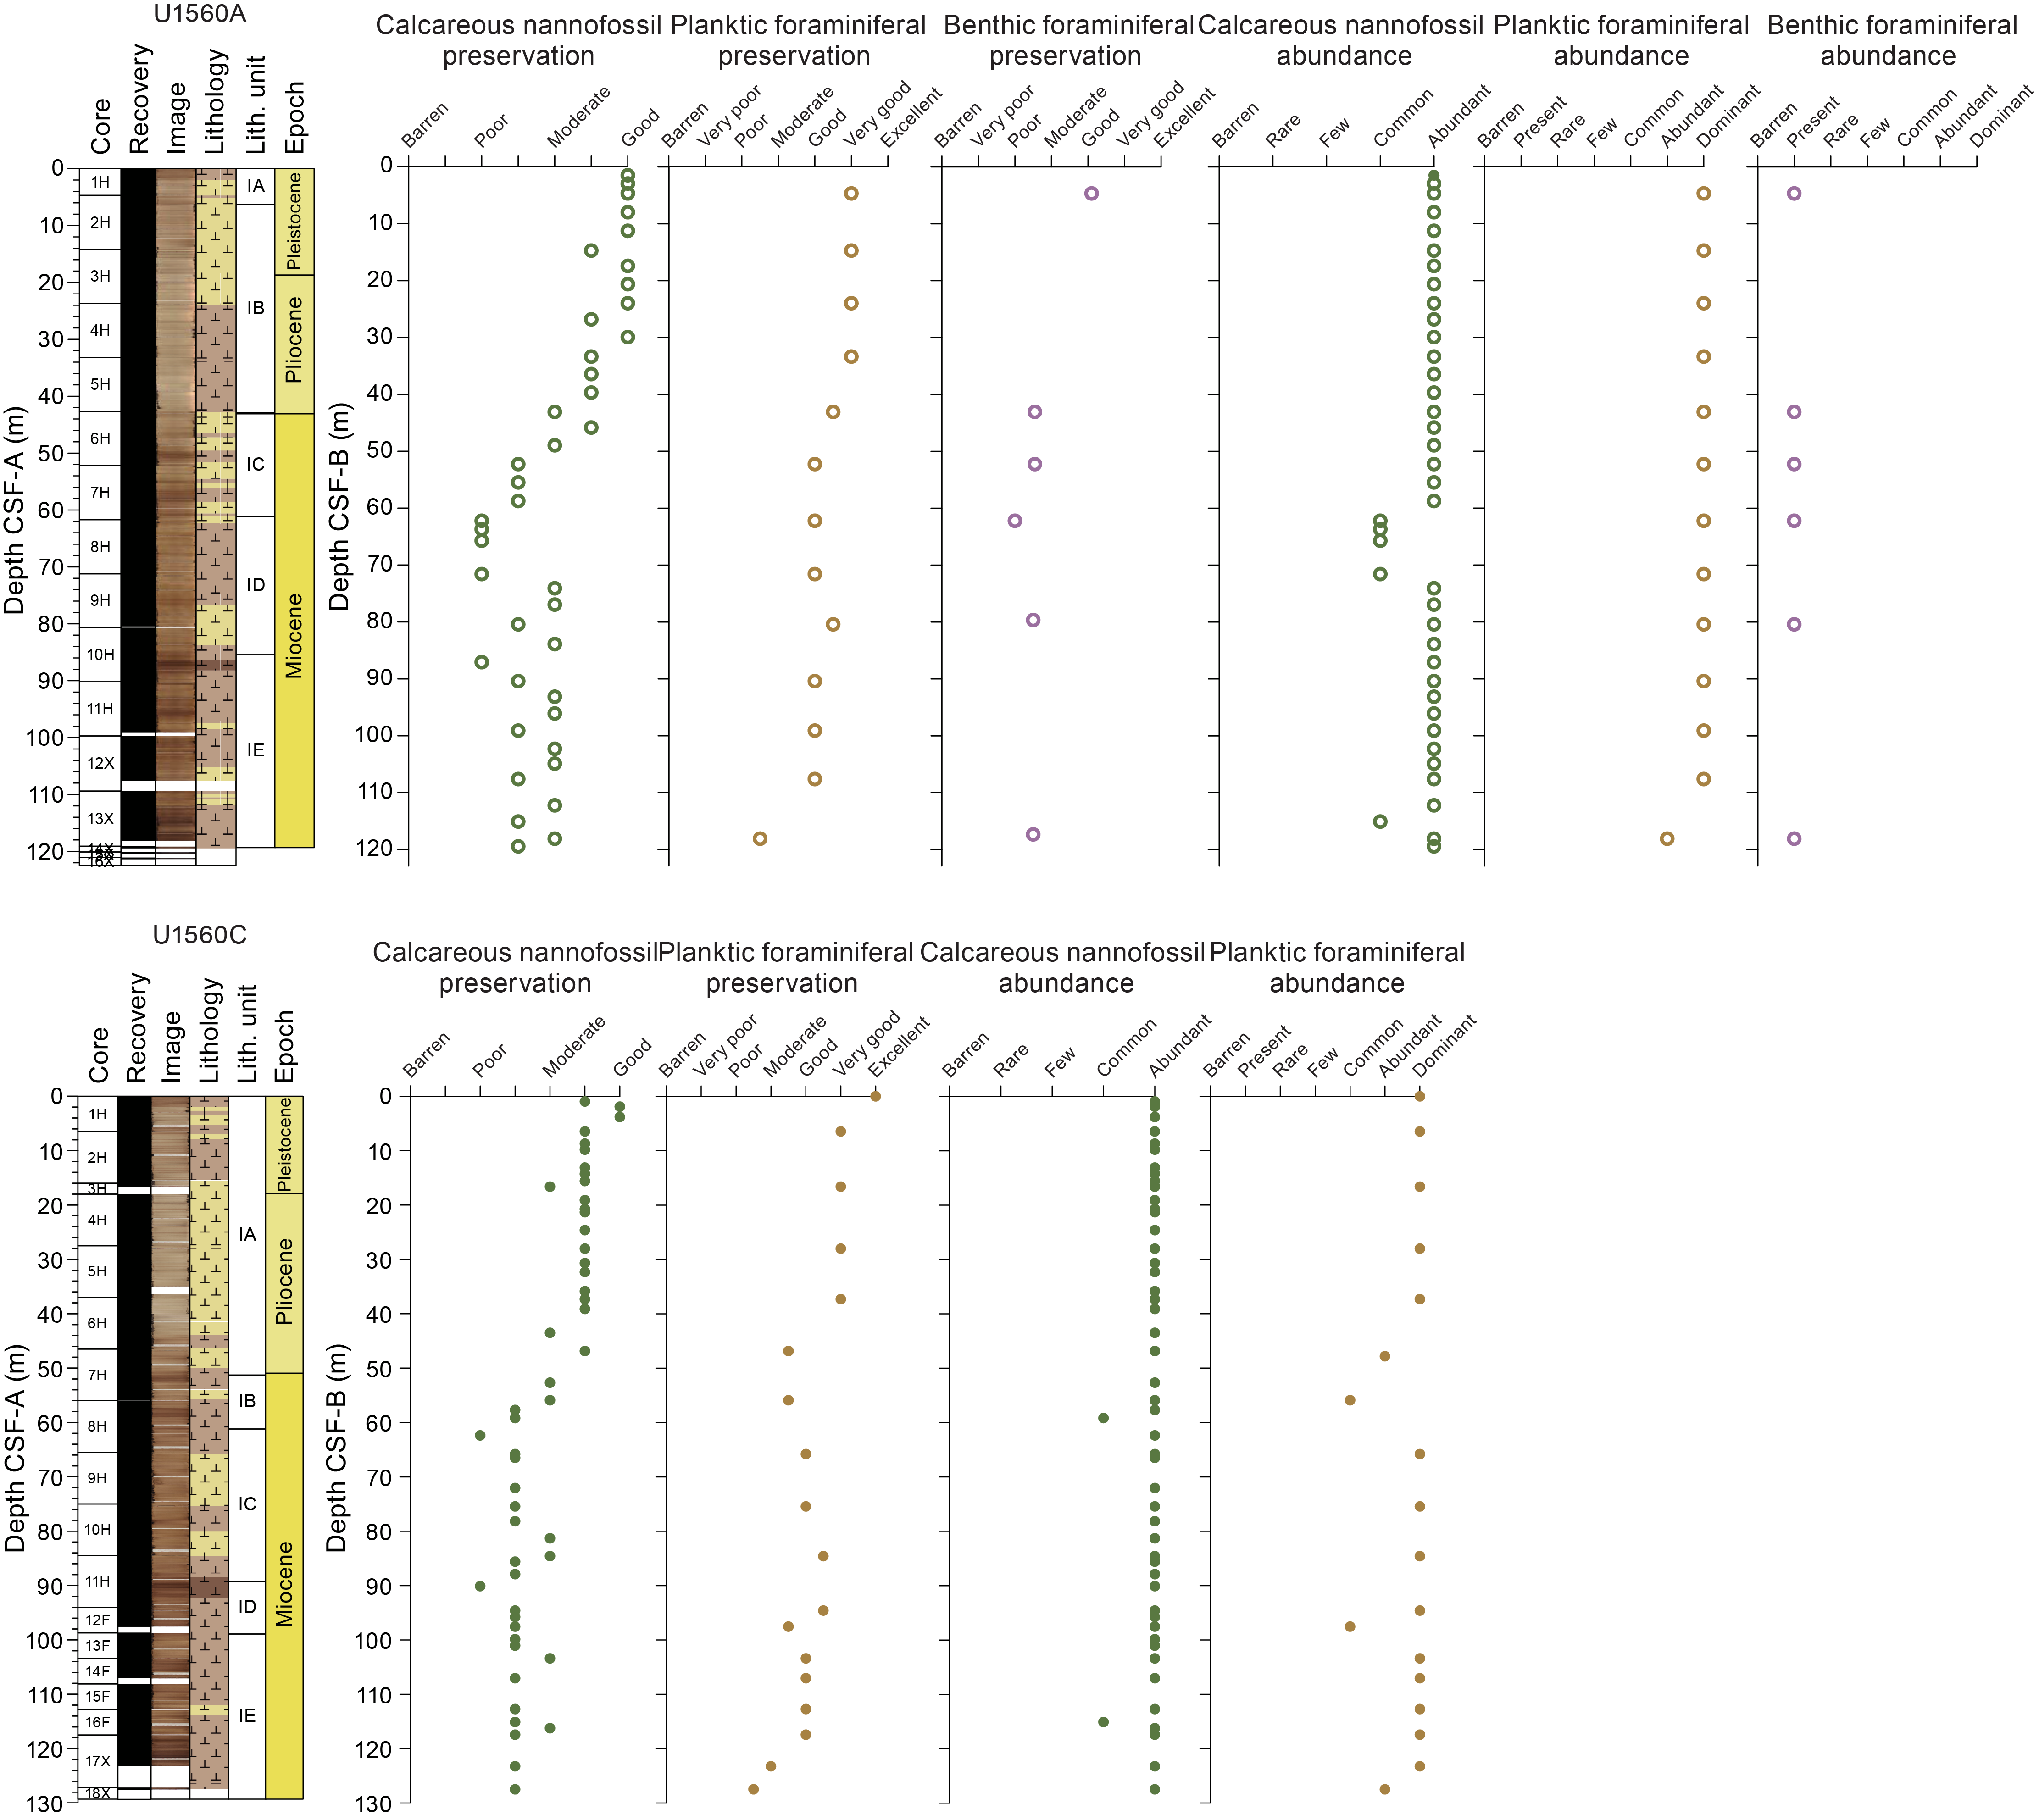
Figure F54. Group abundance and preservation, nannofossils and foraminifera.
Above Samples 395E-U1560A-3H-3, 21 cm, and 393-U1560C-4H-1, 110 cm (17.31 and 19.04 m CSF-B, respectively), sediments are determined to be Pleistocene (Zones CNPL5–CNPL11) using a succession of bioevents. The presence of Emiliania huxleyi is recorded in Samples 395E-U1560A-1H-1, 148 cm (1.48 m CSF-B), and 393-U1560C-1H-1, 95 cm (0.95 m CSF-B), indicating that these samples are younger than 0.29 Ma. The top of Pseudoemiliania lacunosa (base of Zone CNPL11) is identified in Samples 395E-U1560A-1H-CC, 18–23 cm, and 393-U1560C-1H-3, 79–81 cm (4.65 and 3.79 m CSF-B, respectively). The top absence of medium Gephyrocapsa spp. (4–5.5 µm) and top of large Gephyrocapsa spp. (>5.5 µm) are identified in Samples 393-U1560C-2H-2, 70 cm (8.56 m CSF-B), and 2H-3, 30–32 cm (9.59 m CSF-B), respectively. Below these bioevents, the top of Calcidiscus macintyrei is identified in Sample 393-U1560C-2H-5, 59–61 cm (12.68 m CSF-B). The base of medium Gephyrocapsa spp. (4–5.5 µm) is identified in Samples 395E-U1560A-2H-5, 54 cm (10.89 m CSF-B), and 393-U1560C-2H-5, 59–61 cm (12.68 m CSF-B). The top of Zone CNPL6 is identified in Samples 395E-U1560A-2H-CC, 16–21 cm (14.15 m CSF-B), and 393-U1560C-2H-7, 5 cm (15.01 m CSF-B), by the top of Discoaster brouweri. Two biohorizons, the top of Discoaster pentaradiatus and top of Discoaster surculus, are both recorded in Samples 395E-U1560A-3H-3, 21 cm (17.31 m CSF-B), and 393-U1560C-4H-1, 110 cm (19.04 m CSF-B).
The Pliocene (Zones CNPL1–CNPL5) is recognized between Sample 395E-U1560A-3H-5, 42 cm, and 5H-CC, 13–18 cm (20.42–42.65 m CSF-B), and between Sample 393-U1560C-4H-2, 119–121 cm, and 6H-5, 47–49 cm (20.56–43.24 m CSF-B). The Pliocene/Pleistocene boundary is close to the bioevent top Discoaster tamalis (2.76 Ma; top of Zone CNPL4) and is recorded in Samples 395E-U1560A-3H-5, 42 cm (20.42 m CSF-B), and 393-U1560C-4H-2, 119–121 cm (20.56 m CSF-B). Three bioevents are recorded in the same sample in Hole U1560A (Sample 395E-U1560A-4H-CC, 27–32 cm; 33.15 m CSF-B): the top of Sphenolithus spp., top of Reticulofenestra pseudoumbilicus (>7 µm; base of Zone CNPL4), and base common of Discoaster asymmetricus (top of Zone CNPL2). These bioevents occur between 3.61 and 4.04 Ma, and thus the co-occurrence is likely due to sampling resolution and/or slow sedimentation rates. The top of R. pseudoumbilicus (>7 µm) is recorded in Hole U1560C in Sample 393-U1560C-5H-4, 19 cm (32.15 m CSF-B), and the base common of D. asymmetricus occurs in Sample 5H-6, 69–71 cm (35.54 m CSF-B).
Samples 395E-U1560A-6H-3, 12 cm (45.80 m CSF-B), and 393-U1560C-6H-CC, 8–13 cm (46.45 m CSF-B), and below are dated to the Middle–Late Miocene Zones CNM7–CNM20. At Site U1560, Discoaster quinqueramus is not observed, and thus the Miocene/Pliocene boundary is approximated by the base of C. cristatus (5.08 Ma) in Samples 395E-U1560A-5H-CC, 13–18 cm (42.65 m CSF-B), and 393-U1560C-6H-5, 47–49 cm (43.24 m CSF-B). The base of Amaurolithus spp. is identified in Samples 395E-U1560A-7H-3, 27 cm, and 393-U1560C-8H-2, 18–20 cm (55.29 and 57.62 m CSF-B). Below this, the base absence of R. pseudoumbilicus (>7 µm) is recorded in Samples 395E-U1560A-8H-2, 50 cm (63.63 m CSF-B), and 393-U1560C-8H-CC, 23–28 cm (65.45 m CSF-B). The next useful biohorizon is the base of Catinaster coalitus, identified in Samples 395E-U1560A-9H-CC, 9–14 cm (80.40 m CSF-B), and 393-U1560C-11H-1, 110 cm (85.53 m CSF-B). Samples 395E-U1560A-11H-2, 143 cm (93.14 m CSF-B), and 393-U1560C-11H-4, 110–112 cm (89.76 m CSF-B), and below contain Cyclicargolithus floridanus, which is a common Paleogene to Middle Miocene taxon that indicates that these samples are older than 11.85 Ma. In Hole U1560A, the top of Coronocyclus nitescens is recognized in Sample 395E-U1560A-11H-CC, 5–10 cm (99.08 m CSF-B). The top of Zone CNM8 is defined by the top common of Calcidiscus premacintyrei, which is identified in Samples 395E-U1560A-11H-CC, 5–10 cm (99.08 m CSF-B), and 393-U1560C-13F-2, 84–86 cm (101.03 m CSF-B). The lowermost biohorizon is the top of S. heteromorphus (top of Zone CNM7), which is located in Samples 395E-U1560A-13X-2, 134 cm, and 393-U1560C-16F-3, 43 cm (112.24 and 116.23 m CSF-B). The deepest samples (395E-U1560A-14X-1, 35 cm, and 393-U1560C-18X-1, 25–30 cm; 119.45 and 127.45 m CSF-B) analyzed at Site U1560 contain S. heteromorphus and D. signus, which indicate the sediment is between 13.66 and 15.85 Ma. This age corresponds well to the estimated crustal age for Site U1560 of ~15.2 Ma (Kardell et al., 2019; see Background and objectives).
7.3. Planktic foraminifera
Planktic foraminiferal assemblages throughout the sedimentary sequence at Site U1560 are generally robust, with a diverse assemblage in the upper and middle parts of the section, corresponding to very good to good preservation of foraminiferal calcite. The lowermost part of the sequence near the sediment/basement interface is characterized by moderate to poor preservation, with many planktic foraminiferal tests carrying signs of substantial overgrowth, making taxonomic identification difficult. Detailed preservation and abundance data are presented in Figure F54. Key specimens are illustrated in Figure F55. Presence/absence of biostratigraphically significant species can be found in Tables T15 and T16.
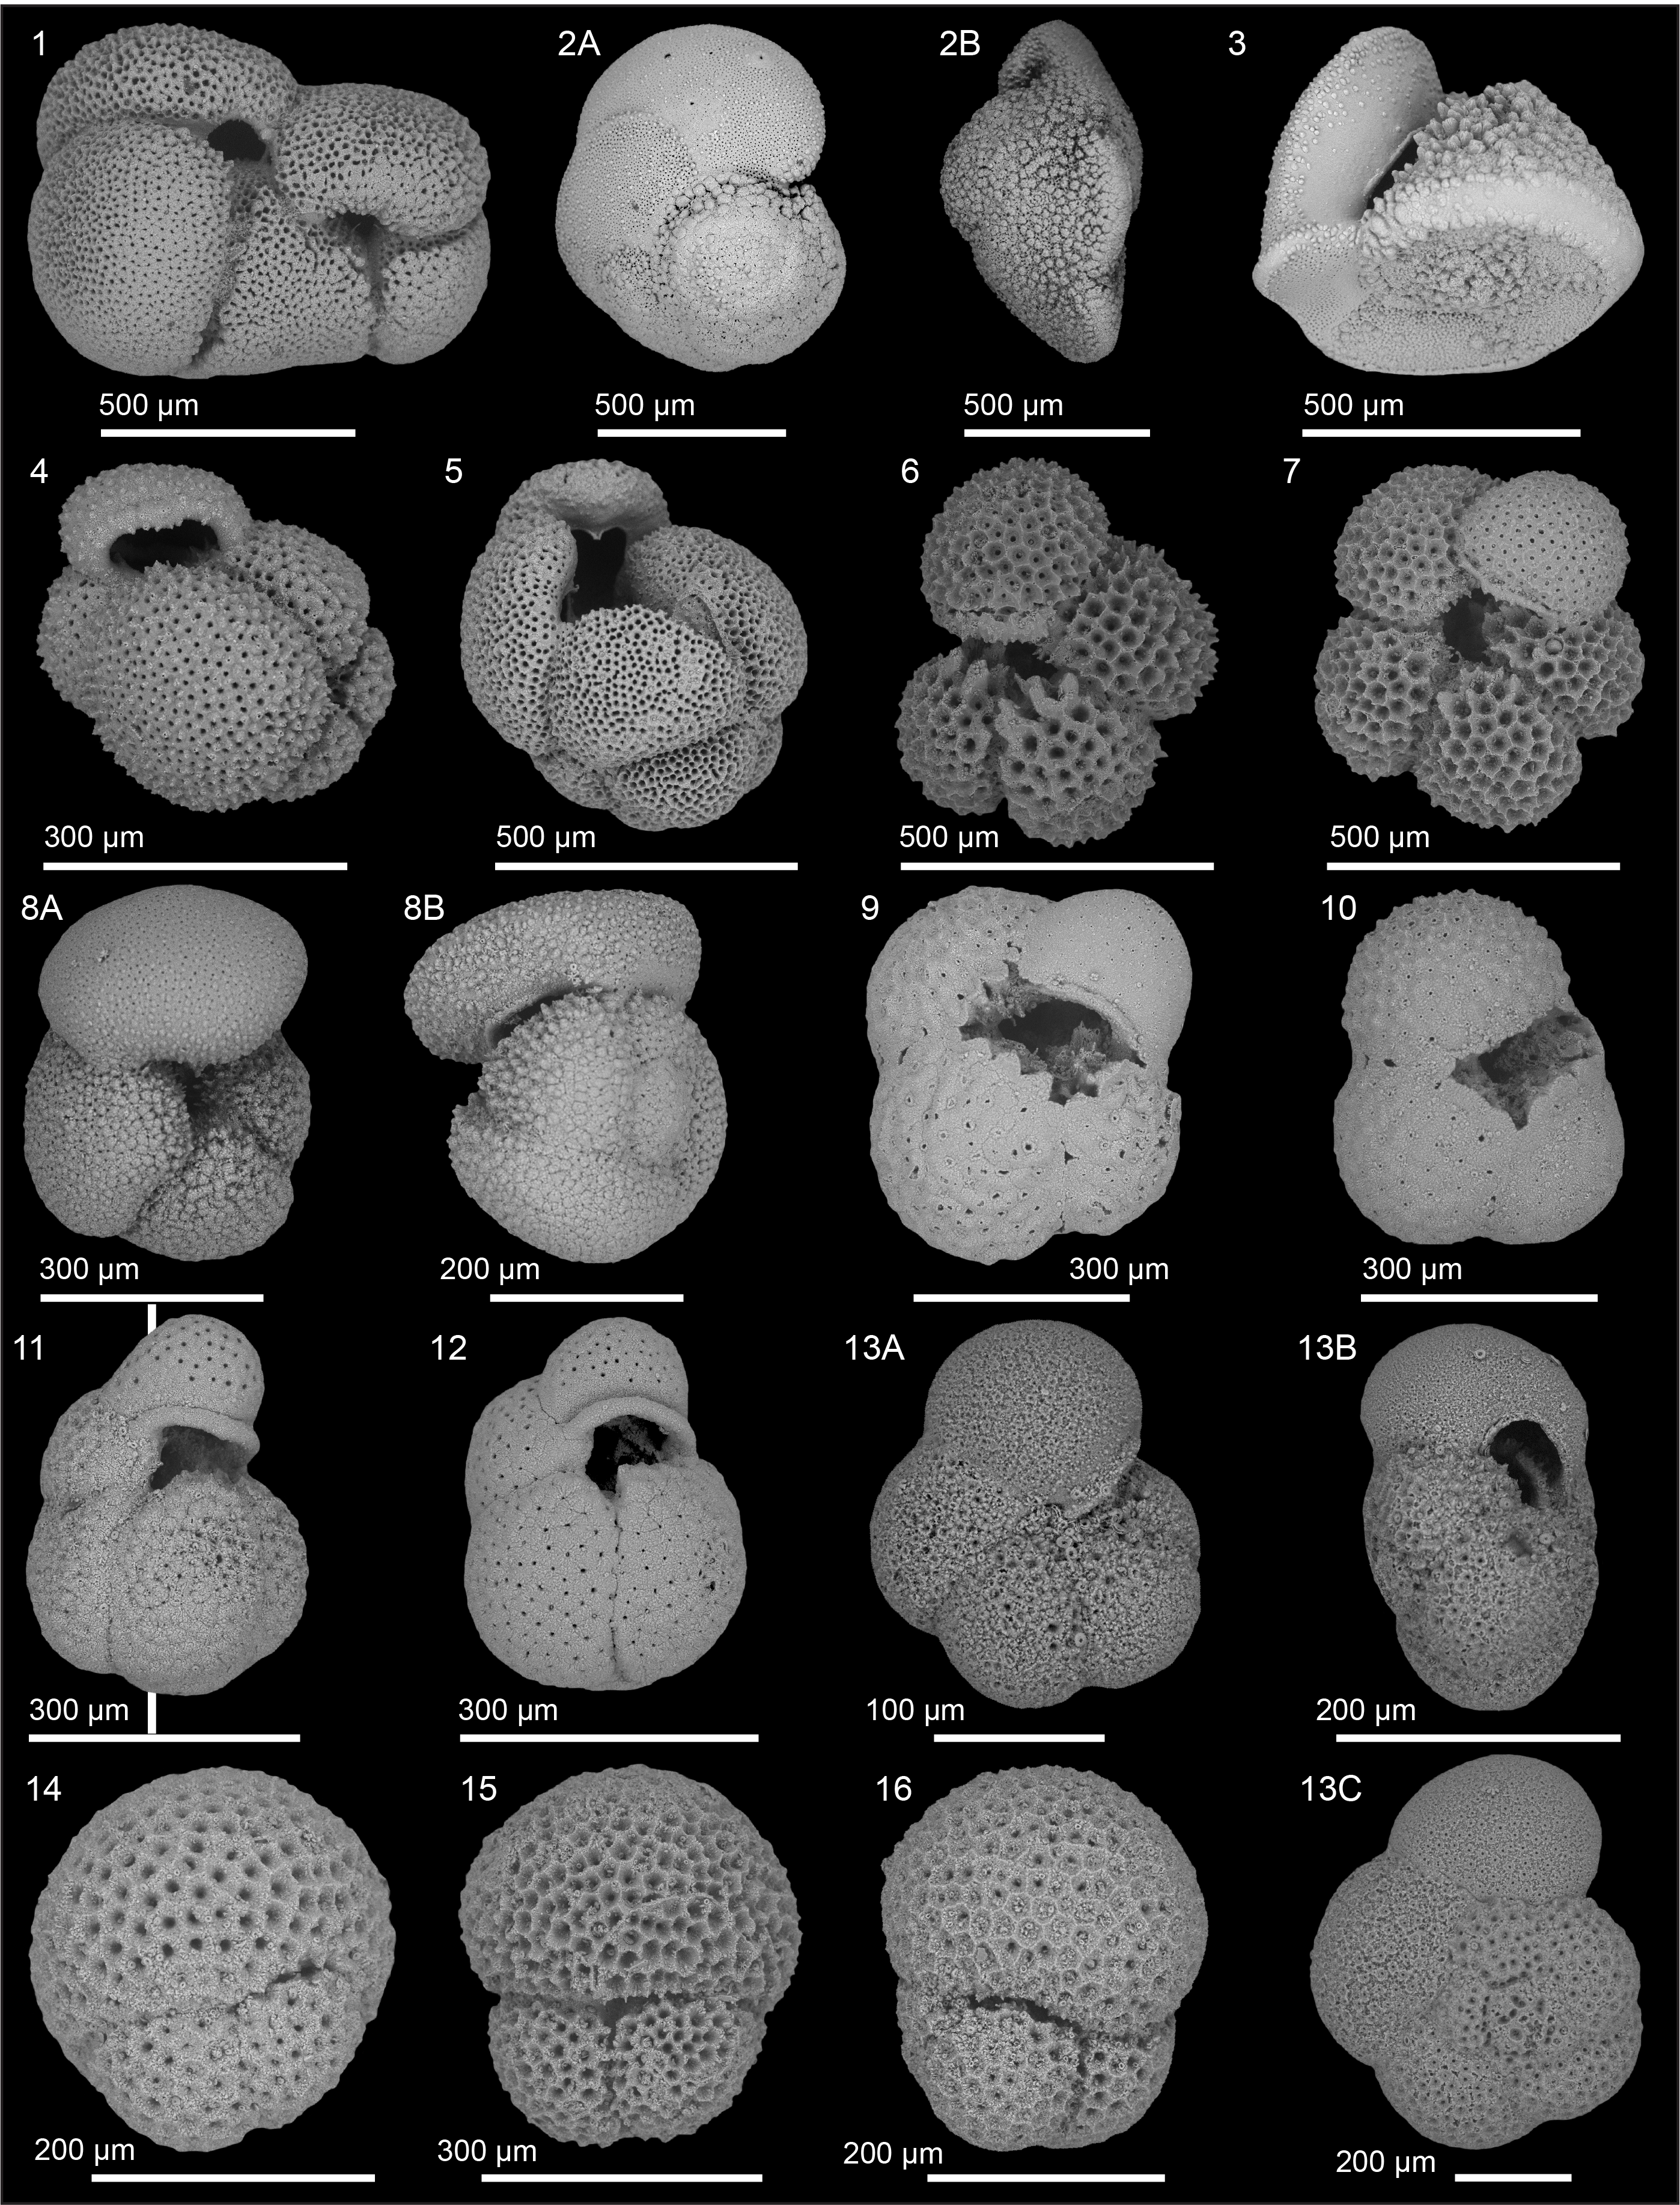
Figure F55. Biostratigraphically significant planktic foraminifera.
The only mudline sample provided for this study was recovered from Hole U1560C and contained modern to Pleistocene assemblages including Globorotalia crassaformis, Globorotalia truncatulinoides, and Globorotalia hirsuta. The presence of G. hirsuta (0–0.45 Ma; King et al., 2020) places the sample in Zone PT1b. Samples 395E-U1560A-1H-CC, 18–23 cm (4.65 m CSF-B), and 393-U1560C-1H-CC, 15–20 cm (6.44 m CSF-B), contain the top of Globorotalia tosaensis (0.61 Ma; King et al., 2020) and the base of Globorotalia hessi (0.74 Ma; King et al., 2020), which provide a narrow age constraint that places these samples within Zone PT1a. The top of Globigerinoides extremus (1.97 Ma), which occurs near the top of Zone PL6, was observed in Samples 395E-U1560A-2H-CC, 16–21 cm (14.15 m CSF-B), and 393-U1560C-2H-CC, 18–23 cm (15.95 m CSF-B).
The first evidence of Pliocene sediments is provided by the presence of Dentoglobigerina altispira (3.00 Ma; King et al., 2020) in Samples 395E-U1560A-3H-CC, 12–17 cm (23.65 m CSF-B), and 393-U1560C-4H-CC, 10–15 cm (27.45 m CSF-B), the highest occurrence of which marks the top of Zone PL4. Sample 393-U1560C-5H-CC, 27–32 cm (36.95 m CSF-B), contains the top of Sphaeroidinellopsis seminulina and the base of G. crassaformis sensu lato (s.l.). The top of S. seminulina (3.05 Ma; King et al., 2020) defines the top of Zone PL3, whereas the base of G. crassaformis s.l. (4.30 Ma; King et al., 2020) typically occurs within Zone PL2. In adjacent Hole U1560A, Zone P3 occurs in Sample 395E-U1560A-4H-CC, 27–32 cm (33.15 m CSF-B), marked by the top of S. seminulina. The base of G. crassaformis s.l. in Sample 5H-CC, 13–18 cm (42.65 m CSF-B), co-occurs with the top of Globoturborotalita nepenthes, the primary marker for the top of Zone PL1 (4.38 Ma; King et al., 2020), which might indicate the presence of a condensed interval or a short, 80 ky hiatus. In adjacent Hole U1560C, the top of G. nepenthes and the base of Globigerinoides conglobatus, a secondary marker bioevent within Zone M13b and age calibrated at 6.21 Ma (King et al., 2020), place Sample 393-U1560C-6H-CC, 8–13 cm (46.45 m CSF-B), in Zones PL1–M13b. Deeper in the same hole, the top of Globoquadrina dehiscens (5.91 Ma), a secondary bioevent in Late Miocene Zone M14, occurs in Sample 393-U1560C-7H-CC, 14–19 cm (55.88 m CSF-B).
In adjacent Hole U1560A, Sample 395E-U1560A-7H-CC, 18–23 cm (61.65–61.70 m CSF-B), contains the top of G. dehiscens, placing this sample within Late Miocene Zone M14. Sample 8H-CC, 10–15 cm (71.50–71.20 m CSF-B), which contains the top of Fohsella lenguaensis, is assigned to Zone M13b.
The top of Paragloborotalia mayeri (10.54 Ma; Gradstein et al., 2020), a secondary marker in Zone M11, is recorded in Samples 395E-U1560A-8H-CC, 10–15 cm (71.15 m CSF-B), and 393-U1560C-10H-CC, 11–16 cm (84.45 m CSF-B). The base of G. nepenthes (11.67 Ma; King et al., 2020), traditionally marking the base of Zone M11, occurs in Samples 395E-U1560A-9H-CC, 9–14 cm (80.50 m CSF-B), and 393-U1560C-12F-CC, 11–16 cm (97.52 m CSF-B). The interval from Samples 393-U1560C-13F-CC, 9–14 cm, through 17X-CC, 15–20 cm (103.35–123.21 m CSF-B), is provisionally assigned to Zones M10–M6 undifferentiated, with a note that Samples 17X-CC, 15–20 cm, and 18X-1, 25–30 cm (127.45 m CSF-B), contain Praeorbulina spp. and Trilobatus trilobus co-occurring with Orbulina spp., restricting the age to a maximum of 15.10 Ma, which is the calibrated age for the base of Orbulina suturalis.
7.4. Benthic foraminifera
Analysis of benthic foraminifera was conducted onshore using core catcher samples from Hole U1560A drilled during Expedition 395E. The composition of the benthic foraminiferal assemblage, as well as benthic foraminiferal abundance and preservation, is biased toward the qualitative analysis of depth-diagnostic calcareous species and other notable calcareous taxa. Benthic foraminiferal preservation and abundance are summarized in Figure F54. The occurrence of important benthic foraminiferal species is reported in Table T17.
Benthic foraminifera are present in all analyzed samples. Overall, specimen preservation is good to very good in Sample 395E-U1560A-1H-CC, 18–23 cm (4.65 m CSF-B), and decreases to moderate to moderate/poor downhole (Figure F54).
According to the site age model (see Age model and mass accumulation rates; Figure F71), the sediment in Hole U1560A spans the Middle Miocene to Late Pleistocene. The benthic foraminiferal assemblage is similar in all samples analyzed, although we record a shift in the dominant species from the Late Miocene to the Pleistocene/Pliocene. In fact, Samples 395E-U1560A-1H-CC, 18–23 cm (4.65 m CSF-B), 5H-CC, 13–18 cm (42.652 m CSF-B), and 6H-CC, 14–19 cm (52.15 m CSF-B), are dominated by Nuttallides umbonifera and Cibicidoides wuellerstorfi. In contrast, in Samples 7H-CC, 18–23 cm (61.652 m CSF-B), and 9H-CC, 9–14 cm (80.40 m CSF-B), the abundance of N. umbonifera decreases significantly until the species is no longer observed (Sample 9H-CC, 9–14 cm). In these samples, the assemblage is dominated by Cibicidoides mundulus, C. wuellerstorfi, and Oridorsalis umbonatus. Stilostomellids are also numerous. In Sample 13X-CC, 17–22 cm (118.10 m CSF-B), C. wuellerstorfi is not observed and C. mundulus and O. umbonatus are the most abundant species. Other commonly observed species among Hole U1560A samples include Cibicidoides bradyi, Globocassidulina subglobosa, Laticarinina pauperata, Melonis barleeanus, Melonis sphaeroides, Pullenia bulloides, Pullenia quinqueloba, Pyrgo murrhina, and various Uvigerina species (primarily Uvigerina auberiana, Uvigerina hispida, and Uvigerina hispidocostata).
The species observed have a wide bathymetric range (bathyal to abyssal) (Holbourn et al., 2013; van Morkhoven et al., 1986). However, many of the species in Hole U1560A characterize abyssal sites in the North Atlantic (e.g., Miller and Katz, 1987) and in the western South Atlantic (e.g., Lohmann, 1978; Mackensen et al., 1995). This, in addition to the fact that we did not observe species characteristic of bathyal depths only (e.g., Bulimina mexicana and Uvigerina proboscidea) (van Morkhoven et al., 1986) suggest that Site U1560 was restricted to abyssal depths (>2000 m) from the Middle Miocene to the Late Pleistocene. The increase in abundance of N. umbonifera and the development of a N. umbonifera–C. wuellerstorfi dominated assemblage might imply an increase in deepwater corrosiveness and/or influence of Antarctic Bottom Water, consistent with deepening of Site U1560 to lower abyssal depths (>3000 m) by the Late Miocene.
8. Paleomagnetism
8.1. Sediment
Continuous measurements of remanent magnetization were performed at 2 cm spacing on archive-half sections from Hole U1560C using the superconducting rock magnetometer (SRM). Remanence was measured before and after alternating field (AF) demagnetization at three different field strengths of 5, 10, and 20 mT (see Paleomagnetism in the Expedition 390/393 methods chapter [Coggon et al., 2024a]). A magnetic polarity stratigraphy based on inclination data from both Holes U1560A and U1560C was used to develop the age model for this site (see Age model and sedimentation rates). Discrete samples (7 cm3 J-cubes) were taken from working halves of Hole U1560C core at a resolution of 2 per full APC core and 1 per HLAPC core. A total of 26 discrete samples were subjected to stepwise AF demagnetization and anisotropy of magnetic susceptibility (AMS) measurements. The acquisition of isothermal remanent magnetization (IRM) and backfield IRM experiments were conducted on 10 selected samples, at least once per each lithostratigraphic subunit.
8.1.1. Results
Natural remanent magnetization (NRM) and remanence after in-line AF demagnetization of APC and XCB cores (Cores 395E-U1560A-1H through 14X and 393-U1560C-1H through 17X) were performed to define the magnetostratigraphy for the sedimentary sequence at Site U1560. The NRM intensities of sediment cores from Holes U1560A and U1560C are generally within the range of 10−3 to 10−2 A/m (Figures F56, F57). The intensity after 20 mT demagnetization falls to 10−4 to 10−3 A/m (mean = 2 × 10⁻³ A/m). Intervals of higher remanence intensity are observed in Cores 395E-U1560A-1H, 3H, and 4H, as well as in Cores 393-U1560C-1H and 5H (Figures F56, F57), but no correlation with variation in MS can be detected. The distribution of the 20 mT inclination is generally bimodal in both holes. The values are clustered around ±46° in Hole U1560A, whereas clusters at +43° and −45° were observed in Hole U1560C (Figure F58). These results agree with the inclination expected at this latitude based on the geocentric axial dipole (GAD; ±49.1° at 30°S), although it is notable that a peak of shallower inclination can be detected around +5° in Hole U1560A. In fact, several intervals in Cores 395E-U1560A-3H and 6H and 393-U1560C-6H and 17X show significantly shallow 20 mT inclination values (Figures F56, F57).
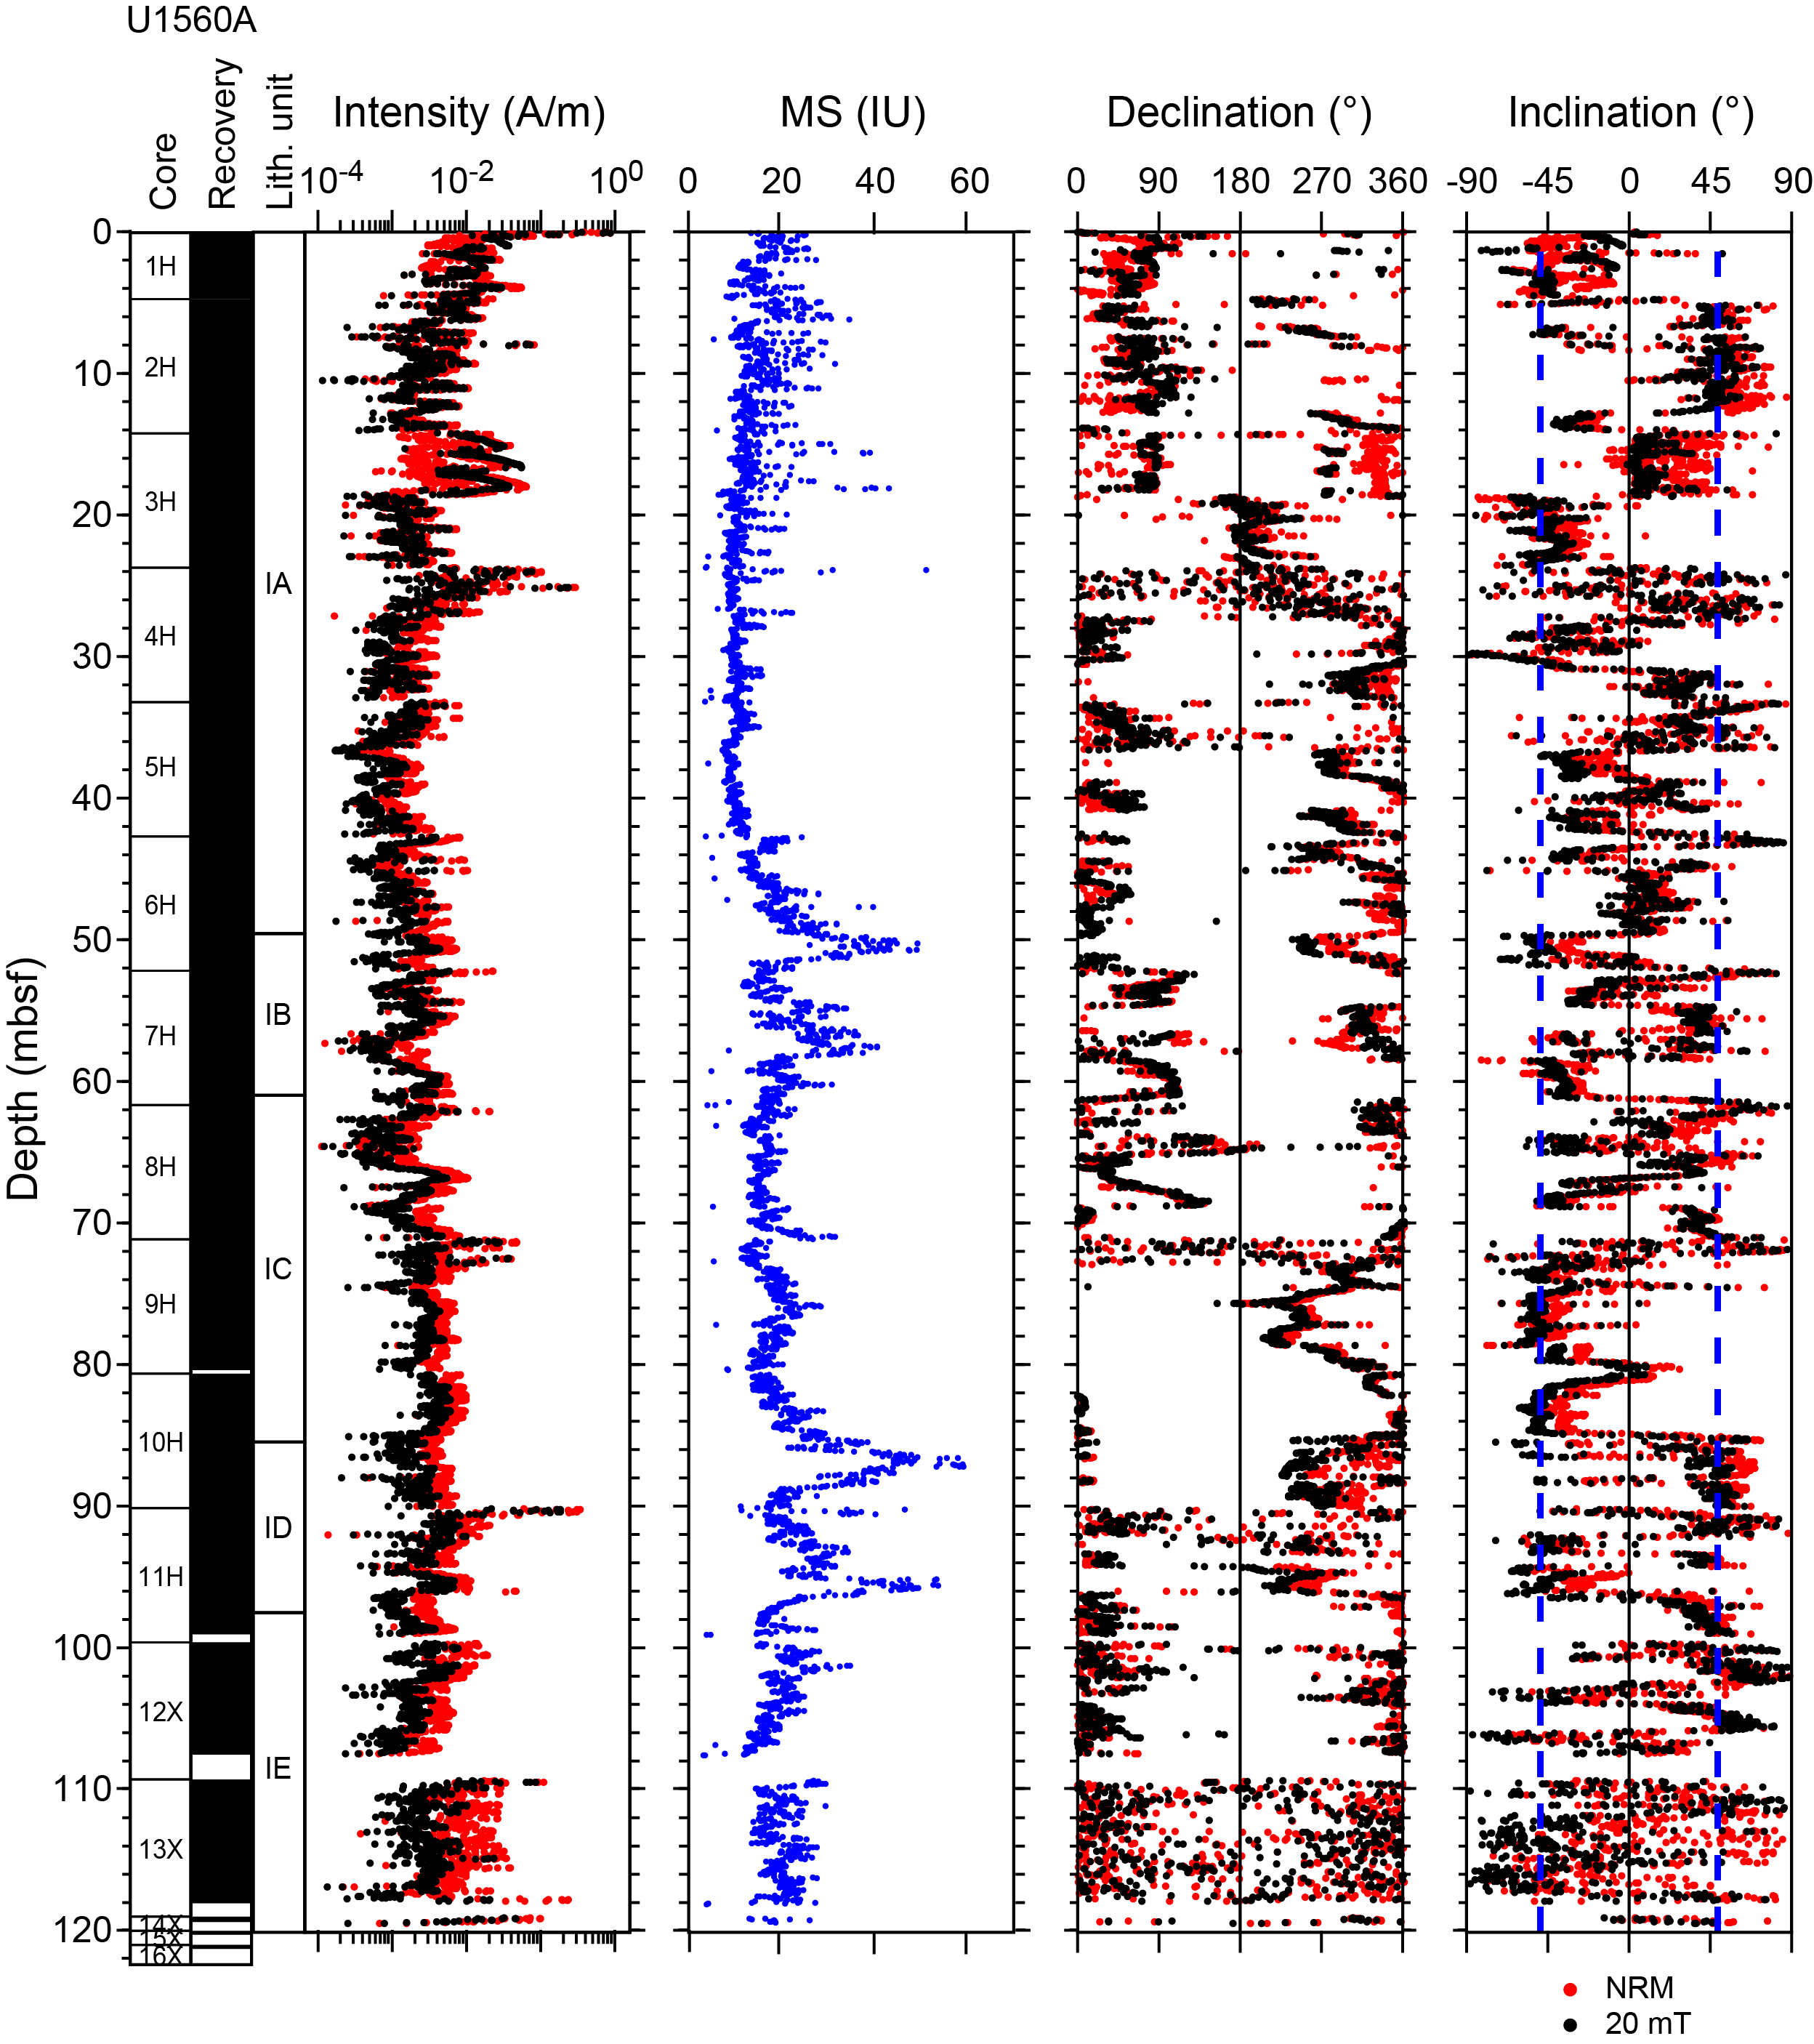
Figure F56. MSP and SRM measurements in sediments, Hole U1560A.
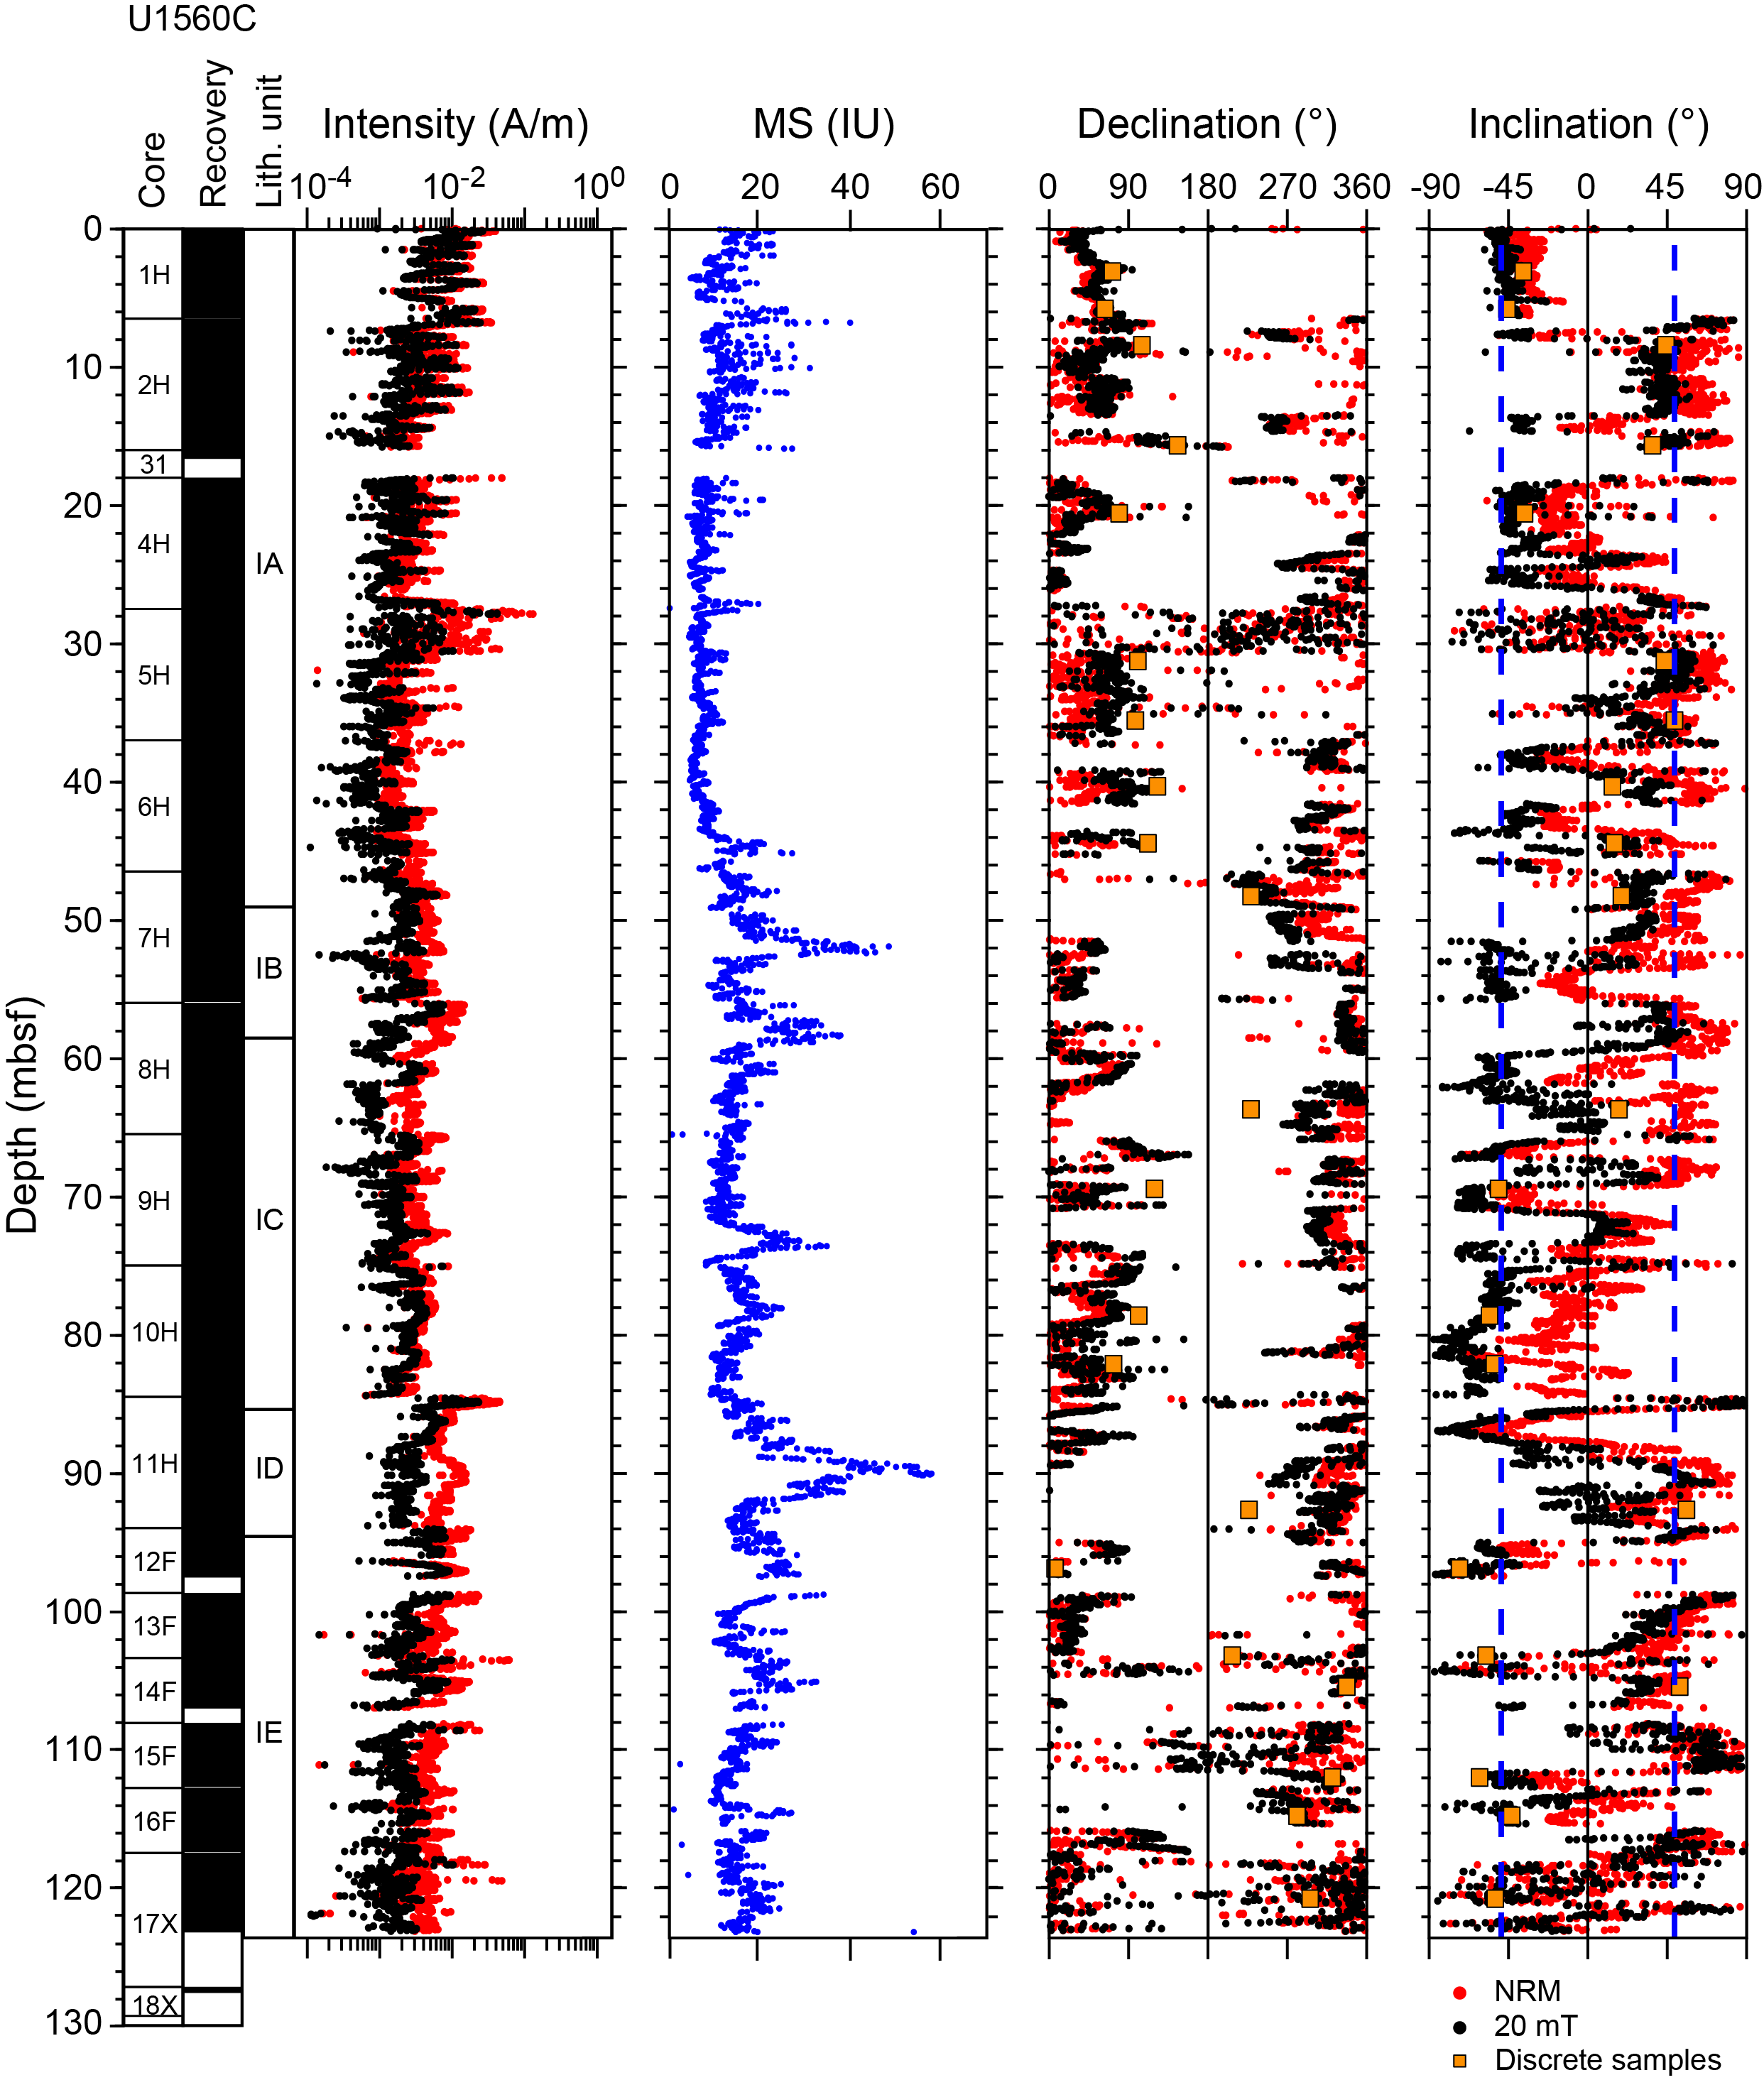
Figure F57. MSP and SRM measurements in sediments, Hole U1560C.
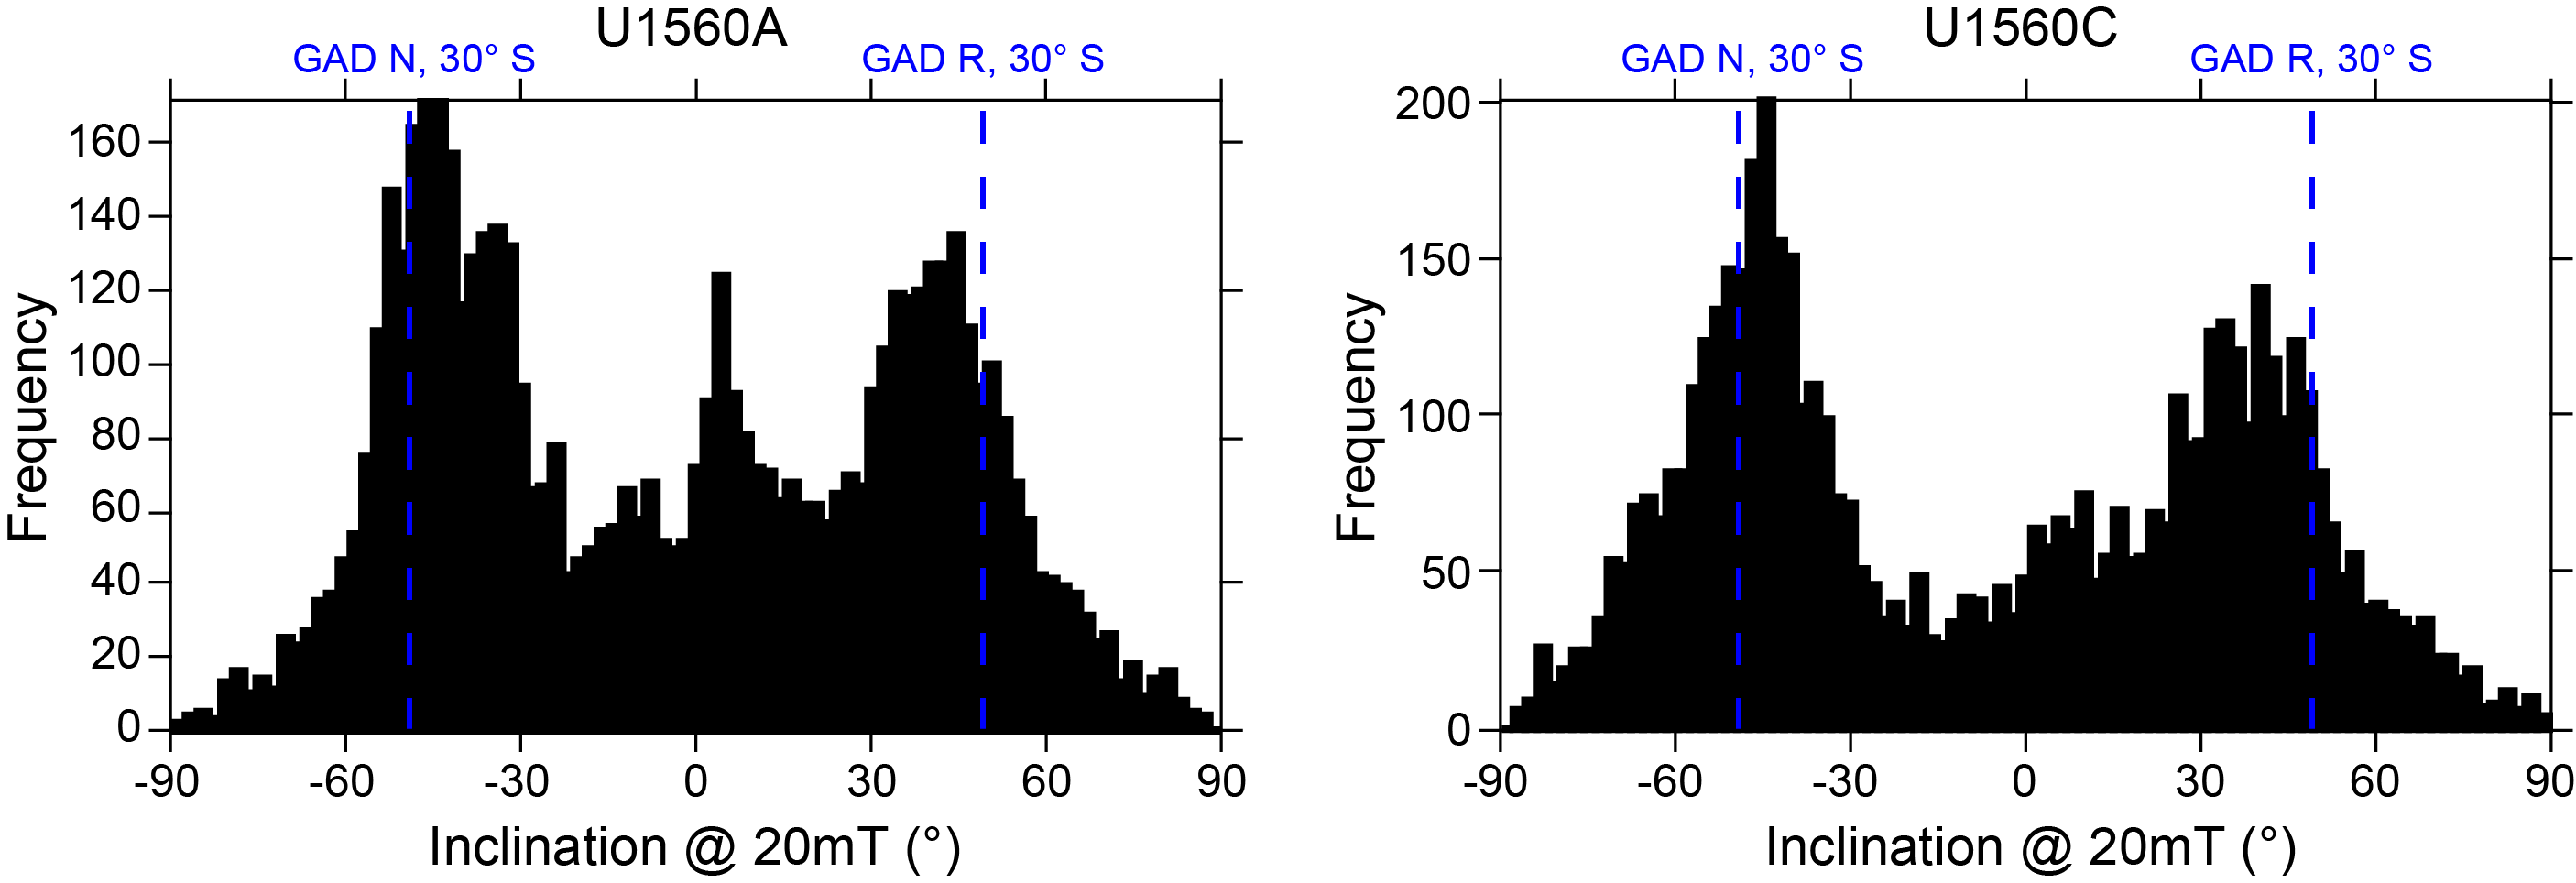
Figure F58. Inclination after 20 mT AF for sediments.
Despite the presence of short intervals of shallow inclinations, the 20 mT inclination generally shows clear positive and negative polarities, allowing good correlation to polarity chrons in the geomagnetic polarity timescale (GPTS 2020; Gradstein et al., 2020).
8.1.1.1. Discrete samples
We collected 2 cubes per core from Hole U1560C, taking representative discrete samples from each lithostratigraphic subunit (see Sedimentology; Table T18). To better constrain the SRM data, samples were subjected to AF demagnetization up to a maximum of 160 mT and the characteristic remanent magnetization (ChRM) was isolated. A single component could be defined after cleaning the drilling overprint with the 5 mT AF demagnetization step in a total of 21 samples (Figure F59A). The maximum angular deviation angles range 2.1°–14.0° (Table T18), suggesting that ChRM components are generally well defined in Hole U1560C (Butler, 1992). Only 5 samples show dispersed demagnetization trends where no ChRM could be clearly isolated (Figure F59B). No correlations between stability of the remanent magnetization and lithologic variations were detected. Overall, the ChRM inclination and declination values agree with the SRM data, including those in the zones of shallow inclination (Figure F57), providing additional support for the magnetostratigraphy of Site U1560.
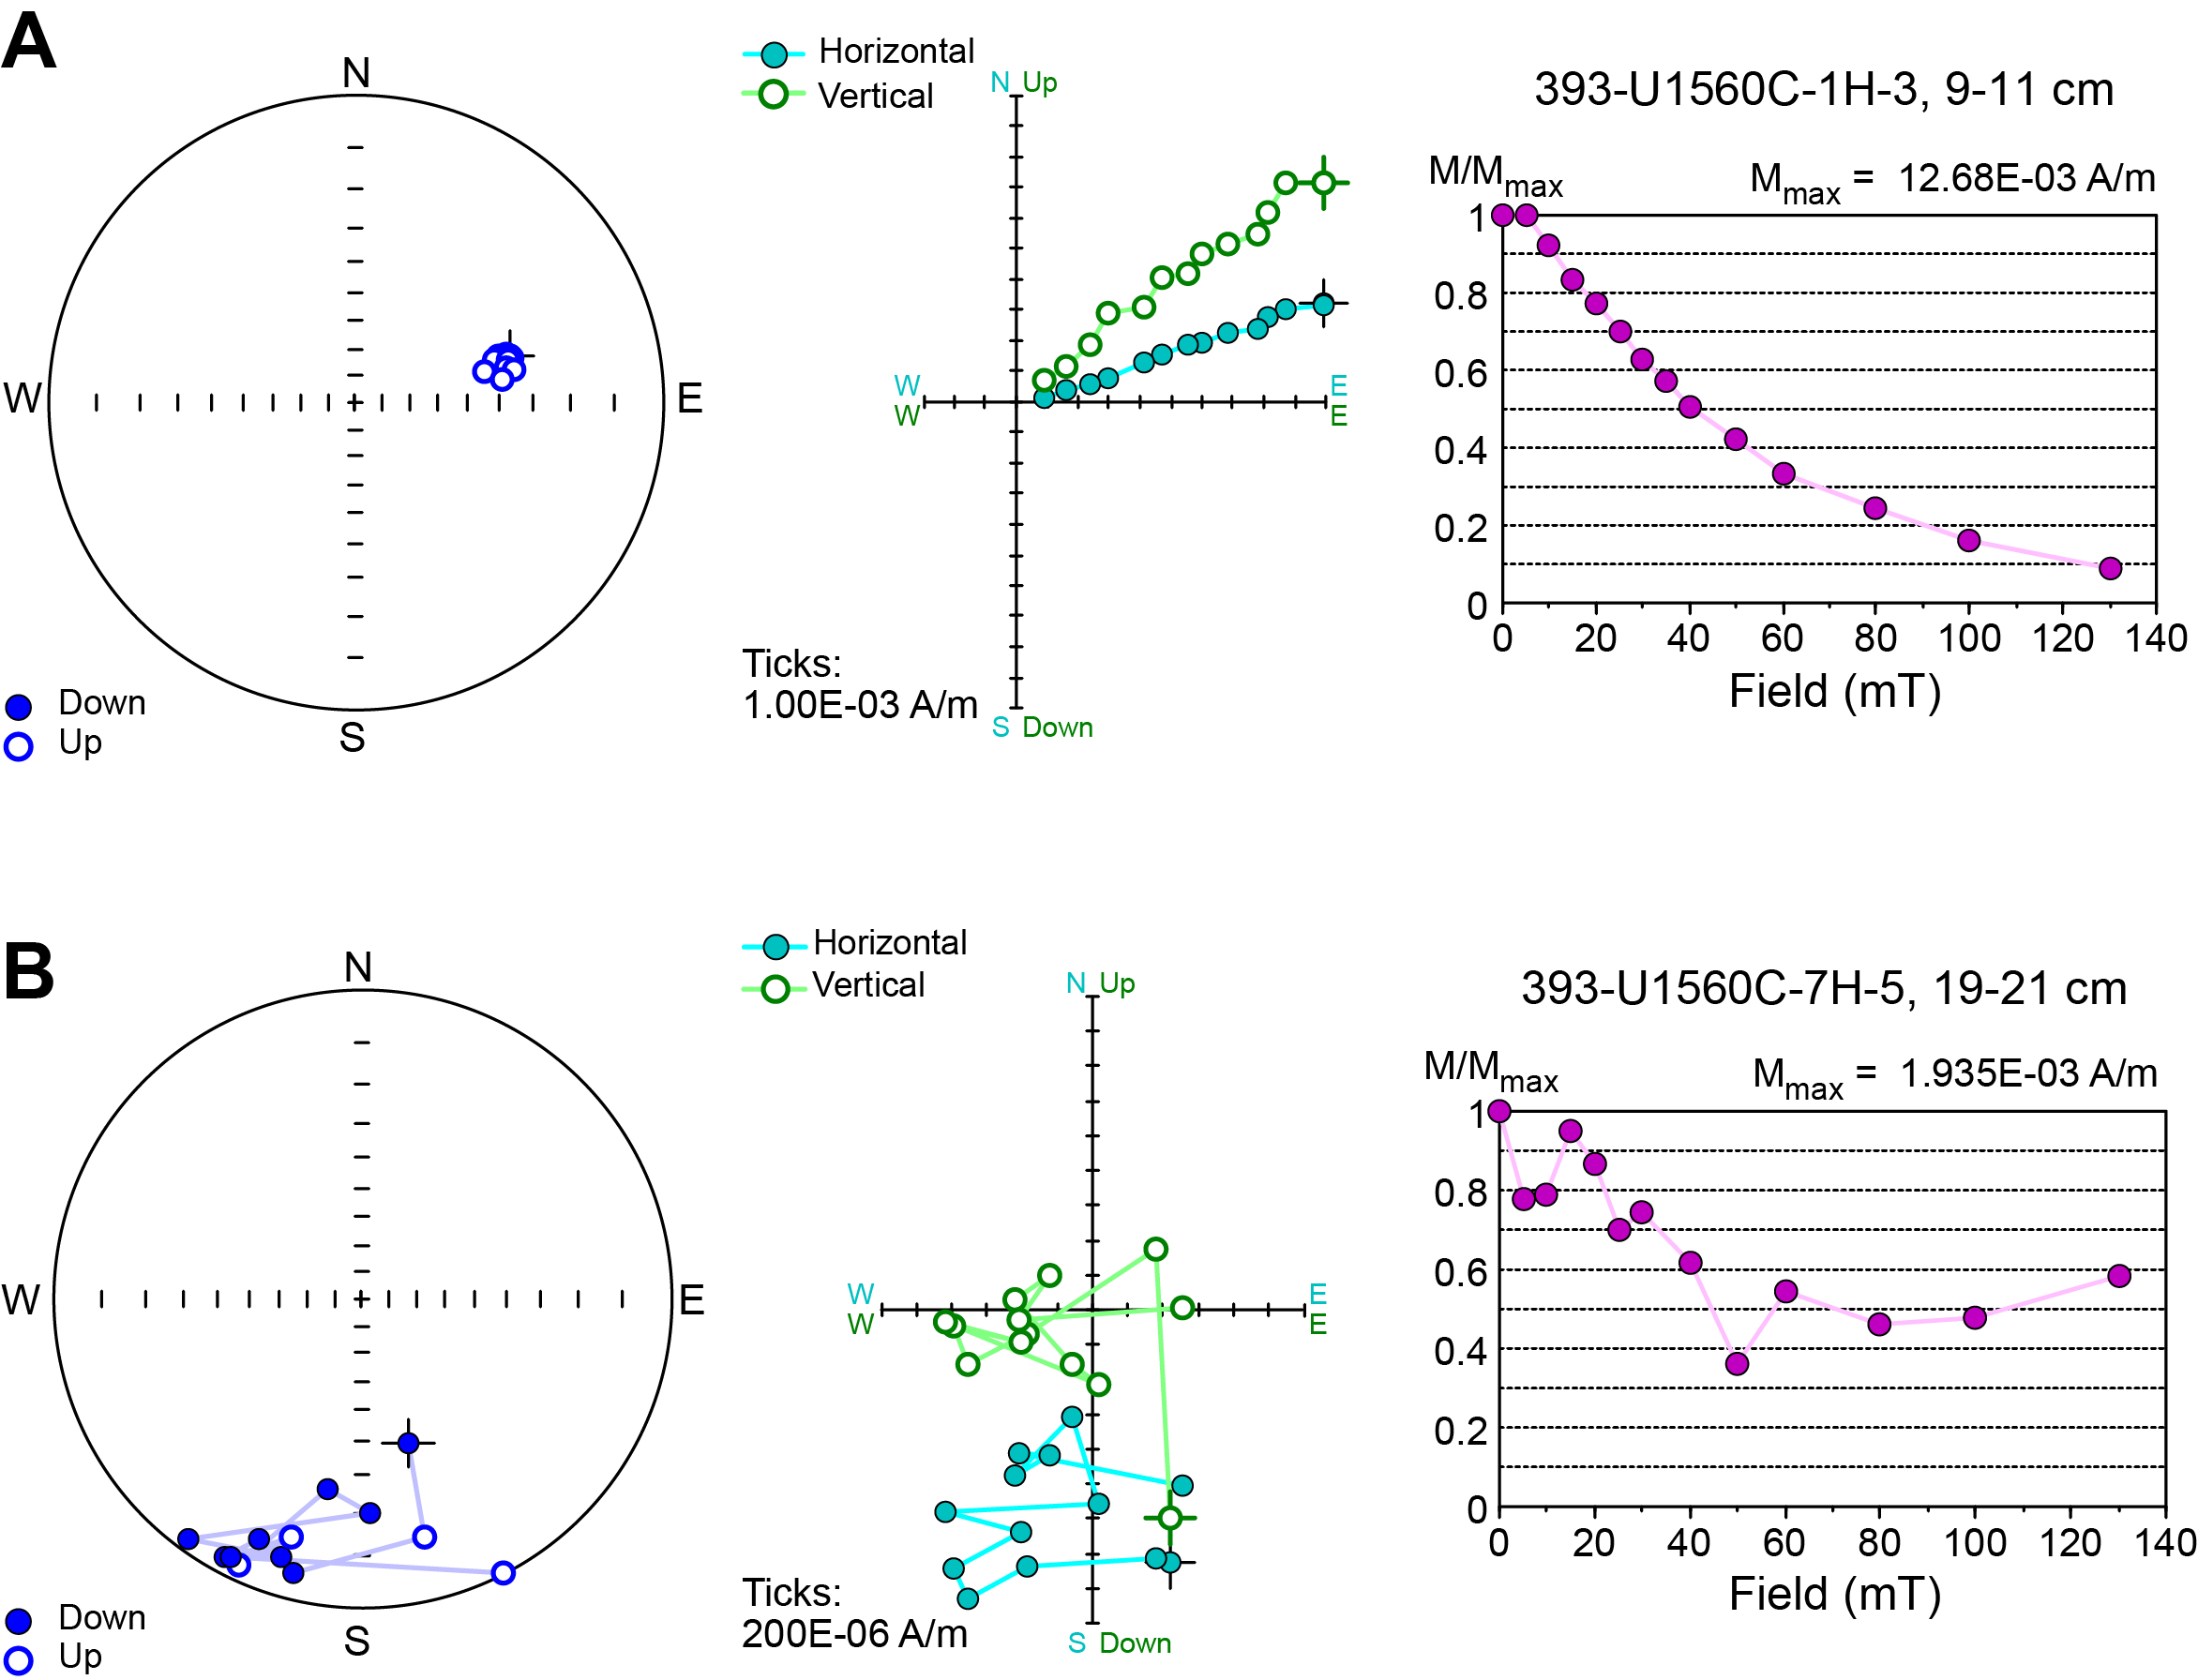
Figure F59. AF demagnetization results.
To characterize the magnetic mineral assemblages, acquisition of IRM and backfield curve experiments were conducted on a total of 10 discrete samples, which is at least one from each lithostratigraphic subunit. All measured samples saturate at fields <300 mT (Figure F60A), implying that the main magnetic carriers within these samples consist of low-coercivity minerals such as magnetite. The backfield curves mostly reveal coercivity of remanence (Bcr) values around 32 mT (Table T19). Deconvolution of the IRM acquisition curves (Figure F60B) shows a best-fit model characterized by a dominant low-coercivity component with mean remanence coercivity (Bh) of ~1.55 log10 units. Only Sample 393-U1560C-2H-2, 55–57 cm, shows a significant contribution (~30%) of a second component, showing Bh values of ~2.16 log10 units. No systematic variations were observed for Bcr among lithostratigraphic subunits (Figure F61; Table T19). The intensity of saturation IRM (SIRM) is significantly high at the top of Subunit IA (Core 2H) and in Subunit ID (Figure F61). A progressive decrease in the median destructive field (MDF) can be observed with depth, suggesting the presence of slightly coarser magnetite grains at the bottom of the sedimentary package. Overall, the S ratio (S0.3) shows values near 1, which is typical of low-coercivity minerals, and no variations with depth and lithostratigraphic subunits are observed. The IRM100/SIRM ratio (S0.1) has constant values around 0.75–0.8. The lowest value is observed at the top of Subunit IA (Sample 2H-2, 55–57 cm). Frequency-dependent susceptibility (χfd%) is mostly <20%, but Sample 6H-6, 20–22 cm, from the lower level of Subunit IA displays a significantly higher value, suggesting a higher fraction of superparamagnetic grains.
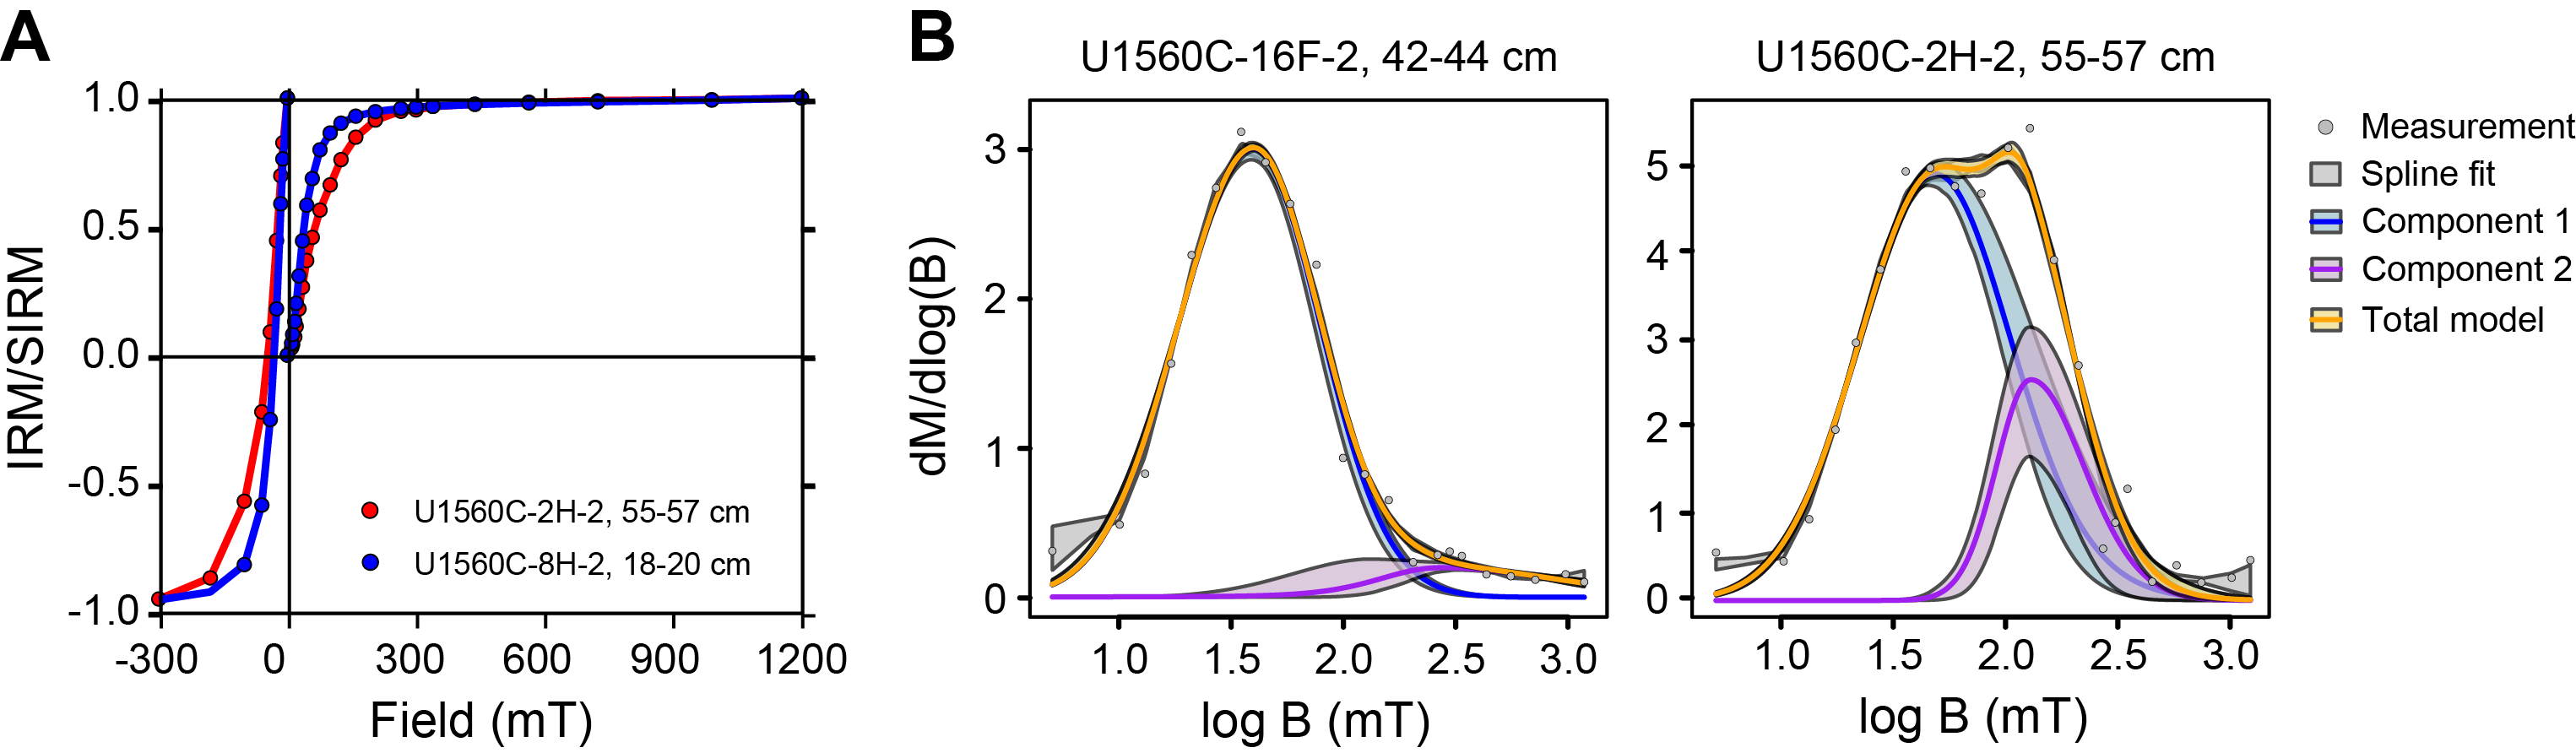
Figure F60. SIRM acquisition curves and coercivity distribution, Hole U1560C.
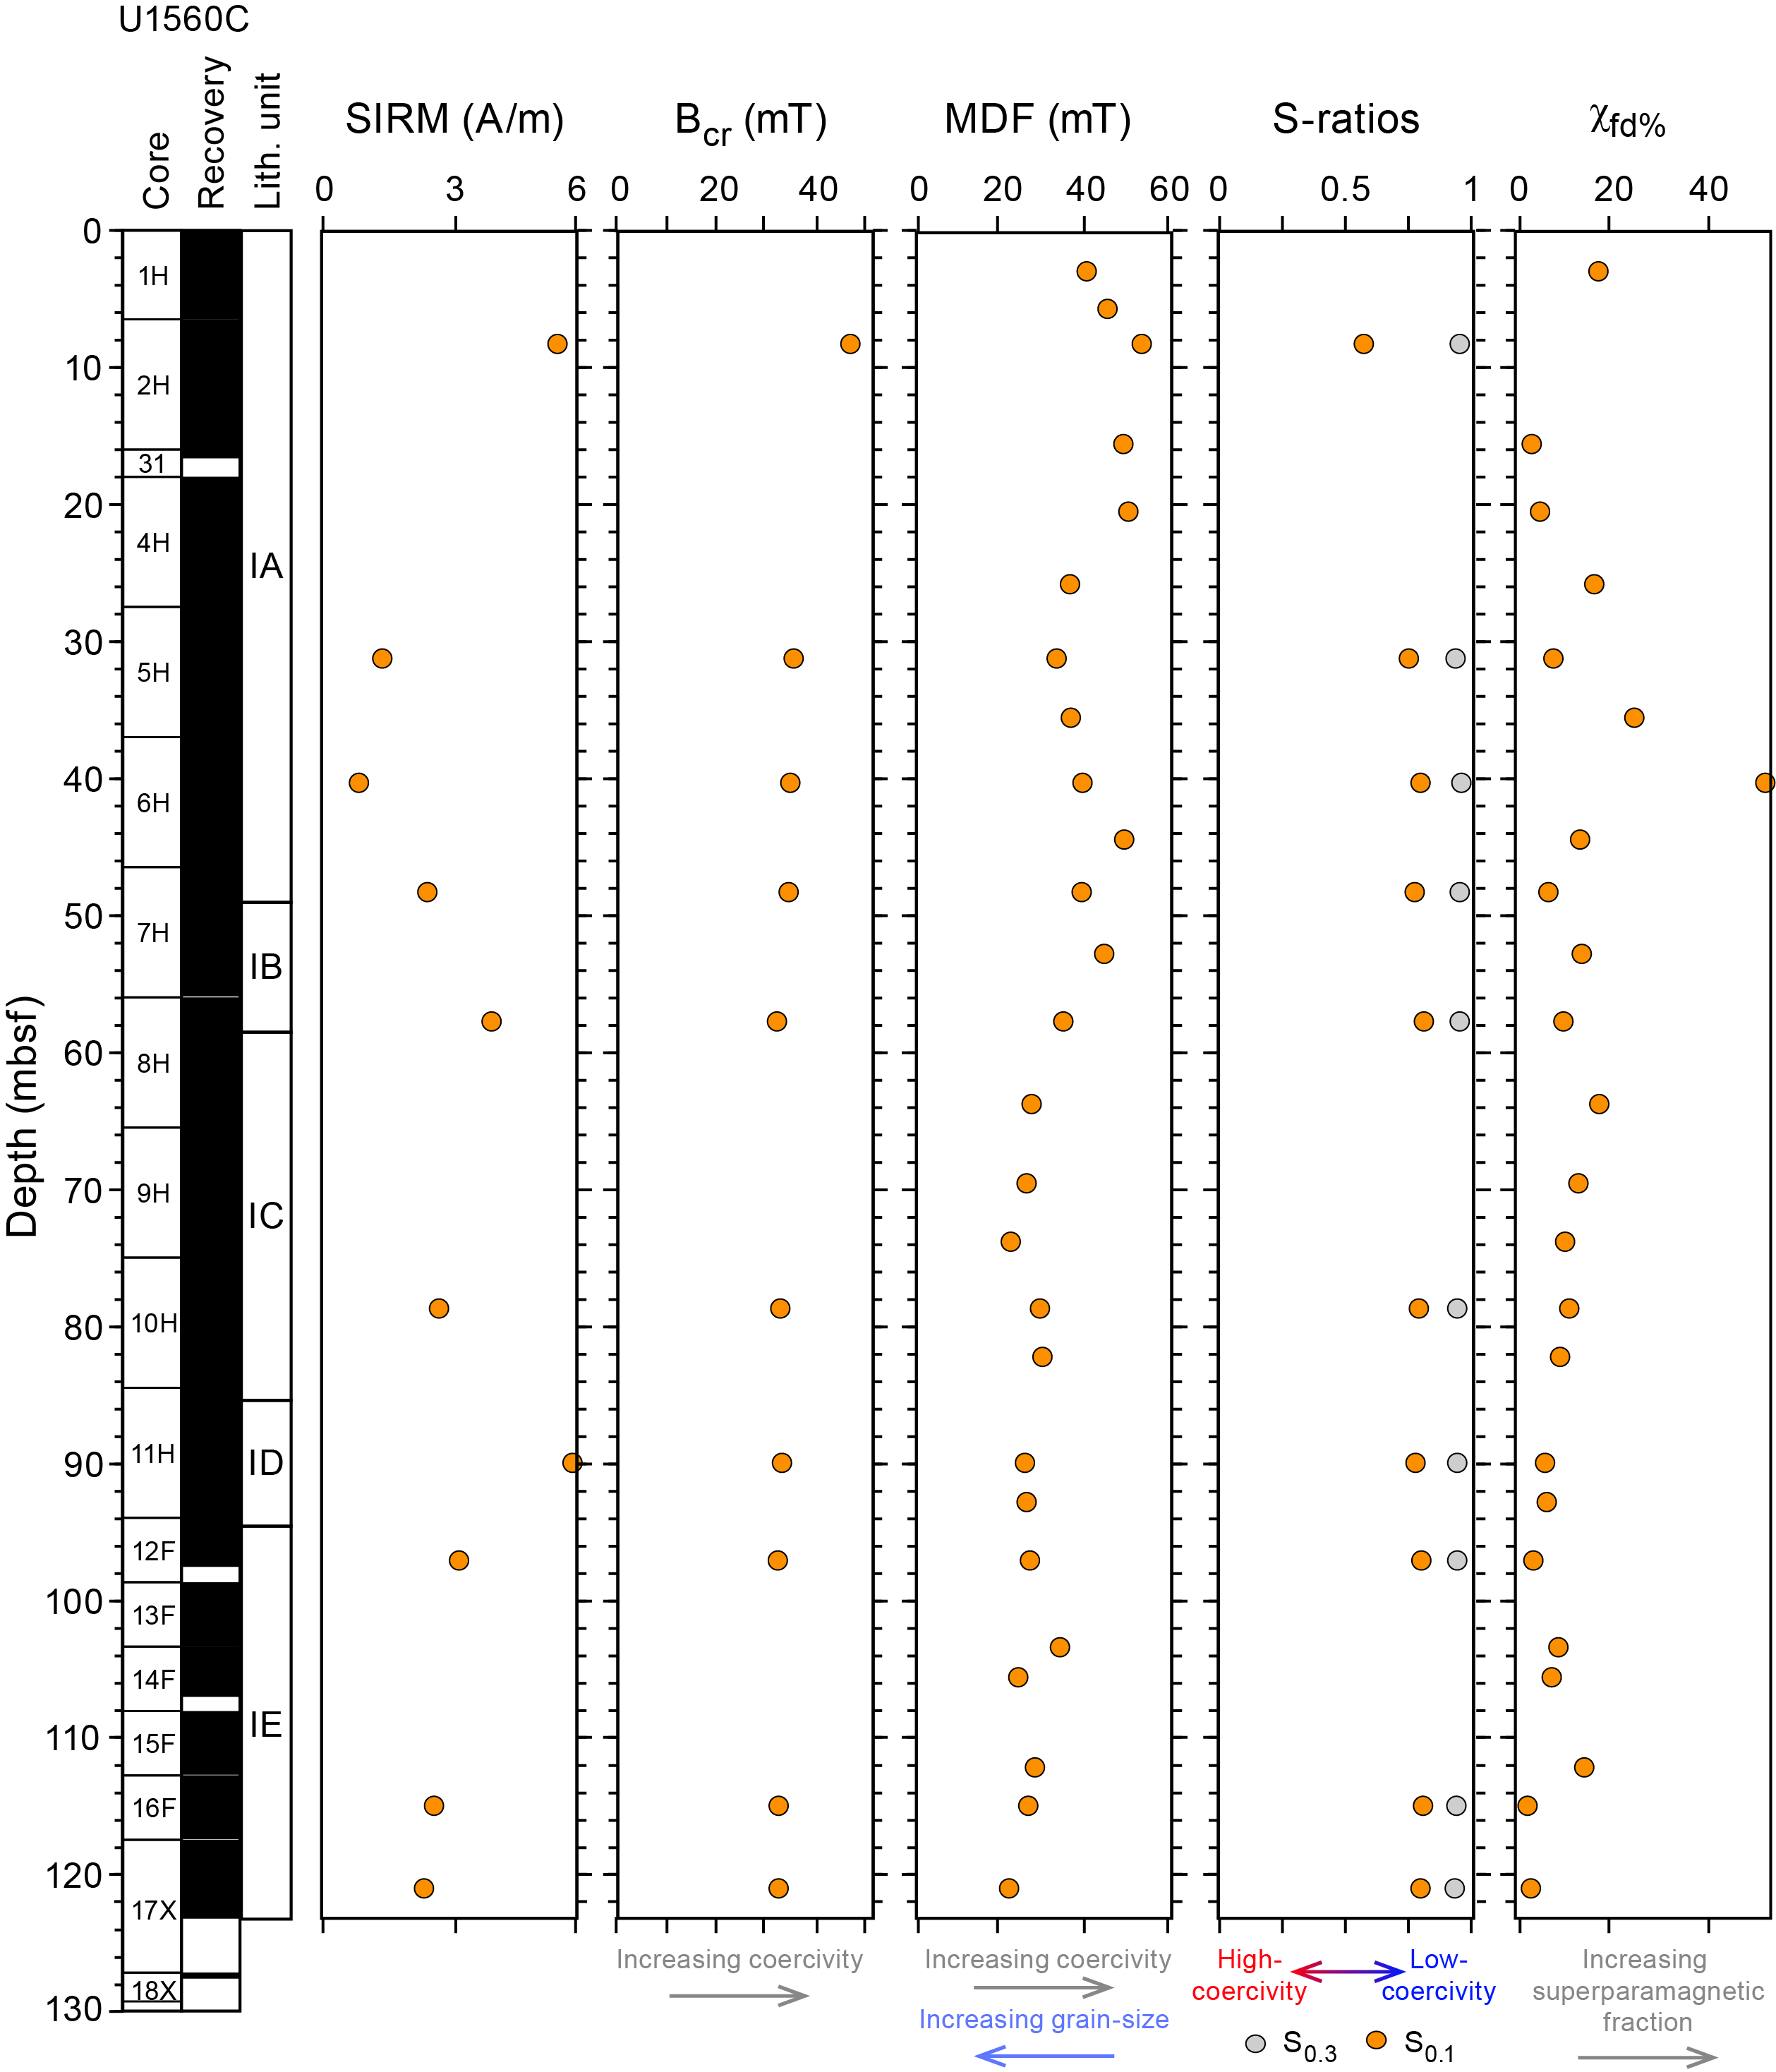
Figure F61. Magnetic mineralogy data, Hole U1560C.
AMS measurements reveal a well-defined magnetic fabric throughout Hole U1560C characterized by steeply inclined magnetic foliation (Figure F62; Table T20). This fabric must be coring related because the Kmin values are closely grouped in core coordinates but not in geographic coordinates. The majority of samples show an oblate fabric with no systematic variations with depth (Figures F62B, F63). Seven samples, concentrated toward the top (Subunit IA) and bottom (Subunit IE) of Hole U1560C display a prolate fabric. The degree of anisotropy (P) varies at 1.004–1.019, and the bulk susceptibility is generally <2.5 × 10⁻⁴ (SI), with one sample from Subunit ID (Sample 393-U1560C-11H-4, 110–112 cm) displaying a high susceptibility value of ~4 × 10⁻⁴ (SI) (Figure F63). In general, no significant variations of P and shape parameter (T) were observed with depth.
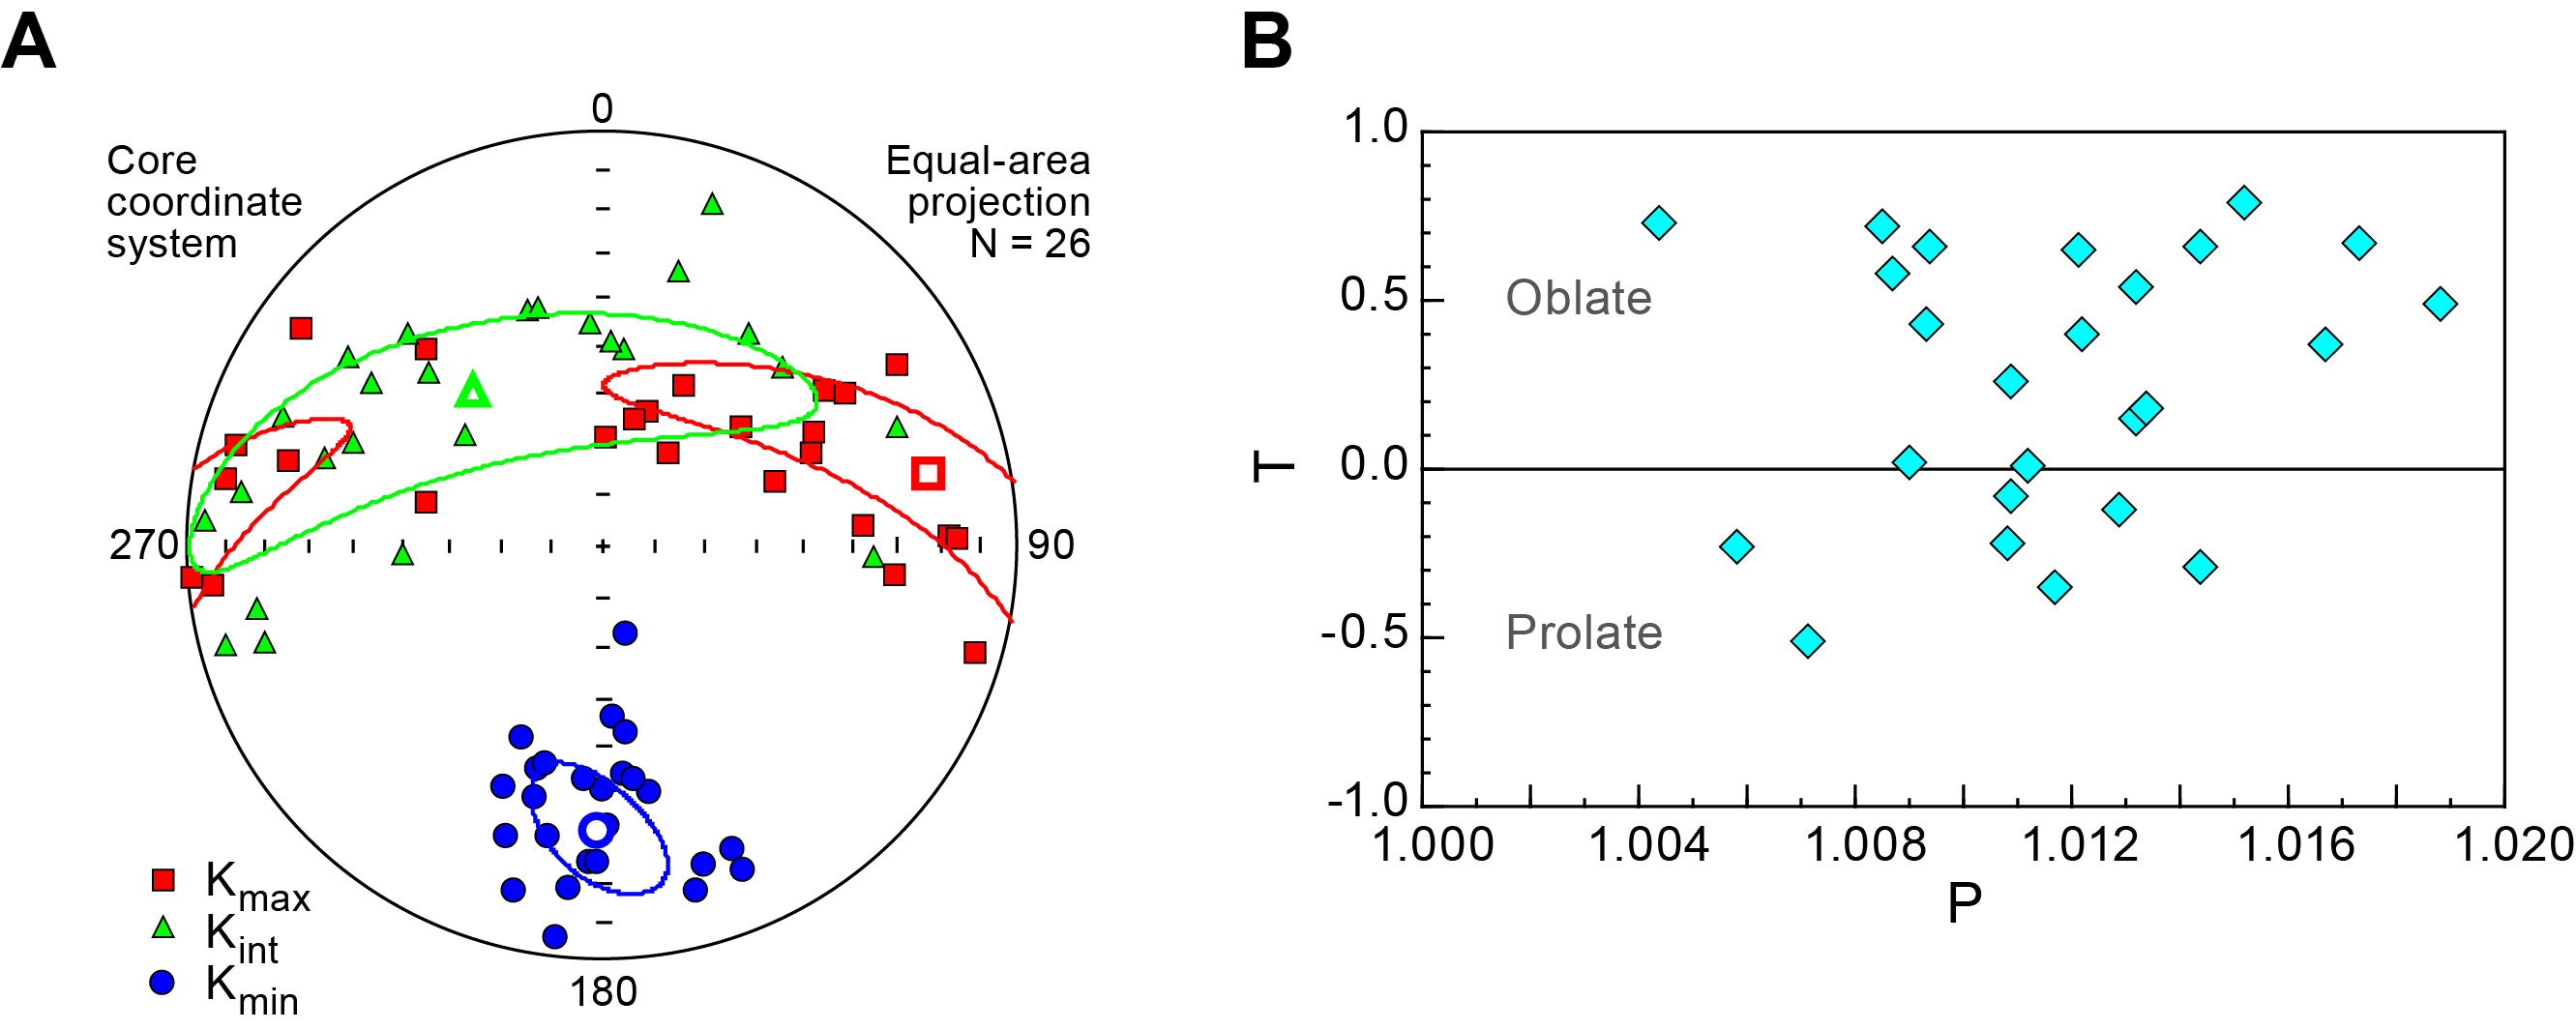
Figure F62. Principal magnetic susceptibility axes, discrete sediment samples.
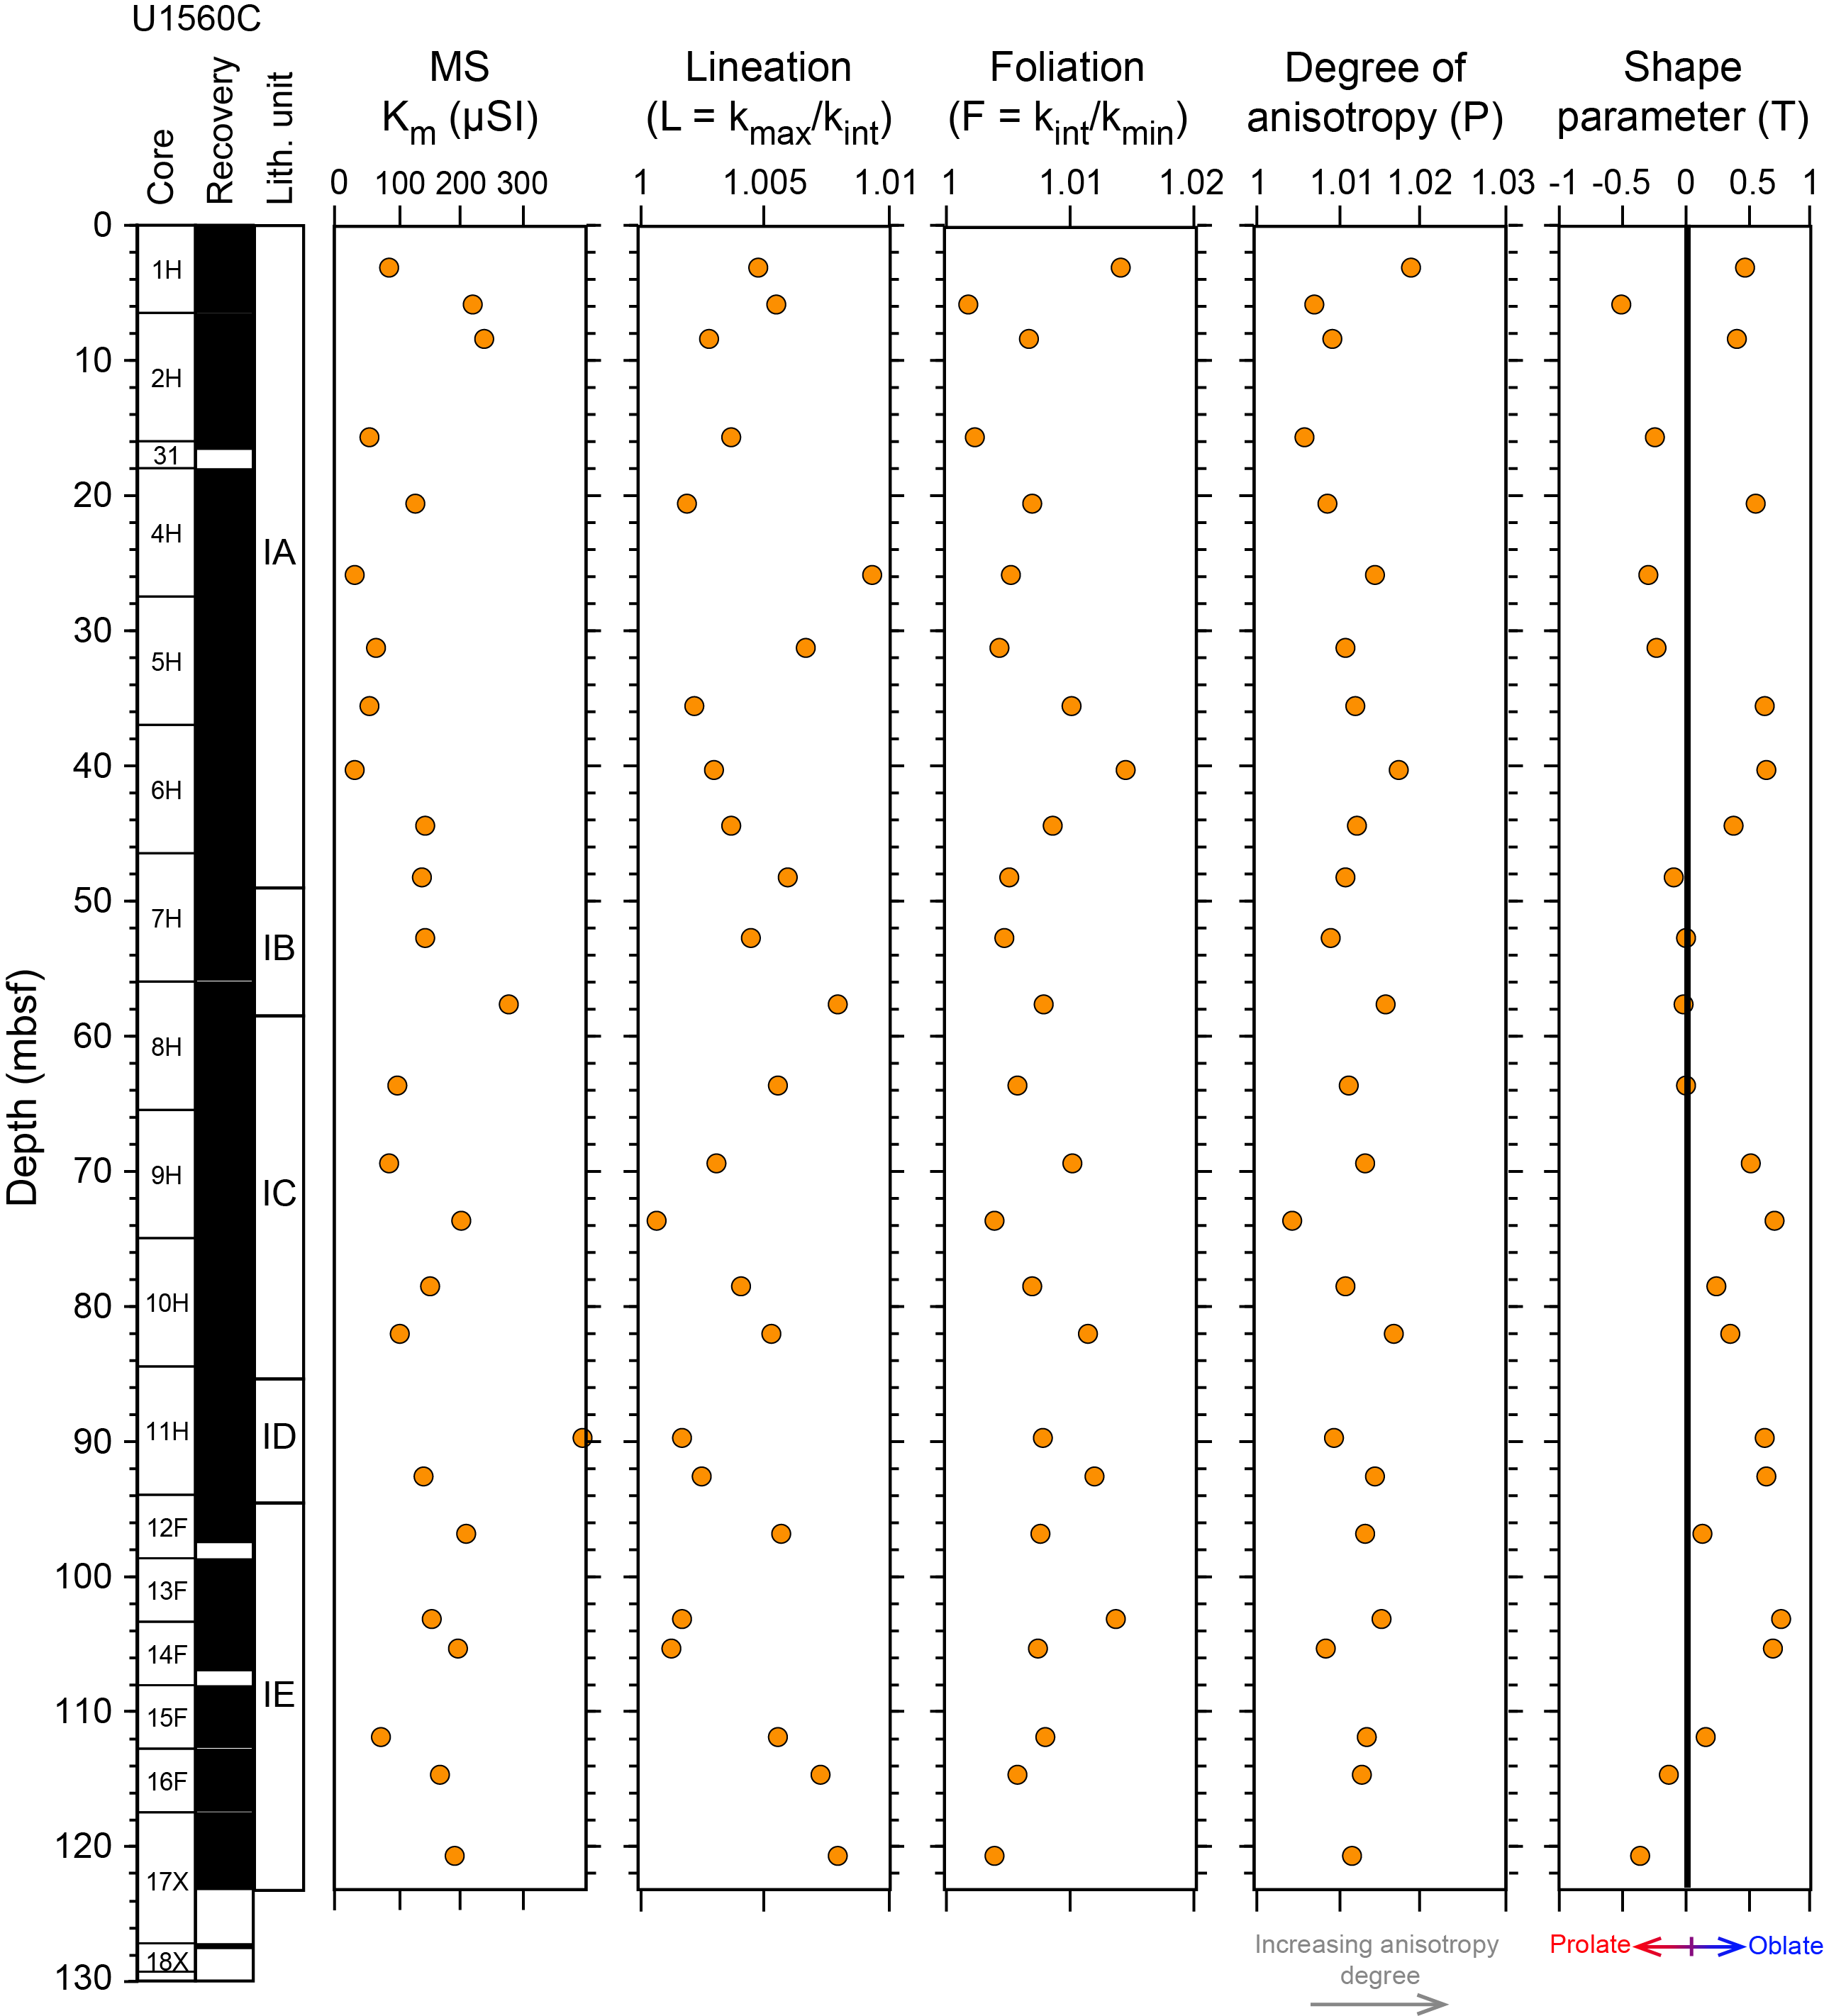
Figure F63. Bulk susceptibility and AMS parameters.
8.1.1.2. Magnetostratigraphy
Results from continuous remanence measurements of the archive-half sections from Holes U1560A and U1560C were used to define the polarity sequence for Site U1560. Our analyses are based on the relative length of the polarity intervals and are supported by the biostratigraphic datums from both nannofossils and foraminifera (see Biostratigraphy). In intervals showing less well defined polarity reversals due to shallow inclinations, correlations between the two holes based on physical properties (see Physical properties and downhole measurements; Figure F64) confirmed that zones of shallow inclinations occur in the same time intervals in both Holes U1560A and U1560C. Biostratigraphic observations were critical to establish robust ties to the GPTS (Figure F64). The uppermost sediment package (to ~8 m CSF-A) of both holes is dated to the Brunhes, Matuyama, and Jaramillo Chrons. The Pleistocene/Pliocene boundary is provisionally placed within Subunit IA at ~19 m CSF-A in Hole U1560A and at ~18 m CSF-A in Hole U1560C. Preliminary ties to the GPTS allowed definition of the Pliocene/Miocene boundary at the transition between Subunits IA and IB in both Holes U1560A and U1560C (Cores 395E-U1560A-6H and 393-U1560C-6H and 7H). Paleomagnetic data at the bottom of the sediment package and above the sediment/basement interface (between 110 and 120 m CSF-A in Hole U1560A and below 122 m CSF-A in Hole U1560C) were placed in Chron C5ADn (14.163–14.609 Ma) (Gradstein et al., 2020). The relative ages of these chrons are consistent with the estimated basement age of ~15.2 Ma (Kardell et al., 2019).
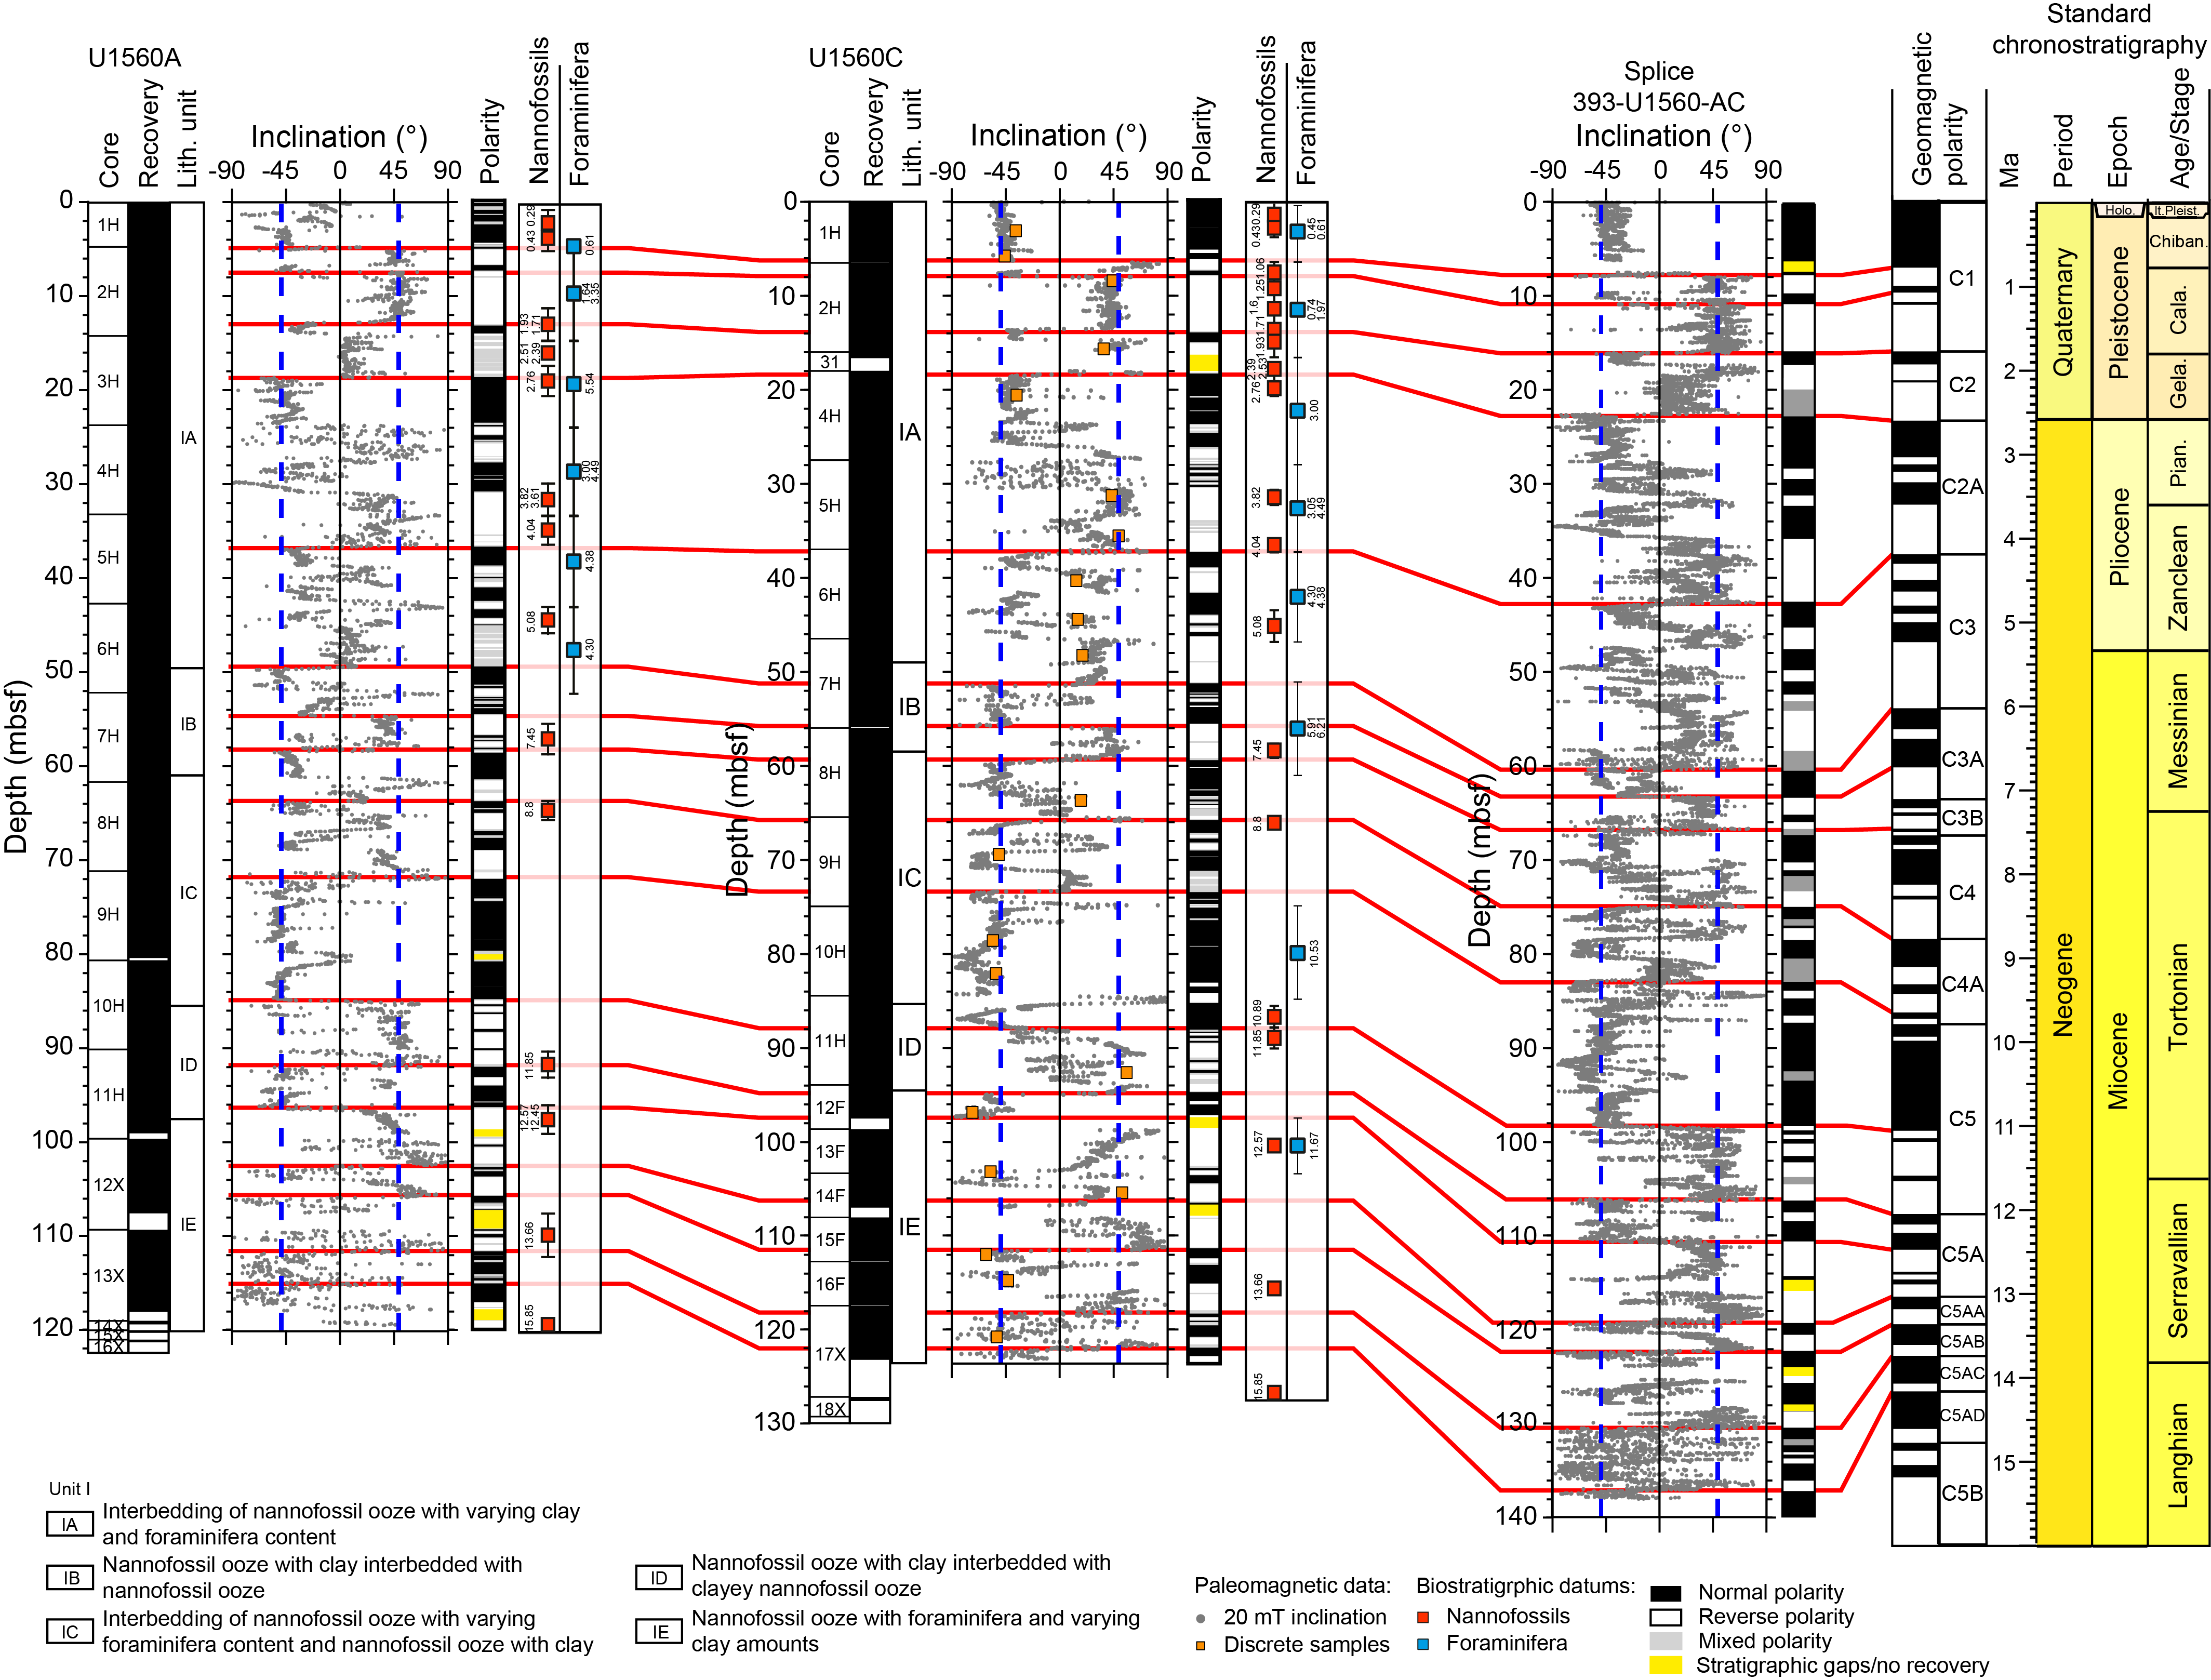
Figure F64. Inclination measurements after 20 mT with splice.
8.2. Basement
Paleomagnetic measurements on archive-half basement cores from Hole U1560B were performed at 2 cm resolution using the SRM. Remanent magnetization was measured before and after AF demagnetization at three different steps (5, 10, and 20 mT). Data resolution varied according to the core recovery rate in Hole U1560B (0%–84%), with higher resolution in Cores 393-U1560B-2R through 6R and 16R–21R. Cores 8R and 26R were excluded because no pieces were longer than 9 cm (see Paleomagnetism in the Expedition 390/393 methods chapter [Coggon et al., 2024a]).
One or two 8 cm3 cubes per core were taken from the working halves of Hole U1560B basement cores, targeting representative levels of both relatively fresh basalts and those with varying degrees and types of alteration (Table T21). Discrete samples were subjected to AF demagnetization and IRM experiments to characterize the remanence properties and define the magnetic mineralogy. A selected subset of samples was subjected to thermal demagnetization (Table T21). AMS measurements were performed on all samples to determine the magnetic fabric of the various igneous units.
8.2.1. Results
Continuous paleomagnetic measurements include measurements of NRM and remanence after in-line AF demagnetization of Cores 393-U1560B-2R through 41R. These measurements are used to characterize the remanence records of ~15.2 Ma basaltic basement (Kardell et al., 2019). Remanence after the 20 mT AF demagnetization step will be referred to as 20 mT remanence hereafter. NRM intensities strongly vary between 8.65 and 0.04 A/m; the highest values were detected in Cores 6R, 16R, 20R–25R, and 31R (Figure F65), which correspond to intervals having significantly higher MS values. Mean value of the 20 mT remanence of the volcanic rocks is ~0.98 A/m. The 20 mT inclinations show dominant positive values below Core 6R, and values cluster around 64° (Figures F65, F66). Positive inclination values indicate reversed polarity for this latitude (~30°S), which agrees with the expected polarity for 15.2 Ma basement. Considering the age of the sediments at the base of the sedimentary package (see Age model and sedimentation rates), the volcanic rocks at Site U1560 might be placed in reversed Chron C5Br (15.16–15.974 Ma) (Gradstein et al., 2020). Notably, the top of the volcanic sequence (to ~145 mbsf) in Subunits 1A and 1B shows negative values of 20 mT inclination (Figure F65). This change in polarity suggests either a time gap during emplacement of the lavas in Core 6R or field reversal around the time of eruption. The age for Subunits 1A and 1B can be possibly associated with normal Chron C5Bn.2n (14.87–15.032 Ma) (Gradstein et al., 2020). In addition, negative inclinations were observed also in Cores 16R–17R, 31R, and 41R, where the presence of a stable secondary component and/or rotated clasts associated with the breccia unit (Subunit 6B) should be taken into account.
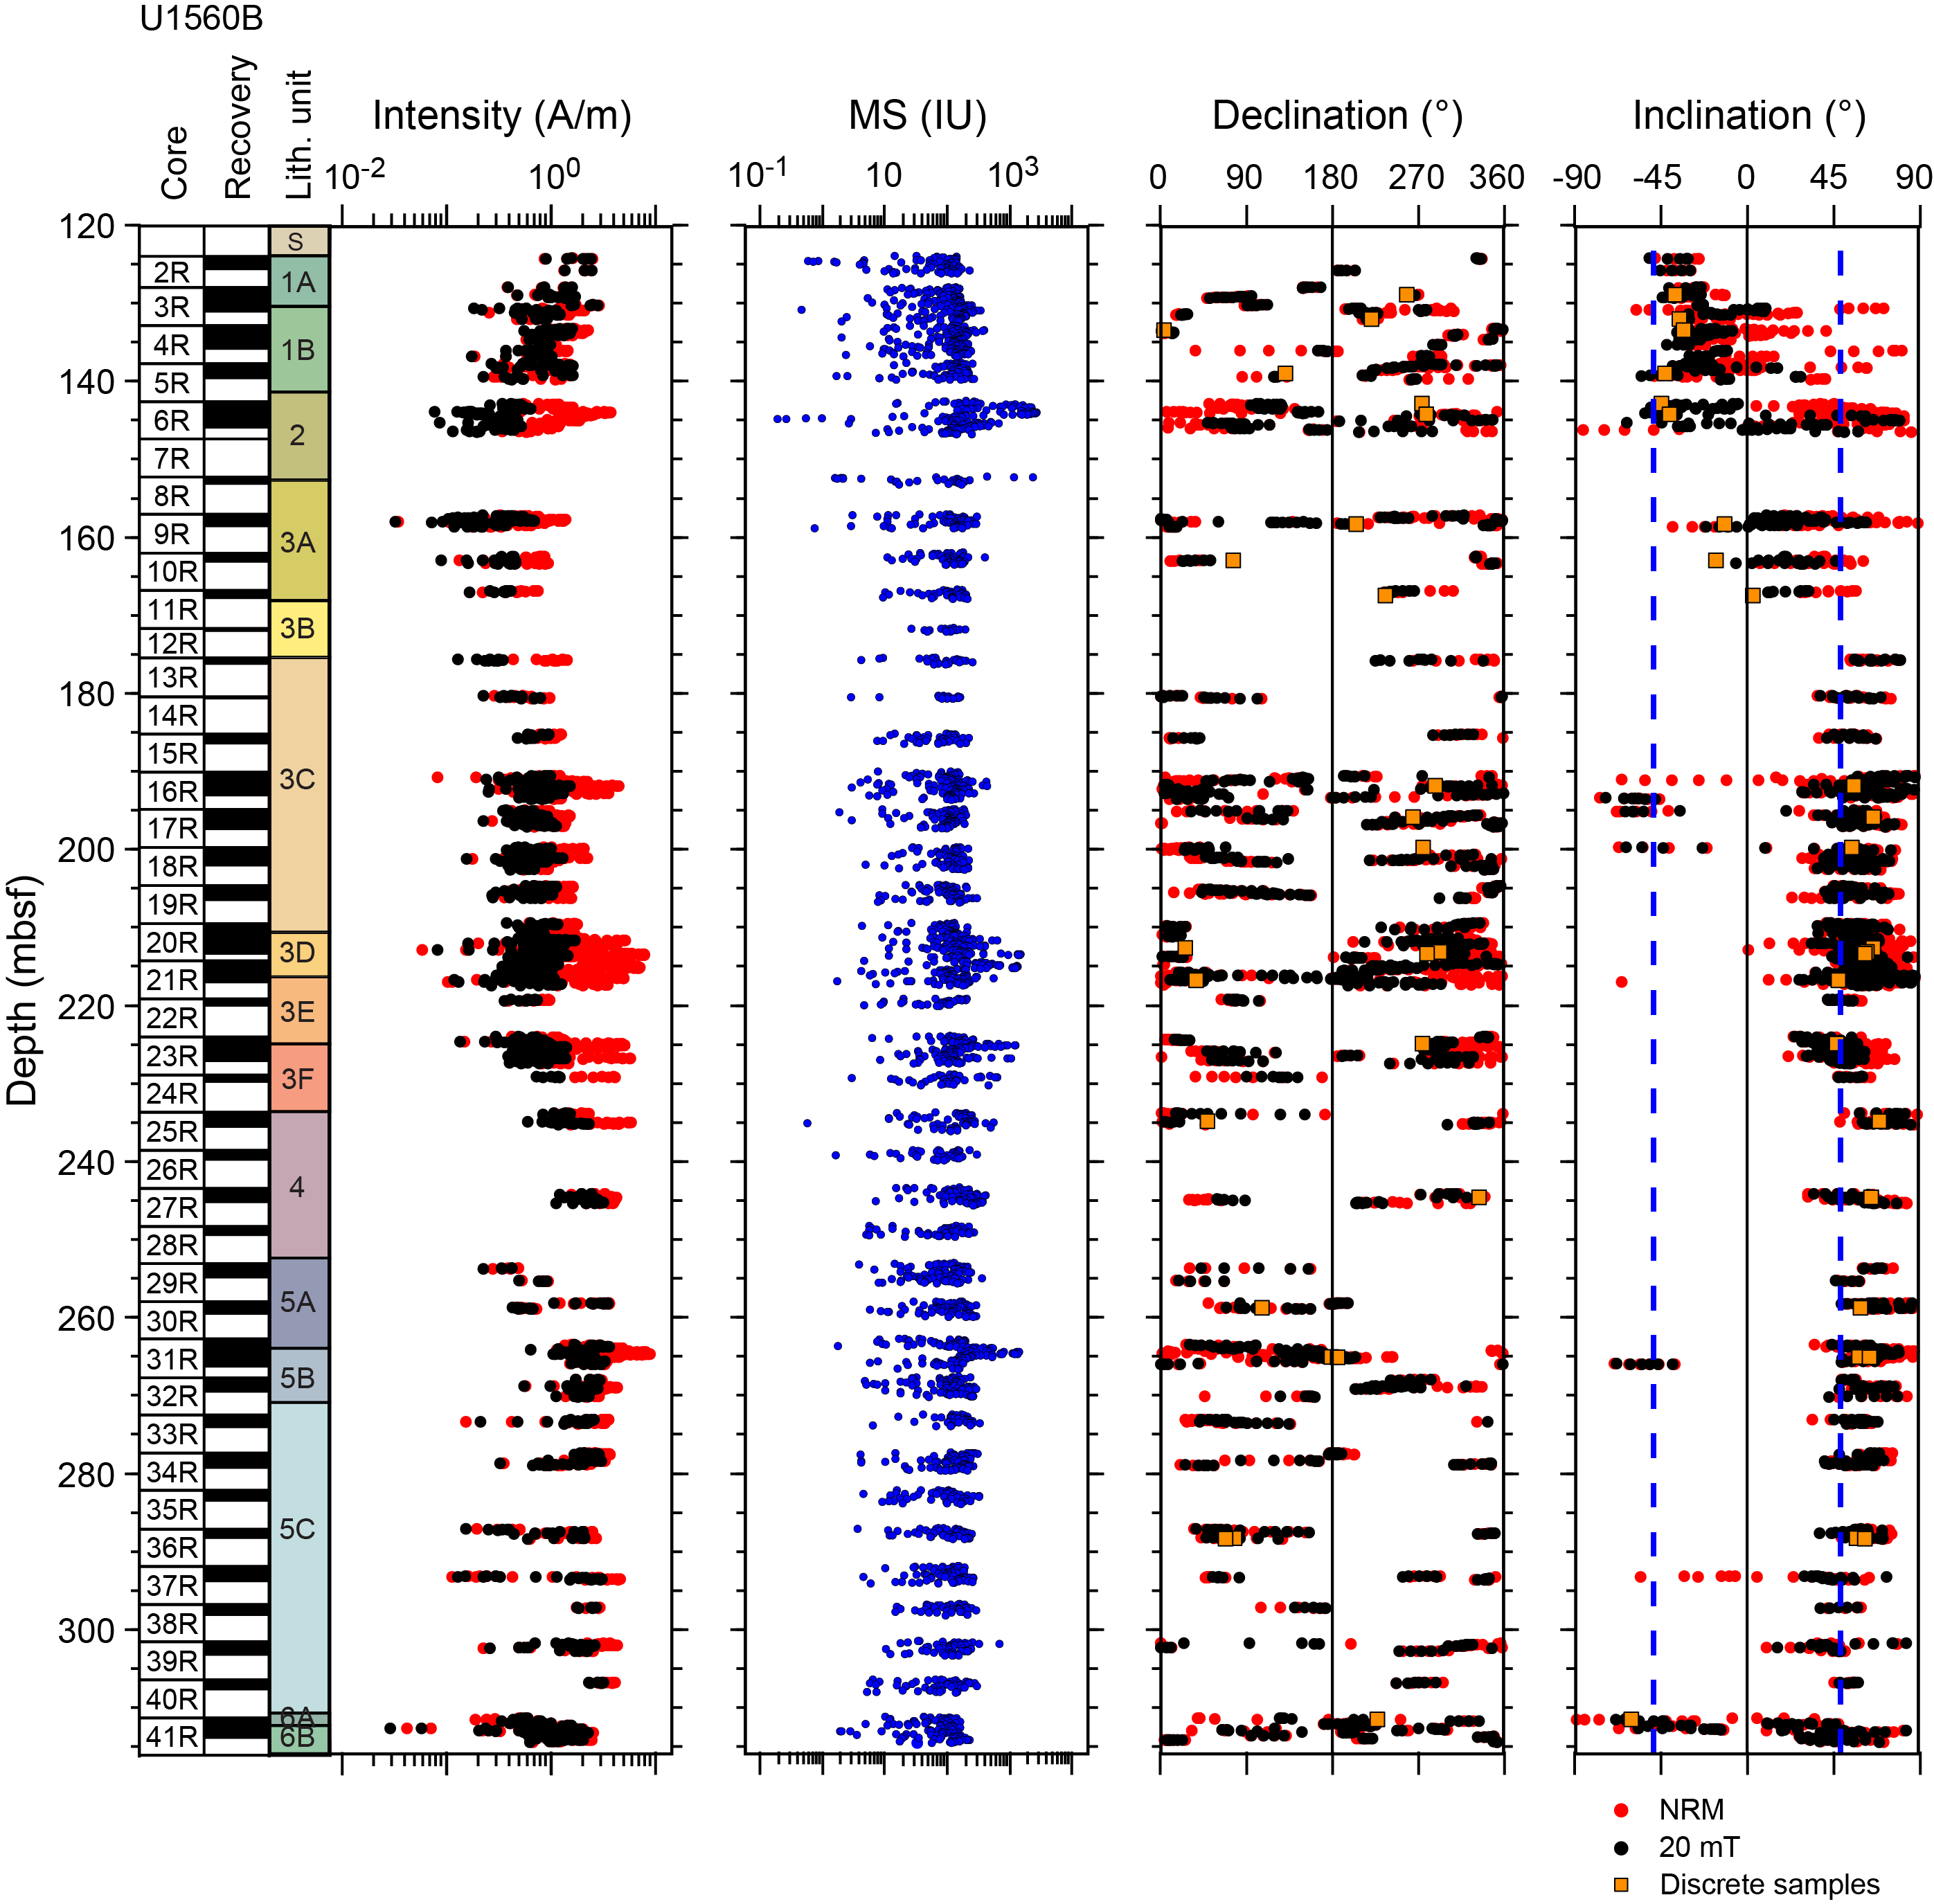
Figure F65. MSP and SRM measurements from volcanic rocks.
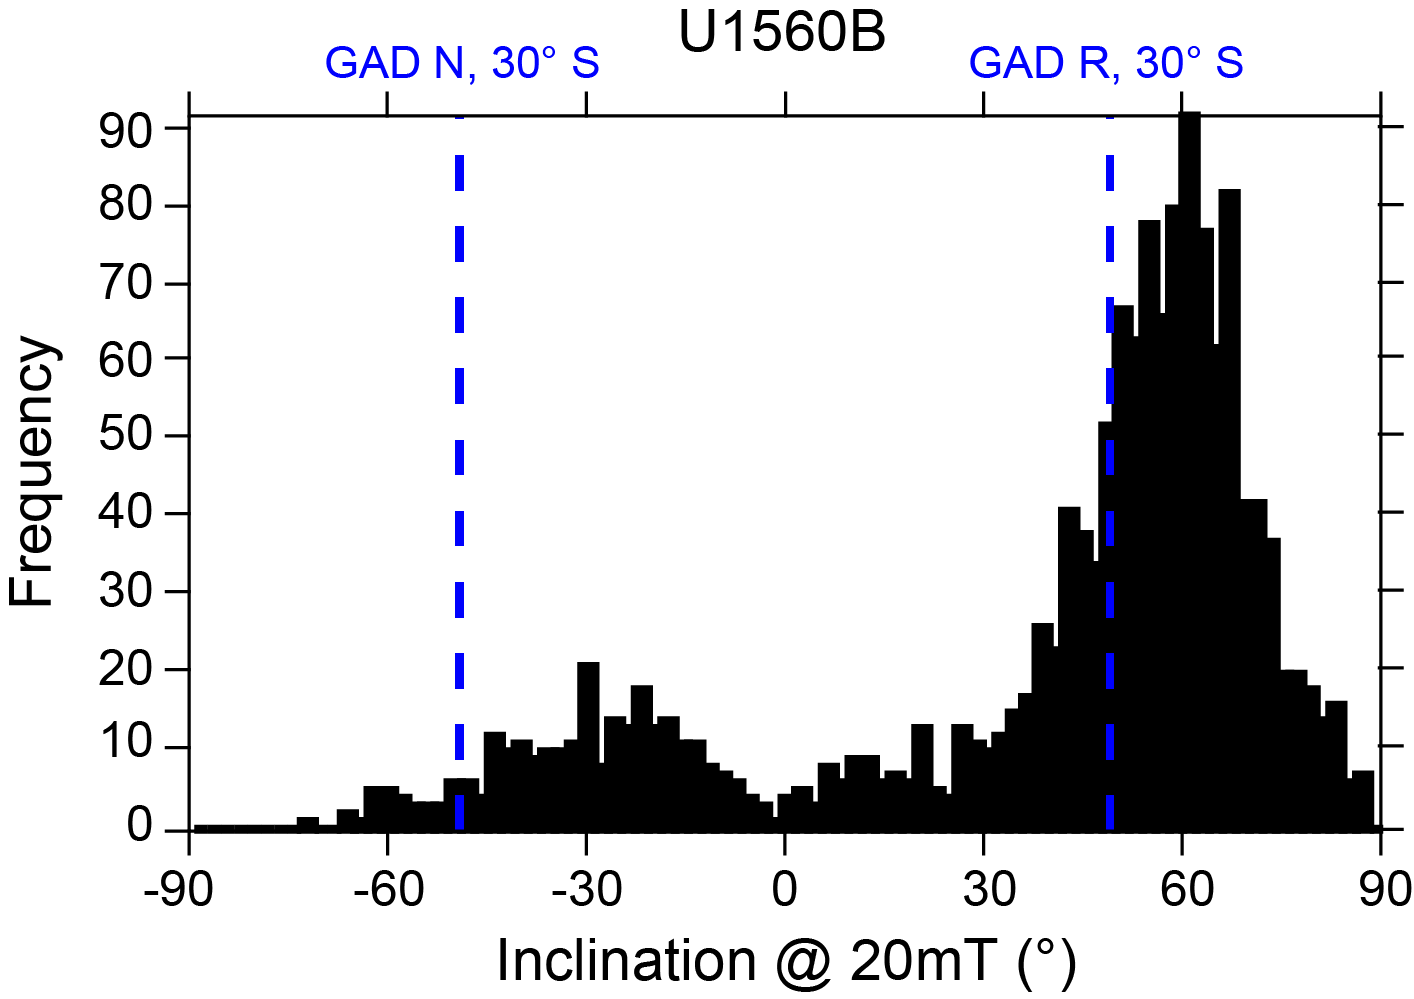
Figure F66. Inclination after 20 mT AF for volcanic rocks.
8.2.1.1. Discrete samples
AF demagnetization was conducted on all discrete samples up to a maximum 190 mT AF to isolate the ChRM and identify possible secondary components. A subset of the measured samples, mostly located in the pillow lava units (Subunits 1A and 1B, Unit 4, and Subunits 5A and 6A), reveal a secondary component stable up to the 25 or 30 mT AF demagnetization step (Figure F67A). Inclination values of the ChRM detected after the 30 mT AF demagnetization step were confirmed by thermal demagnetization experiments executed on few selected samples (Figure F67B). In contrast, samples collected from intervals having high MS, such as Sample 393-U1560B-23R-2, 25–27 cm, show a rapid decrease in remanent magnetization intensity and resolve a ChRM after the 10 mT AF demagnetization step (Figure F67C). Overall, the principal components derived from the discrete samples displayed maximum angular deviation angles between 0.5° and 11.3°, indicating well-defined ChRM directions (Table T21) (Butler, 1992). ChRM inclinations and declinations are consistent with those measured on the SRM, with the exception of Samples 10R-2, 4–6 cm, and 11R-1, 75–77 cm, that reveal slightly lower inclination values (Figure F65). To identify possible changes in the magnetic mineralogy related to igneous units or hydrothermal alteration style and intensity, acquisition of IRM was conducted on 17 discrete samples along with backfield experiments performed on 25 samples. The IRM acquisitions of fresh basalts with gray background reach saturation at ~200–400 mT (Figure F68A), suggesting the dominance of low-coercivity minerals such as magnetite or maghemite. In contrast, basalts showing pervasive grayish brown or reddish yellow halos such as Sample 30R-1, 80–88 cm, reveal high contents of high-coercivity minerals (e.g., hematite or goethite), as IRM did not reach saturation at the 1200 mT field (Figure F68A). Deconvolution of the IRM acquisition curves (Figure F68B) confirms that high- and low-coercivity minerals are mixed within the volcanic rocks of Hole U1560B. Most samples show two low-coercivity components having mean remanence coercivity (Bh) of 1.5–2 log10 units. In contrast, a few samples, such as Sample 21R-3, 6–8 cm, reveal significant contribution (~30%) of a high-coercivity component (Bh ~2.5 log10 units) that might be associated with hematite. The lowest IRM100/SIRM (S0.1) and S ratio (S0.3) values were detected in Subunits 1A, 3E, 5A, and 6B (Figure F68C; Table T22). Those subunits also show the highest coercivity of remanence (Bcr) and MDF values (Figure F68C; Table T22), implying higher contents of high-coercivity minerals and/or fine-grained magnetite. MDF varies depending on the emplacement style (Figure F69A; Table T22), with lower values indicative of coarser grained multidomain magnetite in the massive (Unit 2) and sheet flow (Subunits 3D and 5B) basalts. Pillow flows show mean MDF values of ~60 mT, typical of single-domain magnetite. Pillow flow units also show higher Bcr values (Figure F69B). Those values are associated with the presence of high-coercivity minerals in samples showing reddish yellow alteration style (Alteration Degree 4 in Figure F69C). In addition, highly altered samples (reddish yellow halos) reveal the lowest SIRM values (Figure F69D). Samples having high mass magnetic susceptibility (χm) show also higher remanence intensity and appear to be linked to the different emplacement style (Figure F69E, F69F; Table T22). In addition, the lowest values of both parameters are detected in basalts with reddish yellow halos, suggesting a significant decrease in susceptibility as alteration increases.
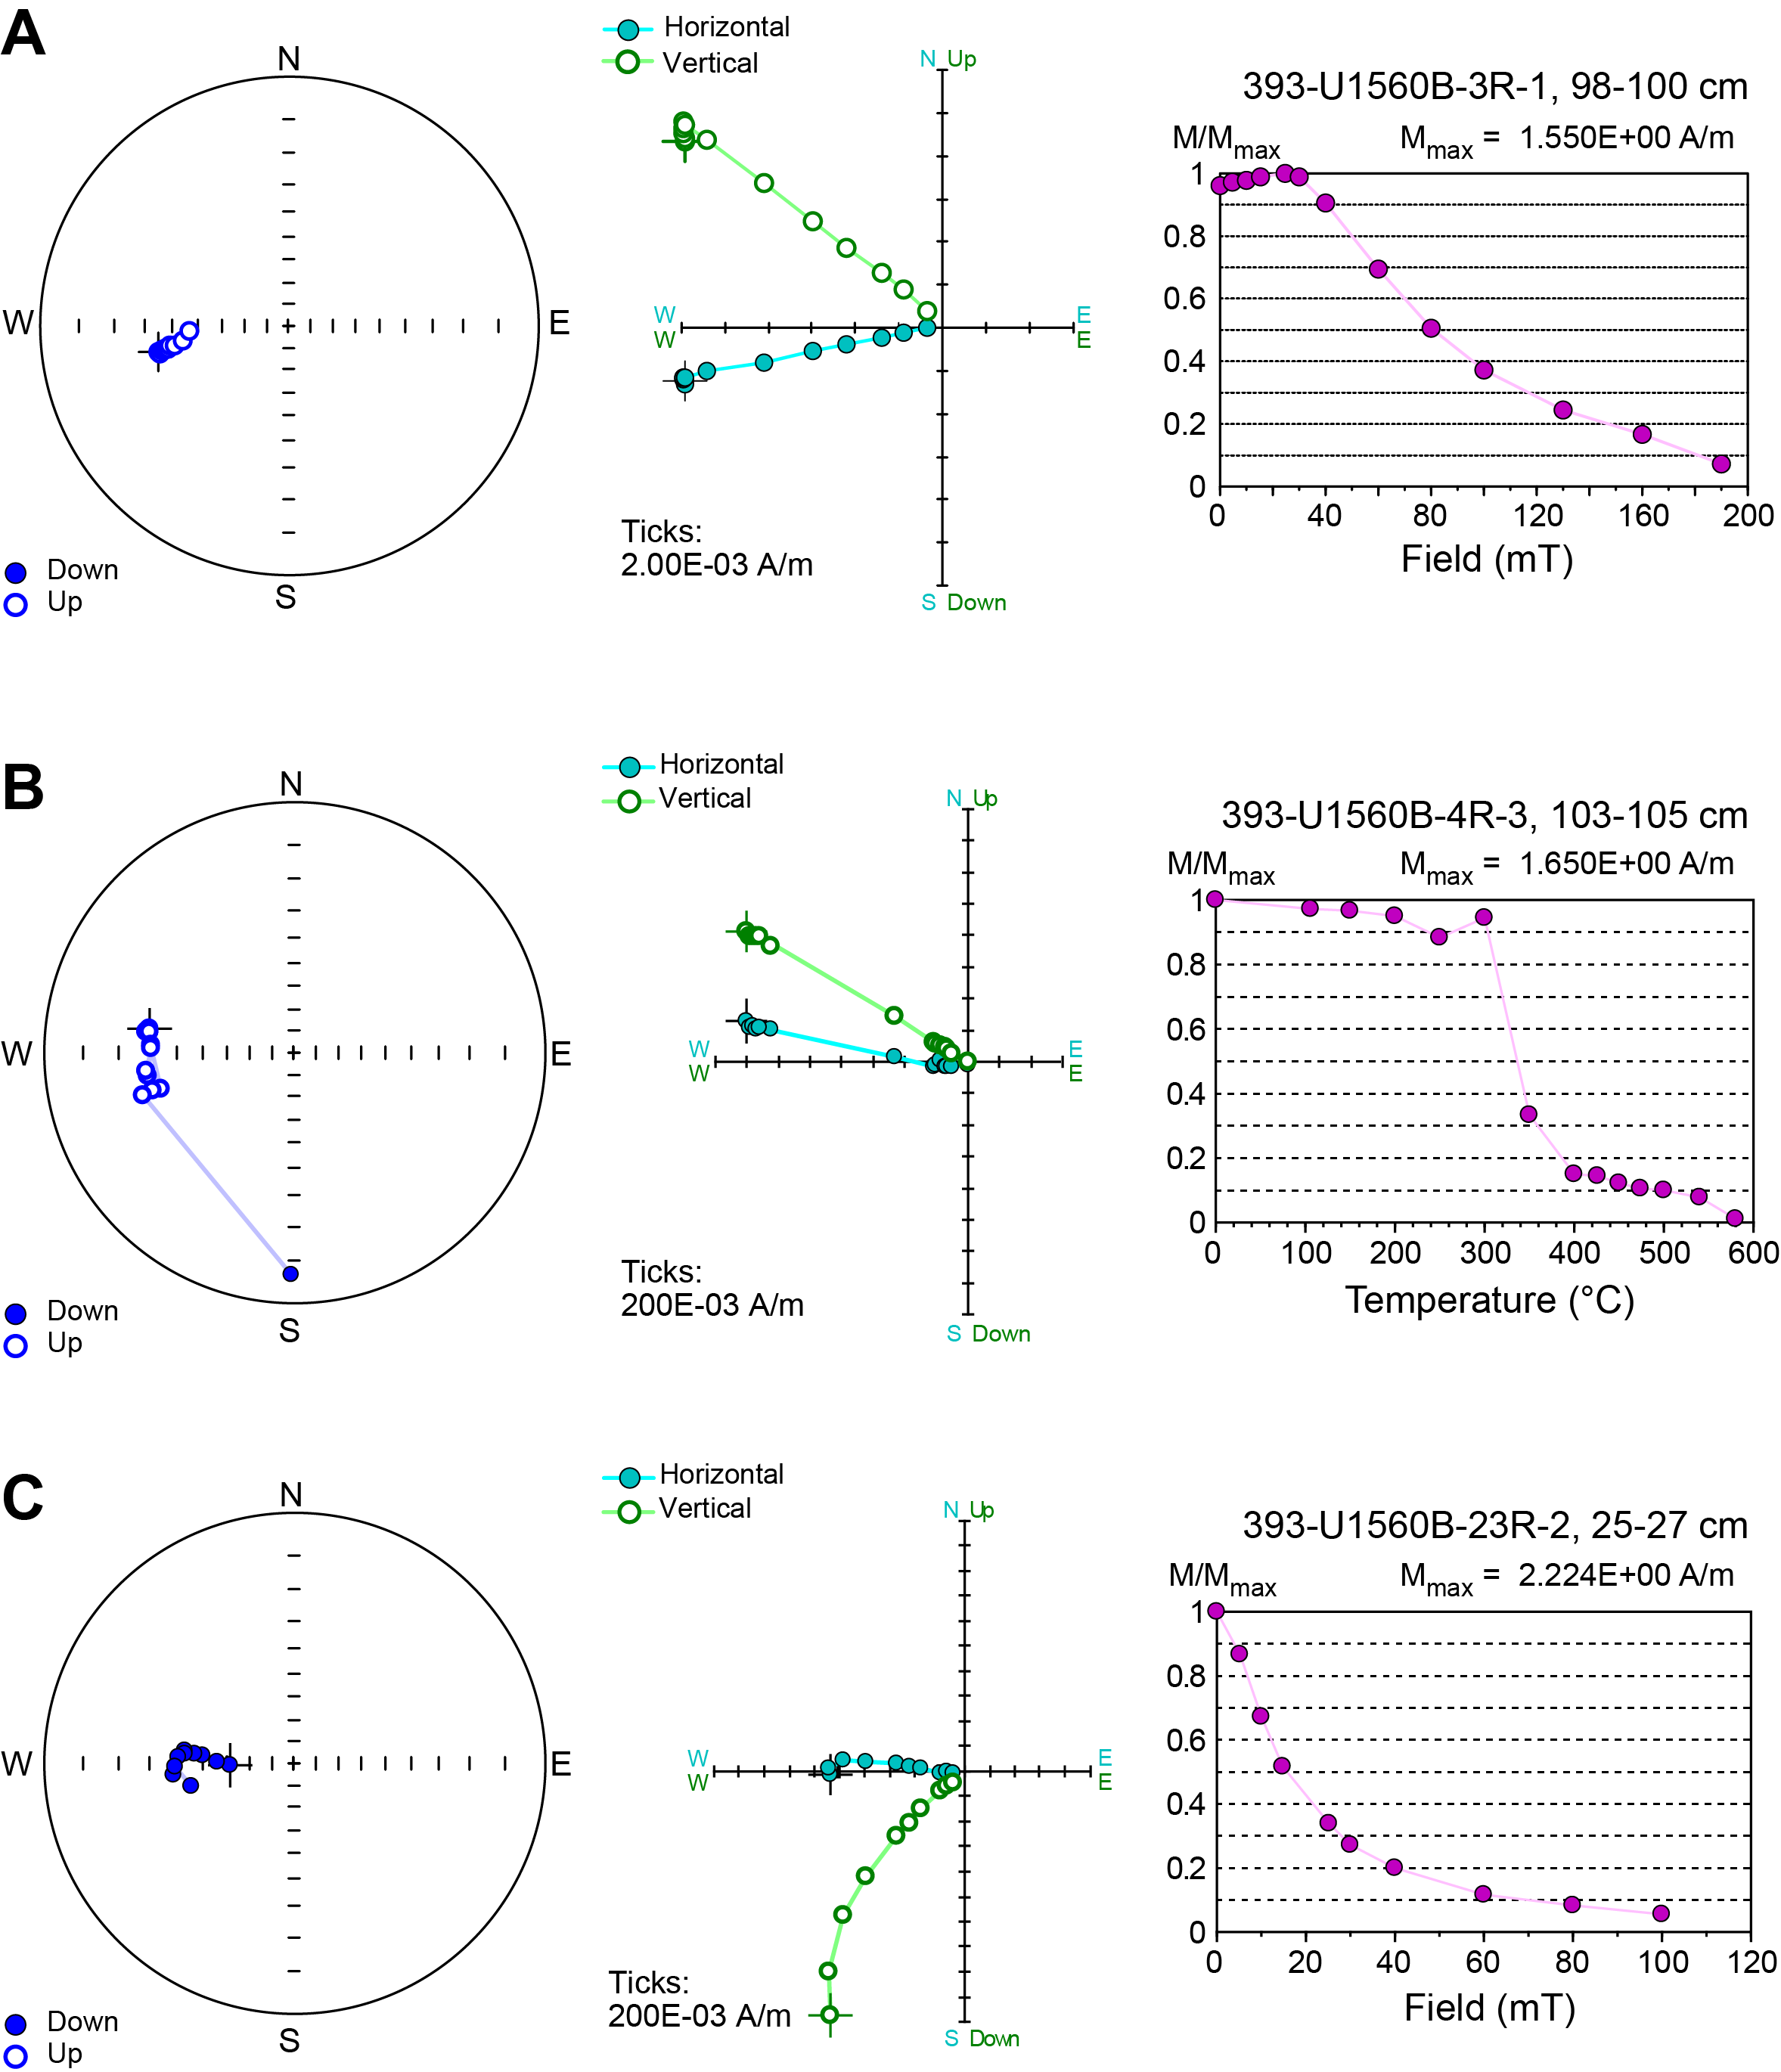
Figure F67. AF and thermal demagnetization for discrete samples.
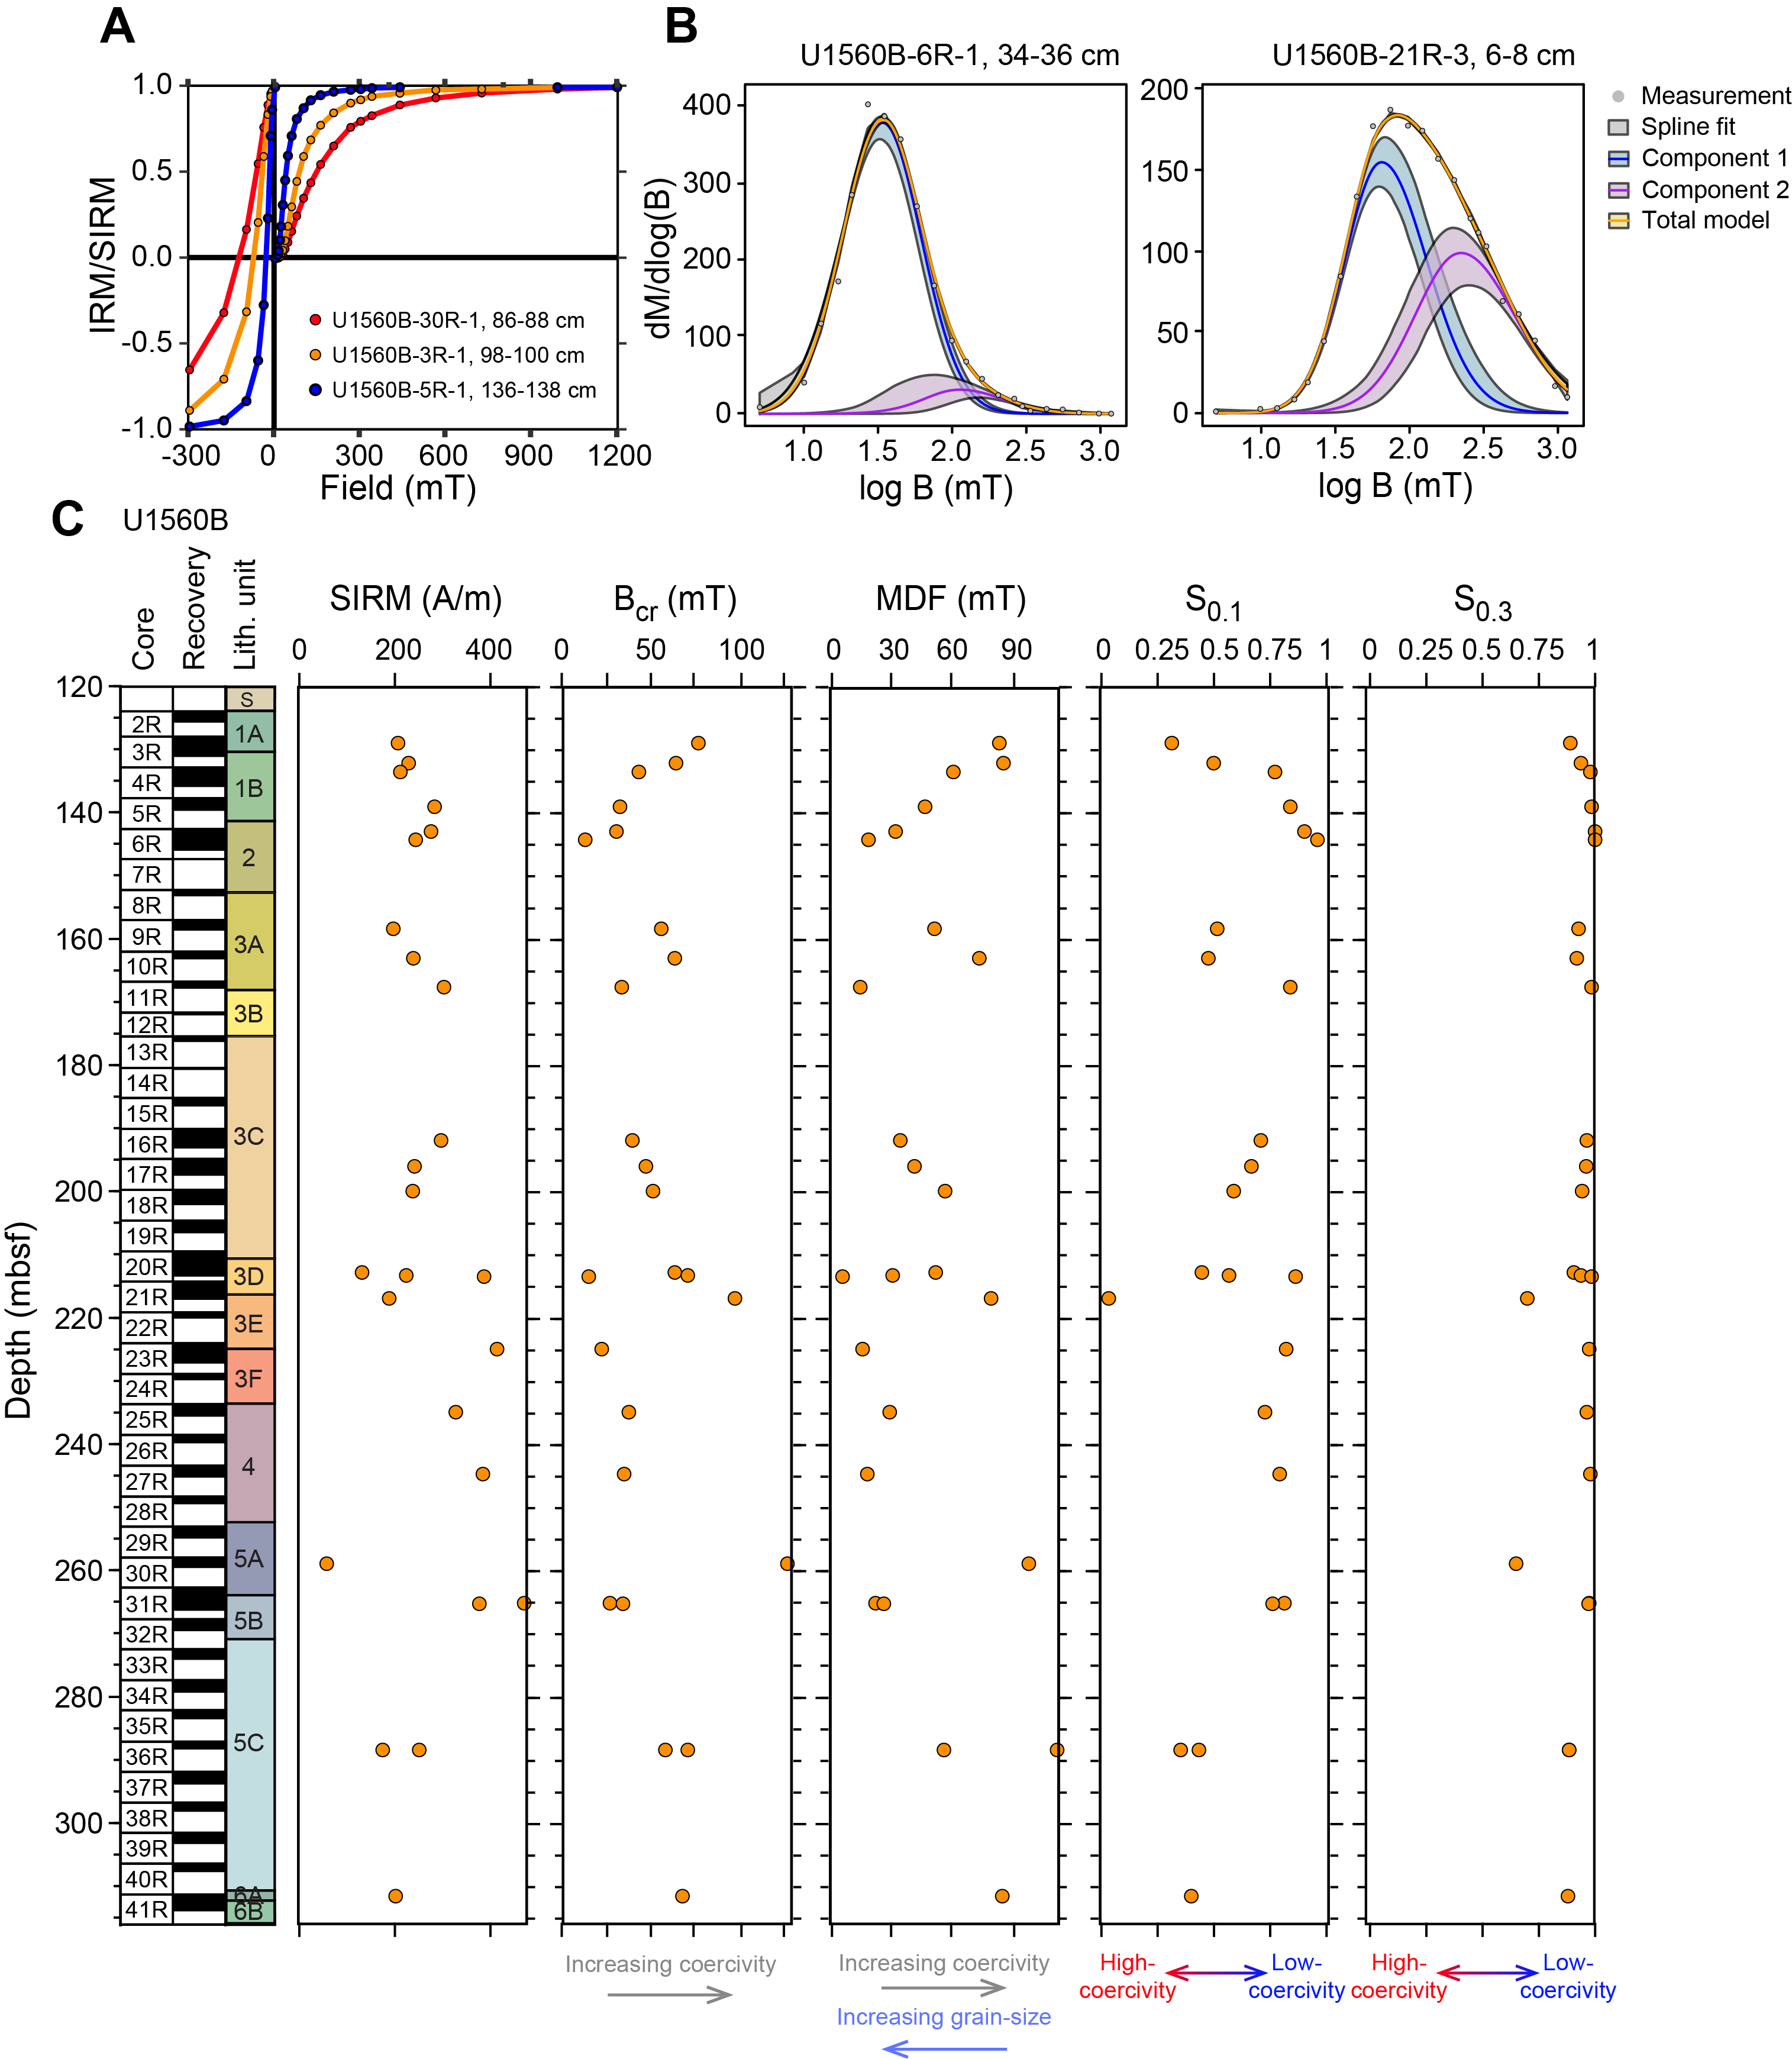
Figure F68. SIRM acquisition curves and coercivity, Hole U1560B.
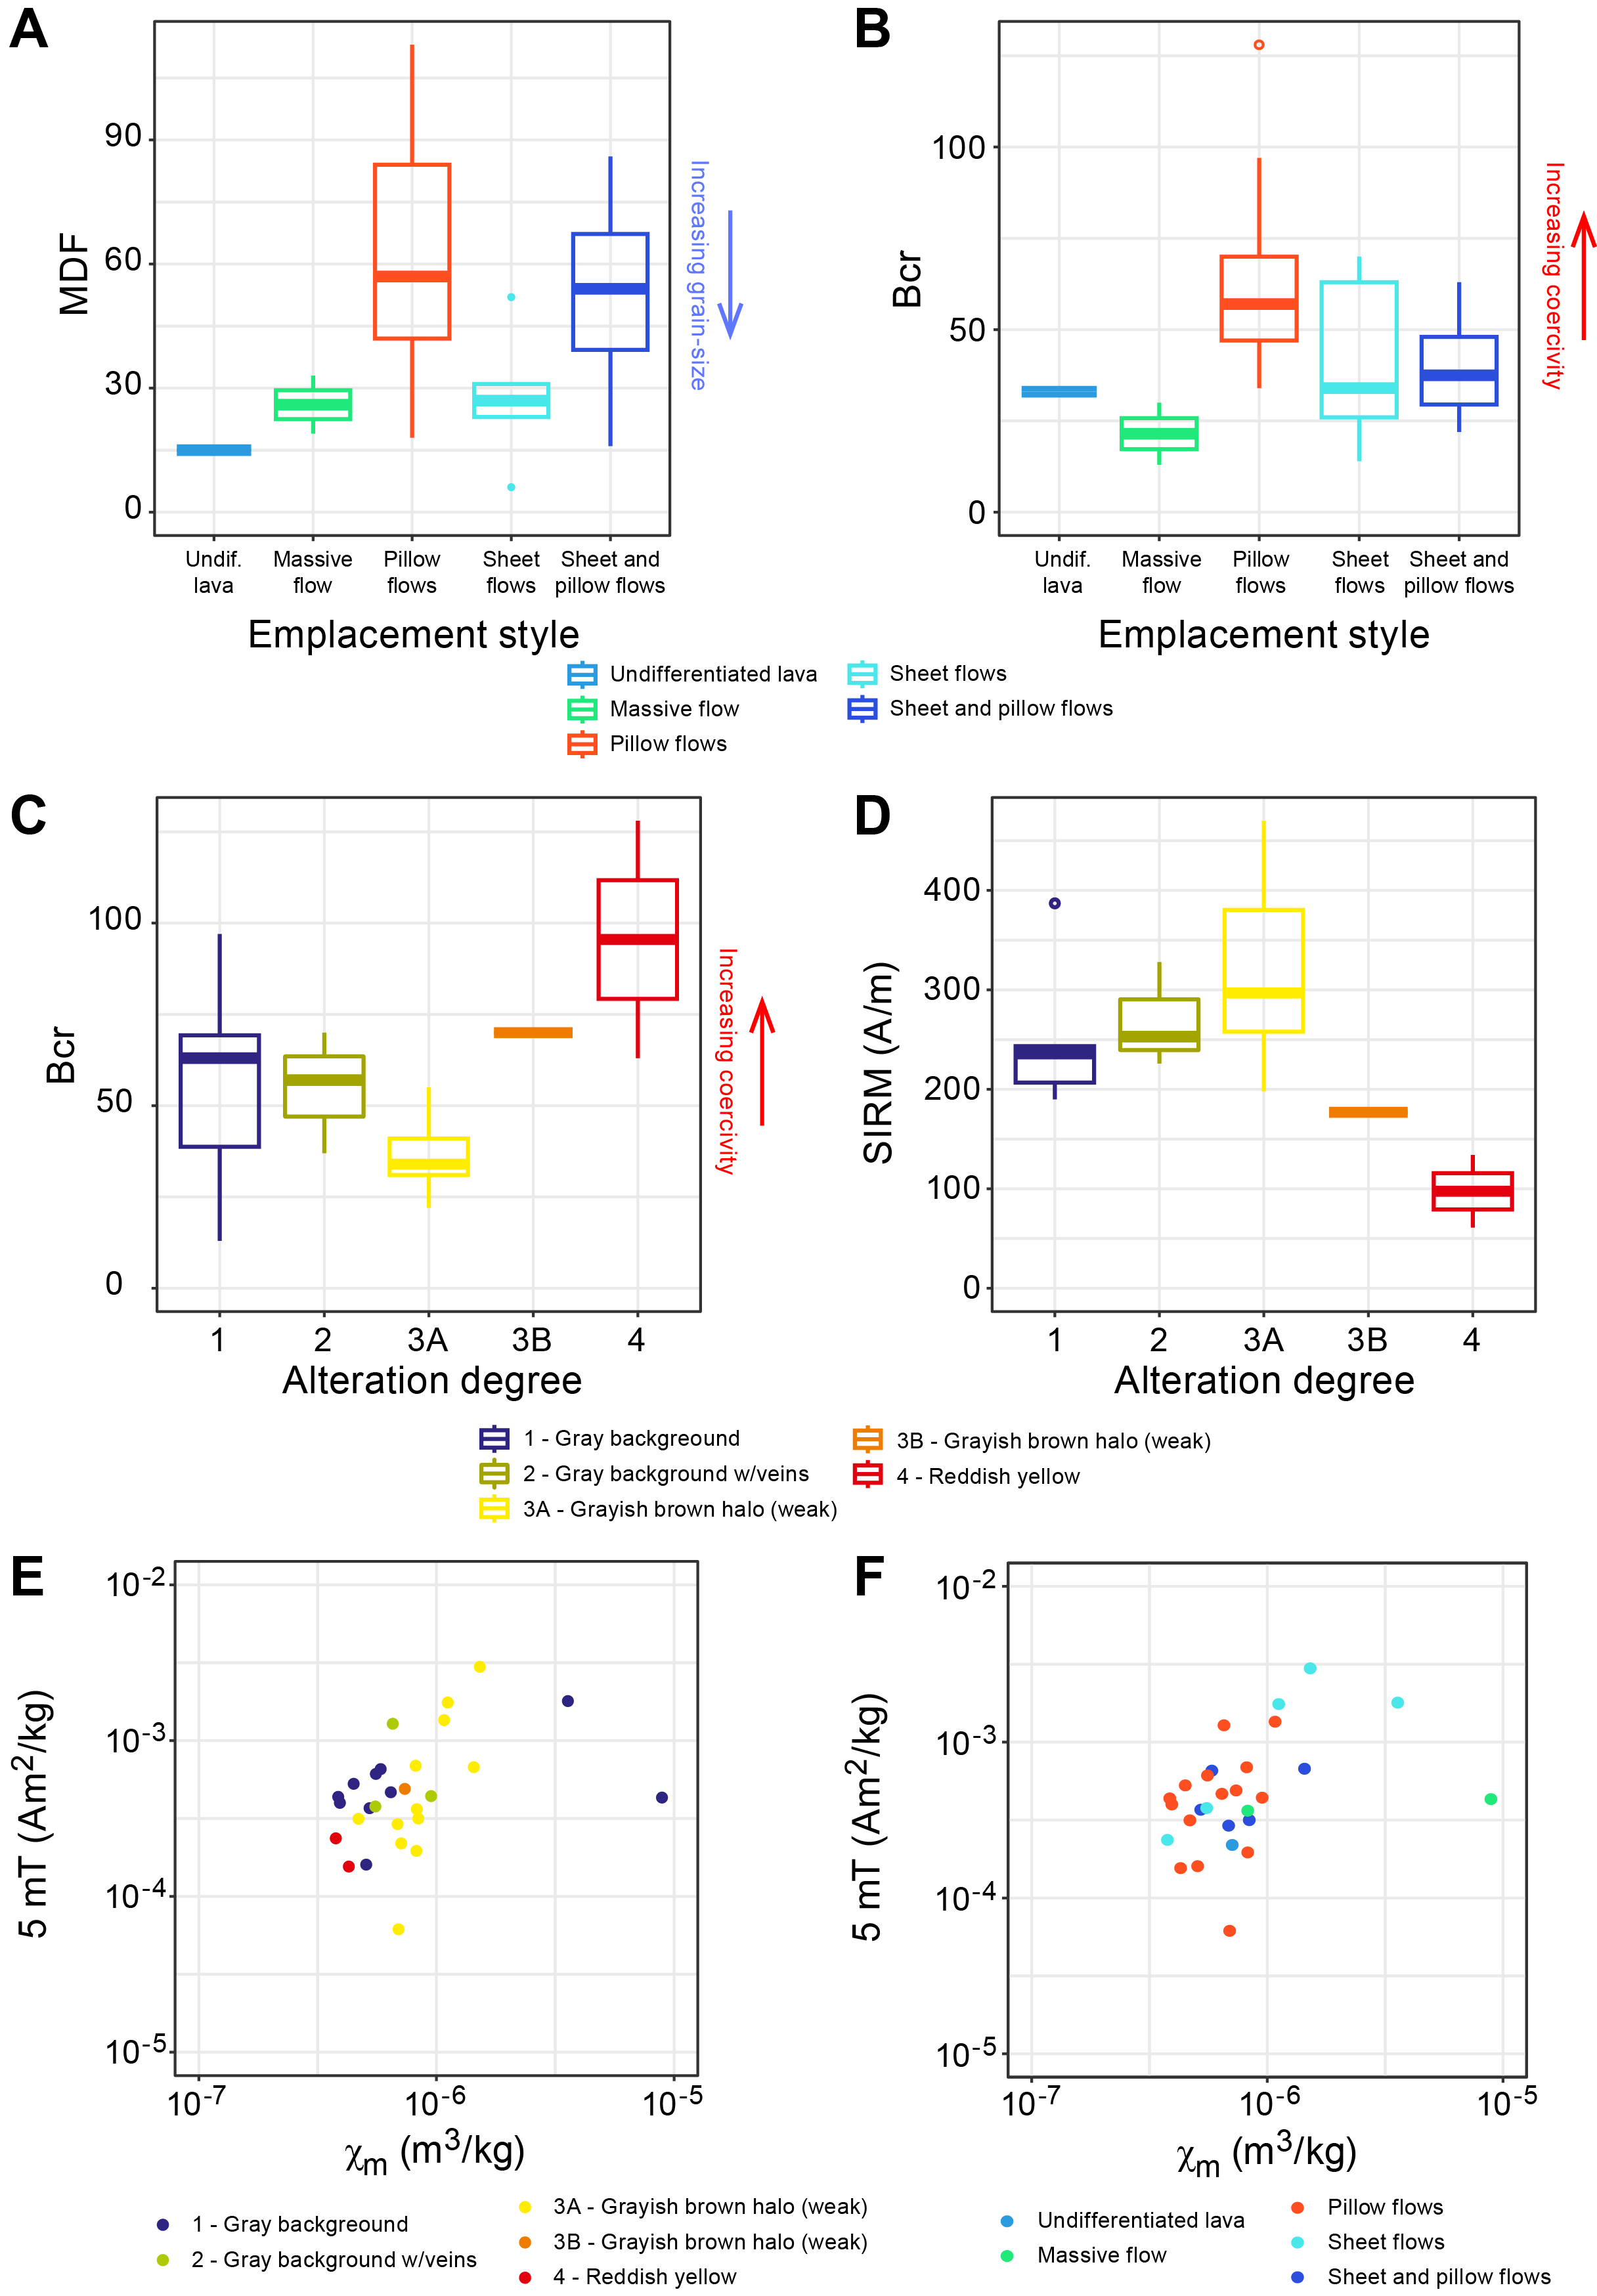
Figure F69. MDF, Bcr, and SIRM.
Results of AMS measurements (Table T23; Figure F70) indicate the dominance of prolate magnetic fabric and subhorizontal magnetic lineation (Kmax) throughout Hole U1560B (Figure F70A, F70B). Oblate fabric is locally observed in Units 1 and 3 (Cores 2R–6R and 17R–22R) but with no visible correlation with emplacement style. The degree of anisotropy (P) shows increased values from within Subunit 3C through Subunit 5B, with the highest values observed in samples having the highest bulk magnetic susceptibility value (Km) (Figure F70C).
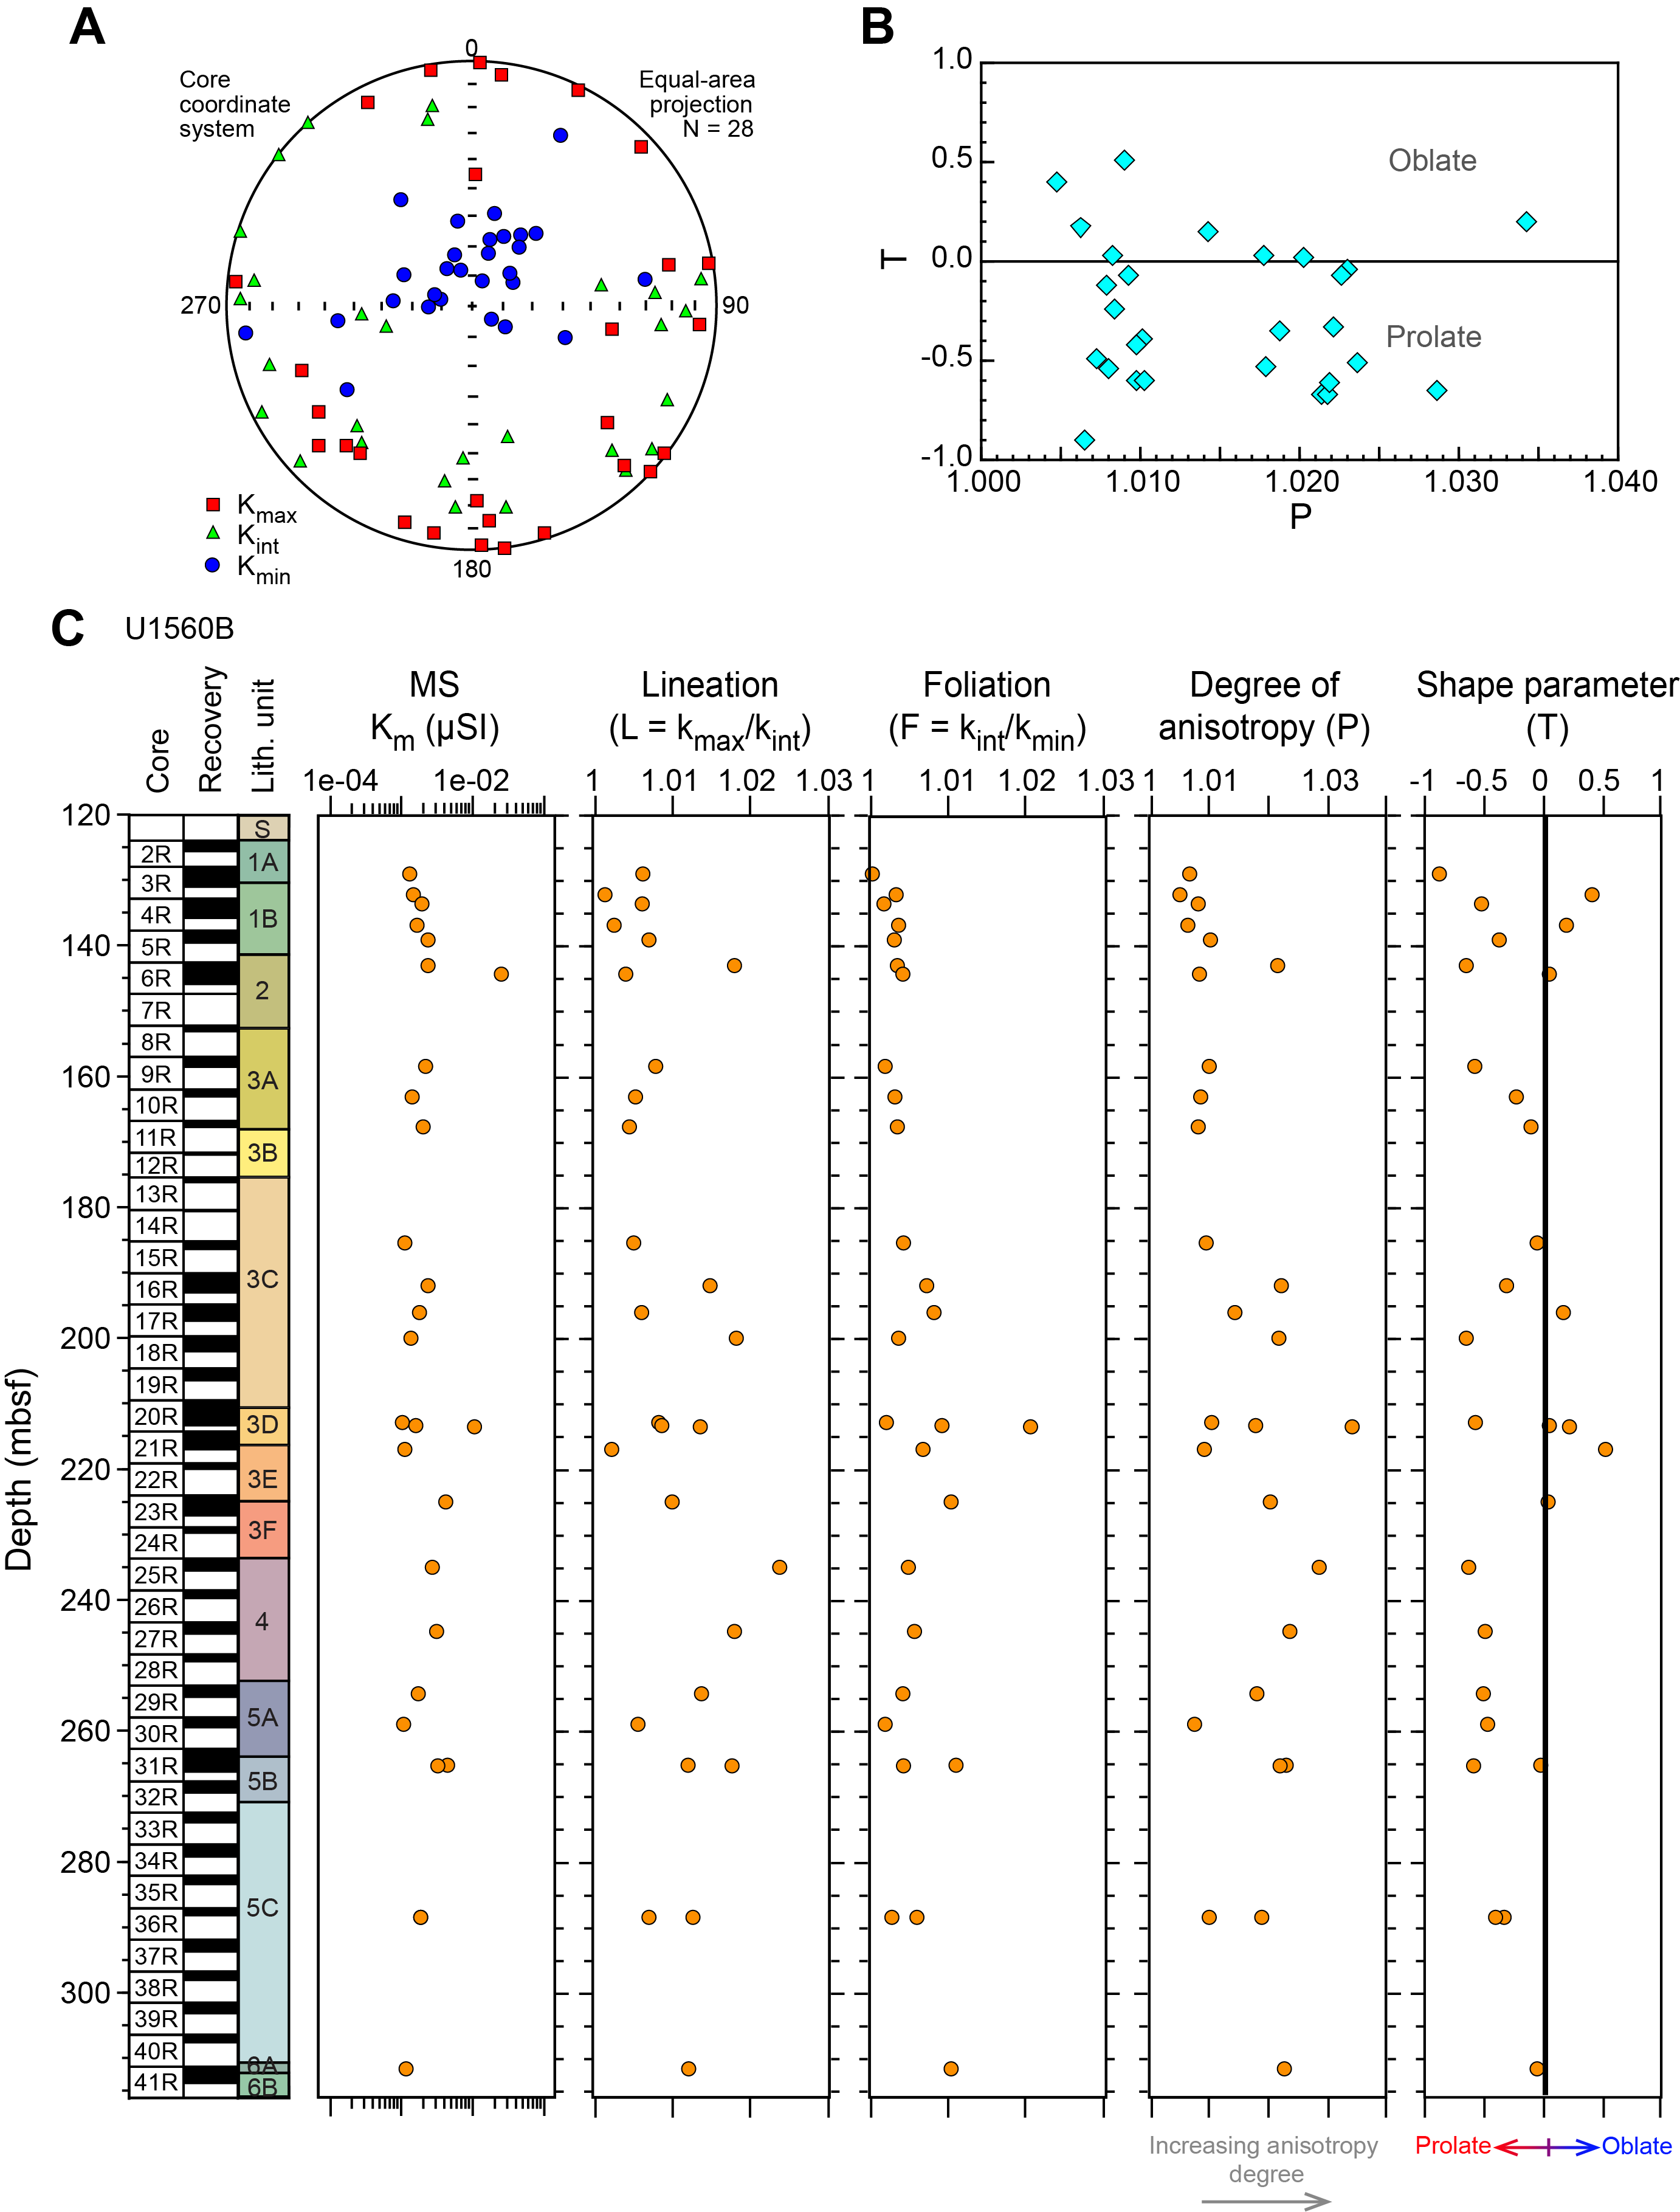
Figure F70. Principal magnetic susceptibility axes, T vs. P, Km, and AMS parameters.
9. Age model and mass accumulation rates
9.1. Age model and linear sedimentation rates
The age model for Site U1560 is based on calcareous nannoplankton and planktic foraminiferal lowest (base) and highest (top) occurrence datums and paleomagnetic reversal datums from Holes U1560A and U1560C (Tables T24, T25; Figures F71, F72). Planktic foraminifera and calcareous nannoplankton occur throughout the cored sediment sequences.
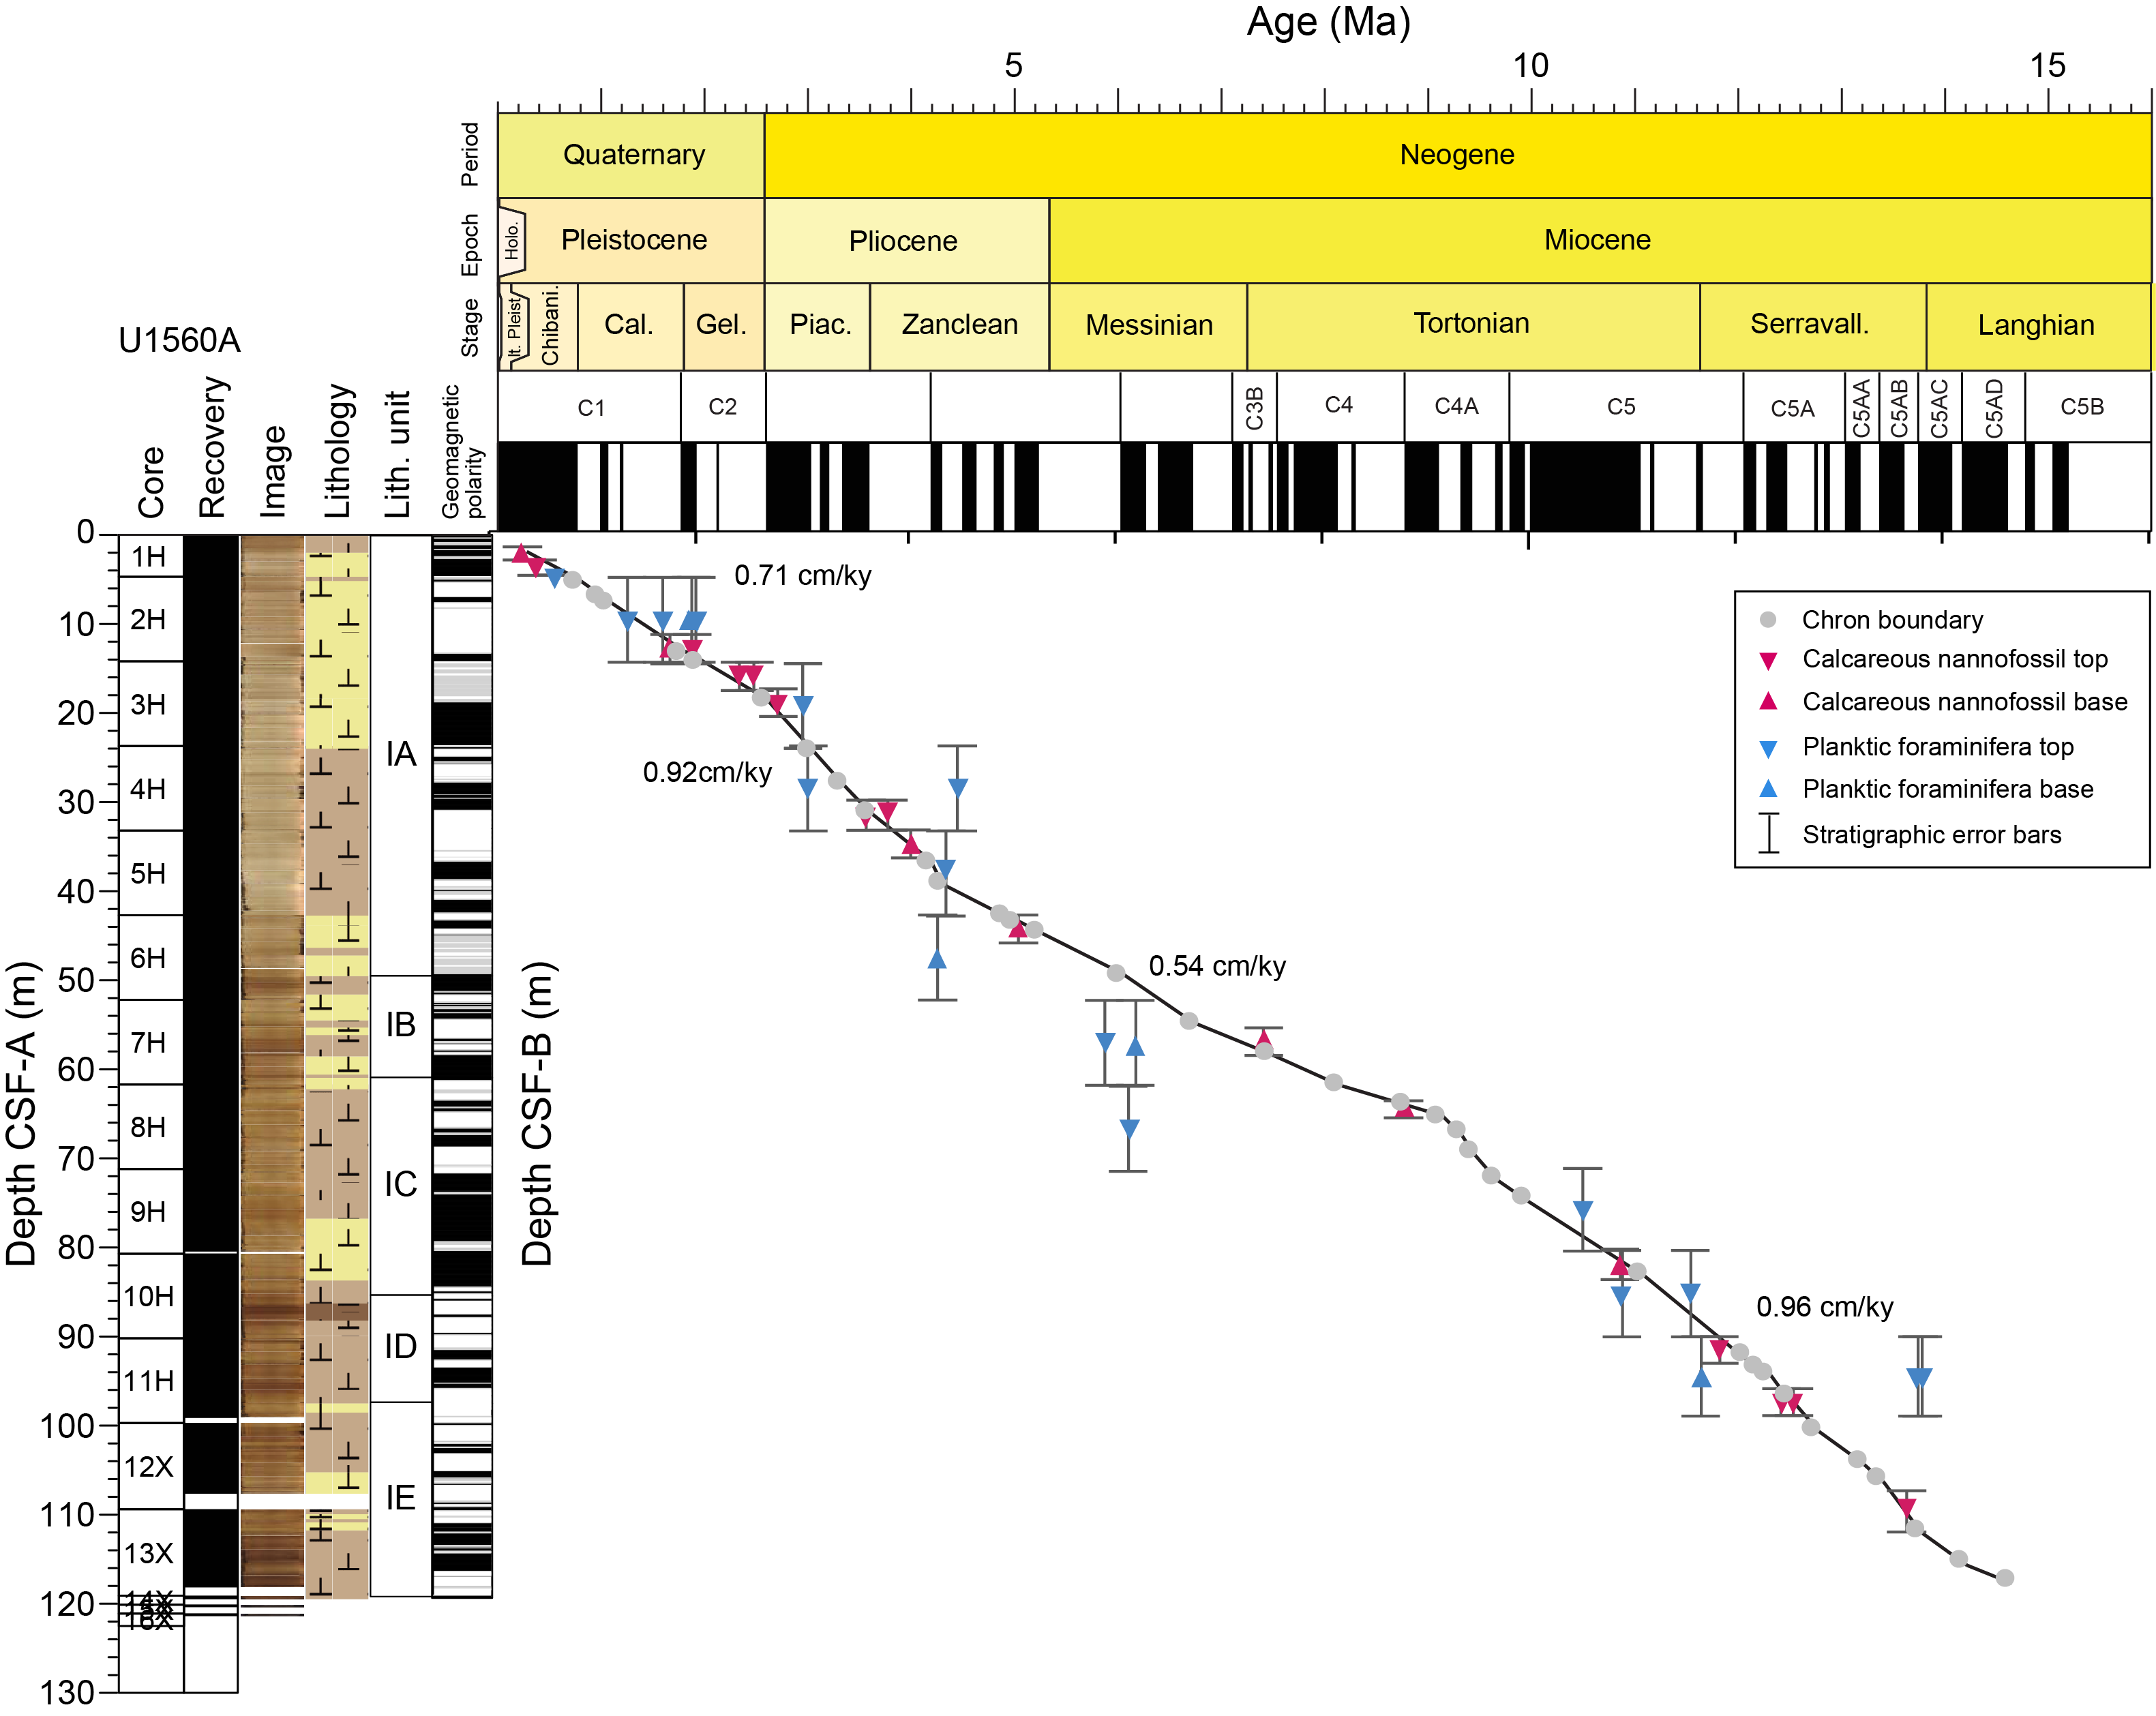
Figure F71. Age-depth model, Hole U1560A.
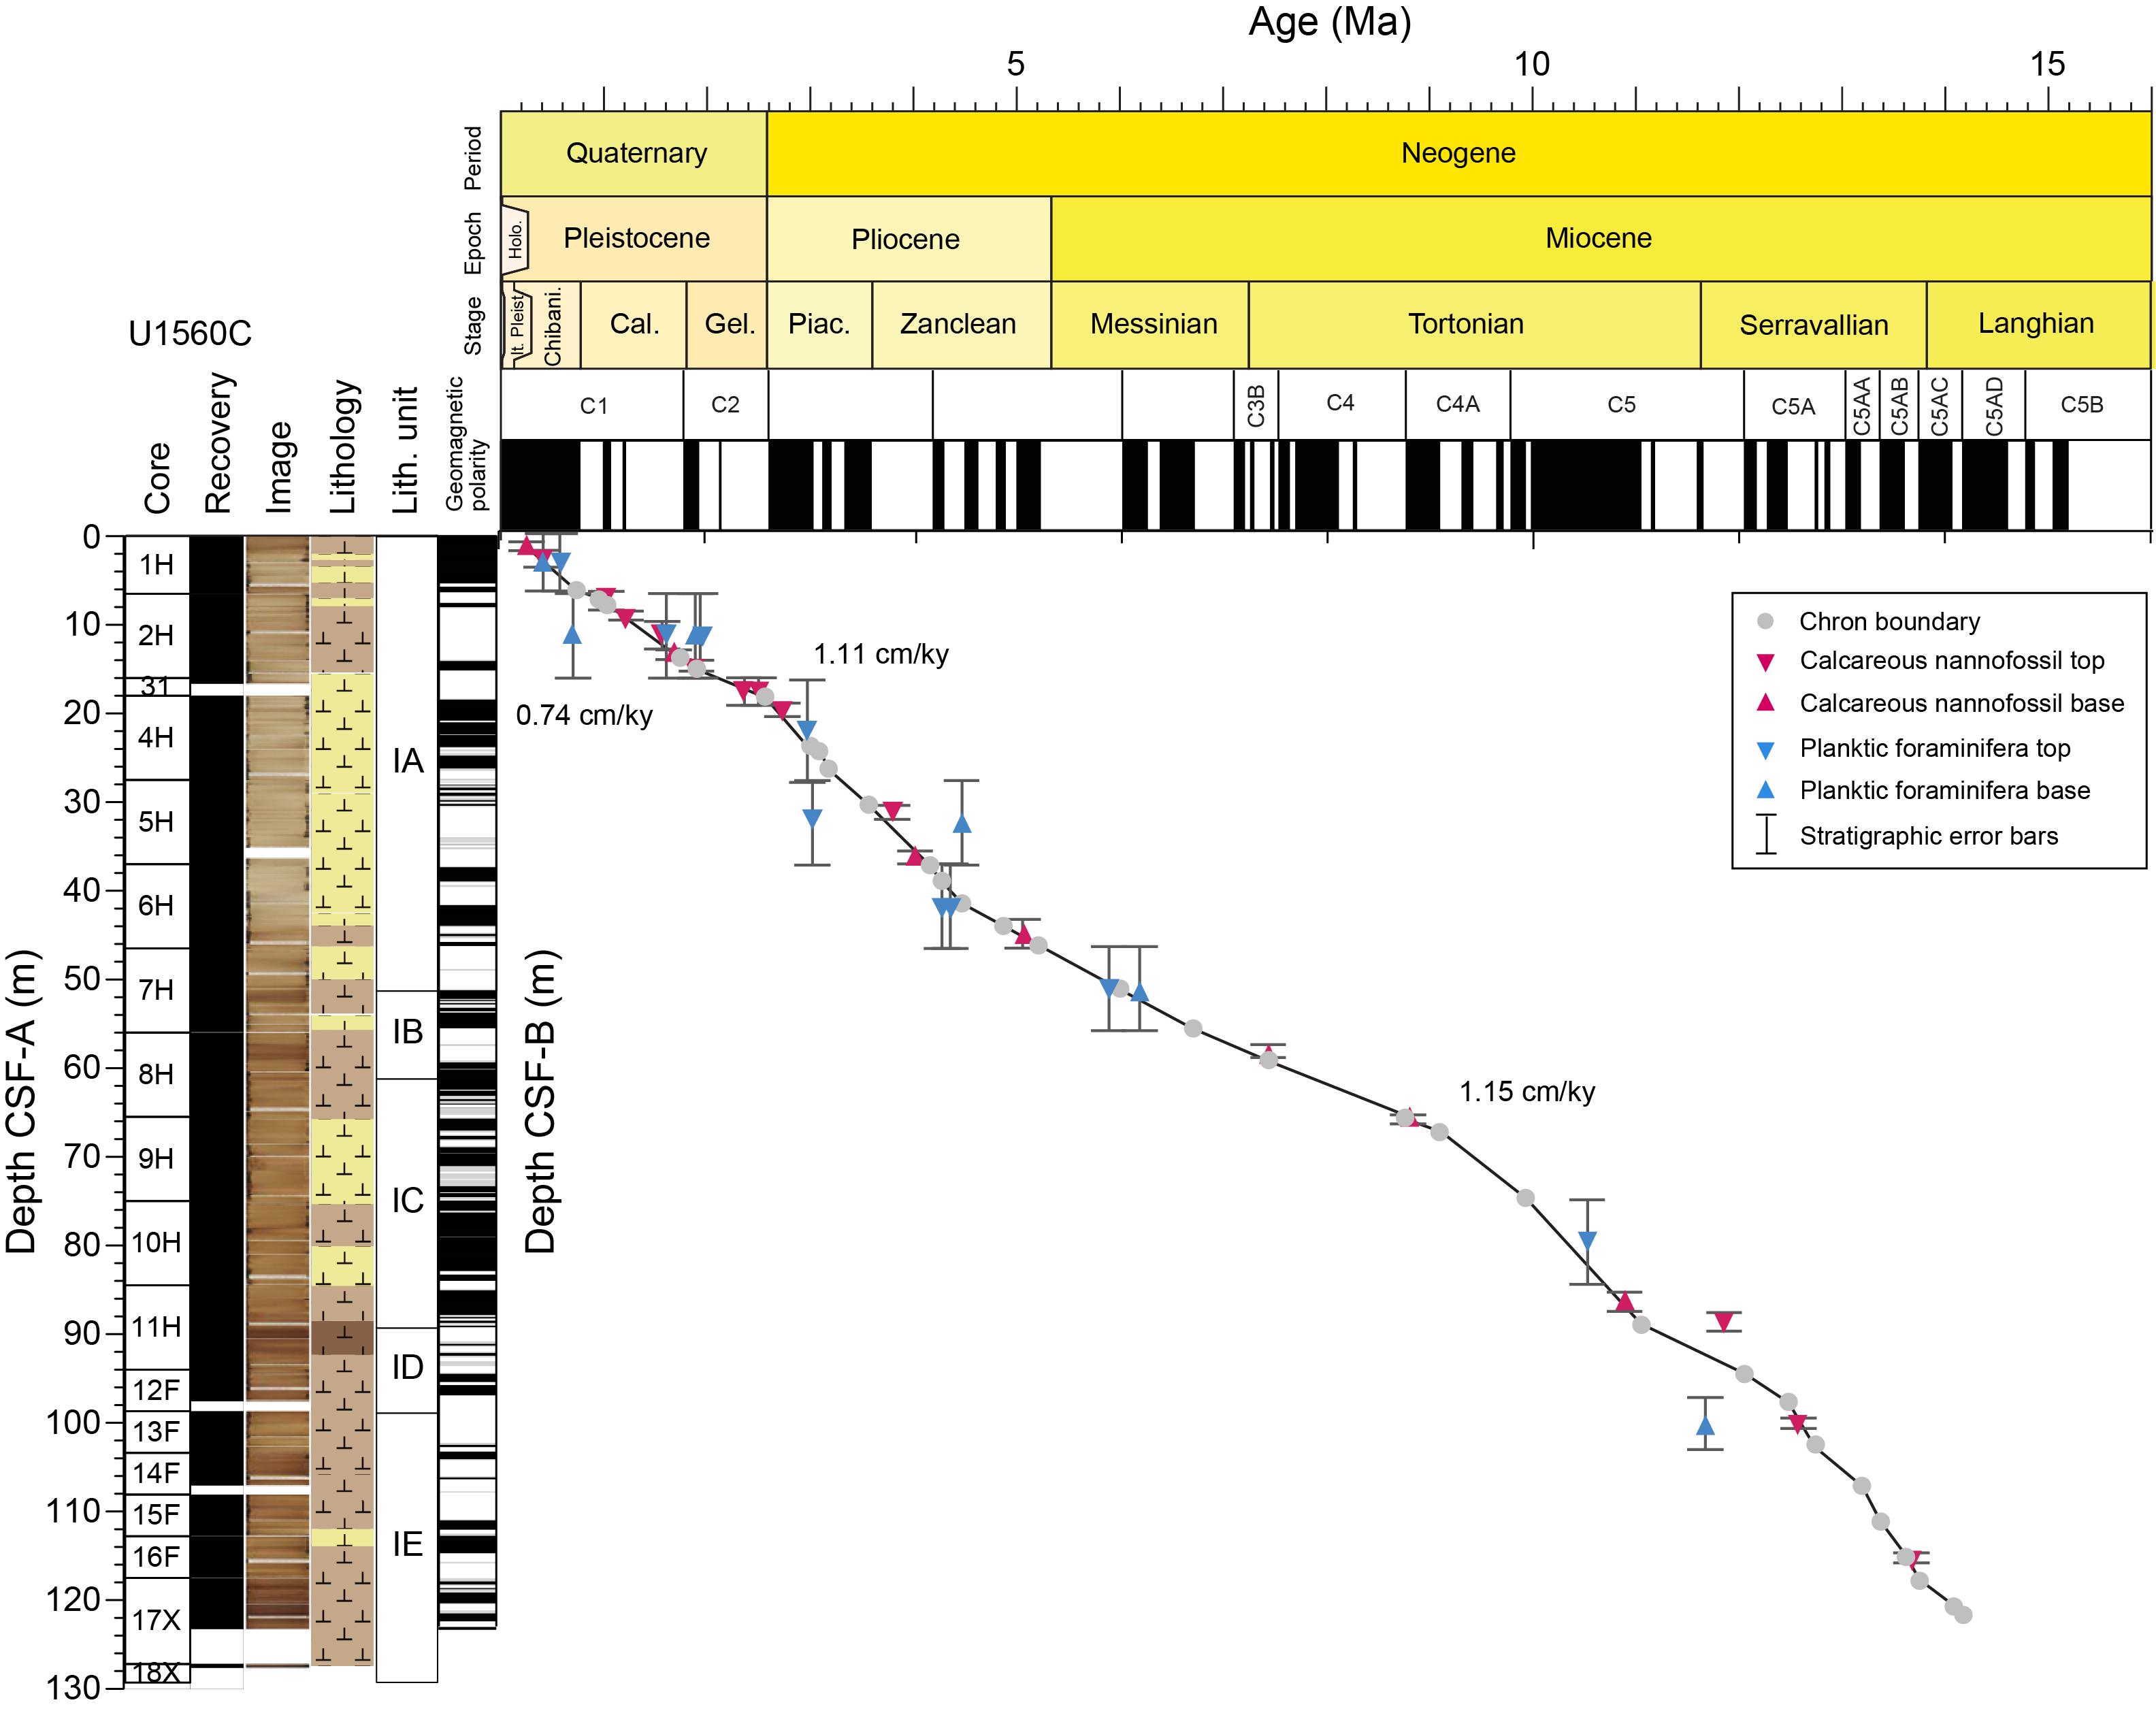
Figure F72. Age-depth model, Hole U1560C.
We identified 19 planktic foraminifera and 18 calcareous nannoplankton bioevents in Hole U1560A and 15 planktic foraminifera and 19 calcareous nannoplankton bioevents in Hole U1560C, ranging in age from Pleistocene to early Middle Miocene. (Figures F71, F72). Additionally, 35 and 31 magnetic reversal boundaries were identified from Holes U1560A and U1560C, respectively (Figures F71, F72). This integrated biostratigraphic and paleomagnetic age model suggests that there are no major hiatuses at Site U1560.
There is mostly good agreement between fossil datums and paleomagnetic reversal datums in both holes, although some planktic foraminiferal datums lie as much as 2.8 My outside of the calcareous nannofossil and magnetic reversal boundaries. This diachroneity is similar to that observed in the upper 5 My at other sites on the SAT (e.g., see Biostratigraphy and Age model and mass accumulation rates, both in the Site U1558 chapter [Teagle et al., 2024a], and Biostratigraphy and Age model and mass accumulation rates, both in the Site U1583 chapter [Teagle et al., 2024b]) and is likely the result of differences between our midlatitude sites and the tropical/subtropical sites at which these datums were calibrated (Wade et al., 2011; King et al., 2020; Lam et al., 2022). Because planktic foraminifera are relatively well preserved at Site U1560 and some of the asynchronous datums are bases, such age offsets cannot be fully explained by mixing or reworking; detailed shore-based analysis will be required to better understand this diachroneity.
Linear sedimentation rates (LSRs) are variable in both holes, with LSRs ranging 0.33–2.01 cm/ky in Hole U1560A and 0.48–2.16 cm/ky in Hole U1560C (Figures F71, F72).
The highest LSRs in both holes occur in the Middle Miocene and Pliocene. Middle Miocene values average 0.95 cm/ky in Hole U1560A and 1.08 cm/ky in Hole U1560C. Late Miocene values average 0.54 cm/ky in both holes. In the Pliocene, values average 0.92 cm/ky in Hole U1560A and 0.95 cm/ky in Hole U1560C. In both holes, generally lower sedimentation rates occur throughout the Pleistocene (0.7–0.8 cm/ky).
9.2. Mass accumulation rates
Mass accumulation rates (MARs) were calculated for Holes U1560A and U1560C using the LSRs and bulk density from gamma ray attenuation (GRA) measurements collected during Whole-Round Multisensor Logger (WRMSL) scans (see Age model and mass accumulation rates in the Expedition 390/393 methods chapter [Coggon et al., 2024a]; see also U1560A_MAR.xlsx and U1560C_MAR.xlsx in AGEMODEL in Supplementary material). The data presented in Figure F73 are binned into 1 My intervals.
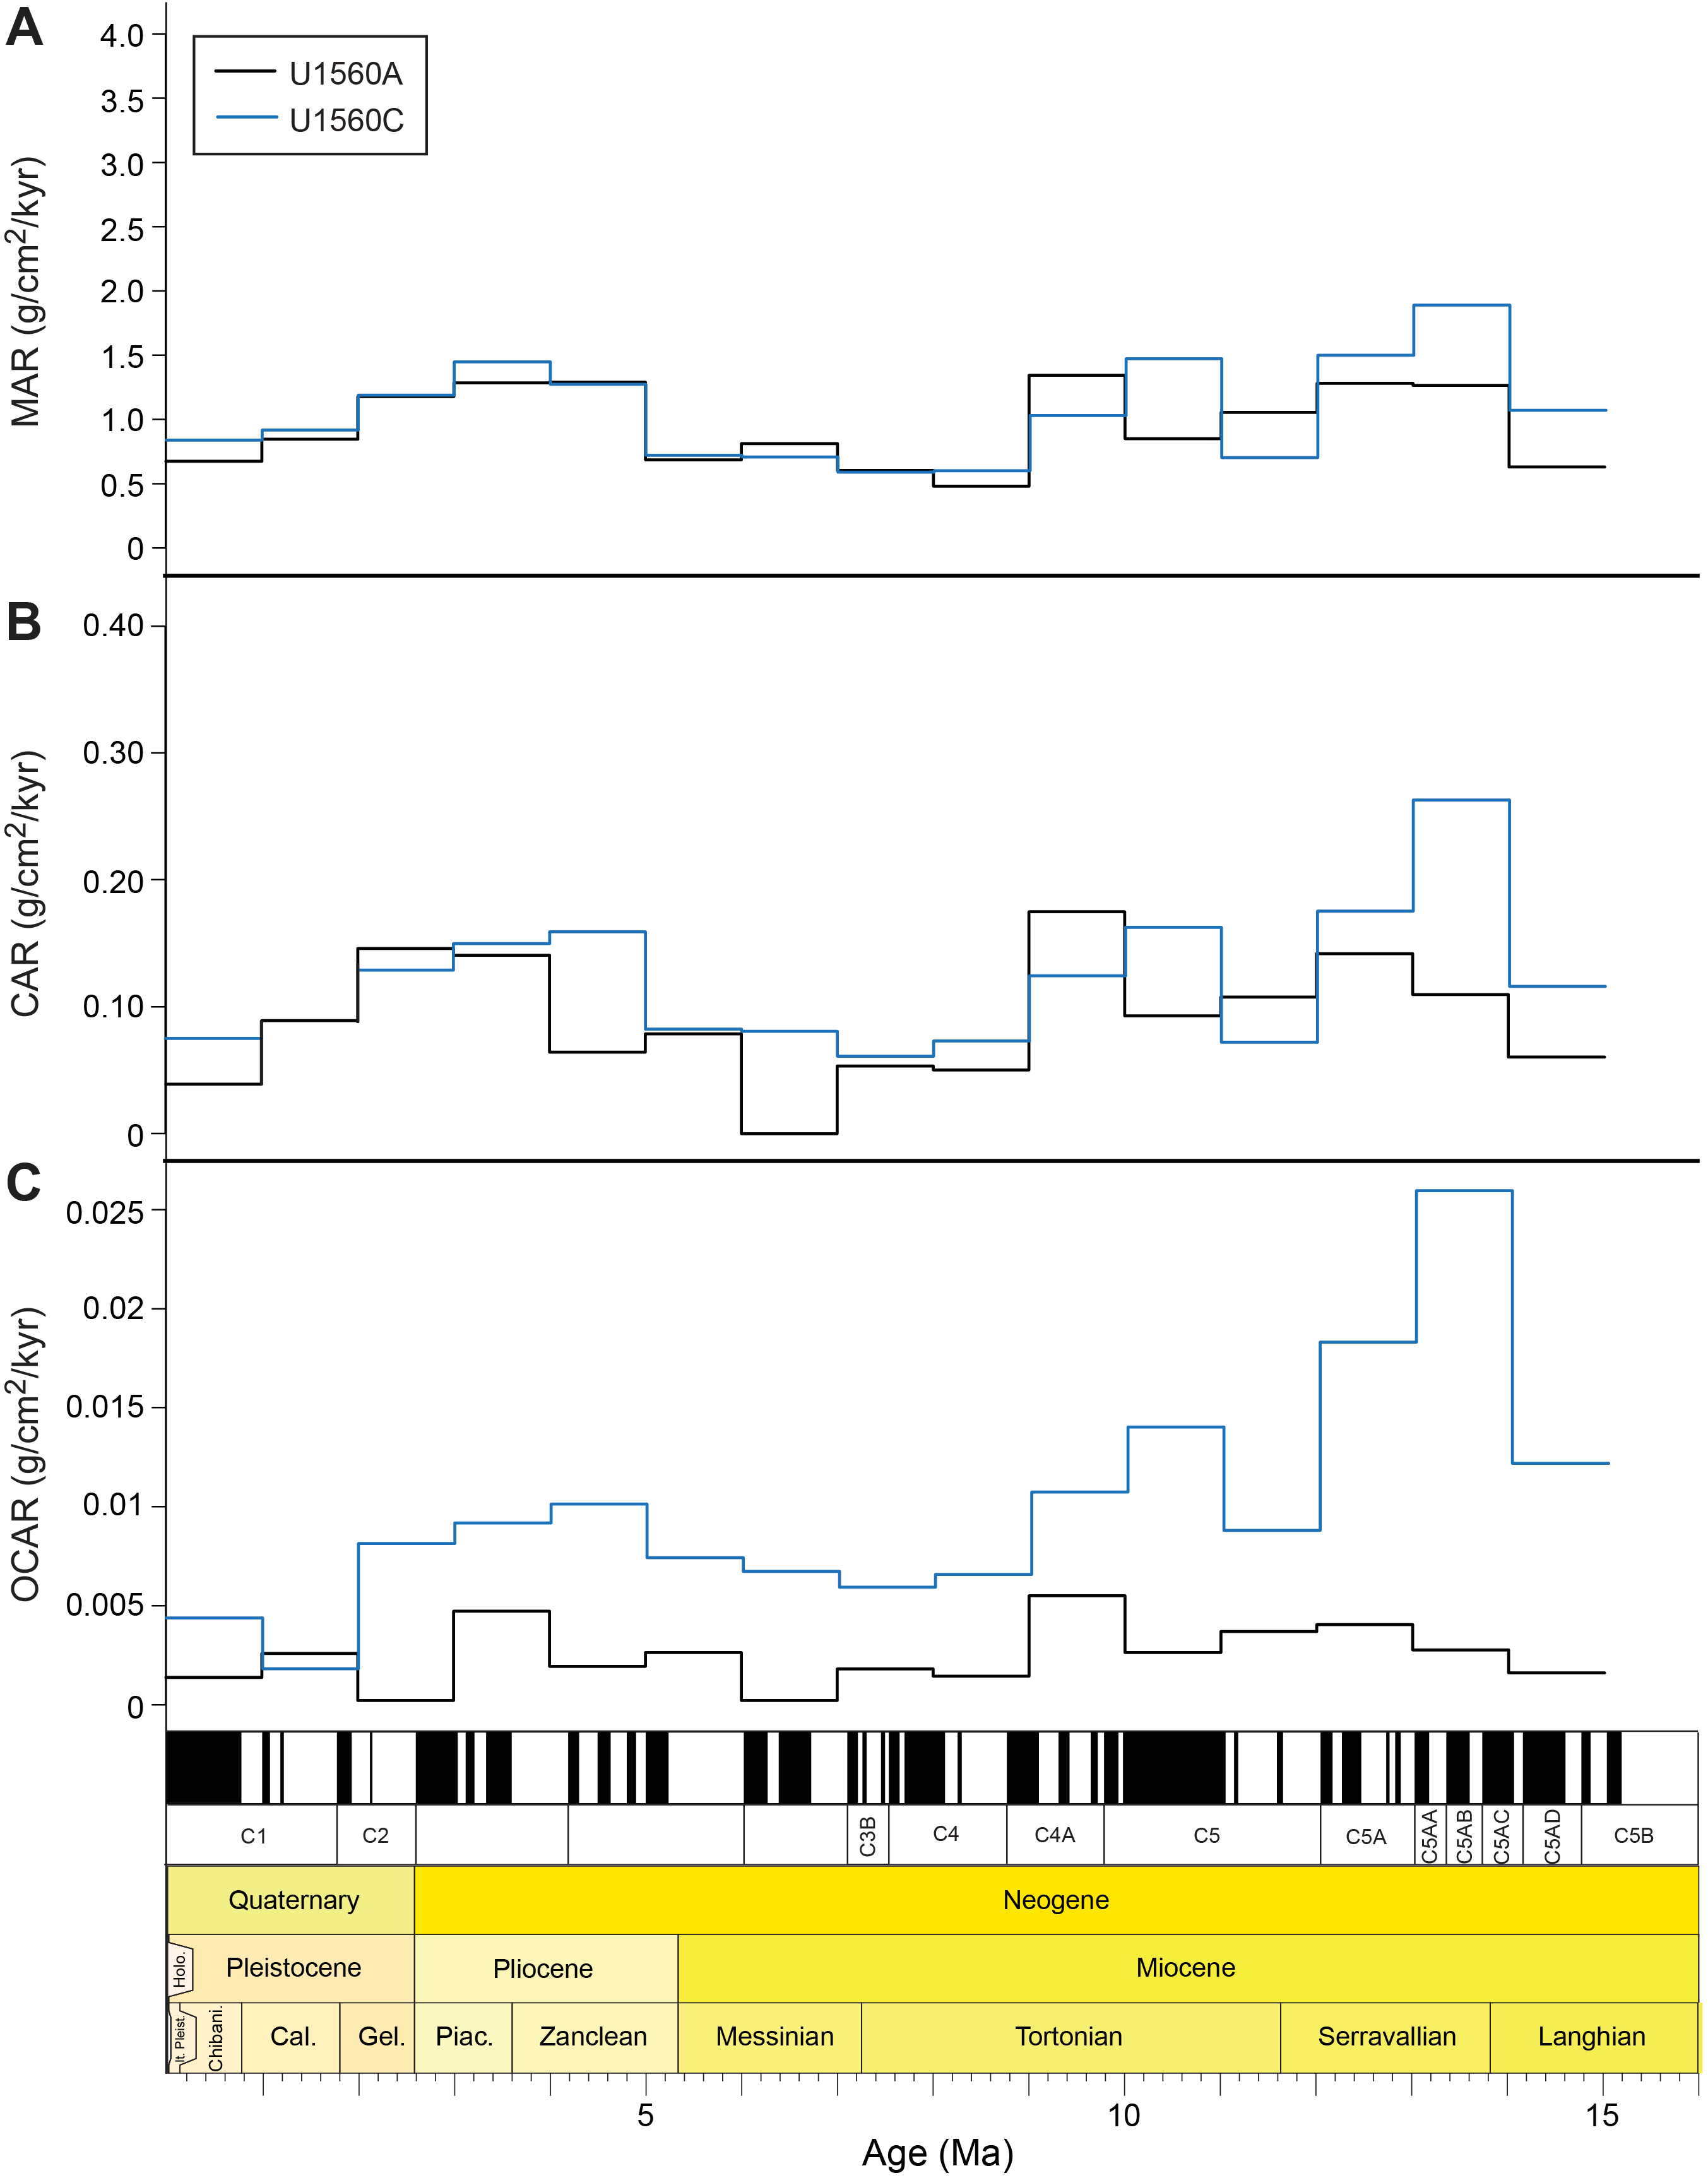
Figure F73. MAR, CAR, and OCAR.
MARs vary somewhat throughout the sedimentary succession at Site U1560 (Figure F73A) and are highest in the Miocene and Pliocene, with peaks of 1.3 g/cm2/ky in Hole U1560A and 1.5 (Pliocene) and 1.9 (Miocene) g/cm2/ky in Hole U1560C. Throughout the Pleistocene, MARs are lower, averaging 0.8 g/cm2/ky in Hole U1560A and 0.9 g/cm2/ky in Hole U1560C.
9.3. Carbonate and organic carbon accumulation rates
Carbonate accumulation rates (CARs) and organic carbon accumulation rates (OCARs) were calculated for Holes U1560A and U1560C by multiplying MARs by weight percent carbonate and weight percent total organic carbon (TOC), respectively (see U1560A_MAR.xlsx and U1560C_MAR.xlsx in AGEMODEL in Supplementary material). In both holes, one or two discrete samples per core was collected for carbonate and organic carbon analysis.
9.3.1. Carbonate accumulation rates
CARs mirror MARs at Site U1560 and are highest for the Miocene and Pliocene. The highest CARs occur in the Miocene, with peaks of 0.2 g/cm2/ky in Hole U1560A and 0.3 g/cm2/ky in Hole U1560C (Figure F73B). Pliocene CARs peak at 0.2 g/cm2/ky in both holes. Pleistocene CARs are generally lower, with values averaging 0.09 g/cm2/ky in Hole U1560A and 0.07 g/cm2/ky in Hole U1560C.
9.3.2. Organic carbon accumulation rates
OCARs are low throughout the section at Site U1560, with values ranging 0.001–0.005 g/cm2/ky in Hole U1560A and 0.002–0.03 g/cm2/ky in Hole U1560C (Figure F73C). Notably, OCARs in Hole U1560C are higher than those recorded in Hole U1560A, especially for the Miocene and Pliocene (Figure F73C).
10. Physical properties and downhole measurements
10.1. Sediment
Physical properties characterization of the sediment sequence at Site U1560 was primarily based on cores from Holes U1560A (from Expedition 395E) and U1560C (drilled during Expedition 393). Both holes recovered a clear mudline and encountered basement. Whole-round core section measurements, including NGR, GRA bulk density, MS (including point magnetic susceptibility [MSP] on the Section Half Multisensor Logger [SHMSL]), and compressional wave (P-wave) velocity, were performed in both holes. Split-core section measurements of thermal conductivity were also performed in both holes. P-wave velocity (caliper method), sediment shear and compressional strength measurements, and a total of 26 discrete samples for moisture and density (MAD) analyses were performed only on samples from Hole U1560C, and consequently, the descriptions of Site U1560 sediment physical properties are predominantly based on Hole U1560C. The track and discrete measurements from Hole U1560C are shown in Figures F74 and F75, respectively. The discrete measurements from this hole are also summarized in Tables T26 and T27. The track measurements from Hole U1560A are shown in Figures F76. Track data including NGR, GRA, MS, and P-wave velocity from both holes display similar features and were used to tie the correlation (see Stratigraphic correlation). For physical properties description and comparison, we use the uncompressed CSF-A depth scale (as meters below seafloor) to show data from each hole. Mean values of all physical properties are represented with ranges of ±1 standard deviation (see Tables T26, T27).
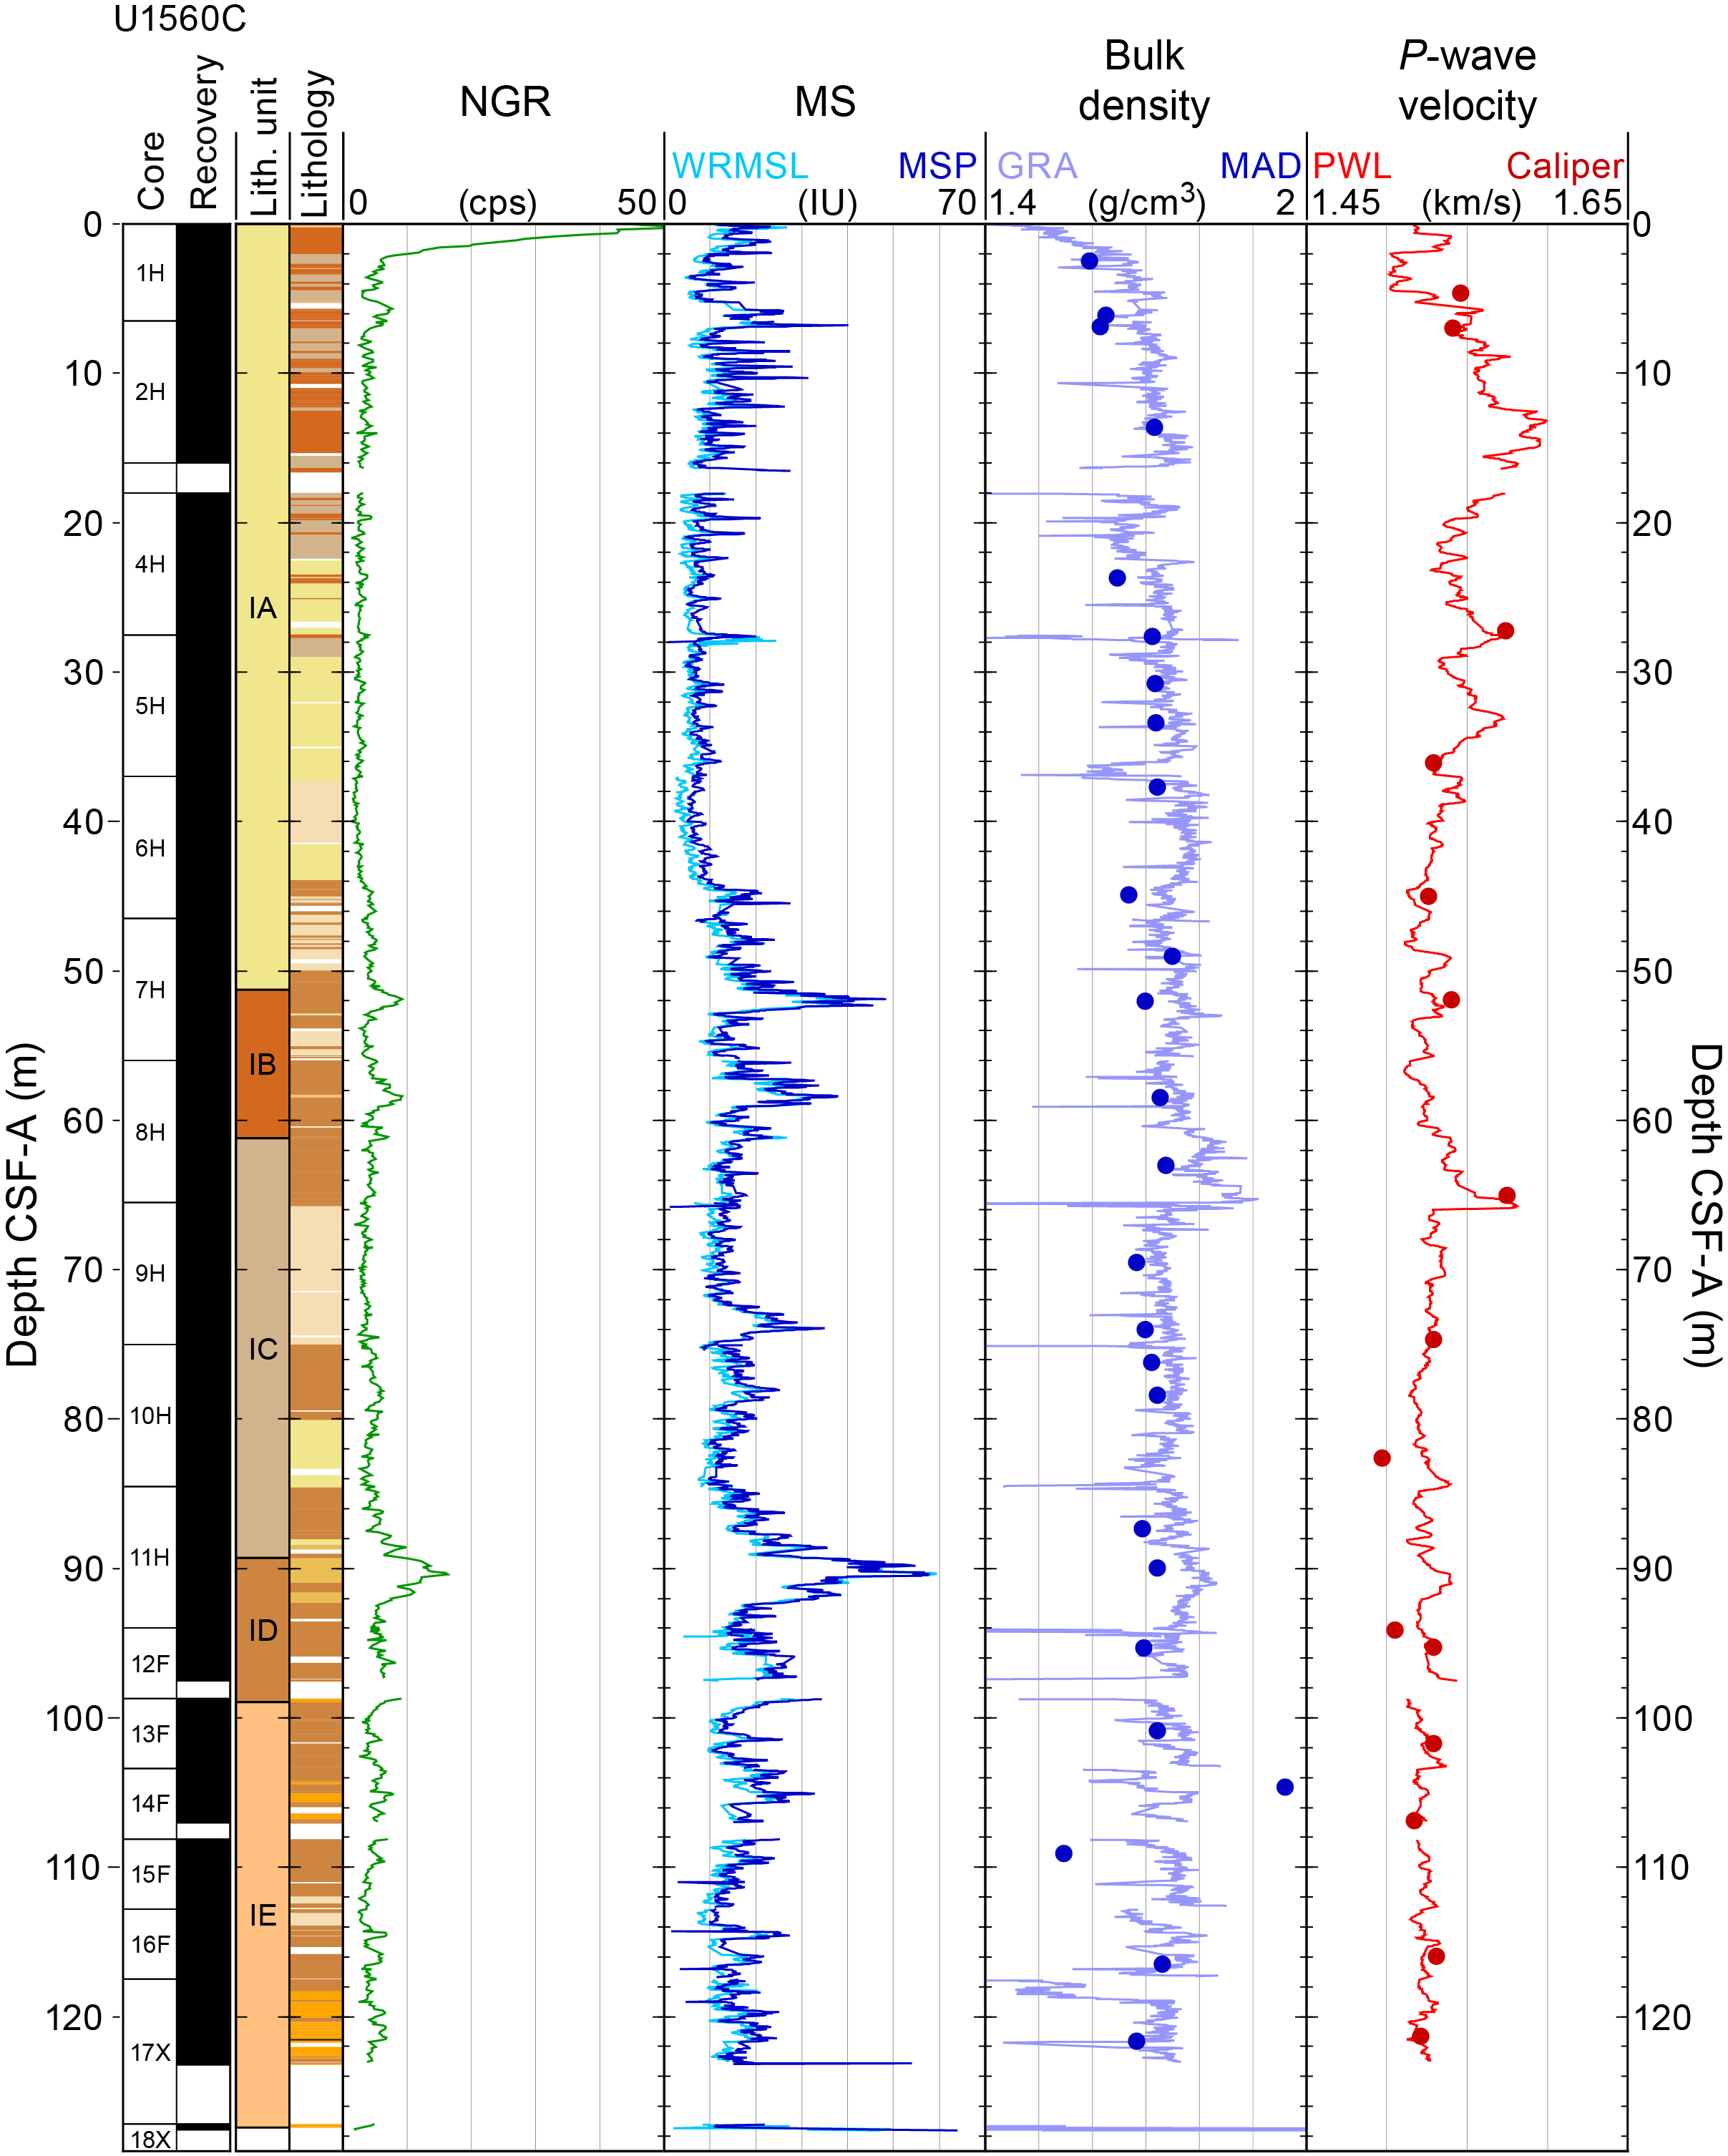
Figure F74. Track physical properties, Hole U1560C.
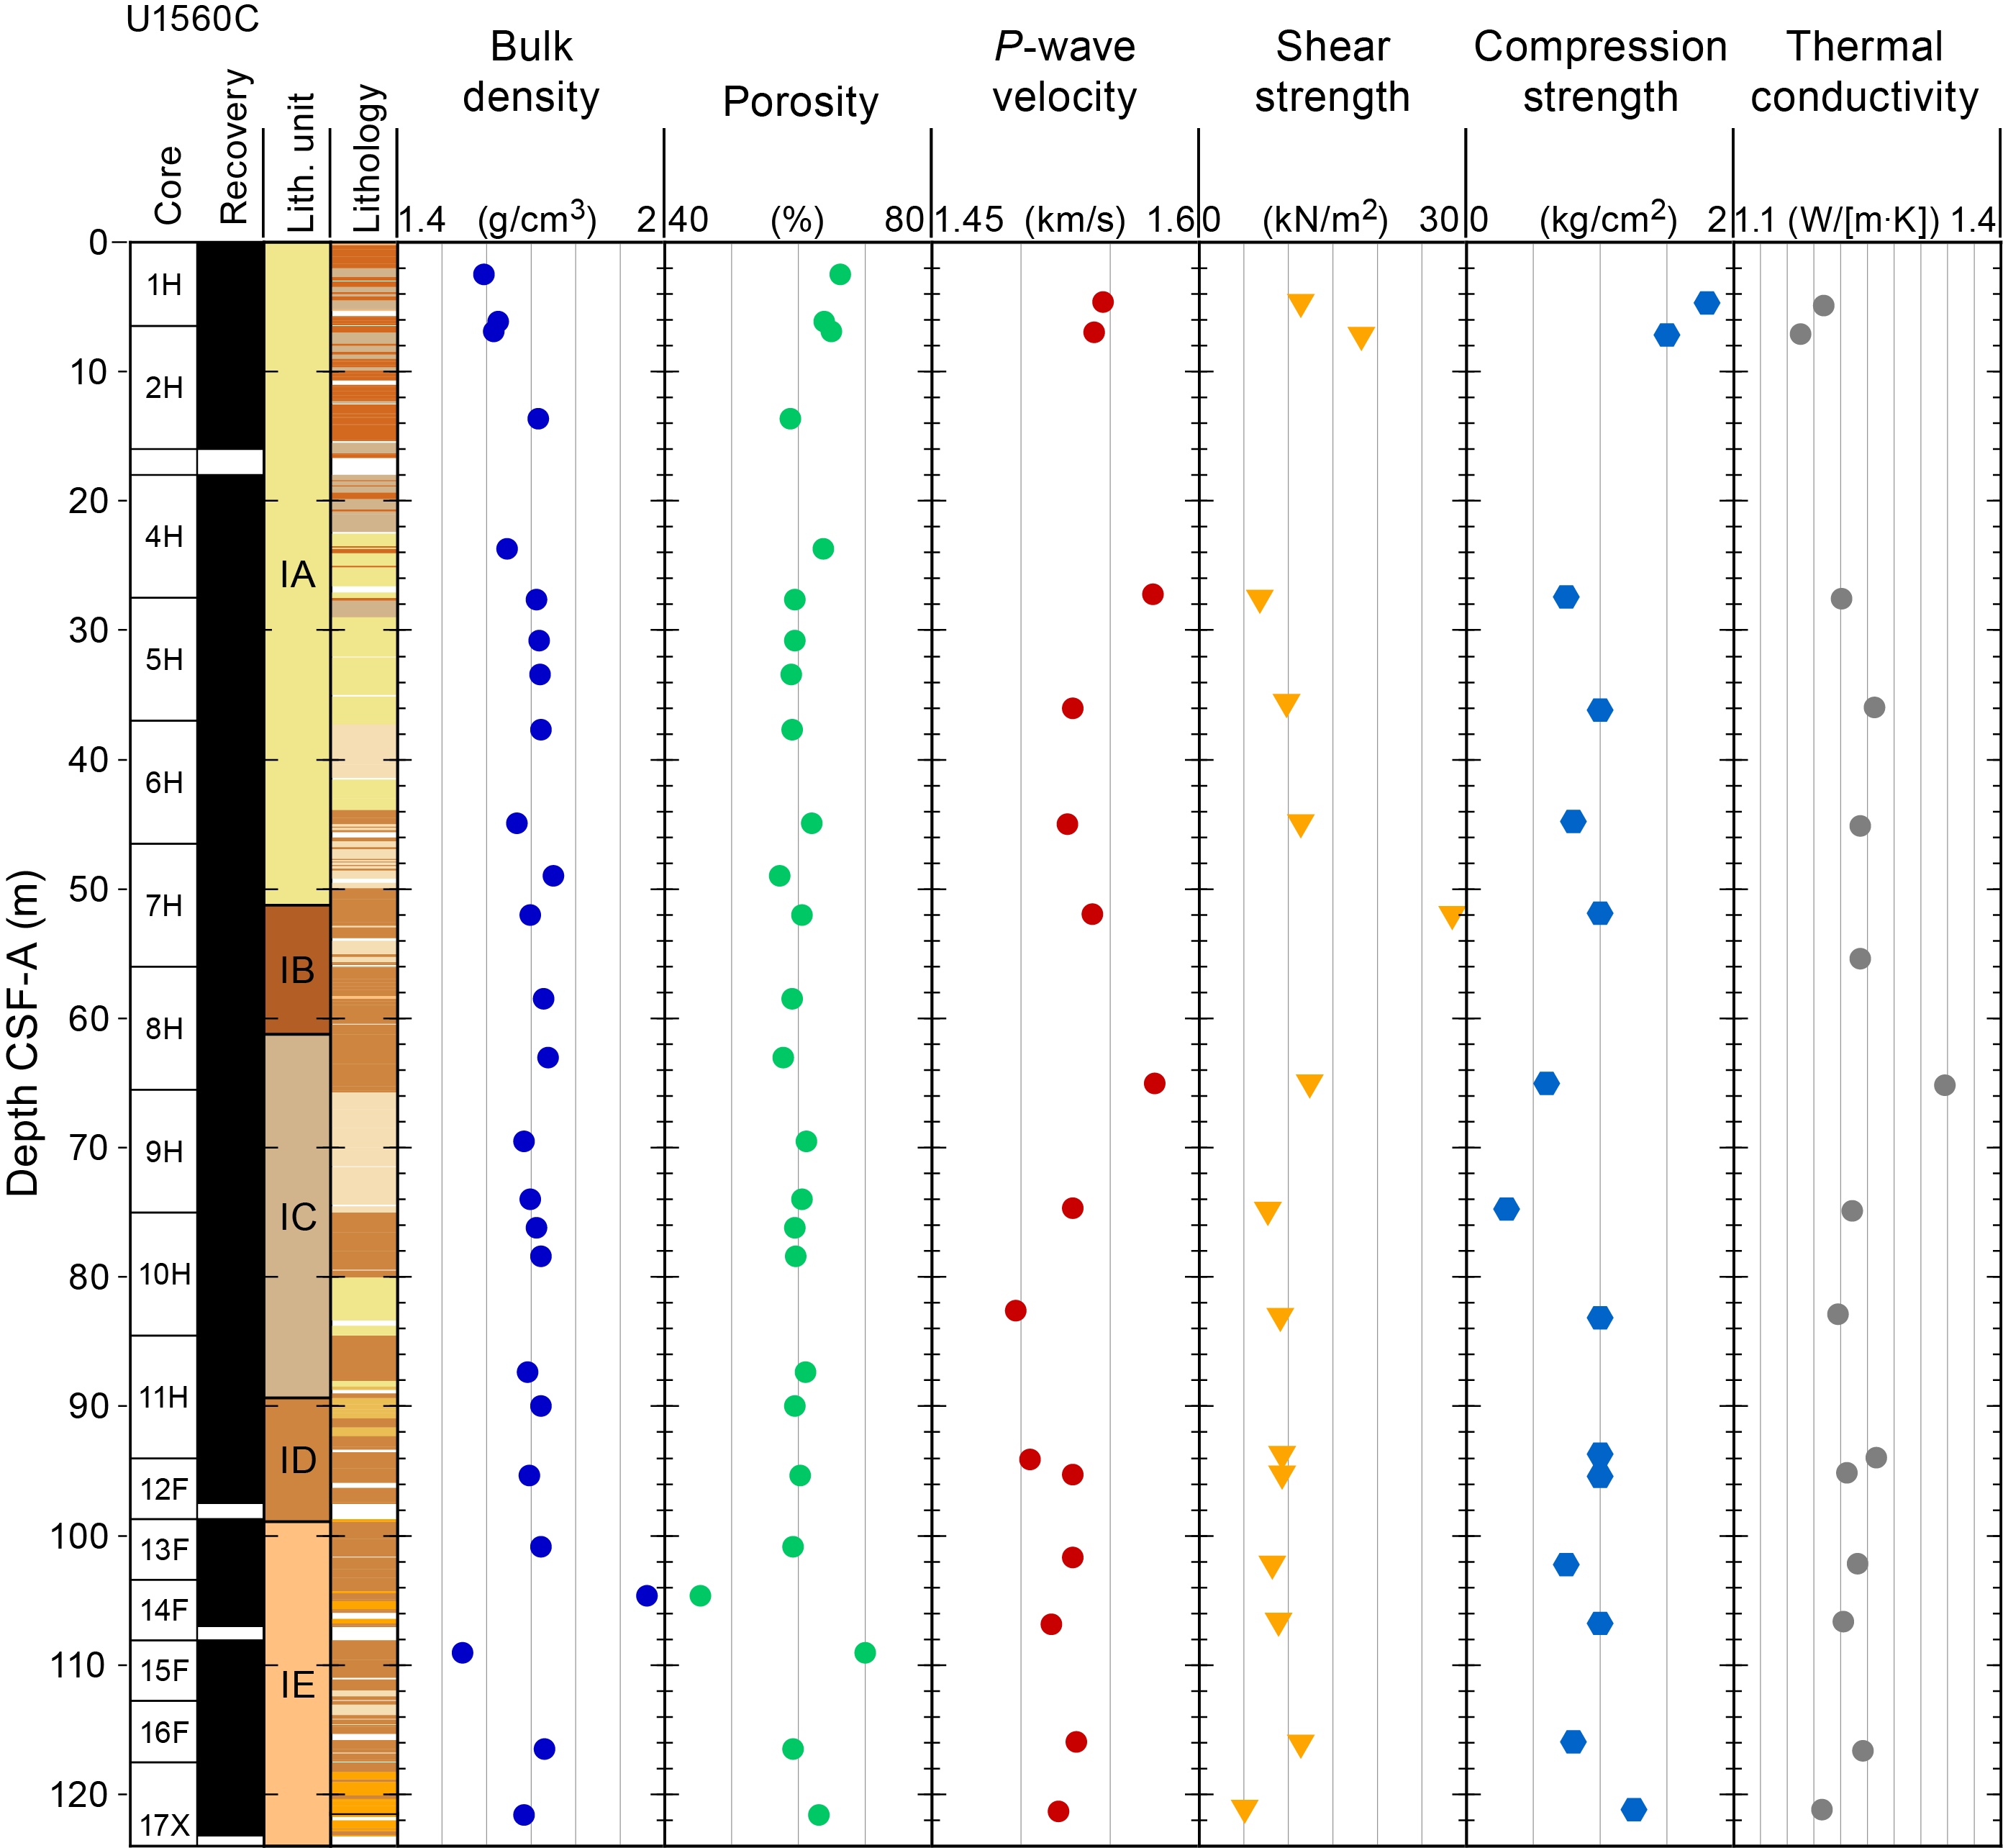
Figure F75. Discrete physical properties, Hole U1560C.
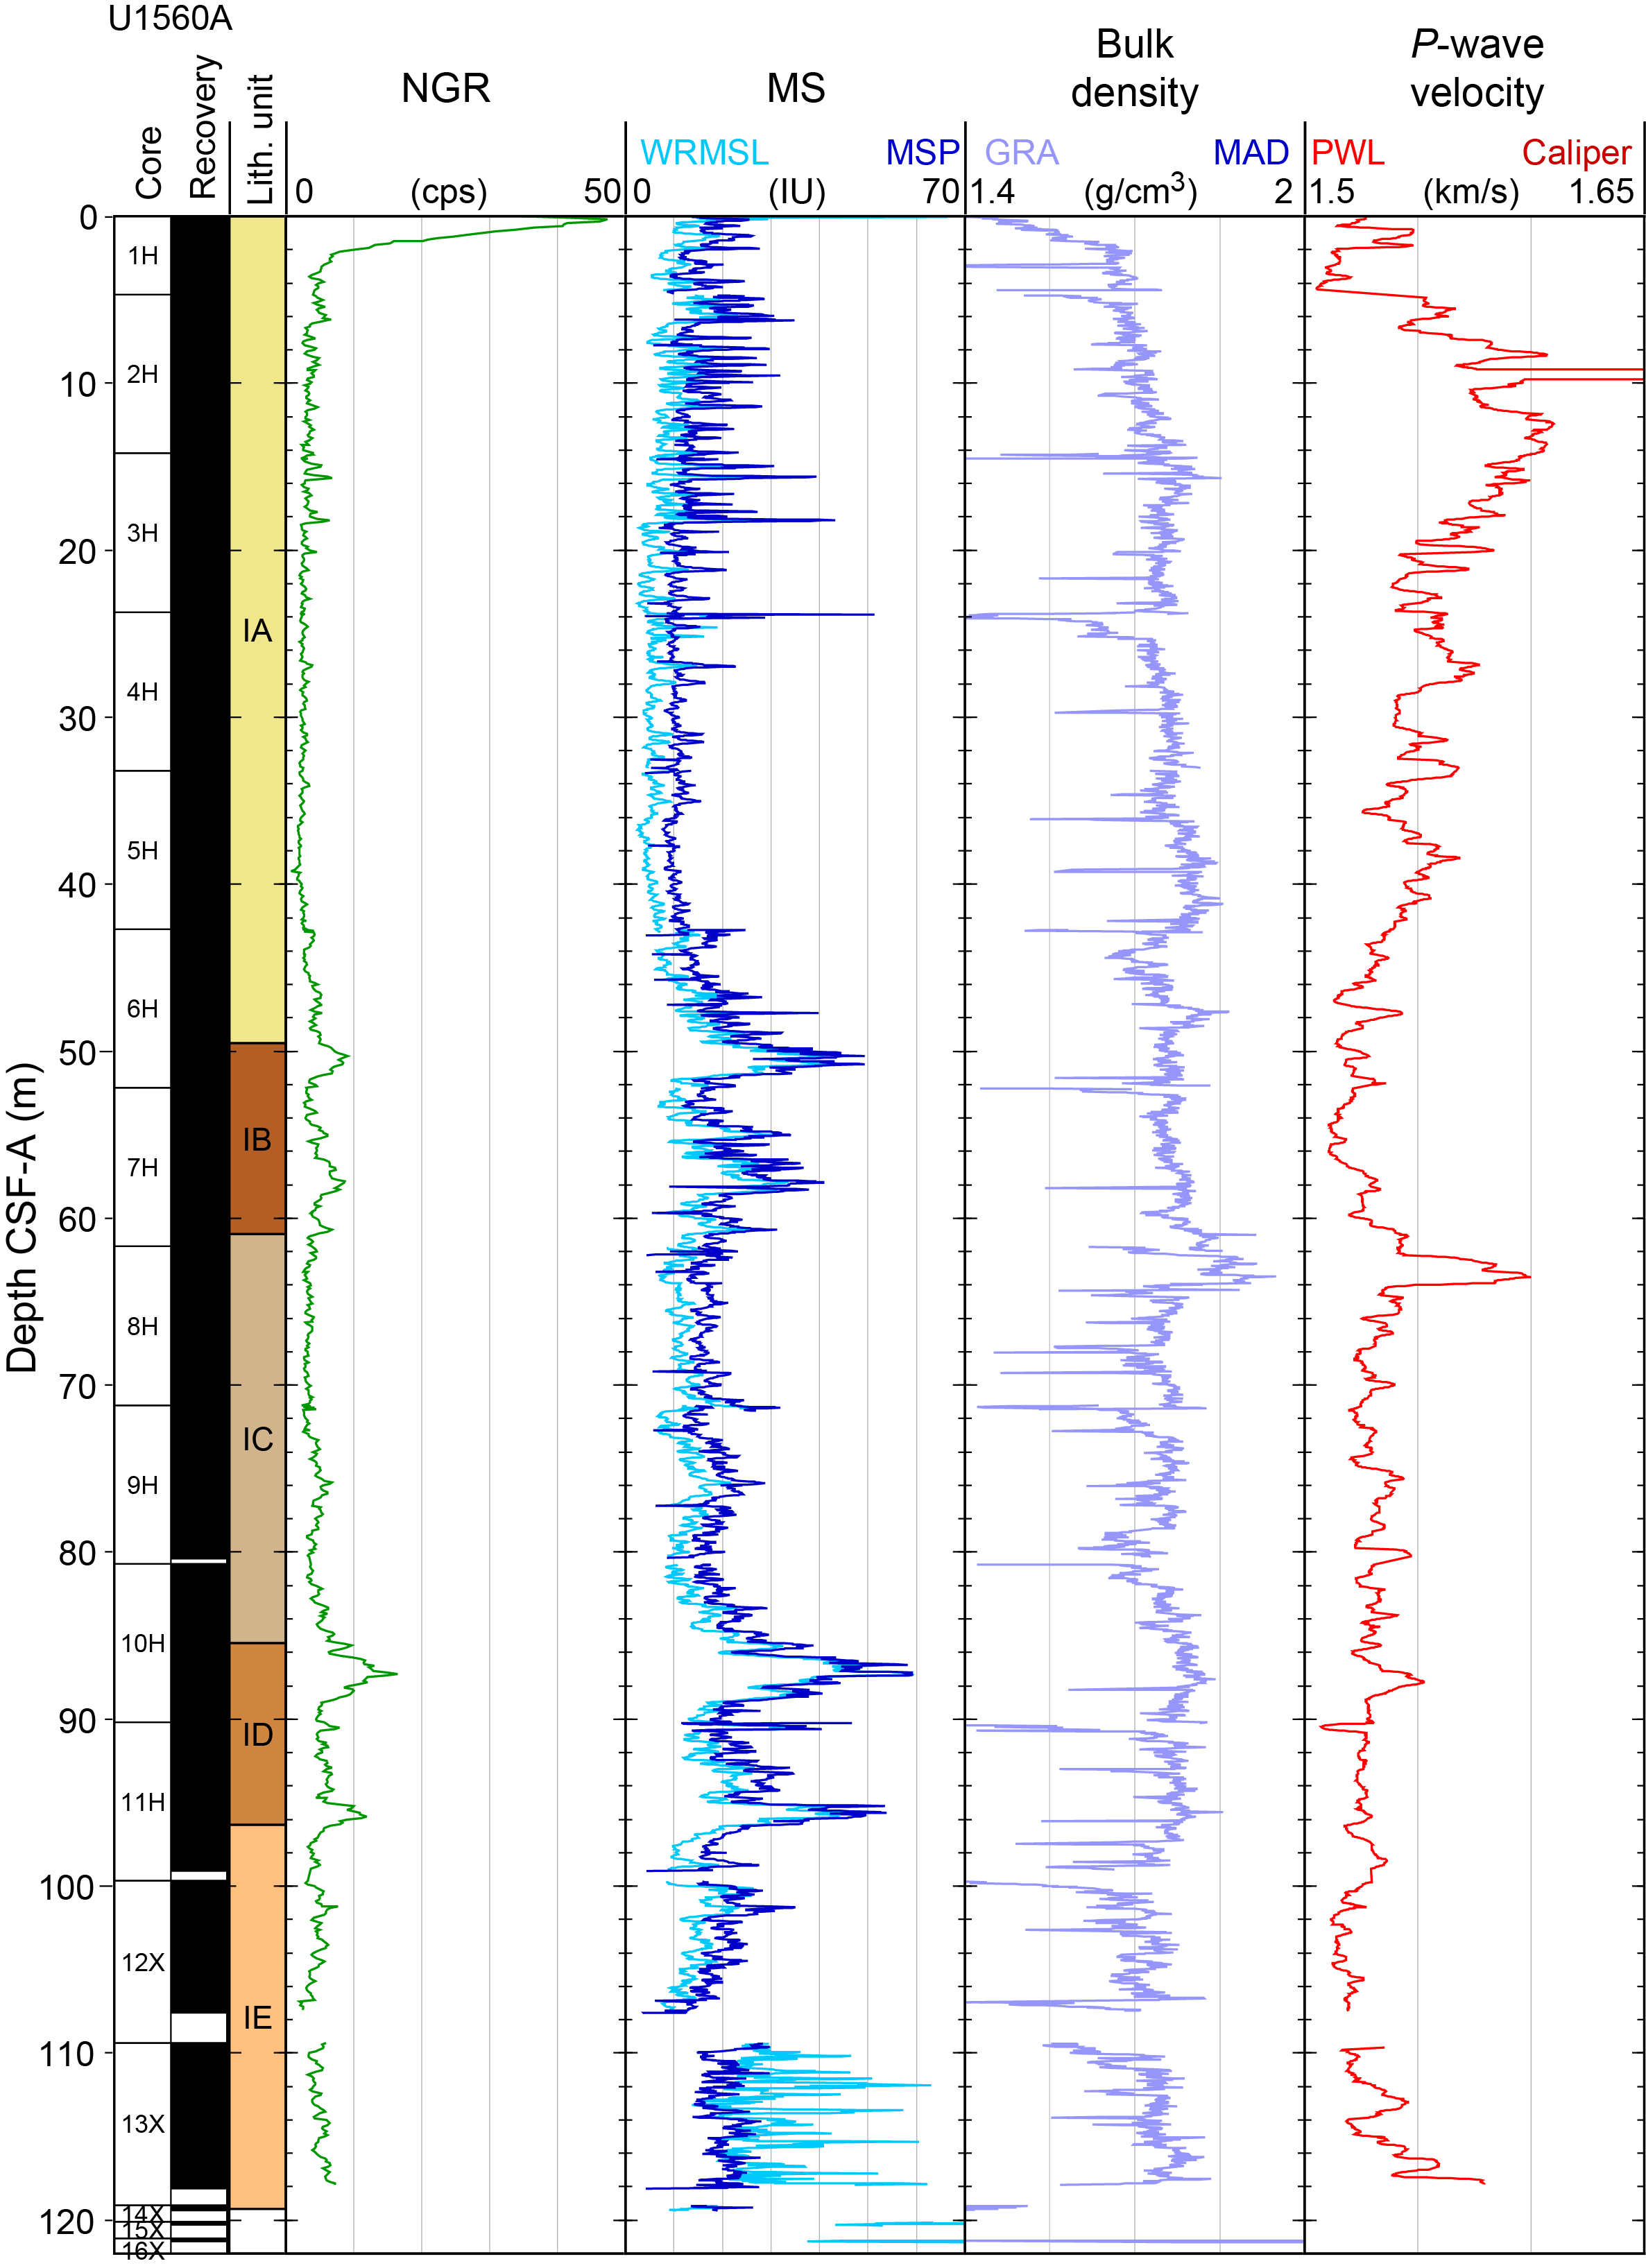
Figure F76. Track physical properties, Hole U1560A.
10.1.1. Physical properties
10.1.1.1. Natural gamma radiation
NGR ranges 1–52 counts/s (mean = 5 ± 4 counts/s) throughout the sedimentary section in Hole U1560C (Figure F74). NGR shows a sharp decrease from ~50 to ~5 count/s in the uppermost 2 m of Subunit IA in both holes. NGR values show two small peaks of ~10 counts/s in Subunit IB (at 52 and 58 mbsf, respectively) and one relatively larger peak of ~16 counts/s in Subunit ID (~90 mbsf). Other than these three peaks, NGR stays relatively uniform, ranging 4–5 counts/s downhole. The overall low NGR values <10 count/s are typical of nannofossil ooze layers at this site.
The elemental concentrations of K, U, and Th were extracted from the NGR total activity (see Physical properties and downhole measurements in the Expedition 390/393 methods chapter [Coggon et al., 2024a]) in both holes and show similar downhole patterns with total NGR (Figures F77, F78). Rapid decreases of K, U, and Th are also seen in the uppermost 2 m of Subunit IA. The downhole Th record is relatively less smooth than those of K and U. The three peaks of NGR at 52, 58, and 90 mbsf are also seen in the K and Th records; however, these peaks are relatively subtler in the U record.
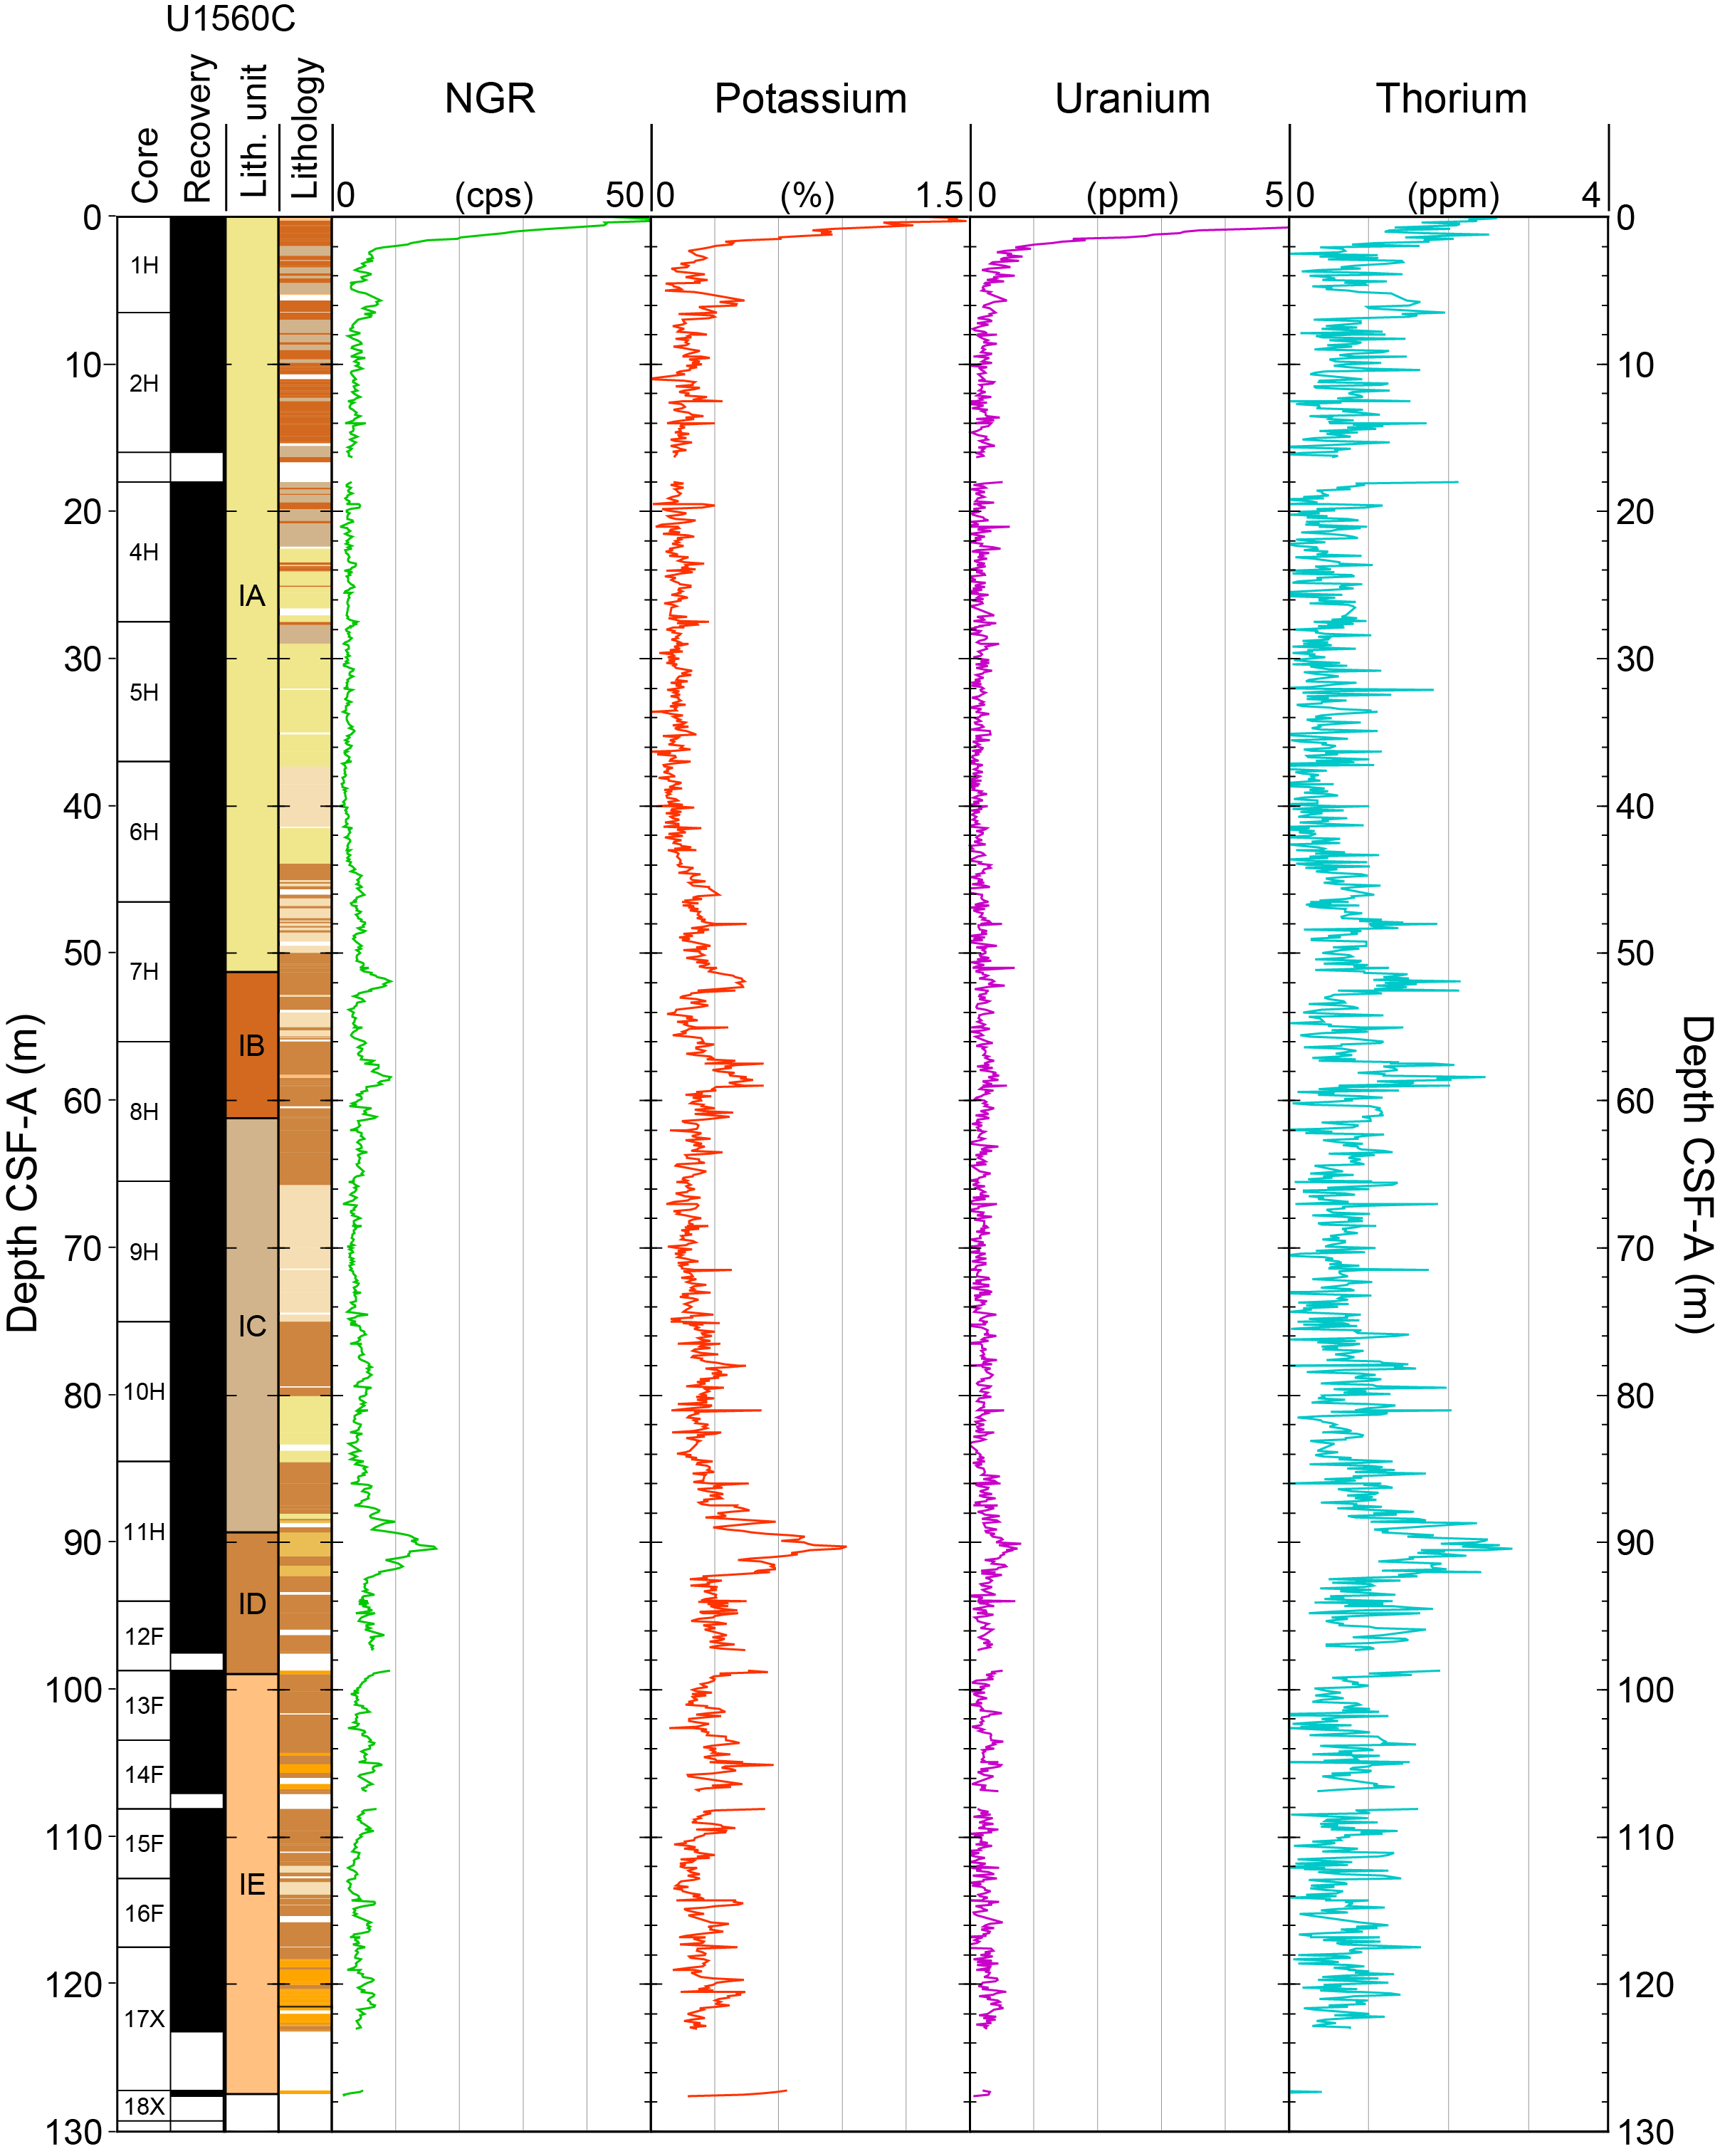
Figure F77. K, U, and Th from NGR, Hole U1560C.
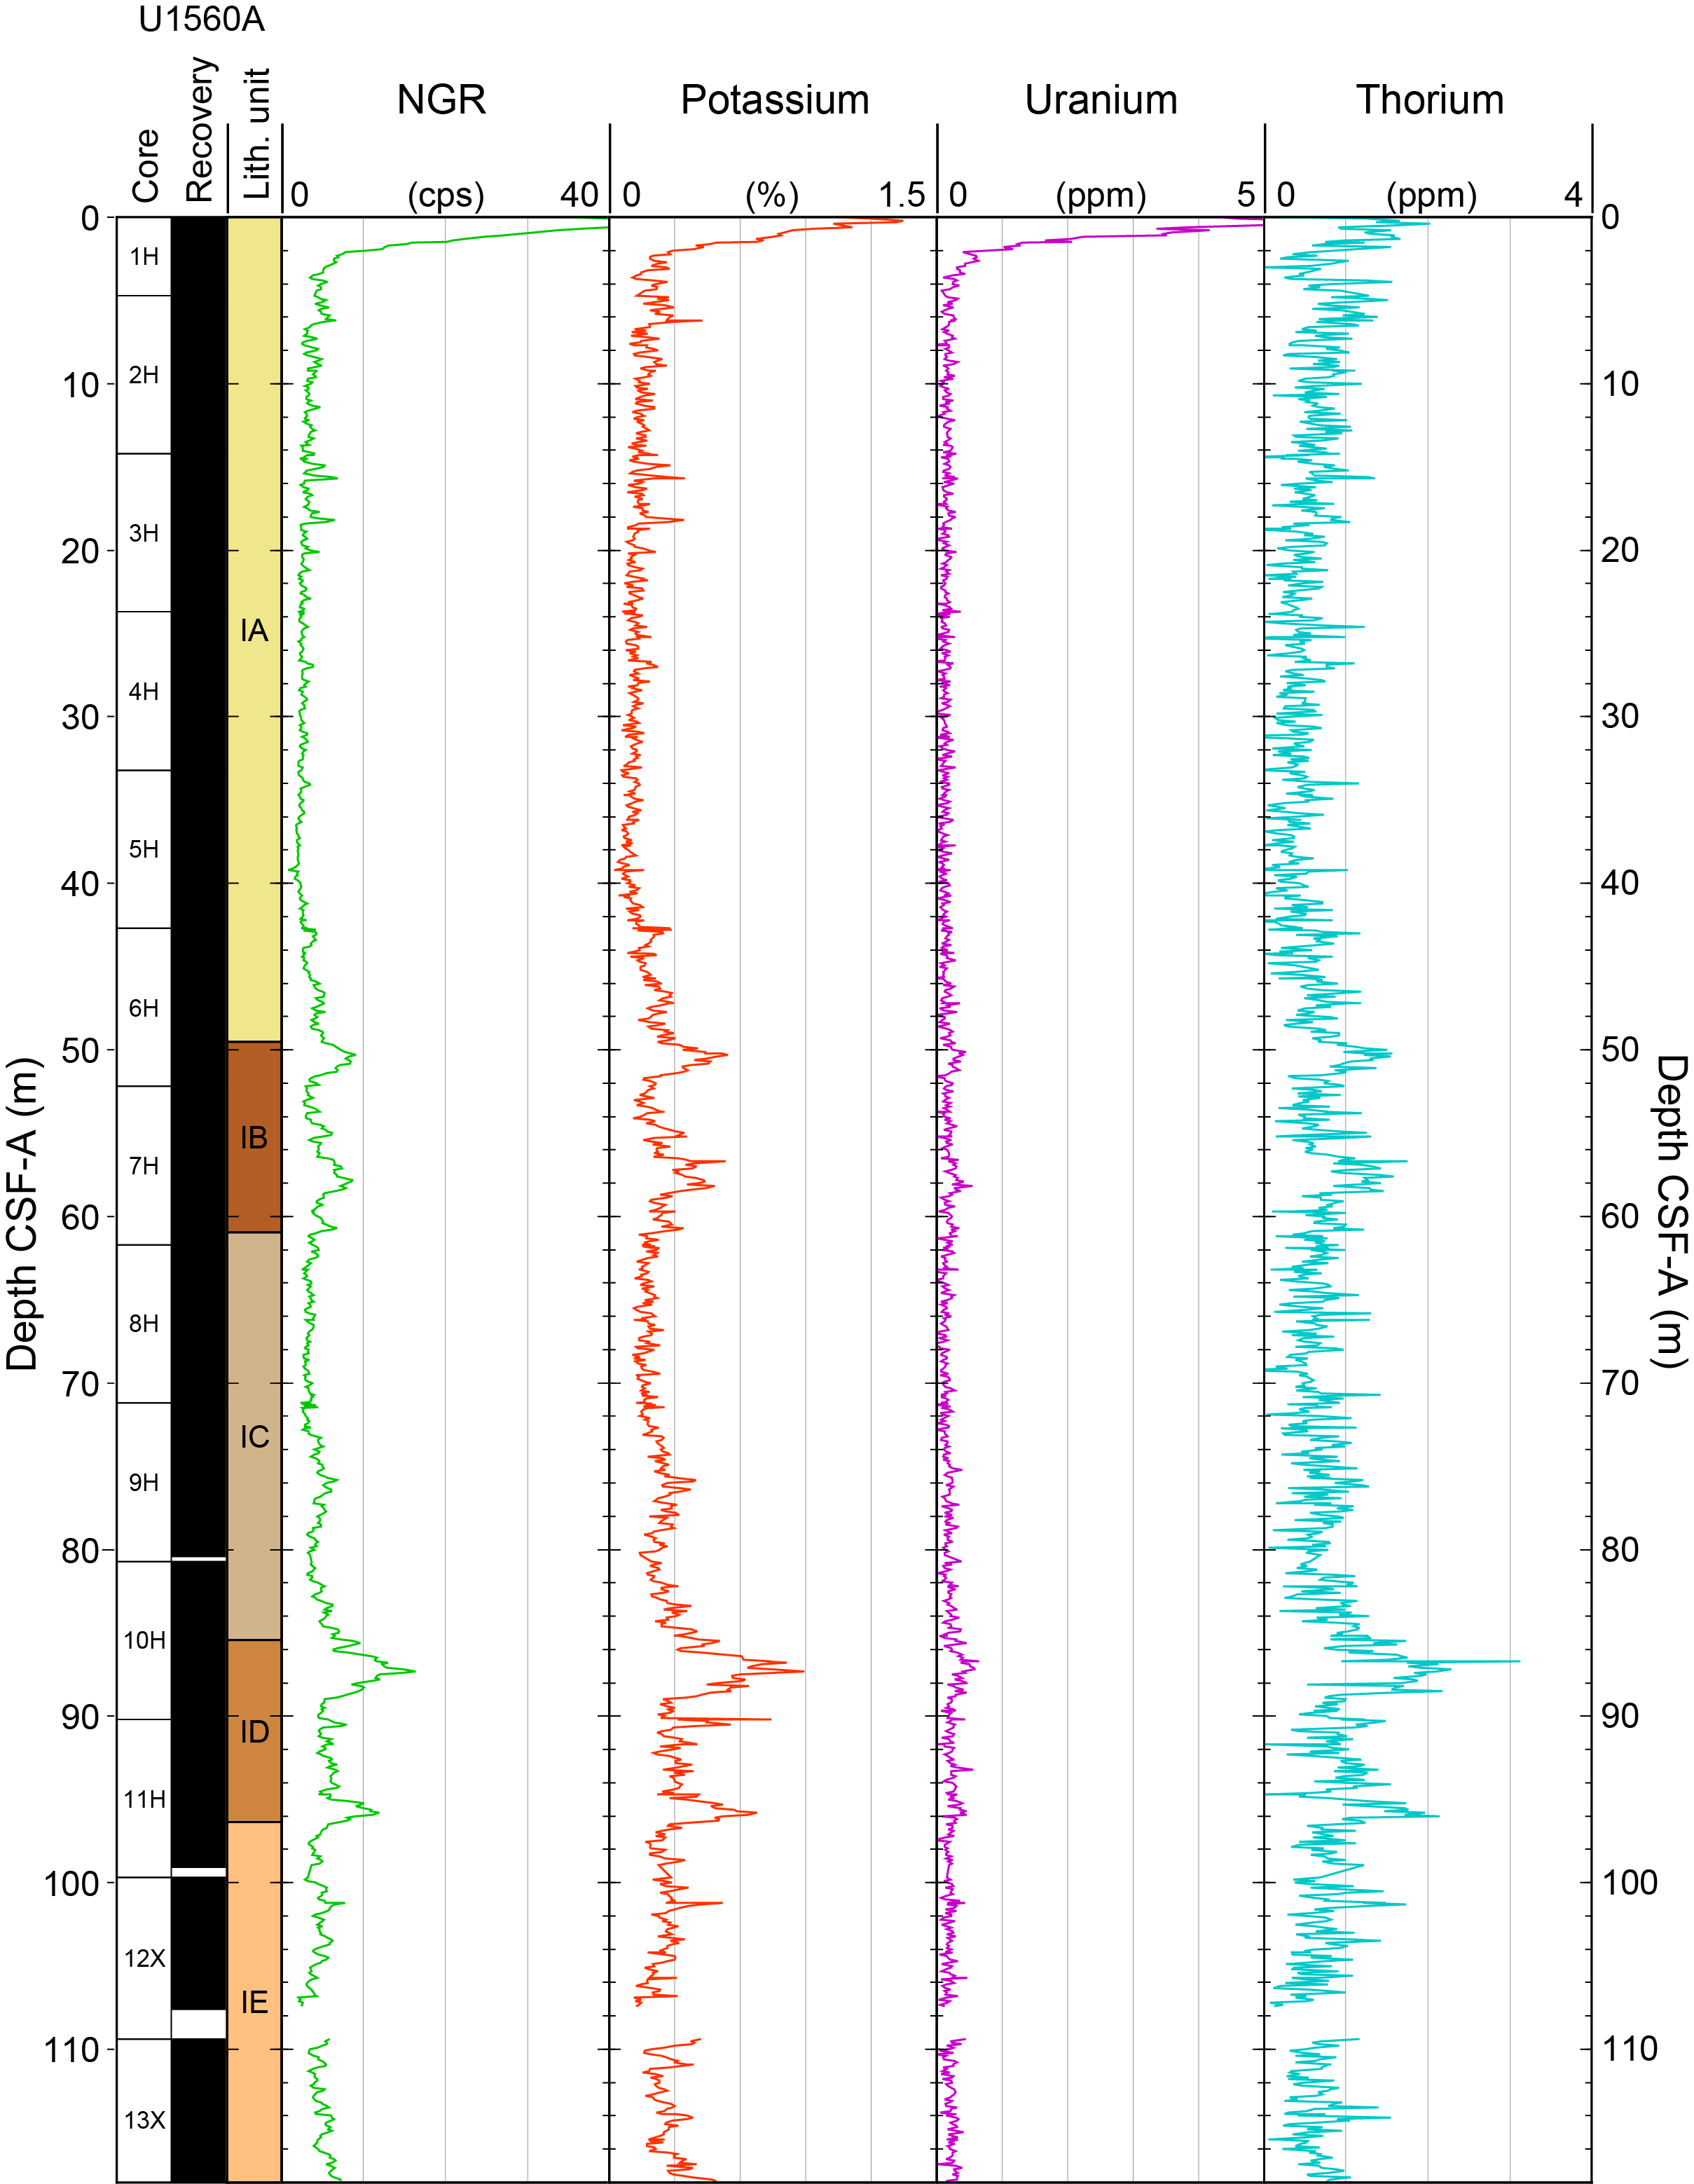
Figure F78. K, U, and Th from NGR, Hole U1560A.
10.1.1.2. Magnetic susceptibility
MS from WRMSL and MSP measurements from Holes U1560A and U1560C show similar downhole trends and magnitudes (range = 2–60 IU; mean = 13 ± 7 IU) (Figures F74, F76; Table T27). Several prominent peaks in MS can be identified in the downhole record. In Hole U1560C, the most relevant are at 52 (~50 IU) and 58 mbsf (~40 IU) in lower Subunits IA and IB, respectively, and at 75 (~30 IU) and 90 mbsf (maximum = ~60 IU) in Subunits IC and ID, respectively. The same peaks are visible in the NGR track data, providing a first-order quantification of clay content (i.e., clay enrichment in the nanno- or microfossil ooze) (see also Sedimentology). These peaks are found in the core sections instead of between section boundaries. Thus, these higher values represent actual sedimentary features rather than artifacts and were further used as tie points in stratigraphic correlation (see Stratigraphic correlation). Similar to NGR, lower MS values are consistent with calcareous nannofossil ooze.
In Hole U1560A, MS (particularly from WRMSL measurements) shows high-frequency scattering of high values toward the lower part of Subunit IE (Core 395E-U1560A-13X) (Figure F76), likely due to drilling disturbance caused by the XCB system.
10.1.1.3. Gamma ray attenuation bulk density
Bulk density from GRA ranges 1.4–1.9 g/cm3 over the measured intervals (mean = 1.7 ± 0.1 g/cm3). Bulk density increases to ~1.8 g/cm3 in the uppermost 18 m in Hole U1560C (Figure F74) and 16 m in Hole U1560A (Figure F76), likely due to early sediment compaction as suggested by the decrease in porosity volume. This is also paired with a marked increase in P-wave velocity (VP) from the WRMSL (Figure F74).
A drop in bulk density to 1.65 g/cm3 is followed by a slowly increasing trend from 22 to 65 mbsf, where the highest density interval is recorded in upper Subunit IC, which also corresponds to a peak in P-wave velocity in the nannofossil ooze with clay.
Through depth, the mean bulk density remains similar and stable (range = 1.72–1.76 g/cm3) until the bottom of the hole in all subunits (Tables T26, T27). The only exception to this regular path is the relative positive peak of 1.79 g/cm3 found at ~90 mbsf between the lowermost part of Subunit IC and upper part of Subunit ID, which also corresponds to the major MS and a P-wave velocity increase.
10.1.1.4. Moisture and density
A total of 26 discrete samples were taken for MAD analysis (Figures F74, F75; Tables T26, T27). GRA and MAD methods show good agreement between bulk density trends (Figure F74). Bulk density from the MAD method ranges 1.5–2.0 g/cm3 (mean = 1.7 ± 0.1 g/cm3). The MAD method generally produces slightly lower bulk densities than those from the GRA method, likely due to sediment volume expansion after splitting and subsequent water loss when exposed to air (see Physical properties and downhole measurements in the Expedition 390/393 methods chapter [Coggon et al., 2024a]). Porosity ranges 45%–70% throughout Hole U1560C (mean = 60% ± 4%). Porosity data show a decreasing trend from 70% at the top of the sediment (uppermost sample from Core 393-U1560C-1H) to 60% in the uppermost 15 m (lowest sample from Core 393-U1560C-2H) and then remain relatively constant at ~60% throughout the rest of the hole. Two discrete samples, at 103 and 109 mbsf (both within the nannofossil ooze with clay of Subunit IE), are offset from the GRA trend (1.96 and 1.55 g/cm3, respectively) and from the mean porosity values (45% and 70%, respectively). No significant drilling disturbance was found in these two samples or nearby; thus, it is possible this difference is linked to high lithologic variability derived from the rhythmically alternating intervals of nannofossil ooze (light) and nannofossil clay/claystone (dark) with opposite physical properties.
10.1.1.5. P-wave velocity
P-wave velocity data are consistent between the WRMSL and caliper methods (Figures F74, F75), ranging 1.46–1.76 km/s (mean = 1.53 ± 0.02 km/s) (Tables T26, T27). P-wave velocity from the WRMSL method rapidly increases from 1.52 km/s at the top of the hole to 1.60 km/s at ~15 m, associated with the interval of light brown ooze with clay in the upper part of Subunit IA (see Sedimentology), then decreases to <1.55 km/s as it changes to pinkish and grayish ooze in the lower part of Subunit IA. From 25 mbsf to the bottom of the hole, P-wave velocity gradually decreases but remains mostly 1.5–1.55 km/s. Three VP peaks stand out from this trend, reaching similar values of ~1.58 km/s at ~27 mbsf and ~32 mbsf in Subunit IA and at 66 mbsf in Subunit IC. The latter is also visible in the GRA trend and corresponds to a lithologic change between nannofossil ooze with and without clay at the boundary of Cores 393-U1560C-8H and 9H.
10.1.1.6. Sediment strength
In Hole U1560C, shear strength ranges 5–28 kg/cm2 (mean = 11 ± 6 kN/cm2) (Figure F75; Tables T26, T27). The highest shear strength, 28 kg/cm2, is found in the brown nannofossil ooze with clay (Subunit IB) at ~55 m, whereas all other values are <20 kg/cm2. Compressional strength ranges 0.3–2.3 kg/cm2 (mean = 1.1 ± 0.5 kg/cm2) throughout the sedimentary sections. Compressional strength data in the uppermost ~80 m, which mostly consist of light-colored nannofossil ooze, show a general decreasing trend from 1.8 to 0.3 kg/cm2. Measurements then return to values around 1.0 kg/cm2 for the remaining ~45 m, where units are more enriched in clay and organic matter (see Sedimentology) (Table T27).
10.1.1.7. Thermal conductivity
A total of 15 discrete thermal conductivity measurements were conducted on representative lithologies from Hole U1560C (Figure F75) using the half-space heating puck on split section halves (see Physical properties and downhole measurements in the Expedition 390/393 methods chapter [Coggon et al., 2024a]). Thermal conductivity ranges 1.19–1.34 W/(m·K) throughout all sections (mean = 1.23 ± 0.03 W/[m·K]) (Tables T26, T27). The thermal conductivity pattern mimics the P-wave velocity trend and also shows some similarities with compressive strength. Two complete oscillations are visible from 0 to 80 mbsf, followed by some scattering until the bottom of the hole in Subunits ID and IE. Both VP and thermal conductivity record maximum values at ~65 mbsf in the nannofossil ooze from the upper part of Subunit IC.
10.1.2. Lithostratigraphic unit comparison
Four physical properties (P-wave velocity, GRA bulk density, MS, and NGR) from the track measurements of Hole U1560C are grouped by lithostratigraphic units and compared in Figure F79. Among the four crossplots, Figure F79D (NGR versus MS) stands out because it displays the only positive and high correlation (R2 = 0.8) between the two variables. Some low MS and high NGR values (10–25 counts/s and 10–20 IU, respectively) are spread outside the main cluster formed by all other units. These values encompass the mudline NGR trend within the uppermost 2 m of Subunit IA (Figure F74). Because of the different nature of this high-NGR signal (due to the localized enrichment in secular half-life radioactive elements at the seabed, such as 230Th) and because the U contents are not necessarily representative of the true U content of the sediments due to increased 214Bi activity (Dunlea et al., 2013; De Vleeschouwer et al., 2017), these data were filtered out from the correlation calculation.
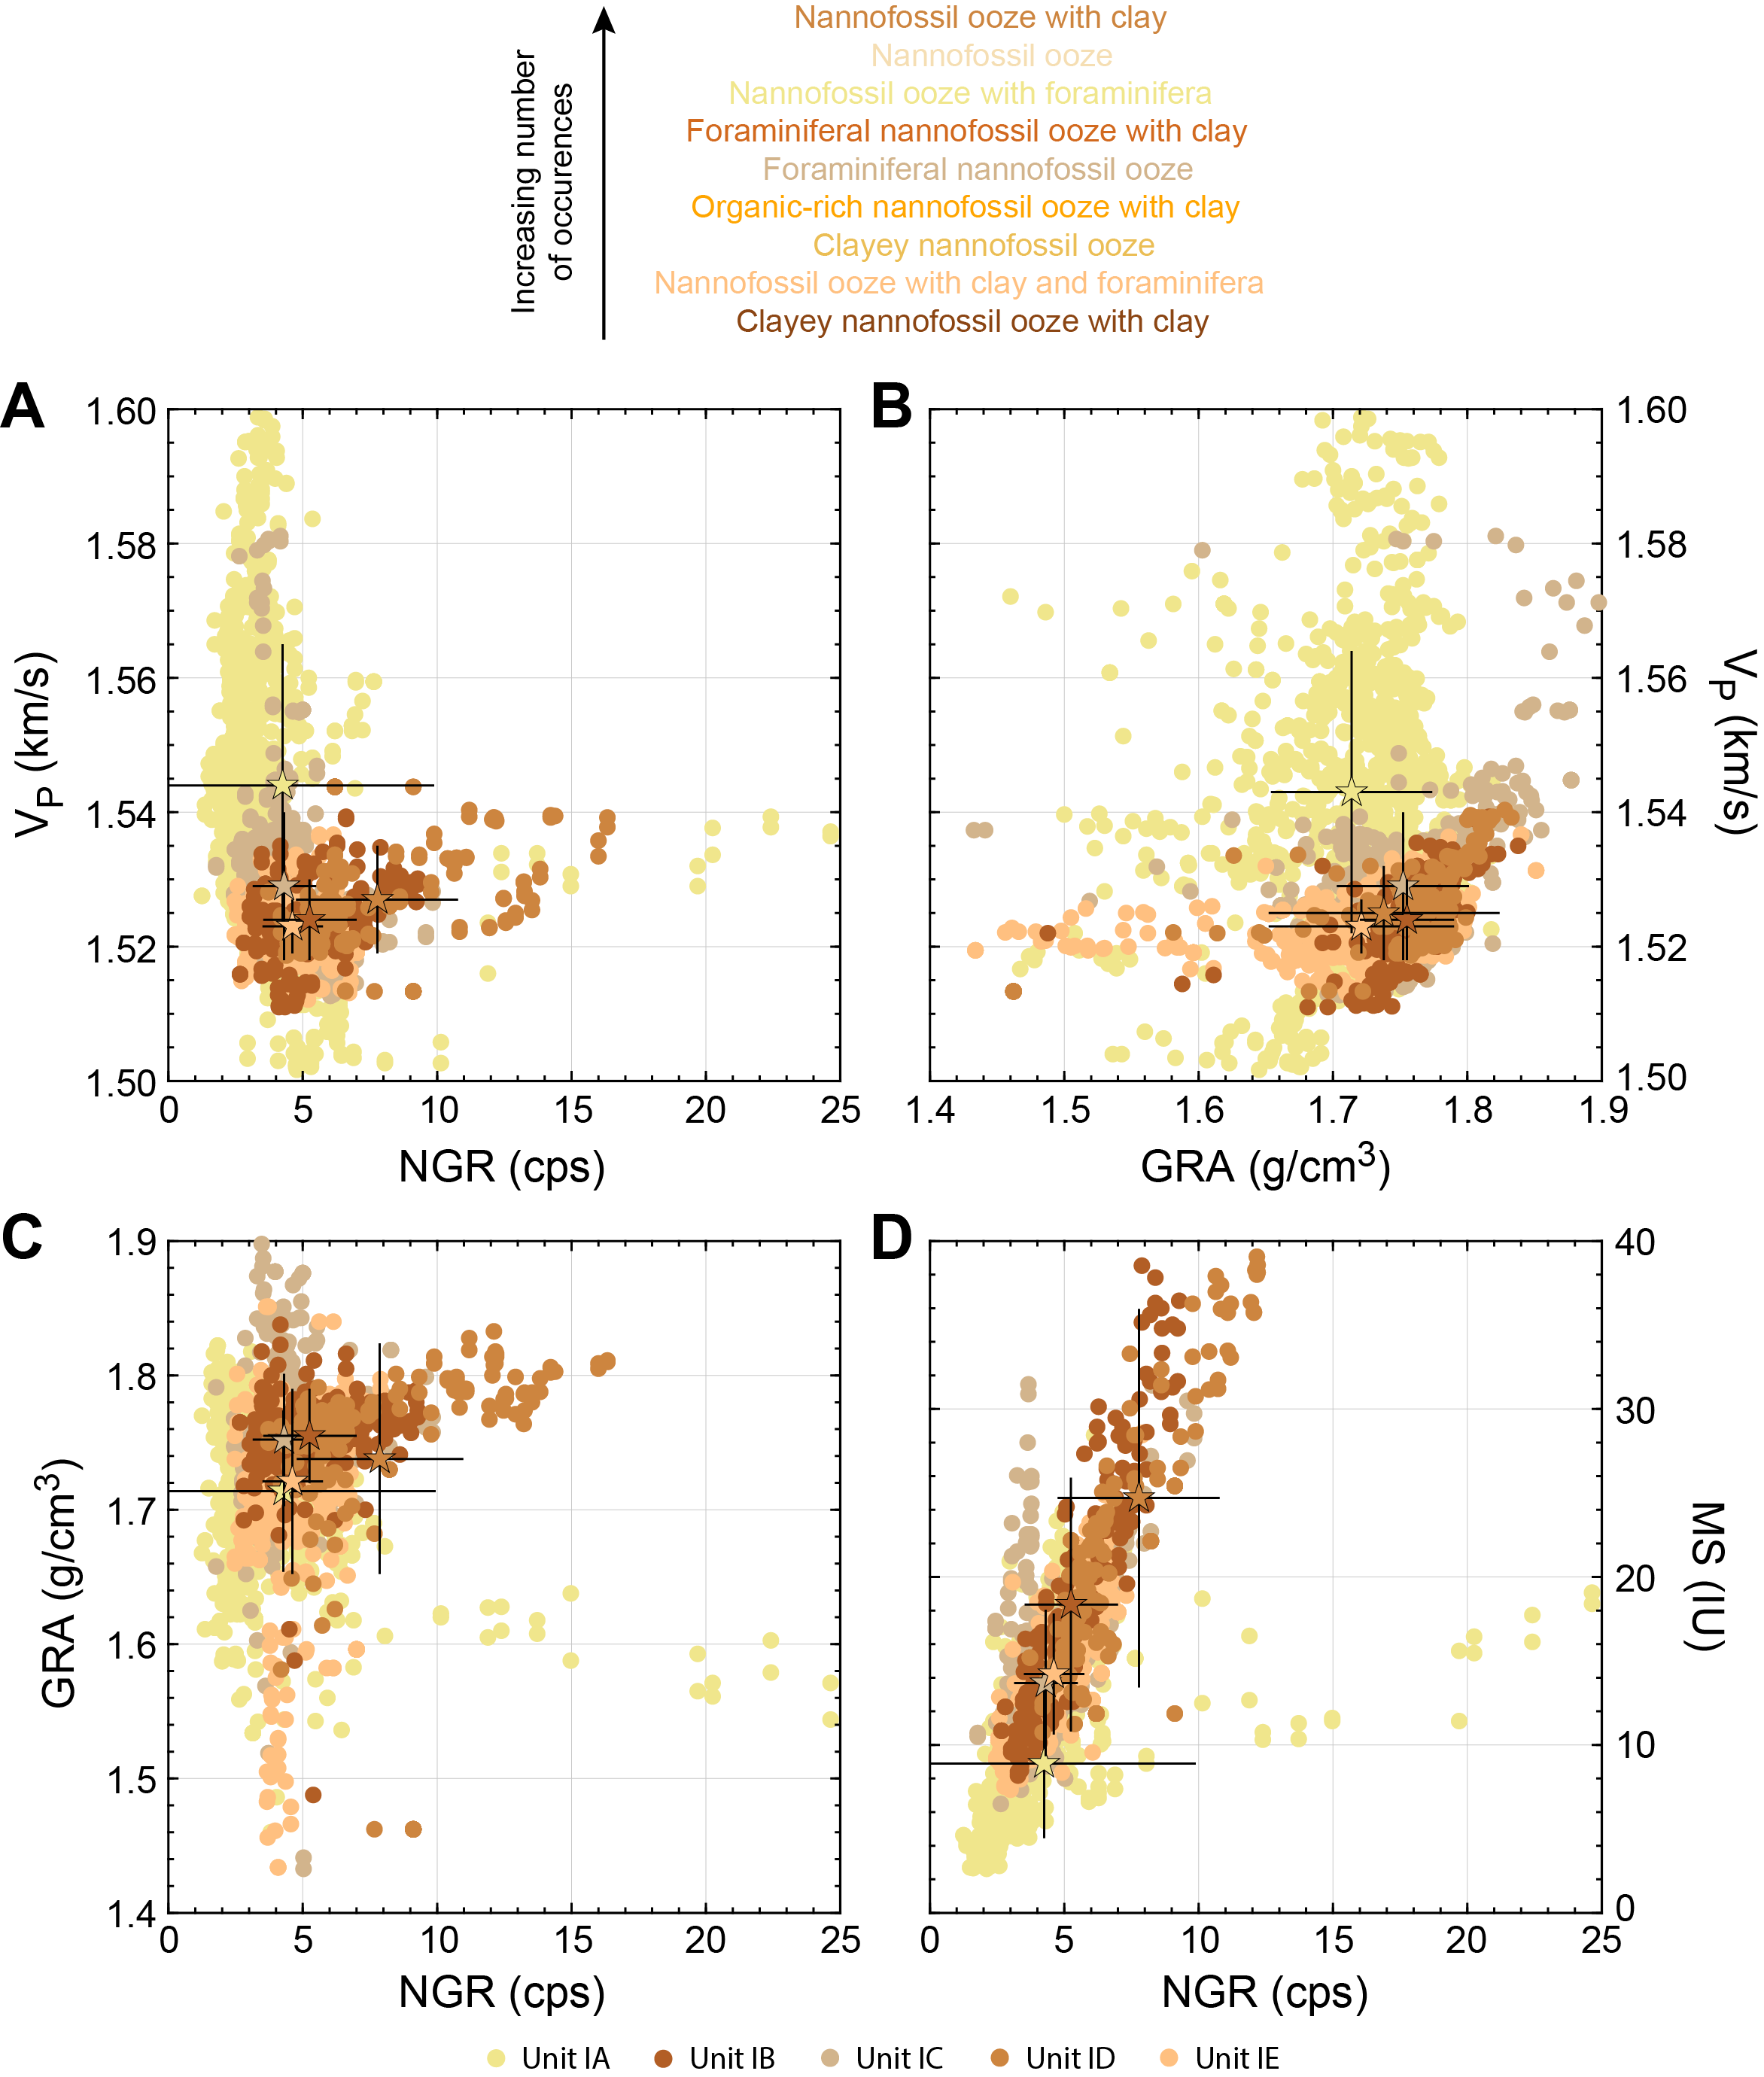
Figure F79. Sediment samples by lithostratigraphic units.
Due to higher P-wave velocity values in Subunit IA and partially in Subunit IC (Figure F74), these units do not group into the same cluster along with the other units, although their mean values are comparable within 1 standard deviation (Figure F79A, F79B; Table T27). In fact, all measurements from Subunits IB–IE are often clustered and hard to distinguish from one another in Figure F79A–F79C.
In Figure F80, we compare physical properties with respect to the most frequent lithology occurring in the sedimentary column (defined by its micro- or nannofossil content and clay abundance), recorded by track measurements (see Sedimentology). For instance, clayey nannofossil ooze with clay is the least frequent lithologic category, whereas nannofossil ooze with clay is the most frequent. The crossplots also show mean values for each lithology to display the range of physical properties that better describes the category.
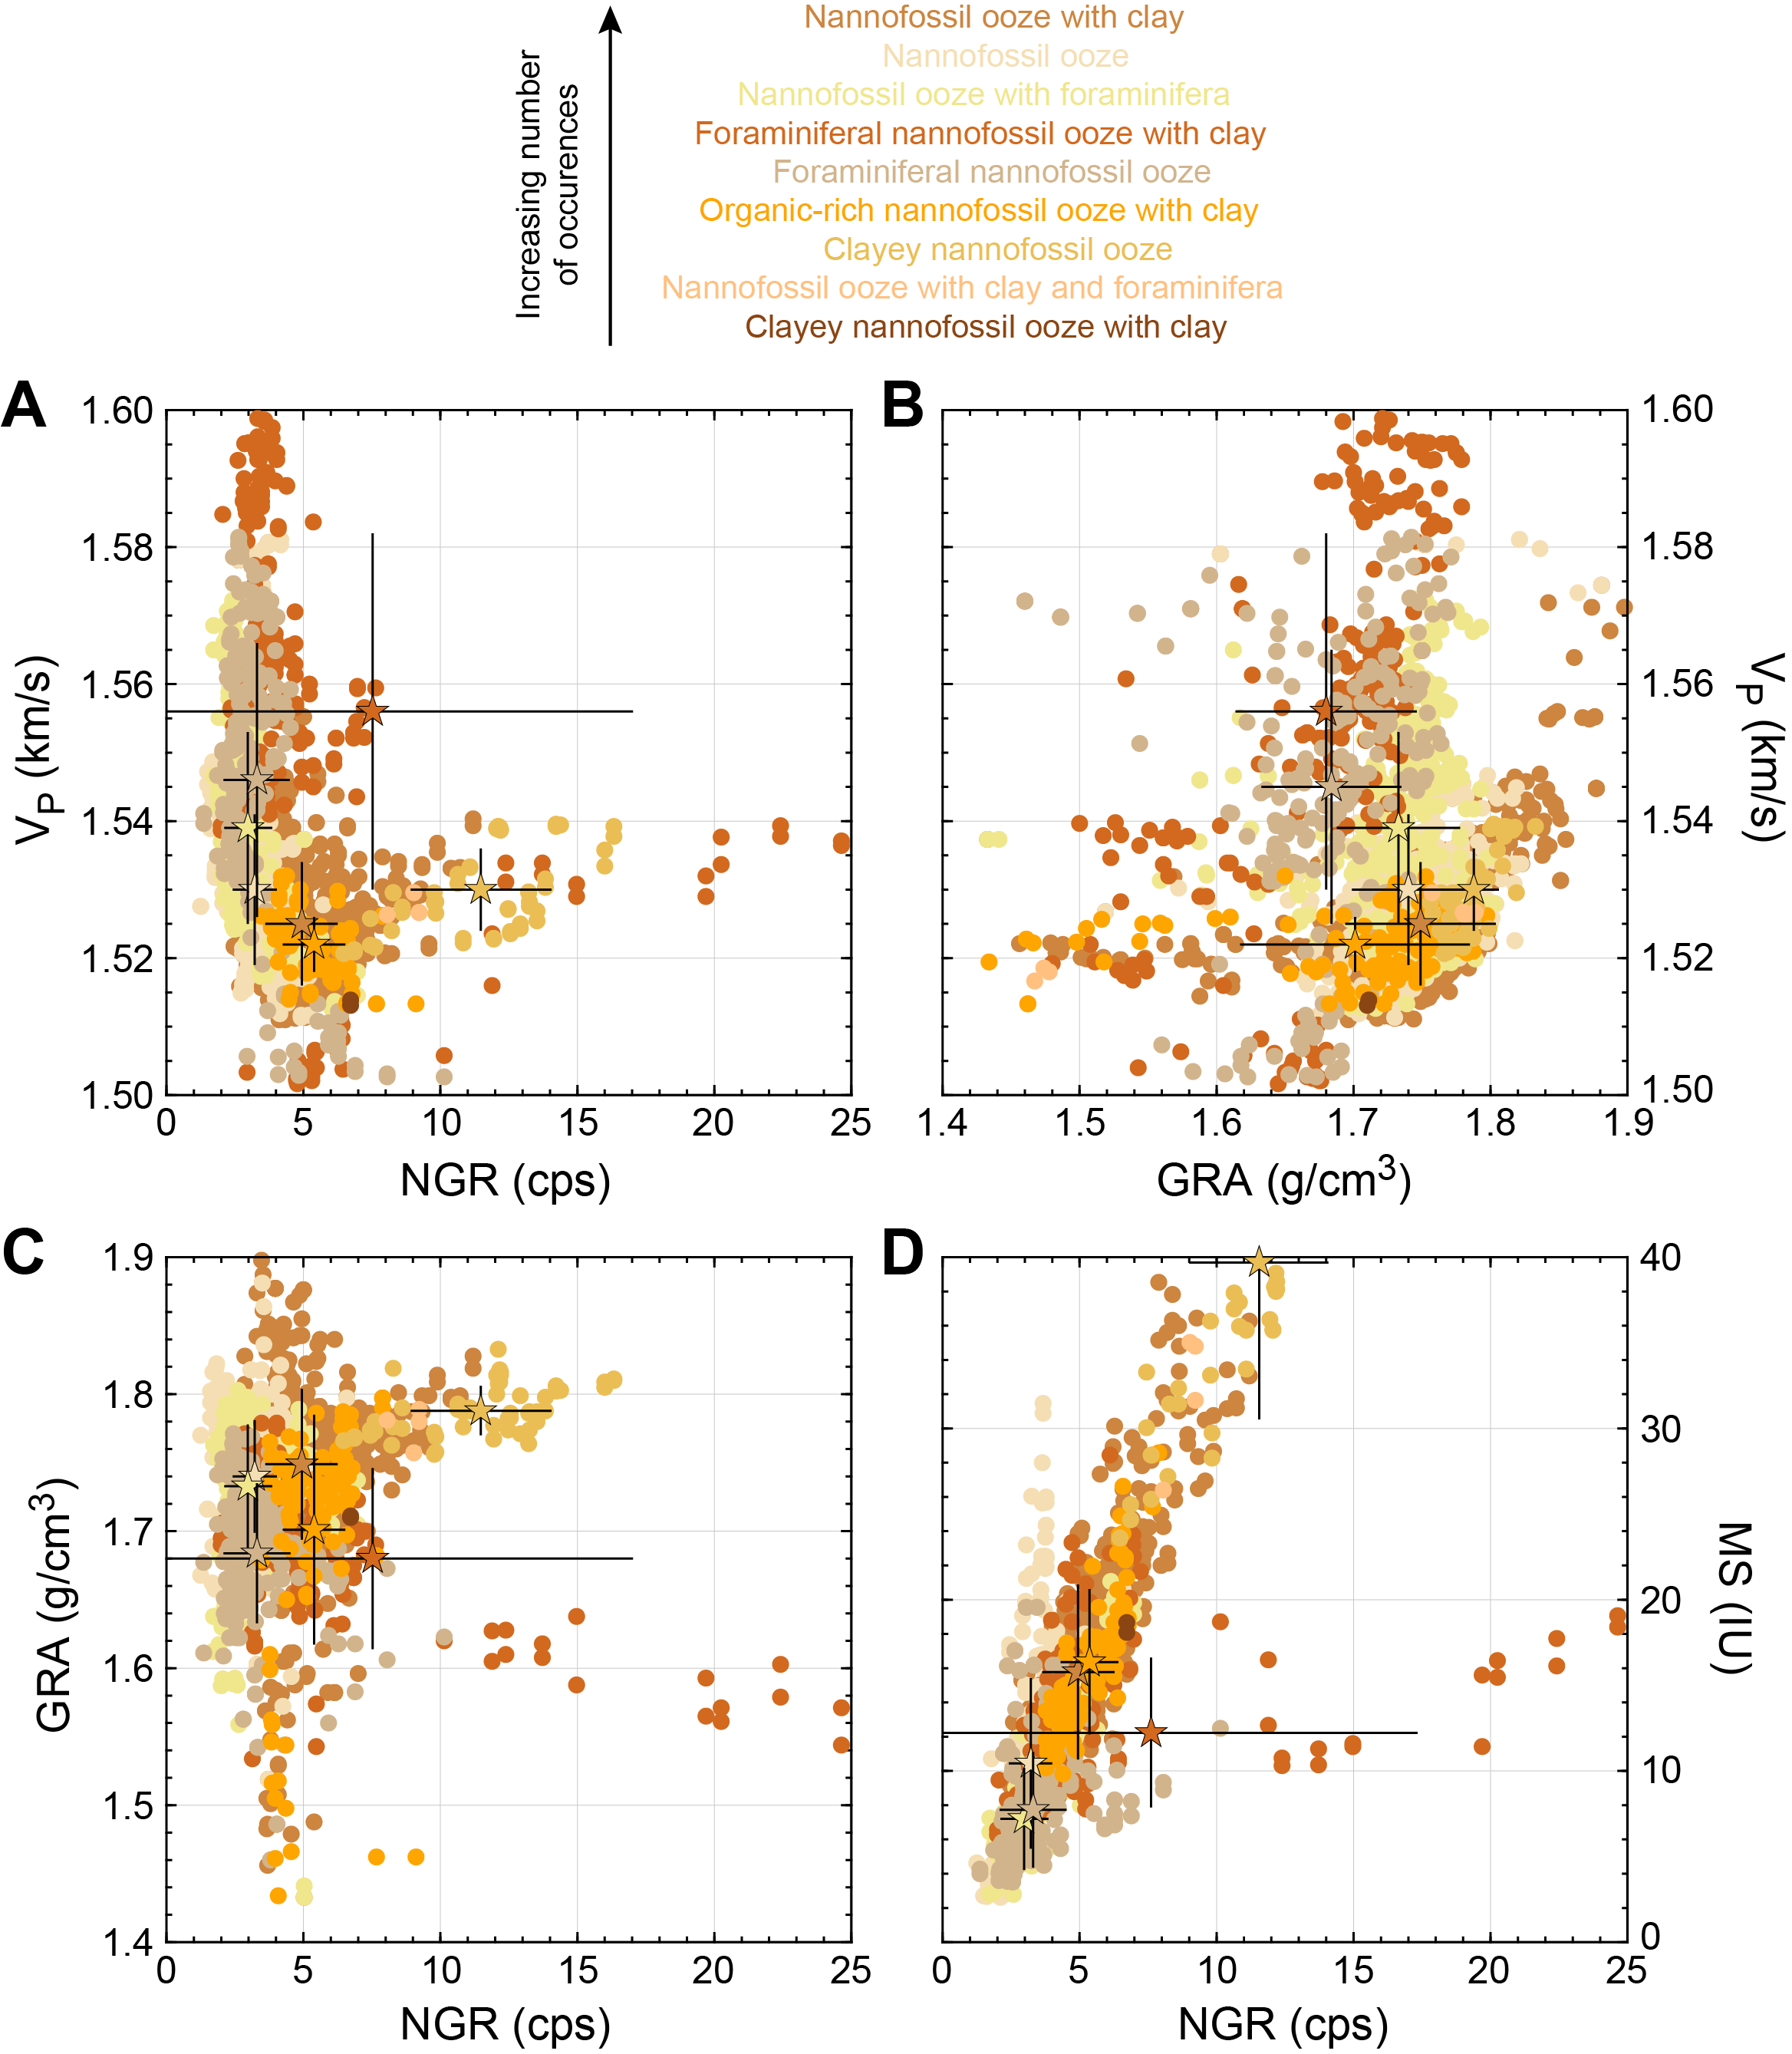
Figure F80. Sediment samples by lithology.
Clayey nannofossil ooze (mostly present at the top of Subunit ID) plots outside the main cloud where all other categories cluster together, due to its higher NGR, MS, and GRA values (Figure F80A, F80C, F80D). Foraminiferal nannofossil ooze (mostly present in upper Subunit IA) also stands a little outside the cloud because it is associated with the highest peak of P-wave velocity in the uppermost 15 m. In addition, this lithology also shows the highest NGR values linked to the mudline trend (Figure F80A, F80C, F80D).
10.1.3. X-ray imaging
Sediment cores from Holes U1560A and U1560C were scanned with the X-ray logger (XMAN), and images were used to assist core description. For example, in interval 393-U1560C-11H-4A, 131–140 cm, the ichnofossil Planolites was identified (see Sedimentology) in both the X-ray images and the core photos (Figure F81A). However, not all ichnofossils identified from core photos could be easily recognized in X-ray images. For example, in interval 395E-U1560A-10H-6, 47–58 cm, X-ray images show homogeneous gray background (with a few gaps along the edges of the liner), whereas ichnofossils Planolites and Skolithos can be identified in the core photos (Figure F81B).
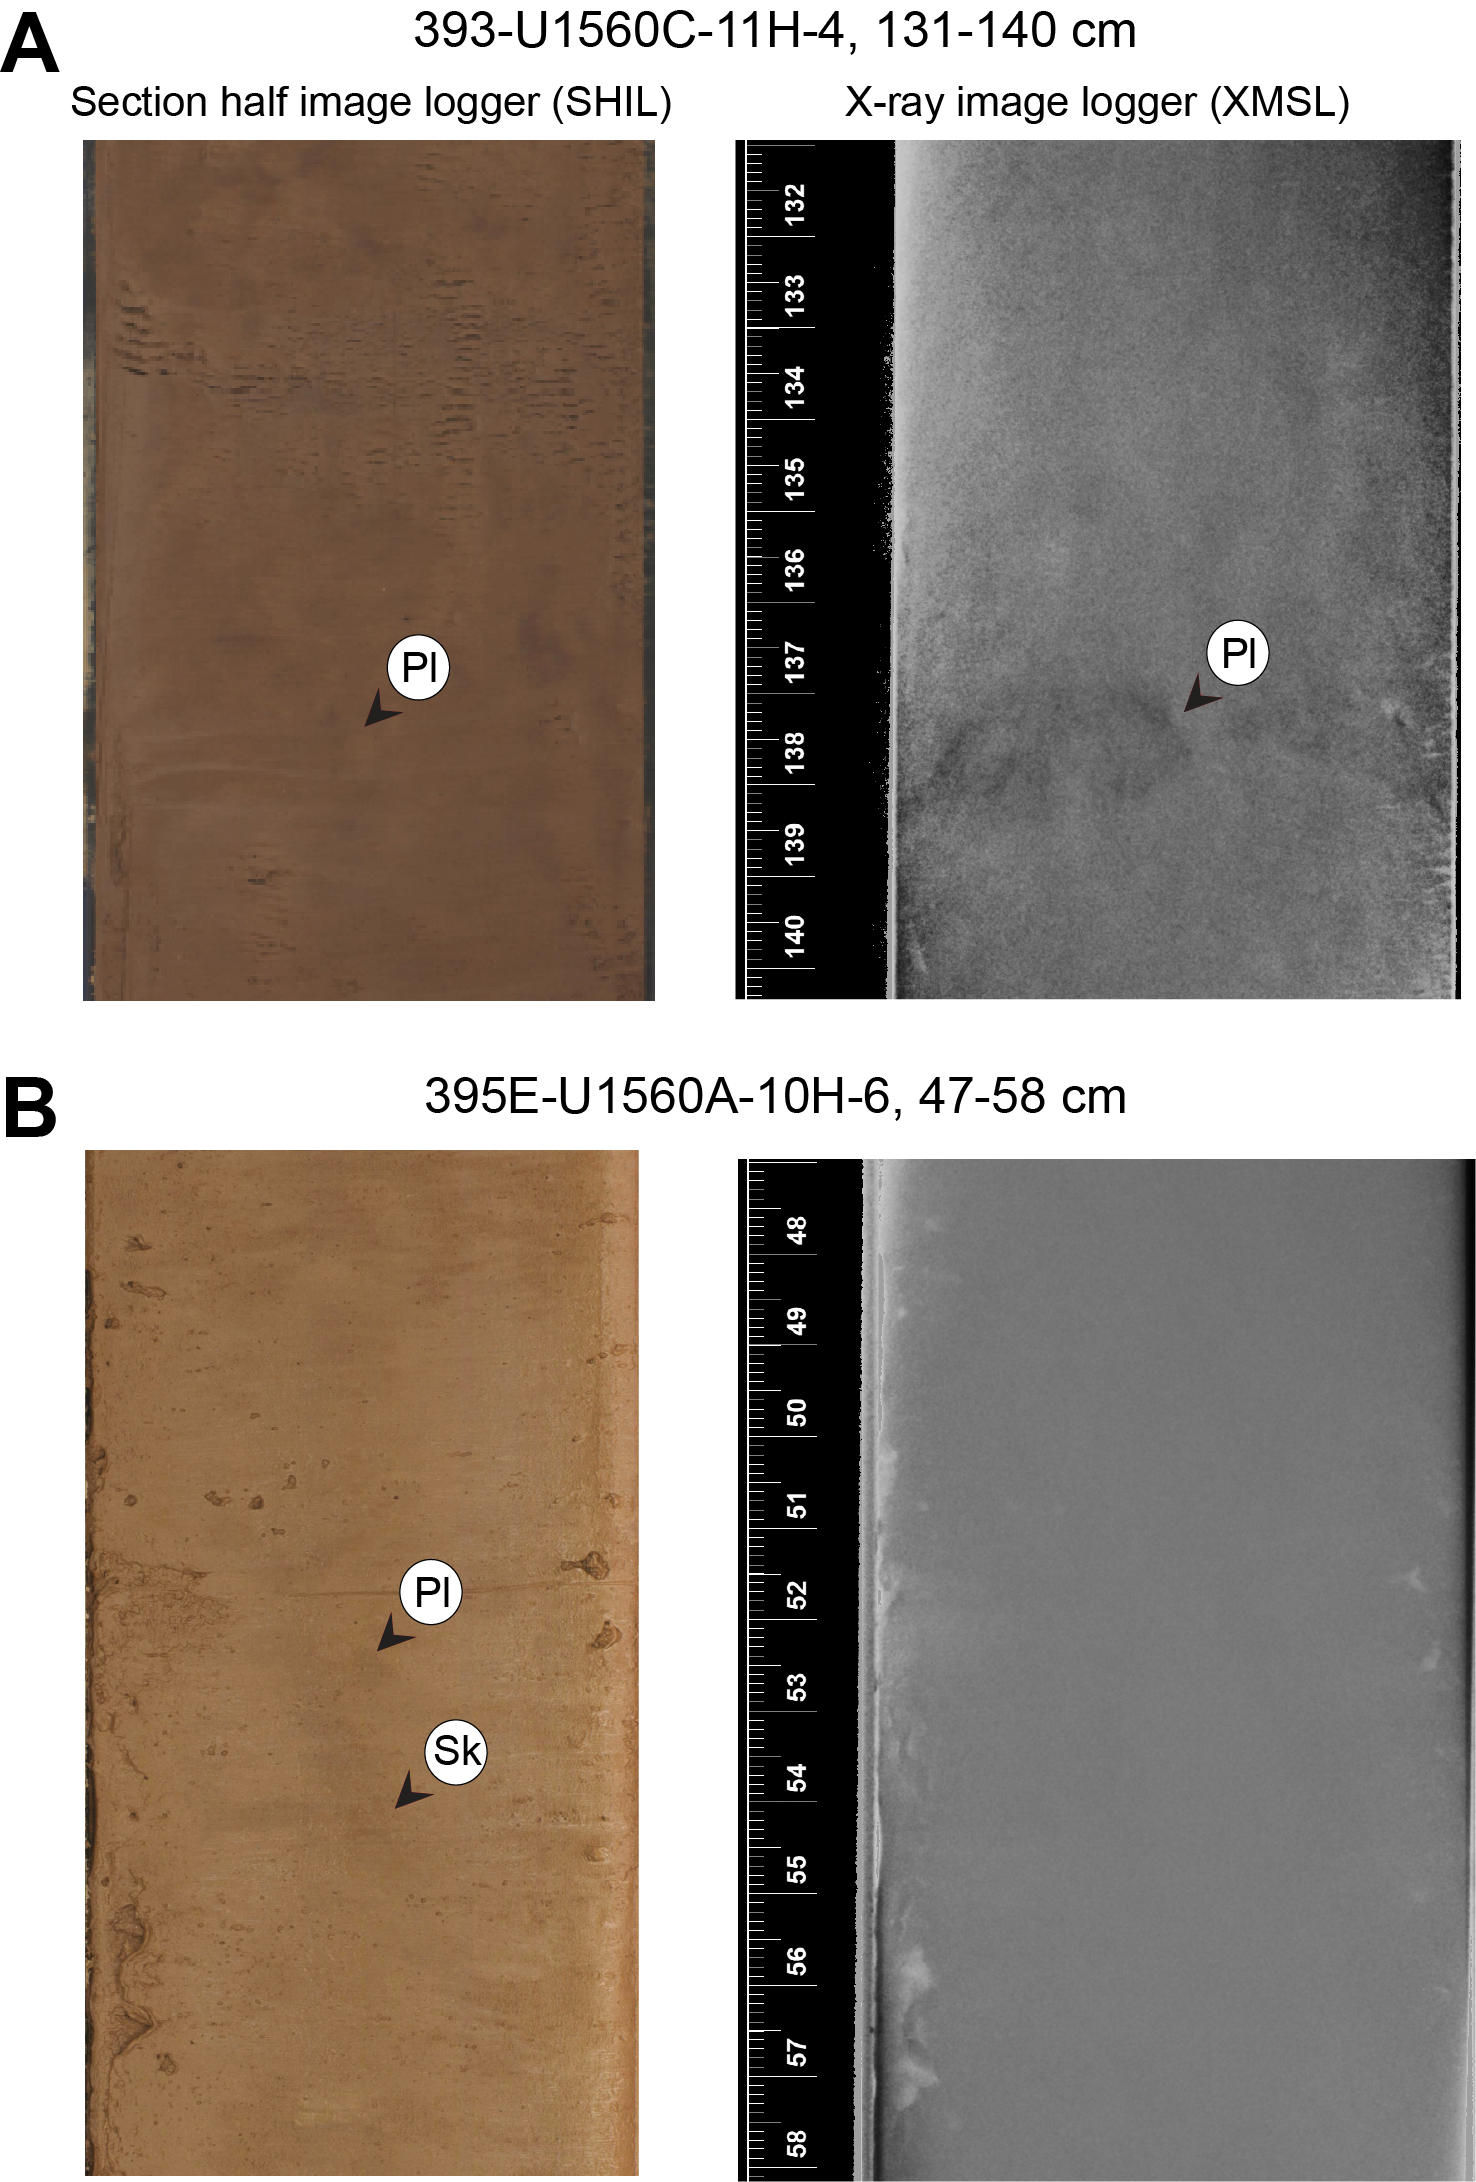
Figure F81. Core and X-ray images.
10.1.4. Downhole measurements
10.1.4.1. Downhole temperature
During APC coring in both Holes U1560C and U1560A, the APCT-3 temperature probe was used to measure in situ formation temperature at selected depths, typically ~30 m apart (Table T28). The probe was deployed while coring Cores 395E-U1560A-4H and 7H as well as Cores 393-U1560C-5H, 8H, and 11H. Figure F82 shows for each deployment the intervals in the temperature records that were used to estimate formation temperature by finding a best fit for a theoretical model to the temperature decay as a function of time (10–75 min) as it recovers from the frictional heating generated when entering the formation. The particularly long record for Core 393-U1560C-11H is due to difficulties retrieving the core from the formation.
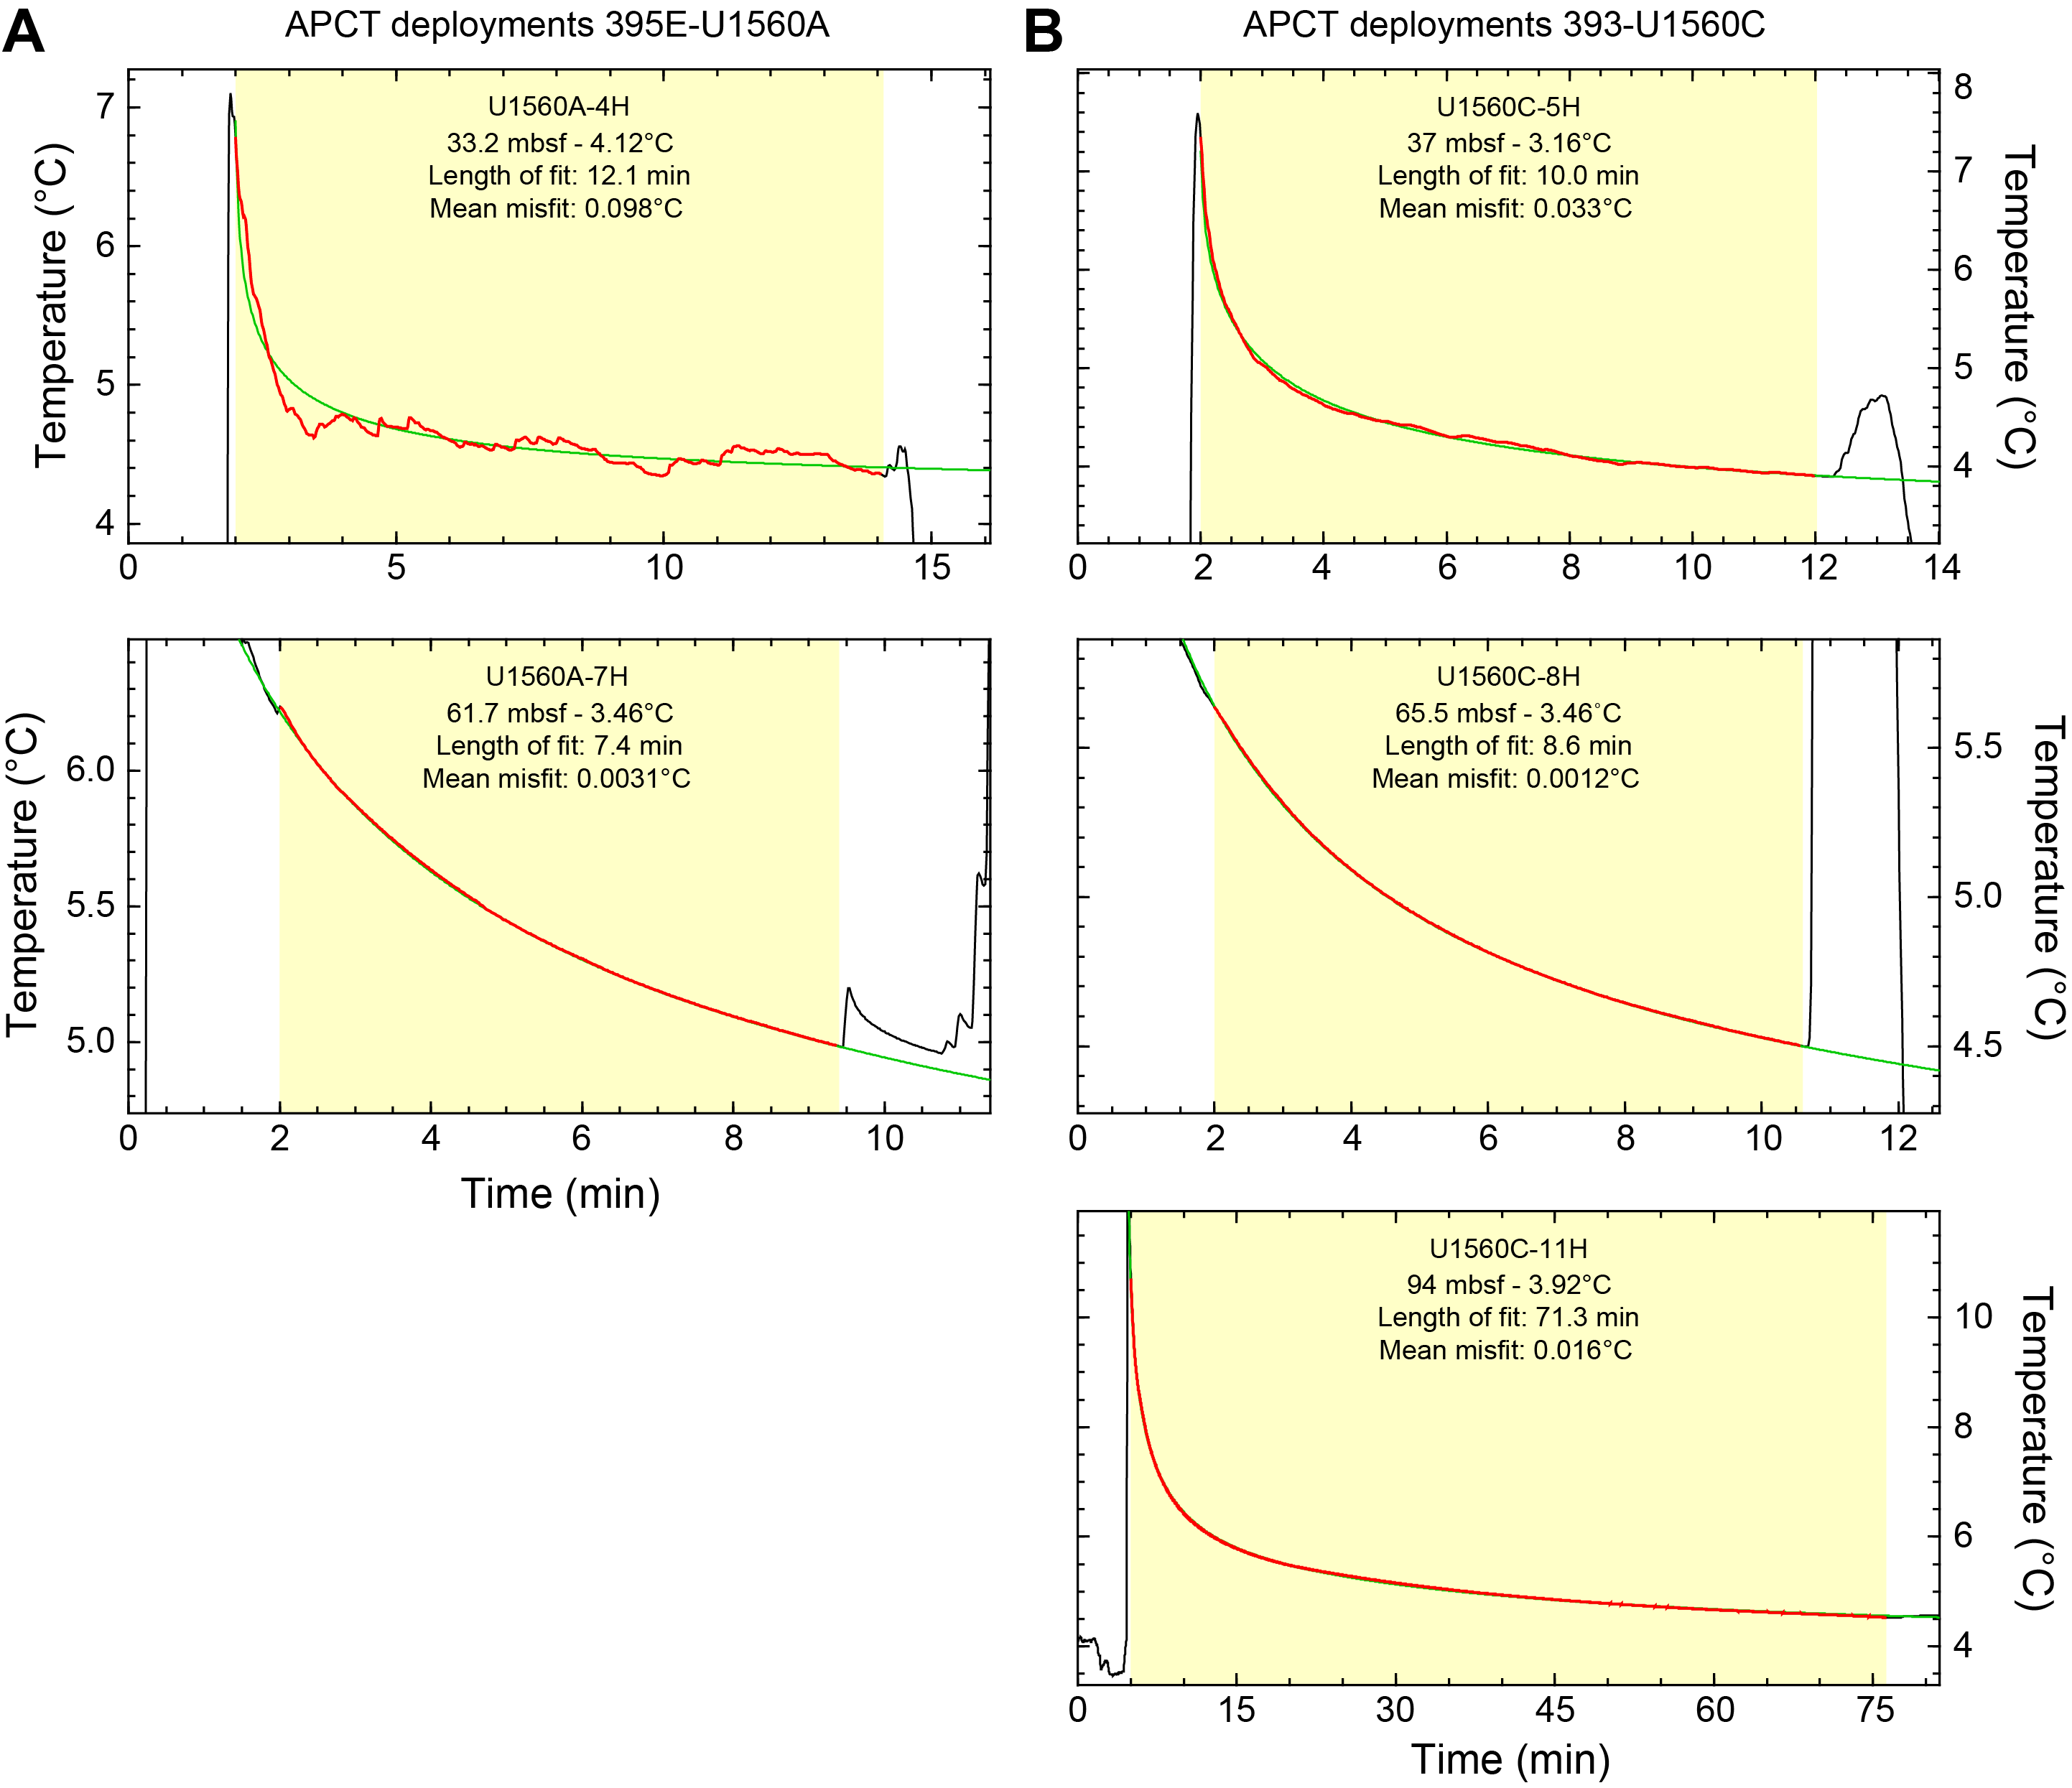
Figure F82. APCT-3 temperature.
10.1.4.2. Heat flow
The rugged record for Core 395E-U1560A-4H (Figure F82A) shows that the probe was never properly seated in the formation, and the fitted result is not reliable. It was discarded for the heat flow calculations. The smooth records for all the other deployments suggest that the probes were stable while in the formation, allowing the temperature decrease to follow clear trends to fit with theoretical decay models. The resulting temperatures define a steadily increasing temperature profile with a least-squares linear fit gradient of 17°C/km (Figure F83C).
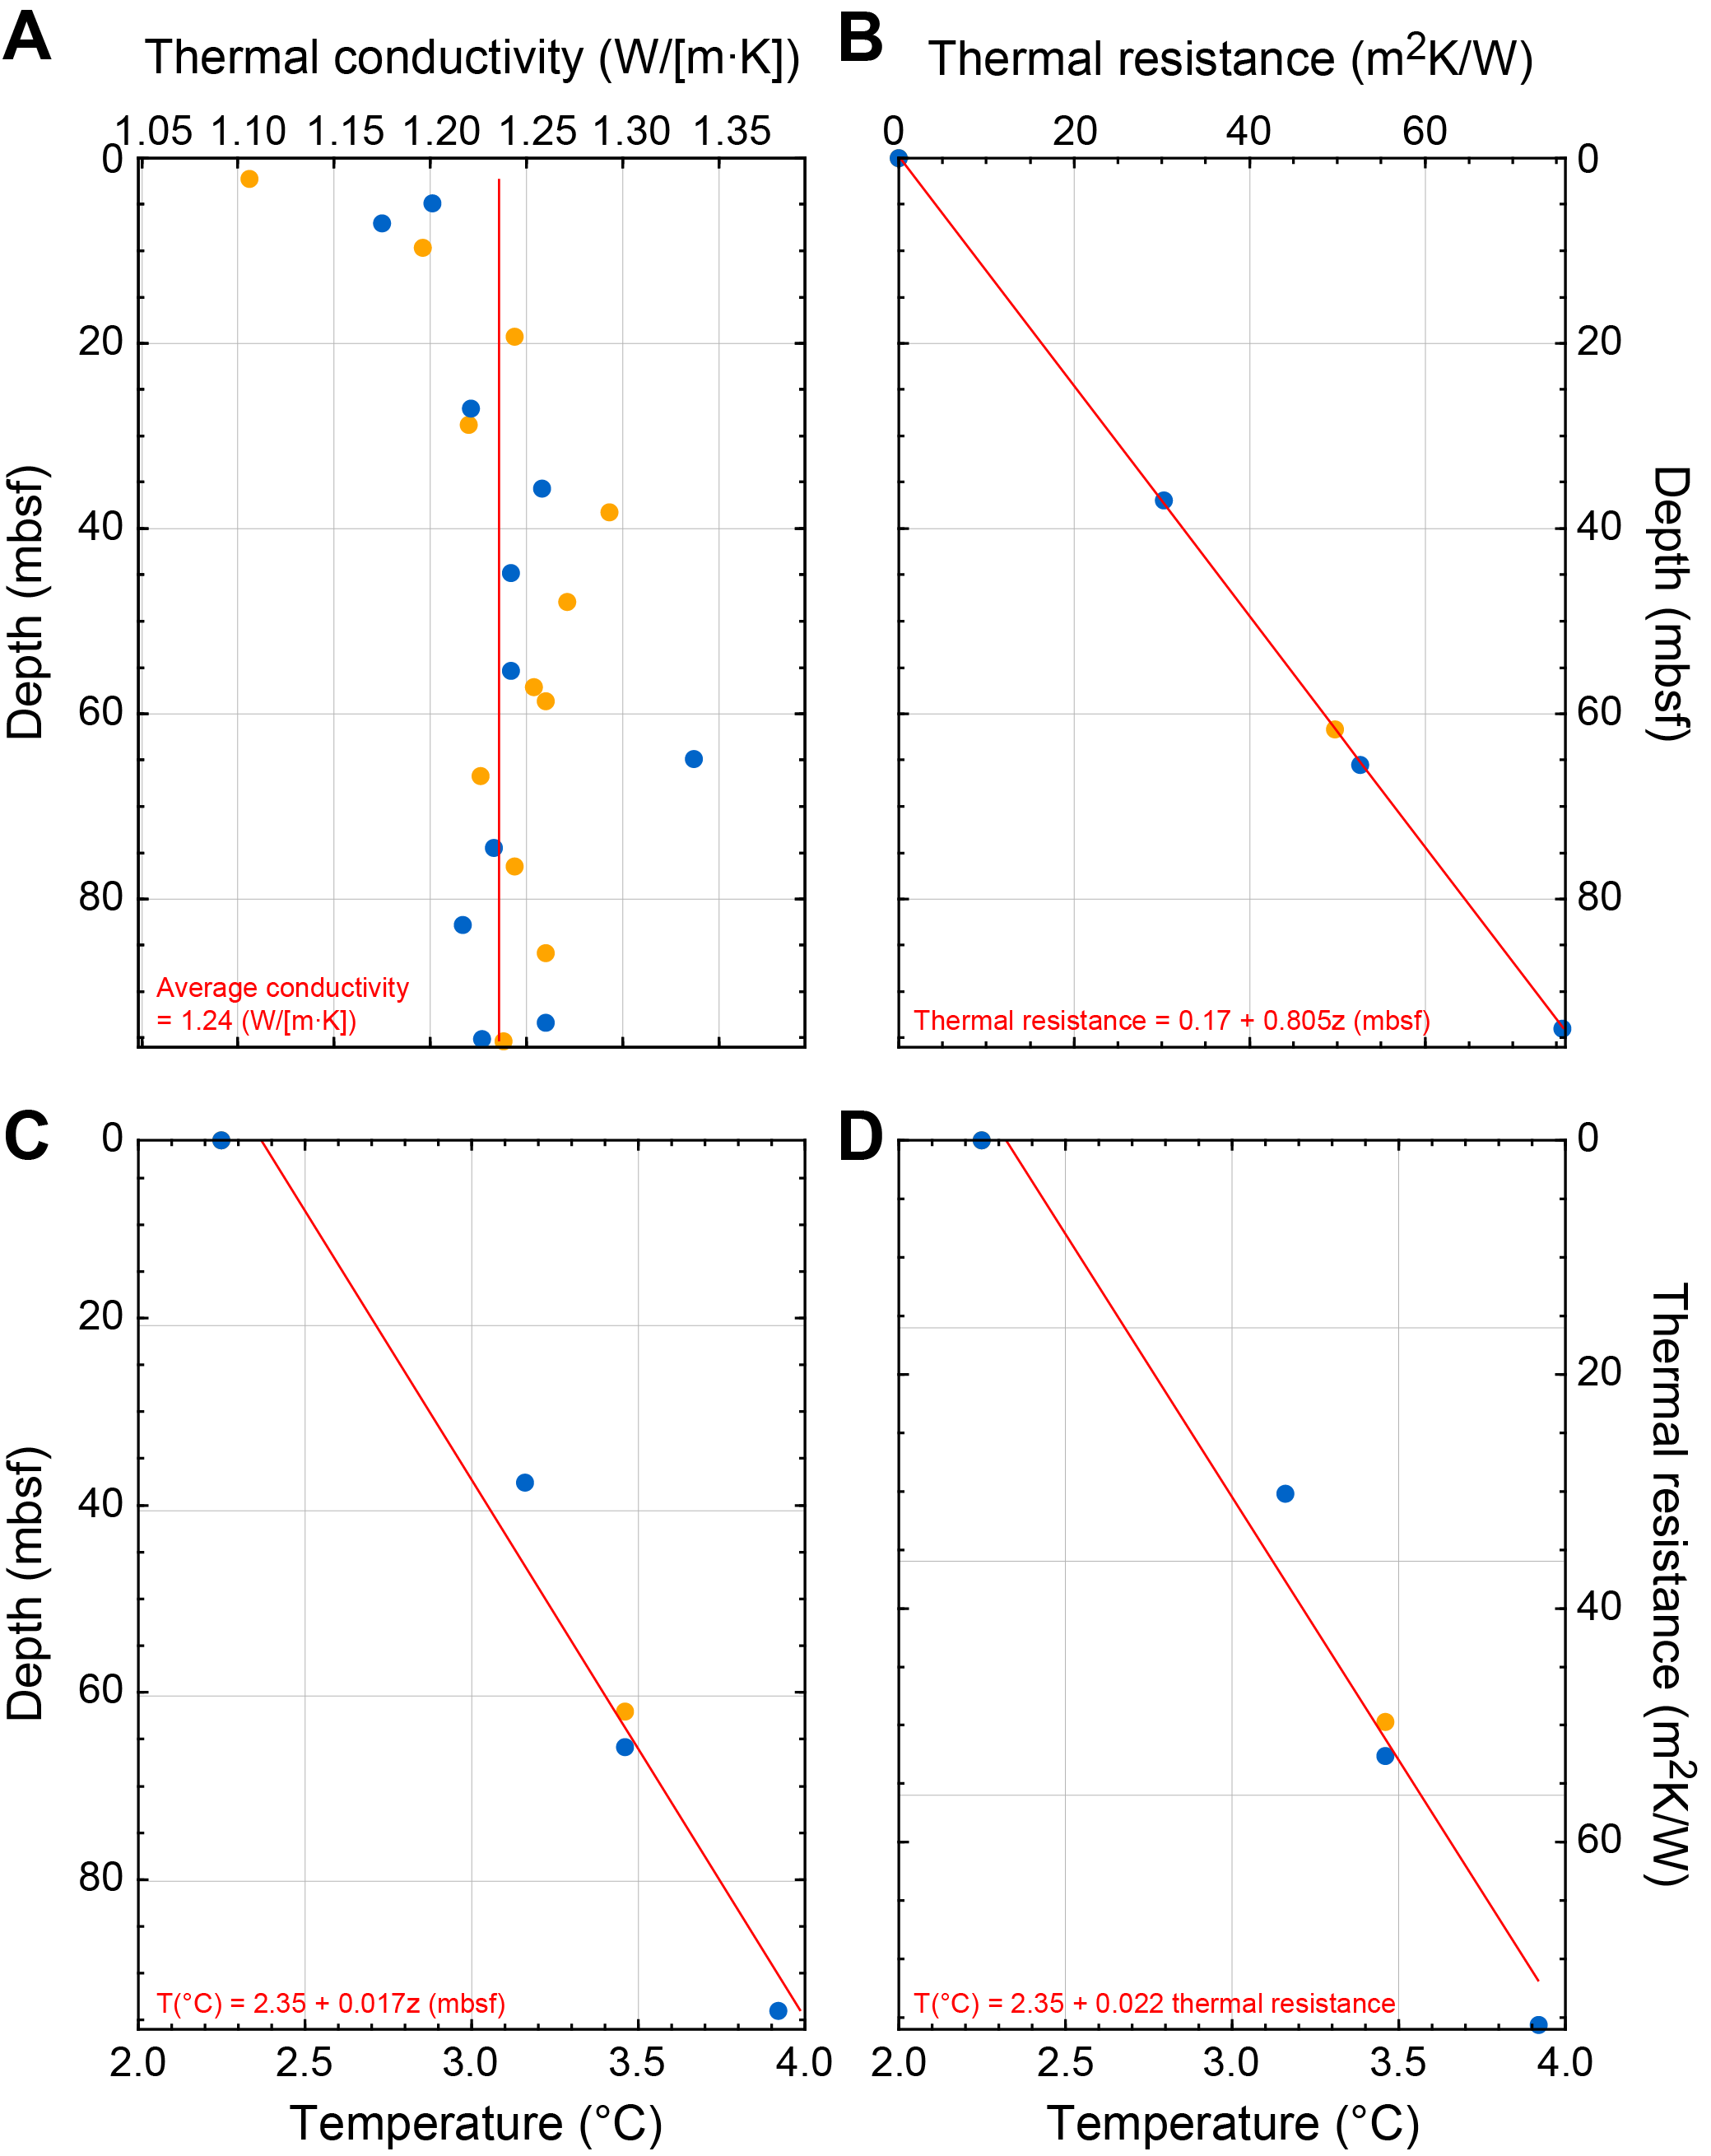
Figure F83. Estimation of conductive heat flow.
A simple estimate of the vertical conductive heat flow can be made by the product of this gradient with the mean thermal conductivity (1.24 W/[m·K]; Figure F83A) measured on the cores recovered over this interval (21 mW/m2) (Table T28).
Another measure of heat flow in a conductive regime can be established with a Bullard plot (see Physical properties and downhole measurements in the Expedition 390/393 methods chapter [Coggon et al., 2024a]). The heat flow estimate, defined by the slope of the least-squares linear fit to the temperature data as a function of thermal resistance, is 22 mW/m2 (Figure F83D; Table T28), close to the previous estimate.
Table T28 summarizes these results, as well as the results of the same calculation for each hole. It confirms that both holes display very similar temperature gradient and conductive heat flow values, far less than the ~130 mW/m2 value predicted for 15 Ma crust by simple plate cooling models (e.g., Stein and Stein, 1992). Our results are also lower than the geographically nearest, and quite diverse, heat flow measurement in the global heat flow compilation (30, 62, and 107 mW/m2) (see Fuchs et al., 2021) or than the average measurement for 15 Ma Southern Atlantic crust (50 mW/m2) (Sclater et al., 1980). The significant differences between the various measurements of the conductive heat flow in the sediments and the model predictions probably result from extensive hydrothermal advection in the crust in this region facilitated by numerous volcanic outcrops and discontinuous sediment blankets (e.g., Kardell et al., 2021).
10.1.5. Stratigraphic correlation
At Site U1560, two holes were cored: Hole U1560A during Expedition 395E and Hole U1560C during Expedition 393. Both recovered the mudline, and their physical properties were correlated to create the splice on a core composite depth below seafloor (CCSF) scale (Figure F84). A total of 118.4 and 127.2 m of sediments were recovered from Holes U1560A and U1560C, respectively.
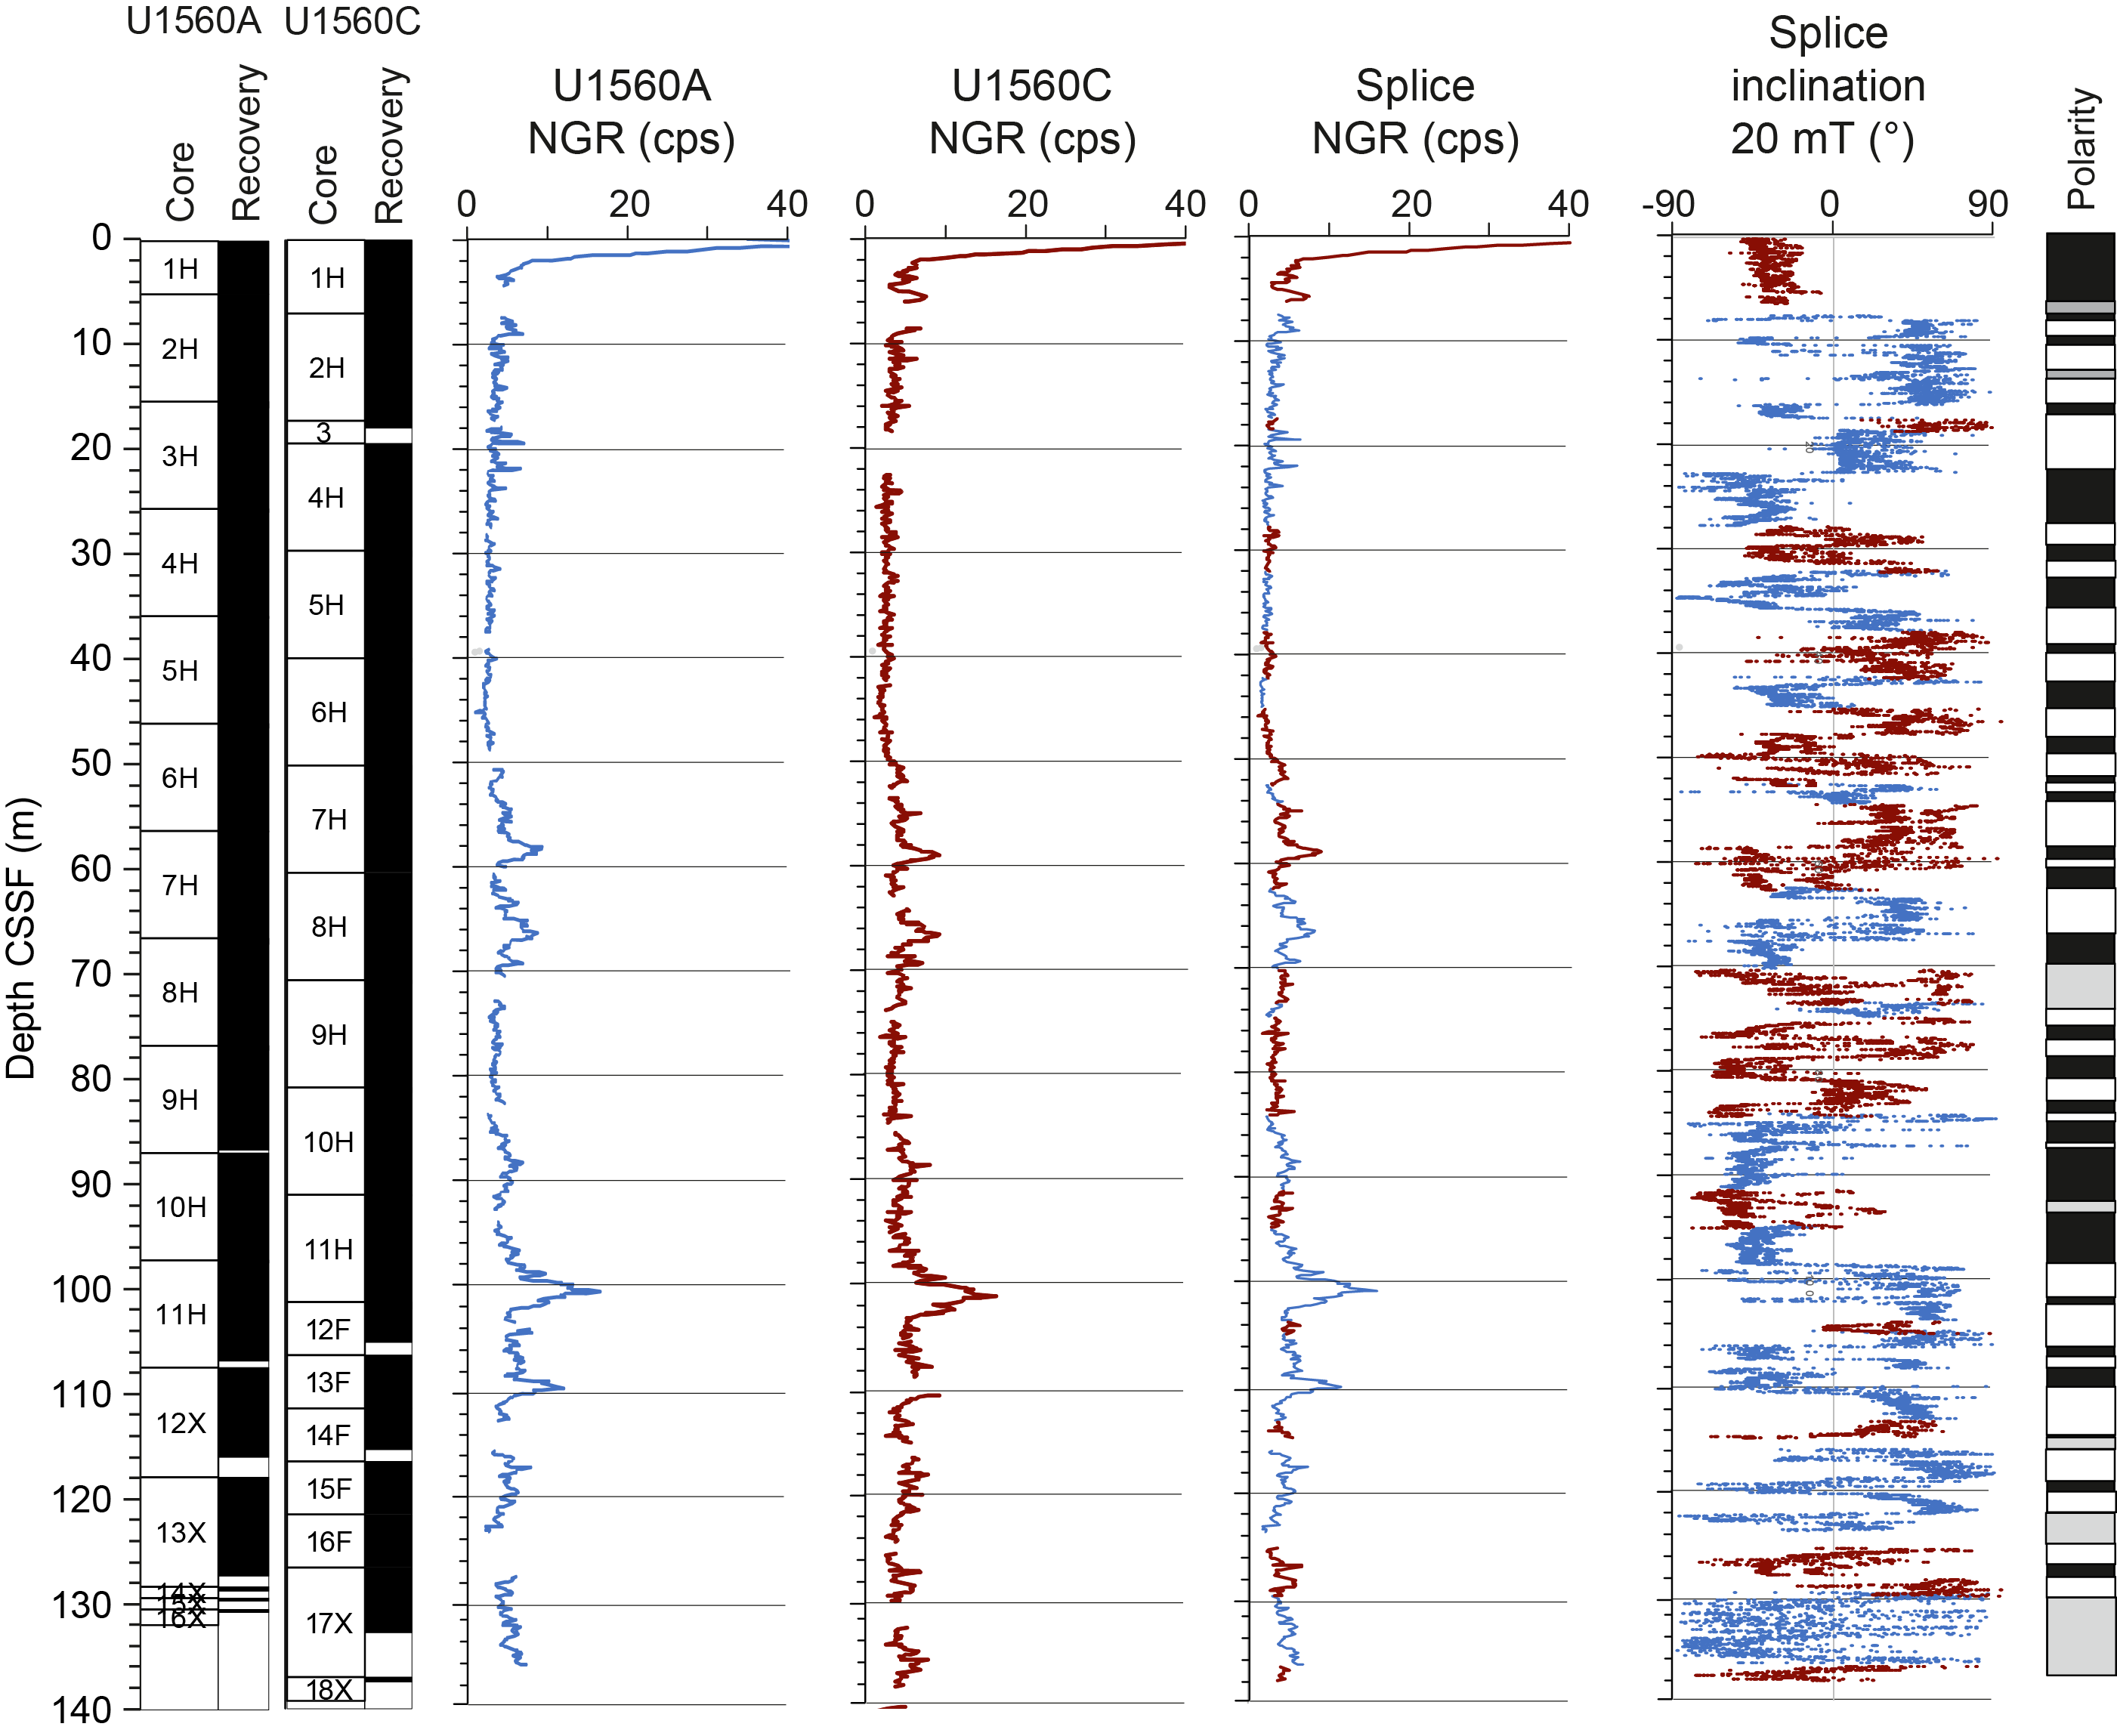
Figure F84. Composite depth scale and splice.
In detail, Hole U1560C is composed of 17 cores, the deepest two cored with the XCB to recover the sediment/basement interface, which was encountered in Section 393-U1560C-18X-2 (127.2 mbsf), through 11 cm of fine-grained basalts. In Hole U1560A, 1 m of basement was recovered at 120 mbsf, which is 7 m shallower than in Hole U1560C. After 16 m of APC coring in Hole U1560C, 2 m of drill bit advancement (drilled interval 393-U1560C-31) was requested to minimize or possibly cover the gaps in Hole U1560A. At 94 mbsf (Core 393-U1560C-12F), the core gaps between the two holes had become aligned again, and a single HLAPC core was requested to restore stratigraphic overlap. However, after Core 11H became stuck (see Operations), coring switched entirely to HLAPC and XCB operations, and some gaps remain in this lower zone of the hole.
10.1.5.1. Correlation and splice
Physical properties data, such as MS (from Special Task Multisensor Logger [STMSL]), GRA, NGR, and paleomagnetic inclination (after the 20 mT demagnetization step; see Paleomagnetism) from Holes U1560A and U1560C were correlated to establish a CCSF depth scale at Site U1560 (Figure F84; Tables T29, T30). Overall correlation of the holes resulted in a spliced record of 138 m CCSF, with an estimated total core gap of 3 m (Figure F84).
Both holes show well-preserved sedimentary features (see Sedimentology), and no severe drilling disturbance influenced the physical properties measurements or the stratigraphic correlation. This is also supported by the XMAN and SHIL image evaluation (see Sedimentology).
Given the lithologic homogeneity of the sedimentary sequence at Site U1560 (both holes are described by one unit; see Sedimentology), physical properties track data often have low values and low variability, with the exception of a few distinctive peaks in MS and NGR (between 50 and 70 m CCSF and between 80 and 100 m CCSF), which were used as ties for correlation. The lower ambiguity of the positive/negative inclination pattern helped to constrain the rest of the splice.
In three cases it was not possible to overlap the stratigraphic records and close the recovery hiatuses: 6–7, 115–116, and 124–125 m CCSF (Figure F84). Aligned core gaps between holes produce floating tied sections on the CCSF scale. Such floating ties were denoted in the affine table as "APPEND" (Table T29). We chose to add 1 m between these cores to include the unknown missing thickness because of incomplete recovery and the ~10% of expansion, mainly due to decompression of the sediments as they are brought to atmospheric pressure (see Physical properties and downhole measurements in the Expedition 390/393 methods chapter [Coggon et al., 2024a]).
The shipboard splice includes four ties selected in the uppermost meter of a core: at 18.5, 45, 54.2, and 103.6 m CCSF. This decision is generally not recommended as best practice (see Stratigraphic correlation in the Expedition 390/393 methods chapter [Coggon et al., 2024a]) but can be the best option where there is only limited stratigraphic overlap. Further analysis, such as XRD scans integrated to a refined age model, will provide better constraints and possibly support or correct this interpretation.
Some stratigraphic intervals were found to be thicker in Hole U1560C (e.g., Subunits IA, IC, and IE; see Sedimentology), on the order of 2–8 m difference with respect to their equivalent in Hole U1560A. We interpret these to be the result of a slightly different sedimentation rate and basement paleobathymetry between the two holes.
Figure F84 also shows the splice of paleomagnetic inclination (see Paleomagnetism), which can be interpreted to be a synthetic polarity scale and integrated with bioevents to create the age model at Site U1560 (see Age model and sedimentation rates).
10.2. Basement
Petrophysical characterization of the ocean crustal section at Site U1560 is primarily based on cores from Hole U1560B that were recovered during Expedition 393. A total of 0.55 m of basalt was recovered from the bottom of Hole U1560A (Cores 395E-U1560A-15X and 16X), and 0.11 m of basalt was recovered from the bottom of Hole U1560C (Section 393-U1560C-18X-2). A clear sediment/basement interface was not recovered in Hole U1560A but was recovered in Hole U1560C. Wireline logging in Hole U1560B was undertaken following the completion of basement coring.
10.2.1. Physical properties
Whole-round core section measurements included NGR, GRA bulk density, and MS. Archive halves of all split-core sections were measured for MSP. A total of 33 discrete sample cubes were taken for P-wave velocity and MAD measurements, including 1 sample of sedimentary breccia and 2 samples from chilled margins to characterize the physical properties of volcanic glass (Table T31). The 30 discrete samples that could be cut into cubes were also used for paleomagnetic measurements (see Basement in Paleomagnetism). Thermal conductivity measurements were made on 41 pieces from working halves of split cores. Full-circumference, true-color images of whole round core exteriors were recorded with the DMT CoreScan3 system on material from Hole U1560B. A summary of core section and discrete physical properties data from Hole U1560B is shown in Figure F85 and Tables T31 and T32. All depths in the tables and figures are in CSF-A (as meters below seafloor), and the means of all physical properties are arithmetic means represented with uncertainty of ±1 standard deviation (1σ), unless otherwise stated.
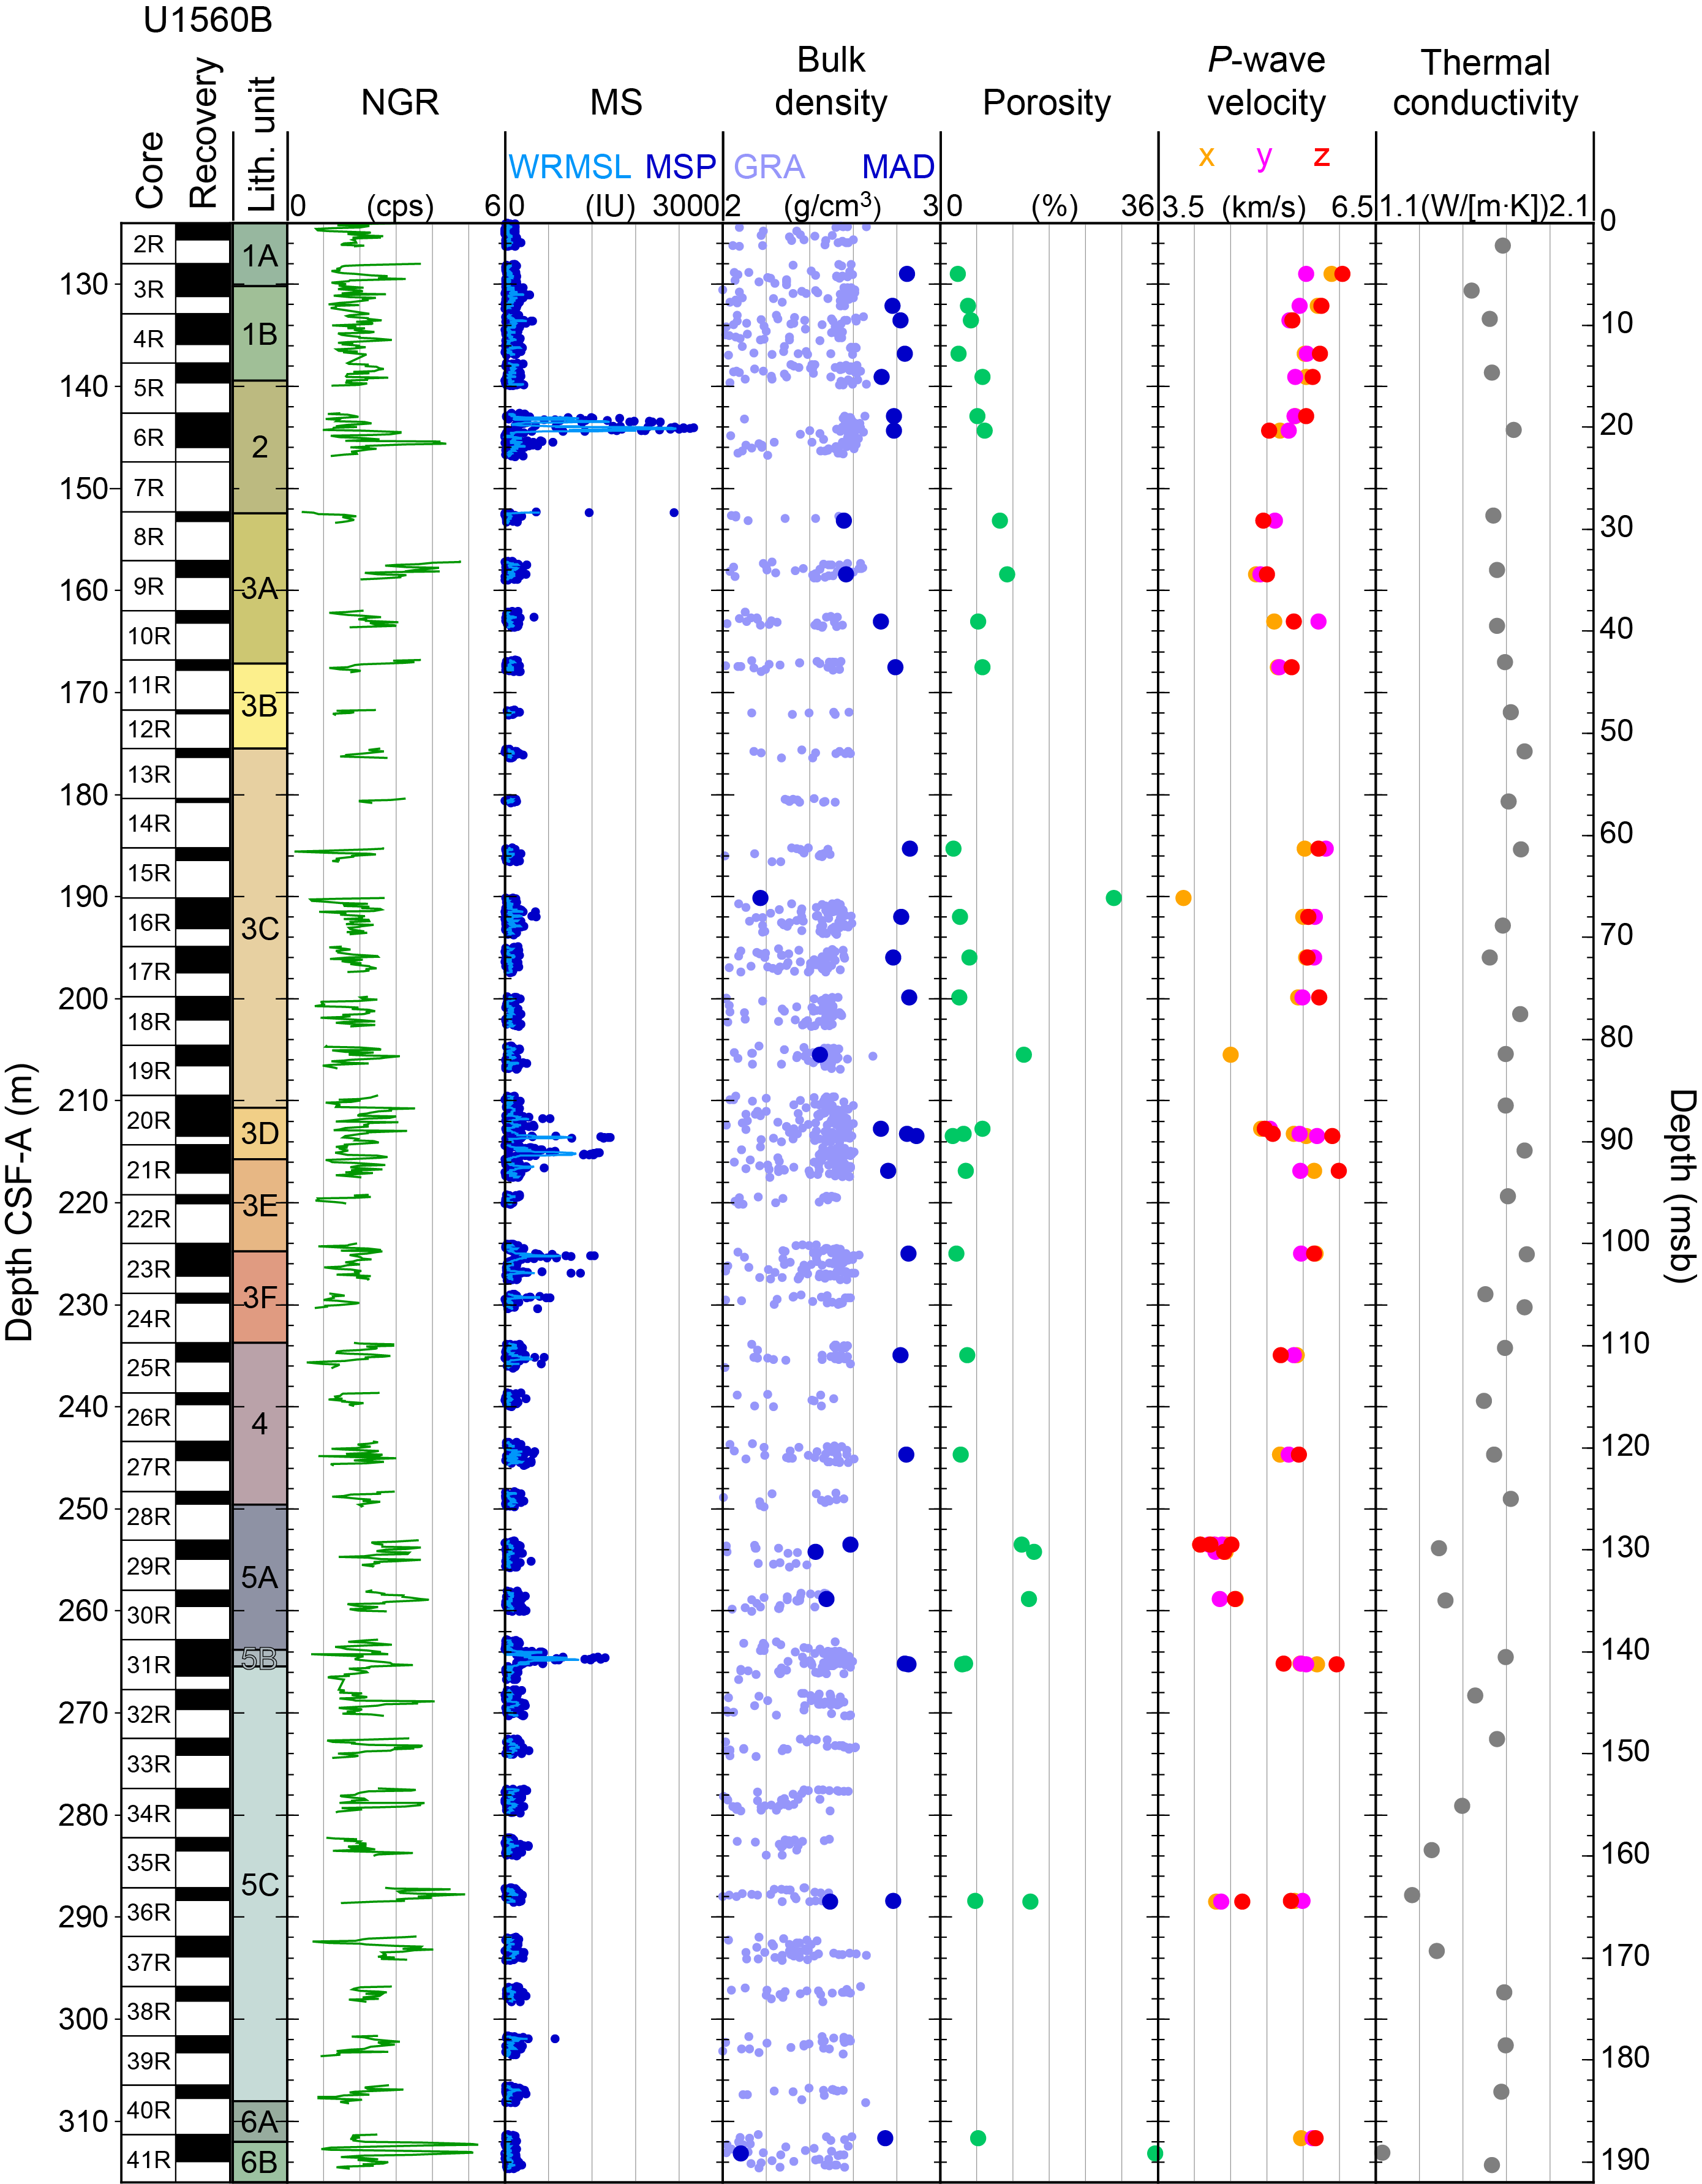
Figure F85. Physical properties, Hole U1560B.
10.2.1.1. Natural gamma radiation
In Hole U1560B, mean NGR is 2.1 ± 0.7 counts/s (range = 0.2–5.3 counts/s) (Figure F85; Table T32). NGR is relatively consistent at ~2 counts/s in Units 1–4 with the exception of two peaks in the middle of Unit 2 and Subunit 3A (Figure F85). The mean NGR is slightly higher in Units 5 and 6 (mean = 2.3 ± 0.7 counts/s and 2.5 ± 1.2 counts/s, respectively), and the highest values are seen in a large peak in Subunit 6B (sedimentary breccia). The highest NGR is associated with sedimentary breccias (mean = 2.7 ± 1.3 counts/s). Basalts characterized as sheet flows, mixed sheet and pillow flows, pillow flows, massive flows, and undifferentiated lava flows have a lower mean NGR (1.8–2.1 counts/s) (Figure F85; Table T32).
10.2.1.2. Magnetic susceptibility
MS measured from both WRMSL and MSP methods show similar downhole trends. The amplitudes of WRMSL data range 0–2362 IU, and MSP ranges 0–2595 IU. MS values from the MSP generally show higher values than those from the WRMSL. The lower WRMSL values generally result from gaps and irregular shaped/small core pieces (heavily influencing the continuous measurements) and/or from the different frequency of data acquisition for the two methods (see Physical properties and downhole measurements in the Expedition 390/393 methods chapter [Coggon et al., 2024a]). Prominent MS peaks occur in the MS in four depth intervals: ~144 mbsf (Unit 2; maximum = 2595 IU by MSP), ~212–218 mbsf (Subunits 3D and 3E; maximum = 1450 IU), ~224–228 mbsf (Subunits 3E and 3F; maximum = 1225 IU), and ~265 mbsf (Subunit 5B; maximum = 1378 IU). Several of these intervals occur as pairs of peaks that each show an increase in MS. The largest MS peaks occur in massive flows (Unit 2) and smaller peaks in sheet flows (Subunits 3D and 5B) and pillow flows (Subunits 3E and 3F), suggesting that magmatic emplacement style may have a strong control on MS in this hole. Visual core inspection also suggests that these intervals of elevated MS are associated with less-altered fine-grained holocrystalline basalt (see Igneous petrology and Alteration petrology).
10.2.1.3. Gamma ray attenuation bulk density
GRA bulk density ranges 2.00–2.69 g/cm3 in Hole U1560B (mean = 2.40 ± 0.17 g/cm3) (Figure F85; Table T32). GRA bulk density values <2 g/cm3 were excluded from figures and interpretations, as these likely represent gaps due to incomplete filling of the core liner and are not representative of the recovered material. The highest GRA bulk density values measured are consistently ~0.2 g/cm3 lower than those measured using MAD methods, largely due to these gap effects. MAD samples may also be biased toward higher density lithologies, as they are selected from cohesive pieces that can withstand being cut into cubes (see Physical properties and downhole measurements in the Expedition 390/393 methods chapter [Coggon et al., 2024a]). The mean GRA bulk density is highest in Unit 2 (2.51 ± 0.16 g/cm3) and ranges ~2.3–2.4 g/cm3 in the other five units. Given the mineral constituents and the low porosity of basalts, these density values are unrealistically low, but the general trends of the upper envelope of values may be interpretable.
10.2.1.4. P-wave velocity
P-wave velocity ranges 3.85–5.89 km/s along the x-axis, 4.20–5.81 km/s along the y-axis, and 4.41–6.04 km/s along the z-axis of discrete samples. All three velocities measured for each sample are shown in Figure F85 and Table T31; however, only the highest value measured for each sample is used to calculate mean velocities (Table T32), as these are considered most representative of the true formation velocity (see Physical properties and downhole measurements in the Expedition 390/393 methods chapter [Coggon et al., 2024a]).
Maximum P-wave velocity decreases slightly from ~6 km/s near the top of the basement sequence in Hole U1560B (Subunit 1A) to ~5 km/s in Subunit 3A (Figure F85; Table T32). There is a gap in discrete samples for P-wave velocity at ~168–182 mbsf where core recovery was low (Subunit 3B through the top of Subunit 3C). P-wave velocity is relatively high (~5.5 km/s) in Subunits 3C–3E with the exception of two samples with very low P-wave velocity that were taken from chilled margins in pillow lavas (mean = 4.17 ± 0.46 km/s) (Figure F85; Table T32). Another interval of low P-wave velocity (~4.5 km/s) is seen in pillow flow basalts from Subunit 5A (Figure F85). In general, P-wave velocity is highest in Units 1 (mean = 5.70 ± 0.25 km/s) and 6 (5.67 km/s; 1 sample). Units 2 and 4 both have a mean of 5.42 km/s. Unit 3 has a mean velocity of 5.36 ± 0.58 km/s, and the lowest mean velocity is seen in Unit 5 (5.01 ± 0.61 km/s) (Figure F86; Table T32).
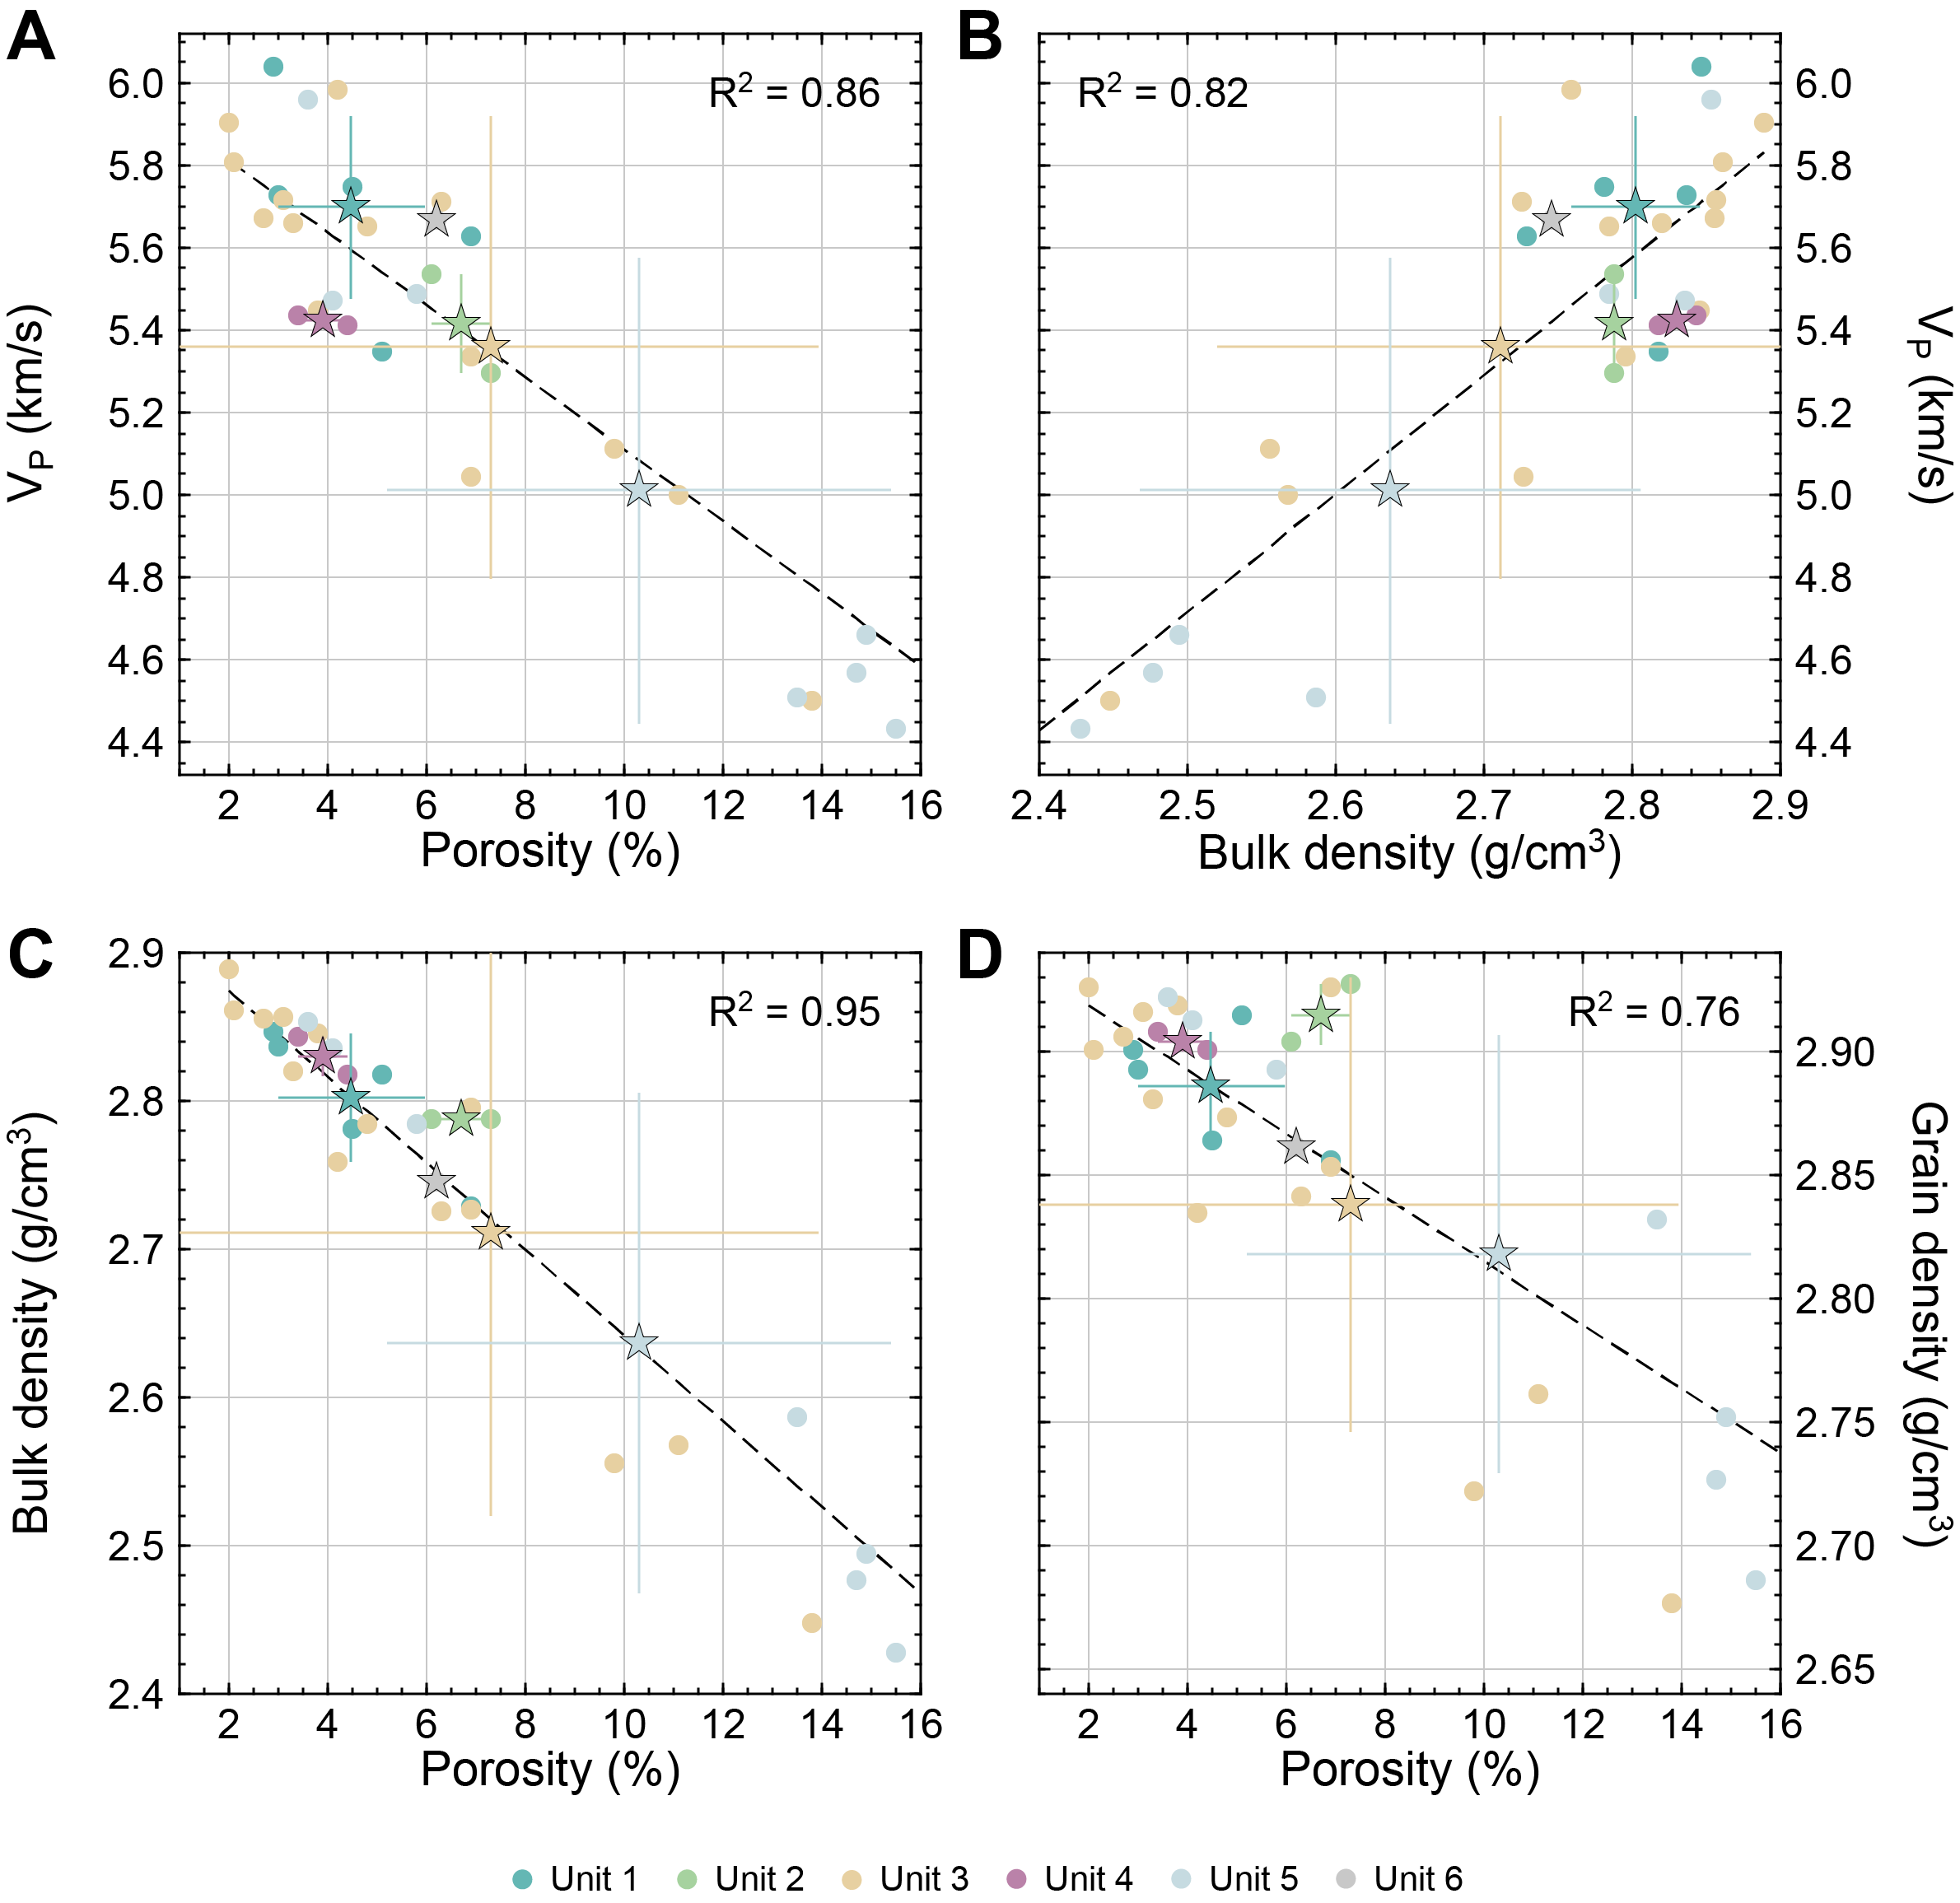
Figure F86. Basalt physical properties by lithostratigraphic unit.
Pillow flows have the lowest mean P-wave velocity of the different emplacement styles (5.19 ± 0.61 km/s) though they encompass the full range of measured velocities in Hole U1560B (Figure F87). Massive flows and sheet flows have intermediate mean P-wave velocities (5.42 ± 0.17 km/s and 5.58 ± 0.29 km/s, respectively), and morphologically undifferentiated lava flows have the highest mean P-wave velocity (5.83 ± 0.23 km/s) (Figure F87; Table T32). No P-wave velocities were measured in the sedimentary breccia from this site (Subunit 6B) because it was not possible to cut a piece from these samples with at least two parallel surfaces.
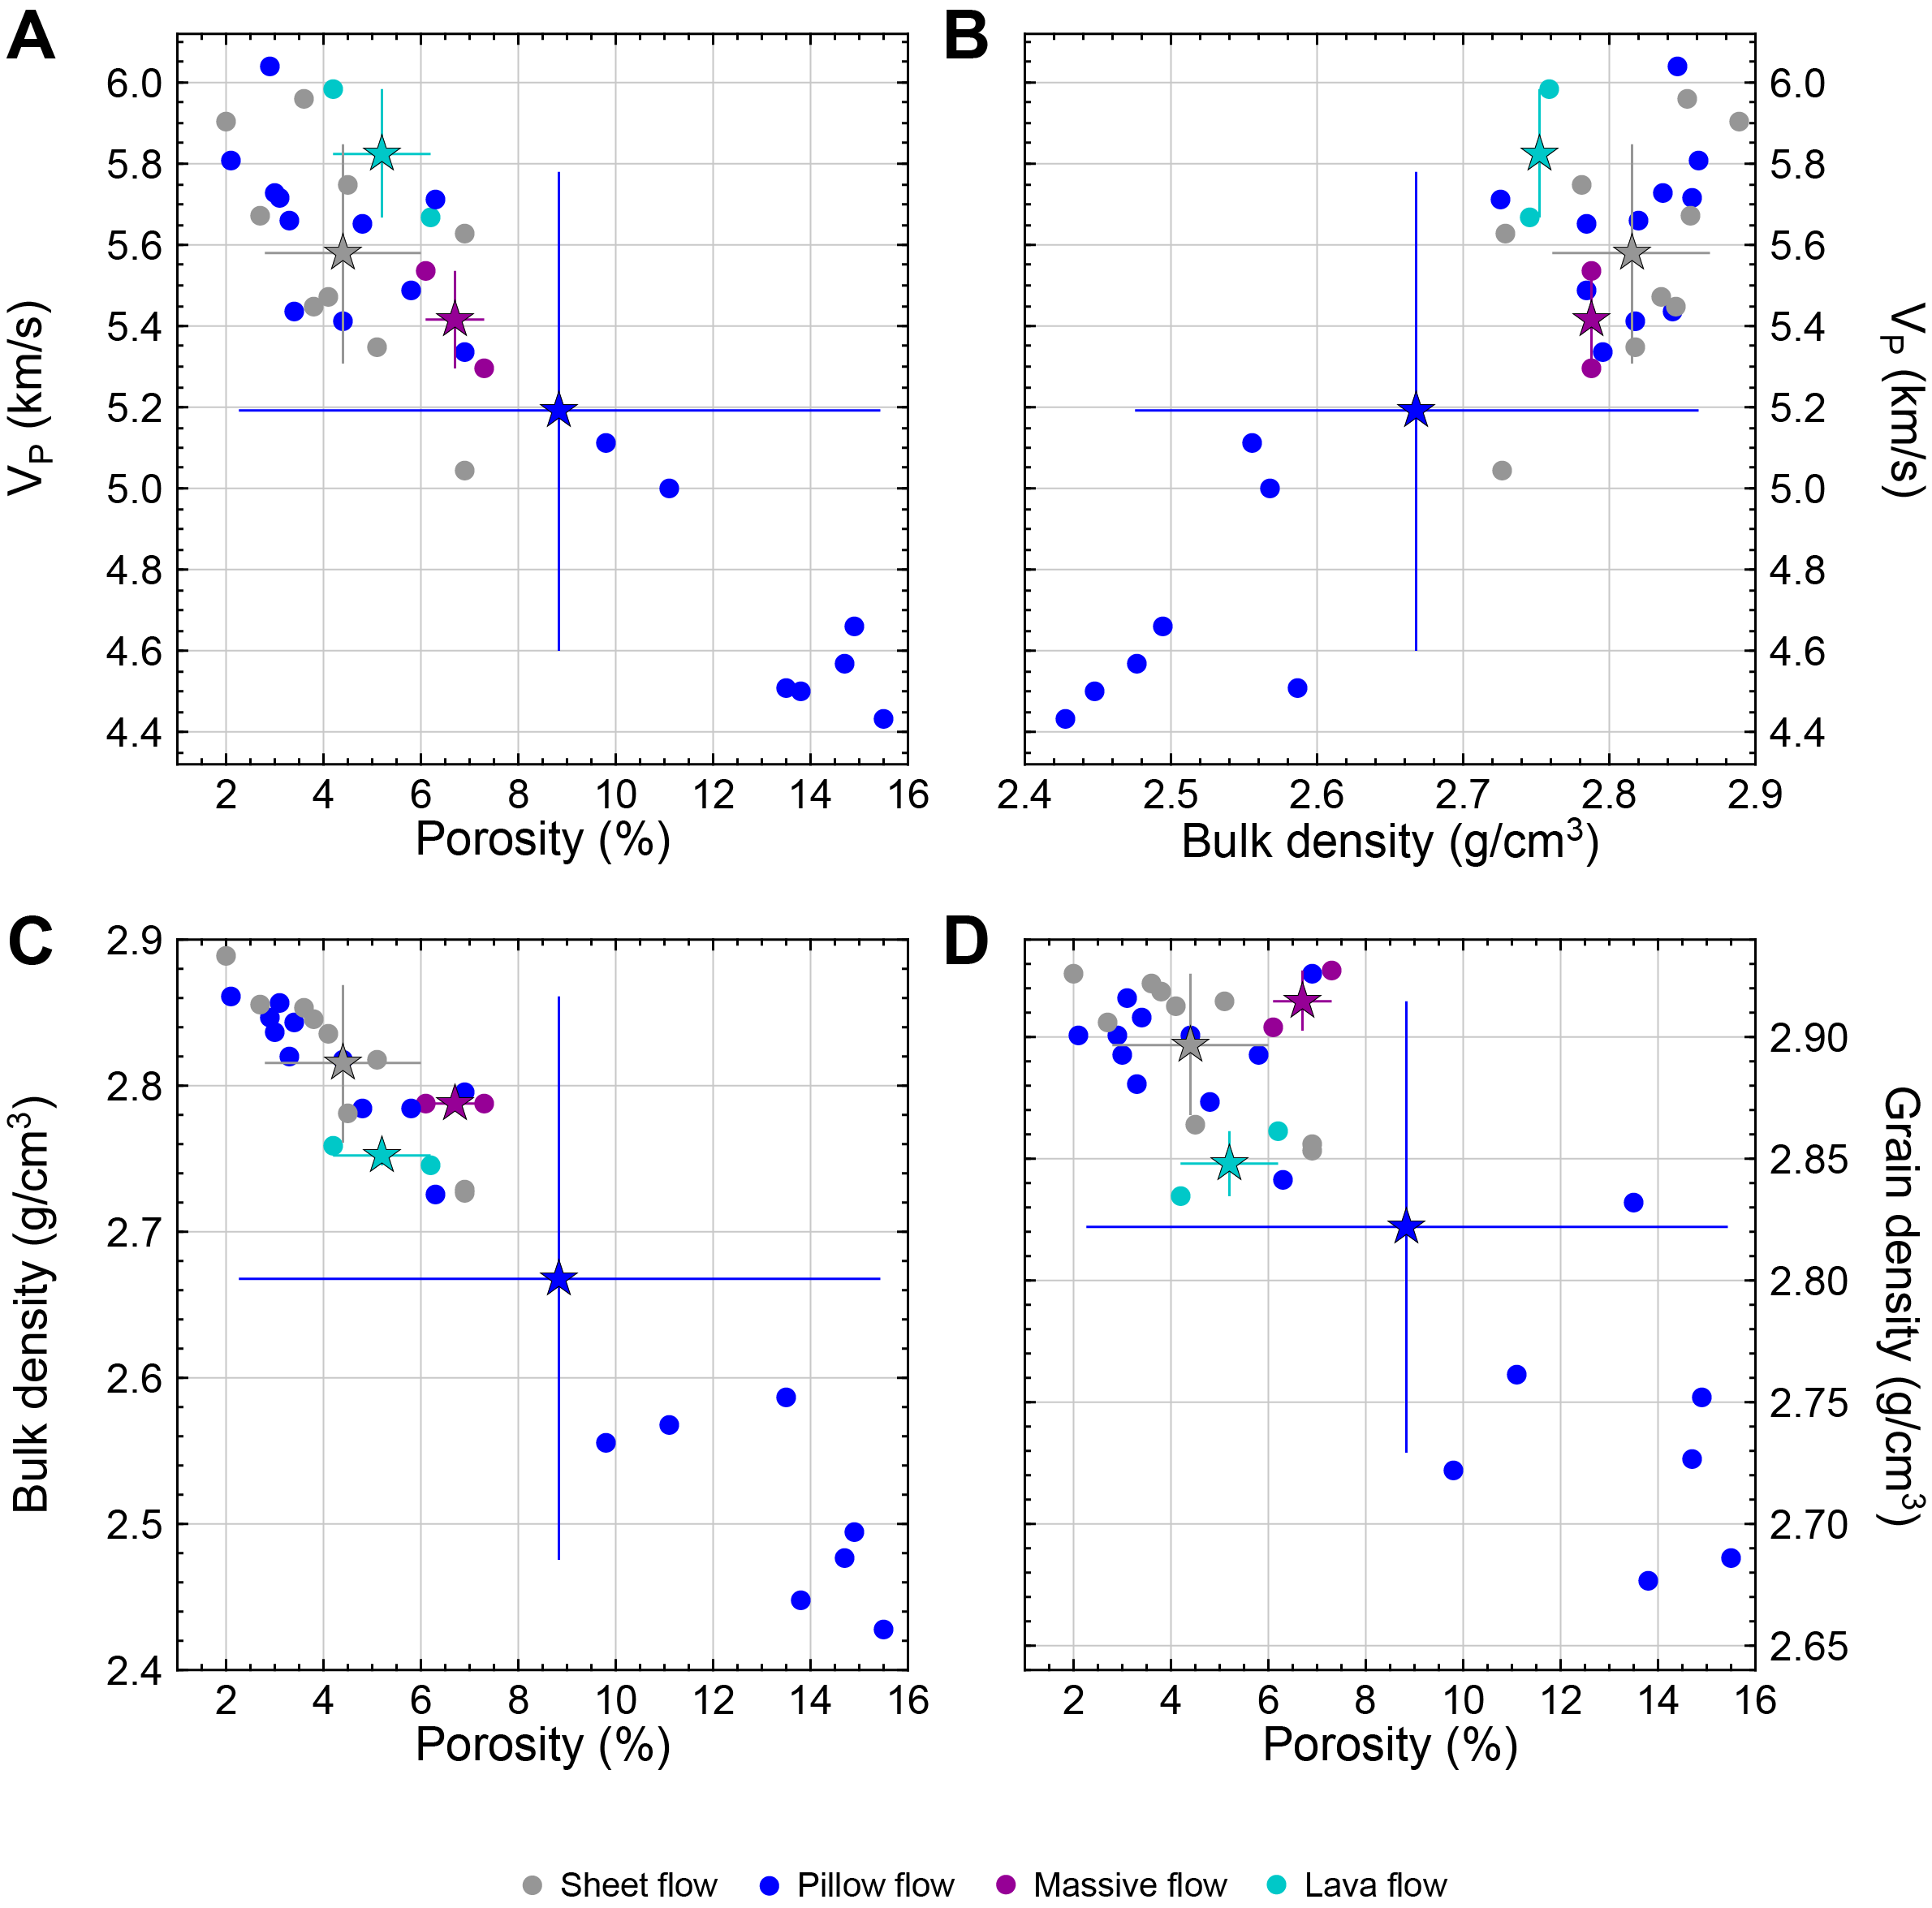
Figure F87. Basalt physical properties by emplacement style.
P-wave velocity does not show a clear trend with increasing groundmass grain size, although the lowest velocities are in basalt samples with finest groundmass grain size (i.e., cryptocrystalline) and the sample of glassy chilled margin (Figure F88). The highest mean P-wave velocity is seen in microcrystalline basalts (mean = 5.58 ± 0.23 km/s) followed by fine-grained basalts (5.46 ± 0.29 km/s) and cryptocrystalline basalts (5.33 ± 0.59 km/s). The largest difference is seen in the chilled margin samples that are composed primarily of volcanic glass (Figure F88; Tables T31, T32).
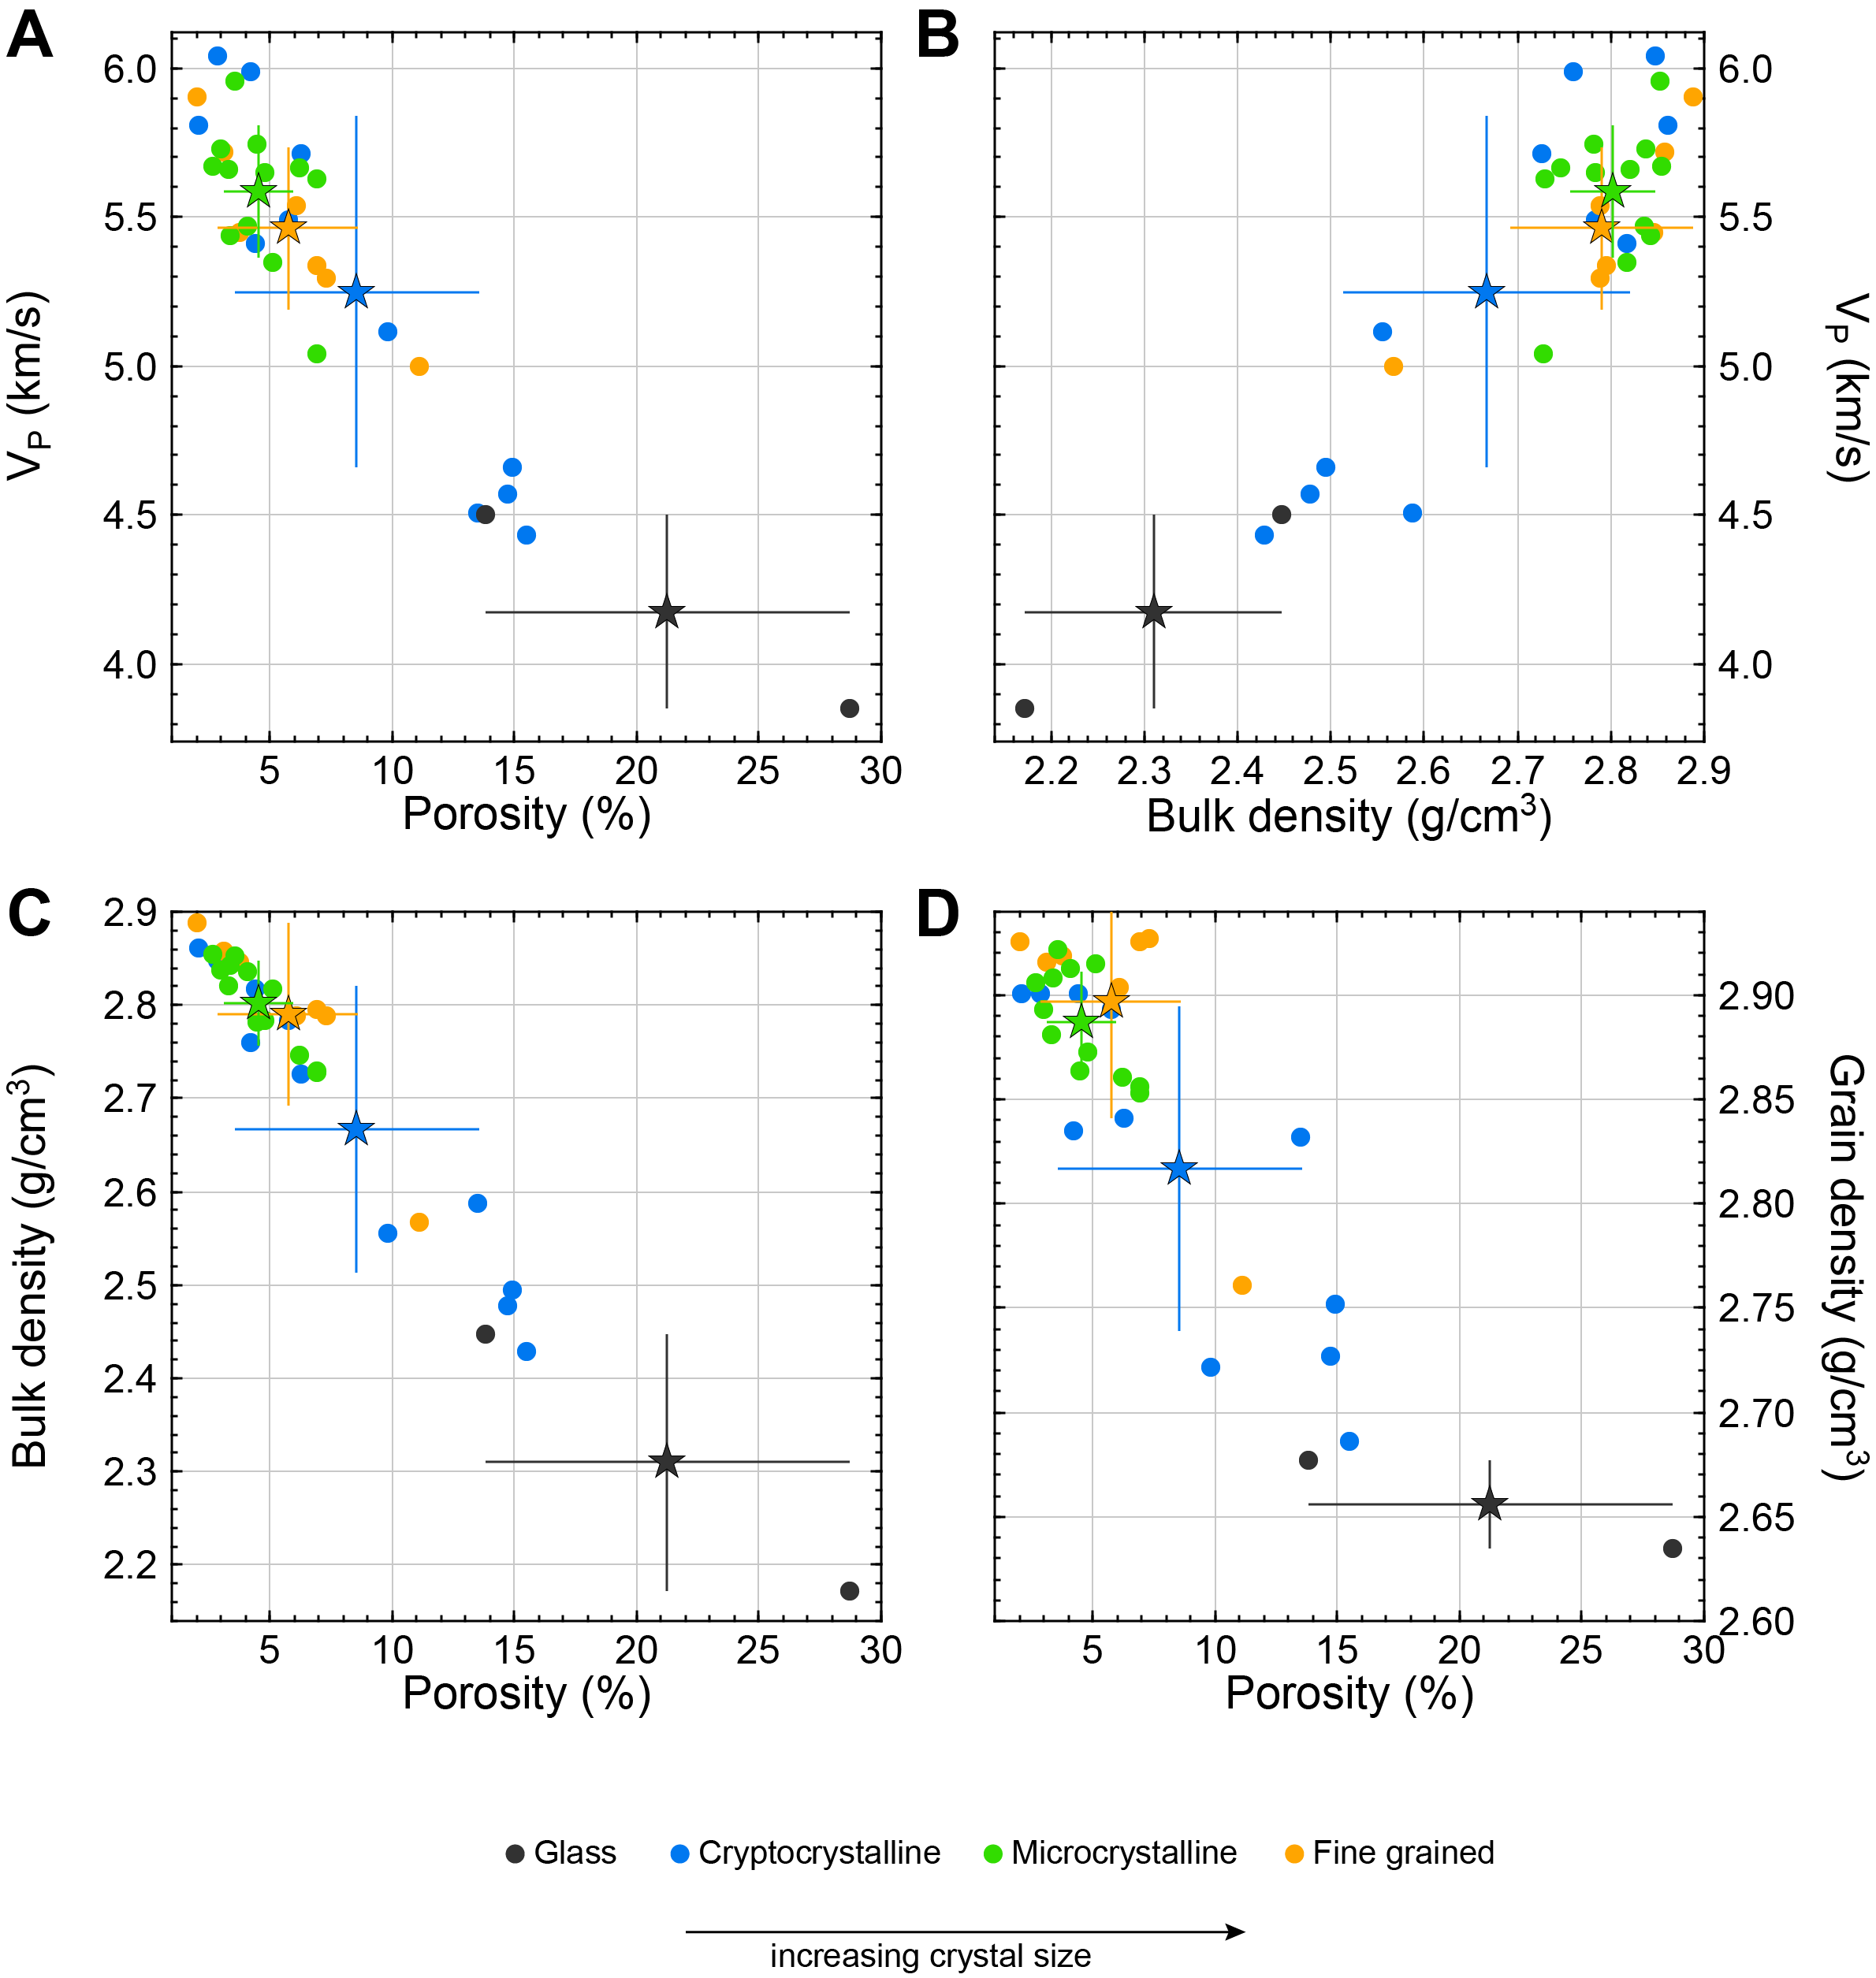
Figure F88. Basalt physical properties by groundmass grain size.
10.2.1.5. Moisture and density
The bulk density of discrete samples from MAD analysis ranges 2.08–2.89 g/cm3 (mean = 2.70 ± 0.20 g/cm3). Lithostratigraphic Units 1, 2, and 4 (see Igneous petrology) have similar mean MAD bulk densities of 2.79–2.83 g/cm3 (Figure F86; Table T32). Units 3 and 5 have lower mean bulk densities (2.71 ± 0.20 km/s and 2.64 ± 0.18 km/s, respectively) over a wider range of values. When results from MAD analysis are grouped by magmatic emplacement styles (see Igneous petrology) (Figure F87; Table T32), sheet flows and massive flows yield the highest mean bulk and grain densities (~2.8 and ~2.9 g/cm3, respectively). Pillow flow mean bulk and grain densities are the lowest, although discrete measurements span the full range of densities and porosities in Hole U1560B (Figure F87C, F87D). As expected, this is also reflected in the large variability of P-wave velocities in pillow flows (Figure F87A, F87B). The single sample of sedimentary breccia from Subunit 6B has the lowest bulk and grain density (2.08 and 2.66 g/cm3, respectively) and the highest porosity (35.5%). MAD measurements from the sedimentary breccia are not included in Figure F87 because they exhibit a large offset with respect to the basalt data set.
Density and porosity changes do not appear to vary systematically with groundmass grain size because the whole data set is spread over a large range of values (Figure F88; Table T32). However, glassy chilled margin samples have consistently high porosity, low bulk density, and low grain density. Among all other samples, lowest bulk and grain densities are measured in cryptocrystalline basalts, followed by fine-grained and microcrystalline basalts. Porosity values show a wide range of 2.0%–35.5% throughout the Site U1560 volcanic sequence (Table T31). Considering only basalts, the highest porosities are seen in pillow flows; this emplacement style has porosity ranging 2.1%–28.7% (mean = 8.8% ± 6.8%), with the highest porosity measured in a chilled margin (Sample 393-U1560B-16R-1, 0–2 cm) (Table T32). Basalts emplaced as sheet flows have the lowest mean porosity (4.40% ± 1.69%) (Figure F87; Table T32). Porosity does not appear to vary systematically with grain size, as it is highest in some cryptocrystalline basalt samples (mean = 8.55% ± 5.24%), although the measurements span the whole range of porosity, followed by fine-grained (mean = 5.76% ± 3.09%) and then microcrystalline samples (mean = 4.54% ± 1.48%) (Figure F88).
10.2.1.6. Thermal conductivity
Thermal conductivity ranges 1.13–1.79 W/(m·K) (mean = 1.63 ± 0.15 W/[m·K]) (Figure F85; Tables T31, T32). The lowest thermal conductivity is measured in a sedimentary breccia (1.20 ± 0.10 W/[m·K]), whereas the highest value (1.74 W/[m·K]) is recorded in massive flows in Unit 2, similar to the mean value (mean = 1.71 ± 0.05 W/[m·K]) of Unit 3, which is made of pillow and morphologically undifferentiated lava flows (Tables T31, T32). There is a slight downhole increase in thermal conductivity from ~1.7 W/(m·K) at the top of the basement sequence to ~1.8 W/(m·K) at ~230 mbsf. Thermal conductivity values show two broad peaks in the lower part of Hole U1560B, with relative minima at ~255 and ~288 mbsf (Figure F85).
10.2.2. Data integration
Several clear relationships between the discrete physical properties (P-wave velocity, porosity, bulk density, and grain density) become apparent when considering Figures F86, F87, and F88. Considering only basalts, we find an inverse relationship between P-wave velocity and porosity (R2 = 0.9), bulk density and porosity (R2 = 0.9), and grain density and porosity (R2 = 0.8) and a positive correlation between bulk density and P-wave velocity (R2 = 0.8). Despite the variability in basalt emplacement styles and groundmass grain sizes, these properties alone do not account for the wide range of observed density, porosity, and P-wave velocity seen in the samples.
Discrete samples used for MAD and P-wave analyses were grouped by alteration style to evaluate the role alteration plays in driving the observed variations in physical properties. A classification scheme of alteration levels was based on color, texture, and presence of alteration halos, following the scheme used in macroscopic core descriptions (see Igneous petrology and Alteration petrology). Five levels of alteration from freshest to most altered are ordered as follows: (1) gray background, (2) gray background with veins, (3A) grayish brown halo (weak), (3B) grayish brown halo (strong), and (4) reddish yellow (Table T31).
P-wave velocity, porosity, and density show only weak trends when classified by alteration level (Figure F89; Table T32). The least altered samples (gray background) generally cluster with lower porosity and higher P-wave velocity, bulk density, and grain density. Samples that are classified as having a weak grayish brown halo (intermediate alteration level) span almost the full range of values measured in each of these physical properties (Figure F89). Porosity is expected to decrease as the alteration level increases because pore space (e.g., cracks or vesicles) is filled with secondary minerals. However, results at sites across the SAT show an opposite, thus counterintuitive trend, suggesting the measurements of porous volume in the most altered samples do not reflect the true porosity of the basement rock. Postexpedition work is needed to address this problem.
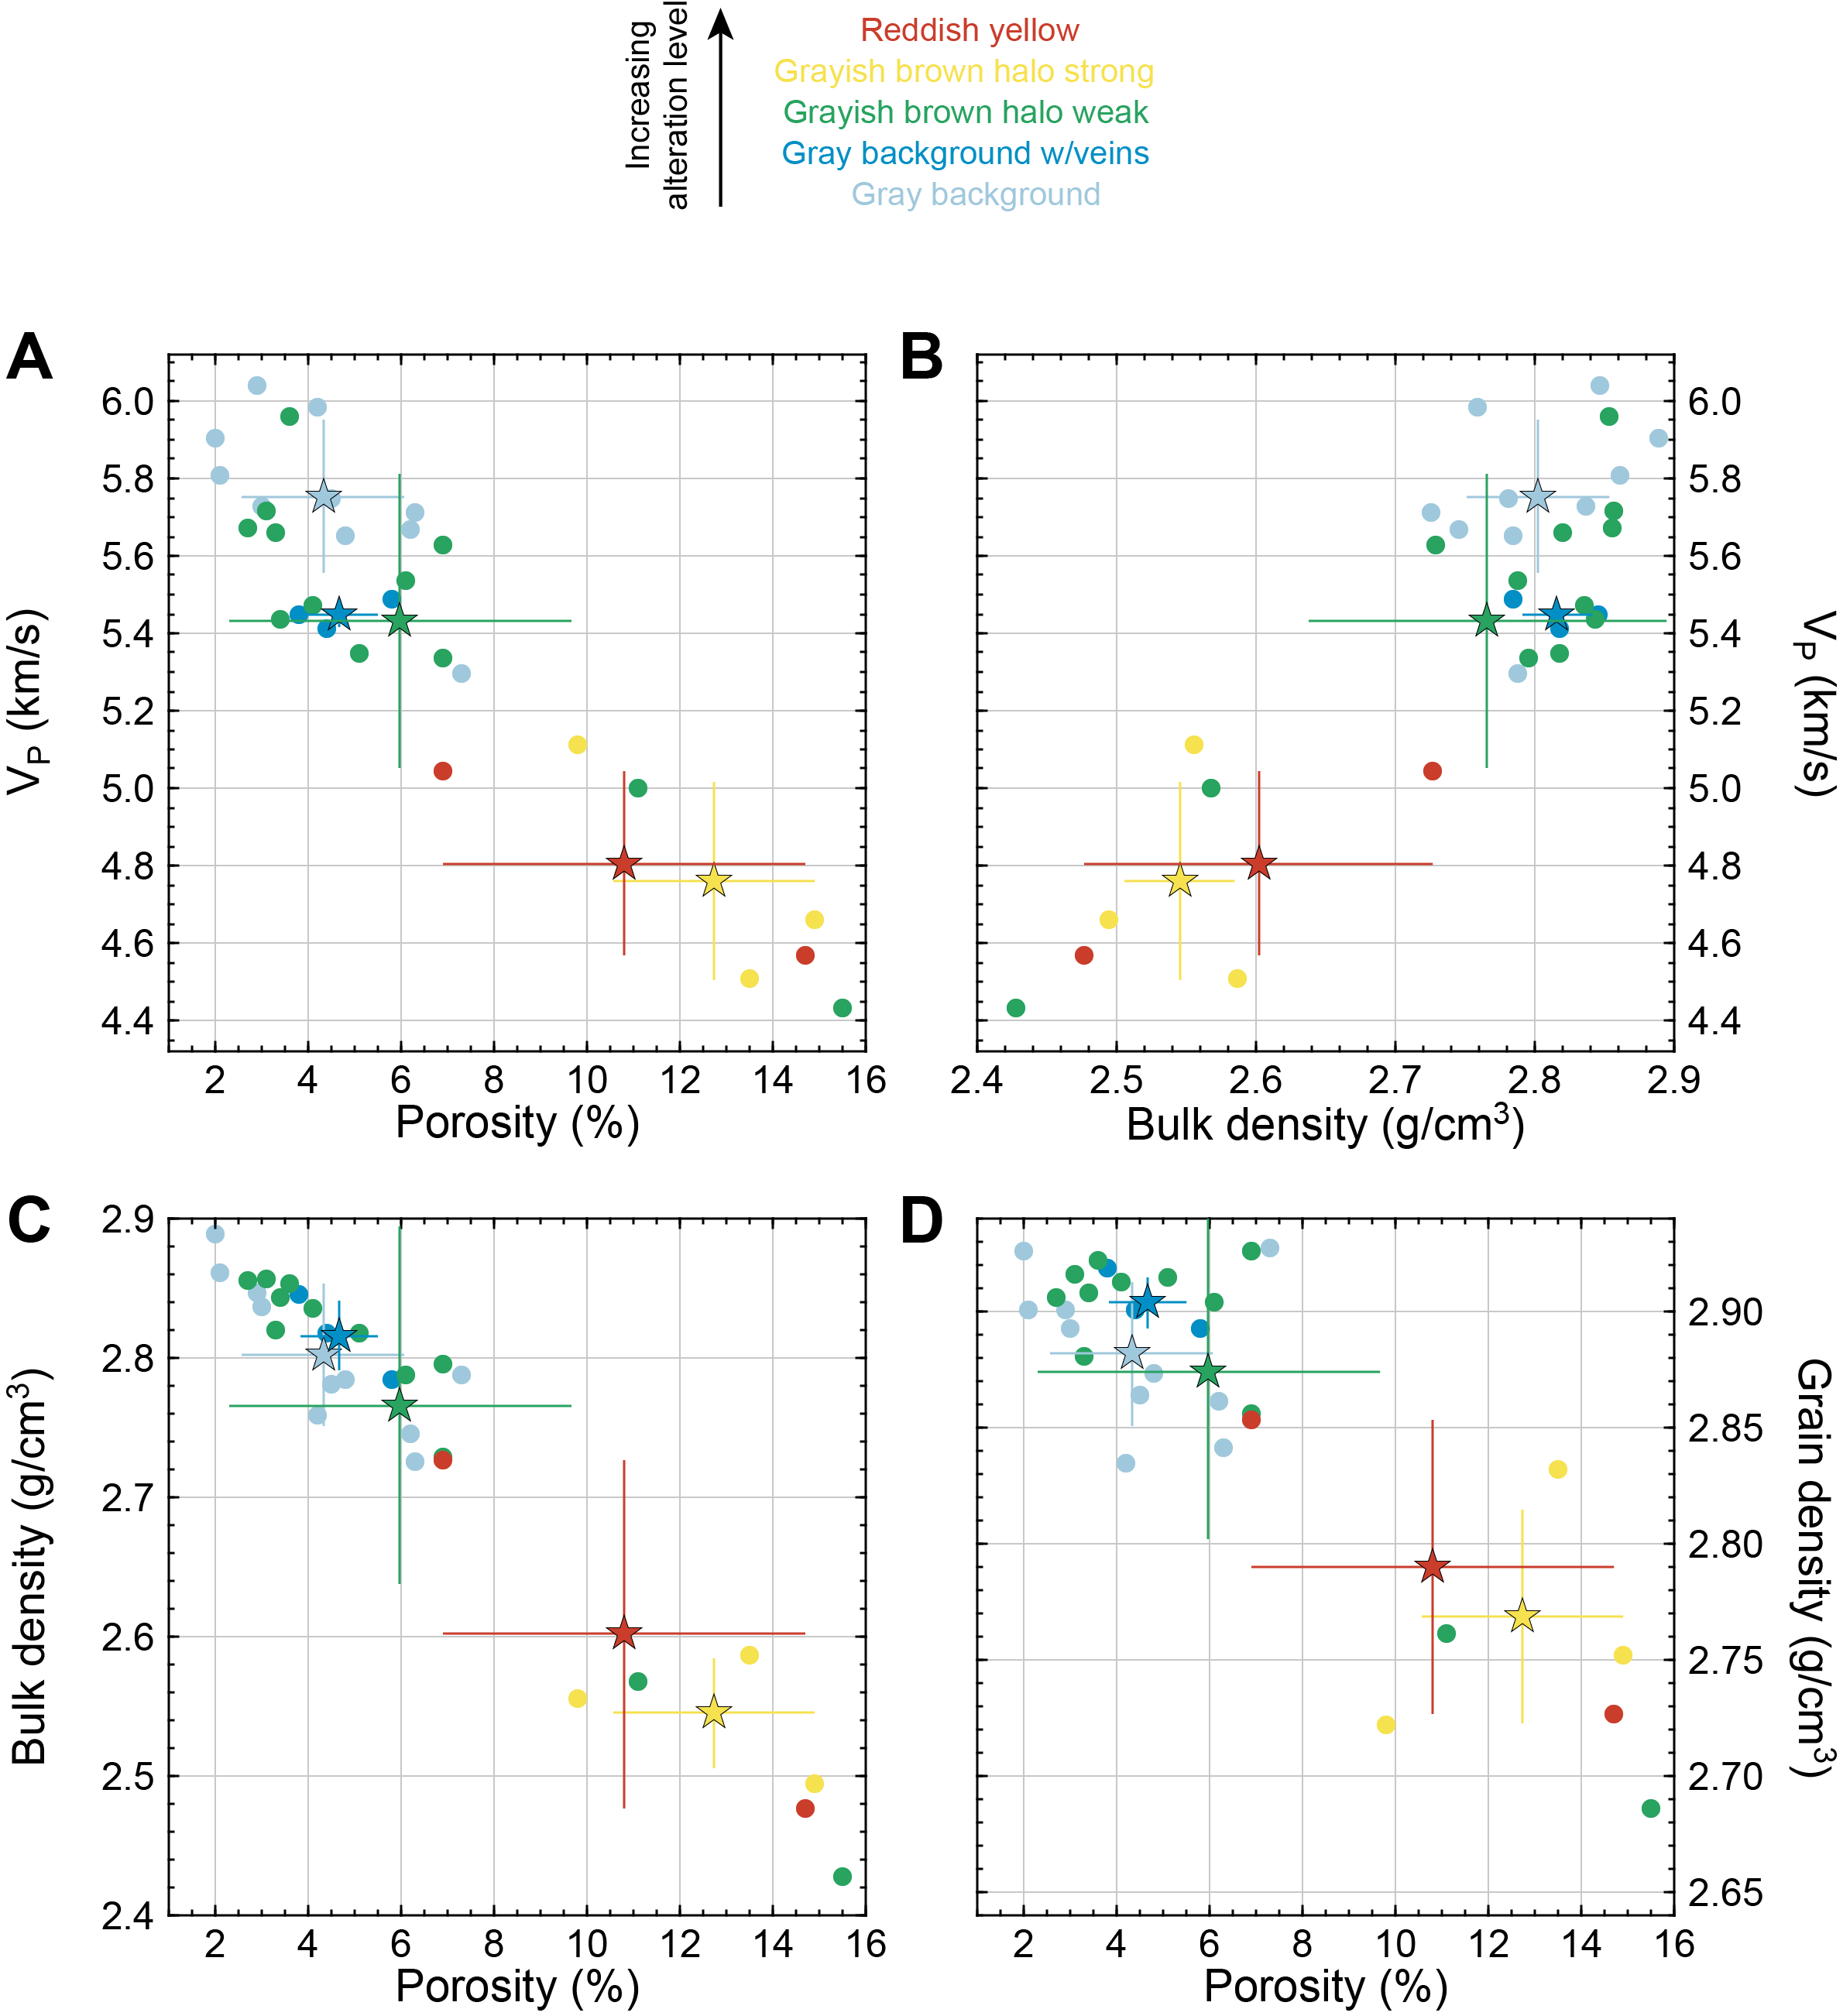
Figure F89. Basalt physical properties by alteration level.
10.2.3. Comparison to ODP Hole 896A
Physical properties from discrete samples at Site U1560 (MAD, P-wave velocity, and thermal conductivity) were compared with the full data set of equivalent measurements from ODP Hole 896A (~7 Ma ocean crust) as a benchmark to evaluate changes in physical properties with crustal age across the SAT (Shipboard Scientific Party, 1993; see Physical properties and downhole measurements in the Expedition 390/393 methods chapter [Coggon et al., 2024a]) (Figure F90). A total of 79% of analyses from Site U1560 have bulk densities within 1σ of the Hole 896A mean. The remainder of samples (2 samples in Subunit 3A, 1 sample in Subunit 3C, 3 samples in Subunit 5A, and 1 sample in Subunit 5C) all have lower bulk densities. Only around half of the samples in Hole U1560B show similar grain densities as those in Hole 896A, and the remainder of samples from almost all lithostratigraphic units and alteration styles have lower grain densities. Porosity values in Hole U1560B generally fall within ±1σ of the mean from Hole 896A, with 1 sample in Subunit 3C, 3 samples in Subunit 5A, and 1 sample in Subunit 5C having higher porosity (Table T31). P-wave velocities in Hole U1560B are also generally within ±1σ of the mean of Hole 896A, with only 4 samples having lower values. Thermal conductivity is generally lower in Hole U1560B, by ~0.1–0.2 W/(m·K), than the mean ±1σ reported in Hole 896A and ~0.3–0.6 W/(m·K) lower in Subunits 5A, 5C, and 6A.
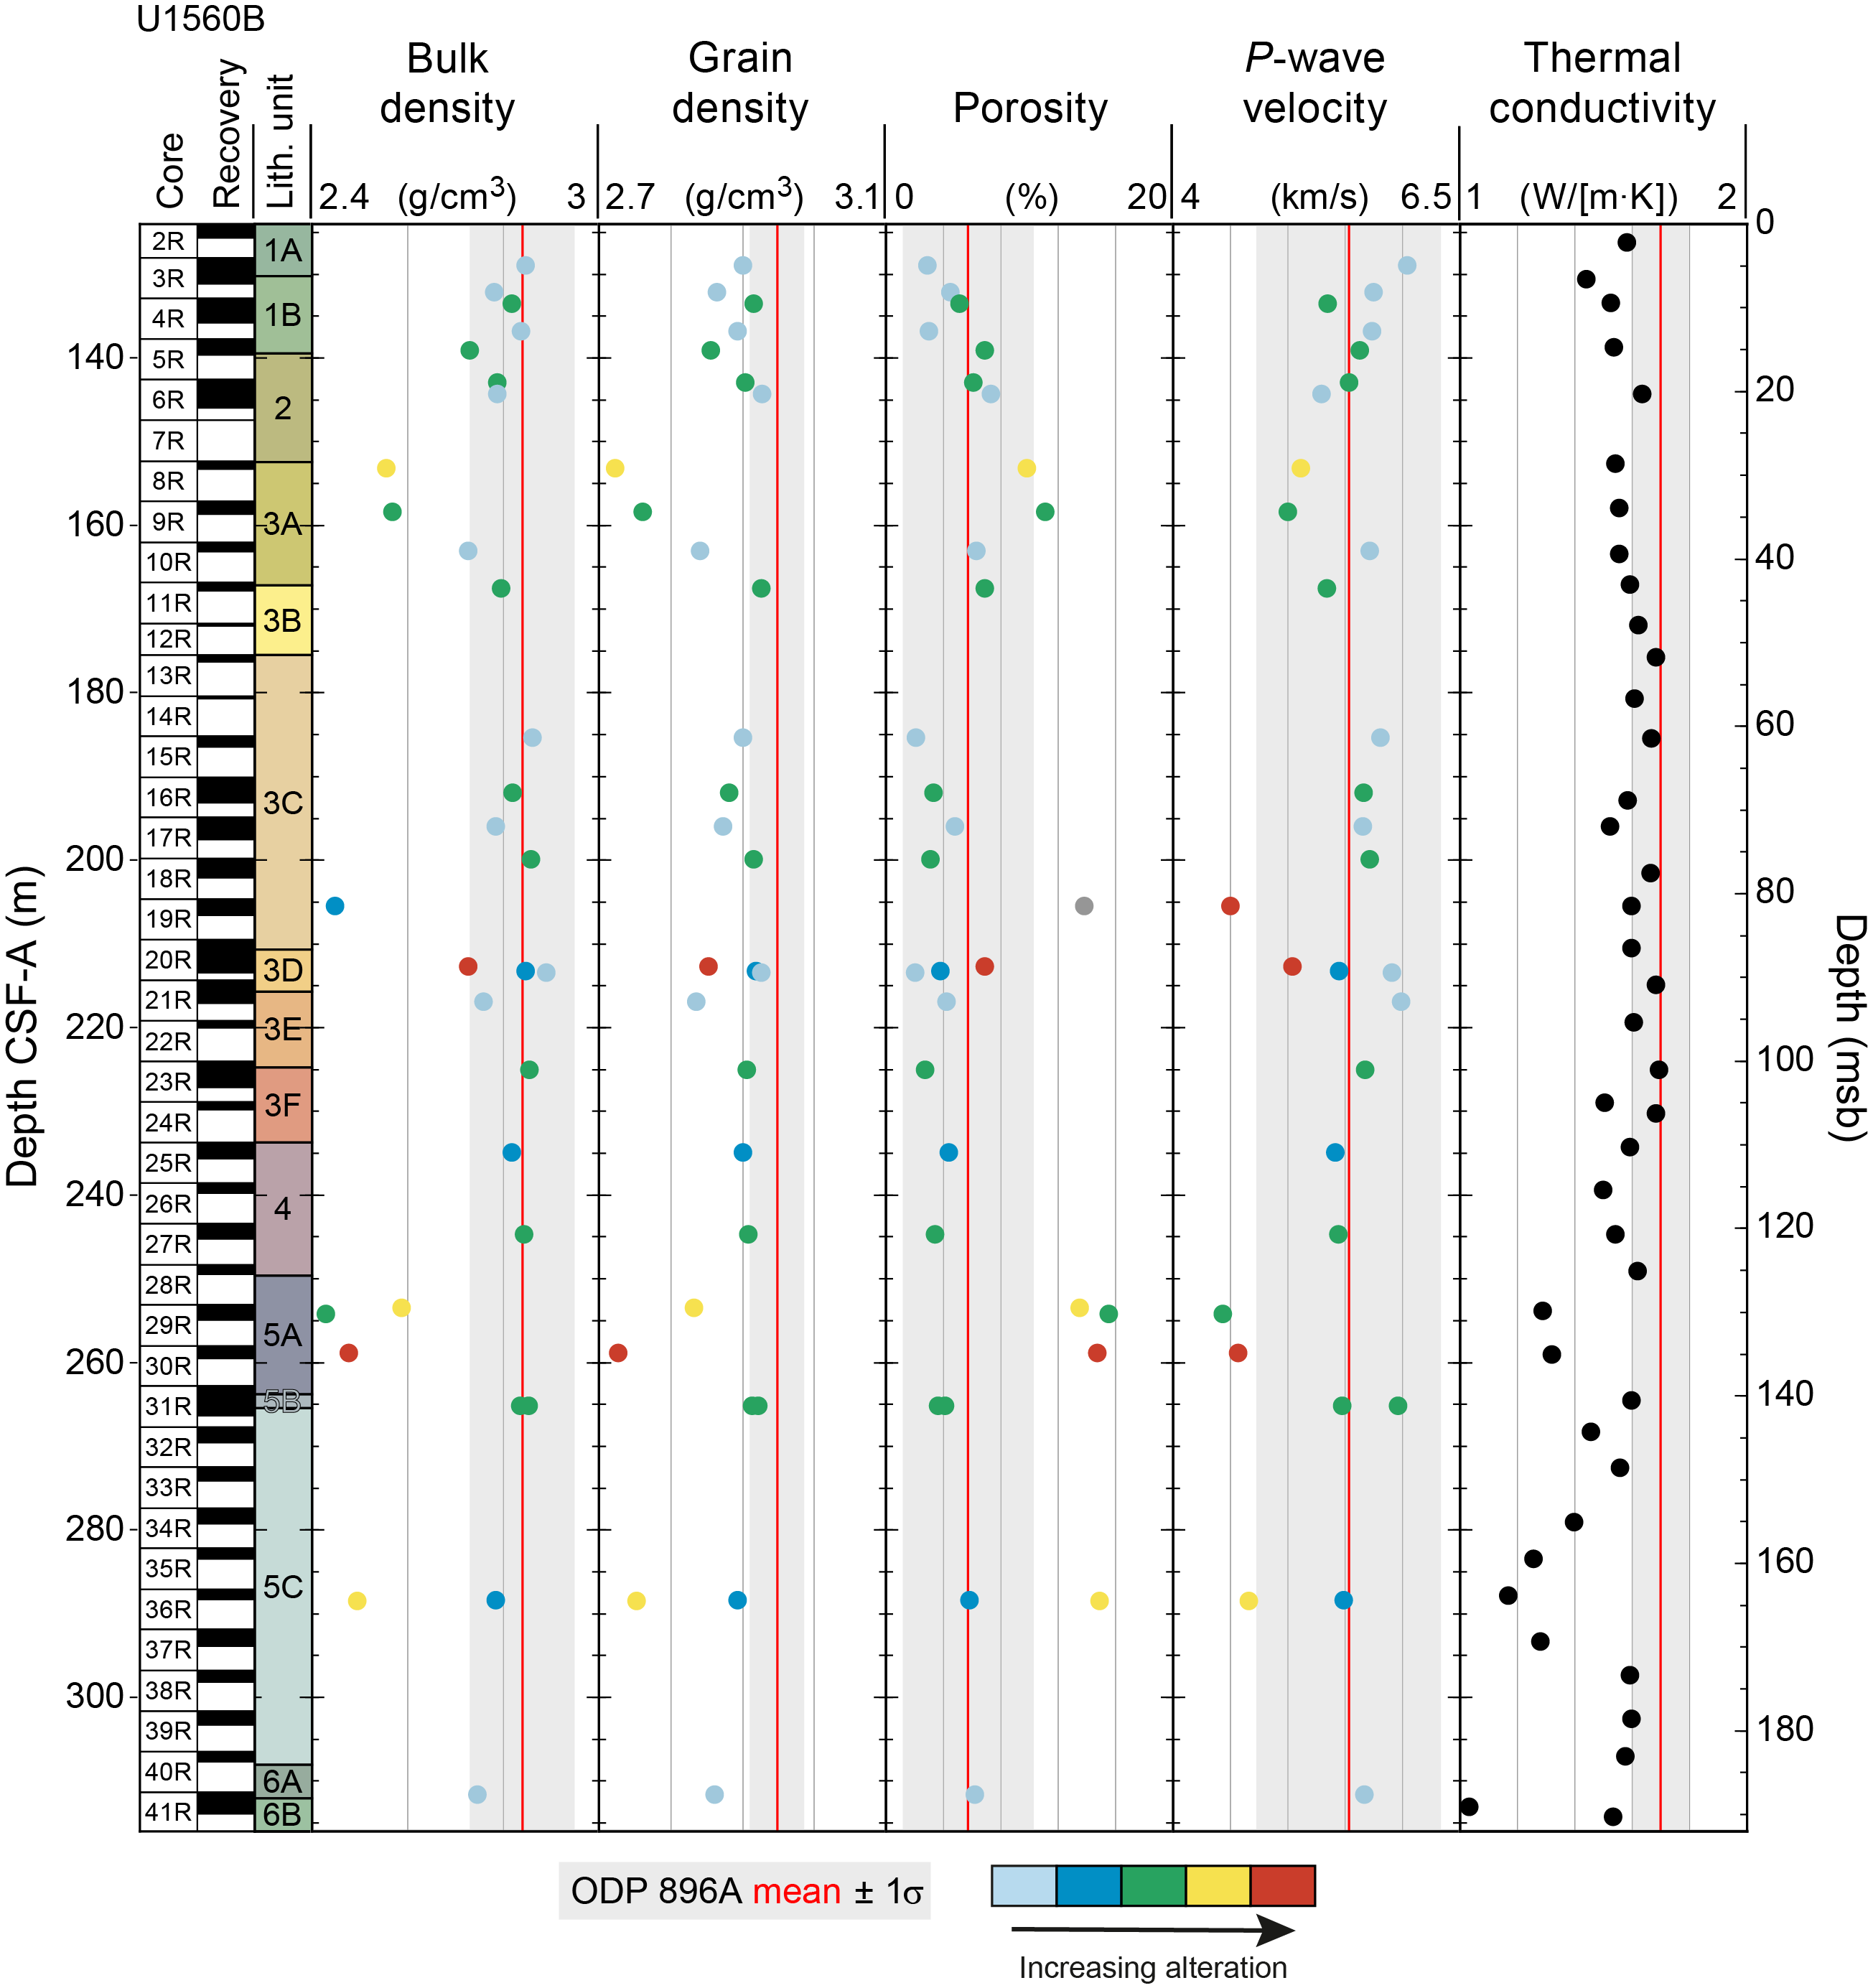
Figure F90. Discrete physical properties, Holes U1560D and 896A.
10.2.4. Downhole measurements
Three logging runs were scheduled in Hole U1560B. A first run with the triple combo tool string was to record the most fundamental measurements (resistivity, gamma ray spectroscopy, density, and neutron log) and evaluate the hole conditions. If the conditions for logging (hole size and sea state) were favorable, it would be followed by the FMS-sonic string (sonic velocity and electrical images) and the UBI (acoustic images of the borehole wall). Because of the favorable sea state and some noticeable features in the MS recorded in the recovered core, it was also decided to add the Magnetic Susceptibility Sonde (MSS) at the bottom of the triple combo. The three runs were completed without any significant issues and provided high-quality data over multiple passes with each tool string.
10.2.4.1. Logging operations
To allow some operational flexibility for the last operations of the expedition, the RCB bit was brought back to the ship after completion of coring in Hole U1560B, and an APC BHA was built with a 9⅞ inch bit that would allow both reentry into Hole U1560B for logging and the subsequent APC/XCB coring of Hole U1560C in the order that would best suit the sea state. By the time the BHA was built, conditions were favorable for logging, and preparation for logging started at 2100 h (ship time, UTC) on 27 July 2022.
The triple combo was built and run into hole (RIH) at 2230 h. Before reaching the seafloor (identified by a step in the gamma ray log at 3736 meters below rig floor [mbrf]), the tools started recording a partial set of data (downlog) all the way to the bottom of the hole (4051 mbrf; 315 mbsf), and the first upward pass started at 0148 h on 28 July. This pass was concluded at 0215 h at 3830 mbrf (95 mbsf, inside the casing), and the tools were run down for another full pass. The bottom of the hole was again reached without any difficulty, and the second pass started from 4051 mbrf at 0230 h and was stopped only once the tool string was fully back into the casing at 3815 mbrf. At this time, it was decided to turn off the wireline heave compensator (WHC). During this operation a voltage drop interrupted acquisition and the pass was concluded without obtaining an additional reading of the seafloor. The tools were back to the surface at 0520 h.
The caliper log had established that the hole was in good condition for the imaging tools, and the FMS-sonic tool string was immediately rigged up and RIH at 0645 h. A downlog was recorded from above the seafloor and concluded at 4046 mbrf (310 mbsf) to protect the lowermost parts of the FMS tool from tagging the hard bottom of the hole a few meters deeper. A first upward pass started at 0950 h and was completed at 1013 h at 3860 mbrf (124 mbsf), and the tool string was returned to the bottom of the hole. The second pass started from 4046 mbrf at 1029 h and was completed at 1050 h at 3863 mbrf (inside the casing). When trying to close the calipers before entering the pipe, it was noted that one of the calipers was not fully closing, and some time was spent until the caliper appeared fully closed and it was possible to bring the tool safely to the surface. It was back on the rig floor at 1500 h.
Next, the UBI string was built and RIH at 1545 h. A downlog with only the gamma ray tools active was run from the seafloor to 4046 mbrf (310 mbsf), and the first upward pass started at 1855 h. The tool configuration needed to be reset, and the first robust borehole image was recorded from ~281 mbsf (~157 msb). After a short time, the WHC stopped functioning and could not be restarted. The heave at the time was <1 m peak-to-peak, and it was decided to continue logging without heave compensation. The first pass was complete once the tool was back in the casing at 1924 h, and the tool was sent back down for a second pass. This second pass started from 4046 mbrf (~188 msb) at 1952 h and, after stopping acquisition of the UBI image inside the casing, proceeded until identification of the seafloor on the gamma ray at 2054 h. The UBI was back on the surface at 2248 h, and the rig floor was ready to resume coring operations at 2330 h on 28 July.
10.2.4.2. Data overview
A summary of the main data recorded during the triple-combo run are shown in Figure F91. The caliper log in this figure shows that the hole appeared in generally good condition, most notably in the interval below ~190 m wireline log matched depth below seafloor (WMSF). Although there are irregular intervals and enlargements, the caliper does not appear to have lost contact with the formation. However, most of the lower values in the density log are clearly associated with large-diameter intervals and suggest that the tool was making poor contact with the formation at these depths. The density log seems to follow the upper envelope of the GRA core readings, which are affected by the sparse recovery and the uneven filling of the core liners (see Physical properties and downhole measurements in the Expedition 390/393 methods chapter [Coggon et al., 2024a]), and agrees very well with the measurements made on MAD samples. These samples were chosen to represent the different lithologies encountered, but the requirement to cut cubes for analysis generates a bias toward more cohesive pieces and, consequently, higher density. The density log displays a broader range of values than the MAD data, but the lower values are associated with large-diameter hole intervals, most notably at 165–170 or 180–190 m WMSF, are probably not representative of the formation.
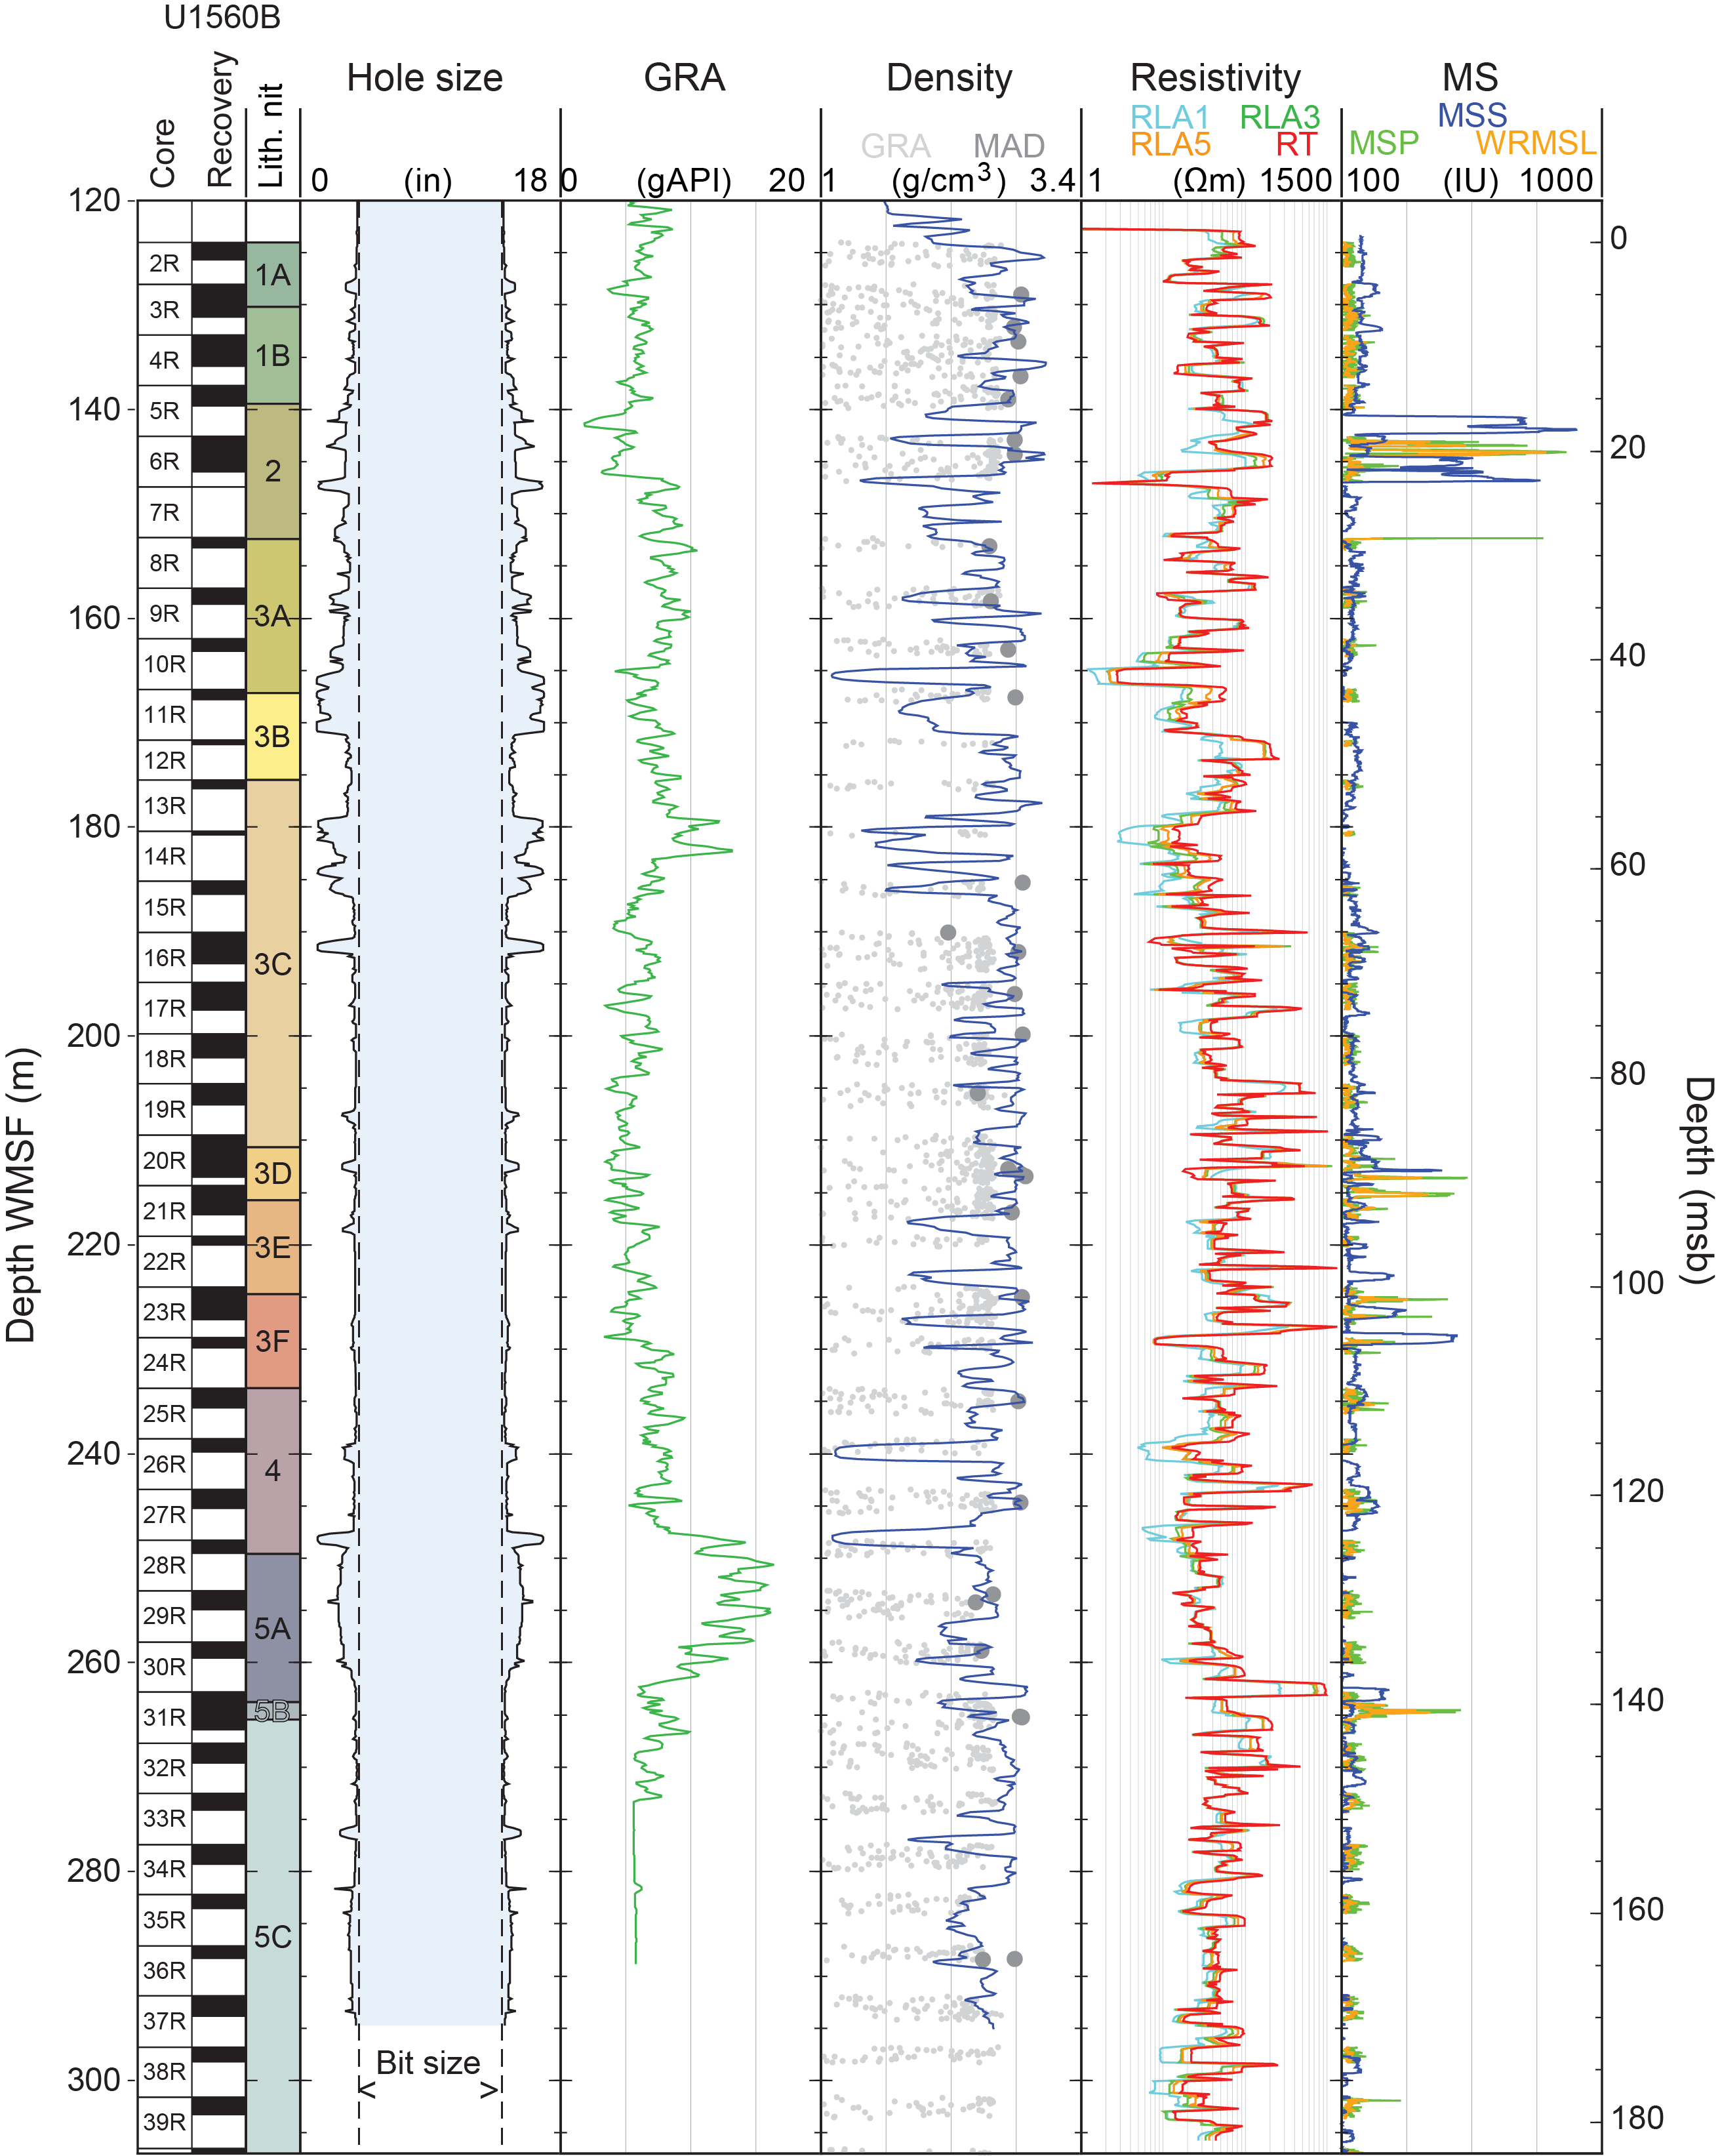
Figure F91. Triple combo logging data.
Although resistivity is overall fairly uniform, it displays some subtle trends with depth that coincide with some of the volcanic units identified in the cores (see Igneous petrology). Resistivity decreases below Unit 1, through Unit 2 and Subunit 3A, where it reaches its minimum value (3 Ωm) and below which it increases slightly with depth through the rest of Unit 3. It decreases again through Unit 4 but rebounds in Subunit 5A to remain fairly uniform in Subunit 5C.
MS displays some of the most prominent features, revealing some peaks that had been previously identified in the cores and associated with the freshest part of massive lava flows. The most prominent are in Unit 2, but other peaks occur downsection, particularly in Subunits 3D and 3F. Comparison between the core measurements, from the WRMSL or MSP, and the logs from the MSS suggests that the sharpest peak recovered in the core, at 143–144 m CSF-A was measured in the logs at 145–146 m WMSF, but that another similar interval with an even stronger signature occurred a few meters shallower (141–142 m WMSF) but was not recovered in core (Figure F92).
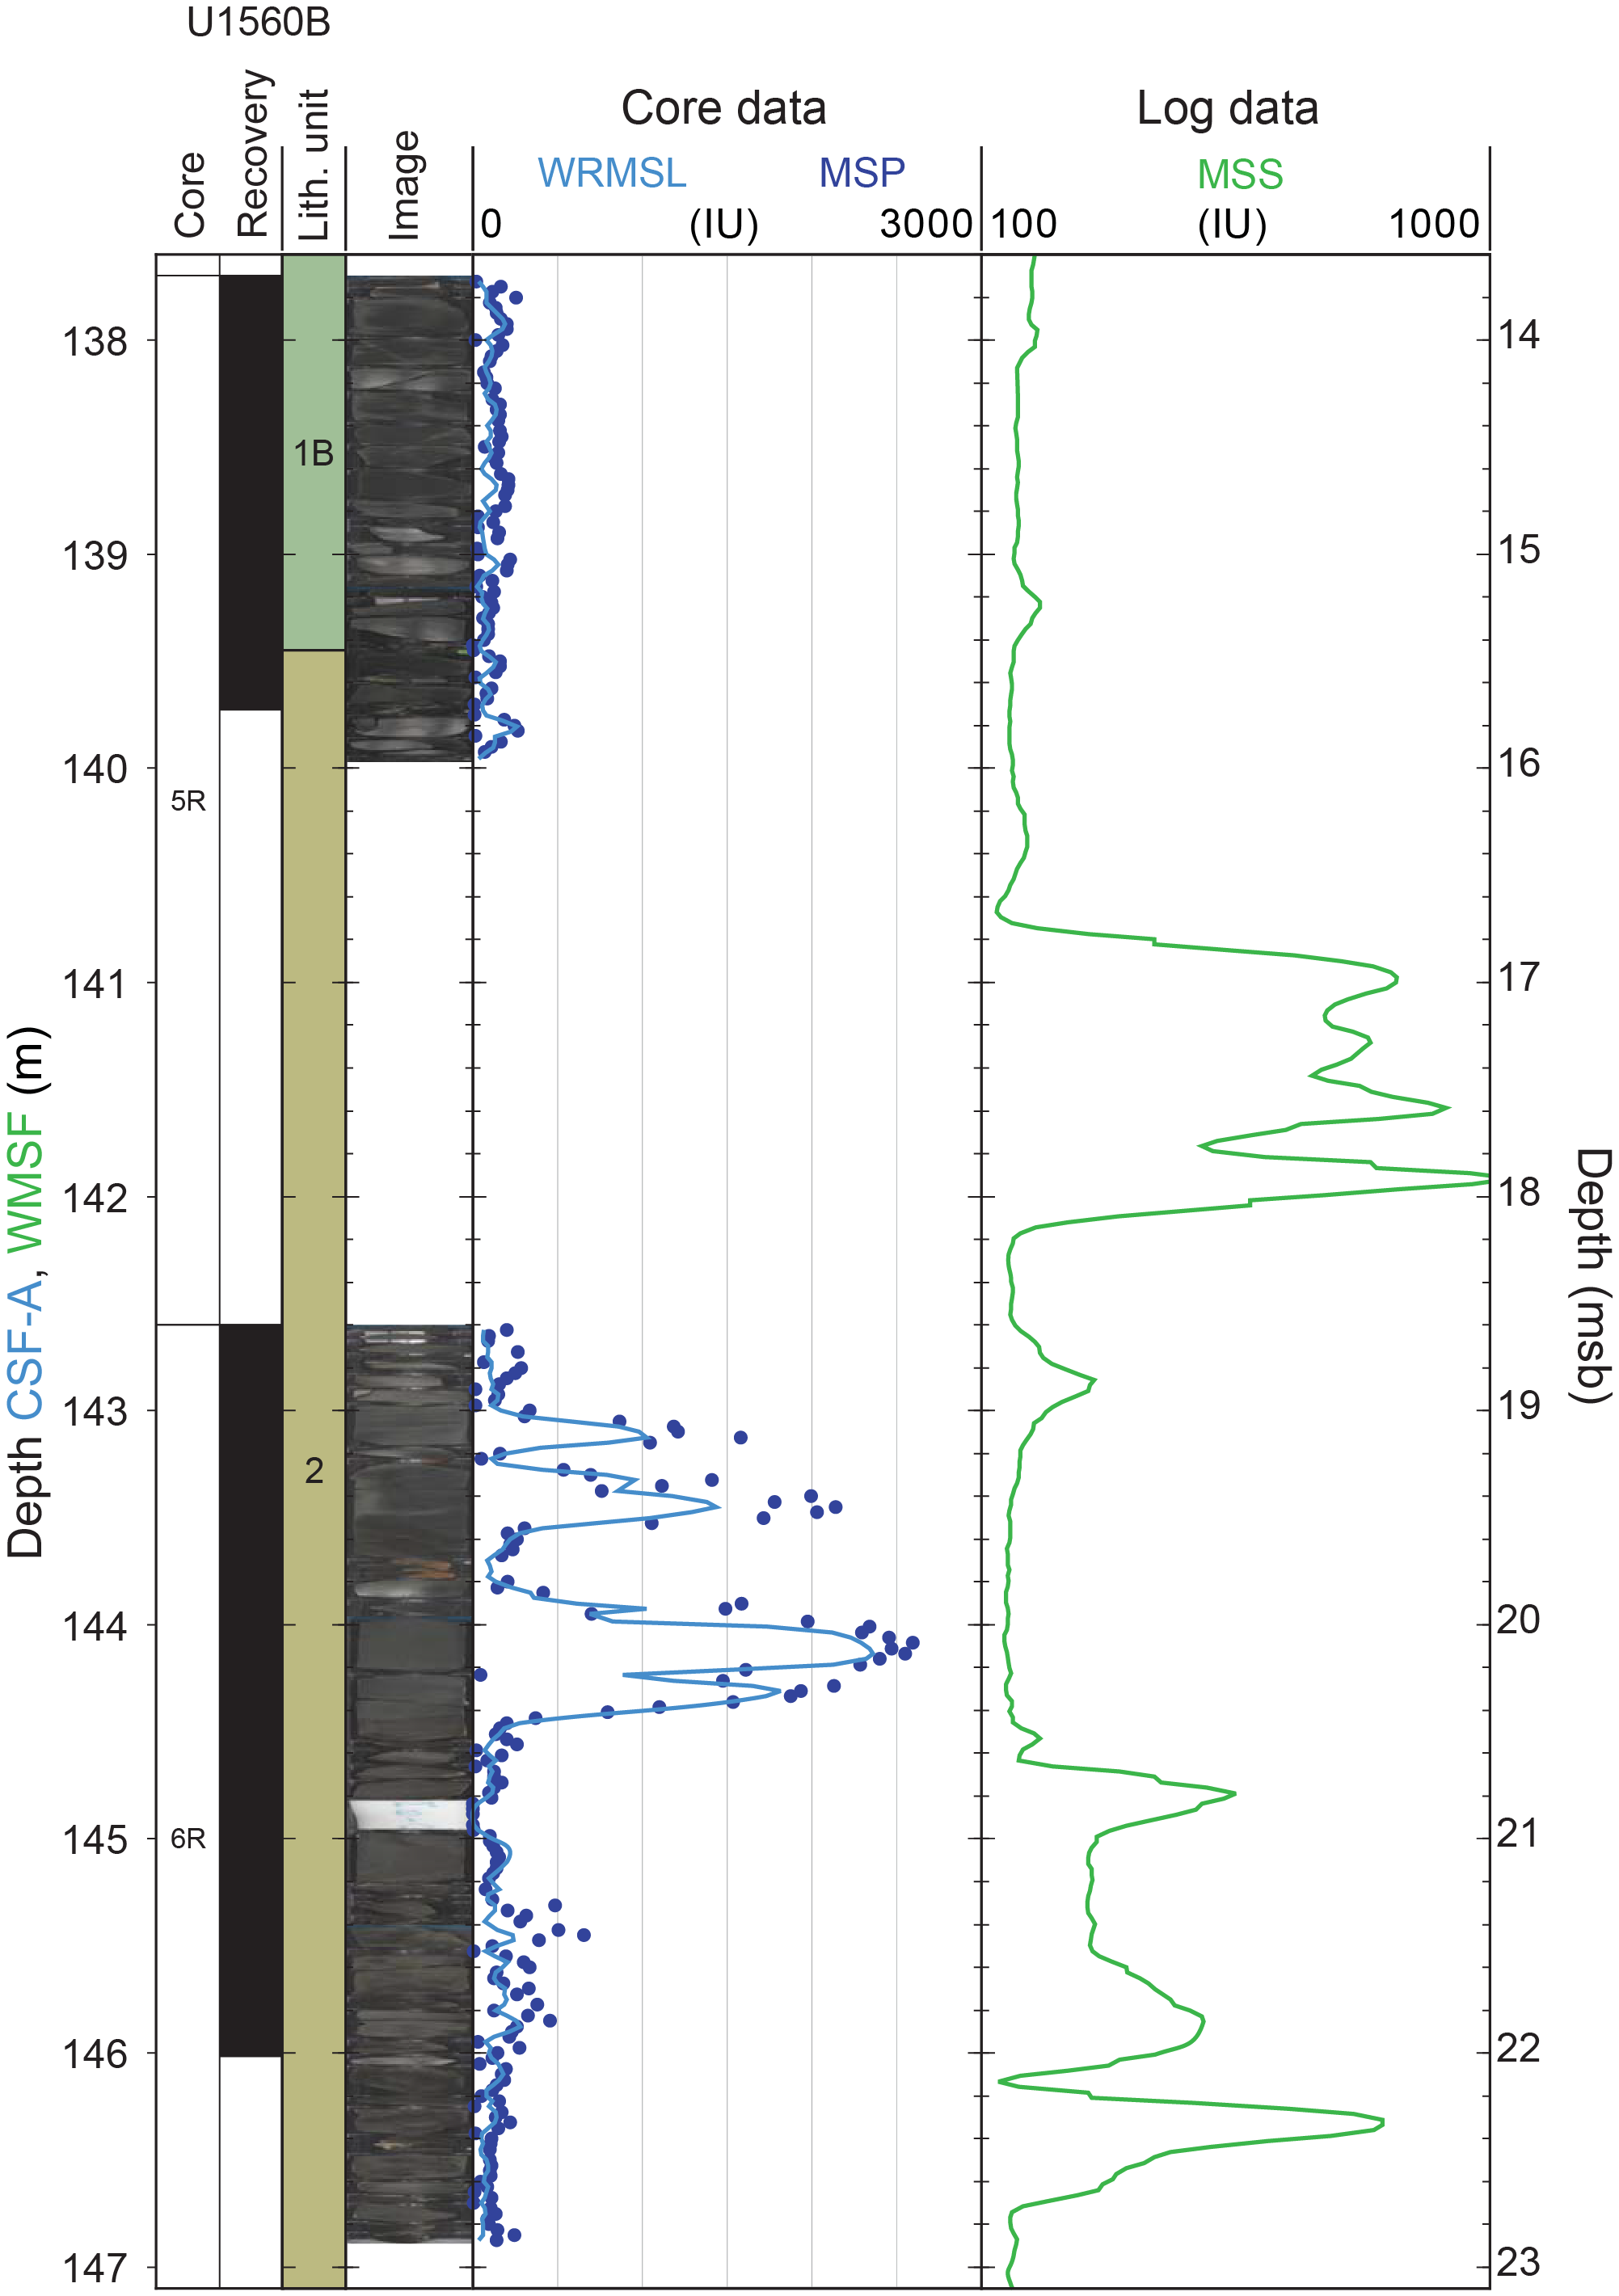
Figure F92. Interval with high magnetic susceptibility.
Figure F93 is a summary of the data collected by the FMS-sonic tool string. The hole size measured by the FMS calipers is too spiky to be representative of the actual hole conditions and is likely the result of some failure of the tool or the acquisition system, which remains unsolved. Similar noise, possibly related, in the acceleration data used in the processing of the images seem to have decreased the quality of the images in the second pass of the FMS.
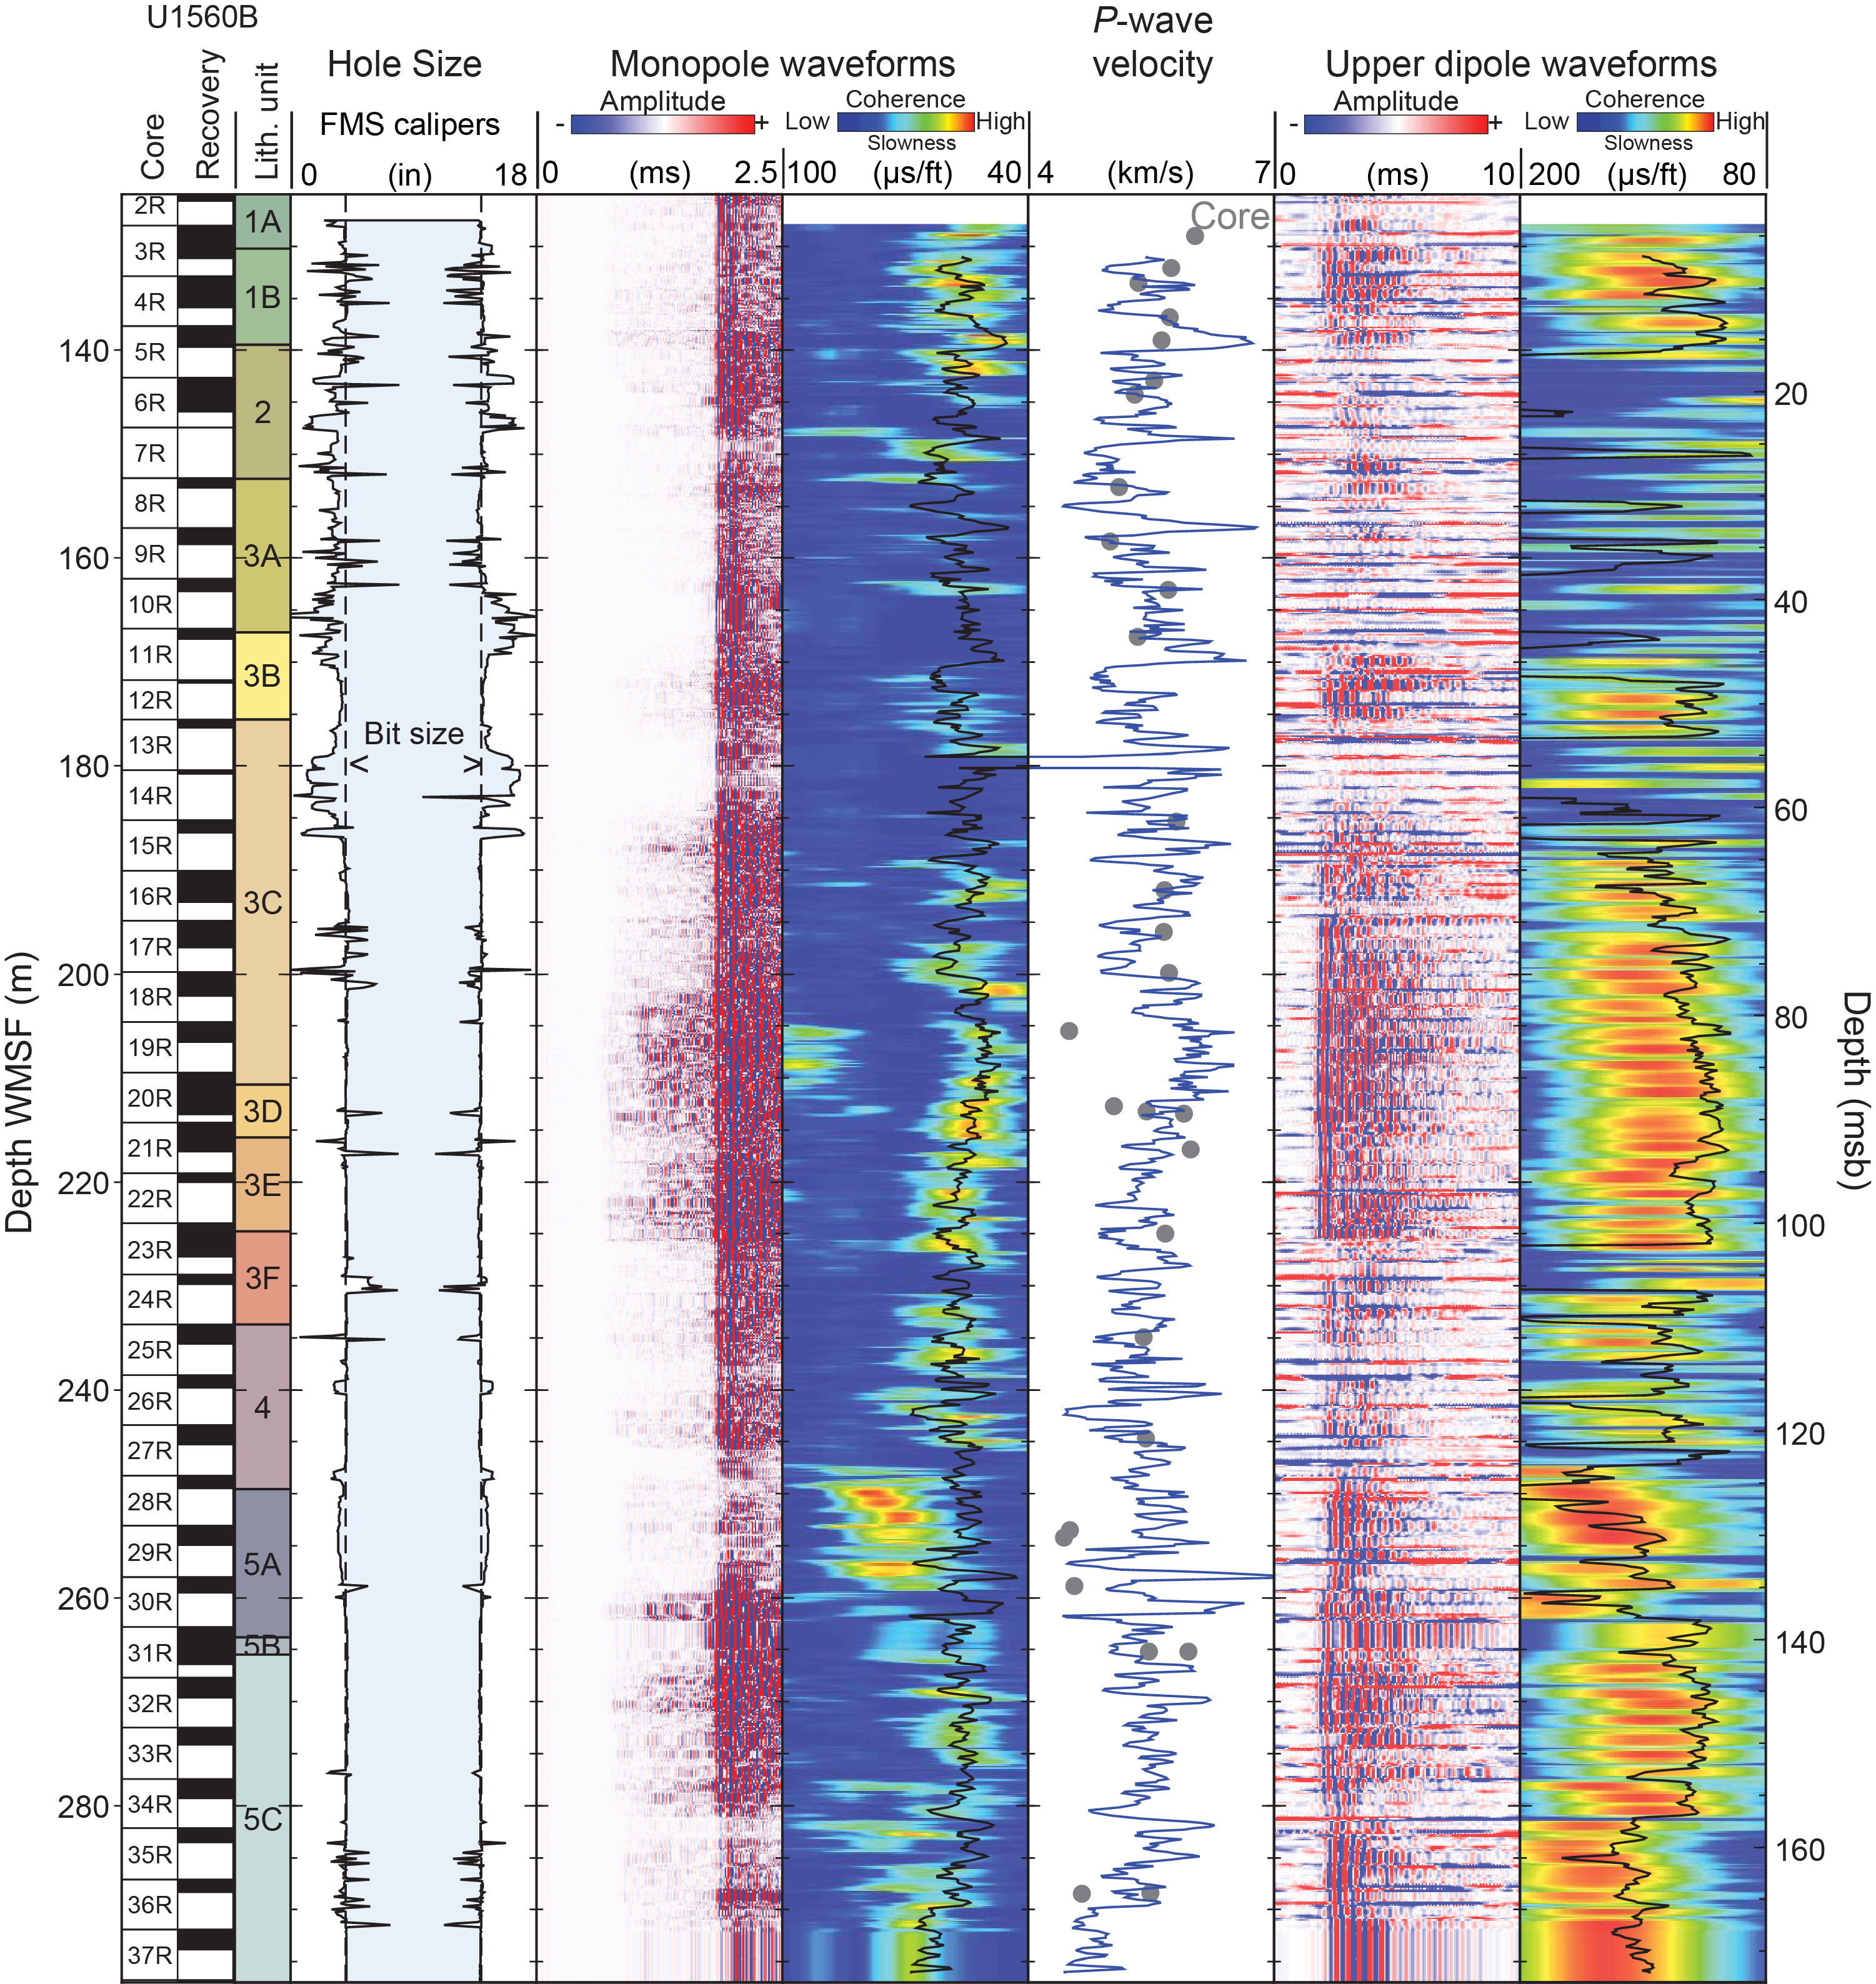
Figure F93. FMS-sonic logging data.
Despite a relatively weak coherence, compressional velocity agrees well with the velocity measurements on core samples. Upper dipole waveforms were noisy, but the acquisition algorithm was mostly successful finding coherence and extracting shear velocity data below 60 m WMSF. Additional processing is necessary to complete the profiles and refine these first results.
Figure F94 is a summary of the data collected by the UBI tool string. The radius image created by the rotating ultrasonic transponder and the hole size calculated from its average on each rotation give a more detailed representation of the hole conditions than the mechanical calipers from the first two runs, but they identify the same intervals with enlargement and possibly data of lower quality: the bottom of Subunit 3A and top of Subunit 3B, the upper part of Subunit 3C, and most of Subunit 5A.
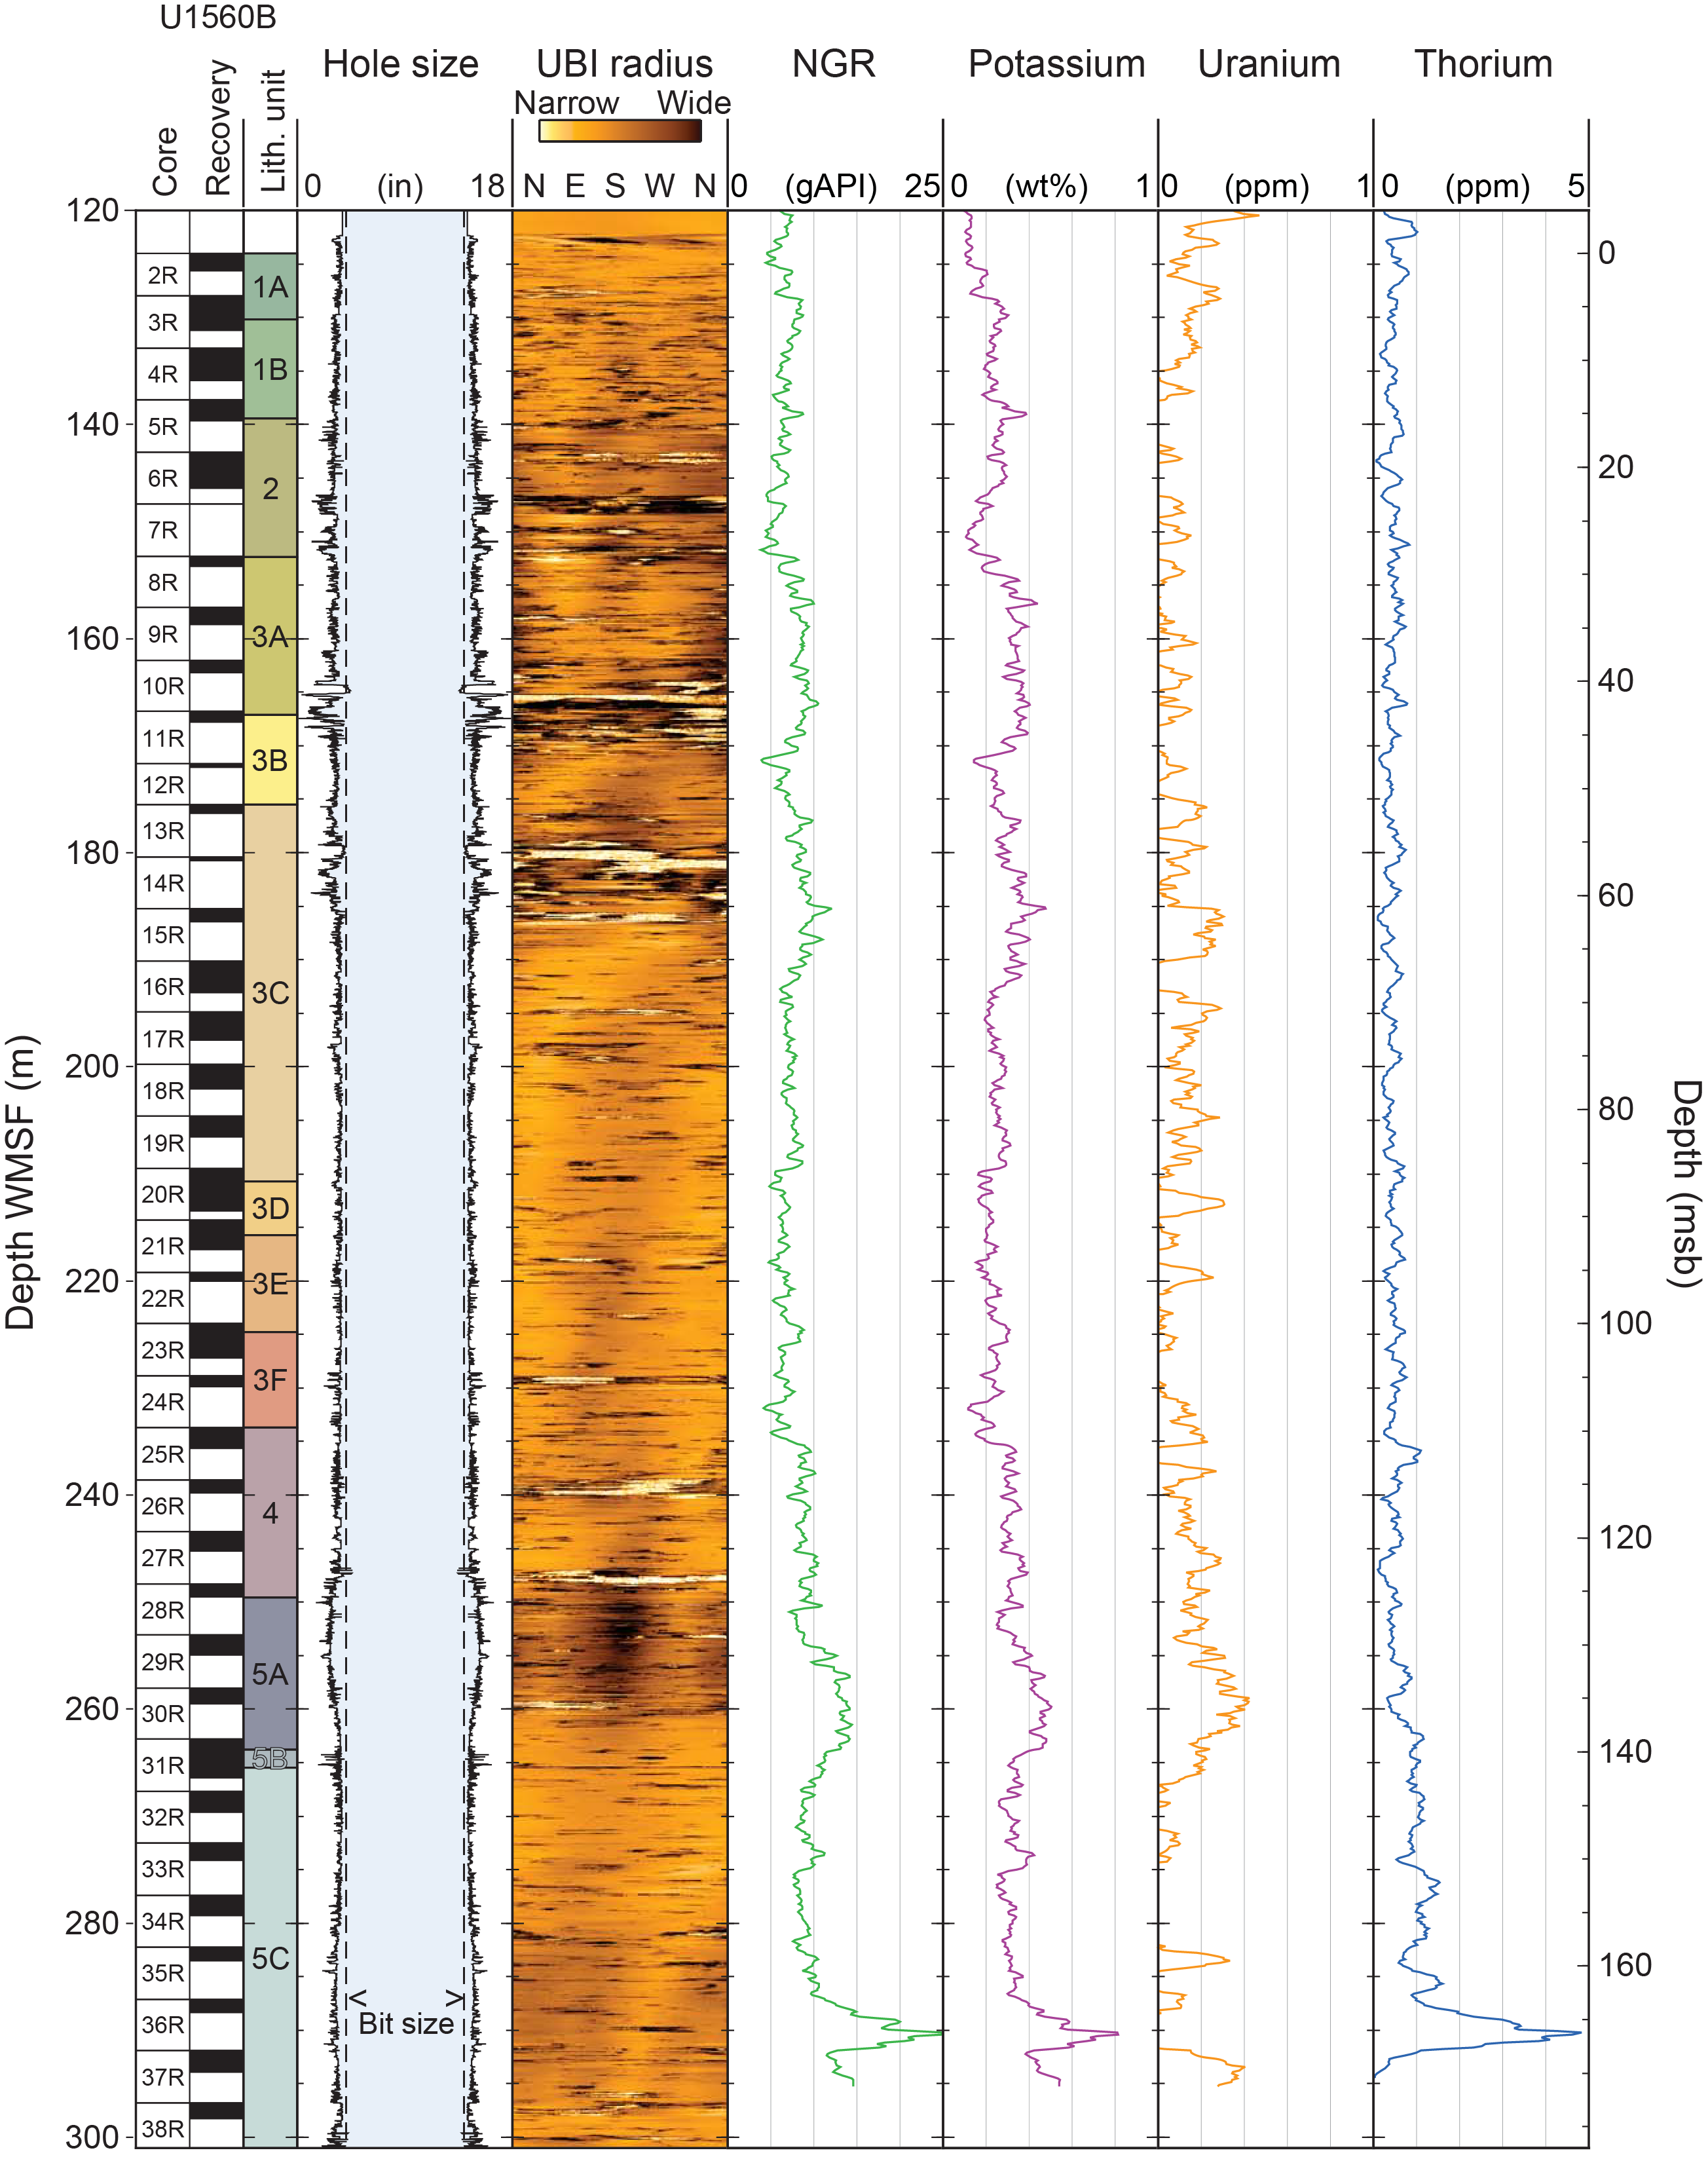
Figure F94. UBI second pass logs.
Because the UBI tool string is about half the length of the triple combo or the FMS-sonic and the gamma ray sondes are systematically located at the top of each tool string, the last run provided the most complete gamma ray log of all runs, reaching a maximum depth of 295 m WMSF. The deeper section of the spectral gamma ray log in Figure F94, which was not reached by the previous runs, shows a significant increase in gamma ray that seems driven primarily by an increase in thorium and, to a lesser extent potassium, that could be related to the breccia recovered in the last few cores in Hole U1560B.
11. Geochemistry
11.1. Sediment
11.1.1. Interstitial water and mudline sampling
During sediment coring in Holes U1560A (Expedition 395E) and U1560C (Expedition 393), a mudline sample was collected from each hole and interstitial water (IW) was extracted by squeezing whole-round sediment cores under laboratory atmosphere. In Hole U1560C, pore water samples were additionally collected by in situ Rhizon sampling (see Geochemistry in the Expedition 390/393 methods chapter [Coggon et al., 2024a]). During Expedition 395E, squeezed IW was collected once per core from Cores 395E-U1560A-1H through 7H and twice per core from Cores 8H–13X. During Expedition 393, squeezed IW was collected once per core from Cores 393-U1560C-12F through 17X and twice per core from Cores 1H, 2H, and 4H–11H. A total of 19 and 26 squeezed IW samples were taken from Holes U1560A and U1560C, respectively (Table T33). In Hole U1560C, Rhizon IW samples were collected from Sections 1–6 of Cores U1560C-1H, 2H, and 4H–11H and from Sections 1–3 of Cores 12F–16F and 17X, for a total of 71 samples. Splits of squeezed and Rhizon-sampled IW and solid residue (squeeze cake) samples were saved for shipboard analyses and postexpedition research.
Both squeezed and Rhizon IW samples, along with the mudline, were analyzed for major cations (Na, Mg, K, Ca) and anions (Cl, Br, SO4) by ion chromatography (IC). Only squeezed IW samples and the mudline were analyzed for minor elements (by ICP-AES) and nutrients (by spectrophotometry [SPEC]). Tables T33, T34, and T35 present all shipboard pore water and sediment analyses from Site U1560 collected during Expeditions 395E and 393, with selected downhole profiles illustrated in Figures F95, F96, F97, F98, F99, and F100. Although major cations (Na, Mg, K, and Ca) are measured by both IC and ICP-AES, all plotted data correspond to IC values (see Geochemistry in the Expedition 390/393 methods chapter [Coggon et al., 2024a]). Reported errors are based on replicate measurements of the International Association for the Physical Sciences of the Oceans (IAPSO) seawater for IC and ICP-AES and IODP in-house standards for ICP and UV-vis SPEC. Instrumental detection limits are estimated as 3 times the standard deviation of blanks (see Table T9 in the Expedition 390/393 methods chapter [Coggon et al., 2024a]). Concentration trends discussed in the following sections are based on squeezed IW data, unless otherwise noted, and lithostratigraphic units include Subunits IA–IE (see Sedimentology). Seawater reference values are based on Ríos et al. (2015) for pH, World Ocean Atlas 2018 for Si (Boyer et al., 2018), and the IAPSO standard for alkalinity, salinity, Na, Cl, Br, Ca, Mg, Sr, Sr/Ca, B, Li, K, and SO4.
11.1.2. Interstitial water geochemistry
11.1.2.1. Salinity, sodium, chloride, and bromide
Hole U1560A salinity varies from 34 (0–10.66 m CSF-A) to 35 (below ~11 m CSF-A), whereas Hole U1560C values remain uniform at 35 (Table T33). Despite little variation in salinity, concentrations of Na, Cl, and Br change relative to modern seawater values. Between 0 and ~20 m CSF-A (Subunit IA; nannofossil ooze with varying clay and foraminifera content), pore water concentrations increase beyond analytical uncertainty for Na and Cl in Holes U1560A (Na = 477–483 mM; Cl = 557–562 mM) and U1560C (Na = 480–486 mM; Cl = 559–567 mM) (Figure F95A, F95B). Although the observed changes in Br concentrations are smaller relative to measurement error, values also increase between 0 and ~20 m CSF-A (Hole U1560A = 0.85–0.86 mM; Hole U1560C = 0.86–0.87 mM) (Figure F95C).
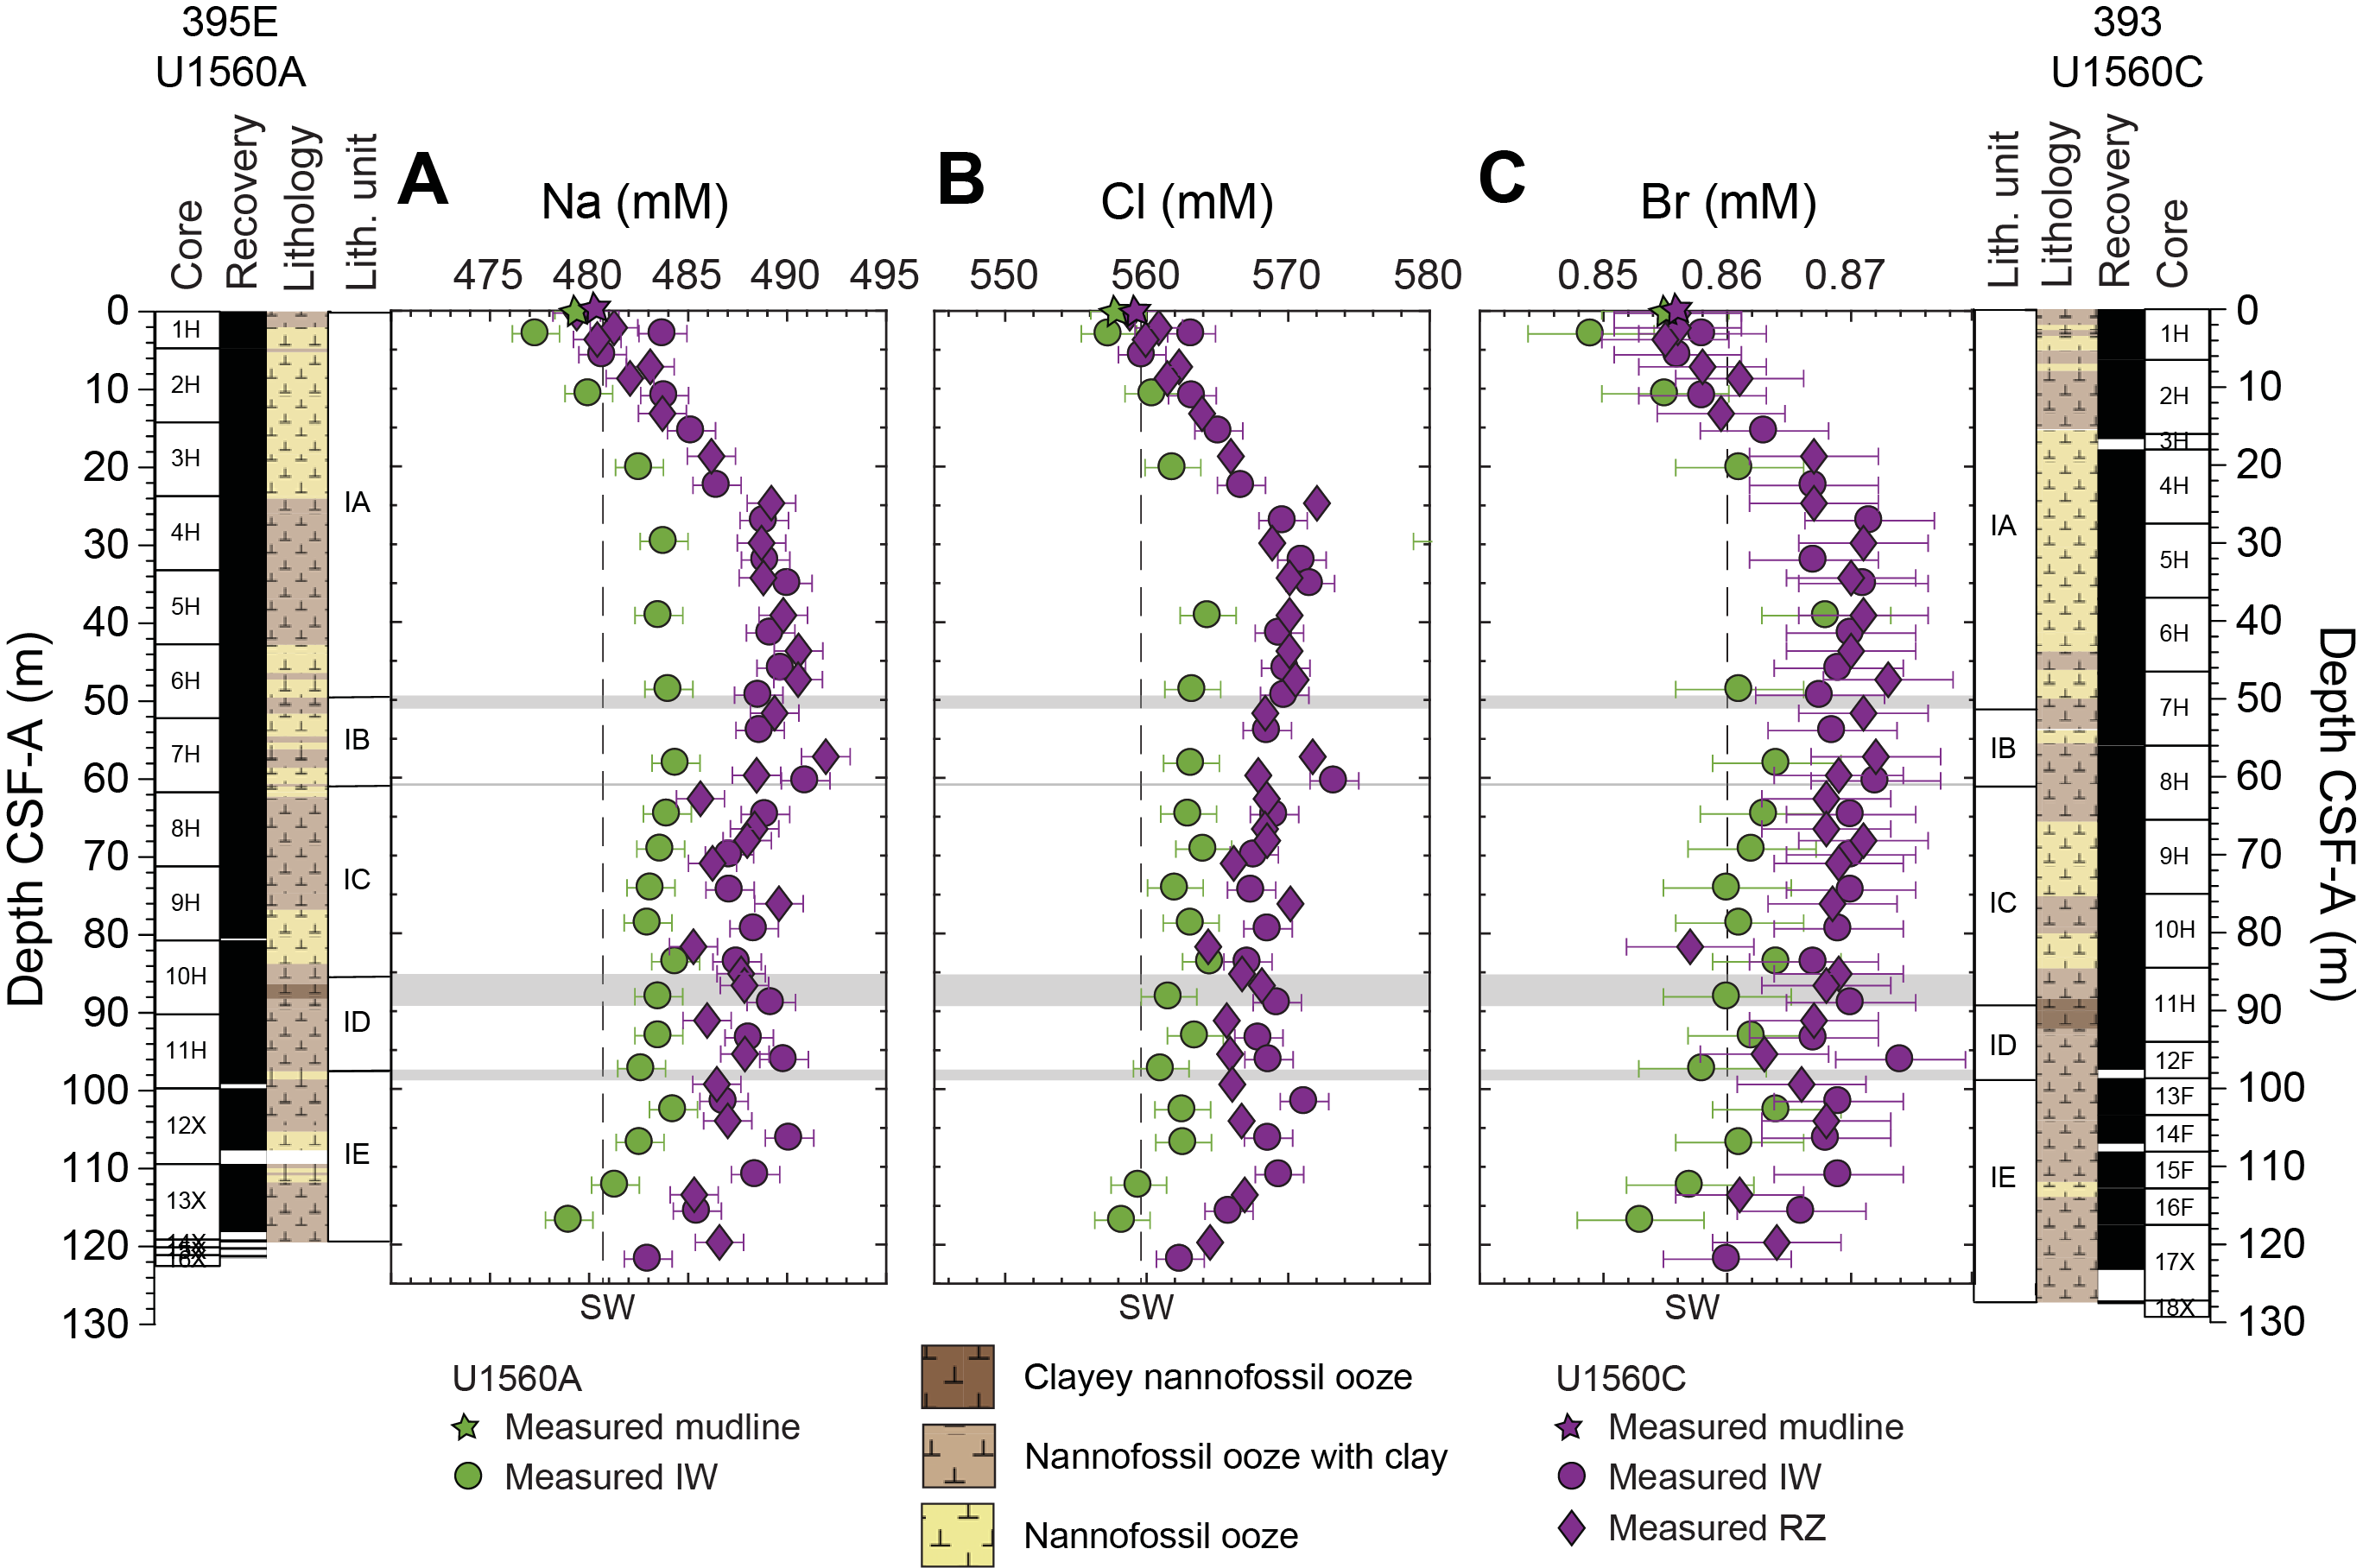
Figure F95. Sodium, chloride, and bromide.
In both holes, Na, Cl, and Br concentrations remain uniformly higher than modern seawater values deeper than ~20 m CSF-A and throughout Subunits IB (nannofossil ooze with clay interbedded with nannofossil ooze), IC (nannofossil ooze with foraminifera and nannofossil ooze with clay), and ID (nannofossil ooze with clay and clayey nannofossil ooze) (Hole U1560A averages: Na = 484 ± 1 mM, 2σ, n = 11; Cl = 563 ± 2 mM; and Br = 0.86 ± 0.02 mM; Hole U1560C averages are higher: Na = 489 ± 2 mM, 2σ, n = 18; Cl = 569 ± 3 mM; and Br = 0.87 mM). In Subunit IE (nannofossil ooze with foraminifera and varying clay amounts), Na, Cl, and Br concentrations gradually reach reference seawater values toward the sediment/basement interface in both holes. There is excellent agreement in Na, Cl, and Br concentrations between squeezed and Rhizon-sampled IW.
11.1.2.2. pH and alkalinity
The mudline pH measured in Hole U1560A (7.8) is within error of that measured in Hole U1560C (7.7) but slightly higher than the pH range reported for bottom seawater at this location (7.6–7.7; Ríos et al., 2015) (Figure F96A). In Hole U1560A, pH values remain high (7.7–7.8) in the uppermost ~40 m in Subunit IA (nannofossil ooze with clay and foraminifera) then decrease to uniform values (average = 7.6 ± 0.1 2σ, n = 13) throughout Subunits IB (nannofossil ooze with clay interbedded with nannofossil ooze) to IE (nannofossil ooze with foraminifera and varying clay amounts). Following a slight decrease relative to the mudline (pH = 7.7), measured pH in Hole U1560C remains uniform throughout the sediment column (average = 7.6 ± 0.1 2σ, n = 26). With the exception of the uppermost ~40 m in Subunit IA, pH values are in good agreement in both holes.
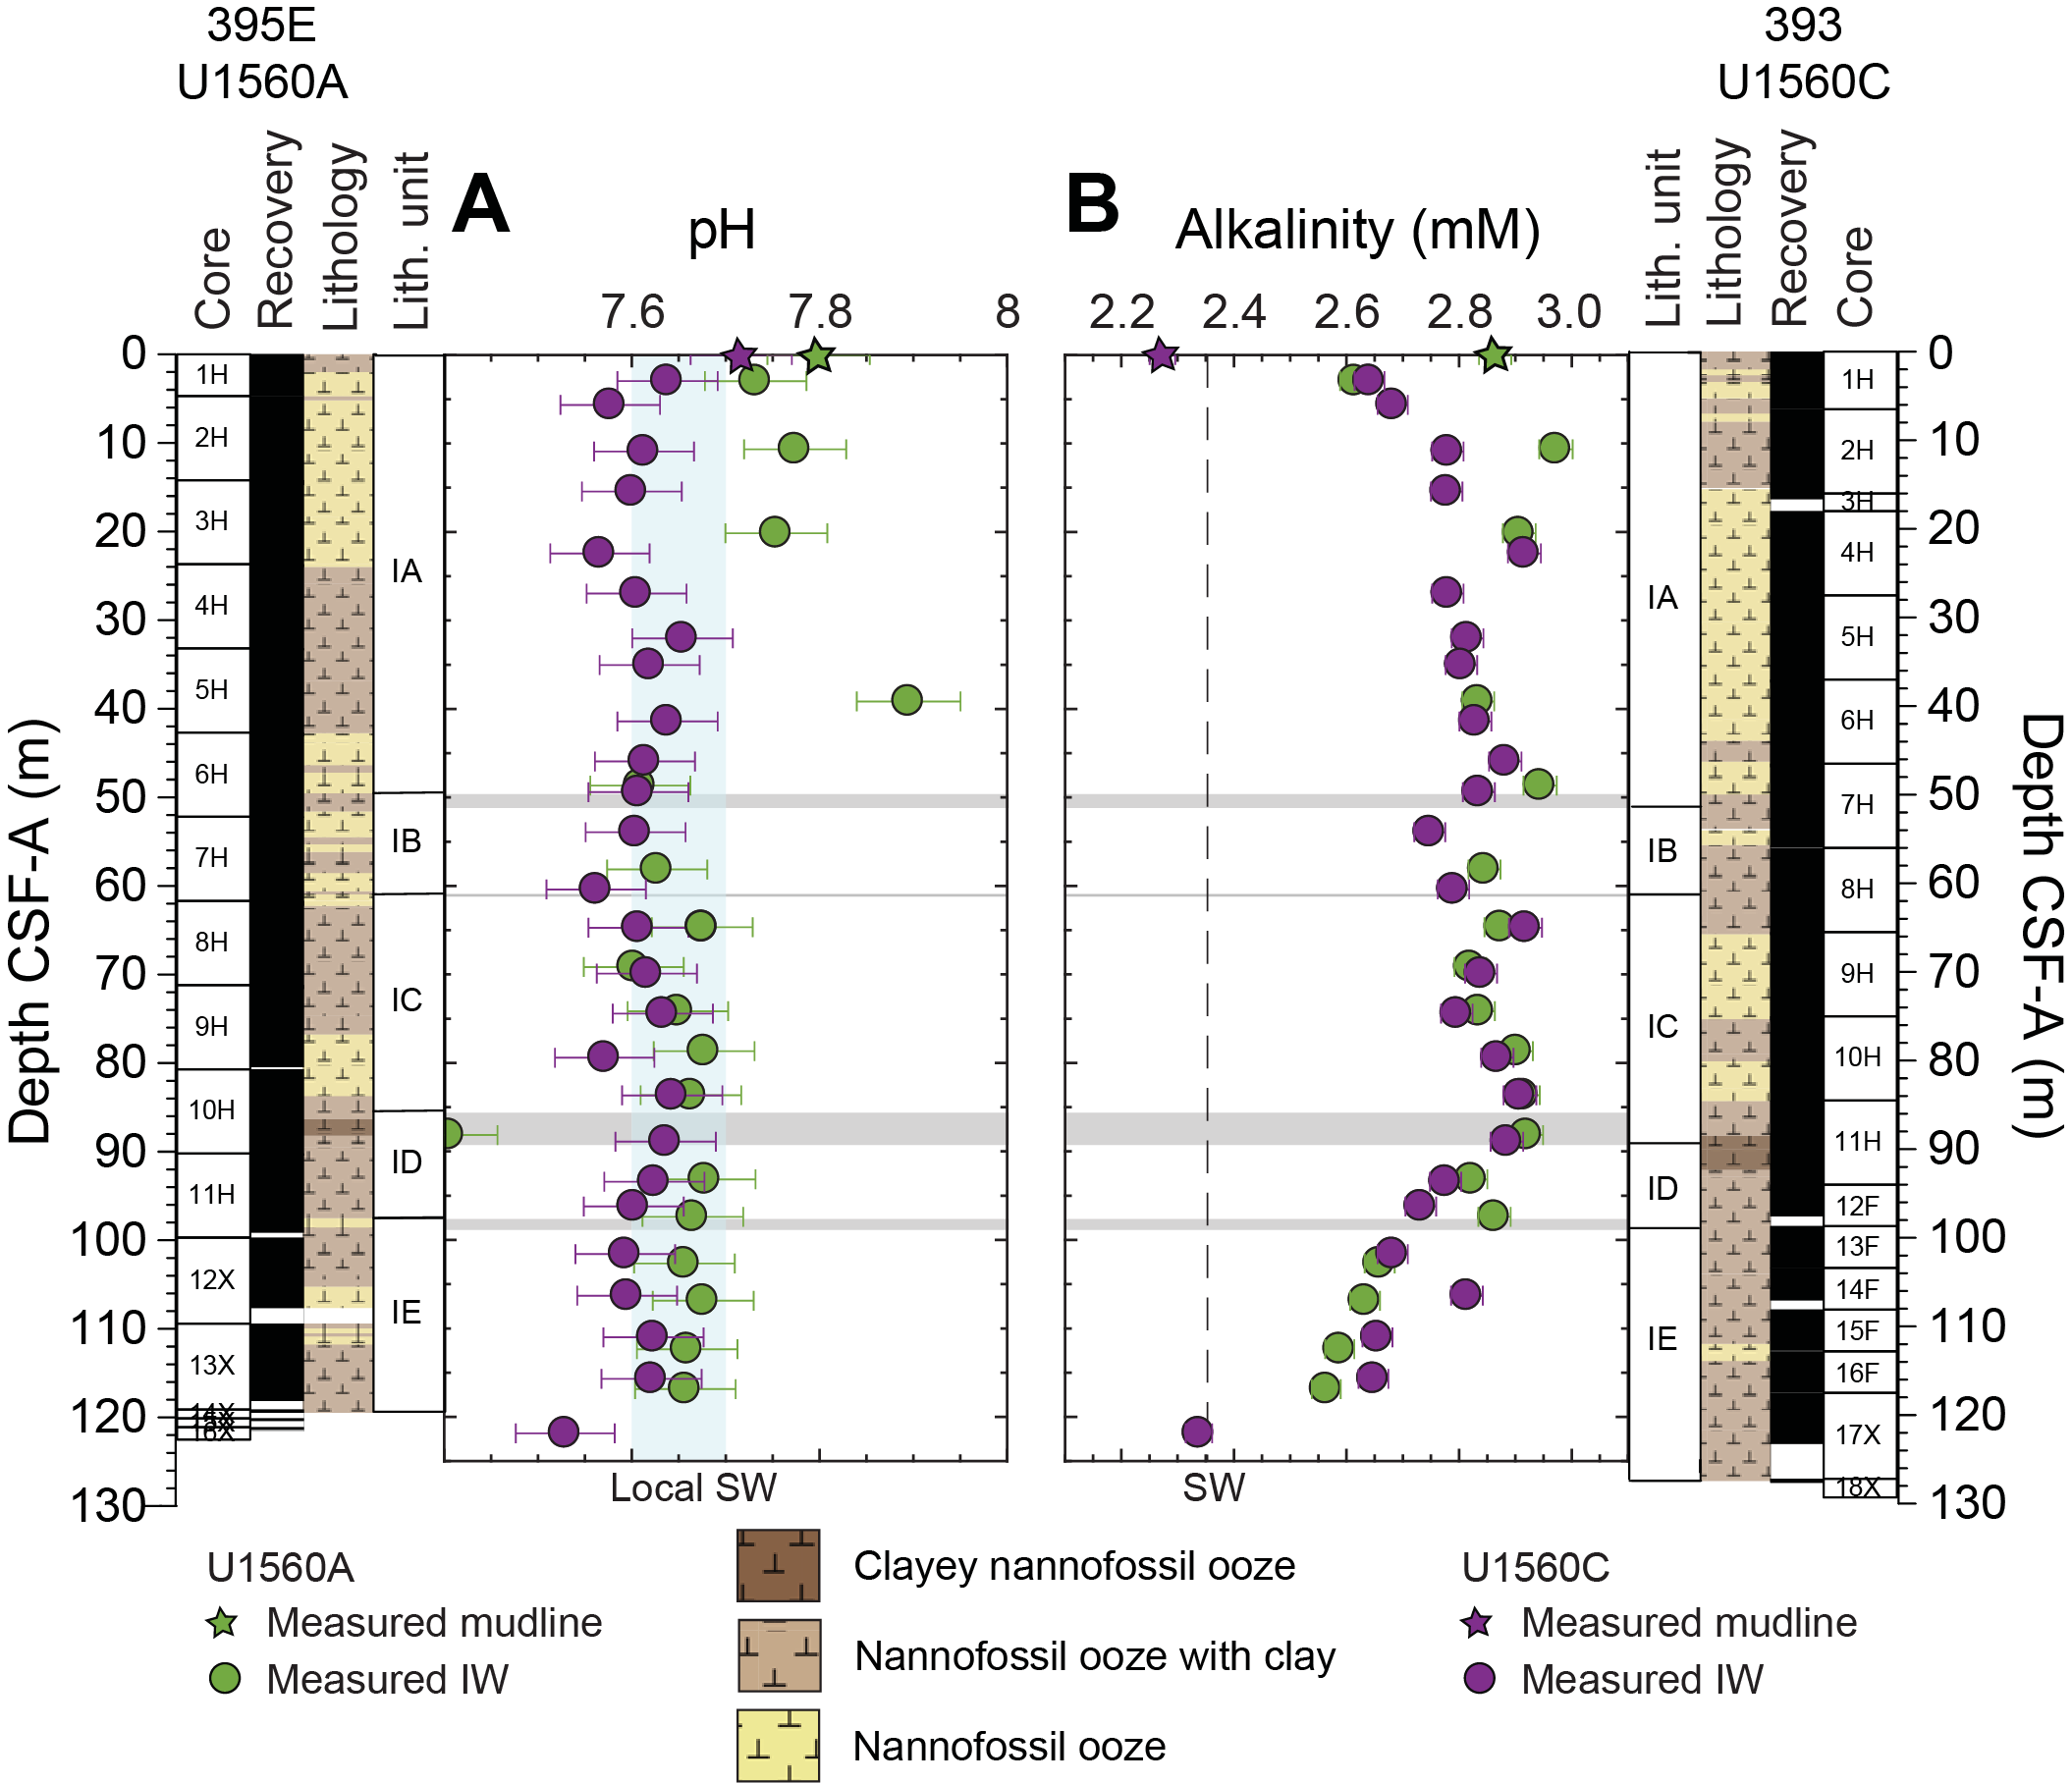
Figure F96. pH and alkalinity.
Alkalinity values for the mudline samples in Holes U1560A (2.9 mM) and U1560C (2.3 mM) differ beyond analytical uncertainty (Figure F96B). However, apart from the mudline, alkalinity profiles are virtually indistinguishable between the two holes. Values increase from 2.6 to 2.9 mM between ~3 and 20 m CSF-A (Subunit IA) in both Holes U1560A and U1560C. Following this initial increase, measured alkalinity values are mostly uniform from ~25 to 100 m CSF-A (Hole U1560A: 2.9 ± 0.1 mM, 2σ, n = 11; Hole U1560C = 2.8 ± 0.1 mM, 2σ, n = 17). Alkalinity gradually decreases from the bottom of Subunit ID (nannofossil ooze with clay and clayey nannofossil ooze) through Subunit IE in Holes U1560A (2.9–2.6 mM) and U1560C (2.7–2.3 mM). The lowermost sampled pore fluid from Hole U1560C, from XCB Core 393-U1560C-17X, has an alkalinity value similar to the reference IAPSO seawater value (2.3 mM).
11.1.2.3. Calcium, magnesium, strontium, and Sr/Ca
Measured Ca concentrations in the mudline samples from Holes U1560A (11.0 mM) and U1560C (10.9 mM) are within error of each other but are slightly higher than the expected value based on the IAPSO seawater standard (10.6 ± 0.4 mM, 2σ, n = 55) (Figure F97A). Ca concentrations decrease between 0 and ~3 m CSF-A, with the uppermost measured pore fluids showing seawater-like concentrations in both holes (10.5 mM at 2.96 m CSF-A in Hole U1560A; 10.5 mM at 2.95 m CSF-A in Hole U1560C). Between ~3 and ~93 m CSF-A, corresponding to Subunits IA (nannofossil ooze with clay and foraminifera) through ID (nannofossil ooze with clay interbedded with clayey nannofossil ooze), Ca concentrations show a broad increase from 10.5 to 11.2 mM in Hole U1560A (with the exception of Cores 395E-U1560A-3H and 4H) and from 10.5 to 11.4 mM in Hole U1560C. In Subunit IE (nannofossil ooze with foraminifera and varying clay amounts), measured Ca values in both holes gradually decrease toward the seawater value at the sediment/basement interface. Rhizon-sampled fluids from Hole U1560A show similar concentration trends as squeezed fluids but are persistently offset to lower values (see Geochemistry in the Expedition 390/393 methods chapter [Coggon et al., 2024a]).
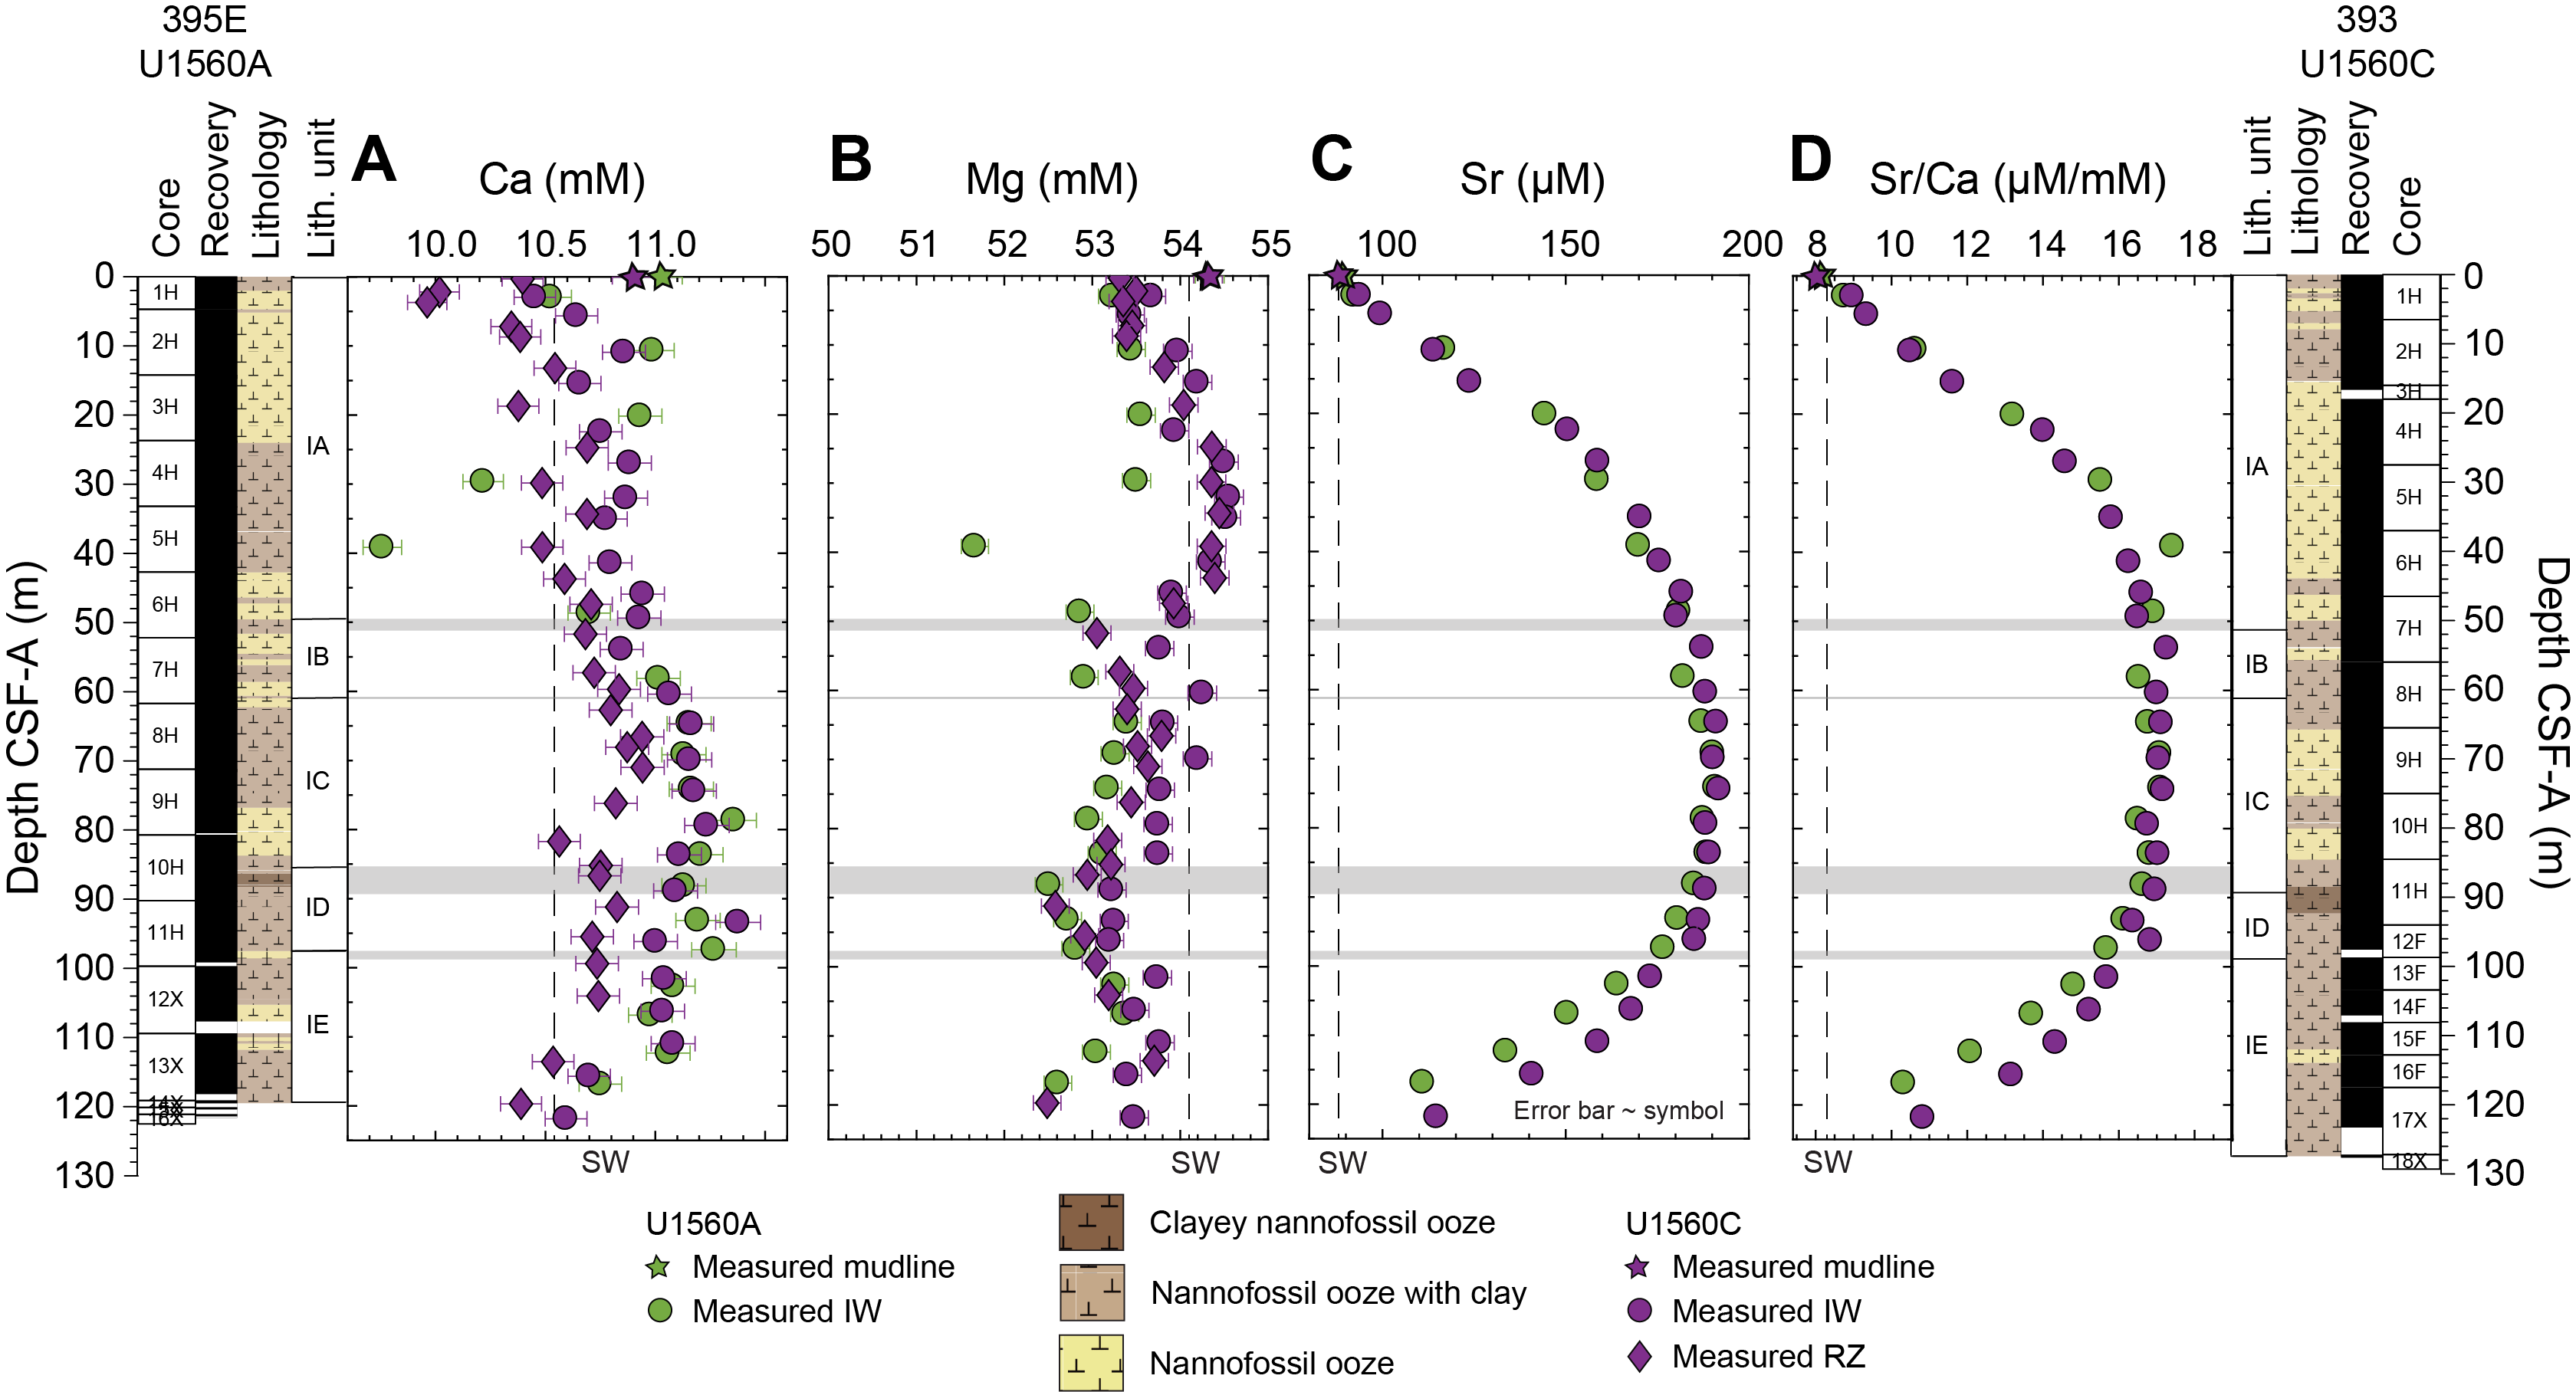
Figure F97. Calcium, magnesium, strontium, and Sr/Ca ratios.
Mg profiles show different concentration trends between the holes (Figure F97B). In Hole U1560A, Mg values decrease relative to the mudline (54.3 mM) and remain lower than seawater throughout Subunits IA (53.3 ± 1.6 mM, 2σ, n = 5; excludes outlier at 39.16 m CSF-A), IB (52.9 mM, n =1; nannofossil ooze with clay interbedded with nannofossil ooze), and IC (53.2 ± 0.3 mM, 2σ, n = 5; nannofossil ooze with clay and clayey nannofossil ooze). Between ~88 and 107 m CSF-A (Subunit ID and top of Subunit IE), Mg concentrations increase to 53.4 mM before decreasing toward the bottom of the hole (52.6 mM at 116.86 m CSF-A). In Hole U1560C, Mg concentrations in squeezed IW decrease relative to the mudline (54.3–53.7 mM) and then increase to 54.5 mM between ~3 and ~27 m CSF-A. Values remain stable between ~30 and ~40 m CSF-A (54.2 ± 0.2 mM, 2σ, n = 3), similar to the seawater value (53.9 ± 0.7 mM, 2σ, n = 55). Throughout Subunit IB and the top ~10 m of Subunit IC (~50–70 m CSF-A), Mg concentrations range 53.8–54.3 mM and then decrease to 53.2 mM between ~70 and ~100 m CSF-A (Subunits IC and ID). In Subunit IE, Mg concentrations are tightly clustered around an average value of 53.6 ± 0.3 mM (2σ, n = 5).
In contrast to the variable profiles of Ca and Mg between Holes U1560A and U1560C, downhole changes in Sr concentrations in both holes show a near-perfect match (Figure F97C). In Subunit IA (0–48.66 m CSF-A in Hole U1560A and 0–49.4 m CSF-A in Hole U1560C), measured Sr values increase (Hole U1560A: 89.5–181.0 µM; Hole U1560C: 87.8–180.3 µM). Sr concentrations remain high throughout Subunits IB and IC (Hole U1560A: 187.8 ± 6.2 µM, 2σ, n = 6; Hole U1560C: 189.4 ± 3.3 µM, 2σ, n = 8). Below ~100 m CSF-A (Subunits ID and IE), Sr values gradually decrease (Hole U1560A: 185.2–111.0 µM; Hole U1560C: 186.4–114.8 µM). Sr/Ca ratios in both holes show the same patterns as Sr concentrations (Figure F97D) because changes in measured Ca values are relatively small (Hole U1560A: 10.2–11.4 mM; Hole U1560C: 10.5–11.4 mM). In Subunit IA, Sr/Ca ratios increase from 8.1 to 17.4 µM/mM in Hole U1560A and from 8.1 to 16.6 µM/mM in Hole U1560C. Ratios are stable between Subunits IB and IC (Hole U1560A: 16.8 ± 0.5 µM/mM, 2σ, n = 6; Hole U1560C: 17.1 ± 0.3 µM/mM, 2σ, n = 8) and gradually drop throughout Subunits ID and IE (Hole U1560A: 16.6–10.3 µM/mM; Hole U1560C: 16.8–10.8 µM/mM).
Although Ca and Mg concentrations do not show major deviations from the seawater values, the variations in Sr (and, as a result, Sr/Ca ratios) observed in both holes are indicative of dissolution of biogenic carbonate and reprecipitation as high-Mg calcite at Site U1560 (e.g., Baker et al., 1982). Indeed, qualitative XRD analyses of these sediments yielded high-Mg calcite peaks at 19.72, 38.27, and 62.98 m CSF-A (see Sedimentology). The gradual shift toward seawater values of Sr and Sr/Ca ratios at the bottom of both holes has also been observed at some other sites across the SAT (e.g., Sites U1558 and U1583) and may indicate the influence of seawater-like fluids at the sediment/basement interface. Such fluids would also help to explain the "freshening" observed in Na, Cl, and Br concentrations at this and other sites.
11.1.2.4. Boron, lithium, silica, and potassium
Small to moderate increases (relative to the mudline) are observed for B (11%–13%), Li (2%–4%), and K (7%–9%) concentrations within the uppermost ~3 m of sediment in Holes U1560A and U1560C (Figure F98). In contrast, Si concentrations increase by 215% in Hole U1560A (57.3–180.9 µM) and by 179% in Hole U1560C (63.4–176.9 µM), indicating biogenic silica dissolution in these sediments (e.g., DeMaster, 1981). Pore fluid profiles of B, Li, Si, and K are similar between the two holes, and concentration changes with depth are generally associated with variations in the clay content of sediments.
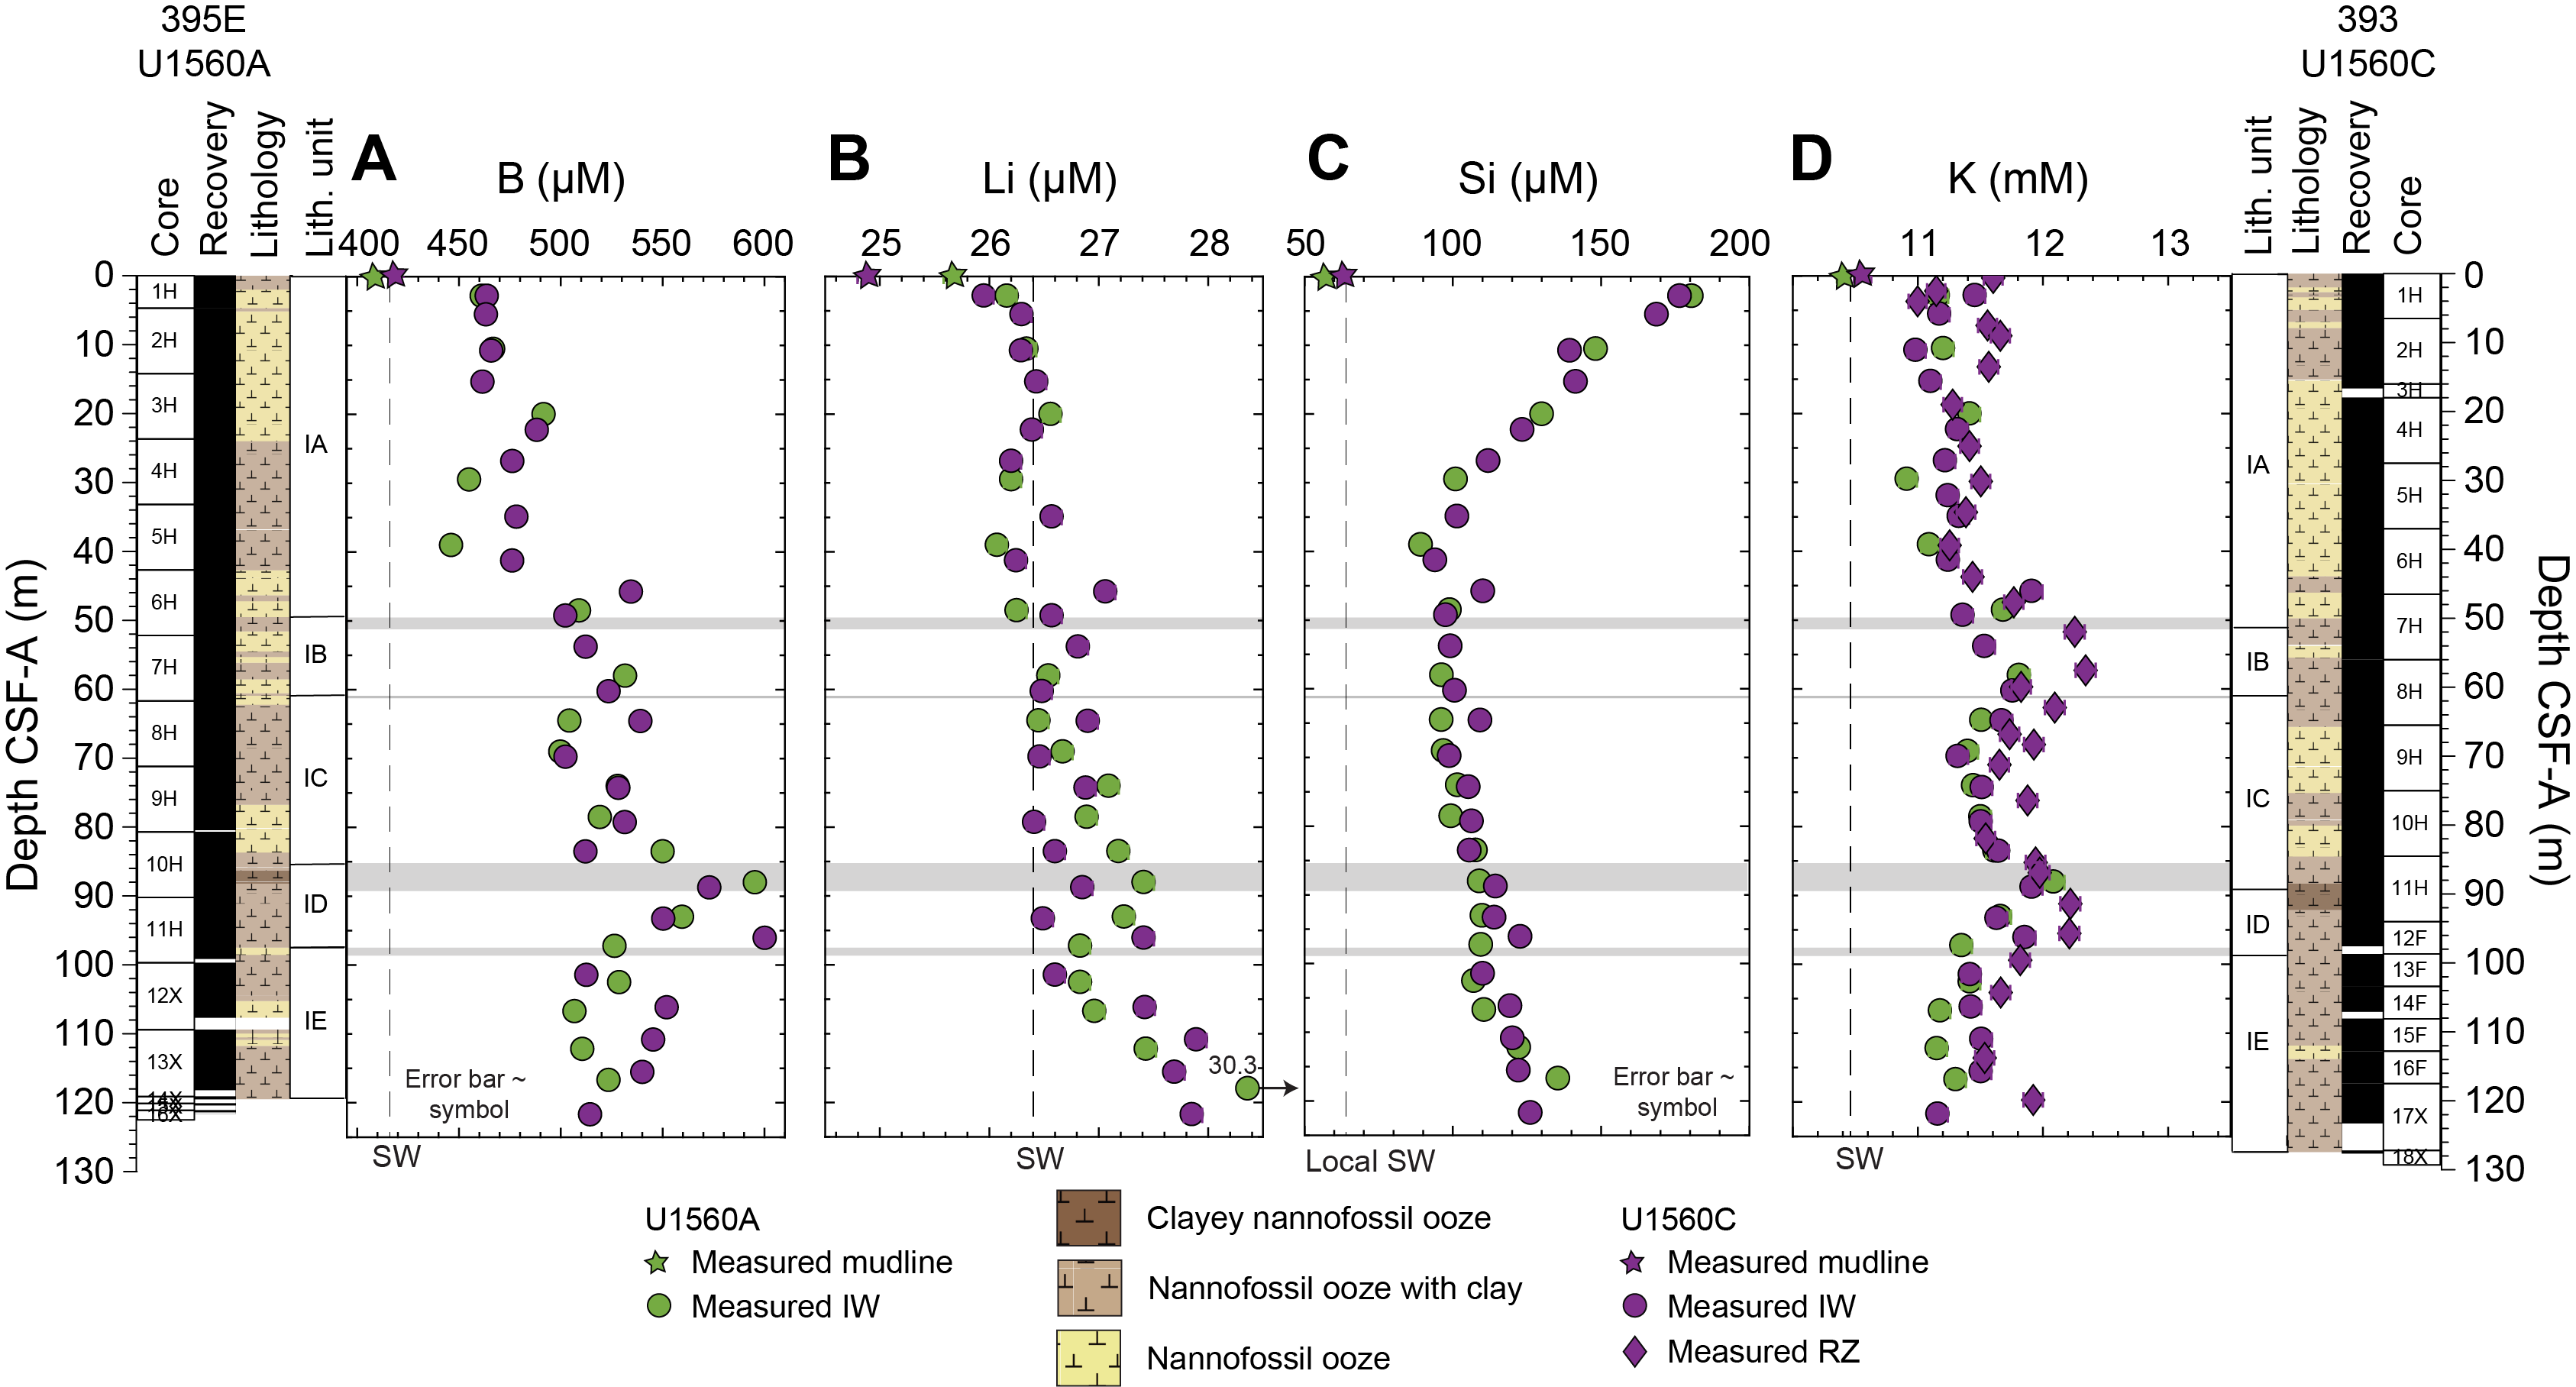
Figure F98. Boron, lithium, silica, and potassium.
B concentrations increase throughout Subunits IA (nannofossil ooze with clay and foraminifera) and IC (nannofossil ooze with foraminifera and nannofossil ooze with clay), ranging 461.8–550.6 µM in Hole U1560A (2.96–83.65 m CSF-A) and 464.2–532.1 µM in Hole U1560C (2.95–79.41 m CSF-A) (Figure F98A). A sharp increase in B values occurs at the boundary between Subunits IC and ID (nannofossil ooze with clay and clayey nannofossil ooze), with concentrations as high as 595.9 µM in Hole U1560A (88.15 m CSF-A) and 573.5 µM in Hole U1560C (88.90 m CSF-A). B concentrations show a broad decrease deeper than ~90 m CSF-A, reaching values of 524.0 µM (Hole U1560A) and 515.0 µM (Hole U1560C) at the sediment/basement interface. Li concentrations are roughly uniform in Subunit IA (Hole U1560A: 26.3 ± 0.4 µM, 2σ, n = 6; Hole U1560C: 26.4 ± 0.4 µM, 2σ, n = 10) and gradually increase throughout Subunits IB and IE, reaching 30.3 µM (Hole U1560A) and 27.9 µM (Hole U1560C) in the lowermost sediments (Figure F98B).
Following the initial increase at the top of Subunit IA, Si concentrations gradually drop between ~3 and ~40 m CSF-A (Hole U1560A: 180.9–89.5 µM; Hole U1560C: 176.9–94.4 µM) (Figure F98C). Below ~40 m CSF-A, Si concentrations slowly increase to maxima of 135.8 µM (Hole U1560A) and 126.5 µM (Hole U1560C) at the sediment/basement interface. K concentrations are uniform in Subunits IA (11.3 ± 0.5 mM, 2σ, in both holes) and IC (Hole U1560A: 11.5 ± 0.2 mM, 2σ, n = 5; Hole U1560C: 11.6 ± 0.4 mM, 2σ, n = 6) and reach local maxima in Subunits IB (11.8 mM in both holes; nannofossil ooze with clay interbedded with nannofossil ooze) and ID (Hole U1560A: 12.1 mM at 88.15 m CSF-A; Hole U1560C: 11.9 mM at 88.90 m CSF-A). Below ~88 m CSF-A, K concentrations decrease (Hole U1560A: 12.1–11.3 mM; Hole U1560C: 11.9–11.2 mM) (Figure F98D).
Some of the variability in B, Li, Si, and K concentrations at Site U1560 might be related to variations in the clay content of sediments downhole, as indicated by qualitative XRD analyses (see Sedimentology). In Subunit IA, total clay ranges 3–5 wt% compared to the 5–6 wt% reported for Subunit IE (nannofossil ooze with foraminifera and varying clay amounts; see Sedimentology). In Subunit ID, where pore fluid B and K concentrations are highest, estimated total clay contents are as high as 9 wt% (see Sedimentology). In addition to silicate diagenesis within the sediment column, chemical exchanges between sediment and basement (e.g., Gieskes, 1975) could explain the more prominent variations in B, Li, and K concentrations in Subunit IE, as well as the broad increase in Si concentrations throughout Subunits IB–IE.
11.1.2.5. Sulfate, ammonium, and manganese
Sulfate concentrations sharply decrease between the mudline (28.8 mM in both holes) and the first measured pore fluid (Hole U1560A: 27.4 mM at 2.96 m CSF-A; Hole U1560C: 27.7 mM at 2.95 m CSF-A) (Figure F99A). In Hole U1560C, this change in SO4 concentration coincides with a decrease in pore fluid oxygen content (Figure F99D) and could indicate localized sulfate reduction within microniches of the uppermost sediments (e.g., Jørgensen, 1977). Following the initial concentration drop, SO4 increases between ~3 and ~40 m CSF-A (Hole U1560A: 27.4–28.1 mM; Hole U1560C: 27.7–28.3 mM). Throughout Subunits IB (nannofossil ooze with clay interbedded with nannofossil ooze) to IE (nannofossil ooze with foraminifera and varying clay amounts), measured SO4 values remain relatively uniform in both holes (Hole U1560A: 27.8 ± 0.3 mM, 2σ, n = 14; Hole U1560C: 28.1 ± 0.3 mM, 2σ, n = 18).
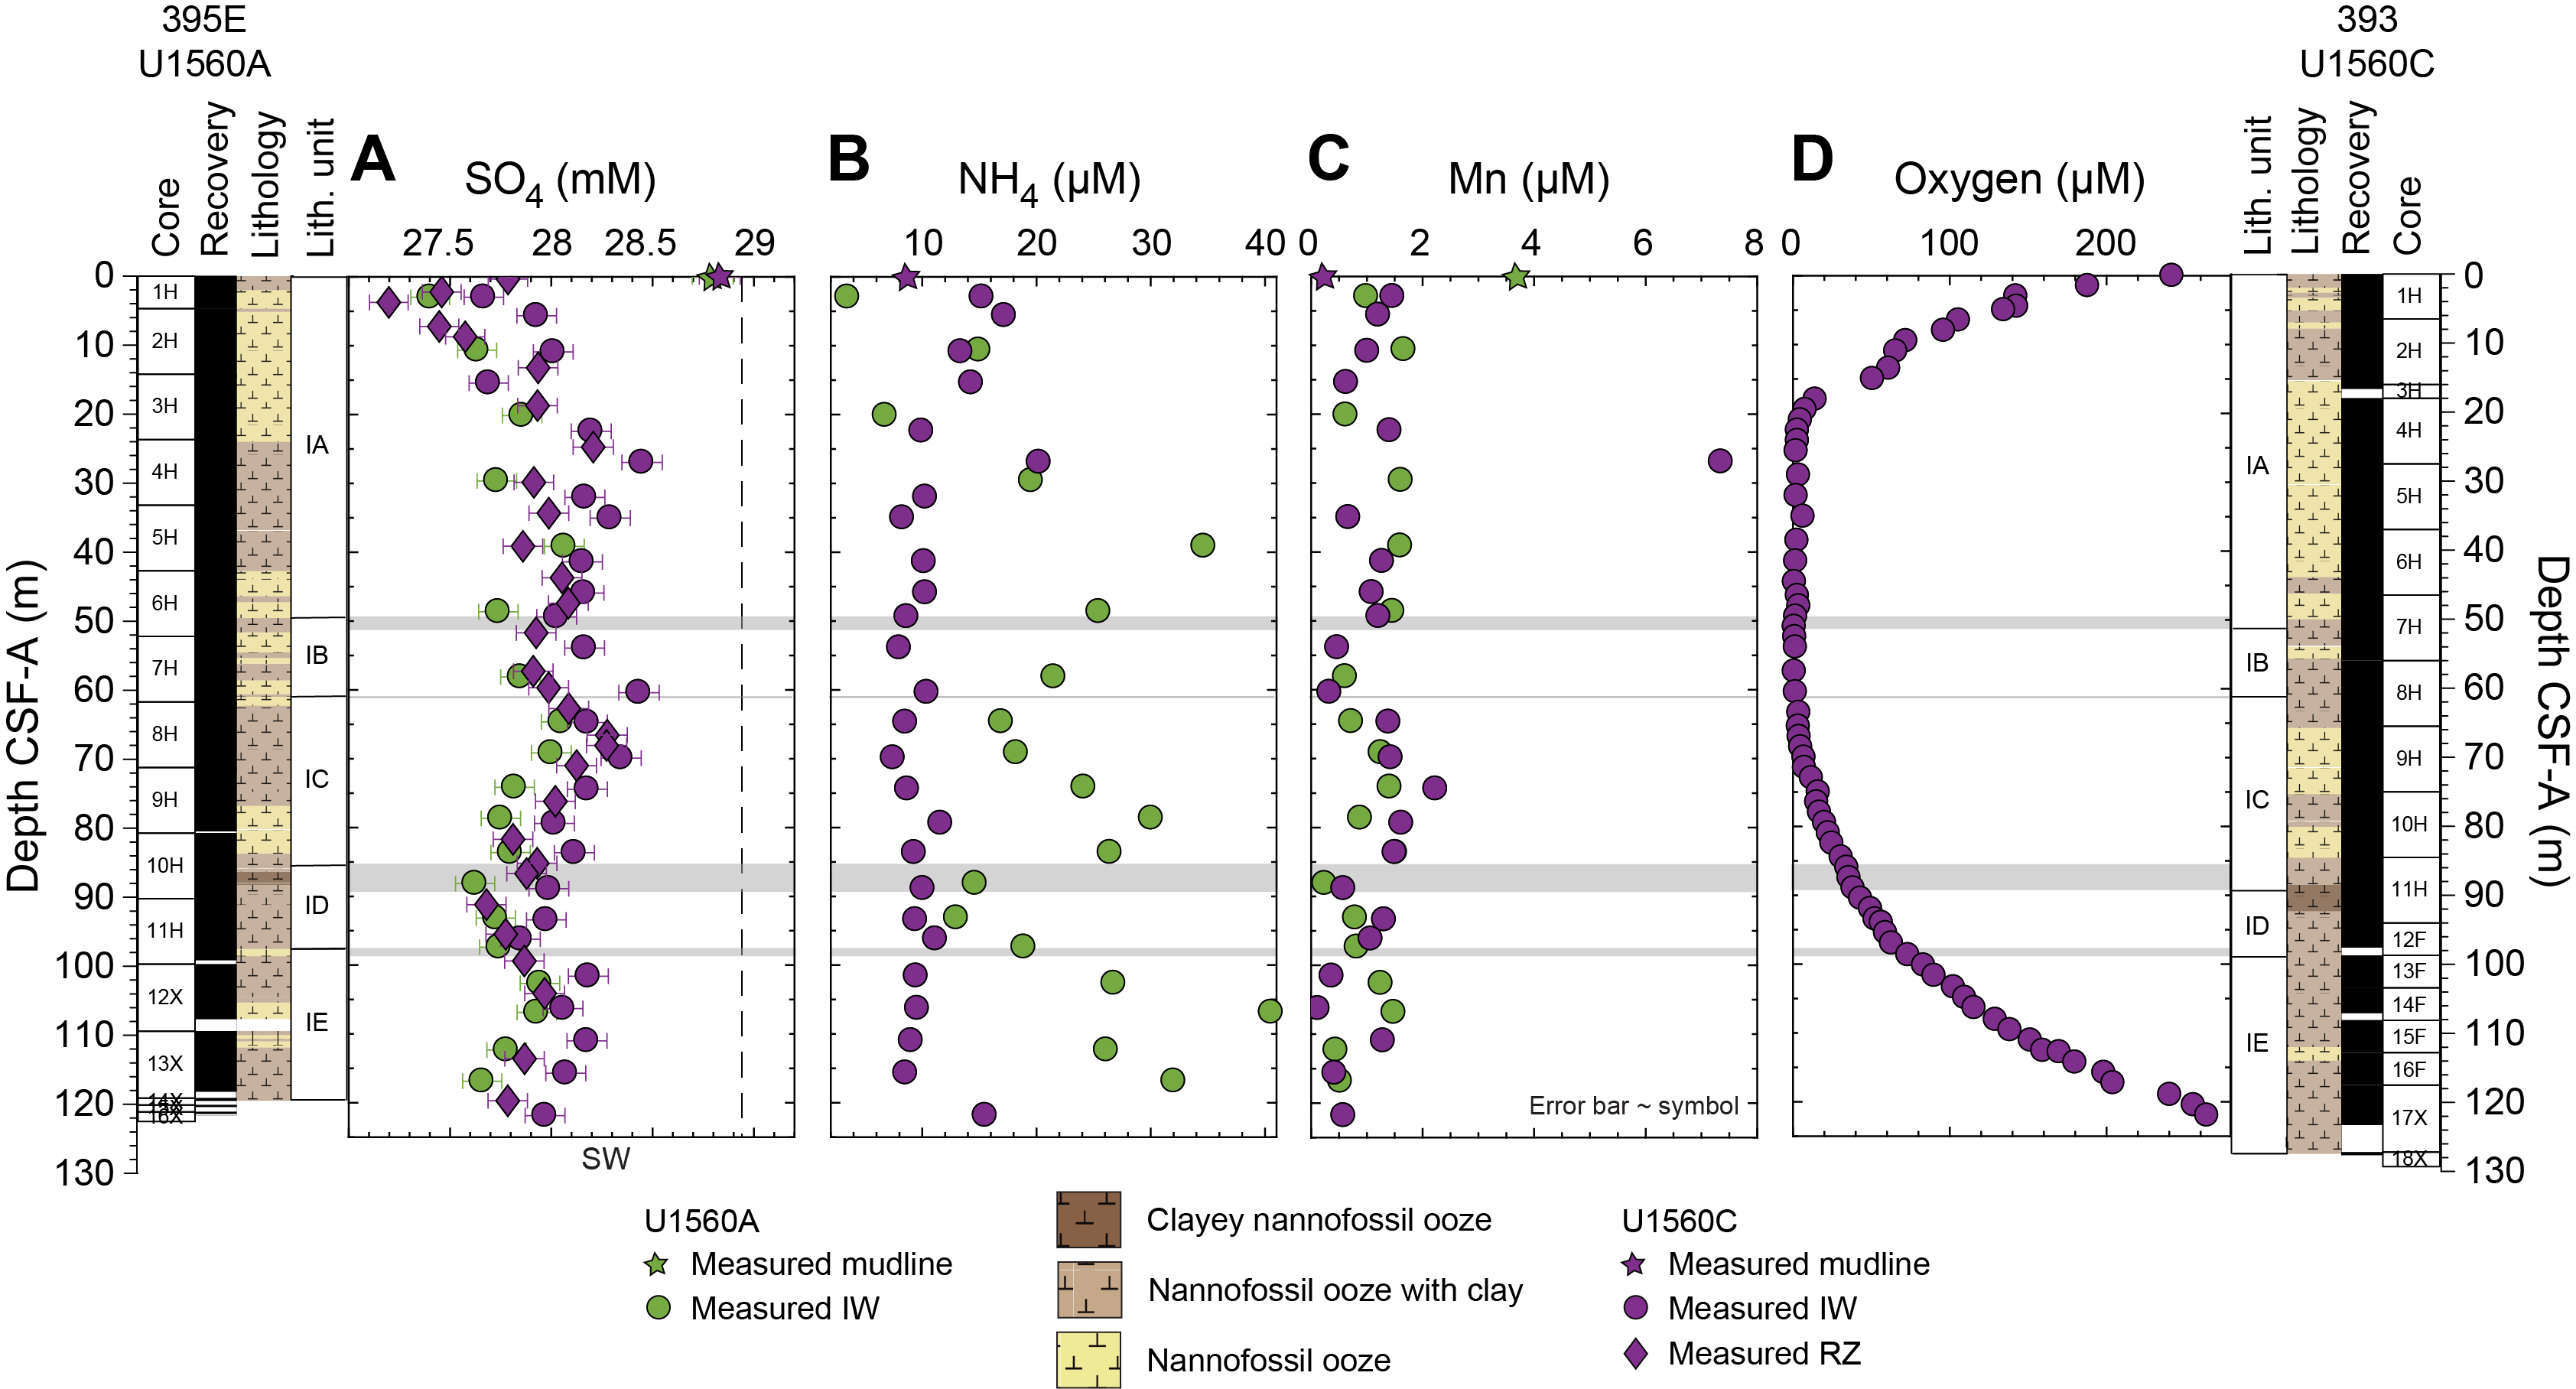
Figure F99. Sulfate, ammonium, manganese, and oxygen.
In contrast to the sulfate profiles, the observed changes in ammonium concentrations with depth are significantly different between the two holes (Figure F99B). In Hole U1560A, NH4 contents increase with depth (3.5–40.6 µM), but values are greatly scattered. In Hole U1560C, NH4 concentrations show an overall increase relative to the mudline (8.7 µM) at the top of Subunit IA (15.1 ± 7.0 µM, 2σ, n = 6; nannofossil ooze with clay and foraminifera), followed by a return to lower values between ~30 and 115 m CSF-A (9.4 ± 2.2 µM, 2σ, n = 19). The lowermost sample in Hole U1560C (121.86 m CSF-A) has a higher NH4 concentration (15.53 µM) compared to fluids directly above. Mn profiles are fairly similar between the two holes (Hole U1560A: 0.25–3.67 µM; Hole U1560C: 0.13–2.24 µM) (Figure F99C). One high-Mn pore fluid (7.36 µM) is observed at 26.96 m CSF-A in Hole U1560C, which coincides with the interval of anoxia reported for this hole (see Oxygen).
11.1.2.6. Oxygen
Oxygen is the pore water constituent measured with the highest reduction potential and is the first molecule reduced during microbial degradation of organic matter. Its profile provides insight into subseafloor biogeochemical and microbial processes. Oxygen concentrations in Hole U1560C steeply decrease from ~242 µM at 0.05 m CSF-A to ~3 µM at ~22 m CSF-A in Subunit IA (nannofossil with clay and foraminifera) (Table T34). Oxygen concentrations remain nearly anoxic (<4 µM) from ~22 to ~60 m CSF-A and then begin to rise at the boundary between Subunits IB (nannofossil ooze with clay and nannofossil ooze) and IC (nannofossil ooze with foraminifera and nannofossil ooze with clay) at ~62 m CSF-A. Measured oxygen values continue to rise from ~62 m CSF-A to the end of the recovered sediment sections at an accelerating rate of increase approaching the basement. The three measurements taken in the lowermost XCB core that contained recovered sediments (Core 393-U1560C-17X) correspond to oxygen concentrations (~240–260 µM) similar to and higher than the value measured for the uppermost sampled sediments (242 µM at 0.05 m CSF-A).
11.1.3. Sediment sampling
During Expeditions 395E and 393, sediment samples from Holes U1560A and U1560C were selected by the sedimentologists from a combination of squeeze cake residues and core working halves for carbon and nitrogen analyses (see Geochemistry in the Expedition 390/393 methods chapter [Coggon et al., 2024a]). During Expedition 395E, all sediment samples were taken from IW squeeze cake residues except for the sample from Core 395E-U1560A-14X, where the sediment was sampled from the core working half. One sample per core was analyzed in Cores 395E-U1560A-1H through 7H and two per core from Cores 8H–14X (n = 21). During Expedition 393, samples were selected by sedimentologists from core working halves. One sample per core was analyzed in Cores 393-U1560C-12F through 18X and two per core in Cores 1H–11H (n = 27). In total, 48 sediment samples from Site U1560 were analyzed between Expeditions 395E and 393 (Table T35). In addition, sediment was sampled from Hole U1560A whole-round cores on the catwalk for headspace hydrocarbon gas analyses during Expedition 395E (see Geochemistry in the Expedition 390/393 methods chapter [Coggon et al., 2024a]). These samples were taken from the top of Sections 14X-1, 1H-3, Section 5 in Cores 2H–7H, and Section 6 in Cores 8H–13X (Table T35). Concentrations of all headspace hydrocarbon samples were 0 ppmv (n = 14) and will not be discussed further.
11.1.4. Sediment bulk geochemistry
11.1.4.1. Calcium carbonate
The calcium carbonate content of sediments is high throughout Holes U1560A (87 ± 19 wt%, 2σ, n = 21) and U1560C (86 ± 15 wt%, 2σ, n = 27). In Subunit IA in both holes (nannofossil ooze with foraminifera and clay), carbonate content is uniform downhole (90 ± 8 wt%, 2σ, n = 17). CaCO3 drops to 80.5 wt% at the top of Subunit IB (nannofossil ooze with clay interbedded with clayey nannofossil ooze; ~50.5–61 m CSF-A) and ranges ~78–85 wt% (n = 3) between both holes. In Subunit IC (nannofossil ooze with foraminifera and nannofossil ooze with clay; ~61–87 m CSF-A), carbonate content increases and is uniform with depth (~90 ± 4 wt%, 2σ, n = 10) in both holes. Local minima in carbonate contents occur in Subunit ID (~87–97 m CSF-A), a clayey nannofossil ooze subunit with average CaCO3 of 79 ± 16 wt% (2σ, n = 5). In Subunit IE (nannofossil ooze with foraminifera and varying clay amounts; ~97–127 m CSF-A), carbonate contents decrease from ~91 wt% at the top of the subunit (at ~107 and 110 m in Holes U1560A and U1560C, respectively) to ~50 wt% (~119 m CSF-A in Hole U1560A) and ~73 wt% (~122 m CSF-A in Hole U1560C) toward the bottom of the holes. The average carbonate content of Subunit IE is ~82 wt% (±22 wt%, 2σ, n = 13) between both holes.
11.1.4.2. Total organic carbon and nitrogen
TOC is calculated for all samples measured for CaCO3 (n = 48) as the difference between total carbon (TC) and total inorganic carbon (See Geochemistry in the Expedition 390/393 methods chapter [Coggon et al., 2024a]). TOC concentrations (Figure F100) are higher and more variable in Hole U1560C (0.88 ± 0.56 wt%, 2σ, n = 27) compared to Hole U1560A (0.32 ± 0.12 wt%, 2σ, n = 21). In Hole U1560A, Subunit IA (shallower than ~49 m CSF-A; nannofossil ooze with clay and foraminifera), TOC concentrations are ~0.33 wt% at the top of the hole (~3 m CSF-A), peak to 0.44 wt% at ~20 m CSF-A, and decrease to 0.32 wt% near the bottom of the subunit. The single data point in Hole U1560A Subunit IB (~49–60 m CSF-A; nannofossil ooze with clay interbedded with clayey nannofossil ooze) has a TOC concentration similar to the average value for the hole (0.32 wt%). In Hole U1560A Subunit IC (nannofossil ooze with foraminifera and clay; ~60–85 m CSF-A), TOC concentrations are mostly uniform downhole with an average of 0.32 wt% (±0.13 wt%, 2σ, n = 5). Hole U1560A Subunit IE (nannofossil ooze with foraminifera and varying clay amounts; ~96–119 m CSF-A) has mostly low TOC values (0.30 ± 0.12 wt%, 2σ, n = 7) with a sharp increase to 0.44 wt% at ~119 m CSF-A.
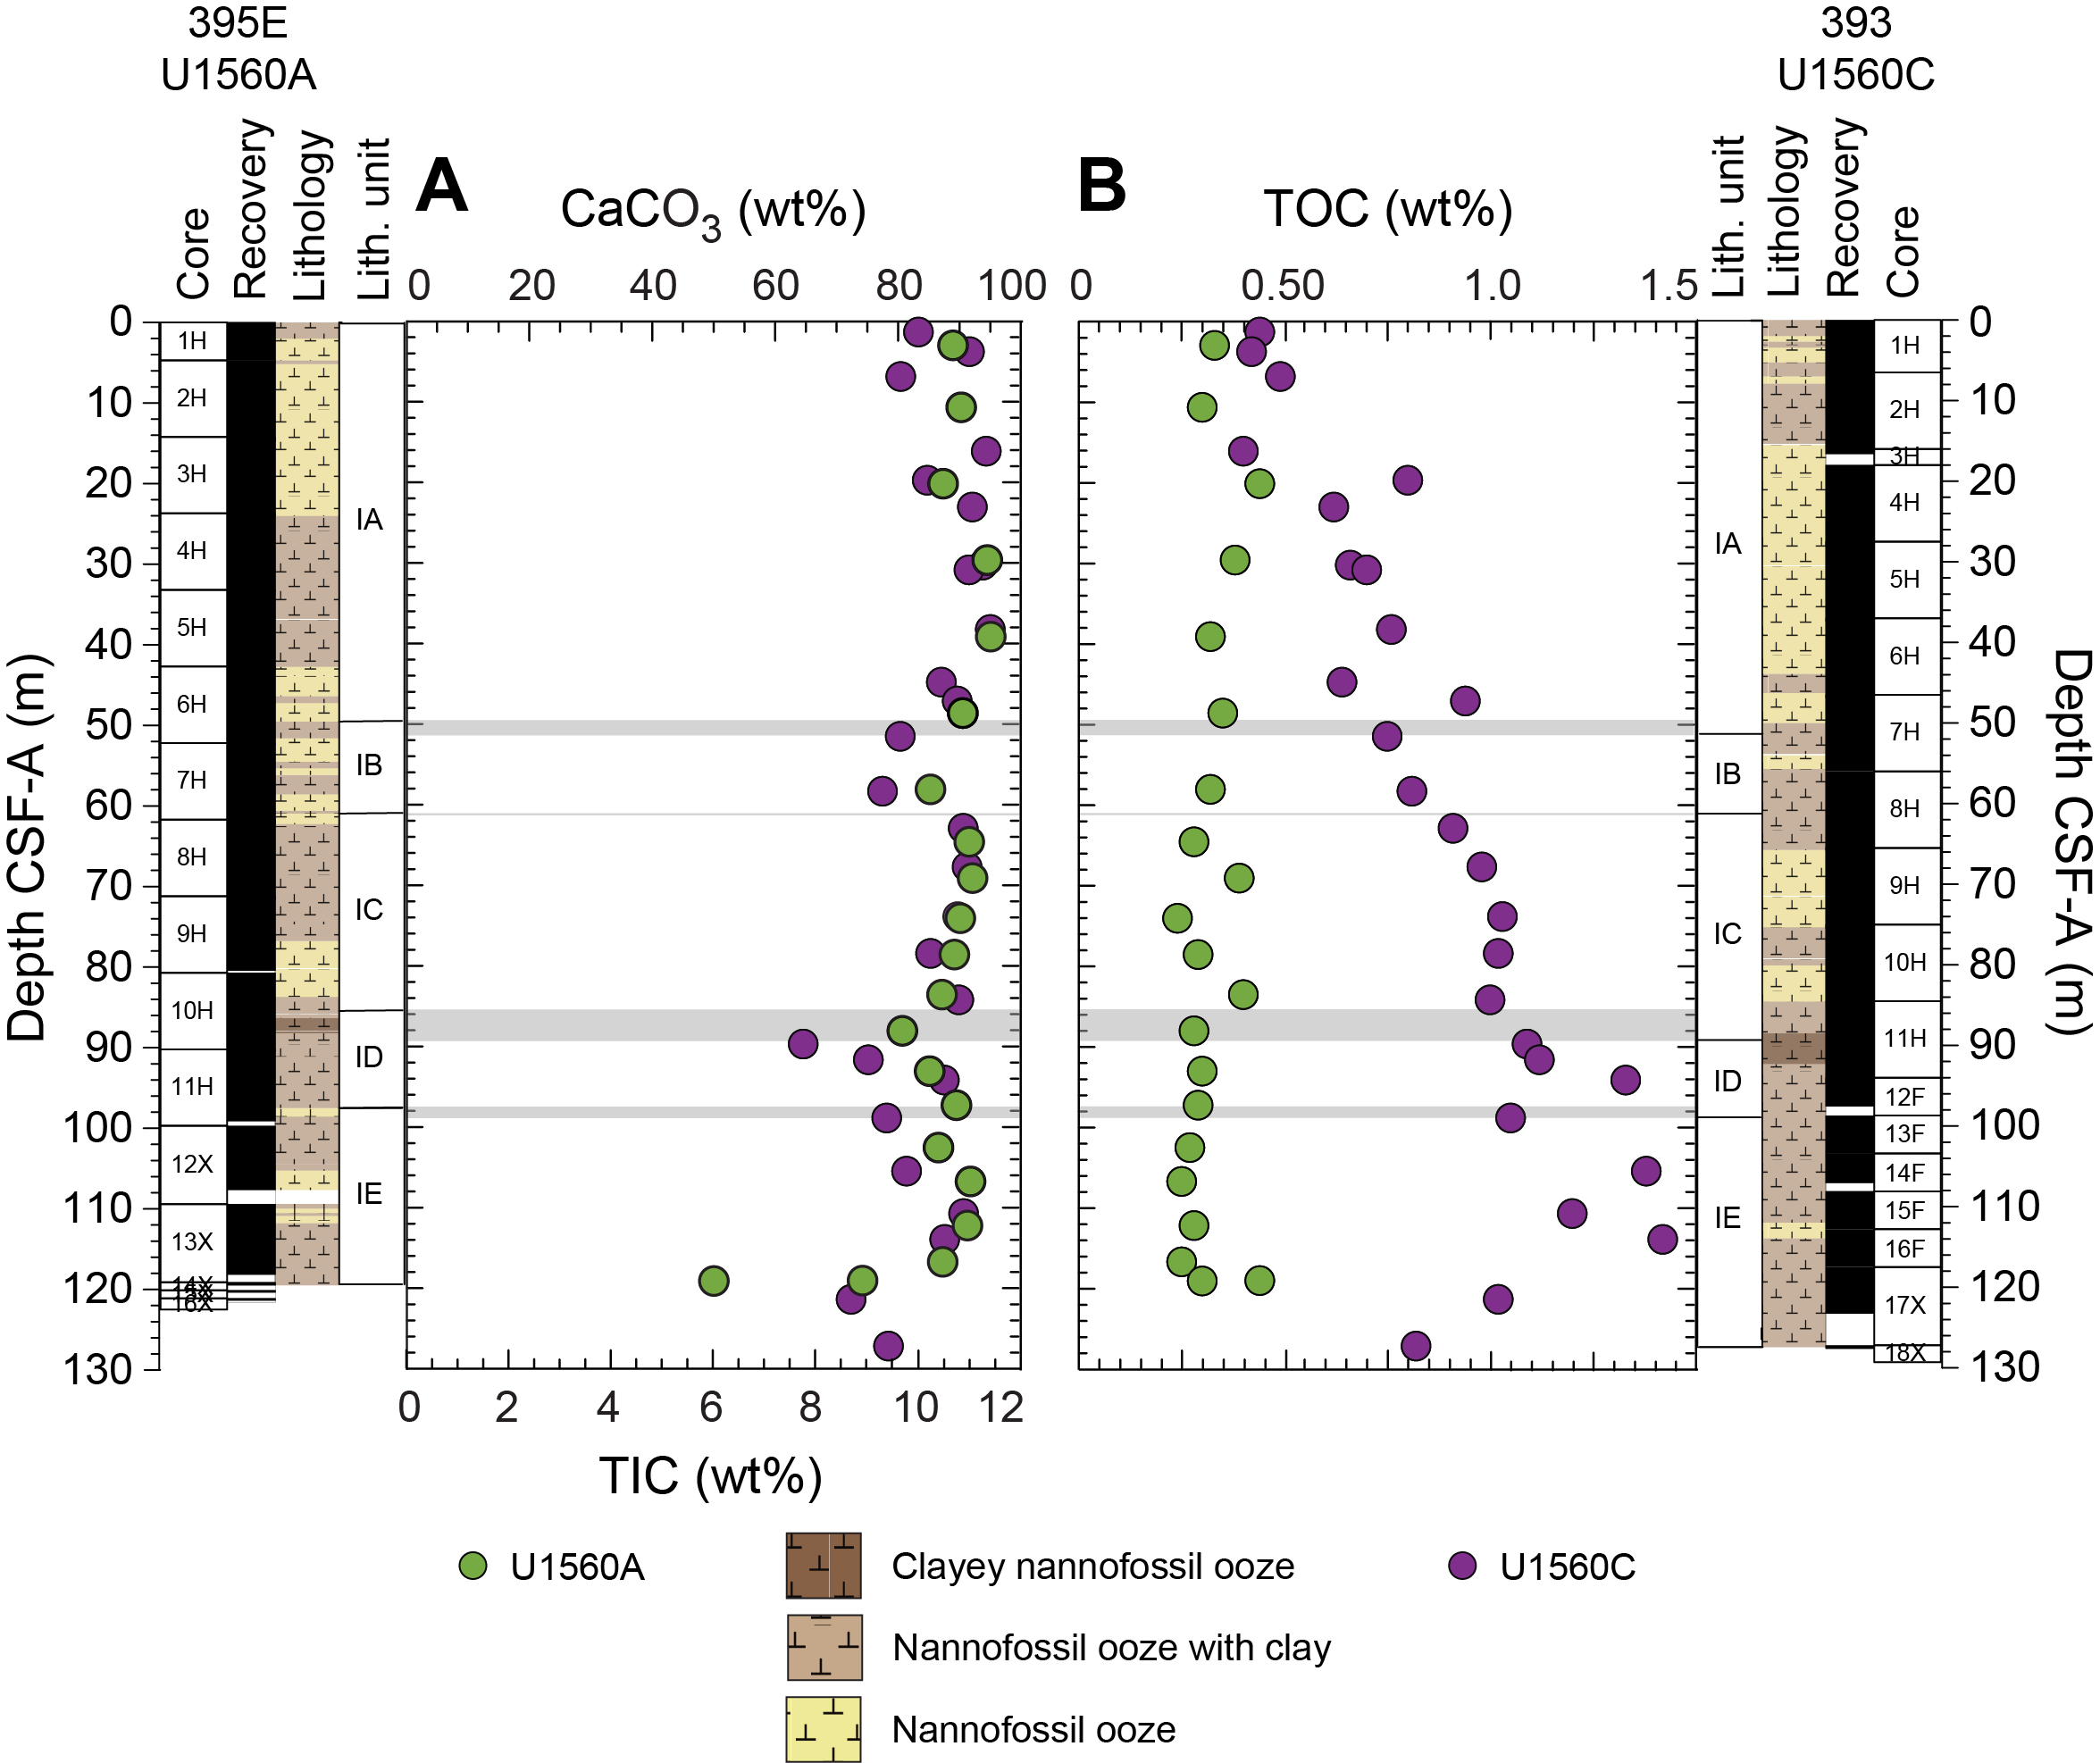
Figure F100. Calcium carbonate, TIC, and TOC.
TOC in Hole U1560C increases with depth (0.44–1.42 wt%), which is not seen in Hole U1560A. In Subunit IA (nannofossil ooze with clay and foraminifera; shallower than ~51 m CSF-A), TOC concentrations average ~0.62 ± 0.33 wt% (2σ, n = 11) and steadily increase from 0.44 wt% at the top of the subunit to 0.94 wt% near the bottom. Two peaks in TOC concentrations are observed at ~20 m (0.80 wt%) and ~47 m CSF-A (0.94 wt%). In Subunit IB (nannofossil ooze with clay interbedded with nannofossil ooze; ~51–61 m CSF-A), the two measured TOC concentrations are uniformly high (0.75–0.81 wt%). In Subunit IC (nannofossil ooze with foraminifera and nannofossil ooze with clay; ~61–89 m CSF-A), TOC concentrations gradually increase at the top of the subunit (0.91–1.03 wt%; ~74 m CSF-A) and then decrease to 1.00 wt% near the bottom of the subunit. The average TOC concentration in Subunit IC (0.99 ± 0.09 wt%, 2σ, n = 5) is higher than the overlying subunits. In Hole U1560C Subunit ID (nannofossil ooze with clay and clayey nannofossil ooze; ~89–98 m CSF-A), TOC concentrations increase to 1.33 wt% near the bottom of the subunit (average = 1.18 ± 0.21 wt%, 2σ, n = 3). The highest average TOC concentration (1.15 ± 0.42 wt%, 2σ, n = 6) is measured in Hole U1560C Subunit IE (nannofossil ooze foraminifera with varying clay amounts; ~98–127 m CSF-A); TOC content returns to near average values toward the bottom of the Hole (0.82 wt%, ~127 m CSF-A).
Total nitrogen (TN) concentrations were measured from all samples analyzed for CaCO3 (n = 48). TN concentrations in Holes U1560A and U1560C are near or below detection limits (Table T35; see Table T9 in the Expedition 390/393 methods chapter [Coggon et al., 2024a]) and are not discussed further. Total sulfur (TS) and total hydrogen (TH) were not measured.
11.2. Basement
During Expedition 393, ~192 m of slightly to moderately altered ~15.2 Ma basalts were drilled in Hole U1560B, recovering 74.8 m of core and representing six distinguishable igneous/volcanostratigraphic units (see Igneous petrology). A total of 27 basement samples were selected for shipboard study: 25 basalts, and 2 samples including sedimentary breccia fill material from Cores 8R and 41R. One basalt sample was also included from Core 395E-U1560A-16X (Table T36). Analytical studies included solution analysis by ICP-AES, loss on ignition (LOI) measurements, and direct analyses of sample powders by pXRF.
11.2.1. Basement rock sampling and geochemical analysis
The geochemical samples selected represented typical material from each of the magmatic units identified by the Petrology team. Geochemical samples were taken adjacent to other sampling (thin sections, PMAG, XRD, etc.) to generate integrated data on these materials. A split of each freshly made sample powder was placed in a powder mount for pXRF analysis, and each sample was measured three times (see Geochemistry in the Expedition 390/393 methods chapter [Coggon et al., 2024a]). ICP-AES measurements were completed on oxidized samples that had undergone LOI determinations, so ICP-AES data are reported on a volatile-free basis.
11.2.2. Bulk chemical compositions and trace element abundances
Table T36 lists the shipboard geochemical data collected on Site U1560 samples by ICP-AES analysis, and Table T37 presents pXRF data collected for these samples from powder mounts. In Figure F101, the Site U1560 data are plotted on the total alkali versus silica classification diagram of Le Bas et al. (1986). Like other SAT samples, Site U1560 samples fall in the basalt field. By the Yoder and Tilley (1962) basalt classification scheme, the Site U1560 basalts are all tholeiites or olivine tholeiites with one low-Mg sample (393-U1560B-29R-1, 114–116 cm) showing normative Ne (Table T36). In Figure F102, Sr versus TiO2, the Site U1560 samples range to higher values of TiO2 than any of the depleted MORB (D-MORB) lavas recovered on the SAT. These higher TiO2 values are associated with higher Sc, V, Y, and Zr contents but not elevated Sr contents, suggesting that these high-TiO2 samples reflect the effects of more extensive crystallization of plagioclase-bearing mineral assemblages.
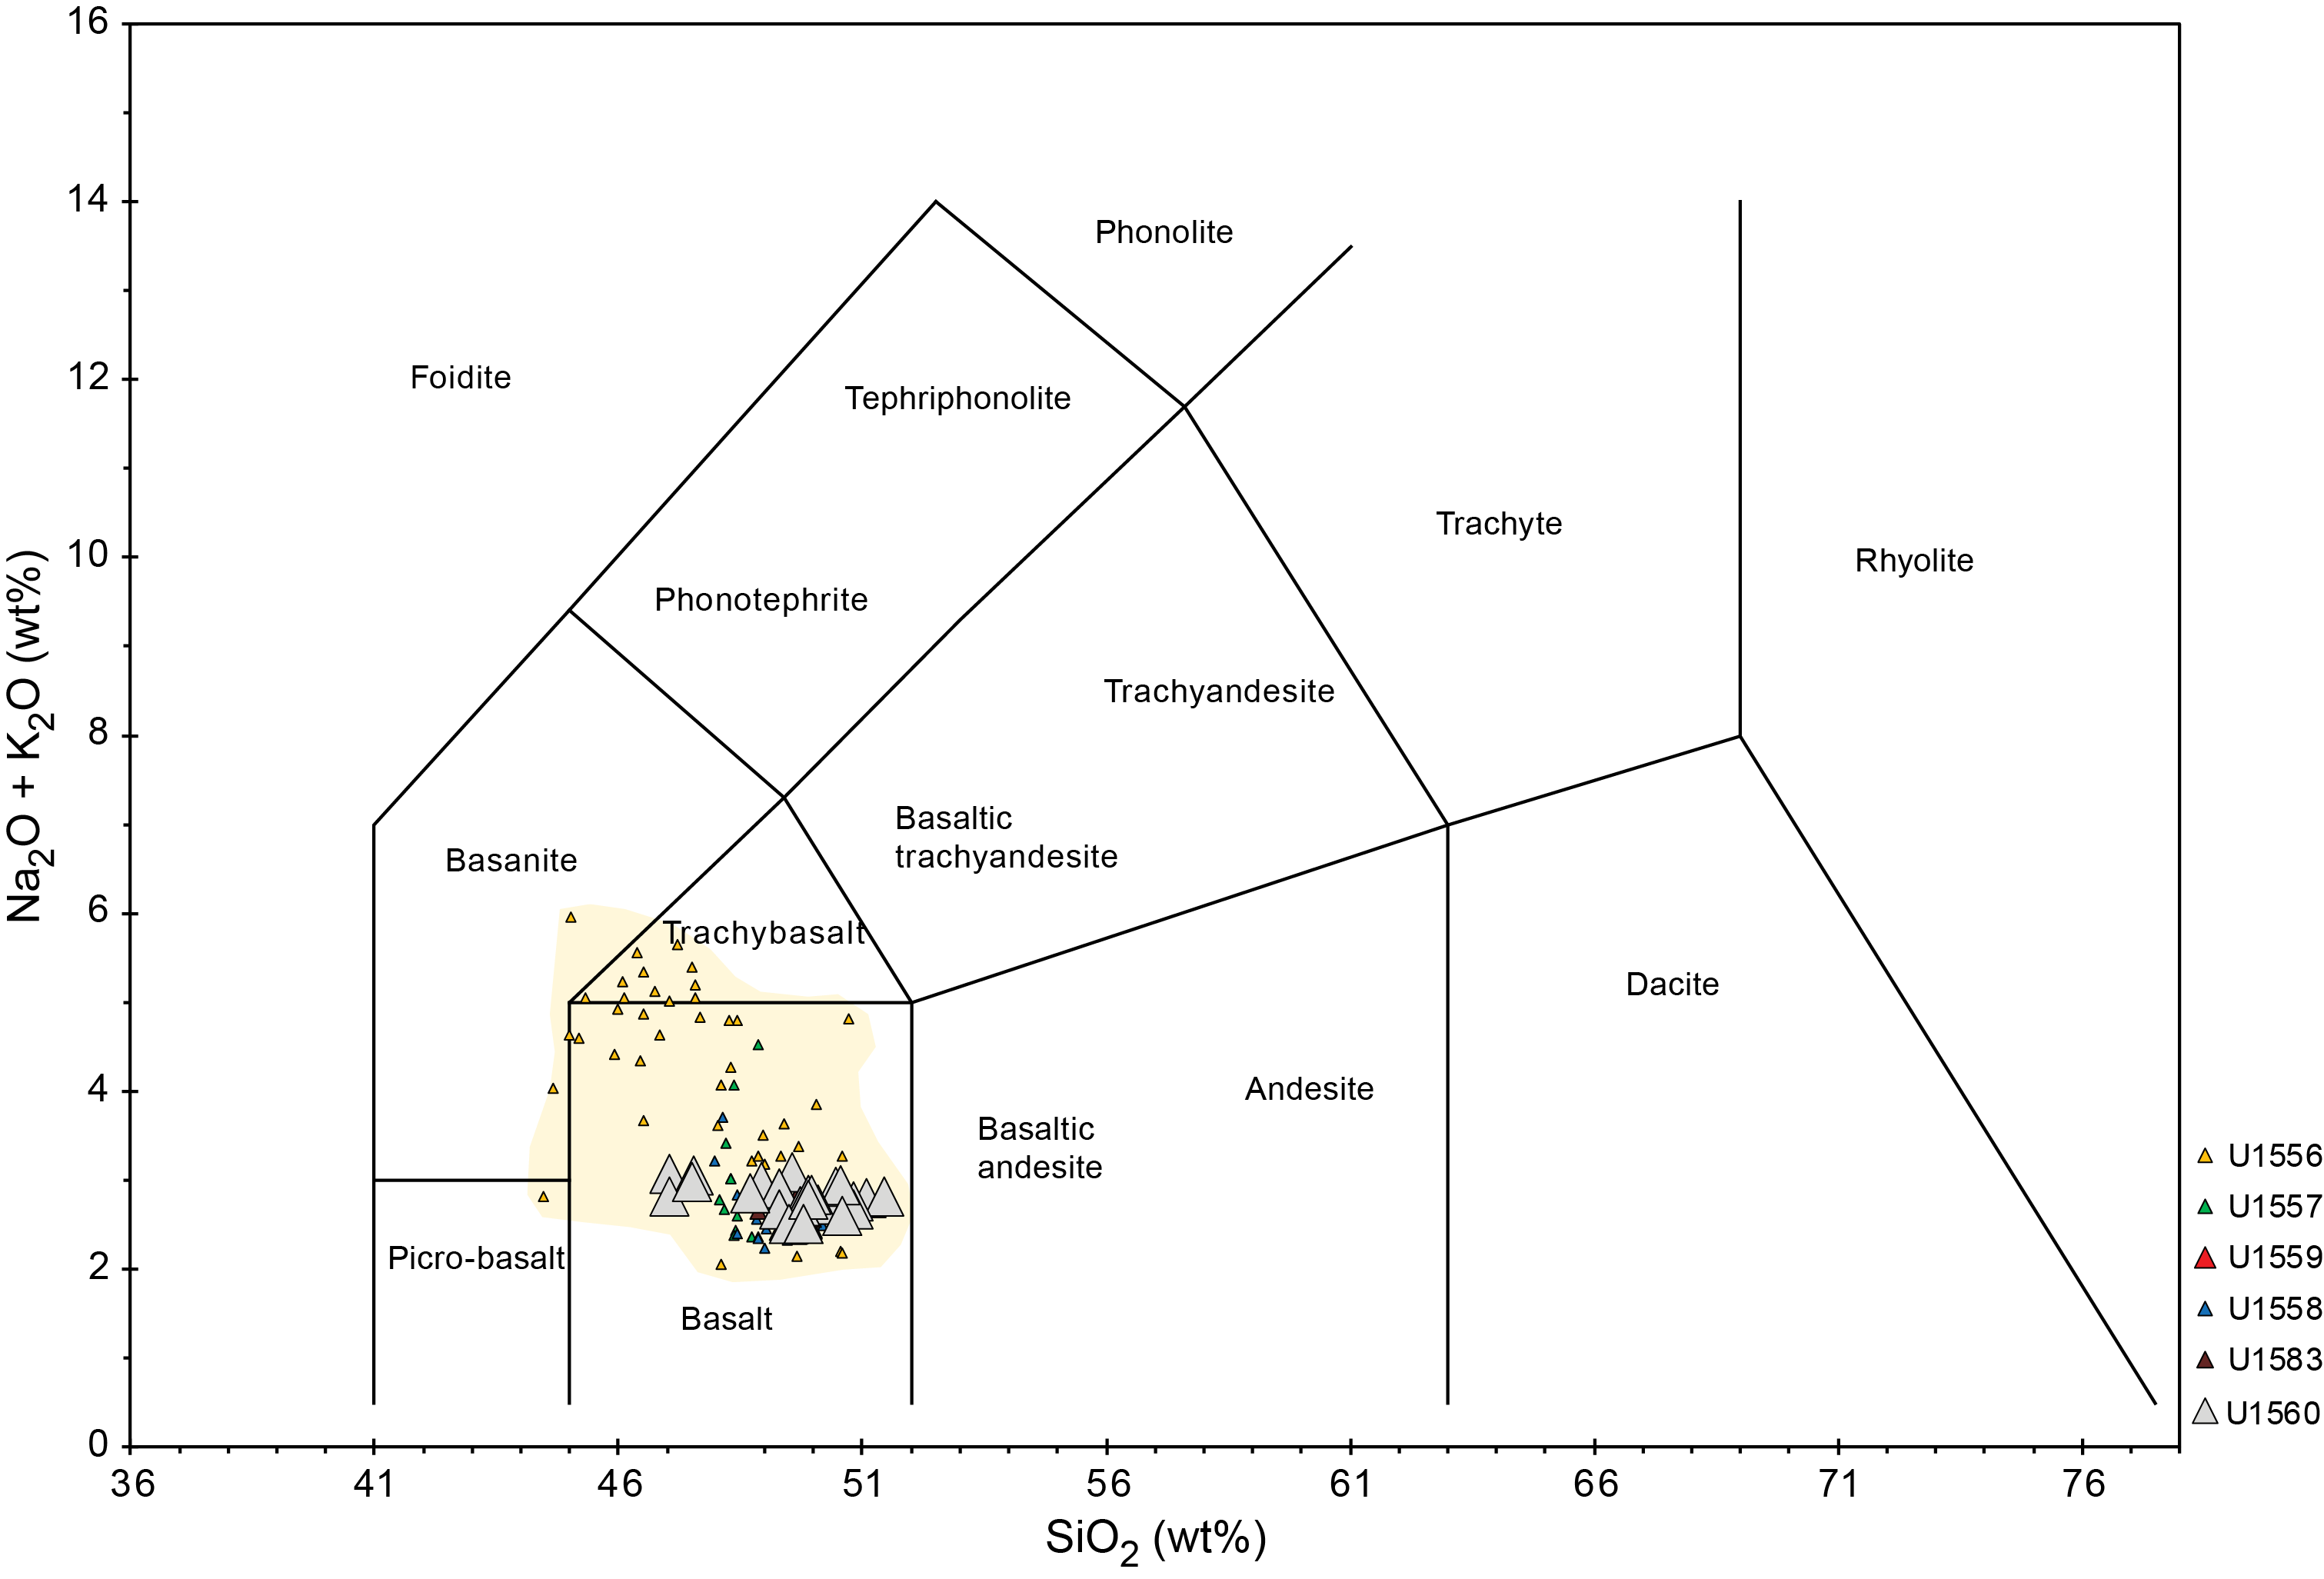
Figure F101. Total alkalis vs. silica diagram.
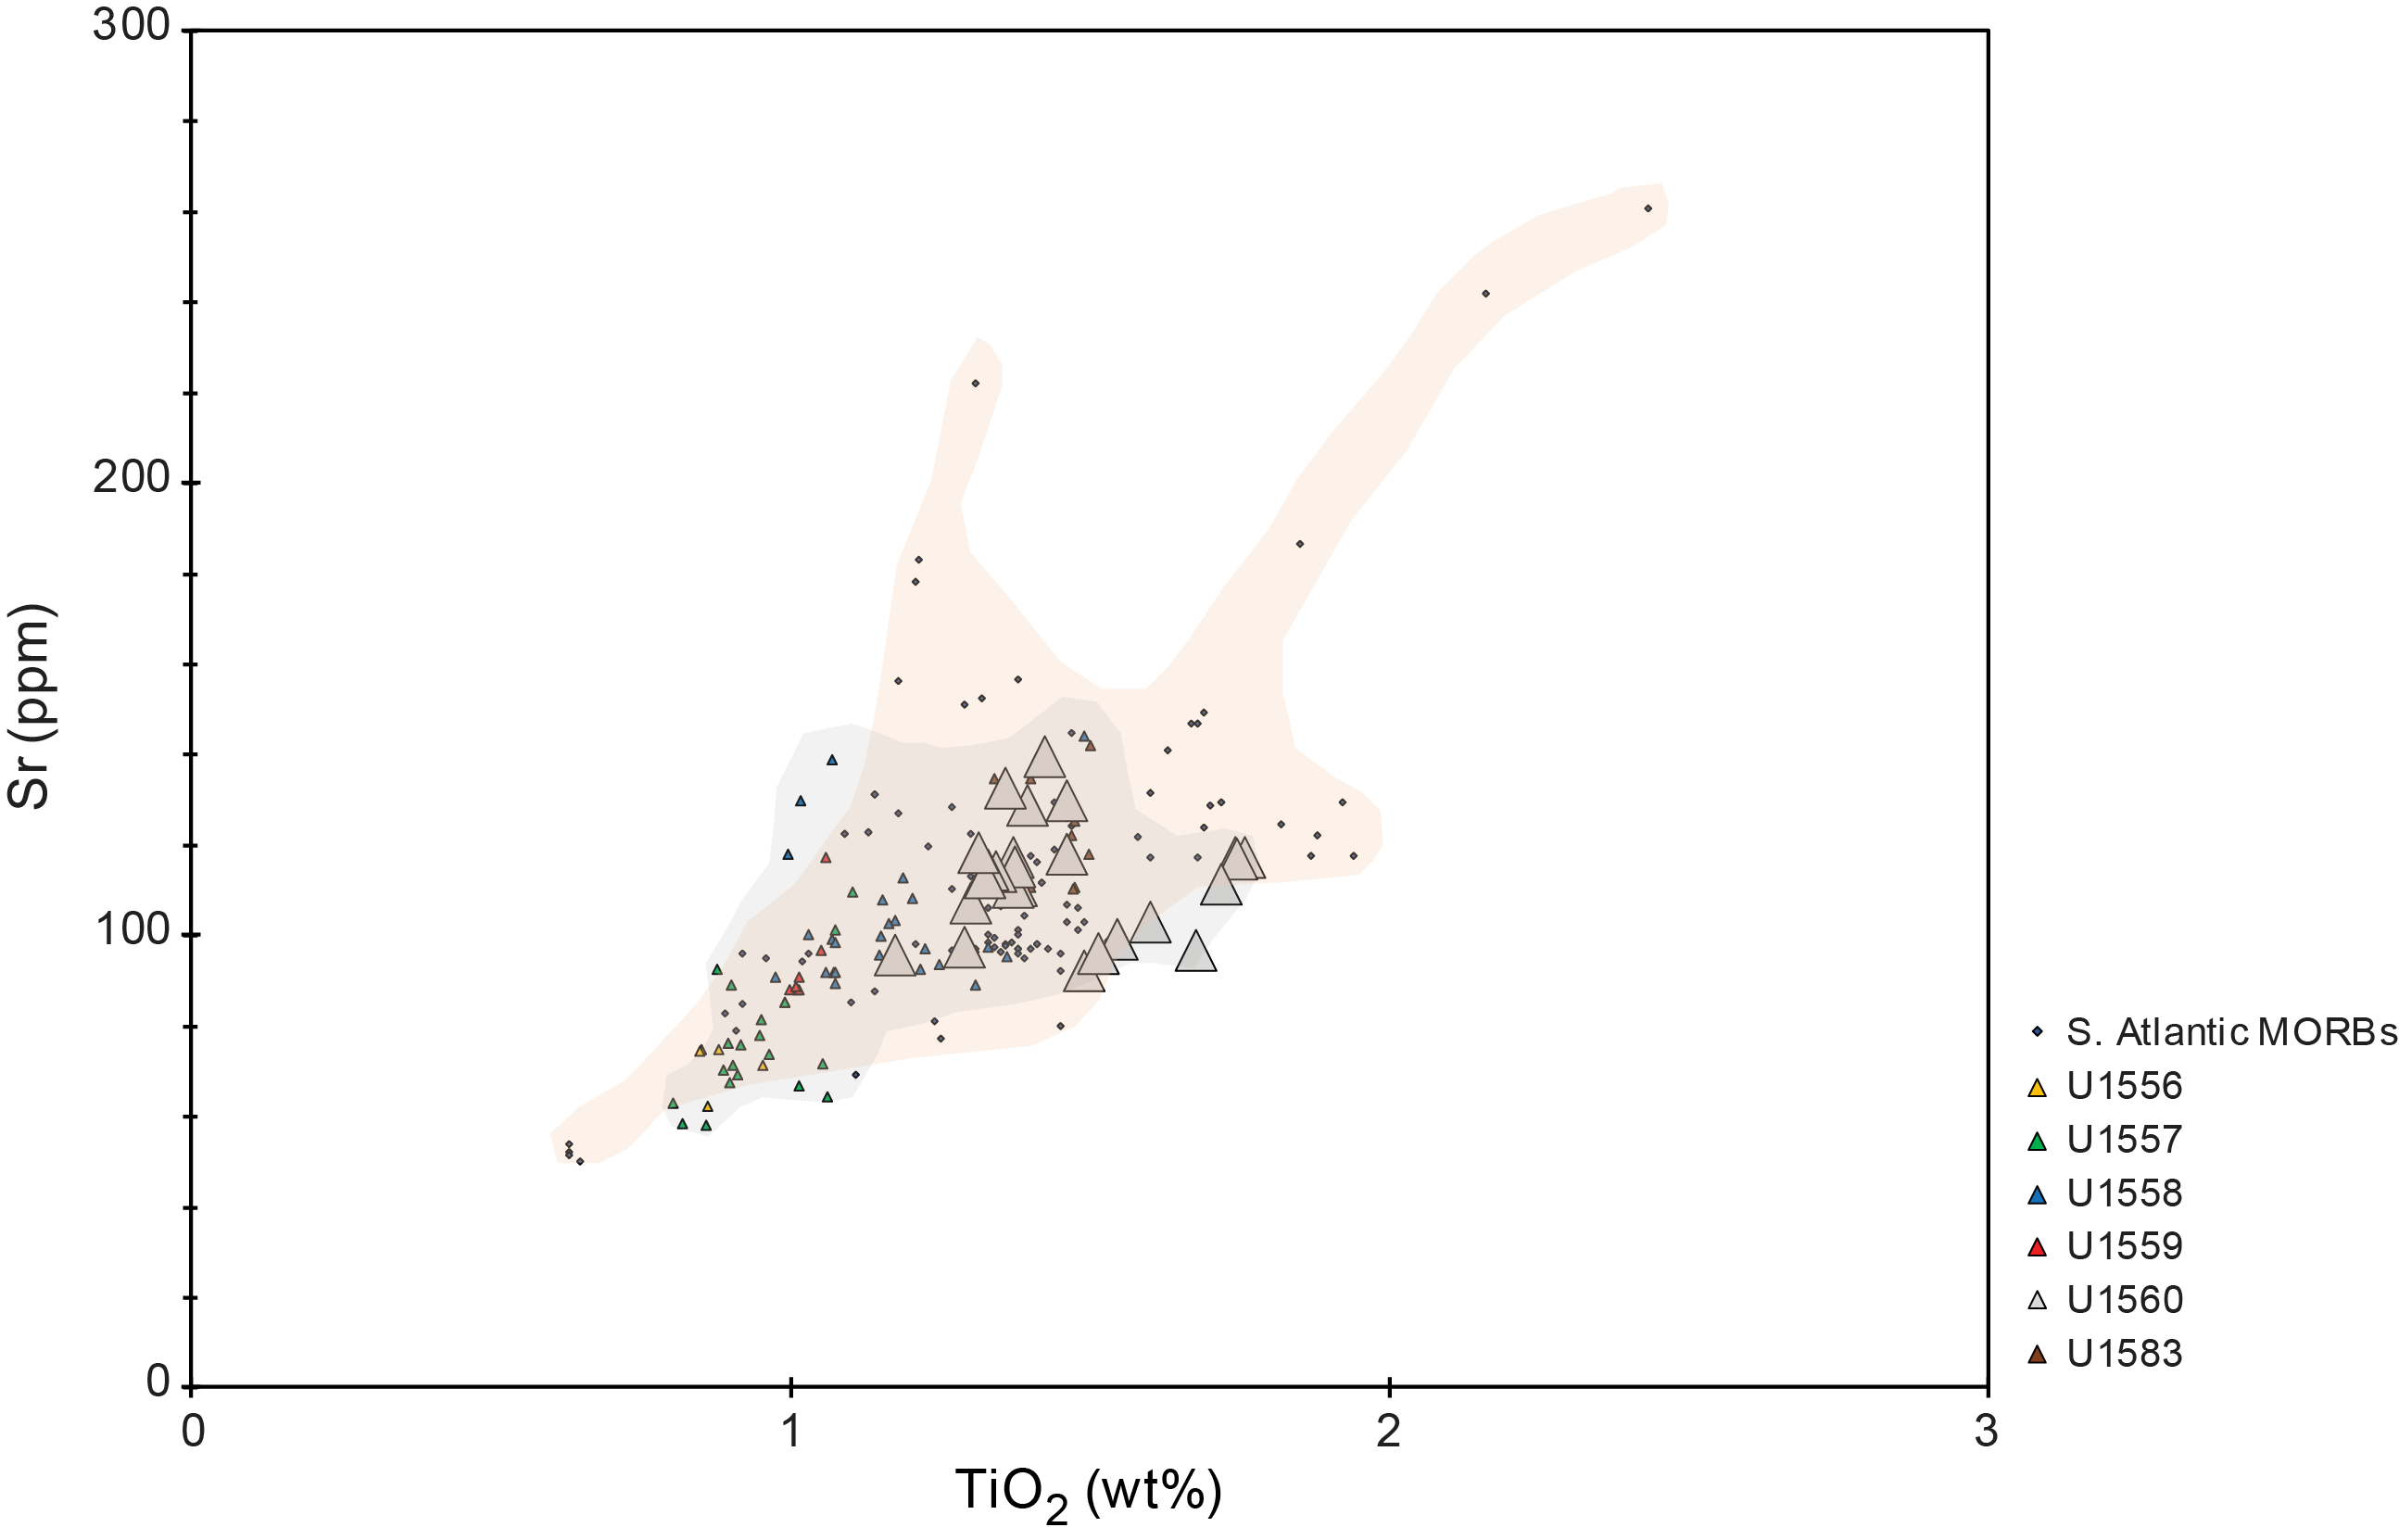
Figure F102. Sr vs. TiO2.
The downhole plots in Figure F103 show that the Site U1560 lavas are highly variable downhole in terms of elemental composition. TiO2 shows several distinct downhole changes in abundance levels: it is lowest at the top of the section and reaches highest values at 240 mbsf at the boundary between Unit 4 and Subunit 5A. Sr shows a contrasting pattern, reaching highest values at ~160 mbsf at the top of Subunit 3A and declines to the Unit 4/5 boundary, where it increases abruptly before declining again. CaO varies over a limited range (11–13 wt%) and reaches its highest values at the Unit 4/5 boundary. These changes appear to largely reflect changes in degree of crystallization before eruption, and Unit 4 includes the most evolved basalts seen in the hole.
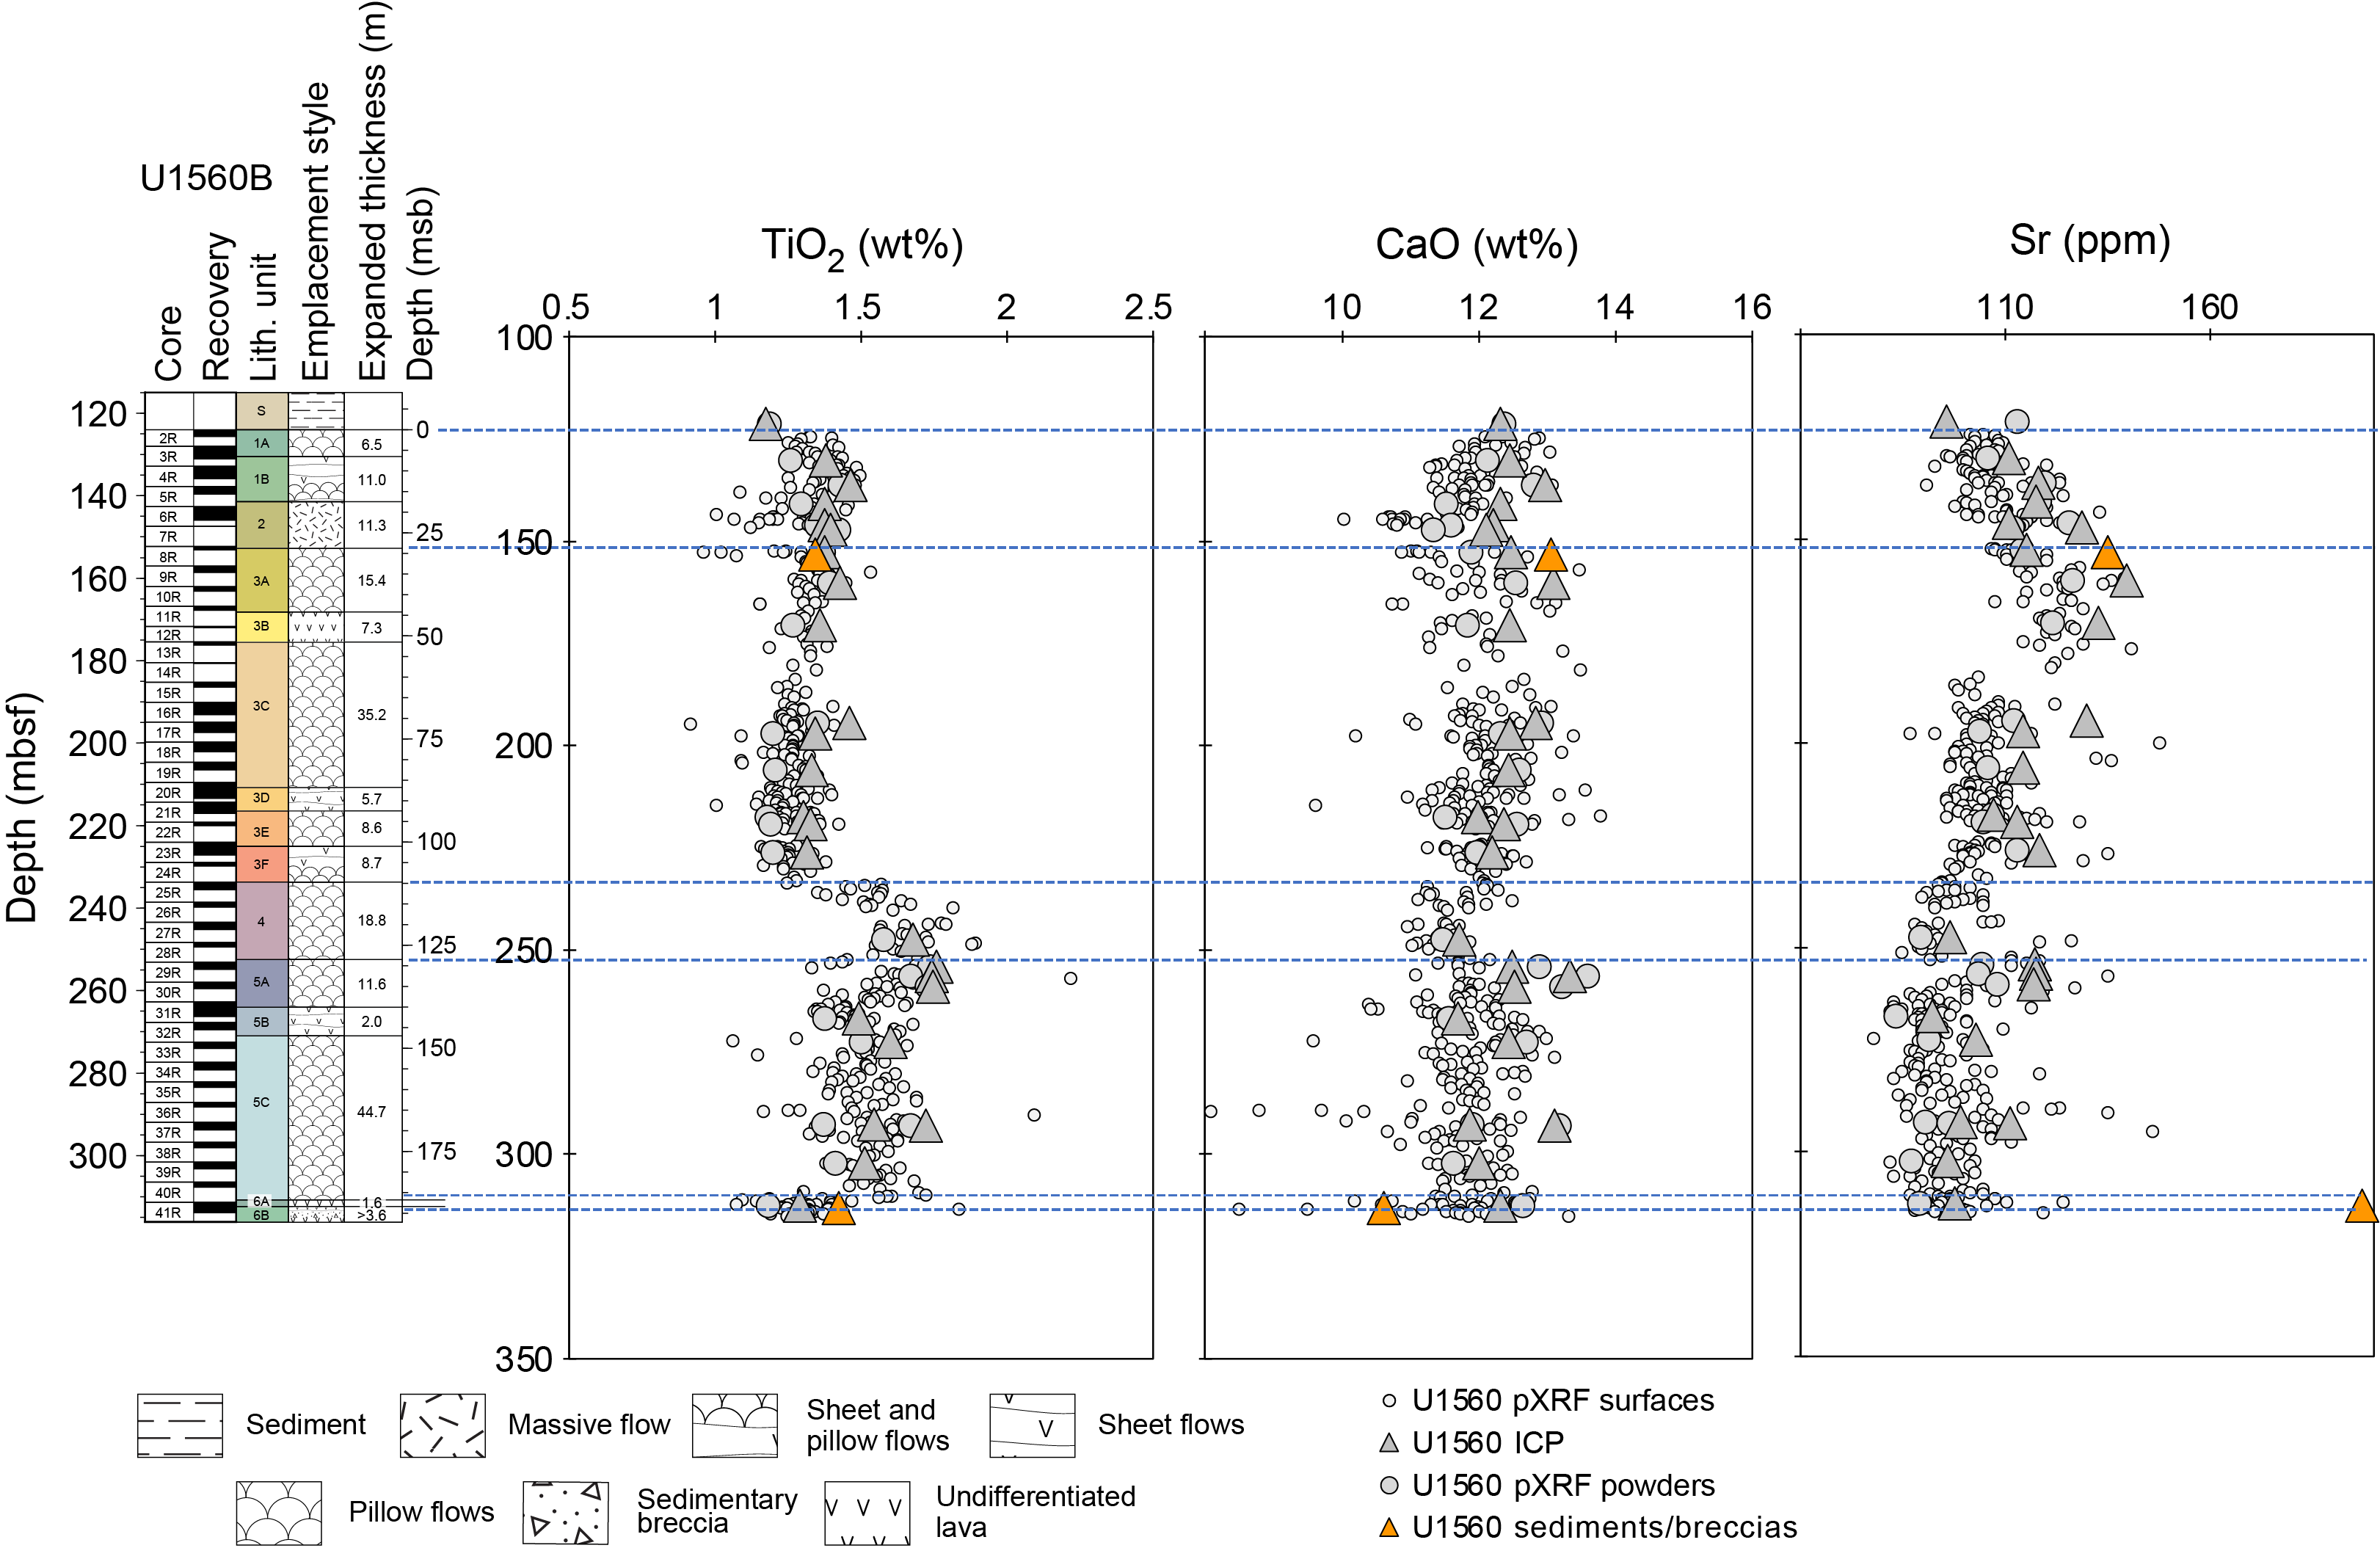
Figure F103. TiO2, CaO, and Sr.
11.2.3. Alteration effects and sediment/breccia materials:
In Figure F104, downhole variations in K2O and MgO help describe alteration effects at Site U1560. K2O contents are overall lower than those in older SAT lavas, though concentrations are higher than those of fresh MORBs. There appears to be a pattern of modest K2O increase downhole. MgO contents show evidence for increased Mg leaching from the rocks downhole with what appear to be local horizons of higher Mg leaching from the basalts associated with unit contacts, specifically the contacts between Units 2 and 3 and Units 4 and 5, that may have seen longer periods of magmatic nondeposition and/or higher fluid flow along a brecciated contact. The Site U1560 lavas are generally Mg-depleted relative to fresh basalts but more Site U1560 samples fall within the range of fresh South Atlantic MORBs, suggesting somewhat less pervasive Mg leaching in these younger (~15.2 Ma) lavas.
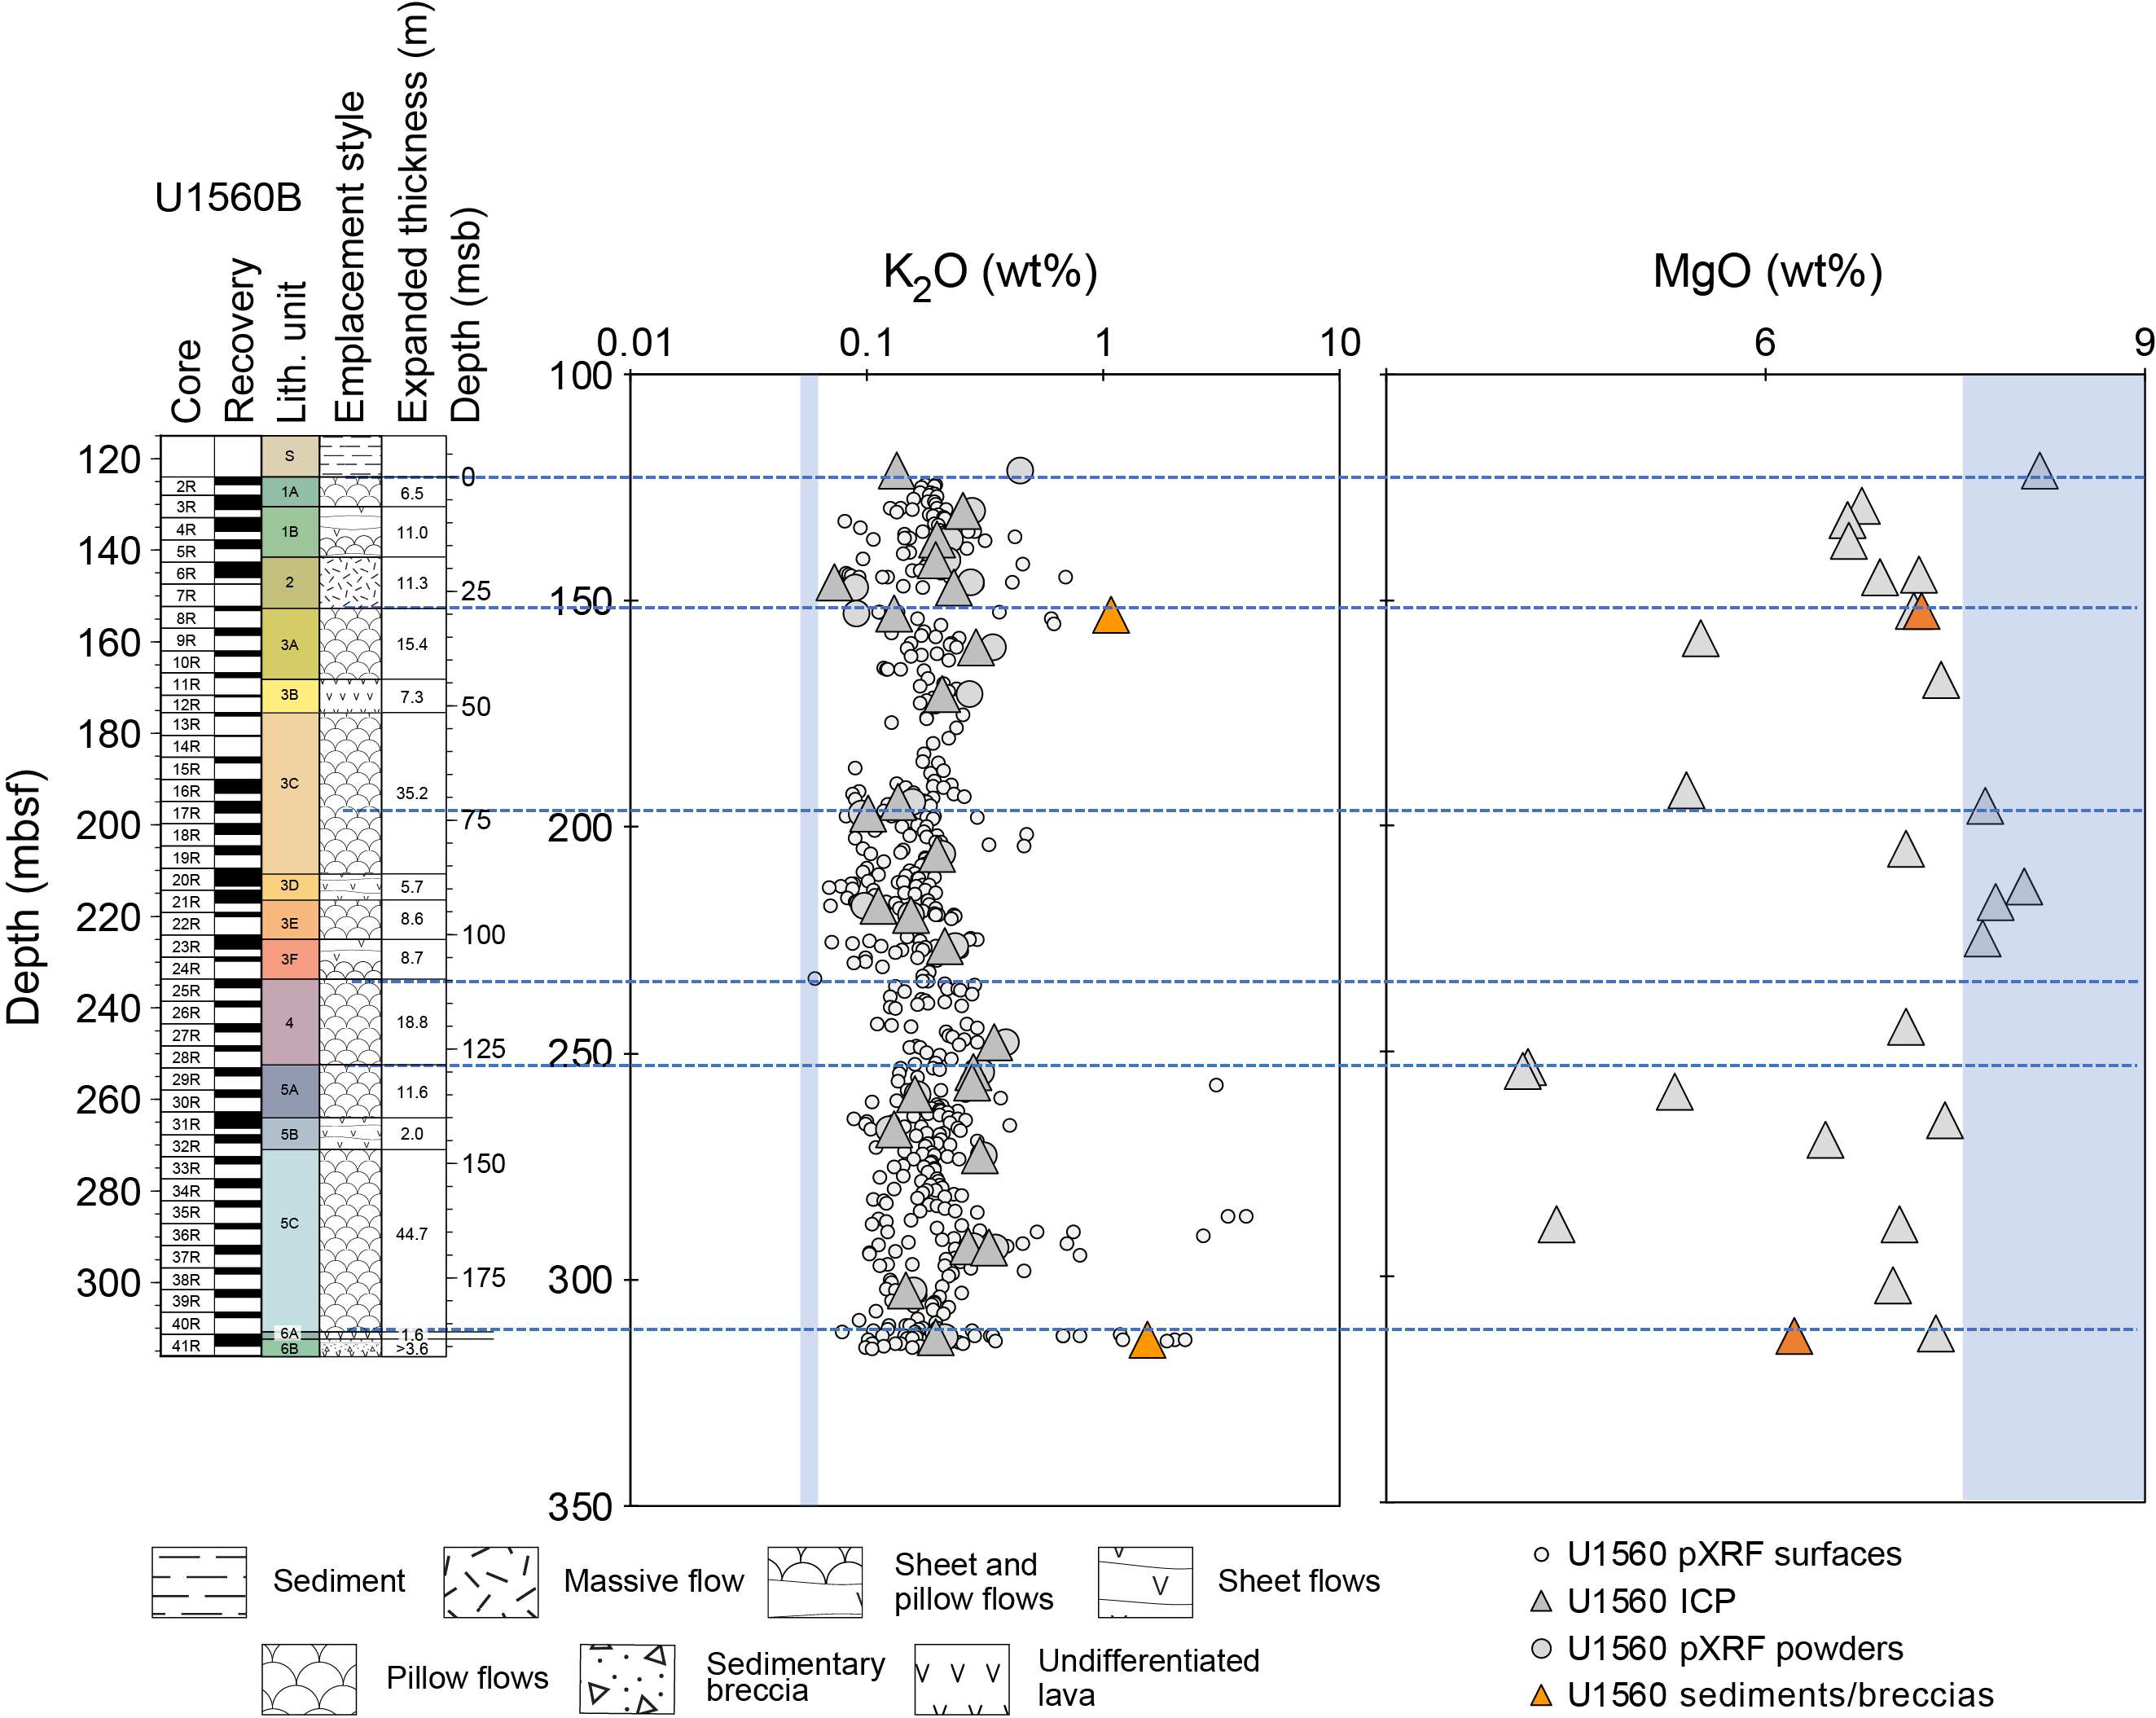
Figure F104. K2O and MgO.
Two Site U1560 breccia samples, both located near unit boundaries, show K2O concentrations >1.0 wt% (Figures F103, F104). Sample 393-U1560B-41R-2, 34–42 cm, comes from the basal breccia Subunit 6A, whereas Sample 8R-1, 16–17 cm, is from near the contact between Unit 2 and Subunit 3A. Neither sample has a particularly anomalous major element composition aside from having high K2O, although the basal breccia sample has slightly lower CaO (at 10.6 wt%) relative to the rest of the Site U1560 suite.
Looking at the U1560 suite on a plot of K/Zr versus Cr/TiO2 ratios in Figure F105, the Site U1560 suite ranges from low K/Zr values typical of fresh MORB ratios up to 24; nonetheless, these higher values are still lower than those observed in the older SAT sites. The Site U1560 samples form two distinct clusters in terms of their Cr/TiO2 values, consistent with the downhole compositional change evident in Figure F103. K/Zr ratios span similar ranges in both sample subsets.
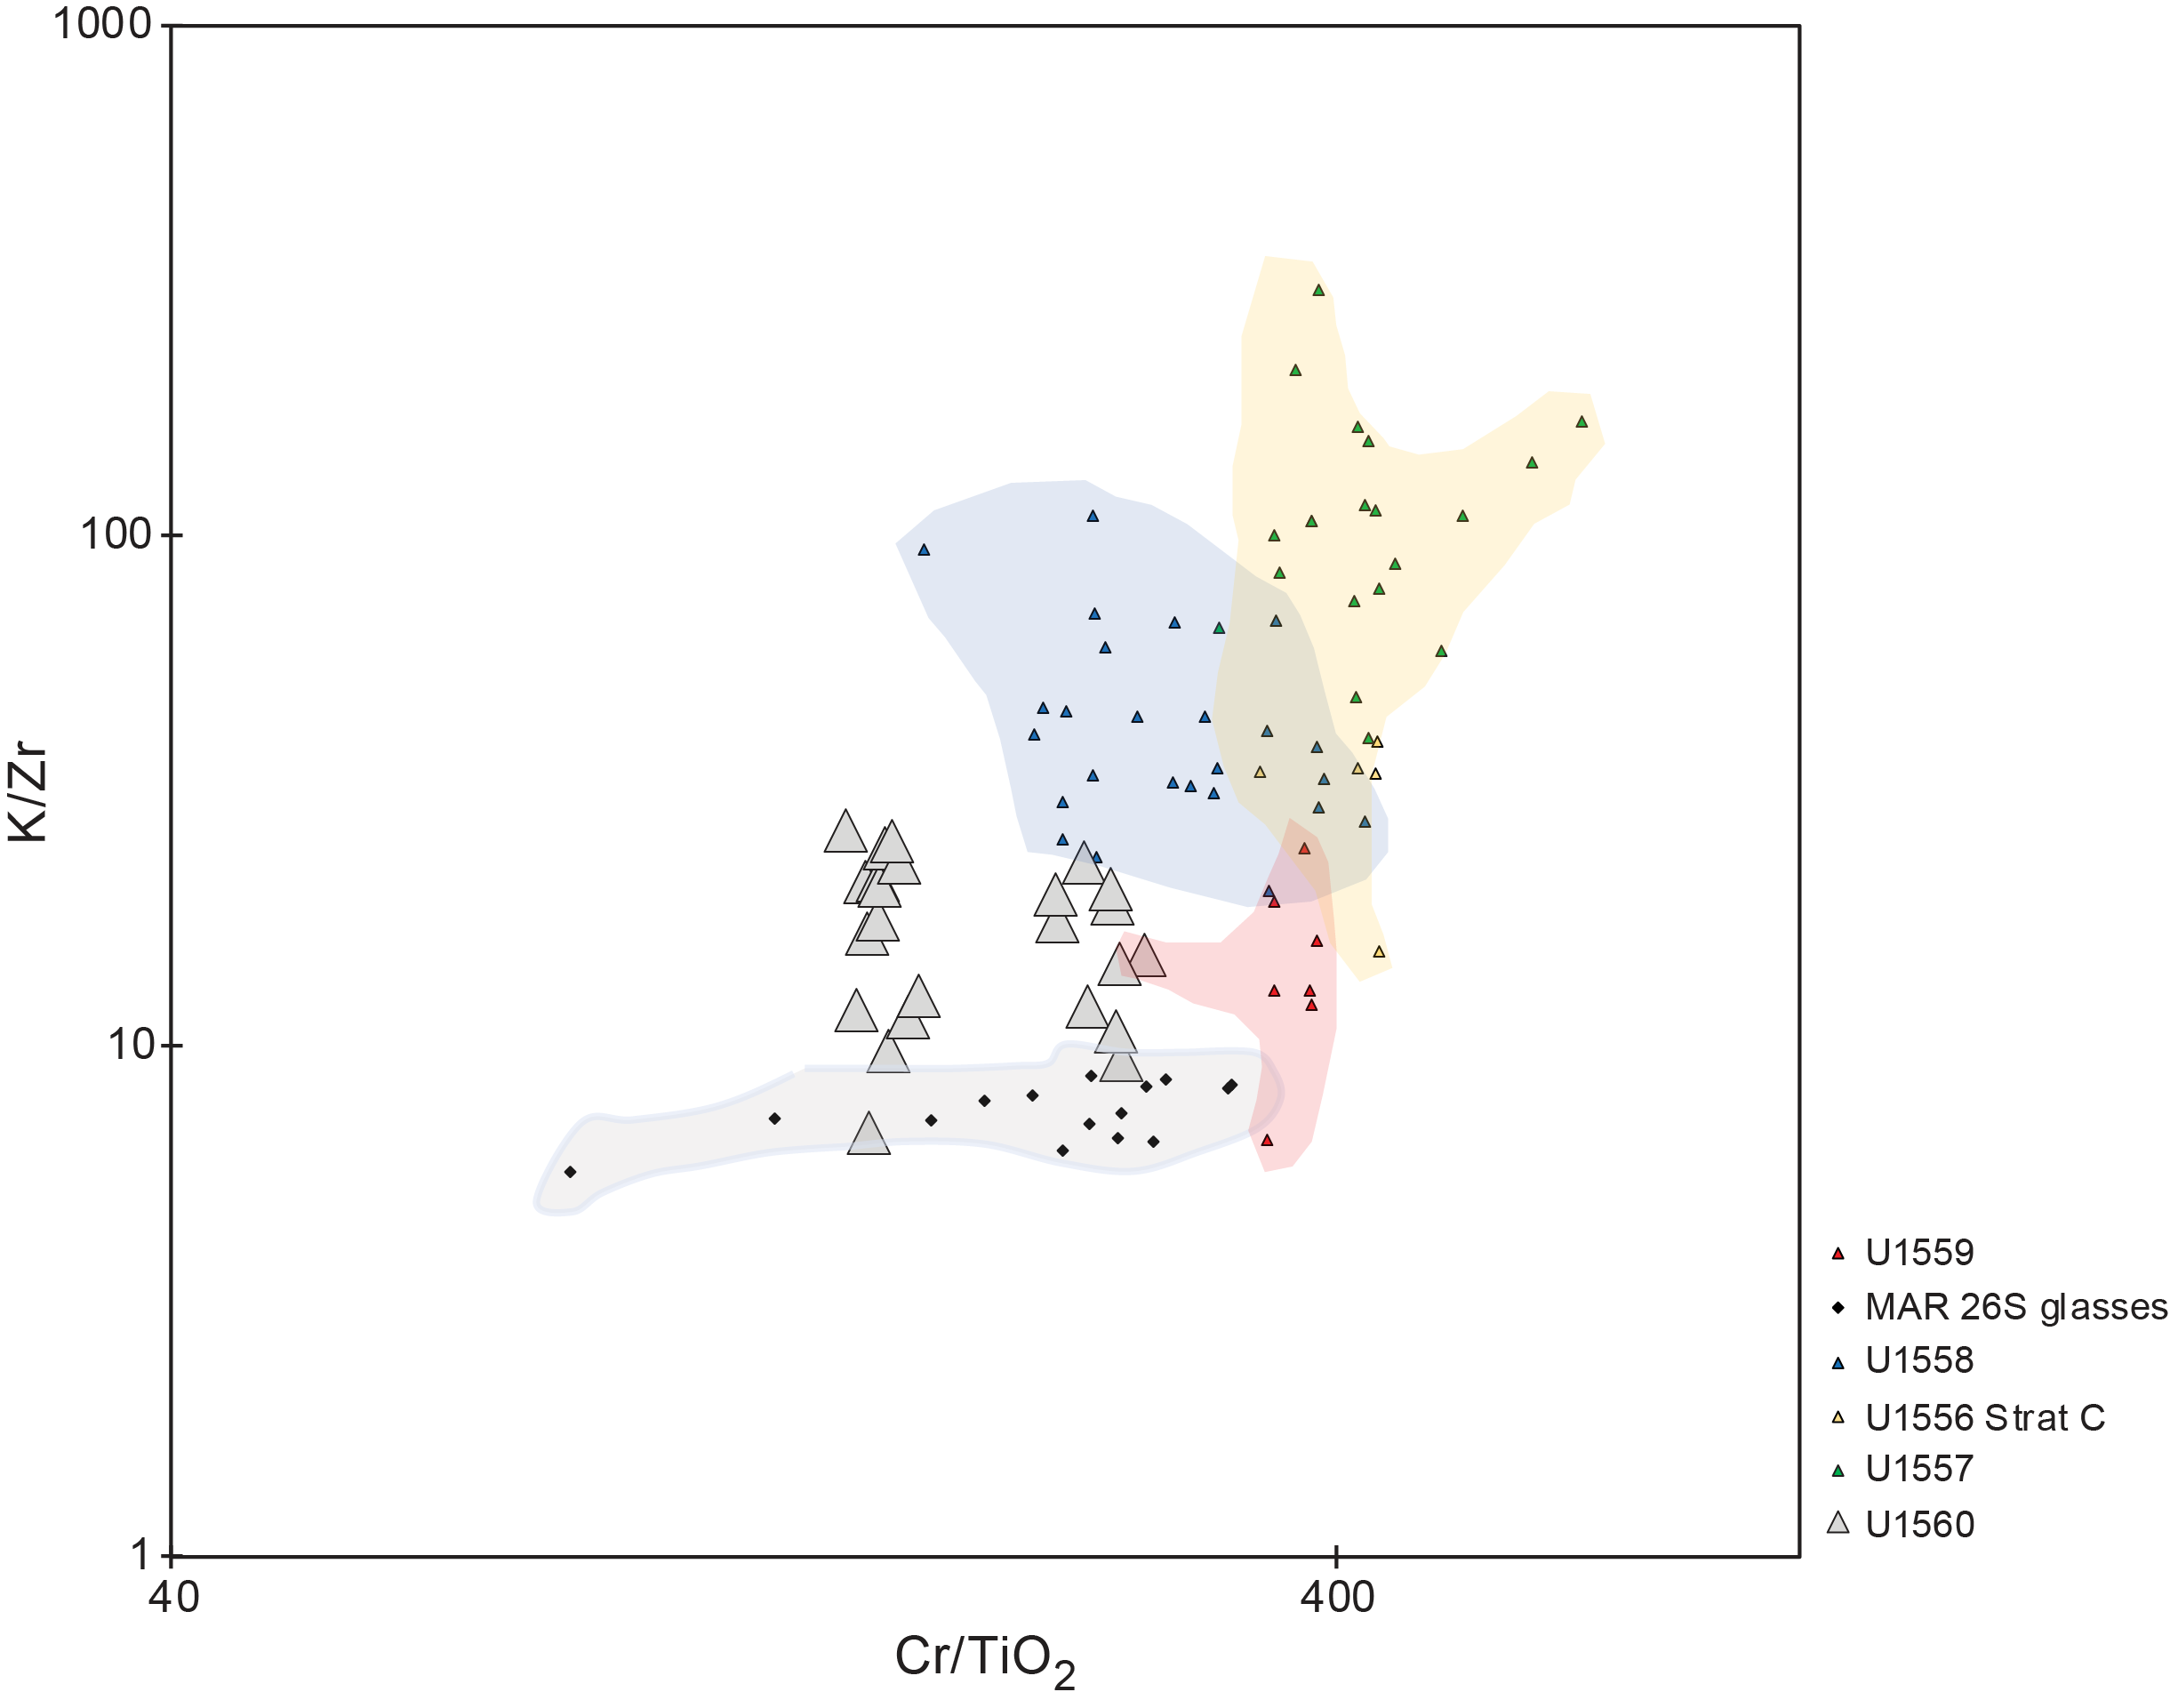
Figure F105. K/Zr vs. Cr/TiO2.
11.2.4. Immobile element systematics and magmatic evolution
On both the Zr/Y versus Zr diagram in Figure F106 and the V versus Ti/1000 diagram in Figure F107, the Site U1560 basalts fall entirely in the MORB field but are distinct from the older SAT sites. The higher Zr/Y ratios and Zr, V, and TiO2 contents of the Site 1560 basalts are consistent with parental melts that have undergone significant shallow-level fractional crystallization. The V vs TiO2 systematics of the Sites U1560 samples, as defined by their near origin-intersecting linear trend in Figure F107, are consistent with this interpretation. Such a trend is consistent with this suite of lavas being related via variable extents of fractional crystallization and/or varying degrees of melting of the mantle.
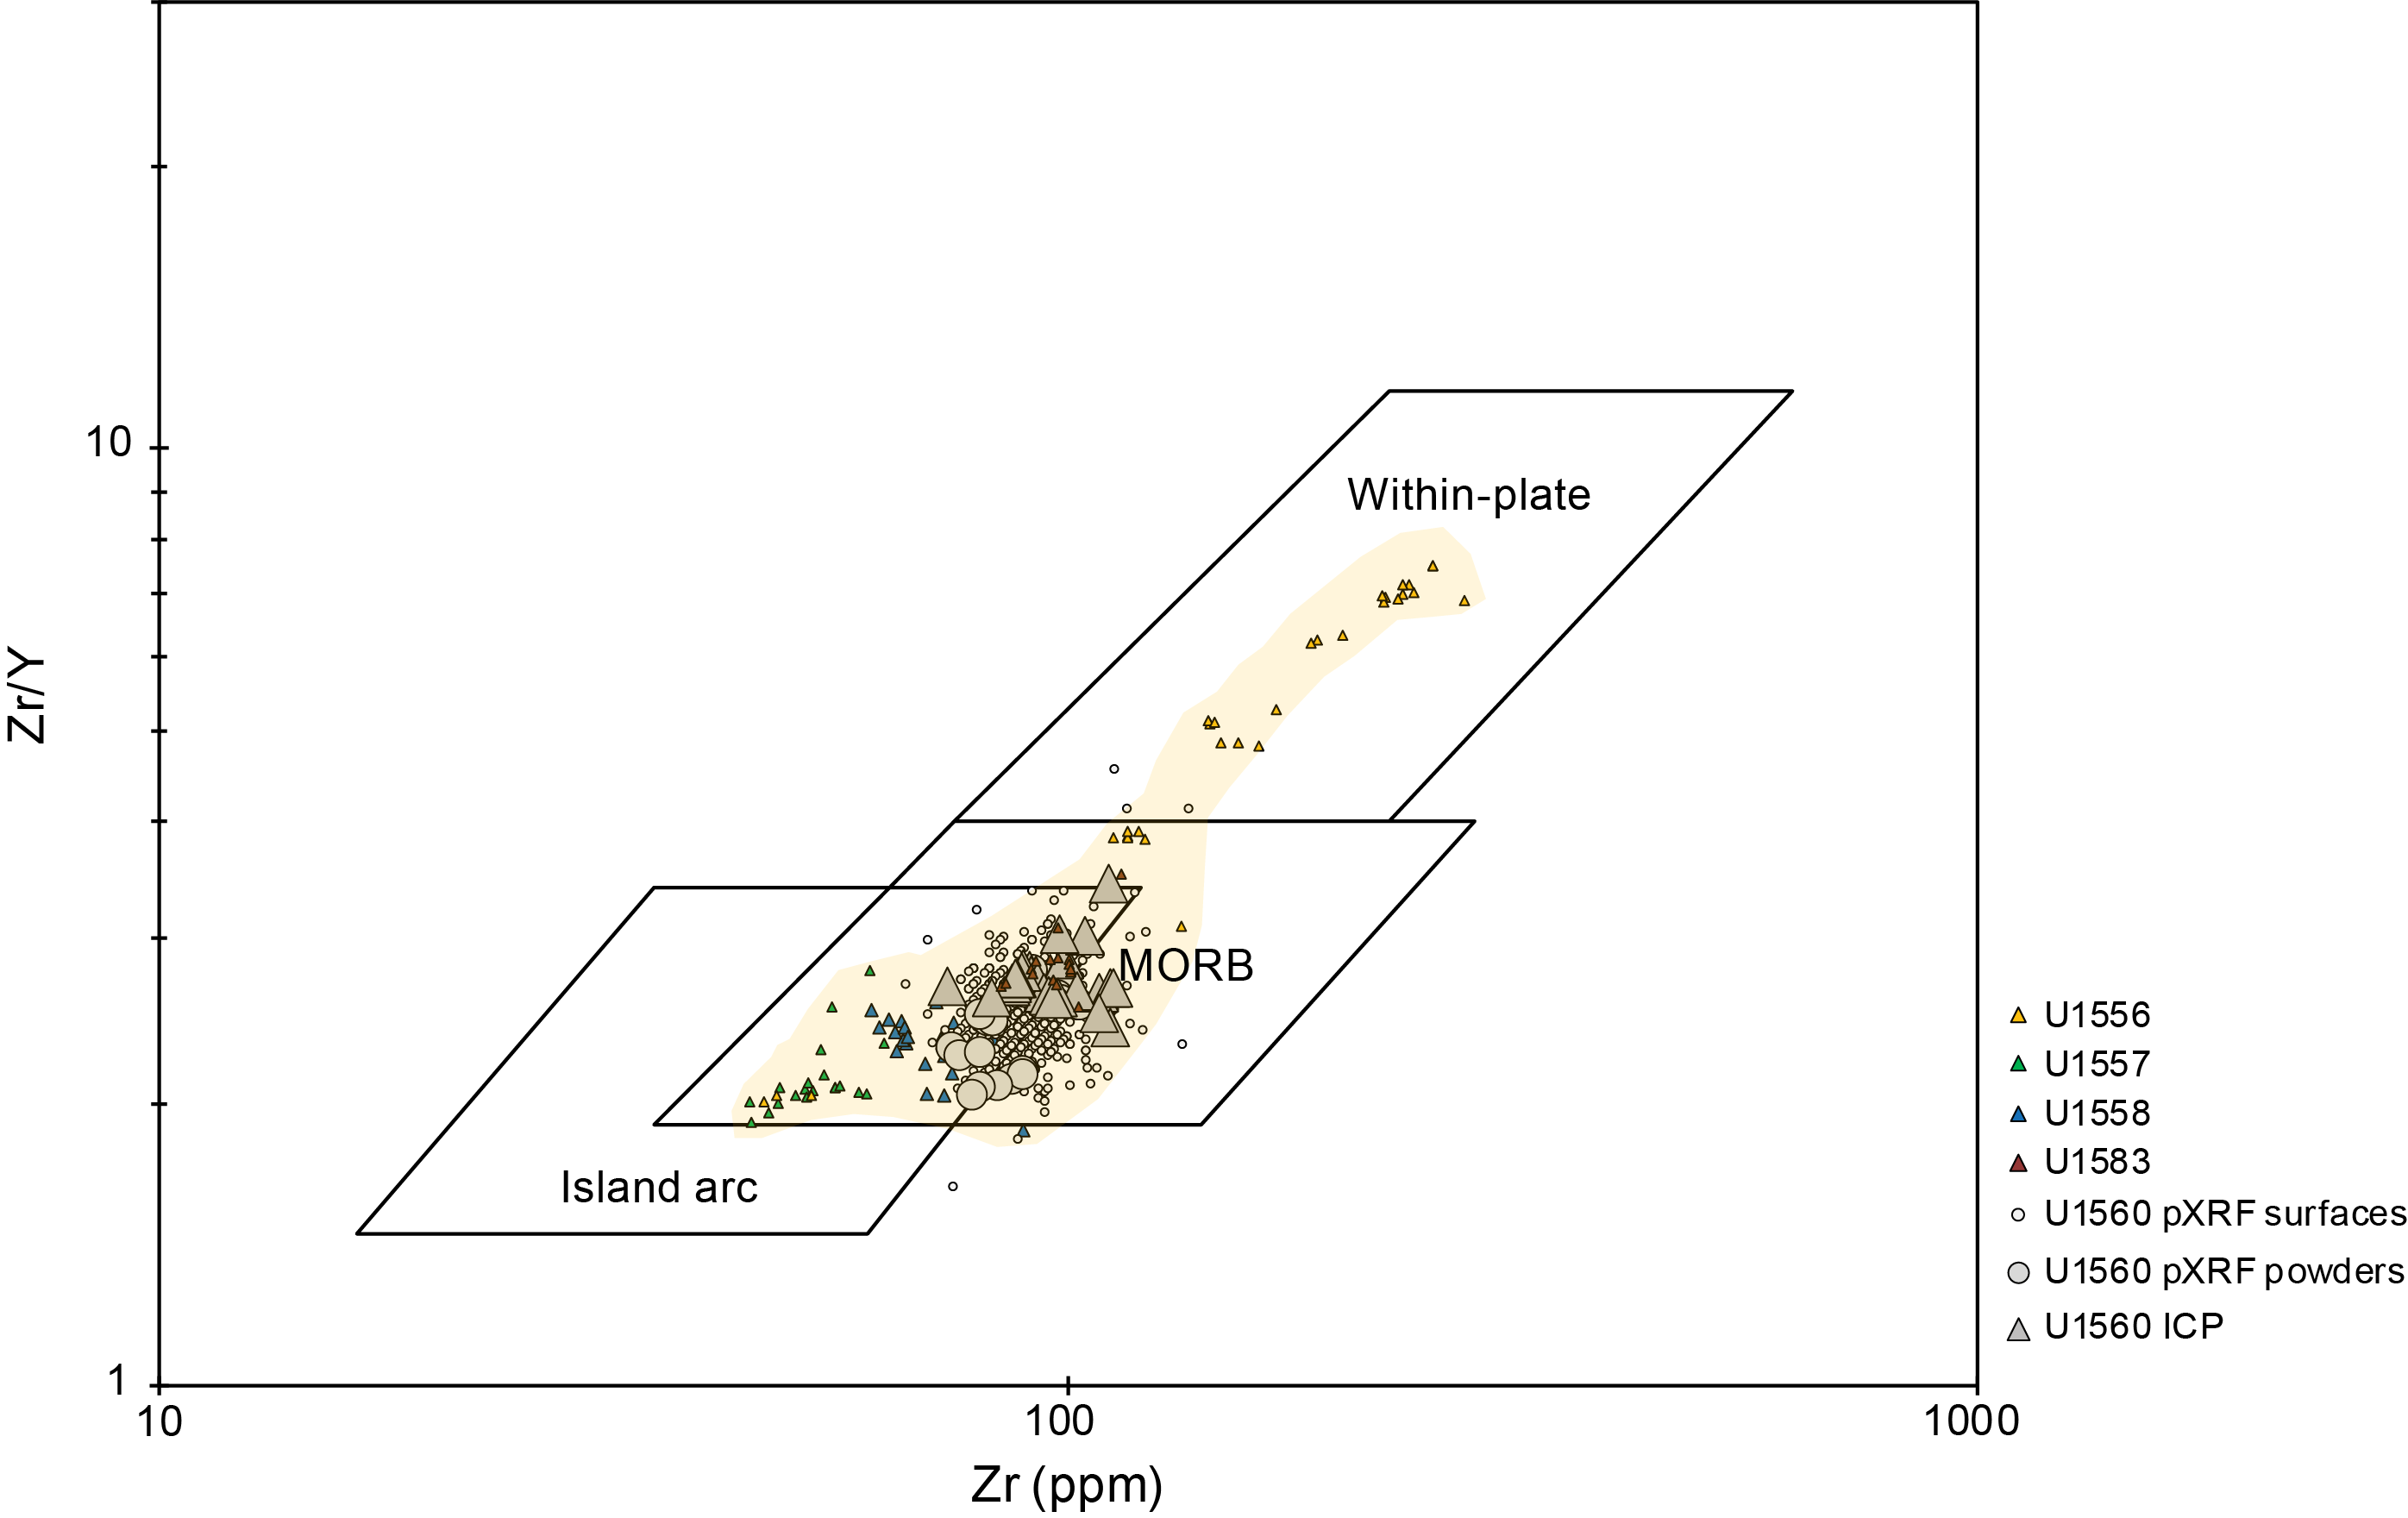
Figure F106. Zr/Y vs. Zr.
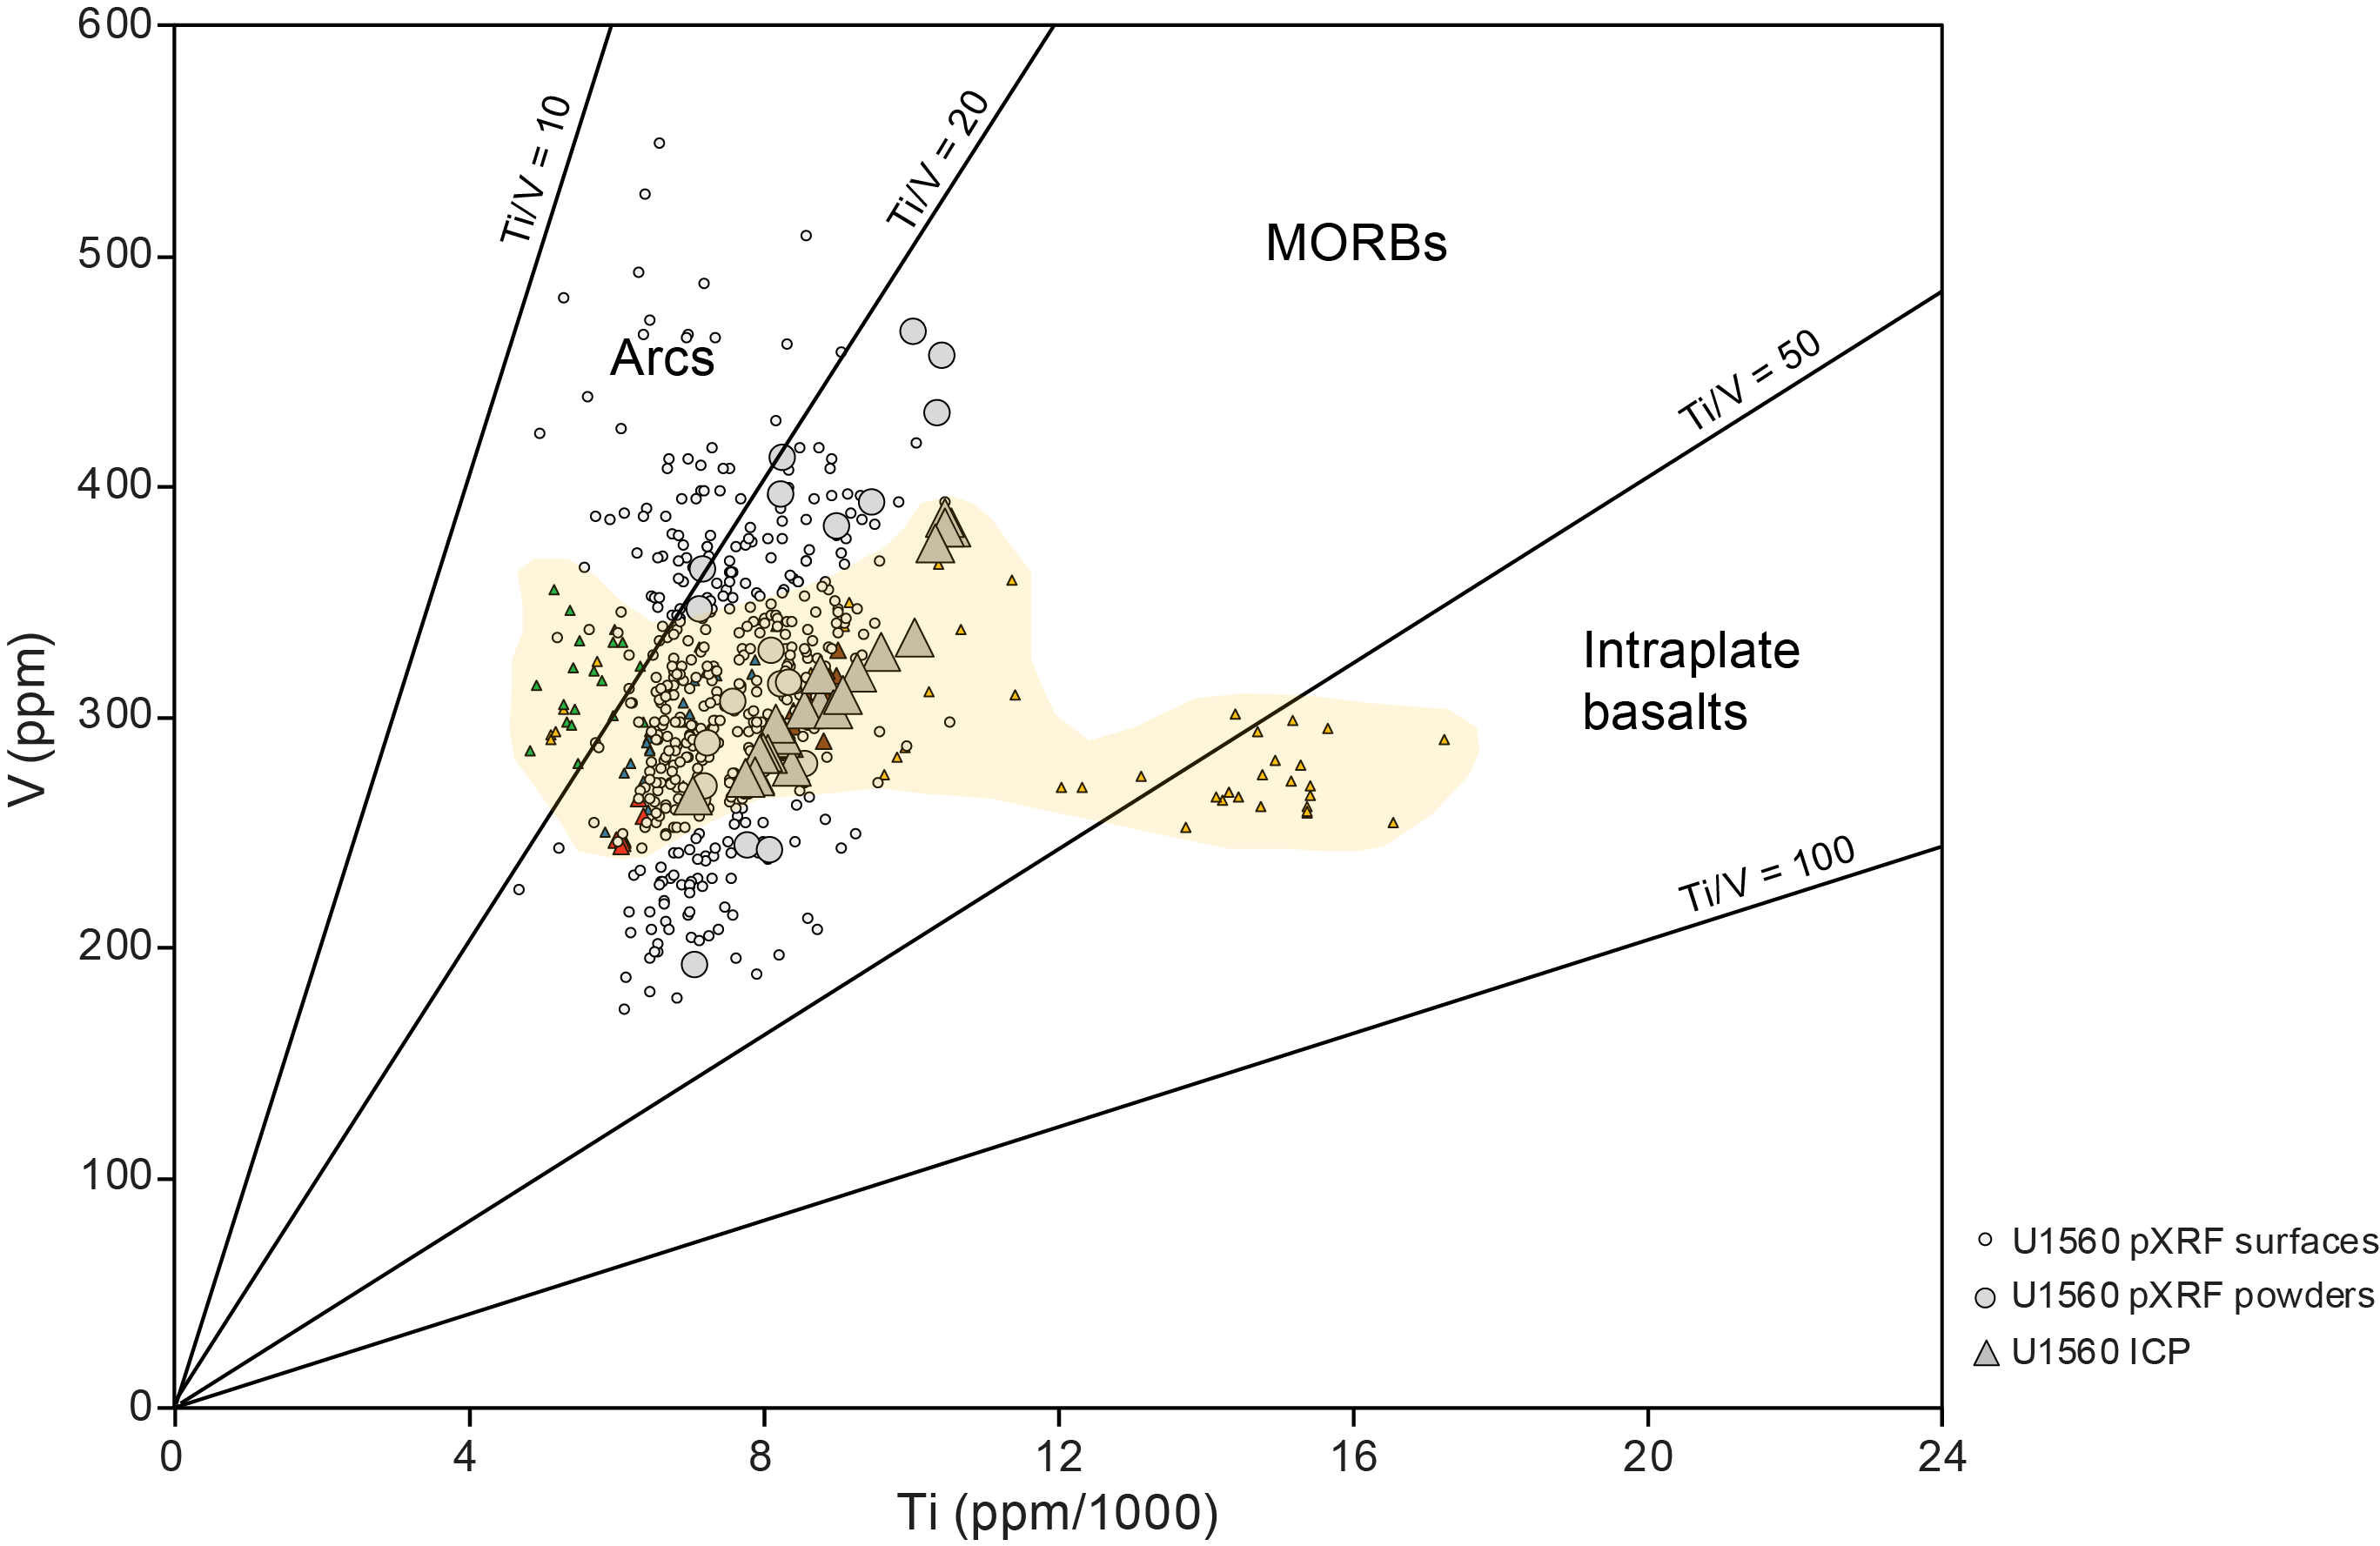
Figure F107. V vs. Ti/1000.
12. Microbiology
12.1. Sediment
Microbiology sampling of sediments in Hole U1560C during Expedition 393 focused on exploring evidence for life in the sediments and at the sediment/basement interface using culture-based and culture-independent approaches. One standard microbiology whole-round sample (5–10 cm long) was collected from each 9.5 m core. These whole-round samples were subsampled for various microbiological analyses performed by different shipboard and shore-based scientists, as described below (Table T38). Additional personal whole-round cores for specialized shore-based analyses were also taken (Table T38). An additional whole-round sample that included both standard and personal microbiology samples was taken in the sediment of Hole U1560B prior to basement drilling at the sediment/basement interface (Table T38). In summary, 14 standard microbiology whole rounds were taken and subsequently subsampled, and an additional 35 whole rounds were taken for personal shore-based analyses.
12.1.1. Microbiological sample processing and experiments
12.1.1.1. Cell and viral counts
Subsamples for cell enumeration were taken in duplicate from every standard microbiology whole round. An additional subsample was taken in each of the seven cores that were sampled for viral metagenomic analysis to perform viral counts on those core sections. Performing shipboard cell or viral counts is difficult because of the time required for sample processing and the need for other shipboard tests. Therefore, shipboard cell and viral counts were not attempted during the SAT expeditions; instead, samples were preserved for postcruise analyses by diluting 1 cm3 of sample in 4 mL of 4% paraformaldehyde in 100 mM phosphate-buffered saline (PBS). Samples were taken in duplicate to enable cross-calibration of cell counts in different laboratories. A third sample was collected from samples where samples for viral metagenomics were also collected.
12.1.1.2. Microbial community structure
From the routine whole rounds, 14 samples were preserved for shore-based polymerase chain reaction [PCR] amplicon based analysis (from DNA and RNA), 14 samples were preserved for single-cell genomics, 14 samples were preserved for viral production experiments, and 13 samples were preserved for high-throughput culturing. Additional personal whole rounds (5–10 cm long) were taken and preserved: eight samples for viral metagenomics, eight samples for microbial metagenomics, six samples for stable isotope probing experiments, eight samples for sediment lipid analysis, and five samples for enrichment of anaerobic Archaea (Table T38). All samples were preserved as described in Microbiology in the Expedition 390/393 methods chapter (Coggon et al., 2024a).
12.1.1.3. Microbial incubation experiments
To determine the extent of viral activity, 10 cm3 from the standard microbiology samples of Sections 393-U1560C-1H-4, 4H-6, 8H-6, 10H-6, 12F-2, and 16F-2 were used for incubation experiments (see Table T38 for specific intervals and depths). Duplicate experiments from each sample were initiated for viral lytic production and prophage induction quantification (see Microbiology in the Expedition 390/393 methods chapter [Coggon et al., 2024a]). Samples 4H-6 and 8H-6 were processed in an anaerobic chamber, whereas Samples 1H-4, 10H-6, 12F-2, and 16F-2 were processed in aerobic conditions. These samples were chosen to represent a range of oxygen and nutrient concentrations throughout the hole. The samples were incubated at room temperature (~18°C), and 1 mL duplicate subsamples were collected after 0, 3, 6, 12, 24, and 48 h and then 7 and 14 days. The seawater that was used to dilute 1 cm3 sediment consisted of autoclaved deep seawater (3706 m depth) collected on 19 July 2022. The pH of the deep water upon collection was 7.54.
12.1.2. Microbiological contamination monitoring
To determine the number of microorganisms present in drilling mud fluid and generate a database of potential contaminants, 250 mL of drilling fluid was collected from the standpipe on the rig floor at the beginning of coring operations in Hole U1560C. This drilling fluid was frozen at −80°C for shore-based molecular biology analysis to determine the microorganisms present in drilling fluid.
12.2. Basement
Microbiology sampling in basement of Hole U1560B during Expedition 393 focused on exploring evidence for life in the volcanic basement, especially at the sediment/basement interface, using culture-based and culture-independent approaches. For Hole U1560B, sampling efforts aimed to collect one ~10–15 cm whole-round core sample from each 9.5 m advance. To maintain acceptable levels of core recovery, drilling generally proceeded with 4.8 or 4.9 m RCB half-core advances. In practice, this meant taking microbiological samples from alternating cores, although this varied depending on adequate recovery and core characteristics as well as geologic characteristics of interest. The whole-round cores selected were photographed immediately in the splitting room. They were then processed and sampled for different microbiological analyses, with the goal of generating a suite of samples that were representative of the different rock and alteration types that compose the volcanic basement stratigraphy at Site U1560 (see Igneous petrology and Alteration petrology). Preference was given to core pieces with evidence of alteration or fracturing because the presence of these features indicates past fluid flow and potential avenues for current fluid ingress, which is a prerequisite for delivery of microorganisms to subseafloor basement. In total, 18 whole-round samples (9–14 cm long) were collected for microbiological analyses (Figure F108):
- Moderately plagioclase-olivine-pyroxene-phyric, microcrystalline basalt (1 sample);
- Sparsely plagioclase-olivine-clinopyroxene-phyric fine-grained basalt (1 sample);
- Sparsely plagioclase-olivine-phyric, microcrystalline to cryptocrystalline basalt (3 samples);
- Sparsely plagioclase-olivine-phyric, microcrystalline to fine-grained basalt (1 sample);
- Aphyric microcrystalline basalt (1 sample);
- Aphyric crypto- to microcrystalline basalt (1 sample);
- Aphyric cryptocrystalline to microcrystalline basalt (1 sample);
- Aphyric cryptocrystalline to fine-grained basalt (1 sample);
- Aphyric cryptocrystalline basalt (1 sample);
- Sparsely plagioclase-olivine-phyric, cryptocrystalline to microcrystalline basalt (1 sample);
- Phyric cryptocrystalline basalt (1 sample);
- Sparsely plagioclase-olivine phyric microcrystalline basalt (1 sample);
- Moderately plagioclase phyric, microcrystalline basalt (1 sample);
- Sparsely plagioclase-olivine-phyric, cryptocrystalline basalt (2 samples);
- Sedimentary breccia with basalt and glass clasts (1 sample);
- Moderately plagioclase-olivine phyric, subtly variolitic massive basalt (2 samples); and
- Moderately plagioclase-olivine-clinopyroxene phyric, fine-grained basalt (1 sample).
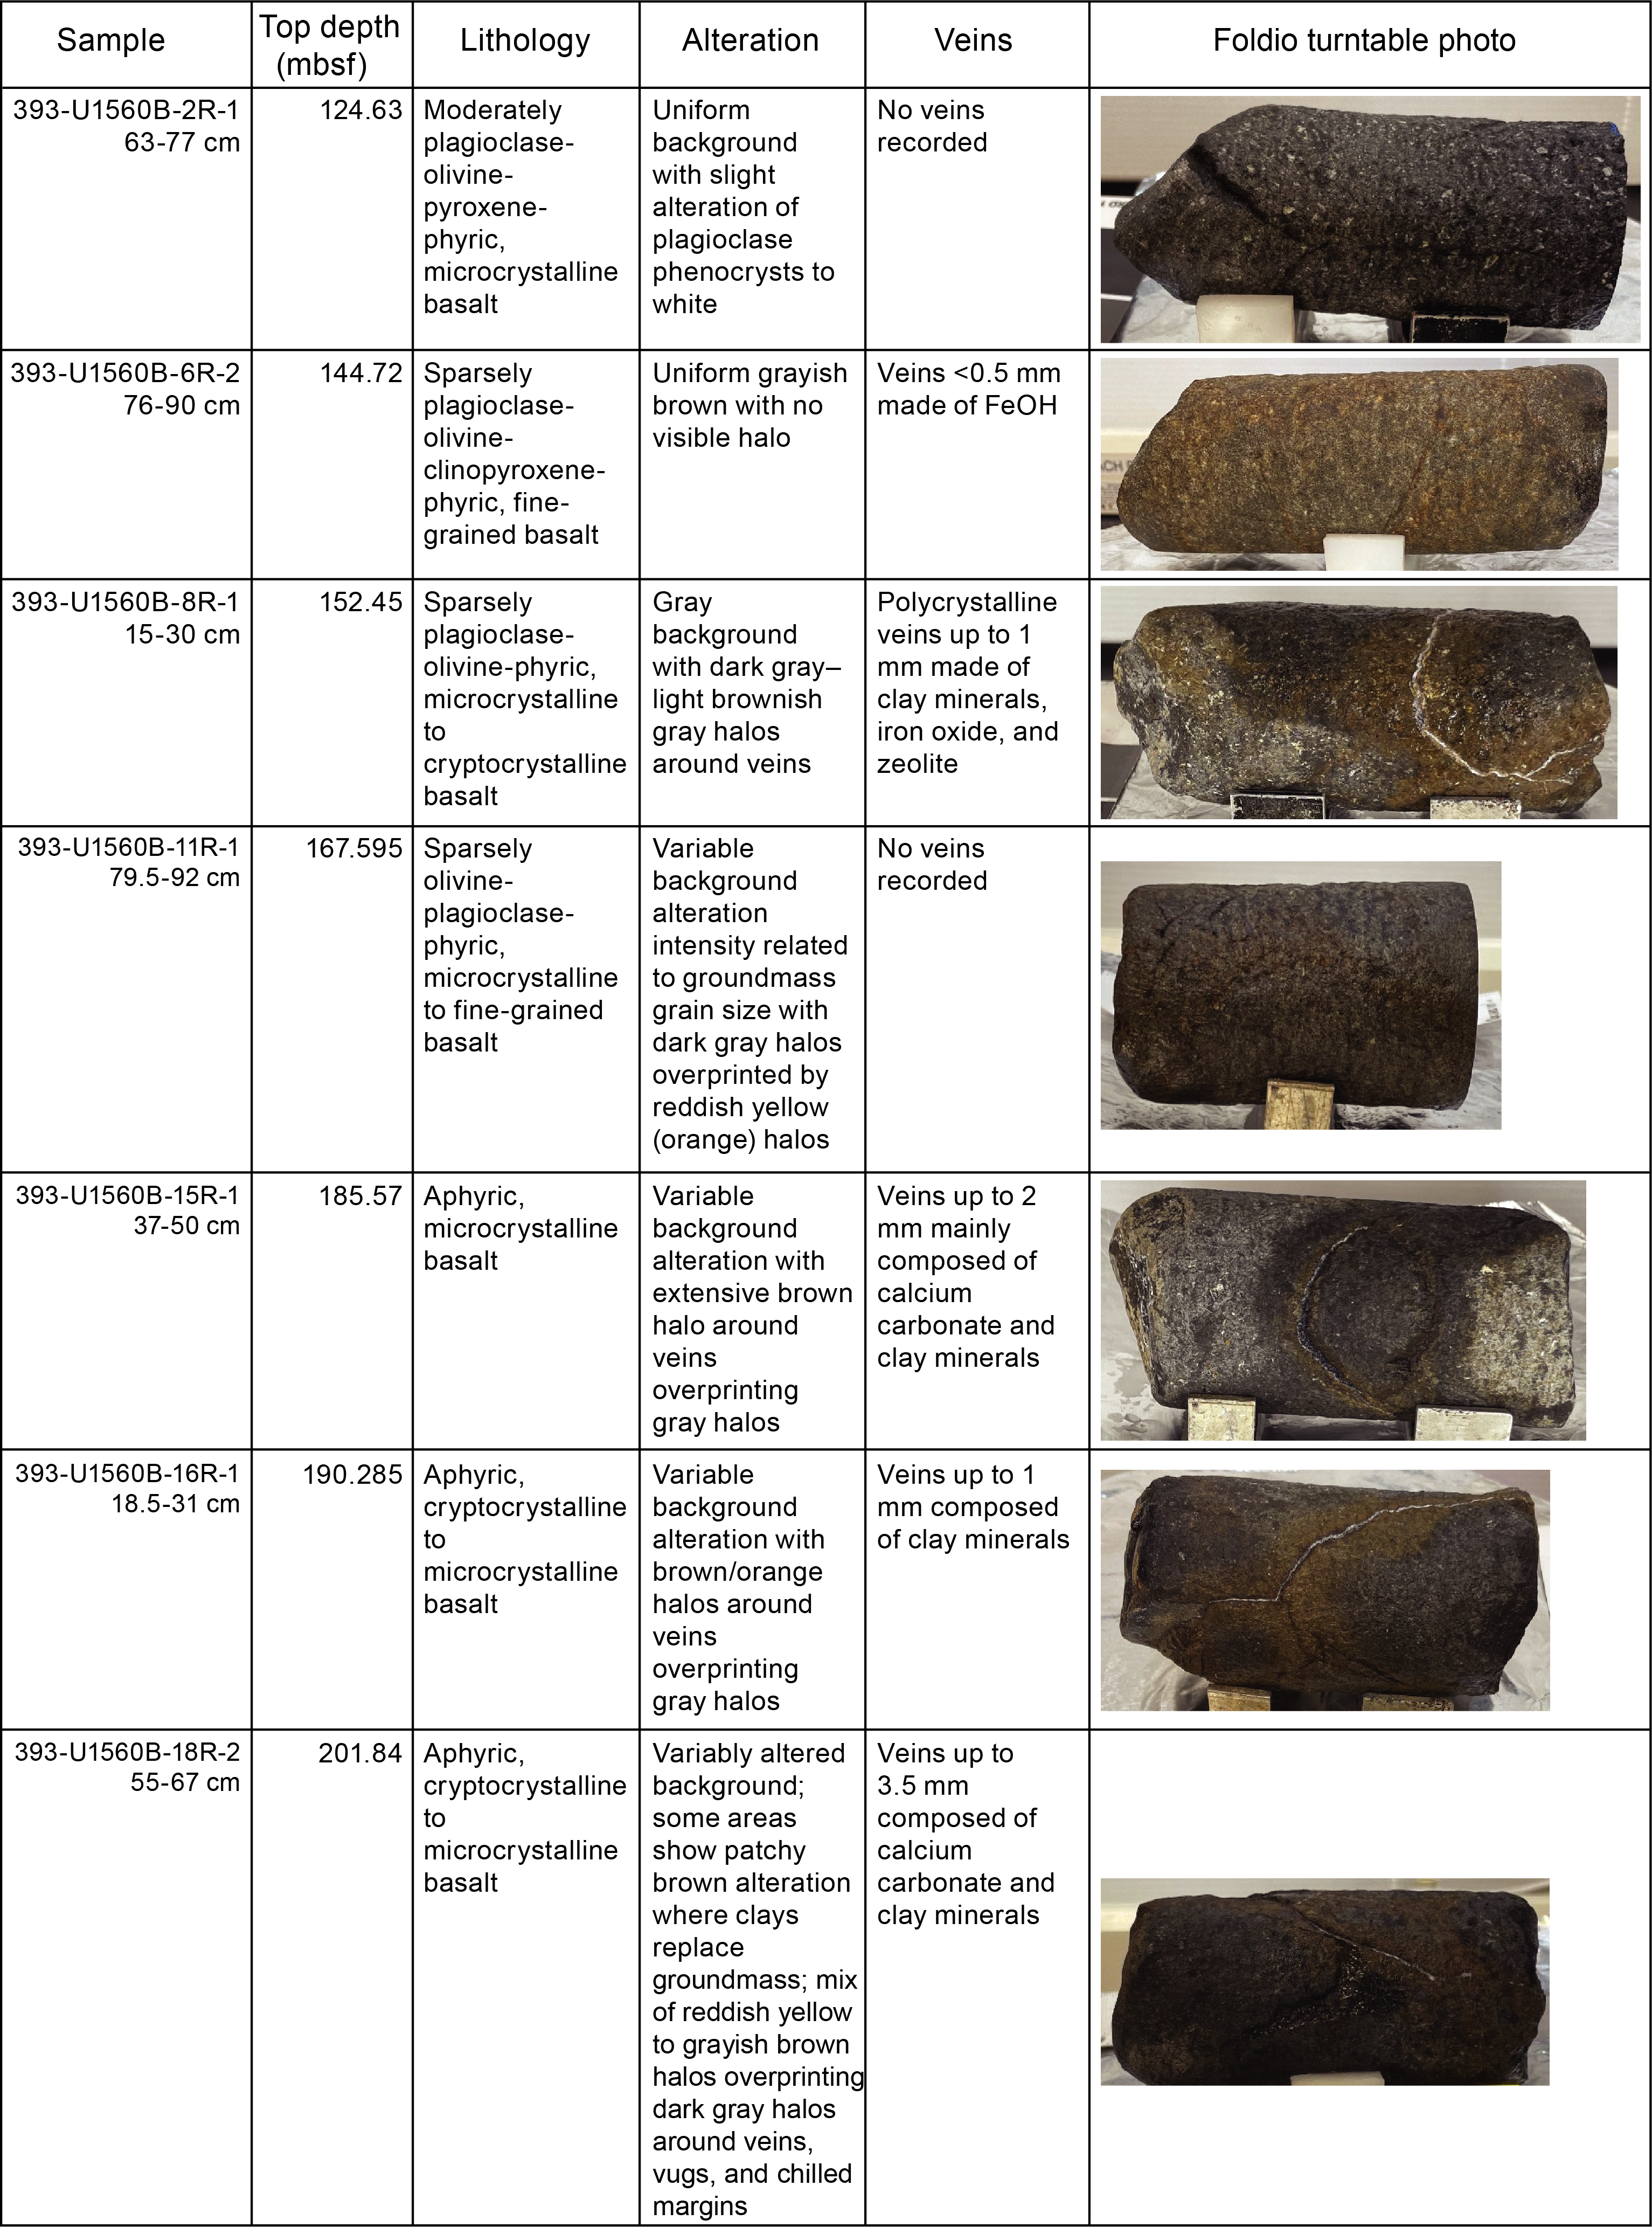
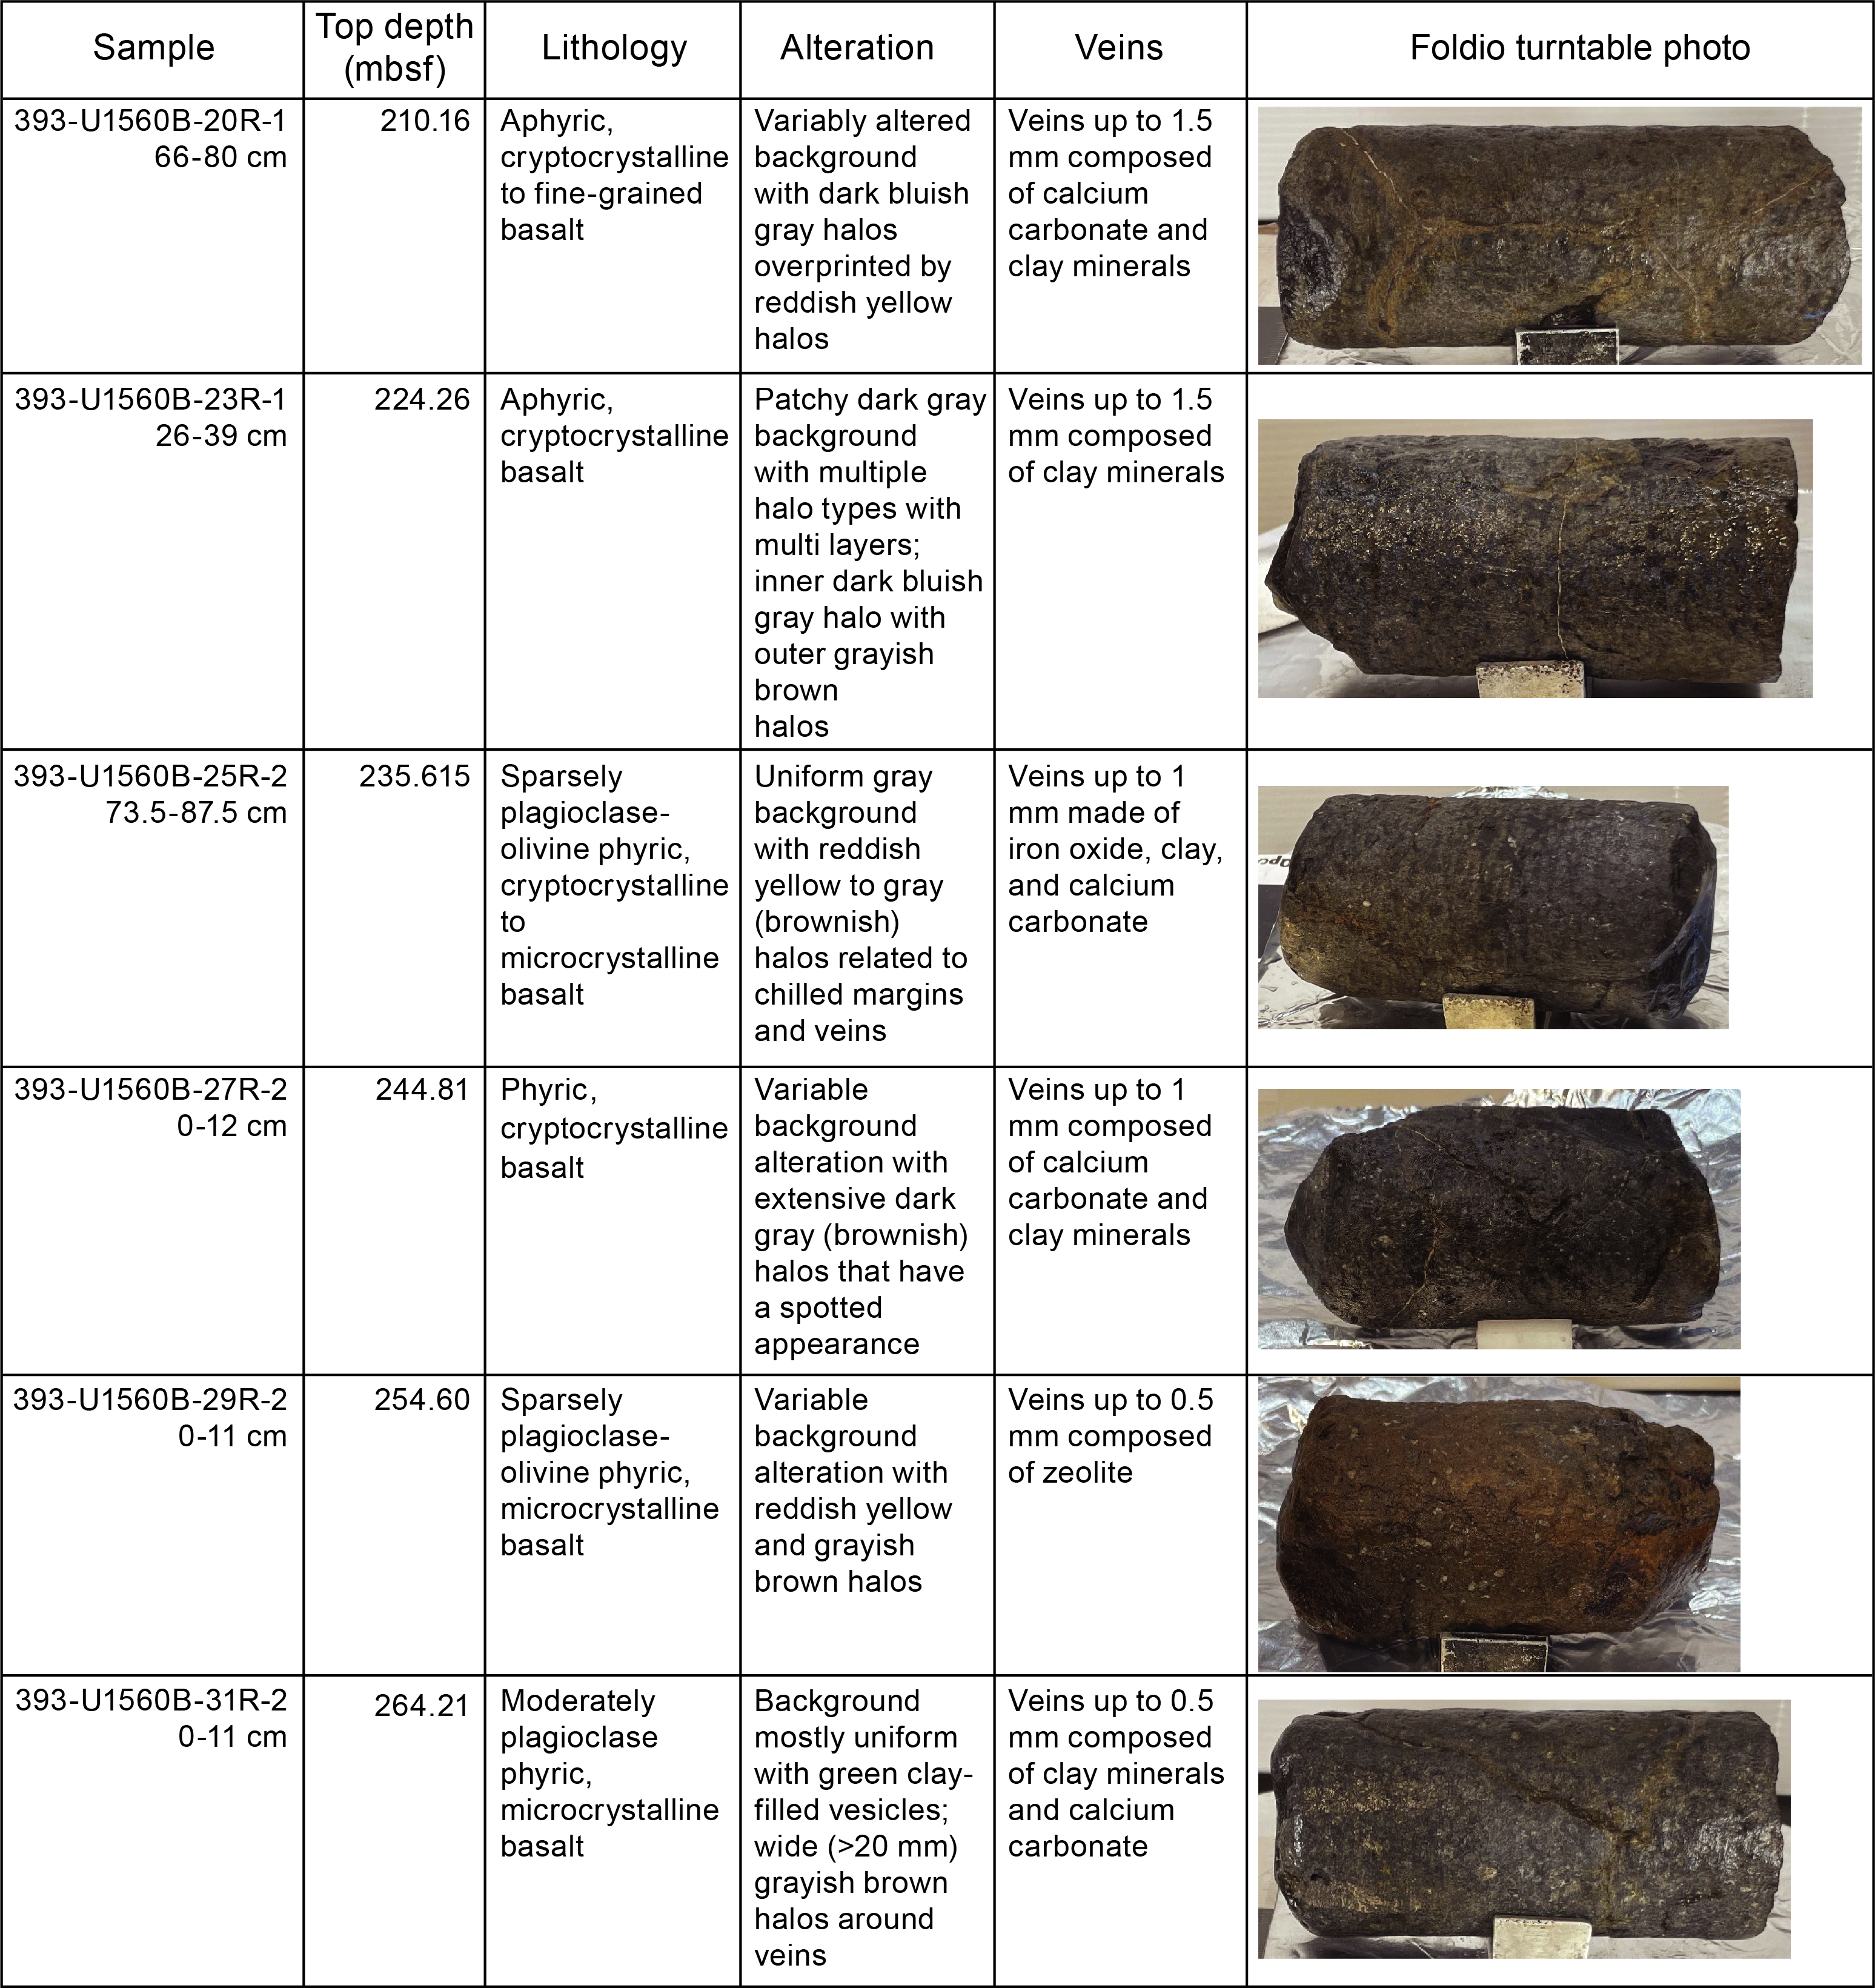
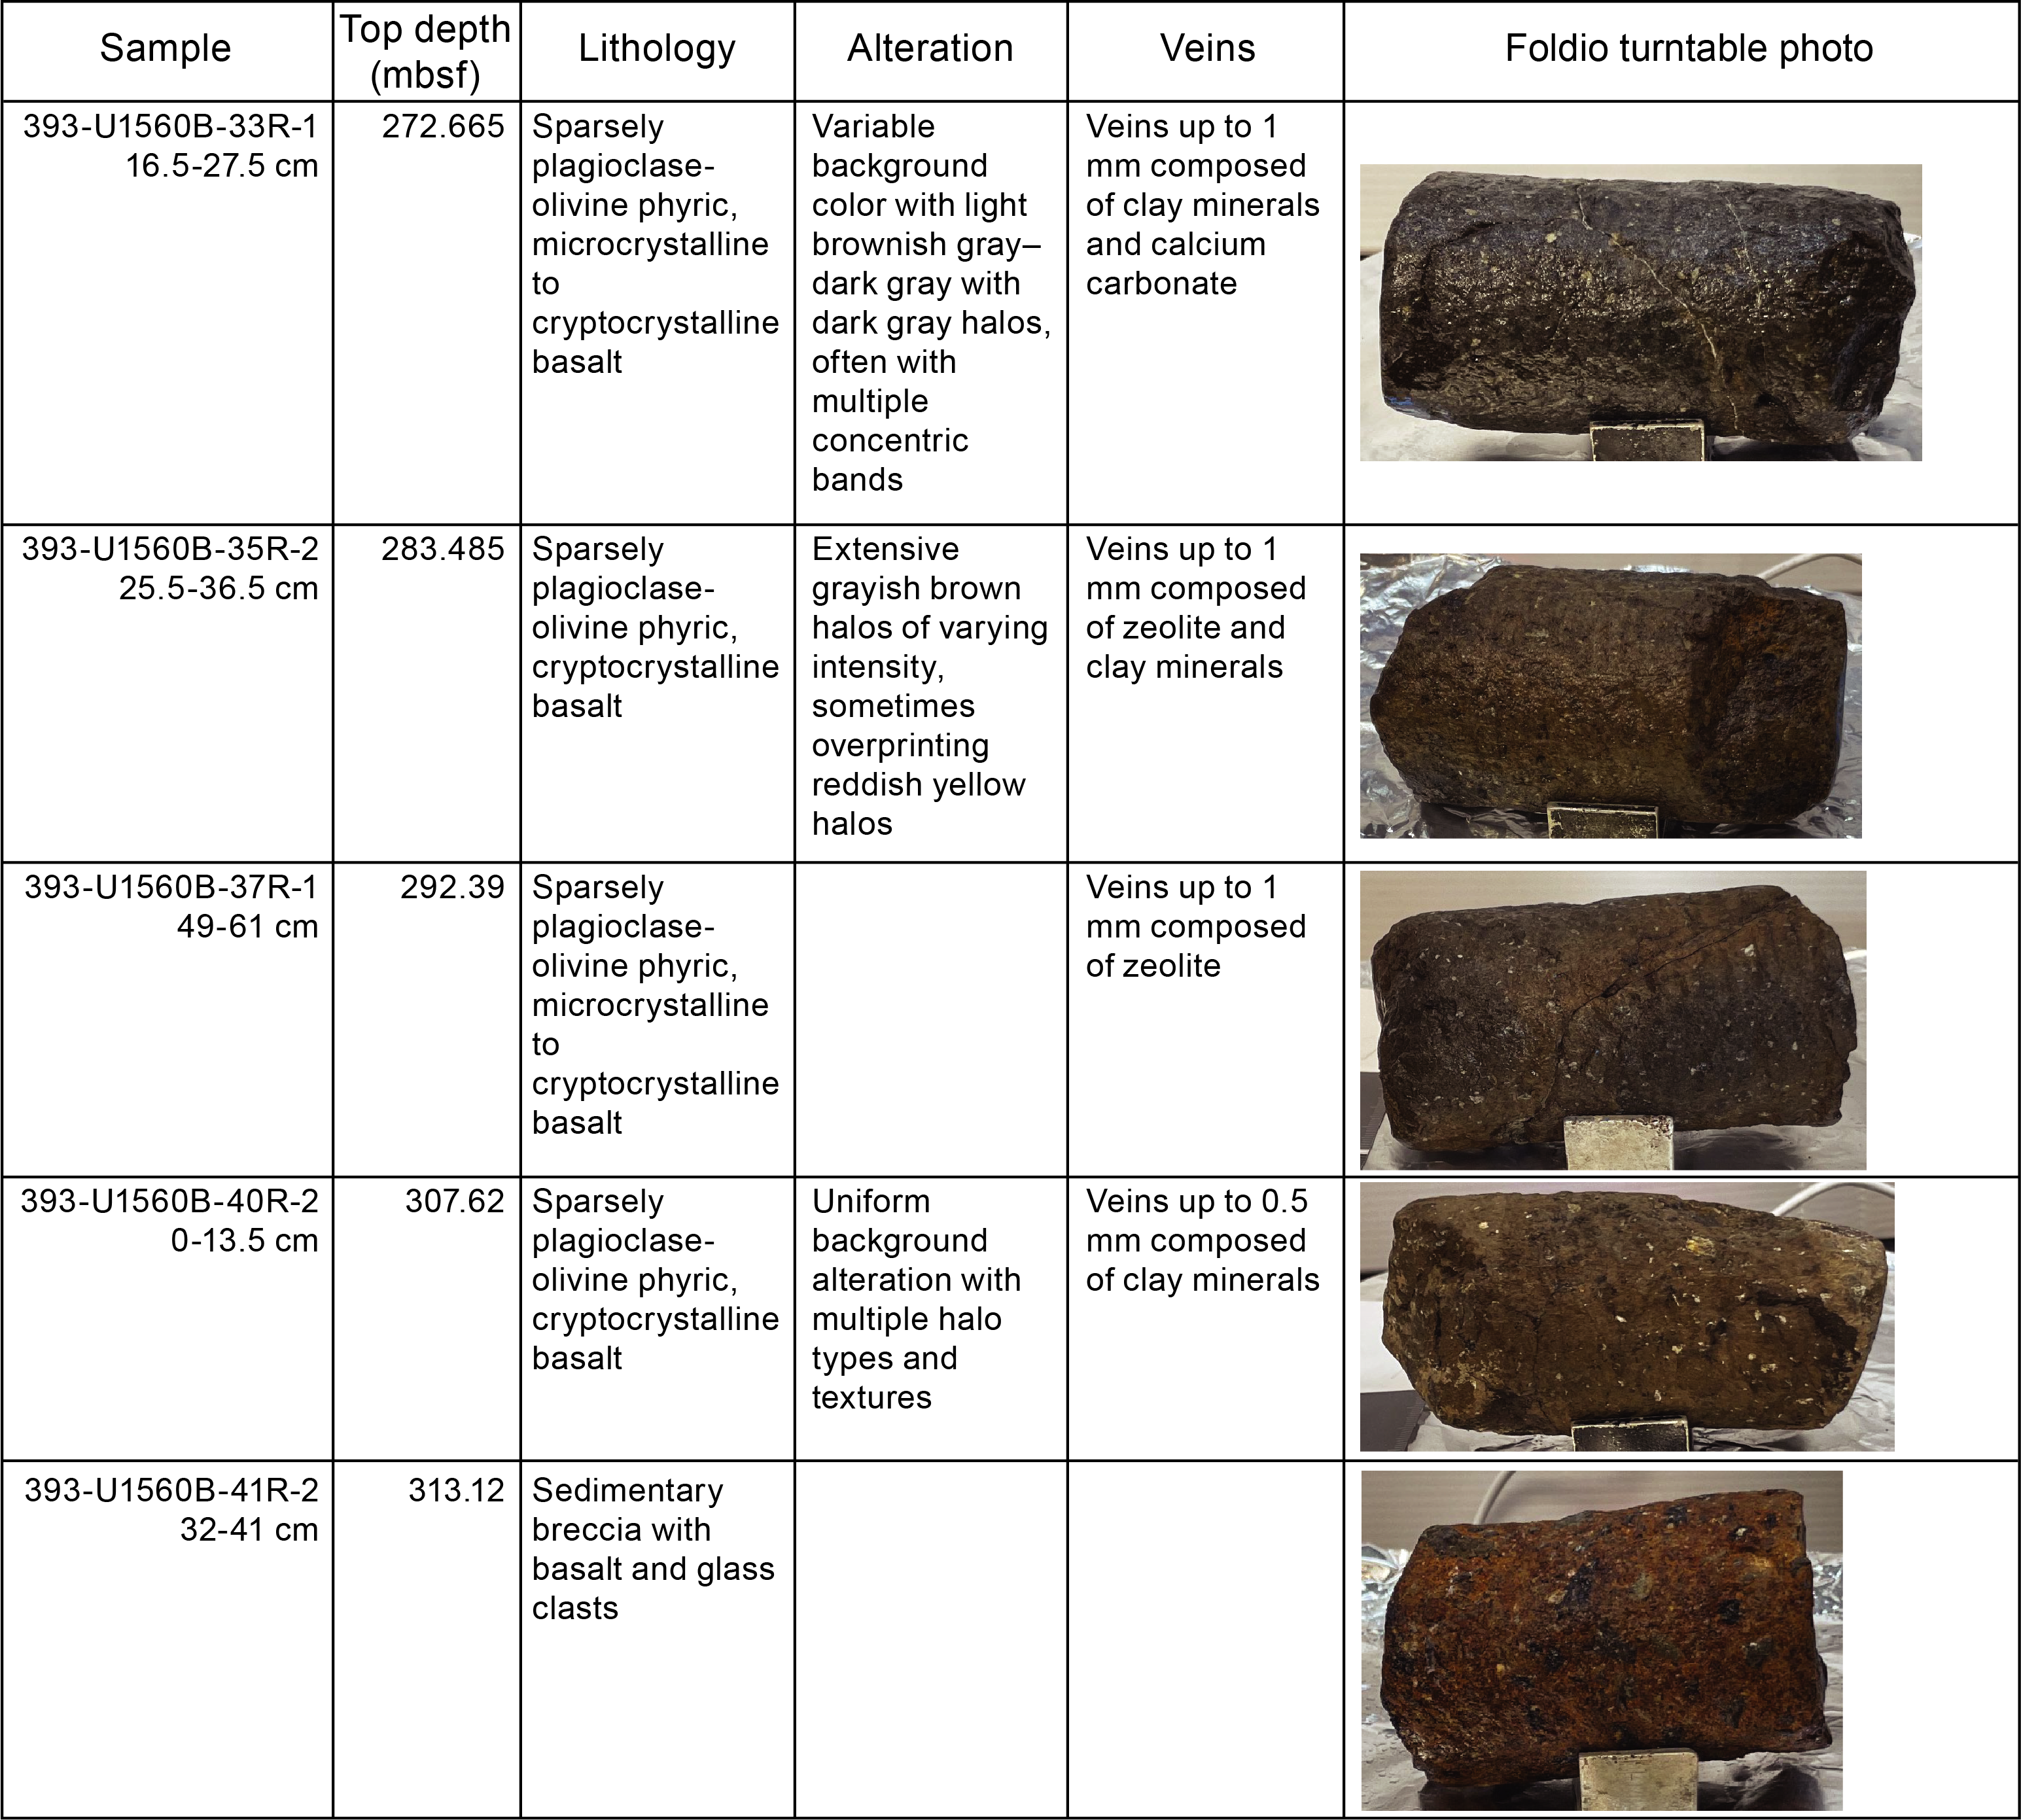
Figure F108. Samples for microbiology research.
The rock types collected represented all igneous lithostratigraphic units (Figure F108; see Igneous petrology).
After the exteriors of whole-round pieces were removed to avoid material contaminated during coring (see Microbiology in the Expedition 390/393 methods chapter [Coggon et al., 2024a]), the remaining material was split into samples that were prepared for different microbiological analyses. The number of samples depended on the amount of material available from each "parent" whole-round sample (Table T39).
12.2.1. Microbiological sample processing and experiments
12.2.1.1. Cell and viral counts
A total of 18 samples were processed for cell and viral enumeration. Performing shipboard cell counts on rock samples is difficult because of the time required to separate cells from rock material in addition to the time required for sample processing and other shipboard tests. Therefore, shipboard cell counts were not attempted during the SAT expeditions. Cell count samples were instead broken into small chips and/or powder and preserved for postexpedition analyses (1 cm3 sample in 4 mL of 4% paraformaldehyde in 100 mM PBS). Duplicate cell count samples were prepared for all samples so that independent measurements could be performed in two different laboratories. When samples were taken for viral metagenomics, a third replicate was processed to allow for viral counts.
12.2.1.2. Microbial community structure
A total of 18 samples were processed for shore-based DNA (PCR amplicon based and metagenomes) and/or RNA (PCR amplicon based and/or metatranscriptomes) analysis, 18 samples were preserved for single-cell genomics, and 18 samples were collected for lipid analysis (Table T39). Material for DNA, RNA, and lipid-based analyses of microbial community composition, which will be performed as part of postexpedition research, was collected and preserved following the procedures described in Microbiology in the Expedition 390/393 methods chapter (Coggon et al., 2024a).
12.2.1.3. Microbial incubation experiments
To determine the extent of viral activity, virus-induced microbial mortality and prophage induction experiments were performed (see Microbiology in the Expedition 390/393 methods chapter [Coggon et al., 2024a]) using samples from Sections 393-U1560B-25R-2 and 41R-2. Approximately 5 g of pulverized rock (crushed with a sterile hammer inside a rock box) was resuspended in 40 mL of autoclaved deep seawater. Subsamples of 1 mL were collected after 0, 3, 6, 12, 24, and 48 h and then 7 and 14 days. The seawater that was used to dilute the rock was collected on 19 July 2022 using a Niskin bottle attached to the subsea camera system frame at a depth of 3725 m. This seawater was filtered through a 0.22 µm pore size polyethersulfone (PES) membrane twice and autoclaved. The pH of the seawater was 7.71, and the salinity was 34.8.
To study nitrogen cycling across the sediment/basement interface, a basement sample from Section 393-U1560B-2R-1 was used in an ammonium enrichment incubation experiment (see Microbiology in the Expedition 390/393 methods chapter [Coggon et al., 2024a]). Briefly, ~9 g of rock crushed with a sterile Diamonite mortar and pestle was diluted in 50 mL vials with deep seawater to achieve a final volume of 40 mL. The seawater was collected from Site U1560B on 19 July and 23 July 2022 at ~3700 mbsl and then filtered twice through 0.22 µm pore size filter. The goal of this experiment is to investigate if ammonium addition increases cell abundance for the basement samples from Holes U1560B and U1560C and to identify the microorganisms that are translationally active. These vials will be incubated at 4°C for 6 months before shore-based analysis at Texas A&M University (USA).
12.2.2. Microbiological contamination monitoring
To determine the number of microorganisms present in drilling mud fluid and generate a database of potential contaminants, 500 mL of drilling fluid was collected from the standpipe on the rig floor during coring operations in Hole U1560B and frozen at −80°C for shore-based molecular biology analysis to determine the microorganisms present in drilling fluid.
References
Backman, J., Raffi, I., Rio, D., Fornaciari, E., and Pälike, H., 2012. Biozonation and biochronology of Miocene through Pleistocene calcareous nannofossils from low and middle latitudes. Newsletters on Stratigraphy, 45(3):221–244. https://doi.org/10.1127/0078-0421/2012/0022
Baker, P.A., Gieskes, J.M., and Elderfield, H., 1982. Diagenesis of carbonates in deep-sea sediments; evidence from Sr/Ca ratios and interstitial dissolved Sr2+ data. Journal of Sedimentary Research, 52(1):71–82. https://doi.org/10.1306/212F7EE1-2B24-11D7-8648000102C1865D
Boyer, T.P., García, H.E., Locarnini, R.A., Zweng, M.M., Mishonov, A.V., Reagan, J.R., Weathers, K.A., Baranova, O.K., Paver, C.R., Seidov, D., and Smolyar, I.V., 2018. World Ocean Atlas 2018. NOAA National Centers for Environmental Information. https://www.ncei.noaa.gov/archive/accession/NCEI-WOA18
Butler, R.F., 1992. Paleomagnetism: Magnetic Domains and Geologic Terranes: Oxford, England (Blackwell).
Christeson, G., and Reece, R., 2020. Bathymetric site survey gridded data in support of IODP Expeditions 390 and 393, South Atlantic Transect (MGL1601, CREST). Interdisciplinary Earth Data Alliance (IEDA). https://doi.org/10.26022/IEDA/327528
Christeson, G.L., Goff, J.A., and Reece, R.S., 2019. Synthesis of oceanic crustal structure from two-dimensional seismic profiles. Reviews of Geophysics, 57(2):504–529. https://doi.org/10.1029/2019RG000641
Christeson, G.L., Reece, R.S., Kardell, D.A., Estep, J.D., Fedotova, A., and Goff, J.A., 2020. South Atlantic transect: variations in oceanic crustal structure at 31°S. Geochemistry, Geophysics, Geosystems, 21(7):e2020GC009017. https://doi.org/10.1029/2020GC009017
Coggon, R.M., Teagle, D.A.H., Sylvan, J.B., Reece, J., Estes, E.R., Williams, T.J., Christeson, G.L., Aizawa, M., Albers, E., Amadori, C., Belgrano, T.M., Borrelli, C., Bridges, J.D., Carter, E.J., D'Angelo, T., Dinarès-Turell, J., Doi, N., Estep, J.D., Evans, A., Gilhooly, W.P., III, Grant, L.J.C., Guérin, G.M., Harris, M., Hojnacki, V.M., Hong, G., Jin, X., Jonnalagadda, M., Kaplan, M.R., Kempton, P.D., Kuwano, D., Labonte, J.M., Lam, A.R., Latas, M., Lowery, C.M., Lu, W., McIntyre, A., Moal-Darrigade, P., Pekar, S.F., Robustelli Test, C., Routledge, C.M., Ryan, J.G., Santiago Ramos, D., Shchepetkina, A., Slagle, A.L., Takada, M., Tamborrino, L., Villa, A., Wang, Y., Wee, S.Y., Widlansky, S.J., Yang, K., Kurz, W., Prakasam, M., Tian, L., Yu, T., and Zhang, G., 2024a. Expedition 390/393 methods. In Coggon, R.M., Teagle, D.A.H., Sylvan, J.B., Reece, J., Estes, E.R., Williams, T.J., Christeson, G.L., and the Expedition 390/393 Scientists, South Atlantic Transect. Proceedings of the International Ocean Discovery Program, 390/393: College Station, TX (International Ocean Discovery Program). https://doi.org/10.14379/iodp.proc.390393.102.2024
Coggon, R.M., Teagle, D.A.H., Sylvan, J.B., Reece, J., Estes, E.R., Williams, T.J., Christeson, G.L., Aizawa, M., Albers, E., Amadori, C., Belgrano, T.M., Borrelli, C., Bridges, J.D., Carter, E.J., D'Angelo, T., Dinarès-Turell, J., Doi, N., Estep, J.D., Evans, A., Gilhooly, W.P., III, Grant, L.J.C., Guérin, G.M., Harris, M., Hojnacki, V.M., Hong, G., Jin, X., Jonnalagadda, M., Kaplan, M.R., Kempton, P.D., Kuwano, D., Labonte, J.M., Lam, A.R., Latas, M., Lowery, C.M., Lu, W., McIntyre, A., Moal-Darrigade, P., Pekar, S.F., Robustelli Test, C., Routledge, C.M., Ryan, J.G., Santiago Ramos, D., Shchepetkina, A., Slagle, A.L., Takada, M., Tamborrino, L., Villa, A., Wang, Y., Wee, S.Y., Widlansky, S.J., Yang, K., Kurz, W., Prakasam, M., Tian, L., Yu, T., and Zhang, G., 2024b. Expedition 390/393 summary. In Coggon, R.M., Teagle, D.A.H., Sylvan, J.B., Reece, J., Estes, E.R., Williams, T.J., Christeson, G.L., and the Expedition 390/393 Scientists, South Atlantic Transect. Proceedings of the International Ocean Discovery Program, 390/393: College Station, TX (International Ocean Discovery Program). https://doi.org/10.14379/iodp.proc.390393.101.2024
Coggon, R.M., Teagle, D.A.H., Sylvan, J.B., Reece, J., Estes, E.R., Williams, T.J., Christeson, G.L., and the Expedition 390/393 Scientists, 2024c. Supplementary material, https://doi.org/10.14379/iodp.proc.390393supp.2024. In Coggon, R.M., Teagle, D.A.H., Sylvan, J.B., Reece, J., Estes, E.R., Williams, T.J., Christeson, G.L., and the Expedition 390/393 Scientists, South Atlantic Transect. Proceedings of the International Ocean Discovery Program, 390/393: College Station, TX (International Ocean Discovery Program).
De Vleeschouwer, D., Dunlea, A.G., Auer, G., Anderson, C.H., Brumsack, H., de Loach, A., Gurnis, M.C., Huh, Y., Ishiwa, T., Jang, K., Kominz, M.A., März, C., Schnetger, B., Murray, R.W., Pälike, H., and Expedition 356 Shipboard Scientists, 2017. Quantifying K, U, and Th contents of marine sediments using shipboard natural gamma radiation spectra measured on DV JOIDES Resolution. Geochemistry, Geophysics, Geosystems, 18(3):1053–1064. https://doi.org/10.1002/2016GC006715
DeMaster, D.J., 1981. The supply and accumulation of silica in the marine environment. Geochimica et Cosmochimica Acta, 45(10):1715–1732. https://doi.org/10.1016/0016-7037(81)90006-5
Devey, C., 2014. SoMARTherm: the Mid-Atlantic Ridge 13–33°S – Cruise No. MSM25 – January 24–March 5, 2013 – Cape Town (South Africa) – Mindelo (Cape Verde). MARIA S. MERIAN-Berichte, MSM25(80). https://doi.org/10.2312/cr_msm25
Dunlea, A.G., Murray, R.W., Harris, R.N., Vasiliev, M.A., Evans, H., Spivack, A.J., and D'Hondt, S., 2013. Assessment and use of NGR instrumentation on the JOIDES Resolution to quantify U, Th, and K concentrations in marine sediment. Scientific Drilling, 15:57–63. https://doi.org/10.2204/iodp.sd.15.05.2013
Estep, J., Reece, R., Kardell, D.A., Christeson, G.L., and Carlson, R.L., 2019. Seismic Layer 2A: evolution and thickness from 0- to 70-Ma crust in the slow-intermediate spreading South Atlantic. Journal of Geophysical Research: Solid Earth, 124(8):7633–7651. https://doi.org/10.1029/2019JB017302
Expedition 309/312 Scientists, 2006. Site 1256. In Teagle, D.A.H., Alt, J.C., Umino, S., Miyashita, S., Banerjee, N.R., Wilson, D.S., and the Expedition 309/312 Scientists, Proceedings of the Integrated Ocean Drilling Program. 309/312: Washington, DC (Integrated Ocean Drilling Program Management International, Inc.). https://doi.org/10.2204/iodp.proc.309312.103.2006
Expedition 335 Scientists, 2012. Site 1256. In Teagle, D.A.H., Ildefonse, B., Blum, P., and the Expedition 335 Scientists, Proceedings of the Integrated Ocean Drilling Program. 335: Tokyo (Integrated Ocean Drilling Program Management International, Inc.). https://doi.org/10.2204/iodp.proc.335.103.2012
Fuchs, S., Norden, B., and the International Heat Flow Commission, 2021. The Global Heat Flow Database. GFZ Data Services. https://doi.org/10.5880/fidgeo.2021.014
Gale, A., Dalton, C.A., Langmuir, C.H., Su, Y., and Schilling, J.-G., 2013. The mean composition of ocean ridge basalts. Geochemistry, Geophysics, Geosystems, 14(3):489–518. https://doi.org/10.1029/2012GC004334
Gieskes, J., 1975. Chemistry of interstitial waters of marine sediments. Annual Review of Earth and Planetary Sciences, 3:433–453. https://doi.org/10.1146/annurev.ea.03.050175.002245
Gradstein, F.M., Ogg, J.G., Schmitz, M.D., and Ogg, G.M. (Eds.), 2020. The Geologic Time Scale 2020: Amsterdam (Elsevier BV). https://doi.org/10.1016/C2020-1-02369-3
Holbourn, A., Henderson, A.S., and MacLeod, N., 2013. Atlas of Benthic Foraminifera: United Kingdom (John Wiley & Sons, Ltd.). https://doi.org/10.1002/9781118452493
Jelinek, V., 1981. Characterization of the magnetic fabric of rocks. Tectonophysics, 79(3–4):T63–T67. https://doi.org/10.1016/0040-1951(81)90110-4
Jørgensen, B.B., 1977. Bacterial sulfate reduction within reduced microniches of oxidized marine sediments. Marine Biology, 41(1):7–17. https://doi.org/10.1007/BF00390576
Kardell, D.A., Christeson, G.L., Estep, J.D., Reece, R.S., and Carlson, R.L., 2019. Long-lasting evolution of Layer 2A in the western South Atlantic: evidence for low-temperature hydrothermal circulation in old oceanic crust. Journal of Geophysical Research: Solid Earth, 124(3):2252–2273. https://doi.org/10.1029/2018JB016925
Kardell, D.A., Zhao, Z., Ramos, E.J., Estep, J., Christeson, G.L., Reece, R.S., and Hesse, M.A., 2021. Hydrothermal models constrained by fine-scale seismic velocities confirm hydrothermal cooling of 7–63 Ma South Atlantic crust. Journal of Geophysical Research: Solid Earth, 126(6):e2020JB021612. https://doi.org/10.1029/2020JB021612
Kelley, K.A., Kingsley, R., and Schilling, J.-G., 2013. Composition of plume-influenced mid-ocean ridge lavas and glasses from the Mid-Atlantic Ridge, East Pacific Rise, Galápagos spreading center, and Gulf of Aden. Geochemistry, Geophysics, Geosystems, 14(1):223–242. https://doi.org/10.1002/ggge.20049
Kendrick, M.A., Hémond, C., Kamenetsky, V.S., Danyushevsky, L., Devey, C.W., Rodemann, T., Jackson, M.G., and Perfit, M.R., 2017. Seawater cycled throughout Earth's mantle in partially serpentinized lithosphere. Nature Geoscience, 10(3):222–228. https://doi.org/10.1038/ngeo2902
King, D.J., Wade, B.S., Liska, R.D., and Miller, C.G., 2020. A review of the importance of the Caribbean region in Oligo-Miocene low latitude planktonic foraminiferal biostratigraphy and the implications for modern biogeochronological schemes. Earth-Science Reviews, 202:102968. https://doi.org/10.1016/j.earscirev.2019.102968
Korenaga, T., and Korenaga, J., 2008. Subsidence of normal oceanic lithosphere, apparent thermal expansivity, and seafloor flattening. Earth and Planetary Science Letters, 268(1):41–51. https://doi.org/10.1016/j.epsl.2007.12.022
Lam, A.R., Crundwell, M.P., Leckie, R.M., Albanese, J., and Uzel, J.P., 2022. Diachroneity rules the mid-latitudes: a test case using Late Neogene planktic foraminifera across the Western Pacific. Geosciences, 12(5):190. https://doi.org/10.3390/geosciences12050190
Le Bas, M.J., Le Maitre, R. W., Streickeisen, A., Zanettin, B., the IUGS Subcommission on the Systematics of Igneous Rocks, 1986. A chemical classification of volcanic rocks based on the total alkali-silica diagram. Journal of Petrology, 27(3):745–750. https://doi.org/10.1093/petrology/27.3.745
Le Roux, P.J., 2000. The geochemistry of selected mid-ocean ridge basalts from the Southern mid-Atlantic ridge (40°–55°S) [PhD dissertation]. University of Cape Town, Cape Town, South Africa. http://hdl.handle.net/11427/4207
Lohmann, G.P., 1978. Abyssal benthonic foraminifera as hydrographic indicators in the western South Atlantic Ocean. Journal of Foraminiferal Research, 8(1):6–34. https://doi.org/10.2113/gsjfr.8.1.6
Mackensen, A., Schmiedl, G., Harloff, J., and Giese, M., 1995. Deep-sea foraminifera in the South Atlantic Ocean: ecology and assemblage generation. Micropaleontology, 41(4):342–358. https://doi.org/10.2307/1485808
Marschall, H.R., Wanless, V.D., Shimizu, N., Pogge von Strandmann, P.A.E., Elliott, T., and Monteleone, B.D., 2017. The boron and lithium isotopic composition of mid-ocean ridge basalts and the mantle. Geochimica et Cosmochimica Acta, 207:102–138. https://doi.org/10.1016/j.gca.2017.03.028
Martini, E., 1971. Standard Tertiary and Quaternary calcareous nannoplankton zonation. Proceedings of the Second Planktonic Conference, Roma, 1970:739–785.
Marty, J.C., and Cazenave, A., 1989. Regional variations in subsidence rate of oceanic plates: a global analysis. Earth and Planetary Science Letters, 94(3):301–315. https://doi.org/10.1016/0012-821X(89)90148-9
Maxbauer, D.P., Feinberg, J.M., and Fox, D.L., 2016. MAX UnMix: a web application for unmixing magnetic coercivity distributions. Computers & Geosciences, 95:140–145. https://doi.org/10.1016/j.cageo.2016.07.009
Michael, P.J., and Graham, D.W., 2015. The behavior and concentration of CO2 in the suboceanic mantle: inferences from undegassed ocean ridge and ocean island basalts. Lithos, 236–237:338–351. https://doi.org/10.1016/j.lithos.2015.08.020
Miller, K.G., and Katz, M.E., 1987. Oligocene to Miocene benthic foraminiferal and abyssal circulation dhanges in the North Atlantic. Micropaleontology, 33(2):97–149. http://www.jstor.org/stable/1485489
Olson, P., Reynolds, E., Hinnov, L., and Goswami, A., 2016. Variation of ocean sediment thickness with crustal age. Geochemistry, Geophysics, Geosystems, 17(4):1349–1369. https://doi.org/10.1002/2015GC006143
Parsons, B., and Sclater, J.G., 1977. An analysis of the variation of ocean floor bathymetry and heat flow with age. Journal of Geophysical Research (1896-1977), 82(5):803–827. https://doi.org/10.1029/JB082i005p00803
Paulick, H., Münker, C., and Schuth, S., 2010. The influence of small-scale mantle heterogeneities on Mid-Ocean Ridge volcanism: evidence from the southern Mid-Atlantic Ridge (7°30′S to 11°30′S) and Ascension Island. Earth and Planetary Science Letters, 296(3–4):299–310. https://doi.org/10.1016/j.epsl.2010.05.009
Pearce, J.A., and Norry, M.J., 1979. Petrogenetic implications of Ti, Zr, Y, and Nb variations in volcanic rocks. Contributions to Mineralogy and Petrology, 69(1):33–47. https://doi.org/10.1007/BF00375192
Reece, R., Christeson, G., Amara, A., Estep, J., Greene, J., Koch, C., Henning, L., Worman, W., and Wright, A., 2016. CREST: Crustal Reflectivity Experiment southern transect South Atlantic multichannel seismic and ocean bottom seismometer experiment, 4 Jan–25 Feb 2016 Cruise Report. http://www.iris.washington.edu/data/reports/2016/16-003/CREST_2016-01-04-2016-02-25_MGL1601_CruiseReport.pdf
Reece, R., and Estep, J., 2019. Processed MCS (PSTM) data from the Mid-Atlantic Ridge (MAR) to the Rio Grande Rise, South Atlantic Ocean, acquired by the R/V Marcus G. Langseth in 2016 (MGL1601) https://doi.org/10.1594/IEDA/500255
Reekie, C.D.J., Jenner, F.E., Smythe, D.J., Hauri, E.H., Bullock, E.S., and Williams, H.M., 2019. Sulfide resorption during crustal ascent and degassing of oceanic plateau basalts. Nature Communications, 10(1):82. https://doi.org/10.1038/s41467-018-08001-3
Ríos, A.F., Resplandy, L., García-Ibáñez, M.I., Fajar, N.M., Velo, A., Padin, X.A., Wanninkhof, R., Steinfeldt, R., Rosón, G., and Pérez, F.F., 2015. Decadal acidification in the water masses of the Atlantic Ocean. Proceedings of the National Academy of Sciences, 112(32):9950–9955. https://doi.org/10.1073/pnas.1504613112
Sclater, J.G., Jaupart, C., and Galson, D., 1980. The heat flow through oceanic and continental crust and the heat loss of the Earth. Reviews of Geophysics, 18(1):269-311. https://doi.org/10.1029/RG018i001p00269
Shervais, J.W., 1982. Ti-V plots and the petrogenesis of modern and ophiolitic lavas. Earth and Planetary Science Letters, 59(1):101–118. https://doi.org/10.1016/0012-821X(82)90120-0
Shipboard Scientific Party, 1993. Site 896. In Alt, J.C., Kinoshita, H., Stokking, L.B., et al., Proceedings of the Ocean Drilling Program, Initial Reports, 148. College Station, TX (Ocean Drilling Program), 123–192. https://doi.org/10.2973/odp.proc.ir.148.103.1993
Shipboard Scientific Party, 2003. Site 1256. In Wilson, D.S., Teagle, D.A.H., Acton, G.D., et al., Proceedings of the Ocean Drilling Program, Initial Reports. 206: College Station, TX (Ocean Drilling Program). https://doi.org/10.2973/odp.proc.ir.206.103.2003
Spinelli, G.A., Giambalvo, E.R., and Fisher, A.T., 2004. Sediment permeability, distribution, and influence on fluxes in oceanic basement. In Davis, E.E., and Elderfield, H. (Eds.), Hydrogeology of the Oceanic Lithosphere. Cambridge, UK (Cambridge University Press), 151–188.
Stein, C.A., and Stein, S., 1992. A model for the global variation in oceanic depth and heat flow with lithospheric age. Nature, 359(6391):123–129. https://doi.org/10.1038/359123a0
Straume, E.O., Gaina, C., Medvedev, S., Hochmuth, K., Gohl, K., Whittaker, J.M., Abdul Fattah, R., Doornenbal, J.C., and Hopper, J.R., 2019. GlobSed: updated total sediment thickness in the world's oceans. Geochemistry, Geophysics, Geosystems, 20(4):1756–1772. https://doi.org/10.1029/2018GC008115
Teagle, D.A.H., Reece, J., Williams, T.J., Coggon, R.M., Sylvan, J.B., Estes, E.R., Christeson, G.L., Albers, E., Amadori, C., Belgrano, T.M., D'Angelo, T., Doi, N., Evans, A., Guérin, G.M., Harris, M., Hojnacki, V.M., Hong, G., Jin, X., Jonnalagadda, M., Kuwano, D., Labonte, J.M., Lam, A.R., Latas, M., Lu, W., Moal-Darrigade, P., Pekar, S.F., Robustelli Test, C., Ryan, J.G., Santiago Ramos, D., Shchepetkina, A., Villa, A., Wee, S.Y., Widlansky, S.J., Aizawa, M., Borrelli, C., Bridges, J.D., Carter, E.J., Dinarès-Turell, J., Estep, J.D., Gilhooly, W.P., III, Grant, L.J.C., Kaplan, M.R., Kempton, P.D., Lowery, C.M., McIntyre, A., Routledge, C.M., Slagle, A.L., Takada, M., Tamborrino, L., Wang, Y., Yang, K., Kurz, W., Prakasam, M., Tian, L., Yu, T., and Zhang, G., 2024a. Site U1558. In Coggon, R.M., Teagle, D.A.H., Sylvan, J.B., Reece, J., Estes, E.R., Williams, T.J., Christeson, G.L., and the Expedition 390/393 Scientists, South Atlantic Transect. Proceedings of the International Ocean Discovery Program, 390/393: College Station, TX (International Ocean Discovery Program). https://doi.org/10.14379/iodp.proc.390393.106.2024
Teagle, D.A.H., Reece, J., Williams, T.J., Coggon, R.M., Sylvan, J.B., Estes, E.R., Christeson, G.L., Albers, E., Amadori, C., Belgrano, T.M., D'Angelo, T., Doi, N., Evans, A., Guérin, G.M., Harris, M., Hojnacki, V.M., Hong, G., Jin, X., Jonnalagadda, M., Kuwano, D., Labonte, J.M., Lam, A.R., Latas, M., Lu, W., Moal-Darrigade, P., Pekar, S.F., Robustelli Test, C., Ryan, J.G., Santiago Ramos, D., Shchepetkina, A., Villa, A., Wee, S.Y., Widlansky, S.J., Aizawa, M., Borrelli, C., Bridges, J.D., Carter, E.J., Dinarès-Turell, J., Estep, J.D., Gilhooly, W.P., III, Grant, L.J.C., Kaplan, M.R., Kempton, P.D., Lowery, C.M., McIntyre, A., Routledge, C.M., Slagle, A.L., Takada, M., Tamborrino, L., Wang, Y., Yang, K., Kurz, W., Prakasam, M., Tian, L., Yu, T., and Zhang, G., 2024b. Site U1583. In Coggon, R.M., Teagle, D.A.H., Sylvan, J.B., Reece, J., Estes, E.R., Williams, T.J., Christeson, G.L., and the Expedition 390/393 Scientists, South Atlantic Transect. Proceedings of the International Ocean Discovery Program, 390/393: College Station, TX (International Ocean Discovery Program). https://doi.org/10.14379/iodp.proc.390393.107.2024
van der Zwan, F.M., Devey, C.W., Hansteen, T.H., Almeev, R.R., Augustin, N., Frische, M., Haase, K.M., Basaham, A., and Snow, J.E., 2017. Lower crustal hydrothermal circulation at slow-spreading ridges: evidence from chlorine in Arctic and South Atlantic basalt glasses and melt inclusions. Contributions to Mineralogy and Petrology, 172(11):97. https://doi.org/10.1007/s00410-017-1418-1
van Morkhoven, F.M., Berggren, W.A., and Edwards, A.S., 1986. Cenozoic cosmopolitan deep-water benthic foraminifera. Bulletin des centres de Recherches exploration-production elf-aquitaine, 11.
Wade, B.S., Pearson, P.N., Berggren, W.A., and Pälike, H., 2011. Review and revision of Cenozoic tropical planktonic foraminiferal biostratigraphy and calibration to the geomagnetic polarity and astronomical time scale. Earth-Science Reviews, 104(1–3):111–142. https://doi.org/10.1016/j.earscirev.2010.09.003
Williams, T., Estes, E.R., Rhinehart, B., Coggon, R.M., Sylvan, J.B., Christeson, G.L., and Teagle, D.A.H., 2021. Expedition 395E Preliminary Report: Complete South Atlantic Transect Reentry Systems. International Ocean Discovery Program. https://doi.org/10.14379/iodp.pr.395E.2021
Wilson, D.S., Teagle, D.A.H., Alt, J.C., Banerjee, N.R., Umino, S., Miyashita, S., Acton, G.D., Anma, R., Barr, S.R., Belghoul, A., Carlut, J., Christie, D.M., Coggon, R.M., Cooper, K.M., Cordier, C., Crispini, L., Durand, S.R., Einaudi, F., Galli, L., Gao, Y., Geldmacher, J., Gilbert, L.A., Hayman, N.W., Herrero-Bervera, E., Hirano, N., Holter, S., Ingle, S., Jiang, S., Kalberkamp, U., Kerneklian, M., Koepke, J., Laverne, C., Vasquez, H.L.L., Maclennan, J., Morgan, S., Neo, N., Nichols, H.J., Park, S.-H., Reichow, M.K., Sakuyama, T., Sano, T., Sandwell, R., Scheibner, B., Smith-Duque, C.E., Swift, S.A., Tartarotti, P., Tikku, A.A., Tominaga, M., Veloso, E.A., Yamasaki, T., Yamazaki, S., and Ziegler, C., 2006. Drilling to gabbro in intact ocean crust. Science, 312(5776):1016–1020. https://doi.org/10.1126/science.1126090
Yang, S., Humayun, M., and Salters, V.J.M., 2018. Elemental systematics in MORB glasses from the Mid-Atlantic Ridge. Geochemistry, Geophysics, Geosystems, 19(11):4236–4259. https://doi.org/10.1029/2018GC007593
Yoder, H.S., Jr., and Tilley, C.E., 1962. Origin of basalt magmas: an experimental study of natural and synthetic rock xystems. Journal of Petrology, 3(3):342–532. https://doi.org/10.1093/petrology/3.3.342
Zijderveld, J.D.A., 1967. AC demagnetization of rocks: analysis of results. In Runcorn, S.K.C., Creer, K.M., and Collinson, D.W. (Eds.), Methods in Palaeomagnetism. Developments in Solid Earth Geophysics, 3: 254–286. https://doi.org/10.1016/B978-1-4832-2894-5.50049-5