Sager, W., Hoernle, K., Höfig, T.W., Blum, P., and the Expedition 391 Scientists
Proceedings of the International Ocean Discovery Program Volume 391
publications.iodp.org
https://doi.org/10.14379/iodp.proc.391.103.2023
Site U15751
![]() W. Sager,
W. Sager,
![]() K. Hoernle,
K. Hoernle,
![]() T.W. Höfig,
T.W. Höfig,
![]() A.J. Avery,
A.J. Avery,
![]() R. Bhutani,
R. Bhutani,
![]() D.M. Buchs,
D.M. Buchs,
![]() C.A. Carvallo,
C.A. Carvallo,
![]() C. Class,
C. Class,
![]() Y. Dai,
Y. Dai,
![]() G. Dalla Valle,
G. Dalla Valle,
![]() A.V. Del Gaudio,
S. Fielding,
A.V. Del Gaudio,
S. Fielding,
![]() K.M. Gaastra,
K.M. Gaastra,
![]() S. Han,
S. Han,
![]() S. Homrighausen,
S. Homrighausen,
![]() Y. Kubota,
Y. Kubota,
![]() C.-F. Li,
C.-F. Li,
![]() W.R. Nelson,
W.R. Nelson,
![]() E. Petrou,
E. Petrou,
![]() K.E. Potter,
K.E. Potter,
![]() S. Pujatti,
S. Pujatti,
![]() J. Scholpp,
J. Scholpp,
![]() J.W. Shervais,
J.W. Shervais,
![]() S. Thoram,
S. Thoram,
![]() S.M. Tikoo-Schantz,
S.M. Tikoo-Schantz,
![]() M. Tshiningayamwe,
X.-J. Wang, and
M. Tshiningayamwe,
X.-J. Wang, and
![]() M. Widdowson2
M. Widdowson2
1 Sager, W., Hoernle, K., Höfig, T.W., Avery, A.J., Bhutani, R., Buchs, D.M., Carvallo, C.A., Class, C., Dai, Y., Dalla Valle, G., Del Gaudio, A.V., Fielding, S., Gaastra, K.M., Han, S., Homrighausen, S., Kubota, Y., Li, C.-F., Nelson, W.R., Petrou, E., Potter, K.E., Pujatti, S., Scholpp, J., Shervais, J.W., Thoram, S., Tikoo-Schantz, S.M., Tshiningayamwe, M., Wang, X.-J., and Widdowson, M., 2023. Site U1575. In Sager, W., Hoernle, K., Höfig, T.W., Blum, P., and the Expedition 391 Scientists, Walvis Ridge Hotspot. Proceedings of the International Ocean Discovery Program, 391: College Station, TX (International Ocean Discovery Program). https://doi.org/10.14379/iodp.proc.391.103.2023
2 Expedition 391 Scientists' affiliations.
1. Background and objectives
The strategy for International Ocean Discovery Program (IODP) Expedition 391 (Walvis Ridge Hotspot) was to drill at three general locations on Walvis Ridge and one in Guyot Province, providing an age transect along the Tristan-Gough-Walvis (TGW) hotspot track. Site U1575 (proposed Site FR-1B), located on the lower Walvis Ridge between Valdivia Bank and Frio Ridge (Figure F1), is the easternmost and presumably the oldest site. Both hotspot models and the age progression of Homrighausen et al. (2019) predict an age of ~100 Ma (Figures F2, F3). Site U1575 is thus an important sample of the early TGW track shortly after it transitioned from the continental flood basalt to the submarine hotspot track setting.
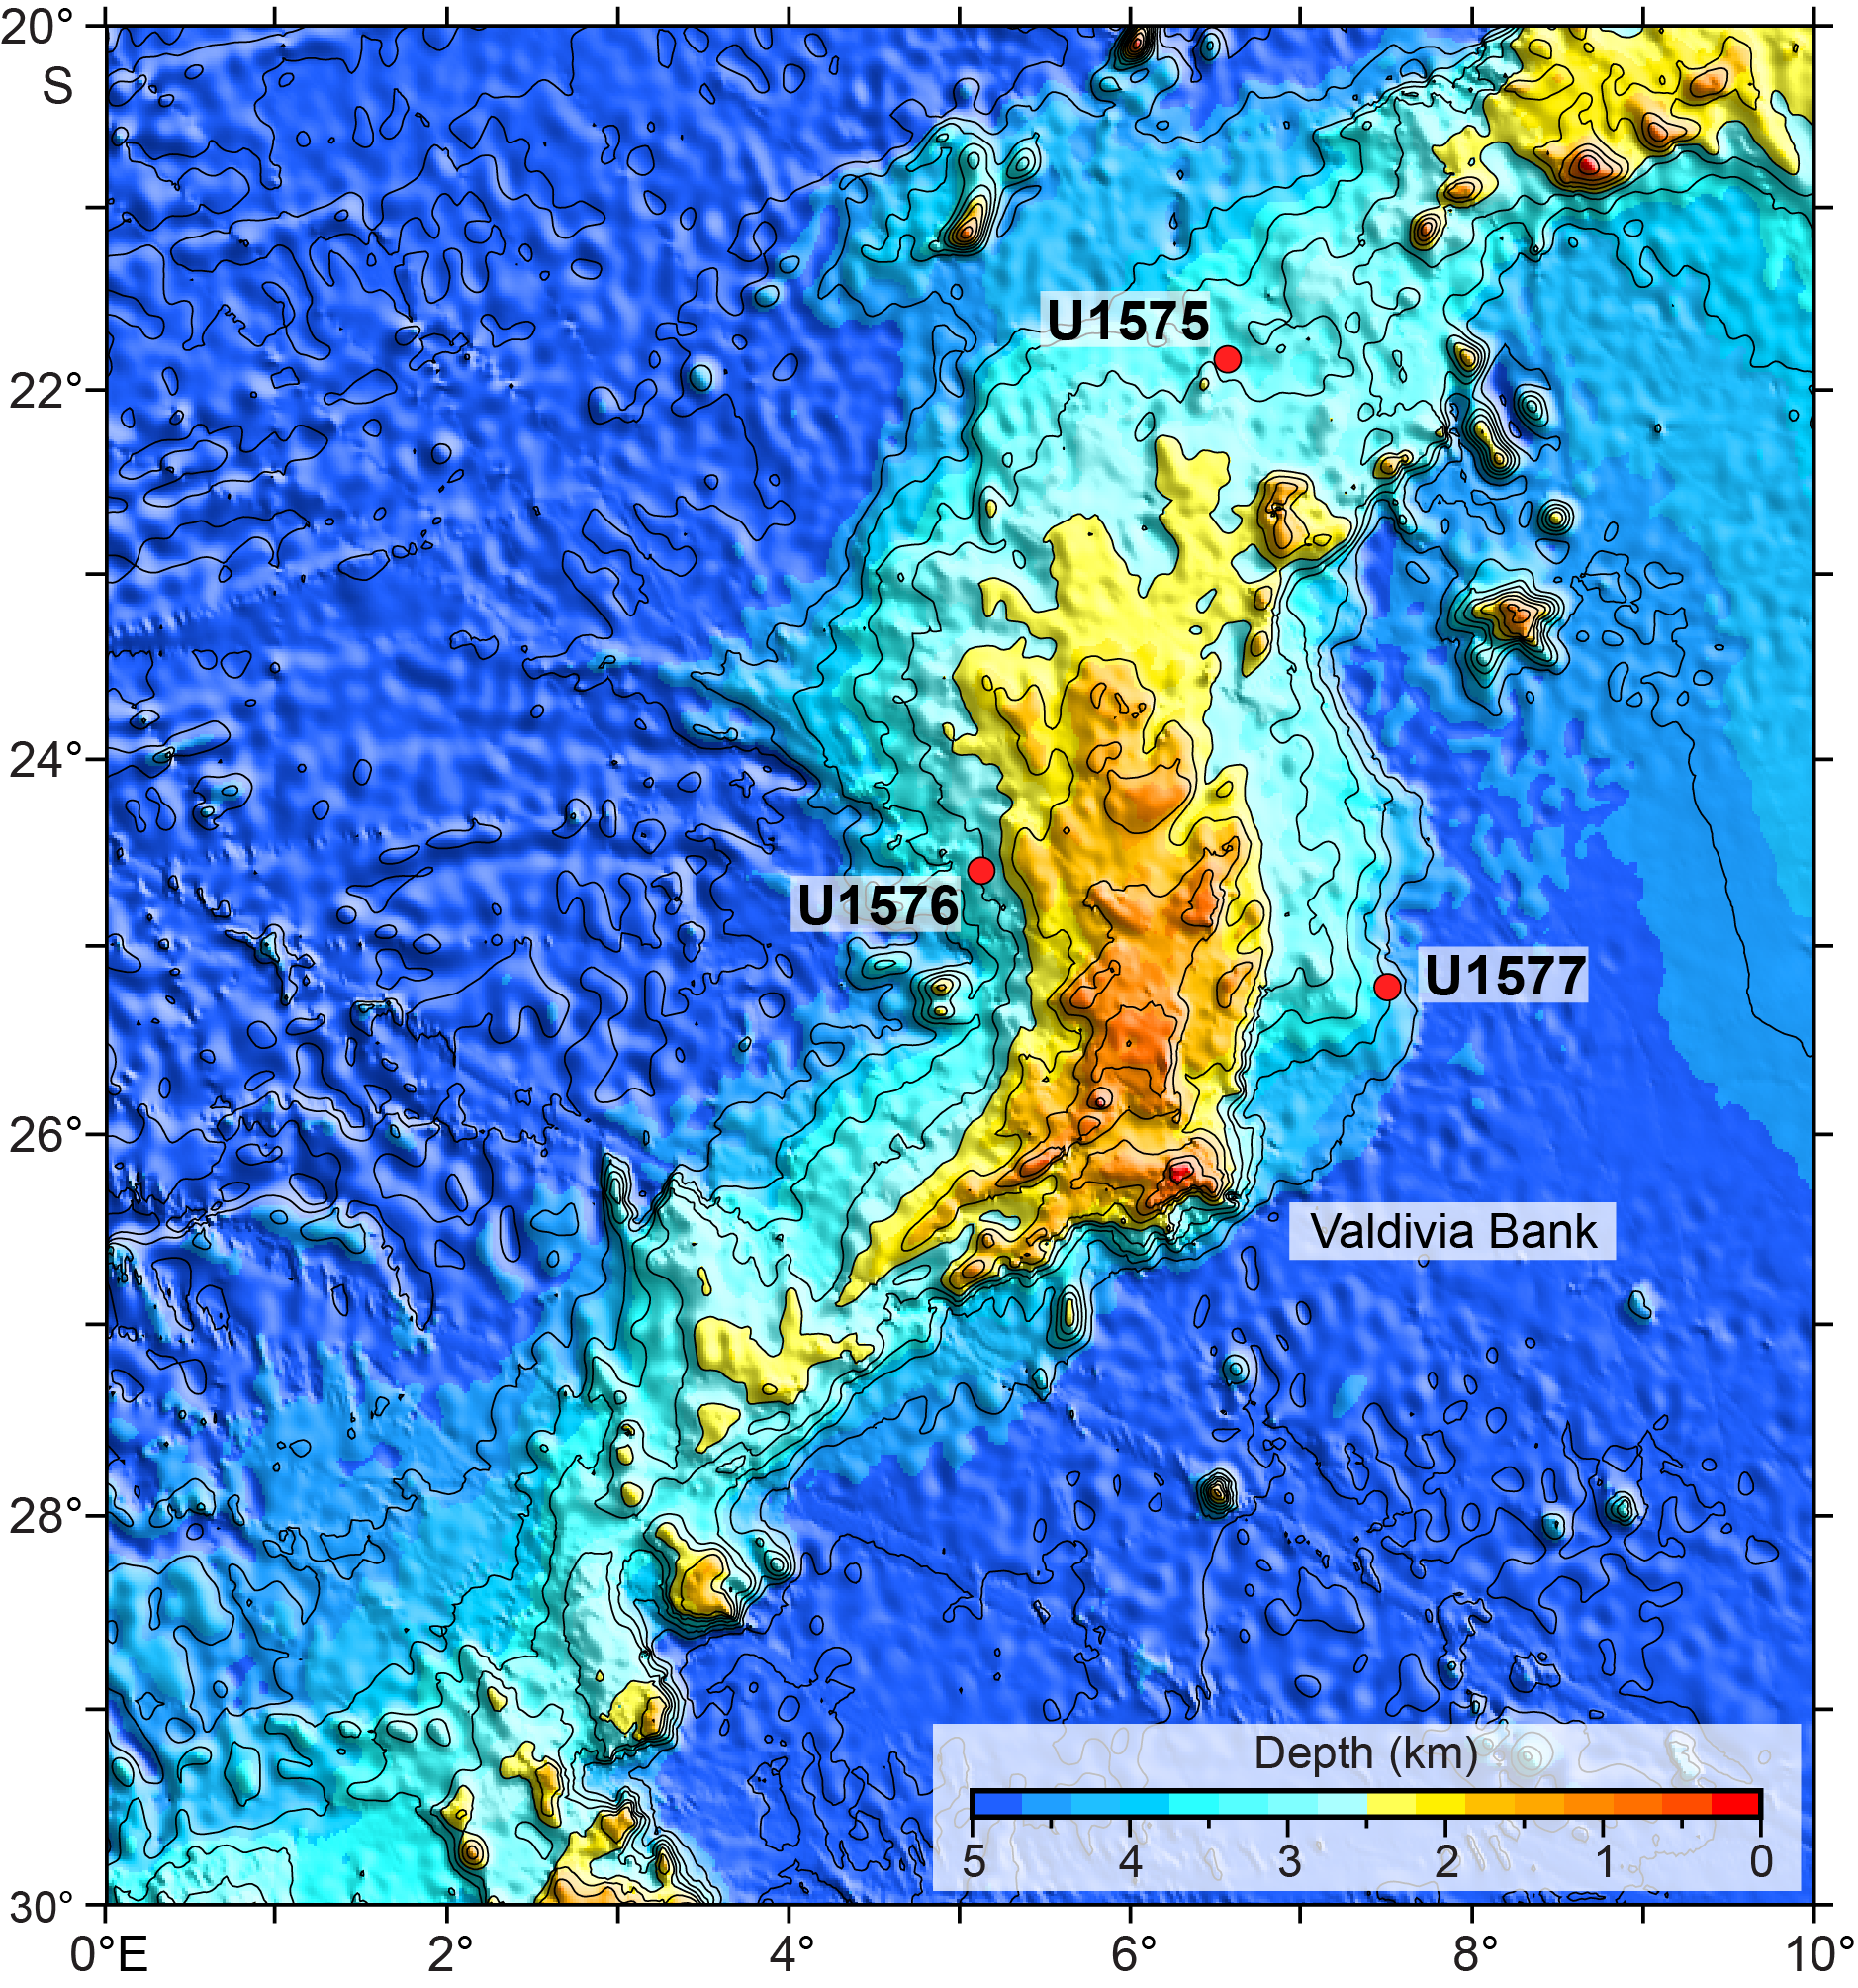
Figure F1. Bathymetry map.
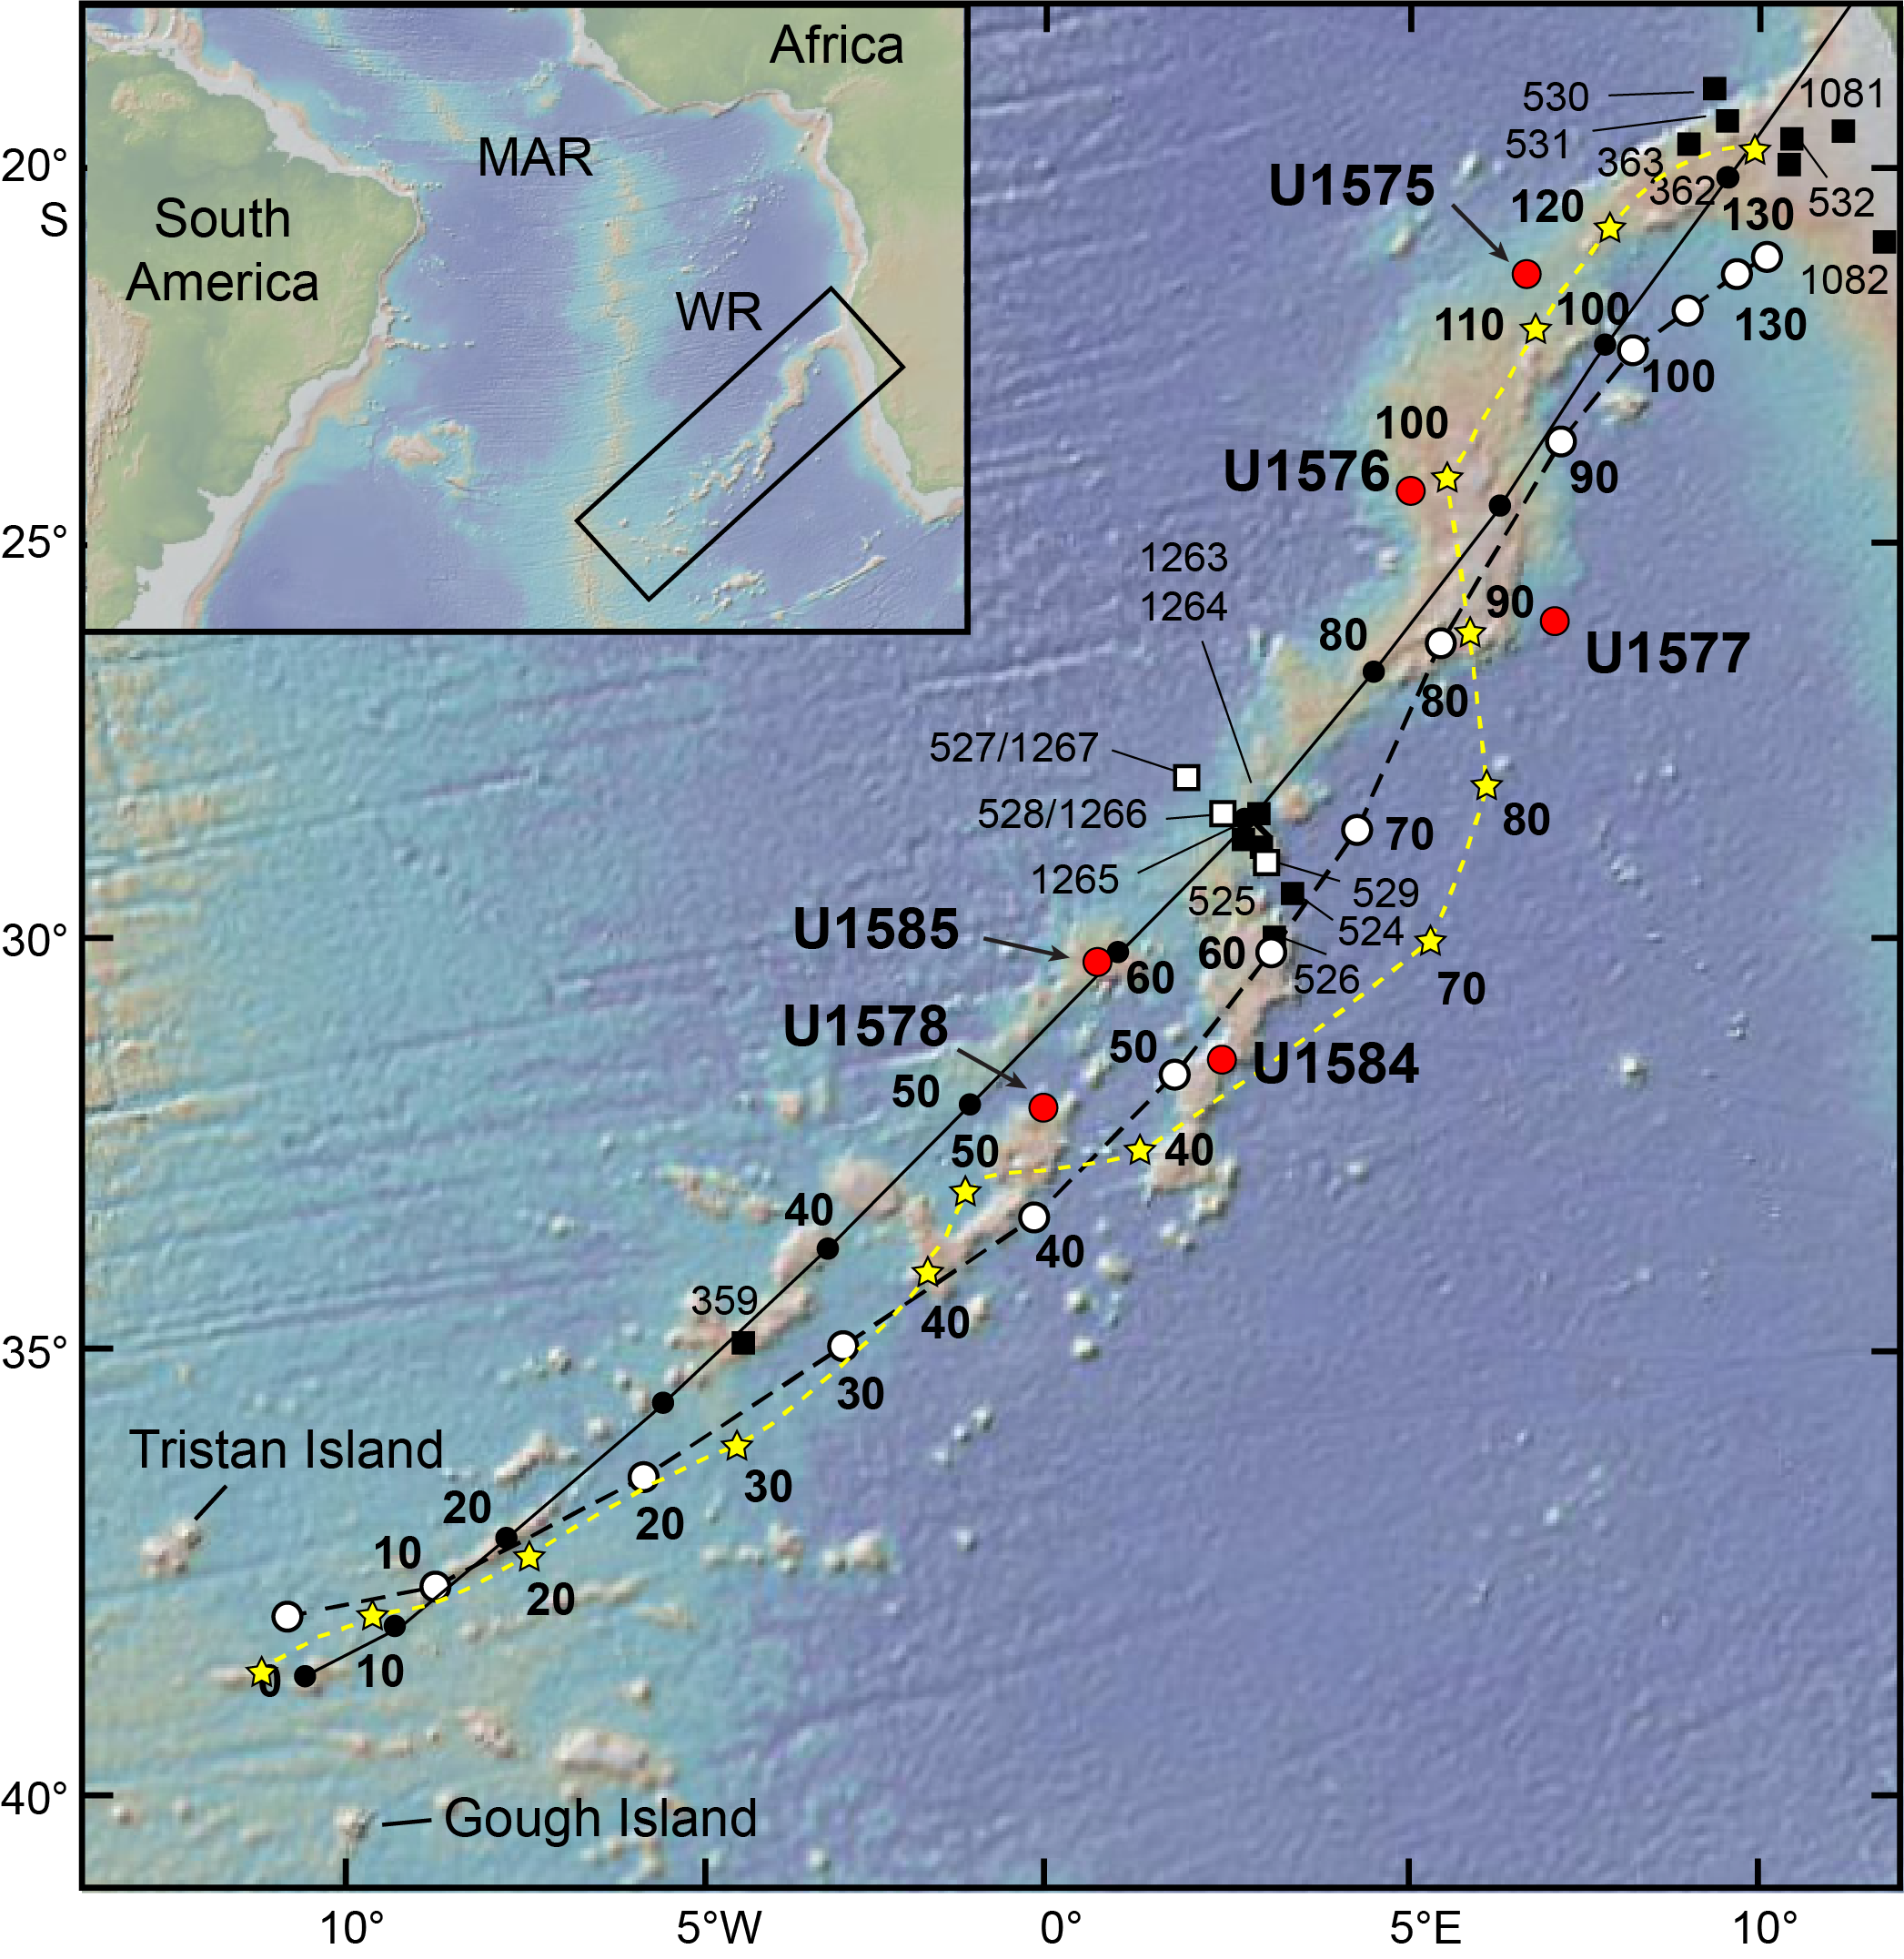
Figure F2. Walvis Ridge bathymetry, hotspot age models, and sites.
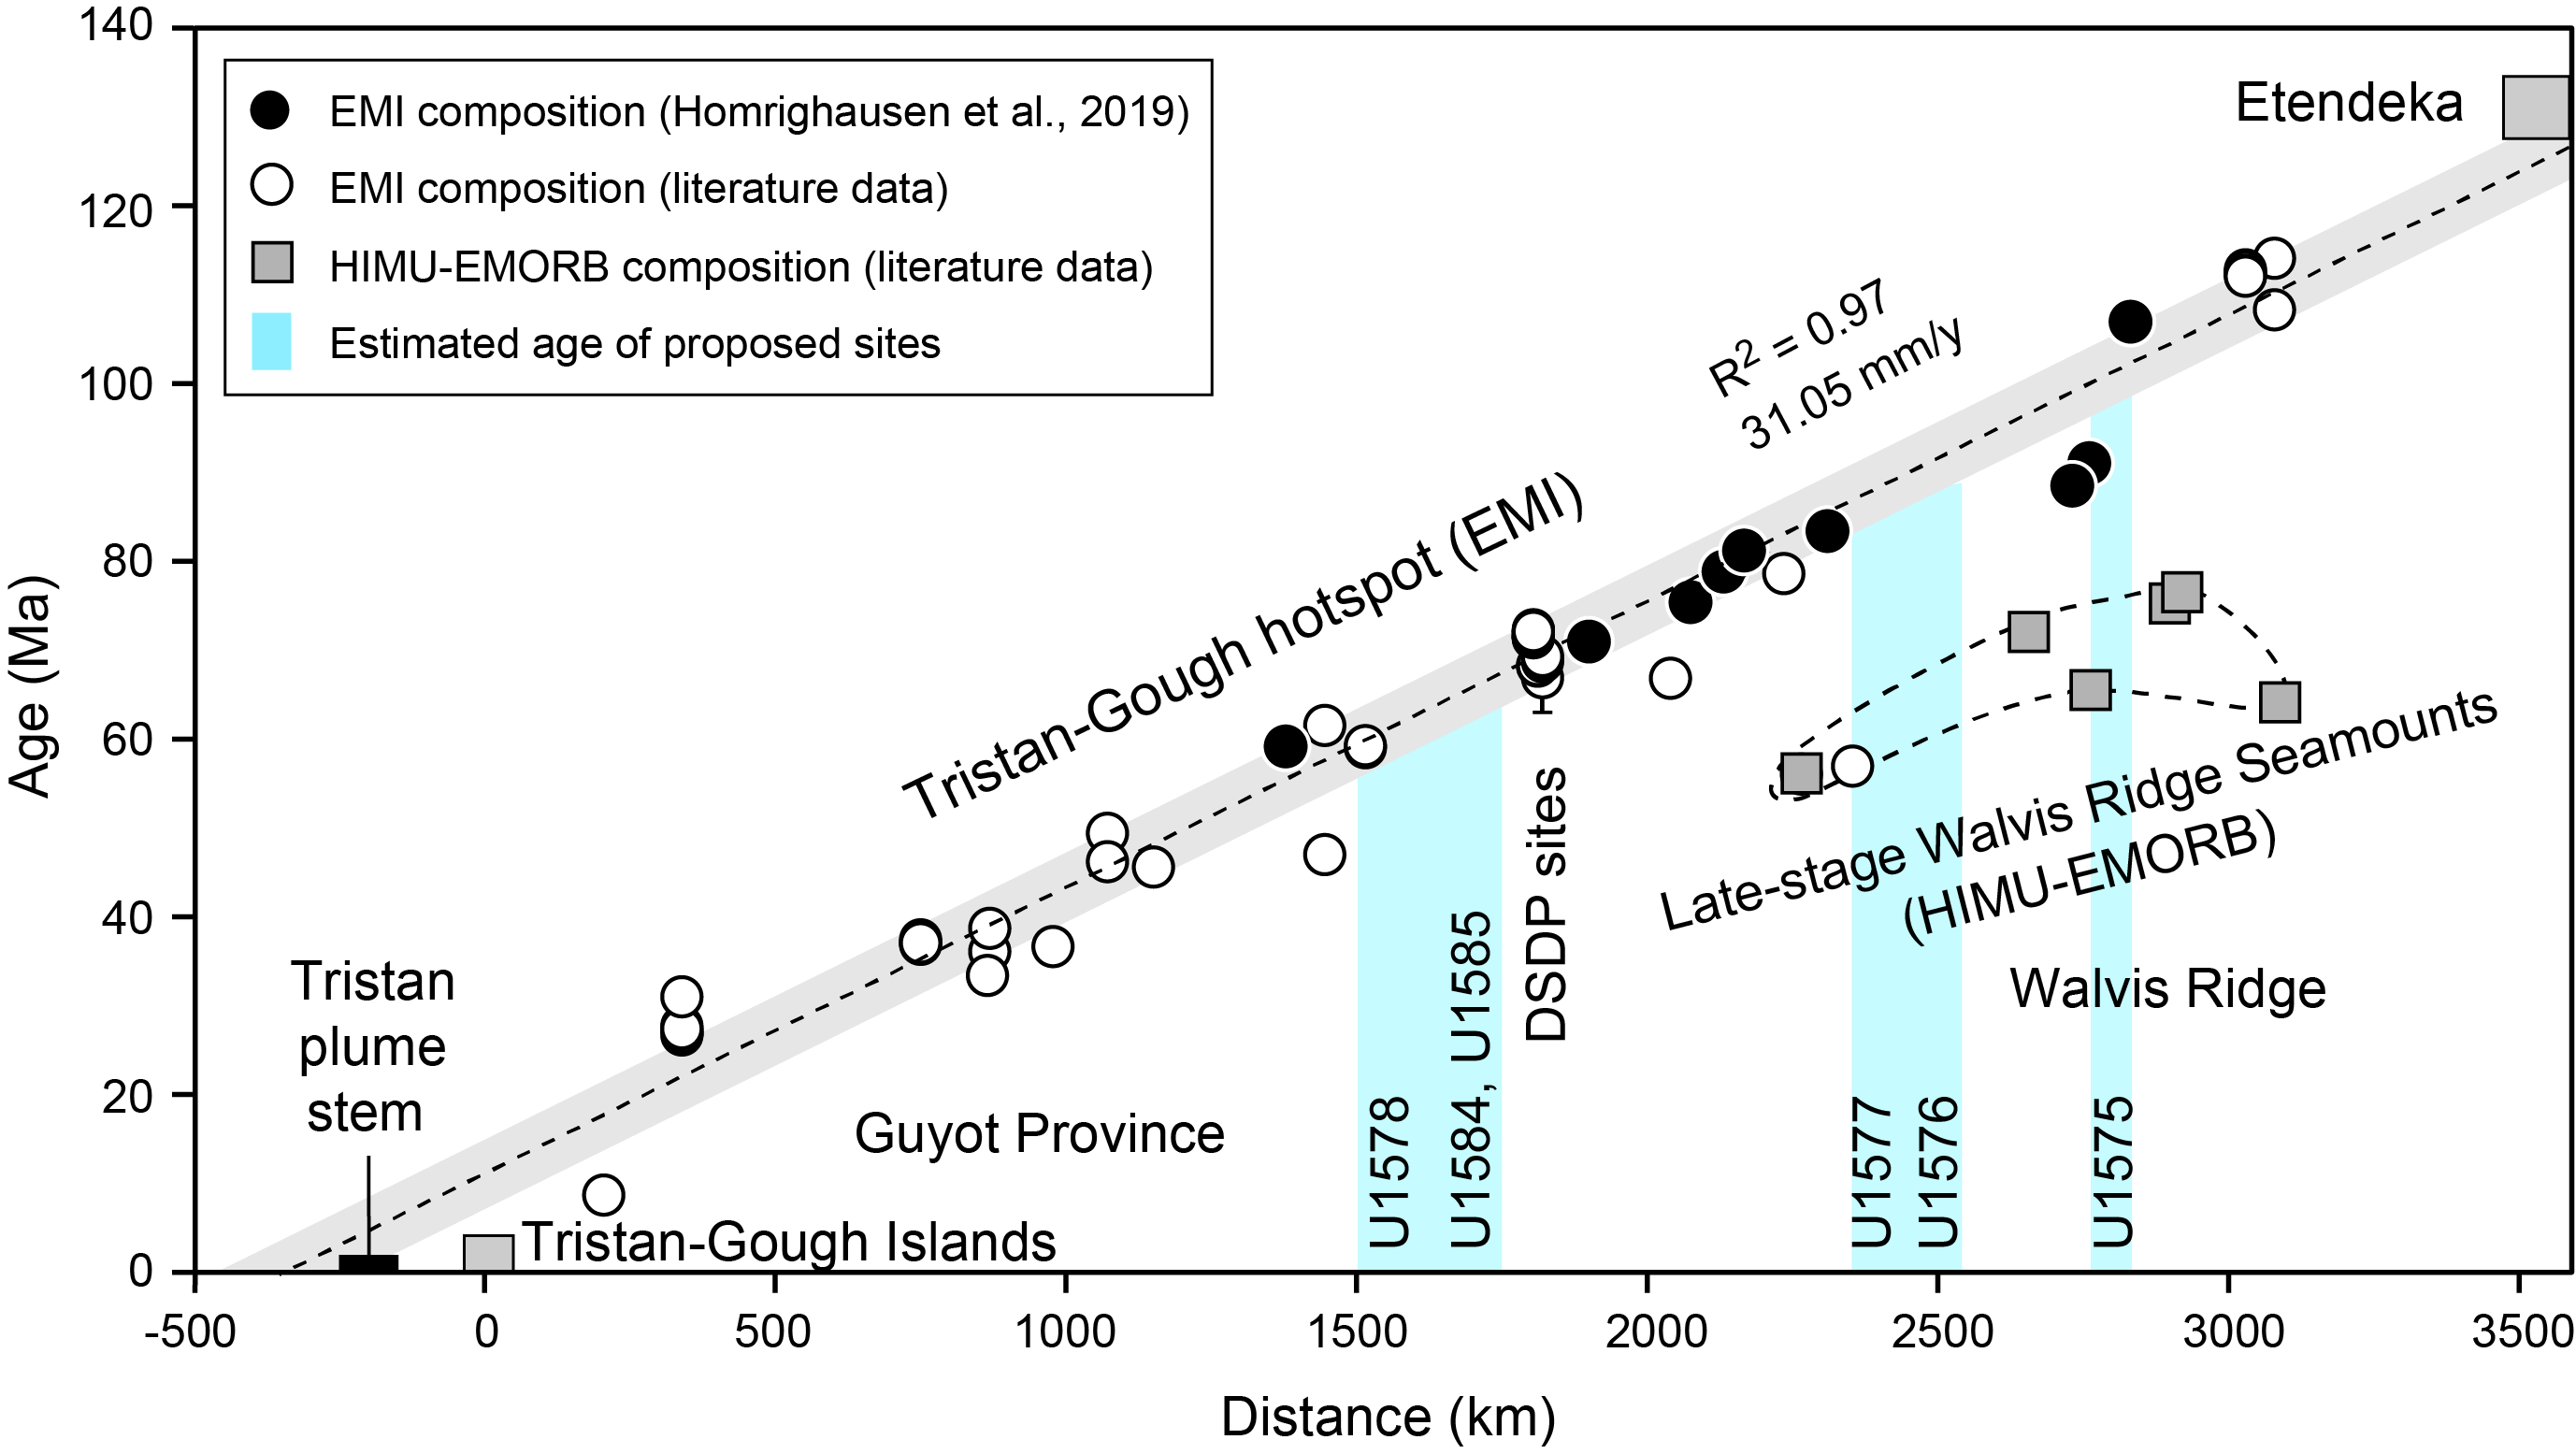
Figure F3. Age progression.
1.1. Operational strategy
Planning for Expedition 391 included using only the rotary core barrel (RCB) bit for all holes to save time. Unfortunately, this choice meant that soft-sediment cores underwent significant drilling disturbance. Site U1575 was originally planned as a two-bit hole, meaning that after the first bit had undergone ~40–50 h of basement drilling, it would be replaced with a new bit and drilling would continue. Owing to the loss of time caused by the late start, the Expedition 391 operational plan was truncated. Site U1575 was reduced to a single-bit hole, and logging plans were dropped.
1.2. Objectives
1.2.1. Geochemical objectives
Site U1575 has the potential to provide important constraints on the geochemical evolution of TGW track volcanism. Beginning at Deep Sea Drilling Project (DSDP) Leg 74 Sites 527, 528, and 525A and going to the Tristan and Gough Islands, the track volcanism shows geochemical zonation with enriched mantle one (EMI)-type compositions that can be divided into Tristan-type (low 207Pb/204Pb for a given 206Pb/204Pb) and Gough-type (high 207Pb/204Pb for a given 206Pb/204Pb) compositions (Rohde et al., 2013; Hoernle et al., 2015). Dredge samples from Walvis Ridge north of the DSDP sites are dominated by the Gough-type geochemical composition (Hoernle et al., 2015). Nevertheless, a sample from the eastern side of Valdivia Bank, near Site U1575, has Tristan-type composition (Homrighausen et al., 2019). Is this an anomaly? Or are Tristan-type compositions mixed with Gough-type compositions but poorly represented by dredge sampling? Could there be an age difference between the two types, such as Gough type overlying Tristan type, thus requiring drilling to detect the Tristan type?
Another important question concerns the presence of two distinct flavors of the Gough type in the Etendeka flood basalts in northwest Namibia, which are believed to represent lavas from the starting plume head of the TGW hotspot (Zhou et al., 2020). The Gough-type basalts on Walvis Ridge are characterized by high-Ti contents. High-Ti basalts also dominate in northern Etendeka, where Walvis Ridge connects to the African continental margin (e.g., Zhou et al., 2020). On the other hand, low-Ti Gough-type basalts dominate in southern Etendeka. The low-Ti Gough type is also common in the Paraná flood basalts in South America, which formed contemporaneously with the Etendeka flood basalts before the continents separated. This component, however, has not been found on Walvis Ridge thus far. This discrepancy may be due to the limited number of samples available from the northeastern part of Walvis Ridge.
In conclusion, Site U1575 provides the best sampling thus far of the poorly sampled northeastern part of Walvis Ridge, allowing us to evaluate whether the aforementioned geochemical components are present.
1.2.2. Geochronologic objectives
Because Site U1575 is located on a lower part of Walvis Ridge with no exposed basement outcrops, it represents a portion of the ridge that is unsampled by dredging. Ages from elsewhere on the eastern part of Walvis Ridge are younger than expected, owing to capping of the ridge by seamounts constructed by late-stage high µ (HIMU)–type eruptions (Homrighausen et al., 2018, 2020). Reliable ages from older basement will help in defining and understanding the contribution of different eruption stages to the TGW age progression. To this end, geochronologic studies will seek to determine reliable ages for igneous rocks cored at Site U1575.
1.2.3. Paleomagnetic objectives
According to global paleomagnetic data, Site U1575 samples the TGW track at a time when the paleolatitude was ~6°–8° farther north than the present hotspot latitude band (Figure F4). This is a period of rapid paleolatitude change for the African plate, during which the paleolatitudes shifted from ~15° farther north than at present around the time of Etendeka emplacement (Ernesto et al., 1990, 1999) to ~5° south than at present around 50–60 Ma. Thus, samples from Site U1575 can provide important constraints on the rapidly shifting Late Cretaceous paleolatitude. Mantle flow models indicate that the TGW hotspot moved ~8° south (Doubrovine et al., 2012) since ~100 Ma, but it is unclear how reliable these models are. Paleomagnetic studies of basal sedimentary rock and igneous rock will be used to determine paleolatitudes that will help unravel the contributions of hotspot drift, plate motion, and true polar wander.
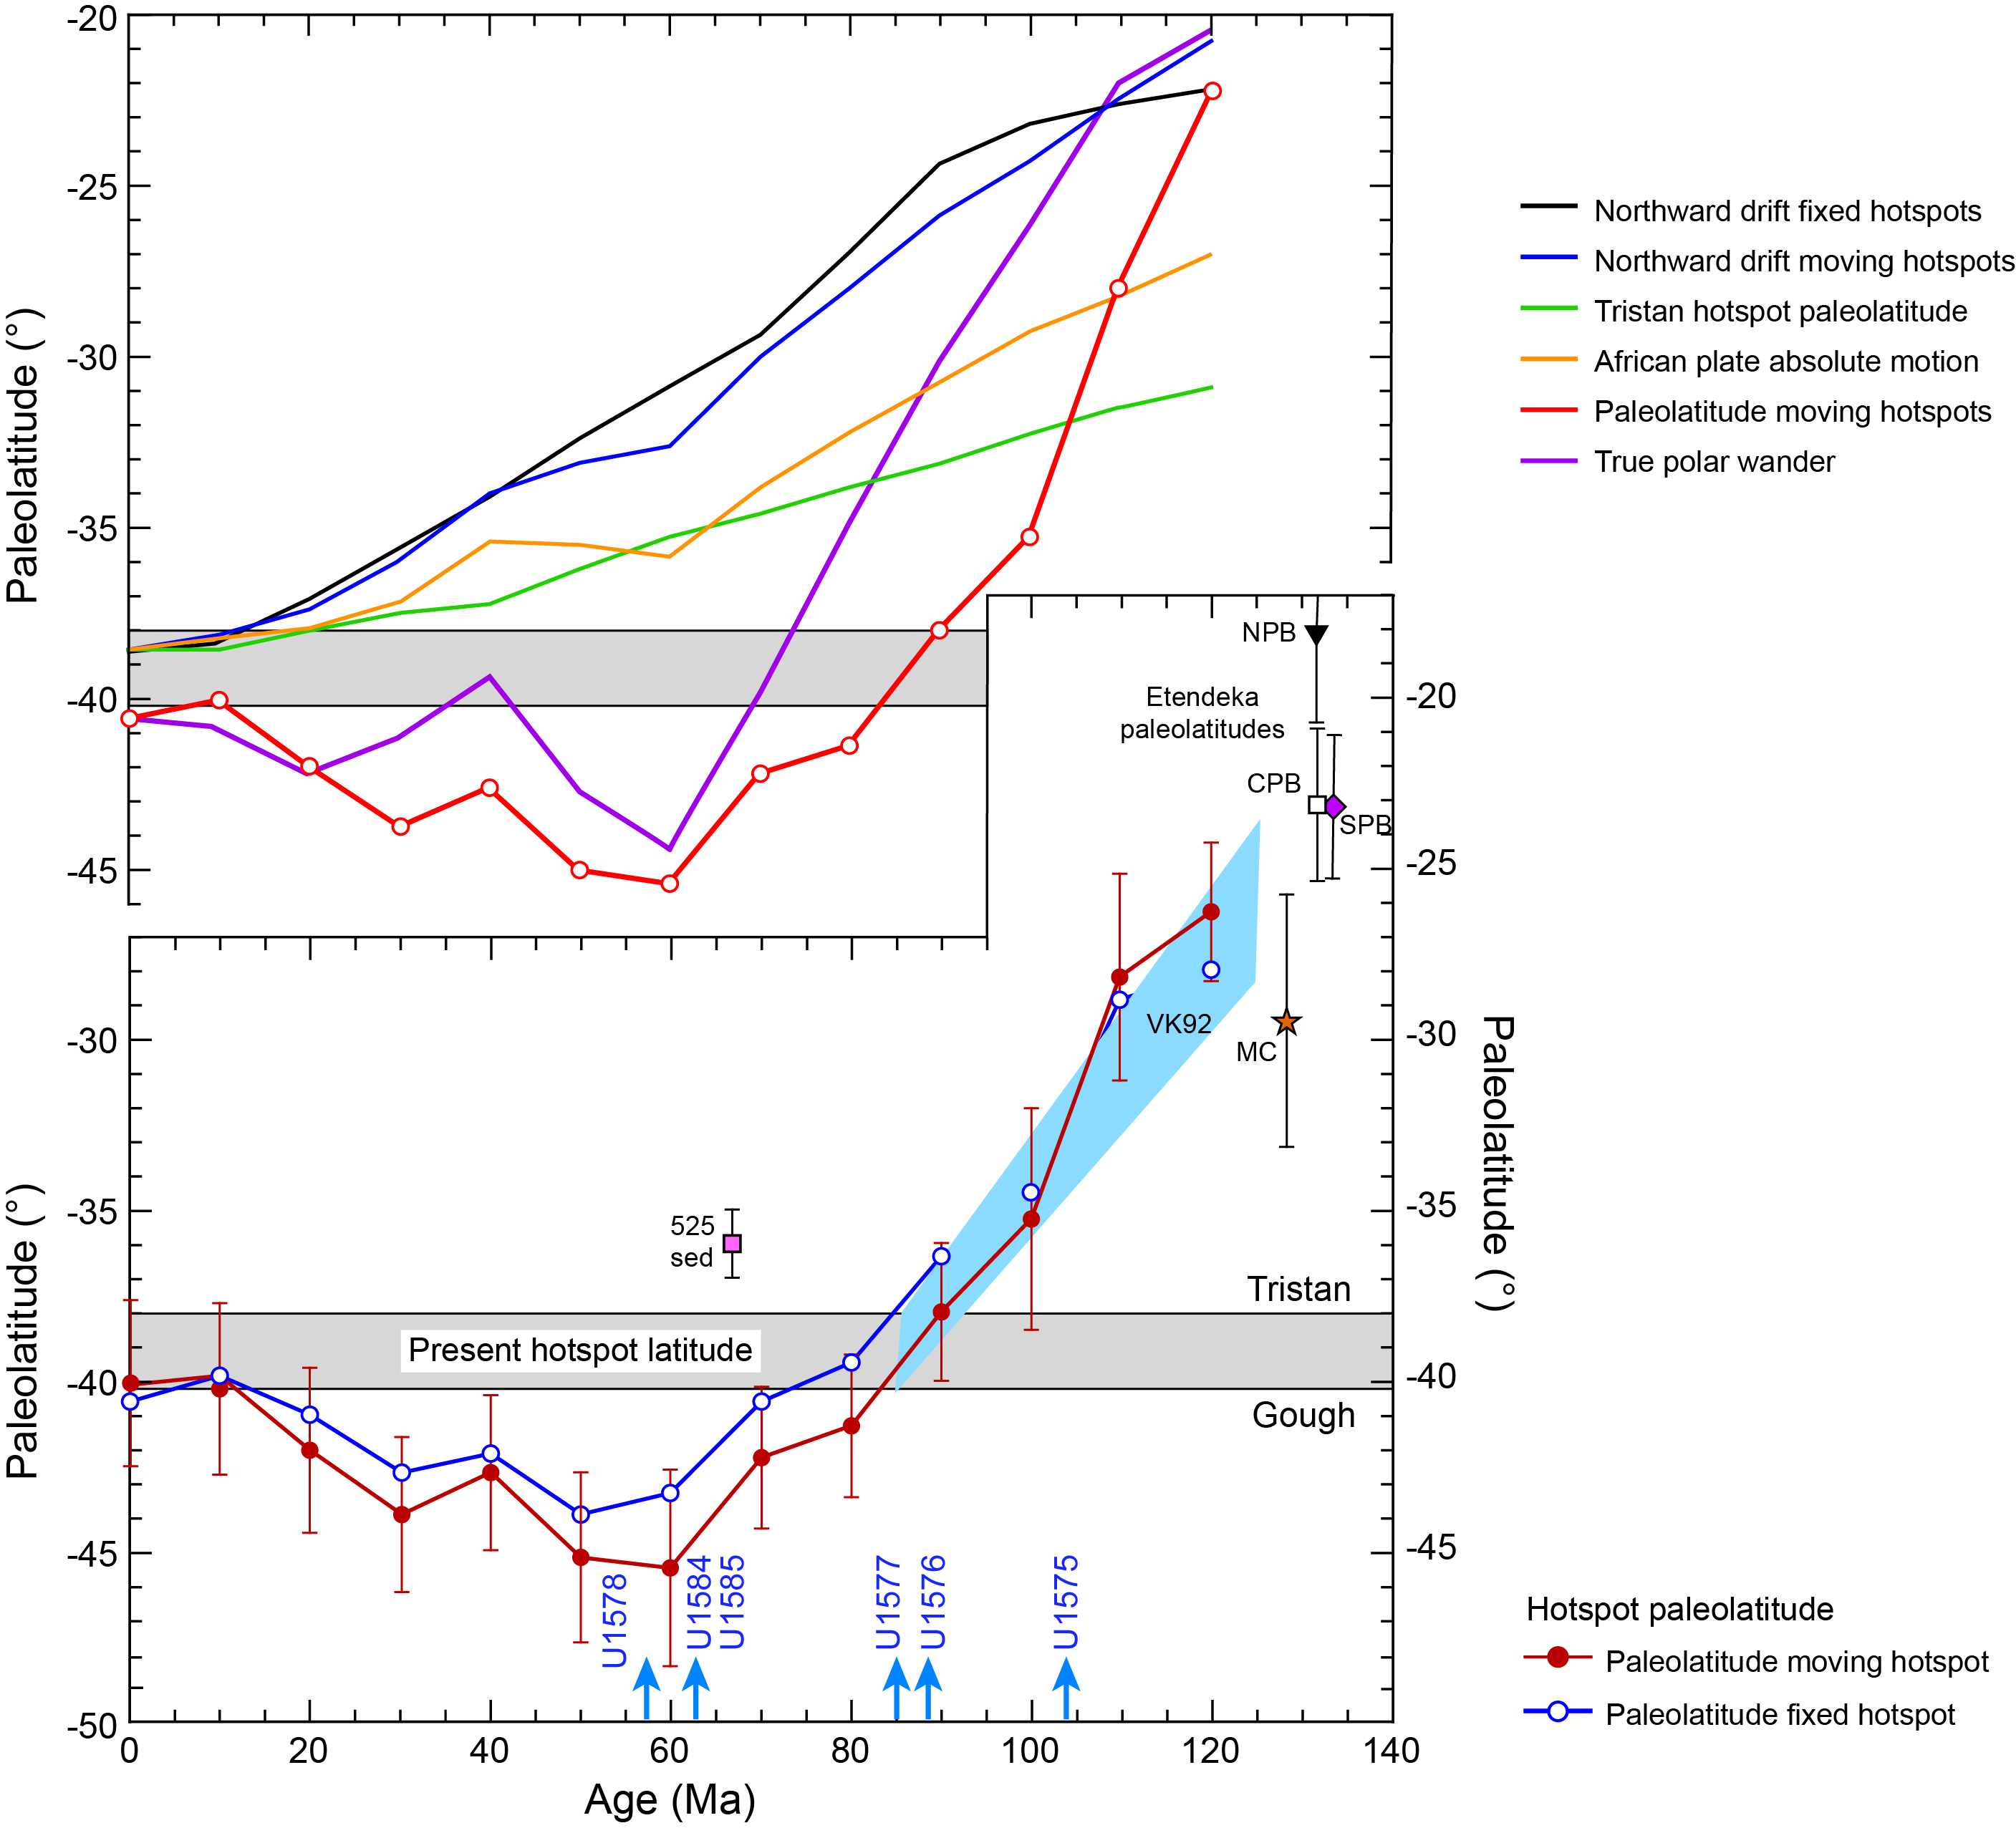
Figure F4. Predicted paleolatitude drift.
1.2.4. Volcanologic objectives
Site U1575 is located on a low part of Walvis Ridge between the more voluminous Frio Ridge and Valdivia Bank. It may thus represent a period of low TGW volcanic output or greater distance from the mid-Atlantic spreading center at the time of formation. Was volcanism during this period fundamentally different than at Valdivia Bank or other high-effusion parts of the ridge? Cores from Site U1575 have the potential to illustrate the style of volcanism on the TGW track to determine whether the volcanologic aspects are different compared to areas where the ridge reaches shallower depths. Studies of igneous rock types will seek to understand the volcanic development of this low spot on Walvis Ridge.
1.2.5. Sedimentologic objectives
Site U1575 is at an important location for understanding the sedimentation off the west coast of southern Africa. Sedimentation rates are high near shore, with a large influx of terrigenous sediment building a thick wedge. Offshore, carbonate sediments prevail and lower sedimentation rates yield a thin drape. The thin sediment package at Site U1575 suggests it was in an area of low sedimentation rate, but it may show fluctuations in deposition. The Benguela Current runs northward off the west African coast, so Site U1575 is in a position to show variations in the position and strength of this current. Although Site U1575 is west of the main Benguela Current (e.g., Summerhayes et al., 1995), it may still show temporal changes of the location of this current. As environmental conditions change, the site could alternately find itself affected by the Benguela Current or by waters of the gyre interior. Layering in the seismic section and in the recovered cores suggests that coring through the Site U1575 sediment column offers clues to shifting conditions offshore of Namibia since the Cretaceous. Biostratigraphic and sedimentologic studies will focus on reconstructing the sedimentary history.
1.3. Site geophysics
Site U1575 is located on Walvis Ridge between Valdivia Bank and Frio Ridge at a water depth of 3233 m (Figure F1). The drill site was picked on Seismic Line GeoB01-25, collected in 2001 by the research vessel (R/V) Meteor. In 2019, a second seismic line (TN373-VB13), collected by the R/V Thomas G. Thompson, was shot crossing the site at nearly right angles to the previous line (Figure F5). Bathymetric data show that the site is in a swale between low rises to the southwest and northeast. The area of the site itself is relatively flat. Ridge-like features south of the drill site have the appearance of sedimentary erosional remnants, suggesting that downslope sediment movement and erosion may have affected the area.
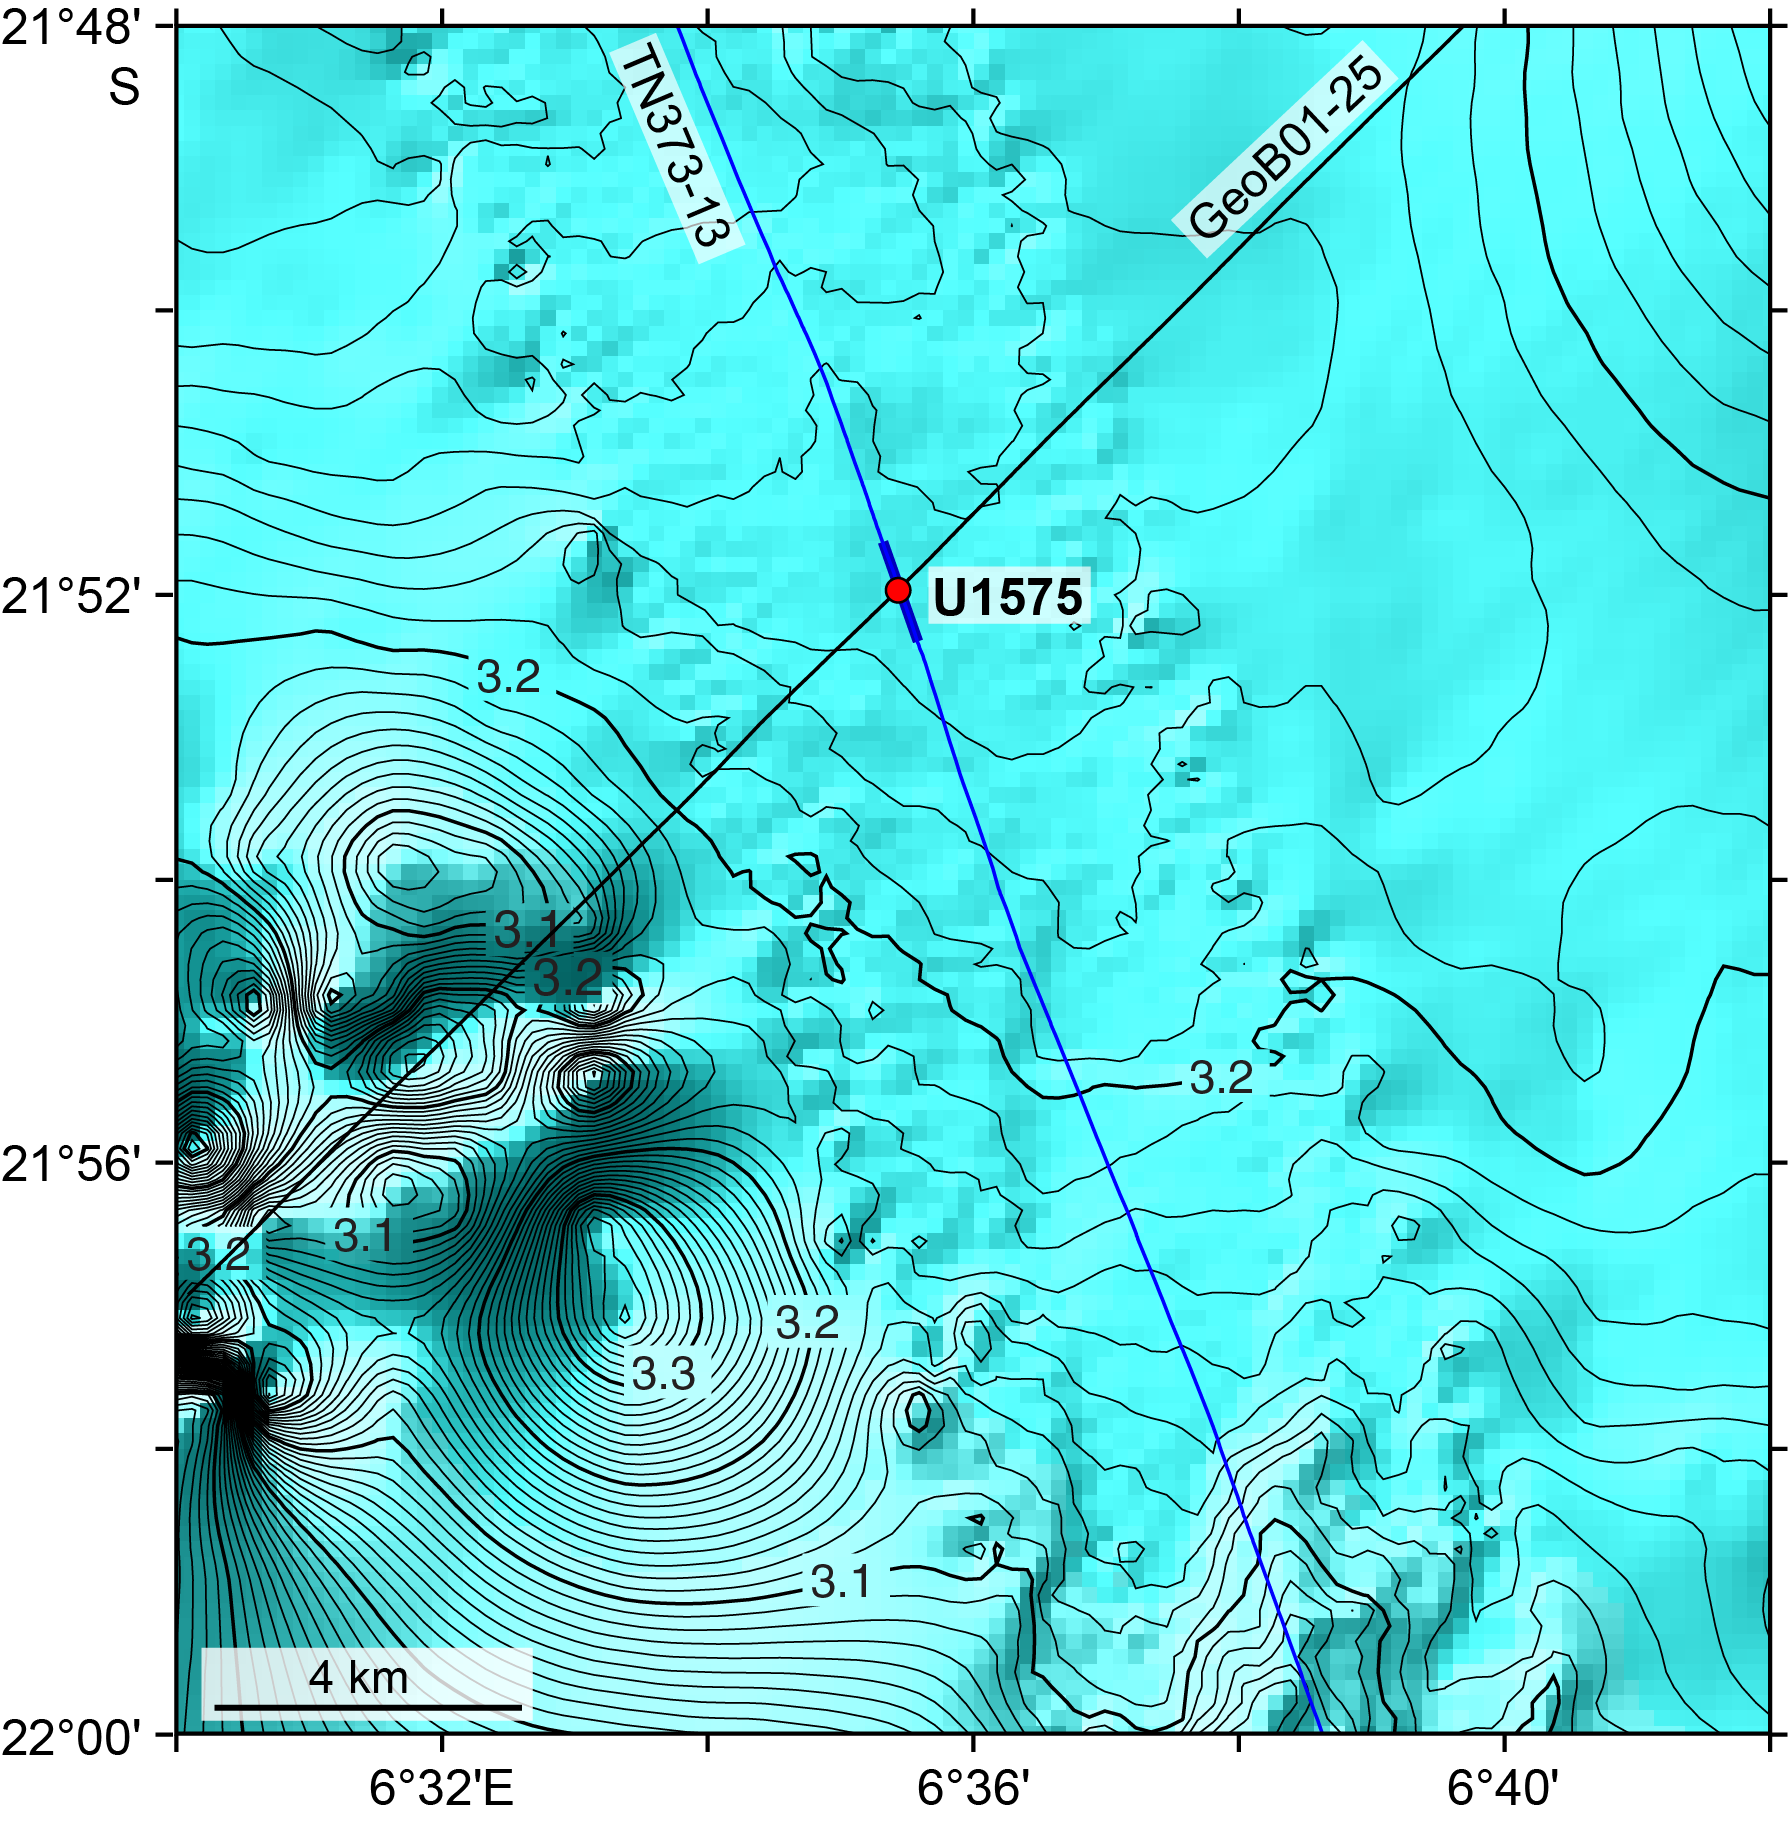
Figure F5. Detailed multibeam bathymetry map.
The GeoB01-25 profile shows a relatively thin sediment layer, ~171 m thick, overlying a strong and undulating basement horizon (Figure F6). Sediment thickness increases to the northeast and southwest, showing that the hills are thicker piles of sediments and implying laterally differential sedimentation and/or erosion. Seismic Line GeoB01-25 shows reflectors at ~50 and 110 ms below the seafloor, implying unit boundaries at ~40 and 88 meters below seafloor (mbsf) (assuming seismic velocity = 1600 m/s). On the GeoB01-25 profile, a reverberant layer is seen near basement, implying a different basal sedimentary layer. Line TN373-VB13 indicates three horizons dividing the section into four layers (Figure F7). Horizons R1 and R2 appear to correlate with the two horizons noted in the GeoB01-25 profile, whereas Horizon R3 appears to be the basal sediment layer noted on the GeoB01-25 profile. This layering suggests that the sedimentary history took place over at least four different periods.

Figure F6. Seismic Line GeoB01-25.
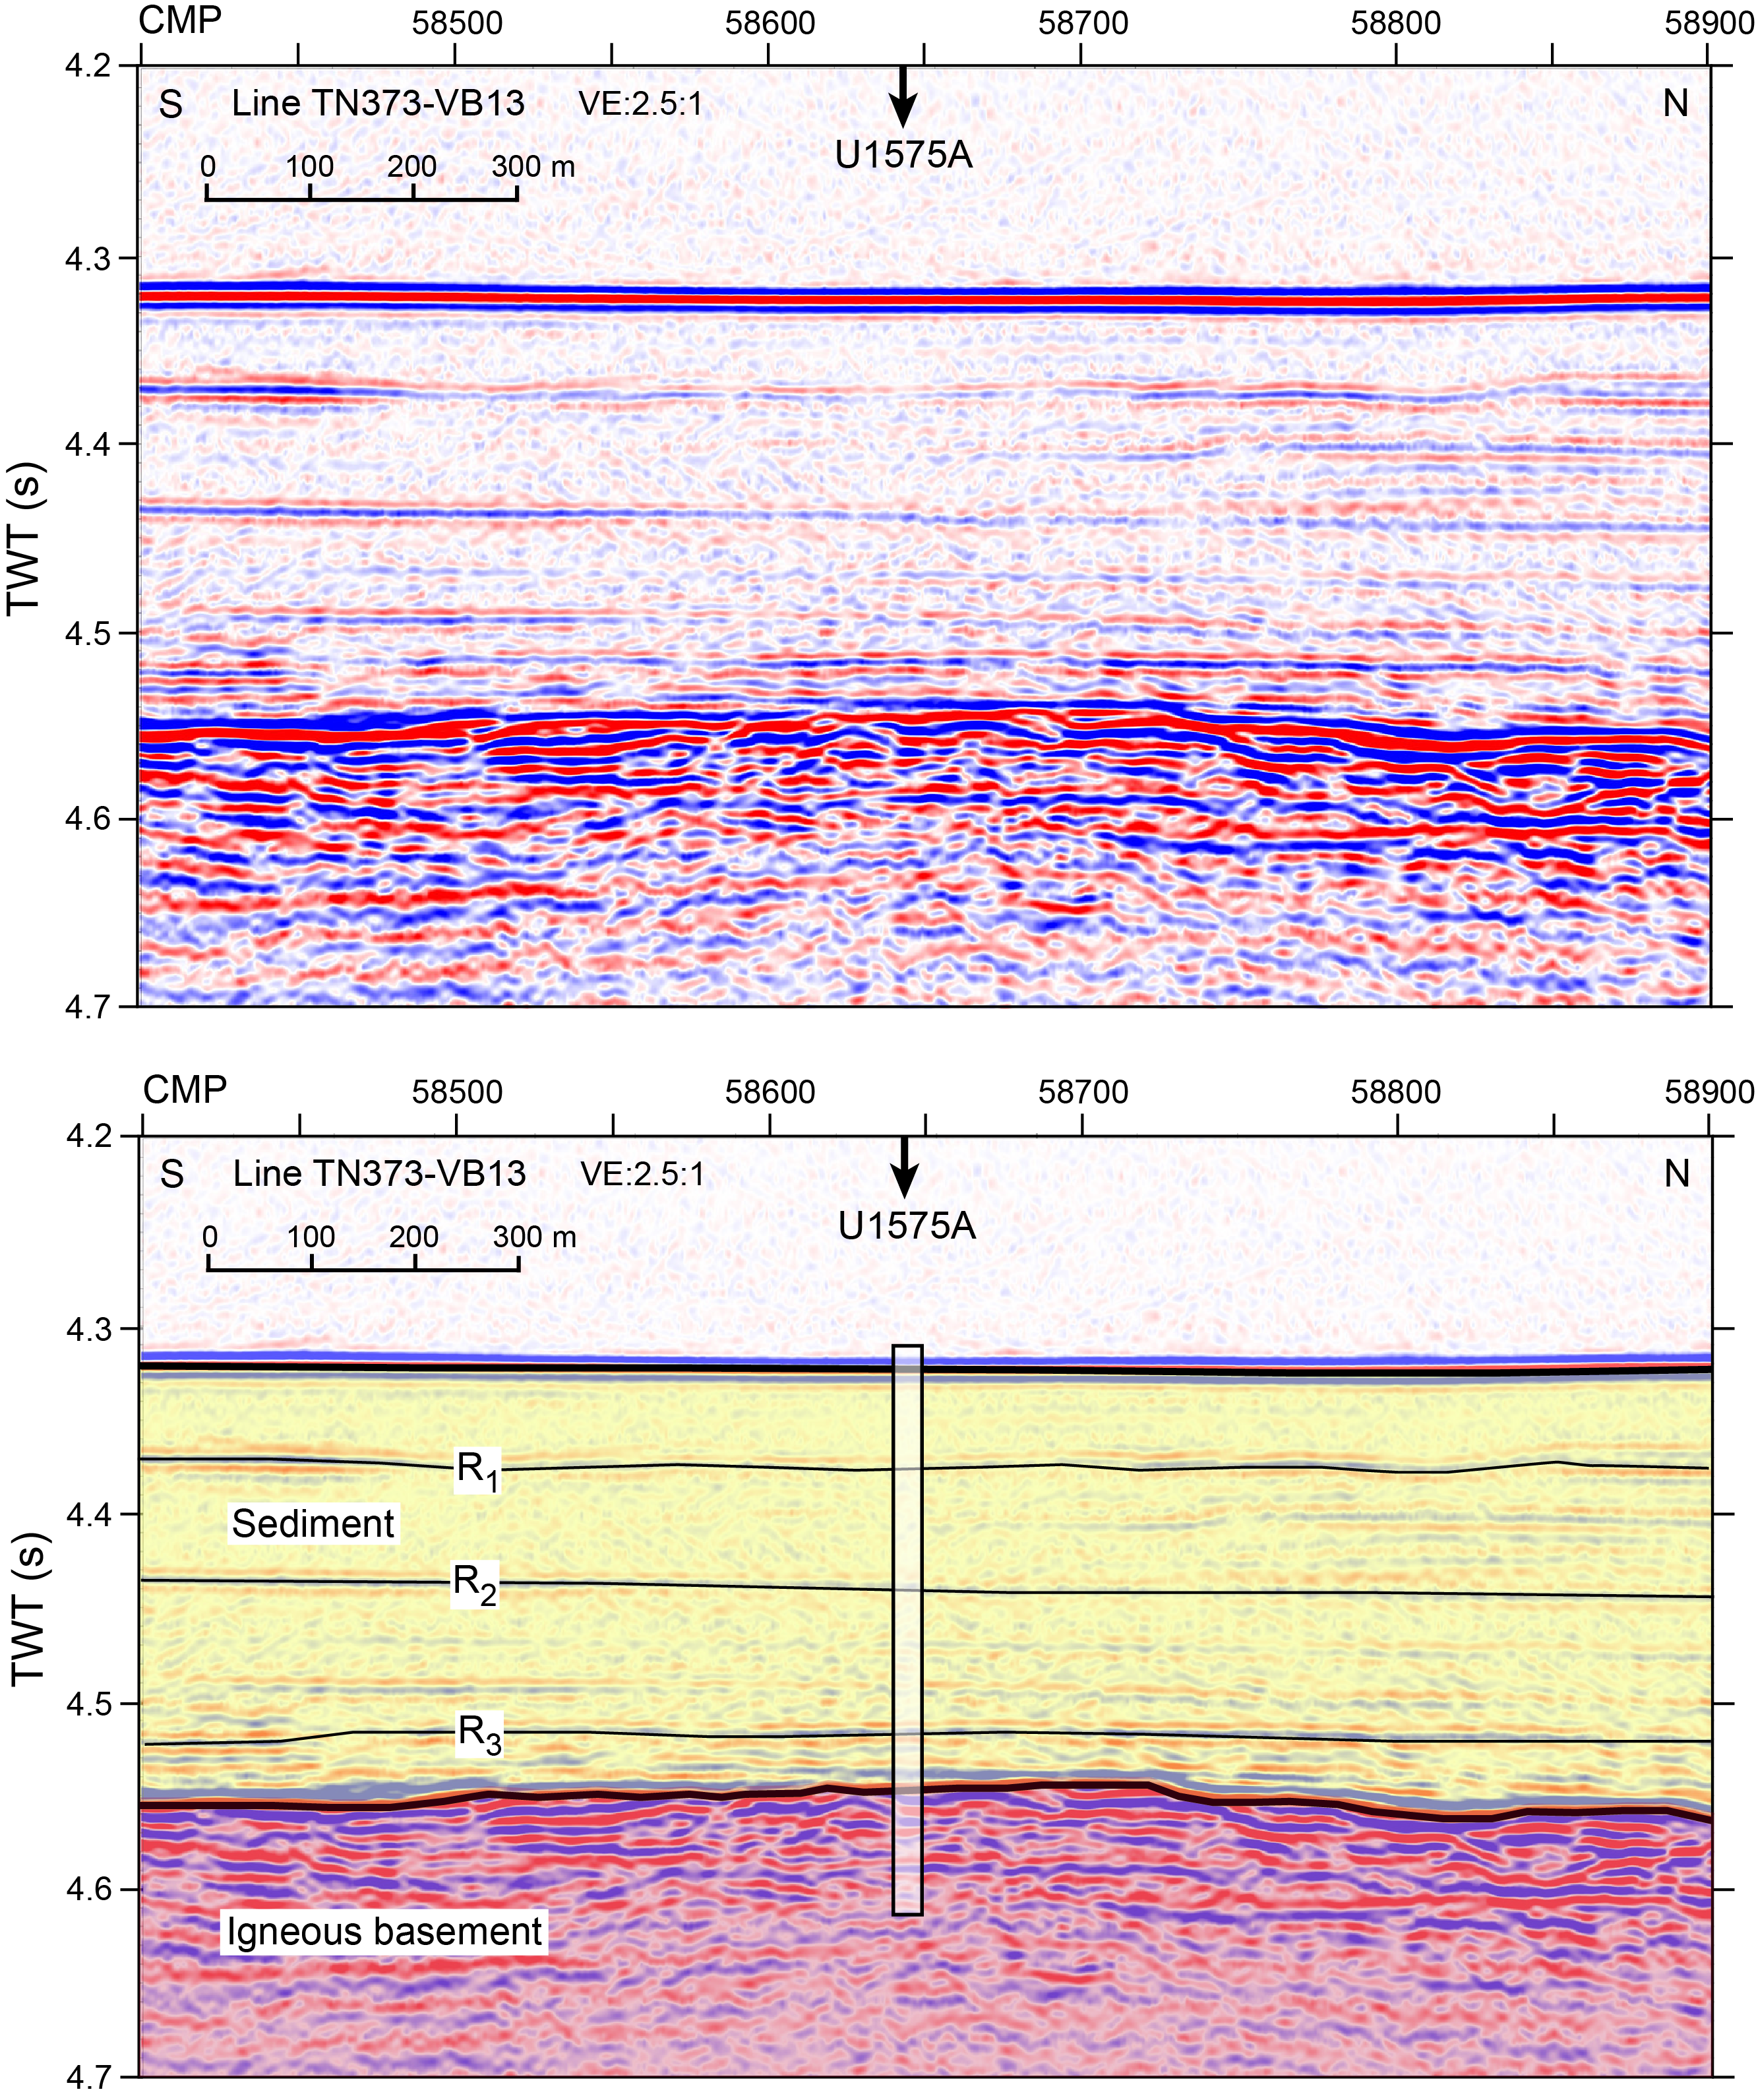
Figure F7. Seismic Line TN373-VB13.
Basement on the TN373-VB13 profile (Figure F7) is interpreted to be igneous rock at the top of Walvis Ridge basement. This surface is undulatory, as is expected for a lava flow surface. Vertical offsets on Line GeoB01-25 imply normal faults, but at distances >2 km from the site (Figure F6). The seismic source for the TN373-VB13 profile was small and does not penetrate deeply into basement, but it apparently shows 2–3 semicontinuous reflectors in the upper ~50 ms (~100 m assuming velocity = 4000 m/s). These reflections likely indicate lava flow packages (Inoue et al., 2018; Sager et al., 2013).
2. Operations
2.1. Cape Town port call
Expedition 391 officially began at 0800 h (UTC + 2 h) on 6 December 2021. The R/V JOIDES Resolution had just completed IODP Expedition 396T, a transit and subsequent tie-up period at Repair Quay 3 in the port of Cape Town, South Africa. On the first day of the port call, incoming IODP JOIDES Resolution Science Operator (JRSO) air freight was loaded on board, including a new 50 kVA uninterruptible power supply unit. All oncoming Expedition 391 personnel, including a reduced JRSO technical staff and science party contingent, arrived in Cape Town 5 days prior to the official start of the expedition to complete a 7 day quarantine period in a local hotel as part of the COVID Mitigation Protocols Established for Safe JR Operations (COPE). On 7 December, six pallets of food stores were loaded and shipboard antigen/polymerase chain reaction (PCR) Coronavirus Disease 2019 (COVID-19) testing was performed on offgoing personnel. After clearing immigration on 8 December, the Siem Offshore staff, JRSO technical staff, and science party boarded the vessel following the 7 day quarantine period. There were no positive COVID-19 cases detected from either of the two tests administered during the quarantine period. On 9 December, the crew loaded frozen and dry catering stores and the ship bunkered 500.2 mt of fuel. A second barge load of 508.3 mt of fuel was bunkered on 10 December. Other port call activities that day included loading four flats containing a mud motor, casing, knobby drilling joints, and core liner and loading a shipment of fresh fruits and vegetables.
After a late urgent air freight shipment required by Siem Offshore was delivered at 1310 h on 11 December, the vessel was secured for transit. In anticipation of this late shipment delivery, a passage plan and arrangements made with the port agent, tugboats, and harbor pilot slated the ship for departure at 1400 h. However, just prior to the scheduled departure, the captain was notified that because of early morning fog and the resulting backlog of other ships waiting to depart, the departure would be delayed. The pilot came on board at 1642 h. Two harbor tugboats arrived, and the mooring lines were released and pulled back on board. The last line was released from Repair Quay 3 at 1709 h. The vessel proceeded to the pilot station, and the pilot departed the vessel at 1738 h after a 5 nmi transit. The vessel began its sea passage at 1800 h on 11 December 2021.
2.2. Transit to proposed Site CT-04A
After the 973 nmi transit from Cape Town, South Africa, averaging 11.1 kt, the vessel arrived at proposed Site CT-04A at 0818 h on 15 December 2021. The thrusters were lowered at 0822 h, and the vessel was switched to full dynamic positioning (DP) mode at 0845 h. The rig floor was then cleared for operations.
2.3. Proposed Site CT-04A
The drilling crew started assembling the RCB bottom-hole assembly (BHA) by making up the outer core barrel. Components on the inner core barrels were inspected and replaced, and both core barrels were spaced out in the outer core barrel. At 1215 h on 15 December 2021, the captain informed the rig floor that operations were being suspended because of an emergent medical issue. During the last day of sea passage to proposed Site CT-04A, suspected cases of COVID-19 were identified among the ship's crew. With several personnel isolated, which limited our ability to continue operations, the decision was made to return to Cape Town. We then rigged down, the core barrels were secured, and the components of the outer core barrel were laid out and secured. All staged drill collars were moved back to the drill collar racks. At 1300 h, the drill floor was secured for transit. In the meantime, the engine department had started the replacement of one of the propulsion motor cooling fans. This was completed at 1445 h. The thrusters were raised and secured, and the switch from DP to cruise mode was implemented.
2.4. Return to Cape Town
The vessel was underway to Cape Town, South Africa, at 1506 h on 15 December 2021. Antigen testing for COVID-19 continued during the transit, and by 2400 h on 18 December, there were several additional cases recorded among the crew, requiring us to make shore-based isolation arrangements to limit the spread of the virus on board. None of the scientists or JRSO personnel tested positive during the transit. Upon completing the 977 nmi sea passage to Cape Town, averaging 8.8 kt, the vessel arrived at an anchorage location outside of Cape Town harbor at 0649 h on 20 December. The anchor was dropped at 0650 h. The personnel who had tested positive for COVID-19 through rapid (antigen) testing disembarked by water taxis and were taken to a Cape Town hotel for isolation. The harbor pilot boarded the vessel at 1114 h, and the anchor was raised and off bottom at 1120 h. Directed by the harbor pilot, the vessel proceeded to Landing Wharf 2. Two harbor tugboats joined the vessel at 1142 h and assisted in its mooring. The first line ashore was at 1224 h, ending the 1.75 nmi pilotage passage from the anchorage to the berth site. All lines were secured by 1307 h, and the pilot departed the vessel.
PCR testing for all remaining shipboard personnel was performed shortly after arrival. Personnel who were close contacts of those who tested positive disembarked from the vessel and were transferred to a hotel to quarantine. An additional positive test was recorded from the first round of shipboard PCR testing. On 21 December, antigen testing continued for crew members who were close associates of the infected personnel, revealing another positive test. These additional infected crew members disembarked and went to a hotel to isolate. On 22 December, antigen testing continued for close contacts with the crew. Another positive test was recorded, and the individual was transferred to isolation in a hotel. A protocol of alternating daily PCR and antigen testing was established for all shipboard personnel, starting with a round of PCR testing on 22 December that returned only negative results. On 23 December, another complete round of antigen testing was performed, and no positive results were recorded. On 24 December, the first two crew members returned to the ship from hotel isolation. Another round of PCR testing was completed for all vessel personnel. No positive tests were recorded from continued close contact antigen testing. However, one crew member who tested negative was isolated on board with a suspected COVID-19-related symptom. On 25 December, the results from the previous day's PCR testing were received and antigen tests were performed on all personnel aboard the ship. The symptomatic crew member isolated on board was confirmed as a positive COVID-19 case by not only the PCR testing but also the antigen test administered, representing the only positive result on that day. The infected person departed the ship to isolate in a hotel. On 26 December, PCR tests were administered for all personnel on the vessel, and all results were negative. One crew member returned to the ship upon completion of the hotel isolation period. On 27 December, an additional 16 crew members returned after their isolation period was completed. All 16 individuals tested negative for COVID-19 prior to their return. Antigen testing was performed on all vessel personnel, yielding solely negative results. On 28 December, PCR tests were administered for all personnel on the vessel. Three personnel returned to the ship upon completion of their hotel isolation period. Surface freight was loaded, consisting of laboratory supplies. Pending COVID-19 testing results, the ship was scheduled to depart Cape Town the following day.
On 29 December, antigen tests were administered for all personnel on the vessel and results from the previous PCR testing were received. All tests were negative for COVID-19, initiating the preparation for departure. Three personnel returned to the ship upon completion of their hotel isolation period. Also, fresh fruit and vegetables were loaded on board. The ship was secured for transit, and the harbor pilot came aboard at 1301 h. Two harbor tugboats were made fast by 1318 h, and the vessel departed Landing Wharf 2 with the last line released at 1330 h, proceeding to the pilot station. The pilot disembarked at 1354 h, and our sea passage to Site U1575 started at 1400 h on 29 December. During the transit, antigen testing was implemented for all vessel personnel daily, and all results were negative.
2.5. Transit to Site U1575
After the 967 nmi transit from Cape Town, South Africa, averaging 12.2 kt, the vessel arrived at Site U1575 at 2100 h (UTC + 2 h) on 1 January 2022. The thrusters were lowered and secured, and at 2140 h, the drill floor was cleared for operations, beginning Hole U1575A.
2.6. Site U1575
Site U1575 consists of a single hole to 332.3 mbsf. The original plan called for a two-bit hole. The total planned depth for the hole was determined by the desire to core through ~250 m of basement. The plan was changed after our operating time was cut short by the COVID-19 outbreak earlier in the expedition. Both logging and our free-fall funnel reentry system were dropped from the plan. Instead, Hole U1575A was a single-bit hole drilled to bit destruction or until available time for the site expired. Hole U1575A was cored to 332.3 mbsf. A total of 41 cores were recorded for the site. The RCB coring system was used exclusively. It cored 332.3 m and recovered 185.15 m of sediment and igneous rock (average = 55.7%).
2.6.1. Hole U1575A
Cleared for operations at 2140 h on 1 January 2022, the rig crew began to make up the RCB BHA, and by 2400 h, the 172.1 m long BHA was assembled with the C-4 RCB bit. A mechanical bit release was installed above the bit during our extended stay in Cape Town prior to the cancellation of logging. A precision depth recorder (PDR) for the site indicated an estimated water depth of 3242.4 meters below rig floor (mbrf). The rig crew lowered the drill string, attaching the circulating head to the top of the drill string and filling the drill pipe with surface seawater after 50 stands of pipe (each stand measures ~28.5 m). The stands of 5 inch drill pipe were drifted and measured while lowering the drill string to just above the seafloor. At 0745 h on 2 January, the top drive was picked up, and circulation through the drill pipe was established when the drill bit reached 3193.9 meters below sea level (mbsl). We then pumped a "pig" (pipe cleaning device) through the drill string to remove some of the rust. The drill bit was lowered farther and positioned at the seafloor depth of 3231.3 mbsl, as obtained from the PDR, to spud Hole U1575A. A dressed nonmagnetic RCB core barrel was dropped and pumped down to land in the outer core barrel.
Hole U1575A was spudded at 1015 h on 2 January, and RCB coring began. The PDR water depth appeared to match the driller's tag depth and was used for the official water depth for Hole U1575A. Cores 1R–41R penetrated from the seafloor to a final depth of 332.3 mbsf and recovered 185.2 m (56%) of sediment and igneous rock. The sediment/igneous basement contact was intersected on 3 January while cutting Core 22R at 209.9 mbsf when the drilling rate slowed from ~5 to ~1.25 m/h. We switched to half-length (~4.8 m) advances on Cores 23R–34R because of the slow penetration rate and to improve core recovery. In an attempt to increase the final depth in Hole U1575A, full coring resumed with Core 35R. This approach continued through Core 36R. On Core 37R, the penetration rate again dropped to 0.6 m/h. After almost 6.5 h of cutting Core 37R and with only a 4 m advance, the core barrel was pulled for inspection. The core recovery was exceptional, but the core catchers were damaged and barely managed to prevent the core from dropping out of the core barrel. While cutting the remaining 5.7 m to complete a full advance on Core 38R, the penetration rate increased to the point where full coring was possible again. Thus, the final three cores (39R–41R) were full-advance cores to a final depth of 332.3 mbsf. In total, 220 bbl (34,977 L) of high-viscosity mud were pumped in 20 bbl (3,180 L) sweeps for hole cleaning over the course of coring Hole U1575A. Coring was terminated in Hole U1575A following Core 41R, which was on deck at 0625 h on 7 January. The RCB core barrels were secured, and we started pulling the drill string out of the hole at 0700 h. The top drive was set back at 0745 h, the bit cleared the seafloor at 0842 h, and the top of the BHA reached the rig floor at 1300 h. The four stands of drill collars were racked back in the derrick, and the outer core barrel components were disassembled, inspected, and laid out. The bit arrived at the rig floor at 1430 h on 7 January, ending Hole U1575A. The rig floor was secured for transit at 1445 h, ending Site U1575. The time spent on Hole U1575A was 137.0 h, or 5.7 days (Table T1).
3. Lithostratigraphy
At Site U1575, a thick (~210 m) sedimentary cover lies on top of an igneous basement. The underlying igneous succession consists of eruptive units of varying thickness from massive (several meters) to individual pillow lavas (<1 m) and contains rare sedimentary intervals and minor infillings. Three lithostratigraphic units were recognized in the overlying sedimentary cover based on core and microscopic (smear slide and thin section) observations (Figure F8).
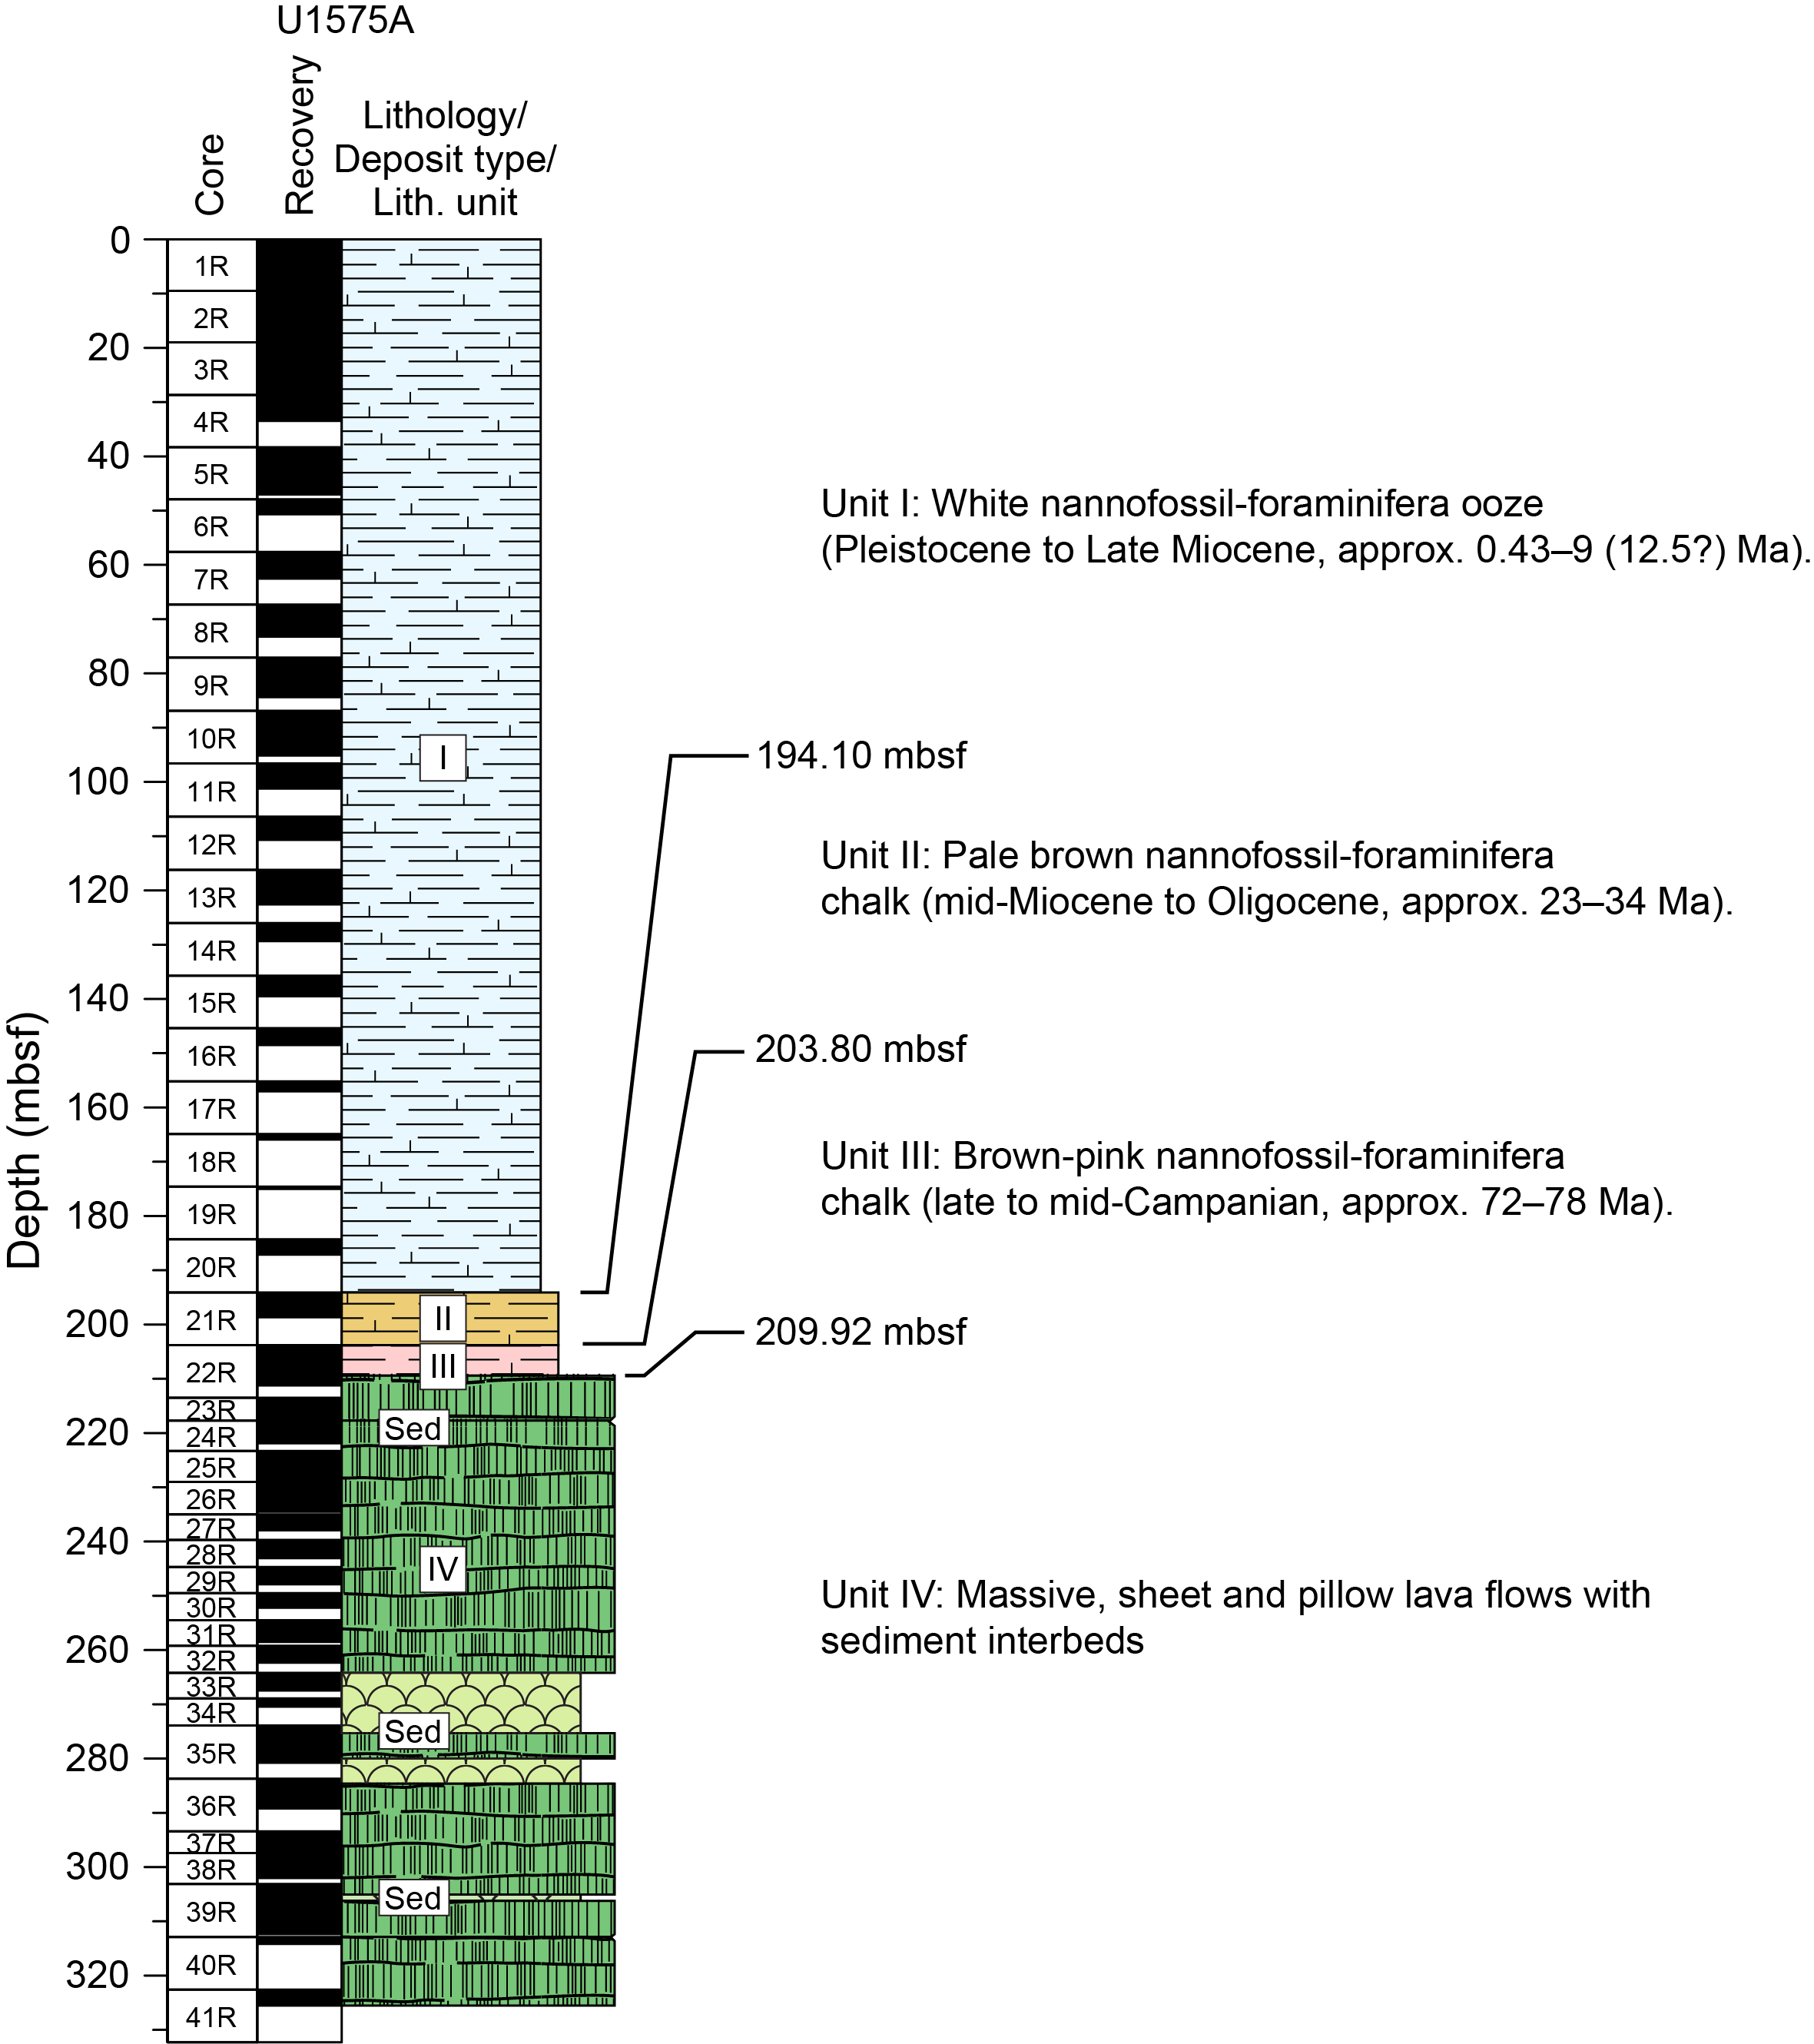
Figure F8. Lithostratigraphic summary.
3.1. Lithostratigraphic unit descriptions
3.1.1. Unit I
- Interval: 391-U1575A-1R-1, 0 cm, to 21R-1, 8 cm
- Depth: 0–194.10 mbsf
- Age: Pleistocene to late Miocene (Tortonian) (~0.43–9 [12.5?] Ma)
Unit I is an unlithified succession of dominantly white calcareous nannofossil-foraminifera ooze with rare to minor radiolarians (Figure F9A). Subtle gray and, more rarely, white-green centimeter-sized banding occurs throughout. CaCO3 content measured in whole-round samples is very similar throughout the unit, ranging 90.5–97.9 wt% (median = 95.2 wt%; n = 37) (see Sediment geochemistry). Despite pervasive drilling disturbance due to poor compaction and lithification of the ooze, the sediment locally retains some of its internal structure in the center of the cores. Generally, deeper levels contain less water and are increasingly cohesive; however, consistency is variable even at some deeper levels. The color changes from white to pale brown in the lowermost 10 m of the unit, reflecting a minor increase in the clay content downhole. The base of Unit I is marked by an 8 cm thick semilithified white foraminifera sandstone (interval 391-U1575A-21R, 0–8 cm), which possibly represents a winnowed lag in the ooze and yields a late Miocene age (see Biostratigraphy). The base of the foraminifera sandstone forms a sharp boundary with the distinctively browner and more lithified nannofossil-foraminifera chalk of Unit II. Micropaleontology reveals apparently near-continuous sedimentation throughout Unit I, spanning the Pleistocene to late Miocene, with an average sedimentation rate of approximately 20 m/My (not corrected for sediment compaction).
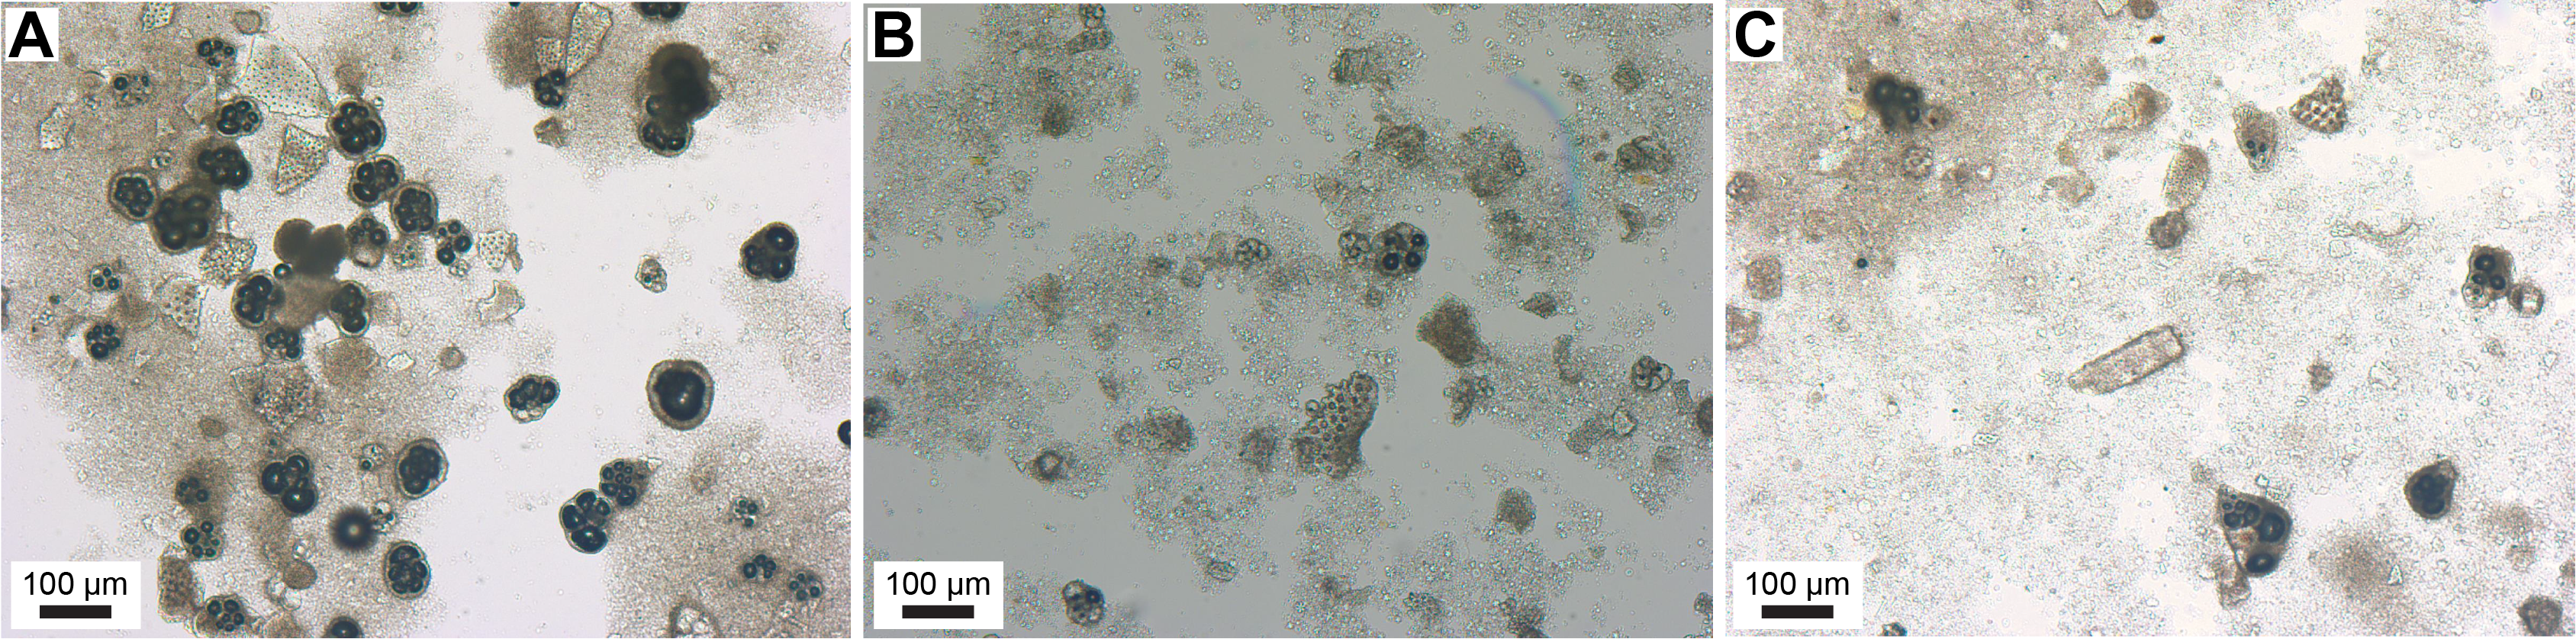
Figure F9. Nannofossil-foraminifera ooze with radiolarians.
Diffuse banding of darker gray material results from accumulations of pyrite framboids and microcrystallites (Figure F10). Many bands are characterized by a downward fading of intensity over a few centimeters returning to the white uniform color of the ooze. The occurrence of pyrite framboids is typically associated with anoxic conditions during the early diagenesis of the sediment, which can be the result of productivity changes in surface waters. Accordingly, the repetitive but variable spacing of the dark bands may be related to long-term climate controls. Such controls might also explain occurrences of faint white-green bands due to changes in the relative abundance of calcareous (i.e., nannofossils and foraminifera) and siliceous (i.e., radiolarians) microfossils. No volcanic clasts were found in Unit I.
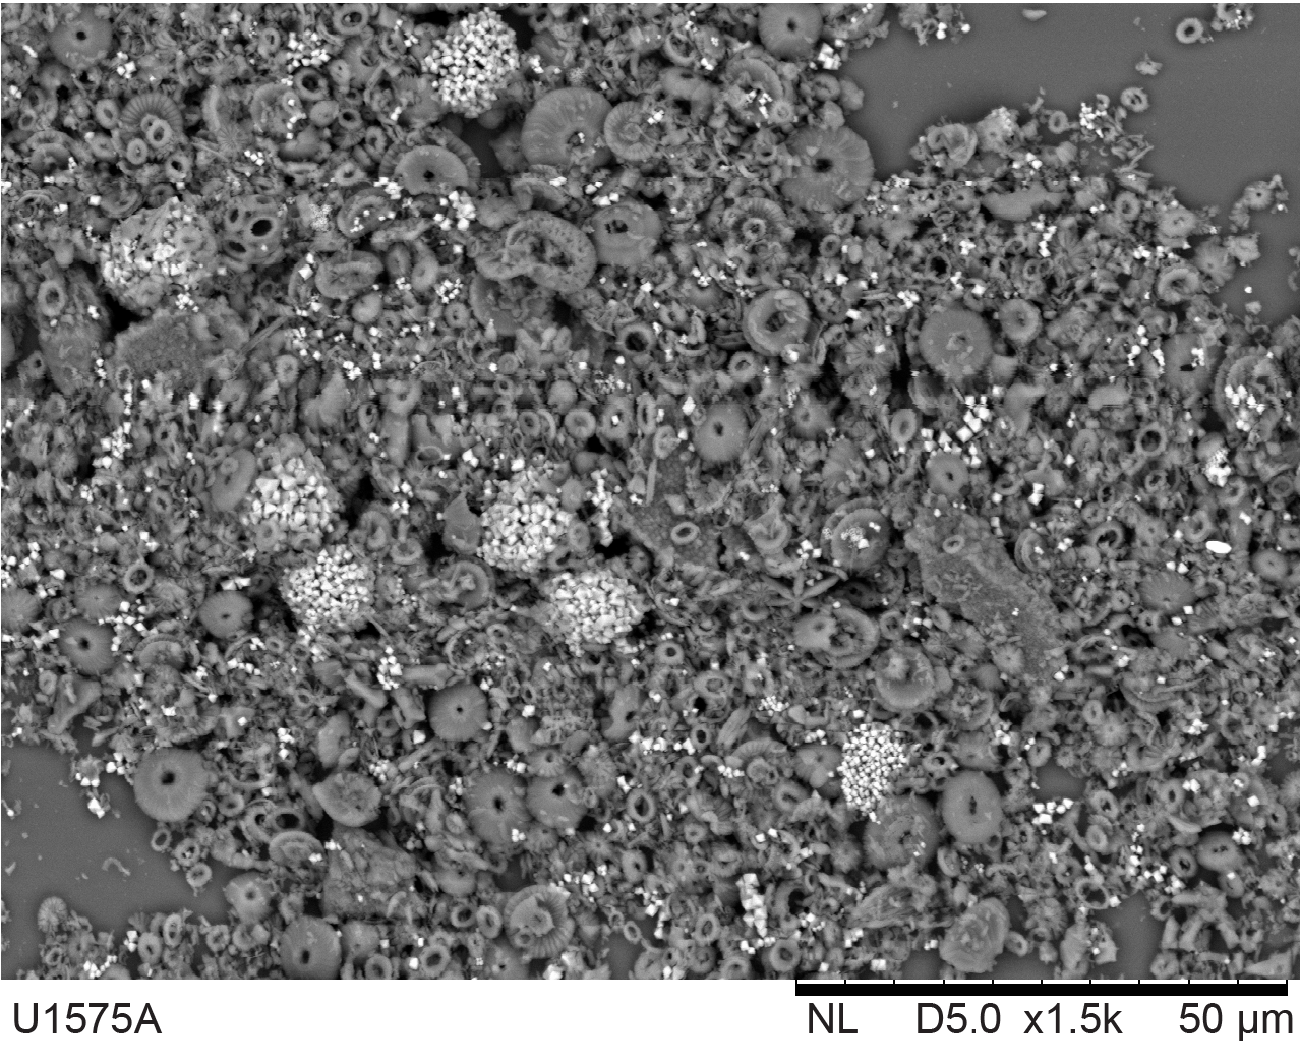
Figure F10. Pyrite framboids and microcrystallites.
3.1.2. Unit II
- Interval: 391-U1575A-21R-1, 8 cm, to 21R-CC, 5 cm
- Depth: 194.10–203.80 mbsf
- Age: mid-Miocene to Oligocene (~23–34 Ma)
Unit II is a <10 m thick sequence of poorly lithified pale brown nannofossil-foraminifera chalk with rare to minor radiolarians and clays (Figure F9B). One round sample (from interval 391-U1575A-21R-2, 140–150 cm) provided a CaCO3 content of 85.5 wt%, which is consistent with the color change and a minor increase in clay abundance compared to Unit I (see Sediment geochemistry). Minor drilling disturbance in this semilithified unit results in excellent retrieval of sedimentary structures, which are outlined by white to pale brown color changes controlled by the relative abundance of nannofossils and clays at the centimeter to subcentimeter scales. The base of the unit was not recovered. However, distinct lithologic characteristics and fossil assemblages between Cores 21R and 22R unambiguously support a unit boundary between these two intervals. Microfossil assemblages suggest a mid-Miocene to Oligocene age of deposition. Determination of younger ages, which may otherwise indicate continuity to Unit I, are undefined due to limited shipboard biostratigraphic data and <50% sediment recovery in Section 21R-3 immediately above the contact with Unit II (see Biostratigraphy). Accordingly, the occurrence of significant depositional hiatus(es) cannot be ruled out.
Two main lithofacies were recognized in the unit.
Lithofacies 1 is composed of slightly to heavily burrowed nannofossil-foraminifera chalk, which forms approximately 80% of the unit. The lithofacies exhibits several types of ichnofossils and associated crosscutting relationships. Local infills and inliers of white nannofossil chalk are associated with burrowing (Figure F11A, F11B).
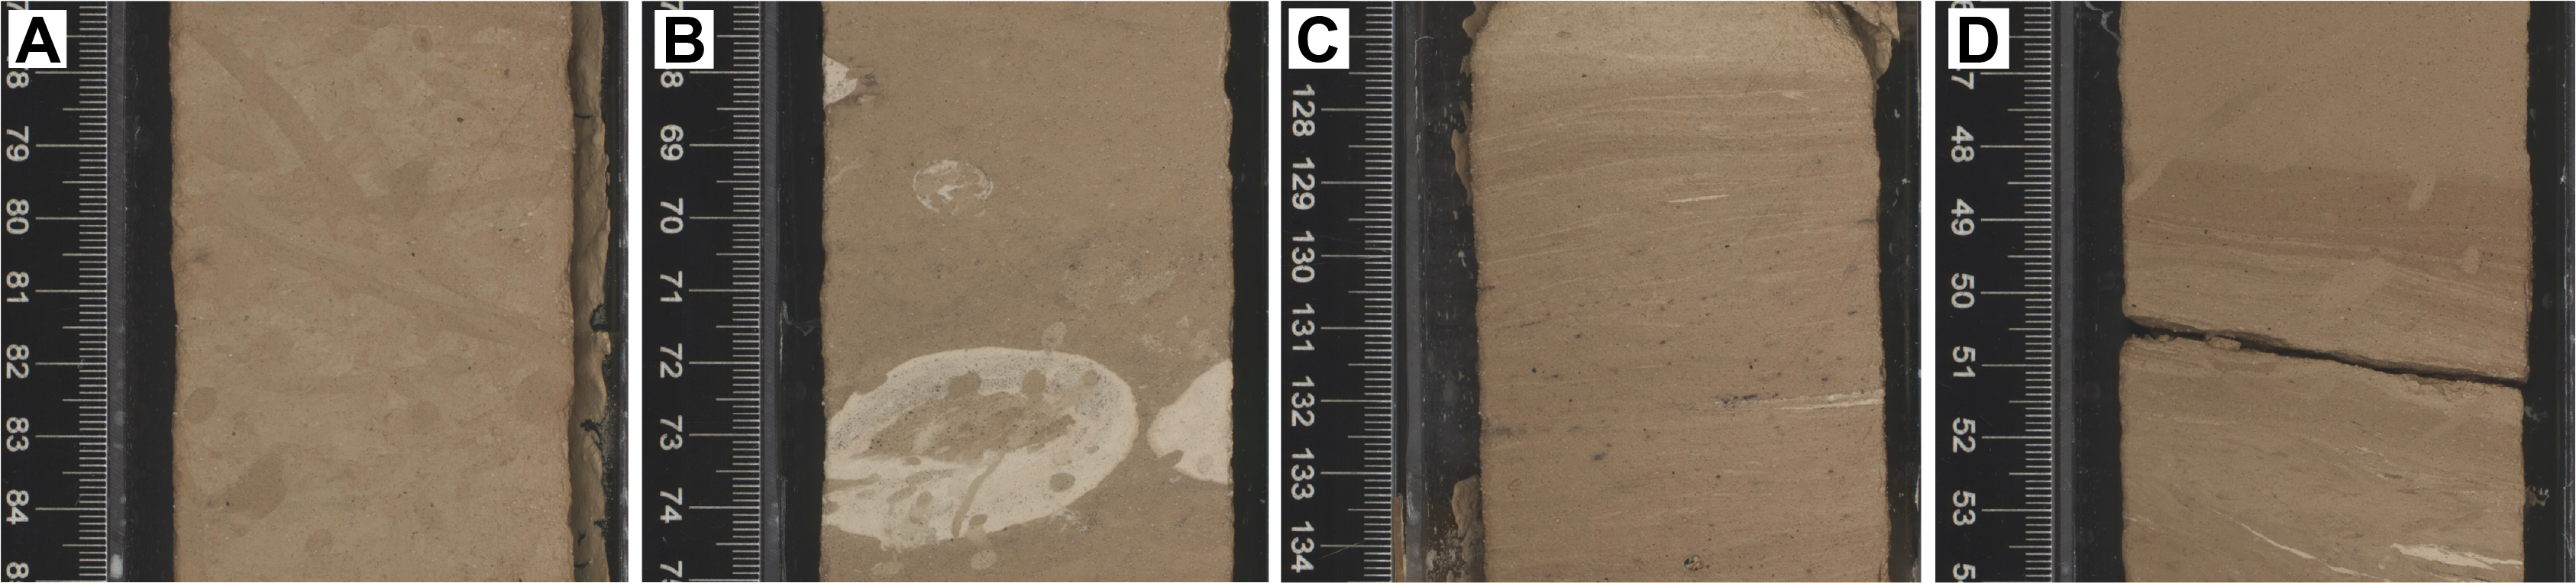
Figure F11. Main sedimentary structures, Unit II.
Lithofacies 2 is composed of laminated nannofossil-foraminifera clayey siltstone, which forms approximately 20% of the unit. This lithofacies forms 4–47 cm thick intervals that predominantly include moderately dipping planar laminae with rare cross-lamination and burrows (Figure F11C, F11D). The lamination is formed by changes in the relative abundance of foraminifera versus finer particles (i.e., nannofossils and clays), thus indicating local winnowing of the finer sedimentary components and reworking of the foraminifera by bottom currents.
Both lithofacies locally include black diffuse centimeter-sized patches and millimeter-sized particles of diagenetic origin (e.g., pyrite or pyrolusite). The alternation of the burrowed and laminated facies within Unit II suggests bottom current fluctuations throughout the deposition of this unit. Volcanic clasts in Unit II are restricted to traces of silt- to fine sand–sized palagonized volcanic glass and volcanic minerals of uncertain origin (Figure F12).
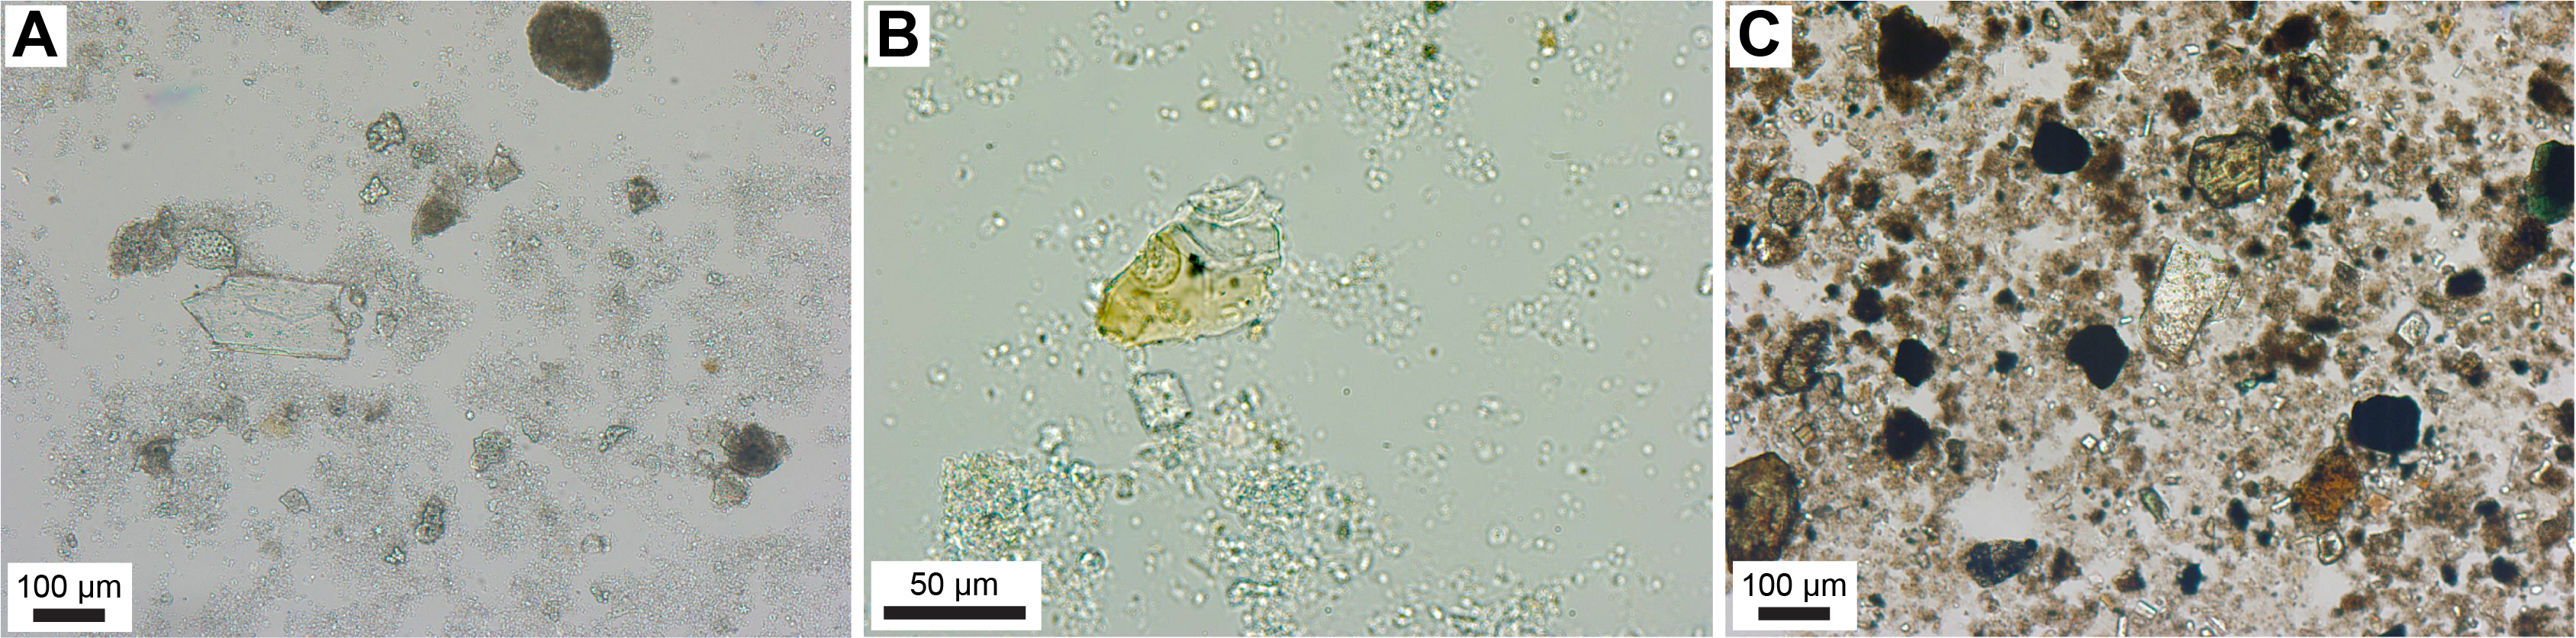
Figure F12. Volcanic clasts.
3.1.3. Unit III
- Interval: 391-U1575A-22R-1, 0 cm, to 22R-5, 32 cm
- Depth: 203.80–209.92 mbsf
- Age: late to mid-Campanian (~72–78 Ma)
Unit III is an approximately >6 m thick consolidated brown-pink nannofossil-foraminifera chalk with rare to minor radiolarians and clays (Figure F9C). One round sample (from interval 391-U1575A-22R-3, 140–150 cm) provided a CaCO3 content of 74.1 wt%, which is consistent with the color of the sediment and a minor increase in clay abundance compared to Unit I (see Sediment geochemistry). Drilling disturbance (including rotational dislocation of segments) was significant in this unit but not always easy to identify due to an efficient resealing of core pieces after drilling-induced fracturing and rotation; such disturbance is clear, however, where planar laminations and inclined burrows were spliced before and/or during retrieval. The base of the unit and original (stratigraphic) sediment/basement interface was lost during drilling and retrieval; the drilling-induced contact between the sedimentary cover and underlying igneous basement was therefore used as the base of Unit III. A significant distinguishing feature between Units II and III is the occurrence of fragments of inoceramid shells restricted to Unit III. The age of the unit is defined by nannofossil assemblages as late to mid-Campanian (see Biostratigraphy). As with Unit II, due to limited shipboard biostratigraphic data and sediment recovery of only 47% and 73% in Units II and III, it is not clear whether the boundaries with overlying and underlying units are continuous or marked by depositional (and/or erosional) hiatus(es).
Five main lithofacies were recognized in the unit.
Lithofacies 1 is composed of brown-pink slightly to heavily burrowed nannofossil-foraminifera chalk and forms approximately 70% of the unit. This lithofacies is very similar to the burrowed facies of Unit II (Figure F13A).
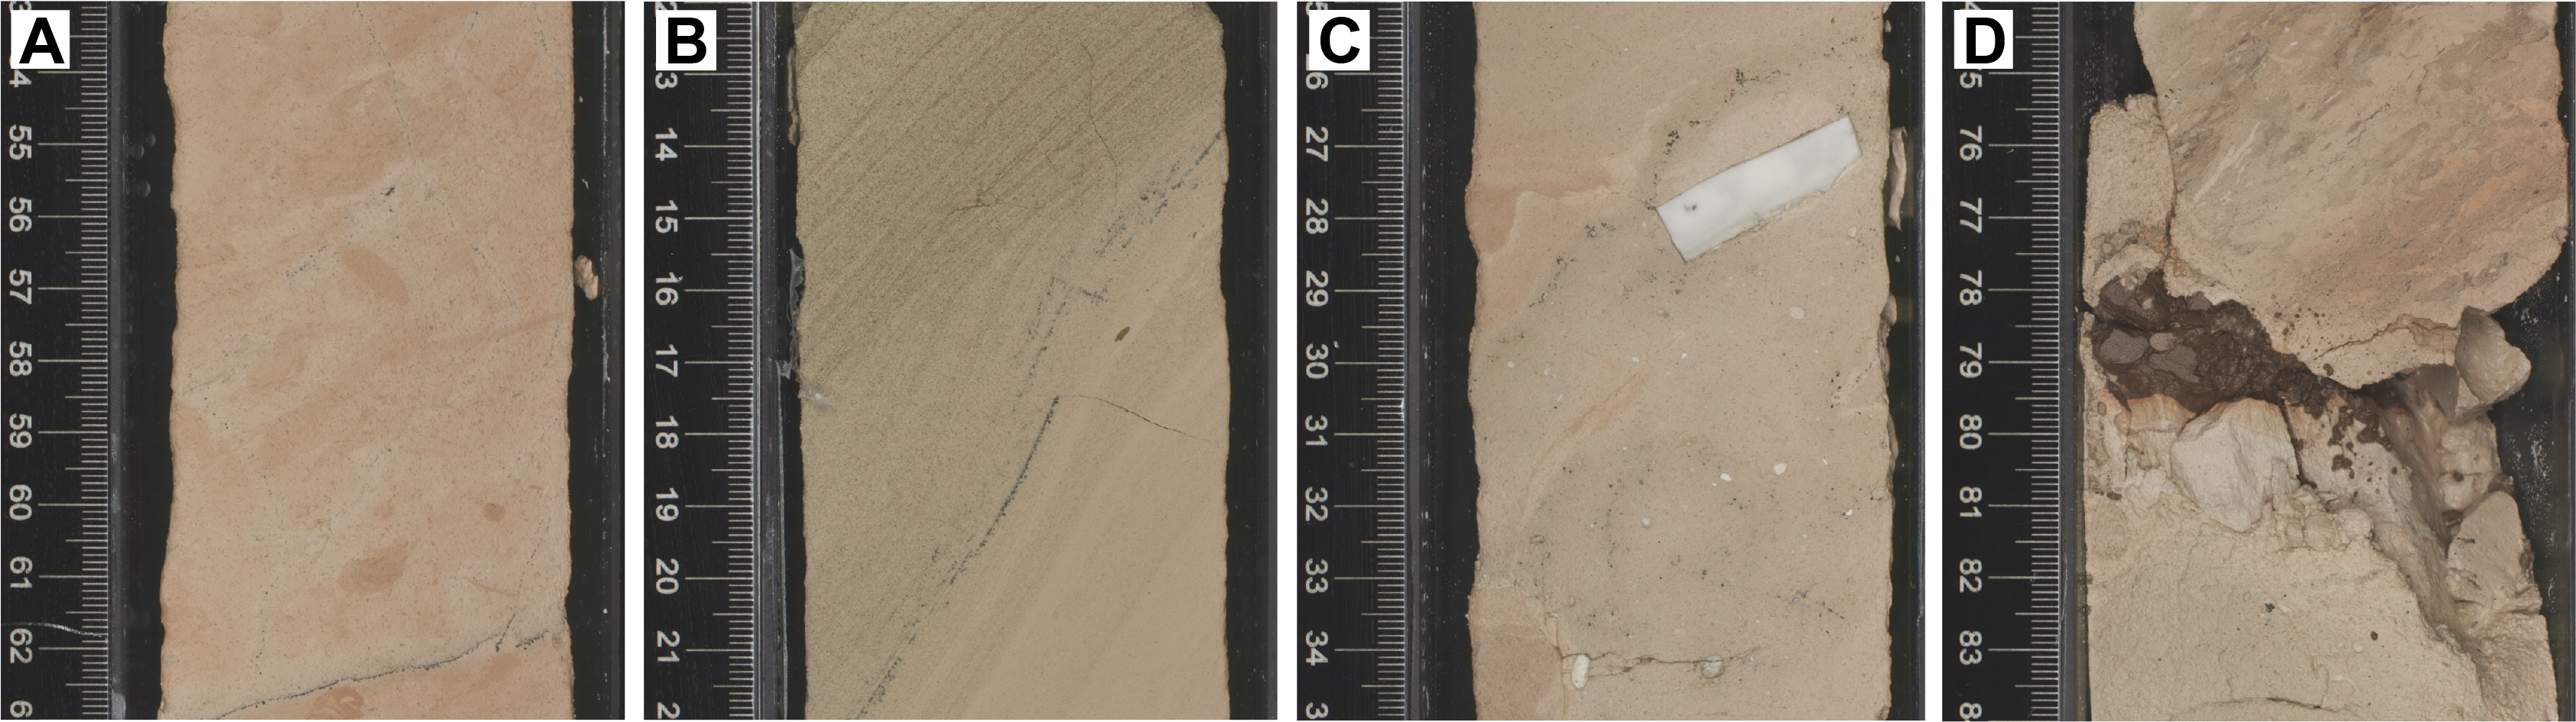
Figure F13. Unit III lithologies.
Lithofacies 2 is composed of brown laminated nannofossil-foraminifera clayey siltstone to sandstone and forms approximately 15% of the unit. This sediment includes common planar laminae and rarer cross-lamination formed by variable contents in foraminifera and finer components (i.e., nannofossils and clays). In addition, it also includes minor volcanic clasts, but the laminae do not appear to preferentially concentrate heavy minerals. Reverse grading occurs locally, revealed by sorting of the foraminifera (Figure F13B). Therefore, as with the laminated lithofacies of Unit II, the lamination in Unit III is interpreted as a result of winnowing and bedload transport by bottom currents. The absence of normal grading and heavy mineral accumulation does not support deposition from turbidites.
Lithofacies 3 is composed of brown-gray nannofossil-foraminifera chalk with convolute/contorted bedding, which forms approximately 15% of the unit. This facies is massive and matrix supported. It commonly includes larger fragments of inoceramid shells and rounded granules of white foraminifera sandstone (Lithofacies 4) (Figure F13C). Lithofacies 3 occurs in three intervals (see Core descriptions); in two of them, it displays contorted bedding and crosscuts the bedding of other lithofacies. This and the occurrence of rounded granules of sandstone suggest that Lithofacies 3 locally represents injections of fluidized sediments or sedimentary dikes. This facies may also include possible mass transport deposits.
Lithofacies 4 is composed of white bioclast sandstone with foraminifera and forms <1% of the unit. This lithofacies could also be classified as a bioclastic grainstone. It includes dominant angular to subrounded fragments of red algae with abundant benthic and planktonic foraminifera, fragments of mollusk shells, bryozoans, and echinoderms (Figure F14). The presence of good sorting, rounded grains, and a low abundance of finer components (e.g., nannofossils or micrite) in this deposit suggest reworking/winnowing by ocean floor (bottom) currents.
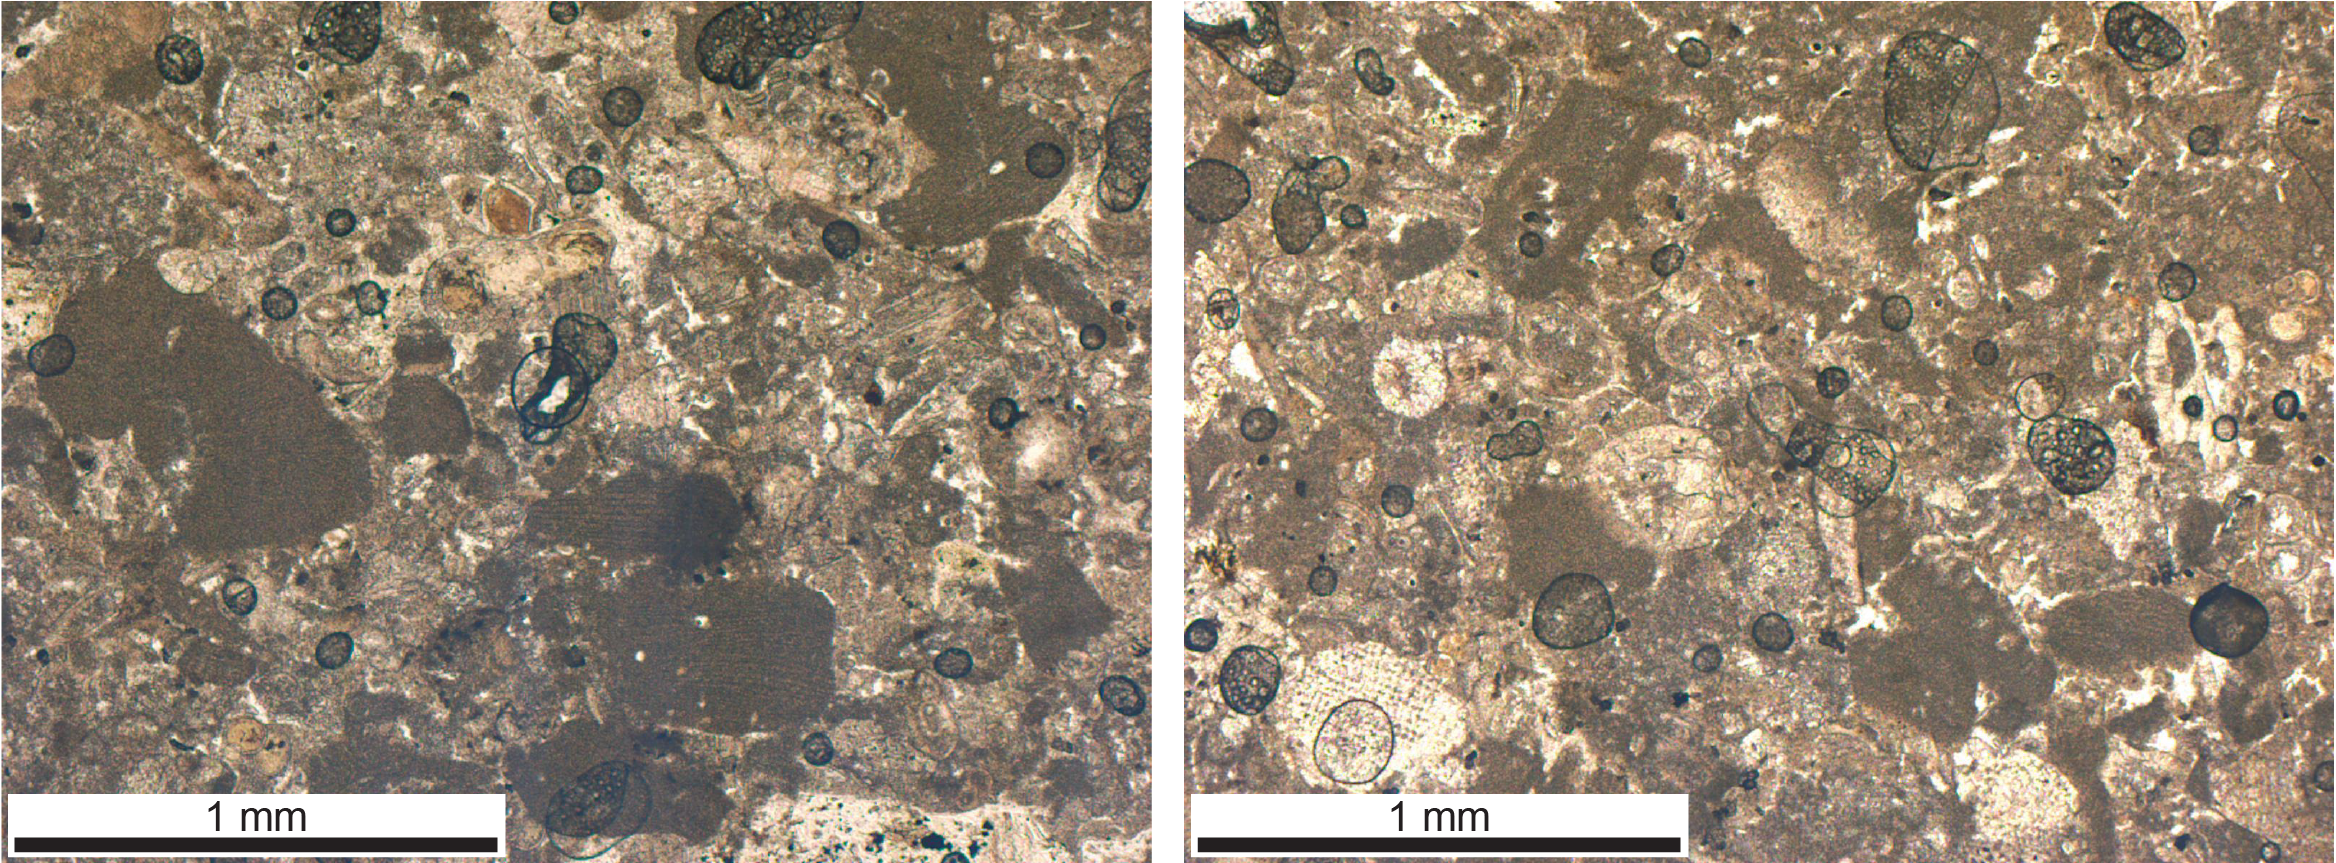
Figure F14. Bioclastic grainstone.
Lithofacies 5 is composed of dark brown volcanic siltstone that only occurs as fragments in drilling breccia and forms <1% of the recovered sediment (Figure F13D). This siltstone is moderately well sorted and grain supported and is predominantly composed of heavy minerals of volcanic origin together with palagonized volcanic glass (Figure F12C). These characteristics suggest deposition through turbidity currents, although such an interpretation remains speculative due to poor recovery of the material and the absence of distinguishing sedimentary structure(s).
Similar to Unit II, Lithofacies 1–3 locally include black diffuse centimeter-sized patches and millimeter-sized particles and dendritic veins of diagenetic origin (probably pyrolusite). The alternation of burrowed and laminated facies (Lithofacies 1 and 2) suggests fluctuations in the strength of bottom current throughout the deposition of Unit III. Despite proximity to the igneous basement, only rare volcanic clasts were observed in this unit in the form of silt- to fine sand–sized palagonized volcanic glass or ferromagnesian and Fe oxide minerals (Figure F12B, F12C). Gravity currents could have led to the transport of the materials found in Lithofacies 5, whereas the remainder of the volcanic clasts were most likely supplied by dilute turbiditic plumes developing in the water column during submarine volcanic eruptions and subsequent mixing with pelagic sediment by bottom currents and burrowing. Sparse tephra deposition and reworking is another possible source for this volcaniclastic component.
Although incomplete core recovery at the sediment/basalt interface limits reconstruction of paleodepths at the end of volcanic activity, the presence of red algae debris in Lithofacies 4 strongly suggests a deposition depth of <300 mbsf. The occurrence of a nearby submarine volcanic shoal is possible, but it seems unlikely because volcaniclastic materials are extremely limited in deposits above the volcanic basement and are entirely absent in the volcanic basement. Nevertheless, material could also have been lost from the top of the basement because the preserved succession offers no indication regarding the completeness of the upper volcanic succession. In summary, the absence of bidirectional current indicators in the laminated sediment and lack of shallow marine fossils (e.g., coral or larger foraminifera) supports deposition below the wave base. Overall, this suggests deposition of Unit III between approximately 300 and 100 mbsf.
3.2. Sedimentary deposits in the igneous basement
The igneous basement (see Igneous petrology and volcanology) consists of a thick (~115 m) stack of eruptive units varying from very thick (>10 m) massive flow units to individual sheet flows and flow lobe and pillow lava stacks (<6 m). The tops of major flows often preserve glassy selvage and a chill zone; beneath this sequence, a network of cooling fractures frequently occurs, the upper reaches of which can act as a conduit for ingress and preservation of any sedimentary material deposited on the lava unit surface (i.e., carbonate ooze). Similarly, the eruption of pillow lavas and accumulation of pillow lava stacks onto thin sedimentary deposits has either patchily preserved these layers beneath the stack or interstitially incorporated the ooze within the interstices of the stack during its emplacement onto the ocean floor substrate.
Accordingly, sparse sedimentary rocks occur in the succession of massive and pillow lavas that forms the igneous basement at Site U1575. These sedimentary rocks are carbonates (originally pelagic oozes) and represent ≪1% of this succession; they likely formed during more prolonged hiatuses in volcanic activity and typically occur in <15 cm thick isolated intervals or infills (total cumulative thickness = 51.5 cm). No siliciclastic or volcaniclastic materials occur. Examples of these carbonates are found capping the glassy flow-top selvage of massive flows, and they are associated with pillow lavas where there is evidence of fluidal mixing of the seafloor sediment during pillow stack accumulation. Nannofossil assemblages from these sedimentary intervals yielded a probable Campanian age (see Biostratigraphy).
Two main lithofacies were recognized in the volcanic basement at Site U1575; they occur in three distinct intervals:
- 391-U1575A-23R-1, 77 cm, to 24R-1, 34.5 cm (214.27–218.05 mbsf);
- 35R-1, 137–146 cm (275.27–275.36 mbsf); and
- 39R-2, 137.5 cm, to 39R-3, 121 cm (305.85–307.00 mbsf).
Lithofacies 1 is composed of yellow-white burrowed nannofossil limestone found in centimeter-sized cavities and cracks within the tops of massive lava flows (Figure F15A). This facies is commonly associated with micrite and sparry calcite. In some instances, several cycles of sediment infill and carbonate mineralization are preserved.

Figure F15. Sedimentary infills and intervals.
Lithofacies 2 is composed of yellow-white burrowed nannofossil limestone with foraminifera and preferentially occurs in lava interbeds <15 cm thick (Figure F15B). This facies locally includes diffuse centimeter-sized layering, rare fragments of inoceramid shells, and black diagenetic patches and minerals (probably pyrolusite).
These lithofacies, together with the occurrence of pillow lavas and an absence of subaerial weathering or paleosols within the volcanic succession (see Igneous petrology and volcanology), indicate that this igneous basement developed entirely in submarine conditions. An absence of shallow marine fossils and the occurrence of fragments of inoceramid shells in the interbedded sediment support somewhat deeper marine conditions, perhaps at a water depth similar to that of Unit III (100–300 m). Because of preserved stratigraphic relationships between foraminifera-bearing sedimentary intervals (Lithofacies 1) and the enclosing eruptive units, the probable biostratigraphic Campanian ages are considered contemporaneous with the development of the volcanic succession; thus, there is a good preliminary indication regarding the age of late-stage volcanism prior to the onset of uninterrupted marine sedimentation at this site. However, infills solely resulting from percolation of nannofossil ooze in cracks in the basalts and devoid of foraminifera (Lithofacies 2) could be postvolcanic material significantly younger than the age of volcanism; this is especially the case for those preserved at the top of the uppermost flow upon which the basal sedimentary succession (Unit III) lies.
4. Igneous petrology and volcanology
Igneous rocks were recovered in Hole U1575A (Figure F16), which penetrated 122.4 m of igneous basement (interval 391-U1575A-22R-5, 32 cm, to 41R-2, 147 cm) and recovered 70.7 m (57.8%). The top of the igneous basement is an altered glassy flow top underlying almost 210 m of pelagic sediment. The igneous basement at Site U1575 represents Lithostratigraphic Unit IV in the overall subseafloor succession (see Lithostratigraphy). Hole U1575A terminates in a massive sheet flow with a minimum thickness of 13 m; the bottom of this flow was not recovered. The igneous basement at Site U1575 comprises an alternating sequence of submarine lavas including massive flows up to 21 m thick as well as pillow and lobate lava flows (Figure F17). The occurrence of such massive flows is noteworthy. It requires an extremely high extrusion rate and a prodigious magma supply. This mode of volcanism is distinct from that occurring at mid-ocean ridges, where pillow lava and thin sheet flows are the dominant mode and massive flows are much less common. The lavas recovered from Hole U1575A are aphanitic to intersertal to holocrystalline basalts with glomerocrysts and phenocrysts of plagioclase (3–15 vol%) and clinopyroxene (1–5 vol%). Olivine is sparse, only intermittently present (0–3 vol%), and almost always altered. The lavas only contain sparse (0–1 vol%), small (~1 mm) vesicles, suggesting a low gas content or that they were fairly degassed.
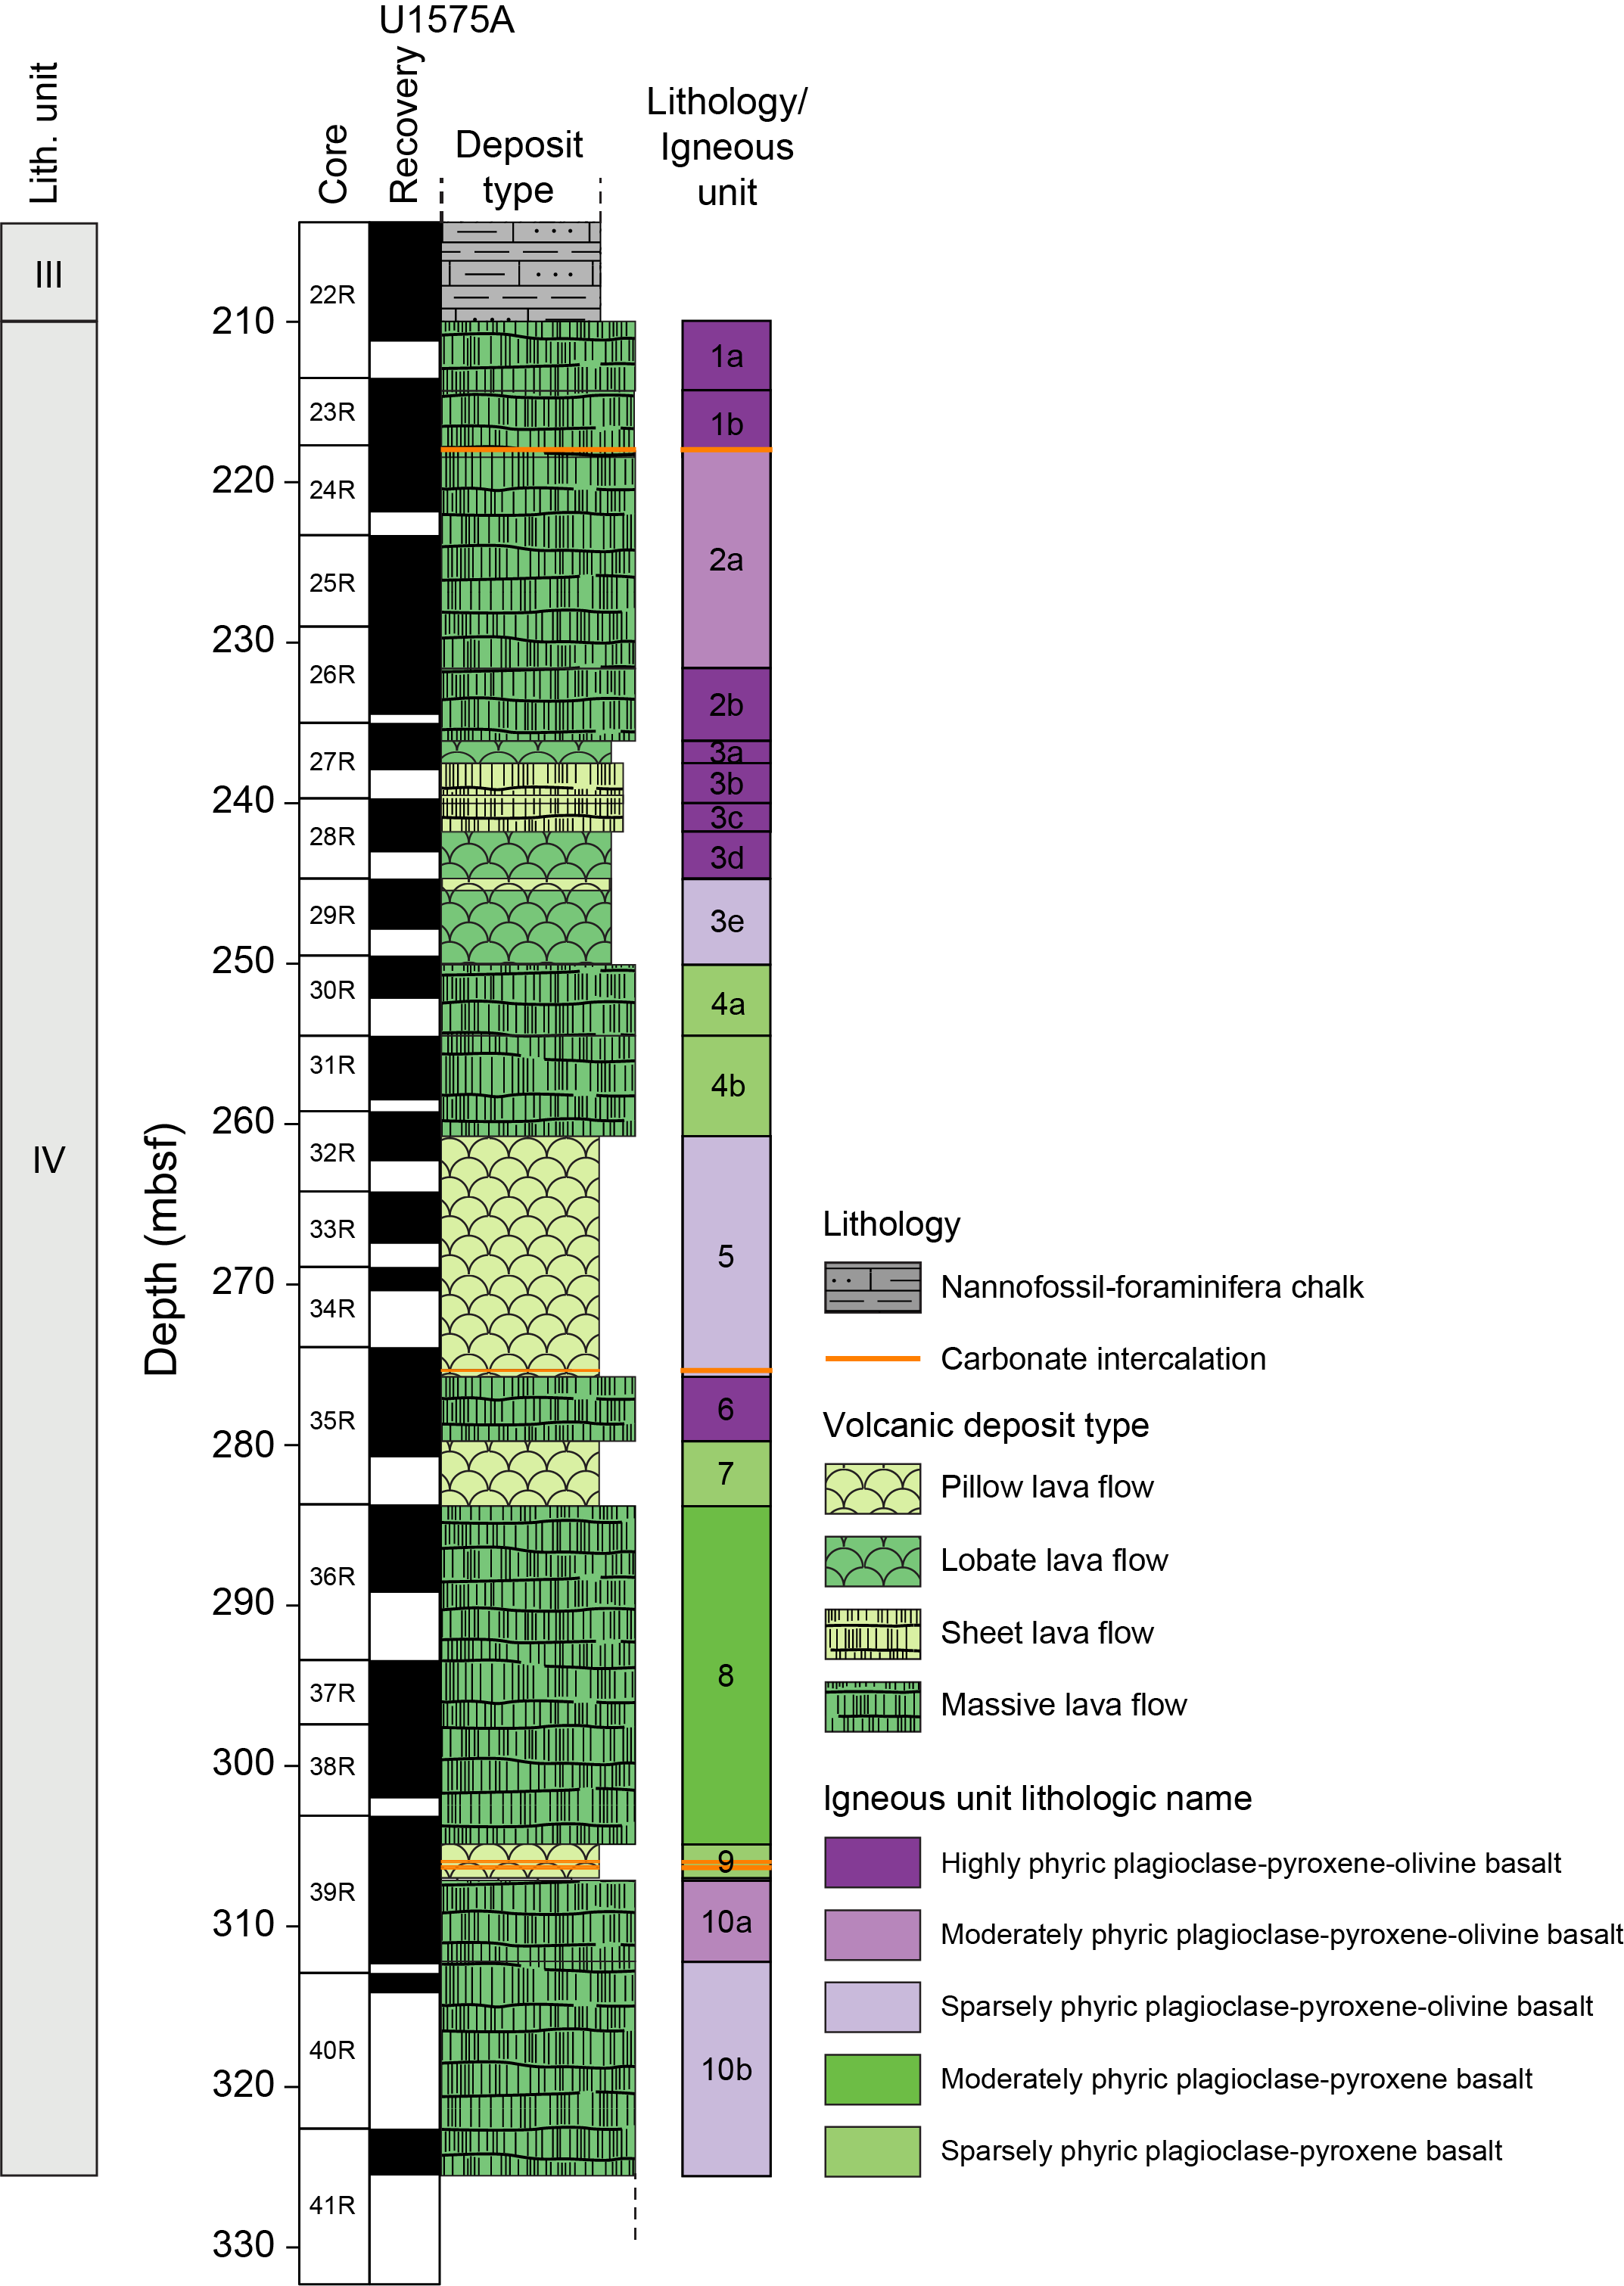
Figure F16. Volcanic succession.
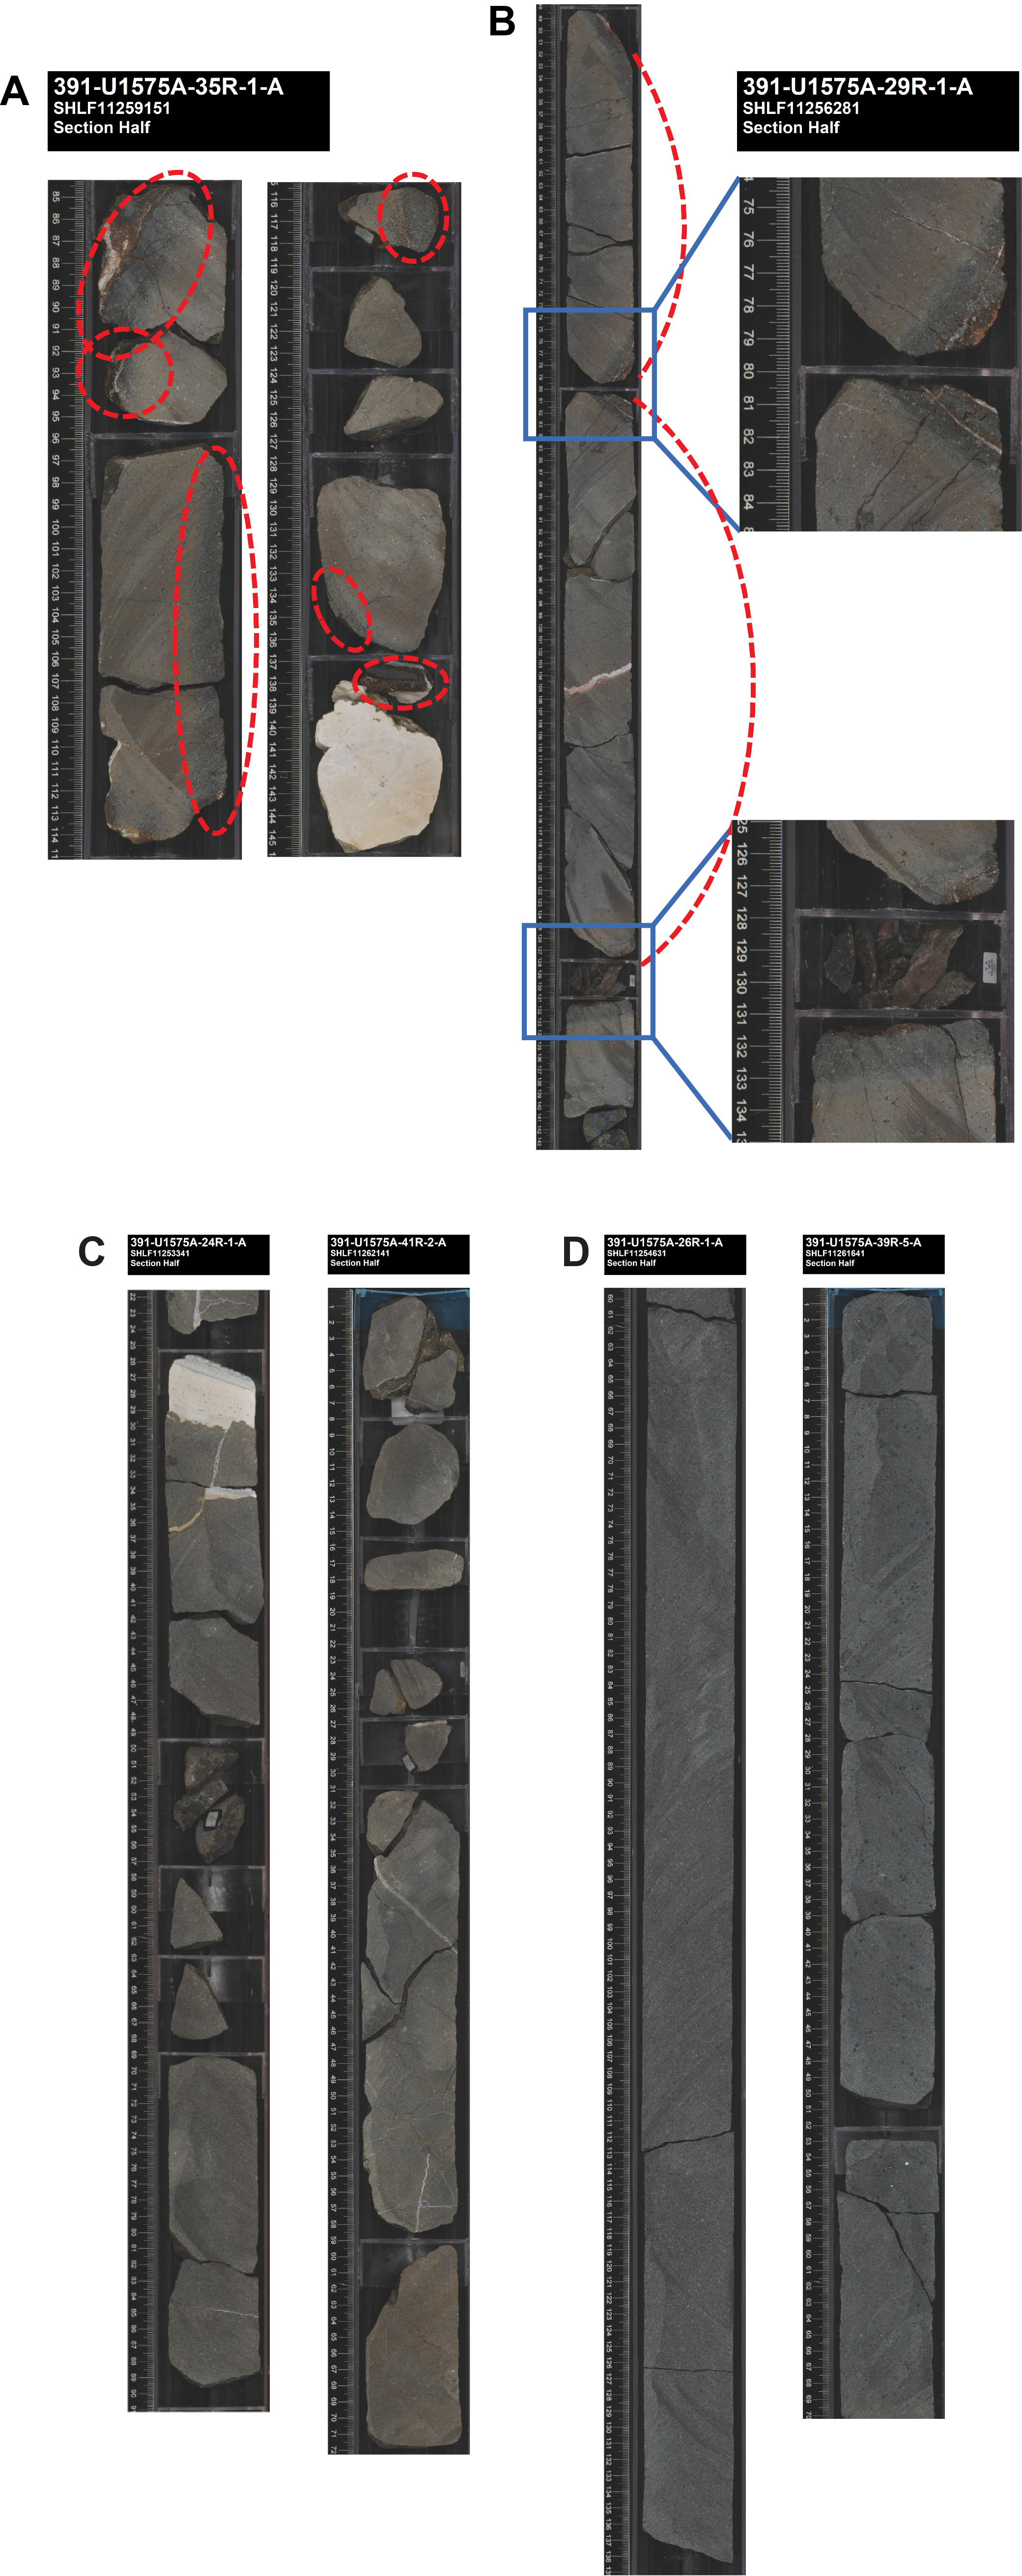
Figure F17. Pillow lavas and massive lava flows.
4.1. Igneous unit descriptions
A total of 10 igneous units were identified in Hole U1575A (Figure F16). Many of these comprise one or two massive flows. Unit boundaries were defined by the transition from one eruptive regime to another (e.g., massive lava to pillow lava or vice versa) or by changes in phenocryst abundance (from sparsely to highly phyric or vice versa). Two unit boundaries (1/2 and 9/10) are defined by thin layers of pelagic sediment.
Units 1 and 2 and the top of Unit 3 are characterized by high phenocryst abundance with common absorption textures and other indicators of disequilibrium, suggesting significant magma mixing and/or disaggregation of xenolithic cumulates prior to eruption. Deeper units have lower phenocryst abundances, and evidence for magma mixing is present but less common. Plagioclase is the dominant phenocryst phase in all units, commonly forming glomerocrysts with clinopyroxene, but plagioclase also occurs as large individual tabular crystals. A handheld portable X-ray fluorescence (pXRF) spectrometer was used to monitor the abundance of the heavier elements during core logging to provide a real-time assessment of chemical variability and to identify chemically distinct units (see Igneous petrology in the Expedition 391 methods chapter [Sager et al., 2023] for discussion of calibration and use). Elements that proved particularly useful for chemostratigraphy were TiO2, Sr, and Zr (see Igneous geochemistry; Figure F36). We used these data to define three chemical types: high TiO2 (the dominant, "normal" composition), low TiO2, and a transitional type that ranges between high and low. Units 1–5 are the dominant, high-TiO2 chemical type. Units 6–9 are the low-TiO2 type. Unit 10 is divided into a transitional type (Subunit 10a) and a normal high-TiO2 chemical type (Subunit 10b).
4.1.1. Unit 1
- Interval: 391-U1575A-22R-5, 28 cm, to 24R-1, 25.5 cm
- Depth: 209.92–217.96 mbsf
- Drilled thickness: 8.04 m
Unit 1 comprises two massive, highly phyric (plagioclase-pyroxene-olivine) basalt flows. The upper contact of both units is defined by a glassy chilled margin. Subunit 1a is overlain by pelagic sediments. The lower contact with Unit 2 is defined by a thin calcareous horizon (5 cm thick).
4.1.1.1. Subunit 1a
- Interval: 391-U1575A-22R-5, 28 cm, to 23R-1, 74.5 cm
- Depth: 209.92–214.24 mbsf
- Drilled thickness: 4.32 m
- Recovered thickness: 2.055 m
- Rock type: highly phyric plagioclase-pyroxene-olivine basalt
- Deposit: massive flow, glass rim on top with fine-grained flow interior
- Chem type: high TiO2
Subunit 1a is a single massive flow with glomeroporphyritic textures and fine-grained, equigranular groundmass. Phenocrysts make up 10%–17% of the subunit, which is dominated by plagioclase (10%–12%) forming large glomerocrysts with pyroxene (2%–3%). Olivine is a minor phenocryst phase (0.5%–3%) and is completely altered, largely to iddingsite. Overall alteration is minor, manifested as patchy light brown discoloration of the groundmass.
4.1.1.2. Subunit 1b
- Interval: 391-U1575A-23R-1, 74 cm, to 24R-1, 25.5 cm
- Depth: 214.24–217.96 mbsf
- Drilled thickness: 3.71 m
- Recovered thickness: 4.4 m
- Rock type: highly phyric plagioclase-pyroxene-olivine basalt
- Deposit: massive flow, glass rim on top with fine-grained flow interior
- Chem type: high TiO2
Subunit 1b is another single massive flow. It has a fine-grained flow interior, which is sparsely vesicular, and the top is defined by a glassy margin. The texture is glomeroporphyritic with fine-grained, equigranular groundmass and 18%–20% phenocrysts (plagioclase = 10%–12%; pyroxene = 5%; olivine = 3%). Olivine is largely altered to iddingsite. Overall alteration is minor, manifested as light brown discoloration of the groundmass.
4.1.2. Sedimentary Subunit S1
Sedimentary Subunit S1 is a calcareous rock.
4.1.3. Unit 2
- Interval: 391-U1575A-24R-1, 30 cm, to 27R-1, 108 cm
- Depth: 218.00–236.08 mbsf
- Drilled thickness: 18.08 m
Unit 2 comprises two massive highly phyric (plagioclase-pyroxene-olivine) basalt flows. A thin calcareous horizon (5 cm thick) separates Unit 2 from Unit 1; the lower contact is marked by the transition to pillow and lobate lava flows.
4.1.3.1. Subunit 2a
- Interval: 391-U1575A-24R-1, 30 cm, to 26R-2, 116 cm
- Depth: 218.00–231.56 mbsf
- Drilled thickness: 13.56 m
- Recovered thickness: 12.61 m
- Rock type: moderately to highly phyric plagioclase-pyroxene-olivine basalt
- Deposit: massive flow, glass rim on top with fine-grained flow interior
- Chem type: high TiO2
Subunit 2a is a massive sheet flow, single flow unit separated from Unit 1 by a calcareous layer in interval 391-U1575A-24R-1, 25–30 cm. The texture is glomeroporphyritic with fine-grained, equigranular groundmass. There are 13%–22% phenocrysts (plagioclase = 7%–12%; pyroxene = 2%–5%; olivine = 1%–5%), with plagioclase-pyroxene glomerocrysts dominating. Olivine is altered to iddingsite, but overall alteration is minor, limited to slight oxidation of the upper 1 m of the flow.
4.1.3.2. Subunit 2b
- Interval: 391-U1575A-26R-3, 0 cm, to 27R-1, 108 cm
- Depth: 231.56–236.08 mbsf
- Drilled thickness: 4.52 m
- Recovered thickness: 4.01 m
- Rock type: highly phyric plagioclase-pyroxene-olivine basalt
- Deposit: massive flow, glass rim on top with fine-grained flow interior
- Chem type: high TiO2
Subunit 2b is a massive flow, single flow unit. The texture is porphyritic with fine-grained, equigranular groundmass containing 5%–18% phenocrysts of plagioclase (3%–12%), clinopyroxene (2%–4%), and olivine (1%–3%), with plagioclase-pyroxene glomerocrysts dominating. Olivine is completely altered, largely to iddingsite, but overall alteration is minor, limited to slight oxidation of the upper 80 cm of the flow.
4.1.4. Unit 3
- Interval: 391-U1575A-27R-1, 108 cm, to 30R-1, 53 cm
- Depth: 236.08–250.03 mbsf
- Drilled thickness: 13.95 m
Unit 3 comprises a sequence of lobate, pillow, and sheet flows that range 1.4–5.3 m thick. The upper and lower contacts mark transitions to the massive sheet flows of Unit 2 and Unit 4.
4.1.4.1. Subunit 3a
- Interval: 391-U1575A-27R-1, 108 cm, to 27R-2, 98 cm
- Depth: 236.08–237.48 mbsf
- Drilled thickness: 1.4 m thick
- Recovered thickness: 1.4 m
- Rock type: highly phyric plagioclase-pyroxene-olivine basalt
- Deposit: lobate and pillow lava flows
- Chem type: high TiO2
Subunit 3a consists of alternating pillow and lobate lava flows. Flow tops are marked by glass rims. Texturally, the unit consists of holocrystalline, fine-grained, equigranular groundmass and 12%–13% phenocrysts (plagioclase = 7%–10%; pyroxene = 1%–4%; olivine = 1%–3%) with glomerocrysts of plagioclase and clinopyroxene. Olivine is completely altered, largely to iddingsite, but overall alteration is minor, limited to slight patchy oxidation to light tan.
4.1.4.2. Subunit 3b
- Interval: 391-U1575A-27R-2, 98 cm, to 28R-1, 27 cm
- Depth: 237.48–239.97 mbsf
- Drilled thickness: 2.49 m
- Recovered thickness: 0.74 m
- Rock type: highly phyric plagioclase-pyroxene-olivine basalt
- Deposit: sheet flow, glass rim on top (single flow unit)
- Chem type: high TiO2
Subunit 3b consists of a single sheet flow marked by a glassy flow top. The sheet flow has fine-grained, aphanitic to holocrystalline, equigranular groundmass and 10%–16% phenocrysts (plagioclase = 5%; pyroxene = 5%; olivine = 1%–2%) with glomerophyres of plagioclase and pyroxene. Olivine is replaced by iddingsite, and the entire subunit has slight oxidative alteration (tan discoloration).
4.1.4.3. Subunit 3c
- Interval: 391-U1575A-28R-1, 27 cm, to 28R-2, 59 cm
- Depth: 239.97–241.74 mbsf
- Drilled thickness: 1.77 m
- Recovered thickness: 1.77 m
- Rock type: highly phyric plagioclase-pyroxene-olivine basalt
- Deposit: sheet flow, glass rim on top (single flow unit)
- Chem type: high TiO2
Subunit 3c is another single sheet flow unit. The top of the flow is marked by an intensely altered chilled margin associated with discoloration that fades into the interior over about 10 cm. The sheet flow contains holocrystalline fine-grained, equigranular groundmass and 14%–16% phenocrysts (plagioclase = 7%–10%; clinopyroxene = 3%–5%; olivine = 2%–3%) with glomerophyres of plagioclase and pyroxene. Olivine is replaced by iddingsite. There is slight oxidative alteration (tan discoloration) in patches.
4.1.4.4. Subunit 3d
- Interval: 391-U1575A-28R-2, 59 cm, to 28R-3, 41 cm
- Depth: 241.74–243.06 mbsf
- Drilled thickness: 2.96 m
- Recovered thickness: 1.32 m
- Rock type: highly phyric plagioclase-pyroxene-olivine basalt
- Deposit: lobate lava and pillow lava
- Chem type: high TiO2
Subunit 3d consists of lobate flows that resemble pillows but form lobes >1 m thick. Basalts have fine-grained, equigranular groundmass and 11%–16% phenocrysts (plagioclase = 5%–7%; pyroxene = 5%–7%; olivine = 1%–2%) with glomerophyres of plagioclase and pyroxene. There is slight, patchy oxidative alteration throughout the unit (tan discoloration), but olivine is completely altered.
4.1.4.5. Subunit 3e
- Interval: 391-U1575A-29R-1, 0 cm, to 30R-1, 53 cm
- Depth: 244.70–250.03 mbsf
- Drilled thickness: 5.83 m
- Recovered thickness: 3.72 m
- Rock type: sparsely to moderately phyric plagioclase-pyroxene-olivine basalt
- Deposit: lobate lava and pillow lava
- Chem type: high TiO2
Subunit 3e consists of pillow lava and lobate flows. Pillow lavas are 30–50 cm in diameter with 1–2 cm thick glass rims, and lobate lava resembles pillows but forms lobes >1 m thick. Basalts are glomeroporphyritic with fine-grained, equigranular groundmass. Subunit 3e has fewer overall phenocrysts (4%–8%) than higher stratigraphic units, and they consist of plagioclase (3%–5%), pyroxene (1%–2%), and olivine (1%). Olivine is commonly but not always altered to iddingsite, and slight oxidative alteration varies from patchy to pervasive.
4.1.5. Unit 4
- Interval: 391-U1575A-30R-1, 53 cm, to 32R-2, 14 cm
- Depth: 236.08–260.72 mbsf
- Drilled thickness: 10.69 m
Unit 4 comprises two massive, sparsely phyric (plagioclase-pyroxene±olivine) basalt flows. The upper and lower contacts are marked by a transition to pillow and lobate lava flows.
4.1.5.1. Subunit 4a
- Interval: 391-U1575A-30R-1, 53 cm, to 30R-3, 60 cm
- Depth: 250.03–255.08 mbsf
- Drilled thickness: 5.05 m
- Recovered thickness: 2.74 m
- Rock type: sparsely to moderately phyric plagioclase-pyroxene basalt
- Deposit: massive flow (single flow)
- Chem type: high TiO2
Subunit 4a is a single massive sheet flow. There is no visible contact preserved with the overlying pillow lavas. The rock texture is porphyritic with aphanitic, microcrystalline groundmass. Phenocrysts (3%–6% total) consist of plagioclase (2%–4%) and pyroxene (0.5%–2%). Rare olivine (<0.5%) is visible macroscopically. This subunit has mild patchy (pale tan) alteration.
4.1.5.2. Subunit 4b
- Interval: 391-U1575A-31R-1, 0 cm, to 32R-2, 14 cm
- Depth: 255.08–260.72 mbsf
- Drilled thickness: 5.64 m
- Recovered thickness: 4.96 m
- Rock type: sparsely to moderately phyric plagioclase-pyroxene basalt
- Deposit: massive flow (single flow unit)
- Chem type: high TiO2
Subunit 4b is a single massive sheet flow. The upper contact is marked by a weathered interval about 60 cm thick at the top of the flow. It is porphyritic rock with microcrystalline groundmass. Phenocrysts (3%–6% total) consist of plagioclase (2%–4%) and pyroxene (0.5%–2%). Rare olivine (<1%) is visible macroscopically. This subunit has mild patchy (pale tan) alteration.
4.1.6. Unit 5
- Interval: 391-U1575A-32R-2, 14 cm, to 35R-2, 38 cm
- Depth: 260.72–275.74 mbsf
- Drilled thickness: 15.02 m
- Recovered thickness: 8.21 m
- Rock type: sparsely to moderately phyric plagioclase-pyroxene-olivine basalt
- Deposit: pillow lava, may include thin sheet flows and lobate flows
- Chem type: high TiO2
Unit 5 consists dominantly of pillow lava flows that may include thin sheet flows and lobate flows. Glass selvages mark quenched rims of pillows, pillow lobes, and/or thin sheet flows. Just below the quenched rims, pillow textures have aphanitic groundmass with faint pinkish alteration. Farther in the pillow interior, the phenocryst proportions increase modestly and the groundmass grades to fine grained. Pillow lavas are porphyritic with 4%–10% phenocrysts (plagioclase = 3%–5%; pyroxene = 1%–4%; olivine = 0%–2%). Olivine is altered to iddingsite. This unit has mild patchy alteration to pale tan. There is a thin (8 cm) chalk intercalation near the bottom of the unit (interval 35R-1, 136–148 cm).
4.1.7. Unit 6
- Interval: 391-U1575A-35R-2, 38 cm, to 35R-5, 43 cm
- Depth: 275.74–279.73 mbsf
- Drilled thickness: 3.99 m
- Recovered thickness: 3.99 m
- Rock type: sparsely to highly phyric plagioclase-pyroxene-olivine basalt
- Deposit: massive flow, single flow unit
- Chem type: low TiO2
Unit 6 consists of a single massive flow of low-TiO2 basalt. Glass selvage marks the upper contact with Unit 5. Below the glass rim, the lava is sparsely phyric with microcrystalline groundmass but grades into moderately to highly phyric/glomerophyric with holocrystalline groundmass toward the interior of the flow. Glomerocrysts consist dominantly of plagioclase with sparse pyroxene. Phenocryst totals show a large range (5–14 vol%) consistent with fewer phenocrysts near the top and bottom flow boundaries. Phenocrysts consist of plagioclase (3%–10%), pyroxene (2%–3%), and olivine (0%–1%). Pale tan oxidative alteration is patchy and largely confined to upper and lower margins of the flow.
4.1.8. Unit 7
- Interval: 391-U1575A-35R-4, 43 cm, to 36R-1, 7.5 cm
- Depth: 279.73–283.78 mbsf
- Drilled thickness: 4.05 m
- Recovered thickness: 1.12 m
- Rock type: sparsely to highly phyric plagioclase-pyroxene basalt with rare olivine
- Deposit: pillow lava flows
- Chem type: low TiO2
Unit 7 is a stack of low-TiO2 pillow basalt. Pillows are marked by an upper glassy rind that grades to altered, sparsely to highly phyric basalt. The lavas are glomerophyric to phyric with fine-grained to microcrystalline, equigranular groundmass. Phenocrysts range 4%–12% (plagioclase= 3%–10%; pyroxene = 1%–2%; olivine = 0%–1%) with variations linked to pillow rims (low phenocryst cargo) to pillow interiors (higher phenocryst cargo). This unit has tan oxidative discoloration.
4.1.9. Unit 8
- Interval: 391-U1575A-36R-1, 7.5 cm, to 39R-2, 38.5 cm
- Depth: 283.78–304.86 mbsf
- Drilled thickness: 21.08 m
- Recovered thickness: 16.99 m
- Rock type: moderately phyric plagioclase-pyroxene basalt with rare olivine
- Deposit: massive flow; single flow unit
- Chem type: low TiO2
Unit 8 consists of a single massive flow of low-TiO2 lava marked by a quenched and discolored (altered) chilled contact near the top of the flow that grades to fresh material toward the interior. This is a very thick single flow unit with a glassy upper contact and no evidence of additional internal contacts. The texture is glomerophyric with 5%–9% phenocrysts in fine-grained, equigranular groundmass. Plagioclase is the dominant phenocryst phase (4%–7%) with only 1%–2% pyroxene and rare olivine. The unit has pale tan oxidative alteration in the upper 60 cm of the flow, and the interior is very fresh dark gray-green. A network of calcite-filled veins 2–6 mm thick is found in the upper 60 cm of the altered flow. Calcite veins are rare in the flow interior.
4.1.10. Unit 9
- Interval: 391-U1575A-39R-2, 38.5 cm, to 39R-3, 107 cm
- Depth: 304.86–306.96 mbsf
- Drilled thickness: 2.10 m
- Recovered thickness: 1.92 m
- Rock type: sparsely to moderately phyric plagioclase-pyroxene basalt with rare olivine (0%–2%)
- Deposit: pillow lavas with intermixed calcareous sediment (peperite)
- Chem type: low TiO2
Unit 9 is a sequence of low-TiO2 pillow lavas intermixed with calcareous sediment. One composite piece of the section shows basalt glass fused to the sediment. This is interpreted to represent pillows that erupted onto and mingled with pelagic ooze. The basalt textures are porphyritic to glomerophyric with fine-grained to microcrystalline, equigranular groundmass. Phenocrysts total 6%–7% with subequal portions of plagioclase, pyroxene, and olivine (2%–3% of each). There is slight Fe oxyhydroxide alteration with patchy tan discoloration, clay mineralization, and alteration of olivine to iddingsite
4.1.11. Sedimentary Subunit S2
Sedimentary Subunit S2 is a thin 15 cm bedded chalk layer that separates Igneous Units 9 and 10.
4.1.12. Unit 10
- Interval: 391-U1575A-39R-3, 122 cm, to 41R-2, 147 cm
- Depth: 307.11–325.52 mbsf
- Drilled thickness: 18.42 m
Unit 10 comprises two massive lava flows with chilled margins at the top and bottom of the upper massive flow.
4.1.12.1. Subunit 10a
- Interval: 391-U1575A-39R-3, 122 cm, to 39R-7, 104.5 cm
- Depth: 307.11–312.17 mbsf
- Drilled thickness: 5.06 m
- Recovered thickness: 5.06 m
- Rock type: moderately phyric plagioclase-pyroxene-olivine basalt
- Deposit: massive lava flow; single flow unit
- Chem type: transitional to high TiO2
Subunit 10a is a single massive lava flow. It is marked by a lower chilled margin separating it from Subunit 10b. The lavas are moderately porphyritic to microporphyritic with 6%–10% phenocrysts in fine-grained, holocrystalline to microcrystalline, equigranular groundmass. Phenocrysts include plagioclase (3%–7%), pyroxene (1%–3%), and olivine (1%–2%). This unit contains rare round vesicles (2%) that are 1–5 mm in diameter and filled with a bluish zeolite. Likewise, the unit as a whole is slightly altered with brownish to bluish discoloration. Subunit 10a is a compositionally transitional unit showing a gradual increase from low-TiO2 lavas to high (normal)-TiO2 lavas.
4.1.12.2. Subunit 10b
- Interval: 391-U1575A-39R-7, 104.5 cm, to 41R-2, 147 cm
- Depth: 312.17–325.52 mbsf
- Drilled thickness: 13.36 m
- Recovered thickness: 4.38 m
- Rock type: sparsely to moderately phyric plagioclase-pyroxene-olivine basalt
- Deposit: massive lava flow, single flow unit
- Chem type: high TiO2
Subunit 10b is a single massive lava flow. The upper chilled margin is not preserved. Lava contains 5%–10% phenocrysts (plagioclase = 3%–6%; pyroxene = 1%–3%; olivine = 1%–2%) in holocrystalline, fine-grained to microcrystalline, equigranular groundmass. As a whole, the unit shows pinkish tan alteration.
4.2. Petrography
Magmatic textures observed in thin section do not appear to correlate with lava composition. They depend on the eruptive style of the lava, which has a direct impact on cooling rates. In general, pillow lavas and lobate flows have quenched or microcrystalline groundmass with distinct phenocrysts. In contrast, massive flows are characterized by seriate groundmass textures that grade into the larger phenocrysts, reflecting slower cooling rates in the massive flows.
4.2.1. Massive flows
Massive lavas are highly to moderately phyric and primarily contain plagioclase and clinopyroxene. Massive lavas exhibit glomeroporphyritic, porphyritic, and intersertal textures (Figure F18). Plagioclase and clinopyroxene occur as large glomerocrysts and groundmass phases. Olivine occurs infrequently and is often observed as altered phenocrysts or groundmass (i.e., iddingsite). Plagioclase in glomerocrysts commonly exhibits oscillatory zoning at its rims and patchy zoning at its core. Some plagioclase crystals also have sieve-textured cores. Clinopyroxene zoning is less common but occurs as hourglass and oscillatory patterns. Plagioclase and pyroxene often contain melt inclusions. Some massive lavas exhibit a clear divide between phenocrysts and groundmass; however, most exhibit seriate texture and continuously grade from small to large crystals. The groundmass often contains plagioclase, clinopyroxene, and skeletal Fe oxide crystals ± olivine. Fresh glass can be found in some samples, but it is more often altered and replaced by clay minerals.
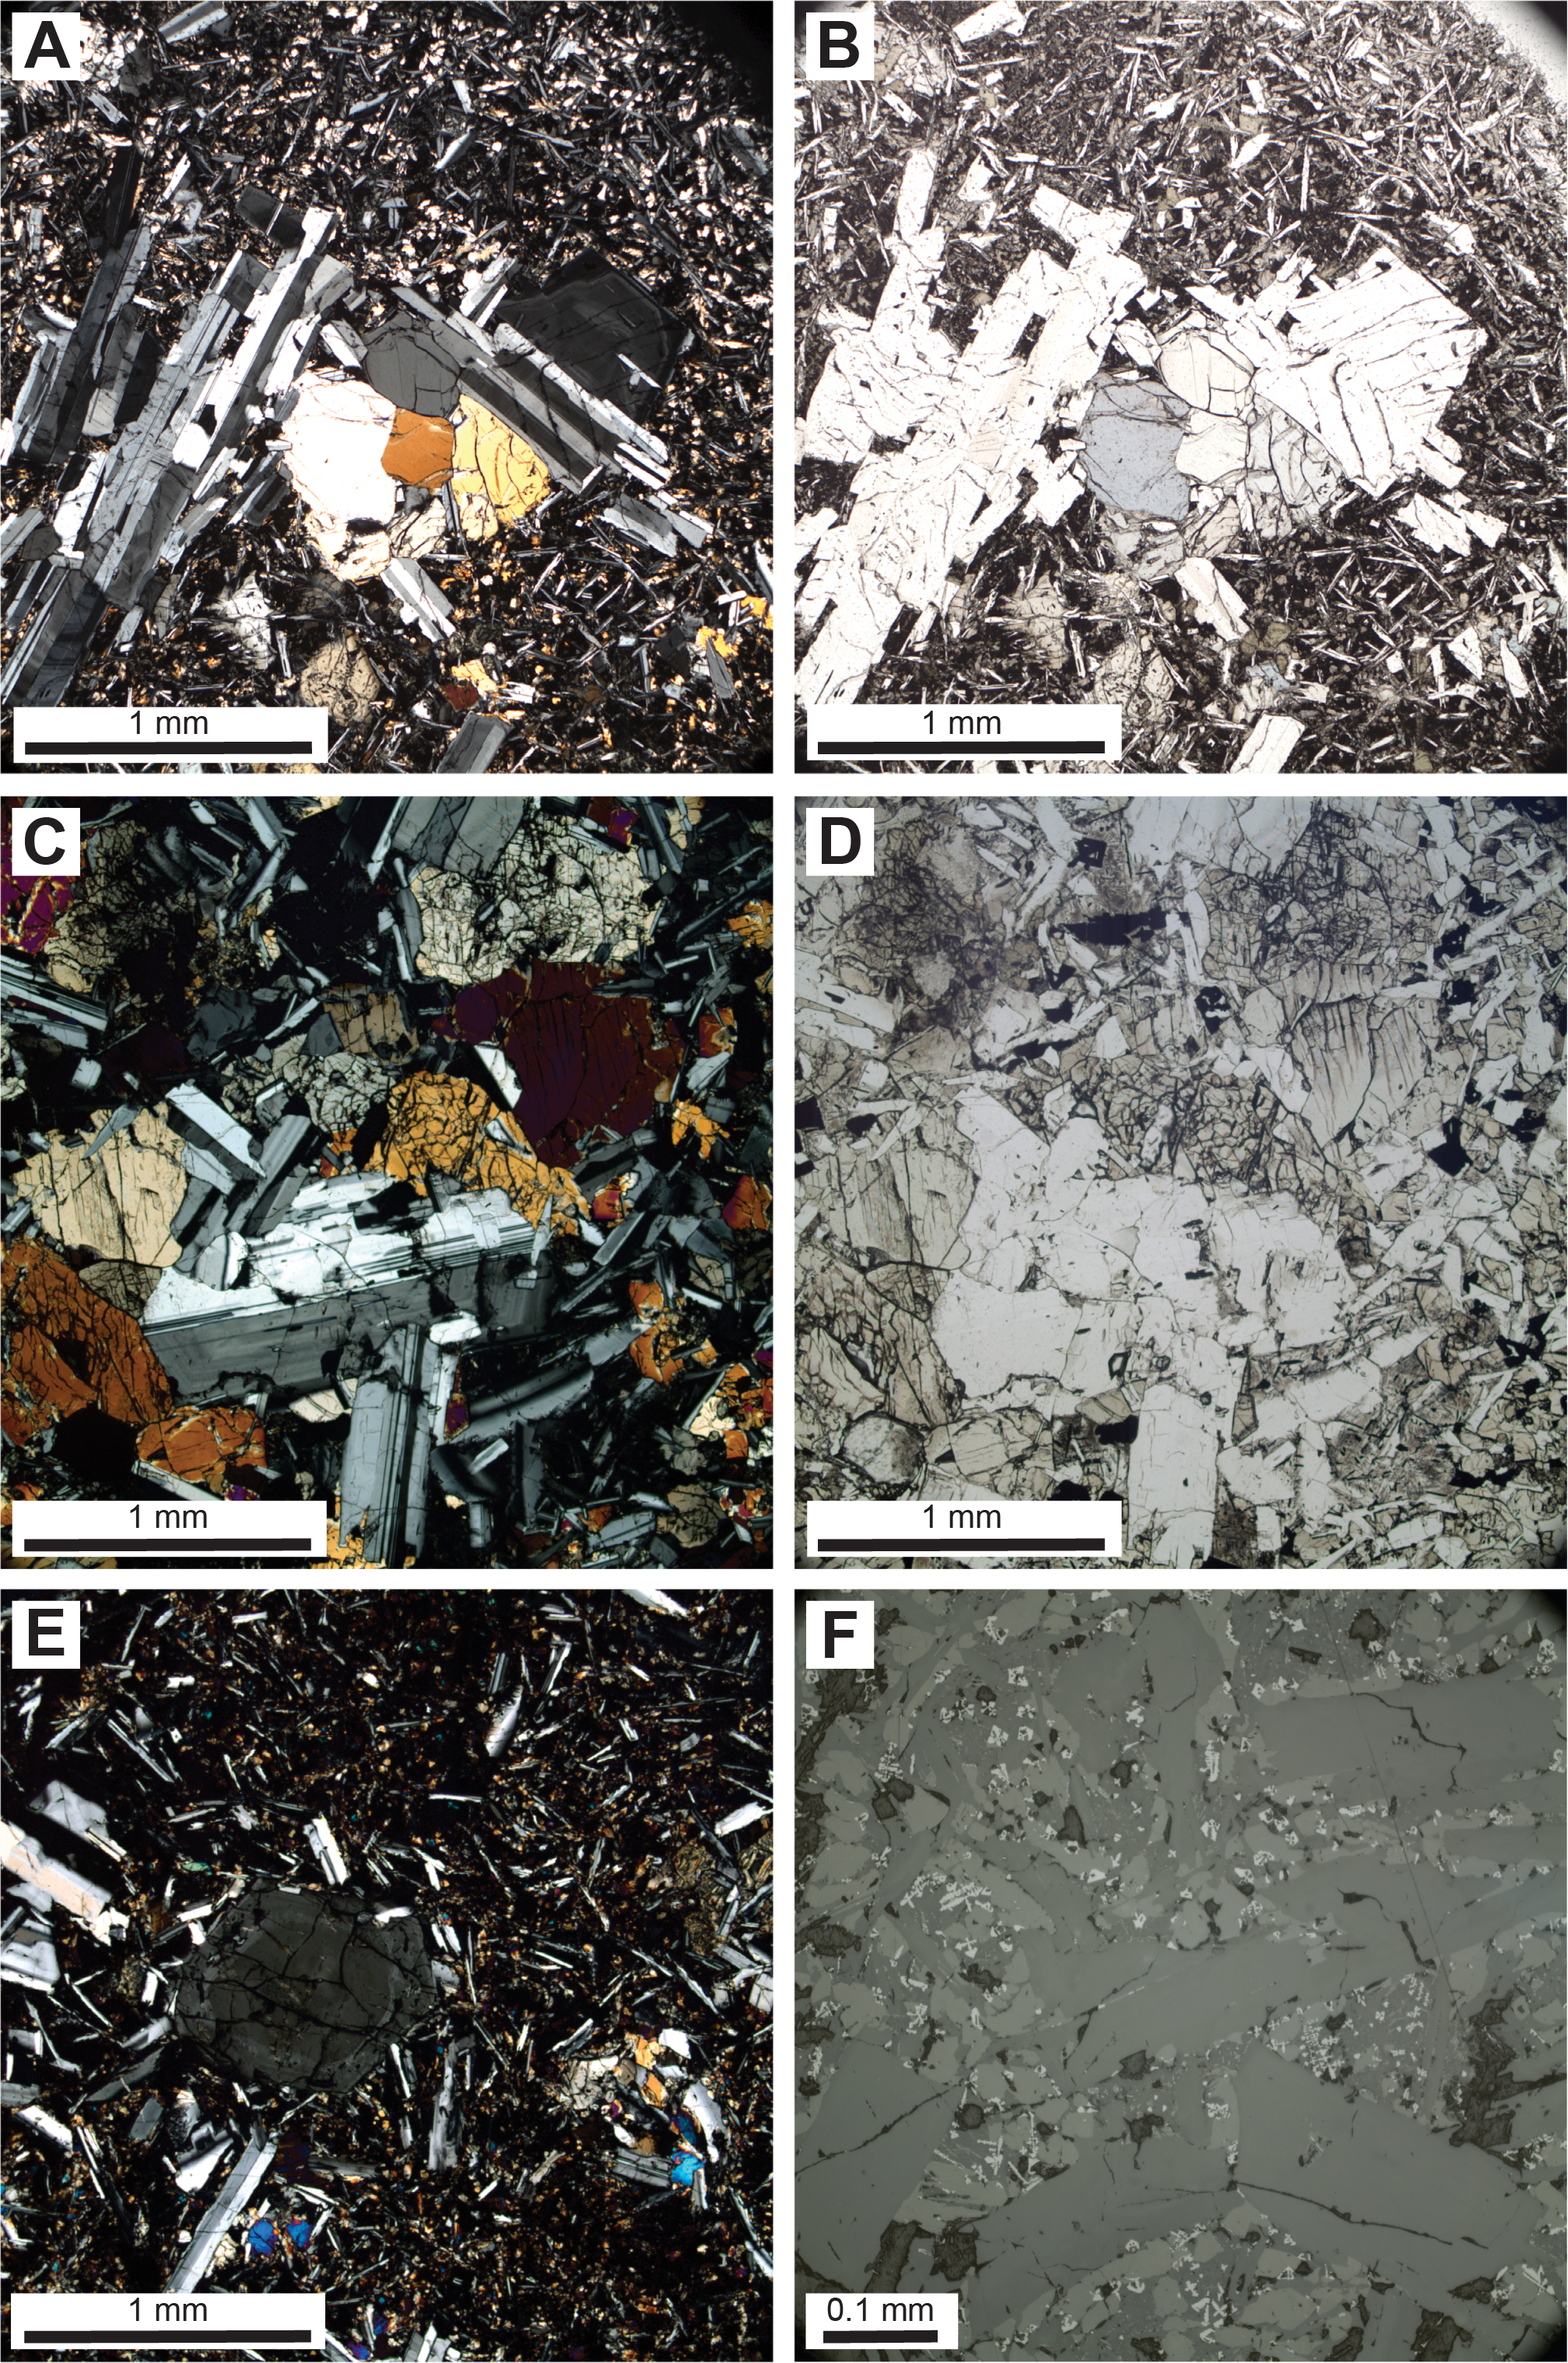
Figure F18. Massive lavas.
4.2.2. Pillow lava
Pillow lavas contain plagioclase and clinopyroxene phenocrysts and glomerocrysts in the glassy rind and in the interior of the pillows (Figure F19). Olivine is also present in sparse amounts, but it has been completely replaced by iddingsite. Plagioclase phenocrysts and glomerocrysts occasionally exhibit oscillatory zoning and contain melt inclusions. Pyroxenes rarely exhibit zoning but can exhibit oscillatory zoning patterns. The glassy rinds consist of fresh basaltic glass with plagioclase microlites and bands of palagonite. Alteration halos are common around crystals in the glassy rind of the pillow. The pillow interiors have a highly altered matrix of highly oxidized glass with skeletal plagioclase groundmass crystals. Altered olivine is also present in the groundmass along with clinopyroxene and rare Fe oxides.

Figure F19. Pillow lavas.
4.3. Alteration in igneous units
All alteration in the basement igneous succession is due to low-temperature processes or ambient seafloor chemical weathering. Alteration intensity of the eruptive units is typically slight to occasionally moderate throughout with larger flow interiors presenting near-fresh materials except for olivine, which is commonly entirely replaced by iddingsite (i.e., a mixture of clay minerals and Fe oxyhydroxides). Other primary igneous minerals are typically retained, and only minor replacement is observed in feldspar (kaolinite) and occasional oxidative Fe oxyhydroxide films around pyroxenes. Fresh glass occurs at the margins of the pillow lavas and as remnants of glassy selvages at the tops of aphanitic chilled margins in the upper edges of some of the massive flows and rarely at the bases of massive flows. Otherwise, the glass is frequently altered to palagonite.
In effect, there are negligible quantities of secondary minerals throughout the volcanic sequence, but those that do occur are disseminated as within-crystal alteration (e.g., plagioclase) or oxidative films around crystals (e.g., pyroxene), and these changes impart minor color changes from unaltered blue-gray flow interiors to a light brown typical of upper margins and, to a lesser extent, the lower contacts of larger units. In the smaller sheet and lobate flow units, this brown alteration is more pervasive, extending over 70% of the flow interior. Pillow lavas typically display concentric alteration color extending from the outer glassy margin inward, and only larger pillows (>1 m) retain relatively unaltered interiors. The brown colors throughout the different units are likely the result of oxidation of primary ferromagnesian minerals, notably olivine when present (to iddingsite) and to a lesser extent pyroxene. Formation of small quantities of secondary Fe oxyhydroxides imparts an increasingly brown cast as alteration progresses.
It is probable that the greater part of the oxidative alteration occurred shortly after eruption as the rapidly cooling lava unit interacted with seawater, often further facilitated by the development of cooling fractures in the brittle outer flow crust. Fracturing allowed ingress of fluids and likely accounts for the broader oxidation zones in the upper parts of larger flows to a depth of 0.1–1 m depending on flow size compared with somewhat thinner alteration zones in the unit base. Where cooling fractures are absent in the flow interiors, discoloration and, hence, alteration are at a minimum.
In the major massive flows, cooling fractures commonly extend into a finer, anastomosing vein network in the uppermost third of the unit. Calcite infilling is typical in the upper parts of these networks, and Fe oxyhydroxide fillings are associated with the lower networks and impinge into the upper interior region of the larger flows. Rarely, alteration has liberated silica from the primary silicates, which were redeposited as vein infillings or, in one exceptional instance, as a large geode with euhedral calcite crystals within a void (interval 391-U1575A-31R-1, 83–88 cm); the origin of the void is unclear, but it may have been a gas-filled cavity (Figure F20). Pillow lavas contain radial fractures that penetrate the center of the unit, enabling pervasive moderate alteration throughout the pillow.
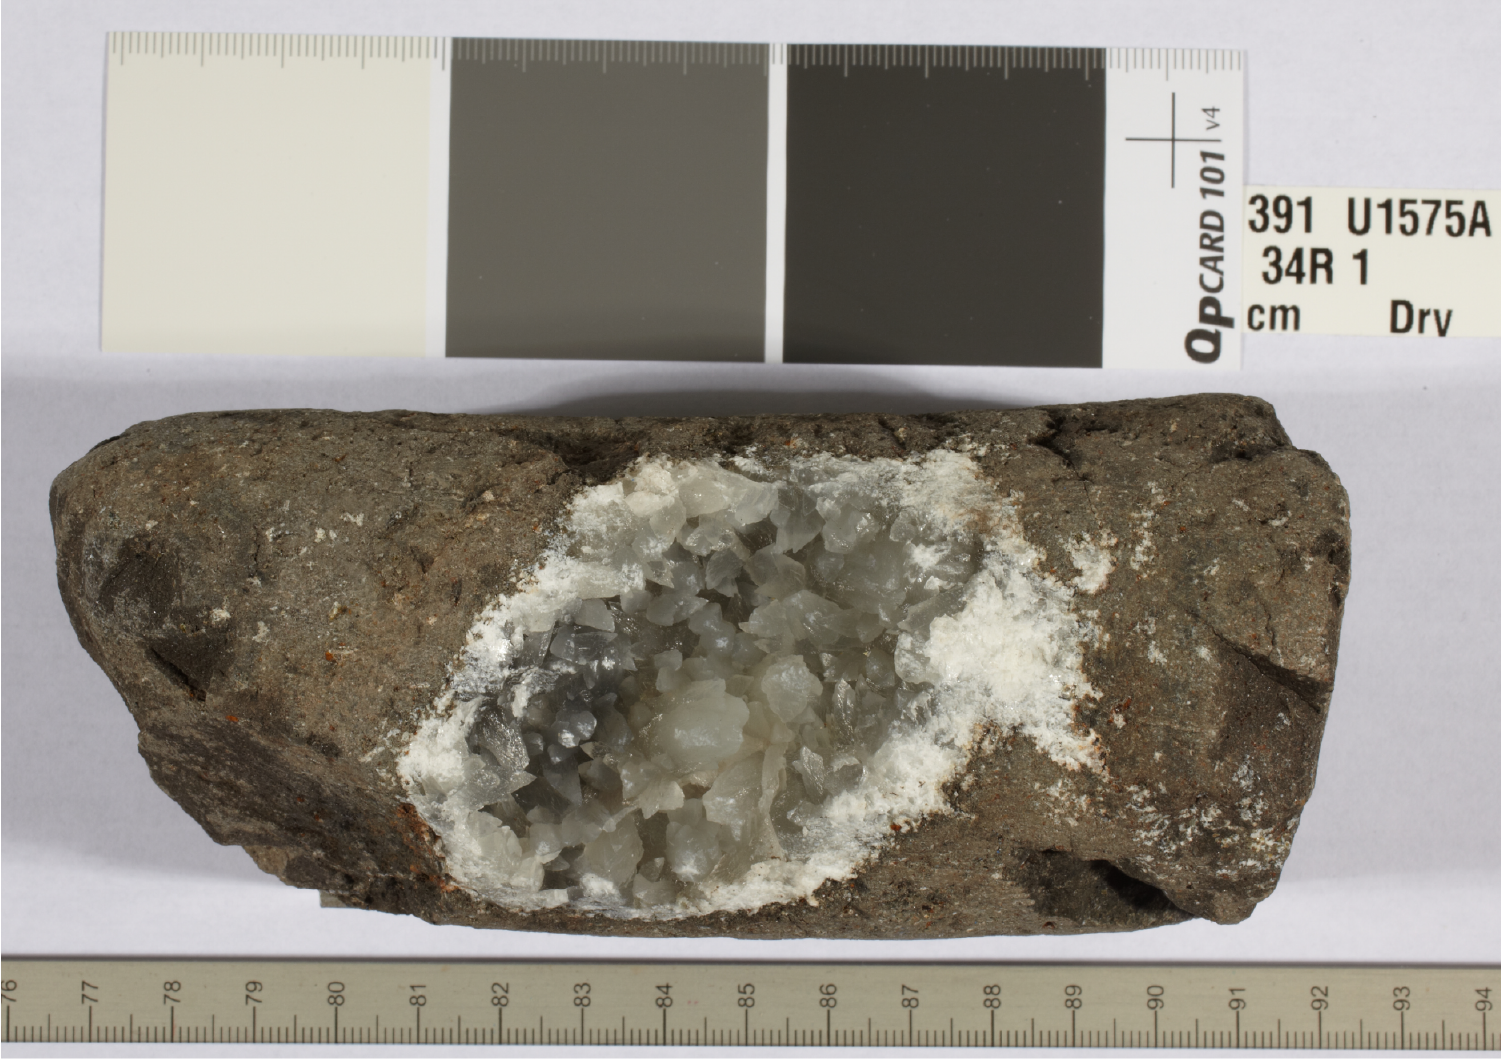
Figure F20. Sparry calcite crystals.
Vesicles are rare, typically occurring as round isolated voids (<1 mm), rare vesicle segregations, or pipe vesicle zones in the interior regions of the largest flows. Vesicle infill is typically calcite or microcrystalline silica (chalcedony). The latter can be observed with a binocular microscope occurring as coalescing botryoidal growths in larger vesicles and voids.
In places, the igneous sequence is associated with pelagic carbonate deposits, which occur on top of the uppermost massive flow, and associated materials that percolated into the flow interior via jointing. Elsewhere, pillow lavas interacted with thin sedimentary layers. Here, the carbonate was fluidized and thermally altered (i.e., marbleized) (see fragments in interval 391-U1575A-39R-3, 0–50 cm). Where the eruptive units are associated with carbonate cover calcite veining, sparry calcite commonly occurs (e.g., intervals 391-U1575A-22R-6, 70–80 cm, and 39R-4, 36–70 cm) (Figure F20).
4.4. Discussion
The lavas in Hole U1575A reveal remarkable textural and mineralogical consistency with subtle variations in groundmass grain size and moderate changes in phenocryst abundance, often (but not always) associated with proximity to flow boundaries. The upper units at Site U1575 are defined mostly by changing eruptive styles of basaltic lavas rather than compositional differences. However, beginning with Section 391-U1575A-35R-2, a notable difference in chemistry accompanies the volcanological boundary within the upper units. The low-TiO2 lavas are mineralogically distinct in that they are dominantly olivine free and consistently contain lower plagioclase and clinopyroxene abundances. These low-TiO2 lavas may indicate a shift from mildly alkaline to more tholeiitic compositions. Transitional to high-TiO2 lavas mark a return to phenocryst proportions similar to the upper, high-TiO2 units and, therefore, possibly a return to mildly alkaline lavas.
A major break in phenocryst distribution occurs in Hole U1575A at ~245 mbsf between Igneous Subunits 3d and 3e (Figure F21). Above this depth, the basalts are generally highly phyric with more than 10% phenocrysts (plagioclase-pyroxene-olivine). In contrast, below this depth the basalts range from aphyric to sparsely or moderately phyric with less than 10% total phenocrysts. This is not simply a function of the cooling rate because the transition occurs within a unit comprising pillow and sheet lava flows, and massive flows are found above and below. Furthermore, the phenocryst abundance does not correlate with composition. Units with low phenocryst abundances include all three TiO2 chem types: low TiO2, high TiO2, and transitional.

Figure F21. Phenocryst loads.
The change in phenocryst abundance most likely reflects storage and eruption dynamics of the magmatic systems, with high crystal loads resulting from longer residence times in shallow magma chambers or from eruption of crystal mushes.
5. Biostratigraphy
Calcareous nannofossils and planktonic foraminifera provided preliminary zonal and stage assignments for sediments recovered at Site U1575. A 210 m thick succession of sediments was recovered, ranging in age from the Pleistocene through the Upper Cretaceous (Campanian). For shipboard analyses, we considered first occurrence (FO) and last occurrence (LO) datums for planktonic foraminifera and calcareous nannofossils.
Figure F22 shows calcareous nannofossil and planktonic foraminifera biohorizon ages (see Lithostratigraphy). The age-depth model (Figure F23) was obtained by plotting biostratigraphic data against depth (mbsf scale). Chronostratigraphic boundaries are from the 2020 geologic timescale (GTS; Gradstein et al., 2020). Biostratigraphic zonations for calcareous nannofossils and planktonic foraminifera can be found in Tables T2 and T3, respectively.
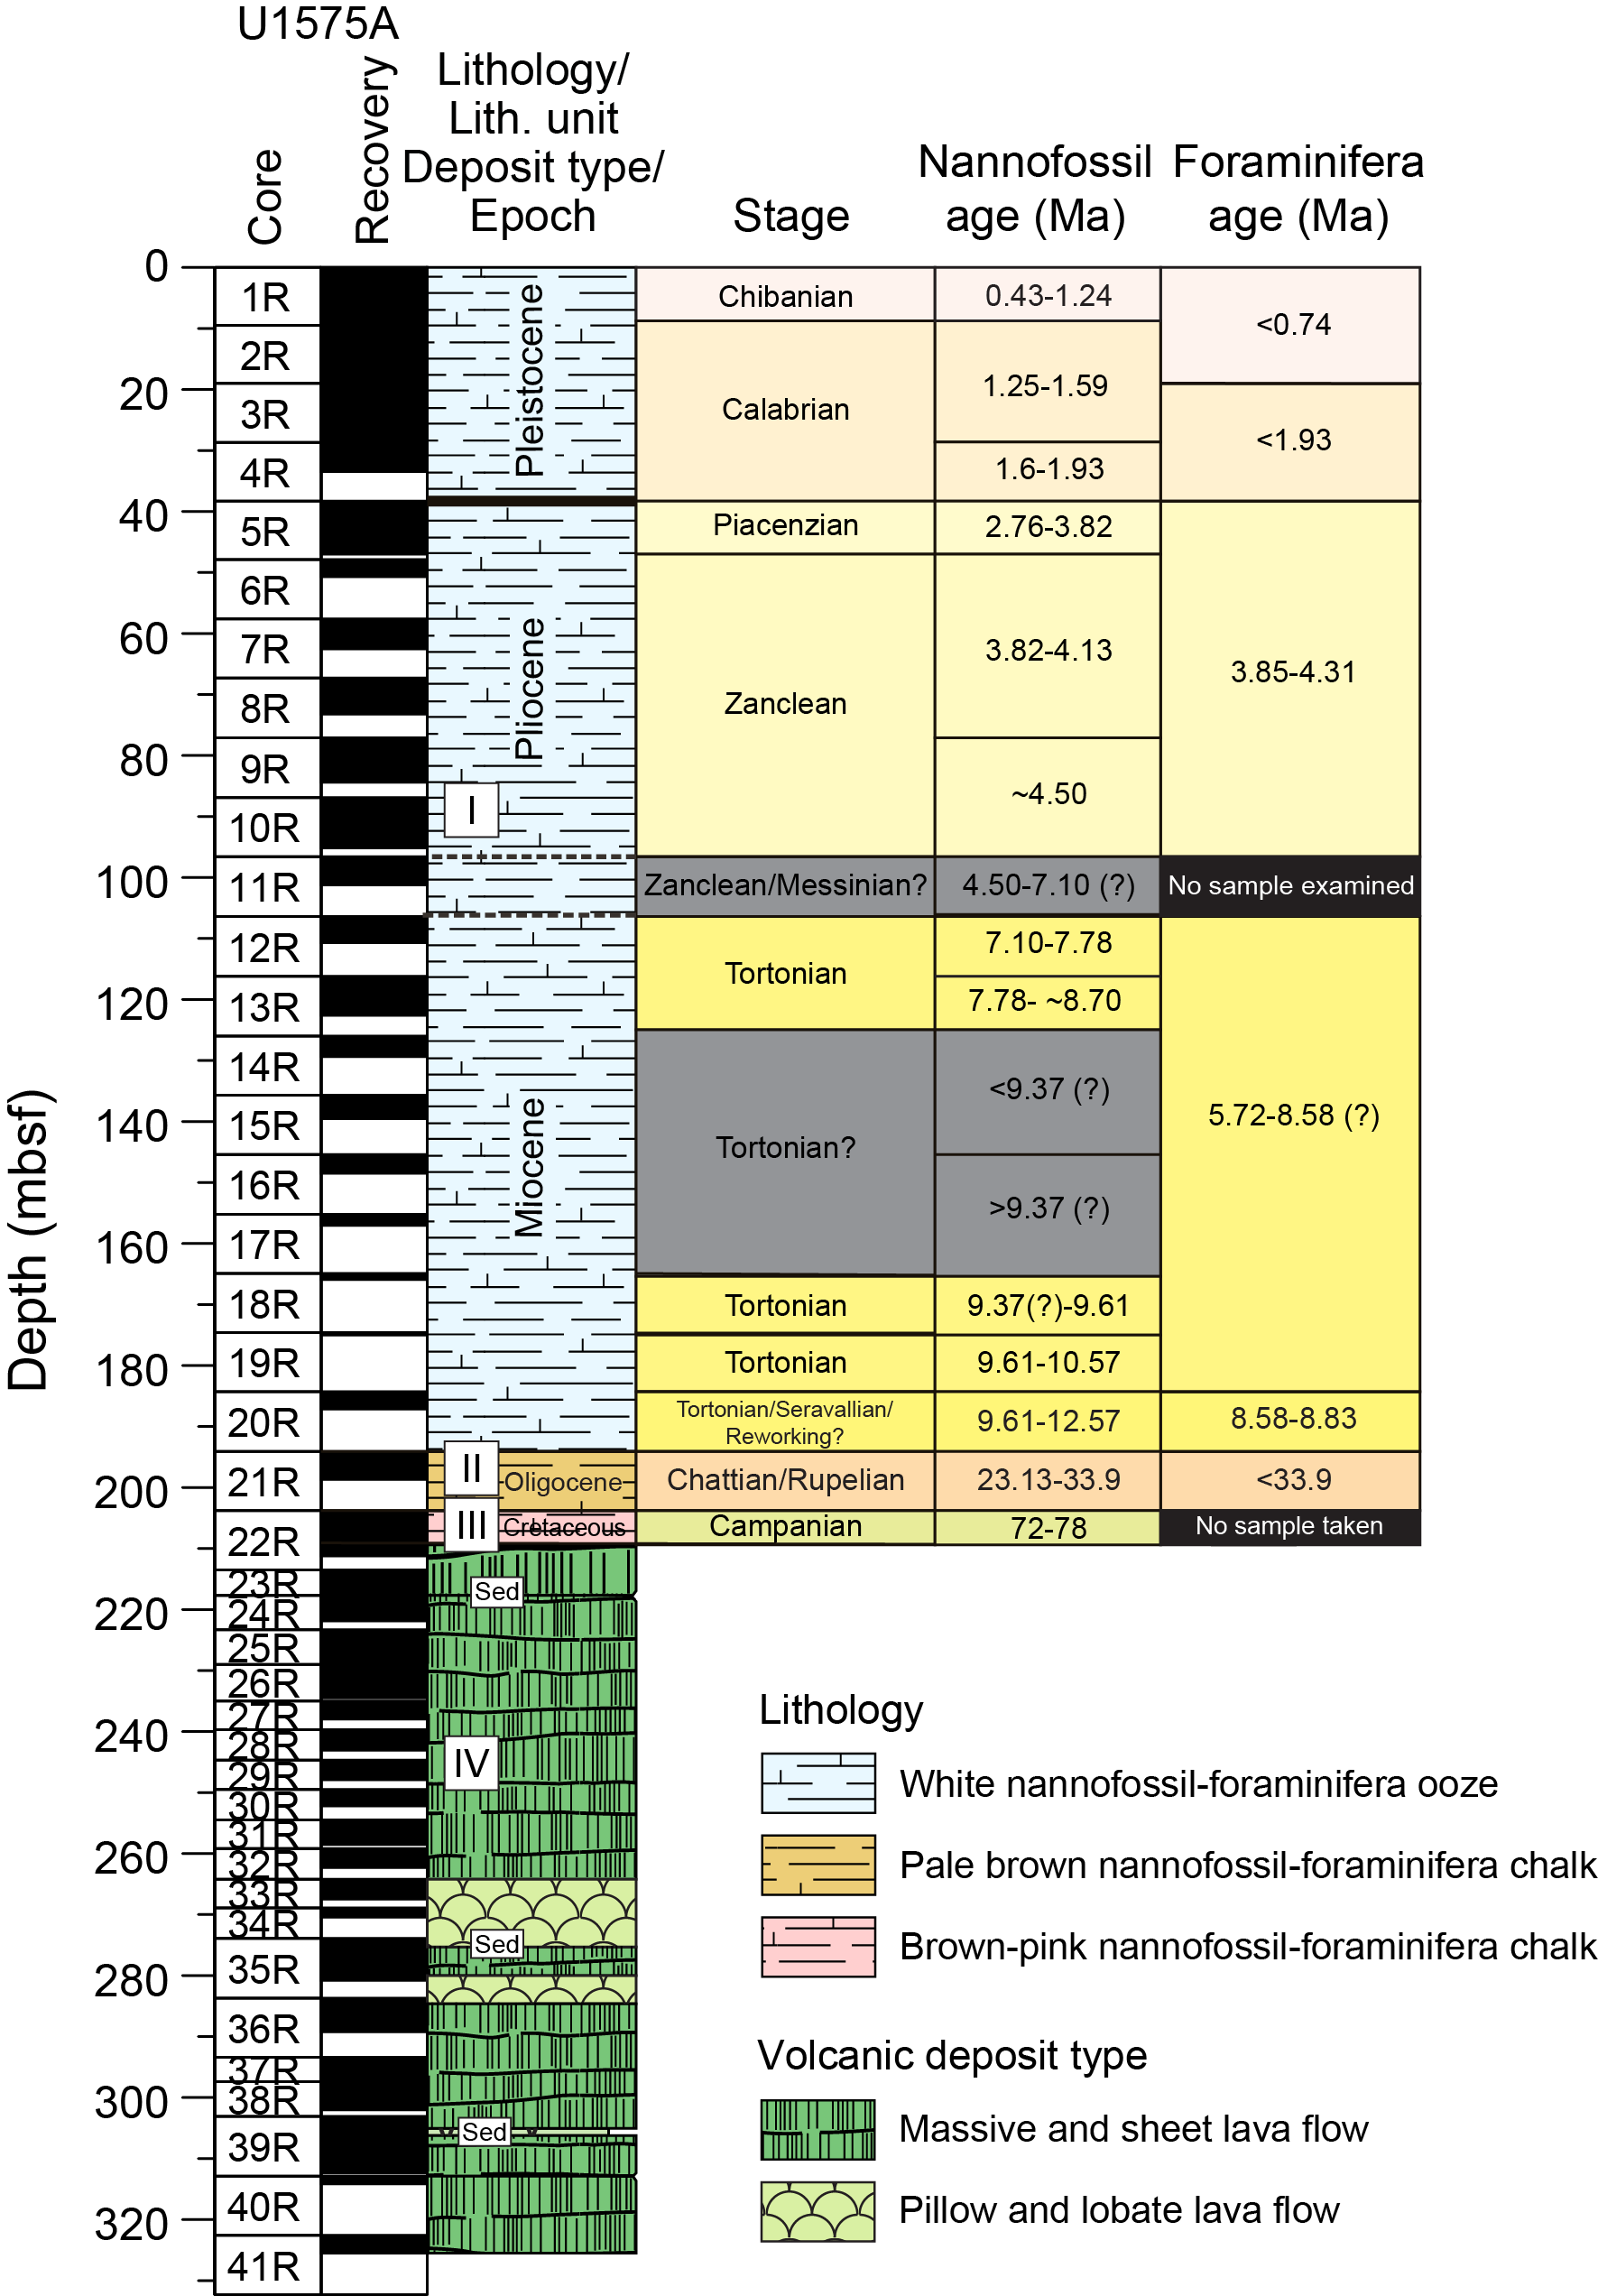
Figure F22. Correlated lithostratigraphy and biostratigraphy.
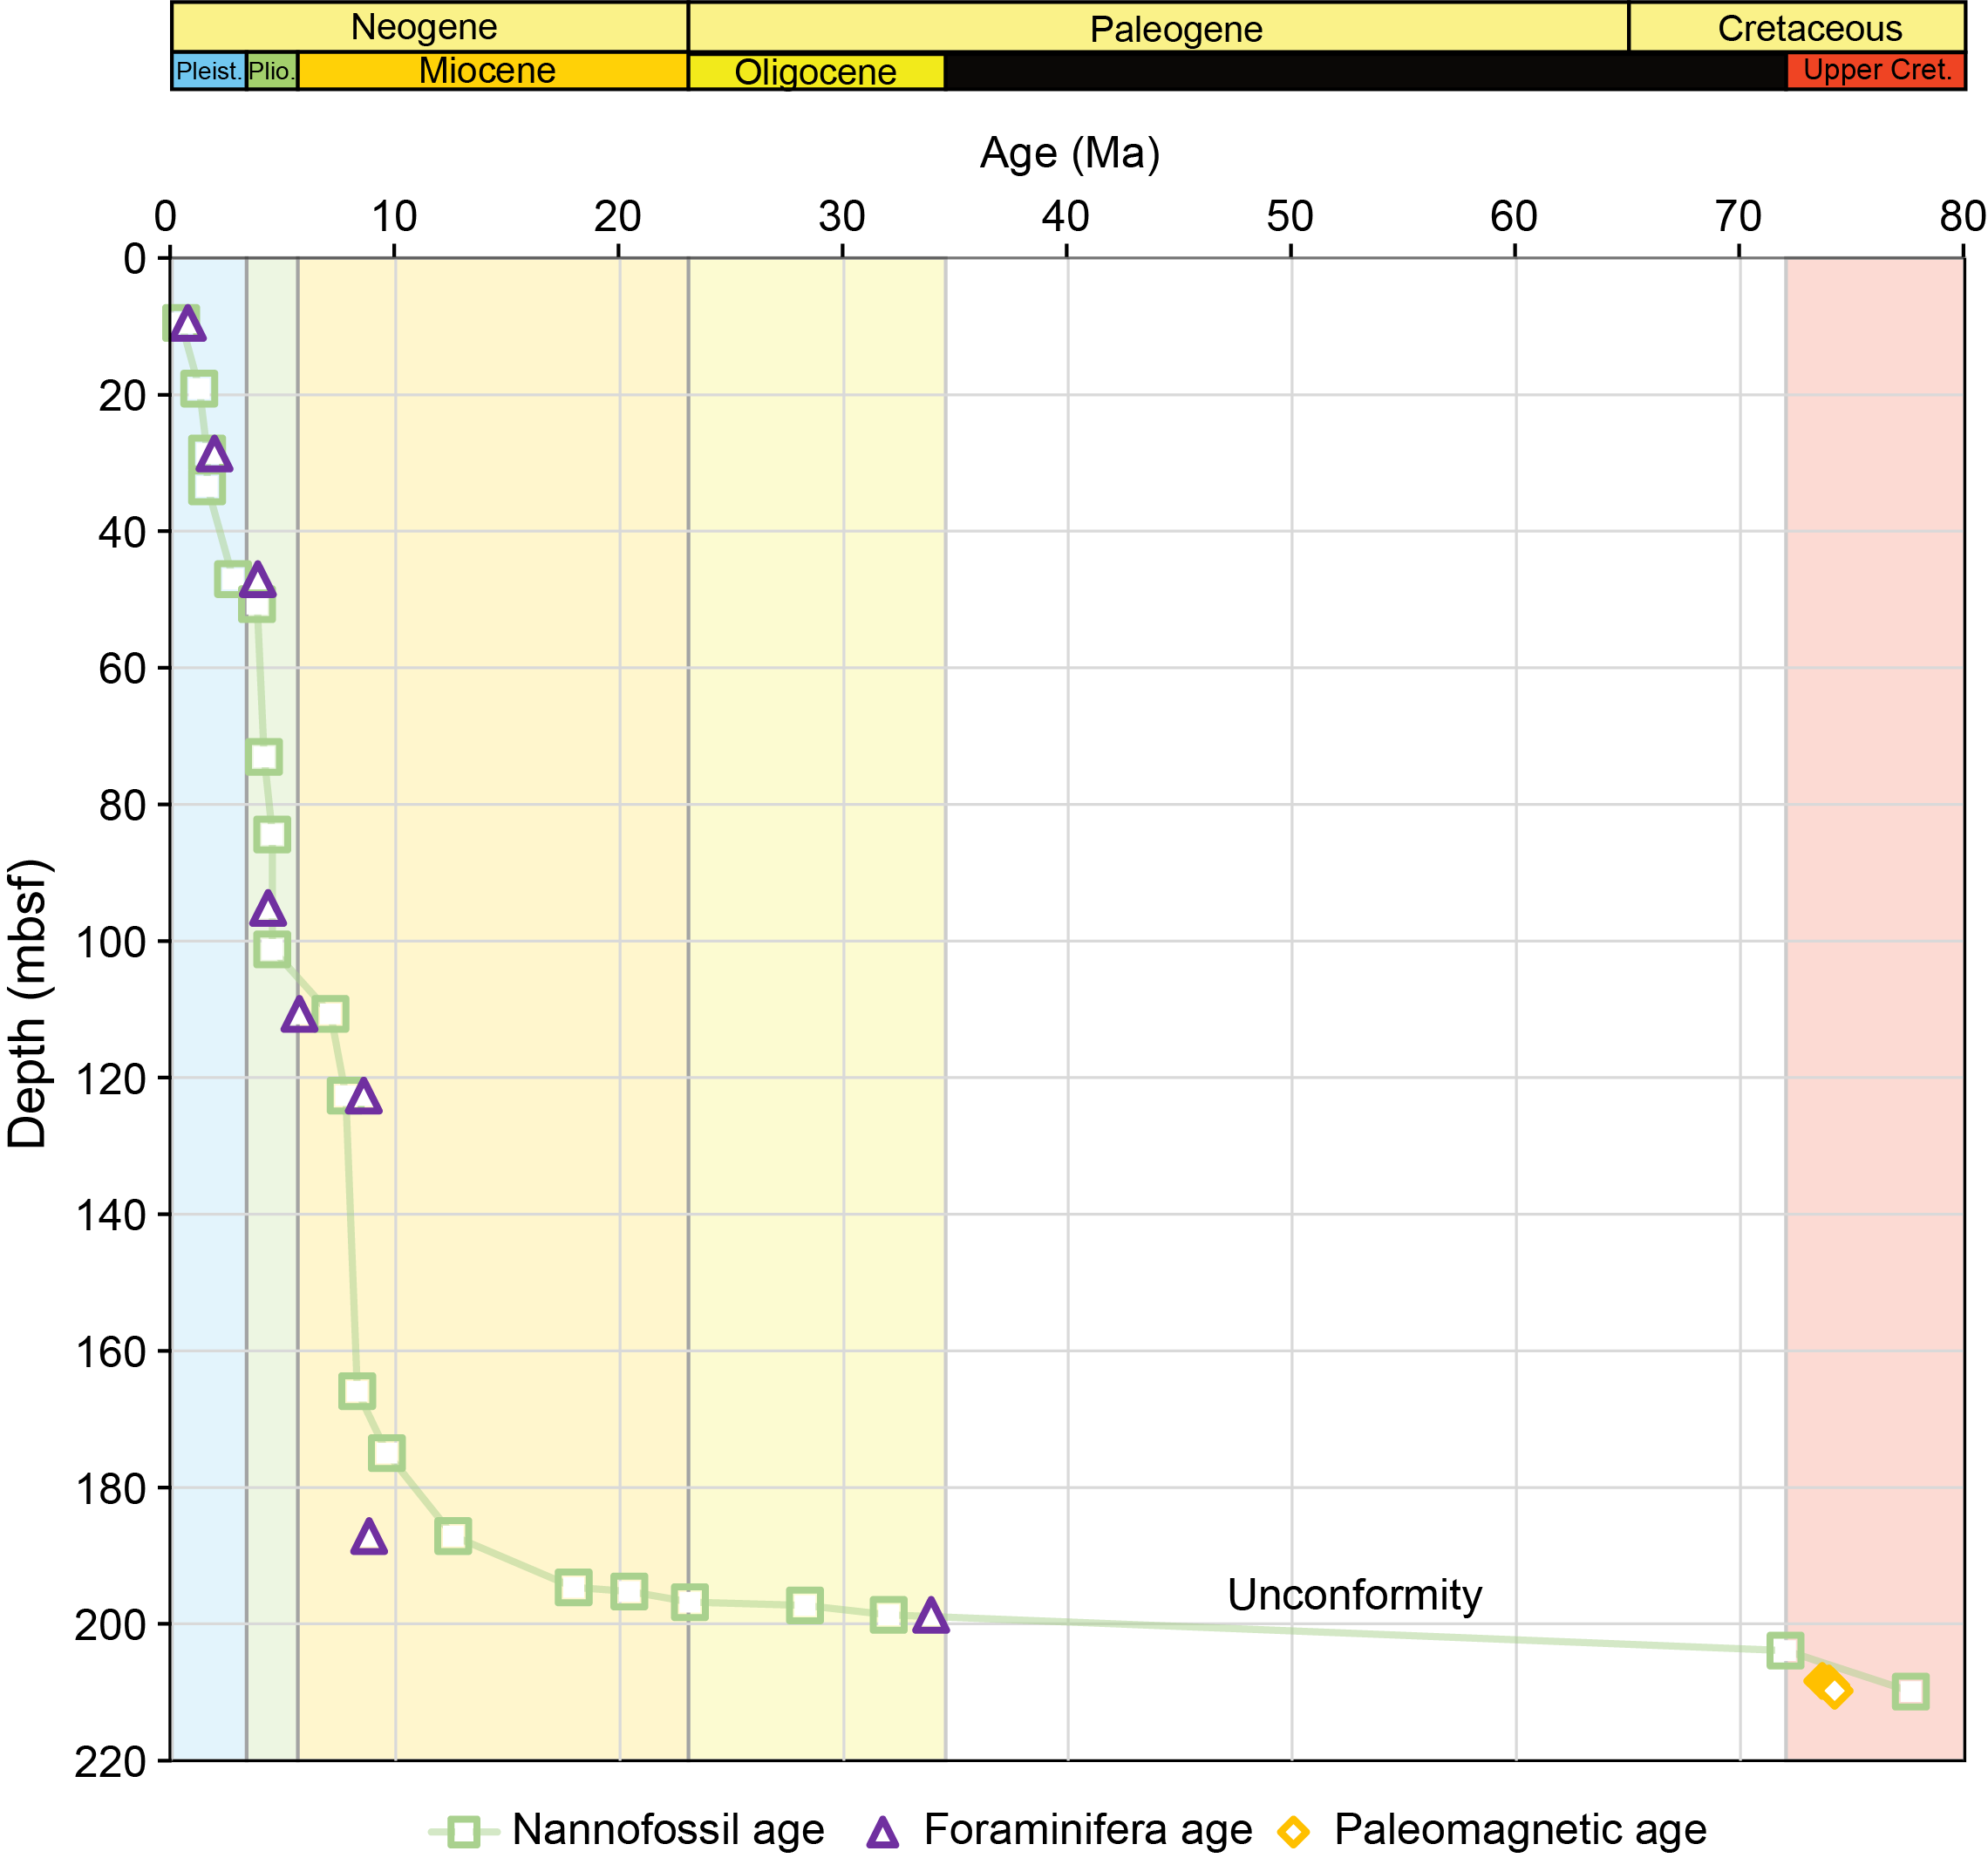
Figure F23. Age-depth model.
5.1. Calcareous nannofossils
Calcareous nannofossil assemblages were examined in core catcher samples from Hole U1575A. A total of 21 core catcher samples were studied, and additional toothpick samples were taken where possible for increased biostratigraphic rigor. Ages and depths of key biostratigraphic markers are provided below on a preliminary basis. Core 22R recovered the transition from sediment to basement. No sediment was recovered in the core catcher. Two toothpick samples were taken (22R-1, 11–12 cm, and 22R-5, 27–28 cm) to provide an age range from the top of Core 22R to the sediment just above the basement.
Nannofossil abundance is extremely high throughout the hole, and almost every sample is considered a flood (for abundance scale, see Biostratigraphy in the Expedition 391 methods chapter [Sager et al., 2023]). Preservation is moderate to good in every sample, with varying degrees of overgrowth and etching throughout. Assemblages are moderately diverse except for Sections 391-U1575A-15R-CC through 17R-CC, where assemblages decrease sharply in diversity. This coincides with an inability to confidently assign ages to these samples, which are discussed below.
5.1.1. Pleistocene to Pliocene
A fairly continuous succession of Pleistocene through Pliocene sediments is recorded in Sections 391-U1575A-1R-CC through 11R-CC. Trace Cretaceous reworking is observed at the top of this depth interval (Sample 1R-CC) and is easily discernible from in situ assemblages during this period. Sample 1R-CC is bounded by the occurrence of Pseudoemiliania lacunosa and the absence of Helicosphaera sellii, giving it an age range of 0.43–1.24 Ma. Samples 2R-CC and 3R-CC are constrained by the occurrence of Gephyrocapsa spp. (>5.5 µm) with H. sellii and the absence of Calcidiscus macintyrei, giving it an age range of 1.25–1.60 Ma. Sample 4R-CC is constrained by the occurrence of C. macintyrei and the absence of Discoaster brouweri, providing an age range of 1.60–1.93 Ma. Sample 5R-CC is constrained by the occurrence of Discoaster tamalis and the absence of Reticulofenestra pseudoumbilicus, providing an age range of 2.76–3.82 Ma. Samples 6R-CC to 8R-CC are constrained by the occurrence of R. pseudoumbilicus and D. tamalis, giving an age range of 3.82–4.13 Ma. The presence of R. pseudoumbilicus in Sample 6R-CC indicates that the Pleistocene/Pliocene boundary is likely contained in Core 5R or Section 6R-CC. Sample 9R-CC is defined by the highest observed specimen of Amaurolithus primus, providing an age of ~4.50 Ma. Samples 10R-CC and 11R-CC provide no new age diagnostic markers. Typical upper Messinian markers such as Discoaster quinqueramus are not observed; therefore, these samples are considered to be lower Pliocene (i.e., Zanclean) in age.
5.1.2. Miocene to Oligocene
The calcareous nannofossil assemblages (Sections 391-U1575A-12R-CC through 21R-CC) proved to be much more complicated than the younger succession. Characterized by possibly large hiatuses, poor recovery, and mixed assemblages, many age determinations are provided with low confidence. High-resolution examination of core sections will be required to discern the best age framework of this section. Even with high-resolution study, the drilling disturbance from rotary coring will provide immense challenges in separating in situ and reworked assemblages. With that in mind, nannofossil assemblages in several core catchers provided remarkably well preserved assemblages of upper Miocene (Tortonian) and Oligocene nannofossils and yield a decent starting age constraint for the bottom half of the sediments at Site U1575.
Sample 391-U1575A-12R-CC is constrained by the disappearance of R. pseudoumbilicus and the absence of Mynilitha convallis, providing an upper Miocene age range of 7.10–7.78 Ma. Although R. pseudoumbilicus disappears in the lowest part of the Messinian (Gradstein et al., 2020), this sample has been assigned to the uppermost Tortonian based on an assemblage that lacks typical Messinian 5-ray discoasters and contains characteristic Tortonian discoasters, namely Discoaster loeblichii and Discoaster calcaris. The latter taxon is widely used in Gulf of Mexico biostratigraphy for oil drilling operations as a Tortonian bioevent. It is not used as a bioevent here because it lacks context within the 2020 GTS (Gradstein et al., 2020). Sample 13R-CC is constrained by the occurrence of M. convallis and is assigned an age of 7.78 to ~8.70 Ma.
Samples 391-U1575A-14R-CC to 17R-CC contain an assemblage change from the previous two core catchers in that many of the discoaster species drop out with an influx of Tortonian biomarker Reticulofenestra rotaria, which was not observed above. It is difficult to determine whether this age should be assigned as younger than Samples 12R-CC and 13R-CC, which would require that the first Tortonian ages must be from slumped sediments or some other mass transport. The succession of nannofossil/foraminiferal ooze makes it likely that such a depositional feature would not be picked up in seismic profiles or in depositional features in cores (which are almost completely obscured in this hole throughout the succession of calcareous ooze). However, the persistence of common Discoaster pentaradiatus enables us to assign a tentative age of <9.37 Ma for Samples 14R-CC and 15R-CC. D. pentaradiatus abundance sharply decreases in Samples 16R-CC and 17R-CC, suggesting that these samples are older than 9.37 Ma, which is an age assigned to the base of common D. pentaradiatus (Gradstein et al., 2020).
Sample 391-U1575A-18R-CC contains the stratigraphically highest observed Discoaster prepentaradiatus and is constrained by the absence of Discoaster hamatus. This sample is tentatively assigned an age of 8.29–9.61 Ma. Sample 19R-CC contains the highest observed D. hamatus and is constrained by its entire range of 9.61–10.57 Ma.
It is difficult to assign a confident age to Sample 391-U1575A-20R-CC. Its assemblage still contains D. hamatus, but there is an influx of Serravallian fossils such as Coronocyclus nitescens and Cyclicargolithus floridanus, which should not overlap in typical stratigraphic succession. It is possible that the older taxa are reworked or that a sharp unconformity has brought these assemblages together through time averaging. More samples are needed to properly assess the nature of the complexity.
Sample 391-U1575A-21R-CC contains a large gap in time from the aforementioned late Miocene to the lowest Oligocene (Rupelian), characterized by the occurrence of Reticulofenestra umbilicus with an excellently preserved assemblage of typical lower Oligocene nannofossils. Higher sample resolution between Samples 20R-CC and 21R-CC is needed to determine whether there is a condensed or missing section between the samples.
5.1.3. Cretaceous (Campanian)
A small section of pink chalk was recovered from the basal sediments in the deepest core that recovered sediment. Two toothpick samples were analyzed to determine the age of this sediment. Sample 391-U1575A-22R-1, 11 cm, contains a typical late Campanian assemblage, including Broinsonia parca constricta, Broinsonia parca parca, Uniplanarius gothicus, Uniplanarius trifidus, and diverse Upper Cretaceous Prediscosphaera spp. and Eiffelithus spp. (not including Eiffelithus eximius). The presence of B. parca parca and the absence of E. eximius give this sample an age of 74.59–77 Ma. Sample 22R-5, 27–28 cm, contains the stratigraphically highest observed E. eximius. The presence of Uniplanarius sissinghi and the absence of U. trifidus allows this sample to be tentatively constrained between 77 and 78 Ma, making the oldest age of sediment just above basement approximately middle Campanian.
5.2. Planktonic foraminifera
Planktonic foraminifera were examined in a total of 13 core catcher samples. Planktonic foraminifera dominate assemblages in all samples, whereas benthic foraminifera are rare. Very rare ostracod shells were also observed. Foraminifera range in age from Pleistocene to (possibly) Oligocene. Preservation is generally good, with planktonic individuals exhibiting very low evidence of dissolution and overgrowth. Pleistocene and Pliocene samples contain a low number of test fragments. Fragmentation increases in Sample 391-U1575A-21R-CC, in which most specimen tests were broken.
5.2.1. Pleistocene to Pliocene
Pleistocene fauna were recovered from Samples 391-U1575A-1R-CC and 2R-CC. Planktonic foraminifera assemblages in the aforementioned samples consist of subtropical and temperate forms with abundant Globoconella inflata and common Globorotalia crassaformis, Globigerina bulloides, and Globorotalia truncatulinoides. Globigerinella siphonifera, Globorotalia hessi, Globorotalia scitula, Globigerinoides ruber, Neogloboquadrina dutertrei, and Trilobatus spp. occur in lower abundances. Very rare species include Globorotalia ungulata, Pulleniatina finalis, Pulleniatina obliquiloculata, and Sphaeroidinella dehiscens. Sediments from Samples 1R-CC and 2R-CC are younger than 0.74 Ma and assigned to Zones PT1b and PT1a based on the presence of G. hessi (FO = 0.74 Ma; Gradstein et al., 2020). Globorotalia tosaensis was not recovered in Hole U1575A. The Pleistocene/Pliocene boundary was not recognizable due to the absence of the index taxon Globigerinoidesella fistulosa.
Planktonic foraminifera in Samples 391-U1575A-3R-CC and 4R-CC include abundant to common G. inflata and G. crassaformis. Samples also contain a low amount of G. siphonifera, G. scitula, P. obliquiloculata, G. ruber, and Trilobatus spp. Samples 3R-CC and 4R-CC are dated older than 0.74 Ma but younger than 1.93 Ma based on the absence of G. hessi (FO = 0.74 Ma; Gradstein et al., 2020) and the presence of G. truncatulinoides (FO = 1.93 Ma; Gradstein et al., 2020).
Samples 391-U1575A-5R-CC to 10R-CC contain lower Pliocene (Zanclean) planktonic foraminifera. Globoconella puncticulata and G. crassaformis are common components of the assemblage, whereas Globorotalia margaritae, G. scitula, G. ruber, and Trilobatus spp. show lower abundances. Few specimens of Globoconella miotumida and Sphaeroidinellopsis kochi in Samples 6R-CC to 10R-CC were also found in the assemblages. The presence of the aforementioned taxa was considered reworked based on poorer preservation compared with the rest of the assemblage. Index taxa G. margaritae and G. crassaformis constrain the age of Samples 5R-CC to 10R-CC to between 3.85 Ma (LO G. margaritae; Gradstein et al., 2020) and 4.31 Ma (FO G. crassaformis sensu lato; Gradstein et al., 2020). Tropical/subtropical index taxa useful to divide the Pliocene–Miocene interval were not recorded at Site U1575.
5.2.2. Miocene
The late Miocene (Messinian–Tortonian) was detected in Samples 391-U1575A-12R-CC, 14R-CC, and 20R-CC. Planktonic foraminifer assemblages in Samples 12R-CC and 14R-CC contain common G. miotumida. The identified fauna also include Globoconella conomiozea, Globorotalia cf. merotumida, Neogloboquadrina acostaensis, Globoturborotalita nepenthes, Sphaeroidinella seminulina, and Globigerinoides extremus. G. conomiozea was tentatively used to provide age constraints for Samples 12R-CC and 14R-CC. Specifically, the sediment was dated older than the FO of G. conomiozea (5.72 Ma; Wei, 1994) and younger than its LO (8.58 Ma; Wei, 1994). Planktonic foraminifera in Sample 20R-CC include common G. miotumida, N. acostaensis, G. nepenthes, S. seminulina, and G. extremus. The core catcher material was dated older than 8.58 Ma (LO G. conomiozea) and younger than 8.83 Ma (FO G. extremus; Gradstein et al., 2020).
5.2.3. Oligocene
The planktonic foraminifera assemblage in Sample 391-U1575A-21R-CC is highly fragmented and dominated by specimens belonging to the dissolution-resistant genus Dentoglobigerina (e.g., Dentoglobigerina tripartita, Dentoglobigerina venezuelana, and Dentoglobigerina tapuriensis). Other species include Ciperoella anguliofficinalis, Globigerinella obesa, and Paragloborotalia nana. The absence of a clear index taxon made it difficult to constrain the age of sediments. The FO (33.90 Ma; Wade et al., 2018) and LO (22.90 Ma; Wade et al., 2018) of D. tapuriensis were tentatively used to provide a chronostratigraphic framework for Sample 21R-CC. Calcareous nannofossils provide a better evaluation for the same sample, constraining it to the early Oligocene (Rupelian).
6. Paleomagnetism
6.1. Sediments
6.1.1. Archive-half measurements
Paleomagnetic measurements of the archive halves of sediment RCB cores recovered from Hole U1575A (1R–21R) were conducted using the pass-through superconducting rock magnetometer (SRM) on board the ship. Natural remanent magnetization (NRM) was measured for all sediment cores. The uppermost cores (1R–19R) consist almost entirely of unconsolidated calcareous nannofossil ooze. Because of the soft nature of the ooze and the associated rapid core recovery, we applied a truncated alternating field (AF) demagnetization protocol to these cores, consisting of a single AF demagnetization step (10 mT) following the initial NRM measurements. More consolidated rocks from the base of the sedimentary section (Cores 21R and 22R) were demagnetized at AF levels of 5, 10, 15, and 20 mT after the initial NRM measurements. In all, 75 archive-half sections were measured.
6.1.2. Discrete sample measurements
Discrete samples were collected from unconsolidated sediments using plastic 7 cm3 Japanese-style sediment cubes, whereas cubic discrete samples from more lithified sediments were prepared using a dual-bladed circular saw. We collected 10 discrete samples from the upper calcareous ooze and 5 discrete samples from the more lithified basal sediments (totaling 15 sedimentary discrete samples). NRM values for cores dominated by calcareous ooze ranged in intensity from 10−6 to 10−3 A/m. Nearly all of these samples were generally too weak to be successfully measured using the shipboard AGICO JR-6A spinner magnetometer, although such measurements and AF demagnetization were attempted. Unconsolidated sediments from Site U1575 typically had weak magnetizations, often similar to the sample holder intensity of the SRM.
The NRMs of the five lithified basal sediment samples were successfully measured using the spinner magnetometer and ranged 10−3 to 101 A/m. These samples were subsequently AF demagnetized to at least 60 mT to remove overprints and reveal characteristic remanent magnetizations (ChRMs). The five discrete basal sediment samples generally contained low coercivity overprints that were removed by AF cleaning at 10 mT, which is consistent with being drilling induced (e.g., Acton et al., 2002). Demagnetization to higher AF levels revealed a single underlying magnetization component in each sample, but most of the higher coercivity components were unstable (i.e., maximum angular deviation values obtained from principal component analysis [PCA] were >15°) and not origin trending (although it is unclear whether this means these are not the primary components in the samples or whether a spurious remanence was acquired during AF demagnetization). We could obtain unconstrained best-fit directions for the highest coercivity magnetization component present in two discrete samples (Figure F24). We identified both positive and negative inclination characteristic magnetizations, which may be indicative of magnetic polarities if these magnetizations represent primary detrital remanence.
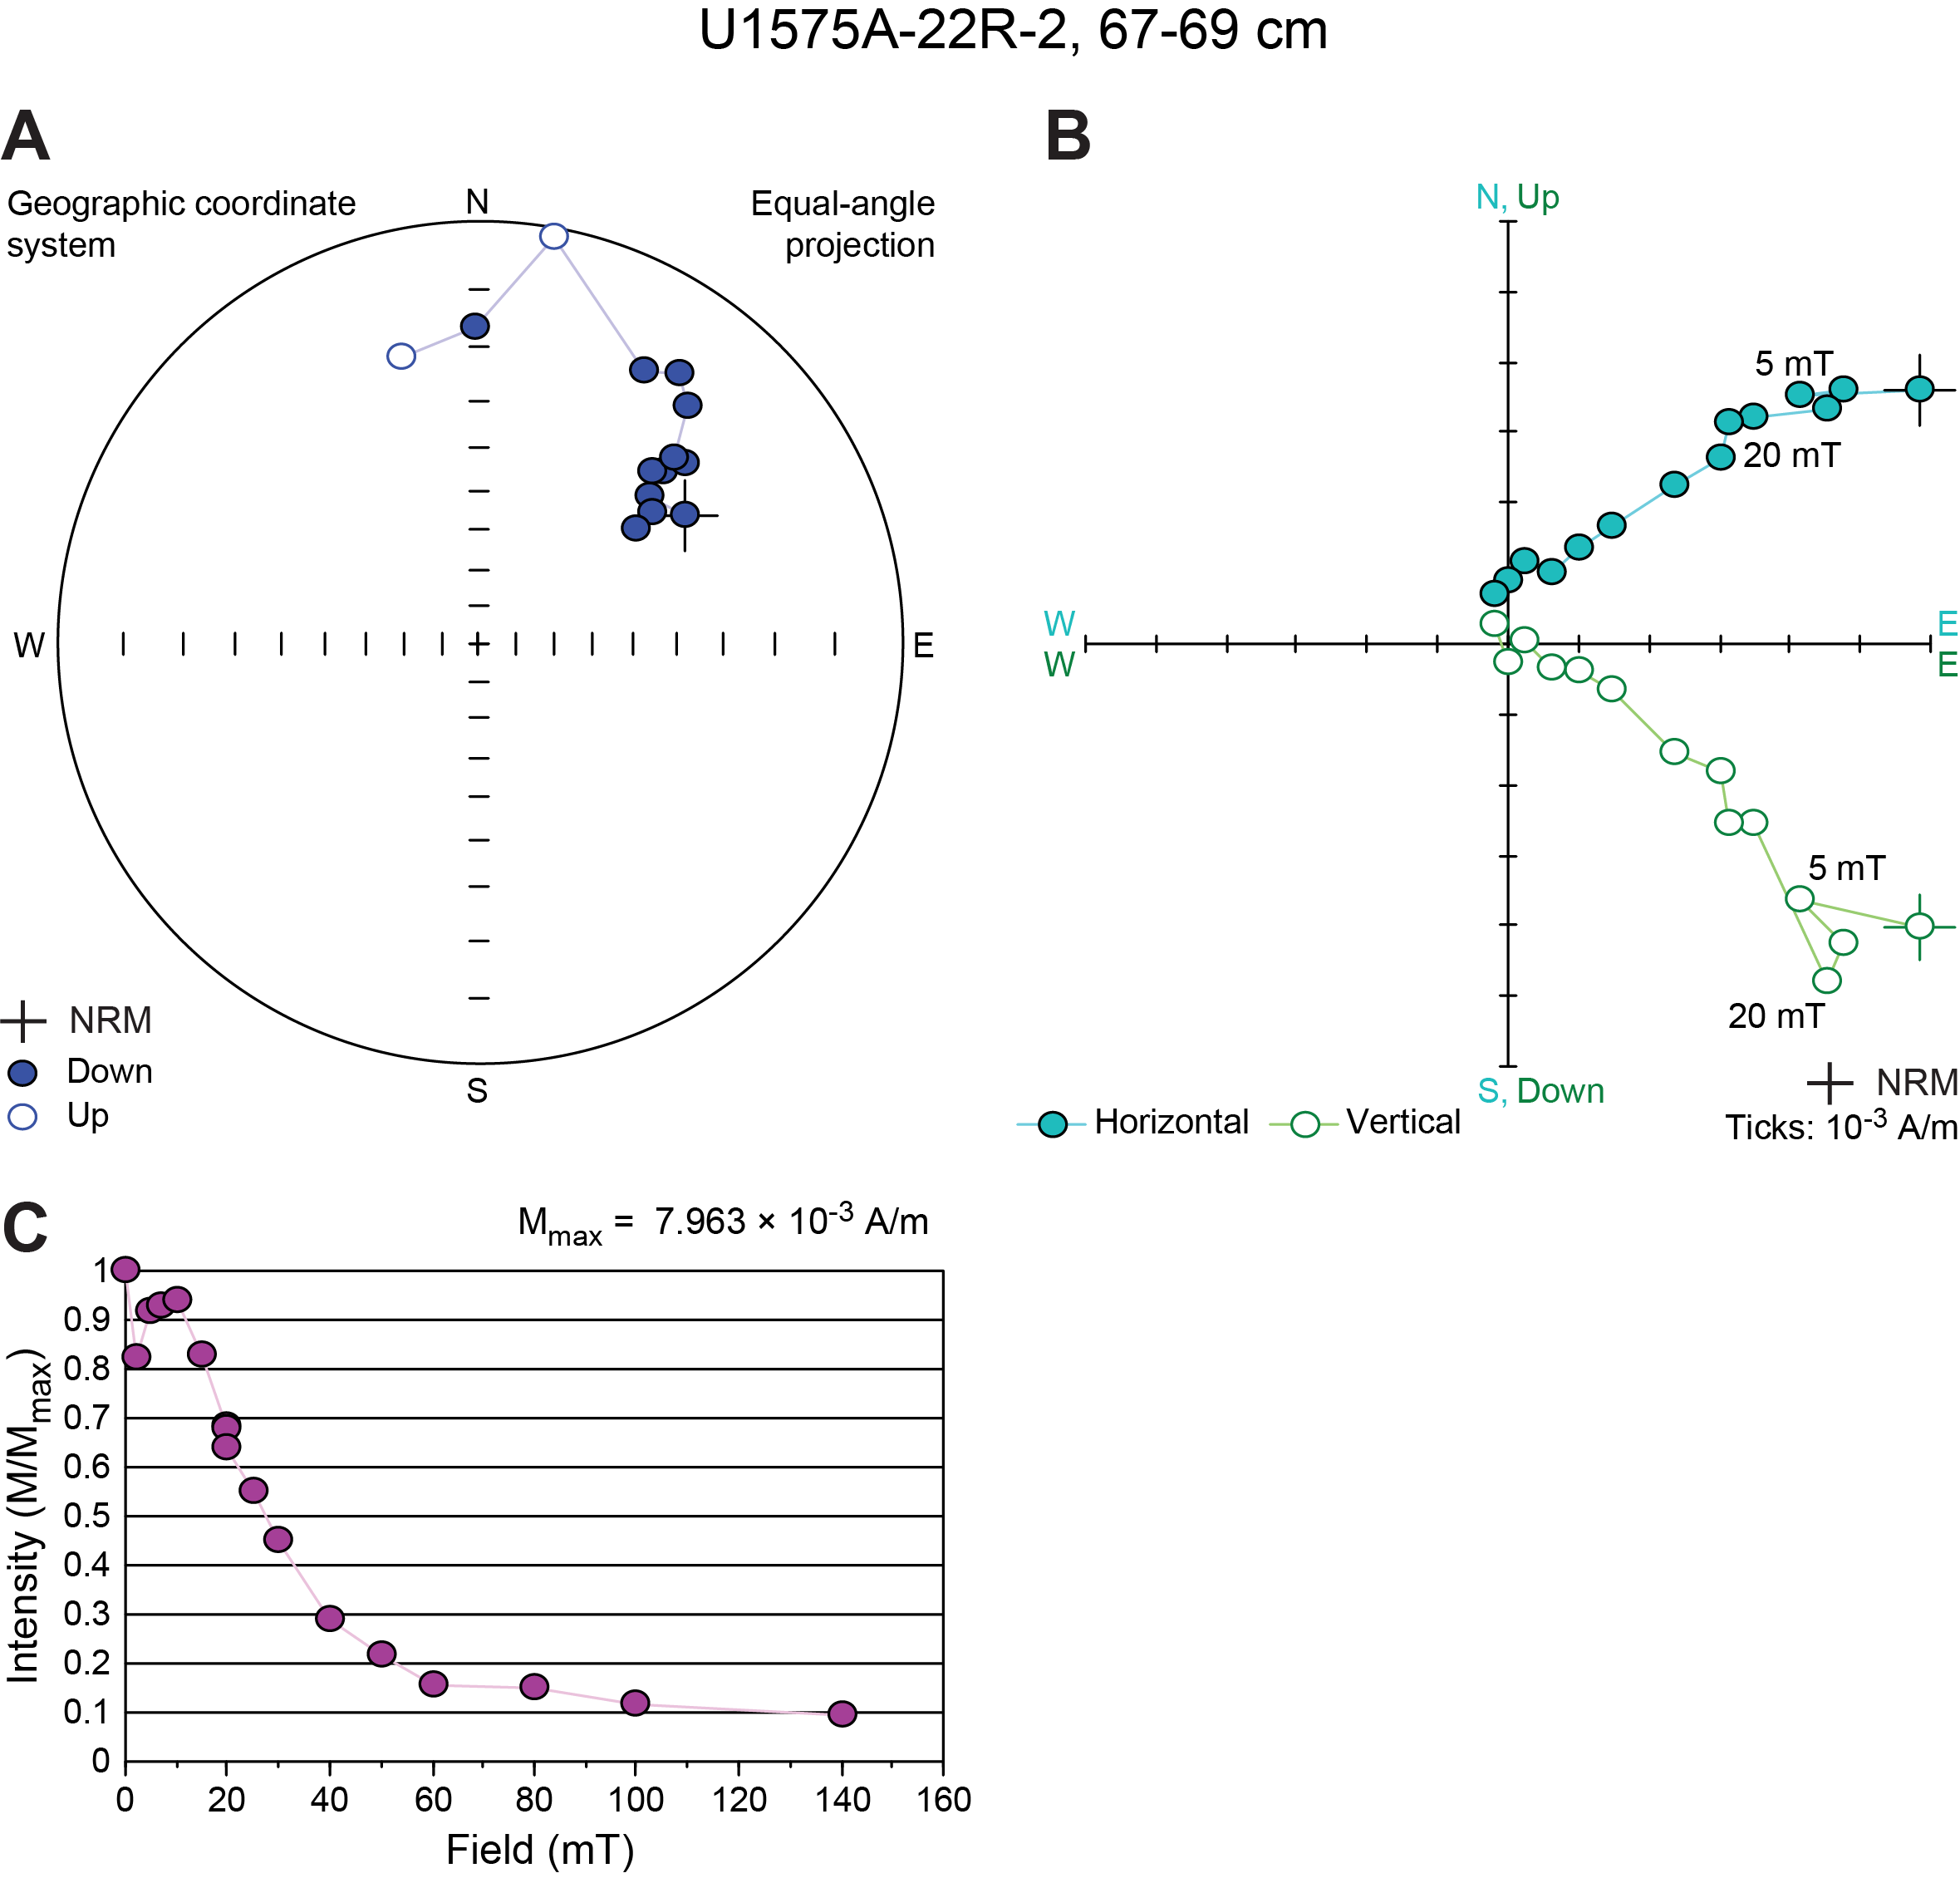
Figure F24. AF demagnetization for a representative sediment sample.
6.1.3. Magnetostratigraphy
Magnetic polarity was interpreted from paleomagnetic inclinations measured after the 10 mT AF demagnetization step for unconsolidated sediments, the 20 mT AF demagnetization step for consolidated basal sediments, and the PCA fit directions obtained from characteristic magnetization components for discrete samples when possible. Only magnetic measurements with intensities >10−3 A/m were included in our magnetostratigraphic analyses to ensure that only high-fidelity magnetization directions were considered.
Because of the weak magnetization intensity of the unconsolidated sediments and the fact that they were only partially demagnetized to 10 mT (which may not have been sufficient to remove drilling-induced magnetization overprints), it was not possible to construct a robust magnetostratigraphy for Cores 391-U1575A-1R through 19R. Basal sediments provided higher quality magnetic measurements, and we were more confidently able to assign polarity zones within Cores 20R and 21R (Figure F25). Although we did not assign any chron labels to Core 21R, the first two sections exhibited normal polarity and the third section displayed reversed polarity. The top of Core 22R contains steeply tilted beds, which suggests that the low (within ~10° of zero) inclinations observed in Sections 22R-1 through 22R-3 are spurious. However, based on correlation with nannofossils constraining the base of Core 22R to the mid-Campanian (see Biostratigraphy), we interpret the reversed polarity interval in Sections 22R-4 and 22R-5 as Chron C32r. Just prior to the sediment/basement contact, there is a shift from Chron C32r toward what is likely Chron C33n.

Figure F25. Magnetization intensity and inclination.
6.1.4. Magnetic properties
Bulk susceptibility and anisotropy of magnetic susceptibility (AMS) measurements were attempted for six discrete samples collected from Cores 391-U1575A-20R through 22R using an AGICO Kappabridge KLY 4 magnetic susceptibility (MS) meter. Measured susceptibility values ranged 1.9 × 10⁻⁵ SI to 4.1 × 10⁻⁴ SI, although these specific values are unlikely to be robust for two reasons. First, the standard deviation associated with the susceptibility measurements during the AMS experiment was higher than the bulk susceptibility. Second, bulk susceptibility values did not agree between repeated measurements. Therefore, we do not discuss sediment MS values obtained using the KLY 4 susceptibility meter here.
Partial anhysteretic remanent magnetization (pARM) acquisition experiments were conducted on a subset of representative discrete samples that had previously been used for AF demagnetization. pARM was acquired using 5 mT steps up to 60 or 70 mT (Figure F26). The pARM acquisition peaks lie between fields of 10 and 15 mT. Our peak values are consistent with those of synthetic magnetite with grain sizes of 3–5 µm for the consolidated sediment and less than 1 µm for the unconsolidated sample (Jackson et al., 1988). Isothermal remanent magnetization acquisition up to 1 T was measured on two samples from the unconsolidated sediments. Isothermal remanent magnetization saturates by 0.3 T, which suggests that the main magnetic carriers in these samples are dominantly titanomagnetite or titanomaghemite.

Figure F26. Partial ARM acquisition.
6.2. Igneous rocks
6.2.1. Archive-half measurements
Paleomagnetic measurements of the archive halves of igneous cores (391-U1575A-23R through 41R) were conducted using the pass-through SRM on board the ship. In all, 70 archive-half sections were measured.
Most basalts contained low-coercivity overprints that may be drilling induced (e.g., Acton et al., 2002). After AF cleaning to 20 mT, basalts typically exhibited a normal polarity magnetization with an average inclination of −34.7°, only slightly shallower than the expected geocentric axial dipole (GAD) inclination of −38.8°. However, this shallower average inclination may be due in part to a partially remaining drill string overprint, which would bias the samples toward positive inclinations.
6.2.2. Discrete sample measurements
A total of 58 discrete sample cubes (7 cm3) were taken from the basalts at a frequency of approximately one sample per core section using a dual-bladed circular saw. A total of 37 cubes were subjected to AF demagnetization, and the remaining 21 cubes were subjected to thermal demagnetization. Basalt AF demagnetization spectra of samples from Cores 391-U1575A-22R through 35R are characterized by very high median destructive field (MDF) values (between ~40 and 125 mT), with a few exceptions, suggesting the presence of very high-coercivity magnetic minerals (Figure F27). Such high coercivity could be caused by the presence of dendritic iron oxides, which can exhibit a strong magnetic anisotropy due to elongation of individual magnetic grains (Shaar and Feinberg, 2013). Dendritic iron oxides were observed in scanning electron microscopy images of basalts from Hole U1575A (see Igneous petrology and volcanology). Samples from Cores 36R–38R have much lower MDF values (around 5 mT), and those from Cores 39R–41R have MDF values between 25 and 45 mT. After the removal of an overprint (typically by ~20 mT), Zijderveld diagrams for 35 of the 37 samples show a clear unidirectional component trending toward the origin, allowing calculation of a reliable inclination value.
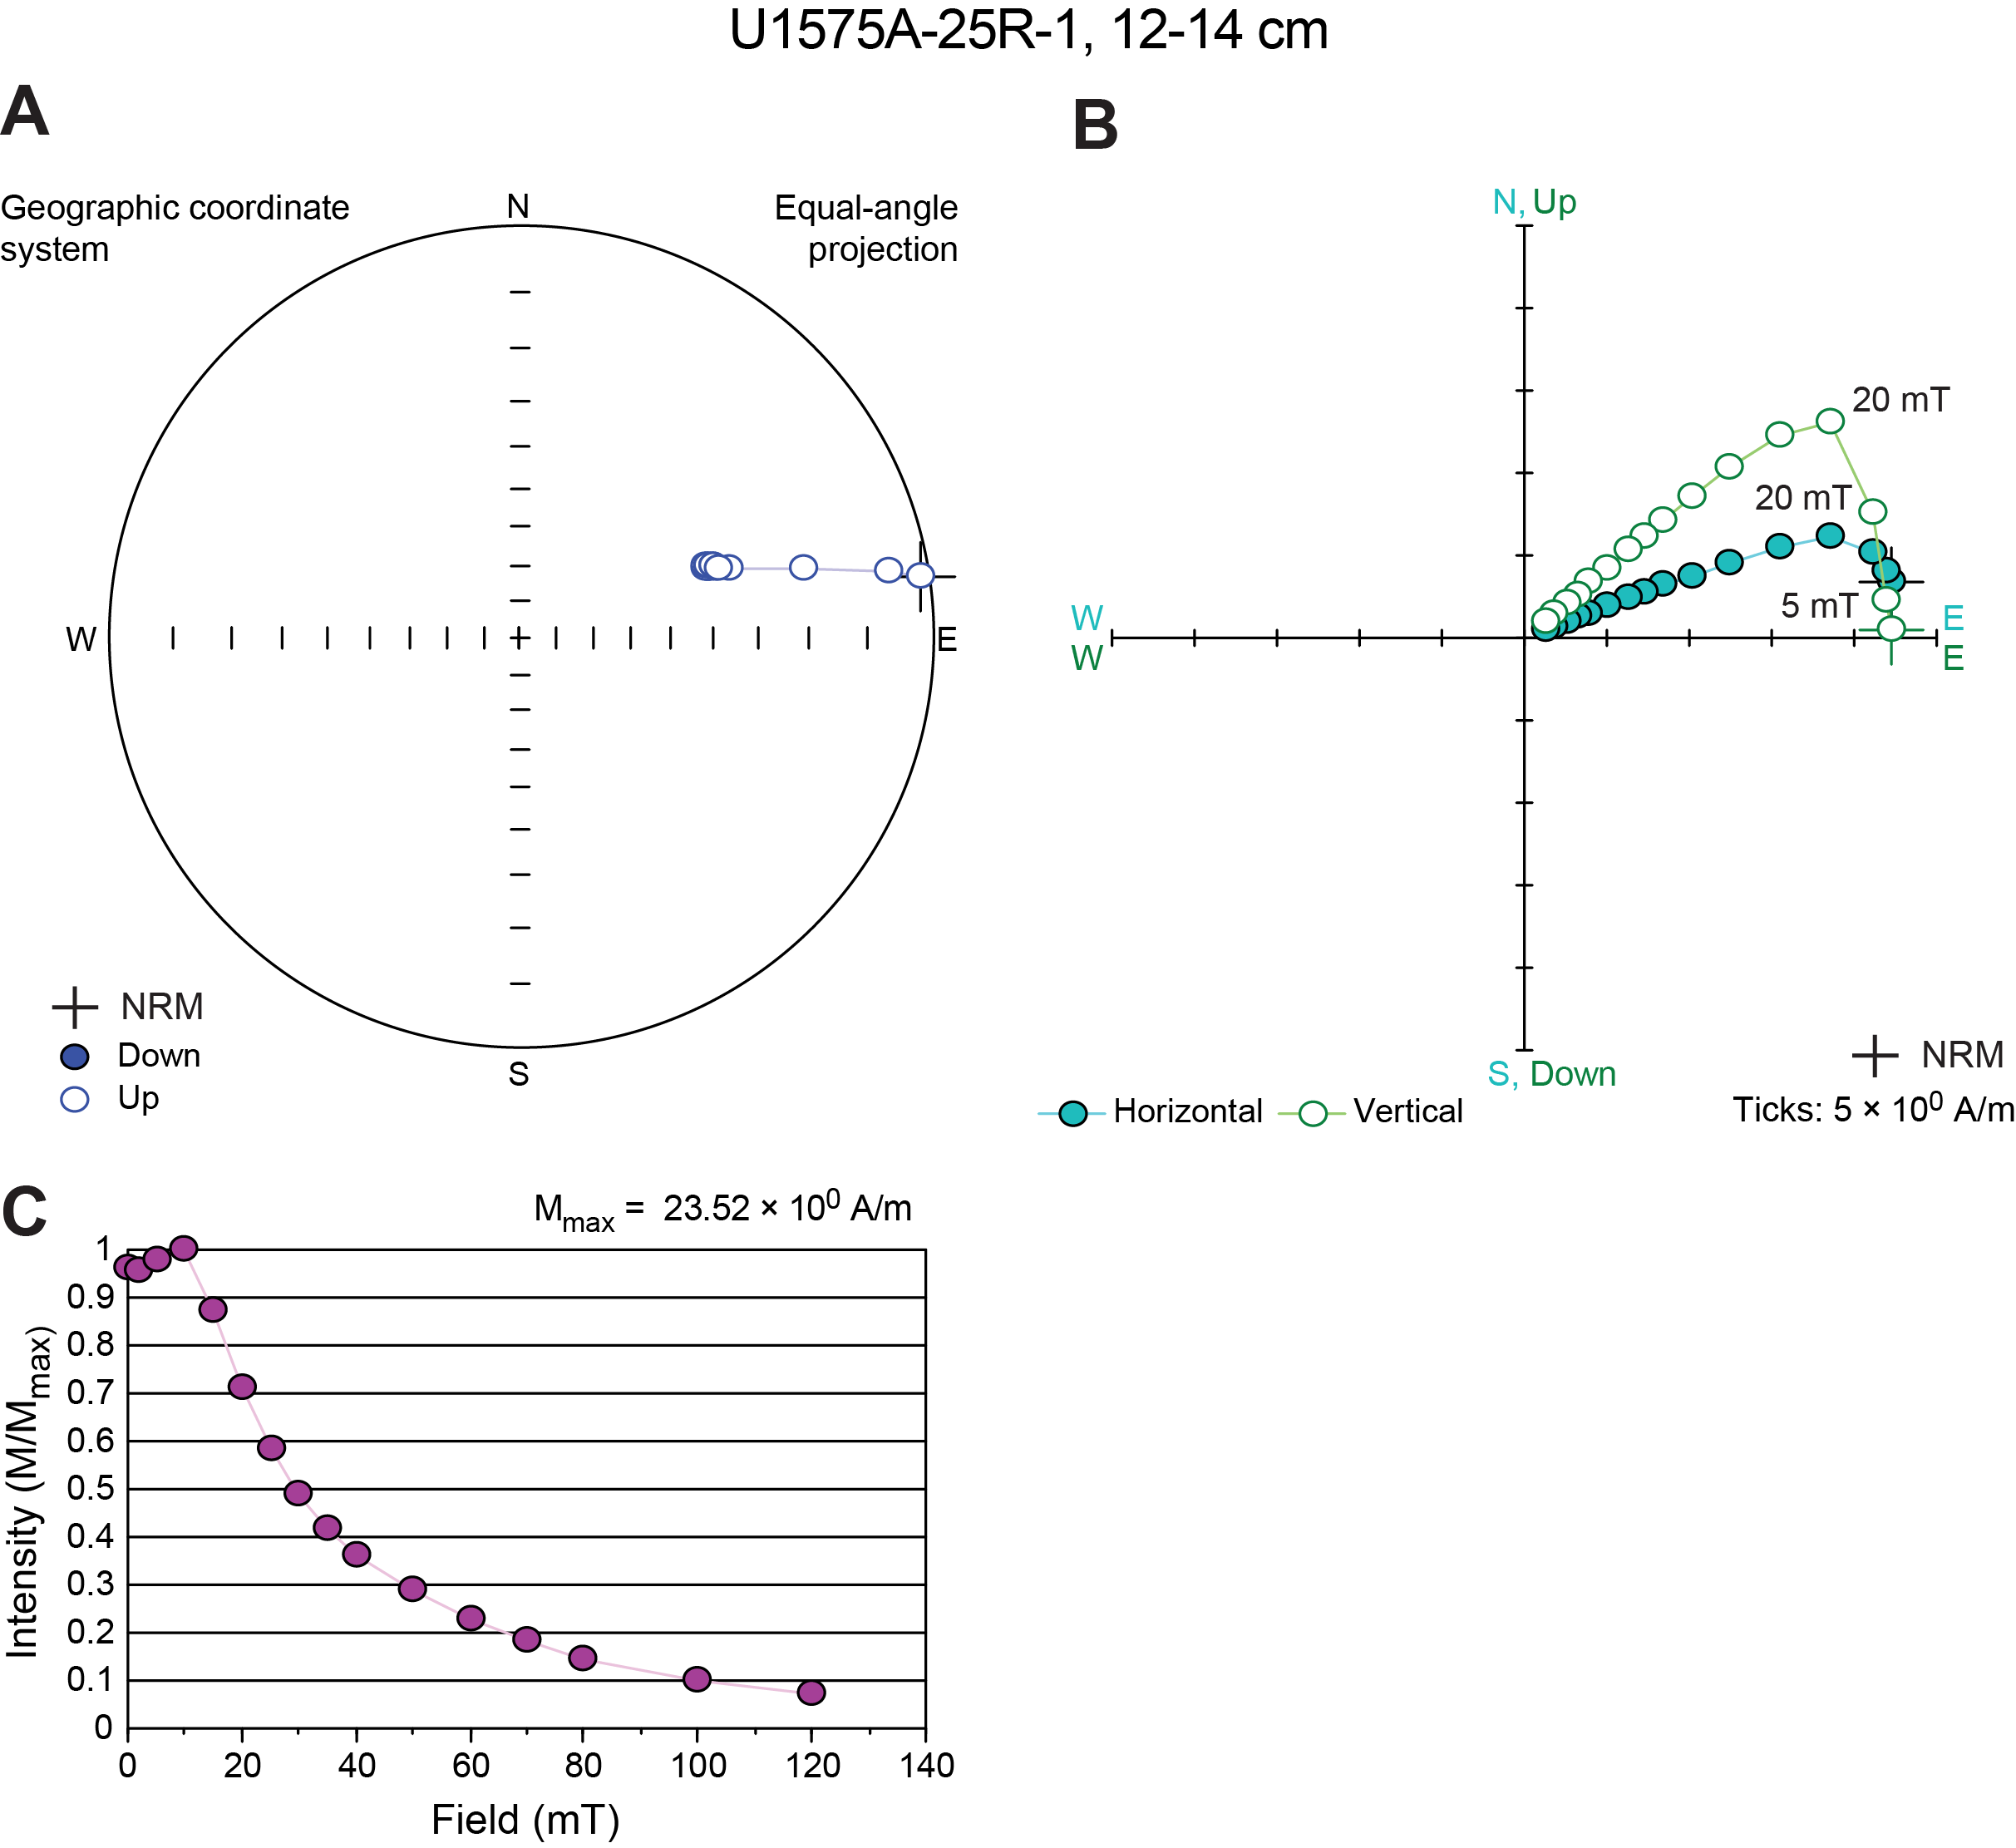
Figure F27. AF demagnetization for a representative basalt sample.
Thermal demagnetization procedures were less successful. Three main behaviors were observed: seven samples were characterized by very low unblocking temperatures (around 150°–200°C), and eight samples (from Cores 391-U1575A-23R through 33R) showed the presence of potential partial self-reversal of magnetization (Figure F28). The remaining six samples (from Cores 37R–41R) had unblocking temperatures between about 300° and 450°C. Three thermal demagnetization specimens showed erratic behavior that precluded determination of a ChRM. Good-quality directions (i.e., those with maximum angular deviation values <15° and N > 4 demagnetization steps) were obtained from PCA for 11 samples, whereas for the remaining 7 samples, the PCA fit was of poor quality.
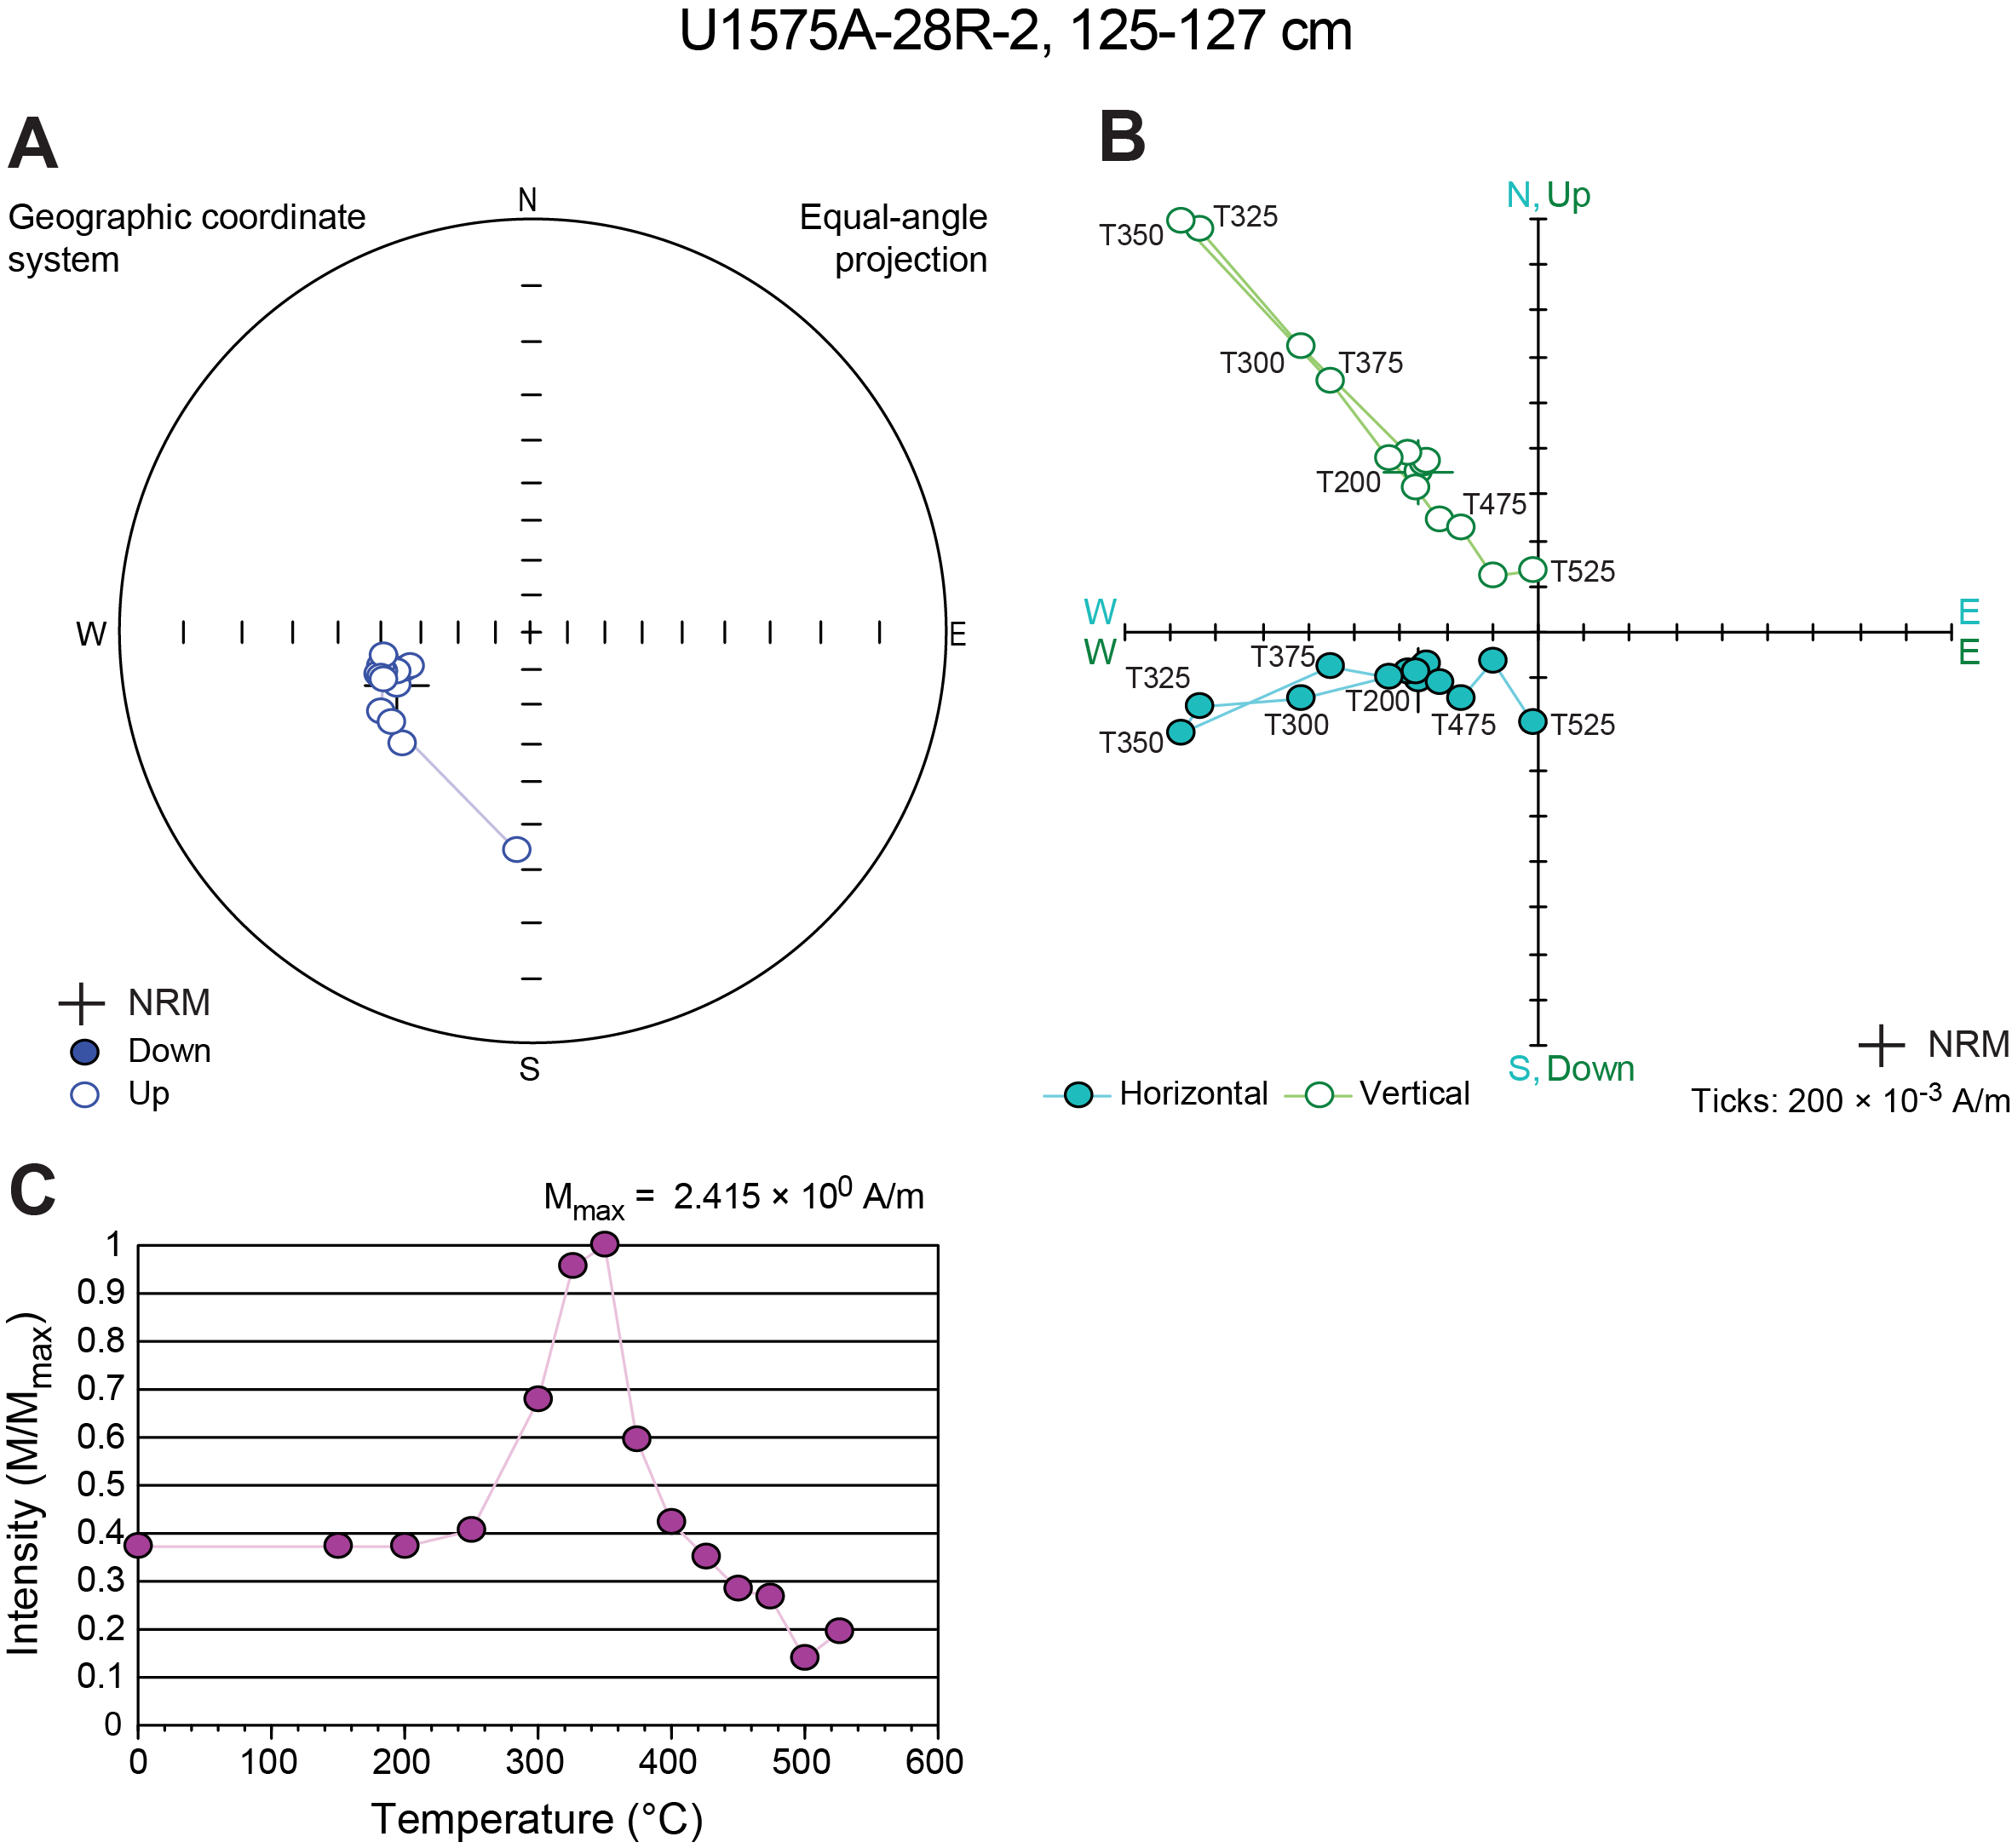
Figure F28. Thermal demagnetization.
Characteristic components from 51 basalt samples had negative inclinations indicative of normal geomagnetic polarity in the Southern Hemisphere (Figure F29). Three samples showed positive inclinations, but two of these inclinations were calculated from poor-quality PCA from thermal demagnetizations. In general, the discrete sample inclinations are in good agreement with the archive-half measurements of inclination after the 20 mT AF demagnetization step (Figure F29). The distribution of inclinations calculated from discrete AF and thermal demagnetizations is similar and comparable with the 20 mT AF step measured on archive halves (Figure F30). Indeed, most of the discrete AF demagnetizations are of such good quality that the 20 mT AF step already gives the characteristic inclination. Characteristic inclinations were nominally shallower for Cores 391-U1575A-22R through 36R (average inclination = ~38°) than for Cores 37R–41R (average inclination = ~45°); all average inclinations were calculated using the protocol of McFadden and Reid (1982). Inclination characteristic component directions with maximum angular deviation values <15° and N > 4 were used to calculate an overall site mean inclination of 40.0°. Because we did not estimate cooling units, we do not report an uncertainty on this number, calculate a paleolatitude, or estimate the degree to which secular variation is averaged downhole.
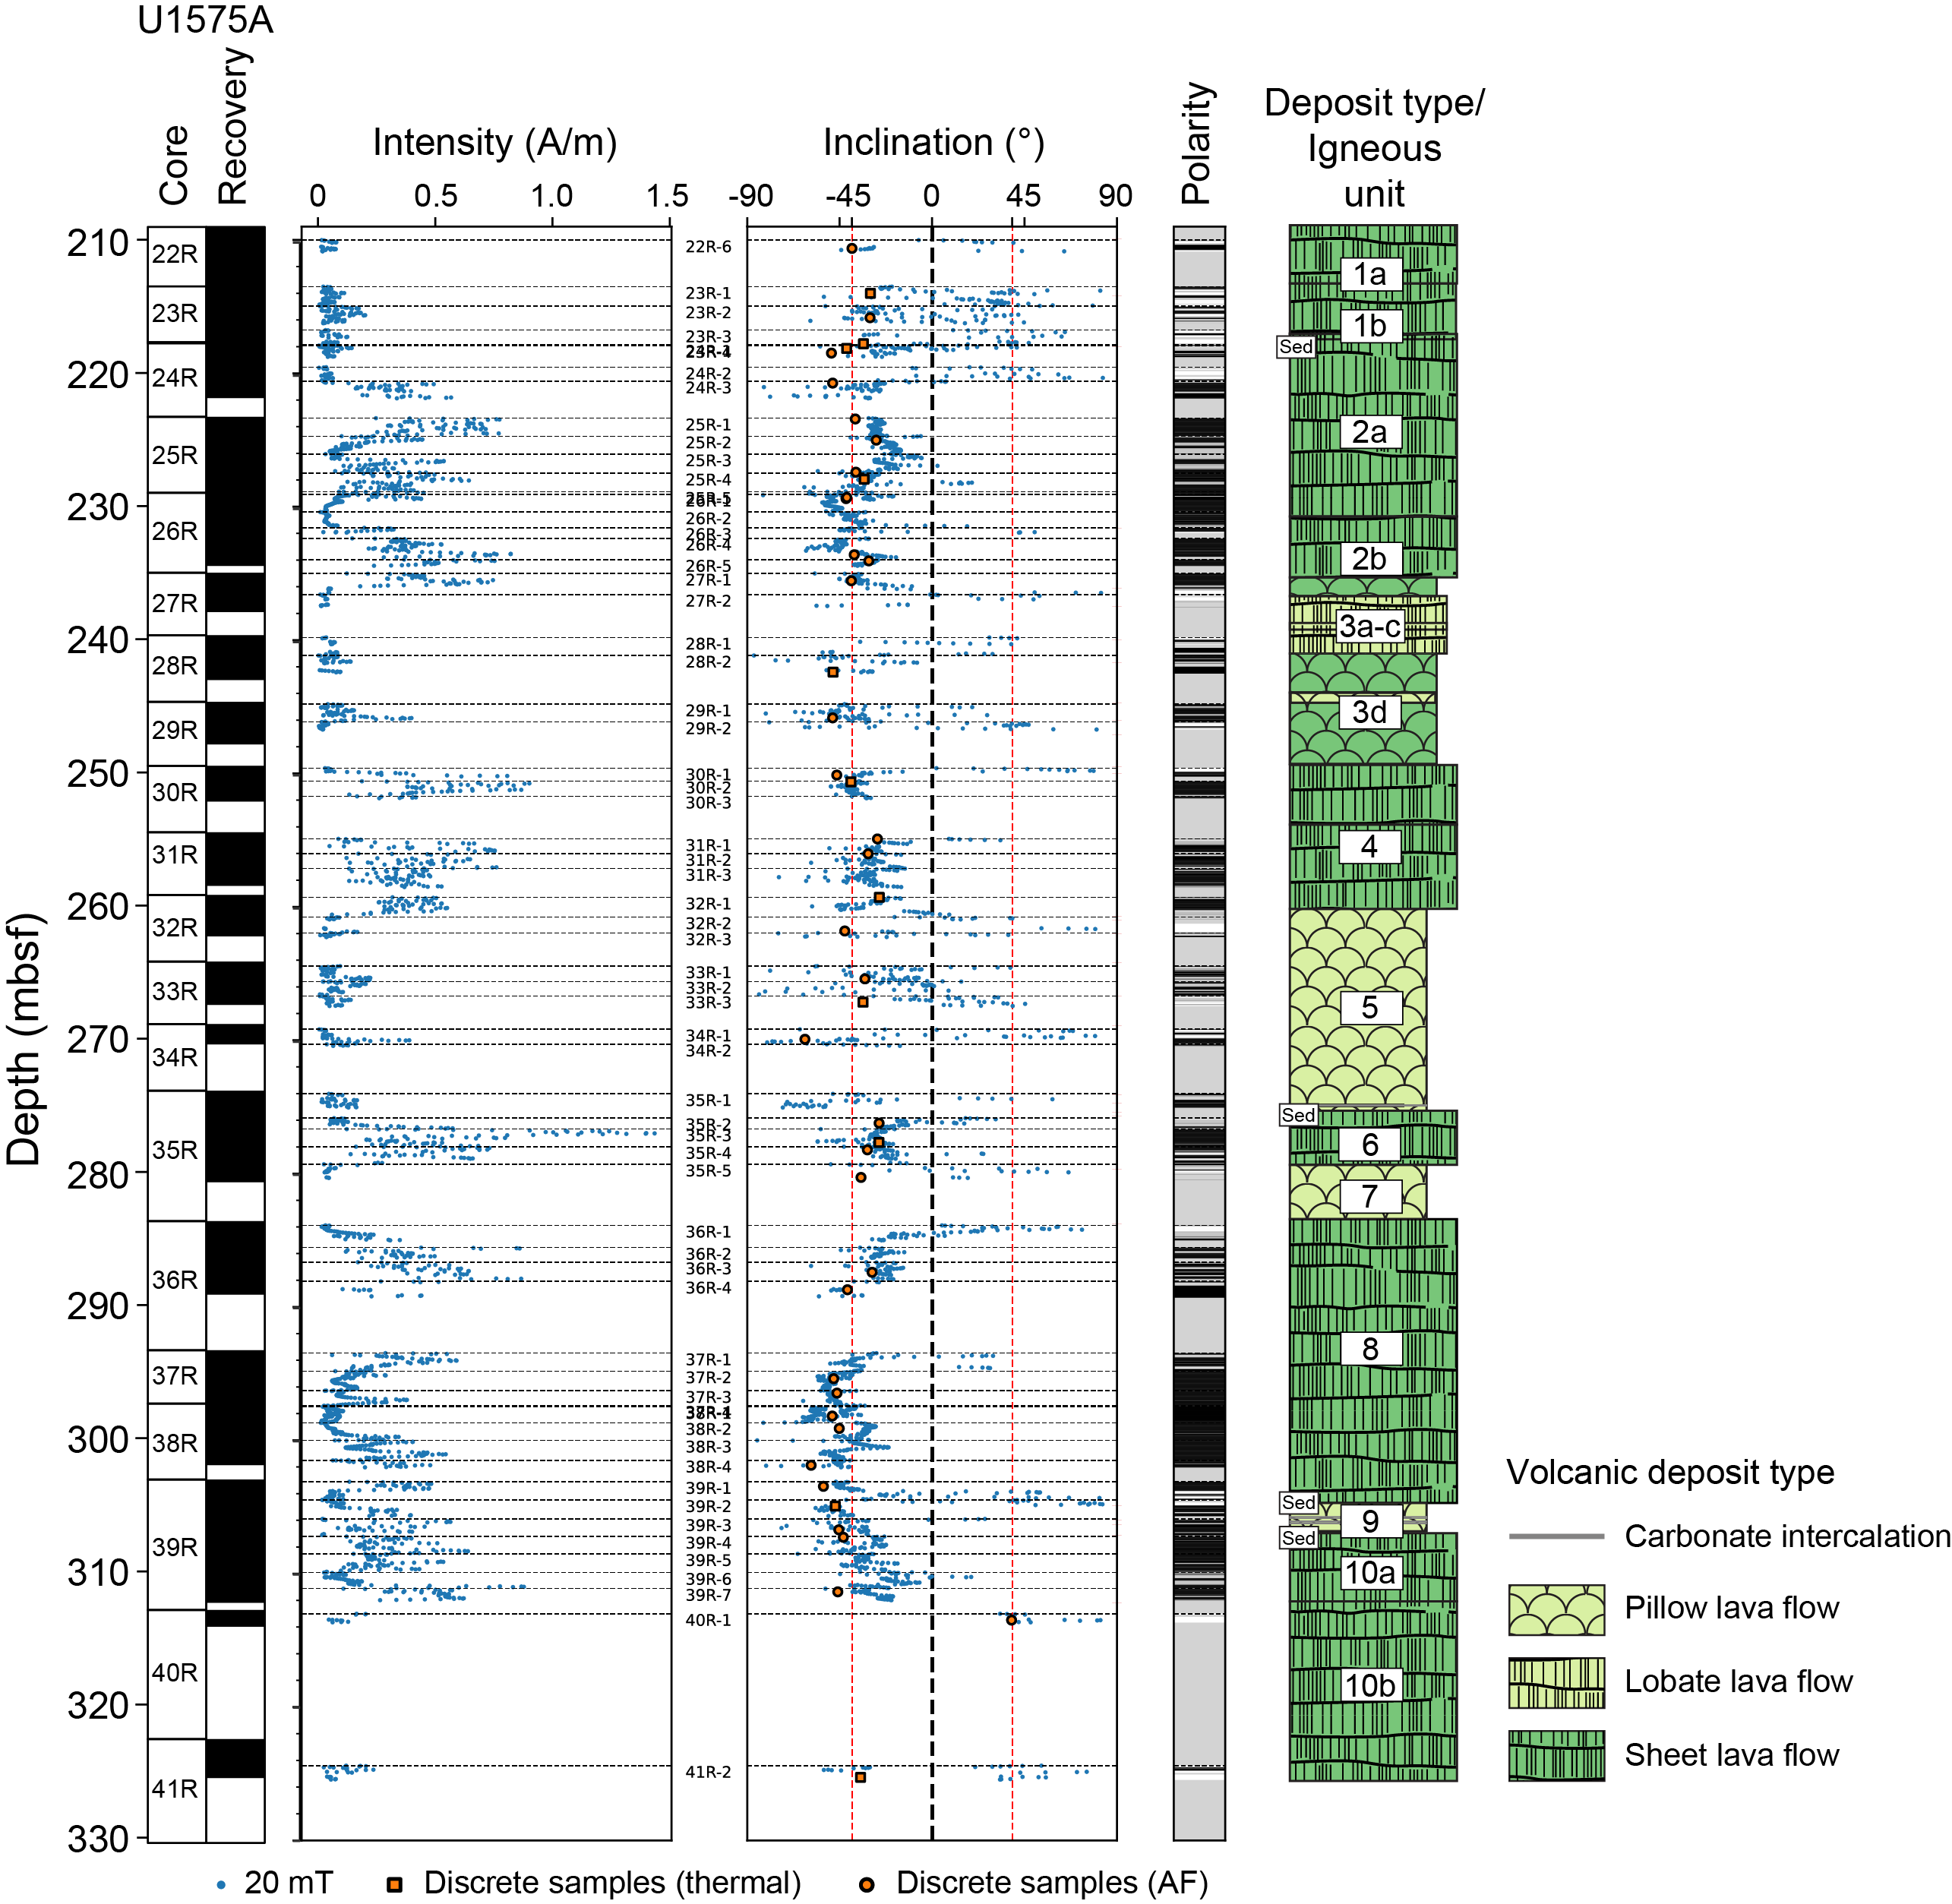
Figure F29. Magnetic intensity and inclination of volcanic units.
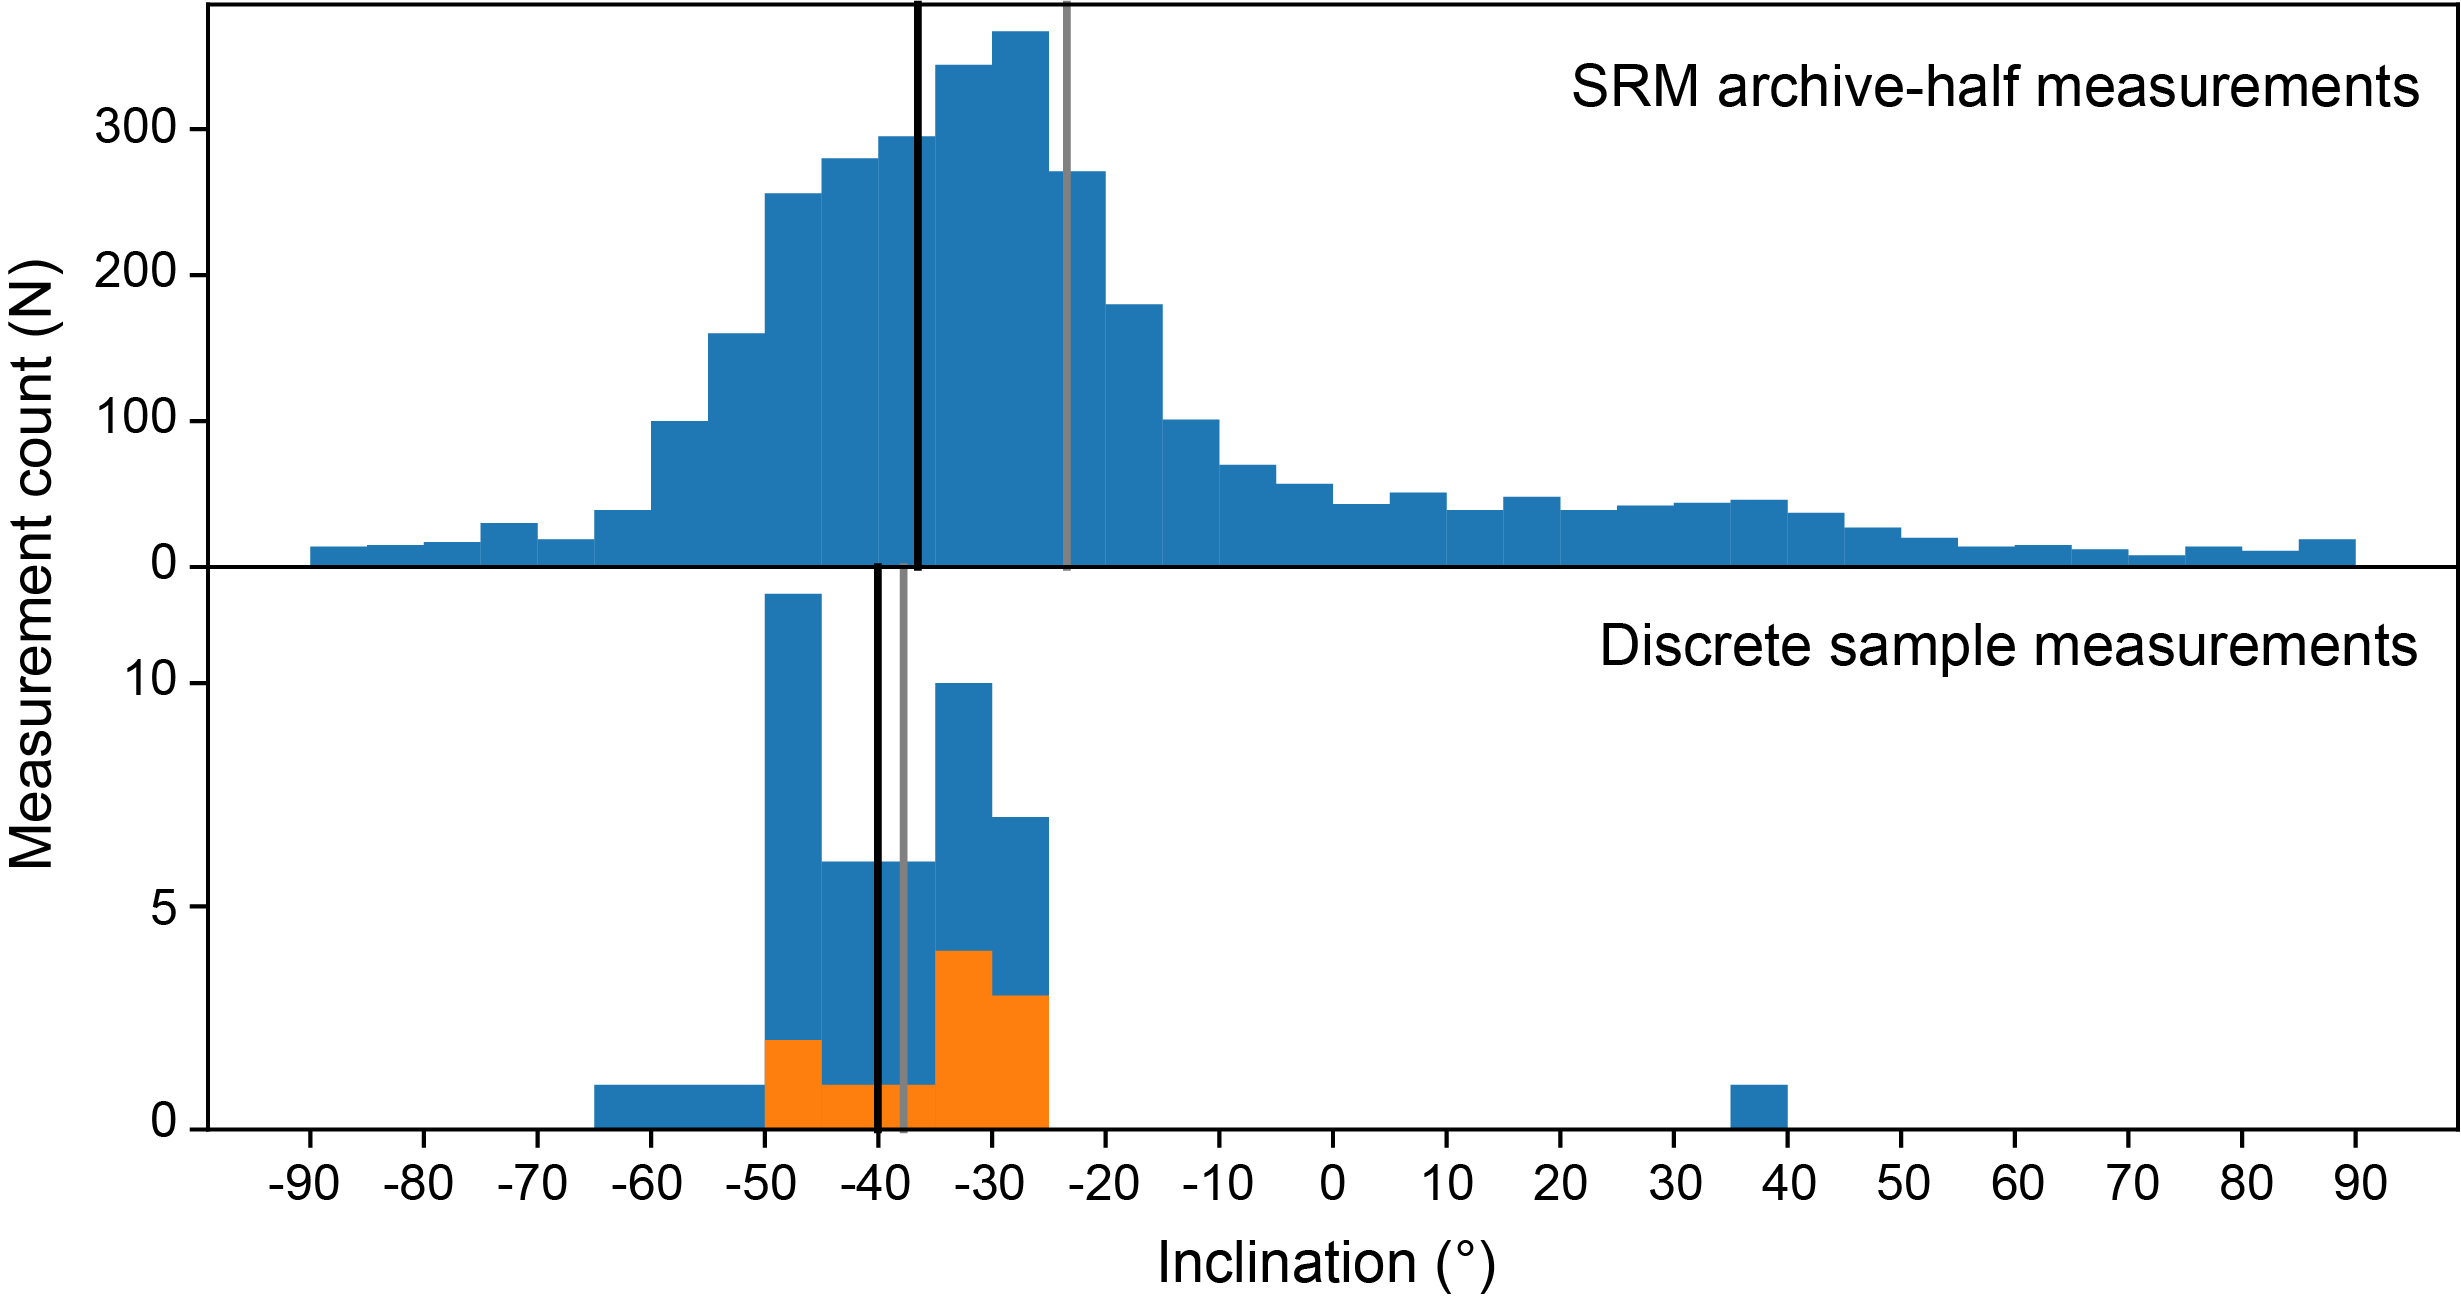
Figure F30. Distributions of inclination values.
6.2.3. Magnetostratigraphy
All igneous rocks returned directions indicative of normal polarity. As such, magnetostratigraphic division could not be established within the basement. Based on the magnetostratigraphy of the overlying sediment, which makes contact with basement in Chron C33n, it is unclear whether the normal polarity in the igneous rocks is a continuation of Chron C33n or a hiatus occurred at the sediment/basement contact and the basement records Chron C34n (i.e., the Cretaceous Normal Superchron).
6.2.4. Magnetic properties
Bulk MS and AMS were measured on 36 discrete basalt AF demagnetization specimens. Bulk susceptibility values range 1.40 × 10⁻³ to 7.33 × 10⁻² SI. Corrected degree of anisotropy (P′) ranges 1.00–1.08. Shape factors (T) range −0.92–0.94. Of 36 basalt specimens, 21 have 0 < T < 1, indicating that the anisotropy in these specimens is largely controlled by foliation. The remaining 15 specimens have −1 < T < 0, indicating that their anisotropy was lineation dominated.
7. Sediment and pore water geochemistry
7.1. Interstitial water chemistry
Interstitial water (IW) was obtained from 32 samples from Site U1575 (1.46–208.19 mbsf) for shipboard analyses. Chemical compositions of these samples were measured according to procedures outlined in Sediment and pore water geochemistry in the Expedition 391 methods chapter (Sager et al., 2023). All results are presented in Table T4 and Figure F31.
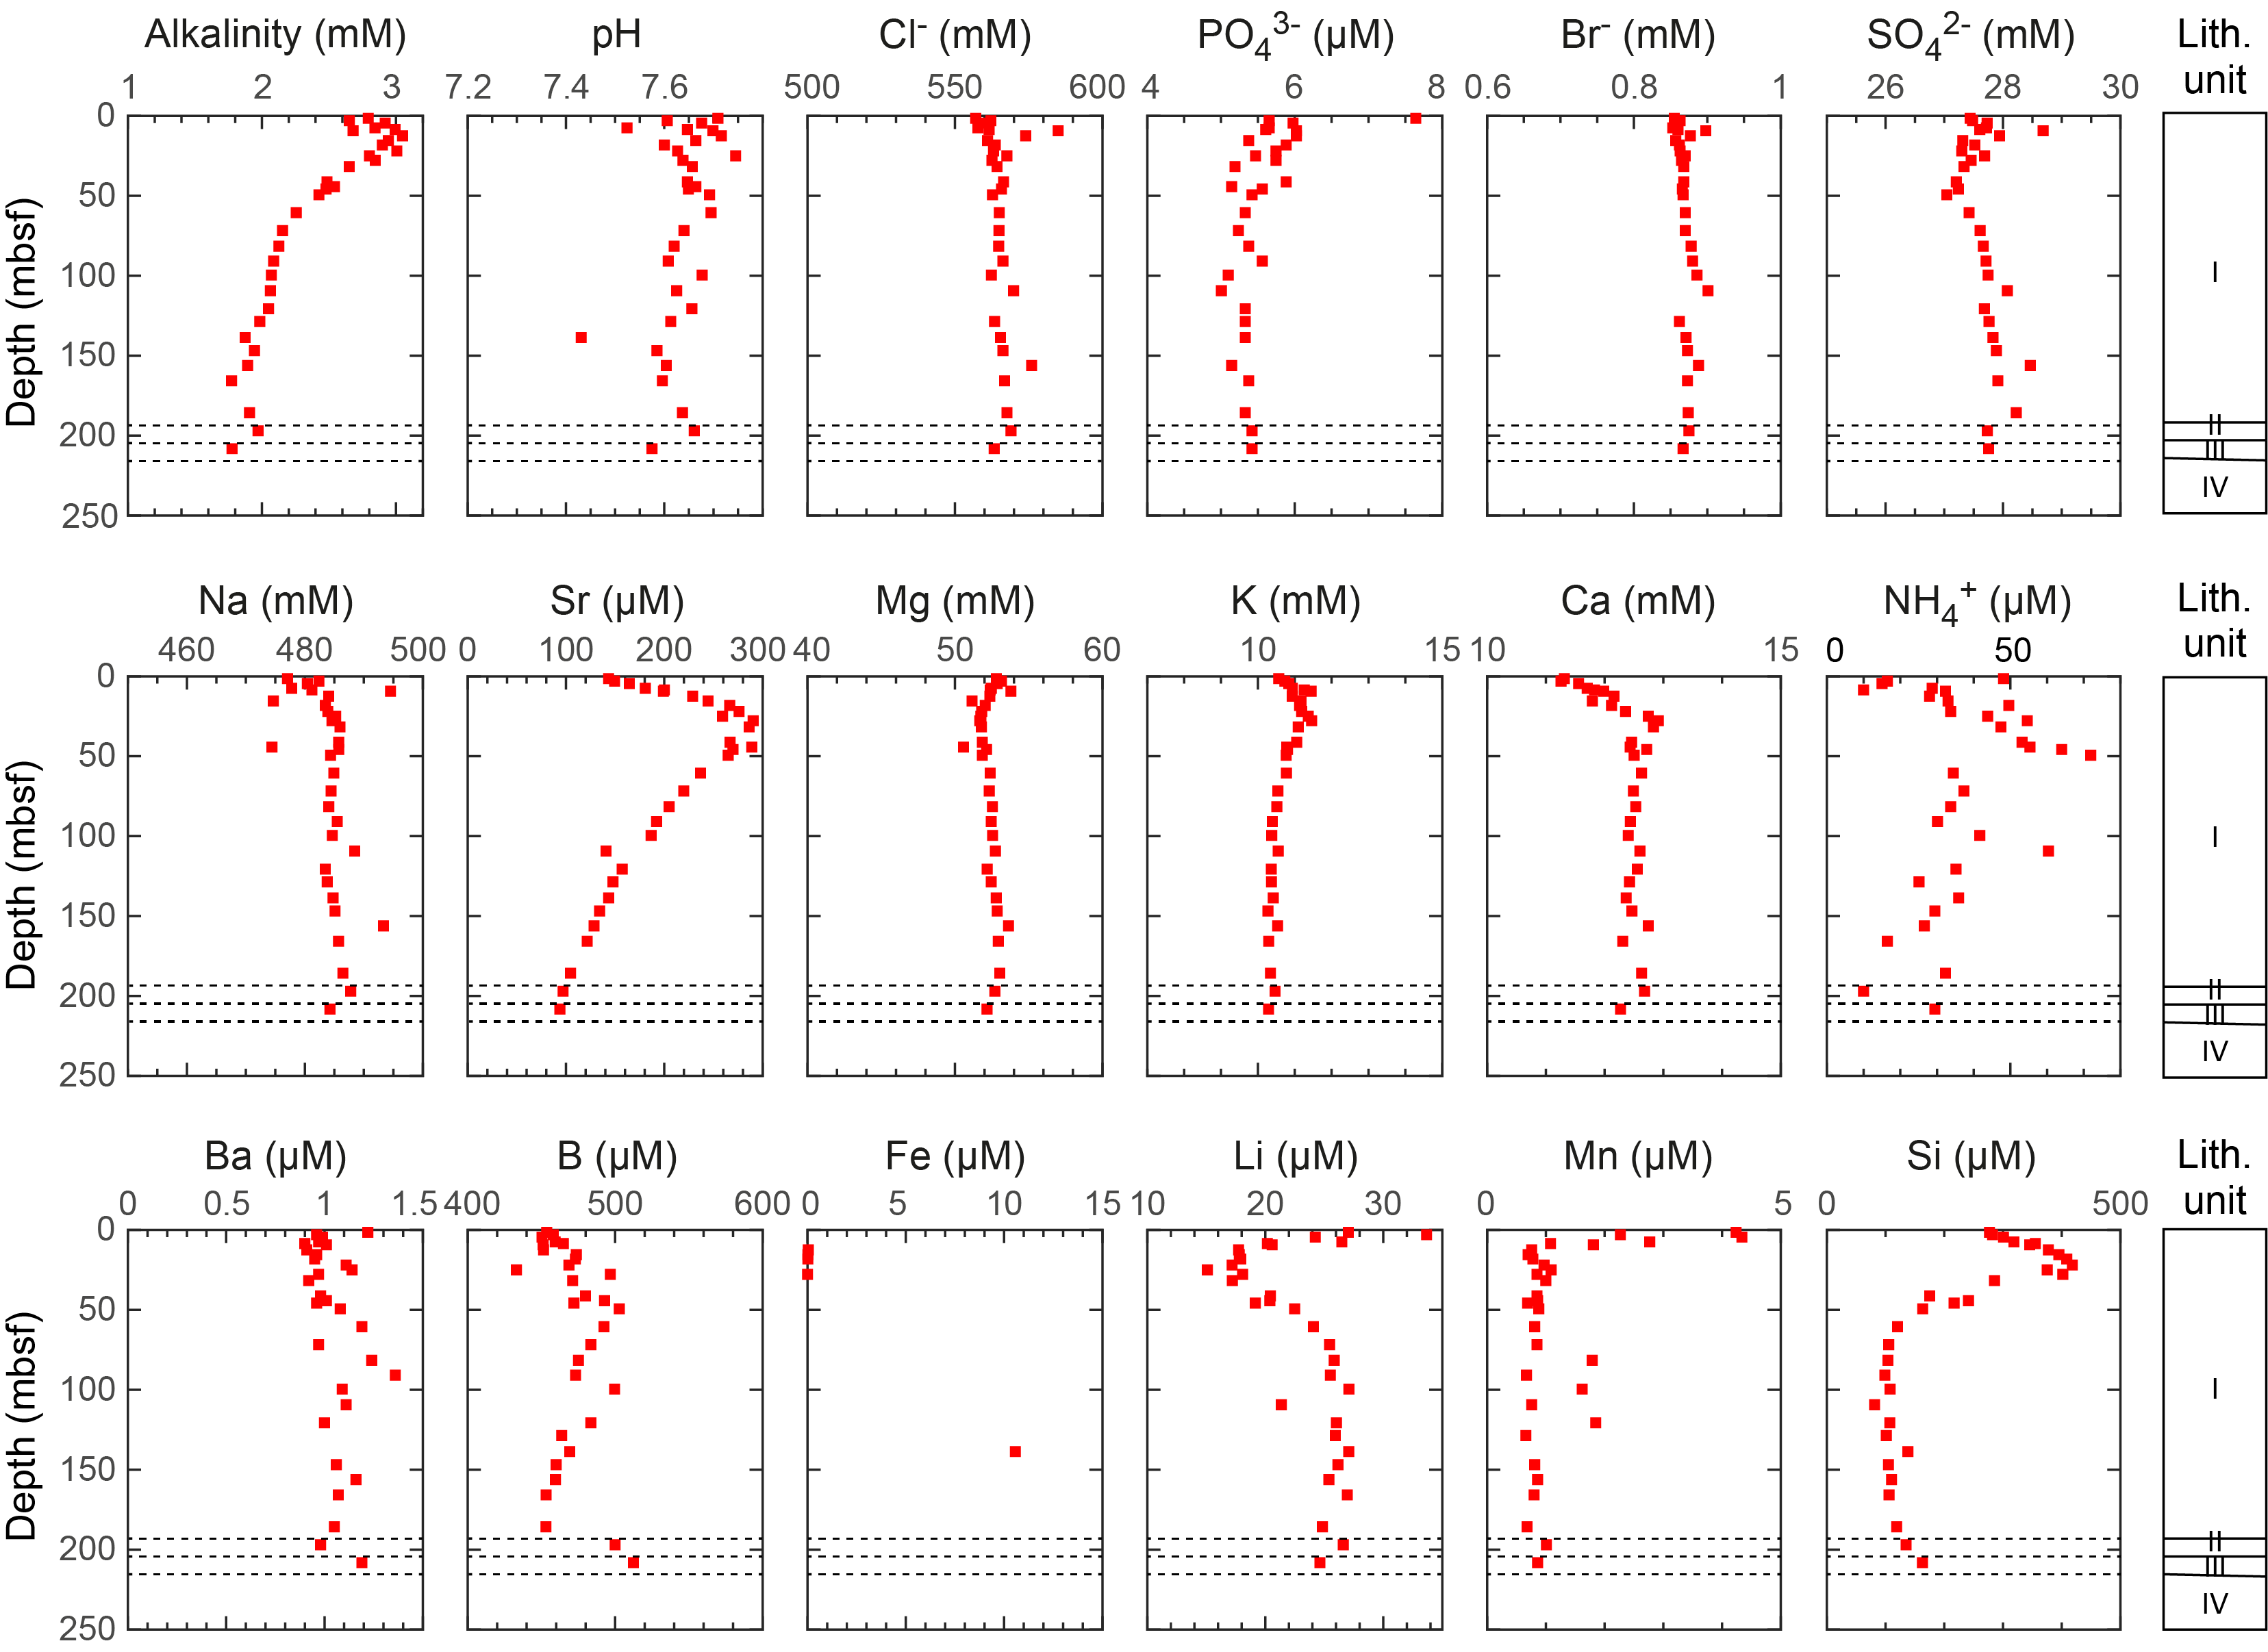
Figure F31. IW chemical compositions.
7.1.1. pH, alkalinity, chloride, and sodium
The pH value of IW at Site U1575 ranges 7.4–7.7. pH is nearly constant with an average of 7.64 ± 0.06 (1σ standard deviation). pH is scattered from the seafloor to ~30 mbsf and appears to be related to calcite dissolution and reprecipitation over the same interval. Excluding one potential outlier at 139 mbsf, pH shows a weak, decreasing trend below ~30 mbsf. IW alkalinity increases from 2.8 mM at 1.5 mbsf to a maximum of 3.0 mM at 12.5 mbsf. Below this maximum, alkalinity gradually decreases to 2.0 mM at 121 mbsf. Farther downhole, alkalinity varies between 1.8 and 2.0 mM. Bicarbonate dissolved in IW may originate from organic matter remineralization and carbonate diagenesis. Using the C/N value range of organic matter found in deep-sea sediment (11–17) (Baudin et al., 2017) and concentrations of ammonium in the IW, the amount of bicarbonate generated by organic matter diagenesis can be estimated. A 36.3 µM ammonium average concentration for all samples indicates that 396–612 µM of bicarbonate can be generated by organic matter remineralization. Given this value, most bicarbonate appears to originate from carbonate diagenesis, in agreement with the sediment lithology.
IW chloride concentration is nearly constant at Site U1575, varying between 551 and 596 mM. With two potential outliers rejected (at 44.3 and 121 mbsf), the average chloride concentration is 565 ± 5 mM. IW sodium concentration is virtually uniform, ranging 474–494 mM with an average value of 484 ± 4 mM. Average chloride and sodium concentrations are close to average concentrations in the modern ocean (chloride = 559.5 mM; sodium = 480.7 mM) (Quinby-Hunt and Turekian, 1983).
7.1.2. Calcium, magnesium, and strontium
IW calcium concentration increases from 11.3 mM at the seafloor to a maximum of 12.9 mM at 27.8 mbsf. Below this maximum, calcium concentration is relatively uniform with an average of 12.5 ± 0.1 mM. IW magnesium concentration decreases from 52.8 mM at the seafloor to a minimum of 51.7 mM at 27.8 mbsf. Below this depth, IW magnesium concentration shows a gentle increasing trend to a maximum of 53.0 mM toward the base of Lithostratigraphic Unit I, excluding two potential outliers at 44.3 and 156 mbsf. IW magnesium concentration in Units II and III seems to decline based on the only two data points generated, possibly indicating that magnesium deportment is affected by interaction with the basalt basement below Unit III (Gieskes, 1981). The maximum of calcium and the minimum of magnesium at 27.8 mbsf are ~10 m below the alkalinity maximum, suggesting that an increasing trend of calcium and a decreasing trend of magnesium are related to diagenetic calcite formation. Although several hypotheses have been suggested, formation of high-magnesium calcite could be the reason that nearly the same amount of calcium and magnesium was released and consumed. Calcium and magnesium contents decrease in the last two cores above the bottom of the sedimentary sequence, suggesting that these elements might be affected by the basalt basement (Gieskes, 1981).
IW strontium concentration increases from 143 µM just beneath the seafloor to a peak of 290 µM at 27.8 mbsf. Below this depth, strontium concentration steadily decreases to 93.8 µM at 208 mbsf. The strontium maximum at 27.8 mbsf, which coincides with a magnesium minimum observed at Site U1575, could be attributable to biogenic carbonate (likely aragonite) dissolution and the subsequent reprecipitation of inorganic diagenetic high-Mg calcite, a process that rejects strontium (Baker et al., 1982).
7.1.3. Silicon, manganese, sulfate, iron, ammonium, and phosphate
IW silicon concentration at Site U1575 ranges 81.2–418 µM. It increases from 277 µM at the seafloor to 418 mM at 21.9 mbsf and then sharply decreases to 105 µM at 71.8 mbsf. Below this depth to 186 mbsf, silicon concentration is consistent and has a mean of 107 ± 14 µM. Silicon concentration increases in the last two cores above the sediment/basalt contact, possibly due to the release from the basalt basement. The increasing trend of silicon from the seafloor to 21.9 mbsf could be caused by dissolution of biogenic silica, identified in the form of radiolarians in Lithostratigraphic Unit I (see Lithostratigraphy). When compared to the dissolved silica concentrations (600–1000 µM) found in other pelagic sediments (Gieskes, 1981), dissolved silica concentrations at Site U1575 are relatively low. This can be explained by the dominance of biogenic calcite at Site U1575.
Manganese concentration rapidly decreases from 4.24 µM near the seafloor to 0.70 µM at 15.5 mbsf. The sharp peak of manganese at shallow depths suggests that Mn(IV)-reducing microbes oxidize organic matter using manganese oxide as electron acceptors under reducing conditions. The manganese peak is shallower than the silica peak, although they are often found at the same depth in pelagic sediment. This offset could be related to the early precipitation of manganese carbonate in the calcite sediment. A manganese reduction interval is followed by a sulfate reduction interval observed at 10–50 mbsf. Iron concentration in IW is lower than the instrumental detection limit in most of the sediment samples. The peaks of phosphate and ammonium are located at 1.5 and 50 mbsf, respectively, in line with the manganese and sulfate reduction zone. A molar ratio of ammonium to phosphate in IW is 7:1.
7.1.4. Lithium, potassium, bromide, boron, and barium
The downhole profile of lithium concentration shows a rapid decrease from 27.0 µM just beneath the seafloor to 15.1 µM at 25.0 mbsf and then an increase to 27.1 mM at 99.6 mbsf. Below this depth, lithium concentrations display a slightly decreasing vertical trend toward the bottom of Unit III and the entire lithium profile mirrors the IW silicon trend. IW potassium concentration is 10.6 mM just beneath the seafloor and increases slightly to 11.5 mM at 27.8 mbsf. The decreasing trend below this depth indicates the interaction of IW potassium with sediment. IW bromide, boron, and barium concentrations show relatively constant depth profiles over the entire sediment succession, with the exception that boron and barium show an increase in the last sample above the basement contact (sampled depth = 208 mbsf), perhaps due to the release of these elements from the underlying basalt lava succession.
7.2. Hydrocarbons in gas phase
Analysis of gas-phase samples was performed for C1–C6 (methane, ethane, propane, butane, pentene, and hexane) for routine safety monitoring in Hole U1575A. Headspace gas, produced by oven heating (at 50°C) ~10 g of sediment in a serum vial, was analyzed per 9.6 m core. The concentration of methane (C1) in 22 headspace samples from Site U1575 was lower than 2.0 µL/L, which corresponds to the atmospheric background level. No hydrocarbon gases higher than C1 were detected.
7.3. Sediment geochemistry
7.3.1. Total carbon, inorganic carbon, and organic carbon
Sediment samples were analyzed to determine the weight percent content of CaCO3, total carbon (TC), total organic carbon (TOC), total nitrogen (TN), and total sulfur (TS). In Hole U1575A, the sampling frequency was approximately two samples per core for Cores 1R–17R, and for deeper cores, one sample was analyzed per core. From 4.5 to 185 mbsf (Lithostratigraphic Unit I), the sediment mainly consists of calcareous ooze and CaCO3 contents that range 92.6–97.9 wt% (mean = 94.9 ± 1.5 wt%). The sample for Unit II in Core 21R and the sample for Unit III in Core 22R have CaCO3 contents of 85 and 74 wt%, respectively. TC values are also consistent from 4.5 to 185 mbsf and range 11.0–11.8 wt% (mean = 11.6 ± 0.2 wt%). Then they rapidly decrease to 10.4 wt% at 197 mbsf (Core 21R) and 9.0 wt% at 208 mbsf (Core 22R) as sediment lithology changes from white nannofossil-foraminifera ooze to pale brown nannofossil-foraminifera chalk with clay. TOC contents vary between 0 and 0.33 wt% (downhole average = 0.17 ± 0.11 wt%) except for the 0.62 wt% found in Core 13R (~123 mbsf). The low TOC contents found in most sediment samples are due to the carbonate-rich lithology of Site U1575. For the same reason, TS and TN contents are below the instrument detection limits for all samples. All results are presented in Table T5 and Figure F32.

Figure F32. TC, CaCO3, and TOC.
8. Igneous geochemistry
A set of samples from Site U1575 was chosen for shipboard geochemical analysis to determine major and trace element composition using inductively coupled plasma–atomic emission spectroscopy (ICP-AES). Sample selection was based on lithostratigraphic position, pXRF measurements along the core, and alteration extent (see Igneous petrology and volcanology). In total, 33 samples were analyzed using ICP-AES, covering the depth range from 210.22 mbsf (Sample 391-U1575A-24R-2, 101–103 cm) to 324.52 mbsf (Sample 41R-2, 46.8–48 cm). The selected samples provide a representative overview of the recovered lithologies from Hole U1575A, which can be briefly summarized as follows:
- Igneous Subunits 1a and 1b: three basaltic samples from highly phyric plagioclase-pyroxene-olivine massive lava flows.
- Igneous Subunits 2a and 2b: 10 basaltic samples from moderately to highly phyric plagioclase-pyroxene-olivine massive flows.
- Igneous Subunits 3c and 3d: two samples from a sequence of alternating pillow, lobate, and sheet lava flows with sparsely to highly phyric plagioclase-pyroxene-olivine basalts.
- Igneous Subunits 4a and 4b: four sparsely phyric plagioclase-pyroxene-olivine basaltic samples from massive flows.
- Igneous Unit 5: four sparsely to moderately phyric plagioclase-pyroxene basalts from pillow, sheet, and lobate flows.
- Igneous Units 6–9: seven samples from an alternating sequence of massive and pillow lava flows with sparsely to highly phyric plagioclase-pyroxene-olivine basalts.
- Igneous Subunits 10a and 10b: three basaltic samples from the moderately to highly phyric plagioclase-pyroxene-olivine massive lava flow.
For all samples, major and trace element compositions were analyzed using ICP-AES and pXRF. Detailed sample preparation, analytical procedures, standard analyses, calibration, and drift corrections are reported for both methods in Igneous geochemistry in the Expedition 391 methods chapter (Sager et al., 2023). The total sums of the major element oxides in weight percentages acquired using ICP-AES range 97.14–102.32 wt% except for six samples that have unusually low values from 90.40–95.42 wt% (Table T6). The reason only some samples have low totals is unclear, but it is most likely due to sample preparation issues and problems with the bead sampler (see Igneous geochemistry in the Expedition 391 methods chapter [Sager et al., 2023]). In the following sections, we do not consider these samples further, but we do display them as small crosses (or yellow dots) on the figures.
The major element oxide concentrations measured using ICP-AES were normalized to 100% on a volatile-free basis, and total iron was recalculated as Fe2O3t (Table T6). The normalized values, omitting effects of variable alteration on major elements, are used for an improved comparison between the Site U1575 data and literature data from previous drill and dredge sites along the submarine TGW hotspot track (e.g., Le Maitre, 1962; Richardson et al., 1984; Weaver et al., 1987; Le Roex et al., 1990; Cliff et al., 1991; Willbold and Stracke, 2006; Class and le Roex, 2008; Salters and Sachi-Kocher, 2010; Rohde et al., 2013; Hoernle et al., 2015; Homrighausen et al., 2018, 2019).
A total of 128 pXRF measurements were conducted on archive-half sections of the basalt lava succession in Hole U1575A (Table T7). In general, each point was analyzed twice to account for analytical error. ICP-AES powders were also analyzed using pXRF with the same methodology as applied to the section-half measurements (Table T8). Drift was monitored by running the BHVO-2 standard intermittently throughout the analytical process, and no instrumental drift was detected (see Table T10 in the Expedition 391 methods chapter [Sager et al., 2023]).
8.1. Comparison of ICP-AES and pXRF results
The ICP-AES and pXRF results display good to excellent linear correlation coefficients between the two methods (Figure F33), with R2 = 0.92–0.96 for TiO2, K2O, Fe2O3t, Y, and Zr and moderate values of R2 = 0.84 for Ni. The weaker correlation for Ni is most likely related to a high relative standard deviation of ICP-AES measurements. The difference between the two methods is relatively small, with less than ±10% for K2O, Ni, Y, and Zr. In contrast, pXRF results are systematically higher for TiO2 by ~16% and lower for Fe2O3t by ~18% than those obtained from ICP-AES. This discrepancy is probably due to the secondary fluorescence effect in pXRF caused by Fe atoms, which decreases the Fe2O3t value compared to the actual value and increases the value of elements with masses lower than iron. V values obtained using pXRF are not considered because the V concentration of the samples is close to the detection limit of pXRF. For elements lighter than K, absorption and scattering have a significant effect on pXRF measurements, so data for these elements are not discussed here. There was no difference in the measured values of powders correlating with the amount of powder used for pXRF analysis (Figure F33).

Figure F33. pXRF and ICP-AES results.
8.2. Alteration
Loss on ignition (LOI) is an indicator of the degree of alteration. For the Site U1575 samples, 26 of 27 samples have relatively low LOI values of <1.51 wt% (LOI = 2.62 wt% for the remaining sample). Samples with petrographic evidence for alteration, compared to less altered samples in the same unit, have overall higher fluid mobile element concentrations, such as K2O and Sr (Table T6), which is a common effect of seawater alteration (e.g., Jochum and Verma, 1996). Overall weaker correlations of Zr versus K2O and Sr (R2 = 0.17 and 0.74, respectively) compared to Zr versus TiO2 or Y (R2 = 0.94 and 0.99, respectively) could support this assumption. Because LOI (<1.5 wt%) and K2O values (<1 wt%) are overall low, enrichment of K2O is likely to be relatively small. Therefore, the total alkali versus silica classification after Le Bas et al. (1986) can be used to give an idea of the sampled rock type.
8.3. Classification
According to the total alkali versus silica classification, all recovered samples are basalts (Figure F34A) and lie within the compositional range of previously reported rocks from Walvis Ridge (Richardson et al., 1984; Salters and Sachi-Kocher, 2010; Hoernle et al., 2015; Homrighausen et al., 2019). Site U1575 samples straddle the alkalic/tholeiitic boundary, with the low-TiO2 lavas plotting in the tholeiite field and the high-TiO2 lavas trending from the tholeiite field into the alkali basalt field (Figure F34A). Other samples from the same plume system from Gough Island, Gough guyot track, other Walvis Ridge dredge sites, and DSDP sites are variably fractionated from basalt to hawaiite to mugearite (Le Maitre, 1962; Richardson et al., 1984; Weaver et al., 1987; Willbold and Stracke, 2006; Salters and Sachi-Kocher, 2010; Rohde et al., 2013; Hoernle et al., 2015; Homrighausen et al., 2019). In contrast, samples from the Tristan Island group are dominantly basanites fractionated to phonotephrites and phonolites (le Roex et al., 1990; Cliff et al., 1991; Willbold and Stracke, 2006).
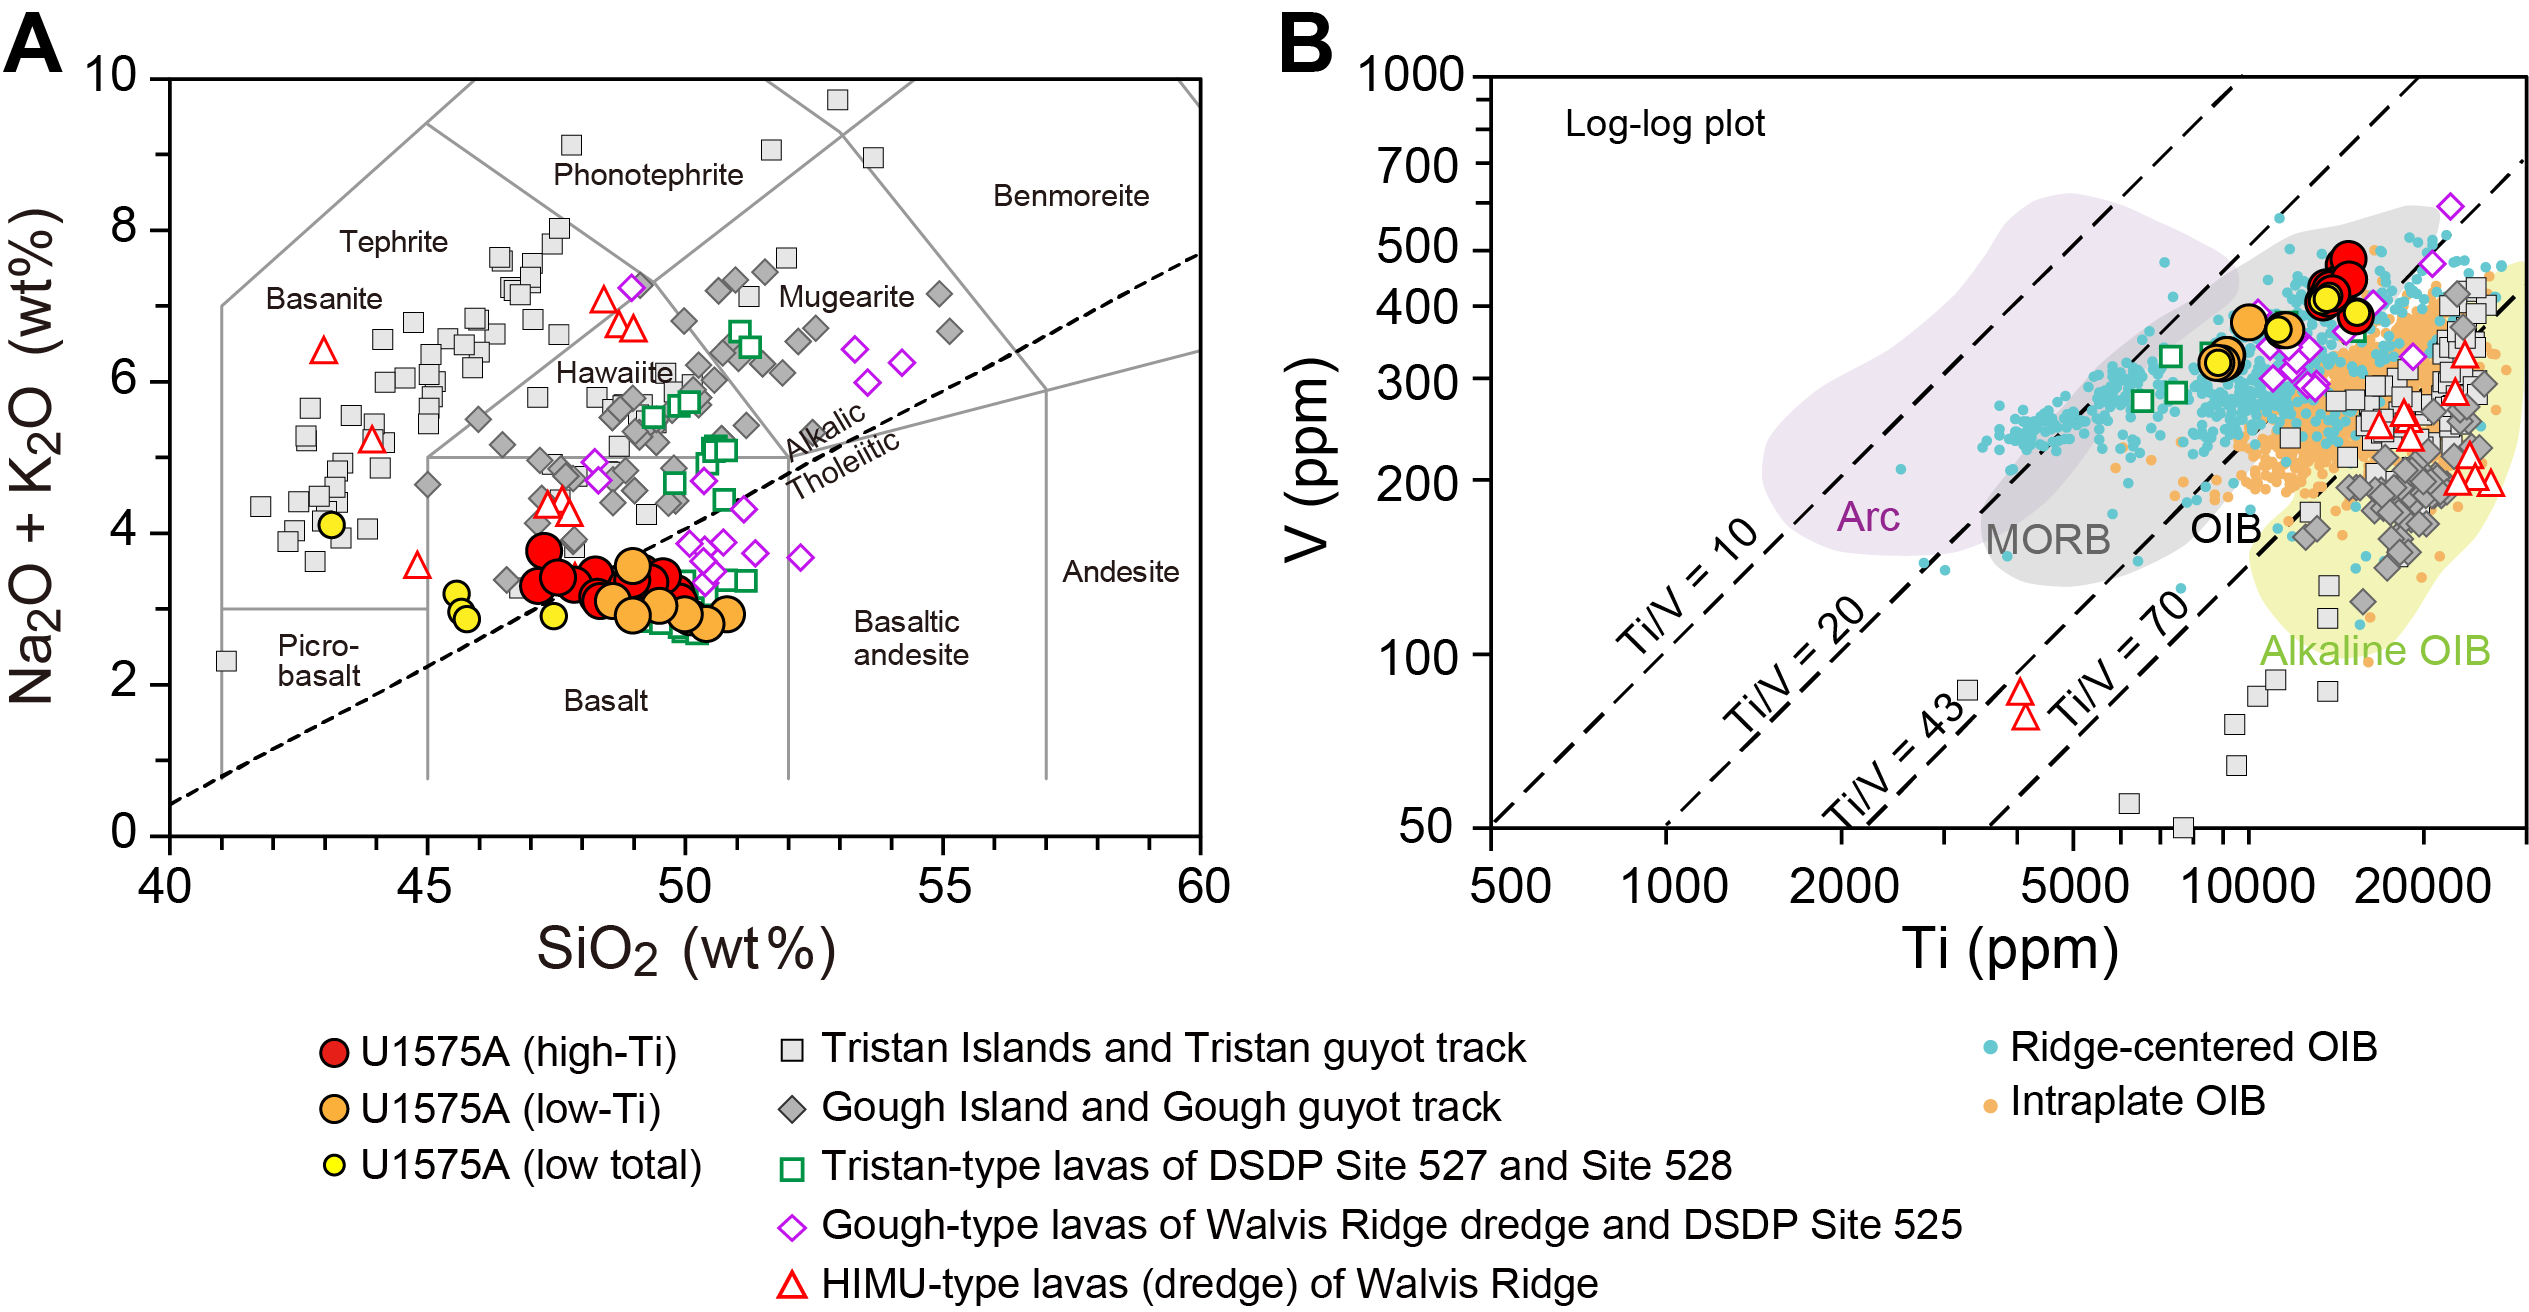
Figure F34. Alkali vs. silica and Ti vs. V classifications.
On the Ti versus V classification diagram after Shervais (2022), all basalt lavas from Site U1575 lie within the mid-ocean ridge basalt (MORB) array and overlap the field of ridge-centered ocean island basalt (OIB) (Figure F34B). The intermediate Ti/V values between 27 and 40 are similar to the previously reported tholeiitic EMI-type (Zindler and Hart, 1986) lavas from Walvis Ridge and Walvis Ridge DSDP drill sites, which are interpreted to result from plume-ridge interaction (e.g., Richardson et al., 1984; Gibson et al., 2005; Hoernle et al., 2015; Homrighausen et al., 2019). In contrast, the late-stage or rejuvenated high µ (HIMU), or high time-integrated 238U/204Pb mantle with radiogenic Pb isotope ratios (Zindler and Hart, 1986), rocks from Walvis Ridge and EMI-type samples from the islands and Guyot Province have overall higher Ti/V values and lie within the OIB array or intraplate setting.
8.4. Bivariate element plots
Basaltic rocks from Site U1575 have normalized SiO2 values of 47.1–50.8 wt% and MgO contents of 4.98–7.15 wt% (Table T6). On bivariate diagrams of MgO (or Mg#) versus other major and trace elements, the samples from Site U1575 form clusters that overlap with previous data from Walvis Ridge and Guyot Province (Figure F35). The only good correlation is a negative trend between MgO and K2O with R2 = 0.63, whereas the remaining elements have best-fit lines of R2 < 0.40. Fe2O3t seems to increase with decreasing MgO, however, as is expected for fractional crystallization of the major ferromagnesian phenocryst phases olivine and clinopyroxene (observed in the majority of igneous units) (see Igneous petrology and volcanology). The olivine fractionation trend is not confirmed in the MgO versus Ni plot (Figure F35), possibly due to the high relative standard deviation values of ICP measurements. Plots of Mg# versus Ti, Zr, Sr, and V (not shown) show curvilinear trends consistent with fractional crystallization, although the offset of high- and low-TiO2 lavas indicates differences in primary magma compositions.

Figure F35. MgO vs. elemental data.
8.5. Downhole variations
The geochemical data display some remarkable characteristics downhole. MgO content seems to increase slightly as depth increases (Figure F36), whereas SiO2 values display a relatively broad scattered array (not shown), possibly related to the lower accuracy of SiO2 compared to MgO. These same systematics are also observed within some igneous units. In Igneous Unit 2, for example, MgO contents seem to systematically increase with depth (apart from slightly altered Sample 391-U1575-26R-3, 9–11 cm, which has low MgO [5.17 wt%] at 231.65 mbsf), whereas SiO2 content displays a scattered array (not shown). A similar trend could be observed in Igneous Units 6–10 with a correlated increase of MgO and slight decrease of SiO2 with depth, which could reflect derivation through time from an evolving magma body.
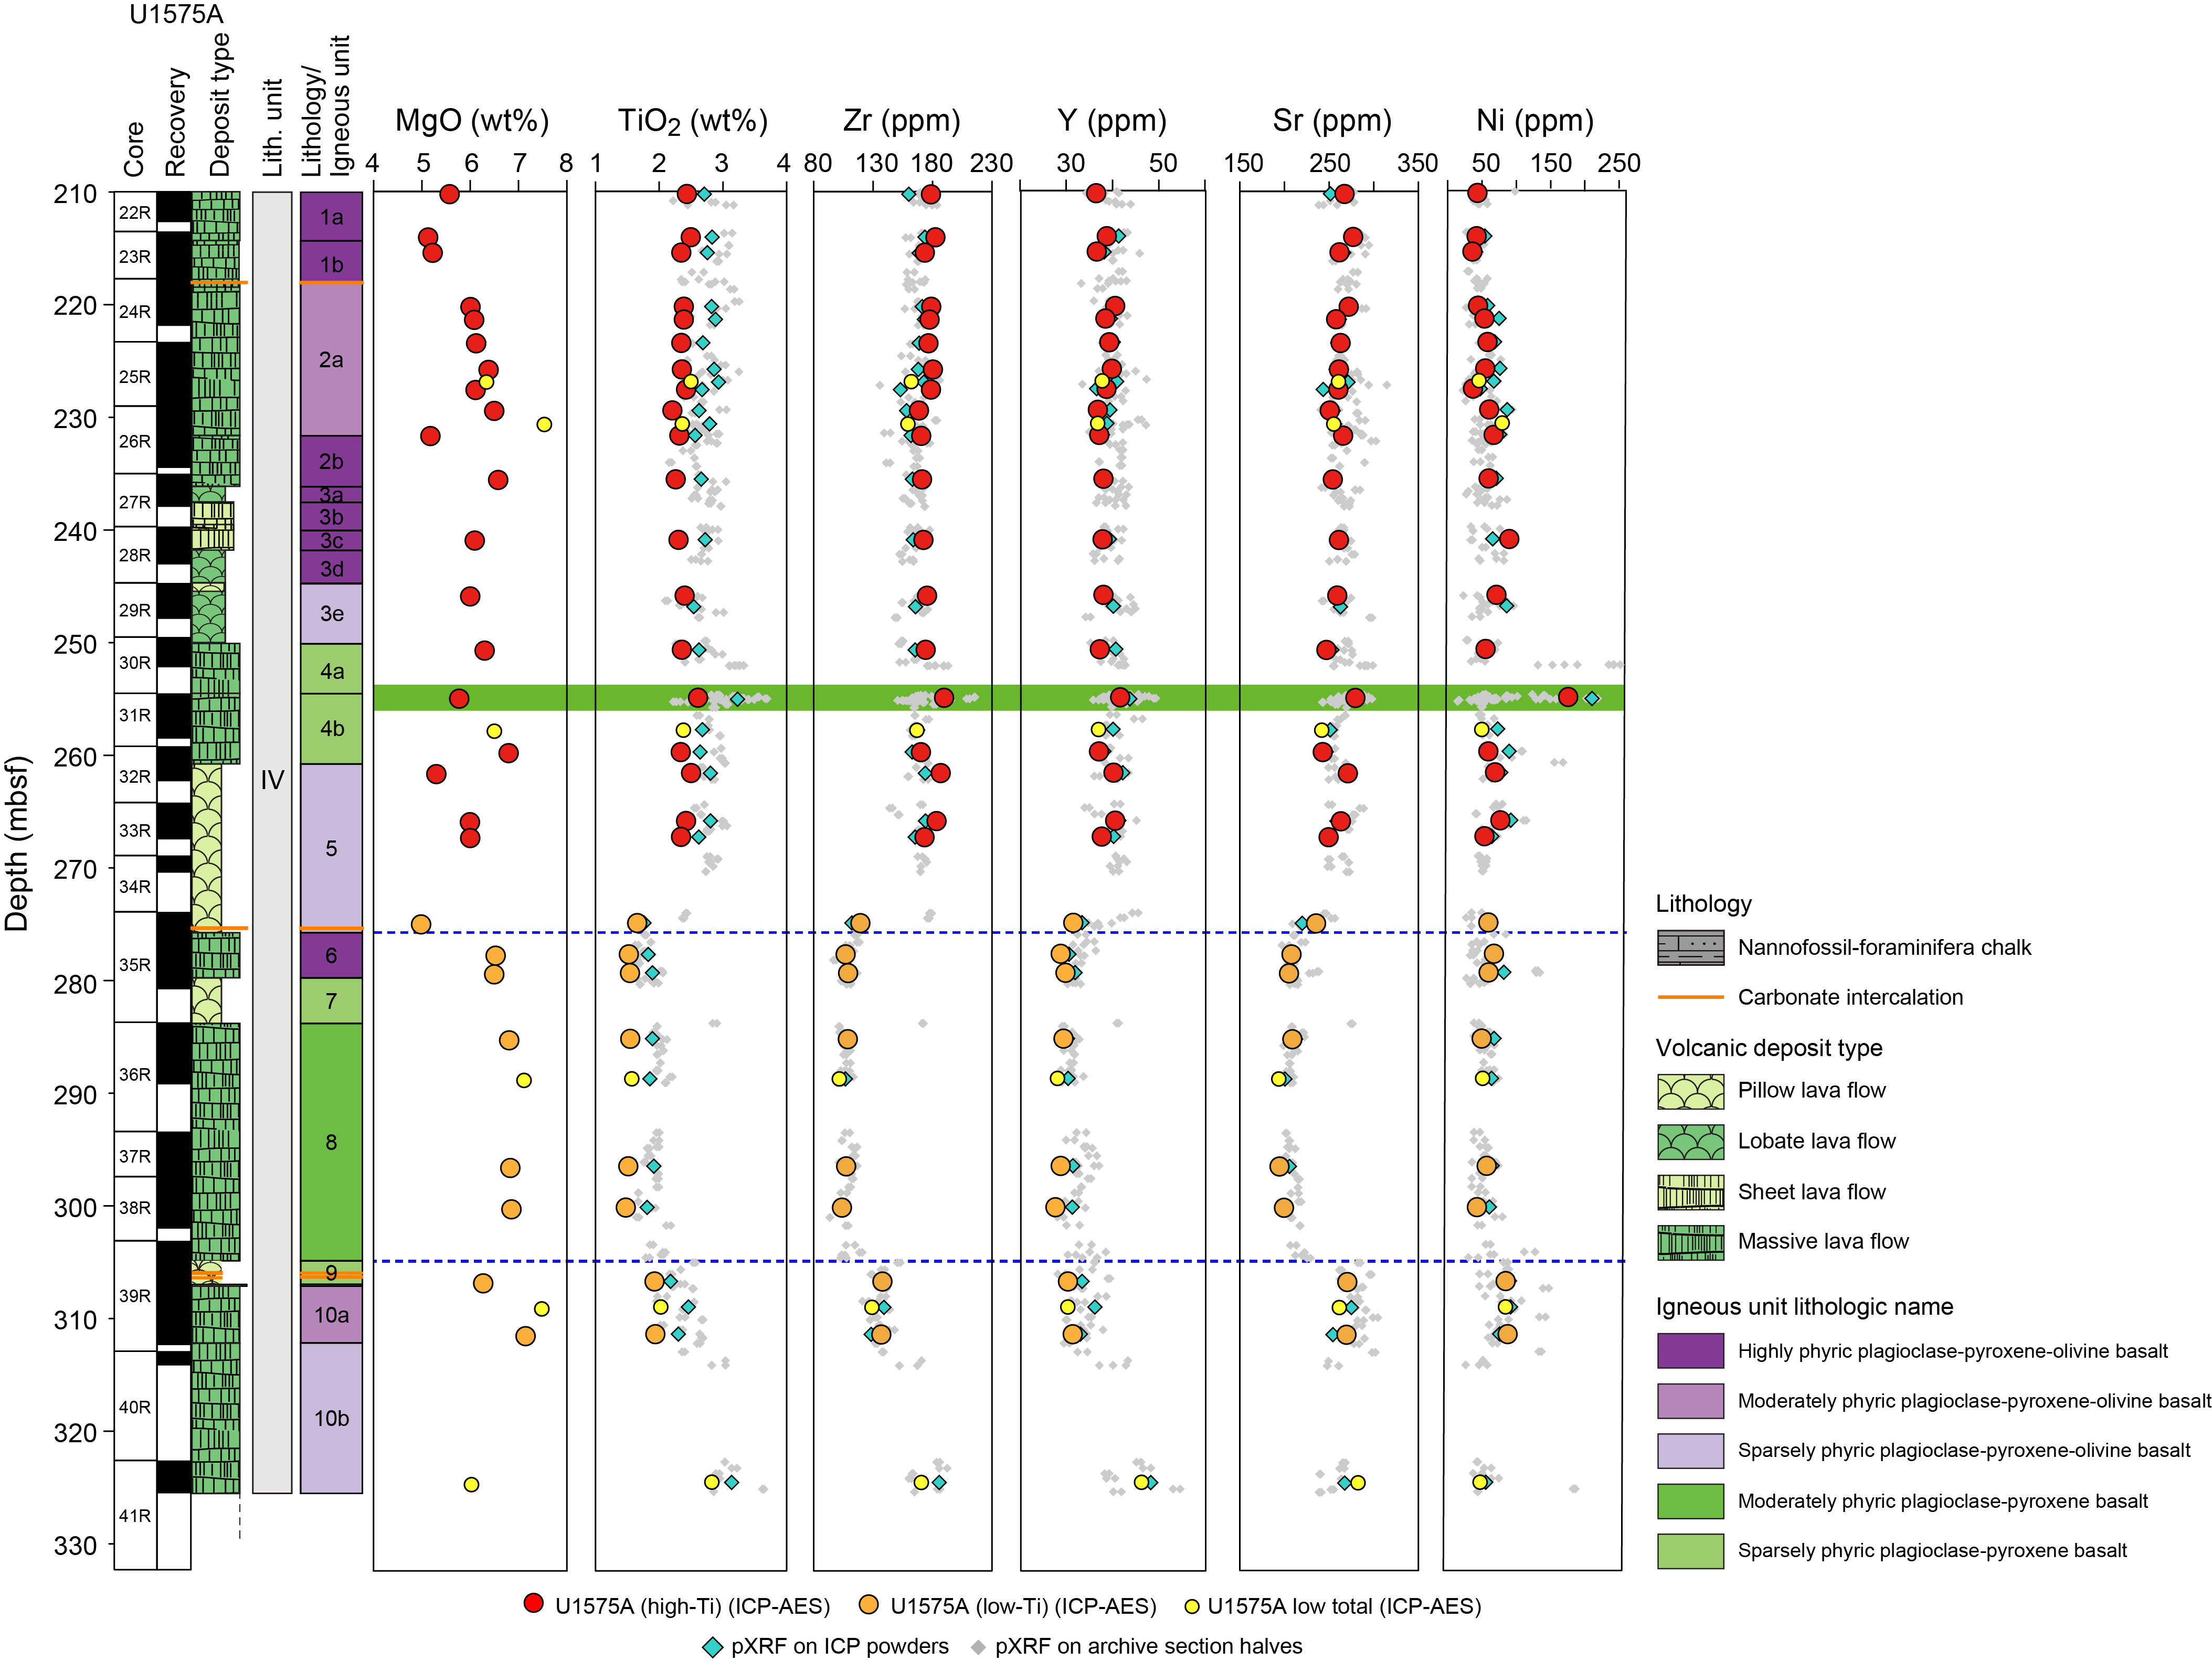
Figure F36. Downhole chemical variations.
The most pronounced downhole variation, however, occurs at ~274 mbsf at the bottom of Igneous Unit 5 (~1.5 m above the transition between Igneous Units 5 and 6). Although TiO2 content remains relatively constant between 2.20 and 2.50 wt% in the upper part of the recovered core (<274 mbsf), the TiO2 value suddenly drops to 1.66 wt% in the lower portion of Unit 5 (Figure F36). This low-Ti signature remains relatively constant, with TiO2 values between 1.48 and 1.54 wt% throughout Units 6–8, and then it slowly increases again through Unit 9 to contents similar to Units 1–5. This downhole Ti variation is clearly mirrored by a similar pattern in Zr, Sr, and Y concentrations and possibly to a lesser extent in Fe2O3t, K2O, P2O5, Cu, and Zn contents (Figure F36; Table T6). The significant geochemical transition at ~274 mbsf also seems to be coupled with a sudden increase in Mg# and, to a lesser extent, CaO (Table T6). It is important to note that the low-Ti signature starts within Unit 5 (Sample 391-U1575A-35R-1, 98.5–99.5 cm, at 274.89 mbsf) and not at the interface between lithologically distinct units. Interestingly, the low-Ti signature is coupled with a mineralogical change to dominantly olivine free and consistently lower plagioclase and clinopyroxene phenocryst proportions (see Igneous petrology and volcanology). Mineralogical variations in other core sections, however, cannot be clearly correlated with other geochemical variabilities, such as the MgO increase in Unit 2.
Another remarkable geochemical signature is observed at the bottom of a single massive (~5 m) flow (Igneous Subunit 4a) at ~255 mbsf (Figure F36), which is characterized by a sudden increase in TiO2, CaO, Mg#, Ni, Cu, and Sc coupled with a drop in Fe2O3t content recorded by the pXRF surface data and confirmed by a single sample (391-U1575A-31R-1, 40–42 cm) using pXRF on powder and ICP-AES (Tables T6, T7). Less pronounced but still significant is a change in composition at the top of Unit 9, which is gradual for most elements, but Sr and Zr show a clear increase, possibly coupled with a small increase in TiO2, Y, and Ni, although to a lesser extent.
At Site U1575, the first 17 samples were measured for S content using the CHNS analyzer. The S content in these basalt samples, however, is below the detection limit of the CHNS analyzer. An additional experiment was conducted with a sample of 100 mg, seven times the initial measurement, but again no S was detected. Going forward, we decided not to measure S content at the other sites.
9. Physical properties
Physical properties measurements were made on recovered whole-round sections, section halves, and discrete cube and wedge samples from Site U1575 in the core laboratory. Hole U1575A was cored to ~325 mbsf. Based on physical properties measurements, the recovered interval is initially described as three distinct lithostratigraphic units: calcareous ooze, chalk, and igneous basement. Abrupt shifts in gamma ray attenuation (GRA), moisture and density (MAD) bulk density, and natural gamma ray (NGR) data indicate the sedimentary/igneous contact at ~210 mbsf. Within the sedimentary package, NGR and MS peaks at ~194 mbsf correlate to the calcareous ooze/chalk contact (Figure F37). Physical properties measurements do not appear to distinguish the lithologic boundary between chalk Lithostratigraphic Units II and III at ~199 mbsf (see Lithostratigraphy).

Figure F37. Physical properties.
At several intervals in the igneous basement (from ~210 mbsf to the bottom of the hole), NGR values and a decrease in GRA bulk density indicate the presence of highly fractured and/or rubbly intervals versus coherent basalts (>20 cm in length). Because submarine-inflated pahoehoe flows do not share the same morphological characteristics as their subaerial equivalents (e.g., highly vesicular, fractured, and shelly flow tops), it is likely that rubbly zones indicate drilling disturbance rather than contacts between individual basalt flows. However, at several depth intervals, MS data appear to correlate to geochemical variations, notably a shift from high to low TiO2 concentrations in basalts at ~270 mbsf made evident by decreases in MS at the same depth.
9.1. Data acquisition
Each whole-round core was measured for GRA bulk density, P-wave velocity (x- and y-axis), and MS on the Whole-Round Multisensor Logger (WRMSL) and NGR on the Natural Gamma Radiation Logger (NGRL). Thermal conductivity measurements were obtained from whole-round sediment cores containing ooze, and point magnetic susceptibility (MSP) measurements of section halves were obtained using the Section Half Multisensor Logger (SHMSL). More localized measurements (thermal conductivity, MAD, P-wave logger, and P-wave caliper [PWC]) of section halves and discrete samples were taken within each representative sedimentary and igneous unit, often multiple samples per core. The higher resolution sampling plan was implemented to identify and track variations in physical properties with depth for correlation to lithologic, magnetic, and chemical characteristics (see Lithostratigraphy and Igneous petrology and volcanology).
For Hole U1575A, a subset of measurements was conducted on paleomagnetic cube saw residue wedges to determine the effects of high-temperature (>500°C) thermal demagnetization experiments on physical properties measurements such as MAD and P-wave velocity. Following heating, hard rock paleomagnetic cube samples and saw residue wedges from the same offset depth were prepared using standard physical properties methods (see Physical properties in the Expedition 391 methods chapter [Sager et al., 2023]). MAD and PWC measurements were collected for the thermal demagnetization cube samples (PWC for the x-, y-, and z-axes) and the control wedges (PWC for the z-axis) to determine whether thermal demagnetization changes these properties. At the time of this publication, this experiment is in progress.
9.2. Thermal conductivity
Within the sedimentary units, mean thermal conductivity for Hole U1575A varies between ~1.10 and ~1.53 W/(m·K) with a mean of 1.31 ± 0.11 W/(m·K) (1σ standard deviation, used throughout) (Figure F37; see Lithostratigraphy). Values are fairly consistent over the entire section but increase gradually downward through the sediments. Across the sediment/basement interface, mean thermal conductivity increases slightly from ~1.40 to ~1.53 W/(m·K), a change that likely reflects variations in mineralogy, compaction, and porosity across the unit boundary. From ~210 mbsf to the bottom of the hole, measurements of igneous basement yield thermal conductivity values of ~1.48 to ~1.76 W/(m·K) with a mean of 1.58 ± 0.09 W/(m·K) and exhibit greater variation than the sediment section above. The range in values is attributed to varying degrees of vesicularity and alteration in basalt flows, as well as observed differences agree with other physical properties measurements at the same depth intervals (e.g., NGR and MS).
9.3. Density and porosity
Measurements of MAD bulk density generally agree with GRA bulk density data (Figure F37). Both MAD and GRA bulk density values are consistent in the uppermost ~194 mbsf, with average values of ~1.98 ± 0.39 g/cm3 and 1.71 ± 0.10 g/cm3, respectively. Below this interval, GRA bulk density values increase to a mean of ~2.58 g/cm3 ± 0.046 g/cm3 with a much larger range (2.50–2.73 g/cm3). The increase in density and associated scatter are attributed to lithologic variations (rubbly versus coherent basalt) and align with other physical properties trends, such as NGR values.
Porosity calculations derived from MAD measurements are fairly consistent in the calcareous ooze unit between ~58 and ~197 mbsf, with a mean value of 55.9 ± 12.5 vol%. The uppermost five porosity measurements, from the seafloor to ~47 mbsf, were disregarded due to experimental error. Below 197 mbsf, porosity decreases slightly to a mean of 49.2 ± 6.6 vol% within the chalk. From ~210 mbsf to the bottom of the hole, porosity values significantly decrease to a mean of 8.58 ± 9.5 vol%, consistent with slightly to moderately vesicular basalts (see Lithostratigraphy). Porosity variations below ~210 mbsf may be related to vein fillings or alteration in massive basalt intervals.
9.4. Magnetic susceptibility
MS pass-through and MSP values measured using the SHMSL are in good agreement along the entire interval of Hole U1575A. MSP measurements plotted by depth show the same overall trends. Both data sets, recorded in instrument units, increase very gradually from the seafloor to ~223 mbsf. Above this depth, both sets of MS measurements are relatively constant and are rather low (average = 67.0 × 10⁻⁵ ± 0.31 × 10⁻⁵ SI). Below ~223 mbsf, MS and MSP values increase sharply from ~200 × 10−5 to ~3000 × 10−5 SI and appear to correlate with fragmented basalt in the uppermost igneous section of the hole. Interestingly, the rapid increase in MS and MSP values does not occur at the sediment/igneous contact at ~210 mbsf; it instead occurs ~13 m below that. From ~223 mbsf to the bottom of the hole, MS values show further variation. The highest recordings, ~3000 to ~3600 × 10−5 SI, are found between ~229 and ~231 mbsf in Sections 26R-1 and 26R-2. This interval of higher magnetism is also represented in SRM measurements, which increase from ~1–5 A/m to ~9–13 A/m in the same interval (see Paleomagnetism). Zones of low MS and MSP values appear to correlate with intervals of highly fragmented basalt, whereas higher values (~1000 to ~3000 × 10−5 SI) appear to be associated with intervals of coherent basalt. These trends are consistent with GRA bulk density and NGR recordings from the same intervals and generally appear to be the result of poor-quality or absent data. Preliminary observations suggest two exceptions to this trend; relatively rubbly intervals (~7–11 cm basalt fragments) at ~277–279 mbsf and ~286–288 mbsf display higher MS and SRM values. pXRF measurements of Fe do not appear to exceed background levels within this interval, but Ti and K appear to decrease beginning at ~250 mbsf and are lower than average to the bottom of the hole (see Igneous petrology and volcanology). Rubbly basalt intervals appear to be associated with drilling disturbance and not individual basalt flows; therefore, we caution against using MS and MSP data (or any single physical properties data set) for detailed correlations in igneous units.
9.5. Sonic velocities
P-wave velocities in the x- and y-directions for whole-round core sections, the x-direction for half sections, and the x-, y-, and z-directions for discrete cubes are consistent through sedimentary and igneous cores recovered from Site U1575.
WRMSL and Section Half Measurement Gantry (SHMG) P-wave measurements are close to mean seawater velocity (1500 m/s; Chen and Millero, 1977) in the calcareous ooze, which has a mean value of 1585 ± 29.1 m/s. Between the seafloor and ~206 mbsf, WRMSL P-wave measurements, SHMG caliper values, and discrete samples fall within a relatively narrow range (1510–1751 m/s). In the chalk below this interval, at ~206 mbsf, P-wave velocity appears to decrease slightly to ~1607 m/s before increasing to ~2600 to ~3200 m/s in the basalt below.
From seafloor to ~194 mbsf, the upper calcareous ooze has a mean x- and y-axis P-wave velocity of ~1586 ± 29 m/s. In the chalk interval, from ~194 to ~210 mbsf, x-axis P-wave velocity values range 1461–1607 m/s with a mean of ~1534 m/s. Discrete basalt samples below ~210 mbsf to the bottom of the hole show the highest P-wave velocities, ranging ~2663 to ~3177 m/s with a mean of ~2937 ± 37.9 m/s. Higher P-wave velocities appear to correlate well with lower porosities and higher bulk densities in massive and sheet basalt flows (Figure F37).
9.6. Natural gamma radiation
NGR measurements are summarized in plots of total counts per second versus depth (Figure F37). NGR recordings are dependent on lithologic characteristics such as composition and porosity. Consequently, highly fragmented and vesicular material results in lower NGR counts than more massive crystalline material, and wide-ranging NGR values are associated with intervals of low and fragmented material (de Ronde et al., 2019). To avoid spurious correlations, NGR values are compared in intervals with high recovery that contain coherent pieces with lengths >20 cm.
NGR recordings also reveal stratigraphic details that can aid in lithologic and geochemical correlations. Higher potassium concentrations in clay- or ash-rich sediments in drilled core yield significantly higher NGR counts, and high NGR counts have been correlated to relatively high potassium concentrations (K2O = >1.8 wt%) in Snake River Plain basalts (Potter et al., 2019). In Hole U1575A, an interval of low NGR and accompanying high MS at 277–279 mbsf appears to correlate with the beginning of a relatively low-TiO2 (1.6–2 wt% versus ~3 wt%) basalt flow identified using pXRF data (see Igneous petrology and volcanology).
At the calcareous ooze/chalk contact at ~194 mbsf, mean NGR values increase from 3.33 ± 1.31 counts/s to 16.0 ± 0.867 counts/s. Across the chalk/igneous basement interface at ~210 mbsf, mean NGR values decrease slightly to 15.4 ± 0.242 counts/s. The sediment units in Hole U1575A yield mean NGR values of 2.60 ± 0.34 counts/s (calcareous ooze) and 4.51 ± 1.06 counts/s (chalk).
9.7. Rheology
Sediment shear strength was measured with the automated vane shear (AVS) system on soft-sediment cores recovered from Hole U1575A. The interval of soft sediment extends from the seafloor to 185 mbsf. AVS measurements were not taken below this depth because of the increasing lithification of sediments. AVS increases from 0.466 to 10.3 kN/m2 in the soft-sediment interval, which is consistent with increasing density and compaction at greater depths.
9.8. Data integration and lithology correlation
Physical properties measurements closely align with the depths of the three stratigraphic subdivisions at Site U1575: calcareous ooze, chalk, and basalt. The calcareous ooze/chalk and chalk/basalt contacts are recorded as sharp increases in P-wave velocity, MS, and bulk density (WRMSL and MAD); as more gradual increases in thermal conductivity and P-wave velocity with depth; and as abrupt decreases in porosity. The basalt unit uniformly displays the highest values of P-wave velocity, MS, bulk density (WRMSL and MAD), and thermal conductivity, and it displays the lowest porosity. In particular, measurements of NGR, GRA bulk density, and MS record both rubbly and coherent intervals and appear to broadly correlate to basalt flow boundaries (Figure F37). Most notably, these data also align with pXRF analyses and demonstrate the presence of chemically anomalous (e.g., low TiO2, K, and Zr) basalts in Hole U1575A between ~270 and ~315 mbsf.
References
Acton, G.D., Okada, M., Clement, B.M., Lund, S.P., and Williams, T., 2002. Paleomagnetic overprints in ocean sediment cores and their relationship to shear deformation caused by piston coring. Journal of Geophysical Research: Solid Earth, 107:2067–2081. https://doi.org/10.1029/2001JB000518
Baker, P.A., Gieskes, J.M., and Elderfield, H., 1982. Diagenesis of carbonates in deep-sea sediments; evidence from Sr/Ca ratios and interstitial dissolved Sr (super 2+) data. Journal of Sedimentary Research, 52(1):71–82. https://doi.org/10.1306/212F7EE1-2B24-11D7-8648000102C1865D
Baudin, F., Martinez, P., Dennielou, B., Charlier, K., Marsset, T., Droz, L., and Rabouille, C., 2017. Organic carbon accumulation in modern sediments of the Angola Basin influenced by the Congo deep-sea fan. Deep Sea Research Part II: Topical Studies in Oceanography, 142:64-74. https://doi.org/10.1016/j.dsr2.2017.01.009
Chave, A.D., 1984. Lower Paleocene-Upper Cretaceous magnetostratigraphy, Sites 525, 527, 528, and 529, Deep Sea Drilling Project Leg 74. In Moore, T.C., Jr., Rabinowitz, P.D., et al., Initial Reports of the Deep Sea Drilling Project, 74: Washington, DC (US Government Printing Office), 525–531. https://doi.org/10.2973/dsdp.proc.74.110.1984
Chen, C.T., and Millero, F.J., 1977. Speed of sound in seawater at high pressures. The Journal of the Acoustical Society of America, 62(5):1129–1135. https://doi.org/10.1121/1.381646
Class, C., and Lehnert, K., 2012. PetDB Expert MORB (Mid-Ocean Ridge Basalt) Compilation, Version 1.0. Interdisciplinary Earth Data Alliance (IEDA). https://doi.org/10.1594/IEDA/100060
Class, C., and le Roex, A.P., 2008. Ce anomalies in Gough Island lavas — trace element characteristics of a recycled sediment component. Earth and Planetary Science Letters, 265(3):475-486. https://doi.org/10.1016/j.epsl.2007.10.030
Cliff, R.A., Baker, P.E., and Mateer, N.J., 1991. Geochemistry of inaccessible island volcanics. Chemical Geology, 92(4):251–260. https://doi.org/10.1016/0009-2541(91)90073-Z
de Ronde, C.E.J., Humphris, S.E., Höfig, T.W., Brandl, P.A., Cai, L., Cai, Y., Caratori Tontini, F., Deans, J.R., Farough, A., Jamieson, J.W., Kolandaivelu, K.P., Kutovaya, A., Labonté, J.M., Martin, A.J., Massiot, C., McDermott, J.M., McIntosh, I.M., Nozaki, T., Pellizari, V.H., Reyes, A.G., Roberts, S., Rouxel, O., Schlicht, L.E.M., Seo, J.H., Straub, S.M., Strehlow, K., Takai, K., Tanner, D., Tepley III, F.J., and Zhang, C., 2019. Expedition 376 methods. In de Ronde, C.E.J., Humphris, S.E., Höfig, T.W., and the Expedition 376 Scientists, Brothers Arc Flux. Proceedings of the International Ocean Discovery Program, 376: College Station, TX (International Ocean Discovery Program). https://doi.org/10.14379/iodp.proc.376.102.2019
Doubrovine, P.V., Steinberger, B., and Torsvik, T.H., 2012. Absolute plate motions in a reference frame defined by moving hot spots in the Pacific, Atlantic, and Indian oceans. Journal of Geophysical Research: Solid Earth, 117(B9):B09101. https://doi.org/10.1029/2011JB009072
Ernesto, M., Pacca, I.G., Hiodo, F.Y., and Nardy, A.J.R., 1990. Palaeomagnetism of the Mesozoic Serra Geral Formation, southern Brazil. Physics of the Earth and Planetary Interiors, 64(2):153–175. https://doi.org/10.1016/0031-9201(90)90035-V
Ernesto, M., Raposo, M.I.B., Marques, L.S., Renne, P.R., Diogo, L.A., and de Min, A., 1999. Paleomagnetism, geochemistry and 40Ar/39Ar dating of the north-eastern Paraná Magmatic Province: tectonic implications. Journal of Geodynamics, 28(4):321–340. https://doi.org/10.1016/S0264-3707(99)00013-7
Gibson, S.A., Thompson, R.N., Day, J.A., Humphris, S.E., and Dickin, A.P., 2005. Melt-generation processes associated with the Tristan mantle plume: constraints on the origin of EM-1. Earth and Planetary Science Letters, 237(3–4):744–767. https://doi.org/10.1016/j.epsl.2005.06.015
Gieskes, J.M., 1981. Deep-sea drilling interstitial water studies: implications for chemical alteration of the oceanic crust, Layers I and II. In Warme, J.E., Douglas, R.G., and Winterer, E.L. (Eds.), Deep Sea Drilling Project: A Decade of Progress. Special Publication - SEPM (Society for Sedimentary Geology), 32: 149–168.
Gradstein, F.M., Ogg, J.G., Schmitz, M.D., and Ogg, G.M. (Eds.), 2020. The Geologic Time Scale 2020: Amsterdam (Elsevier BV). https://doi.org/10.1016/C2020-1-02369-3
Hoernle, K., Rohde, J., Hauff, F., Garbe-Schönberg, D., Homrighausen, S., Werner, R., and Morgan, J.P., 2015. How and when plume zonation appeared during the 132 Myr evolution of the Tristan Hotspot. Nature Communications, 6(1):7799. https://doi.org/10.1038/ncomms8799
Homrighausen, S., Hoernle, K., Geldmacher, J., Wartho, J.A., Hauff, F., Portnyagin, M., Werner, R., van den Bogaard, P., and Garbe-Schönberg, D., 2018. Unexpected HIMU-type late-stage volcanism on the Walvis Ridge. Earth and Planetary Science Letters, 492:251–263. https://doi.org/10.1016/j.epsl.2018.03.049
Homrighausen, S., Hoernle, K., Hauff, F., Wartho, J.A., van den Bogaard, P., and Garbe-Schönberg, D., 2019. New age and geochemical data from the Walvis Ridge: the temporal and spatial diversity of South Atlantic intraplate volcanism and its possible origin. Geochimica et Cosmochimica Acta, 245:16–34. https://doi.org/10.1016/j.gca.2018.09.002
Homrighausen, S., Hoernle, K., Zhou, H., Geldmacher, J., Wartho, J.-A., Hauff, F., Werner, R., Jung, S., and Morgan, J.P., 2020. Paired EMI-HIMU hotspots in the South Atlantic—starting plume heads trigger compositionally distinct secondary plumes? Science Advances, 6(28):eaba0282. https://doi.org/10.1126/sciadv.aba0282
Inoue, H., Coffin, M.F., Nakamura, Y., Mochizuki, K., and Kroenke, L.W., 2008. Intrabasement reflections of the Ontong Java Plateau: implications for plateau construction. Geochemistry, Geophysics, Geosystems, 9(4):Q0401. https://doi.org/10.1029/2007GC001780
Jackson, M., Gruber, W., Marvin, J., and Banerjee, S.K., 1988. Partial anhysteretic remanence and its anisotropy: applications and grainsize-dependence. Geophysical Research Letters, 15(5):440–443. https://doi.org/10.1029/GL015i005p00440
Jochum, K.P., and Verma, S.P., 1996. Extreme enrichment of Sb, Tl and other trace elements in altered MORB. Chemical Geology, 130(3–4):289–299. https://doi.org/10.1016/0009-2541(96)00014-9
Le Bas, M.J., Le Maitre, R. W., Streickeisen, A., Zanettin, B., the IUGS Subcommission on the Systematics of Igneous Rocks, 1986. A chemical classification of volcanic rocks based on the total alkali-silica diagram. Journal of Petrology, 27(3):745–750. https://doi.org/10.1093/petrology/27.3.745
Le Maitre, R.W., 1962. Petrology of volcanic rocks, Gough Island, South Atlantic. Geological Society of America Bulletin, 73(11):1309–1340. https://doi.org/10.1130/0016-7606(1962)73[1309:POVRGI]2.0.CO;2
Le Roex, A.P., Cliff, R.A., and Adair, B.J.I., 1990. Tristan da Cunha, South Atlantic: geochemistry and petrogenesis of a basanite-phonolite lava series. Journal of Petrology, 31(4):779–812. https://doi.org/10.1093/petrology/31.4.779
MacDonald, G.A., and Katsura, T., 1964. Chemical composition of Hawaiian lavas. Journal of Petrology, 5(1):82–133. https://doi.org/10.1093/petrology/5.1.82
McFadden, P.L., and Reid, A.B., 1982. Analysis of palaeomagnetic inclination data. Geophysical Journal International, 69(2):307–319. https://doi.org/10.1111/j.1365-246X.1982.tb04950.x
O'Connor, J.M., and le Roex, A.P., 1992. South Atlantic hot spot-plume systems: 1. Distribution of volcanism in time and space. Earth and Planetary Science Letters, 113(3):343–364. https://doi.org/10.1016/0012-821X(92)90138-L
Potter, K.E., Champion, D.E., Duncan, R.A., and Shervais, J.W., 2019. Volcanic stratigraphy and age model of the Kimama deep borehole (Project Hotspot): evidence for 5.8 million years of continuous basalt volcanism, central Snake River Plain, Idaho. Geosphere, 15(3):736–758. https://doi.org/10.1130/GES01679.1
Quinby-Hunt, M.S., and Turekian, K.K., 1983. Distribution of elements in sea water. Eos, Transactions of the American Geophysical Union, 64(14):130. https://doi.org/10.1029/EO064i014p00130
Renne, P.R., Scott, G.R., Glen, J.M.G., and Feinberg, J.M., 2002. Oriented inclusions of magnetite in clinopyroxene: source of stable remanent magnetization in gabbros of the Messum Complex, Namibia. Geochemistry, Geophysics, Geosystems, 3(12):1–11. https://doi.org/10.1029/2002GC000319
Richardson, S.H., Erlank, A.J., Reid, D.L., and Duncan, A.R., 1984. Major and trace element and Nd and Sr isotope geochemistry of basalts from the Deep Sea Drilling Project Leg 74 Walvis Ridge transect. In Moore, T.C., Jr., Rabinowitz, P. D., et al., Initial Reports of the Deep Sea Drilling Project, 74: Washington, DC (US Government Printing Office), 739–754. https://doi.org/10.2973/dsdp.proc.74.125.1984
Rohde, J., Hoernle, K., Hauff, F., Werner, R., O'Connor, J., Class, C., Garbe-Schönberg, D., and Jokat, W., 2013. 70 Ma chemical zonation of the Tristan-Gough hotspot track. Geology, 41(3):335–338. https://doi.org/10.1130/G33790.1
Sager, W., Hoernle, K., Höfig, T.W., Avery, A.J., Bhutani, R., Buchs, D.M., Carvallo, C.A., Class, C., Dai, Y., Dalla Valle, G., Del Gaudio, A.V., Fielding, S., Gaastra, K.M., Han, S., Homrighausen, S., Kubota, Y., Li, C.-F., Nelson, W.R., Petrou, E., Potter, K.E., Pujatti, S., Scholpp, J., Shervais, J.W., Thoram, S., Tikoo-Schantz, S.M., Tshiningayamwe, M., Wang, X.-J., and Widdowson, M., 2023. Expedition 391 methods. In Sager, W., Hoernle, K., Höfig, T.W., Blum, P., and the Expedition 391 Scientists, Walvis Ridge Hotspot. Proceedings of the International Ocean Discovery Program, 391: College Station, TX (International Ocean Discovery Program). https://doi.org/10.14379/iodp.proc.391.102.2023
Sager, W.W., Zhang, J., Korenaga, J., Sano, T., Koppers, A.A.P., Widdowson, M., and Mahoney, J.J., 2013. An immense shield volcano within the Shatsky Rise oceanic plateau, northwest Pacific Ocean. Nature Geoscience, 6(11):976–981. https://doi.org/10.1038/ngeo1934
Salters, V.J.M., and Sachi-Kocher, A., 2010. An ancient metasomatic source for the Walvis Ridge basalts. Chemical Geology, 273(3–4):151–167. https://doi.org/10.1016/j.chemgeo.2010.02.010
Shaar, R., and Feinberg, J.M., 2013. Rock magnetic properties of dendrites: insights from MFM imaging and implications for paleomagnetic studies. Geochemistry, Geophysics, Geosystems, 14(2):407–421. https://doi.org/10.1002/ggge.20053
Shervais, J.W., 2022. The petrogenesis of modern and ophiolitic lavas reconsidered: Ti-V and Nb-Th. Geoscience Frontiers, 13(2):101319. https://doi.org/10.1016/j.gsf.2021.101319
Smith, W.H.F., and Sandwell, D.T., 1997. Global sea floor topography from satellite altimetry and ship depth soundings. Science, 277(5334):1956–1962. https://doi.org/10.1126/science.277.5334.1956
Summerhayes, C.P., Kroon, D., Rosell-Melé, A., Jordan, R.W., Schrader, H.J., Hearn, R., Villanueva, J., Grimalt, J.O., and Eglinton, G., 1995. Variability in the Benguela Current upwelling system over the past 70,000 years. Progress in Oceanography, 35(3):207–251. https://doi.org/10.1016/0079-6611(95)00008-5
Torsvik, T.H., Müller, R.D., Van der Voo, R., Steinberger, B., and Gaina, C., 2008. Global plate motion frames: toward a unified model. Reviews of Geophysics, 46(3):RG3004. https://doi.org/10.1029/2007RG000227
Tozer, B., Sandwell, D.T., Smith, W.H.F., Olson, C., Beale, J.R., and Wessel, P., 2019. Global bathymetry and topography at 15 arc sec: SRTM15+. Earth and Space Science, 6(10):1847–1864. https://doi.org/10.1029/2019EA000658
Van Fossen, M.C., and Kent, D.V., 1992. Paleomagnetism of 122 Ma plutons in New England and the mid-Cretaceous paleomagnetic field in North America: true polar wander or large-scale differential mantle motion? Journal of Geophysical Research: Solid Earth, 97(B13):19651–19661. https://doi.org/10.1029/92JB01466
Verosub, K.L., 1977. Depositional and postdepositional processes in the magnetization of sediments. Reviews of Geophysics, 15(2):129–143. https://doi.org/10.1029/RG015i002p00129
Wade, B.S., Pearson, P.N., Olsson, R.K., Fraass, A.J., Leckie, R.M., and Hemleben, C., 2018. Taxonomy, biostratigraphy, and phylogeny of Oligocene and lower Miocene Dentoglobigerina and Globoquadrina. In Wade, B.S., Olsson, R.K., Pearson, P.N., Huber, B.T., and Berggren, W.A. (Eds.), Atlas of Oligocene Planktonic Foraminifera. Cushman Foundation Special Publication, 46: 331–384. https://www.ucl.ac.uk/earth-sciences/sites/earth-sciences/files/Chapter_11.pdf
Weaver, B.L., Wood, D.A., Tarney, J., and Joron, J.L., 1987. Geochemistry of ocean island basalts from the South Atlantic: Ascension, Bouvet, St. Helena, Gough and Tristan da Cunha. In Fitton, J.G., and Upton, B.G.J. (Eds.), Alkaline Igneous Rocks. Geological Society Special Publication, 30:253–267. https://doi.org/10.1144/GSL.SP.1987.030.01.11
Wei, K.-Y., 1994. Stratophenetic tracing of phylogeny using SIMCA pattern recognition technique: a case study of the late Neogene planktonic foraminifera Globoconella clade. Paleobiology, 20(1):52–65. https://www.jstor.org/stable/2401150
Willbold, M., and Stracke, A., 2006. Trace element composition of mantle end-members: implications for recycling of oceanic and upper and lower continental crust. Geochemistry, Geophysics, Geosystems, 7(4):Q04004. https://doi.org/10.1029/2005GC001005
Zhou, H., Hoernle, K., Geldmacher, J., Hauff, F., Homrighausen, S., Garbe-Schönberg, D., and Jung, S., 2020. Geochemistry of Etendeka magmatism: spatial heterogeneity in the Tristan-Gough plume head. Earth and Planetary Science Letters, 535:116123. https://doi.org/10.1016/j.epsl.2020.116123
Zindler, A., and Hart, S., 1986. Chemical geodynamics. Annual Review of Earth and Planetary Sciences, 14:493–570. https://doi.org/10.1146/annurev.ea.14.050186.002425