Sager, W., Hoernle, K., Höfig, T.W., Blum, P., and the Expedition 391 Scientists
Proceedings of the International Ocean Discovery Program Volume 391
publications.iodp.org
https://doi.org/10.14379/iodp.proc.391.104.2023
Site U15761
![]() W. Sager,
W. Sager,
![]() K. Hoernle,
K. Hoernle,
![]() T.W. Höfig,
T.W. Höfig,
![]() A.J. Avery,
A.J. Avery,
![]() R. Bhutani,
R. Bhutani,
![]() D.M. Buchs,
D.M. Buchs,
![]() C.A. Carvallo,
C.A. Carvallo,
![]() C. Class,
C. Class,
![]() Y. Dai,
Y. Dai,
![]() G. Dalla Valle,
G. Dalla Valle,
![]() A.V. Del Gaudio,
S. Fielding,
A.V. Del Gaudio,
S. Fielding,
![]() K.M. Gaastra,
K.M. Gaastra,
![]() S. Han,
S. Han,
![]() S. Homrighausen,
S. Homrighausen,
![]() Y. Kubota,
Y. Kubota,
![]() C.-F. Li,
C.-F. Li,
![]() W.R. Nelson,
W.R. Nelson,
![]() E. Petrou,
E. Petrou,
![]() K.E. Potter,
K.E. Potter,
![]() S. Pujatti,
S. Pujatti,
![]() J. Scholpp,
J. Scholpp,
![]() J.W. Shervais,
J.W. Shervais,
![]() S. Thoram,
S. Thoram,
![]() S.M. Tikoo-Schantz,
S.M. Tikoo-Schantz,
![]() M. Tshiningayamwe,
X.-J. Wang, and
M. Tshiningayamwe,
X.-J. Wang, and
![]() M. Widdowson2
M. Widdowson2
1 Sager, W., Hoernle, K., Höfig, T.W., Avery, A.J., Bhutani, R., Buchs, D.M., Carvallo, C.A., Class, C., Dai, Y., Dalla Valle, G., Del Gaudio, A.V., Fielding, S., Gaastra, K.M., Han, S., Homrighausen, S., Kubota, Y., Li, C.-F., Nelson, W.R., Petrou, E., Potter, K.E., Pujatti, S., Scholpp, J., Shervais, J.W., Thoram, S., Tikoo-Schantz, S.M., Tshiningayamwe, M., Wang, X.-J., and Widdowson, M., 2023. Site U1576. In Sager, W., Hoernle, K., Höfig, T.W., Blum, P., and the Expedition 391 Scientists, Walvis Ridge Hotspot. Proceedings of the International Ocean Discovery Program, 391: College Station, TX (International Ocean Discovery Program). https://doi.org/10.14379/iodp.proc.391.104.2023
2 Expedition 391 Scientists' affiliations.
1. Background and objectives
The strategy for International Ocean Discovery Program (IODP) Expedition 391 was to drill at three distributed locations on Walvis Ridge and one in Guyot Province, providing an age transect along the Tristan-Gough-Walvis (TGW) hotspot track. Site U1576 (proposed Site VB-14A), located on the western flank of Valdivia Bank (Figure F1), is one of two sites on this edifice selected to investigate the type of volcanism, possible plume-ridge interaction, the older extent of hotspot track geochemical zonation, and the age progression. Both hotspot models and the age progression of Homrighausen et al. (2019) predict an age of ~80–85 Ma (Figures F2, F3). A magnetic anomaly map indicates that Site U1576 is located on a prominent negative anomaly (Figure F4) that is thought to be Chron 33r (79.9–83.6 Ma; Ogg, 2020).

Figure F1. Bathymetry map.
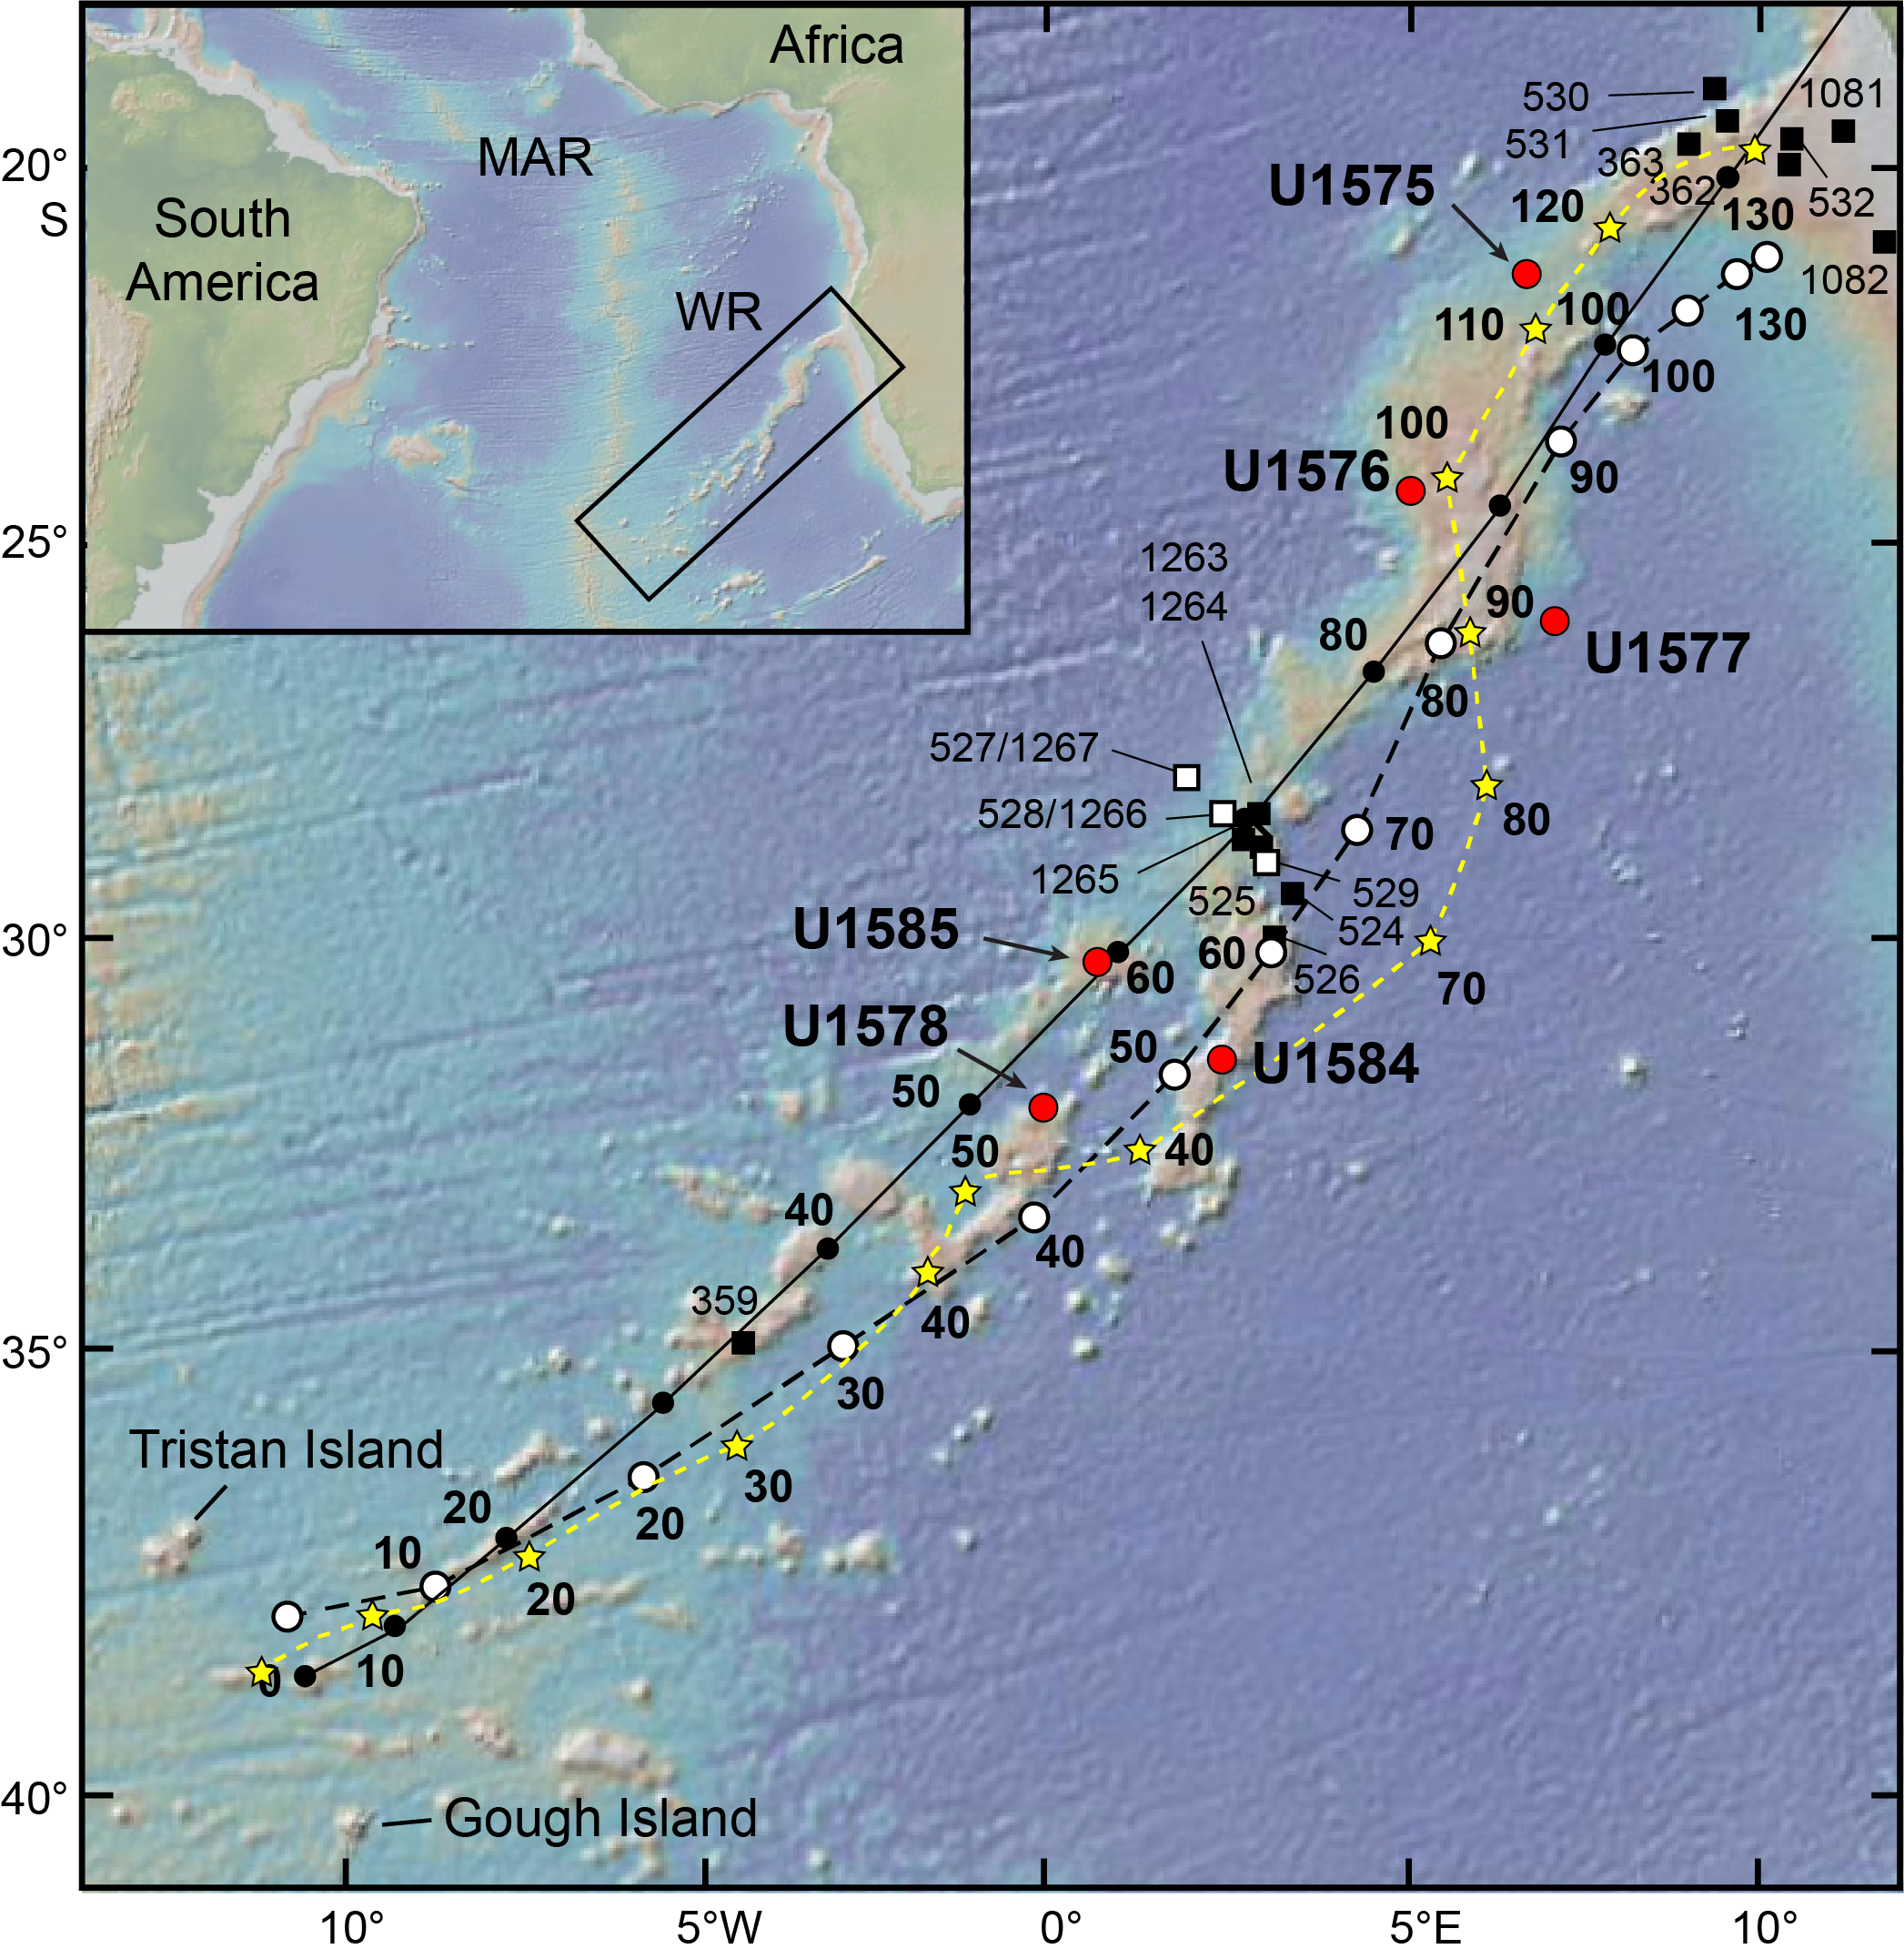
Figure F2. Walvis Ridge bathymetry, hotspot age models, and sites.
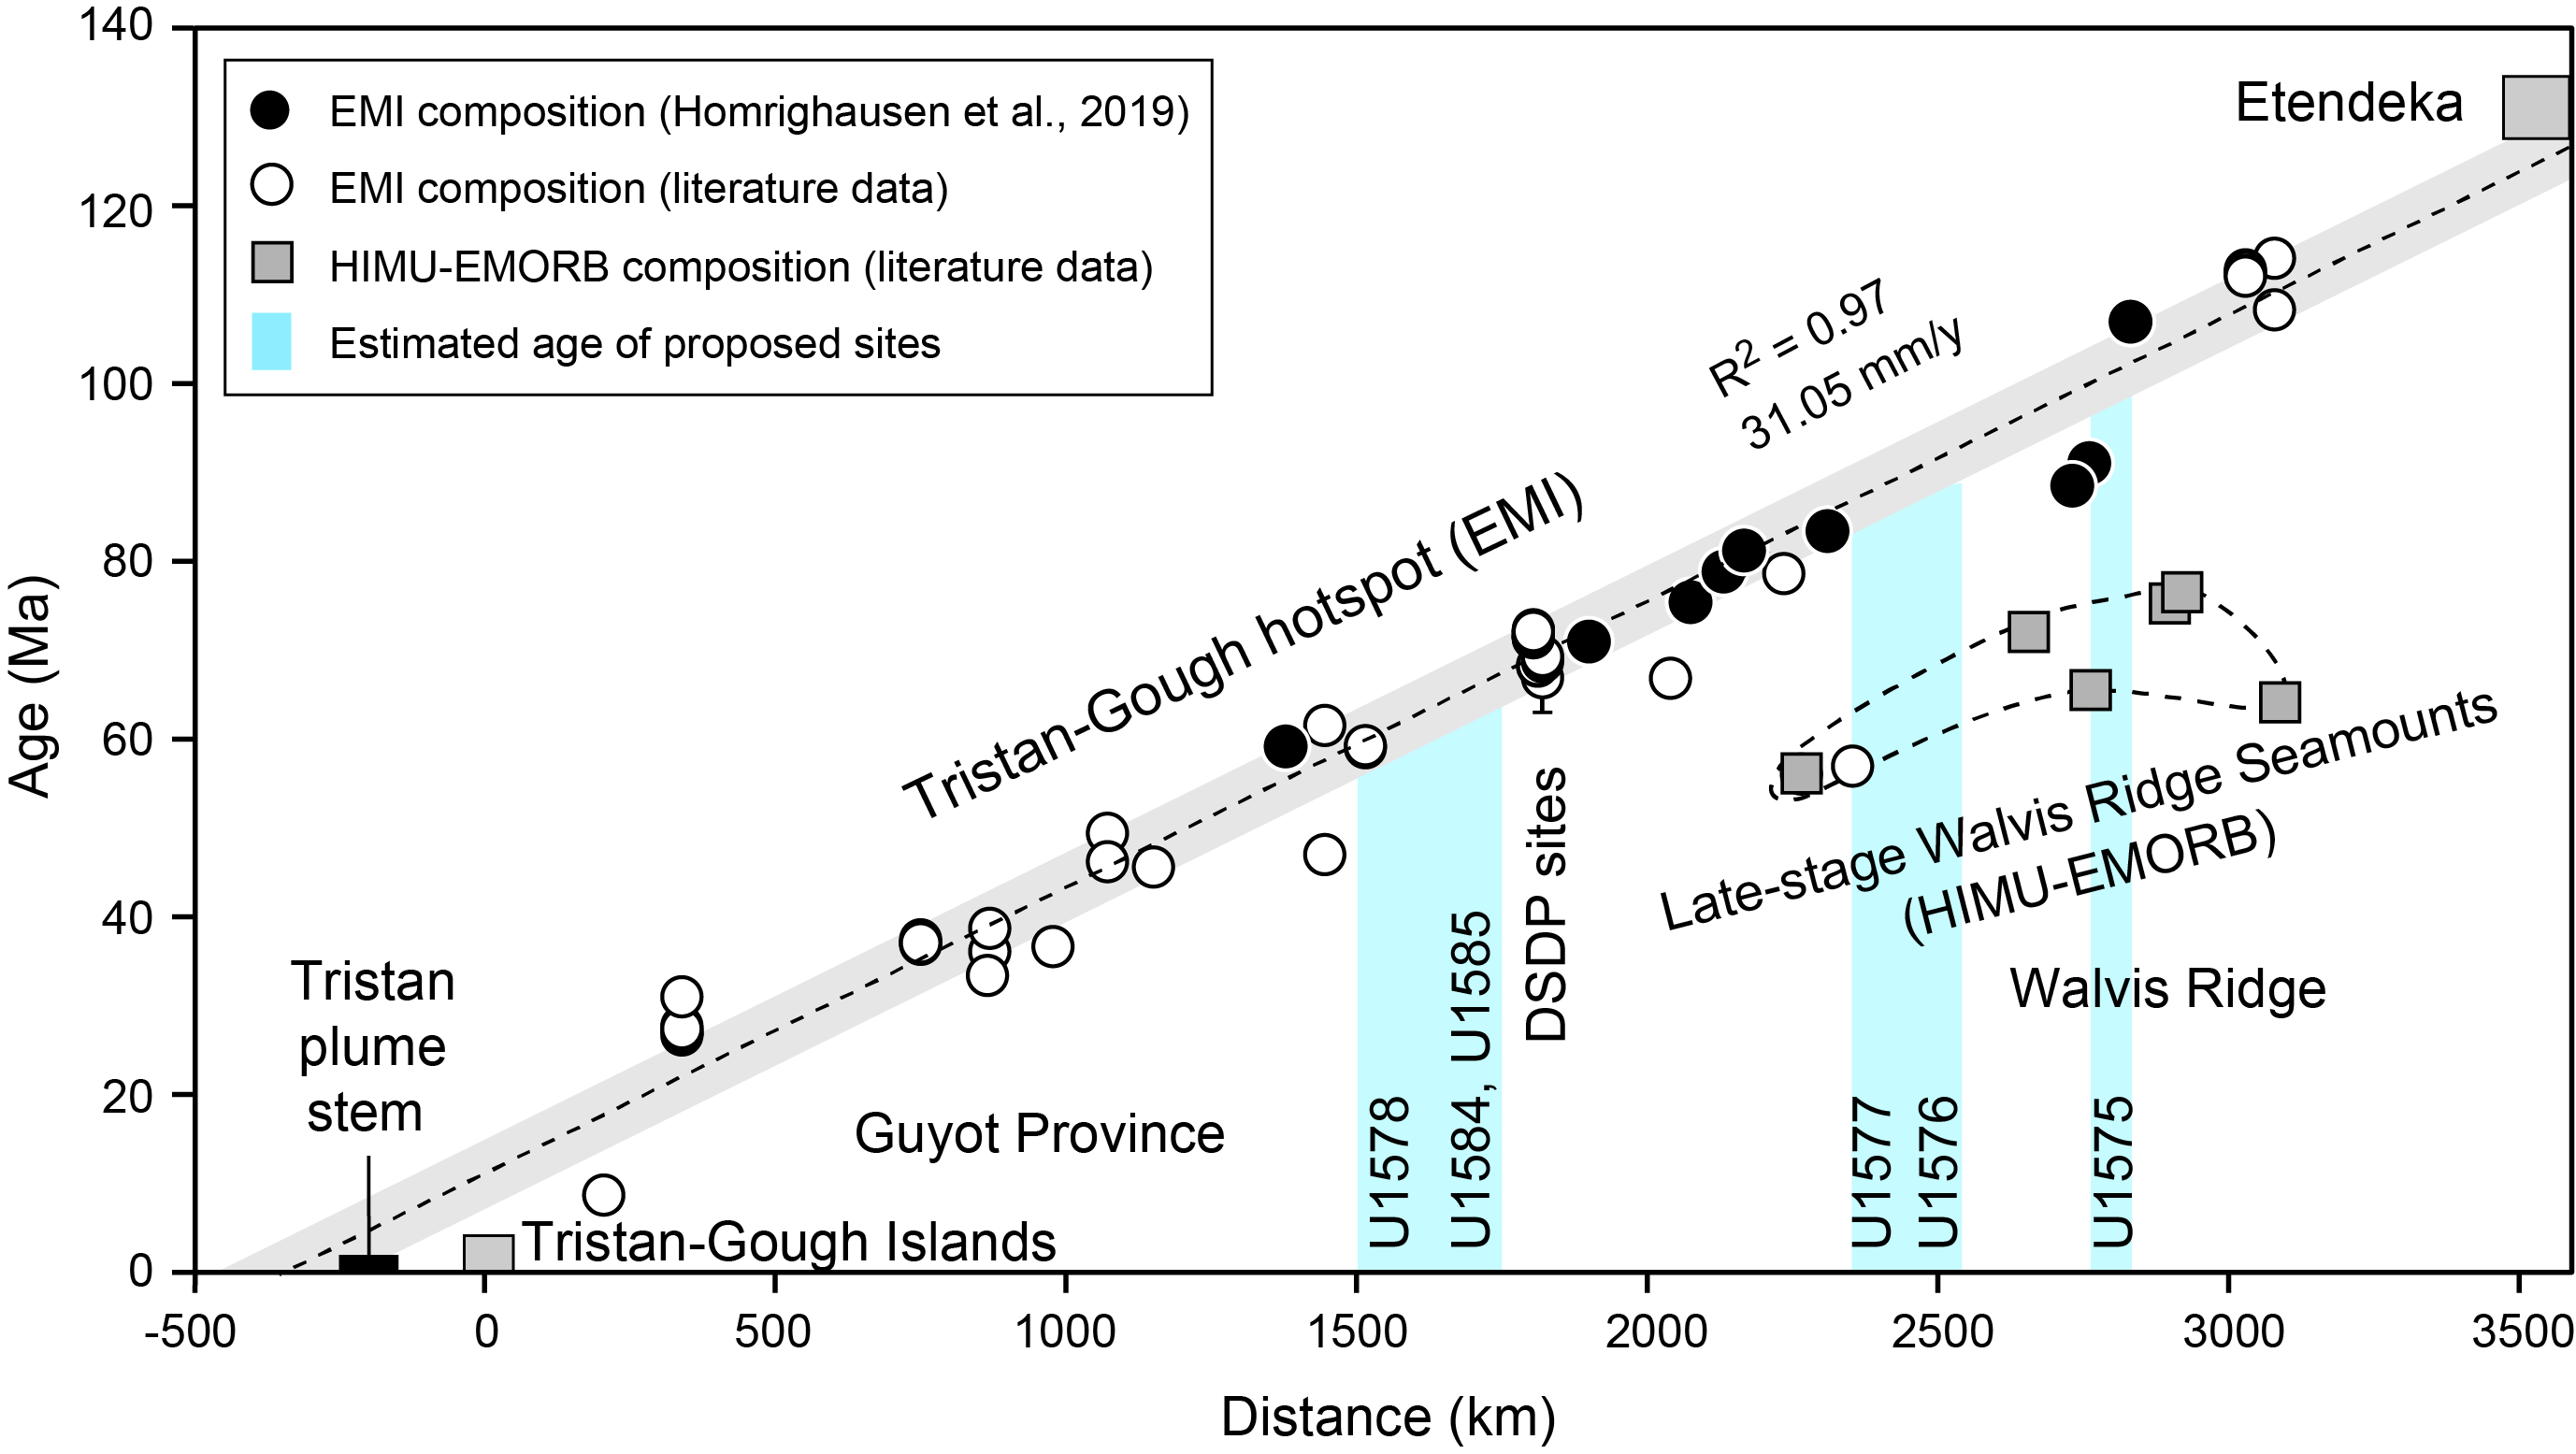
Figure F3. Age progression.
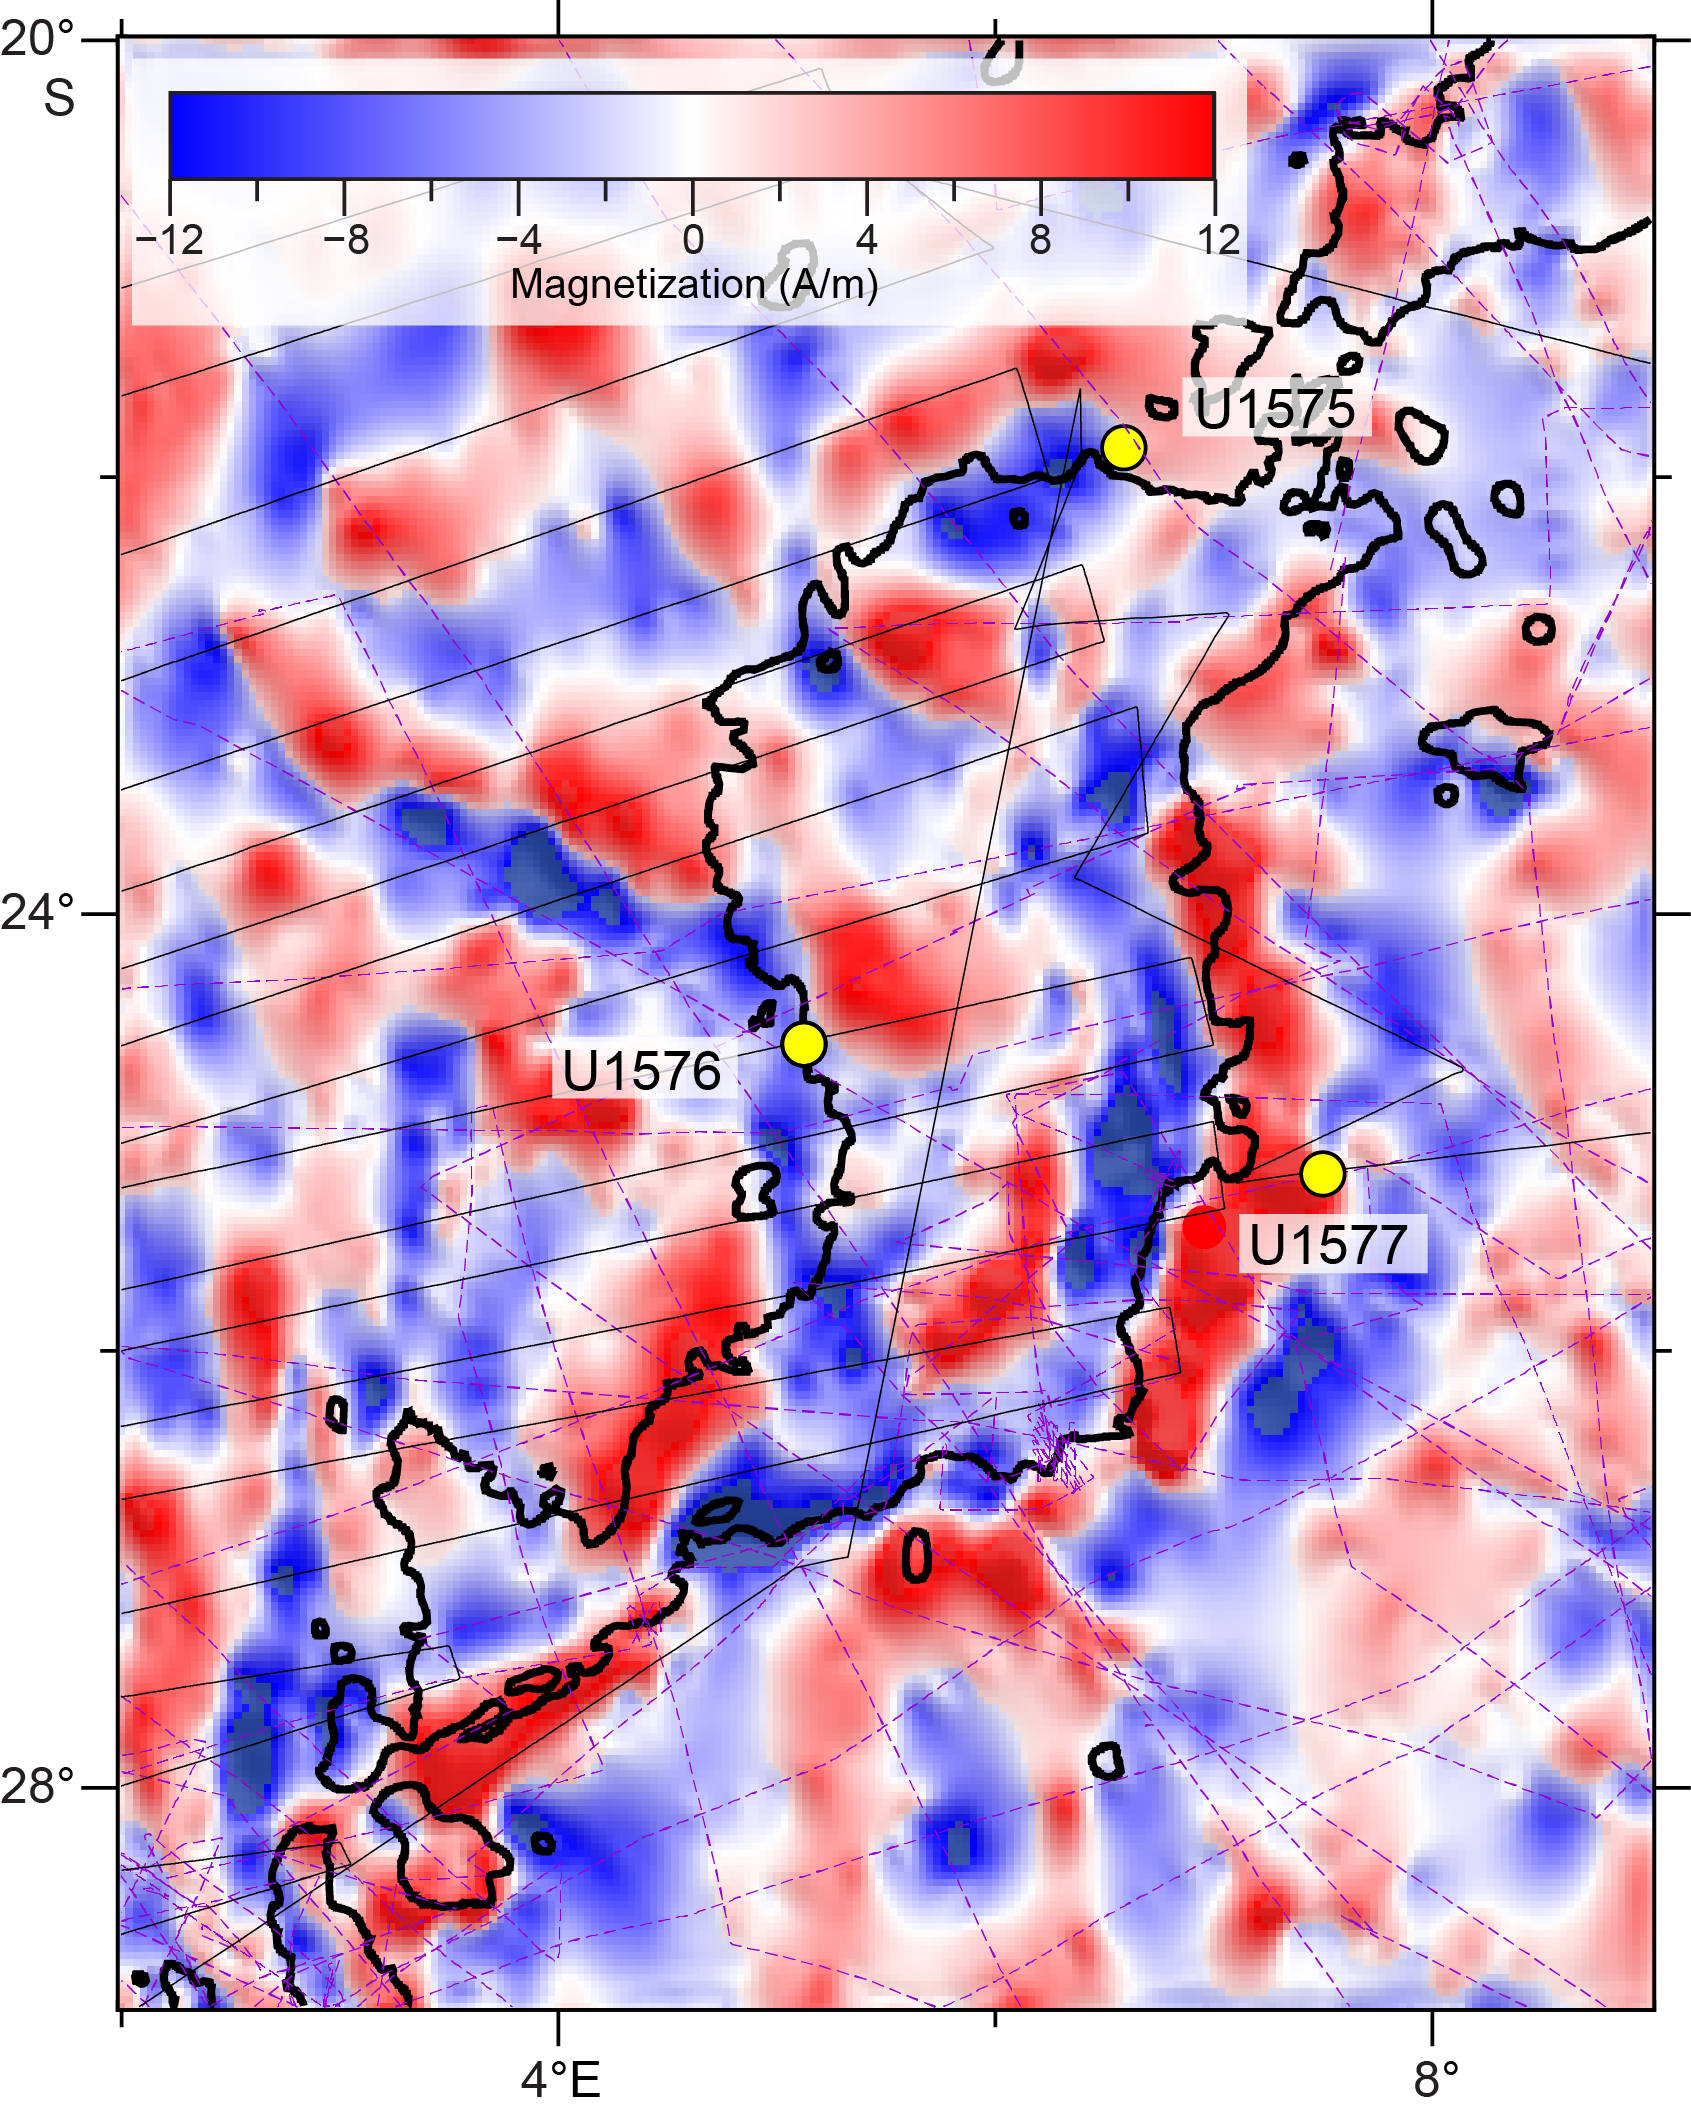
Figure F4. Magnetization of Valdivia Bank and environs.
1.1. Operational strategy
Planning for Expedition 391 included using only the rotary core barrel (RCB) bit for all holes to save time. Unfortunately, this choice meant that soft-sediment cores experienced significant drilling disturbance. Site U1576 was planned as a single-bit hole, meaning that only one bit was to be deployed and the hole was to be drilled until the allotted time ran out.
1.2. Objectives
1.2.1. Geochemical objectives
Site U1576 has the potential to provide important constraints on the geochemical evolution of TGW track volcanism. Beginning at Deep Sea Drilling Project (DSDP) Leg 74 Sites 527, 528, and 525A and going to the Tristan and Gough Islands, the volcanic track shows geochemical zonation with enriched mantle one (EMI)-type compositions that can be divided into Tristan-type (low 207Pb/204Pb at a given 206Pb/204Pb) and Gough-type (high 207Pb/204Pb at a given 206Pb/204Pb) compositions (Rohde et al., 2013; Hoernle et al., 2015). Dredge samples from Walvis Ridge north of the Leg 74 sites are dominated by the Gough-type geochemical composition, with rare exceptions (Hoernle et al., 2015; Homrighausen et al., 2019). Unfortunately, there are almost no steep slopes on the western side of Walvis Ridge appropriate for dredging, so it has not been possible to constrain the northern extent of the Tristan geochemical zone. Specifically, does it extend past Sites 527 and 528 along the western side of Walvis Ridge? It should be noted that Site 527, which shows the purest form of the Tristan component (see purple crosses in Figure F10 in the Expedition 391 summary chapter [Sager et al., 2023b]), is located northwest of the topographic expression of Walvis Ridge. Without drilling, we would not know that the Tristan component extends this far northwest and onto the Walvis Ridge portion of the hotspot track because Site 528 has an intermediate composition between the Tristan (Site 527; see purple stars in Figure F10 in the Expedition 391 summary chapter [Sager et al., 2023b) and Gough (Site 525) end-members.
Another important question concerns the presence of two distinct flavors of the Gough subtype in the Etendeka flood basalts in northwest Namibia, which are believed to represent lavas from the starting plume head of the TGW hotspot (Zhou et al., 2020). The Gough-type basalts on Walvis Ridge are characterized by high-Ti contents. High-Ti basalts also dominate in northern Etendeka, where Walvis Ridge connects to the African continental margin (e.g., Zhou et al., 2020). On the other hand, low-Ti Gough-type basalts dominate in southern Etendeka. The low-Ti Gough type is also common in the Paraná flood basalts in South America, which formed contemporaneously with the Etendeka flood basalts before the continents separated. This component, however, has not been found on Walvis Ridge thus far. This discrepancy may be due to the limited number of samples available from Walvis Ridge.
In summary, Site U1576 is the best of the planned Walvis Ridge sites for testing the northern extent of the Tristan geochemical zone of the TGW hotspot track. Site U1576 may also provide further insights into the transition from plume head to plume tail volcanism.
1.2.2. Geochronologic objectives
Site U1576 is located on the west flank of Valdivia Bank on a negative magnetic anomaly interpreted as Chron 33r (Thoram, 2021). Site U1575 was drilled on the north flank of this plateau, and Site U1577 was drilled on the east side. This distribution of sites will help determine the age progression along and across Valdivia Bank. Hotspot models predict a north–south age progression, which has been observed in the sparse sampling thus far (Homrighausen et al., 2019), but plume-ridge interaction models imply an east–west age progression, at least locally (Thoram et al., 2019; Sager et al., 2021). Thus, it is important to determine the age of basement sites to understand how the edifice formed through time in relation to the Mid-Atlantic Ridge and hotspot. Sites on Valdivia Bank will also help us understand the development of this large volcanic edifice. These sites were chosen on the lower, more distal flanks because on a typical volcano, such sites have lower volcanic emplacement rates as a result of more voluminous units not reaching these distal sites. Therefore, it is expected that drill holes on the lower, more distal flanks may sample a longer time span than more central areas that receive more frequent eruptive products. In the absence of volcanic centers on the volcano flanks, temporal variations downhole may be sufficiently large to discern them with geochronologic studies.
1.2.3. Paleomagnetic objectives
According to global paleomagnetic data, the Late Cretaceous is a period of rapid paleolatitude change for the African plate, during which the paleolatitudes shifted from ~15° farther north than at present around the time of Etendeka emplacement (Ernesto et al., 1990, 1999) to ~5° south of present around 50–60 Ma (Figure F5). Site U1576 samples the TGW track at a time when the paleolatitude was nearly the same as the present hotspot latitude band. Thus, samples from Site U1576 can provide important constraints on hotspot latitude changes with time. Paleomagnetic studies of basal sedimentary rock and igneous rock basement will be used to determine paleolatitudes that will help define the contributions of hotspot drift, plate motion, and true polar wander.
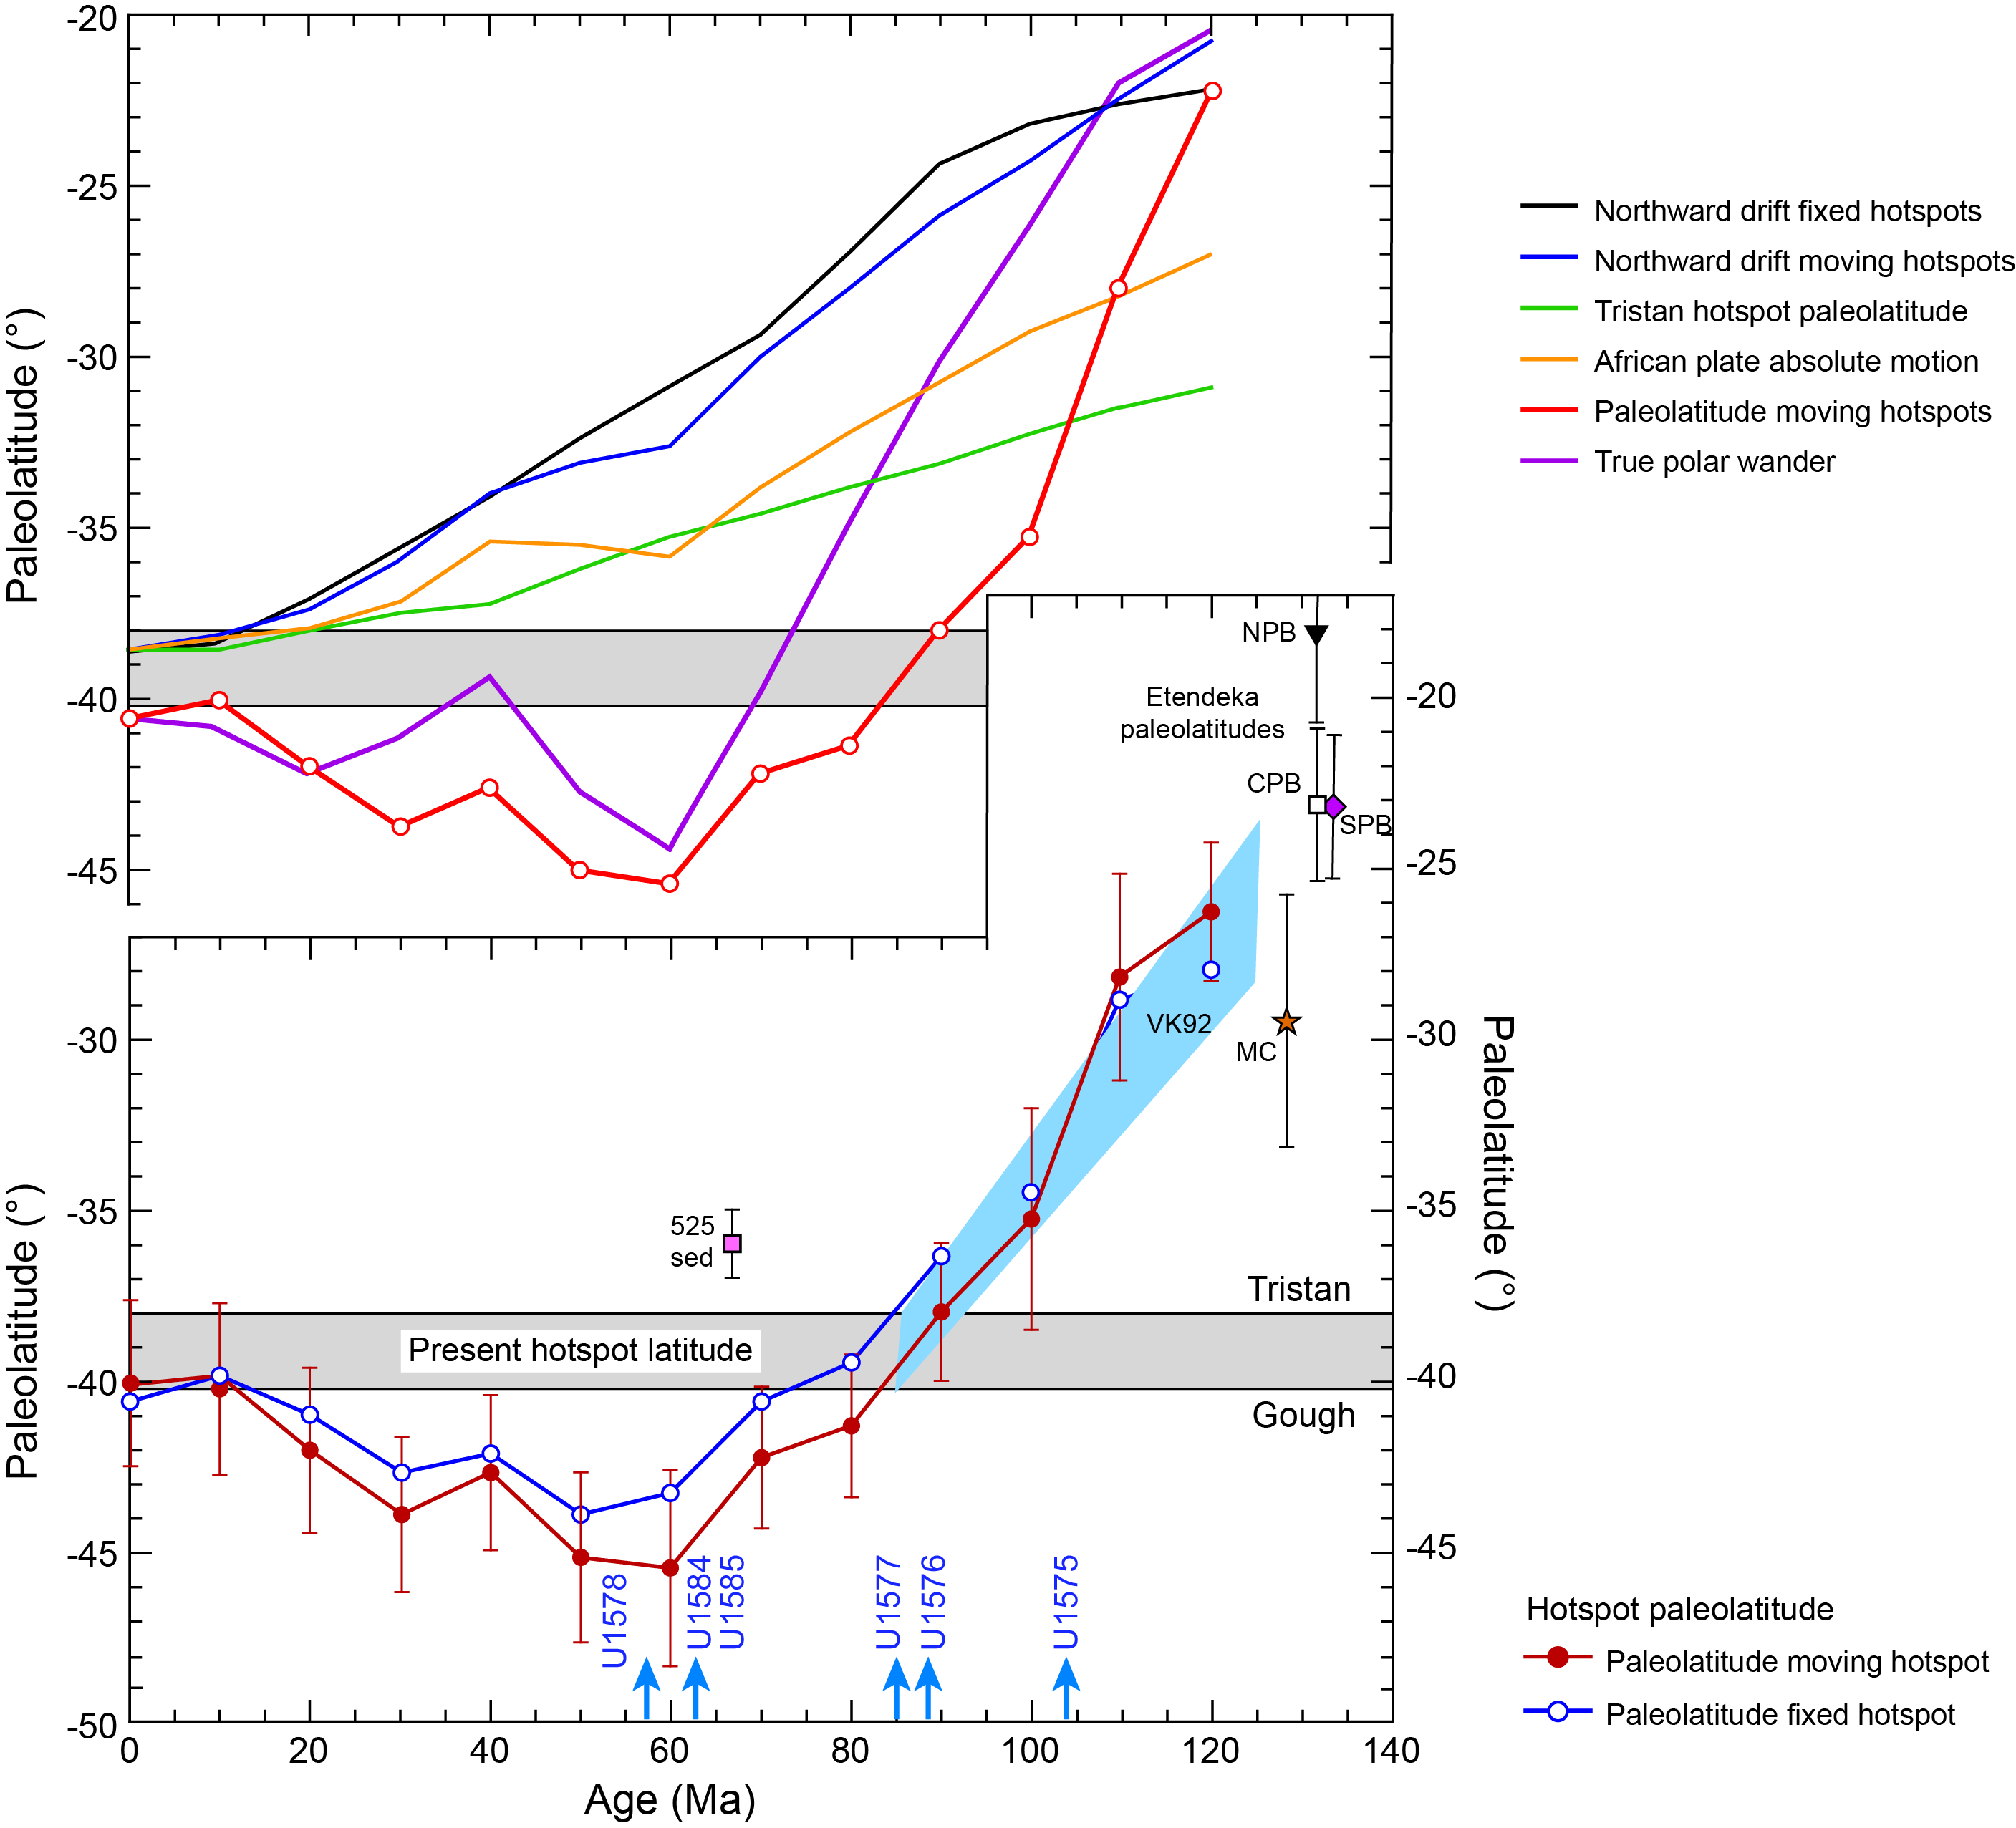
Figure F5. Predicted paleolatitude drift.
1.2.4. Volcanologic objectives
As noted above, Site U1576 is located on Valdivia Bank, an oceanic plateau incorporated into Walvis Ridge. It represents a period of high hotspot volcanic output. This has been explained as interaction of the TGW plume and the Mid-Atlantic Ridge (O'Connor and Duncan, 1990; O'Connor and Jokat, 2015). Was volcanism during formation of this plateau fundamentally different than elsewhere on the ridge? Site U1576 cores have the potential to illustrate the style of volcanism for this oceanic plateau to see whether it is similar to other plateaus such as Ontong Java Plateau (Neal et al., 1997), Kerguelen Plateau (Coffin et al., 2002), and Shatsky Rise (Sager et al., 2016). Studies of igneous rock types will seek to understand the volcanic development of this large edifice forming part of Walvis Ridge.
1.2.5. Sedimentologic objectives
Site U1576 is at an important location for understanding the sedimentation regime on Valdivia Bank. The summit of this volcanic edifice was most likely in shallow water for much of its history, probably subaerial originally and then eroding to sea level before subsiding well below wave base (Homrighausen et al., 2019). Moreover, it experienced a late-stage volcanic episode ~30–40 My after the main volcanic stage (Homrighausen et al., 2018, 2020) that probably caused additional faulting and uplifted the summit near sea level again. Thus, the sediments on the flank at Site U1576 are likely to have recorded much of this complex history. Layering in the seismic section implies that coring through the Site U1576 sediment column will provide clues about changing conditions in the South Atlantic. Biostratigraphic and sedimentologic studies will focus on reconstructing the complex history of the Valdivia Bank, providing clues as to how the flat-topped bank formed.
1.3. Site geophysics
Site U1576 is located on the western flank of Valdivia Bank at a water depth of ~3035 m (Figures F1, F6). The drill site was picked on Seismic Line TN373-VB08, collected in 2019 by the research vessel Thomas G. Thompson. Bathymetry data show that the site is between a low flank ridge and a wide gully. This topography probably indicates erosion of flank sediments by downslope mass transport.
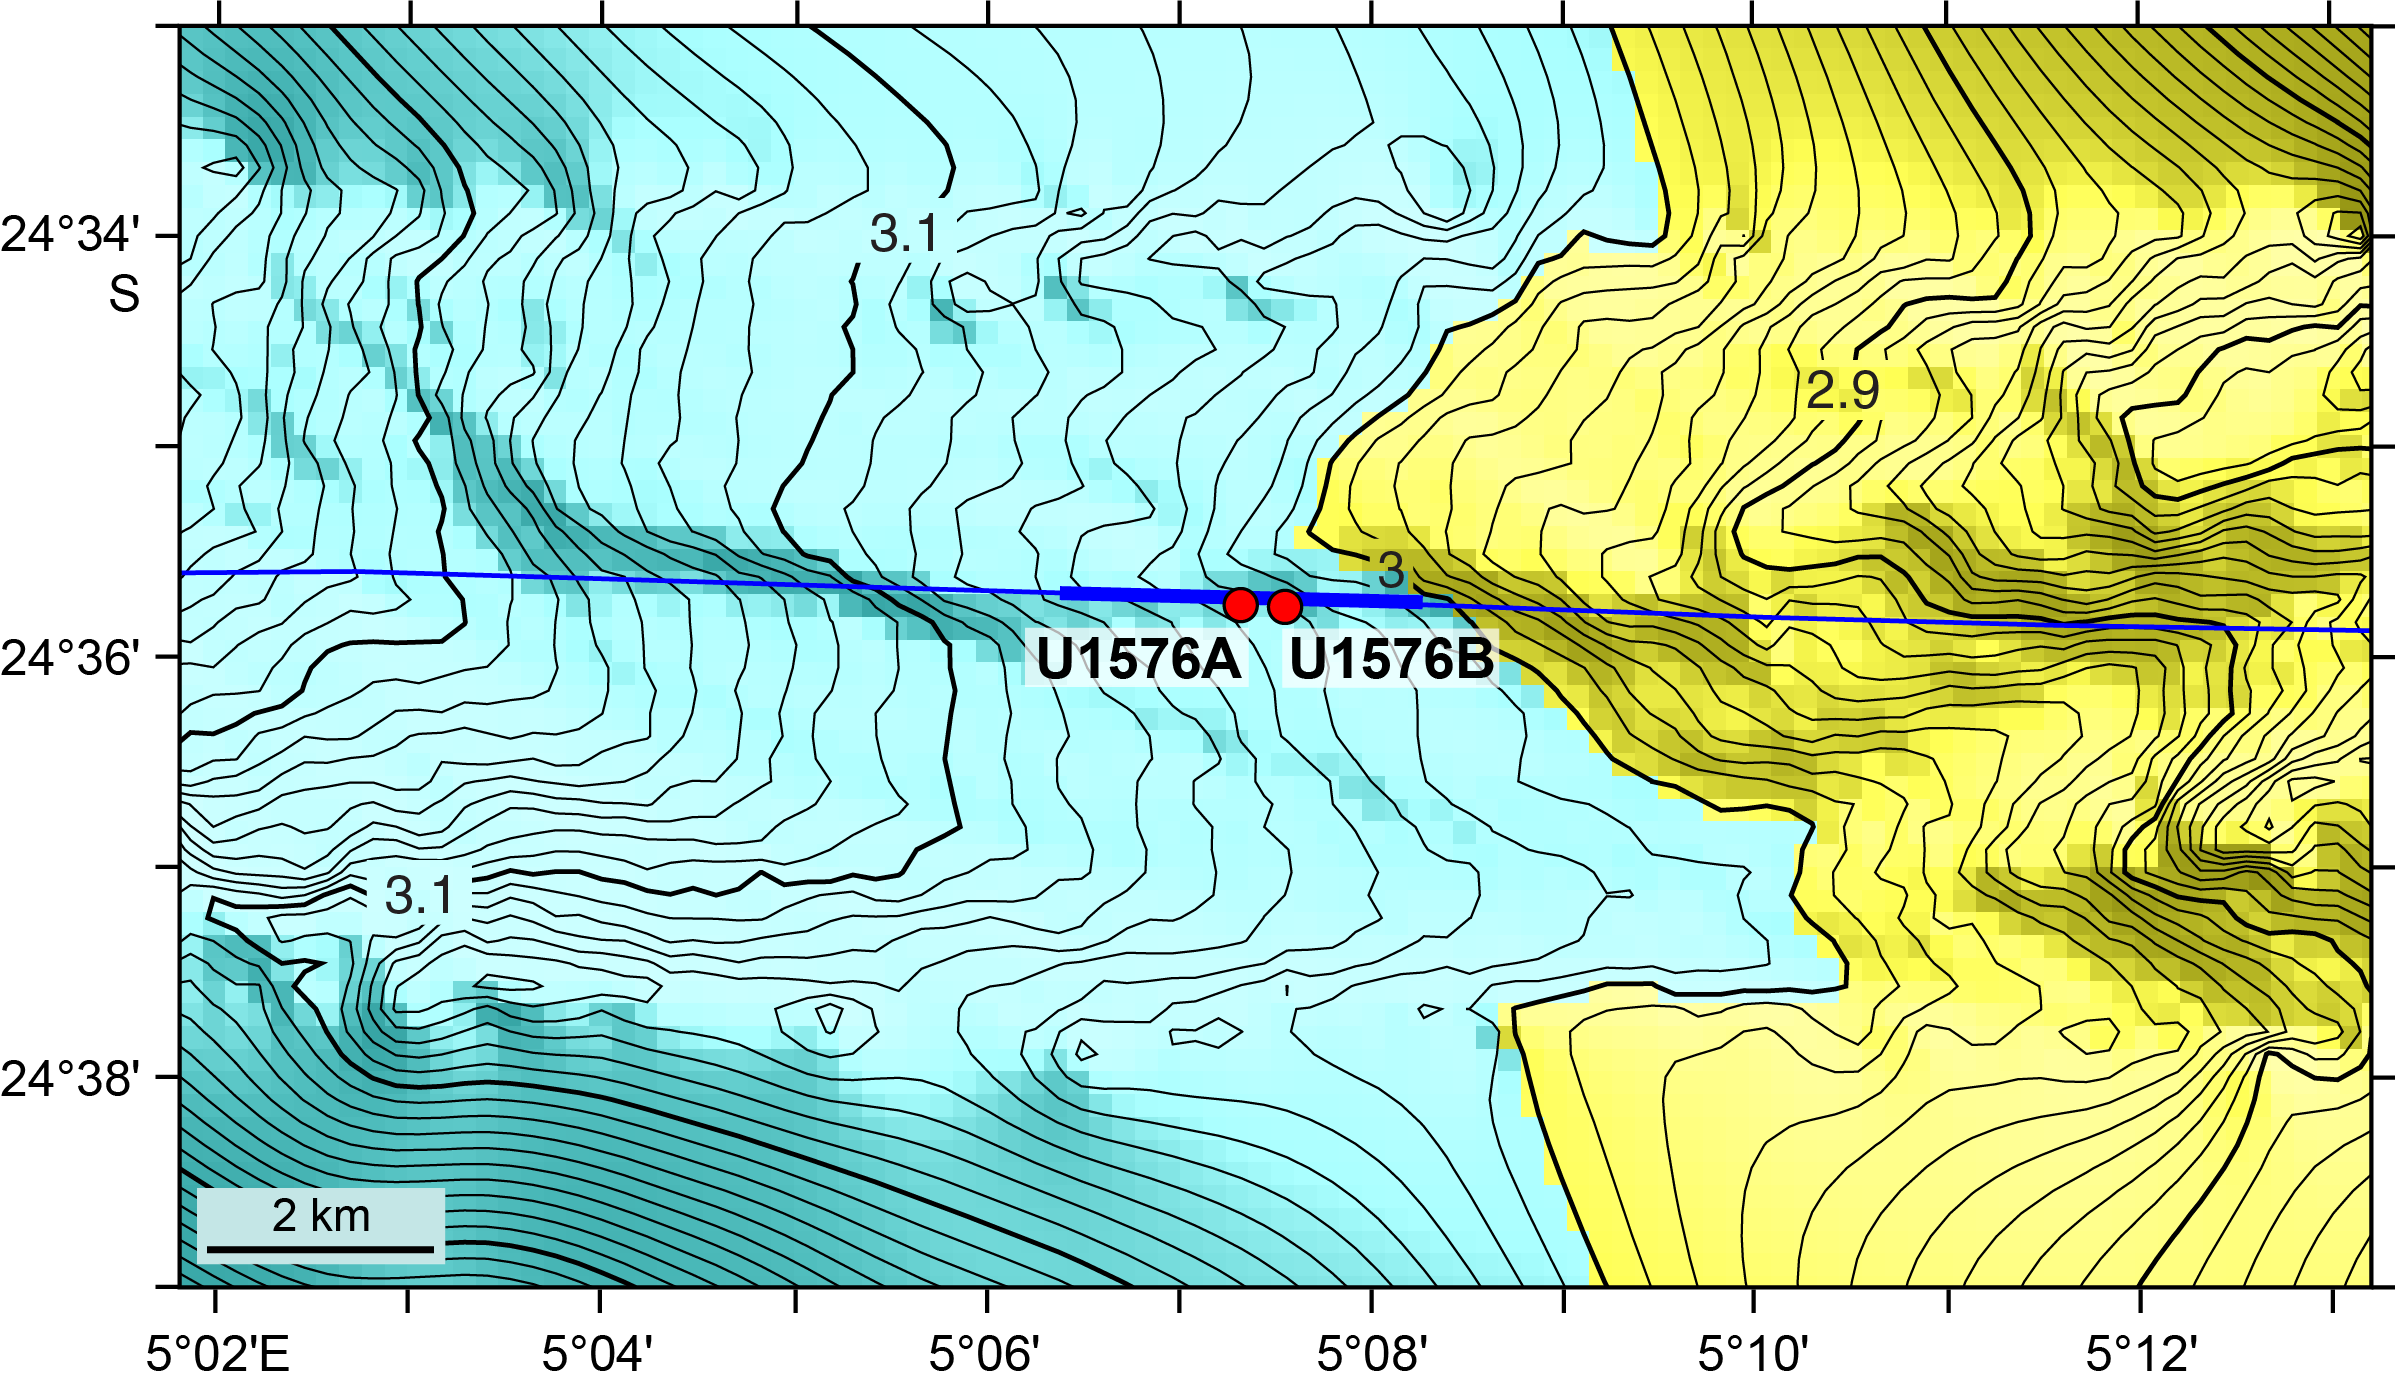
Figure F6. Detailed multibeam bathymetry map.
The TN373-VB08 profile shows a ~310 m thick sediment layer overlying a strong and undulating basement horizon (Figure F7). Sediment thickness is relatively uniform along the profile, but igneous basement displays offsets that probably represent faults (Figure F8). To avoid these faults, the site was chosen at a spot where the basement shows no offsets. The sediment section shows four reflectors that divide the sediments into three or four layers. Based on Site U1575 recovery and other drill sites in the region (e.g., Bartels et al., 2007), the uppermost layer was thought to be calcareous ooze. Deeper layers grade downward into Late Cretaceous chalk.

Figure F7. Short portion of Seismic Line TN373-VB08.

Figure F8. Longer portion of Seismic Line TN373-VB08.
Basement on the TN373 profile is interpreted to be igneous rock at the top of Valdivia Bank basement. This surface is undulatory, as is expected for a lava flow surface. The seismic source for the TN373-13 profile was small and does not penetrate deeply into the basement, but it shows several semicontinuous reflectors in the upper ~50 ms (~100 m, assuming velocity = 4000 m/s). These reflections likely indicate lava flow packages (Inoue et al., 2018; Sager et al., 2013).
2. Operations
2.1. Transit to Site U1576
After securing the rig floor for transit at Site U1575, the thrusters were pulled and secured at 1506 h (UTC + 2 h) on 7 January 2022. The vessel was then switched from dynamic positioning (DP) to cruise mode and began transit. The sea passage to Site U1576 commenced at 1512 h. The 183 nmi transit was completed in 16.6 h at an average speed of 11.0 kt. The vessel arrived at Site U1576 at 0748 h on 8 January. The thrusters were lowered and secured at 0809 h. The operating mode was switched from cruise to DP mode at 0810 h. The drill floor was cleared for operations at 0812 h, beginning Hole U1576A.
2.2. Site U1576
Site U1576 comprises two holes. The original plan for Site U1576 was for a single hole; Hole U1576A would be cored with the RCB system to a volcanic basement penetration of 100 m, amounting to a total depth of 410 meters below seafloor (mbsf) that included a 310 m thick sediment cover as interpreted based on preexpedition seismic surveys. Actual operations differed from the plan (Table T1). Hole U1576A was RCB cored to 398.1 mbsf while intersecting the sediment/volcanic succession contact at 380.2 mbsf. Unfortunately, a plugged bit required raising the drill string and an untimely end to drilling in Hole U1576A. Hole U1576B was drilled to 365.0 mbsf without core recovery and then RCB cored to 450.3 mbsf while penetrating the first sediment/volcanic succession contact at 385.4 mbsf. The time spent at Site U1576 was 155.0 h, or 6.5 days.
2.2.1. Hole U1576A
Upon being released to start operations, the rig floor crew began to make up the RCB bottom-hole assembly (BHA). The outer core barrel, as part of the RCB BHA, was already made up during the transit to Site U1576. There was no logging in the operations plan, so the mechanical bit release was removed from the outer core barrel and a normal bit sub was inserted. An additional drill collar was included in the BHA assembly, and the 181.3 m long BHA was assembled. We started lowering the drill string to the seafloor at 0915 h on 8 January 2022, continuing for 50 stands of drill pipe (each stand measures ~28.5 m). We then paused to install the circulating head. The drill pipe was filled with surface seawater. The drill string was then lowered to a water depth of 3000.9 meters below sea level (mbsl). Precision depth recorder (PDR) measurements of the seafloor recorded a depth of 3032.3 mbsl. Upon implementing a routine slip and cut of 115 feet of the drilling line, we picked up the top drive system at 1500 h and lowered the drill bit to just above the seafloor. At 1640 h on 8 January, we spudded Hole U1576A and began coring. The first advance recorded amounted to 7.8 m into the seafloor. The PDR water depth appeared to match the driller's tag depth and was used as the official water depth for Hole U1576A. Coring continued from the seafloor with full core advances through Core 41R to 396.6 mbsf. The initial sediment/basalt contact was made at 380.2 mbsf while cutting Core 40R on 10 January.
During the advance of Core 41R, unusual, highly variable standpipe and pump pressures were observed. The inner core barrel was retrieved at 1635 h on 10 January. It was completely jammed with core material, so it was disassembled, and the plastic liner that contains the core was pumped out of the core barrel. Recovery was 5.7 m for Core 41R. The jamming was caused by a sheared latch connecting the inner and outer core barrel. It was suspected that the outer core barrel was also plugged, and a bit deplugger was deployed to attempt to unblock the bit. The deplugger was run multiple times without confirmation of a clear outer core barrel. Another dressed core barrel was lowered to the base of the BHA, and we attempted to cut Core 42R. We advanced 1.5 m but experienced the same erratic standpipe pressures. The attempt to continue coring with Core 42R proved unsuccessful when we recovered an empty core barrel from 398.1 mbsf at 2305 h on 10 January. Subsequently, more unsuccessful deployments of the bit deplugger were completed. This left raising the drill pipe as the only option.
At 0500 h on 11 January, the decision was made to abandon Hole U1576A, and we started pulling the drill bit out of the hole. The top drive was set back at 0615 h, and the bit cleared the seafloor at 0730 h. While we were retrieving the drill string, the vessel was moved 400 m at 95°, and a new PDR measurement was taken in preparation for establishing a second borehole at Site U1576. The bit arrived at the rig floor at 1230 h, ending Hole U1576A. The bit was removed from the outer core barrel, revealing a completely plugged outer core barrel. Approximately 1.2 m of igneous rock core, fragmented in pieces, was removed from the bit and outer core barrel. This extended up through the float and into the RCB bearing assembly.
In total, there were 42 cored intervals in Hole U1576A. Cores 1R–42R penetrated from the seafloor to a final depth of 398.1 mbsf and recovered 309.3 m (78%) of sediment and igneous rock. The time spent on Hole U1576A was 76.25 h, or 3.2 days.
2.2.2. Hole U1576B
After the bit float and bearing were removed, cleaned, and reassembled, we made up the RCB BHA again, installed an inner core barrel in the outer core barrel, and started lowering the bit back to the seafloor. After the drill string was lowered to 3000.8 mbsl, we picked up the top drive at 1930 h. The bit was then positioned at the seafloor depth of 3027.2 mbsl obtained from the PDR. At 2050 h on 11 January 2022, we spudded Hole U1576B and began drilling without core recovery, having already successfully cored the sediment section. The hole was advanced to the target depth of 365 mbsf with the installed core barrel in place. At 0655 h on 12 January, we retrieved the core barrel. It contained some sediment unintentionally recovered at an indeterminate depth while drilling and was recorded as wash Core 1W. Cores 2R–17R penetrated from 365.0 mbsf to a final depth of 450.3 mbsf and recovered 66.3 m (78%) of sediment and igneous rock. The first contact with volcanic rock occurred in Core 5R at 385.4 mbsf. Half-length (~4.8 m) RCB coring was implemented through Core 14R to 430.8 mbsf with varying penetration rates. While Core 15R was advancing at a high penetration rate of 8.95 m/h, we switched to full-length (~9.6 m) coring. This core only contained sediment. Half-length Cores 16R and 17R returned to slow penetration rates (1.47 and 1.18 m/h, respectively).
After Core 17R arrived on deck at 1040 h on 14 January, it was decided to terminate coring in Hole U1576B at a final depth of 450.3 mbsf. In total, 140 bbl (22,258 L) of high-viscosity mud were pumped for hole cleaning while coring Hole U1576B. After securing the coring equipment, we started pulling the drill string out of the hole at 1100 h. When the drill string was pulled to 381.6 mbsf, we set back the top drive at 1200 h and continued pulling the drill string up to the surface. The bit cleared the seafloor at 1305 h and arrived at the rig floor at 1820 h, ending Hole U1576B. The outer core barrel was disassembled and inspected, and a new bit was installed. The assembly was spaced out in preparation for the next drill site. The rig floor was secured at 1915 h on 14 January, ending Site U1576. The total time spent on Hole U1576B was 78.75 h, or 3.3 days.
3. Lithostratigraphy
Two holes were drilled at Site U1576. In Hole U1576A, a thick sedimentary cover lies over a volcanic succession at 380.18 mbsf. In Hole U1576B, core retrieval commenced ~20 m above the volcanic basement, which extends from 385.28 mbsf downhole. Accordingly, only the lowermost 5% (~20 m) of comparable sedimentary cover observed overlying basement in Hole U1576A was retrieved. This dual-hole approach enabled successful recovery of three significant sedimentary intervals within the igneous succession down to 441.36 mbsf in Hole U1576B. Coring of the lowermost sedimentary cover in Hole U1576B was planned to provide the potential for stratigraphic correlation between the two holes and thus ensure consistency in interpretation of the lower sedimentary sequence and underlying volcano-sedimentary basement between the two holes. In both Holes U1576A and U1576B, the igneous succession consists of eruptive units of thicker lobate and sheet flows (a few meters) to individual pillow lavas (<1 m) and stacks of the latter. In Hole U1576B, sediments are intercalated with the volcanic units (see Igneous petrology and volcanology). A useful marker horizon may be recognized in the sedimentary succession in both Holes U1576A and U1576B, which permits accurate correlation of the sedimentary-volcanic rock assemblage at both localities. Four lithostratigraphic units (the first divided into three subunits and the third divided into two) were recognized in the overlying sedimentary cover based on detailed core observations and evaluation of smear slides and thin sections (Figure F9).

Figure F9. Lithostratigraphic summary.
3.1. Lithostratigraphic unit descriptions
3.1.1. Unit I
- Interval: 391-U1576A-1R-1, 0 cm, to 11R-2, 33 cm
- Depth: 0–96.83 mbsf
- Age: Pleistocene to Middle Miocene (~0.4–16 Ma)
Unit I is a 96.83 m thick succession of unconsolidated calcareous ooze, locally with clay, that underwent significant drilling disturbance. Nannofossil and foraminifera assemblages retrieved in this unit range in age between the Pleistocene and Middle Miocene (see Biostratigraphy). Only one lithofacies occurs in this unit. Three subunits were defined in Unit I based on distinct brownish coloration correlated to minor changes in clay content. The lower boundary of Unit I is marked by a hiatus between the base of unconsolidated light brown calcareous ooze in Subunit IC and the brown-pink poorly consolidated calcareous ooze/chalk with clay in Unit II.
3.1.1.1. Subunit IA
Subunit IA is a ~9 m thick unconsolidated succession of dominantly very pale brown nannofossil-foraminifera ooze with minor radiolarians and clay (Figure F10A) that contains significant drilling disturbance. The base of the subunit is marked by a gradual disappearance of the brown color in Section 391-U1576A-1R-7. Despite pervasive drilling disturbance due to poor lithification of the ooze, the sediment locally retains some of its internal structure in the center of the core. Subtle gray and, more rarely, white-green centimeter-sized banding occurs throughout. CaCO3 content is 90 wt% based on one whole-round sample in Section 1R-4 (see Sediment geochemistry).
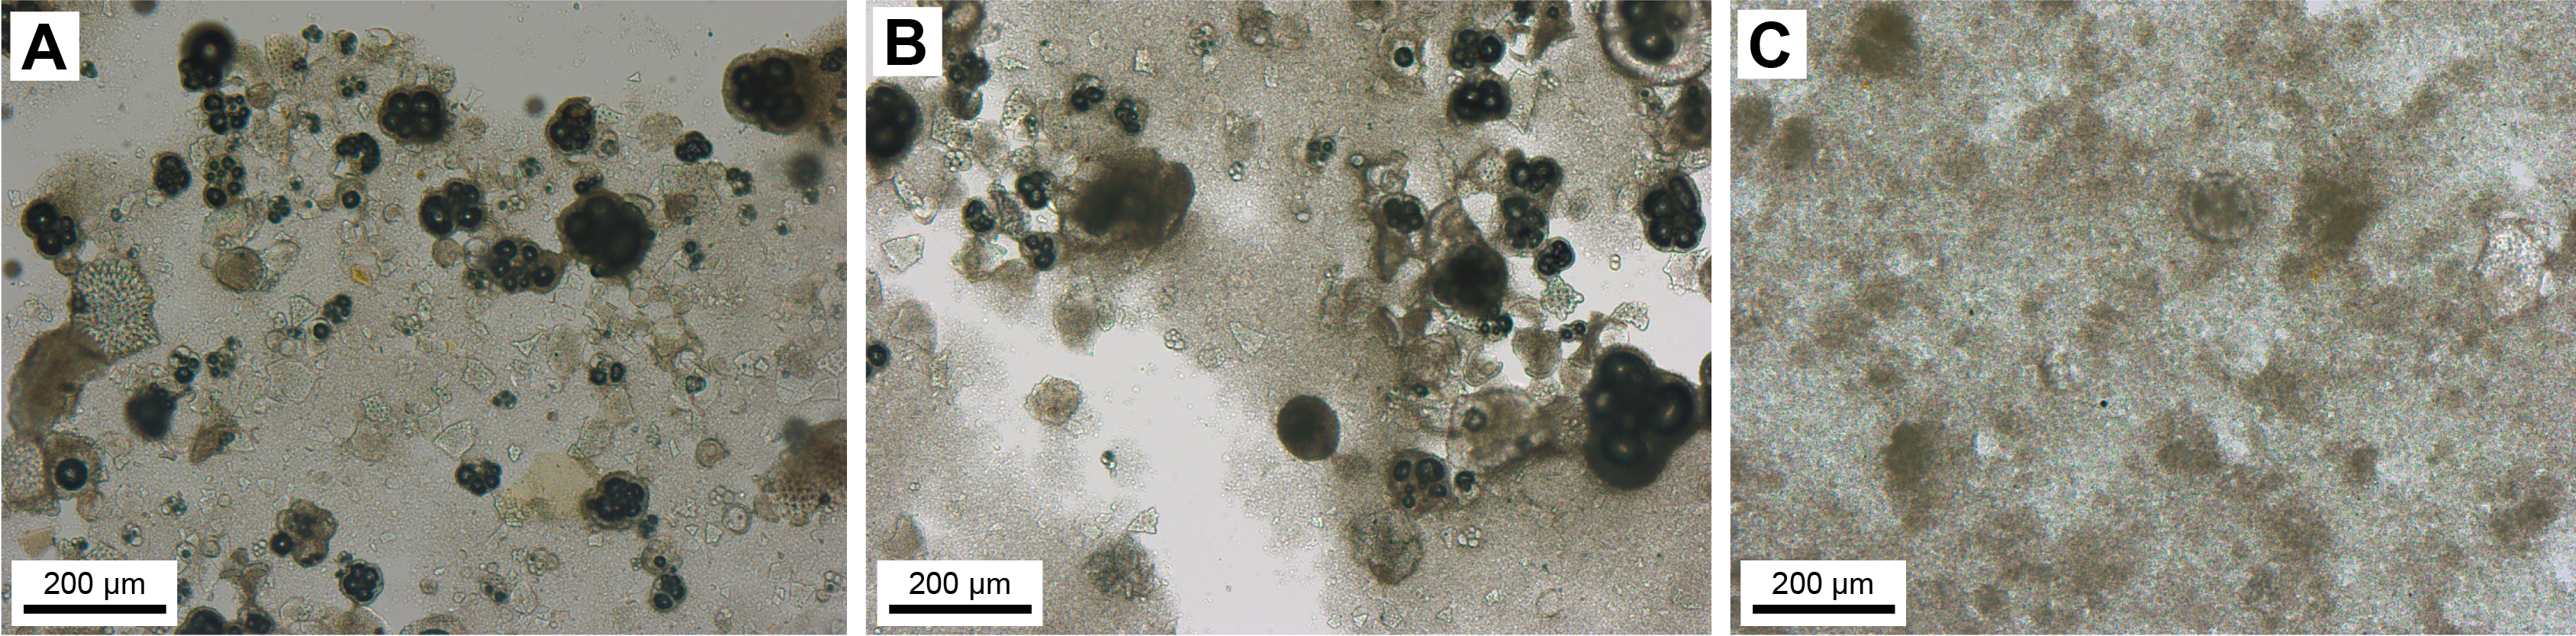
Figure F10. Ooze.
3.1.1.2. Subunit IB
- Interval: 391-U1576A-1R-7, 30 cm, to 7R-2, 25 cm
- Depth: 9.98–57.65 mbsf
- Age: Pleistocene to Late Miocene (Messinian) (~1–7 Ma)
Subunit IB is a ~48 m thick sequence of lithologically similar white nannofossil-foraminifera ooze with minor radiolarians (Figure F10B). The base of the subunit corresponds to a sharp transition to the underlying pale brown ooze at 57.65 mbsf (Section 391-U1576A-7R-2, 25 cm). Despite pervasive drilling disturbance due to poor lithification of the ooze, the sediment locally retains some of its internal structure in the center of the cores. Centimeter-sized dark patches of diffuse pyrite grains and centimeter-thick light gray layers (most likely richer in framboids) occur throughout. Very low clay content in this subunit is corroborated by CaCO3 content of whole-round samples that ranges ~95–100 wt% (n = 5) (see Sediment geochemistry).
3.1.1.3. Subunit IC
- Interval: 391-U1576A-7R-2, 25 cm, to 11R-2, 33 cm
- Depth: 57.65–96.83 mbsf
- Age: Late Miocene (Tortonian) to Middle Miocene (Langhian) (>7 to ~16 Ma)
Subunit IC is a ~40 m thick sequence of lithologically similar, faintly banded, very pale to pale brown nannofossil ooze with foraminifera and minor radiolarians (Figure F10C). Although this subunit was pervasively affected by drilling disturbance, some of the original (faint) layering is locally preserved in the center of the cores. A slight increase in clay content downhole is indicated by the sediment color, which gradually changes from very pale to pale brown, and by CaCO3, which decreases from ~96 to 88 wt% (n = 4) in whole-round samples (see Sediment geochemistry). A sharp increase to a slightly browner color occurs in Section 391-U1576A-8R-3, 123 cm (69.83 mbsf); this boundary does not seem to correlate with significant biostratigraphic changes (see Biostratigraphy), and its importance could not be fully addressed based on shipboard results.
Significantly, the base of Subunit IC (and Unit I) corresponds to a sharp contact with underlying brown to pale brown bioturbated foraminifera-nannofossil ooze with clay (Section 391-U1576A-11R-2, 33 cm). Foraminifera and nannofossil biochronologic data suggest this boundary corresponds to a major ~45 My hiatus in the upper part of Hole U1576A. Both the Oligocene and Eocene are missing from the recovered core material (see Biostratigraphy). However, the exact lithologic nature of this apparent contact and its precise relationship to the hiatus boundary remain poorly constrained due to incomplete (71%) recovery in Core 11R. Further detail awaits additional biostratigraphic sampling across Cores 10R and 11R.
3.1.2. Unit II
- Interval: 391-U1576A-11R-2, 33 cm, to 14R-1, 51 cm
- Depth: 96.83–124.71 mbsf
- Age: early Paleocene (Danian) (~62 to <65 Ma)
Unit II is a ~28 m thick sequence of unconsolidated to consolidated pale brown to brown foraminifera-nannofossil ooze/chalk with clay and minor radiolarians. Drilling disturbance is significant down to Section 391-U1576A-12R-1 (104.80 mbsf) with almost pervasive disaggregation of unlithified sediment. Below this depth, a slight increase in sediment lithification led to core discing, biscuiting, and minor fracturing. The original bedding and sedimentary structures were generally well preserved between discrete intervals of disturbed sediment. The base of the unit corresponds to the occurrence of a distinctive ferromanganese crust at the top of Unit III (Section 14R-1, 51 cm), which likely represents a significant reduction or pause in ooze accumulation at or very close to the Cretaceous/Paleogene (K/Pg) boundary (see Biostratigraphy). The boundary is additionally marked immediately below by ~1 m of convolute bedding below (and a similar small interval above) the ferromanganese crust.
Unlike Unit I, significant lithologic changes occur at the section scale in Unit II, with the occurrence of ~10–50 cm thick cycles of brown-red to pale brown ooze/chalk. In addition to the ooze/chalk lithology, the unit includes rare occurrences of calcareous to volcanic sand. Therefore, two main lithofacies were defined in Unit II.
Lithofacies 1 is almost exclusively composed of slightly to heavily burrowed foraminifera-nannofossil ooze/chalk with clay. Color changes are regular and form ~10–50 cm thick cycles with more prominent burrowing in the darker intervals (Figure F11A). Ichnofossils are generally outlined by infills of lighter brown nannofossil ooze/chalk; rarely, volcanic to foraminifera sand can also be locally preserved in the burrows. Cyclical changes in color correspond to fluctuation in the relative abundance of clays and Fe minerals relative to carbonates. Three whole-round samples were taken for carbon and carbonate analyses of this unit; they yielded very similar CaCO3 contents of ~86–89 wt% (see Sediment geochemistry). Higher clay content in the brown-red beds is supported by natural gamma ray data and mimicked the color changes in individual cycles (see Physical properties). Higher Fe mineral content in the brown-red beds is supported by magnetic susceptibility (MS) and portable X-ray fluorescence (pXRF) measurements in lithologically similar Subunit IIIA (Tables T6, T8). Patches or disturbed layers with black material occur from Section 391-U1576A-12R-3 to the base of Unit II. The pXRF data indicate that at least some of the material is rich in Fe and Mn. It is also possible that the black material includes diagenetic pyrite, as observed in Unit I. The chalk at the base of the unit includes a distinctive deposit with convolute bedding and chalk intraclasts, which is in stratigraphic contact with the ferromanganese crust at the top of Unit III (Figure F12A).
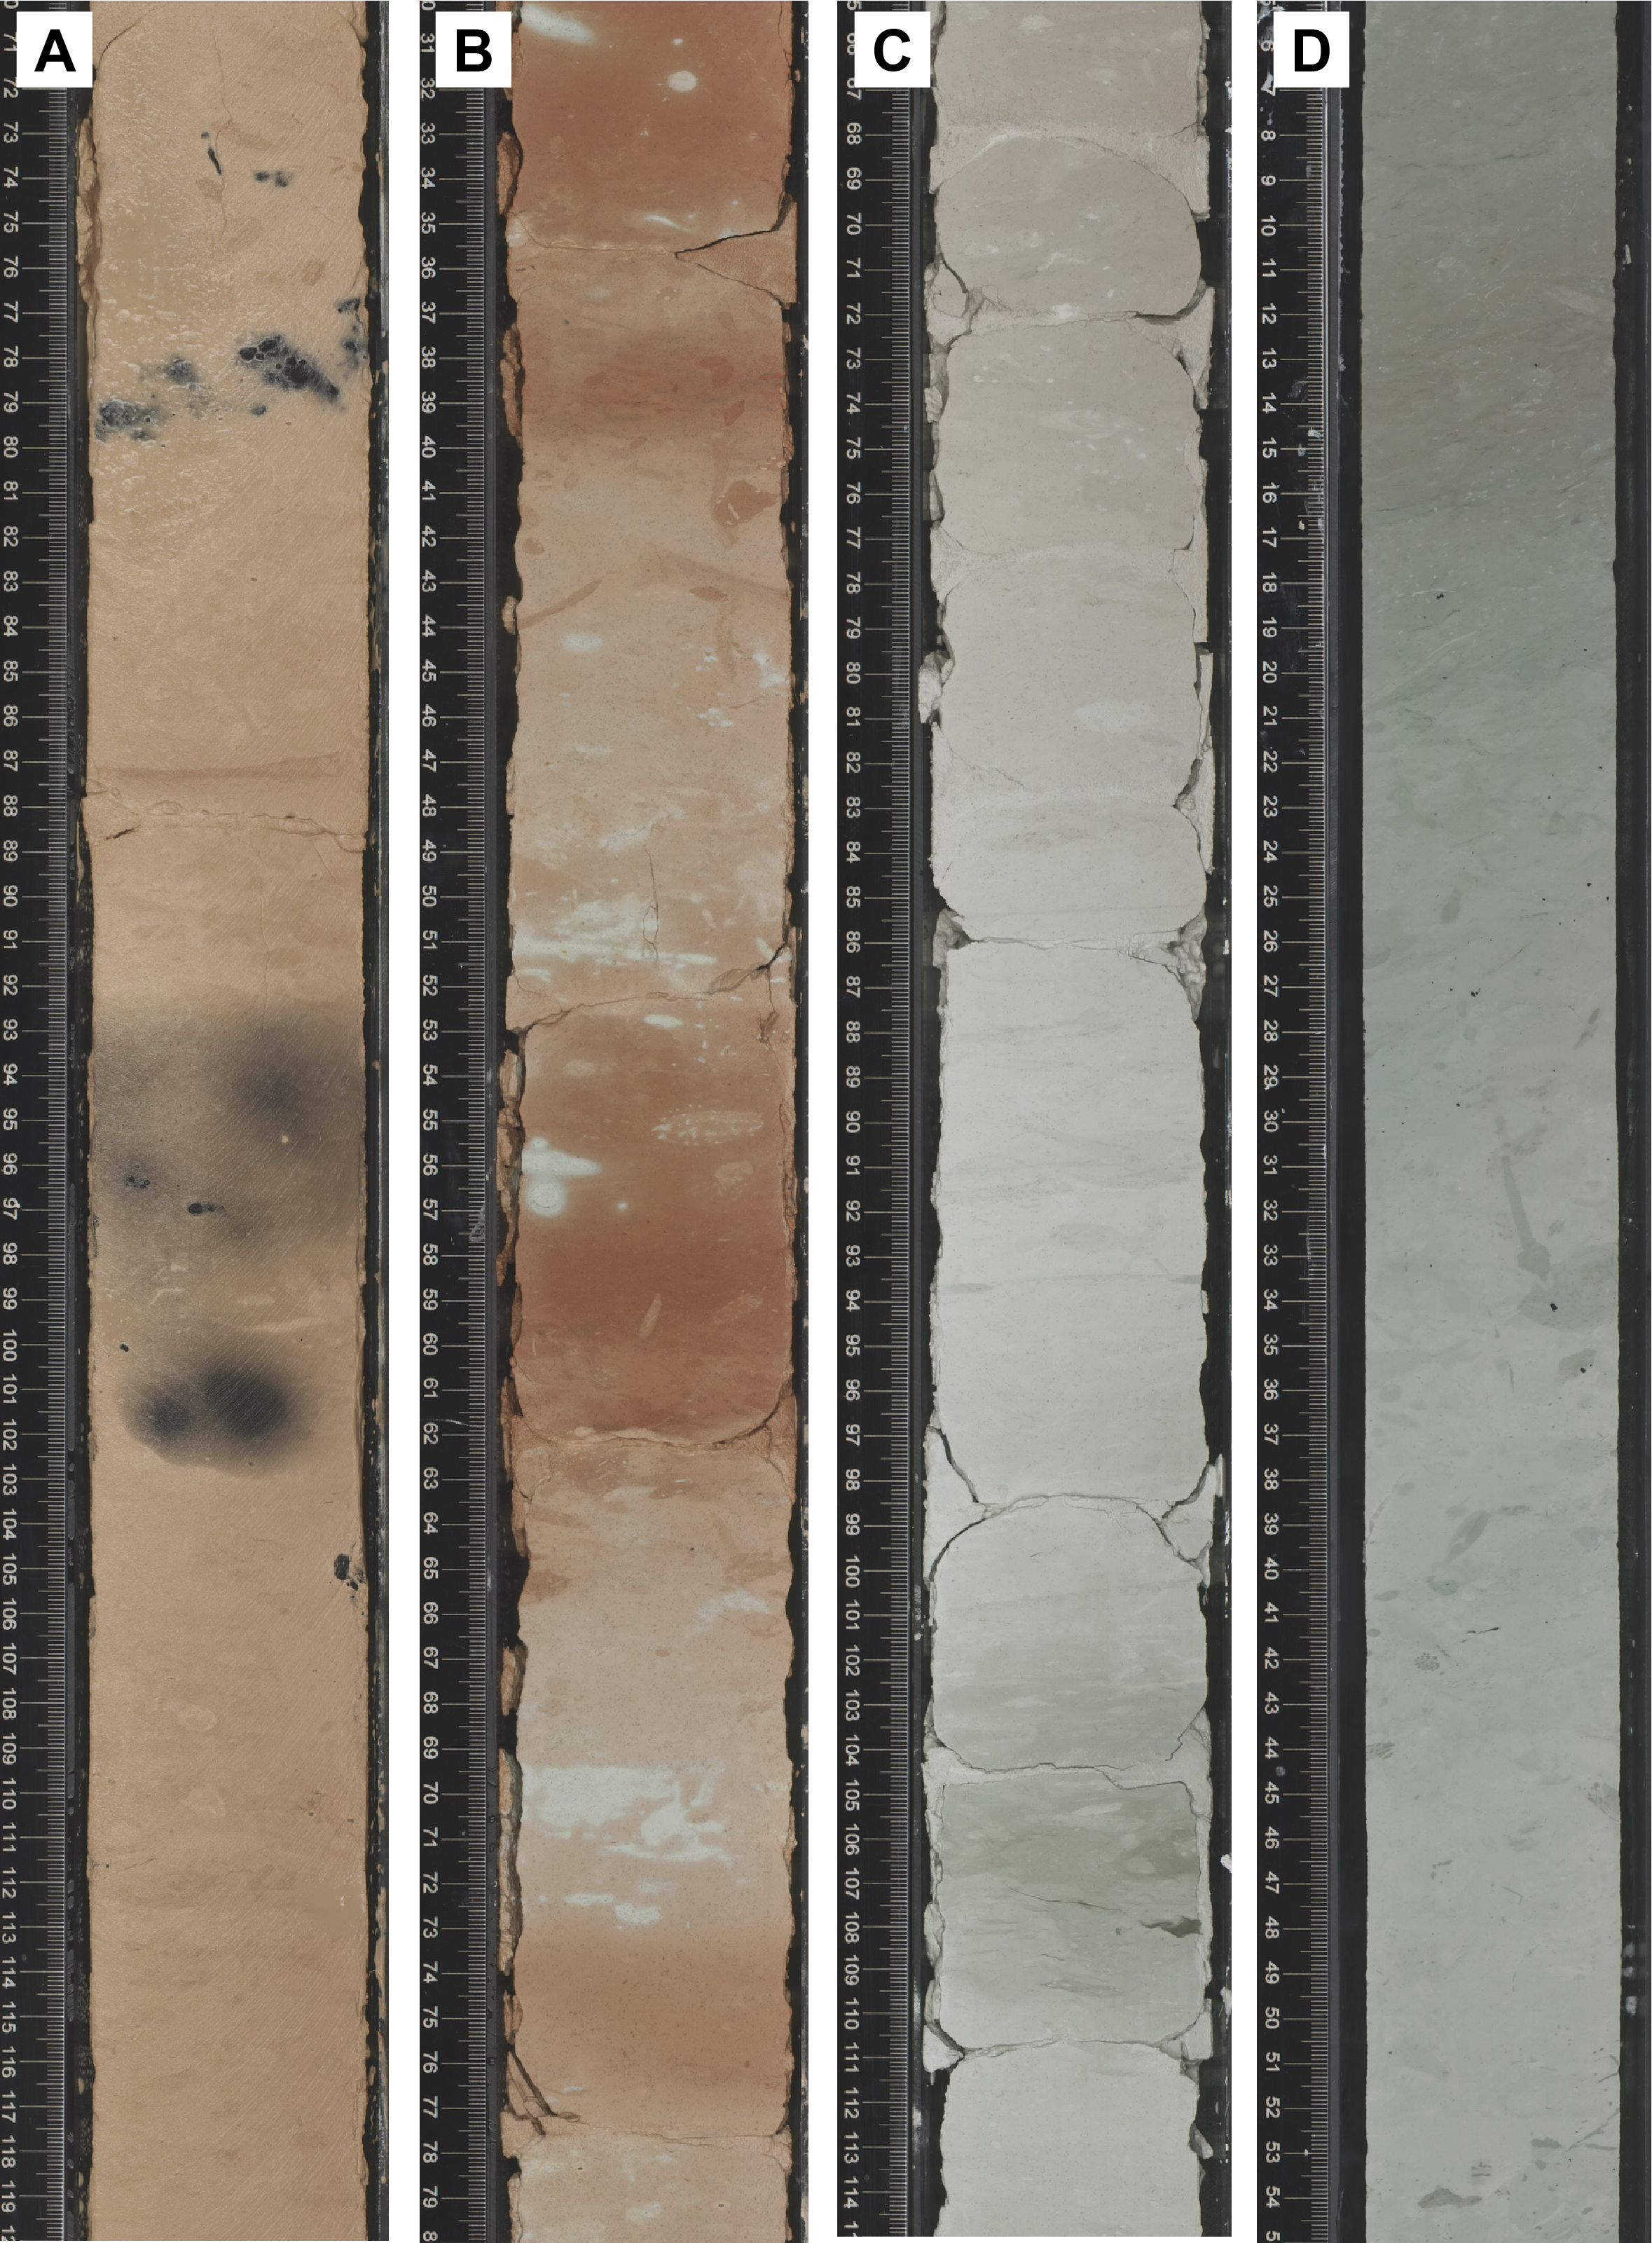
Figure F11. Chalk.
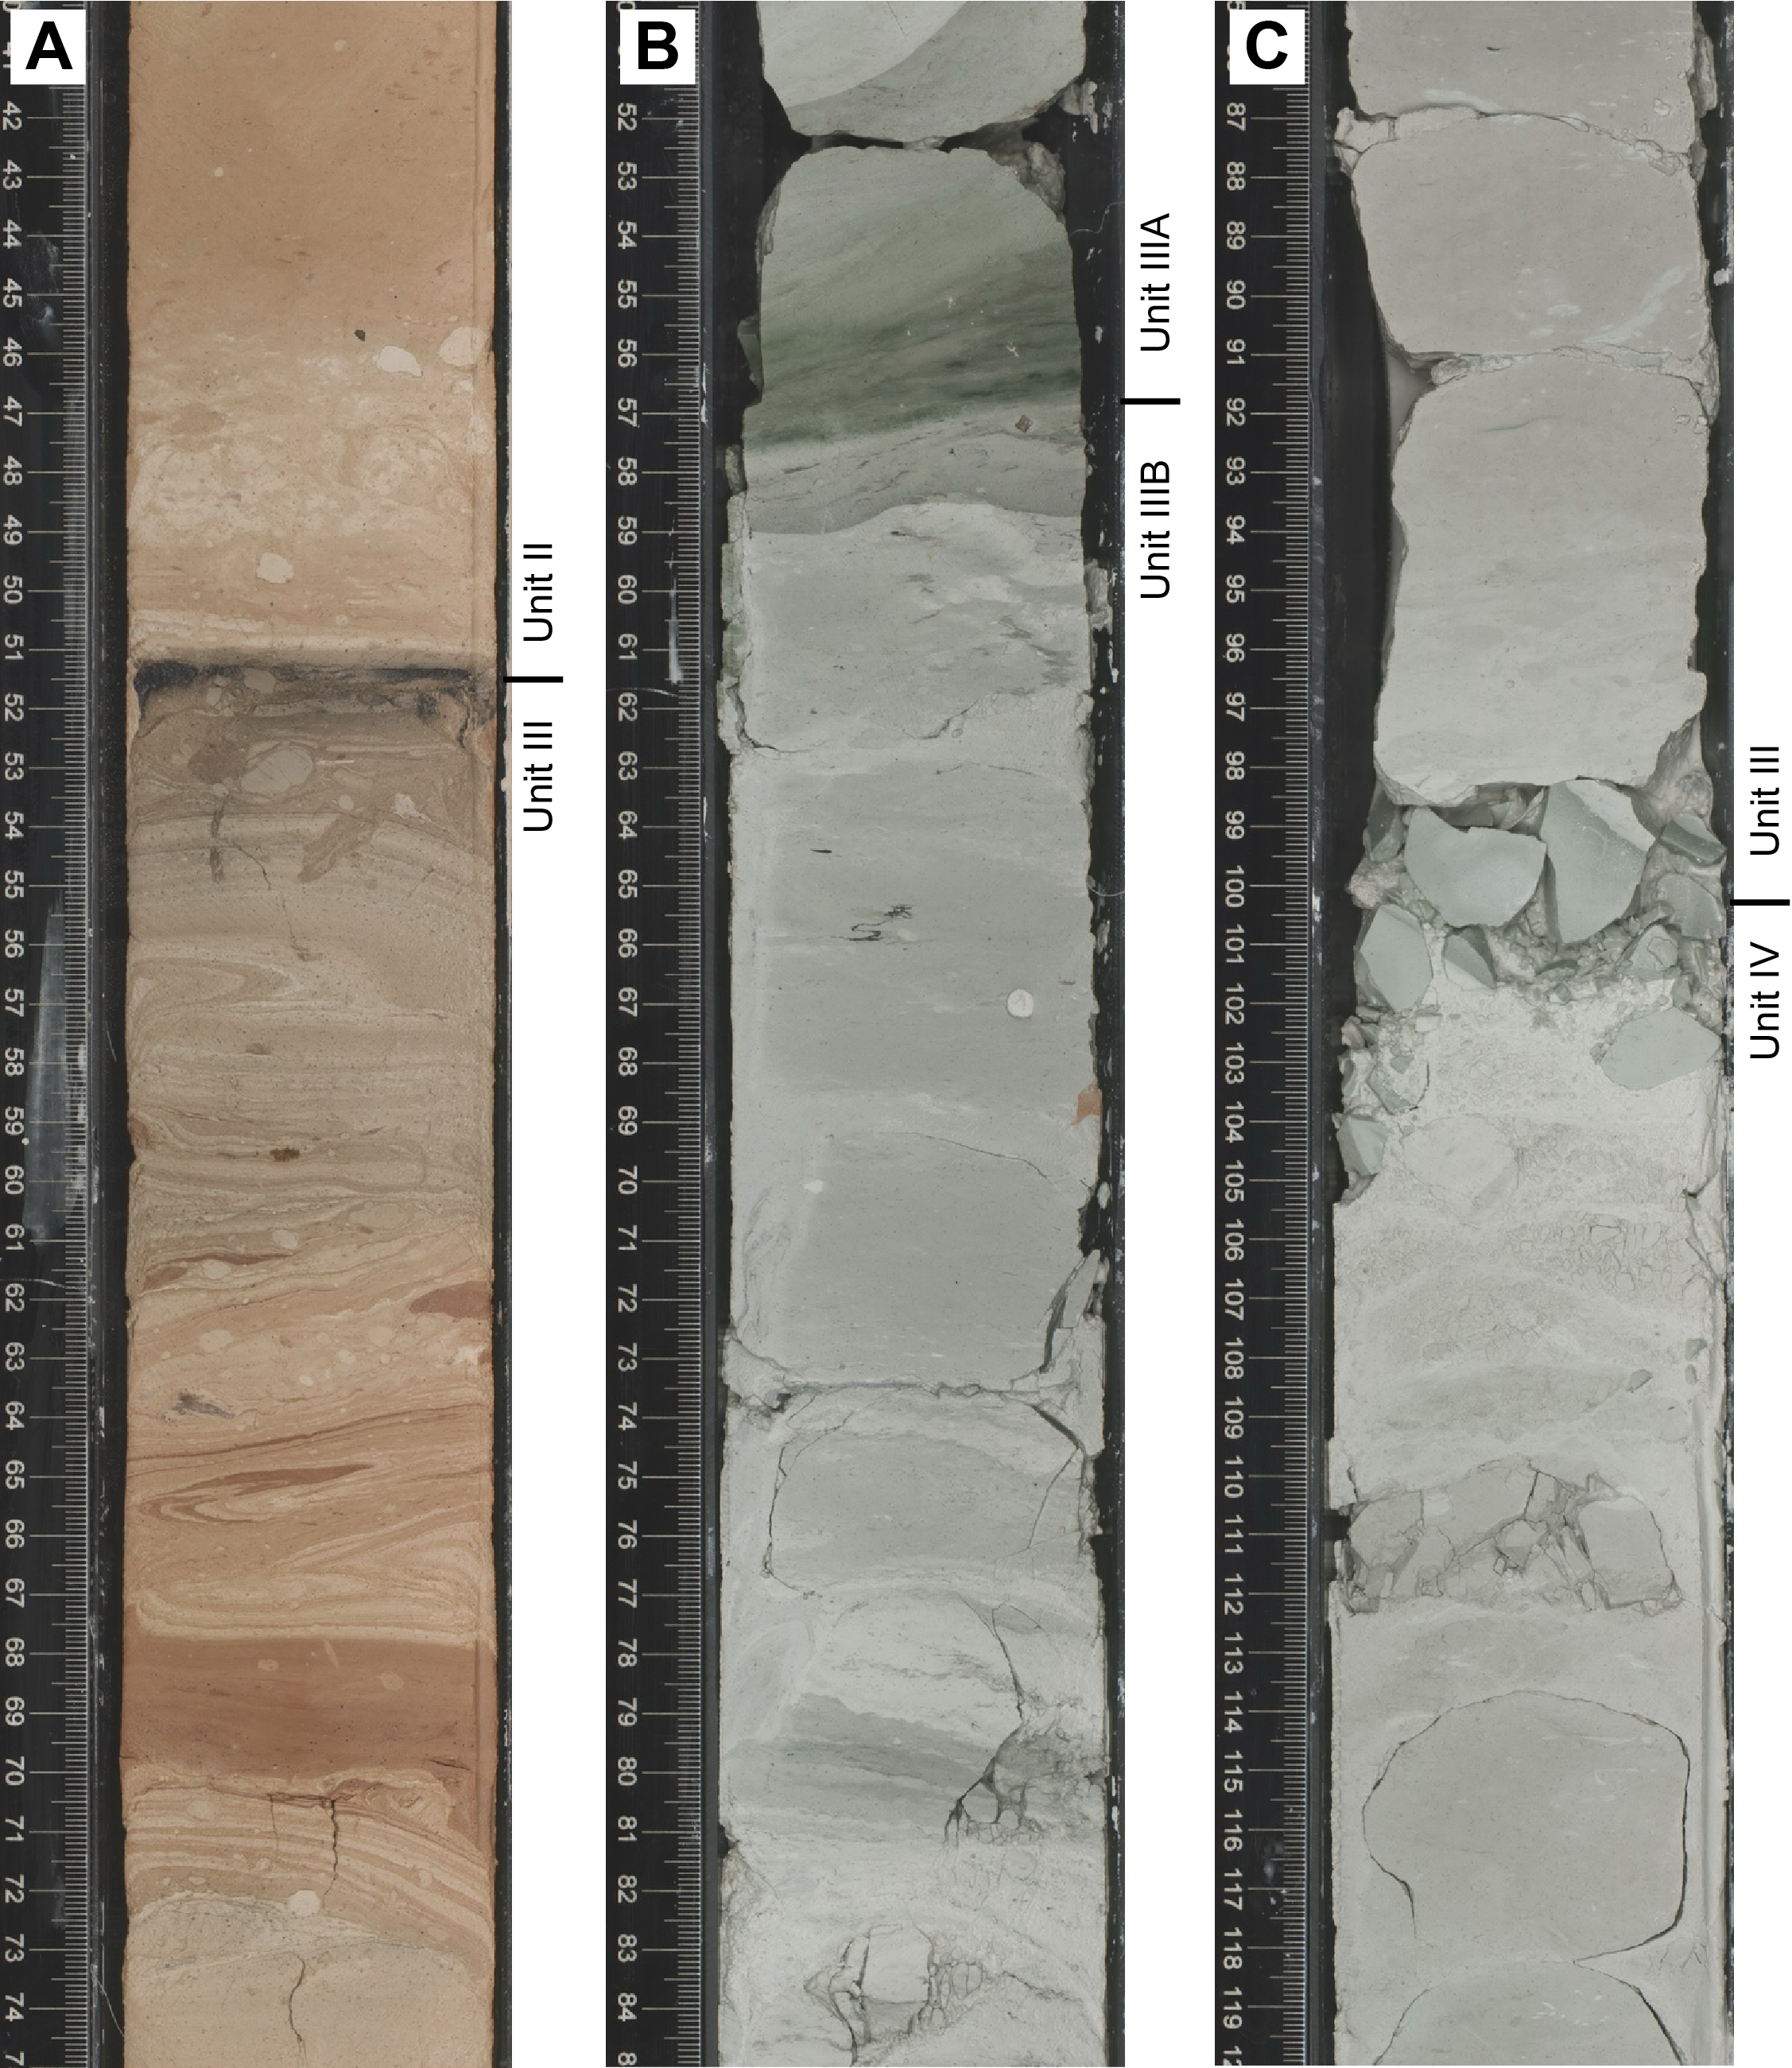
Figure F12. Stratigraphic boundaries.
Lithofacies 2 forms <1% of recovered cores and is composed of well-sorted foraminifera to volcanic sand. This facies is poorly preserved due to disaggregation by drilling. Accordingly, it is commonly unclear if the sand from Unit II originally deposited in laminated sediment or burrow infills. Some of the volcanic sand intervals may also represent rare tephra deposits disturbed by drilling. Fall-in material at the top of Section 391-U1576A-12R-1 (104.80 mbsf) includes a unique occurrence of consolidated white foraminifera chalk in association with darker brown volcanic sand. Smear slide observations of this and other volcanic sands in Unit II indicate that feldspars and palagonized glass form the dominant volcanic fraction (see Core descriptions).
Unit II is interpreted as recording sedimentation in a pelagic environment, with calcareous and volcanic sands most likely reflecting the occurrence of highly infrequent bottom and/or turbidity currents. Some of these volcaniclastic deposits may also include rare, poorly preserved (commonly burrowed) tephra layers. Patches and possibly dismembered layers of dark ferromanganese material suggest the occurrence of several periods of slow sedimentation on the seafloor. As further suggested by observations from underlying units, color cyclicity observed throughout Unit II represents fluctuation in clay and biogenic components in the pelagic sediment. Postexpedition research is required to assess whether these cycles result from astronomically controlled changes in paleoceanographic conditions during the Danian. Postexpedition research is also necessary to determine the exact position and nature of the K/Pg boundary at Site U1576.
3.1.3. Unit III
- Interval: 391-U1576A-14R-1, 51 cm, to 34R-3, 98 cm
- Depth: 124.71–322.19 mbsf
- Age: Maastrichtian to Campanian (~66 to ~79 Ma)
Unit III is a ~197 m thick sedimentary sequence predominantly composed of well-defined cyclical white and reddish brown or greenish gray foraminifera-nannofossil chalk with clay that is lithologically similar to the layered chalk in Unit II. Lithification and preservation of sedimentary structures markedly increase from Core 391-U1576A-16R (143.7 mbsf) downhole. Two subunits (IIIA and IIIB) were defined in Unit III based on progressive attenuation of reddish brown coloration of the chalk and its replacement by a greenish gray color, which likely corresponds to a transition from predominantly oxidative to predominantly reducing conditions on the seafloor starting in Section 29R-4 (~275 mbsf). The base of the unit is marked by almost complete attenuation/replacement of the reddish brown color downhole and the first appearance of thin centimeter-sized bands of dark green siliceous chalk in Section 34R-3, 98 cm (Figure F12C).
Similar to Unit II, the chalk deposits in Unit III are interpreted as a record of pelagic sedimentation. The chalk is interbedded or mingled with sparse volcanic to calcareous sand, which is commonly laminated and normally graded. Similar to Unit II, these deposits are considered to represent infrequent bottom and/or turbidity currents. Unit III is also characterized by sparse, thin layers of altered ash that are interpreted as distal tephra deposits preserved during periods of low sedimentation and/or bioturbation in the pelagic sediment. Shipboard biostratigraphic data support a Maastrichtian to Campanian age of deposition (see Biostratigraphy).
3.1.3.1. Subunit IIIA
- Interval: 391-U1576A-14R-1, 51 cm, to 29R-4, 56 cm
- Depth: 124.71–275.27 mbsf
- Age: Maastrichtian to late Campanian (~66–77 Ma)
Subunit IIIA is a ~151 m thick sequence topped by a distinctive occurrence of a 1 cm thick ferromanganese crust and ~1.5 m of disturbed bedding, with significant possible discing (drilling effects) as well as primary convolute beds of white to gray-brown chalk crosscut by burrows (Figure F12A). These are particularly rhythmic and are well developed in the lower part of the subunit (Cores 391-U1576A-20R through 28R). With the exception of an abnormal sample in Section 22R-4 that has 46 wt% CaCO3, the analysis of whole-round samples from Subunit IIIA yielded CaCO3 contents between ~76 and 96 wt% (n = 15; median = ~83 wt%) (see Sediment geochemistry); this probably captures the overall variability in the relative clay and carbonate abundances in the layered chalk.
The lower boundary of the subunit corresponds to a distinctive 2 cm thick layer of dark green chalk with clay in Section 391-U1576A-29R-4, 56 cm, at the top of an unusual interval of laminated chalk in Subunit IIIB (Figure F12B).
Three main lithofacies were recognized in Subunit IIIA.
Lithofacies 1 forms ~99% of the subunit and is composed of slightly to heavily burrowed reddish brown to white foraminifera-nannofossil ooze/chalk with clay, which is the downward continuation of Lithofacies 1 (layered cyclical chalk) observed in Unit II. The light brown beds observed in Unit II are progressively replaced by whiter intervals in the upper part of Subunit IIIA (Figure F11B). This lithofacies is interpreted as a record of pelagic sedimentation.
Lithofacies 2 forms ~1% of Subunit IIIA and is composed of calcareous to volcanic sand (to sandstone) and ash layers. The sand is commonly laminated and normally graded. The sandy calcareous components are dominated by foraminifera and fragments of inoceramid shells and other possible shell fragments, whereas the volcanic grains typically include feldspar, palagonized volcanic glass (locally vesiculated), and opaque minerals. The sandy intervals are not more than 25 cm thick and are commonly only a few centimeters thick (Figure F13A). As in Unit II, the thinner sand layers are frequently bioturbated, and sand also occurs as burrow infills (Figure F13B). Accordingly, this lithofacies is also interpreted to represent sedimentation by turbidity and/or bottom currents. Some of the volcanic sand intervals may also include rare tephra deposits disturbed by drilling.
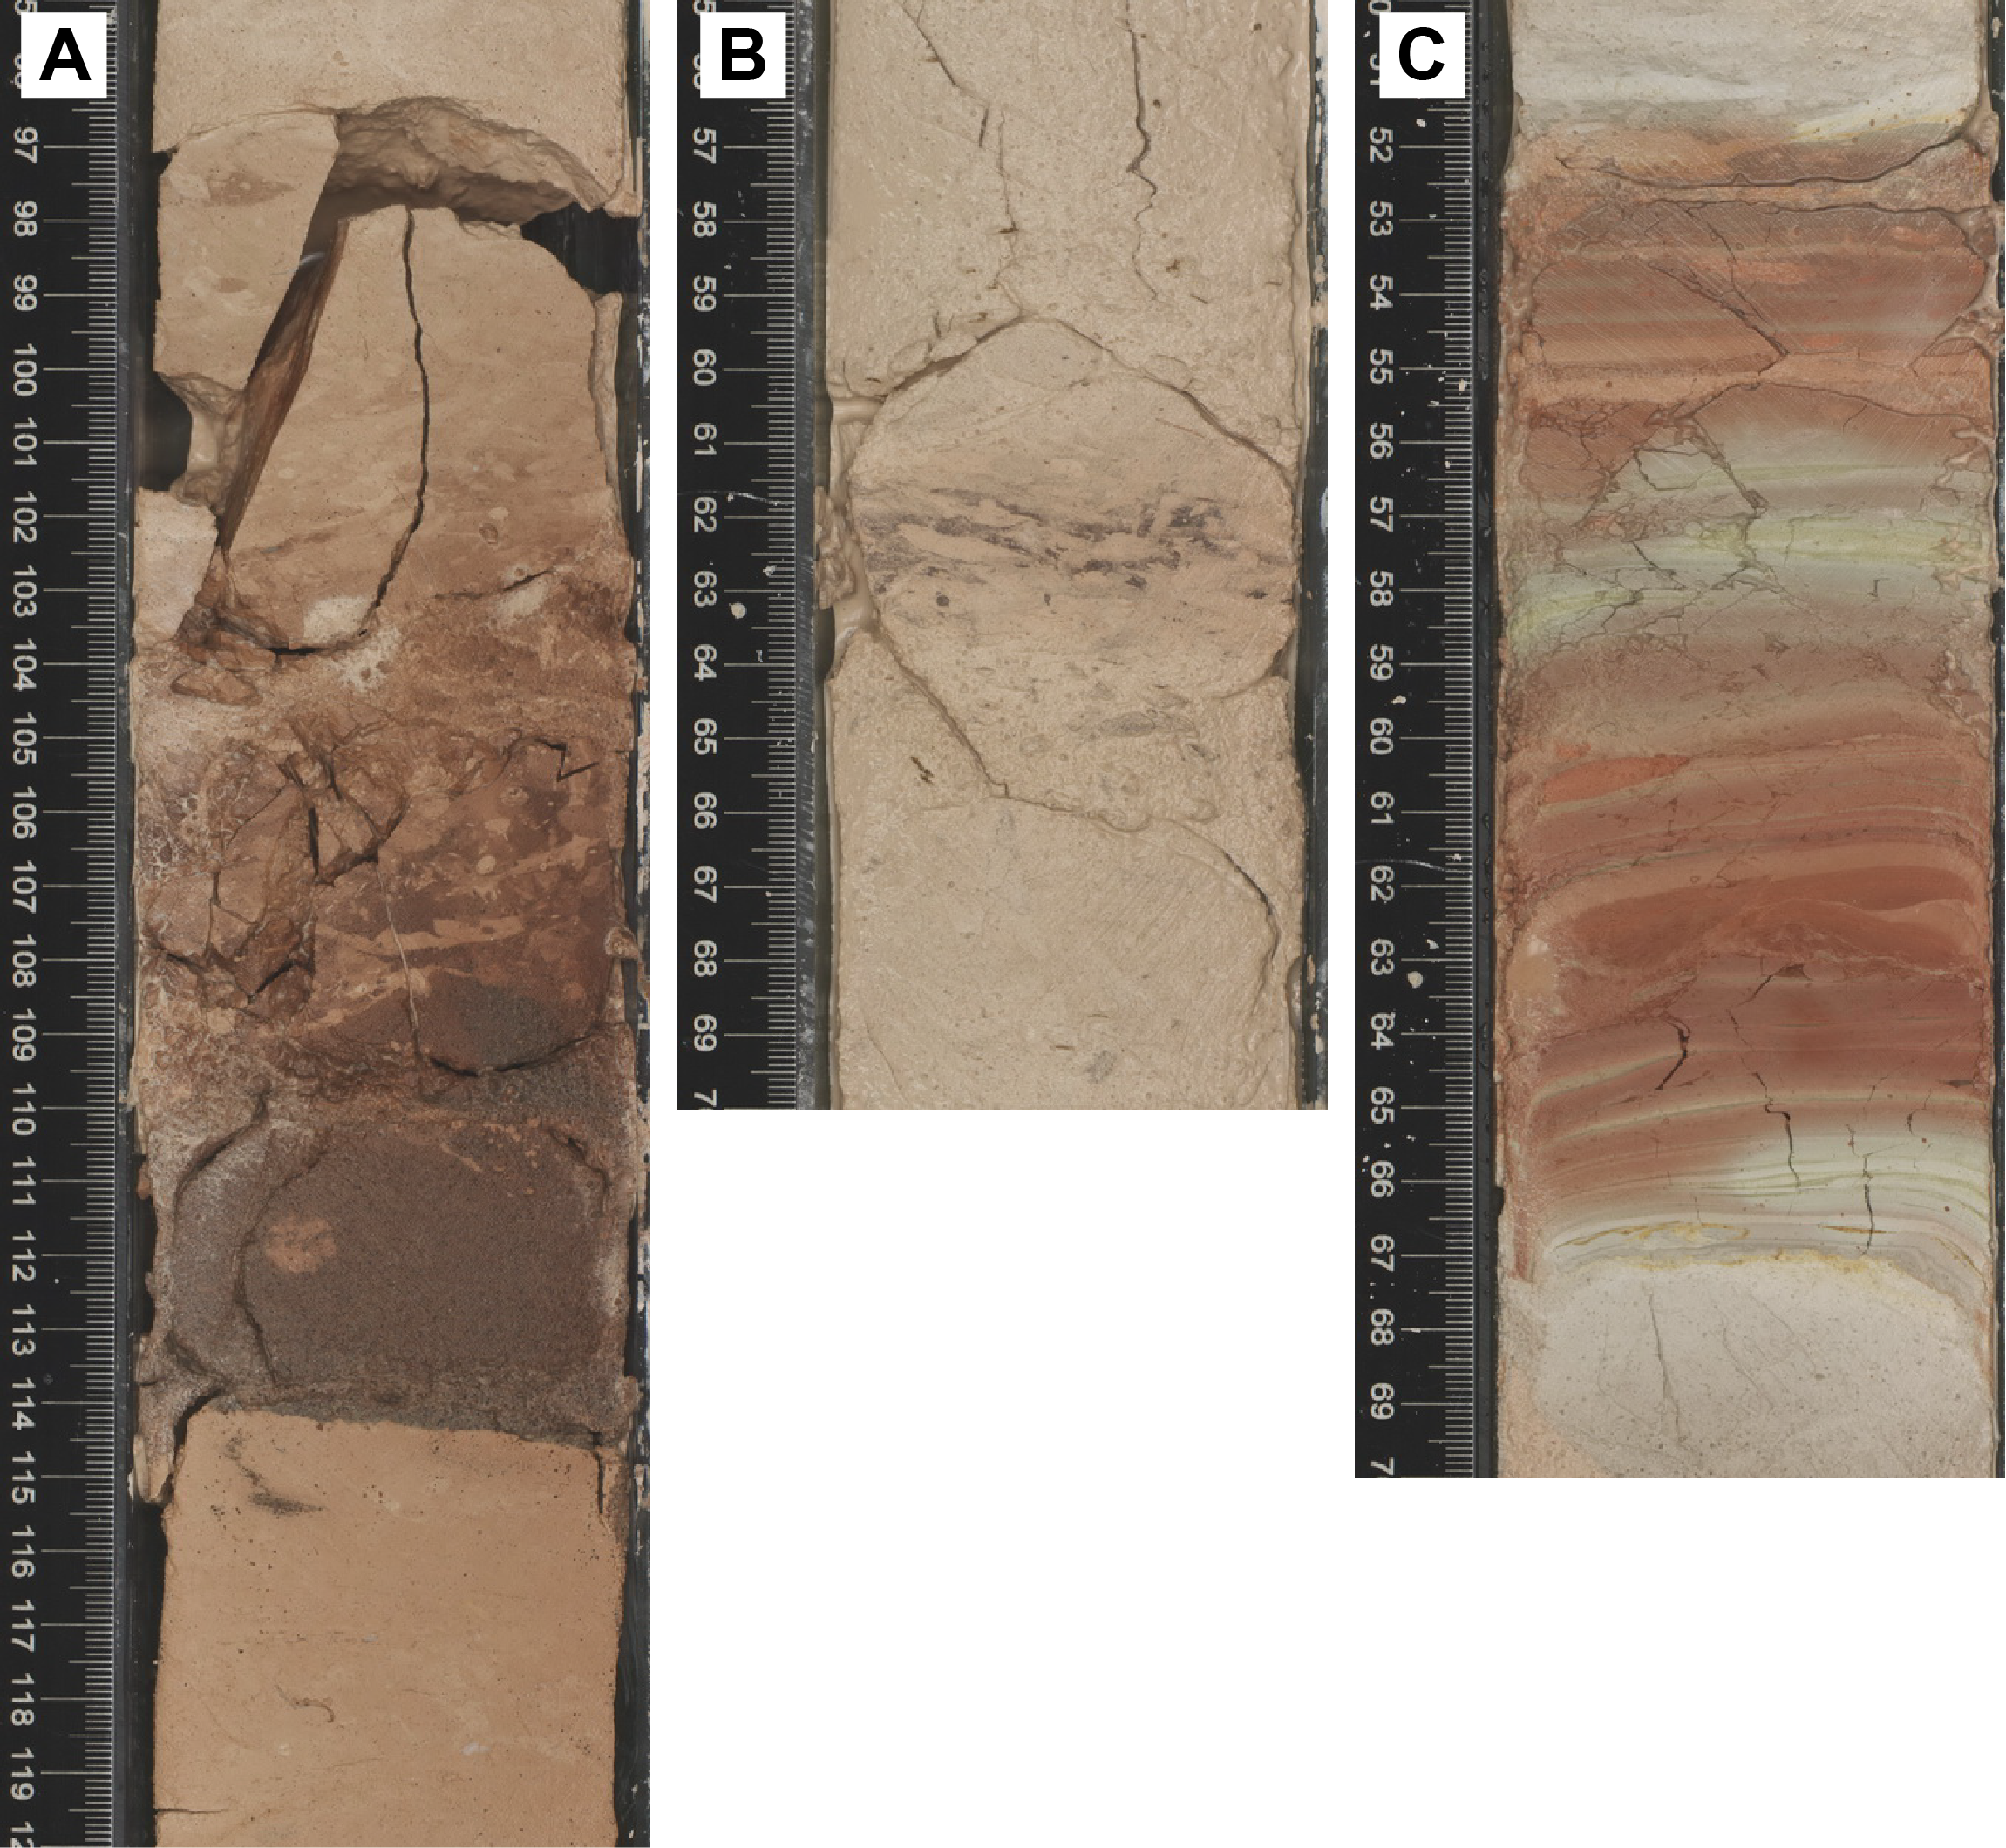
Figure F13. Volcaniclastic facies.
Lithofacies 3 forms <1% of Subunit IIIA and was only found in this subunit at Site U1576. This facies consists of typically <1 cm thick layers of light green clay with rare remnants of volcanic minerals. Similar clayey material is also encountered as millimeter-thick lenses within the bioturbated chalk. One of the best examples of light green clay occurs in Section 391-U1576A-19R-4, where several clay laminae are preserved within a red clayey interval in the layered chalk (Lithofacies 1) (Figure F13C). This lithofacies is interpreted as altered volcanic tephra (ash) only sparsely preserved during periods of reduced pelagic sedimentation and burrowing.
3.1.3.2. Subunit IIIB
- Interval: 391-U1576A-29R-4, 56 cm, to 34R-3, 98 cm
- Depth: 275.27–322.19 mbsf
- Age: mid-Campanian (~77 to <79 Ma)
Subunit IIIB is a ~47 m thick sequence with a lithofacies assemblage very similar to that of Unit II and Subunit IIA. This subunit is almost fully composed of light green and light brown-pink to white foraminifera-nannofossil chalk with clay, which corresponds to Lithofacies 1 (Figure F11C). The uppermost ~2 m of the unit has a greater concentration of dark diffuse laminae and subcentimeter layering (Figure F12B), but these become fainter and less abundant down to Core 391-U1576A-30R, where the characteristic 10–50 cm thick cycles with burrows become apparent again. The cycles are similar to those of Unit II and Subunit IIA, although color variation is less accentuated and is expressed by gray-green variation rather than the previously observed reddish brown. The intensity of intracycle color variation increases farther downhole and is particularly accentuated and regular in Cores 30R–34R. The analysis of whole-round chalk samples in Subunit IIIA yielded CaCO3 contents between ~66 and 77 wt% (n = 5; average = ~71 wt%), possibly indicating a slight increase in clay abundance downhole (see Sediment geochemistry). Beds of laminated calcareous to volcanic sandstone similar to those of Lithofacies 2 in Unit II and Subunit IIA form <1% of the retrieved sequence. This is interpreted as a continuation of sedimentation sparsely affected by turbidity and/or bottom currents, as well as possible tephra deposits. Disappearance of the red color of the chalk in Subunit IIIB is considered a change to more reducing conditions in the basin during pelagic sedimentation.
3.1.4. Unit IV
- Intervals: 391-U1576A-34R-3, 98 cm, to 40R-3, 101 cm; 391-U1576B-2R-1, 0 cm, to 5R-3, 50 cm
- Depths: Hole U1576A = 322.19–380.18 mbsf; Hole U1576B = 365.00–385.28 mbsf
- Age: early Campanian (~79 to ~81 Ma)
Unit IV was recovered in both holes at Site U1576. It is a ~60 m thick sedimentary sequence predominantly composed of light green to darker gray foraminifera-nannofossil chalk with clay and locally faint nuances of pinkish gray intervals. This lithology resembles Lithofacies 1 in the units above. Calcareous and volcanic sandy deposits similar to those observed in Units II and III (Lithofacies 2) become a slightly more important component in Unit IV for a total of 5% of retrieved sediment. Biostratigraphic data indicate a consistent early Campanian (~79–81 Ma) age of deposition of the unit in Holes U1576A and U1576B (see Biostratigraphy).
The lower boundary of Unit IV corresponds to the inferred (i.e., not recovered) contact with the underlying igneous succession (Unit V) in Holes U1576A and U1576B. As discussed below, the correlation of Unit IV between Holes U1576A and U1576B is further established by the occurrence of a >161 cm thick matrix-supported conglomerate (hyperconcentrated flow deposit) that defines a clear stratigraphic marker ~18.2 and 16.0 m above the igneous basement in Holes U1576A and U1576B, respectively (Sections 391-U1576A-38R-3 through 38R-CC and 391-U1576B-2R-3 and 2R-4). The sedimentary package between the conglomerate and the top of the basement is lithologically similar in both holes. Notably, graded and laminated sandstones, most likely turbidites, are not found in abundance below ~5.8 and 7.0 m above the top of the first lava in Holes U1576A and U1576B, respectively. Minor discrepancies in the thickness of these intervals and the conglomerate could easily be accounted for by recovery rates of approximately 70% in the lower part of Unit IV, the distance between the two holes, and possible topographic effects on top of lavas in the drilled area. Stratigraphic correlation is additionally supported by physical properties, notably the recognition of an unusual dark green clayey band and its overlying chalk and turbidite beds in Sections 391-U1576A-39R-3, 77 cm, and 391-U1576B-3R-1, 25 cm, approximately 2 m below the conglomerate (see Physical properties). Interestingly, preliminary fine-tuning of stratigraphic correlations suggests minor lateral variability in the facies of the turbidites, which will be constrained further during postexpedition research.
Three main lithofacies were recognized in Unit IV.
Lithofacies 1 is light green to darker gray foraminifera-nannofossil chalk with clay, with locally faint nuances of pinkish gray intervals. This lithology is analogous to Lithofacies 1 in Units II and III and forms 94% of Unit IV. Similar to the overlying units, the chalk in Unit IV includes 10–50 cm thick cycles marked by changes in color and bioturbation intensity (Figure F11D). However, it is darker in color compared to the succession above. The analysis of whole-round samples in Unit IV yielded CaCO3 contents between ~59 and 77 wt% (n = 7; average = ~68 wt%) (see Sediment geochemistry), similar to the values observed in Subunit IIIB. Another distinguishing feature of the chalk in Unit IV is occasional <5 cm thick interbeds of darker green siliceous chalk. Consistent with Subunit IIIB, this facies is interpreted as a record of pelagic sedimentation in continuing anoxic conditions.
Lithofacies 2 includes graded and laminated calcareous to volcanic siltstone and sandstone that form 5% of the Unit IV sediment retrieved from in Hole U1576A. These deposits are similar to those of Lithofacies 2 in the overlying units and have a higher abundance of calcareous debris that generally consist of reworked foraminifera and broken shell fragments (commonly inoceramid calcite prisms). Other debris generally consist of rare altered volcanic glass (sometimes vesicular), feldspars, Fe oxides, and ferromagnesian minerals. The recurrence and thickness of the sandstone increase toward the base of the unit before a return to a dominance by Lithofacies 1 approximately 6–7 m above the igneous basement. The structures in the sandstone include normal grading that often terminates in a fine green carbonate-rich micrite (mud), planar laminae, cross-laminae, cross-bedding, and erosional bases (Figure F14A, F14B). Preceding observations are consistent with the emplacement of the sand and silt by turbidity currents. It is possible that some of Lithofacies 2 includes bottom current sediment, but no conclusive evidence for this origin could be identified. Some of the volcanic sand intervals may also include rare tephra deposits disturbed by drilling. The bedding of the graded sandstone is subhorizontal throughout Unit IV. Only one sandstone bed occurs close to the top of the igneous rock-dominated succession (Section 391-U1576A-40R-2, 102 cm), and it shows a dip of approximately 30°, which is interpreted as draping by sediment of an irregular topography at the top of the lavas.
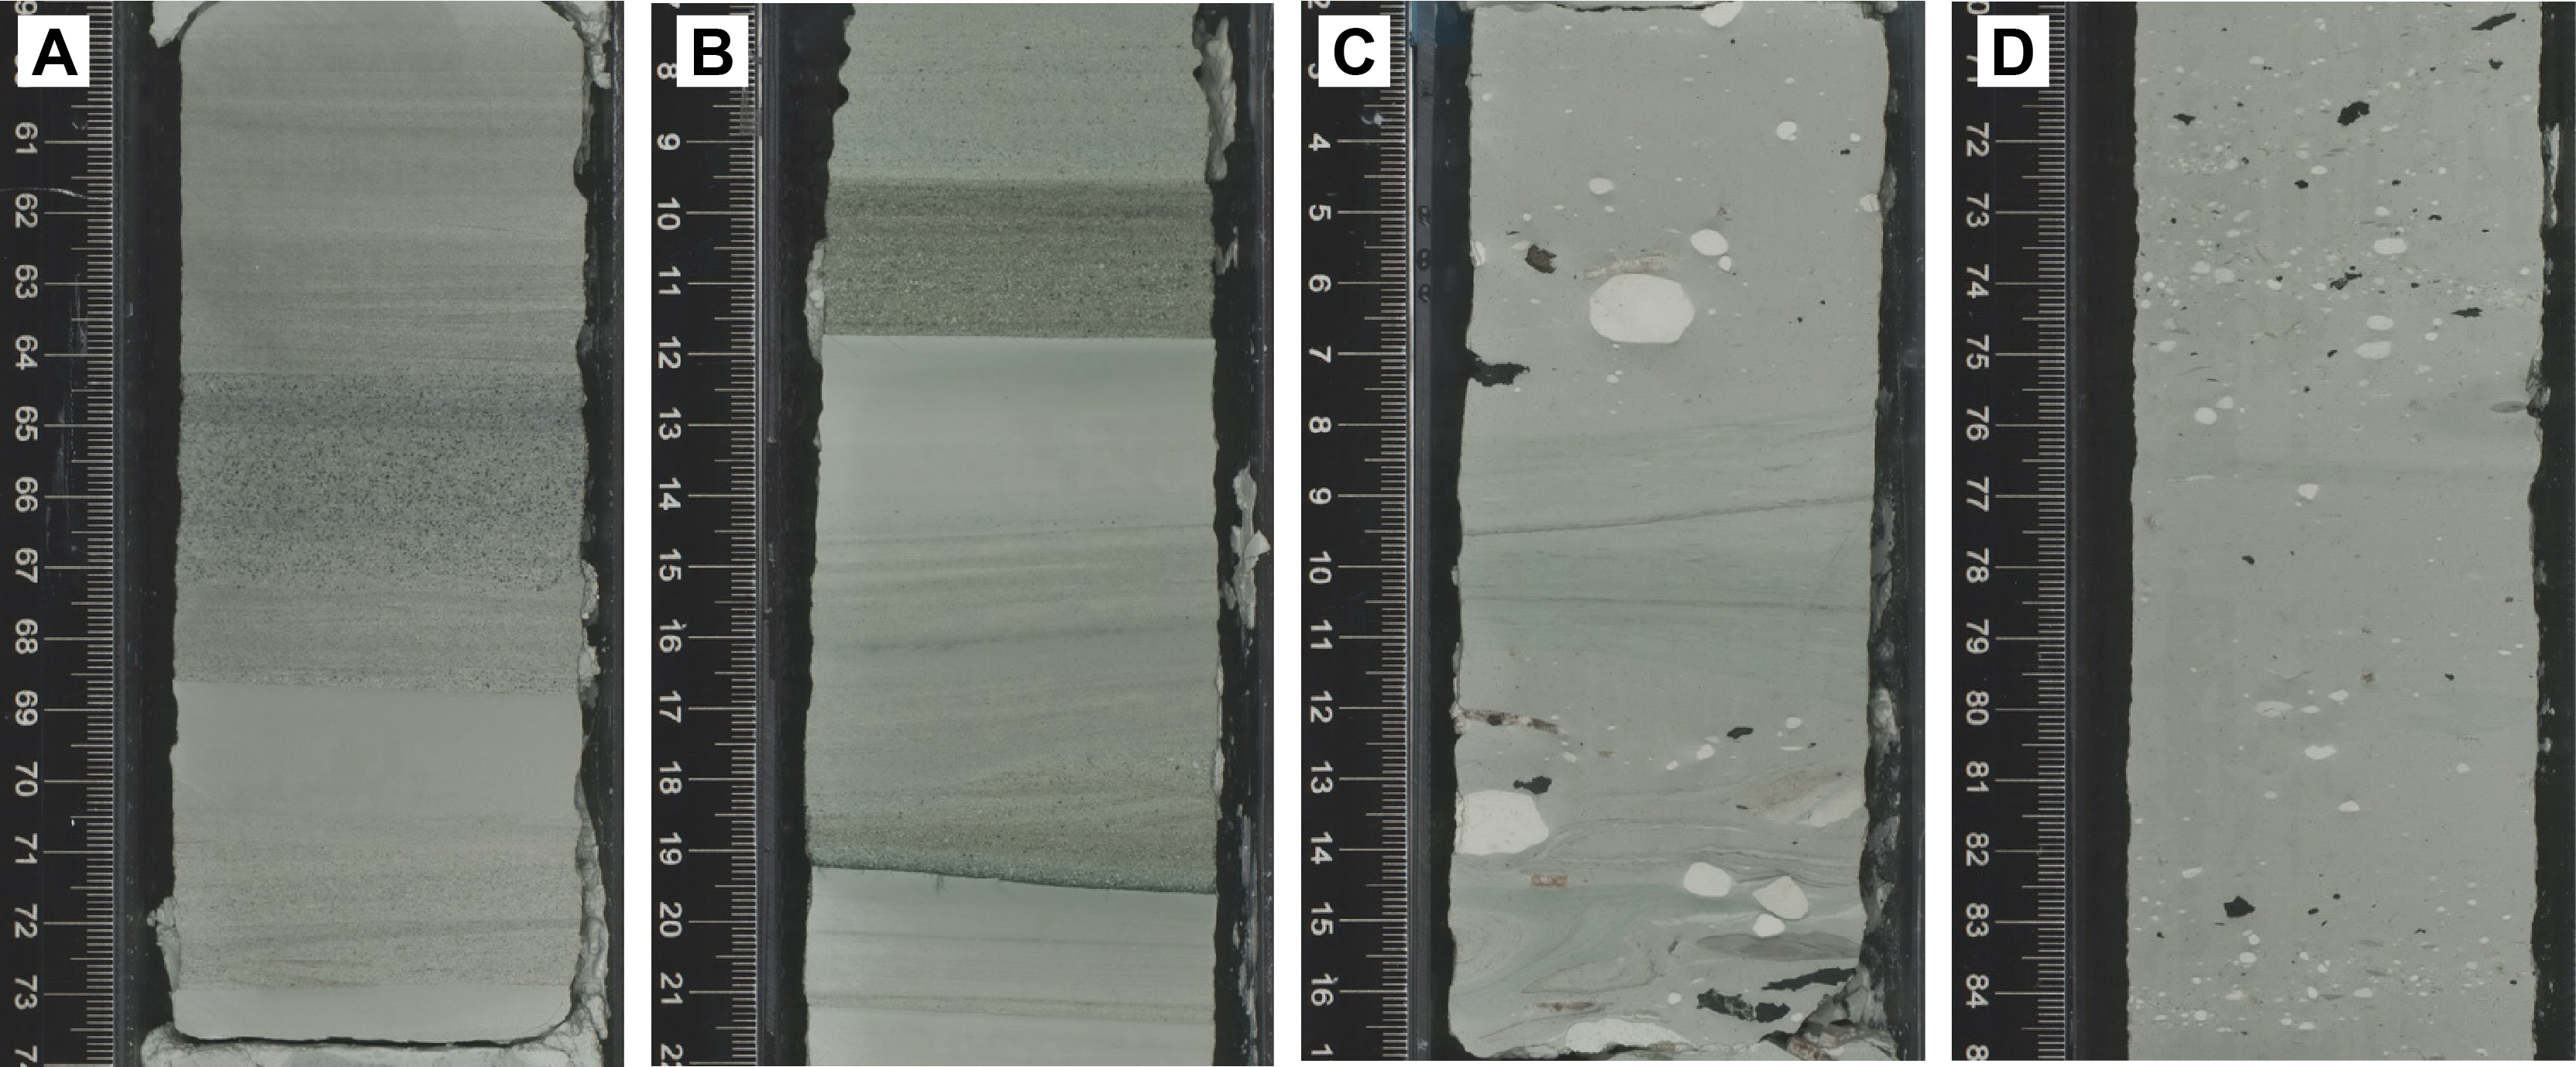
Figure F14. Calcareous sandy-volcaniclastic facies.
Lithofacies 3 is restricted to a unique bed of matrix-supported conglomerate (~1% of the total unit) or gray chalk with granules to pebbles that was encountered in both holes and provides excellent stratigraphic control above the basement (Sections 391-U1576A-38R-3 through 38R-CC and 391-U1576B-2R-3 and 2R-4). The bed is at least 161 cm thick based on better recovery in Hole U1576B. It includes a matrix of light gray-green chalk with clay, with sand- to granule-sized angular inoceramid shell fragments, rounded granules to pebbles (up to 1.5 cm) of rounded white chalk, and sand- to granule-sized black-green angular volcanogenic material and/or metalliferous sediment. The grains are locally in contact along lenticular bands or layers, and layering at the base of the deposit is contorted (Figure F14C, F14D). These observations indicate transport by transient cohesive to turbulent flow, suggesting that the conglomerate bed was produced by a hyperconcentrated flow carrying exotic materials (e.g., poorly consolidated white chalk) from a shallower part of the submarine topography (i.e., volcanic edifice).
3.1.5. Unit V (igneous rock–dominated succession)
- Intervals: 391-U1576A-40R-3, 101 cm, to 41R-4, 105 cm (bottom of hole); 391-U1576B-2R-1, 0 cm, to 391-U1576B-17R-5, 110 cm (bottom of hole)
- Depths: Hole U1576A = 380.18–392.80 mbsf; Hole U1576B = 385.45–450.80 mbsf
- Age: early Campanian (~81 Ma; full time interval is undetermined)
The boundary between Unit V and the overlying sedimentary succession is placed at the top of the first igneous unit at both sites. The succession in Hole U1576A consists of an altered sheet flow underlain by pillow lavas (Igneous Units 1 and 2), and the actual contact is not recovered. There are no sedimentary intercalations.
In Hole U1576B, core recovery began with Section 391-U1576B-2R-1 (365.12 mbsf). This hole encountered a sedimentary succession comparable with that of the lower part of Lithostratigraphic Unit IV cored at Hole U1576A, which is lower Campanian in age (approximately >77 Ma) (see Biostratigraphy). The sediment/basement boundary was encountered at 385.28 mbsf, some 5 m deeper than at the previous hole. Here, the succession consists of a series of pillow lavas and massive flow units with sedimentary intercalations that are ~7.6, 4.9, and 11.6 m thick, respectively. Unit V ends within a thick >6 m massive flow (Section 391-U1576A-17R-5, 110 cm; 450.8 mbsf) (Figure F9). Sedimentary intercalations are sequentially numbered downhole (Sedimentary Interbeds S1, S2, S3, etc.), as defined by intervening igneous units (see Lithostratigraphy in the Expedition 391 methods chapter [Sager et al., 2023a]). Details of the igneous composition and description of the associated eruption units are given in Igneous petrology and volcanology. The intercalated sedimentary succession encountered in Lithostratigraphic Unit V is very similar to that found in Unit IV, such that the base of Unit V effectively represents the uninterrupted continuation of the sedimentary environment existing during emplacement of Igneous Units 1–11.
3.1.5.1. Sedimentary Interbeds S1 and S2
- Interval: 391-U1576B-7R-3, 0 cm, to 8R-CC, 15 cm
- Depth: 393.94–416.1 mbsf
- Age: early Campanian (~77–79 Ma)
Sedimentary Interbeds S1 and S2 lie between Igneous Units 1 and 3 (see Igneous petrology and volcanology). A ~7.5 m thick succession of foraminifera-nannofossil chalk with clay (Lithofacies 1 of Lithostratigraphic Unit IV) containing a minor isolated(?) pillow lava occurs in interval 391-U1576B-8R-3, 11 cm, to 8R, 28 cm (Igneous Unit 2).
3.1.5.2. Sedimentary Interbeds S3 and S4
- Interval: 391-U1576B-12R-2, 84 cm, to 13R-2, 17 cm
- Depth: 417.98–422.77 mbsf
- Age: early Campanian (~79–81 Ma)
Sedimentary Interbeds S3 and S4 lie between Igneous Units 5 and 7 (see Igneous petrology and volcanology), a ~5 m thick succession of green to gray foraminifera-nannofossil chalk with clay (Lithofacies 1 of Lithostratigraphic Unit IV). This lithology is darker at the top nearer the base of the overlying massive lava but becomes paler downhole, and it is characterized by faint cycles of gray to green chalk with slight to heavy bioturbation. The sediments immediately beneath the flow (i.e., Interbed S3) show evidence of soft-sediment deformation and minor brittle displacement below; these likely resulted from loading and thermal alteration of the sediment during flow emplacement. Disturbed sediment continues for ~1 m below the lava contact and is likely due to both loading deformation and hot fluid fluxing and localized mixing with the soft substrate. Here, the dark, bioturbated chalk is interbedded with thin beds of darker gray material enriched in S, Ti, and V, indicating a metalliferous sedimentation component, likely an umber interval in Sections 391-U1576B-12R-2 and 12R-3 (Figure F15). Below this depth, the interval of sedimentary rocks also contains a single lava pillow in interval 13R-1, 71 cm, to 13R-1, 86 cm (Igneous Unit 6). At the base of this interbed, there is evidence of considerable sediment bleaching in interval 13R-1, 90 cm, to 13R-2, 35 cm, and then sediment-lava mingling (i.e., peperite), which is likely related to the emplacement of the underlying massive flow (Igneous Unit 7).
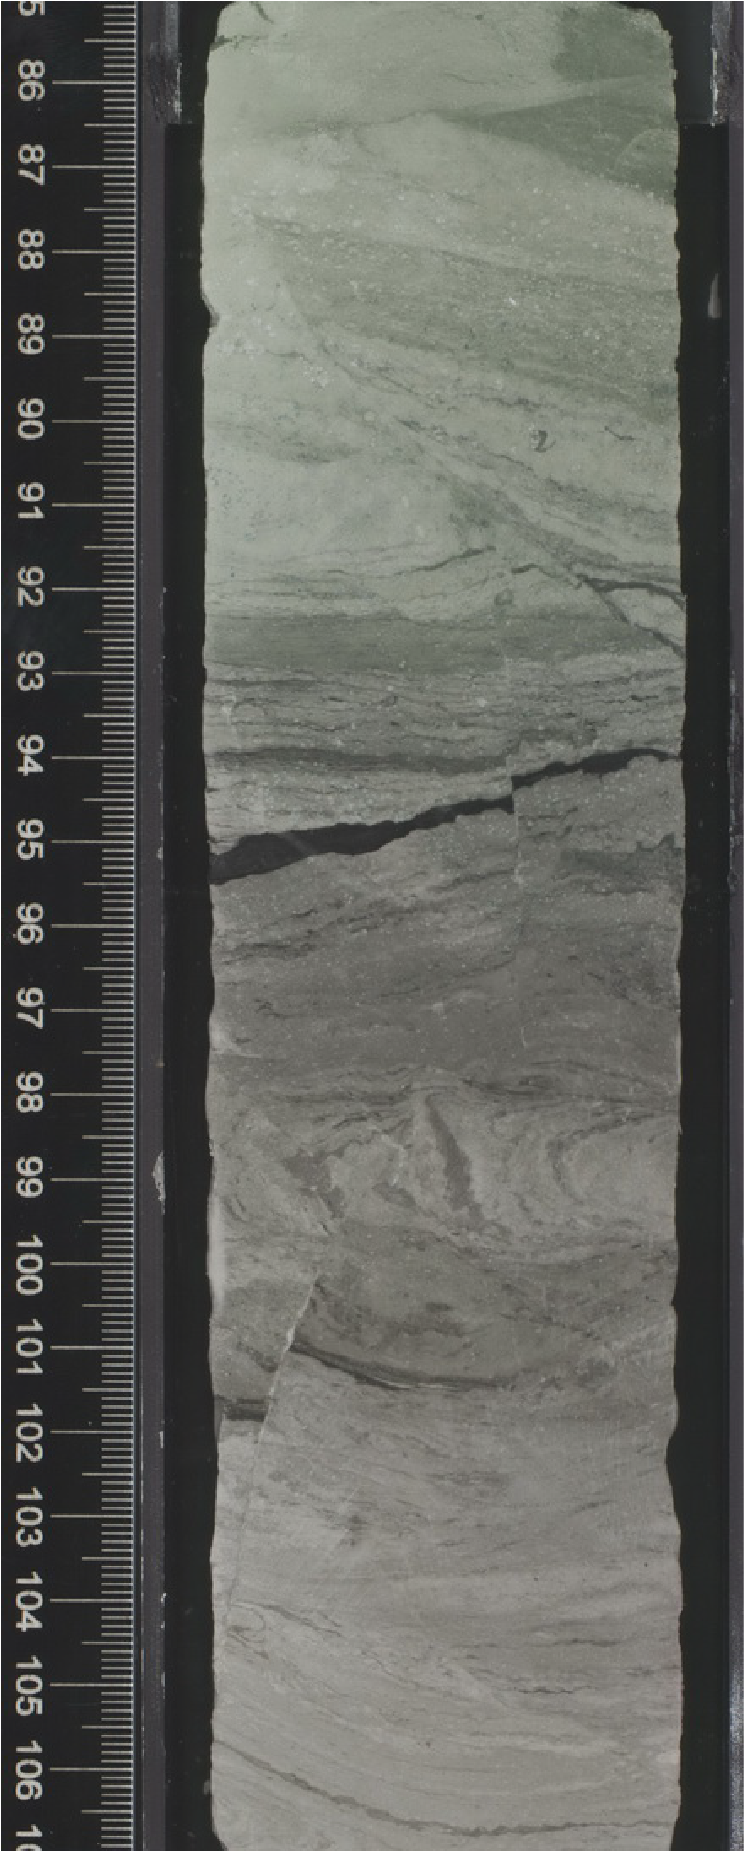
Figure F15. Metalliferous sediment.
3.1.5.3. Sedimentary Interbeds S5 and S6
- Interval: 391-U1576B-14R-2, 115.5 cm, to 16R-1, 86.0 cm
- Depth: 428.30–441.36 mbsf
- Age: early Campanian (~79–81 Ma)
Sedimentary Interbeds S5 and S6 lie between Igneous Units 8 and 9 (see Igneous petrology and volcanology), a ~12 m thick succession of foraminifera-nannofossil chalk with clay (Lithofacies 1 of Lithostratigraphic Unit IV). As previously indicated, the sedimentary material lying immediately above the massive lava (Igneous Unit 7) is peperite, which, together with the associated bleaching, indicates this lava unit may have locally sunk into the unconsolidated sedimentary substrate of Interbed S5, over which it was advancing. As with the previous massive flow, the sediments (Interbed S5) immediately beneath this flow (Igneous Unit 7) are similarly locally bleached beneath the lower contact and also show evidence of soft-sediment deformation (interval 391-U1576B-14R-2, 115.5 cm, to 14R-3, 20 cm); these likely resulted from loading and hot fluid fluxing causing localized mixing of the soft substrate. Beneath these sediments, there is evidence of sediment draping over a minor, intercalated pillow lava in interval 14R-3, 78.5 cm, to 14R-3, 135.5 cm, located above the remaining ~11 m of this sedimentary interval (Interbed S6).
3.1.5.4. Sedimentary Interbed S7
Sedimentary Interbed S7 lies between Igneous Units 9 and 10 (see Igneous petrology and volcanology), a patch of highly bleached sediment similar to Lithostratigraphic Unit IV. This small intercalation is made up of marbleized limestone derived from alteration (leading to bleaching) by thermally driven fluids flushing through the lava/sediment contact and/or the interstices between pillow lavas.
4. Igneous petrology and volcanology
Igneous rocks were recovered from Hole U1576A, which penetrated 17.9 m of igneous basement (interval 391-U1576A-40R-3, 101 cm, to the bottom of the hole at 398.1 mbsf) and recovered 7.56 m (42.2%), and Hole U1576B, which penetrated 65.9 m of igneous basement (interval 391-U1576B-5R-3, 57 cm, to the bottom of the hole at 450.3 mbsf) and recovered 51.48 m (78.1%). Of that succession, 18.69 m is intercalated foraminifera-nannofossil chalk and the remaining 32.79 m is volcanic rock. In Hole U1576A, the top of the igneous basement is marked by a ~2 m thick highly altered sheet flow that transitions to pillow lavas, whereas the top of the igneous basement in Hole U1576B consists of a completely altered pillow basalt flow top. In both holes, the igneous basement underlies 380–385 m of pelagic sediment. In Hole U1576A, the basal sedimentary succession immediately overlying the uppermost igneous unit shows evidence of depositional draping in the form of inclined sedimentary contacts, which eventually diminish upward. This is interpreted as pelagic sedimentation filling the basement topography on the surface of the extrusive units (i.e., lava flow topography). In Holes U1576A and U1576B, the sediment/basement contact is sharp and moderately well preserved.
The igneous basement at Site U1576 represents Lithostratigraphic Unit IV in the overall subseafloor succession (see Lithostratigraphy). Hole U1576A terminates in a pillow lava sequence with a minimum thickness of 10.6 m; the bottom of this unit was not intersected. Hole U1576B terminates in a sheet flow with a minimum thickness of 2.56 m.
Geochemical monitoring using the pXRF spectrometer shows that all of the lavas contain the high-TiO2 chemistry type (see Igneous geochemistry), in contrast to Site U1575, at which lavas contain both the high- and low-TiO2 chemistry types (see Igneous geochemistry in the Site U1575 chapter [Sager et al., 2023c]).
4.1. Igneous unit descriptions, Hole U1576A
Two igneous units were identified in Hole U1576A (Figure F16). The uppermost is a sheet flow (1.97 m) underlain by the second unit, which consists of pillow basalt sequence (10.65 m). The lower unit in Hole U1576A appears to correlate with the uppermost unit in Hole U1576B.
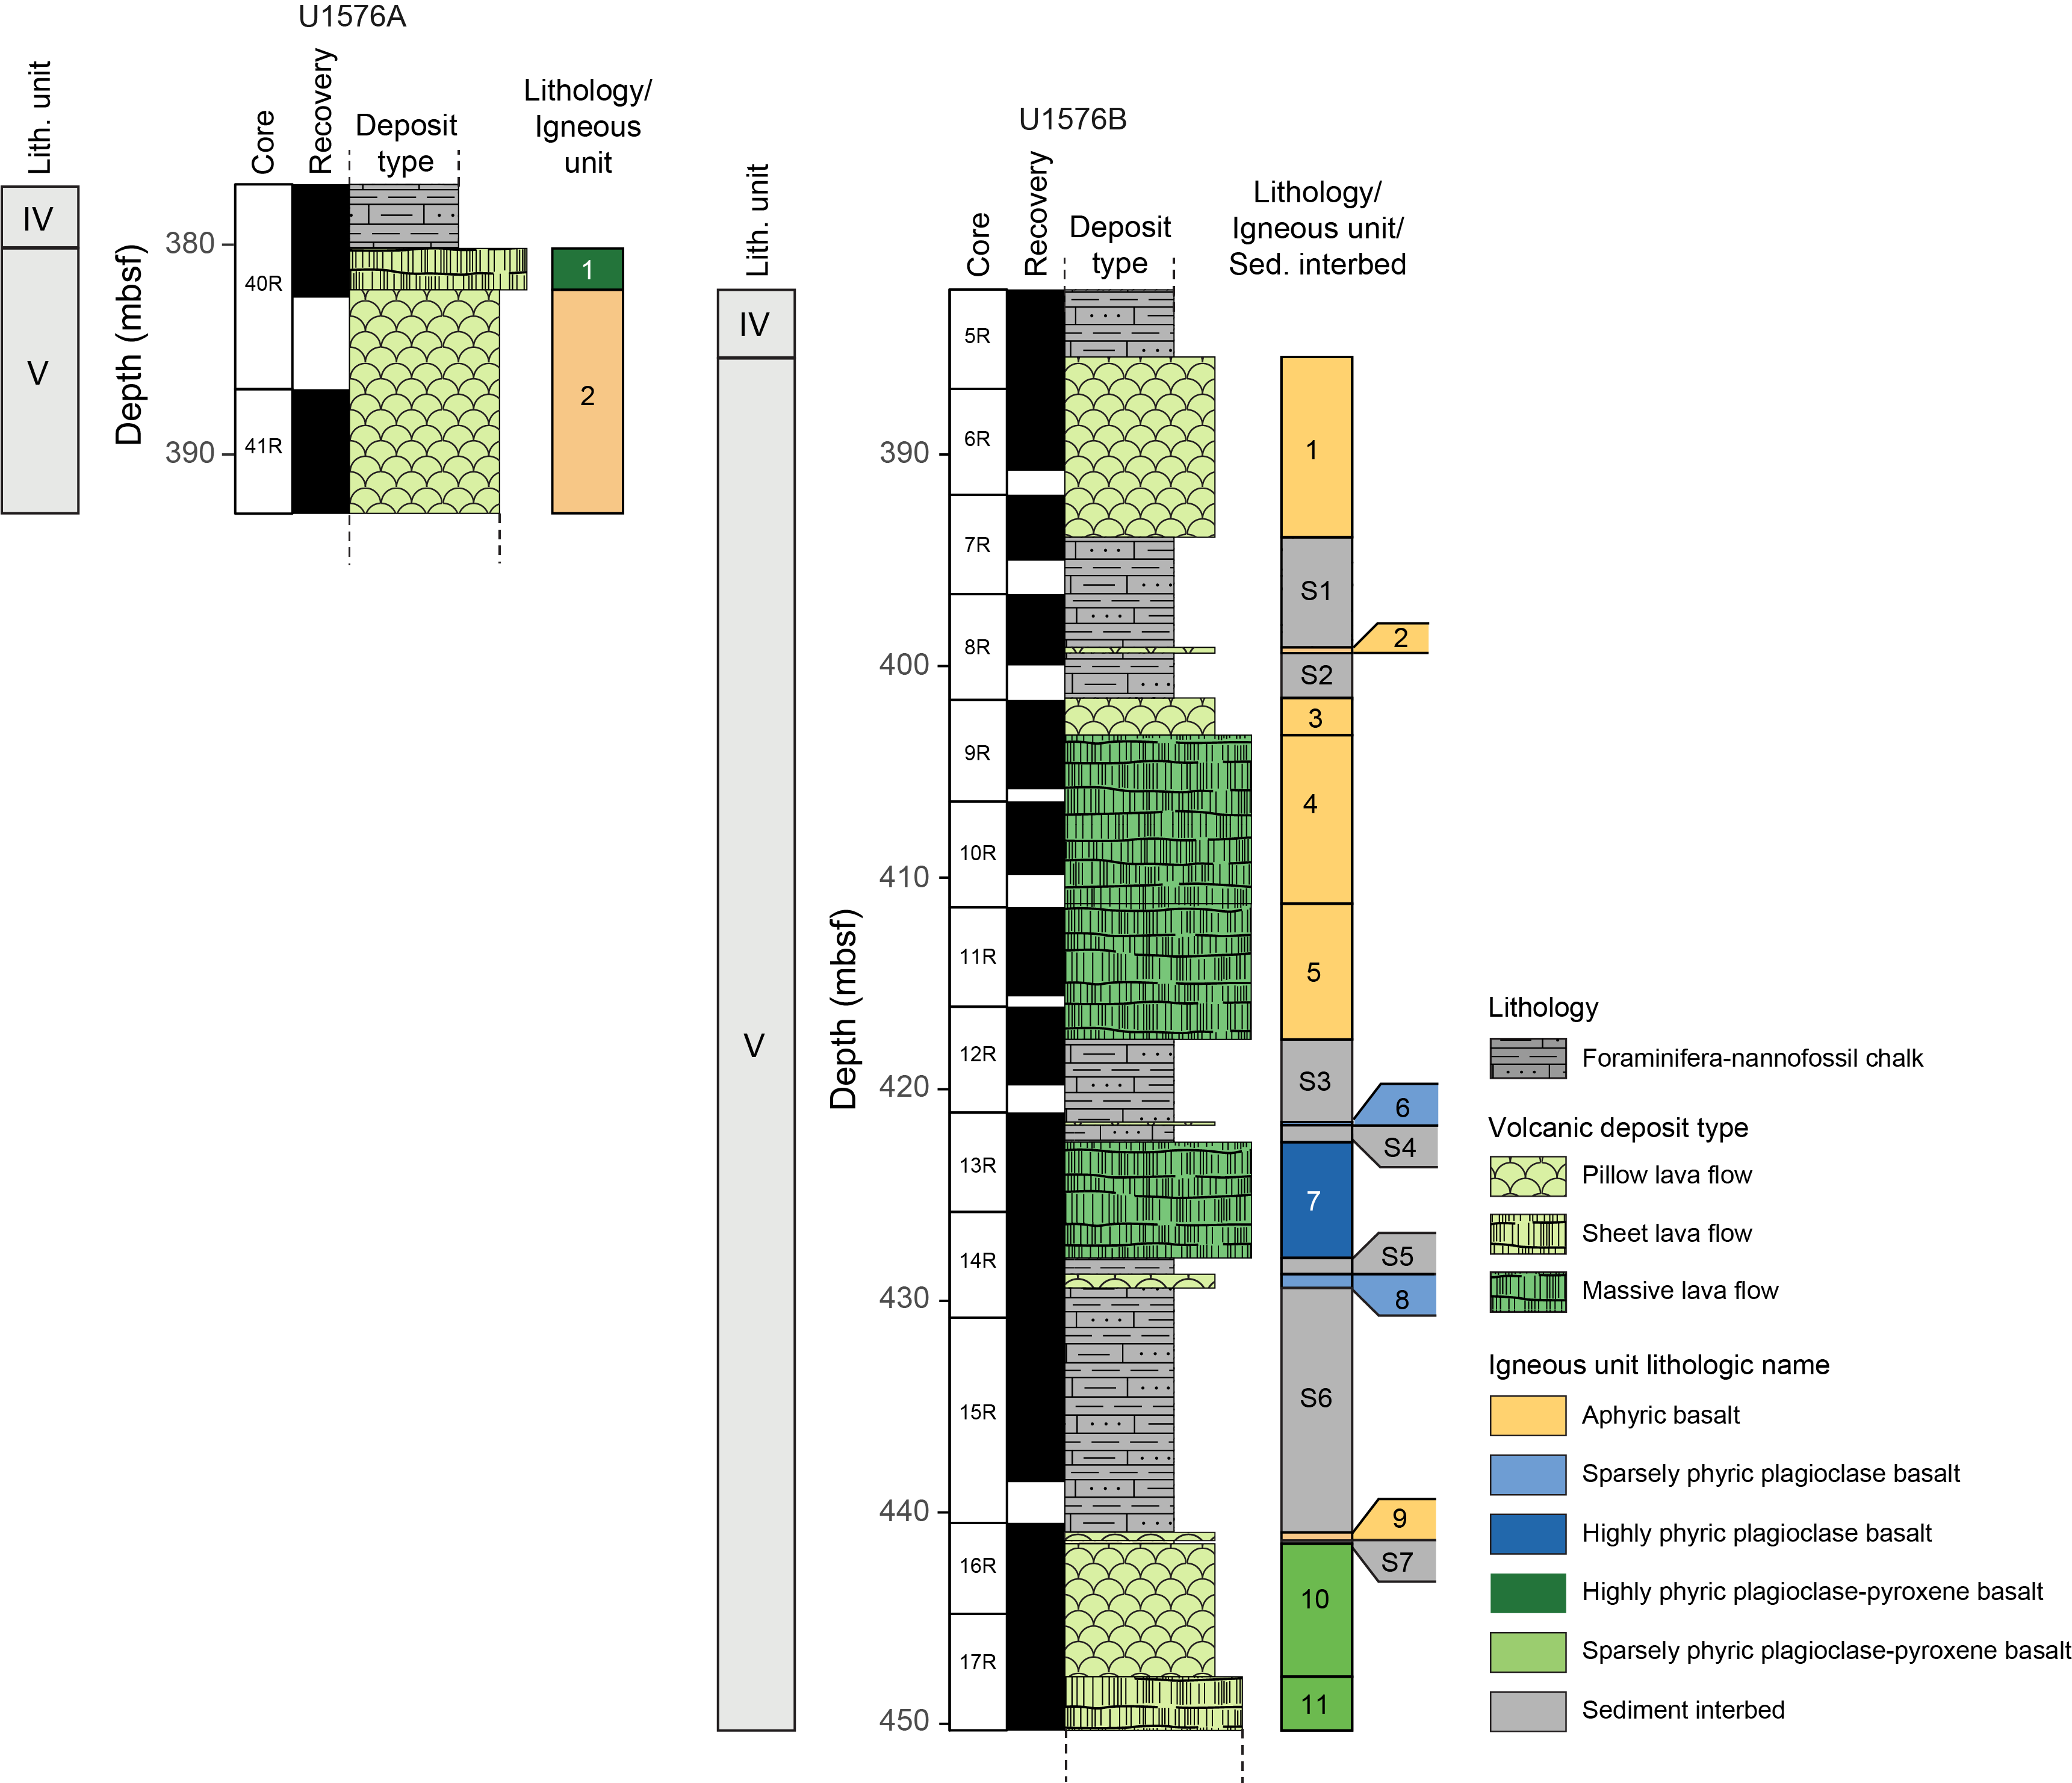
Figure F16. Stratigraphic column.
The lavas range from glassy and aphanitic to intersertal and holocrystalline (Figure F17). Fresh glass is present on pillow margins. When phenocrysts are present, the lavas are highly phyric and contain plagioclase (9%–12%) and clinopyroxene (6%–8%). The lavas are slightly vesicular with small (~1 mm) round vesicles.
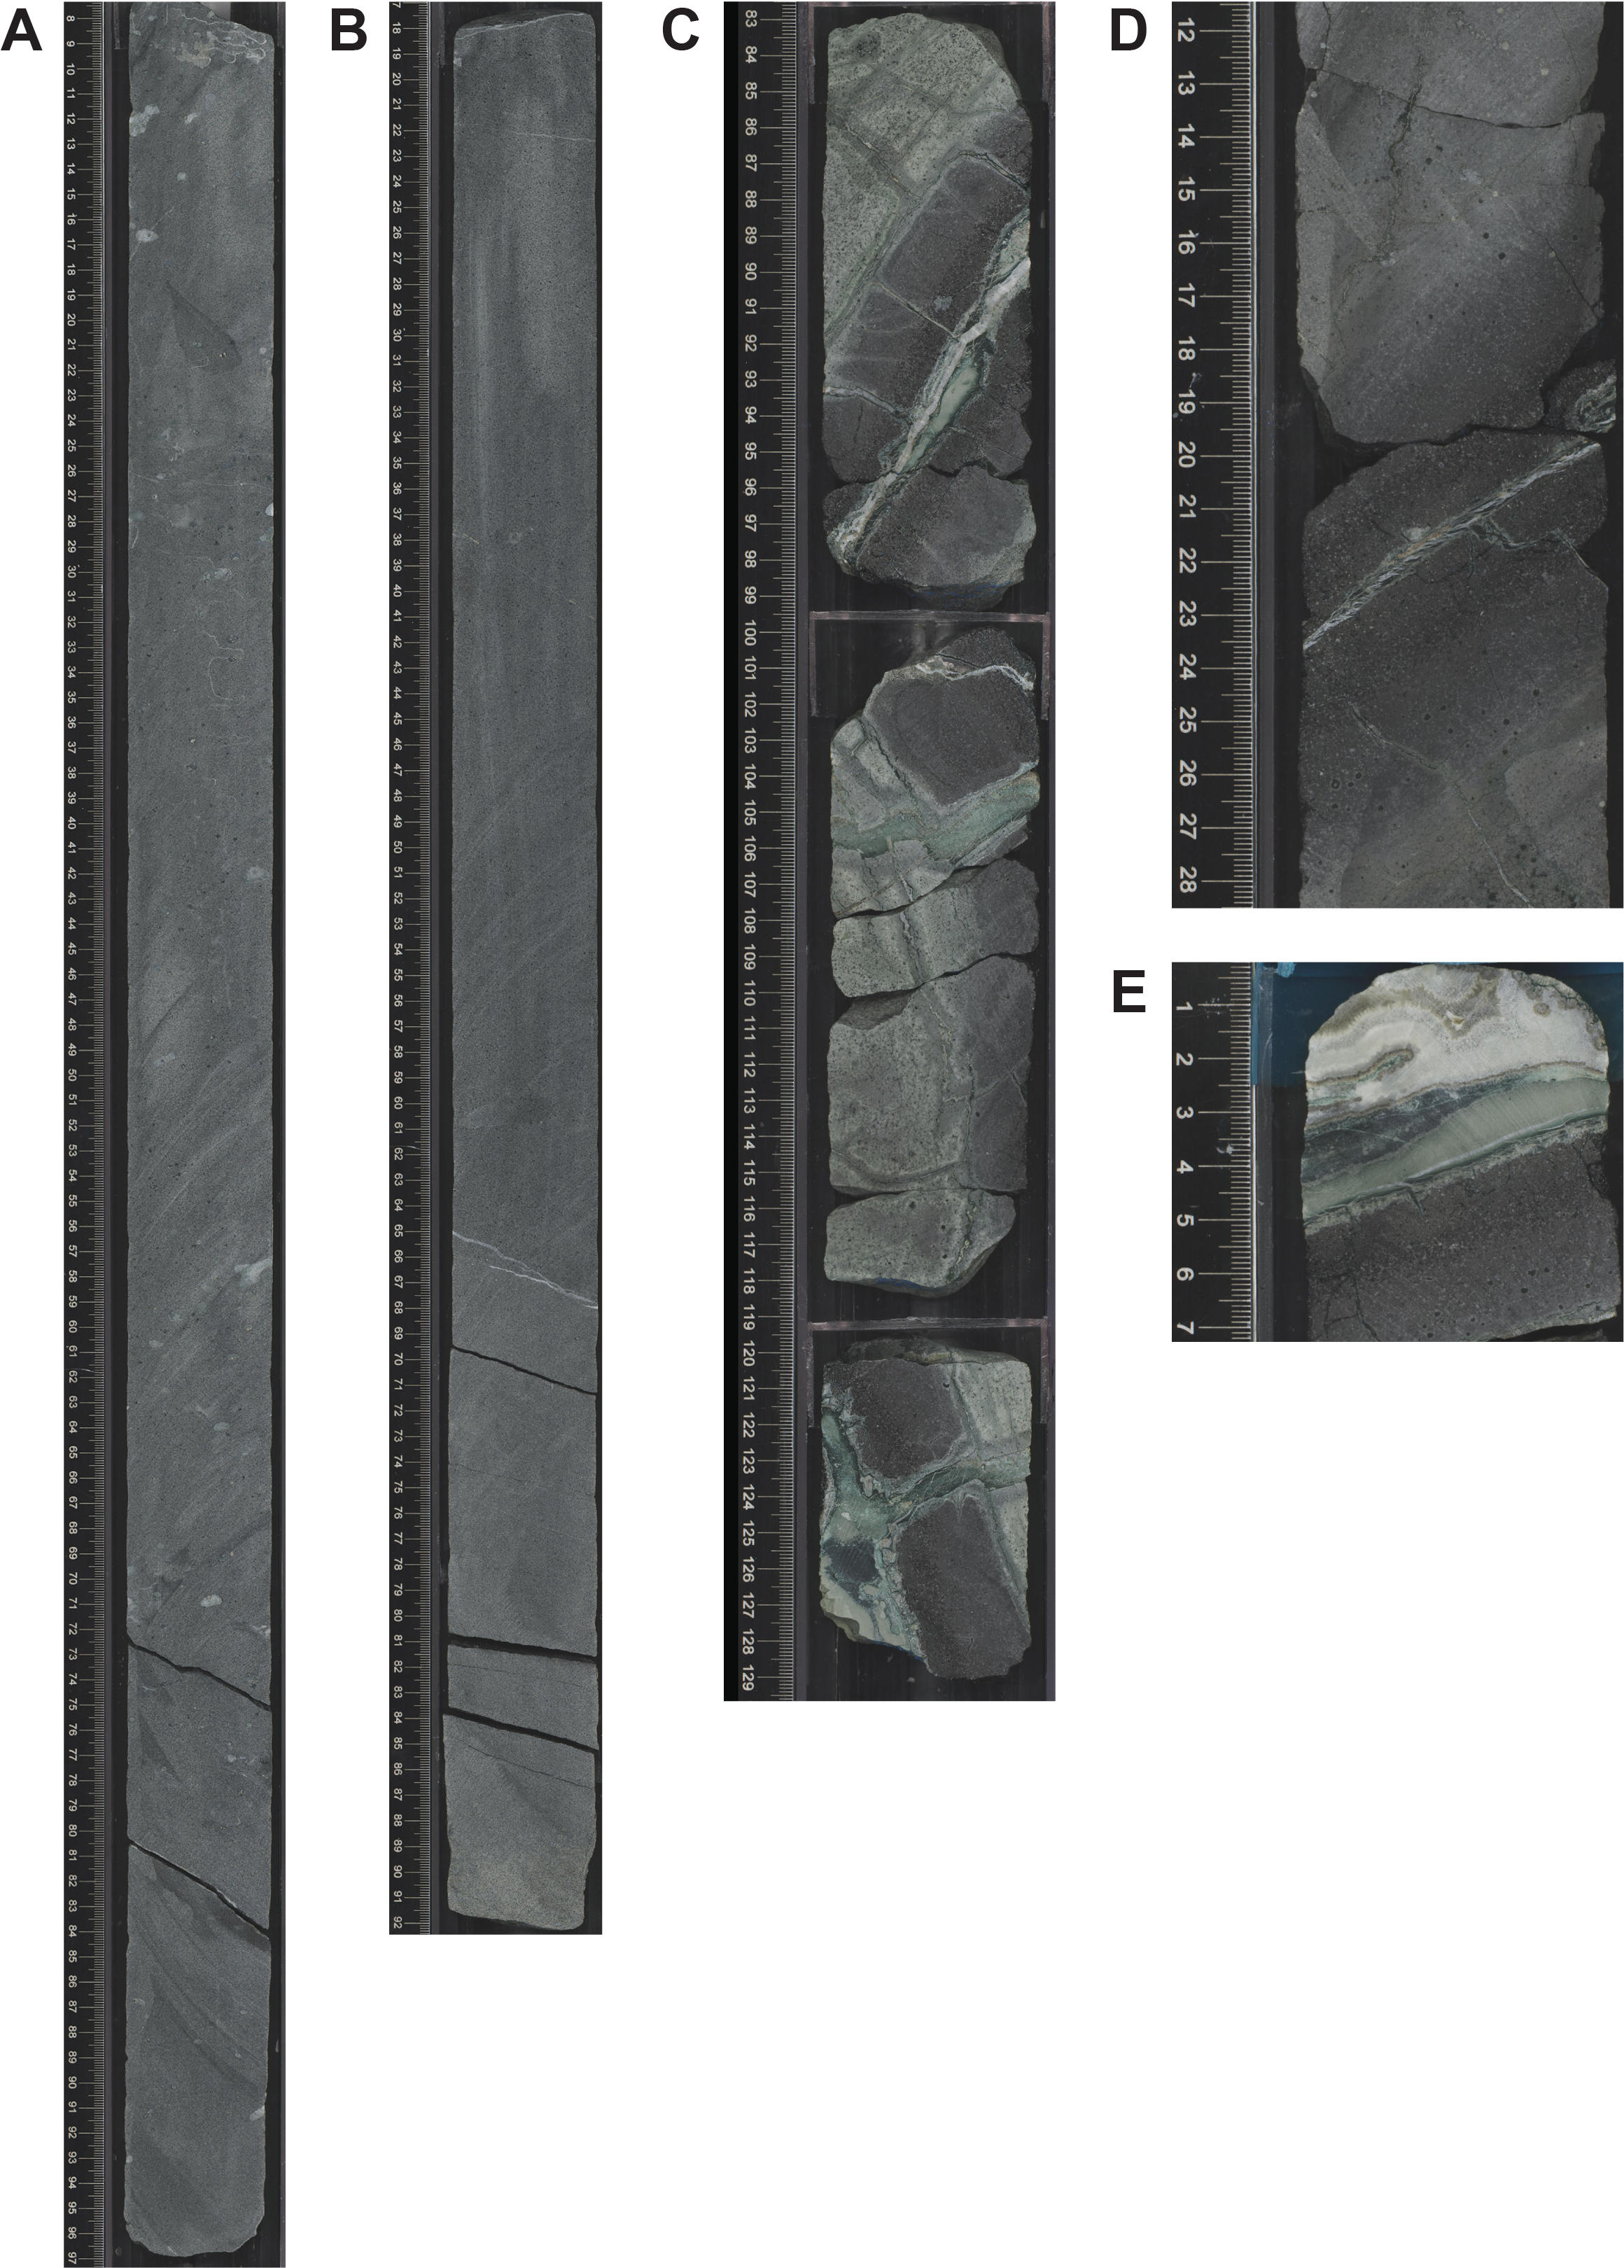
Figure F17. Lava and glass pillows.
4.1.1. Unit 1
- Interval: 391-U1576A-40R-3, 101 cm, to 40R-5, 38 cm
- Depth: 380.18–382.15 mbsf
- Drilled thickness: 1.97 m
- Recovered thickness: 1.97 m
- Rock type: highly phyric plagioclase-pyroxene basalt
- Deposit: sheet flow (single flow unit)
- Chemistry type: high TiO2
Unit 1 is a sheet flow with porphyritic texture in a groundmass that ranges from aphanitic (microcrystalline) to holocrystalline (fine grained). The uppermost 70 cm of this unit underwent isovolumetric alteration, including entire pseudomorphing of phenocrysts and erasure of groundmass minerals. This severe degree of alteration ends at an alteration front marked by a change of color from gray-green to dark gray (see Alteration). The lower 1.27 m of this unit is substantially less altered and contains a glassy lower margin. Total phenocryst cargo in this unit ranges 15%–20% and is dominated by plagioclase (9%–12%) forming individual phenocrysts and glomerocrysts (up to ~5 mm). Pyroxene is also present as individual phenocrysts (5%–8%, typically). Sparse round vesicles (~1–2 mm diameter) are filled with secondary minerals, dominantly calcite and clay.
4.1.2. Unit 2
- Interval: 391-U1576A-40R-5, 38 cm, to 41R-4, 149 cm
- Depth: 382.15–392.8 mbsf
- Drilled thickness: 10.65 m
- Recovered thickness: 6.31 m
- Rock type: aphyric basalt
- Deposit: pillow lava
- Chemistry type: high TiO2
Unit 2 is characterized by pillow basalt fragments, some of which have well-preserved glassy margins. The lavas are dominantly glassy (pillow rims) to aphyric with rare microphenocrysts of plagioclase and pyroxene. Groundmass crystals range from microcrystalline to cryptocrystalline. Highly altered material present interstitially between the pillow rims is a combination of gray-green sediment (from the overlying succession) and palagonitized hyaloclastite (glass spalled from pillow rims). The altered material extends into syneruptive fractures. Alteration of the pillow interiors is typically moderate, resulting in gray-green discoloration that is especially evident along fracture surfaces and in vein halos. Pyrite is visible in parts of the groundmass and in some of the veins. The lavas range from sparsely to moderately vesicular and contain round vesicles filled with at least one secondary mineral (e.g., clay, calcite, zeolite, and/or pyrite). Vesicle sizes are, on average, 1–2 mm in diameter but can be as large as 10 mm.
4.2. Igneous unit descriptions, Hole U1576B
A total of 11 igneous units were identified in Hole U1576B (Figure F16), comprising pillow lava and sheet flows, some of which are massive, intercalated with foraminifera-nannofossil chalk. The igneous units consist of pillow lava (18.2 m total) and massive flows with some sheet flows (22.76 m total). Units 1–5 are aphyric, although in some samples, microphenocrysts of plagioclase are visible. Units 6–11 are sparsely to moderately plagioclase ± pyroxene phyric (see, for example, Igneous Unit 7) (2%–4% total phenocrysts), and the centers of massive flows contain higher phenocryst abundances (≤8%). Olivine was not observed. The lavas are dominantly nonvesicular to sparsely vesicular, although one unit was moderately to highly vesicular with all vesicles filled by secondary minerals. The intercalated sedimentary rock horizons, which range in thickness from 15 cm to 11.7 m, are referred to as Sedimentary Interbeds S1–S7.
4.2.1. Unit 1
- Interval: 391-U1576B-5R-3, 57 cm, to 7R-2, 57 cm
- Depth: 385.35–393.94 mbsf
- Drilled thickness: 8.59 m
- Recovered thickness: 8.95 m
- Rock type: aphyric basalt
- Deposit: pillow lava
- Chemistry type: high TiO2
Unit 1 is a thick stack of pillow lava preserving abundant glassy pillow margins. Whole pillows transected by core range 30–98 cm in diameter with glass pillow rims 25–40 mm thick. Much of the glass appears to be unaltered. The pillows are aphyric macroscopically but may contain microphenocrysts in the glass margins. Pillow interstices are commonly filled with multicolored carbonate (white with brown layering) and what appears to be highly altered interpillow glass. Pillow interiors are cut by veins of calcite (brown and white) and a few dark veins, possibly clay minerals. The uppermost 1 m of this unit is highly weathered, especially the pillow margins, which are visible as gray-green discoloration. Below this, alteration mainly affects the outer rims of pillow fragments and halos adjacent to calcite veins (see Alteration).
4.2.2. Sedimentary Interbed S1
Sedimentary Interbed S1 is pelagic limestone.
4.2.3. Unit 2
- Interval: 391-U1576B-8R-3, 11 cm, to 8R-3, 38 cm
- Depth: 399.19–399.46 mbsf
- Drilled thickness: 0.27 m
- Recovered thickness: 0.27 m
- Rock type: aphyric basalt
- Deposit: pillow lava
- Chemistry type: high TiO2
Unit 2 is a single basalt pillow embedded in the overlying and underlying pelagic limestone. The pillow has glass margins on its top and bottom that appear to consist of unaltered glass, but the pillow interior is altered to pale green and cut by veins of calcite.
4.2.4. Sedimentary Interbed S2
Sedimentary Interbed S2 is pelagic limestone essentially identical to Sedimentary Interbed S1.
4.2.5. Unit 3
- Interval: 391-U1576B-9R-1, 0 cm, to 9R-2, 39 cm
- Depth: 401.60–403.37 mbsf
- Drilled thickness: 1.77 m
- Recovered thickness: 1.77 m
- Rock type: aphyric basalt
- Deposit: pillow lava
- Chemistry type: high TiO2
Unit 3 is a small stack of pillow lava with glass pillow margins largely altered to palagonite. The pillows are macroscopically aphyric but may contain pyroxene microphenocrysts. The pillow interiors are altered to light brown. Vesicles are typically small (2 mm), round, and filled with calcite and/or clay; pyrite lines or fills some vesicles.
4.2.6. Unit 4
- Interval: 391-U1576B-9R-2, 39 cm, to 11R-1, 0 cm
- Depth: 403.37–411.40 mbsf
- Drilled thickness: 8.03 m thick
- Recovered thickness: 5.93 m
- Rock type: aphyric basalt
- Deposit: massive flow
- Chemistry type: high TiO2
Unit 4 is a massive flow with a fine-grained equigranular texture and rare pyroxene microphenocrysts. The groundmass is altered to light brown. Sparse vesicles (~1–2 mm in diameter) are filled with clay and/or calcite; some are filled or lined with pyrite. Pyrite is also visible in the groundmass. An extensive alteration front occurs at the upper contact of this unit, where a color change from gray-green (complete alteration) diminishes gradually and visibly to a more typical gray basalt in the slightly altered flow core.
4.2.7. Unit 5
- Interval: 391-U1576B-11R-1, 0 cm, to 12R-2, 84 cm
- Depth: 411.40–417.87 mbsf
- Drilled thickness: 6.47 m
- Recovered thickness: 5.98 m
- Rock type: aphyric basalt
- Deposit: massive flow
- Chemistry type: high TiO2
Unit 5 is a single massive lava flow with chilled top and bottom margins and areas with significant secondary mineralization (including sulfides such as pyrite). The dark gray to gray-green groundmass has a fine-grained, equigranular texture that alters to pale gray-green in the lowermost 50 cm where it overlies sediment.
4.2.8. Sedimentary Interbed S3
Sedimentary Interbed S3 is pelagic limestone.
4.2.9. Unit 6
- Interval: 391-U1576B-13R-1, 71 cm, to 13R-1, 86 cm
- Depth: 421.81–421.96 mbsf
- Drilled thickness: 0.15 m
- Recovered thickness: 0.15 m
- Rock type: sparsely phyric plagioclase basalt
- Deposit: pillow lava
- Chemistry type: high TiO2
Unit 6 consists of a single basalt pillow embedded in the overlying and underlying pelagic limestone. It displays intense pistachio-green alteration with calcite- and clay-filled vesicles.
4.2.10. Sedimentary Interbed S4
Sedimentary Interbed S4 is pelagic limestone essentially identical to Sedimentary Interbed S3.
4.2.11. Unit 7
- Interval: 391-U1576B-13R-2, 17 cm, to 14R-2, 115.5 cm
- Depth: 422.77–428.29 mbsf
- Drilled thickness: 5.52 m
- Recovered thickness: 5.55 m
- Rock type: sparsely to moderately phyric plagioclase-pyroxene basalt
- Deposit: massive flow
- Chemistry type: high TiO2
Unit 7 is a pale gray-green massive basalt with rare vesicles and 4%–7% phenocrysts (plagioclase = 3%–5%, pyroxene = 1%–2%). The groundmass has a fine-grained, equigranular texture, which appears sugary in the more altered intervals. The central part of the unit is relatively fresh with a dark gray-green to gray color; interval 391-U1576B-14R-1, 0 cm, to 14R-2, 42 cm, is especially fresh, with minimal alteration. The uppermost 42 cm is intensely altered, with pistachio-green alteration, calcite-filled veins, and calcite- and clay-filled amygdules. The base of this unit (the lowermost 50 cm), which overlies sediment, is slightly altered to pale gray-green (see Alteration).
4.2.12. Sedimentary Interbed S5
Sedimentary Interbed S5 is pelagic limestone.
4.2.13. Unit 8
- Interval: 391-U1576B-14R-3, 70 cm, to 14R-3, 135.5 cm
- Depth: 429.06–429.72 mbsf
- Drilled thickness: 0.65 m
- Recovered thickness: 0.65 m
- Rock type: sparsely phyric plagioclase basalt
- Deposit: pillow lava (+ possible peperite)
- Chemistry type: high TiO2
Unit 8 is a single sparsely phyric (2%–4% plagioclase) basalt pillow with minor peperite embedded in the overlying and underlying pelagic limestone. The pillow is intensely altered to pale gray-green, and plagioclase is completely replaced by secondary minerals. It is interpreted to represent a pillow lobe from Unit 7 that intruded into a thick underlying layer of pelagic ooze.
4.2.14. Sedimentary Interbed S6
Sedimentary Interbed S6 is pelagic limestone essentially identical to Sedimentary Interbed S5.
4.2.15. Unit 9
- Interval: 391-U1576B-16R-1, 86 cm, to 16R-2, 38 cm
- Depth: 441.36–441.75 mbsf
- Drilled thickness: 0.39 m
- Recovered thickness: 0.39 m
- Rock type: aphyric basalt
- Deposit: pillow lava
- Chemistry type: high TiO2
Unit 9 is a small pillow with a thin selvage of glass (partly palagonite) next to the upper contact with the sediment and a thin glassy rim marking the lower boundary of the flow. There is a 1 cm thick alteration front below the glass margin, but otherwise the flow is medium gray with mild alteration. Microphenocrysts of plagioclase are visible. The unit is very sparsely vesicular with small subrounded vesicles that are filled with white botryoidal mineral.
4.2.16. Sedimentary Interbed S7
Sedimentary Interbed S7 is pelagic limestone.
4.2.17. Unit 10
- Interval: 391-U1576B-16R-2, 53 cm, to 17R-3, 87 cm
- Depth: 441.90–448.24 mbsf
- Drilled thickness: 6.34 m
- Recovered thickness: 6.65 m
- Rock type: sparsely phyric plagioclase-pyroxene basalt
- Deposit: pillow lavas
- Chemistry type: high TiO2
Unit 10 consists of pillow lava with glassy margins partly altered to palagonite, and it is sparsely plagioclase-pyroxene phyric, with 1%–3% each of plagioclase and pyroxene phenocrysts or microphenocrysts (≤3 mm long). The upper 1 m of the unit is intensely altered to pistachio-green with calcite fill between pillows. Farther down, the flow becomes progressively less altered and is dark gray-green. The pillow rims consist of abundant fresh glass. Pillow interstices are filled with dark green, thoroughly altered hyaloclastite (likely glass spalled from pillows). The unit consists largely of 40–70 cm thick pillows, but the lowermost parts have small pillow buds 14–20 cm thick. One thick pillow may represent an intercalated sheet flow. Veins of calcite and/or saponite are common.
4.2.18. Unit 11
- Interval: 391-U1576B-17R-3, 87 cm, to 17R-5, 110 cm
- Depth: 448.24–450.80 mbsf
- Drilled thickness: 2.56 m
- Recovered thickness: 2.56 m
- Rock type: sparsely phyric plagioclase-pyroxene basalt
- Deposit: sheet flow
- Chemistry type: high TiO2
Unit 11 is a sheet flow with microphenocrysts and small glomerocrysts of plagioclase and pyroxene containing 1%–3% of each phase. The upper contact with Unit 10 pillow lavas is marked by a glass selvage on the flow top. The lower contact was not recovered because drilling stopped; however, there is no indication of a lower flow boundary, and it is likely this sheet flow exceeds 3 m in thickness. The flow is nonvesicular overall except near the top, where it is sparsely vesicular (vesicles are ~1 mm or less). Alteration is mild with pale gray-green discoloration near fractures and vein halos.
4.3. Petrography
4.3.1. Massive and sheet flows
Massive and sheet lava flows are highly to moderately phyric and primarily contain plagioclase and clinopyroxene ± olivine. These flow types are consistently glomeroporphyritic or porphyritic, exhibiting intersertal groundmass textures (Figure F18). Plagioclase and clinopyroxene occur as large glomerocrysts and groundmass phases. Olivine occurs infrequently and is often observed as altered phenocrysts or groundmass (i.e., iddingsite). Plagioclase in glomerocrysts often exhibits oscillatory zoning at its rims and patchy zoning at its core. Some plagioclase crystals also have sieve-textured cores. Clinopyroxene zoning is less common but occurs as hourglass and oscillatory patterns. Both plagioclase and clinopyroxene often contain melt inclusions. Some massive lavas exhibit a clear divide between phenocrysts and groundmass; however, most exhibit seriate texture and continuously grade from small to large crystals. The groundmass commonly contains plagioclase, clinopyroxene, and skeletal Fe oxide crystals ± olivine. Fresh glass is present in some samples, but it is generally altered and replaced by clay minerals.

Figure F18. Massive lavas and sheet flows.
4.3.2. Pillow lava
Pillow lavas contain plagioclase and clinopyroxene microlites and small glomerocrysts in their glassy rinds (Figure F19). Plagioclase microlites occasionally exhibit oscillatory zoning. Pyroxenes rarely exhibit zoning, but when they do, they exhibit oscillatory zoning patterns. Plagioclase microlites often exhibit labradorescence in reflected light, so they are An50–70 in composition. Halos of alteration are common around crystals in the glassy rind of the pillow. Glass in the pillow rinds contains needles of cryptocrystalline groundmass around the plagioclase and clinopyroxene microlites. The pillow interiors have a highly altered matrix of oxidized glass with tabular plagioclase groundmass crystals. Altered clinopyroxene and Fe oxides are also present in the groundmass. Phenocrysts are rare in the pillow rims and interiors, likely due to rapid cooling and crystallization of the lava.
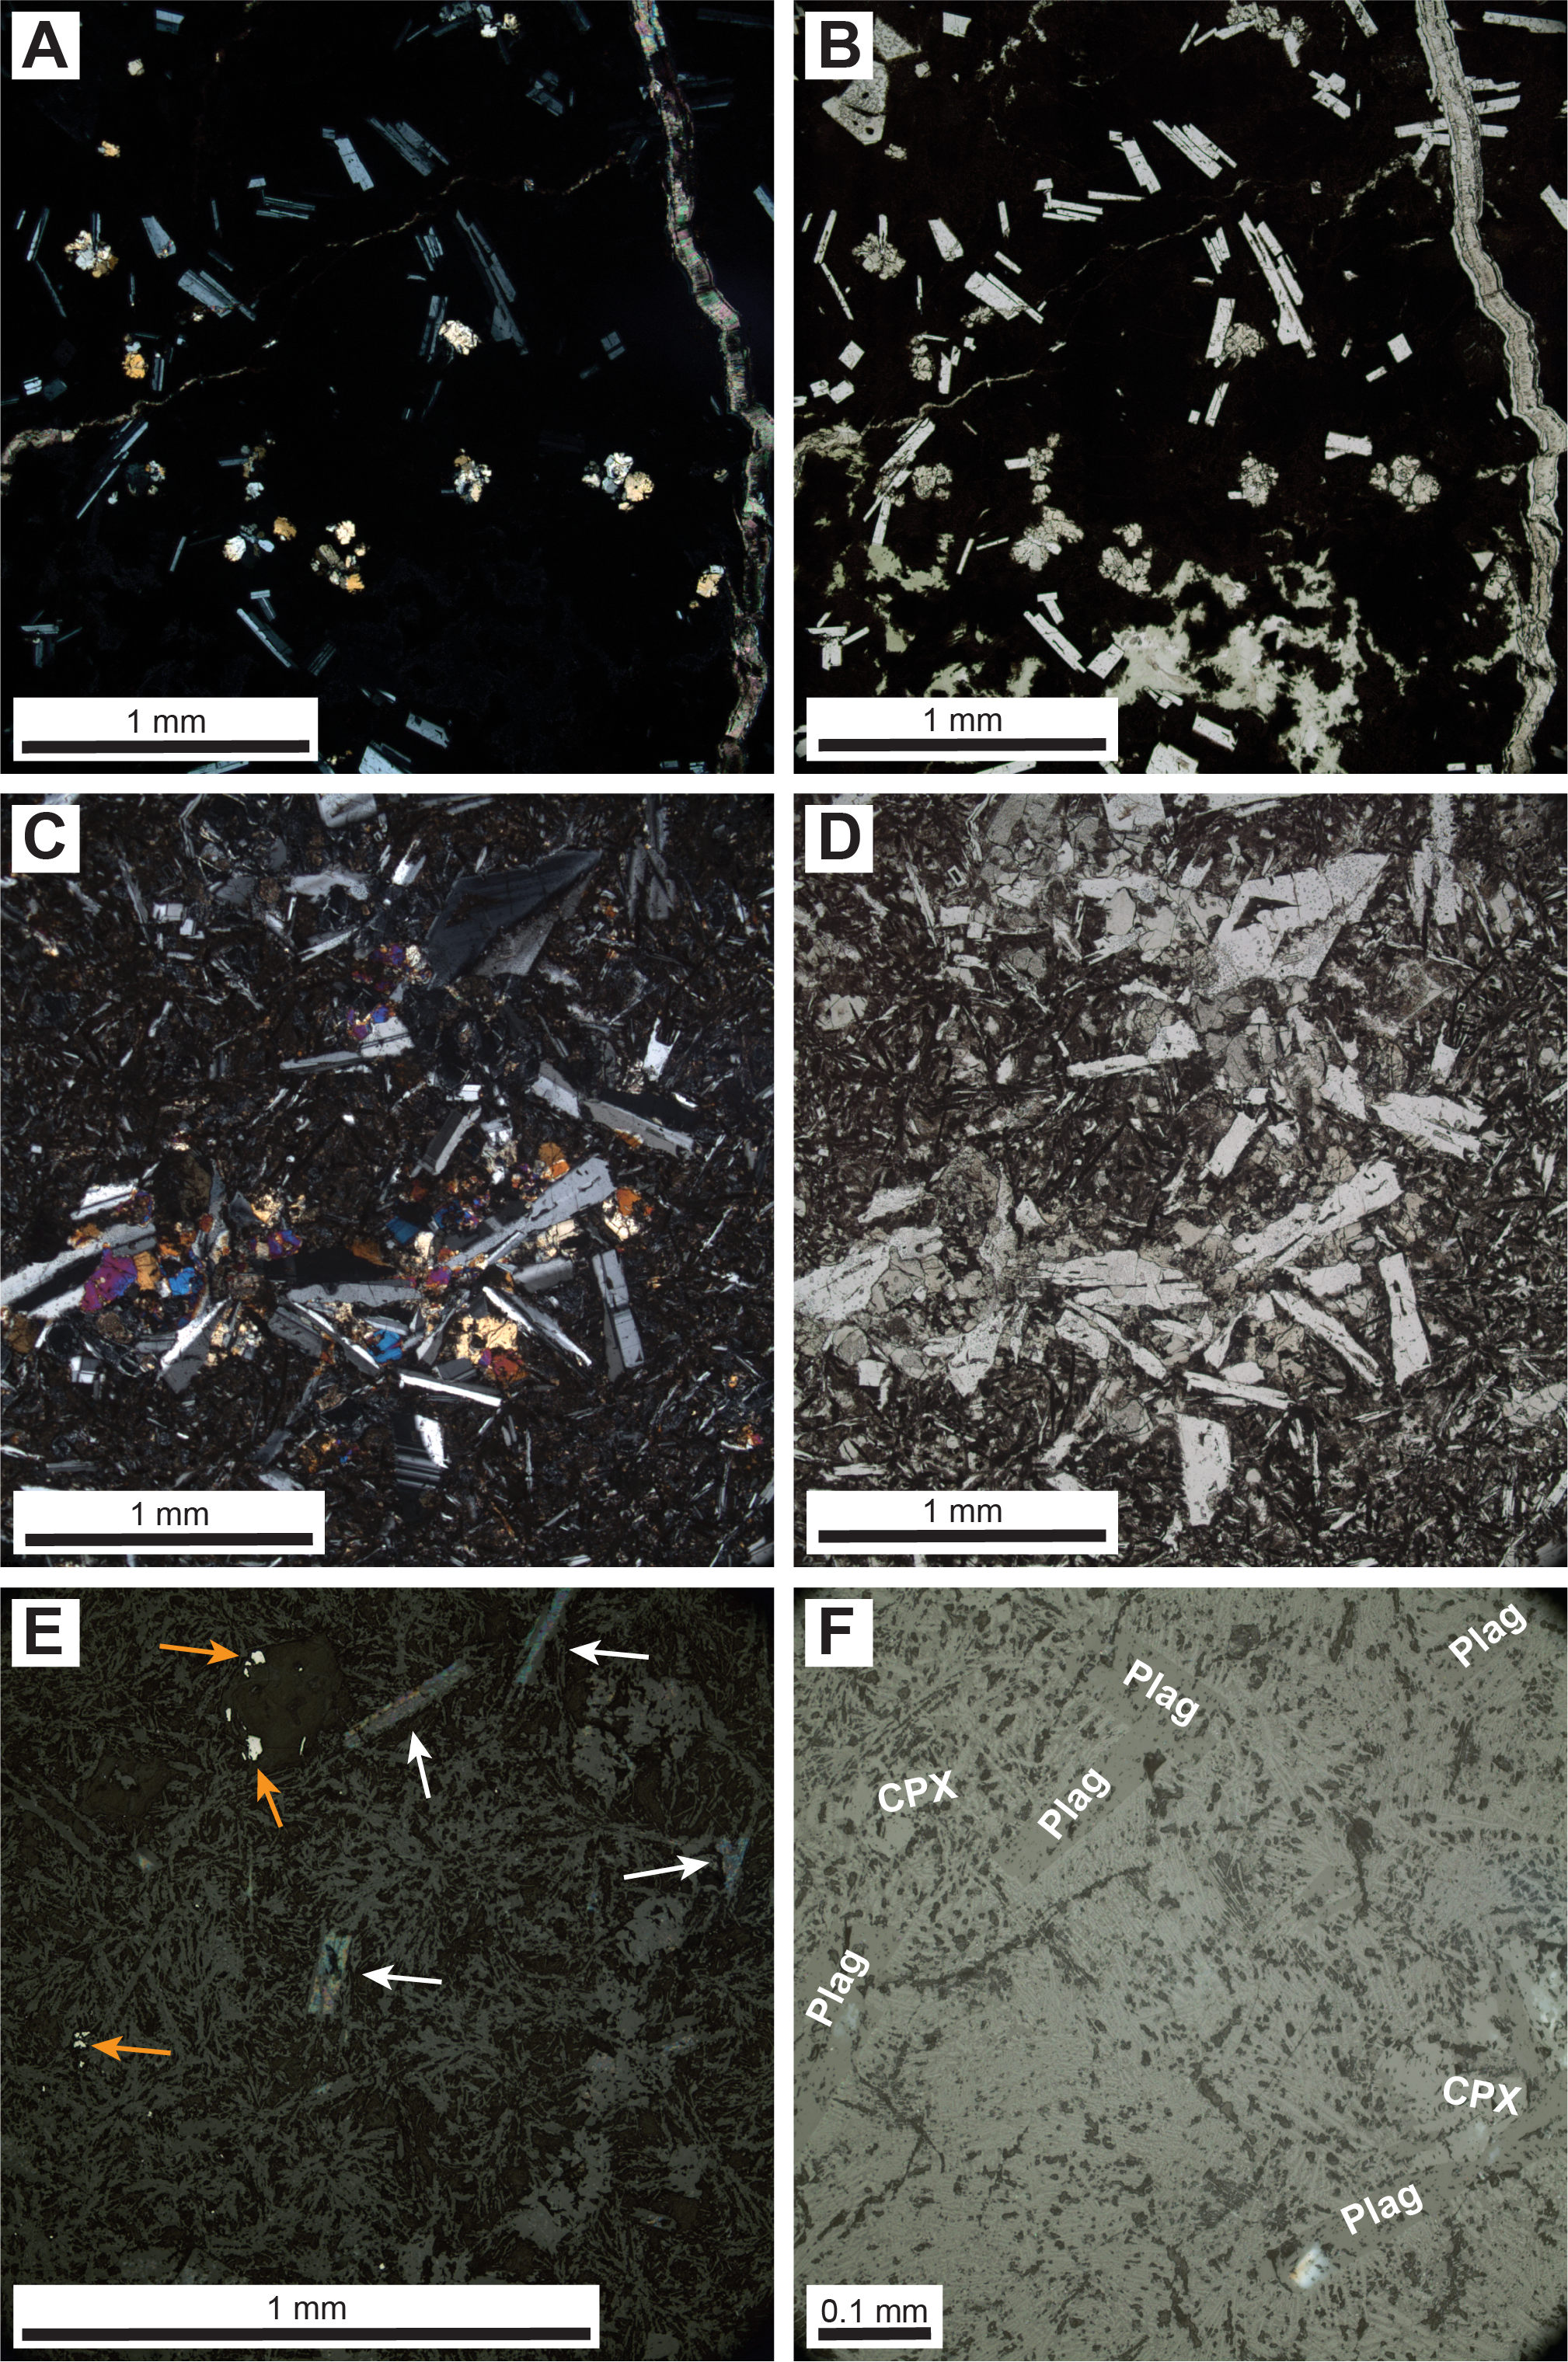
Figure F19. Pillow lava.
4.4. Alteration
Alteration in the basement basalt succession is significant and consists of pervasive alteration of the upper and smaller eruption units and the tops and bases of the massive flows. In Holes U1576A and U1576B, the recovered lava units are commonly highly altered by reductive hydrothermal fluids, resulting in pale green discoloration of the altered rocks, which is distinctive from the pale reddish tan color associated with the oxidative alteration at Site U1575. This likely indicates a predominantly reducing alteration environment producing ferrous rather than ferric oxidation during alteration of primary ferromagnesian and oxide minerals. The green alteration colors throughout the different units are likely the result of chemical reduction and liberation of Fe from primary ferromagnesian minerals, which are largely pyroxene, and to a lesser extent, the more resistant Fe-Ti oxides. These primary phases are likely the source of Fe, which is recombined into complex hydrated silicates (clays) that then form the later stage of veining. This type of chemically reduced alteration further manifests as secondary pyrite (and chalcopyrite) that fills or partially fills vesicles and fractures, and it less commonly occurs in the groundmass of altered lavas. Reductive alteration in pillow stacks and sheet flows is pervasive, and only the larger massive flow cores deeper in the succession of Hole U1576B contain any near-fresh igneous material.
4.4.1. Sheet and massive flows
Igneous units of all sizes show significant alteration, which is characterized by a green-gray color. A notable alteration front occurs in Hole U1576A in Igneous Unit 1 (interval 391-U1576A-40R-4, 60–65 cm), beyond which further alteration appears to be significantly reduced (Figure F19A); this is likely due to the development of alteration clays preventing fluid intercrystal ingress farther into the flow. Here, alteration in the uppermost ~1 m of Unit 1 is extreme, ending in a clear alteration front; the degree of alteration is such that MS behavior remains unchanged between the altered volcanic material and the overlying sediments (see Physical properties).
A similar but less abrupt example of an alteration front occurs in massive flow Units 4 and 7 in Hole U1576B, where the color change from green-gray (complete alteration) diminishes gradually and visibly to a more typical blue-gray basalt in the slightly to moderately altered flow cores. Here, the larger massive flows reveal gradual changes from less altered blue-gray interiors to increasingly greener flow exteriors (tops and bases), revealing greater degrees of mineral replacement in the upper margins and, to a lesser extent, the lower contacts. However, for massive flow Unit 7 (Figure F20B), this pattern is reversed, and there is a much broader and more extensive green alteration zone at the base compared with the upper contact. This massive unit is underlain by about >11.5 m of sediment that is locally bleached immediately beneath the lower contact and then passes into a zone of soft-sediment deformation and minor brittle displacement likely resulting from loading and thermal alteration of the sediment during flow emplacement. Disturbed sediment continues for ~1 m below the lava contact and is likely a result of both loading deformation and hot fluid fluxing and localized mixing. Hence, fluid exchange of the soft substrate with the cooling flow base promotes increased alteration (Figure F20C). The upper contact reveals hyaloclastite and mingling of sediment and glassy lava typical of peperite (Section 13R-2, 17–34 cm). Because this is an extrusive unit, this interaction with sediment likely represents sinking of the flow into the uppermost soft substrate of the thick sediment package during its emplacement.
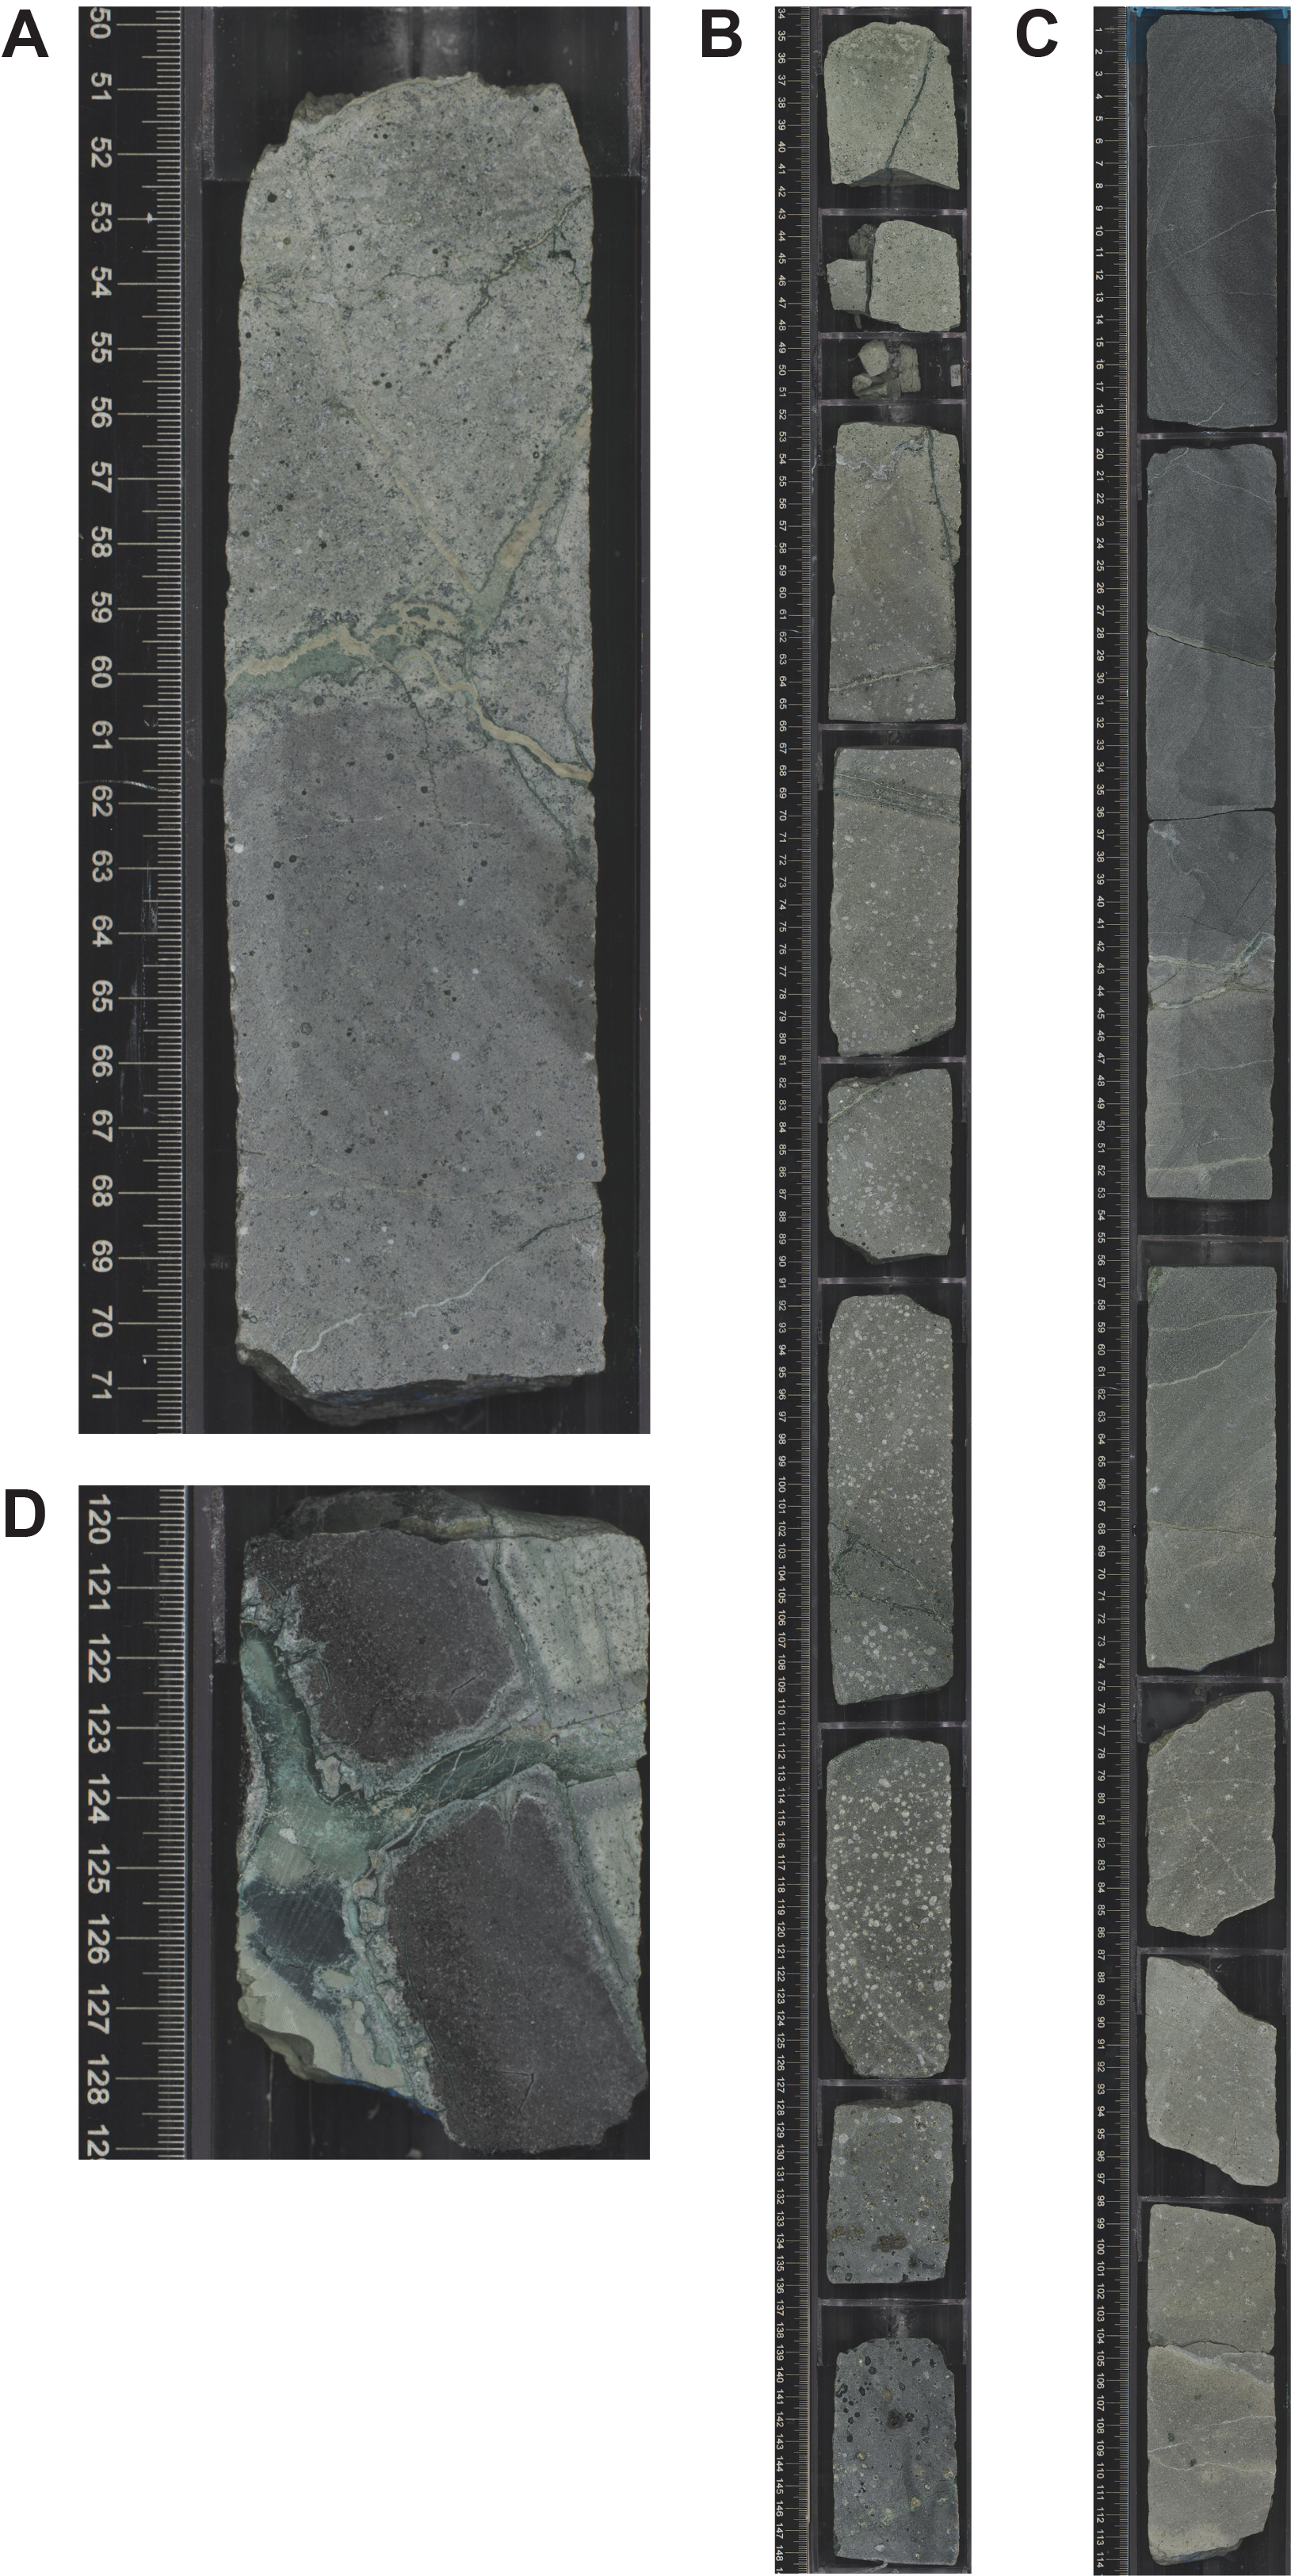
Figure F20. Basalt.
4.4.2. Pillow lavas
Pillow lavas typically display pervasive alteration throughout their interior. Remarkably, the glassy outer rims of the pillows remain the least altered components of individual pillows, and primary phases (i.e., feldspar and pyroxene crystals) can be preserved in this glassy mesostasis. However, where radial cooling fractures have breached the glass, the ingress of fluids has not only altered the interior but has also palagonized the glass, creating clay-rich halos adjacent to the fracture. Progression inward of this glass alteration produces a deep green, reticulated turtle shell pattern in both the sediment and the hyaloclastite that originally filled voids in the pillow stack, as well as entering into the pillow rims themselves (interval 391-U1576B-7R-1, 120–128 cm; Figure F20D).
4.4.3. Phenocrysts
Phenocrysts are typically replaced with secondary minerals, including predominantly green clay minerals, calcite, and some pyrite. There is near-complete kaolinite replacement of feldspar, but the phenocrysts retain their original shapes (pseudomorphs). Evidence of olivine is either absent or very uncommon in these units. In the rare phenocryst-bearing units, plagioclase and clinopyroxene phenocrysts are generally entirely replaced, with the exception of feldspar cores in some crystal agglomerates. Preservation of feldspar may be a result of alteration buffering once the outer regions of the crystal or cluster have been entirely altered to an enclosing rim of kaolinite. Groundmass crystals and interstitial glassy mesostasis, where present, are entirely replaced by secondary clays, and the original igneous texture has largely been erased.
4.4.4. Vesicles
Vesicles are common in sheet and pillow lavas but infrequent in the interiors of larger massive units. They are typically isolated and occur as round, isolated voids that are <1 mm, but they occur as vesicle segregations in massive flow Igneous Unit 6, which contains ~0.4–0.6 mm vesicles that are filled or partially filled. In many instances, vesicles display a complex sequential infilling history that begins with a thin chlorite coating lining the vesicles often associated with or disturbed by the growth of near-spherical (often solitary) pyrite clusters attached around the periphery of the vesicle chamber. Some have chlorite rim infills preserved as cuspate fragments in later calcite/clay infill. In other examples, the pyrite has degraded and been replaced by Fe oxyhydroxides, possibly during a subsequent infilling stage. The later infill stages involve complete infilling of the void with a light to dark green clay mineral and/or calcite. This sequential infill may represent different stages of syneruptive and immediate posteruptive alteration followed by longer term hydrothermally driven elemental exchange:
- Initial posteruption alteration of ferromagnesian minerals to generate chlorite,
- Sulfur-rich fluids derived from either volcanic gases or underlying/adjacent sediments combine with liberated Fe to generate pyrite rosettes, and
- Subsequent hydrothermally driven fluids source elements from the lava units and the affected sedimentary pile.
4.4.5. Veins
Veins are common in many of the units, especially the massive flows. Veins (1–2 mm thick) are usually dark and probably consist of clay minerals. The thicker veins (>5 mm) generally consist of carbonate with a thin green clay selvage along the vein wall. Veins of all sizes may include pyrite.
4.5. Discussion
The igneous basement at Site U1576 comprises an alternating sequence of submarine lavas (~62%) and sediment (~38%). The lavas are typically aphyric to sparsely phyric (plagioclase = 1%–3%; clinopyroxene = 1%–3%), although the uppermost unit in Hole U1575A is highly phyric. All represent the high-TiO2 chemistry type, similar to the upper lavas at Frio Ridge (see Igneous geochemistry in the Site U1575 chapter [Sager et al., 2023c]).
The uppermost pillow lavas in Hole U1576B (Igneous Unit 1) appear to correlate with the pillow lava unit in Hole U1576A (Unit 2). Both units are aphyric with fresh glass preserved in pillow rims and have a similar alteration overprint, suggesting that they are the same.
The volcanic units are almost evenly divided between massive/sheet flows (22.5 m) and pillow lavas (18.1 m), but there is no systematic relationship between volcanic flow successions and thick sedimentary interbeds, which may be found between two pillow units, two massive/sheet units, or a pillow unit and a massive/sheet unit. The most dramatic change observed is the onset of highly phyric lavas in Unit 1 in Hole U1576A. These lavas contrast significantly with all the deeper units, which are either aphyric or sparsely phyric. The significance of this change is not apparent.
The occurrence of thick sedimentary intercalations implies significant time gaps between eruptions or that most eruptions occurred in centers somewhat distant from the drill site and did not reach this site on the flank of Walvis Ridge. Normally, the type and degree of hydrothermal alteration, veining, and sulfide deposition that characterize much of this core are considered indicative of a relatively near-site source of heat provided by a local vent system and/or magmatic intrusion. However, the massive flows (Units 5 and 7) both exhibit significant interaction with the sediment substrate onto which they were emplaced. Disturbed sediment occurs up to ~1 m below the lava contact and is likely due to loading deformation, hot fluid fluxing, and localized mixing of the soft substrate during and immediately after emplacement. The occurrence of single pillow lobes encased within identical sedimentary horizons above and below (e.g., Igneous Unit 2 within Sedimentary Interbeds S1 and S2, Igneous Unit 6 within Sedimentary Interbeds S3 and S4, and Igneous Units 8 and 9 within Sedimentary Interbeds S5–S7) may represent lava toes sourced in the overlying pillow lava flows, which intruded into the underlying pelagic ooze. Peperite (magma-sediment mixing) occurs above Unit 7, which, together with the associated bleaching, indicates this lava unit may have locally sunk into the unconsolidated sedimentary substrate and thus also thermally and chemically altered the surrounding sediment.
The presence of umbers within the sediments of Lithostratigraphic Units IV and V may similarly be metalliferous deposits also resulting from fluid fluxing through and element leaching from nearby lava flows both during and postemplacement. Thick massive lavas and lava stacks contain and retain considerable thermal energy, and, due to the self-insulating properties required to propagate such large flows, this internal heat is released over a long time postemplacement. Accordingly, reductive alteration within the flows and the type and degree of vein development should be considered part of a thermal regime set up within newly formed lava stacks in the immediate vicinity as well as the interaction of massive flows with intervening sediment packages in a deep submarine environment. Better understanding of flow-generated thermal alteration processes will require detailed chemostratigraphy and assessment of paleosecular variation in the magnetic inclinations in the units.
Carracedo Sánchez et al. (2012) documented the transition from massive sheet flows to pillow lava in Turonian basalts of the Basque-Cantabrian Basin. They showed that megapillows and then pillows may form initially as breakouts from the toe of inflationary massive sheet flows, and if they are erupted over soft sediments, lobes of the sheet flow and/or pillow flow may intrude the underlying pelagic sediment as peperite. This process could explain both the occurrence of pillow lava and lobate flows far from the expected axis of eruption (near the crest of Valdivia Bank) and the occurrence of single pillows buried in pelagic sediment between major eruptive deposits.
5. Biostratigraphy
Shipboard analyses provided a biostratigraphic framework for Site U1576. Pleistocene to Late Cretaceous (Campanian) sediments were recovered from Hole U1576A, and Late Cretaceous (Campanian) material was in five core catcher samples from Hole U1576B. Preliminary zonal and stage assignments were determined using calcareous nannofossils and planktonic foraminifera. For the shipboard analyses, we consider first occurrence (FO) and last occurrence (LO) datums for planktonic foraminifera and tops (T) and bases (B) for calcareous nannofossils, following the conventions of biozonation listed in the 2020 geologic timescale (Gradstein et al., 2012, 2020). Chronostratigraphic boundaries are from the same source.
5.1. Calcareous nannofossils
Calcareous nannofossil assemblages from 39 core catcher samples from Hole U1576A as well as five core catcher samples from Hole U1576B, where sediments were recovered interbedded with basement rock, were examined. Biozonations, datums, and marker taxa for Holes U1576A and U1576B are shown in Table T2.
5.1.1. Quaternary to Neogene (Pleistocene to Miocene)
Samples 391-U1576A-1R-CC to 5R-CC provide an apparent continuous section of Pleistocene through mid-Pliocene sediments. These sediments consist entirely of unconsolidated nannofossil-foraminiferal ooze. Section 6R-CC shows a tentative zonation of the upper Messinian stage of the Late Miocene based on the occurrence of Reticulofenestra rotaria (5.94–6.91 Ma); however, this identification is very preliminary because this species occurs with a strong Pliocene (Zanclean) assemblage and may actually be a closely related Pliocene species with nearly identical morphology. Closer examination is required to determine the proper zonation of this sample. The lack of upper Messinian 5-ray Discoaster spp. from the Discoaster quinqueramus lineage supports a younger age determination. More samples and detailed data are required for a confident determination. As such, the Pliocene/Miocene boundary is not well defined by core catcher samples.
Sections 391-U1576A-6R-CC (tentatively) through 10R-CC contain the Miocene section recovered at this site ranging from Late Miocene (Messinian?) to Middle Miocene (Langhian). Serravallian-aged nannofossil markers were not observed in core catcher samples; therefore, it is unclear whether this part of the Miocene is recovered but not sampled or is missing due to a hiatus or unconformity, for example. The lower part of this depth interval is bounded by a large unconformity spanning a possible ~45 My. The exact amount of time missing in the unconformable boundary will need to be determined by additional sampling.
5.1.2. Paleogene (Paleocene)
Sections 391-U1576A-11R-CC through 13R-CC provide lower Paleocene (lower Danian) assemblages. The nature of calcareous nannofossil assemblages just above the K/Pg boundary requires more detailed examination and higher resolution sampling than is available based on core catcher samples. For this reason, fossil bases, which are the primary nannofossil markers delineating the lower Paleocene (Danian), are difficult to confidently resolve. Therefore, all zones and age determinations found in Table T2 are considered tentative until complete assemblages and changes can be documented throughout the section.
5.1.3. Cretaceous (Late Cretaceous)
- Unit: Hole U1576A = Lithostratigraphic Subunits IIIA and IIIB and Unit IV; Hole U1576B = Sedimentary Interbeds S1–S6
- Depth: Hole U1576A = 124.71–380.18 mbsf; Hole U1576B = 400–440 mbsf
Upper Cretaceous sediments were recovered from Sections 391-U1576A-14R-CC to the bottom of the sedimentary sequence in Section 40R-3. Maastrichtian sediments were recovered from Sections 14R-CC through 23R-CC. The top of Broinsonia parca constricta (72.02 Ma) was observed in Section 23R-CC, providing the oldest Maastrichtian age just above the Campanian boundary. Sections 24R-CC through 39R-CC recovered Campanian-aged sediments likely down to the lower Campanian. Section 39R-CC is constrained by the continued occurrence of B. parca constricta, which has a base of 81.38 Ma (Gradstein et al., 2020). Therefore, the age above the uppermost basaltic lava flow deposit is tentatively identified as lower Campanian, younger than 81.38 Ma.
Five core catcher samples from Sections 391-U1576B-7R-CC, 8R-CC, 12R-CC, and 15R-CC were analyzed from the uppermost sediment/basalt interface and interbedded sediments within the volcanic rock sequence recovered from Hole U1576B. All samples provided a Late Cretaceous (Campanian) age, with the oldest age range tentatively set at 81.2–81.38 Ma based on the occurrence of Eprolithus floralis in Section 12R-CC (T 81.2 Ma) (Burnett, 1998) along with the persistence of B. parca constricta into the deepest sample (B 81.38 Ma) (Gradstein et al., 2012). However, there is much discussion about the true stratigraphic top of E. floralis. A wide range of ages are assigned to its stratigraphic top from the Coniacian to Santonian stages of the Upper Cretaceous. It has been used by some oil industry biostratigraphers in the Gulf of Mexico as a lower Campanian marker as well (Weber et al., 2018). This makes this age designation and identification questionable and tentative. However, Lithastrinus grillii was observed in Section 14R-CC, giving a youngest possible age above the lowermost basalt contact of ~79.00 Ma (Gradstein et al., 2020).
5.2. Planktonic foraminifera
A total of 16 planktonic foraminifera samples were processed (Table T3). Overall, planktonic foraminifera are the dominant component of the assemblages, with only one sample (391-U1576A-33R-CC) showing lower abundances. Rare specimens of benthic foraminifera were also found in several samples. The preservation of planktonic foraminifera varies in the sedimentary sequence. In almost all of the samples, they are well preserved, with most specimens preserving the primary morphological characteristics. The only exception is Section 33R-CC, in which specimens showed some evidence of dissolution and/or being partially or totally encrusted, which made identification of the species difficult.
Sample preparation for Site U1576 became problematic in Sections 391-U1576A-23R-CC through 39R-CC and 391-U1576B-2R-CC, 7R-CC, 8R-CC, 12R-CC, and 14R-CC because the sediments were more lithified. Hydrogen peroxide solution (30%) was necessary to disaggregate the material. However, this procedure was time consuming. Therefore, only a limited number of samples from Hole U1576A could be used for shipboard investigations. Further postexpedition analyses are needed to provide a more complete biostratigraphic framework for Hole U1576A and to date the lithified sediments from Hole U1576B.
5.2.1. Quaternary to Neogene (Pleistocene to Miocene)
A Late Pleistocene assemblage was found in Section 391-U1576A-1R-CC. Preservation is very good, and fauna is very rich. Species include common Globoconella inflata and Globorotalia truncatulinoides. Other species recorded were Globigerina bulloides, Globorotalia crassaformis, Globigerinoides ruber, Globigerinoides elongatus, Orbulina universa, Trilobatus spp., Globigerinella siphonifera, Globorotalia flexuosa, Globorotalia tumida, Globorotalia scitula, and Pulleniatina obliquiloculata. The sample is dated younger than 0.40 Ma based on the presence of G. flexuosa (FO 0.40 Ma; Wade et al., 2011). This placed the sample in the upper part of the Pleistocene, Zone PT1b (Gradstein et al., 2020).
Sections 391-U1576A-2R-CC and 3R-CC contain Pleistocene planktonic foraminifera. G. inflata is a common component of the assemblage. The sample also contains Globigerinoides obliquus, Neogloboquadrina acostaensis, O. universa, Globoturborotalita apertura, Sphaeroidinella dehiscens, G. siphonifera, Globigerinoides conglobatus, G. ruber, G. elongatus, Trilobatus spp., G. bulloides, G. tumida, G. scitula, G. crassaformis, and G. truncatulinoides. The age of these samples is tentatively placed between 1.64 and 1.58 Ma based on the occurrence of G. apertura and G. truncatulinoides (Zone PT1a/PL6; Gradstein et al., 2020). The absence of Globigerinoidesella fistulosa did not allow us to further constrain the age of the samples.
Planktonic foraminiferal fauna in Section 391-U1576A-4R-CC include common G. inflata. Other recorded species are O. universa, G. siphonifera, G. ruber, G. elongatus, Trilobatus spp., G. bulloides, G. scitula, G. crassaformis, S. dehiscens, and Globoturborotalita woodi. The LO of G. woodi and the FO of G. inflata were tentatively used to constrain the age of the sample between 2.30 and 3.24 Ma and assign it to Zone PL6/PL3.
Section 391-U1576A-5R-CC contains Globorotalia margaritae, G. scitula, Globoturborotalita decoraperta, Globoconella puncticulata, Globigerinoides extremus, N. acostaensis, Sphaeroidinellopsis seminulina, Sphaeroidinellopsis kochi, G. tumida, and Globoturborotalita nepenthes. The sample is dated older than 4.53 Ma (LO S. kochi; Gradstein et al., 2020) to 5.72 Ma (FO G. tumida; Gradstein et al., 2020). Thus, the assigned zone for Section 5R-CC is Zone PL1/M14–M13b.
The planktonic foraminiferal assemblage in Section 391-U1576A-9R-CC consists of G. nepenthes, Orbulina suturalis, Dentoglobigerina spp., Trilobatus spp., Globoquadrina dehiscens, S. kochi, S. seminulina, Globorotalia menardii, and Globorotalia miotumida. Specimens of Praeorbulina curva are also present, possibly indicating a mixed assemblage. The presence of common G. nepenthes may suggest an age younger than 11.67 Ma. However, the age determination is provided with low confidence. Further high-resolution study is required to obtain a better age framework.
Section 391-U1576A-10R-CC includes common Trilobatus sacculifer and P. curva, Trilobatus bisphericus, G. dehiscens, Dentoglobigerina spp., T. sacculifer, and Globigerinoides neoparawoodi. The core catcher material was tentatively dated between 14.24 and 16.29 Ma using the stratigraphic range of P. curva (Kennett and Srinivasan, 1983; Wade et al., 2011). The assigned zone is Zone M6/M5a.
5.2.2. Paleogene (Paleocene)
A lower Paleocene (Danian) assemblage was found in Sections 391-U1576A-11R-CC and 13R-CC. Section 11R-CC contains Globanomalina imitata (FO 62.0 Ma, as estimated from Wade et al., 2011), Globanomalina compressa (FO 63.5 Ma; Wade et al. 2011), and Praemurica inconstans (FO 63.5 Ma; Wade et al., 2011). The assemblage also includes Parasubbotina varianta and Subbotina triloculinoides. The age of the material is younger than the FO of G. imitata estimated at 62.0 Ma. The correspondent biozone is Zone P2 (Wade et al., 2011)
Section 391-U1576A-13R-CC includes abundant P. inconstans (FO 63.5 Ma; Wade et al., 2011. Other species include P. varianta and S. triloculinoides. The FO of P. inconstans was used to provide a chronostratigraphic framework for the sample (Zone P2).
5.2.3. Cretaceous (Late Cretaceous)
A Maastrichtian faunal assemblage was found in Sections 391-U1576A-14R-CC and 16R-CC. The assemblage consists of Abathomphalus mayaroensis, Contusotruncana contusa, Racemiguembelina fructicosa, and Globotruncana spp. The possible age for the aforementioned samples is between 69.18 and 66.35 Ma based on the FO and LO of A. mayaroensis (Gradstein et al., 2012).
Campanian assemblages were recorded in Sections 391-U1576A-23R-CC through 25R-CC and 33R-CC. The core catcher material in Sections 23R-CC through 25R-CC includes Gansserina gansseri, Praegublerina acuta, Globigerinelloides prairiehillensis, Pseudoguembelina costellifera, Guembelitria cretacea, and Globotruncana aegyptiaca. The presence of the species G. gansseri indicates that the samples are younger than 72.97 Ma (Gradstein et al., 2012).
Sample 391-U1576A-33R-CC contains a low number of planktonic foraminifera specimens. Furthermore, planktonic foraminifera were encrusted, and their poor preservation prevented a detailed identification of the taxa. Few specimens of P. costellifera and Contusotruncana plummerae may indicate an age younger than 79.20 Ma (FO C. plummerae; Gradstein et al., 2012). Section 39R-CC was found to be barren of planktonic foraminifera.
5.3. Lithobiostratigraphy
Figure F21 plots biostratigraphic ages of both fossil groups with lithostratigraphy for visual comparison of ages to sediment packages. Good agreement is found between nannofossil and foraminifera ages throughout the hole. The major unconformity is identified as similar to Hole U1575A in that it represents a large amount of missing time. However, the missing section is slightly different. Unlike Hole U1575A, no Oligocene-aged sediments are identified here. Additionally, lower Paleocene and Late Cretaceous, Maastrichtian sediments were recovered from Hole U1576A, whereas in Hole U1575A, the Oligocene sediments directly overlay Late Cretaceous, Campanian sediments. It should be noted that, due to time constraints involved in more intense processing, the gray boxes in this figure represent areas where planktonic foraminifera samples were not processed for shipboard analysis.
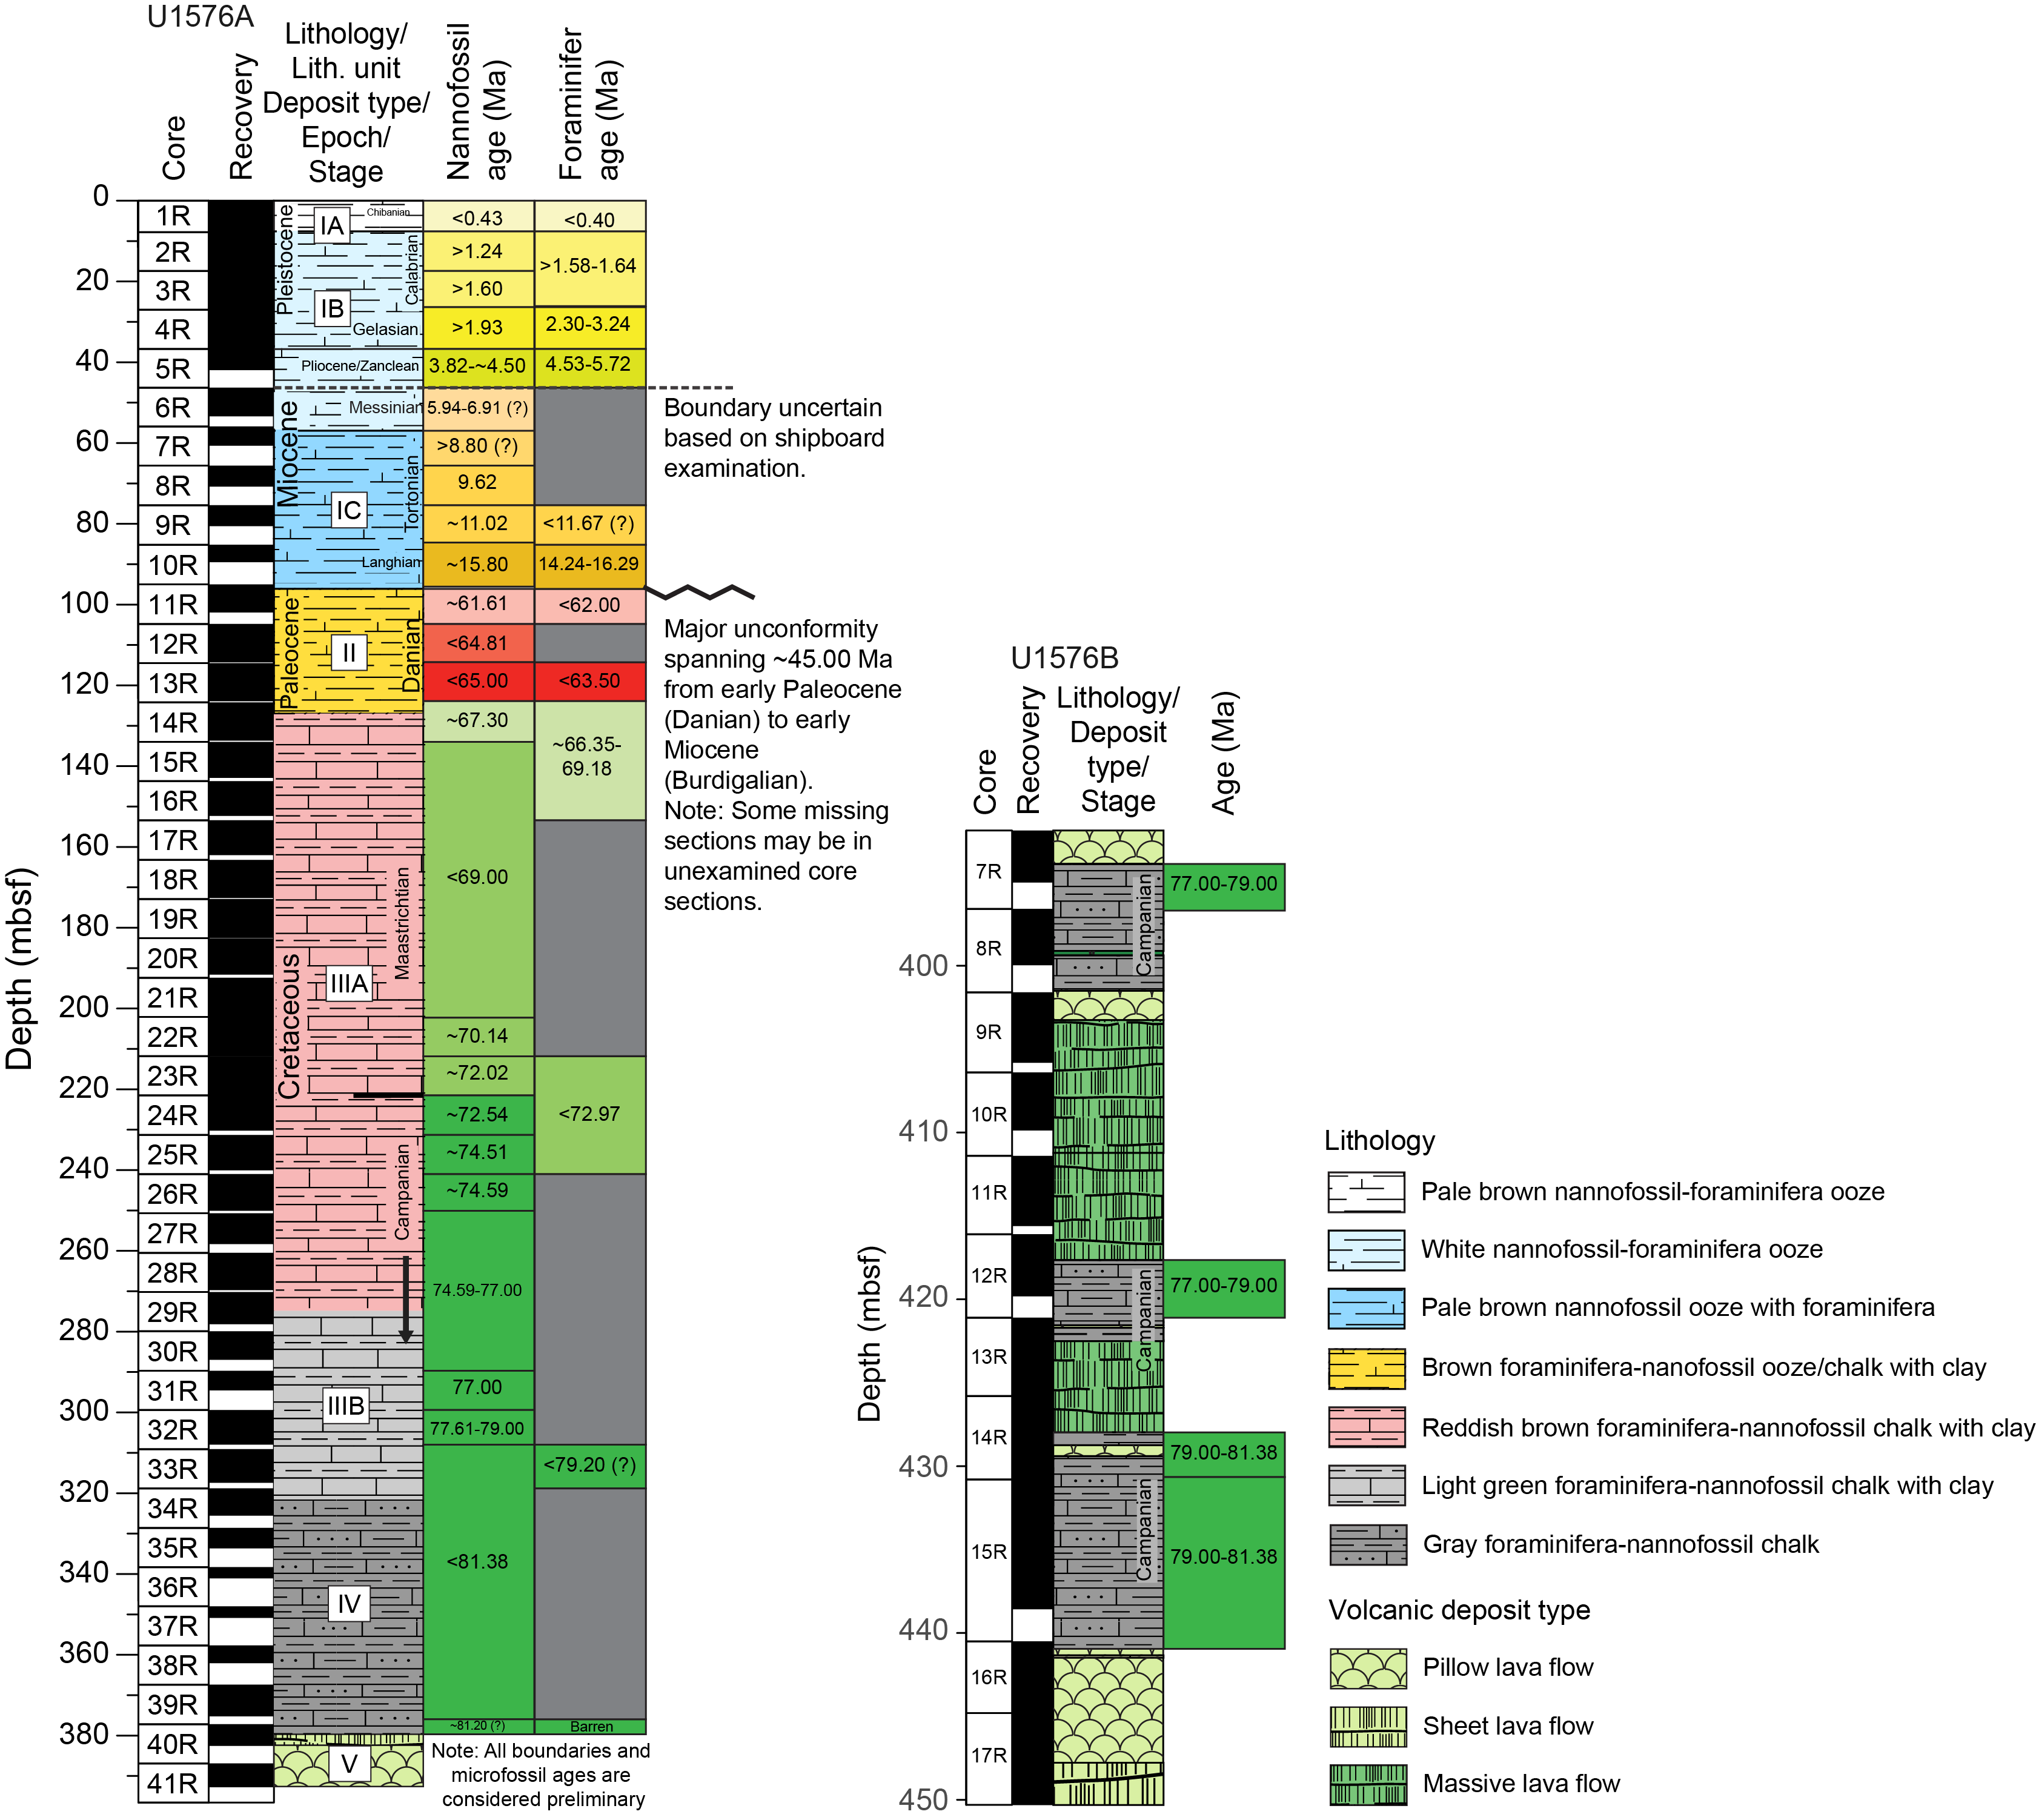
Figure F21. Correlated lithostratigraphy and biostratigraphy.
5.4. Age depth model
The age-depth plot in Figure F22 is a visual representation of relative sedimentation rates throughout the borehole. The major unconformity can be seen very obviously on this graph and is (again) identified between the oldest Miocene and youngest Paleocene sediments recovered. The figure demonstrates the excellent agreement of nannofossil and foraminifera ages in the upper part of the hole (Miocene and younger) and the excellent agreement of nannofossil, foraminifera, and magnetostratigraphic ages in the lower part of the hole (Paleocene and older). Sedimentation rates appear to be relatively high throughout the hole; however, it is likely these are exaggerated due to low-resolution preliminary data. They should therefore be viewed in a relative manner rather than as quantified values at this point. For this reason, sedimentation rate calculations are not completed, or included, in the figure.
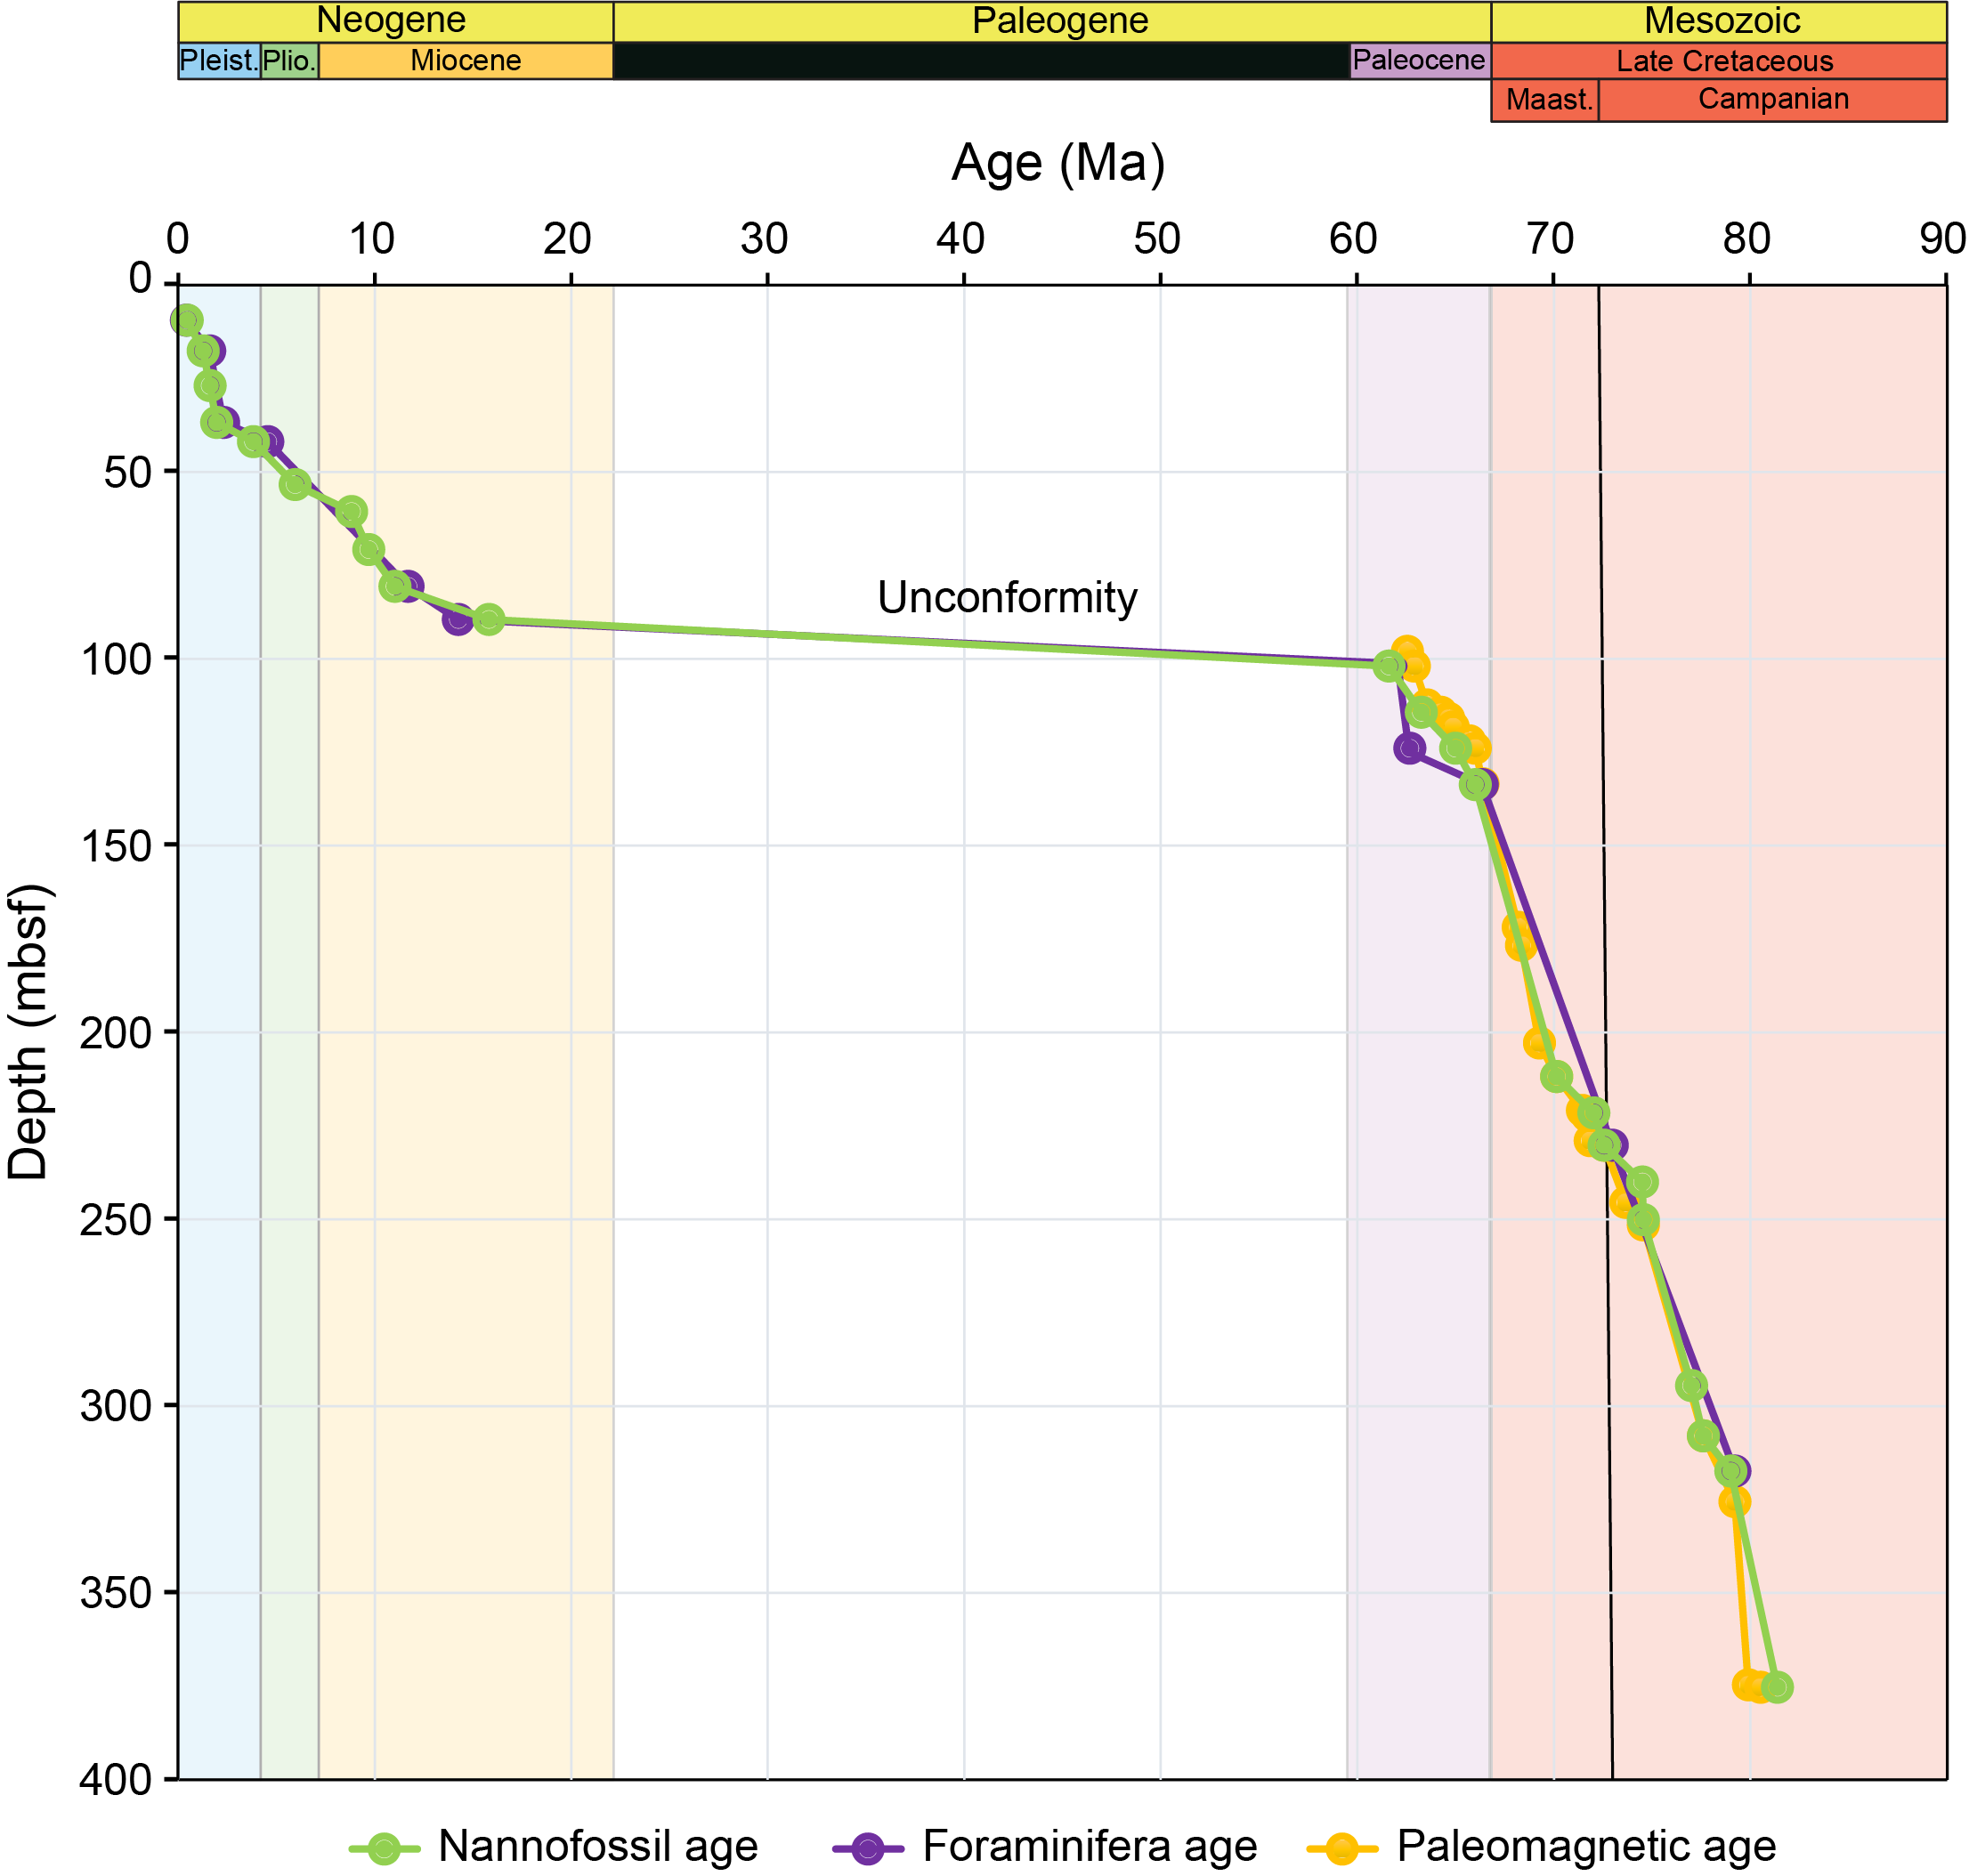
Figure F22. Age-depth model.
6. Paleomagnetism
6.1. Sediments and sedimentary rocks
6.1.1. Archive-half measurements
Paleomagnetic measurements of the archive halves of sedimentary cores recovered from Hole U1576A (Cores 1R–39R) were conducted using the pass-through superconducting rock magnetometer (SRM) on board the ship. Natural remanent magnetization (NRM) was measured for all sediment cores. The uppermost cores (1R–10R) consist almost entirely of unconsolidated calcareous nannofossil ooze (Lithostratigraphic Unit I; see Lithostratigraphy). Because of the soft nature of the ooze and the associated rapid penetration and core recovery, we applied a truncated alternating field (AF) demagnetization protocol to these cores, consisting of a single AF demagnetization step (10 mT) following the initial NRM measurements. This truncated measurement protocol was also applied to Cores 16R–19R in an attempt to speed up measurement and keep pace with the rapid influx of sediment cores. More consolidated sediments from Cores 11R–15R were demagnetized at AF levels of 5, 10, 15, and 20 mT after the initial NRM measurements. Cores 20R–39R were demagnetized at AF levels of 10 and 20 mT after the initial NRM measurements. Sections 391-U1576B-2R-1 through 5R-3 were demagnetized at AF levels of 5, 10, 15, and 20 mT after the initial NRM measurements. In all, 232 sediment archive-half sections totaling 315 m were demagnetized and measured (Figure F23).
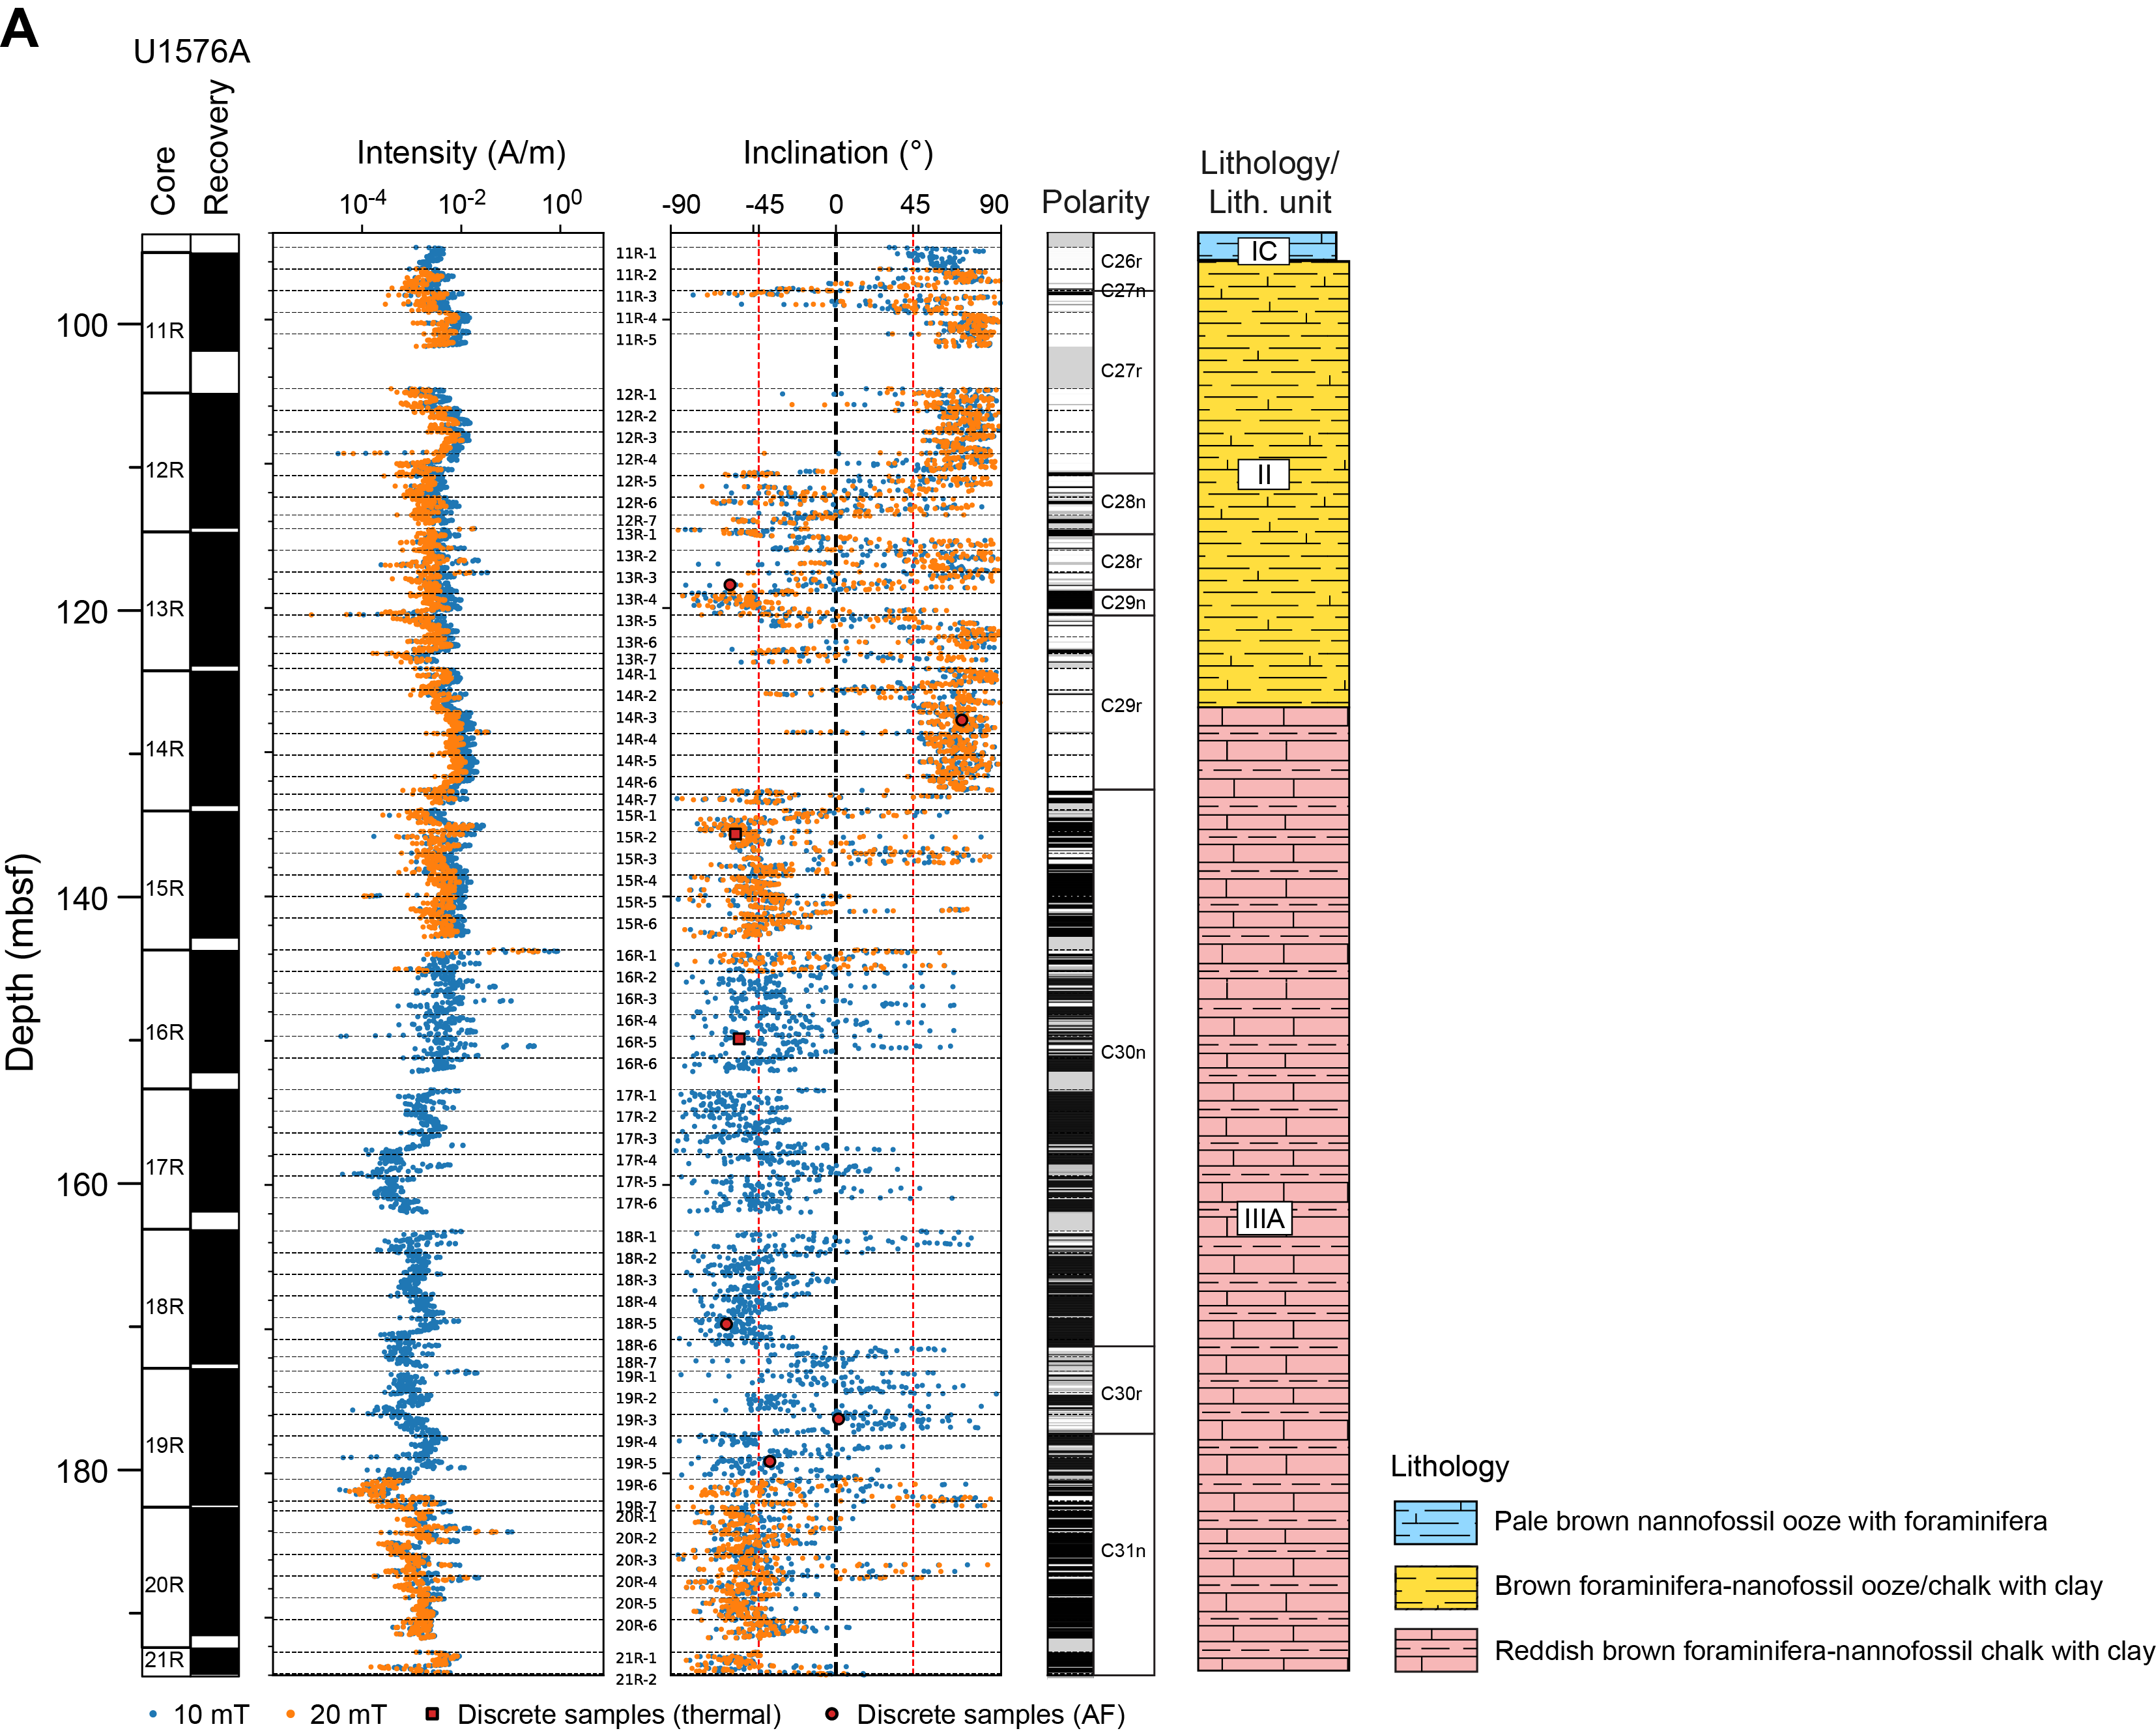
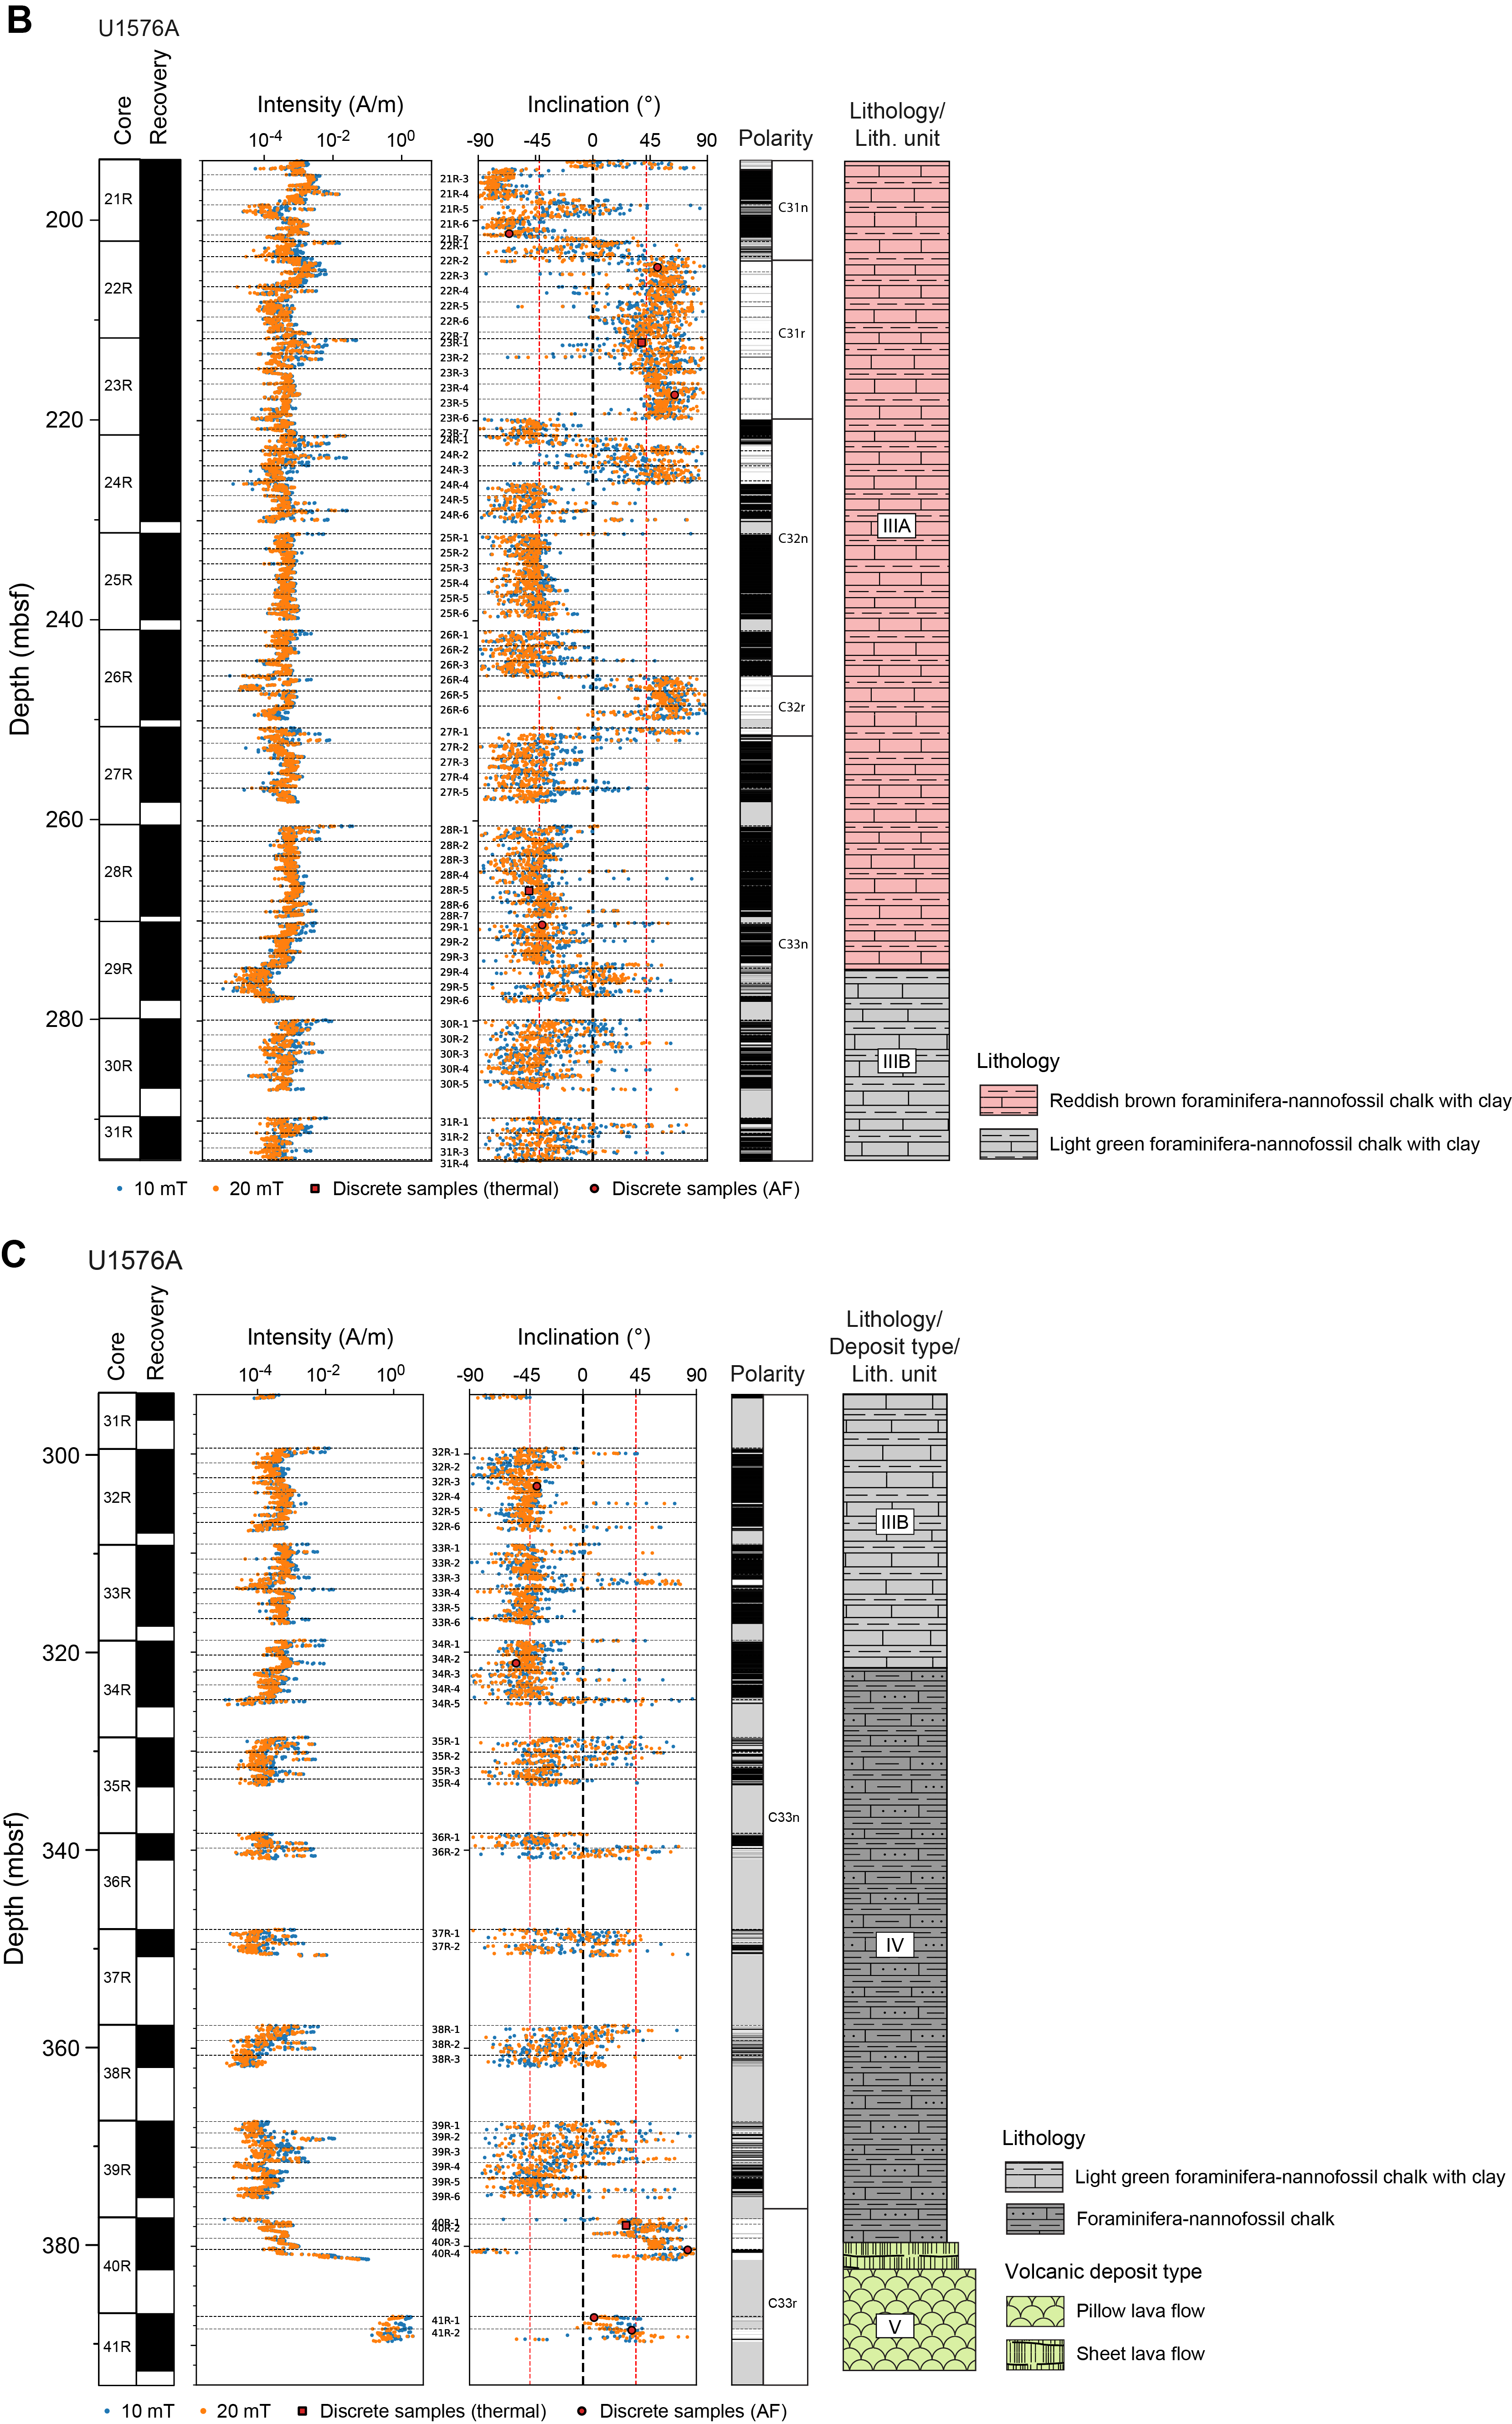
Figure F23. Magnetization intensity and inclination, Hole U1576A.
Unconsolidated sediments from Site U1576 typically had weak magnetizations, which were often similar to the sample holder intensity of the SRM. NRM values for cores dominated by calcareous ooze range in intensity from 10−6 to 10−3 A/m. Nearly all of these samples were generally too weak to be successfully measured using the shipboard AGICO JR-6A spinner magnetometer.
Consolidated sediments from Hole U1576A (Cores 11R–39R) and Hole U1576B (Core 2R through Section 5R-3) had higher magnetizations that showed regular peaks in the intensity of magnetic remanence associated with cyclical stratigraphy. NRM values for the consolidated sediments ranged in intensity from 10−5 to 100 A/m. The average of the 20 mT step inclinations for the consolidated sediments from Hole U1576A was calculated using the method of McFadden and Reed (1982) and gave average positive and negative inclinations of 56.5° and −46.8°, respectively (Figure F24A). The slightly steeper positive inclination is consistent with a persistent drill string overprint in some of the sections after the 20 mT demagnetization, although the inclinations are sufficiently steep that this likely does not affect our polarity assignments (Acton et al., 2002). Both of these inclination values are nominally steeper than the expected geocentric axial dipole (GAD) inclination of −42.5°. We did not assign an uncertainty to these averages because the degree of independence of the 2 cm SRM measurements from each other is questionable and any uncertainty we could estimate would be of dubious reliability.
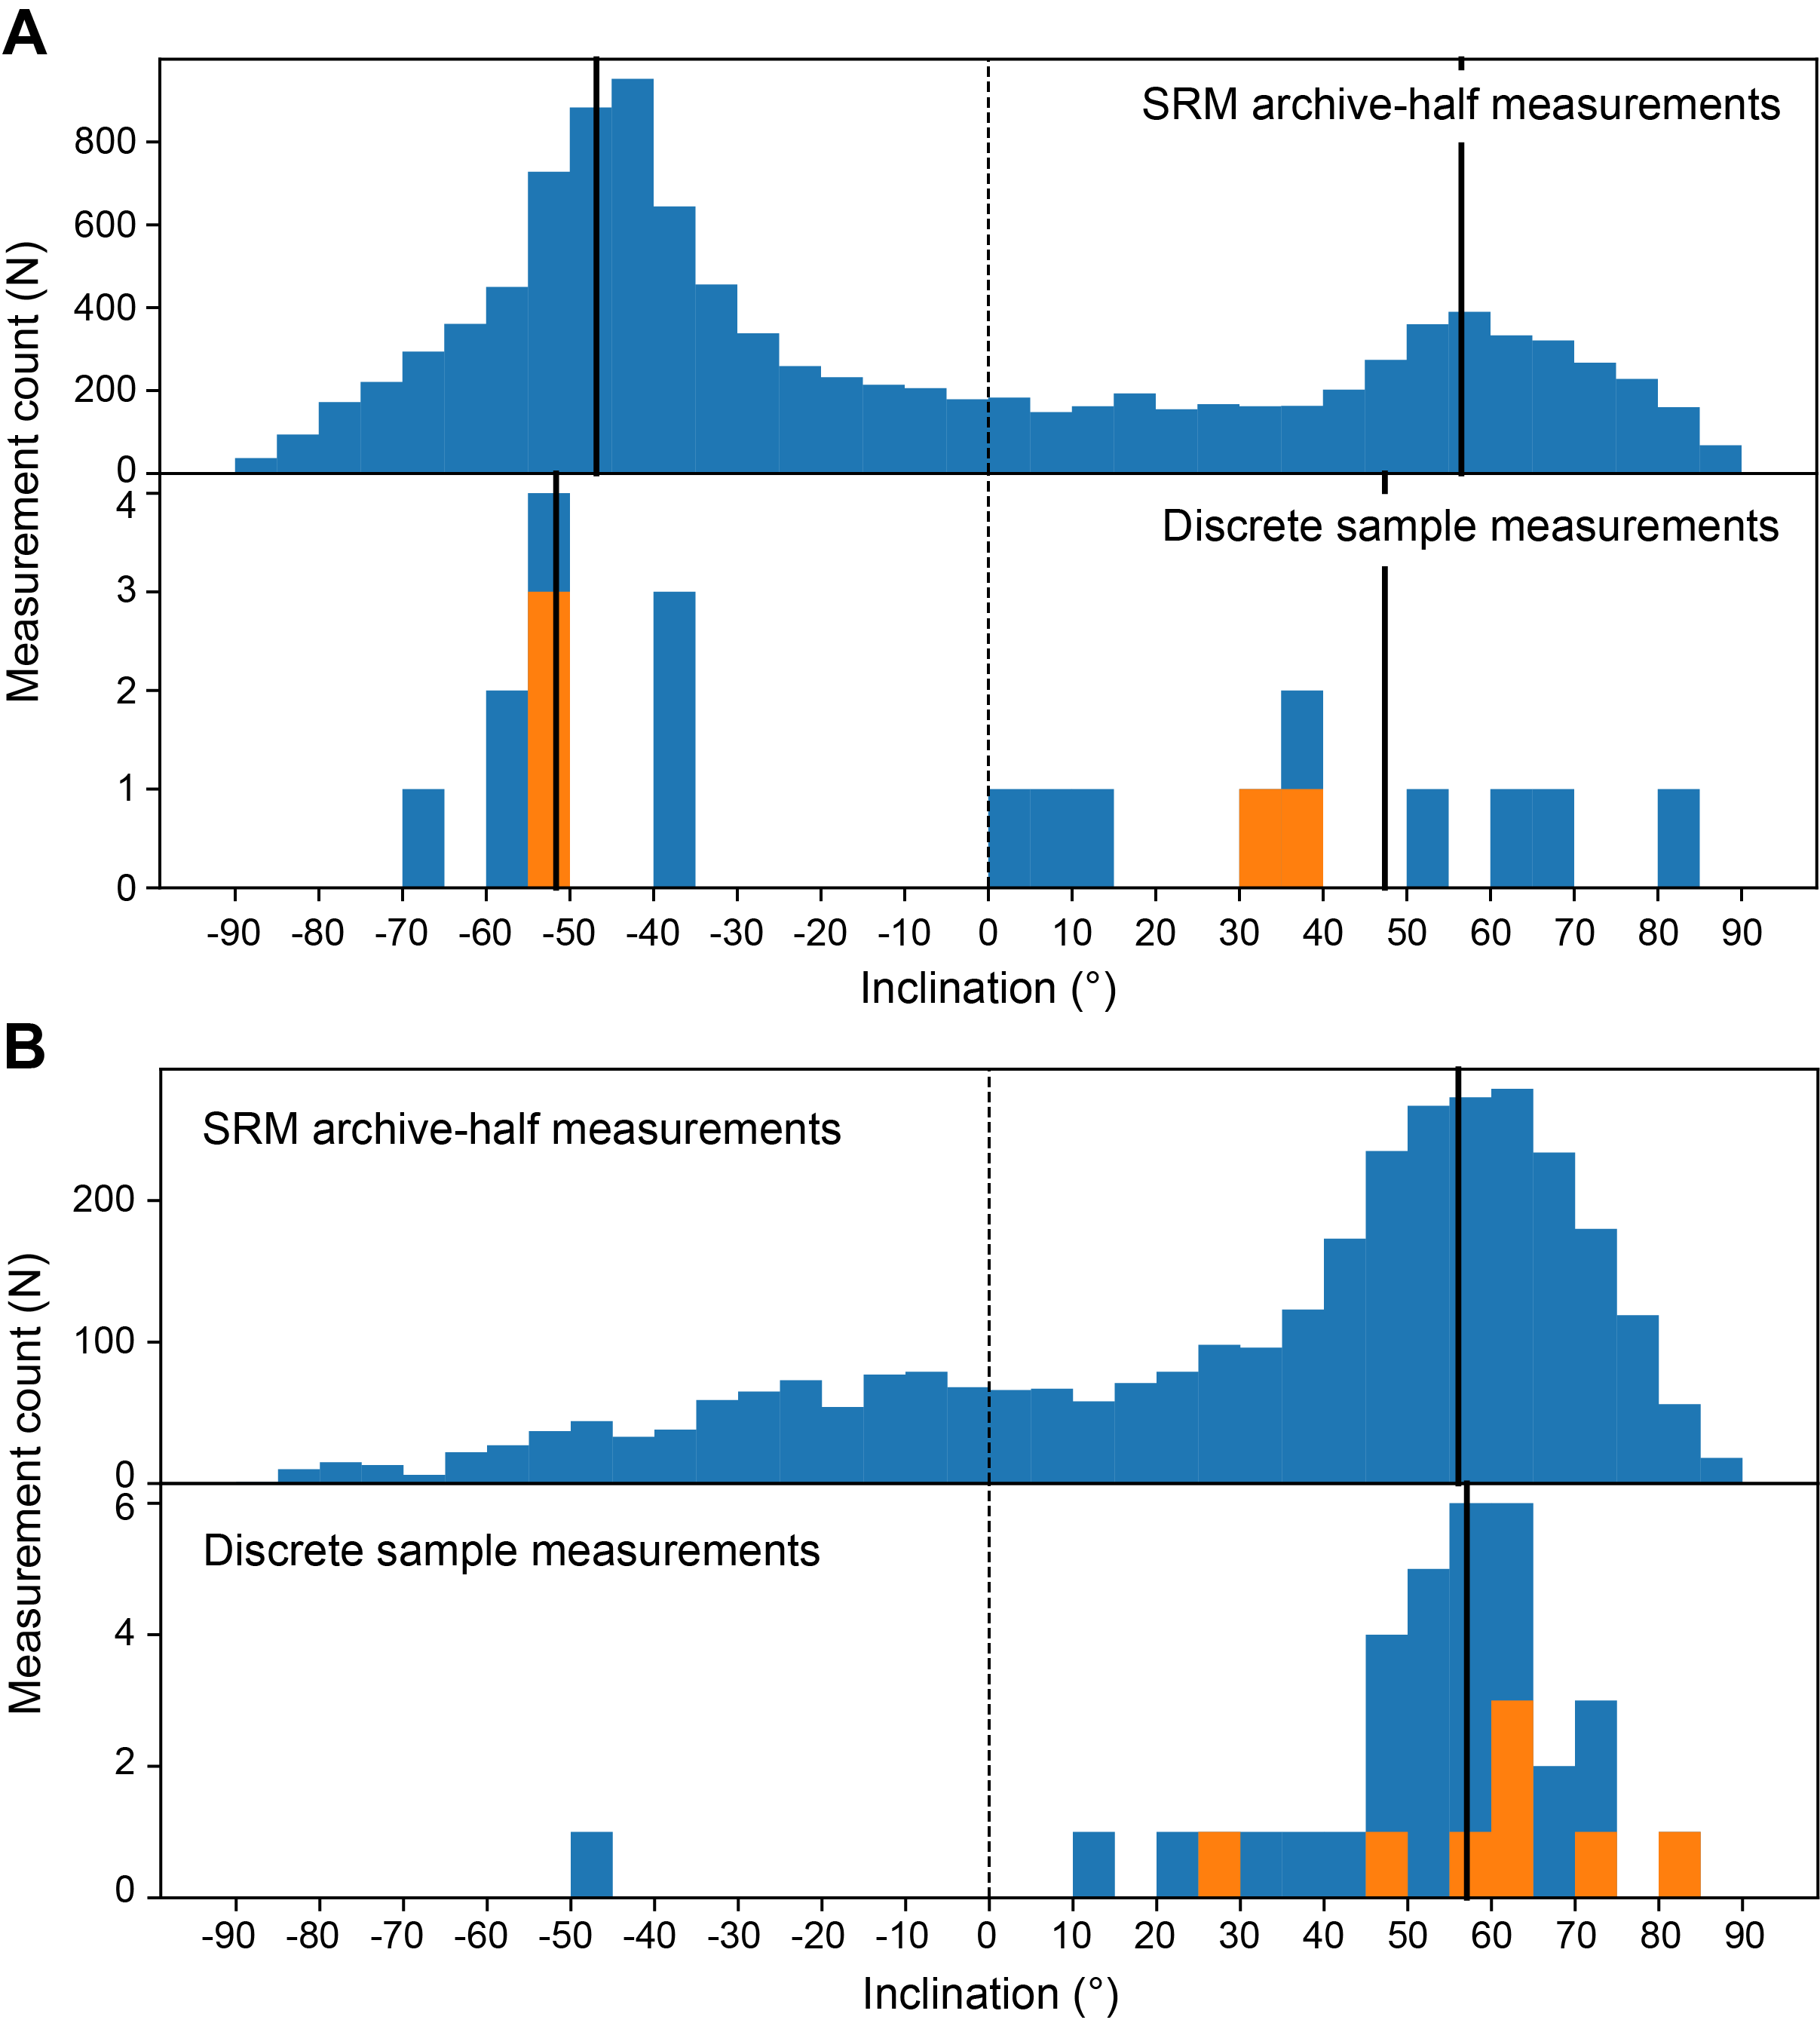
Figure F24. Distributions of inclination.
6.1.2. Discrete sample measurements
Discrete samples were collected from unconsolidated sediments using plastic 7 cm3 Japanese-style sediment cubes, whereas cubic discrete samples from more lithified sediments were prepared using a dual bladed circular saw. We collected 37 discrete sediment samples from Hole U1576A and 6 sediment samples from Hole U1576B (Sections 2R-1 through 5R-4) with the circular saw. All 21 samples in plastic cubes were treated to AF demagnetization. Of the 22 remaining samples, 19 were subjected to thermal demagnetization and 9 to AF demagnetization.
Most red sediment samples (Lithostratigraphic Subunits IIIA and IIIB; see Lithostratigraphy), which were taken from Cores 391-U1576A-10R through 28R, had a sufficiently strong magnetization to obtain a direction fitted with principal component analysis (PCA). Median destructive fields (MDFs) range from around 5 mT to as high as 200 mT. Most MDFs are higher than 20 mT and indicate the presence of high-coercivity minerals (Figure F25). Thermal demagnetization spectra for most of these samples show unblocking temperatures close to the 580°C Curie temperature of magnetite (Figure F26). Samples from Cores 29R–41R were much less magnetic, making it more difficult to obtain high-fidelity directions (i.e., those with maximum angular deviation values <15°) by AF or thermal demagnetization. Moreover, a significant fraction of the NRM (sometimes as much as half) was not removed even after applying an AF of 200 mT. Similarly, for these samples from Cores 29R–41R, thermal demagnetization of up to 625°C was often insufficient to remove all the NRM (we did not continue at higher temperature steps because the behavior was too erratic). The presence of such high-coercivity and high–unblocking temperature grains in these rocks suggests that these lower cores contain hematite. Similar behavior was also observed in both the AF and thermal demagnetization of the six sediment samples from Hole U1576B.
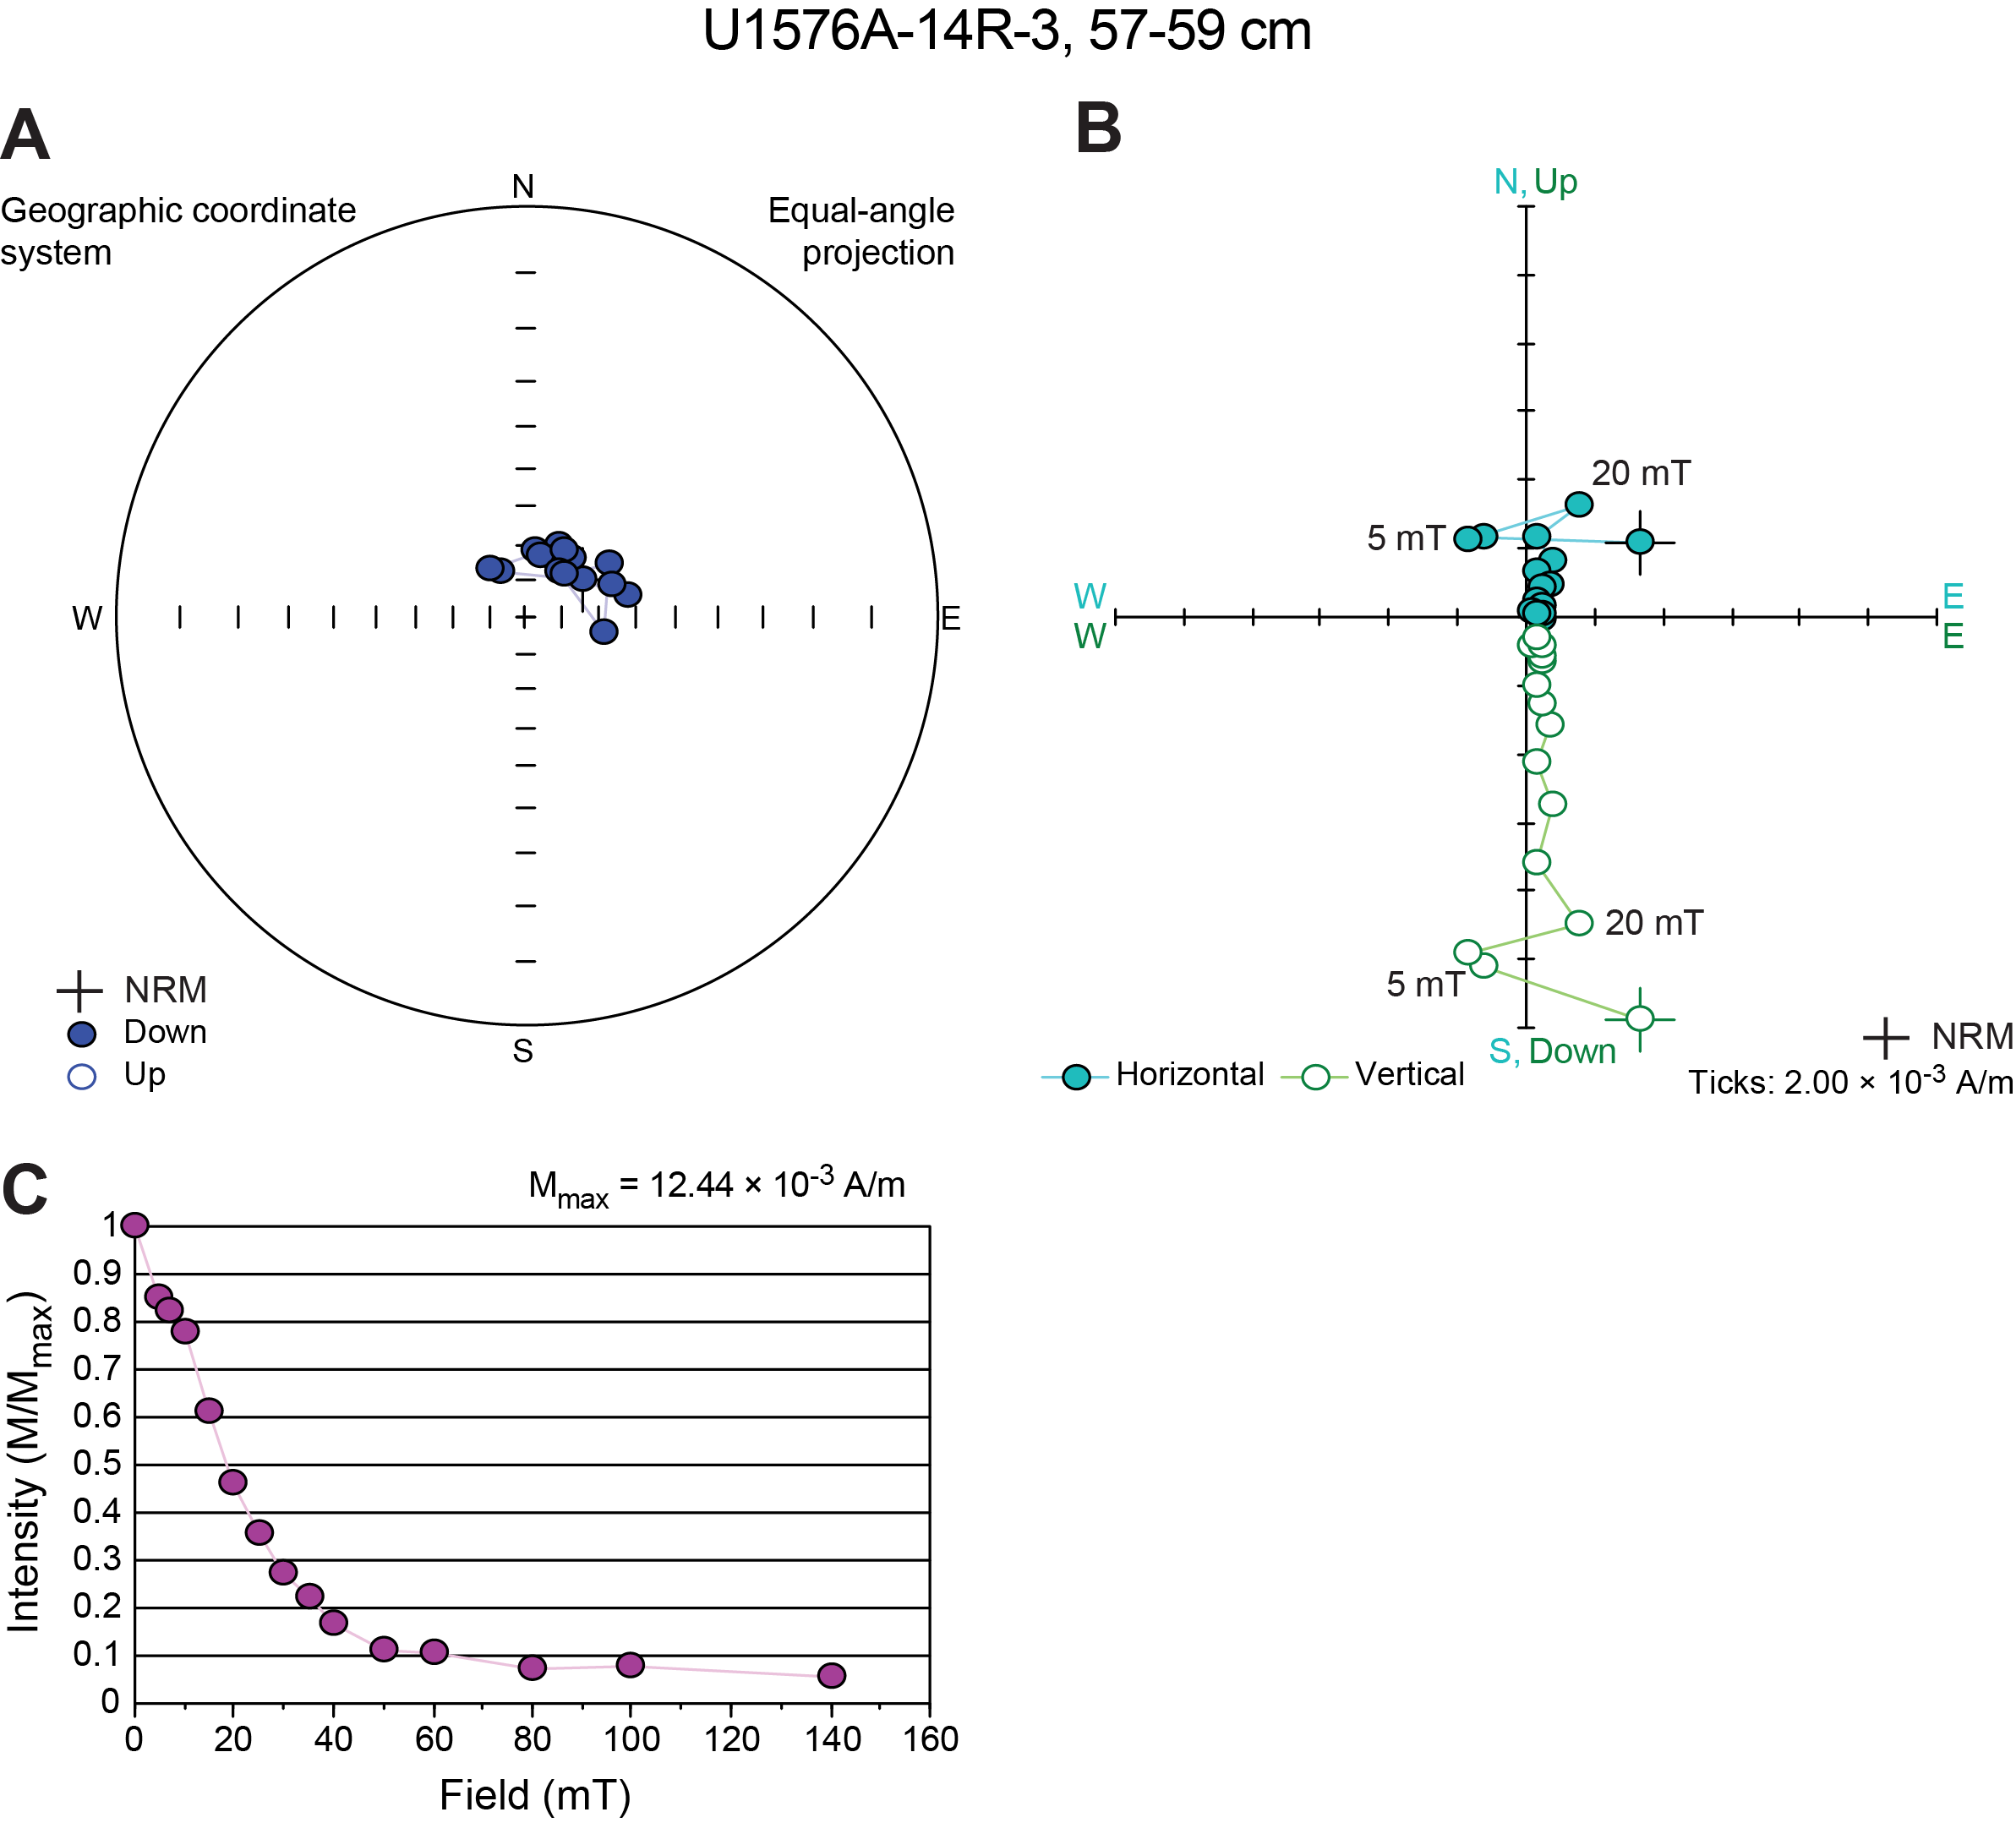
Figure F25. AF demagnetization result for a representative sediment sample.
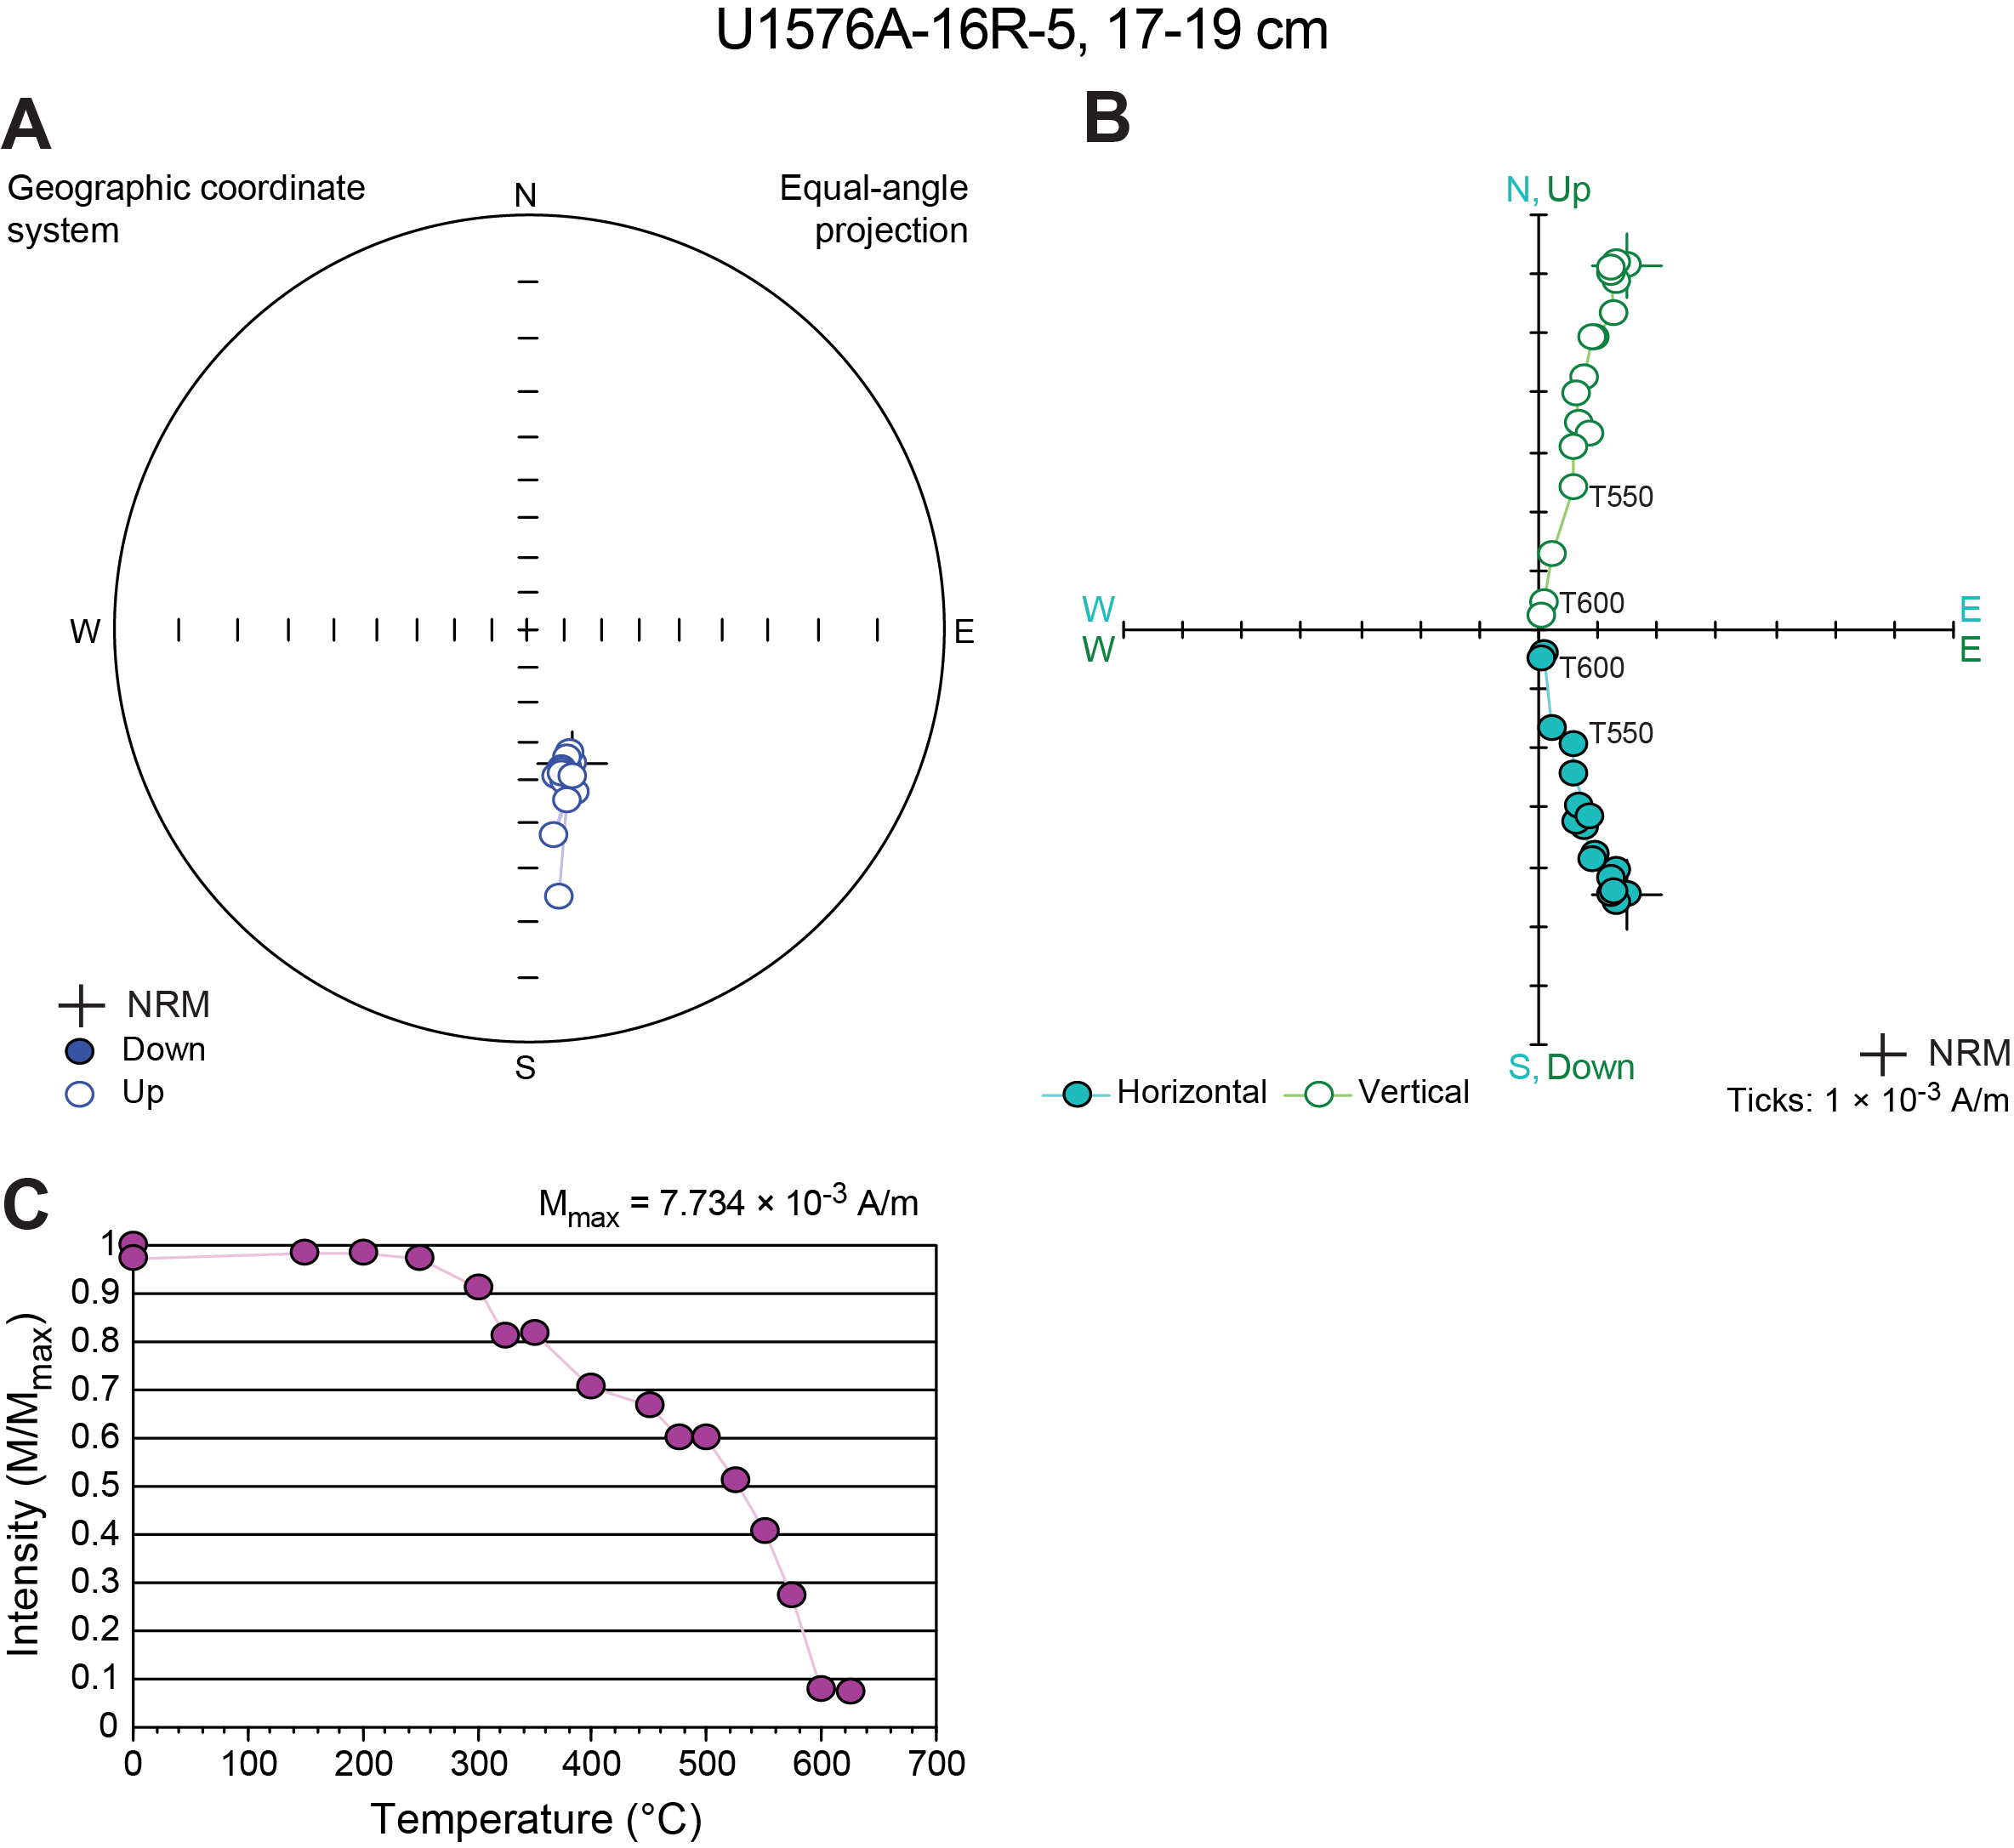
Figure F26. Thermal demagnetization result for a representative sediment sample.
In total, 14 AF demagnetized samples and 7 thermally demagnetized samples revealed reliable inclination values (N > 4 data points included in the PCA fit and maximum angular deviation < 15°). In total, 10 AF demagnetized samples and 4 thermally demagnetized samples yielded poor-quality inclination values (maximum angular deviation > 15°). Such samples generally contained low-coercivity overprints that were removed by AF cleaning at 10 mT and are consistent with being drilling induced (e.g., Acton et al., 2002). The Zijderveld plots for the other eight samples were too erratic to obtain any direction from PCA.
We identified both positive and negative inclination characteristic remanent magnetizations (ChRMs), which may be indicative of magnetic polarities if these magnetizations represent primary detrital remanence. The most reliable inclination values calculated with PCA agreed well with the SRM inclinations after 20 mT AF demagnetization except for one discrete sample (Figure F23). The average inclination of the discrete, reversed polarity sediment samples is 47.4° ± 20.3°, and the average inclination of the discrete, normal polarity sediment samples is −51.6° ± 6.7° (95% confidence).
6.1.3. Magnetostratigraphy
Magnetic polarity was interpreted from paleomagnetic inclinations measured from archive halves after the 20 mT AF demagnetization step for most consolidated sediments, although the 10 mT AF step was used instead for sections for which a 20 mT step was missing (Cores 391-U1576A-16R through 19R). The PCA fit directions obtained from ChRM components for discrete samples were checked against the SRM inclination values and the interpreted magnetic polarity, where available.
Because of the weak magnetization intensity of the unconsolidated sediments and the fact that they were only partially demagnetized to 10 mT (which may not have been sufficient to remove drilling-induced magnetization overprints), it was not possible to construct a robust magnetostratigraphy for Cores 391-U1576A-1R through 10R. Consolidated sediments provided magnetic measurements of higher quality, and it was possible to confidently assign polarity zones for Cores 11R–39R following Ogg et al. (2020) (Figure F23). In total, we observed 14 polarity chrons starting with the base of Chron C26r (62.278 Ma) in Core 11R to the top of Chron C33r (79.900 Ma) at the contact with the basement. This sequence of polarity chrons is consistent with an early Paleocene (Danian) to Upper Cretaceous (early Campanian) succession. There were no apparent gaps in the magnetostratigraphy. We interpret Cores 13R and 14R as recording Chron C29r (66.380–65.700 Ma), indicating that the K/Pg boundary should be contained therein. We also note that Chron C32n.2n (73.651–71.851 Ma) is entirely contained in Sections 24R-4 through 26R-3; therefore, the Maastrichtian/Campanian boundary can be constrained to occur in those sections. For the consolidated sediments recovered from Hole U1576B (Sections 2R-1 through 5R-3), we found a magnetostratigraphy consistent with the polarity chron assignments from Hole U1576A (Figure F27). Sections 391-U1576B-2R-1 through 4R-2 represent normal polarity and are consistent with normal Chron 33n (79.900–74.201 Ma). They are followed by reversed polarity Chron 33r (82.875–79.900 Ma) in Sections 5R-1 through 5R-3, which contact the uppermost basalt occurrence in Hole U1576B.

Figure F27. Magnetization intensity and inclination, Hole U1576B.
6.1.4. Magnetic properties
Bulk susceptibility measurements were conducted for 10 discrete samples collected from Cores 391-U1576B-2R through 13R (including sediments that were interbedded between basalt layers, as described in the next section) using an AGICO Kappabridge KLY 4 MS meter. Measured susceptibility values ranged 7.1 × 10⁻⁵ to 2.7 × 10⁻⁴ SI.
Stepwise isothermal remanent magnetization (IRM) curves were acquired for four discrete samples (Figure F28): two red sediment samples (from the top half of Hole U1576A) and two gray samples (from the bottom half of Hole U1576A). IRM acquisition curves show that magnetization does not completely saturate in a field of 1.2 T, confirming the presence of high-coercivity minerals as inferred from the AF demagnetization spectra. The two gray samples (29R-1, 19–21 cm, and 32R-3, 85–87 cm) do not show saturation at 1.2 T. This behavior seems to indicate that these two samples are hematite rich, whereas the red samples probably have a lower content of hematite mixed with magnetite. This is also consistent with the higher unblocking temperatures and lower NRM values observed in the gray samples compared to the red samples.
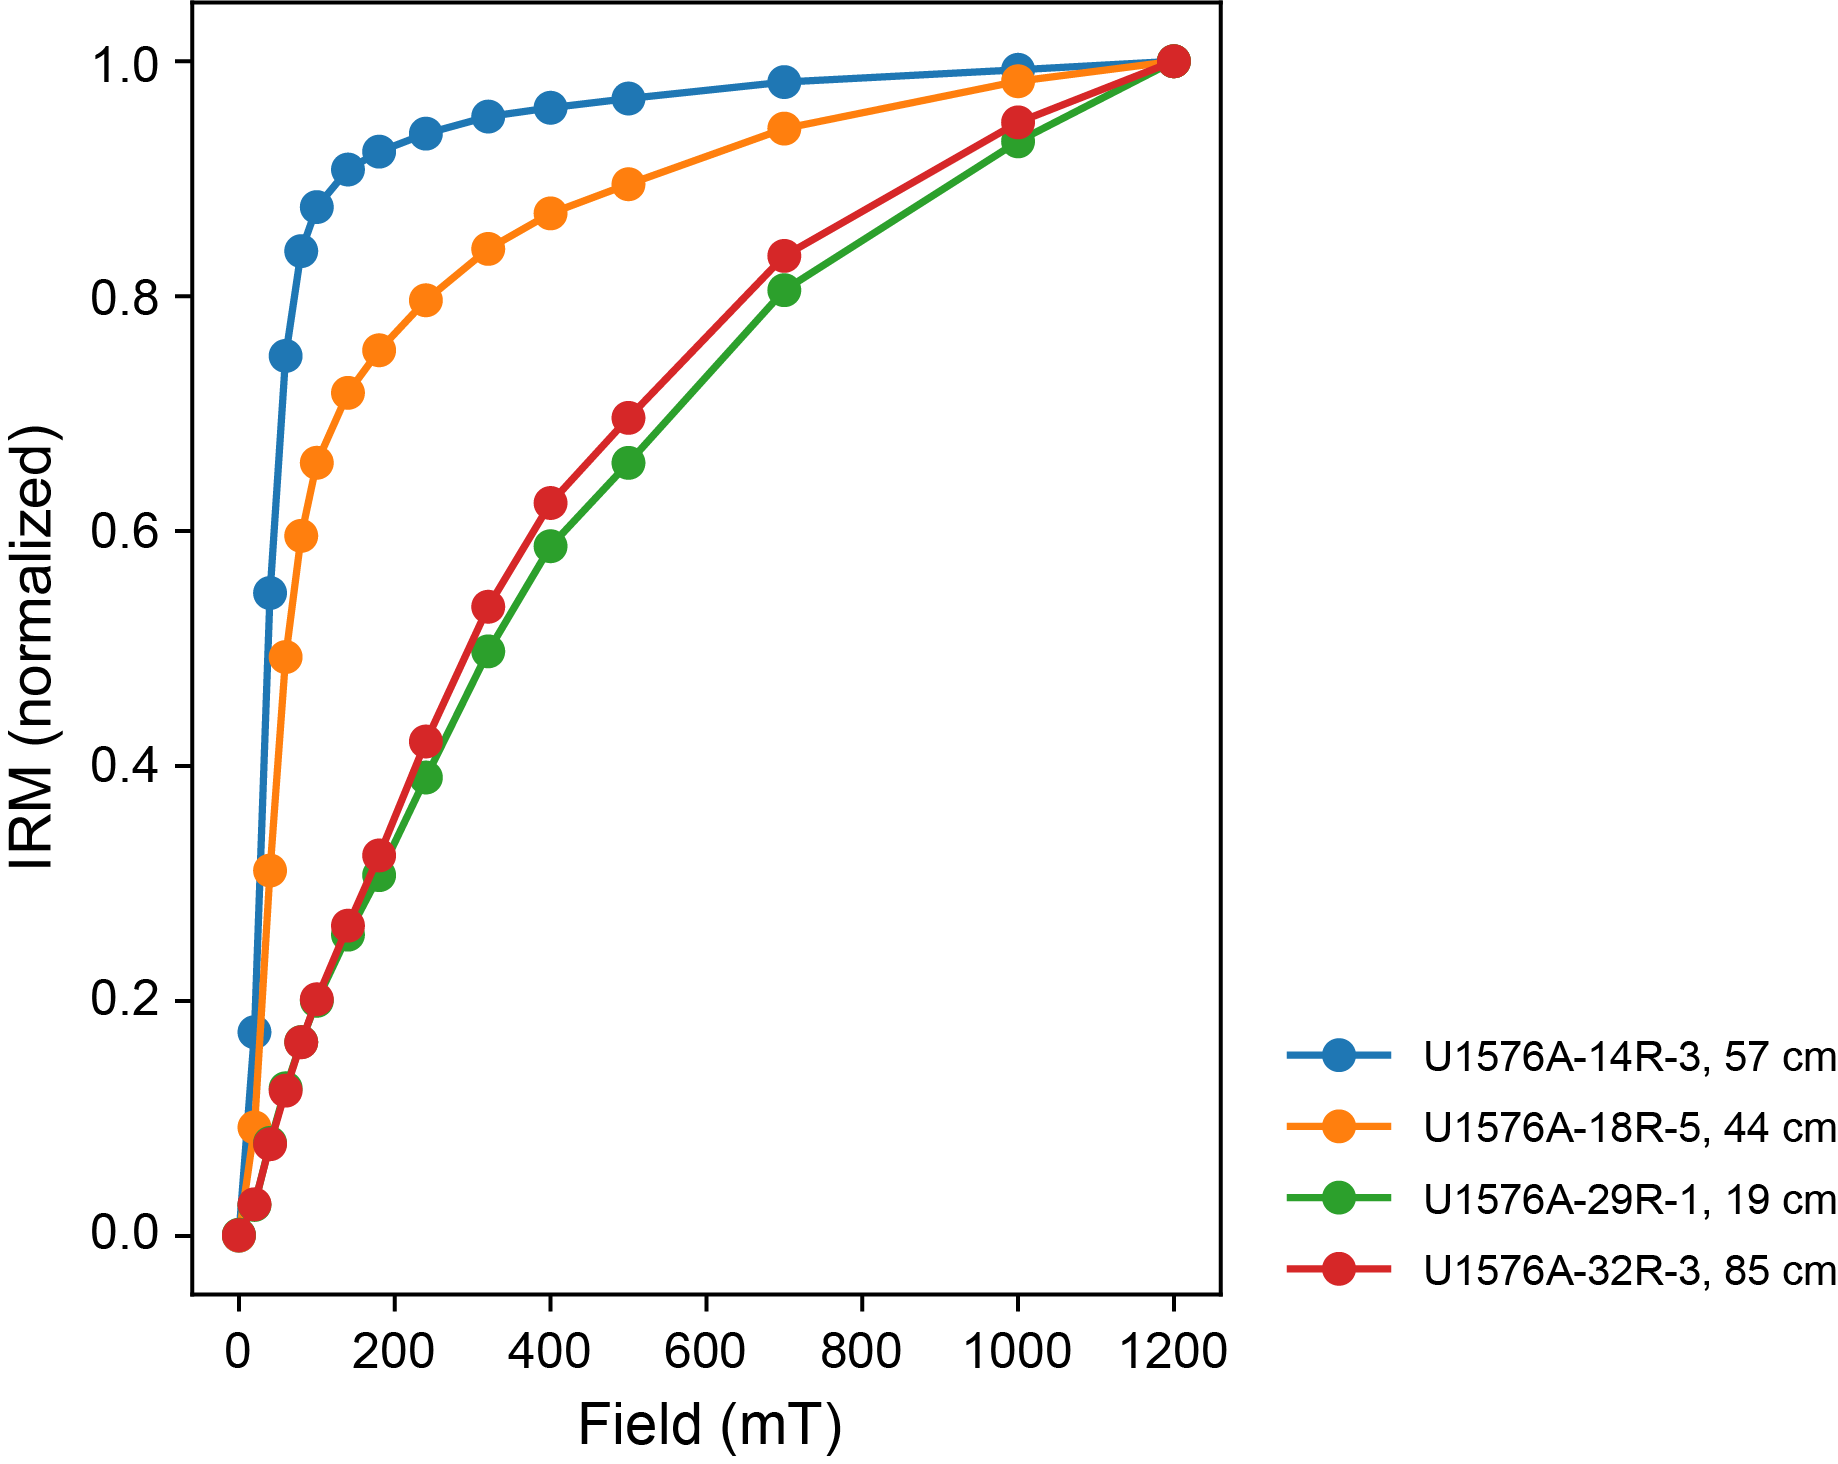
Figure F28. IRM acquisition curves.
6.2. Igneous rocks
6.2.1. Archive-half measurements
Paleomagnetic measurements of the archive halves of igneous RCB cores from Site U1576 (Cores 391-U1576A-40R and 41R and 391-U1576B-5R through 17R) were conducted using the pass-through SRM on board the ship and demagnetized at AF levels of 5, 10, 15, and 20 mT after the initial NRM measurements. When discussing the igneous RCB cores, we are referring to the dominantly igneous cores which regularly contain igneous rock as well as chalk interbedded between the basaltic lava flows. The latter exhibited a great deal of alteration in some places, which significantly affected the magnetic properties of the material. The strongest alteration was observed near the sedimentary interbed contacts. Magnetic intensities ranged from 10−5 to 10−2 A/m in the sedimentary interbeds and heavily altered basalt and 1–10 A/m in the mostly unaltered basaltic sections. In all, 45 igneous archive-half sections were demagnetized and measured (Figure F27).
Most of the igneous RCB cores contained low-coercivity overprints that may be drilling induced (e.g., Acton et al., 2002). After AF cleaning to 20 mT, igneous cores typically exhibited a reversed polarity magnetization consistent with the reversed polarity assignment of Chron 33r observed in the basement contacting sediment. The average inclination, calculated using the method of McFadden and Reed (1982) after cleaning the igneous cores to 20 mT, was 56.0° (Figure F24B). This average inclination is nominally steeper than the expected GAD inclination of 42.5°. However, this steeper average inclination may be due in part to a partially remaining drill string overprint, which would bias the samples toward positive inclinations. No significant directional difference was observed between the basalt sections of the igneous cores and the sedimentary interbeds, regardless of alteration, although sedimentary interbeds and heavily altered basalt sections showed higher variance in their inclination values likely due to their lower magnetizations.
6.2.2. Discrete sample measurements
A total of 46 discrete sample cubes (7 cm3) were taken from the basalts and interbedded sediments at a frequency of approximately one sample per core section using a dual bladed circular saw (5 from Hole U1576A and 41 from Hole U1576B). A total of 32 cubes were subjected to AF demagnetization, and the remaining 14 cubes were subjected to thermal demagnetization. Interbedded sediment samples had demagnetization behavior consistent with that of the sediments overlying the basalts (i.e., very high coercivities and high unblocking temperatures). Only about half of the AF demagnetization procedures led to reliable inclination values; the thermal demagnetizations were even less successful. The unaltered basalts led to high-quality demagnetizations. AF demagnetizations are characterized by unidirectional Zijderveld diagrams after the removal of a small overprint by ~15–20 mT, with MDFs between ~5 and 25 mT (Figure F29). Thermal demagnetizations show linear trends on the Zijderveld diagrams after the removal of an overprint by 250°C and magnetization unblocking steadily between 200° and 550°C (Figure F30). These thermal and AF demagnetization behaviors suggest that the magnetization carriers seem to be pseudo–single domain to multidomain titanomagnetite with a wide range of Ti contents. Of 19 unaltered basalt samples, 17 led to reliable inclination determinations. Finally, the more altered basalts gave reliable directions with AF demagnetizations and had MDFs of around 20 mT. Two altered basalt samples were treated with thermal demagnetization and rapidly increased in magnetization near 400°C, resulting in unreliable directions.
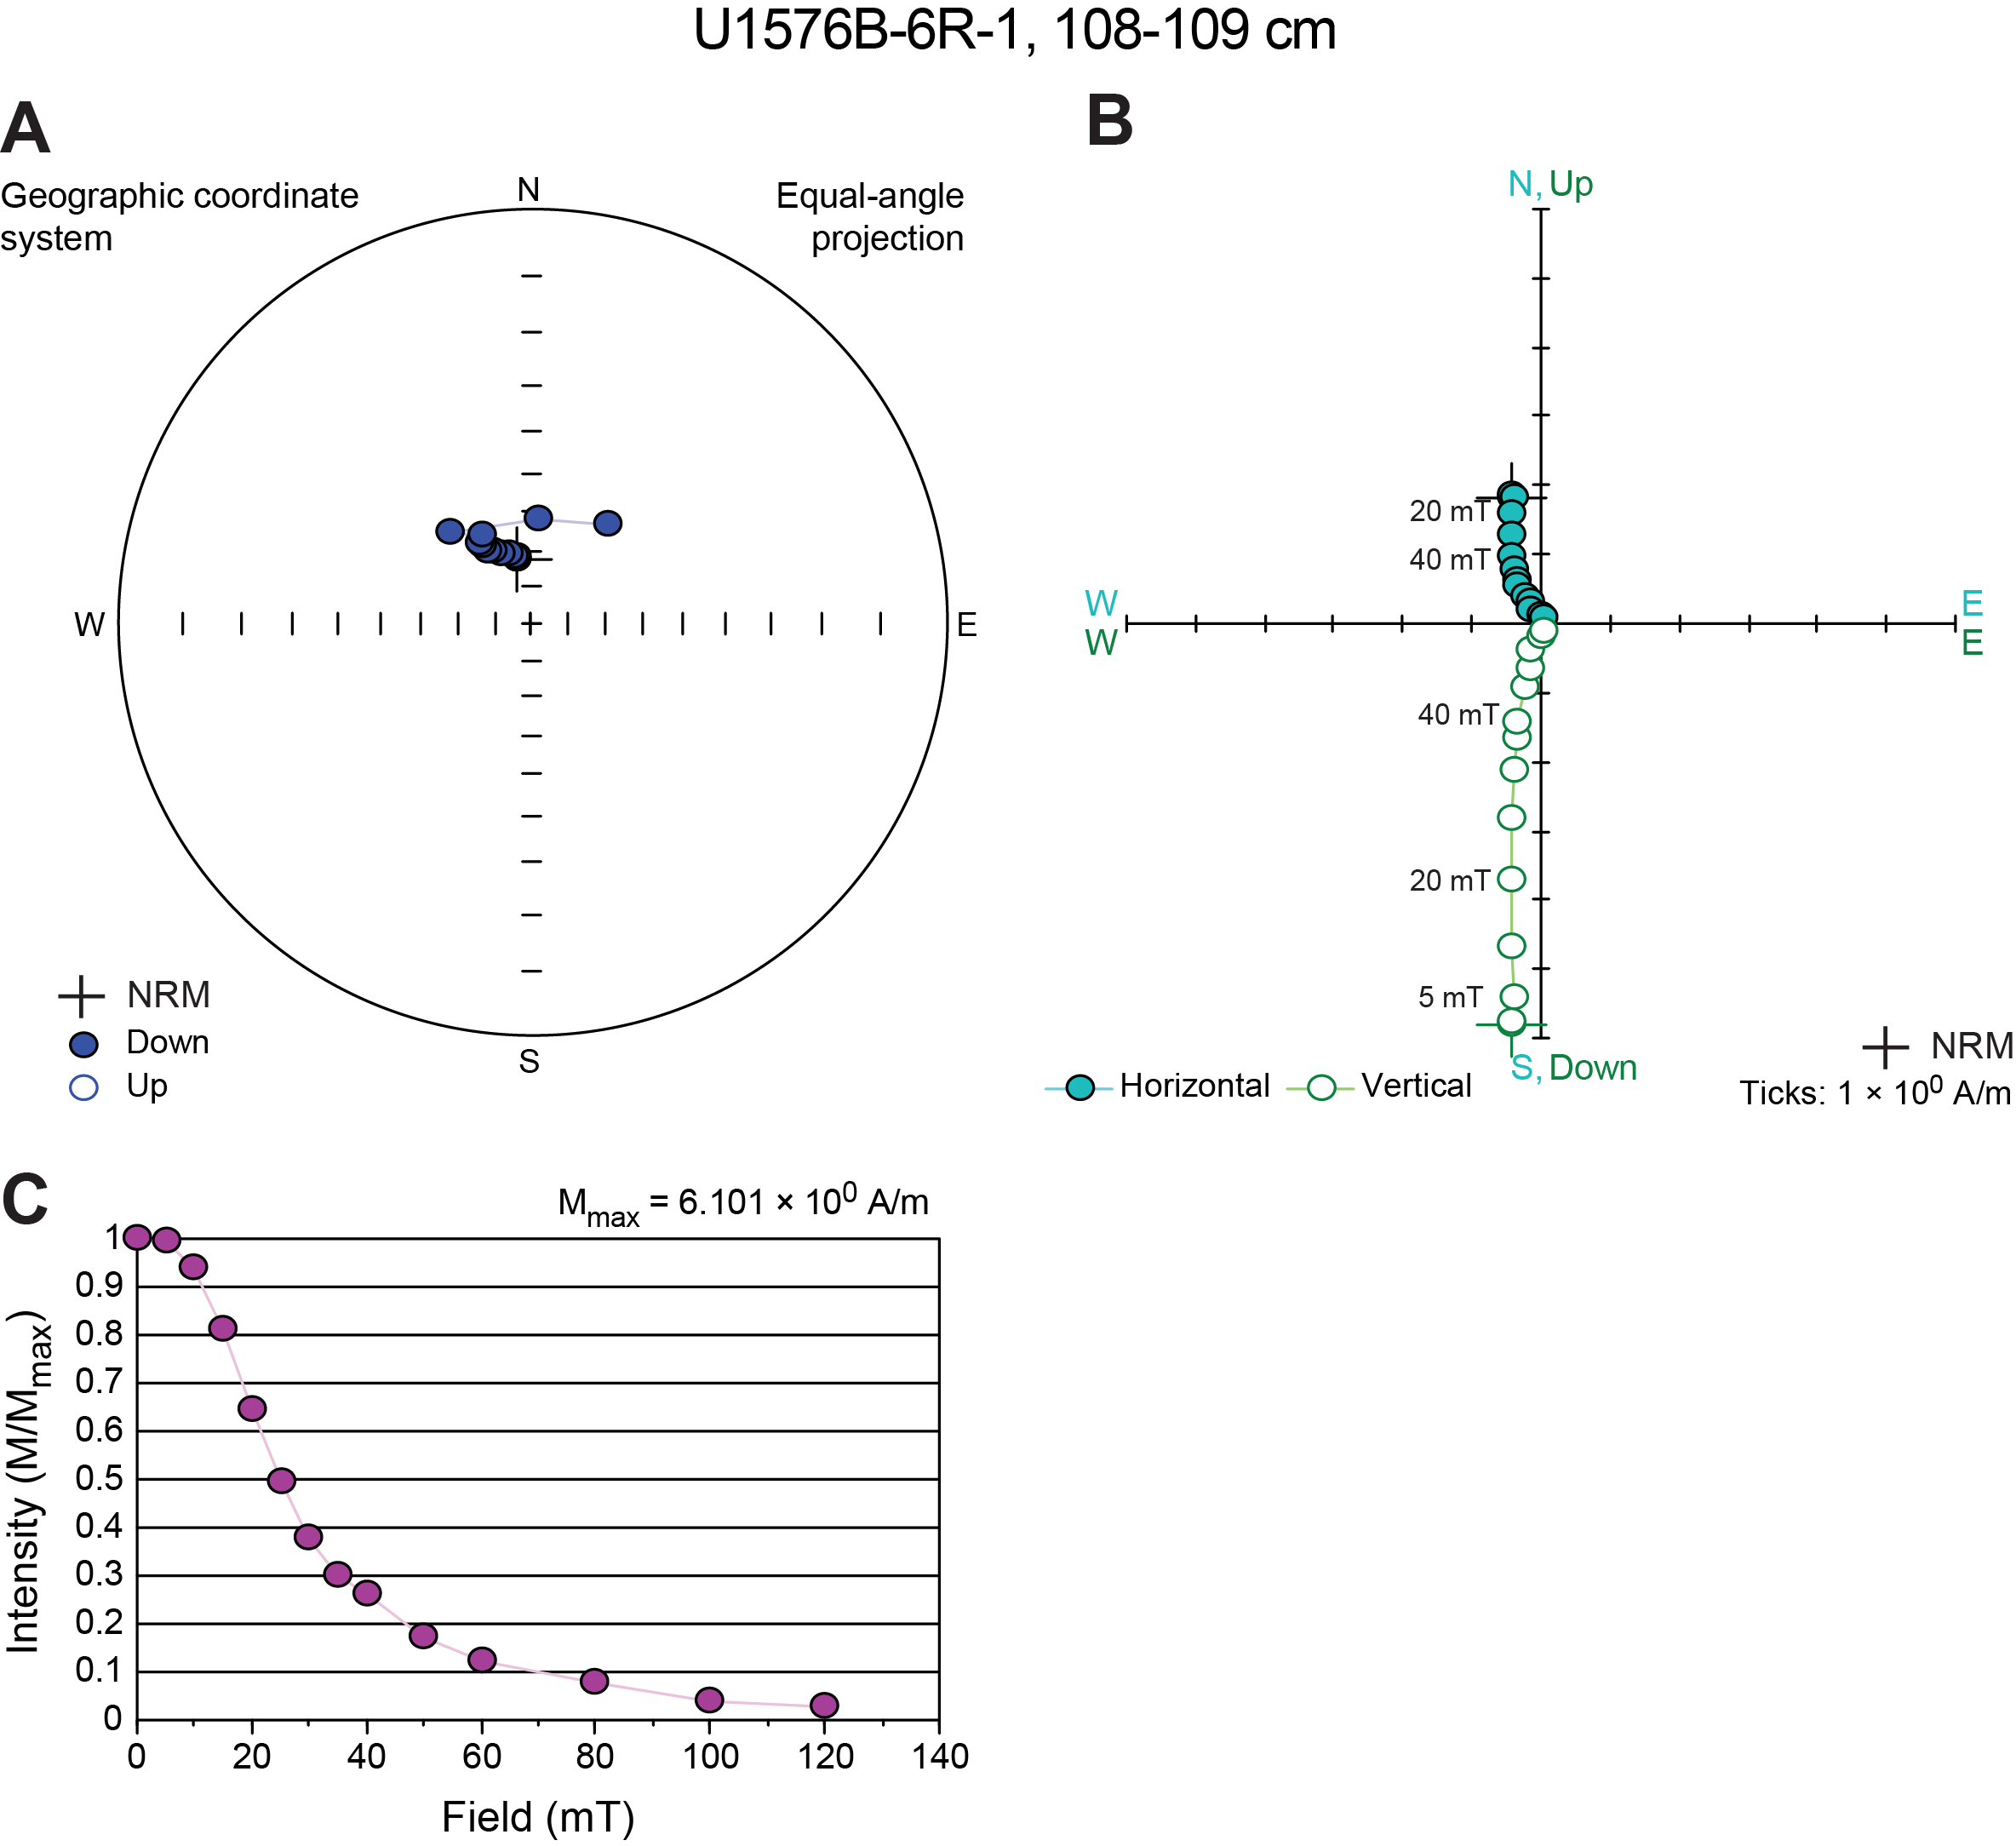
Figure F29. AF demagnetization results for a representative basalt sample.
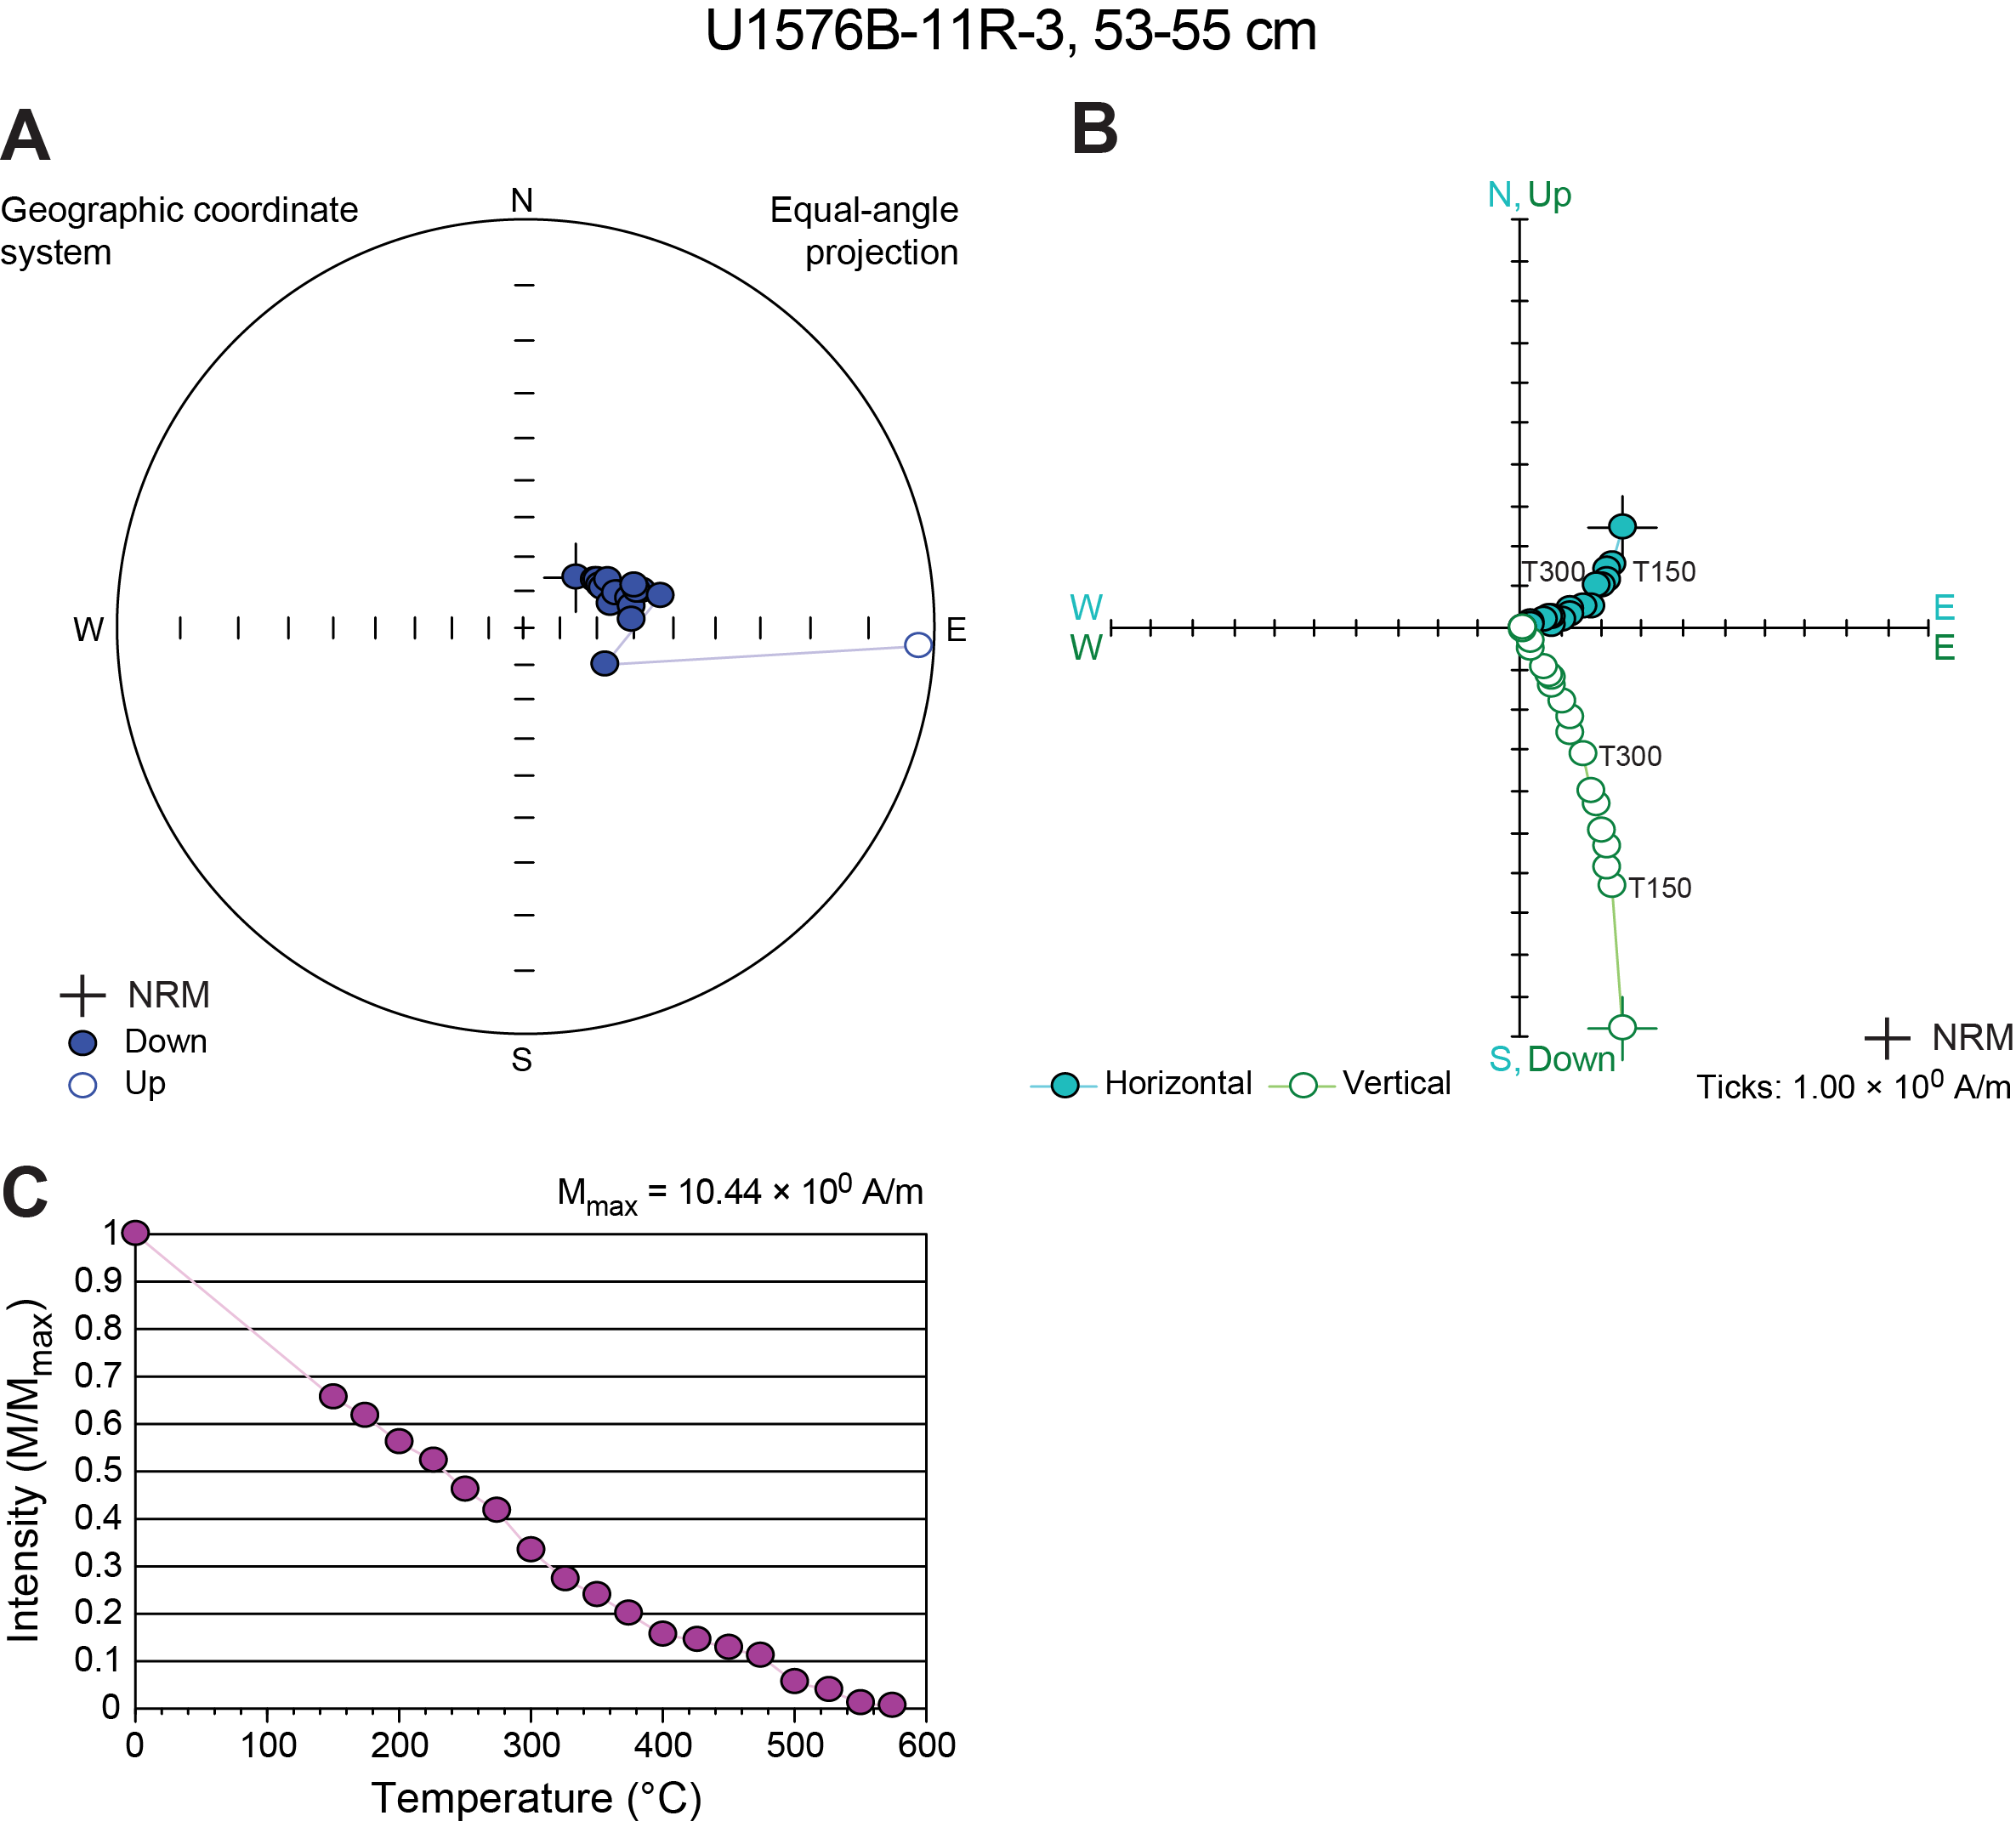
Figure F30. Thermal demagnetization result for a representative basalt sample.
Overall, 35 samples gave reliable ChRM directions. In general, the discrete sample inclinations are in good agreement with the archive-half measurements of inclination after the 20 mT AF demagnetization step (Figure F27). The distribution of inclinations calculated from discrete AF and thermal demagnetizations is similar and comparable to the 20 mT AF step measured on archive-half sections (Figure F24B). Most of the discrete AF demagnetizations are of such good quality that the 20 mT AF step already gives the ChRM inclination; all average inclinations were calculated using the protocol of McFadden and Reid (1982). Inclination ChRM component directions with maximum angular deviation values <15° and N > 4 were used to calculate an overall site mean inclination of 57.4°. Because we did not estimate cooling units, we do not report an uncertainty on this number, calculate a paleolatitude, or estimate the degree to which secular variation is averaged downhole.
6.2.3. Magnetostratigraphy
All igneous rocks recovered from Holes U1576A and U1576B exhibited reversed polarity consistent with the polarity assignment of Chron C33r (82.875–79.900 Ma) in the basement contacting sediments and are consistent with the ages recovered from the interbedded chalk (see Biostratigraphy).
6.2.4. Magnetic properties
Bulk MS and anisotropy of magnetic susceptibility were measured on 16 discrete basalt AF demagnetization specimens. Bulk susceptibility values range from 1.31 × 10⁻⁴ to 3.06 × 10⁻² SI. The corrected degree of anisotropy (P ′) ranges 1.00–1.05. Shape factors (T) range −0.79–0.38. Of 16 basalt specimens, 3 have 0 < T < 1, indicating that the anisotropy in these specimens is largely controlled by foliation. The remaining 13 specimens have −1 < T < 0, indicating that their anisotropy is lineation dominated.
Partial anhysteretic remanent magnetization (pARM) acquisition experiments were conducted on four discrete samples that had previously been used for AF demagnetization (two fresh basalts and two altered basalts). pARM was acquired using 5 mT steps up to 50 mT (Figure F31). The pARM acquisition peaks lie between fields of 10 and 15 mT. These values are consistent with those of synthetic magnetite with grain sizes larger than about 4 μm (Jackson et al., 1988).
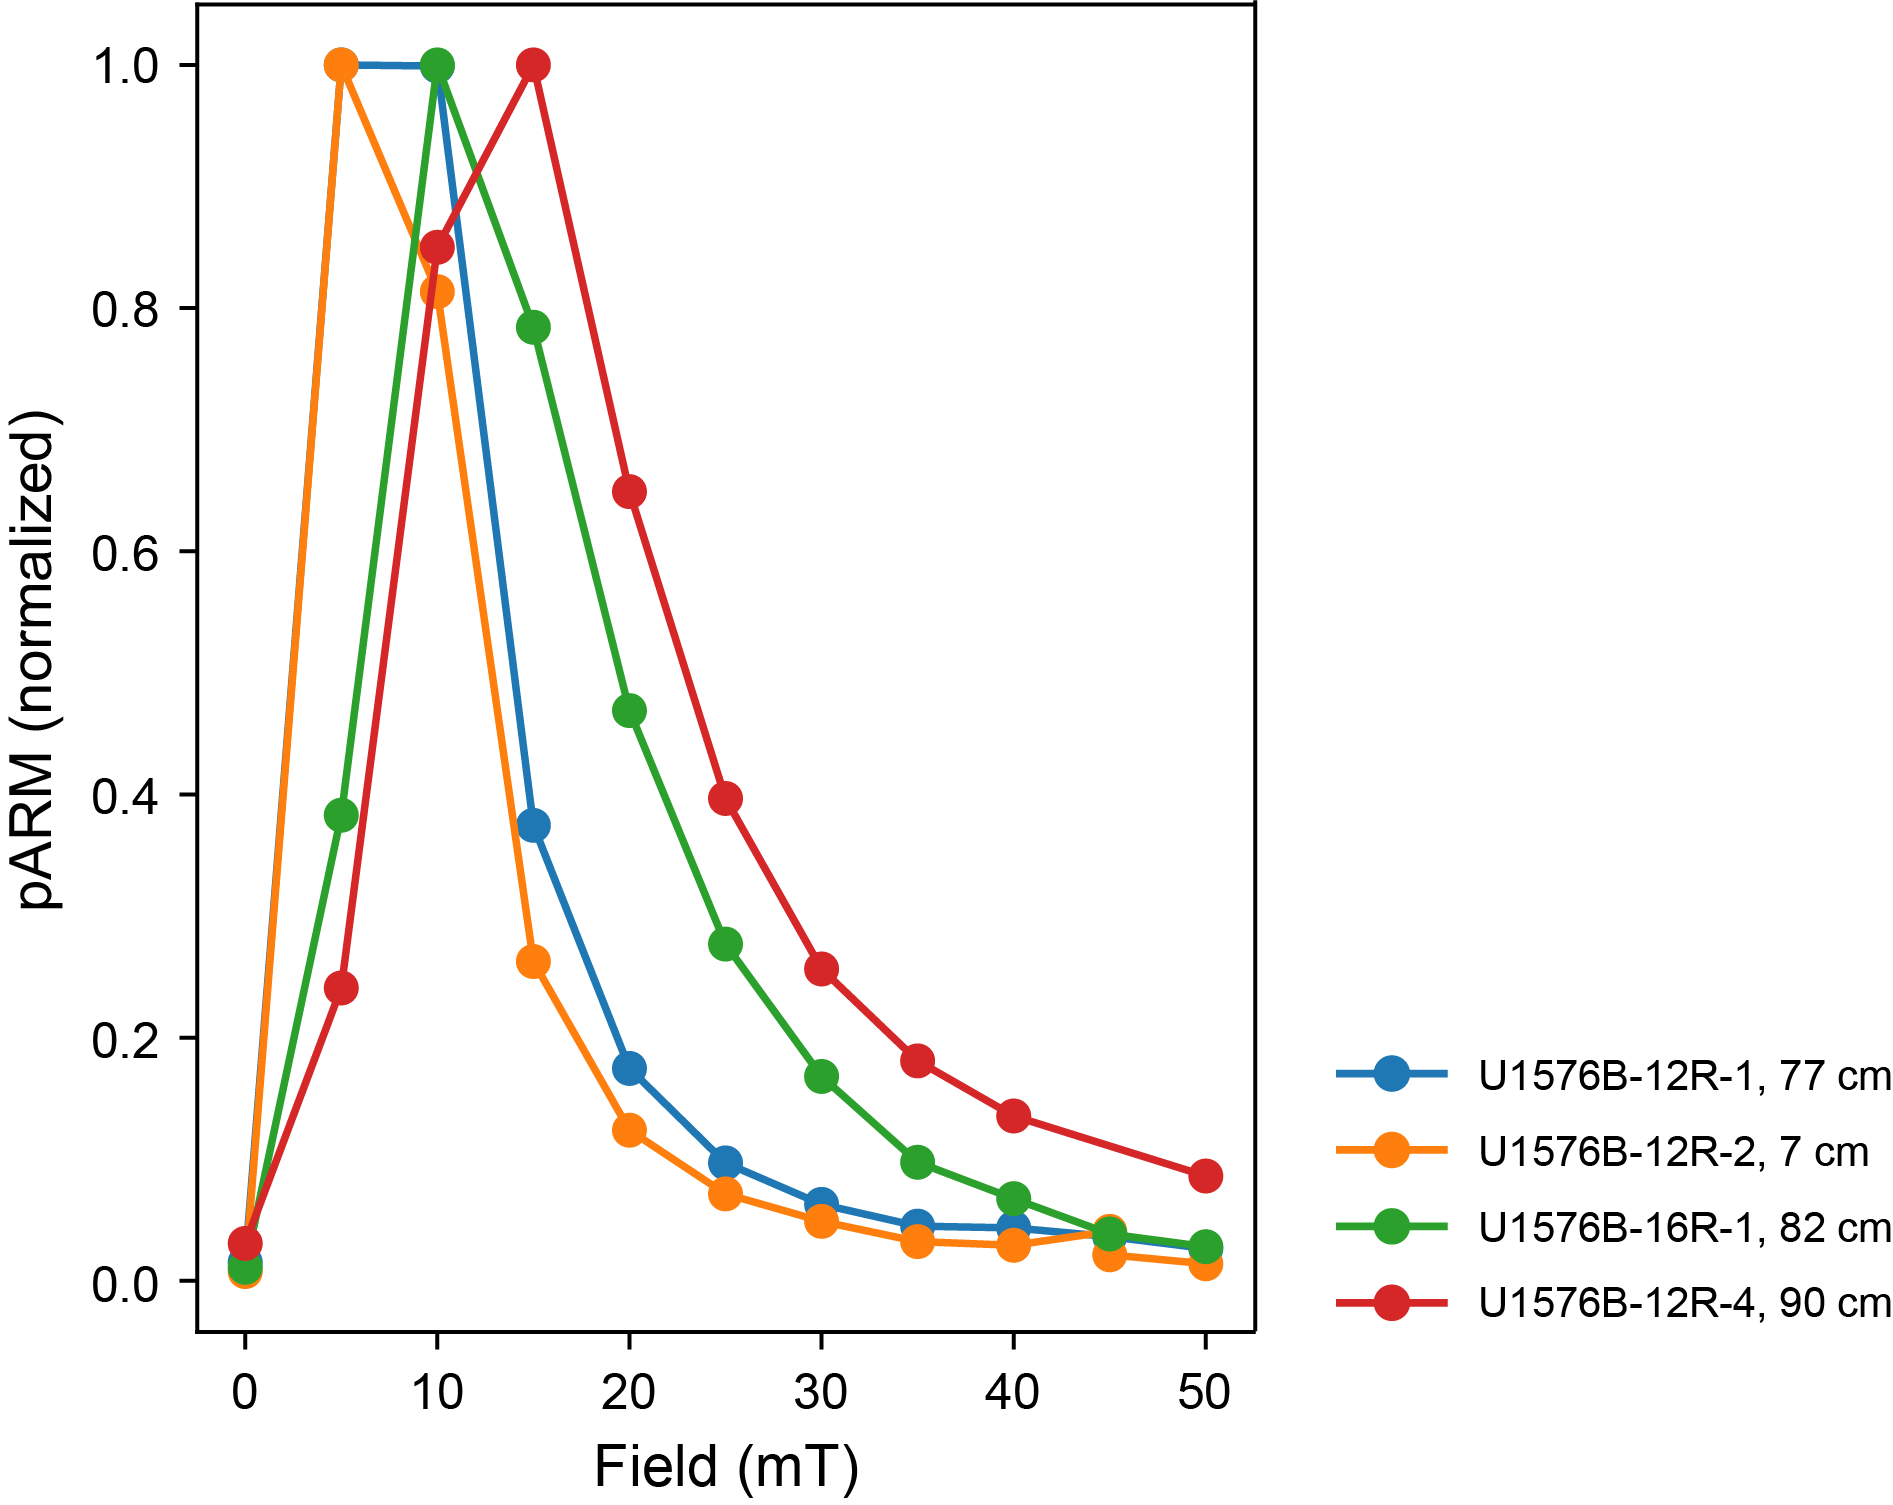
Figure F31. pARM acquisition.
7. Sediment and pore water geochemistry
7.1. Interstitial water chemistry
Interstitial water (IW) was collected from 46 whole-round samples from Hole U1576A (2.99–371.5 mbsf) for shipboard analyses. Chemical compositions of these samples were measured according to procedures outlined in Sediment and pore water geochemistry in the Expedition 391 methods chapter (Sager et al., 2023a). All results are presented in Table T4 and Figure F32.
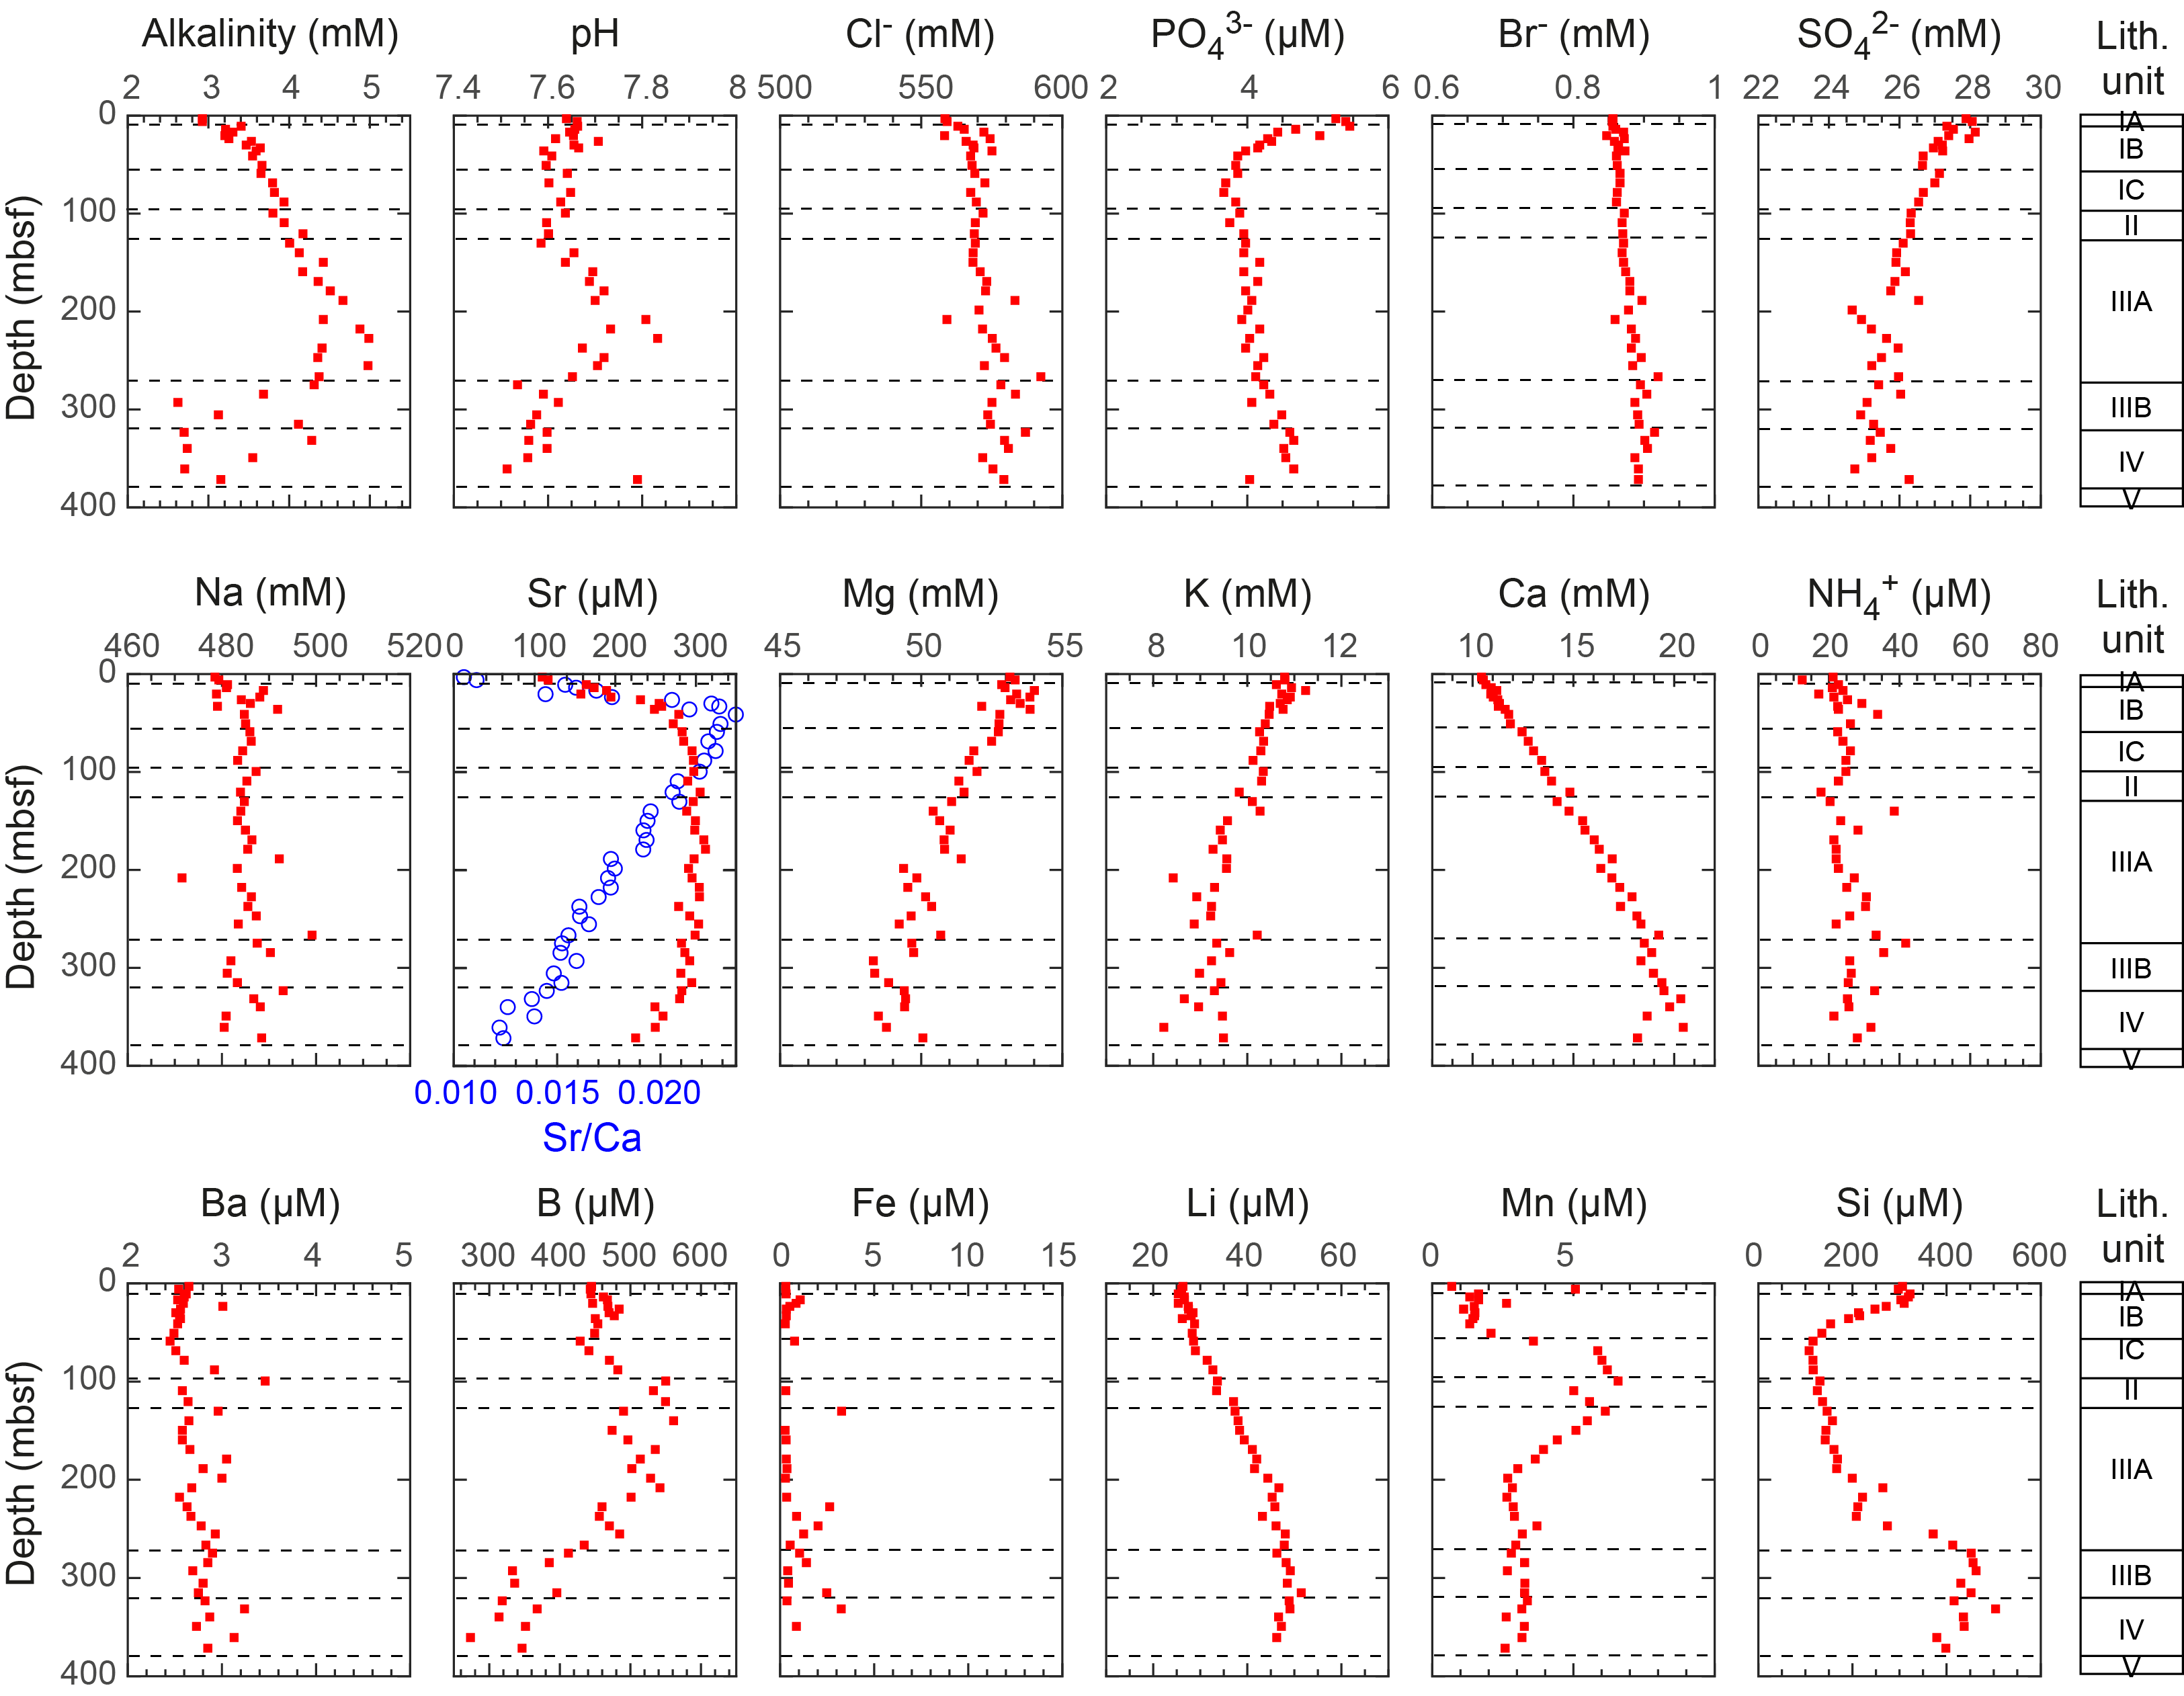
Figure F32. IW chemical compositions.
7.1.1. pH, alkalinity, chloride, and sodium
The pH value of IW at Site U1576 ranges 7.56–7.81. pH is nearly constant in Lithostratigraphic Units I and II (2.99–120 mbsf) with an average of 7.63 ± 0.02 (1σ standard deviation). In Subunit IIIA, pH starts to increase toward the maximum of 7.81 at 208 mbsf. Below this depth, pH declines gradually to 7.51 through the lower part of Subunit IIIA and into Subunit IIIB and Unit IV (208–360 mbsf). IW alkalinity increases from 2.9 mM at ~3 mbsf to a maximum of 5.0 mM at the bottom of Subunit IIIA (227 mbsf). Below this maximum, alkalinity becomes more scattered but generally shows a decreasing trend to the minimum close to the bottom of the sedimentary succession (360 mbsf).
IW chloride concentration varies between 558 and 592 mM with an average of 572 ± 7 mM. A weak increasing trend of IW chloride concentration can be observed throughout the depth profile. IW sodium concentration is nearly uniform at Site U1576, ranging 474–494 mM with an average value of 485 ± 4 mM. Average chloride and sodium concentrations are close to mean values in the modern ocean (chloride = 559.5 mM; sodium = 480.7 mM) (Quinby-Hunt and Turekian, 1983), similar to Site U1575.
7.1.2. Calcium, lithium, magnesium, and potassium
IW calcium concentration is 10.4–10.5 mM above 10 mbsf, close to the modern ocean average value (10.60 mM) (Quinby-Hunt and Turekian, 1983). From the seafloor, calcium concentration increases nearly linearly to 20.4 mM in Lithostratigraphic Unit IV near the bottom of the sediment succession. IW lithium concentration displays a similar pattern as the calcium profile and increases from 26.3 µM at the seafloor, which is close to the modern seawater value (26.30 µM) (Quinby-Hunt and Turekian, 1983), to a maximum of 51.5 µM in Subunit IIIB. A slight decrease of lithium to 46.3 µM was observed in Unit IV.
IW magnesium concentration is 53.1–53.3 mM above 10 mbsf, which is also close to the modern ocean average value (54.00 mM) (Quinby-Hunt and Turekian, 1983). It shows a decreasing trend throughout the depth profile and reaches a minimum of 48.3 mM in Unit IV at the bottom of the sedimentary succession. The IW potassium trend is similar to that of magnesium. It decreases from 10.8 mM, close to the modern seawater value (10.50 mM) (Quinby-Hunt and Turekian, 1983), to a minimum of 8.2 mM in Lithostratigraphic Unit IV.
Site U1576 IW depth profiles of calcium, lithium, magnesium, and potassium concentrations are distinct from those at Site U1575, where depositional hiatuses may have occurred in the lower part of the sediment sequence, but they are similar to observations made at various Ocean Drilling Program Leg 208 sites on Walvis Ridge (Zachos et al., 2004). At Site U1576, the increase in IW calcium concentration is roughly 10 times that of Site U1575, suggesting that potential dissolution and reprecipitation of calcite were more intense at Site U1576. This could be related to the intense carbonate dissolution and reprecipitation associated with clay-rich sediment (Gieskes, 1981). Indeed, an enhanced clay content was observed in Lithostratigraphic Units II–IV at Site U1576, whereas the sediment section at Site U1575 consists almost entirely of nannofossil-foraminifera ooze (see Lithostratigraphy).
7.1.3. Strontium
IW strontium concentration increases from 110 µM just below the seafloor to 300 µM in Lithostratigraphic Subunit IC, remains relatively constant throughout Subunits IC–IIIB, and gently decreases in Unit IV. The IW strontium concentration profile is often the result of biogenic carbonate dissolution and subsequent reprecipitation (Baker et al., 1982). Because IW calcium concentration increases with depth, a typical dissolution-related IW strontium profile cannot be observed at Site U1576. However, the Sr/Ca value of IW reveals a peak at 32.9 mbsf, which is attributable to the peak rejection of strontium during dissolution of biogenic and reprecipitation of inorganic carbonates (Baker et al., 1982). This Sr/Ca peak is at a similar depth to that of IW strontium concentration at Site U1575.
7.1.4. Silicon, manganese, iron, sulfate, ammonium, and phosphate
IW silicon concentration at Site U1576 ranges 108–504 µM. It decreases from 306 µM at the seafloor to 134 µM at 50.8 mbsf at the bottom of Lithostratigraphic Subunit IB. Below this depth, IW silicon concentration gently increases toward the bottom of Subunit IIIA and abruptly peaks in the upper part of Subunit IIIB. The upper peak of the IW silicon concentration found in Unit I could be the result of biogenic silica dissolution, whereas the lower peak observed in Subunit IIIB could be due to the silica dissolution of volcanic sand and sandstone.
IW manganese concentration increases from 0.69 µM at the seafloor to the maximum value of 5.1 µM at 6.0 mbsf in Unit I. Below this sharp peak, a broad peak is found in Subunit IC and Unit II, with the maximum concentration of 6.6 µM at 99 mbsf and a decrease thereafter to 200 mbsf. IW manganese concentrations are consistently low in Subunit IIIB and Unit IV with a mean of 3.0 ± 1.5 µM. The broad peak of manganese found in the upper half of the sediment column indicates that Mn(IV)-reducing bacteria oxidize organic matter over this sediment succession (Brezonik and Arnold, 2011). IW iron concentration slightly increases to 1.3 ± 0.9 µM between 220 and 370 mbsf (Subunit IIIA–Unit IV) below the broad manganese peak, hinting that ferric oxides may be used as electron acceptors below the manganese reduction zone (Brezonik and Arnold, 2011). IW sulfate concentration gently decreases from 28.1 mM at 6.0 mbsf to 24.7 mM at 198 mbsf and remains relatively constant thereafter. The sulfate trend, distinctive from that at Site U1575, suggests that approximately 3.4 mM of sulfate was reduced to sulfide, which can potentially produce sulfides (Jorgensen et al., 2019). A uniform downhole concentration profile of ammonium is observed with an average of 26 ± 5.5 µM in the entire sedimentary succession. In the case of IW phosphate content, a shallow peak is observed in Subunits IA and IB. This peak is likely linked to biogenic silica dissolution, coinciding with the shallow peak of IW silicon concentration. Below the surface peak, a gentle increase of phosphate from 3.8 to 4.7 µM was observed in Units II–IV. A molar ratio of ammonium to phosphate in IW is 6:1, which is comparable to that of Site U1575.
7.1.5. Bromide, boron, and barium
IW contents of bromide and barium change little over the entire sediment depth range, with a mean concentration of 0.88 ± 0.02 mM for bromide and 450 ± 69 µM for barium. Boron concentration is relatively constant in Lithostratigraphic Subunits IA and IB, with a mean of 459 ± 14 µM. Below Subunit IB, a broad peak of IW boron with a mean value of 492 ± 42 µM is observed in Subunits IC–IIIA and then successively decreases to the bottom of Unit IV. The broad peak could be related to increased leaching from volcanic sands observed in these depth intervals (Deyhle and Kopf, 2002).
7.2. Hydrocarbons in gas phase
Gas phase samples were analyzed for C1 to C6 (methane, ethane, propane, butane, pentene, and hexane) for routine safety monitoring in Hole U1576A with a frequency of one sample per 9.6 m core. The concentration of methane in 38 headspace samples from Site U1576 was lower than 2.0 µL/L, which is at the atmospheric background level. No hydrocarbon gases higher than C1 were detected.
7.3. Sediment geochemistry
7.3.1. Total carbon, inorganic carbon, and organic carbon
Sediment samples were analyzed to determine the weight percent of CaCO3, total carbon (TC), total organic carbon (TOC), total nitrogen (TN), and total sulfur (TS) (Figure F33; Table T5). In Hole U1576A, the sampling frequency was one sample per core for Cores 1R–40R. In Lithostratigraphic Unit I, where sediment mainly consists of nannofossil-foraminifera ooze (see Lithostratigraphy), calcium carbonate content usually exceeds 88.4 wt% with a mean of 94.0 ± 3.80 wt%. Calcium carbonate content shows an overall decrease from its maximum content of 100% at 33 mbsf toward the bottom of Unit IV. The decreasing trend agrees with the lithology changes from foraminifera-nannofossil ooze to foraminifera-nannofossil chalk with clay that includes minor or rare layers of volcanic sand or sandstone. TC contents are nearly identical to inorganic carbon contents and have a narrow range of 10.7–11.8 wt% (11.3 ± 0.42 wt%) in Unit I. Farther downhole, TC content decreases to the bottom of Unit IV, similar to calcium carbonate content. TOC content in the sedimentary succession varies between 0 and 0.16% (0.09 ± 0.04%) in Unit I. In Units II–IV, TOC content generally increases, ranging 0–0.42 wt% (0.21 ± 0.13 wt%). TS and TN contents are below the instrumental detection limits for all samples.
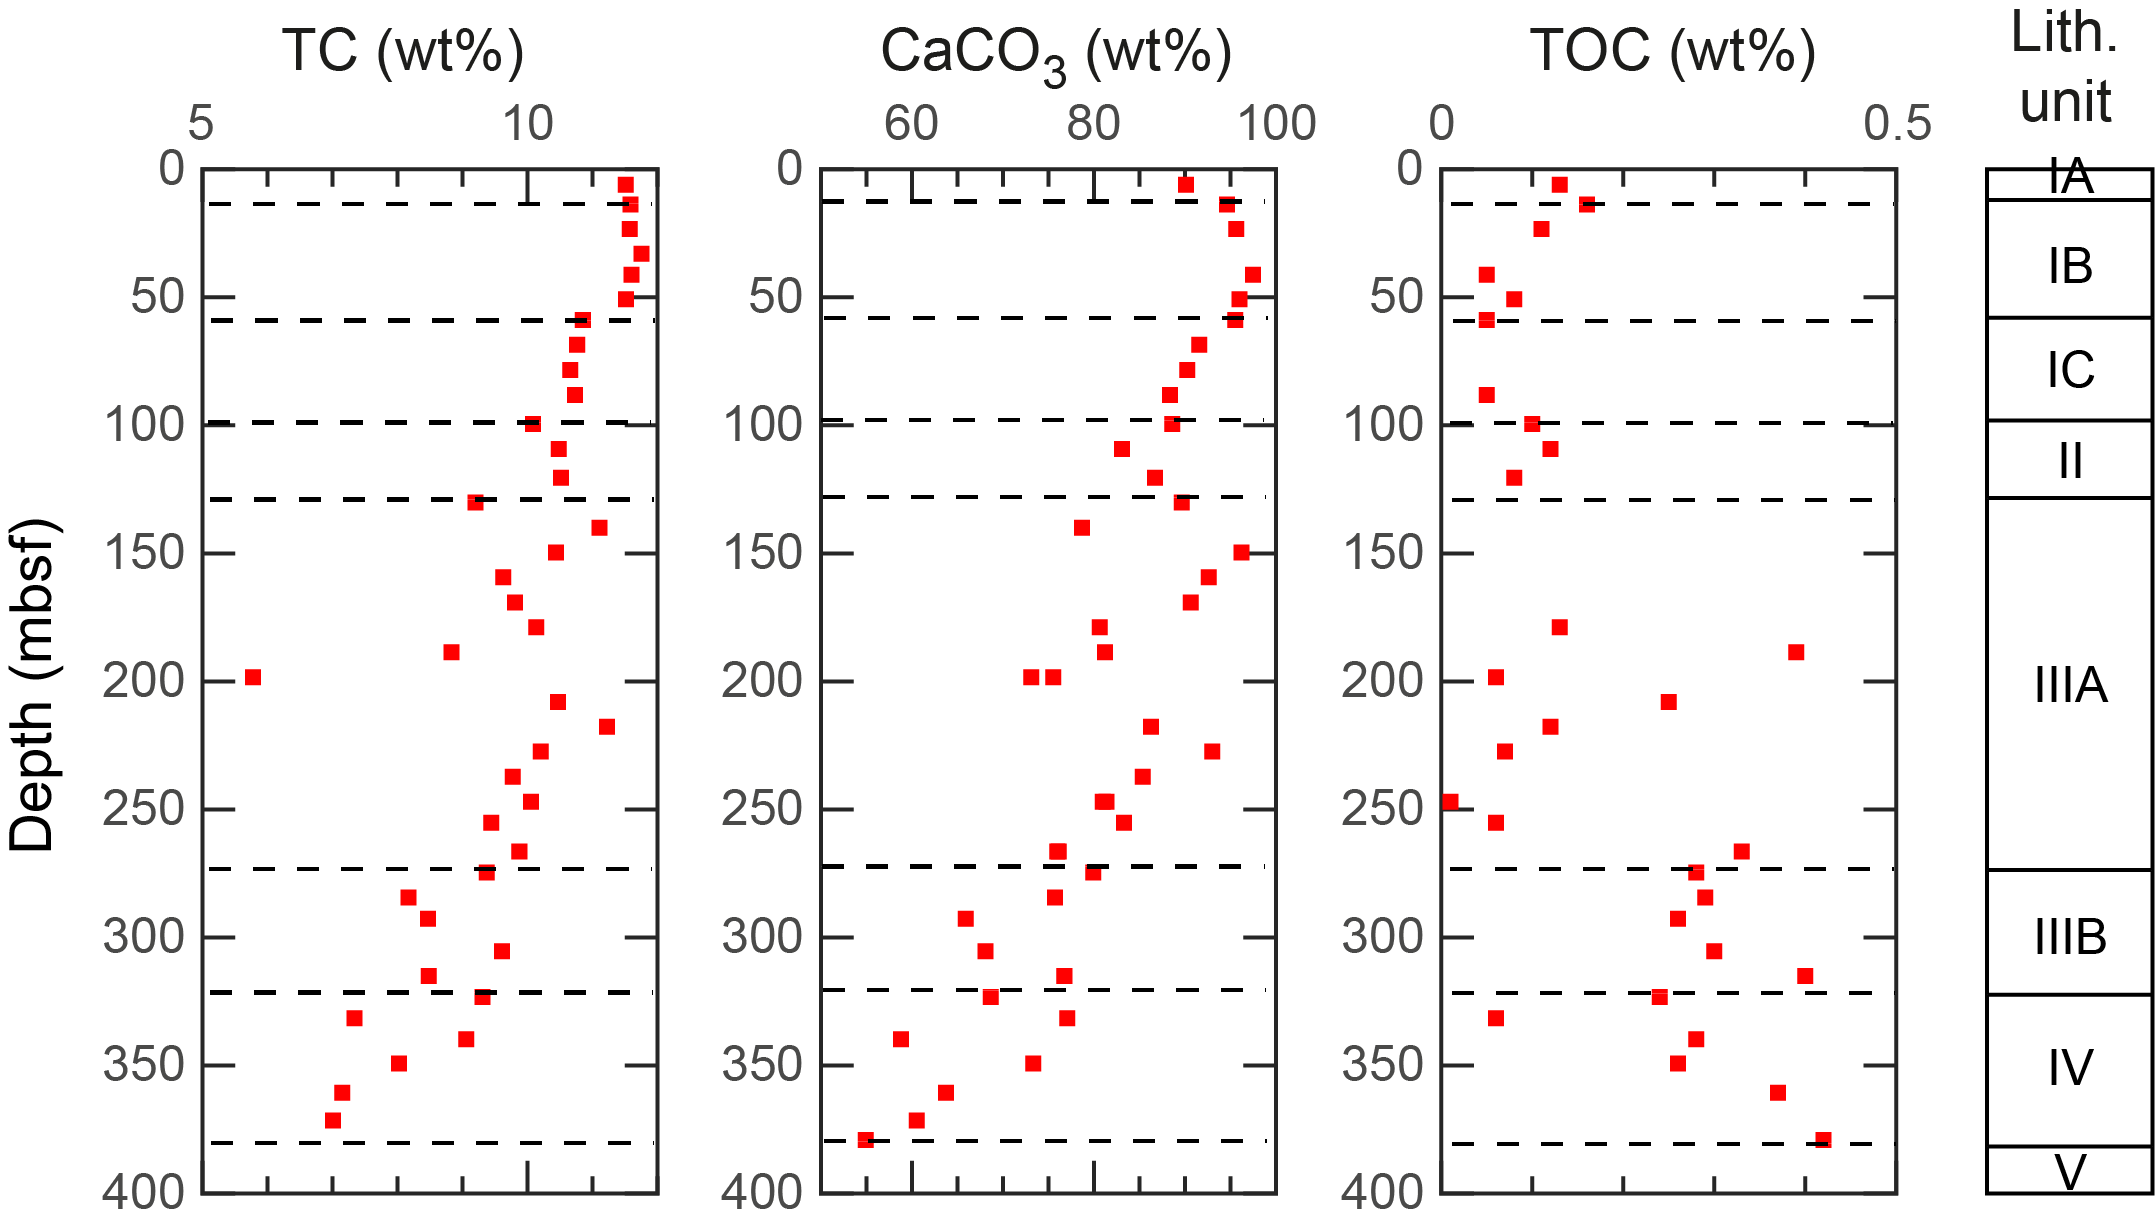
Figure F33. TC, CaCO3, and TOC.
8. Igneous geochemistry
Sample selection was based on variations of lithology, pXRF (Table T6) measurement results, and alteration extent (see Igneous petrology and volcanology). In total, 2 samples from Hole U1576A (40R-4, 117–119 cm, [381.49 mbsf] and 41R-2, 16–18 cm [388.52 mbsf]) and 10 samples from Hole U1576B, which cover the depth range from 385.84 mbsf (5R-4, 33–35 cm) to 449.82 mbsf (17R-5, 11–12 cm), were analyzed using inductively coupled plasma–atomic emission spectroscopy (ICP-AES) and pXRF (Tables T7, T8). Hole U1576B comprises 11 igneous units, some of which experienced intense alteration. Although we preferred to sample the freshest and least altered sections of distinct lithologies, several samples were obviously affected by varying degrees of alteration. The selected samples, however, are representative of the recovered lithologies from Holes U1576A and U1576B, which can be briefly described as follows.
- Hole U1576A:
- Igneous Unit 1: one sample from a highly phyric plagioclase-clinopyroxene basaltic sheet flow.
- Igneous Unit 2: one sample from an aphyric pillow basalt sequence.
- Hole U1576B:
- Igneous Unit 1: three samples from a thick stack of aphyric pillow lavas.
- Igneous Unit 2: one sample from a thin aphyric single pillow lava flow embedded in the overlying/underlying sediment.
- Igneous Unit 4: one sample from a massive aphyric sheet flow.
- Igneous Unit 5: one sample from single massive aphyric sheet flow.
- Igneous Unit 7: one sample from a sparsely to moderately phyric plagioclase-pyroxene basaltic sheet flow.
- Igneous Unit 10: two samples from moderately phyric plagioclase-pyroxene basaltic pillow lavas.
- Igneous Unit 11: one sample from a moderately phyric plagioclase-pyroxene basaltic sheet flow.
Major and trace element compositions were analyzed using ICP-AES and pXRF on all 12 samples (Tables T7, T8). Detailed sample preparation, analytical procedures, standards, calibration, and drift corrections are reported for both methods described in the Igneous geochemistry in the Expedition 391 methods chapter (Sager et al., 2023a). The total sums of the major element oxides in weight percentages acquired by ICP-AES range 96.7–102.9 wt%, which suggests there were still some issues with sample preparation. Similar to Site U1575, total iron was recalculated as Fe2O3t, and the major element oxide concentrations determined using ICP-AES were normalized to 100% on a volatile-free basis (Table T7). Normalized values are used for an improved comparison between the respective Expedition 391 sites and literature data from previous drill and dredge sites along the submarine TGW hotspot track (e.g., Le Maitre, 1962; Richardson et al., 1984; Weaver et al., 1987; Le Roex et al., 1990; Cliff et al., 1991; Willbold and Stracke, 2006; Class and le Roex, 2008; Salters and Sachi-Kocher, 2010; Rohde et al., 2013; Hoernle et al., 2015; Homrighausen et al., 2018, 2019). For Holes U1576A and U1576B, 9 and 50 pXRF measurements were conducted on archive-half sections (Table T6), respectively. Drift was monitored by running the BHVO-2 standard intermittently throughout the analytical process, and no instrumental drift was detected (Table T10 in the Expedition 391 methods chapter [Sager et al., 2023a]). Each point was usually analyzed twice to account for analytical error.
8.1. Comparison of ICP-AES and pXRF results
The ICP-AES and pXRF results display good to excellent linear correlation coefficients (Figure F34), with R2 ≥ 0.90 for TiO2, Fe2O3t, MnO, CaO, Cu, and Y, whereas K2O, Ni, and Zr have moderate correlation coefficients (R2 = 0.60–0.90). The difference between the two methods is relatively good (less than ±10% for K2O, Zn, and Y). The pXRF results are systematically higher for TiO2 and lower for Fe2O3t than those using ICP-AES, probably due to the secondary fluorescence effect in pXRF caused by Fe atoms, which decreases the Fe2O3t value compared to the actual value and increases the value of elements with masses similar to iron. CaO also shows systematically lower pXRF results, with the discrepancy increasing with increasing CaO content up to 30% compared to ICP-AES results. A similar trend, although less pronounced, is also observed for Zr and possibly Y. Ni values are significantly more dispersed than other elements due to a high relative standard deviation of ICP-AES measurements. Cr values obtained using pXRF are not considered because the Cr concentration of the sample is close to the detection limit of pXRF. For elements lighter than K, absorption has a significant effect on pXRF measurements, so data for these elements are not discussed here (Figure F34).

Figure F34. pXRF and ICP-AES results.
8.2. Alteration
The loss on ignition (LOI), an indicator for the degree of alteration, is relatively high for the majority of samples. Only 4 of 12 Site U1576 samples have LOI < 3 wt%, and the remaining 8 samples have LOI ranging 3.1–10.7 wt%, including three samples with LOI > 8 wt% (Table T7). Even if the rocks are presumably Late Cretaceous submarine samples, the LOI is relatively high, especially compared to Site U1575. Samples were divided based on petrographic evidence for alteration into two groups: slightly and moderately to heavily altered (Table T7; Figure F34). The slightly altered samples are characterized by their gray color and are often vesicle free, but many have disseminated sulfides or partly filled vesicles or veins filled with clay minerals, calcites, and/or secondary sulfides. The moderately to heavily altered group is defined by a brownish to reddish sawed section surface color that is most likely associated with oxidative alteration or by greenish discoloration commonly attributed to reductive hydrothermal fluids (Figure F35) (see Alteration in Igneous petrology and volcanology). LOI is variable but is highest in the moderately to heavily altered samples and lowest in the slightly altered samples (Table T7).
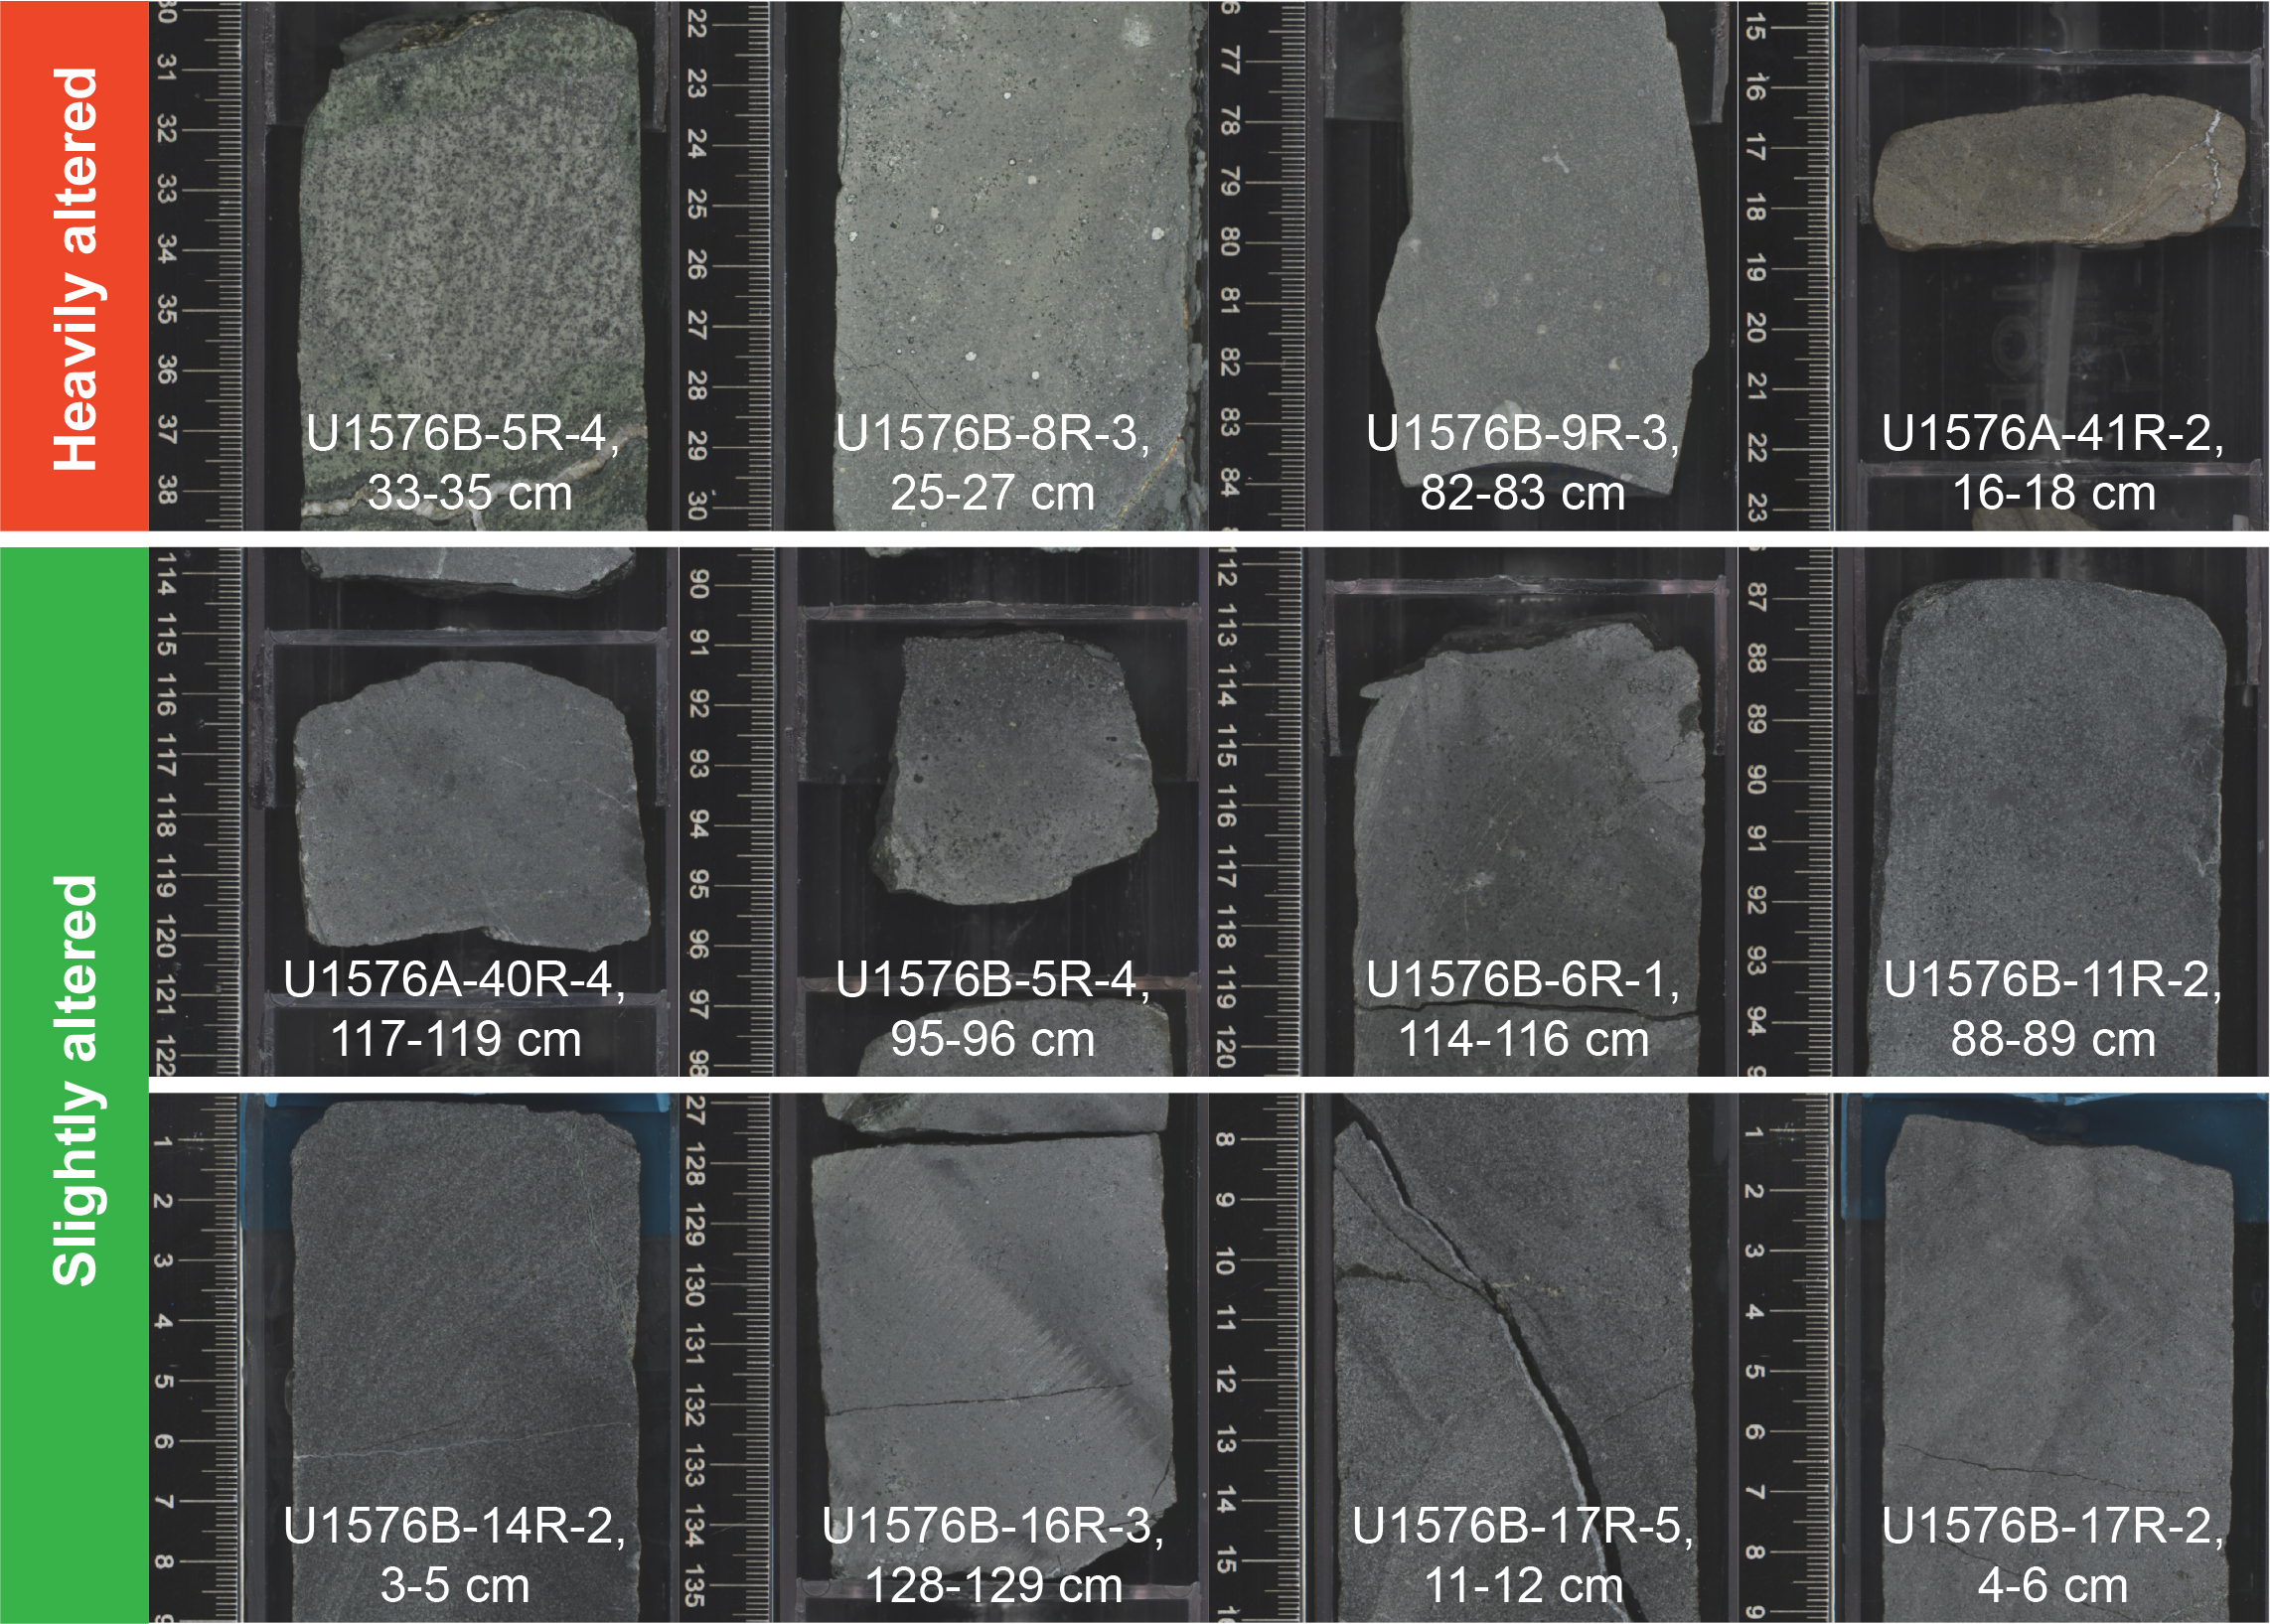
Figure F35. ICP-AES measurements.
Site U1576 samples with lower MgO (<3 wt%) are overall more altered than samples with higher MgO (up to 6 wt%) (Table T7). As expected, element concentrations of fluid-mobile oxides and elements, here most notably K2O, seem to be affected by seawater alteration (e.g., Jochum and Verma, 1996). The large scatter in fluid immobile element versus fluid mobile element diagrams, here TiO2 versus K2O, most likely reflects variable degrees of seawater alteration (Figure F36). TiO2 forms a good negative trend versus CaO and good positive correlations versus Na2O, P2O5, V, Y, and Zr (R2 > 0.9, excluding the moderately to highly altered samples), consistent with fractional crystallization of basaltic magmas. Interestingly, despite the good correlation of TiO2 versus Zr, the moderately to heavily altered samples form a separate trend subparallel to the trend of the slightly altered samples, possibly indicating some limited dilution of Zr due to the addition of mobile elements by seawater alteration. Because MgO shows relatively good negative correlations with oxides and elements of fluid-immobile elements for all samples (e.g., TiO2: R2 = 0.84; Y: R2 = 0.59; Zr: R2 = 0.73), MgO does not appear to have been appreciatively affected by alteration, despite the large range in LOI. Therefore, although some scatter in the data is most likely caused by seawater alteration, the major and trace element data can still be used with caution (especially for highly mobile elements such as K2O) to discuss the pristine geochemical systematics in the U1576 rocks.
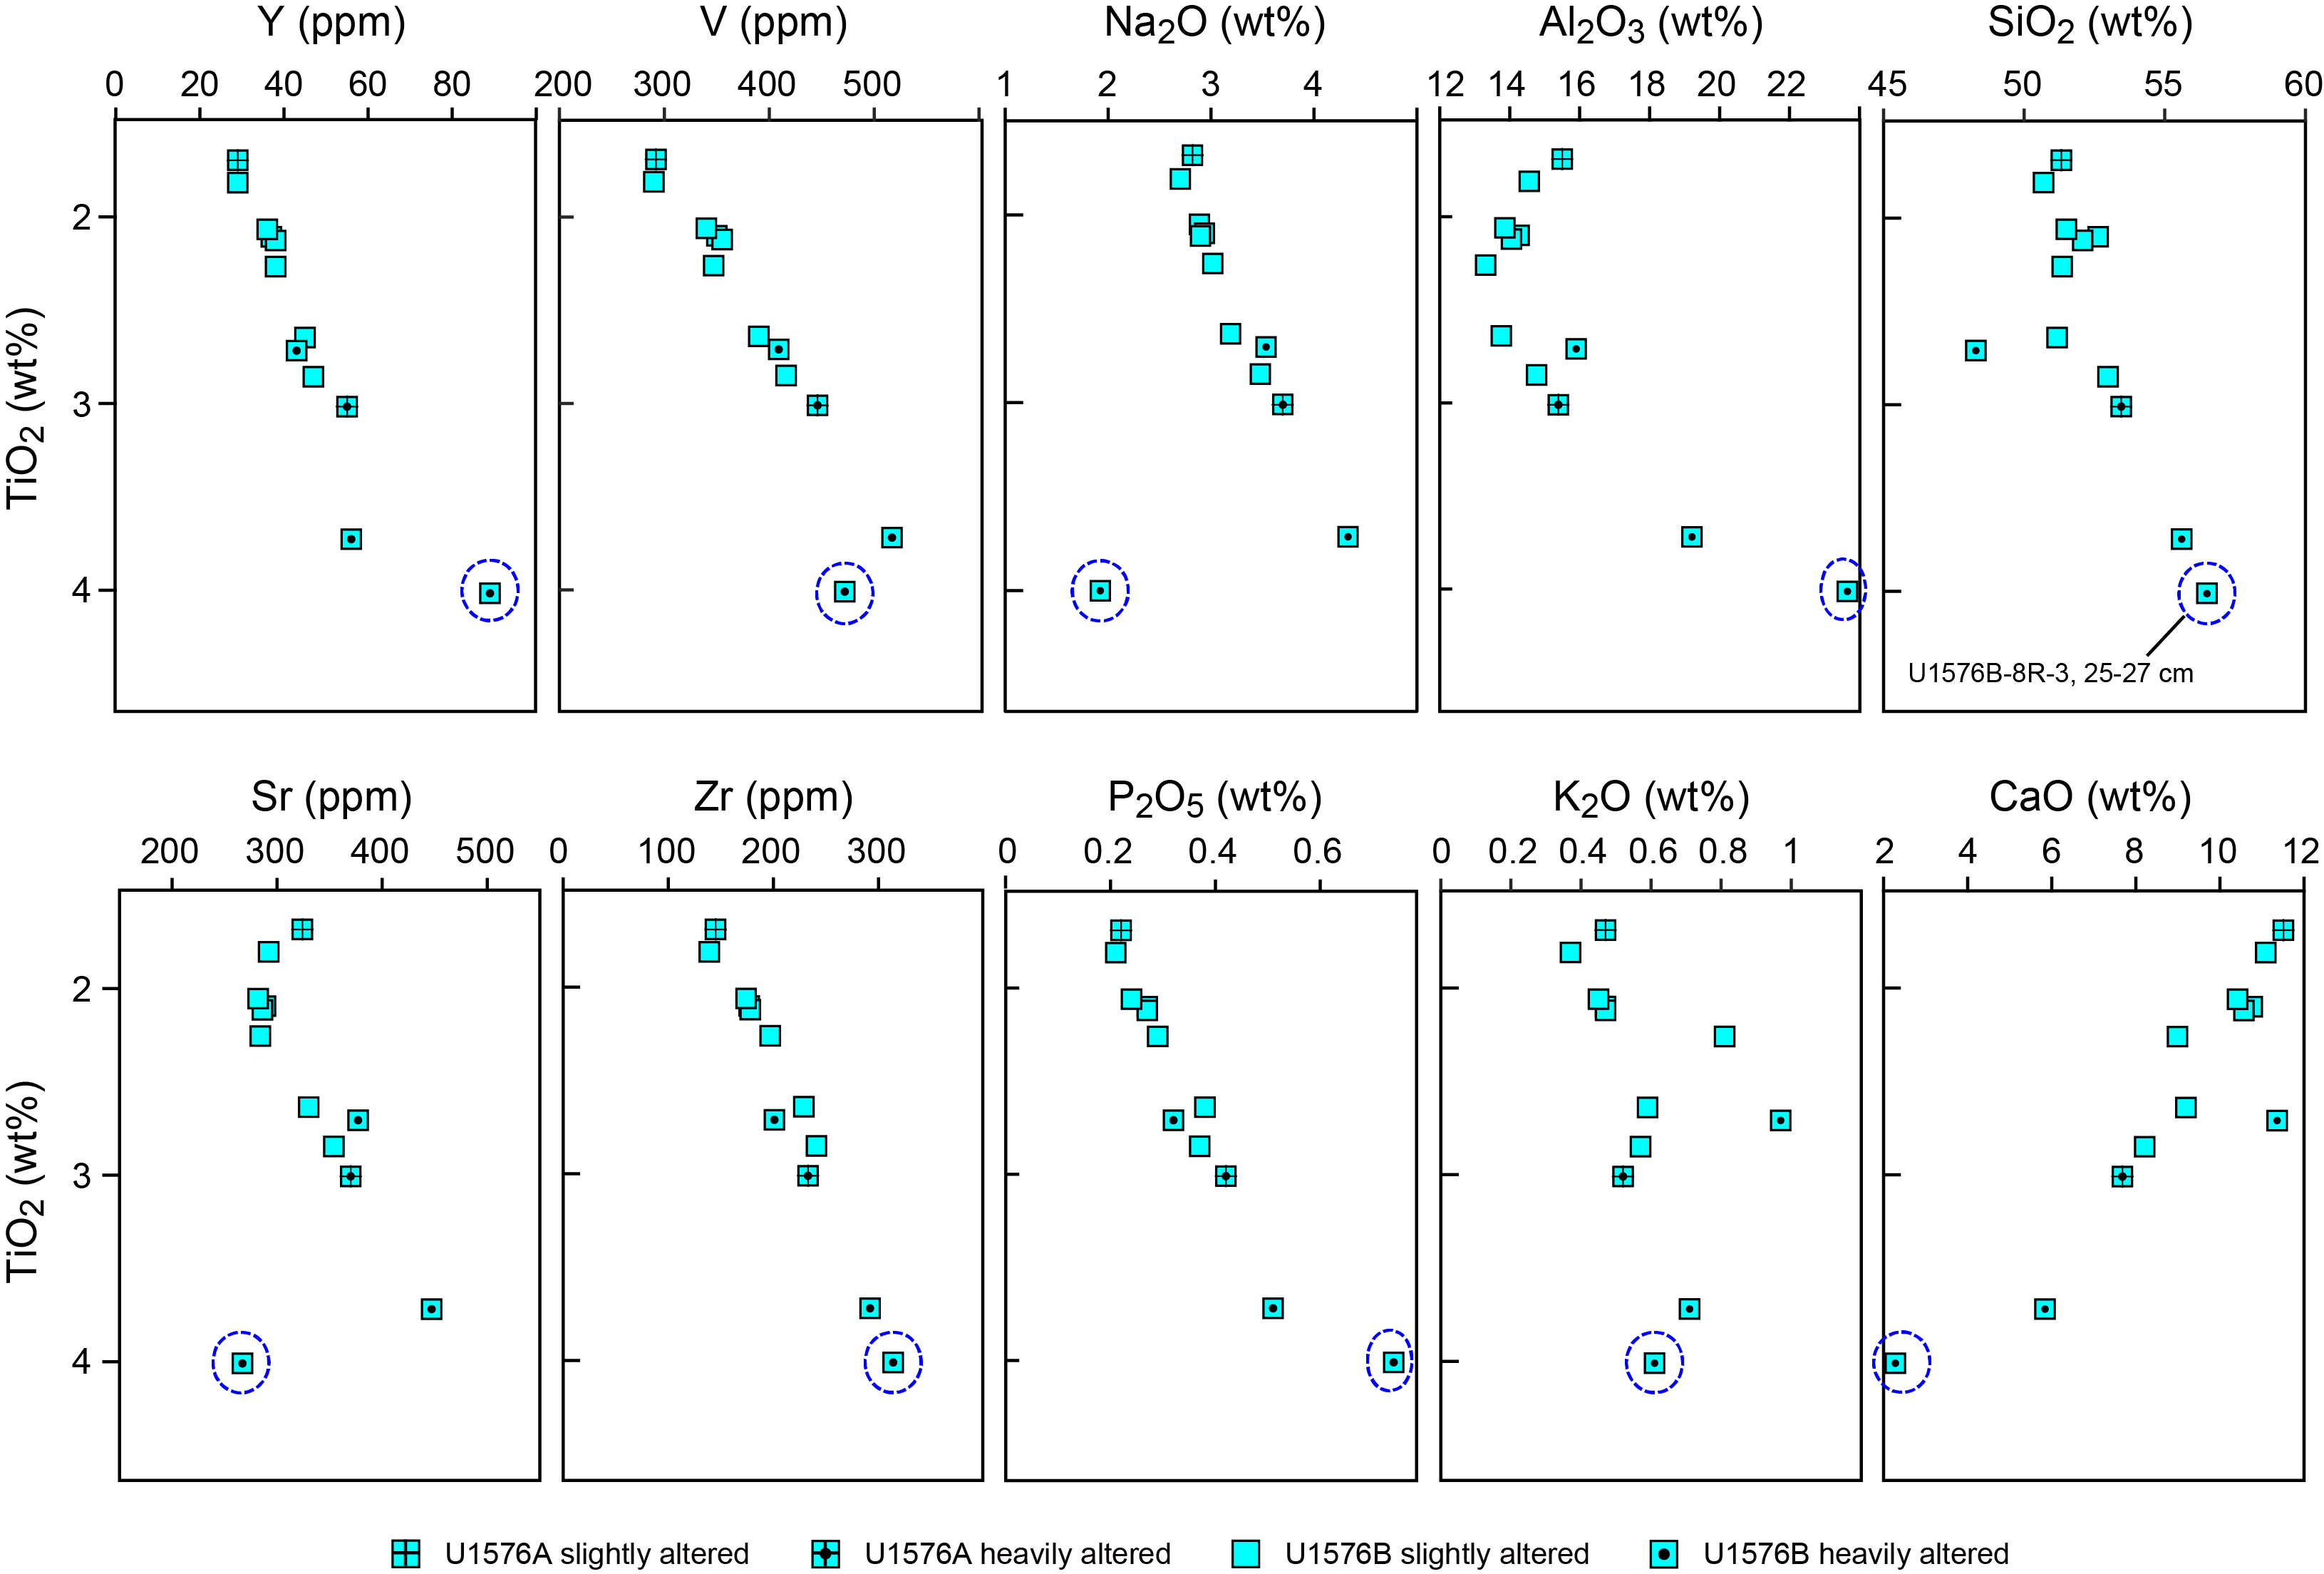
Figure F36. TiO2 vs. major element compositions.
8.3. Classification
On the total alkali versus silica (TAS) classification (after Le Bas et al., 1986), Site U1576 samples form a rough positive correlation between SiO2 and the alkalis, excluding the highly altered samples (denoted by dots in the middle of the respective symbols). The fresher samples range from tholeiitic basalt to mafic basaltic andesite (Figure F37A). Site U1576 is rich in Na2O and low in K2O, and the possible alkali addition through seawater alteration appears to be limited to K2O based on the correlations with TiO2 (Figure F36). This leads us to believe that the TAS classification of Site U1576 samples is, with the exception of the most altered samples, not substantially affected by seawater alteration, and the positive correlation indicates limited fractional crystallization, which is consistent with the other major element variations. Only one other sample reported from the TGW hotspot system thus far has a basaltic andesitic composition (Le Maitre, 1962; Richardson et al., 1984; Weaver et al., 1987; Willbold and Stracke, 2006; Salters and Sachi-Kocher, 2010; Rohde et al., 2013; Hoernle et al., 2015; Homrighausen et al., 2019; le Roex et al., 1990; Cliff et al., 1991). This is in contrast to Site U1575 samples, which straddle the alkalic/tholeiitic boundary line of MacDonald and Katsura (1964). All samples from Site U1576 lie in the tholeiitic field.

Figure F37. Alkali versus silica and Ti vs. V classifications.
On the Ti versus V classification diagram after Shervais (2022), all basalt and basaltic andesite lavas from Site U1576 lie within the mid-ocean-ridge basalt (MORB) array and the overlapping field of ridge-centered ocean island basalt (OIB) (Figure F37B). The intermediate Ti/V values (35–50) are only slightly higher than the values for Site U1575 (27–40), which also lie within the MORB and mid-ocean-basalt–centered OIB arrays. Site U1576 Ti/V values overlap with the previously reported tholeiitic EMI-type (Zindler and Hart, 1986) lavas from Walvis Ridge and Walvis Ridge DSDP sites, which were interpreted as the result of plume-ridge interaction (e.g., Richardson et al., 1984; Gibson et al., 2005; Homrighausen et al., 2019). In contrast, the late-stage or rejuvenated high μ (HIMU), or high time-integrated 238U/204Pb mantle with radiogenic Pb isotope ratios, samples from Walvis Ridge and EMI-type samples from Tristan and Gough Islands and Guyot Province have overall higher Ti/V values and lie within the OIB array or intraplate setting.
8.4. Bivariate element plots
The basalt and basaltic andesite lavas from Site U1576 have normalized SiO2 values of 48.3–56.5 wt% and MgO contents of 2.1–6.5 wt% and trend toward more evolved compositions compared to Site U1575 basalts (SiO2 = 47.1–50.8 wt%; MgO = 5.0–7.2 wt%). The lavas from Site U1576 have similar major and trace element concentrations to those from Site U1575 but trend to slightly higher SiO2, TiO2, V, Y, Zr, Sr, and Ba values and slightly lower Mn, Sc, Cr, Ni, and Cu concentrations with decreasing MgO (Figure F38; Table T7). On the bivariate diagrams with MgO plotted against the other major and trace elements, the Site U1576 rocks generally lie within the compositional array of the previously reported dredge and DSDP site samples from Walvis Ridge of the Tristan-Gough hotspot track (Figure F38), whereas highly altered Sample 391-U1576B-8R-3, 25–27 cm, displays deviating Al2O3, MnO, CaO, Na2O, Sr, Y, and Ba values (Figure F38; Table T7).
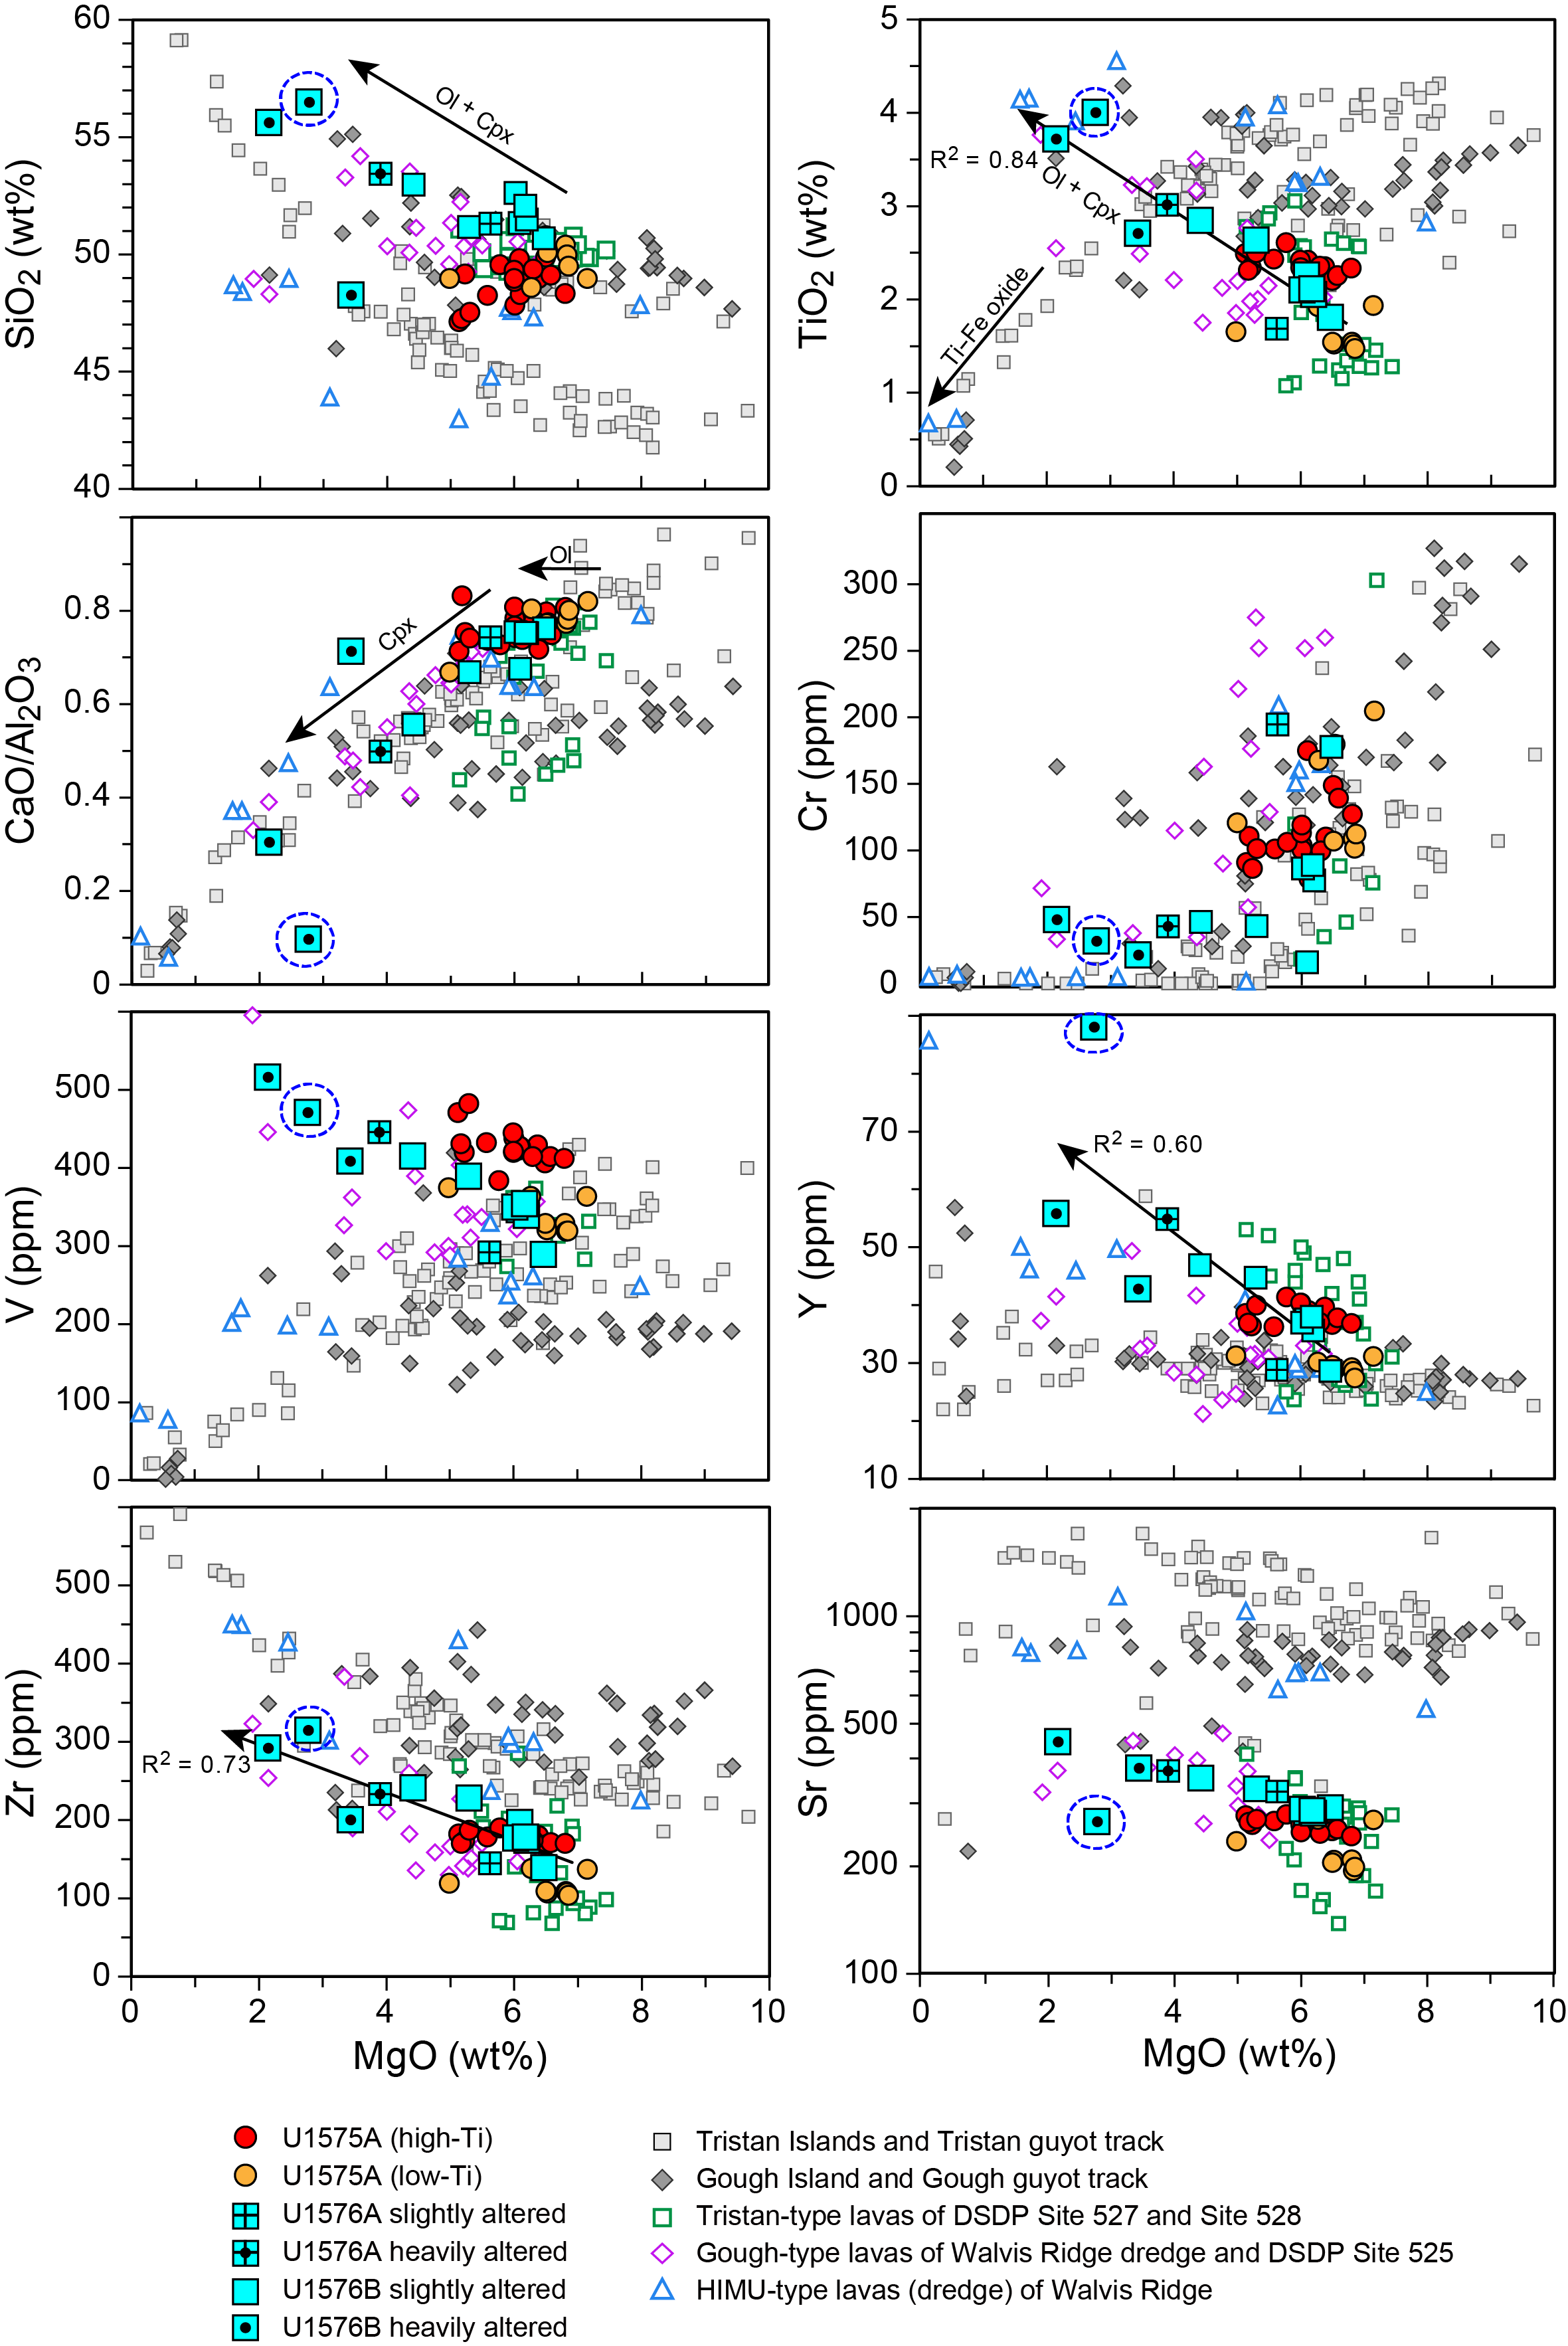
Figure F38. MgO vs. major element compositions.
Major and trace element variations are overall consistent with crystal fractionation of ferromagnesian minerals, Cr-spinel, and minor plagioclase (Figures F36, F38; Table T7). Fractionation of olivine is indicated by decreasing MgO and Ni, although olivine is no longer observed as a phenocryst phase in these more evolved and partly aphyric magmas. Cr shows a crude positive correlation with MgO, suggesting fractional crystallization of olivine together with Cr-spinel. Pyroxene fractionation is indicated by decreasing CaO and CaO/Al2O3, although Sc appears to display incompatible behavior. Although plagioclase is a phenocryst phase, there is an increase in Sr with decreasing MgO, suggesting that plagioclase fractional crystallization is limited. Interestingly, V correlates well with MgO and TiO2 at Sites U1575 and U1576, but the trends are offset and Site U1576 has a slightly lower V concentration at a given Ti concentration (Figure F37B). This discrepancy may be caused by different degrees of partial melting, with Site U1576 lavas having formed by lower degrees of melting. However, a general enrichment of incompatible elements in Site U1576 compared to Site U1575 is not observed, possibly indicating compositional differences of their sources.
8.5. Downhole variations
Two igneous units were identified in Hole U1576A, and 11 igneous units were identified in Hole U1576B (Figure F39). Because of the close proximity of the two drill holes, the uppermost pillow sequence in the two holes (Igneous Unit 2 in Hole U1576A and Igneous Unit 1 in Hole U1576B) may be part of the same flow sequence, as suggested by core description (see Igneous petrology and volcanology). This correlation is supported by a similar geochemical composition (Figure F39).

Figure F39. Downhole chemical variations.
The geochemical variations with depth at Site U1576 do not show clear systematic trends. If the highly altered samples are excluded, there does seem to be a slight increase in MgO downhole with the highest MgO (6.0–6.5 wt%) and lowest SiO2 (50.7–52.6 wt%) located at the base of the hole. The other elements, including immobile elements, do not appear to show systematic variations downhole (Figure F39).
In general, the geochemical systematics of Site U1575 can be divided into high-Ti units (TiO2 = 2.2–2.6 wt%) and low-Ti units (TiO2 = 1.5–1.76 wt%). The ICP-AES analyses of Hole U1576A yield a TiO2 content of 1.7 wt% in Igneous Unit 1 and 2.9 wt% in Unit 2, which could represent a change from low- to high-Ti signature (Figure F39). The TiO2 value, however, is slightly higher than the low-Ti unit of Site U1575, but it is also significantly lower than the high-Ti signature. The majority of rocks from Hole U1576B have a high-Ti signature with TiO2 values between 2.3 and 4.0 wt%, whereas Units 7, 10, and 11 have a low to intermediate TiO2 content of 1.8–2.1 wt% (Figure F39). Taking differentiation, the degree of alteration, and pXRF data into account, a clear low-Ti signature is not observed.
9. Physical properties
Physical properties measurements were made on recovered whole-round and half-round sections and discrete cube and wedge samples from Holes U1576A and U1576B in the core laboratory.
Physical properties measurements from Hole U1576A identified two distinct units (Figure F40). The sedimentary unit begins as calcareous ooze and grades to more cohesive chalk and limestone to ~380 mbsf. Below this depth, the igneous unit comprises basalt massive and pillow flows to the bottom of the hole at ~393 mbsf. MS, gamma ray attenuation (GRA) bulk density, and natural gamma radiation (NGR) values follow similar trends from the seafloor to the sedimentary/igneous contact at ~380 mbsf. However, peaks in NGR and MS logs appear to correlate to volcaniclastic deposits (e.g., from ~95 to ~280 mbsf) and align with Section Half Multisensor Logger (SHMSL) reflectance values over the same interval. All three data sets display a broad cyclical trend from ~95 to ~280 mbsf.

Figure F40. Physical properties.
Hole U1576B was cored from 365 to ~451 mbsf. The uppermost sediments (likely calcareous ooze) were drilled without core recovery to prioritize basement recovery. Physical properties measurements appear to record contacts between three dominant lithologies (interbedded basalts, chalks, and limestones), and the upper sediment/basalt contact is imaged at ~385 mbsf. MS and GRA bulk density trends and lithologic observations at 371 mbsf in Section 391-U1576A-39R-3 and at 374 mbsf in Section 391-U1576B-11R-3 appear to correlate the two holes (see Magnetic susceptibility; Figure F41).
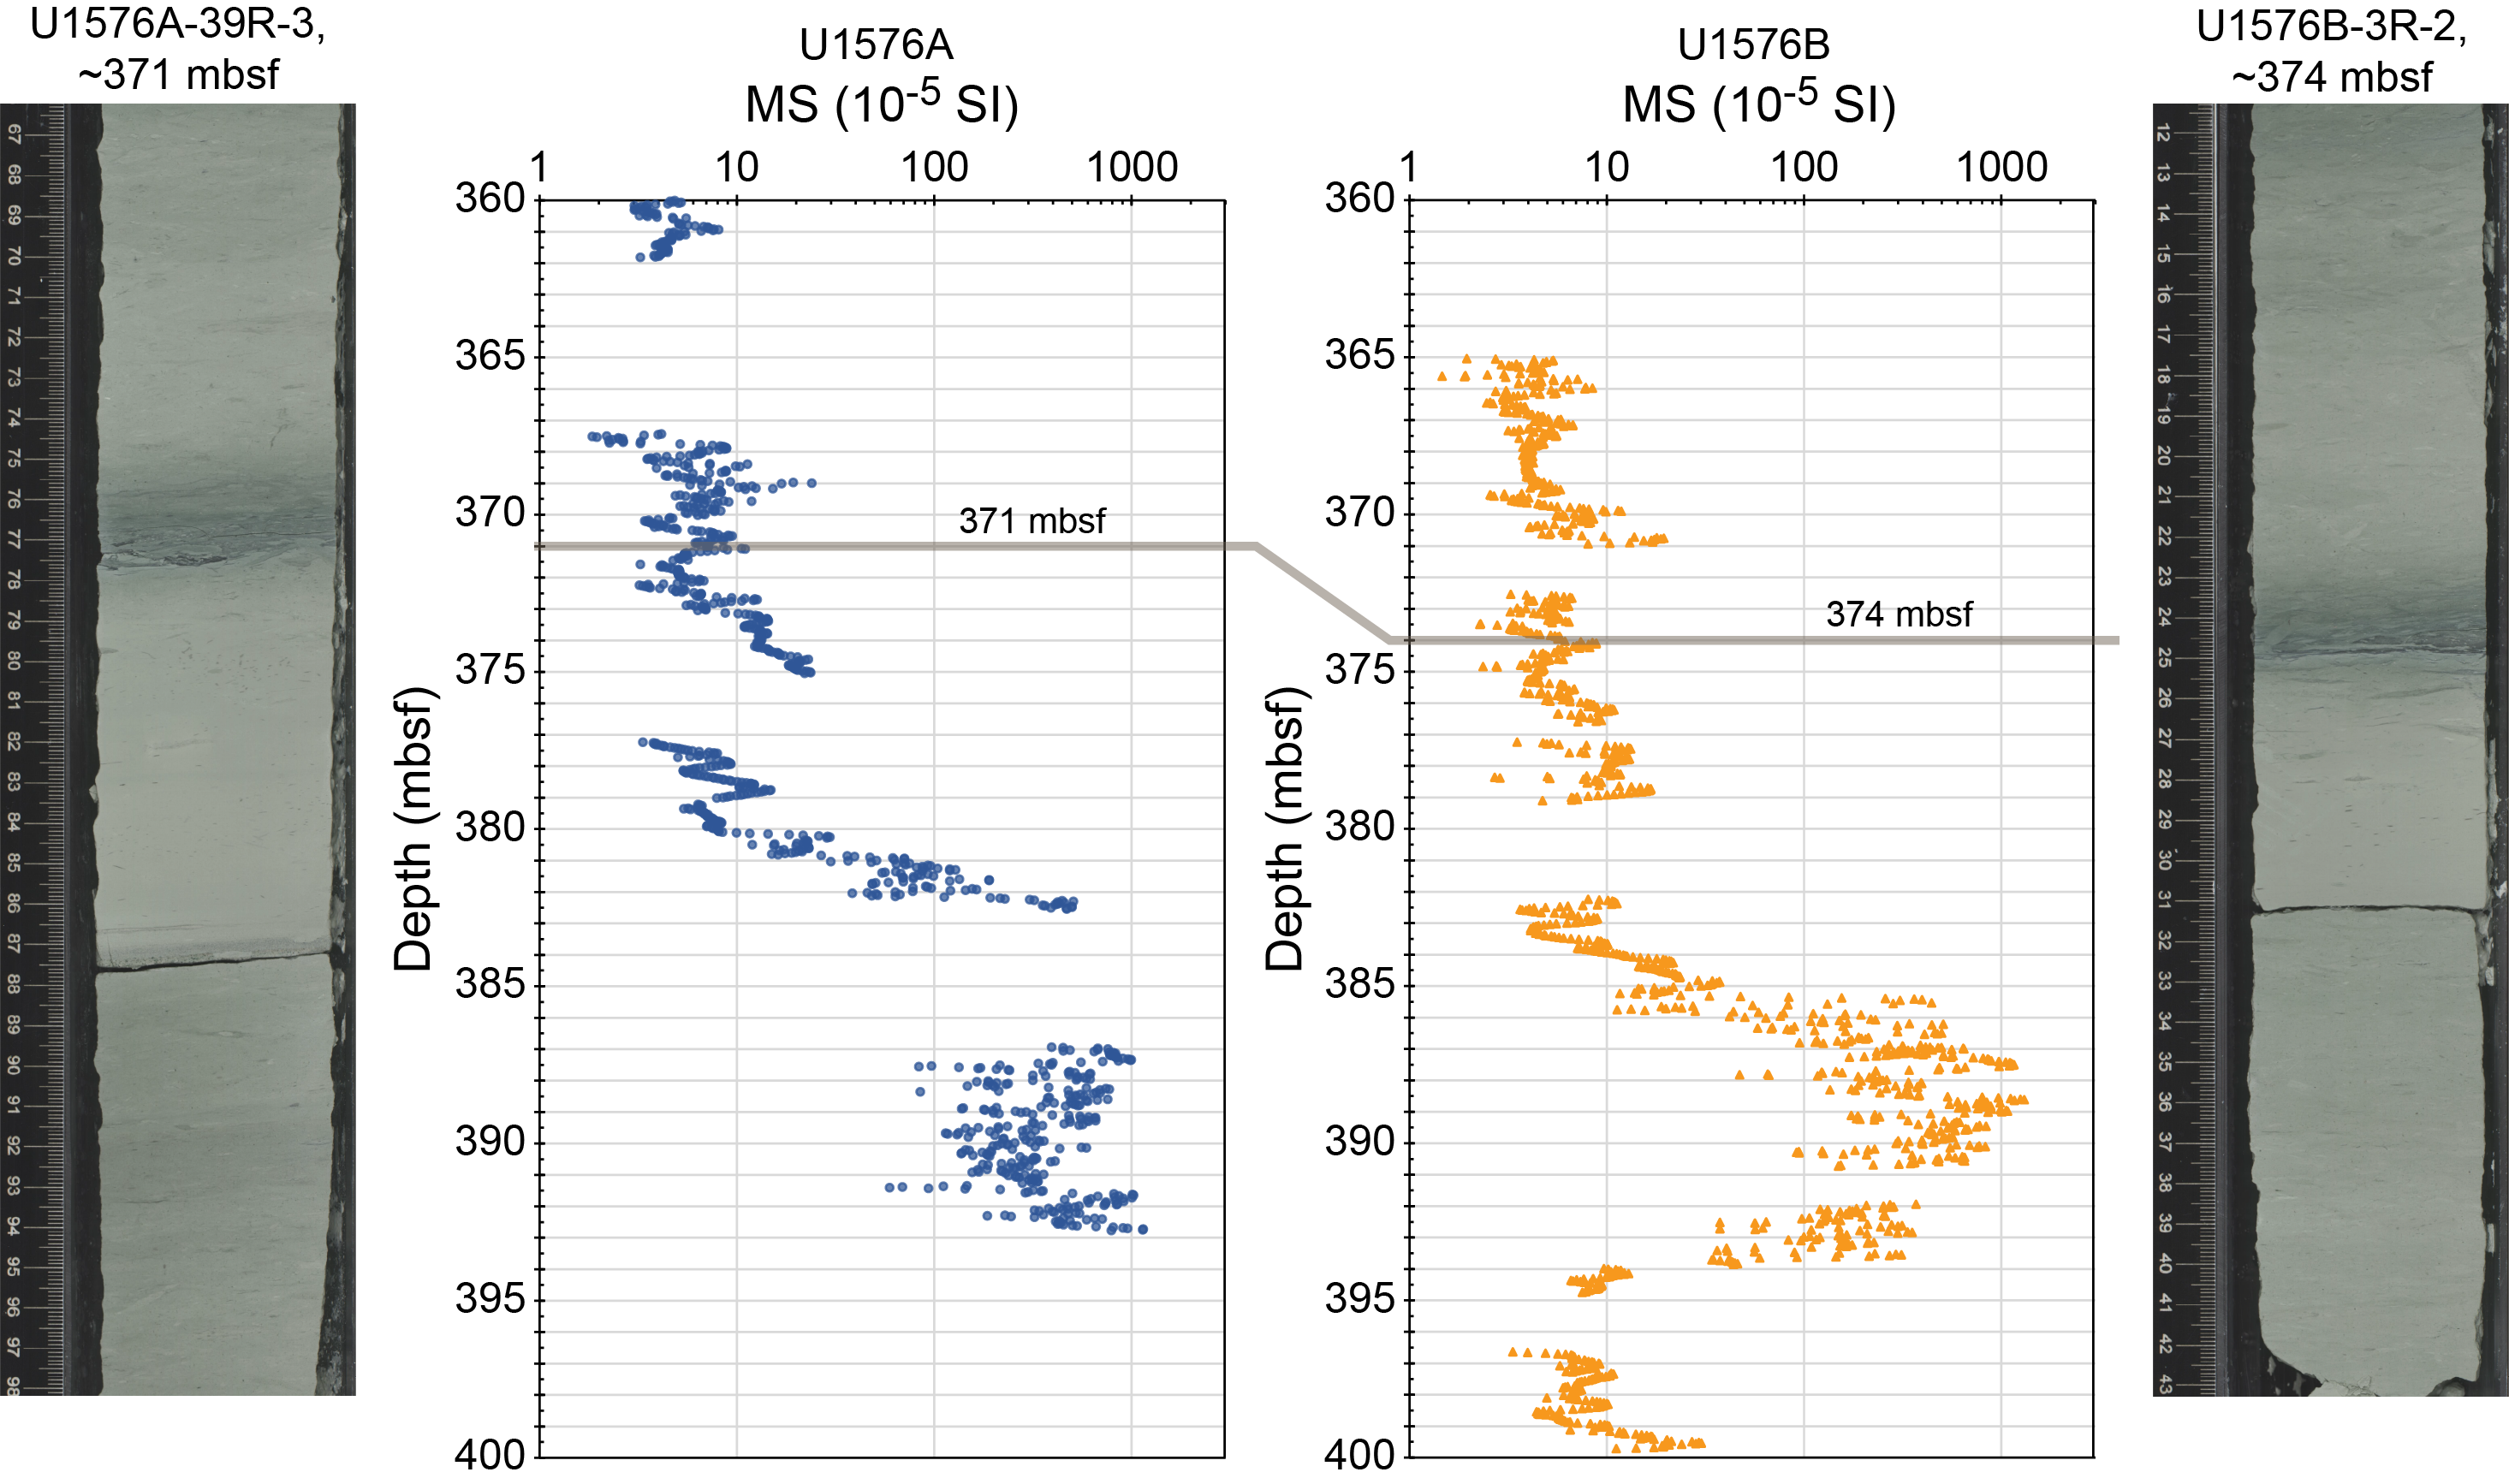
Figure F41. Lithologic and MS correlation.
9.1. Data acquisition
Measured physical properties and measurement procedures are described in Physical properties in the Expedition 391 methods chapter (Sager et al., 2023a). Each whole-round core was measured for GRA bulk density, P-wave velocity (x- and y-axis), and MS on the WRMSL and NGR on the NGRL. Point magnetic susceptibility (MSP) measurements of section halves were obtained using the SHMSL. Thermal conductivity measurements were obtained from whole-round sediment cores containing unconsolidated sediment using the needle probe. Shear stress measurements were obtained using the automated vane shear stress (AVS) instrument, and y- and z-axis P-wave velocities were measured using the P-wave bayonet (PWB) on the Section Half Measurement Gantry (SHMG) system from the same general intervals in representative section halves. Local measurements (thermal conductivity on lithified units, moisture and density [MAD], PWB, and P-wave caliper [PWC]) of section halves and discrete samples were taken within each representative sedimentary and igneous unit at a rate of at least one sample per core. As for Site U1575, the higher resolution sampling plan is important for identifying and tracking physical properties variations with depth. These measurements are particularly important for correlating between Holes U1576A and U1576B and with lithologic, paleomagnetic, and geochemical data sets.
9.2. Thermal conductivity
Within the sedimentary unit, thermal conductivity for Hole U1575A ranges 0.836–1.81 W/(m·K) with a mean of 1.36 ± 0.11 W/(m·K) (1σ standard deviation, used throughout) (Figure F40). Thermal conductivity values are fairly consistent within sediment and basalt units, and the transition from sediment to basalt appears to be represented by gradual increases in thermal conductivity with depth. At the calcareous ooze/chalk contact (Lithostratigraphic Subunit IC/Unit II boundary; 96.83 mbsf), values increase from 1.19 to 1.35 W/(m·K). In the chalk interval, values increase from ~1.35 to 1.54 W/(m·K). At the sediment/basement interface, thermal conductivity increases slightly from 1.54 to 1.80 W/(m·K). The calcareous ooze–chalk interval is represented by thermal conductivity values of 0.338–1.71 W/(m·K) (mean = 1.40 ± 0.20 W/[m·K]), and basalt in Hole U1576A has thermal conductivity values ranging 1.52–1.81 W/(m·K) (mean = 1.62 ± 0.14 W/[m·K]).
In Hole U1576B, thermal conductivity values show larger variation than in the uppermost sediment/basalt contact at ~385 mbsf, and they correlate to chalk or limestone interbeds. Interbedded sediments are recorded by thermal conductivity values of 1.47–1.85 W/(m·K) (mean = 1.69 ± 0.06 W/[m·K]), whereas basalts range 1.40–1.61 W/(m·K) (mean = 1.52 ± 0.06 W/[m·K]).
9.3. Rheology
Sediment shear strength was measured with the AVS system in the calcareous ooze interval of Hole U1576A. Shear strength increased from 2.80 to 7.46 kN/m2 from the seafloor to 100 mbsf. AVS is not suitable for measuring shear strength in lithified sediments; hence, AVS measurements were not collected below ~100 mbsf in the chalk interval of U1576A or in any of the sedimentary intervals in Hole U1576B.
9.4. Magnetic susceptibility
MS and MSP show good agreement in Hole U1576B and general agreement in Hole U1576A (Figure F40). Measurements from both instruments are reported in SI × 10−5. Each sediment/basalt contact in Hole U1576B is recorded by an abrupt increase in MS and MSP values. In contrast, the sediment/igneous contact at ~380 mbsf in Hole U1576A is not represented by an abrupt positive increase in MS; instead, higher MS values (59.4–1147 × 10−5 SI) begin appearing slightly deeper, at ~382 mbsf, within the less altered basalts of Section 391-U1576B-40R-4 (see Lithostratigraphy). MS and MSP measurements do not appear to image discrete lithologic boundaries within sedimentary units (i.e., the calcareous ooze/chalk contact), but they reliably record basalt/sediment contacts within each hole (Figure F40).
Several intervals between ~95 and 280 mbsf in the sedimentary succession of Hole U1576A show an abrupt increase in MS and NGR and a decrease in GRA bulk density. The highest MS (325 × 10−5 SI) recorded in the sediment interval correlates to a ~4 cm thick volcaniclastic deposit (e.g., sediments and tephra; see Lithostratigraphy) at ~135 mbsf (Section 391-U1576A-15R-1). Other high MS peaks within the Hole U1576A sediment interval correlate to a ~2 cm volcaniclastic deposit at ~98 mbsf (MS = 150 × 10−5 SI) in Section 11R-3 and a ~2 cm volcaniclastic deposit at ~123 mbsf (MS = 145 × 10−5 SI) in Section 13R-6.
In Hole U1576B, MS and MSP values define sedimentary and basalt lithologies across eight distinct intervals:
- Chalk, ~365–385 mbsf, mean = 7.58 ± 5.65 × 10⁻⁵ SI;
- Altered basalt pillows, ~385–394 mbsf, mean = 340 ± 273 × 10−5 SI;
- Silicified limestone, ~394–404 mbsf, mean = 33.1 ± 55.3 × 10⁻⁵ SI;
- Altered basalt pillows, 429–434 mbsf, mean = 1506 ± 660 × 10−5 SI;
- Thinly bedded limestone, 428–442 mbsf, mean = 9.62 ± 5.57 × 10⁻⁵ SI;
- Altered basalts, ~423–428 mbsf, mean = 974 ± 519 × 10−5 SI;
- Limestone, 428–442 mbsf, mean = 13.0 ± 5.8 × 10⁻⁵ SI; and
- Altered basalt flow, 442–450 mbsf, mean = 1124 ± 606 × 10−5 SI.
In the upper chalk layer and interbedded limestones, MS values are uniformly low with an overall mean value of 15.8 ± 24.8 × 10⁻⁵ SI in sediment layers. In basalt layers, MS increases to an overall mean of 986 ± 171 × 10−5 SI. pXRF measurements suggest that the basalts at Site U1575 are compositionally similar (see Igneous geochemistry). Therefore, higher MS values in Hole U1576A and U1576B basalt intervals may signal pervasive secondary pyrite mineralization in vesicles and veins (see Lithostratigraphy). MS, MSP, and GRA bulk density measurements do not record a <1 m basalt flow at 399 mbsf.
Measurements of MS and MSP in Hole U1576A cores also appear to correlate with NGR counts, SHMSL spectral data (reflectance a* and b* [i.e., red–green and blue–yellow bandwidths, respectively]), and SRM measurements (see Paleomagnetism) in imaging cyclicity in the sediment interval from ~95 to ~280 mbsf (Sections 11R-2 to 30R-1; Figure F42).
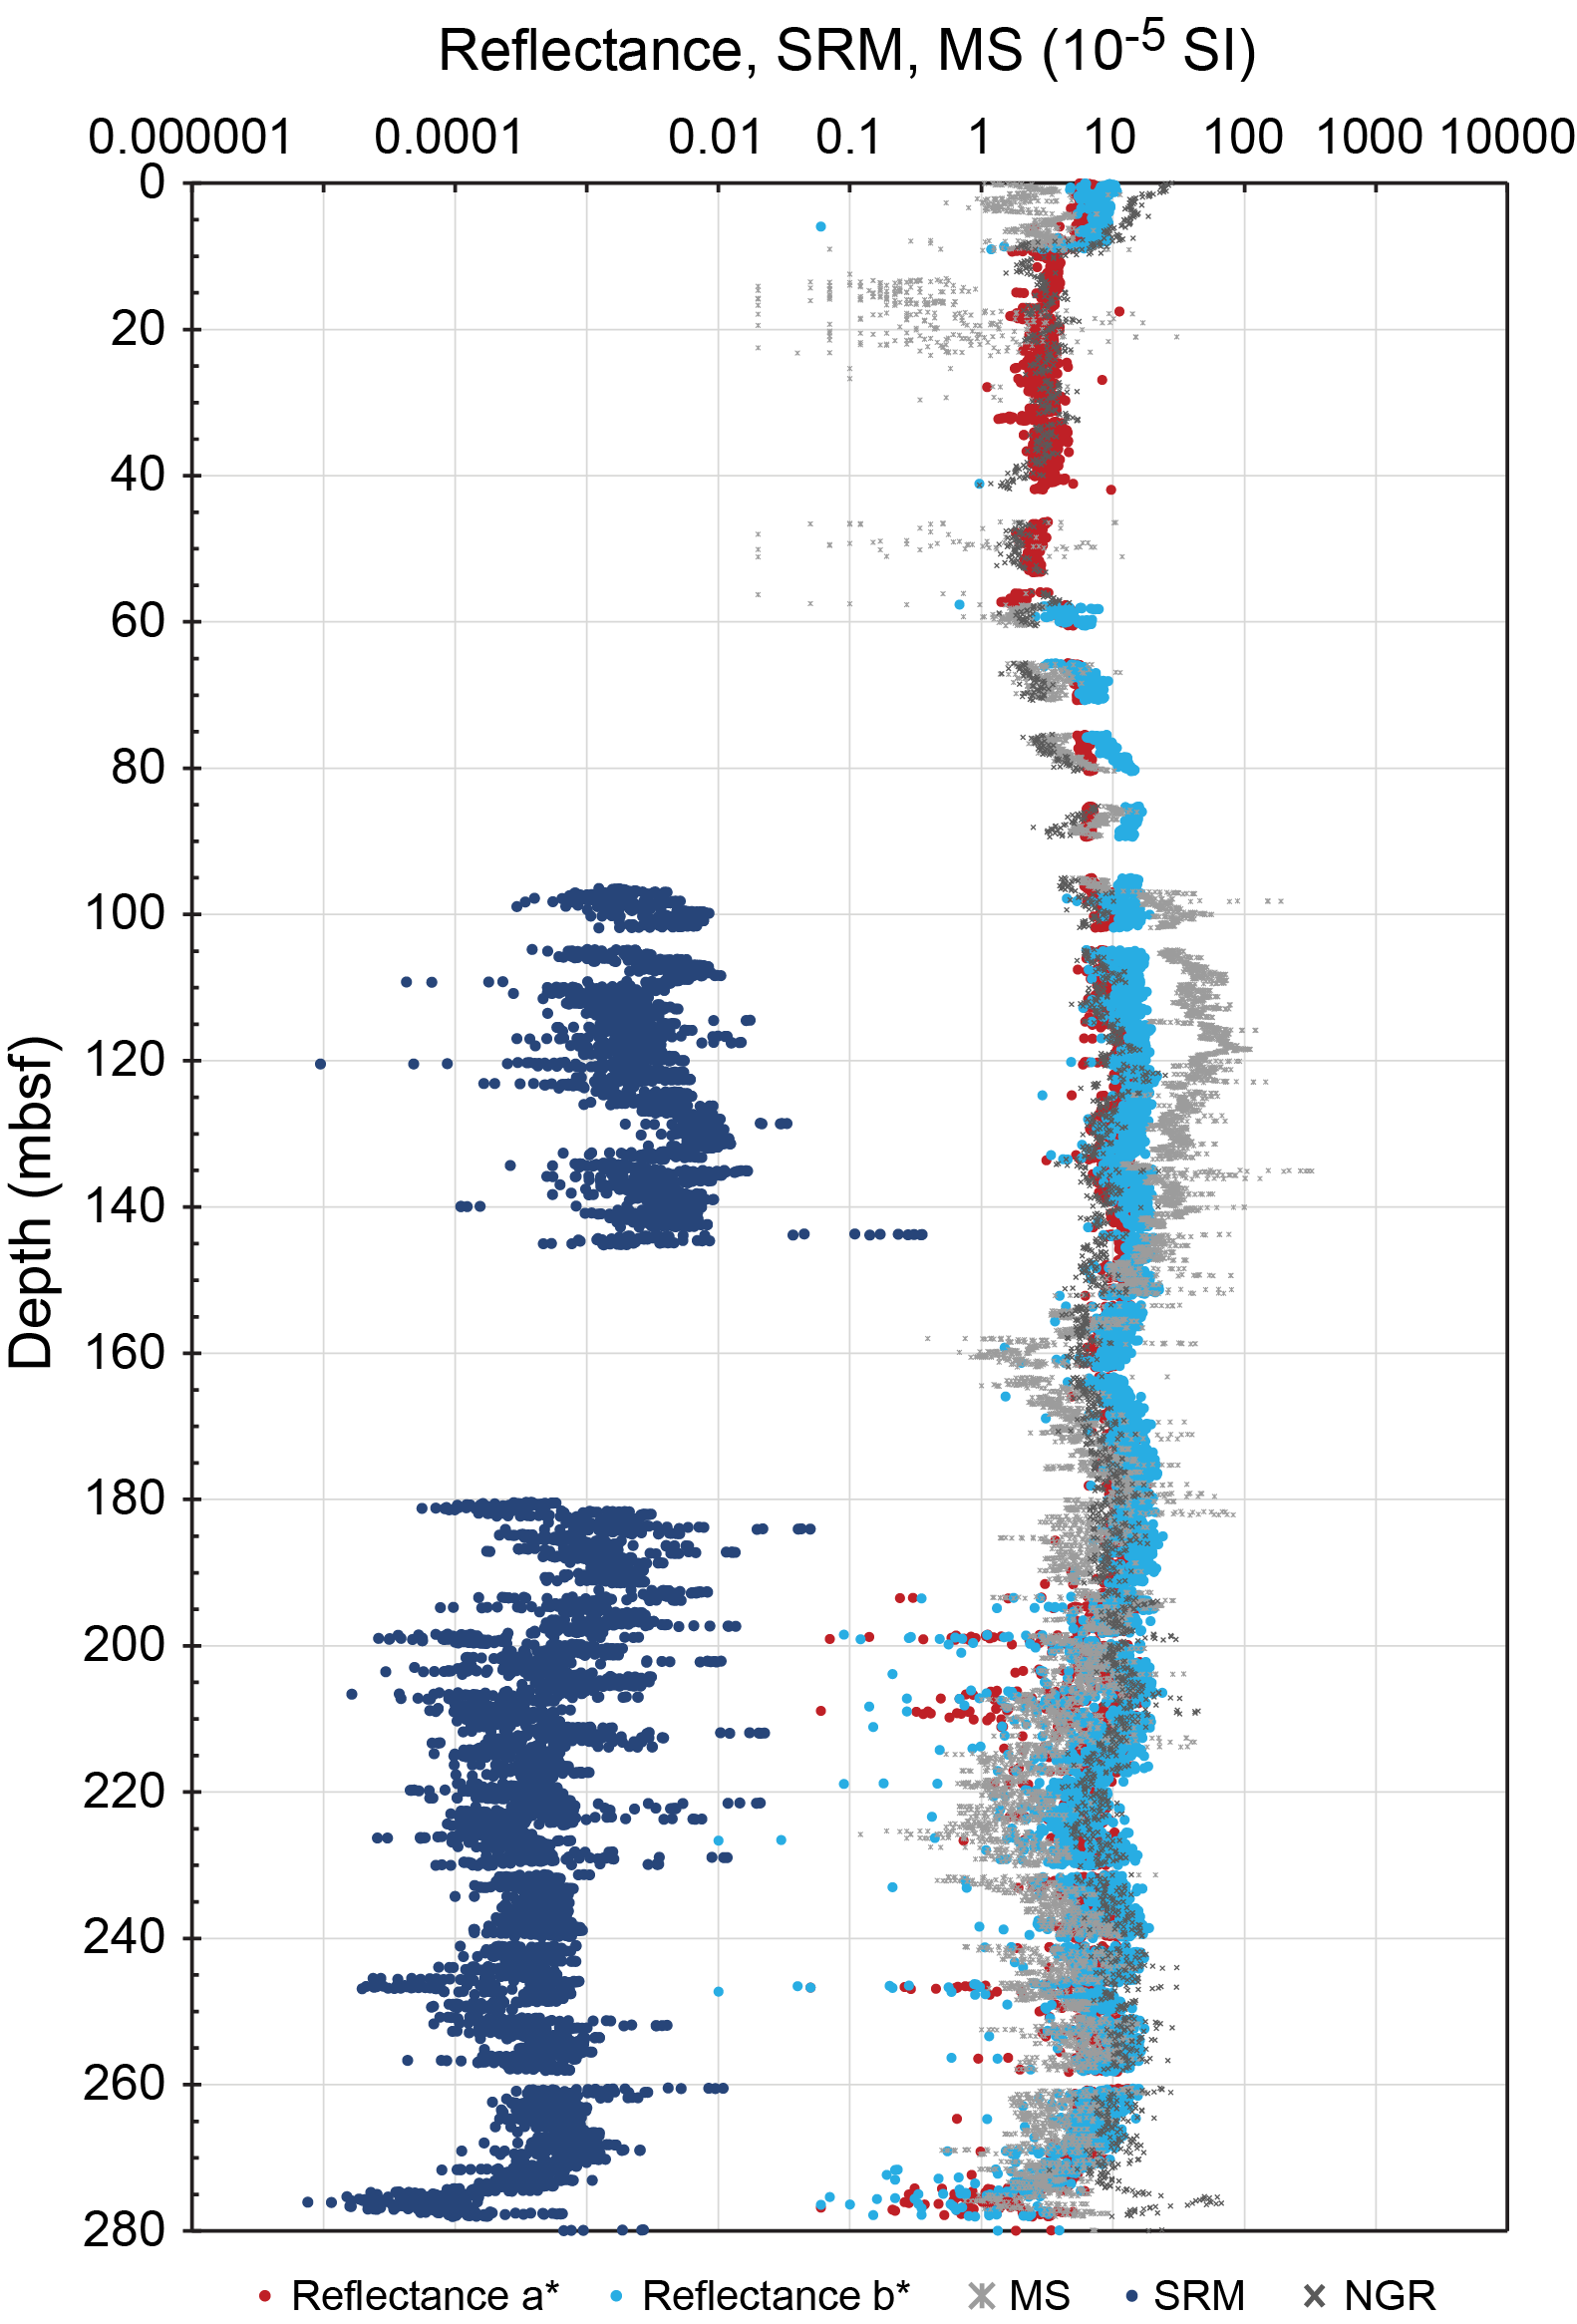
Figure F42. Reflectance, MS, SRM magnetization intensity, and NGR.
9.5. Bulk density and porosity
In Hole U1576A, GRA and MAD bulk density data define a relatively uniform trend from seafloor to the sediment/igneous basement contact at ~380 mbsf. Narrow (~2–5 cm) intervals of lower bulk density (greater than ~1.4–1.6 g/cm3) in the chalk interval are associated with volcaniclastic deposits (e.g., ~98 mbsf in Section 11R-3, and ~178 mbsf in Section 19R-4). Otherwise, sediments collectively range 1.00–2.60 g/cm3 (mean = 1.71 ± 0.019 g/cm3). Basalt below the sediment contact in Hole U1576A is highly fractured and rubbly with numerous veins and evidence of widespread secondary alteration (see Lithostratigraphy). Intervals of missing data and abrupt decreases in bulk density align with gaps between basalt fragments and fractures in basalt sections. Most core pieces are <20 cm; therefore, it is likely that abrupt decreases in bulk density record missing intervals or poor data quality.
In Hole U1576B, GRA and MAD bulk densities are relatively uniform in the uppermost sediment interval from 365 to ~385 mbsf, ranging 1.04–2.11 g/cm3 (mean = 1.82 ± 0.16 g/cm3). The uppermost basalt flow between ~385 and 394 mbsf is indicated by relatively higher bulk density values (1.01–2.54 g/cm3; mean = 2.05 ± 0.37 g/cm3). The three limestone interbeds between ~394 and 442 mbsf show increasing mean bulk density with depth from 1.69 ± 0.18 g/cm3 to 1.90 ± 0.20 g/cm3. Below 394 mbsf, basalt units have bulk density values ranging 1.00–2.65 g/cm3 (mean = 2.14 ± 0.01 g/cm3).
MAD measurements were also used to calculate porosity in both holes. In Hole U1576A, porosity values are relatively uniform in the calcareous ooze interval from the seafloor to ~97 mbsf (mean = 61.5 ± 3.0 vol%). Below ~97 mbsf, porosity steadily decreases to 54.0 ± 41.9 vol% immediately above the sediment/basement contact at ~380 mbsf. Basalt units display uniformly low porosity (mean = 24.6 ± 10.7 vol%) to the bottom of the hole. Figure F43 shows a nearly linear relationship between decreasing porosity values and increased density in the sediment intervals.

Figure F43. Porosity and grain density vs. bulk density.
Porosity values in Hole U1576B also decrease with depth and correlate well with the observed shift from sedimentary to basalt intervals. The uppermost chalk units average 36.9 ± 4.1 vol%, interbedded limestones average 43.0 ± 0.73 vol%, and basalts average 24.6 ± 10.7 vol%.
9.6. Sonic velocities
P-wave velocities appear to agree with other physical properties measurements and image distinct lithologic zones in Holes U1576A and U1576B. In Hole U1576A, the WRMSL P-wave logger (PWL) and SHMG PWB and PWC were used to measure calcareous ooze and unlithified sediment core from the seafloor to ~191 mbsf. Below this depth and in all cores from Hole U1576B, P-wave velocity measurements were obtained from lithified sediments and basalts using the PWC. Following standard protocol (see the Expedition 391 methods chapter [Sager et al., 2023a]), representative section halves from each core were measured using the PWC in the x-direction, and discrete sample cubes from lithified intervals were measured in the x-, y-, and z-directions. In Hole U1576A, the transition from PWL to PWC results in a shift from continuous measurements to a wider sampling interval with increased depth. However, P-wave velocities appear to be consistent through sedimentary and igneous cores recovered from Holes U1576A and U1576B (Figure F40).
P-wave velocities in Hole U1576A sediments (calcareous ooze and chalk) appear to be relatively uniform (mean = 1536 ± 22.7 m/s) from the seafloor to 97 mbsf. Below 97 mbsf, higher background P-wave velocities (mean = 1598 ± 64.8 m/s) and abrupt increases in PWL P-wave velocities (1662–3139 m/s) appear to distinguish clay deposits associated with volcaniclastic deposits in the chalk section. PWC velocities gradually increase from 1532 to 2898 m/s from 219 mbsf to the sediment/basalt contact at ~380 mbsf in Hole U1576A. Basalt velocities are 2384–2456 m/s below this depth.
In Hole U1576B, P-wave velocities are relatively uniform (1661–1992 m/s) in the uppermost sediment interval between 365 and ~385 mbsf. Sediments below this depth display greater degrees of alteration (see Lithostratigraphy) and have slightly higher P-wave velocities ranging 1710–2456 m/s. Basalt flows below ~385 mbsf have P-wave velocities that range 4849–6237 m/s. As at Site U1575, higher P-wave velocities appear to be associated with lower porosities and higher bulk densities in basalt flows. However, it is possible that the higher degree of alteration observed in basalts from Site U1576 impacted P-wave measurements (see Lithostratigraphy).
9.7. Natural gamma radiation
NGR measurements are reported in Figure F40. Calcareous ooze and chalk in Hole U1576A range 0.967–66.7 counts/s in the sediment interval. Mean NGR values decrease slightly to 9.56 ± 5.40 counts/s across the chalk/igneous basement contact at ~380 mbsf. Basalts show an increasing trend from 3.88 to 48.0 counts/s with depth. NGR measurements in Hole U1576A display similar cyclic trends to those observed in MS, SHMSL reflectance, and SRM data sets between ~95 and 280 mbsf (Figure F42).
NGR values in sediment and basalt intervals in Hole U1576B are relatively uniform from the seafloor to the bottom of the hole at ~451 mbsf. In the upper sediment section in Hole U1575B (seafloor to ~385 mbsf) NGR values increase from 7.13 to 21.9 counts/s. NGR counts in interbedded chalks and limestones below the sediment/basalt contact range 4.31–30.2 counts/s (mean = 11.8 ± 1.06 counts/s). A gradual decrease in NGR values at ~380 mbsf in Hole U1576A correlates with the sediment/igneous basement contact at ~385 mbsf in Hole U1576B. Below ~385 mbsf, NGR values have a relatively narrow range of 8.56–13.9 counts/s (mean = 11.5 ± 2.20 counts/s).
9.8. Data integration and lithology correlation
Physical properties measurements align with general lithologic boundaries in Holes U1576A and U1576B. Basalt is clearly distinguished from sedimentary units by abrupt shifts in physical properties measurements (e.g., MS, MSP, GRA bulk density, NGR, and P-wave velocity). Contacts between calcareous ooze, chalk, and limestone in Hole U1576A are less abrupt, owing to more gradual changes in lithologic characteristics with depth. Interestingly, discrete lithologic features within the sediment section in Hole U1576A reliably correlate with variations in physical properties data sets. NGR, MS, and GRA bulk density logs record volcaniclastic deposits. Broader color and compositional cyclicity in Hole U1576A sediments also correlate with NGR, MS, GRA bulk density, and SRM values (see Lithostratigraphy and Paleomagnetism). Distinct MS and GRA bulk density "wiggles" observed in plots of physical properties versus depth and lithologic observations identify at least one marker bed: dark green clay in a volcaniclastic deposit at ~371 mbsf in Section 391-U1576A-39R-3 and ~374 mbsf in Section 391-U1576B-3R-1 (Figure F41) (see Lithostratigraphy). This correlation suggests that Holes U1576A and U1576B may sample a common stratigraphic sequence from the seafloor to ~451 mbsf.
Basalts in both holes uniformly display the highest values of P-wave velocity, MS, bulk density (WRMSL and MAD), and thermal conductivity and the lowest porosity compared to sediment intervals. Measurements of NGR, GRA bulk density, and MS in basalt flows and pillows record both rubbly and coherent intervals and appear to broadly correlate with flow boundaries (Figure F40) (see Igneous petrology and volcanology). Unlike Site U1575, MS and NGR do not appear to record chemical variations (e.g., low-TiO2 basalts) in either hole at Site U1576.
In Hole U1576B, basalts from ~394 mbsf to the bottom of the hole are extensively fractured and altered along veins, and many intervals contain pyrite vesicle and vein mineralization (see Igneous petrology and volcanology); however, the effect of this alteration on discrete sample bulk density has yet to be determined. Limestone interbeds appear to become increasingly silicified (e.g., >40% silica at 422.5 mbsf measured using pXRF) with proximity to basalt flows (see Igneous geochemistry), which may result in increased bulk density values in sedimentary units below ~385 mbsf. Bulk densities of basalts from Site U1576 are slightly below the mean bulk density recorded in Site U1575 basalts (2.58 ± 0.046 g/cm3) (see Physical properties in the Site U1575 chapter [Sager et al., 2023c]).
References
Acton, G.D., Okada, M., Clement, B.M., Lund, S.P., and Williams, T., 2002. Paleomagnetic overprints in ocean sediment cores and their relationship to shear deformation caused by piston coring. Journal of Geophysical Research: Solid Earth, 107:2067–2081. https://doi.org/10.1029/2001JB000518
Baker, P.A., Gieskes, J.M., and Elderfield, H., 1982. Diagenesis of carbonates in deep-sea sediments; evidence from Sr/Ca ratios and interstitial dissolved Sr (super 2+) data. Journal of Sedimentary Research, 52(1):71–82. https://doi.org/10.1306/212F7EE1-2B24-11D7-8648000102C1865D
Bartels, T., Krastel, S., and Spiess, V., 2007. Correlation of high-resolution seismic data with ODP Leg 208 borehole measurements. In Kroon, D., Zachos, J.C., and Richter, C. (Eds.), Proceedings of the Ocean Drilling Program, Scientific Results. 208: College Station, TX (Ocean Drilling Program). https://doi.org/10.2973/odp.proc.sr.208.204.2007
Brezonik, P.L., and Arnold, W.A., 2011. Water Chemistry: An Introduction to the Chemistry of Natural and Engineered Aquatic Systems: Oxford, UK (Oxford University Press).
Burnett, J.A., 1998. Upper Cretaceous. In Bown, P.R. (Ed.), Calcareous Nannofossil Biostratigraphy. Dordrecht, The Netherlands (Kluwer Academic Publishing), 132–199.
Carracedo Sánchez, M., Sarrionandia, F., Juteau, T., and Gil Ibarguchi, J.I., 2012. Structure and organization of submarine basaltic flows: sheet flow transformation into pillow lavas in shallow submarine environments. International Journal of Earth Sciences, 101(8):2201–2214. https://doi.org/10.1007/s00531-012-0783-2
Chave, A.D., 1984. Lower Paleocene-Upper Cretaceous magnetostratigraphy, Sites 525, 527, 528, and 529, Deep Sea Drilling Project Leg 74. In Moore, T.C., Jr., Rabinowitz, P.D., et al., Initial Reports of the Deep Sea Drilling Project. 74: Washington, DC (US Government Printing Office), 525–531. https://doi.org/10.2973/dsdp.proc.74.110.1984
Class, C., and Lehnert, K., 2012. PetDB Expert MORB (Mid-Ocean Ridge Basalt) Compilation, Version 1.0. Interdisciplinary Earth Data Alliance (IEDA). https://doi.org/10.1594/IEDA/100060
Class, C., and le Roex, A.P., 2008. Ce anomalies in Gough Island lavas — trace element characteristics of a recycled sediment component. Earth and Planetary Science Letters, 265(3–4):475–486. https://doi.org/10.1016/j.epsl.2007.10.030
Cliff, R.A., Baker, P.E., and Mateer, N.J., 1991. Geochemistry of inaccessible island volcanics. Chemical Geology, 92(4):251–260. https://doi.org/10.1016/0009-2541(91)90073-Z
Coffin, M.F., Pringle, M.S., Duncan, R.A., Gladczenko, T.P., Storey, M., Müller, R.D., and Gahagan, L.A., 2002. Kerguelen hotspot magma output since 130 Ma. Journal of Petrology, 43(7):1121–1137. https://doi.org/10.1093/petrology/43.7.1121
Deyhle, A., and Kopf, A., 2002. Strong B enrichment and anomalous δ11B in pore fluids from the Japan Trench forearc. Marine Geology, 183(1):1–15. https://doi.org/10.1016/S0025-3227(02)00186-X
Doubrovine, P.V., Steinberger, B., and Torsvik, T.H., 2012. Absolute plate motions in a reference frame defined by moving hot spots in the Pacific, Atlantic, and Indian oceans. Journal of Geophysical Research: Solid Earth, 117(B9):B09101. https://doi.org/10.1029/2011JB009072
Ernesto, M., Pacca, I.G., Hiodo, F.Y., and Nardy, A.J.R., 1990. Palaeomagnetism of the Mesozoic Serra Geral Formation, southern Brazil. Physics of the Earth and Planetary Interiors, 64(2):153–175. https://doi.org/10.1016/0031-9201(90)90035-V
Ernesto, M., Raposo, M.I.B., Marques, L.S., Renne, P.R., Diogo, L.A., and de Min, A., 1999. Paleomagnetism, geochemistry and 40Ar/39Ar dating of the north-eastern Paraná Magmatic Province: tectonic implications. Journal of Geodynamics, 28(4):321–340. https://doi.org/10.1016/S0264-3707(99)00013-7
Gibson, S.A., Thompson, R.N., Day, J.A., Humphris, S.E., and Dickin, A.P., 2005. Melt-generation processes associated with the Tristan mantle plume: constraints on the origin of EM-1. Earth and Planetary Science Letters, 237(3–4):744–767. https://doi.org/10.1016/j.epsl.2005.06.015
Gieskes, J.M., 1981. Deep-sea drilling interstitial water studies: implications for chemical alteration of the oceanic crust, Layers I and II. In Warme, J.E., Douglas, R.G., and Winterer, E.L. (Eds.), Deep Sea Drilling Project: a Decade of Progress. Special Publication - SEPM (Society for Sedimentary Geology), 32: 149–168.
Gradstein, F.M., Ogg, J.G., Schmitz, M.D., and Ogg, G.M. (Eds.), 2012. The Geologic Time Scale 2012: Amsterdam (Elsevier). https://doi.org/10.1016/C2011-1-08249-8
Gradstein, F.M., Ogg, J.G., Schmitz, M.D., and Ogg, G.M. (Eds.), 2020. The Geologic Time Scale 2020: Amsterdam (Elsevier BV). https://doi.org/10.1016/C2020-1-02369-3
Hoernle, K., Rohde, J., Hauff, F., Garbe-Schönberg, D., Homrighausen, S., Werner, R., and Morgan, J.P., 2015. How and when plume zonation appeared during the 132 Myr evolution of the Tristan Hotspot. Nature Communications, 6(1):7799. https://doi.org/10.1038/ncomms8799
Homrighausen, S., Hoernle, K., Geldmacher, J., Wartho, J.A., Hauff, F., Portnyagin, M., Werner, R., van den Bogaard, P., and Garbe-Schönberg, D., 2018. Unexpected HIMU-type late-stage volcanism on the Walvis Ridge. Earth and Planetary Science Letters, 492:251–263. https://doi.org/10.1016/j.epsl.2018.03.049
Homrighausen, S., Hoernle, K., Hauff, F., Wartho, J.A., van den Bogaard, P., and Garbe-Schönberg, D., 2019. New age and geochemical data from the Walvis Ridge: the temporal and spatial diversity of South Atlantic intraplate volcanism and its possible origin. Geochimica et Cosmochimica Acta, 245:16–34. https://doi.org/10.1016/j.gca.2018.09.002
Homrighausen, S., Hoernle, K., Zhou, H., Geldmacher, J., Wartho, J.-A., Hauff, F., Werner, R., Jung, S., and Morgan, J.P., 2020. Paired EMI-HIMU hotspots in the South Atlantic—starting plume heads trigger compositionally distinct secondary plumes? Science Advances, 6(28):eaba0282. https://doi.org/10.1126/sciadv.aba0282
Inoue, H., Coffin, M.F., Nakamura, Y., Mochizuki, K., and Kroenke, L.W., 2008. Intrabasement reflections of the Ontong Java Plateau: implications for plateau construction. Geochemistry, Geophysics, Geosystems, 9(4):Q0401. https://doi.org/10.1029/2007GC001780
Jackson, M., Gruber, W., Marvin, J., and Banerjee, S.K., 1988. Partial anhysteretic remanence and its anisotropy: applications and grainsize-dependence. Geophysical Research Letters, 15(5):440–443. https://doi.org/10.1029/GL015i005p00440
Jochum, K.P., and Verma, S.P., 1996. Extreme enrichment of Sb, Tl and other trace elements in altered MORB. Chemical Geology, 130(3–4):289–299. https://doi.org/10.1016/0009-2541(96)00014-9
Jørgensen, B.B., Findlay, A.J., and Pellerin, A., 2019. The biogeochemical sulfur cycle of marine sediments. Frontiers in Microbiology, 10:849. https://doi.org/10.3389/fmicb.2019.00849
Kennett, J.P., and Srinivasan, M.S., 1983. Neogene Planktonic Foraminifera: A Phylogenetic Atlas: London (Hutchinson Ross).
Le Bas, M.J., Le Maitre, R. W., Streickeisen, A., Zanettin, B., the IUGS Subcommission on the Systematics of Igneous Rocks, 1986. A chemical classification of volcanic rocks based on the total alkali-silica diagram. Journal of Petrology, 27(3):745–750. https://doi.org/10.1093/petrology/27.3.745
Le Maitre, R.W., 1962. Petrology of volcanic rocks, Gough Island, South Atlantic. Geological Society of America Bulletin, 73(11):1309–1340. https://doi.org/10.1130/0016-7606(1962)73[1309:POVRGI]2.0.CO;2
Le Roex, A.P., Cliff, R.A., and Adair, B.J.I., 1990. Tristan da Cunha, South Atlantic: geochemistry and petrogenesis of a basanite-phonolite lava series. Journal of Petrology, 31(4):779–812. https://doi.org/10.1093/petrology/31.4.779
MacDonald, G.A., and Katsura, T., 1964. Chemical composition of Hawaiian lavas. Journal of Petrology, 5(1):82–133. https://doi.org/10.1093/petrology/5.1.82
McFadden, P.L., and Reid, A.B., 1982. Analysis of palaeomagnetic inclination data. Geophysical Journal International, 69(2):307–319. https://doi.org/10.1111/j.1365-246X.1982.tb04950.x
Neal, C.R., Mahoney, J.J., Kroenke, L.W., Duncan, R.A., and Petterson, M.G., 1997. The Ontong Java Plateau. In Mahoney, J.J., and Coffin, M.F. (Eds.), Large Igneous Provinces: Continental, Oceanic, and Planetary Flood Volcanism. Geophysical Monograph, 100: 183–216. https://doi.org/10.1029/GM100p0183
O'Connor, J.M., and Duncan, R.A., 1990. Evolution of the Walvis Ridge-Rio Grande Rise hot spot system: implications for African and South American plate motions over plumes. Journal of Geophysical Research: Solid Earth, 95(B11):17475–17502. https://doi.org/10.1029/JB095iB11p17475
O'Connor, J.M., and Jokat, W., 2015. Age distribution of ocean drill sites across the Central Walvis Ridge indicates plate boundary control of plume volcanism in the South Atlantic. Earth and Planetary Science Letters, 424:179–190. https://doi.org/10.1016/j.epsl.2015.05.021
O'Connor, J.M., and le Roex, A.P., 1992. South Atlantic hot spot-plume systems: 1. Distribution of volcanism in time and space. Earth and Planetary Science Letters, 113(3):343–364. https://doi.org/10.1016/0012-821X(92)90138-L
Ogg, J.G., 2020. Geomagnetic Polarity Time Scale. In Gradstein, F.M., Ogg, J.G., Schmitz, M., and Ogg, G. (Eds.), Geologic Time Scale 2020. Amsterdam (Elsevier), 159–192.
Parker, R.L., and Huestis, S.P., 1974. The inversion of magnetic anomalies in the presence of topography. Journal of Geophysical Research, 79:1587–1593. https://doi.org/10.1029/JB079i011p01587
Quinby-Hunt, M.S., and Turekian, K.K., 1983. Distribution of elements in sea water. Eos, Transactions of the American Geophysical Union, 64(14):130. https://doi.org/10.1029/EO064i014p00130
Renne, P.R., Scott, G.R., Glen, J.M.G., and Feinberg, J.M., 2002. Oriented inclusions of magnetite in clinopyroxene: source of stable remanent magnetization in gabbros of the Messum Complex, Namibia. Geochemistry, Geophysics, Geosystems, 3(12):1–11. https://doi.org/10.1029/2002GC000319
Richardson, S.H., Erlank, A.J., Reid, D.L., and Duncan, A.R., 1984. Major and trace element and Nd and Sr isotope geochemistry of basalts from the Deep Sea Drilling Project Leg 74 Walvis Ridge transect. In Moore, T.C., Jr., Rabinowitz, P. D., et al., Initial Reports of the Deep Sea Drilling Project. 74: Washington, DC (US Government Printing Office), 739–754. https://doi.org/10.2973/dsdp.proc.74.125.1984
Rohde, J., Hoernle, K., Hauff, F., Werner, R., O'Connor, J., Class, C., Garbe-Schönberg, D., and Jokat, W., 2013. 70 Ma chemical zonation of the Tristan-Gough hotspot track. Geology, 41(3):335–338. https://doi.org/10.1130/G33790.1
Sager, W., Hoernle, K., Höfig, T.W., Avery, A.J., Bhutani, R., Buchs, D.M., Carvallo, C.A., Class, C., Dai, Y., Dalla Valle, G., Del Gaudio, A.V., Fielding, S., Gaastra, K.M., Han, S., Homrighausen, S., Kubota, Y., Li, C.-F., Nelson, W.R., Petrou, E., Potter, K.E., Pujatti, S., Scholpp, J., Shervais, J.W., Thoram, S., Tikoo-Schantz, S.M., Tshiningayamwe, M., Wang, X.-J., and Widdowson, M., 2023a. Expedition 391 methods. In Sager, W., Hoernle, K., Höfig, T.W., Blum, P., and the Expedition 391 Scientists, Walvis Ridge Hotspot. Proceedings of the International Ocean Discovery Program, 391: College Station, TX (International Ocean Discovery Program). https://doi.org/10.14379/iodp.proc.391.102.2023
Sager, W., Hoernle, K., Höfig, T.W., Avery, A.J., Bhutani, R., Buchs, D.M., Carvallo, C.A., Class, C., Dai, Y., Dalla Valle, G., Del Gaudio, A.V., Fielding, S., Gaastra, K.M., Han, S., Homrighausen, S., Kubota, Y., Li, C.-F., Nelson, W.R., Petrou, E., Potter, K.E., Pujatti, S., Scholpp, J., Shervais, J.W., Thoram, S., Tikoo-Schantz, S.M., Tshiningayamwe, M., Wang, X.-J., and Widdowson, M., 2023b. Expedition 391 summary. In Sager, W., Hoernle, K., Höfig, T.W., Blum, P., and the Expedition 391 Scientists, Walvis Ridge Hotspot. Proceedings of the International Ocean Discovery Program, 391: College Station, TX (International Ocean Discovery Program). https://doi.org/10.14379/iodp.proc.391.101.2023
Sager, W., Hoernle, K., Höfig, T.W., Avery, A.J., Bhutani, R., Buchs, D.M., Carvallo, C.A., Class, C., Dai, Y., Dalla Valle, G., Del Gaudio, A.V., Fielding, S., Gaastra, K.M., Han, S., Homrighausen, S., Kubota, Y., Li, C.-F., Nelson, W.R., Petrou, E., Potter, K.E., Pujatti, S., Scholpp, J., Shervais, J.W., Thoram, S., Tikoo-Schantz, S.M., Tshiningayamwe, M., Wang, X.-J., and Widdowson, M., 2023c. Site U1575. In Sager, W., Hoernle, K., Höfig, T.W., Blum, P., and the Expedition 391 Scientists, Walvis Ridge Hotspot. Proceedings of the International Ocean Discovery Program, 391: College Station, TX (International Ocean Discovery Program). https://doi.org/10.14379/iodp.proc.391.103.2023
Sager, W.W., Sano, T., and Geldmacher, J., 2016. Formation and evolution of Shatsky Rise oceanic plateau: insights from IODP Expedition 324 and recent geophysical cruises. Earth-Science Reviews, 159:306–336. https://doi.org/10.1016/j.earscirev.2016.05.011
Sager, W.W., Thoram, S., Engfer, D.W., Koppers, A.A.P., and Class, C., 2021. Late Cretaceous Ridge reorganization, microplate formation, and the evolution of the Rio Grande Rise – Walvis Ridge hot spot twins, South Atlantic Ocean. Geochemistry, Geophysics, Geosystems, 22(3):e2020GC009390. https://doi.org/10.1029/2020GC009390
Sager, W.W., Zhang, J., Korenaga, J., Sano, T., Koppers, A.A.P., Widdowson, M., and Mahoney, J.J., 2013. An immense shield volcano within the Shatsky Rise oceanic plateau, northwest Pacific Ocean. Nature Geoscience, 6(11):976–981. https://doi.org/10.1038/ngeo1934
Salters, V.J.M., and Sachi-Kocher, A., 2010. An ancient metasomatic source for the Walvis Ridge basalts. Chemical Geology, 273(3–4):151–167. https://doi.org/10.1016/j.chemgeo.2010.02.010
Shervais, J.W., 2022. The petrogenesis of modern and ophiolitic lavas reconsidered: Ti-V and Nb-Th. Geoscience Frontiers, 13(2):101319. https://doi.org/10.1016/j.gsf.2021.101319
Smith, W.H.F., and Sandwell, D.T., 1997. Global sea floor topography from satellite altimetry and ship depth soundings. Science, 277(5334):1956–1962. https://doi.org/10.1126/science.277.5334.1956
Thoram, S., 2021. Tectonic evolution of oceanic plateaus and hotspot-ridge interactions: Walvis Ridge-Rio Grande Rise, South Atlantic, and Tamu Massif, Pacific Ocean [PhD dissertation]. University of Houston, Houston, TX.
Thoram, S., Sager, W.W., and Jokat, W., 2019. Implications of updated magnetic anomalies for the Late Cretaceous tectonic evolution of Walvis Ridge. Geophysical Research Letters, 46(16):9474–9482. https://doi.org/10.1029/2019GL083467
Torsvik, T.H., Müller, R.D., Van der Voo, R., Steinberger, B., and Gaina, C., 2008. Global plate motion frames: toward a unified model. Reviews of Geophysics, 46(3):RG3004. https://doi.org/10.1029/2007RG000227
Tozer, B., Sandwell, D.T., Smith, W.H.F., Olson, C., Beale, J.R., and Wessel, P., 2019. Global bathymetry and topography at 15 arc sec: SRTM15+. Earth and Space Science, 6(10):1847–1864. https://doi.org/10.1029/2019EA000658
Van Fossen, M.C., and Kent, D.V., 1992. Paleomagnetism of 122 Ma plutons in New England and the mid-Cretaceous paleomagnetic field in North America: true polar wander or large-scale differential mantle motion? Journal of Geophysical Research: Solid Earth, 97(B13):19651–19661. https://doi.org/10.1029/92JB01466
Verosub, K.L., 1977. Depositional and postdepositional processes in the magnetization of sediments. Reviews of Geophysics, 15(2):129–143. https://doi.org/10.1029/RG015i002p00129
Wade, B.S., Pearson, P.N., Berggren, W.A., and Pälike, H., 2011. Review and revision of Cenozoic tropical planktonic foraminiferal biostratigraphy and calibration to the geomagnetic polarity and astronomical time scale. Earth-Science Reviews, 104(1–3):111–142. https://doi.org/10.1016/j.earscirev.2010.09.003
Weaver, B.L., Wood, D.A., Tarney, J., and Joron, J.L., 1987. Geochemistry of ocean island basalts from the South Atlantic: Ascension, Bouvet, St. Helena, Gough and Tristan da Cunha. In Fitton, J.G., and Upton, B.G.J. (Eds.), Alkaline Igneous Rocks. Geological Society Special Publication, 30: 253–267. https://doi.org/10.1144/GSL.SP.1987.030.01.11
Weber, R.D., Lu, Y., George, R.A., Reilly, T.M., Roederer, R.V., Edmunds, J.A., Myers, N.R., Avery, A.J., Waterman, A.S., and Smith, V., 2018. Bioevent Ages – Gulf of Mexico Basin, USA. Paleo-Data Inc. https://www.paleodata.com/chart/
Willbold, M., and Stracke, A., 2006. Trace element composition of mantle end-members: implications for recycling of oceanic and upper and lower continental crust. Geochemistry, Geophysics, Geosystems, 7(4):Q04004. https://doi.org/10.1029/2005GC001005
Zachos, J.C., Kroon, D., Blum, P., et al., 2004. Proceedings of the Ocean Drilling Program, Initial Results, 208: College Station, TX (Ocean Drilling Program). https://doi.org/10.2973/odp.proc.ir.208.2004
Zhou, H., Hoernle, K., Geldmacher, J., Hauff, F., Homrighausen, S., Garbe-Schönberg, D., and Jung, S., 2020. Geochemistry of Etendeka magmatism: spatial heterogeneity in the Tristan-Gough plume head. Earth and Planetary Science Letters, 535:116123. https://doi.org/10.1016/j.epsl.2020.116123
Zindler, A., and Hart, S., 1986. Chemical geodynamics. Annual Review of Earth and Planetary Sciences, 14:493–570. https://doi.org/10.1146/annurev.ea.14.050186.002425