Planke, S., Berndt, C., Alvarez Zarikian, C.A., and the Expedition 396 Scientists
Proceedings of the International Ocean Discovery Program Volume 396
publications.iodp.org
https://doi.org/10.14379/iodp.proc.396.103.2023
Site U15651
![]() S. Planke,
S. Planke,
![]() C. Berndt,
C. Berndt,
![]() C.A. Alvarez Zarikian,
C.A. Alvarez Zarikian,
![]() A. Agarwal,
A. Agarwal,
![]() G.D.M. Andrews,
G.D.M. Andrews,
![]() P. Betlem,
P. Betlem,
![]() J. Bhattacharya,
J. Bhattacharya,
![]() H. Brinkhuis,
H. Brinkhuis,
![]() S. Chatterjee,
S. Chatterjee,
![]() M. Christopoulou,
M. Christopoulou,
![]() V.J. Clementi,
V.J. Clementi,
![]() E.C. Ferré,
E.C. Ferré,
![]() I.Y. Filina,
I.Y. Filina,
![]() J. Frieling,
J. Frieling,
![]() P. Guo,
P. Guo,
![]() D.T. Harper,
D.T. Harper,
![]() M.T. Jones,
M.T. Jones,
![]() S. Lambart,
S. Lambart,
![]() J. Longman,
J. Longman,
![]() J.M. Millett,
J.M. Millett,
![]() G. Mohn,
G. Mohn,
![]() R. Nakaoka,
R. Nakaoka,
![]() R.P. Scherer,
R.P. Scherer,
![]() C. Tegner,
C. Tegner,
![]() N. Varela,
N. Varela,
![]() M. Wang,
M. Wang,
![]() W. Xu,
W. Xu,
![]() S.L. Yager2
S.L. Yager2
1 Planke, S., Berndt, C., Alvarez Zarikian, C.A., Agarwal, A., Andrews, G.D.M., Betlem, P., Bhattacharya, J., Brinkhuis, H., Chatterjee, S., Christopoulou, M., Clementi, V.J., Ferré, E.C., Filina, I.Y., Frieling, J., Guo, P., Harper, D.T., Jones, M.T., Lambart, S., Longman, J., Millett, J.M., Mohn, G., Nakaoka, R., Scherer, R.P., Tegner, C., Varela, N., Wang, M., Xu, W., and Yager, S.L., 2023. Site U1565. In Planke, S., Berndt, C., Alvarez Zarikian, C.A., and the Expedition 396 Scientists, Mid-Norwegian Margin Magmatism and Paleoclimate Implications. Proceedings of the International Ocean Discovery Program, 396: College Station, TX (International Ocean Discovery Program). https://doi.org/10.14379/iodp.proc.396.103.2023
2 Expedition 396 Scientists’ affiliations.
1. Background and objectives
Site U1565 is located 2071 meters below sea level (mbsl) on the western flank of the Kolga High, a pronounced structural high within the Jan Mayen Corridor (Figure F1). It is an elongated high that is approximately 45 km long and 25 km wide and is associated with a positive Bouguer gravity anomaly that correlates spatially with a prominent deep crustal seismic reflection and a negative magnetic anomaly (Manton et al., 2018; Millett et al., 2022). The Kolga High is one of several areas along the mid-Norwegian rifted margin that is covered by thin sediment drapes above the top basalt surface and a rapid westward shoaling of the Base Cretaceous Unconformity (BCU) (Zastrozhnov et al., 2020). Detailed 3-D seismic mapping shows that it is covered by a variable-thickness Paleogene basalt unit overlying a complex and variable basement intruded by Paleogene sills and dikes (Millett et al., 2022; Zastrozhnov et al., 2020). Two sets of tilted subbasalt fault blocks characterize the central and eastern part of the high, whereas the nature of the basement in the western part is unconstrained. The faults were likely formed by a combination of Early Cretaceous or older rifting and Late Cretaceous/Paleocene rifting. The proximity to the Jan Mayen Fracture Zone may well have played a role in the formation of the high as well because this area was likely associated with a crustal transfer zone prior to breakup.

Figure F1. Tectonic and magmatic elements of the Jan Mayen Corridor.
Except for two small areas, the Kolga High is covered with breakup-related basalts (Millett et al., 2022; Gernigon et al., 2021). Seaward-dipping reflectors (SDR) exist on the Møre Marginal High toward the south, and similar but smaller seismic reflections lap onto the western part of the Kolga High. A classic lava delta and escarpment defines the eastern limit of the high. The uppermost part of this lava delta was drilled by the Norwegian Petroleum Directorate in 2014 (Hole 6403/1-U-1), and 38 m of hyaloclastite with a tholeiitic composition was recovered (Bakke, 2017). The volcanic seismic facies is more ambiguous in the northern part of the Kolga High, but the seismic data suggest that the basalt cover is rather thin. The 3-D seismic interpretation predicts that the basalt cover is absent in two small (5 km × 3 km) areas just west of the summit (Millett et al., 2022; Gernigon et al., 2021). This interpretation is based on the seismic geomorphological analysis of the top basalt reflection, a distinct increase of the reflection amplitude in the basalt windows, and the pinch-out of the seismic facies units that are interpreted as basaltic lava flows (e.g., the SDR) toward the basalt windows. The seismic data further show a deeper transparent seismic unit that extends down to a strong seismic reflection at about 7.5 s two-way traveltime (TWT) (Figures F2, F3).
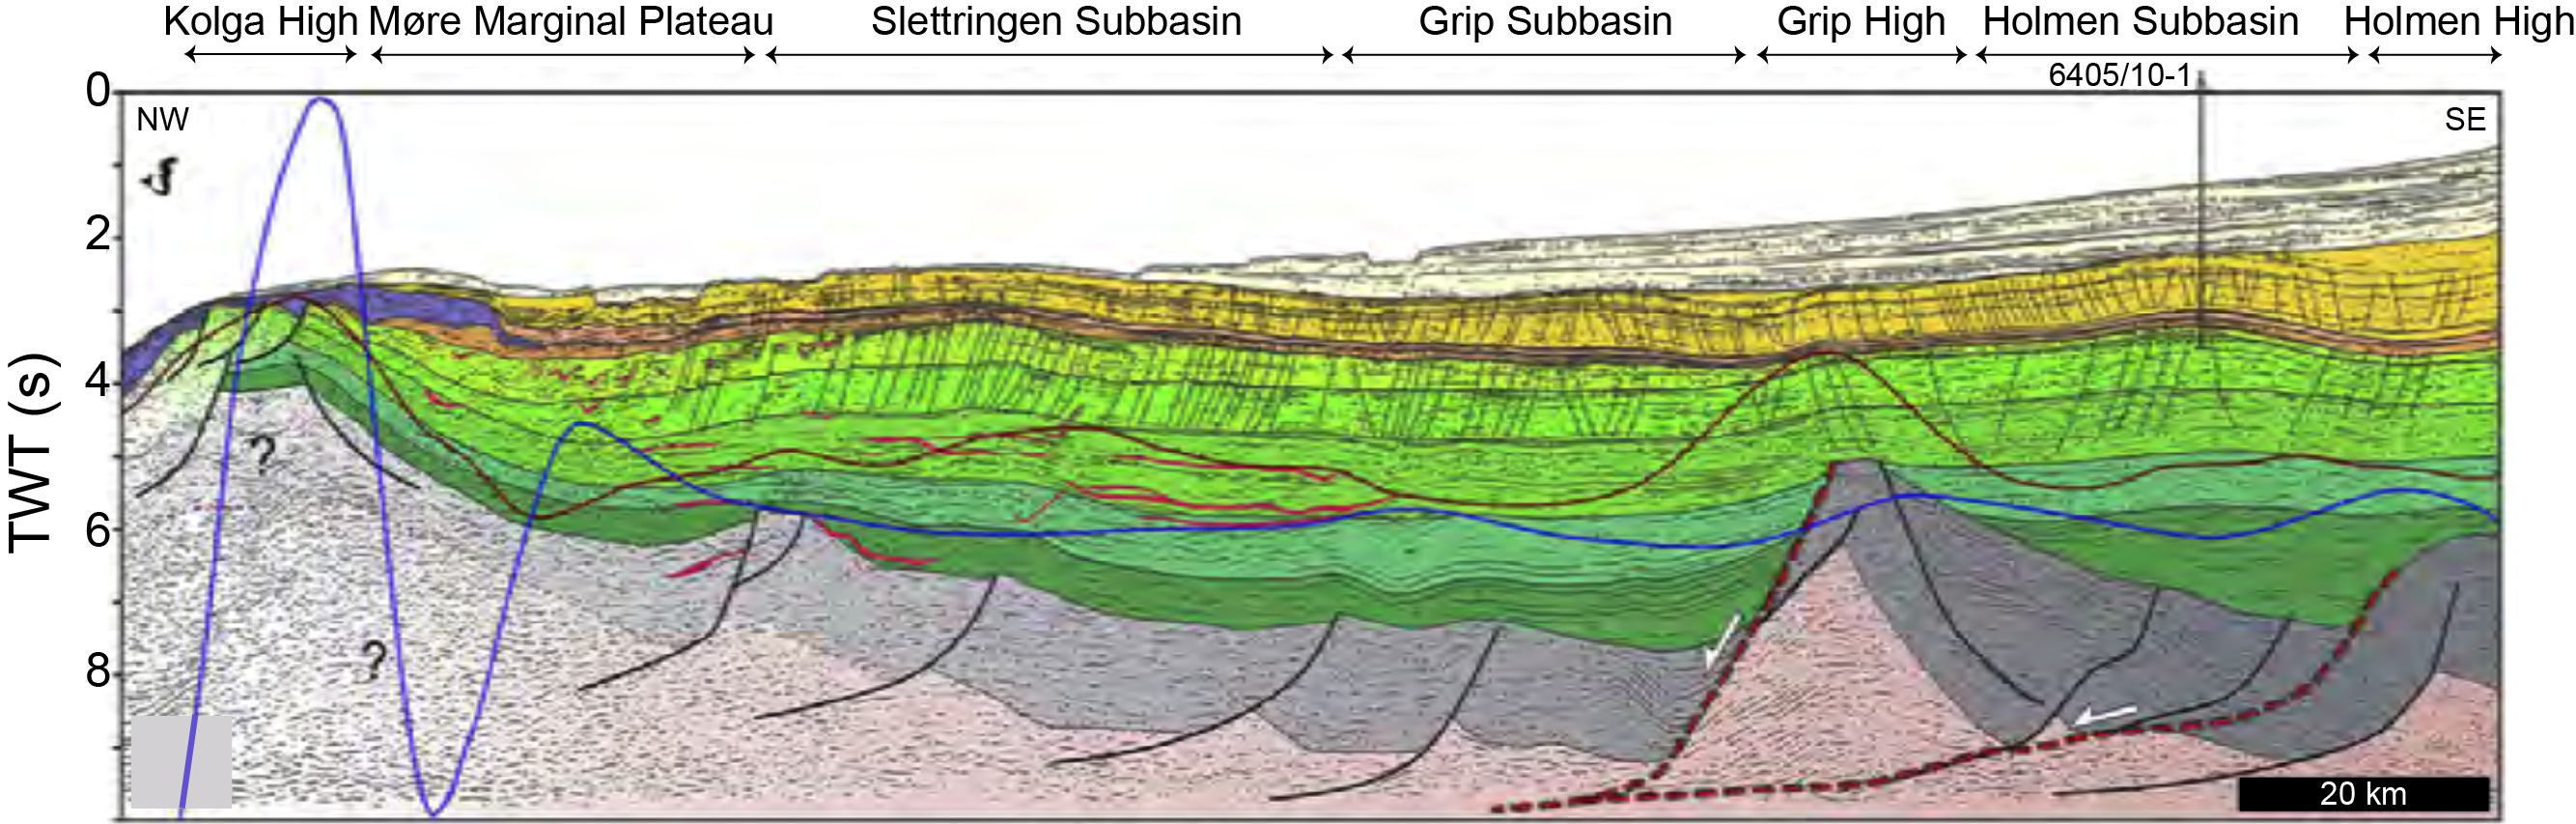
Figure F2. Kolga High seismic profile.
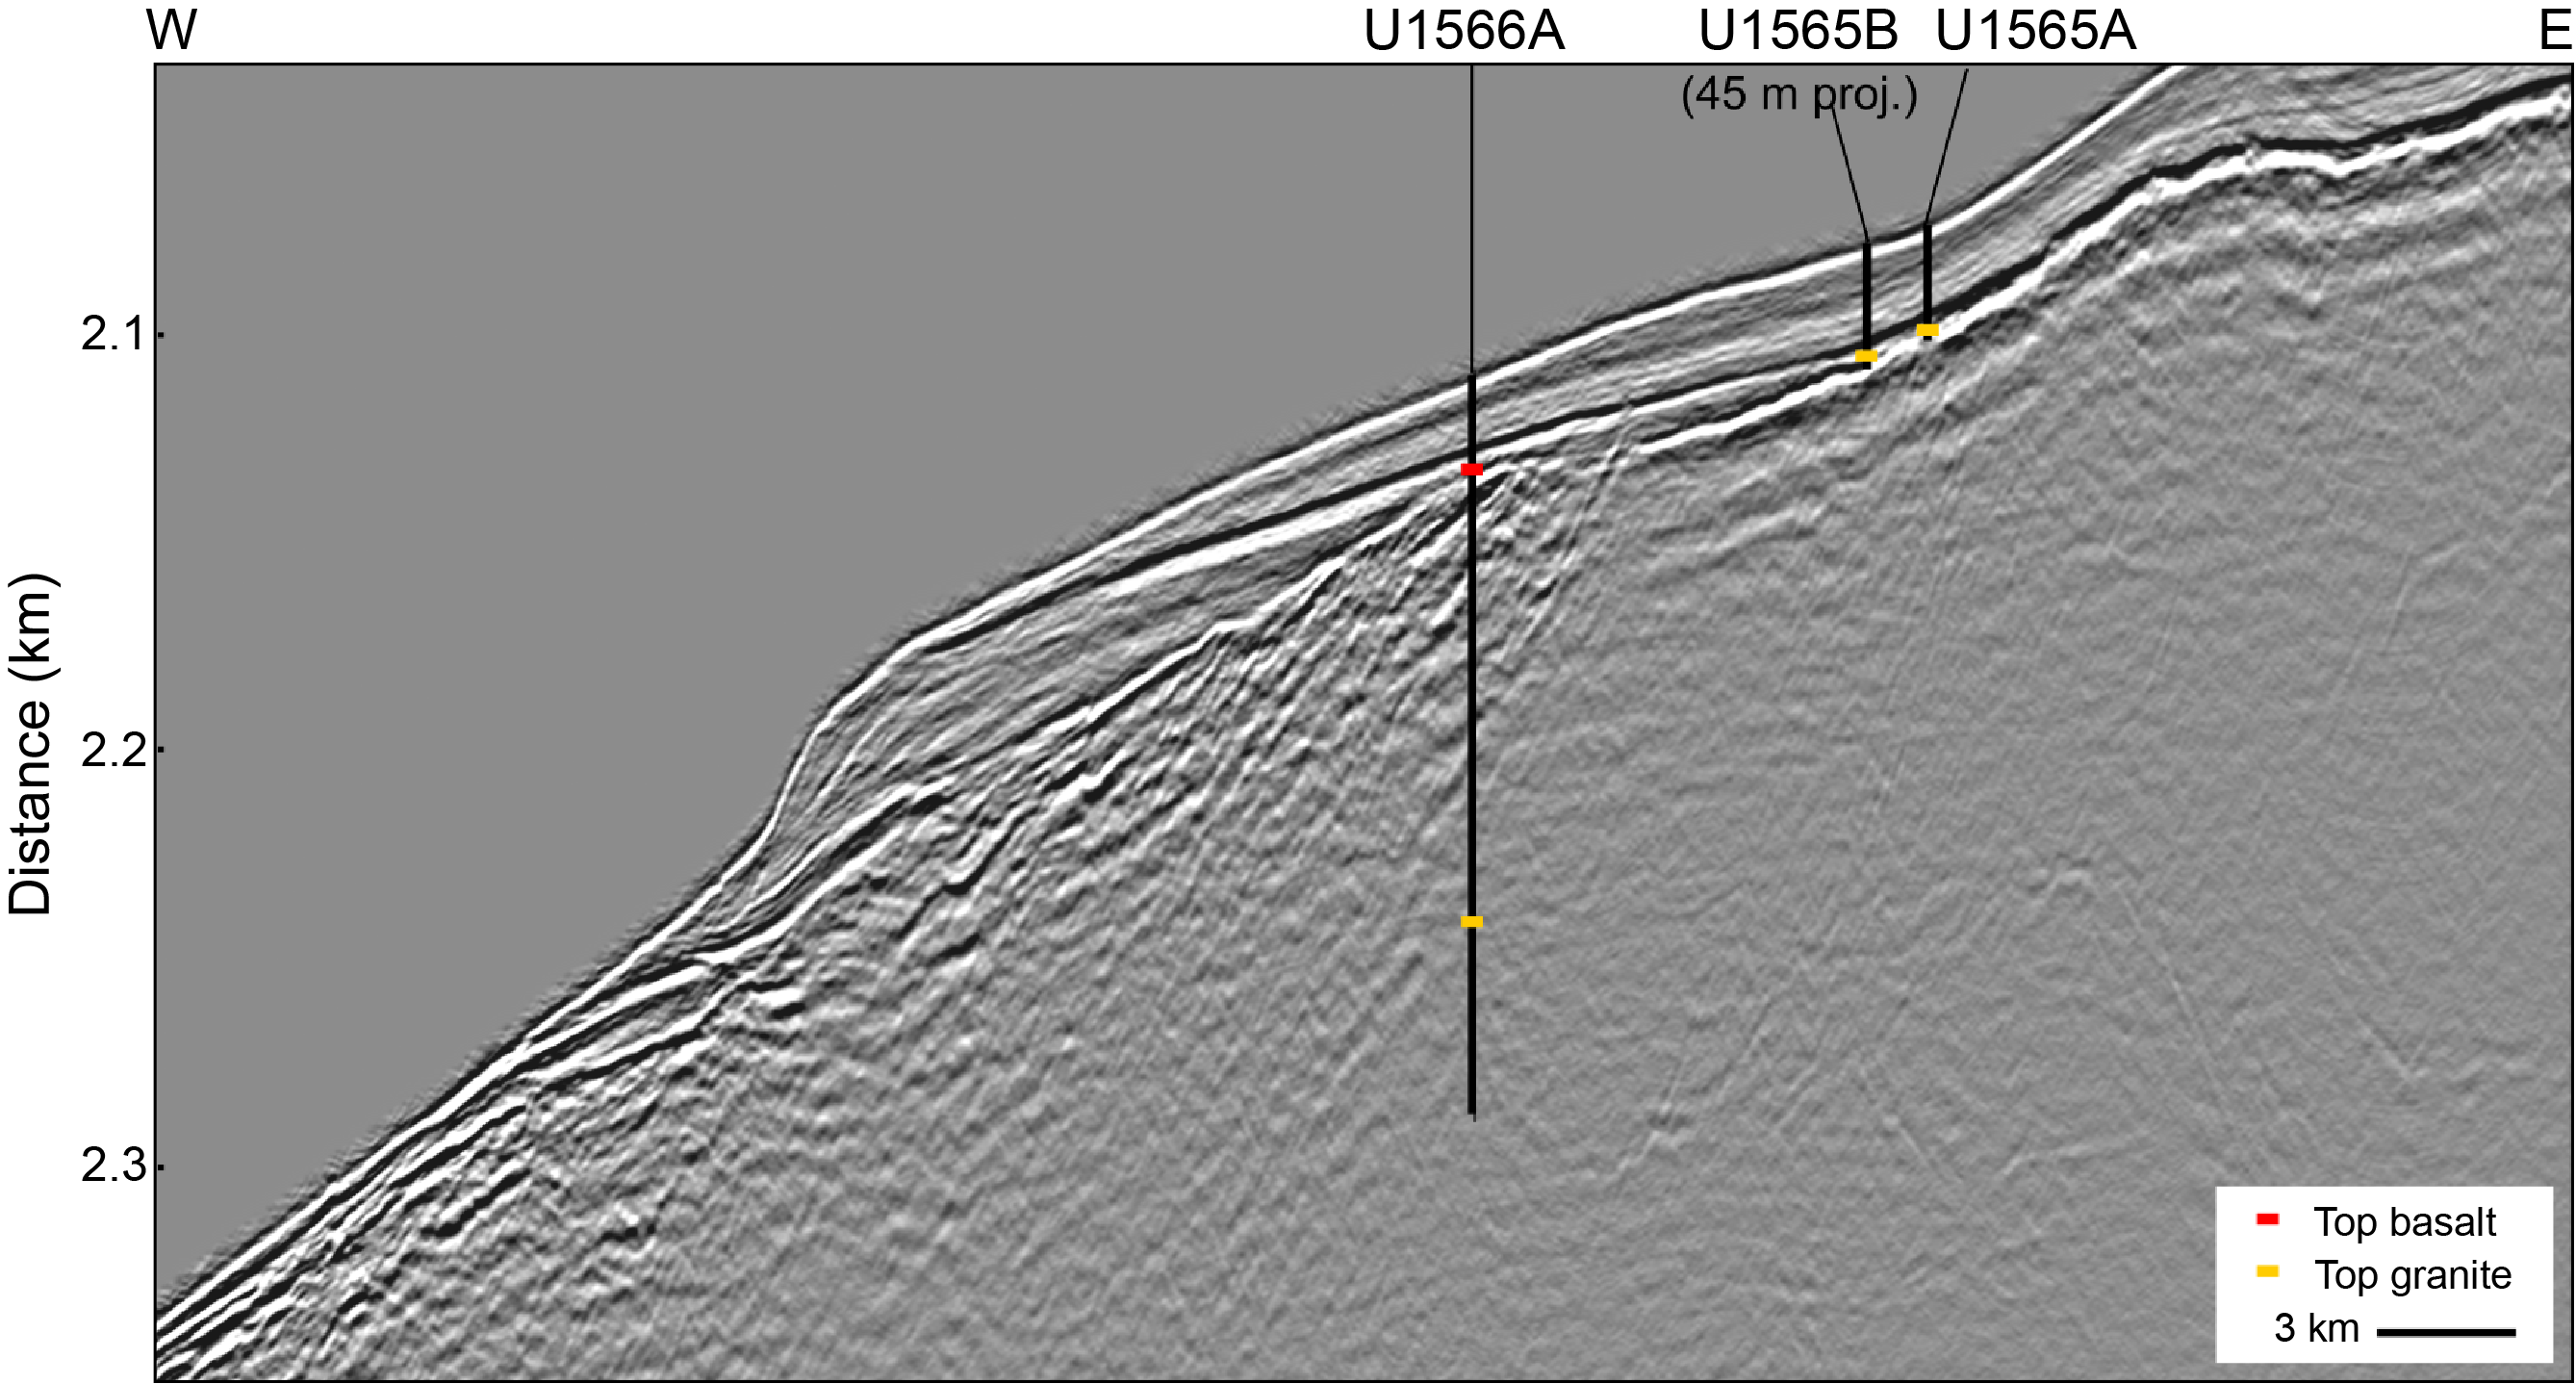
Figure F3. Seismic Line CAGE-2.
The gap in the basalt cover makes the Kolga High a unique place on the Vøring and Møre margins where the subbasalt sequence can be sampled with shallow coring. The primary objective of Site U1565 was to core and sample the subbasalt geology that was entirely unconstrained along the mid-Norwegian margin. Predrilling assessment of the age of the basement included the entire stratigraphic succession from the onset of extrusive volcanism in the late Paleocene through Cretaceous, Jurassic, and Triassic sediments to the crystalline basement. However, the high-amplitude top basement reflection indicates rather dense and old lithologies. Sampling the subbasalt succession would provide important constraints on the rifting history both in time and space as well as constraints on the vertical movements of this margin segment prior to breakup that likely took place in the Thanetian along the Møre Margin (i.e., slightly prior to breakup along the Vøring Margin in the earliest Eocene) (Gernigon et al., 2015, 2020). By comparing these results with basaltic cores targeted by Site U1566 about 1 km west of Site U1565, we also aspired to constrain the imprint of the extrusive volcanism on the substrata.
In summary, we expected to sample the subbasalt rocks on Site U1565 after penetrating about 25–30 m of Quaternary sediments. The plan was to core for 2 days or to a maximum depth of 200 meters below seafloor (mbsf) to recover representative samples of the basement rocks to characterize the lithologies and alternation. Because we encountered altered granitic basement immediately below the soft-sediment cover, we decided to drill a second hole (U1565B) approximately 140 m west to verify the lateral continuity of the basement rocks recovered in Hole U1565A rather than spending time deepening the hole at a very low penetration rate.
2. Operations
2.1. Reykjavik port call
International Ocean Discovery Program (IODP) Expedition 396, Mid-Norwegian Margin Magmatism and Paleoclimate Implications, began with the first line ashore in Reykjavik, Iceland, at Berth 10 Skarfabakki at 0842 h (all times are in UTC + 0 h) on 6 August 2021. The ship cleared customs and immigration on arrival from Expedition 395C and began port call operations. The Expedition 396 Siem staff, JOIDES Resolution Science Operator (JRSO) staff, and scientific party boarded the R/V JOIDES Resolution on the third day of port call after completing a 7 day quarantine period in a local hotel following COVID-19 mitigation protocols established by the JRSO for safe ship operations. These included 2 weeks of sheltering in place prior to travel, a pretravel COVID-19 test, a 7 day quarantine in a hotel in Reykjavik, and two additional COVID-19 tests prior to boarding the vessel on 8 August. Expedition 396 sailed with a reduced science party and JRSO staff and is the first IODP expedition to sail with a scientific team since the start of the COVID-19 pandemic.
During the hotel quarantine period, seven oncoming crew tested positive for COVID-19 and remained quarantined until they recovered. Additional personnel were sourced from the previous expedition to complete the ship’s crew for Expedition 396. Nine other close contacts remained quarantined in a local hotel before they were allowed to board the vessel on 11 August. The freshly quarantined personnel completed their 14 day quarantine period on board the vessel and were released from quarantine on 14 August.
Fresh food and catering consumables were loaded on board on 10 August. On 9 and 10 August, 1110 mt of marine gas oil, which was transported alongside the ship by two barges (one each day), were pumped on board. Fueling was completed at 1008 h on 10 August. The passage plan for the expedition was completed, and arrangements were made with the agent, tugboats, and harbor pilots for a departure at 1300 h on 11 August. After securing for sea, a pilot arrived on board at 1245 h and port tugs Haki and Lemir arrived to assist with the departure. The mooring lines were released and pulled back on board, and the last line was released at 1312 h. The vessel proceeded to the pilot station, and the pilot departed the vessel at 1326 h after a 6 nmi transit. The vessel began its sea passage at 1400 h on 11 August. After the 803 nmi transit from Reykjavik, averaging 10.8 kt, the vessel arrived at the first expedition site (U1565) at 1535 h on 14 August.
2.2. Site U1565
Site U1565 consists of two shallow holes. Hole U1565A was cored with the rotary core barrel (RCB) system to 28.0 mbsf. Coring was stopped because of very slow penetration rates while drilling into granite, which was sampled in Core 4R. With the objective to confirm the lateral extent of the granite, a second hole (U1565B) was added to the original plan and drilled 138 m west-northwest of the first hole in the direction of the next site (U1566). Hole U1565B was cored to 31.7 mbsf and yielded similar core material. Operations were ended at 0215 h on 16 August 2021, and the drill string was pulled clear of the seafloor to begin the short transit to the next site.
A total of nine cores were drilled using the RCB coring system at the site over 34.25 h or 1.4 days. The total cored interval at Site U1565 was 59.7 m, and 19.66 m of core was recovered (32.9%) (Table T1).
2.2.1. Hole U1565A
After arriving on location (64°57.7605′N, 2°44.9893′E), the thrusters were lowered and the dynamic positioning (DP) system was engaged. The vessel shifted to full automatic DP mode at 1600 h, and the drill floor was cleared to begin operations at Site U1565. An acoustic positioning beacon was prepared and placed on standby. Hydrophones were lowered and secured into place. Vessel positioning was measured with the GPS systems on board during operations.
The RCB bottom-hole assembly (BHA) was picked up, assembled, and run in the hole to 172.1 meters below rig floor (mbrf). All drill string tubulars were strapped and drifted during the pipe trip. The drill string was filled with water every 20 stands on the trip to the seafloor. The nonmagnetic core barrels were spaced out after assembling the outer core barrel. There were no significant operational problems running the drill string to just above the seafloor. The top drive was picked up and spaced out, and a wiper pig was inserted into the drill string. The wiper pig was pumped through the drill string with 1.5× the annular volume of the drill string to clean any rust or debris from the inside of the drill string. The calculated precision depth recorder (PDR) depth for the site was 2067.4 mbrf. The core barrels were dressed with liners, and the first core barrel was deployed.
The drill string was spaced out to spud, and the sinker bars were picked up and inserted through the main blocks. The first attempt to spud Hole U1565A was unsuccessful. The core barrel was retrieved empty. The second core barrel was dropped, and Hole U1565A was spudded at 0515 h on 15 August 2021. The mudline core recovered 0.26 m of sediment on a 5 m advance. The seafloor tag measured at 2083.4 mbrf (2072.3 mbsl). RCB coring continued through Core 4R to 28.0 mbsf, when coring was suspended due to very slow penetration rates and the interest to drill a new hole to confirm the lateral extent of granites sampled in this core. The drilling knobby was laid out, and the drill string was pulled clear of the seafloor at 1515 h, ending Hole U1565A. The time spent on Hole U1565A was 23.25 h or 1.0 day.
2.2.2. Hole U1565B
Hole U1565B began when the bit cleared the seafloor while pulling out of Hole U1565A. After clearing the seafloor, the bit was pulled a stand above the seafloor, and the vessel was offset 138 m west-northwest in the direction of the next site.
With the top drive already installed, the drilling knobby was picked up and the bit was spaced out to spud Hole U1565B using the new PDR depth of 2077.4 mbrf. Hole U1565B was spudded at 1635 h on 15 August 2021. The mudline core recovered 6.9 m of sediment on a 7 m advance. The seafloor tag measured at 2081.5 mbrf (2070.4 mbsl). RCB coring continued through Core 5R to 31.7 mbsf. Coring was ended after sampling more granite similar to that sampled in Hole U1565A. The drilling knobby was laid out, and the drill string was pulled clear of the seafloor at 0215 h on 16 August, ending Hole U1565B. After clearing the seafloor, the bit was pulled to 2020 mbrf and the vessel was offset 462 m west-northwest to the coordinates of Site U1566. The time spent on Hole U1565B was 11.0 h or 0.5 days.
3. Lithostratigraphy
The lithology of Holes U1565A and U1565B was examined, and two lithostratigraphic units were established (Figure F4; Table T2). Lithostratigraphic units were primarily defined by principal lithology and the repetitive assemblages of facies that occur in each unit (see Lithostratigraphy in the Expedition 396 methods chapter [Planke et al., 2023a]) and subsequently corroborated using physical properties measurements, smear slide and thin section inspection, mineralogic data from X-ray diffraction (XRD) and portable X-ray fluorescence (pXRF) analyses, and calcium carbonate concentrations (%CaCO3).
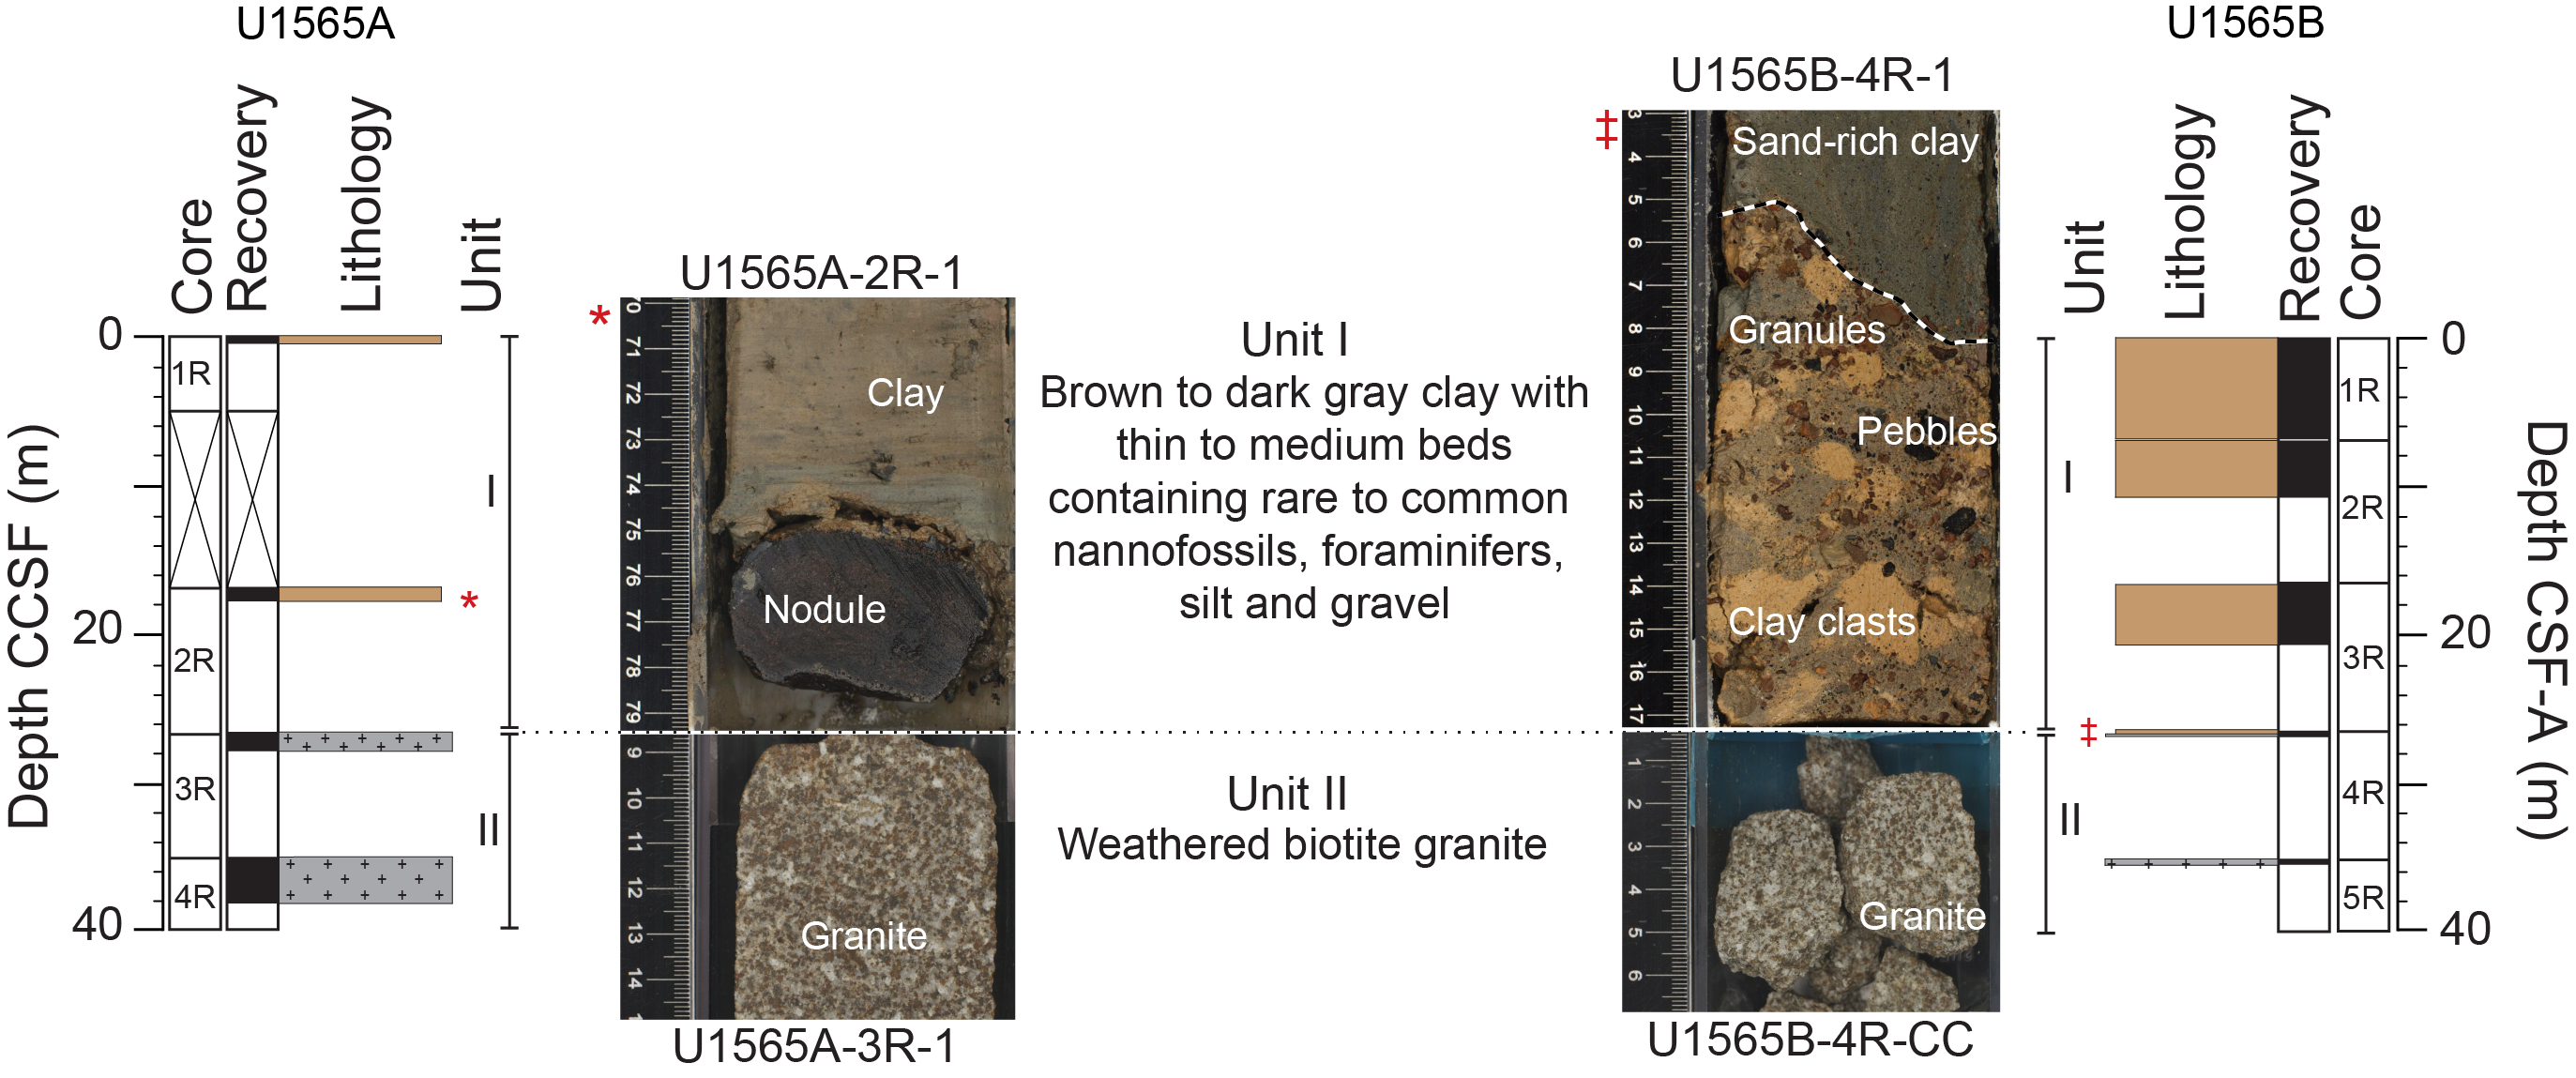
Figure F4. Lithostratigraphic summary.
Unit I is sedimentary, and Unit II is igneous. The top of Unit II is located at 14.60 m CSF-A in Hole U1565A and 26.28 m CSF-A in Hole U1565B. The boundary between the two units was determined using drilling data; the bit depth shows a sharp decrease in the rate of penetration (ROP) from about 15 to 1–2 m/h at 20.9 mbsf in Hole U1565A and 28.0 mbsf in Hole U1565B. Unit I is 7.1 m thinner in Hole U1565A than in Hole U1565B. High-resolution seismic data show that the expected overburden thickness is the same in both holes. The thickness discrepancy in the drilling data is attributed to uncertainties in the determination of the seabed depth for RCB drilling because it was determined using the increase in torque in Hole U1565A and the mudline recovery in Hole U1565B. The thicknesses of granite drilled in Holes U1565A and U1565B are 7.1 m and 3.6 m, respectively.
A total of 10.7 m of altered monzogranite with biotite was recovered from the bottom part of both holes. The discovered granite represents subbasaltic basement in the western part of the Kolga High.
3.1. Unit I
- Intervals: 396-U1565A-1R-1, 0 cm, to 2R-CC, 4 cm; 396-U1565B-1R-1, 0 cm, to 4R-1, 18 cm
- Depths: Hole U1565A = 0.00–5.84 m CSF-A; Hole U1565B = 0.00–26.28 m CSF-A
- Age: Quaternary
The low recovery of Lithostratigraphic Unit I is attributed to the unconsolidated nature of the sediment and dispersal into seawater due to RCB coring and the core retrieval process. In Unit I in Hole U1565A, the sediment is primarily composed of olive-brown to reddish brown clay, whereas Unit I in Hole U1565B is mainly composed of brown, grayish brown to dark gray clay. Generally, this unit contains varying amounts of silt, sand, calcareous nannofossils, and planktonic foraminifers, with diatoms common in the first section of Hole U1565A (1R-1). Amphibolite and granite dropstones are present (e.g., Section 1R-1). The unit is overall moderately to very well sorted. Smear slide analysis indicates Unit I primarily consists of abundant undifferentiated clay-sized minerals, rare to trace foraminifers and nannofossils with larger silt- and sand-sized grains comprised of common quartz and undifferentiated feldspar, and rare lithics (Figure F5). Trace amounts of diatoms, zircon, chlorite, and glauconite are also present. Slight to moderate drilling disturbances are observed in parts of the unit.
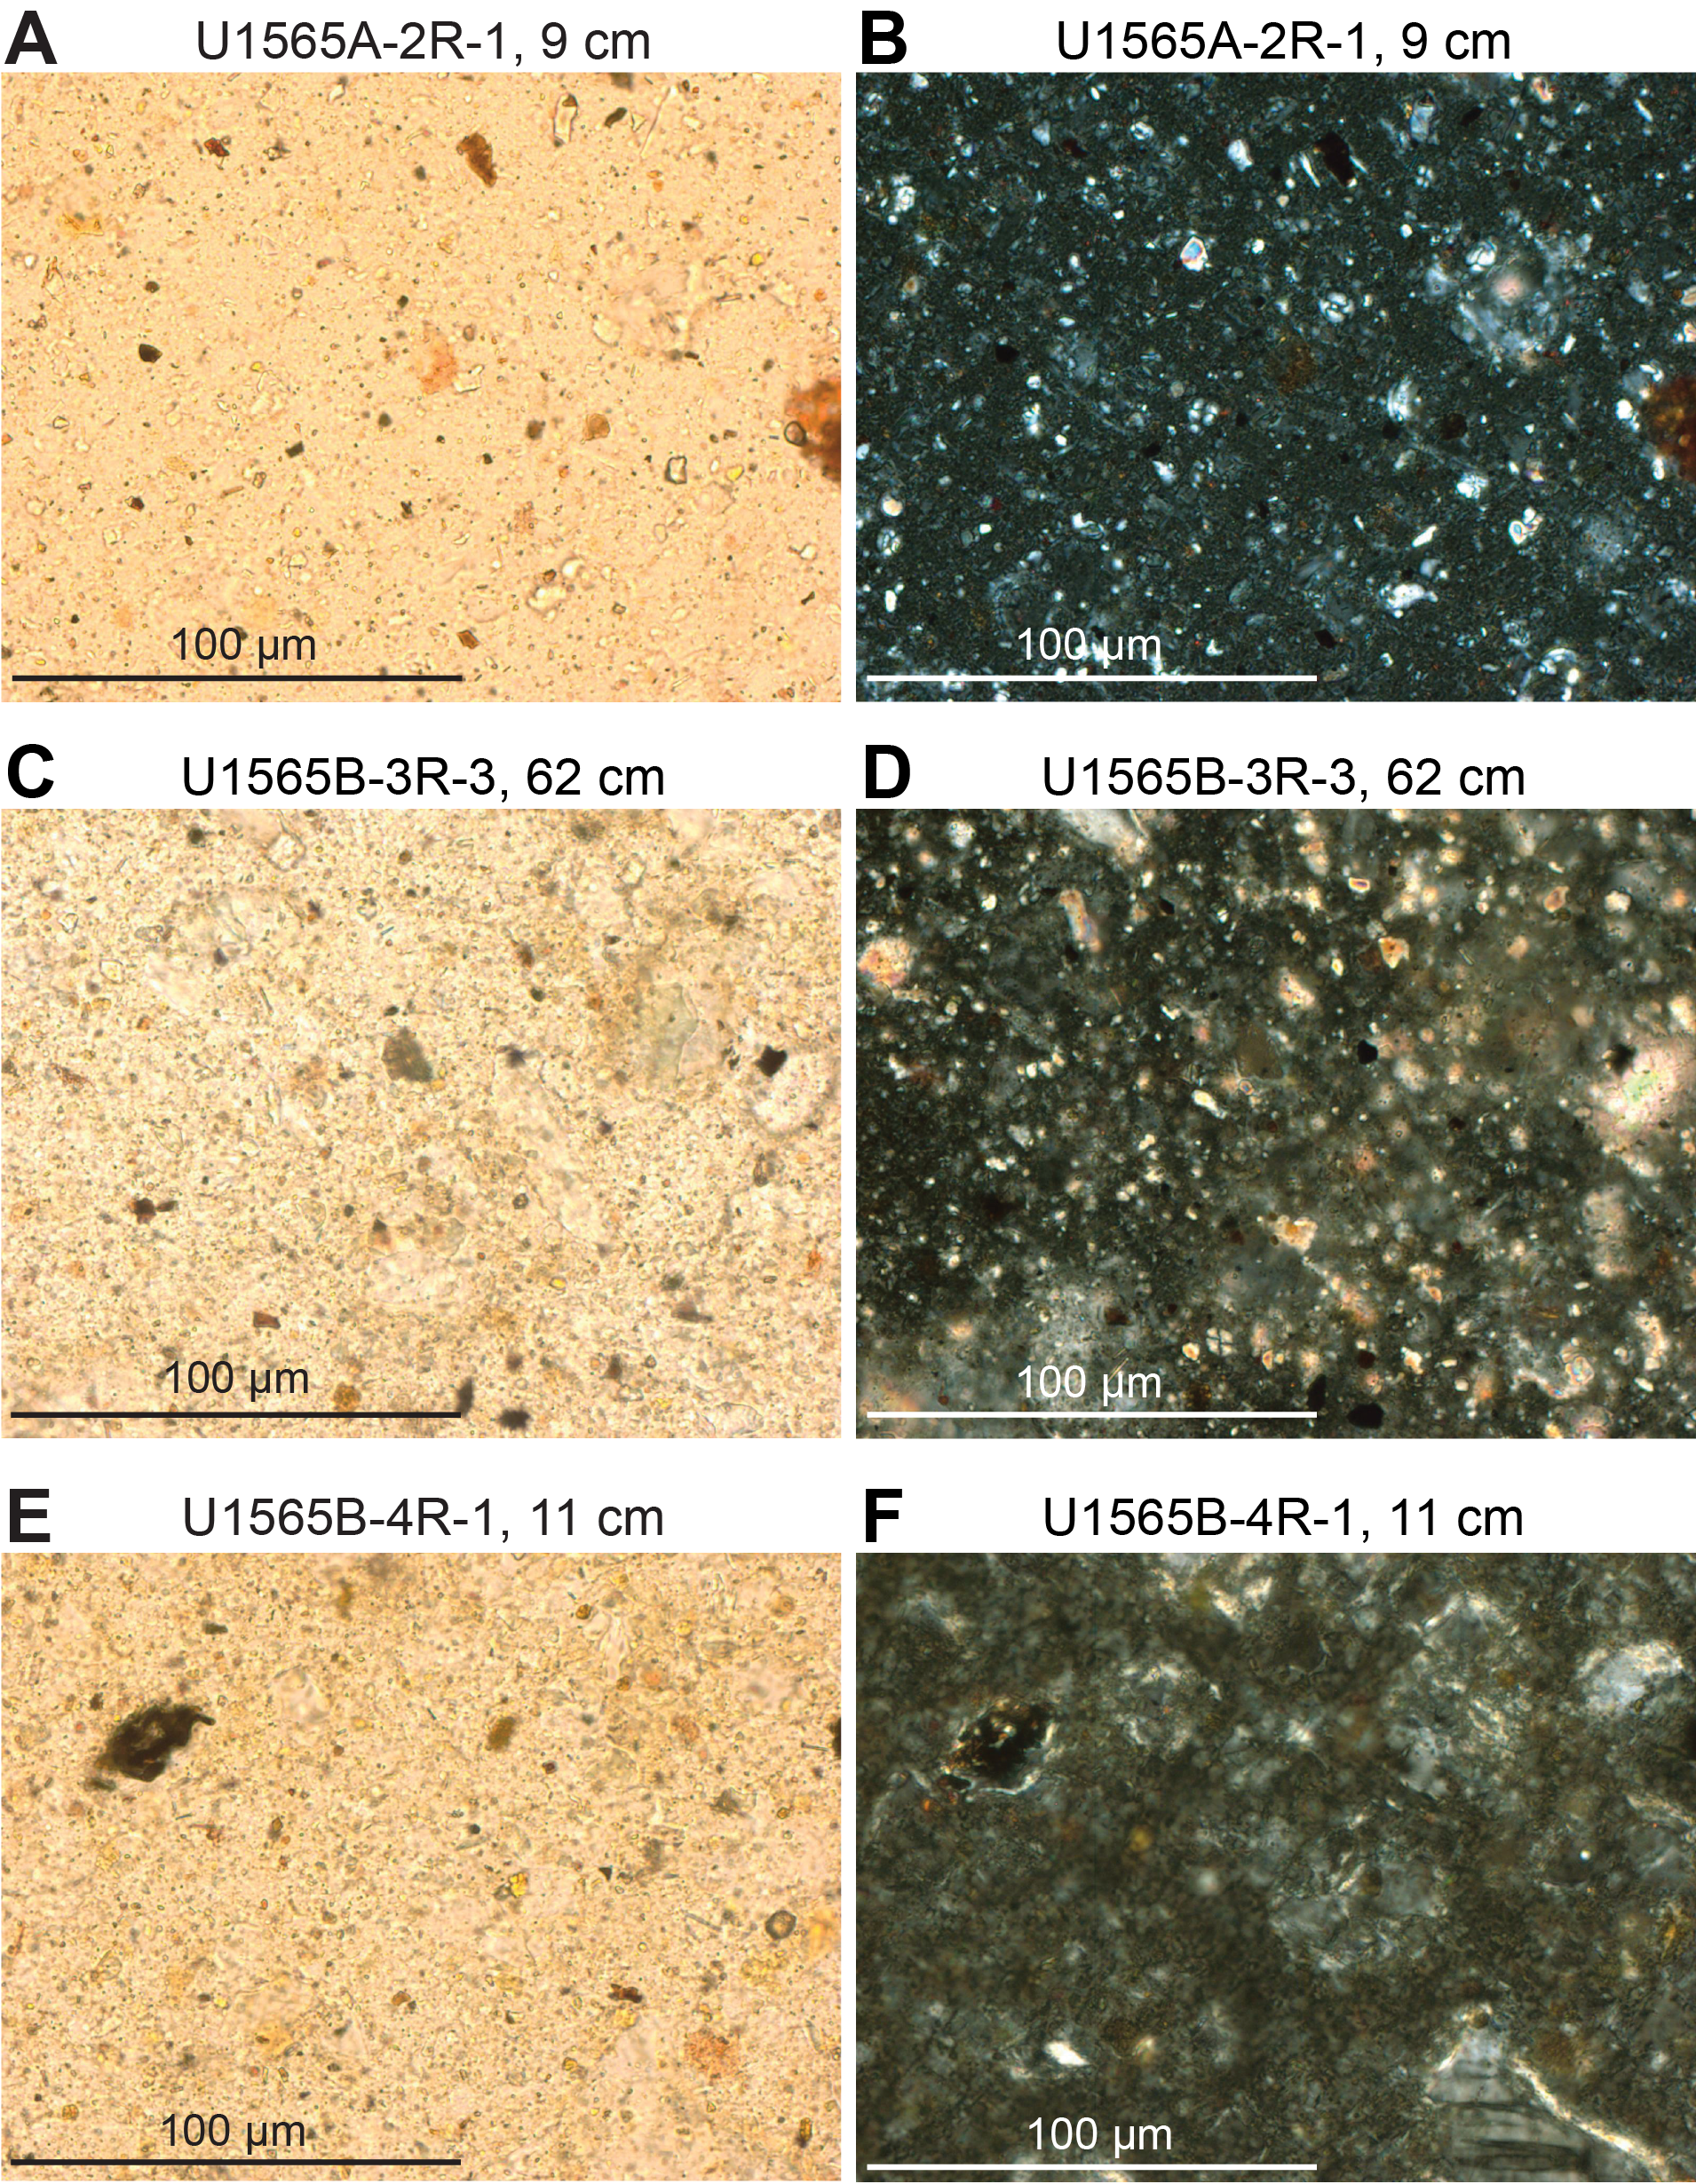
Figure F5. Sediment and matrix material.
Dark gray polymetallic concentric nodules are observed at the base of Unit I in Hole U1565A (interval 2R-1, 75–79 cm; Figure F4). pXRF data were collected from the nodules at 5.80–5.84 m CSF-A (Section 2R-CC). The composition of the nodule material consists of low to moderate concentrations of transition metals (Fe2O3 = 10.7 wt%, Mn2O3 = 2.6 wt%, Ni = 210 ppm, Cu = 80 ppm, and Zn = 94 ppm). The silica content (~35 wt%) is considered relatively high for such nodules and suggests the presence of clay materials.
The base of Unit I in Hole U1565B directly above Unit II consists of a mixture of sand, subrounded yellow-brown clay clasts, and granules to medium pebbles with a poorly sorted grain size (Figure F4). Smear slide analysis of matrix material from this interval indicates abundant undifferentiated clay-sized minerals with rare nannofossils, rare organic debris, and trace diatoms (Figure F5E, F5F). Silt and sand grains consist of common undifferentiated feldspar, rare quartz, and rare lithics.
Calcium carbonate measures 0.05–10.43 wt%. Values over 10 wt% CaCO3 are from the first core in both holes (396-U1565A-1R and 396-U1565B-1R). Total organic carbon (TOC) contents are 0.01–0.63 wt%.
The holes were preliminarily correlated and placed on a common depth scale (core composite depth below seafloor [CCSF]; Figure F4). The tops of Sections 396-U1565A-1R-1 and 396-U1565B-1R-1 were tied based on %CaCO3 content (~10%) and biostratigraphic assemblages (i.e., Section 396-U1565A-1R-1, 0 cm, tied to Section 396-U1565B-1R-1, 0 cm; Figure F4). The top of Unit II was used as a second tie such that the Unit I/II boundary was aligned for the two holes (i.e., Section 396-U1565A-3R-1, 0 cm, tied to Section 396-U1565B-4R-CC, 0 cm). A 11.68 m gap was tentatively placed between Cores 396-U1565A-1R and 2R to accommodate the unit boundaries as inferred from the ROP without distorting depth scales. Core 2R consists of clays with basal polymetallic nodules; it is interpreted to lie on top of the granite corresponding to Unit II because recovery was completely lost below this interval, likely due to abrupt lithologic change (i.e., Unit I/II boundary). Thus, Core 2R was placed below this gap so that it lies above the Unit II granite observed in Core 3R.
3.2. Unit II
- Intervals: 396-U1565A-3R-1, 0 cm, to 4R-3, 19 cm (bottom of hole); 396-U1565B-4R-CC, 0 cm, to 5R-1, 21.5 cm (bottom of hole)
- Depths: Hole U1565A = 14.60–25.99 m CSF-A; Hole U1565B = 26.28–30.915 m CSF-A
- Age: undetermined
The contact surface between Lithostratigraphic Units I and II was not retrieved in Hole U1565A. In Hole U1565B, the boundary was recovered (Sections 4R-1 and 4R-CC; Figure F4). The first retrieval of Unit II was at 14.60 m CSF-A in Hole U1565A. In Hole U1565A, Unit II continues to 25.99 m CSF-A, whereas the bottom of recovered material in Hole U1565B is 30.915 m CSF-A.
Unit II is an igneous unit and consists of weathered granitic basement. It is an altered medium-grained granite with biotite and local mafic or felsic enclaves (Figure F6). This unit was recovered in the lower part of Holes U1565A and U1565B (14.6–30.1 m CSF-A). In Hole U1565A, Unit II was drilled from 14.60 to 26.00 m CSF-A, and the total recovered core was 11.40 m. In Hole U1565B, it was drilled from 26.40 to 30.10 m CSF-A, and the total recovered core was 3.70 m.
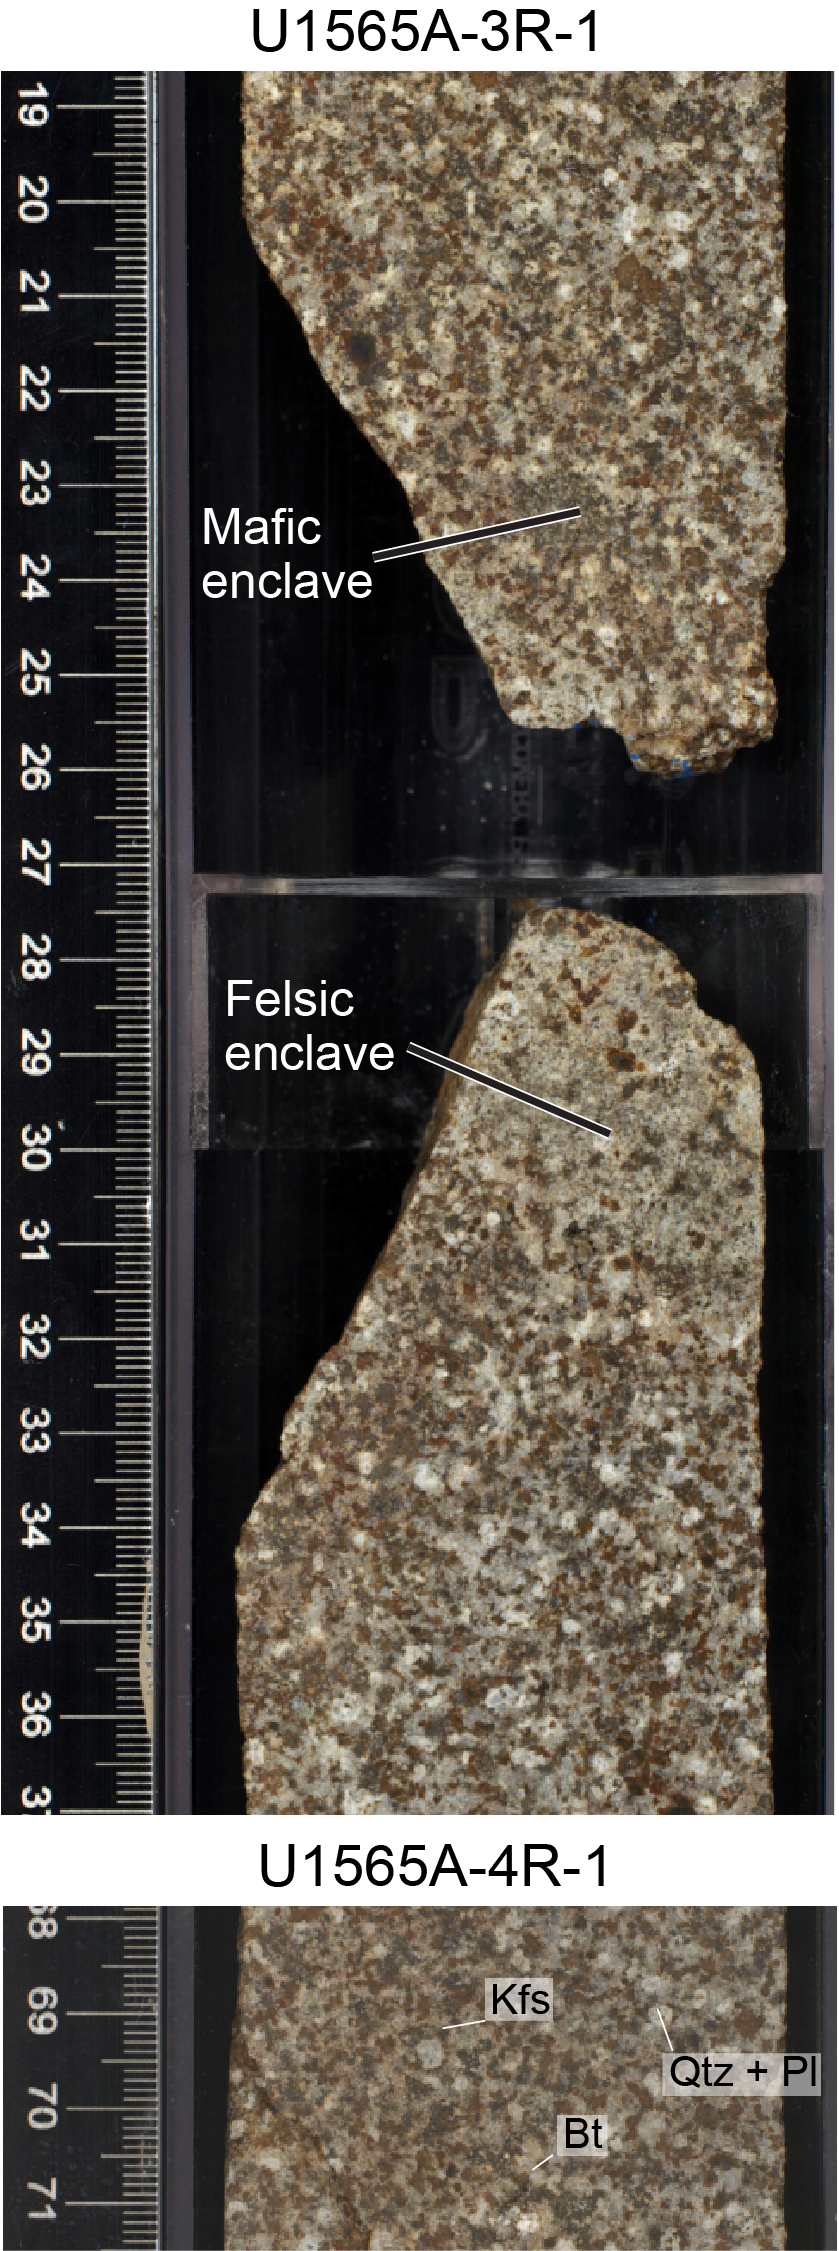
Figure F6. Unit II macroscopic observations.
The igneous intervals were described macroscopically and microscopically using thin section analysis (see Lithostratigraphy in the Expedition 396 methods chapter [Planke et al., 2023a]). Chemical analyses were obtained using pXRF spectrometry to check for any major compositional changes, both primary and from the alteration process. Throughout Unit II, the recovered biotite monzogranite remains mineralogically and texturally consistent (Figure F6) and is moderately to highly altered. Microscopic observations confirm that Unit II consists primarily of medium-grained biotite monzogranite with quartz, K-feldspar (altered to clay), plagioclase, and biotite (somewhat altered to limonite). Discrete fine-grained enclaves are present in parts of Unit II.
3.2.1. Petrology
3.2.1.1. Macroscopic observations
Unit II is characterized by altered, medium-grained granite consisting of alkali feldspar, plagioclase, quartz, and biotite (Figure F6). Phenocrysts (approximately millimeter sized) of euhedral alkali feldspars are observed, although they are generally highly altered and rimmed by red-brown clay minerals. Biotite also commonly presents a dark corona. In Hole U1565A, small (diameter = 1–5 cm), both darker and lighter, slightly less altered enclaves were found throughout the core (Figures F6, F7A, F7B).

Figure F7. Monzogranite microstructure.
3.2.1.2. Microscopic observations
Observations of two thin sections confirmed the pervasive alteration and mineralogy observed at macroscopic scale (Figure F7A, F7B). Alkali feldspars are generally partially or totally replaced by undetermined brownish clay minerals and zeolite (Figure F7C, F7D). Biotite grains show corona of limonite (Figure F7E). The plagioclase is euhedral and characterized by polysynthetic twinning. Quartz is anhedral. The estimated mineralogy of the sample plots in the monzogranite field of the quartz-alkali feldspar-plagioclase-feldspathoid (QAPF) Streckeisen classification (Streckeisen, 1974).
The contact between a light-colored enclave and the biotite granite appears irregular (Figure F6A, F6B). The mineralogy of the enclave is similar to the host but contains some textural differences. The average grain size of the enclave is slightly smaller than the monzogranite. When alkali feldspar is preserved, grains show localized microperthitic texture (Figure F7F). Subophiotic textures (Figure F7G, F7H) between larger (~5 mm) quartz grains and small (~0.3 mm) plagioclase lathes are also locally observed.
4. Biostratigraphy
Unconsolidated mixed gray and brown sands, silts, and clays with intervals containing gravel and larger clasts were recovered while drilling Holes U1565A and U1565B before reaching igneous basement rocks. Core catcher samples collected from these cores (396-U1565A-1R-CC and 2R-CC and 396-U1565B-1R-CC to 4R-CC) were analyzed for microfossil content and are estimated to be of Quaternary age. We interpret these materials to have originated from ice-rafted debris. Microfossil occurrences are summarized in Table T3.
4.1. Siliceous microfossils
Smear slides were prepared from all six core catchers samples yielding sedimentary materials as well as the mudline sample to evaluate occurrences of siliceous microfossils. Additionally, several smear slides were prepared and analyzed from split cores at selected depths. These smear slides were presented to the Lithostratigraphy team for cataloging because no further research was to be performed on the diatoms. The mudline sample from Hole U1565B was soaked in 10% H2O2 and, after the sample was diluted with deionized water, sieved with a 20 µm stainless steel sieve and prepared as a strewn slide. Diatoms occur in the mudlines of Holes U1565A and U1565B. Examination of four smear slides from the split cores revealed a decreasing occurrence of diatoms below the upper 20 cm of Section 1 from both holes. Samples 396-U1565A-1-CC and 396-U1565B-1-CC contain trace occurrences of corroded diatoms and other biosiliceous debris, including sponge spicules, silicoflagellates, and radiolarians. All subsequent core catcher samples are barren of identifiable biosilica. The diatoms of the mudline include Shionodiscus oestrupii, Thalassiosira trifulta, Thalassiosira nordenskioldii, Thalassiosira lineata, and Thalassionema nitzschioides, all characteristic of late Quaternary deposition.
4.2. Palynology
Core catcher Samples 396-U1565A-1R-CC and 2R-CC were processed for palynology using 10% HCl followed by density separation in the ultrasonic bath. No hydrofluoric acid (HF) treatment was deemed required because of the uncompacted nature of the sediments. Sample 1R-CC yielded palynomorphs, whereas Sample 2R-CC was entirely devoid of acid resistant organic debris and palynomorphs.
Besides a few likely in situ Quaternary palynomorphs, such as the organic walled dinoflagellate cyst (dinocyst) species Operculodinium centrocarpum, some Spiniferites spp., and freshwater elements like Pediastrum spp., Sample 1R-CC yielded abundant reworked palynomorphs. These included marine dinocysts of various ages, mainly the Early Cretaceous and Paleogene, as well as pollen and spores, exclusively of Early Cretaceous age. The combination of these reworked, typical coastal taxa (e.g., various species of Cribroperidinium, Oligosphaeridium, and Pseudoceratium) with the abundance of reworked pollen and spores suggests a provenance of some shallow marine formation of Early Cretaceous age. Paleogene (e.g., Areoligera, Apectodinium, and Chiropteridium spp.) taxa are dominant, however, providing evidence of Paleocene, Eocene, and Oligocene sources. No quantitative analysis was conducted on this sample.
Core catcher Samples 396-U1565B-1R-CC to 396-U1565B-4R-CC were processed for palynology using 10% HCl followed by density separation in the ultrasonic bath. No HF treatment was deemed required given the uncompacted nature of the sediments.
Very few palynomorphs and some palynodebris were found in Samples 1R-CC and 3R-CC, whereas Samples 2R-CC and 4R-CC are barren. Encountered dinocyst species, along with a few pollen and spores recorded in Samples 1R-CC and 3R-CC, match those described above from Sample 396-U1565A-1R-CC, and a Quaternary age is assumed. We did not perform quantitative analyses.
In addition, some 20 g of yellowish clay from Sample 4R-1, 13–15 cm was processed using the HF protocol to double check potentially missed palynomorphs. The sample was found to be barren of acid-resistant organic materials altogether.
4.2.1. Foraminifers
Core catcher Samples 396-U1565A-1R-CC and 2R-CC and the mudline were processed for planktonic foraminifers by washing the samples through a >63 µm wet sieve and, after samples were dried in an oven, a dry sieve. No hydrogen peroxide was used because the sample was easily washed through the >63 µm wet sieve.
Only the mudline and Sample 1R-CC yielded abundant planktonic foraminifers, with Neogloboquadrina pachyderma (sin.) strongly dominating. Neogloboquadrina dutertrei, N. cf. dutertrei, N. pachyderma (dex.), Neogloboquadrina sp., Globigerina bulloides, Globigerina quinqueloba, Globigerinita sp., and one Lower Cretaceous specimen also occur in various amounts. Most of the N. pachyderma (sin.)–encrusted planktonic foraminifers in Sample 2R-CC are rare, and N. pachyderma (sin.) dominates the sample. G. bulloides, Globigerinita sp. and Neogloboquadrina sp. were also noted in Sample 2R-CC. Preservation states of planktonic foraminifers in Samples 1R-CC and 2R-CC and the mudline were generally noted as good. Pyrite was noted in some specimens.
Core catcher Samples 396-U1565B-1R-CC to 4R-CC and the mudline were also processed for planktonic foraminifers. Samples 1R-CC to 3R-CC and the mudline have abundant planktonic foraminifers with N. pachyderma (sin.) strongly dominating. Other species occurring in various amounts include G. bulloides, Neogloboquadrina atlantica (sin.), N. dutertrei, N. cf. dutertrei, N. cf. pachyderma, N. pachyderma (dex.), and Neogloboquadrina sp. Sample 4R-CC is barren of planktonic foraminifers. Preservation of planktonic foraminifers in Samples 1R-CC and 3R-CC and the mudline is generally good. Pyrite was noted in some specimens.
Both sites exhibit planktonic foraminifers that are indicative of Quaternary age. Following the zonal scheme of Spiegler and Jansen (1989), Samples 396-U1565A-1R-CC and 2R-CC and 396-U1565B-1R-CC to 4R-CC indicate Zone NSPF 6.
4.3. Calcareous nannofossils
Calcareous nannofossils are noted in the carbonate-bearing sediments of Sections 1 and 2 from Holes U1565A and U1565B based on analysis of four smear slides from split cores. No attempt to identify these fossils was made.
4.4. Ostracods
All sedimentary core catcher and mudline samples from Holes U1565A and U1565B were examined for ostracods (Table T3). Ostracods are very rare although slightly more common in the mudline samples. Preservation is moderate. All identified genera are common deep-sea taxa found in the North Atlantic Ocean and are not stratigraphically conclusive (e.g., Krithe, Henryhowella, and Cytheropteron).
4.5. Summary
All sediment samples analyzed from Holes U1565A and U1565B yielded common to trace diatoms, in situ and reworked dinocysts, reworked sporomorphs, rare ostracods, common to trace benthic foraminifers, and common planktonic foraminifers. The youngest age-diagnostic microfossils indicate an overall Quaternary age. In addition, palynomorphs (mainly dinocysts) indicate substantial reworking from Paleogene and (lower) Cretaceous strata and pollen and spores also indicate reworking from Lower Cretaceous deposits.
Diatoms and foraminifers are common in the mudline samples of Hole U1565A and U1565B and together suggest a middle Pleistocene–Holocene age.
5. Paleomagnetism
5.1. Shipboard measurements
Shipboard paleomagnetic investigations combined two complementary approaches (see Paleomagnetism in the Expedition 396 methods chapter [Planke et al., 2023a]): (1) measurement and in-line alternating field (AF) demagnetization of archive-half sections on the pass-through 2G Enterprises superconducting rock magnetometer (SRM) at a 2.5 cm spacing and (2) measurement and AF demagnetization of three oriented discrete samples on the AGICO spinner magnetometer (JR-6A). In addition, anisotropy of magnetic susceptibility (AMS) was measured on the same three discrete samples using an AGICO KLY 4S Kappabridge.
Only one discrete sample was collected from each core to perform AF demagnetization and AMS measurement. We used the directional and intensity data of archive-half sections (measured at 20 mT) to determine magnetic polarity along the core. Directional and intensity data from discrete samples were used to validate the polarities inferred from section measurements. Directional data were analyzed using Zijderveld diagrams (Zijderveld, 2013). The characteristic remanent magnetization (ChRM) direction(s) were determined using the Remasoft 3.0 software (Chadima and Hrouda, 2006).
5.2. Demagnetization behavior
5.2.1. Sediments (Lithostratigraphic Unit I)
The archive-half sections of sediment from Cores 396-U1565A-1R through 3R (0.0–23.20 m CSF-A) and 396-U1565B-1R (0.0–7 m CSF-A) were measured on the SRM at a 2.5 cm spacing (Figures F8, F9). After measuring the natural remanent magnetization (NRM), the cores were subjected to a stepwise in-line AF demagnetization at 5, 10, 15, and 20 mT. The variations of magnetic parameters toward the ends of pieces are measurement artifacts. Two of the magnetic parameters measured on the SRM (inclination and intensity) show consistent and continuous variations throughout the sections, which indicates that, despite drilling disturbance, these parameters are meaningful. The high variability of magnetic parameters observed in a few intervals could equally be explained by local drilling disturbance or by a weakly coercive magnetic assemblage. The steep values of magnetic inclination (>80°) might be due to drilling-induced magnetization because the current geomagnetic field for Holes U1565A and U1565B is ~77° (https://www.ngdc.noaa.gov/geomag/calculators/magcalc.shtml#igrfwmm).

Figure F8. Magnetic parameters, Hole U1565A.
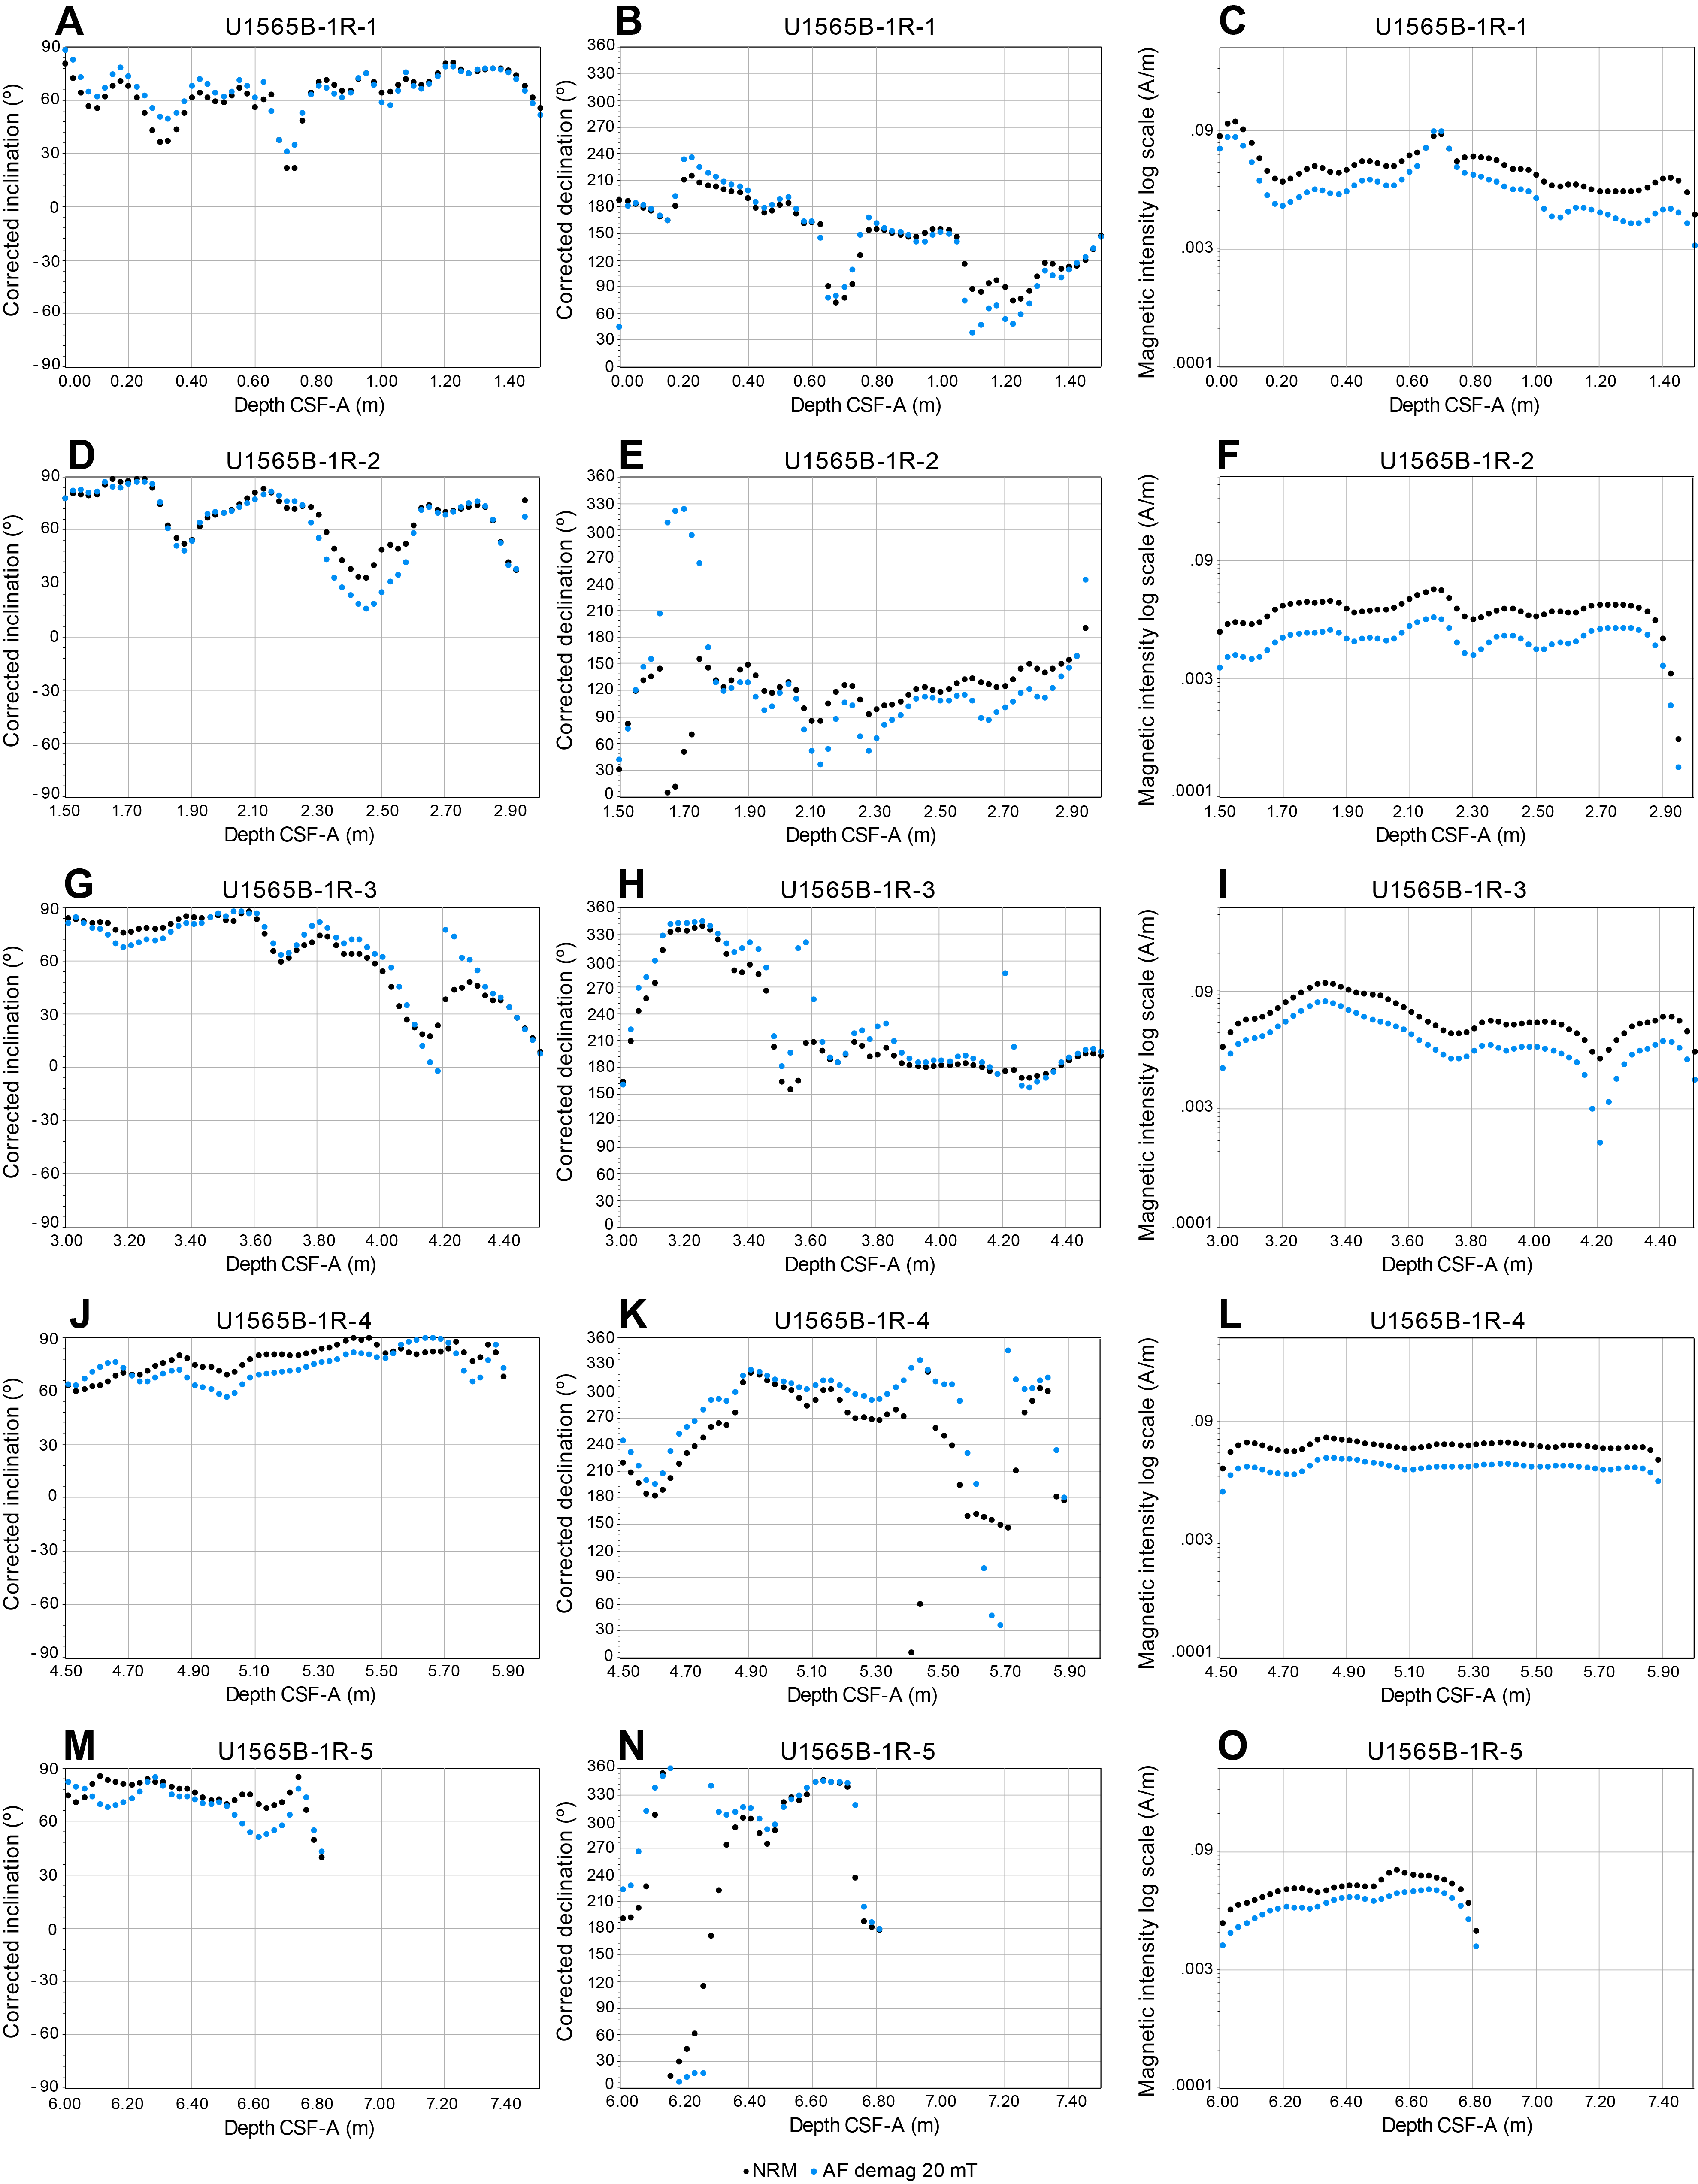
Figure F9. Magnetic parameters, Hole U1565B.
The Icefield MI-5 core orientation tool was not deployed; therefore, the core azimuthal orientation and the magnetic declination should not be considered as accurate. Lithostratigraphic Unit I, characterized by greenish gray to brownish gray clay with a few dropstones, has an average initial intensity of magnetization 3.6 × 10⁻² A/m.
In Holes U1565A and U1565B, the magnetic inclination indicates geomagnetic polarity and remains overall normal (positive), except at 5.58–5.78 m CSF-A (Hole U1565A), where shallow and negative inclinations are measured, possibly indicative of a magnetic reversal (Figure F8D). This potential reversal could not be confirmed in Hole U1565B. The degree of magnetic coercivity is expressed by the ratio of magnetization intensity left after 20 mT AF demagnetization to NRM intensity (Figure F10; Table T4). Sediments dominated by large grain size detrital magnetite should have a low coercivity, whereas those dominated by diagenetic hematite or goethite should have larger coercivities. The gain in magnetization observed in interval 1R-1, 68–70 cm, might be caused by the 4 cm long dropstone at this location.

Figure F10. Magnetic coercivity.
One discrete sample was collected from Unit I (see Core descriptions). Sample 1R-3, 40–42 cm, was AF demagnetized at 0.5, 1, 2, 3, 4, 8, 12, 20, 30, 40, 60, 80, and 100 mT steps (Figure F11). The sample shows limited demagnetization up to a field of 100 mT, which indicates the presence of a highly coercive magnetic phase in this sediment (goethite or hematite). The main carrier of magnetic remanence cannot be identified without thermal demagnetization of the NRM. The magnetic polarity of this sample is normal and shows an inclination of 73° in the geographic framework, confirming the normal polarity of this interval.
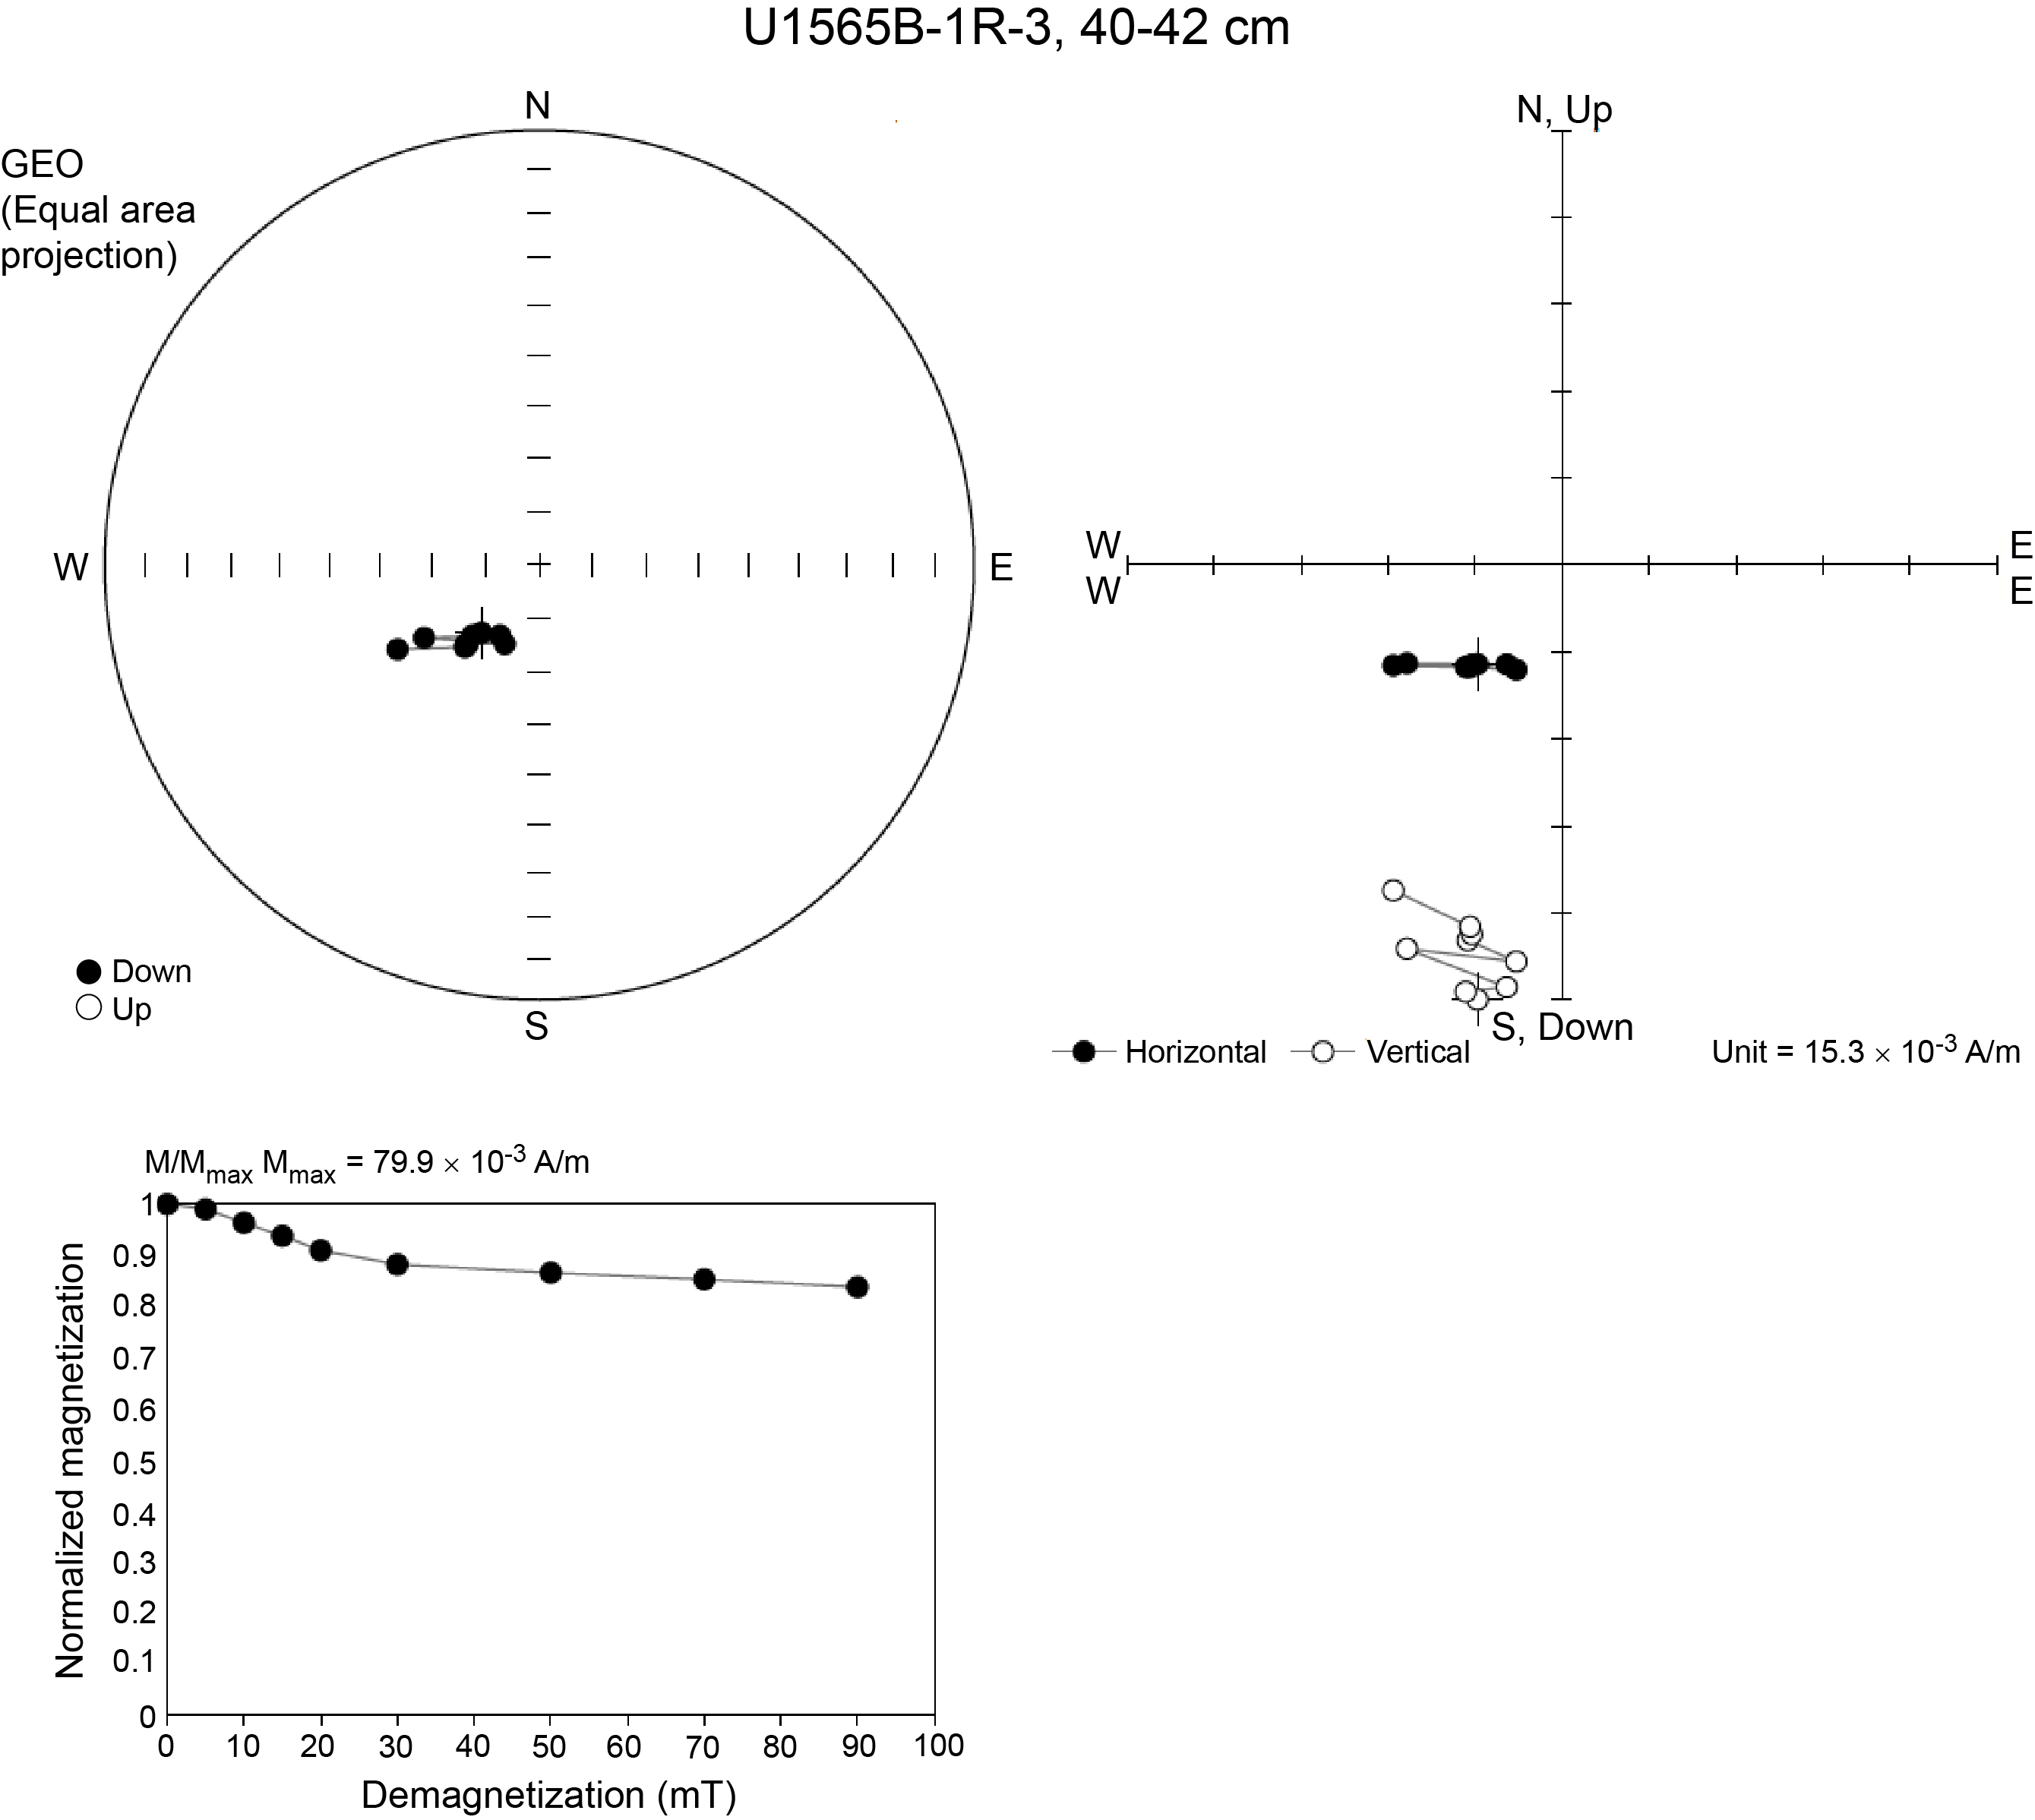
Figure F11. AF demagnetization, Sample 396-U1565B-1R-3, 40–42.
5.2.2. Basement (Lithostratigraphic Unit II)
The archive-half sections of granite from Core 396-U1565A-4R (23.20–25.99 m CSF-A), excluding pieces that were small (~8 cm), were measured using the SRM at a 2.5 cm spacing. After measuring the NRM, the cores were subjected to a stepwise in-line AF demagnetization at 5, 10, 15, and 20 mT. The average initial intensity of magnetization for granites (Lithostratigraphic Unit II) is on the order of 1.17 × 10⁻² A/m. At least part of this low magnetization intensity can be attributed to the pervasive alteration undergone by the granite, which most likely resulted in the dissolution of some magnetite followed by in situ precipitation of goethite. Overall, the granites show distinctively lower magnetic coercivity compared to the sediments (Figure F10), most likely because magnetite or maghemite still dominates the NRM.
Two discrete samples were collected from Unit II (see Core descriptions) and AF demagnetized at 0.5, 1, 2, 3, 4, 8, 12, 20, 30, 40, 60, 80, and 100 mT steps (Figures F12, F13). Both samples (3R-1, 52–54 cm, and 4R-1, 55–57 cm) show a normal polarity and a demagnetization behavior indicative that the NRM is carried by a low-coercivity phase (magnetite, titanomagnetite, or maghemite). The ChRM direction pointing toward the origin of the Zijderveld diagram is consistent with an NRM arising from thermal remanent magnetization, as expected in an igneous rock. In addition, Sample 4R-1, 55–57 cm, shows an additional component of magnetization with a reverse ChRM direction. This low-coercivity component is removed above 15 mT and could be attributed to a secondary magnetization, possibly a chemical remanent magnetization, at a different time than the principal component.

Figure F12. AF demagnetization, Sample 396-U1565A-3R-1, 52–54.
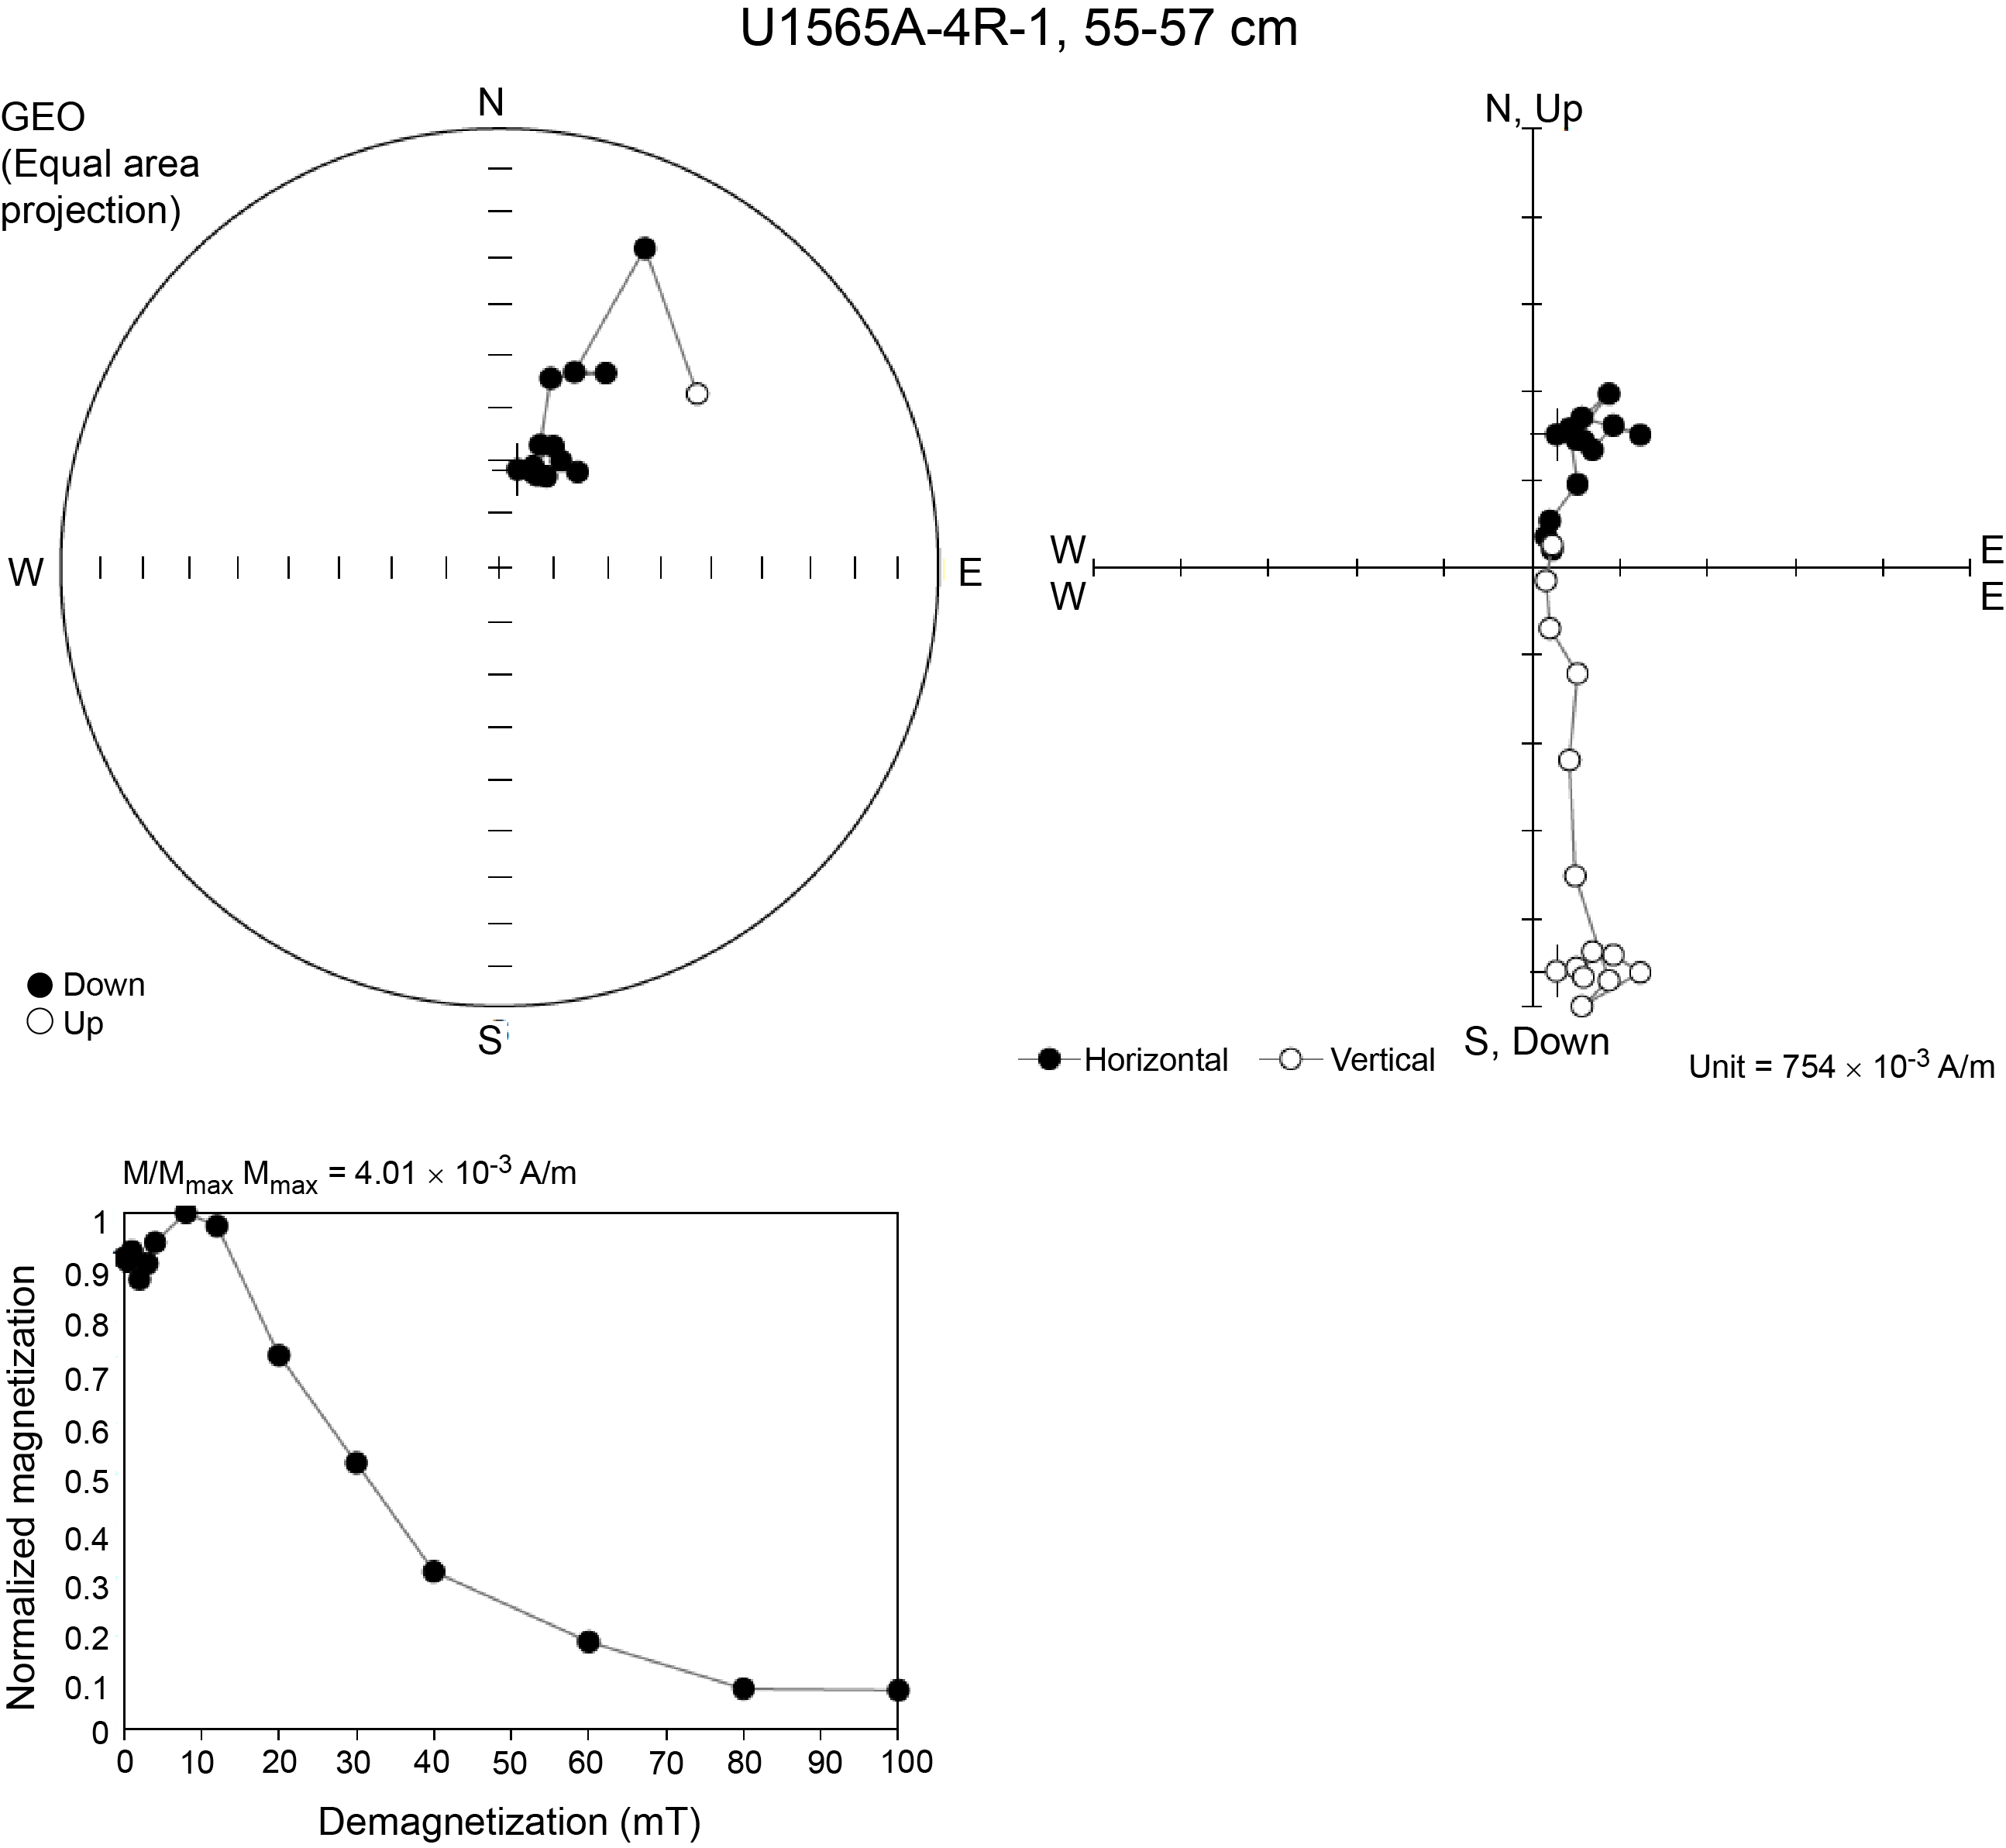
Figure F13. AF demagnetization, Sample 396-U1565A-4R-1, 55–57.
5.3. Anisotropy of magnetic susceptibility
5.3.1. Sediments (Lithostratigraphic Unit I)
The discrete sediment samples (396-U1565A-3R-1, 52–54 cm, and 396-U1565B-1R-3, 40–42 cm) have a magnetic susceptibility (MS) (κ) of ~707 × 10−6 [SI]. The degree of magnetic anisotropy (P′) is low (~1.001). The oblique orientation of the AMS κ3 axis, which should normally be vertical in a sedimentary rock deposited on a horizontal surface, suggests that the fabric might be disturbed, possibly because of drilling.
5.3.2. Basement (Lithostratigraphic Unit II)
Two cubes of altered granite (Sample 396-U1565A-4R-1, 55–57 cm) have a relatively low κ of 212 × 10−6 [SI] and a very low P′ (~1.001). The low degree of magnetic anisotropy is comparable with that of A-type granites (e.g., Ferré et al., 1999).
5.4. Summary
The paleomagnetic data from Lithostratigraphic Unit I sediments show that they are weakly to moderately magnetized. There are local drilling disturbances as well as drilling-induced magnetic overprints. Despite these limitations, the inclination data are deemed meaningful. Magnetic polarity is overall normal in this unit except at 5.58–5.78 m CSF-A, where a reversal occurs. The relatively high magnetic coercivity of some intervals points to possible presence of hematite or goethite.
The magnetic data from Lithostratigraphic Unit II granites indicate a low coercivity, relatively low magnetic remanence, and low MS. The magnetic assemblage is most likely dominated by magnetite and secondary hematite.
6. Geochemistry
In total, four interstitial water (IW) and two mudline samples (one each from Holes U1565A and U1565B) were analyzed for their geochemical composition. The deepest IW sample was recovered from 26 m CSF-A. Six samples were taken for headspace gas analysis, although none were taken once basement was encountered. For organic and inorganic carbon analysis, six sediment samples were analyzed at a rate of one per core; the deepest sample was taken at 17.9 m CSF-A. Hard rock geochemistry was analyzed for two basement granite samples. XRD was performed on six samples from the sediment layers. pXRF analysis was completed in triplicate on six samples.
6.1. Inorganic geochemistry
Both mudline samples have a similar alkalinity ranging 2.1–2.3 mM. Downcore, alkalinity increases linearly, reaching 3.5 mM in the lowermost IW sample. Measured pH is around 7.9 in the mudlines and 7.7–7.9 in the IW samples. Phosphate values vary with no clear trends and range 2.1–7.1 µM. Ammonium is higher in the mudline sample from Hole U1565A (41 µM) than the one from Hole U1565B (26 µM). Downcore NH4+ values show no trends and range 32–69 µM (average = 45 µM).
Elemental compositions of IW samples were analyzed using either ion chromatography (IC) or inductively coupled plasma–atomic emission spectrometry (ICP-AES) (see Geochemistry in the Expedition 396 methods chapter [Planke et al., 2023a]). Mudline water compositions vary between the two holes, and most constituents (Br, Cl, Mg, K, Na, and SO42−) are more concentrated in Hole U1565B than in Hole U1565A. The exception is Ca, which has higher values in the mudline of Hole U1565A than Hole U1565B. IW concentrations of Ca also decrease downcore (10.4–11.7 mM), mirrored by increases in Cl (540–556 mM), Br (0.82–0.84 mM), and Na (466–481 mM). Dissolved Mg, K, and SO42− concentrations are stable through the entirety of the sampled IW (Figure F14; Table T5).
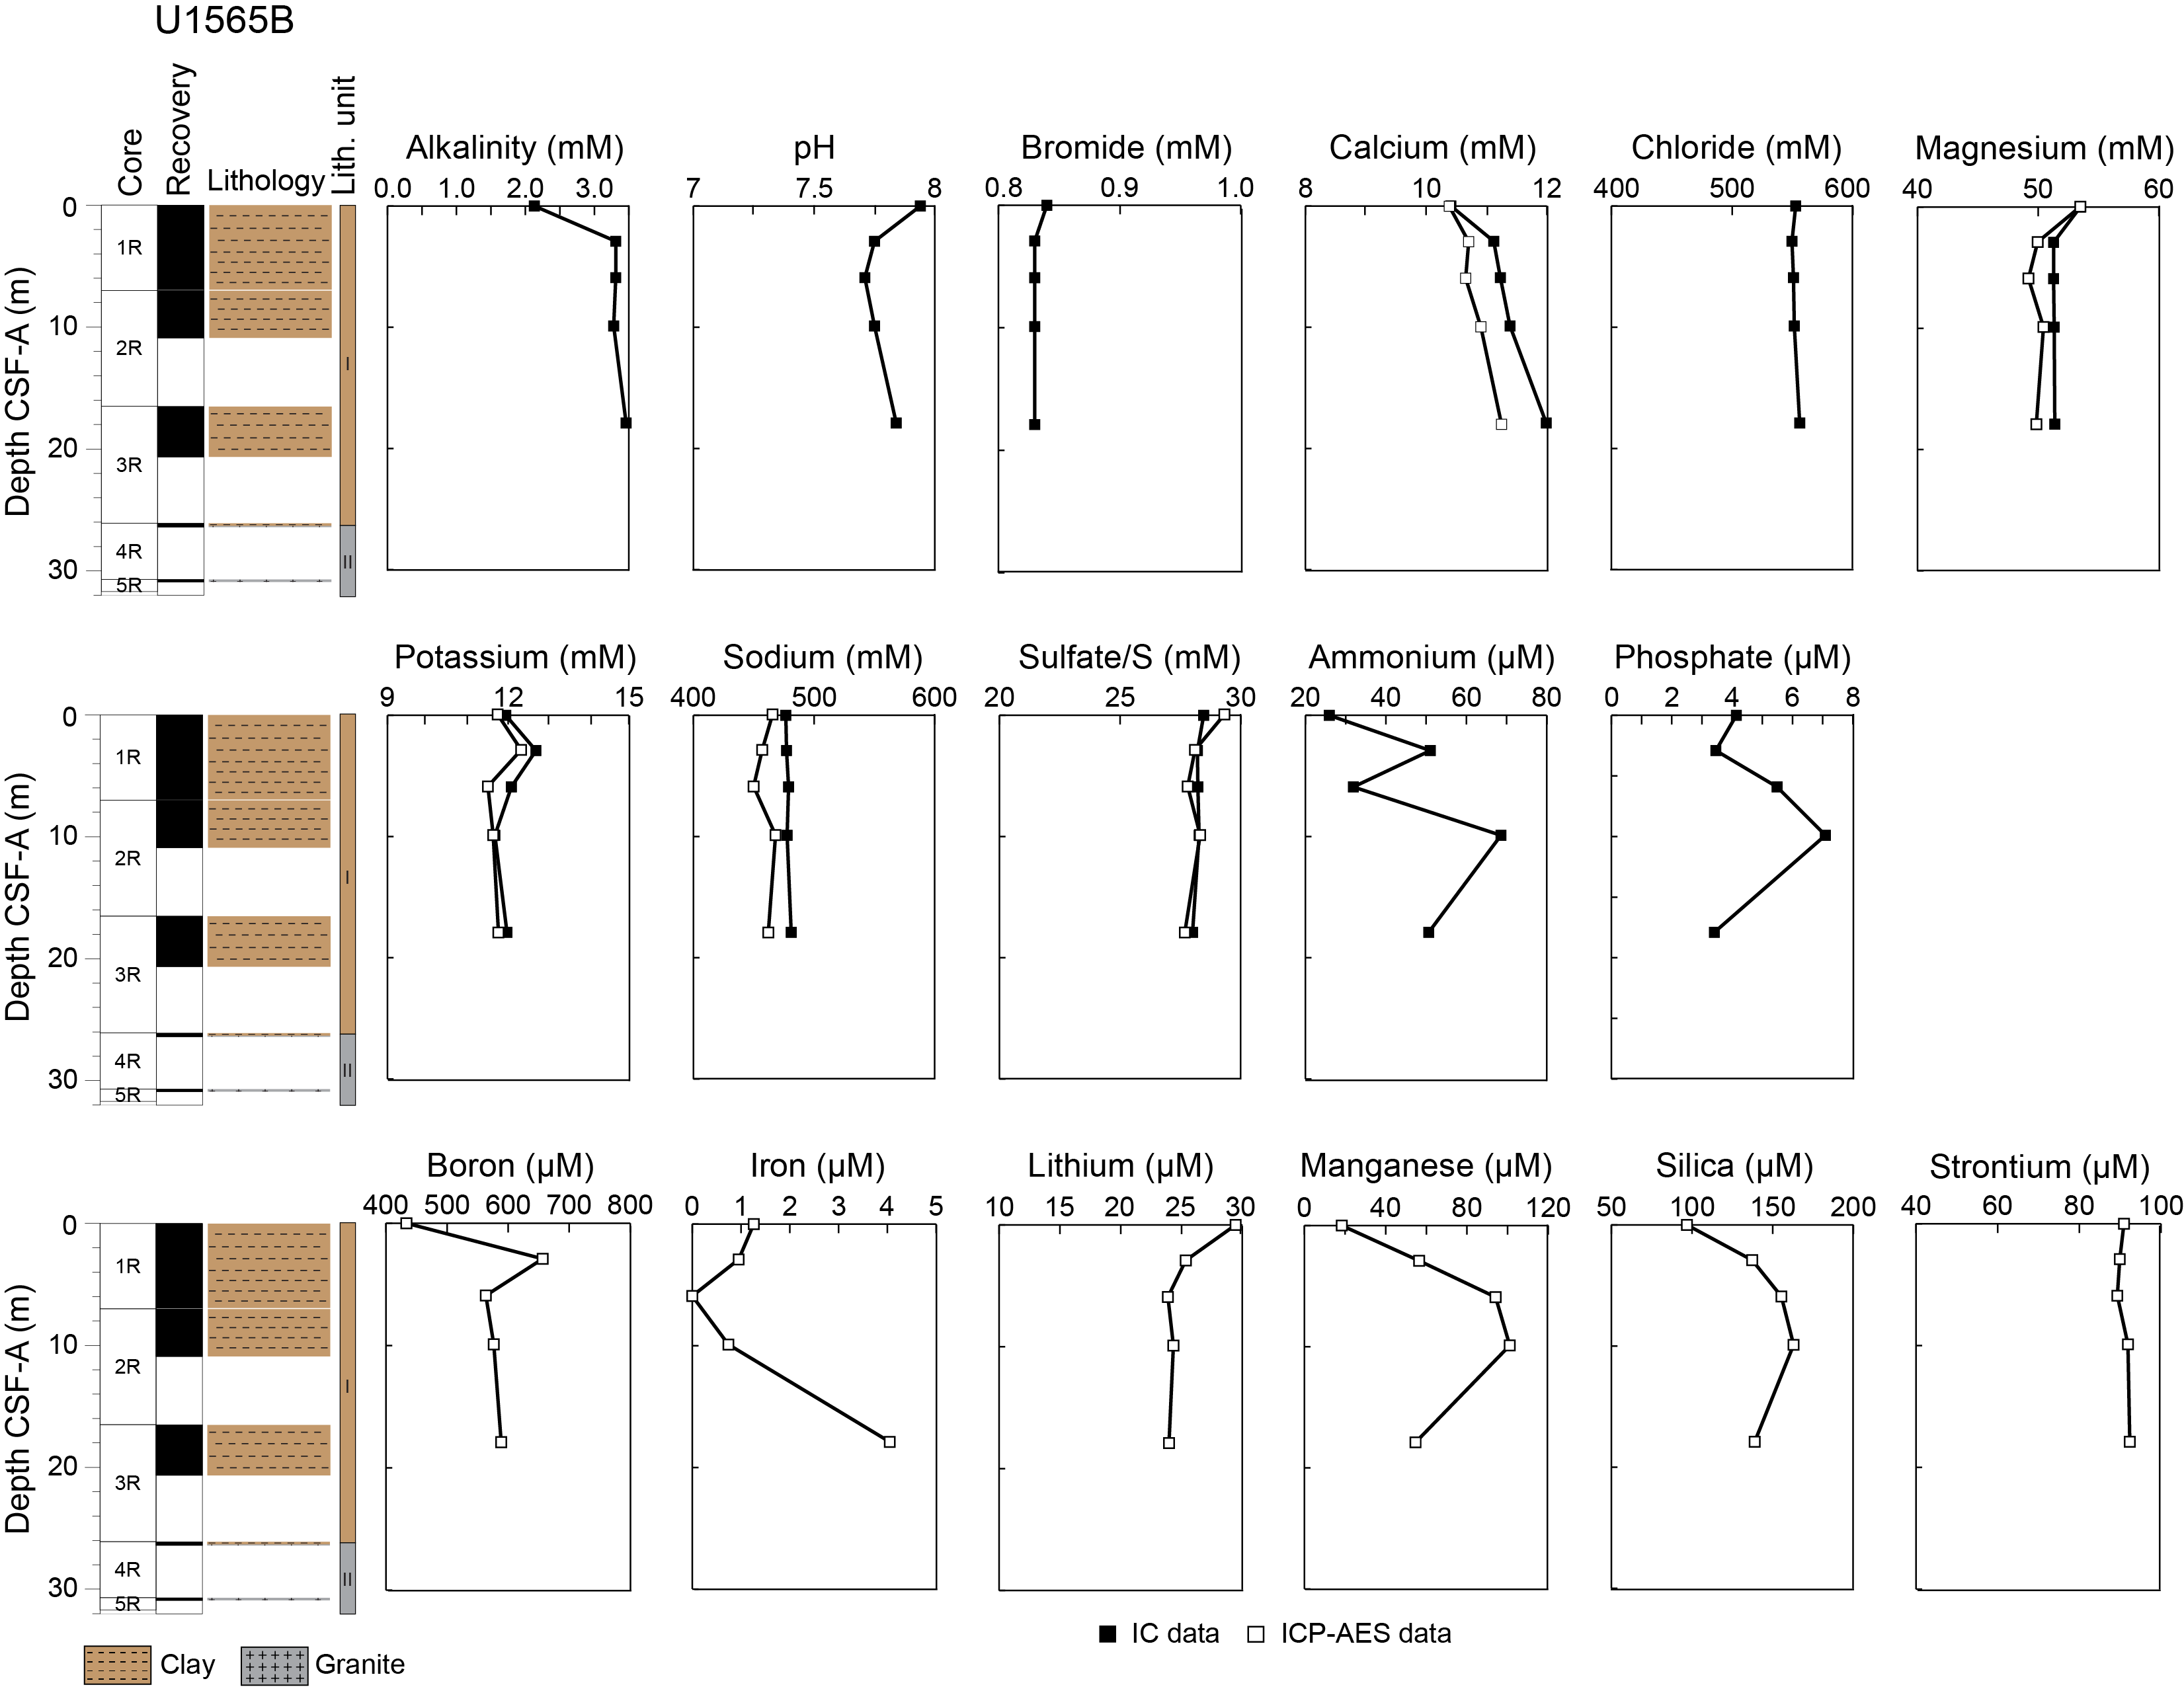
Figure F14. IW profiles.
ICP-AES data show higher concentrations for most measured elements (K, Na, Fe, S, and Sr) in the mudline from Hole U1565B than Hole U1565A, with some (Mn, P, and S) concentrations near zero in Hole U1565A but present in Hole U1565B. Many elements (B, Fe, Sr, P, and Na) show little or no trend downcore, whereas Ca and Si concentrations increase with depth (Figure F14). Manganese and Fe concentrations increase in the two middle IW samples before decreasing downcore. Only S shows a reverse trend with decreasing concentrations downcore. Barium is below detection limits in all samples, and Fe is below detection limit in two of the IW samples (Figure F14; Table T5).
6.2. Hard rock geochemistry
Two samples were taken from the basement granites from Site U1565A (Lithostratigraphic Unit II) and analyzed for major and trace element concentrations (Table T6) using ICP-AES (see Geochemistry in the Expedition 396 methods chapter [Planke et al., 2023a] and Sun et al. [2018] for information on analytical procedures, instrumentation, and data quality). In the alkali-lime index (Na2O + K2O − CaO) versus SiO2 diagram (after Frost et al., 2001) (Figure F15), the SiO2 concentrations of data plotted in the alkali-calcic and calc-alkalic fields range 65–71 wt%. The FeO*/(FeO + MgO) versus SiO2 (FeO* = Fe2O3 × 0.8998) discrimination diagram classifies the composition of selected samples as A-type granitoid (Frost et al., 2001) (Figure F15).

Figure F15. Alkali-lime index and FeO*/(FeO + MgO) vs. SiO2.
6.3. Deconvolved natural gamma radiation
Natural gamma radiation (NGR) measurements were made to 26 m CSF-A in Hole U1565A and 20 m CSF-A in Hole U1565B. Following the approach of de Vleeschouwer et al. (2017), NGR spectra were deconvolved to estimate the amount of K, U, and Th in samples. In all sediment samples from both holes, K values range 1.8–3 wt%, U ranges 4–8 ppm with occasional outliers, and Th ranges 1.6–1.8 ppm (Figure F16). There is limited evidence for periods of K and Th variation, but some increasing and decreasing trends are visible in the data from Hole U1565B. Measurements from the granite lithologies are both higher on average and display more variability, with K values ranging 2–5 wt%, Th ranging 0.8–2.4 ppm, and U ranging 8–20 ppm (Figure F16).
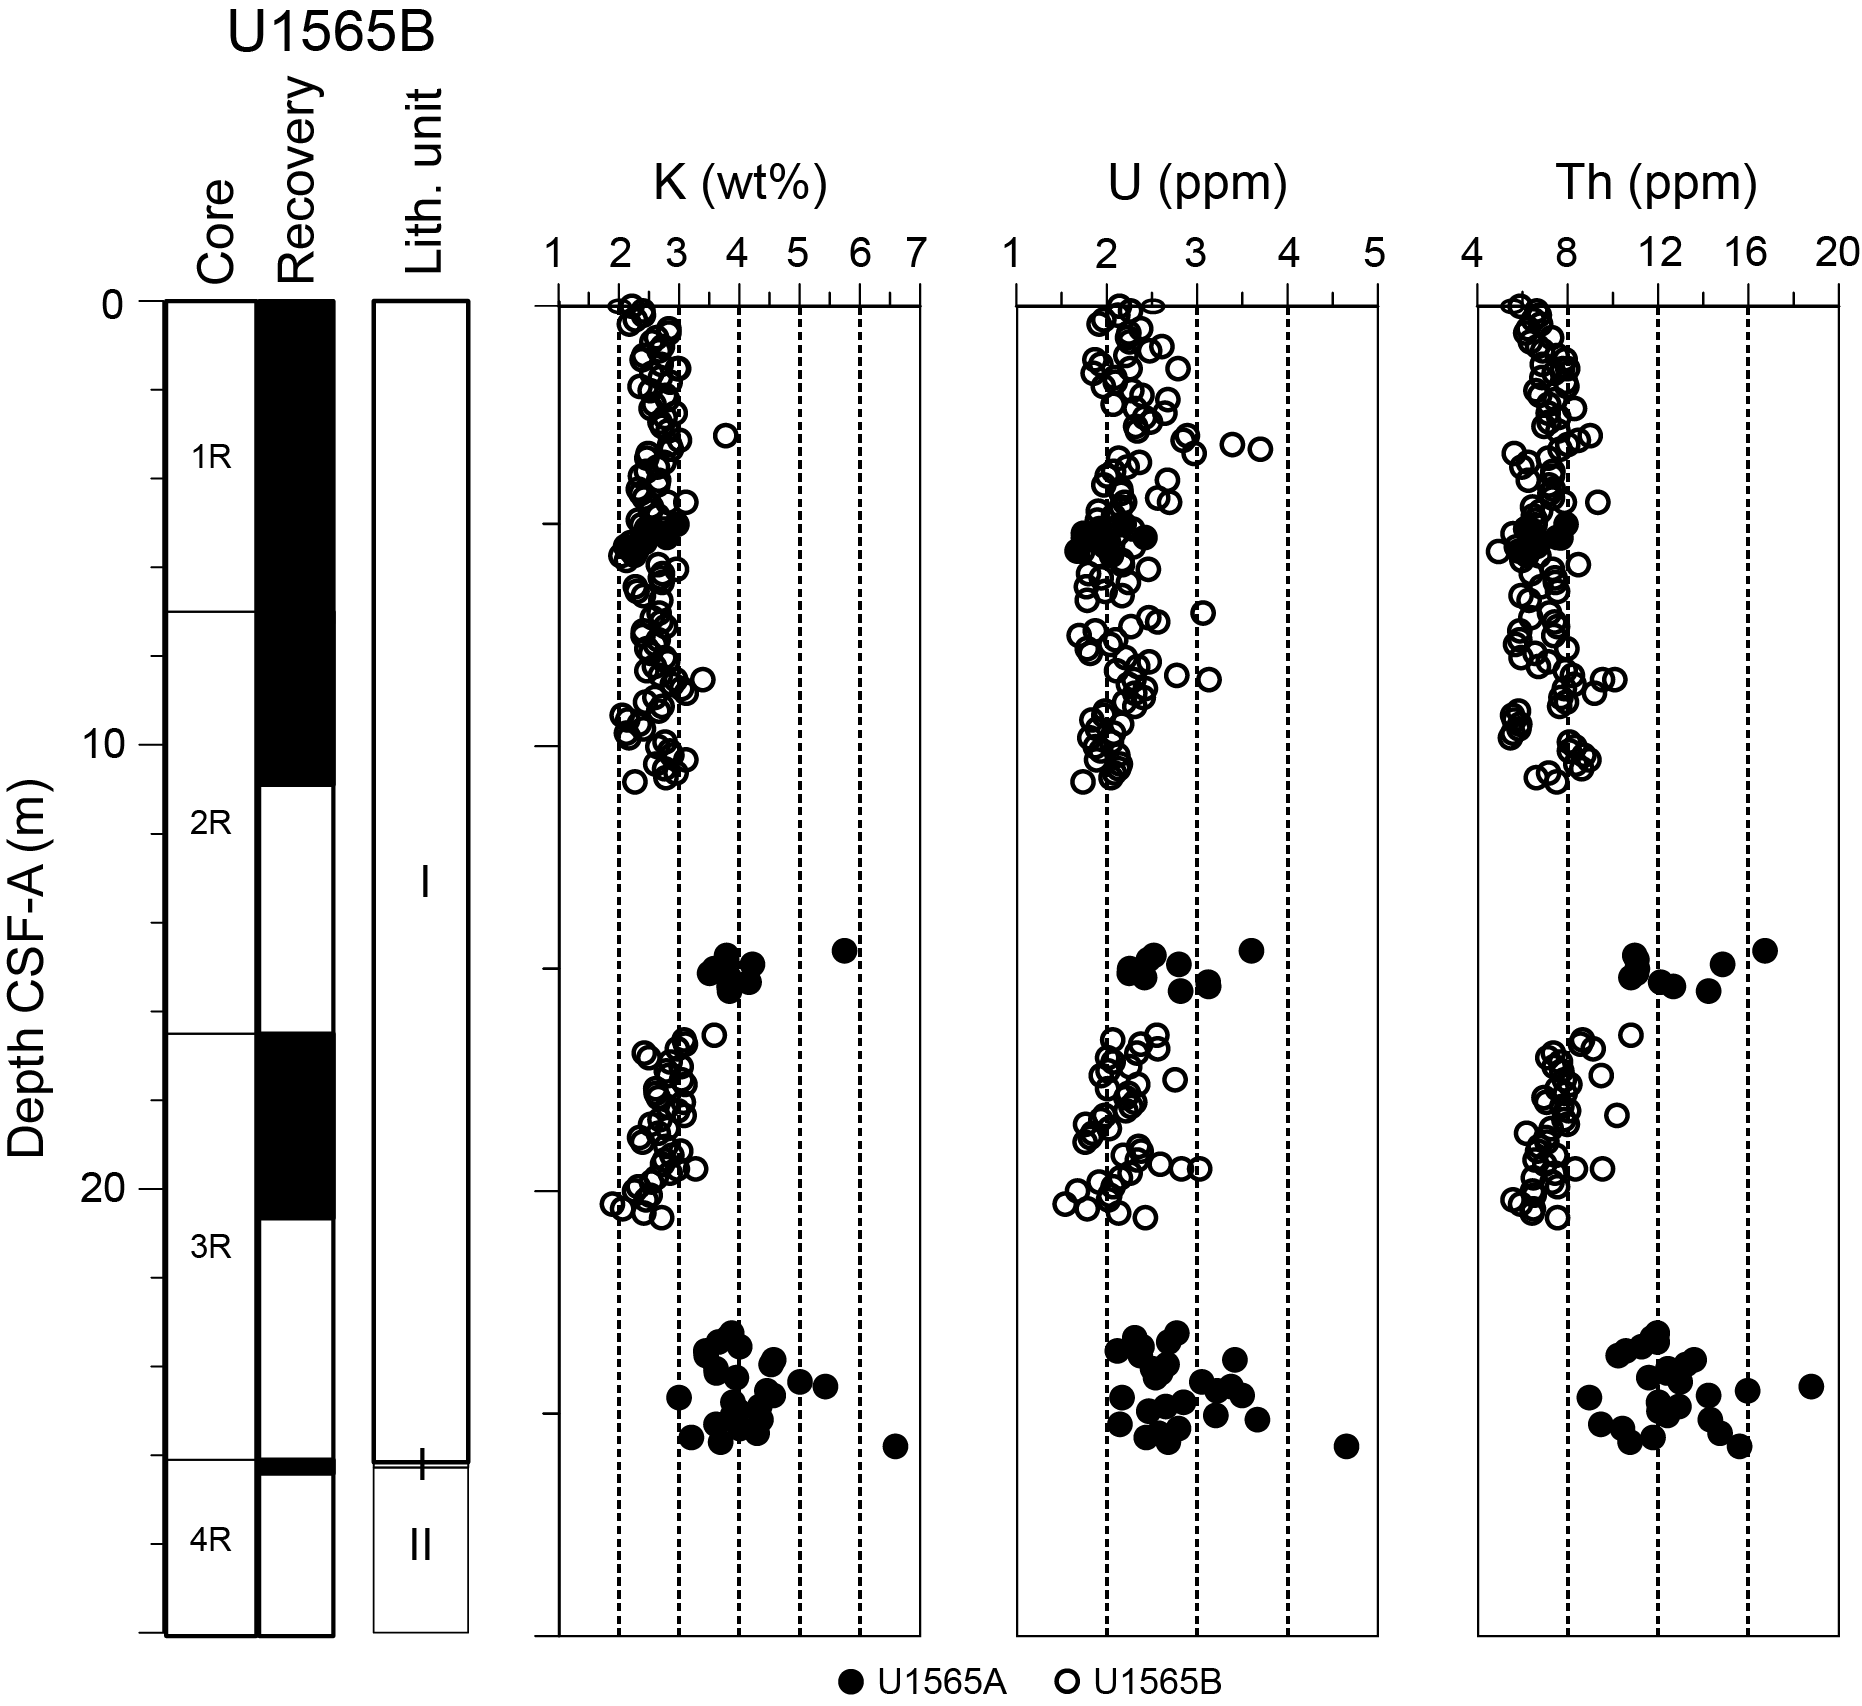
Figure F16. NGR.
6.4. X-ray diffraction
XRD was completed on five bulk samples and a single sample after preparation for clay analysis. For the samples taken from the overburden, XRD analysis confirmed the presence of quartz and calcite. A range of clay minerals, including montmorillonite and kaolinite, were also identified.
6.4.1. Portable X-ray fluorescence
pXRF analysis was completed on one nodule recovered from Hole U1565A and on five granites from Hole U1565A. This analysis identified the nodules recovered in Hole U1565A (Section 2R-1, 75–79 cm) as polymetallic, containing 10.7 wt% Fe2O3, 2.6 wt% Mn2O3, 210 ppm Ni, 80 ppm Cu, and 94 ppm Zn. Silica content of 34% indicates some minor clay content. These analyses indicate that the granite is of A-type composition (Figure F15).
6.5. Organic geochemistry
6.5.1. Headspace gas
Six headspace gas samples were taken for routine safety monitoring from all sediments cored in Holes U1565A and U1565B. The sedimentary cover was very thin, and no samples were taken once basement was encountered. All methane values in the sediment sections are low (<2 ppmv). Concentrations of all other hydrocarbon gases were below detection limits in all samples.
6.5.2. Carbon, nitrogen, and sulfur
Total carbon (TC), total inorganic carbon (TIC), calcium carbonate (CaCO3), TOC, total nitrogen (TN), and sulfur were determined on six discrete sediment samples (Table T7). Bulk sediment TC and TN were determined by elemental analysis, and TIC was determined by coulometer (see Geochemistry in the Expedition 396 methods chapter [Planke et al., 2023a]; Sun et al., 2018).
TIC content ranges 1.25 to <0.01 wt% downcore (average = 0.69 wt%). Assuming TIC is purely representative of CaCO3, values range <0.1–10.4 wt%.
TC varies between 0.2 and 1.6 wt% (average = 1.2 wt%). TOC ranges 0.17–0.63 wt% (average = 0.33 wt%) and shows no clear trend downcore (Figure F17; Table T7). TOC/TN ratios are between 3 and 25, with an average value of 9 representative of primarily marine organic matter (Müller and Mathesius, 1999). In all samples, S values are below detection limits.
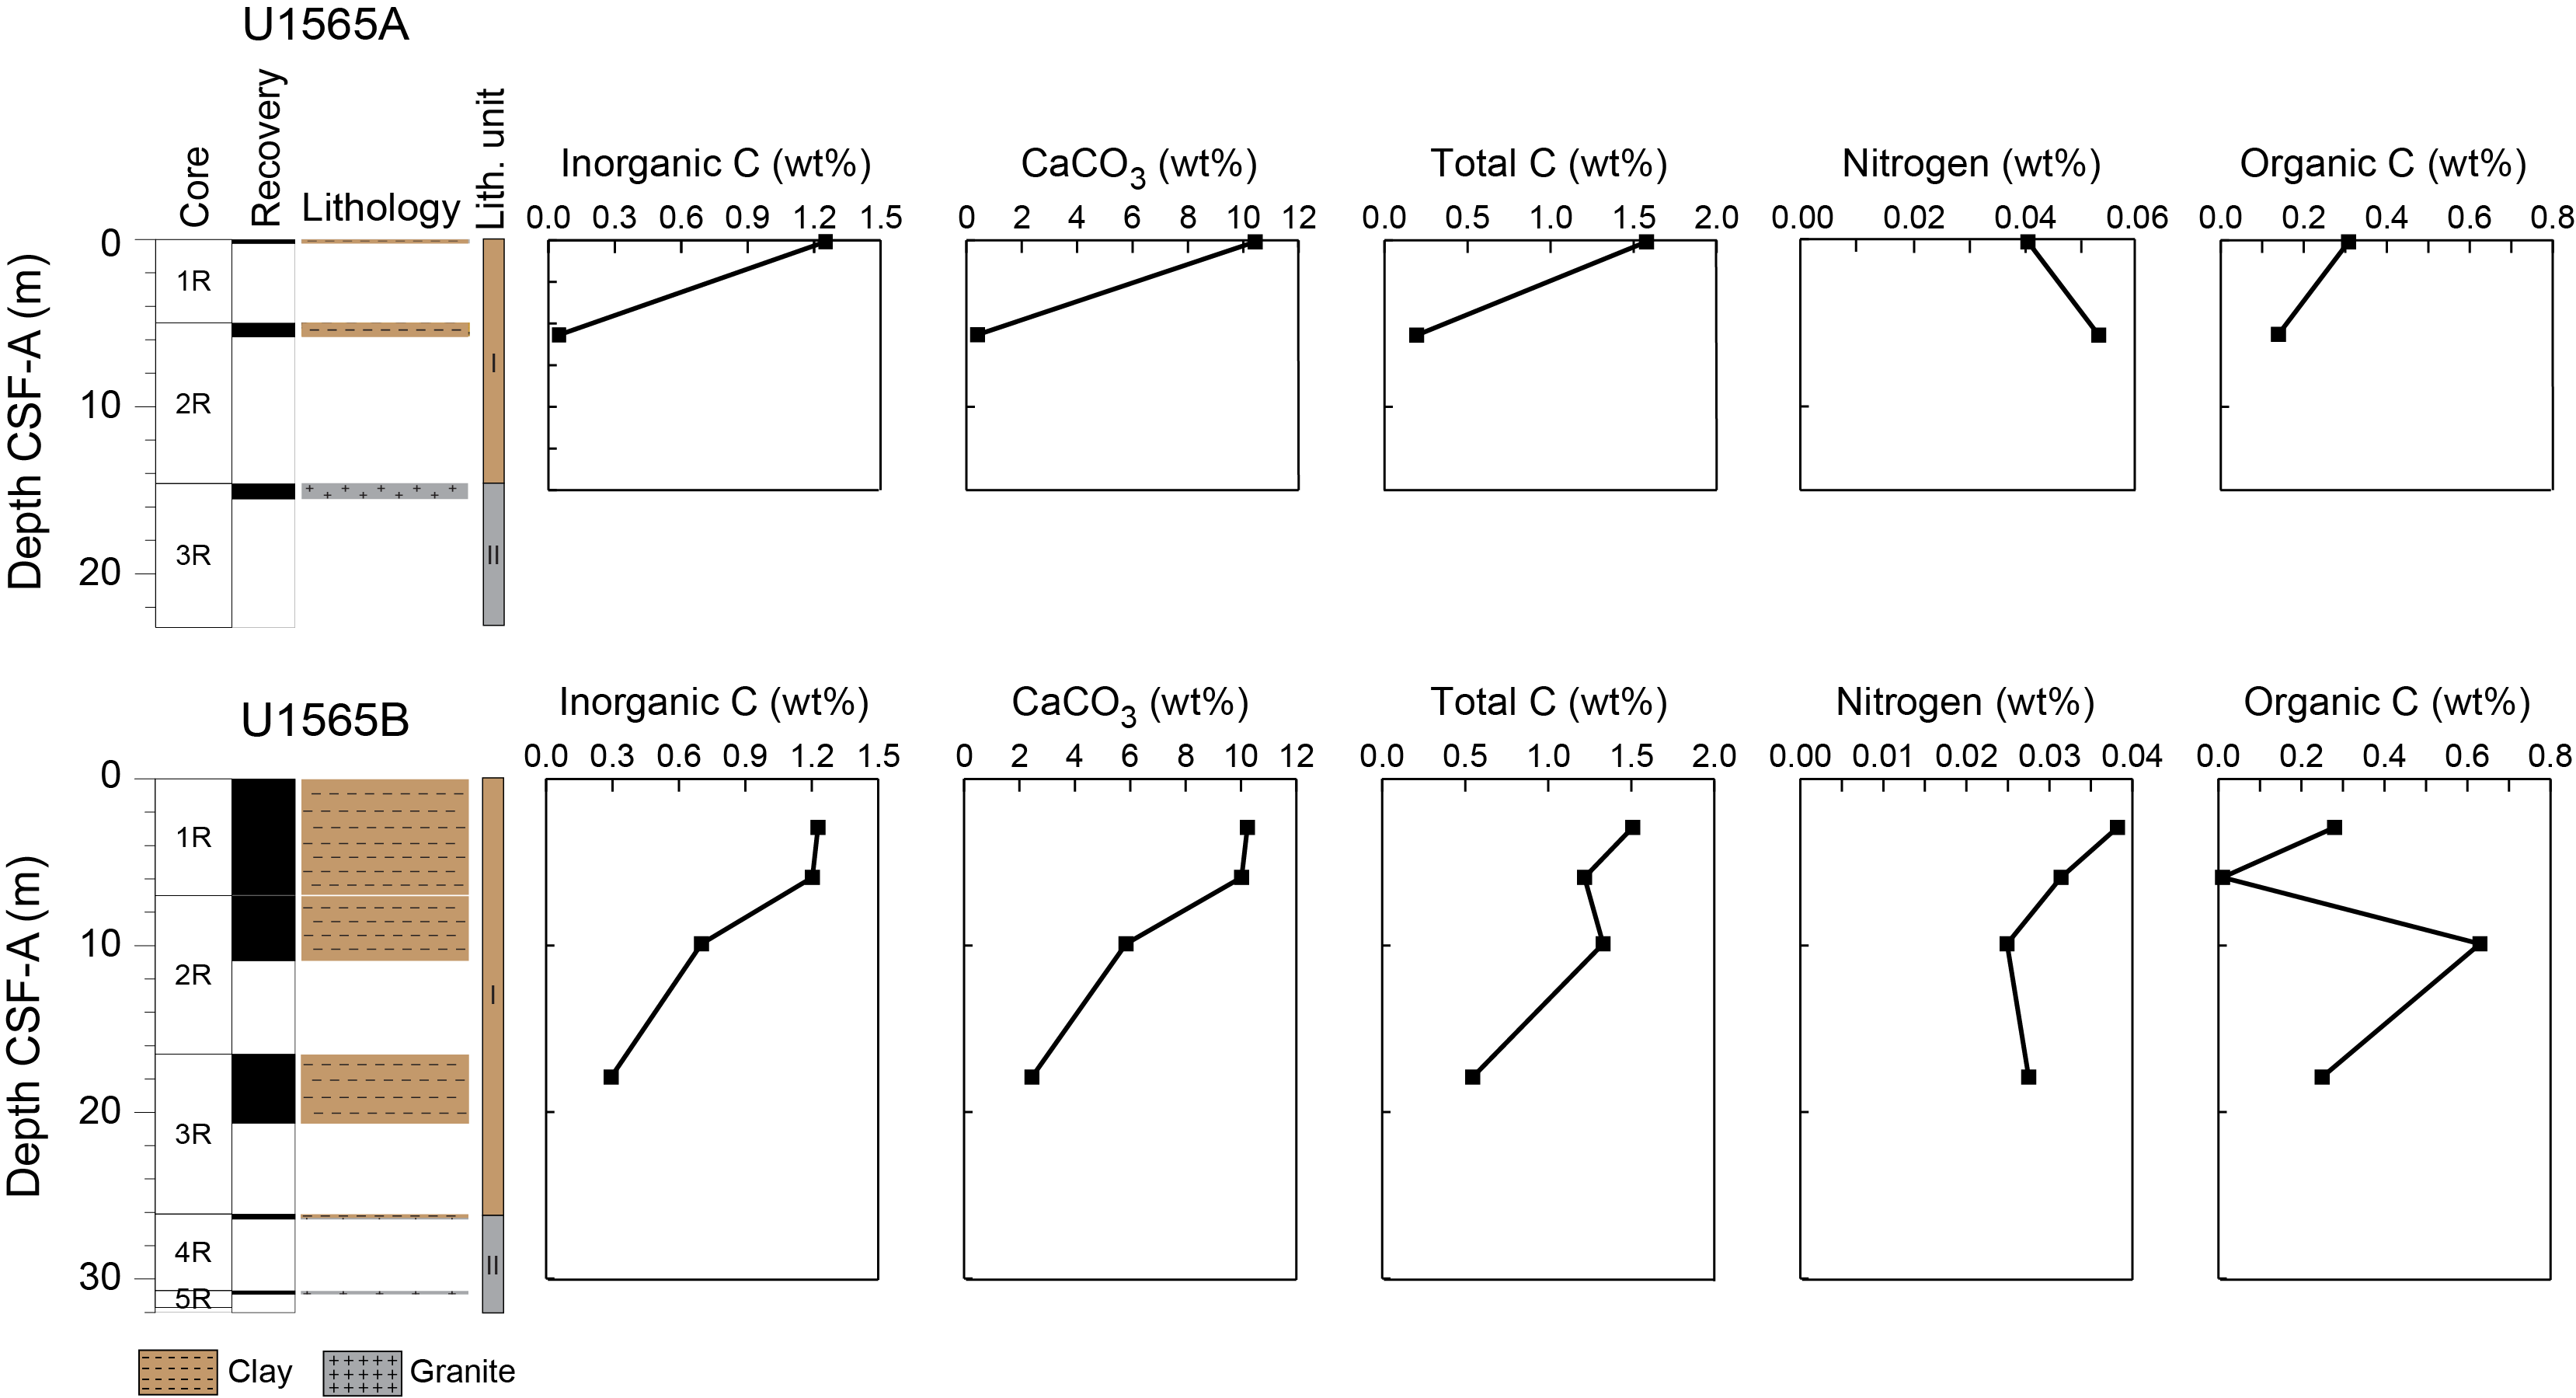
Figure F17. Carbon and nitrogen.
6.6. Microbiology
Because of the lack of visible ash layers, no microbiological samples were taken from the sediments. One sample was collected at the interface between the granite basement unit and the overlying pelagic muds using a syringe (396-U1565B-4R-CC; 26.3 m CSF-A). This sample was immediately transferred to a −80°C freezer for storage.
6.7. Site summary
The primary unit of geochemical interest at Site U1565 is the granitic basement because it was unexpected to discover granite so far offshore in the Vøring Basin. The granitic composition (A-type, or an orogenic) has implications for pluton formation mechanisms and timing. The overlying Pleistocene–Holocene IWs show interesting variations in chemistry such as the increased dissolved Si concentrations with depth, but because these strata are so thin it is challenging to make meaningful interpretations of the data.
7. Physical properties
Holes U1565A and U1565B both encountered similar successions comprising a thin sedimentary unit overlying the granitic basement. For each borehole, ROP was calculated from the RigWatch data to determine a depth to basement of ~25 m and a basement penetration of 7 m (Hole U1565A) and 4 m (Hole U1565B). Physical properties were measured on whole-round and section-half cores and discrete samples from both holes (see Physical properties in the Expedition 396 methods chapter [Planke et al., 2023a]; Table T8). In addition, a minor study was undertaken to verify gamma ray attenuation (GRA) bulk density liner correction recommendations for hard rock sections.
7.1. Data summary and processing
A total of 16.1 m of overburden sediments and 3.4 m of granite were recovered at Site U1565. These were characterized through a combined total of 1927 Whole-Round Multisensor Logger (WRMSL) measurements, of which 726 were GRA bulk density, 720 were MS, and 481 were P-wave velocity. Sixteen discrete samples were taken for moisture and density (MAD) analysis and triaxial P-wave velocity testing. A total of 46 manual Section Half Measurement Gantry (SHMG) P-wave velocity measurements using P-wave calipers (PWC) and P-wave bayonets (PWB) were taken on the working-half sections, supplementing 198 NGR readings and 16 thermal conductivity measurements.
Processing and screening were applied for quality assurance and filtering of the data (see Physical properties in the Expedition 396 methods chapter [Planke et al., 2023a]). A total of 49 GRA bulk density points (22 within 1.5 cm from a bin liner; 27 with a lower cutoff of 1.2 g/cm3) and 11 MS values, all of which were negative, were removed from the Hole U1565A data set. No points were removed from the Hole U1565B data sets. Processed data are presented unless stated otherwise.
7.2. Hole U1565A
In Hole U1565A, Section 1R-1 recovered only a very short and disturbed sediment interval for which no physical properties were measured, whereas Section 2R-1 resulted in an ~80 cm long sediment core that was analyzed for all the standard sediment physical properties (Figure F18). The GRA bulk density of sediments in Hole U1565A (Lithostratigraphic Unit I; see Lithostratigraphy) varies from 1.5 to 1.8 g/cm3, and a MAD sample collected from offset 61 cm in Section 2R-1 yielded a bulk density of 1.8 g/cm3, grain density of 2.7 g/cm3, and porosity of 55%. MS across the 0–12 m CSF-A interval reaches 109 × 10−5 [SI] when measured on the WRMSL, with higher point MS measurements (389 × 10−5 [SI]) taken on the Section Half Multisensor Logger (SHMSL). Thermal conductivity measured at the offset of 40 cm in the sedimentary Section 2R-1 yielded an average value of 1.418 W/(m·K). The NGR values for sedimentary units in Hole U1565A vary from 28 to 38 counts/s (average = ~33 counts/s). The P-wave velocity measured at the offset of 60 cm in Section 2R-1 with the SHMG resulted in 1532 m/s in the x-direction and 1509 m/s in the z-direction, which is in line with the average WRMSL P-wave velocity measurements across the unit (1542 m/s).
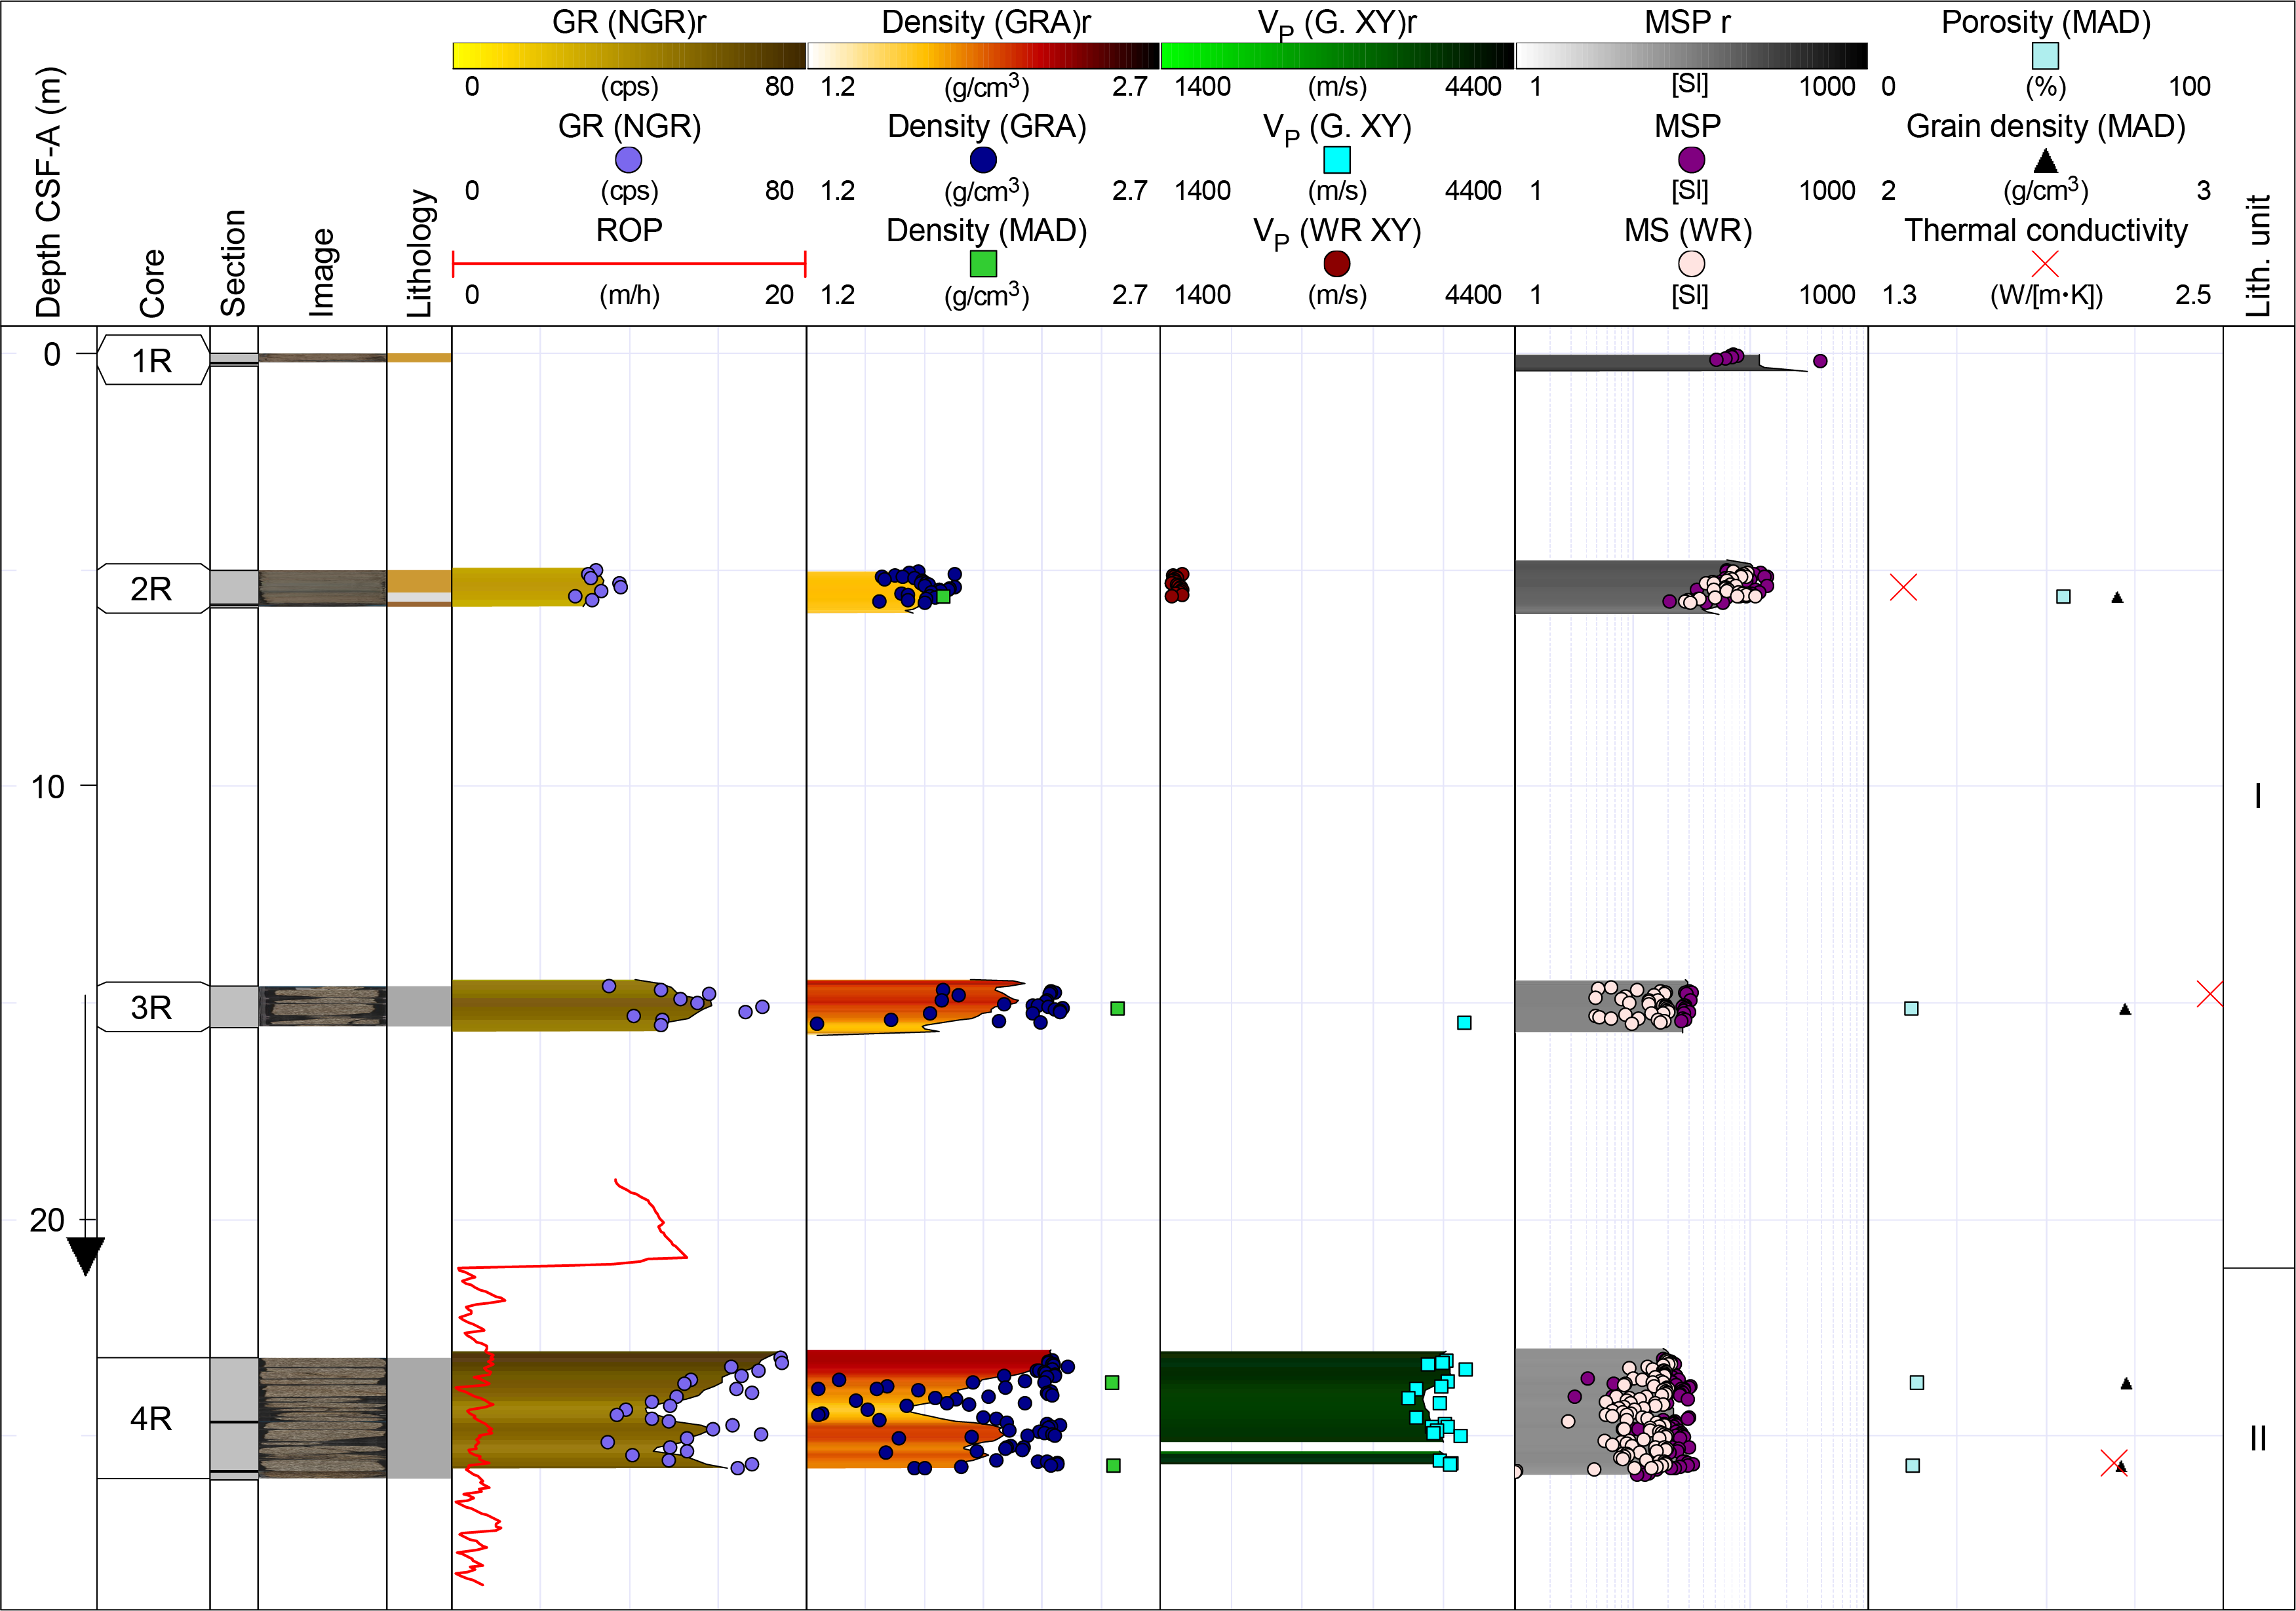
Figure F18. Physical properties, Hole U1565A.
The ROP data reveal that the top of the granitic basement (Lithostratigraphic Unit II) likely occurs at 21 m drilling depth below seafloor (DSF) in between core recovery for Cores 3R and 4R, where ROP drops sharply from ~15 to <3 m/h. Cores 3R and 4R recovered granitic basement rocks, which were analyzed for the full suite of hard rock physical properties. WRMSL GRA bulk density measurements must be corrected for the differences in diameter of the core liner (66 mm) and the RCB core, which typically returns ~58 mm diameter cores for hard rock (see Physical properties in the Expedition 396 methods chapter [Planke et al., 2023a]). To appraise the standard value of the liner correction of 66⁄58 = 1.138 for the GRA bulk density for hard rocks (Jarrard and Kerneklian, 2007), three sets of measurements were performed on different pieces of the hard rock samples from Sections 3R-1 (Pieces 2 and 4) and 4R-1 (Piece 1). A total of 10 caliper measurements of whole-round core diameter were taken for each section and averaged 58.184 mm (Section 3R-1 [Piece 2]), 58.517 mm (Section 3R-1 [Piece 4]), and 57.838 mm (Section 4R-1 [Piece 1]). These measurements suggest the coefficient of 1.137 is in close agreement with the standard values and give support to the application of this standard correction for the rocks in question.
GRA bulk densities of the hard rocks for Sections 3R-1, 4R-1, and 4R-2 vary from 1.2 to 2.6 g/cm3, with the lower end associated with voids in the section. For longer unbroken core intervals such as 23.25–23.4 m CSF-A (Section 4R-1), an average corrected bulk density of 2.56 cm3 is regarded as reasonable for the given rock type.
Three hard rock cubes (one per core) were cut for discrete density and velocity measurements. These data include discrete measurements of P-wave velocity in the x-, y-, and z-orientations on ~8 cm3 cubes shared with paleomagnetic analyses. The velocity measurements revealed a reduction of ~10%–14% between saturated (12 h in vacuum pump with seawater) versus dry (24 h in an oven at 105°C) samples (Table T9).
MAD measurements revealed relatively high porosities (~10%) in the granite cubes, which were double-checked using MAD Methods C and D. The measured values were confirmed to be replicable, and the elevated porosities (typical fresh granitoids generally have porosities <5%; Schild et al., 2001) are inferred to relate to the presence of extensive alteration clays within the weathered granite, promoting adsorption of the saturating seawater.
Noticeably, MS values in the hard rocks are significantly lower than those of the overlying sediments (0 × 10−5 to 22 × 10−5 [SI]).
7.3. Hole U1565B
Hole U1565B encountered a sequence of sediments (Cores 1R–4R) with increased recovery compared to Hole U1565A along with low (17%) recovery of granitic basement in Core 5R (Figure F19). The ROP data clearly defines the top of the basement granite at ~28 m DSF, where ROP drops rapidly from over 9 to under 3 m/h. The boundary between Lithostratigraphic Units I and II has been revised accordingly (see Lithostratigraphy).

Figure F19. Physical properties, Hole U1565B.
The full suite of physical properties measurements were made on sedimentary Cores 1R–3R (see Physical properties in the Expedition 396 methods chapter [Planke et al., 2023a]). The WRMSL GRA bulk density measured for these sediments varies from 1.3 to 2.34 g/cm3. MAD measurements collected for each section yielded very similar bulk density values (average = 1.7 g/cm3; n = 11), with measured grain density values varying from 2.72 to 2.79 g/cm3 (average = 2.75 g/cm3) and porosities ranging 56%–67%, reflecting their uncompacted nature. The MS values of sediments measured by WRMSL and SHMSL are very close and typically range from ~70 × 10−5 to 100 × 10−5 [SI], with the only spike (567 × 10−5 [SI]) occurring in Section 1R-1. It appears to correlate to a dropstone in the mud at an offset of ~15 cm.
Only discrete MAD and PWC P-wave velocity measurements were possible on the short basement Sections 4R-1 and 5R-1. A MAD cube from Section 5R-1 has a bulk density of 2.5 g/cm3 and P-wave velocities of x = 3806 m/s, y = 3648 m/s, and z = 3719 m/s.
7.4. Summary
The two holes at Site U1565 penetrated granitic basement (Lithostratigraphic Unit II) beneath a relatively thin (~30 m) sedimentary overburden (Lithostratigraphic Unit I). Granitic samples from both holes revealed porosities of ~10%, values that were confirmed with a series of repeated measurements with both saturation-based (MAD Method C) and dry cube volume based (MAD Method D) measurements. The elevated porosities (higher than typical fresh granitoid porosities of <5%) are inferred to relate to high-alteration clay content that promotes adsorption. This interpretation is consistent with the anomalously low MS values of the granitic basement, which is also attributed to weathering and alteration. The Kolga High granites also reveal relatively low velocities of around 1500 m/s that are inferred to relate to deep weathering and alteration. Physical properties of the granites sampled at Kolga High have important implications for understanding margin scale heterogeneity, gravity, and magnetic modeling.
References
Bakke, V.N., 2017. Volcanic rocks at the Møre marginal high: geochemistry, petrogenesis and emplacement mechanisms [MS thesis]. University of Bergen, Norway. https://bora.uib.no/
Bünz, S., and Shipboard Scientists, 2020. CAGE-20-4 cruise report. High-resolution 2D and 3D seismic investigations on the Møre and Vøring margins. UiT The Arctic University of Norway report, 47.
Chadima, M., and Hrouda, F., 2006. Remasoft 3.0 a user-friendly paleomagnetic data browser and analyzer. Travaux Géophysiques, 27:20–21.
de Vleeschouwer, D., Dunlea, A.G., Auer, G., Anderson, C.H., Brumsack, H., de Loach, A., Gurnis, M.C., Huh, Y., Ishiwa, T., Jang, K., Kominz, M.A., März, C., Schnetger, B., Murray, R.W., Pälike, H., and Expedition 356 Shipboard Scientists, 2017. Quantifying K, U, and Th contents of marine sediments using shipboard natural gamma radiation spectra measured on DV JOIDES Resolution. Geochemistry, Geophysics, Geosystems, 18(3):1053–1064. https://doi.org/
Ferré, E.C., Wilson, J., and Gleizes, G., 1999. Magnetic susceptibility and AMS of the Bushveld alkaline granites, South Africa. Tectonophysics, 307(1):113–133. https://doi.org/
Frost, B.R., Barnes, C.G., Colins, W.J., Arculus, R.J., Ellis, D.J., and Frost, C.D., 2001. A geochemical classification for granitic rocks. Journal of Petrology, 42(11):2033–2048. https://doi.org/
Gernigon, L., Blischke, A., Nasuti, A., and Sand, M., 2015. Conjugate volcanic rifted margins, seafloor spreading, and microcontinent: Insights from new high-resolution aeromagnetic surveys in the Norway Basin. Tectonics, 34(5):907–933. https://doi.org/
Gernigon, L., Franke, D., Geoffroy, L., Schiffer, C., Foulger, G.R., and Stoker, M., 2020. Crustal fragmentation, magmatism, and the diachronous opening of the Norwegian-Greenland Sea. Earth-Science Reviews, 206:102839. https://doi.org/
Gernigon, L., Zastrozhnov, D., Planke, S., Manton, B., Abdelmalak, M.M., Olesen, O., Maharjan, D., Faleide, J.I., and Myklebust, R., 2021. A digital compilation of structural and magmatic elements of the mid-Norwegian continental margin. Norwegian Journal of Geology, 101. https://doi.org/
Jarrard, R.D., and Kerneklian, M.J., 2007. Data report: physical properties of the upper oceanic crust of ODP Site 1256: multisensor track and moisture and density measurements. In Teagle, D.A.H., Wilson, D.S., Acton, G.D., and Vanko, D.A., Proceedings of the Ocean Drilling Program, Scientific Results. 206: College Station, TX (Ocean Drilling Program). https://doi.org/
Manton, B., Planke, S., Zastrozhnov, D., Abdelmalak, M.M., Maharjan, D., Millett, J.M., Polteau, S., Faleide, J.I., Gernigon, L., Myklebust, R., and Kjølhamar, B., 2018. Pre-Cretaceous prospectivity of the outer Møre and Vøring basins constrained by new 3D seismic data. Conference Proceedings, 80th EAGE Annual Conference & Exhibition, 2018(1–5). https://doi.org/
Millett, J.M., Manton, B.M., Zastrozhnov, D., Planke, S., Maharjan, D., Bellwald, B., Gernigon, L., Faleide, J.I., Jolley, D.W., Walker, F., Abdelmalak, M.M., Jerram, D.A., Myklebust, R., Kjølhamar, B.E., Halliday, J., and Birch-Hawkins, A., 2022. Basin structure and prospectivity of the NE Atlantic volcanic rifted margin: cross-border examples from the Faroe–Shetland, Møre and Southern Vøring Basins. In Krmíček, L., and Chalapathi Rao, N.V. (Eds.), Lamprophyres, Lamproites and Related Rocks: Tracers to Supercontinent Cycles and Metallogenesis. Geological Society Special Publication, 495. https://doi.org/
Müller, A., and Mathesius, U., 1999. The palaeoenvironments of coastal lagoons in the southern Baltic Sea, I. The application of sedimentary Corg/N ratios as source indicators of organic matter. Palaeogeography, Palaeoclimatology, Palaeoecology, 145(1–3):1–16. https://doi.org/
Planke, S., Berndt, C., Alvarez Zarikian, C.A., Agarwal, A., Andrews, G.D.M., Betlem, P., Bhattacharya, J., Brinkhuis, H., Chatterjee, S., Christopoulou, M., Clementi, V.J., Ferré, E.C., Filina, I.Y., Frieling, J., Guo, P., Harper, D.T., Jones, M.T., Lambart, S., Longman, J., Millett, J.M., Mohn, G., Nakaoka, R., Scherer, R.P., Tegner, C., Varela, N., Wang, M., Xu, W., and Yager, S.L., 2023a. Expedition 396 methods. In Planke, S., Berndt, C., Alvarez Zarikian, C.A., and the Expedition 396 Scientists, Mid-Norwegian Margin Magmatism and Paleoclimate Implications. Proceedings of the International Ocean Discovery Program, 396: College Station, TX (International Ocean Discovery Program). https://doi.org/
Planke, S., Berndt, C., Alvarez Zarikian, C.A., Agarwal, A., Andrews, G.D.M., Betlem, P., Bhattacharya, J., Brinkhuis, H., Chatterjee, S., Christopoulou, M., Clementi, V.J., Ferré, E.C., Filina, I.Y., Frieling, J., Guo, P., Harper, D.T., Jones, M.T., Lambart, S., Longman, J., Millett, J.M., Mohn, G., Nakaoka, R., Scherer, R.P., Tegner, C., Varela, N., Wang, M., Xu, W., and Yager, S.L., 2023b. Sites U1567 and U1568. In Planke, S., Berndt, C., Alvarez Zarikian, C.A., and the Expedition 396 Scientists, Mid-Norwegian Margin Magmatism and Paleoclimate Implications. Proceedings of the International Ocean Discovery Program, 396: College Station, TX (International Ocean Discovery Program). https://doi.org/
Planke, S., Berndt, C., Alvarez Zarikian, C.A., Agarwal, A., Andrews, G.D.M., Betlem, P., Bhattacharya, J., Brinkhuis, H., Chatterjee, S., Christopoulou, M., Clementi, V.J., Ferré, E.C., Filina, I.Y., Frieling, J., Guo, P., Harper, D.T., Jones, M.T., Lambart, S., Longman, J., Millett, J.M., Mohn, G., Nakaoka, R., Scherer, R.P., Tegner, C., Varela, N., Wang, M., Xu, W., and Yager, S.L., 2023c. Sites U1569 and U1570. In Planke, S., Berndt, C., Alvarez Zarikian, C.A., and the Expedition 396 Scientists, Mid-Norwegian Margin Magmatism and Paleoclimate Implications. Proceedings of the International Ocean Discovery Program, 396: College Station, TX (International Ocean Discovery Program). https://doi.org/
Schild, M., Siegesmund, S., Vollbrecht, A., and Mazurek, M., 2001. Characterization of granite matrix porosity and pore-space geometry by in situ and laboratory methods. Geophysical Journal International, 146(1):111–125. https://doi.org/
Spiegler, D., and Jansen, E., 1989. Planktonic foraminifer biostratigraphy of Norwegian Sea sediments: ODP Leg 104. In Eldholm, O., Thiede, J., Taylor, E., et al., Proceedings of the Ocean Drilling Program, Scientific Results. 104: College Station, TX (Ocean Drilling Program), 681–696. https://doi.org/
Streckeisen, A., 1974. Classification and nomenclature of plutonic rocks recommendations of the IUGS subcommission on the systematics of Igneous Rocks. Geologische Rundschau, 63(2):773–786. https://doi.org/
Sun, Z., Jian, Z., Stock, J.M., Larsen, H.C., Klaus, A., Alvarez Zarikian, C.A., Boaga, J., Bowden, S.A., Briais, A., Chen, Y., Cukur, D., Dadd, K.A., Ding, W., Dorais, M.J., Ferré, E.C., Ferreira, F., Furusawa, A., Gewecke, A.J., Hinojosa, J.L., Höfig, T.W., Hsiung, K.-H., Huang, B., Huang, E., Huang, X.-L., Jiang, S., Jin, H., Johnson, B.G., Kurzawski, R.M., Lei, C., Li, B., Li, L., Li, Y., Lin, J., Liu, C., Liu, C., Liu, Z., Luna, A., Lupi, C., McCarthy, A.J., Mohn, G., Ningthoujam, L.S., Nirrengarten, M., Osono, N., Peate, D.W., Persaud, P., Qiu, N., Robinson, C.M., Satolli, S., Sauermilch, I., Schindlbeck, J.C., Skinner, S.M., Straub, S.M., Su, X., Tian, L., Van der Zwan, F.M., Wan, S., Wu, H., Xiang, R., Yadav, R., Yi, L., Zhang, C., Zhang, J., Zhang, Y., Zhao, N., Zhong, G., and Zhong, L., 2018. Expedition 367/368 methods. In Sun, Z., Jian, Z., Stock, J.M., Larsen, H.C., Klaus, A., Alvarez Zarikian, C.A., and the Expedition 367/368 Scientists, South China Sea Rifted Margin. Proceedings of the International Ocean Discovery Program, 367/368: College Station, TX (International Ocean Discovery Program). https://doi.org/
Zastrozhnov, D., Gernigon, L., Gogin, I., Planke, S., Abdelmalak, M.M., Polteau, S., Faleide, J.I., Manton, B., and Myklebust, R., 2020. Regional structure and polyphased Cretaceous-Paleocene rift and basin development of the mid-Norwegian volcanic passive margin. Marine and Petroleum Geology, 115:104269. https://doi.org/
Zijderveld, J.D.A., 2013. A. C. demagnetization of rocks: analysis of results. Developments in Solid Earth Geophysics, 3:254–286. https://doi.org/