Planke, S., Berndt, C., Alvarez Zarikian, C.A., and the Expedition 396 Scientists
Proceedings of the International Ocean Discovery Program Volume 396
publications.iodp.org
https://doi.org/10.14379/iodp.proc.396.104.2023
Site U15661
![]() S. Planke,
S. Planke,
![]() C. Berndt,
C. Berndt,
![]() C.A. Alvarez Zarikian,
C.A. Alvarez Zarikian,
![]() A. Agarwal,
A. Agarwal,
![]() G.D.M. Andrews,
G.D.M. Andrews,
![]() P. Betlem,
P. Betlem,
![]() J. Bhattacharya,
J. Bhattacharya,
![]() H. Brinkhuis,
H. Brinkhuis,
![]() S. Chatterjee,
S. Chatterjee,
![]() M. Christopoulou,
M. Christopoulou,
![]() V.J. Clementi,
V.J. Clementi,
![]() E.C. Ferré,
E.C. Ferré,
![]() I.Y. Filina,
I.Y. Filina,
![]() J. Frieling,
J. Frieling,
![]() P. Guo,
P. Guo,
![]() D.T. Harper,
D.T. Harper,
![]() M.T. Jones,
M.T. Jones,
![]() S. Lambart,
S. Lambart,
![]() J. Longman,
J. Longman,
![]() J.M. Millett,
J.M. Millett,
![]() G. Mohn,
G. Mohn,
![]() R. Nakaoka,
R. Nakaoka,
![]() R.P. Scherer,
R.P. Scherer,
![]() C. Tegner,
C. Tegner,
![]() N. Varela,
N. Varela,
![]() M. Wang,
M. Wang,
![]() W. Xu,
W. Xu,
![]() S.L. Yager2
S.L. Yager2
1 Planke, S., Berndt, C., Alvarez Zarikian, C.A., Agarwal, A., Andrews, G.D.M., Betlem, P., Bhattacharya, J., Brinkhuis, H., Chatterjee, S., Christopoulou, M., Clementi, V.J., Ferré, E.C., Filina, I.Y., Frieling, J., Guo, P., Harper, D.T., Jones, M.T., Lambart, S., Longman, J., Millett, J.M., Mohn, G., Nakaoka, R., Scherer, R.P., Tegner, C., Varela, N., Wang, M., Xu, W., and Yager, S.L., 2023. Site U1566. In Planke, S., Berndt, C., Alvarez Zarikian, C.A., and the Expedition 396 Scientists, Mid-Norwegian Margin Magmatism and Paleoclimate Implications. Proceedings of the International Ocean Discovery Program, 396: College Station, TX (International Ocean Discovery Program). https://doi.org/10.14379/iodp.proc.396.104.2023
2 Expedition 396 Scientists’ affiliations.
1. Background and objectives
Site U1566 is a companion site to Site U1565. Both sites are located on the western flank of the Kolga High (see Figure F1 in the Site U1565 chapter [Planke et al., 2023b]) about 1 km apart at a water depth just above 2000 m. The Kolga High is one of several areas along the rifted margin characterized by a thin sediment cover above the top basalt surface and a rapidly westward shoaling of the Base Cretaceous Unconformity (BCU) (Zastrozhnov et al., 2020) (for a summary, see Background and objectives in the Site U1565 chapter [Planke et al., 2023b]).
Interpretation of extensive 3-D seismic reflection data shows that the Kolga High is covered by breakup-related basalts except for two small windows (5 km × 3 km) just west of the summit (Millett et al., 2022; Gernigon et al., 2021). Characteristic seaward-dipping reflectors (SDR) lap onto the Kolga High along its western margin, thinning toward the basalt windows where the lavas have most likely been eroded, making the Kolga High one of the few sites along the Vøring and Møre margins where the transition from the lowermost extrusive volcanic rocks to the subbasalt strata is accessible by drilling. A previous attempt to determine the nature of this boundary was carried out during Ocean Drilling Program (ODP) Leg 104 in 1985 on the Vøring Marginal High. Hole 642E showed that the SDR represent thick piles of subaerially emplaced basalt flows, but unfortunately coring did not get through the entire lava pile (Eldholm et al., 1989; Planke and Eldholm, 1994). The Norwegian Petroleum Directorate drilled the eastern part of the Kolga High in 2014 (Hole 6403/1-U-1) and recovered 38 m of hyaloclastite with a tholeiitic composition (Bakke, 2017) in the upper part of a lava delta, as defined by eastward-prograding reflections, but again did not penetrate through the extrusive volcanic sequence.
The primary objective of Site U1566 was to sample the lowermost part of the SDR on the Kolga High (see Figure F3 in the Site U1565 chapter [Planke et al., 2023b]). If possible, we would also try to drill through the entire basalt sequence, but this was not a key target because the primary target of the nearby Site U1565 was to recover the subbasalt units.
By drilling Site U1566, we first aimed to determine the emplacement environment of the initial volcanism on the Kolga High because it provides important constraints on the vertical movement of the margin prior to the onset of extrusive volcanism and the extension during the final rifting phase prior to breakup. A second objective was to constrain the timing of the onset of extrusive volcanism in this area and to provide further insights into the hypothesis that breakup and extrusive volcanism on the Møre Margin predated breakup along the Vøring Margin (e.g., Gernigon et al., 2012, 2021). A third objective was to characterize the magma source of the earliest extrusive basalts and determine whether it was primordial, which would imply rapid ascent through the crust, or whether it evolved during storage at crustal levels with potential incorporation of continental crustal rocks. A fourth objective was to constrain the rates of magma production both from geochemical analyses and potentially by biostratigraphic dating of interlayered sediments, although these were expected to be highly altered unless the lava flows were emplaced over a long time interval. The final objective of Site U1566 was to get information on the extent of the basement strata drilled at Site U1565 and on lava-subsurface interaction if the bottom of the lava pile could be reached. Although Site U1566 was placed only 1 km away from Site U1565, the seismic data are inconclusive about the dip of the basal surface of the lava pile and hence the depth to this interface. Although high-resolution seismic data (see Figure F3 in the Site U1565 chapter [Planke et al., 2023b]) may indicate that this base basalt is as shallow as 200 meters below seafloor (mbsf) (depending on the choice of seismic velocity), 3-D exploration seismic data suggest that the basal surface may be as deep as 400 mbsf and out of reach of the planned 200 m hole.
2. Operations
2.1. Transit to Site U1566
After clearing the seafloor in Hole U1565B, the bit was raised to 2020 meters below rig floor (mbrf) and the vessel was offset 462 m west-northwest to Site U1566 at the approved Environmental Protection and Safety Panel (EPSP) coordinates. The transit in dynamic positioning (DP) mode was completed in 1.75 h at 0400 h (all times are provided in UTC + 0 h) on 16 August 2021. The drill floor was cleared for operations, beginning Hole U1566A.
2.2. Site U1566
Site U1566 consists of a single hole to 181.7 mbsf, and operations included wireline logging. Coring started at 0525 h on 16 August 2021 and ended at 2230 h on 19 August to accommodate the Versatile Seismic Imager (VSI) logging run in daylight hours on 20 August. After conditioning the hole for logging, the end of pipe was set at 50 mbsf. The triple combination (triple combo), VSI, Formation MicroScanner (FMS), and Ultrasonic Borehole Imager (UBI) tool strings were all run to/from 145 mbsf in Hole U1566A because an obstruction at the top of the basal granite prevented the logging tools from going any deeper. After the conclusion of logging, the drill string was pulled back to the surface and secured at 0754 h, ending Hole U1566A and Site U1566. A total of 124 h or 5.2 days were recorded while at Site U1566. A total of 33 cores were recovered using the rotary core barrel (RCB) coring system to 181.7 mbsf, and 100.5 m of core was recovered (55.3%) (Table T1).
2.2.1. Hole U1566A
The drilling knobby was picked up, and the bit was spaced out based on a water depth of 2094.3 meters below sea level (mbsl) calculated using the shipboard precision depth recorder (PDR). A nonmagnetic RCB core barrel was dropped, and Hole U1566A was spudded at 0525 h. The seafloor was tagged at 2110.3 mbrf (2099.2 mbsl). We continued RCB coring with full cores through Core 3R, where basement contact occurred at around 21 mbsf. To improve our overall recovery, coring continued with Cores 4R (26.2 mbsf) through 31R (162.3 mbsf) with half advances. The final two cores for Hole U1566A were full advances to reach the final depth of 181.7 mbsf. The last core on deck was at 2230 h on 19 August. The hole was swept clean of cuttings with a 50 bbl sweep of high-viscosity mud. After circulating the mud through the hole, the hole was then cleaned with twice the hole volume surface salt water to improve the performance of the scheduled UBI logging tool run. The RCB system was secured. The rotary shifting tool (RST) was run in on the coring line to release the RCB C-4 coring bit. At 0024 h on 20 August, the bit was released. The RST was run again to reposition the bit shifting sleeve back to the circulating position in the mechanical bit release (MBR). After shifting the sleeve in the MBR, the RST was pulled back to the surface and the sinker bars were removed. The drill string was pulled back to 122.7 mbsf with the top drive installed. The top drive was set back, and the drill string was pulled back to logging depth (50 mbsf). After positioning the end of the pipe with knobbies through the guide horn, the rig floor was rigged up for logging. The rig floor personnel and the Schlumberger engineer held a toolbox meeting to review safety issues for the upcoming logging operations.
A total of four wireline logging runs were completed without operational problems using a modified triple combo tool string, the VSI, the FMS-sonic tool string (FMS resistivity images and calipers as well as natural gamma radiation [NGR]), and the UBI. Our first logging run consisted of the triple combo tool string. The tools were assembled, tested, and run into the hole at 0445 h on 20 April. A down log was performed from just above seafloor to 145 mbsf. An obstruction was found at that depth. After several attempts to pass the obstruction, the hole was logged up for a full-length open hole calibration pass, run back to bottom (145 mbsf), and logged up with the modified triple combo tool string through the drill string to the seafloor. The caliper was closed prior to entering the drill string. The tools were at the surface at 0830 h and rigged down by 0900 h on 20 April.
The second run consisted of the VSI. The tool string was lowered to ~145 mbsf. We were unable to pass the bridge encountered on the first logging tool run. The protected species watch was initiated on board, and we began a soft start of the seismic guns. The caliper was opened, and testing began at the first station. Stations were selected at 10 m intervals, and a test was performed at each station, yielding good results. There were no shutdowns during our seismic work. At 1335 h, the last station was completed and the air guns were secured. The VSI logging tool string was at the rig floor at 1520 h and rigged down and secured by 1545 h.
The third run consisted of the FMS-sonic tool string. Starting at 1545 h, the FMS-sonic was rigged up, and it was ready to deploy at 1640 h. The tool string was lowered, and a down log with the FMS calipers closed began just above the seafloor (2100 mbrf) and went to 2255 mbrf (145 mbsf). NGR was logged through the drill pipe to identify the seafloor to match the depth results on the first logging run. The hole was the same depth as the previous logging run. Once at total depth, we conducted the first log upward from 145 to ~90 mbsf with the FMS calipers open. The tools were run back to bottom (145 mbsf). The second upward log was started, the calipers were opened, and the hole was logged to the seafloor. The calipers were closed just prior to entering the drill pipe. The tools were at the surface at 2030 h and rigged down by 2105 h on 20 August.
The fourth and final logging tool string with the UBI was assembled and tested. At 2140 h, the tool string was lowered without difficulty through the drill pipe to just above the seafloor. The logging tools were turned on, and the hole was logged down to and then up from 145 mbsf. The tool was lowered back to near the bottom of the hole, and the second pass started at 140 mbsf. Both passes were made without incident at the very slow speed of ~122 m/h. The tool string was pulled back to the surface and rigged down by 0200 h on 21 August. At 0230 h, all logging tools were rigged down and the logging wireline was secured. No damage was found to any of the logging tools from any of the four tool strings.
The drilling knobbies were removed from the drill string, and the drill string was pulled out of the hole to the surface. The bottom-hole assembly (BHA) reached the rig floor at 0630 h after clearing the seafloor at 0335 h. The four stands of drill collars were racked back in the derrick, and the outer core barrel components were disassembled, inspected, and laid out. The rig floor was secured for transit, and the bridge was notified at 0754 h that operations at Site U1566 were complete. We switched from DP mode to cruise mode, the thrusters were raised and secured by 0820 h, and the sea passage to the next site began at 0824 h. The time spent on Hole U1566A was 124.00 h or 5.2 days.
3. Lithostratigraphy
The succession cored at Site U1566 is divided into three lithostratigraphic units (Figure F1; Table T2). Lithostratigraphic Unit I (0.00–19.05 m core depth below seafloor, Method A [CSF-A]) is unconsolidated clay with varying amounts of silt and sand, as well as planktonic foraminifers. Unit II (26.20–147.99 m CSF-A) is composed of basalt and interbasaltic sediment. This unit is divided into 14 subunits consisting of basaltic lava flow packages and 13 sedimentary subunits and has a total thickness of 121.80 m. Unit III (148.00–173.40 m CSF-A) is weakly to moderately altered medium-grained granite with biotite alternating with decomposed granite and granite-derived sandstones.
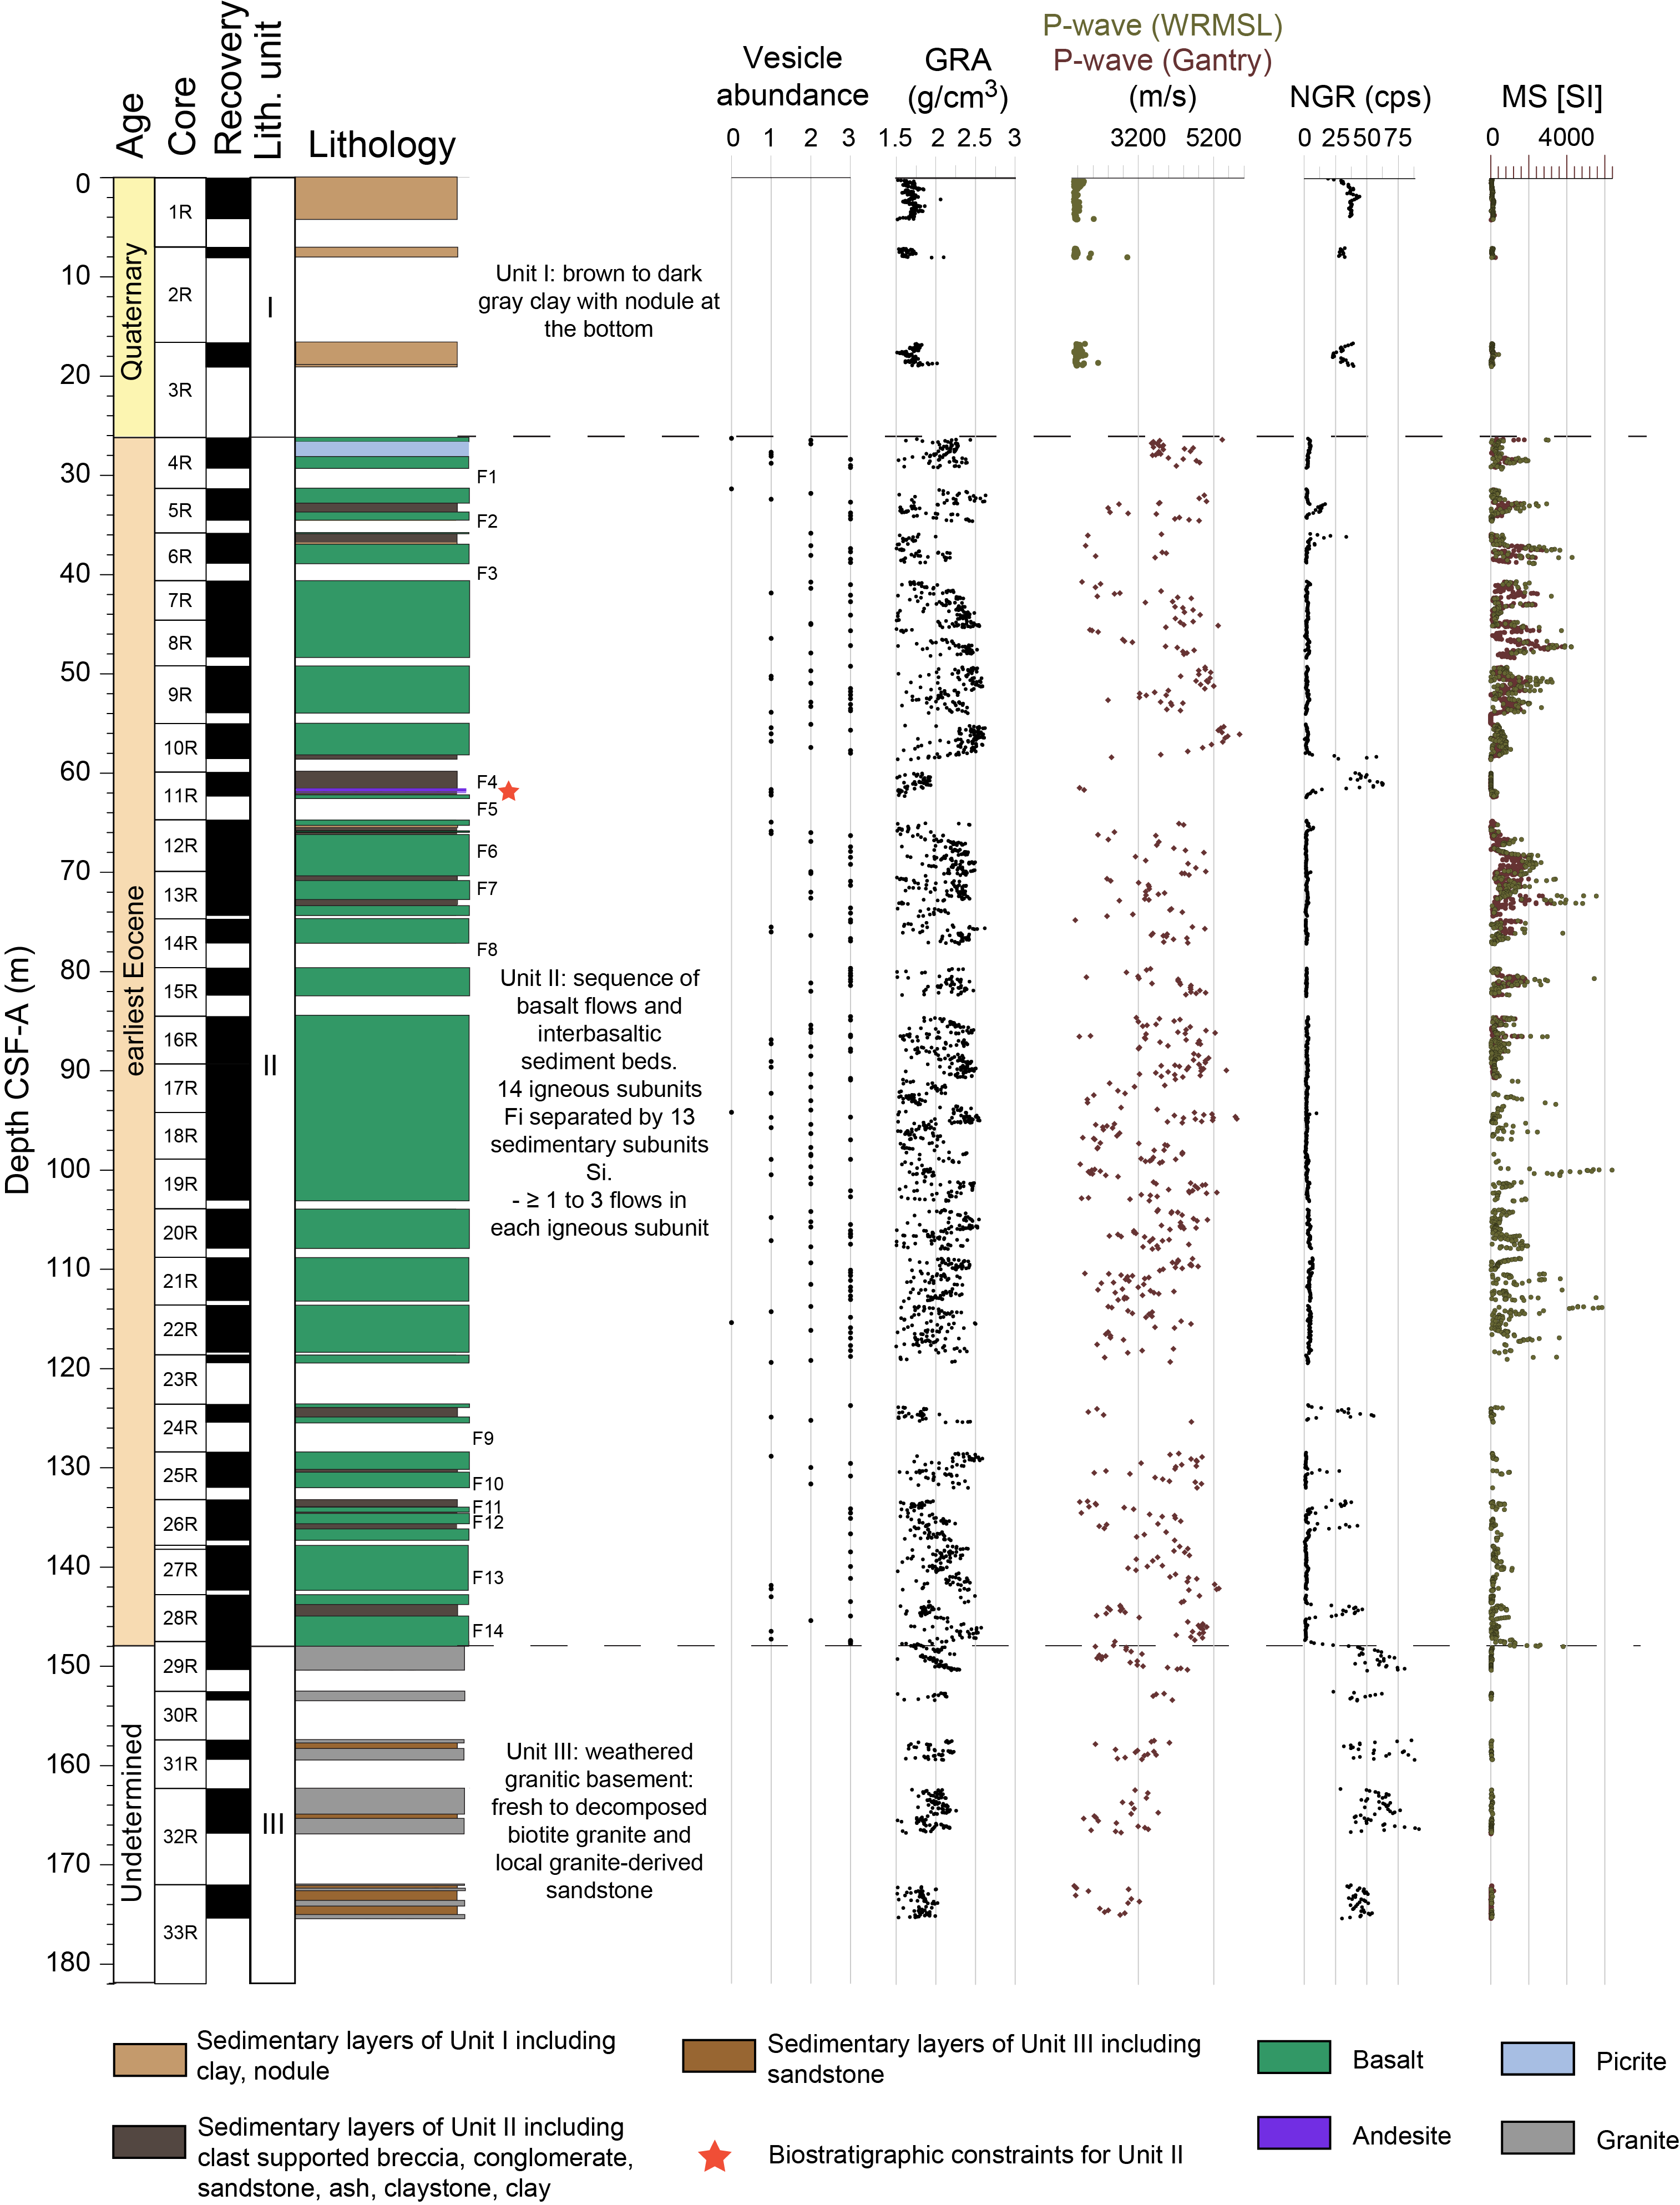
Figure F1. Lithostratigraphic summary.
3.1. Highlights
The lithostratigraphic highlights of Site U1566 are as follows:
- A series of 14 basaltic lava flow subunits, often consisting of packages of multiple lava flows, and 13 interbasaltic sedimentary subunits were cored with a total thickness of 121.80 m.
- The lava flows are mainly composed of aphyric basalt, with one picritic subunit in the upper part.
- The interbasaltic sediments are of diverse composition, including conglomerates, sandstones, and claystones with local layers rich in organic matter and wood fragments.
- 25.40 m of granitic and decomposed granite basement with granite-derived sandstones was cored below the basalt sequence. This unit demonstrates the regional extent of the granite drilled at the previous site (U1565).
- Interval: 396-U1566A-1R-1, 0 cm, to 3R-CC, 15 cm
- Depth: 0.00–19.05 m CSF-A
- Age: Quaternary
3.2. Unit I
Lithostratigraphic Unit I consists of 19.05 m of olive-brown to grayish brown to very dark gray clay with various amounts of silt and sand. Clasts and nodules are observed at the bottom of the unit (e.g., Section 396-U1566A-3R-2; Figure F2). Planktonic foraminifers are present throughout the unit. The clay is overall moderately to well sorted with some intervals of poor sorting due to the presence of clasts and nodules (e.g., Section 2R-1 and Core 3R).
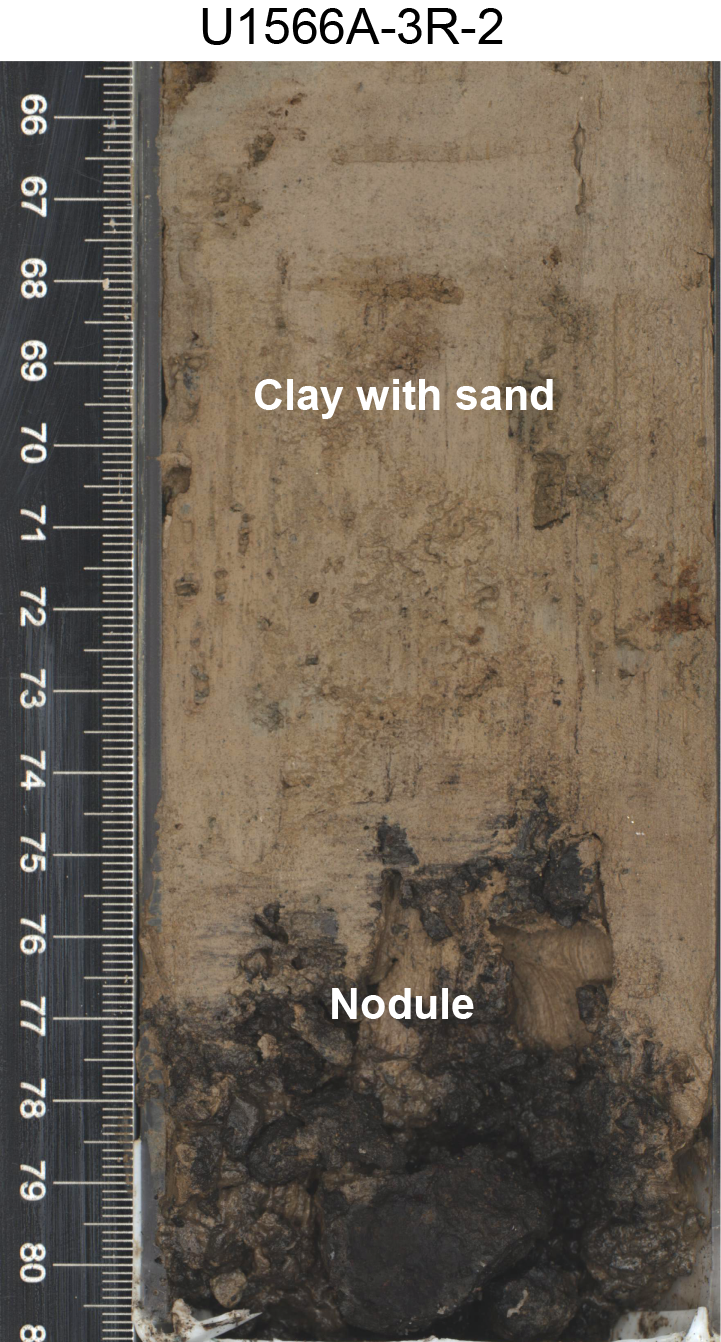
Figure F2. Sand and nodules.
3.3. Unit II
Lithostratigraphic Unit II consists of basalt flows and interbasalt sediments. It is divided into 14 basaltic lava flow subunits (or igneous subunits) (Fi) and 13 sedimentary subunits (Si) and has a total cored thickness of 121.79 m (Figure F3). Each subunit is progressively numbered downhole (i.e., F1, S1, F2, S2, F3, and so on). Each igneous subunit is composed of one to several discrete lava flow packages, which are delimited by chilled margins or brecciated flow tops (Figure F4). The sedimentary subunits are divided into five groups. Their compositions downhole are described after the igneous subunits.
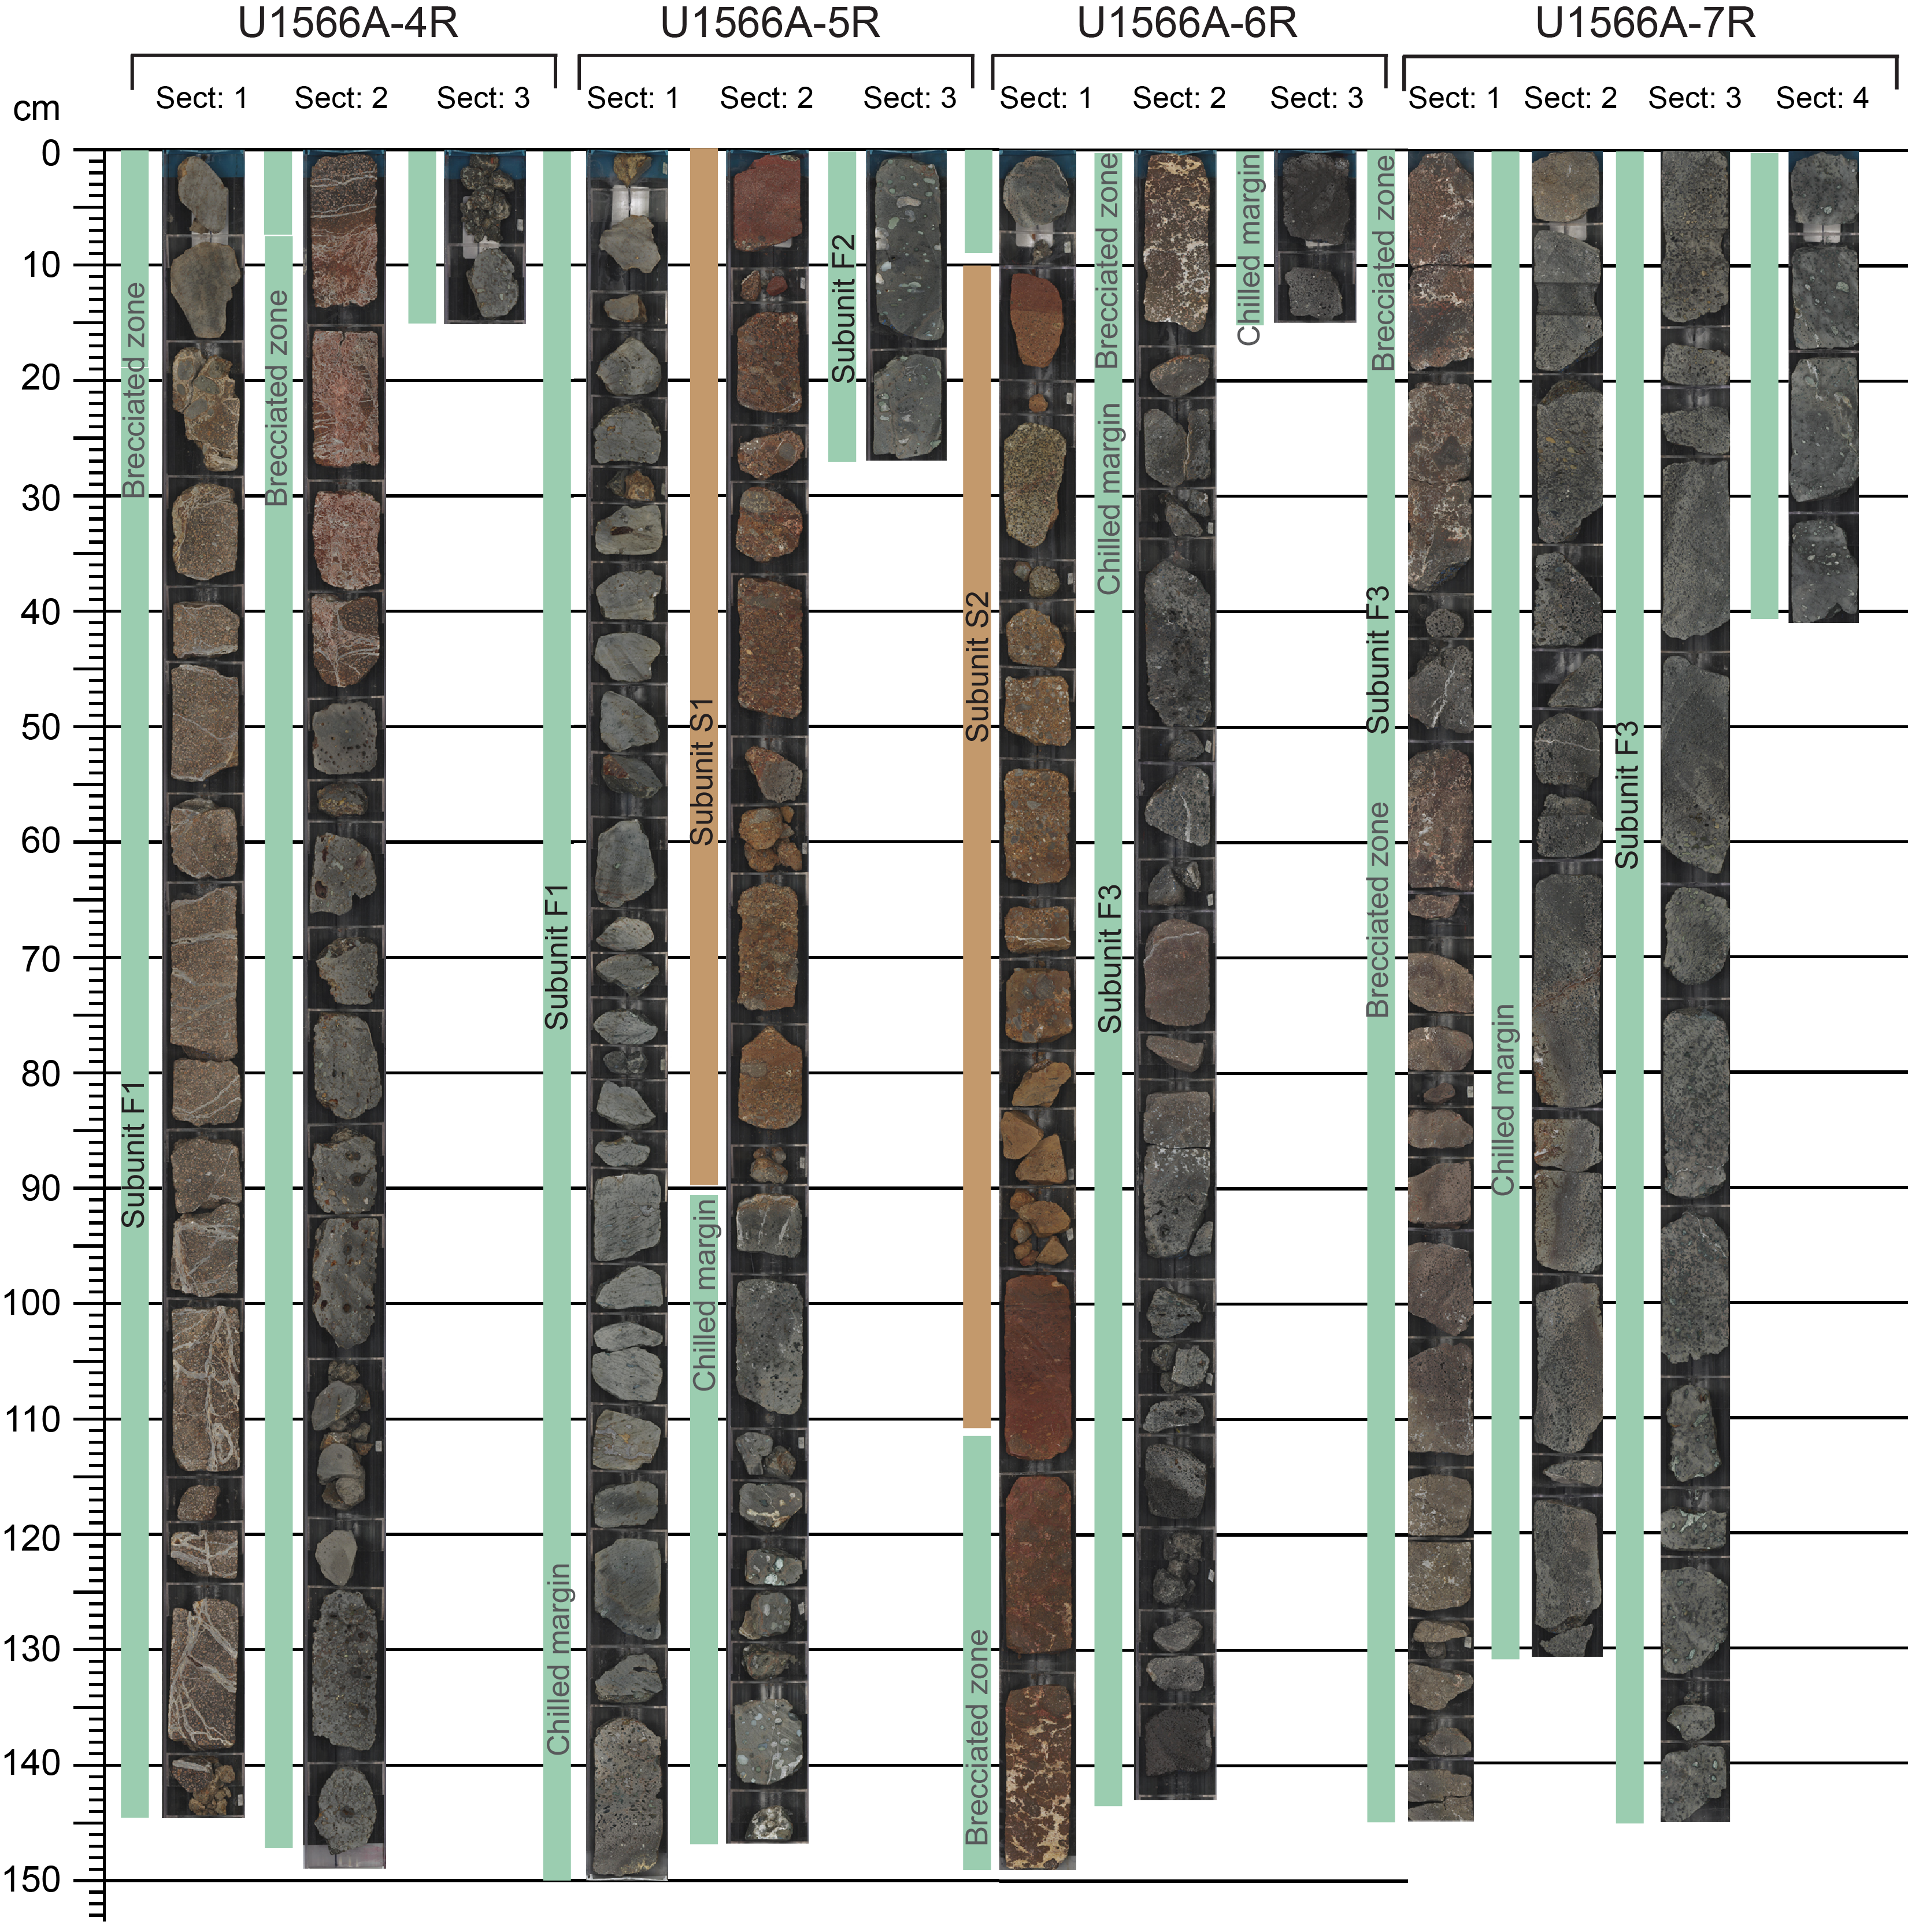
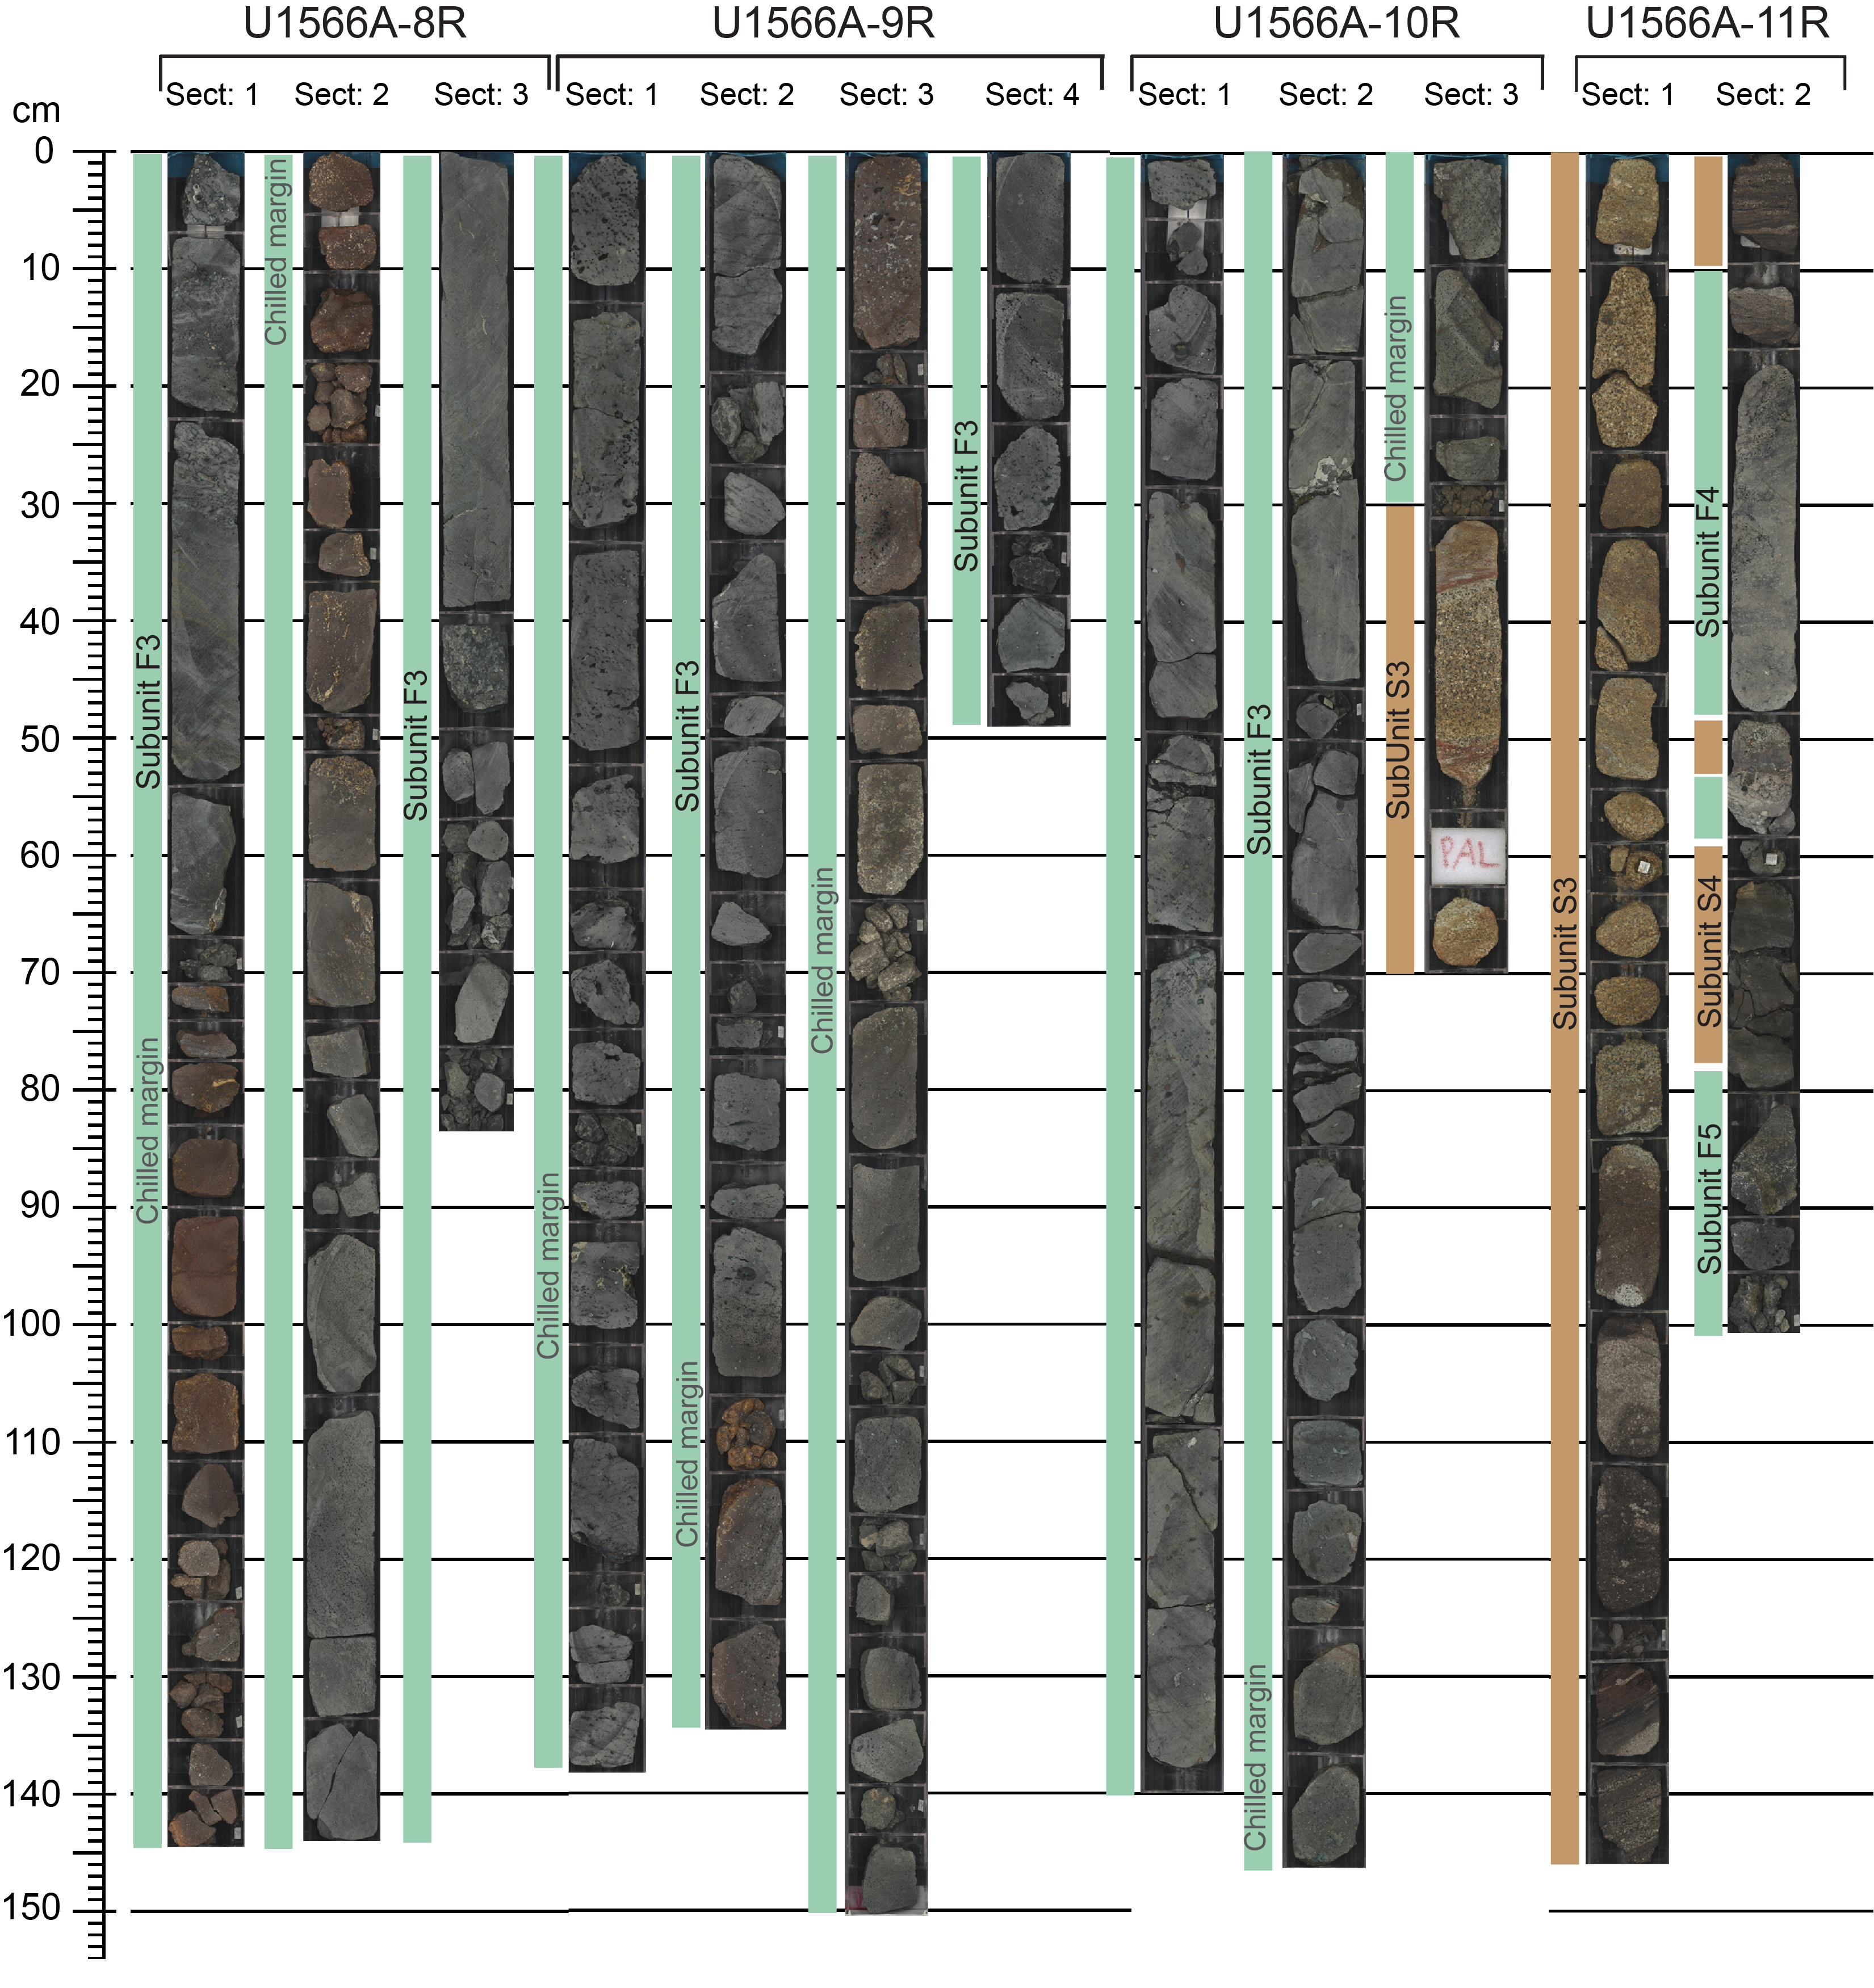
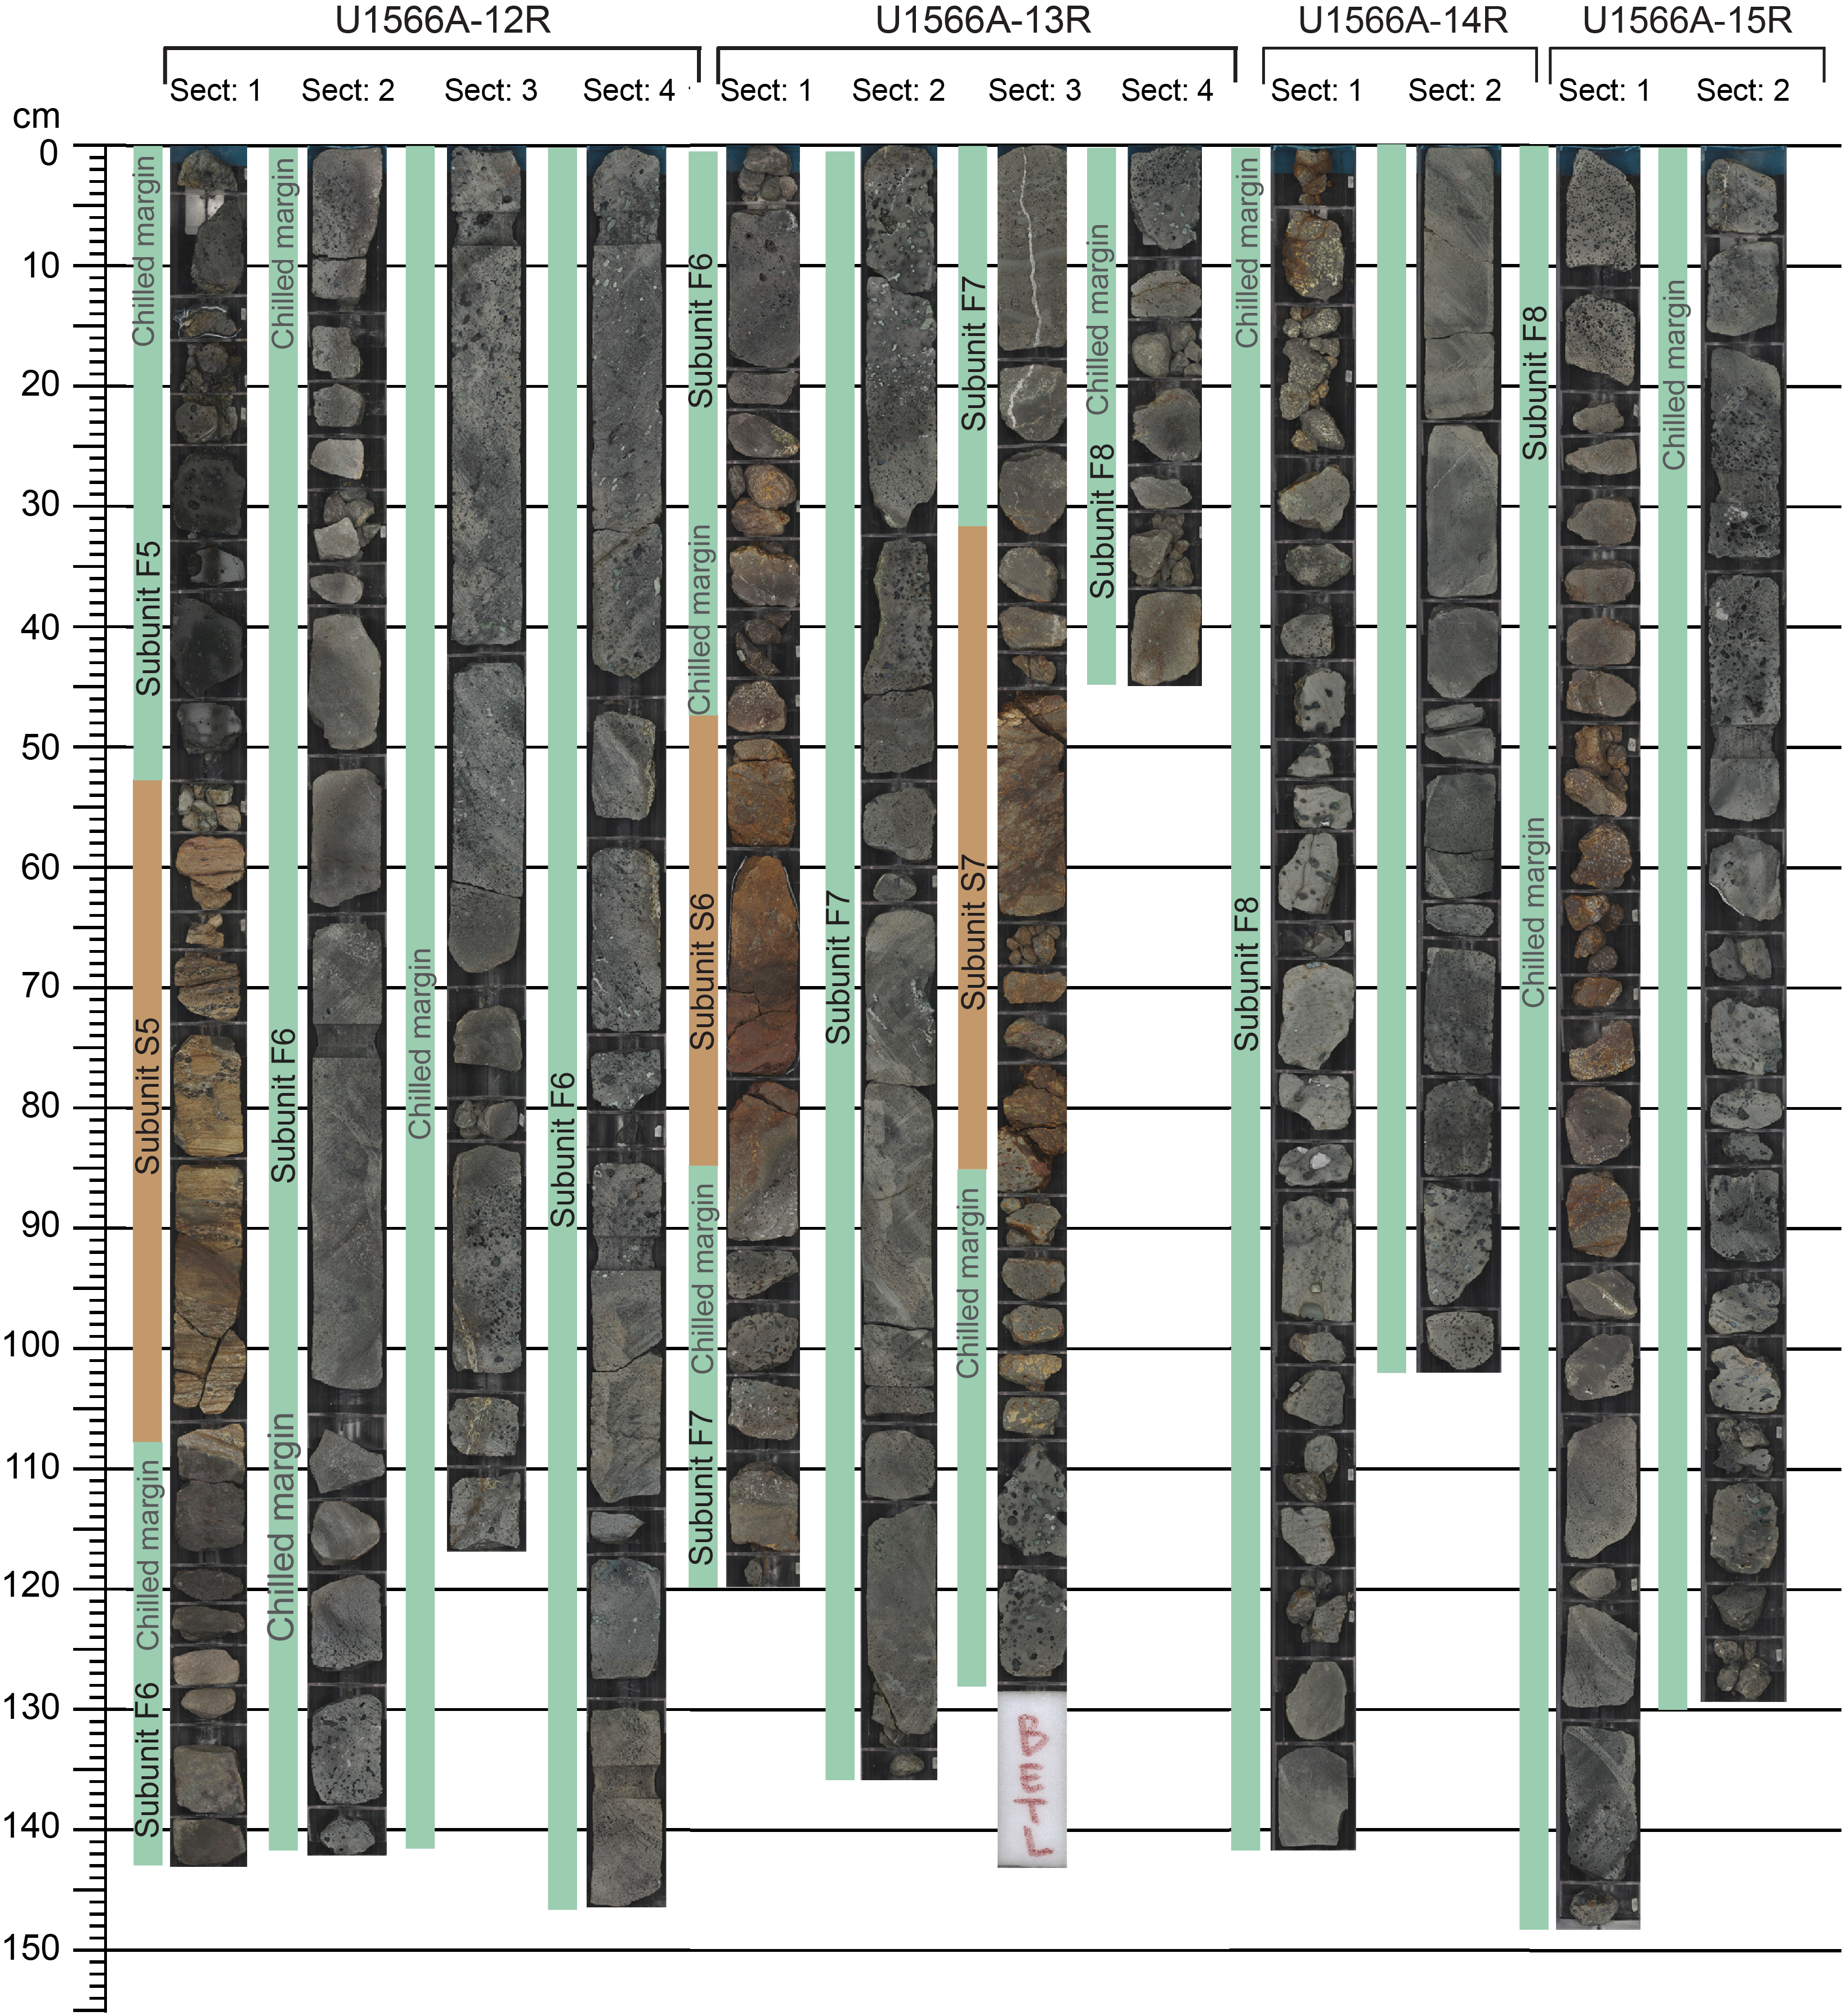
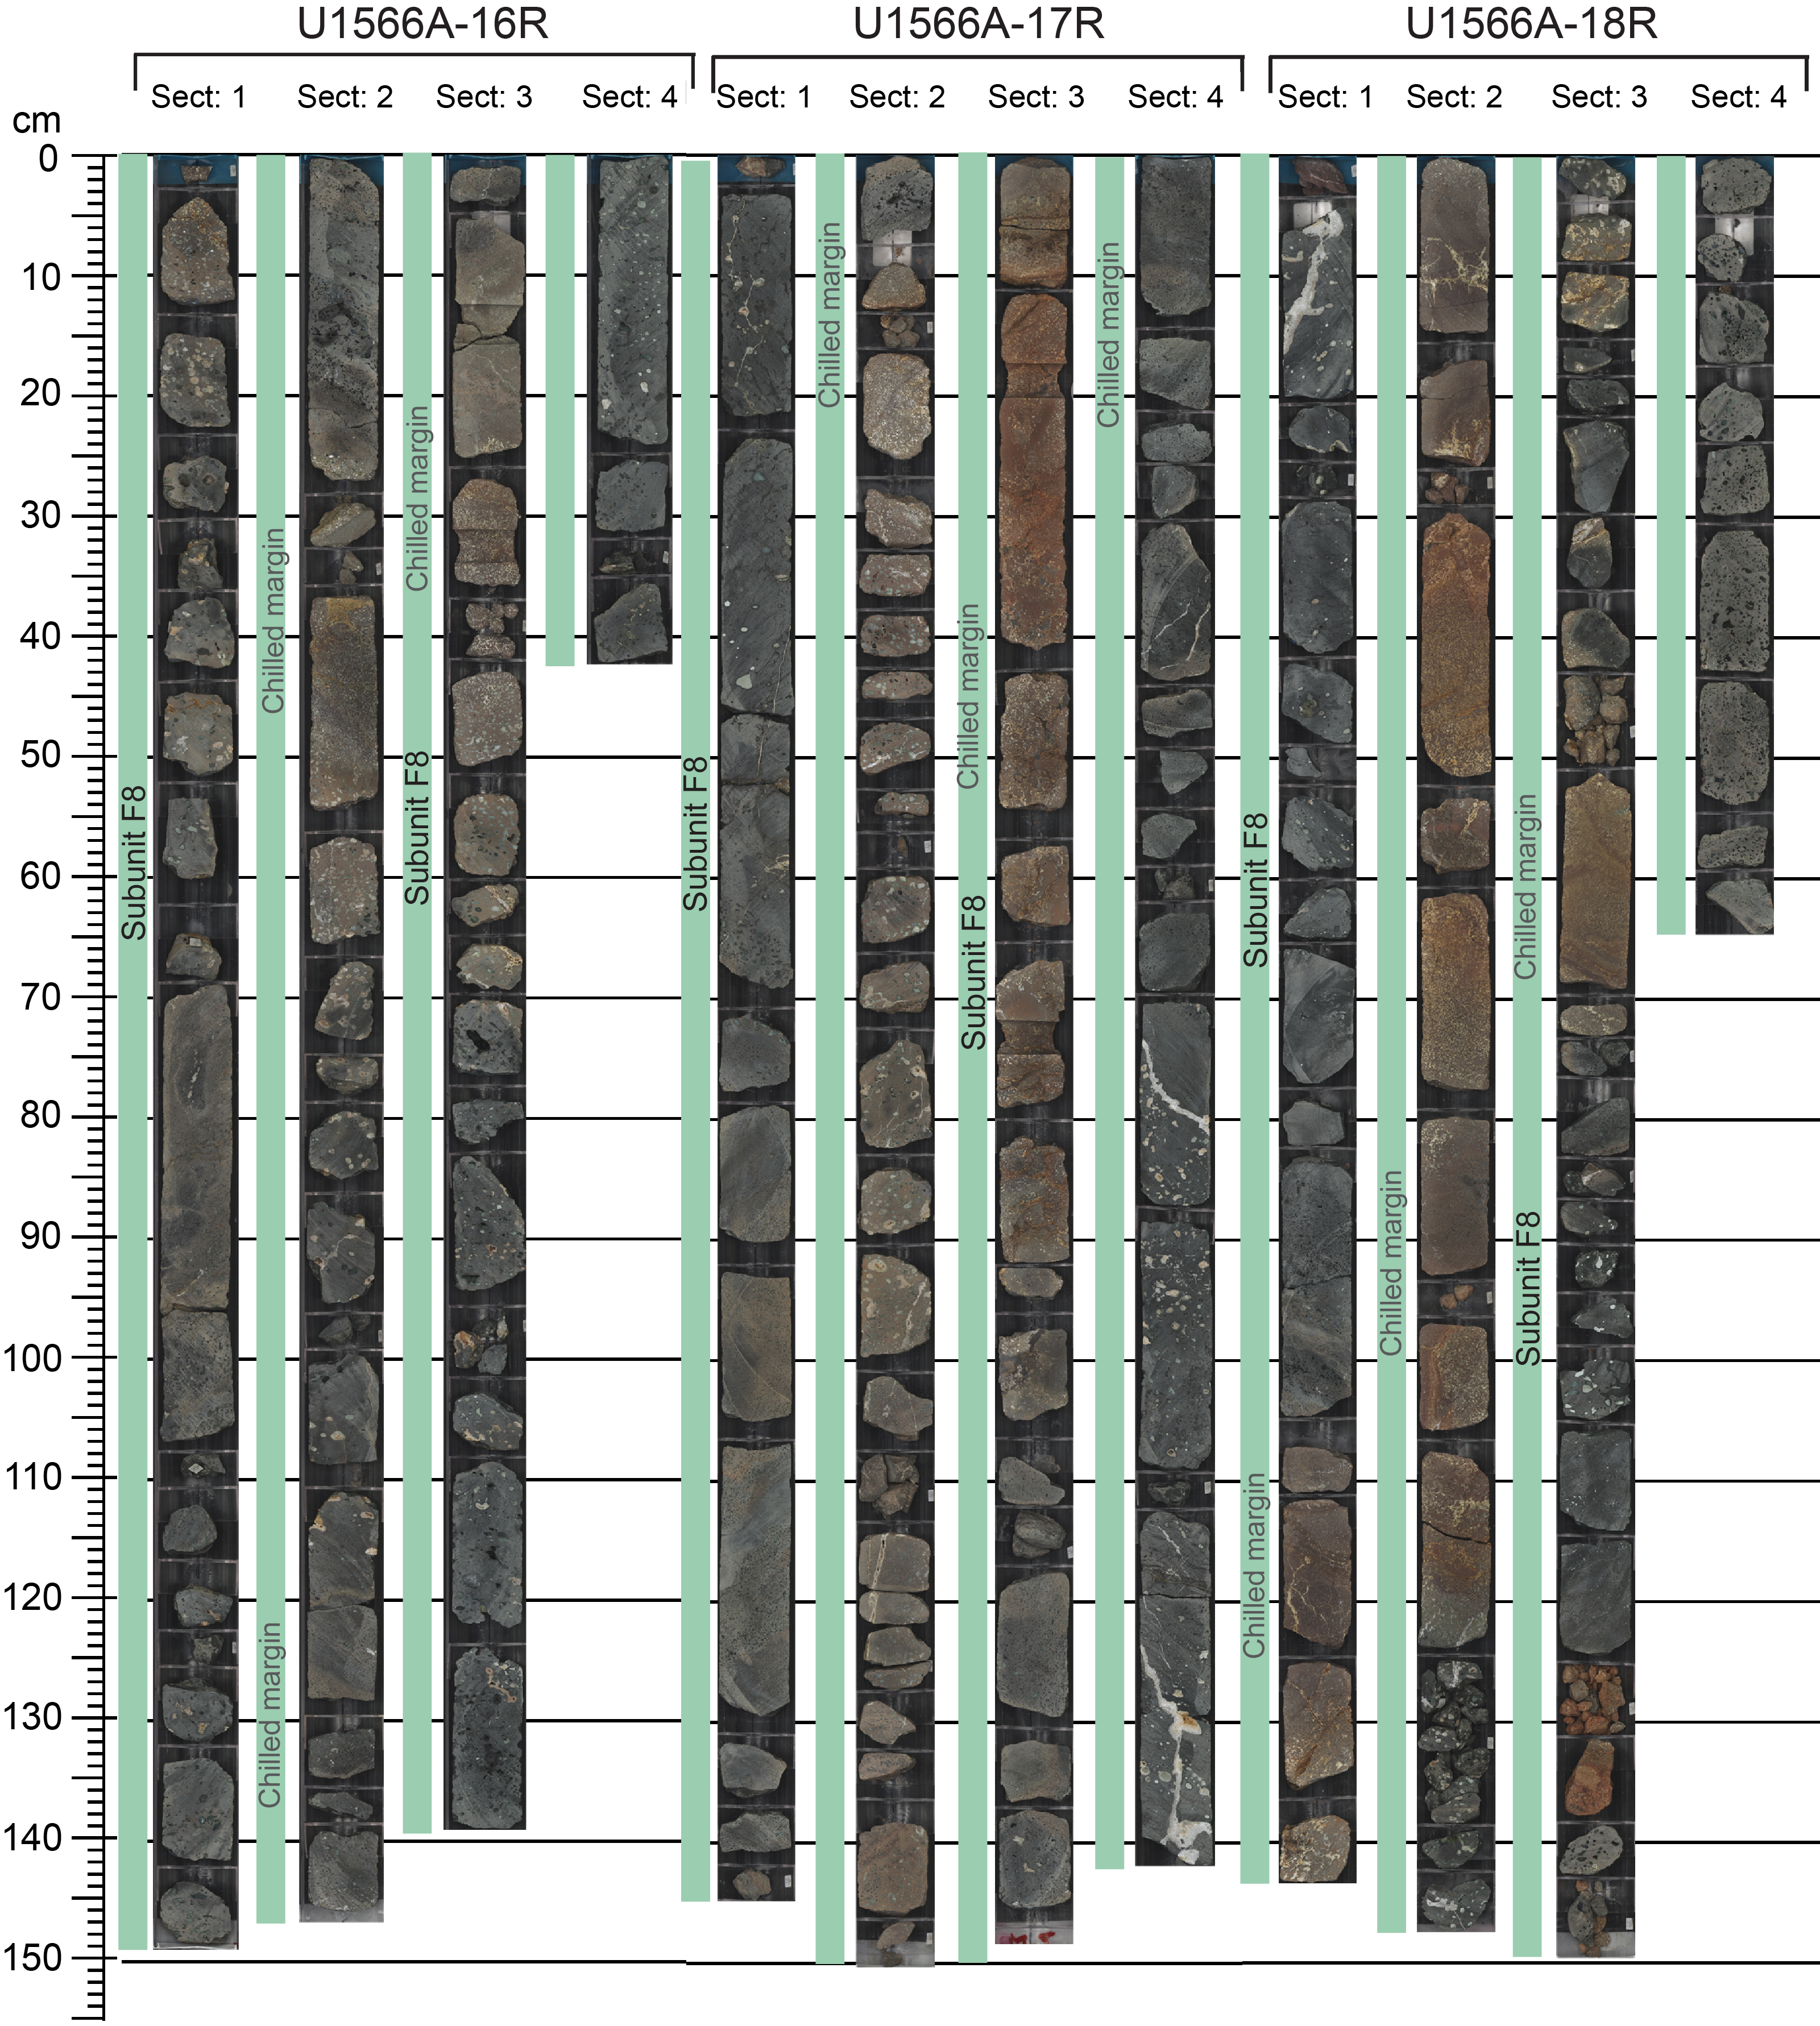
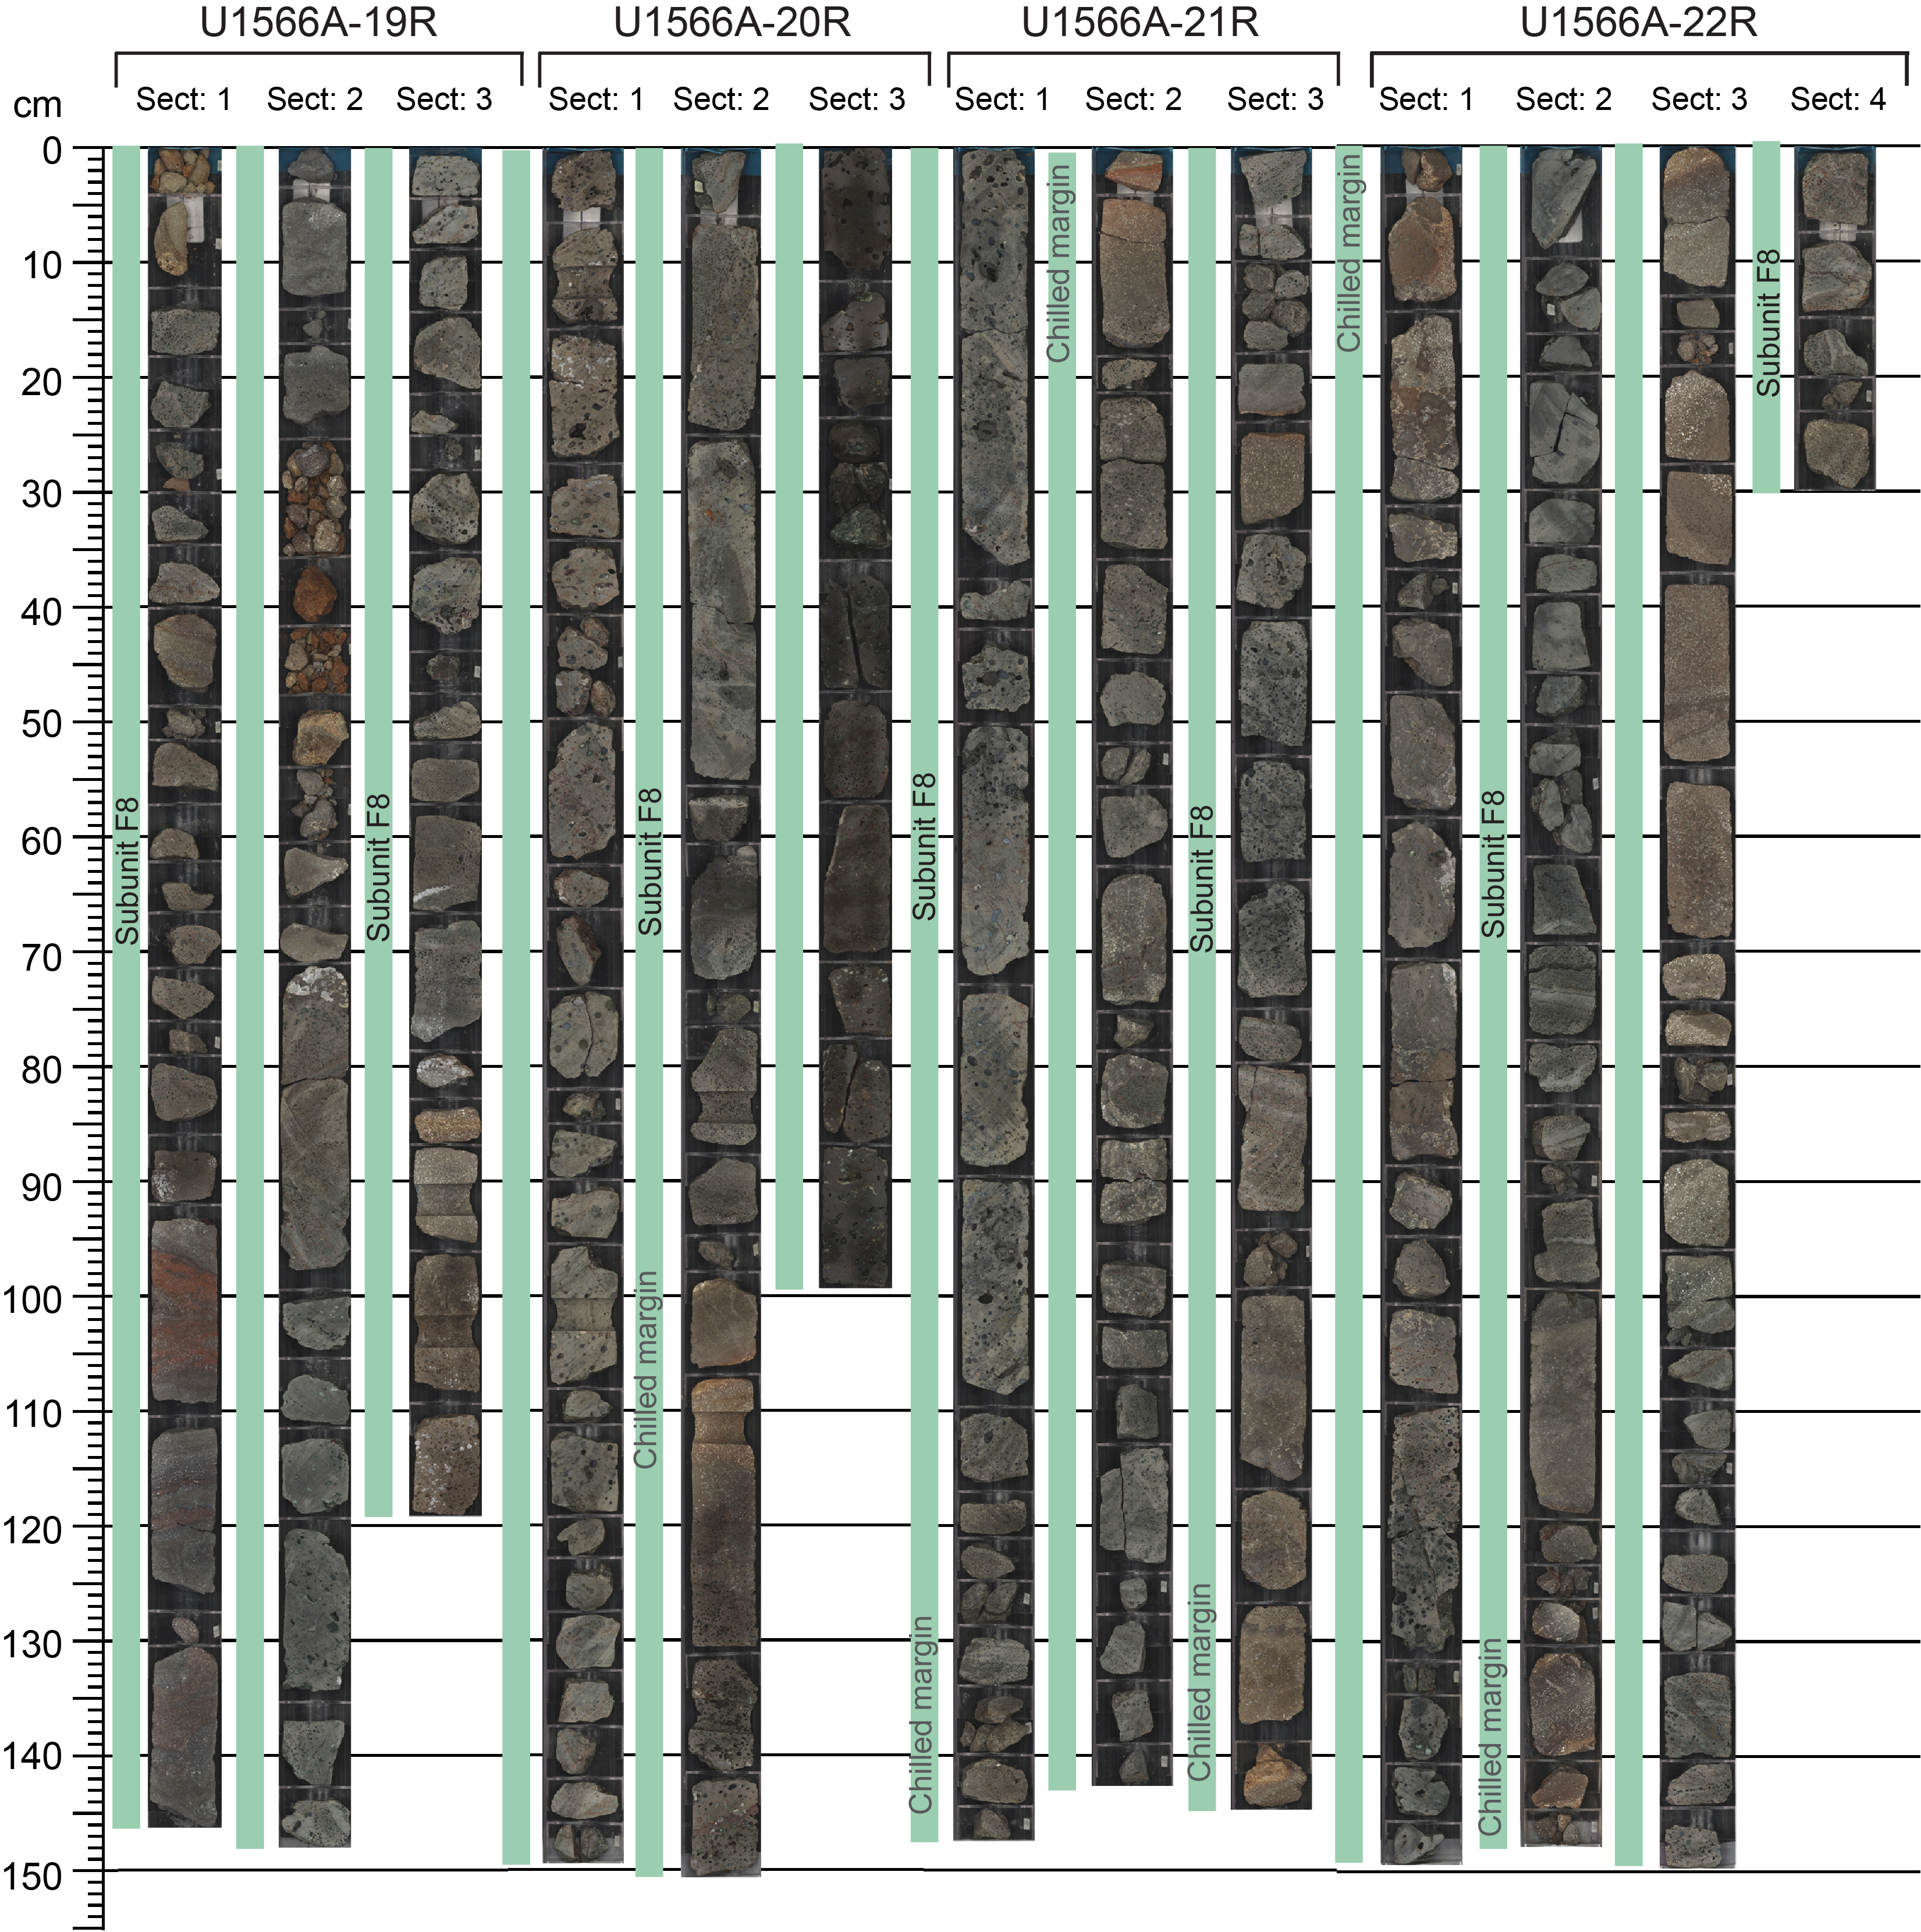
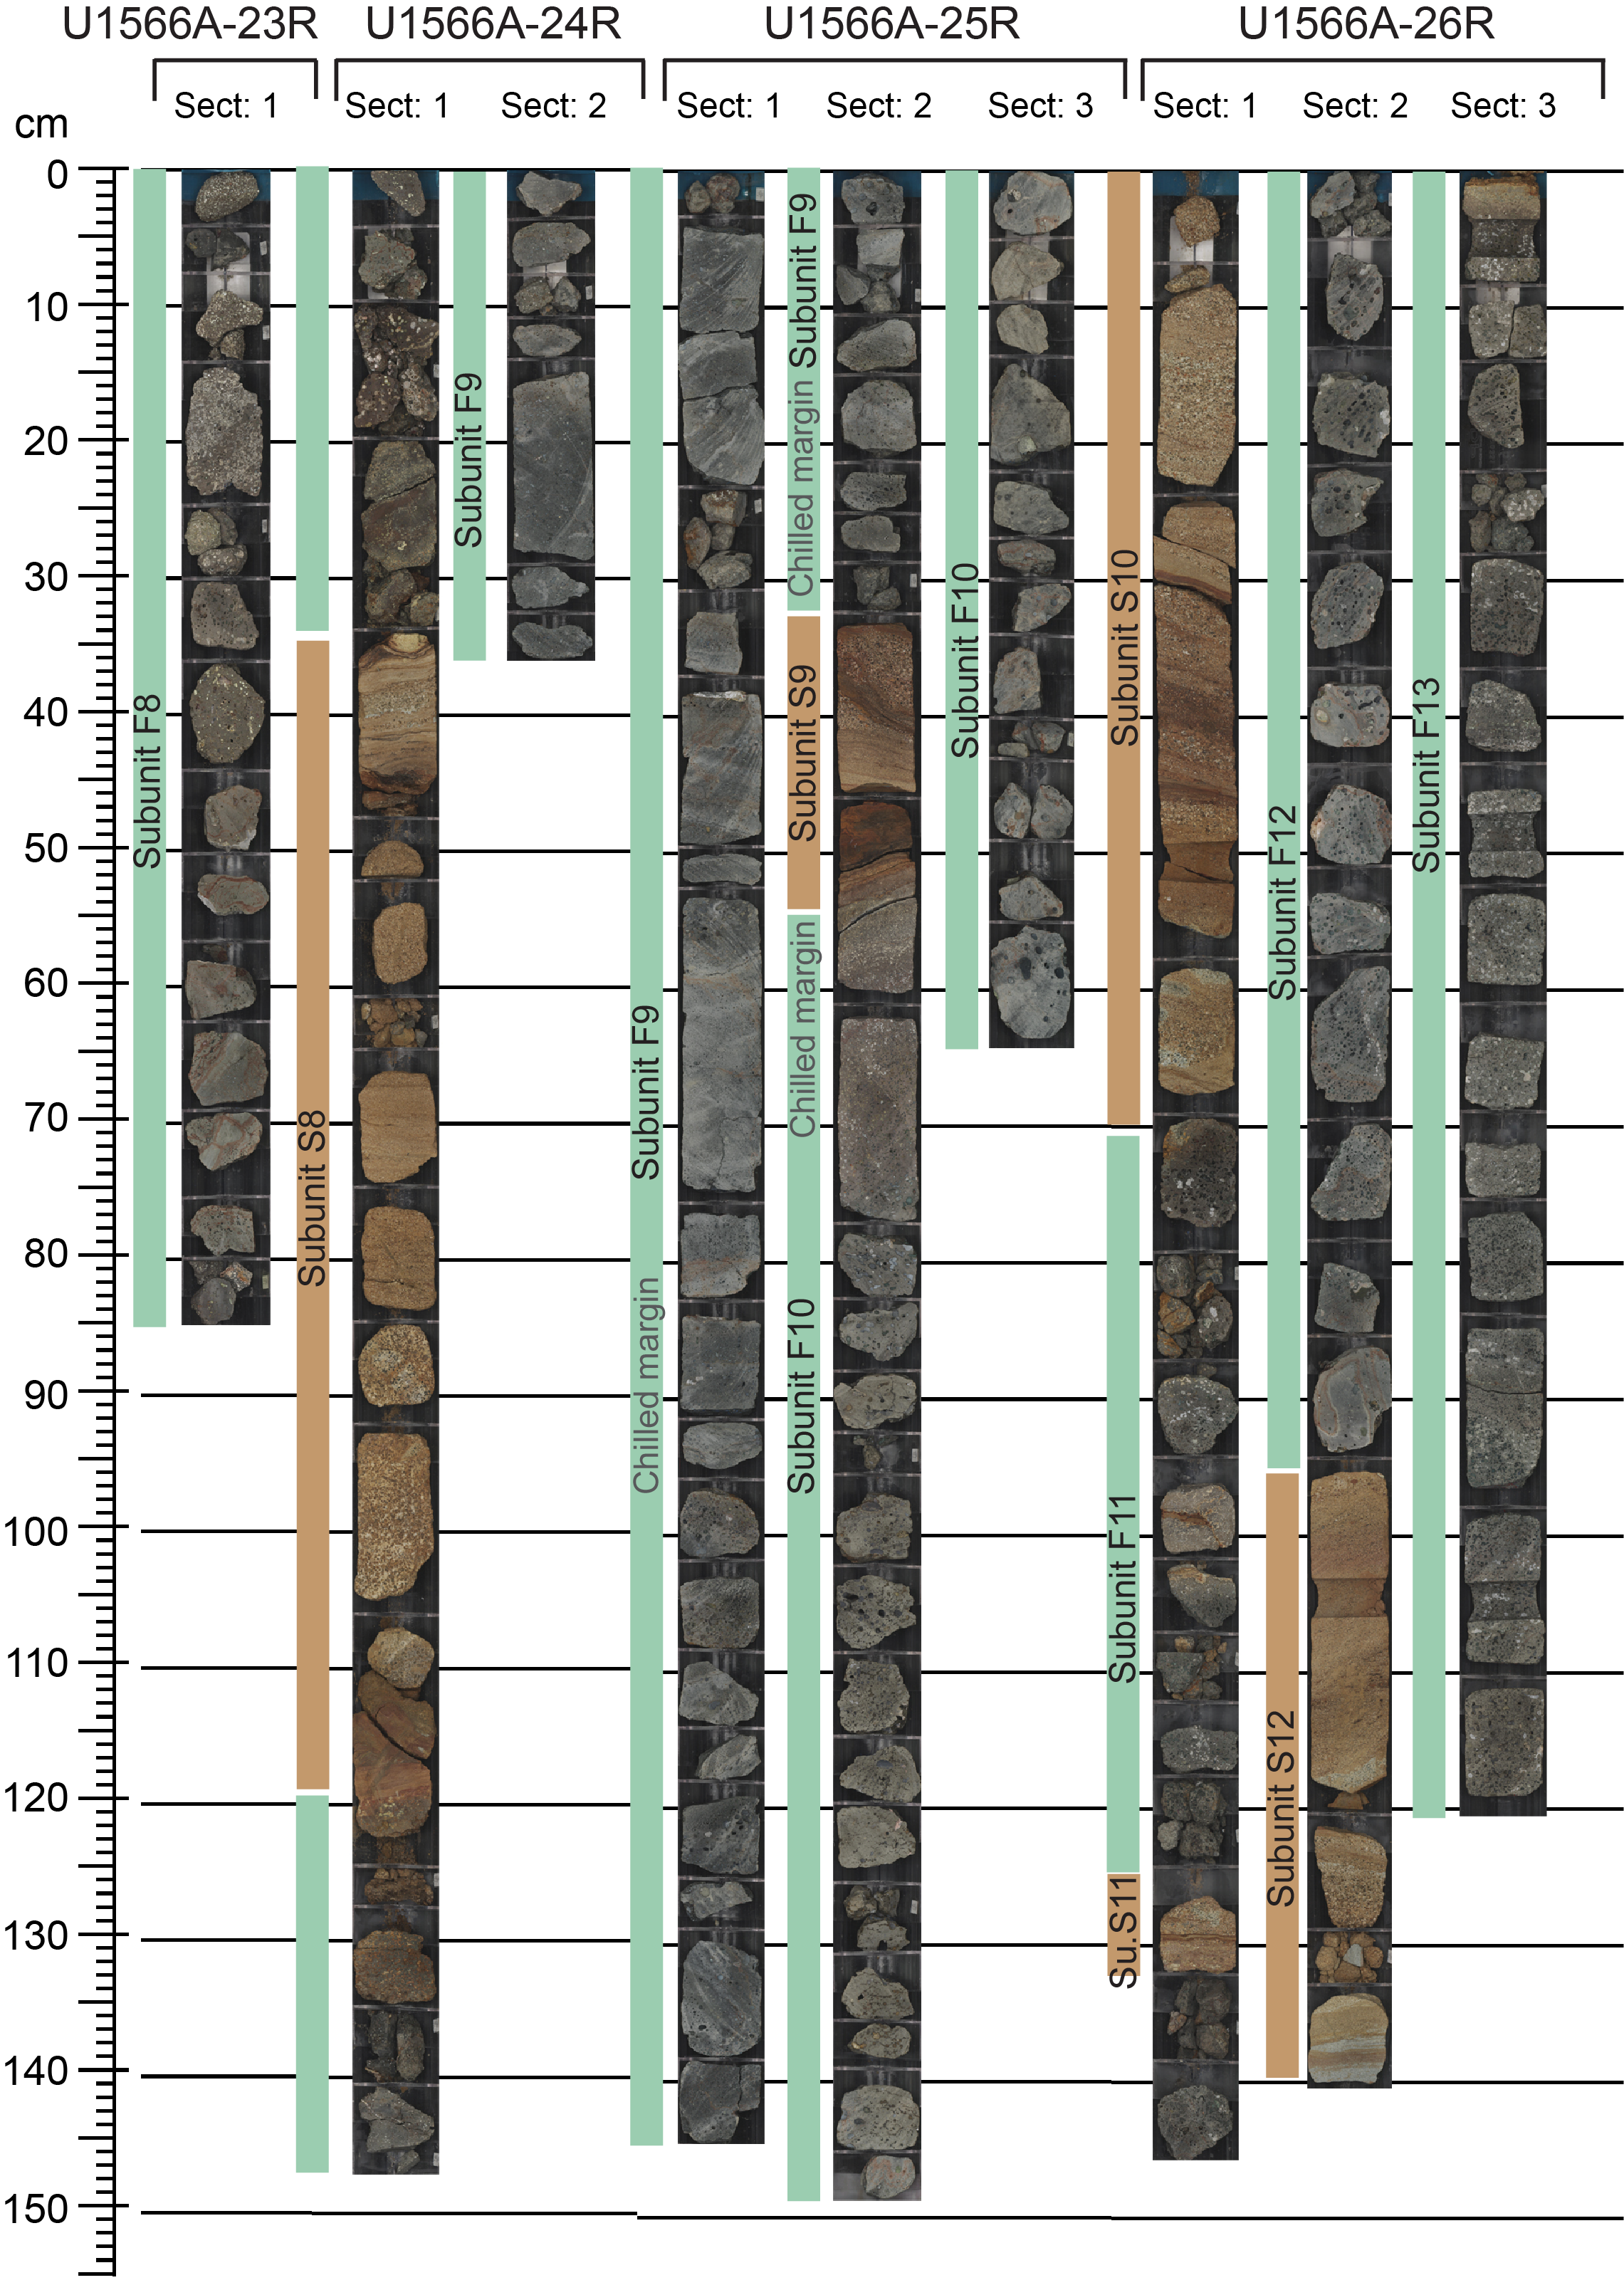
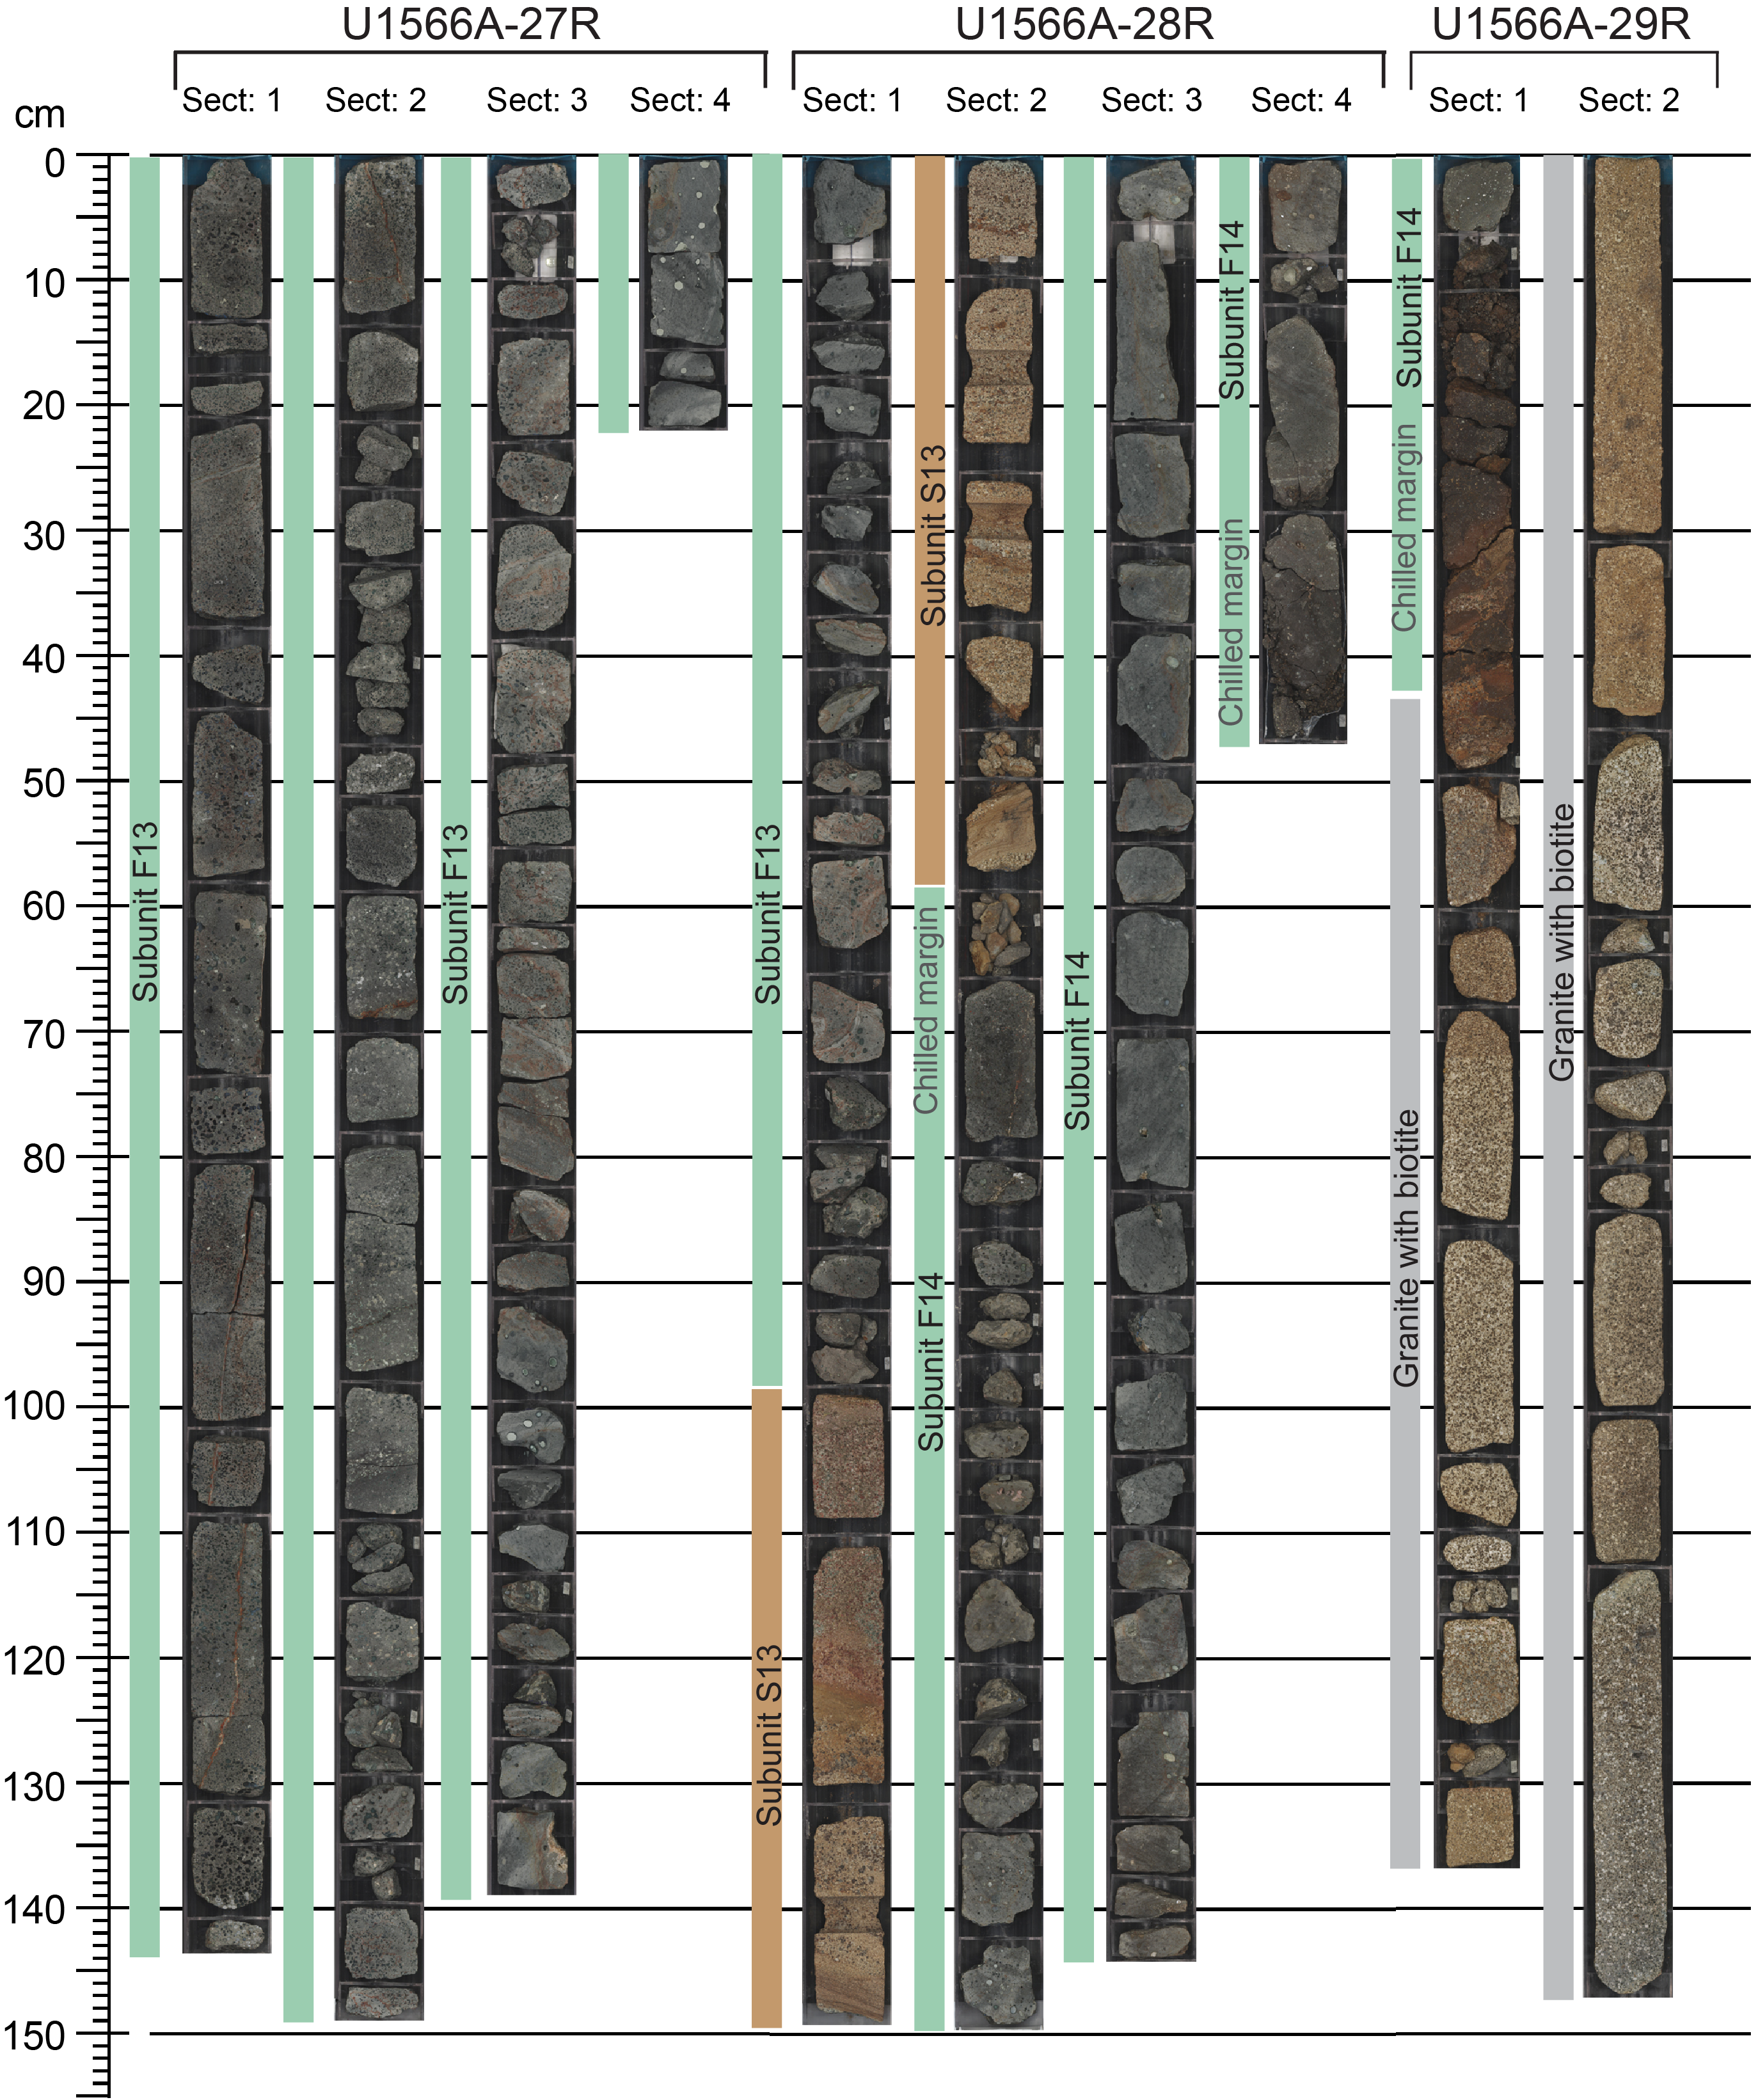
Figure F3. Lava flow subunits.
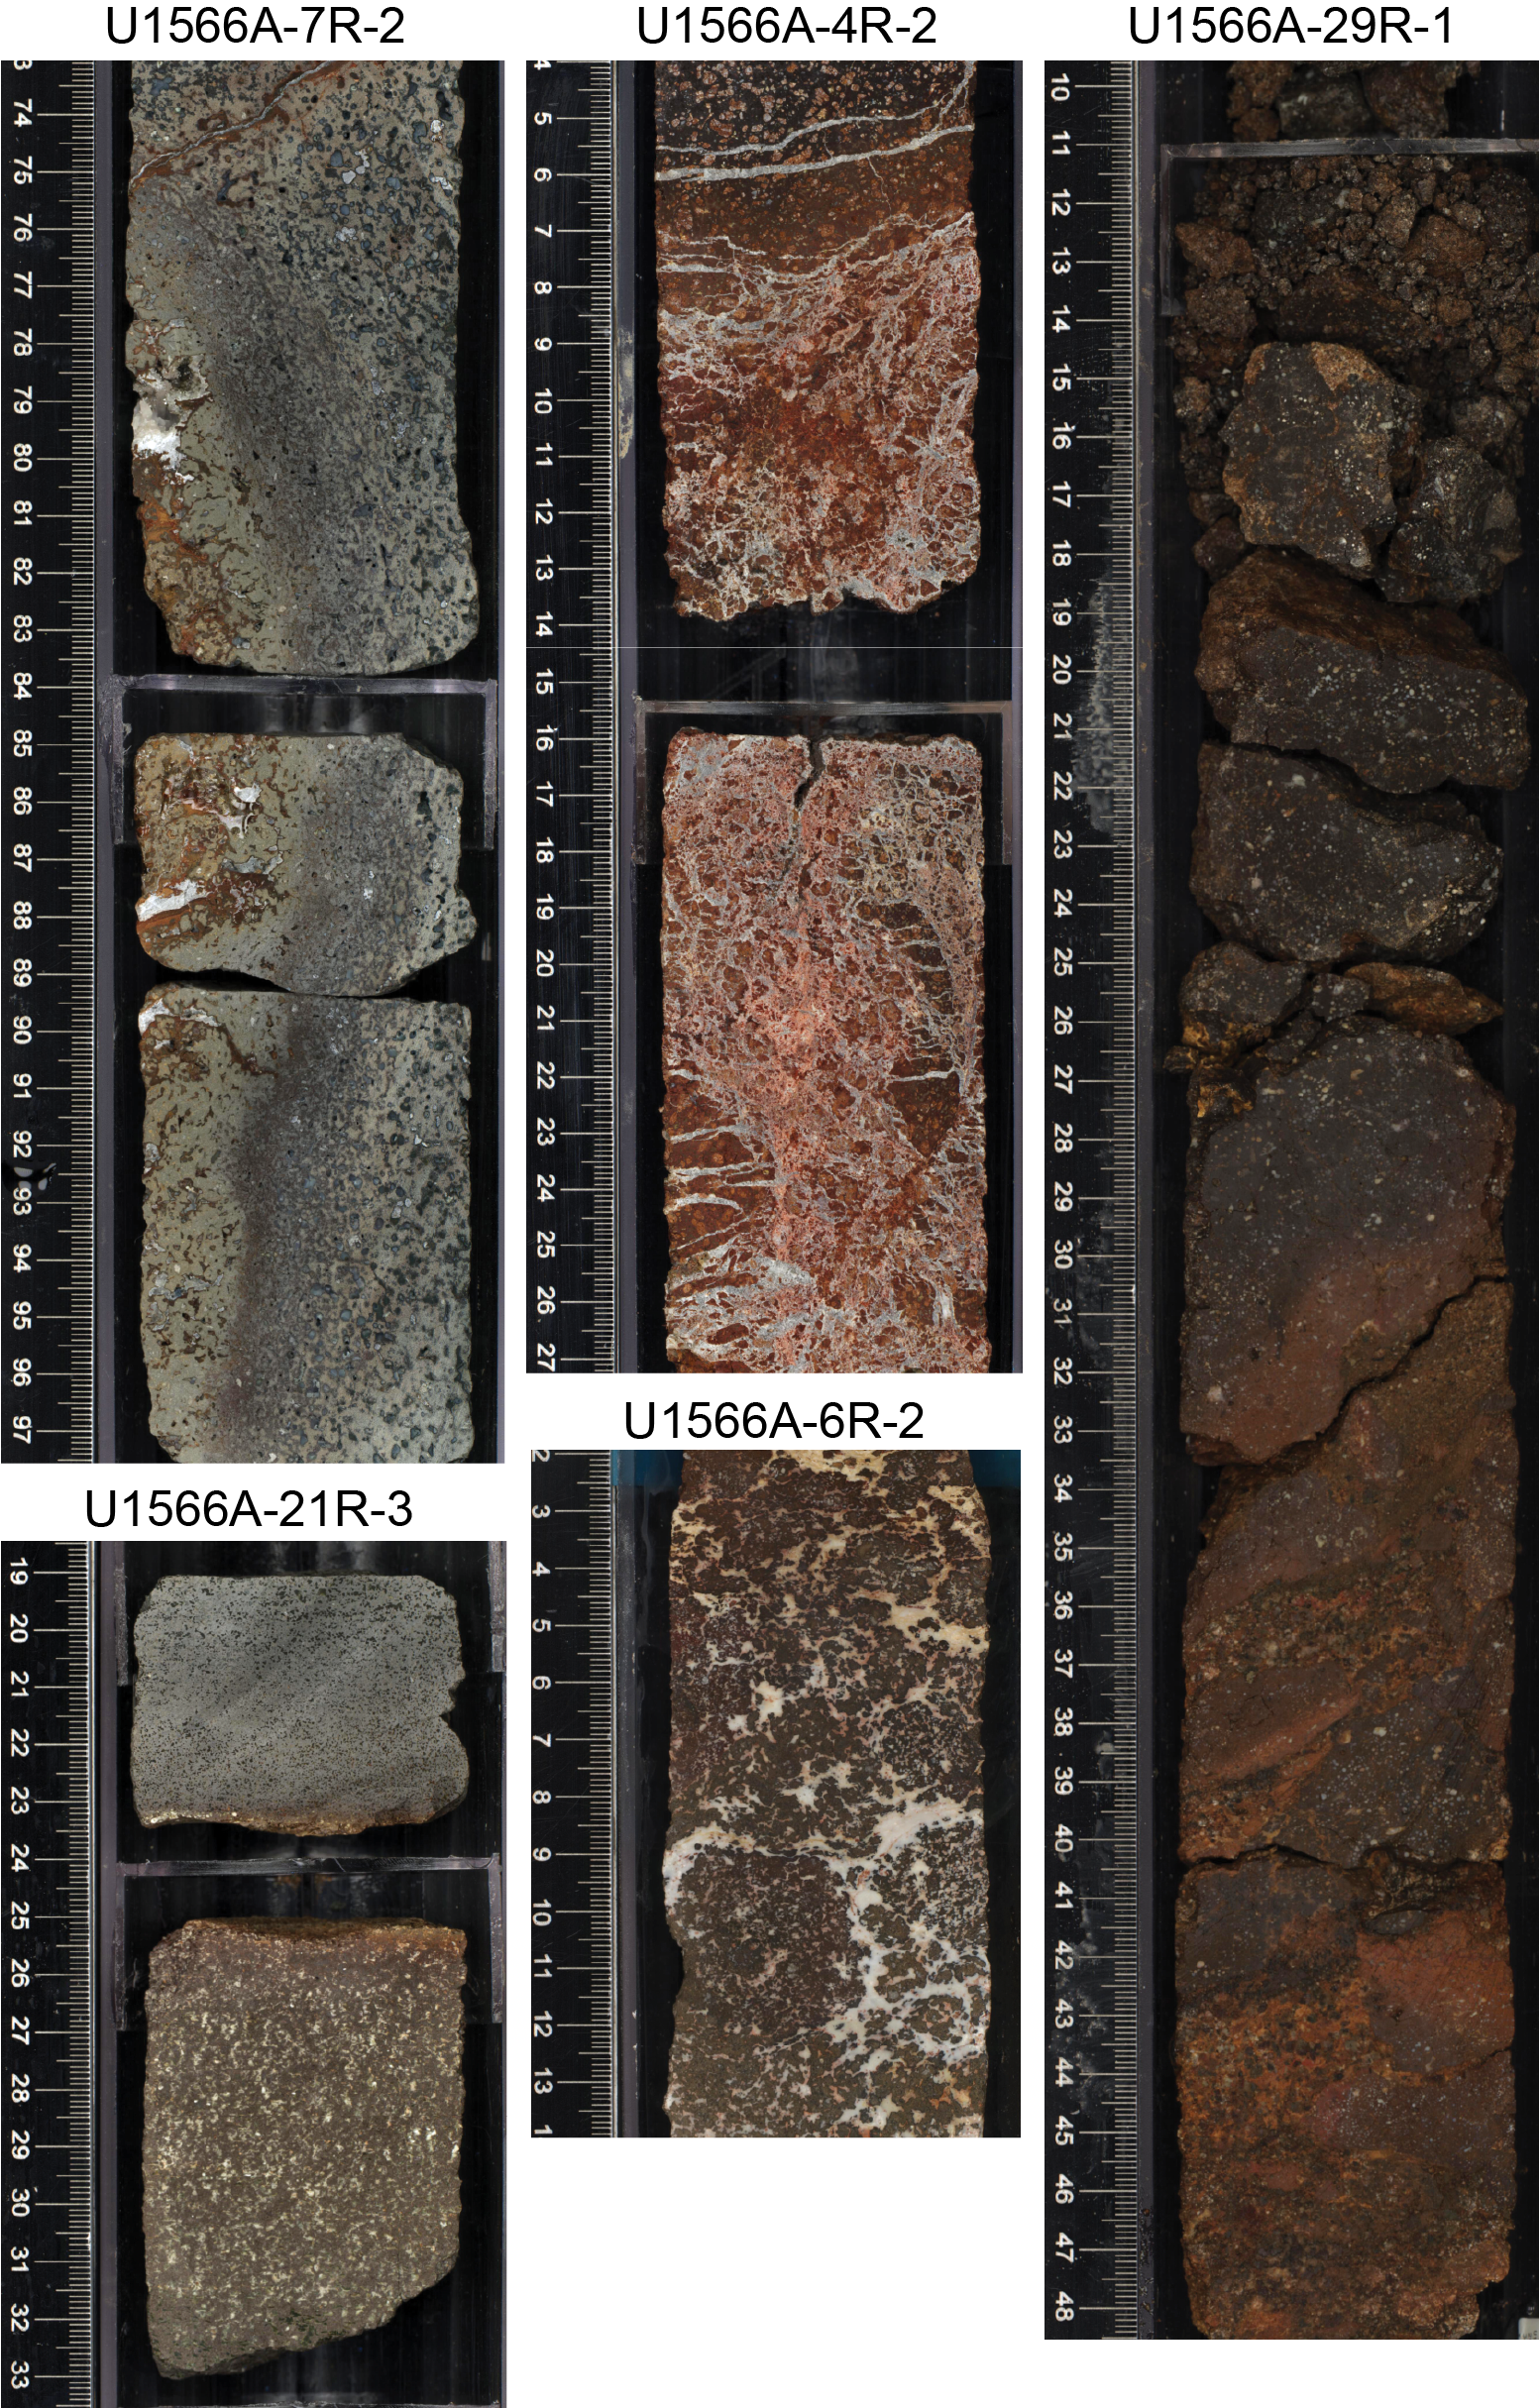
Figure F4. Chilled margins and breccias.
3.3.1. Petrology: igneous subunits
3.3.1.1. Macroscopic observations
The basalt flows are mostly composed of light to dark gray aphyric basalt (Figure F5) with rare occurrences of sparsely plagioclase-phyric basalt. The mostly aphyric basalt flows are characterized by degree of vesicularity, ranging from nonvesicular to highly vesicular (Figures F1, F6), and by the variable sizes of vesicles. Vesicles are often elongated, suggesting a syn-emplacement shear fabric. Within lava flow subunits, flow banding is often observed as internal variations of vesicularity (Figure F7). Flow edges are mostly characterized by chilled margin with submillimeter-sized vesicles. Brecciated flow tops are composed of aphyric basalt clasts with carbonate veins showing branched to network connectivity (Figure F4).
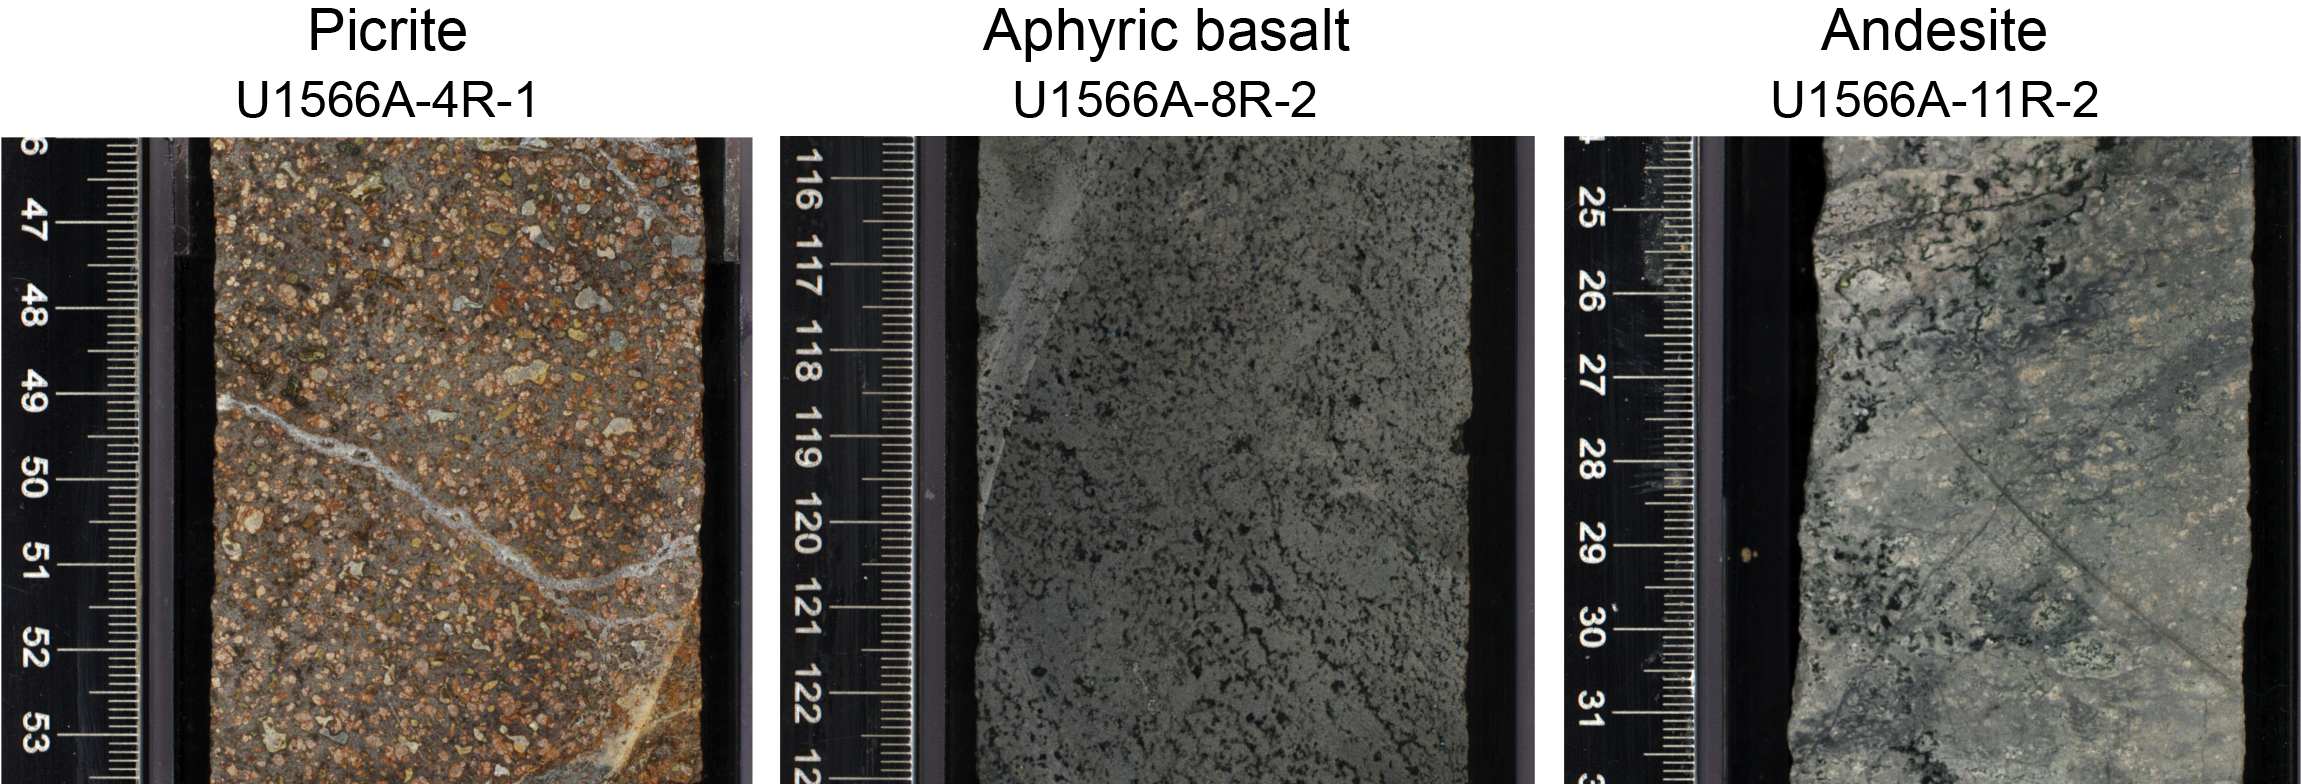
Figure F5. Igneous lithologies.
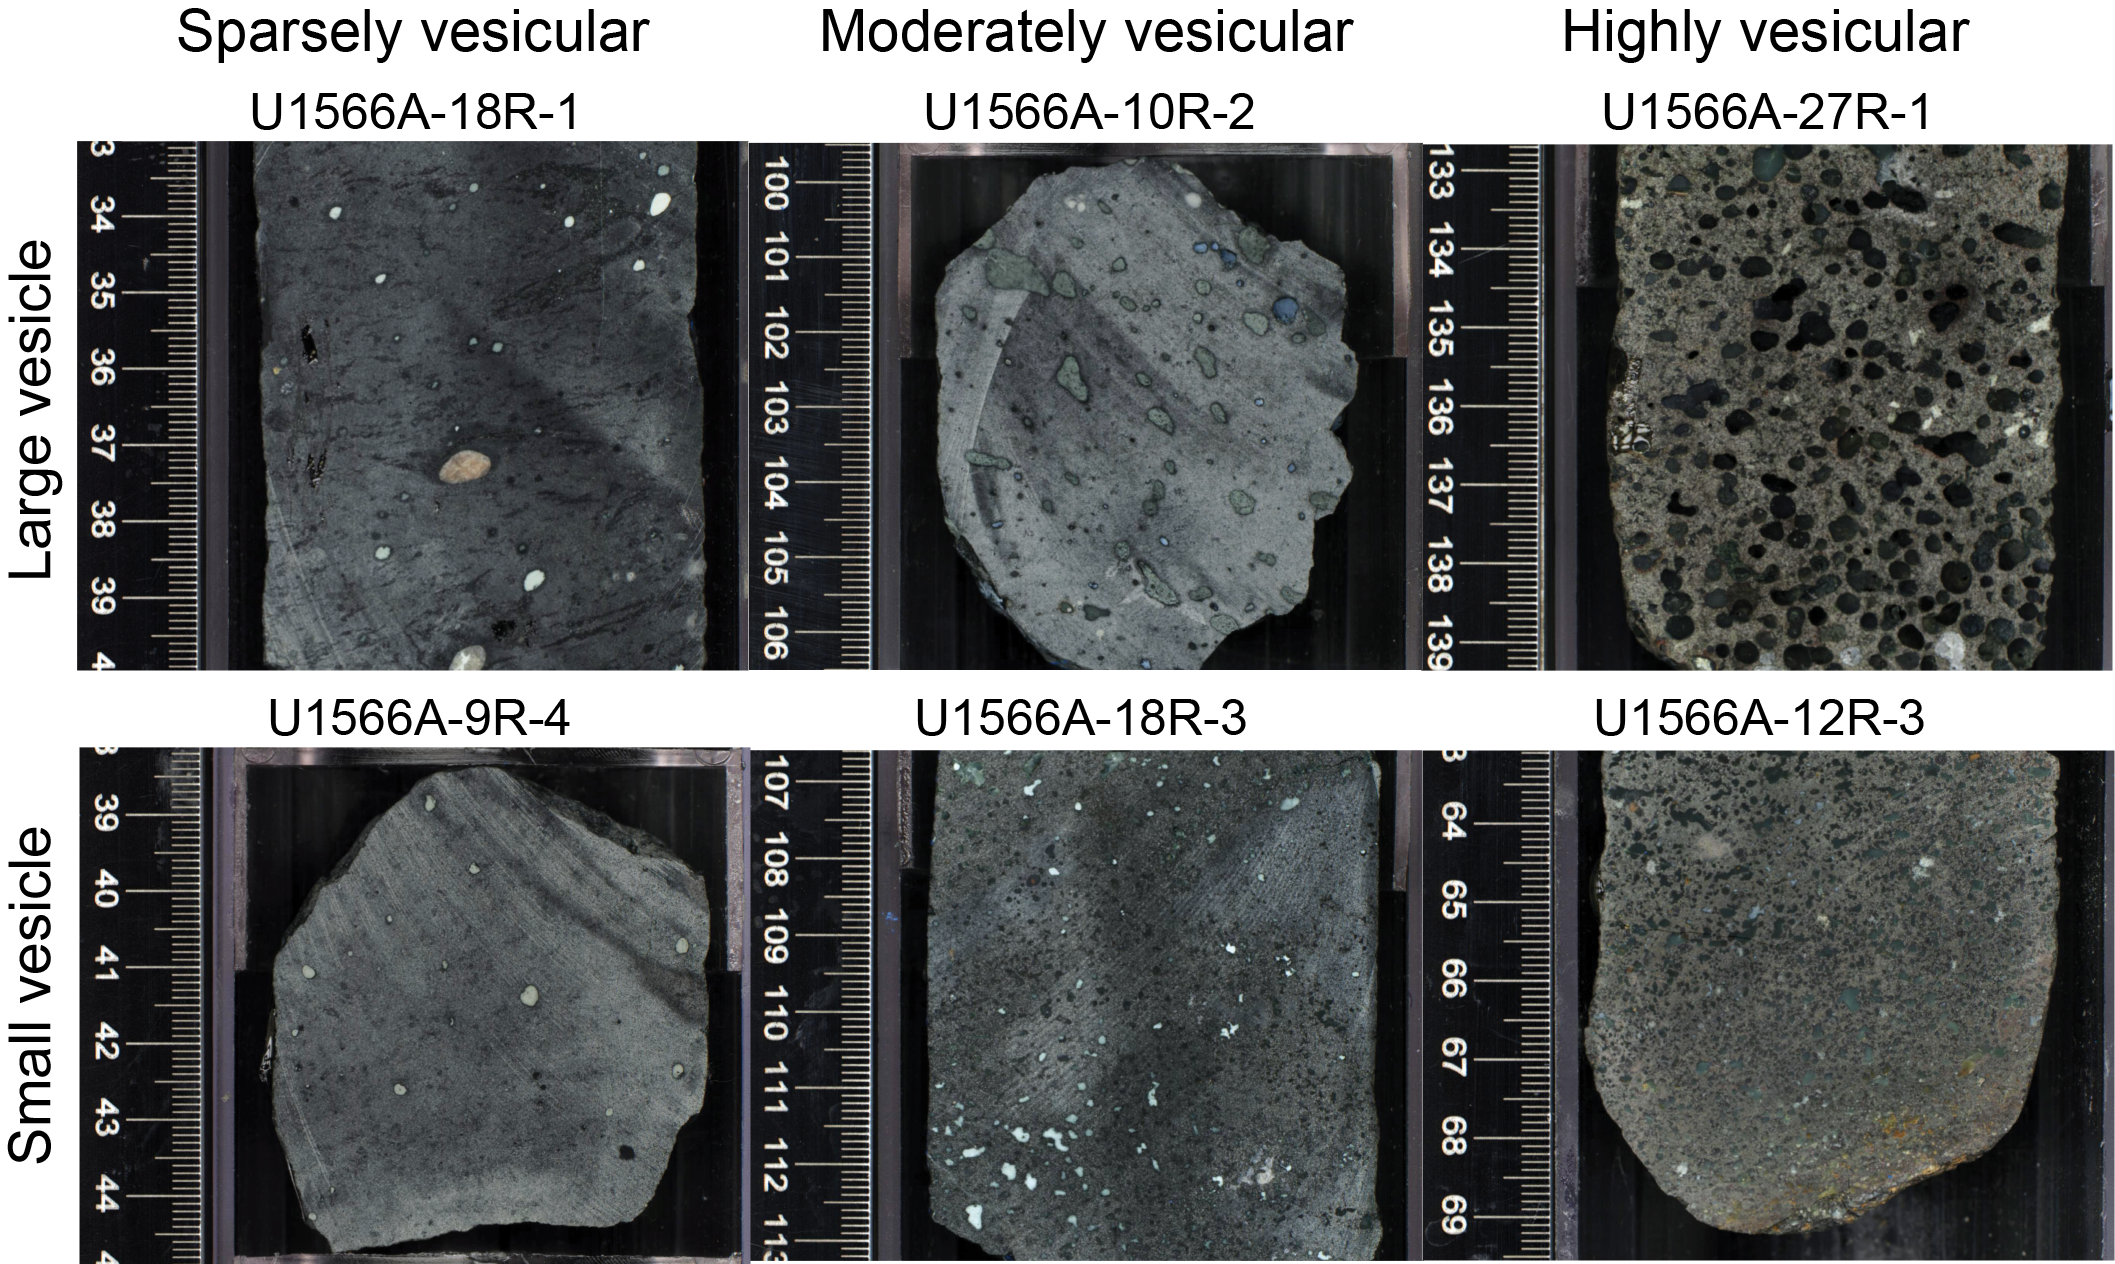
Figure F6. Basalt vesicularity.
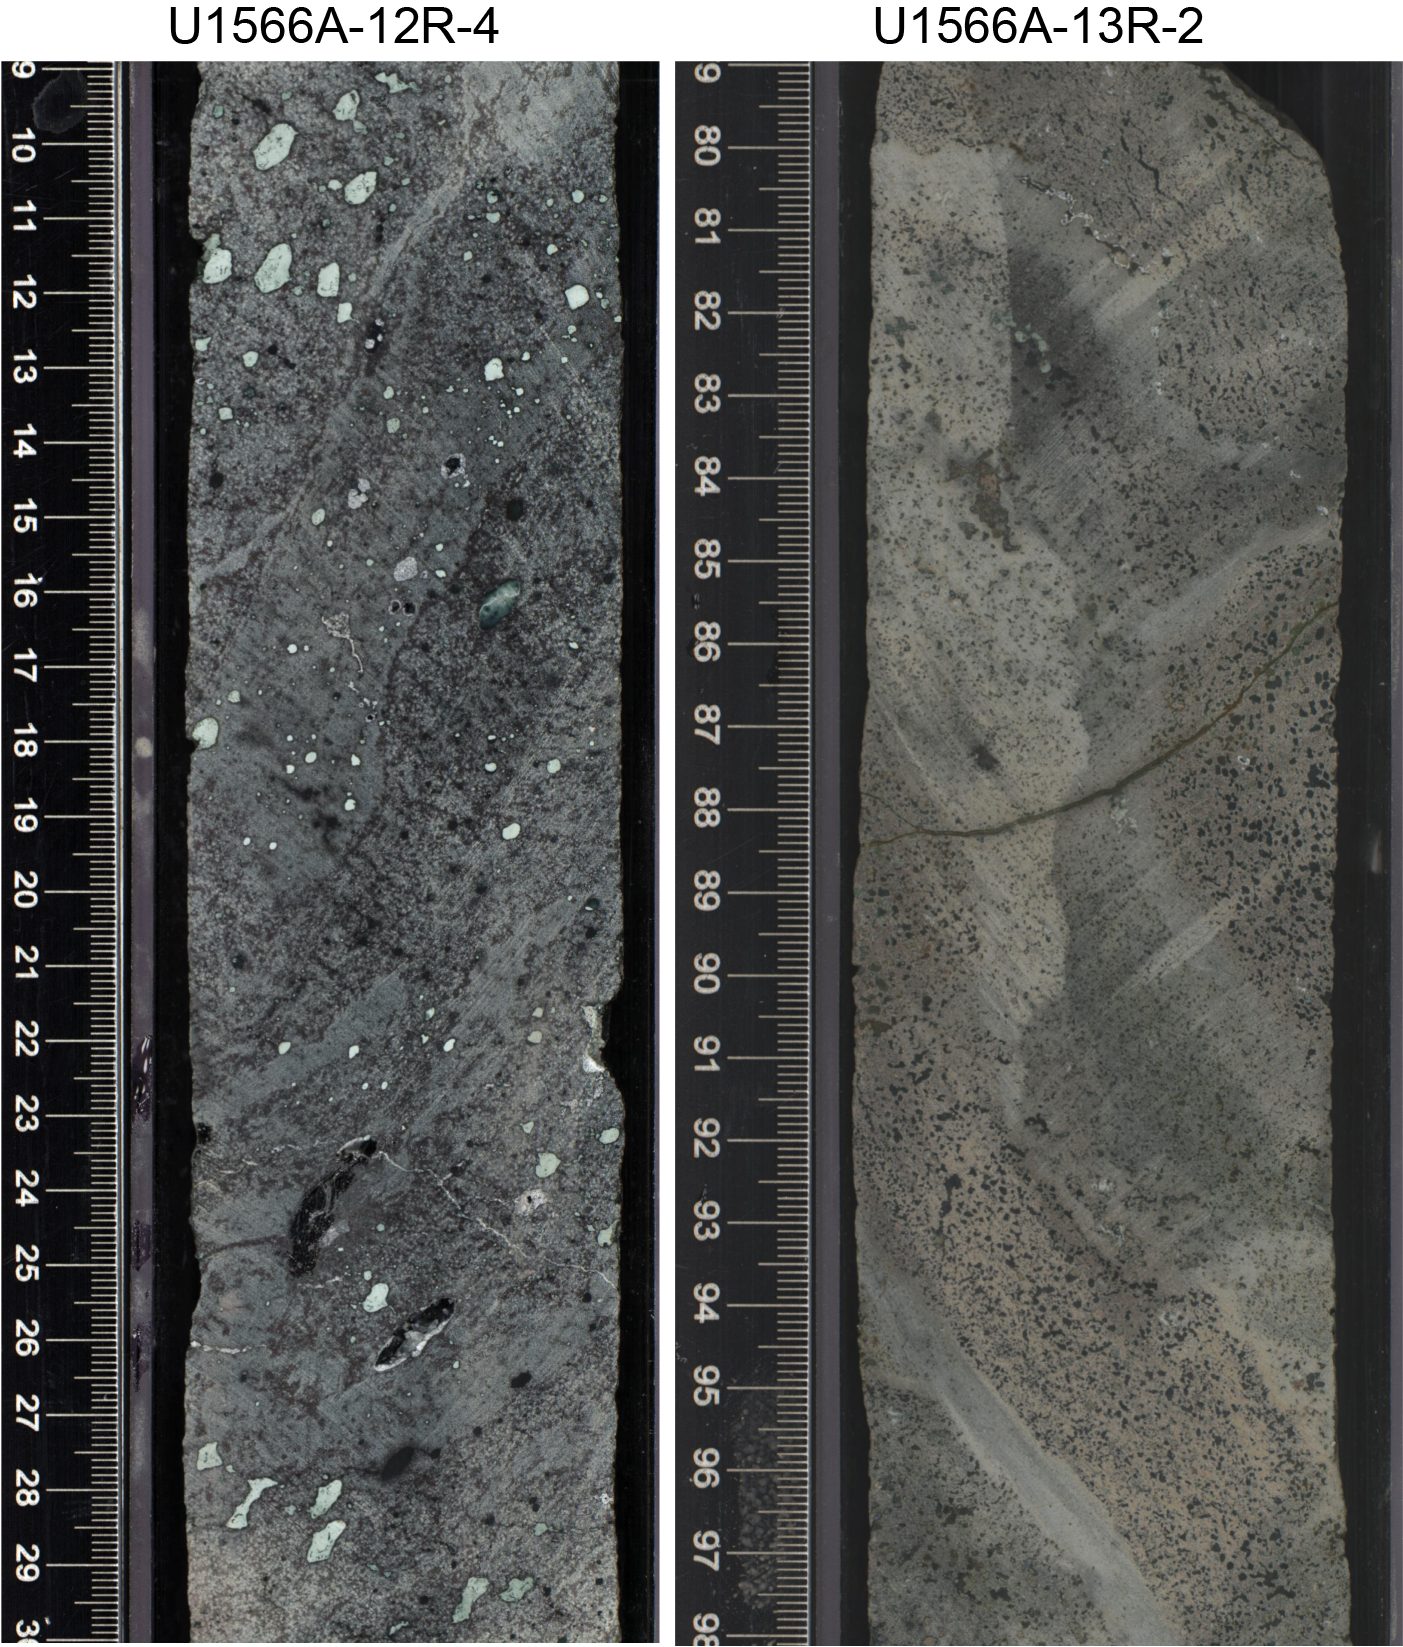
Figure F7. Flow banding.
In addition to the dominant facies, several other igneous lithologies are observed. Subunit F1 contains a 1.75 m thick lava flow (interval 396-U1566A-4R-1, 38 cm, to 4R-2, 47 cm) interpreted to be a picrite. This picritic flow is highly altered, with olivine systematically replaced by saponite (Figure F5), whereas in the interval 4R-2, 7 cm, to 4R-2, 45 cm, the flow groundmass is strongly carbonated (Figure F4). Subunit F4 is composed of an andesitic pyroclastic unit with highly altered phenocrysts of feldspars (interval 11R-2, 15 cm, to 11R-2, 48 cm; Figure F5). The base of the lowermost basaltic flow (Subunit F14) (interval 29R-1, 7 cm, to 29R-1, 49.5 cm) consists of 42.5 cm of brecciated basalt intermingling with granite and represents the lower boundary of Unit II (Figure F3).
3.3.1.2. Microscopic observations
The aphyric basalts are cryptocrystalline to microcrystalline. Vesicles are partly to completely filled by secondary alteration minerals consisting of zeolites, clay minerals, and carbonates (Figure F8A, F8B). Flow textures observed macroscopically are confirmed with subparallel arrangement of the vesicles and/or a change of the average grain size at the centimeter scale (Figure F8C, F8D). The groundmass is usually altered and partly recrystallized into clay minerals. The original groundmass is hypocrystalline to holocrystalline and dominated by subhedral microlites of plagioclase, sometimes arranged in clusters (Figure F8E), and anhedral clinopyroxenes (Figure F8F). One occurrence of an originally glass-rich flow, altered into clay minerals with microlites of plagioclase and euhedral grains of olivine recrystallized in saponite, is observed in Subunit F8 (interval 396-U1566A-19R-1, 95–140 cm). The microphenocrysts of plagioclase (Figure F8G) are rare, except in Subunit F8, and some lava flows also contain few microphenocrysts of clinopyroxene (Figure F8H).
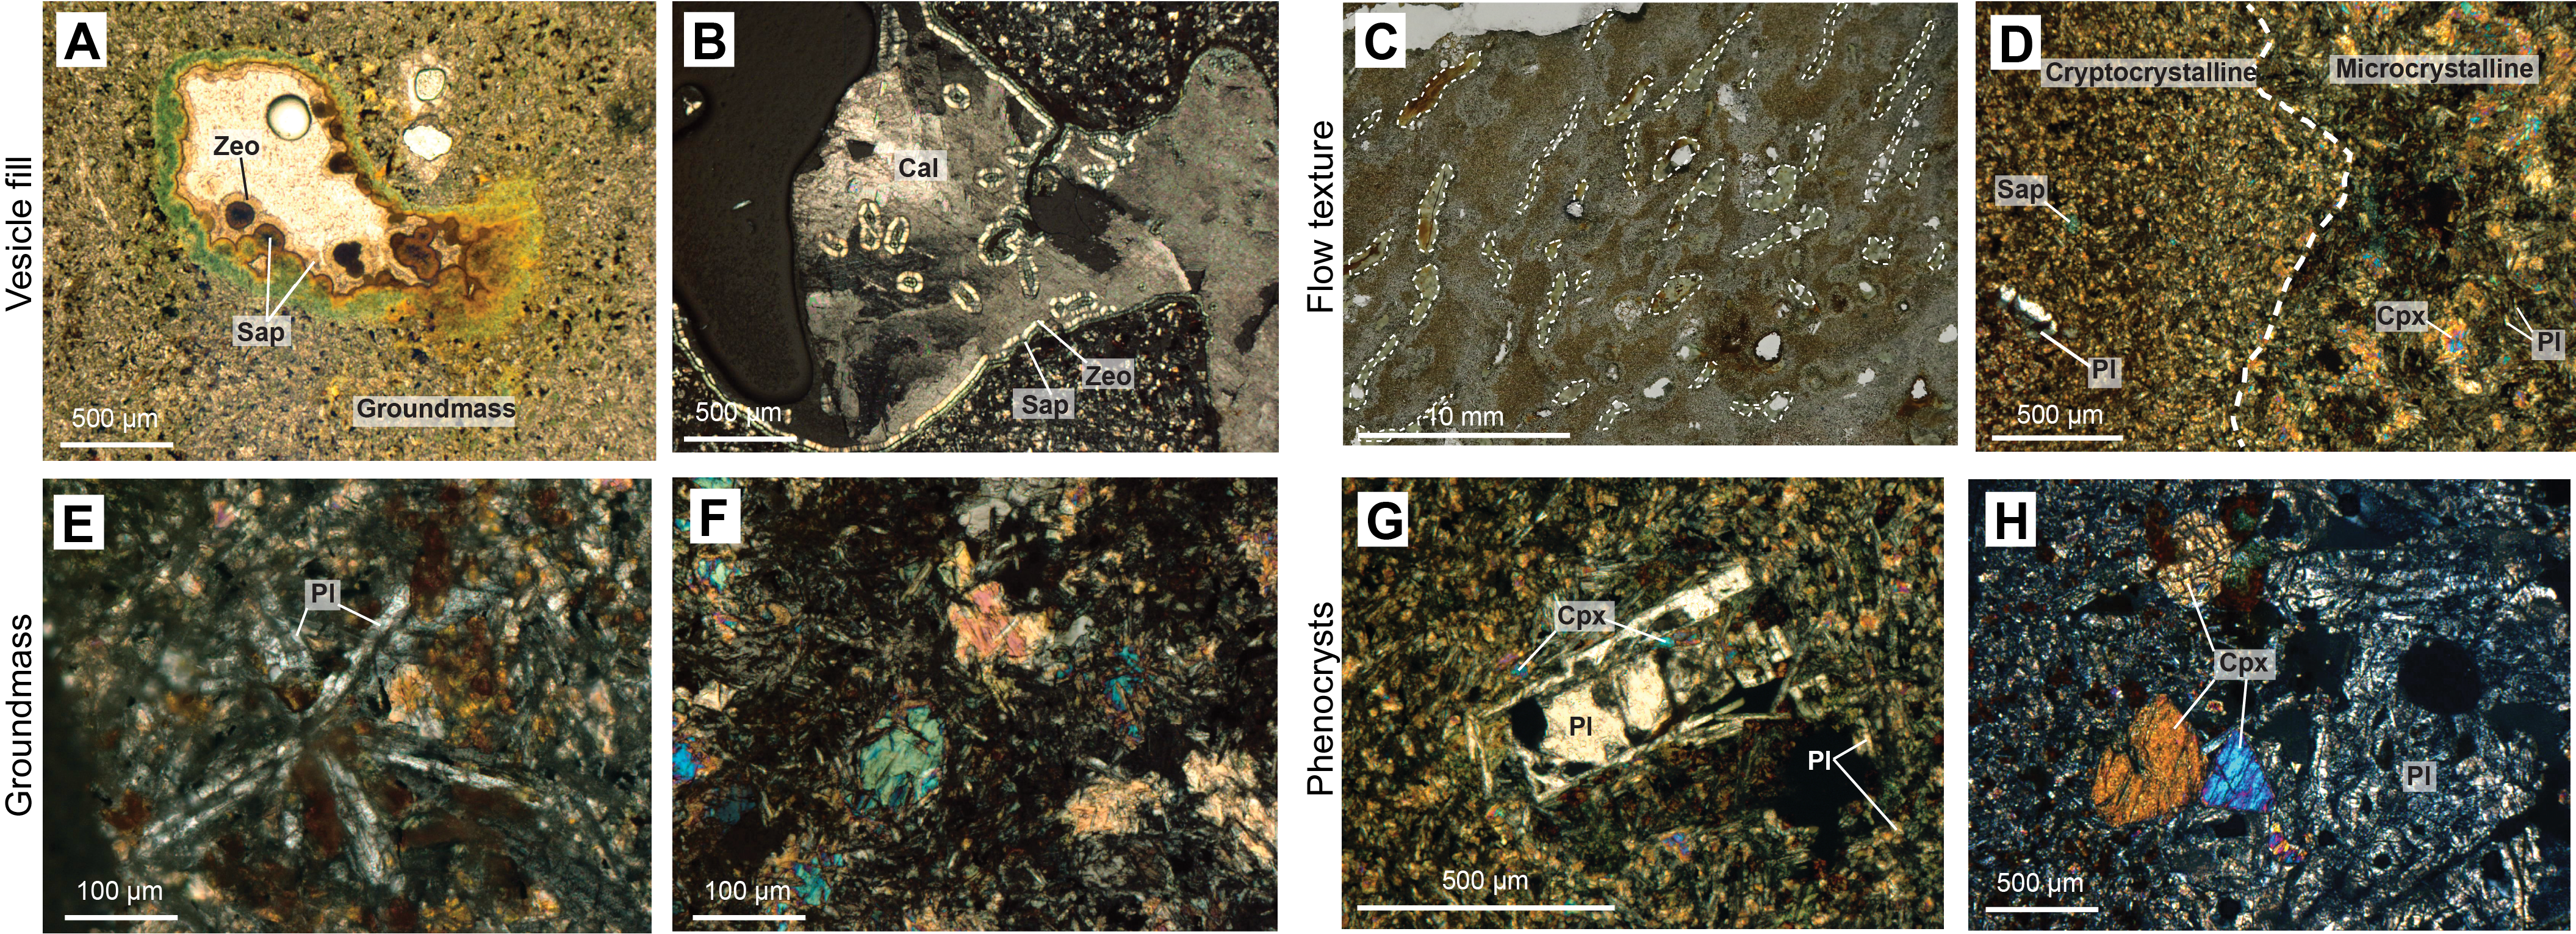
Figure F8. Lava flow microstructure..
3.3.1.3. Geochemical observations
The chemostratigraphy of the basalts show significant chemical variations with depth (Figure F9) that are not correlated with the interbasaltic sediment beds (sedimentary subunits). For instance, Subunit F8 is the thickest basaltic unit (50.60 m) and contains at least 16 identified lava flows. The individual lava flows vary from ~0.5 m to >4 m thick. The deepest part of the subunit shows relatively constant and low Ni content to 98.91 m CSF-A, the depth at which Ni concentration increases significantly to the highest content recorded in the basalts of Unit II. These high concentrations are recovered within two thin lava flows (intervals 396-U1566A-18R-2, 62 cm, to 18R-3, 51 cm, and 18R-3, 51 cm, to 18R-3, 125 cm) separated by a chilled margin, overlaid with basalt flows with intermediate Ni contents that slightly decrease with depth.
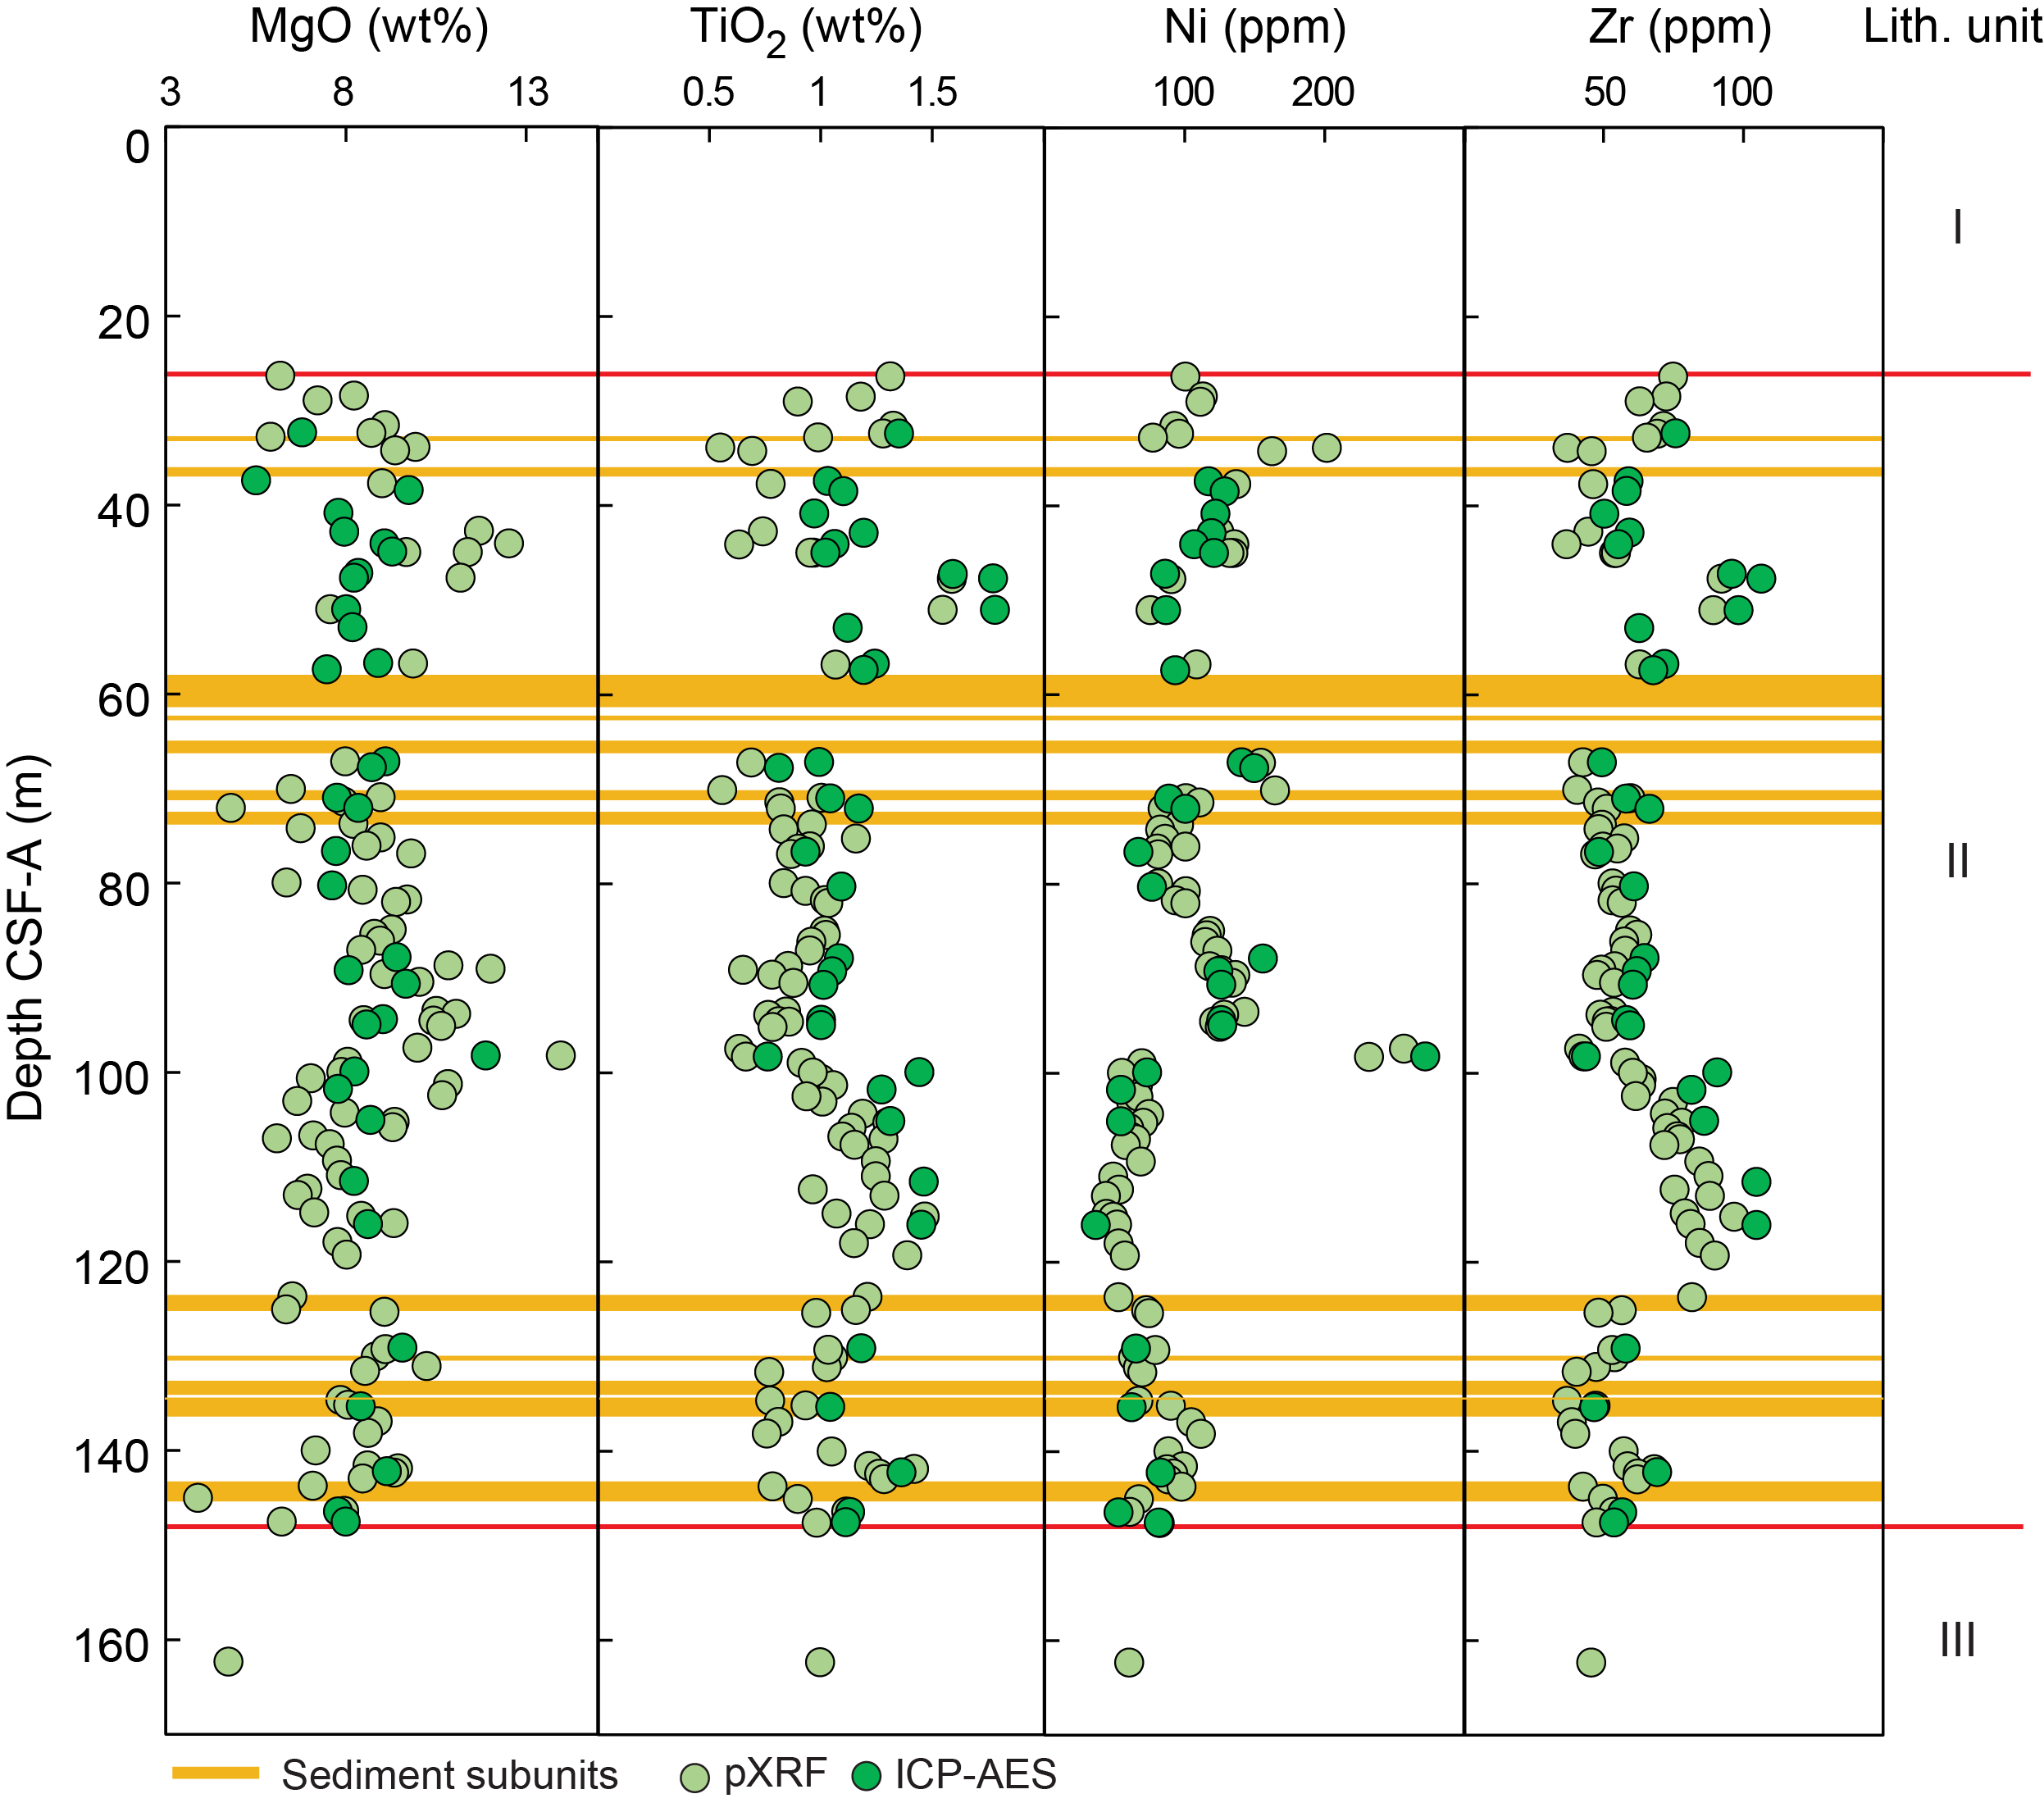
Figure F9. Basalt chemical stratigraphy.
3.3.2. Sedimentology: interbasaltic sediments
Figure F10 summarizes the main facies of the sediments encountered in Unit II. Table T3 lists the intervals and the CSF-A depth of the interbasaltic sedimentary subunits.
- Subunits S1 and S2 consist of granite-derived yellowish red sandstone, basalt-derived matrix-supported brown conglomerate, clay-rich sandstone, and red clay.
- Subunits S3 and S4 consist of dark gray conglomerate, yellowish brown sandstone to very dark gray claystone, sometimes clast rich with gravel or organic matter. Wood fragments and parallel to wavy lamination are common.
- Subunit S5 consists of pinkish brown claystone with gravel and brownish yellow volcanic ash with sand. Parallel lamination is present throughout this subunit. Wood fragments are rare.
- Subunits S6 and S7 consist of very dark brown clast-supported breccia with clay and dark brown claystone with gravel.
- Subunits S8–S13 consist of yellowish brown clast-supported sandstone with gravel. Faint to thick parallel laminations are present in parts of these subunits. Coarsening-upward structures occur occasionally.
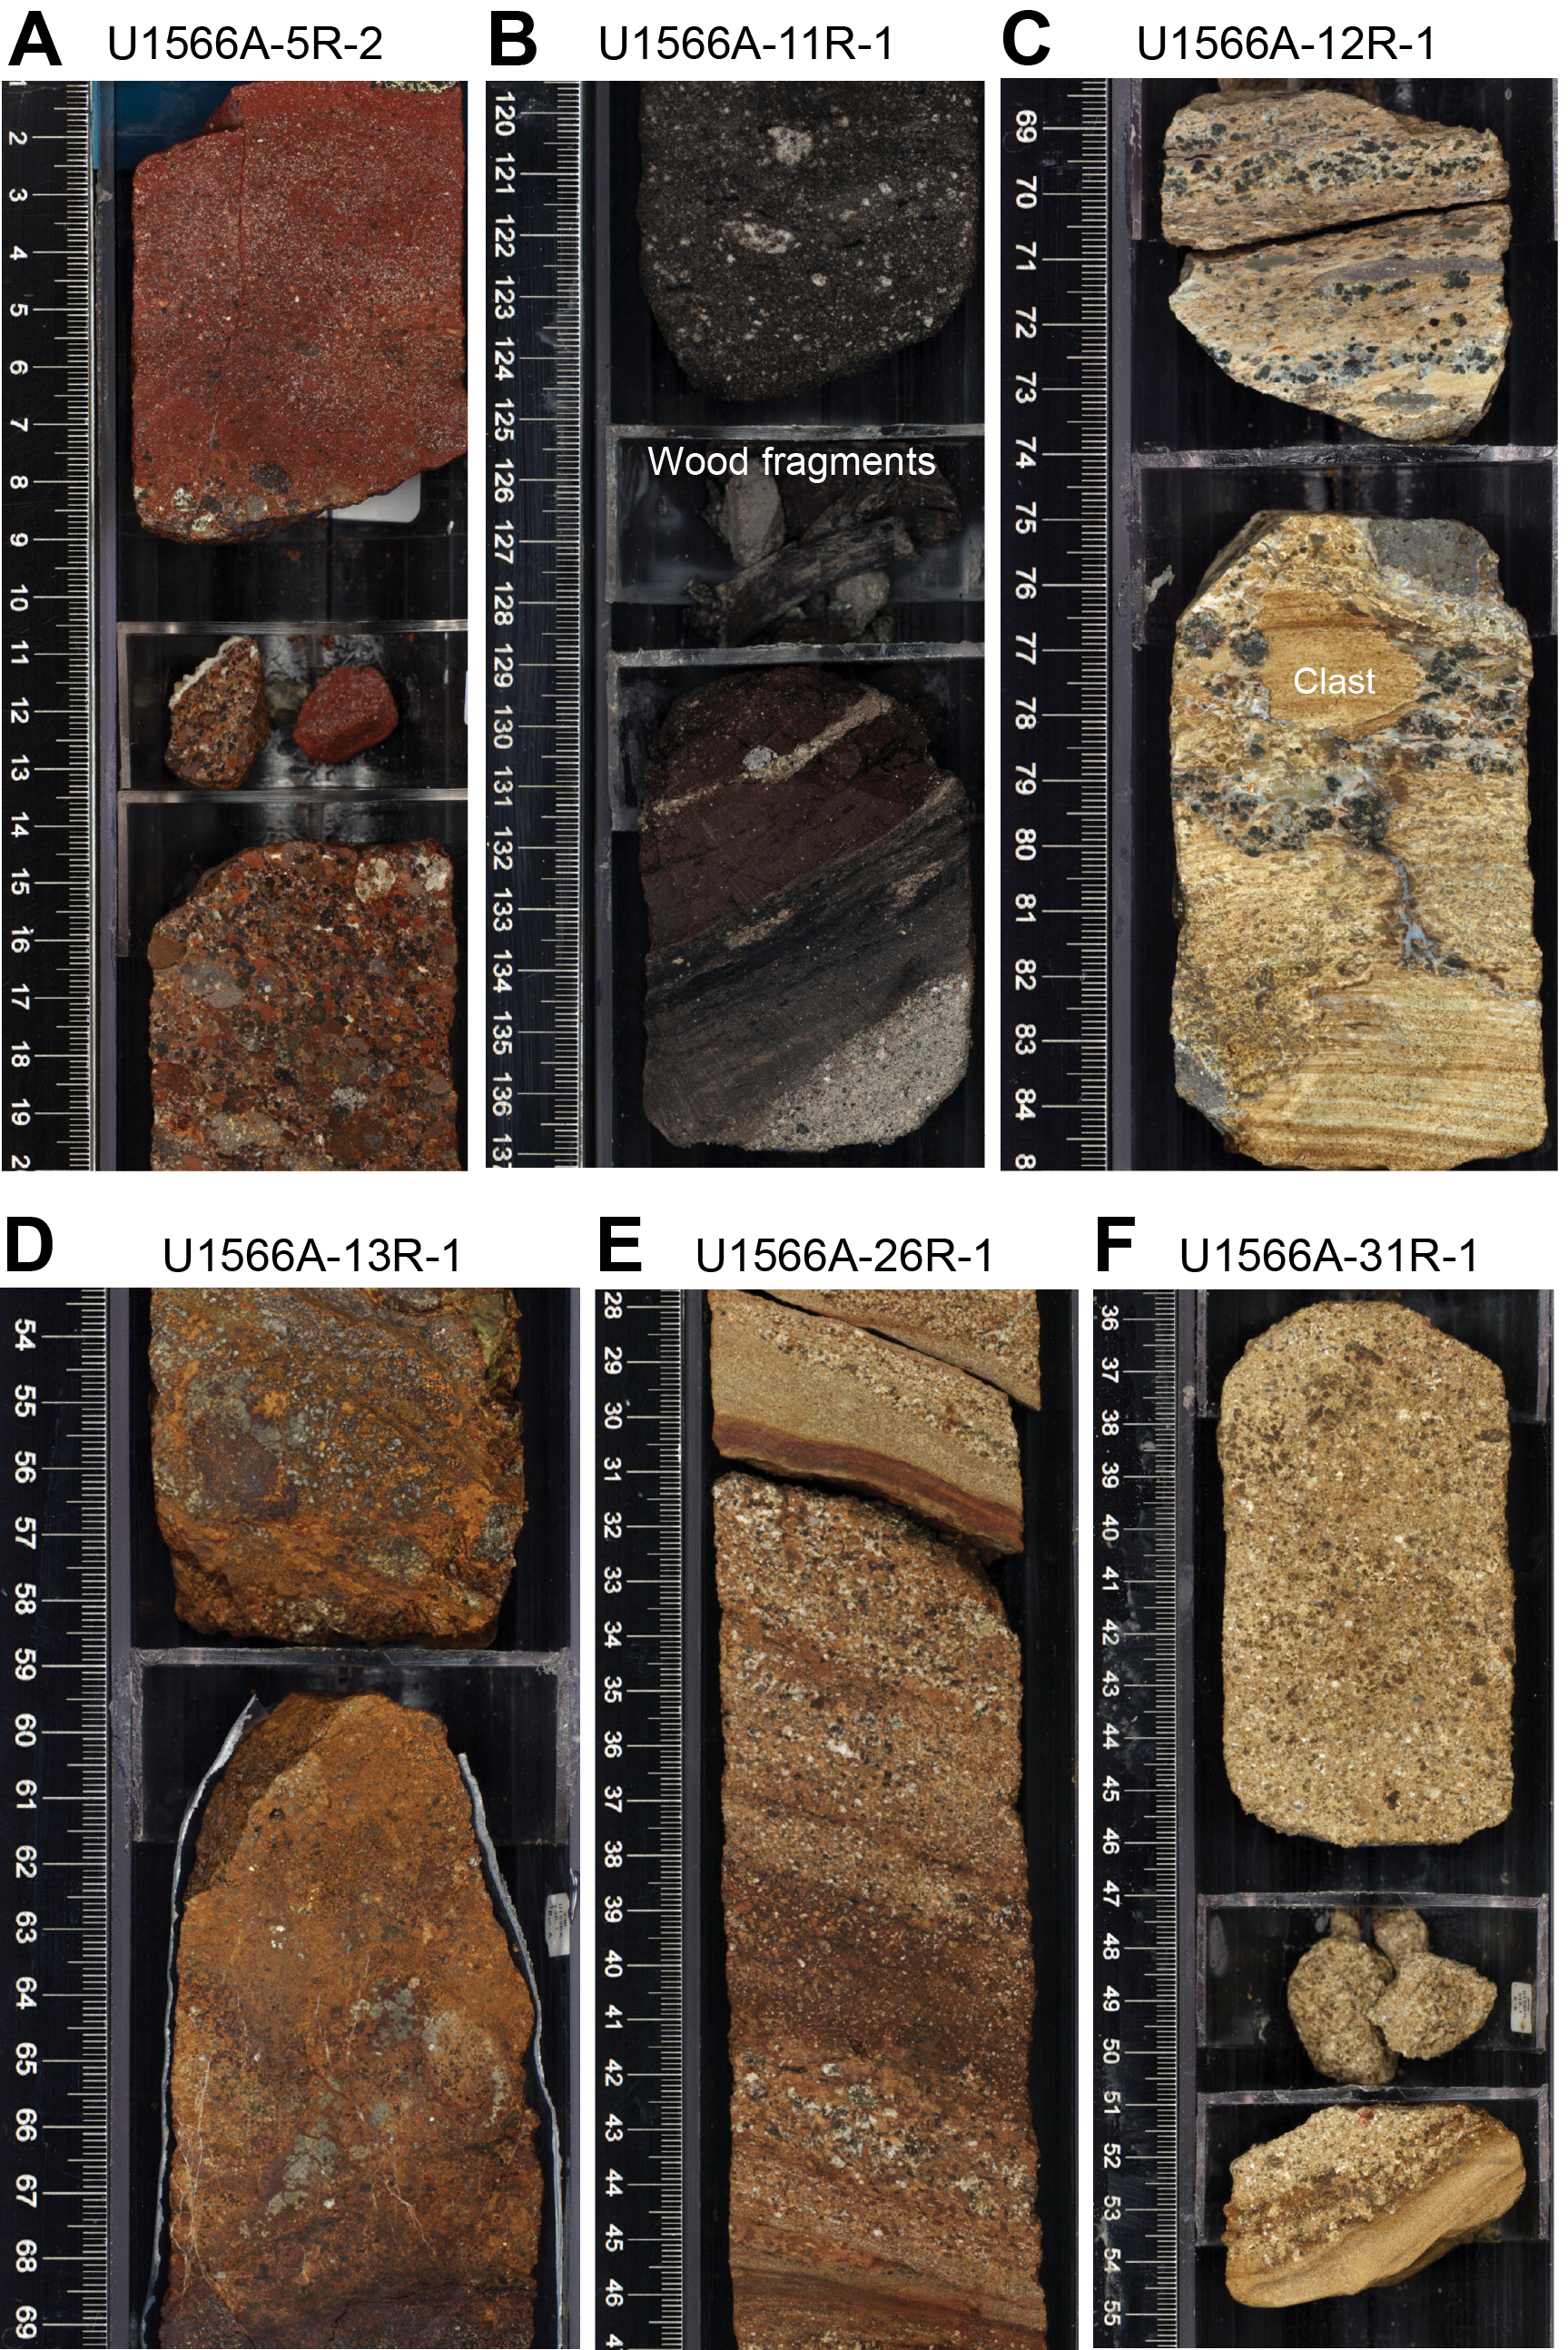
Figure F10. Sediment facies.
3.4. Unit III
- Interval: 396-U1566A-29R-1, 49.5 cm, to 33R-3, 54 cm (bottom of hole)
- Depth: 148.00–175.40 m CSF-A
- Age: undetermined
Lithostratigraphic Unit III consists of weakly to moderately altered medium-grained granite with biotite alternating with decomposed granite and granite-derived sandstones. Several subunits composed either of variably altered granite to sediments are identified.
3.4.1. Petrology
3.4.1.1. Macroscopic observations
Throughout Unit III, the recovered granite rocks remain mineralogically and texturally consistent (Figure F11). The weakly to moderately altered intervals are composed of medium-grained granite with alkali-feldspar, quartz, plagioclase, and biotite. Intense alteration results in decomposed granite consisting of remaining minerals in a clay matrix (Figure F11).
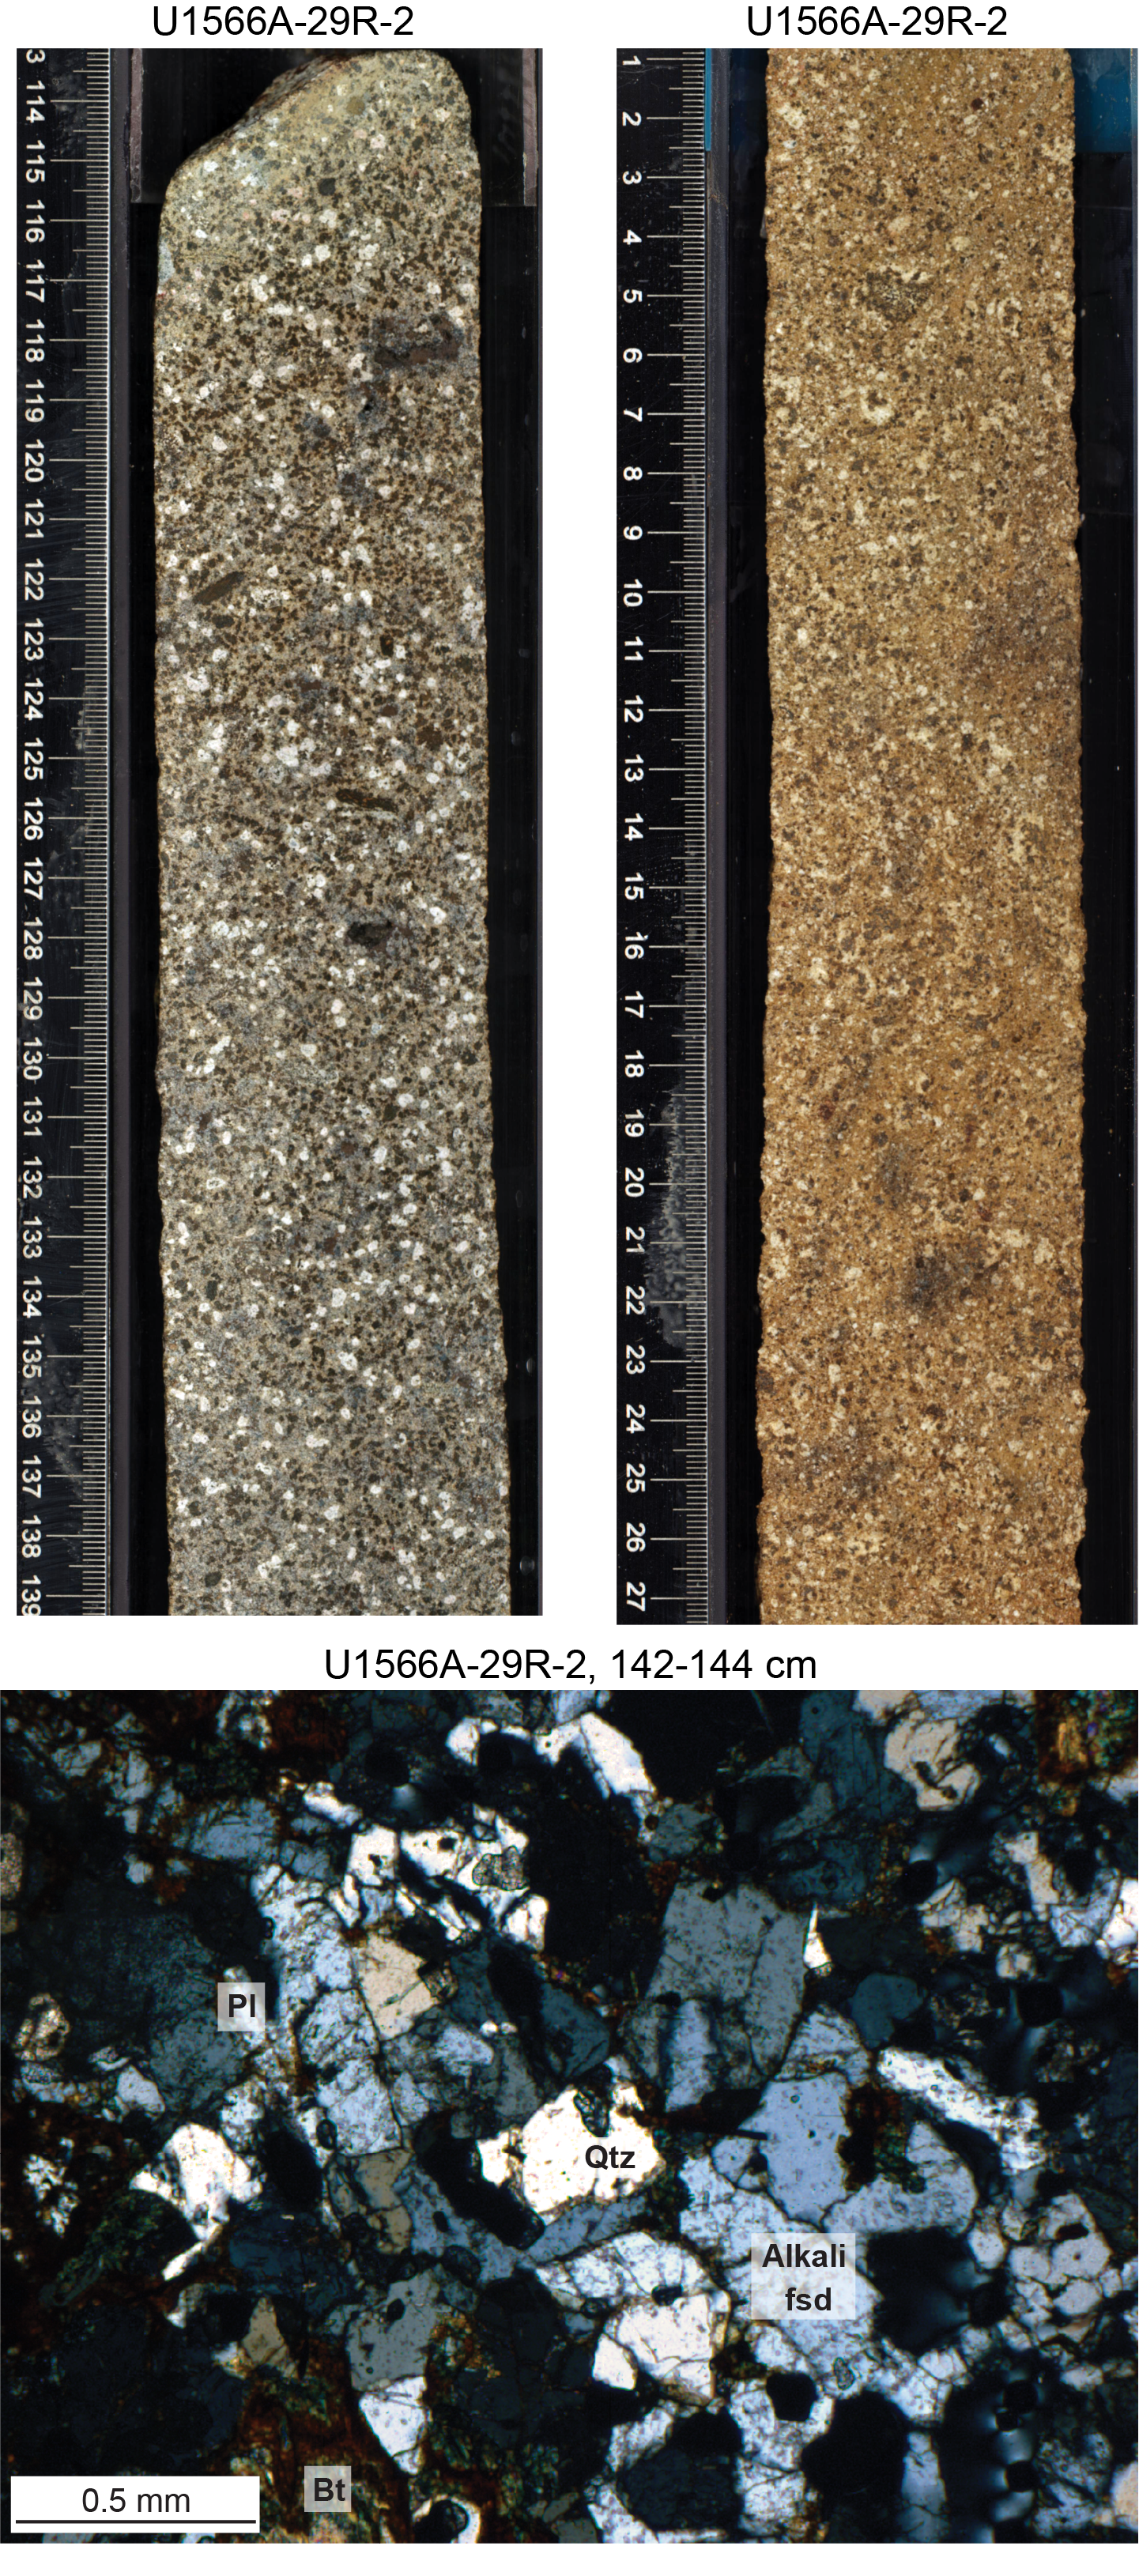
Figure F11. Granite.
3.4.1.2. Microscopic observations
Euhedral alkali feldspars show local Carlsbad twinning and microperthitic texture (Figure F11). Fine-grained (0.2 mm) quartz is anhedral; biotite is often altered into limonite. Plagioclase is rare, and only a few elongated lathes with polysynthetic twinning were identified.
3.4.1.3. Geochemical observations
Analyses performed on Unit III samples show compositions of a high-K granite (Rickwood, 1989), consistent with the high proportion of alkali feldspar and a signature typical of A-type granitoids (Frost et al., 2001).
3.4.2. Sedimentology: intergranitic sediments
Alternating with granite, several granite-derived sandstones were identified (Table T4). These sediments consist of brownish yellow sandstone with silt (Figure F10F), as well as granite clasts observed at the bottom of the unit. Overall, this configuration appears typical of a subaerial weathering profile of granite (e.g., Mitchell and Soga, 2005).
4. Biostratigraphy
Biostratigraphic analysis of samples from Hole U1566A was performed on the mudline and on the few core catchers that yielded sedimentary materials. In the first three cores and core catchers, these sedimentary materials are unconsolidated hemipelagic muds, including mixed sands, silts, and clays with modest amounts of carbonate as well as intervals containing gravel and larger clasts that are interpreted as ice-rafted debris (Lithostratigraphic Unit I; see Lithostratigraphy). In Units II and III, mostly igneous rocks (dominantly basalt but also weathered granite) were recovered. Thin interbedded sedimentary layers occur between some igneous units; the organic-rich sedimentary layers were analyzed for palynology (Sections 10R-CC, 11R-1, and 24R-1). Microfossil occurrences are summarized in Table T5.
4.1. Siliceous microfossils
Biosiliceous microfossils occur in the mudline sample of Hole U1566A, but they were not detected in any other sample studied, including smear slides from sediment-bearing core catchers and split-core sedimentary layers.
4.2. Palynology
In total, eight sedimentary samples from Hole U1566A were processed for palynology: three from the core catchers of the first three cores, which yielded soft, clay- and silt-rich hemipelagic sediments, one from clay-rich sediments in Sample 4R-1, 13–15 cm, and four from (rare) sediments interbedded in the igneous facies (Table T5). Because of the generally scarce and/or poorly preserved nature of the encountered palynomorphs, no quantitative analyses were conducted.
The three core catcher samples (396-U1566A-1R-CC to 3R-CC) were processed using 10% HCl, whereas an additional sample (4R-1, 13–15 cm) was taken and processed using the standard hydrofluoric acid (HF) technique (see Biostratigraphy in the Expedition 396 methods chapter [Planke et al., 2023a]). These three uppermost core catcher samples were found to be virtually barren of palynomorphs and palynodebris, although Sample 3R-CC yielded some amorphous organic material next to brown-black particles reminiscent of a higher plant origin (phytoclasts and/or spores) but did not reveal any recognizable structures.
The interbasalt sediments in Sample 396-U1566A-10R-CC contain fragments of acid resistant organic matter (palynodebris). Treatment with dilute H2O2 showed no changes, suggesting these elements were carbonized. No palynomorphs were found in this sample.
Sample 396-U1566A-11R-1, 125–129 cm, was taken from a thin, dark, mud-rich layer directly below some large (centimeter scale) carbonized (charred) wood fragments. Treatment with 10% HCl followed by 2 h dilute H2O2 resulted in dissolution of the more labile organic matrix and separation of organic matter and palynomorphs. The thermal alteration of the palynodebris and palynomorphs in this sample ranged from ~1 to 3 on the Thermal Alteration Index (TAI), suggesting a minor but variable degree of maturation.
The palynomorphs in Sample 396-U1566A-11R-1, 125–129 cm, include abundant pollen grains that are dominated by the following groups: various bisaccate pollen, Taxodiaceae-pollenites, Sequoia-pollenites, and Carya-Momipites type pollen. Spores were found to be less common. In addition, multiple specimens of the age-diagnostic pollen taxon Montanapollis sp. were identified (Figure F12A, F12B). Based on the presence of this taxon, we tentatively interpret this sample to be of earliest Eocene age following, for example, Jolley (1997) and Lund (1989). Other notable palynomorphs include a few specimens of freshwater algae (Tasmanites spp.) (Figure F12C) and a single dinocyst belonging to the freshwater/brackish water tolerant genus Phthanoperidinium (Figure F12D). The general interpretation of the depositional environment is a coastal peat bog or swamp.
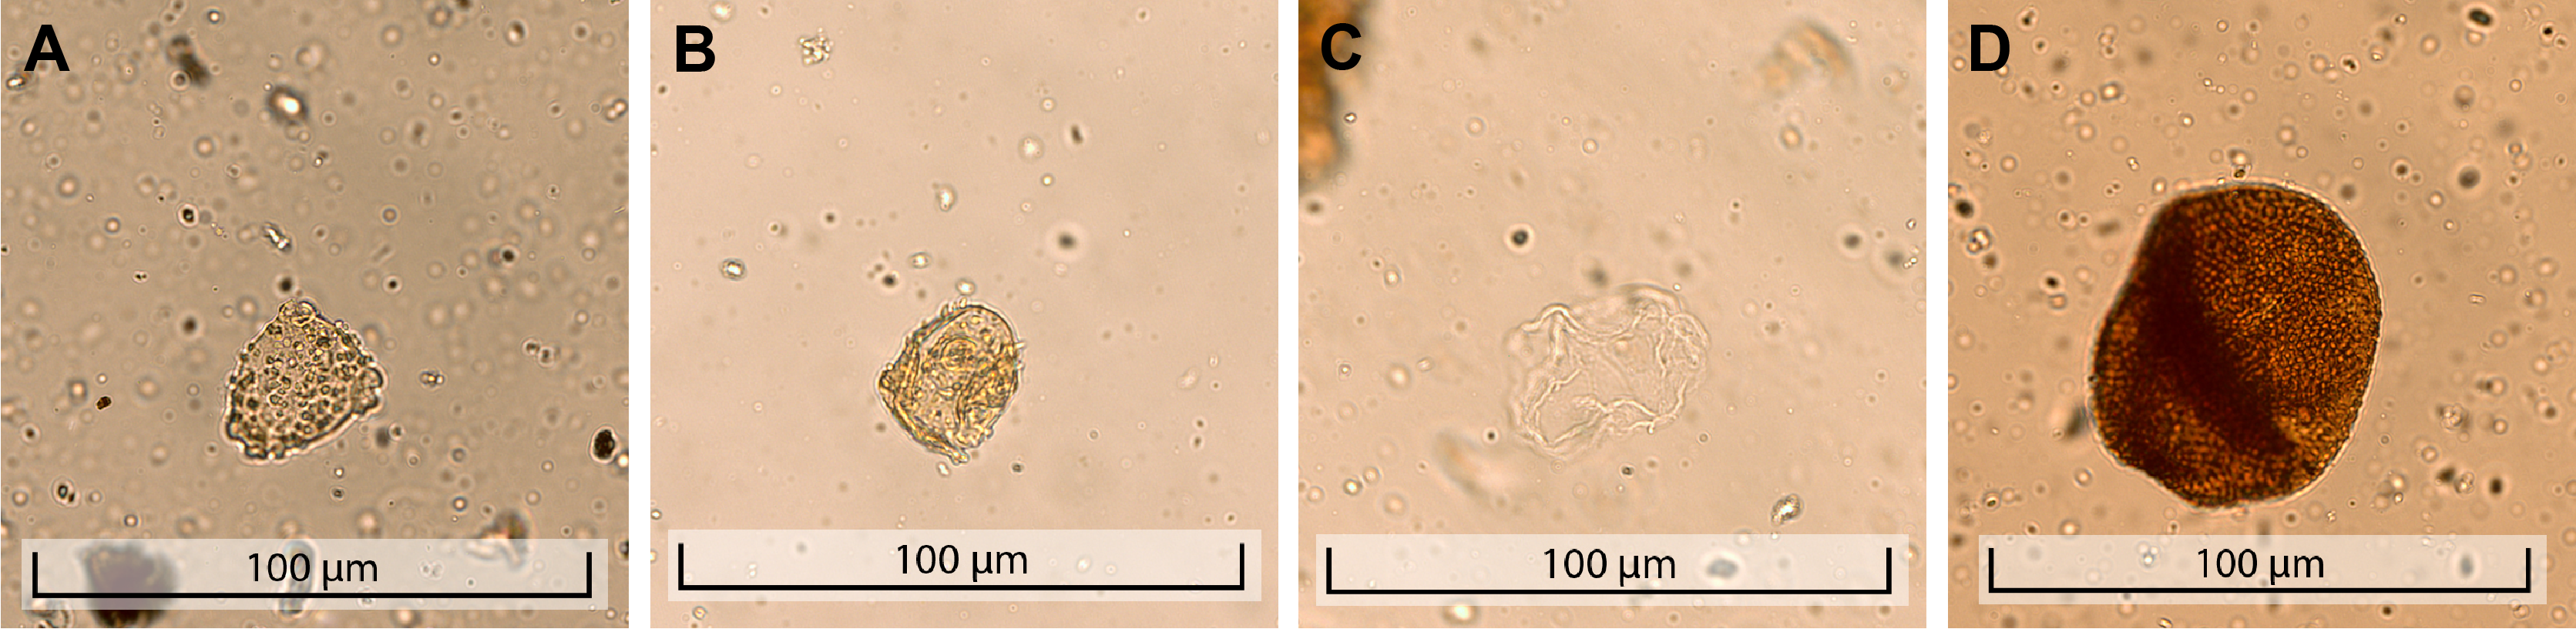
Figure F12. Palynomorphs.
4.3. Planktonic foraminifers
Core catcher Samples 396-U1566A-1R-CC to 3R-CC, two select samples (24R, 90–91 cm, and 24R, 116–117 cm), and the mudline were processed for planktonic foraminifers using techniques described in Biostratigraphy in the Expedition 396 methods chapter (Planke et al., 2023a).
The mudline sample was noted to have abundant planktonic foraminifers. The preservation state for all specimens in core catcher samples is good to moderate, and some of the reworked material consists of broken and/or fragmented tests. The latter are found in all core catcher samples. Neogloboquadrina spp. and Globigerina sp. are the most abundant taxa in the mudline sample.
Sample 396-U1566A-1R-CC is dominated by Neogloboquadrina pachyderma (sin.), and several of this species show an encrusting of the chambers in the last whorl. Some rarer foraminifers include Globigerina bulloides, Neogloboquadrina atlantica, Neogloboquadrina cf. dutertrei, Neogloboquadrina continuosa, N. dutertrei, and Neogloboquadrina sp.
Sample 396-U1566A-1R-CC includes several specimens that were not determined to a species level due to their preservation state and may represent reworked material. Sample 2R-CC is also dominated by N. pachyderma (sin.), with several specimens showing an encrusting of the chambers in the last whorl. Other rarer foraminifers include N. cf. dutertrei, N. cf. pachyderma, N. dutertrei, and Neogloboquadrina sp. Planktonic foraminifers are rare in Sample 3R-CC. N. pachyderma (sin.) and N. dutertrei are the only foraminifers identified, and N. pachyderma (sin.) has the highest abundance.
Samples 396-U1566A-24R-1, 90–91 cm, and 24R-1, 116–117 cm, were taken from interbedded sediments in the igneous facies. In Sample 24R-1, 90–91 cm, only two planktonic foraminifers were identified, G. bulloides and Neogloboquadrina sp. A diagnostic age cannot be determined for Sample 24R-1, 90–91 cm. Sample 24R-1, 116–117 cm, contains sparse planktonic foraminifers that indicate a late Neogene age. It is plausible that hole conditioning just before drilling Core 24R carried some younger material downhole.
The mudline and three core catcher samples (396-U1566A-1R-CC to 3R-CC) indicate a Quaternary age and can be placed in the N. pachyderma (sin.) Zone of Spiegler and Jansen (1989).
4.4. Ostracods
Four samples (396-U1566A-1R-CC, 2R-CC, 3R-CC, and 11R, 125–129 cm) and the mudline sample from Hole U1566A were examined for ostracods, and only the uppermost three samples produced rare specimens with moderate preservation (Table T6). The ostracod taxa are the same found at Site U1565 (Krithe, Henryhowella, and Cytheropteron) and are typical North Atlantic deep-sea species.
4.5. Calcareous nannofossils
Calcareous nannofossils were noted in smear slides from the mudline and underlying carbonate-bearing diamictons in core catcher Samples 396-U1566A-1R-CC to 3R-CC. No attempt to identify or biostratigraphically date them was attempted.
4.6. Summary
Sedimentary samples analyzed from the first three cores of Hole U1566A yield common to trace diatoms and other biosiliceous debris, trace in situ dinoflagellate cysts, sporomorphs, rare ostracods, common to trace benthic foraminifers, and common planktonic foraminifers. Age-diagnostic microfossils indicate an overall Quaternary age for the sedimentary deposits above the uppermost igneous facies.
In addition, a single sample taken from sediments interbedded between igneous rocks (Sample 396-U1566A-11R-1, 125–129 cm) yielded a diverse terrestrial pollen and spore assemblage as well as a few aquatic, freshwater and freshwater tolerant elements. Age-diagnostic pollen encountered at this level suggest an earliest Eocene age for this sample.
5. Paleomagnetism
5.1. Shipboard measurements
Shipboard paleomagnetic investigations combined two complementary approaches (see Paleomagnetism in the Expedition 396 methods chapter [Planke et al., 2023a]): (1) measurement and in-line alternating field (AF) demagnetization of archive-half sections on the pass-through 2G Enterprises superconducting rock magnetometer (SRM) at a 2.5 cm spacing and (2) measurement and AF demagnetization of 37 oriented discrete samples on the AGICO spinner magnetometer (JR-6A). In addition, anisotropy of magnetic susceptibility (AMS) was measured on four discrete samples using an AGICO KLY 4S Kappabridge.
We used the directional and intensity data of archive-half sections (measured at 20 mT) to determine magnetic polarity along the core. AF demagnetization steps were 5, 10, 15, and 20 mT for sediments and 2, 4, 6, 8, 10, 15, and 20 mT for igneous rocks. The variations of magnetic parameters toward the ends of pieces are a measurement artifact.
Directional and intensity data from discrete samples were used to validate the polarities inferred from section measurements. Directional data were plotted using the Remasoft 3.0 software (Chadima and Hrouda, 2006) and analyzed using Zijderveld diagrams (Zijderveld, 2013).
5.2. Demagnetization behavior
5.2.1. Sediments (Lithostratigraphic Unit I)
The archive-half sections of sediment Cores 396-U1566A-1R through 3R were measured using the SRM at a 2.5 cm spacing (Figures F13, F14). The inclination and intensity show consistent and continuous variations throughout the sections, which indicates that, despite drilling disturbance, these parameters are meaningful. The high variability of magnetic parameters observed in a few intervals could be due to local drilling disturbance or a weakly coercive magnetic assemblage. The high values of magnetic inclination (>80°) might be due to drilling-induced magnetization along the current geomagnetic field for Hole U1566A at ~75° inclination (https://www.ngdc.noaa.gov/geomag/calculators/magcalc.shtml#igrfwmm). The Icefield MI-5 core orientation tool was not deployed; therefore, the core azimuthal orientation and the magnetic declination are deemed uncertain.
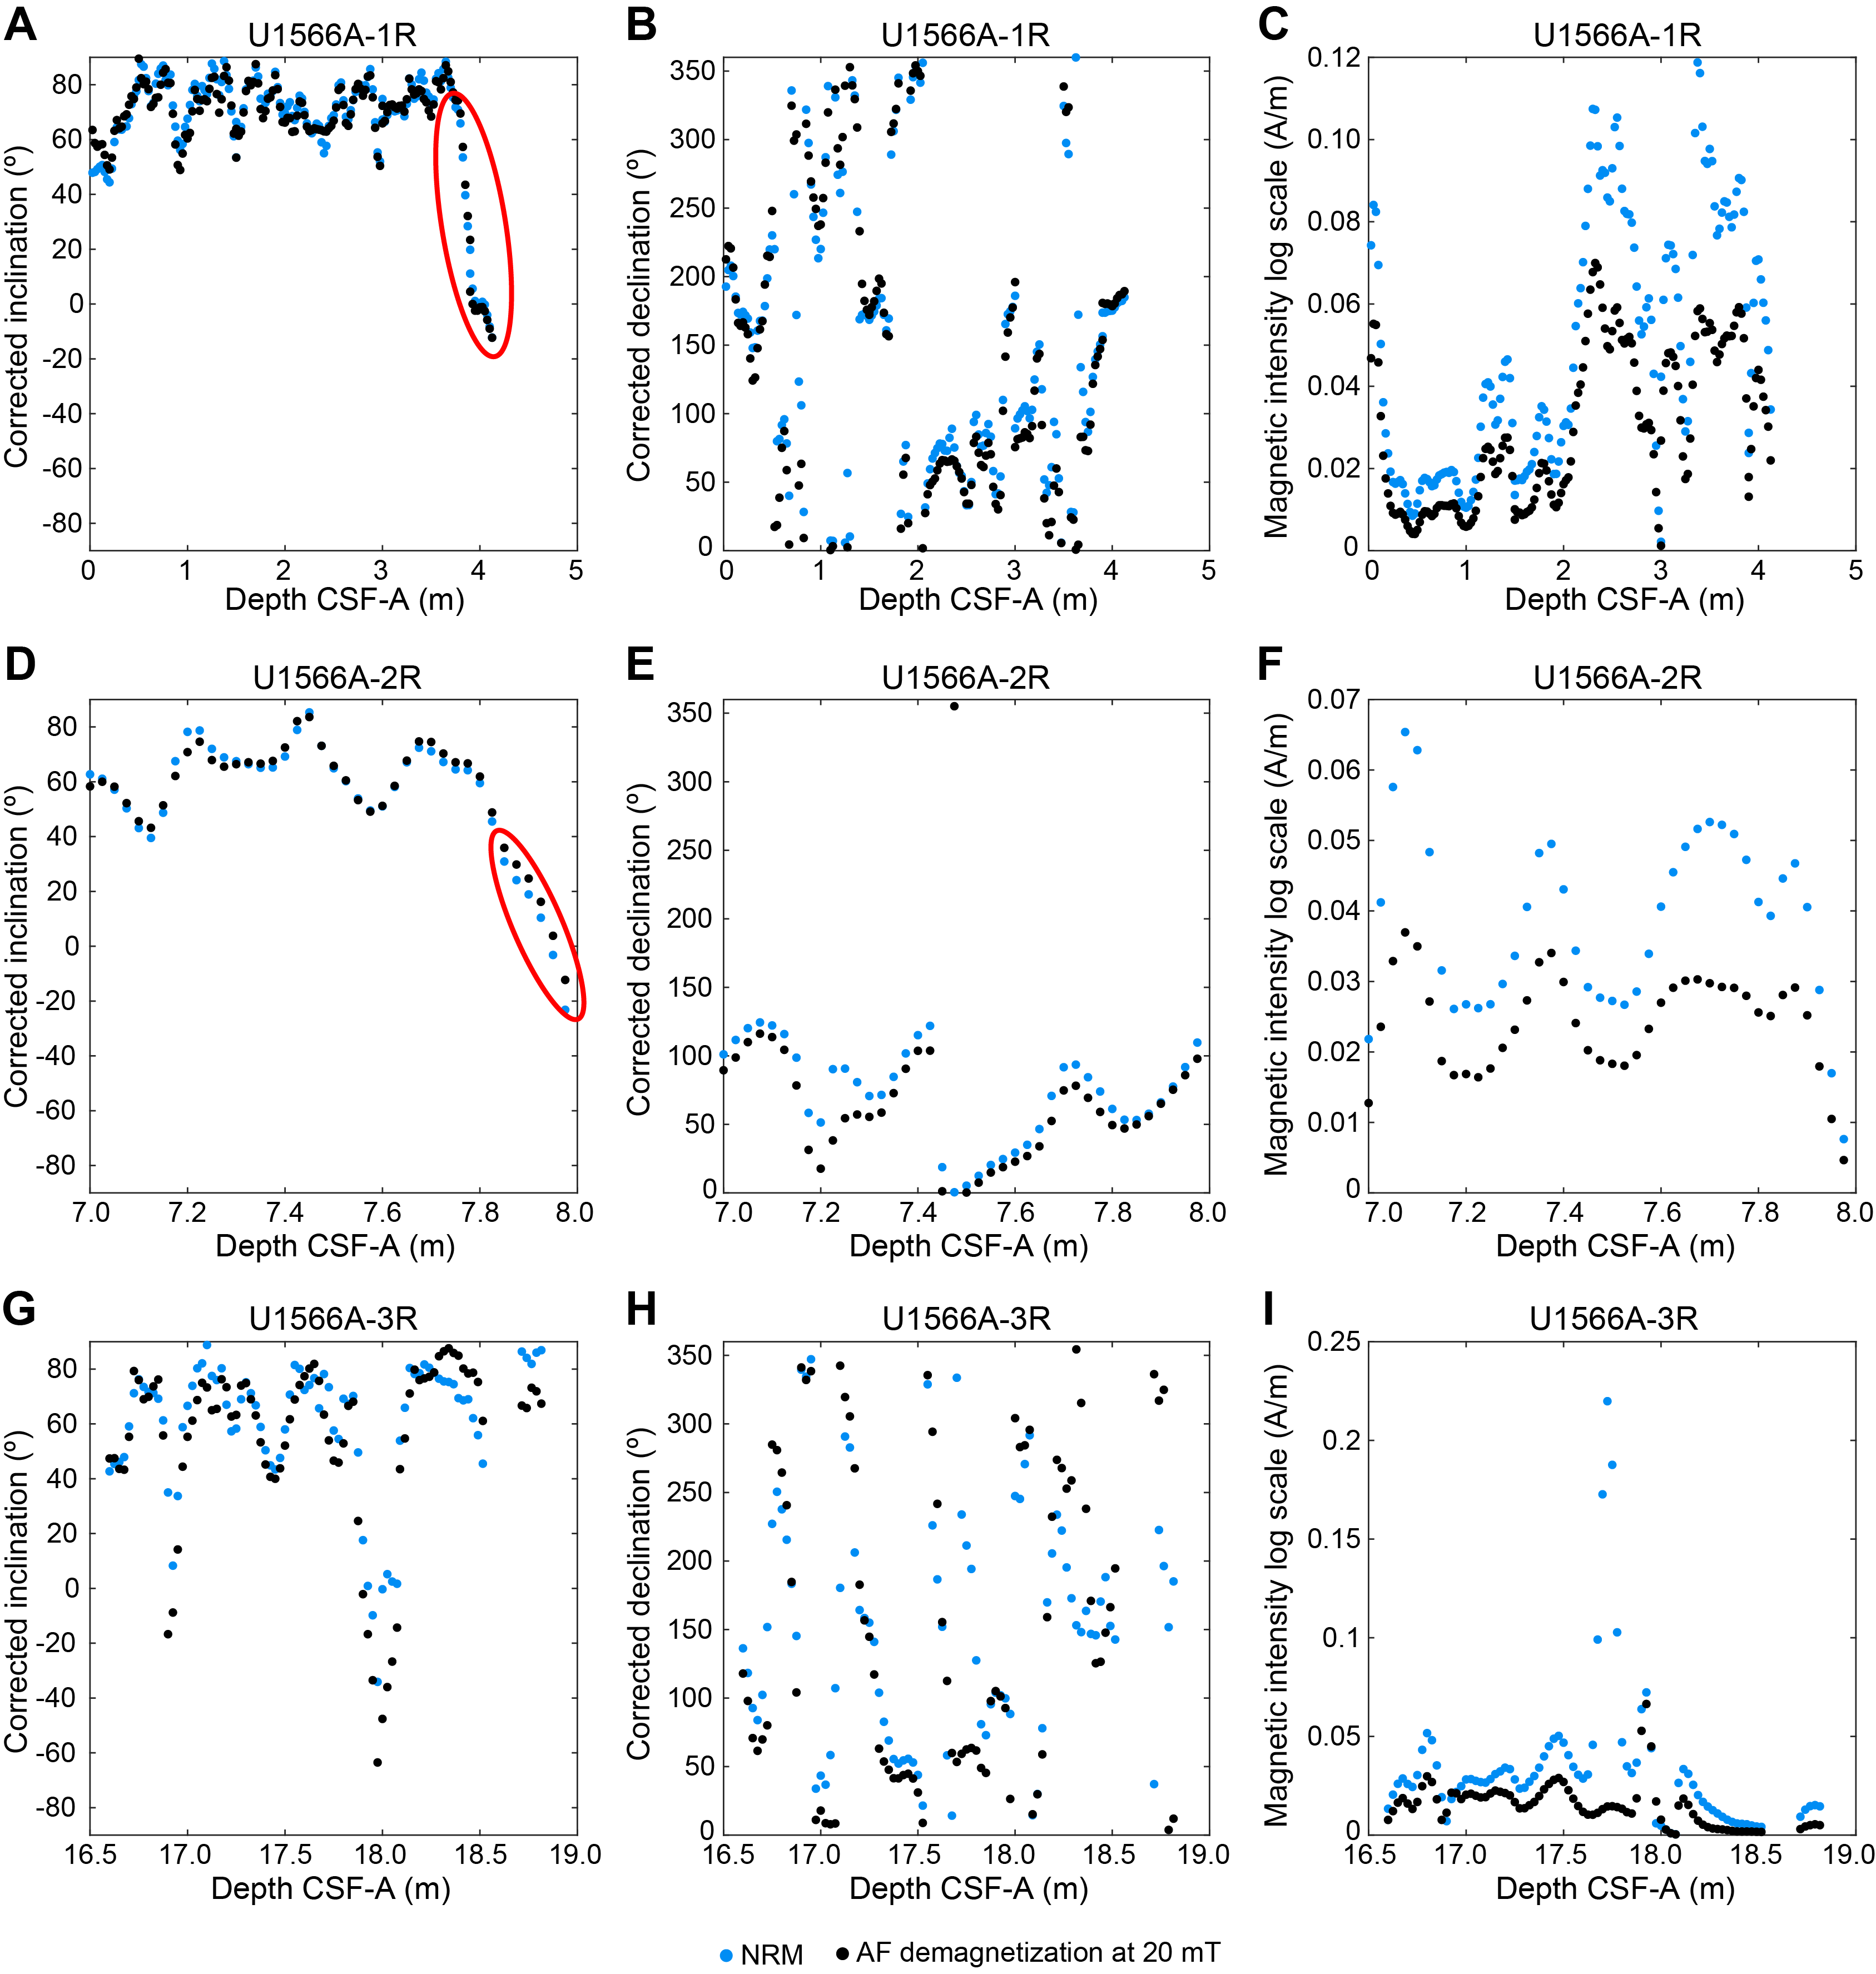
Figure F13. Magnetic parameters.
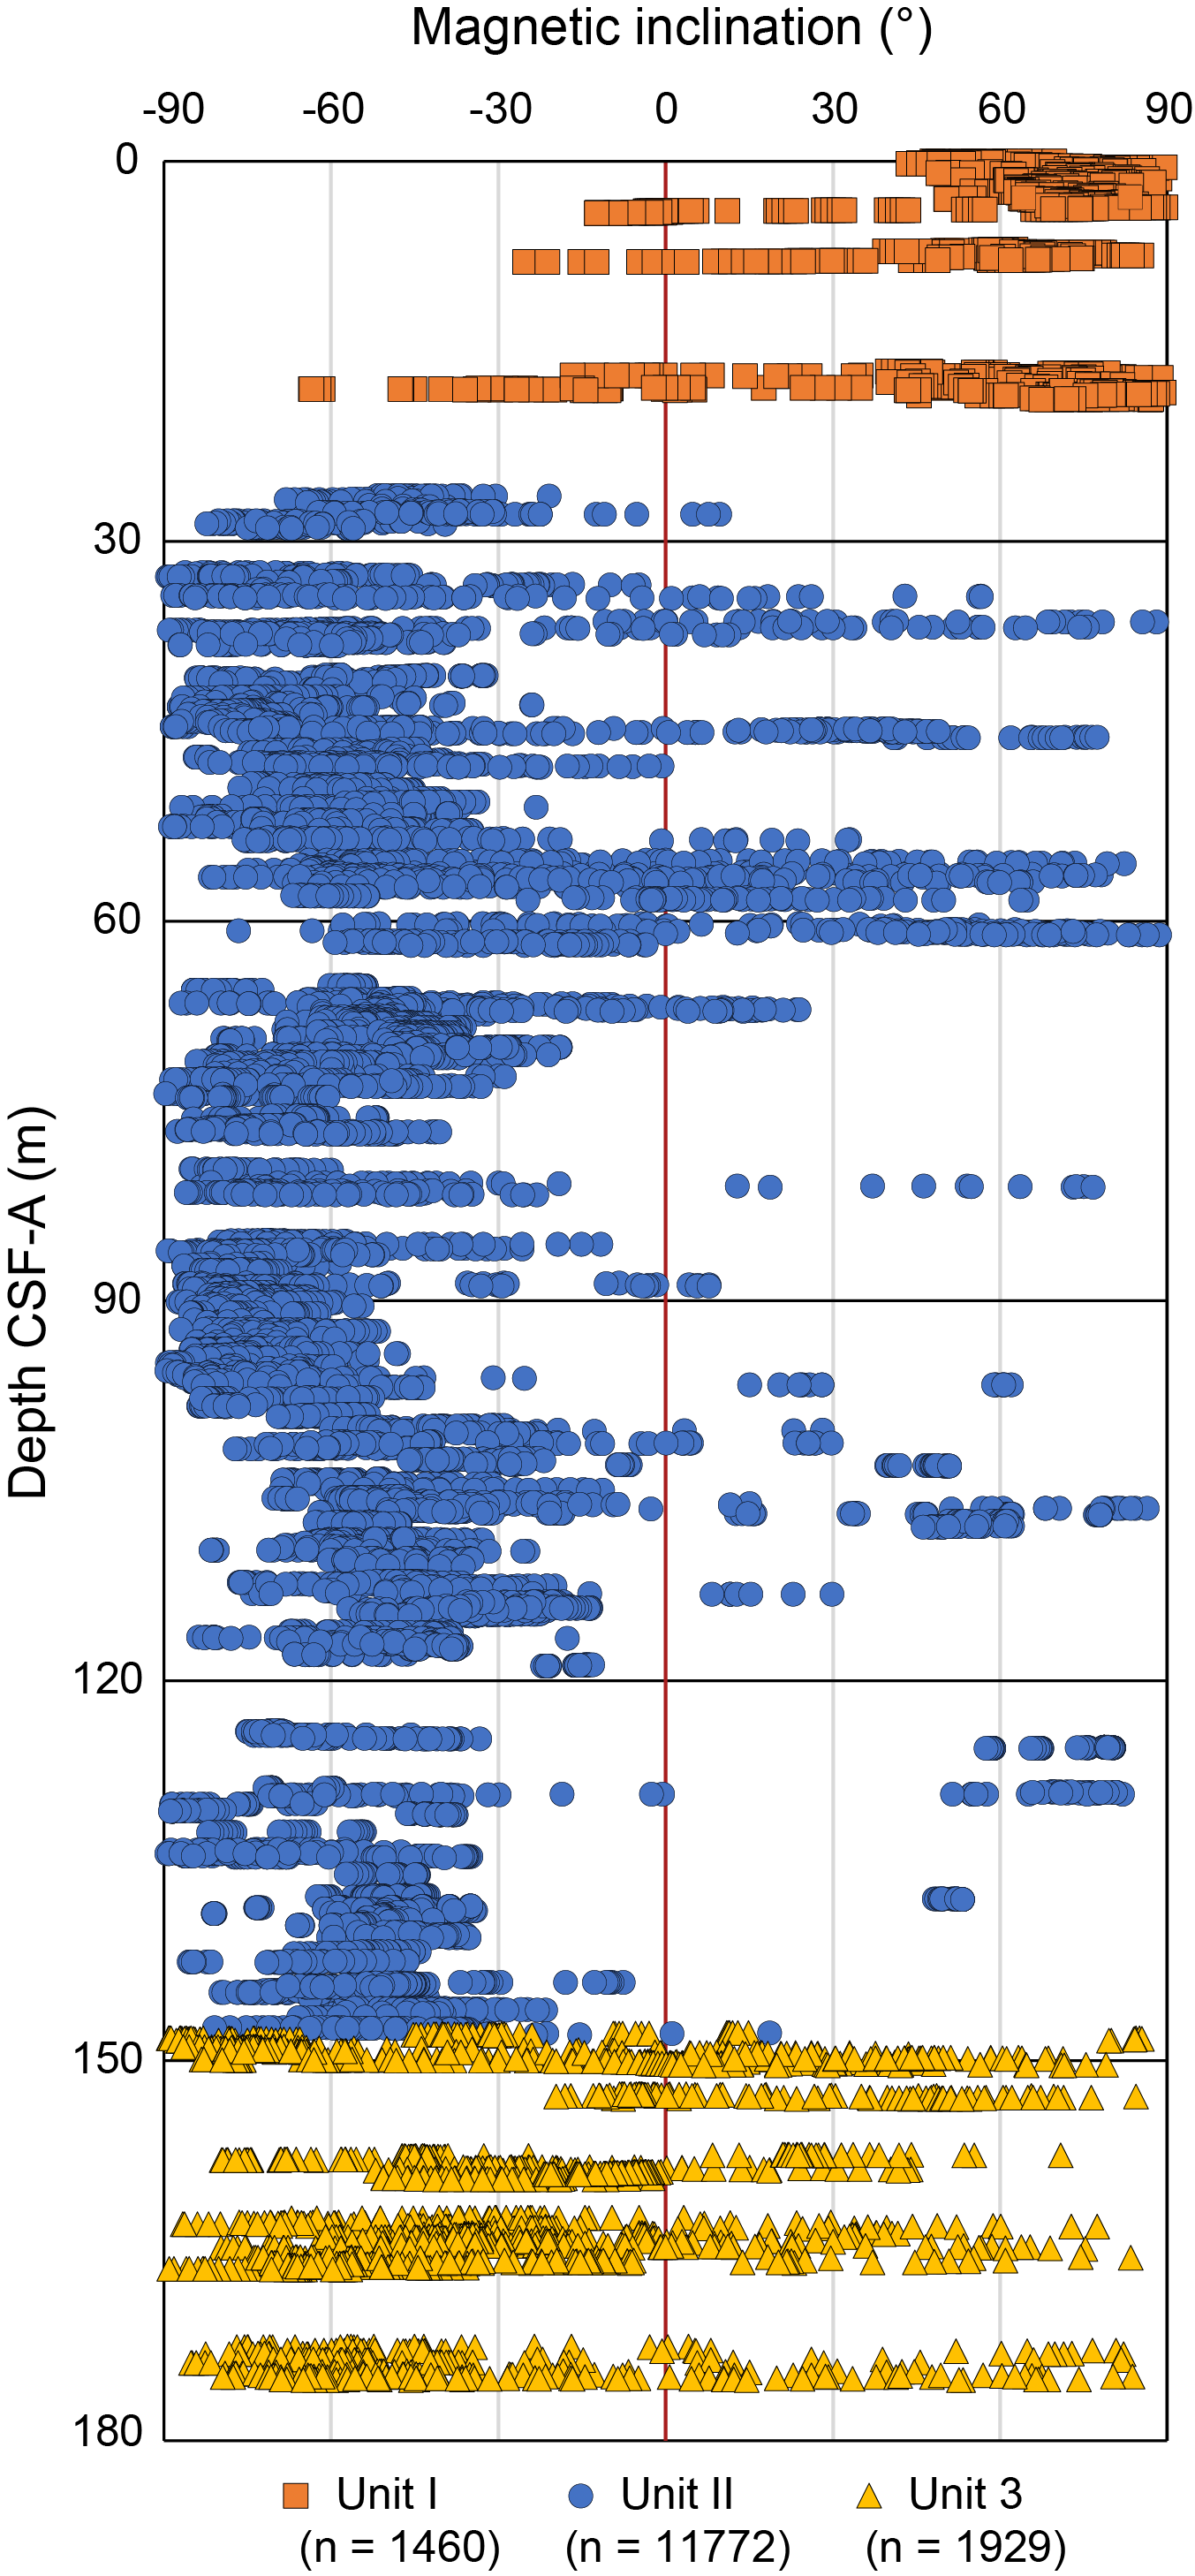
Figure F14. Magnetic inclination.
Lithostratigraphic Unit I, characterized by greenish gray to brownish gray clay, has a moderate initial intensity of magnetization of 4.3 × 10⁻² A/m. The gain in magnetization observed in Core 3R might be caused by a small dropstone because no inclusion is visible in the core image. The cores were not completely demagnetized in an applied field of 20 mT, and the decreased remanent magnetization averages 2.45 × 10⁻² A/m.
The degree of magnetic coercivity is expressed by the ratio of magnetization left after 20 mT AF demagnetization to natural remanent magnetization (NRM) (Figure F15). Generally, the sediments with large grains of detrital magnetite have a low coercivity, whereas those dominated by diagenetic hematite or goethite present larger coercivities. The median coercivity is 0.59.
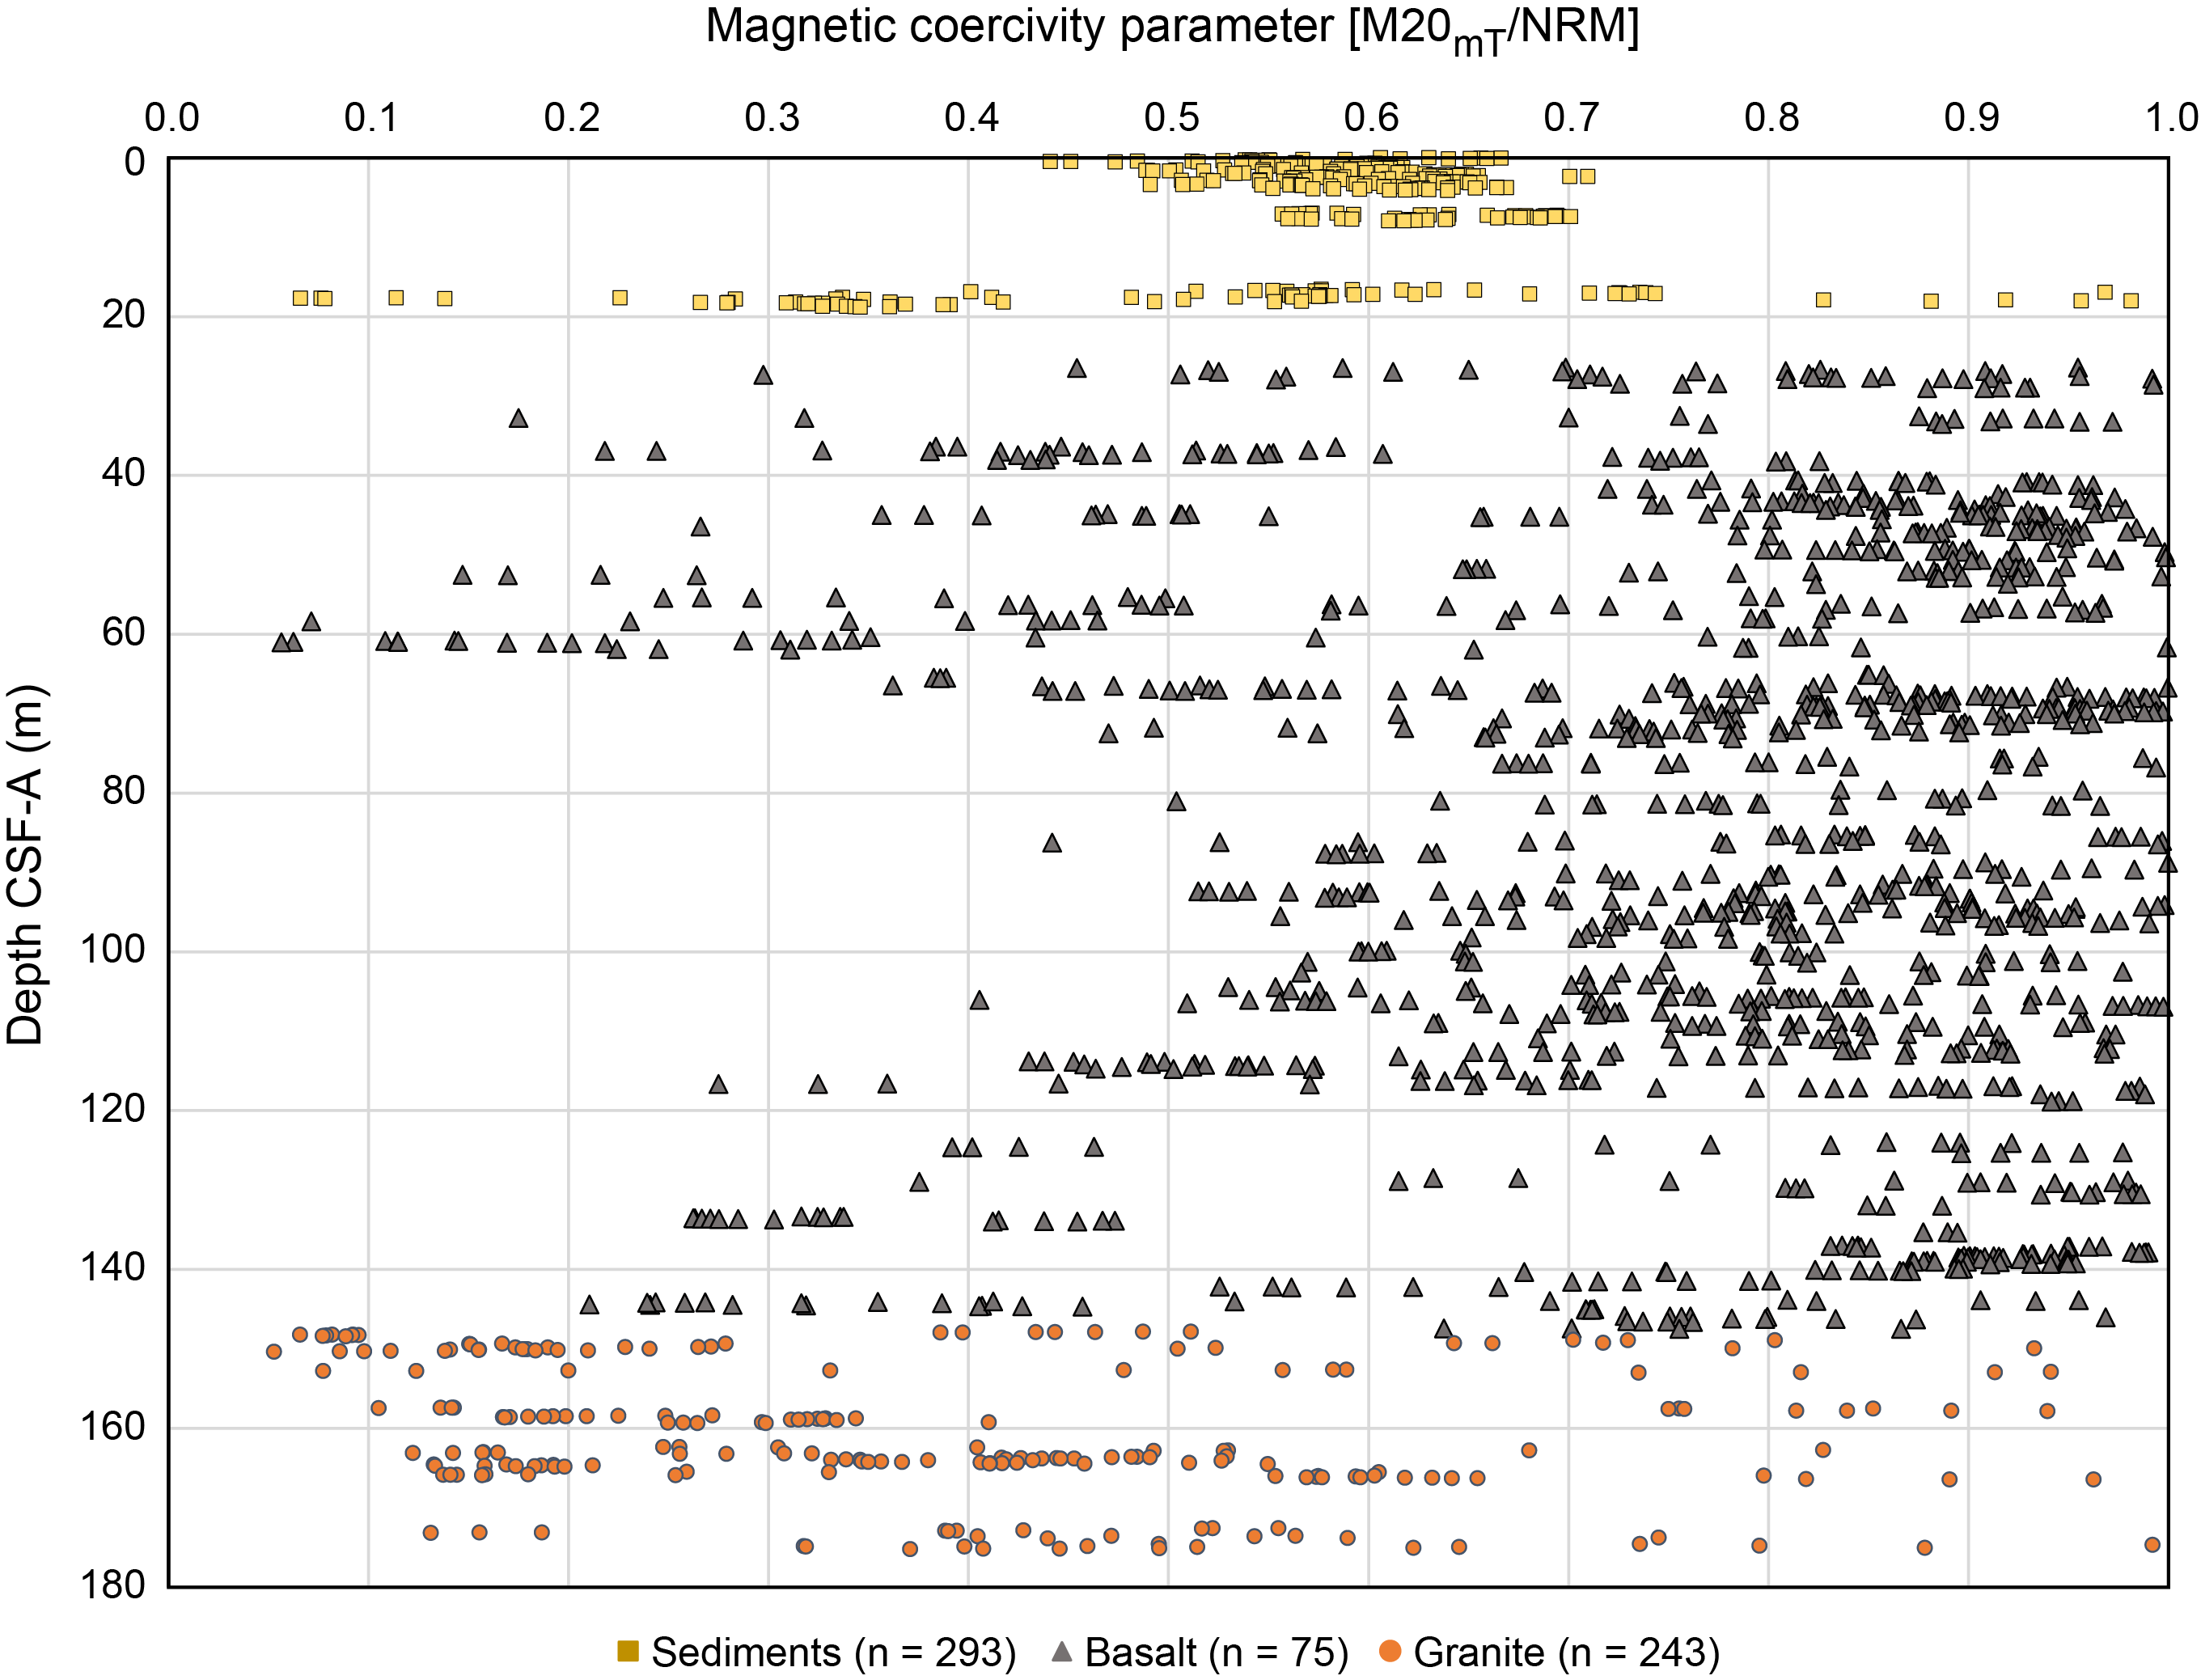
Figure F15. Magnetic coercivity.
Excluding the artifacts, the magnetic inclination indicates geomagnetic polarity and remains “normal” with positive inclination (Figure F13). No discrete sample was measured from the sediments.
5.2.2. Basalt sequence (Lithostratigraphic Unit II)
The archive-half sections of basalt Cores 396-U1566A-4R–28R (18.81–147.52 m CSF-A) were measured on the SRM at a 2.5 cm spacing. The average intensity of magnetization (NRM) is on the order of 1.4 A/m, which is two orders of magnitude higher than that of the sediments. Higher NRM intensities in basalts are generally due to greater concentration of ferromagnetic (s.l.) minerals such as titanomagnetite. Demagnetization experiments indicate that the basalts retain most of their magnetization up to AF fields of 20 mT, which suggests the presence of highly coercive minerals (Figure F15). A total of 32 discrete samples were taken and AF demagnetized at steps of 5, 10, 15, 20, 30, 40, 50, 60, 70, 80, 100, and 120 mT. Most of the discrete samples present reverse polarity; four present normal polarity. These mixed results could be explained by either the alternance of short-lived field polarities or self reversal (e.g., Krása et al., 2005). In Sample 4R-1, 88–90 cm, the magnetic component removed between 15 and 40 mT might be interpreted as a thermal remanent magnetization (TRM) based on its relatively low coercivity, which is typical of oceanic basalts (Figure F16). Sample 19R-3, 116–118 cm, shows a very stable behavior and a relatively low coercivity, and the corresponding SRM data at ~103 m CSF-A are in agreement with the observed positive inclination (Figure F17).
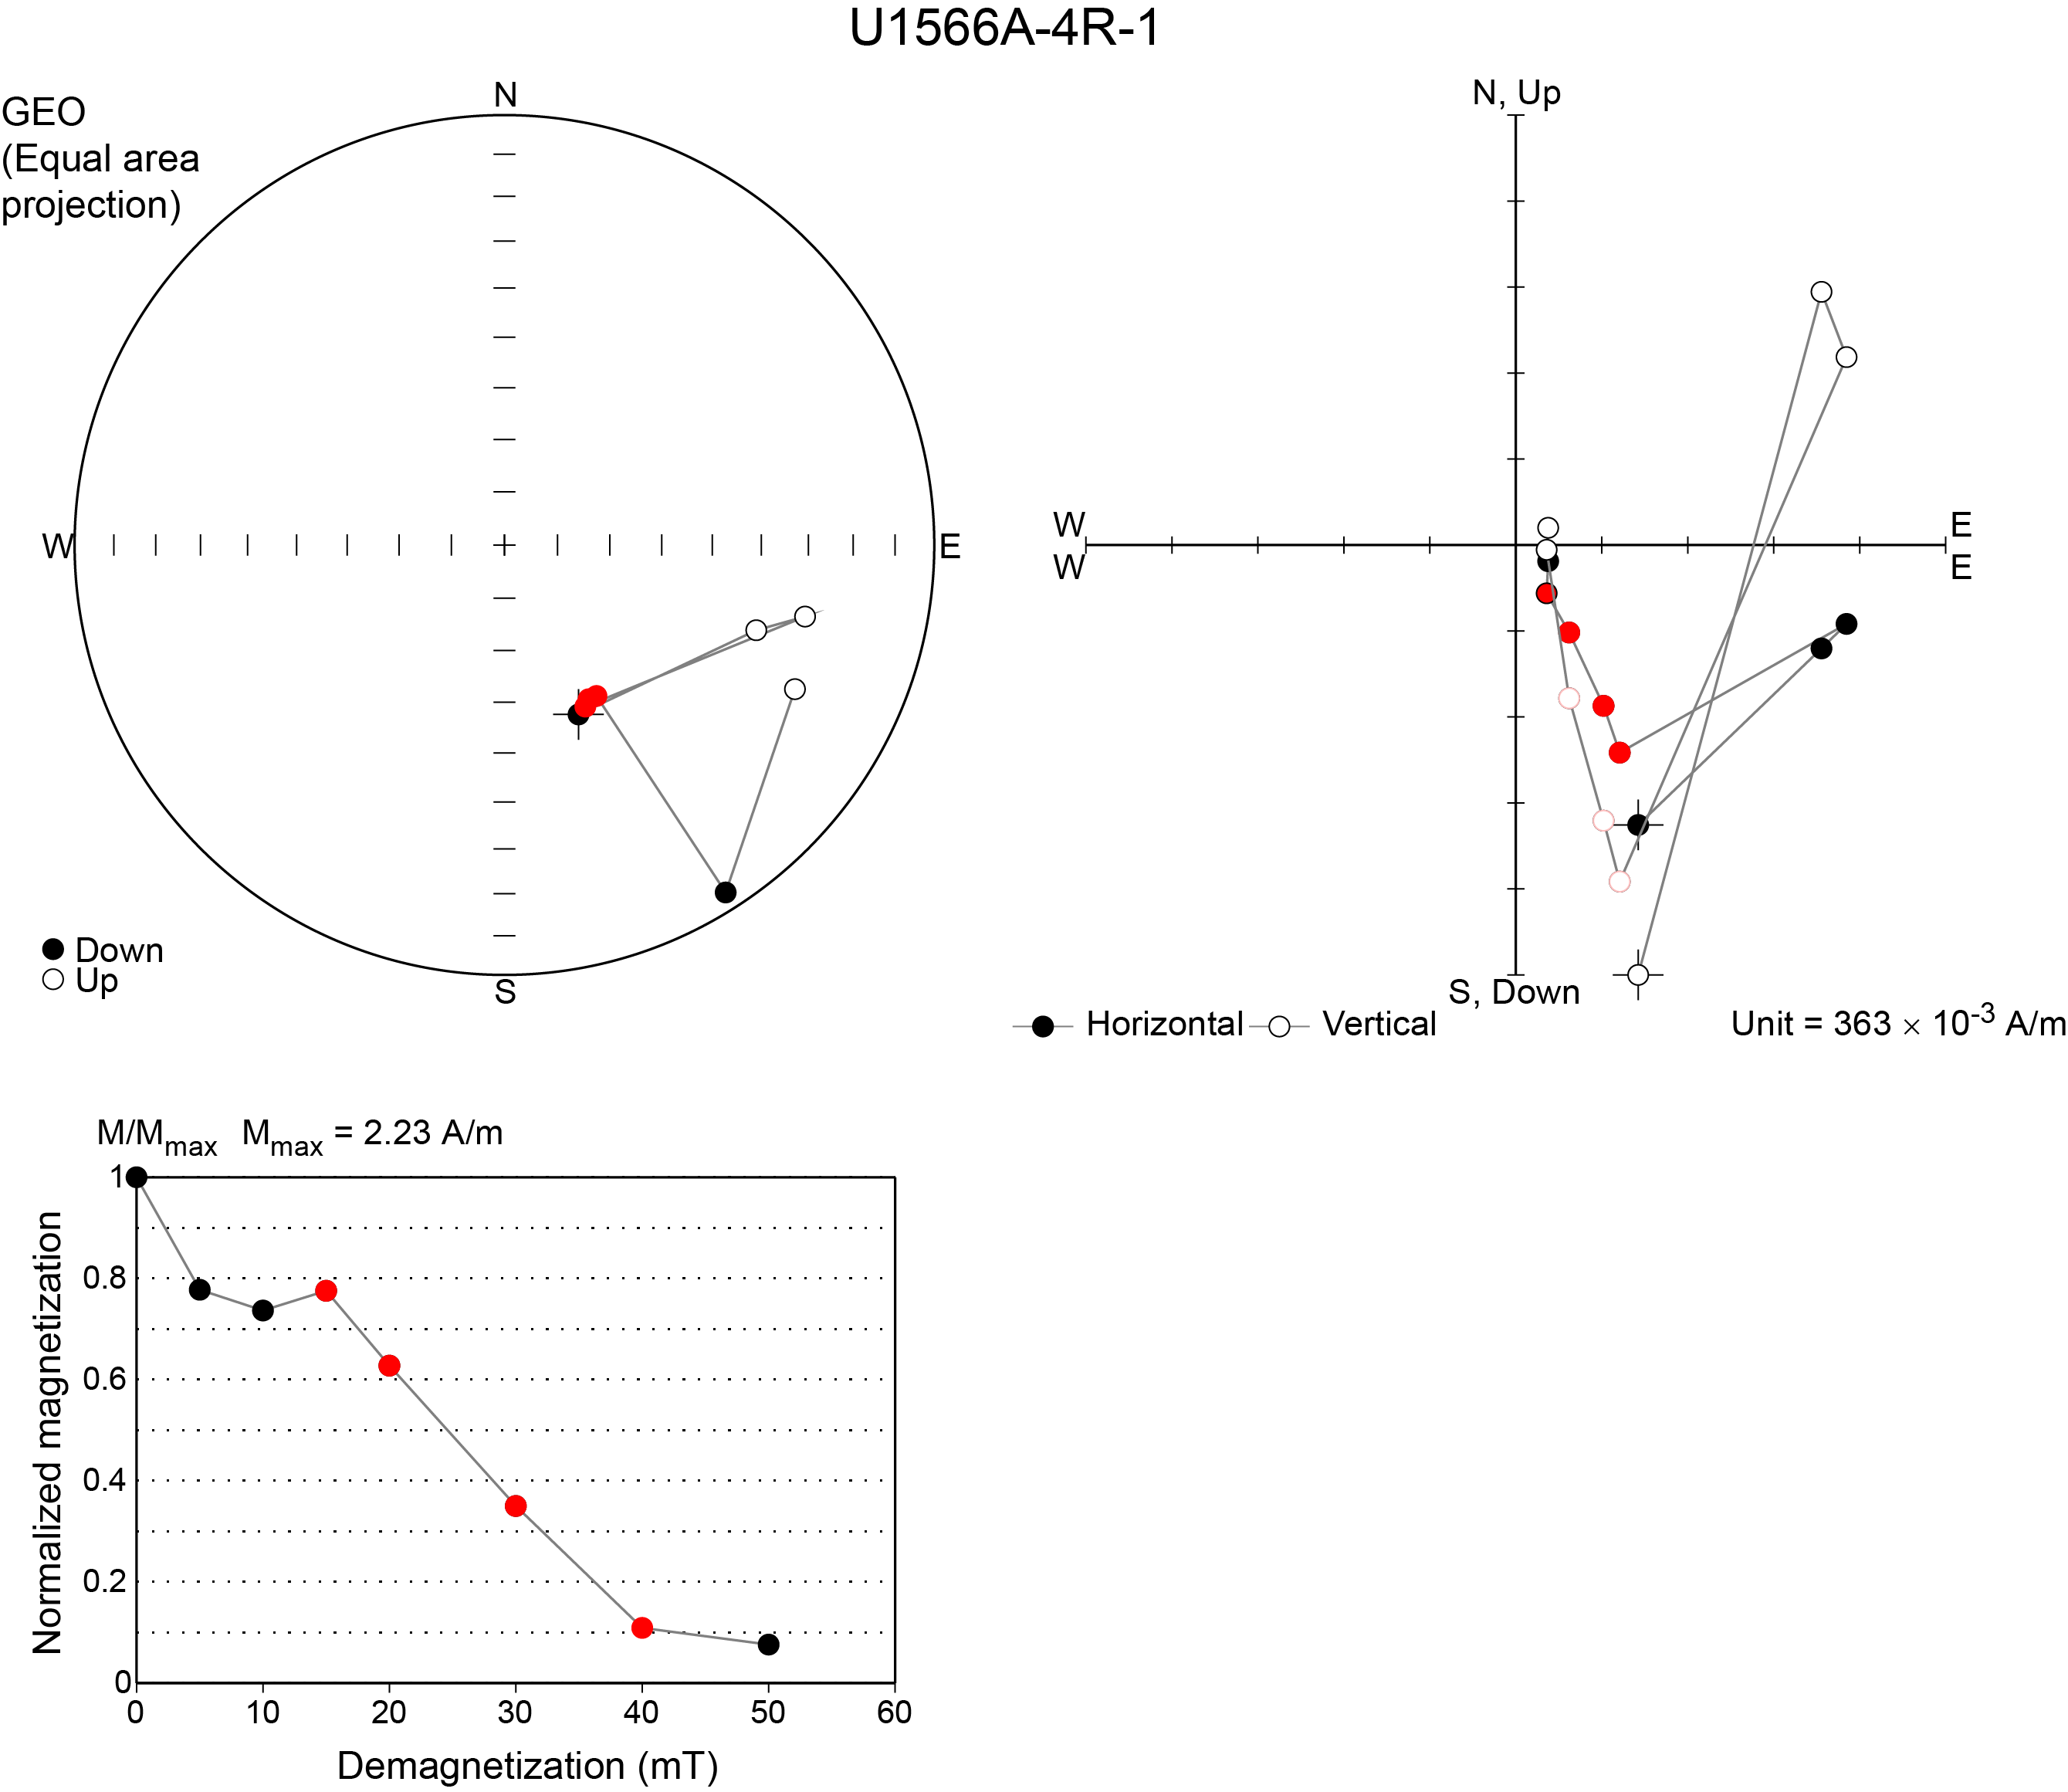
Figure F16. AF demagnetization, Sample 396-U1566A-4R-1, 88–90 cm.
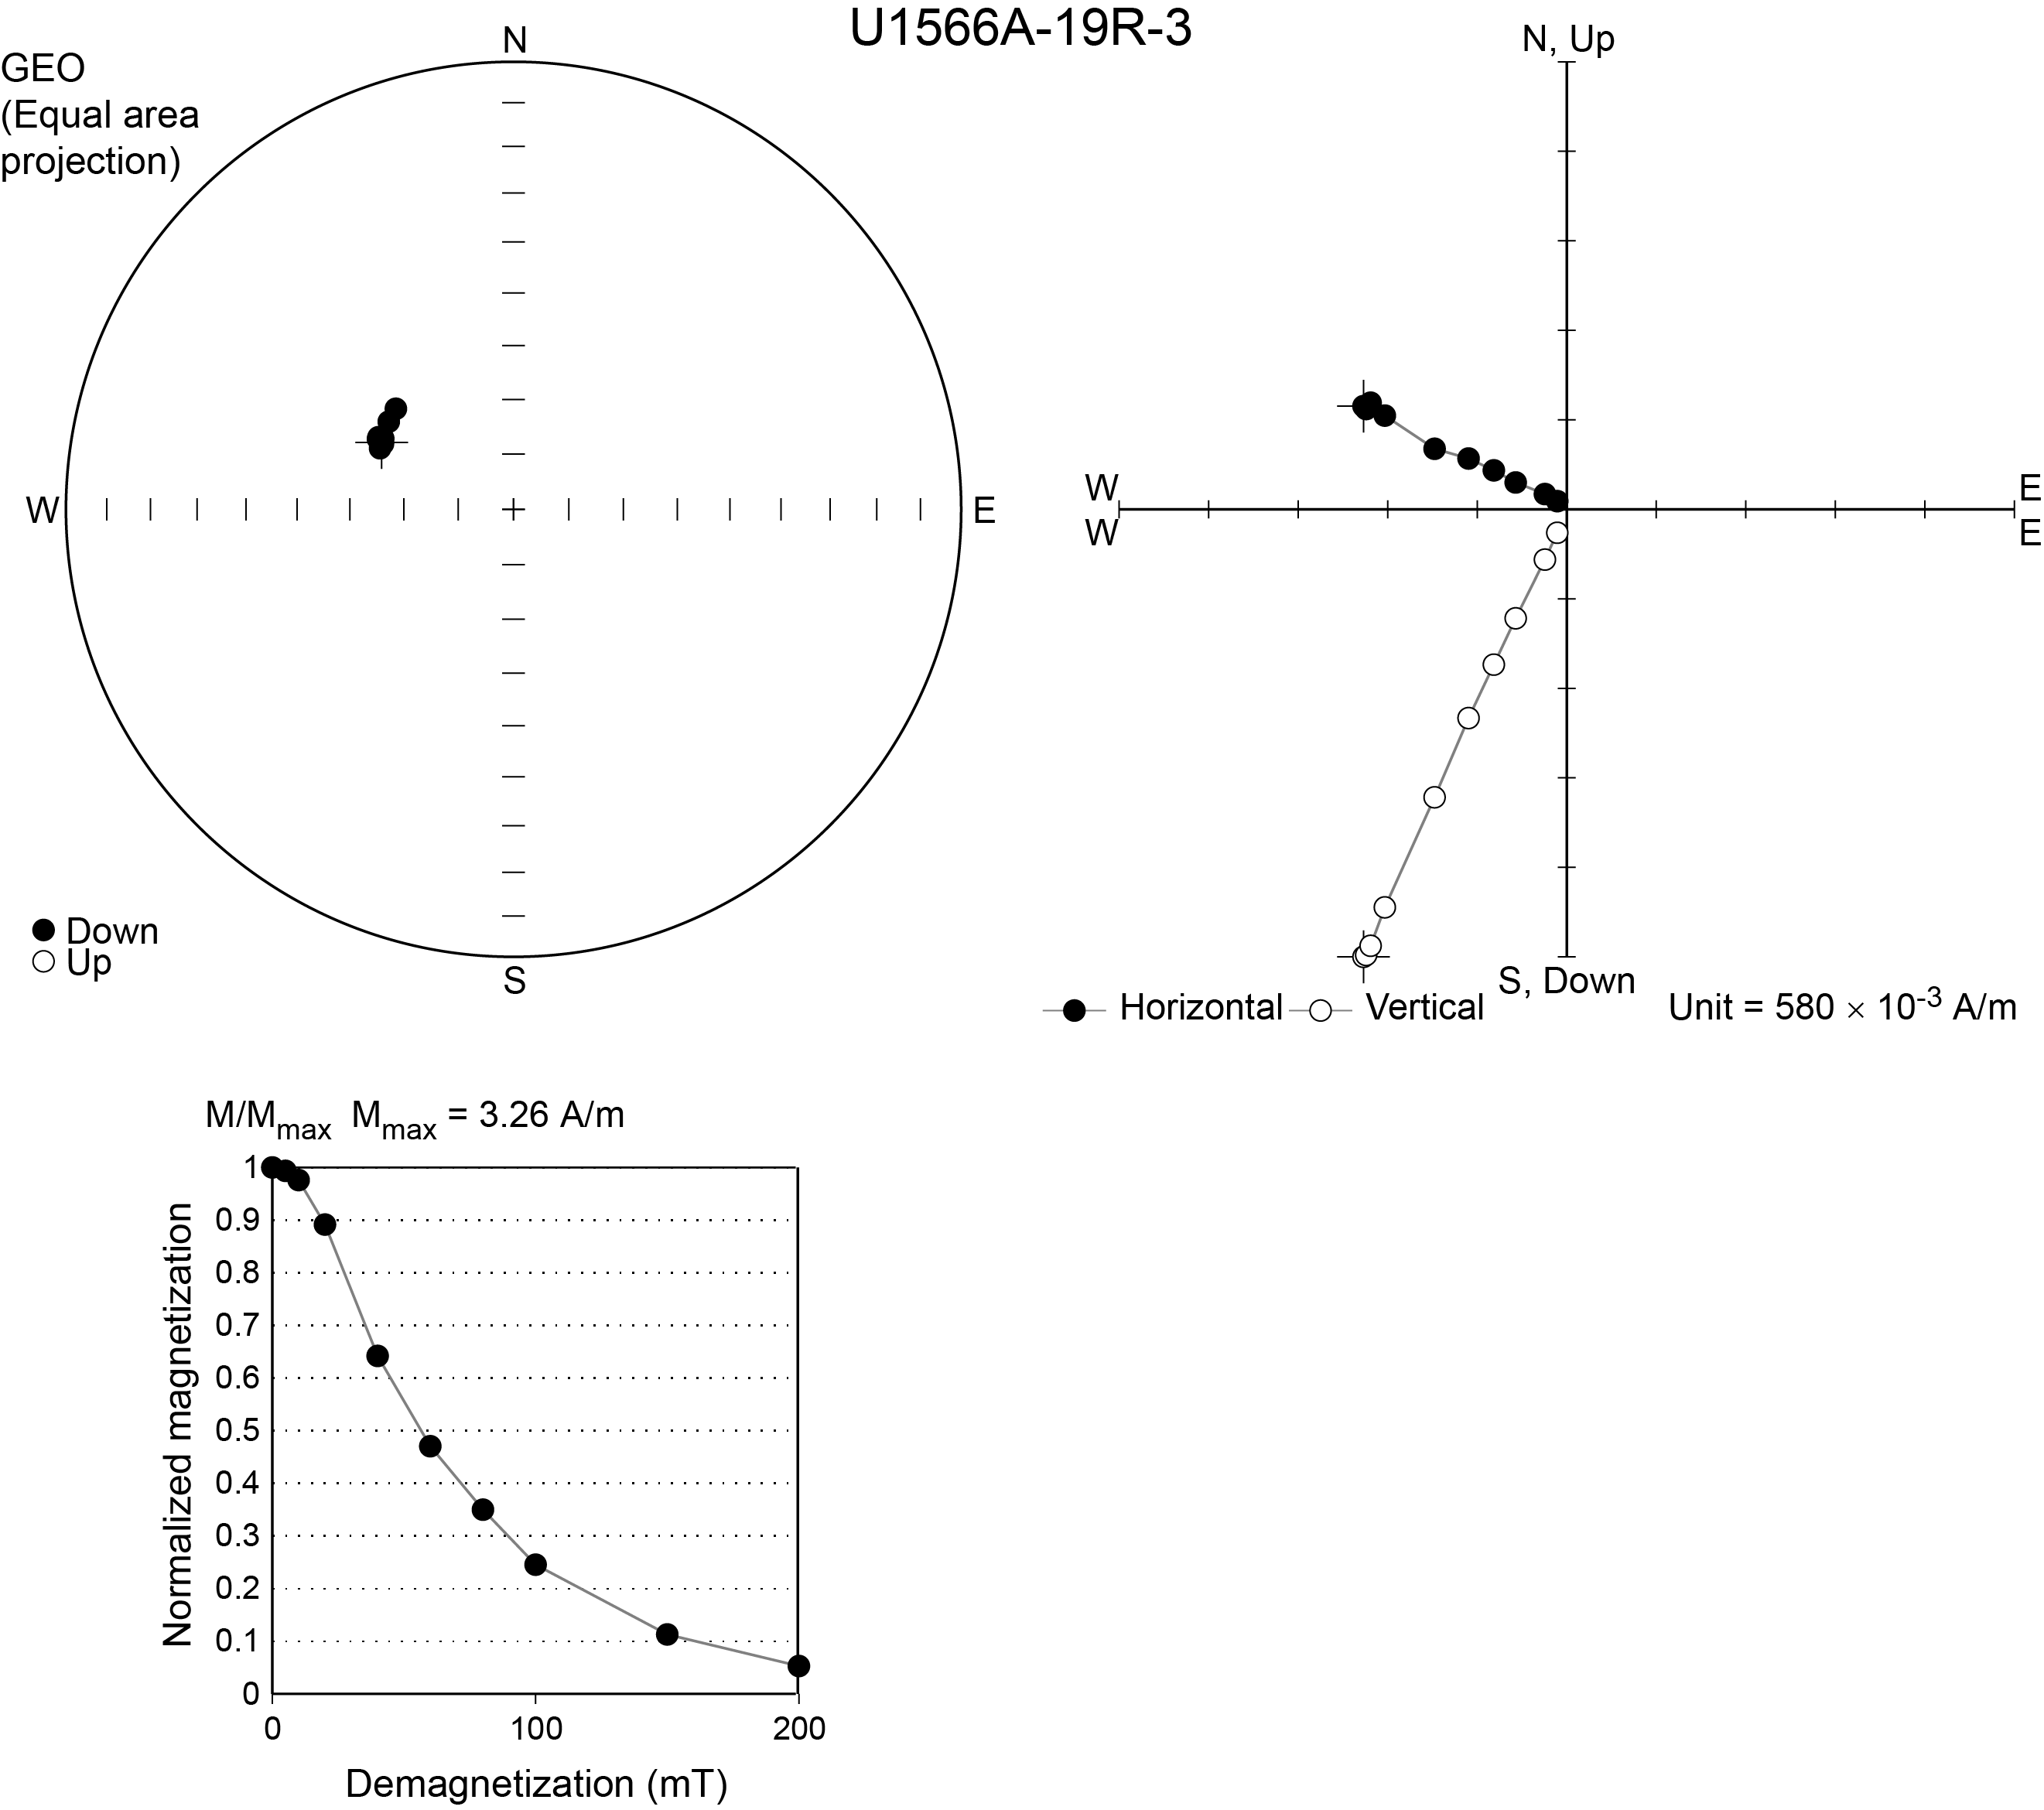
Figure F17. AF demagnetization, Sample 396-U1566A-19R-3, 116–118 cm.
To summarize, the basalts observed in Cores 4R–28R (18.81–147.52 m CSF-A; Unit II) dominantly present a reverse magnetic polarity. One confirmed and three tentative intervals of normal polarity are sandwiched between the longer reverse polarity intervals. The tentative normal polarity intervals will require further investigation.
5.2.3. Altered granite (Lithostratigraphic Unit III)
The archive-half sections of granite from Cores 396-U1566A-29R through 33R (117.53–147.52 m CSF-A), excluding pieces that were too small to be analyzed, were measured on the SRM at a 2.5 cm spacing. After measuring the NRM, the cores were subjected to a stepwise in-line AF demagnetization at 2, 4, 6, 8, 10, 15, and 20 mT. In some sections, the magnetic inclination and intensity show consistent and continuous variations, and in others they are inconsistent. In some cases, demagnetization does not completely remove the remanent magnetization; however, the median coercivity of ~0.41 is lower than that of the basalts and sediments. Most likely, magnetite and maghemite carry the magnetic remanence.
One sample (29R-2; 93–95 cm) was analyzed and showed a relatively unstable demagnetization behavior.
5.3. Anisotropy of magnetic susceptibility
5.3.1. Sediments (Lithostratigraphic Unit I)
One sediment sample (396-U1566A-1R-2; 114–116 cm) has a magnetic susceptibility (MS) (κ) of 0.677 × 10⁻³ [SI]. The degree of magnetic anisotropy P′ is low (~1.001). The magnetic foliation strikes N083°, 71°S, with a magnetic lineation at N221°, 63°.
5.3.2. Basalt and granite (Lithostratigraphic Units II and III)
No samples were measured for these units.
5.4. Summary
Paleomagnetic data show that Lithostratigraphic Unit I sediments (Cores 396-U1566A-1R through 3R) are moderately magnetized and show local drilling disturbance as well as a drilling-induced magnetic overprint. Despite these issues, the inclination data is considered meaningful. Magnetic polarity is overall normal in this unit. The moderate to low magnetic coercivity of these sediments is consistent with magnetite or titanomagnetite as the main carrier of remanence.
The magnetic data from Lithostratigraphic Unit II basalts (Cores 4R–28R) indicate a high coercivity, relatively high magnetic remanence, and high MS. The magnetic assemblage is most likely dominated by fine grained magnetite or titanomagnetite.
The magnetic data from Lithostratigraphic Unit III granites (Cores 29R–33R) indicate a highly variable coercivity reflecting highly variable hematite and goethite contents resulting from variable degree of alteration.
6. Geochemistry
One mudline sample and two interstitial water (IW) samples from Site U1566 were analyzed for their geochemical composition. This limited number of samples was a result of thin sediment cover and underlying basalt lithology. The deepest IW sample was recovered from 18 m CSF-A. Total carbon, total inorganic carbon (TIC), calcium carbonate (CaCO3), total organic carbon (TOC), total nitrogen (TN), and sulfur were determined on three discrete sediment samples from Unit I. Three samples of headspace gas were taken for safety monitoring in all sediments cored at the site. No carbonate samples were taken upon reaching Unit II. In total, 42 samples of hard rock from Units II and III were taken at Site U1566 and prepared for elemental analysis via inductively coupled plasma–atomic emission spectrometry (ICP-AES). Portable X-ray fluorescence (pXRF) analysis was completed on 127 basalt samples in triplicate. X-ray diffraction (XRD) was completed on 24 samples, 6 of which were sediments and 18 of which were basalts and interbasalt sediments.
6.1. Inorganic geochemistry
Alkalinity increases from the mudline (2.3 mM) to the deepest IW sample (3.1 mM; 18 m CSF-A). Measured pH is around 7.8 in the mudline and decreases to 7.7 at the base of the sediments. Phosphate content varies; the highest value is 4.04 µM (2.95 m CSF-A), and the lowest is 2.16 µM (17 m CSF-A). Ammonium is below detection limit in the mudline but increases to 56.6 µM in the lowermost IW sample.
Most analyzed elements (Br, B, Cl, K, Na, and Sr) show no clear trends in composition between the mudline and the base of the sediments. The elements Ca, Li, and Si, however, clearly increase between the mudline and the lowermost IW sample. In contrast, Mg and S values decrease from the sediment/water interface to the deep sediment (Figure F18; Table T7). Barium is below detection limit in all samples, and Mn is below detection limit in the mudline.
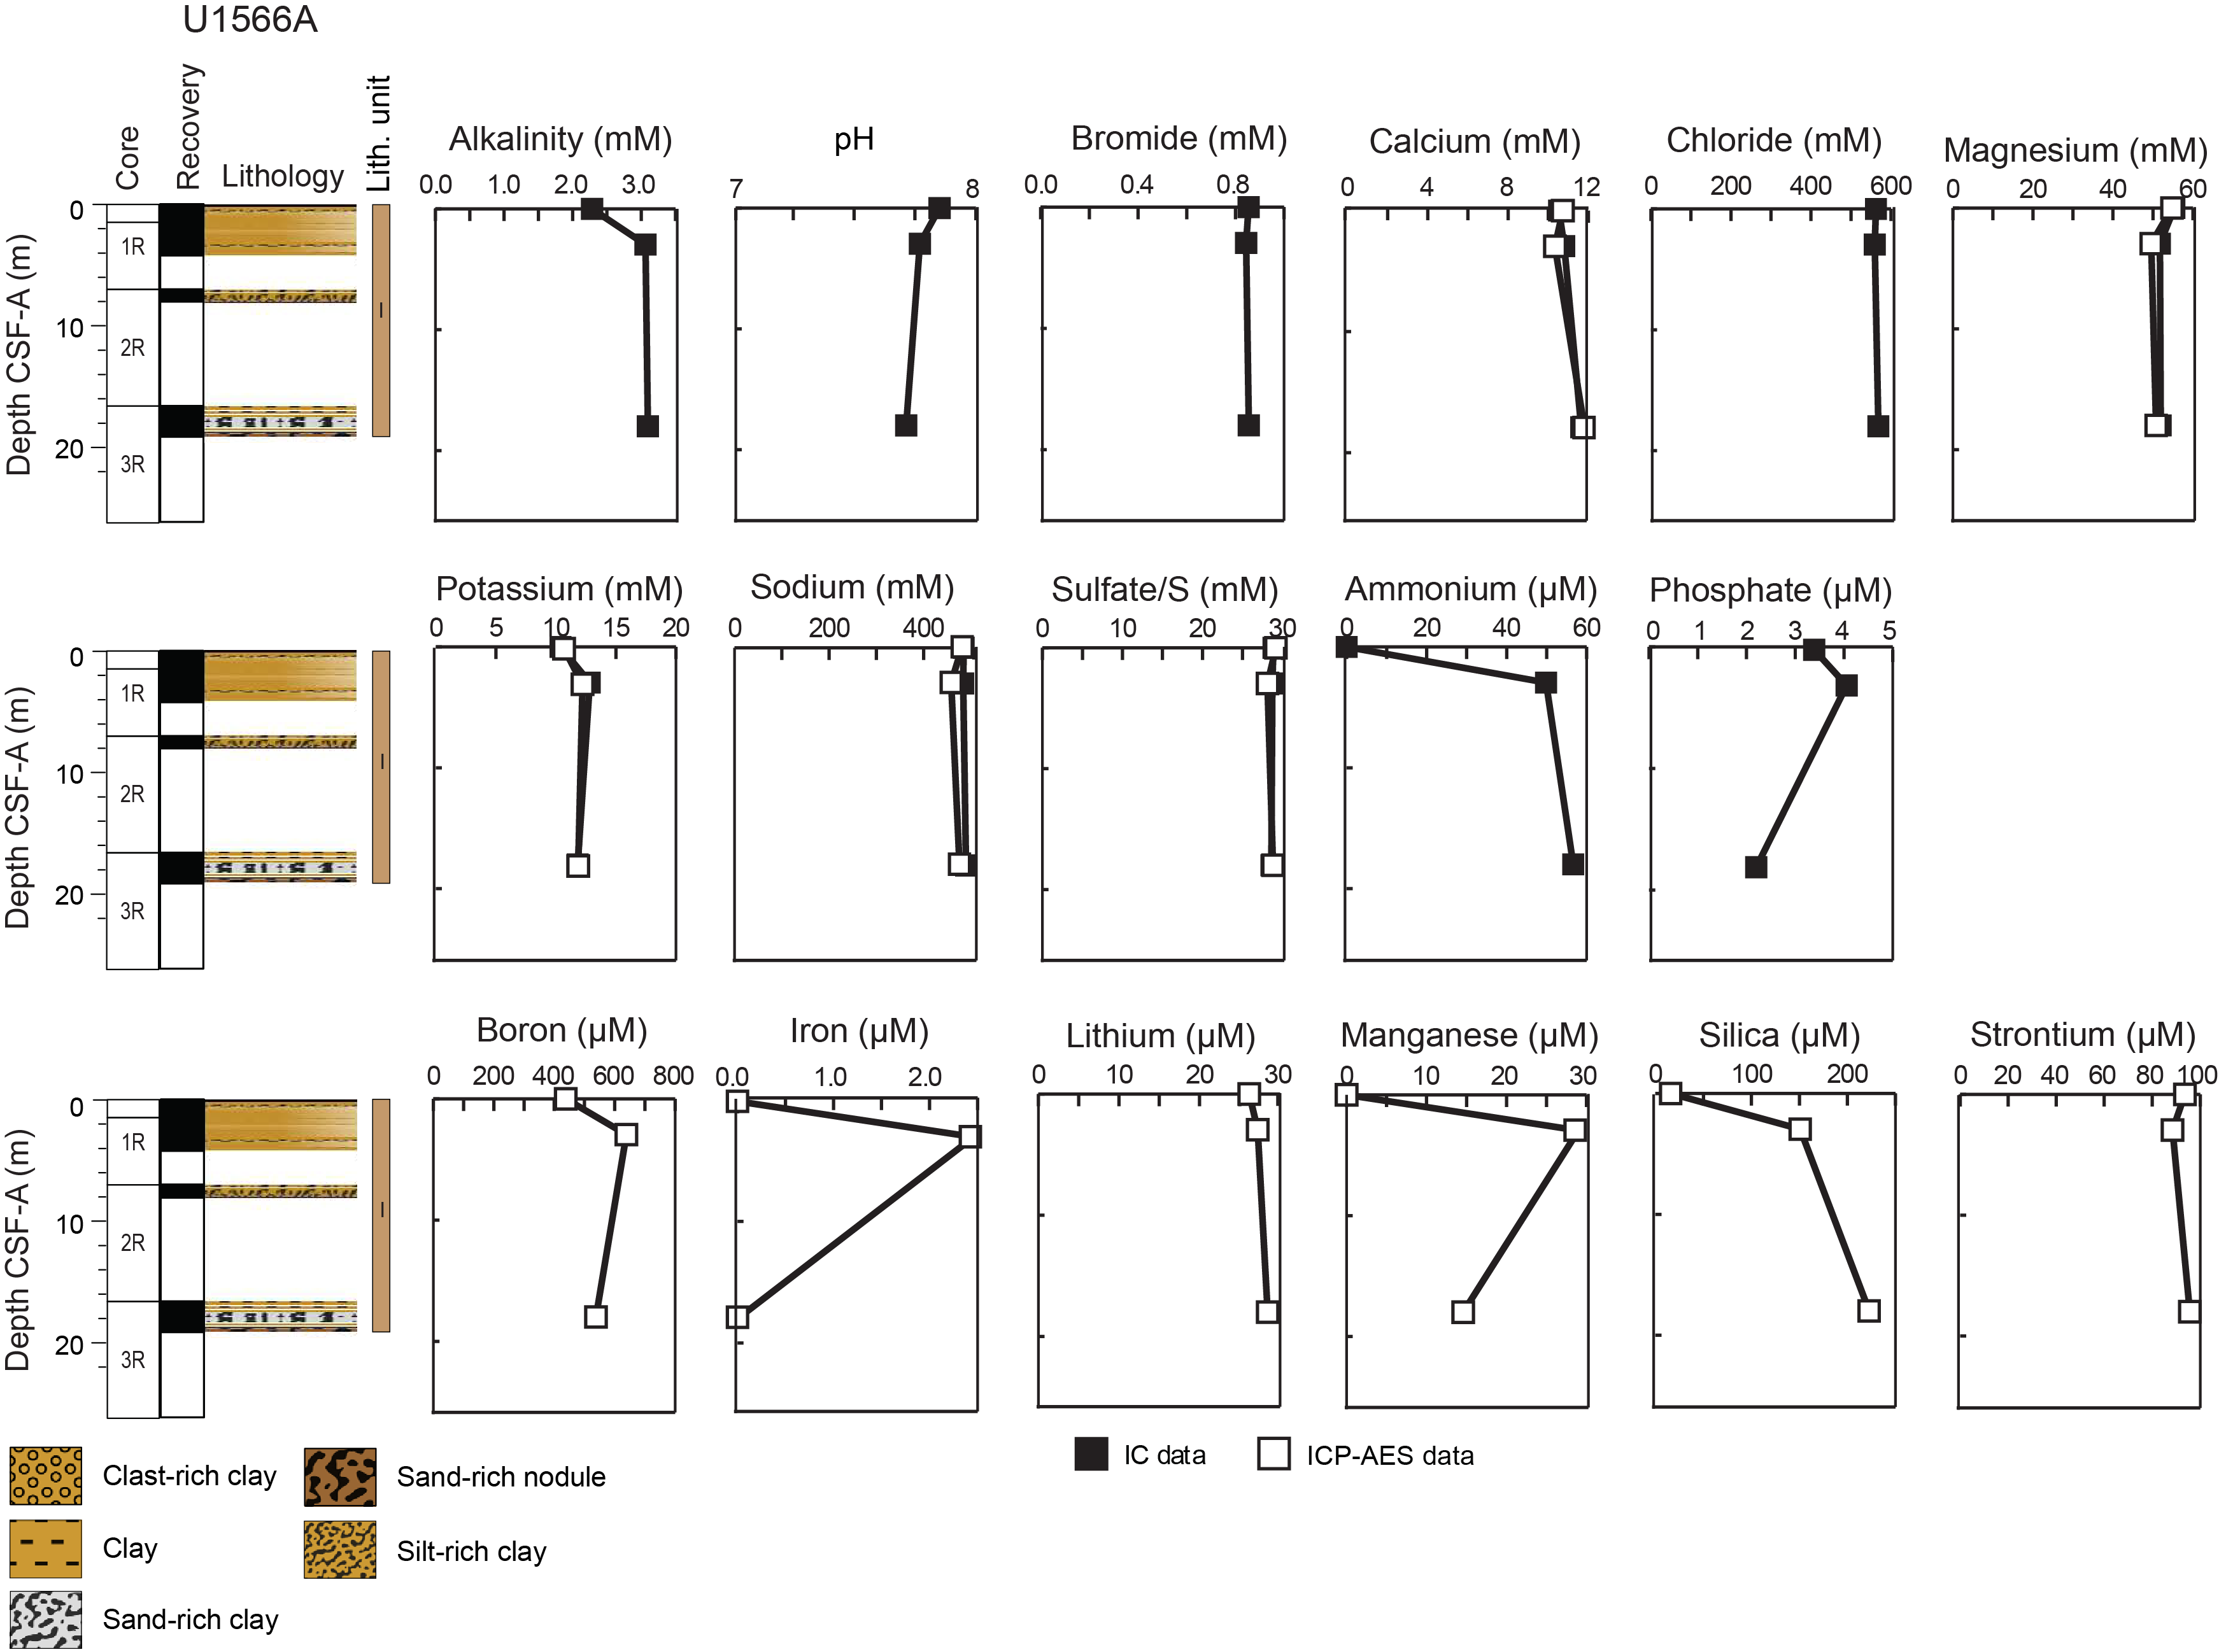
Figure F18. IW profiles.
6.1.1. Hard rock geochemistry
Of the 42 hard rock samples prepared for ICP-AES analysis, 39 were taken from basaltic lava flows and 3 from weakly to moderately altered medium-grained granitic basement. Loss on ignition (LOI) serves as a rough indicator of the overall level of alteration in these rocks. LOI values for the basaltic lava flows (Lithostratigraphic Unit II) range 1–7 wt%. In Unit III, the majority of samples have <3 wt% LOI, with the exception of Samples 396-U1566A-4R-1, 47.5–50.0 cm; 11R-2, 32–34.5 cm; and 11R-2, 52.5–55 cm, which have more than 13 wt% LOI. The effects of alteration on the suite of elements measured appear to be strongest on the distribution of potassium. K2O contents of Samples 11R-2, 32–34.5 cm, and 11R-2, 52.5–55 cm (i.e., those with the highest LOI values), have the greatest K2O content in the basaltic lava flows, reaching 0.34 wt%. All samples with low LOI values (2–4 wt%) have K2O contents that vary between 0.1 and 0.25 wt% (Table T8).
In a plot of total alkalis (Na2O + K2O) versus SiO2 (Le Maitre, 1989) (Figure F19A) from Unit II, the data indicate most samples are subalkaline basalt with normalized SiO2 concentrations ranging 40–54 wt%. One of the samples from Unit II has the composition of a picro-basalt, and a further three samples from Unit III are dacitic to rhyolitic.
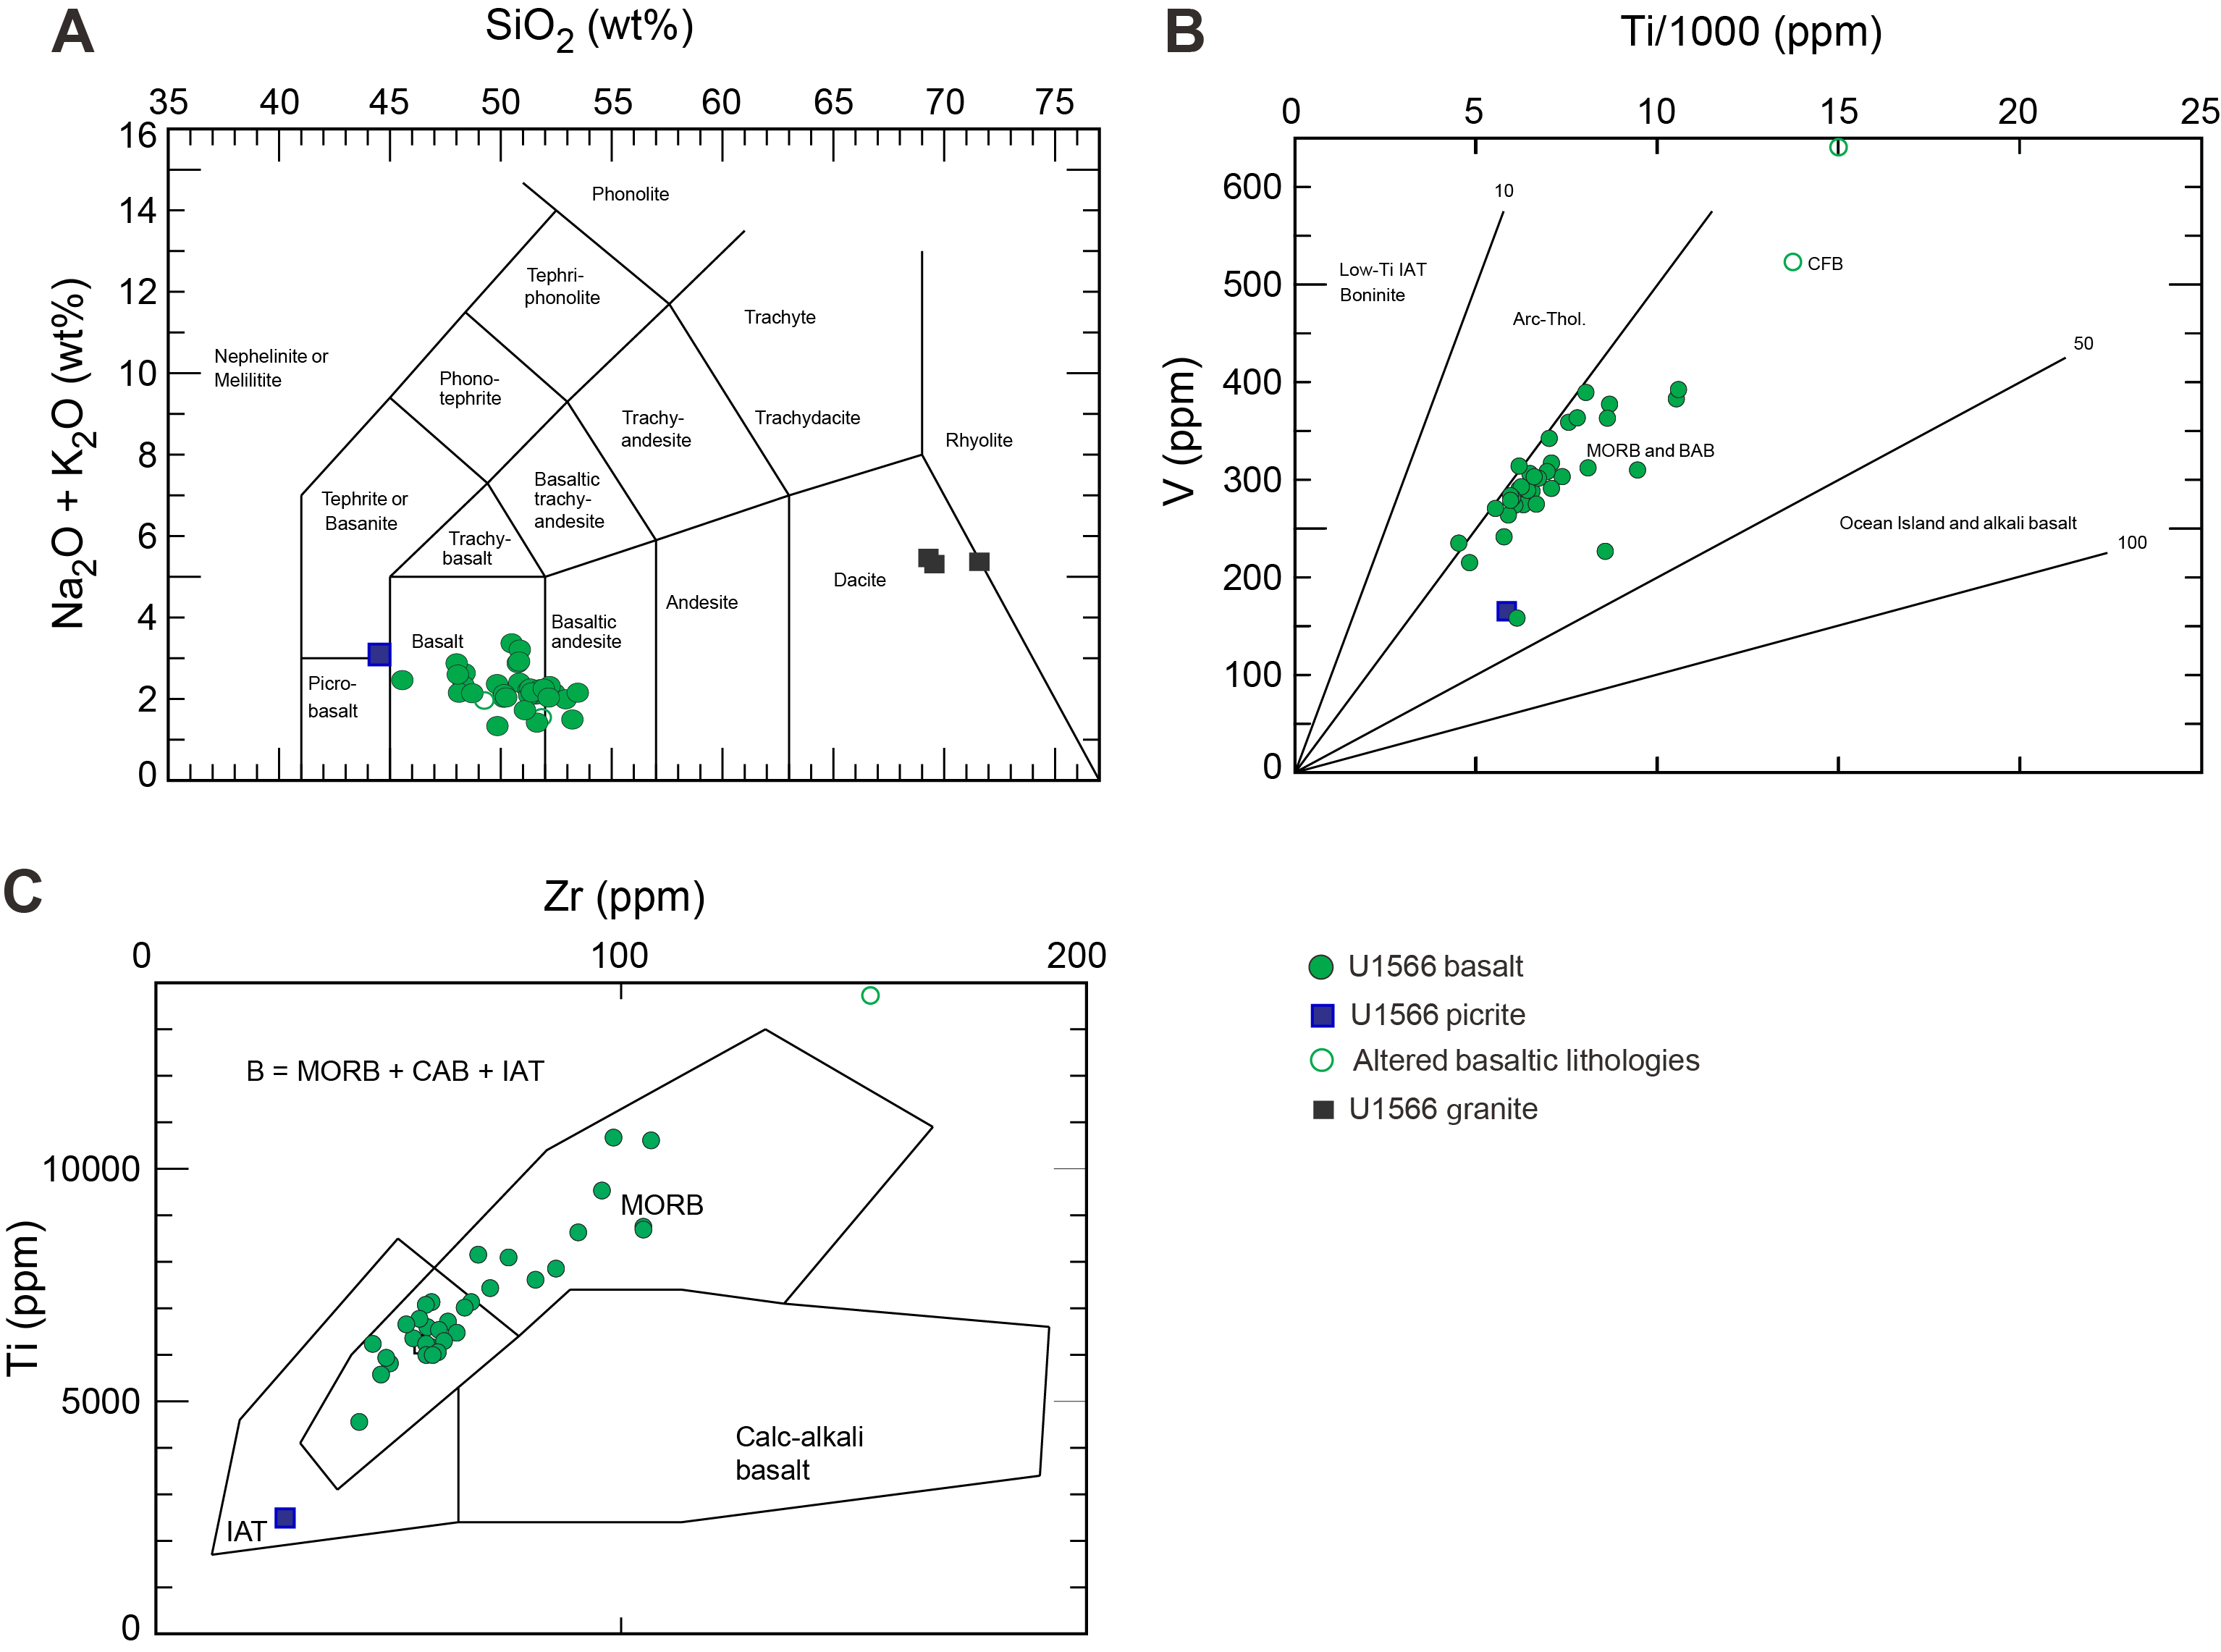
Figure F19. Volcanic rocks..
On a diagram of V versus Ti (Shervais, 1982) (Figure F19B), samples from Hole U1566A plot in the mid-ocean-ridge basalt (MORB) and back-arc basalt fields. Likewise, in a Ti versus Zr diagram (Pearce and Cann, 1973) (Figure F19C), most samples plot in the MORB field, with a small number plotting in the region of several basalt types. The two altered basalt samples are not plotted.
In a TiO2 versus Mg# diagram (Mg# = Mg/[Mg + Fe2+] × 100, assuming FeO/Fe2O3 = 0.85) (Tegner et al., 1998), all the basalts from Unit II have TiO2 < 2 wt% and Mg# ranging 55–72 wt% (Figure F20A). Comparison of the data obtained from ICP-AES and/or pXRF analysis with basalts from the upper series in ODP Hole 642E (Meyer et al., 2009) and with flood basalts from East Greenland (Tegner et al., 1998) indicates that most samples from Site U1566 overlap with the low-Ti basalts of Greenland. When plotted on an Mg# versus SiO2 diagram (Figure F20B), most basalts from Site U1566 fall in the range of basic to intermediate composition. Four outliers with 40–44 wt% SiO2 plot within the range of the ultrabasic group (Figure F20B).
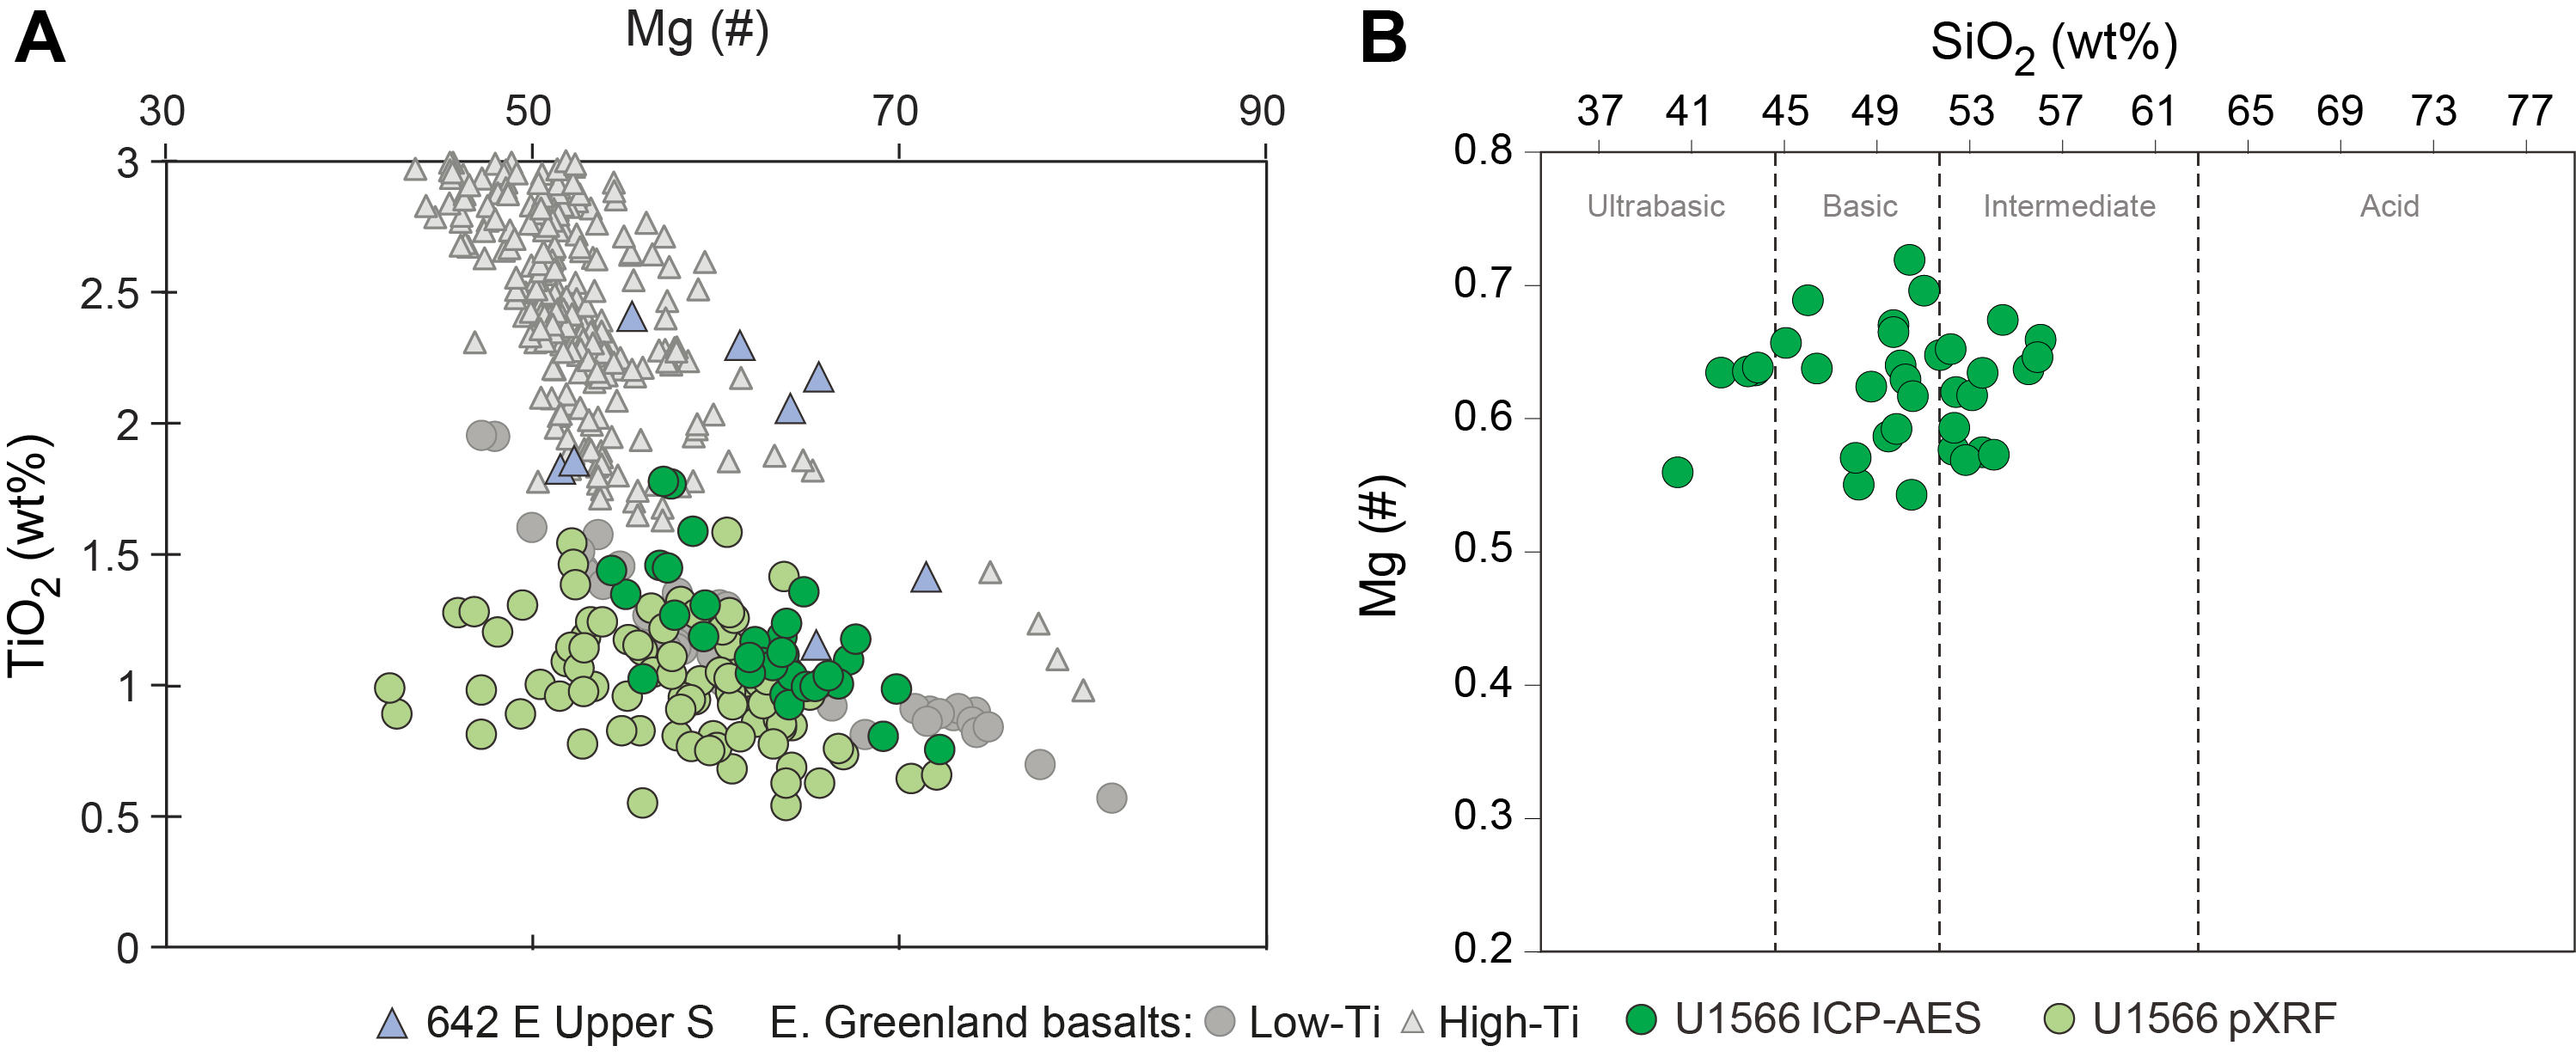
Figure F20. Mg# vs. TiO2 and Mg# vs. SiO2.
Downhole plots of Unit II basalts indicate discontinuities in MgO, TiO2, Ni, and Zr at ~70, 110, and 130 m CSF-A, respectively (Figure F9). These results are consistent with those derived from pXRF analysis (see Lithostratigraphy). These shifts could reflect upwardly evolving units of magma intruded in individual events. Ni concentrations decrease with depth from 200 to 50 ppm. The highest Ni concentration at 110 m CSF-A is accompanied by high concentrations of MgO (~12 wt%) and Cr (~550 ppm).
Granitic samples from Unit III were also analyzed using ICP-AES. In an alkali-lime index (Na2O + K2O − CaO) versus SiO2 diagram (after Frost et al., 2001), data plotted in the alkali-calcic and calc-alkalic fields show SiO2 concentrations ranging 65–79 wt% (Figure F21A). A FeO*/(FeO + MgO) versus SiO2 discrimination diagram (assuming FeO/Fe2O3 = 0.85) (Tegner et al., 1998) classifies the composition of two samples as A-type granite (Frost et al., 2001) (Figure F21B). The remaining sample (396-U1566A-33R-3, 13–14 cm), which has a SiO2 concentration of 79.78 wt%, is considered highly altered. pXRF analyses show compositions of high-K granite (Rickwood, 1989), consistent with the high proportion of alkali feldspar; these analyses also show a typical signature of an A-type granitoid (Frost et al., 2001).
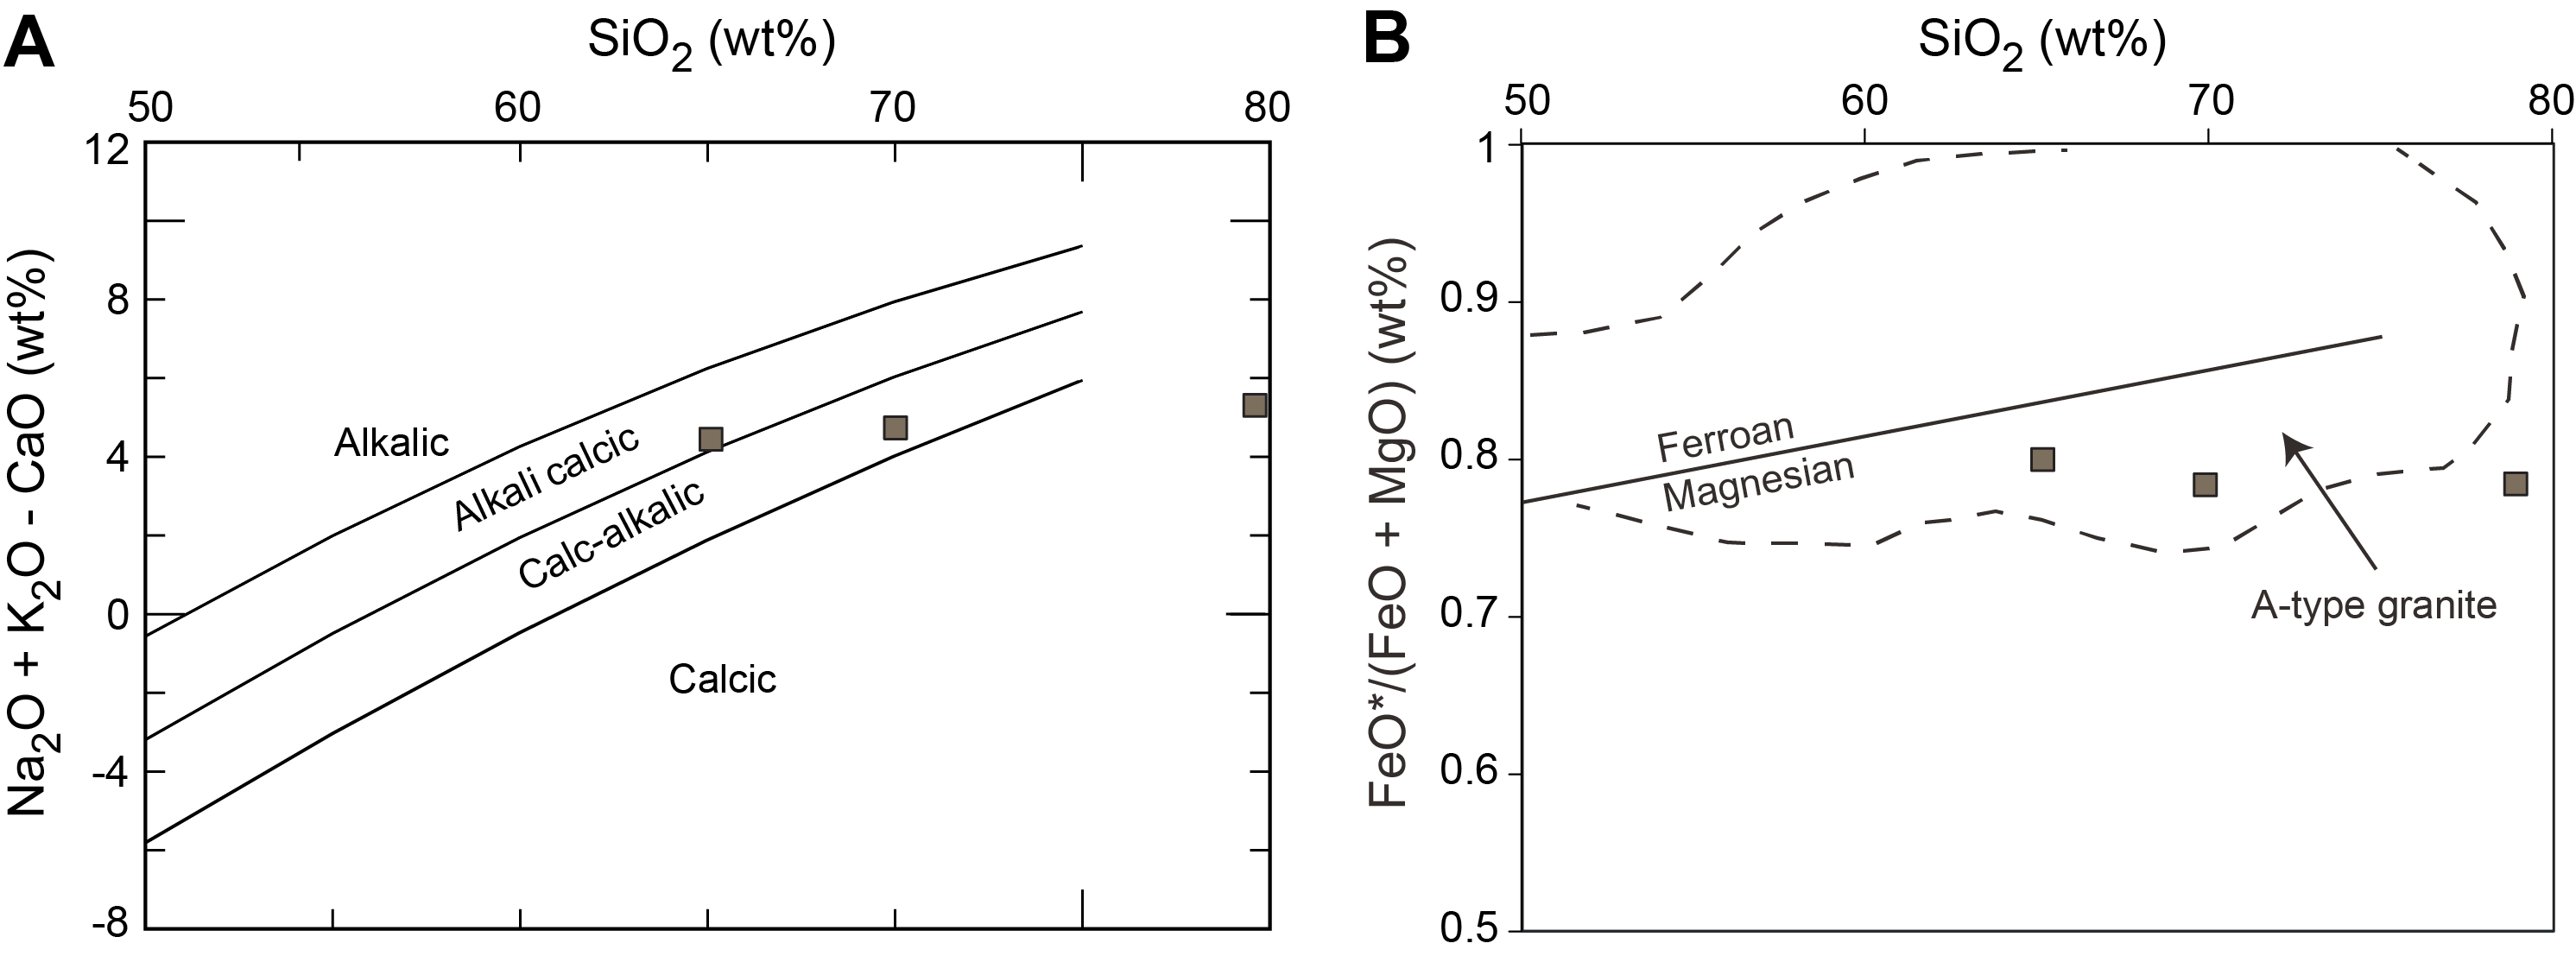
Figure F21. Alkali-lime index and FeO*/(FeO + MgO) vs. SiO2.
6.1.2. Deconvolved natural gamma radiation
The three primary lithostratigraphic units identified in Hole U1566A are well defined by shifts in their K, Th, and U contents, as derived from the NGR logs (see Geochemistry in the Expedition 396 methods chapter [Planke et al., 2023a]). Unit I, the glacial sedimentary package, is defined by K values ranging 1–3 wt%, Th ranging 5–10 ppm, and U ranging 1–2 ppm, representing the uppermost 27 m of core. K and Th contents are lower in the underlying basalts (Unit II), and U content, though variable, is on average higher in the basalts than in the overlying sediments (Figure F22). In the basalt unit, sedimentary interbeds may be identified by increases in K and Th content (e.g., Cores 396-U1566A-11R and 18R). Unit III, composed of granites interbedded with granite-derived sandstone, displays more enriched K (3–4 wt%) and Th (>10 ppm) content than the basalt package. U content is relatively stable.
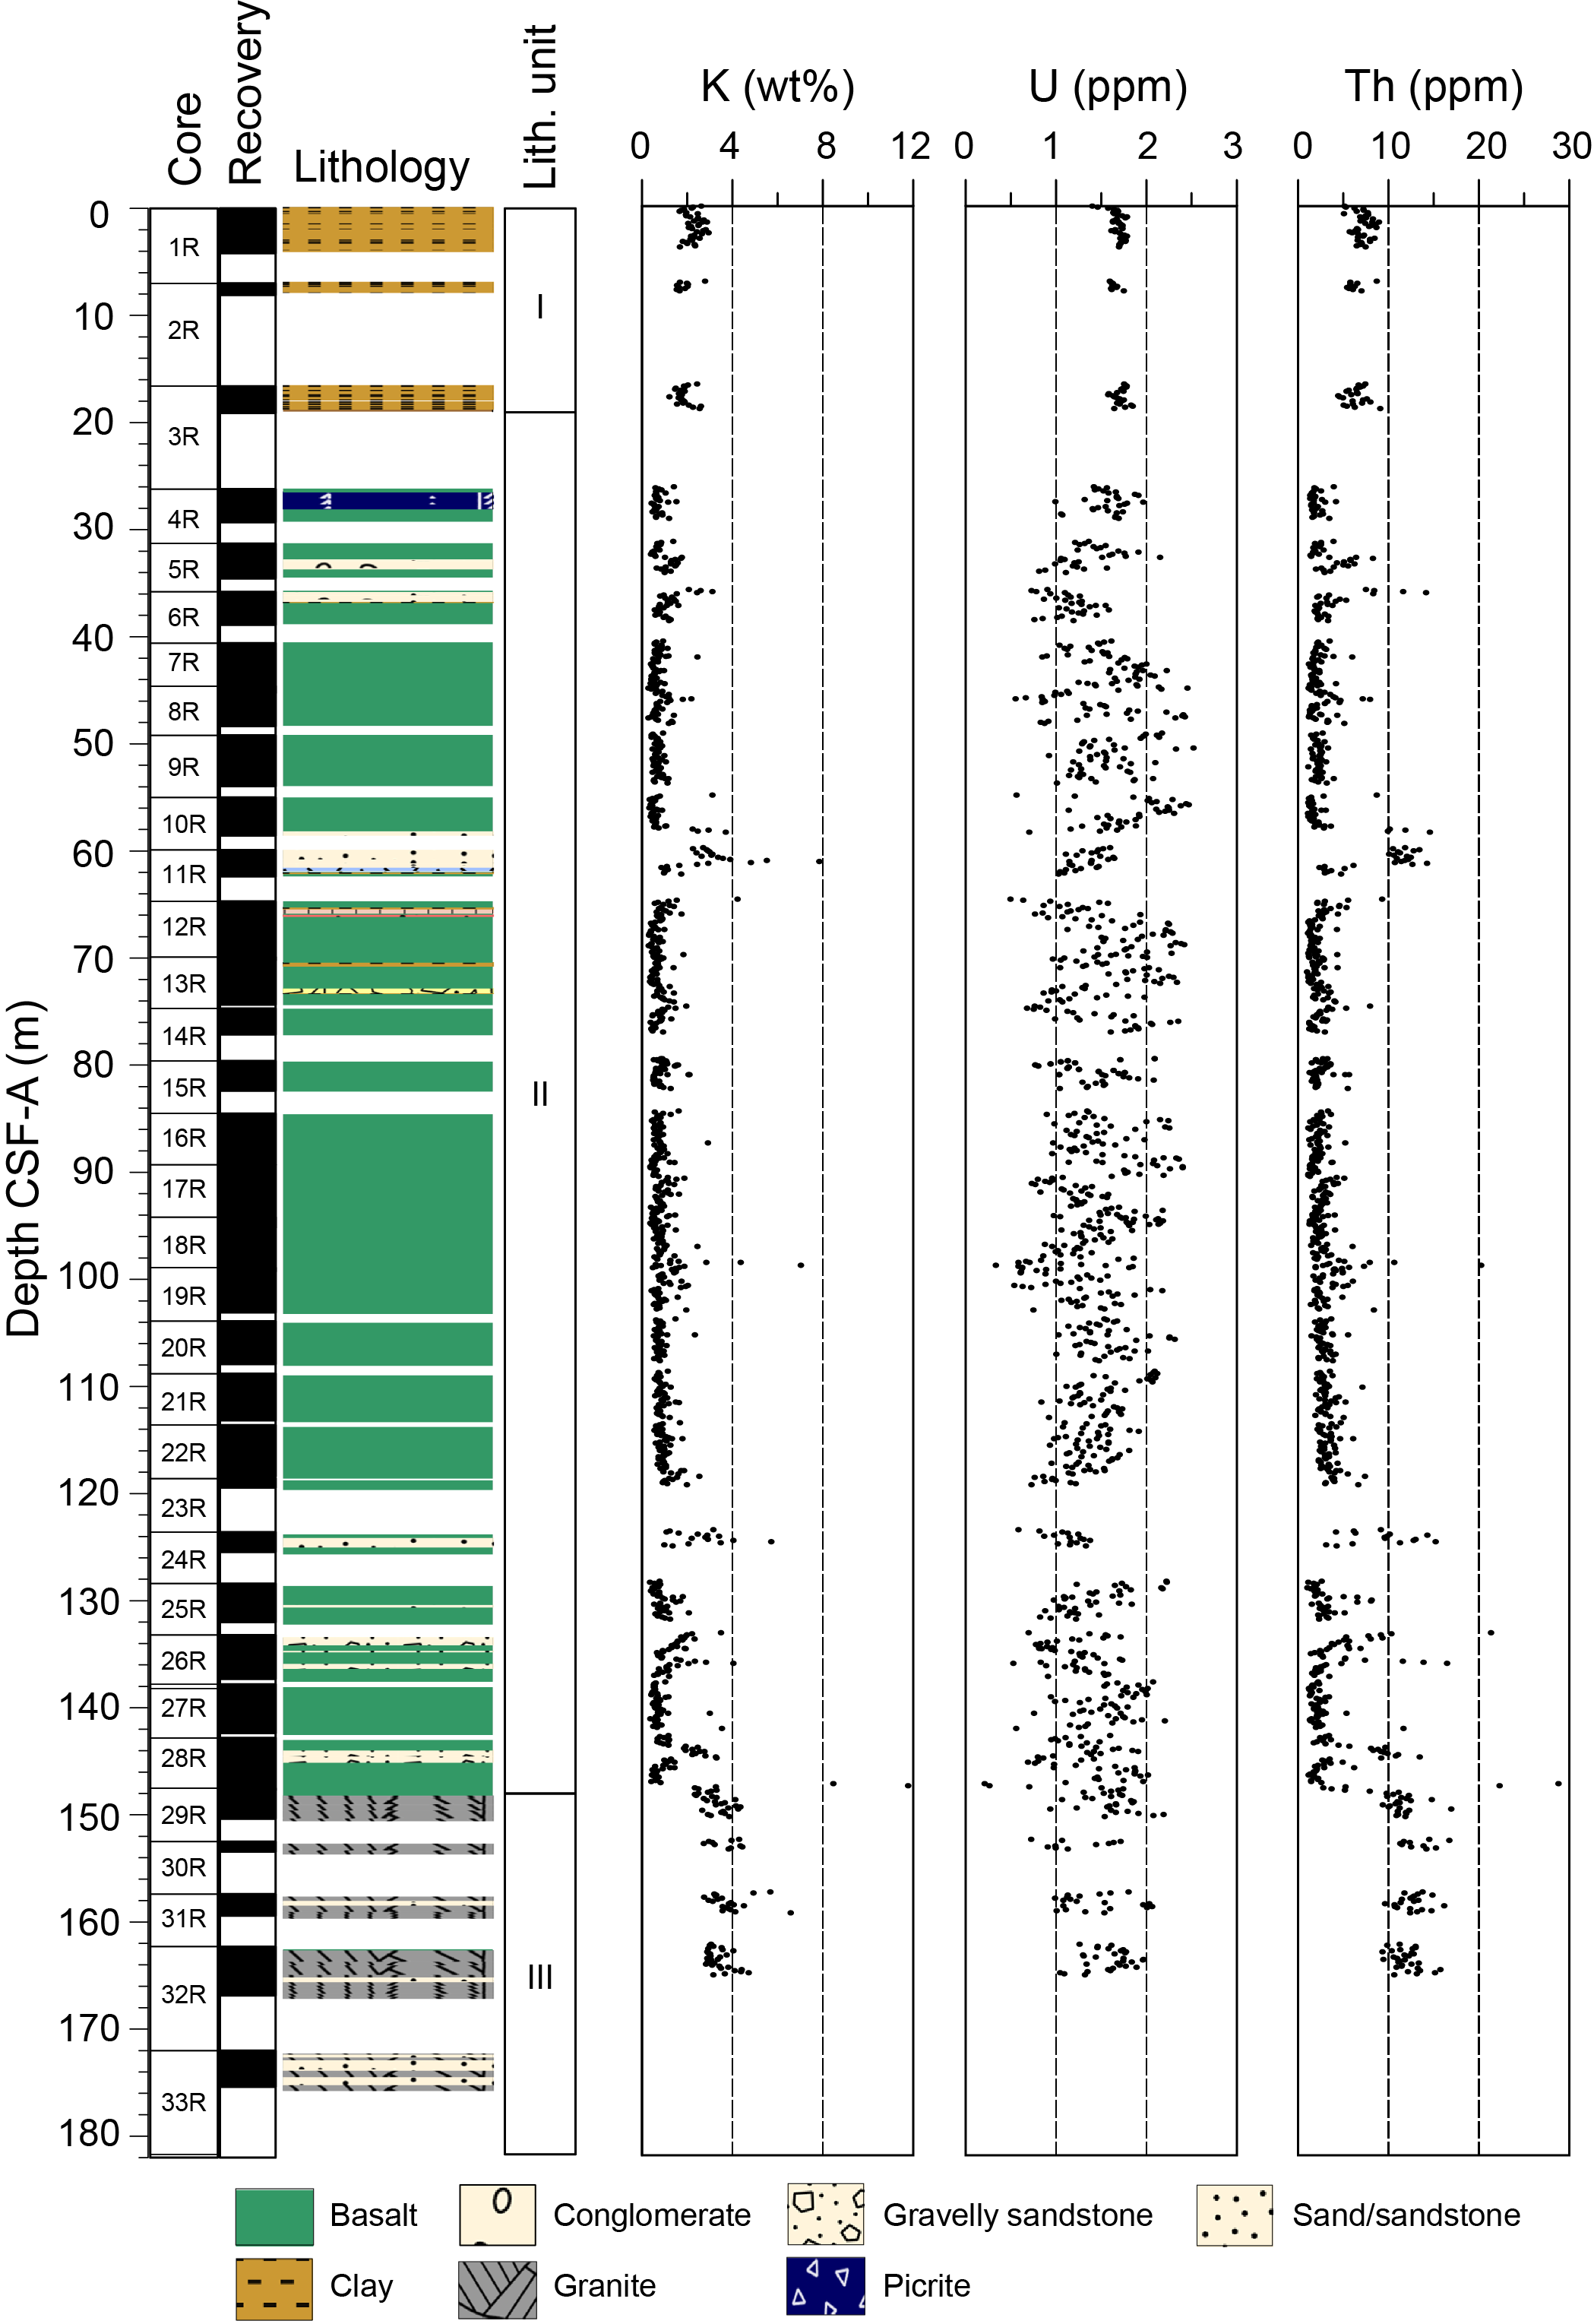
Figure F22. NGR.
6.1.3. X-ray diffraction
XRD analysis indicates the sediments are composed of calcite, clay minerals, and quartz. The analyzed basalt samples show a range of mineralogic components, with pyroxene (e.g., diopside, augite) and clinopyroxene present in most samples and evidence for calcite in some samples (e.g., Sample 396-U1566A-13R-1, 105–106 cm). At the basalt/granite interface (Sample 29R-3, 13–14 cm), a range of clay minerals are present (zeolite, montmorillonite, and palygorskite), suggesting authigenic mineralization.
6.2. Organic geochemistry
6.2.1. Headspace gas
Methane values increase from 0.58 to 1.17 ppmv downcore, but these are very low and several orders of magnitude lower than unsafe concentrations. All other hydrocarbon gases are below detection limits in all samples.
6.2.2. Carbon, nitrogen, hydrogen, and sulfur
TIC content ranges from 1.1 wt% in the uppermost sample (2.95 m CSF-A) to 0.02 wt% by the base of the sediment (17.99 m CSF-A). Assuming TIC is purely representative of CaCO3, CaCO3 values range 0.2–11.3 wt% (Figure F23). Total carbon varies between 1.5 wt% at the top of the sediment and 0.1 wt% at the base. TOC ranges 0.03–0.21 wt%. All TOC/TN ratios are below 5, indicating marine organic matter (Müller and Mathesius, 1999) (Table T9). In all samples, sulfur values are below detection limits.
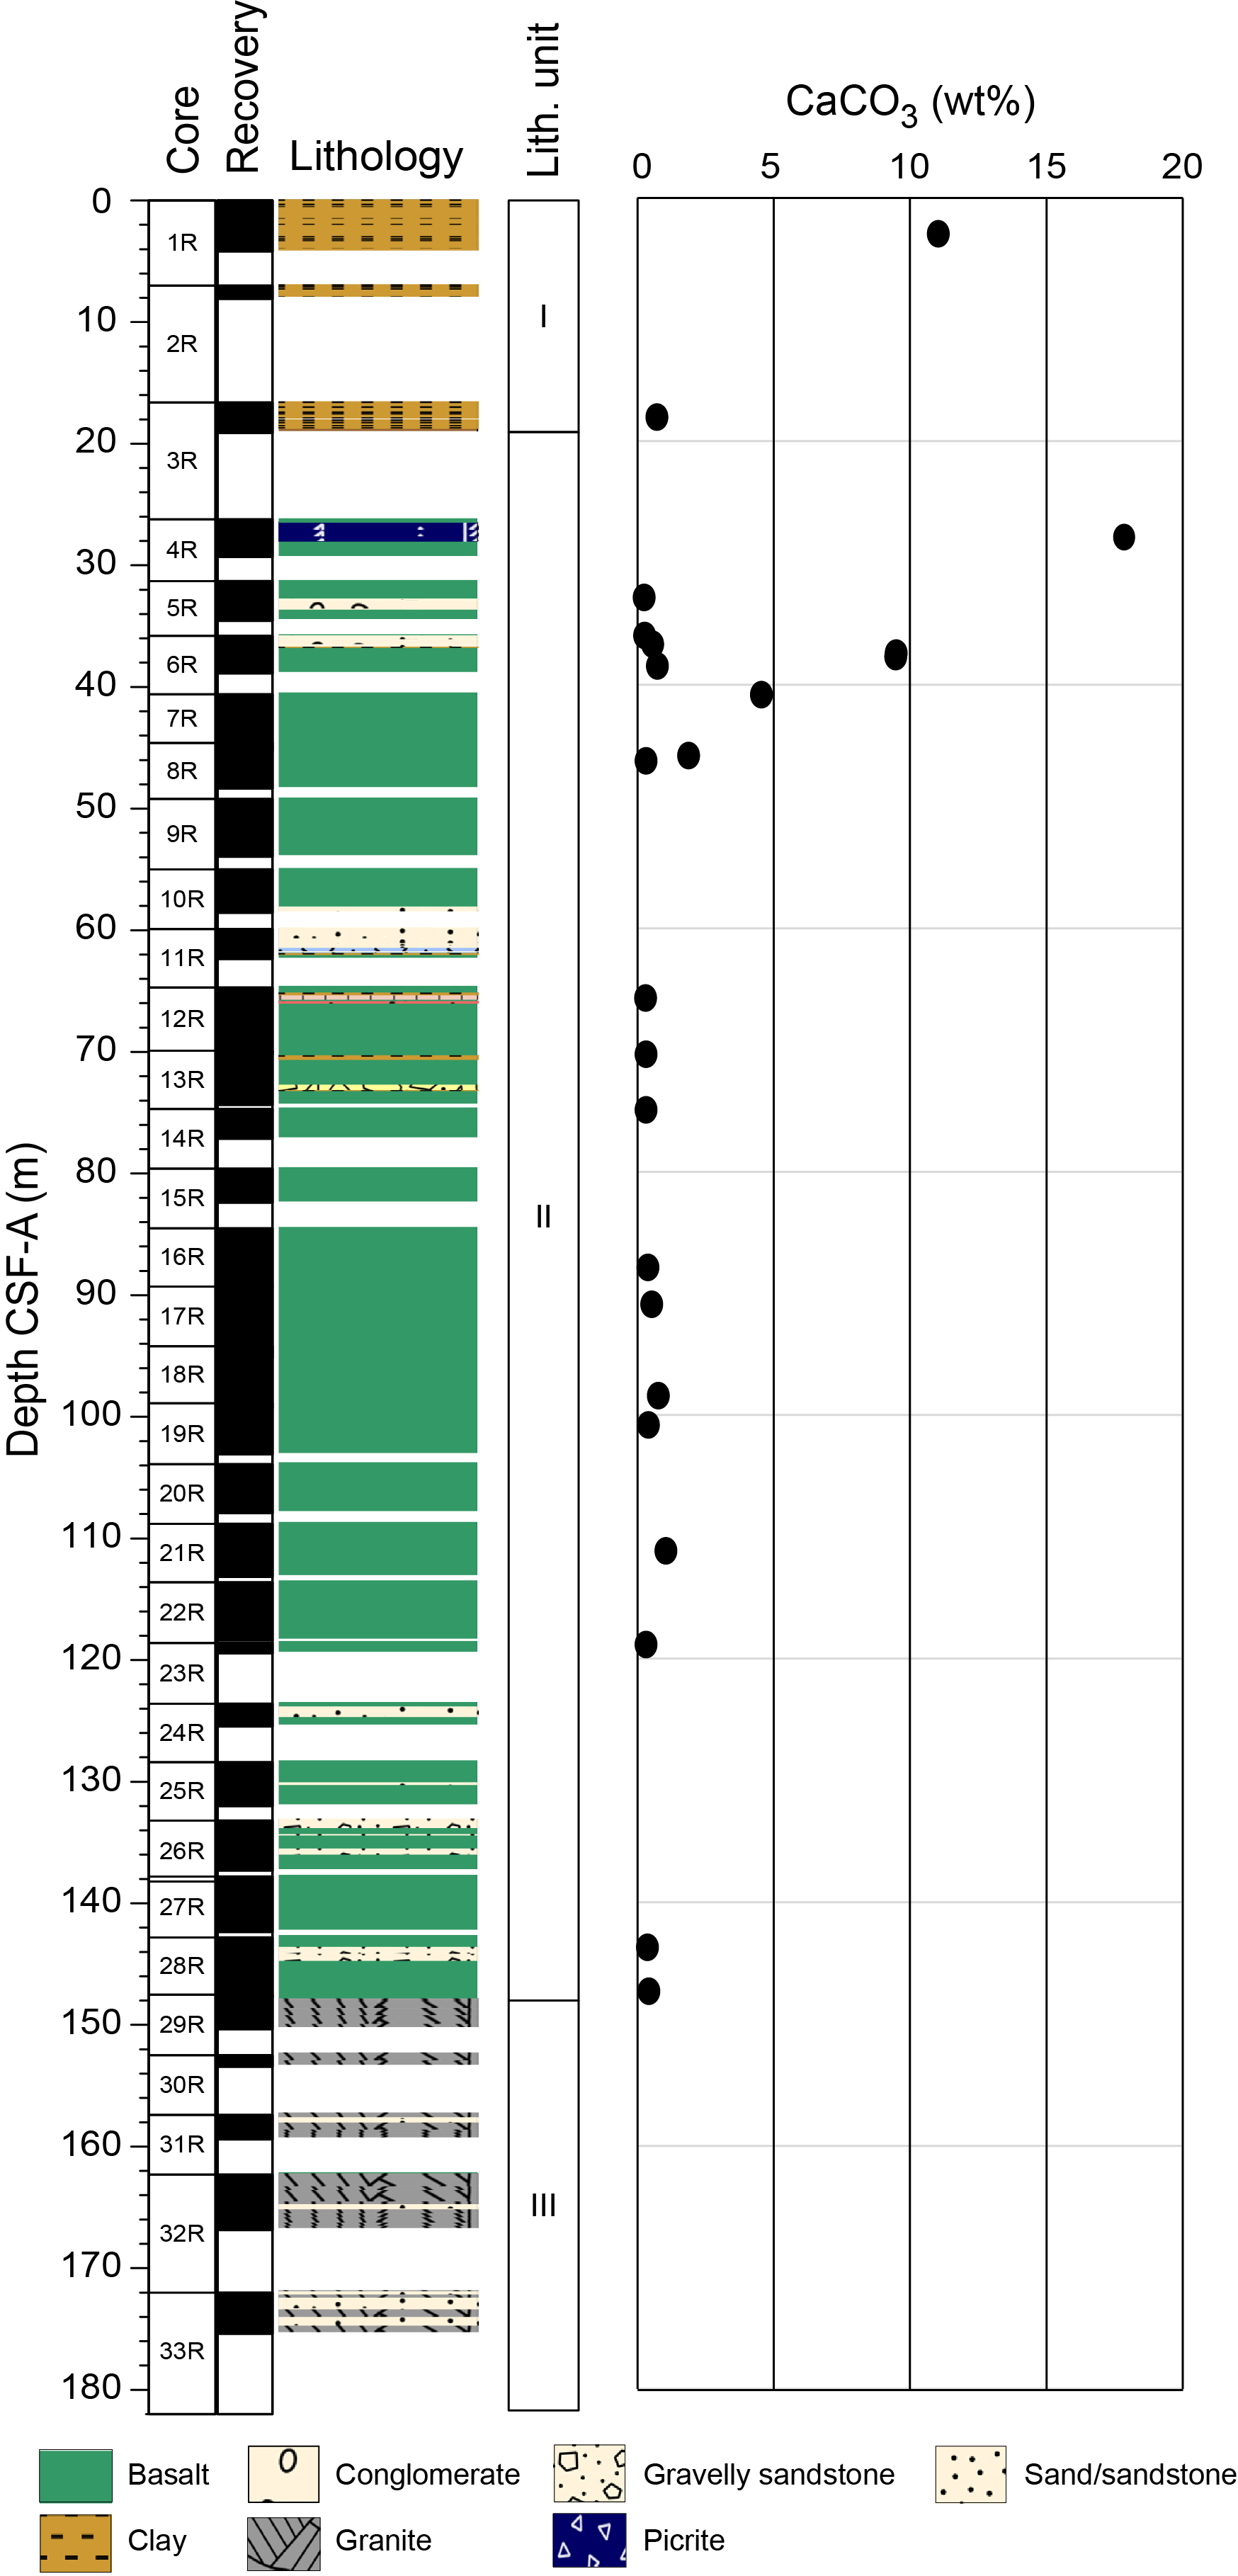
Figure F23. Calcium carbonate profile.
6.3. Microbiology
Two samples of a sediment layer located within the basalt flows were taken for postcruise microbiological analysis (Samples 396-U1566A-24R-1, 90–91 cm, and 24R-1, 116–117 cm). In both cases, material was taken from the palynology sample. Samples were immediately transferred to a −80°C freezer for storage.
6.4. Site summary
Because of the thin sediment cover, it is difficult to make any meaningful interpretations with the small number of IW and carbonate samples taken at Site U1566. The hard rock geochemistry indicates most of the sampled rocks are subalkaline and MORBs. Their low Ti content is consistent with previously sampled basalts in this area and with flood basalts from East Greenland. Downhole variations in some elements (e.g., MgO, TiO2, Ni, and Zr) suggest basalt unit changes and the recovery of numerous eruptive events. Pyroxene and clinopyroxenes dominate the mineralogy of the basalts, and minor calcite contributions represent alteration.
7. Physical properties
The one hole drilled at Site U1566 (Hole U1566A) encountered a succession with a thin clay-rich sedimentary package (Lithostratigraphic Unit I; Cores 1R–3R) overlying a thick sequence of basaltic lava flows interlayered with thin sedimentary layers (Unit II; Cores 4R–29R) above a deeply weathered granitic basement with sandstone interlayers (Unit III; Cores 29R–33R) (Figure F24).
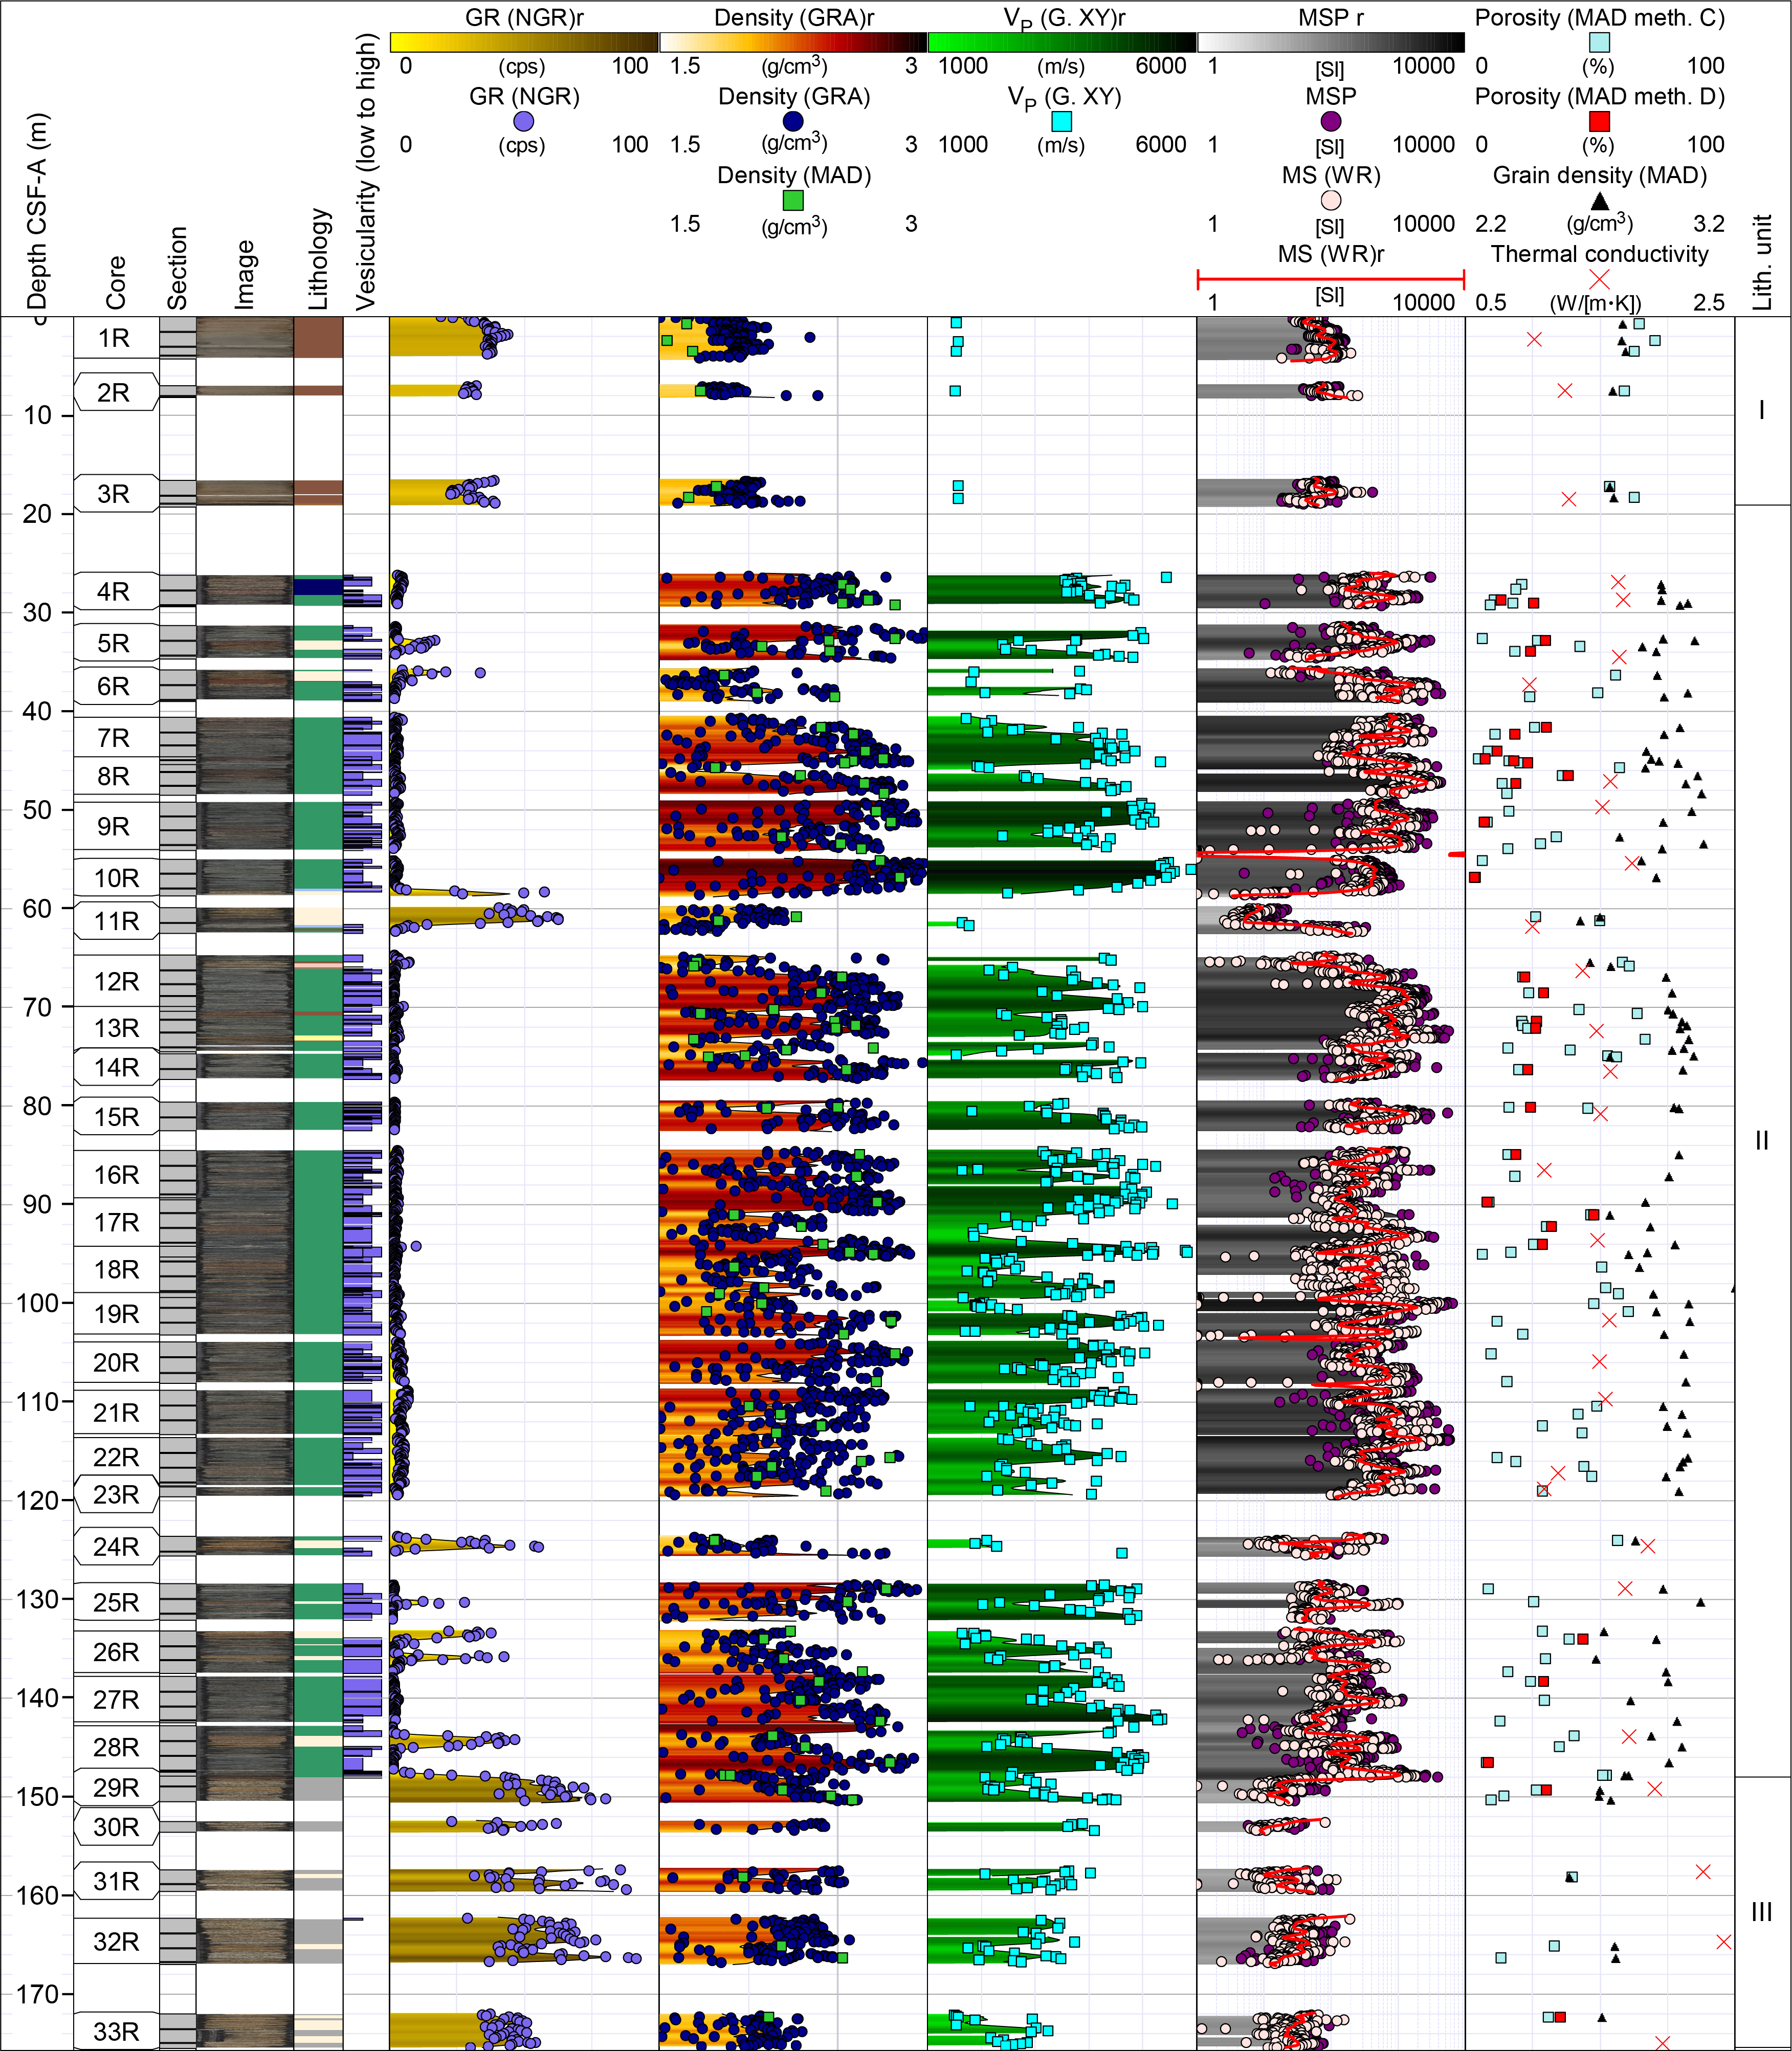
Figure F24. Physical properties summary.
Physical properties were measured and screened on all whole-round cores, working-half sections, and discrete samples (see Physical properties in the Expedition 396 methods chapter [Planke et al., 2023a]).
7.1. Data summary and postprocessing
A total of 9490 Whole-Round Multisensor Logger (WRMSL) measurements were taken, of which 4657 were gamma ray attenuation (GRA) bulk densities, 4616 were MS, and 220 were P-wave velocities, supplementing 1222 NGR and 94 thermal conductivity measurements. A total of 102 discrete samples were taken for moisture and density (MAD) analysis and triaxial P-wave velocity testing. Close to 600 Section Half Measurement Gantry (SHMG) P-wave caliper (PWC) P-wave velocities and 2219 point magnetic susceptibilities (MSPs) were measured on the working-half sections.
Standard processing and screening was applied for quality assessment of the data sets (see Physical properties in the Expedition 396 methods chapter [Planke et al., 2023a]). The processing of GRA bulk densities applied minimum threshold values of 1.2 g/cm3 to Unit I and 1.5 g/cm3 to Units II and III. Processing removed 1951 GRA bulk density values (1414 within ± 1.5 cm of liner bins, 2 below the sediment threshold, and 537 below the hard rock threshold), 5 (negative) MS values, and 39 unreliable readings (error = >20% counts/s) from the Natural Gamma Radiation Logger (NGRL). This discussion relates to the processed data unless otherwise stated.
7.2. Hole U1566A
7.2.1. Unit I: overburden sediments
Cores 396-U1566A-1R through 3R (0–26 m CSF-A) resulted in a combined recovery of ~7 m. P-wave velocities measured on the whole-round cores vary from 1489 to 2909 m/s (mean = 1578 m/s) and generally compare well with SHMG section-half measurements (Figure F25; Table T10). MAD samples were collected from Sections 1R-1 through 1R-3, as well as one each from Sections 2R-1, 3R-1, and 3R-2. Discrete bulk densities range 1.54–1.82 g/cm3 (average = 1.68 g/cm3; n = 6), and grain densities vary from 2.74 to 2.80 g/cm3 (average = 2.76 g/cm3; n = 6). Whole-round GRA bulk density varies from 1.51 to 2.10 g/cm3, and MS values reach as high as 272.9 × 10⁻⁵ [SI] with a mean of 77.7 × 10⁻⁵ [SI]. Section-half MS measurements taken using the Section Half Multisensor Logger (SHMSL) yielded slightly higher values, reaching as high as 414.2 × 10⁻⁵ [SI] (mean = 86.9 × 10⁻⁵ [SI]). Thermal conductivity was measured for Sections 1R-2, 2R-1, and 3R-2 and yielded values of 0.8, 1.248, and 1.238 W/(m·K), respectively (average = 1.2 W/[m·K]). The NGR values for the overburden sediments vary from 23 to 44 counts/s (average = 34 counts/s).
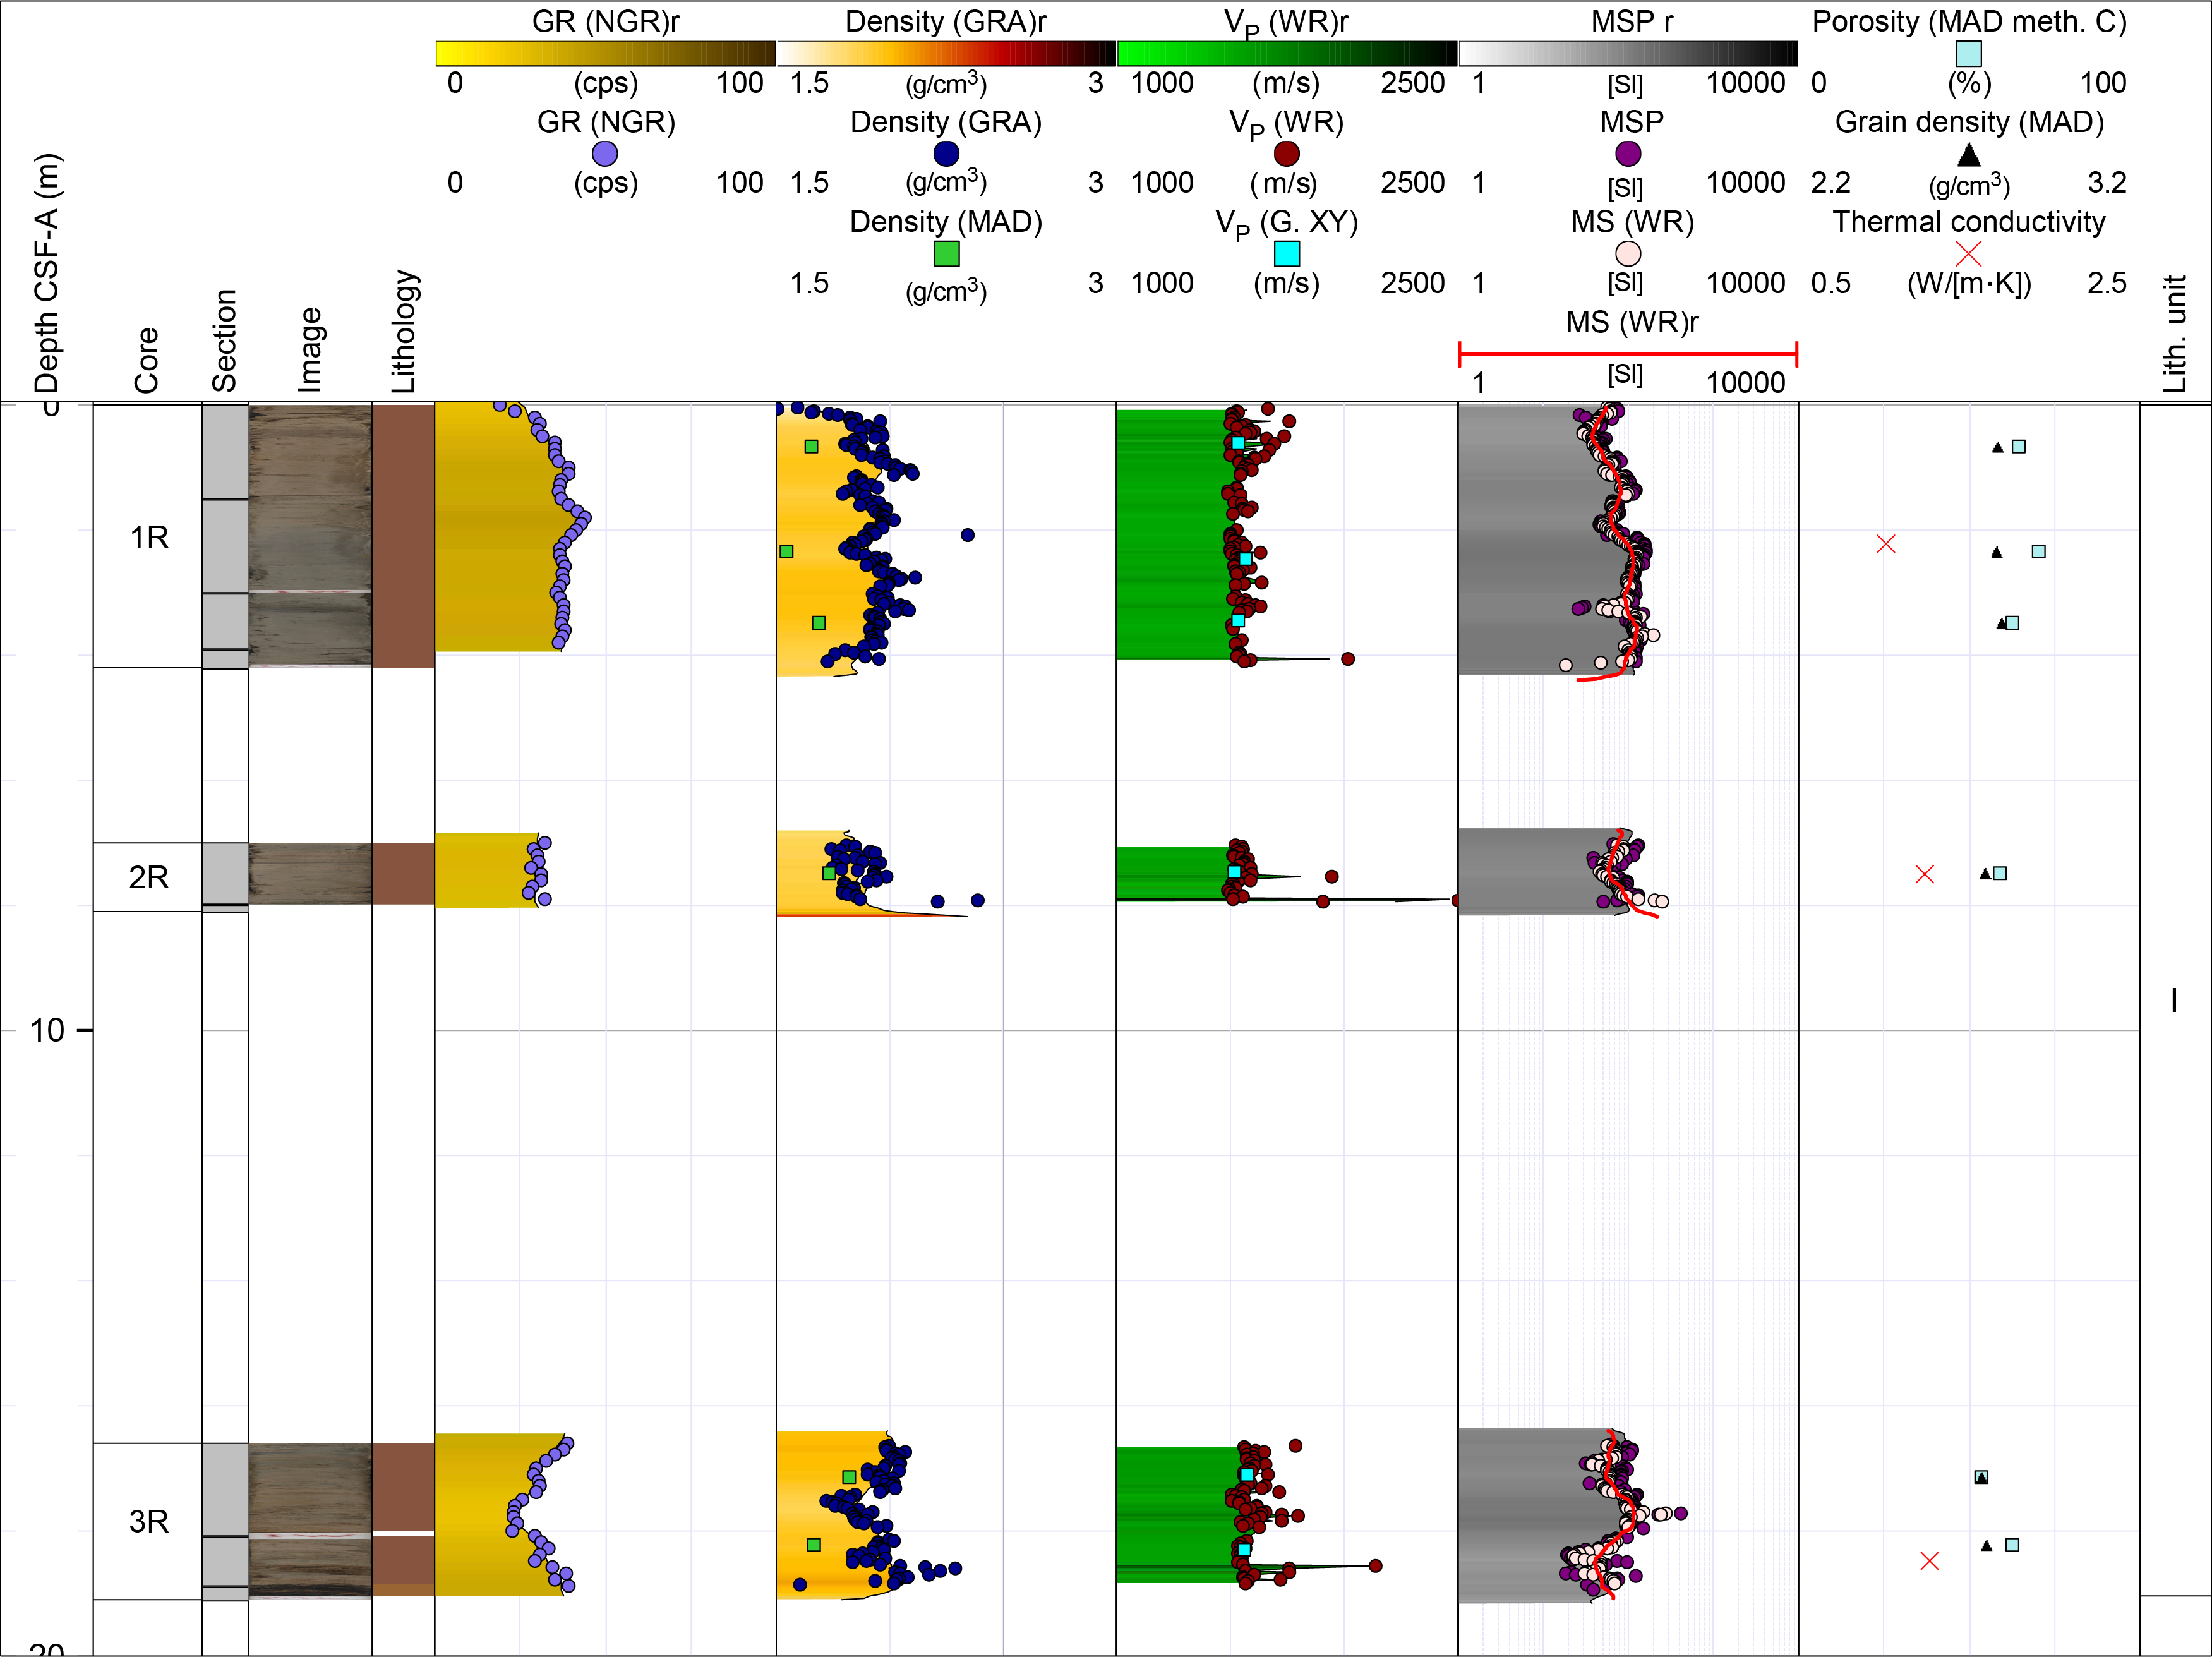
Figure F25. Physical properties.
7.2.2. Unit II: volcano-sedimentary sequence
Cores 396-U1566A-4R through 29R penetrated a ~121 m thick volcanic interval dominated by basaltic lava flows interlayered with mixed volcaniclastic to siliciclastic sediments with nearly 80% recovery. The full physical properties analytical work program for hard rocks was followed and resulted in a high-resolution physical property data set (Figure F24).
The basaltic nature of the lava sequence is confirmed by the very low NGR counts (typically <10 counts/s) for all the effusive units, and the intervolcanic sediments range from equivalently low values consistent with basalt-derived volcaniclastic material to sediments with NGR readings as high as 63 counts/s associated with sediment layers, including weathered granitic material. Within the basaltic sequence, a subtle shift in baseline NGR occurs throughout Cores 19R–22R, and the basalt baseline increases from a background of ~2.5 counts/s above and below to as high as ~4.5 counts/s over this interval. Similar subtle background shifts in basaltic NGR trends are commonly linked to petrological variations seen in other subsurface volcanic sequences within the province (e.g., Millett et al., 2022) and may be linked to provisional chemical variations identified using pXRF analysis (see Geochemistry).
High-resolution SHMG P-wave measurements were taken throughout the cored hard rock section. Removing section halves from the core liner for these measurements returned superior signals compared to the within-liner method and in turn enabled significantly more measurements per core section. First arrival picks for P-wave measurements were manually quality controlled and revised from the automatic picking function that often underestimated velocity by 10–300 m/s (as much as ~5%) for fresh samples with good signal and often became unreliable for noisier signals, such as those from within interlava sediments or deeply altered vesicular basalt. Discrete measurements of P-wave velocity in the x-, y-, and z-orientations (saturated and dry) were also made on hard rock cubes that were also measured for remanent magnetism. Velocity measurements revealed a reduction in velocity of ~12%–15% when measured saturated versus dry (Table T11).
An extensive suite of MAD analyses (count = 89) (Table T10) was made for the volcanic sequence, incorporating a range of volcanic and sedimentary interlayers from both core fragments and 8 cm3 cubes (at least one per core; total = 39). MAD bulk densities range 1.69–2.84 g/cm3, and associated grain densities range 2.63–3.24 g/cm3; both ranges were deemed to be acceptable for the encountered lithologies.
Calculated porosities derived from the MAD Method C protocol gave extremely high values—as high as ~66.6% for certain altered vesicular basalt and clay-rich sedimentary interlayers. These elevated values are inferred to relate to a combination of clay and zeolite contents in the samples, and as such, the Method C results must be used with caution because these values clearly do not relate exclusively or even primarily to “effective” porosity.
MAD Method D, measured on cubes, gives more reliable effective porosity results. In most cases, however, the highly altered or clay-rich sediments did not yield usable cubes because of their soft nature, so using Method C on rock fragments was often the only possible approach. Porosity results should therefore be appraised carefully for lithotype and clay percentage. Generally, very close correspondence between MAD methods results is achieved for all fresher/harder samples where cubes could be cut.
In total, 23 successful thermal conductivity measurements were made across a range of lithologies within the volcano-sedimentary interval, and values range 1–1.9 W/(m·K) (average = 1.5 W/[m·K]). MS values in the volcanic hard rock sequence are significantly higher than those of the overlying soft sediments.
Combined high-resolution discrete (PWC P-wave velocity) measurements on the section-half cores along with whole-round track (WRMSL) measurements are presented in Figure F24 as interpolated traces that give a first approximation of the likely log characteristics of the sequence. A running average of 50 cm with a maximum interpolation gap of 50 cm was applied, and vertical-colored fills were added to highlight the dynamic variations through the sequence.
In an expanded sequence of the volcanic to granitic basement complex (Figure F26), clear asymmetrical physical property profiles diagnostic of simple lava flows and the more serrated physical property motifs of compound lava flows (Planke, 1994; Nelson et al., 2009; Millett et al., 2022) are visible in the interpolated traces. These features are consistent with the recovered core observations (see Lithostratigraphy). MS clearly increases toward weathered lava flow tops and bases, a feature noted from other similar character lava sequences in the region (Planke, 1994).
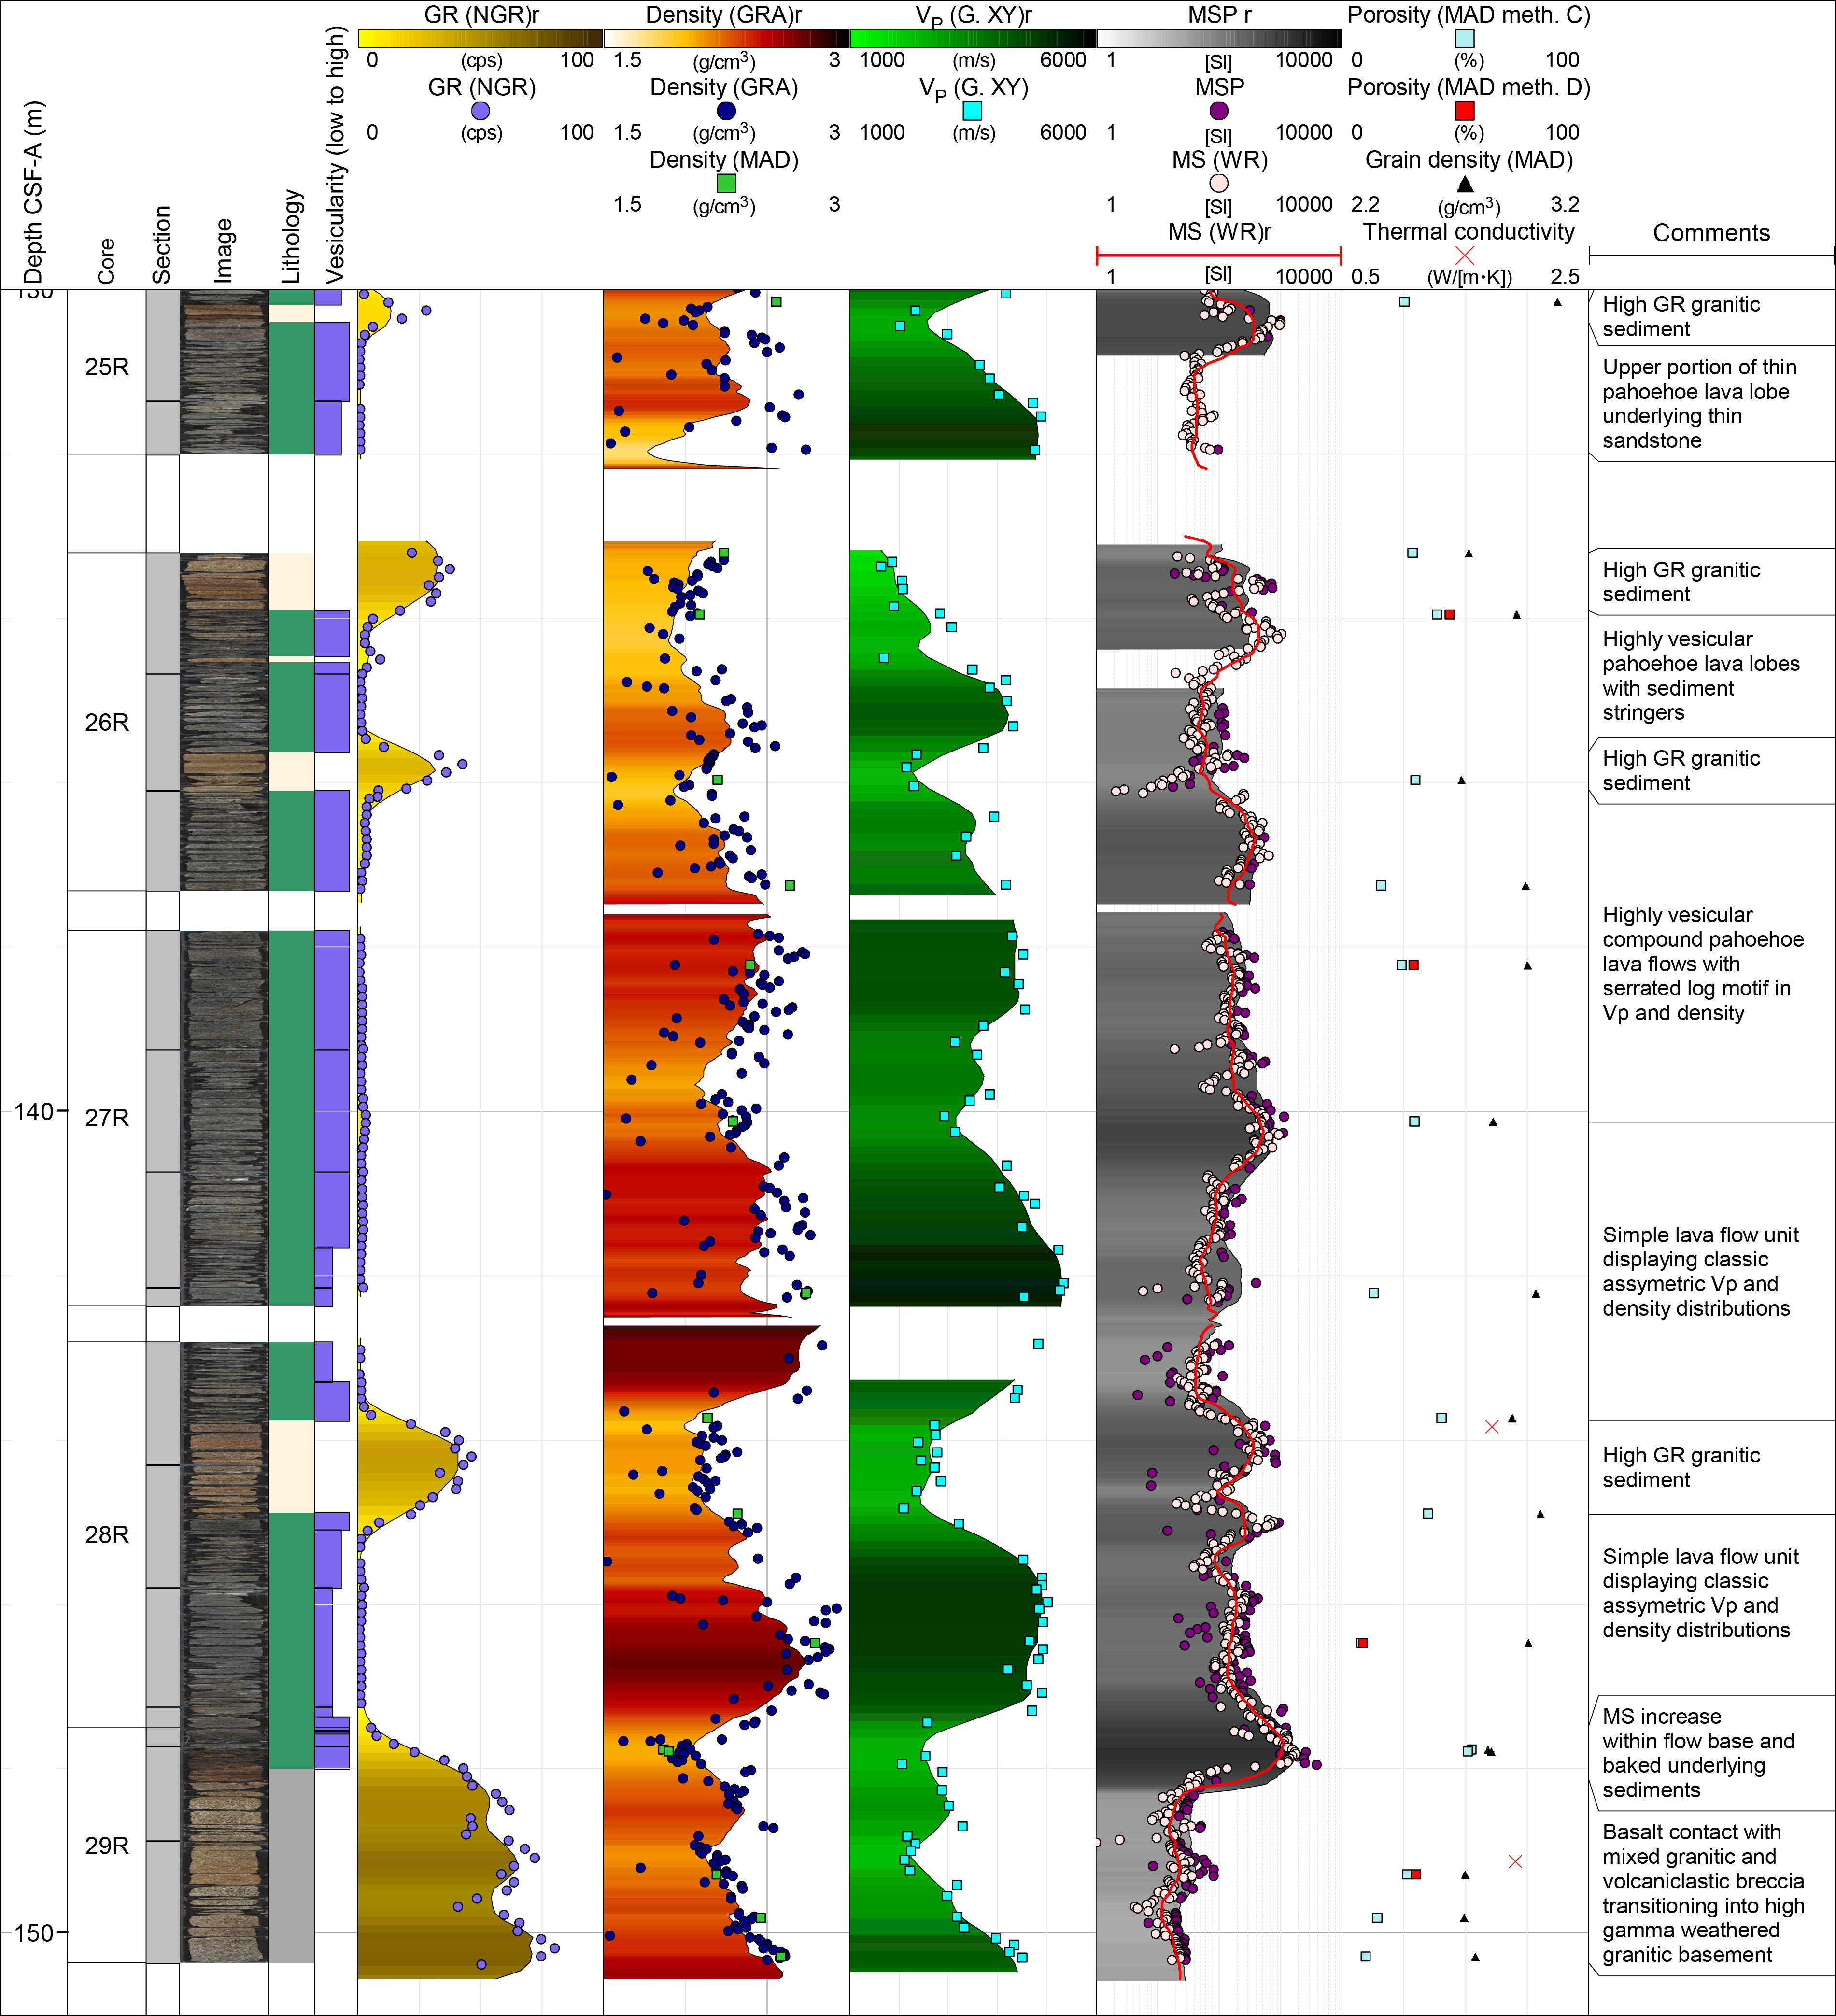
Figure F26. Expanded physical properties.
7.2.3. Unit III: basement
Cores 396-U1566A-29R through 33R penetrated a granitic basement sequence with thin sandstone stringers and resulted in a combined recovery of ~12 m (34%) (Figure F27). The full physical properties analytical work program for hard rocks was followed. Discrete x-, y-, and z-orientation (one per core) and high-resolution SHMG P-wave velocity measurements throughout the cored hard rock section produced significantly lower velocities than those recorded for the overlying basalt (Table T11).
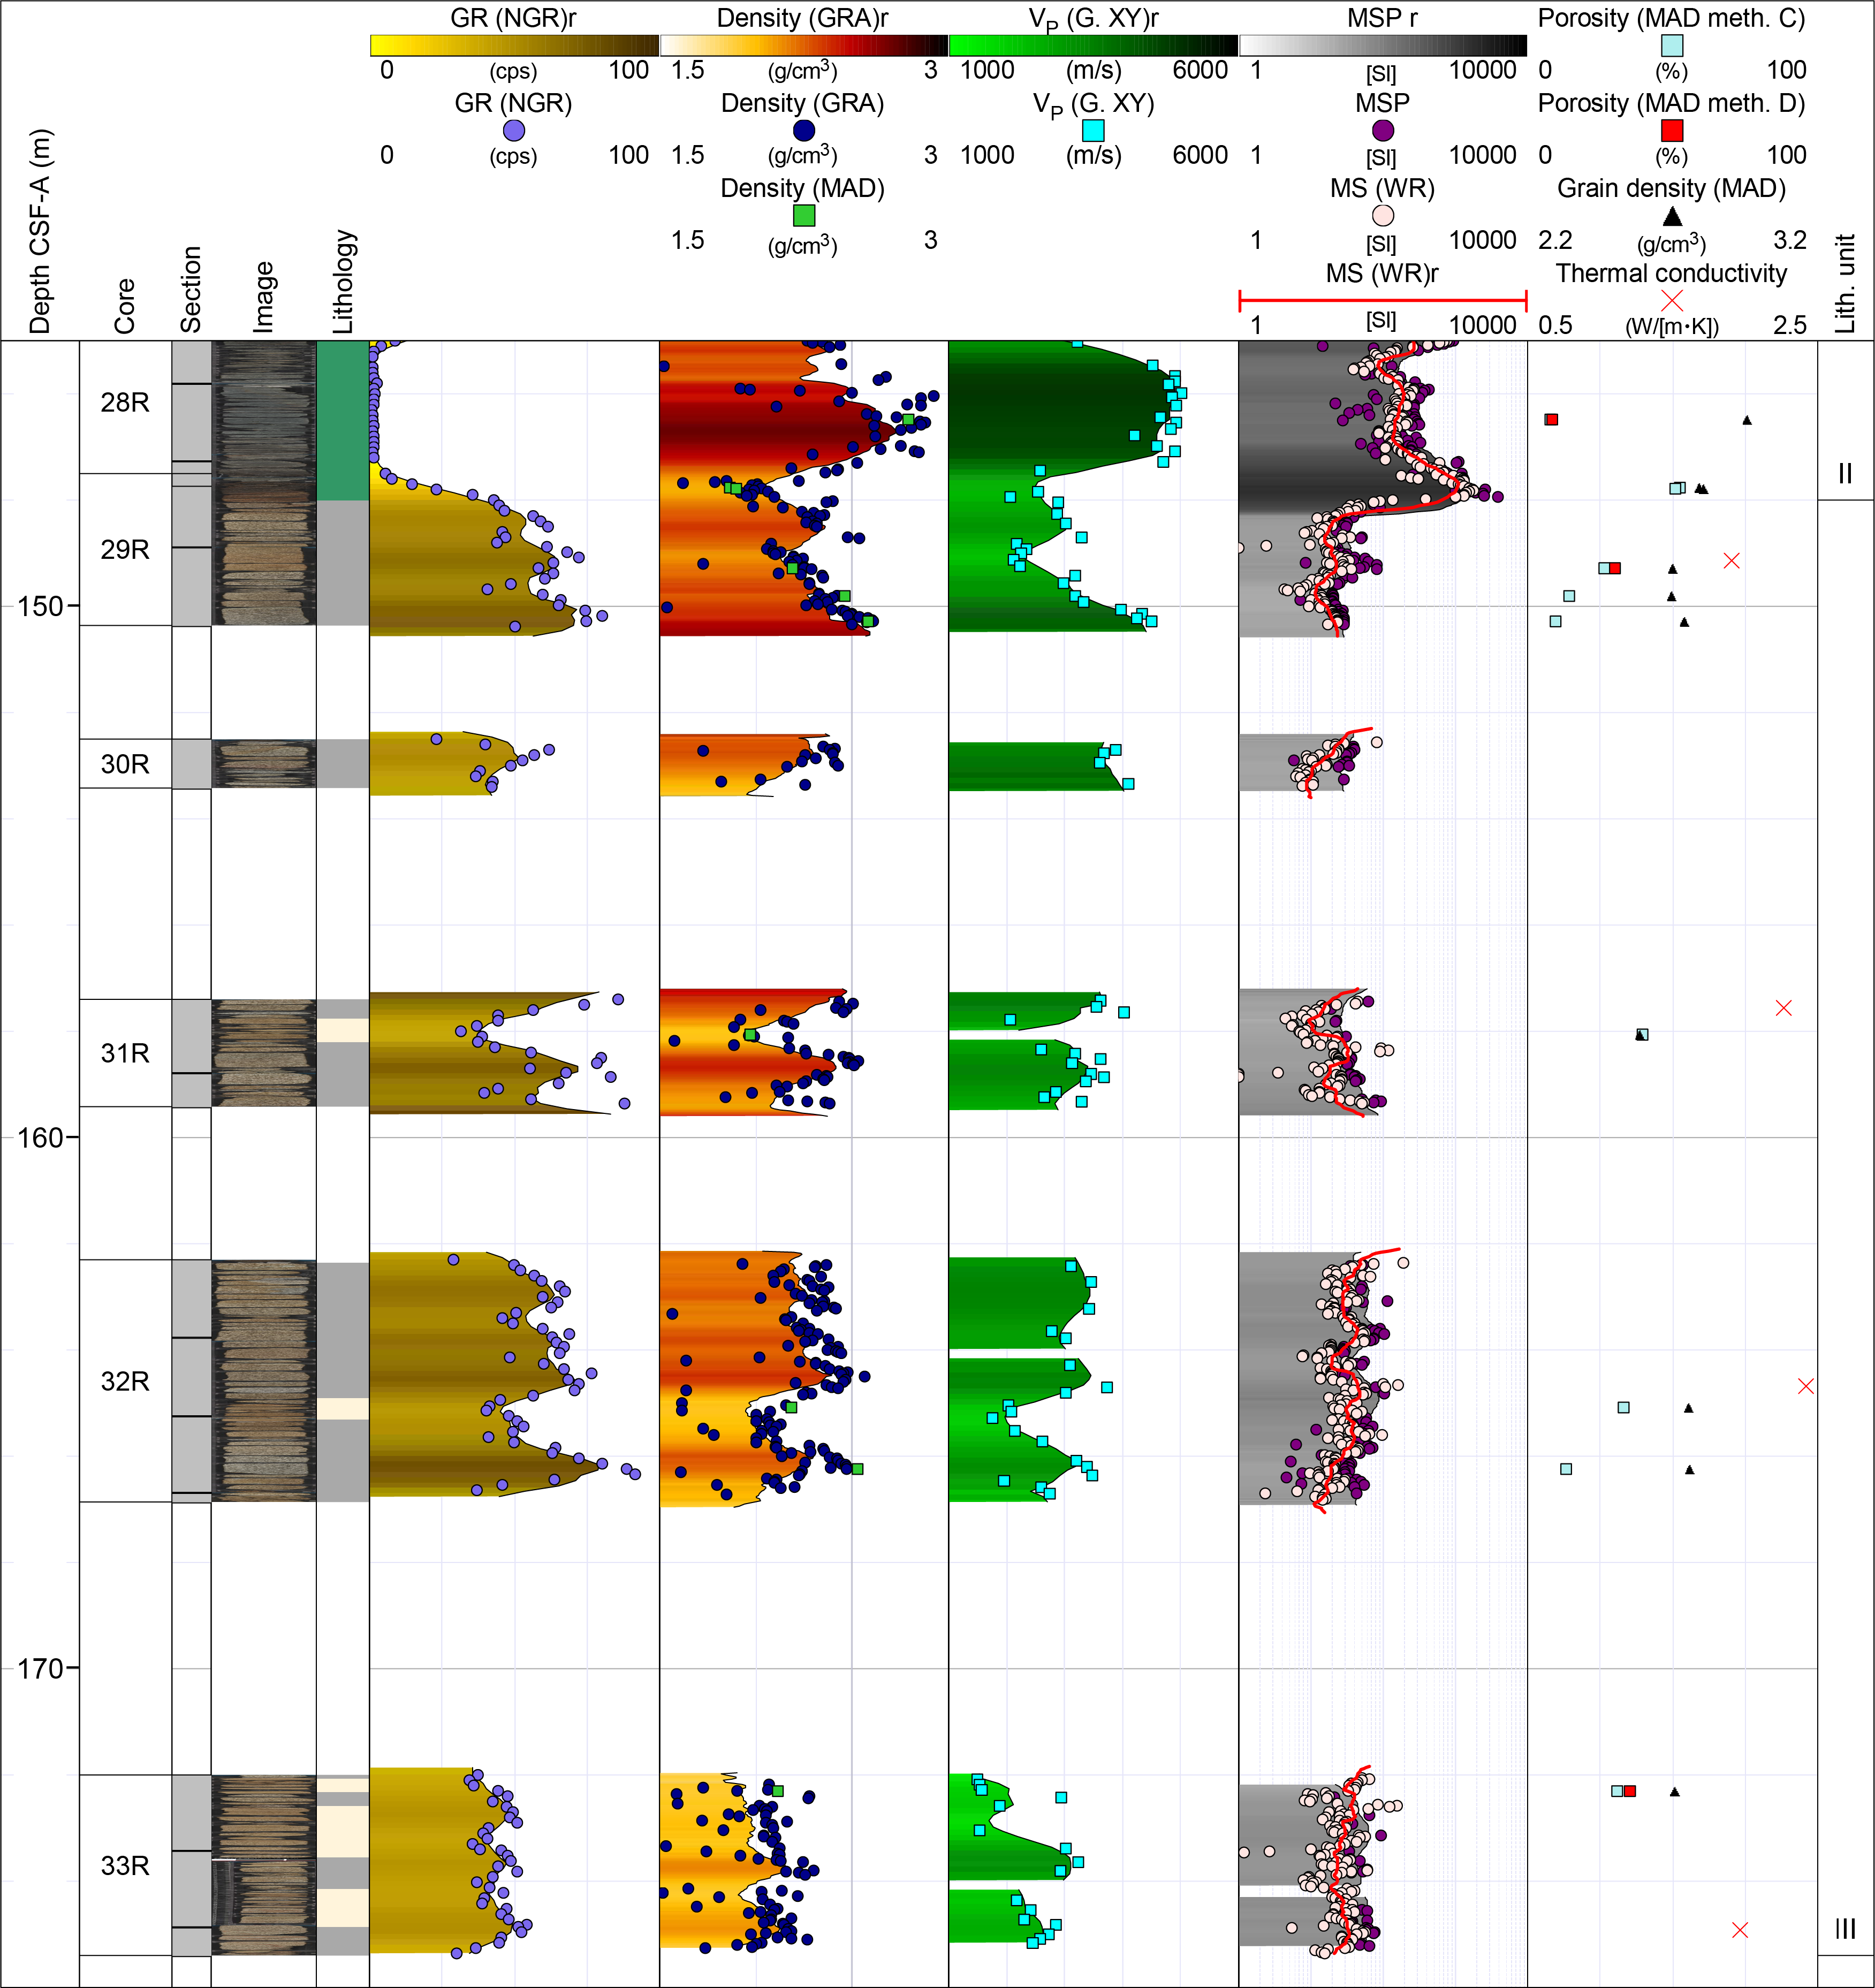
Figure F27. Granitic basement physical properties.
NGR data from the granite are significantly higher than either overlying unit by a factor of 1.5 for sediments and 10 for basalt sequences. Whole-round MS measurements reach as high as 193.5 × 10⁻⁵ [SI] with a mean of 26.2 × 10⁻⁵ [SI], and section-half MSP measurements give a slightly higher mean of 40.7 × 10⁻⁵ [SI].
Thermal conductivity was measured for Sections 29R-2, 31R-1, 32R-2, and 33R-2 and resulted in a mean of 2.1 W/(m·K).
7.3. Summary
Hole U1566A penetrated three lithostratigraphic units, including a thin ~26 m thick clay-dominated package (Lithostratigraphic Unit I) overlying a ~148 m thick lava-dominated sequence with sediment interlayers (Lithostratigraphic Unit II), which in turn overlies the granitic basement with sandstone stringers (Lithostratigraphic Unit III; see Lithostratigraphy). An extensive suite of physical properties were measured, including near-continuous gantry P-wave measurements and MAD density and porosity measurements enabling high-resolution core-log comparison. P-wave gantry measurements give clear reductions in P-wave velocity with both increasing vesicular porosity and degree of alteration for the basaltic cores revealing vertical velocity distributions typical of lava flow units. Coarse grained interlava sediments reveal high NGR similar to the Unit III granites and in clear contrast to the generally low background NGR of the basaltic composition lava flows.
8. Downhole measurements
After coring was completed, Hole U1566A was prepared for logging and the drill pipe was pulled back to a logging depth of ~47 m wireline log depth below seafloor (WSF). Four separate logging runs were completed, including the modified triple combo, VSI, FMS-sonic, and UBI tool strings (see Downhole measurements in the Expedition 396 methods chapter [Planke et al., 2023a]) (Table T12).
The triple combo logging run captured the sequence from just above seafloor to 145 m WSF, where an obstruction (not passable after several attempts) near the base of the volcanic sequence prevented access to the lower ~34 m of the hole. Three passes, including a down, main, and repeat logging run, were recorded. Data from the main logging run is presented in this section unless otherwise stated. The Hostile Environment Natural Gamma Ray Sonde (HNGS) was run on all logging trips through the drill pipe to identify the seafloor, which shows a clear increase in gamma ray (GR), and to depth match the different logging runs.
The VSI tool string was run next and was similarly unable to pass the hole obstruction at 145 m WSF. Several air gun source shots were fired at each of eight VSI downhole positions (secured by caliper arm) spaced at 10 m intervals in the open hole section, yielding good results, and a further three experiments were carried out within the drill pipe, none of which yielded usable results because of the high noise level linked to pipe movement. The VSI tool string is the shortest of the four runs, and the HNGS therefore reached the deepest interval of the well during this logging run. The additional coverage proved to be highly useful because it reached a clear high GR marker bed beneath the otherwise low GR basalt sequence.
The FMS-sonic tool string was deployed after the VSI, and down (calipers closed), main, and repeat (both with calipers open) runs were performed from 145 to 90 m WSF. The UBI tool string was used for the fourth and final logging run, which was completed with two main runs from 145 m WSF to below casing at a speed of ~122 m/h to ensure image quality while operating with the highest resolution (500 kHz) tool setting.
All logging data were sent for processing and depth matching on shore at the Lamont-Doherty Earth Observatory and then sent back as a processed data package to the shipboard team. The depth scale for all wireline logs is presented as wireline log matched depth below seafloor (WMSF) in meters, whereas the associated core data is presented using the CSF-A depth scale in meters. No depth matching of core data to wireline is presented in this chapter. Therefore, comparisons between the separate measurements can have as much as a ~3.5 m offset in some sections (the seafloor 0 m CSF-A reference reads deeper when compared to the wireline WMSF). A summary of the main logging data is plotted in Figure F28. The hole condition is generally very good, with only minor hole enlargements occurring at ~57 (sandstone layer) and ~118 m WMSF (thin FMS C2 caliper expanded layer within basalt lava flows).
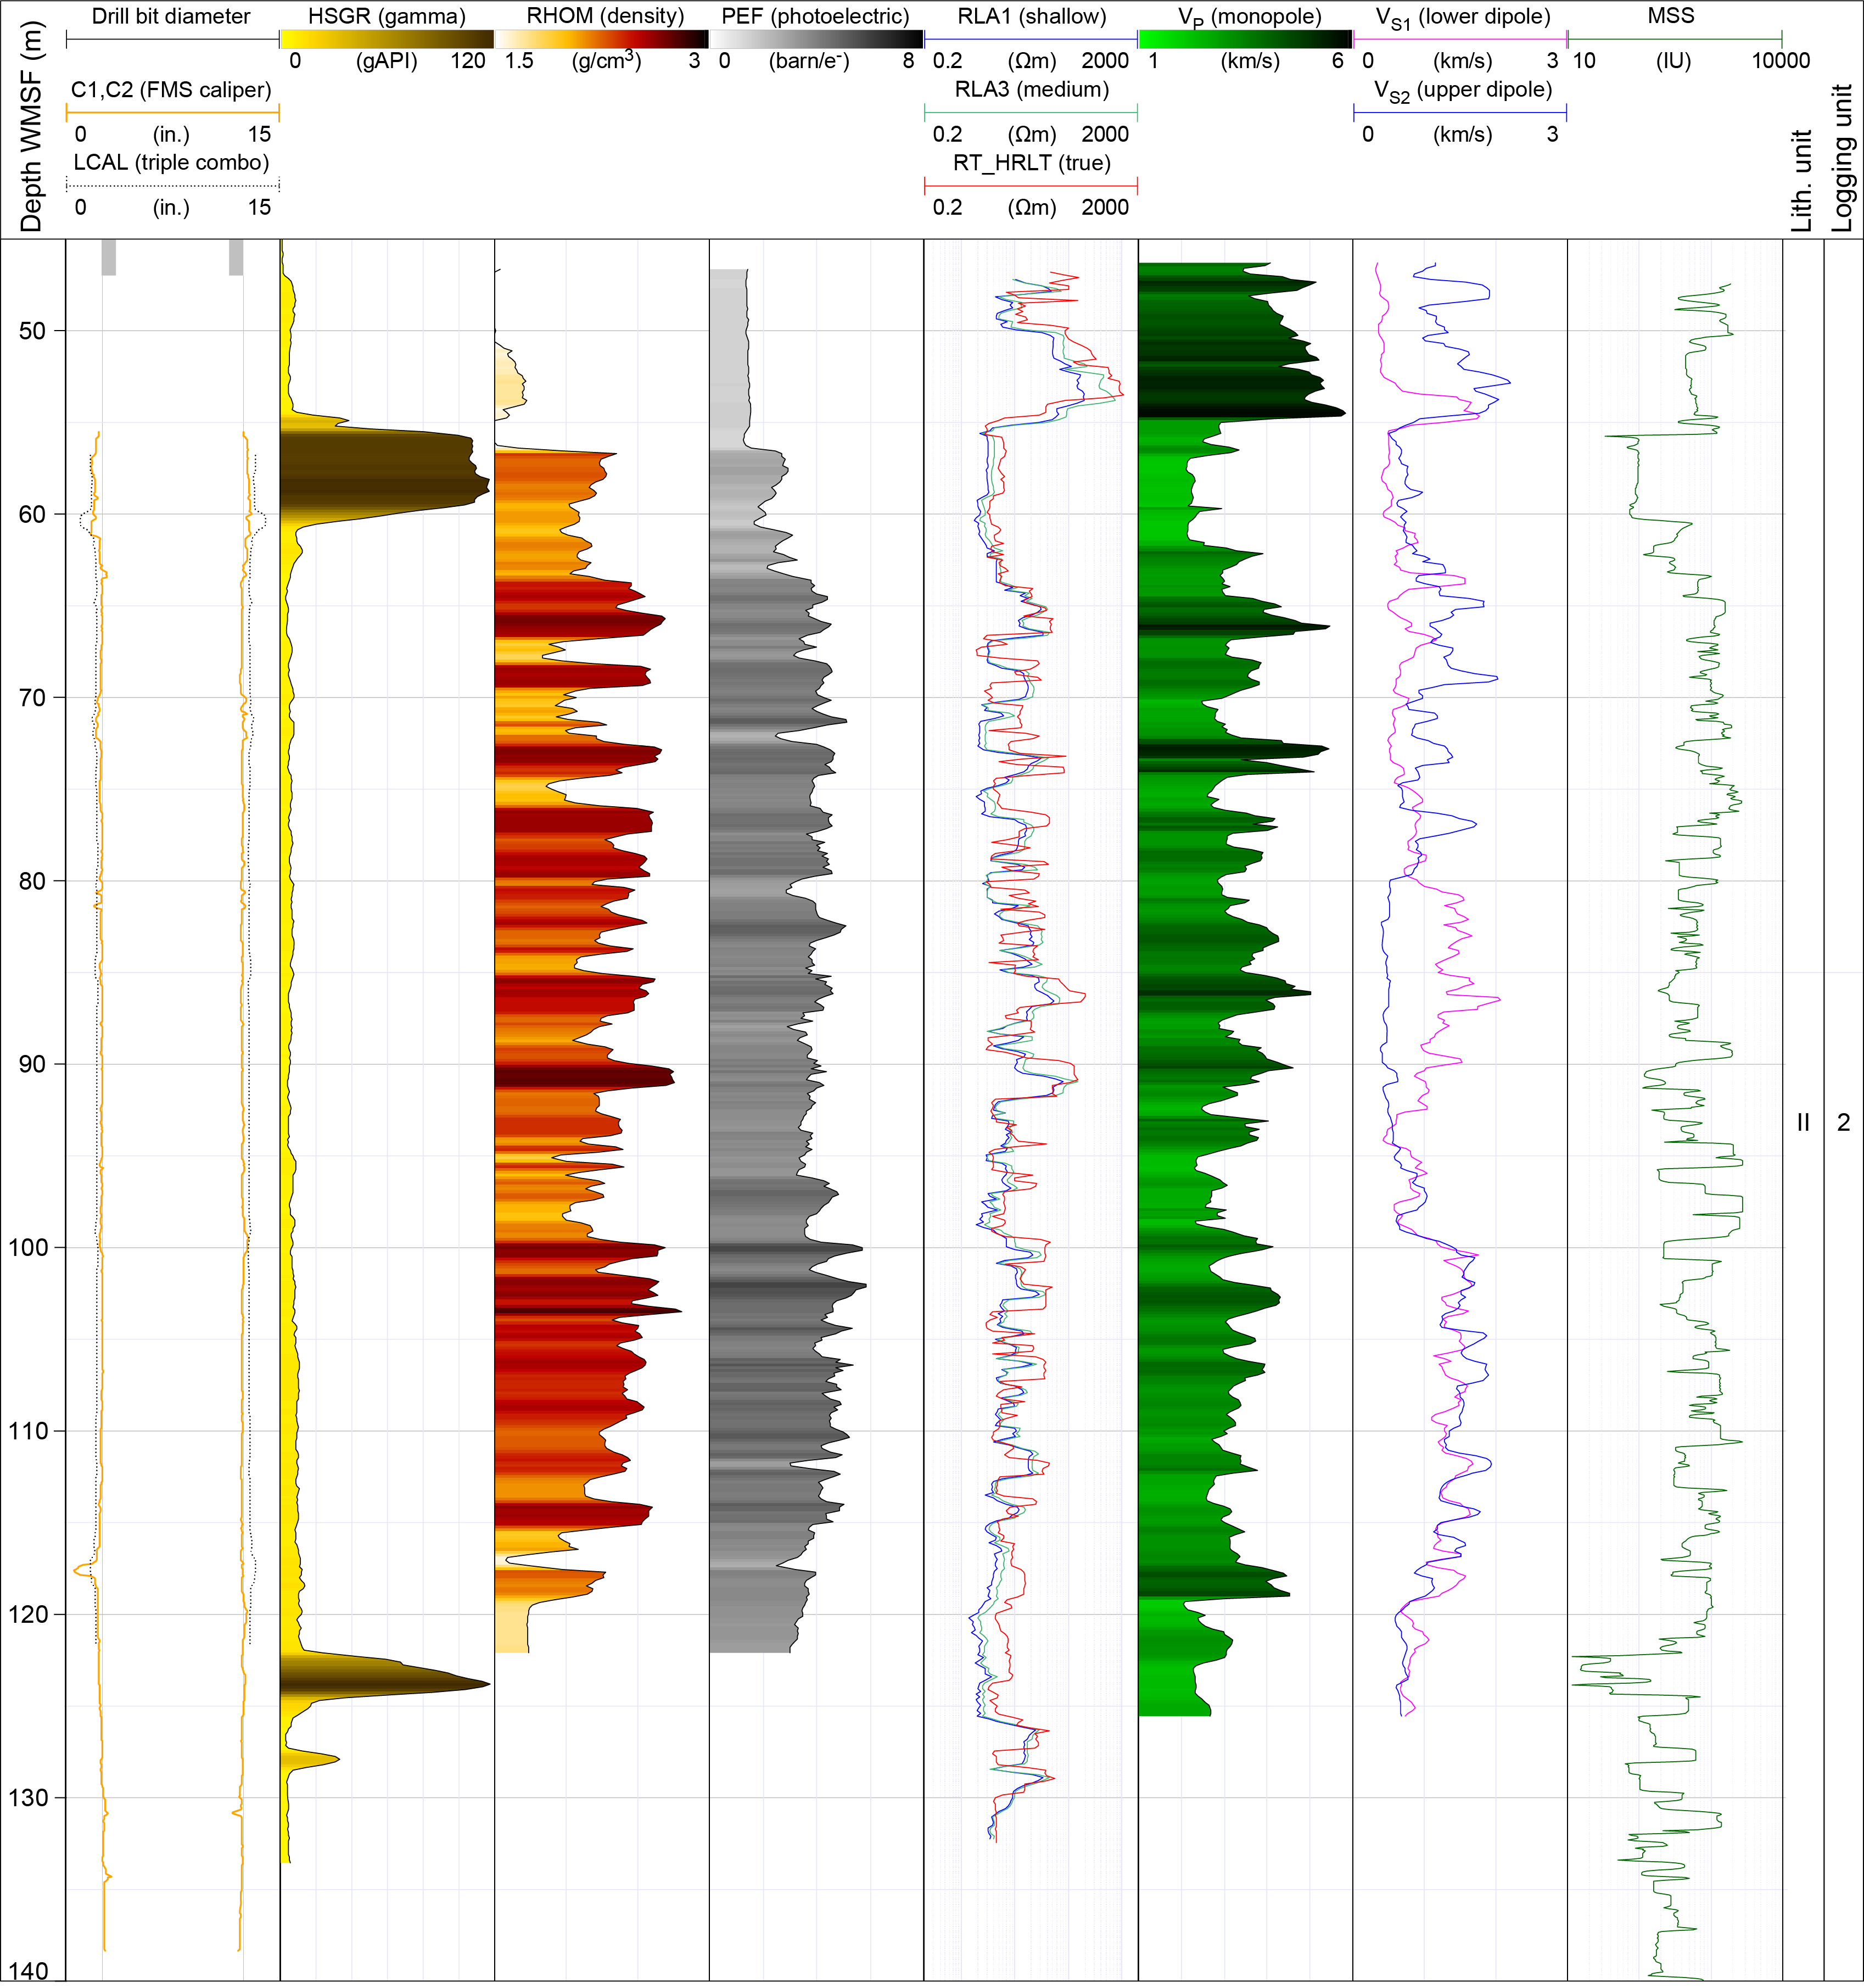
Figure F28. Wireline log traces.
8.1. Logging units
Only GR data was collected for the upper Lithostratigraphic Unit I sedimentary sequence (acquired within the drill string). However, all deployed tools yielded extensive coverage of the main volcano-sedimentary unit (Lithostratigraphic Unit II) in Hole U1566A. No logging data were collected in granitic Lithostratigraphic Unit III because of an obstruction.
Two broad logging units are defined in Hole U1566A and constrained by a combination of the lithostratigraphy, physical properties, and wireline data (see Lithostratigraphy and Physical properties). The logging units correspond to the lithostratigraphic units in all but the location of the Lithostratigraphic Unit I–II transition, which is ~2 m lower in the corresponding logging units.
8.1.1. Logging Unit 1
In Figure F29, wireline caliper, GR, and MS data are plotted alongside core data summaries. GR data across Logging Unit 1 reveal a subdued GR signal compared to the underlying open hole Logging Unit 2 because the drill string attenuates some of the formation signature. This is clearly seen at ~47 m WMSF, where the background wireline GR reduces abruptly from ~8 to ~1 gAPI over an interval where there is no change in the NGR core-derived data (Figure F29). Outside of this baseline change, Logging Unit 1 reveals clear fluctuations in GR, as highlighted by the expanded scale in Figure F29. The GR log appears to delineate the top of the dominantly low GR volcanic sequence at 24 m WMSF, where the GR increases sharply in a section with poor core recovery (Core 396-U1566A-3R; recovery = 26%). A high drilling rate of penetration in Logging Unit 1 confirms the soft-sediment-dominated nature of the sequence.
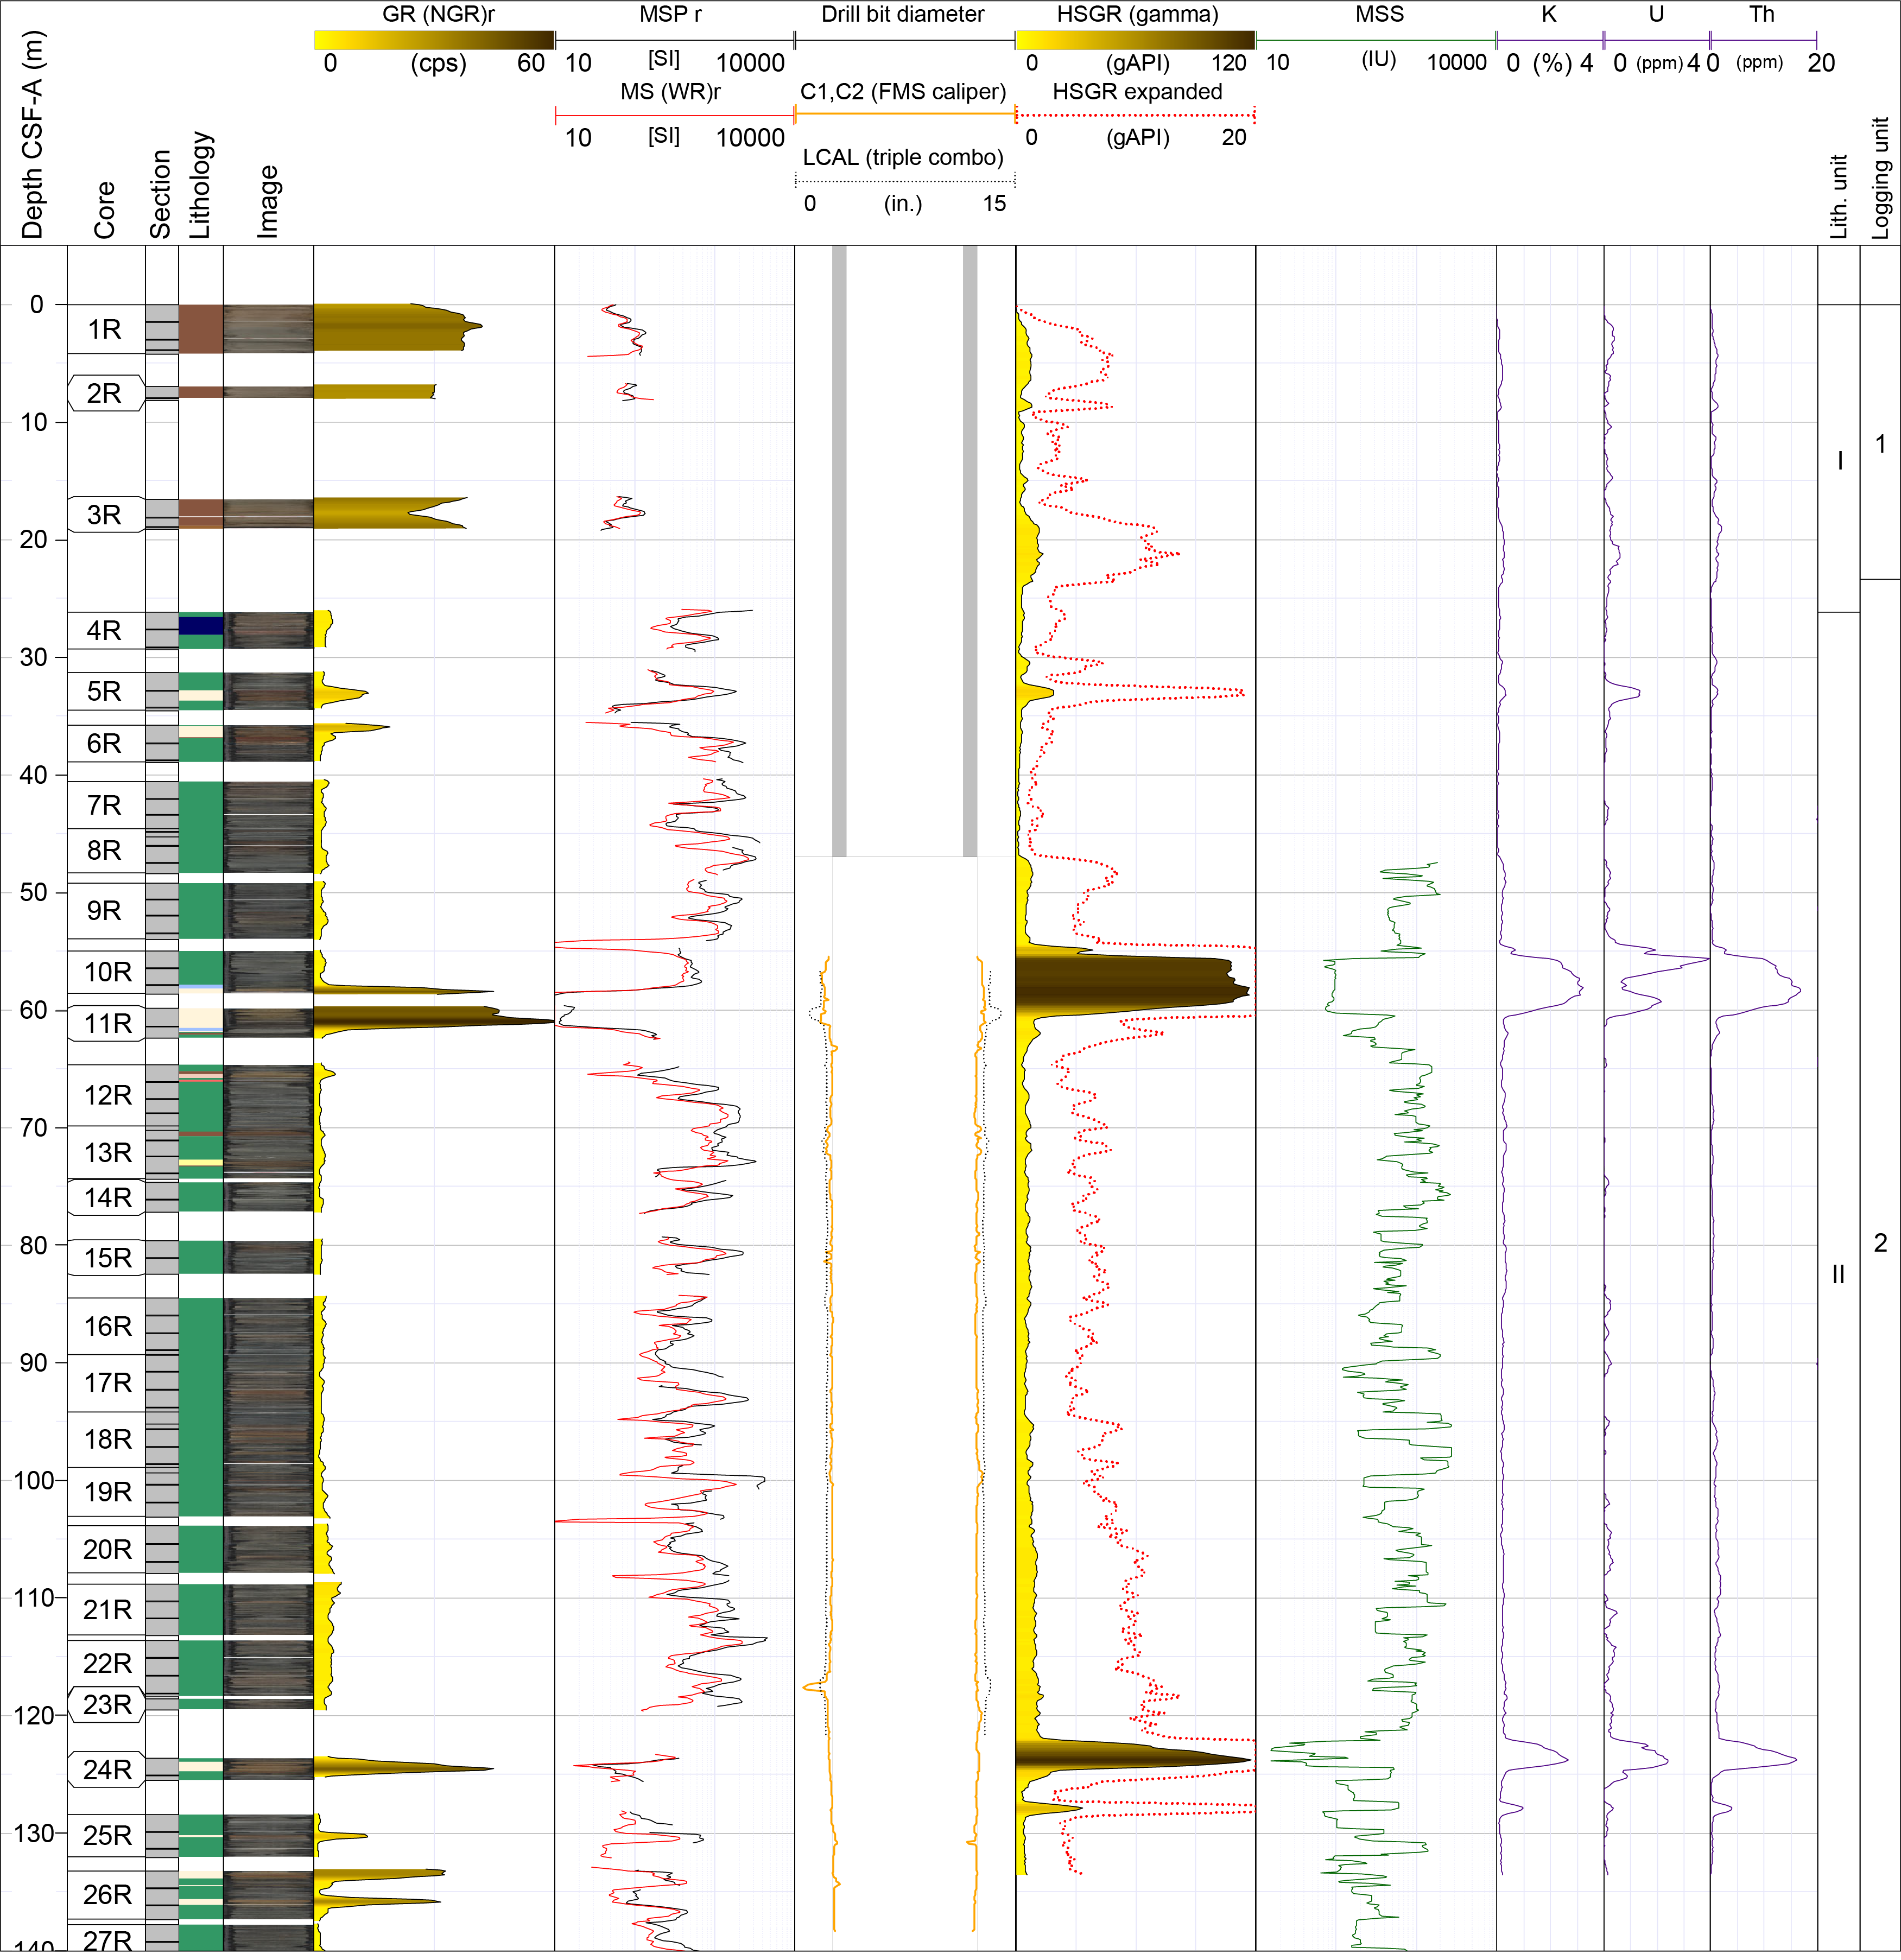
Figure F29. Wireline GR and MS..
8.1.2. Logging Unit 2
Logging Unit 2 comprises a thick sequence dominated by basaltic lava flows with interlayered siliciclastic sediments corresponding to Lithostratigraphic Unit II. The lava package reveals a consistently low background GR trend for the logged interval and three clear peaks in GR linked to siliciclastic sediment interlayers (Figure F29). Variations in the spectral GR recorded elements K, U, and Th are visible in the low GR lavas and the sediment interlayers; however, for most of the sequence they are generally well correlated (Figure F29). When the GR log scale is expanded (0–20 gAPI) to focus on within-basalt fluctuations, clear and systematic variations in background wireline GR readings are seen (e.g., shift to higher gAPI at ~100 m WMSF) and may be linked to subtle chemical variability of the basalt sequence independently observed from pXRF results (see Lithostratigraphy). Finer resolution fluctuations more likely relate to weathering (Planke, 1994).
MS also reveals clear variations within Logging Unit 2, and the basaltic lava flows reveal generally higher and more variable susceptibility values (equivalent to those described in Physical properties), whereas the siliciclastic interlayers reveal almost zero MS response.
In Figure F30, wireline bulk density (RHOM), P-wave velocity (VP), photoelectric effect (PEF), and calculated acoustic impedance (AI) (density × VP) are presented alongside core data summaries spanning Logging Unit 2. All porosity dependent logs reveal clear fluctuations throughout the sequence, which is typical of lava flow dominated sequences (Planke, 1994; Nelson et al., 2009; Millett et al., 2022), and correspond reasonably well with the core-derived data, although a ~2.5–3.5 m depth shift is required to align the depth models.
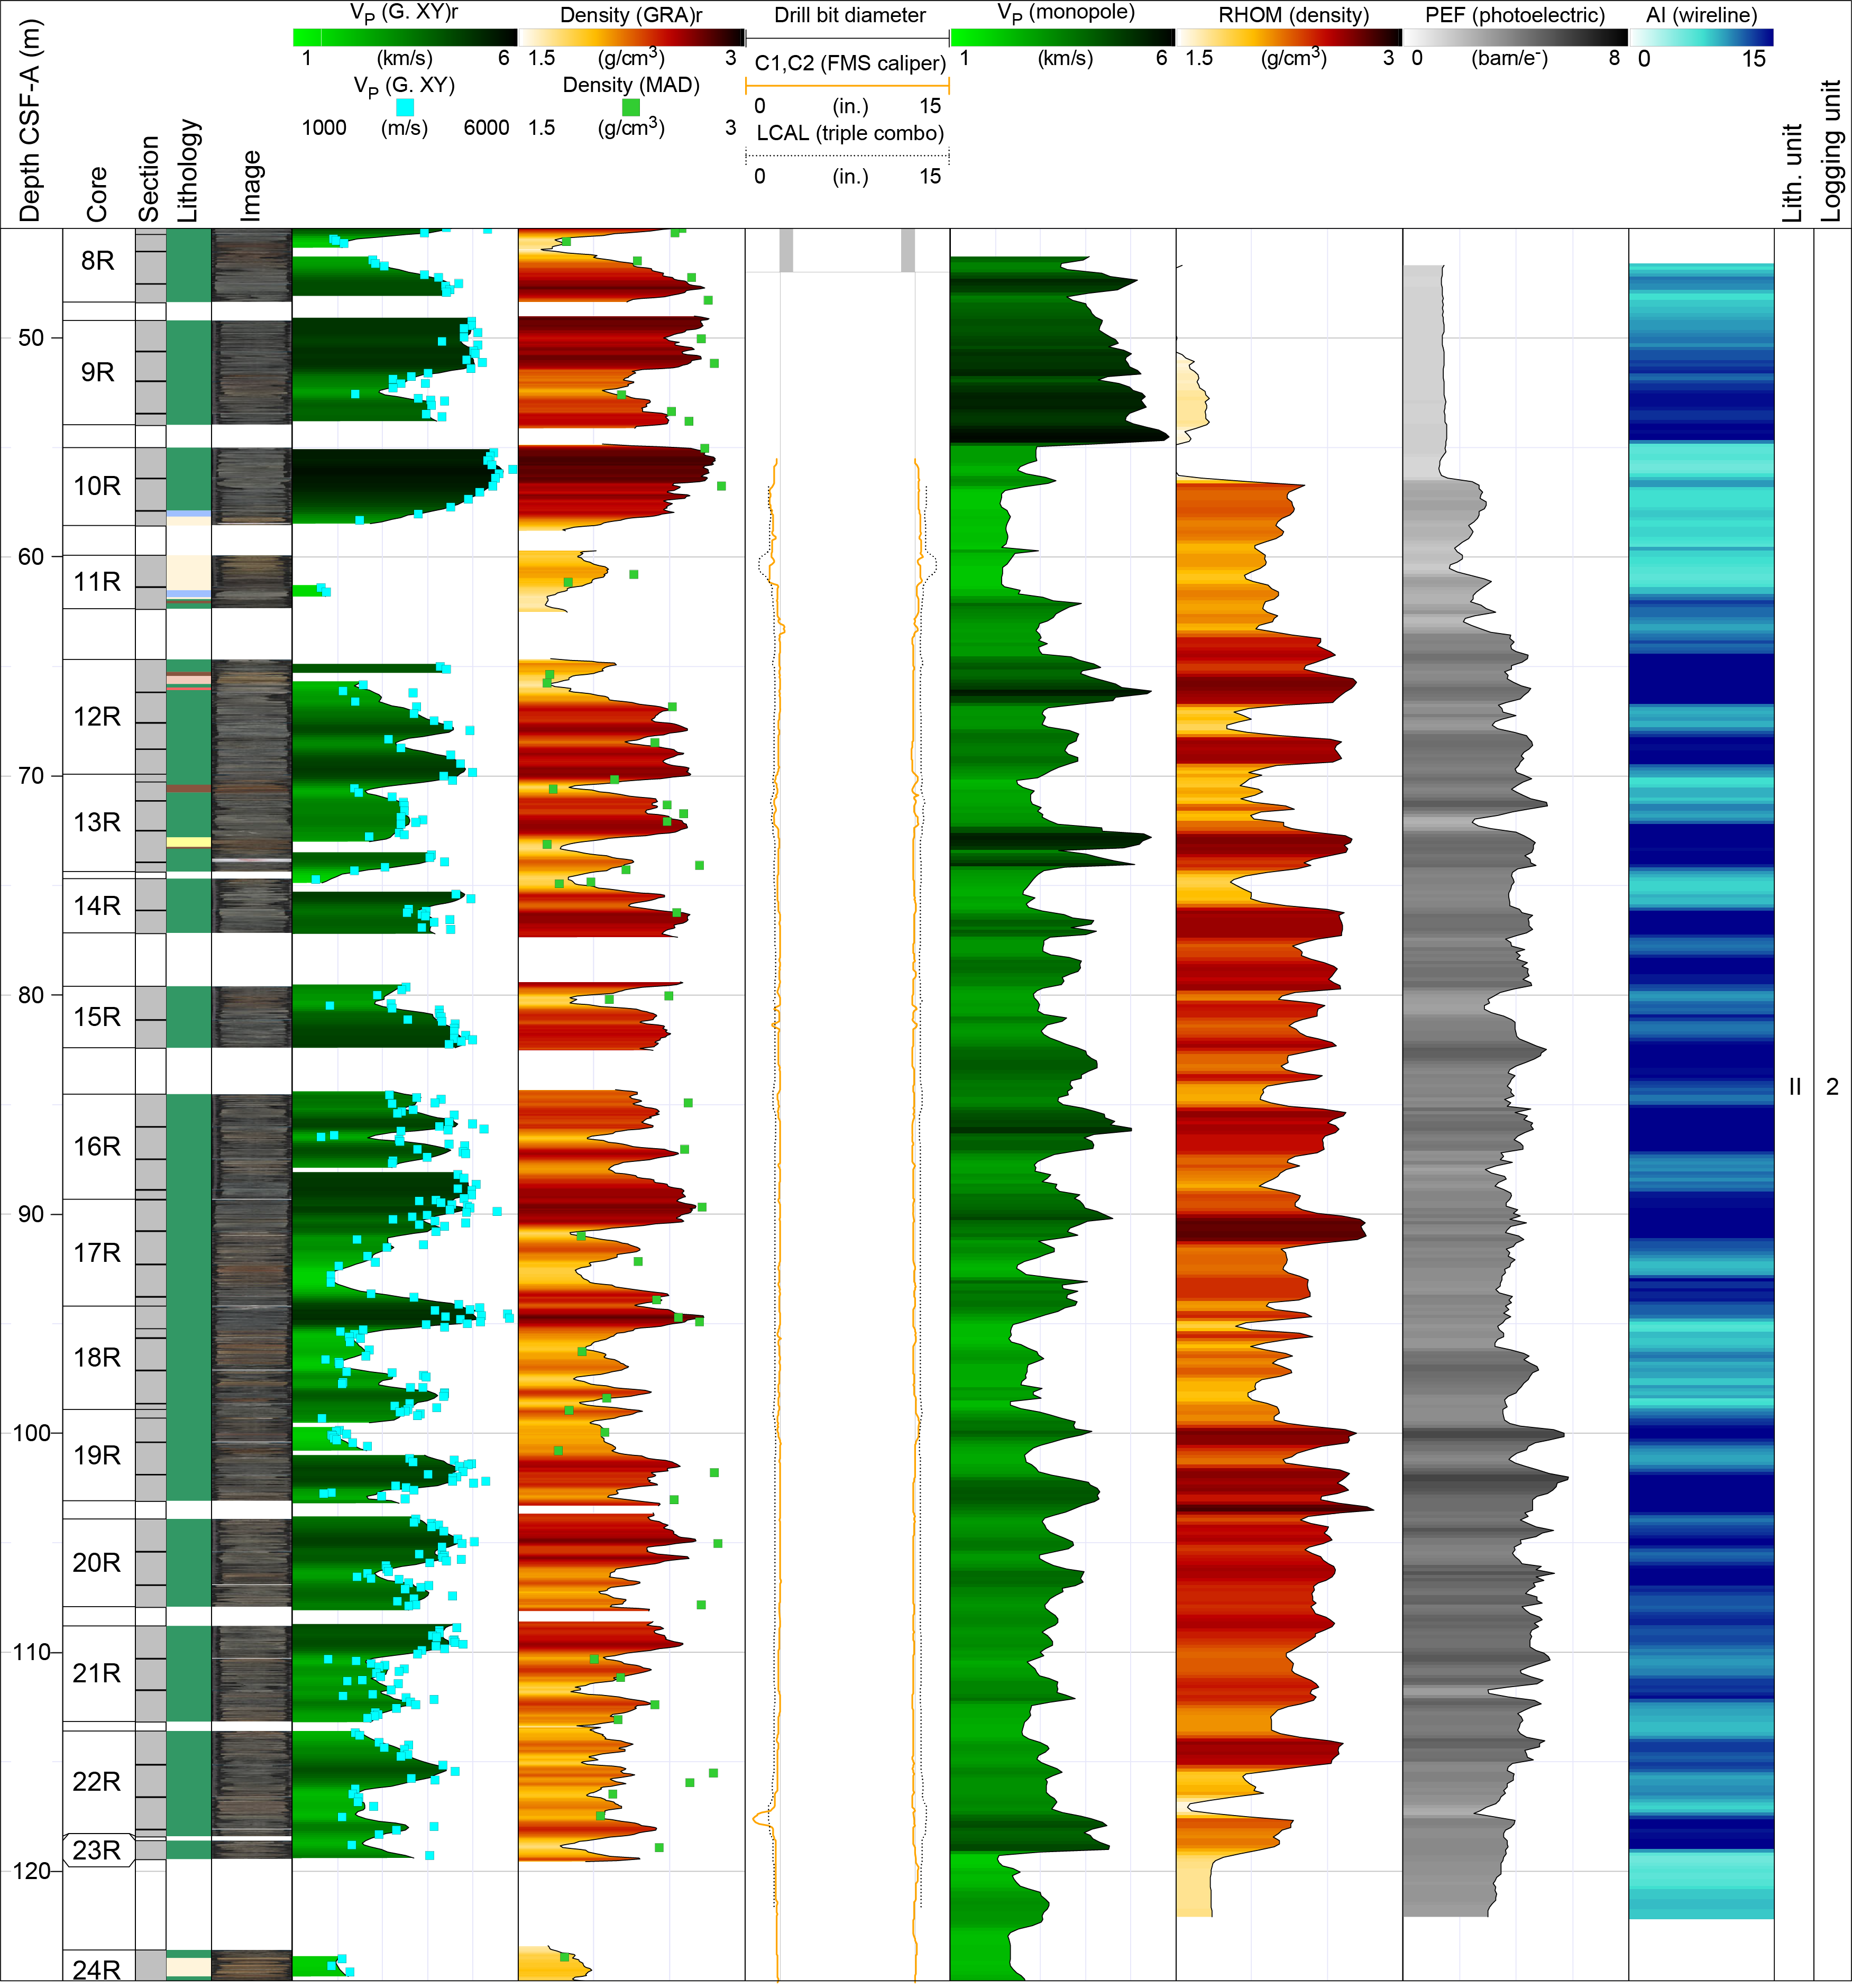
Figure F30. RHOM, PEF, VP, and AI.
Figure F31 presents resistivity alongside the processed FMS image logs for Hole U1566A, revealing generally very good imaging of Logging Unit 2. Intervals with “smeared” image data are highlighted with the flag “FMS tool sticking” to highlight data intervals that are not representative of the formation. These features are common and relate to scenarios where the FMS pads got momentarily stuck against the borehole wall and/or slid over the borehole wall at speeds deviating from the uniform logging speed and are commonly worse where either weather (i.e., increased heave) or hole conditions deteriorate. Resistivity logs demonstrate a clear association between the dark, conductive FMS layers and the lighter, more resistive layers, again consistent with lava dominated sequences (e.g., Watton et al., 2014). Results from the UBI log are presented alongside the FMS images and show a generally good correlation linking higher amplitude (brighter) lava interiors with resistive layers and lower amplitude (darker) flow margins and sediments with more conductive layers. The image quality is lower resolution than the FMS; however, because of the full borehole coverage, the UBI gives valuable support for future fracture and facies mapping.
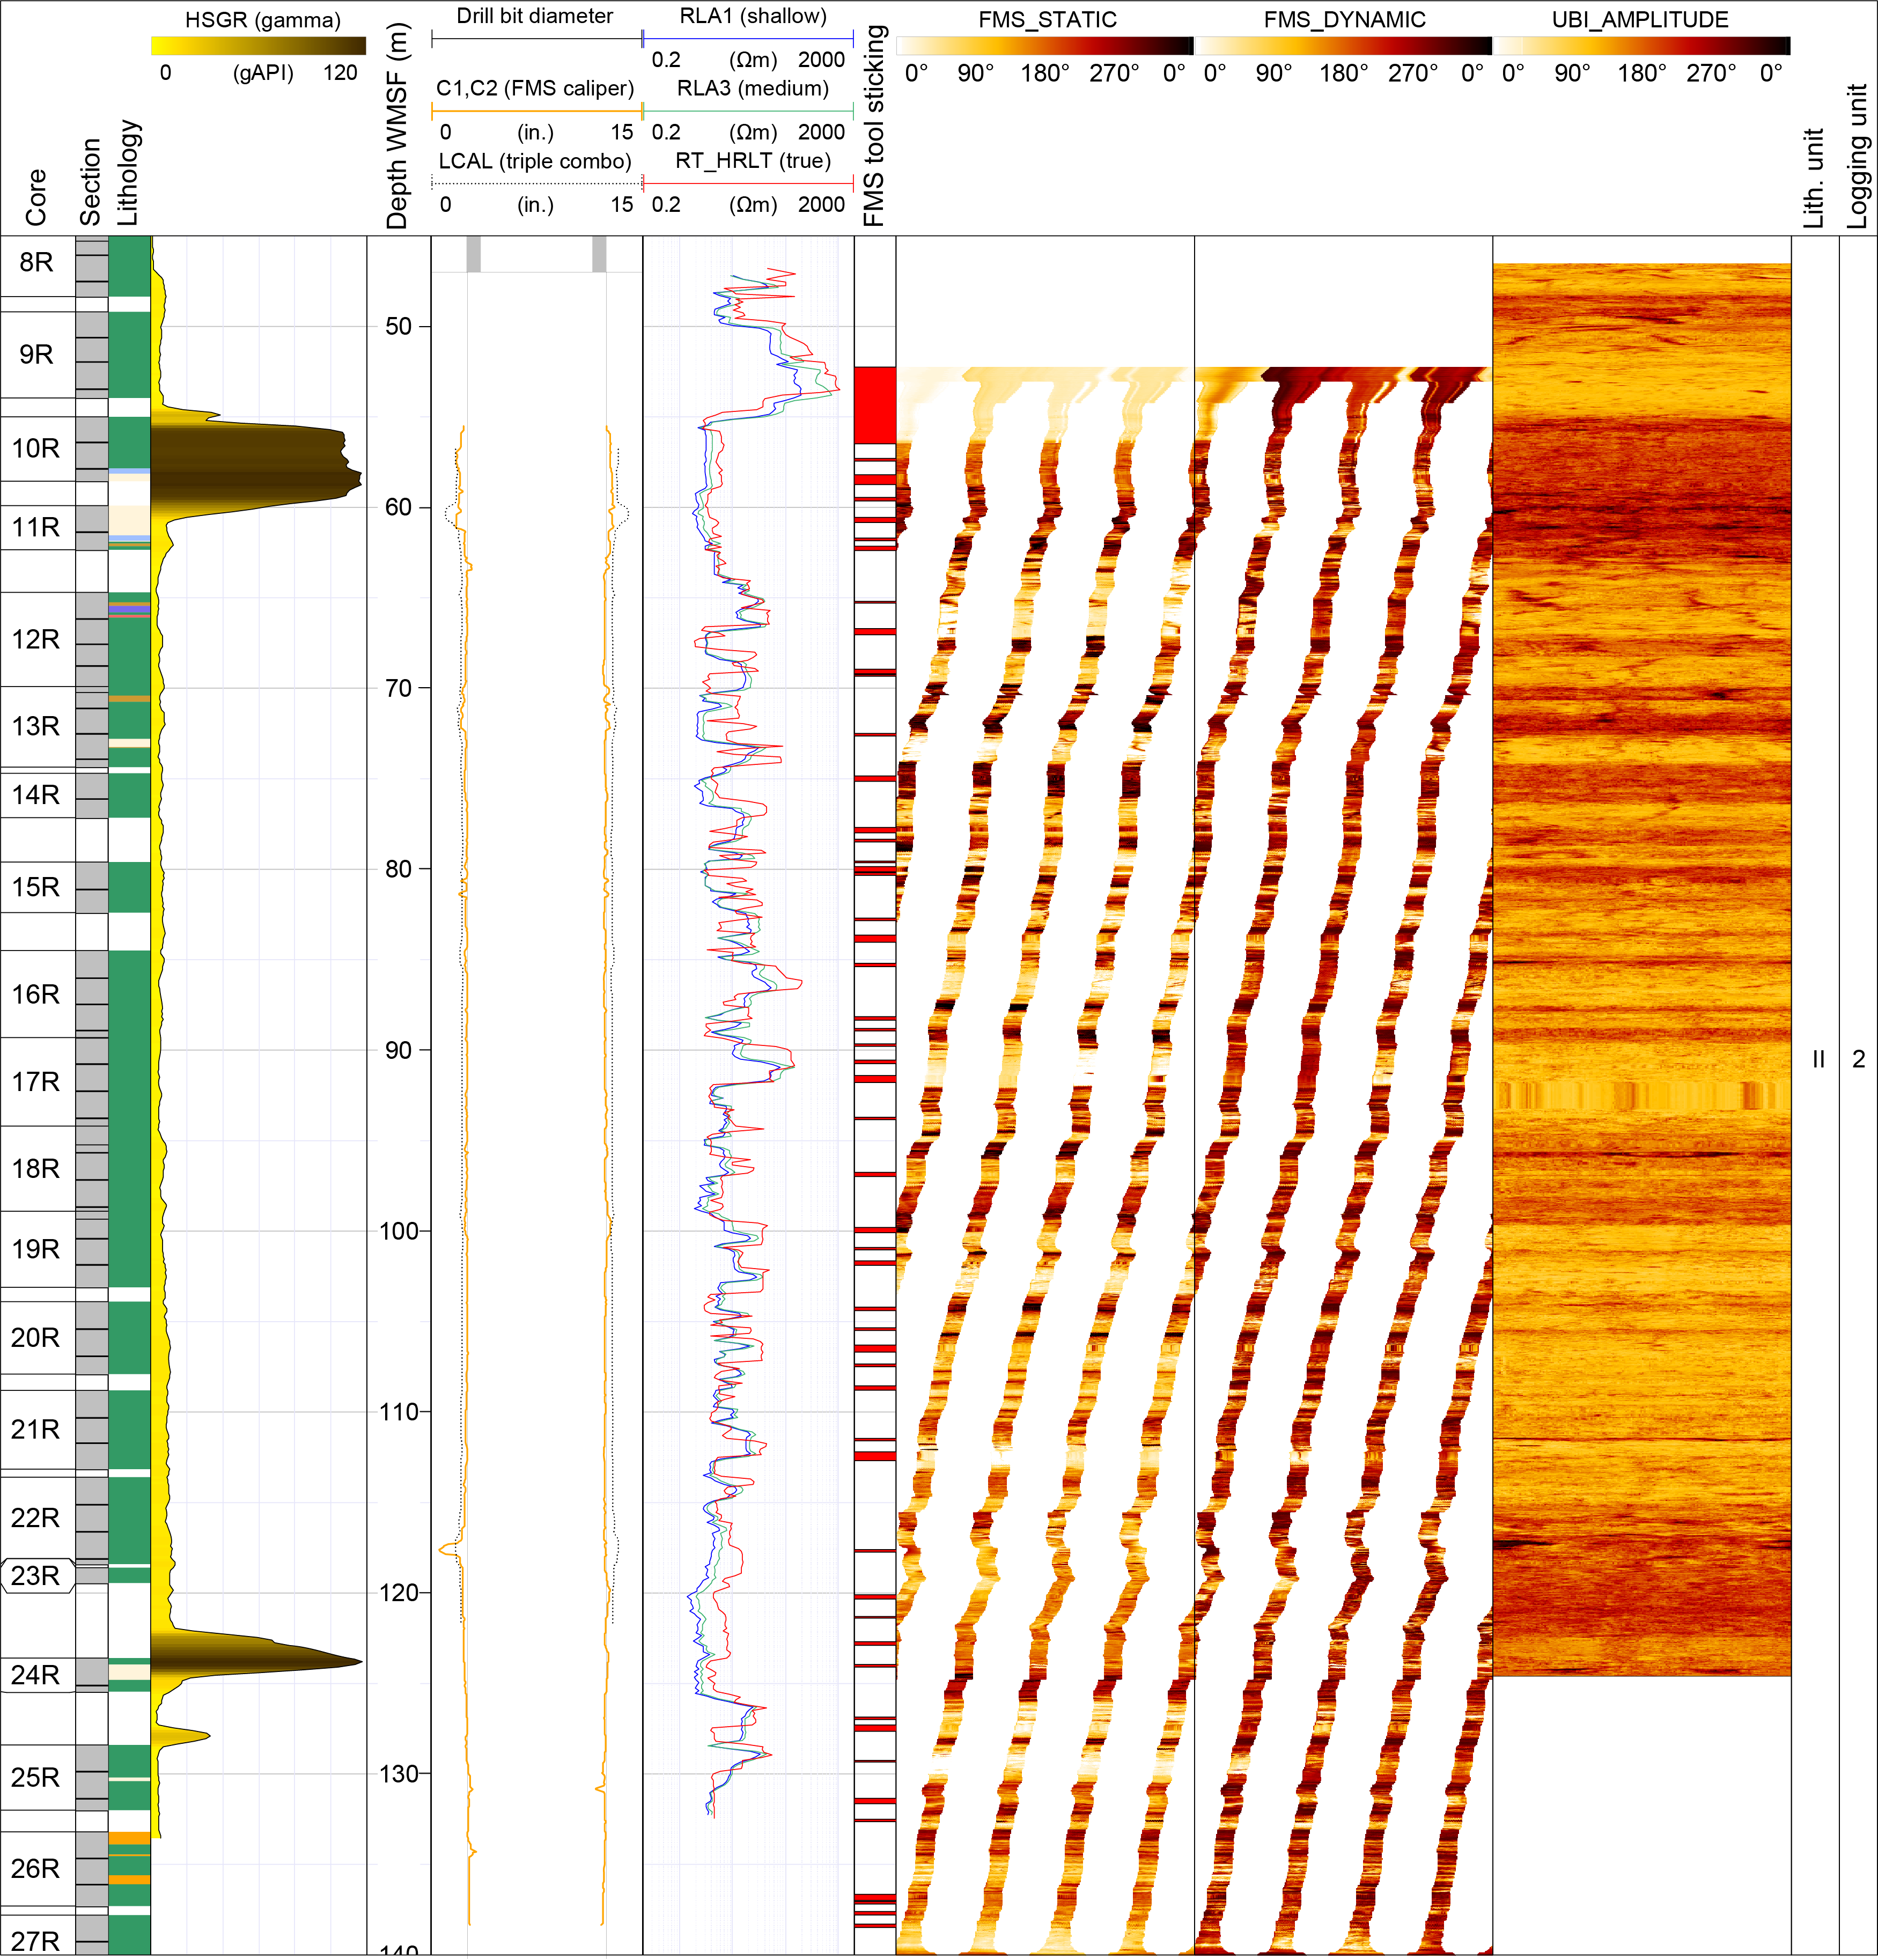
Figure F31. Logging Unit 2.
In detail, additional features relating to the lava flow dominated sequence such as vesicles, fractures, alteration, and facies architecture can be extracted from the image log data (e.g., Jerram et al., 2019). Figure F32 highlights some key features of the FMS image logs from a package of thin pahoehoe dominated lava flows.
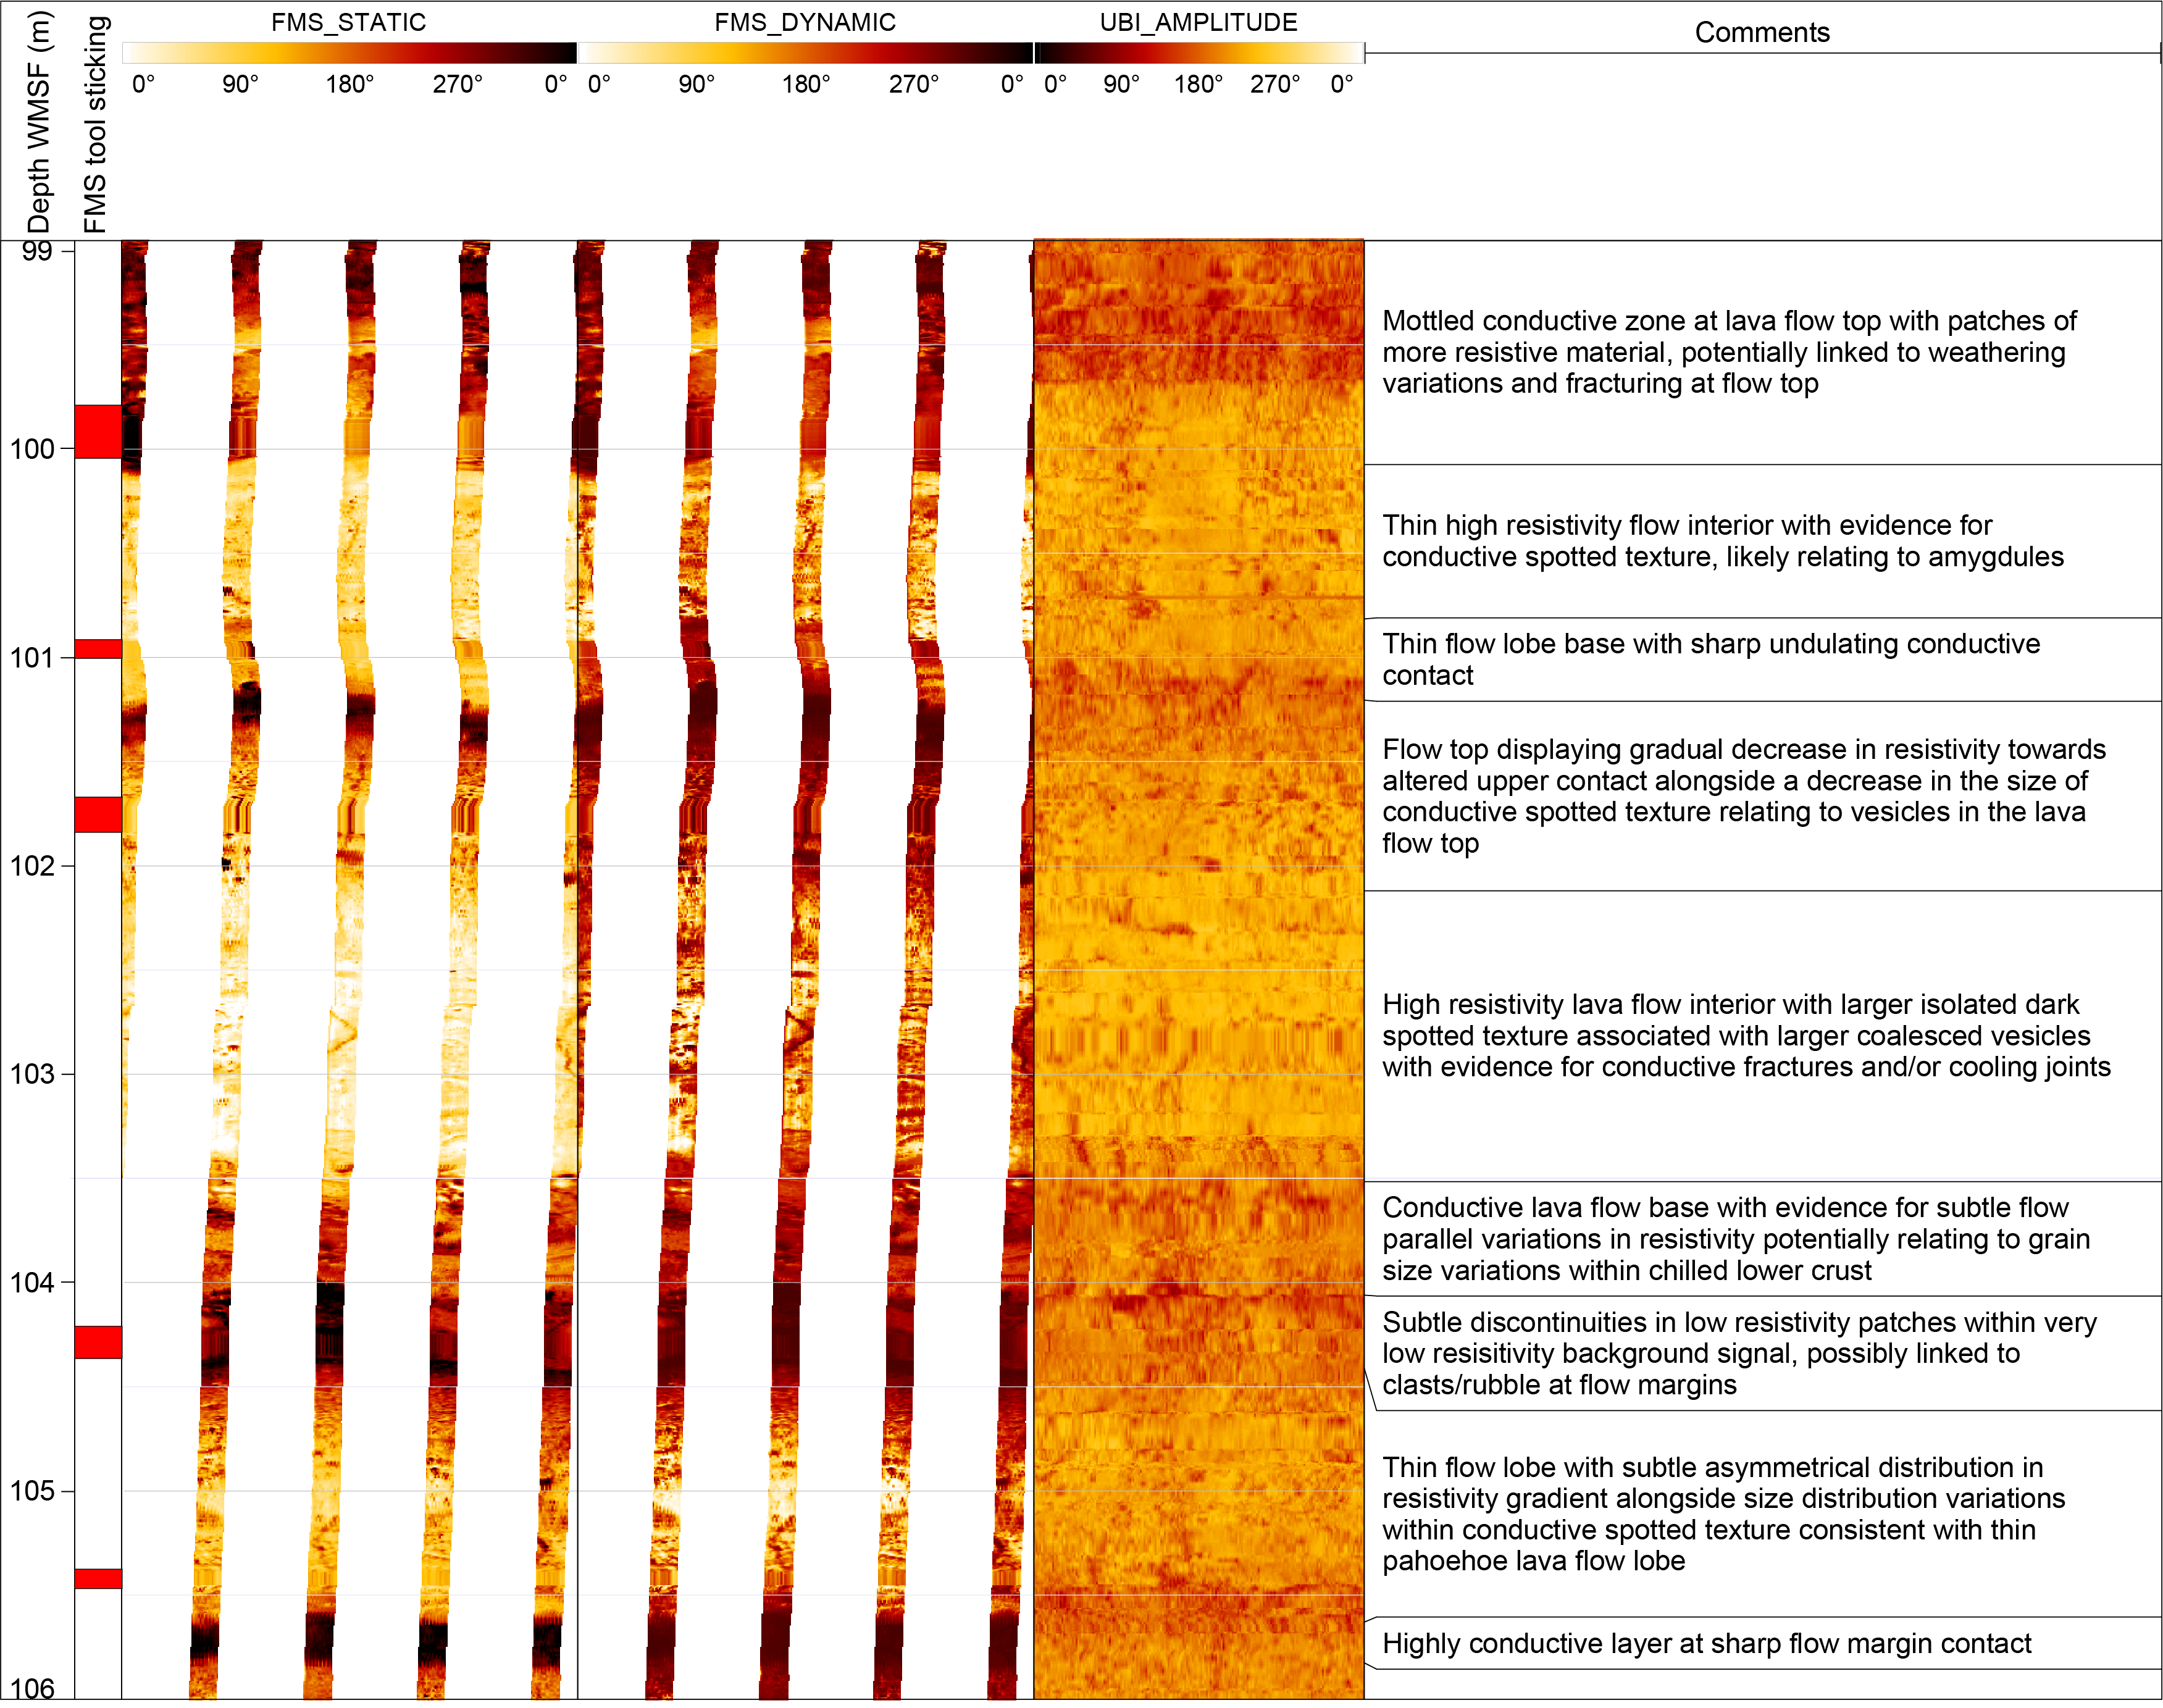
Figure F32. Basaltic lava flows.
8.2. Summary
Logging operations at the Kolga High delivered a comprehensive wireline logging data set spanning the majority of the ~122 m thick basaltic lava flow–dominated volcanic sequence with interlayered sediments (Lithostratigraphic Unit II). GR logging data revealed two main packages of basaltic lava flows and helped constrain the true thickness of two high-GR interlava sediment layers for which incomplete cores were recovered. The volcanic package reveals systematic wireline profiles consistent with subaerial lava flows and enables the appraisal of lava flow thicknesses and boundaries that are challenging where incomplete core recovery was achieved. High-quality FMS image log data acquisition has further aided in the characterization of flow boundaries, the presence of volcaniclastic interbeds, and intrafacies features such as vesicle, fracture, and alteration distribution. These wireline data collectively support the dominantly subaerial nature of the lava flow sequences with mixed source sedimentation during intervals of volcanic quiescence. An obstruction in the well meant that the logging tool strings could not access the lowermost interval of the hole comprising the granitic basement.
References
Bakke, V.N., 2017. Volcanic rocks at the Møre marginal high: geochemistry, petrogenesis and emplacement mechanisms [MS thesis]. University of Bergen, Norway. https://bora.uib.no/
Chadima, M., and Hrouda, F., 2006. Remasoft 3.0 a user-friendly paleomagnetic data browser and analyzer. Travaux Géophysiques, 27:20–21.
Eldholm, O., Thiede, J., and Taylor, E., 1989. The Norwegian continental margin: tectonic, volcanic, and paleoenvirontmental framework. In Eldholm, O., Thiede, J., Taylor, E., et al., Proceedings of the Ocean Drilling Program, Scientific Results. 104: College Station, TX (Ocean Drilling Program), 5–26. https://doi.org/
Frost, B.R., Barnes, C.G., Colins, W.J., Arculus, R.J., Ellis, D.J., and Frost, C.D., 2001. A geochemical classification for granitic rocks. Journal of Petrology, 42(11):2033–2048. https://doi.org/
Gernigon, L., Gaina, C., Olesen, O., Ball, P.J., Péron-Pinvidic, G., and Yamasaki, T., 2012. The Norway Basin revisited: from continental breakup to spreading ridge extinction. Marine and Petroleum Geology, 35(1):1–19. https://doi.org/
Gernigon, L., Zastrozhnov, D., Planke, S., Manton, B., Abdelmalak, M.M., Olesen, O., Maharjan, D., Faleide, J.I., and Myklebust, R., 2021. A digital compilation of structural and magmatic elements of the mid-Norwegian continental margin. Norwegian Journal of Geology, 101. https://doi.org/
Jerram, D.A., Millett, J.M., Kück, J., Thomas, D., Planke, S., Haskins, E., Lautze, N., and Pierdominici, S., 2019. Understanding volcanic facies in the subsurface: a combined core, wireline logging and image log data set from the PTA2 and KMA1 boreholes, Big Island, Hawai`i. Scientific Drilling, 25:15–33. https://doi.org/
Jolley, D.W., 1997. Palaeosurface palynofloras of the Skye lava field and the age of the British Tertiary volcanic province. In Widdowson, M., Palaeosurfaces: Recognition, Reconstruction and Palaeoenvironmental Interpretation. Geological Society Special Publication, 120: 67–94. https://doi.org/
Krása, D., Shcherbakov, V.P., Kunzmann, T., and Petersen, N., 2005. Self-reversal of remanent magnetization in basalts due to partially oxidized titanomagnetites. Geophysical Journal International, 162(1):115–136. https://doi.org/
Le Maitre, R.W. (Ed.), 1989. A Classification of Igneous Rocks and Glossary of Terms: Boston (Blackwell).
Lund, J., 1989. A late Paleocene nonmarine microflora from the interbasaltic coals of the Faeroe Islands, North Atlantic. Bulletin of the Geological Society of Denmark, 37:181–203.
Meyer, R., Hertogen, J., Pedersen, R.B., Viereck-Götte, L., and Abratis, M., 2009. Interaction of mantle derived melts with crust during the emplacement of the Vøring Plateau, N.E. Atlantic. Marine Geology, 261(1–4):3–16. https://doi.org/
Millett, J.M., Manton, B.M., Zastrozhnov, D., Planke, S., Maharjan, D., Bellwald, B., Gernigon, L., Faleide, J.I., Jolley, D.W., Walker, F., Abdelmalak, M.M., Jerram, D.A., Myklebust, R., Kjølhamar, B.E., Halliday, J., and Birch-Hawkins, A., 2022. Basin structure and prospectivity of the NE Atlantic volcanic rifted margin: cross-border examples from the Faroe–Shetland, Møre and Southern Vøring Basins. In Krmíček, L., and Chalapathi Rao, N.V. (Eds.), Lamprophyres, Lamproites and Related Rocks: Tracers to Supercontinent Cycles and Metallogenesis. Geological Society Special Publication, 495. https://doi.org/
Mitchell, J.K., and Soga, K., 2005. Fundamentals of Soil Behavior (3rd edition): New York (Wiley).
Müller, A., and Mathesius, U., 1999. The palaeoenvironments of coastal lagoons in the southern Baltic Sea, I. The application of sedimentary Corg/N ratios as source indicators of organic matter. Palaeogeography, Palaeoclimatology, Palaeoecology, 145(1–3):1–16. https://doi.org/
Nelson, C.E., Jerram, D.A., and Hobbs, R.W., 2009. Flood basalt facies from borehole data: implications for prospectivity and volcanology in volcanic rifted margins. Petroleum Geoscience, 15(4):313–324. https://doi.org/
Pearce, J.A., and Cann, J.R., 1973. Tectonic setting of basic volcanic rocks determined using trace element analyses. Earth and Planetary Science Letters, 19(2):290–300. https://doi.org/
Planke, S., 1994. Geophysical response of flood basalts from analysis of wire line logs; Ocean Drilling Program Site 642, Vøring volcanic margin. Journal of Geophysical Research: Solid Earth, 99(B5):9279–9296. https://doi.org/
Planke, S., Berndt, C., Alvarez Zarikian, C.A., Agarwal, A., Andrews, G.D.M., Betlem, P., Bhattacharya, J., Brinkhuis, H., Chatterjee, S., Christopoulou, M., Clementi, V.J., Ferré, E.C., Filina, I.Y., Frieling, J., Guo, P., Harper, D.T., Jones, M.T., Lambart, S., Longman, J., Millett, J.M., Mohn, G., Nakaoka, R., Scherer, R.P., Tegner, C., Varela, N., Wang, M., Xu, W., Yager, S.L., 2023a. Expedition 396 methods. In Planke, S., Berndt, C., Alvarez Zarikian, C.A., and the Expedition 396 Scientists, Mid-Norwegian Margin Magmatism and Paleoclimate Implications. Proceedings of the International Ocean Discovery Program, 396: College Station, TX (International Ocean Discovery Program). https://doi.org/
Planke, S., Berndt, C., Alvarez Zarikian, C.A., Agarwal, A., Andrews, G.D.M., Betlem, P., Bhattacharya, J., Brinkhuis, H., Chatterjee, S., Christopoulou, M., Clementi, V.J., Ferré, E.C., Filina, I.Y., Frieling, J., Guo, P., Harper, D.T., Jones, M.T., Lambart, S., Longman, J., Millett, J.M., Mohn, G., Nakaoka, R., Scherer, R.P., Tegner, C., Varela, N., Wang, M., Xu, W., Yager, S.L., 2023b. Site U1565. In Planke, S., Berndt, C., Alvarez Zarikian, C.A., and the Expedition 396 Scientists, Mid-Norwegian Margin Magmatism and Paleoclimate Implications. Proceedings of the International Ocean Discovery Program, 396: College Station, TX (International Ocean Discovery Program). https://doi.org/
Planke, S., and Eldholm, O., 1994. Seismic response and construction of seaward dipping wedges of flood basalts: Vøring volcanic margin. Journal of Geophysical Research: Solid Earth, 99(B5):9263–9278. https://doi.org/
Rickwood, P.C., 1989. Boundary lines within petrologic diagrams which use oxides of major and minor elements. Lithos, 22(4):247–263. https://doi.org/
Shervais, J.W., 1982. Ti-V plots and the petrogenesis of modern and ophiolitic lavas. Earth and Planetary Science Letters, 59(1):101–118. https://doi.org/
Spiegler, D., and Jansen, E., 1989. Planktonic foraminifer biostratigraphy of Norwegian Sea sediments: ODP Leg 104. In Eldholm, O., Thiede, J., Taylor, E., et al., Proceedings of the Ocean Drilling Program, Scientific Results. 104: College Station, TX (Ocean Drilling Program), 681–696. https://doi.org/
Tegner, C., Lesher, C.E., Larsen, L.M., and Watt, W.S., 1998. Evidence from the rare-earth-element record of mantle melting for cooling of the Tertiary Iceland plume. Nature, 395(6702):591–594. https://doi.org/
Watton, T.J., Cannon, S., Brown, R.J., Jerram, D.A., and Waichel, B.L., 2014. Using formation micro-imaging, wireline logs and onshore analogues to distinguish volcanic lithofacies in boreholes: examples from Palaeogene successions in the Faroe–Shetland Basin, NE Atlantic. In Cannon, S.J.C., and Ellis, D. (Eds.), Hydrocarbon Exploration to Exploitation West of Shetlands. Geological Society Special Publication, 397: 173–192. https://doi.org/
Zastrozhnov, D., Gernigon, L., Gogin, I., Planke, S., Abdelmalak, M.M., Polteau, S., Faleide, J.I., Manton, B., and Myklebust, R., 2020. Regional structure and polyphased Cretaceous-Paleocene rift and basin development of the mid-Norwegian volcanic passive margin. Marine and Petroleum Geology, 115:104269. https://doi.org/
Zijderveld, J.D.A., 2013. A. C. demagnetization of rocks: analysis of results. Developments in Solid Earth Geophysics, 3:254–286. https://doi.org/