Planke, S., Berndt, C., Alvarez Zarikian, C.A., and the Expedition 396 Scientists
Proceedings of the International Ocean Discovery Program Volume 396
publications.iodp.org
https://doi.org/10.14379/iodp.proc.396.105.2023
Sites U1567 and U15681
![]() S. Planke,
S. Planke,
![]() C. Berndt,
C. Berndt,
![]() C.A. Alvarez Zarikian,
C.A. Alvarez Zarikian,
![]() A. Agarwal,
A. Agarwal,
![]() G.D.M. Andrews,
G.D.M. Andrews,
![]() P. Betlem,
P. Betlem,
![]() J. Bhattacharya,
J. Bhattacharya,
![]() H. Brinkhuis,
H. Brinkhuis,
![]() S. Chatterjee,
S. Chatterjee,
![]() M. Christopoulou,
M. Christopoulou,
![]() V.J. Clementi,
V.J. Clementi,
![]() E.C. Ferré,
E.C. Ferré,
![]() I.Y. Filina,
I.Y. Filina,
![]() J. Frieling,
J. Frieling,
![]() P. Guo,
P. Guo,
![]() D.T. Harper,
D.T. Harper,
![]() M.T. Jones,
M.T. Jones,
![]() S. Lambart,
S. Lambart,
![]() J. Longman,
J. Longman,
![]() J.M. Millett,
J.M. Millett,
![]() G. Mohn,
G. Mohn,
![]() R. Nakaoka,
R. Nakaoka,
![]() R.P. Scherer,
R.P. Scherer,
![]() C. Tegner,
C. Tegner,
![]() N. Varela,
N. Varela,
![]() M. Wang,
M. Wang,
![]() W. Xu,
W. Xu,
![]() S.L. Yager2
S.L. Yager2
1 Planke, S., Berndt, C., Alvarez Zarikian, C.A., Agarwal, A., Andrews, G.D.M., Betlem, P., Bhattacharya, J., Brinkhuis, H., Chatterjee, S., Christopoulou, M., Clementi, V.J., Ferré, E.C., Filina, I.Y., Frieling, J., Guo, P., Harper, D.T., Jones, M.T., Lambart, S., Longman, J., Millett, J.M., Mohn, G., Nakaoka, R., Scherer, R.P., Tegner, C., Varela, N., Wang, M., Xu, W., and Yager, S.L., 2023. Sites U1567 and U1568. In Planke, S., Berndt, C., Alvarez Zarikian, C.A., and the Expedition 396 Scientists, Mid-Norwegian Margin Magmatism and Paleoclimate Implications. Proceedings of the International Ocean Discovery Program, 396: College Station, TX (International Ocean Discovery Program). https://doi.org/10.14379/iodp.proc.396.105.2023
2 Expedition 396 Scientists’ affiliations.
1. Background and objectives
A key objective of Expedition 396 was to constrain the role of breakup volcanism on the Paleocene–Eocene Thermal Maximum (PETM). For a long time, it has been argued that large igneous provinces may have a dramatic impact on the Earth’s environment (e.g., Eldholm and Thomas, 1993; Svensen et al., 2019), likely causing mass extinctions (e.g., Ernst and Youbi, 2017). Explosive volcanism influences the climate by eruption of large volumes of aerosols and ash into the stratosphere, affecting the climate over short time periods of days to years. Long-term climate effects of volcanism are mainly related to emission of sulfur dioxide, which may cause global cooling, and greenhouse gases such as carbon dioxide, which may cause global warming.
Very large volumes of greenhouse gases must be emitted in short time periods to trigger global warming. Svensen et al. (2004) proposed a new mechanism for the formation and eruption of several thousands of gigatons of carbon gasses formed by maturation of sedimentary rocks by igneous intrusions offshore mid-Norway. The key aspects of this hypothesis are that (1) magma injected as sill intrusions into organic-rich sedimentary rocks generates large volumes of greenhouse gases (methane and carbon dioxide) in metamorphic aureoles around the sills and (2) pressure buildup due to gas generations cause fracturing of the host rocks, forming so-called hydrothermal vent complexes where the gasses and associated solids are transported from the deep sediment basins to the hydrosphere and atmosphere.
Although this process may release the amount of carbon required for the observed climate change, between 2000 and 12000 Gt (Dickens et al., 1995; Dickens, 2011), it is not immediately clear why the bulk of the intrusion should be emplaced over the geologically short time span that is required to explain the observed spike in global warming. Also, it is unclear in which form the carbon would have been emitted, as CO2 or as CH4, which acts as a stronger greenhouse gas.
The hydrothermal systems associated with sill intrusions are manifested as pipe-like seismic anomalies that typically root at the tips of saucer-shaped sill intrusions (Planke et al., 2005). These so-called hydrothermal vent complexes are divided into a lower part (the pipe) and an upper part that is characterized by crater-, eye-, or dome-shaped seismic features at the paleoseafloor. The pipes are hundreds of meters long and sometimes as long as 6 km. The upper part is typically 1–2 km in diameter but may vary in size from hundreds of meters to >5 km. Many of the crater-shaped depressions are infilled by stratified seismic units and characteristic mounds above the paleoseafloor. More than 1000 of these hydrothermal vent complexes have been mapped in sedimentary basins along the northeast Atlantic margins (Skogseid and Eldholm, 1989; Planke et al., 2005; Manton, 2015; Reynolds et al., 2017; Kjoberg et al., 2017; Omosanya et al., 2018; Roelofse et al., 2021).
Information on the nature of the pipes exists from cuttings in one well in the Vøring Basin (6607/12-1) (Svensen et al., 2003; Frieling et al., 2016) and from field analogs, for example in the Karoo Basin in South Africa (Jamtveit et al., 2004; Svensen et al., 2006, 2020) and the Tunguska Basin in Siberia (Svensen et al., 2009, 2018). The nature of the mound structures, however, is largely unconstrained. Their interpretation reaches from mud volcano–like sediment deposition to buildup of massive sulfide deposits that are formed at the hydrothermal vent sites by precipitation from hot vent fluids (Berndt et al., 2016).
Sites U1567 and U1568 are located on the Modgunn Arch (Figure F1; see Figure F1 in the Site U1565 chapter [Planke et al., 2023b]), some 50 km north of the basalt flows sampled at the Kolga High on a dome structure that is interpreted to have formed during the Miocene (Gernigon et al., 2021). The sites were selected because the doming uplifted the vent sites to within reach of International Ocean Discovery Program (IODP) drilling. Such shallow burial depths of vent complexes are currently only identified in the Modgunn Arch area in the Vøring Basin and in the Danmarkshavn Basin on the northeast Greenland shelf.
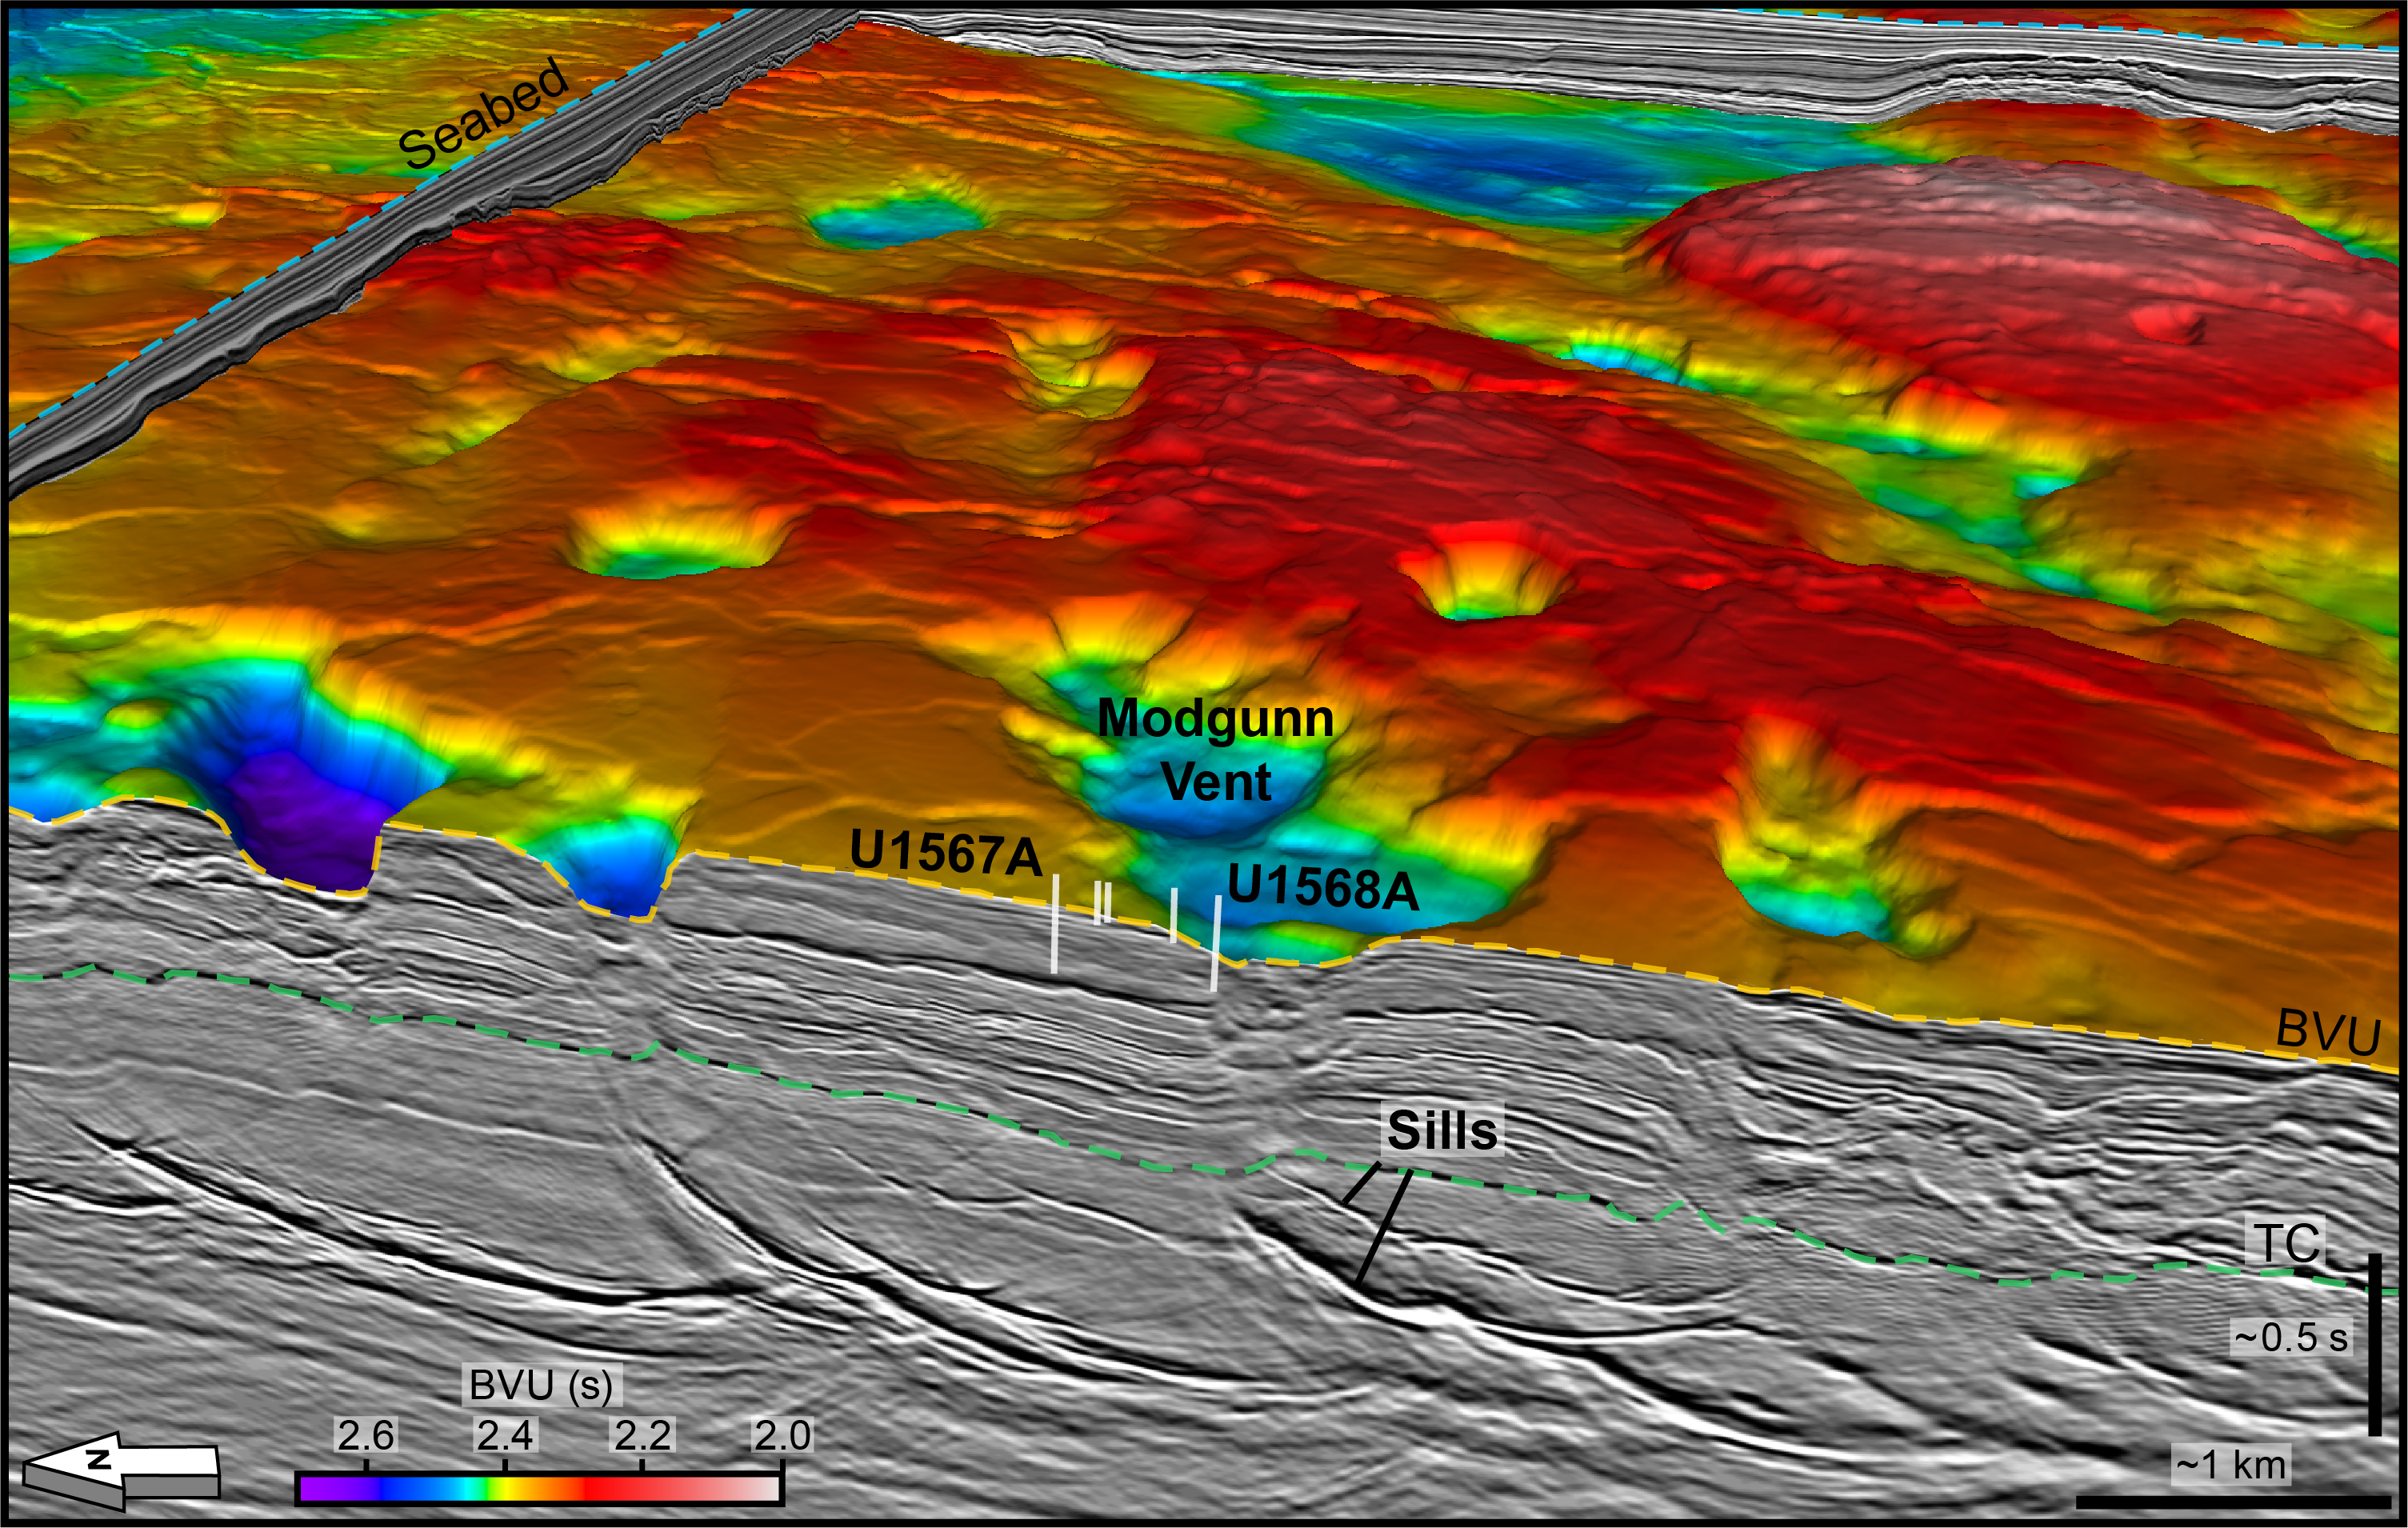
Figure F1. Base Vent Unconformity area.
Seismic data clearly show the presence of sill intrusions at a shallow depth, ~1 km below seafloor, in the Modgunn Arch (Planke et al., 2021) (Figure F1). The sills are located in a deformed sedimentary unit with weak reflections that terminate against an angular unconformity. A hydrothermal vent complex is interpreted above the upper termination of the sill. The unconformity truncates the dipping reflections in the upper part of the hydrothermal vent complex (Figure F2). At the center of the depression, immediately above the pipe structure, the reflections bend upward and form a mound. This mound is overlain by draping and onlapping reflections up toward the seafloor.
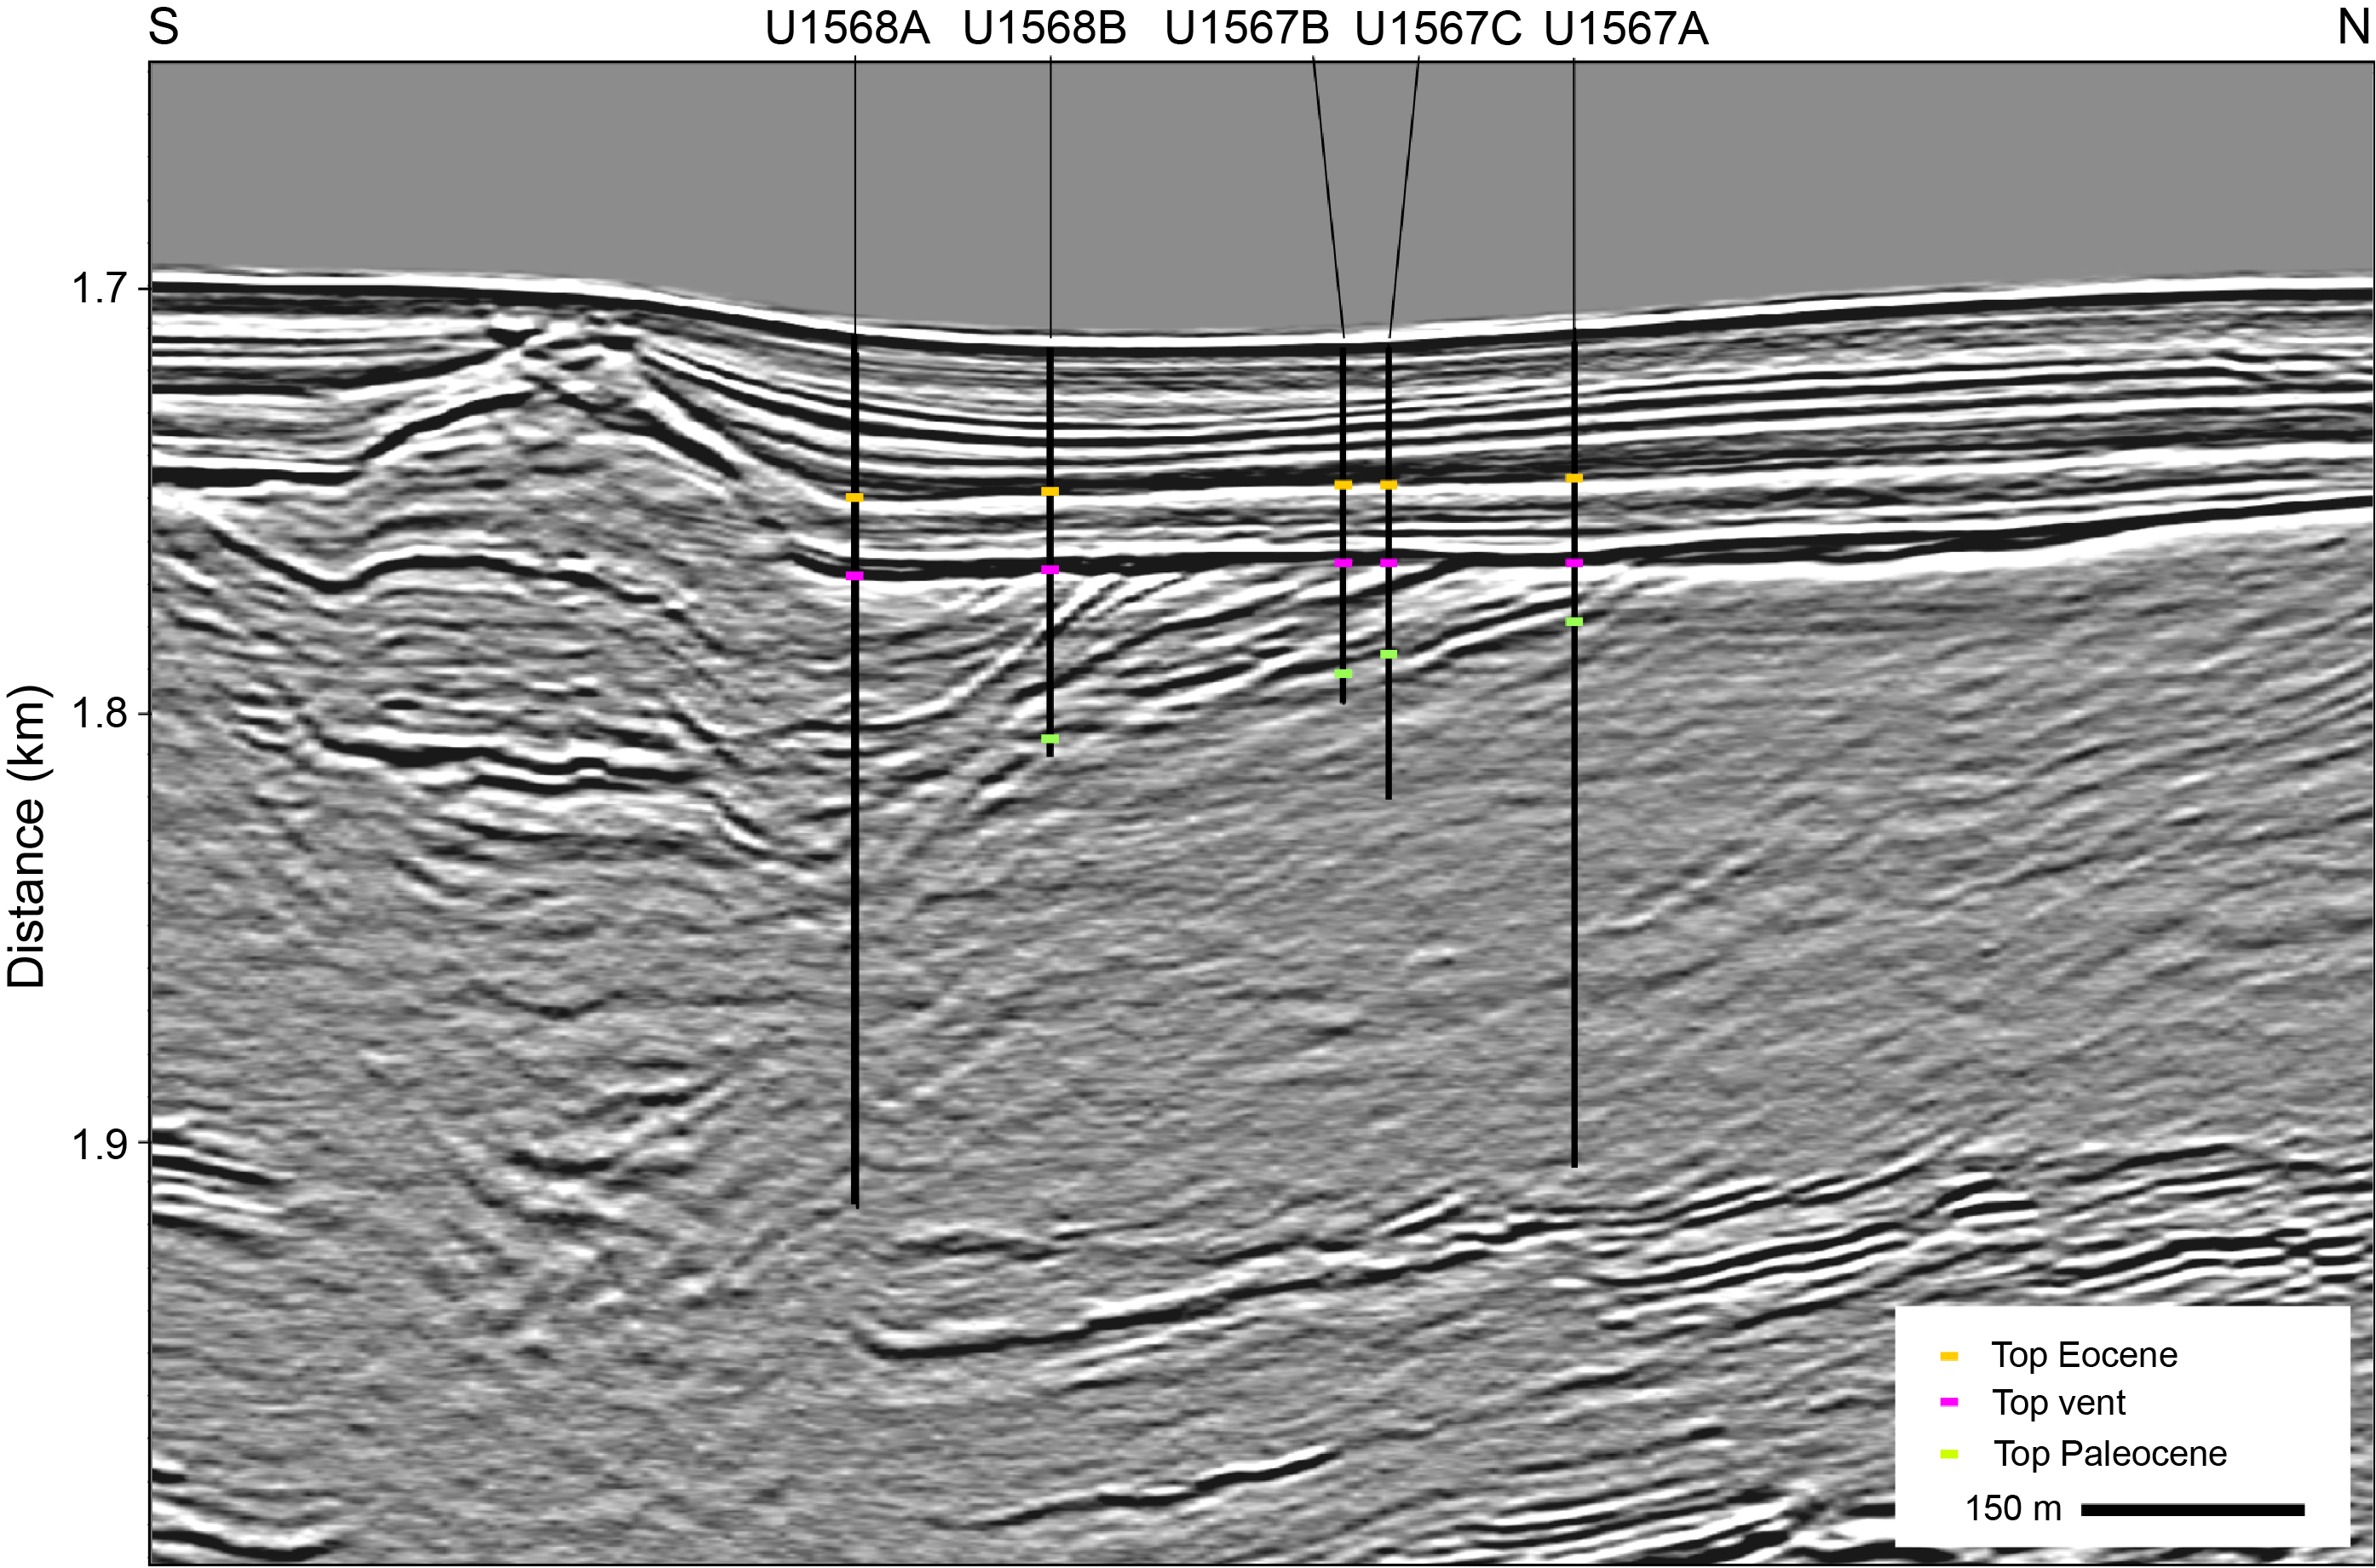
Figure F2. Seismic profile.
The aim of Sites U1567 and U1568 was to sample the upper part of a hydrothermal vent complex and a nearby reference site along a 500 m transect, avoiding the dome-shaped central part of the structure, to characterize the geology of the vent complex.
The first drilling objective was to constrain the processes that form the seafloor depressions and the infill. At least four potential scenarios are conceivable for this. First, pipe initiation may be explosive due to interaction of sill intrusions with preexisting zones of overpressure that may lead to hydrofracturing of the host rock and rapid ascent of expanding gas. This would result in blowouts that can create craters with similar dimensions as the observed eye structure within days (Thatje et al., 1999; Leifer and Judd, 2015) and infill within a few hundred years. Second, they may be caused by long-term seepage of gas and aqueous fluids liquefying the surface sediments, such as the Lusi mud volcano (Mazzini et al., 2007). Third, they may be caused by repeated mobilization of mud by sills intruding into unconsolidated sediments leading to mud volcanism (e.g., Perez-Garcia et al., 2009) over a time span of thousands of years. Finally, they may result from venting of hydrothermal fluids and precipitation of pyrites and pyrotites (Berndt, et al., 2016), again over thousands of years. The first two processes would require a later mobilization of the infill to form the observed domes at the upper termination, for example by gas-controlled seafloor doming (Koch et al., 2015), and the domes in the latter two scenarios would be explained by the ejection of vent material.
Each of the four processes would be associated with very different types of material ejected during the time that the pipe was formed—both for the solid and the fluid phase. Therefore, understanding the formative processes for the eye structures is intrinsically linked to the second objective: to obtain information on the type of fluids (i.e., CO2, CH4, or higher hydrocarbons) and the amount of carbon release, which is crucial for understanding the potential role of hydrothermal venting as a driver of PETM climate change. This includes constraining the rates of fluid venting and its potential to reach into the water column, provided that the venting was submarine.
The third objective was to characterize the emplacement environment of the hydrothermal vent complexes and how it changed in response to venting and rapid warming during the PETM. This characterization includes the changes in microfossil assemblages before, during, and after the PETM. In particular, we also set out to determine whether there is evidence for environmental changes in the immediate vicinity of the proposed source of greenhouse gases.
The fourth objective of Sites U1567 and U1568 was to date the prominent unconformity at the Modgunn Arch and the timing of uplift of the eye structure because this constrains the vertical movement of the margin, which is crucial input for melt generation models.
2. Operations
2.1. Transit to Site U1567
The 25 nmi sea passage from Site U1566 to Site U1567 was completed at 1148 h (all times are provided in UTC + 0 h) on 21 August 2021. The thrusters were lowered and secured. Full dynamic positioning (DP) mode with automatic heading was achieved at 1206 h as the vessel moved in DP mode over the site’s coordinates. The drill floor was cleared for operations at 1208 h, beginning Hole U1567A. The precision depth recorder (PDR) estimated the water depth to be 1710.4 meters below rig floor (mbrf). A shot depth of 1705.4 mbrf was selected for the first attempt at a mudline core.
2.2. Site U1567
Site U1567 consists of three holes. The first hole reaches 195.9 meters below seafloor (mbsf). Three coring systems were used for the cored interval. The advanced piston corer (APC) system was used from the seafloor to 52.9 mbsf. The half-length APC (HLAPC) system was deployed for a single core between 52.9 and 54.1 mbsf. With piston coring at refusal, the extended core barrel (XCB) system was deployed for the remainder of the hole. Half-length advances of the coring system were employed to 69.4 mbsf, and the remainder of the hole was cored using full-length advances of the XCB coring system. After coring operations ended in Hole U1567A, the hole was prepared for wireline logging and then successfully logged with the triple combination (triple combo) and Formation MicroScanner (FMS)-sonic tool strings.
Hole U1567B was offset ~165 m west of Hole U1567A in the direction of Site U1568. It was drilled without recovery to 25 mbsf and then cored with the APC system to 49.3 mbsf, where we experienced a partial stroke of the APC system on Core 396-U1567B-4H. We then switched to the XCB system and continued coring with half-length advances to maximize core recovery. Hole U1567B was terminated at 83 mbsf after retrieving Core 11X. After the conclusion of coring, the drill string was pulled back, clearing the seafloor at 1850 h and ending Hole U1567B. The rig floor was secured for transit under DP mode, and the ship was moved to Site U1568.
After completing coring and logging operations at Site U1568, we returned to Site U1567 to drill another hole (U1567C). The short distance between Holes U1568B and U1567C was completed with the drill string still deployed and in DP mode. Hole U1567C is located between Holes U1567A and U1567B. The strategy for Hole U1567C was similar to Hole U1567B: an initial drill down without recovery to 30 mbsf followed by coring with the APC/XCB system. As in Hole U1567B, we reached APC refusal at 47.8 mbsf and then cored with the XCB system to a final depth of 106 mbsf. After coring operations were completed at 0820 h on 27 September 2021, the drill string was returned on board and secured for the sea passage to the next site (U1569). A total of 72.25 h or 3.0 days of operations and 46 cores were recorded at Site U1567. The APC coring system was deployed 11 times over a 95.0 m interval and recovered 97.13 m of core (102.2%). The HLAPC system was deployed a single time and recovered 1.14 m of core. A 1.2 m advance was taken after recovery. The XCB system was deployed 34 times over a 233.7 m interval and recovered 205.8 m of core (87.8%). The total interval cored at Site U1567 was 329.9 m with 303.35 m of core recovered (92%) (Table T1).
2.2.1. Hole U1567A
On arrival at Site U1567, the rig crew began making up the outer core barrel. The nonmagnetic drill collar was picked up, and the remainder of the bottom-hole assembly (BHA) was assembled and deployed to 136.78 mbrf. The drill pipe was lowered to 1667 mbrf, and the top drive was picked up. The drilling knobbies were installed, the APC core barrels were dressed, and the bit was spaced out to 1705.4 mbrf. The first attempt to spud Hole U1567A returned only traces of mud at the cutting shoe and was called a water core. The bit was lowered 5 m to 1710.4 mbrf, and Hole U1567A was spudded at 2102 h. Core 1H returned 5.41 m of sediment, making the APC calculated water depth 1714.5 mbrf (1703.2 meters below sea level [mbsl]). We continued APC coring through Core 6H to 52.9 mbsf. Core 6H was recorded as a partial stroke despite the 10.02 recovery. An overpull of 35,000 lb was required to release it from the formation. The HLAPC coring system was deployed and, despite the shorter barrel, was also a partial stroke. The recovery from the core was only 1.14 m, and the decision was made to call this APC refusal. The XCB system was deployed to cut Core 8X and to cut half cores to maximize recovery through this critical zone. The hole was advanced to 69.4 mbsf, and after Core 10X was on deck, XCB coring continued with full advances to the final depth of 195.9 mbsf and finished with Core 23X.
After coring was completed at 1655 h on 22 August 2021, the hole was swept clean of cuttings with a 50 bbl sweep of high-viscosity mud and displaced with 85 bbl of 10.5 lb/gal mud. The drill string was pulled back to 140.5 mbsf with the top drive installed. The top drive was set back, and the drill string was raised to bring the end of the pipe to 82.8 mbsf in preparation for downhole logging. The rig floor personnel and the Schlumberger engineer met to review safety issues surrounding the upcoming logging operations. Two downhole logging tool strings were run in Hole U1567A: the modified triple combo tool string with the Magnetic Susceptibility Sonde (MSS) and the FMS-sonic tool string. The triple combo was assembled, tested, and deployed at 2105 h on 22 August. A downhole log was performed from just above seafloor to the full depth of the hole (~196 mbsf). The hole was logged up for a full-length open hole calibration pass, and the tool string was deployed back to the bottom of hole. We collected data over two successful upward runs. As the triple combo approached the bit, the drill string was raised 10 m to allow these additional meters of hole to be logged. The caliper was closed prior to entering the drill pipe. The tools were brought back to the surface and rigged down by 0100 h on 23 August. We then rigged up the FMS-sonic tool string and deployed it, collecting a downward log with the FMS calipers closed from just above the seafloor to 196 mbsf. We logged with the natural gamma radiation (NGR) tool through the drill pipe to identify the seafloor depth and match the results of the first logging run. Once we reached the bottom of the hole, we conducted two upward passes, collecting data from 196 to ~125 mbsf with the FMS calipers open. The calipers were closed just prior to entering the drill pipe, and the hole was logged to the seafloor. The tool string was pulled back to the surface. At 0600 h on 21 August, all logging tools were rigged down and the logging wireline was secured. No damage was found to any of the logging tools from either of the two tool strings. The drilling knobbies were removed from the drill string, and the drill string was pulled to 1667 mbrf, clearing the seafloor at 0640 h on 23 August and ending Hole U1567A. The DP operator was notified that operations at Hole U1567A were complete and began moving the ship to Hole U1567B. The time spent on Hole U1567A was 42.50 h or 1.8 days.
2.2.2. Hole U1567B
After clearing the seafloor from Hole U1567A, the bit was pulled to 1667 mbrf and the vessel was offset 160 m south following the direction of the seismic line toward Site U1568 to start Hole U1567B. The reason for coring a second hole at this site was to sample a critical interval between 50 and 70 mbsf that was not fully recovered in Hole U1567A. The top drive and drilling knobby were picked up, and the bit was spaced out in preparation to start the hole. The seafloor depth was established at 1704.3 mbsl using the offset depth from Hole U1567A with a small adjustment to account for the difference in seafloor depth using the PDR. An XCB wash barrel was dropped, and Hole U1567B was spudded at 0820 h. We drilled without recovering any core to 25.0 mbsf, and the wash barrel was recovered by wireline. The APC coring system was deployed, and we cut Cores 2H–4H to 49.3 mbsf with a recovery of 102.2%. Core 4H was recorded as a partial stroke with a 5.3 m advance (recovery = 5.29 m). At that point, we switched to the XCB system and began to cut half cores to improve the chances of fully recovering the missing interval. We cored with the XCB system from 49.3 to 83.0 mbsf (Cores 5X–11X) and recovered 30.45 m (90.4%). After coring in Hole U1567B was ended, we pulled the drill string out of the hole at 1900 h and set the end of the pipe at 1686.7 mbrf to move to Site U1568. The time spent on Hole U1567B was 12 h or 0.5 days.
2.3. Transit to Site U1568
We completed the 0.27 nmi transit to Site U1568 in just 45 min at 1936 h on 23 August 2021. With the thrusters already down, the drill floor was cleared for operations to begin Hole U1568A.
2.4. Site U1568
Site U1568 consists of two holes. Hole U1568A reached 200.0 mbsf. Two coring systems were used. The APC system was used from the seafloor to 51.7 mbsf. The final two cores, 6H and 7H, were both incomplete strokes. Core 7H advanced only 0.3 m into the formation. The XCB system was employed to advance the hole to the final depth of 200 mbsf. This hole was then prepared for logging, and we successfully conducted two passes each with the triple combo and FMS-sonic tool strings. With operations at Hole U1568A complete, the vessel was offset along the seismic line at approximately 165 m in the direction of Site U1567.
Hole U1568B was washed down to 30 mbsf. The APC system was deployed and advanced to 49.0 mbsf, where we experienced a partial stroke of the APC system on Core 3H. The XCB system was deployed, and coring continued with half advances to maximize core recovery to 114.8 mbsf. Hole U1568B was terminated at 124.6 mbsf after retrieving the full advance Core 17X. After the conclusion of coring, the drill string was pulled back to just above the seafloor and secured for the DP transit to Site U1567. The seafloor was cleared at 1900 h, ending Hole U1568B. After completing operations at Site U1568 and with the APC/XCB drill string still deployed, the vessel moved in DP mode to reoccupy Site U1567. A total of 71.50 h or 3.0 days were recorded while at Site U1568.
A total of 43 cores were taken at this site. The APC coring system was deployed nine times over a 70.7 m interval and recovered 72.03 m of core (101.9%). A total of 34 XCB cores were recovered over a 223.9 m interval. The XCB system recovered 167.34 m of core (74.7%). The total interval cored at Site U1568 was 294.6 m with 239.37 m of core recovered (81.3%) (Table T2).
2.4.1. Hole U1568A
With the top drive already in place, a reading from our PDR estimated the water depth at 1707.4 mbsl. Because most of the PDR depths had been shallow, the bit was spaced out to 1705.0 mbrf to spud Hole U1568A. An APC core barrel was run into the hole, landed, fired, and recovered, but it did not recover any core. The bit was lowered to 1710.0 mbrf, and another APC core barrel was dropped and retrieved 3.89 m of core. The APC calculated water depth was 1715.6 mbrf (1704.4 mbsl). Hole U1568A was spudded at 2132 h, and we continued APC coring through Core 7H to 51.7 mbsf. Core 6H was recorded as a partial stroke despite the 9.58 m recovery. An overpull of 20,000 lb was required to release the core barrel from the formation. The following attempt with the APC core barrel returned a core of 0.3 m. After that attempt, we switched to the XCB coring system. The XCB system was deployed to cut Core 8X and to cut half cores to maximize recovery through this critical zone. The hole was advanced through Core 12X at 77.4 mbsf. After Core 12X was on deck, XCB coring continued with full advances to 165.3 mbsf. Coring resumed with half-length advances and finished with Core 28X at a final hole depth of 200.0 mbsf.
After coring was completed at 0050 h, we conditioned the hole for downhole logging with a 50 bbl high-viscosity mud sweep to clear the cuttings and then displaced the hole with 84 bbl of 10.5 lb/gal mud. We raised the end of the pipe to a logging depth of 82 mbsf, rigged up the triple combo tool string, and lowered it through the pipe, but it was unable to pass through the outer core barrel after several attempts. The tool string was brought back to the surface at 0830 h, rigged down, and inspected, and all of its components were verified to be in good condition. We then picked up the top drive, dropped an XCB core barrel, and circulated to verify that the barrel was landed. Everything seemed to be in good order, so we retrieved the core barrel by wireline, rigged up the triple combo once again, and lowered it inside the hole at 1200 h. This time, the tool string passed into the open hole without problems, reaching 188.7 mbsf on the first pass and 187.8 mbsf on the second pass. We conducted two successful upward passes, collecting magnetic susceptibility (MS), resistivity, density (with caliper), neutron porosity, temperature, and NGR data. The triple combo was retrieved at 1505 h and rigged down. We then rigged up the FMS-sonic tool string and lowered it through the open hole. We conducted two upward passes from 185.7 mbsf. The FMS-sonic was retrieved at 1945 h, and the rig floor was cleared of all the logging equipment. We pulled up the pipe, clearing the seafloor and ending Hole U1568A at 2200 h on 25 August 2021. After raising the pipe and setting the bit at 1677 mbrf (1665.8 mbsl), we moved 160 m north in DP mode to start Hole U1568B. We dropped an XCB wash barrel and dressed out the APC barrels in preparation for piston coring.
2.4.2. Hole U1568B
Hole U1568B was spudded at midnight on 25 August 2021 at a PDR depth of 1706.1 mbsl. An XCB wash barrel was dropped, and we drilled without recovery to 30.0 mbsf. At that point, the wash barrel was recovered by wireline and the APC system was deployed, advancing the hole to 49 mbsf with Cores 2H and 3H. Once the core was retrieved, we found that the liner had imploded inside the barrel, and we had to pump it out. We switched to the XCB coring system and cored from 49 mbsf to a final depth of 124.6 mbsf (Cores 4X–17X). We then raised the drill string out of the hole, clearing the seafloor at 1900 h on 25 August and ending Hole U1568B. Total core recovery for the hole was 63.95 m (84.6%). The time spent on Hole U1568B was 21.00 h or 0.9 days.
After completing coring operations at Site U1568, we set the end of the pipe at 1677 mbrf and returned to Site U1567 in DP mode to core an additional hole between Holes U1567A and U1567B with the objective to improve and expand the sampling and core interval recovered across the Paleocene/Eocene boundary at these two sites.
2.5. Hole U1567C
The 0.2 nmi transit took 0.75 h and was completed at 2005 h on 26 August 2021. The ship was positioned over the new hole coordinates, and coring in Hole U1567C began at 2040 h. The PDR seafloor depth was 1705.1 mbsl. We drilled to 30 mbsf without recovery and then APC cored to 47.8 mbsf with Cores 2H and 3H retrieving 18.81 m (99%). Core 4H was recorded as a partial stroke with an 8.3 m advance and equal core recovery. We then switched to the XCB system and continued coring with half-length advances to 96.2 mbsf. The last core we cut, Core 14X, was a full advance and completed the hole at 106 mbsf. In total, we cored an interval of 76 m and recovered 66.5 m (87.5%).
We retrieved the drill string and disassembled and laid out all the components. The bridge was notified at 1340 h on 27 August that the rig floor was secured and operations at Site U1567 were complete. The time spent on Hole U1567C was 17.75 h or 0.7 days. After raising the thrusters, we got underway to Site U1569 at 1345 h.
3. Lithostratigraphy
Sites U1567 and U1568 are described together because the five holes are located along one 500 m transect across a crater of the Modgunn hydrothermal vent complex. The succession recovered at the two sites is divided into six lithostratigraphic units (Figure F3, F4; Table T3). All six units are identified in each of the five holes and preliminarily tied based on unit boundaries (Figure F3). Generally, the recovery for all holes is high and the depths (using the core depth below seafloor, Method A [CSF-A] depth scale in meters) of most boundaries between the lithostratigraphic units are well established (Table T3). Where core recovery is low, boundaries are placed at the upper part of the underlying unit.
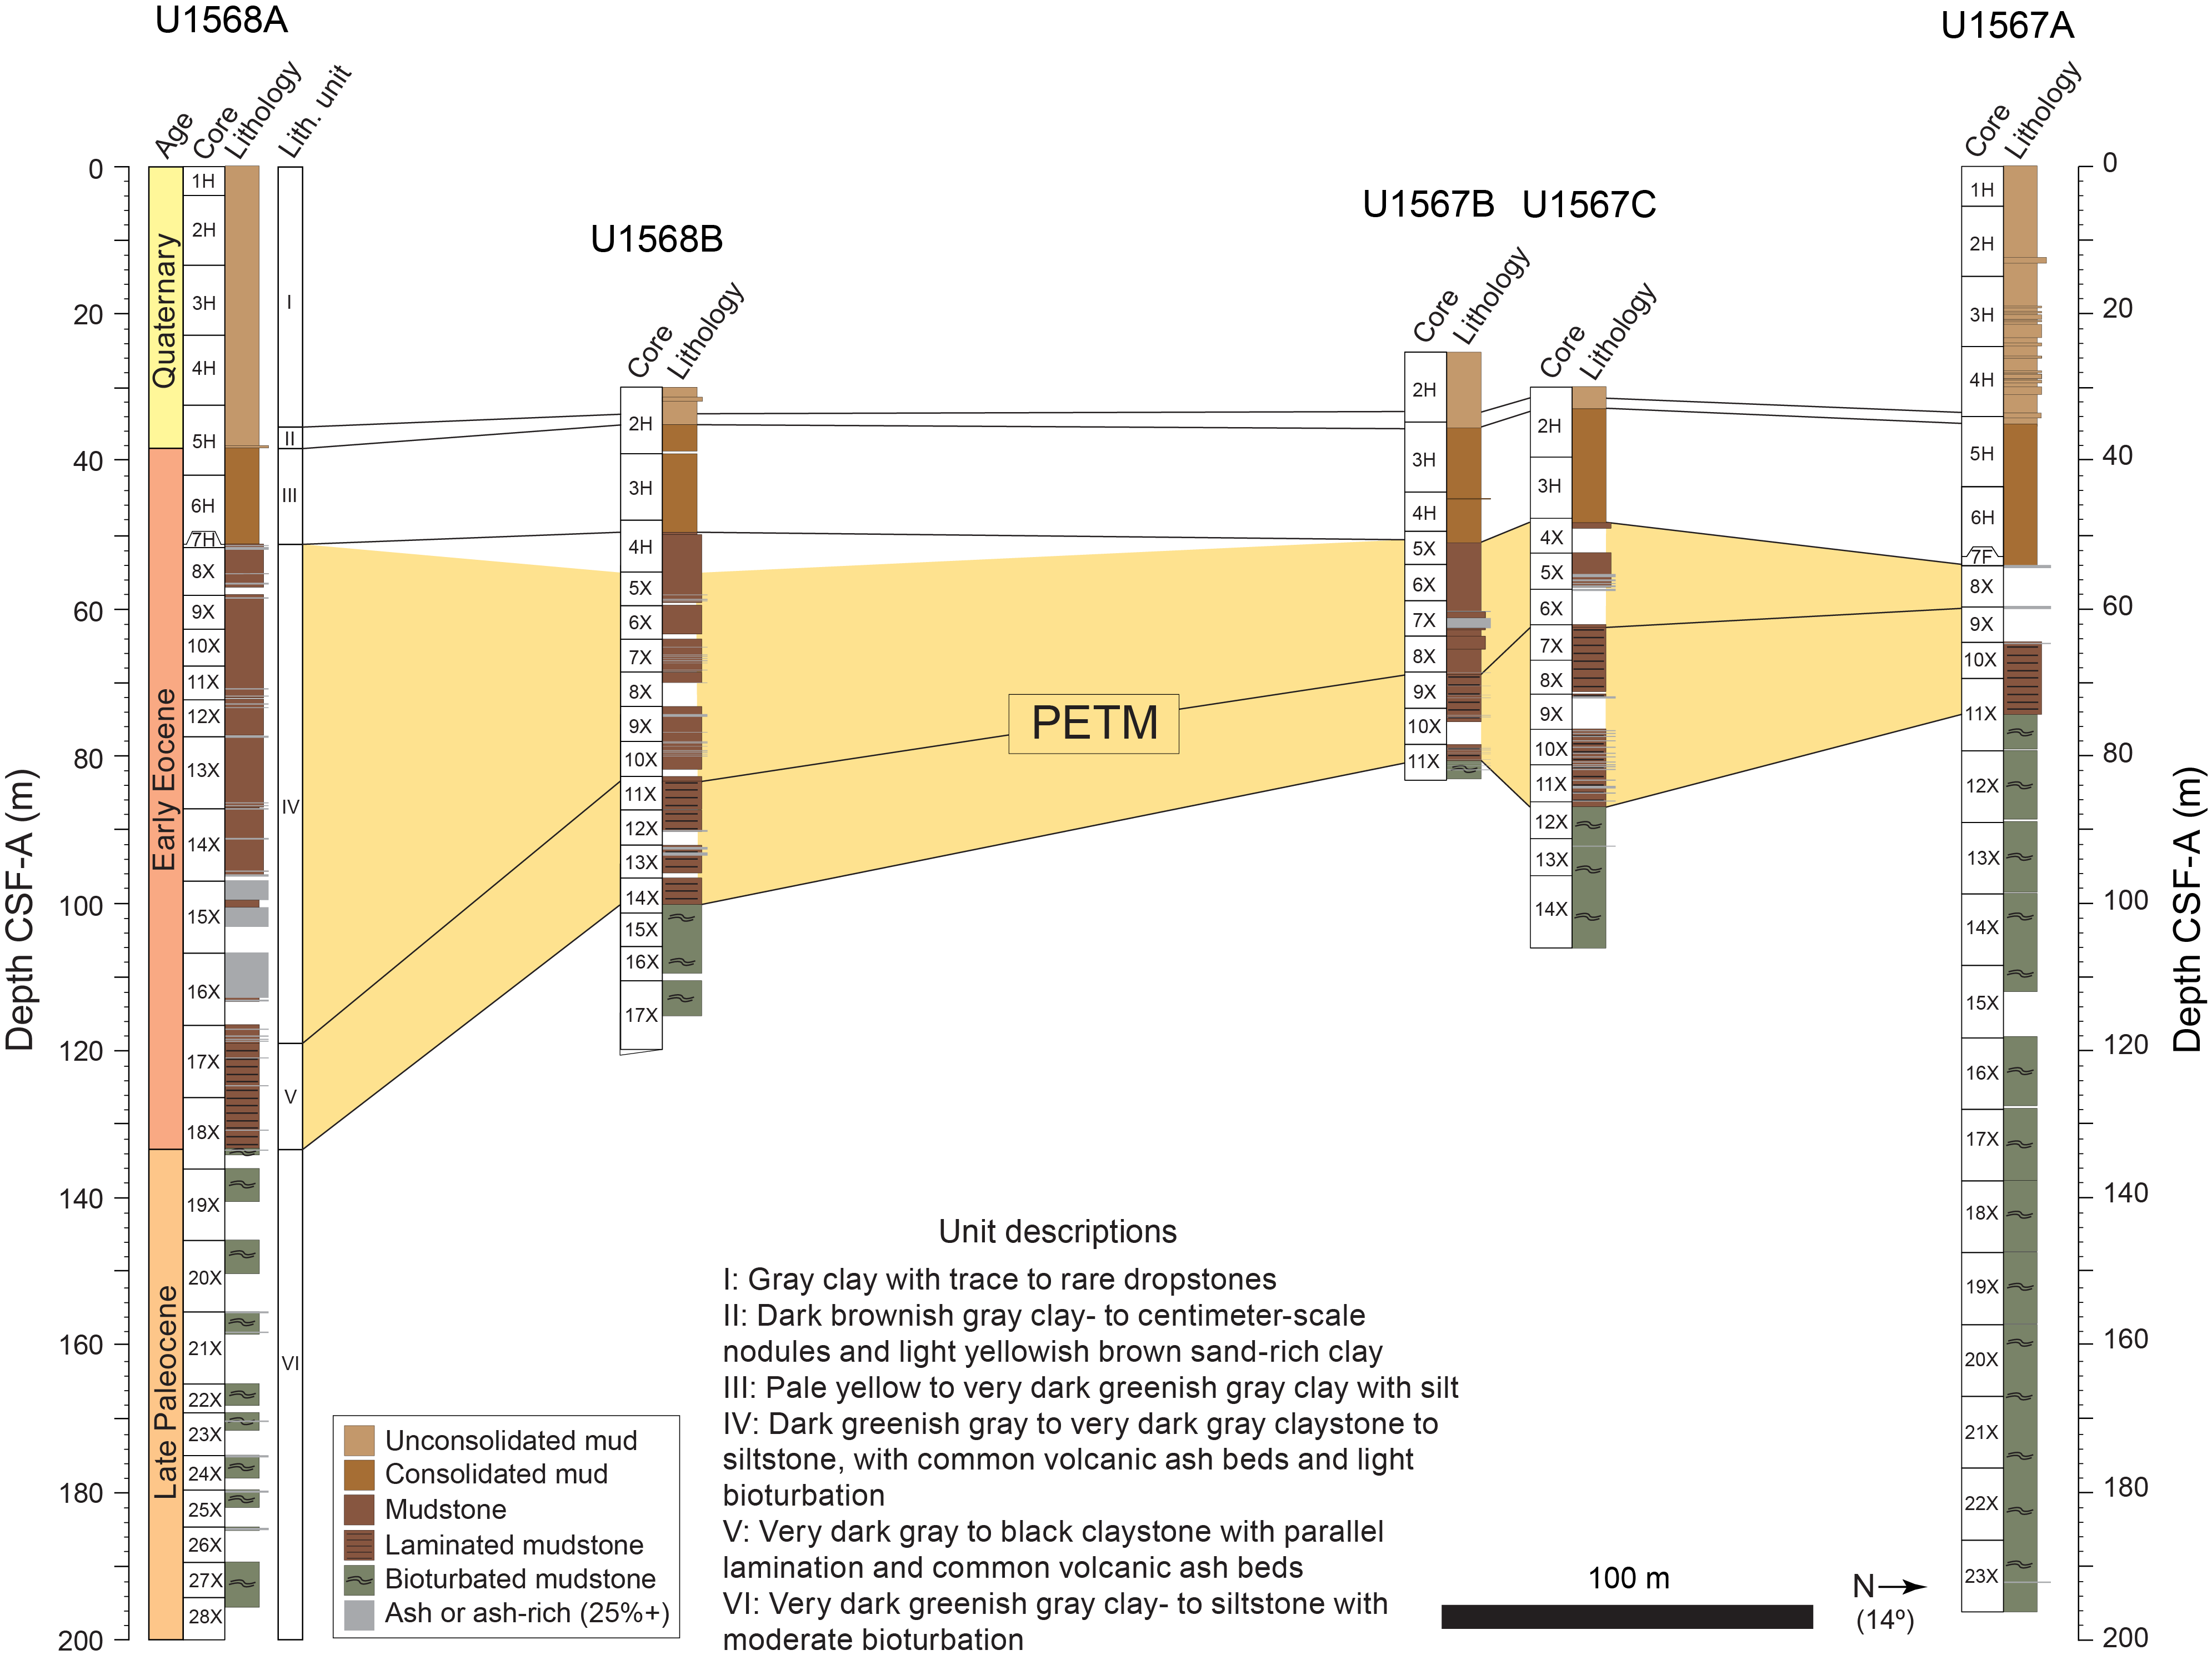
Figure F3. Lithostratigraphic summary.
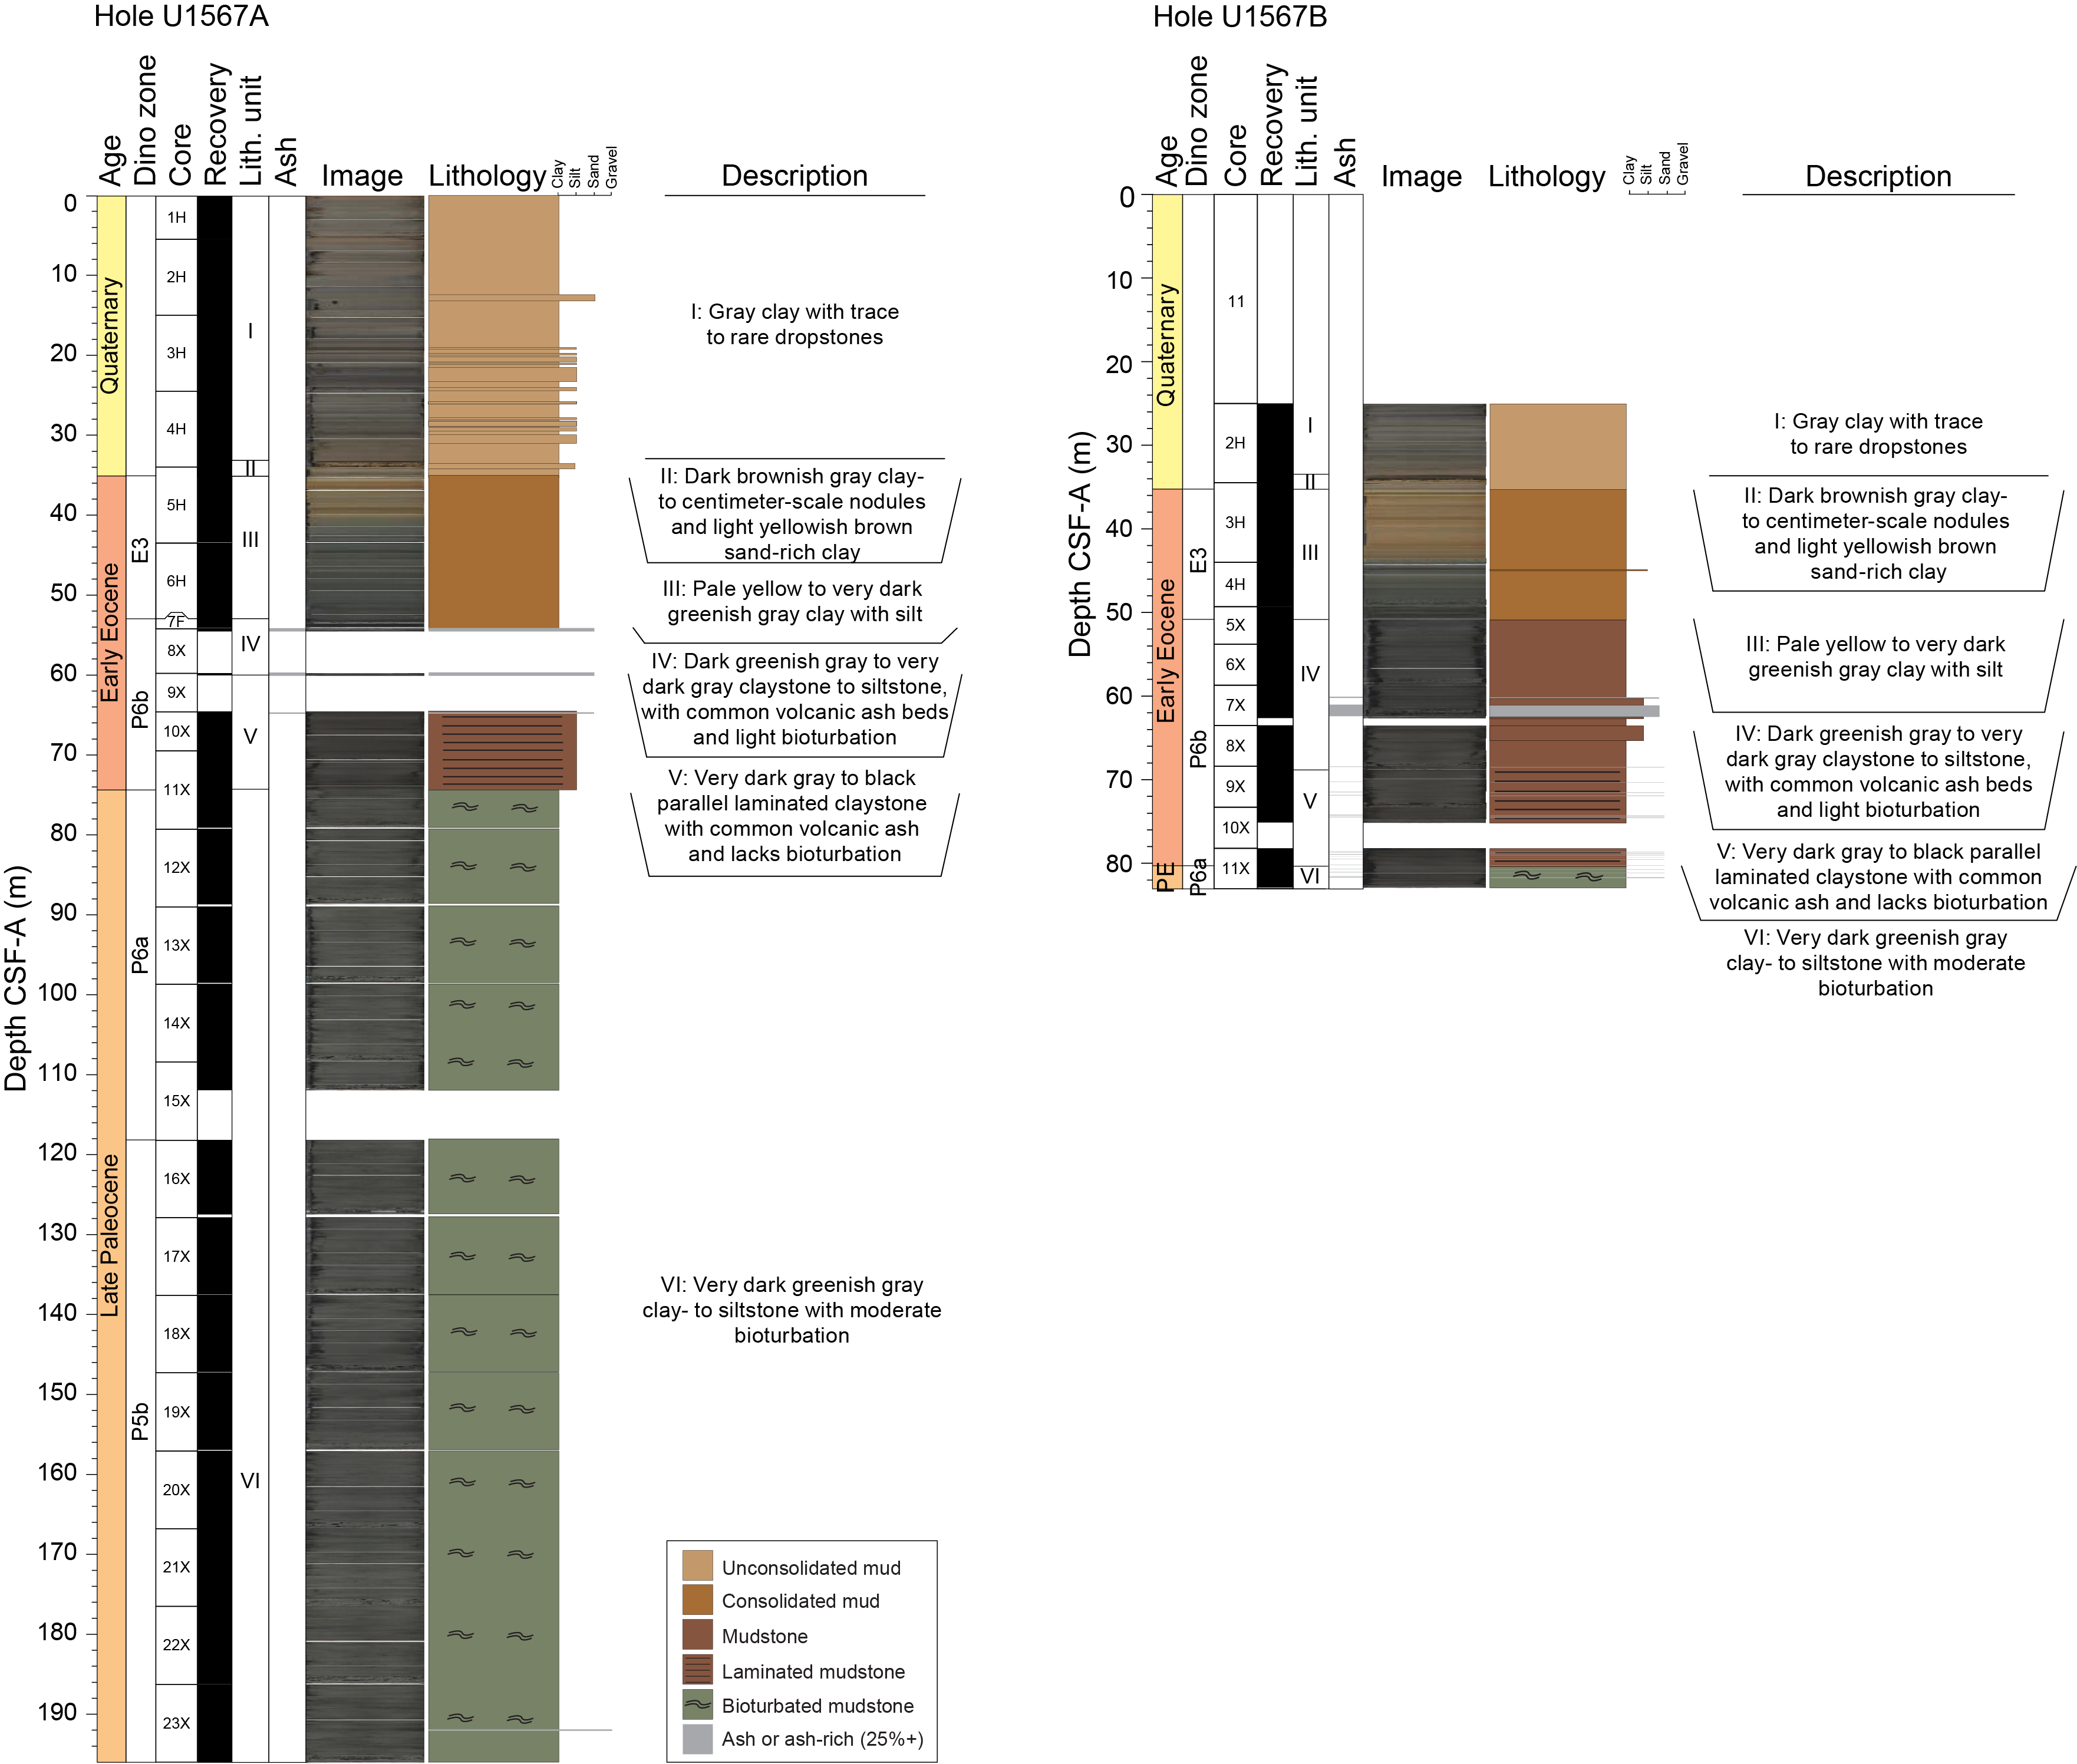
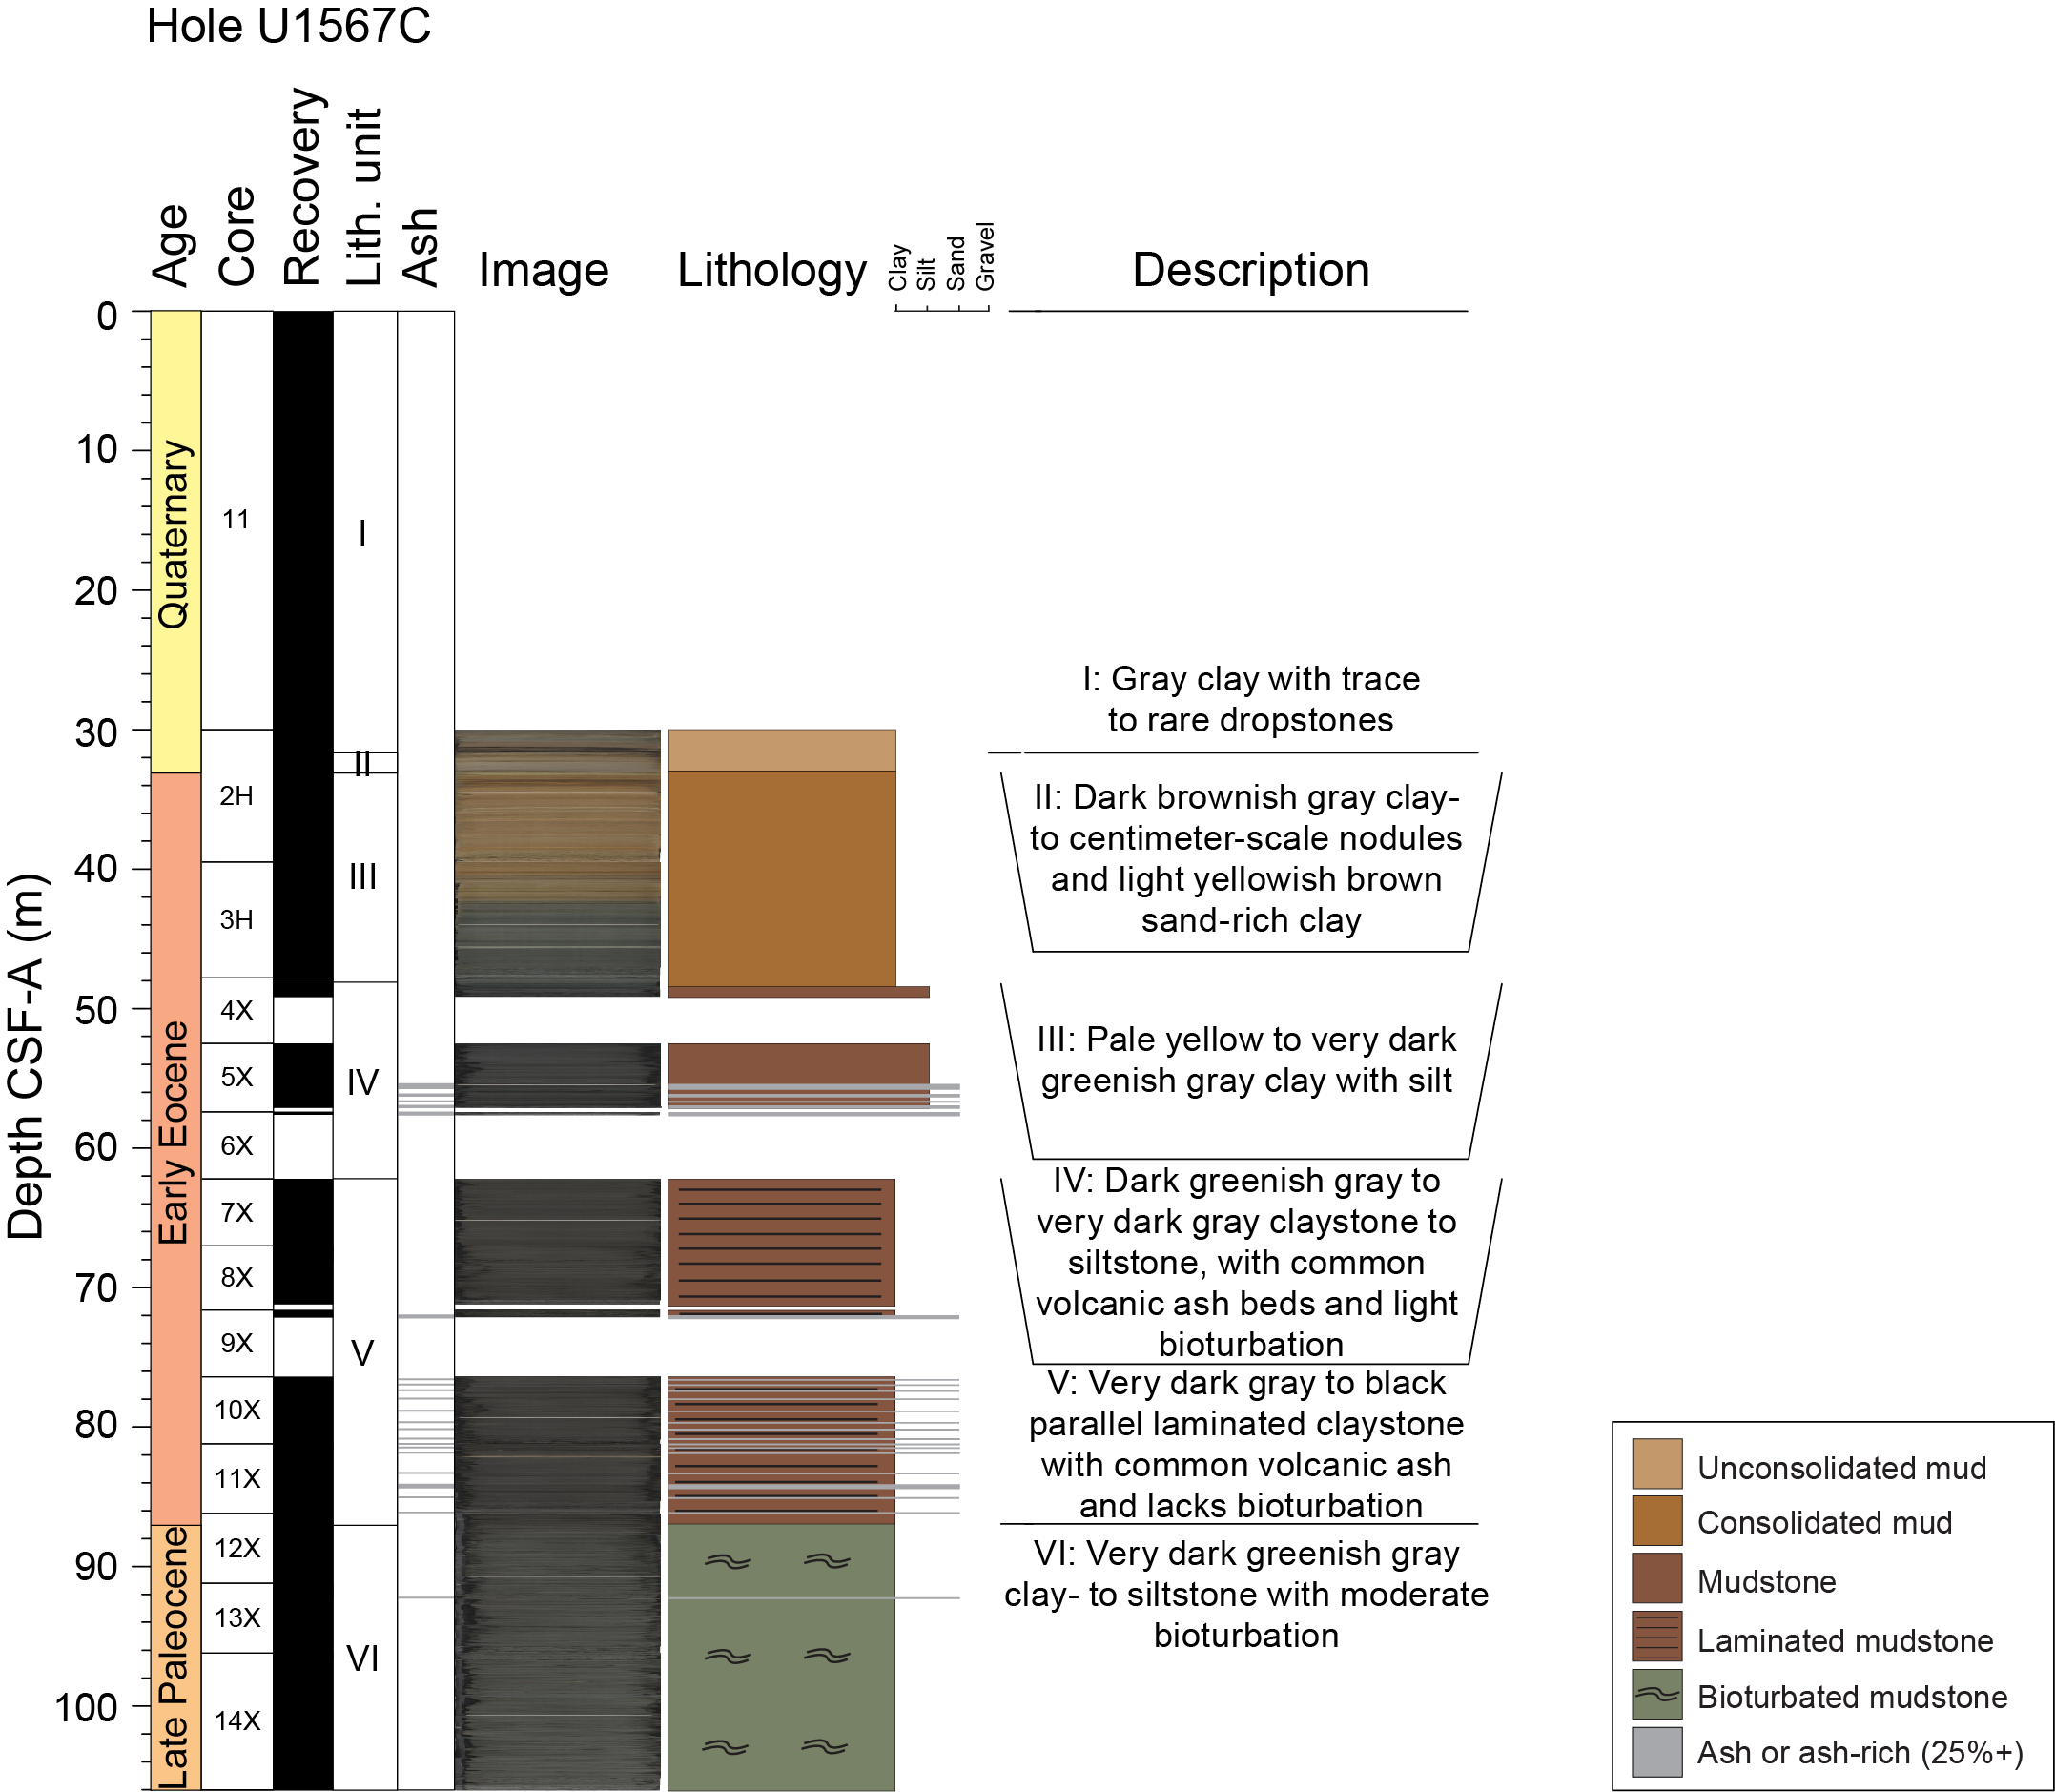
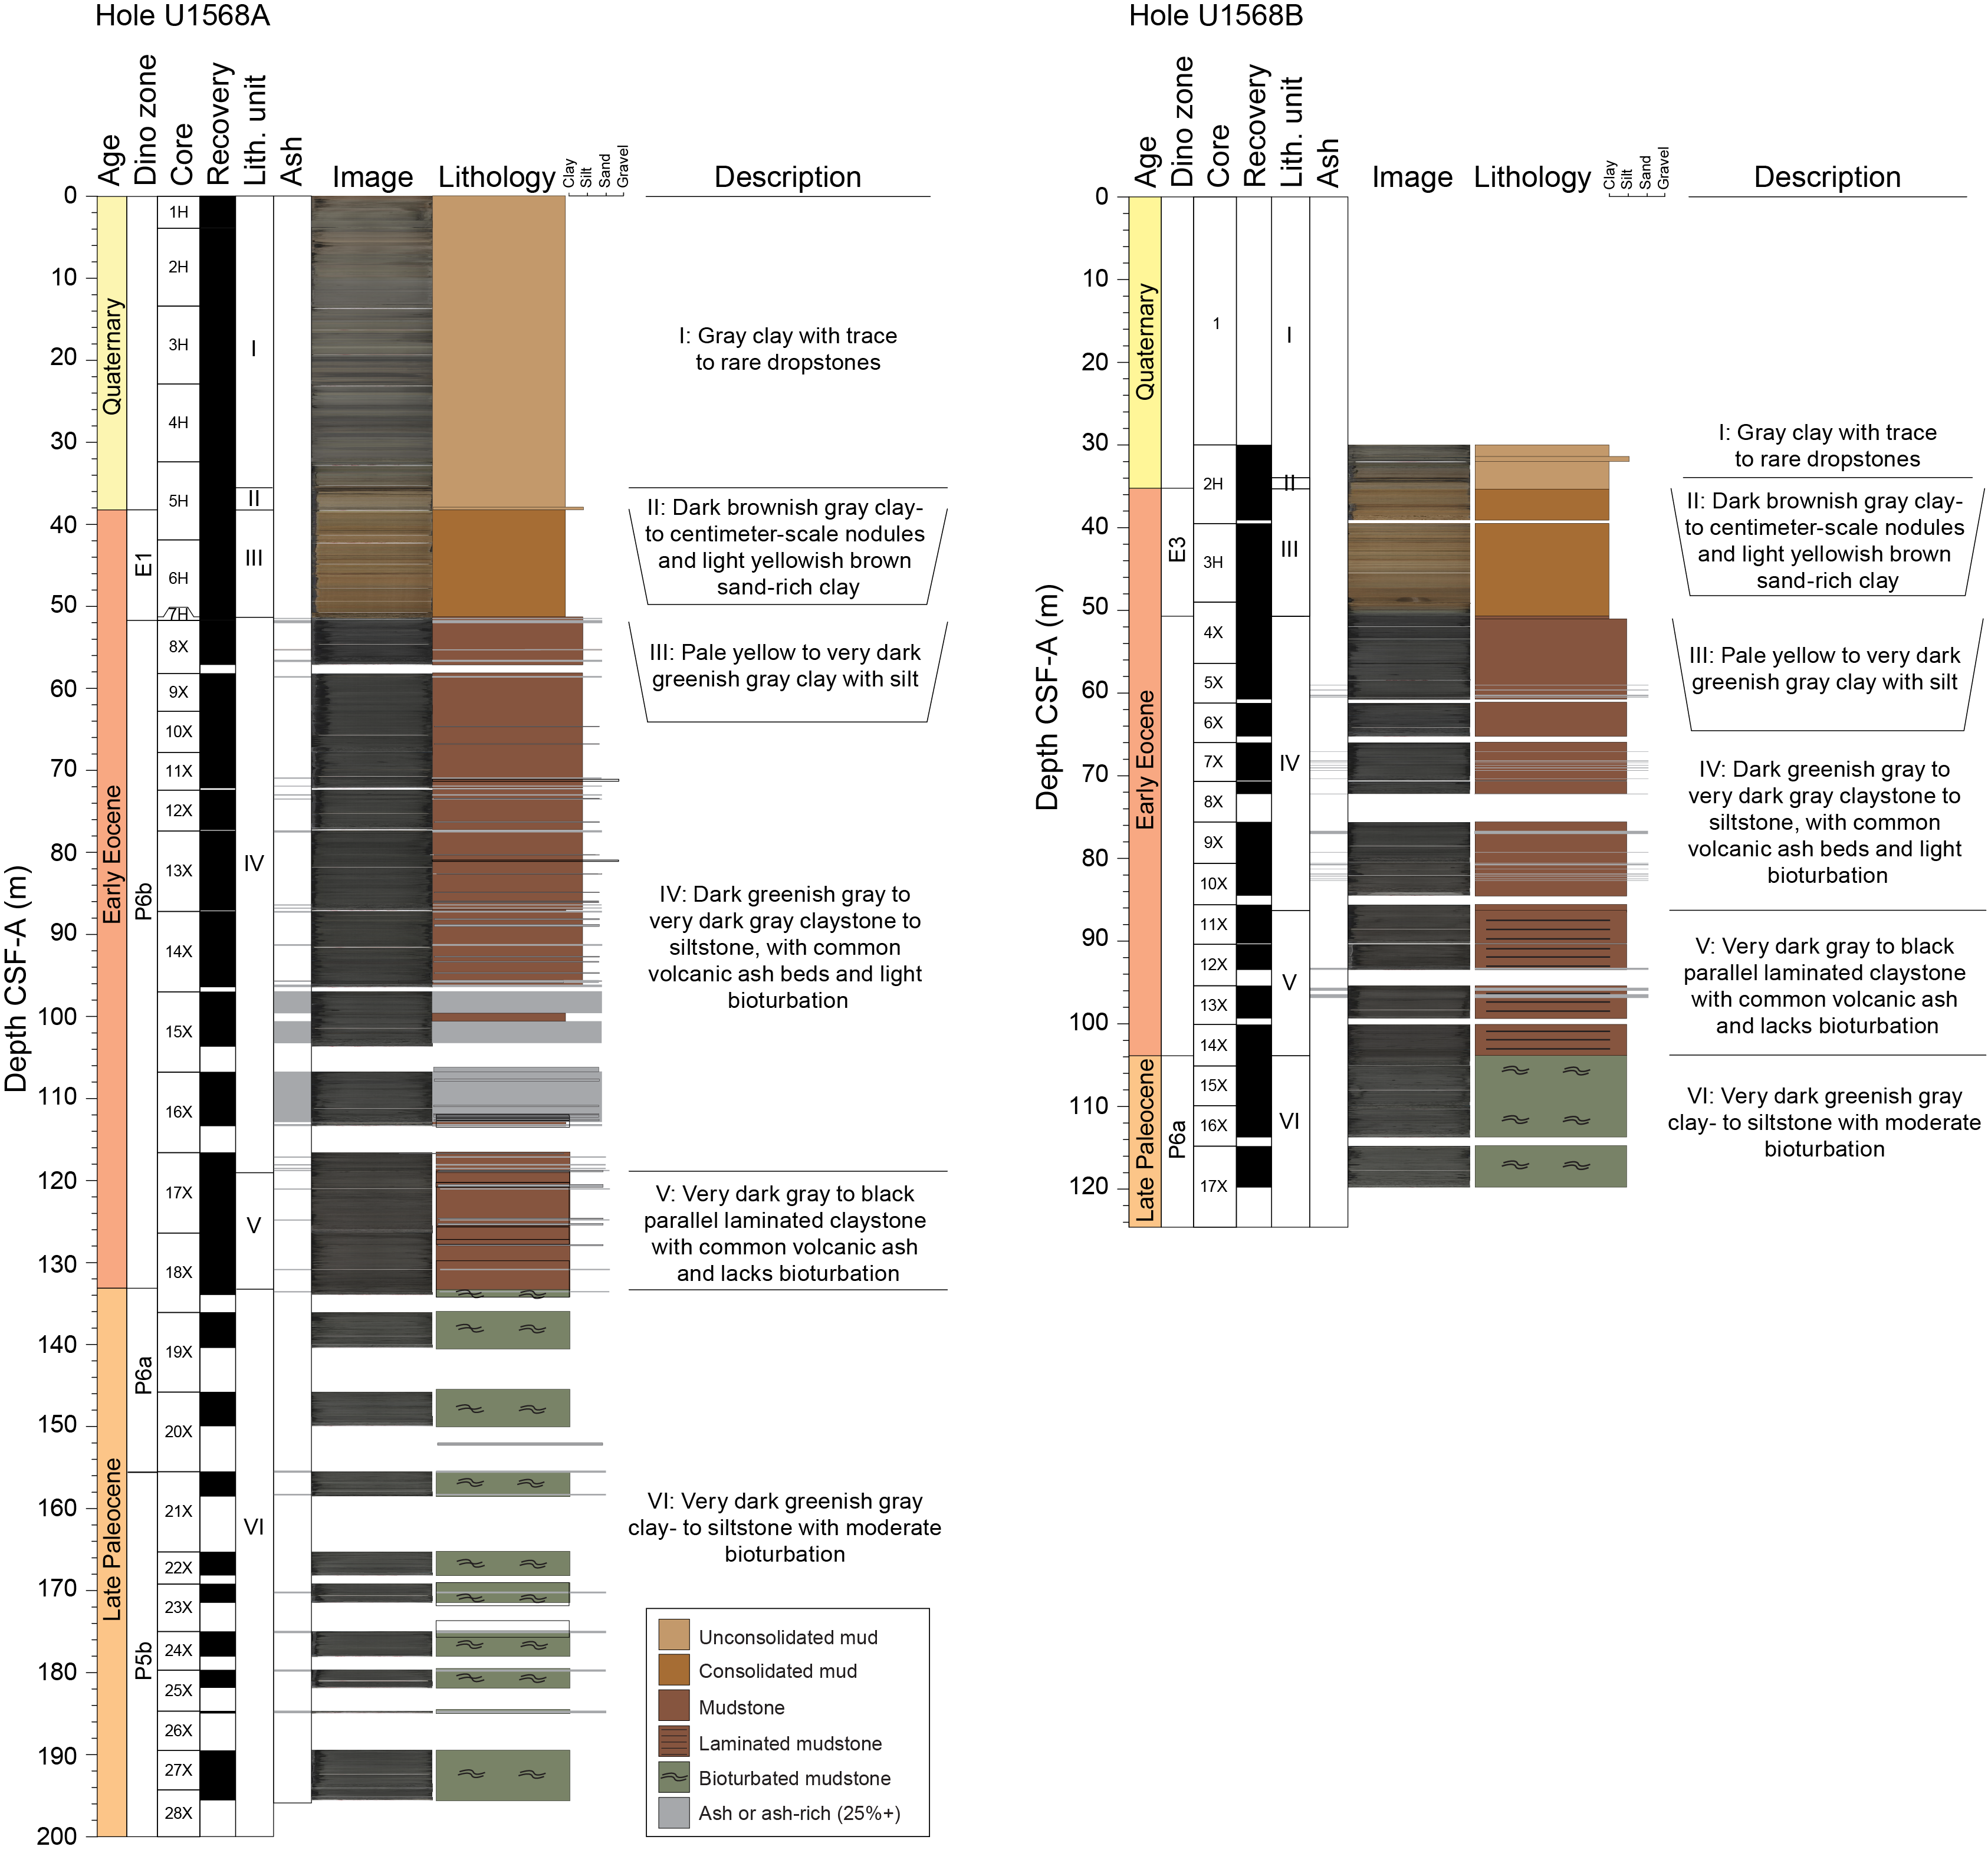
Figure F4. Lithostratigraphic columns.
The lithology at Sites U1567 and U1568 is as follows:
- Unit I is gray clay with trace to rare dropstones.
- Unit II consists of dark brownish gray sediments (clay- to centimeter-scale nodules) rich in manganese and iron in the uppermost interval and light yellowish brown sand-rich clay throughout.
- Unit III is pale yellow to very dark greenish gray clay with silt, including clasts of clay and rare beds of siltstone.
- Unit IV is dark greenish gray to very dark gray claystone to siltstone, with common volcanic ash beds and light bioturbation.
- Unit V is very dark gray to black parallel laminated claystone with common volcanic ash and lacking bioturbation.
- Unit VI is very dark greenish gray clay- to siltstone with moderate bioturbation.
The lithostratigraphic highlights of Sites U1567 and U1568 are as follows:
- An expanded (tens of meters) section of PETM laminated mudstone with abundant ash was recovered in all five holes.
- A PETM interval overlies Late Paleocene green bioturbated mudstone in each hole.
- The Early Eocene interval lies just below Quaternary clays.
- Small (centimeter) scale normal faulting is observed in PETM and Late Paleocene mudstone.
3.1. Lithostratigraphic Unit I
- Intervals: 396-U1567A-1H-1, 0 cm, to 4H-6, 119 cm; 396-U1567B-2H-1, 0 cm, to 2H-6, 108 cm; 396-U1567C-2H-1, 0 cm, to 2H-2, 16 cm; 396-U1568A-1H-1, 0 cm, to 5H-3, 20 cm; 396-U1568B-2H-1, 0 cm, to 2H-4, 99 cm
- Depths: Hole U1567A = 0.00–33.11 m CSF-A; Hole U1567B = 25.00–33.60 m CSF-A; Hole U1567C = 30.00–31.66 m CSF-A; Hole U1568A = 0.00–35.60 m CSF-A; Hole U1568B = 30.00–33.97 m CSF-A
- Age: Quaternary
Lithostratigraphic Unit I is present in all five holes (Figure F4), although the recovered thickness varies (Table T3). In Holes U1567B, U1567C and U1568B, a thinner interval of Unit I was recovered (Figure F3) because the uppermost 25–30 m of sediments were drilled without recovery. This unit primarily consists of grayish brown to very dark gray clay with varying amounts of silt and sand. Foraminifers are common in some beds of the upper interval and become rarer downhole. Occasional dropstones varying in lithology (e.g., claystone to granite) are present, and some intervals contain trace amounts of visible organic matter.
3.2. Lithostratigraphic Unit II
- Intervals: 396-U1567A-4H-6, 119 cm, to 5H-1, 131 cm; 396-U1567B-2H-6, 108 cm, to 3H-1, 79 cm; 396-U1567C-2H-2, 16 cm, to 2H-3, 10 cm; 396-U1568A-5H-3, 20 cm, to 5H-4, 135 cm; 396-U1568B-2H-4, 99 cm, to 2H-5, 81 cm
- Depths: Hole U1567A = 33.11–35.21 m CSF-A; Hole U1567B = 33.60–35.29 m CSF-A; Hole U1567C = 31.66–33.10 m CSF-A; Hole U1568A = 35.60–38.25 m CSF-A; Hole U1568B = 33.97–35.29 m CSF-A
- Age: Quaternary
Lithostratigraphic Unit II consists of very dark brownish gray sediment (clay- to pebble-sized) in the uppermost interval and light yellowish brown sand-rich clay throughout. The lithologic transition from Unit I to Unit II is illustrated in Figure F5.
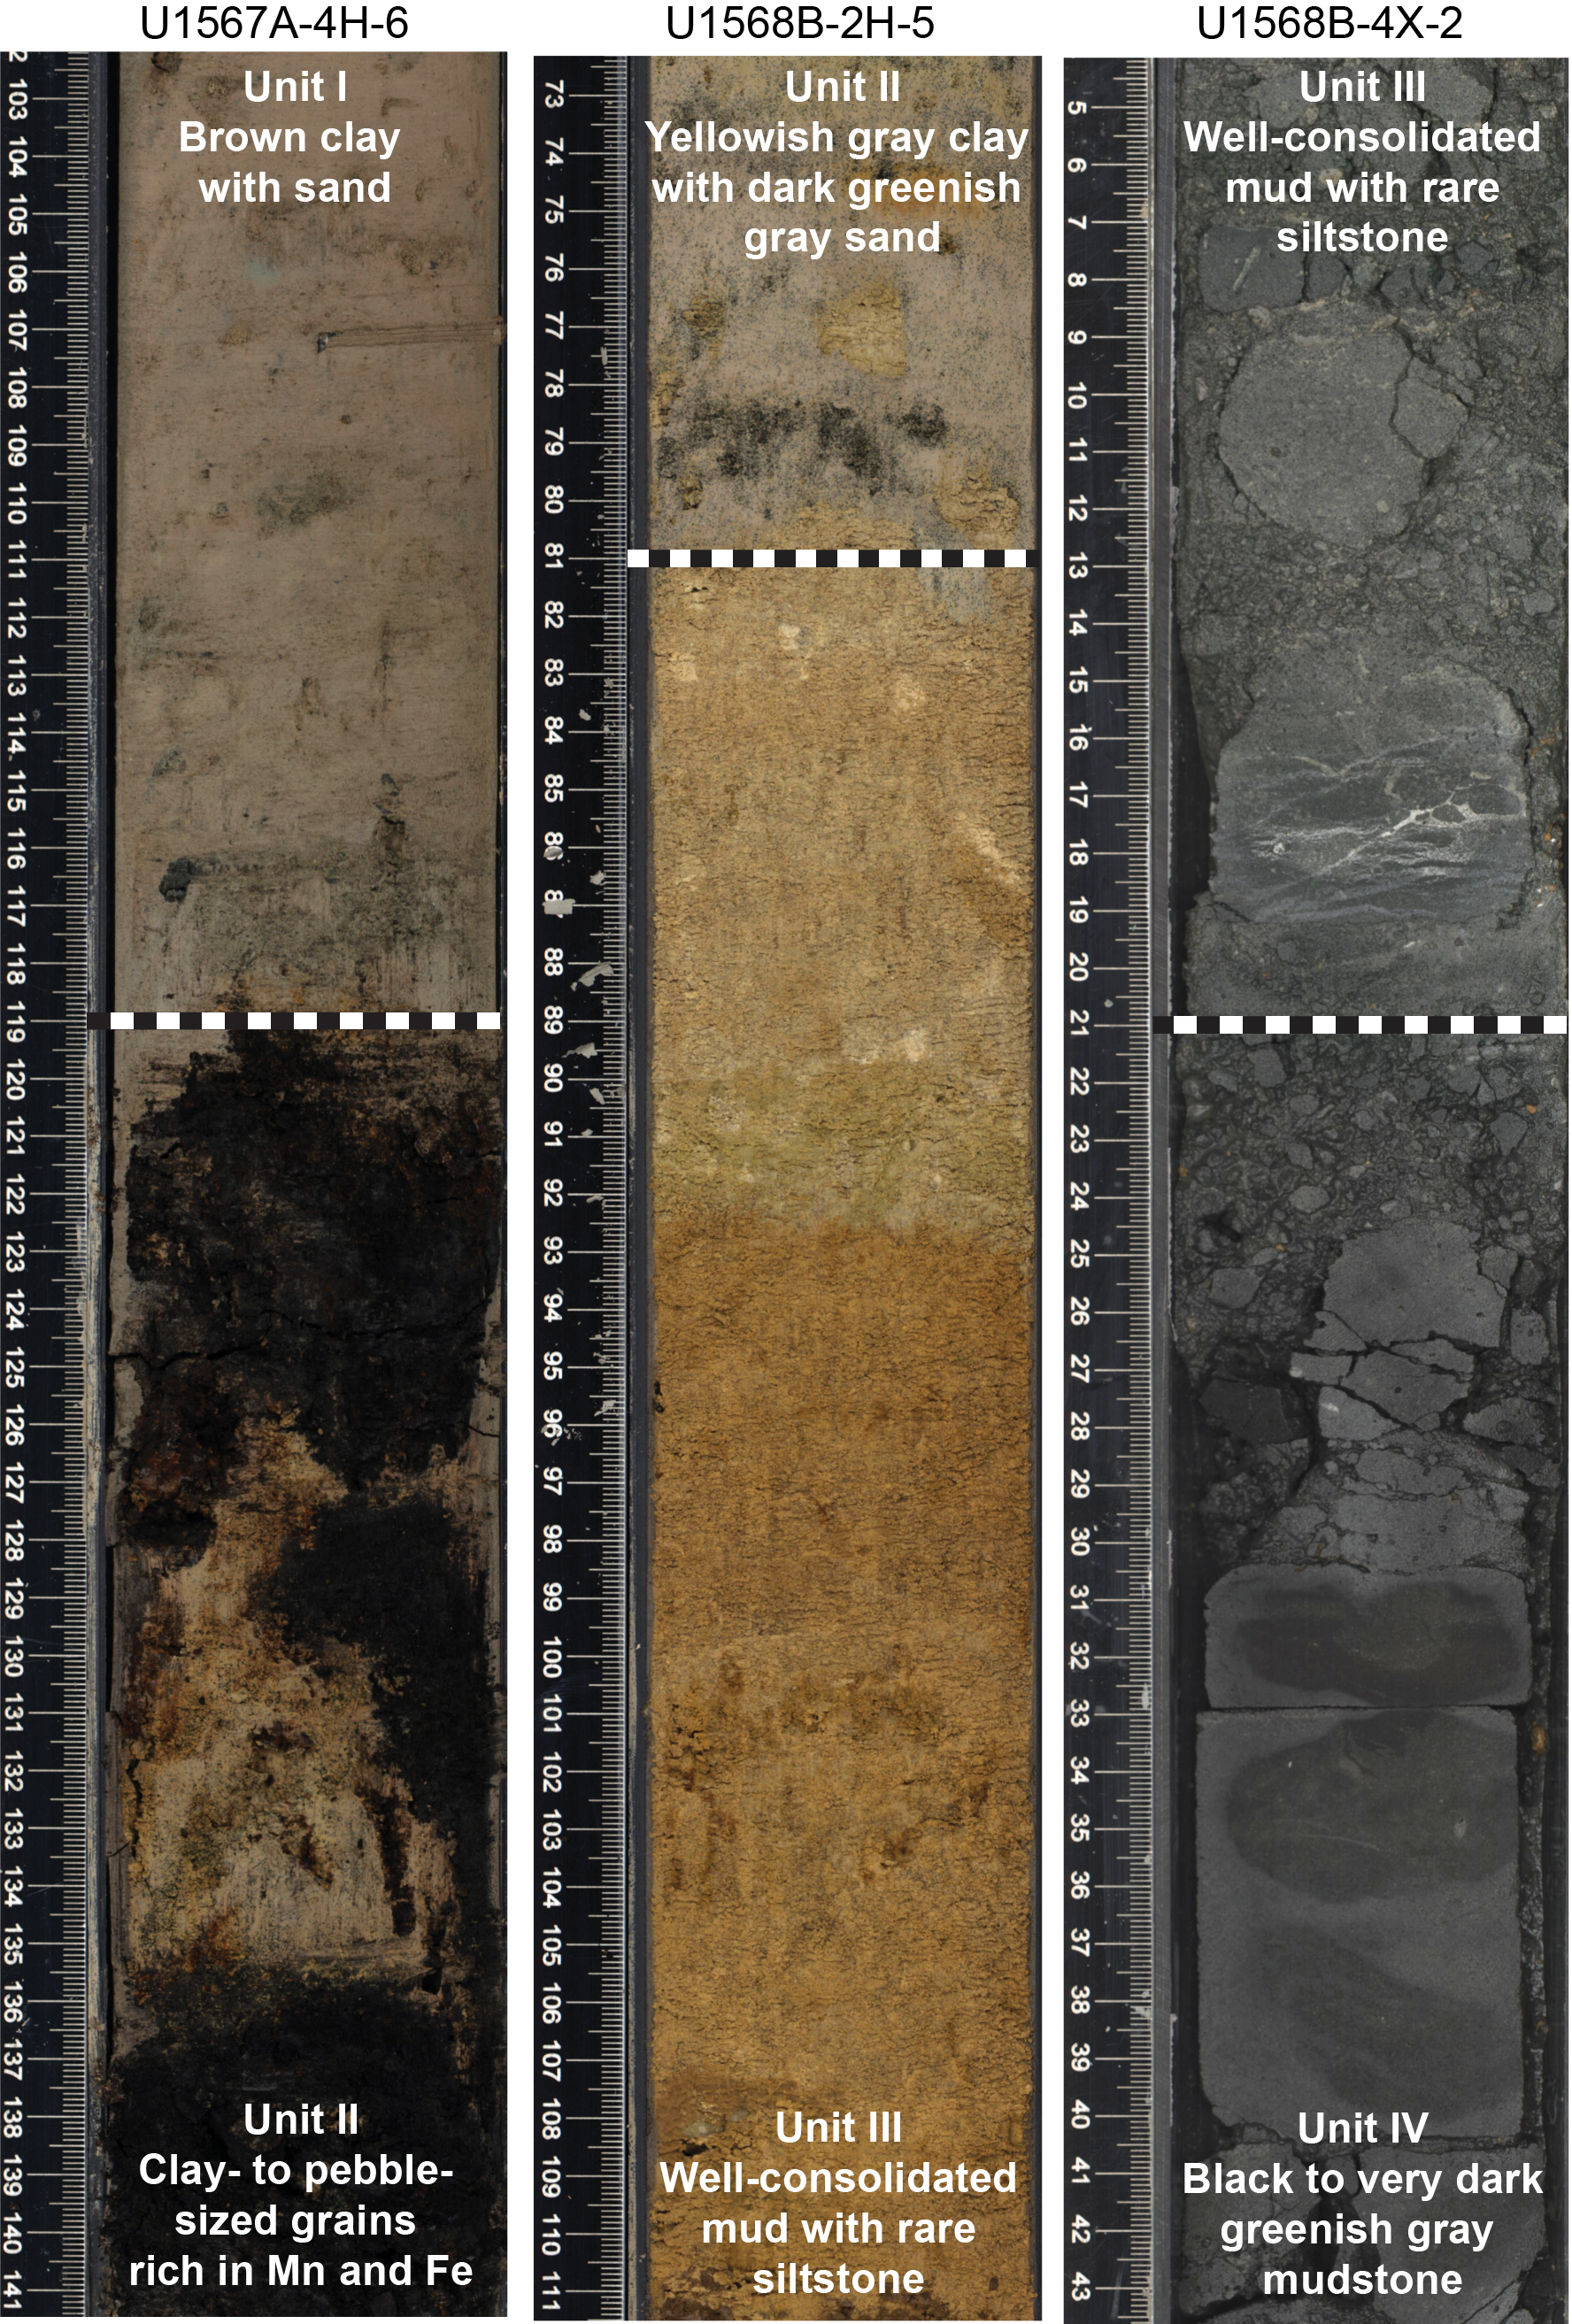
Figure F5. Unit transitions.
Inspection of smear slides from the top dark brownish gray layer shows predominantly clay-sized materials with a few larger (silt to fine sand) grains of quartz and zircon. In the uppermost dark brownish gray interval, portable X-ray fluorescence (pXRF) measurements show high manganese and iron content (Mn2O3 = 18.4%; Fe2O3 = 18.5%) and low concentrations of light elements (<4%). Total carbon content as measured using the carbon-hydrogen-nitrogen-sulfur (CHNS) analyzer is 0.1%.
3.3. Lithostratigraphic Unit III
- Intervals: 396-U1567A-5H-1, 131 cm, to 7F-1, 0 cm; 396-U1567B-3H-1, 79 cm, to 5X-2, 0 cm; 396-U1567C-2H-3, 10 cm, to 4X-1, 43 cm; 396-U1568A-5H-4, 135 cm, to 7H-CC, 5 cm; 396-U1568B-2H-5, 81 cm, to 4X-2, 21 cm
- Depths: Hole U1567A = 35.21–52.90 m CSF-A; Hole U1567B = 35.29–50.80 m CSF-A; Hole U1567C = 33.10–48.23 m CSF-A; Hole U1568A = 38.25–51.45 m CSF-A; Hole U1568B = 35.29–50.71 m CSF-A
- Age: Early Eocene
Lithostratigraphic Unit III consists of well-consolidated clay with silt and clasts of clay and siltstone. The unit is highly variable in color and includes yellow, orange, green, brown, and gray intervals (e.g., Figure F6). The lithologic transition from Unit II to Unit III is illustrated in Figure F5. In Hole U1568B, this transition is marked by a change from light yellowish gray clay with dark greenish gray fine sand to well-consolidated clay without dark sand grains. In contrast, in Hole U1567C the unit boundary is also marked by a clear texture change, but the color change is more gradual.
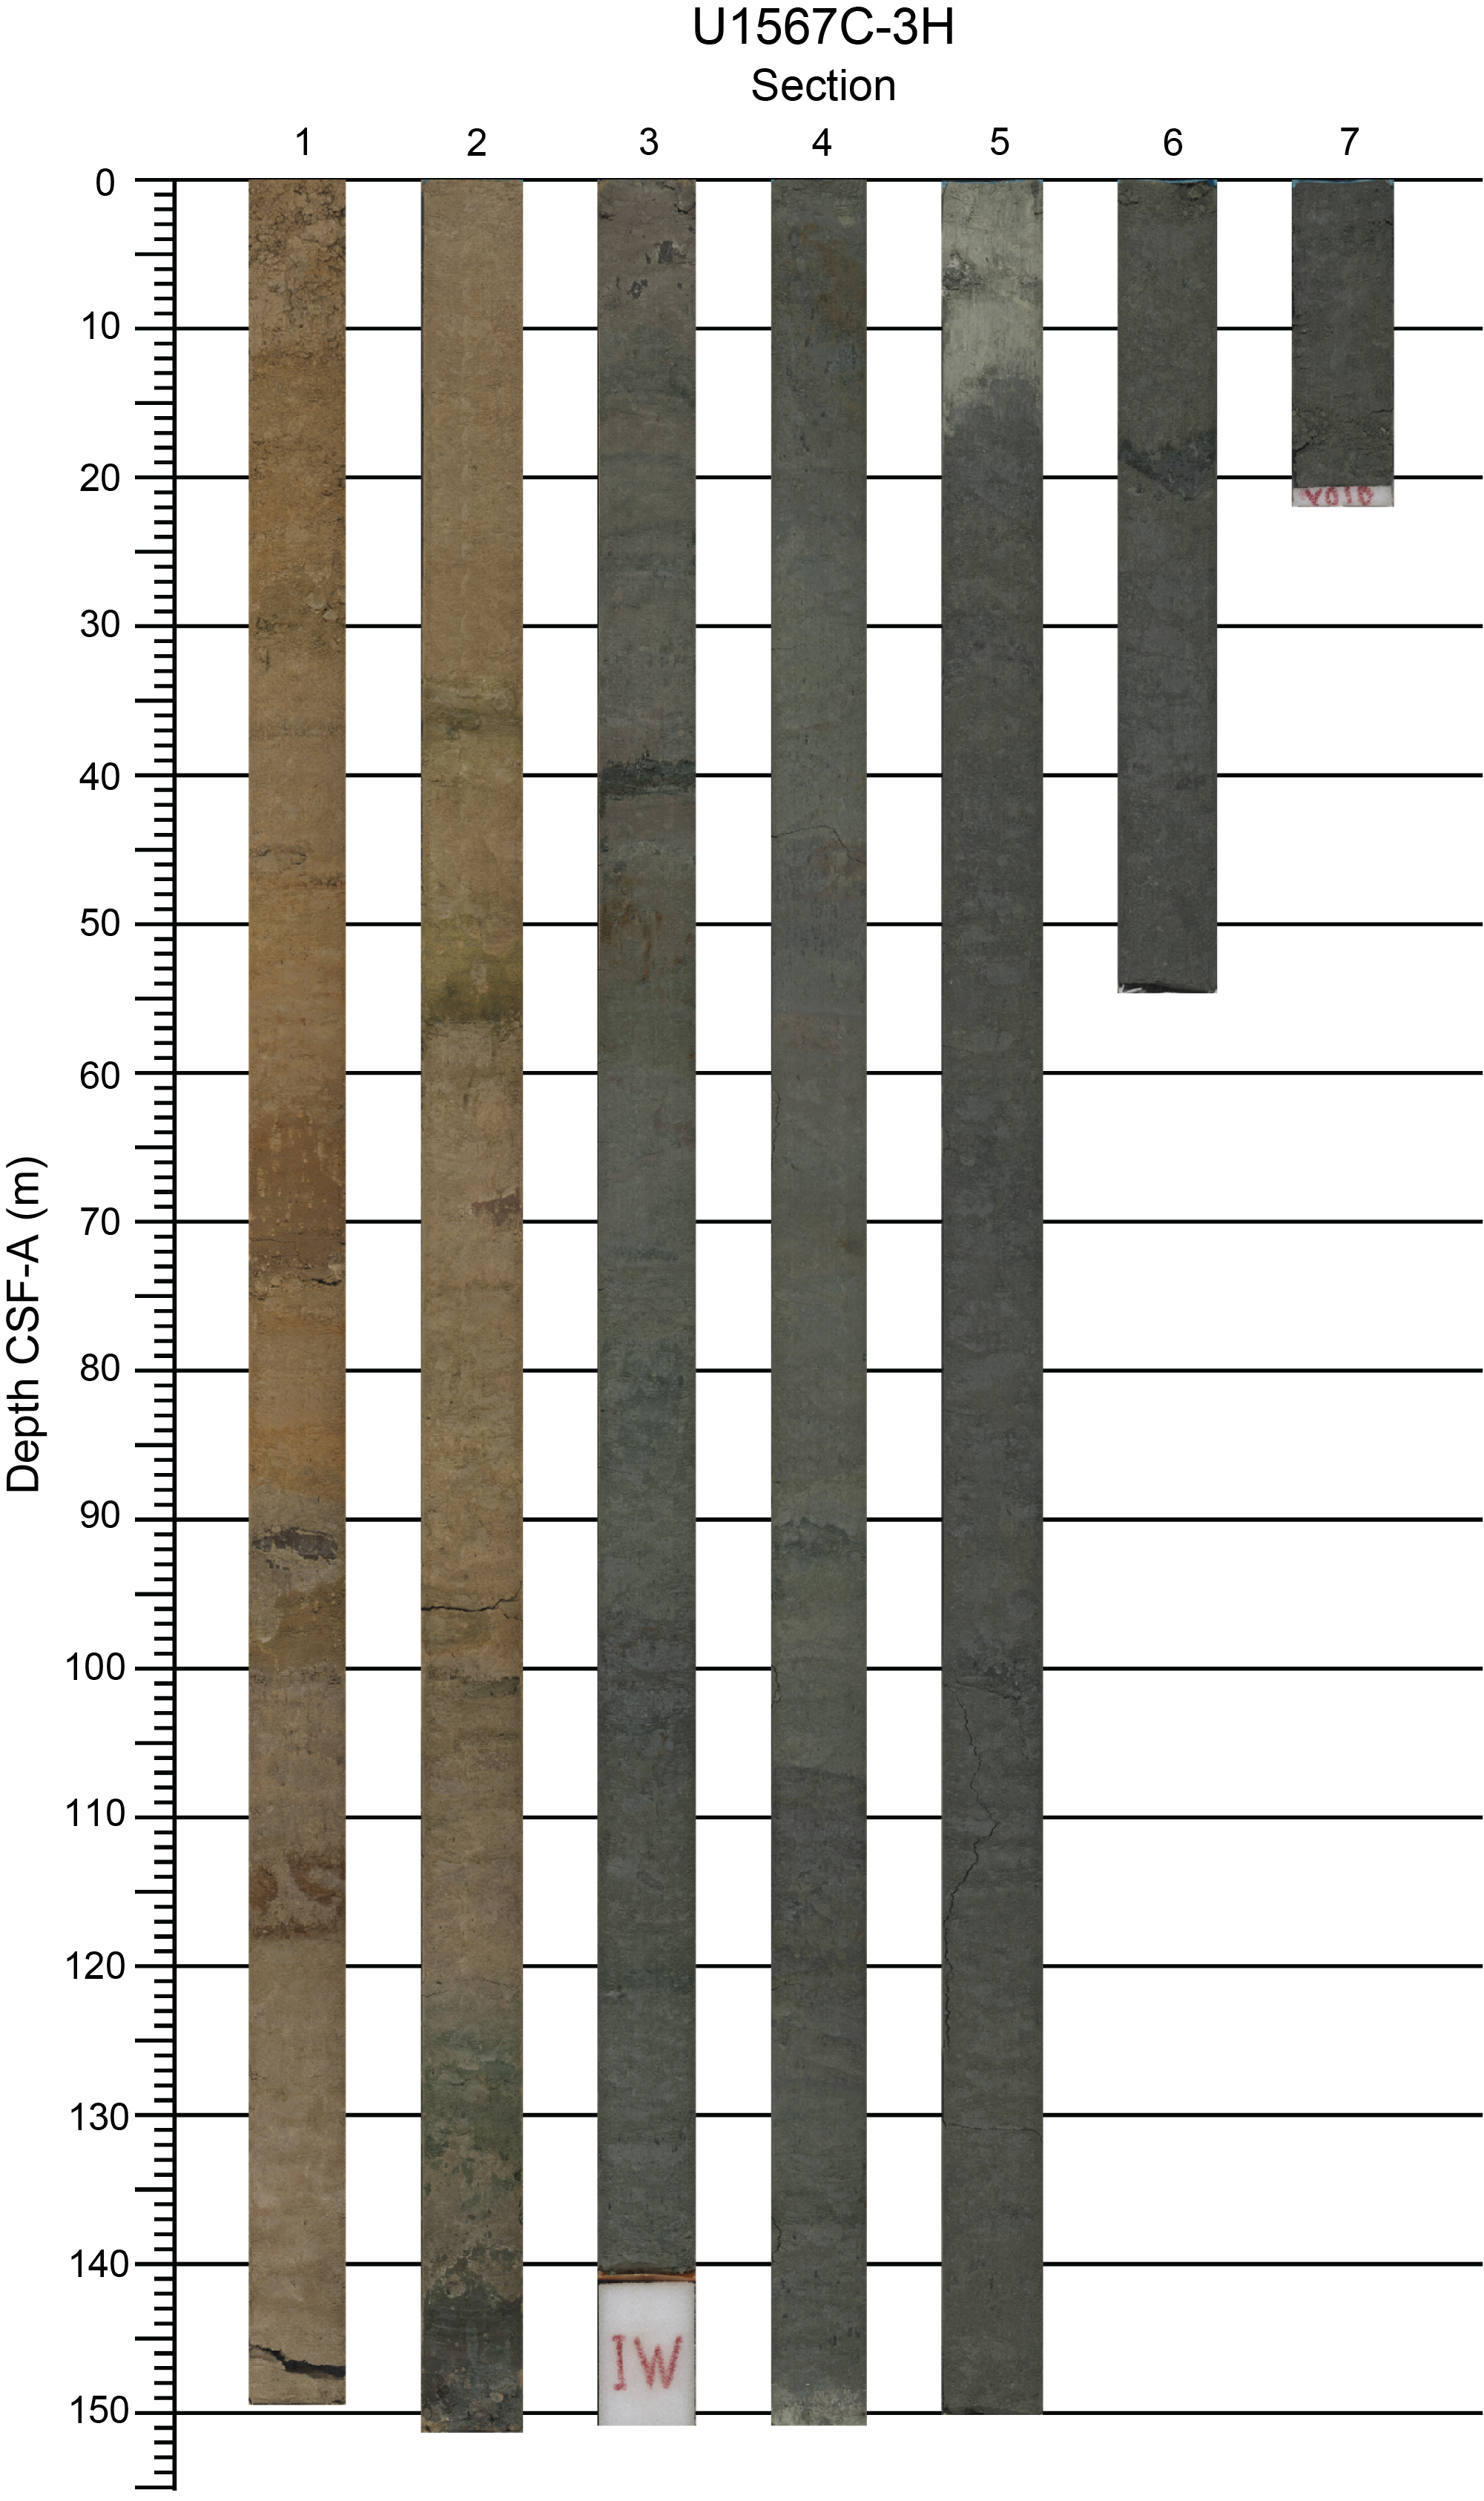
Figure F6. Section half images.
3.4. Lithostratigraphic Unit IV
- Intervals: 396-U1567A-7F-1, 0 cm, to 9X-CC, 15 cm; 396-U1567B-5X-2, 0 cm, to 9X-1, 67 cm; 396-U1567C-4X-1, 43 cm, to 7X-1, 0 cm; 396-U1568A-7H-CC, 5 cm, to 17X-2, 100 cm; 396-U1568B-4X-2, 21 cm, to 11X-1, 70 cm
- Depths: Hole U1567A = 52.90–59.85 m CSF-A; Hole U1567B = 50.80–64.17 m CSF-A; Hole U1567C = 48.23–62.20 m CSF-A; Hole U1568A = 51.45–119.09 m CSF-A; Hole U1568B = 50.71–86.30 m CSF-A
- Age: earliest Eocene (PETM) to Early Eocene
Lithostratigraphic Unit IV is dark greenish gray to very dark gray claystone or siltstone with commonly occurring black ash beds (Figure F7). The lithologic transition from Unit III to Unit IV shows a change from consolidated clay to claystone/siltstone (Figure F5). Unit IV in Hole U1568A contains common organic matter such as wood fragments, coal, and plant debris (Figure F8A). Smear slides show common diatoms that are often fragmented and sometimes accompanied by volcanic glass (Figure F8A). Tiny pyrite framboids (diameter = <10 µm) are also observed (Figure F8A). Smear slide inspection was carried out on many of the volcanic ash beds. For example, Sample 396-U1568A-13X-2, 66 cm, contains 10%–15% fresh glass with common dark, lithic, sand-sized grains (i.e., unidentifiable in smear slides) and rare zircon, biotite, feldspar, and quartz (Figure F8B). Some nearby (i.e., within the same core) intervals, with very similar lithologies to the ash beds that are verified by smear slide inspection, are described as ash or ash rich. This is largely supported by increased MS, in agreement with observations of confirmed ashes.
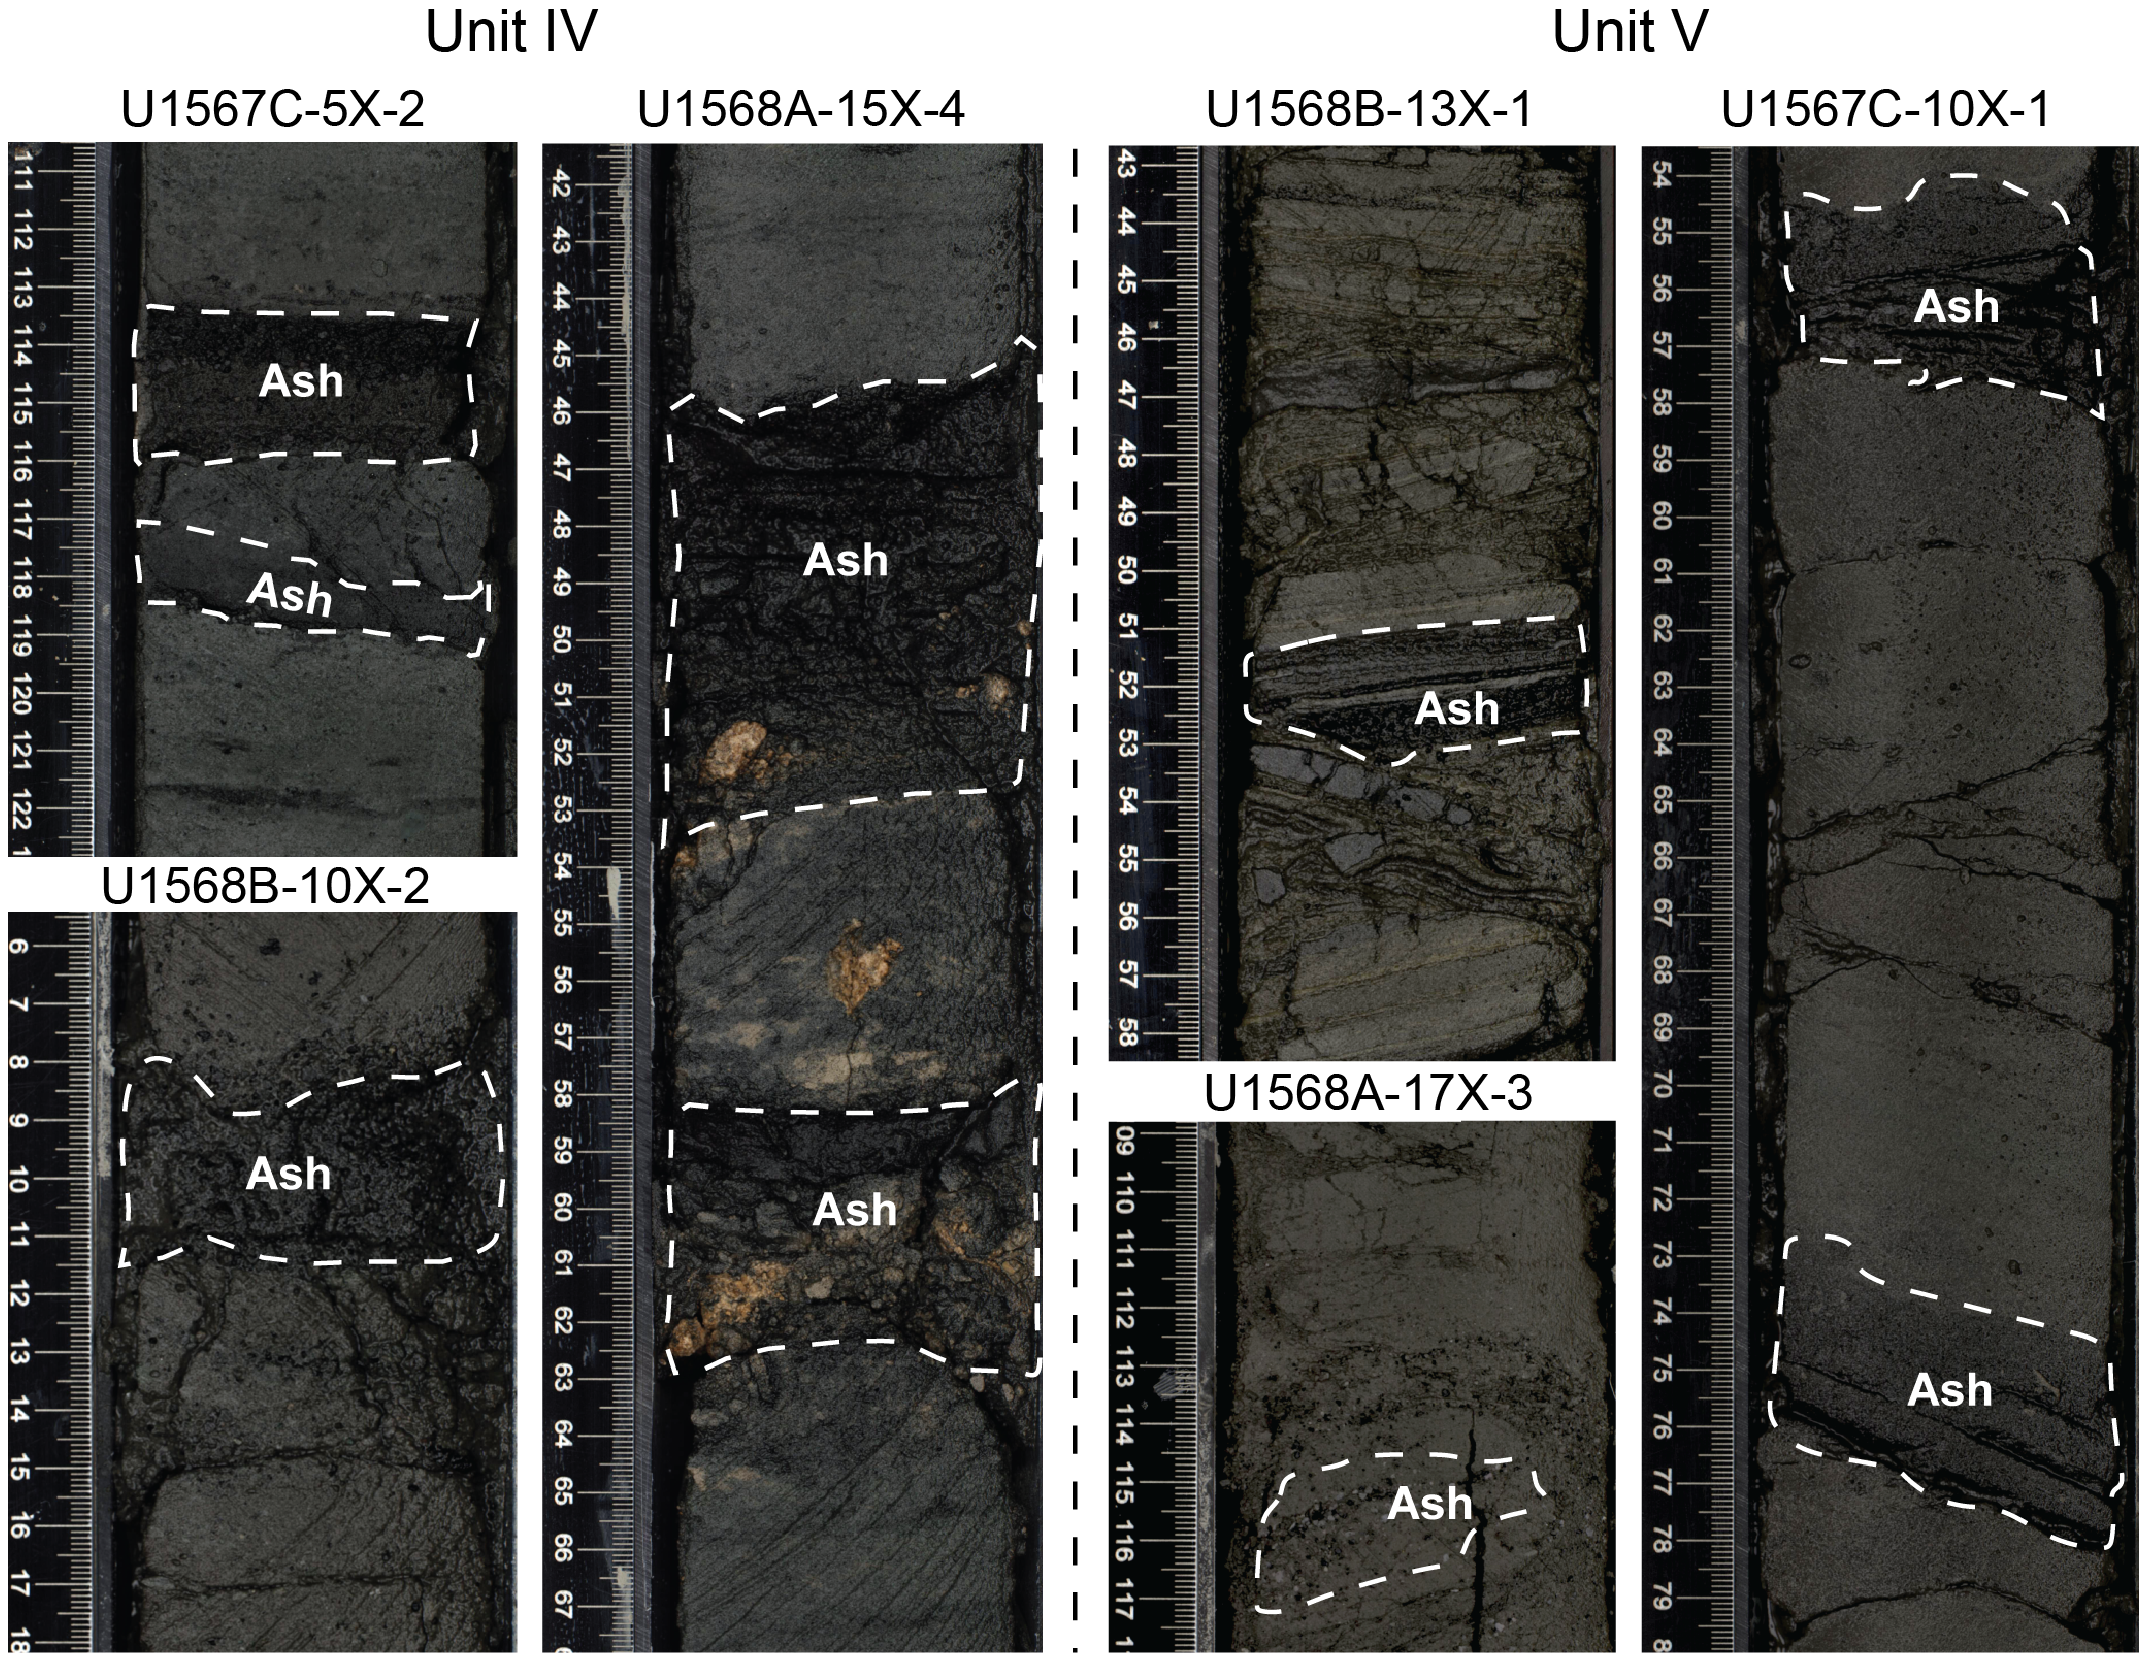
Figure F7. Volcanic ash beds.
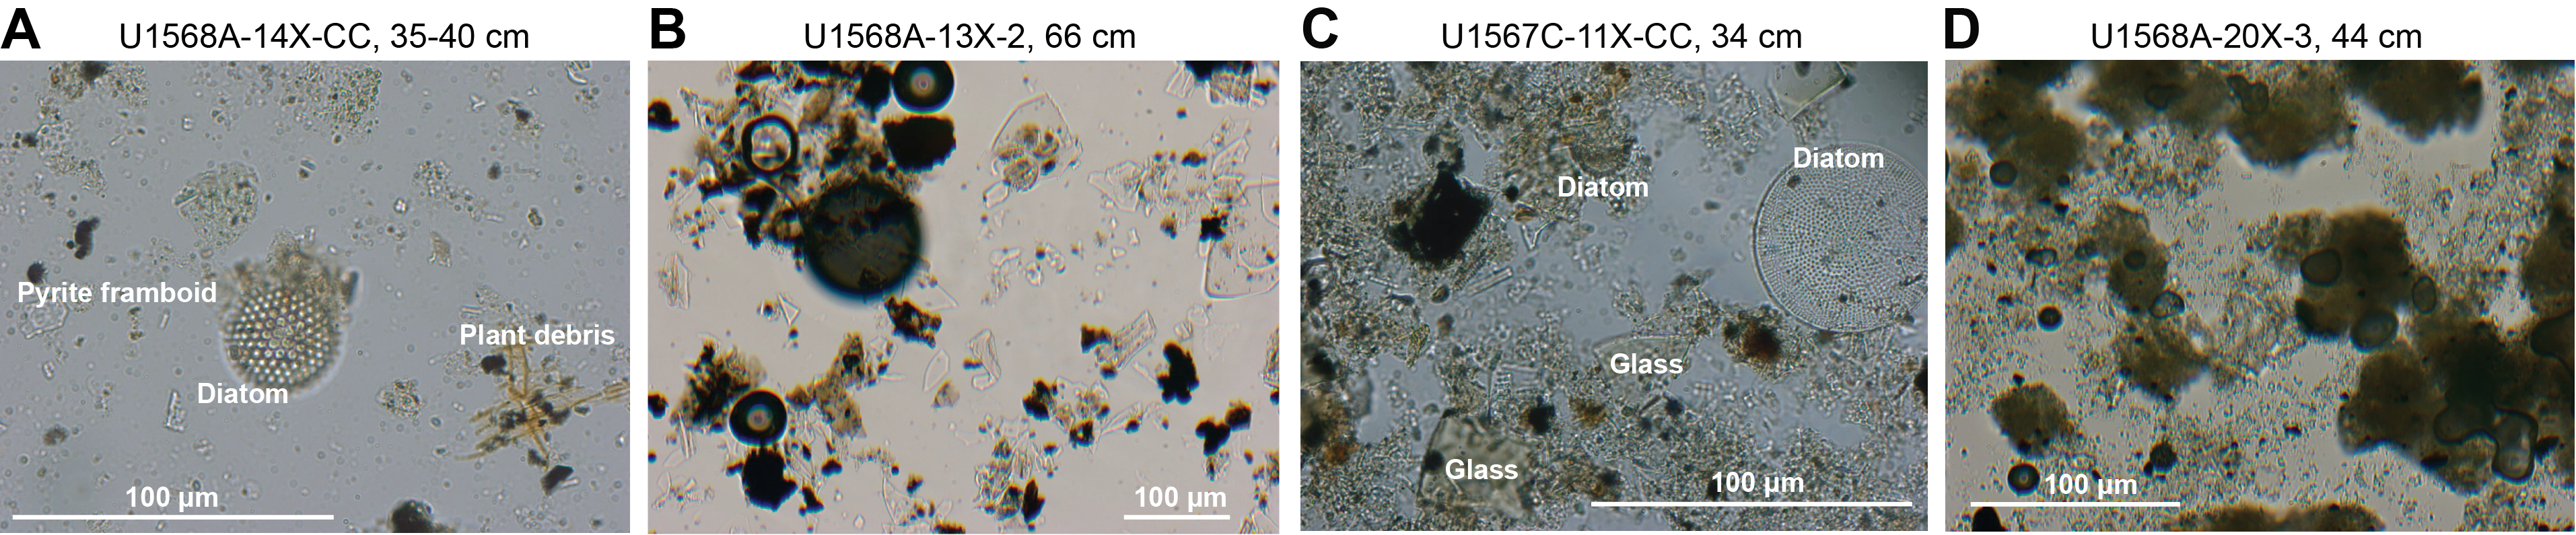
Figure F8. Smear slides.
3.5. Lithostratigraphic Unit V
- Intervals: 396-U1567A-9X-CC, 15 cm, to 11X-4, 46 cm; 396-U1567B-9X-1, 67 cm, to 11X-2, 53 cm; 396-U1567C-7X-1, 0 cm, to 12X-1, 87 cm; 396-U1568A-17X-2, 100 cm, to 18X-5, 84 cm; 396-U1568B-11X-1, 70 cm, to 14X-3, 77 cm
- Depths: Hole U1567A = 59.85–74.36 m CSF-A; Hole U1567B = 64.17–80.23 m CSF-A; Hole U1567C = 62.20–87.07 m CSF-A; Hole U1568A = 119.09–133.26 m CSF-A; Hole U1568B = 86.30–103.87 m CSF-A
- Age: earliest Eocene (PETM)
Lithostratigraphic Unit V mainly consists of very dark gray to black, laminated claystone without bioturbation (Figure F9). Diatoms that are complete or fragmental are commonly observed in smear slides (Figure F8). Tiny pyrite framboids (<20 µm in diameter) and volcanic glass (silt to fine sand in size) are also commonly observed in smear slides from this unit (Figure F8). Macroscopic wood fragments, sometimes coalified, are often observed, particularly in Hole U1568A. Total organic carbon (TOC) content for the few measured samples from Unit V reaches as high as 1.4%. Two stratigraphic levels in the lower part of Unit V in Hole U1567C (Cores 10X and 11X) contain glendonite (lighter colored interval in Figure F9). Glendonite is a calcite pseudomorph after ikaite (e.g., Greinert and Derkachev, 2004), a hydrous calcium carbonate mineral (CaCO3·6H2O).
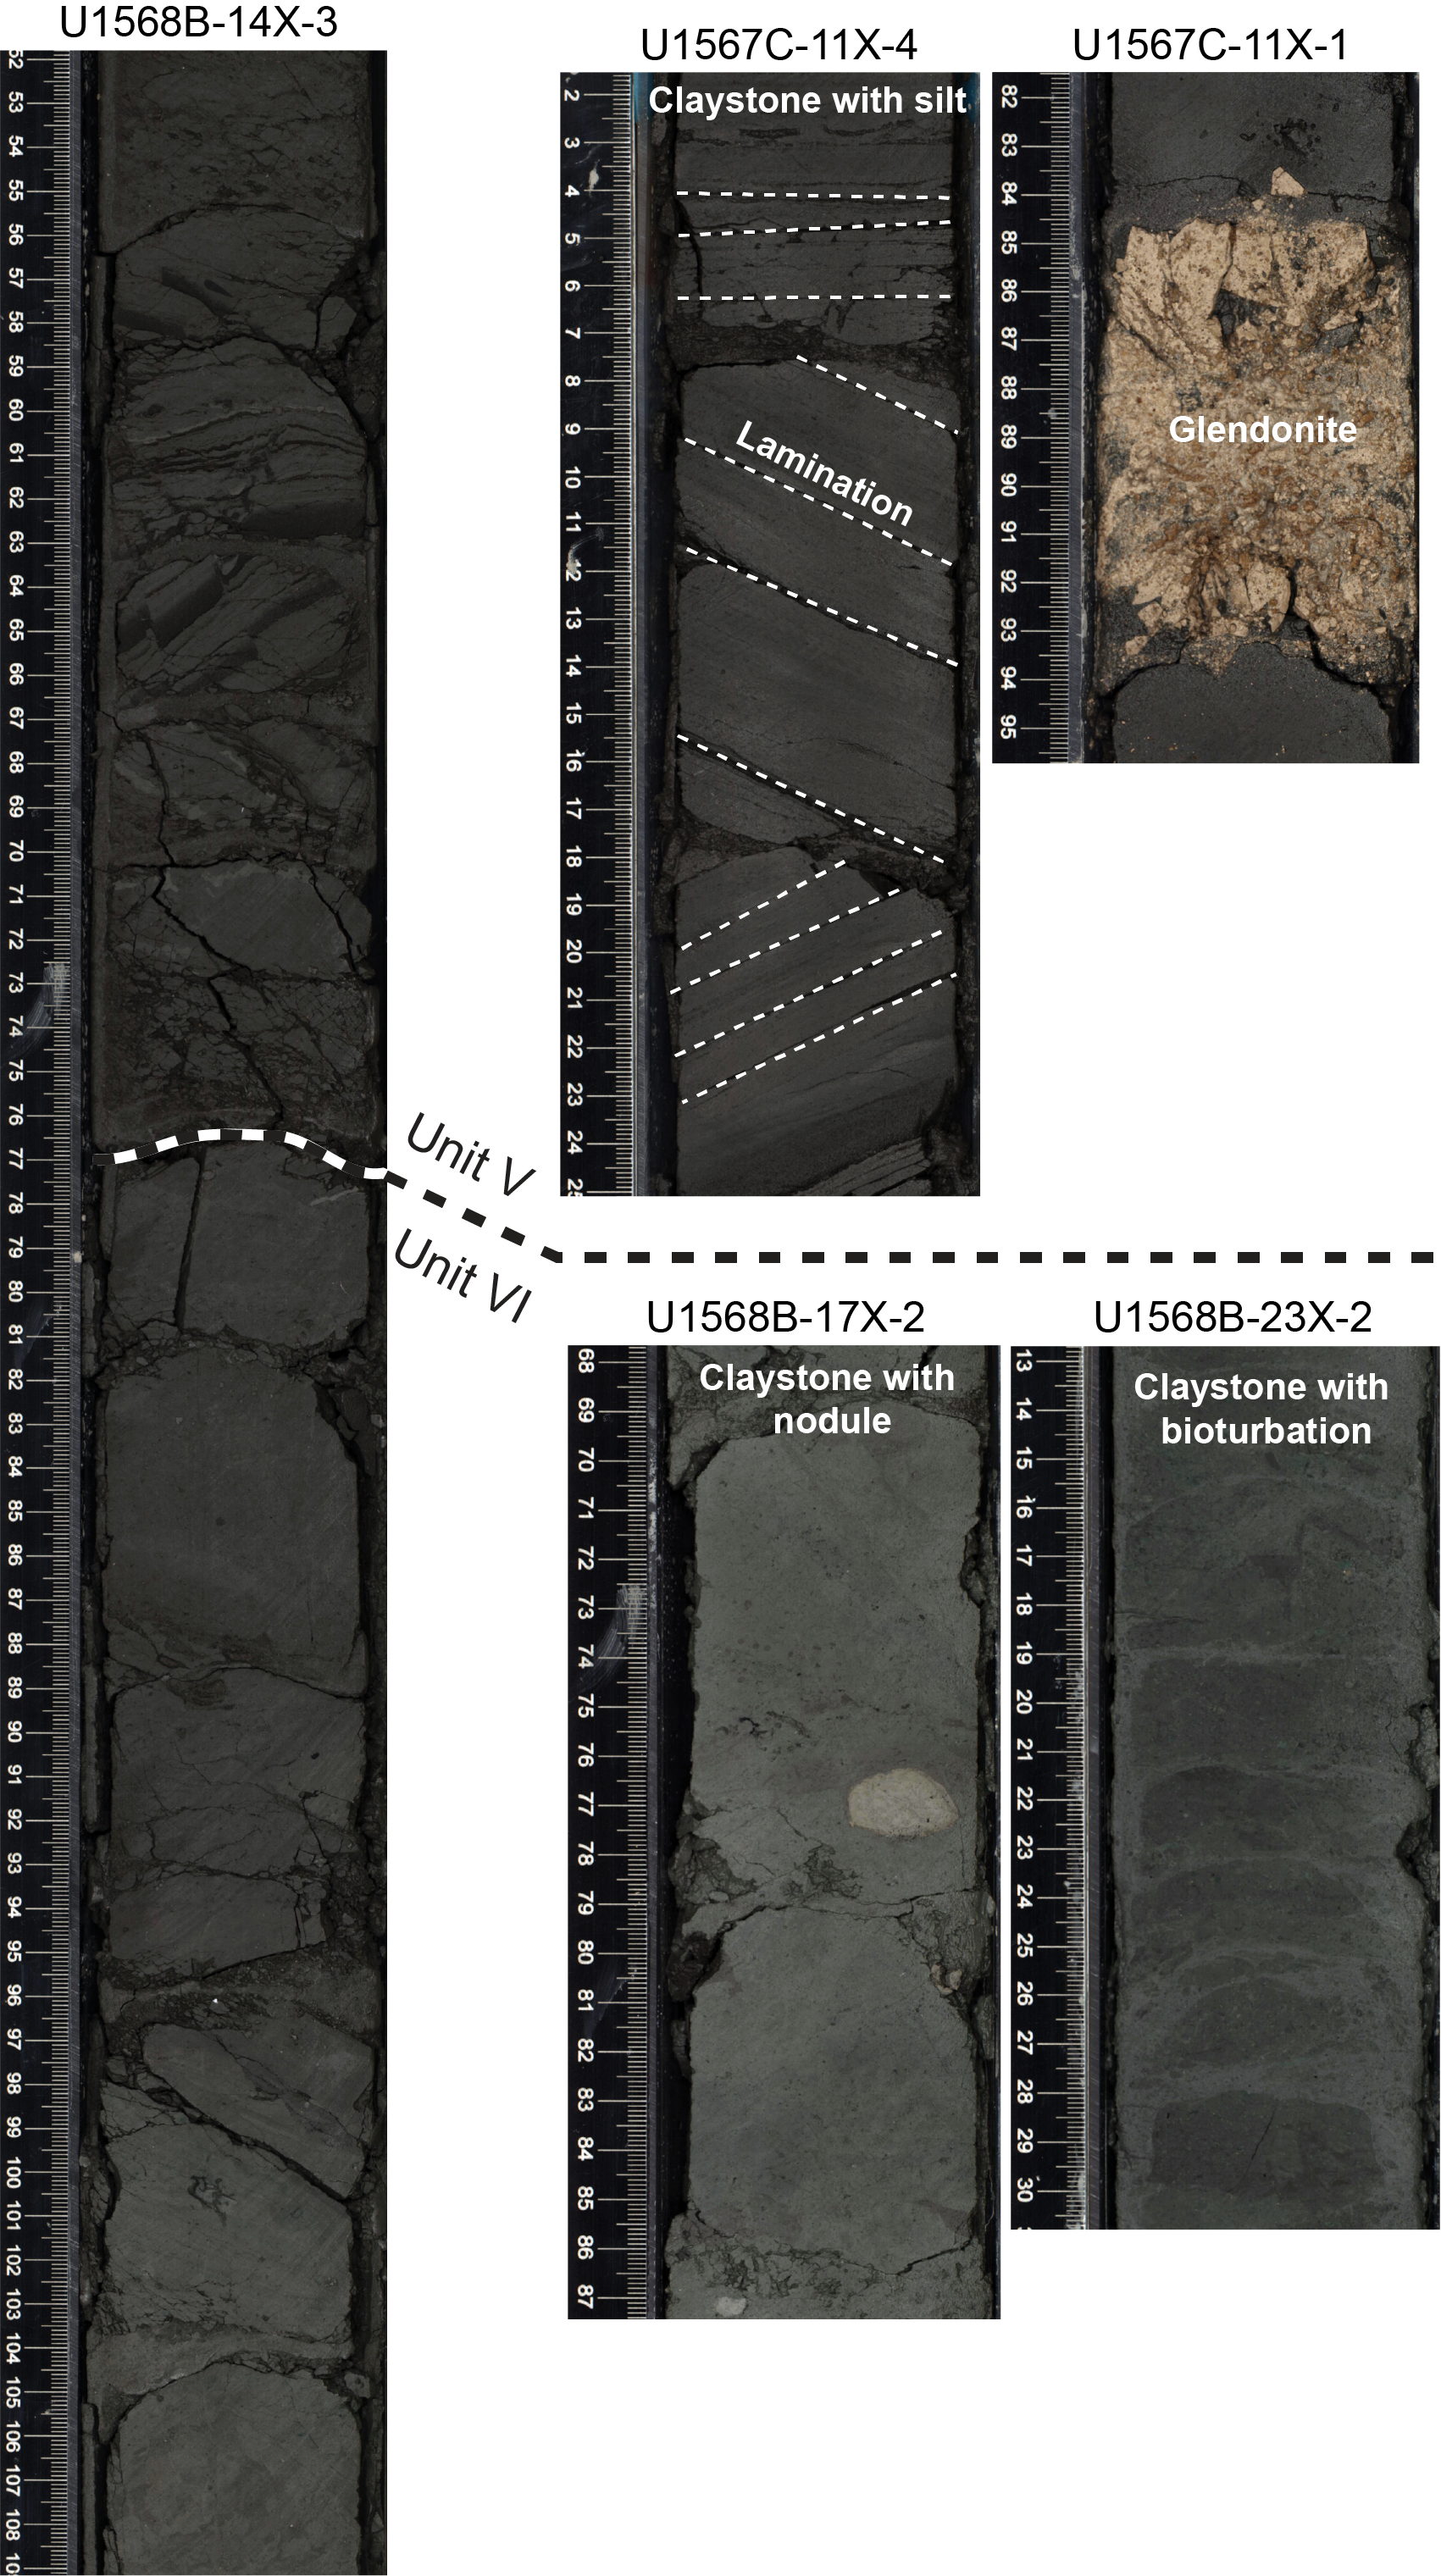
Figure F9. Unit V–VI transition.
3.6. Lithostratigraphic Unit VI
- Intervals: 396-U1567A-11X-4, 46 cm, to 23X-CC, 36 cm (bottom of hole); 396-U1567B-11X-2, 53 cm, to 11X-CC, 26 cm (bottom of hole); 396-U1567C-12X-1, 87 cm, to 14X-CC, 34 cm (bottom of hole); 396-U1568A-18X-5, 84 cm, to 28X-CC, 40 cm (bottom of hole); 396-U1568B-14X-3, 77 cm, to 17X-CC, 25 cm (bottom of hole)
- Depths: Hole U1567A = 74.36–196.01 m CSF-A; Hole U1567B = 80.23–82.88 m CSF-A; Hole U1567C = 87.07–106.03 m CSF-A; Hole U1568A = 133.26–195.59 m CSF-A; Hole U1568B = 103.87–119.79 m CSF-A
- Age: Late Paleocene (pre-PETM)
Lithostratigraphic Unit VI consists of dark greenish gray claystone or siltstone with moderate bioturbation, often in the form of burrows. The lithologic transition from Unit V to Unit VI is marked by the occurrence of bioturbation and disappearance of parallel lamination (Figure F9). Fall-in drilling disturbance occurred for all the cores retrieved from this unit in Hole U1567A, which is consistent with gravel in the top interval of all cores for the hole. Smear slide inspection indicates that the interval consists predominately of clay minerals and lacks preserved diatoms. Volcanic glass is also mostly absent (Figure F8), although trace ash beds are present in the uppermost intervals of some holes (Figure F4).
3.7. Lithostratigraphic correlation
A preliminary lithostratigraphic correlation across the five holes based on the unit boundaries is illustrated in Figure F3. Ages of the sediments across the five holes are tentatively constrained based on core catcher biostratigraphic markers identified onboard (Figure F4). Unconformities representative of depositional hiatus and/or erosion of sediments are identified at the base of Units II and III. The unconformities across the five holes differ in terms of hiatus length (see Biostratigraphy). They are mostly, though not always, likely due to drilling disturbance, distinguished by an erosional or sharp lithologic contact. Biostratigraphic constraints are required to confirm the precise position of the unconformities and length of the associated hiatus. The base of Unit II is Pleistocene in age, whereas the top of Unit III is Early Eocene in age. Nodules are often observed near this unit boundary, most consistent with a substantial depositional hiatus, whereas, for the unconformity between Units III and IV, the hiatus is much shorter (younger than 6 Ma; within the Early Eocene) and varies across the five holes.
3.8. Structural geology
Only unequivocal structures that are observed in Units V–VI are described here. These structures are observed below Sections 396-U1567A-9X-CC, 396-U1567B-8X-3, 396-U1568A-24X-CC, and 396-U1568B-14X-1. Note that the identification of deformation structures is hampered in the different lithostratigraphic units by significant XCB-related drilling disturbance.
Unit V is characterized by subhorizontal to gently dipping lamination with dips as steep as 35° (e.g., in Holes U1568B and U1567C, Figure F9). In sections without drilling disturbance, small-scale normal faults with planar geometries are observed. These faults are rare and heterogeneously distributed. These structures are well identified in ash-rich claystone intervals in which ash layers are offset by an array of microfaults (Figure F10). The displacement remains minor, with apparent offset ranging 0.1–1 cm and apparent dips of 40° to 70°.
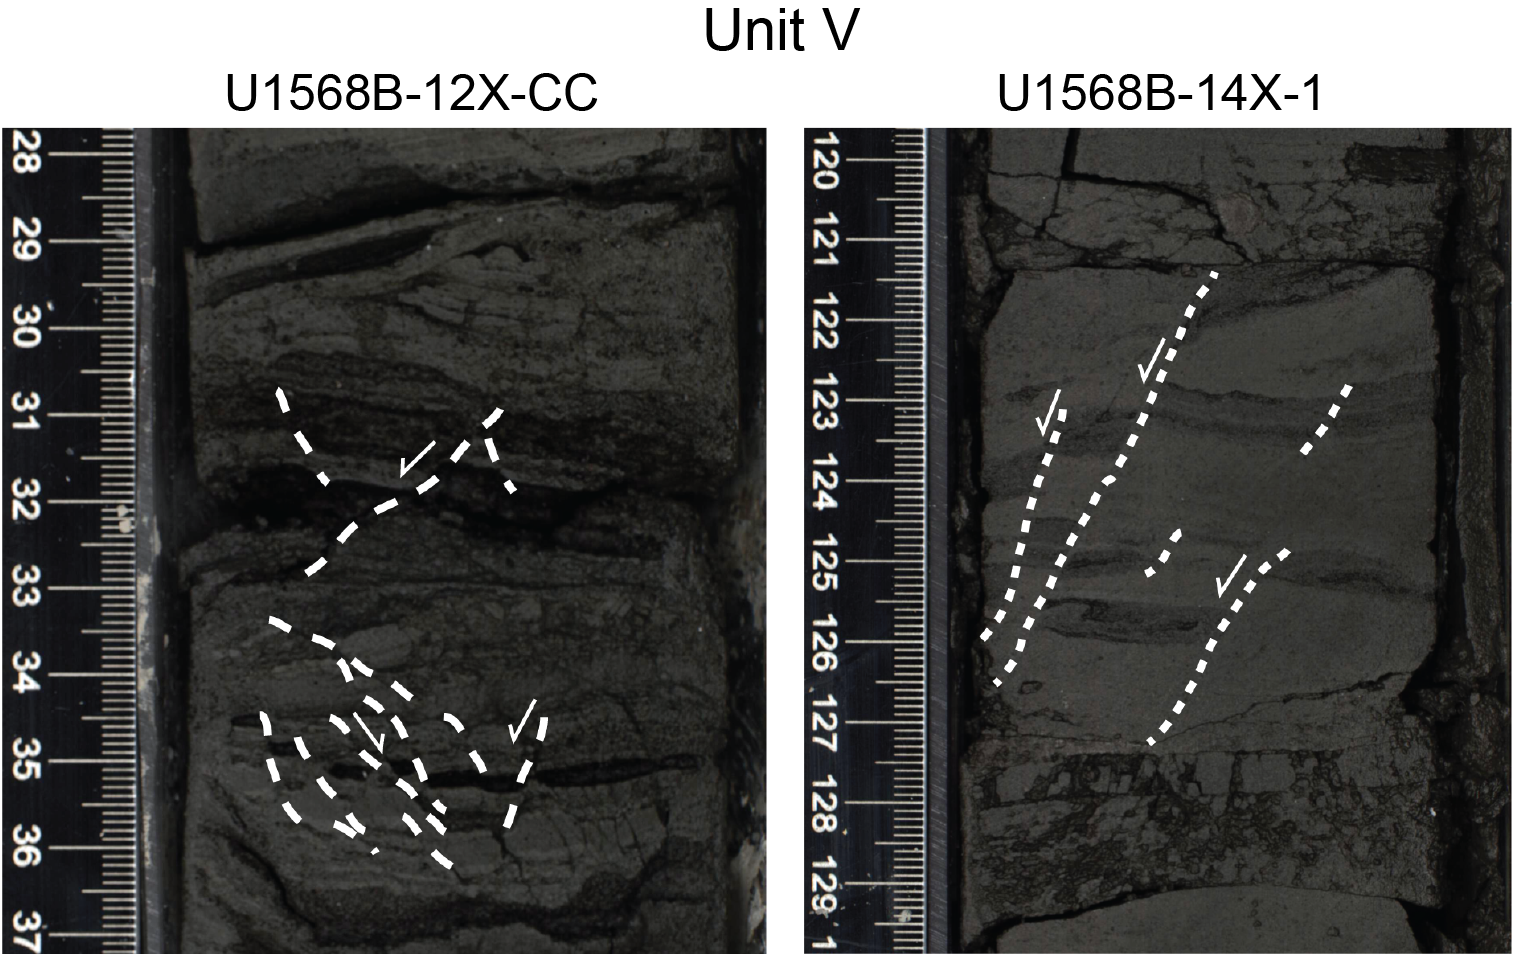
Figure F10. Unit V deformation structures.
Millimeter- to centimeter-scale normal faults are also observed in the variably bioturbated claystone in Unit VI (Figure F11). These faults accommodated an apparent offset of 0.1 cm to a few centimeters. In addition, subvertical fractures less than 0.2 cm related to dewatering and fluidization of sediment during compaction are locally identified (Figure F11).
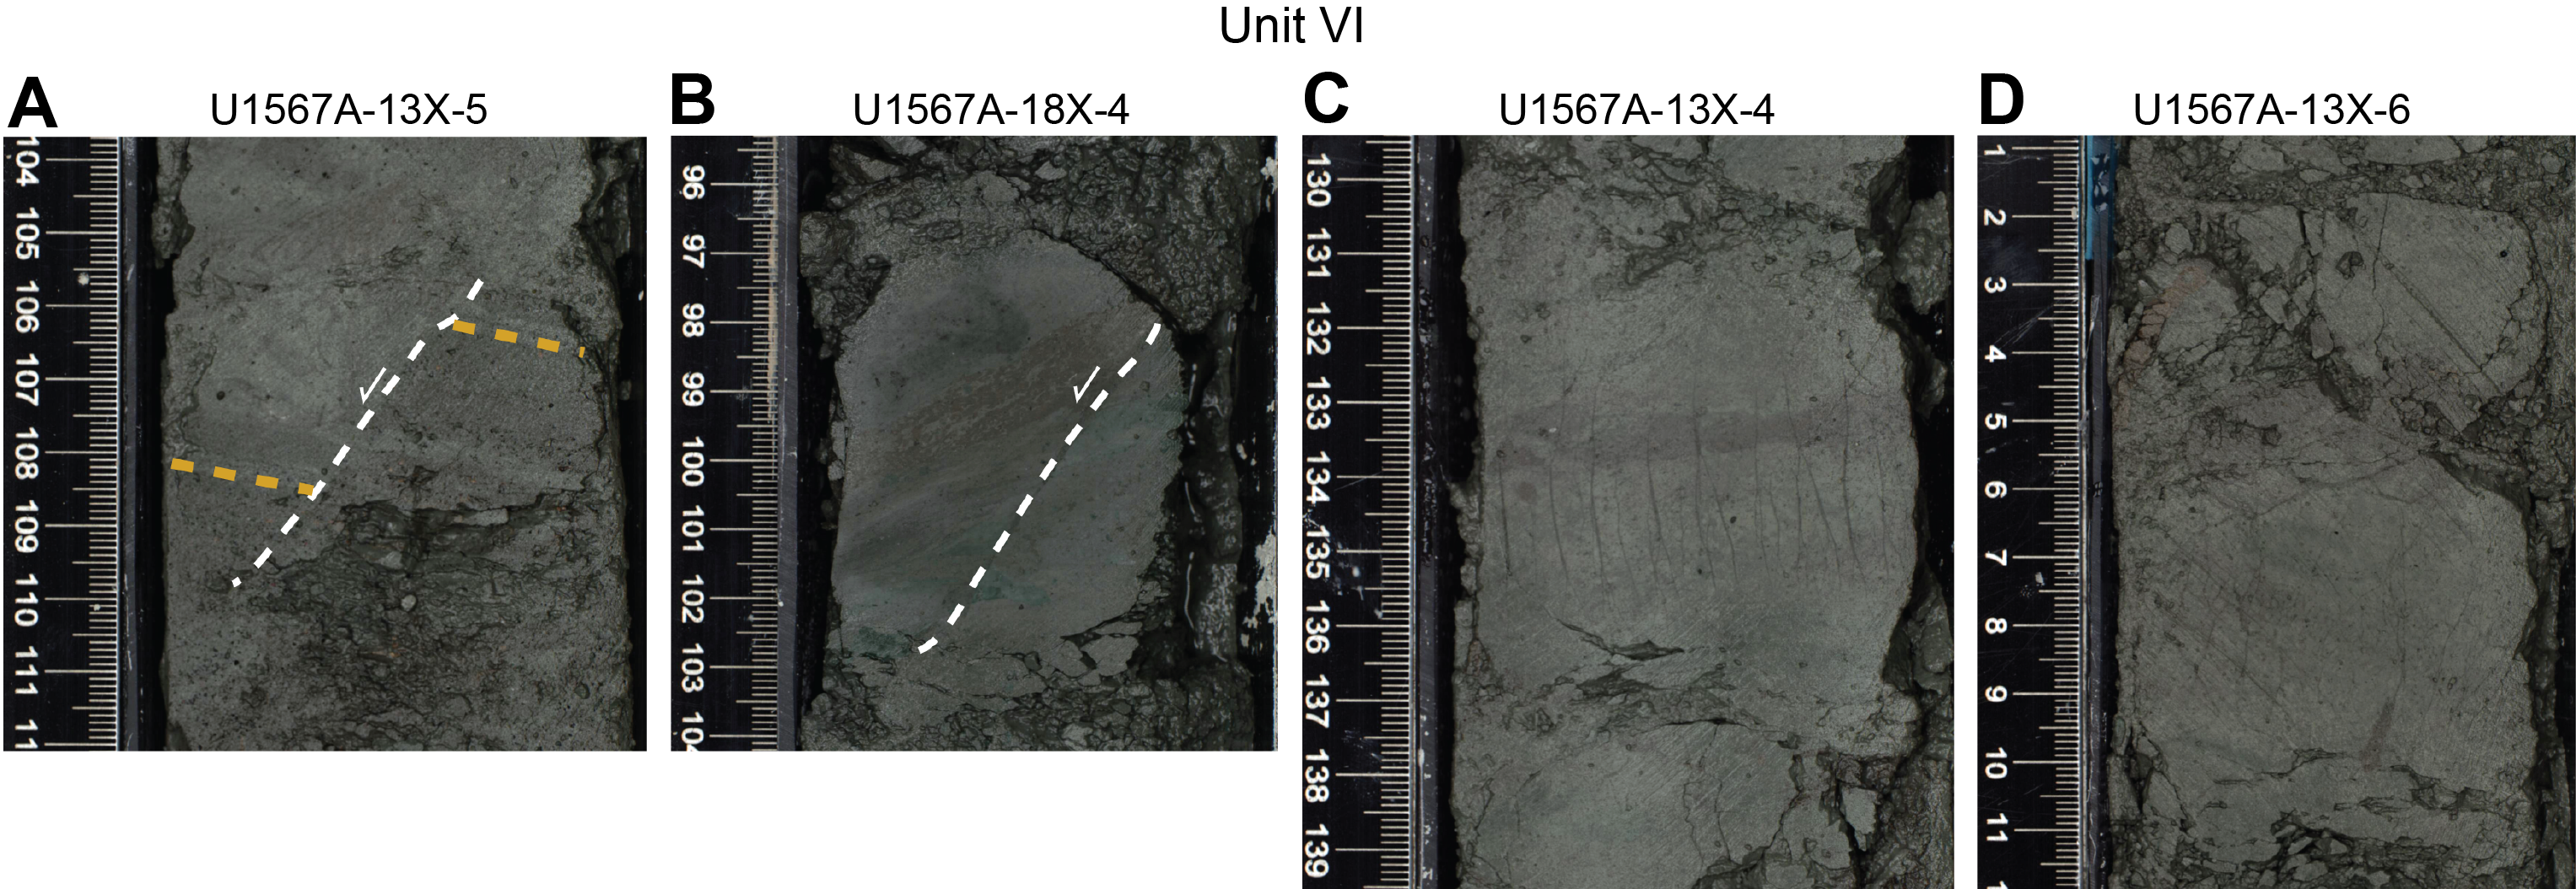
Figure F11. Unit VI deformation structures.
4. Biostratigraphy
4.1. Site U1567
Biostratigraphic analysis for Site U1567 includes all (~30) core catcher samples from Holes U1567A and U1567B for siliceous and organic-walled microfossils. In addition, all core catcher samples from Hole U1567C below Sample 6R-CC were checked for siliceous microfossils. The mudline samples from all holes and all core catcher samples from Holes U1567A and U1567B were also examined for the presence of planktonic foraminifers and ostracods.
Siliceous and organic-walled microfossils were found in abundance in the Lower Eocene and down into Upper Paleocene strata, whereas calcareous microfossils were only recorded in the youngest parts of the sections retrieved, which are assigned to the Quaternary.
4.1.1. Siliceous microfossils
Biosiliceous microfossils, including diatoms, silicoflagellates, ebridians, radiolarians, sponge spicules, and other siliceous groups, were examined in smear slides from all 38 recovered core catchers from Holes U1567A and U1567B and most core catchers from Hole U1567C, as well as selected intervals from split cores. Most core catcher samples were disaggregated in 10% H2O2, and select samples, guided by smear slide analysis, were prepared as strewn slides. Select material was sieved at 15 or 20 µm for further examination of larger taxa. Hole U1567A was the focus, but all slides were examined. Diatom abundance and preservation for samples from Holes U1567A–U1567C are summarized in Table T4. A full account of diatom species encountered and specific assignment to published diatom biozones is not included here because some of the identifications are tentative and equal time was not paid to each sample, skewing results toward those samples receiving more attention.
4.1.1.1. Hole U1567A
Biosiliceous microfossils are absent from Samples 396-U1567A-1H-CC to 6H-CC. Samples 7F-CC and 8X-CC contain unidentifiable remains of diagenetically altered biosiliceous debris. Diatom abundance and preservation is superb in Samples 9X-CC and 10X-CC. Below this depth, diatoms remain common or abundant with moderate preservation to the bottom of the hole (Sample 23X-CC), where abundance is high and preservation is good. Three diatom-based units are recognized below Sample 8F-CC to the bottom of the hole.
Sample 396-U1567A-9F-CC contains mass concentrations of pristinely preserved diatoms in laminated ooze with common silicoflagellates and few radiolarians and ebridians. Relatively high concentrations of biosilica continue in every core catcher to Sample 23X-CC at the base of the succession, although abundance and preservation varies. Volcanic ash is common in many samples. The diatom assemblage present in Samples 9X-CC to 23X-CC contains characteristic Late Paleocene–Early Eocene diatoms, and we infer that much of the sequence reflects very high biogenic sediment accumulation rates.
Throughout the sequence, typical Paleocene diatoms include abundant Grunoviella gemmata, Hemiaulus curvatulus, Hemiaulus danicus, and Hemiaulus pungens; common Trochosira spp., Stephanopyxis turris, and Paralia sp.; and common resting spores of several genera. Less common are Pseudostictodiscus spp., Arachnoidiscus sp., Aulacodiscus sp., Grunoviella sp. 1 (Oreshkina and Radionova, 2014), and Trinacria cornuta. The upper section of highly diatomaceous, mostly finely laminated sediments includes the notable taxa Trinacria excavata f. tetragona (Figure F12A, F12B) and Solium exculptum (Figure F12C, F12D) in Core 396-U1567A-9F to Sample 396-U1567A-11X-CC, as well as Trinacria heibergii and Trinacria regina. This assemblage is consistent with the PETM, but most of these taxa are known to range higher and lower (i.e., from the Middle Paleocene into the earliest Eocene) or are even longer ranging. The assemblage of this interval is strikingly similar to the PETM sequence described from outcrops and drill holes in the Volga region of central Russia (Aleksandrova et al., 2012; Oreshkina and Radionova, 2014; Oreshkina and Aleksandrova, 2007) and referred to as the Hemiaulus proteus Zone, coincident with their Apectodinium augustum dinocyst zone (see Palynology).
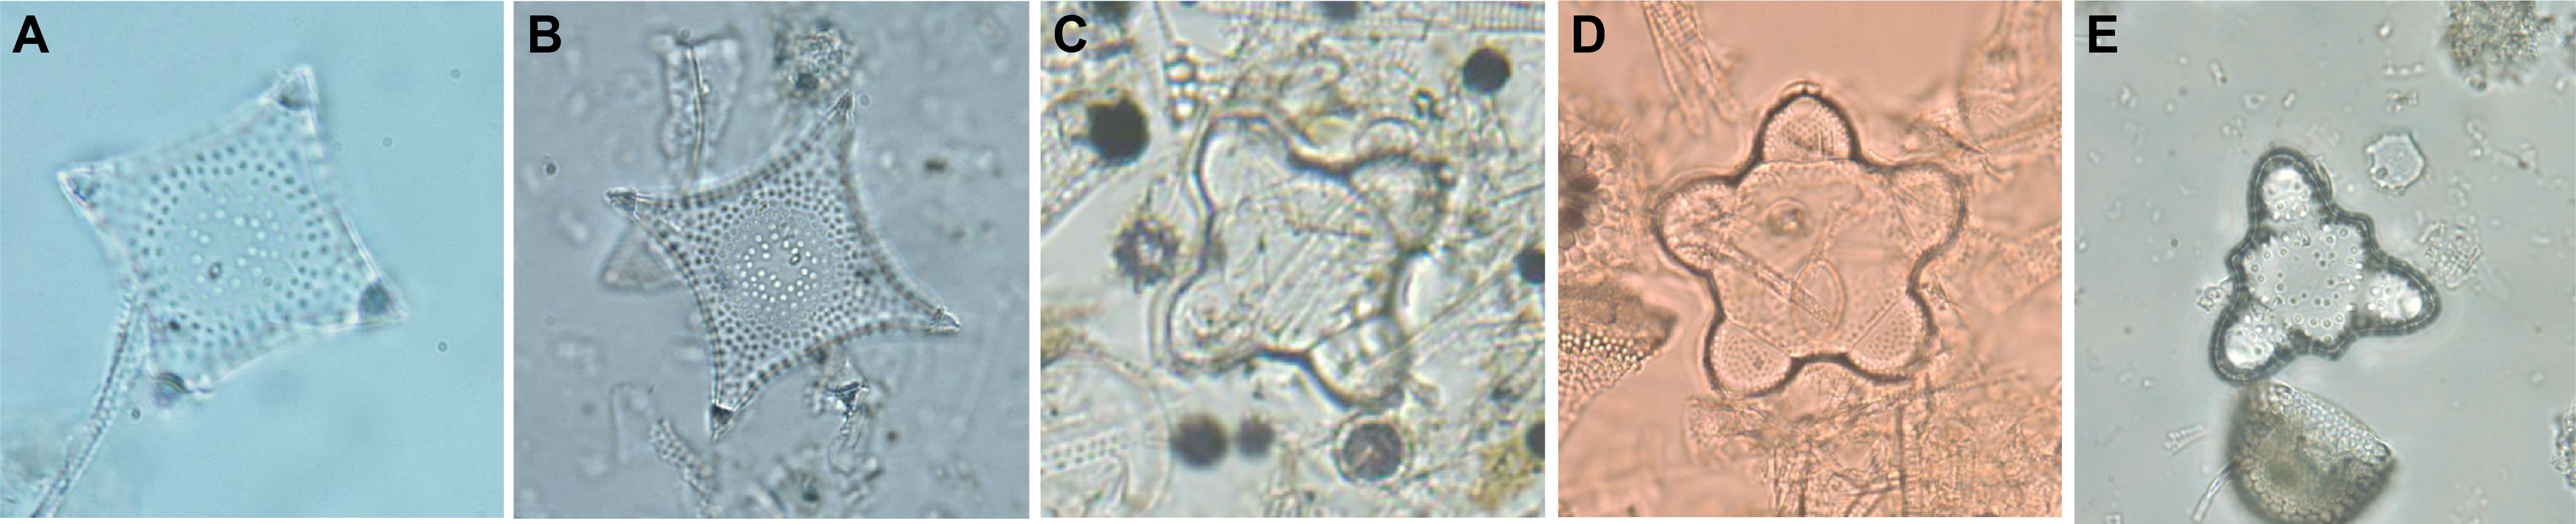
Figure F12. Diagnostic diatoms.
Trinacria simulacrum and other typical Paleogene diatoms are noted from Sample 396-U1567A-10X-CC to the base of the hole. The assemblage evident in Samples 11X-CC to 21X-CC appear consistent, as is the lithology (dark gray mud with common bioturbation), suggesting an extended period of high hemipelagic deposition rates. Samples 22X-CC and 23X-CC indicate a change in the assemblage characterized by the occurrence of Sheshukovia flos (Figure F12E), which is not seen above. S. flos was described from the Harre borehole recovery of Fur Formation (Denmark), between ashes −16 to −21 (Fenner, 1994), and estimated to have an age of 55.7 Ma (Stokke et al., 2020), but the range of the taxon is not well established. Trinacria pileolus and Trinacria ventriculosa place this unit in the T. ventriculosa Zone (Oreshkina and Radionova, 2014; Witkowski et al., 2020).
Based on the palynology, the full diatomaceous unit spans from the PETM at the top to the Paleocene below. The abundance of spore-forming taxa, as well as Stephanopyxis and the tychopelagic taxon Paralia sp., implies a neritic setting. Volcanic ash is common in many intervals. Pollen grains were commonly encountered during examination of diatom samples, further indicating a nearshore environment. The absence of marine fully benthic diatoms suggests a water depth of >50 m and/or oxygen-depleted bottom waters. The presence of abundant pyrite is consistent with low oxygen conditions in the basin.
4.1.1.2. Holes U1567B and U1567C
The diatom successions described for Hole U1567A are largely repeated in recovered materials from Holes U1567B and U1567C. Hole U1567C received little analysis, and although several core catchers were briefly examined for occurrence of diatoms, no full assemblage characterization was performed. Several samples from Hole U1567B were analyzed to see if more of the PETM was recovered than in Hole U1567A to develop a composite depth chronology. The diatom assemblage of Sample 396-U1567B-8X-CC is rich and contains diatoms not seen in Core 396-U1567A-9F. These include T. regina, T. heibergii, T. excavata, H. proteus, and the “Navicula-like diatoms” noted by Oreshkina and Radionova (2014). This assemblage defines Phase 2 of the PETM from Central Russia, a subzone within the H. proteus Zone. These diatoms are not noted in Core 9F, which corresponds with the underlying Phase 1 in the Russian deposits. Sample 396-U1567B-8X-CC lacks S. exculptum, T. excavata f. tetragona, and other species that define the Core 396-U1567A-9F assemblage. This analysis implies that somewhat more of the upper part of the PETM interval may have been sampled in Hole U1567B. This interval displays very high species richness, with more than 40 distinct diatom taxa and several silicoflagellates species recognized.
A small chunk of finely laminated diatomite (interval 396-U1567B-11X-1, 123 cm) that is approximately stratigraphically equivalent to Core 396-U1567A-9F was analyzed in the Hitachi EM3000 scanning electron microscope (SEM) in the paleontology laboratory for microstratigraphy (Figure F13). SEM analysis confirmed that the diatomite is absent of clay but includes common framboidal pyrite. Most microlaminae are ~100 µm thick and consist of successions of different diatom assemblages. Most layers are nearly monospecific, heavily dominated by either H. curvatulus and H. pungens or G. gemmata and Grunoviella sp. 1 of Oreshkina and Radionova (2014). Other layers include a higher number of large pelagic discoid diatoms. Because the layers of taxa repeat across the six laminae examined, we consider this strong evidence that seasonal diatom deposition is preserved in this part of the PETM (age confirmed by palynology). The near monospecific layers are interpreted as individual seasonal blooms, whereas layers containing more mixed pelagic taxa are inferred to reflect slightly slower diatom accumulation rates between seasonal productivity events.
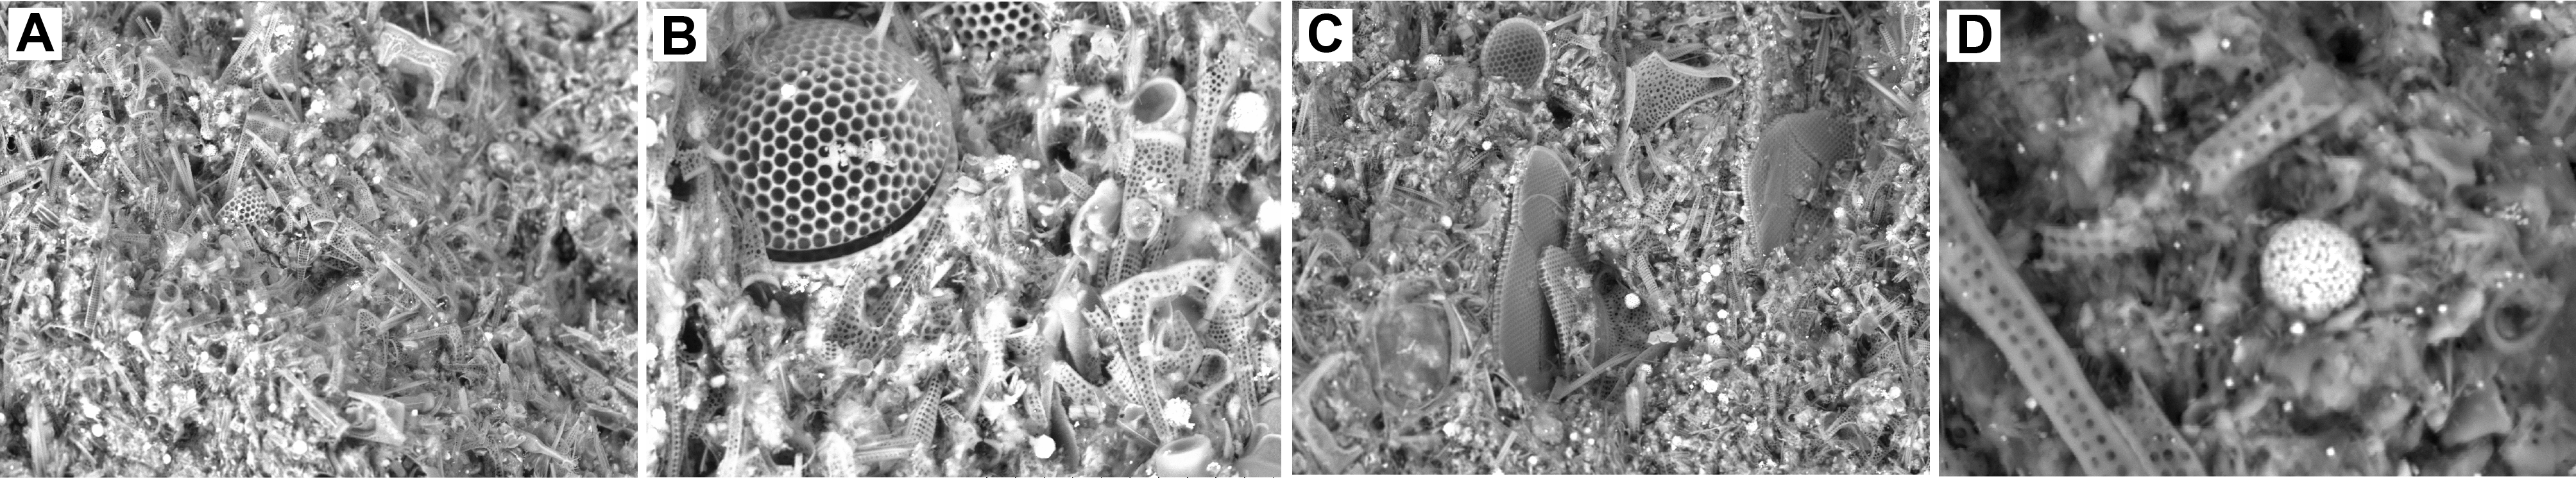
Figure F13. Laminated diatomite.
Silicoflagellates are common through the succession, notably Corbisema spp. and Dictyocha spp. Ebridians and radiolarians are present in lower concentrations, as are sponge spicules.
4.1.2. Palynology
In total, 21 core catcher samples from Hole U1567A and 11 from Hole U1567B were processed for palynology. All of the samples (396-U1567A-3H-CC to 23X-CC and 396-U1567B-1H-CC to 11X-CC) were processed using the standard hydrofluoric acid (HF) technique (see Biostratigraphy in the Expedition 396 methods chapter [Planke et al., 2023a]). Overall, palynomorphs, and notably the dinocysts among them, were found to be scarce, except for a few intervals, and no quantitative analyses were performed. Occurrences of palynofacies categories and palynomorphs for Holes U1567A and U1567B are listed in Tables T5, T6, and T7. The associations with sparse dinocysts are useful for broad age assessments, but detailed paleoenvironmental analyses are not attempted. The informal North Sea dinocyst zonation scheme of Bujak and Mudge (1994) (see also Mudge and Bujak, 1994, 1996) is applied for characterization of the Paleogene section of these holes.
4.1.2.1. Hole U1567A
Palynofacies distribution and palynomorph occurrences are listed in Table T5. From younger to older, dinocyst first and last occurrences allow recognition of a Quaternary section, a middle Lower Eocene section, an uppermost Paleocene–lowermost Eocene section, and an underlying Middle to lower Upper Paleocene section.
Yielding a few likely in situ palynomorphs, such as Operculodinium centrocarpum, some Spiniferites spp., and abundant, reworked, mainly Early Cretaceous palynomorphs (Table T5), Sample 396-U1567A-3H-CC and overlying materials are assigned to the Quaternary.
This sharply contrasts the middle Early Eocene age assessment for the next sample downcore (396-U1567A-4H-CC). This is based on the combined occurrences of, notably, Membranilarnacia (occasionally referred to as “Eatonicysta”) glabra (Figure F14A), Wetzeliella cf. meckelfeldensis (Figure F14G), Wetzeliella articulata, and the co-occurrence of Melitasphaeridium pseudorecurvatum are all indicative of Zone E3 of Bujak and Mudge (1994) (Table T6). The two subsequent core catcher samples downhole are palynologically unproductive.
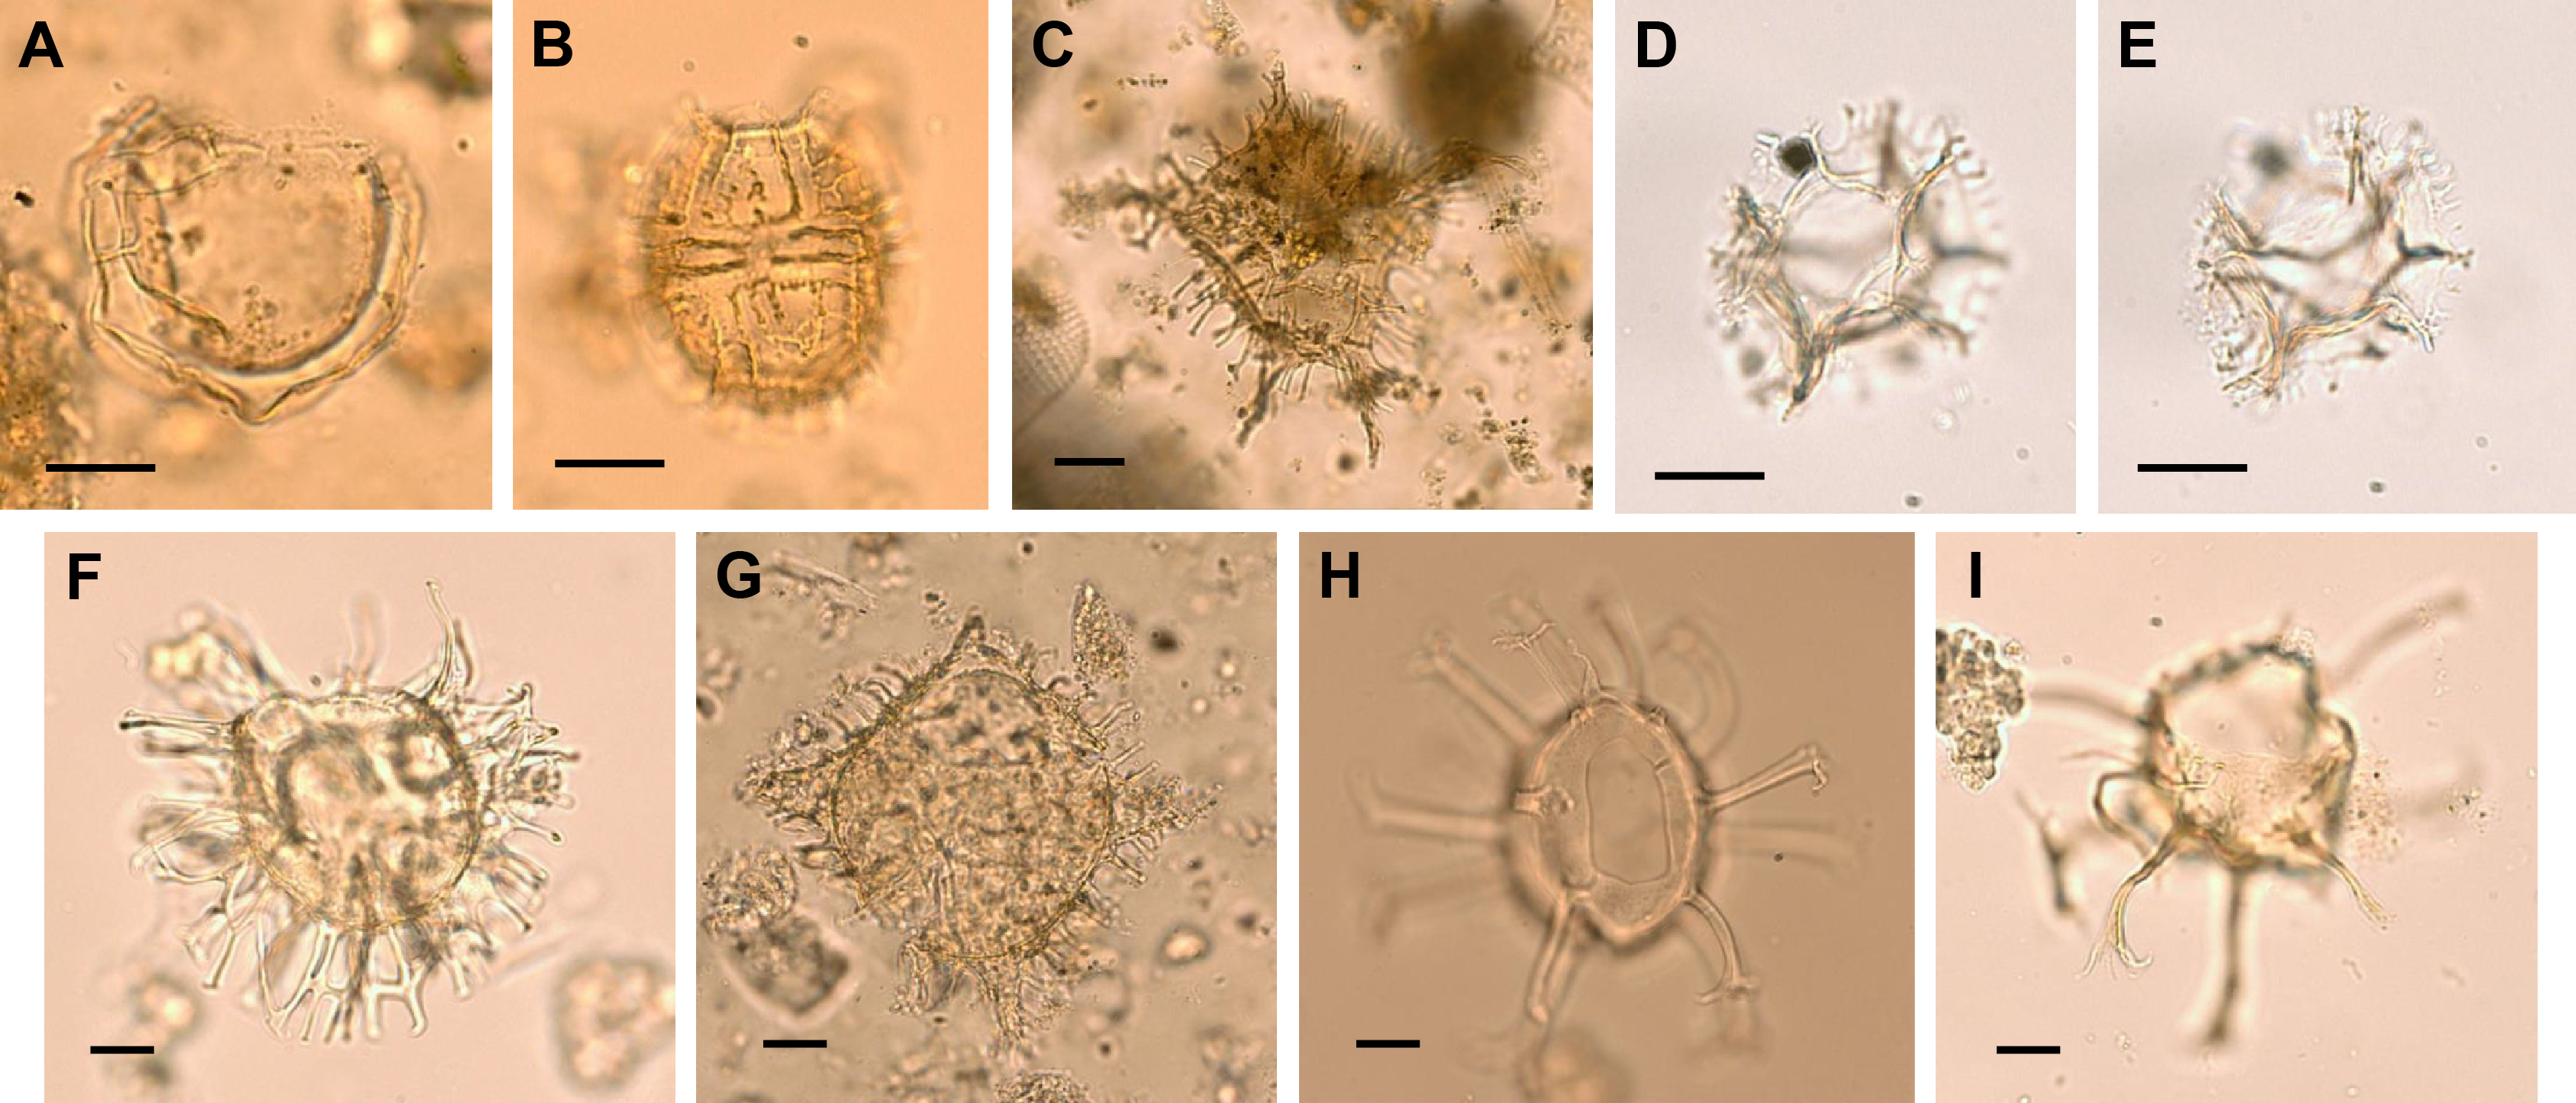
Figure F14. Age diagnostic dinocysts, Site U1567.
The next samples downcore are palynologically almost barren, but a few isolated specimens of Alisocysta circumtabulata (Figure F14B) in Samples 393-U1567A-16X-CC and 17X-CC, and farther down in Sample 23X-CC, when combined with the single occurrence of Areoligera gippingensis (Figure F14F) and Spiniferites rhomboideus (Figure F14D, F14E) in Sample 393-U1567A-17X-CC, may point to a middle Late Paleocene age and assignment to Subzones P6a and P5b of Bujak and Mudge (1994) (Table T6), also when compared with other records in the larger North Sea area (Vieira and Mahdi, 2019).
4.1.2.2. Hole U1567B
Palynofacies distribution and palynomorph occurrences are listed in Table T7, and the distribution is overall similar to that found in Hole U1567A. As in Hole U1567A, from younger to older, dinocyst first and last occurrences allow recognition of a Quaternary section, a middle Lower Eocene section, an uppermost Paleocene–lowermost Eocene section, and an underlying upper Middle to Upper Paleocene section.
With a few recovered, likely in situ palynomorphs, such as (again) O. centrocarpum, some Spiniferites and Protoperidinium spp., and abundant, reworked Early Cretaceous palynomorphs, Section 396-U1567B-1H, Sample 2H-CC, and overlying materials are assigned a Quaternary age.
This again sharply contrasts the middle Early Eocene assessment for the next sample downcore (396-U1567B-3H-CC). In Hole U1567B, this is based on the combined occurrences of, notably, M. glabra and Areosphaeridium michoudii (Figure F14I) and the co-occurrence of Pentadinium laticinctum, from Zone E3, following Mudge and Bujak (1994). The next sample downhole (4H-CC) is palynologically nonproductive.
A latest Paleocene to earliest Eocene age assessment (i.e., Subzones P6a and P6b of Bujak and Mudge, 1994) for Samples 396-U1567B-10X-CC to 5X-CC is based on the consistent occurrence of A. augustum in every core catcher sample in this interval. Detailed assemblage work on these samples may reveal a succession typical of the onset, body, and recovery of the PETM. The single analyzed sample below this interval with consistent A. augustum (11X-CC) is quasibarren of palynomorphs but may be considered to be of latest Paleocene age (Subzone P6a), given the presence of other species of Apectodinium spp. but no A. augustum. Although Apectodinium abundance/occurrence is often quoted as a marker for the PETM due to its global acme (e.g., Crouch et al., 2001), the first occurrence of the genus at midlatitudes often precedes the PETM (Crouch et al., 2001; Sluijs et al., 2007, 2011; Frieling et al., 2018). The single specimen of Palaeoperidinium pyrophorum, if in situ, may even indicate an age slightly older than the latest Paleocene.
4.1.3. Planktonic foraminifers
All core catcher samples from Sample 396-U1567A-1H-CC to 23X-CC and 396-U1567B-5X-CC to 7X-CC were processed for planktonic foraminifers. The mudline sample was processed with rose bengal stain to identify any living organisms. Only Samples 396-U1567A-1H-CC to 4H-CC and the mudline contain planktonic foraminifers. Samples 5H-CC to 23X-CC are barren of planktonic foraminifers. Preservation ranges from moderate to good across the four productive core catcher samples. Broken foraminiferal tests were noted across all four core catcher samples. The mudline from Hole U1567A has abundant planktonic foraminifers, and Neogloboquadrina spp. and Globigerina spp. are the dominant taxa.
Neogloboquadrina pachyderma (sin.) dominates Sample 396-U1567A-1H-CC, with several specimens showing encrusting of the tests. Neogloboquadrina sp., N. pachyderma (dex.), Neogloboquadrina dutertrei, N. cf. pachyderma, N. cf. dutertrei, Neogloboquadrina atlantica, Globigerinella sp., Turborotalia quinqueloba, and Globigerina bulloides are also noted in this sample.
Sample 396-U1567A-2H-CC is dominated by N. pachyderma (sin.). Several of the specimens show encrusting of the tests (Figure F15). Some rarer foraminifers include G. bulloides, Globigerinella sp., N. cf. dutertrei, N. cf. pachyderma, N. dutertrei, N. pachyderma (dex.), and Neogloboquadrina sp.
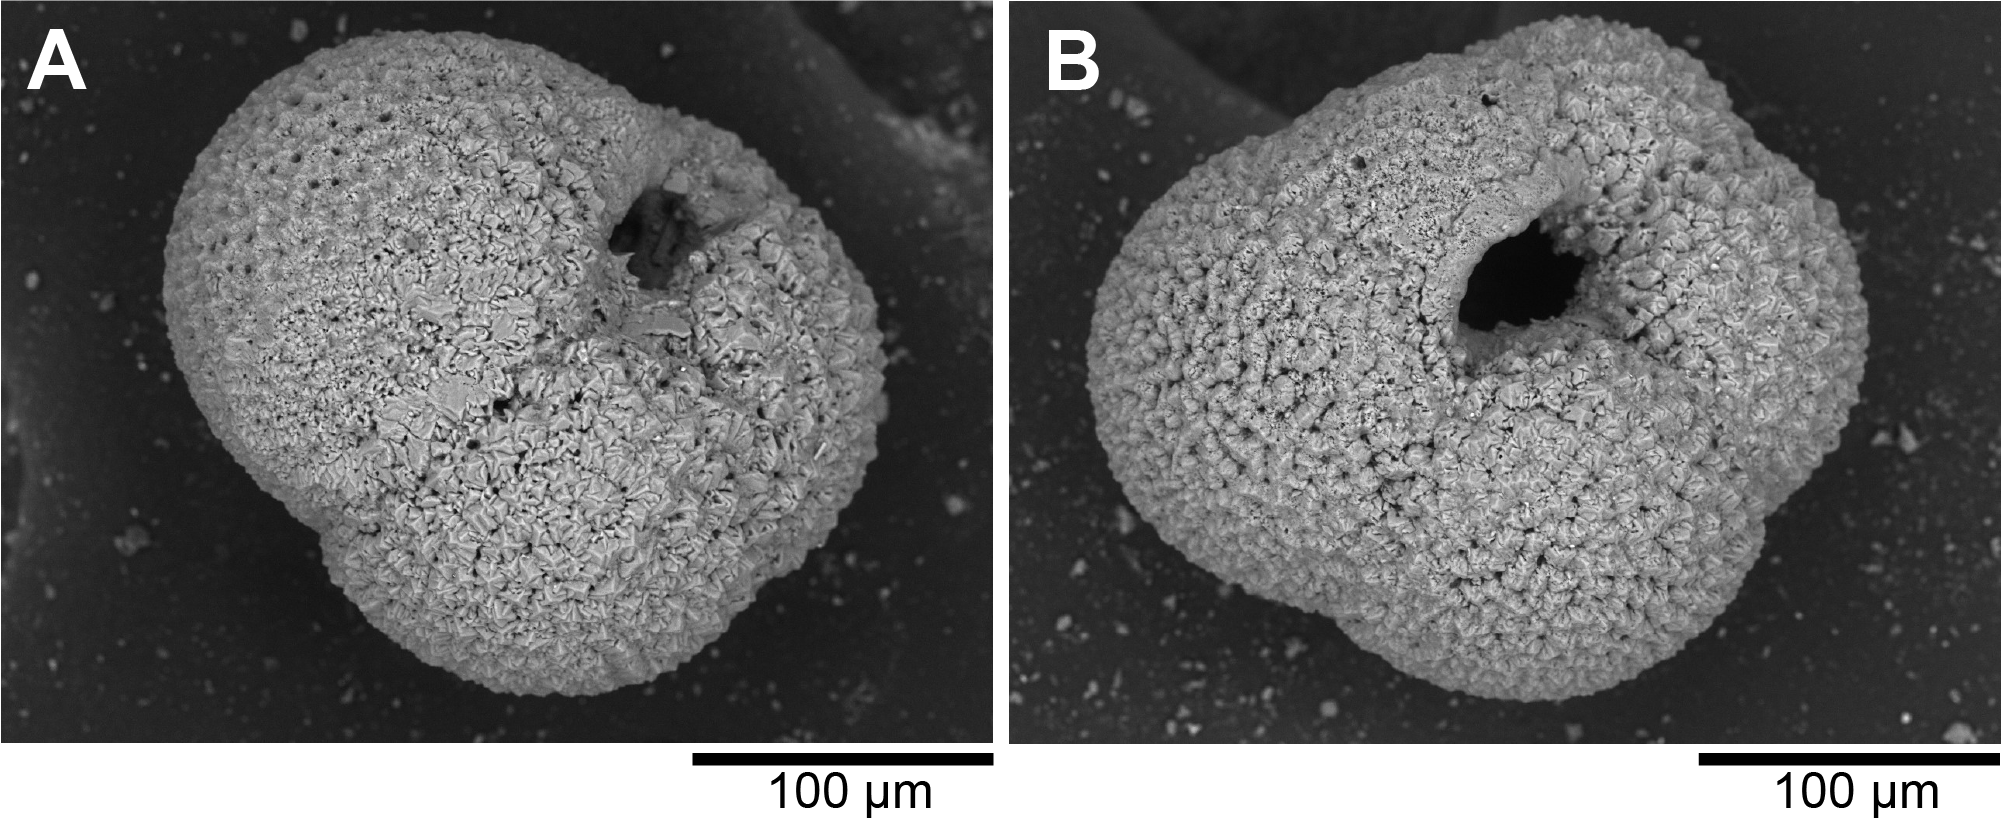
Figure F15. Neogloboquadrina pachyderma (sin.).
N. pachyderma (sin.) is very abundant in Sample 396-U1567A-3H-CC, and several show encrusting of the tests. Other rarer planktonic foraminifers include G. bulloides, G. cf. bulloides, Globigerina sp., Globigerinella sp., Globigerinita sp., N. atlantica, N. cf. dutertrei, N. cf. pachyderma, N. dutertrei, N. pachyderma (dex.), Neogloboquadrina sp., and Orbulina universa.
The overall foraminifer abundance in Sample 396-U1567A-4H-CC is very low, and 15 foraminifers were identified. N. pachyderma (sin.) is prevalent in this sample. N. atlantica and G. bulloides are the two species identified in this sample.
Samples 396-U1567A-5H-CC to 23X-CC are barren of planktonic foraminifers, with the exception of one foraminifer, identified as Neogloboquadrina sp., found in Core 5H. Samples 396-U1567B-5X-CC to U1567B-7X-CC were examined to confirm the boundary of the PETM section. Sample 6X-CC shows rare abundance of Quaternary age contamination. The other two core catcher samples are barren of planktonic foraminifers. The mudline and four core catcher samples (396-U1567A-1R-CC to 4R-CC) indicate a Quaternary age and can be placed in the N. pachyderma (sin.) Zone of Spiegler and Jansen (1989).
4.1.4. Ostracods
The mudline sample from Hole U1567A and all core catcher samples from Cores 396-U1567A-1H through 23X and 396-U1567B-5X through 7X were checked for the presence of ostracods. Ostracods were absent from all samples except Sample 396-U1567A-1H-CC, where only two valves of the genus Krithe and one valve of Henryhowella asperrima were found. These species were present in slightly higher numbers in the mudline sample.
4.1.5. Calcareous nannofossils
Rare, poorly preserved calcareous nannofossils were noted in Samples 396-U1567A-1H-CC and 2H-CC. All other samples examined are barren. Samples from Hole U1567B were not examined for nannofossils.
4.2. Site U1568
Biostratigraphic analysis of Site U1568 included only core catcher samples from Hole U1568A for calcareous, siliceous, and organic-walled microfossils. Core catcher samples from Hole U1568B were checked for siliceous microfossils only. In addition, two samples were checked for palynomorphs to confirm age interpretations based on samples from Hole U1568A. The mudline samples from both holes were processed for calcareous biota. Distribution of the various microfossil groups is shown in Table T8.
Organic-walled microfossils are frequent to common below Quaternary strata down into Paleocene strata, whereas calcareous biotic remains were only recorded in the youngest parts of the sections retrieved, assigned to the Quaternary. Siliceous microfossils are poorly preserved or absent in most studied intervals of Holes U1568A and U1568B.
4.2.1. Siliceous microfossils
Biosiliceous fossils are generally poorly preserved or absent in most studied intervals of Holes U1568A and U1568B, presumably due to dissolution or silica diagenesis at this site. Several samples contain identifiable remains of diatom frustules, including high abundances in Samples 396-U1568A-12X-CC and 14X-CC and 396-U1568B-8X-CC and 9X-CC. Diatoms occur in moderately high abundance in Sample 396-U1568B-14X-3, 68 cm. The diatom assemblages add little new detail to age determination and correlation to Site U1567 holes beyond the information provided by palynology. Diatom occurrences for examined samples are reported in Table T9.
4.2.2. Palynology
In total, 25 core catcher samples from Hole U1568A and 2 from Hole U1568B (14X-CC and 4X-2, 68–69 cm) were processed for palynology. All of the samples were processed using the standard HF technique (see Biostratigraphy in the Expedition 396 methods chapter [Planke et al., 2023a]).
Overall, palynomorphs and, notably, the dinocysts among them occur in highly variable quantities from absent to scarce to abundant; therefore, no overall quantitative analysis was conducted. Occurrences of palynofacies categories and palynomorphs for Hole U1568A are listed in Table T10. In view of the highly variable yield of palynomorphs, the associations are useful for broad age assessments, but no detailed reconstruction of the paleoenvironment was attempted. The informal dinocyst North Sea zonation scheme of Bujak and Mudge, 1994 (see also Mudge and Bujak, 1994, 1996) is applied for the characterization of the Paleocene and Eocene sections of these holes (Table T11).
4.2.2.1. Hole U1568A
Palynofacies distribution and palynomorph occurrences are listed in Table T10. From younger to older, dinocyst first and last occurrences allow recognition of a Quaternary section, an uppermost Paleocene–lowermost Eocene section (Subzone P6b of Bujak and Mudge, 1994), and an underlying lower Upper Paleocene section (Subzones P6a–P5b/a of Bujak and Mudge, 1994).
Yielding a few likely in situ palynomorphs, such as O. centrocarpum, as well as some Spiniferites spp. and abundant, reworked, mainly Cretaceous and Paleogene palynomorphs (Table T10), Samples 396-U1568A-3H-CC to 4H-CC and all overlying materials are assigned a Quaternary age, similar to the setting at Site U1567.
Although Sample 396-U1568A-5H-CC proved barren, a latest Paleocene to earliest Eocene age (Subzone P6b and Zone E1 of Bujak and Mudge, 1994) may be assigned to Samples 17X-CC to 7H-CC. This is based on the consistent occurrences of A. augustum (Figure F16B) in Samples 17X-CC to 10X-CC, followed by the abundance of Cerodinium wardenense (Figure F16A), Glaphyrocysta ordinata (Figure F16E), Senegalinium spp., and H. tubiferum (Figure F16G) in Sample 7H-CC. The absence of typical younger Eocene taxa and A. augustum suggests an earliest Eocene age for Sample 7H-CC, in Zone E1 of Bujak and Mudge (1994). The entire interval from Sample 17X-CC to Sample 7H-CC may be regarded as encompassing an extremely expanded PETM section (>70 m) worthy of postcruise studies.
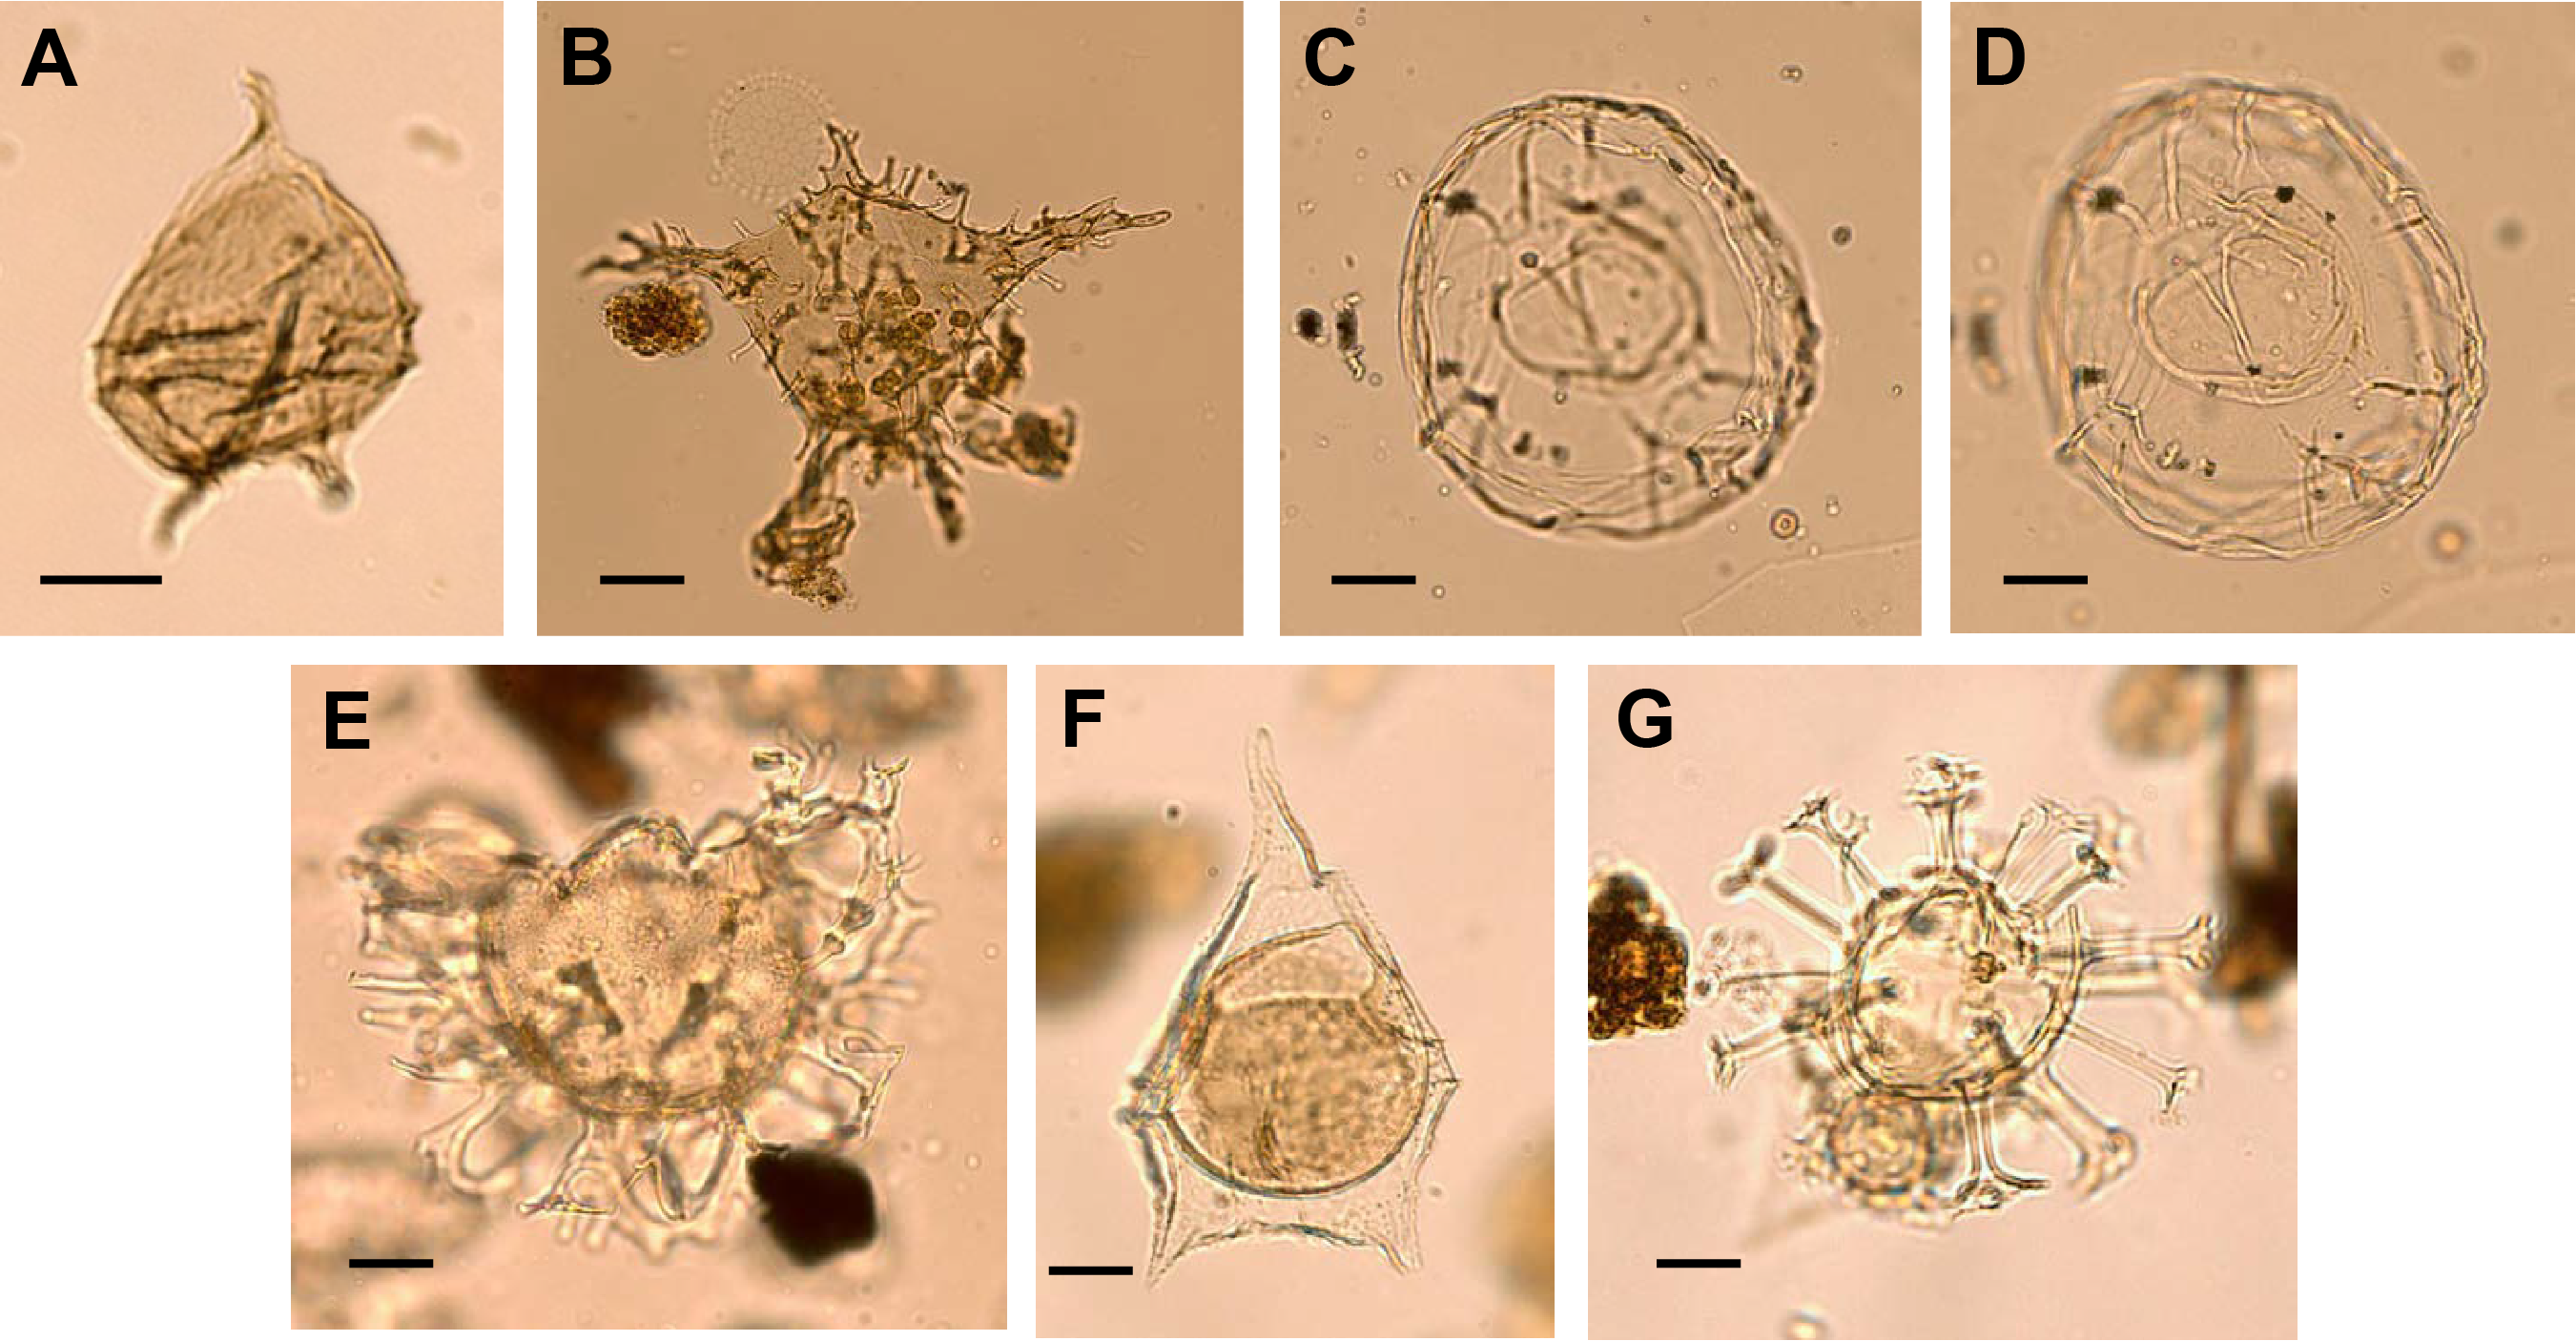
Figure F16. Age diagnostic dinocysts, Site U1568.
In the underlying section, the impoverished dinocyst assemblage in Sample 396-U1568A-18X-CC contains D. oebisfeldensis (Figure F16F) and Thalassiphora delicata (Figure F16C, F16D) but no specimens of Apectodinium spp. (see Palynology for Site U1567) and only rare occurrences of other and/or no age diagnostic species. Specimens assignable to species of Spiniferites recently described by Vieira and Mahdi (2019) may provide further constraints on the age of this interval when Samples 19X-CC and 20X-CC are considered as well. Both samples contain Spiniferites truncatus, as well as S. rhomboideus in combination with relatively rare A. gippingensis, which together may indicate a middle Late Paleocene age for these samples (Subzone P5b of Bujak and Mudge, 1994). D. oebisfeldensis, S. truncatus, and S. rhomboideus are not commonly found in subsequent Samples 21X-CC to 28X-CC, where rather impoverished dinocyst assemblages contain taxa typical for a late Middle Paleocene age: A. circumtabulata, Alisocysta margarita, and P. pyrophorum. Assemblages in Samples 21X-CC to 28X-CC may reflect an overall mid-Late Paleocene age (Subzone P5a of Bujak and Mudge, 1994) following, for example, Mudge and Bujak (1996), Vieira and Mahdi (2019), and Vieira et al. (2020).
4.2.2.2. Hole U1568B
Hole U1568B was drilled to recover a near identical succession to Hole U1568A. Hence, it was decided to focus palynological processing and analysis on the lithostratigraphic units that were poorly represented or recovered in Hole U1568A. Sample 396-U1568B-4X-2, 68–69 cm, was taken from that part of the succession assigned to the Early Eocene in Hole U1568A, which is represented in a more extended fashion in Core 396-U1568B-4X. From that section, one sample was analyzed to determine whether this interval is coeval with the lithologically similar interval in Hole U1568A. Similarly, Sample 396-U1568B-14X-CC was processed to confirm the youngest possible age for the lithostratigraphic unit underlying the black laminated claystone interval (Lithostratigraphic Unit V). See Table T12 for distribution of taxa.
Sample 396-U1568B-4X-2, 68–69 cm, yields a well-preserved palynological association dominated by a diverse angiosperm and gymnosperm pollen assemblage, with abundant bisaccates and spores as well. Dinocysts occur frequently and are mainly composed of representatives of Senegalinium, besides common G. ordinata, H. tubiferum, and Cerodinium depressum. Species of Membranosphaera not previously encountered form a substantial part of the dinocyst assemblage, as does Lentinia wetzelii. Taken together, while noting a poorly preserved specimen of Dracodinium varielongitudum, this association reflects a middle Early Eocene age following Mudge and Bujak (1994) (Zone E3 of Bujak and Mudge, 1994).
Sample 396-U1568B-14X-CC contains an impoverished assemblage with some D. oebisfeldensis and a single P. pyrophorum. The sample is tentatively assigned a mid-Late Paleocene age (Subzone P5b of Bujak and Mudge, 1994).
4.2.3. Planktonic foraminifers
Samples 396-U1568A-1H-CC to 28X-CC and the mudline were processed for planktonic foraminifers. The mudline sample was processed with rose bengal stain to identify any organisms presently living on the seafloor. Samples 1H-CC to 4H-CC have planktonic foraminifers that range in overall abundance from abundant to rare (Table T8). The preservation state of the four core catcher samples is moderate with some encrusting of tests (prevalent in N. pachyderma [sin.]) (Figure F17). Broken tests and pyrite framboids are observed throughout the four core catcher samples.
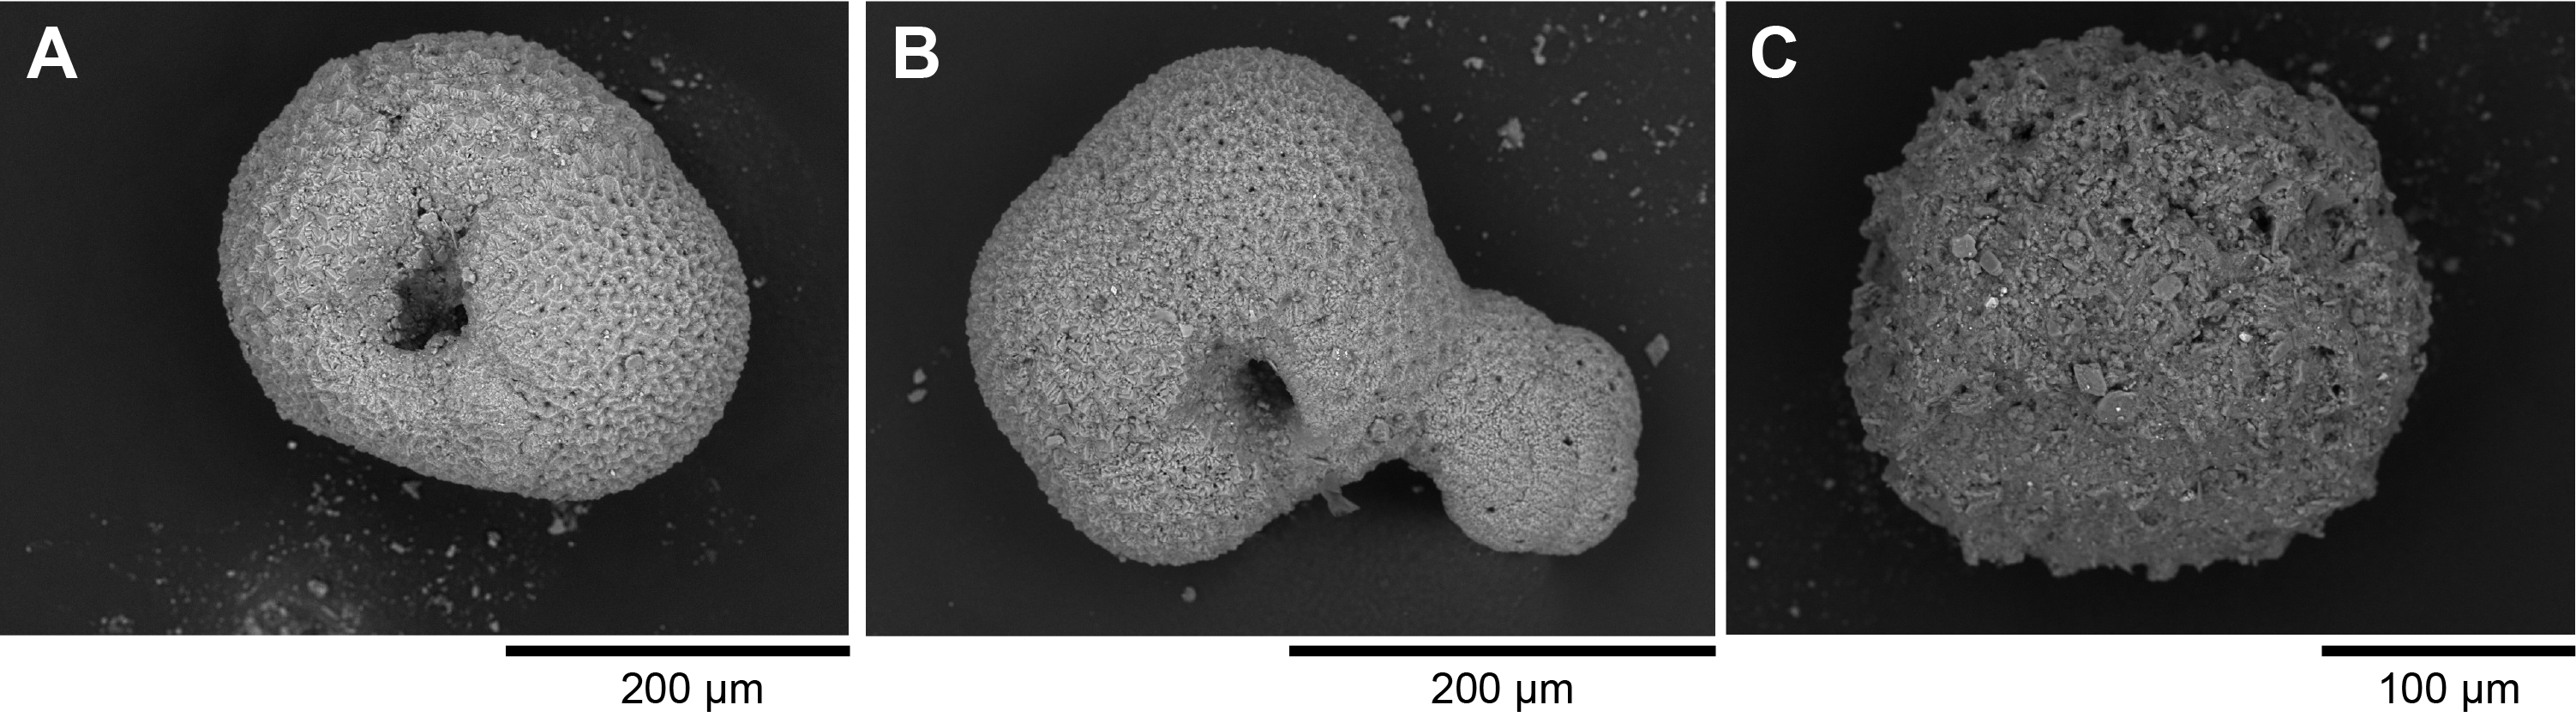
Figure F17. Planktonic and benthic (?) foraminifers.
Planktonic foraminifers are very abundant in the mudline sample. Neogloboquadrina spp. and Globigerina sp. are two dominant genera noted in the mudline sample.
Sample 396-U1568A-1H-CC has abundant planktonic foraminifers with moderate preservation and slight pre-Quaternary reworking. N. pachyderma (sin.) dominates this core catcher sample. Other rare planktonic foraminifers include Neogloboquadrina sp., N. pachyderma (dex.), Neogloboquadrina incompta, N. cf. pachyderma, N. dutertrei, N. cf. dutertrei, N. atlantica, Globigerinita sp., Globigerinella obesa, and G. bulloides.
Sample 396-U1568A-2H-CC has common overall abundance of planktonic foraminifers with moderate preservation and slight pre-Quaternary reworking. N. pachyderma (sin.) accounts for 77% of the identified taxa. Other rare taxa include Neogloboquadrina sp., N. incompta, N. cf. pachyderma, N. atlantica, G. obesa, Globigerinita sp., and G. bulloides. Sediment from Sample 2H-CC is noted to be rich with quartz (90%).
Sample 396-U1568A-3H-CC also has a common overall abundance of planktonic foraminifers with slightly more pre-Quaternary reworking than the previous two core catcher samples. N. pachyderma (sin.) dominates this sample. Neogloboquadrina sp., N. pachyderma (dex.), N. cf. pachyderma, N. cf. dutertrei, N. atlantica, and G. obesa are other rare taxa recorded in this sample. Sediment from Sample 3H-CC is also noted to be rich in quartz (~90%).
The overall abundance of foraminifers in Sample 396-U1568A-4H-CC is rare with moderate preservation. Neogloboquadrina sp., N. pachyderma (sin.), N. cf. pachyderma, and Globigerinella sp. are recorded in this sample. Census data collected is not enough to give an age. Sediment from this sample is noted to be rich in quartz (~89%).
The palynology team identified (benthic) foraminiferal linings in Samples 396-U1568A-9X-CC to 15X-CC, 18X-CC to 19X-CC, 21X-CC, and 25X-CC. Analysis from these samples did not yield foraminifers, except for Sample 24X-CC, which has a benthic taxon that resembles Pulsiphonina prima.
The mudline and three core catcher samples (396-U1568A-1H-CC to 3H-CC) indicate a Quaternary age and can be placed in the N. pachyderma (sin.) Zone of Spiegler and Jansen (1989). Noteworthy taxa are shown in Figure F17.
4.2.4. Ostracods
Samples 396-U1568A-1H-CC to 28X-CC and the mudline sample were examined for ostracods following the same methods as for foraminifers. A few ostracod valves of Krithe spp. (78%), H. asperrima (18%), and Cytheropteron sp. (4%) were only present in the mudline sample. All three genera had stained specimens.
4.3. Summary
Biostratigraphic analysis at Site U1567 included all 38 core catcher samples from Holes U1567A and U1567B for siliceous and organic-walled microfossils (Figure F18). All core catcher samples from Hole U1567A and selected samples from Hole U1567B (5X-CC, 6X-CC, and 7X-CC) were processed for planktonic foraminifers. In addition, all core catcher samples from Hole U1567C were checked for siliceous microfossils.
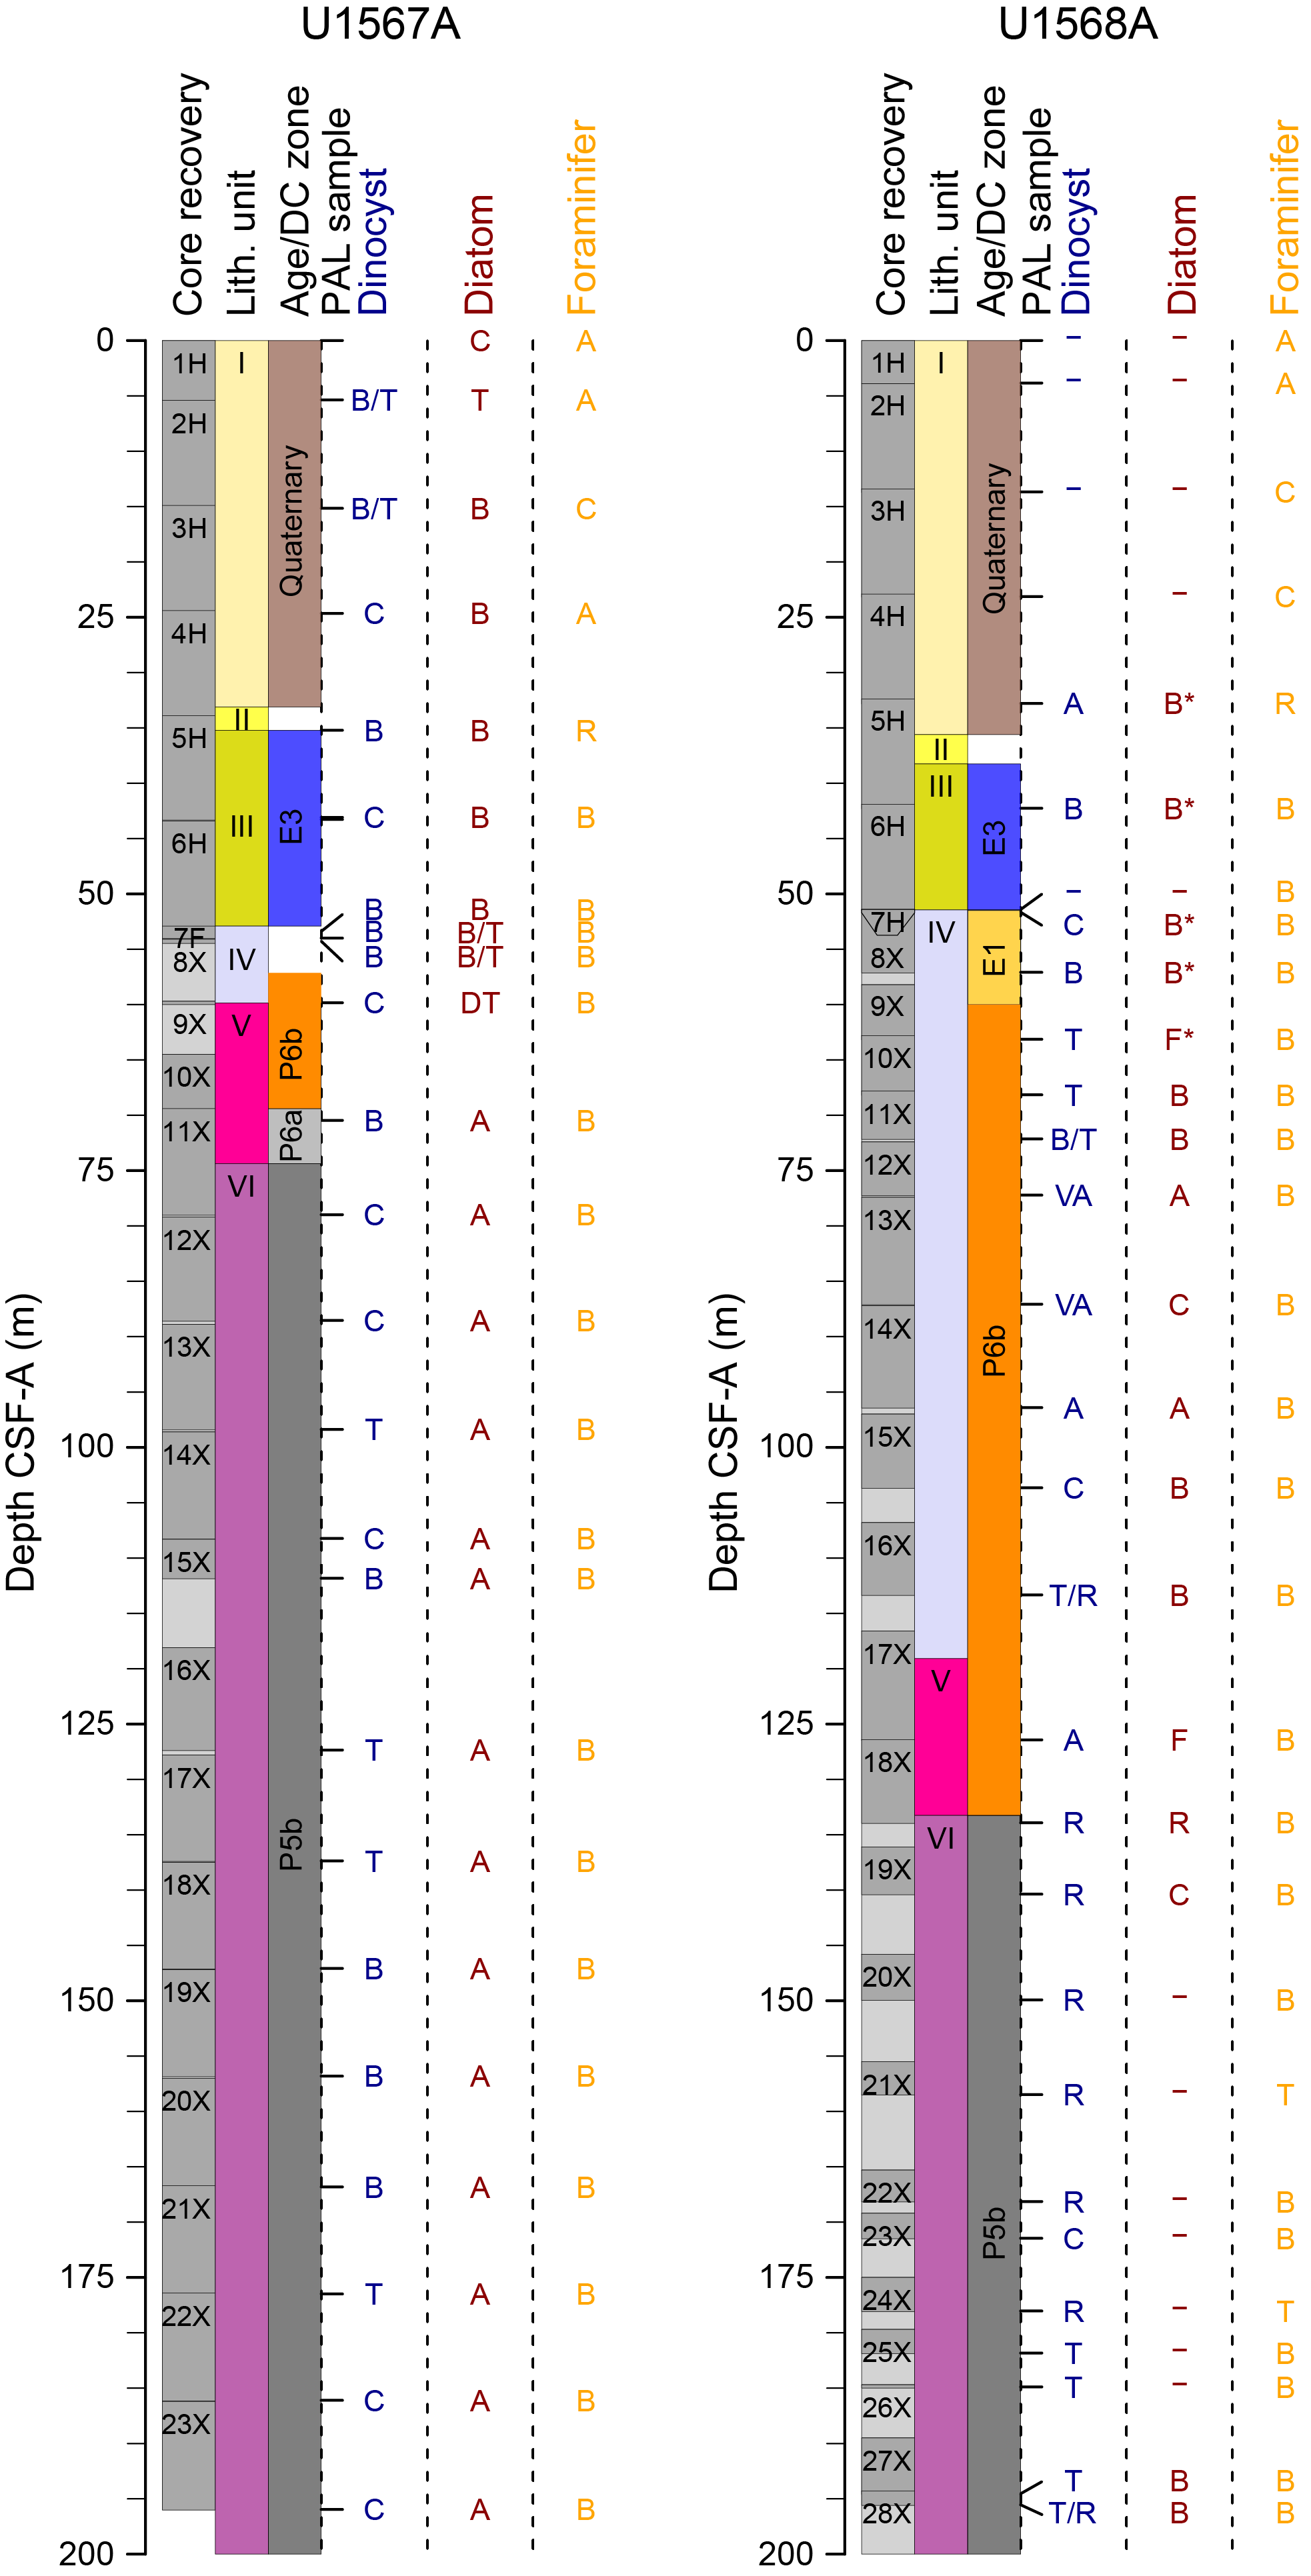
Figure F18. Microfossils.
Analysis of Site U1568 included only core catcher samples from Hole U1568A for calcareous, siliceous, and organic-walled microfossils. From Hole U1568B, core catcher samples were checked for siliceous microfossils only. In addition, two samples were checked for palynomorphs to confirm age interpretations based on samples from Hole U1568A. The mudline samples from all holes from Sites U1567 and U1568 were processed for calcareous biota.
Generally, moderate numbers of siliceous and organic-walled microfossils were found in the lower Upper Paleocene to middle Lower Eocene section, whereas calcareous microfossils only were recorded in the youngest parts of the sections retrieved, which are assigned to the Quaternary. In Hole U1567B (and likely in Hole U1567C), an expanded, unprecedented microlaminated PETM and Early Eocene section was retrieved; the upper part is likely truncated by deposits dating to the middle Early Eocene. All holes appear to terminate in the lower Upper Paleocene part of the hole.
Organic-walled microfossils were found in abundance in the lower Upper Paleocene to middle Lower Eocene section. Well-preserved siliceous microfossils are limited to several levels associated with the PETM and Upper Paleocene in Site U1568, unlike nearby Site U1567, where preservation is exceptional. Calcareous biotic remains were only recorded in the youngest parts of the sections retrieved, which are assigned to the Quaternary.
Altogether, biostratigraphic constraints show the five holes at Sites U1567 and U1568 penetrated strata of predominantly early Paleogene age. A thin (~35 m thick) sedimentary succession, which was assigned a Quaternary age based on foraminifer contents, was present in all holes.
Below the Quaternary sediments, middle Early Eocene sediments, attributable to Zone E3 of Bujak and Mudge (1994), were sampled in Holes U1567A, U1567B, and U1568A. Earliest Eocene sediments (Zone E1) were recorded in Hole U1568A, but not in Holes U1568B or U1567A–U1567C, based on biostratigraphic analyses.
The PETM succession is identified based on the presence of the dinocyst marker species A. augustum (P6b) and supported by diatom marker taxa. The extremely expanded PETM deposits span from ~20 m in Hole U1567A to a virtually unprecedented 70–80 m in Hole U1568A, confirmed by combined biostratigraphic and lithostratigraphic constraints.
Hole U1567B, and perhaps Hole U1568B, may contain a latest Paleocene sequence (assigned to Subzone P6a), but this was not confirmed in other holes, where the PETM succession rests unconformably on thick lower Upper to Middle Paleocene sedimentary successions (Subzone P5b) that appear rather similar in age and species composition in all holes.
4.3.1. Paleoenvironment and noteworthy microfossil characteristics
Despite the variable yield, some generalities can be gleaned from the palynofacies and palynomorph composition. For example, the abundant phytodebris and massive occurrence of terrestrial palynomorphs throughout the PETM and remainder of the Early Eocene suggest a nearshore depositional environment, whereas the succession assigned to the Late Paleocene shows characteristics of a somewhat more distal marine setting.
Strong thermal alteration of organic matter was not observed, with the exception of a few sparse, seemingly in situ, altered specimens near the bottom of the Paleocene succession recovered from Hole U1568A. Most samples yielded immature organic microfossils and pristine to reasonably well preserved siliceous microfossils. Reworking of older material is uncommon below the Quaternary, although both Upper and Lower Cretaceous palynomorphs occur throughout the entire recovered succession.
The exceptional siliceous microfossil-bearing sequence at Site U1567 will greatly aid the development of a high-resolution diatom and silicoflagellate biostratigraphy for the PETM and Paleocene in postcruise analyses and contribute to a better understanding of environmental conditions during this critical interval in Earth’s history.
5. Paleomagnetism
5.1. Shipboard measurements
Shipboard paleomagnetic investigations combined (1) measurement and in-line alternating field (AF) demagnetization of archive-half sections on the superconducting rock magnetometer (SRM) and (2) measurement and AF demagnetization of discrete samples on the spinner magnetometer (JR-6A). A total of 386 archive sections from Holes U1567A–U1567C, U1568A, and U1568B were measured on the SRM. Anisotropy of magnetic susceptibility (AMS) measurements were not performed due to time constraints. The Icefield MI-5 core orientation tool was used on Cores 396-U1567A-3H through 6H and 396-U1568A-2H through 6H. The reoriented cores were then compared to the inclination polarity record.
A total of 16 discrete samples were collected to perform AF demagnetization: 11 from Hole U1567A, 3 from Hole U1567B, and 2 from Hole U1568B. Directional and intensity data from discrete samples were used to validate the polarities inferred from section measurements. Directional data were analyzed using Zijderveld diagrams (Zijderveld, 2013). The characteristic remanent magnetization direction(s) were determined using the Remasoft 3.0 software (Chadima and Hrouda, 2006).
5.2. Demagnetization behavior
A synthesis of paleomagnetic data is presented in Figures F19 and F20. In ~40% of recovered sections, sediments show low magnetic intensity (I < ~10−3 A/m). In some well-defined depth intervals (Figures F19, F20), both magnetic intensity and magnetic inclination angle vary greatly. The consistent distribution of these intervals with depth suggests that the low magnetic intensity is controlled by the detrital source rather than by a drilling artifact. In these intervals, magnetic polarity cannot be reliably determined.
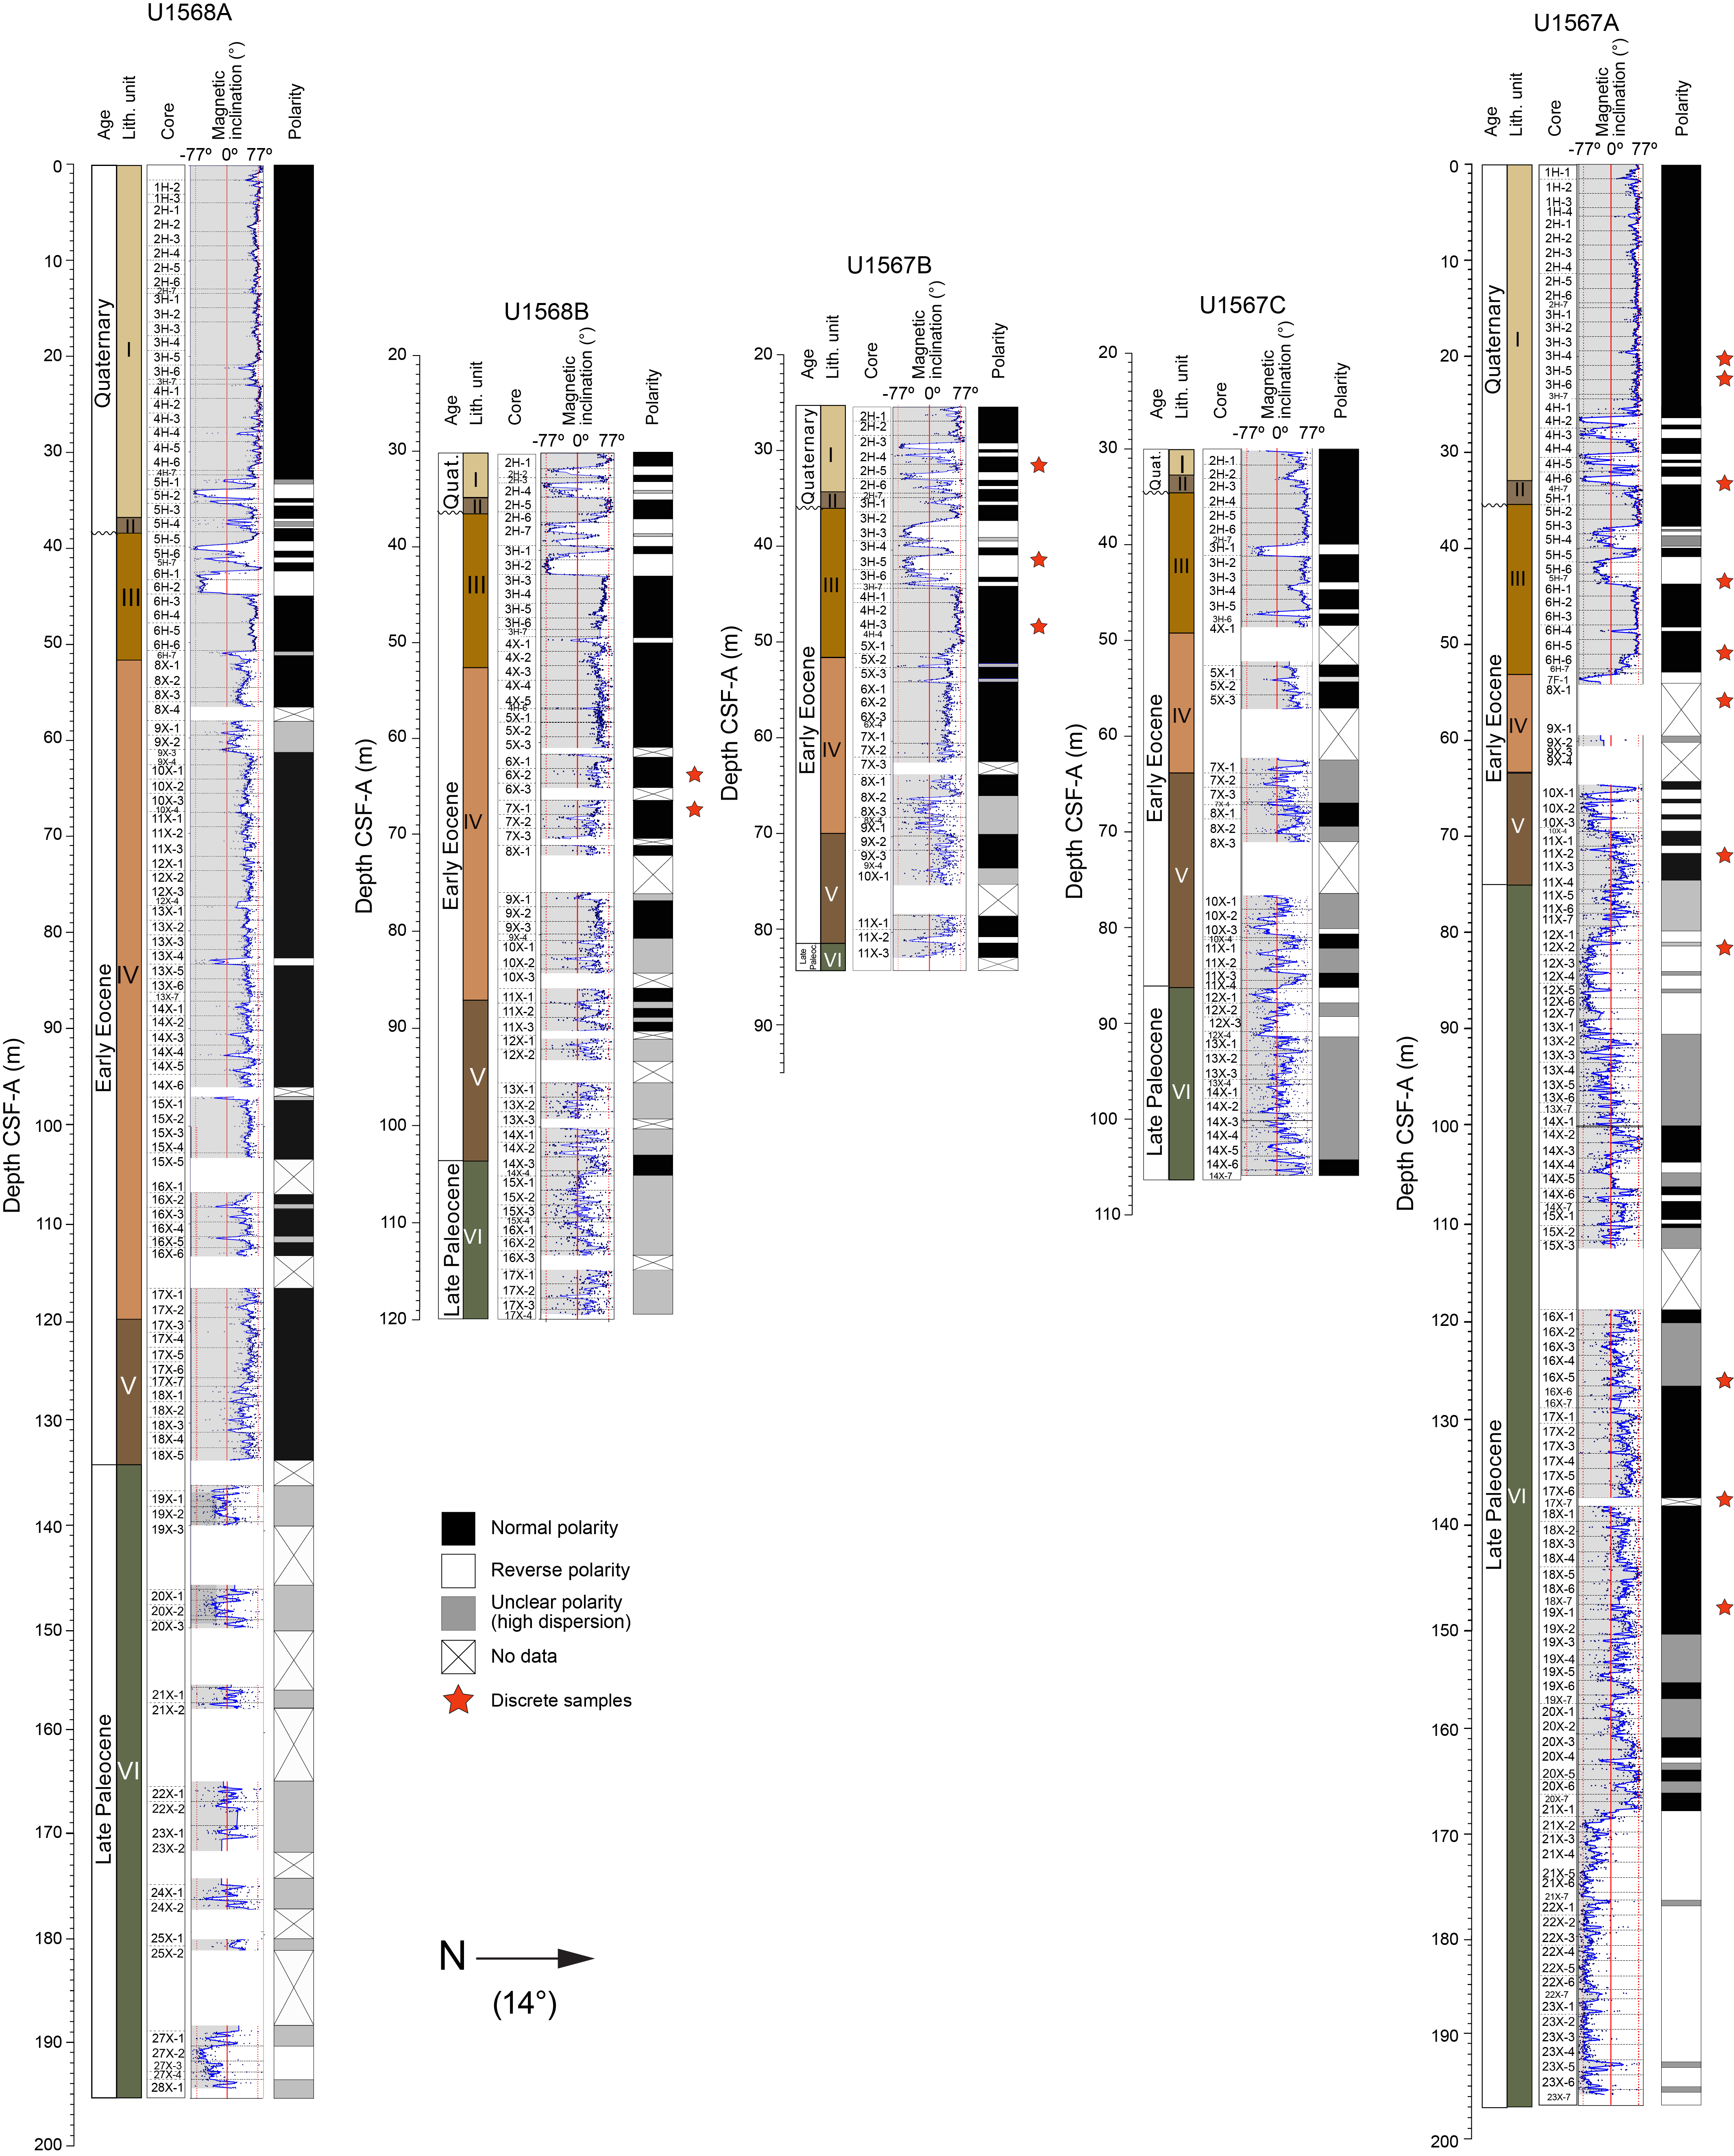
Figure F19. Magnetic inclination.
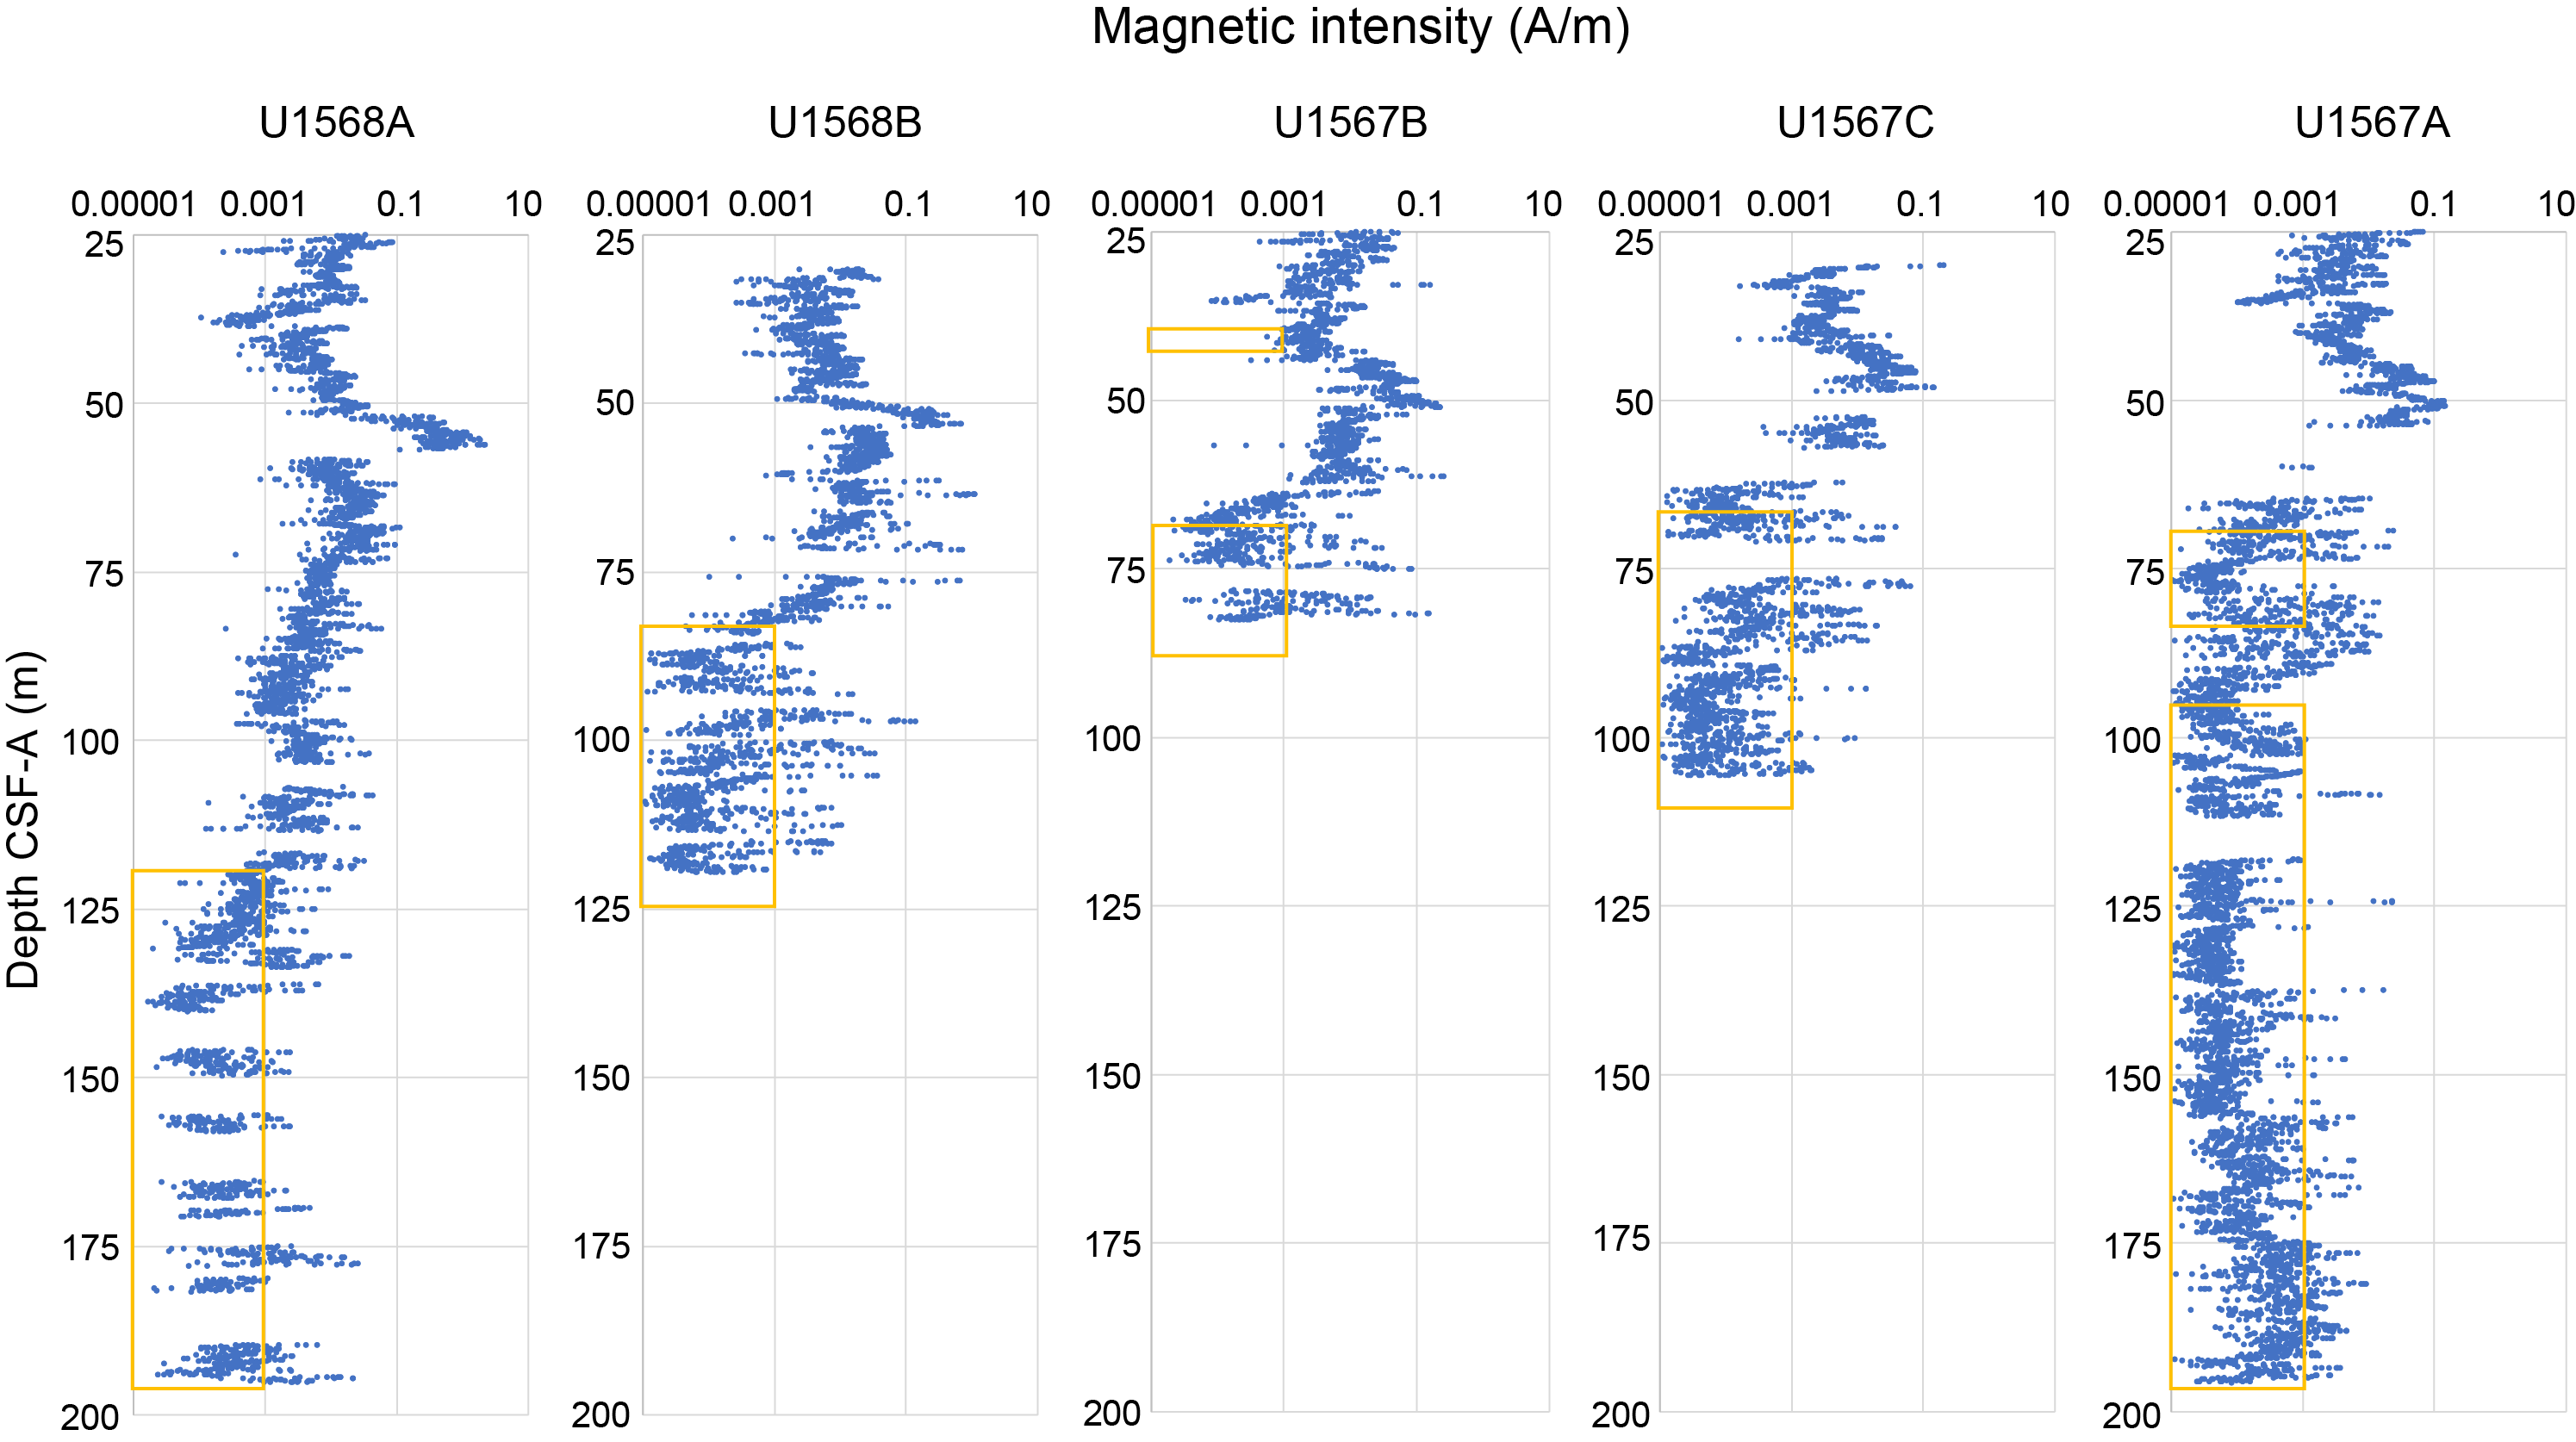
Figure F20. Absolute magnetic intensity.
Magnetic inclination data, after 20 mT AF demagnetization, is used to determine magnetic polarity and to place the core sections in a magnetostratigraphic age framework. Intervals with moderate to high magnetic intensity (I > ~10−3 A/m) present both magnetic reversals and magnetic excursions, particularly in Sections 396-U1567A-4H-1 through 4H-7, 396-U1567B-2H-1 through 2H-7, and 396-U1568A-4H-3 through 5H-3. These reversals, which have similar inclination angles in normal and reverse polarity, pass the polarity test and are therefore interpreted as accurately recording the geomagnetic field.
The uppermost cores from each hole show a dominantly normal polarity and a magnetic inclination close to the calculated geomagnetic dipole field inclination (~77°) for these latitudes. These characteristics suggest that the paleomagnetic data of the youngest sediments accurately recorded the geomagnetic field and its periodic reversals.
The Paleocene–Eocene (Chron 29r through Chron 15n) is characterized mainly by reverse polarity (e.g., Ogg, 2020). However, polarities are normal for most core sections from Sites U1567 and U1568 that biostratigraphy places in this time interval. Several hypotheses could explain this important anomaly:
- Fluids may have percolated through permeable sediments and remagnetized these sediments during any normal chron after sedimentation.
- A yet to be defined regional-scale metamorphic event may have remagnetized the sediment through the transformation of thermally unstable mineral phases during any normal chron.
- The originally weak magnetization of the sediment may have prevented the sediment from adequately recording the geomagnetic field (e.g., Valet et al., 2016).
Normal polarity intervals during the PETM have been described elsewhere in marine sediments of the Atlantic Ocean (Dallanave et al., 2012). For example, Lee and Kodama (2009) reported a similar 53 ky long normal interval during the PETM within Chron 24r, although Lerbekmo and Evans (2010) dispute a causal link between the hyperthermal event and magnetic polarity.
Overall, the magnetic intensities in the cores recovered at Sites U1567 and U1568 vary across six orders of magnitude (Figure F21). The larger variability of inclinations in the sections that have low magnetic intensities compared to the sections that have high intensities supports a remagnetization event.
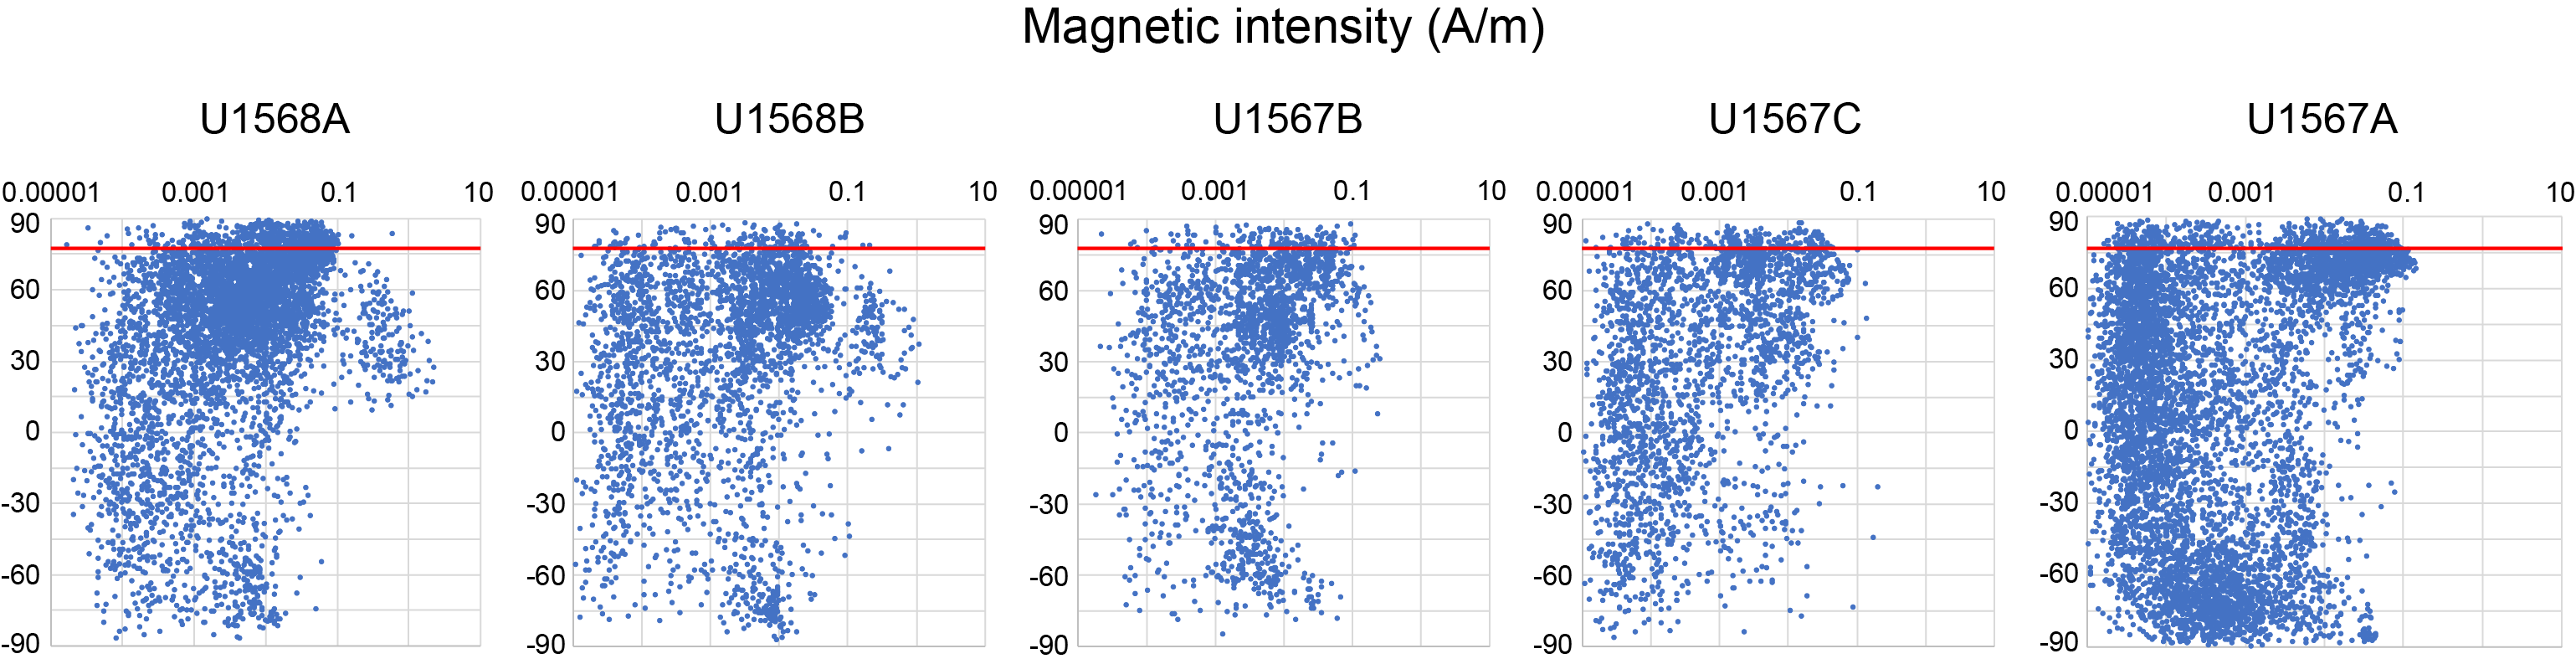
Figure F21. Magnetic inclination vs. magnetic intensity.
The AF demagnetization of the 14 discrete samples shows two end-member behaviors (Figure F22). Moderately to strongly magnetized samples (I > 10−3 A/m) have uniform demagnetization characterized by one characteristic/stable magnetization component (e.g., Sample 396-U1567A-1H-3, 93–95 cm). Demagnetization from 0 to 80 mT is progressive, as expected from a sediment carrying a wide range of magnetic coercivities. Weakly magnetized samples (I < 10−3 A/m) show an unstable demagnetization behavior characterized by a low-coercivity (soft) magnetic assemblage. These behaviors suggest that the weakly magnetized samples host a soft magnetic assemblage most likely represented by a low concentration of multidomain grains of magnetite or titanomagnetite (diameter = >10 µm). The lack of a high-coercivity component in the low-intensity sections does not support the first hypothesis because the magnetically remanent minerals produced through fluid migration, such as pyrrhotite or hematite-goethite, have relatively high magnetic coercivities. The redox conditions that characterize these mineral assemblages will need to be addressed postcruise.
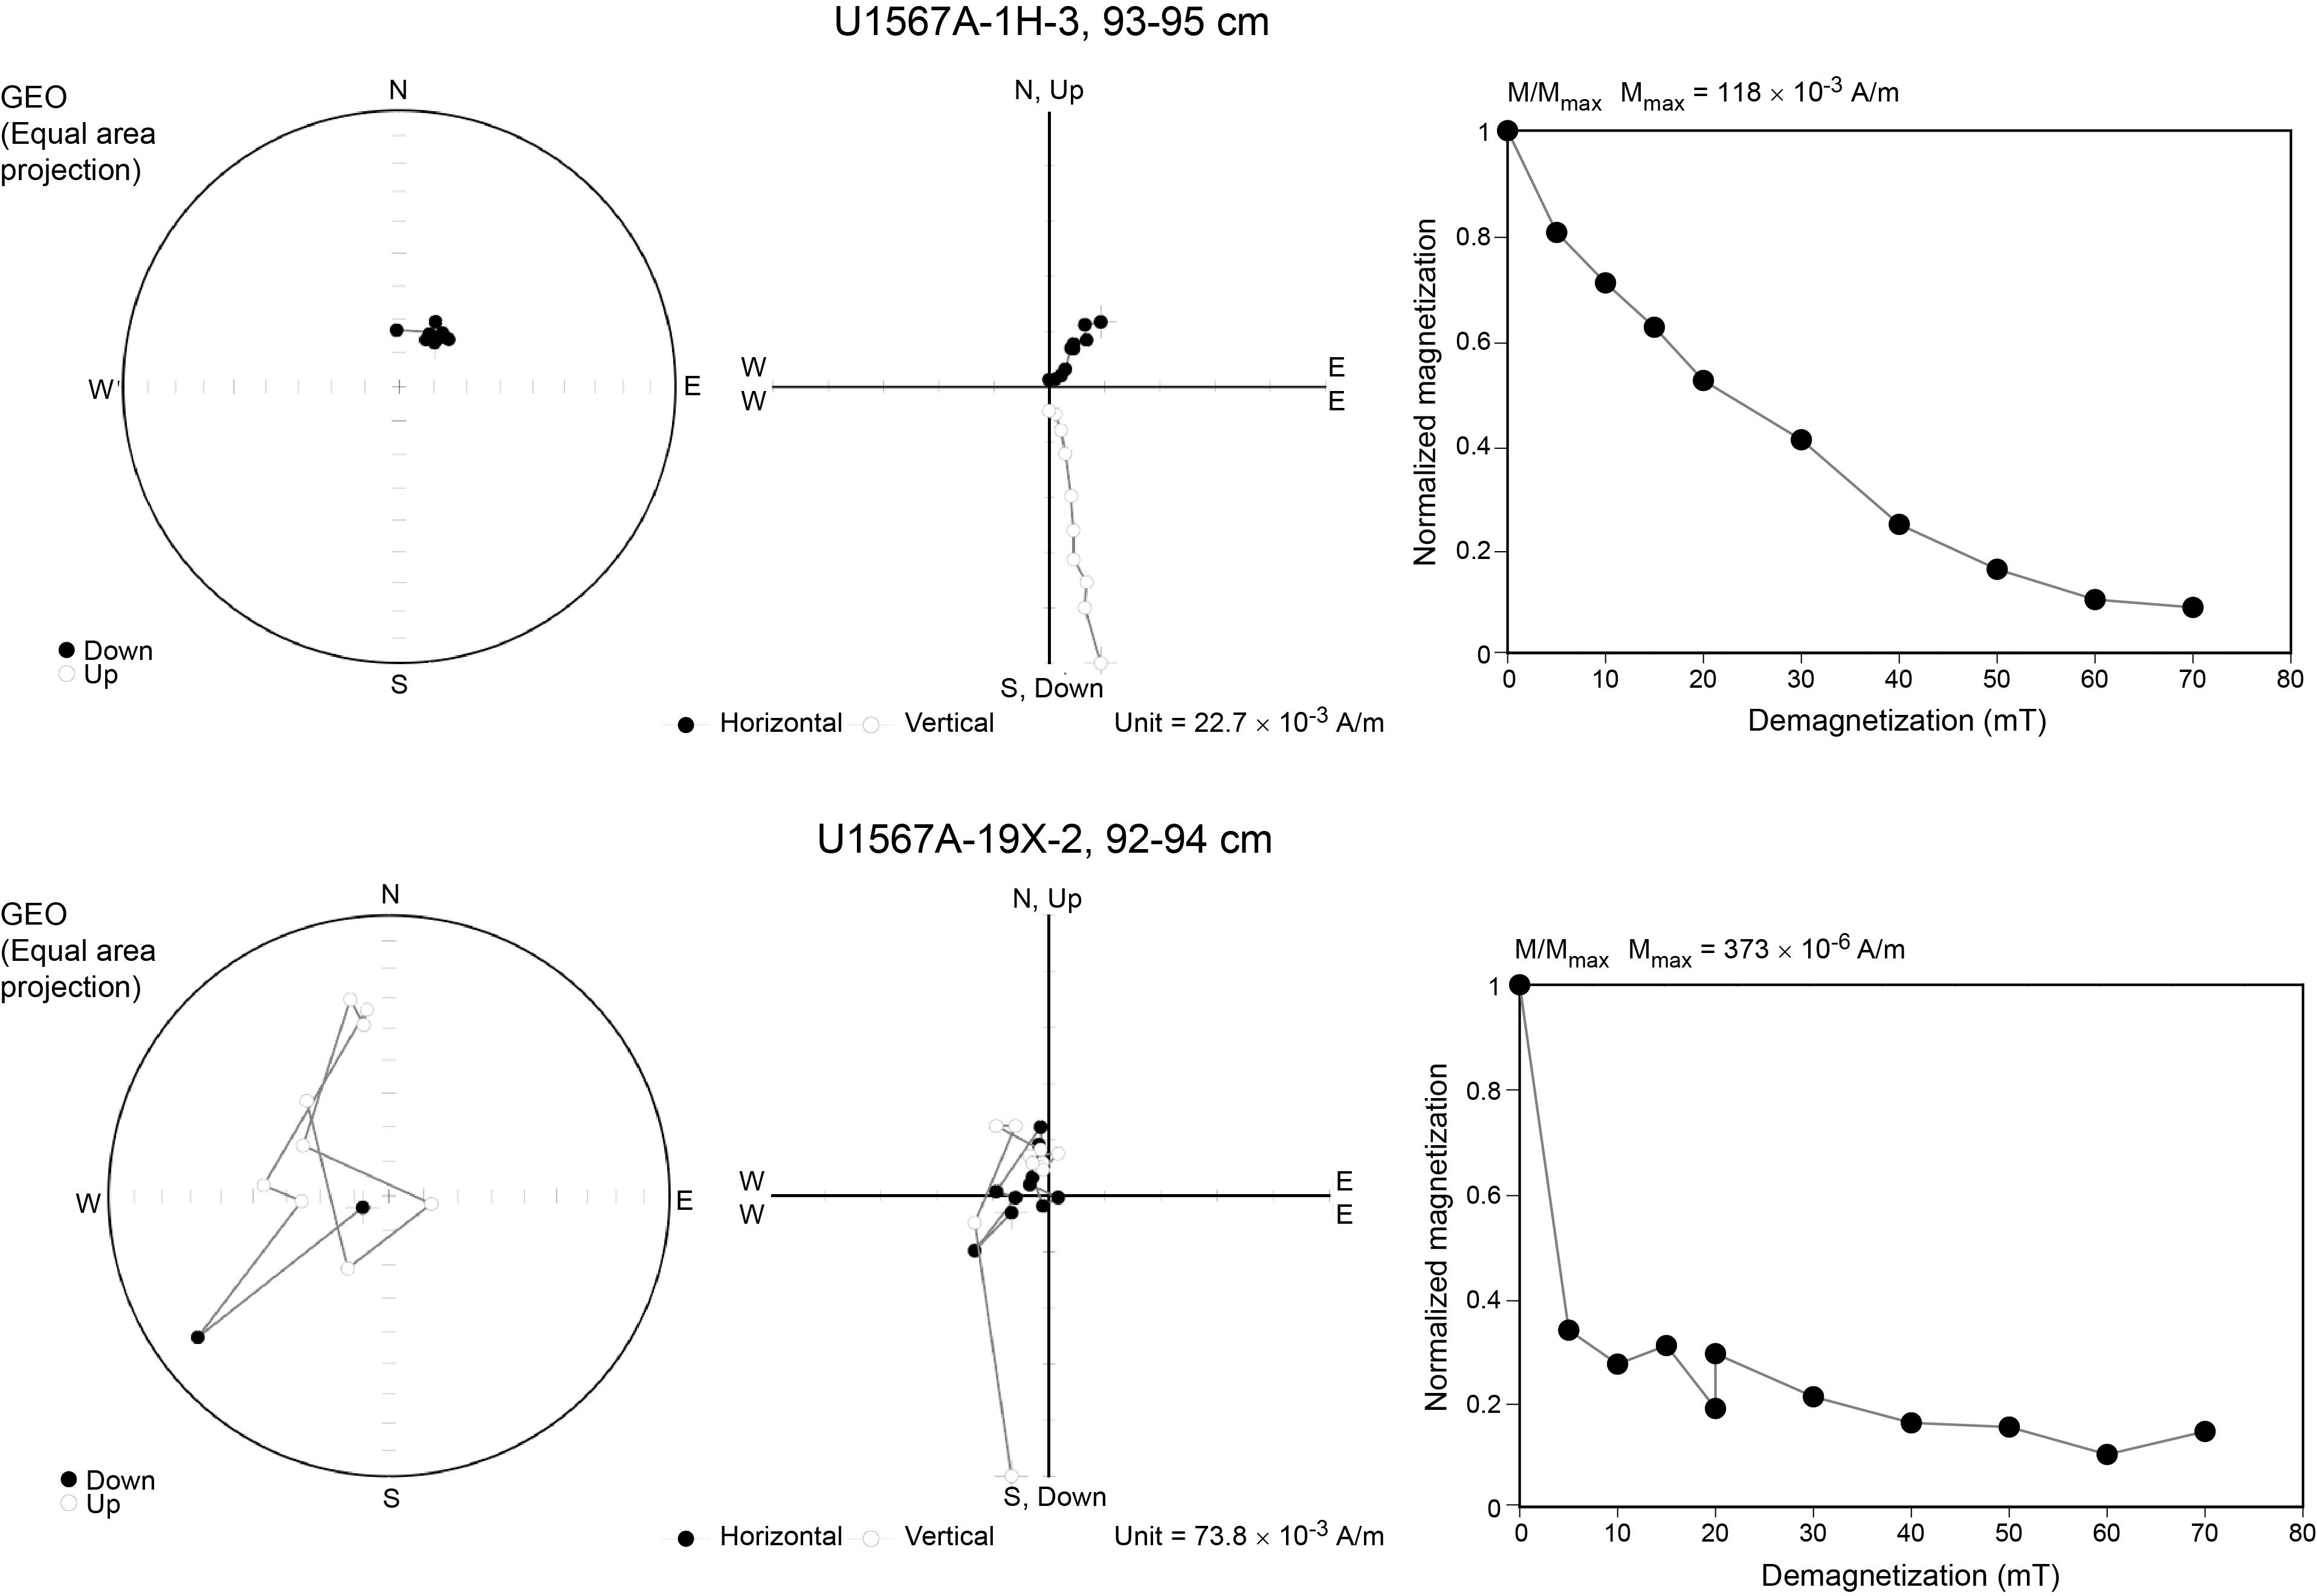
Figure F22. AF demagnetization.
XCB coring resulted in less consistent magnetic inclination data and, to a lesser extent, less consistent magnetic intensity data compared to APC coring. This lack of consistency is caused primarily by hardened sediment crumbling after recovery and other drilling disturbances.
5.3. Summary
The low magnetic intensities did not allow us to determine the magnetic polarity for about 40% of the core. The rest of the cores show a pattern of normal and reverse polarities that pass the reversal test (having similar inclinations but opposite signs). The uppermost parts of the cores record the recent geomagnetic field with normal, steep inclinations (~77°). Surprisingly, some of the intervals corresponding to the PETM show a normal polarity where a reverse polarity is expected (Chron 24r). This major anomaly justifies further investigations.
6. Geochemistry
Sites U1567 and U1568 represent a transect across the upper part of a hydrothermal vent complex. In terms of increasing proximity to the vent center, the holes are ordered U1567A, U1567C, U1567B, U1568B, and U1568A, with the latter being the most central. Hole U1567A is considered the “reference” borehole and Hole U1568A the “vent” borehole.
Five mudline samples were taken for water analysis, one from each hole. A total of 40 interstitial water (IW) samples were collected from Site U1567 (32 from Hole U1567A, 1 from Hole U1567B, and 7 from Hole U1567C), and another 40 were collected from Site U1568 (33 from Hole U1568A and 7 from Hole U1568B). Carbonate and CHNS analyses were completed on all corresponding squeeze cake samples and on eight additional intervals sampled from the working-half sections of the cores when interesting features and/or changes in lithology were observed during core description.
A total of 55 samples were taken next to the IW samples to be analyzed for routine headspace gas analysis. Seven samples were measured using a pXRF spectrometer under Geochem mode: four from Hole U1567A, one from Hole U1567B, and two from Hole U1568B. Each sample was run in triplicate, and one layer was run twice in triplicate, resulting in 24 discrete analyses. X-ray diffraction (XRD) analysis was conducted for Holes U1567A and U1568A, resulting in 128 discrete measurements for normal and heated clay procedures. Of these, 94 measurements were from Hole U1567A, 9 were from Hole U1567B, and 25 were from Hole U1568A.
6.1. norganic geochemistry
The two holes at either end of the transect, Holes U1567A and U1568A, have the most complete and comprehensive IW profiles, so they are the primary focus here. In Hole U1567A, alkalinity does not vary greatly downcore and values range 4–4.5 mM in the upper 75 m (Figure F23; Table T13). In the section below this interval, values are between 5 and 6.8 mM with a gradual linear increase downcore. In the uppermost 35 m at both sites, increased alkalinity, NH4+, and PO43− concentrations coinciding with decreased SO42− content likely reflect oxidation of organic matter by sulfate reduction (Jørgensen, 1982). However, incomplete consumption of SO42− and low CH4 concentrations indicate low rates of sulfate reduction.
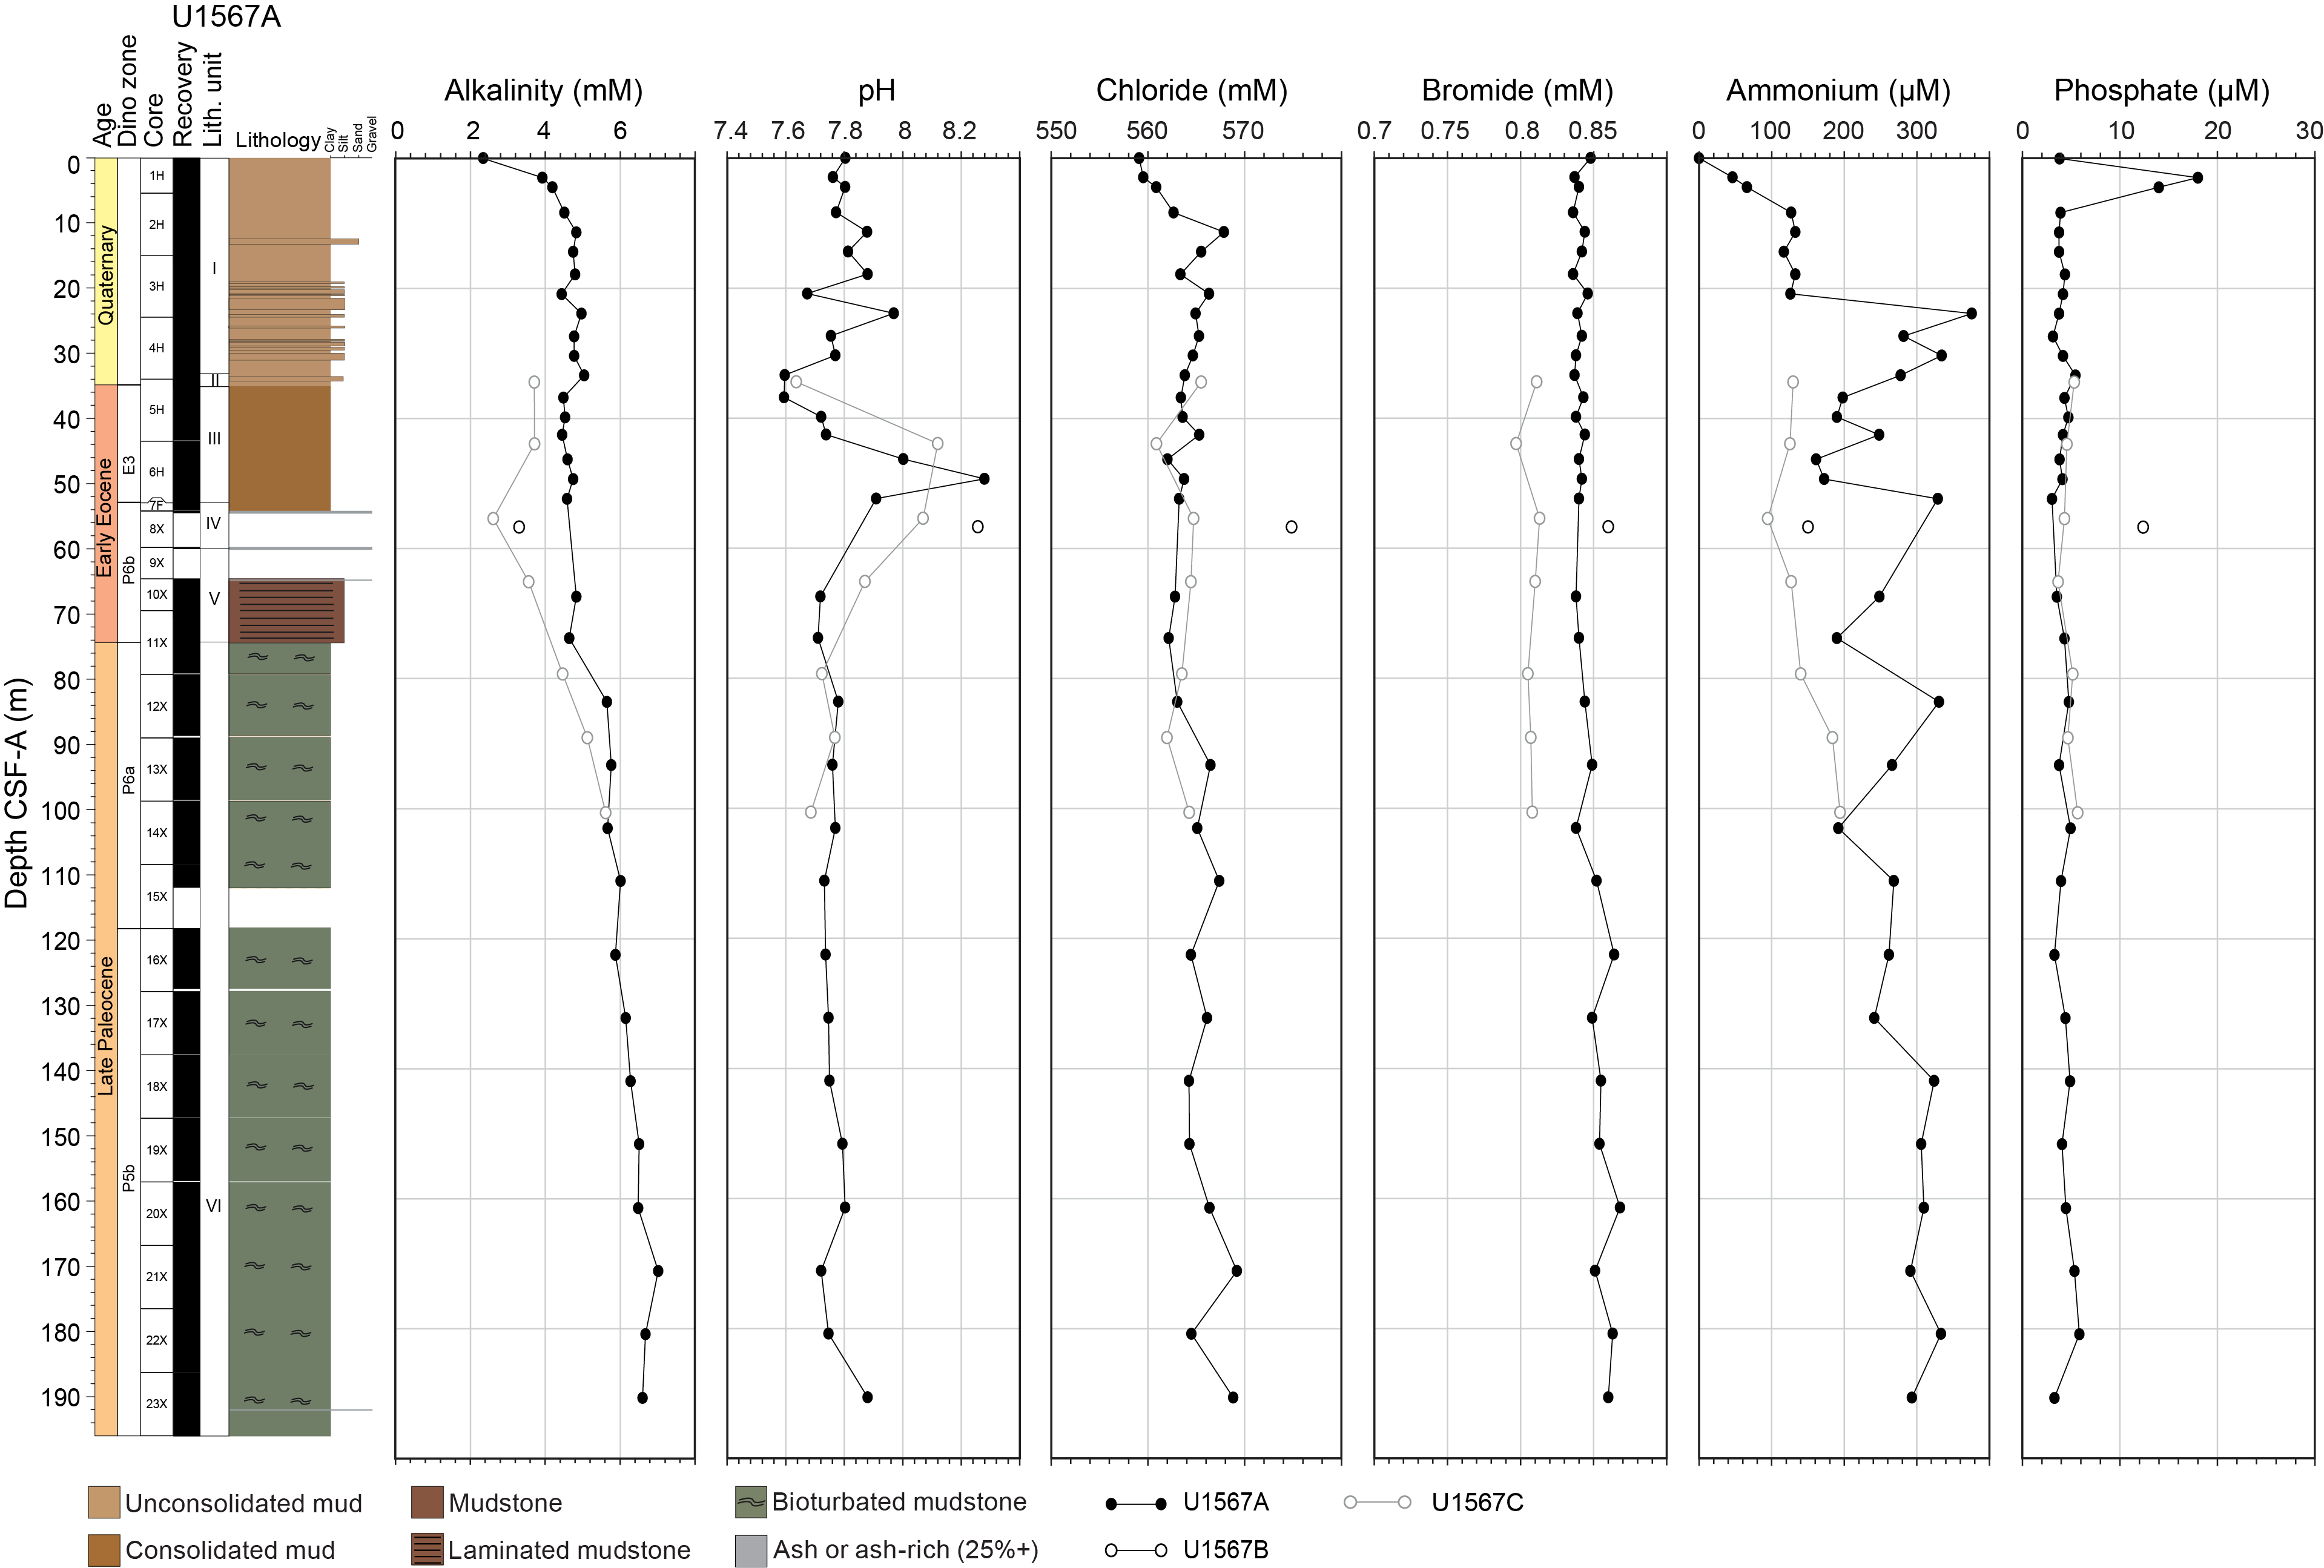
Figure F23. IW, Holes U1567A–U1567C.
In contrast to the record at Hole U1567A, the record at Hole U1568A diverges from the reference locality below ~25 m CSF-A (Figure F24; Table T14). Alkalinity begins to decrease, reaching a minimum of 2 mM at 51 m CSF-A before recovering to values of 3 mM by 75 m CSF-A. Below this depth, alkalinity increases linearly to a maximum of 5 mM at the base of the studied section. Similar trends (with decreases between 25 and 75 m CSF-A) can be seen in NH4+ and PO43− concentrations (Figure F24), suggesting that the mechanism behind the alkalinity shift also controls these variables.
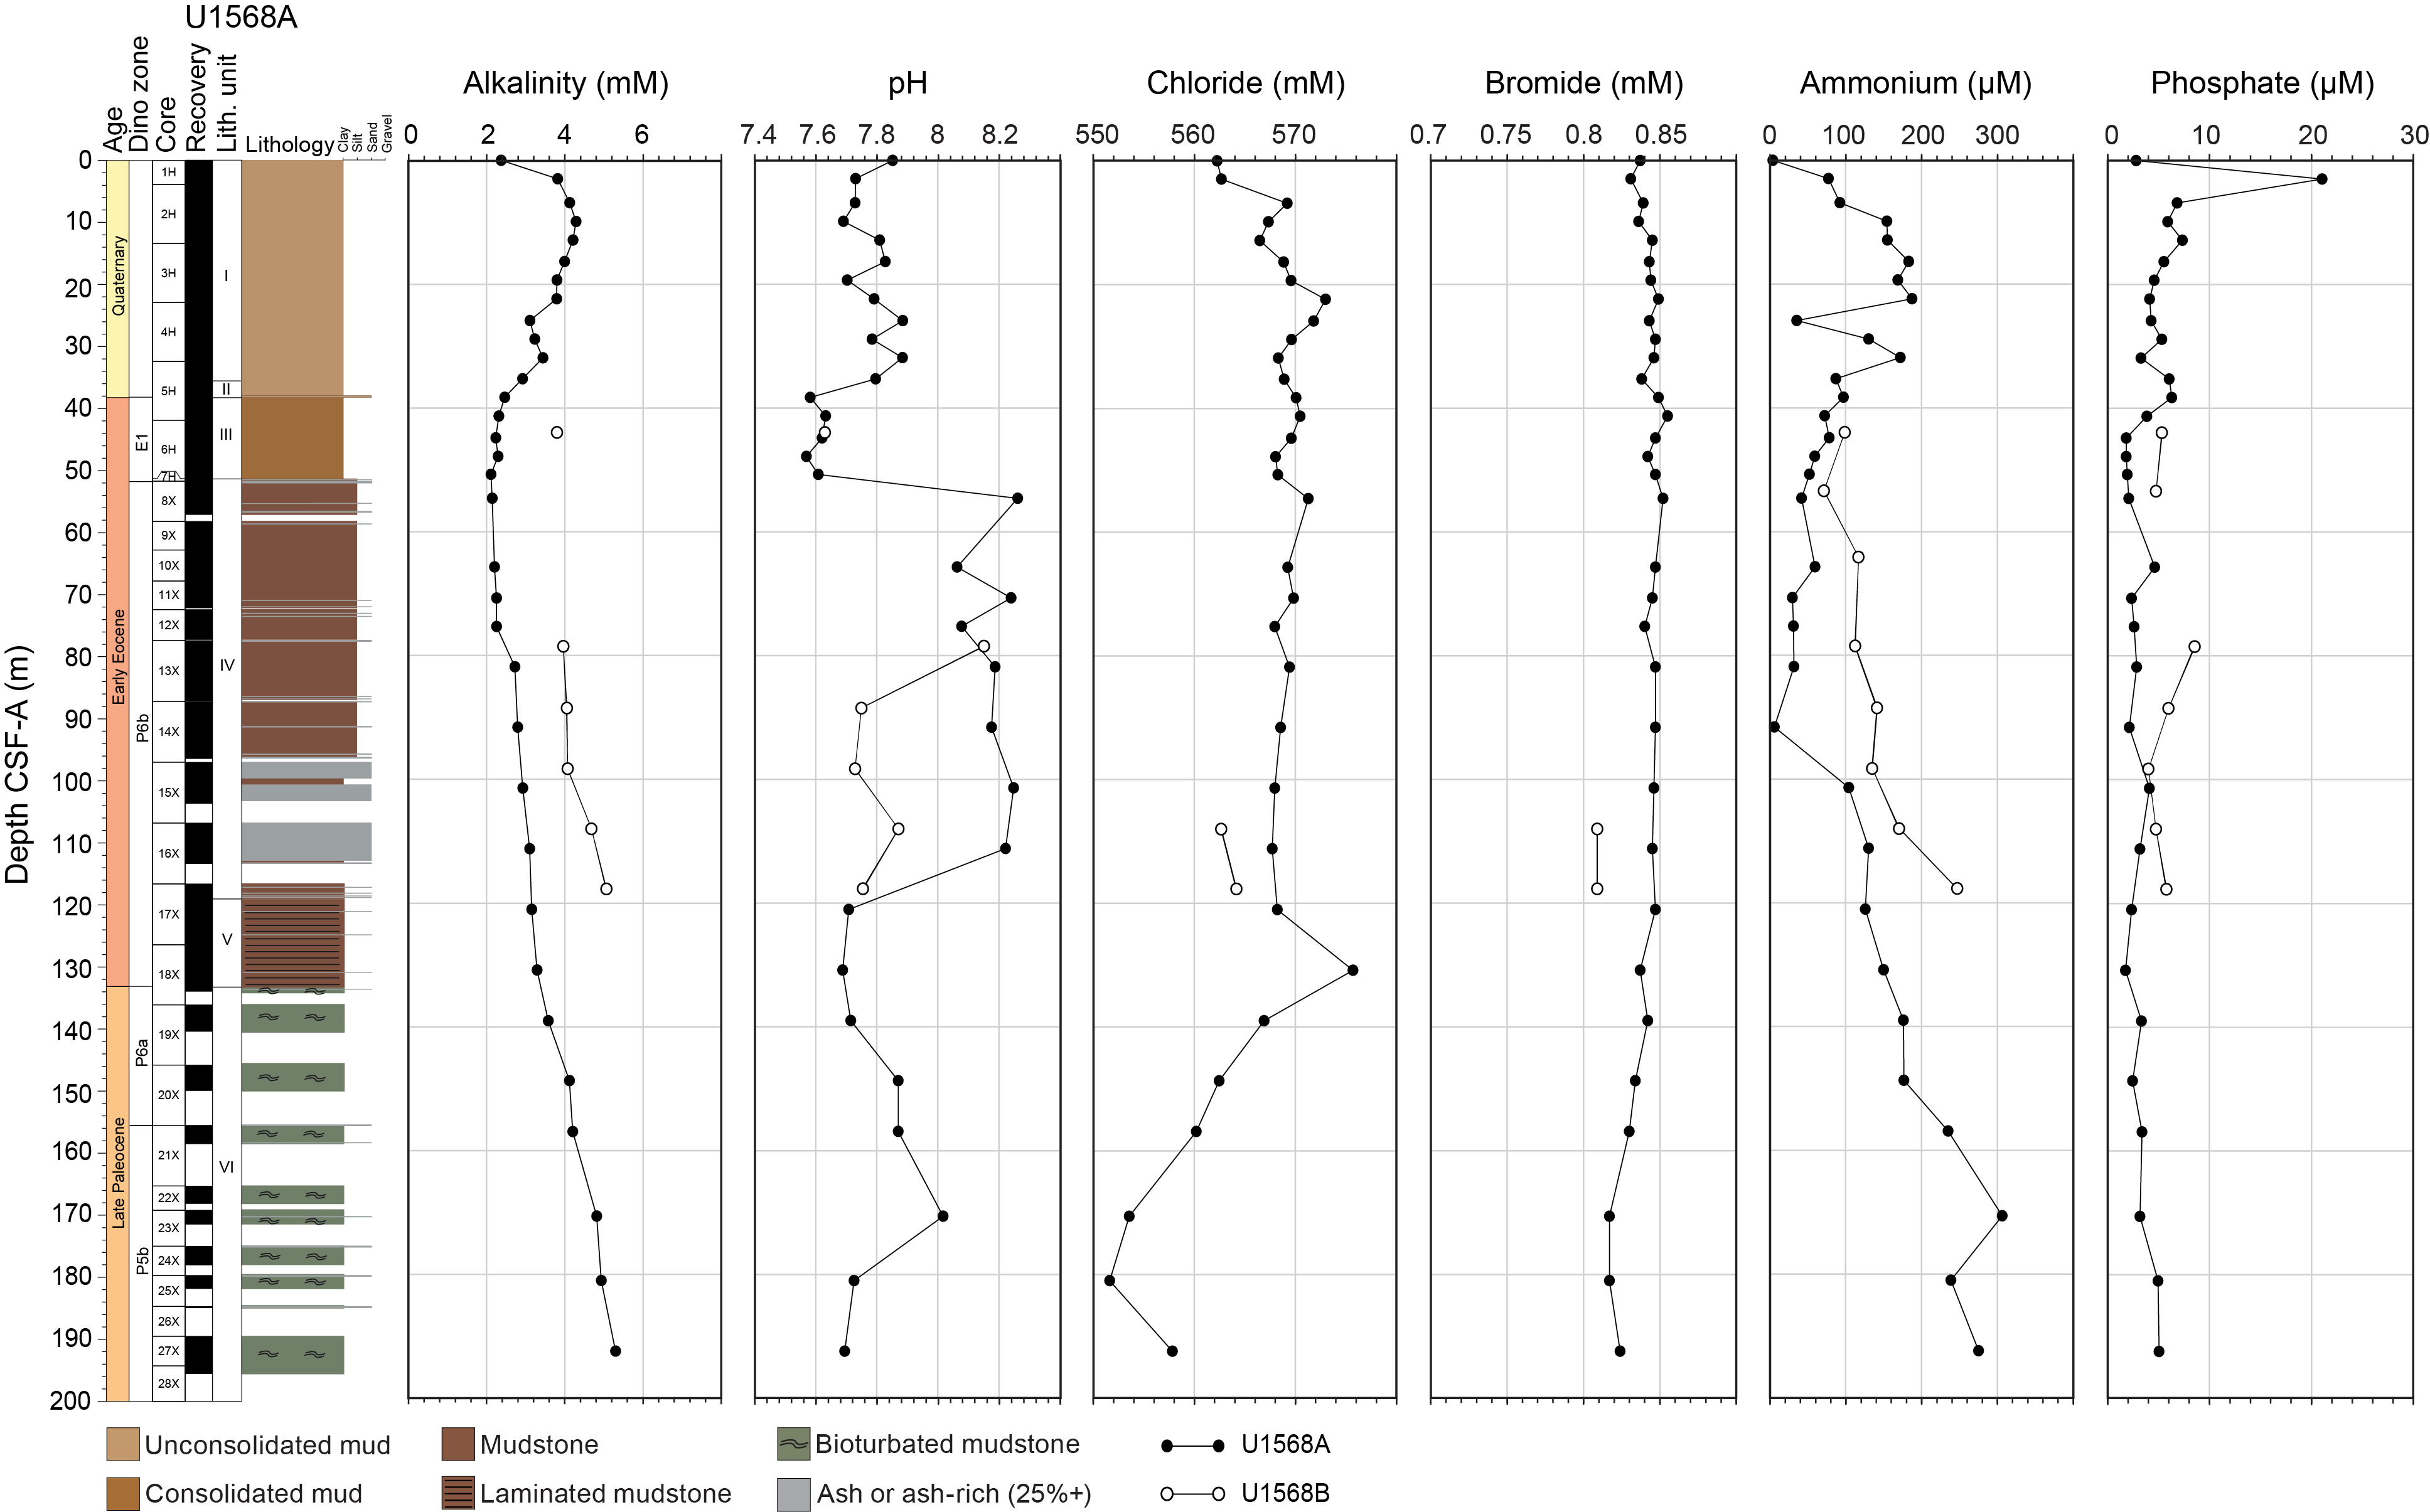
Figure F24. IW, Holes U1568A and U1568B.
For pH, the variation in Hole U1568A compared to the reference hole is even more marked and is also the inverse of the changes in alkalinity (Figure F24). Sharp shifts in pH values are present, varying from around 7.8 in the upper and lower sections of Hole U1568A to above 8.1 in the sections between 50 and 110 m CSF-A (Lithostratigraphic Unit IV). A discrete interval with higher pH values is also present in Hole U1567A (Figure F23), although the rise to pH values approaching 8 is limited to a small section between 50 and 60 m CSF-A before pH returns to typical values (7.5–8.9) by 70 m CSF-A. These values are similar for the remainder of the reference hole. Low alkalinity and high pH IWs are also observed in Unit IV in Holes U1568B, U1567B, and U1567C (Figures F23, F24), suggesting that these variations are lithologically controlled.
With the exception of the sediments in Hole U1568A between 50 and 110 m CSF-A, alkalinity, PO43−, and NH4+ display conservative profiles across all five holes, and the primary controls are likely the breakdown of organic matter and diffusion. These controls appear dominant in Hole U1567A, and the majority of the hole shows little variation. In Hole U1568A, the sections of low alkalinity, NH4+, and PO43− and high pH between ~25 and 110 m CSF-A possibly indicate reverse weathering and ash alteration (Michalopoulos and Aller, 1995; Gieskes and Lawrence, 1981).
Elemental data further support the hypothesis of conservative behavior of pore waters in reference Hole U1567A. Several constituents display decreasing trends downcore, most clearly SO42–, Mg, and K (Figures F25, F26; Table T13). Other elements, including Cl, Br, Ca, Na, Sr, and Li, show the opposite trend, rising in concentration from the core top to the base of the sampled sediment. These trends are typical for conservative elemental distributions (Chester and Jickells, 2012). Chloride concentrations increase steadily from the sediment/seawater interface to a peak of ~570 mM at around 35 m CSF-A; this feature likely reflects the diffusive history of seawater salinity since the Last Glacial Maximum (e.g., Adkins et al., 2002). For this reference hole, it therefore appears that diffusive processes are the dominant control on IW elemental concentrations.
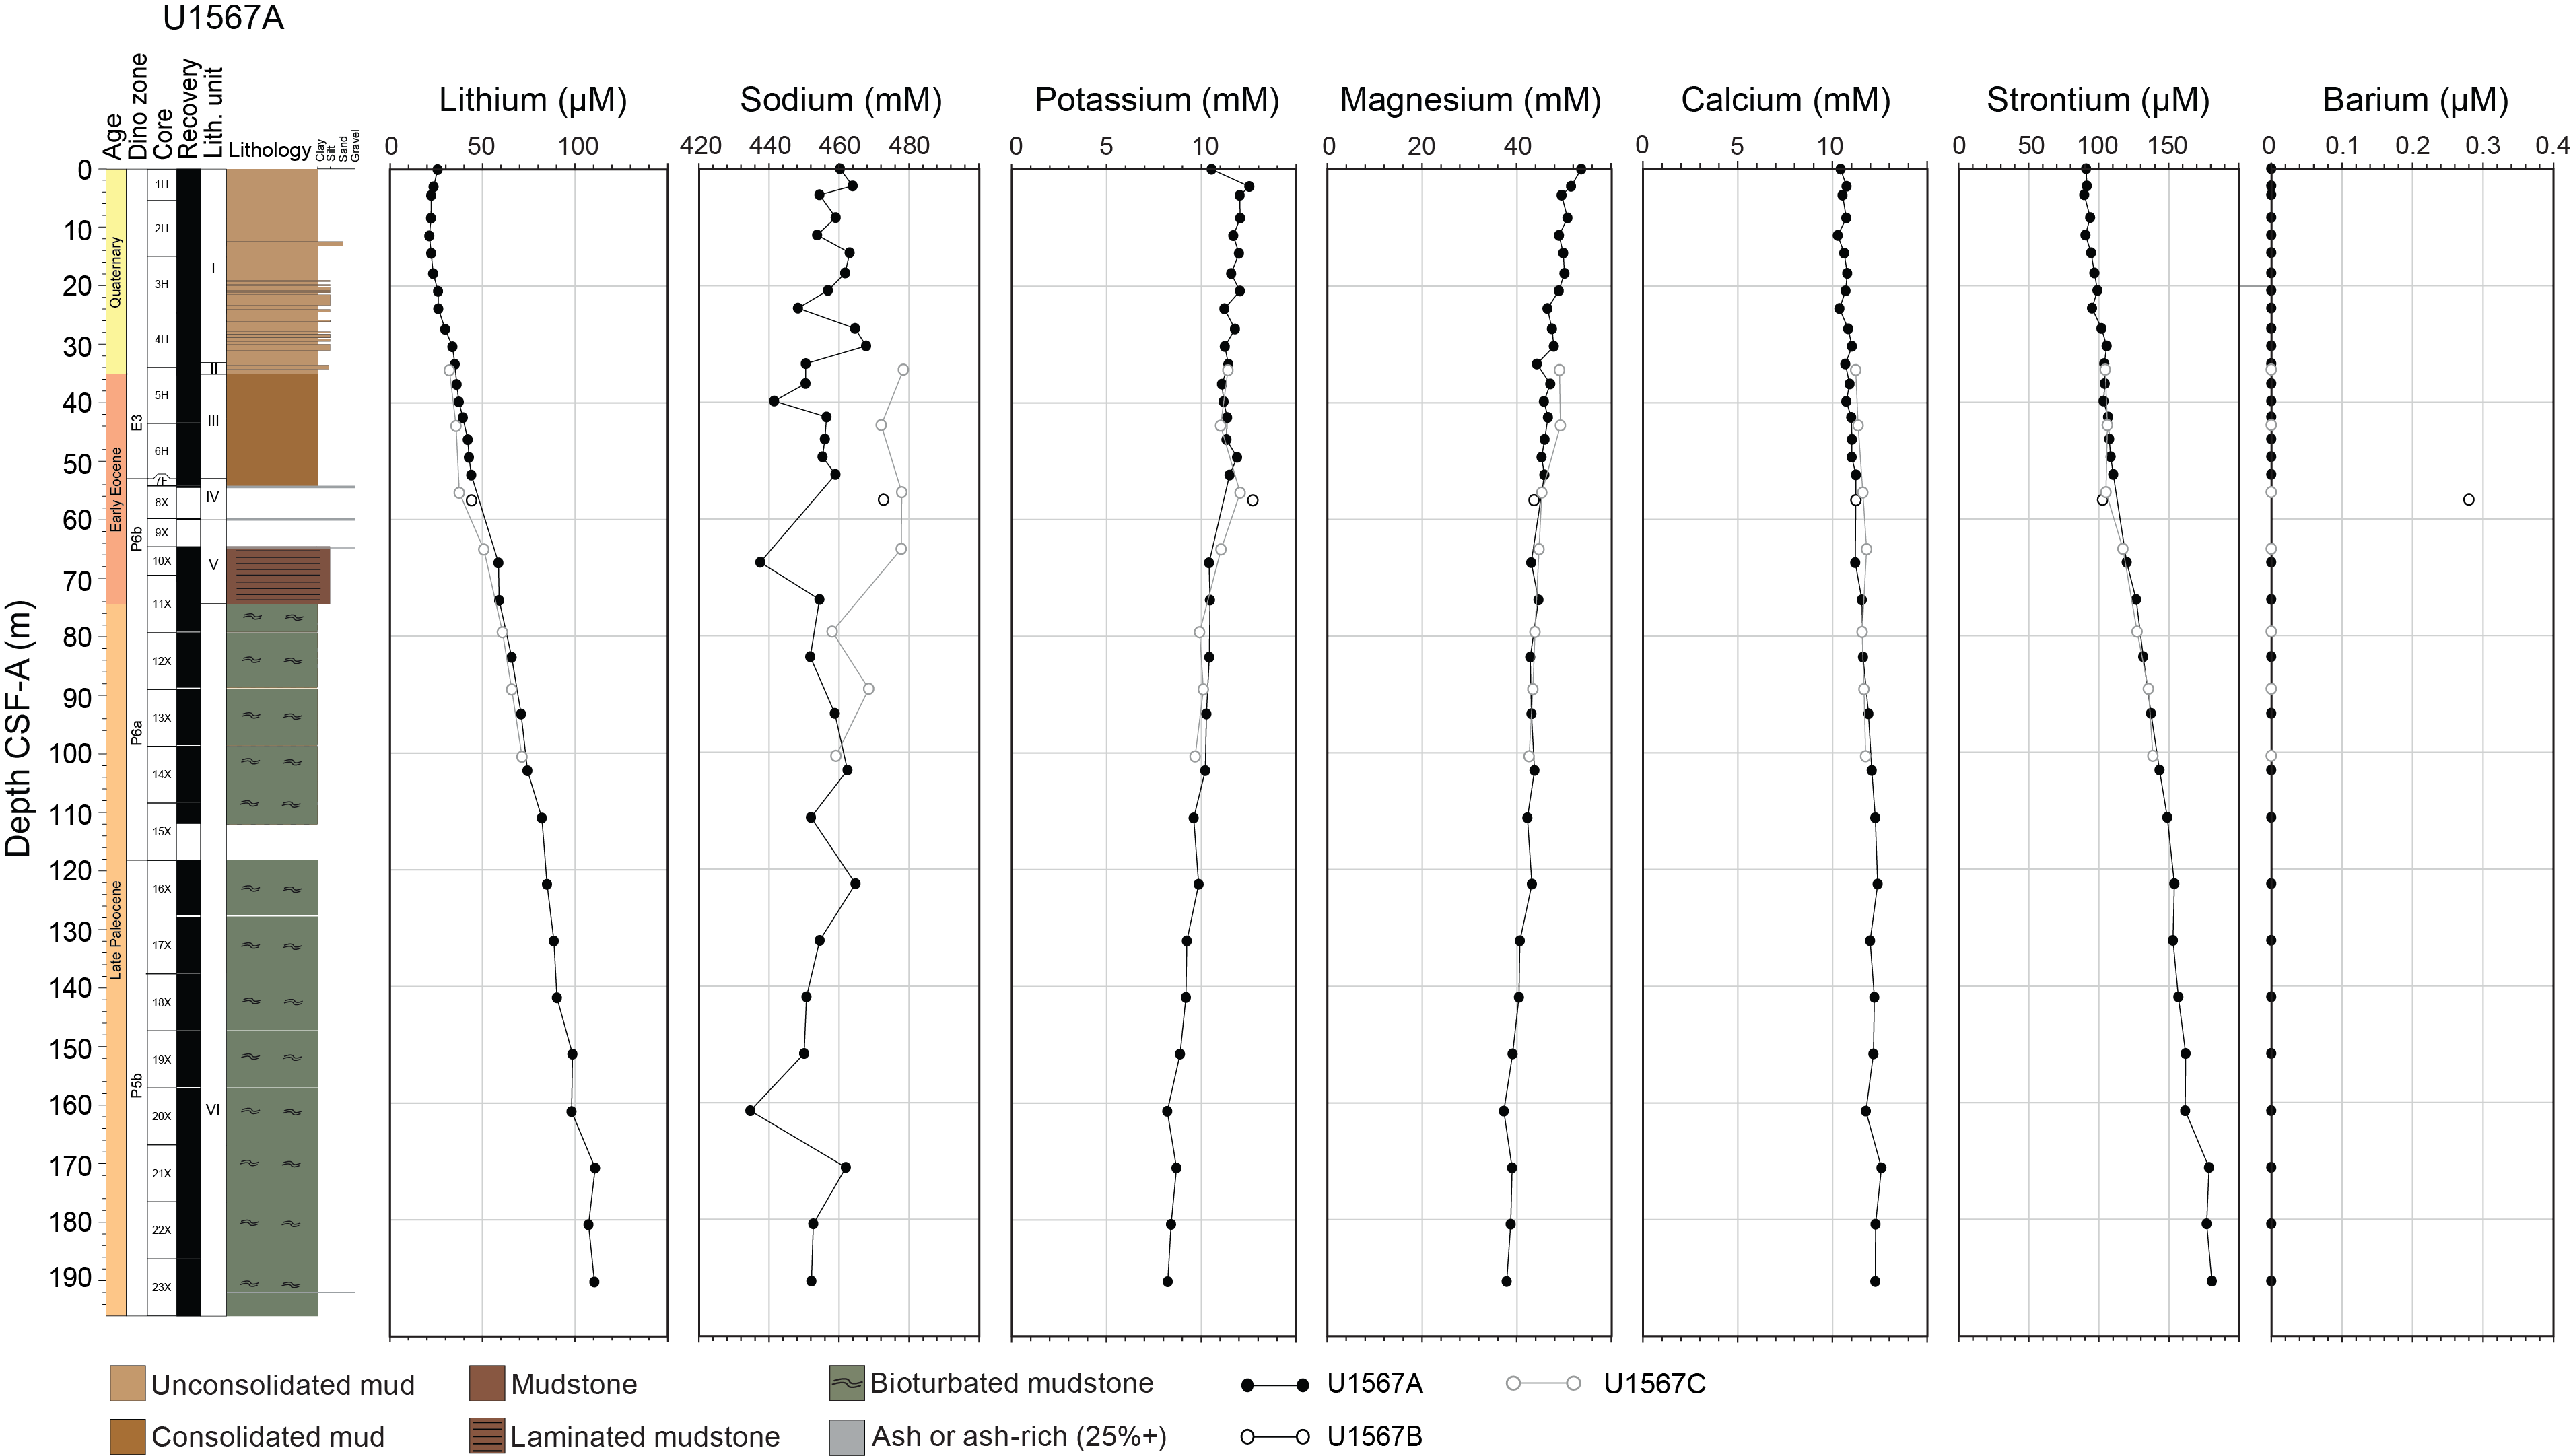
Figure F25. IW content of alkali and alkali earth metals, Holes U1567A–U1567C.
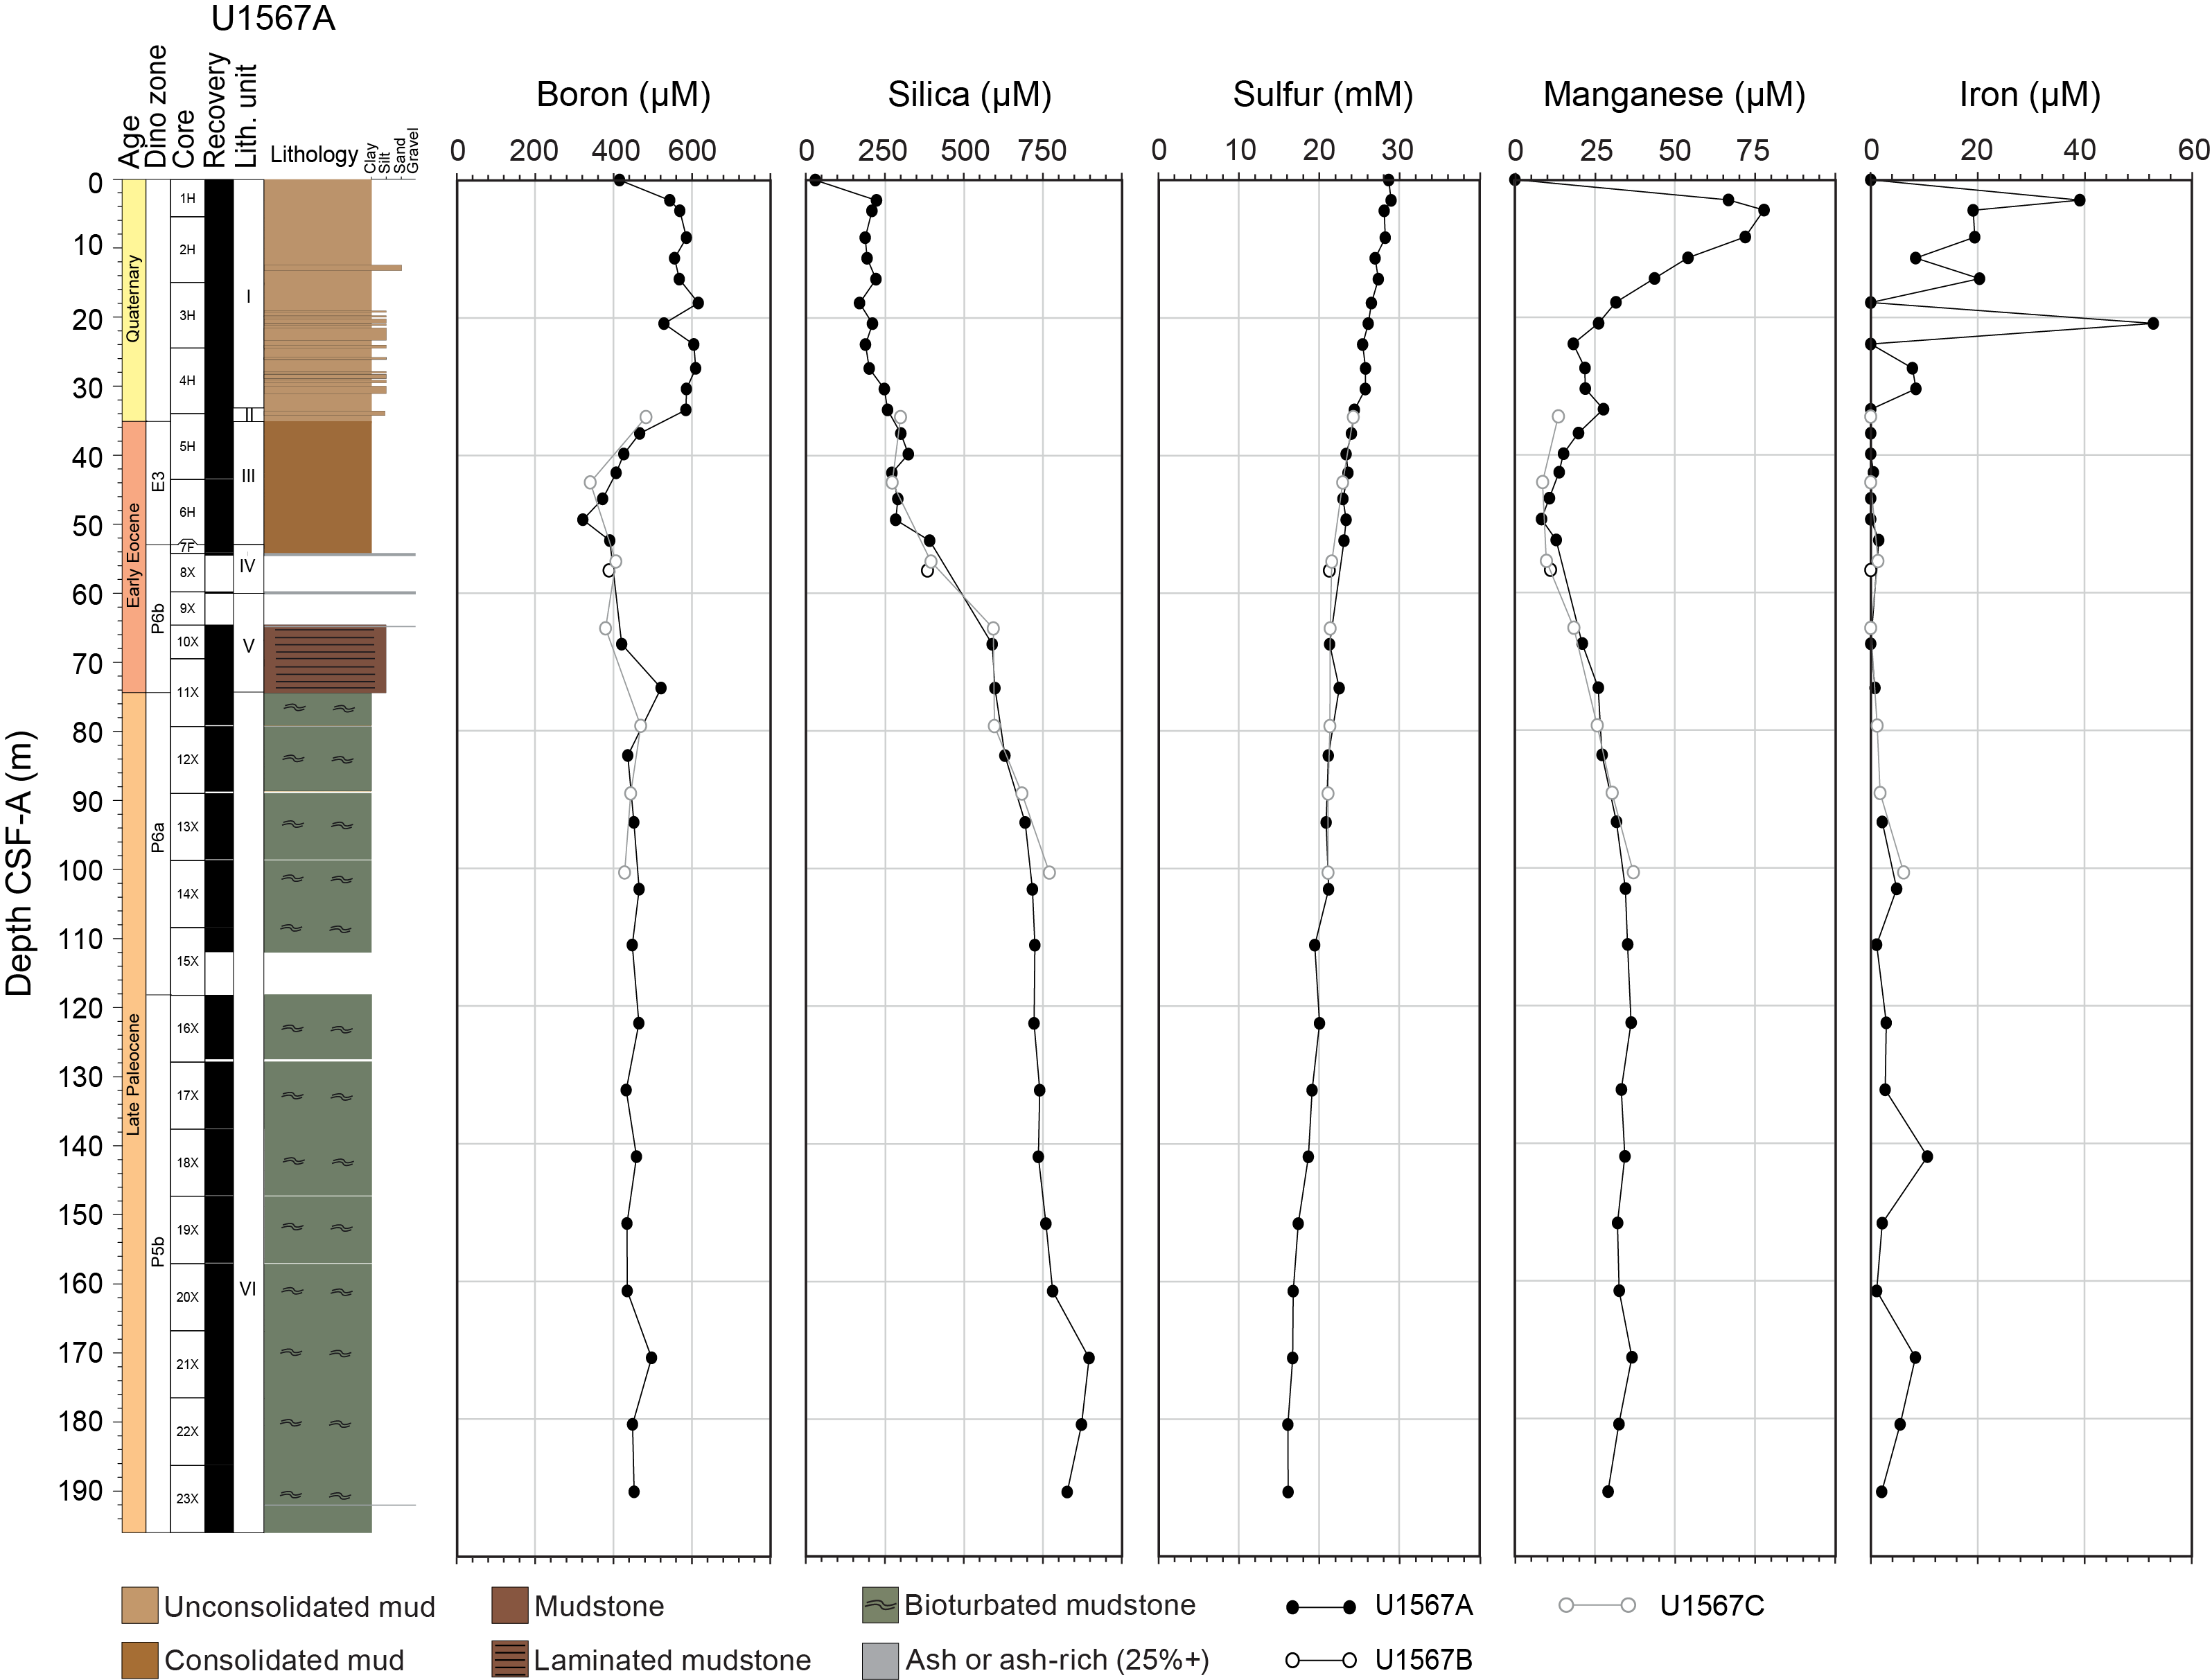
Figure F26. IW content of B, Si, Sulfur, Mn, and Fe, Holes U1567A–U1567C.
For Hole U1568A, the site closest to the vent apex, several elemental profiles diverge from the conservative behavior observed in Hole U1567A (Figures F27, F28; Table T14). The first evidence for this can be seen in the transition between Lithostratigraphic Units I and II (36 m CSF-A), where some elemental concentrations decrease significantly downcore. These include K (from 12 to 11 mM) and Mg (from >50 to <45 mM). Some of the analyzed elements increase in concentration across this boundary, and the clearest increases are observable in the profiles of Ca (from >12 to 13.5 mM), Sr (from 80 to 110 mM), and Li (from 30 to 40 mM). These shifts suggest a complex diagenetic environment with evidence for marine silicate weathering (e.g., increasing Na and K concentrations) but also ash alteration (e.g., rising Ca and decreasing Mg concentrations).
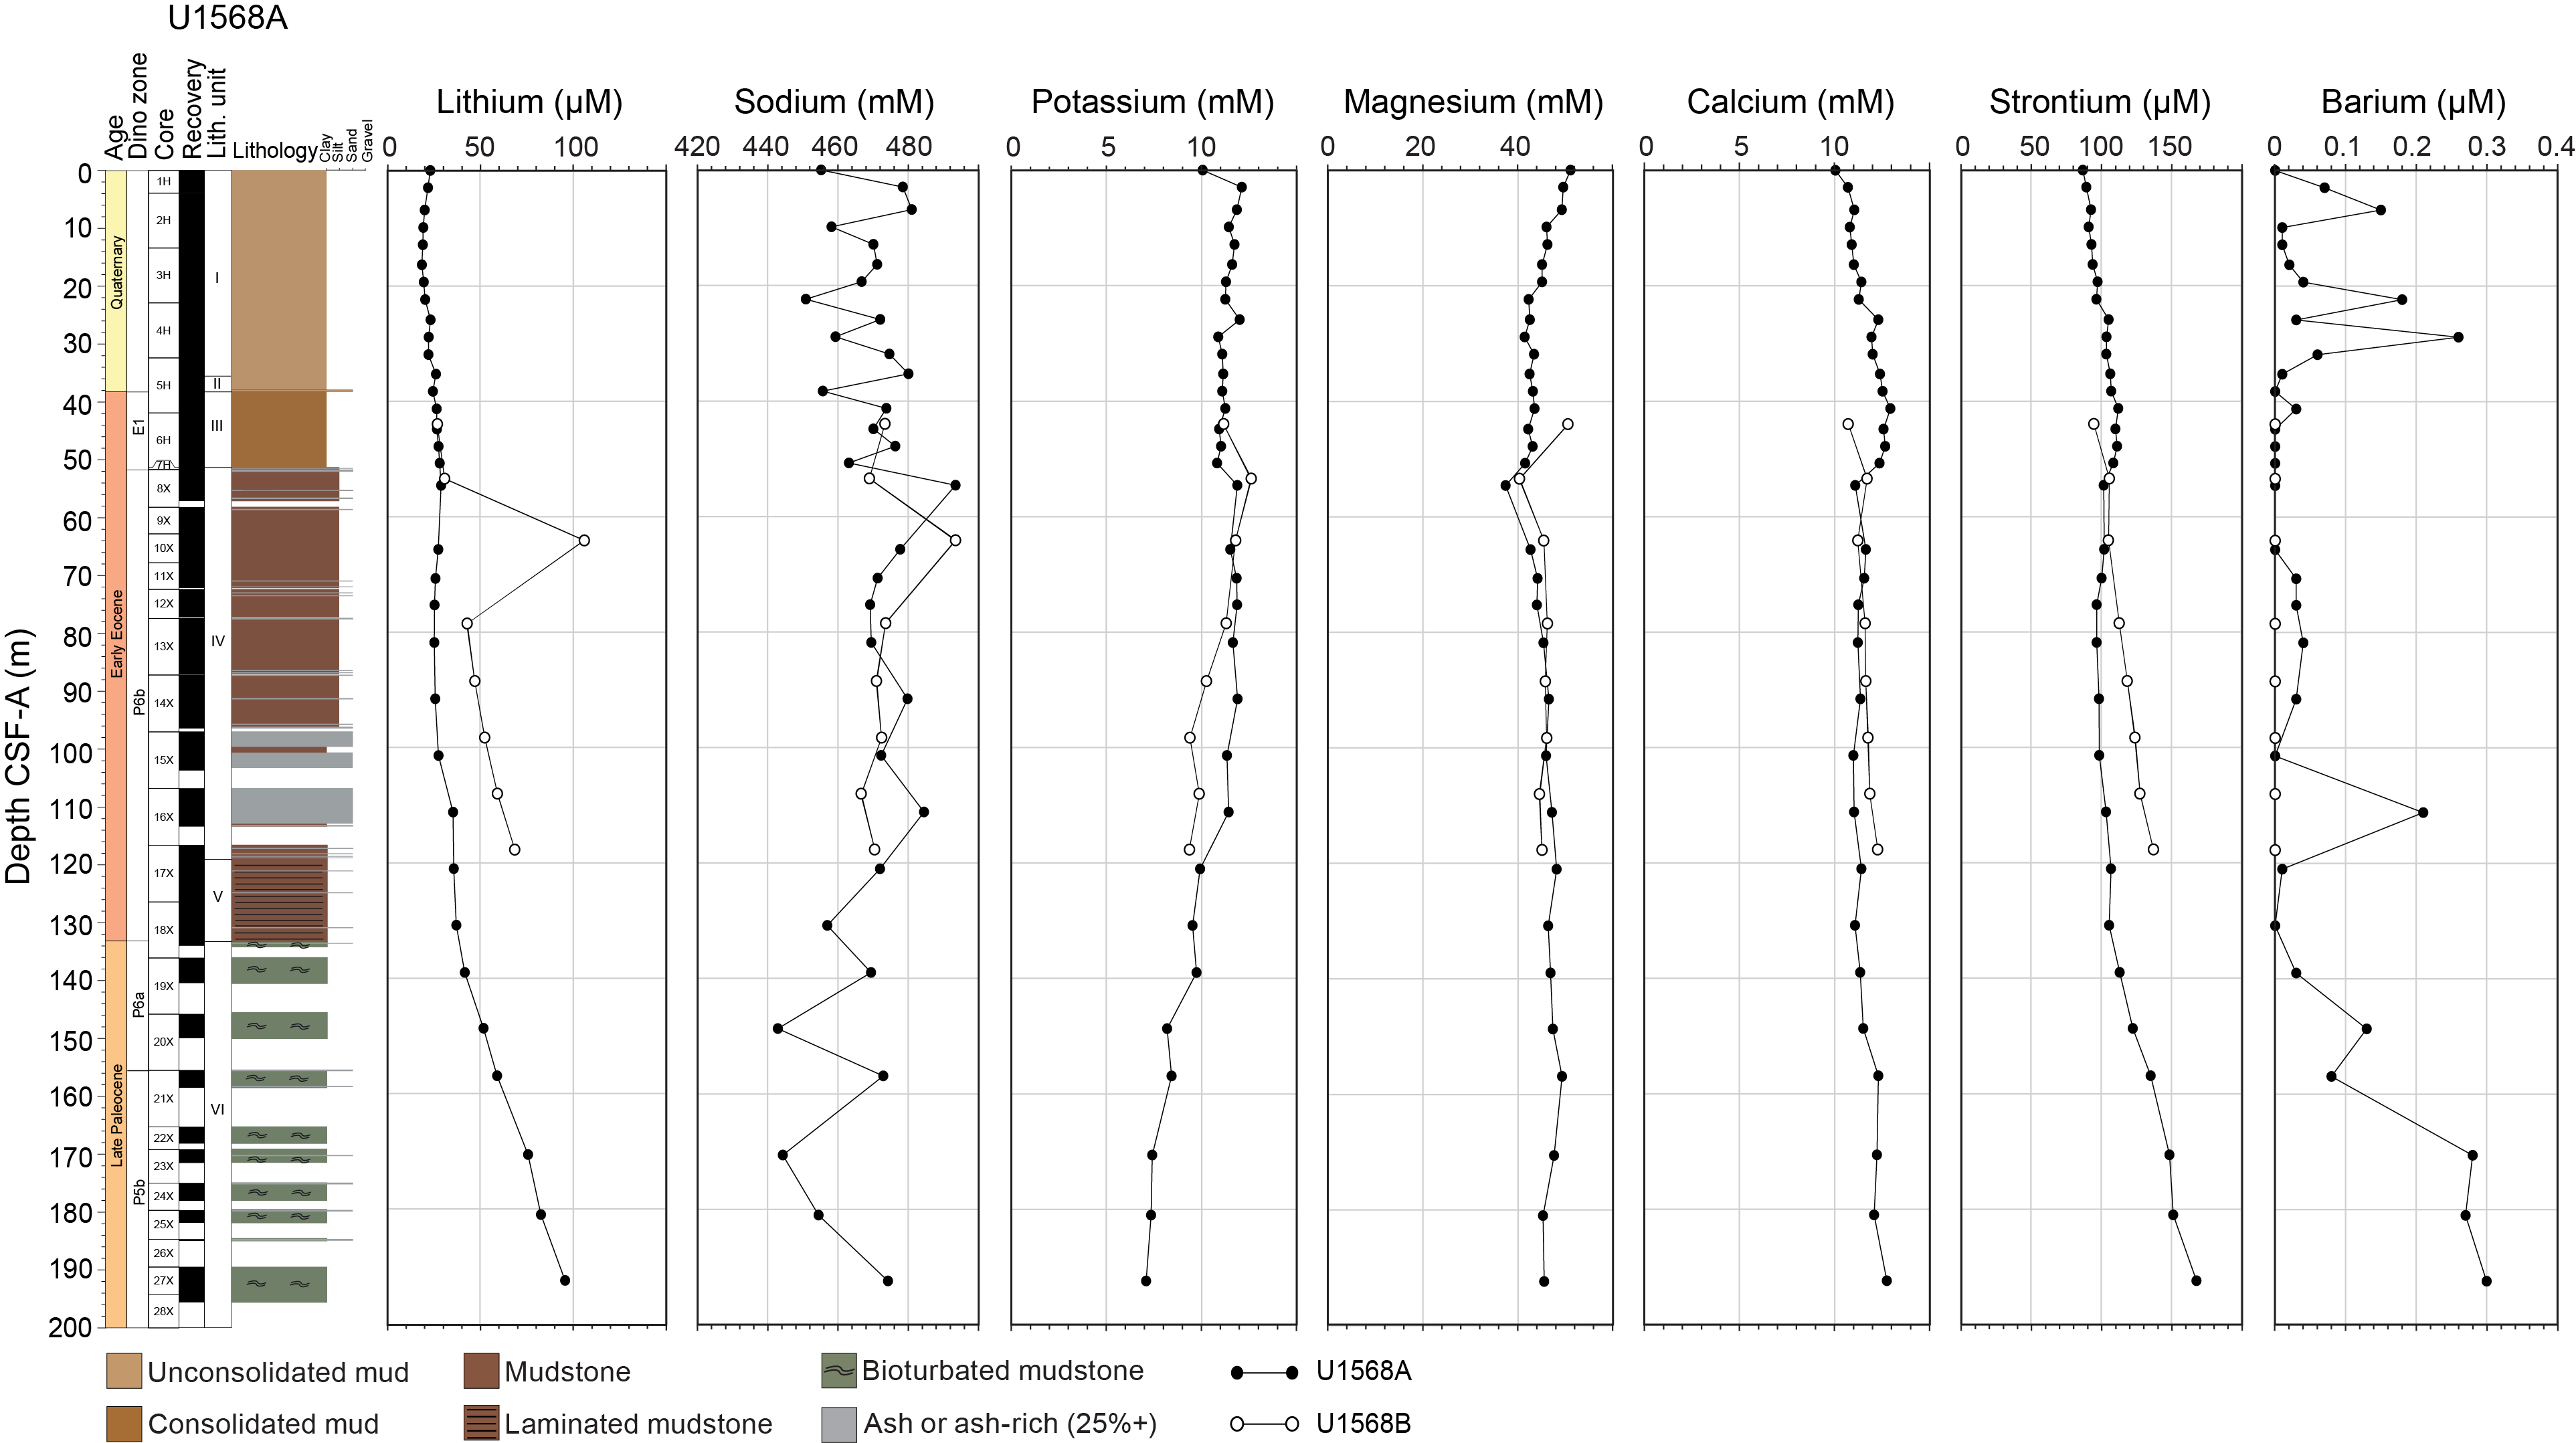
Figure F27. IW content of alkali and alkali earth metals, Holes U1568A and U1568B.
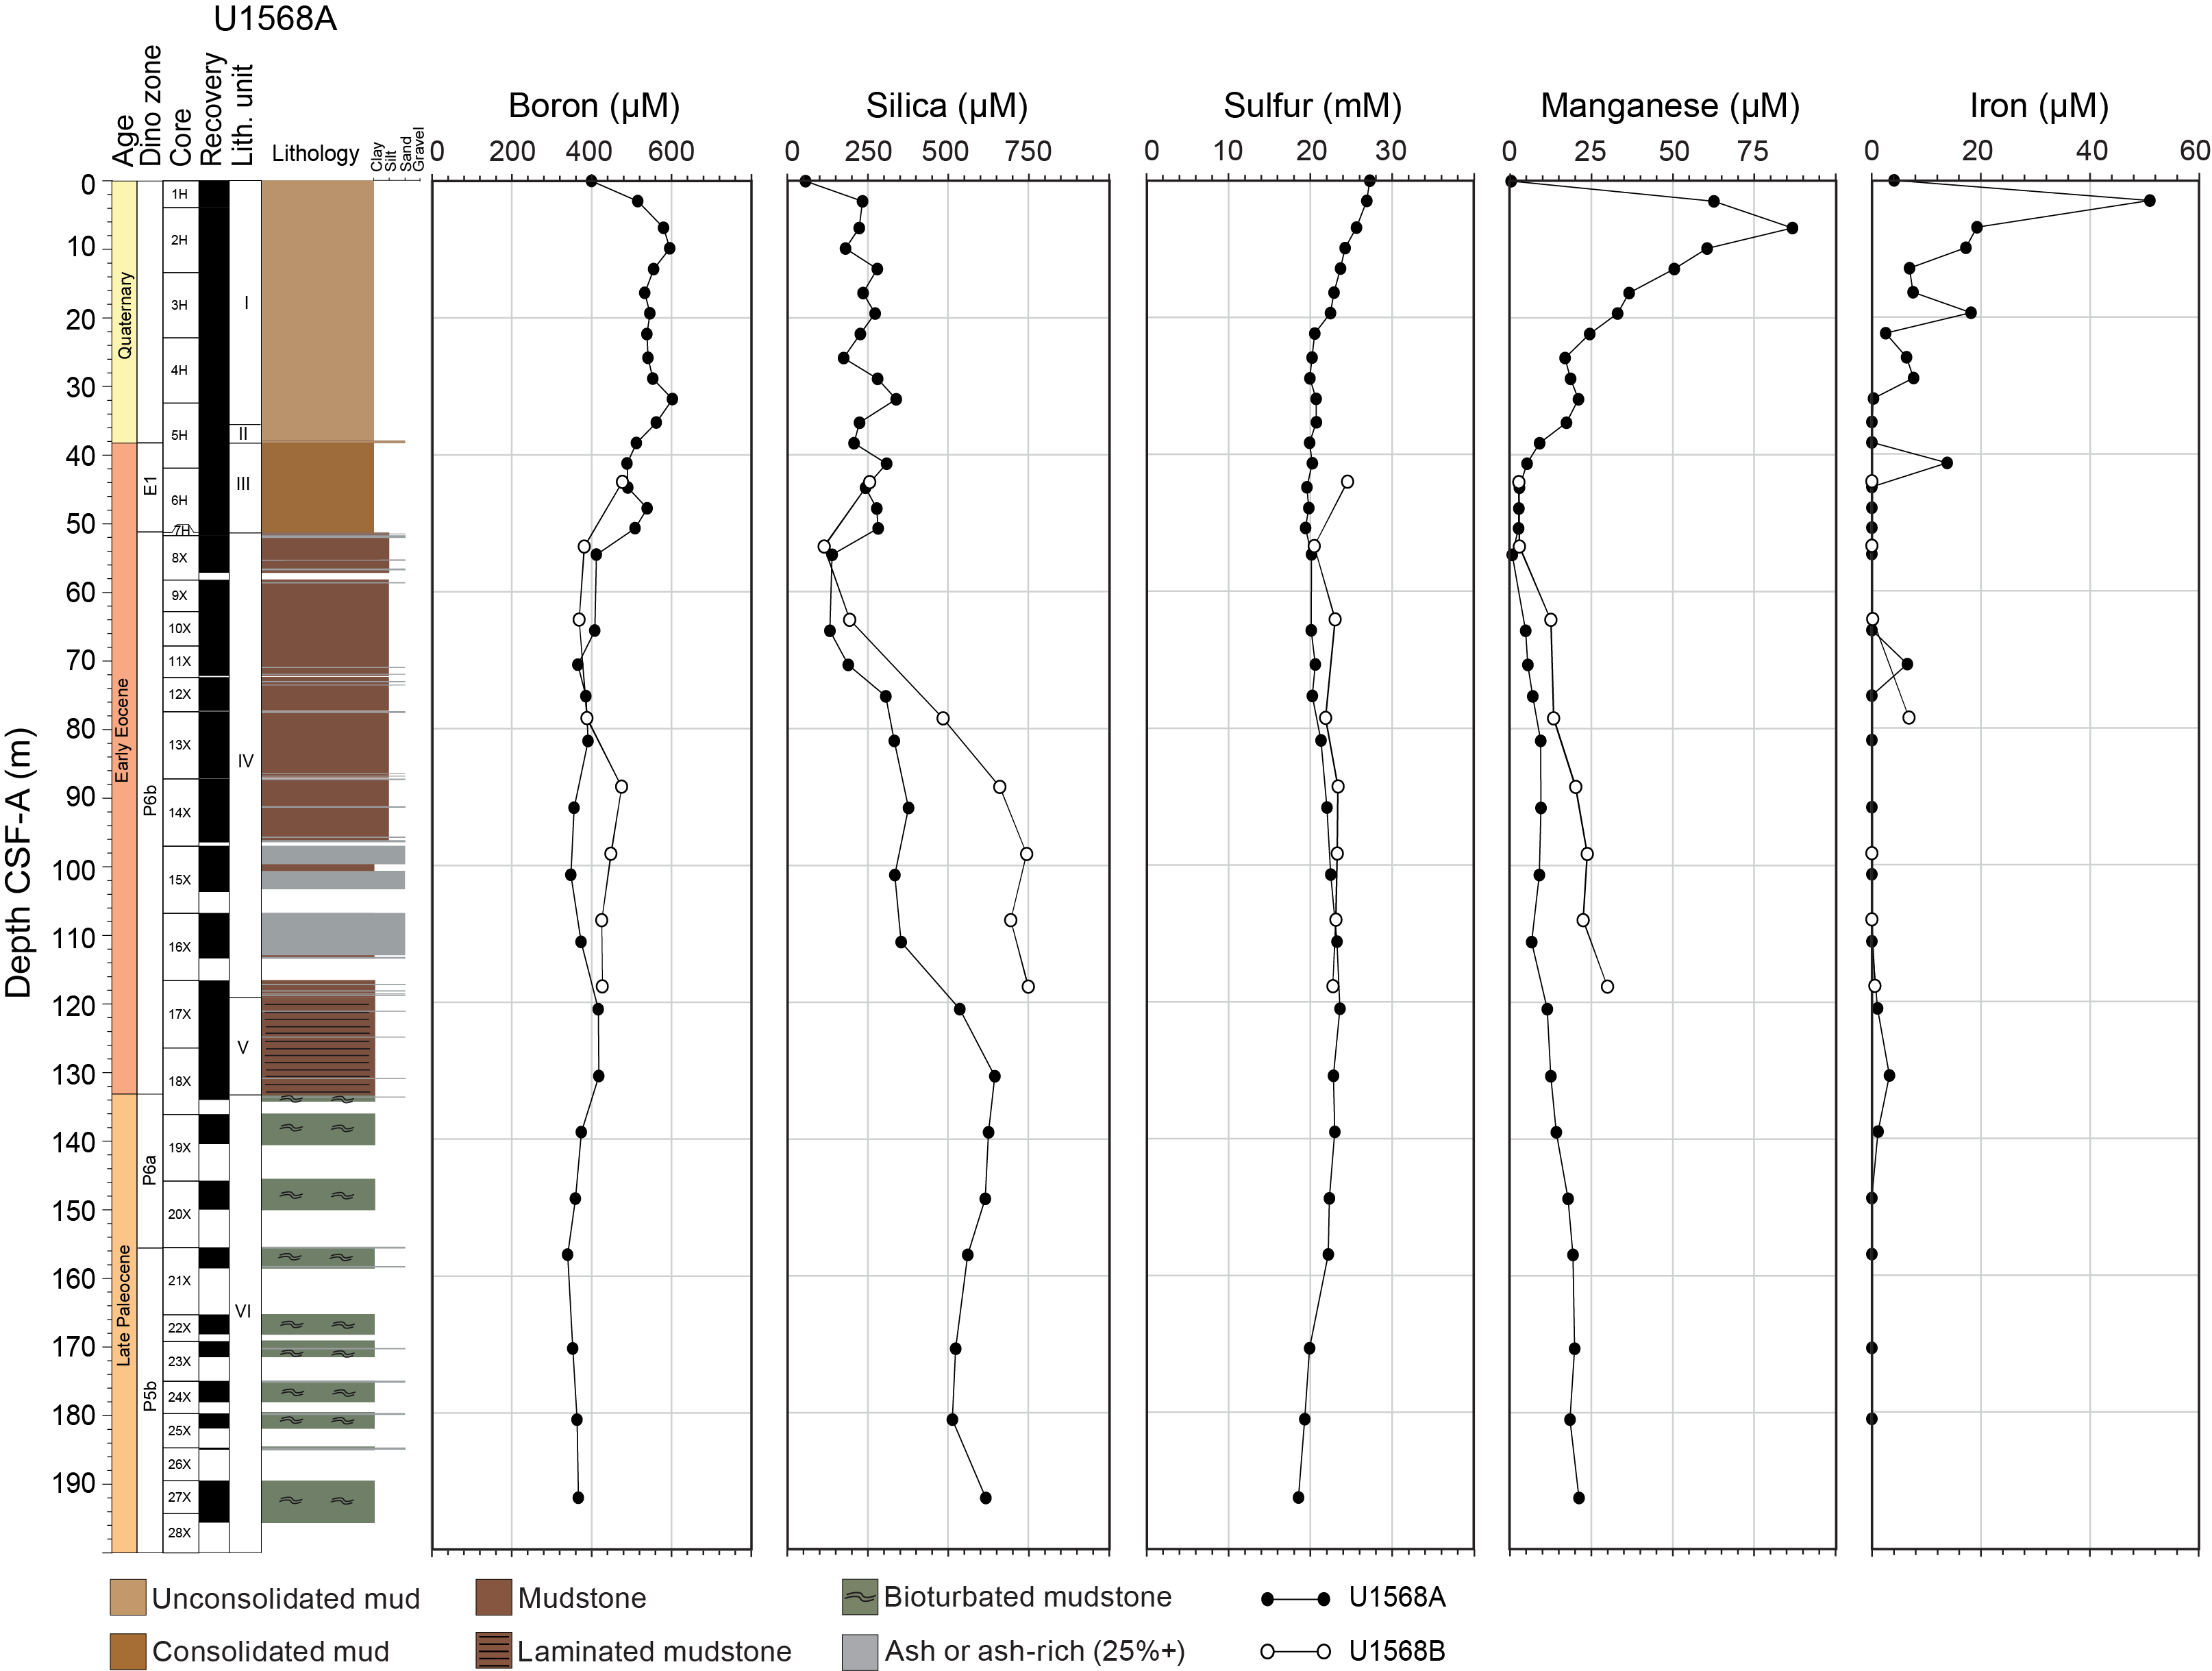
Figure F28. IW content of B, Si, Sulfur, Mn, and Fe, Holes U1568A and U1568B.
The elemental data for Unit IV in Hole U1568A corroborates the anomalous values of alkalinity and pH in these strata. Concentrations of B, Ca, Mg, Si, Sr, and Li are all diminished with respect to overlying and underlying sediments (Figures F27, F28). In contrast, dissolved K concentrations are elevated, although this feature is less apparent toward the base of the unit. These nonconservative elemental trends with depth suggest that a number of competing diagenetic processes have occurred. The depletion of dissolved Mg, Li, and Sr may support the precipitation of authigenic clays (Michalopoulos and Aller, 1995), whereas the enrichment of K is indicative of ongoing marine silicate weathering (Torres et al., 2020; Longman et al., 2021). The contemporaneous decrease in Mg and increase in Ca concentrations with depth suggests an influence of ash alteration throughout the sediment column (Murray et al., 2018).
Manganese, Fe, and PO43− concentrations covary in Hole U1568A (Figures F24, F28), displaying clear enrichments in the uppermost sections of the core, but are found in much lower concentrations below 50 m CSF-A. Increased concentrations of these constituents in the upper sections lends further support for microbially mediated oxidation of organic matter. Iron measurements were hampered by concentrations regularly approaching the detection limit, an issue that also impacted Ba measurements. The one IW sample from Hole U1567B is anomalous across much of the elemental spectrum, particularly the Ba concentration (Figure F25). This suggests that this sample may have been contaminated by drilling fluid.
6.1.1. Hard rock geochemistry
No samples were run using inductively coupled plasma–atomic emission spectrometry (ICP-AES) at these two sites. XRD analysis was completed on selected intervals and resulted in a sampling interval of roughly one per core for Hole U1567A, one each for Cores 396-U1567B-2H through 7X, and intermittent sampling for Cores 396-U1568A-8X through 27X. Most of the diffractograms are dominated by clay signals, and smectite-illite and zeolite (including phillipsite) are the most common components. Quartz is also present in varying quantities with occasional pyroxene (primarily diopside), but little other primary volcanic mineral assemblages are observed.
The samples targeted for pXRF analysis were suspected ash layers, basaltic sands, and nodules in the sediments (Table T15). In addition, one key interval was targeted in Sections 396-U1567B-2H-6 and 396-U1568B-2H-4. The pXRF data show high concentrations of both Mn2O3 and Fe2O3 (~18.5% each) and less than 4% total light elements. Such composition has been found in manganese nodules (Baturin, 2012), indicating that this layer is a potential nodule horizon that did not manage to nucleate.
6.1.2. Deconvolved natural gamma radiation
For Site U1567A, K content is highest in all three holes in the uppermost 35 m, with values between 2.5 and 3.5 wt%, and the lowest value (0.5 wt%) is at ~60 m CSF-A (Figure F29). Concentrations increase again downcore to ~2 wt% by 67 m CSF-A, and below this depth all values are between 1 and 3 wt% and show little variability. U contents in Holes U1567A–U1567C are generally stable, showing values between 1 and 4 ppm for the majority of the analyzed units. Short intervals of U enrichment are observed, and peaks as high as 4 ppm are present at ~30, 65–75, and 150 m CSF-A. Fluctuations in Th content follow the K trend, showing the highest values (6–8 ppm) in the uppermost 30 m before a slow decrease to the lowest values (between 2 and 3 ppm) by 65 m CSF-A. The remainder of the core has Th concentrations of 4–8 ppm, with occasional peaks outside this range.
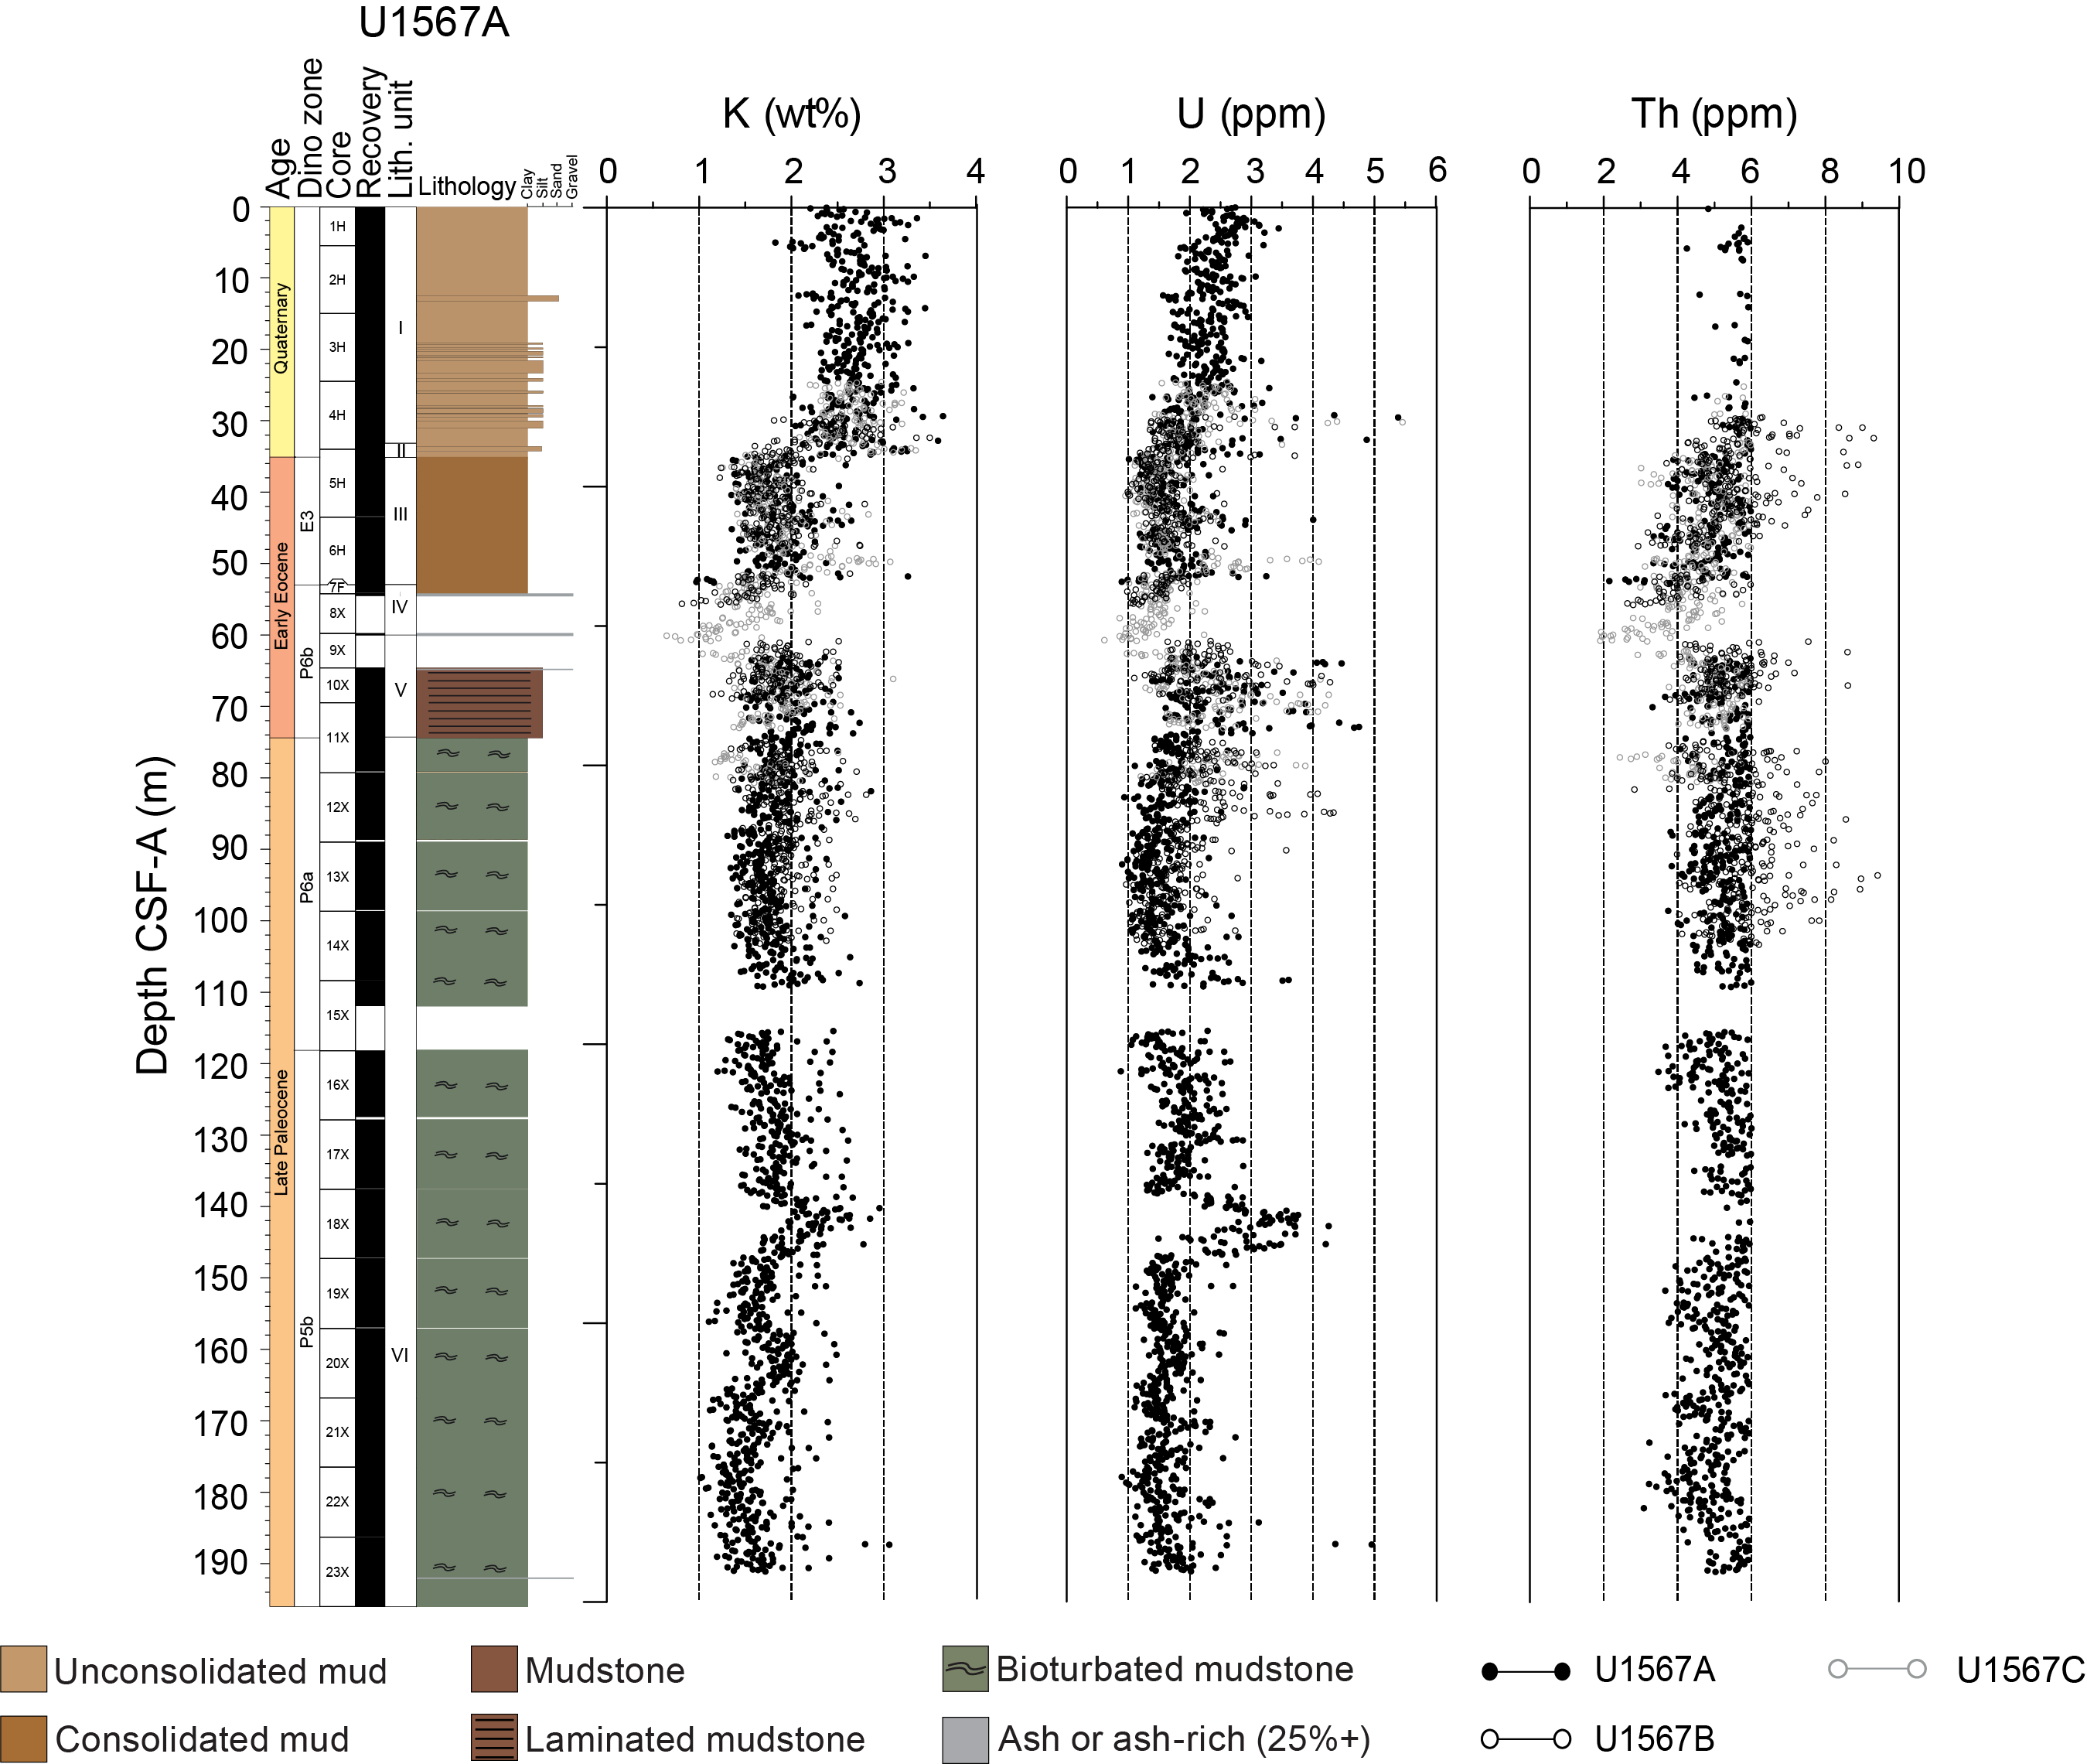
Figure F29. K, U, and Th, Holes U1567A–U1567C.
K content is between 1 and 3.5 wt% for the entirety of Hole U1568A (Figure F30). The highest values are again in the uppermost 30 m (2–3.5 wt%), and the remainder of the stratigraphy has concentrations between 1 and 2.5 wt%. U content also shows an enrichment in the uppermost 30 m of both Holes U1568A and U1568B and reaches a peak of 8 ppm at 30 m CSF-A before a drop to values between 1 and 3 ppm. Thereafter, values show more variability than the K content and include a series of periods of enrichment, the clearest of which are at around 75, 90, 100, and 150 m CSF-A (Figure F30). Th content mirrors the trends seen in the K data, showing 4–8 ppm throughout the core with the exception of the low content at ~30 m CSF-A (reaching as low as 2 ppm).
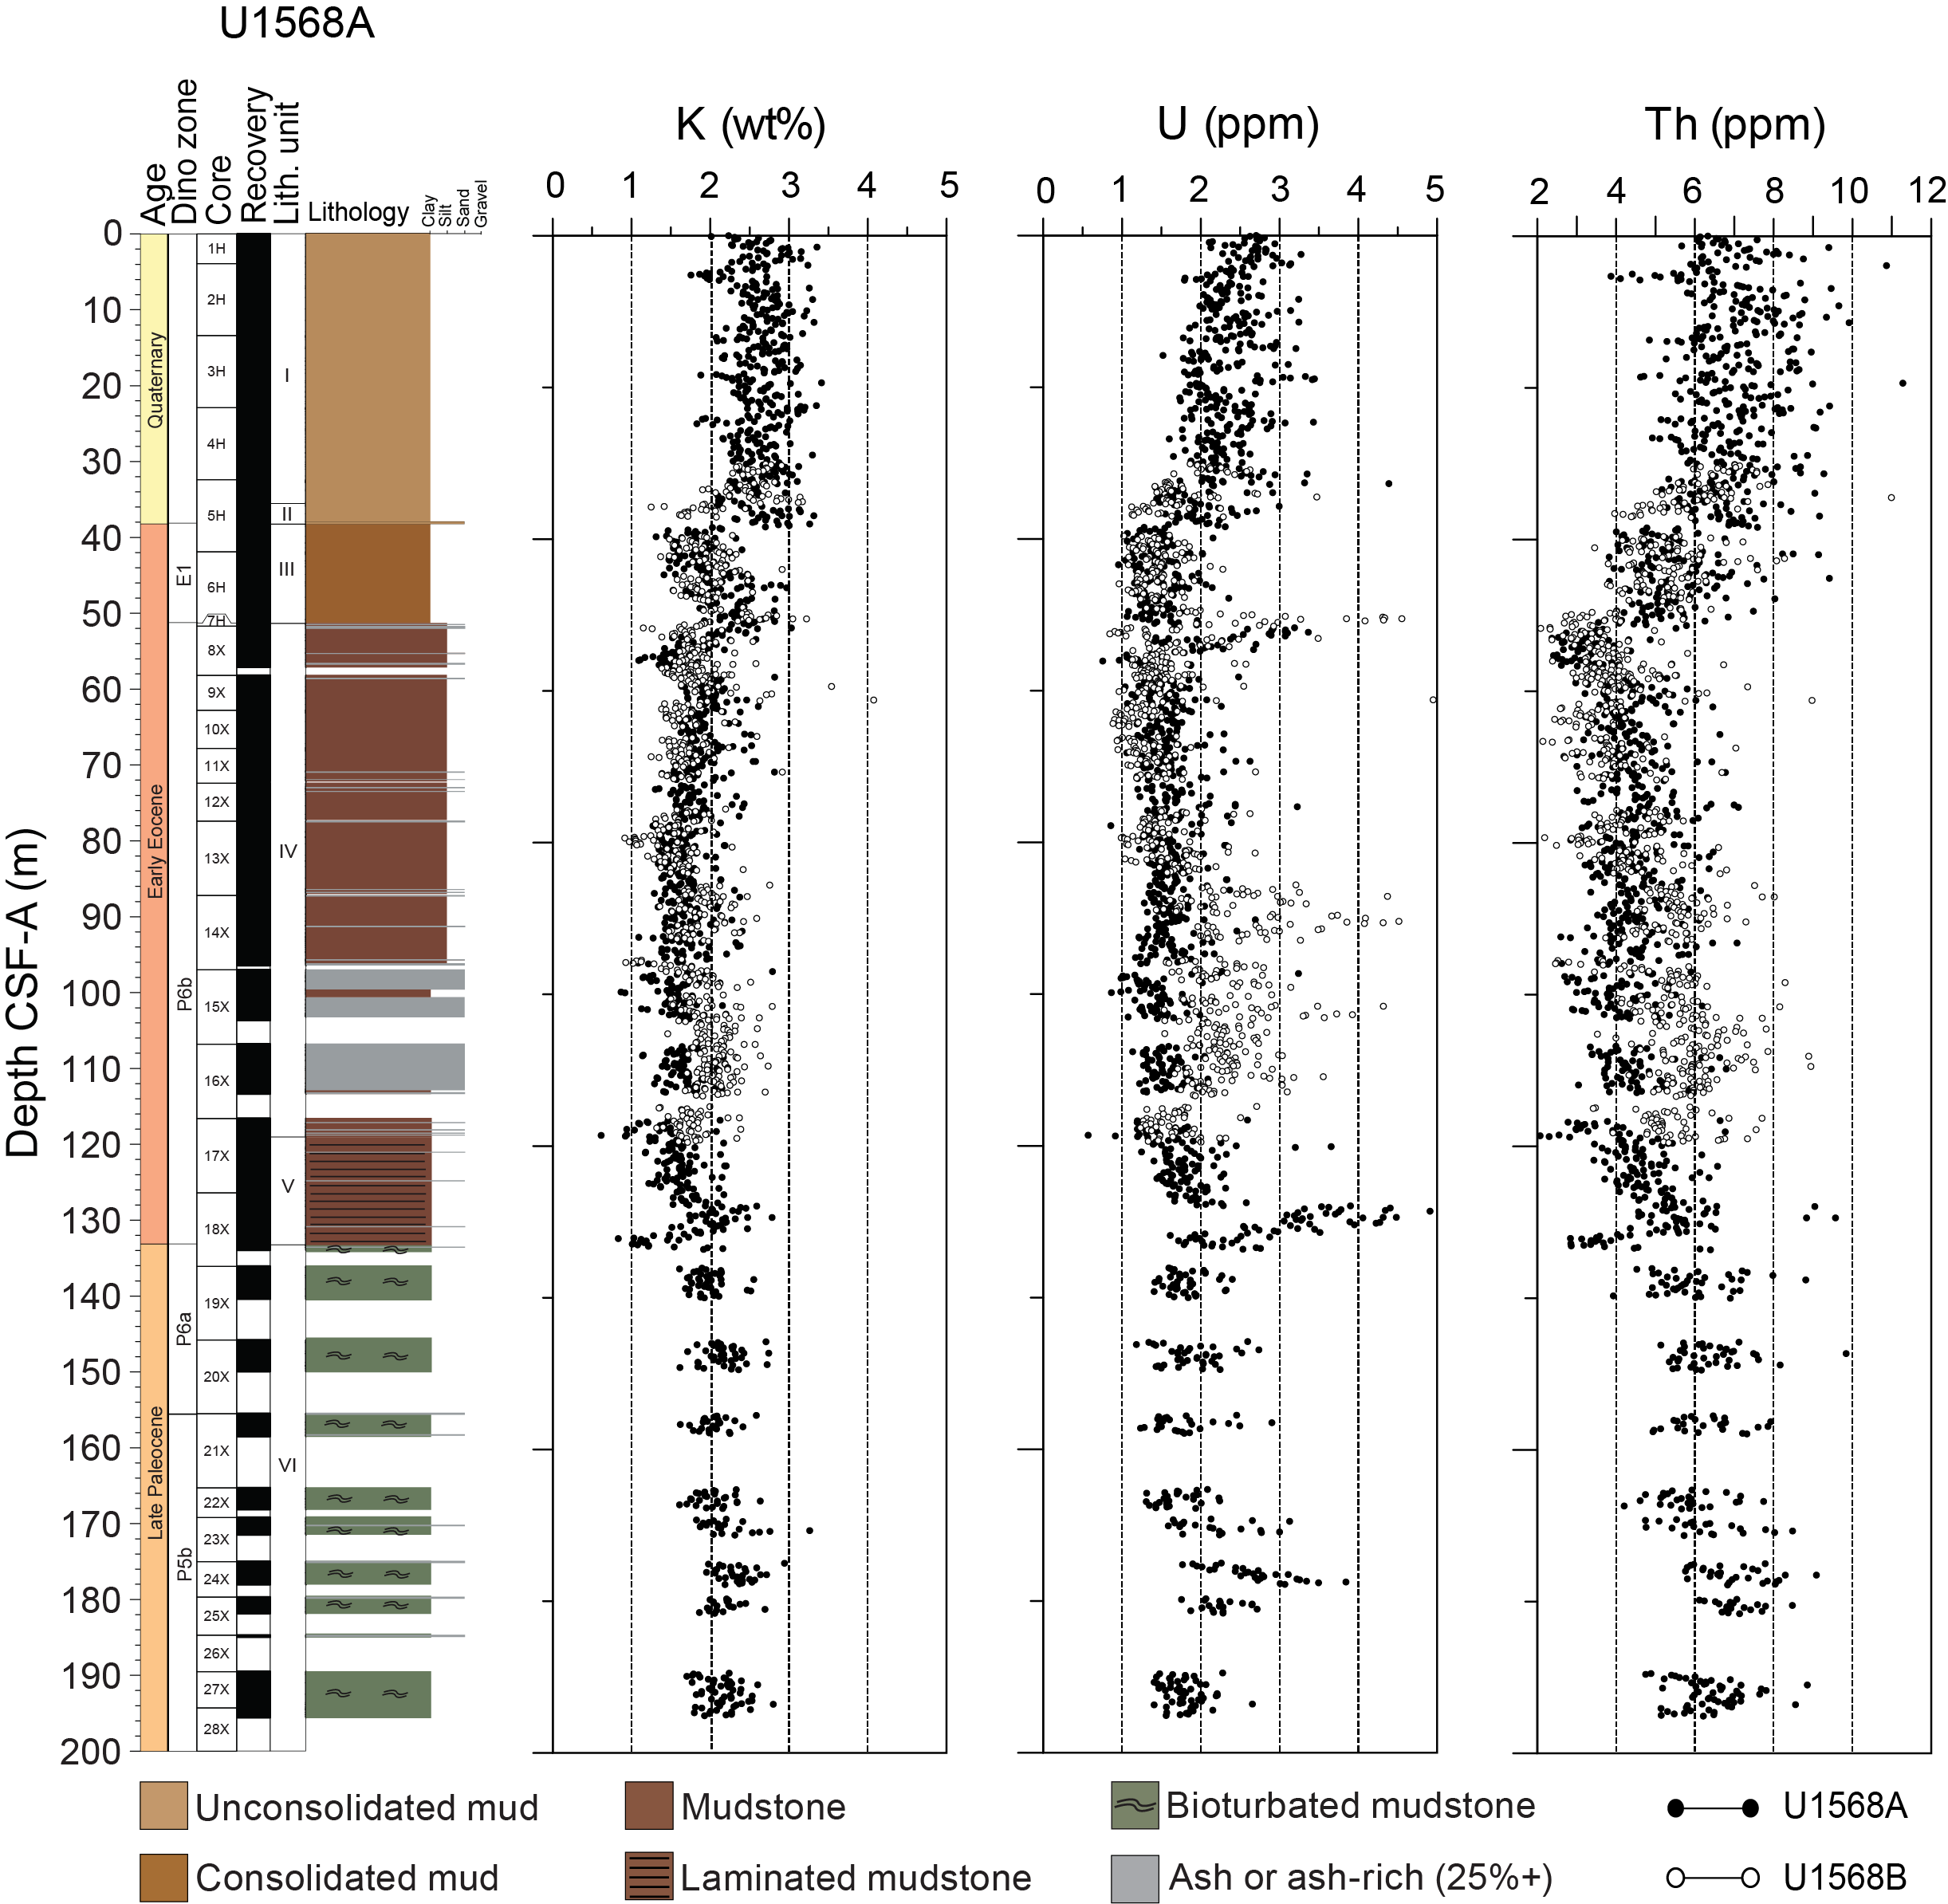
Figure F30. K, U, and Th content, Holes U1568A and U1568B.
6.2. Organic geochemistry
6.2.1. Headspace gas
In the first holes of both sites (i.e., Holes U1567A and U1568A), headspace gas analyses were taken for routine safety monitoring in all sediment cores. Methane values across all sediments are low, and all values are below 3 ppmv. All other measured gas elements were below detection in all samples, indicating thermal maturation of organic matter does not produce hydrocarbons that reach the surface sediments at these sites.
6.2.2. Carbon, nitrogen, and sulfur
6.2.2.1. Site U1567
Measurements of carbonates in solid squeezed cake samples at Site U1567 show similar trends across the three holes (Figure F31; Table T16). The upper part of Hole U1567A, corresponding to Lithostratigraphic Unit I, displays relatively high levels of CaCO3 (as high as 19.3 wt%), which drop to consistently below 1 wt% at the base of the unit (~35 m CSF-A). This high carbonate content is likely linked to preserved foraminifers and other biogenic carbonates. This trend is echoed by total nitrogen (TN) values, which drop from 0.07 to 0.02 wt%, and is the inverse of the TOC values, which rise from 0.4 wt% at the core top to as high as 1 wt% at the base of Unit I (Figure F31). At the top of Unit II, however, TOC is extremely low and below detection using shipboard instruments. All measured variables remain low throughout Units II and III to the transition into Unit IV at 51 m CSF-A. At this point in the cores, CaCO3 values rise again, showing high but transient peaks through to the base of Unit IV at 110 m CSF-A. These sections are barren of biogenic carbonate, so it is likely that secondary mineralization of authigenic carbonate has occurred. TOC in this interval is also high but variable; values are as high as 1.4 wt% before dropping to around 0.25 wt% for sections of core below 100 m CSF-A. TN also rises upon the transition to Unit IV, increasing to >0.05 wt%, where it remains for the remainder of the core. This is similar to the downcore profile of S content, which describes a rise from zero in the upper section of the core (to Unit IV at 51 m CSF-A) to values between 1 and 4 wt% in the remainder.
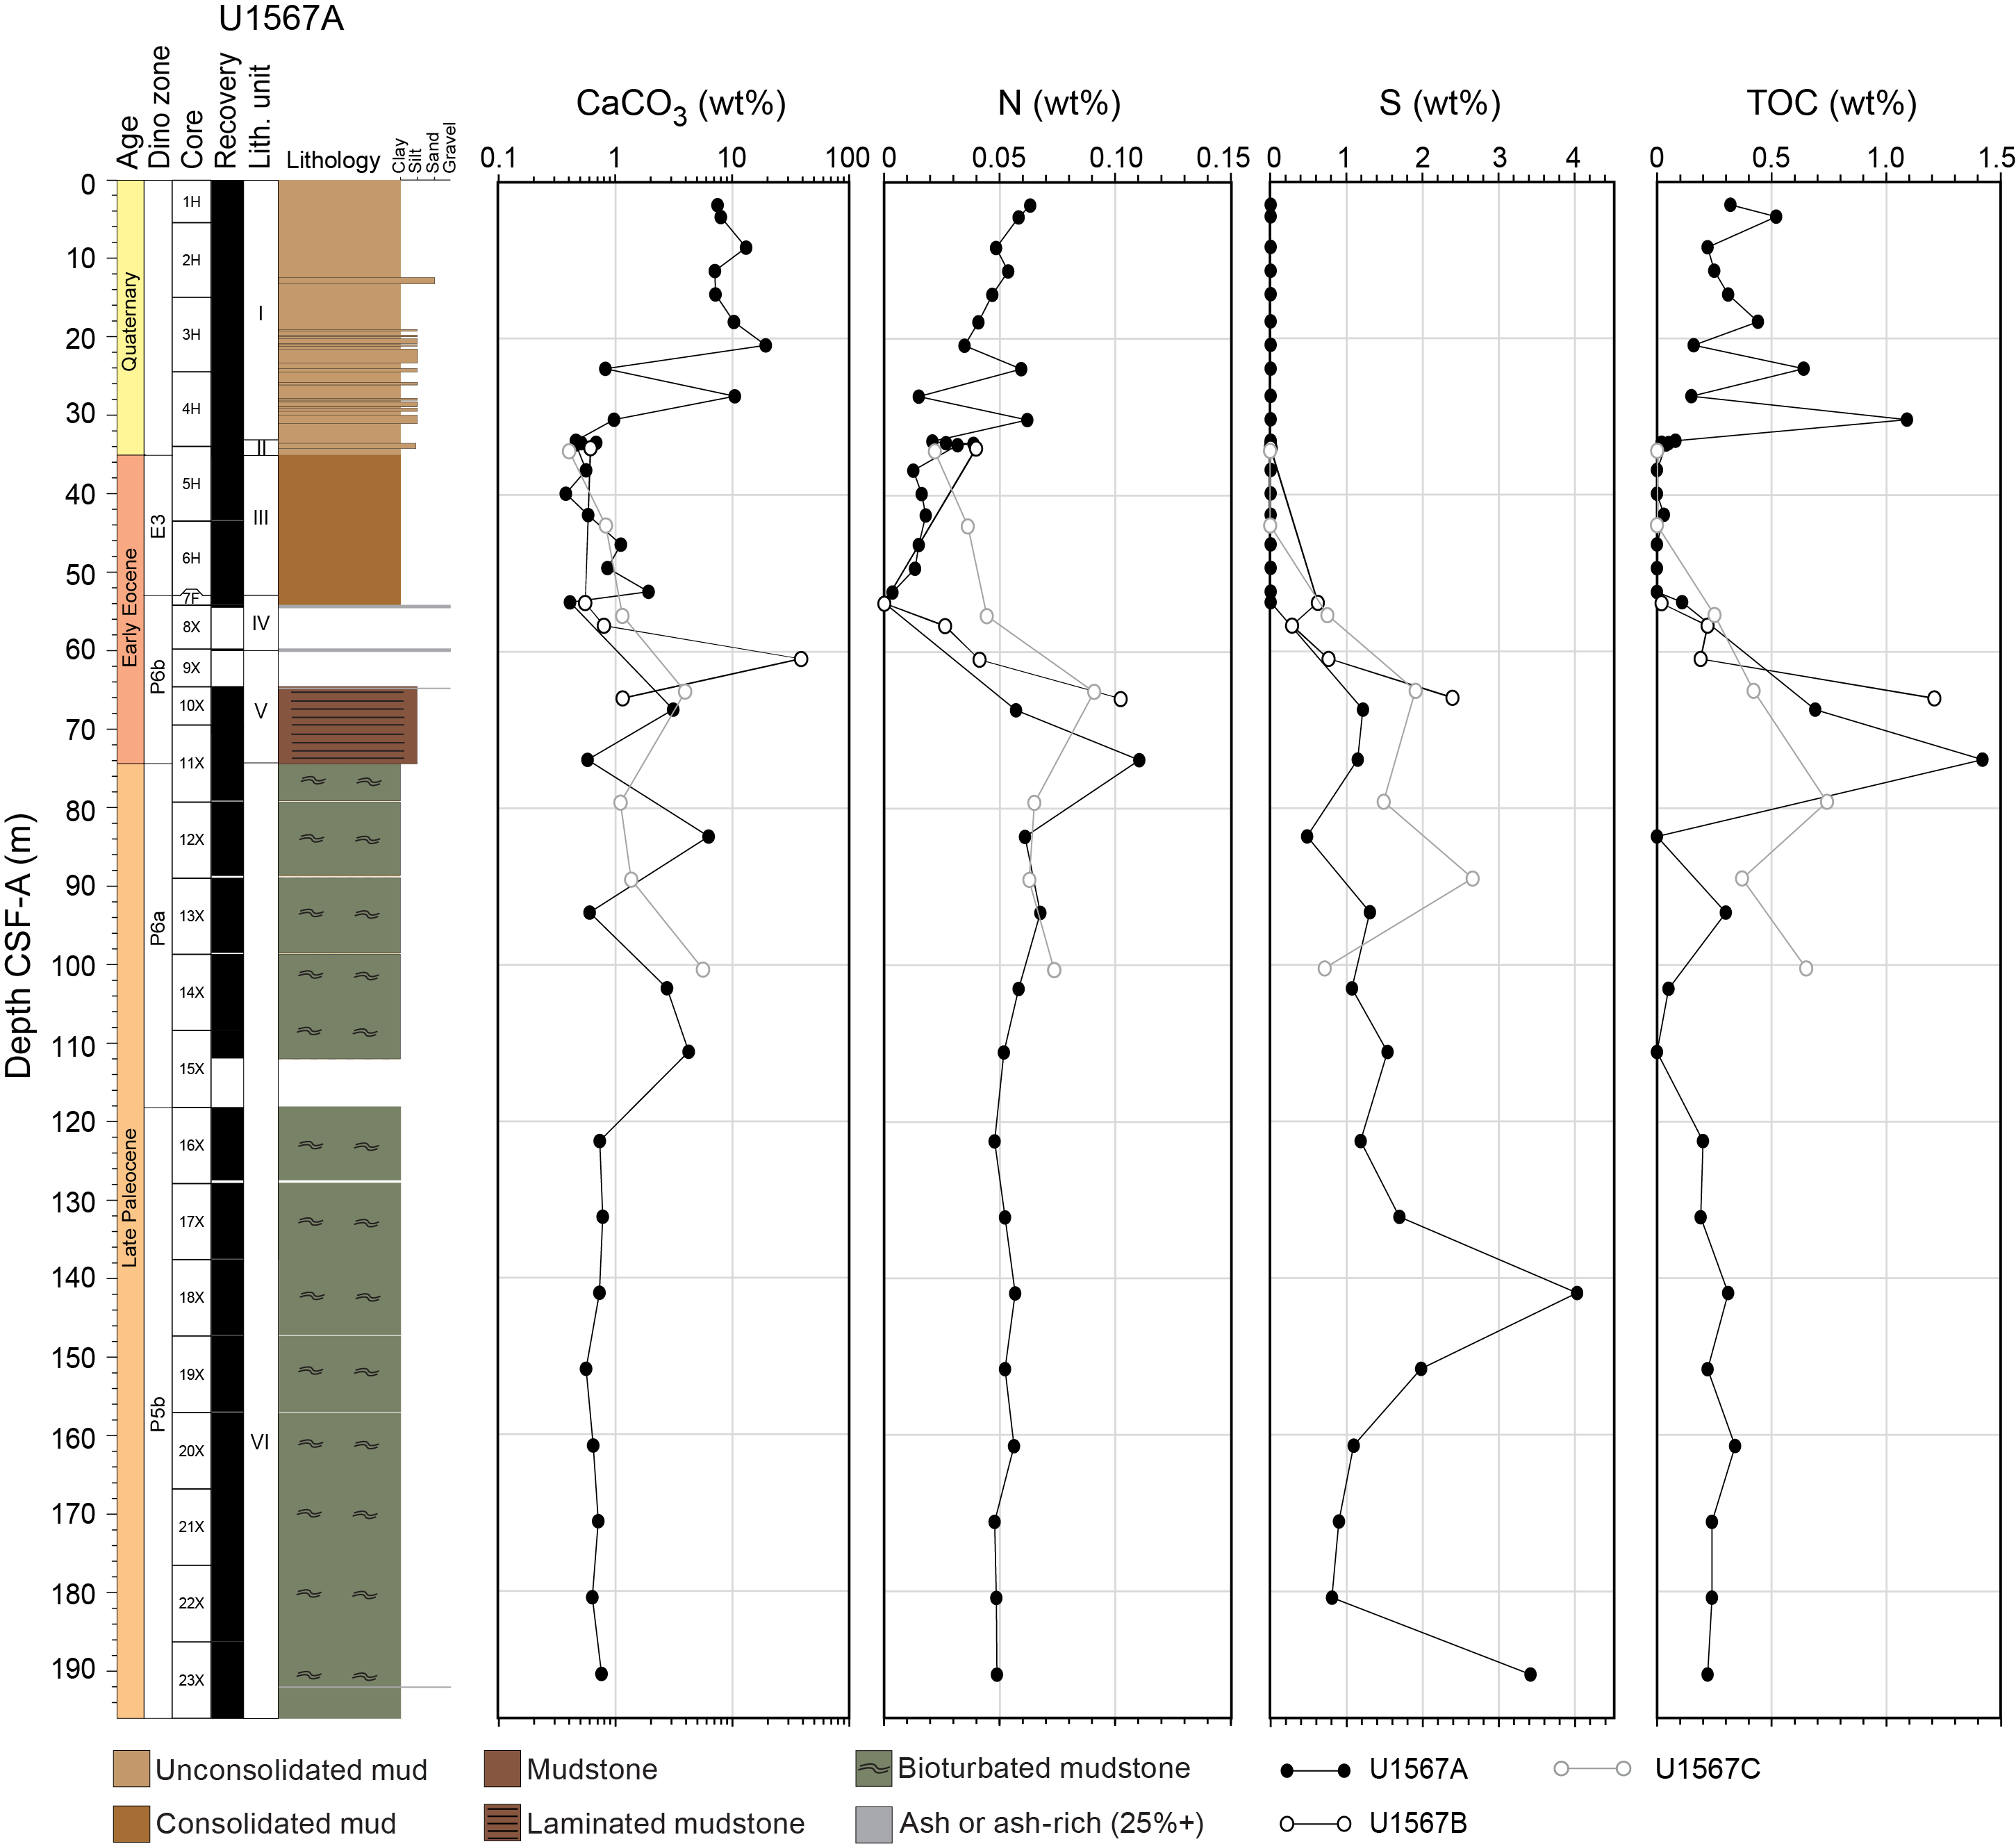
Figure F31. Carbon, nitrogen, and sulfur, Holes U1567A–U1567C.
6.2.2.2. Site U1568
The two holes at Site U1568 display generally similar downcore carbonate profiles to those at Site U1567. The uppermost sections again contain high CaCO3 (as high as 20.5 wt%) before a drop to below 1 wt% by the transition into Unit II at 32 m CSF-A (Figure F32; Table T17). As with the reference site, TOC is variable throughout this first unit. Concentrations of CaCO3 and TOC are low throughout Units II and III before rising upon the transition into Unit IV. Unit IV is characterized by variable carbonate concentrations, showing CaCO3 <12 wt% in Hole U1568A but as high as 50 wt% in Hole U1568B. Carbonate content again points toward an authigenic precipitation origin. TOC concentrations are typically between 0.1 and 1 wt% in this interval and for the remainder of the hole. CaCO3 content decreases downcore from a peak ~90 m CSF-A, reaching <0.5% by 110 m CSF-A and remaining low until the very last sample at 193.4 m CSF-A. This bottom sample has a CaCO3 concentration of 3.8 wt%, suggesting the reappearance of authigenic carbonate at greater depths.
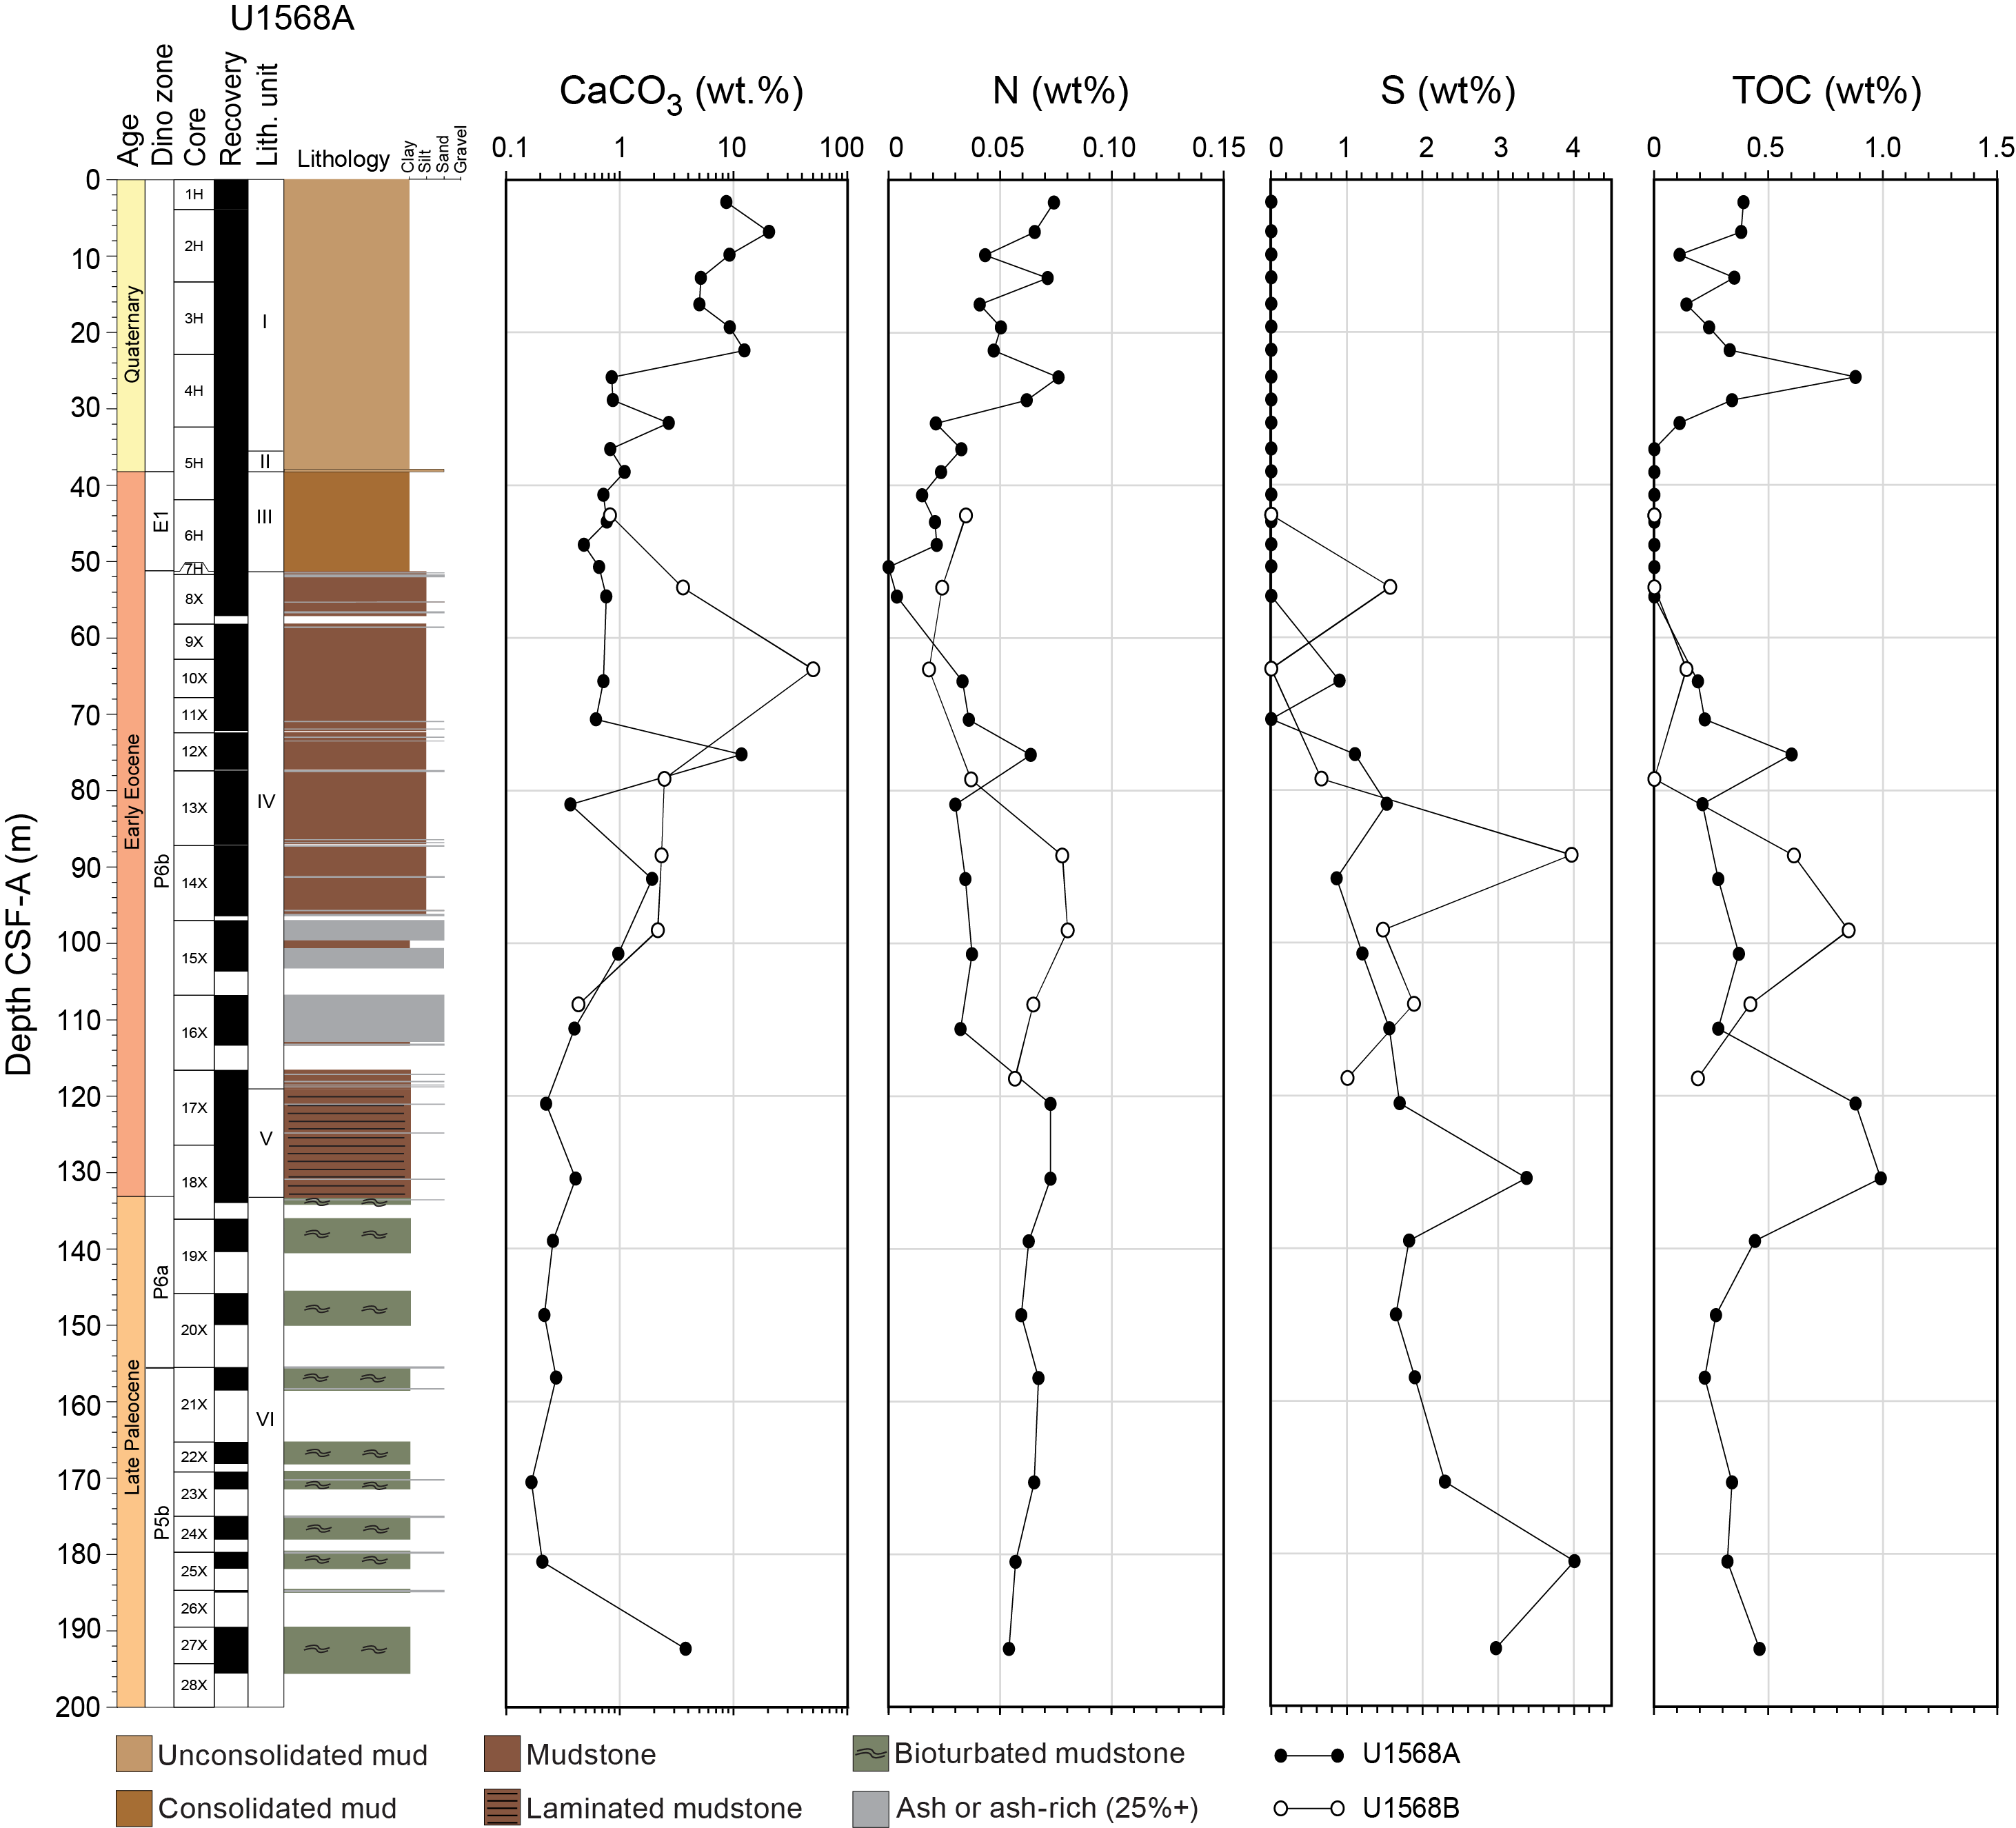
Figure F32. Carbon, nitrogen, and sulfur, Holes U1568A and U1568B.
Sulfur levels in Hole U1568A are in trace quantities in sediments to the transition between Units III and IV at 52 m CSF-A (Figure F32). As observed in the reference site strata, S concentrations rise steadily with depth below this transition, reaching a peak of 4 wt% at 181 m CSF-A. The lack of a similar increase in TOC concentrations suggests that the observed increase is linked to pyrite content. TN concentrations from Hole U1568A and reference Hole U1567A show subtle yet consistent features that are also present in the three holes between them (Figure F33). Both Holes U1567A and U1568A show decreasing TN contents from ~0.07 wt% at the surface to near zero at ~50 m CSF-A. All five holes then show moderate TN concentrations of ~0.04 wt% through Unit IV, elevated values of 0.07–0.11 wt% through Unit V, and very stable contents of 0.05–0.07 wt% through basal Unit VI. The close agreement between TN values and the interpreted sedimentary units further corroborates these lithologic interpretations.
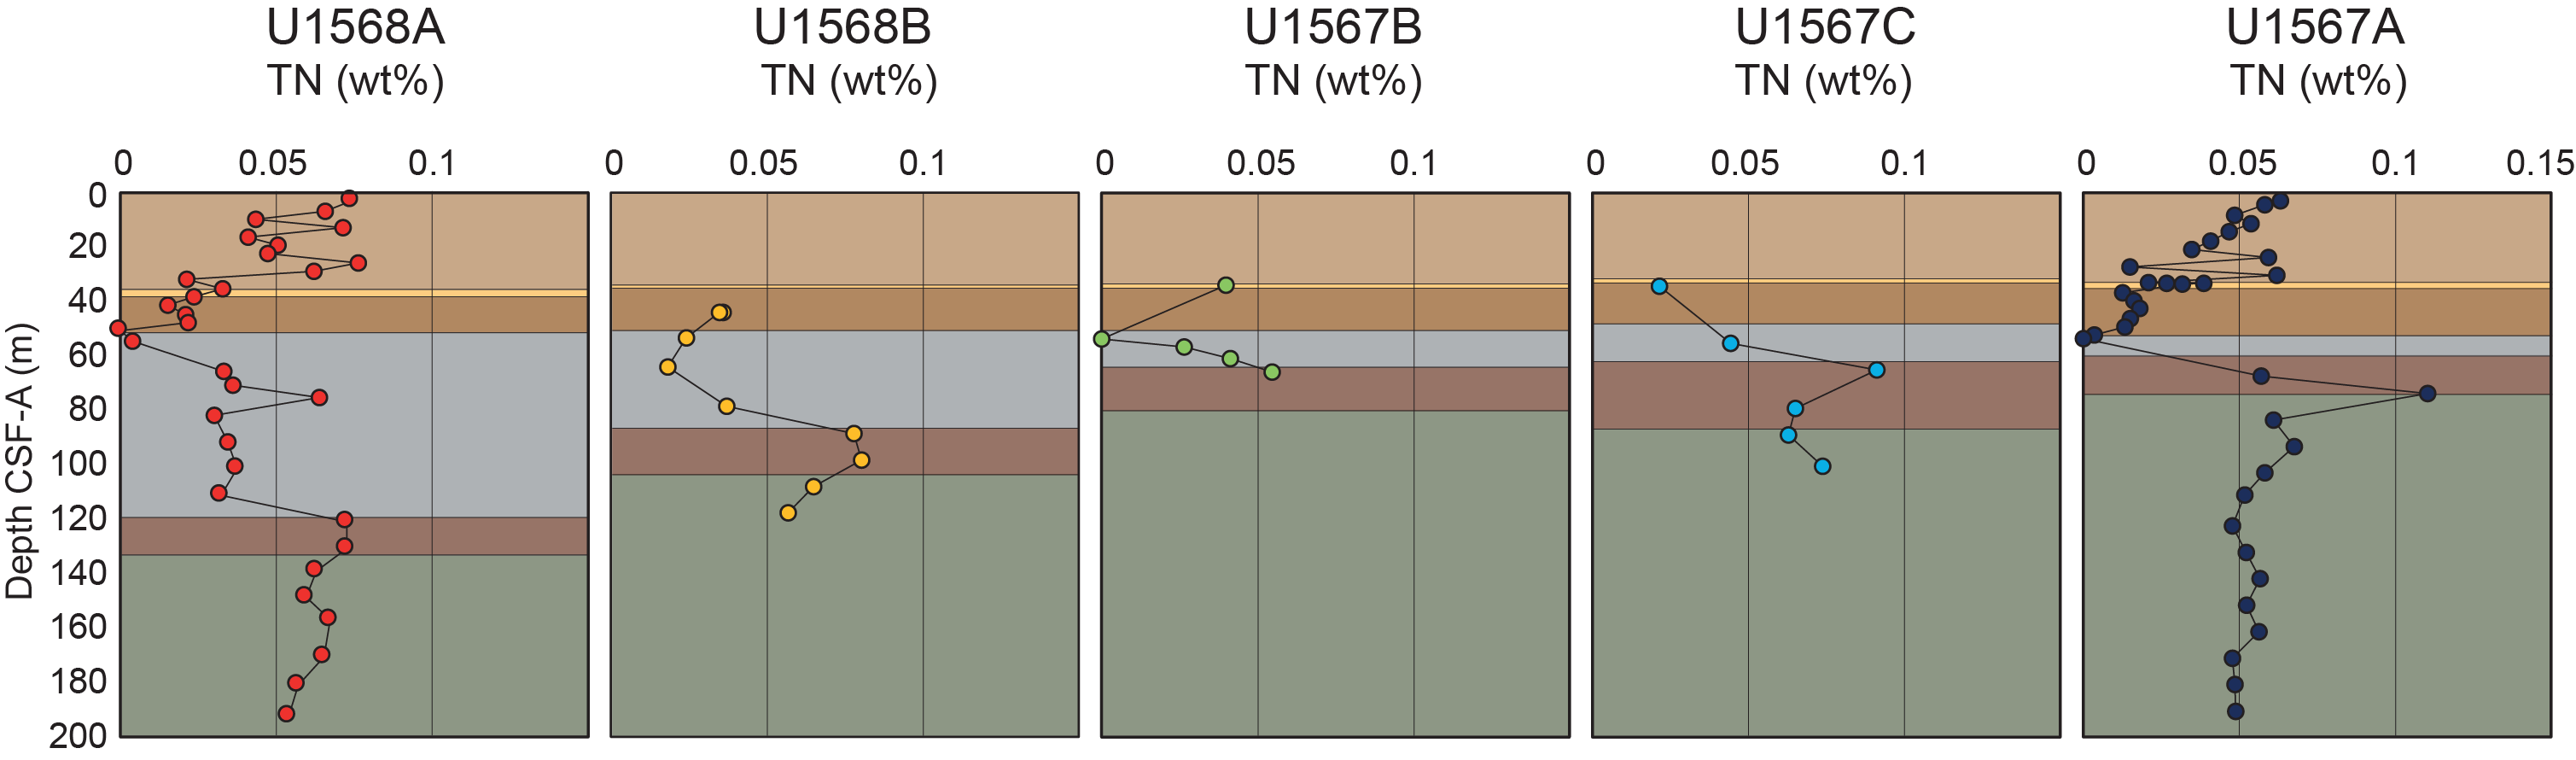
Figure F33. Nitrogen, Sites U1567 and U1568.
6.3. Microbiology
Samples for microbiological analysis were taken from both sites. A total of 10 samples were taken from Site U1567 (8 from Hole U1567A and 2 from Hole U1567B), and all samples were immediately transferred to the −80°C freezer. Two samples were taken from Core 396-U1568B-13H (one ash and one sediment). Each was subsampled into two fractions; one was immediately frozen, and the other was preserved in a nitrogen-flushed atmosphere before freezing.
6.4. Summary
The geochemical data, especially the IW data, show interesting variations between distal Hole U1567A and vent-proximal Hole U1568A. Unit IV, which thickens toward the hydrothermal vent structure, is typified by low alkalinity and high pH with respect to surrounding strata. Several other elements display nonconservative IW profiles across this interval in Hole U1568A, including NH4+, PO43−, and most alkali metals. The difference between the IW profiles at the vent-distal and vent-proximal sites matches unit shifts, which suggests that these variations are lithologically controlled. XRD analysis indicates mineralogies dominated by clays, particularly those formed by the breakdown of volcanic ash such as smectite-illite. Analysis of bulk sediment samples indicate generally low carbonate contents below the upper 20–30 m, and sulfur and nitrogen increase with depth below this interval. Source rock analysis shows that Unit IV sediments are thermally mature with Tmax consistently >400°C (Table T18). There is no evidence of significant burial at this locality, suggesting that the high Tmax may be related to the vent structure.
7. Physical properties
A transect consisting of five holes was drilled at two sites (U1567 and U1568) across one side of a ~1 km diameter hydrothermal vent complex in the Modgunn Arch. Site U1567 included three holes (U1567A–U1567C), and Site U1568 included two holes (U1568A and U1568B). A comprehensive suite of physical properties was collected for Sites U1567 and U1568, including all standard whole-round (X-Ray, Whole-Round Multisensor Logger [WRMSL], and NGR) and section-half (MS and Section Half Measurement Gantry [SHMG]) measurements. Discrete analyses (e.g., moisture and density [MAD], thermal conductivity, and SHMG P-wave caliper [PWC] P-wave measurements) focused primarily on Hole A at each site, along with analyses of new lithologies and key intervals at the other holes. Standard data reduction and screening procedures removed 264 gamma ray attenuation (GRA) bulk density points (lower cutoff = 1.2 g/cm3) and 117 points from the WRMSL P-wave XY data sets (lower cutoff = 1480 m/s) for both sites (see Physical properties in the Expedition 396 methods chapter [Planke et al., 2023a]).
Six lithostratigraphic units (I–VI) were identified (see Lithostratigraphy). Each lithostratigraphic unit was penetrated by every borehole, although with varying thickness and recovery. A brief summary of each borehole is presented in the following sections prior to a summary of the separate units.
7.1. Hole U1567A
The physical properties for Hole U1567A are shown in Figure F34. In general, the sequences of Lithostratigraphic Unit I show the highest NGR values with respective mean, median, and standard deviations of 40.8, 40.8, and 6.7 counts/s. In Unit I, bulk densities and acoustic velocities gradually increase before an apparent inversion in both properties occurs coincident with Unit II. In contrast, MS in Unit III shows an increasing trend with depth and reaches maximum values at the base of this layer. Physical measurements for Unit IV were limited in Hole U1567A because of poor core recovery. Units V and VI do not show significant variations in measured physical properties except for minor elevations in MS.
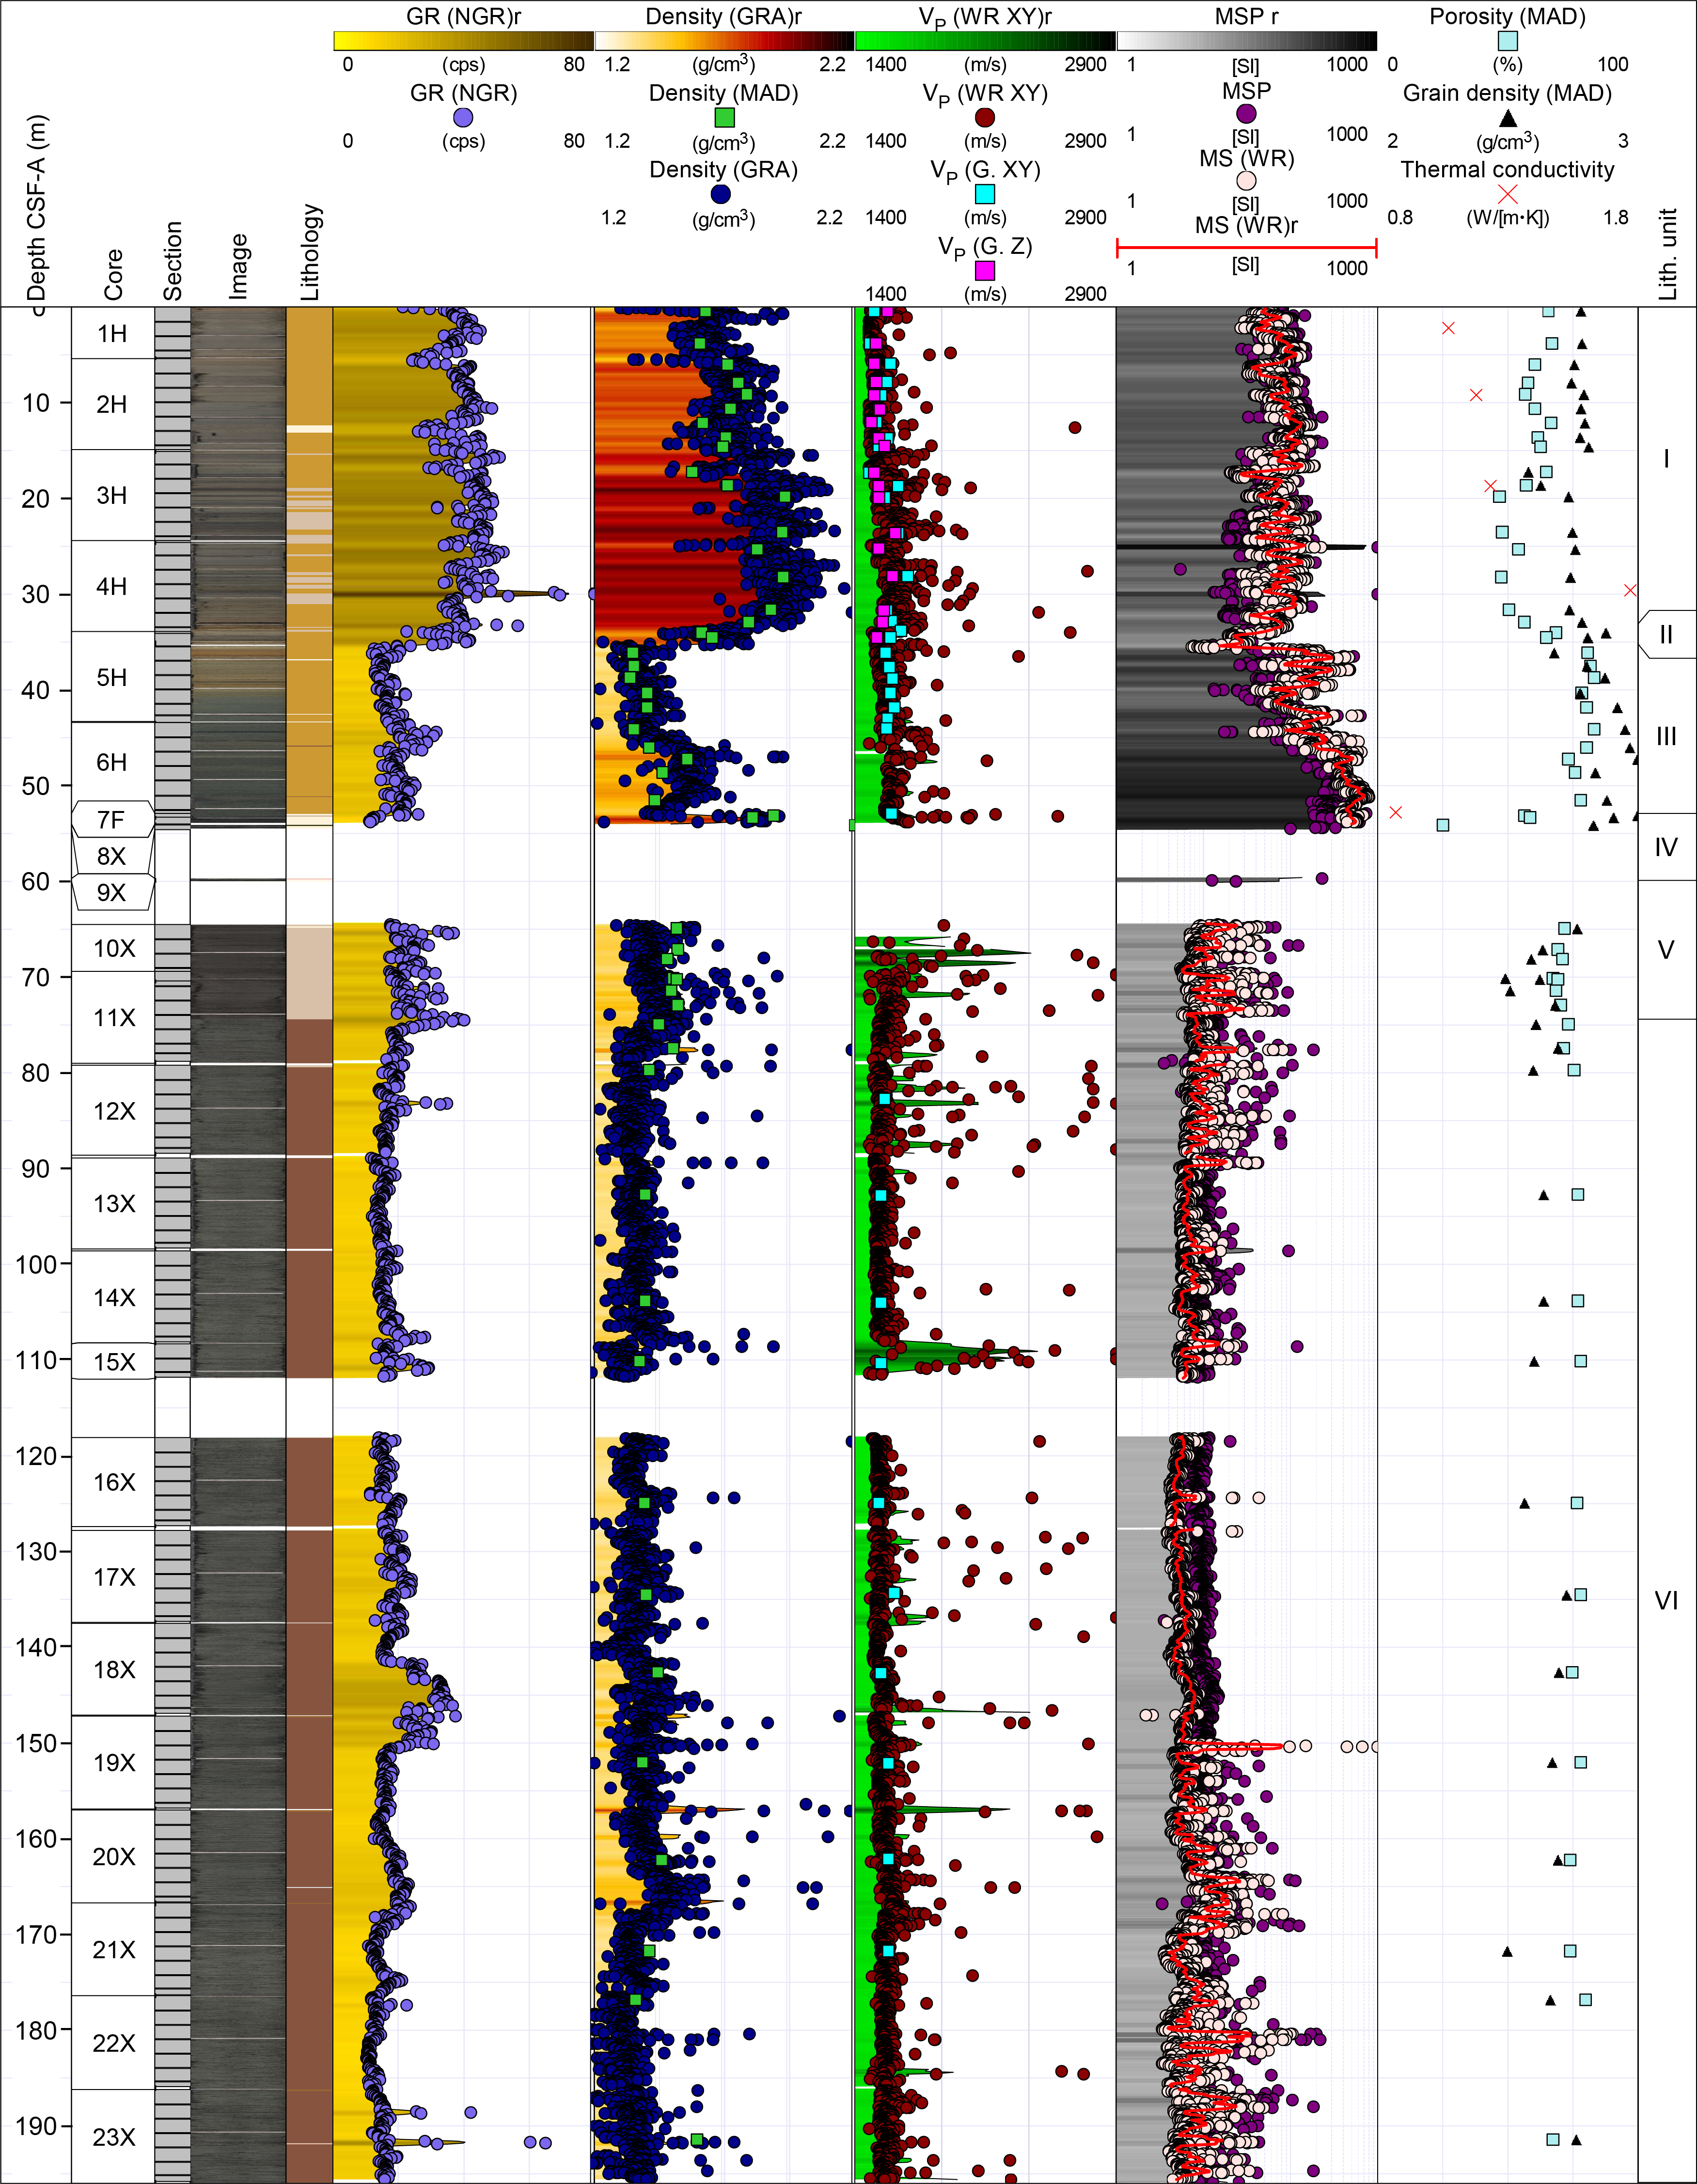
Figure F34. Physical properties summary, Hole U1567A.
In addition to continuous WRMSL measurements, 53 MAD samples were measured. The MAD bulk densities of recovered sediments range 1.34–2.38 g/cm3, and porosity varies between 25% and 83%, with the extremely high values relating to high clay contents. SHMG P-wave velocity measurements recorded very low overall velocities (1481–1635 m/s) throughout the sequence. Five thermal conductivity measurements (four with the needle tool, one with the puck) returned values of 1.07–1.77 W/(m·K) for Unit I, and a single measurement at the base of Unit III (42.71 m CSF-A) returned 0.87 W/(m·K). Several more thermal conductivity measurements attempted in the deeper sections of the hole were unsuccessful.
7.2. Hole U1567B
Hole U1567B is located south of Hole U1567A. Measured physical properties for Hole U1567B are summarized in Figure F35. The first 20 m of Unit I were drilled without recovery. The lowermost sequences of Unit I feature a trend similar to that seen in adjacent Hole U1567A, including relatively higher densities (mean = 1.91 g/cm3; median = 1.92 g/cm3) and variable MS values (WRMSL values range 16 × 10−5 to 563 × 10−5 [SI]). Similar to Hole U1567A, Unit II marks a distinct transition in all measured physical properties. Unit III (33.1–54 m CSF-A) features relatively lower densities (1.24–1.89 g/cm3; mean = 1.43 g/cm3; median = 1.42 g/cm3) and P-wave velocities (1488–2098 m/s) compared to the overlying units, and it has the highest recorded MS values in the well (Figure F36), as high as 757 × 10−5 [SI].
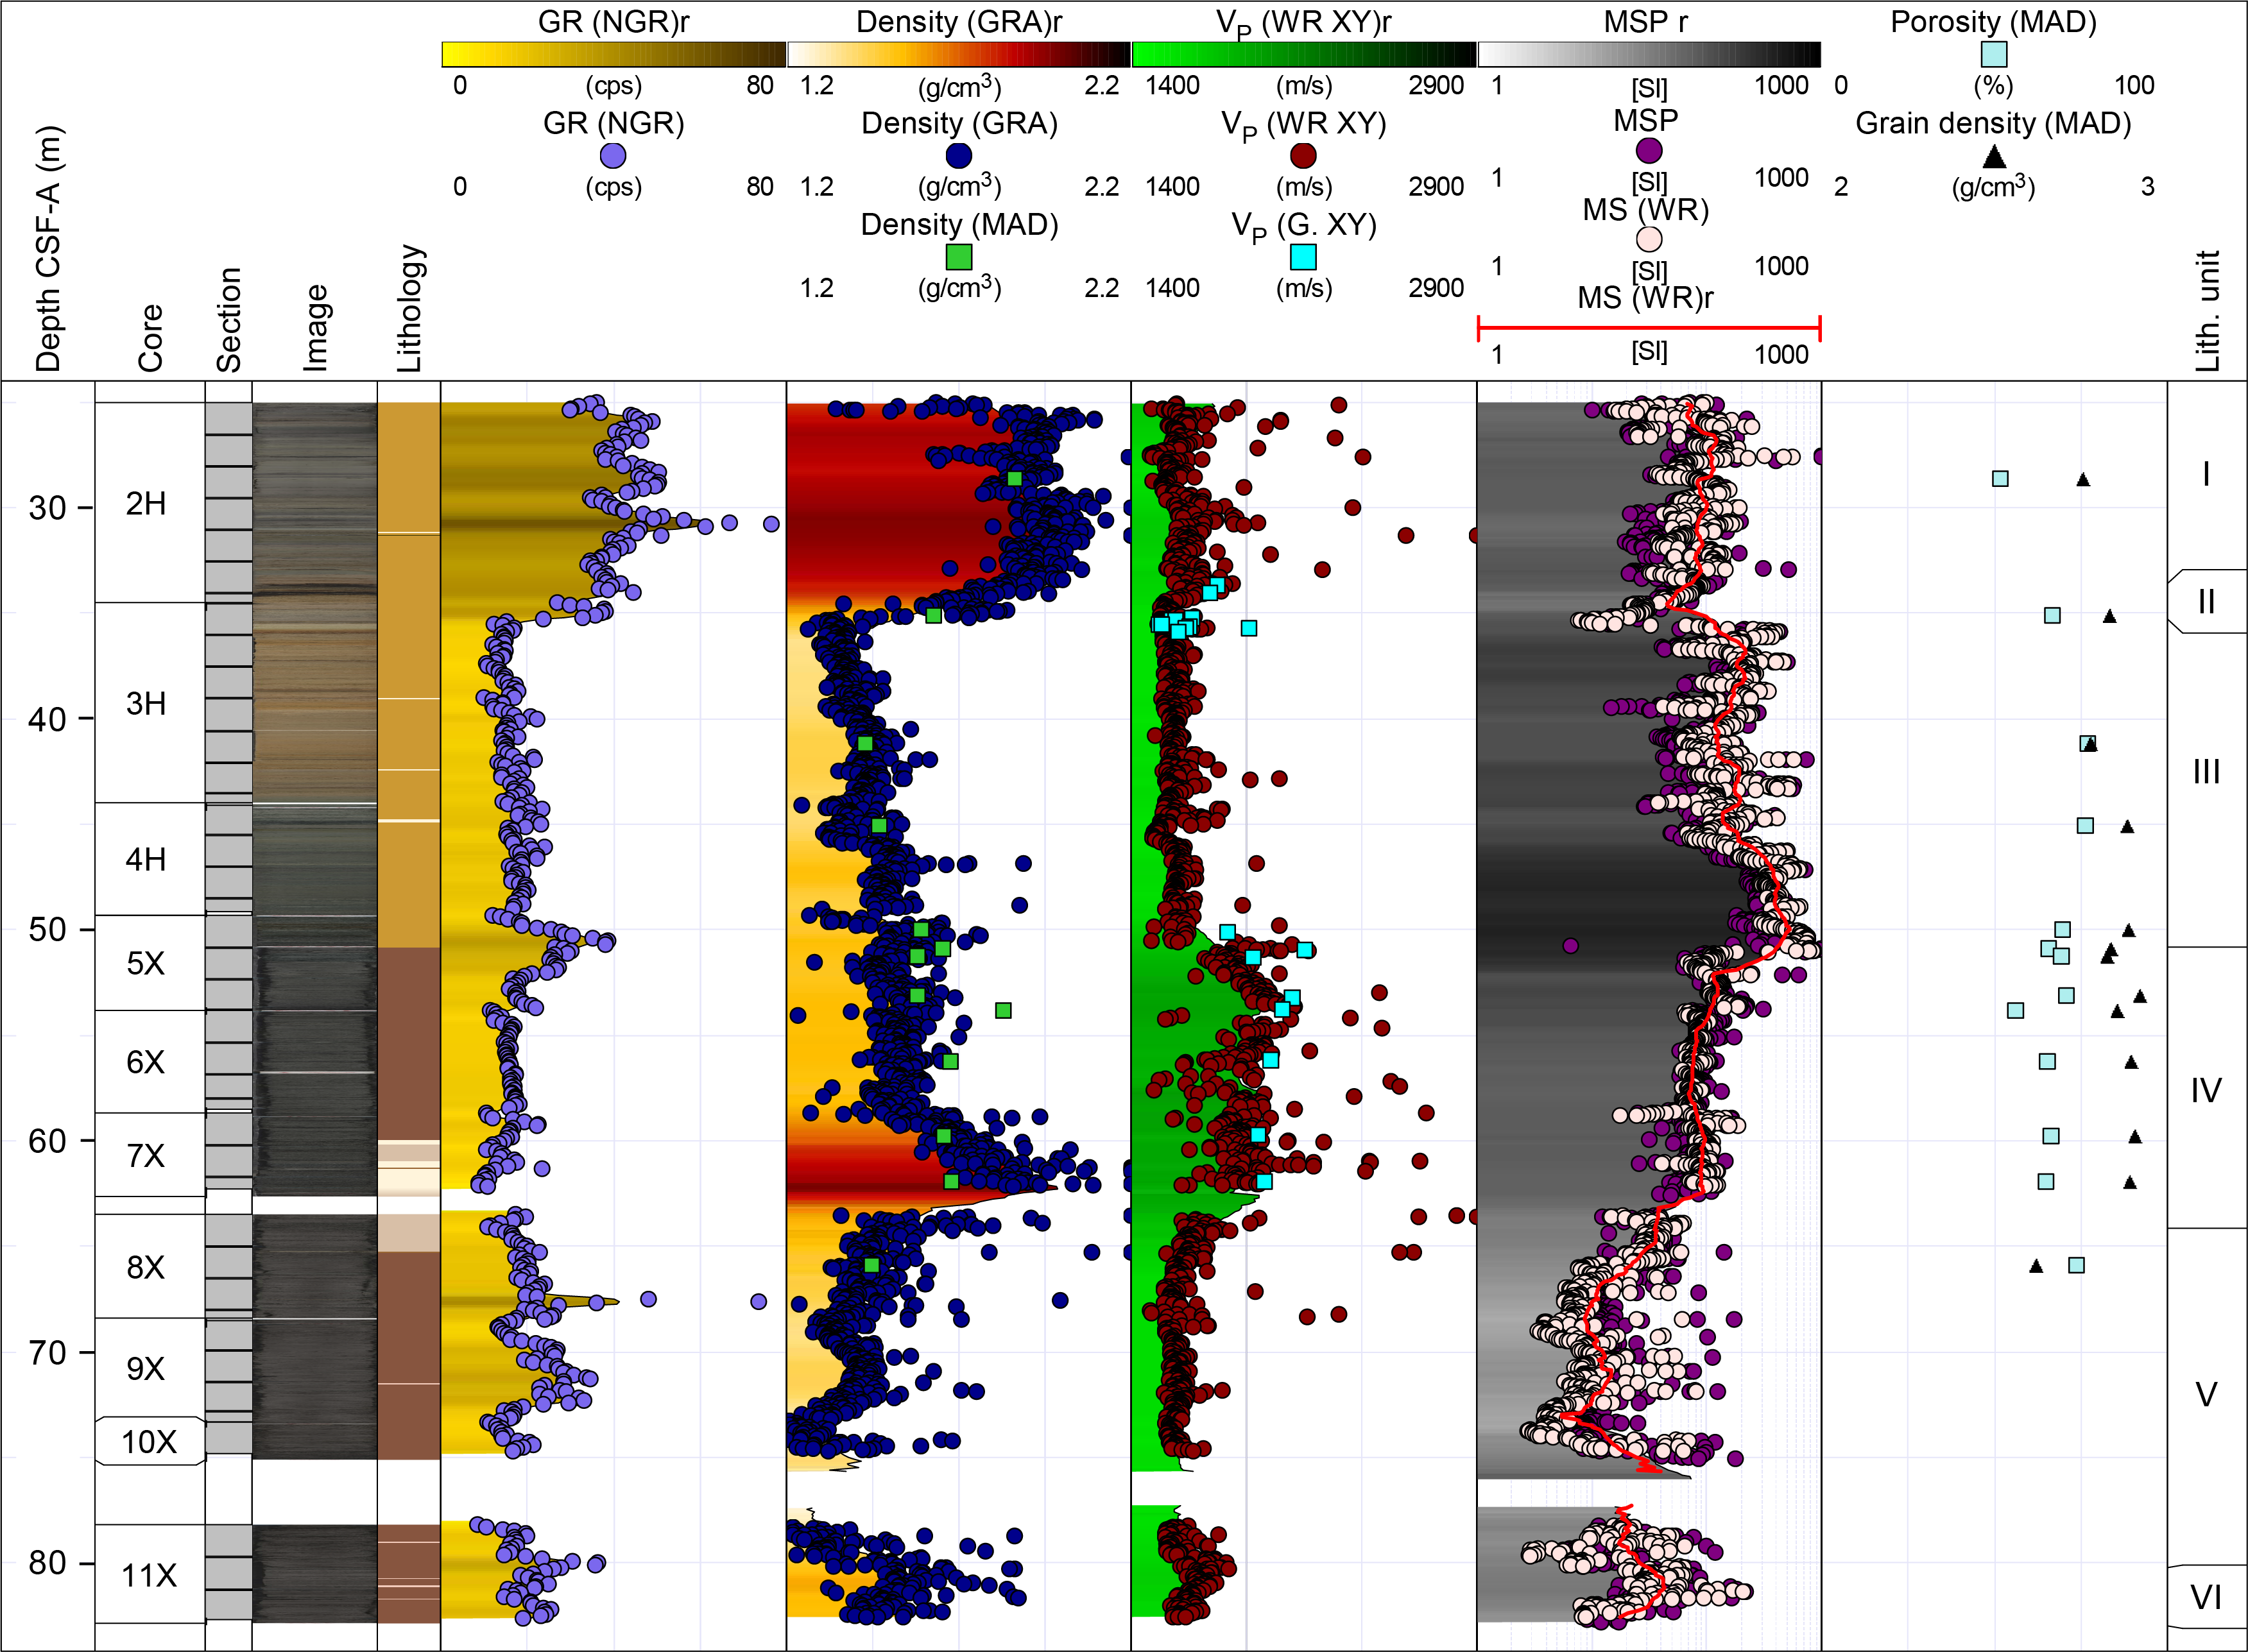
Figure F35. Physical properties summary, Hole U1567B.
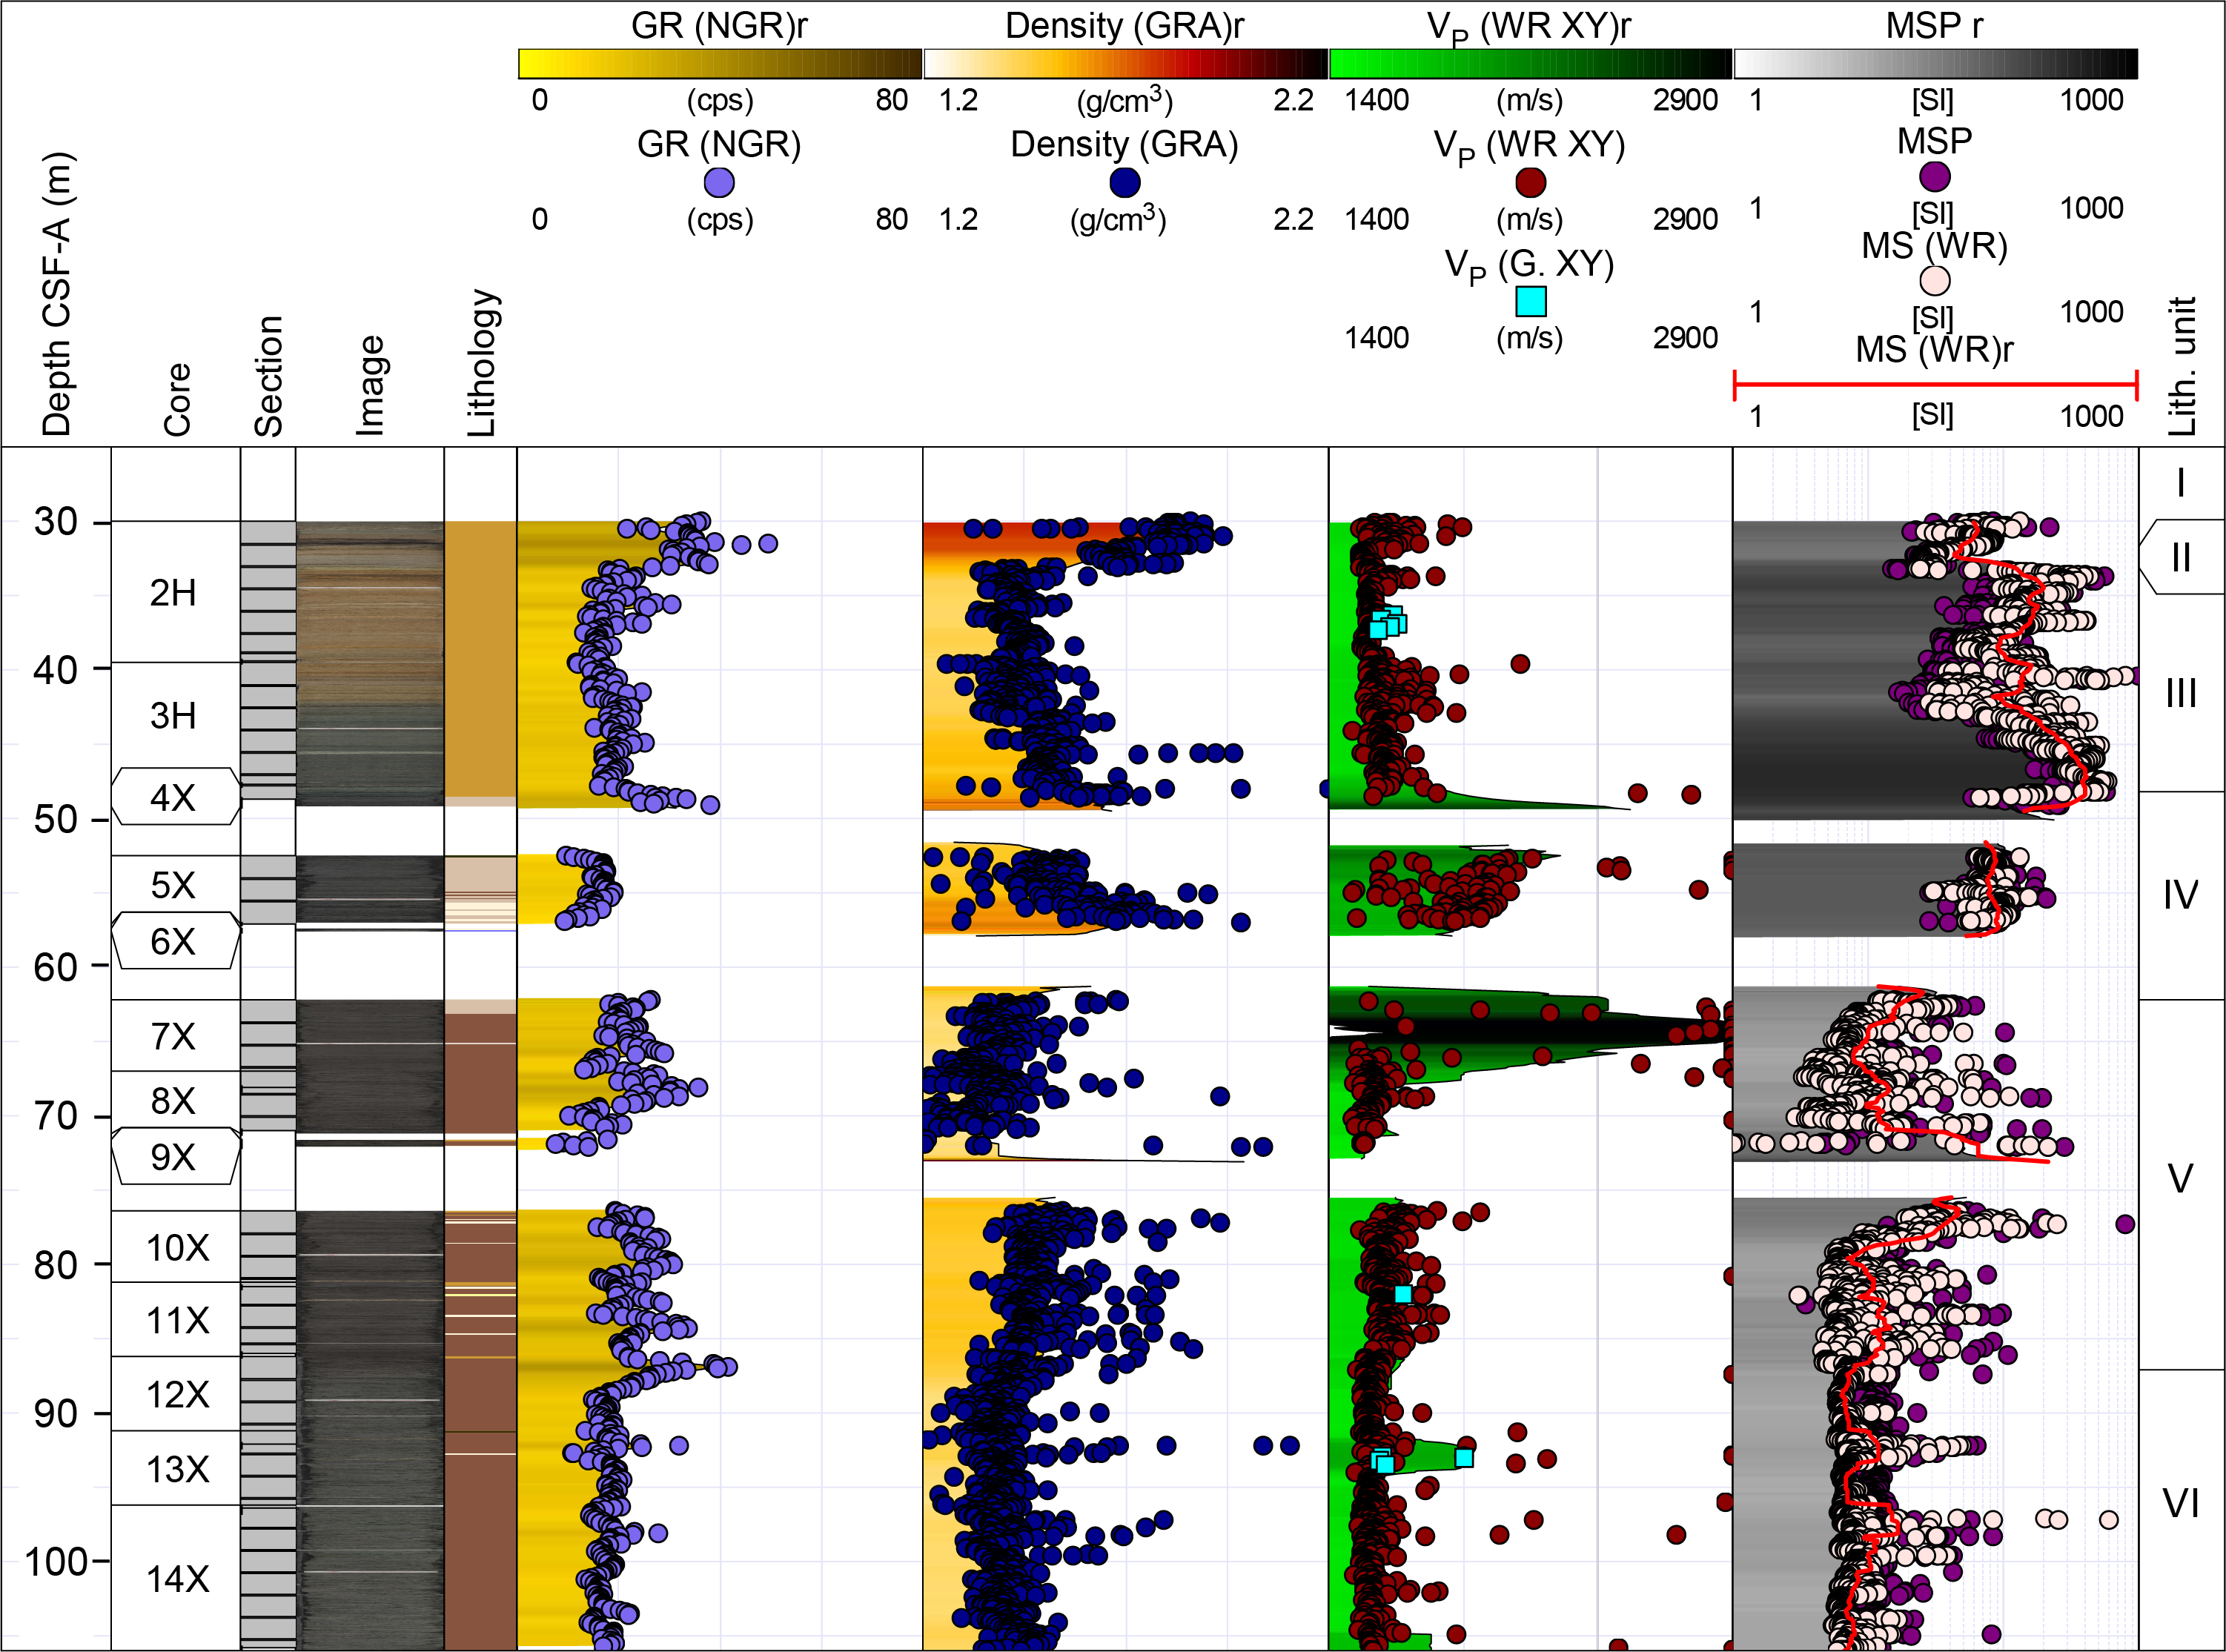
Figure F36. Physical properties summary, Hole U1567C.
In Unit IV, MS decreases with depth, and density remains ~1.6 g/cm3 in the upper half of this unit and increases to ~1.9 g/cm3 toward the base of the unit. Unit V shows generally decreasing trends in P-wave velocity, density, and MS, although there are some spikes in MS, which are, in some cases, linked to ash layers. The boundary with underlying Unit VI occurs toward the bottom of the penetrated sequence and is subtle, based on the limited available physical properties measurements below the transition.
In addition to WRMSL measurements, 13 MAD samples were collected, 7 of which targeted Unit IV, which was poorly recovered in adjacent Hole U1567A. Calculated MAD bulk densities reveal good correlations with GRA bulk density measured using the WRMSL. The computed porosity values range 52%–77%, with the lowest values associated with a calcareous claystone sample from Unit IV (53.81 m CSF-A). P-wave velocity was measured at 34 discrete intervals throughout the recovered cores using the SHMG and varied between 1521 and 2150 m/s. No reliable thermal conductivity measurements were obtained for this hole.
7.3. Hole U1567C
Hole U1567C is located between Holes U1567A and U1567B. The measured physical properties for Hole U1567C are summarized in Figure F36. Because this hole was drilled last in the sequence of the five holes, no MAD samples were collected. A total of 10 discrete P-wave velocity measurements range 1581–1902 m/s.
7.4. Hole U1568A
Hole U1568A is located 492 m south of Hole U1567A and is the closest hole to the vent’s center. Measured physical properties from Hole U1568A are summarized in Figure F37. Physical property trends in the uppermost part of Unit I are similar to those observed in cores from Site U1567. In particular, relatively high gamma radiation (22.5–55.5 counts/s; mean = 39 counts/s; median = 39.7 counts/s) is recorded in this unit. Bulk density increases with depth throughout Unit I from around 1.6 to 1.9 g/cm3, and P-wave velocity remains essentially constant at around 1600 m/s. MS is largely constant throughout Unit I (mean = 88 × 10−5 [SI]).

Figure F37. Physical properties summary, Hole U1568A.
In Unit III (between 38.25 and 57 m CSF-A), densities and acoustic velocities remain relatively low with means of 1.52 g/cm3 and 1707 m/s, respectively. Similar to cores from Site U1567, the MS of Unit III is relatively high and increases with depth to as high as 1773 × 10−5 [SI]. Unit IV is the thickest in this hole out of all five holes drilled at Sites U1567 and U1568. The transition from Unit III to Unit IV is offset between units, and the key physical properties transition occurs ~6 m deeper. Densities are high (~1.7 g/cm3) in the uppermost part of Unit IV, as defined by lithostratigraphy, and are coincident with the highest MS values; densities then reduce abruptly to ~1.4–1.5 g/cm3 in Section 396-U1568A-9X-1 and remain largely constant for the remainder of the layer. This abrupt reduction in density coincides with a distinct drop in MS to values typically below 20 × 10−5 [SI] for the remainder of Unit IV and Units V and VI. MS is relatively high in the upper ~14 m of Unit IV (~150–200 × 10−5 [SI]), but it drops off in the lower part of Unit IV to between 30 × 10−5 and 50 × 10−5 [SI] with occasional thin elevated spikes and then drops sharply to between ~10 × 10−5 and 20 × 10−5 [SI] at the Unit IV–V transition. Small perturbations in MS occur in the lower units and are, similar to the other holes at Site U1567, often coincident with thin isolated ash layers.
In addition to the WRMSL readings, 20 MAD samples were collected in the three bottommost units. Bulk density derived from MAD samples agrees well with GRA bulk density measurements, generally giving values around 1.6 g/cm3. Porosities vary between 36% and 78% with medians of 65%, 76%, and 69% for Units IV, V, and VI, respectively. In total, 60 SHMG P-wave velocity measurements were conducted, yielding velocities from 1526 to 3781 m/s. Four thermal conductivity measurements in the upper two units range 0.94–1.58 W/(m·K).
7.5. Hole U1568B
Measured physical properties of Hole U1568B are summarized in Figure F38. The first 20 m were drilled without coring. The remaining portion of Unit I shows physical properties similar to Unit I in all three holes from Site U1567 and in Hole U1568A, followed by a general decrease in all measured properties in Unit II. Unit III (~34–54 m CSF-A) shows the highest MS values (1788 × 10−5 [SI]). Unit IV reveals an overall decreasing trend in MS values similar to Hole U1568A, but there is a slightly thicker upper interval (>20 m) of high but variable MS before MS reduces sharply at the Unit IV–V transition, below which a small number of isolated peaks occur. Unit IV has a median of 96 × 10−5 [SI] and does not contain the thick, constant low MS seen in Hole U1568A, suggesting, as with the lithologic inference (see Lithostratigraphy), that the unit varies significantly laterally between the two sites.
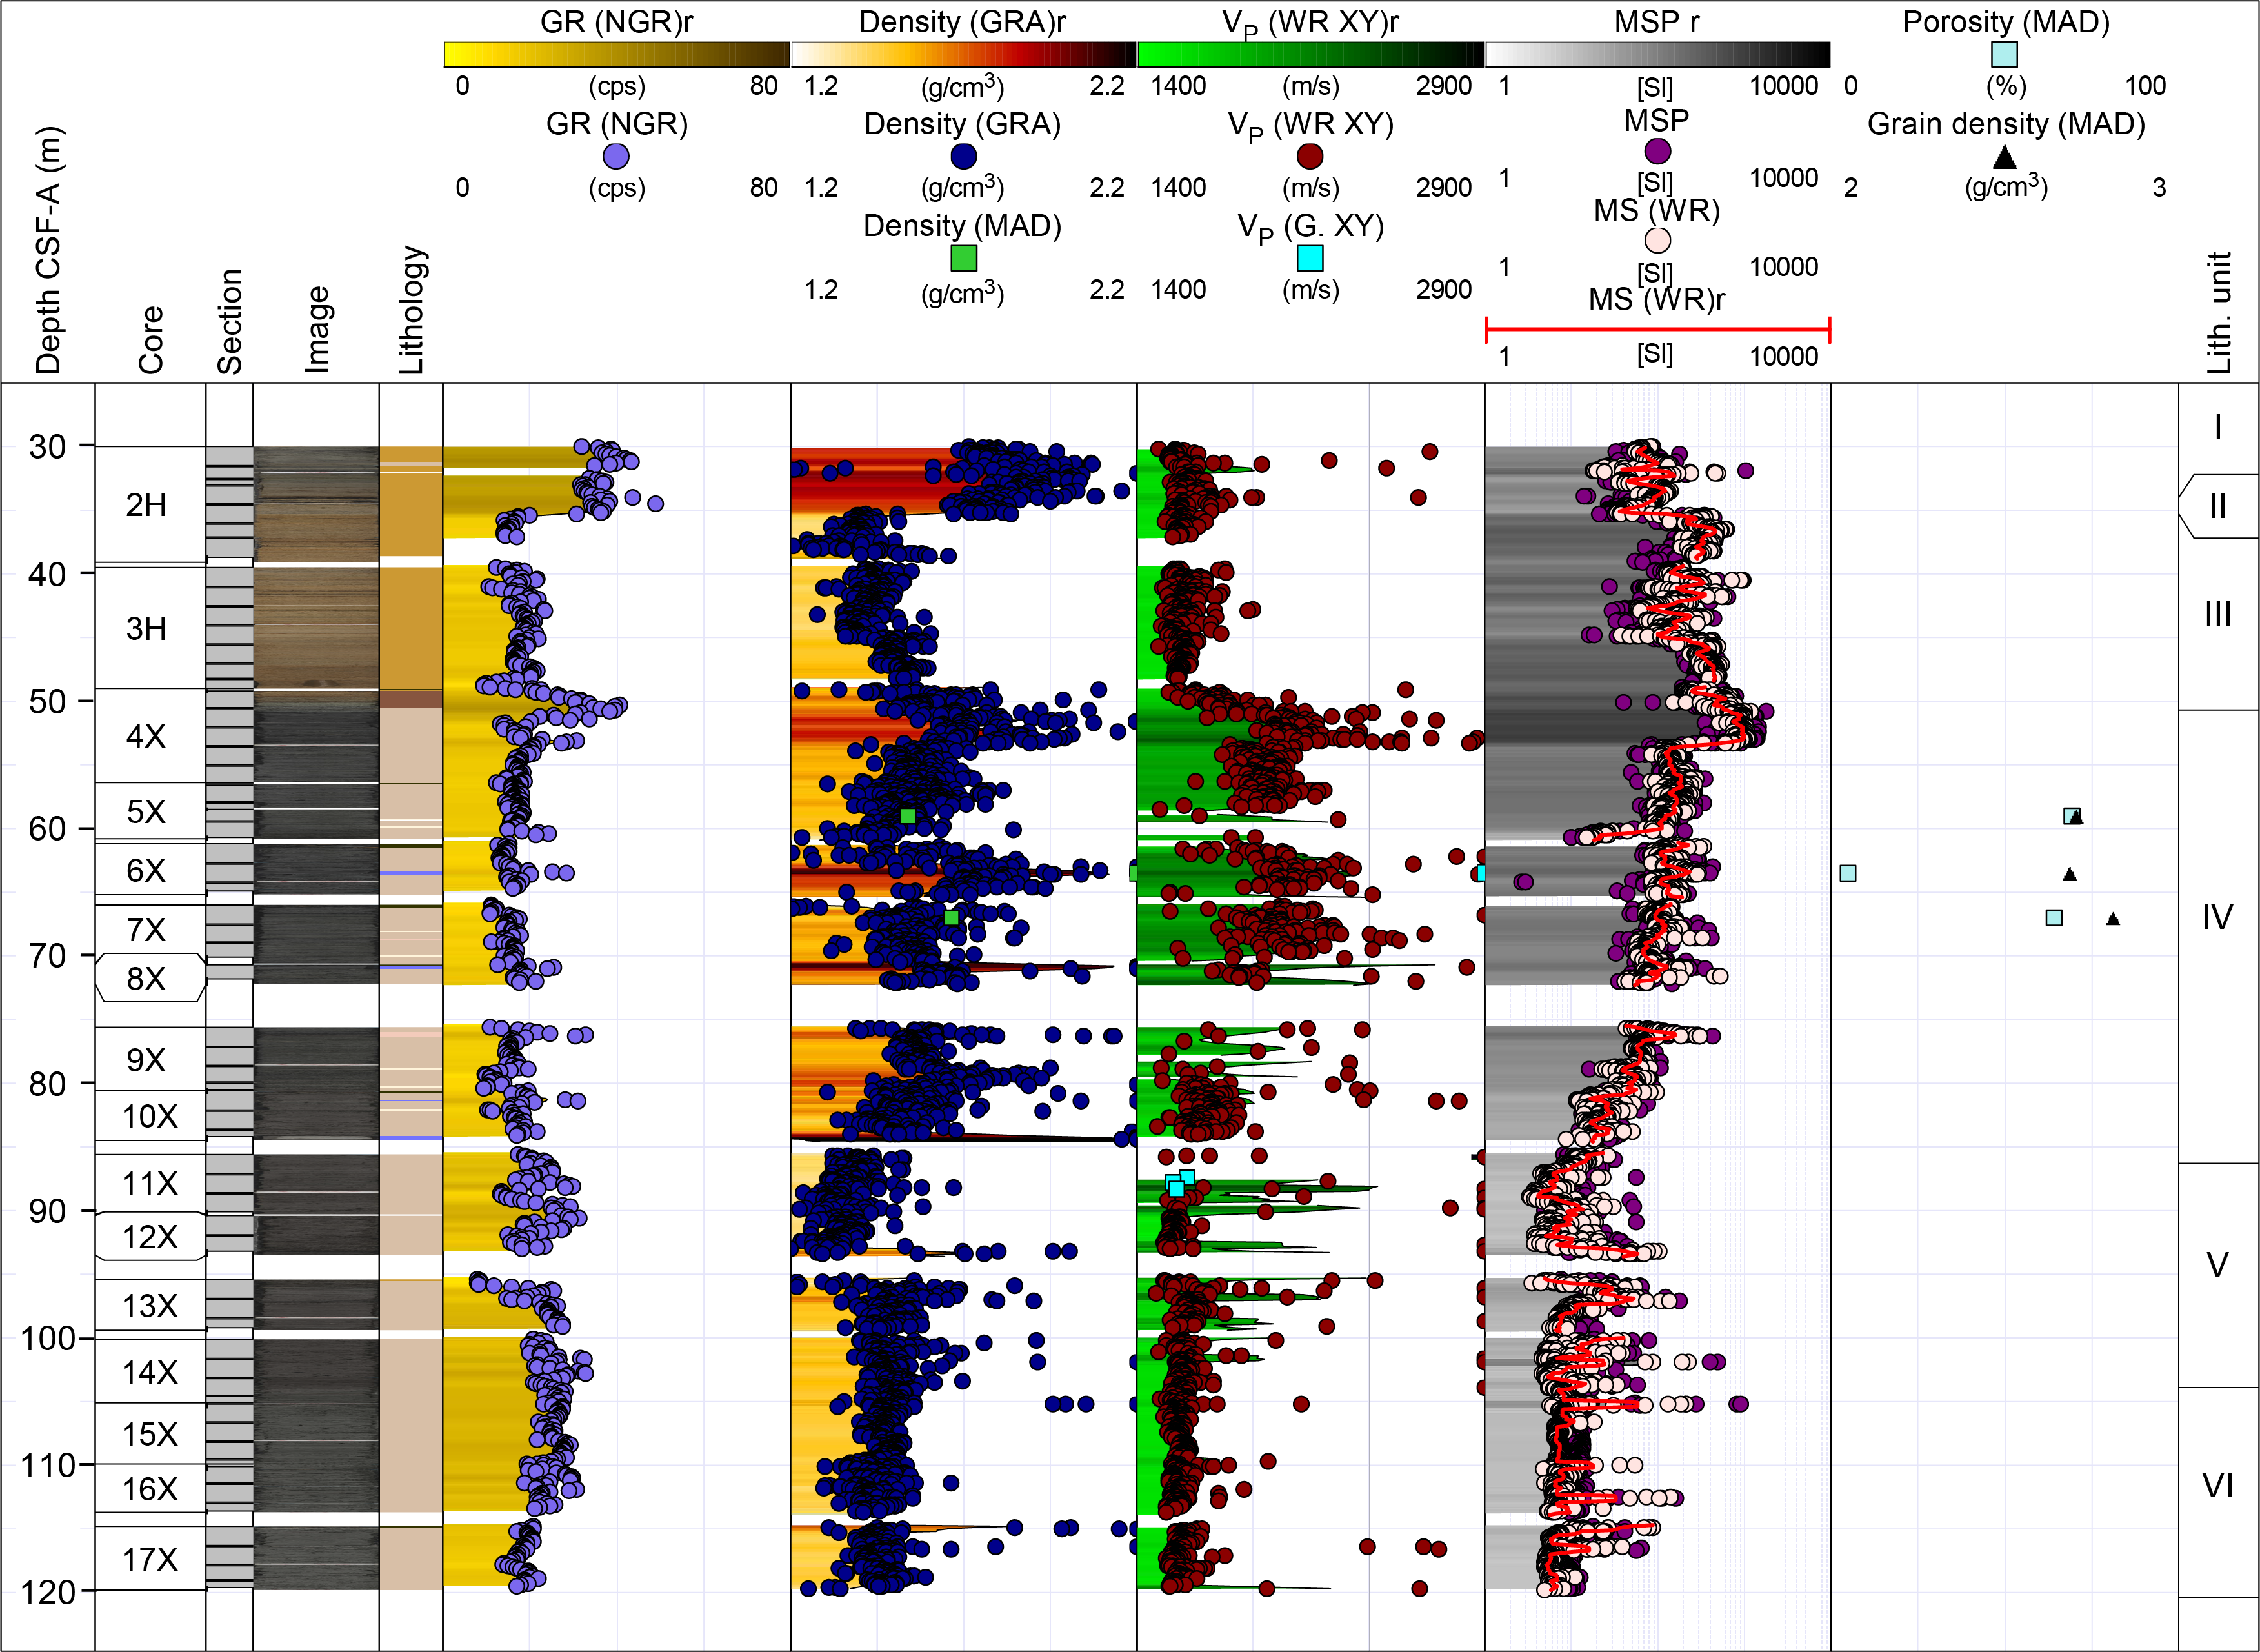
Figure F38. Physical properties summary, Hole U1568B.
Unit IV densities reach as high as 2.57 g/cm3 (median = 1.56 g/cm3). MAD measurements were limited due to the proximity to Hole U1568A. However, spot samples are consistent with GRA bulk densities, and porosities range 5%–69%. The lowest porosity and the highest densities were observed for the limestone sample in Section 396-U1568B-6X-2 (63.2 m CSF-A). Three SHMG velocity measurements range 1555–1615 m/s.
7.6. Summary
The following description is based on the combined data across the five boreholes from Sites U1567 (3 holes) and U1568 (2 holes). Figure F39 provides a multiwell summary of the main physical properties for the five wells along with the lithostratigraphic units (see Lithostratigraphy and Biostratigraphy). Unit I consists of Pleistocene–Holocene glacial and interglacial deposits as thick as 35 m with a mean bulk density of 1.81 g/cm3 and porosities between 47% and 67%. The unit shows a relatively high gamma radioactivity with an across-borehole median of 40 counts/s. P-wave velocities measured using the WRMSL range 1480–2978 m/s (median = 1572 m/s), and SHMG P-wave measurements never exceed 1702 m/s, attesting to the soft and poorly compacted nature of the sediments. Unit II is generally less than 2 m thick and consists of Pleistocene clay characterized by a rapid decrease in all measured physical properties.
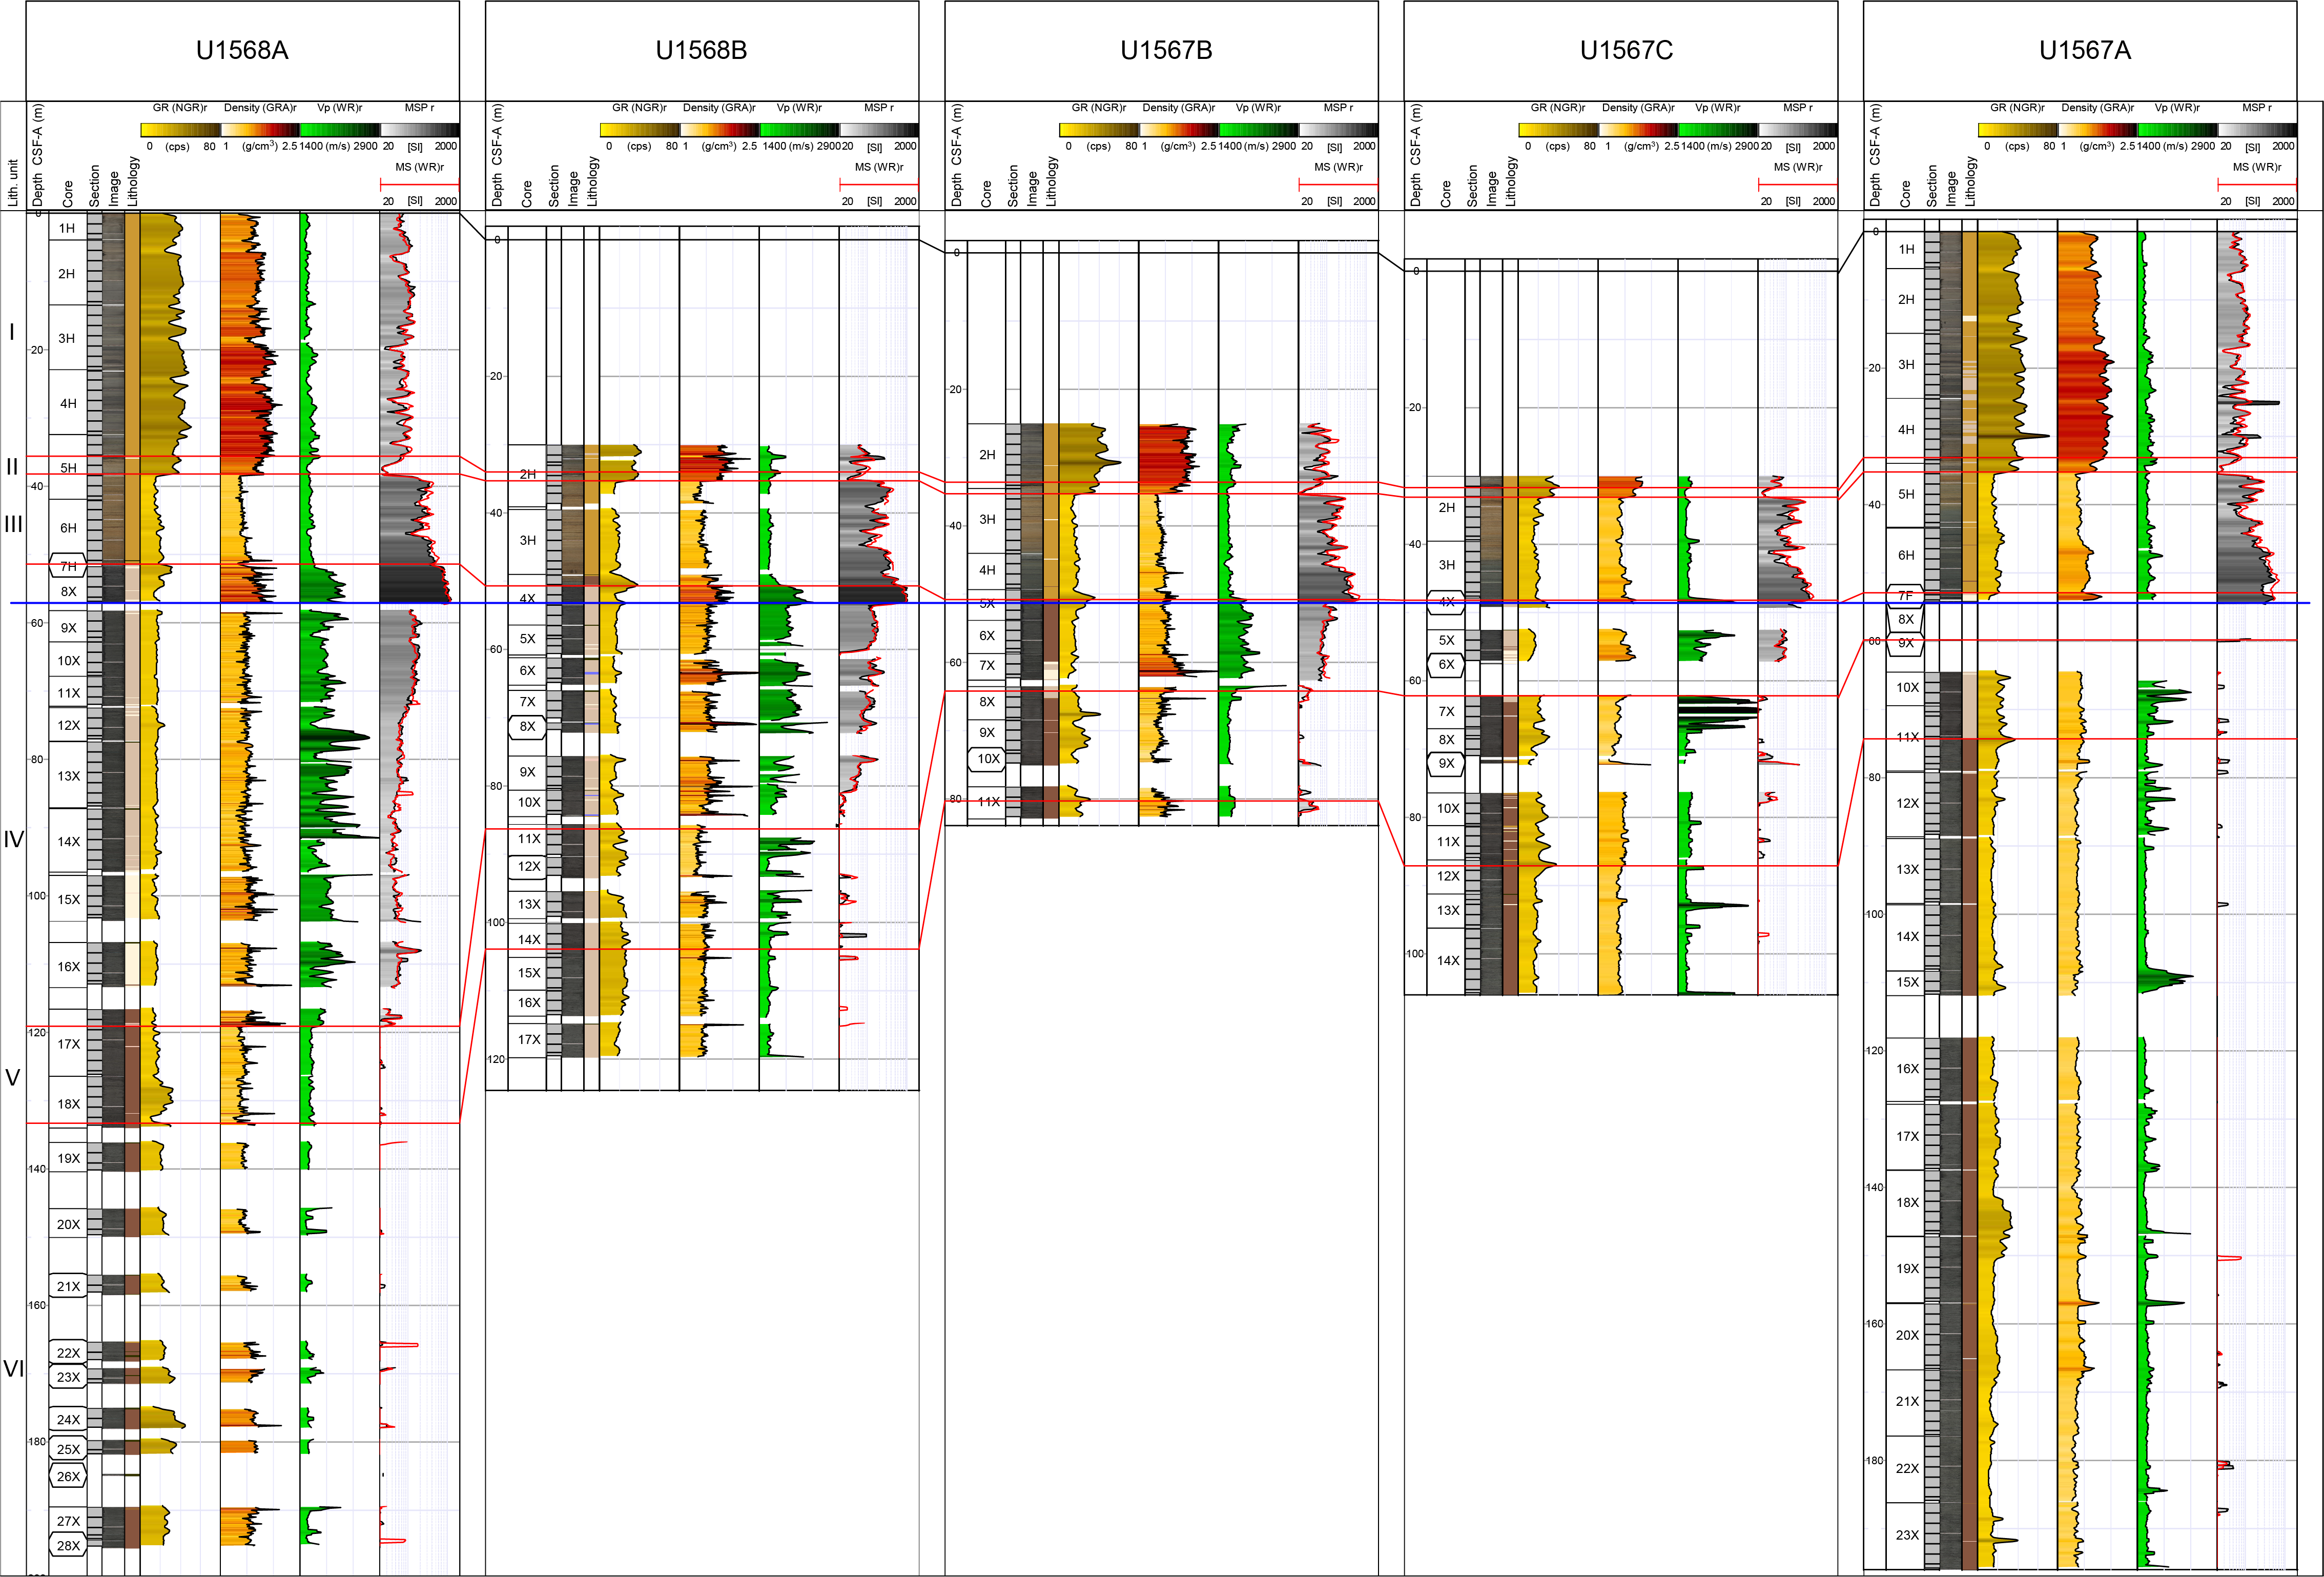
Figure F39. Physical properties data, Sites U1567 and U1568.
The underlying mid-Early Eocene Unit III is characterized by a gradual increase in densities (mean = 1.71 g/cm3) with a corresponding increase in MS values that increases most substantially toward the base of the unit, reaching maximal values in all five cores, from 7 × 10⁻⁵ to as high as 2066 × 10−5 [SI]. The boundary between Units III and IV, as defined by the lithostratigraphic units, clearly deviates from the major physical properties change that defines the increase followed by rapid decrease in the MS (Figure F39). To better highlight this important transition, a revised boundary was defined (Figure F40) that moves the Unit III–IV transition deeper in Holes U1568A, U1568B, and U1567A to better summarize the physical properties. It is also clearly seen (Figure F40) that the peak MS transition associated with the Unit III/IV boundary, as measured on the WRMSL, decreases laterally from Hole U1568A (max = 1428.5 × 10−5 [SI]; mean = 501.7 × 10⁻⁵ [SI]) to Hole U1567A (max = 801.3 × 10⁻⁵ [SI]; mean = 293.3 × 10⁻⁵ [SI]). The highest MS values above this horizon only occur in the two vent-proximal Site U1568 holes, and Unit III, without this basal layer, displays a remarkably consistent thickness. In light of this, it may be inferred that the basal high MS layer in these Site U1568 boreholes could pinch out prior to reaching Site U1567 boreholes.
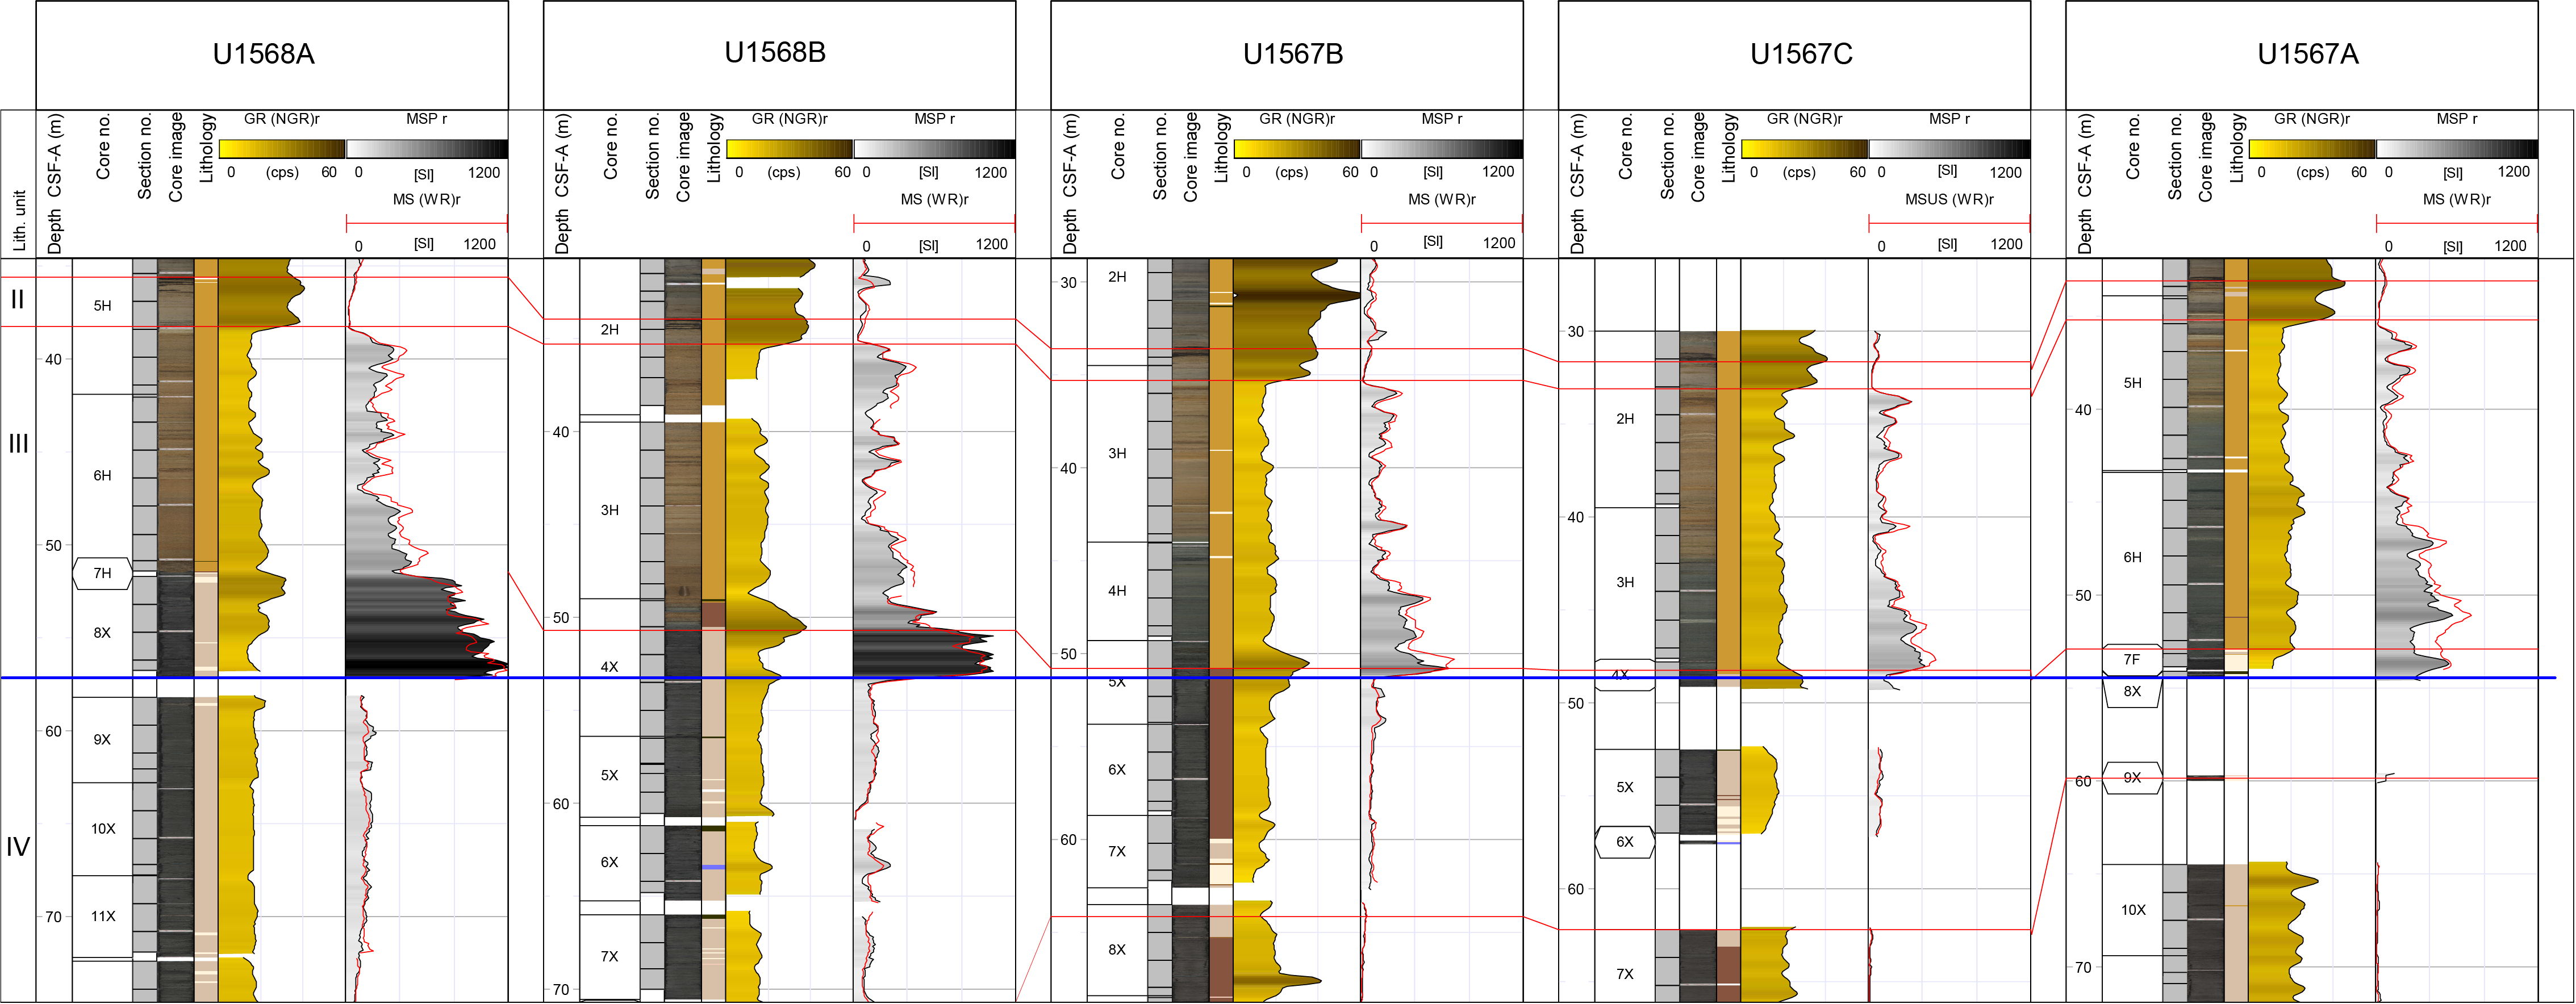
Figure F40. MS and GR on the Unit III/IV boundary.
The recovered thickness of Unit IV varies from ~6 m for Hole U1567A to over 65 m for Hole U1568A. The recorded P-wave velocity (mean = 1922 m/s; median = 1903.0 m/s) is the highest among all units, and Unit IV has a relatively high mean bulk density of 1.74 g/cm3 and relatively low MS of 90 × 10−5 [SI] compared to Unit III. The general trend of decreasing MS with depth (Figure F41) appears to be linked to the presence of several ash layers (see Lithostratigraphy) that become less abundant with depth in the unit with the dispersion and/or sharpness of the susceptibility signatures potentially linking to primary versus dispersed/reworked ash deposition (e.g., Rosenthal et al., 2018).
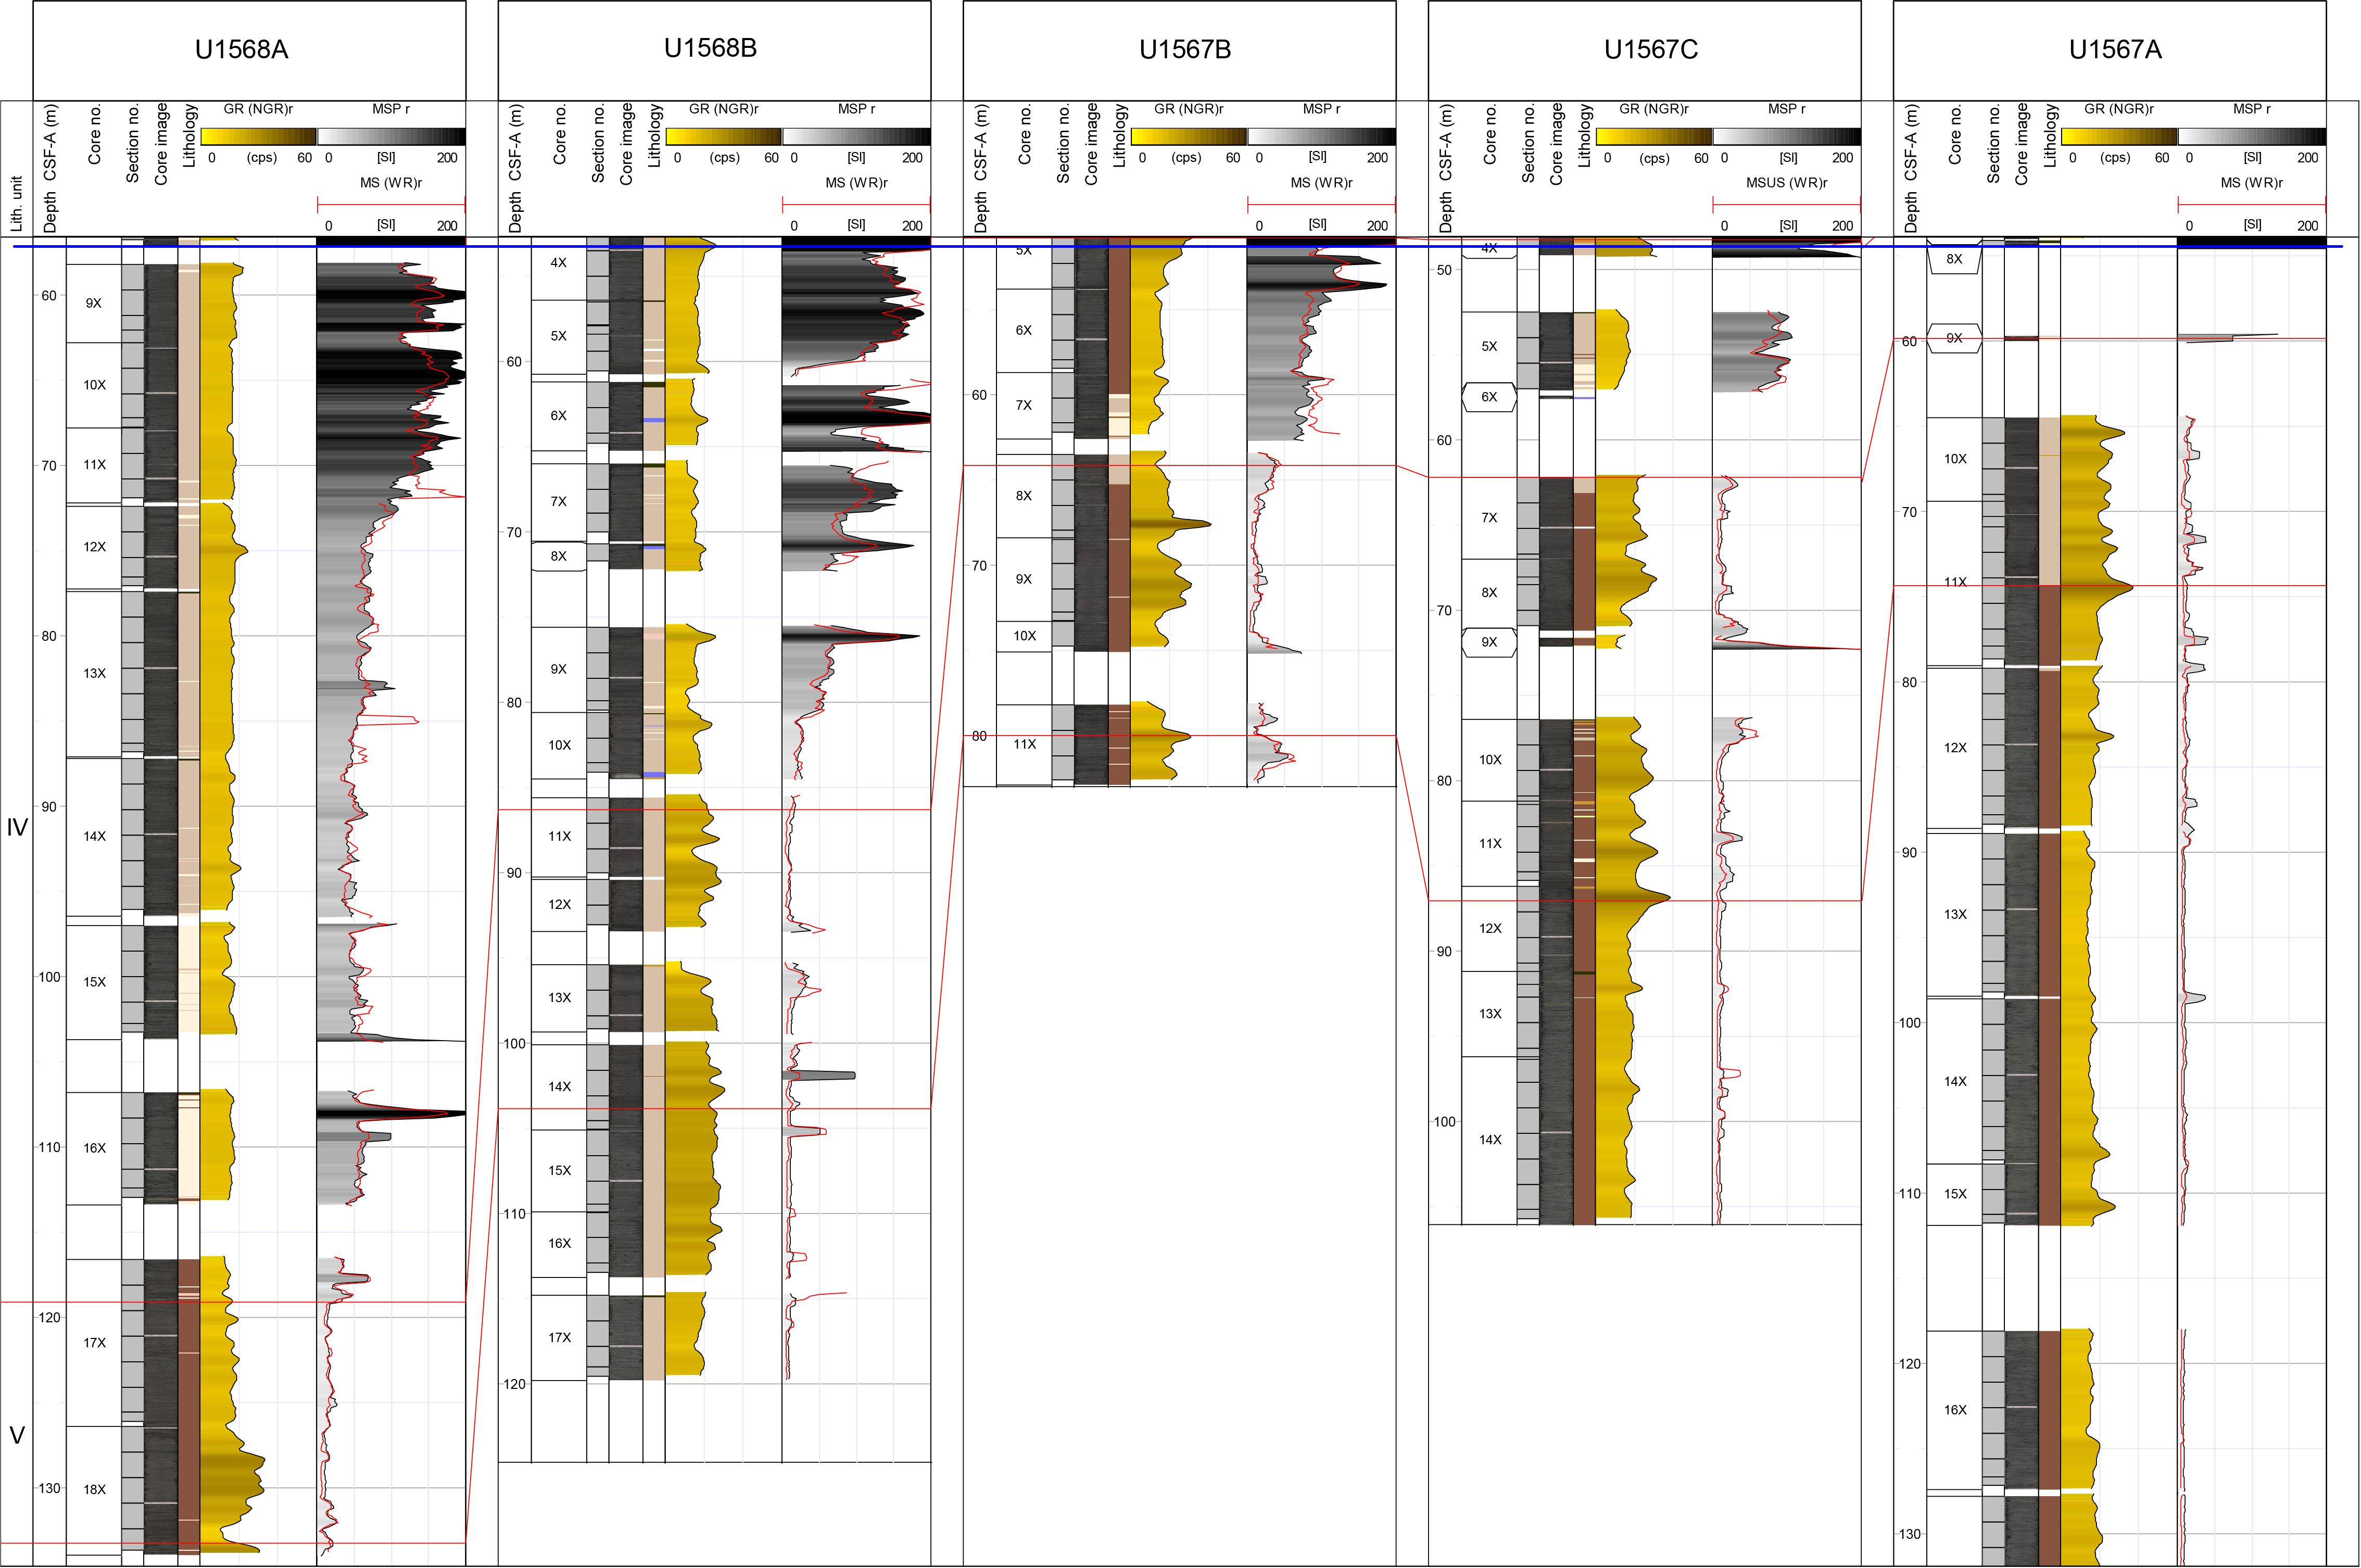
Figure F41. MS and GR on the modified Unit III/IV boundary.
Units V and VI reveal generally low and consistent P-wave velocities of around 1600 m/s and have accompanying low bulk density mean averages of 1.43 and 1.42 g/cm3, respectively. NGR values reveal fluctuations in Units V (mean = 22 counts/s) and VI (mean = 19 counts/s). However, gamma trends across all boreholes fluctuate such that correlations across the penetrated boreholes are not clearly defined. Overall, the penetrated sequences reveal physical properties consistent with a very poorly compacted mudstone-dominated sequence with fine-scale internal physical properties variations linked to ash deposition in the basin setting.
8. Downhole measurements
Wireline logging was conducted in Holes U1567A and U1568A and terminated at 195.9 and 200 m drilling depth below seafloor (DSF), respectively (Tables T19, T20). After coring was completed, Hole U1567A was prepared for logging and the drill pipe was pulled back to a logging depth of 82.8 mbsf. In Hole U1568A, the hole was prepared for logging and the drill string was pulled back to 82 mbsf for logging. Two logging tool strings were deployed at each site, the triple combo and the FMS-sonic. Two consecutive upward logging runs were collected for each tool string, and data from the main logging run is presented in this section unless otherwise indicated. The logs were also run while the tool strings descended into the well with calipers closed. Gamma ray (GR) was logged through the drill pipe to identify the seafloor, which shows a clear increase in GR at both sites, and was used to zero all logging runs to seafloor.
Logging operations were successful, and data were collected over a total open hole interval of ~112 m in Hole U1567A and ~105 m in Hole U1568A. However, depending on sensor position within the tool string, not all of these intervals were measured by all tools. Data were sent for processing, depth matching, and quality control to Lamont-Doherty Earth Observatory at Columbia University, and the processed data were returned to the onboard logging team within 1–2 days. The depth scale for all wireline data is wireline log matched depth below seafloor (WMSF) in meters, whereas the associated core data uses the CSF-A depth scale in meters. No depth matching between core and wireline data is presented in this chapter, and core-log data comparisons are therefore only indicative.
8.1. Logging units
The four logging units defined for Holes U1567A and U1568A are constrained by a combination of lithostratigraphy, physical properties, and wireline data (see Lithostratigraphy and Physical properties). The logging units are restricted to broad GR-based inferences in the upper parts of each hole above the drill string, and several of the lithostratigraphic units are therefore not identifiable with only GR information. However, in the main open hole logged intervals, the wireline properties reveal several transitions that are not seen in the macroscopic lithologies. Only three logging units are defined in Hole U1568A because of limited data coverage. Because of differing logging data coverage, logging units are defined individually for each hole and should not be confused with the correlated numbering system used in Lithostratigraphy.
8.1.1. Hole U1567A
A summary of selected wireline traces for the main open hole logged interval of Hole U1567A is presented in Figure F42. GR, MS, and borehole caliper wireline traces are presented alongside core-derived measurements in Figure F43. Bulk density (RHOM), P-wave velocity, photoelectric effect (PEF), and acoustic impedance (AI) (density × VP) are presented in Figure F44 alongside core-derived measurements. In general, the borehole data revealed enlargements (caliper diameter readings are ~2–5 cm wider than the bit diameter) for much of the logged open hole section, indicating borehole instability and washouts, which influence wireline data quality. In addition, the closure of the caliper arms on the triple combo tool string at ~100 m WMSF had a significant impact on all caliper-corrected log traces run in the triple combo tool string. Most log data from this tool run (density, PEF, resistivity, and GR) show distinct nongeological shifts in values at precisely this depth and can be confirmed as nongeological by comparison to the repeat logging run and the other tool string runs.
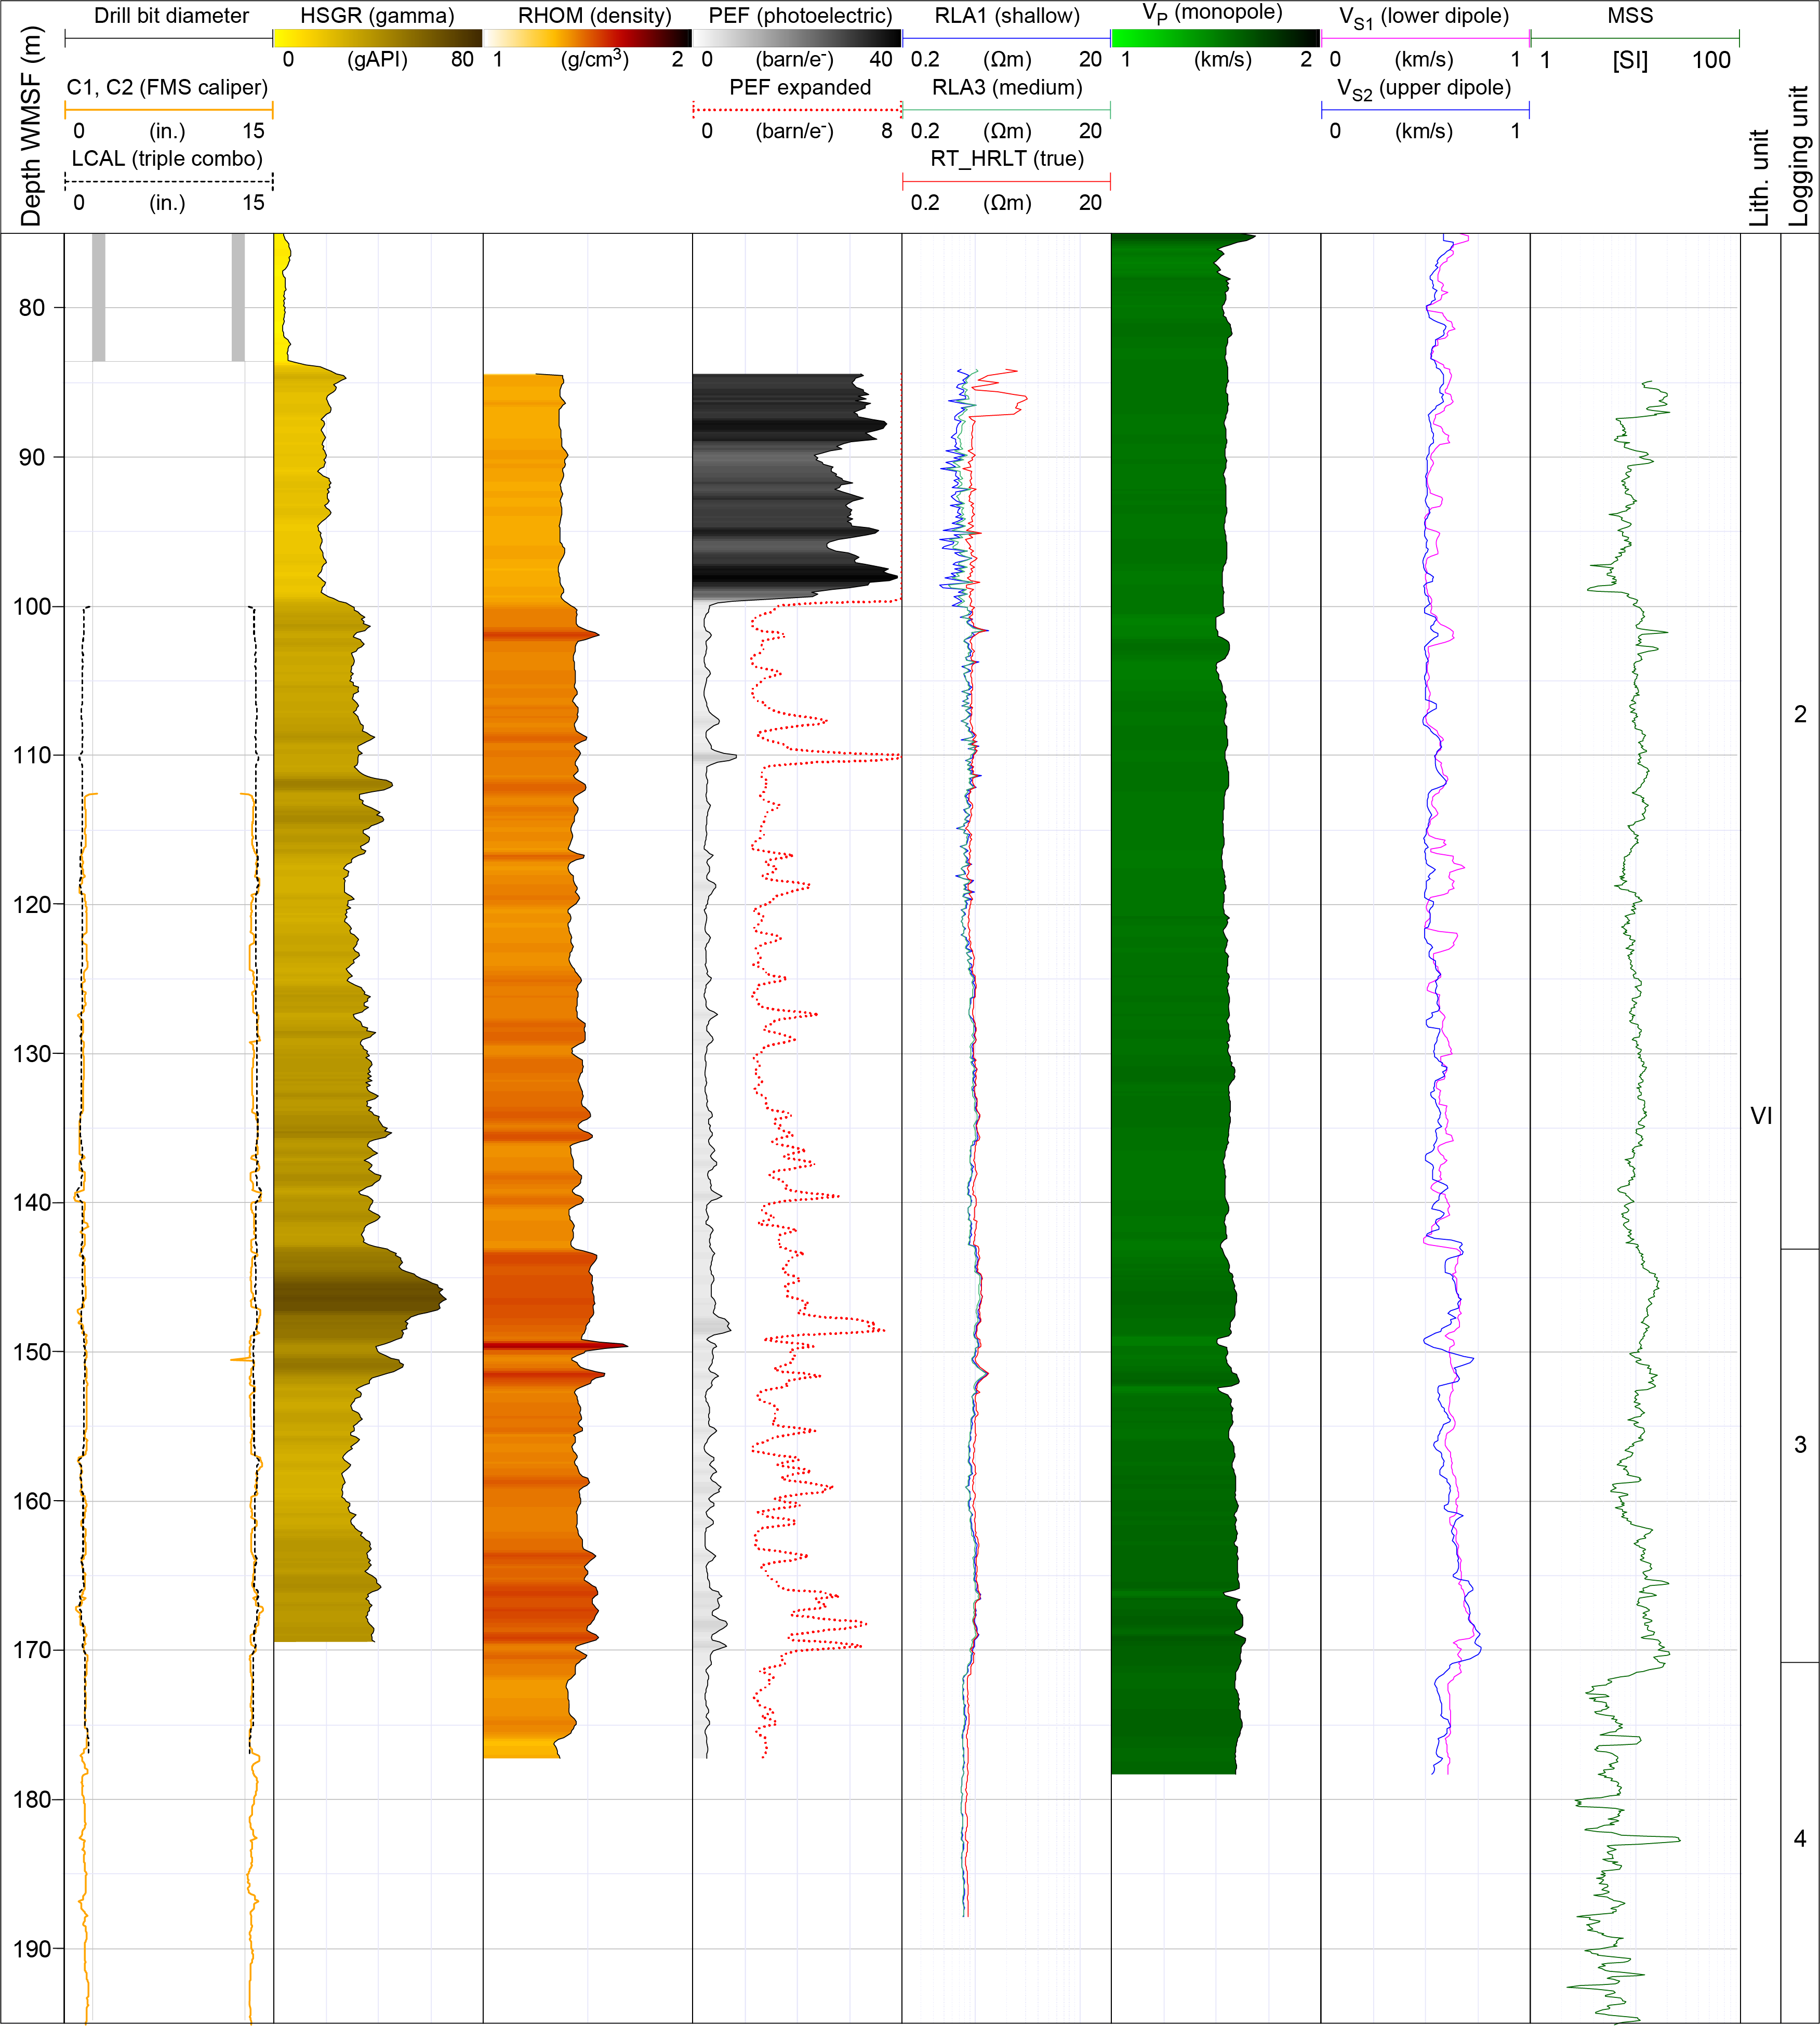
Figure F42. Wireline log traces, Hole U1567A.
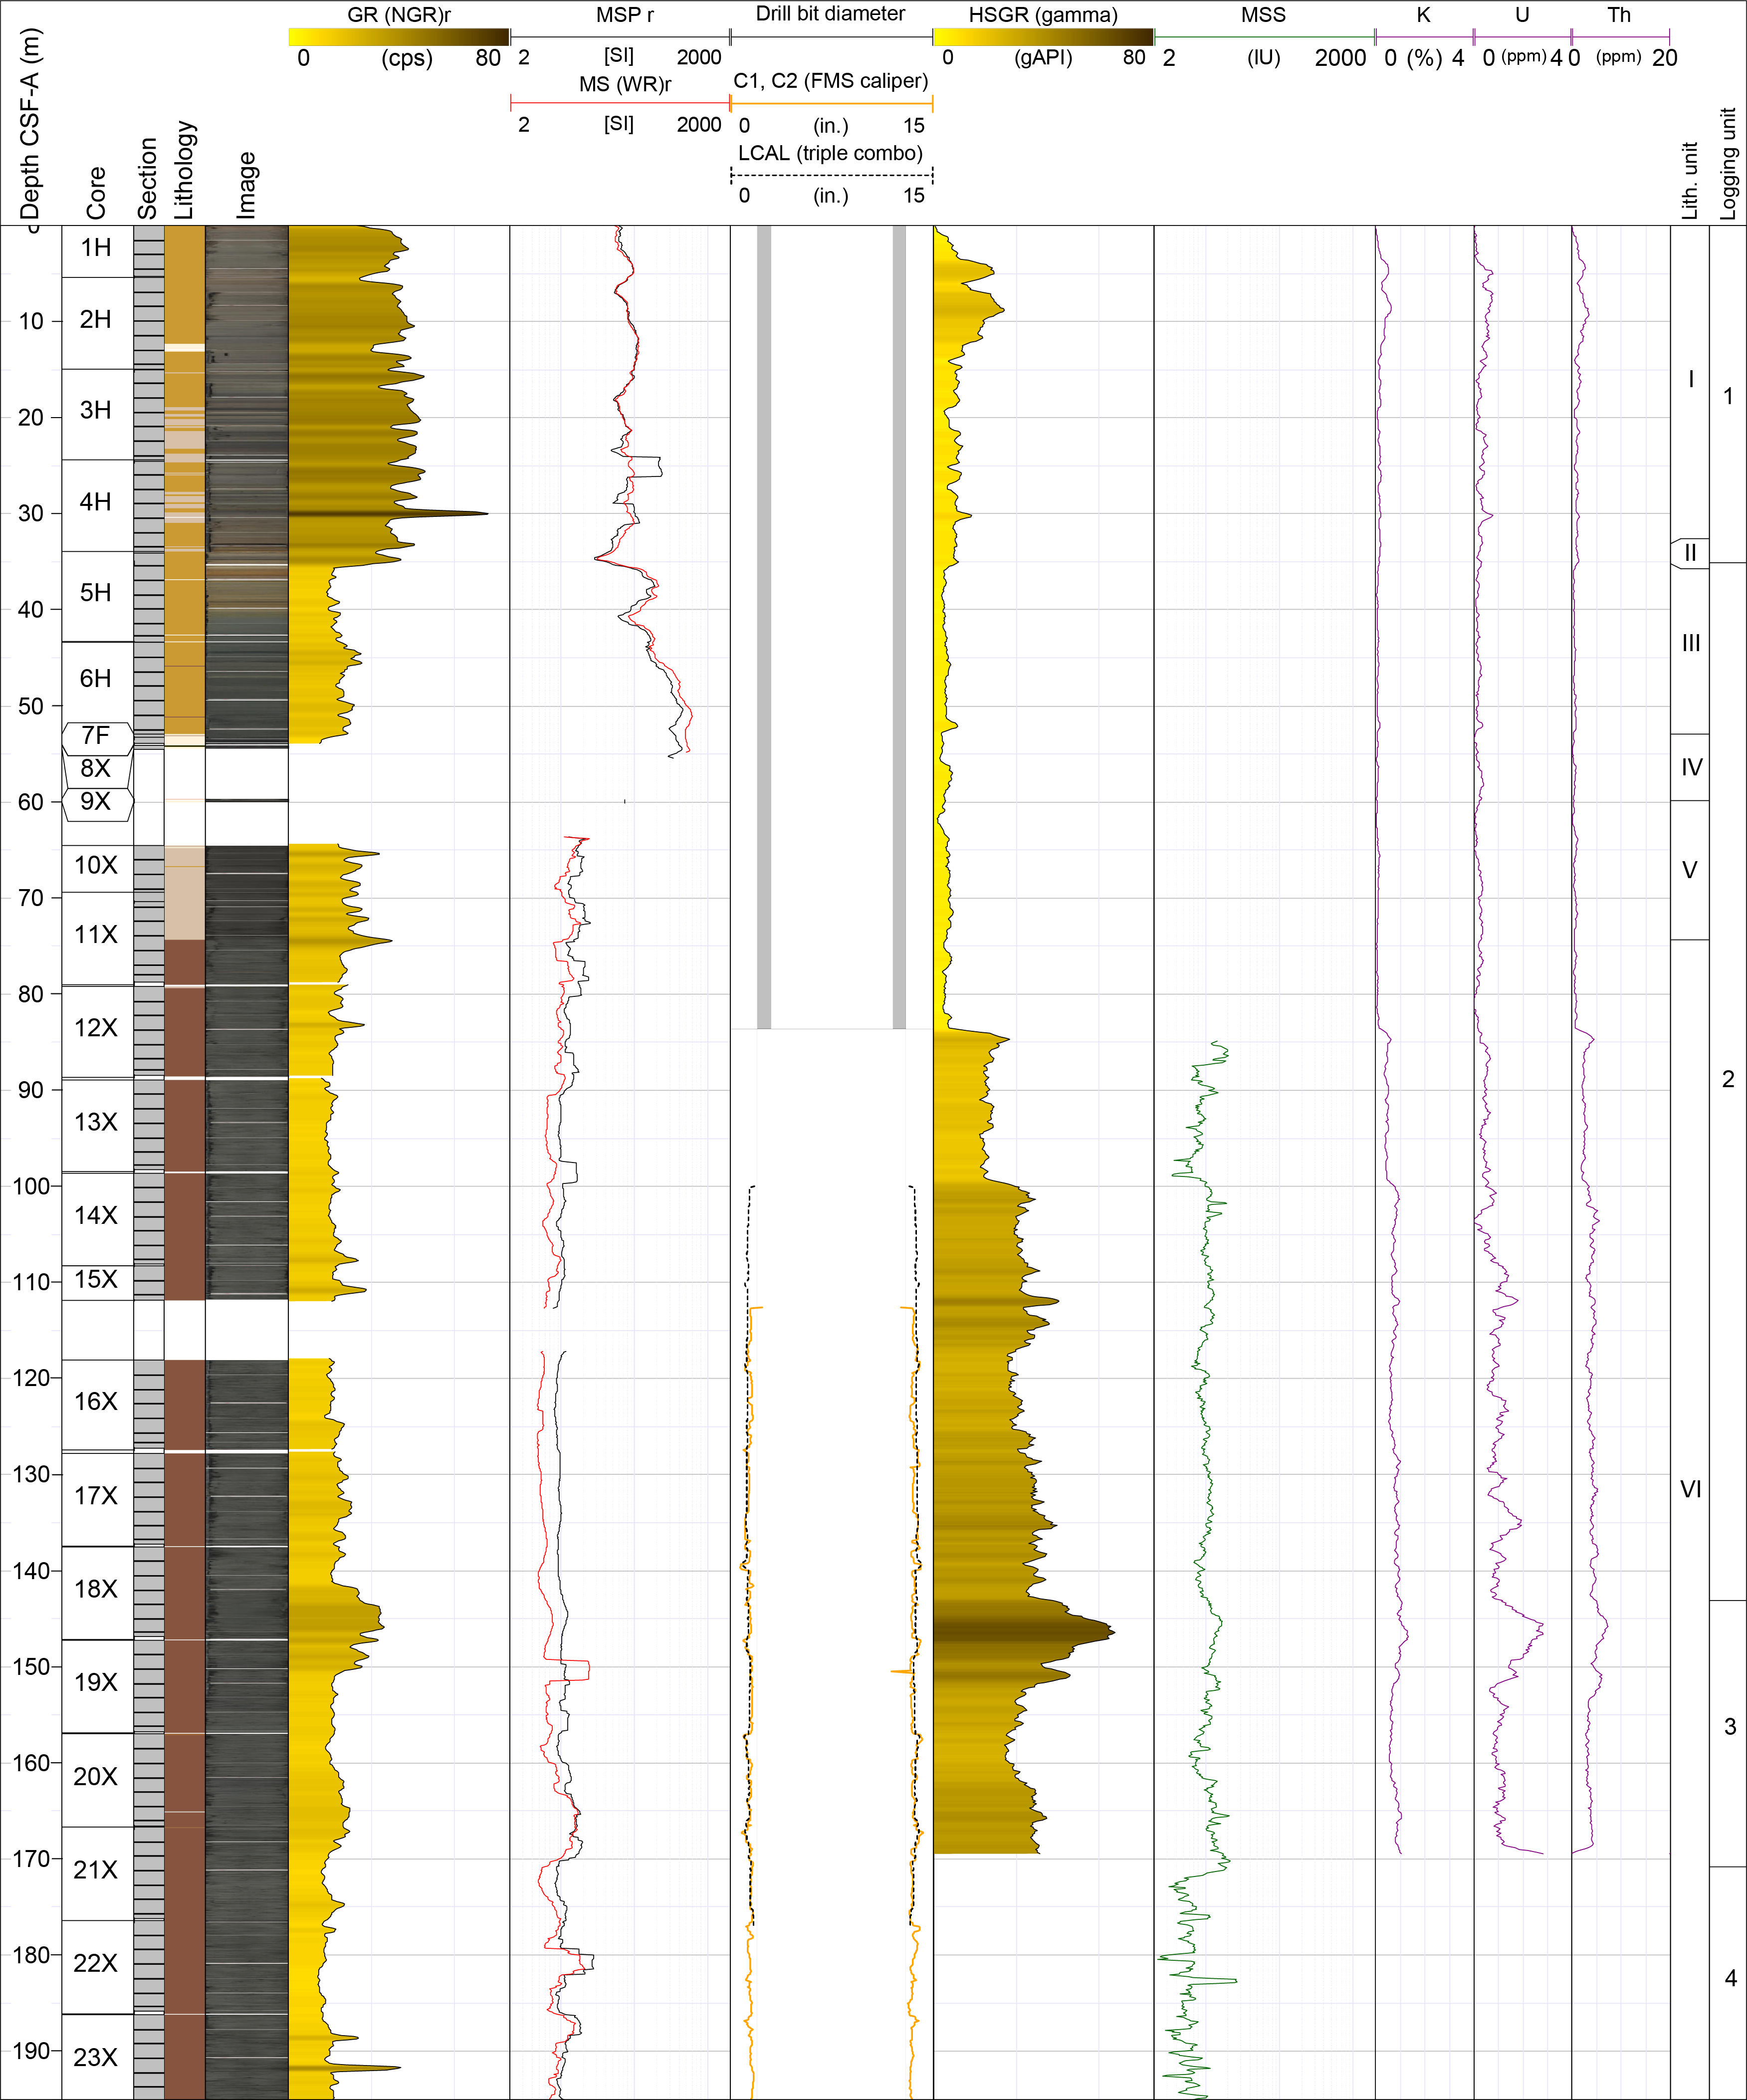
Figure F43. Wireline GR and MS, Hole U1567A.
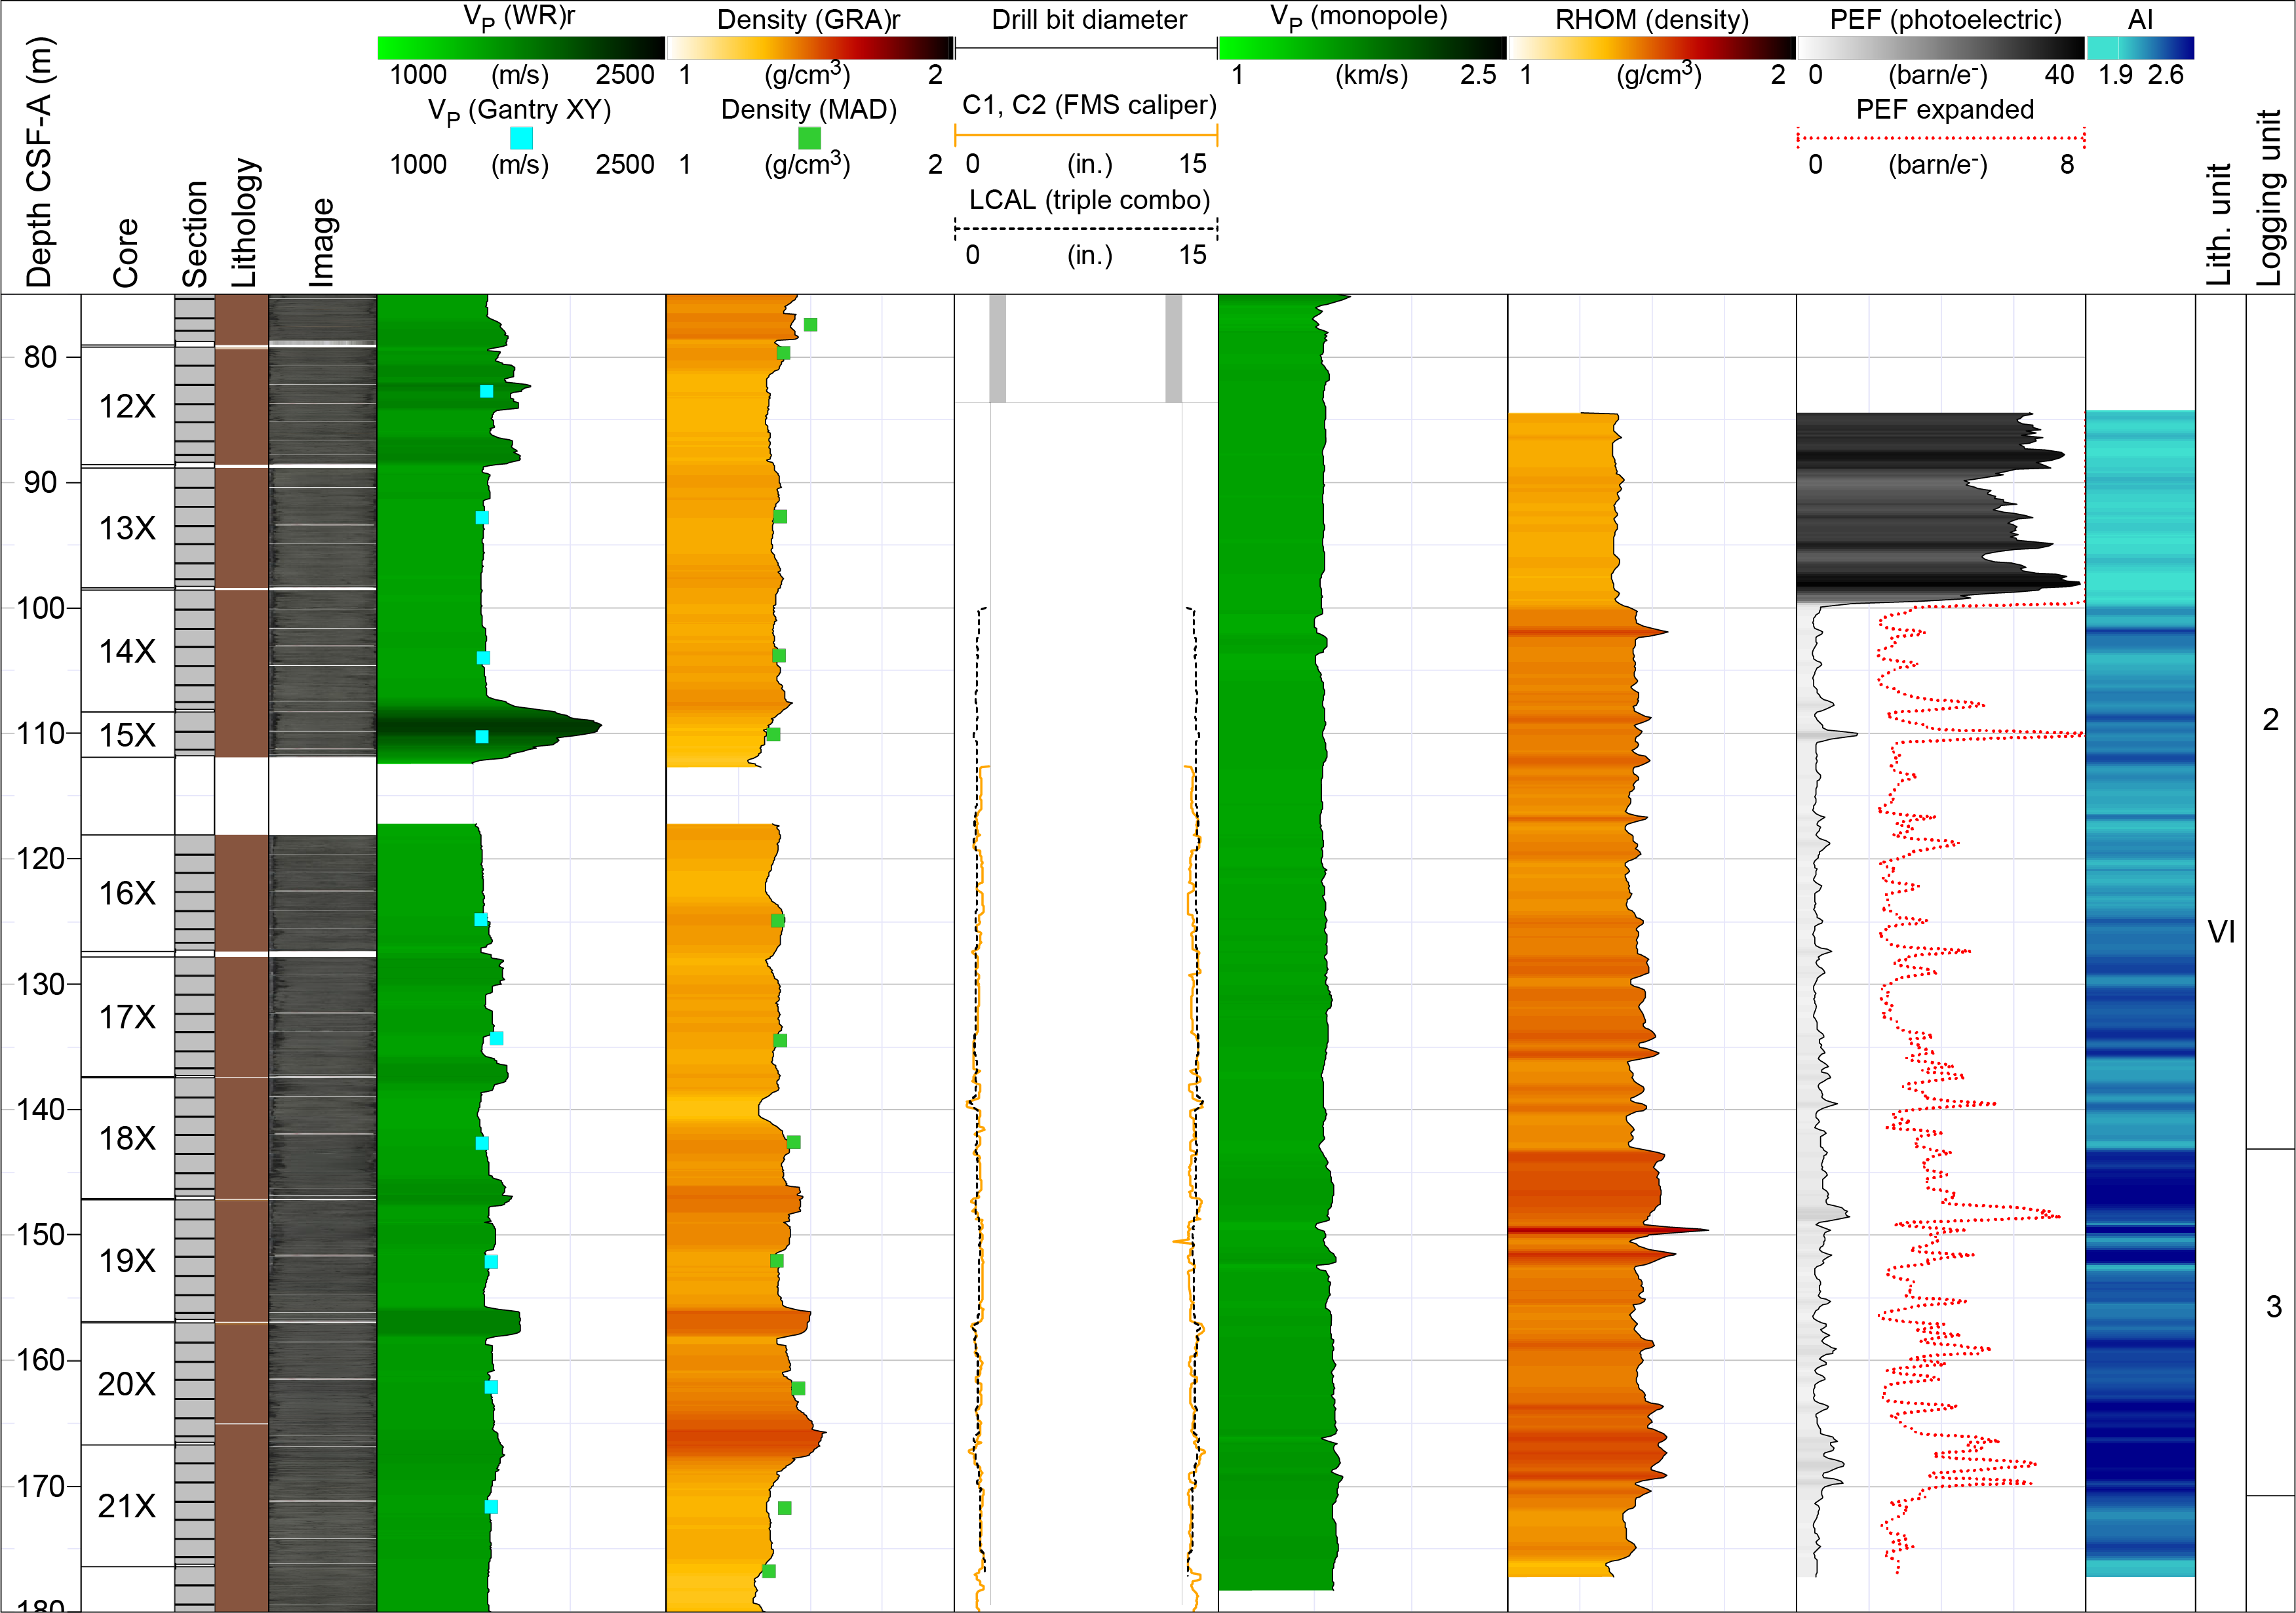
Figure F44. Wireline bulk density, PEF, sonic P-wave, and calculated AI, Hole U1567A.
8.1.1.1. Logging Units 1 and 2
GR data across Logging Units 1 and 2 reveal a subdued GR signal compared to the underlying open hole intervals that is related to signature attenuation by reading through the drill string. This is observed at ~83 m WMSF, where the wireline GR data suddenly jumps from ~10 to 25 gAPI but the core-derived NGR response remains stable. A similar jump at ~100 m WMSF relates to the closure of the caliper during the main triple combo upwards logging pass as noted above. Beyond the baseline changes, increases in both core-derived NGR and wireline GR data are observed, and a sudden drop at ~35 m WMSF defines the transition between Logging Units 1 and 2. Although a strong peak in P-wave velocity is visible at ~110 m WMSF in the core-derived acoustic velocity data, no similar increase is observed in the wireline measurements. Instead, wireline GR, MS, resistivity, P-wave velocity, and bulk density all remain constant throughout the remainder of Logging Unit 2, gradually increasing only slightly to ~145 m WMSF (Figure F44). The higher core-derived velocity is linked to WRMSL scatter and may thus be linked to poor connections between the core and liner during track analyses at this depth.
8.1.1.2. Logging Unit 3
The start of Logging Unit 3 is marked at ~145 m WMSF by a strong increase in bulk density, resistivity, and MS and in the individual GR derived elements K, U, and Th that follow similar trends (Figure F43). Variations in GR and MS are captured in the core-derived data sets within a 1–2 m offset, indicating a close depth correlation prior to core depth shifting. GR, MS, and resistivity data all gradually decline and then increase throughout the unit. The increasing trend is also observed for the shear velocities, which reach their maxima toward the base of Logging Unit 3.
8.1.1.3. Logging Unit 4
A reduction in shear velocity, density, and MS marks the transition into Logging Unit 4, although most wireline data terminate within ~15 m from the boundary and no wireline GR was recorded for this interval. Comparison between wireline and core-derived MS shows the same transition in the core data with good correlation for the peak observed at ~182 m WMSF.
8.1.2. Site U1568A
A summary of selected wireline traces for the main open hole logged interval in Hole U1568A is presented in Figure F45. GR, MS, and borehole caliper wireline traces are presented alongside core-derived measurements in Figure F46. Bulk density (RHOM), P-wave velocity, PEF, and AI (density × VP) are presented in Figure F47 alongside core-derived measurements. In general, the borehole reveals enlargement (3–10 cm diameter increases above the drill bit diameter) for much of the logged open hole section; the borehole diameter pinches in at ~114 m WMSF and becomes more irregular and serrated below 140 m WMSF, indicating unstable borehole wall conditions.
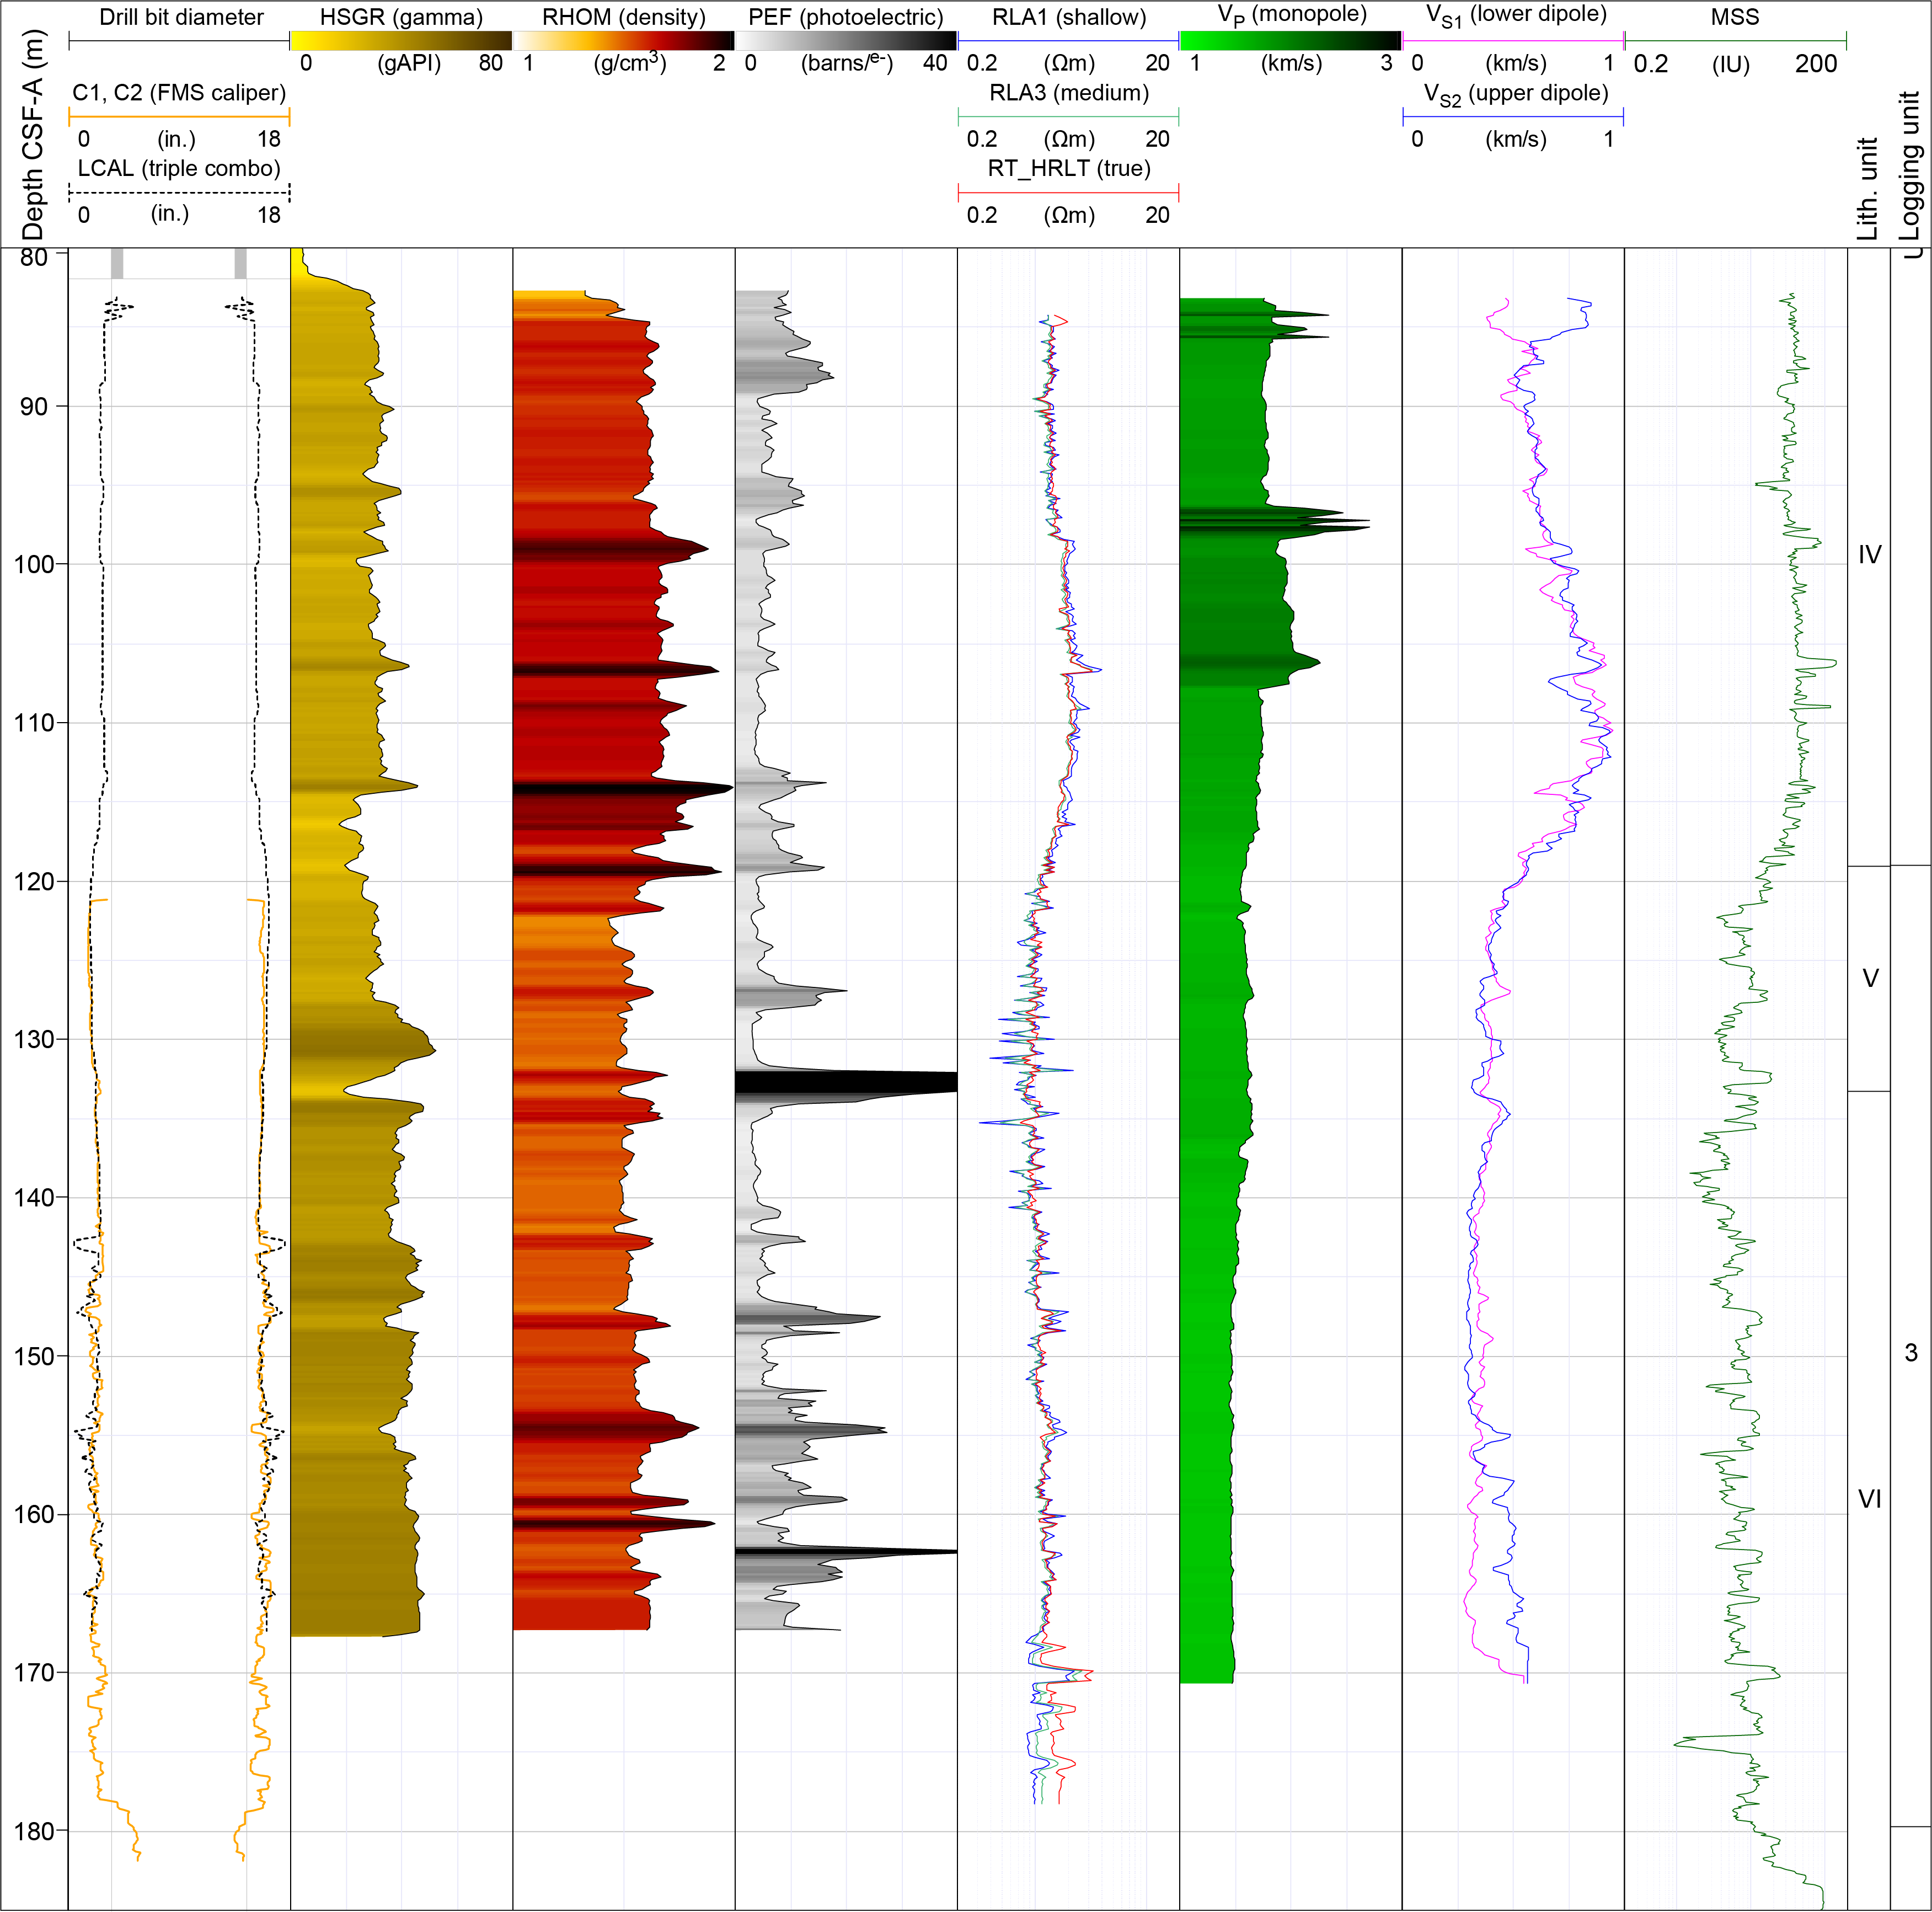
Figure F45. Wireline log traces, Hole U1568A.
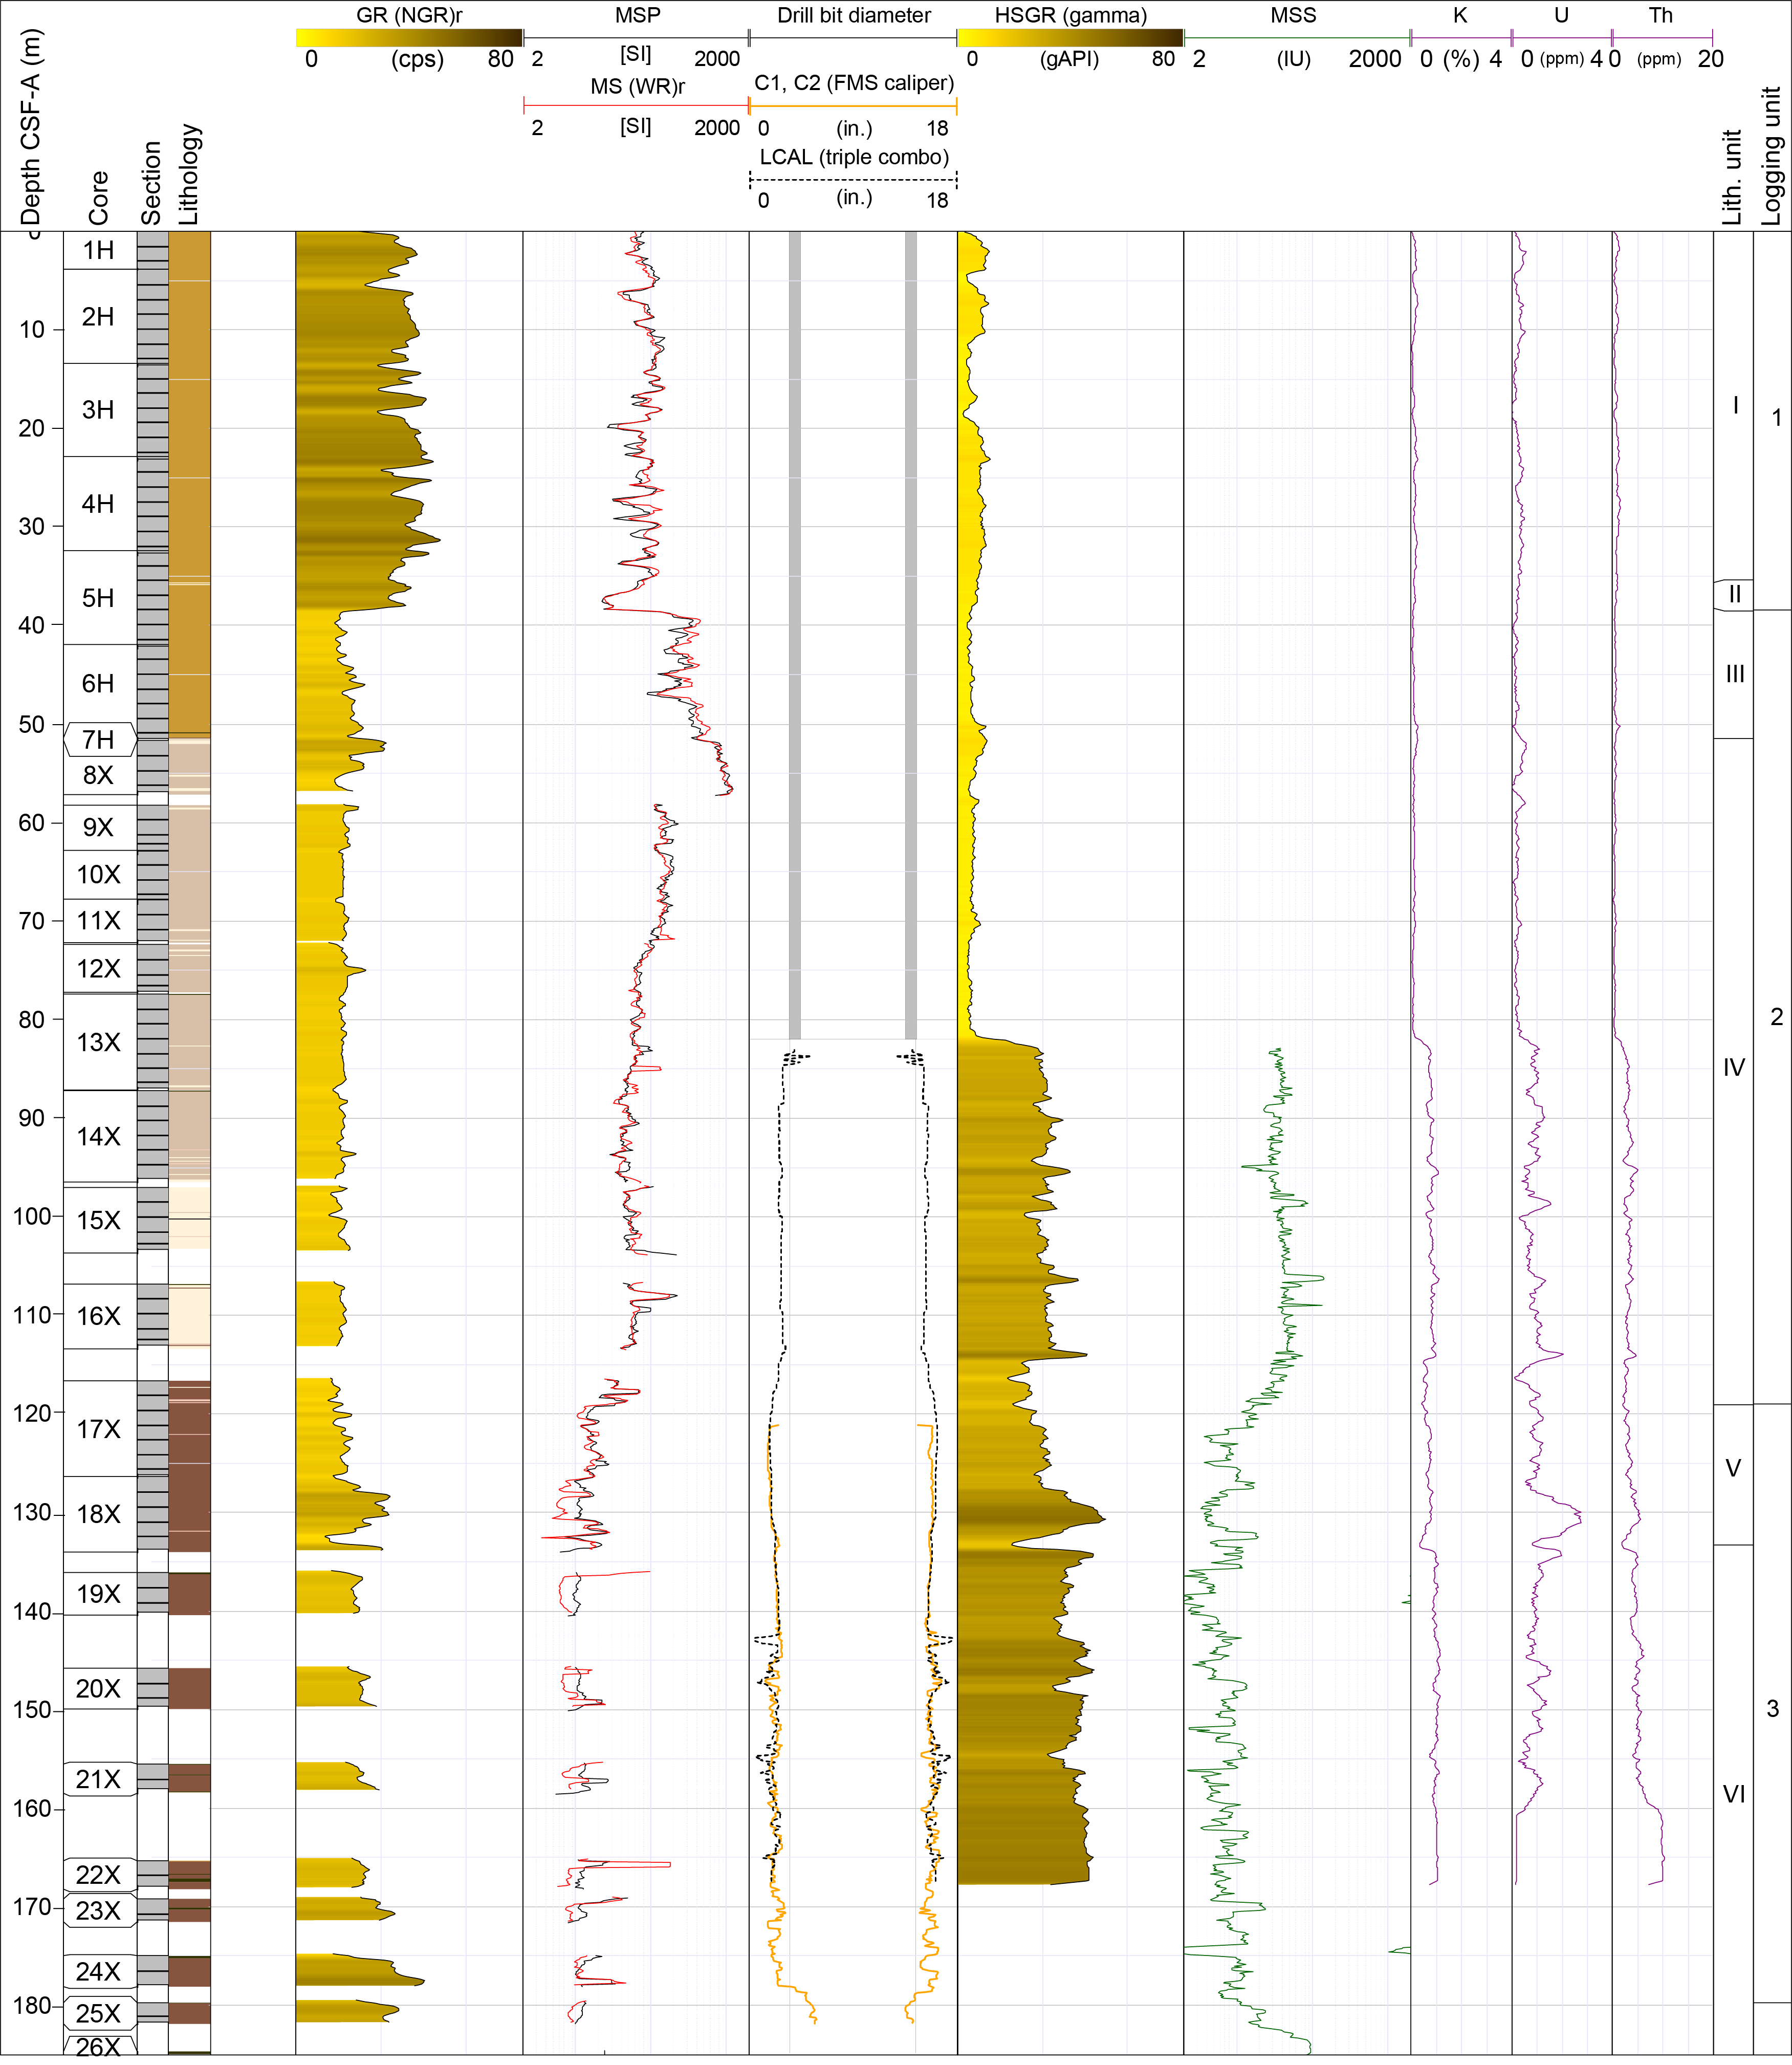
Figure F46. Wireline GR and MS, Hole U1568A.
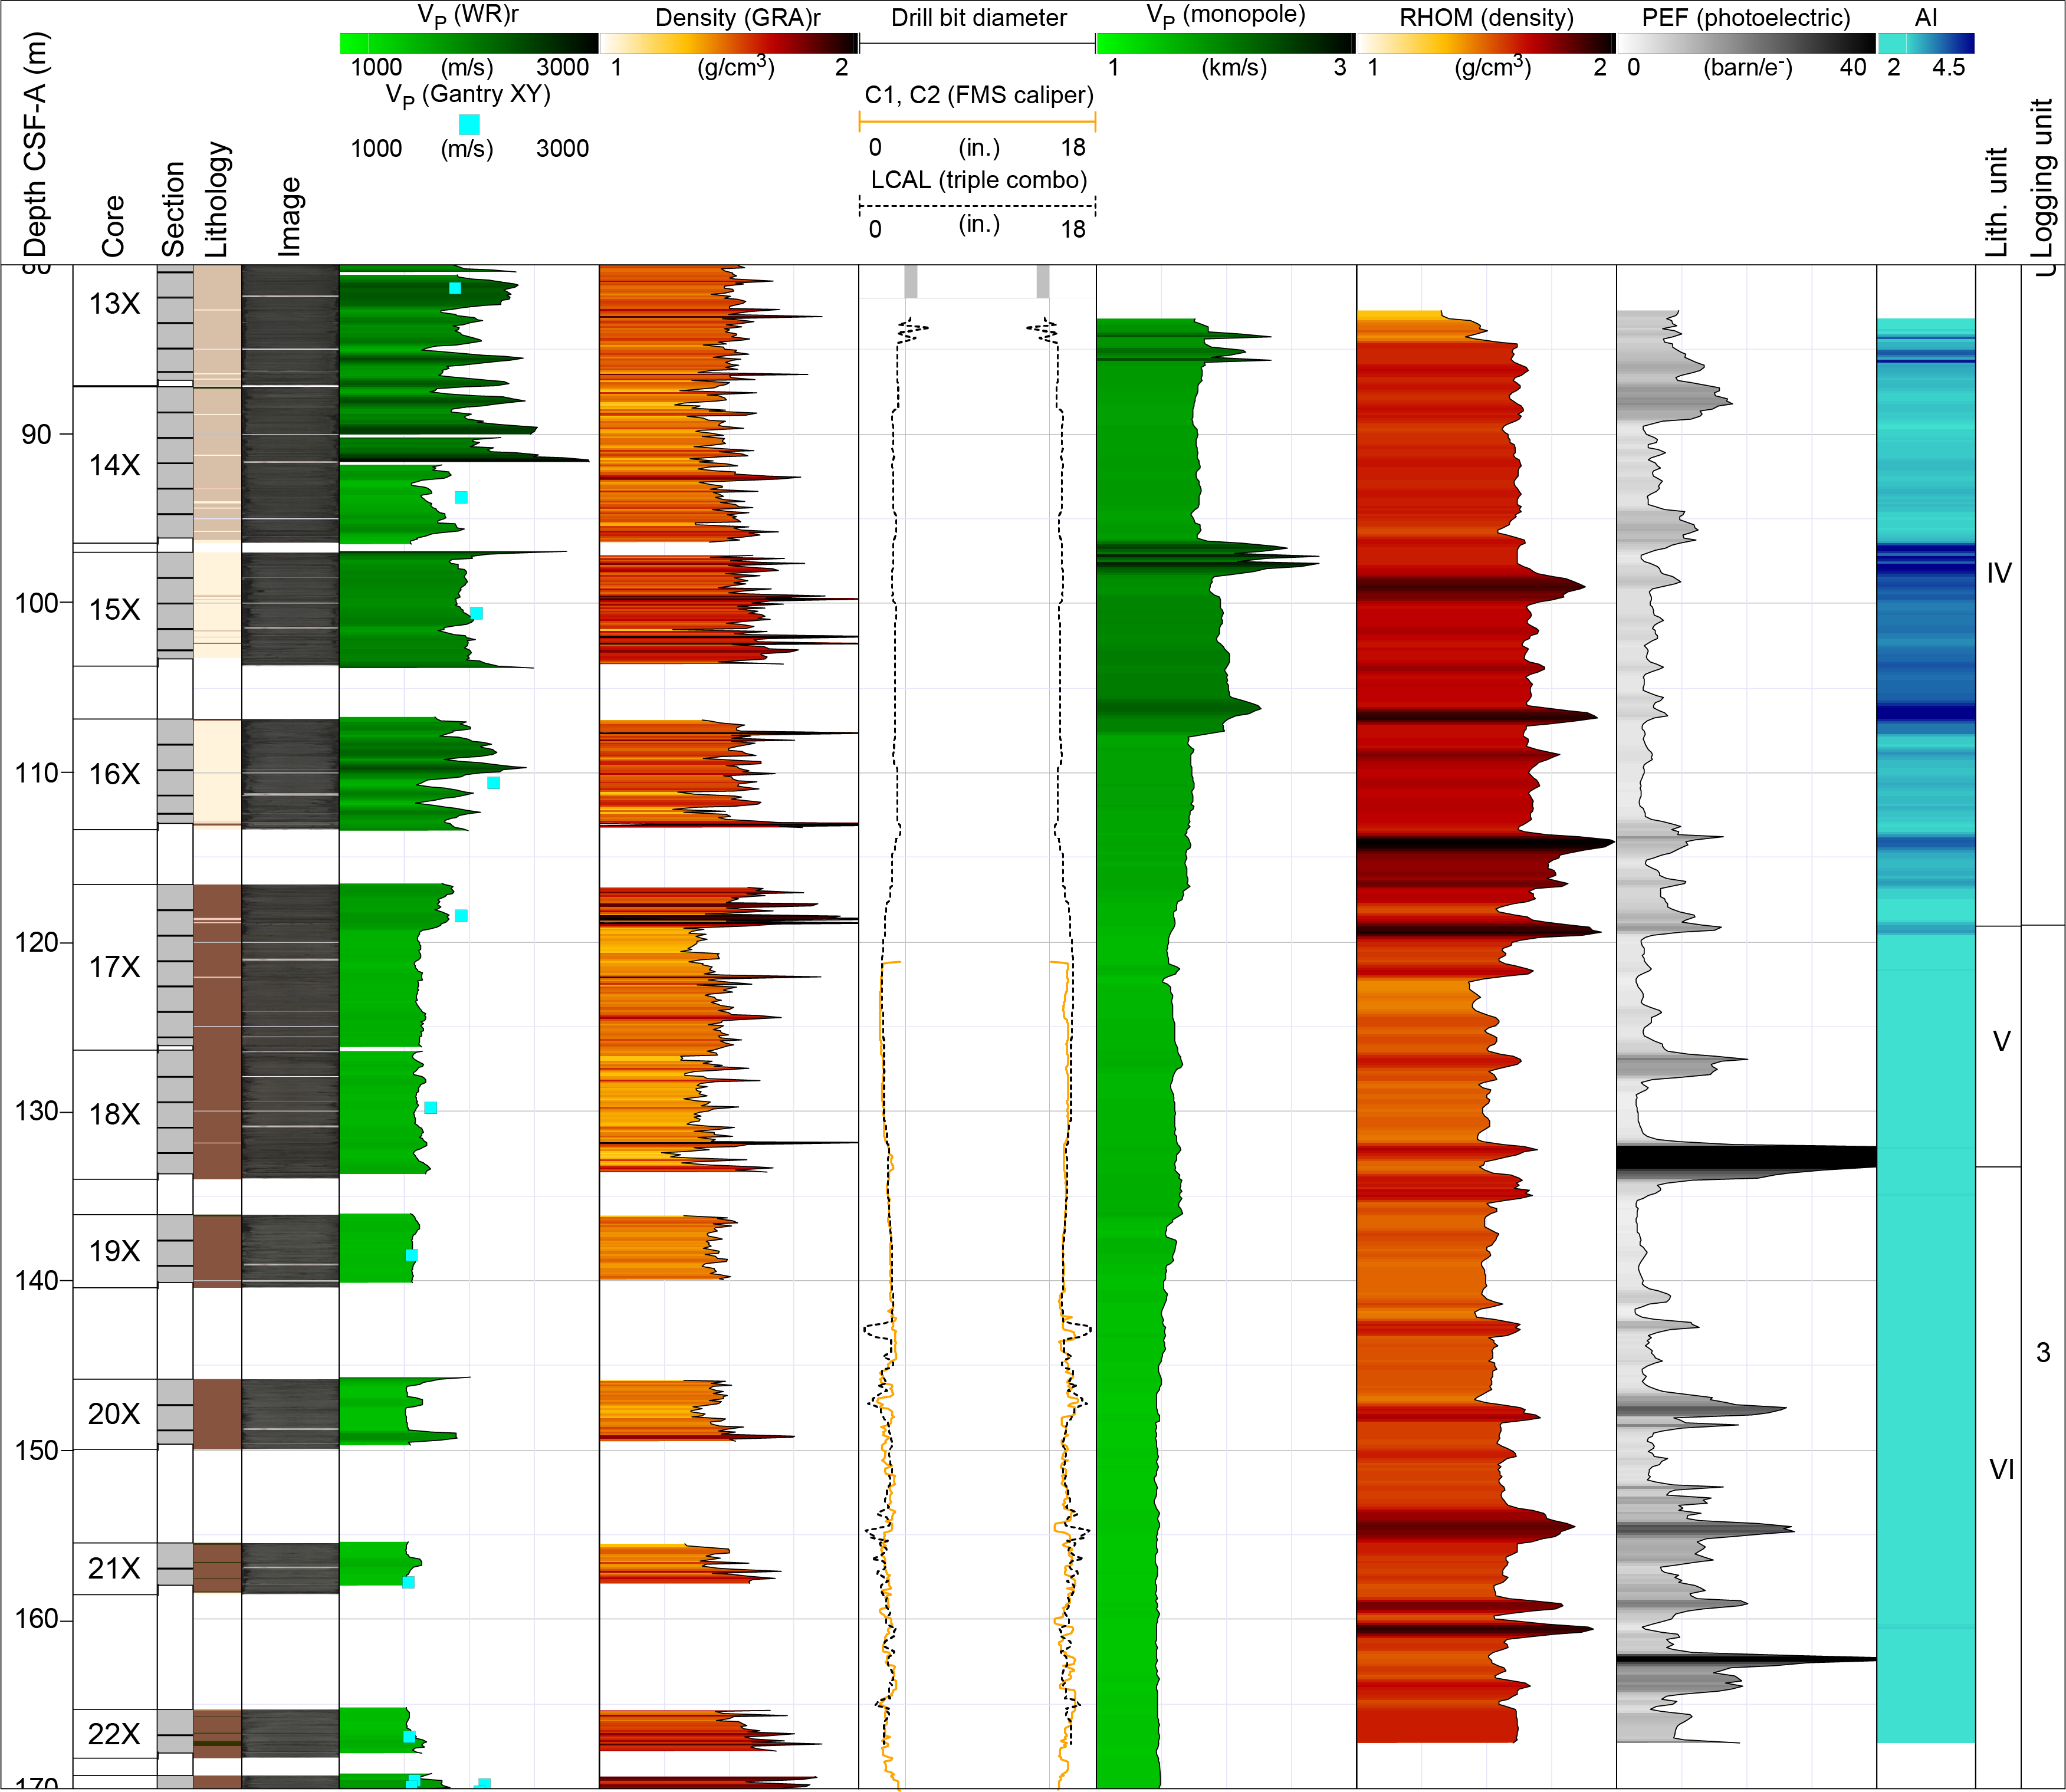
Figure F47. Wireline bulk density, PEF, sonic P-wave, and calculated AI, Hole U1568A.
8.1.2.1. Logging Units 1 and 2
Logging Units 1 and 2 span most of the interval logged within the drill string casing, leading to GR being severely subdued to ~82 m WMSF. Logging Unit 1 is best defined by the slightly higher GR readings that correspond to the observed increase in core-derived NGR for Lithostratigraphic Units I and II from the seafloor to ~38 m WMSF. Correlation between core and wireline remains within 1–2 m throughout the remainder of Logging Unit 2. The open hole part of Logging Unit 2 features high resistivity, MS, bulk density, and P- and S-wave velocity values that are similar to core-derived trends. A return to low baseline values marks the end of Logging Unit 2 and the start of Logging Unit 3.
8.1.2.2. Logging Unit 3
The upper part of Logging Unit 3 coincides with a gradual decline in MS and a drop in GR. Bulk density and associated PEF spikes occur throughout Logging Unit 3 and are best observed by a PEF peak at ~133 m WMSF that exceeds the recording range of 40 barn/e−. The PEF log gives a value for the PEF of the formation, which is dependent on the formation’s mean atom number and therefore comprises a highly valuable log for assessing the matrix composition of formations. If the anomaly at ~133 m WMSF is real and related to the formation, significant quantities of a heavy mineral or combination of minerals such as barite (266.82 barn/e−) or zircon (69 barn/e−) may be present in this layer and the deeper layers that also show PEF spikes. However, barite is also one of the additives used in the drilling mud prior to logging to increase mud weight, so PEF anomalies are possible where caved sections or cavities result in the tool pads losing contact with the borehole wall (e.g., see example from Hole U1567A). The caliper reading over this interval does not show any cavities beyond the general borehole widening; therefore, the potential presence of heavy mineral–bearing layers in Logging Unit 3 cannot currently be discounted.
8.2. Summary
Logging operations returned GR, density, velocity, resistivity, PEF, MS, and FMS image log data covering part of the hydrothermal vent infill in Hole U1568A and the underlying sediment sequence in Hole U1567A. Both holes are dominated by soft claystones with very low and consistent velocities (typically <1700 m/s) and densities (~1.4–1.6 g/cm3). These wireline properties are consistent with almost uncompacted sediments that have not undergone significant postdepositional burial. Elevated PEF signatures at the base of the Early Eocene vent infill (base of Unit V) are identified in Hole U1568A, potentially indicating the presence of high atomic number elements such as Ba or Zr in this thin layer. Core observations do not show clear lithologic variations at this depth, and the hole is generally in good condition, so the origin of the anomaly and whether it links to a geological (linked to venting process) or drilling (e.g., fluid invasion with barite drilling mud) process remains to be resolved.
References
Adkins, J.F., McIntyre, K., and Schrag, D.P., 2002. The salinity, temperature, and δ18O of the glacial deep ocean. Science, 298(5599):1769–1773. https://doi.org/
Aleksandrova, G.N., Oreshkina, T.V., Iakovleva, A.I., and Radionova, E.P., 2012. Late Paleocene-early Eocene diatoms and dinocysts from biosiliceous facies of the middle Trans-Urals region. Stratigraphy and Geological Correlation, 20(4):380–404. https://doi.org/
Baturin, G.N., 2012. The Geochemistry of Manganese and Manganese Nodules in the Ocean: Berlin (Springer Science & Business Media).
Berndt, C., Hensen, C., Mortera-Gutierrez, C., Sarkar, S., Geilert, S., Schmidt, M., Liebetrau, V., Kipfer, R., Scholz, F., Doll, M., Muff, S., Karstens, J., Planke, S., Petersen, S., Böttner, C., Chi, W.-C., Moser, M., Behrendt, R., Fiskal, A., Lever, M.A., Su, C.-C., Deng, L., Brennwald, M.S., and Lizarralde, D., 2016. Rifting under steam—how rift magmatism triggers methane venting from sedimentary basins. Geology, 44(9):767–770. https://doi.org/
Bujak, J., and Mudge, D., 1994. A high-resolution North Sea Eocene dinocyst zonation. Journal of the Geological Society (London, UK), 151(3):449–462. https://doi.org/
Bünz, S., and Shipboard Scientists, 2020. CAGE-20-4 cruise report. High-resolution 2D and 3D seismic investigations on the Møre and Vøring margins. UiT The Arctic University of Norway report, 47.
Chadima, M., and Hrouda, F., 2006. Remasoft 3.0 a user-friendly paleomagnetic data browser and analyzer. Travaux Géophysiques, 27:20–21.
Chester, R., and Jickells, T., 2012. Marine Geochemistry, 3rd edition: London (Wiley-Blackwell). https://doi.org/
Crouch, E.M., Heilmann-Clausen, C., Brinkhuis, H., Morgans, H.E.G., Rogers, K.M., Egger, H., and Schmitz, B., 2001. Global dinoflagellate event associated with the late Paleocene thermal maximum. Geology, 29(4):315–318. https://doi.org/
Dallanave, E., Muttoni, G., Agnini, C., Tauxe, L., and Rio, D., 2012. Is there a normal magnetic-polarity event during the Palaeocene–Eocene Thermal Maximum (~55 Ma)? Insights from the palaeomagnetic record of the Belluno Basin (Italy). Geophysical Journal International, 191(2):517–529. https://doi.org/
Dickens, G.R., 2011. Down the rabbit hole: toward appropriate discussion of methane release from gas hydrate systems during the Paleocene-Eocene Thermal Maximum and other past hyperthermal events. Climate of the Past, 7(3):831–846. https://doi.org/
Dickens, G.R., O’Neil, J.R., Rea, D.K., and Owen, R.M., 1995. Dissociation of oceanic methane hydrate as a cause of the carbon isotope excursion at the end of the Paleocene. Paleoceanography, 10(6):965–971. https://doi.org/
Eldholm, O., and Thomas, E., 1993. Environmental impact of volcanic margin formation. Earth and Planetary Science Letters, 117(3–4):319–329. https://doi.org/
Ernst, R.E., and Youbi, N., 2017. How Large Igneous Provinces affect global climate, sometimes cause mass extinctions, and represent natural markers in the geological record. Palaeogeography, Palaeoclimatology, Palaeoecology, 478:30–52. https://doi.org/
Fenner, J., 1994. Diatoms of the Fur Formation, their taxonomy and biostratigraphic interpretation–results from the Harre borehole, Denmark. Aarhus Geoscience, 1(99):131.
Frieling, J., Huurdeman, E.P., Rem, C.C.M., Donders, T.H., Pross, J., Bohaty, S.M., Holdgate, G.R., Gallagher, S.J., McGowran, B., and Bijl, P.K., 2018. Identification of the Paleocene–Eocene boundary in coastal strata in the Otway Basin, Victoria, Australia. J. Micropalaeontol., 37(1):317–339. https://doi.org/
Frieling, J., Svensen, H.H., Planke, S., Cramwinckel, M.J., Selnes, H., and Sluijs, A., 2016. Thermogenic methane release as a cause for the long duration of the PETM. Proceedings of the National Academy of Sciences of the United States of America, 113(43):12059–12064. https://doi.org/
Gernigon, L., Zastrozhnov, D., Planke, S., Manton, B., Abdelmalak, M.M., Olesen, O., Maharjan, D., Faleide, J.I., and Myklebust, R., 2021. A digital compilation of structural and magmatic elements of the mid-Norwegian continental margin. Norwegian Journal of Geology, 101. https://doi.org/
Gieskes, J.M., and Lawrence, J.R., 1981. Alteration of volcanic matter in deep sea sediments: evidence from the chemical composition of interstitial waters from deep sea drilling cores. Geochimica et Cosmochimica Acta, 45(10):1687–1703. https://doi.org/
Greinert, J., and Derkachev, A., 2004. Glendonites and methane-derived Mg-calcites in the Sea of Okhotsk, eastern Siberia: implications of a venting-related ikaite/glendonite formation. Marine Geology, 204(1–2):129–144. https://doi.org/10.1016/
Jamtveit, B., Svensen, H., Podladchikov, Y.Y., and Planke, S., 2004. Hydrothermal vent complexes associated with sill intrusions in sedimentary basins. In Breitkreuz, C., and Petford, N. (Eds.), Physical Geology of High-Level Magmatic Systems. Geological Society Special Publication, 234: 233–241. https://doi.org/
Jørgensen, B.B., 1982. Mineralization of organic matter in the sea bed—the role of sulphate reduction. Nature, 296(5858):643–645. https://doi.org/
Kjoberg, S., Schmidedel, T., Planke, S., Svensen, H.H., Millett, J.M., Jerram, D.A., Galland, O., Lecomte, I., Scnhofield, N., Haug, Ø.T., and Helsem, A., 2017. 3D structure and formation of hydrothermal vent complexes at the Paleocene-Eocene transition, the Møre Basin, mid-Norwegian margin. Interpretation, 5(3):1A–T449. https://doi.org/
Koch, S., Berndt, C., Bialas, J., Haeckel, M., Crutchley, G., Papenberg, C., Klaeschen, D., and Greinert, J., 2015. Gas-controlled seafloor doming. Geology, 43(7):571–574. https://doi.org/
Lebedeva-Ivanova, N., Millett, J., et al., 2021. Fast-track seismic data processing report for data from CAGE20-4 cruise. VBPR Report.
Lee, Y.S., and Kodama, K., 2009. A possible link between the geomagnetic field and catastrophic climate at the Paleocene-Eocene Thermal Maximum. Geology, 37(11):1047–1050. https://doi.org/
Leifer, I., and Judd, A., 2015. The UK22/4b blowout 20 years on: investigations of continuing methane emissions from sub-seabed to the atmosphere in a North Sea context. Marine and Petroleum Geology, 68:706–717. https://doi.org/
Lerbekmo, J.F., and Evans, M.E., 2010. A possible link between the geomagnetic field and catastrophic climate at the Paleocene-Eocene Thermal Maximum: COMMENT. Geology, 38(11):e225. https://doi.org/
Longman, J., Gernon, T.M., Palmer, M.R., Jones, M.T., Stokke, E.W., and Svensen, H.H., 2021. Marine diagenesis of tephra aided the Palaeocene-Eocene Thermal Maximum termination. Earth and Planetary Science Letters, 571:117101. https://doi.org/
Manton, B., 2015. The mechanics of sill propagation and associated venting investigated using 3D seismic data from offshore Norway [PhD dissertation]. Cardiff University, Cardiff, England. http://orca.cardiff.ac.uk/
Mazzini, A., Svensen, H., Akhmanov, G.G., Aloisi, G., Planke, S., Malthe-Sørenssen, A., and Istadi, B., 2007. Triggering and dynamic evolution of the LUSI mud volcano, Indonesia. Earth and Planetary Science Letters, 261(3):375–388. https://doi.org/
Michalopoulos, P., and Aller, R.C., 1995. Rapid clay mineral formation in Amazon Delta sediments: reverse weathering and oceanic elemental cycles. Science, 270(5236):6140150617. https://doi.org/
Mudge, D.C., and Bujak, J.P., 1994. Eocene stratigraphy of the North Sea Basin. Marine and Petroleum Geology, 11(2):166–181. https://doi.org/
Mudge, D.C., and Bujak, J.P., 1996. Palaeocene biostratigraphy and sequence stratigraphy of the UK central North Sea. Marine and Petroleum Geology, 13(3):295–312. https://doi.org/
Murray, N.A., McManus, J., Palmer, M.R., Haley, B., and Manners, H., 2018. Diagenesis in tephra-rich sediments from the Lesser Antilles Volcanic Arc: pore fluid constraints. Geochimica et Cosmochimica Acta, 228:119–135. https://doi.org/
Ogg, J.G., 2020. Geomagnetic Polarity Time Scale. In Gradstein, F.M., Ogg, J.G., Schmitz, M., and Ogg, G.M. (Eds.), Geologic Time Scale 2020. Amsterdam (Elsevier), 159–192.
Omosanya, K.O., Eruteya, O.E., Siregar, E.S.A., Zieba, K.J., Johansen, S.E., Alves, T.M., and Waldmann, N.D., 2018. Three-dimensional (3-D) seismic imaging of conduits and radial faults associated with hydrothermal vent complexes (Vøring Basin, offshore Norway). Marine Geology, 399:115–134. https://doi.org/
Oreshkina, T.V., and Aleksandrova, G.N., 2007. Terminal paleocene of the Volga middle reaches: biostratigraphy and paleosettings. Stratigraphy and Geological Correlation, 15(2):206–230. https://doi.org/
Oreshkina, T.V., and Radionova, E.P., 2014. Diatom record of the Paleocene–Eocene Thermal Maximum in marine paleobasins of Central Russia, Transuralia and adjacent regions. Nova Hedwigia, Beiheft, 143:307–336.
Perez-Garcia, C., Feseker, T., Mienert, J., and Berndt, C., 2009. The Håkon Mosby mud volcano: 330,000 years of focused fluid flow activity at the SW Barents Sea slope. Marine Geology, 262(1–4):105–115. https://doi.org/
Planke, S., Berndt, C., and Alvarez Zarikian, C.A., 2021. Expedition 396 Scientific Prospectus: Mid-Norwegian Continental Margin Magmatism: International Ocean Discovery Program. https://doi.org/
Planke, S., Berndt, C., Alvarez Zarikian, C.A., Agarwal, A., Andrews, G.D.M., Betlem, P., Bhattacharya, J., Brinkhuis, H., Chatterjee, S., Christopoulou, M., Clementi, V.J., Ferré, E.C., Filina, I.Y., Frieling, J., Guo, P., Harper, D.T., Jones, M.T., Lambart, S., Longman, J., Millett, J.M., Mohn, G., Nakaoka, R., Scherer, R.P., Tegner, C., Varela, N., Wang, M., Xu, W., and Yager, S.L., 2023a. Expedition 396 methods. In Planke, S., Berndt, C., Alvarez Zarikian, C.A., and the Expedition 396 Scientists, Mid-Norwegian Margin Magmatism and Paleoclimate Implications. Proceedings of the International Ocean Discovery Program, 396: College Station, TX (International Ocean Discovery Program). https://doi.org/
Planke, S., Berndt, C., Alvarez Zarikian, C.A., Agarwal, A., Andrews, G.D.M., Betlem, P., Bhattacharya, J., Brinkhuis, H., Chatterjee, S., Christopoulou, M., Clementi, V.J., Ferré, E.C., Filina, I.Y., Frieling, J., Guo, P., Harper, D.T., Jones, M.T., Lambart, S., Longman, J., Millett, J.M., Mohn, G., Nakaoka, R., Scherer, R.P., Tegner, C., Varela, N., Wang, M., Xu, W., and Yager, S.L., 2023b. Site U1565. In Planke, S., Berndt, C., Alvarez Zarikian, C.A., and the Expedition 396 Scientists, Mid-Norwegian Margin Magmatism and Paleoclimate Implications. Proceedings of the International Ocean Discovery Program, 396: College Station, TX (International Ocean Discovery Program). https://doi.org/
Planke, S., Rasmussen, T., Rey, S.S., and Myklebust, R., 2005. Seismic characteristics and distribution of volcanic intrusions and hydrothermal vent complexes in the Vøring and Møre Basins. Geological Society of London, Petroleum Geology Conference Series, 6(1):833–844. https://doi.org/
Reynolds, P., Planke, S., Millett, J.M., Jerram, D.A., Trulsvik, M., Schofield, N., and Myklebust, R., 2017. Hydrothermal vent complexes offshore northeast Greenland: a potential role in driving the PETM. Earth and Planetary Science Letters, 467:72–78. https://doi.org/
Roelofse, C., Alves, T.M., and Omosanya, K.d.O., 2021. Reutilisation of hydrothermal vent complexes for focused fluid flow on continental margins (Modgunn Arch, Norwegian Sea). Basin Research, 33(2):1111–1134. https://doi.org/
Rosenthal, Y., Holbourn, A.E., Kulhanek, D.K., Aiello, I.W., Babila, T.L., Bayon, G., Beaufort, L., Bova, S.C., Chun, J.-H., Haowen, D., Drury, A.J., Dunkley Jones, T., Eichler, P.P.B., Fernando, A.G.S., Gibson, K.A., Hatfield, R.G., Johnson, D.L., Kumagai, Y., Tiegang, L., Linsley, B.K., Meinicke, N., Mountain, G.S., Opdyke, B.N., Pearson, P.N., Poole, C.R., Ravelo, A.C., Sagawa, T., Schmitt, A., Wurtzel, J.B., Jian, X., Yamamoto, M., and Zhang, Y.G., 2018. Expedition 363 methods. In Rosenthal, Y., Holbourn, A.E., Kulhanek, D.K., and the Expedition 363 Scientists, Western Pacific Warm Pool. Proceedings of the International Ocean Discovery Program, 363: College Station, TX (International Ocean Discovery Program). https://doi.org/
Skogseid, J., and Eldholm, O., 1989. Vøring Plateau continental margin: seismic interpretation, stratigraphy, and vertical movements. In Eldholm, O., Thiede, J., Taylor, E., et al., Proceedings of the Ocean Drilling Program, Scientific Results, 104: College Station, TX (Ocean Drilling Program), 993–1030. https://doi.org/
Sluijs, A., Bijl, P.K., Schouten, S., Röhl, U., Reichart, G.J., and Brinkhuis, H., 2011. Southern ocean warming, sea level and hydrological change during the Paleocene-Eocene Thermal Maximum. Climate of the Past, 7(1):47–61. https://doi.org/
Sluijs, A., and Brinkhuis, H., 2009. A dynamic climate and ecosystem state during the Paleocene-Eocene Thermal Maximum: inferences from dinoflagellate cyst assemblages on the New Jersey Shelf. Biogeosciences, 6(8):1755–1781. https://doi.org/
Sluijs, A., Brinkhuis, H., Schouten, S., Bohaty, S.M., John, C.M., Zachos, J.C., Reichart, G.-J., Sinninghe Damsté, J.S., Crouch, E.M., and Dickens, G.R., 2007. Environmental precursors to rapid light carbon injection at the Palaeocene/Eocene boundary. Nature, 450(7173):1218–1221. https://doi.org/
Spiegler, D., and Jansen, E., 1989. Planktonic foraminifer biostratigraphy of Norwegian Sea sediments: ODP Leg 104. In Eldholm, O., Thiede, J., Taylor, E., et al., Proceedings of the Ocean Drilling Program, Scientific Results, 104: College Station, TX (Ocean Drilling Program), 681–696. https://doi.org/
Stokke, E.W., Liu, E.J., and Jones, M.T., 2020. Evidence of explosive hydromagmatic eruptions during the emplacement of the North Atlantic Igneous Province. Volcanica, 3(2):227–250. https://doi.org/
Svensen, H., Jamtveit, B., Planke, S., and Chevallier, L., 2006. Structure and evolution of hydrothermal vent complexes in the Karoo Basin, South Africa. Journal of the Geological Society (London, UK), 163(4):671–682. https://doi.org/
Svensen, H., Planke, S., Jamtveit, B., and Pedersen, T., 2003. Seep carbonate formation controlled by hydrothermal vent complexes: a case study from the Vøring Basin, the Norwegian Sea. Geo-Marine Letters, 23(3):351–358. https://doi.org/
Svensen, H., Planke, S., Malthe-Sørenssen, A., Jamtveit, B., Myklebust, R., Rasmussen Eidem, T., and Rey, S.S., 2004. Release of methane from a volcanic basin as a mechanism for initial Eocene global warming. Nature, 429(6991):542–545. https://doi.org/
Svensen, H., Planke, S., Polozov, A.G., Schmidbauer, N., Corfu, F., Podladchikov, Y.Y., and Jamtveit, B., 2009. Siberian gas venting and the end-Permian environmental crisis. Earth and Planetary Science Letters, 277(3–4):490–500. https://doi.org/
Svensen, H.H., Frolov, S., Akhmanov, G.G., Polozov, A.G., Jerram, D.A., Shiganova, O.V., Melnikov, N.V., Iyer, K., and Planke, S., 2018. Sills and gas generation in the Siberian Traps. Philosophical Transactions of the Royal Society A: Mathematical, Physical and Engineering Sciences, 376(2130):20170080. https://doi.org/
Svensen, H.H., Hammer, Ø., Chevallier, L., Jerram, D.A., Silkoset, P., Polteau, S., Planke, S., Adatte, T., Bond, D.P.G., and Keller, G., 2020. Understanding thermogenic degassing in large igneous provinces: inferences from the geological and statistical characteristics of breccia pipes in the western parts of the Karoo Basin. In Adatte, T., Bond, D.P.G., and Keller, G. (Eds.), Mass Extinctions, Volcanism, and Impacts: New Developments. Special Paper - Geological Society of America, 544. https://doi.org/
Svensen, H.H., Jerram, D.A., Polozov, A.G., Planke, S., Neal, C.R., Augland, L.E., and Emeleus, H.C., 2019. Thinking about LIPs: a brief history of ideas in large igneous province research. Tectonophysics, 760:229–251. https://doi.org/
Thatje, S., Gerdes, D., and Rachor, E., 1999. A seafloor crater in the German Bight and its effects on the benthos. Helgoland Marine Research, 53(1):36–44. https://doi.org/
Torres, M.E., Hong, W.-L., Solomon, E.A., Milliken, K., Kim, J.-H., Sample, J.C., Teichert, B.M.A., and Wallmann, K., 2020. Silicate weathering in anoxic marine sediment as a requirement for authigenic carbonate burial. Earth-Science Reviews, 200:102960. https://doi.org/
Valet, J.-P., Meynadier, L., Simon, Q., and Thouveny, N., 2016. When and why sediments fail to record the geomagnetic field during polarity reversals. Earth and Planetary Science Letters, 453:96–107. https://doi.org/
Vieira, M., and Mahdi, S., 2019. New Paleocene species and biostratigraphic relevance of the genus Spiniferites across the North Sea and Norwegian Sea. Review of Palaeobotany and Palynology, 262:28–43. https://doi.org/
Vieira, M., Mahdi, S., and Holmes, N., 2020. High resolution biostratigraphic zonation for the UK central North Sea Paleocene. Marine and Petroleum Geology, 117:104400. https://doi.org/
Witkowski, J., Harwood, D.M., Wade, B.S., and Bryłka, K., 2020. Rethinking the chronology of early Paleogene sediments in the western North Atlantic using diatom biostratigraphy. Marine Geology, 424:106168. https://doi.org/
Zachos, J., Pagani, M., Sloan, L., Thomas, E., and Billups, K., 2001. Trends, rhythms, and aberrations in global climate 65 Ma to Present. Science, 292(5517):686–693. https://doi.org/
Zijderveld, J.D.A., 2013. A. C. demagnetization of rocks: analysis of results. In Collinson, D.W., Creer, K.M., and Runcorn, S.K. (Eds.), Methods in Paleomagnetism. Developments in Solid Earth Geophysics, 3: New York (Elsevier), 254–286. https://doi.org/