Planke, S., Berndt, C., Alvarez Zarikian, C.A., and the Expedition 396 Scientists
Proceedings of the International Ocean Discovery Program Volume 396
publications.iodp.org
https://doi.org/10.14379/iodp.proc.396.107.2023
Sites U1571 and U15721
![]() S. Planke,
S. Planke,
![]() C. Berndt,
C. Berndt,
![]() C.A. Alvarez Zarikian,
C.A. Alvarez Zarikian,
![]() A. Agarwal,
A. Agarwal,
![]() G.D.M. Andrews,
G.D.M. Andrews,
![]() P. Betlem,
P. Betlem,
![]() J. Bhattacharya,
J. Bhattacharya,
![]() H. Brinkhuis,
H. Brinkhuis,
![]() S. Chatterjee,
S. Chatterjee,
![]() M. Christopoulou,
M. Christopoulou,
![]() V.J. Clementi,
V.J. Clementi,
![]() E.C. Ferré,
E.C. Ferré,
![]() I.Y. Filina,
I.Y. Filina,
![]() J. Frieling,
J. Frieling,
![]() P. Guo,
P. Guo,
![]() D.T. Harper,
D.T. Harper,
![]() M.T. Jones,
M.T. Jones,
![]() S. Lambart,
S. Lambart,
![]() J. Longman,
J. Longman,
![]() J.M. Millett,
J.M. Millett,
![]() G. Mohn,
G. Mohn,
![]() R. Nakaoka,
R. Nakaoka,
![]() R.P. Scherer,
R.P. Scherer,
![]() C. Tegner,
C. Tegner,
![]() N. Varela,
N. Varela,
![]() M. Wang,
M. Wang,
![]() W. Xu,
W. Xu,
![]() S.L. Yager
2
S.L. Yager
2
1 Planke, S., Berndt, C., Alvarez Zarikian, C.A., Agarwal, A., Andrews, G.D.M., Betlem, P., Bhattacharya, J., Brinkhuis, H., Chatterjee, S., Christopoulou, M., Clementi, V.J., Ferré, E.C., Filina, I.Y., Frieling, J., Guo, P., Harper, D.T., Jones, M.T., Lambart, S., Longman, J., Millett, J.M., Mohn, G., Nakaoka, R., Scherer, R.P., Tegner, C., Varela, N., Wang, M., Xu, W., and Yager, S.L., 2023. Sites U1571 and U1572. In Planke, S., Berndt, C., Alvarez Zarikian, C.A., and the Expedition 396 Scientists, Mid-Norwegian Margin Magmatism and Paleoclimate Implications. Proceedings of the International Ocean Discovery Program, 396: College Station, TX (International Ocean Discovery Program). https://doi.org/10.14379/iodp.proc.396.107.2023
2 Expedition 396 Scientists’ affiliations.
1. Background and objectives
Sites U1571 and U1572 are located on the Skoll High on the Vøring Marginal High (Figure F1) about 15 km west of the Vøring Escarpment (Figure F2). The western part of the Vøring Marginal High is characterized by seaward-dipping reflectors (SDR), first noted by Hinz and Weber (1976), that have early been interpreted to be volcanic complexes as thick as 6 km near the continent/ocean boundary (Skogseid and Eldholm, 1987, 1989). The first sampling of basalts on the Vøring Marginal High was accomplished in 1974 during Deep Sea Drilling Project (DSDP) Leg 38 (Talwani, Udintsev, et al., 1976). DSDP Holes 338 and 342 were drilled, and 37 and 17 m of basalt were recovered, respectively, from below the acoustic basement reflection. Subsequently, a 1277 m borehole was drilled into the upper termination of the SDR during Ocean Drilling Program (ODP) Leg 104 during the summer of 1985 (Eldholm et al., 1987). ODP Hole 642E yielded more than 900 m of basalt and penetrated at least 135 lava flows and three dikes. The flows were interlayered with 59 volcaniclastic sedimentary units that mainly represent weathered basalt flow tops and one ignimbrite. Based on their geochemical and petrological composition, the volcanic succession was divided into an upper 800 m thick tholeiite series and a lower series that is at least 100 m thick and consists of dominantly basaltic andesite flows (Eldholm et al., 1987; Abdelmalak et al., 2016a).
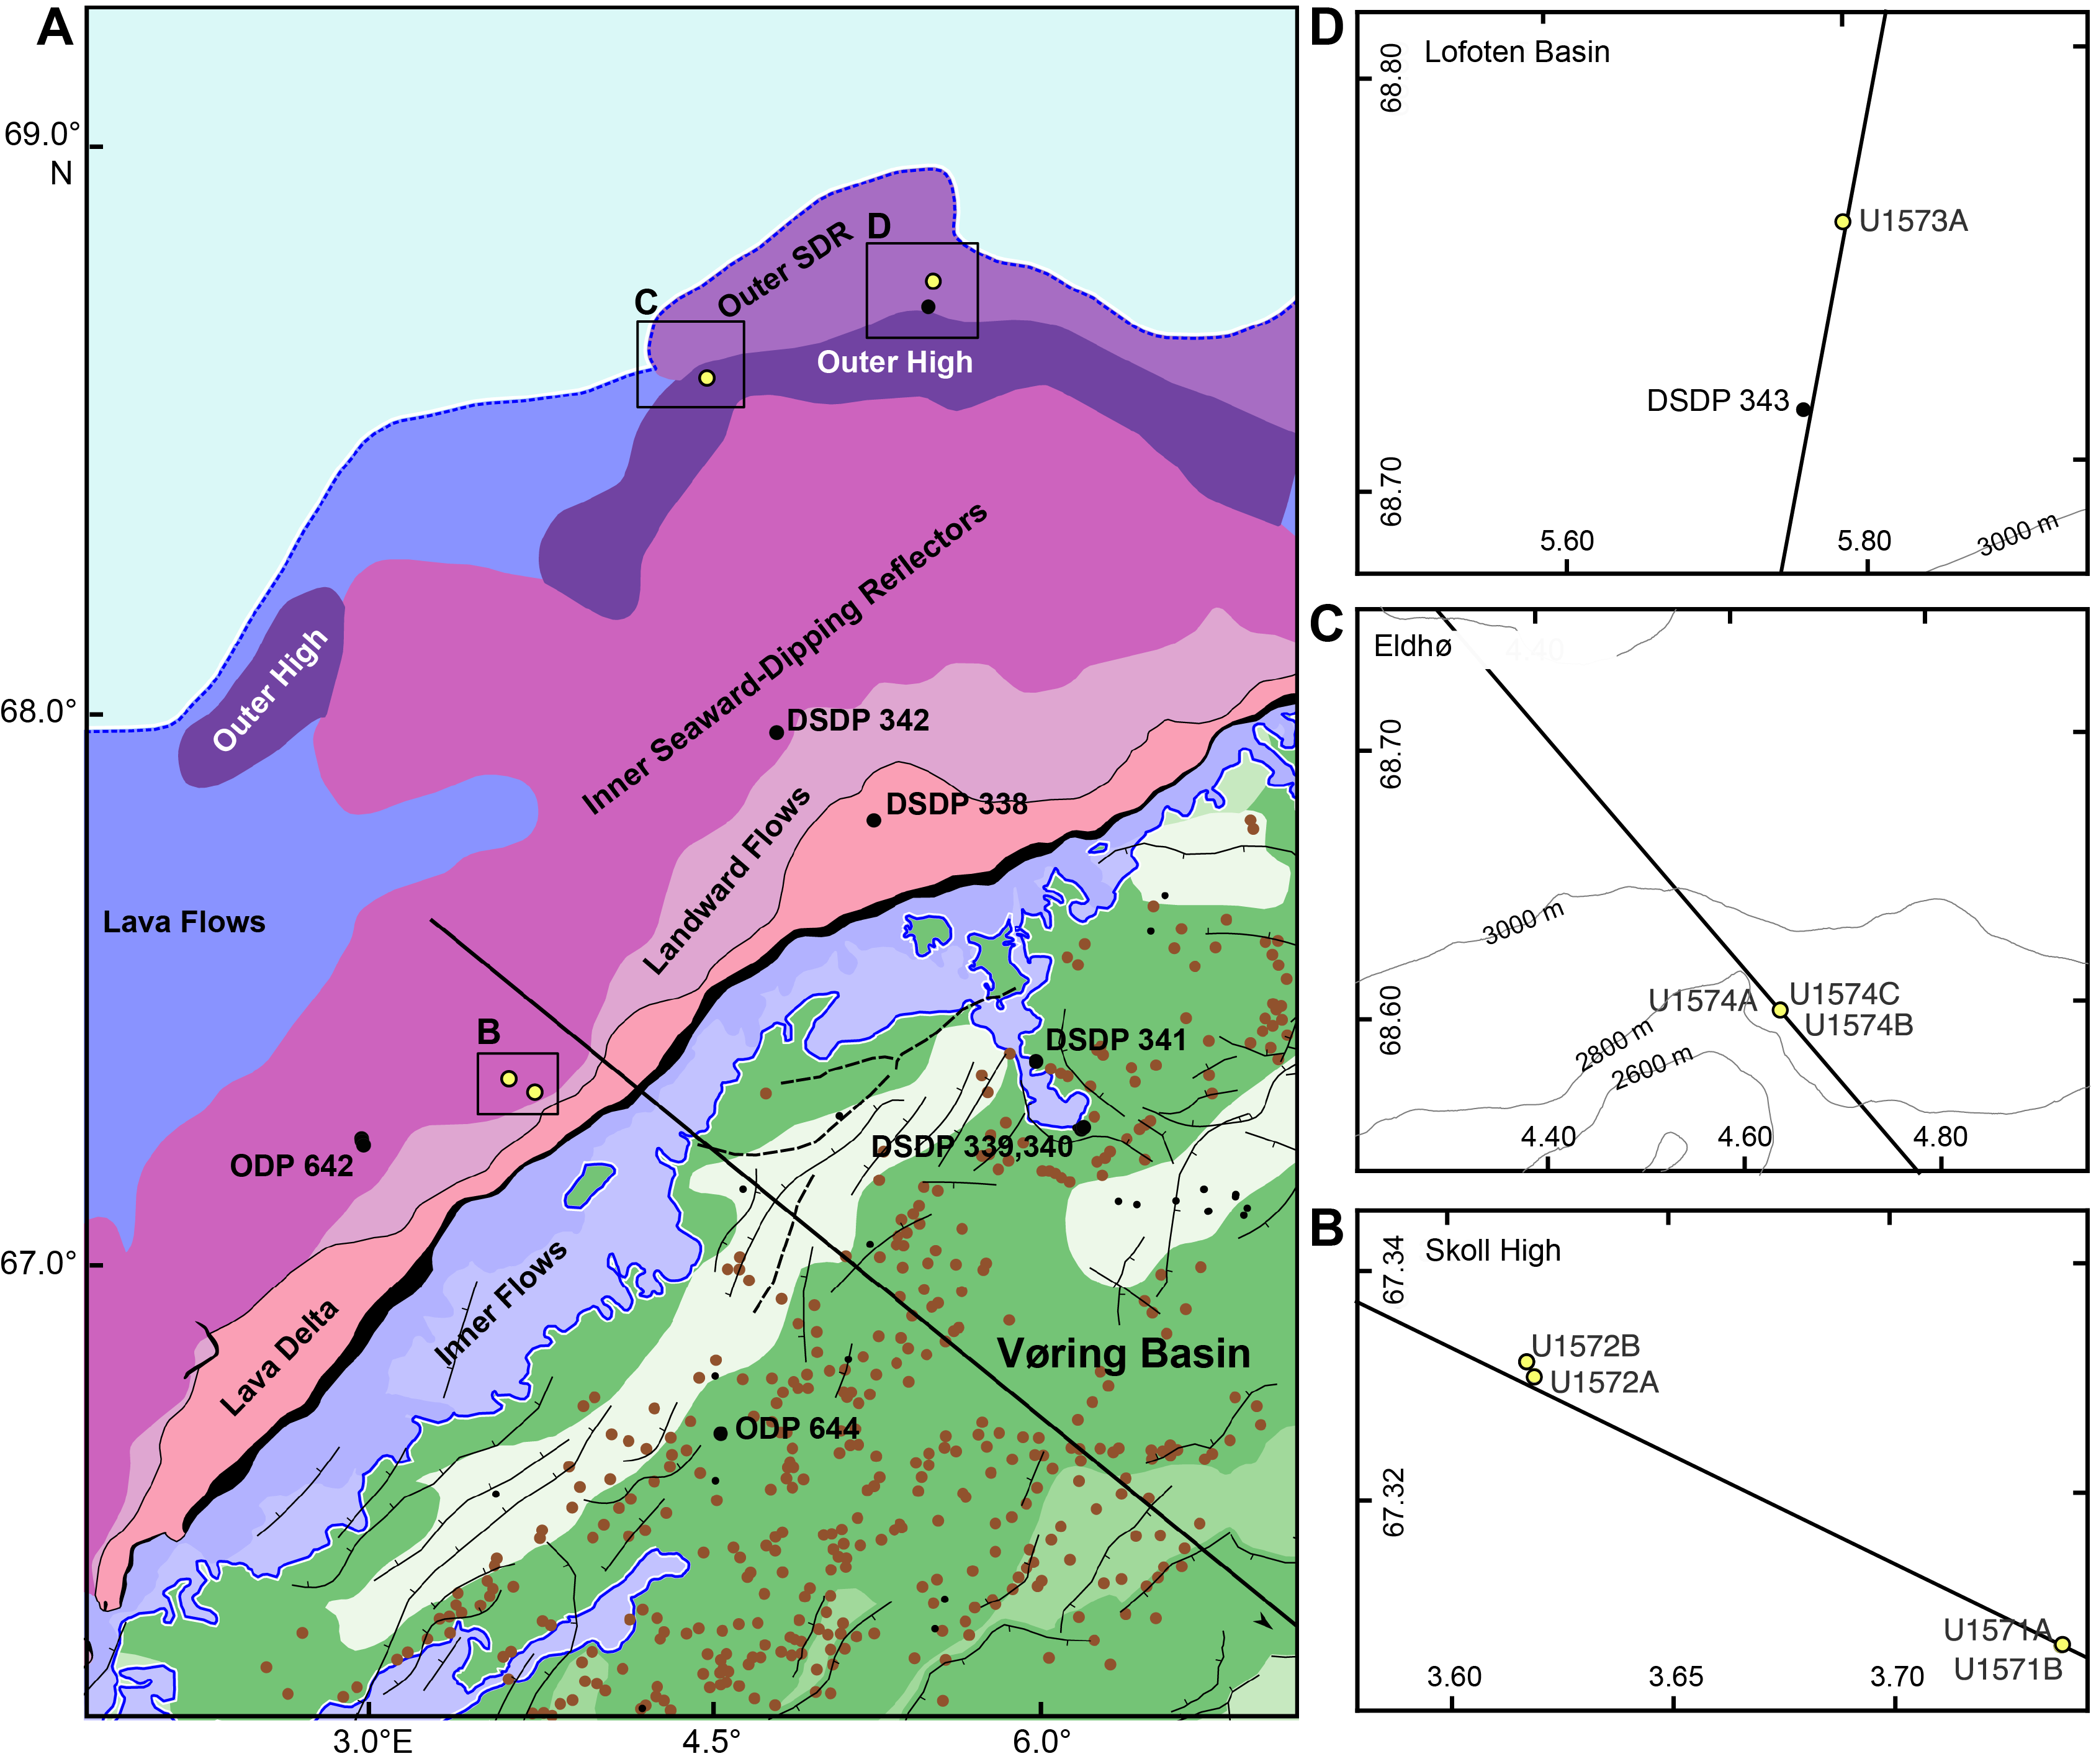
Figure F1. Northern Vøring Plateau.
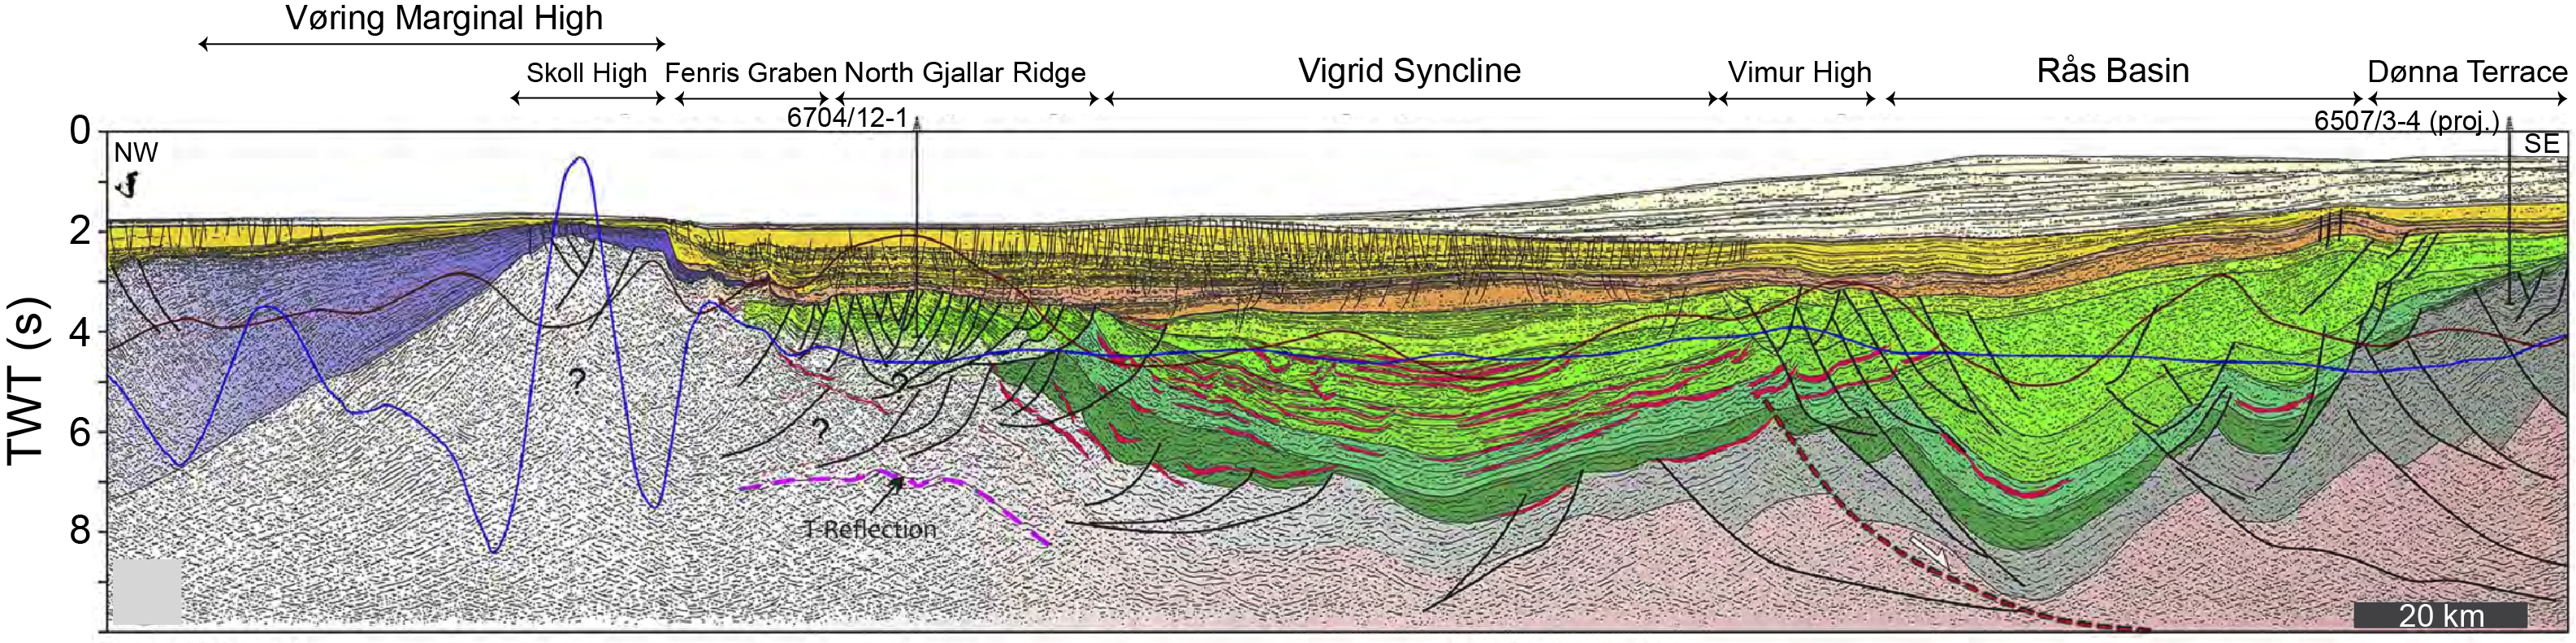
Figure F2. Crustal transects, Vøring Basin and Vøring Marginal High.
The extent and thickness of the breakup-related basaltic complex has subsequently been mapped along the mid-Norwegian continental margin using the concepts of seismic volcanostratigraphy and igneous seismic geomorphology (Berndt et al., 2001; Planke et al., 2000, 2017; Millett et al., 2022; Gernigon et al., 2021). The seismic reflection data reveal substantial differences in the volcanic emplacement environments across the Vøring Marginal High in time and space. Planke et al. (2017) documented distinct differences in the physical volcanology across the marginal high based on geomorphometric analysis of the top basalt surface. The eastern parts of the margin are characterized by a lava flow field that suggests that lava was flowing from eruption centers in the west toward the paleocoastline in the east where they form a lava delta (Abdelmalak et al., 2016b). Incised valleys on the top basalt surface further suggest erosion by rivers flowing from west to east. The top basalt surface farther west is characterized by a rough morphology with numerous semicircular anomalies that have been interpreted as rootless cones due to lava flowing across a wet substrate leading to phreatomagmatic eruptions. This pitted surface belongs to a seismic sequence that onlaps onto the eastern flow field and must be younger than the subaerial basalts drilled at Site 642E (Figure F3). Strikingly, the two domains also exhibit very different structural deformation. Although there are only few normal faults with little displacement that offset the sequence with the pitted surface, the eastern lava flows toward the escarpment are offset by numerous north–south trending normal faults with offsets of tens of meters.
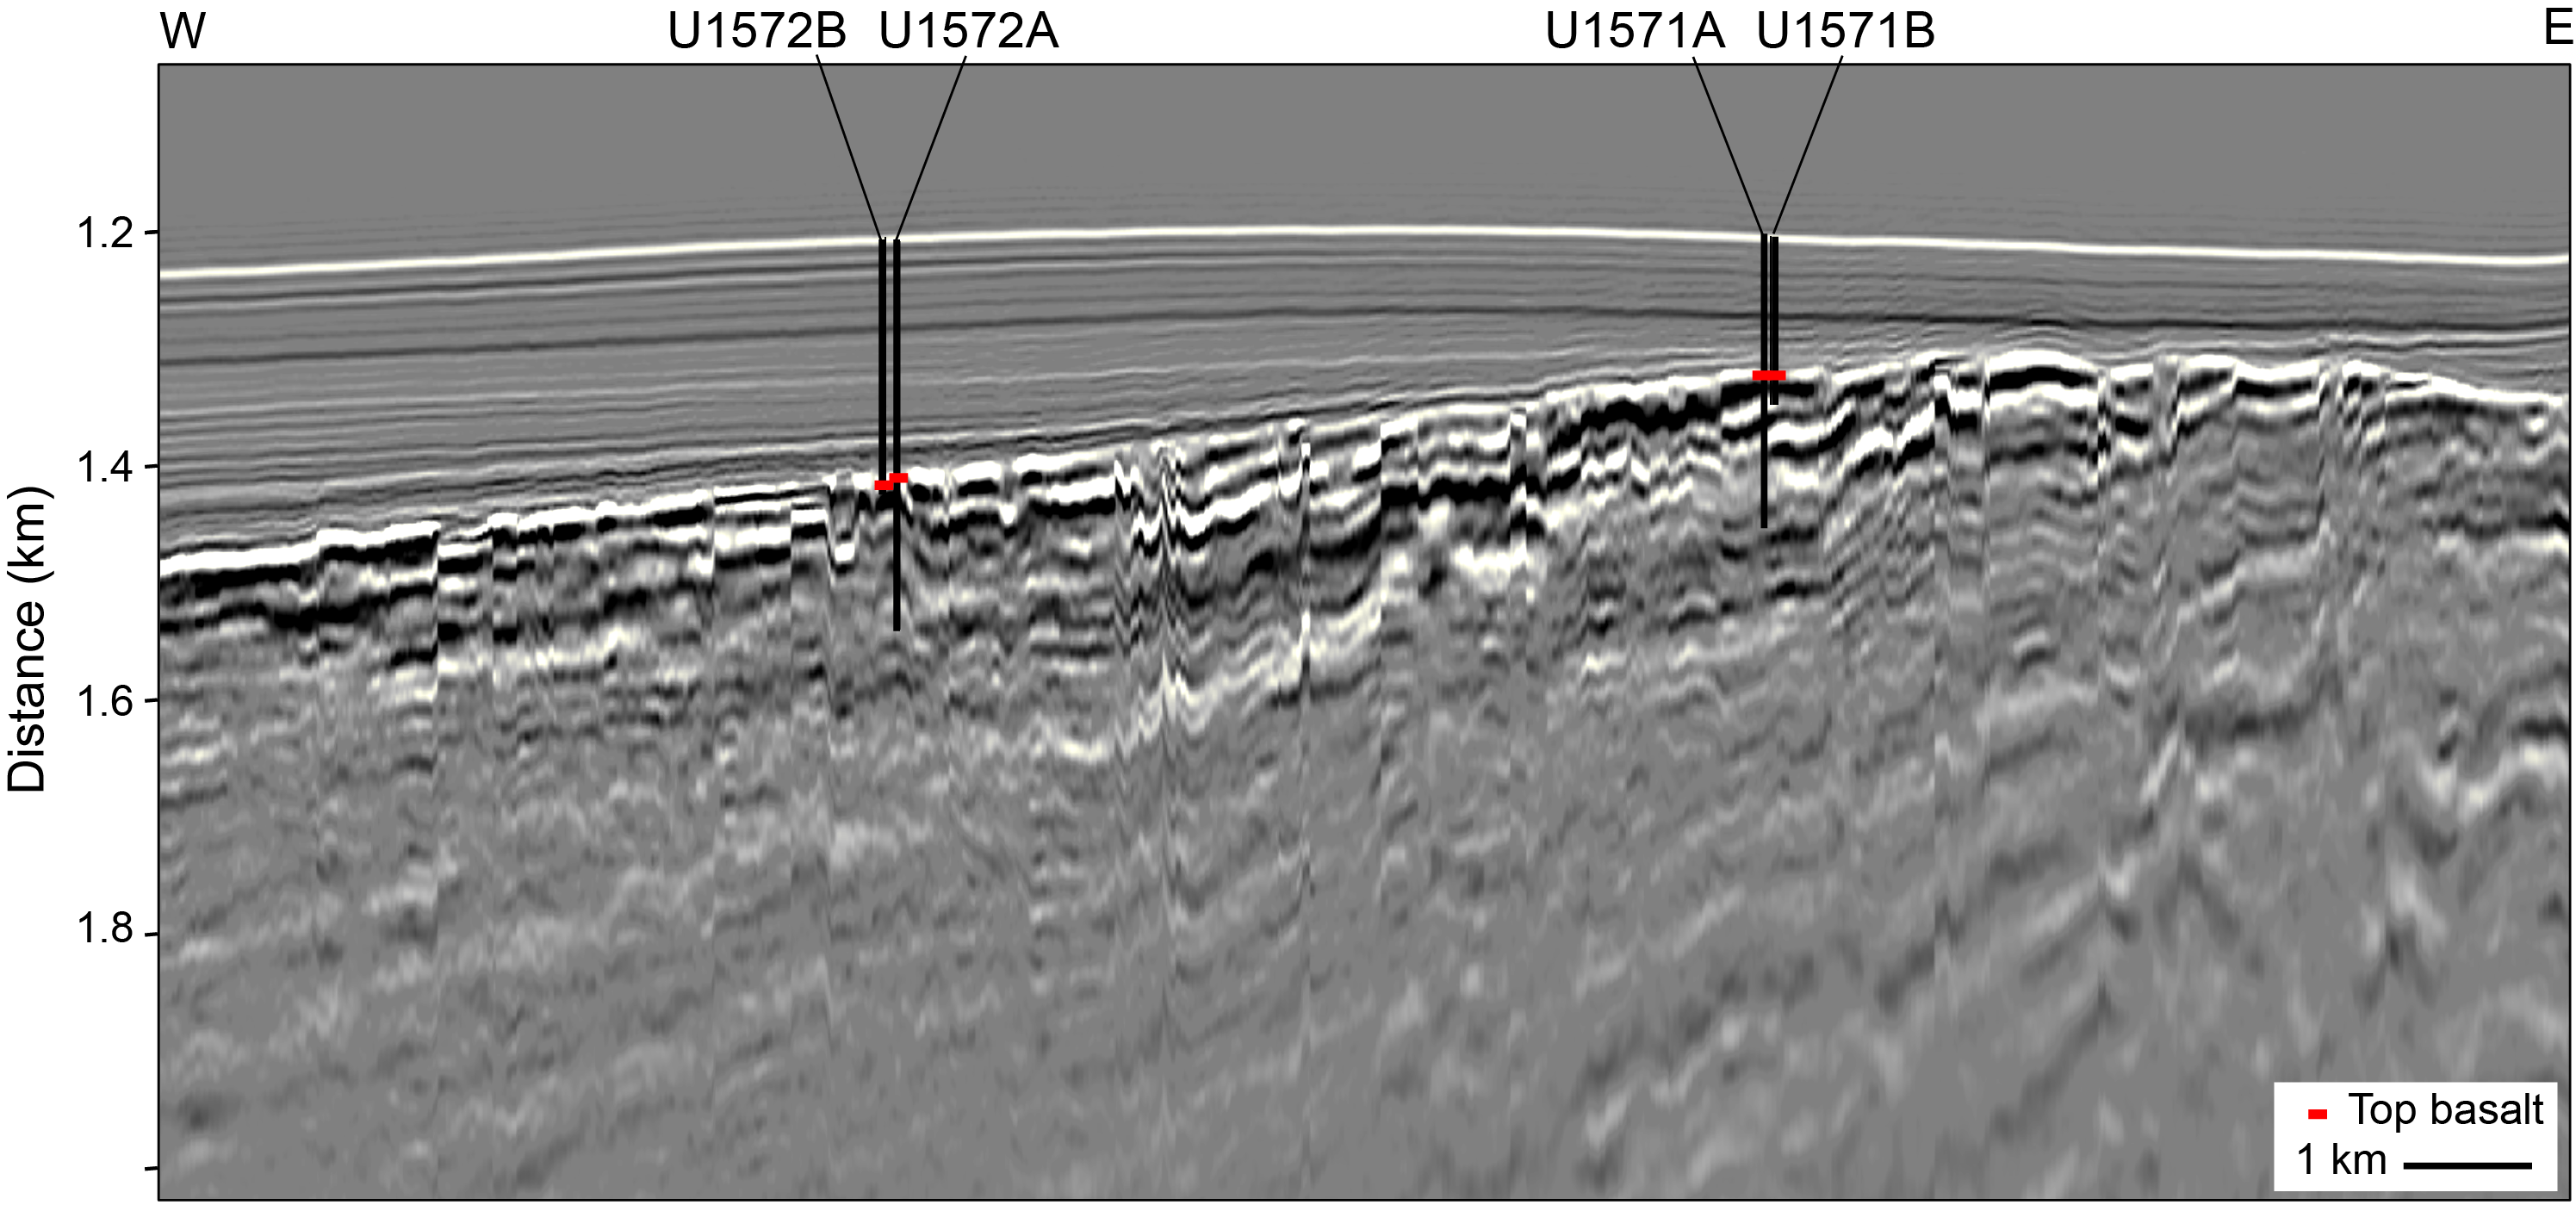
Figure F3. Seismic line from 3-D Cube CVX1101.
Site U1571 is located on the eastern faulted lava flow field, whereas Site U1572 is located on the pitted surface farther west (Planke et al., 2021). The morphological difference between the two sites and the onlap relationship suggest that the lavas have been emplaced diachronously and in different environments. The first objective of the drilling sites was to obtain information on the emplacement environment based on the facies of the recovered basalt and sediments. This information will constrain the vertical movements of the margin, for example, if both facies were indeed emplaced in a subaerial environment or if there is a difference between the relatively well constrained subaerial flows in the east and the possibly shallow marine flows in the west. The second objective was to establish the time of emplacement of the two sequences to constrain the temporal evolution of the breakup volcanism. The third objective is closely linked to the first two: by analyzing the emplacement environment, we hoped to obtain information on the environmental changes and, by proxy, the climatic changes during and shortly after the main phase of volcanism. This will primarily be based on biostratigraphic and geochemical analysis of the sedimentary succession immediately above the top of the basalt and possibly of sedimentary layers between basalt flows. The fourth objective was to constrain the conditions in the melt region, specifically the composition of the mantle before melting and the ambient temperature from the geochemistry and petrology of the encountered rocks. Reaching this objective will help to parameterize geodynamic models that will distinguish between the relative importance of the drivers of excess volcanism.
Furthermore, Sites U1571 and U1572 will address two auxiliary objectives laid out in the expedition’s Scientific Prospectus (Planke et al., 2021). First, we hope to provide information on the suitability of the breakup basalt sequences and interbedded sediments for permanent geological storage of CO2. This will require obtaining information on their porosity and permeability as well as their geochemical composition, in particular the abundance of olivine that may react with CO2. Second, we hope to obtain information on the earliest incursion of deep water into the North Atlantic and the extent of freshwater incursions into the young ocean, for example, during the Azolla event (Brinkhuis et al., 2006).
Finally, and akin to the other sites drilled during Expedition 396, we will use the drilling results to test and calibrate the volcanological predictions of seismic volcanostratigraphy and igneous seismic geomorphology for the landward flows, SDR, and smaller scale volcanic elements identified in the seismic reflection data.
2. Operations
2.1. Transit to Site U1571
We completed the 97 nmi transit to Site U1571 in 9.1 h, arriving over the site coordinates at 0918 h (all times are provided in UTC + 0 h) on 6 September 2021. The vessel was switched to dynamic positioning (DP) mode, and the drill floor was cleared for operations at 0952 h, beginning Hole U1571A.
2.2. Site U1571
Site U1571 consists of two holes. The first hole was cored using the rotary core barrel (RCB) system from the seafloor to 247.6 meters below seafloor (mbsf) and then logged with the triple combination (triple combo), Formation MicroScanner (FMS)-sonic, and Ultrasonic Borehole Imager (UBI) logging tool strings. Although the original plan called for a single hole to 240 mbsf, the poor recovery through a critical stratigraphic interval suggested an additional hole should be cored at the site. The advanced piston corer (APC) and extended core barrel (XCB) systems were selected for the second hole at the site. Hole U1571B was cored with the APC system to refusal at 57.2 mbsf. The XCB system was deployed and cored with good results to 143.7 mbsf. Polycrystalline diamond compact (PDC) XCB cutting shoes were used to core through the hard layers between 125 and 143.7 mbsf. Coring in Hole U1571B was terminated by the science office at 1005 h on 11 September 2021. The drill string was pulled back to the surface after clearing the seafloor at 1110 h. Upon clearing the seafloor, the vessel began moving in DP mode to the next site, located 3.1 nmi away. The APC/XCB coring bit cleared the rotary table at 1351 h, ending Hole U1571B and Site U1571. A total of 124 h or 5.2 days were recorded while on Site U1571.
A total of 59 cores were taken at the site. The RCB coring system was used for Hole U1571A. The RCB system was used to 247.6 m and 116.55 m of core was recovered (47.1%). Hole U1571B used both the APC and XCB systems. Seven APC cores were taken over a 57.2 m interval. Recovery was 58.73 m (102.7%). The XCB system was used for 13 cores over a 86.5 m interval and recovered 62.2% of the cored interval (Table T1).
2.2.1. Hole U1571A
The rig crew began assembling the RCB bottom-hole assembly (BHA) with a new bit and bit release system and deployed them to the seafloor. Using an estimated depth from the precision depth recorder (PDR) of 1205.8 meters below sea level (mbsl), Hole U1571A was spudded at 1500 h on 6 September 2021. The PDR measurement was used for the official seafloor depth. We continued RCB coring with full-length advances through Core 13R (121.1 mbsf) and then switched to half-length advances for Cores 14R–38R (121.1–237.9 mbsf) to improve core recovery. The last core for the hole was Core 39R, which was a full-length advance to reach the final hole depth of 247.6 mbsf. Core 39R was recovered at 0525 h on 9 September.
At the end of coring, we cleaned the hole by pumping 50 bbl of high-viscosity mud and then lowered the rotary shifting tool (RST) and released the bit at the bottom of the hole. We displaced the hole with 75 bbl of 10.5 lb/gal mud, raised the drill string, and set the end of the pipe at 87 mbsf in preparation for wireline logging. At 1000 h, we rigged up the triple combo tool string and deployed it to 246.9 mbsf. We made two upward passes collecting data through the open hole and then recovered and rigged down the logging tool. Starting at 1400 h, we rigged up and deployed the FMS-sonic tool string. Natural gamma radiation (NGR) was logged through the drill pipe to identify the seafloor depth and match the depth with the results on the triple combo logging run. The FMS-sonic tool also reached 246.9 mbsf, and two upward logs were carried out through the open hole with the calipers open. The tool string was recovered at 1745 h and rigged down by 1830 h on 9 September. After rigging down the FMS-sonic tool string, the rig floor was cleared of logging equipment and the drilling knobbies were removed from the top of the drill string. The end of the mechanical bit release (MBR) was run back down to 242.9 mbsf. The circulating head was attached to the top of the drill string, and the hole was circulated clean with saltwater in preparation for running the UBI tool string. At the end of the circulation period, the end of the pipe was pulled back and set at 104.9 mbsf. The UBI tool string was assembled and tested. At 2230 h, the tool string was deployed without difficulty through the drill pipe and turned on at 1198.7 mbsl (just above the seafloor). The hole was logged down and up two times to 237.9 mbsf. Both passes were made slowly and without incident at a speed of ~122 m/h. The tool string was pulled back to the surface and rigged down by 0345 h on 10 September. At 0430 h, all logging tools were rigged down and the logging wireline was secured. No damage was found to any of the logging tools.
After logging operations concluded, the drilling knobbies were removed from the drill string, and it was recovered back aboard ship. The BHA reached the rig floor at 0645 h. The four stands of drill collars were racked back in the derrick, and the outer core barrel components were disassembled, inspected, and laid out. The top half of the MBR cleared the rig floor at 0730 h, ending Hole U1571A. The time spent on Hole U1571A was 93.75 h or 3.9 days.
2.2.2. Hole U1571B
Following operations in Hole U1571A, we moved the vessel 20 m east, and coring with the APC and XCB systems in Hole U1571B began at 0730 h on 10 September 2021 with the aim to increase the recovery of the sedimentary succession and the sediment–basalt transition sampled in Hole U1571A. An APC/XCB outer core barrel and a BHA were assembled, and the drill pipe was deployed to the seafloor. The top drive and drilling knobby were picked up, and the bit was spaced out based on the water depth for Hole U1571A. A shot depth of 1200.8 mbsl was selected. An APC core barrel was dropped in and run to the bottom, the drill string was pressured up, and the hole was spudded at 0730 h. The mudline core returned 5.05 m of core, and the calculated seafloor depth was 1205.3 mbsl. The APC coring system advanced from the seafloor to 57.2 mbsf, where we recorded a partial stroke for Core 396-U1571B-7H with only 4.7 m advanced (recovery = 4.75 m). We switched to the XCB system, and coring continued with full-length advances to 115.5 mbsf (Core 13X). Beginning with Core 14X, cores were obtained using half-length advances through Core 20X to a final depth of 143.7 mbsf at 1005 h. The coring systems were secured, the top drive was set back, and the bit was pulled back and cleared the seafloor at 1110 h on 11 September. The bridge was notified when the bit cleared the seafloor and began moving the vessel in DP mode to the next site (U1572) at 0.5 kt. A total of 7 APC and 13 XCB cores were taken with an overall recovery of 112.5 m (78%). The time spent on Hole U1571B was 30.25 h or 1.3 days.
2.3. Transit to Site U1572
Pipe tripping operations continued over the 3.1 nmi transit to Site U1572. All APC/XCB BHA components were retrieved and stored, the rig’s traveling equipment was serviced, and a new RCB BHA was assembled. We arrived at Site U1572 at 1600 h on 11 September 2021 after a 4.7 h transit under DP mode and while deploying the drill string to the seafloor to spud Hole U1572A.
2.4. Site U1572
Site U1572 consists of two holes. The first hole was cored using the RCB system to 330.5 mbsf and then logged with the triple combo tool string. Further logging was canceled because of degrading hole conditions. The original plan called for a single hole to 320 mbsf. The poor recovery through a critical zone suggested an additional hole should be cored at the site. The APC/XCB coring system was selected for the second hole at the site. Hole U1572B was cored with the APC and half-length APC (HLAPC) systems to refusal at 209.6 mbsf. The XCB coring system was deployed and cored the basement contact interval to 224.3 mbsf. PDC XCB cutting shoes were used to core through the hard layers between 209.6 and 224.3 mbsf. Coring in Hole U1572B was terminated by the science office at 1045 h on 16 September 2021. The drill string was pulled back to the surface after clearing the seafloor at 1235 h. On clearing the rotary table, the APC/XCB BHA was secured at 1612 h, ending Hole U1572B. The bridge was notified that the drill floor activities were complete. The thrusters and hydrophones were pulled back inside the hull of the vessel, and the vessel began the sea passage to Site U1573. A total of 122.5 h or 5.1 days were recorded while on Site U1572.
A total of 79 cores were recorded for the site. The RCB coring system was used for Hole U1572A. The RCB system was used to 330.5 m and 139.53 m of core was recovered (42.2%). The APC, HLAPC, and XCB systems were used for Hole U1572B. A total of 16 APC cores were recorded over a 149.3 m interval. The recovery for the 16 cores was 154.45 m (103.5%). The HLAPC system was used for 13 cores over a 60.3 m interval and recovered 99.1% of the cored interval. The XCB coring system was used for 4 cores over a 14.7 m interval and recovered 28.3% of the cored interval (Table T2).
2.4.1. Hole U1572A
At 1930 h on 11 September 2021, with the end of the pipe at 1172.6 mbsl, we spaced out the bit above the seafloor and attempted to spud Hole U1572A based on a PDR depth of 1207.6 mbsl, but the core was retrieved empty. We added a single joint of pipe and dropped an RCB core barrel for a second attempt. This time we recovered 5 m of core, spudding Hole U1572A at 2145 h, and calculating a water depth of 1210.5 mbsl. We continued coring with the RCB system, retrieving Cores 2R–4R (5–38.5 mbsf) before midnight on 11 September. We continued RCB coring with full-length advances through Core 21R to 204 mbsf and then changed to half-length advances to improve core recovery, which averaged ~23% throughout the upper section. Cores 22R–45R (204–320.7 mbsf) yielded 89 m of material, which translated into a coring recovery of 76%. The final core for the hole, Core 46R, was advanced at full length to reach the final hole depth of 330.5 mbsf. Core 46R was on deck at 1240 h on 14 September.
At the end of coring, we swept the hole clean of cuttings with a 50 bbl sweep of high-viscosity mud and then lowered the RST and released the RCB C-4 coring bit at the bottom of the hole. The RST was pulled back to the surface, and the sinker bars were removed. The hole was then displaced with 110 bbl of 10.5 lb/gal mud, and the drill string was pulled back to 81.0 mbsf in preparation for wireline logging. The rig floor personnel and the Schlumberger engineer held a safety meeting as the drill floor was rigged up for logging. Only the triple combo logging tool string was deployed in Hole U1572A. The tools were assembled, tested, and deployed at 1900 h on 14 September. A down log was performed from just above seafloor to a maximum depth of 256 mbsf, where the tool encountered a blockage. The hole was logged up for a full-length open hole calibration pass, redeployed to 256 mbsf, and logged up one more time. The caliper was closed prior to entering the drill string. The tools were recovered, rigged down, and secured by 2400 h. No damage was found to the triple combo, but with solid evidence of hole deterioration, logging was terminated and the drill pipe was pulled out of the hole, ending Hole U1572A. The total core recovery from Hole U1572A was 139.53 m (42%). The time spent on Hole U1572A was 86.25 h or 3.6 days.
2.4.2. Hole U1572B
After laying out the RCB outer core barrel components, we assembled the APC/XCB outer core barrel and BHA and deployed the drill string to 1196.0 meters below rig floor (mbrf). We picked up the top drive and drilling knobby and spaced out the bit to a core shot depth of 1215.0 mbrf based on an estimate combining the PDR depth and the confirmed depth obtained from the logging run in Hole U1572A. Hole U1572B was spudded at 1015 h on 15 September 2021. Based on the 6.78 m of material returned in the mudline core, we calculated the water depth at 1206.5 mbsl. We continued APC coring, advancing from the seafloor to 149.3 mbsf (Core 16H). Core 16H required 90,000 lb of overpull to retrieve the core from the formation, reaching APC refusal. We deployed the HLAPC system and continued coring from 149.3 to 209.6 mbsf, reaching HLAPC refusal with Core 29F. We then deployed the XCB system and coring continued with partial advances to 224.3 mbsf. The final core (33X) was on deck at 1045 h on 16 September. We terminated the hole after reaching basement and achieving our science objective of sampling the sediment–basement transition. After laying out the last core, the coring systems were secured, the top drive was set back, and the bit was pulled clear of the seafloor at 1235 h. We recovered the drill pipe, disassembled and inspected all the components, and secured the rig floor for transit to the next site. The total amount of core recovered in Hole U1572B was 218.37 (97%). The time spent on Hole U1572B was 36.25 h or 1.6 days.
3. Lithostratigraphy
Sites U1571 and U1572 consist of four holes. At each site, one hole was drilled using the APC system and one was drilled using the RCB system. The sites are located along a 118° transect (i.e., Site U1572 to Site U1571) ~6.5 km apart on Skoll High. The succession recovered from the four holes has been divided into eight lithostratigraphic units (Table T3). Units I–VI are sedimentary, Unit VII is igneous, and Unit VIII is characterized by primarily igneous rock interbedded with sediment and volcaniclastics. The lithologic summary and preliminary correlation of the holes is shown in Figure F4, and detailed lithostratigraphic columns for each hole are available in Figure F5. A more detailed depiction of the transition from Eocene sediments to igneous rock is available in Figure F6.
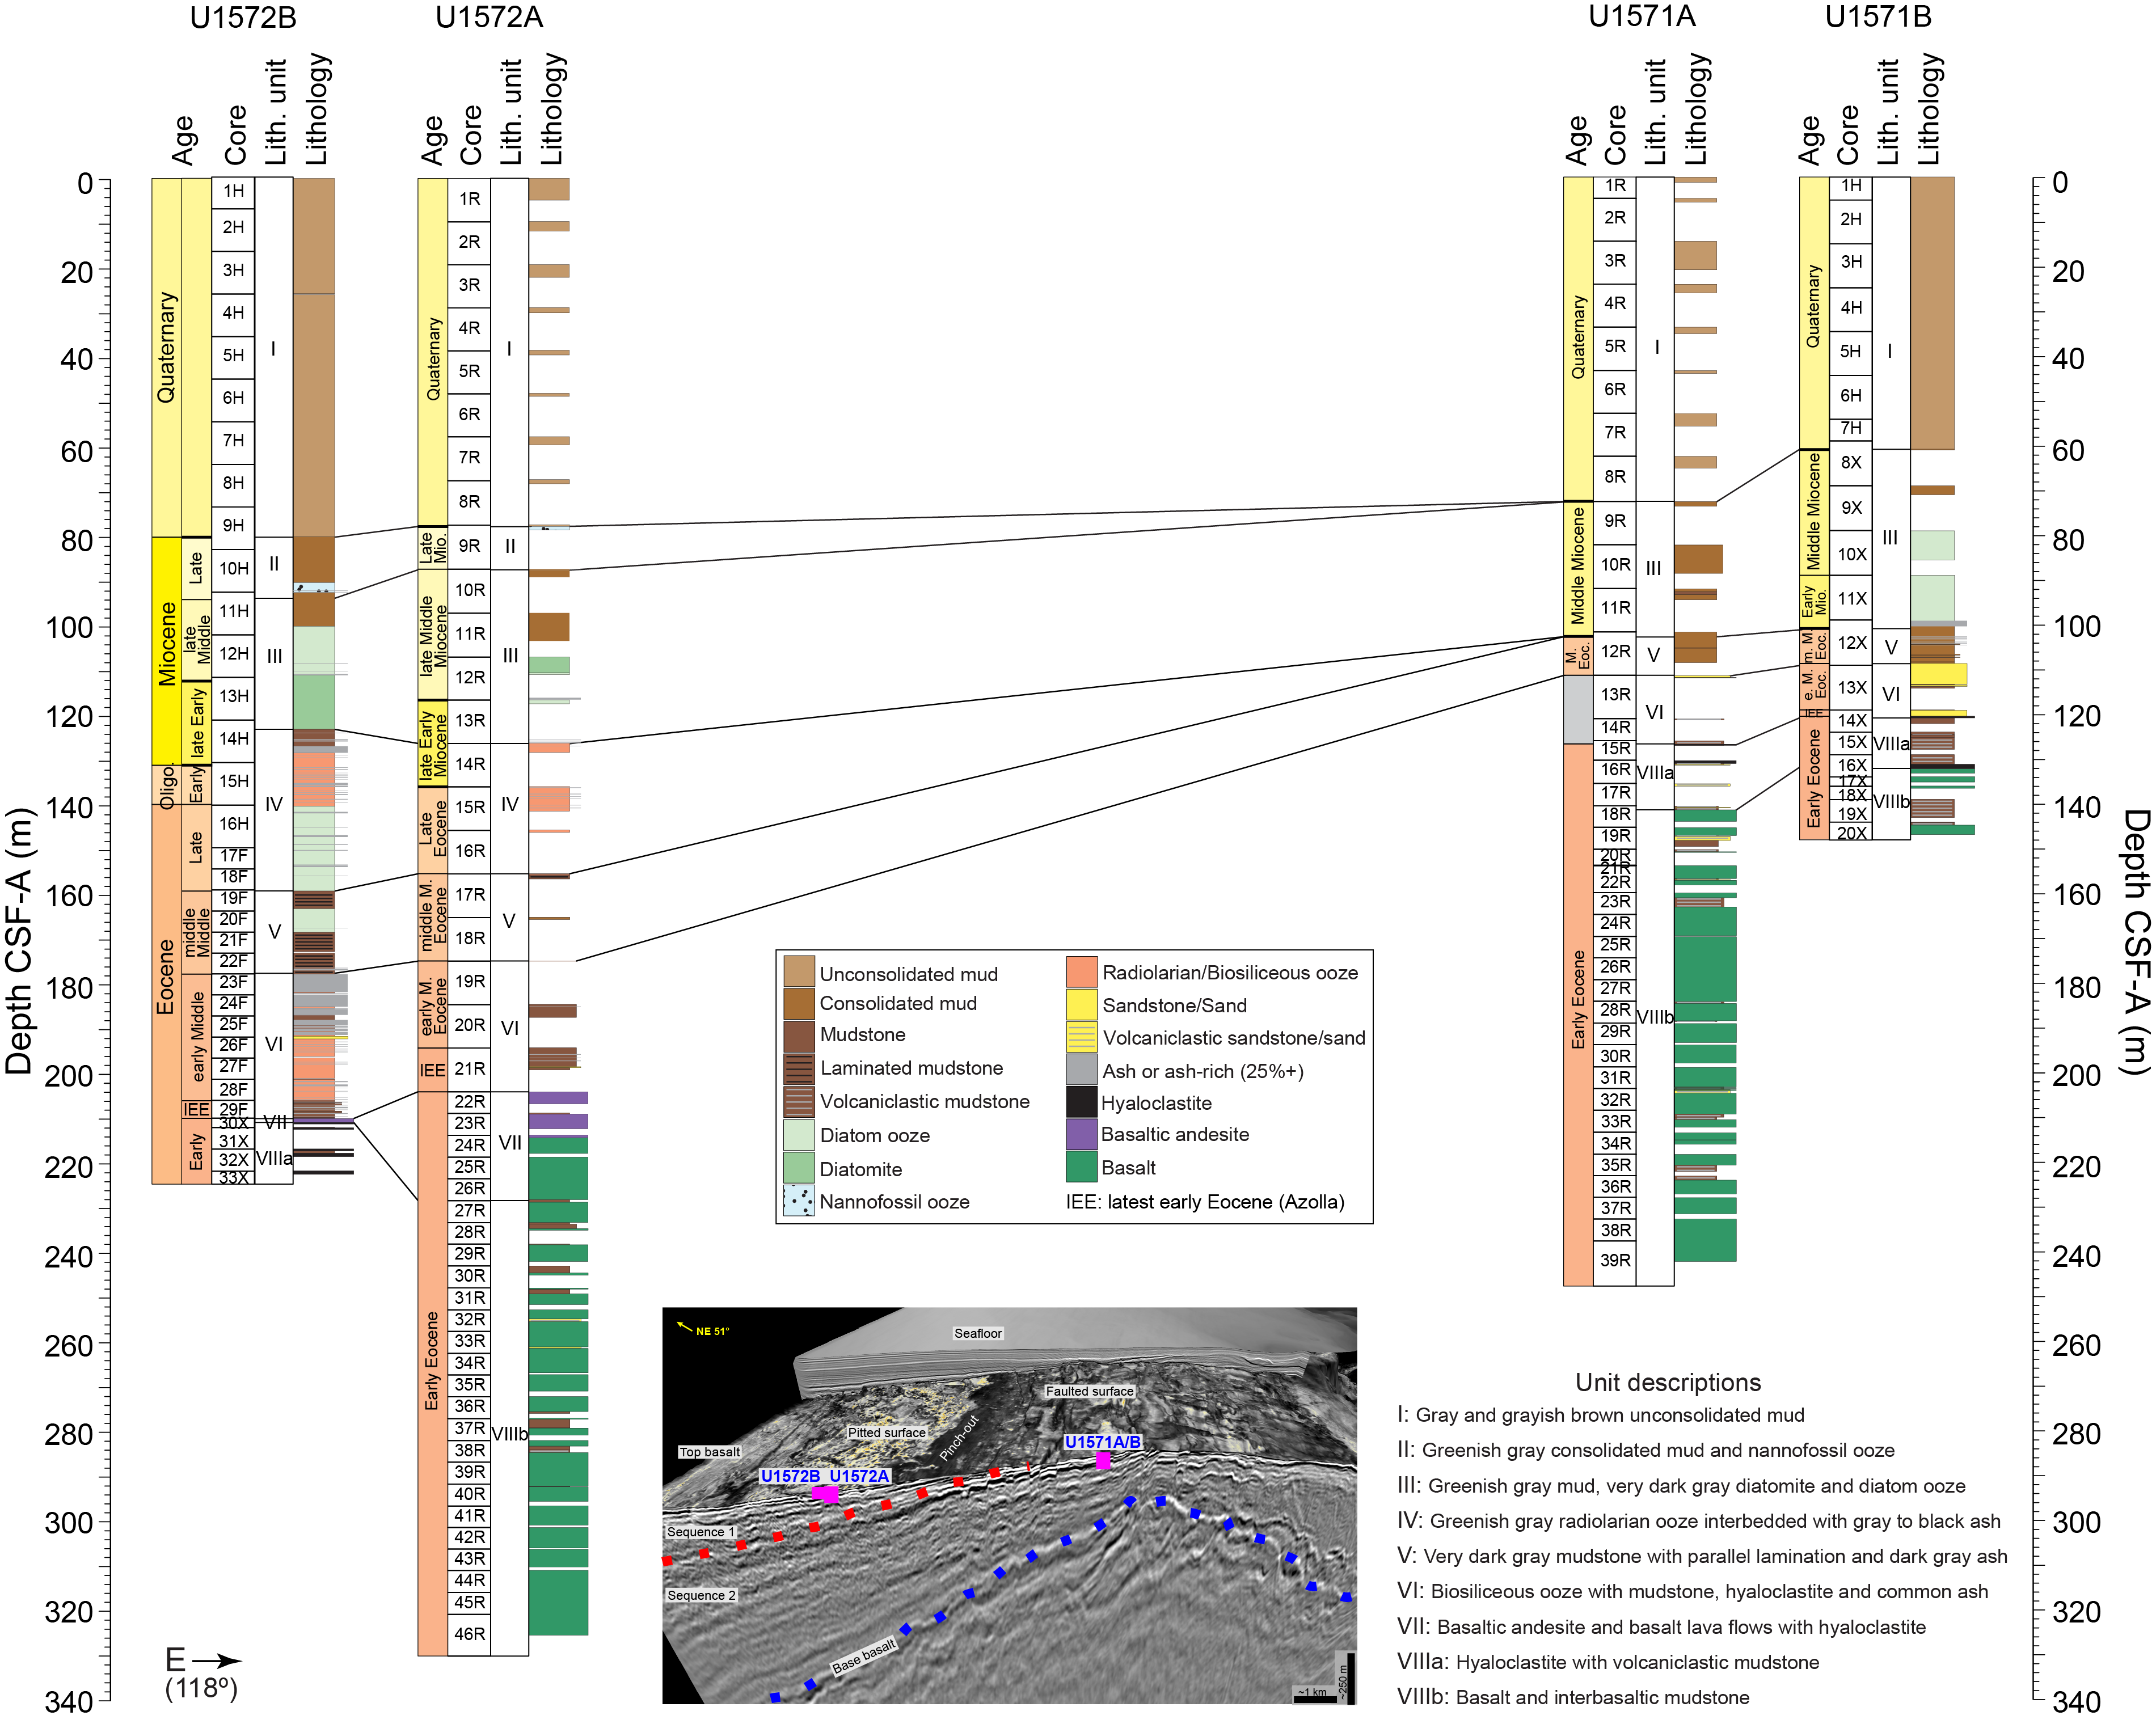
Figure F4. Lithostratigraphic summary.
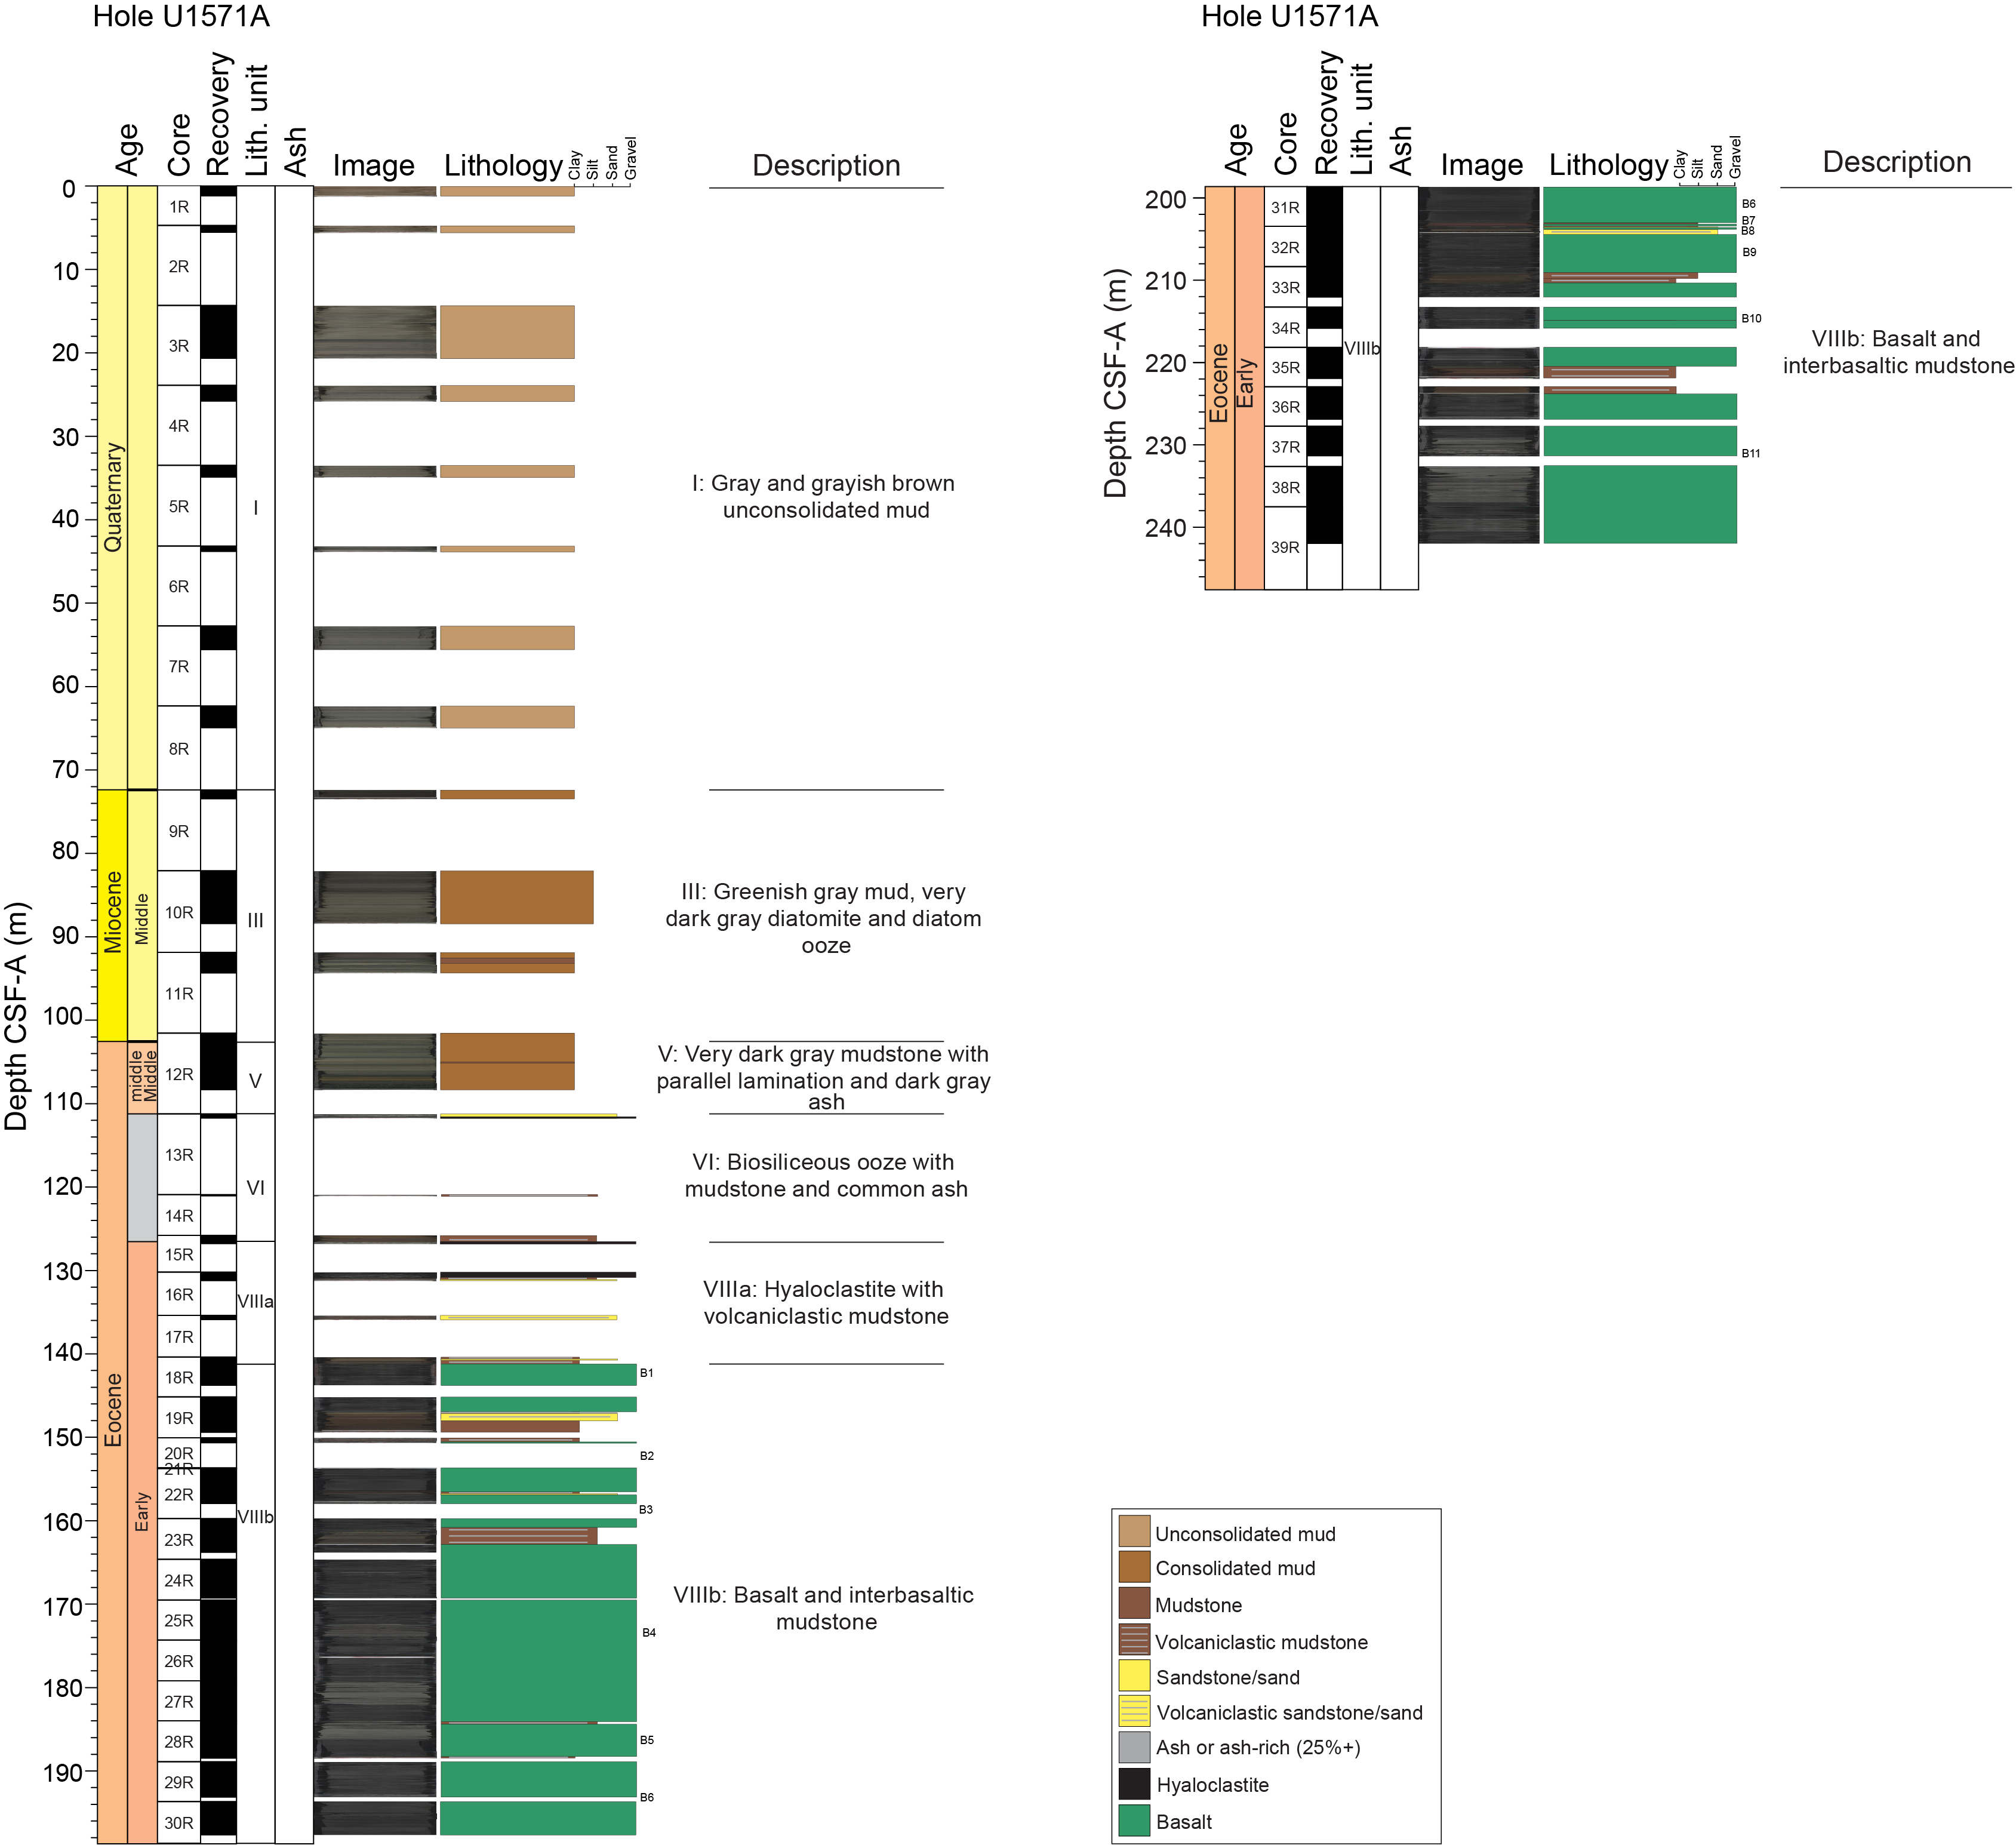
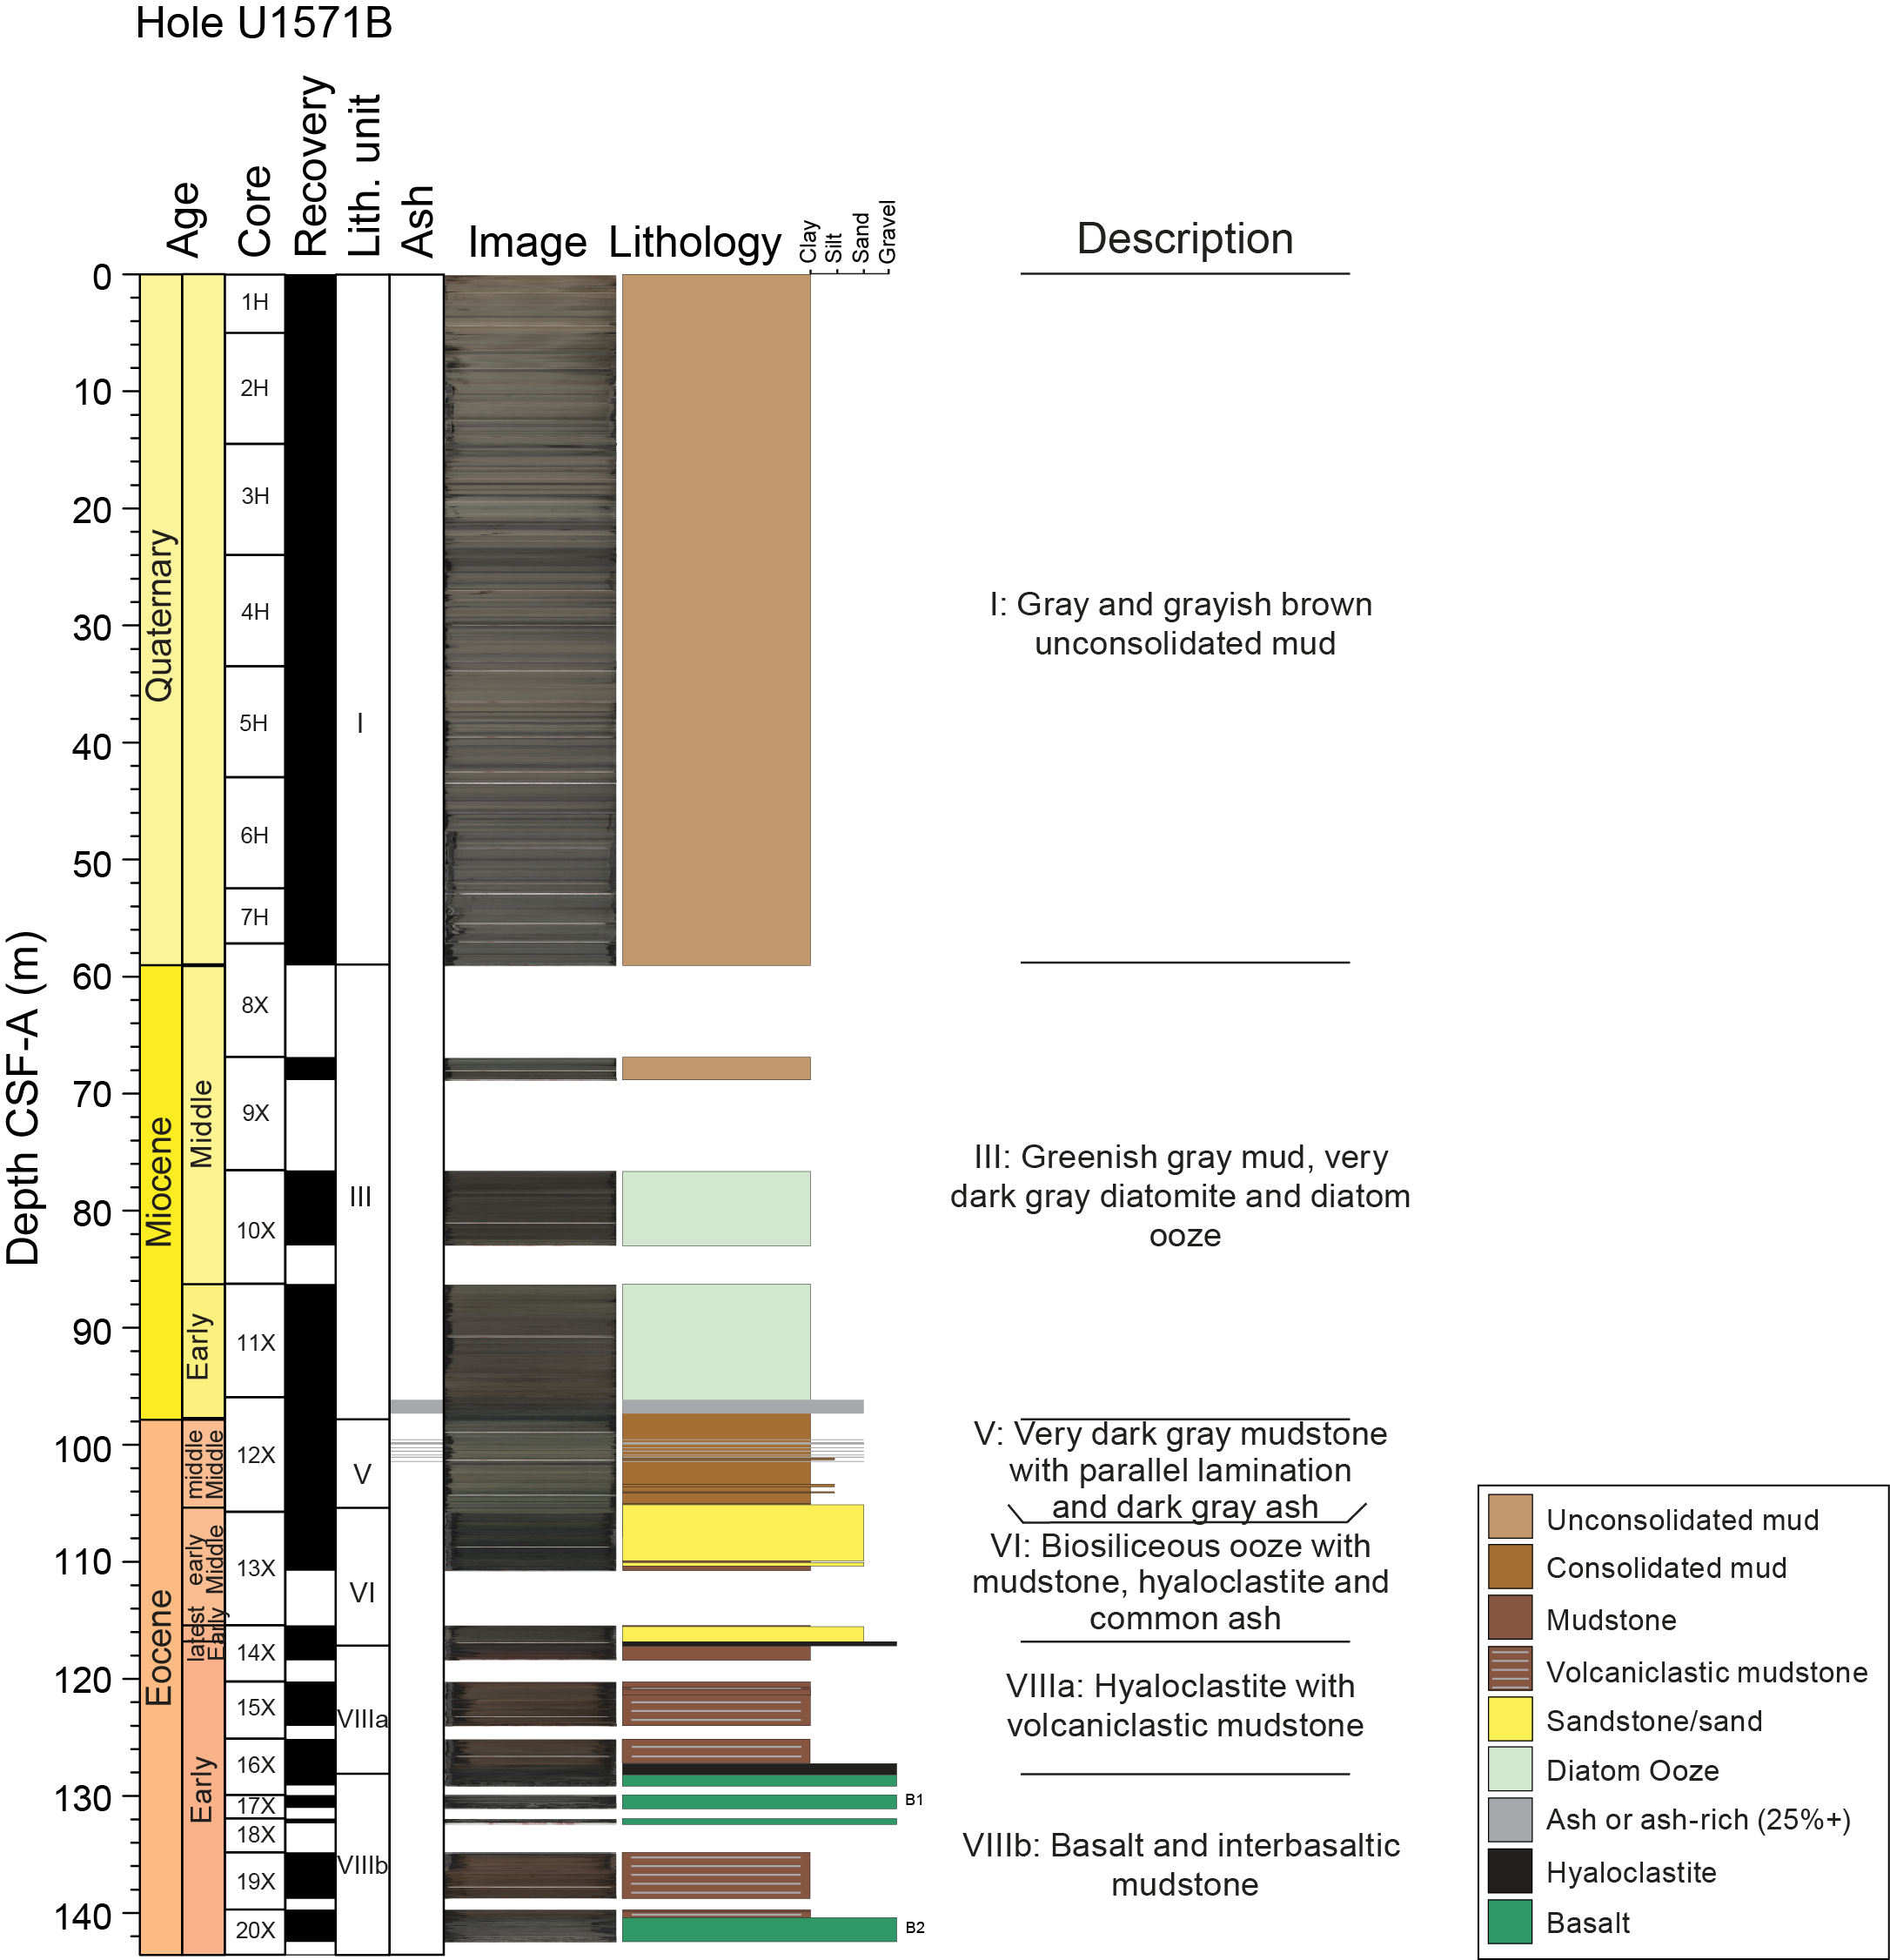
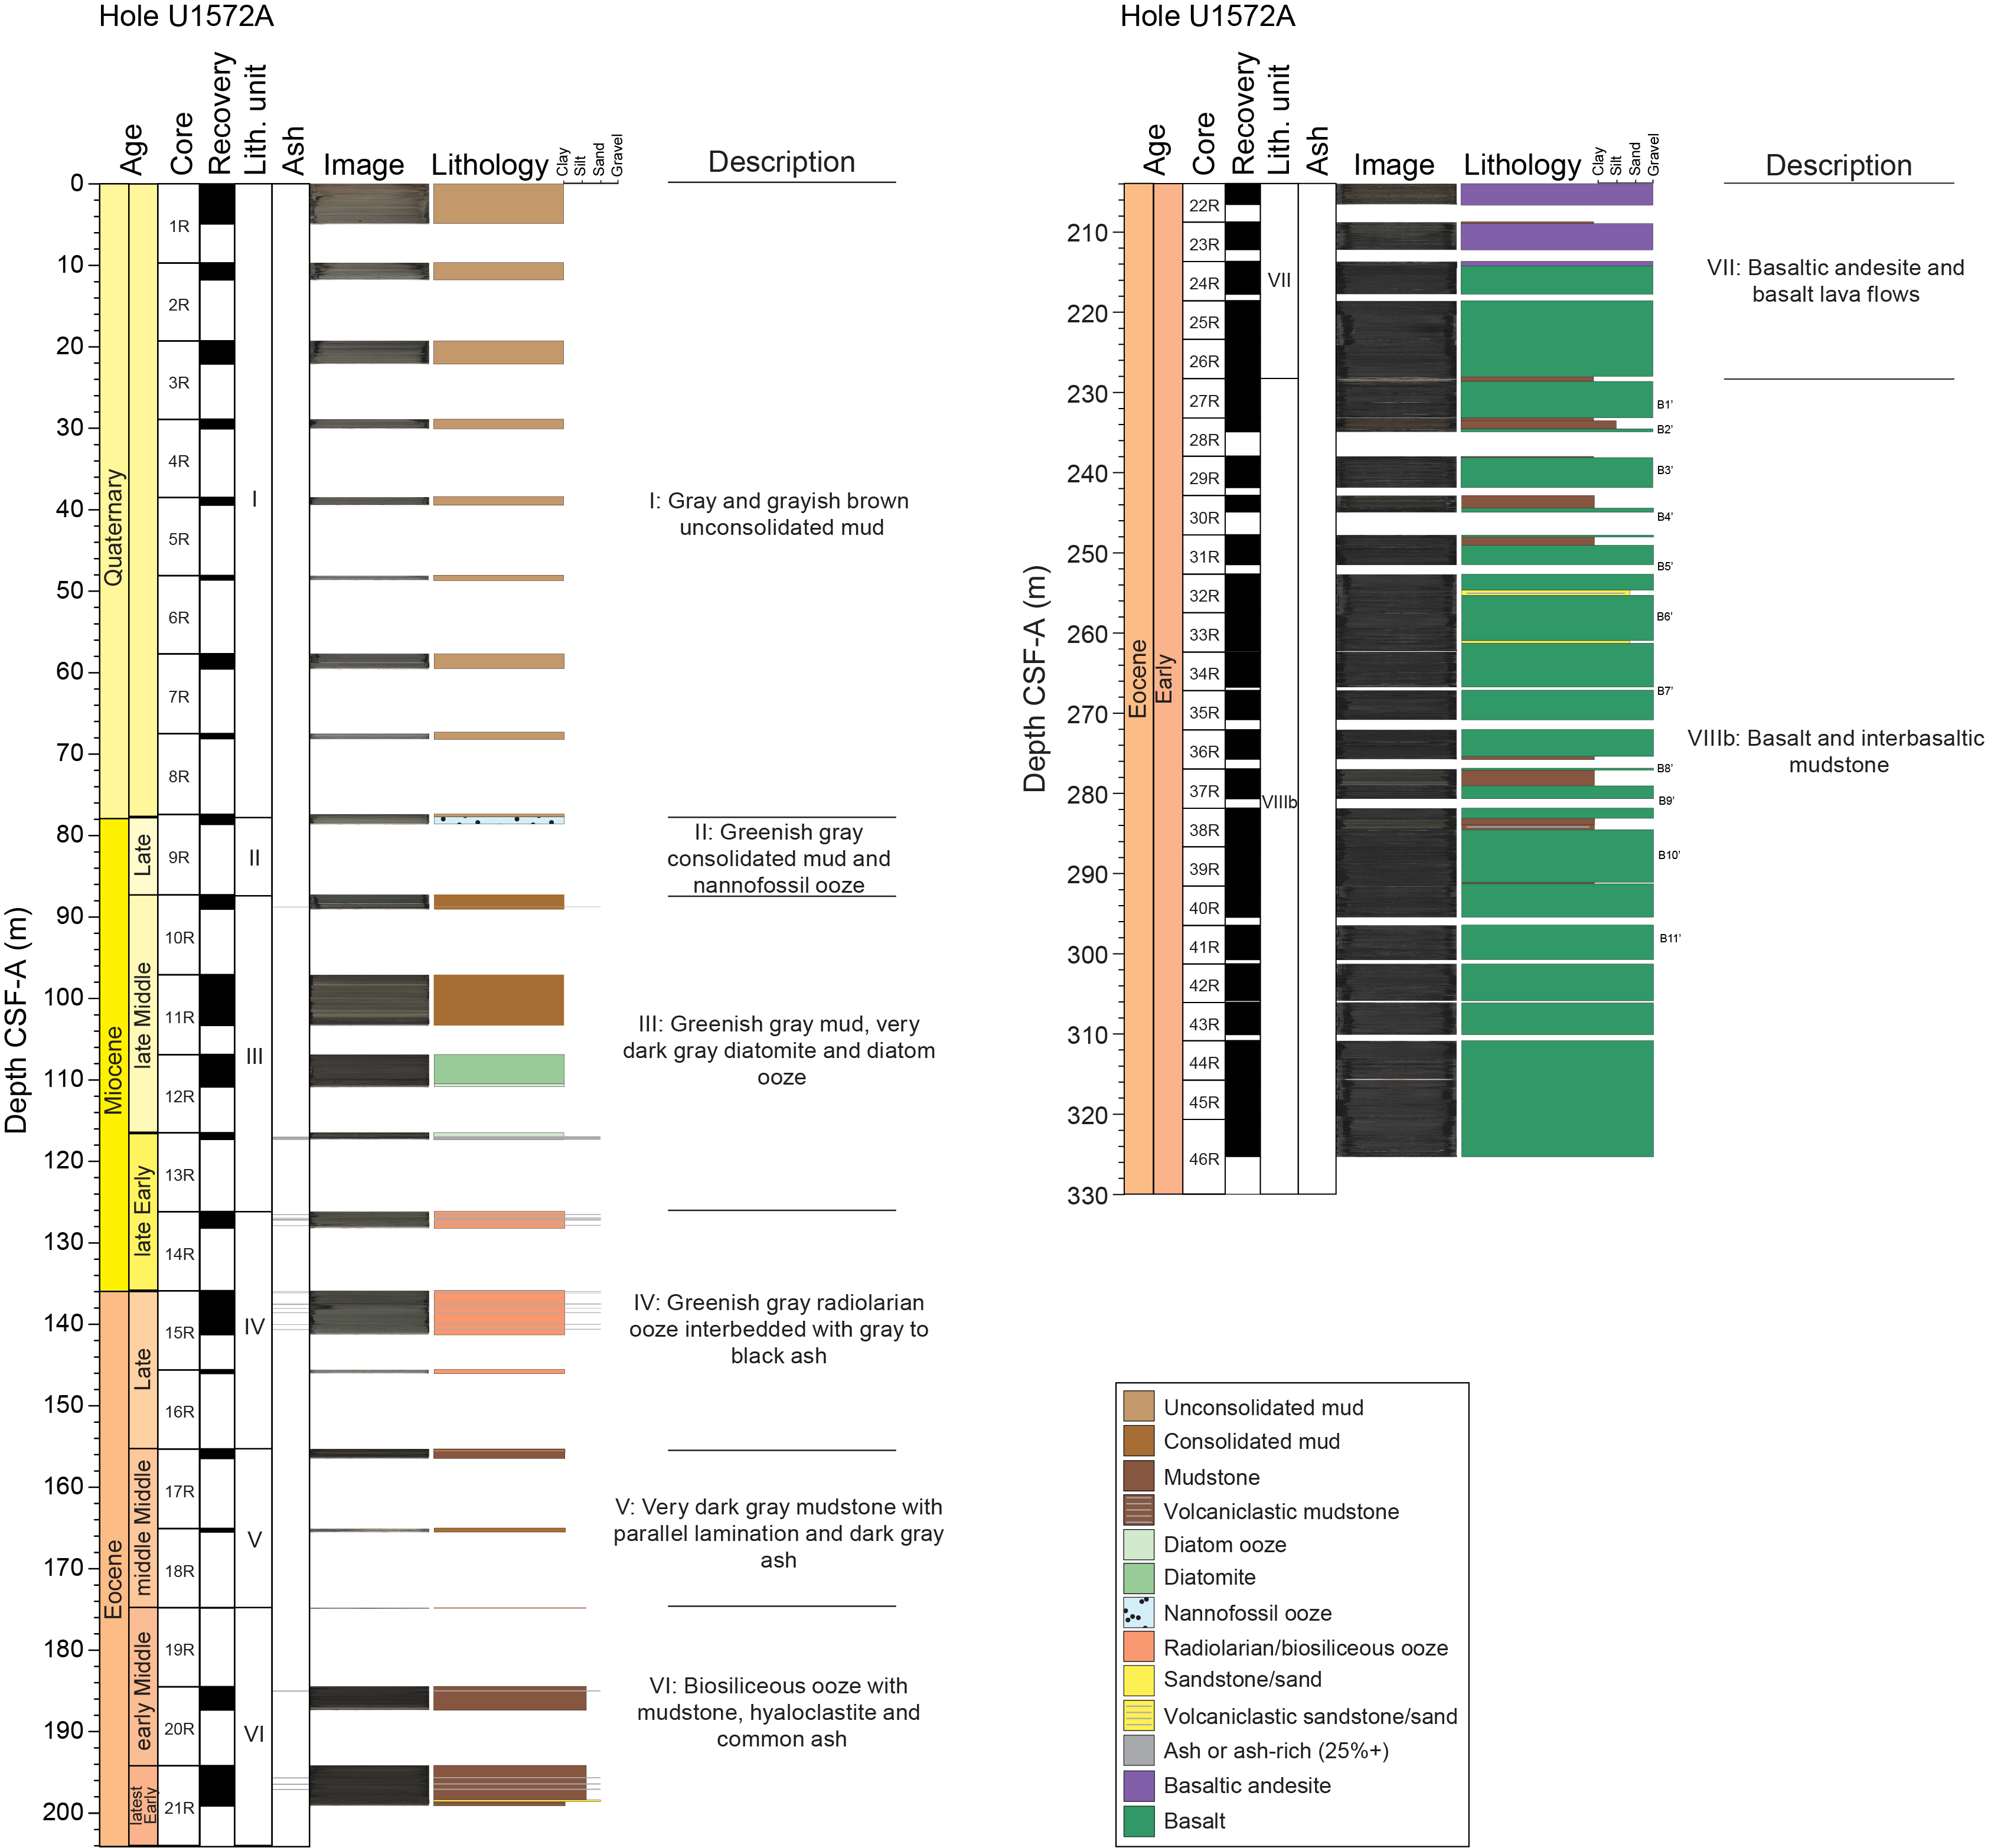
Figure F5. Lithostratigraphic columns.
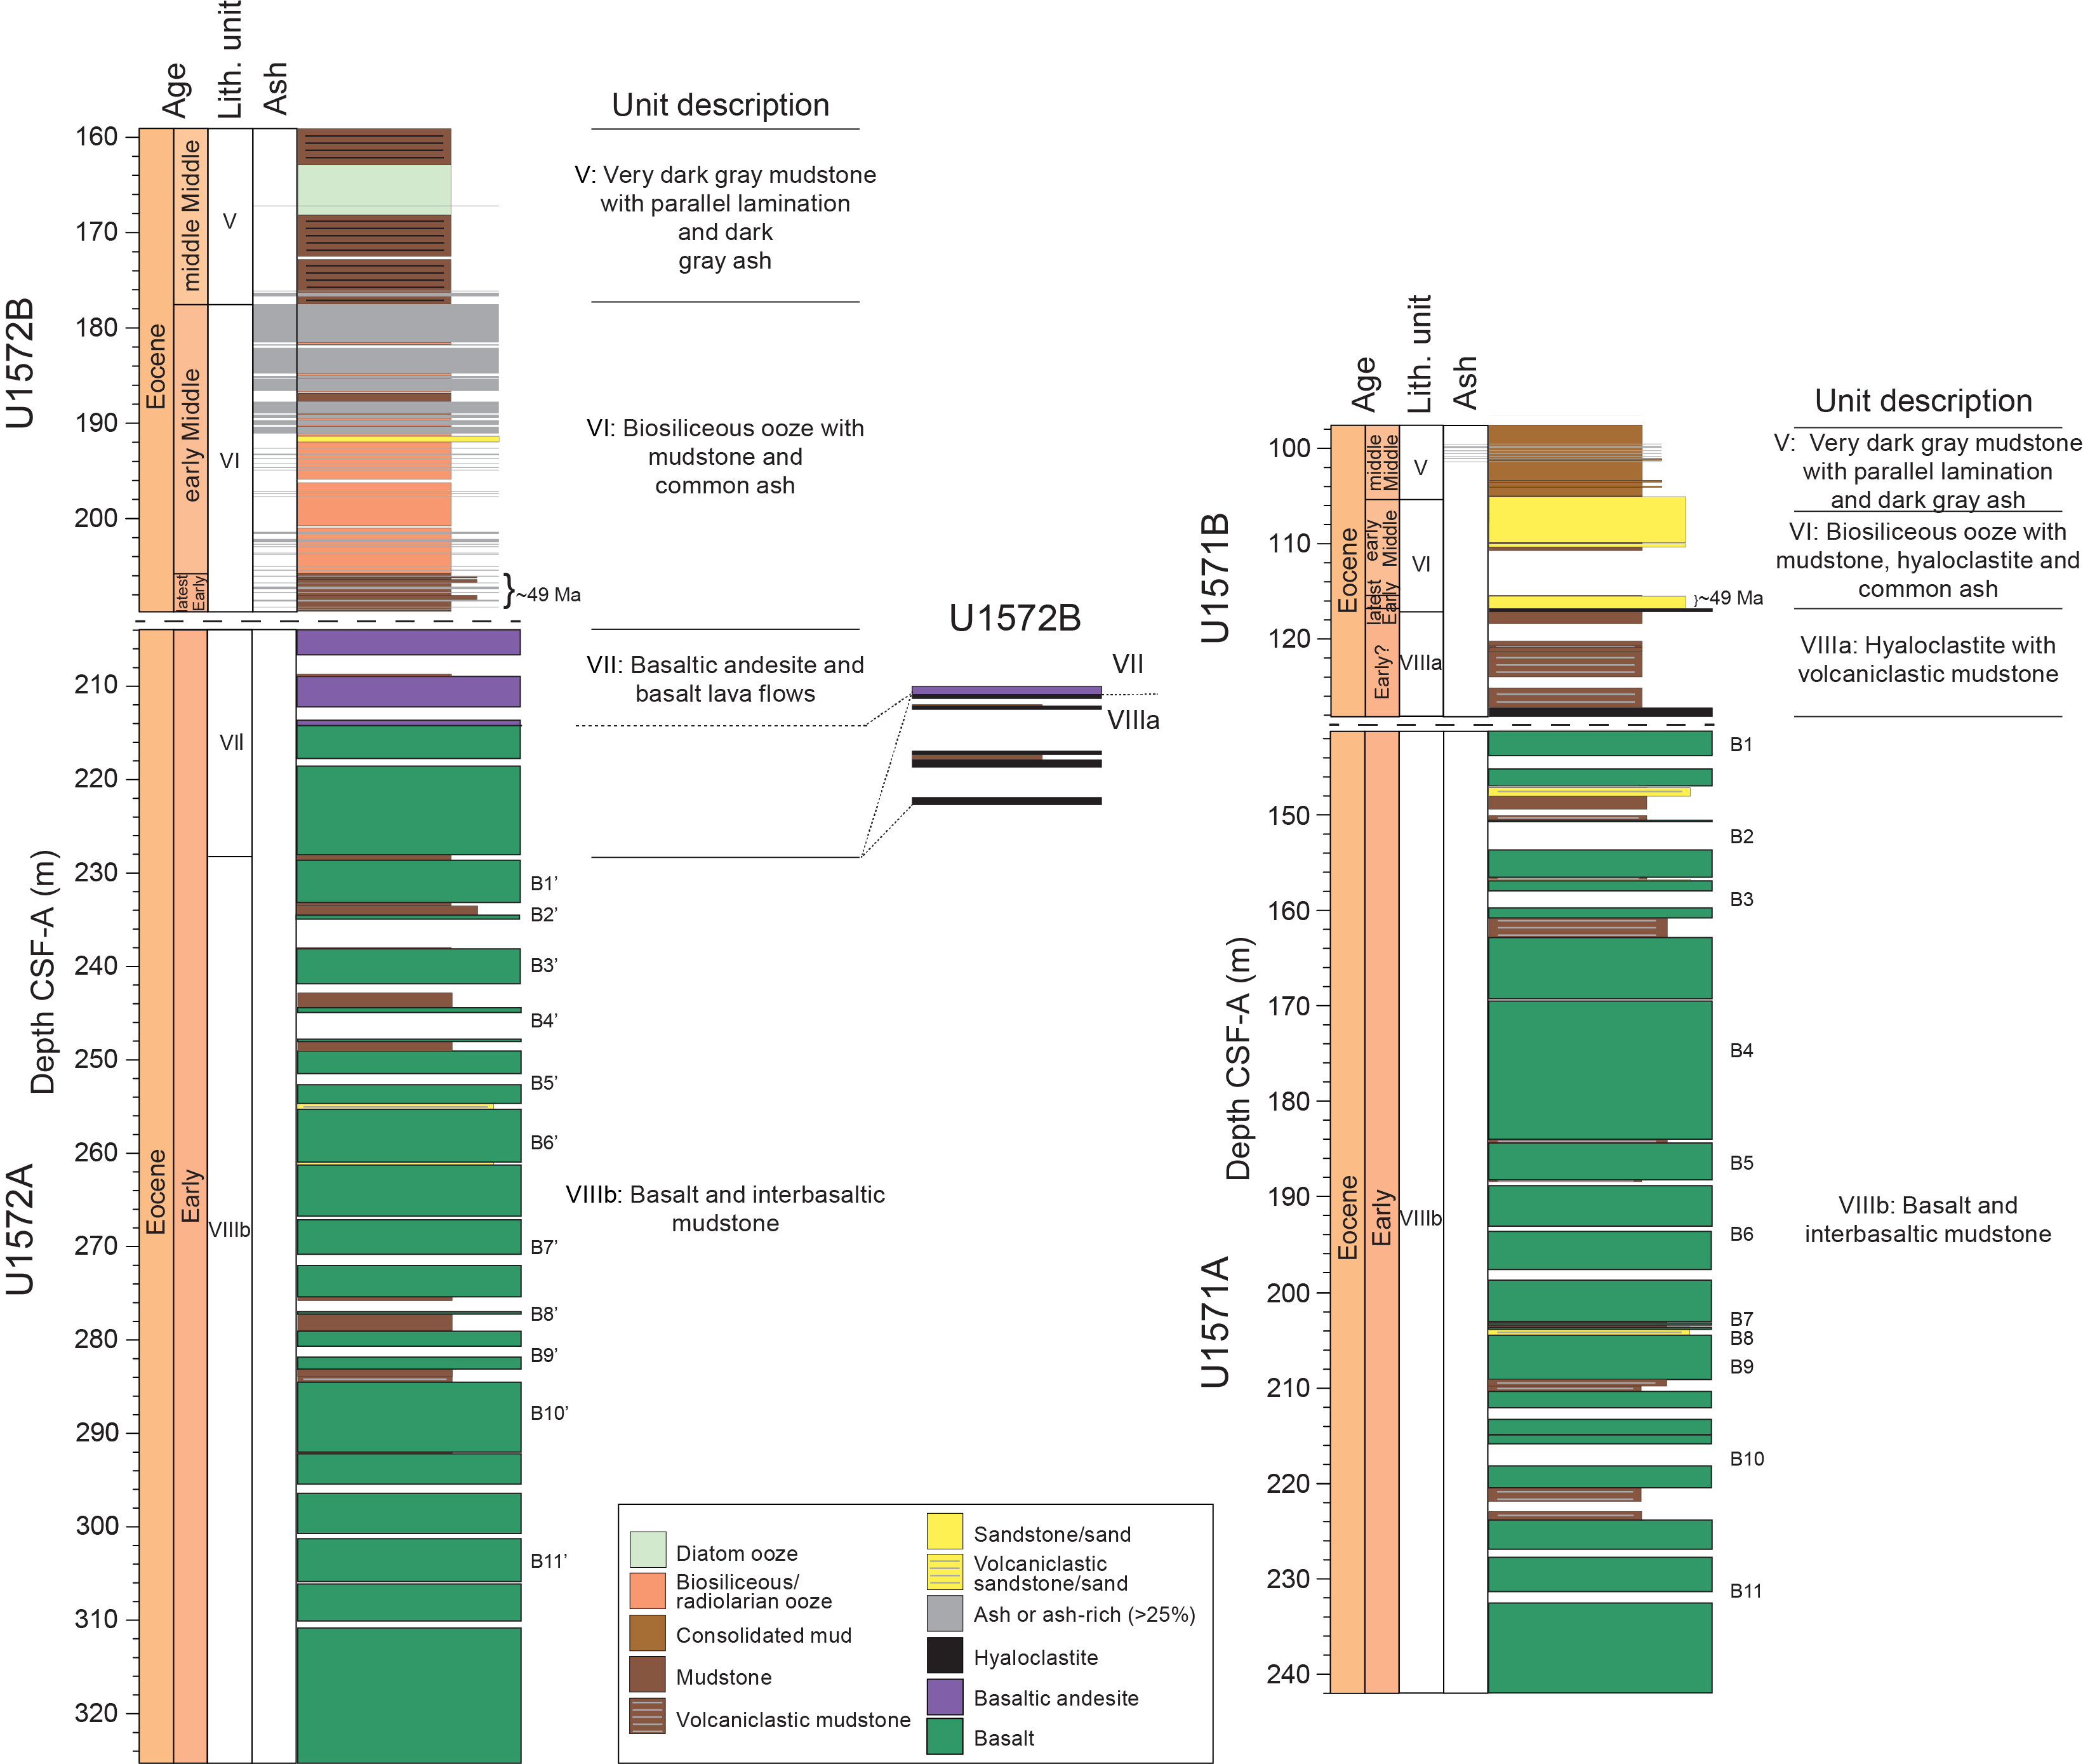
Figure F6. Core composites.
Units were determined based on macroscopic observations and microscopic analysis and are supported by physical properties and biostratigraphy (see Lithostratigraphy in the Expedition 396 methods chapter [Planke et al., 2023a]). Unit intervals, depths, and descriptions are provided in Table T3. Hole U1572A is the only hole that includes all eight units. In Holes U1572B and U1571B, APC drilling was utilized and recovery of sediments was more than 100% in many sediment cores (Figure F5). Where core recovery is low across unit boundaries or fall-in drilling is observed, boundaries are placed at the top of the underlying unit.
The lithology at Sites U1571 and U1572 is as follows:
- Unit I is grayish brown and brown unconsolidated mud.
- Unit II is greenish gray consolidated mud and nannofossil ooze.
- Unit III is greenish gray mud, very dark gray diatomite, and diatom ooze.
- Unit IV consists of greenish gray radiolarian ooze interbedded with gray to black ash.
- Unit V is very dark gray mudstone with parallel lamination and dark gray ash.
- Unit VI is biosiliceous ooze with mudstone, hyaloclastite, and abundant ash.
- Unit VII is basaltic andesite and basalt lava flows.
- Unit VIII consists of basalt, hyaloclastite, and interbasaltic mudstone and is divided into Subunits VIIIa and VIIIb based on compositional changes in the igneous material.
The lithostratigraphic highlights of Sites U1571 and U1572 are as follows:
- Two igneous units (Lithostratigraphic Units VII and VIII) exhibit pahoehoe flow-type emplacement.
- The presence of hyaloclastite and peperite at the top of Unit VIII indicates the flow was emplaced in shallow water.
- Major shifts in biosiliceous sediment composition (e.g., shift from diatom- to radiolarian-dominated) correspond to intervals of high ash abundance.
- An expanded Miocene-aged interval of nannofossil ooze, diatom ooze, and diatomite was recovered at Site U1572.
3.1. Lithostratigraphic Unit I
- Intervals: 396-U1571A-1R-1, 0 cm, to 9R-1, 0 cm; 396-U1571B-1H-1, 0 cm, to 8X-CC, 15 cm; 396-U1572A-1R-1, 0 cm, to 9R-1, 48 cm; 396-U1572B-1H-1, 0 cm, to 9H-5, 64 cm
- Depths: Hole U1571A = 0.00–72.50 m core depth below seafloor, Method A (CSF-A); Hole U1571B = 0.00–58.95 m CSF-A; Hole U1572A = 0.00–77.88 m CSF-A; Hole U1572B = 0.00–80.00 m CSF-A
- Age: Quaternary
Lithostratigraphic Unit I consists of gray and grayish brown unconsolidated mud and is present in all four holes. Characteristic cyclic color variability is observed throughout the unit between gray and very dark gray clay. Clasts and dropstones are present locally, and rare organic matter is observed in some intervals. Foraminifers are common in some beds, evidenced by textural (i.e., coarseness) changes and confirmed using a hand lens.
3.2. Lithostratigraphic Unit II
- Intervals: 396-U1572A-9R-1, 48 cm, to 9R-CC, 19 cm; 396-U1572B-9H-5, 64 cm, to 11H-1, 116 cm
- Depths: Hole U1572A = 77.88–78.65 m CSF-A; Hole U1572B = 80.00–93.46 m CSF-A
- Age: Late Miocene
Lithostratigraphic Unit II consists of greenish gray consolidated mud and nannofossil ooze and is only present in Holes U1572A and U1572B. The upper part of the unit in Hole U1572B is characterized by centimeter-scale thick bedding with slight bioturbation. Microscopic inspection indicates the presence of fresh glass, albeit rare, in Hole U1572B (Figure F7A), although distinct ash beds are not apparent. The lithologic transition from Unit I to Unit II is primarily based on an increase in the consolidation of clay and is microscopically characterized by an increase in the abundance of nannofossils (i.e., nannofossil ooze) (Figure F7C, F7D). Furthermore, the boundary between Units I and II is supported by a distinct change in physical properties (see Physical properties).
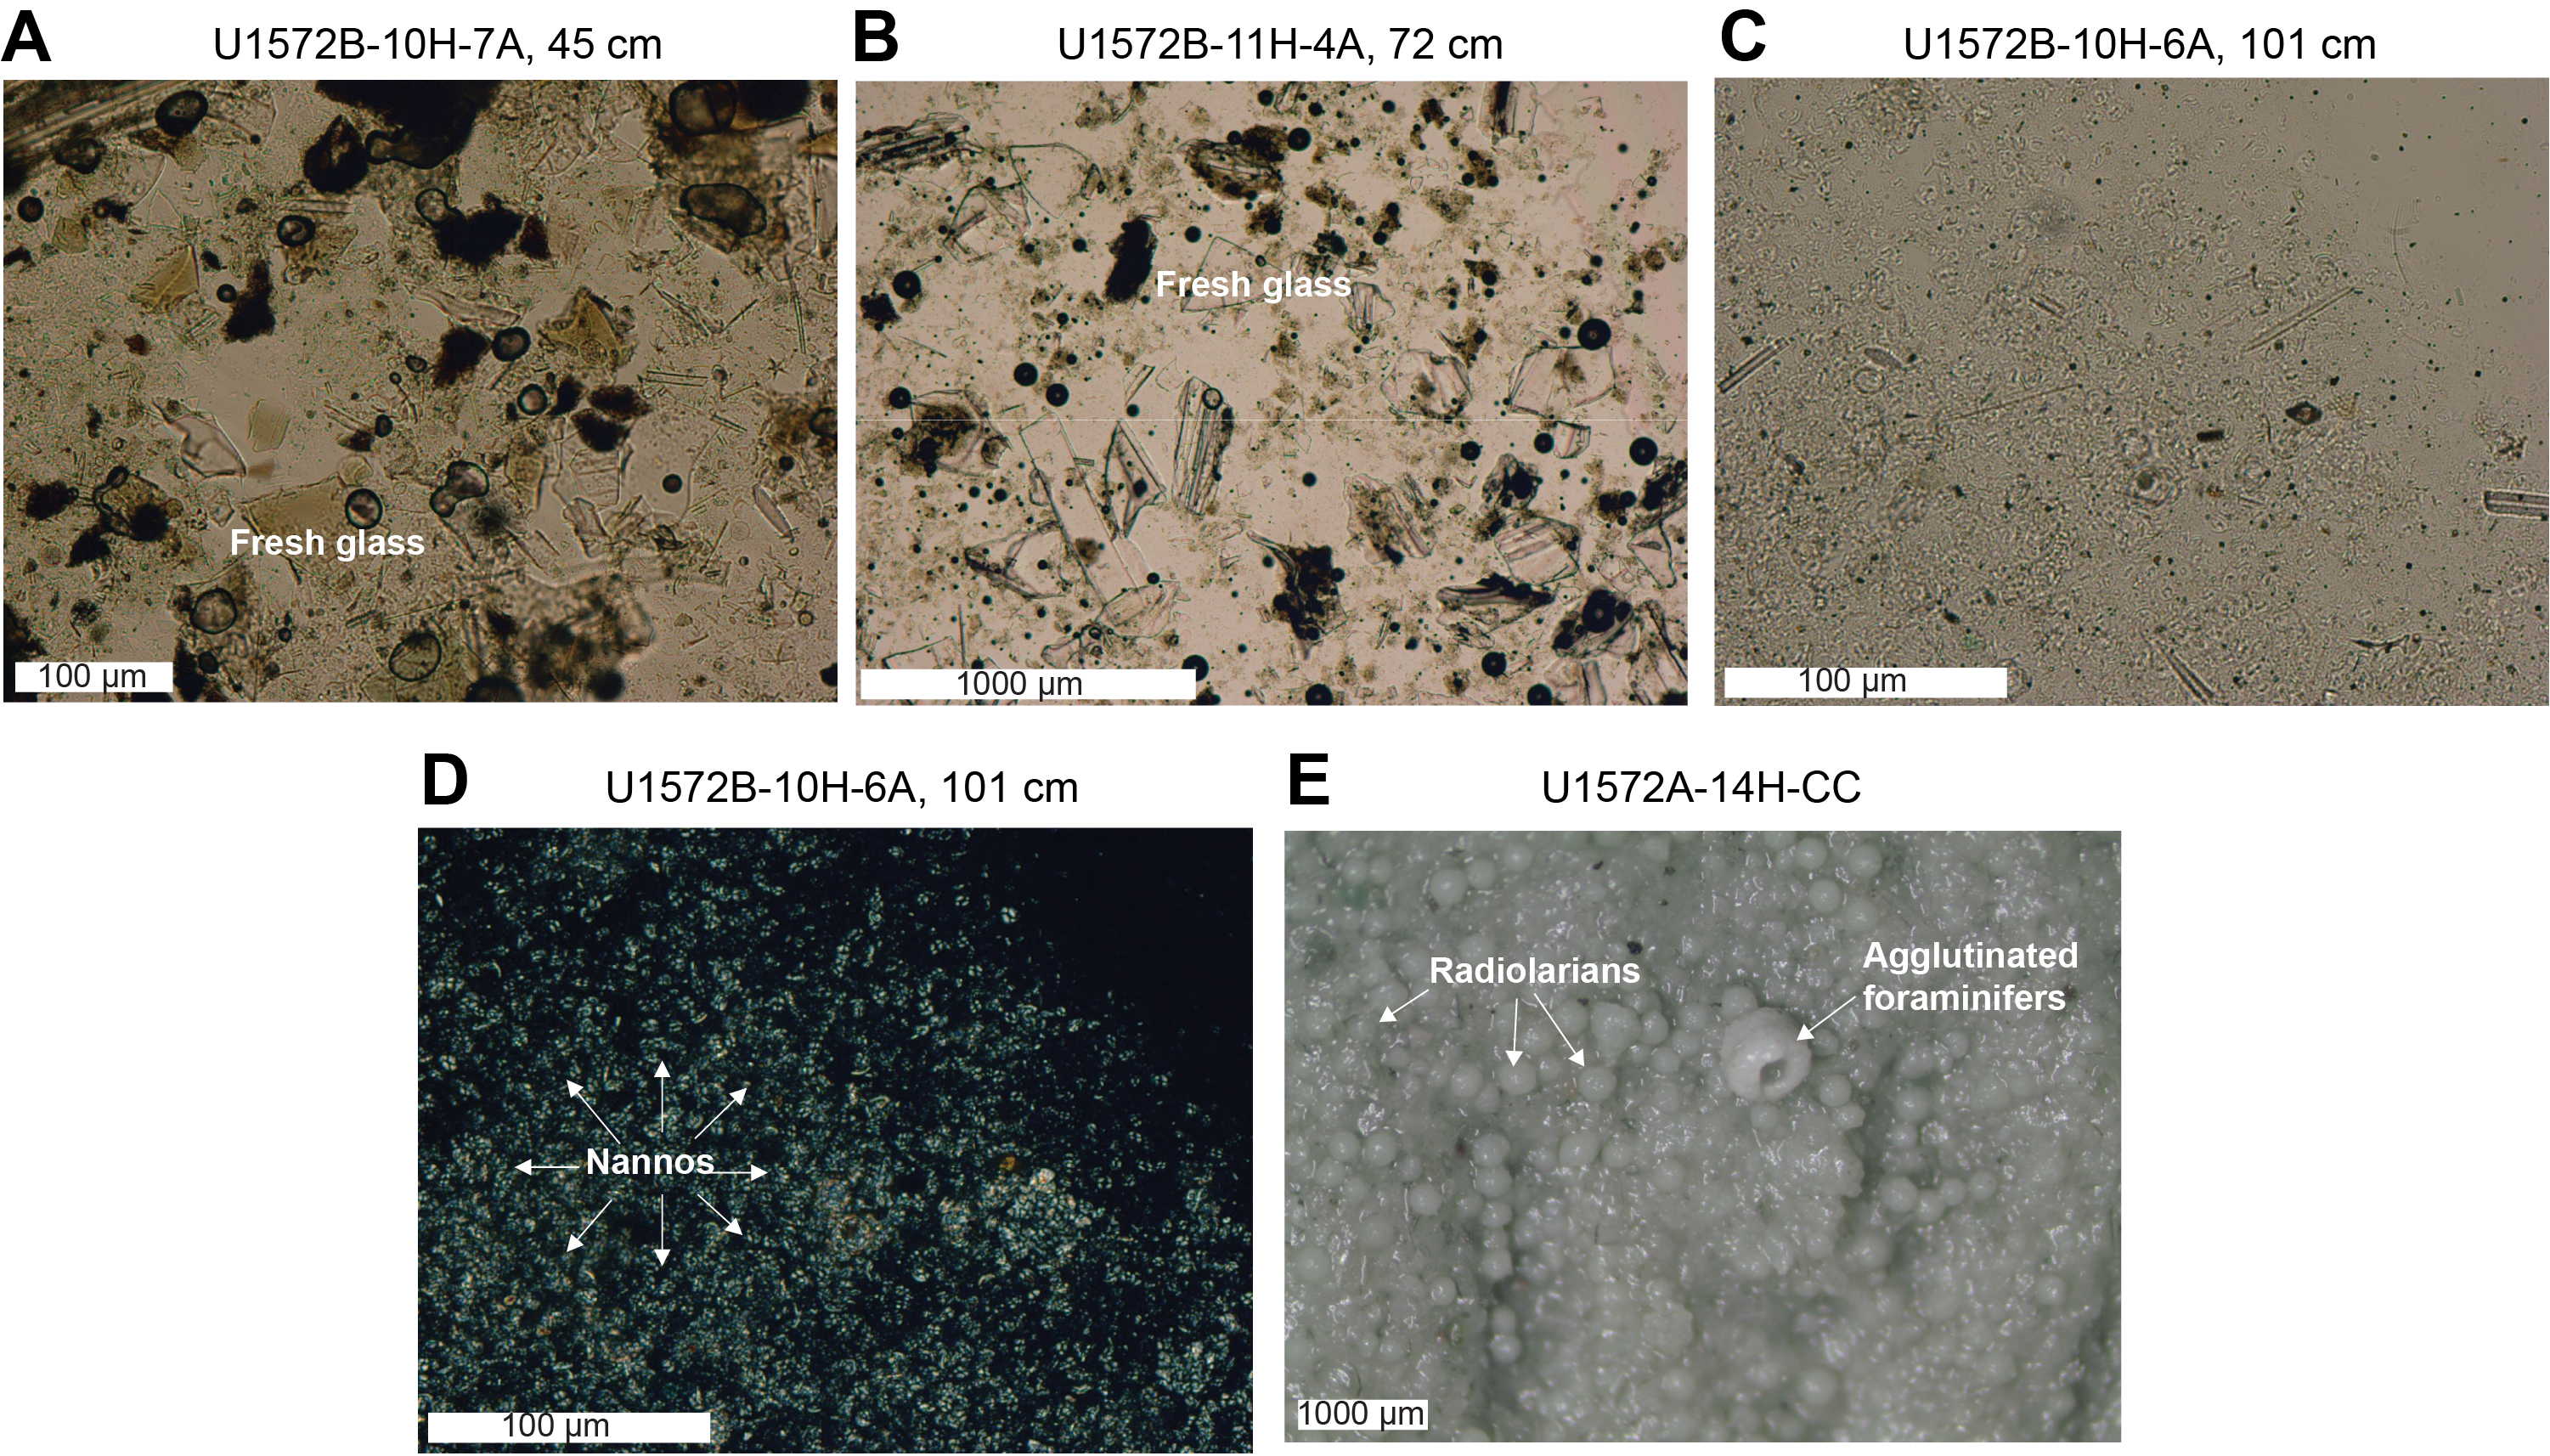
Figure F7. Ash beds and oozes.
3.3. Lithostratigraphic Unit III
- Intervals: 396-U1571A-9R-1, 0 cm, to 12R-1, 101 cm; 396-U1571B-8X-CC, 15 cm, to 12X-2, 46 cm; 396-U1572A-10R-1, 3 cm, to 14R-1, 0 cm; 396-U1572B-11H-1, 116 cm, to 14H-2, 58 cm
- Depths: Hole U1571A = 72.50–102.71 m CSF-A; Hole U1571B = 58.95–97.96 m CSF-A; Hole U1572A = 87.33–126.20 m CSF-A; Hole U1572B = 93.46–122.83 m CSF-A
- Age: late Early Miocene to late Middle Miocene
Lithostratigraphic Unit III is present in all four holes and consists of greenish gray and very dark brown consolidated clay, very dark gray diatomite, and diatom ooze. The boundary between Units II and III at Site U1572 is placed where the sediment changes from light greenish gray nannofossil ooze to greenish gray to dark greenish gray well-consolidated clay. In Hole U1572B, a 1.2 m thick disturbed soupy interval overlies Unit III in Core 11H (Figure F8A–F8C). At Site U1571, the boundary between Units I and III (i.e., Unit II is not present at this site) is placed where a color change and an increase in mud consolidation is observed (Figure F8D). Though some lateral variability is observed, and recovery is variable in APC (high) versus RCB (low) holes, the unit consists of similar sediments. Overall, the unit is moderately bioturbated and contains diatom ooze with sand, as well as clay. At the bottom of the unit, diatom ooze shows parallel lamination and ash rich intervals are observed. Ash is confirmed with smear slide inspection, which indicates the presence of fresh glass. Compared to Unit II, Unit III tends to contain coarser grains of glass in ash intervals (e.g., Figure F7A, F7B). At Site U1571, the dominant lithology is dark greenish gray and very dark brown clay, with diatom ooze. This diatom ooze was not well recovered in Hole U1571A. Sand-rich clay intervals are observed primarily in the uppermost interval. At Site U1572, the unit consists of diatom ooze with ash rich intervals in the lower part, very dark gray diatomite, and clay. Wavy lamination and moderate to heavy bioturbation are observed in some intervals of the unit at this site.
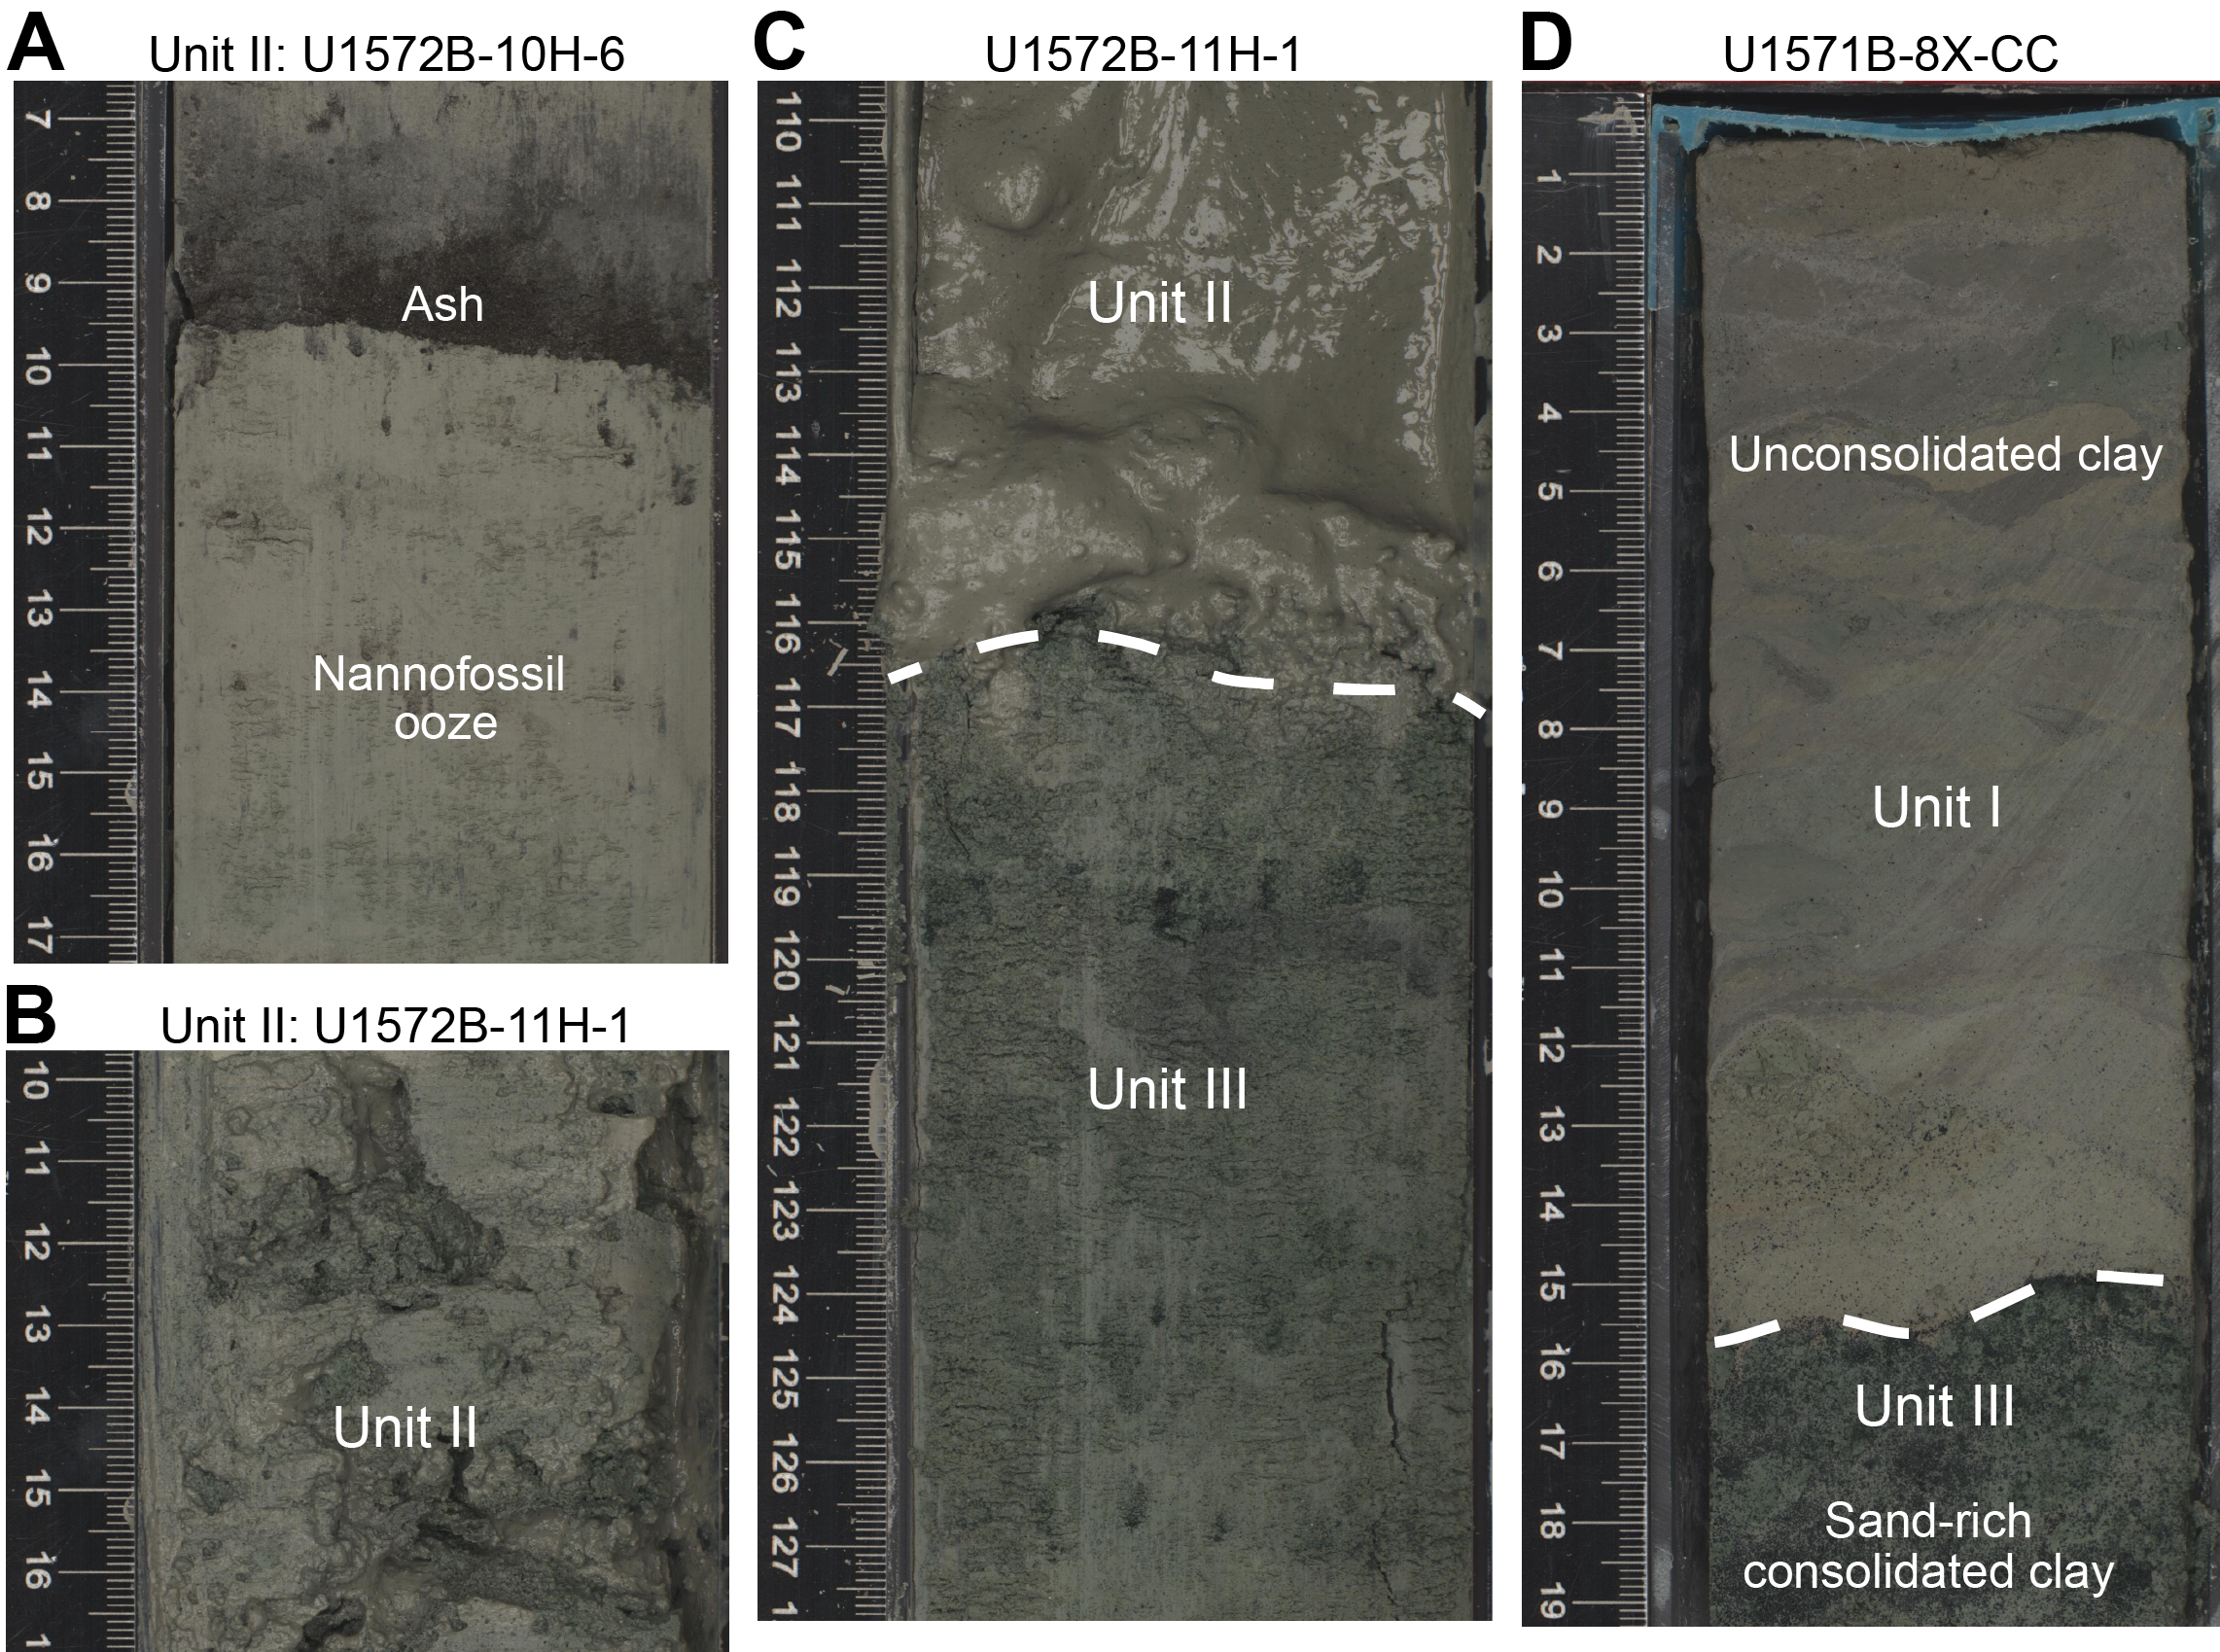
Figure F8. Unit II–III and Unit I–III transitions.
3.4. Lithostratigraphic Unit IV
- Intervals: 396-U1572A-14R-1, 0 cm, to 17R-1, 0 cm; 396-U1572B-14H-2, 58 cm, to 19F-1, 24 cm
- Depths: Hole U1572A = 126.20–155.30 m CSF-A; Hole U1572B = 122.83–158.94 m CSF-A
- Age: Late Eocene to late Early Miocene
Lithostratigraphic Unit IV is greenish gray radiolarian ooze interbedded with gray to black ash and is only present at Site U1572. The lithologic transition between Units III and IV is marked by a change from dark grayish brown diatomite to dark greenish gray claystone (Figure F9A). In both holes, the dominant lithology consists of radiolarian to biosiliceous (i.e., combination of radiolarians and diatoms) ooze commonly interbedded with ash. Some intervals of radiolarian ooze are dominated by radiolarians (>90%), and trace agglutinated foraminifers are present (Figure F7E). Diatom ooze is recovered in the lowermost portion of the unit in Hole U1572B and is not recovered in Hole U1572A. The unit shows some intervals of parallel lamination and moderate bioturbation.
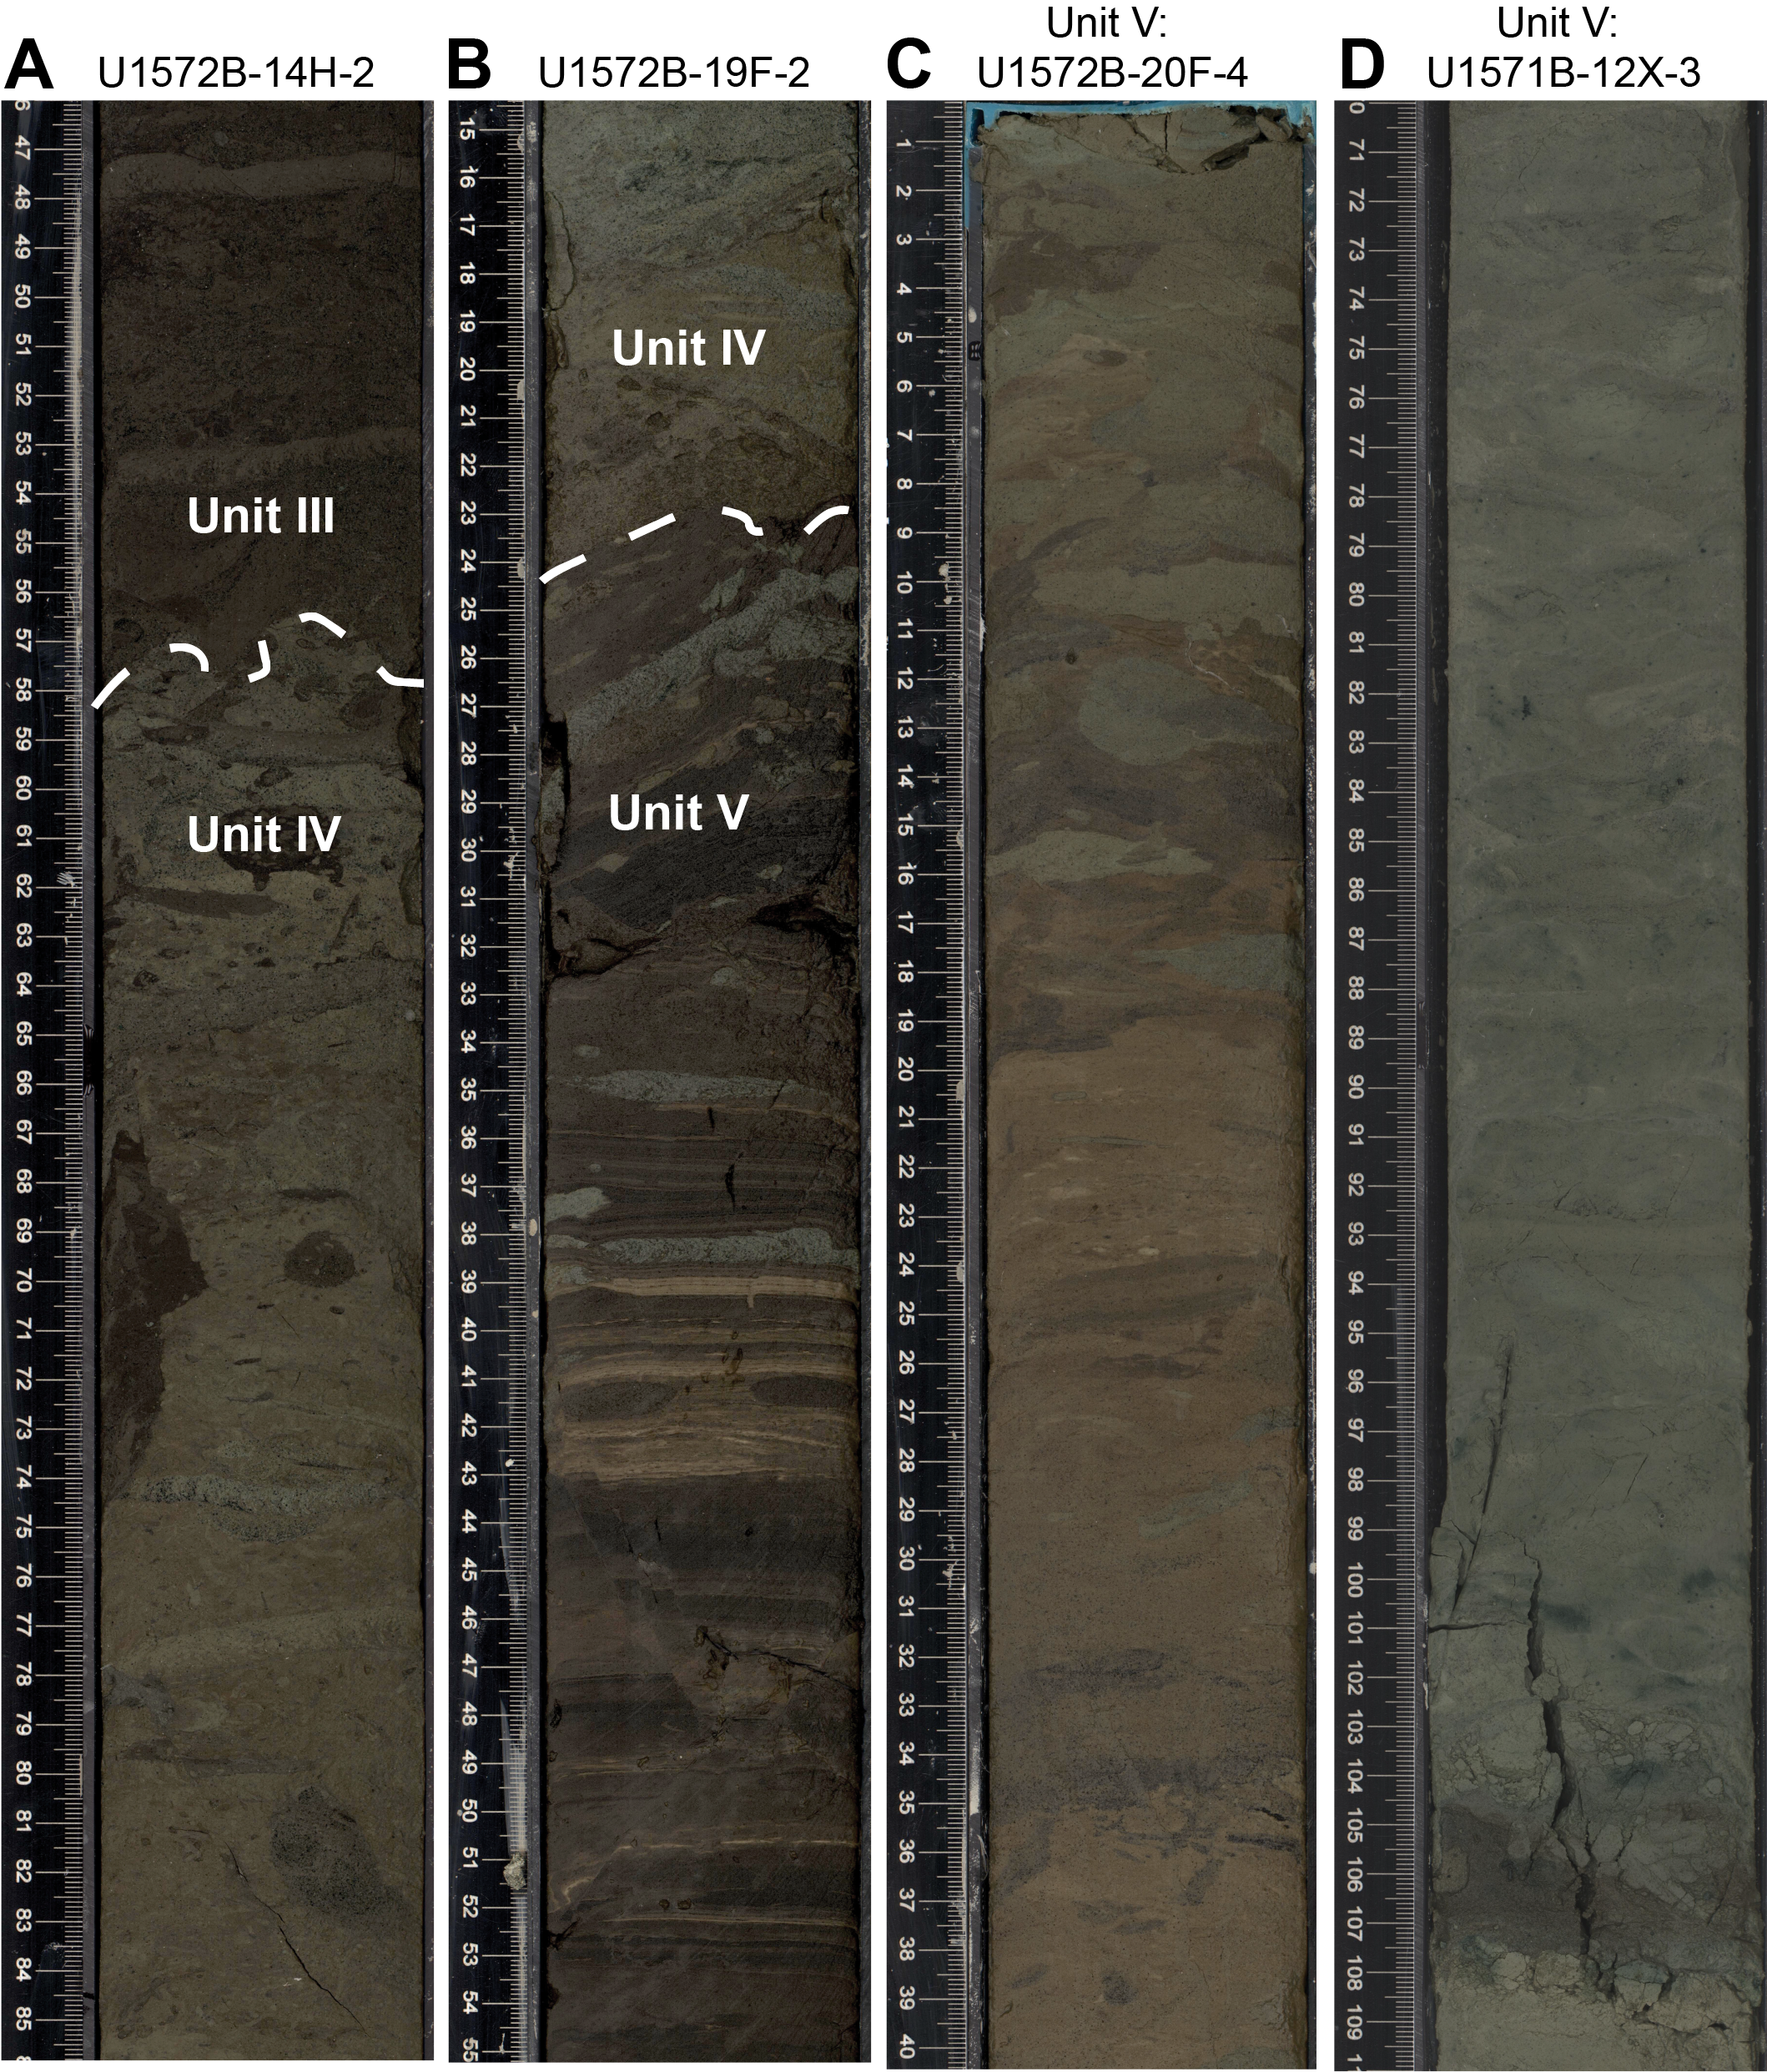
Figure F9. Unit III–IV and IV–V transitions and Unit V lithology.
3.5. Lithostratigraphic Unit V
- Intervals: 396-U1571A-12R-1, 101 cm, to 13R-1, 0 cm; 396-U1571B-12X-2, 46 cm, to 12X-CC, 23 cm; 396-U1572A-17R-1, 0 cm, to 19R-1, 0 cm; 396-U1572B-19F-1, 24 cm, to 22F-3, 131 cm
- Depths: Hole U1571A = 102.71–111.40 m CSF-A; Hole U1571B = 97.96–105.62 m CSF-A; Hole U1572A = 155.30–174.8 m CSF-A; Hole U1572B = 158.94–178.71 m CSF-A
- Age: middle Middle Eocene
Lithostratigraphic Unit V is present in all four holes and is mainly characterized by very dark gray clay to claystone and some intervals of parallel lamination (Figure F9B–F9D). Ash beds are common in Hole U1571B and trace in Hole U1572B. The near absence of ash beds in Holes U1571A and U1572A is likely because of the poor recovery associated with RCB drilling of unlithified sediments. The lithologic transition from Unit IV to Unit V in Hole U1572B is well recovered and marked by a gradational change from greenish gray diatom ooze with ash to very dark brown organic-rich clay with thin parallel lamination (Figure F9B). At Site U1571, Unit V is characterized by greenish gray clay with some sand to sandstone intervals. Generally, the boundary at this site (Units III–V) is characterized by a decrease in diatom abundances and abrupt transition from Miocene-aged to Eocene-aged microfossils (see Biostratigraphy). Wavy to parallel lamination and moderate bioturbation is observed throughout much of the unit, although laminations are more distinct at Site U1572. At this site, Unit V is characterized by very dark brown organic rich mud with thin parallel laminations and diatom ooze with various amounts of ash and biosiliceous rich mud. Biosiliceous intervals tend to contain higher degrees of bioturbation, whereas organic-rich intervals remain largely undisturbed (i.e., parallel lamination; Figure F9B–F9D).
3.6. Lithostratigraphic Unit VI
- Intervals: 396-U1571A-13R-1, 0 cm, to 15R-CC, 7 cm; 396-U1571B-12X-CC, 23 cm, to 14X-2, 22 cm; 396-U1572A-19R-1, 0 cm, to 22R-1, 0 cm; 396-U1572B-22F-3, 131 cm, to 30X-1, 7 cm
- Depths: Hole U1571A = 111.40–126.88 m CSF-A; Hole U1571B = 105.62–117.22 m CSF-A; Hole U1572A = 174.8–204.0 m CSF-A; Hole U1572B = 178.71–209.67 m CSF-A
- Age: early Middle Eocene
Lithostratigraphic Unit VI overlies the volcanic rocks in all four holes. The lithology for Unit VI varies (Figure F4). In Hole U1571A, Unit VI mainly consists of dark greenish gray sand and reddish brown to dark yellowish brown to very dark gray volcaniclastic siltstone and sandstone (Figure F10). In Hole U1571B, Unit VI mainly consists of greenish gray to greenish black to very dark grayish brown clay and sand. In Hole U1572A, Unit VI mainly consists of very dark gray diatom rich siltstone with rare ash beds. In Hole U1572B, Unit VI mainly consists of dark greenish gray to very dark grayish brown radiolarian/biosiliceous ooze with common ash beds and very dark grayish brown claystone and siltstone at the bottom. Some intervals of the unit contain high ash abundances and volcaniclastic mudstone (i.e., Site U1572) and some thin beds of hyaloclastite (i.e., Site U1571). The lithologic transition from Unit V to Unit VI in Hole U1572B is characterized by an increase in the abundance of ashes and volcaniclastics and change in color. The boundary is further supported by a distinct change in physical properties (increase in gamma ray attenuation [GRA] bulk density, P-wave velocity, and NGR and a shift to variable magnetic susceptibility [MS]) and dinocyst assemblages that indicate a shift from early Middle to middle Middle Eocene (see Physical properties and Biostratigraphy). The base of Unit VI in Holes U1571B, U1572A, and U1572B contains the freshwater fern Azolla massulae and glochidia, suggesting that the sediments directly overlying the top of the basalt units are all latest Early Eocene in age.
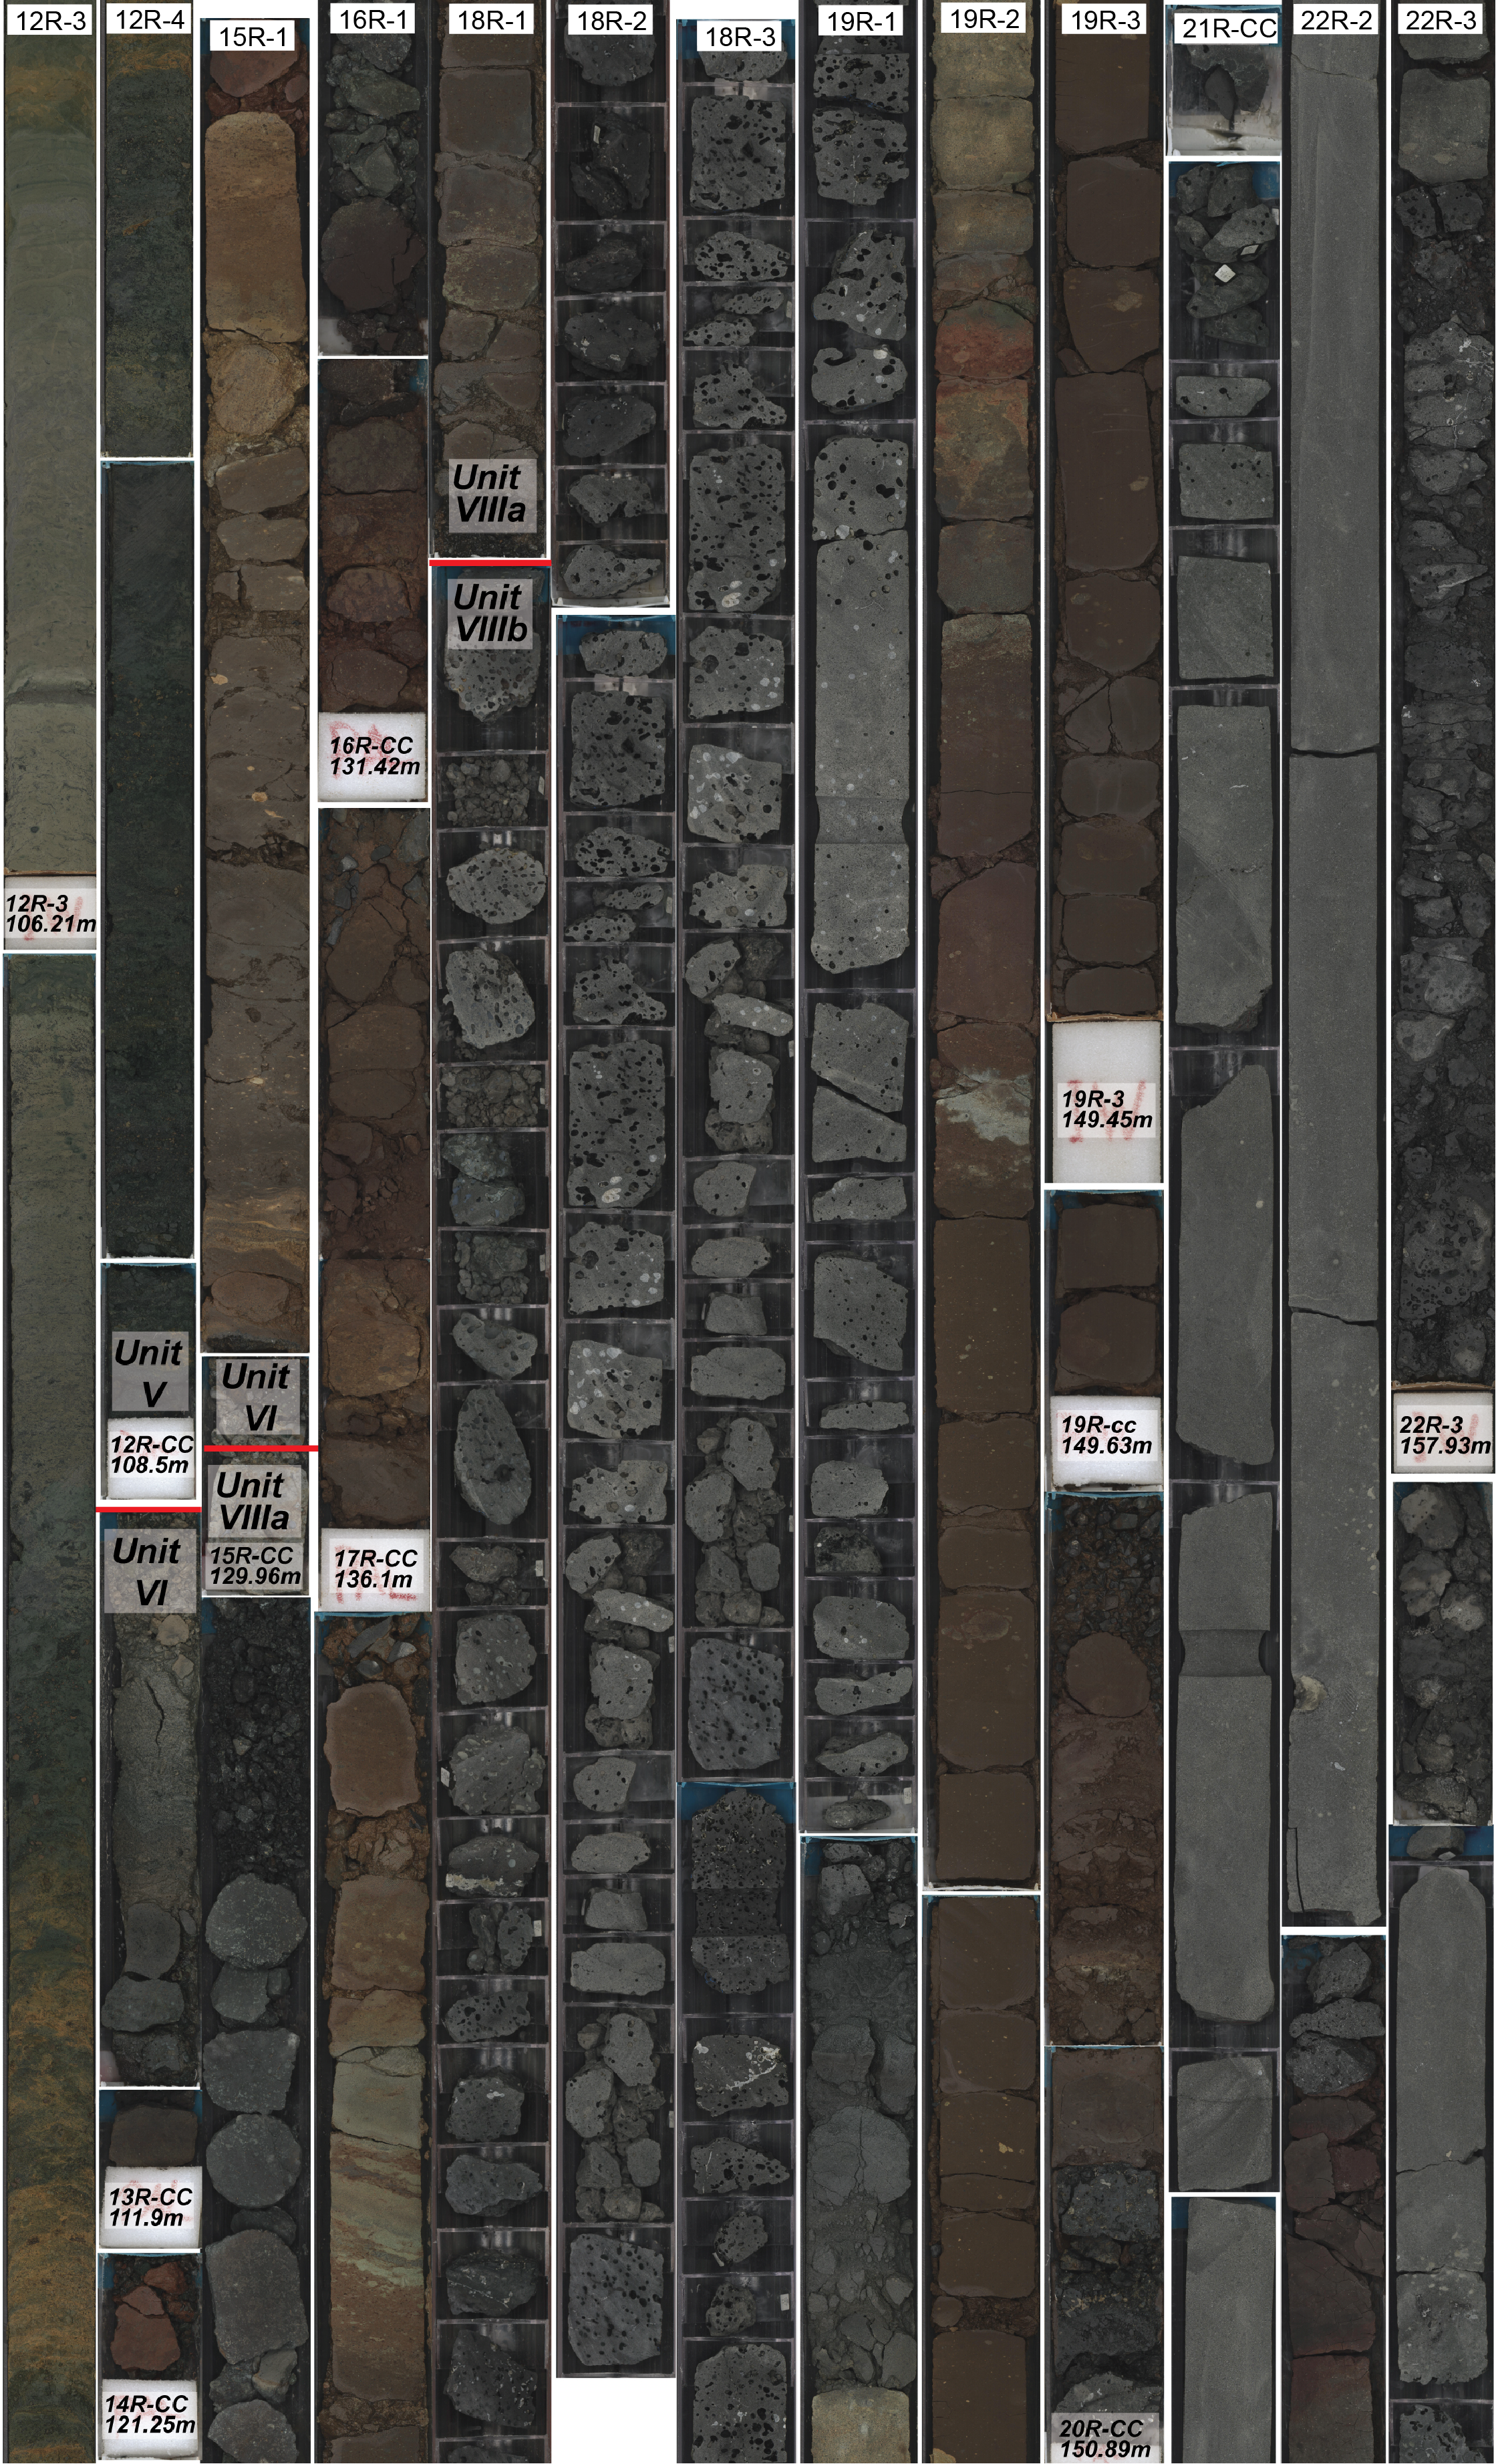
Figure F10. Core composite, base of Unit V to top of Subunit VIIIb.
3.7. Lithostratigraphic Unit VII
- Intervals: 396-U1572A-22R-1, 0 cm, to 27R-1, 0 cm; 396-U1572B-30X-1, 7 cm, to 30X-2, 0 cm
- Depths: Hole U1572A = 204.00–228.43 m CSF-A; Hole U1572B = 209.67–210.48 m CSF-A
- Age: Early Eocene
Lithostratigraphic Unit VII (Igneous Lithologic Unit 1) is only encountered at Site U1572 and has a total cored thickness of 25.75 m in Hole U1572A and only 1.01 m in Hole U1572B. In Hole U1572A, it consists of basaltic andesite transitioning downcore to massive basalt (Figure F11). The basaltic andesite at the top of the unit (interval 22R-1, 0 cm, to 23R-1, 31 cm) is significantly altered with strong to complete recrystallization in very dark to greenish green clay minerals (Figure F11). Below the massive basalt and above the Unit VIII transition (i.e., Section 26R-2, 126 cm, to 26R-CC, 28 cm), gray silt-rich gravel claystone is observed (Figure F11). The high Al content (>10% indicated using portable X-ray fluorescence [pXRF] analysis) may suggest the occurrence of kaolinite, though this has yet to be confirmed using X-ray diffraction (XRD) analysis. In Hole U1572B, the 1.01 m thick recovered interval is only composed of basaltic andesite.
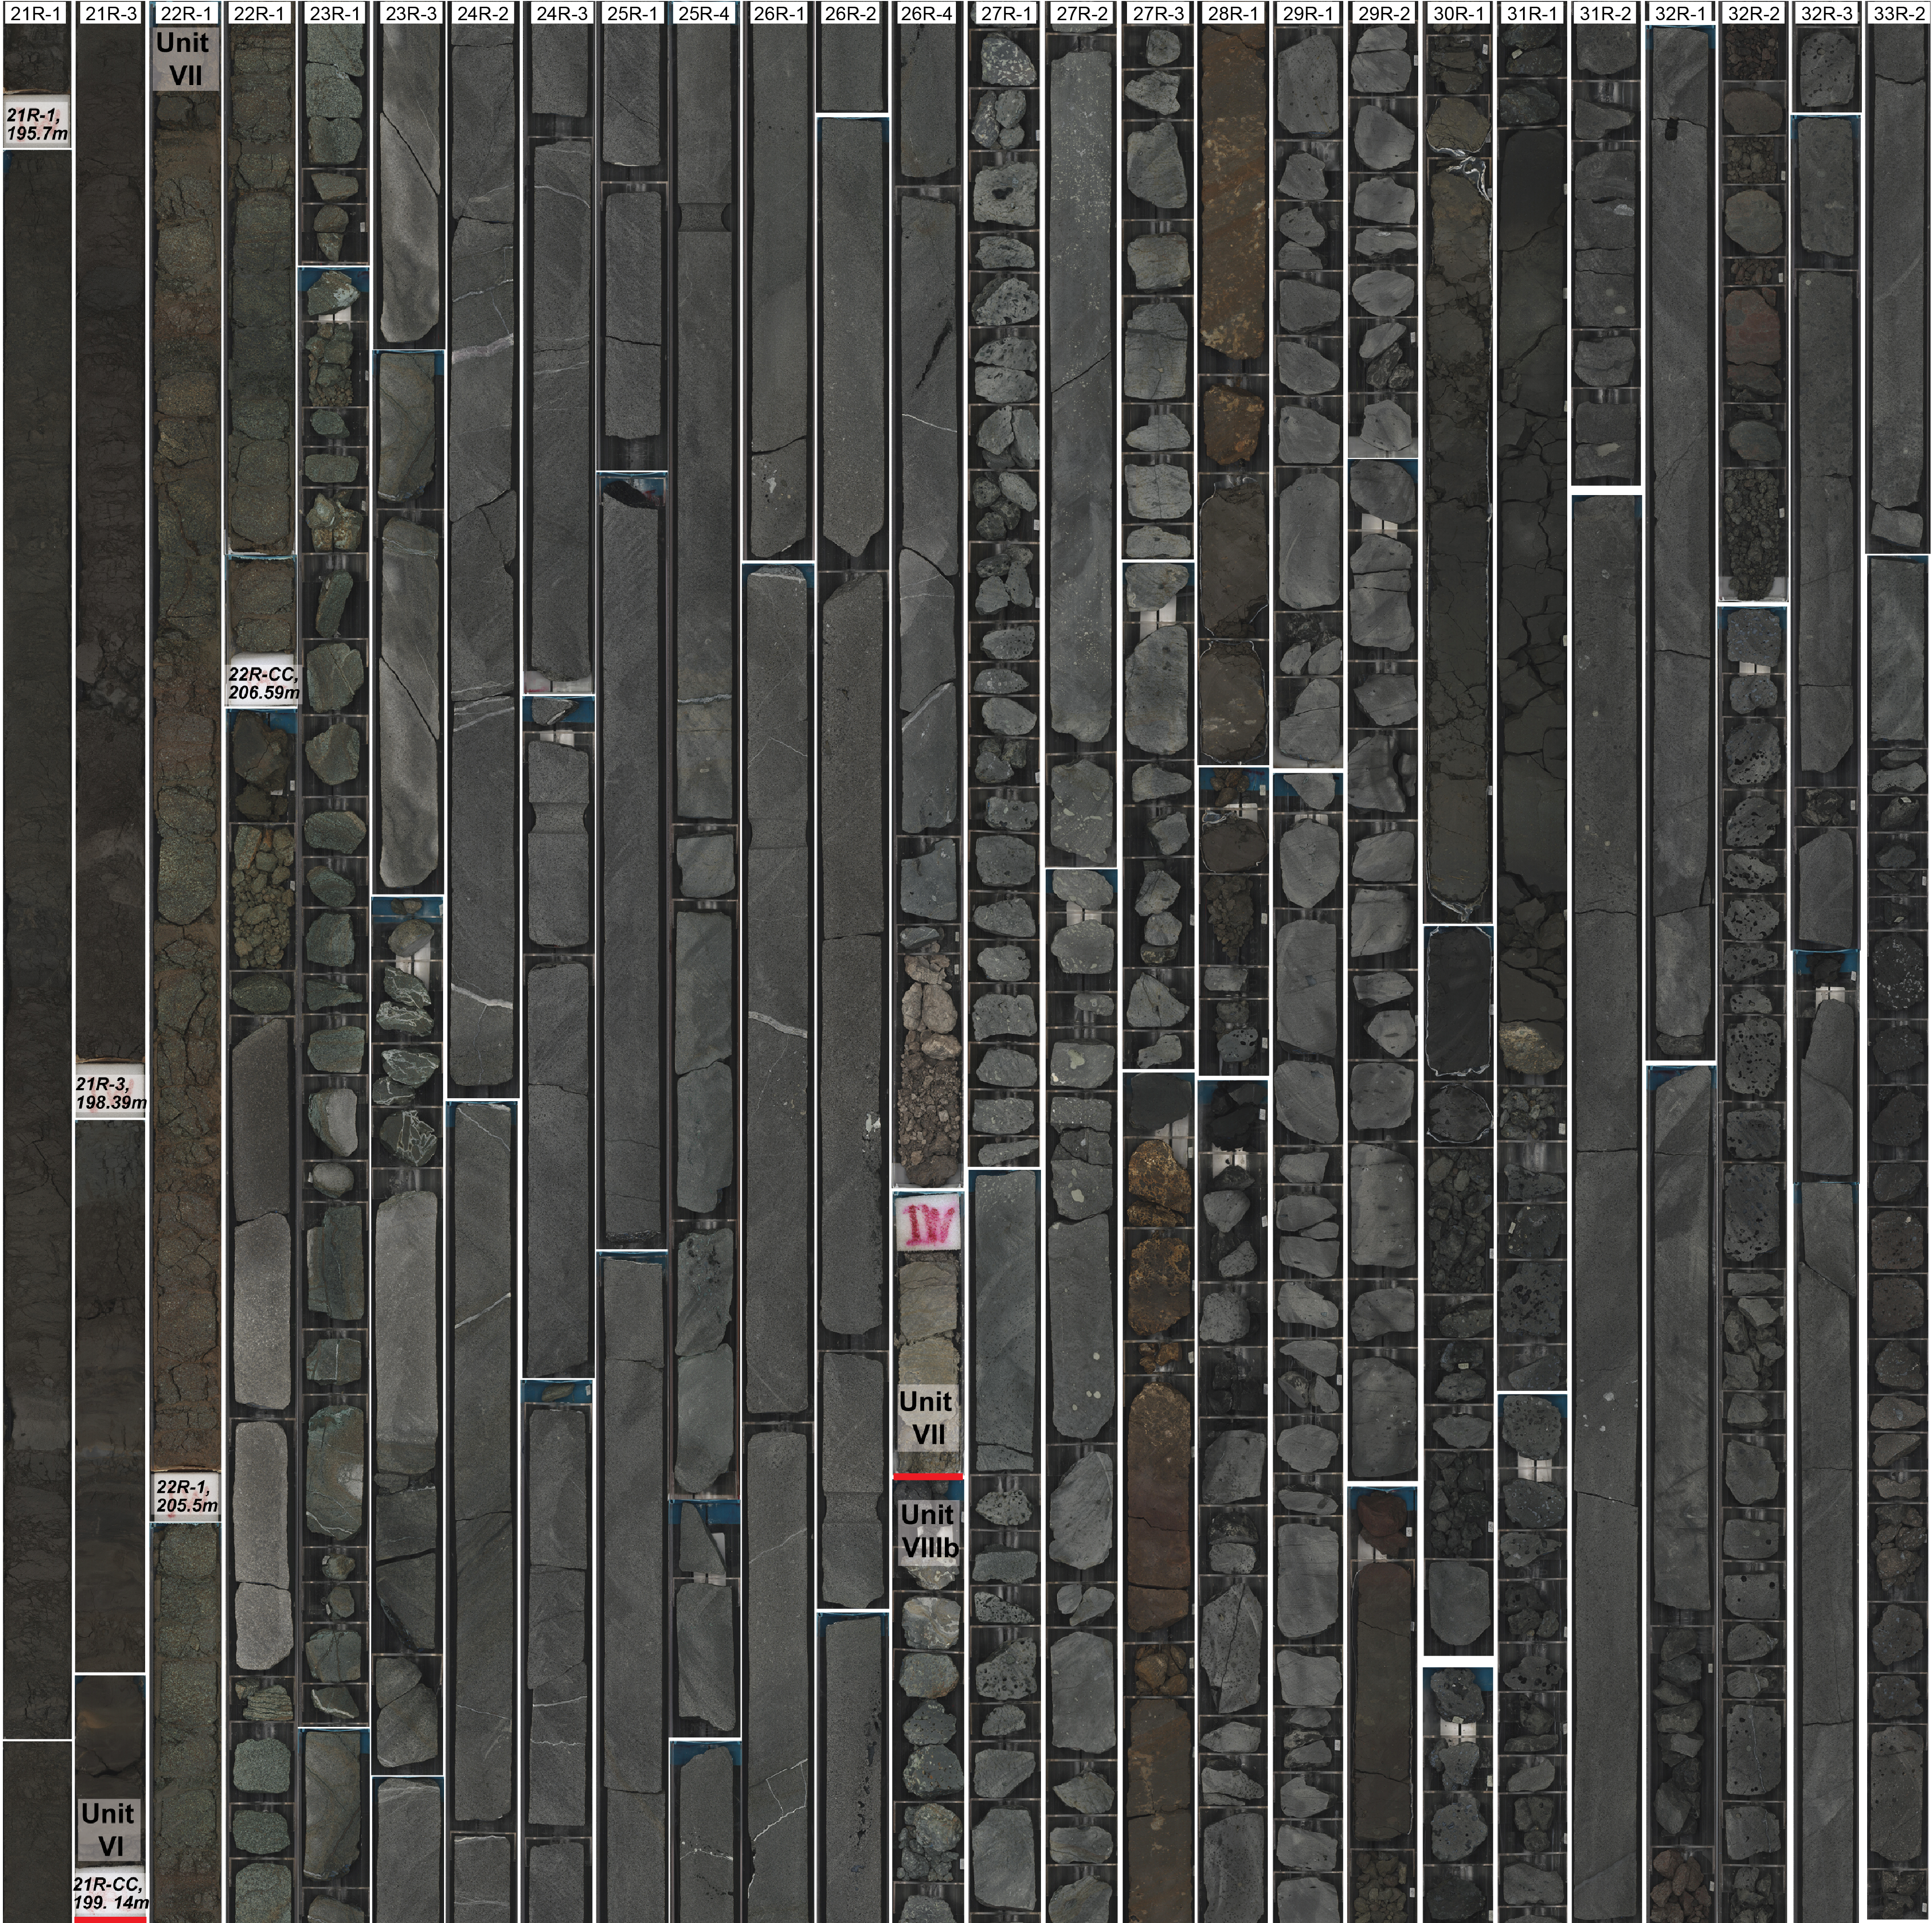
Figure F11. Core composite, middle of Unit VI to top of Subunit VIIIb.
3.7.1. Petrology: igneous subunit
3.7.1.1. General observations
The top of Unit VII (intervals 396-U1572A-22R-1, 0 cm, to 24R-1, 50 cm, and 396-U1572B-30X-1, 7 cm, to 30X-2, 0 cm) is composed of a massive gray aphyric phaneritic basaltic andesite (Figures F10, F11, F12). The color change from gray to light gray in the basaltic andesite is primarily due to variable degree of alteration (i.e., the light gray section is more altered with a higher proportion of the groundmass replaced by carbonate and clay minerals; Figures F10, F11, F12). The basaltic andesite is nonvesicular in Hole U1572A and highly vesicular in Hole U1572B.
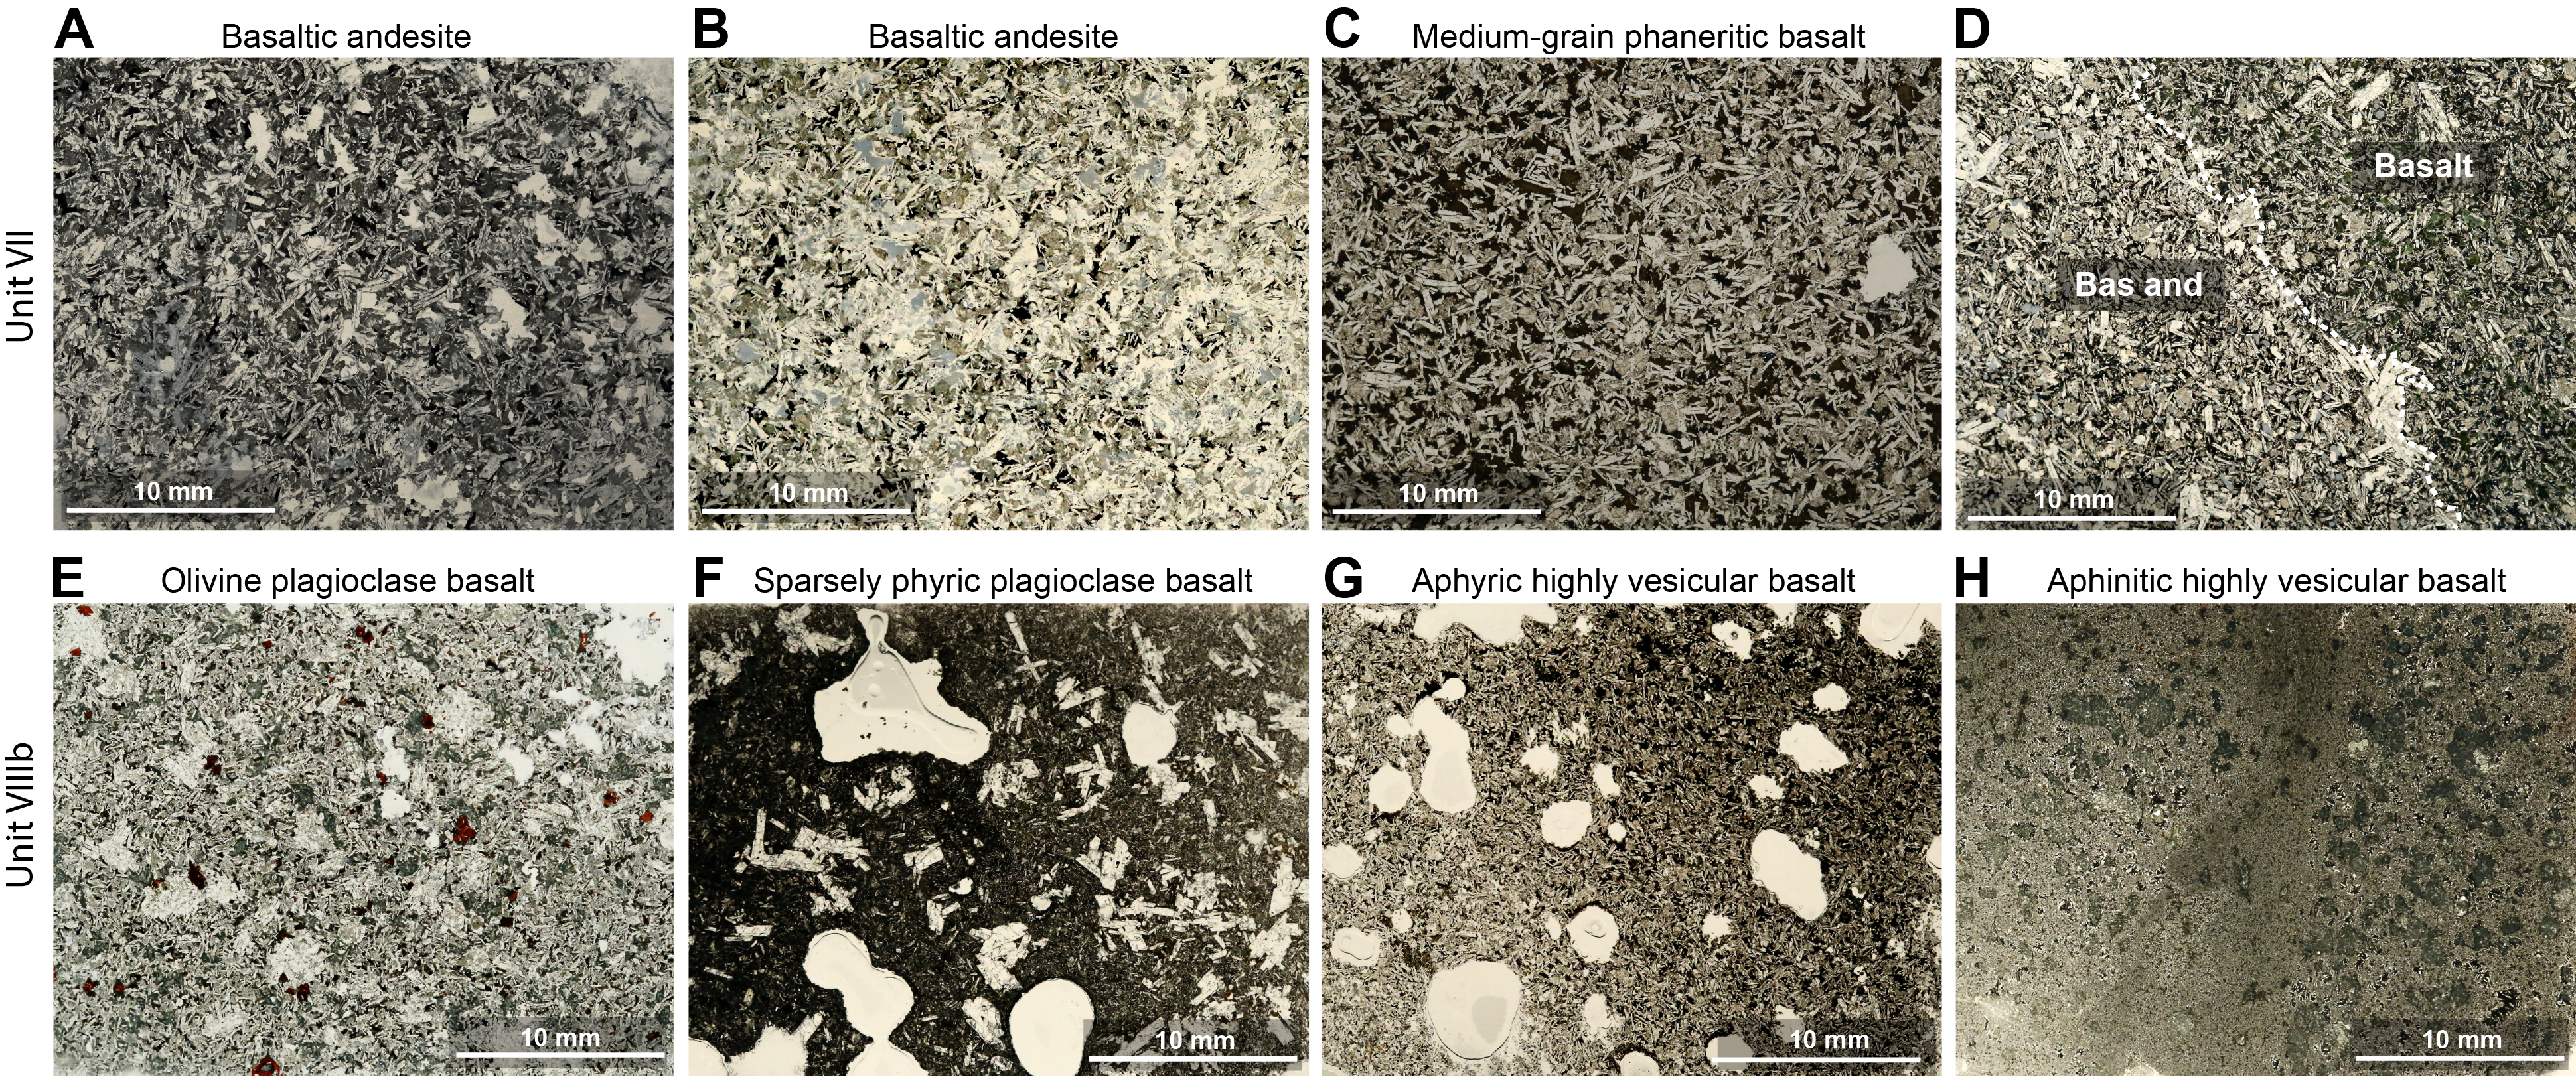
Figure F12. Microstructures of main igneous facies.
In Hole U1572A, this basaltic andesite lava flow overlies a massive, dark gray phaneritic basalt. The contact between the two volcanic rock types is sharp (Figure F13). The underlying basalt contains localized pipe vesicles (Figure F14) typical of pahoehoe lava flow and indicating the base of a lava flow (e.g., Walker, 1987). Trace native copper is observed in vesicles and veins. The presence of copper is also likely responsible for the greenish gray color of the most altered sections of the unit (Figure F11).
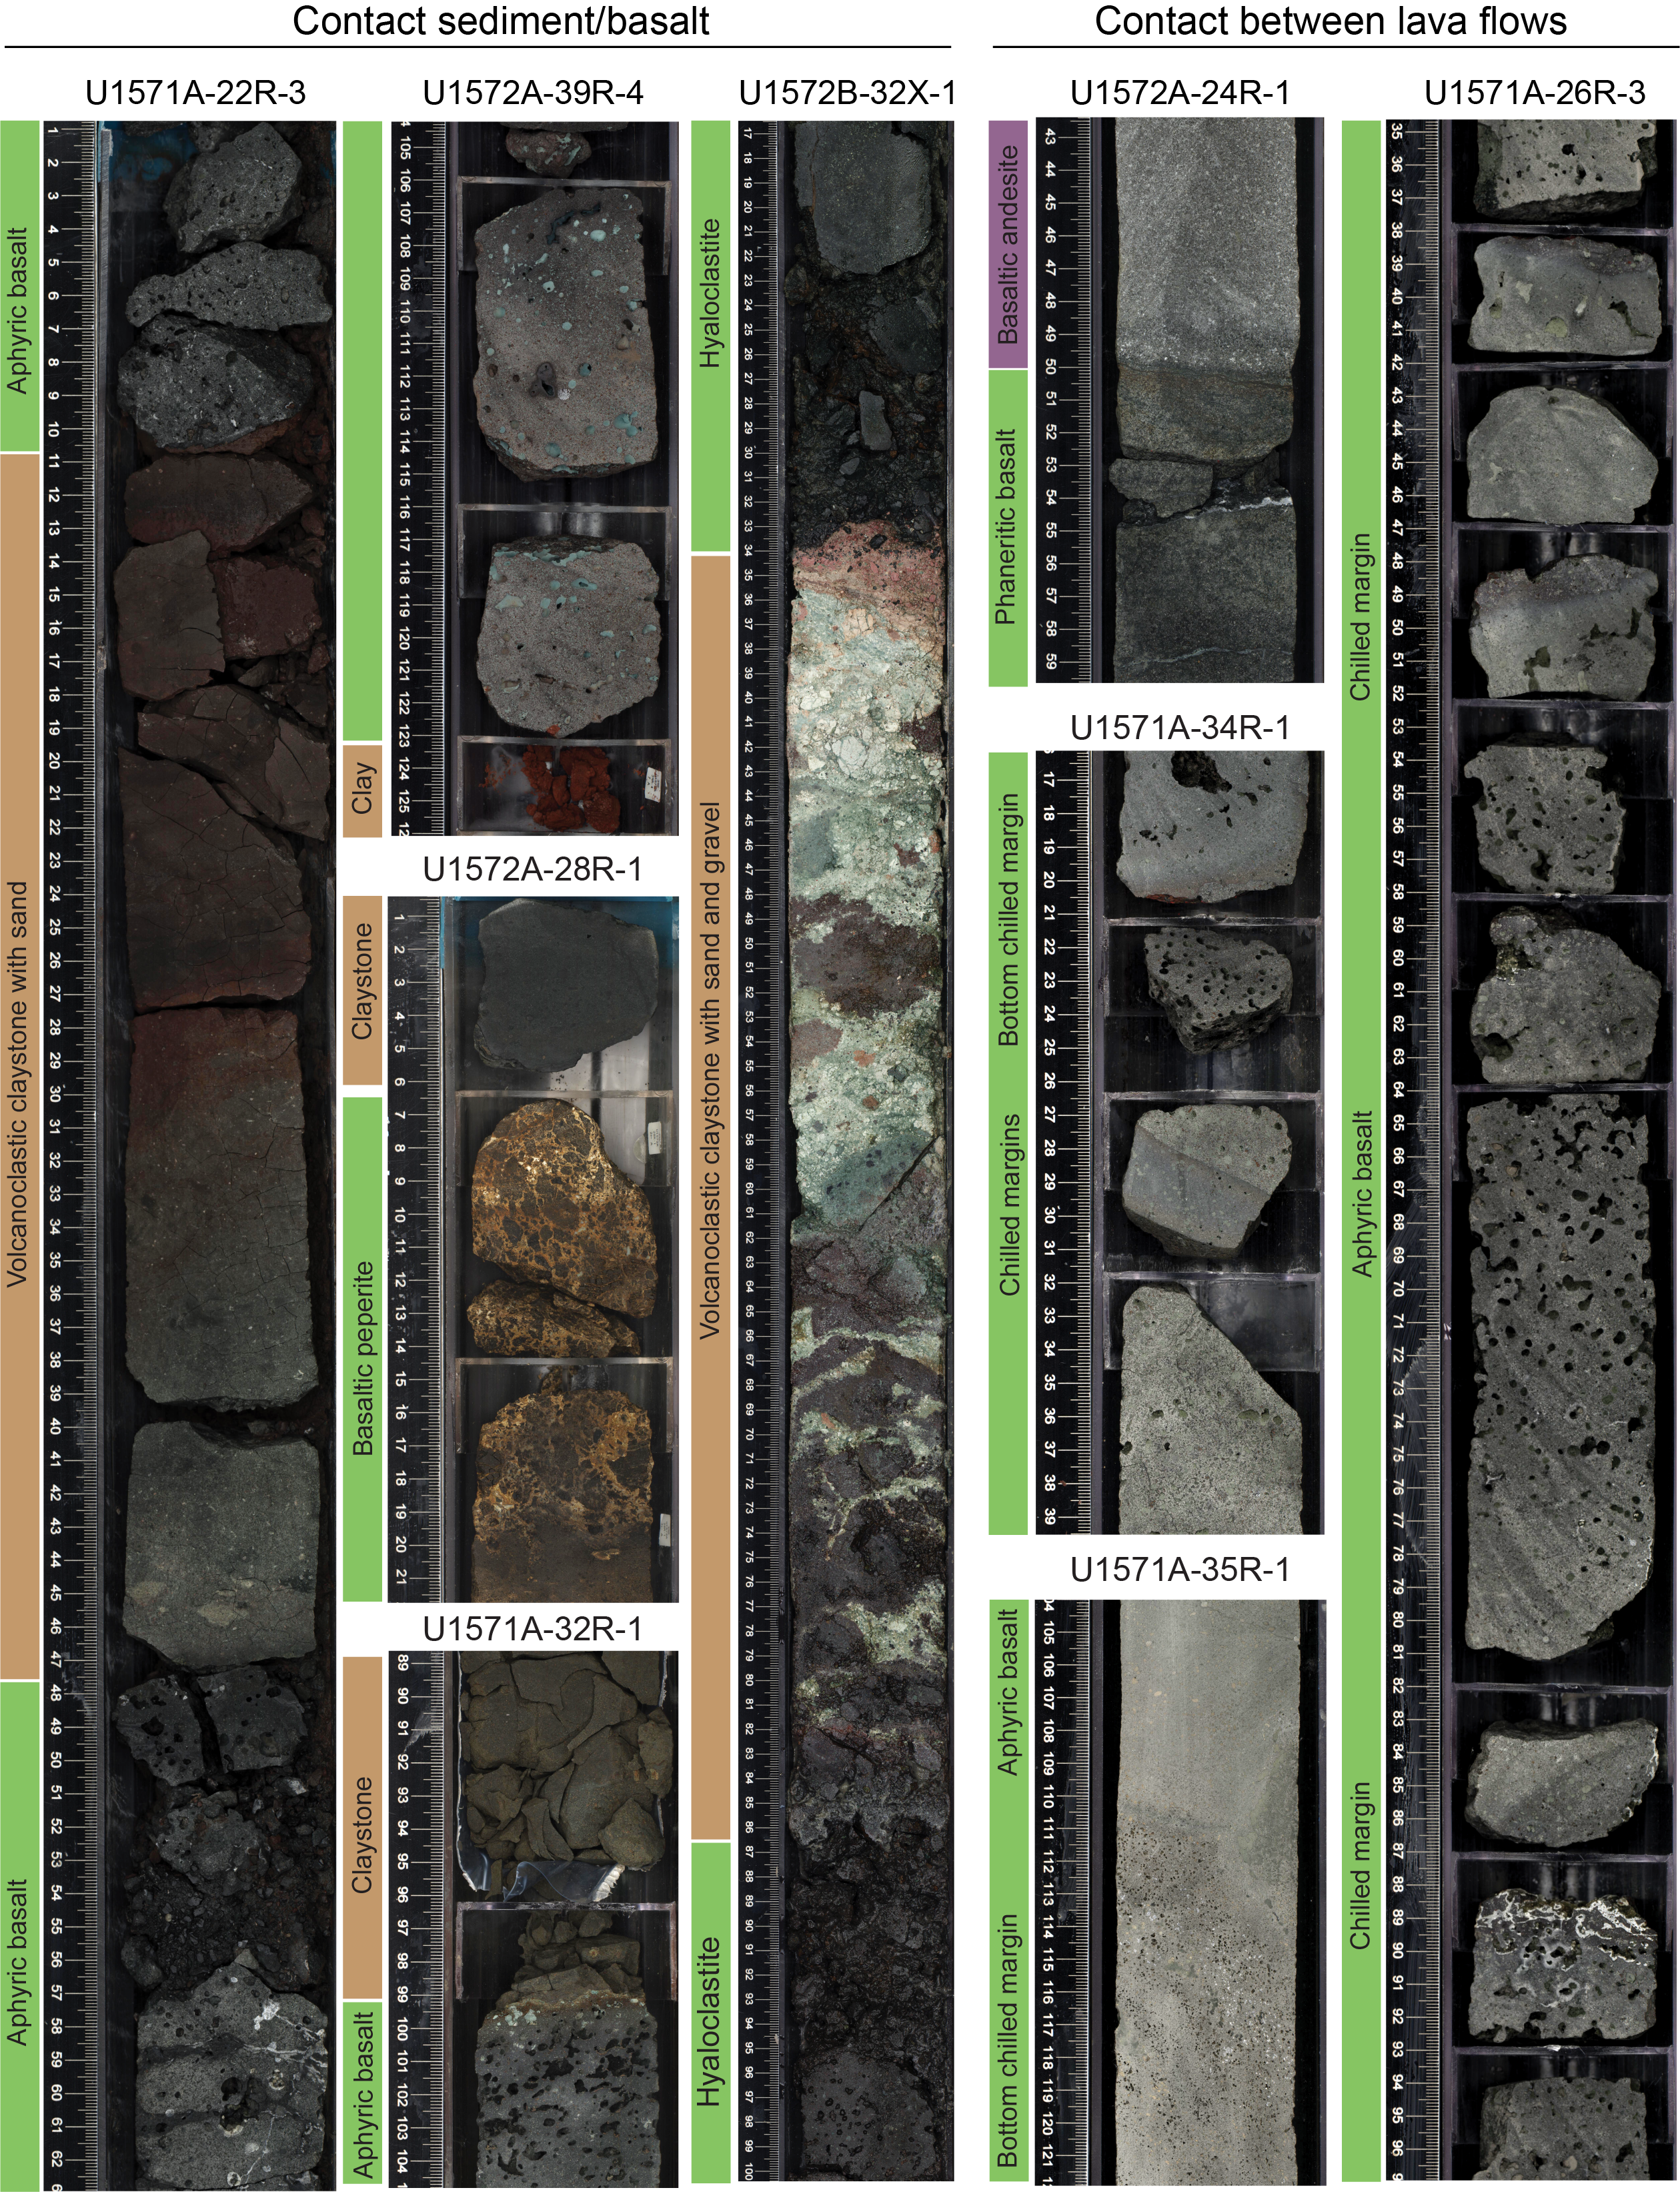
Figure F13. Basalt/sediment and lava flow contacts.
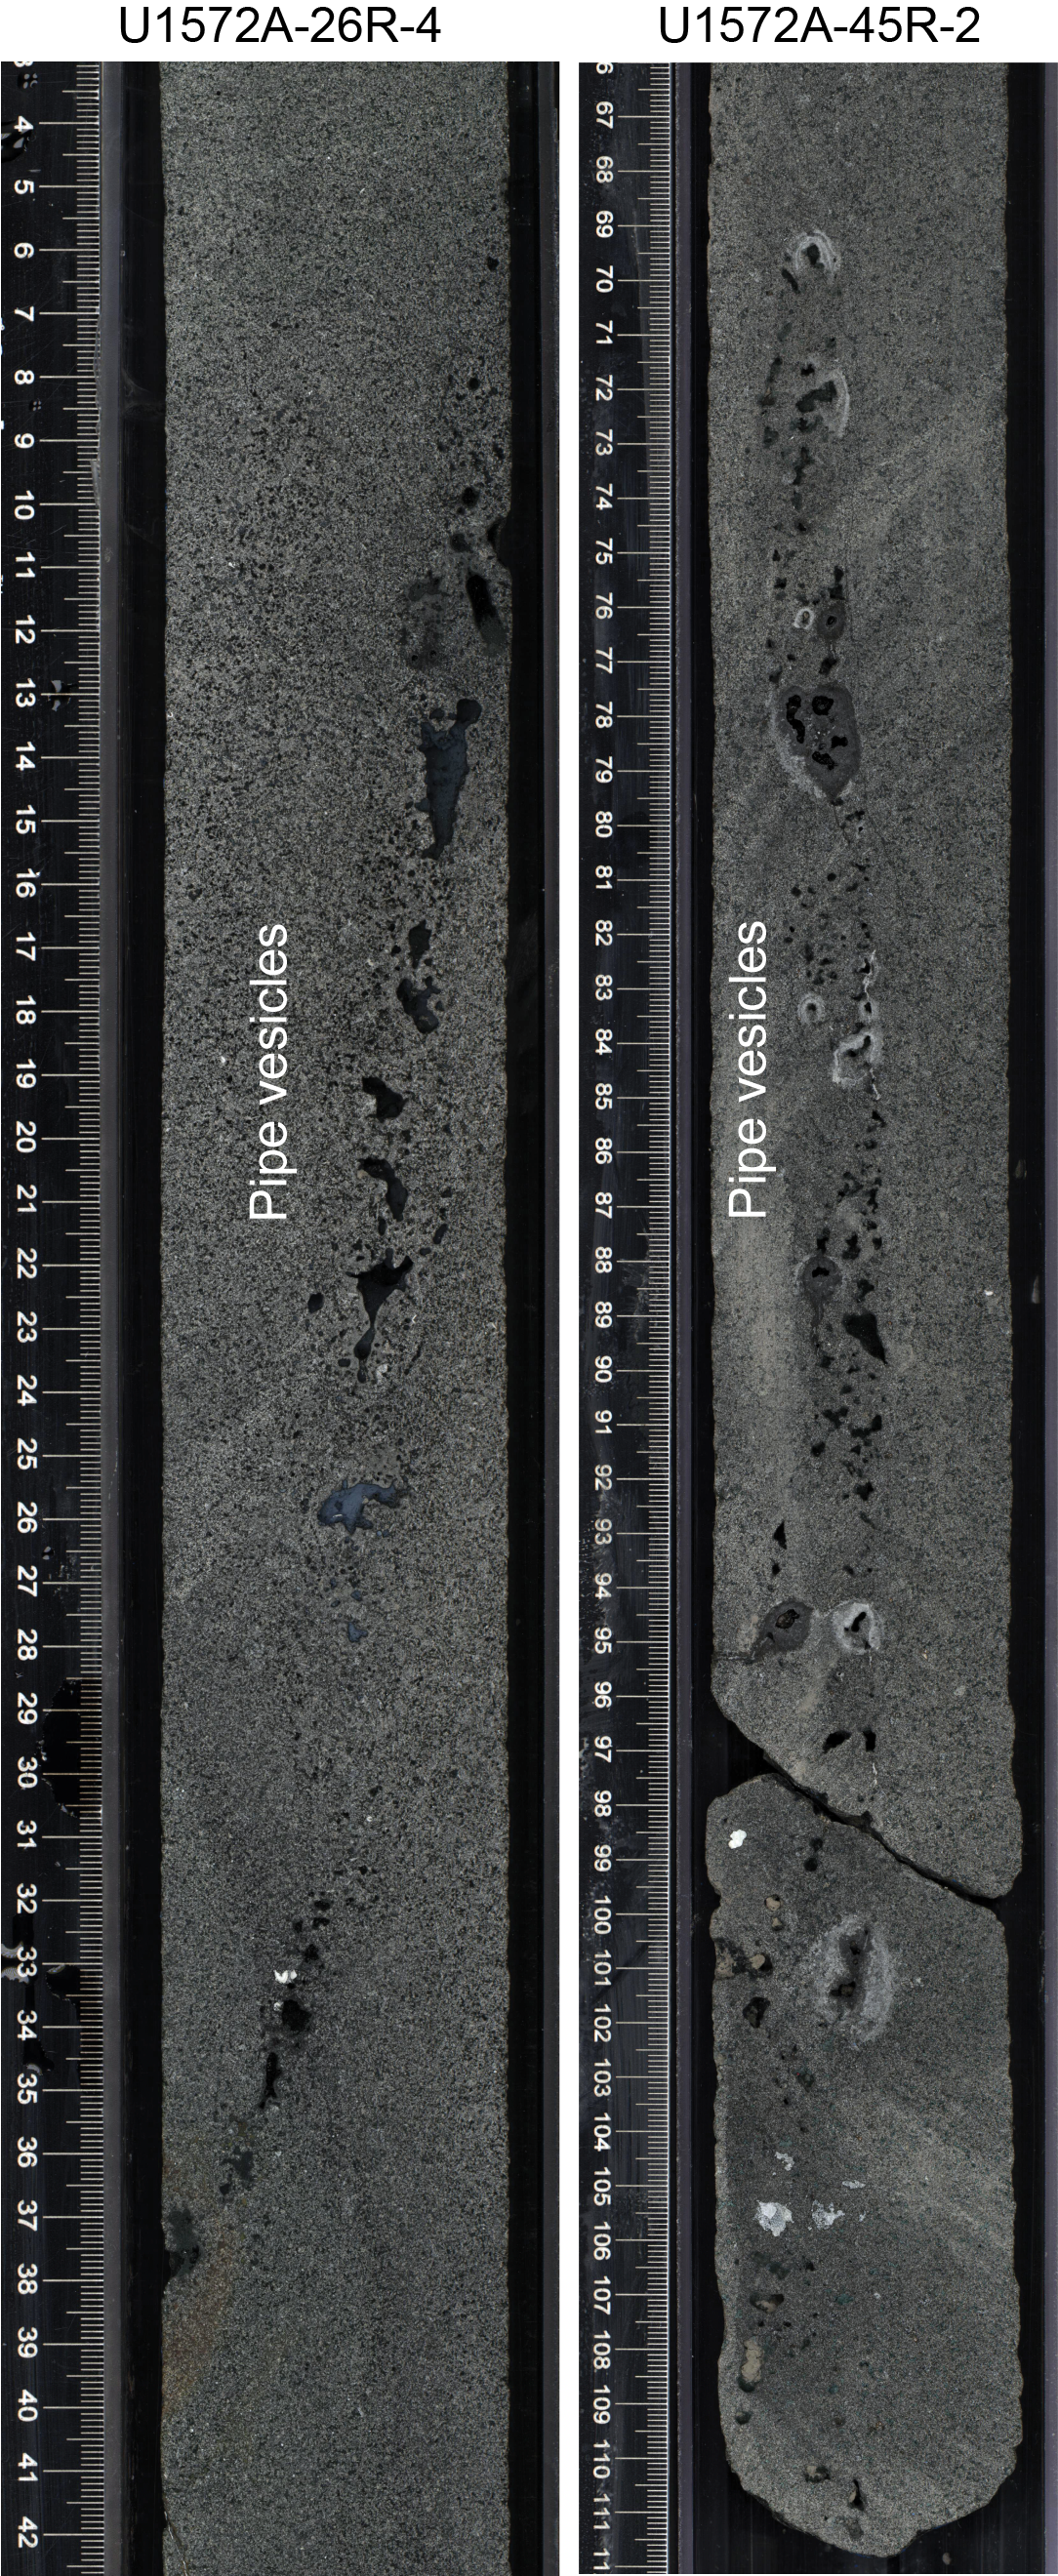
Figure F14. Pipe vesicles.
3.7.1.2. Microscopic observations
The basaltic andesite is fine grained with euhedral plagioclase (30%), anhedral augite (40%), and subhedral oxide (5%) (Figure F12). The groundmass is partly recrystallized into calcite (Figure F15A, F15B) and saponite. Submillimeter native copper flakes are also observed in the groundmass. The phaneritic basalt contains millimetric euhedral plagioclase and anhedral clinopyroxene. A large proportion of the groundmass is replaced to brown saponite (Figure F15C, F15D).
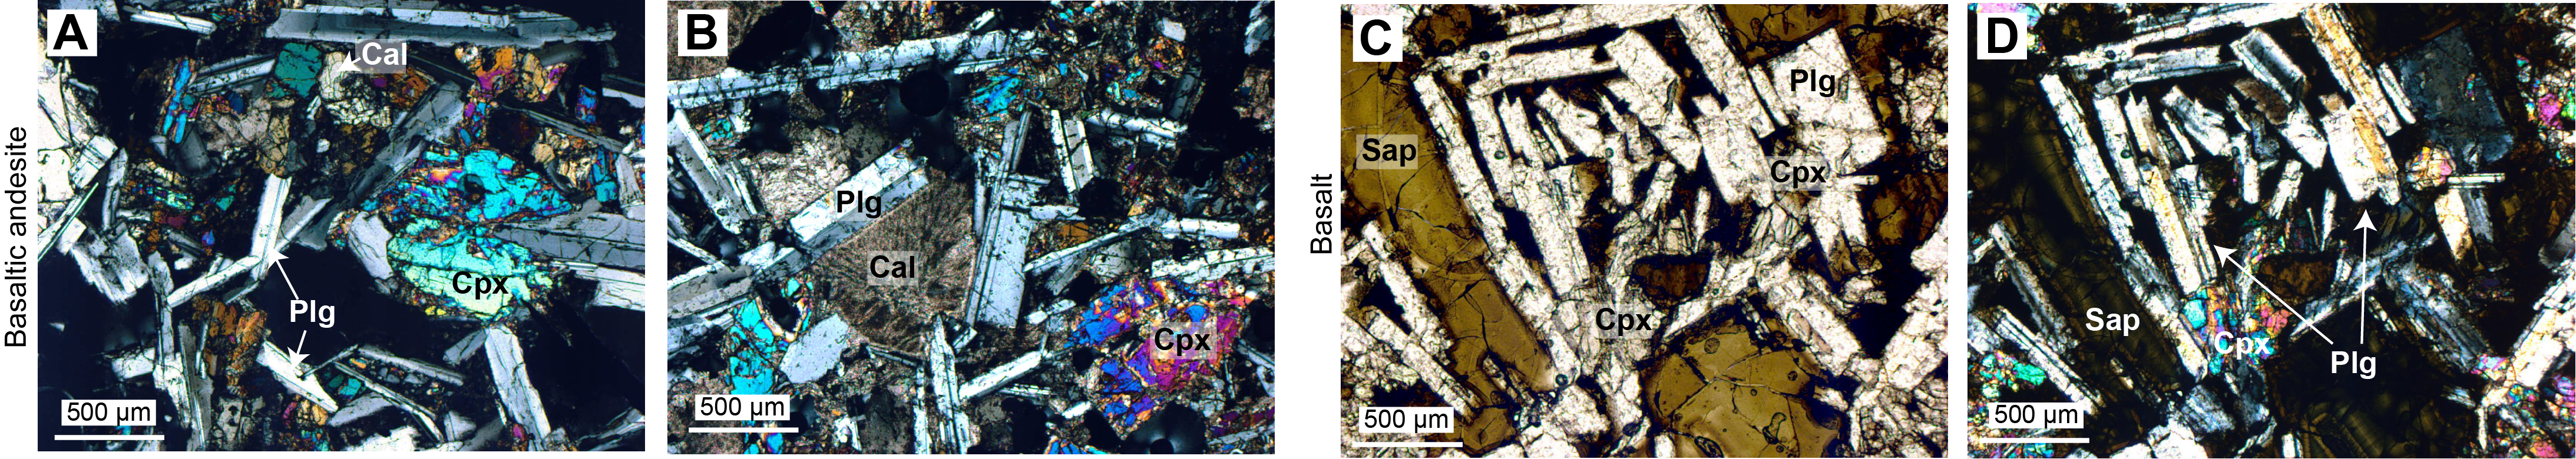
Figure F15. Unit VII mineralogy.
3.7.1.3. Geochemical observations
The basaltic andesite shows higher contents in TiO2, K2O, MnO, Zr, and Y than the underlying basalt, which is consistent with a higher degree of fractionation. Lithostratigraphic Unit VII also shows a progressive decrease in Sr and P contents downhole (Figure F16).
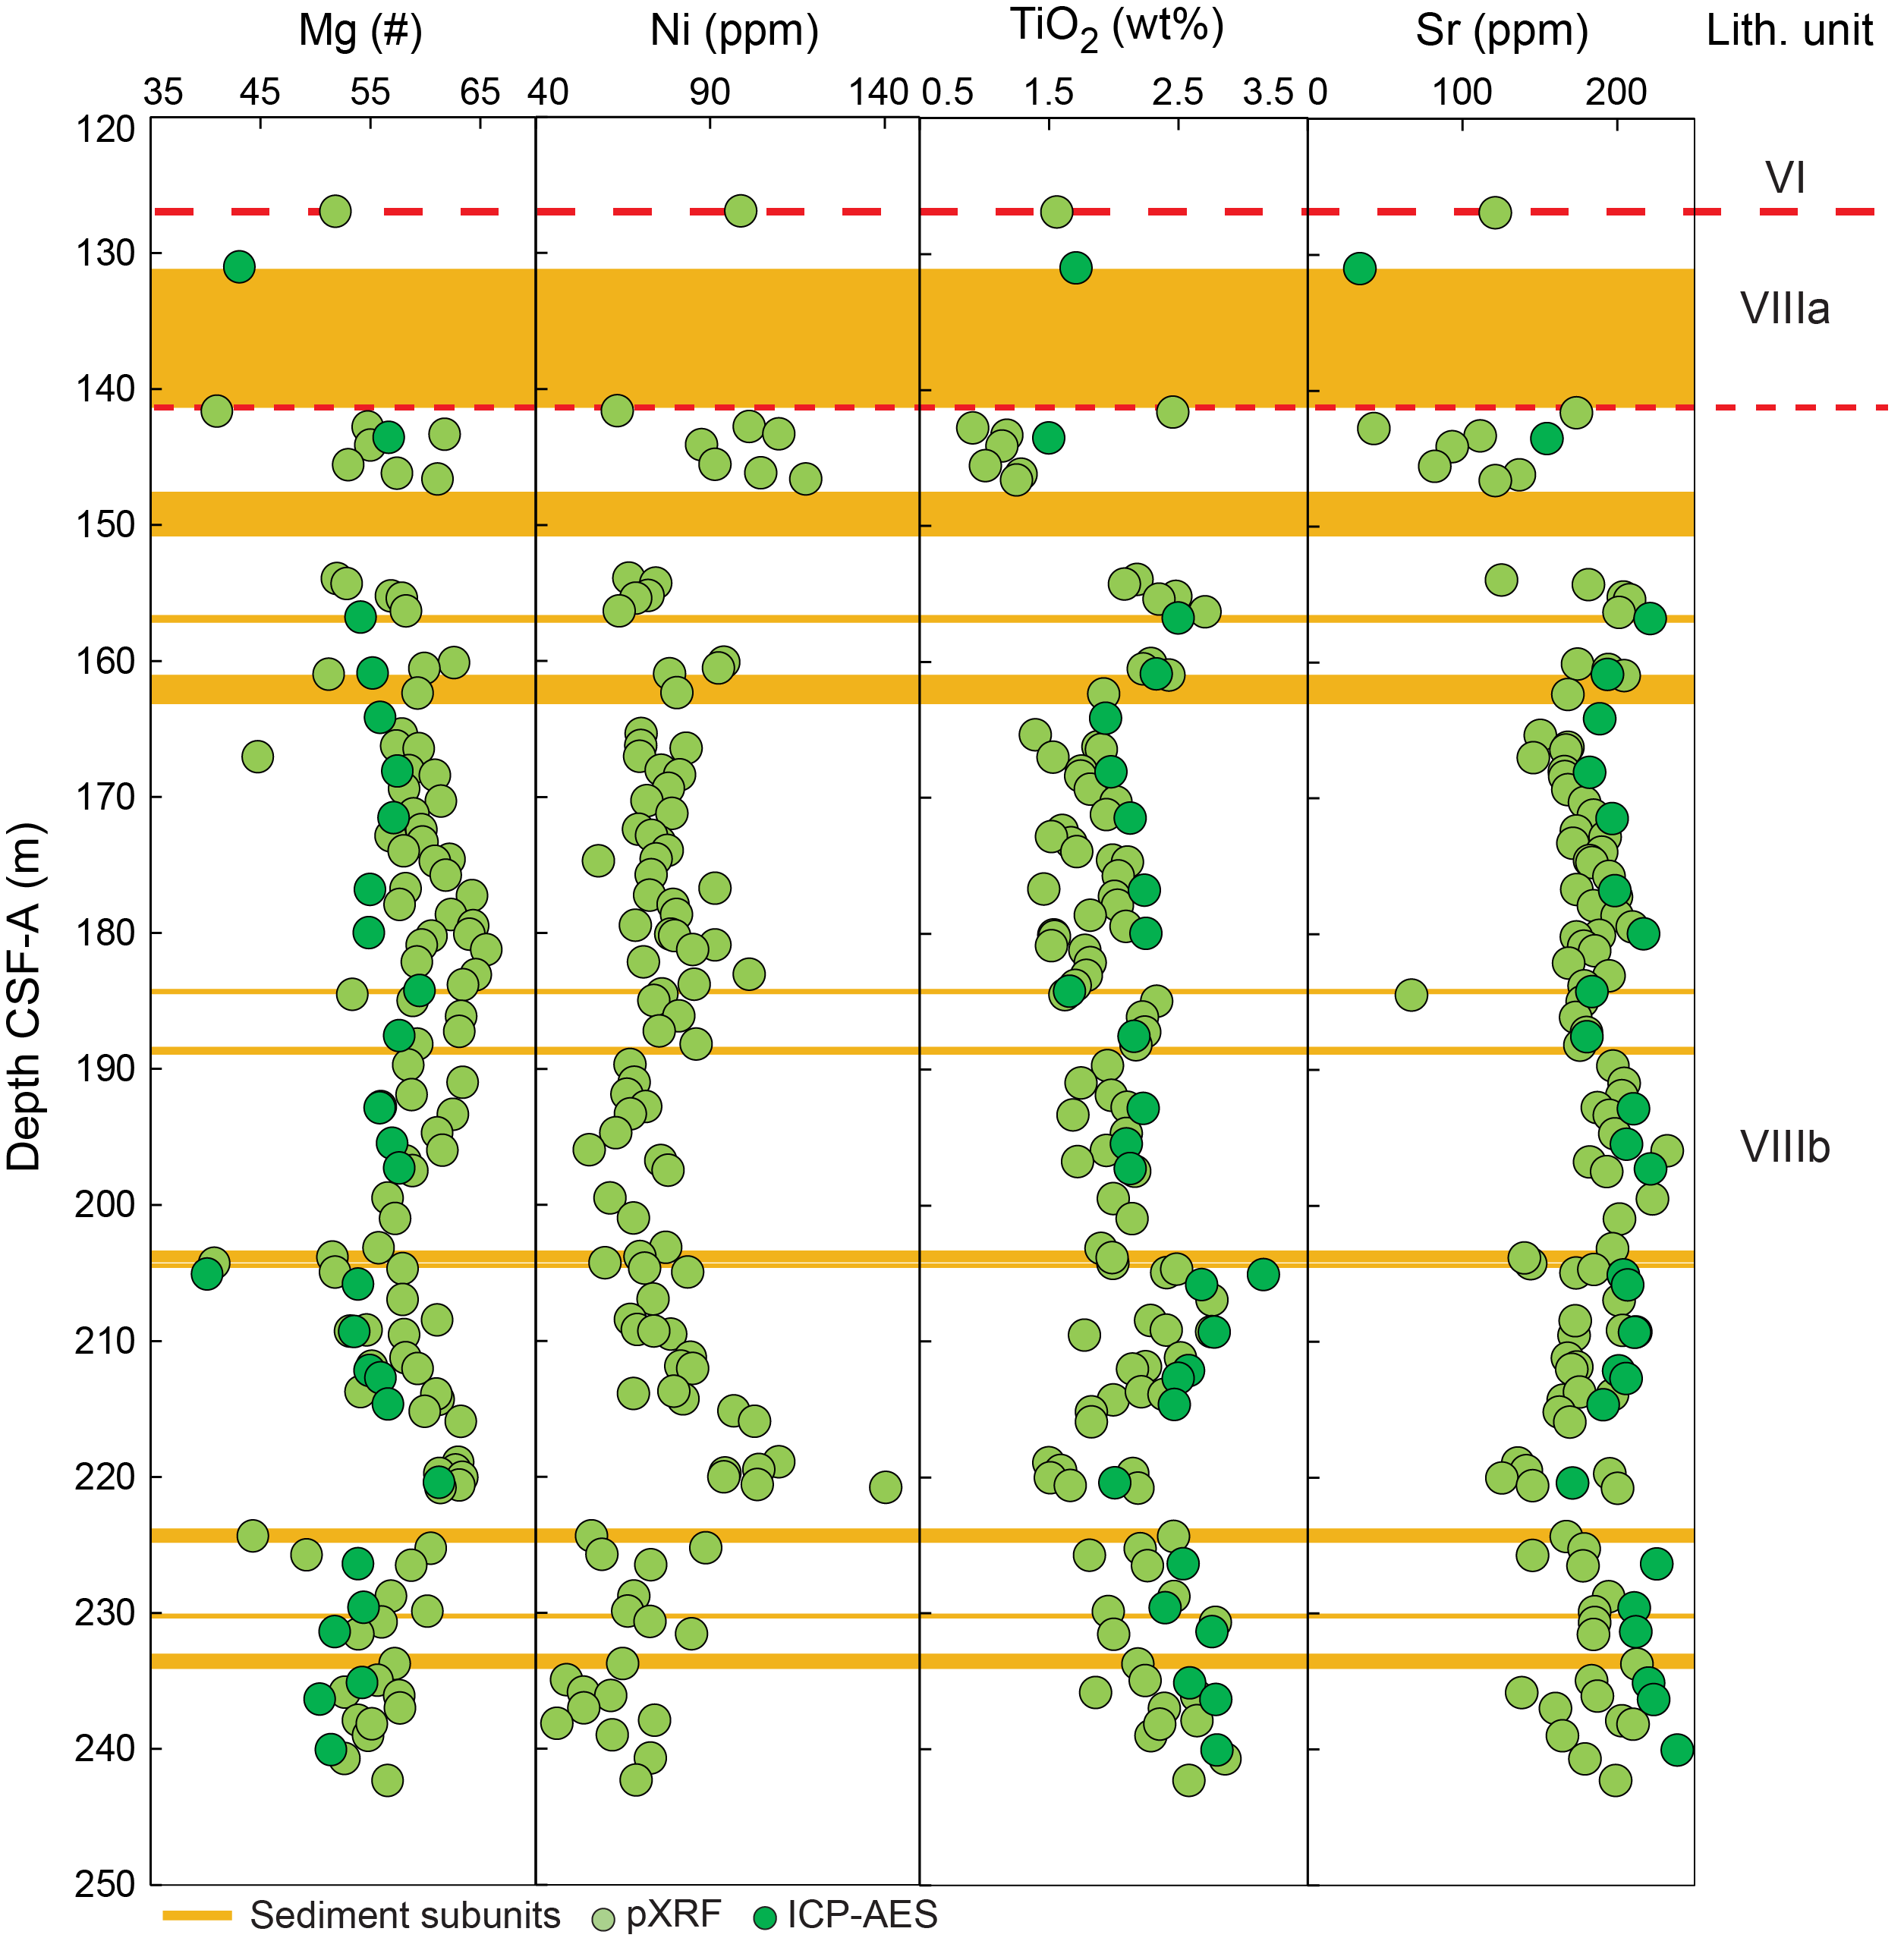
Figure F16. Chemical stratigraphy, Unit VII and Subunit VIIIb igneous rocks.
3.8. Lithostratigraphic Unit VIII
- Intervals: 396-U1571A-15R-CC, 7 cm, to 39R-3, 75 cm (bottom of hole); 396-U1571B-14X-2, 22 cm, to 20X-CC, 37 cm (bottom of hole); 396-U1572A-27R-1, 0 cm, to 46R-CC, 15 cm (bottom of hole); 396-U1572B-30X-2, 0 cm, to 33X-CC, 75 cm (bottom of hole)
- Depths: Hole U1571A = 126.88–242.35 m CSF-A; Hole U1571B = 117.22–142.54 m CSF-A; Hole U1572A = 228.43–325.34 m CSF-A; Hole U1572B = 210.48–222.15 m CSF-A
- Age: Early Eocene or earlier
Lithostratigraphic Unit VIII (Igneous Lithologic Unit 2) consists of basalt flows (including hyaloclastite) and interbasalt sediments. Lithostratigraphic Unit VIII is divided into two distinct subunits. Subunit VIIIa is composed of hyaloclastite (Figure F13) alternating with volcanic mudstone. This subunit was identified in Holes U1571A, U1571B, and U1572B. Subunit VIIIb is intercalated basaltic lavas flows and mudstone encountered in Holes U1571A, U1571B, and U1572A (Figures F9, F10, F11).
3.8.1. Subunit VIIIa
- Intervals: 396-U1571A-15R-CC, 7 cm, to 18R-2, 0 cm; 396-U1571B-14X-2, 22 cm, to 16X-3, 0 cm; 396-U1572B-30X-2, 0 cm, to 33X-CC, 75 cm (bottom of hole)
- Depths: Hole U1571A = 126.88–141.43 m CSF-A; Hole U1571B = 117.22–128.19 m CSF-A; Hole U1572B = 210.48–222.15 m CSF-A
The highest recovery of Subunit VIIIa is in Hole U1571A with a total cored thickness of 14.55 m. It consists of a submeter thick layer of black hyaloclastite (interval 15R-CC, 7 cm, to 16R-1, 67 cm) overlying a volcaniclastic claystone and sandstone (Figure F10). In Hole U1571B, the subunit is exclusively composed of hyaloclastite and has a total cored thickness of 12.02 m. In Hole U1572A, hyaloclastites alternate with intervals of talc-rich claystone with sand and gravel (Figure F13). These sedimentary intervals likely result from the in situ reworking of hyaloclastites.
3.8.2. Subunit VIIIb
- Intervals: 396-U1571A-18R-2, 0 cm, to 39R-3, 75 cm (bottom of hole); 396-U1571B-16X-3, 0 cm, to 20X-CC, 37 cm (bottom of hole); 396-U1572A-27R-1, 0 cm, to 46R-CC, 15 cm (bottom of hole)
- Depths: Hole U1571A = 141.43–242.35 m CSF-A; Hole U1571B = 128.19–142.54 m CSF-A; Hole U1572A = 228.43–325.34 m CSF-A
Subunit VIIIb is identified in all holes except Hole U1572B. In Hole U1571A, 100.92 m of material was recovered; in Hole U1572A, 95.59 m of material was recovered; and in Hole U1571B, only 14.35 m of material was recovered. The interval of interbasaltic sediments across the holes is reported in Tables T4 and T5. Because core recovery was more than 100%, in some sedimentary and basaltic subunits CSF-A depth intervals are not representative of the total observed thickness.
The basaltic sequences are composed of one to several discrete lava flows, delimited by chilled margins (Figure F13) or the presence of pipe vesicles (Figure F14). In Subunit VIIIb, we identified 11 basaltic subunits (Bi) and 10 sedimentary subunits (Si) in Hole U1571A (Table T4), 2 basaltic subunits and 1 sedimentary subunit in Hole U1571B (Table T4), and 11 basaltic subunits and 11 sedimentary subunits in Hole U1572A (Table T5). Each subunit is progressively numbered downhole (i.e., B1, S1, B2, S2, B3, S3, etc.)
3.8.3. Petrology: igneous subunits
3.8.3.1. General observations
Subunit VIIIb consists primarily of massive very dark gray to gray aphyric aphanitic and phaneritic basalt (Figure F12). The rare occurrence of sparsely plagioclase-phyric intervals is observed, especially in Cores 396-U1571A-38R and 39R (Figures F11, F12, F13, F14, F15, F16, F17, F18D). Across this igneous unit, several chilled margins, characterized by variation in the size and shape of vesicles together with transition from phaneritic to aphanitic texture, represent limits between different lava flows. Locally, the succession of several chilled margins on a short scale (<1 m) (Figure F13), typical of pahoehoe toes (e.g., Gregg and Keszthelyi, 2004), and the presence of pipe vesicles (Figure F14) suggest the emplacement of pahoehoe-type lava flows. The top of the subunit is also characterized by the presence of peperite (Figure F13), which is typical of magma–wet sediment interaction (White et al., 2000).
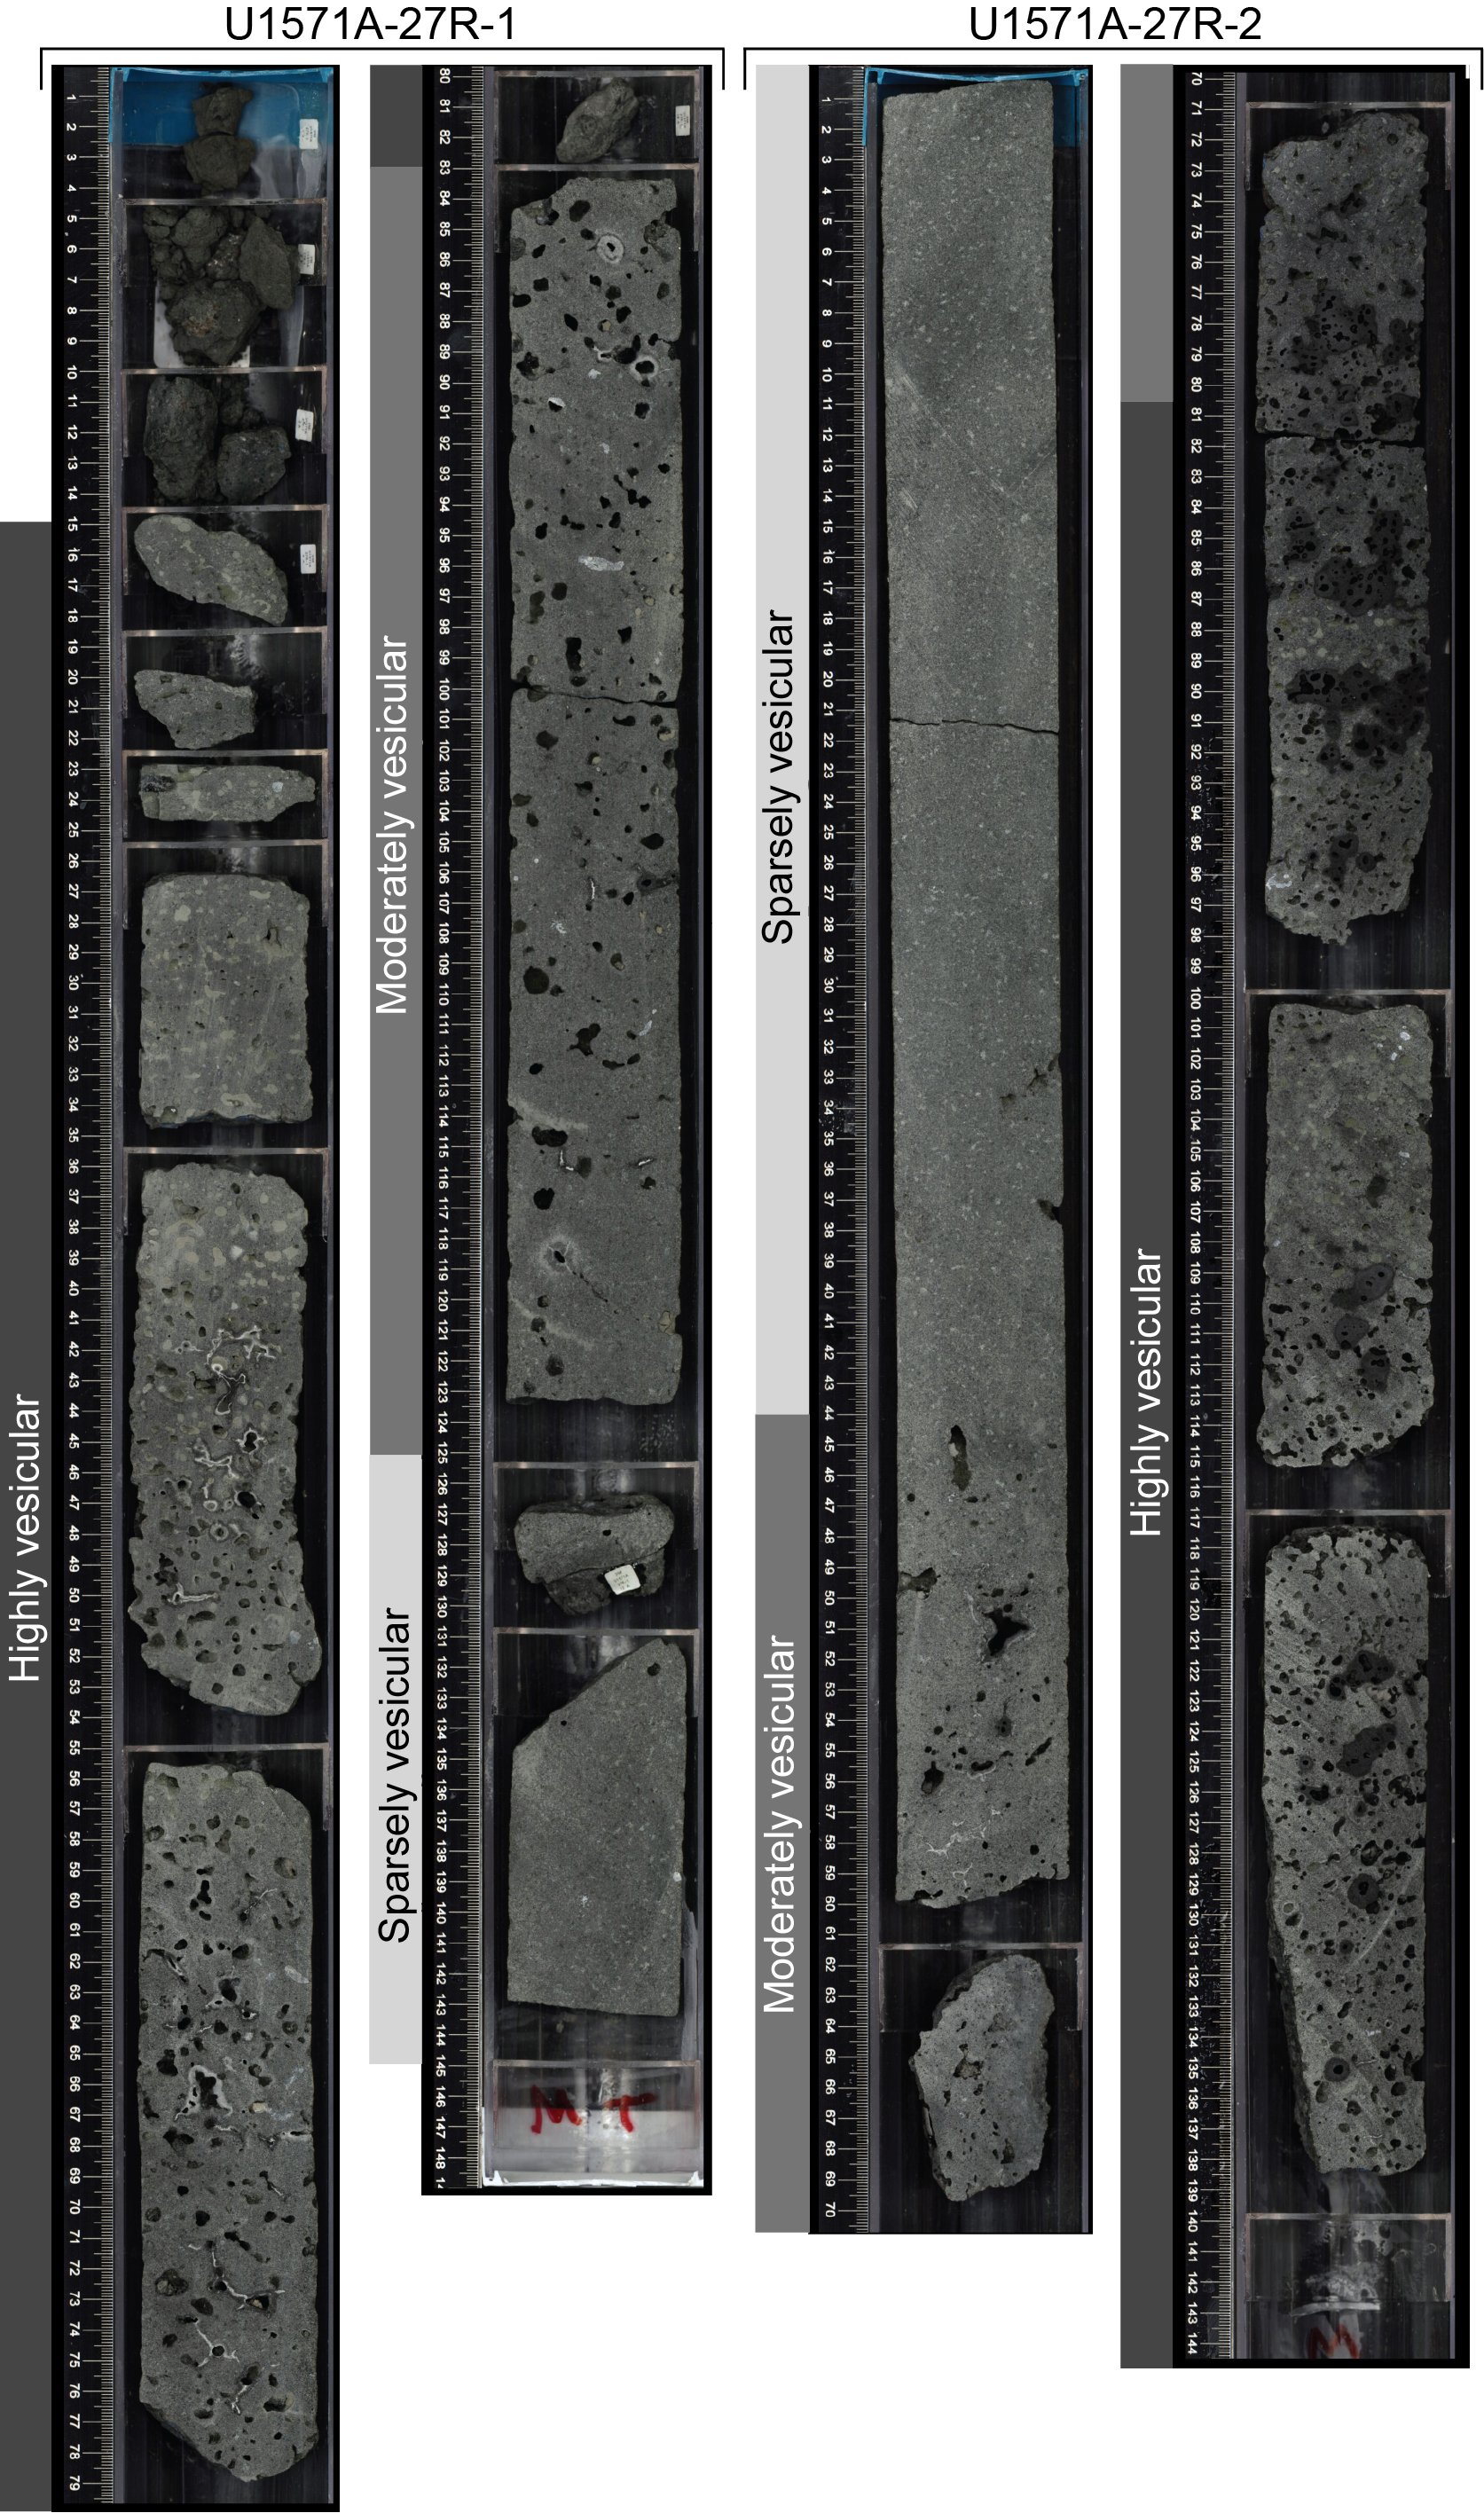
Figure F17. Change of vesicularity into single lava flows.
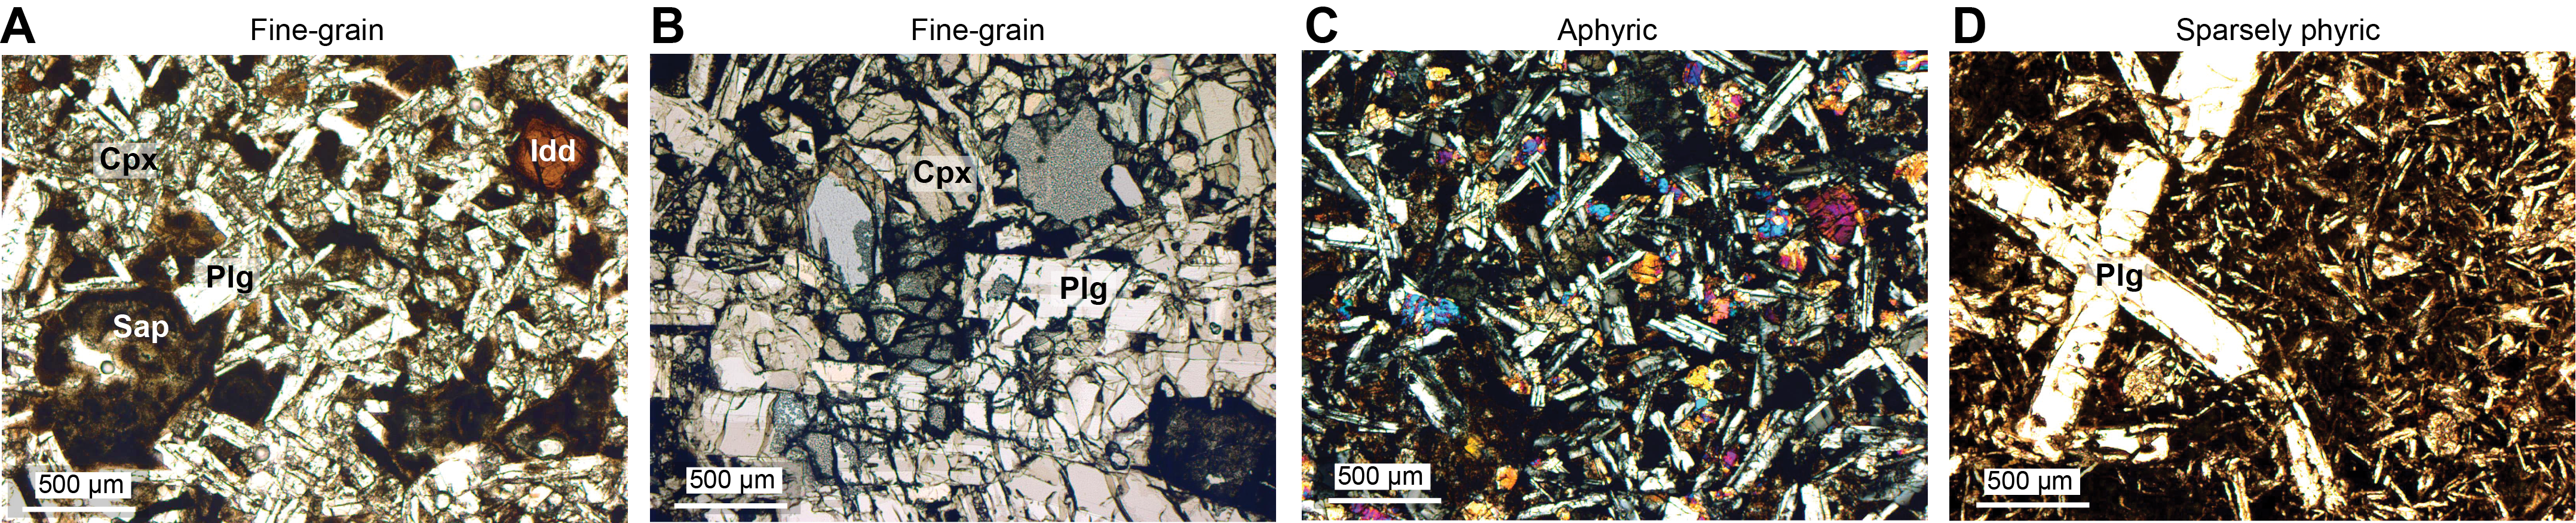
Figure F18. Subunit VIIIb mineralogy.
The aphyric basalt is non- to highly vesicular with a variable degree of alteration from slight to high. Discrete lava flows show significant variation of vesicularity from highly vesicular with a size of more than 2 mm at the edge to sparsely vesicular with a size of less than 2 mm in the center (Figure F17). Vesicles in this unit are often filled by pale green to turquoise zeolite or clay minerals and white calcite. Several massive veins of calcite and clay minerals with single or branched morphologies are also observed.
In Sections 396-U1572A-38R-3, 40R-1, 40R-3, and 41R-3, native Cu is observed either as vesicle infill, in veins, or in groundmass. Site 642 from ODP Leg 104 located in the same area also reported native Cu in the sampled basalt (LeHuray, 1989) that was suggested to be of magmatic origin.
3.8.3.2. Microscopic observations
The aphyric basalts are cryptocrystalline to fine grained (Figure F12). Vesicle filling ranges from empty to completely filled by clay minerals (mostly saponite) and carbonates (Figure F18). Flow textures observed macroscopically are confirmed by change of vesicularity at the centimeter scale (Figure F12H). The groundmass is usually altered and partly recrystallized by clay minerals. The original groundmass is hypocrystalline to holocrystalline and dominated by subhedral microlites of plagioclase and anhedral clinopyroxene (Figure F18C). One occurrence of euhedral microphenocrysts of olivine recrystallized with iddingsite and saponite is recovered in Hole U1571A (Figure F18A). Microphenocrysts of euhedral plagioclase are also observed in sparsely plagioclase phyric basalt (Figures F6, F18D).
3.8.3.3. Geochemical observations
The chemostratigraphy of the basalts show homogeneous compositions (Figures F16, F17) relative to Unit VII. Comparison of the chemostratigraphy between Sites U1571 and U1572 shows a similar top basaltic sequence (Subunit B1), with composition showing distinctly higher Ni and lower TiO2 contents than the rest of the unit. Downhole, compositions of the basalts are relatively constant at both sites to the bottom of Hole U1572A and to ~205 m CSF-A in Hole U1571A (i.e., Subunit S7) (Table T4). In Hole U1571A, below Subunit S7, basalt compositions are more variable and show a progressive increase in the Mg# and Ni content and decrease in the TiO2 content to ~220 m CSF-A, followed by a reversal of trends to the bottom of the hole (Figure F19).
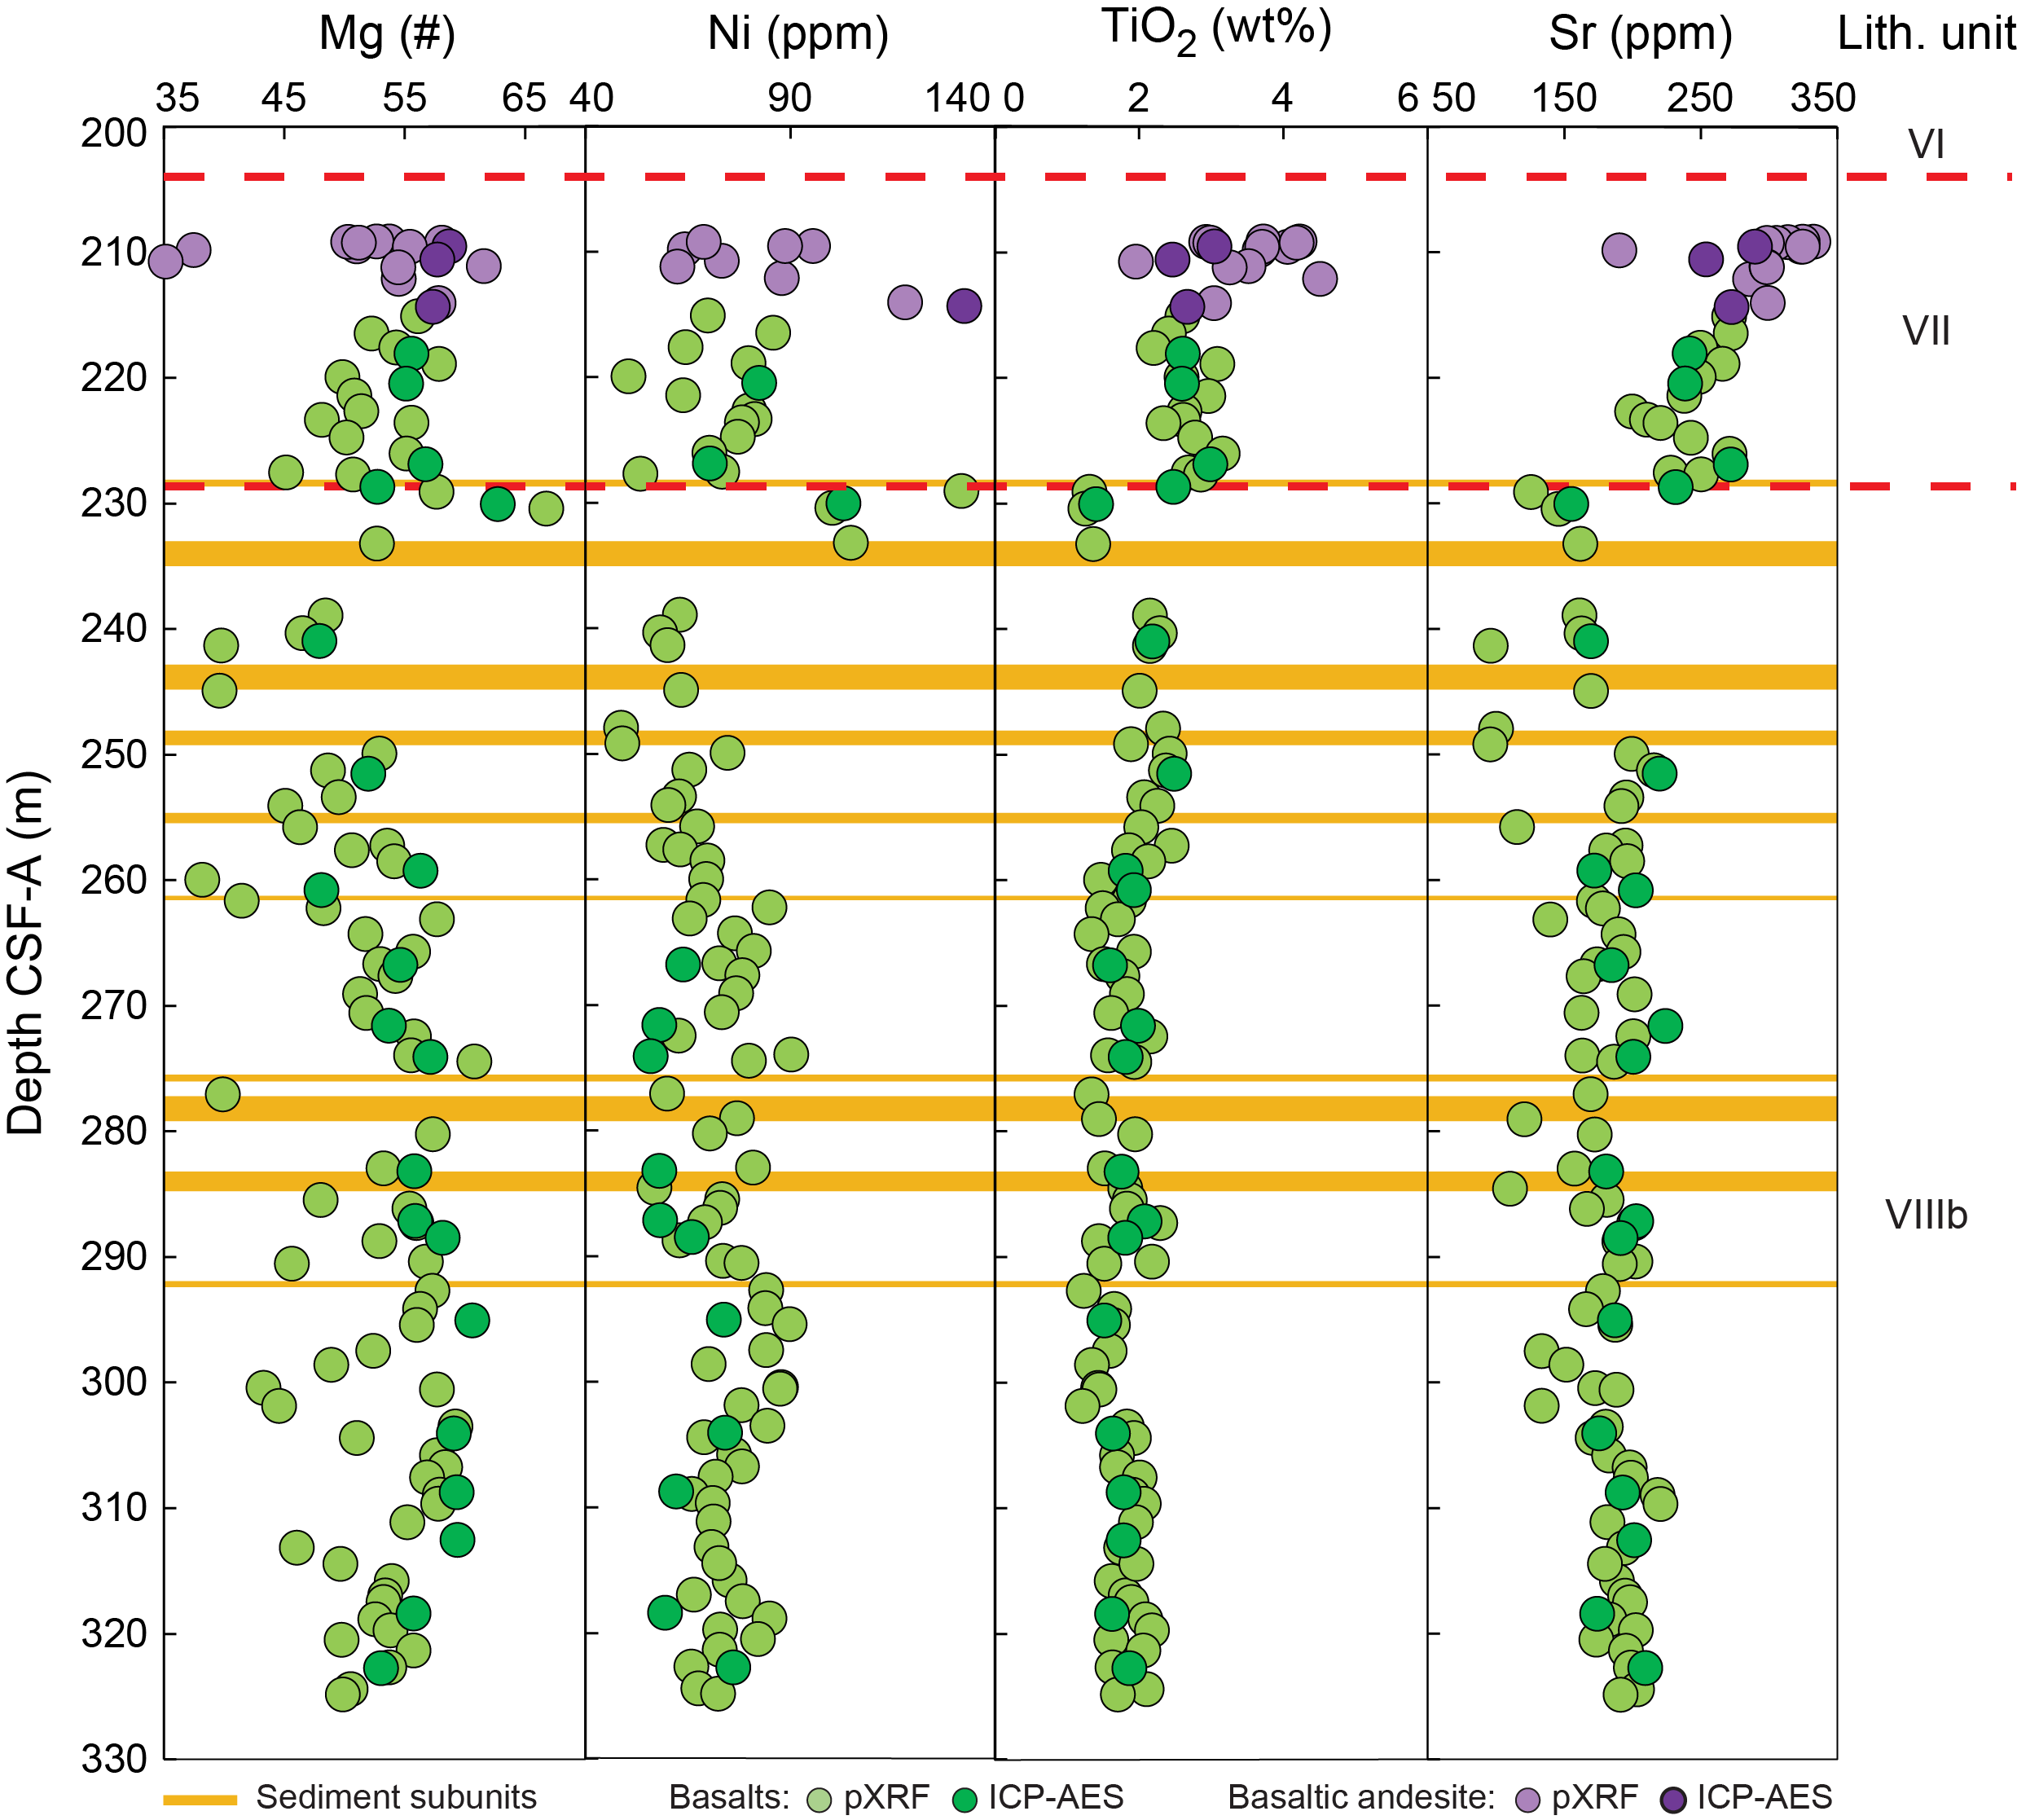
Figure F19. Chemical stratigraphy, Subunit VIIIb basalts.
3.8.4. Interbasaltic sediments
Unit VIII sediments consist of well-lithified mudstone with common volcaniclastics including ash, basalt, and mudstone clasts (Figures F4, F5). Generally, these sedimentary beds are much thinner than the surrounding basalt (tens of centimeters to ~2 m). Interbasaltic sediments are primarily dark reddish brown, indicating a high degree of oxidation and possible subaerial exposure (Figures F10, F11), although a few 5–50 cm intervals of greenish gray mudstone are present (e.g., Sections 396-U1571A-32R-1 and 396-U1572A-38R-2), possibly indicative of submarine deposition. The deepest recovered interbasaltic sediments in Hole U1572A tend to be less oxidized, suggesting a transition to less exposed conditions downhole, although this is not as clearly observed in Hole U1571A.
3.9. Lithostratigraphic correlation
A preliminary lithostratigraphic correlation across the four holes based on unit boundaries and biostratigraphic constraints is presented in Figure F4. The unit intervals and ages observed in each hole are documented in Table T3. Ages of the sediments across the five holes are tentatively constrained with biostratigraphic markers identified on board the ship from core catcher material (i.e., dinocyst zonations in Bujak and Mudge [1994]) and observations of diatom and foraminifer assemblages. Where possible, informal ages are included to indicate precision of biostratigraphic ages and continuity of sediment accumulation. Breaks in the accumulation of sediments are suggested by jumps in biostratigraphic assemblages and represented by thicker black boundary lines in informal age columns.
4. Biostratigraphy
Sediment samples from core catchers and intervals of interest in cores from Sites U1571 and U1572 were processed and analyzed for siliceous, organic-walled, and/or calcareous microfossils. Typically, analysis of the biosiliceous content judged from smear slides was taken as guidance for additional palynological sampling and processing. The mudline in all holes was processed for calcareous biota. Siliceous and organic-walled microfossils were found in various abundances below the Quaternary deposits, and calcareous biotic remains were very rare. Upper Middle Miocene, some Oligocene, and upper Lower to Upper Eocene sedimentary strata are identified above the igneous sequence. None of the sampled interbedded sediments were productive for microfossils. The lowermost sedimentary strata, dated ~48–49 Ma, reflect coastal waters, above which a gradual trend toward more neritic, distal, perhaps oceanic conditions in the Late Eocene is inferred. A summary of microfossil abundances at Sites U1571 and U1572 is given in Tables T6, T7, T8, and T9.
4.1. Siliceous microfossils
Core catcher and occasional split core smear slides provided diatom biostratigraphic data that allowed the identification of Miocene, Upper Oligocene, and Middle and Upper Eocene intervals in Holes U1571A, U1571B, U1572A, and U1572B based on diatoms and silicoflagellates. Radiolarians are common in some samples, but no attempt to identify taxa was made.
4.1.1. Holes U1571A and U1571B
Diatoms and other siliceous microfossils are absent or occur only in trace amounts in core catcher Samples 396-U1571A-1R-CC to 8R-CC and 396-U1571B-1R-CC to 8R-CC. Miocene diatoms occur in Samples 396-U1571A-9R-CC to 10R-CC and 396-U1571B-9X-CC to 11X-CC. Samples 396-U1571A-9R-CC and 396-U1571B-9X-CC contain common Actinocyclus ingens and rare A. ingens var. nodus. Sample 396-U1571B-11X-CC contains a diverse Miocene assemblage that includes A. ingens, Thalassiosira leptopus, Sceptroneis ossiformis, Cymatosira biharensis, rare Crucidenticula nicobarica, Asteromphalus symmetricus, and an unidentified plicate Thalassiosira as well as unusual diatoms including Stictodiscus eulensteinii (sensu Dzinoridze et al., 1978) and Lithodesmium rotunda (sensu Schrader and Fenner, 1976). Also present in this sample are numerous well-preserved Eurossia irregularis. This is a mid-Miocene diatom assemblage, but E. irregularis has generally been reported from Oligocene sediments, suggesting a much longer range in this region. Diatoms and other biosiliceous fossils are largely absent from Samples 396-U1571A-11R-CC and 396-U1571B-12X-CC to the bottom of the sediment columns in each hole.
4.1.2. Holes U1572A and U1572B
Beneath younger sediments barren of diatoms, upper Middle Miocene sediments are limited to Sample 396-U1572A-9R-CC, which contains diatoms Thalassiosira burckliana, Thalassionema schraderii, Hemidiscus cuneiformis, Thalassiosira eccentrica, and Rhaphoneis spp. in a nannofossil ooze dominated by the coccolith Coccolithus pelagicus. This diatom assemblage indicates a late Middle Miocene age. Samples 10R-CC to 12R-CC contain Middle Miocene Denticulopsis lauta and Denticulopsis hyalina (Sample 10R-CC) and biostratigraphically useful silicoflagellates Bachmannocena diodon, Cannopilus schultzii, and Dictyocha brevispina var. ausonia (which also occur in Sample 396-U1572B-13F-CC). D. lauta is particularly common in Samples 396-U1572A-10R-CC and 396-U1572B-12F-CC.
Sample 396-U1572A-14R-CC contains abundant radiolarians and a low-diversity diatom assemblage dominated by Pyxilla spp. (often assigned to Pyrgupyxis), which is typical of Lower Oligocene to Upper Eocene strata, but the lack of small and finely silicified diatoms suggests that the sediment is strongly winnowed. Pyxilla is a very robust and therefore commonly reworked diatom that may occur here displaced from older deposits. Samples 15R-CC and 16R-CC contain relatively few diatoms and abundant volcanic ash.
Middle Eocene diatoms are recognized in Samples 396-U1572A-17R-CC to 20R-CC. Much of this interval is highly diatomaceous, including intervals of nearly pure diatomite. The sediment is fully unconsolidated and unaltered. Smear slides from Cores 17R and 18R reveal a highly variable diatom assemblage suggestive of a highly productive sea with high diatom accumulation rates and diverse assemblages. Samples 18R-1, 6 cm, 18R-1, 1–13 cm, 18R-1, 1–26 cm, and 18R-CC are very heavily dominated (90%–95% of the assemblage) by the Middle Eocene diatom Fenneria brachiata (Greville) Witkowski (2018; most often reported in literature as Triceratium barbadense) Figure F20. Remarkably similar observations were also reported by Schrader and Fenner (1976) for Sample 29-CC from DSDP Site 338, which lies ~50 nmi from Hole U1572A. The ecological conditions that led to the accumulation of this F. brachiata acme is unknown, but its thickness indicates that it represents accumulation across a significant amount of time. Diatom occurrences continue to Sample 21R-CC, which is the sample that contains abundant Azolla (see Palynology). This sample contains abundant and diverse ebridians and the diatom Pyxilla oligocaenica, which has a documented first occurrence at 49.8 Ma (Lazarus et al., 2014). All samples below this one are barren of biosiliceous materials.
Figure F20. Fenneria brachiata–dominated diatom assemblage.
The succession in Hole U1572A is recovered in Hole U1572B in far higher quality because of the use of the APC and HLAPC systems (core types H = full length and F = half length) instead of rotary coring. Core catchers and selected core intervals were analyzed. A Miocene age is recognized in nannofossil-rich Sample 396-U1572B-9H-CC. Miocene sediments continue, based on diatoms and supported by silicoflagellates, in Cores 10H–13H. Age control in Core 14H is problematic, requiring careful comparison of the diatom floras with petrophysics and lithostratigraphy to discern a coherent interpretation. Diatoms suggesting a Miocene age occur throughout this core, but marker taxa are rare. Intermixed in this core are Early Oligocene to Late Eocene diatoms, suggesting considerable reworking. The core is mottled and variably bioturbated and includes several distinct ash layers and blebs. Smear slides from these sedimentary blebs yielded several examples of an Early Oligocene assemblage of the Sceptroneis pupa Zone of Scherer and Koç (1996), but the surrounding matrix may contain more in situ Miocene materials. Sample 14H-CC contains abundant radiolarians and a winnowed diatom assemblage dominated by several species of the robust diatom genus Pyxilla. No specific Miocene diatoms were noted in extensive examination, although palynomorphs examined do indicate a Miocene component. Radiolarians are abundant in this sample, and a potentially correlative radiolarian ooze, dominated by Hexalonche sp., was reported by Bjørklund (1976) from DSDP Site 338 Cores 10–12.
Section 396-U1572B-15H-1 contains intervals that are clearly Early Oligocene in age (S. pupa Zone; Scherer and Koç, 1996), thought to be in situ, with both large and small taxa present. For example, characteristic species present in Sample 15H-1, 66 cm, include Azpeitia oligocenica, S. pupa, Sceptroneis fennerae, Rouxia granda, Asterolampra punctifera, A. symmetricus, A. oligocenica, and E. irregularis in a well-preserved and abundant assemblage. Earliest Oligocene or Late Eocene diatoms occur below this sample in assemblages characterized by several species of Pyxilla, which are abundant in Sample 15H-CC.
Diatoms are less abundant in Samples 396-U1572B-16F-CC and 17F-CC. The diatom assemblage contains dominantly long ranging taxa, but many of these, such as Pterotheca aculeifera and many other robust diatom resting spores, are typical of Upper Eocene deposits. The Middle Eocene is identified in Sample 18F-CC. The Middle Eocene Craspedodiscus oblongus Zone (Barron et al., 2015) is recognized in Sample 20F-CC, with common C. oblongus as well as Asterolampra vulgaris, Asterolampra marylandicus, and other associated taxa, including F. brachiata, placing it in the upper Middle to lower Upper Eocene (likely Bartonian, utilizing low-latitude datums of Barron et al., 2015). Core 19F contains dark, very finely laminated diatomite with short intervals of bioturbation (Figure F21). Smear slides through this interval show no significant assemblage differences between light and dark layers, implying continuous pelagic accumulation rather than annual or seasonal laminations. The diatomite includes rare volcanic ash, but it does not comprise a significant volumetric contribution to the diatomite.
Figure F21. Early to Middle Eocene dinocysts, Hole U1571A.
The mass occurrence of F. brachiata in Core 396-U1572A-18R and DSDP Sample 338-29-CC (Schrader and Fenner, 1976) occurs through most of Core 396-U1572B-21F, at least in Samples 21F-1, 74 cm, to 22F-2, 10 cm. The event began abruptly, following an ash fall, with no evidence of missing time despite the dramatic change in diatom assemblage directly above the ash (Sample 22F-2, 10 cm) compared with the diatomite immediately below it (22F-2, 60 cm), where F. brachiata is extremely rare. The ecological significance of the F. brachiata mass occurrence event is unknown. Rare F. brachiata is noted to Sample 23F-CC. Below that, Early Eocene diatoms, including Trinacria excavata, Trinacria heibergii, and Trinacria regina, are noted, but diatoms are effectively absent in samples from Core 28F, which is identified by palynology as the Azolla event, to the base of the sedimentary section.
4.2. Palynology
4.2.1. Site U1571
In total, 11 samples from Hole U1571A (mainly core catcher samples) and 7 from Hole U1571B were processed for palynology, guided by results of the smear slide analysis of biosiliceous remains. All samples were processed using the standard hydrofluoric acid (HF) technique (see Biostratigraphy in the Expedition 396 methods chapter [Planke et al., 2023a]). Most samples are barren of acid resistant organic materials, and none of the processed interbasalt sediment samples yielded identifiable palynomorphs. Palynomorphs, including age-diagnostic dinocysts, are present only in some of the Miocene samples and a few of the Eocene samples. No quantitative analyses were conducted.
4.2.1.1. Miocene in Holes U1571A and U1571B
Samples 396-U1571A-10R-CC and 396-U1571B-9X-CC to 11X-CC yield abundant, well-preserved, typical Miocene dinocysts. Samples 396-U1571A-10R-CC and 396-U1571B-9X-CC and 10X-CC may be assigned to the Middle Miocene, and Sample 11X-CC may be assigned to the upper Lower Miocene. The presence of the Middle Miocene succession is inferred from the co-occurrence of age-diagnostic taxa like Labyrinthodinium truncatum, Invertocysta lacrymosa, Apteodinium spiridoides, Selenopemphix dionaeacysta, Cannosphaeropsis passio, and Hystrichosphaeropsis obscura (e.g., Munsterman and Brinkhuis, 2004; Egger et al., 2016; Dybkjær et al., 2021). Sample 11X-CC is characterized by equally rich assemblages with, for example, dominant Cleistosphaeridium placacanthum, various representatives of Protoperidinium cysts, and Invertocysta tabulata, Homotryblium floripes, and Cousteaudinium aubryae. Notably, the latter suggests an age of late Burdigalian (late Early Miocene) for this sample (cf., e.g., Dybkjær et al., 2021). Besides dinocysts, bisaccate pollen are common in these samples.
4.2.1.2. Eocene in Holes U1571A and U1571B
Only Samples 396-U1571A-12R-CC and 396-U1571B-13X-CC and 14X-1, 140–150 cm, yield well-preserved, rich, typical Early and Middle Eocene dinocysts. Other samples are barren of organic-walled microfossils. Sample 396-U1571A-12R-CC may be assigned to the middle Middle Eocene, and the two samples from Hole U1571B may be assigned to the latest Early and earliest Middle Eocene age.
Determination of the latter for Sample 396-U1571A-12R-CC is inferred from the co-occurrence of age-diagnostic taxa, including but not limited to Phthanoperidinium distinctum, Areosphaeridium michoudii, Cerebrocysta bartonensis, Lentinia spp., and Damassadinium abbreviatum. This, together with a mass occurrence of representatives of the Phthanoperidinium geminatum-regalis-clithridium complex, allows rather precise designation to the magnetochronological timescale following Eldrett et al. (2004) using material from previous legs in the Greenland Norwegian Sea (DSDP Leg 38 and ODP Legs 104 and 151). Comparison to those results allows assignment to the midpoint of Magnetochron C20n (~43 Ma) for this sample.
Assignment of a latest Early Eocene to earliest Middle Eocene age for Samples 396-U1571B-14X-1, 140–150 cm, to 13X-CC is inferred from a mass occurrence of Azolla massulae and glochidia in the lower sample, together with age-diagnostic dinocyst taxa, including, among others, Diphyes ficusoides, Membranilarnacia glabra, Wetzeliella articulata brevicornuta, and A. michoudii, in both samples. The mass occurrence of Azolla remains in the Nordic Seas represents a well-known period of ~800 ky at the end of the Early Eocene, the demise of which correlates to the midpoint of Magnetochron C21r (~48 Ma; cf. Eldrett et al., 2004; Brinkhuis et al., 2006). The overlying sample (13X-CC) did not yield any Azolla remains but contains mostly the same age-diagnostic dinocysts. The age is comparable to that of Sample 14X-1, 140–150 cm, and is hence assigned a slightly younger age of earliest Middle Eocene.
4.2.2. Site U1572
In total, 7 core catcher samples from Hole U1572A and 16 from Hole U1572B were processed for palynology, partly guided by results of the smear slide analysis of biosiliceous remains, as for Site U1571. All samples were processed using the standard HF technique (see Biostratigraphy in the Expedition 396 methods chapter [Planke et al., 2023a]). As at Site U1571, palynomorphs, including age-diagnostic dinocysts, are present in some of the Miocene samples and several from the Eocene, occasionally in great abundance and well diversified. None of the processed interbasalt sediment samples yielded identifiable age-diagnostic palynomorphs. In light of such variable yield, no quantitative analyses were conducted. Occurrences of palynofacies categories and palynomorphs for Eocene samples from Hole U1572B are listed in Table T10, and a summary is provided in Table T11. Characteristic taxa are depicted in Figures F21, F22, F23, F24, F25, F26, and F27.
Figure F22. Early to Middle Eocene dinocysts and other palynomorphs, Site U1571.
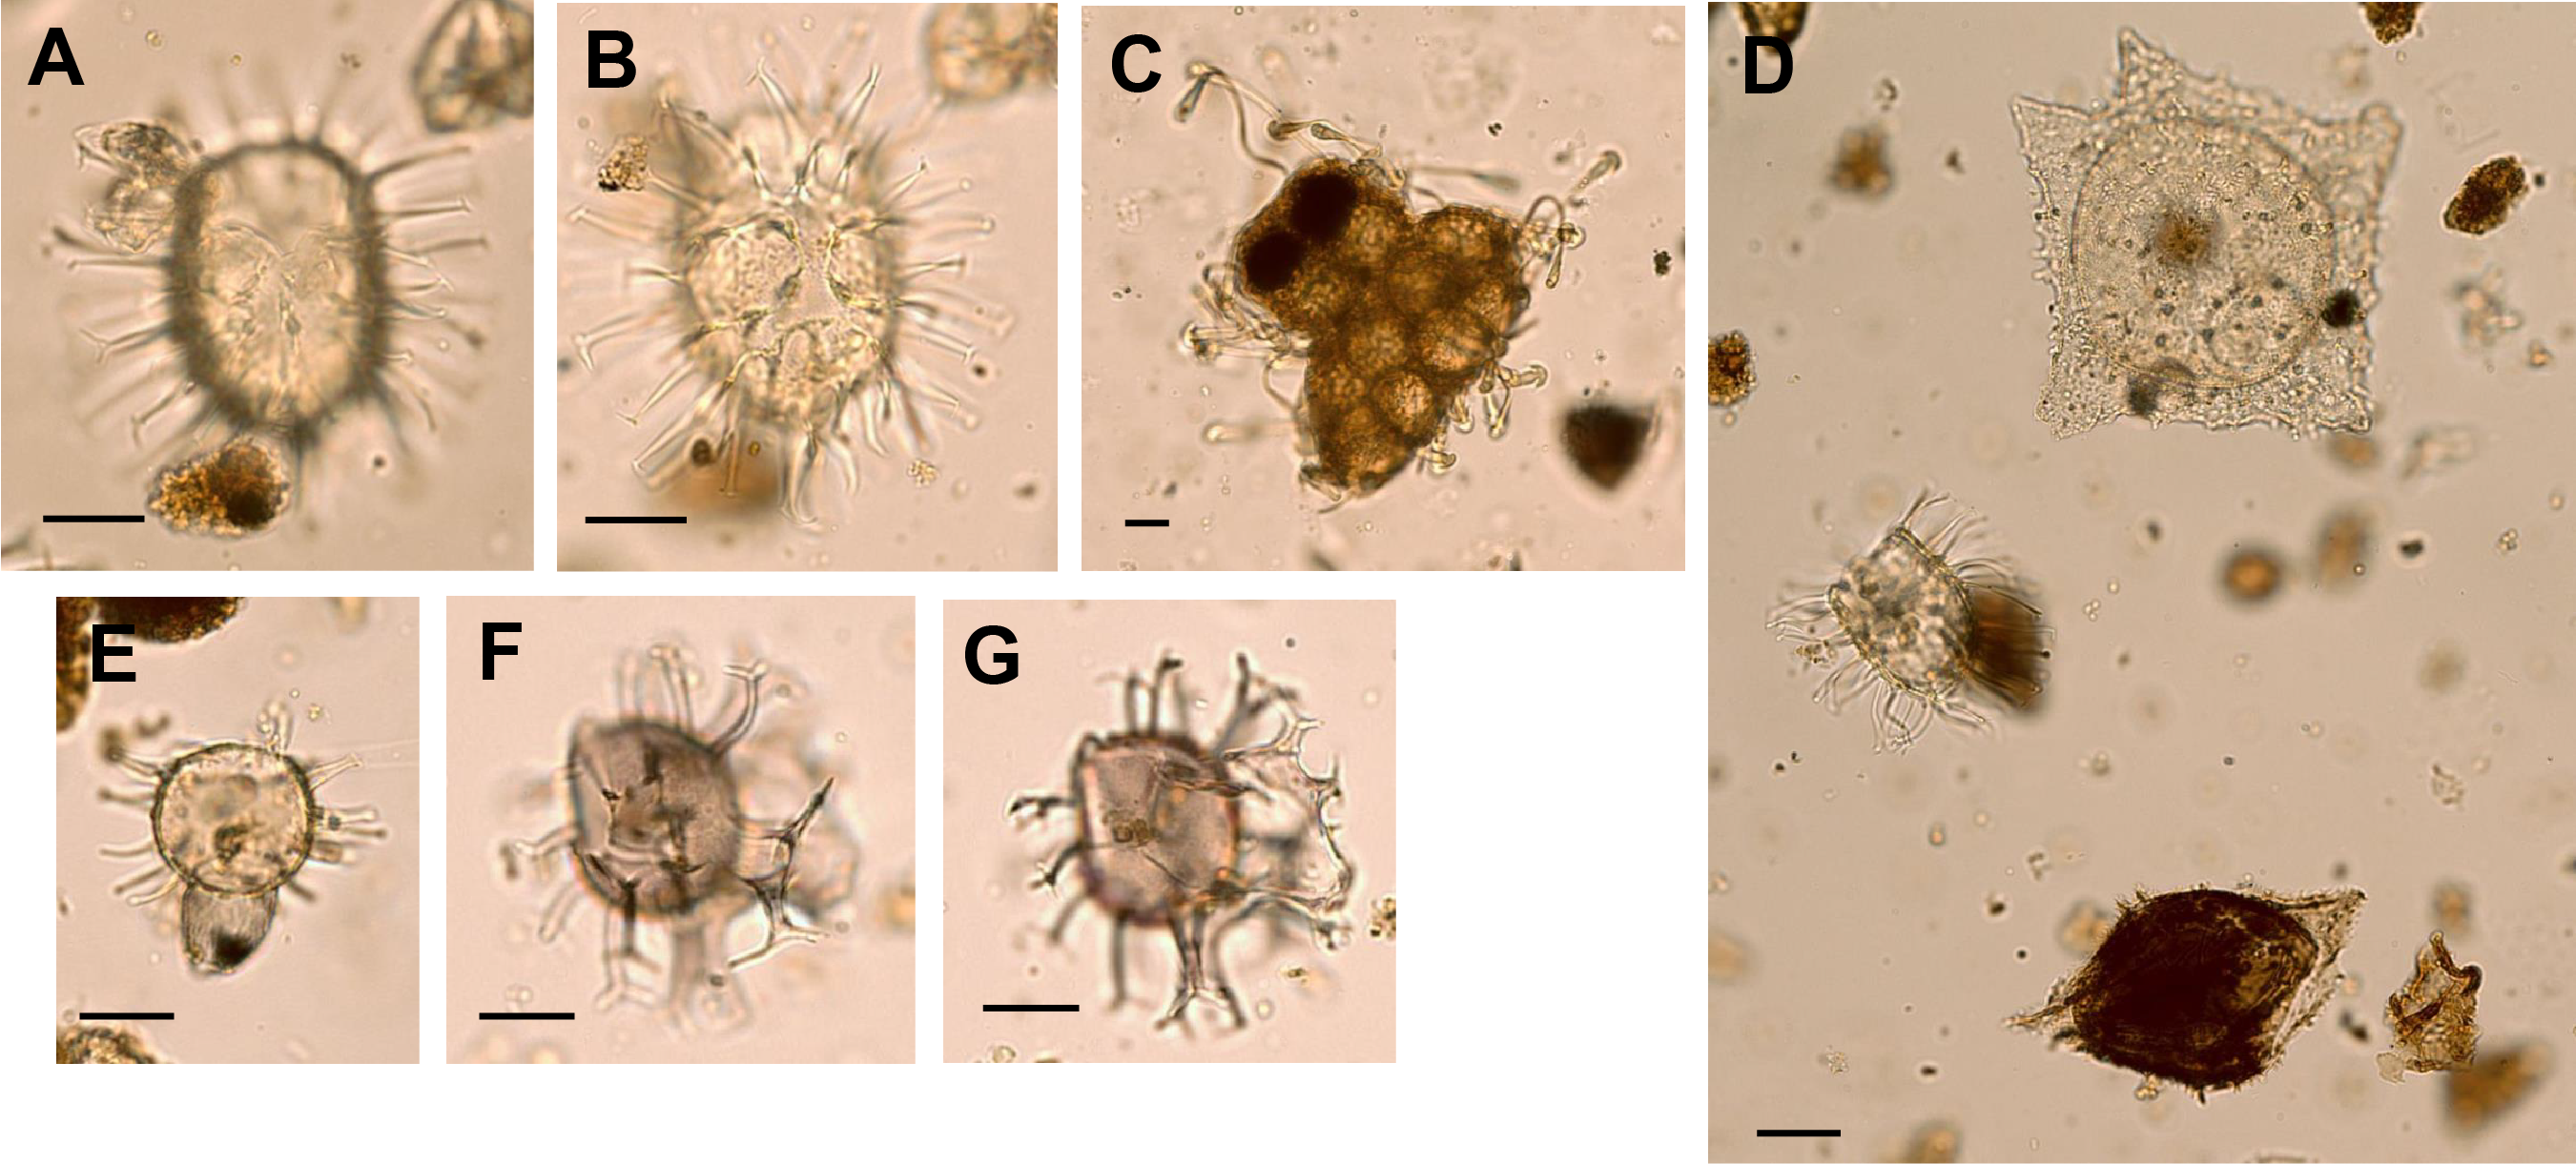
Figure F23. Early to Middle Eocene dinocysts and other palynomorphs, Sites U1571 and U1572.
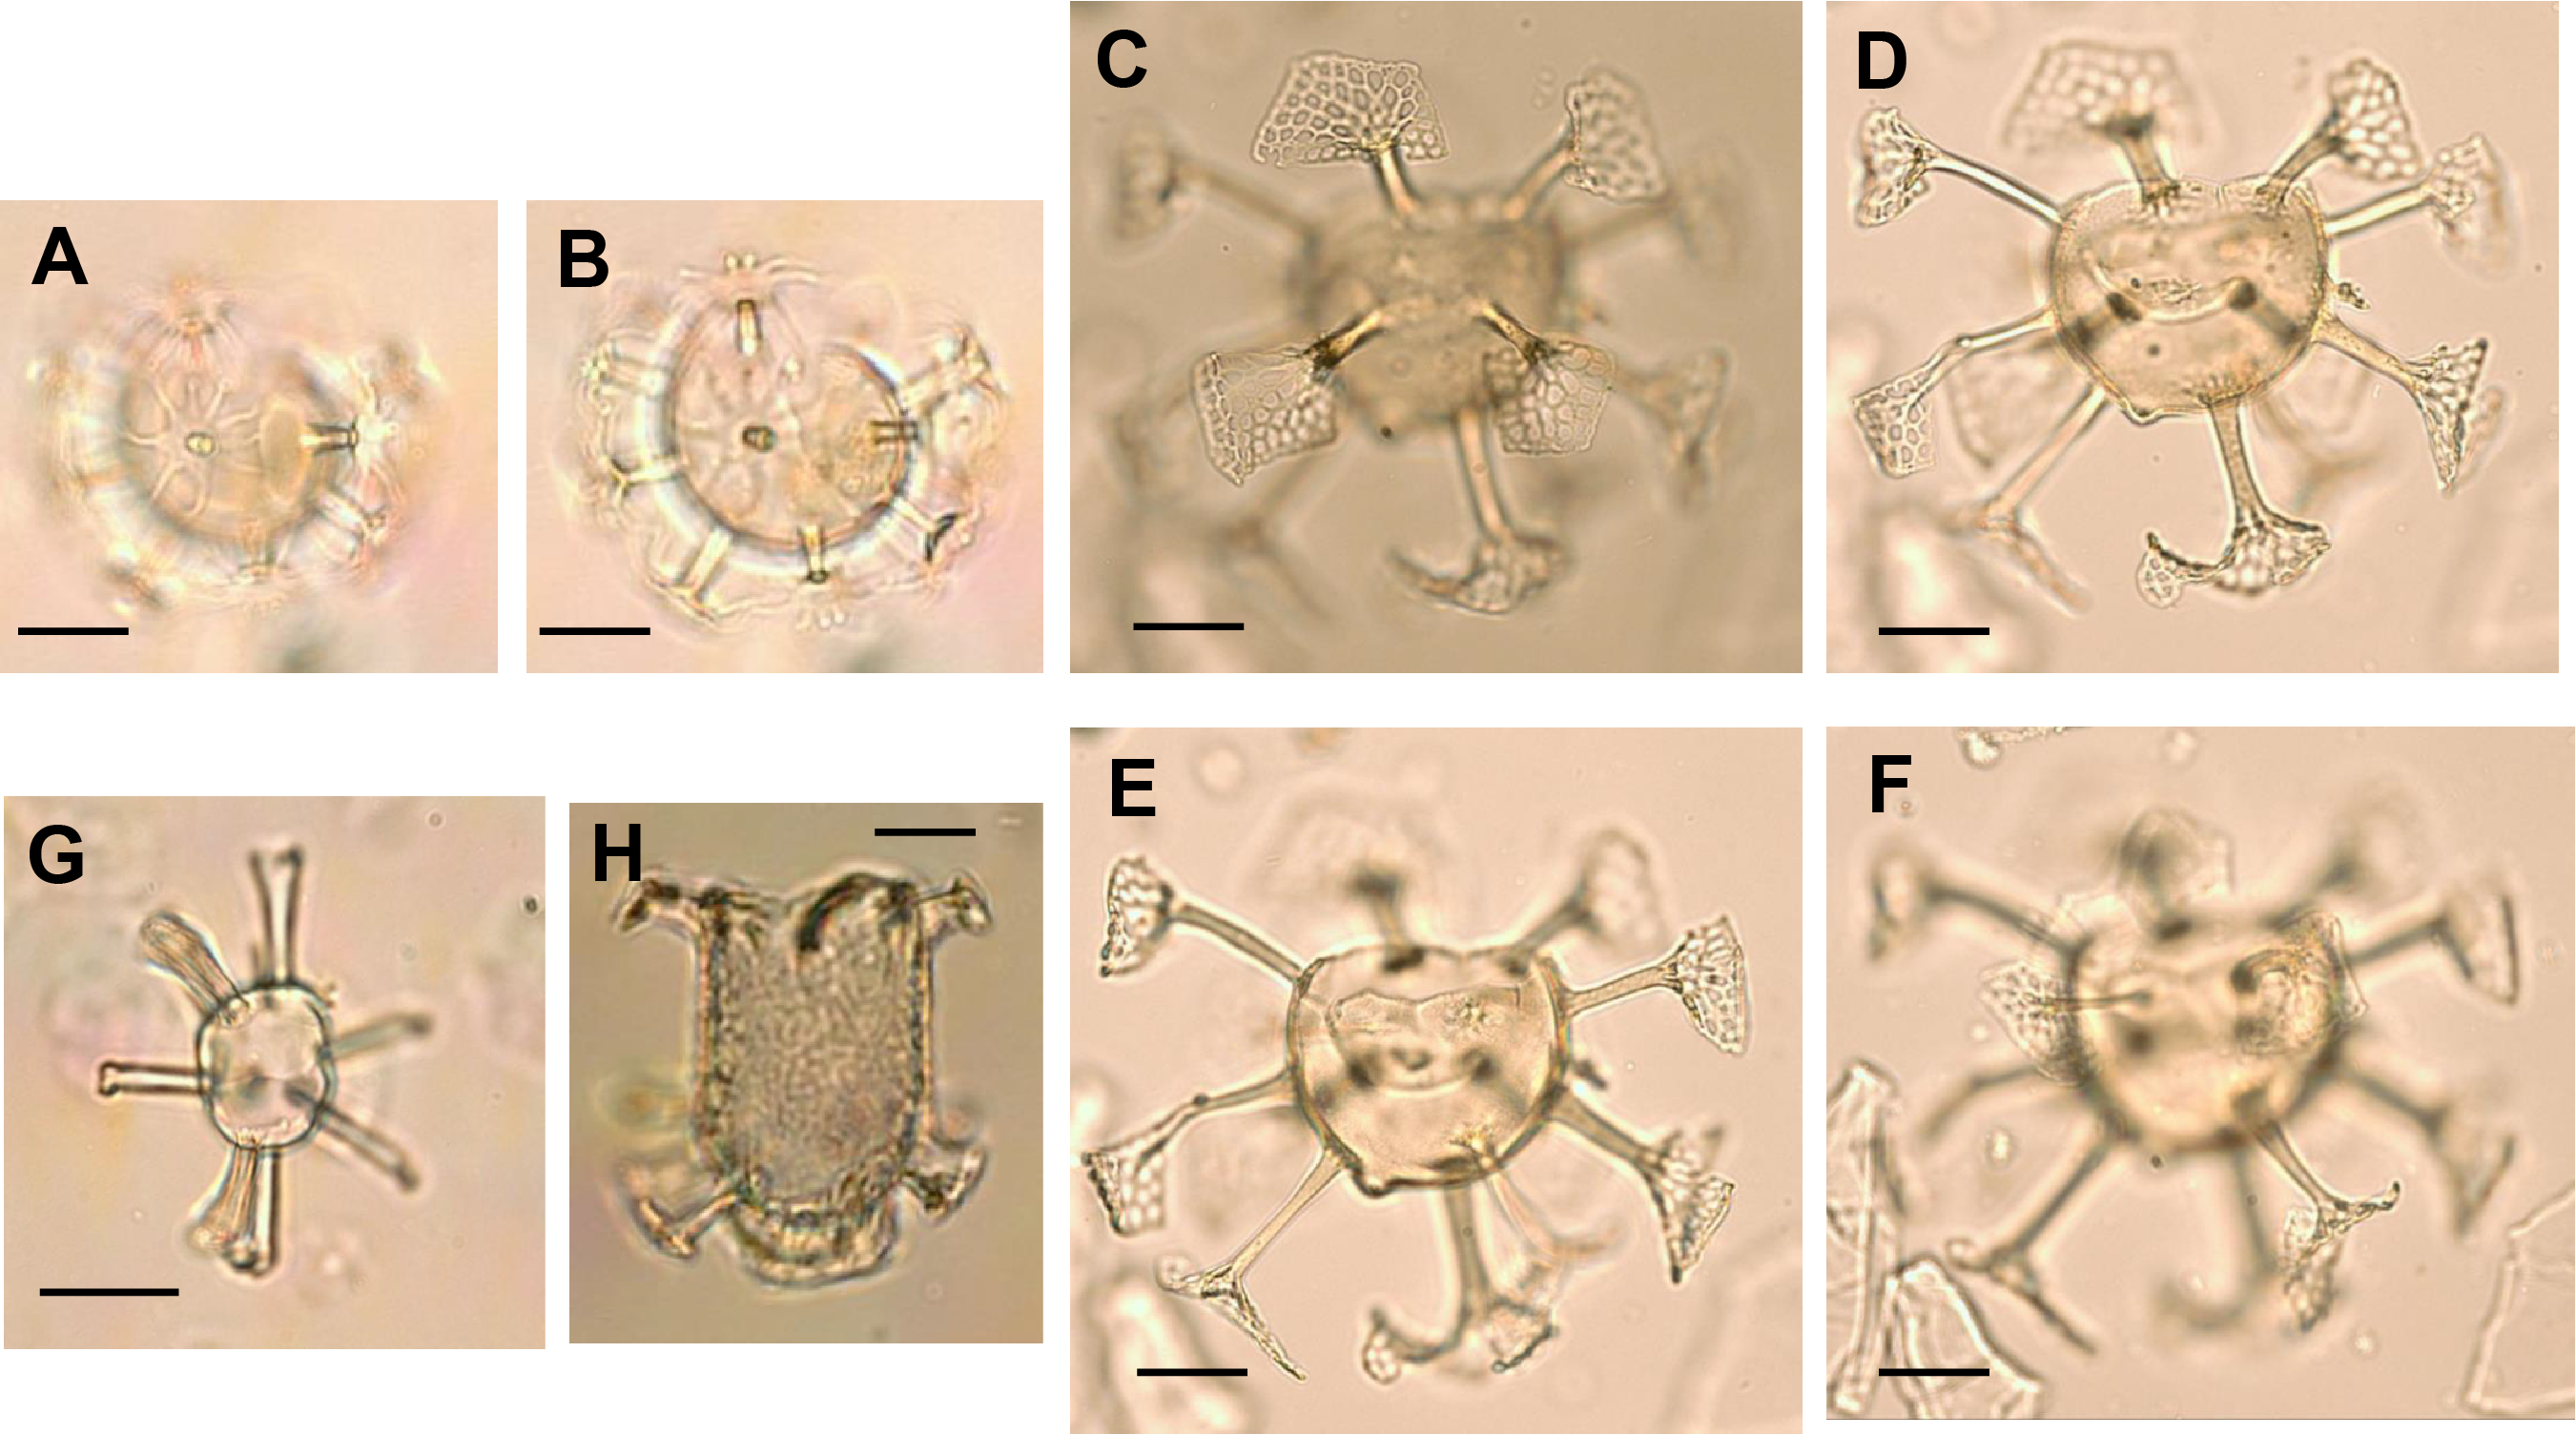
Figure F24. Early to Middle Eocene dinocysts and other palynomorphs, Hole U1572B.
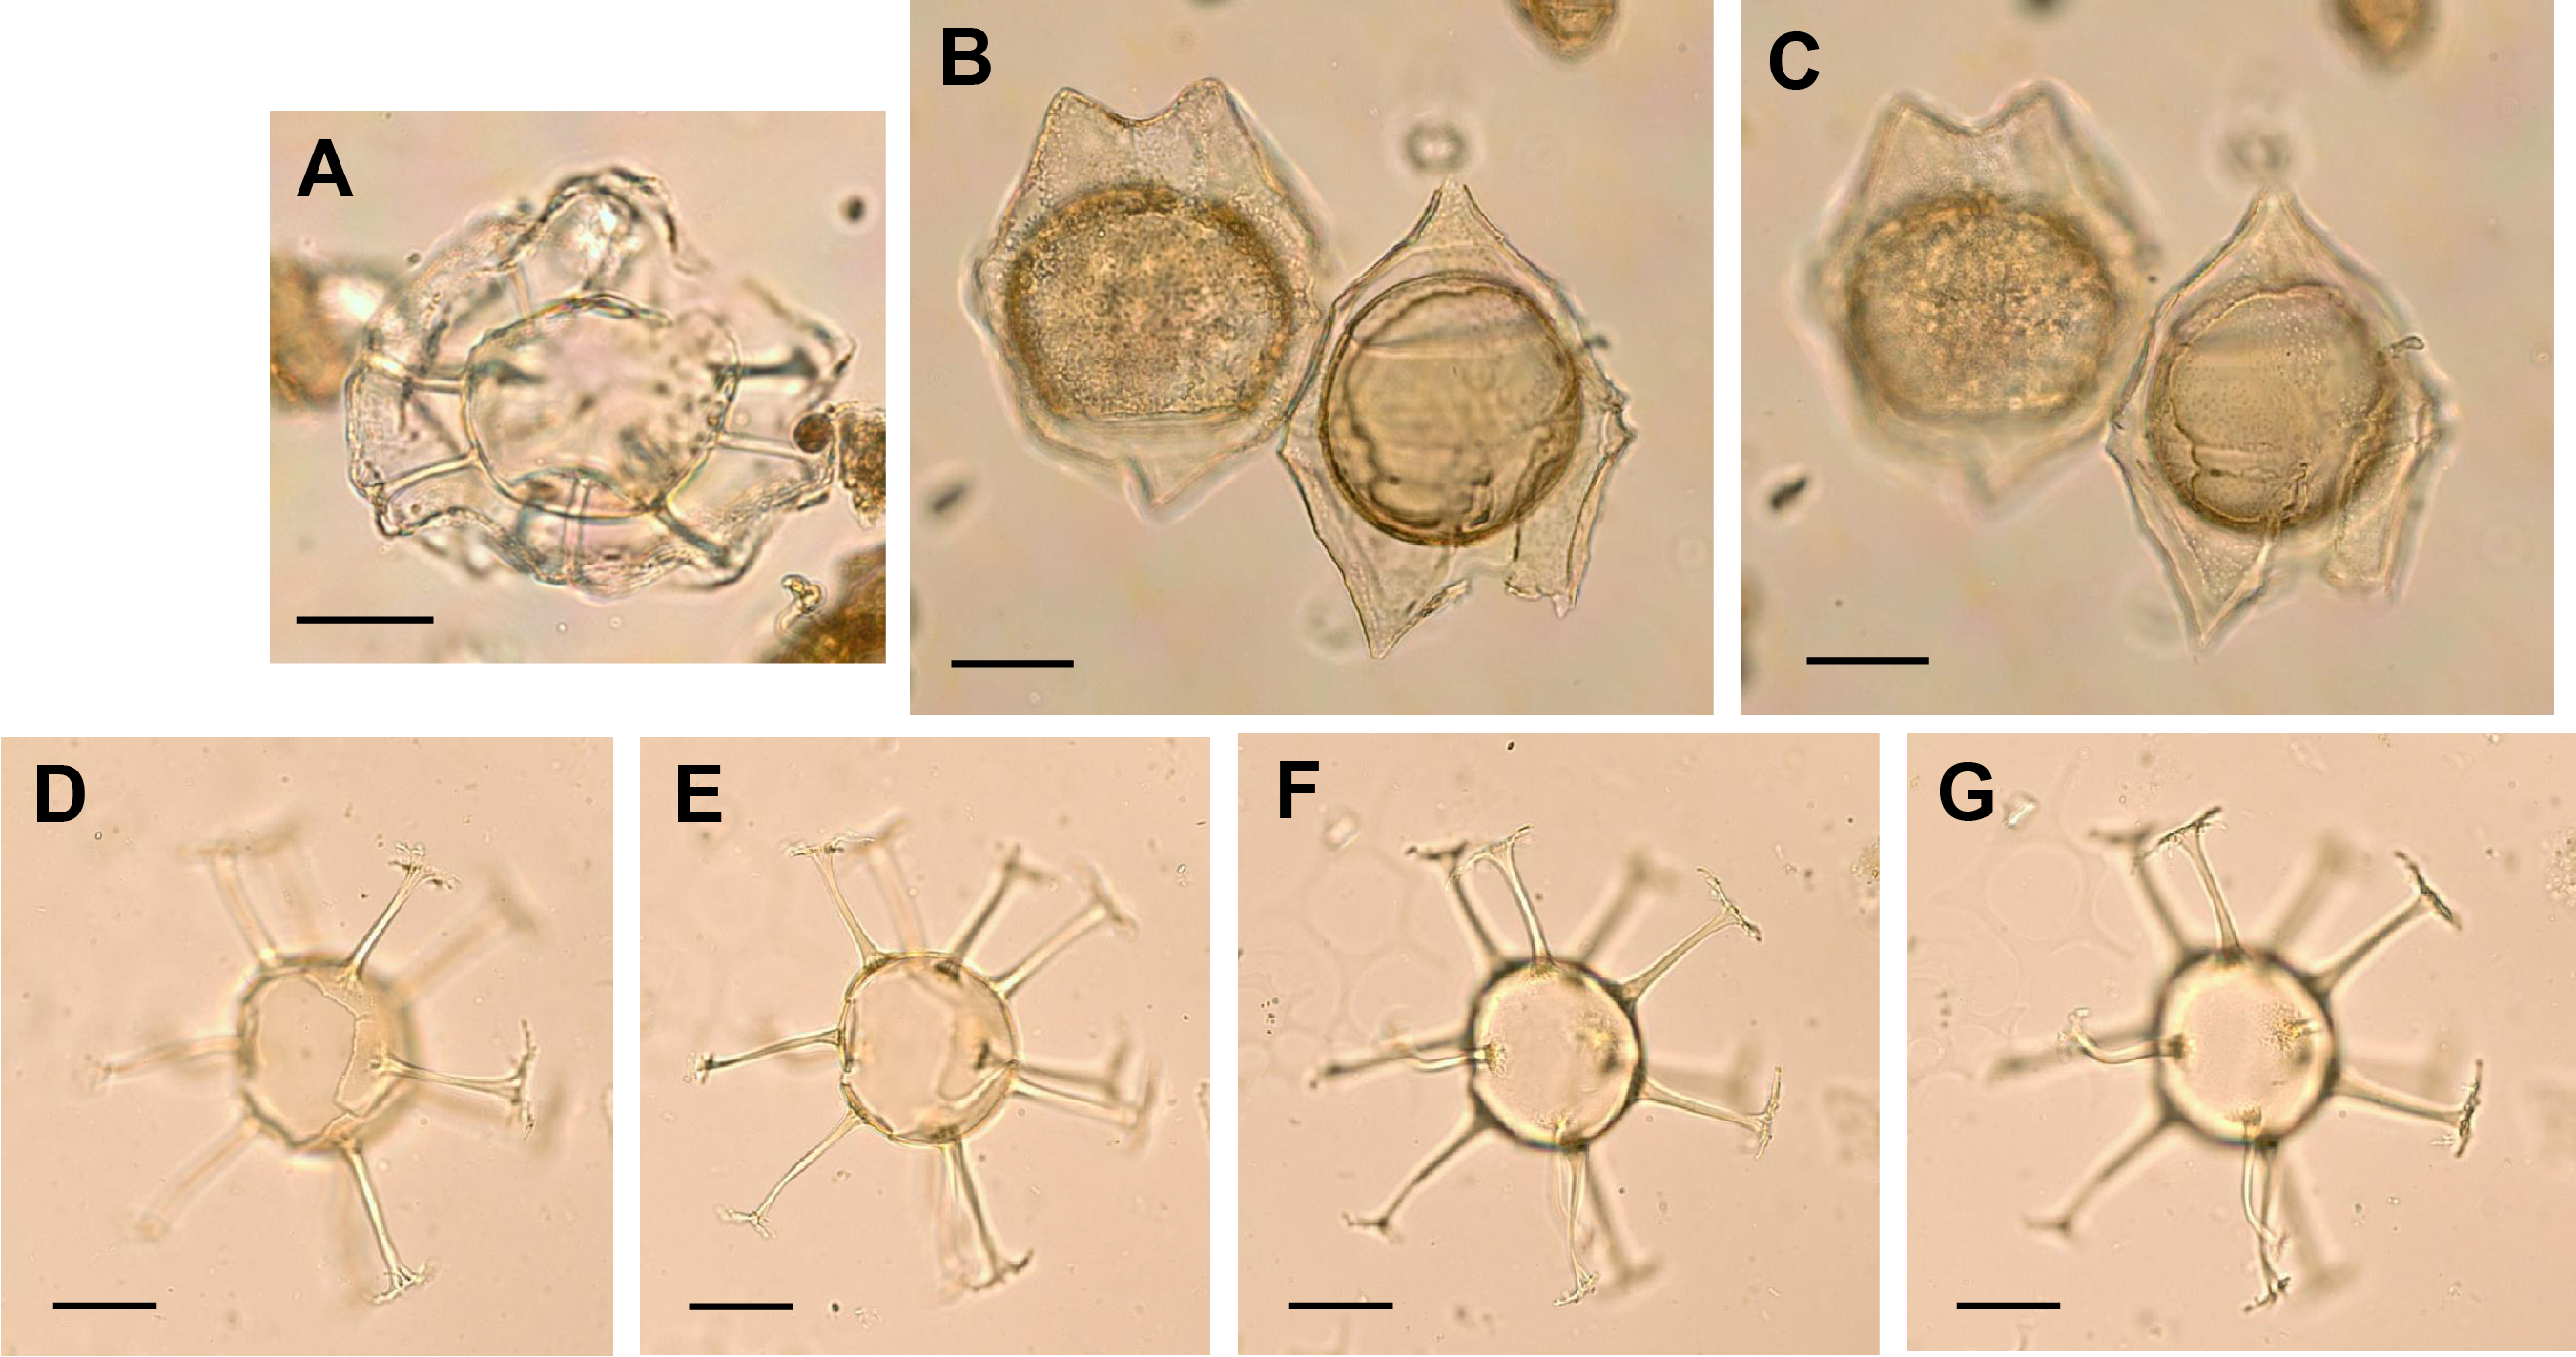
Figure F25. Early to Middle Eocene dinocysts, 396-U1572B-17F-CC through 28F-CC.
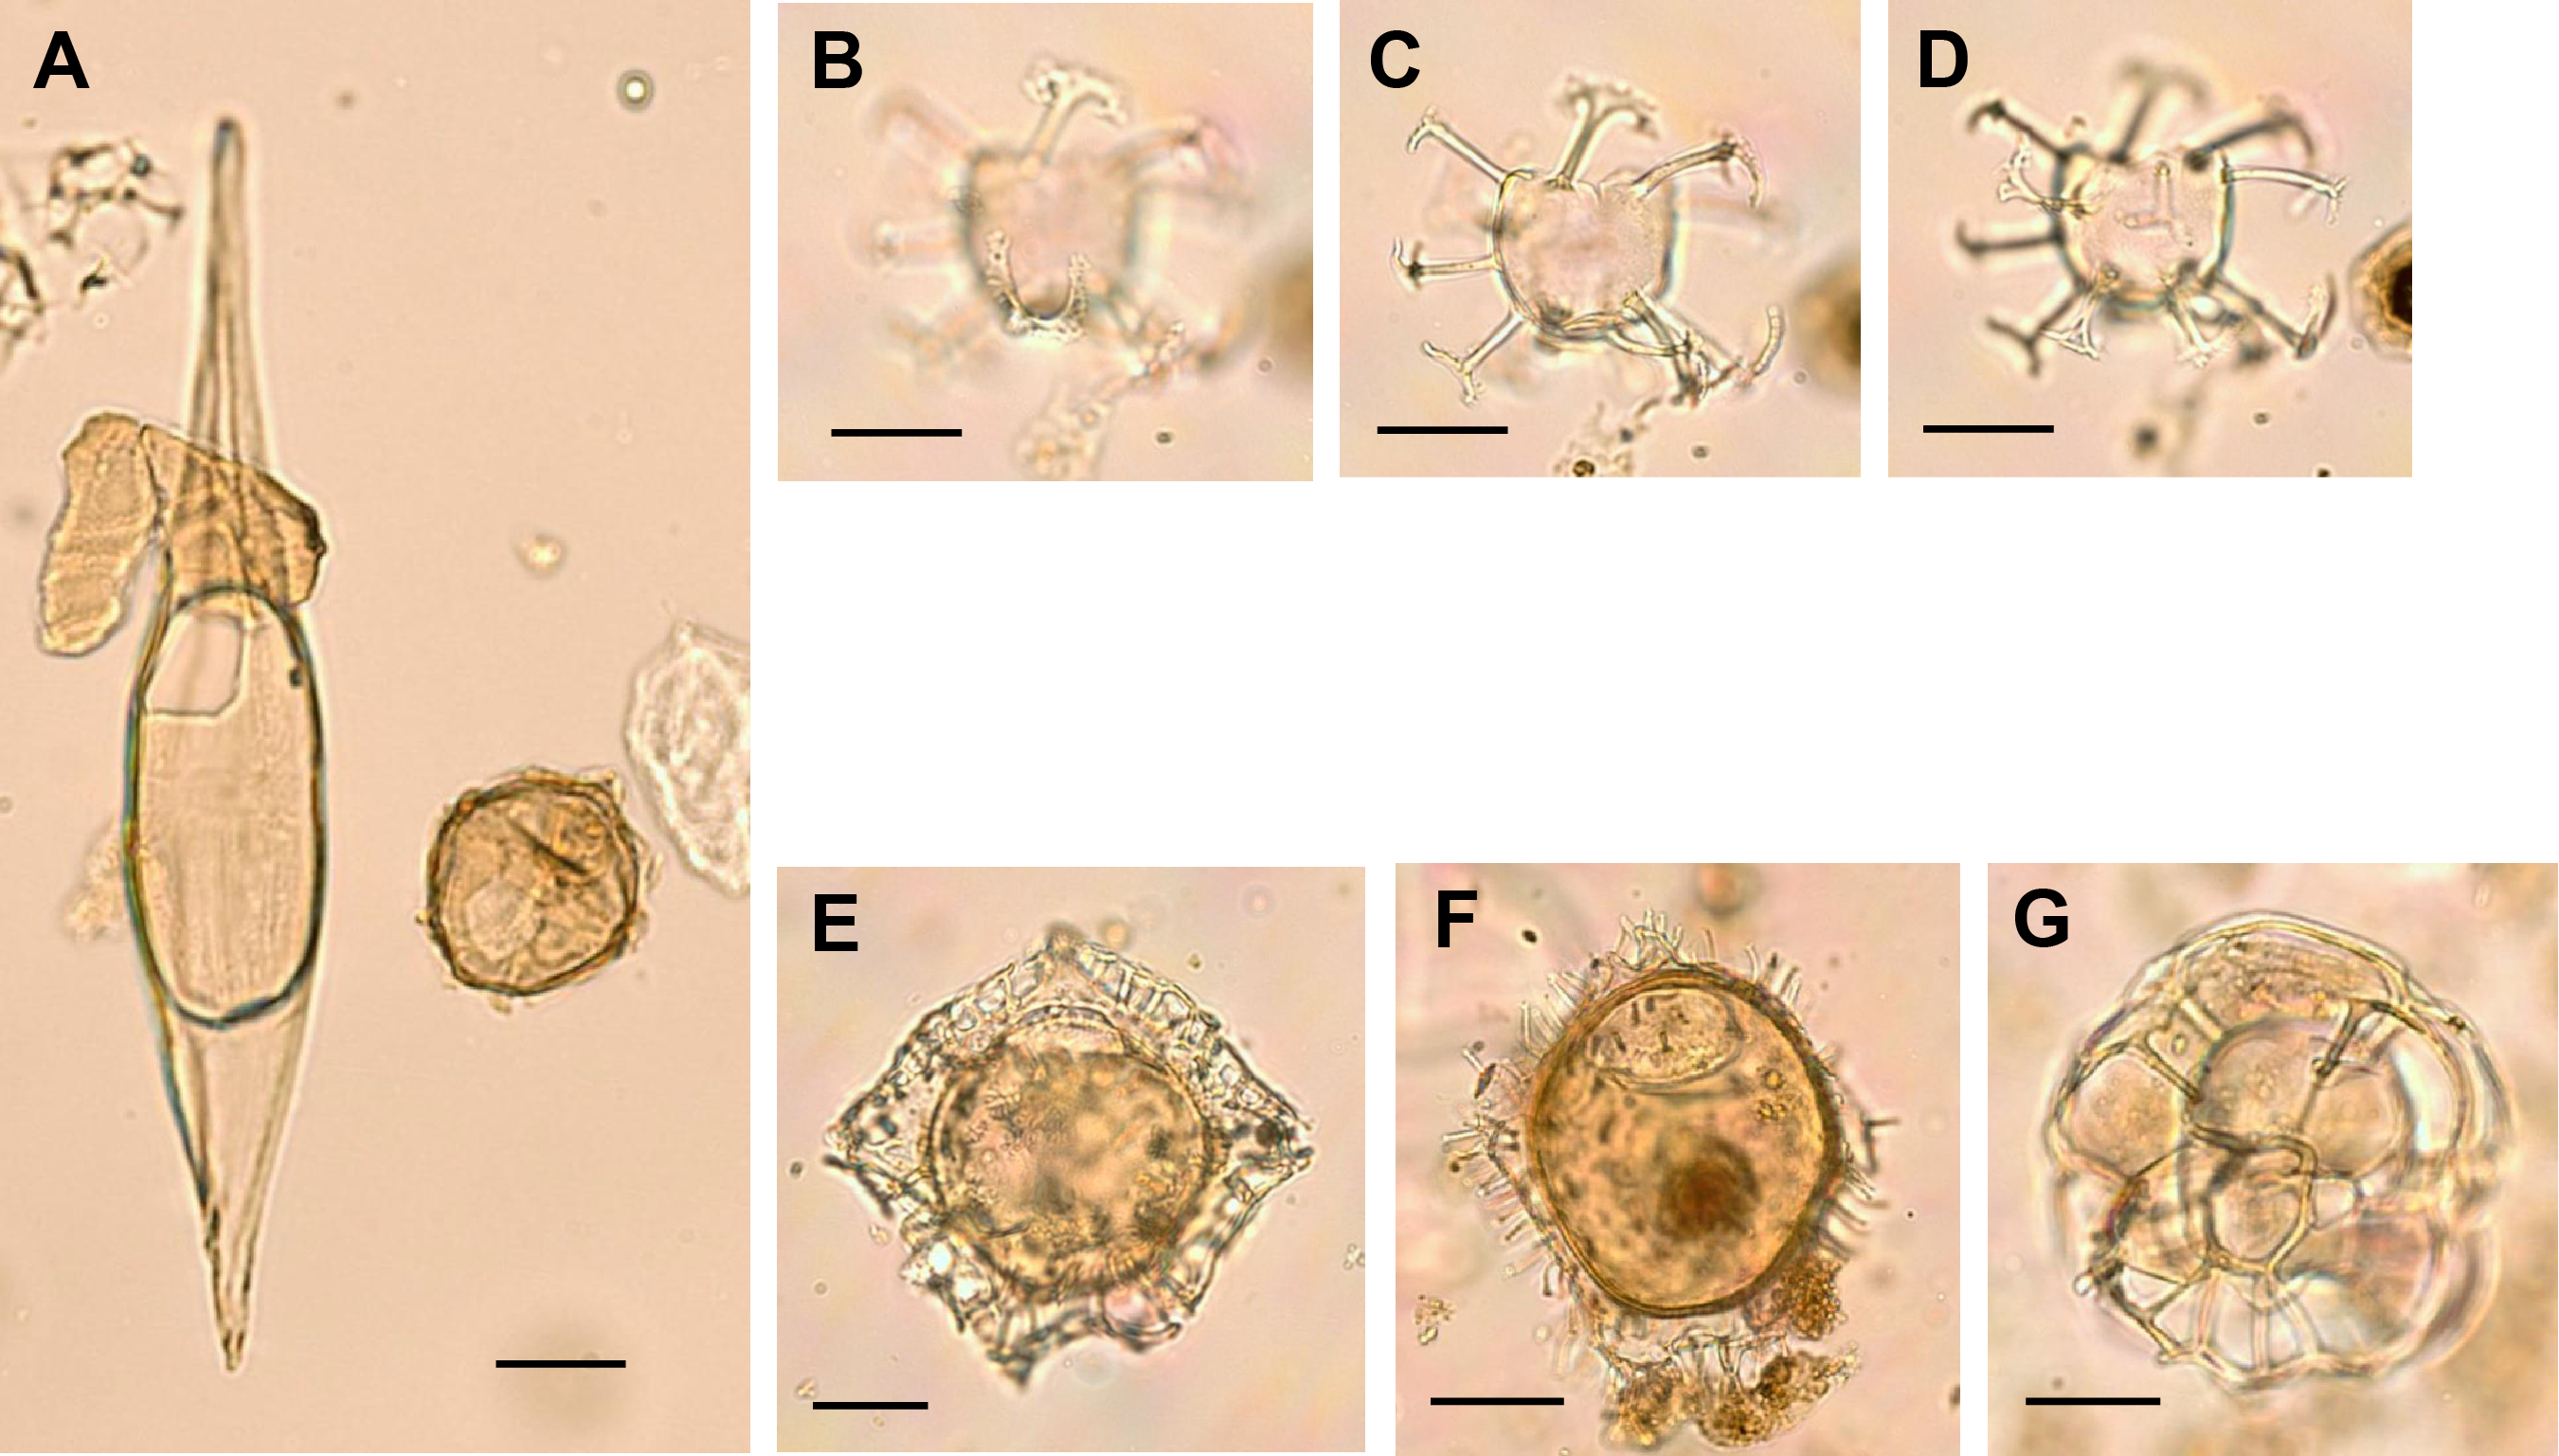
Figure F26. Early to Middle Eocene dinocysts, 396-U1572B-18F-CC through 28F-CC.
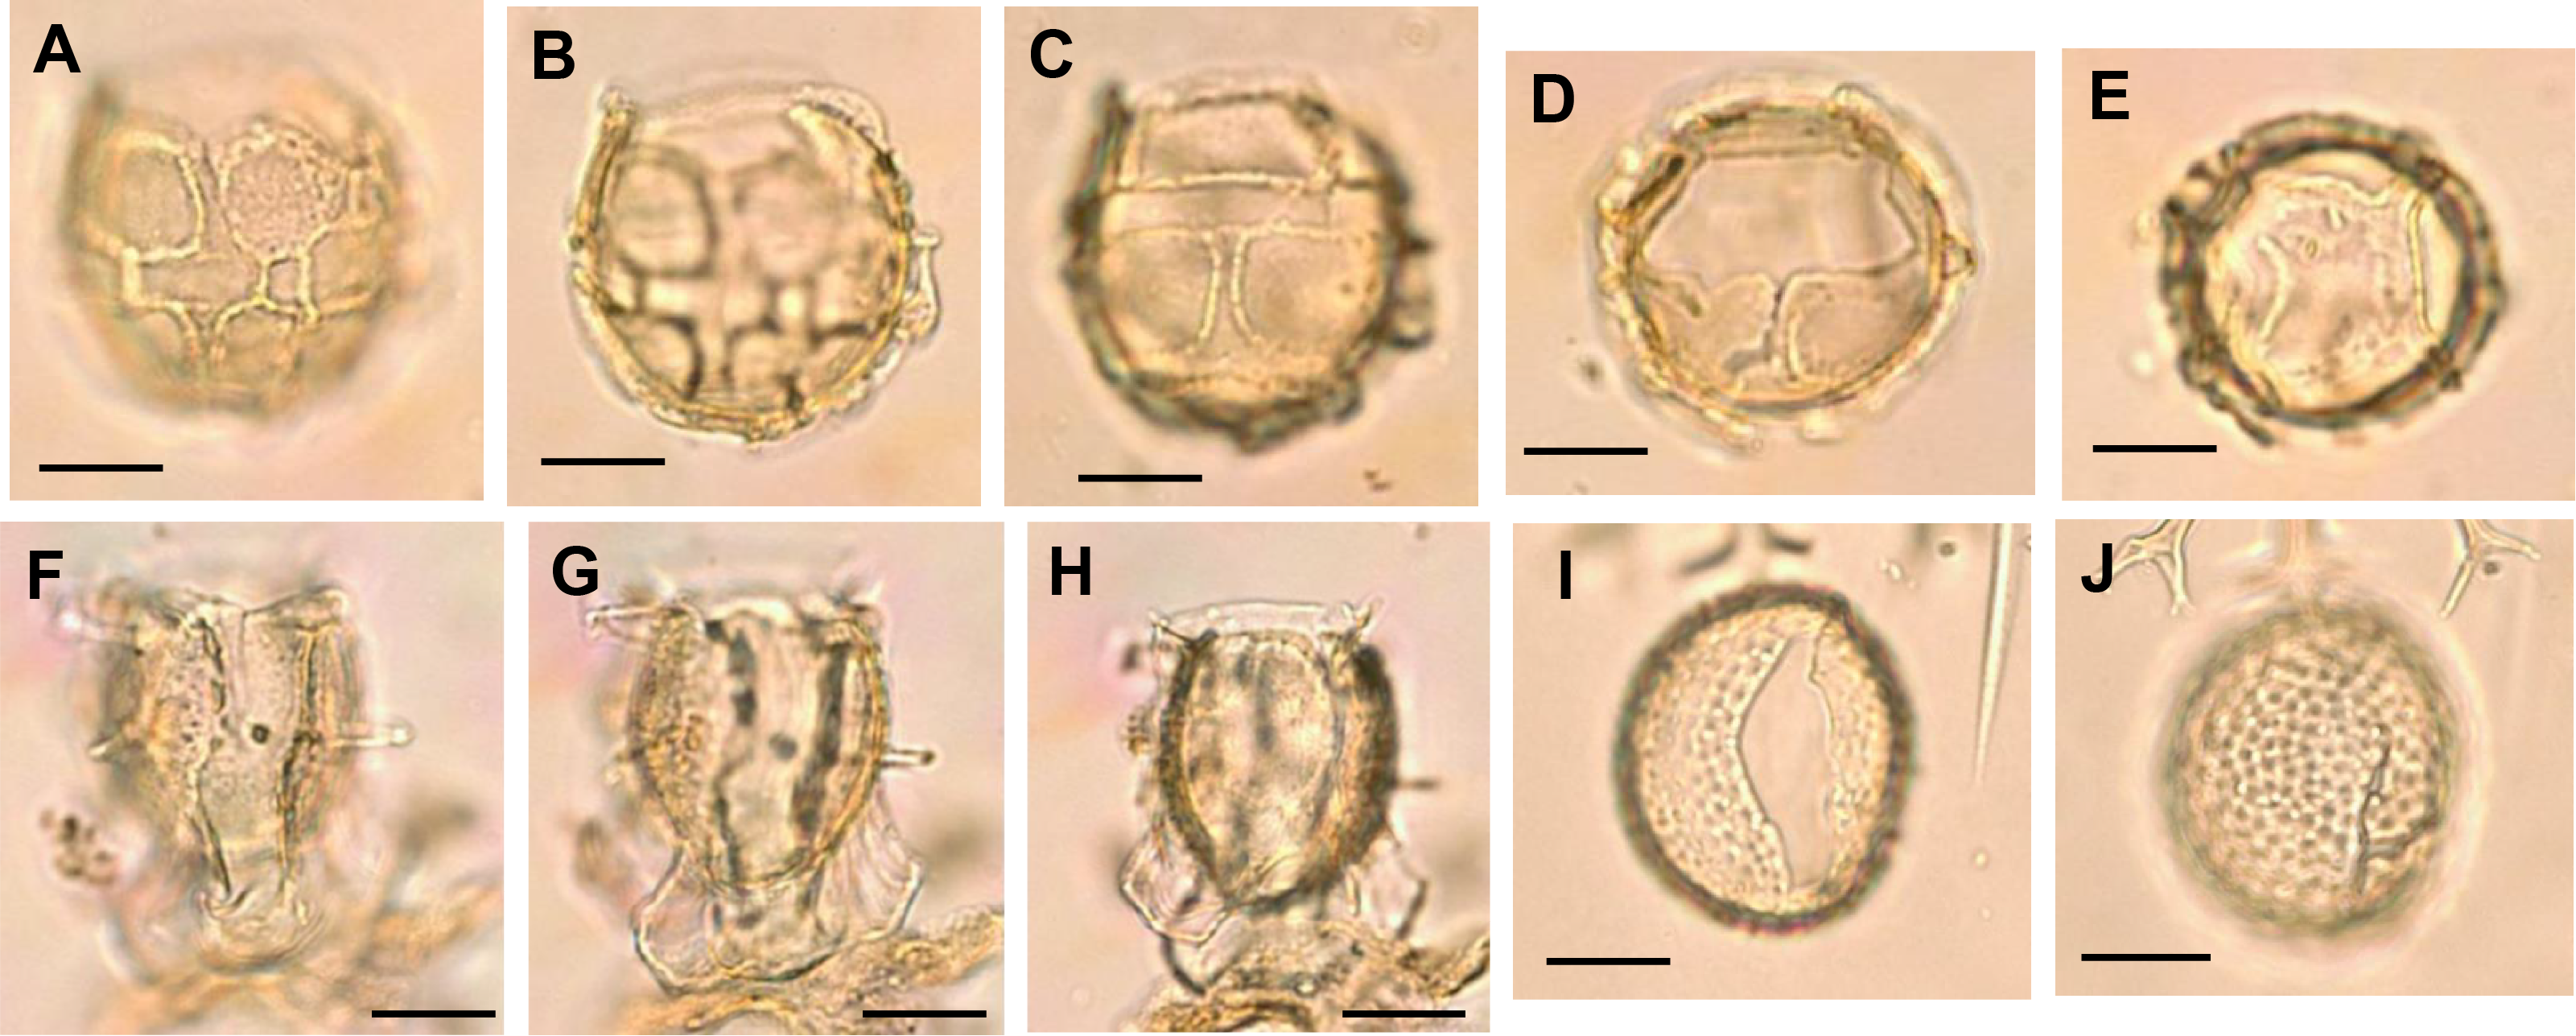
Figure F27. Early to Middle Eocene dinocysts, 396-U1572B-16H-CC through 25F-CC.
4.2.2.1. Miocene in Holes U1572A and U1572B
Samples 396-U1572A-11R-CC to 13R-CC yielded abundant, well-preserved, typical Miocene dinocysts. Samples 11R-CC and 12R-CC can be confidently assigned to the Middle Miocene. The late Middle Miocene (Langhian) age for this part of the sedimentary succession is inferred from the co-occurrence of several age-diagnostic taxa, such as Unipontedinium aquaeductus, L. truncatum, Melitasphaeridium choanophorum, I. lacrymosa, and H. obscura (e.g., Munsterman and Brinkhuis, 2004; Egger et al., 2016; Dybkjær et al., 2021). Sample 13R-CC yielded an impoverished assemblage resembling that of Sample 12R-CC, but it includes Batiacasphaera baculata (Manum et al., 1989) and is tentatively assigned to the late Early to early Middle Miocene.
Sample 396-U1572B-14H-CC is the only sample analyzed from the Neogene portion of the succession recovered from Hole U1572B. An impoverished assemblage reminiscent of that in Sample 396-U1572A-13R-CC was recorded, to which we tentatively assign a late Early to early Middle Miocene age.
4.2.2.2. Eocene Holes U1572A and U1572B
Samples 396-U1572A-17R-CC, 20R-CC, and 21R-CC and 396-U1572B-15H-CC to 29F-CC generally yielded abundant, diverse, and well-preserved Early, Middle, and even Late Eocene dinocysts. A single sample taken at the base of the sedimentary succession (30X-CC) (Table T10) turned out to be barren of organic microfossils.
Ages ranging from late Early Eocene to middle Middle Eocene (upper Chron C22n to lower Chron 21n; approximately >49–46.5 Ma) are inferred from the diverse and well-preserved dinocyst assemblages found in Samples 396-U1572A-17R-CC, 20R-CC, and 21R-CC. This is based primarily on the presence of D. ficusoides, which occurs in all three samples, and Dracodinium pachydermum (Samples 17R-CC and 20R-CC). Sample 21R-CC contains Charlesdowniea columna, and, like Sample 396-U1571B-14X-1, 140–150 cm, abundant Azolla massulae and glochidia. In addition, this sample is dominated by representatives of Senegalium and Phthanoperidinium spp. (mostly Senegalium dilwynense and Phthanoperidinium crenulatum), which are generally considered to be fresh to brackish water tolerant (e.g., Barke et al., 2011). The lowermost productive sample is therefore assigned an age of latest Early Eocene (upper part of Chron C22n), potentially equivalent to the lower half of the widespread Azolla phase (Eldrett et al., 2004; Brinkhuis et al., 2006). Characteristic taxa are depicted in Figures F23, F24, F25, F26, and F27.
Samples 396-U1572B-18F-CC to 15F-CC yielded assemblages not yet encountered during Expedition 396, with a few species indicative of a late Middle Eocene to even Early Oligocene age, most notably, an abundance of Enneadocysta arcuata-Enneadocysta pectiniformis, common Svalbardella cooksoniae, and Phthanoperidinium comatum. These are accompanied by Melitasphaeridium asterium, Schematophora speciosa, Batiacasphaera compta, and Thalassiphora fenestrata, which have calibrated first occurrences no older than the early Late Eocene (Subchron 16n.1n or perhaps Subchron C16n.2n) (Van Mourik et al., 2001; Thomsen et al., 2012). However, the combination of taxa is similar to previously documented assemblages from Egger et al. (2016) and Śliwińska (2019), which points to an age close to the Eocene–Oligocene transition. This inference is supported by the occurrence of Oligocene siliceous microfossil marker taxa in sections directly above the core catcher of Core 15F.
The good recovery of the Eocene sedimentary succession and the rich and well-preserved palynological associations in samples from Hole U1572B allow for the construction of a rather detailed age-depth model for the Middle and Upper Eocene (Figure F28). With assistance from the shipboard lithostratigraphy and physical properties teams, we identified a hiatus or an “interval of nondeposition” between Cores 18F and 19F. The sediments above the break in lithology appear to span much of the Late Eocene (Priabonian) to across the Eocene/Oligocene boundary, overlying sediments of middle Middle Eocene to late Early Eocene age. The good recovery in Hole U1572B also reveals potential for the presence of a slightly younger Middle Eocene (approximately >43 Ma) that was not recorded in Holes U1571A, U1571B, or U1572A. As in Holes U1571B and U1572A, the sedimentary succession terminates in the well-documented Azolla phase that has been dated to ~48–49 Ma, beginning at a level correlative to the middle of Chron C22n (Figure F28).
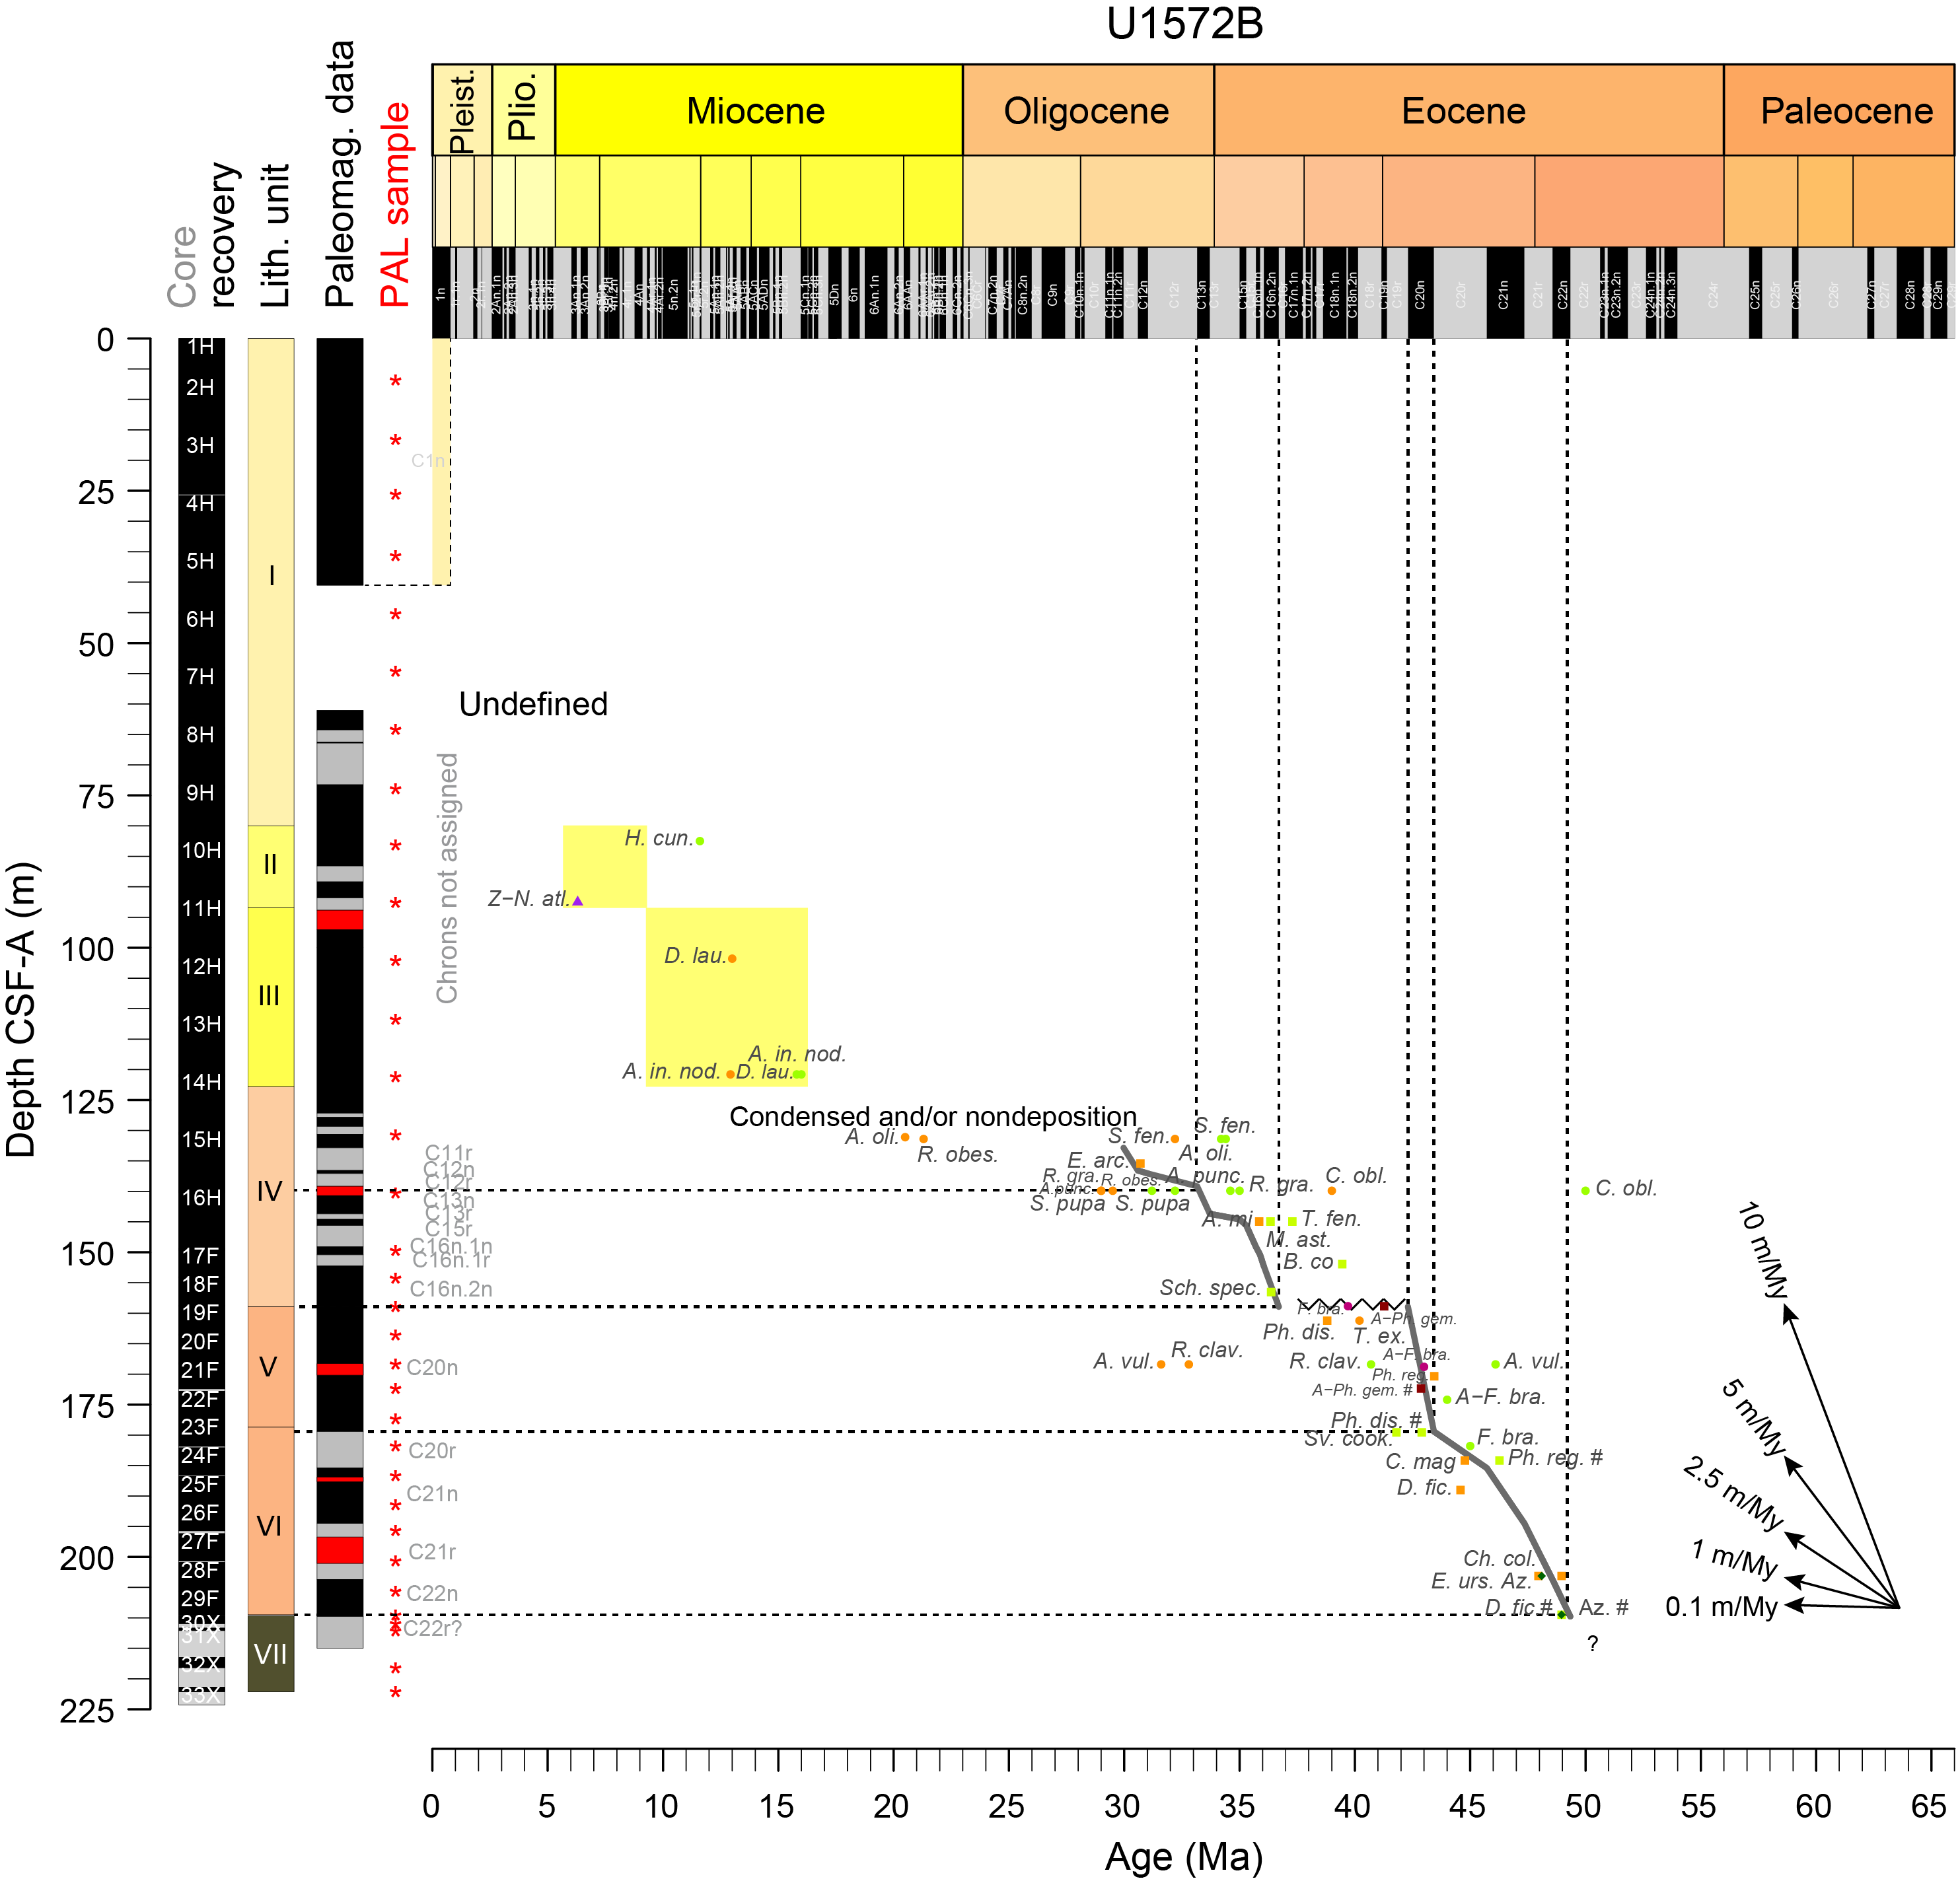
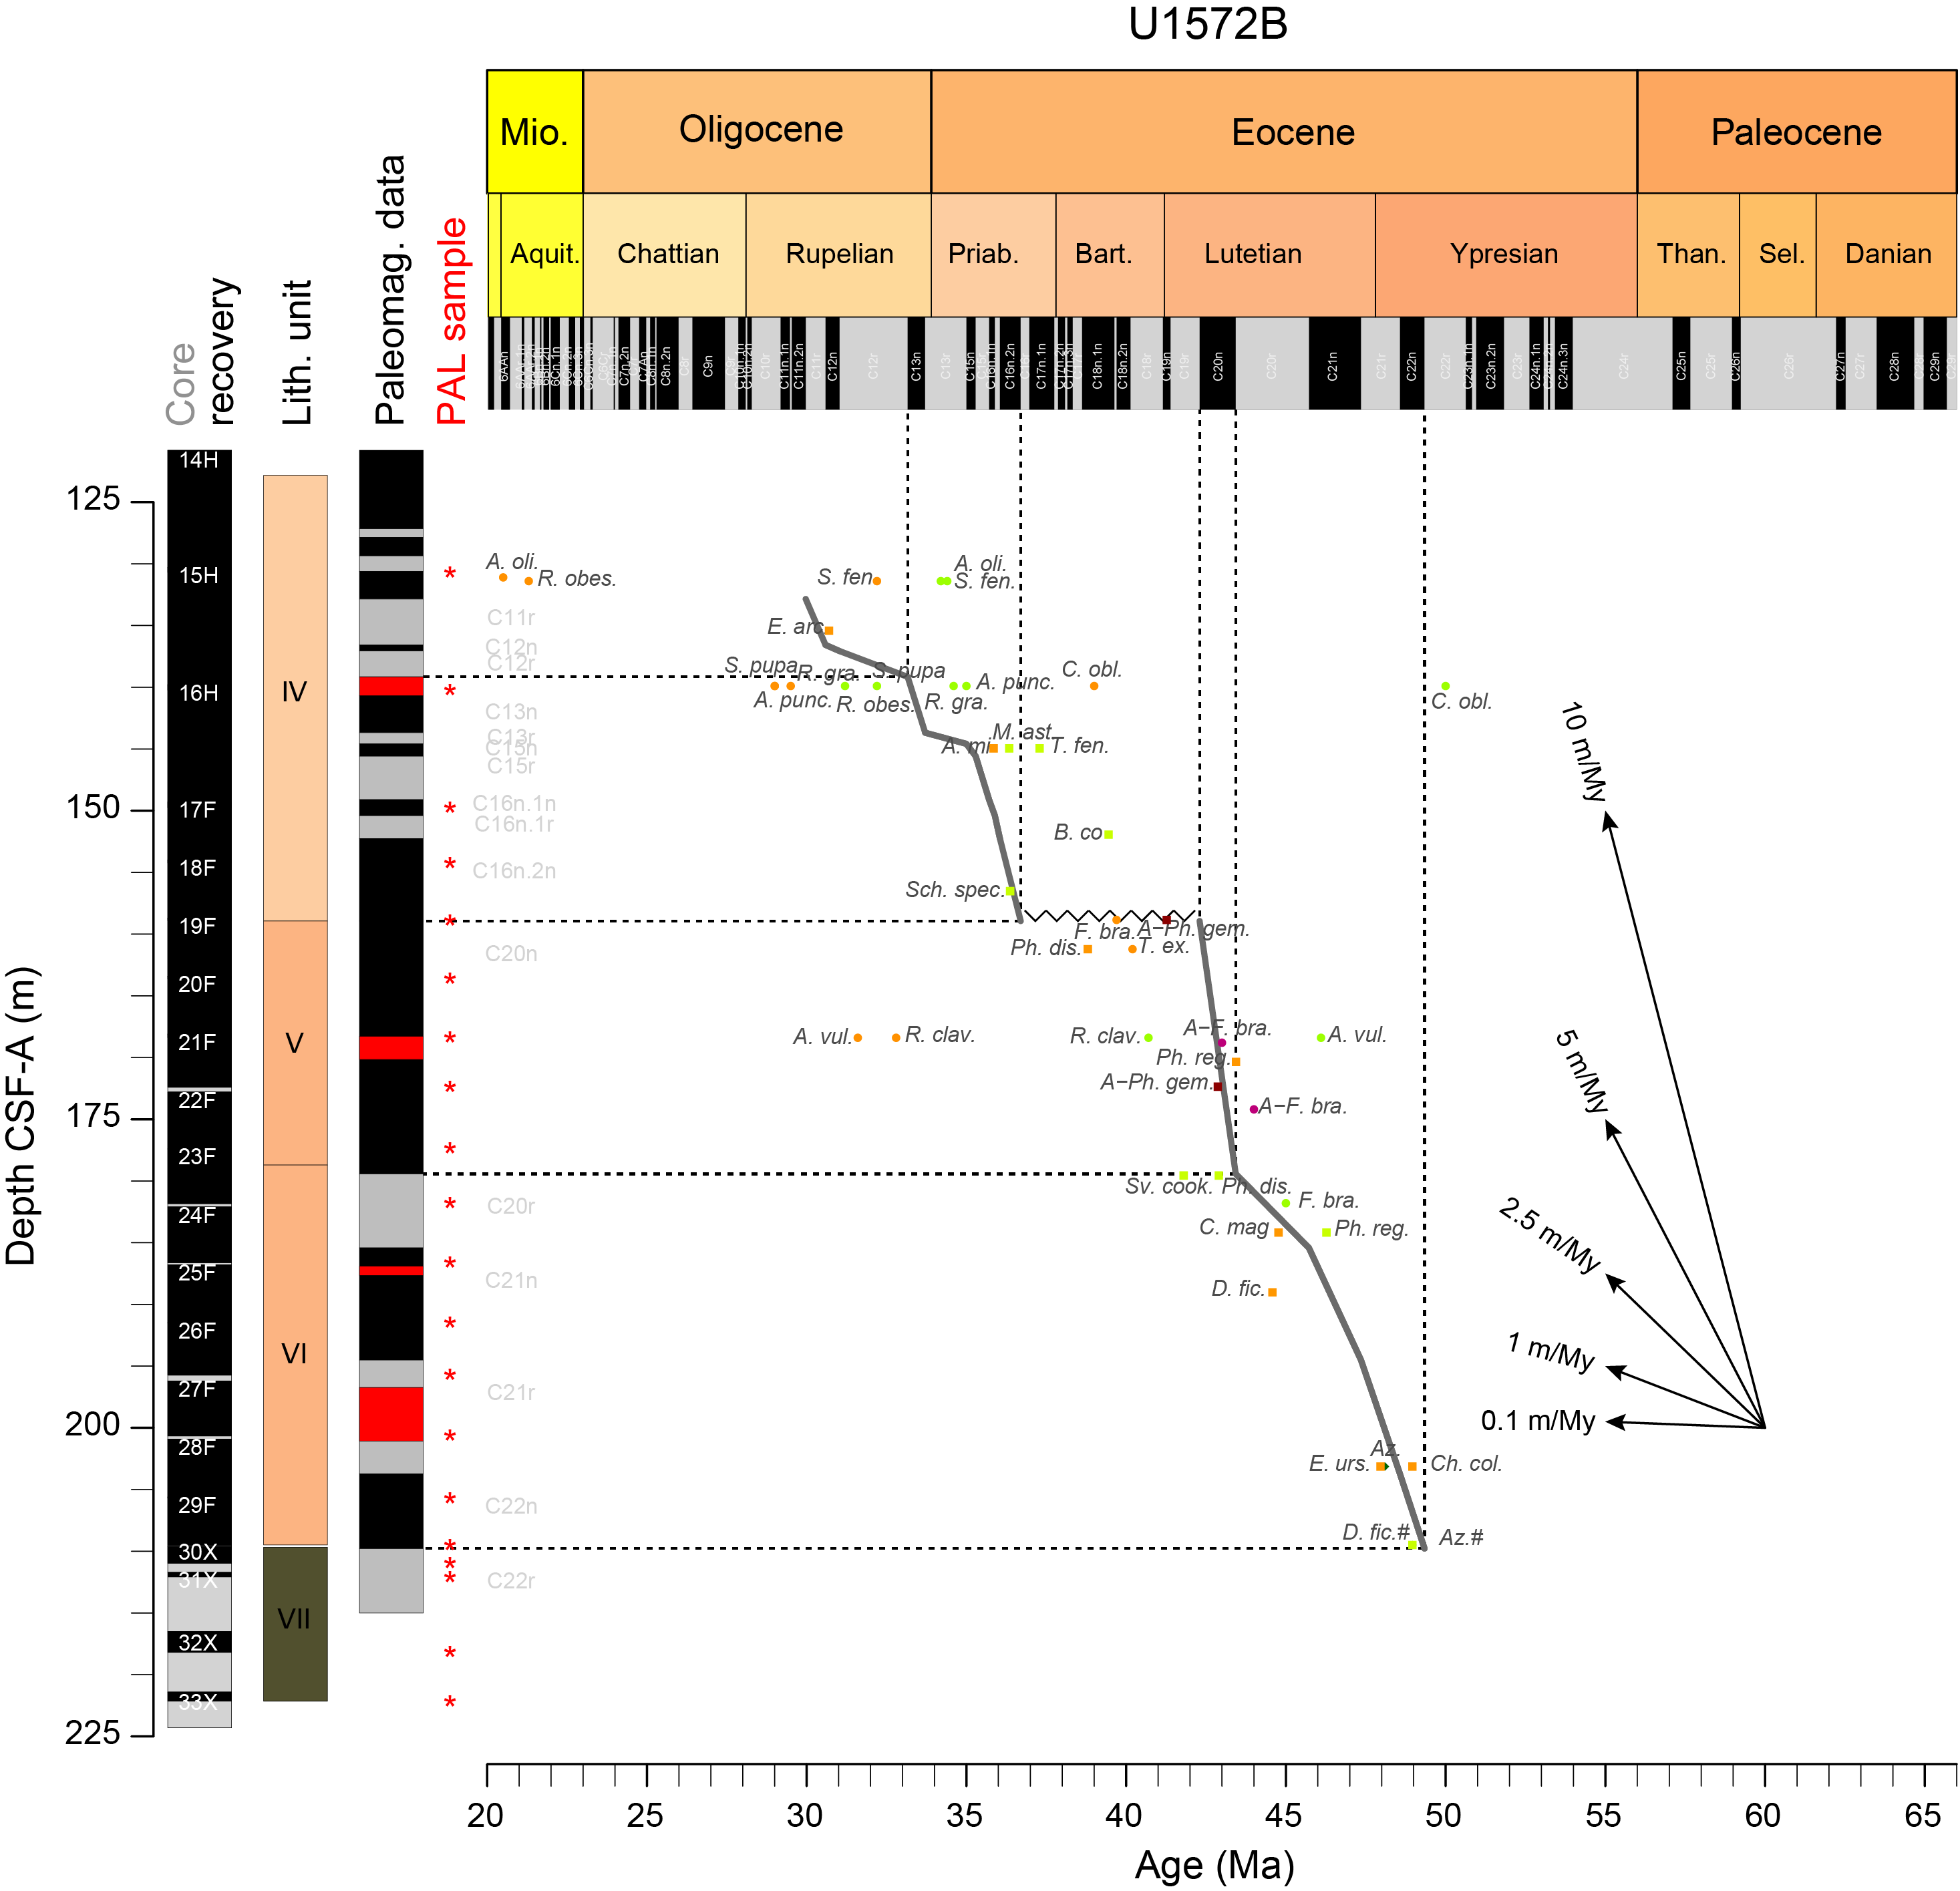
Figure F28. Age-depth estimates.
If the full array of shipboard-measured paleomagnetic reversals (see Paleomagnetism) is used, the Middle Eocene section of Hole U1572B may be interpreted to span Chron 22n through Subchron C18n.1n. However, applying this reversal scheme to our biostratigraphic information and the consistent succession of events reveals multiple apparent mismatches with published biostratigraphic data (cf. Eldrett et al., 2004).
In Eldrett et al. (2004), most of the bioevents we apply are calibrated to the geomagnetic polarity timescale (GPTS) using sediments from DSDP Hole 338 and ODP Holes 643A and 913B in the Norwegian Greenland Sea, which all have similar lithologies and magnetic properties, but with much poorer recovery throughout. It is therefore conceivable that minor and perhaps major adjustments are required following postcruise research. We anticipate that the excellent recovery and well-diversified organic and siliceous microfossil-rich sediments recovered in Hole U1572B will allow future improvements of existing calibrations.
4.3. Planktonic foraminifers
4.3.1. Site U1571
Hole U1571A and U1571B core catcher samples, the mudline, and areas of interest from working-half sections were processed for planktonic foraminifers. Processing samples from Holes U1571A and U1571B followed the methods outlined in Biostratigraphy in the Expedition 396 methods chapter (Planke et al., 2023a). Rose bengal stain was applied to the mudline sample. Hole U1571A samples were fully processed and analyzed for foraminifers; however, from Hole U1571B, only Samples 9R-CC to 19R-CC were processed and analyzed. Core catcher samples that were identified as igneous were not sampled. Foraminifer abundances range from trace to abundant, and preservation ranges from poor to moderate. Tables T6 and T7 show the distribution of abundances from Holes U1571A and U1571B.
Three of the eight core catcher samples have reworked material (Globigerina officinalis and Parasubbotina sp.). Samples 396-U1571A-6R-CC and 12R-CC to 36R-CC are barren of foraminifers. Benthic foraminifers and agglutinated foraminifers are noted in Samples 9R-CC to 11R-CC. The mudline from Holes U1571A and U1571B has an abundance of planktonic (Globigerina sp. and Neogloboquadrina sp. dominating) and benthic foraminifers, diatoms, radiolarians, sponge spicules, and ostracods.
Sample 396-U1571A-1R-CC has common abundance with poor to moderate preservation and slight reworking. Neogloboquadrina pachyderma (sin.) is the most abundant taxon in the core catcher sample. Other less abundant taxa include Globigerina bulloides, G. officinalis, Neogloboquadrina cf. dutertrei, N. cf. pachyderma, and Neogloboquadrina sp. Sample 2R-CC is quartz rich with trace abundance and moderate preservation, and it has the most reworked material. N. pachyderma (sin.) dominates, and other taxa include G. officinalis, N. cf. dutertrei, N. cf. pachyderma, N. pachyderma (dex.), Neogloboquadrina sp., and Parasubbotina sp.
Sample 396-U1571A-3R-CC is quartz rich with common abundance and moderate preservation. Reworked material was not recorded when analyzed for foraminifers. Again, the most dominant taxon in the sample is N. pachyderma (sin.). Less abundant taxa include Neogloboquadrina acostaensis, N. cf. dutertrei, N. cf. pachyderma, N. pachyderma (dex.), and Neogloboquadrina sp. Sample 4R-CC is also quartz rich with trace abundance, poor to moderate preservation, and slight reworking. N. pachyderma (sin.) is the most abundant taxon in this sample. Other taxa include G. officinalis, N. cf. pachyderma, N. pachyderma (dex.), Neogloboquadrina sp., and Parasubbotina sp. Sample 5R-CC is abundant with poor preservation (considerable encrusting of N. pachyderma [sin.] tests). The most dominant taxon in this sample is N. pachyderma (sin.). Less abundant taxa include Neogloboquadrina atlantica, N. cf. dutertrei, N. cf. pachyderma, N. pachyderma (dex.), and Neogloboquadrina sp. Sample 7R-CC has rare abundance with poor preservation. Only two foraminifers were identified, N. pachyderma (sin.) and N. pachyderma (dex.). Sample 8R-CC has trace abundance with poor to moderate preservation. Sample 8R-CC could have the first occurrence of N. pachyderma (sin.) and is tentatively assigned to the Late Miocene.
Hole U1571A exhibits planktonic foraminifers that are indicative of Quaternary age. Following the zonal scheme of Spiegler and Jansen (1989), Samples 1R-CC through 5R-CC are placed in the N. pachyderma (sin.) Zone.
4.3.2. Holes U1572A and U1572B
Hole U1572A and U1572B core catcher samples, the mudline, and selected core intervals of interest were processed for planktonic foraminifers. Processing for both holes followed the methods outlined in Biostratigraphy in the Expedition 396 methods chapter (Planke et al., 2023a). Rose bengal stain was used for the mudline samples. For Hole U1572A, only Samples 9R-CC to 14R-CC were processed. Hole U1572B was fully processed, but not all samples were analyzed because of time constraints. Preservation ranges from poor to moderate for Holes U1572A and U1572B. Abundance ranges from rare to abundant in both holes. Samples 396-U1571B-9R-CC to 14R-CC are barren of planktonic foraminifers. Agglutinated benthic foraminifers are noted in Samples 396-U1572A-11R and 12R-CC and 396-U1572B-12R. Samples 396-U1572A-11R-CC to 14R-CC, 396-U1572B-4R-CC to 9R-CC, and 11R-CC to 34X-CC are barren of foraminifers. Tables T8 and T9 show the distribution of abundances from Holes U1572A and U1572B.
Sample 396-U1572A-9R-CC has common abundance with poor to moderate preservation and reworked material. Apertures from some specimens are calcified over, making identification difficult. Turborotalia quinqueloba is the dominant taxon in this sample. Other taxa include Ciperoella sp., Dentoglobigerina sp., G. bulloides, G. cf. bulloides, G. officinalis, Globigerina falconensis, Globigerina sp., Globigerinella obesa, Globigerinella pseudobesa, Globigerinita glutinata, Globigerinita sp., N. atlantica, Paragloborotalia continuosa, Paragloborotalia sp., and Turborotalia sp.
Sample 396-U1572B-1R-CC is quartz rich with poor to moderate preservation and rare abundance and includes some reworked Miocene material. The dominant taxon in this sample is N. pachyderma (sin.). Less abundant taxa include Ciperoella anguliofficinalis, N. cf. pachyderma, Neogloboquadrina incompta, N. pachyderma (dex.), Neogloboquadrina sp., and P. continuosa. Sample 2R-CC is also quartz rich with poor to moderate preservation and rare abundance. No reworking is noted in Sample 2R-CC. The dominant taxon is N. pachyderma (sin.). N. atlantica, N. cf. pachyderma, N. pachyderma (dex.), Neogloboquadrina sp., and Orbulina sp. are identified in lower quantities.
Sample 396-U1572B-3R-CC is the only core catcher sample with abundant foraminifers. All other samples have foraminifers in rare abundance. Sample 3R-CC has poor to moderate preservation with slight reworked material. N. pachyderma (sin.) is the dominant taxon in this sample. Less abundant taxa include Globigerina sp. G. glutinata, N. atlantica, N. cf. dutertrei, N. cf. pachyderma, N. dutertrei, N. pachyderma (dex.), Neogloboquadrina sp., Paragloborotalia sp., and T. quinqueloba.
Sample 396-U1572B-4R-CC is quartz rich with an abundance of rock fragments. Preservation ranges from poor to moderate with foraminifers in rare abundance. N. pachyderma (sin.) is the most abundant taxon in the sample. Other taxa in Sample 4R-CC include N. cf. pachyderma and N. pachyderma (dex.). Similar to Sample 4R-CC, Sample 5R-CC is quartz rich with abundant rock fragments. Preservation state is noted as poor to moderate with foraminifers in rare abundance. N. pachyderma (sin.) dominates the sample, and Neogloboquadrina sp. is the only other taxon identified. Just like the previous two core catcher samples, Sample 10R-CC is rich in quartz and rock fragments. Preservation is poor to moderate, and abundance is rare. Only one taxon, N. atlantica, was identified in Sample 10R-CC.
Following the zonal scheme of Spiegler and Jansen (1989), Samples 396-U1571A-1R-CC to 5R-CC are placed in the N. pachyderma (sin.) Zone. Although no zonation can be given for Sample 10R-CC because of a lack of marker taxa, a tentative age of middle Late Miocene can be given. Sample 396-U1572B-1R-CC to 5R-CC exhibits planktonic foraminifers that are indicative of Quaternary age. Sample 10R-CC could be tentatively placed in the lower N. atlantica Zone following the Spiegler and Jansen (1989) zonal scheme. More work is needed to obtain a higher resolution of the zones and investigate what is causing the shift to rare abundance in Samples 1R-CC and 2R-CC compared to that found at previous sites.
4.4. Calcareous nannofossils
Rare, poorly preserved calcareous nannofossils were noted in Sample 396-U1571B-10X-3, 26 cm, but nannofossils are abundant and well preserved, including sediments classified as nannofossil ooze, in the lower Upper Miocene sediments of Holes U1572A and U1572B. The nannofossil assemblage is dominated by C. pelagicus, but numerous other taxa are present. The remainder of samples from these holes are devoid of calcareous nannofossils.
4.5. Ichthyoliths
Fish teeth are noted in Sample 396-U1571B-13X-CC (Figure F29). Samples 396-U1572B-28F-CC and 29F-CC also contain fish teeth, bones, and scales.
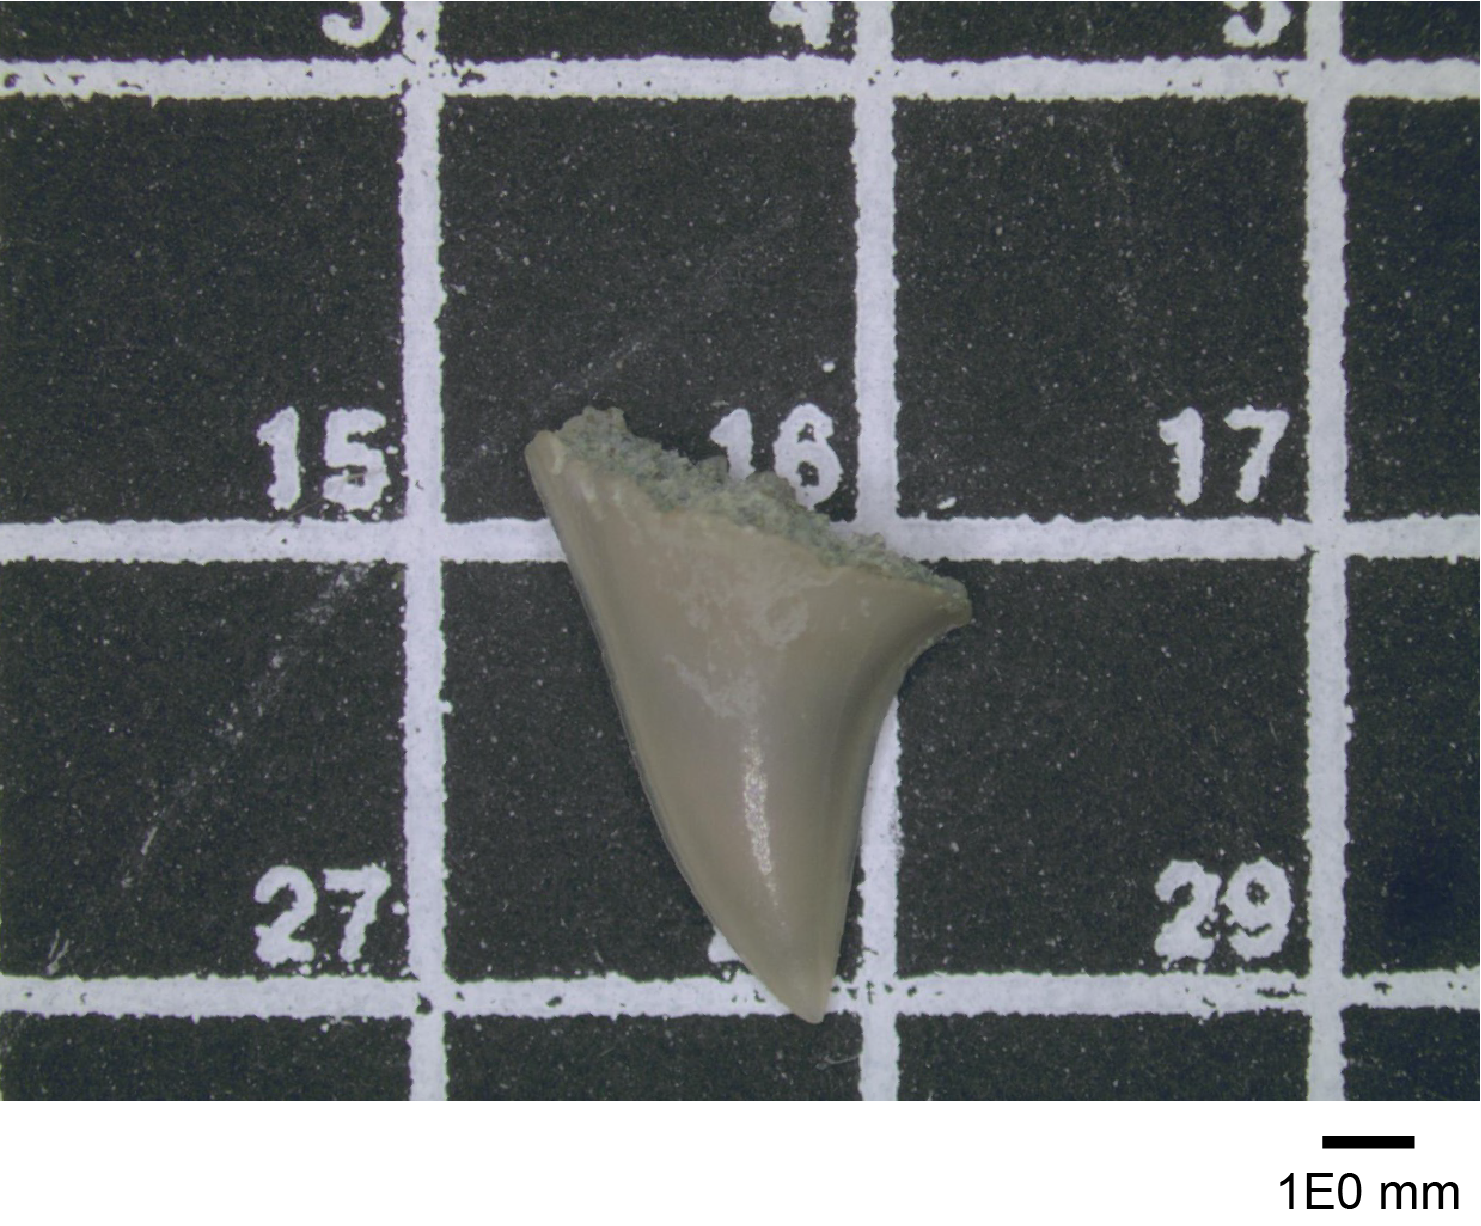
Figure F29. Fish tooth.
4.6. Ostracods
Samples that yielded planktonic and/or benthic foraminifers were also examined for the presence of ostracods, but only single valves of ostracods Krithe and Cytheropteron were found in the mudline sample and the uppermost two core catcher samples from both Holes U1571A and U1572B.
4.7. Summary
The Quaternary sediments recovered from Sites U1571 and U1572 (max = ~80 m) are, like all other holes drilled during Expedition 396, characterized by glacially influenced hemipelagic muds, which typically unconformably overlie Miocene strata. Siliceous and organic-walled microfossils were found in various abundances below the Quaternary deposits. The successions at Sites U1571 and U1572 are very similar; lower to upper Middle Miocene strata overlie upper Lower to Upper Eocene strata, with likely some Lower Oligocene sediments, especially in Hole U1572B.
In Holes U1571B, U1572A, and U1572B, sediments recovered from directly above the igneous facies yielded Azolla spp. and associated dinocyst marker species. The well-documented Nordic Sea Azolla phase has been dated to between ~49 and 48 Ma (mid-Chron C22n to mid-Chron C21r) at the end of the Early Eocene (Ypresian) (e.g., Brinkhuis et al., 2006; Barke et al., 2011). This constrains the earliest sediment accumulation to the very end of or directly postdating the Early Eocene Climatic Optimum (EECO) as defined by Westerhold et al. (2018). The Middle and Late Eocene appear to be marked by a progressive deepening or increasing distance to shore. Because of a general absence of microfossils, no biostratigraphic age constraints are available from in between the igneous facies.
The microfossil-rich sedimentary succession in Hole U1572B was utilized to construct an integrated age-depth model, and the correlation to the shipboard paleomagnetic reversal interpretation and lithologic units is shown in Figures F28 and F30 (Table T12).
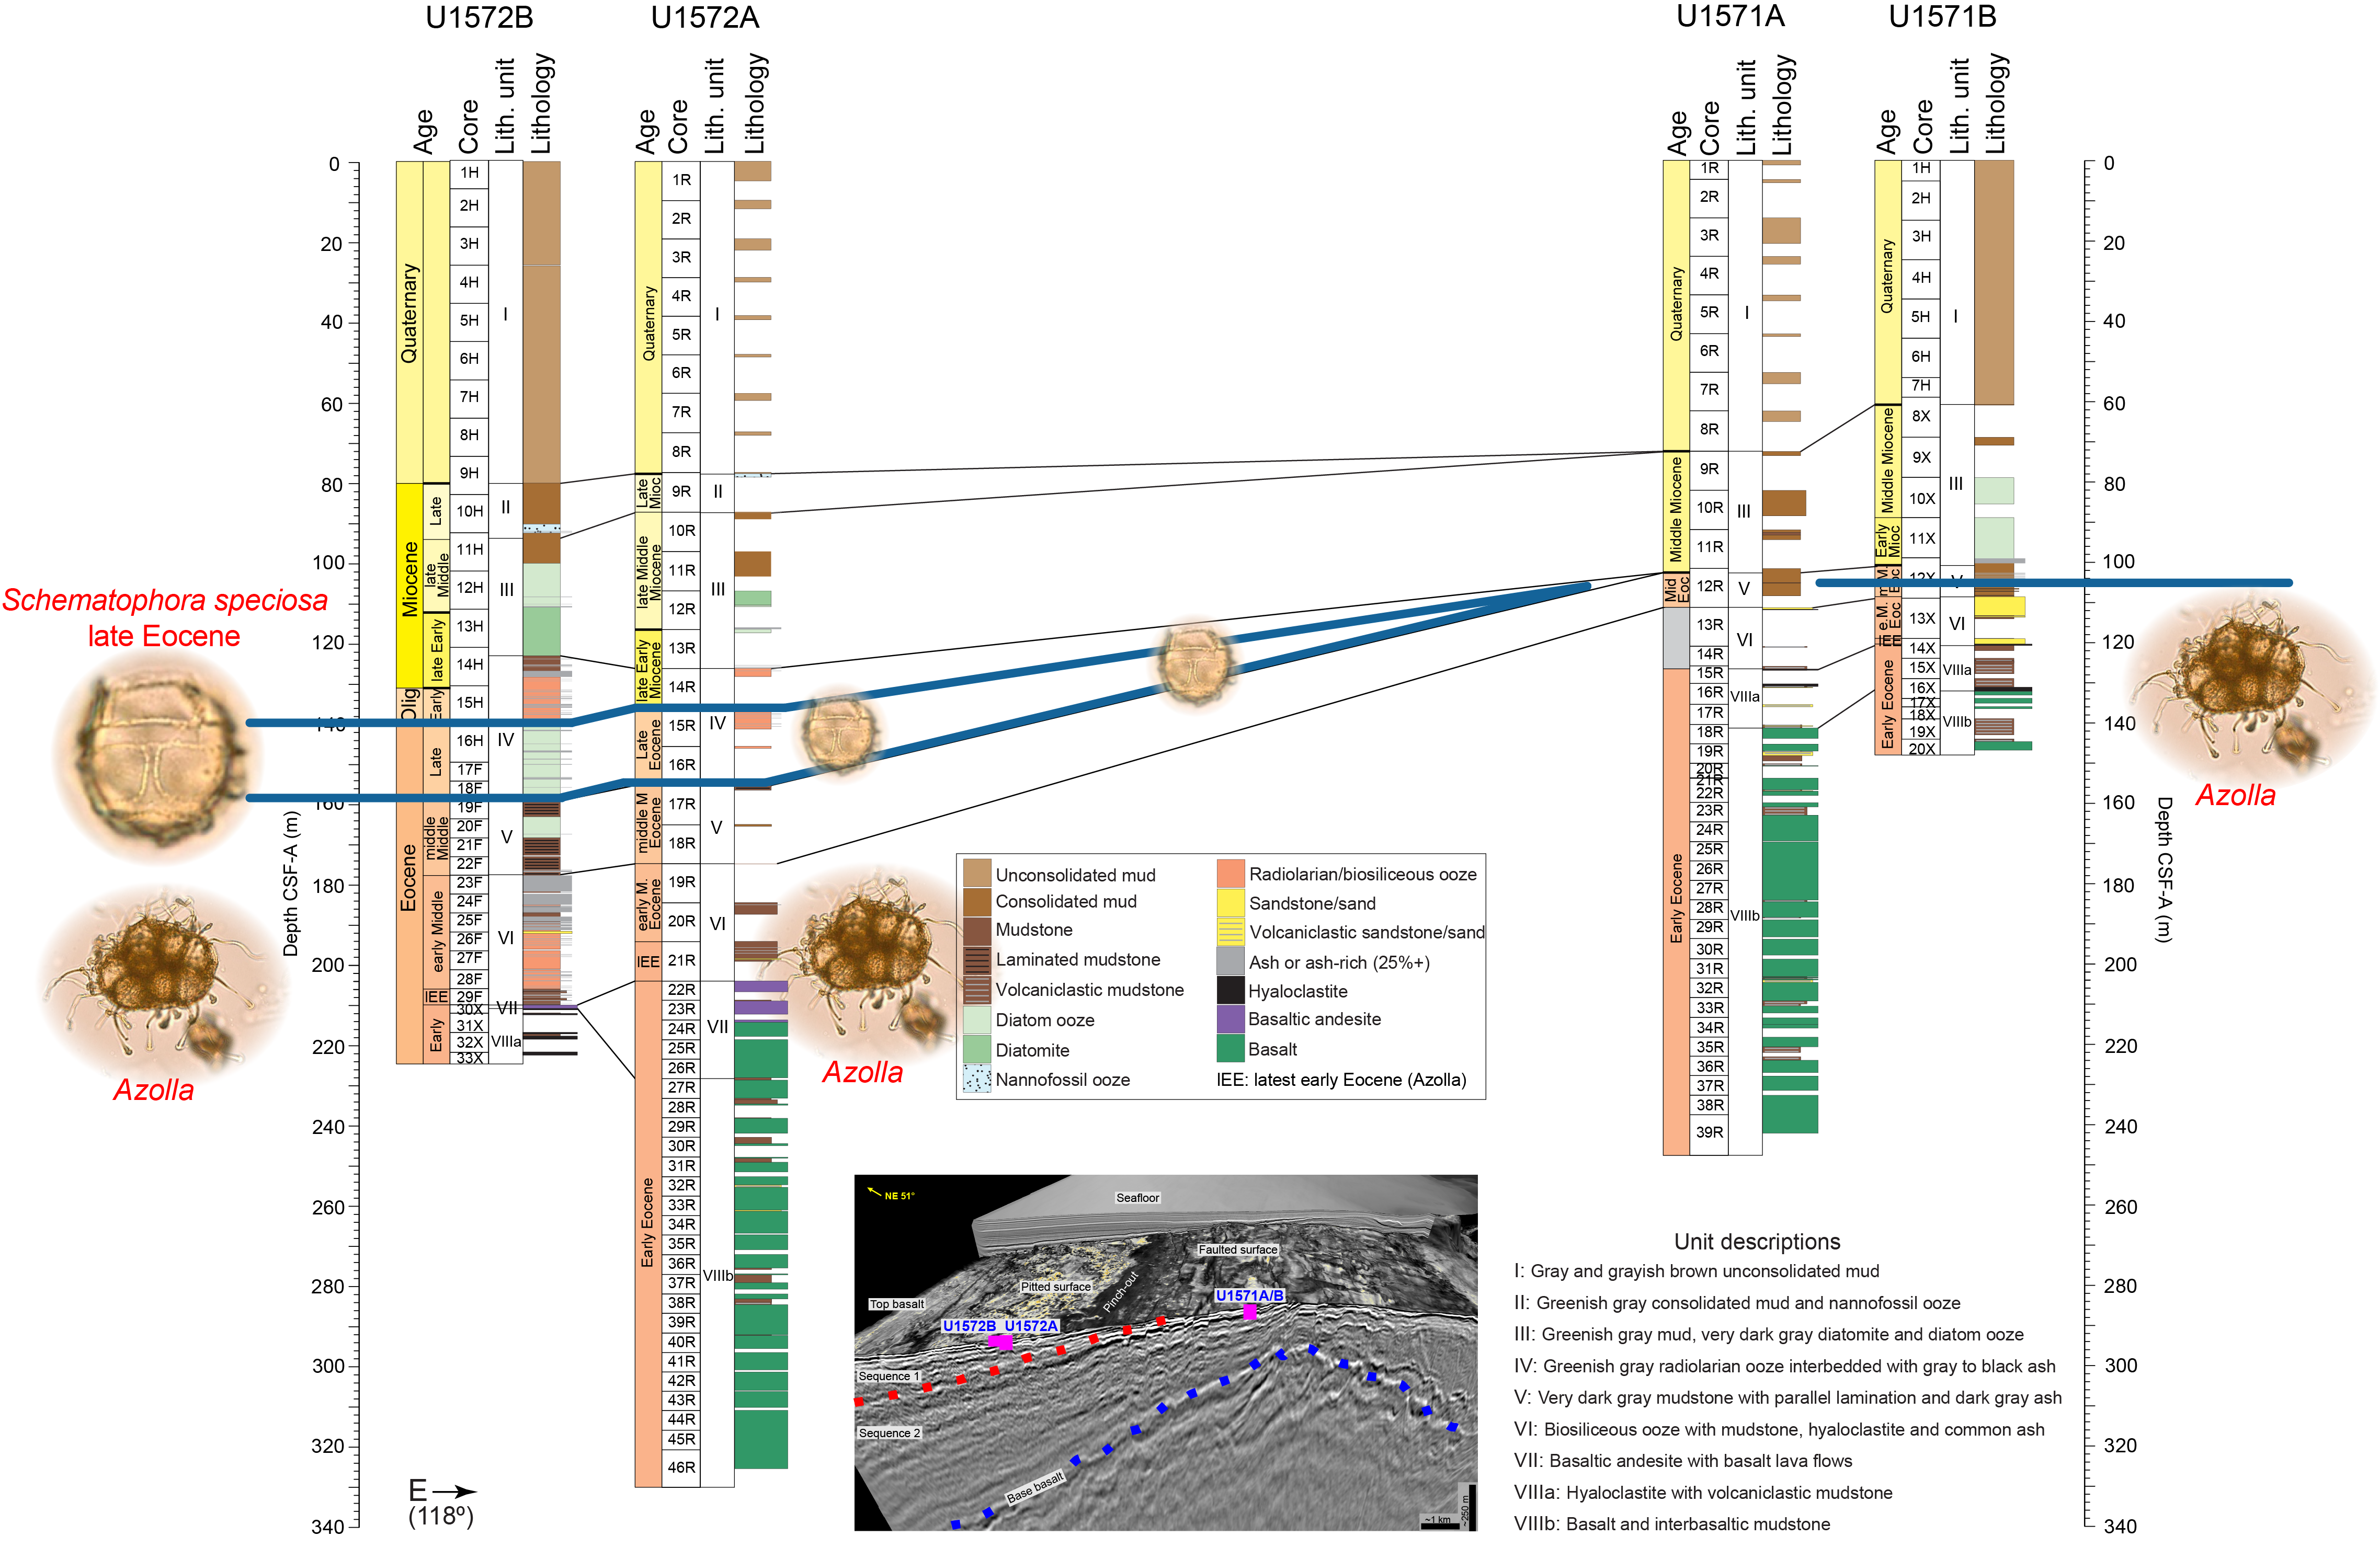
Figure F30. Lithostratigraphic and chronobiostratigraphic correlation.
5. Paleomagnetism
5.1. Shipboard measurements
Shipboard paleomagnetic investigations combined two complementary approaches (see Paleomagnetism in the Expedition 396 methods chapter [Planke et al., 2023a]): (1) measurement and in-line alternating field (AF) demagnetization of archive-half sections on the pass-through 2G Enterprises superconducting rock magnetometer (SRM) at a 2.5 cm spacing and (2) measurement and AF demagnetization of oriented discrete samples on the AGICO spinner magnetometer (JR-6A). A total of 17 discrete samples were recovered from Hole U1571A (4 from sediment and 13 from basalt), 3 from Hole U1571B (2 from sediment and 1 from basalt), 21 from Hole U1572A (3 from sediment and 18 from basalt), and 16 from Hole U1572B (15 from sediment and 1 from basalt). All discrete samples were also measured for anisotropy of magnetic susceptibility (AMS) using the AGICO KLY 4S Kappabridge.
We used the directional and intensity data of archive halves (measured at 20 mT) to determine magnetic polarity along the core. AF demagnetization steps were 5, 10, 15, and 20 mT for sediments and 2, 4, 6, 8, 10, 15, and 20 mT for igneous rocks. The variations of magnetic parameters toward the ends of pieces are measurement artifacts. We use the I20mT/natural remanent magnetization (NRM) ratio as a crude proxy for magnetic coercivity.
Directional and intensity data from discrete samples were used to validate the polarities inferred from section measurements. Directional data were analyzed using Zijderveld diagrams (Zijderveld, 2013). The characteristic remanent magnetization (ChRM) direction(s) were determined using the Remasoft 3.0 software (Chadima and Hrouda, 2006).
5.2. Demagnetization behavior
5.2.1. Sediments
The synthesis of SRM paleomagnetic data on sections is shown in Figure F31. The relatively low sediment recovery in Holes U1571A (~47%) and U1572A (~42%), however, prevents the construction of a meaningful magnetostratigraphic record for these two holes. Because recovery was significantly better in Holes U1571B (~78%) and U1572B (~97%), these two holes will be used for subsequent magnetostratigraphic interpretations.
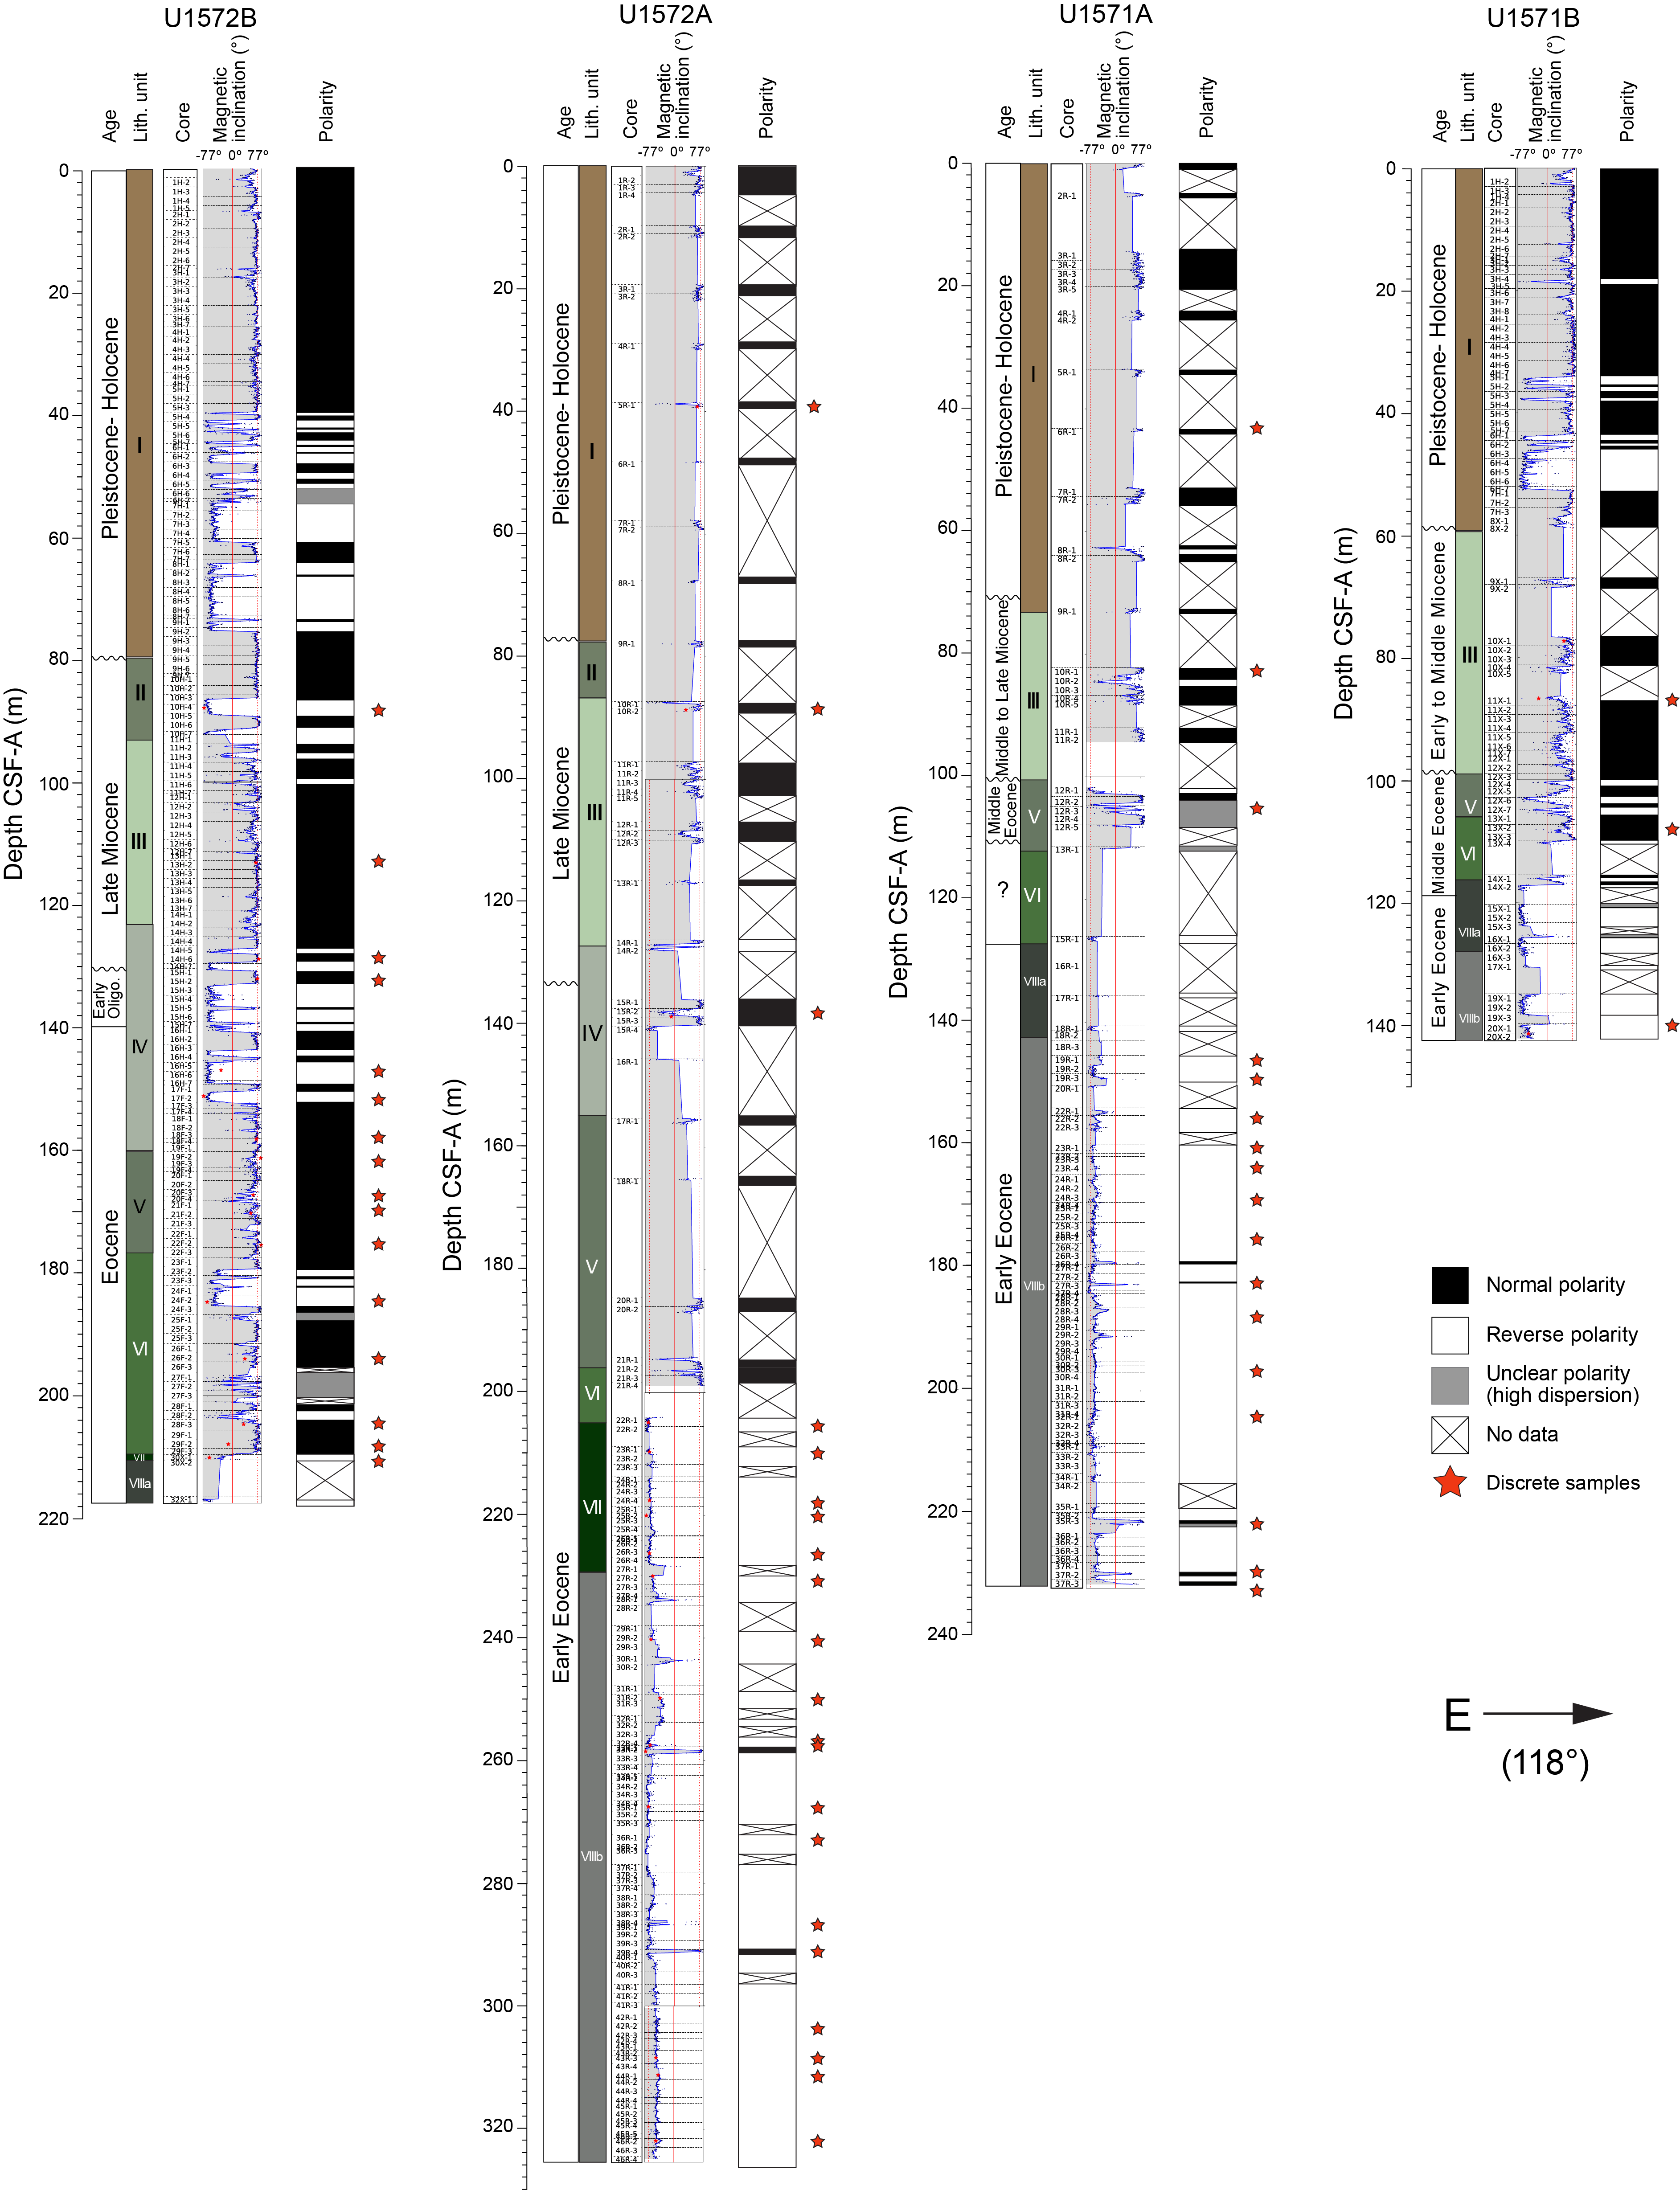
Figure F31. Inclinations and inferred polarities.
In Lithostratigraphic Unit I, Pleistocene gray and grayish brown unconsolidated mud shows mostly normal polarities, particularly in the uppermost 40 m (Cores 396-U1571A-1R through 9R, 396-U1571B-1H through 9X, 396-U1572A-1R through 9R, and 396-U1572B-1H through 9H). The reverse polarities observed, for example, in Sections 396-U1571A-8R-1, 396-U1571B-3H-4, and 396-U1572B-7H-1 through 7H-17, are determined on averagely magnetized sediments and are consistent with depth. The decrease of the I20mT/NRM ratio with decreasing depth in the upper half of the Pleistocene section (Figure F32) suggests an important change in the magnetic assemblage possibly caused by an important climatic change.
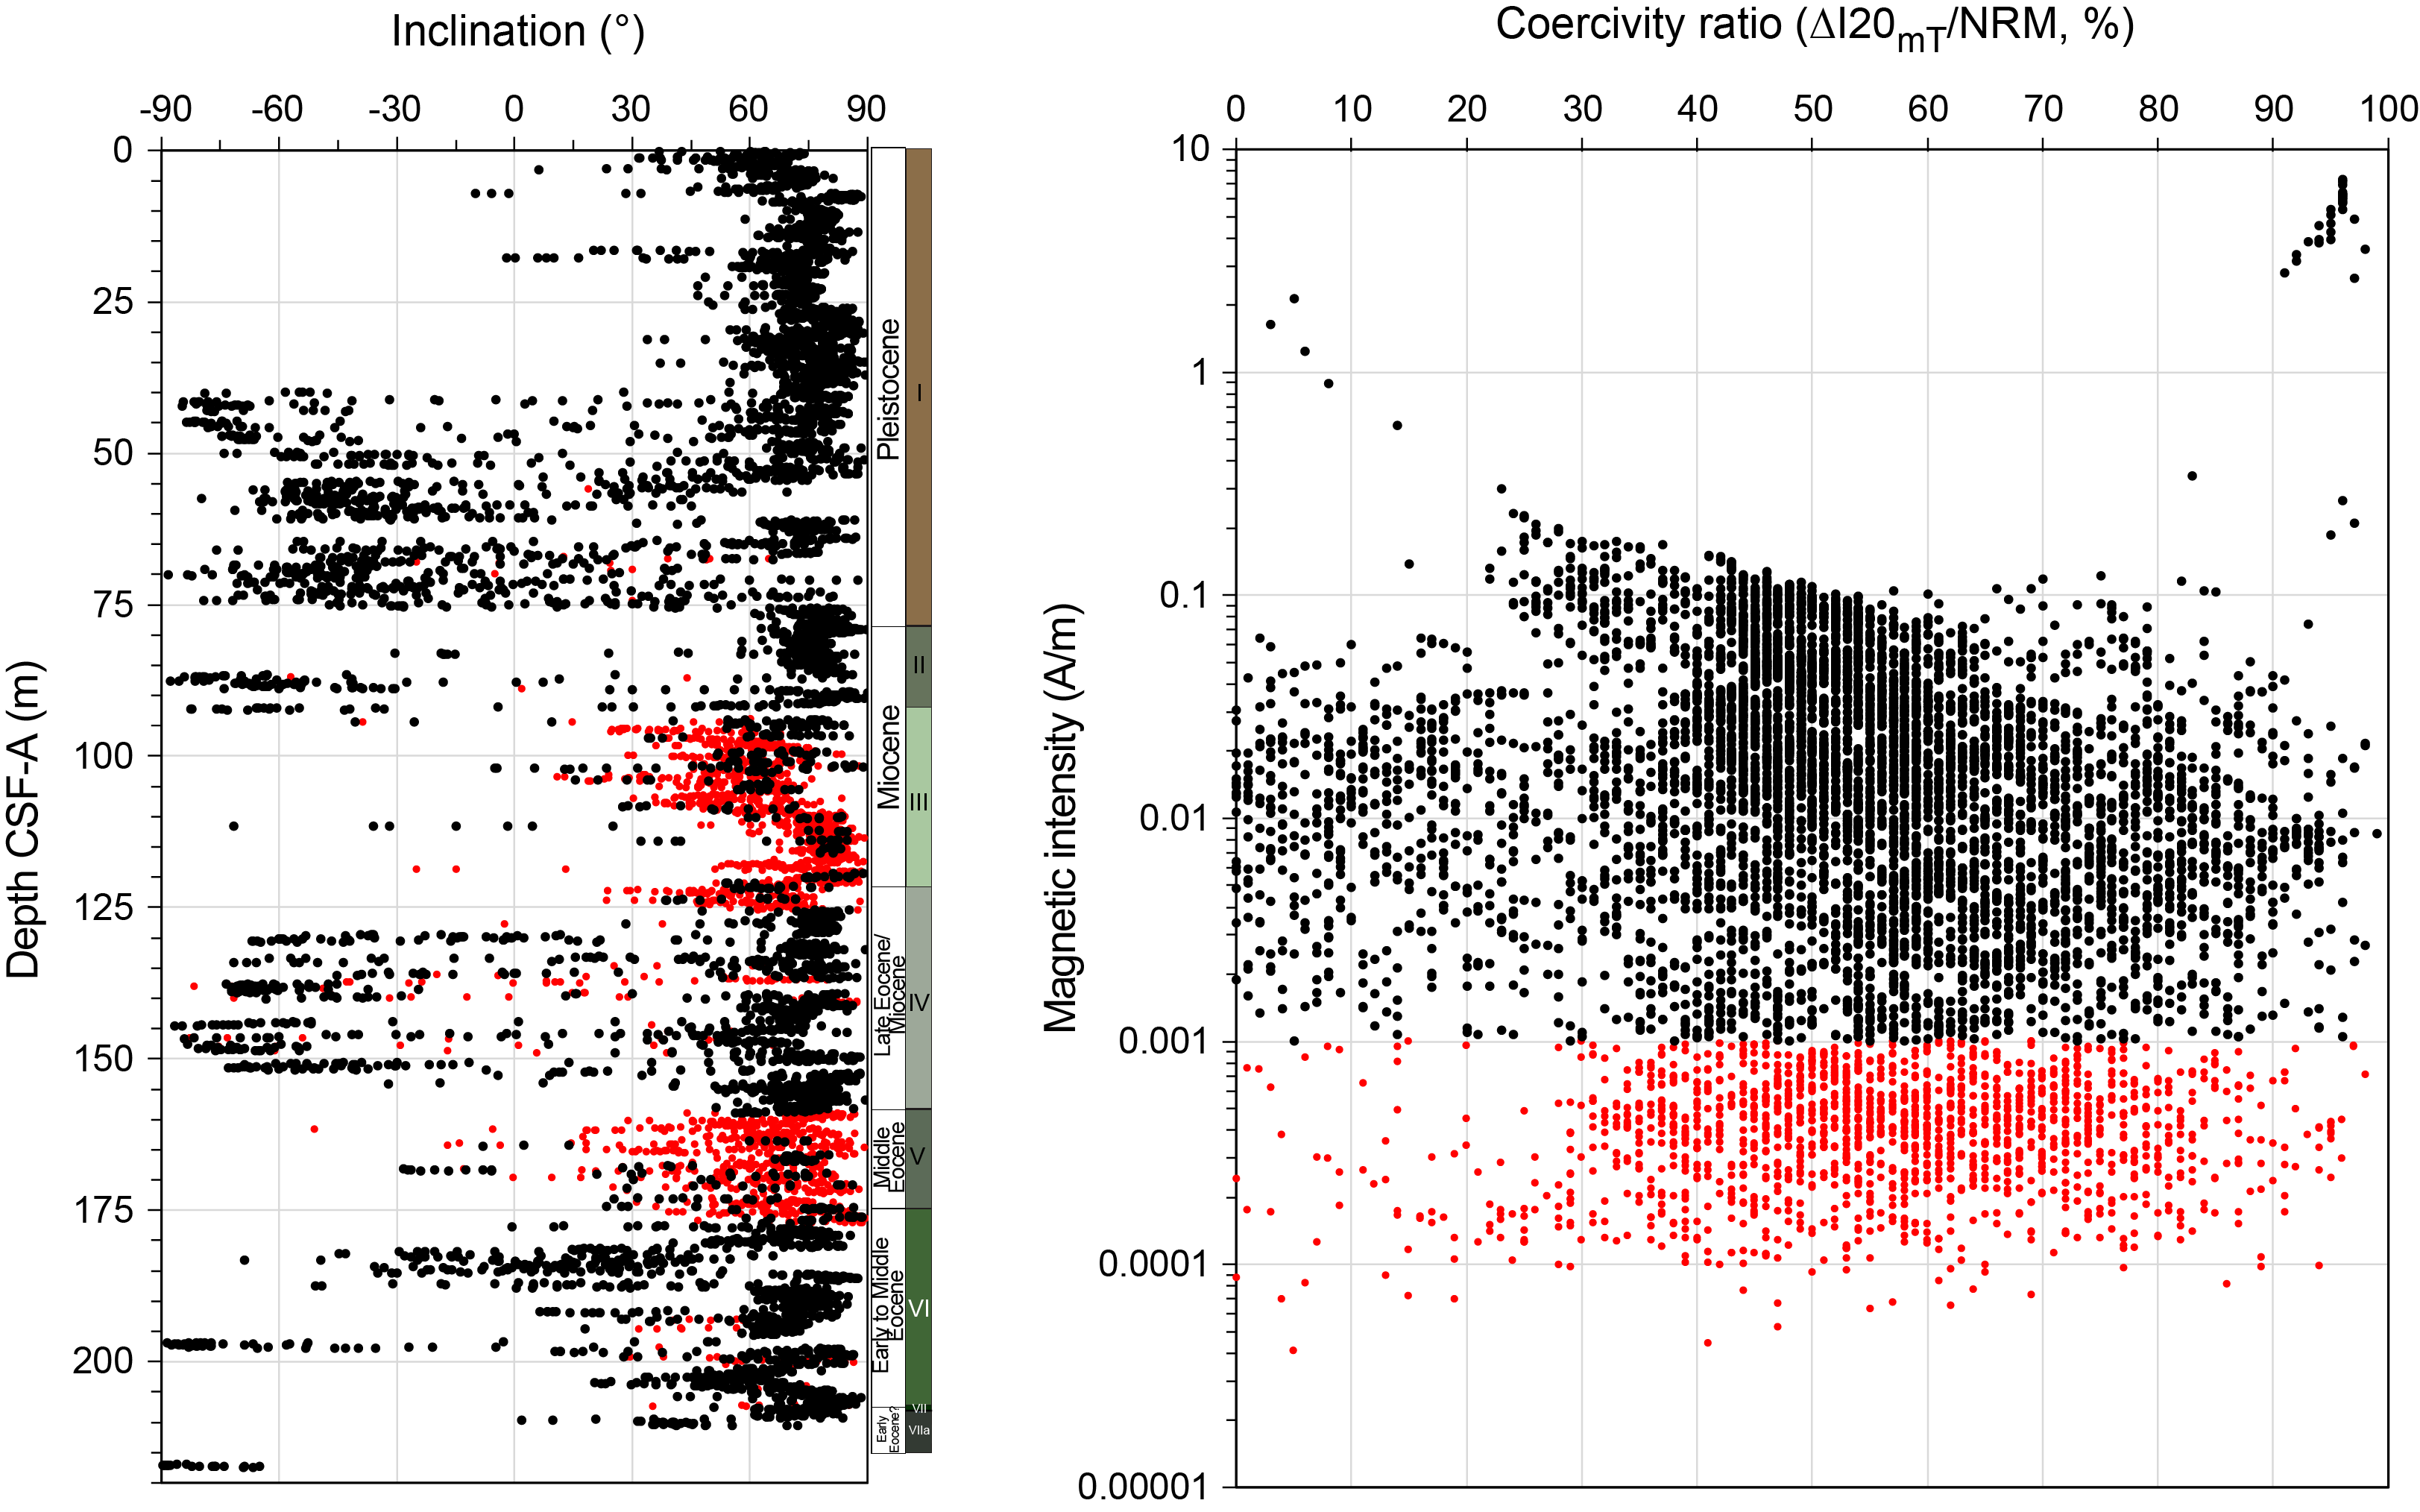
Figure F32. Inclinations and coercivity ratio.
In Lithostratigraphic Unit II, Miocene greenish gray consolidated mud and nannofossil ooze was not recovered at Site U1571. However, Unit II is present at Site U1572, particularly in Hole U1572B, and relatively large magnetic intensities conducive for magnetostratigraphy are observed. The upper part and lowermost part of Unit II show normal polarities, and the middle interval shows reverse polarity (Figure F31).
In Lithostratigraphic Unit III, Miocene greenish gray mud, very dark gray diatomite, and diatom ooze was recovered in all four holes (U1571A, U1571B, U1572A, and U1572B). The most extensive recovery was in Hole U1572B, which is used for magnetostratigraphy in this section. The polarities from the other three holes are consistent with those determined for Hole U1572B. Unit III is characterized by some of the lowest magnetic intensities in the sediments (INRM < 10−4 A/m). The magnetic polarities are dominantly normal and show few reverse polarity intervals of minor extent, except in the uppermost part of Unit III (Figure F31). This observation, combined with the low magnetic intensities, suggests that some of these normal polarities might be anomalous and caused by drilling-induced magnetization. Two discrete samples validate the SRM polarities (Sections 396-U1572B-13H-2 and 396-U1572A-10R-2), and a third discrete sample (Section 396-U1571B-11X-1) invalidates the SRM normal polarity.
In Lithostratigraphic Unit IV, Late Eocene to Miocene greenish gray radiolarian ooze interbedded with gray to black ash was also recovered in all holes at Sites U1571 and U1572. Recovery was excellent in Hole U1572B, which is used for magnetostratigraphy. The magnetic polarities in Unit IV are evenly normal and reverse in Hole U1572B but skewed toward normal and transitional polarities in the other three holes. The magnetic intensities are relatively low in the upper part of Unit II (Sections 396-U1572B-14H-3 through 14H-7) and moderate in the rest of the unit. These polarities are validated by four discrete samples in Sections 14H-6, 15H-2, 16H-5, and 17F-2 and one sample in Section 396-U1572A-15R-2.
In Lithostratigraphic Unit V, Middle Eocene very dark gray mudstone with parallel lamination and dark gray ash was recovered in Holes U1572A and U1572B but not in Holes U1571A and U1571B. The magnetic polarities in Unit V are exclusively normal and validated by four discrete samples (Figure F31). The excellent recovery of Unit V in Hole U1572B provides a good foundation for magnetostratigraphy, although the low magnetic intensity of this unit (INRM < 10−4 A/m) casts doubts on the reliability of magnetic polarities.
In Lithostratigraphic Unit VI, Early to Middle Eocene biosiliceous ooze with mudstone and common ash was recovered at Site U1572 only. The magnetic intensities in Unit VI are sufficiently high to interpret magnetic polarities with confidence (Figure F32). These polarities are also validated by three out of four discrete samples (Figure F31). Unit IV shows a mixture of normal and reverse polarities.
The magnetic polarities determined on the basis of magnetic inclination after 20 mT of AF demagnetization are considered relatively robust for the following reasons:
- The discrete samples indicated with red stars on Figure F31 overall validate the magnetic polarities determined using the SRM data, with a few exceptions of discrete samples that have the correct polarity but a different inclination.
- The SRM data systematically passes the reversal test (Butler, 1992), in which the magnetic inclination during a normal chron is equal to the inclination during a reverse chron.
- The possibility of an overprint from drilling-induced magnetization can be ruled out because the polarities observed in most sediments, with the exception of Units III and V (Figure F32), show both normal and reverse polarities. Drilling-induced magnetization would produce high inclination, normal polarities because of the current geomagnetic field.
5.2.2. Basalt sequence
The basaltic sequences are well represented in Holes U1571A and U1572A over several tens of meters. Lithostratigraphic Unit VII consists of Middle to Late Paleocene basaltic andesite and basalt lava flows. Unit VIII consists of Middle to Late Paleocene basalt and interbasaltic mudstone. These rocks show strong magnetization intensities, up to 2 or 3 orders of magnitude stronger than the sediments. The magnetic polarities are dominantly reverse and systematically validated by 13 samples from Hole U1571A and 1 sample from Hole U1571B.
The discrete basalt samples typically show a demagnetization behavior characterized by low mean demagnetizing field (10–20 mT) indicative of an NRM carried by a magnetically soft mineral phase such as magnetite. The stable demagnetization behavior allows definition of ChRM directions that point to the origin of Zijderveld diagrams, a common characteristic of magnetizations acquired through thermal remanent magnetization (TRM) in igneous rocks (Figure F33). In addition, most basaltic discrete samples also exhibit a small component of normal magnetization that demagnetizes readily at low fields. This behavior is interpreted as resulting from viscous remanent magnetization (VRM). Because VRM is imparted primarily in today’s geomagnetic field, it could be used to reorient the specimen and associated data.
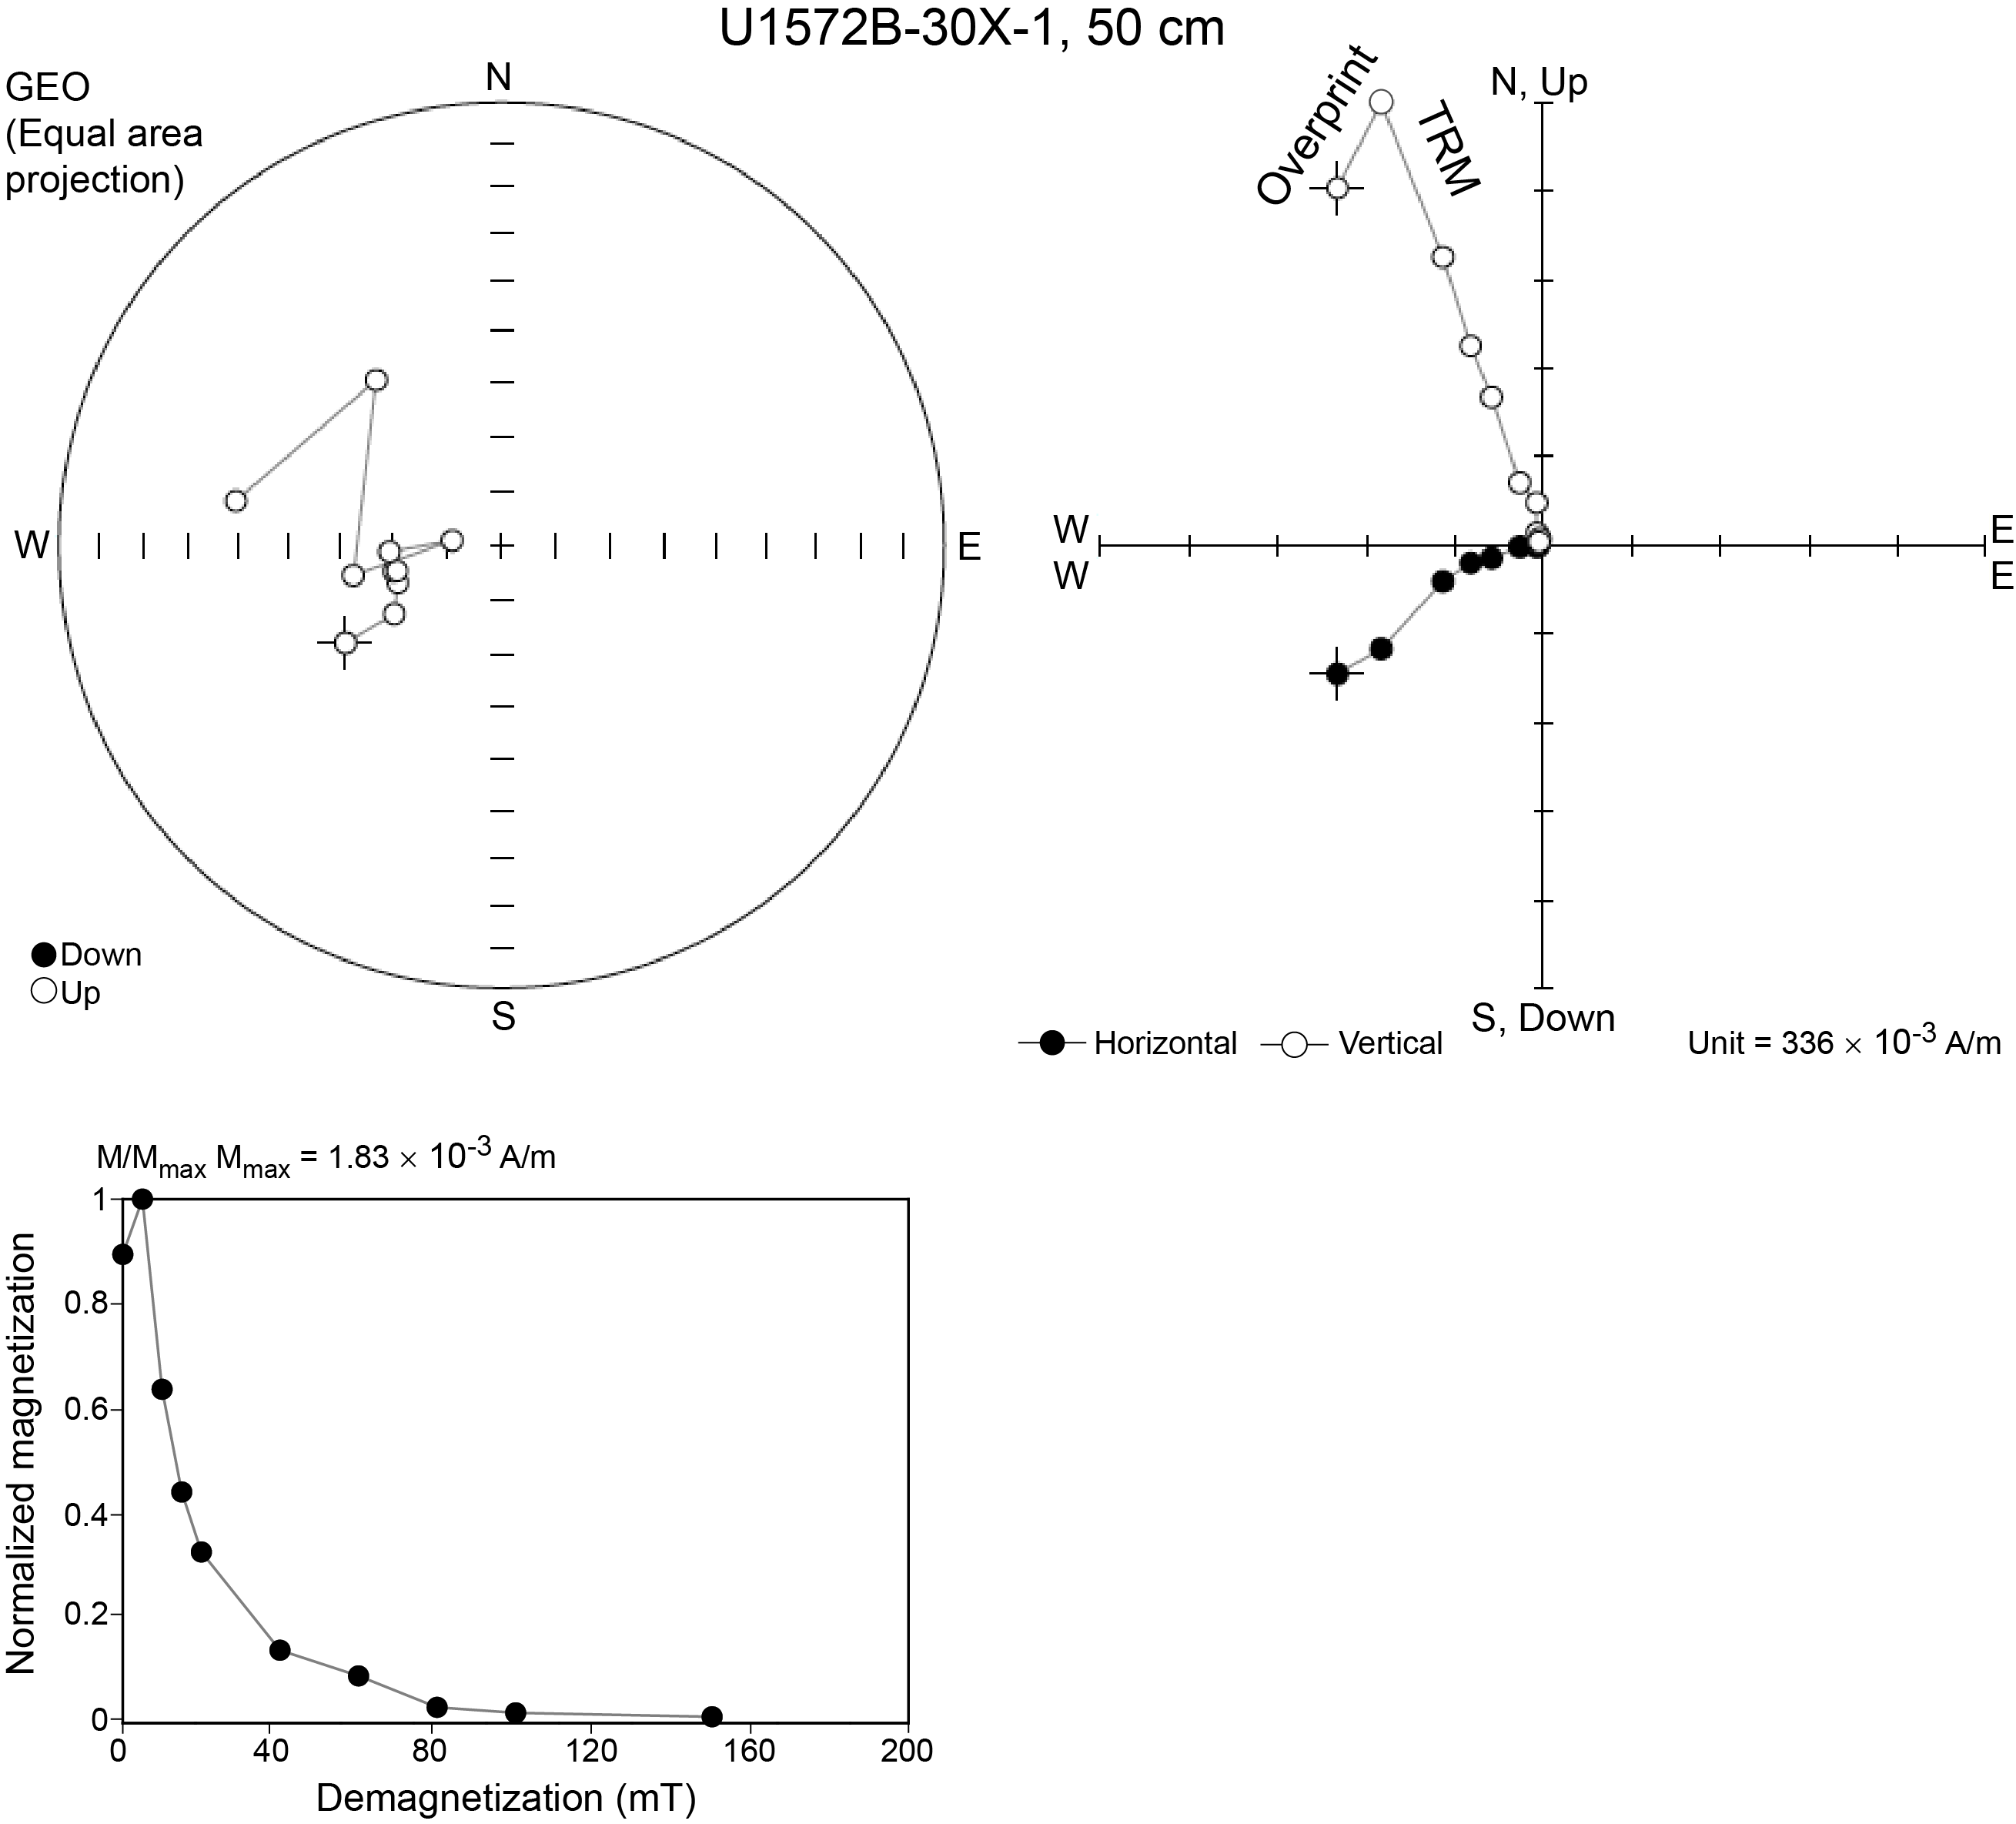
Figure F33. Paleomagnetic directions and demagnetization steps.
5.3. Anisotropy of magnetic susceptibility
5.3.1. Sediments
The AMS of all discrete samples shows a general pattern of shallowly dipping magnetic foliations (plane perpendicular to κ3 axis, in blue in Figure F34), as should be expected in nearly horizontal sedimentary beds. The degree of magnetic anisotropy (P′), a proxy for the degree of orientation of grains, is generally less than 1.01. This low P′ indicates that minimal to no compaction occurred after deposition and therefore the correction of magnetic inclination for inclination shallowing is not necessary.
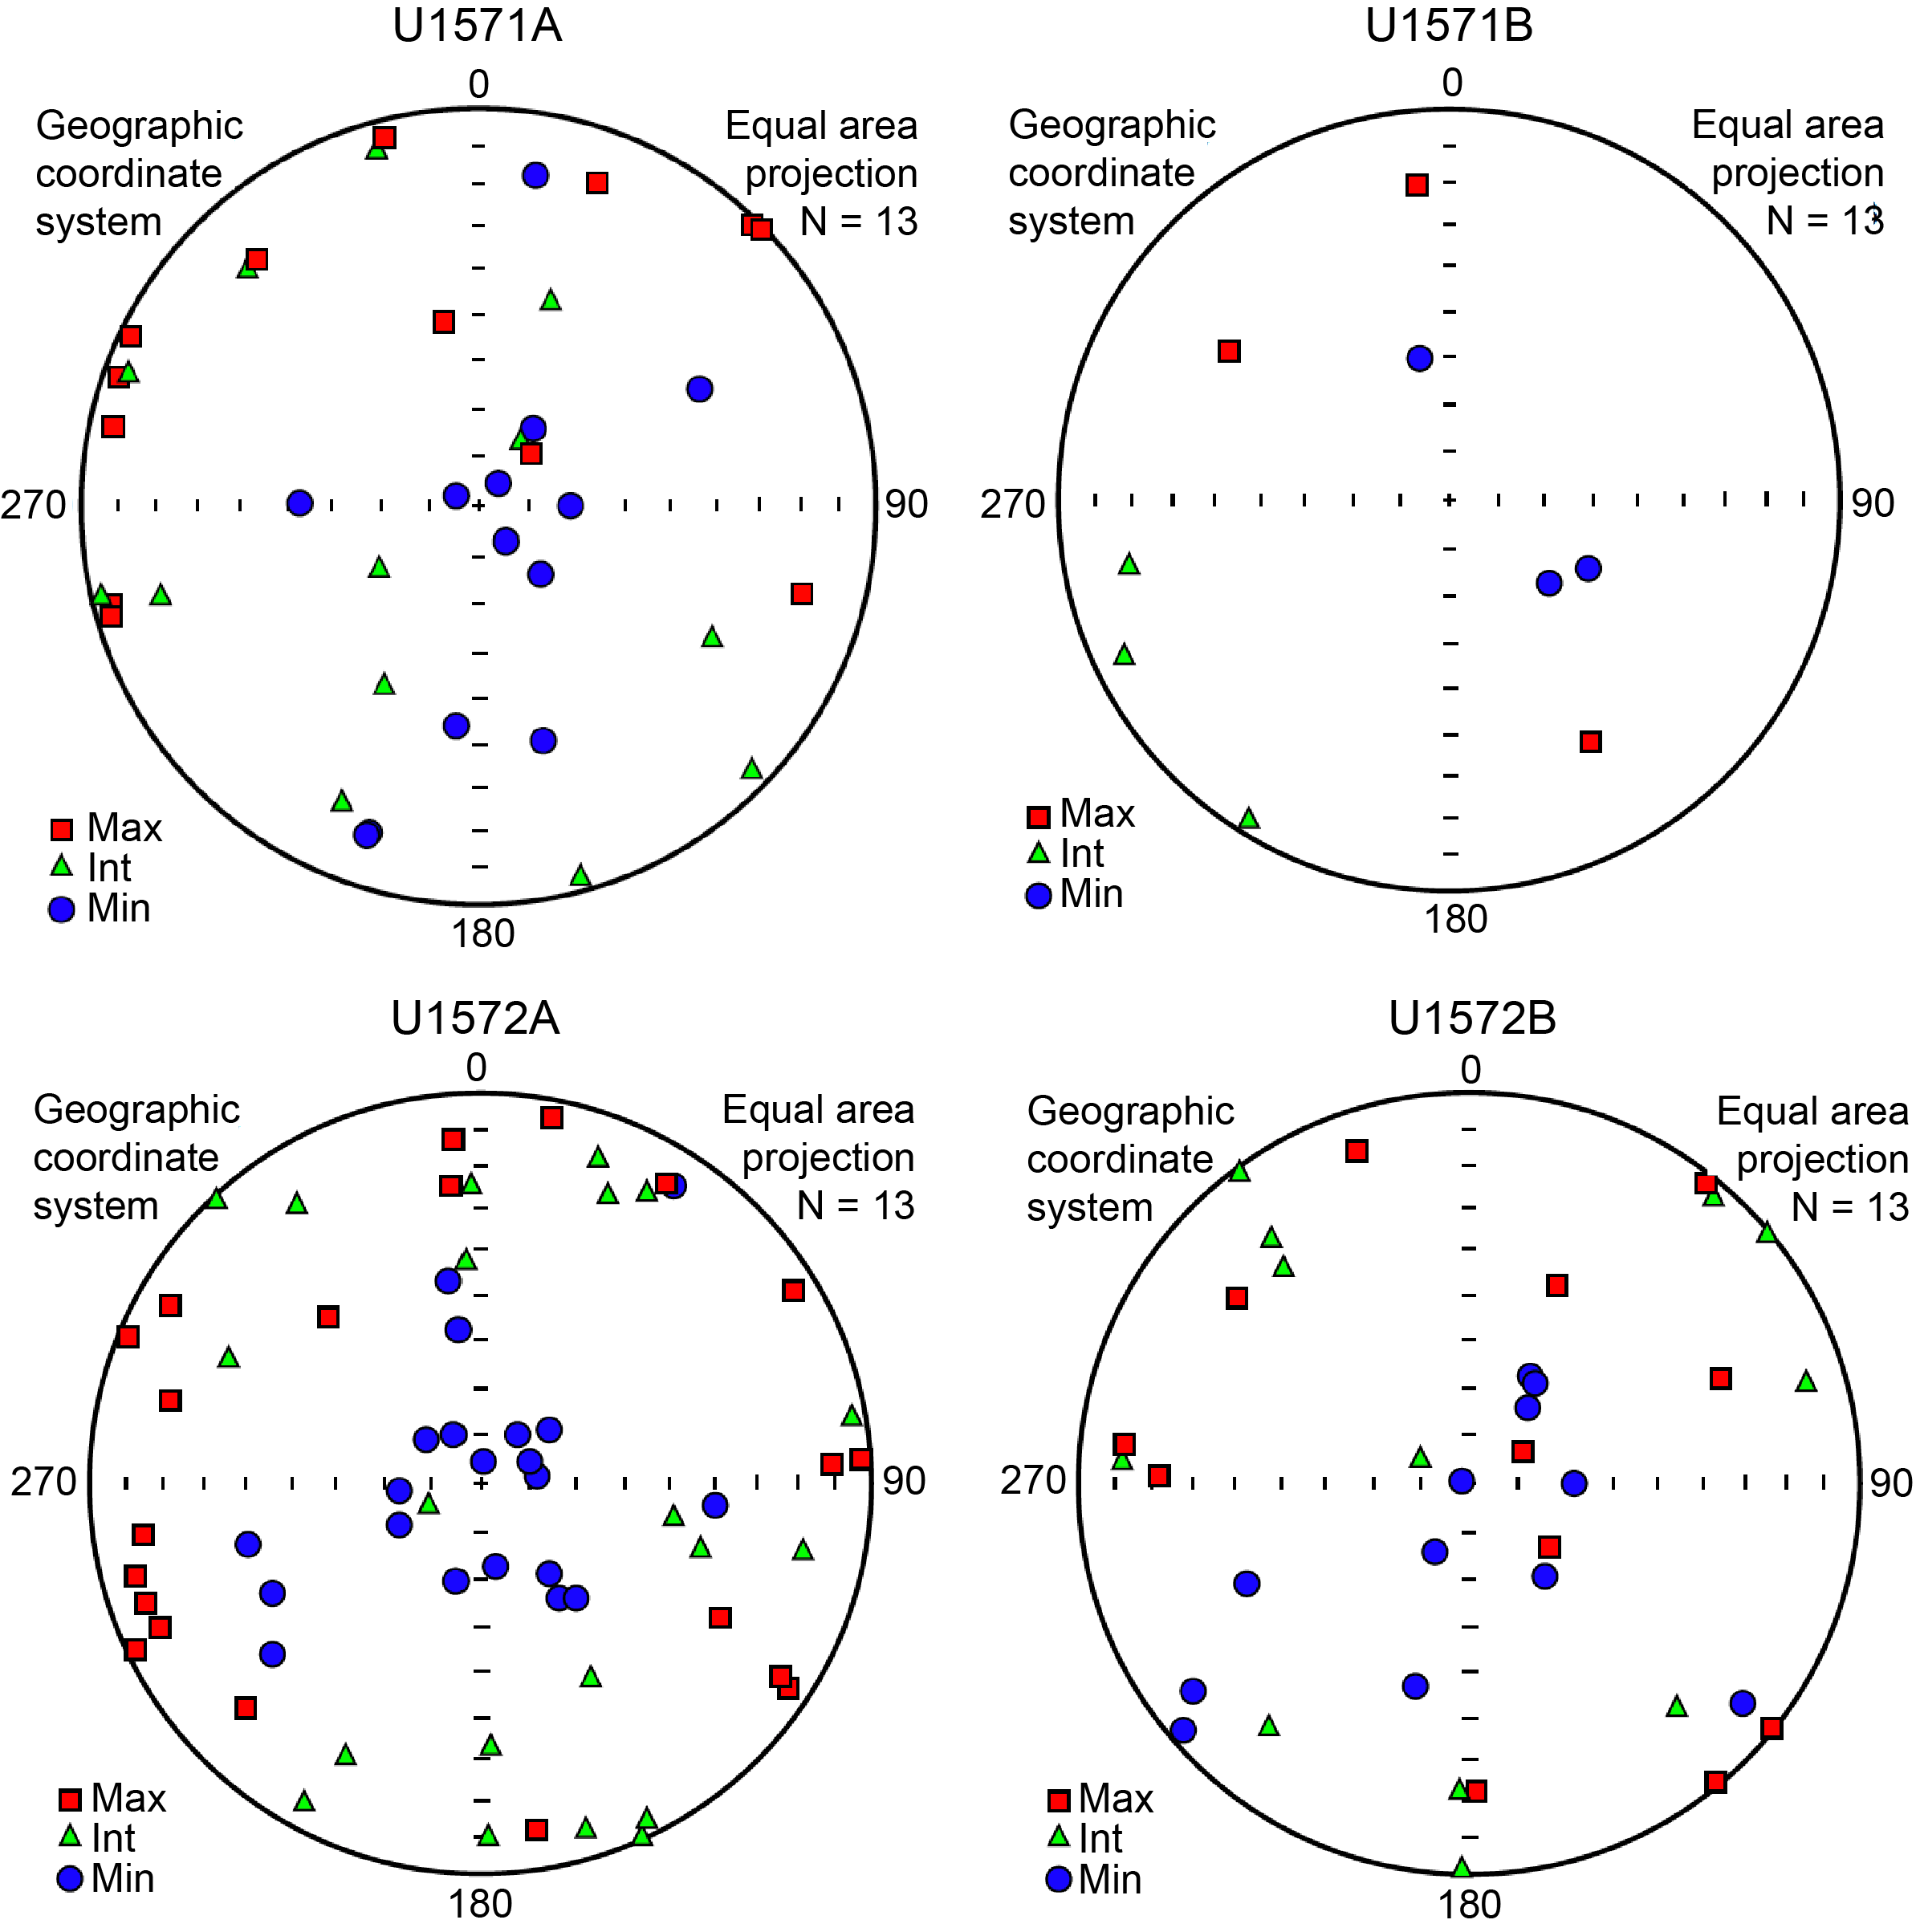
Figure F34. AMS.
5.3.2. Basalt
The basalts show a significantly stronger P′, up to 1.15, which attests of a relatively strong viscous flow fabric (e.g., Hrouda et al., 2005; Boiron et al., 2013; Caballero-Miranda et al., 2016). Because these samples have acquired a VRM, it should be possible to reorient the material and determine a flow direction in the geographic reference framework.
5.4. Summary
Holes U1571B and U1572B provided fairly complete recovery and material suitable for paleomagnetic investigations. Several paleomagnetic reversals characterize the sediments overlying the basalts. The polarities provided by the discrete samples as well as reversal tests show that the paleomagnetic results are robust and can be used for magnetostratigraphy. The decrease in the I20mT/NRM ratio in Lithostratigraphic Unit I hints toward an important climatic change. The underlying basaltic sequences show strong magnetization intensities and the magnetic polarity is dominantly reverse, which could be validated by 14 discrete samples. Low mean demagnetizing fields (10–20 mT) suggests that the magnetization is carried by magnetically soft minerals such as magnetite or titanomagnetite. Small components of normal magnetization that demagnetizes readily at low fields (VRM) may allow reorientation of the specimen and associated data.
6. Geochemistry
In total, 47 interstitial water (IW) samples and 1 mudline sample were taken from sediments recovered at Site U1571: 19 from Hole U1571A and 28 from Hole U1571B. The lowermost sample is from 222 m CSF-A. The hard rock geochemistry of 27 samples was investigated using inductively coupled plasma–atomic emission spectrometry (ICP-AES) and was supported by 106 analyses using pXRF. A total of 47 samples were analyzed using XRD to investigate mineralogy, of which 10 were prepared for clay analysis and 10 for heated clay analysis. Carbonate analysis was completed on all corresponding squeeze cake samples from IW extraction and a single additional sediment sample from Core 396-U1571A-33R. A total of 21 samples were taken for routine headspace analysis from Hole U1571A. Because of low methane content (<2 ppmv), no headspace samples were taken from Hole U1571B.
At Site U1572, 48 IW samples and a single mudline were taken: 12 from Hole U1572A and 37 from Hole U1572B. All corresponding squeeze cakes and two core catcher samples were analyzed for their carbonate content. A total of 39 XRD measurements were made: 11 after clay preparation and 11 after heated clay. A total of 96 samples were measured using pXRF for elemental composition. A total of 38 routine headspace analyses were completed on samples from Hole U1572A. As at Site U1571, methane concentrations were low throughout, so no headspace samples were taken in Hole U1572B.
6.1. Inorganic geochemistry
6.1.1. Site U1571
The alkalinity content at Site U1571 is very similar for both holes. Surface values are around 2.2 mM, rising to 6 mM in both holes between 30 and 50 m CSF-A (Figure F35; Table T13). These values then decrease downcore, reaching around 1 mM at ~110 m CSF-A (at the sediment–basalt transition). Alkalinity is below 1 mM in all interbasalt sediments recovered. Measured pH from Site U1571 displays no clear trends; there is high variability and no evident correlation between Holes U1571A and U1571B. In the uppermost 100 m CSF-A, pH is between 7.4 and 8, but below this depth the range is greater, ranging 7.3–8.4 (Figure F35). The NH4+ profiles are similar to those of alkalinity, showing increases in concentration for the upper 50 m before dropping to low values by 130 m CSF-A. The profile of PO43− matches the variability in Hole U1571B, fluctuating between 6 and 11 µM for the entirety of the analyzed cores. In Hole U1571A, however, this variability is much lower, showing concentrations between 4 and 7 µM (Figure F35). The increasing alkalinity and ammonium with depth in the upper 50 m suggests that diffusion is the main control on concentrations for these constituents. The decreases below 50 m CSF-A indicate that basalt alteration is affecting IW compositions (Seyfried and Mottl, 1982; Lyons et al., 2000). The elemental profiles collected from Site U1571 support the hypothesis of a dominant basaltic impact on IW chemistry below 50 m CSF-A.
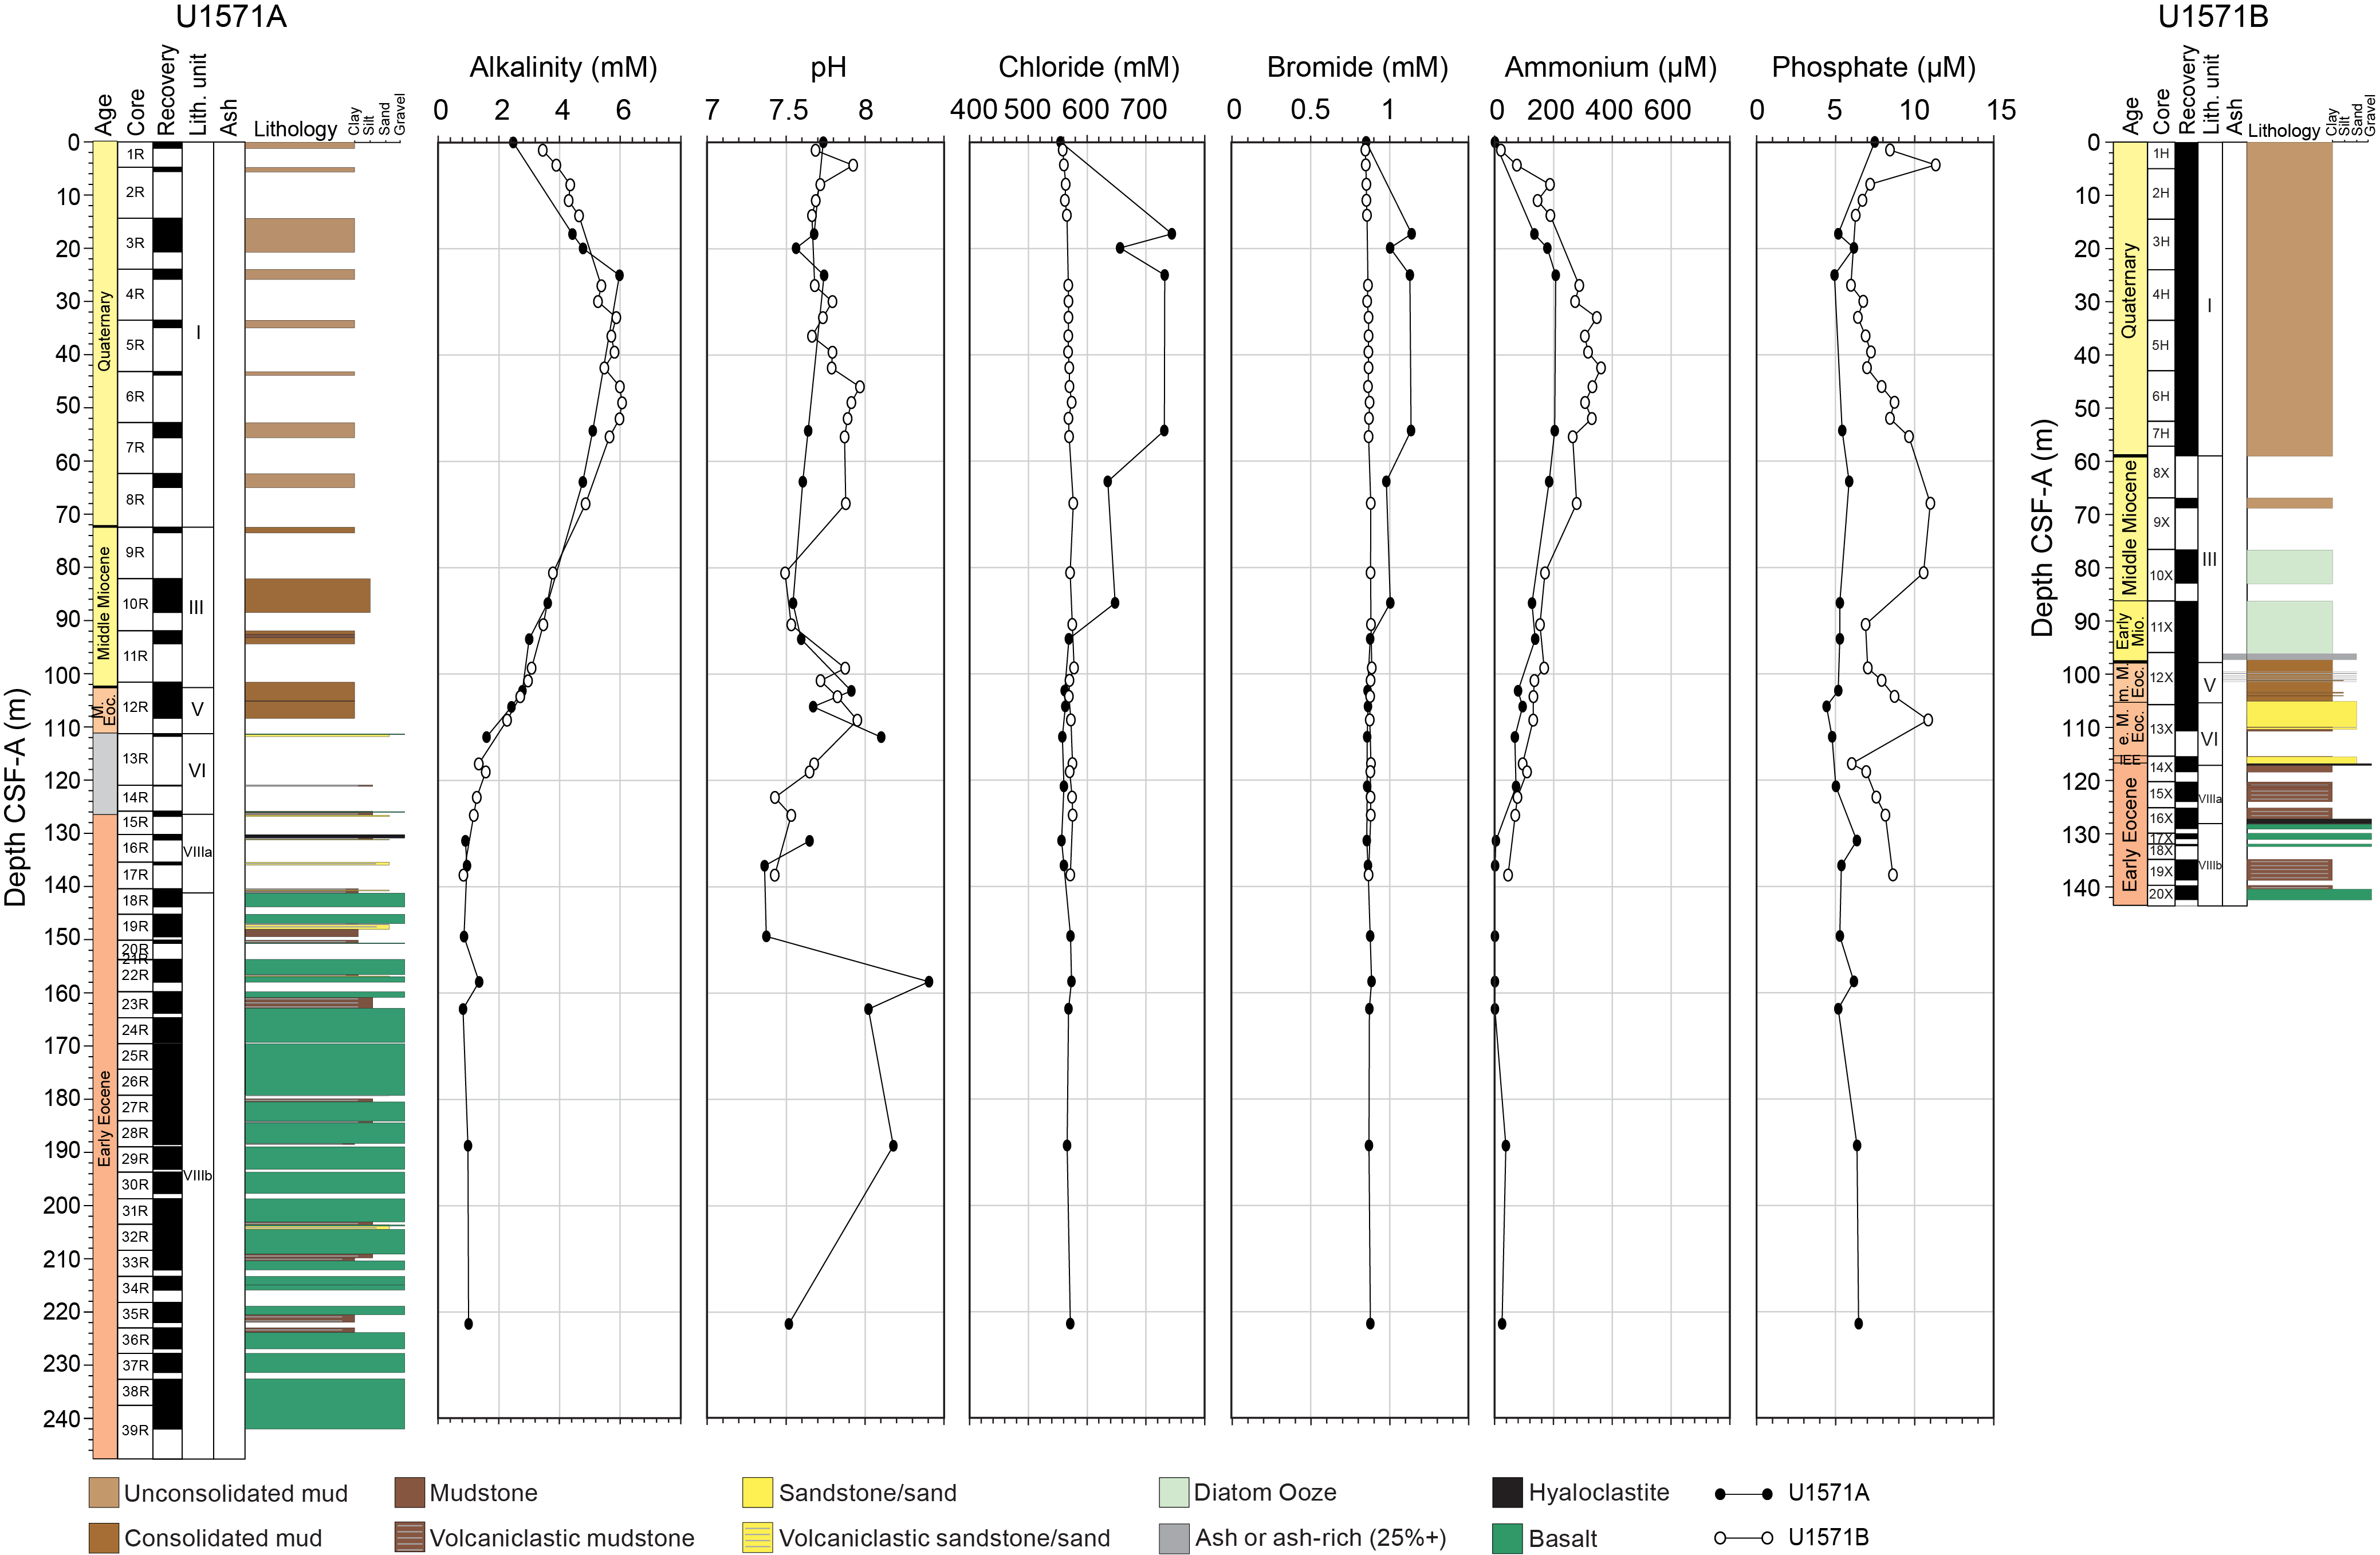
Figure F35. Alkalinity, pH, Cl, Br, NH4+, and PO43−, Site U1571.
As at previous sites, certain alkali metals show conservative profiles with depth. Dissolved Mg concentrations display a linear decreasing trend downcore in both holes, dropping from 50 mM to below 25 mM at the basalt/sediment interface (Figure F36). Similar profiles are also observed for K (dropping from 14 to 6 mM) and S (from 32 to 20 mM) (Figure F37). Calcium concentrations again show linear enrichment with depth, but unusually Sr concentrations only show a slight increase with depth (Figure F36). Lithium concentrations show very little variation downcore. Barium contents differ considerably between holes, are below detection in Hole U1571B, and show variations with no clear trend in Hole U1571A (Figure F36).
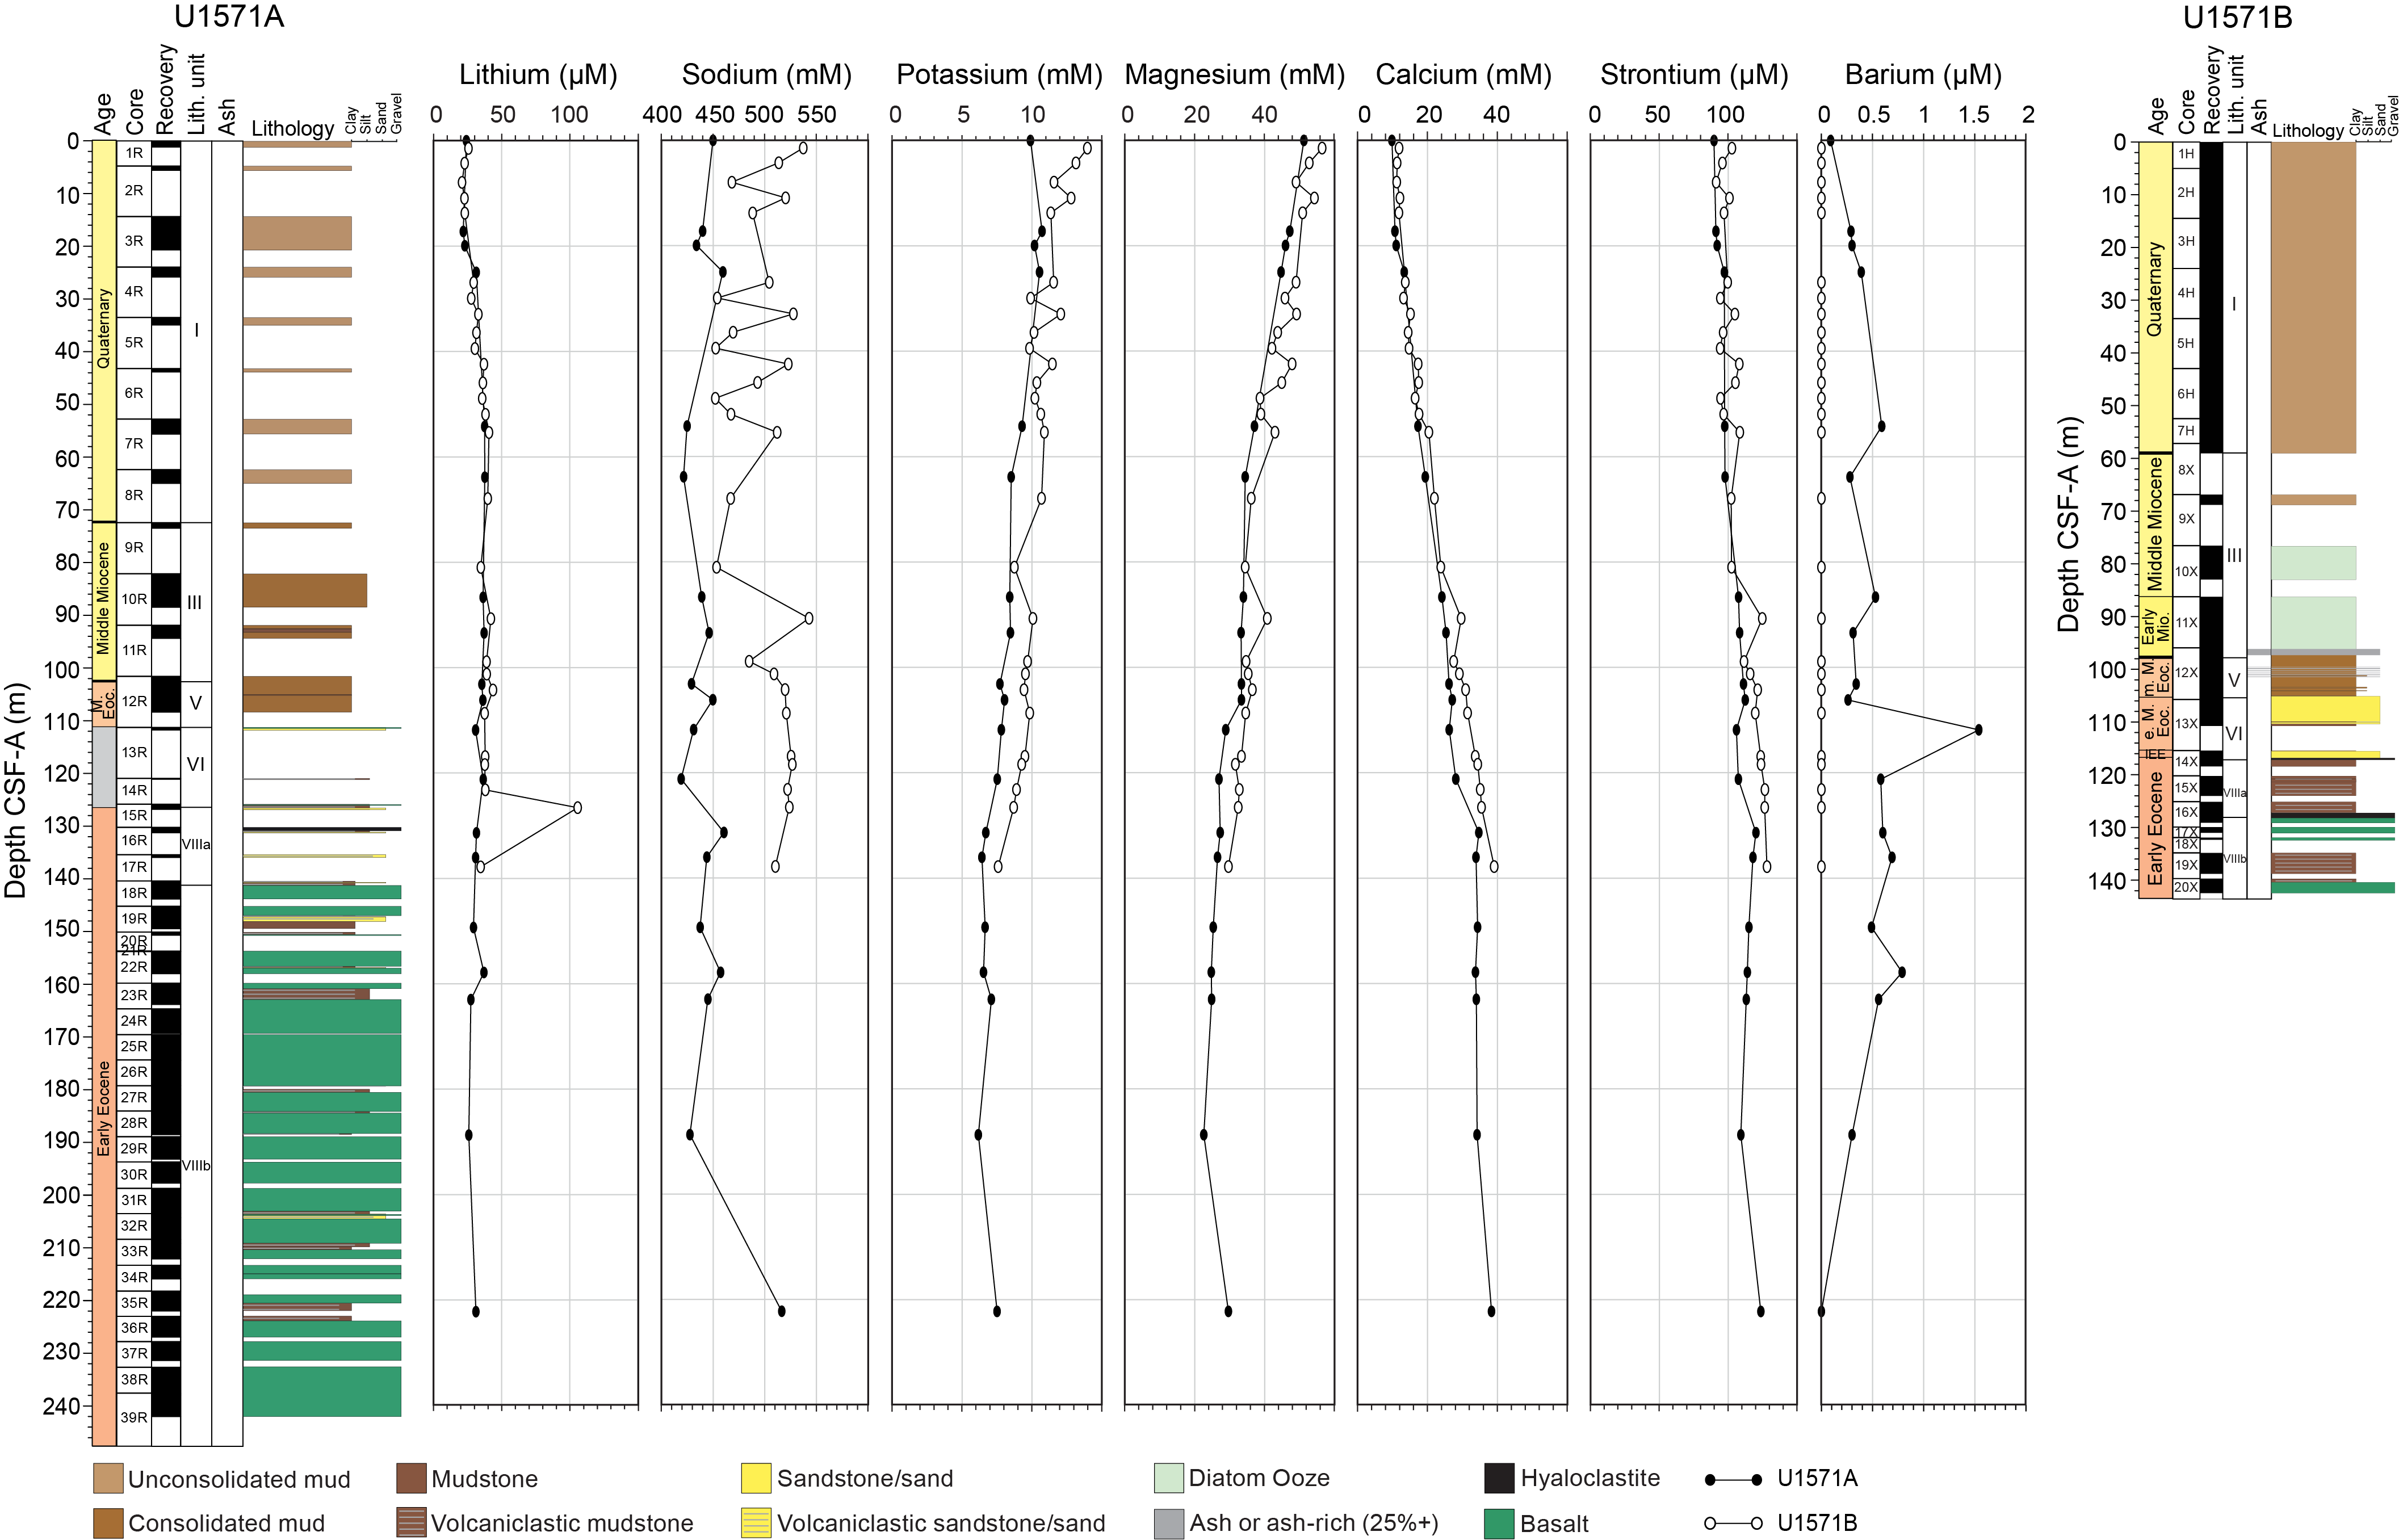
Figure F36. Alkali and alkali earth metals, Site U1571.
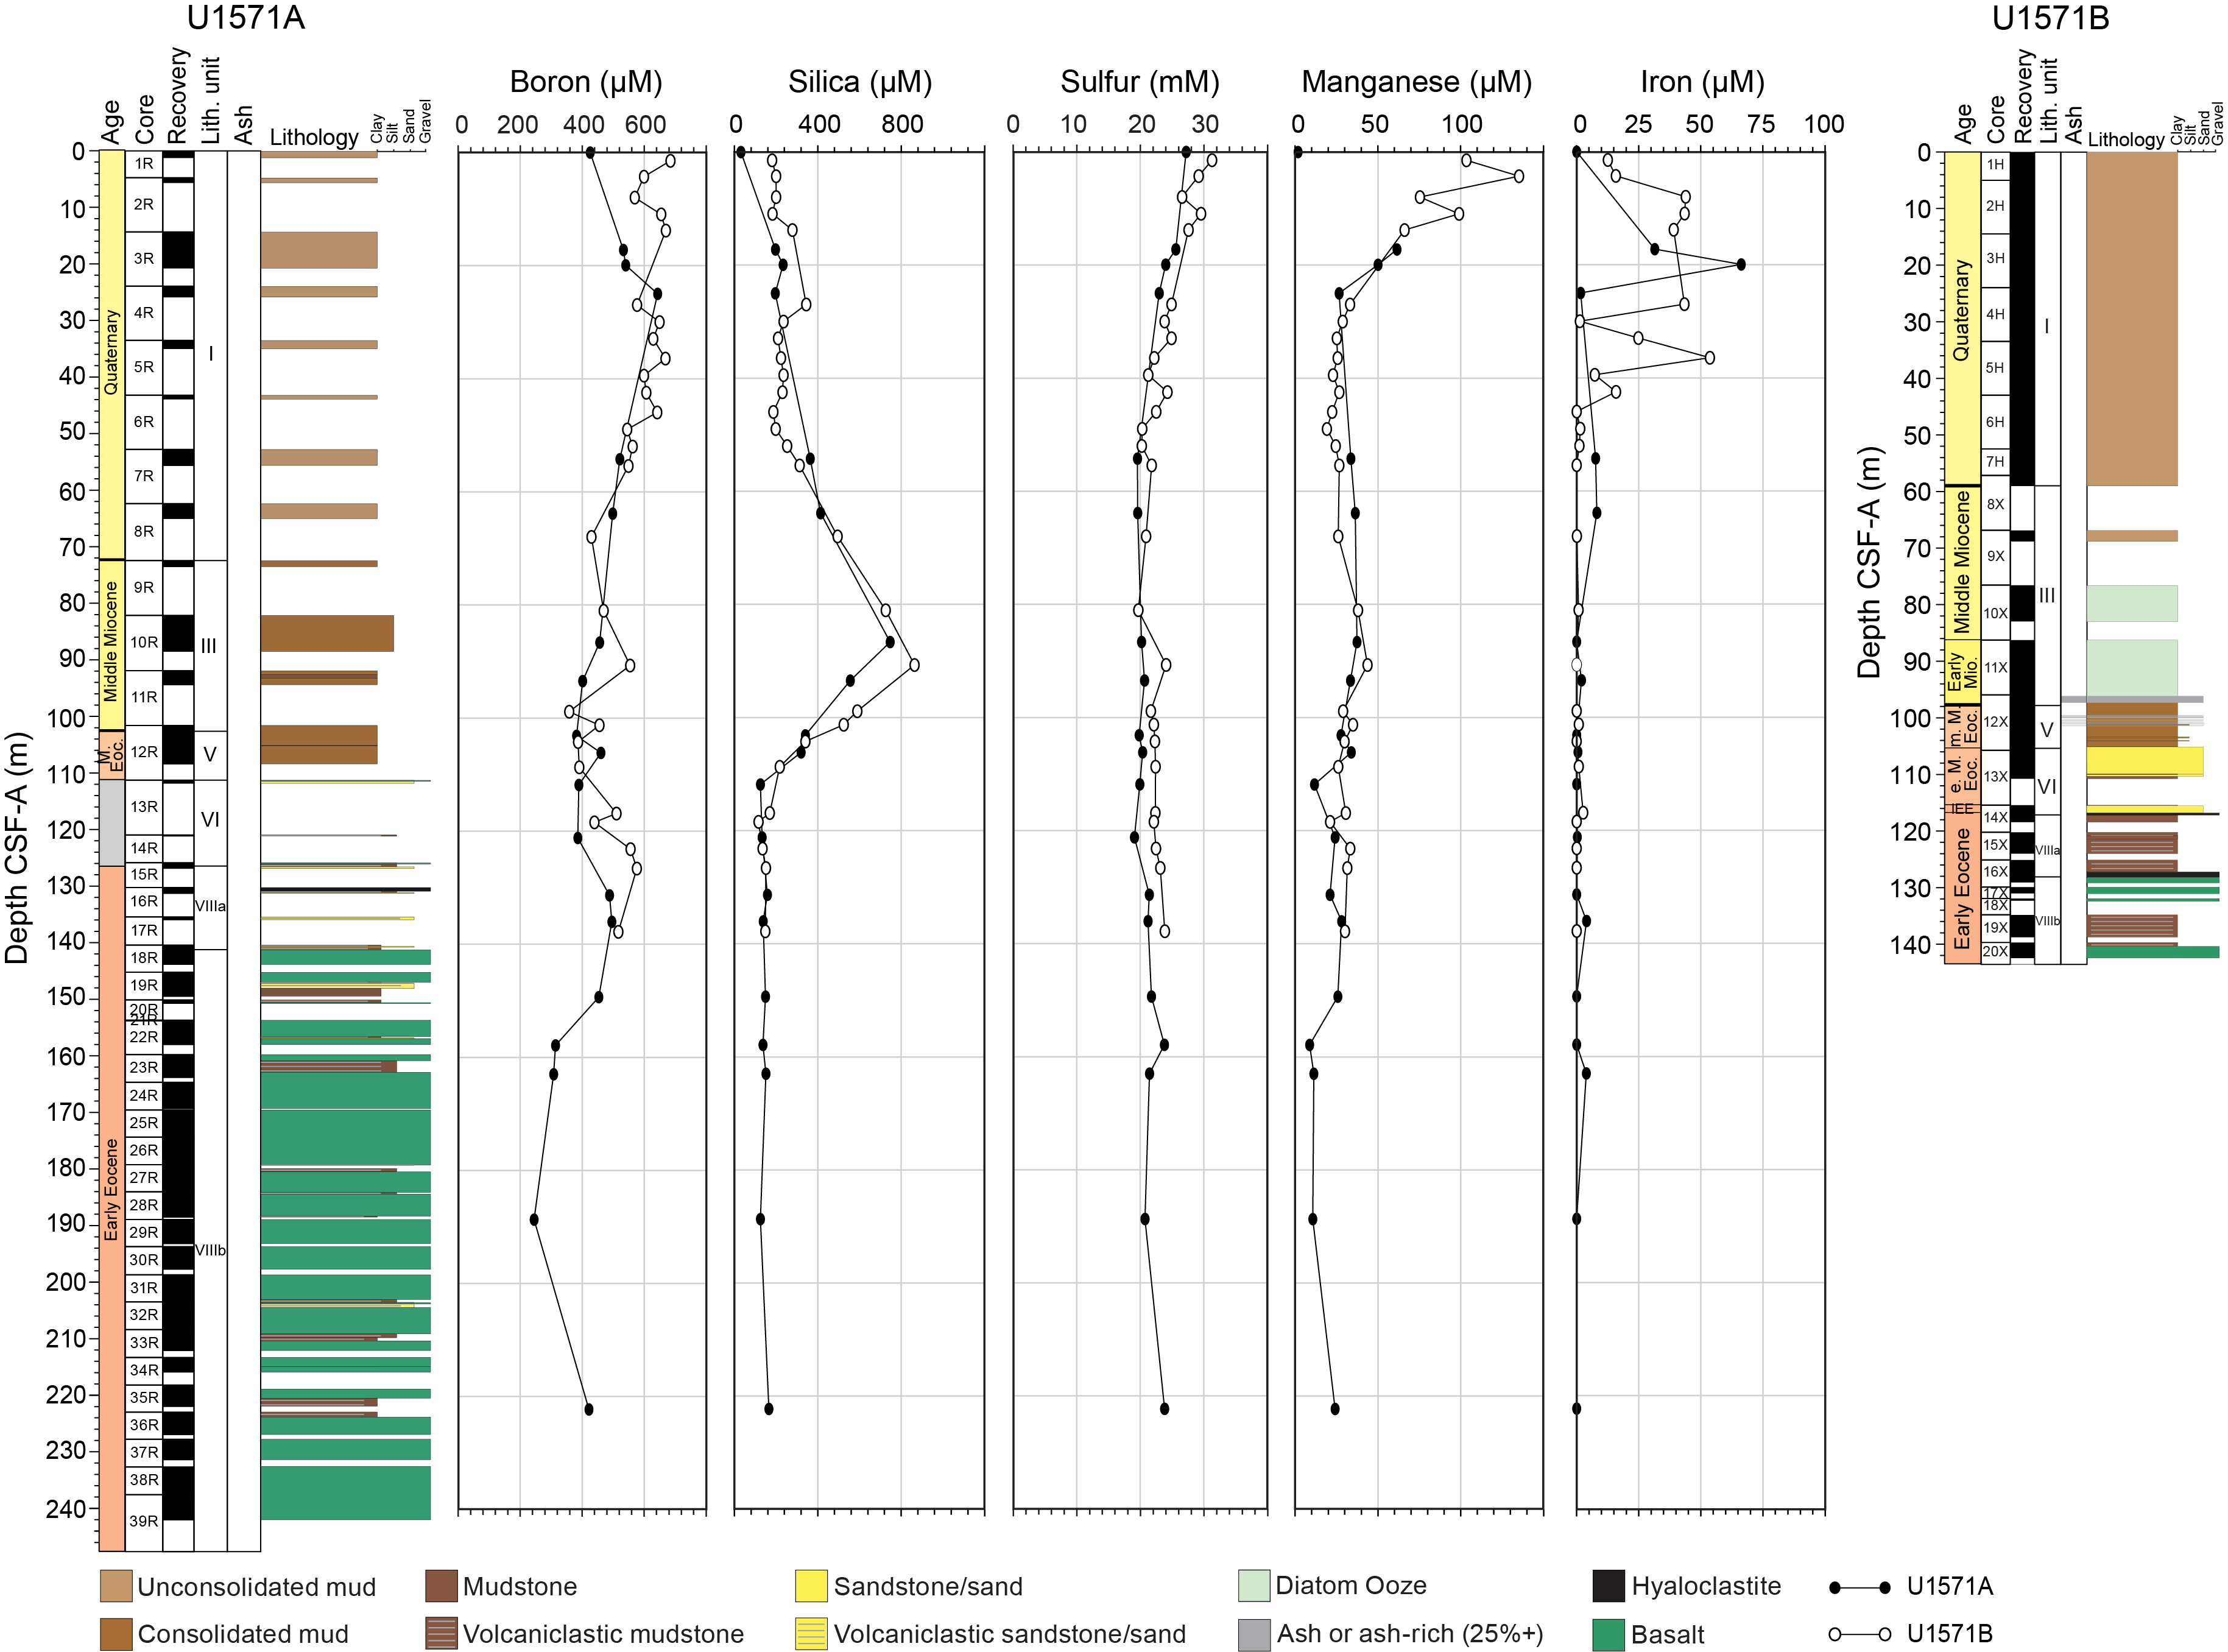
Figure F37. B, Si, S, Mn, and Fe, Site U1571.
Dissolved Si concentrations show interesting variations in both holes. Between 60 and 110 m CSF-A, corresponding to Lithostratigraphic Units III and IV (see Lithostratigraphy), concentrations are elevated to 864 µM (Figure F37). Above and below this interval, concentrations are fairly consistent at ~200 µM. The high Si contents in these strata are likely due to the prevalence of diatomaceous ooze and frequent ash layers, saturating siliceous phases in pore waters through marine silicate weathering (Torres et al., 2020; Longman et al., 2021). Manganese and Fe profiles show clear enrichments in the upper 30 m in both holes, and concentrations are as high as 130 and 60 µM, respectively (Figure F37). Below this interval, concentrations of both elements drop, and values reach as low as 20 µM for Mn and 5 µM for Fe by 50 m CSF-A. For both elements, there is limited evidence for a slight increase immediately above the basalts and within the interbasalt sediments (Figure F37).
The elemental IW profiles appear to reflect the dominant influence from basalt alteration on their composition. The formation of authigenic clay minerals like smectite and illite acts to release Ca (along with Na and Sr) during the transformation reactions, whereas Mg and K are incorporated into the mineral structures (Lyons et al., 2000; Seyfried and Bischoff, 1979; Seyfried and Mottl, 1982). The low alkalinity may also be related to these reactions, with clay authigenesis releasing H+ ions (Seyfried and Bischoff, 1979). Basalt alteration is also the likely cause of the enrichment of Fe and Mn at and around the basalt/sediment boundary, where both elements are known to be released because of dissolution (Seyfried and Bischoff, 1979).
6.1.2. Site U1572
In general, IW compositions at Site U1572 show similar trends to those at Site U1571. The data from Holes U1572A and U1572B are consistent because the two holes are located just 20 m apart. Alkalinity values again begin low (2.3 mM at the surface), rise rapidly to a peak 9.6 mM at 51 m CSF-A, and slowly decrease through the remainder of the sediment succession (Figure F38; Table T14). This culminates in 2.6 mM at the sediment/basalt interface, which is located at 204 m CSF-A in Hole U1572A and 209 m CSF-A in Hole U1572B. As at Site U1571, pH varies between 7.5 and 8 throughout the two holes and exhibits no clear trends. The NH4+ profile shows the same trend as alkalinity, rising from 70 to 600 µM in the upper 50 m before decreasing to around 70 µM again at the basalt/sediment interface and staying low in the interbasalt sediment. Dissolved S does not follow this pattern, instead falling from surface values (around 27 mM) to below 20 mM by 70 m CSF-A and remaining low for the remainder of the samples from both holes (Figure F39).
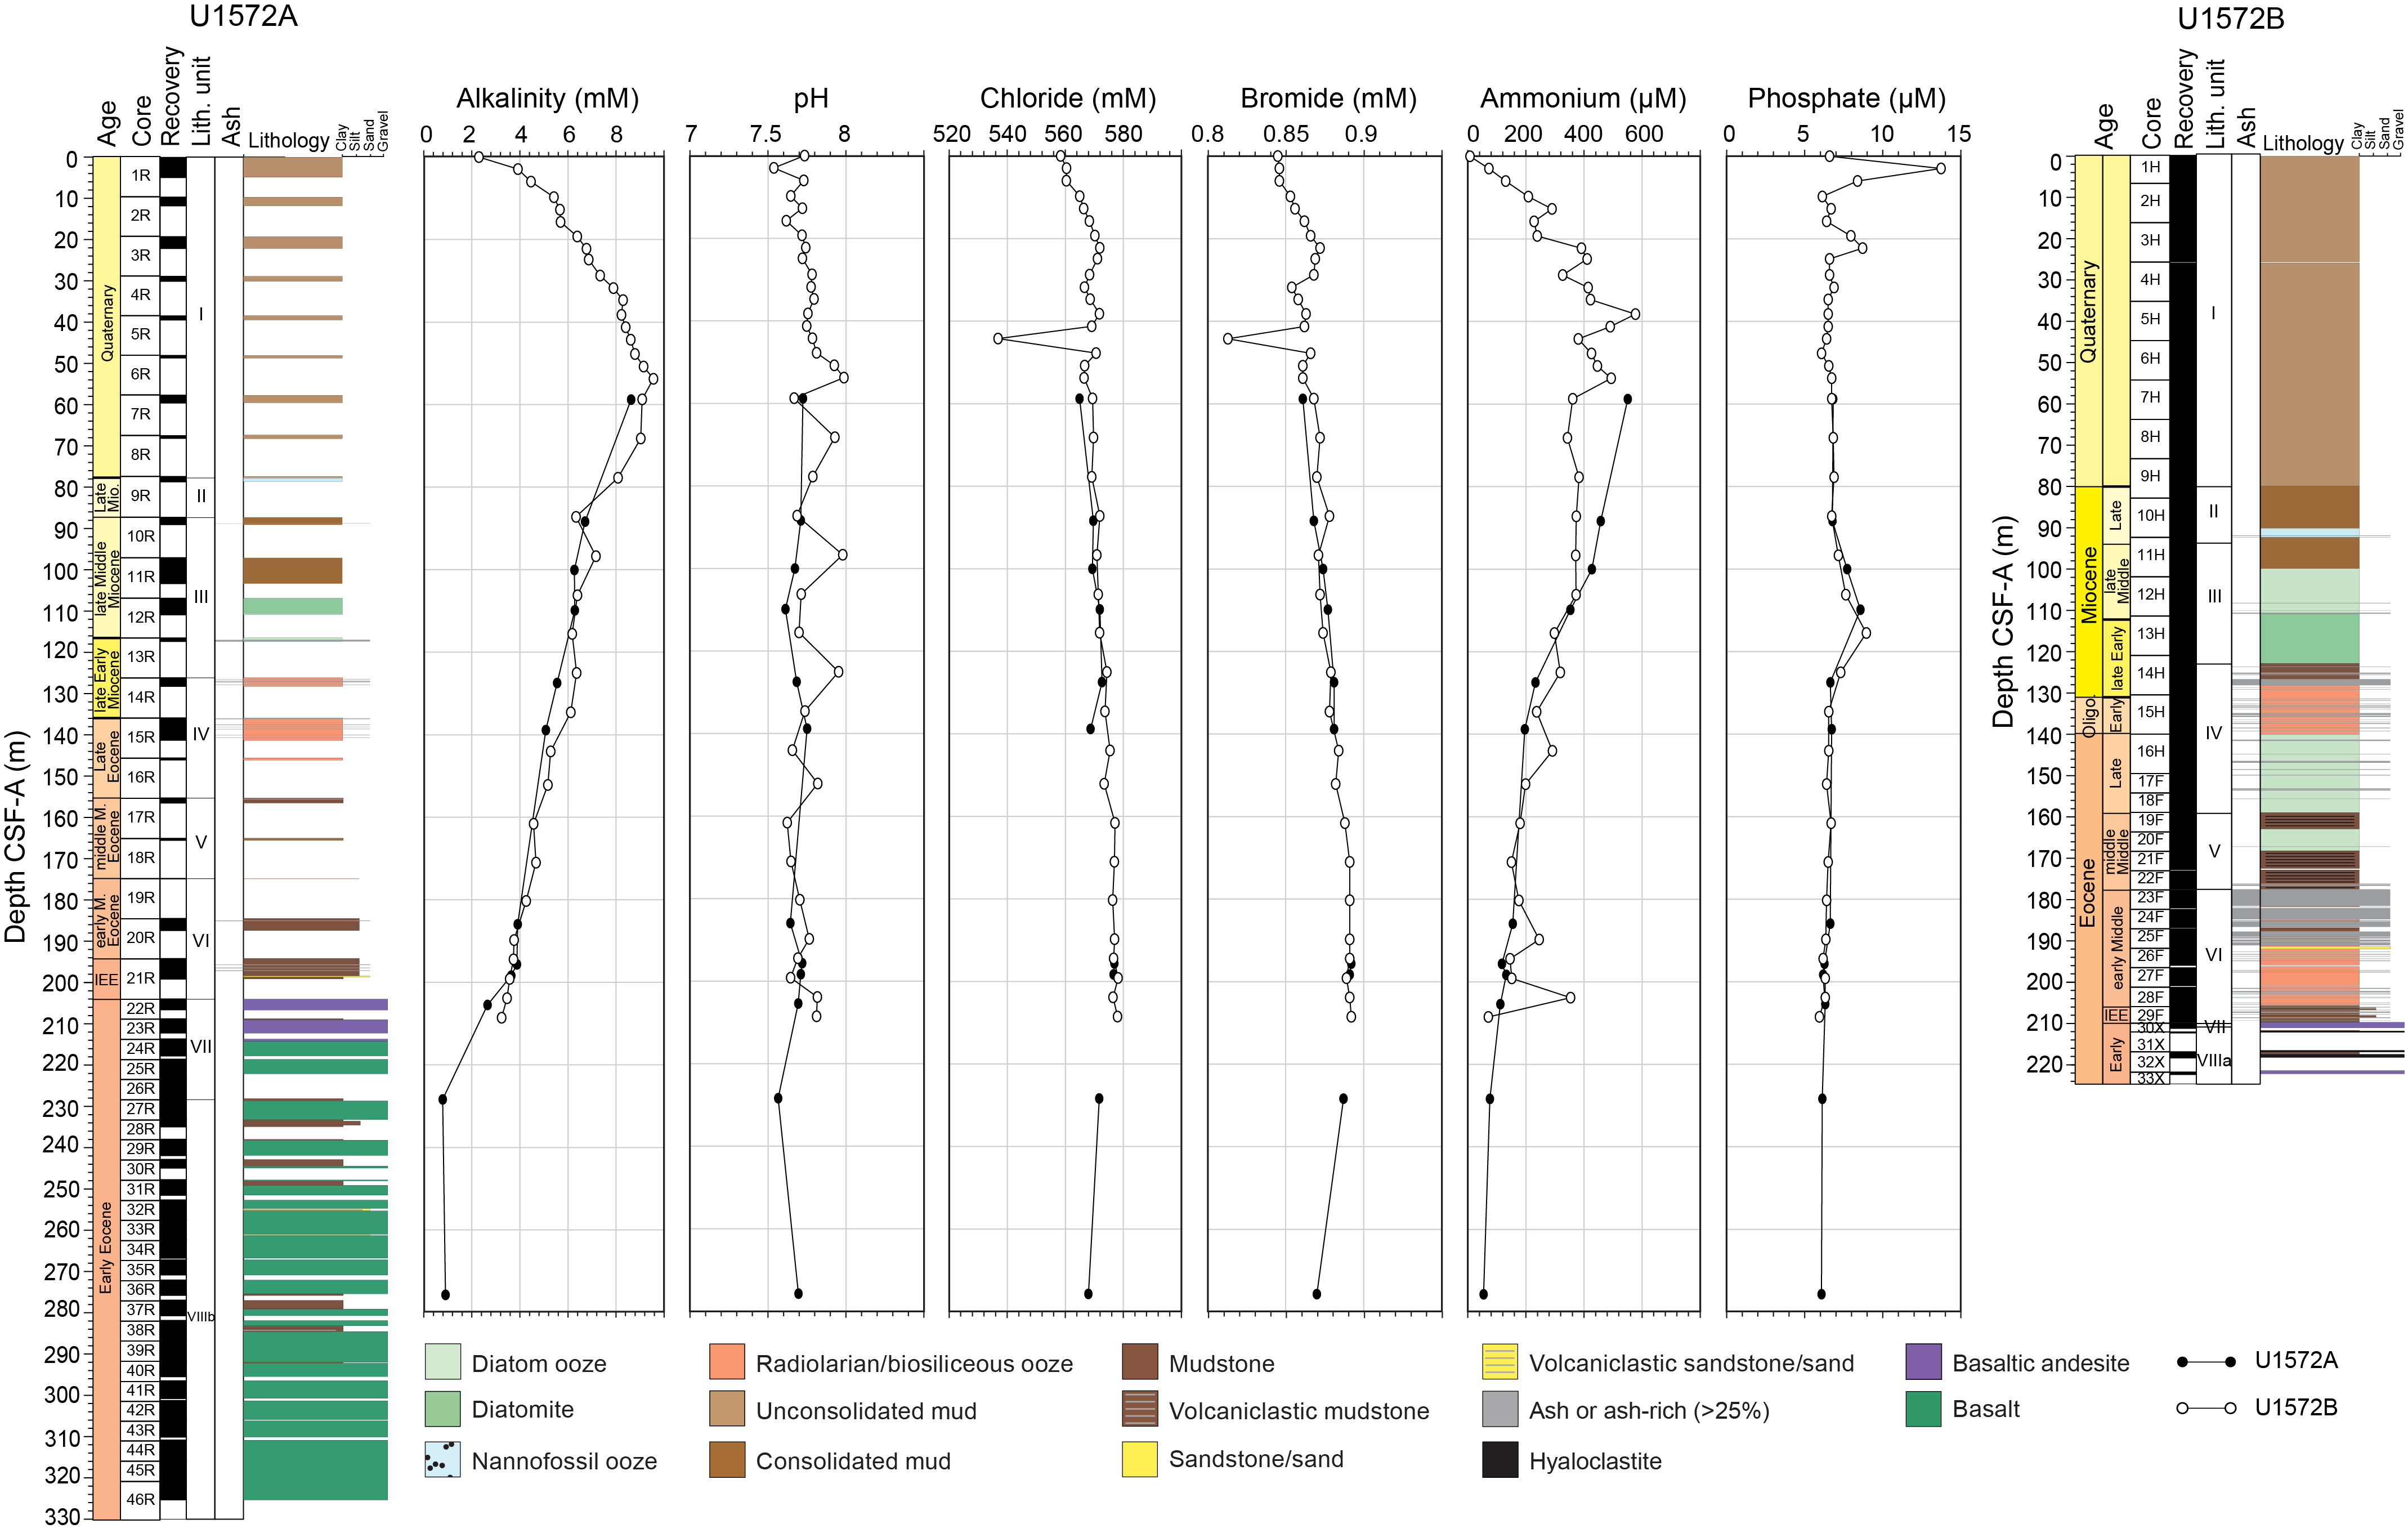
Figure F38. Alkalinity, pH, Cl, Br, NH4+, and PO43−, Site U1572.
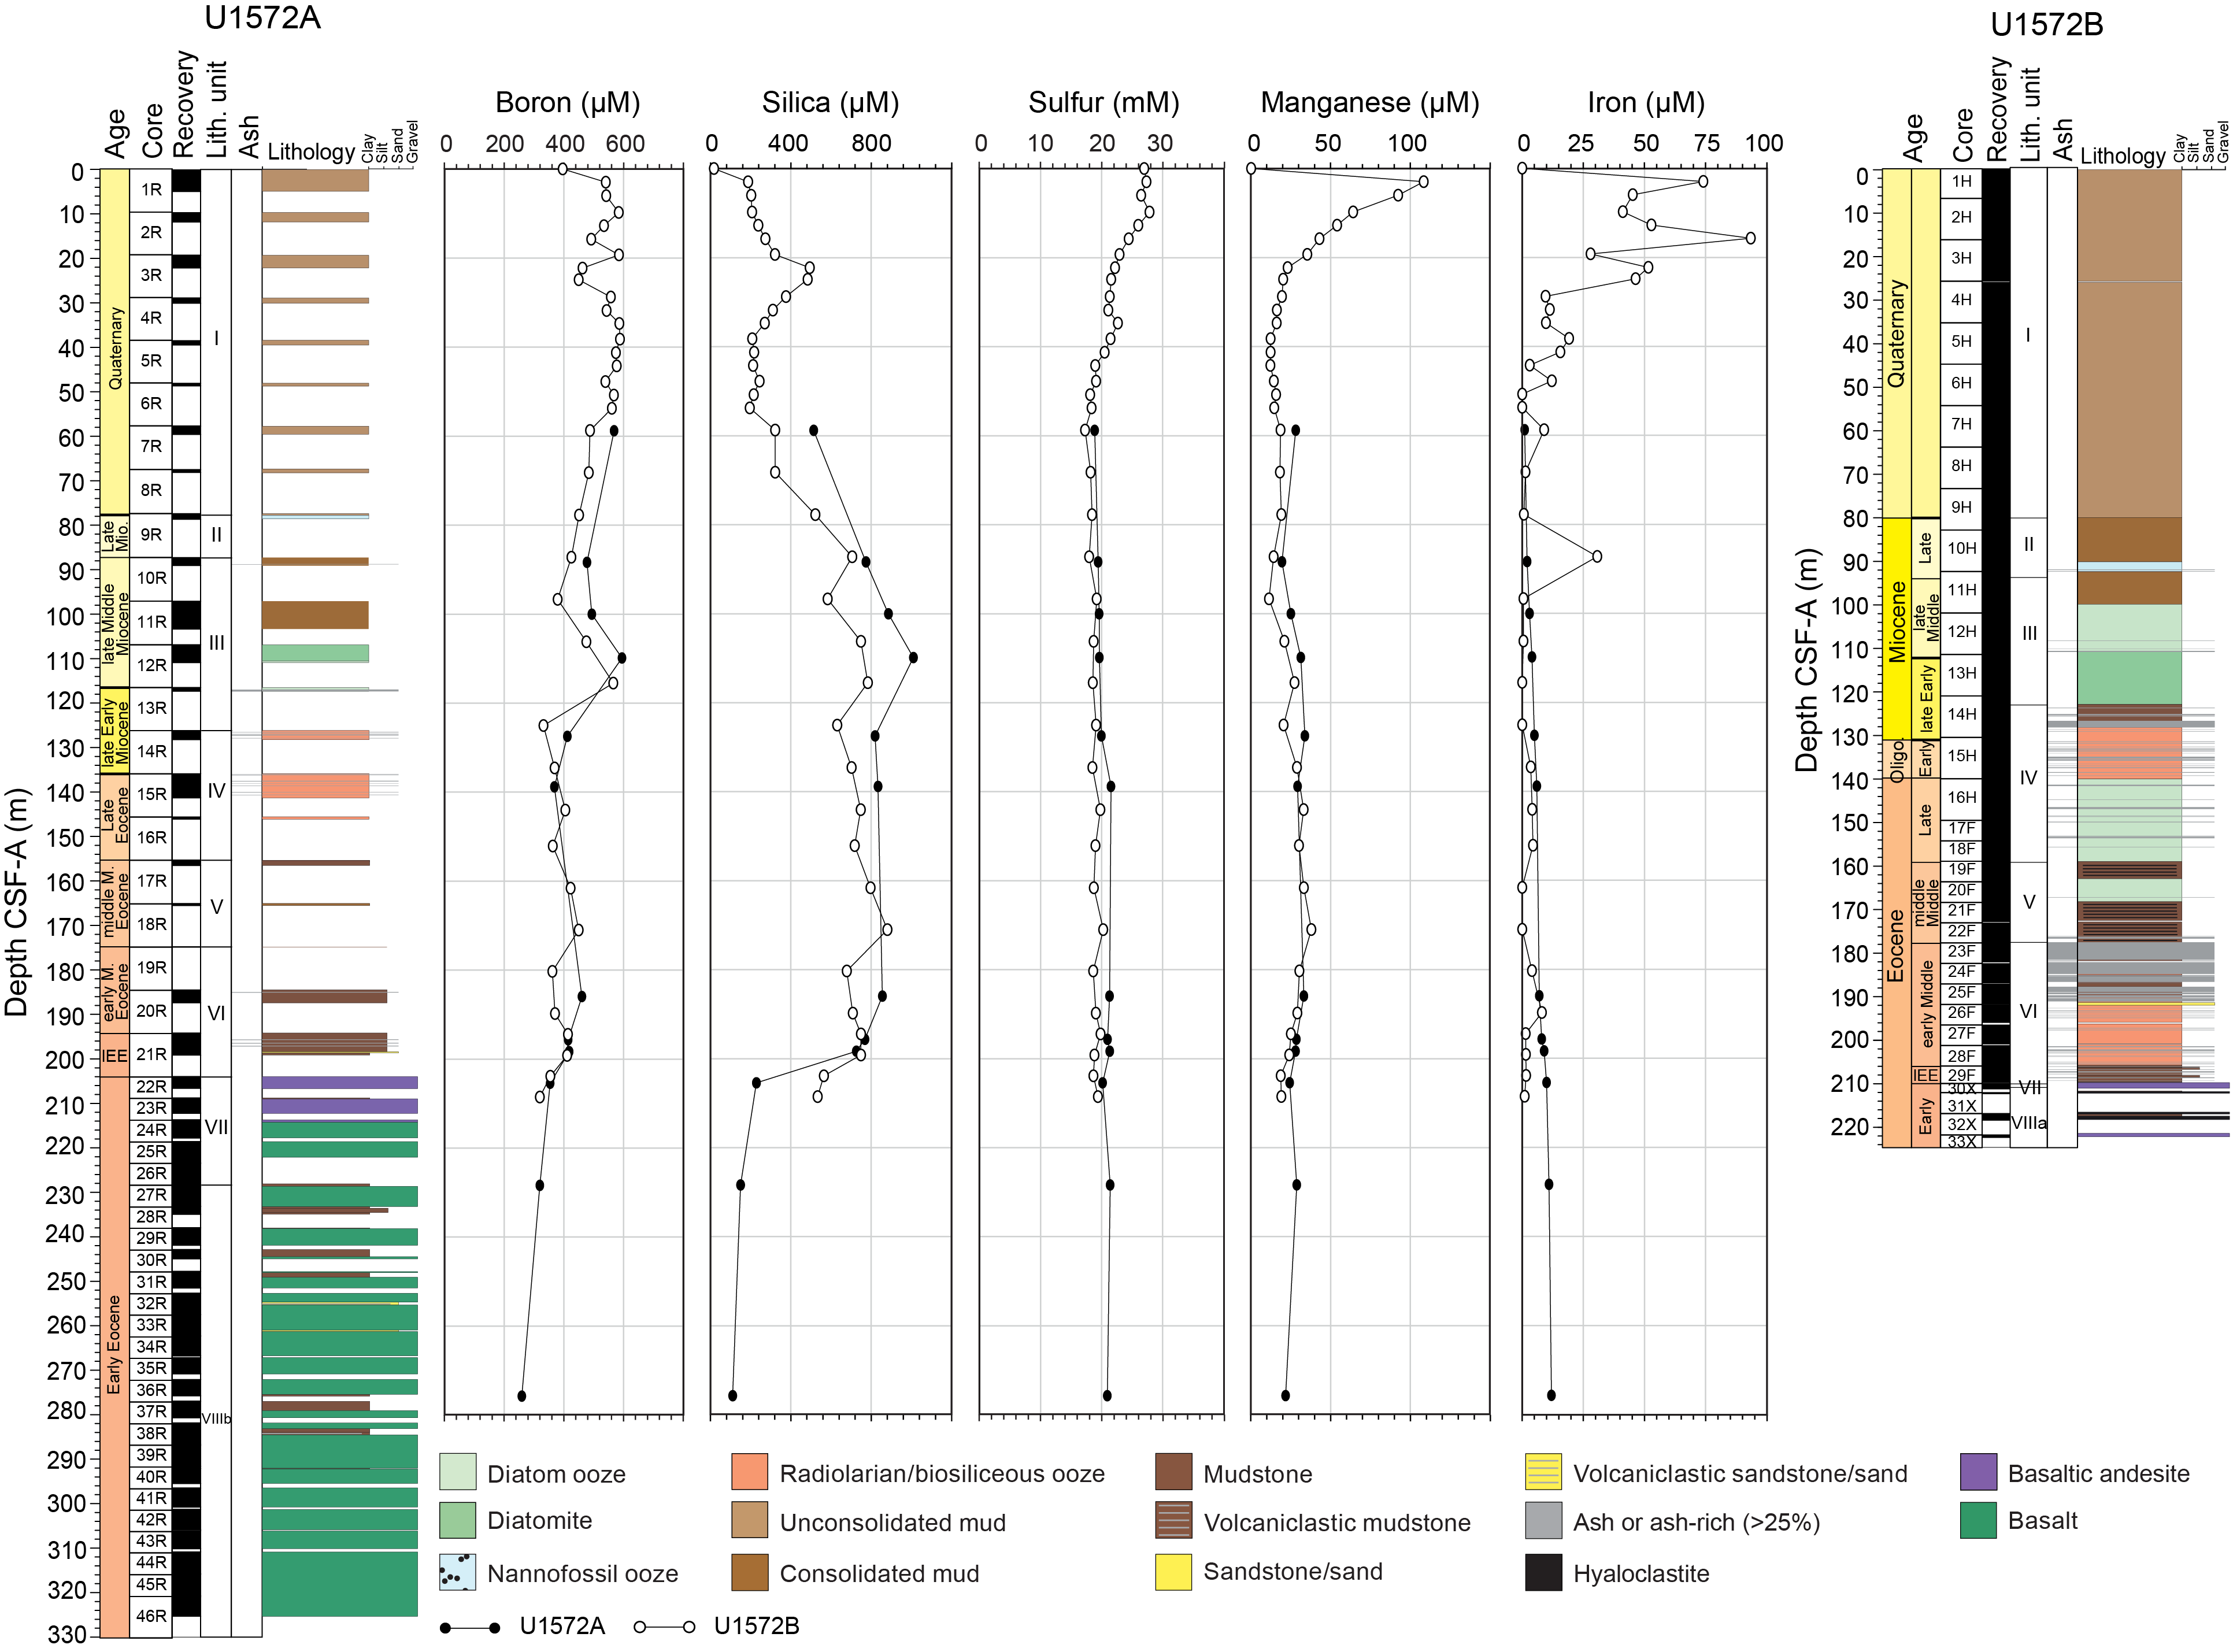
Figure F39. B, Si, S, Mn, and Fe, Site U1572.
In a similar manner to Site U1571, Ca displays conservative behavior and increases from 10 mM in the uppermost sediment to 25 mM at the basalt/sediment interface (Figure F40). Strontium increases from 82 to 120 µM through the sediment package. IW concentrations of Ca and Sr appear strongly influenced by the underlying basalts. Interbasalt sediments show markedly higher concentrations of both elements, as high as 50 mM for Ca and 140 µM for Sr (Figure F40). Other elemental concentrations decrease downcore, and linear trends are observed for Mg (from 52 to 38 mM), K (from 12 to 10 mM), and B (from 600 to 350 µM) (Figures F39, F40). For all these elements, even lower values are present in the interbasalt sediments, where Mg minima is 25 mM, B is 275 µM, and K is 6 mM. The formation of clays during diagenesis has likely removed these constituents from the IW and incorporated them into authigenic minerals (Lyons et al., 2000).
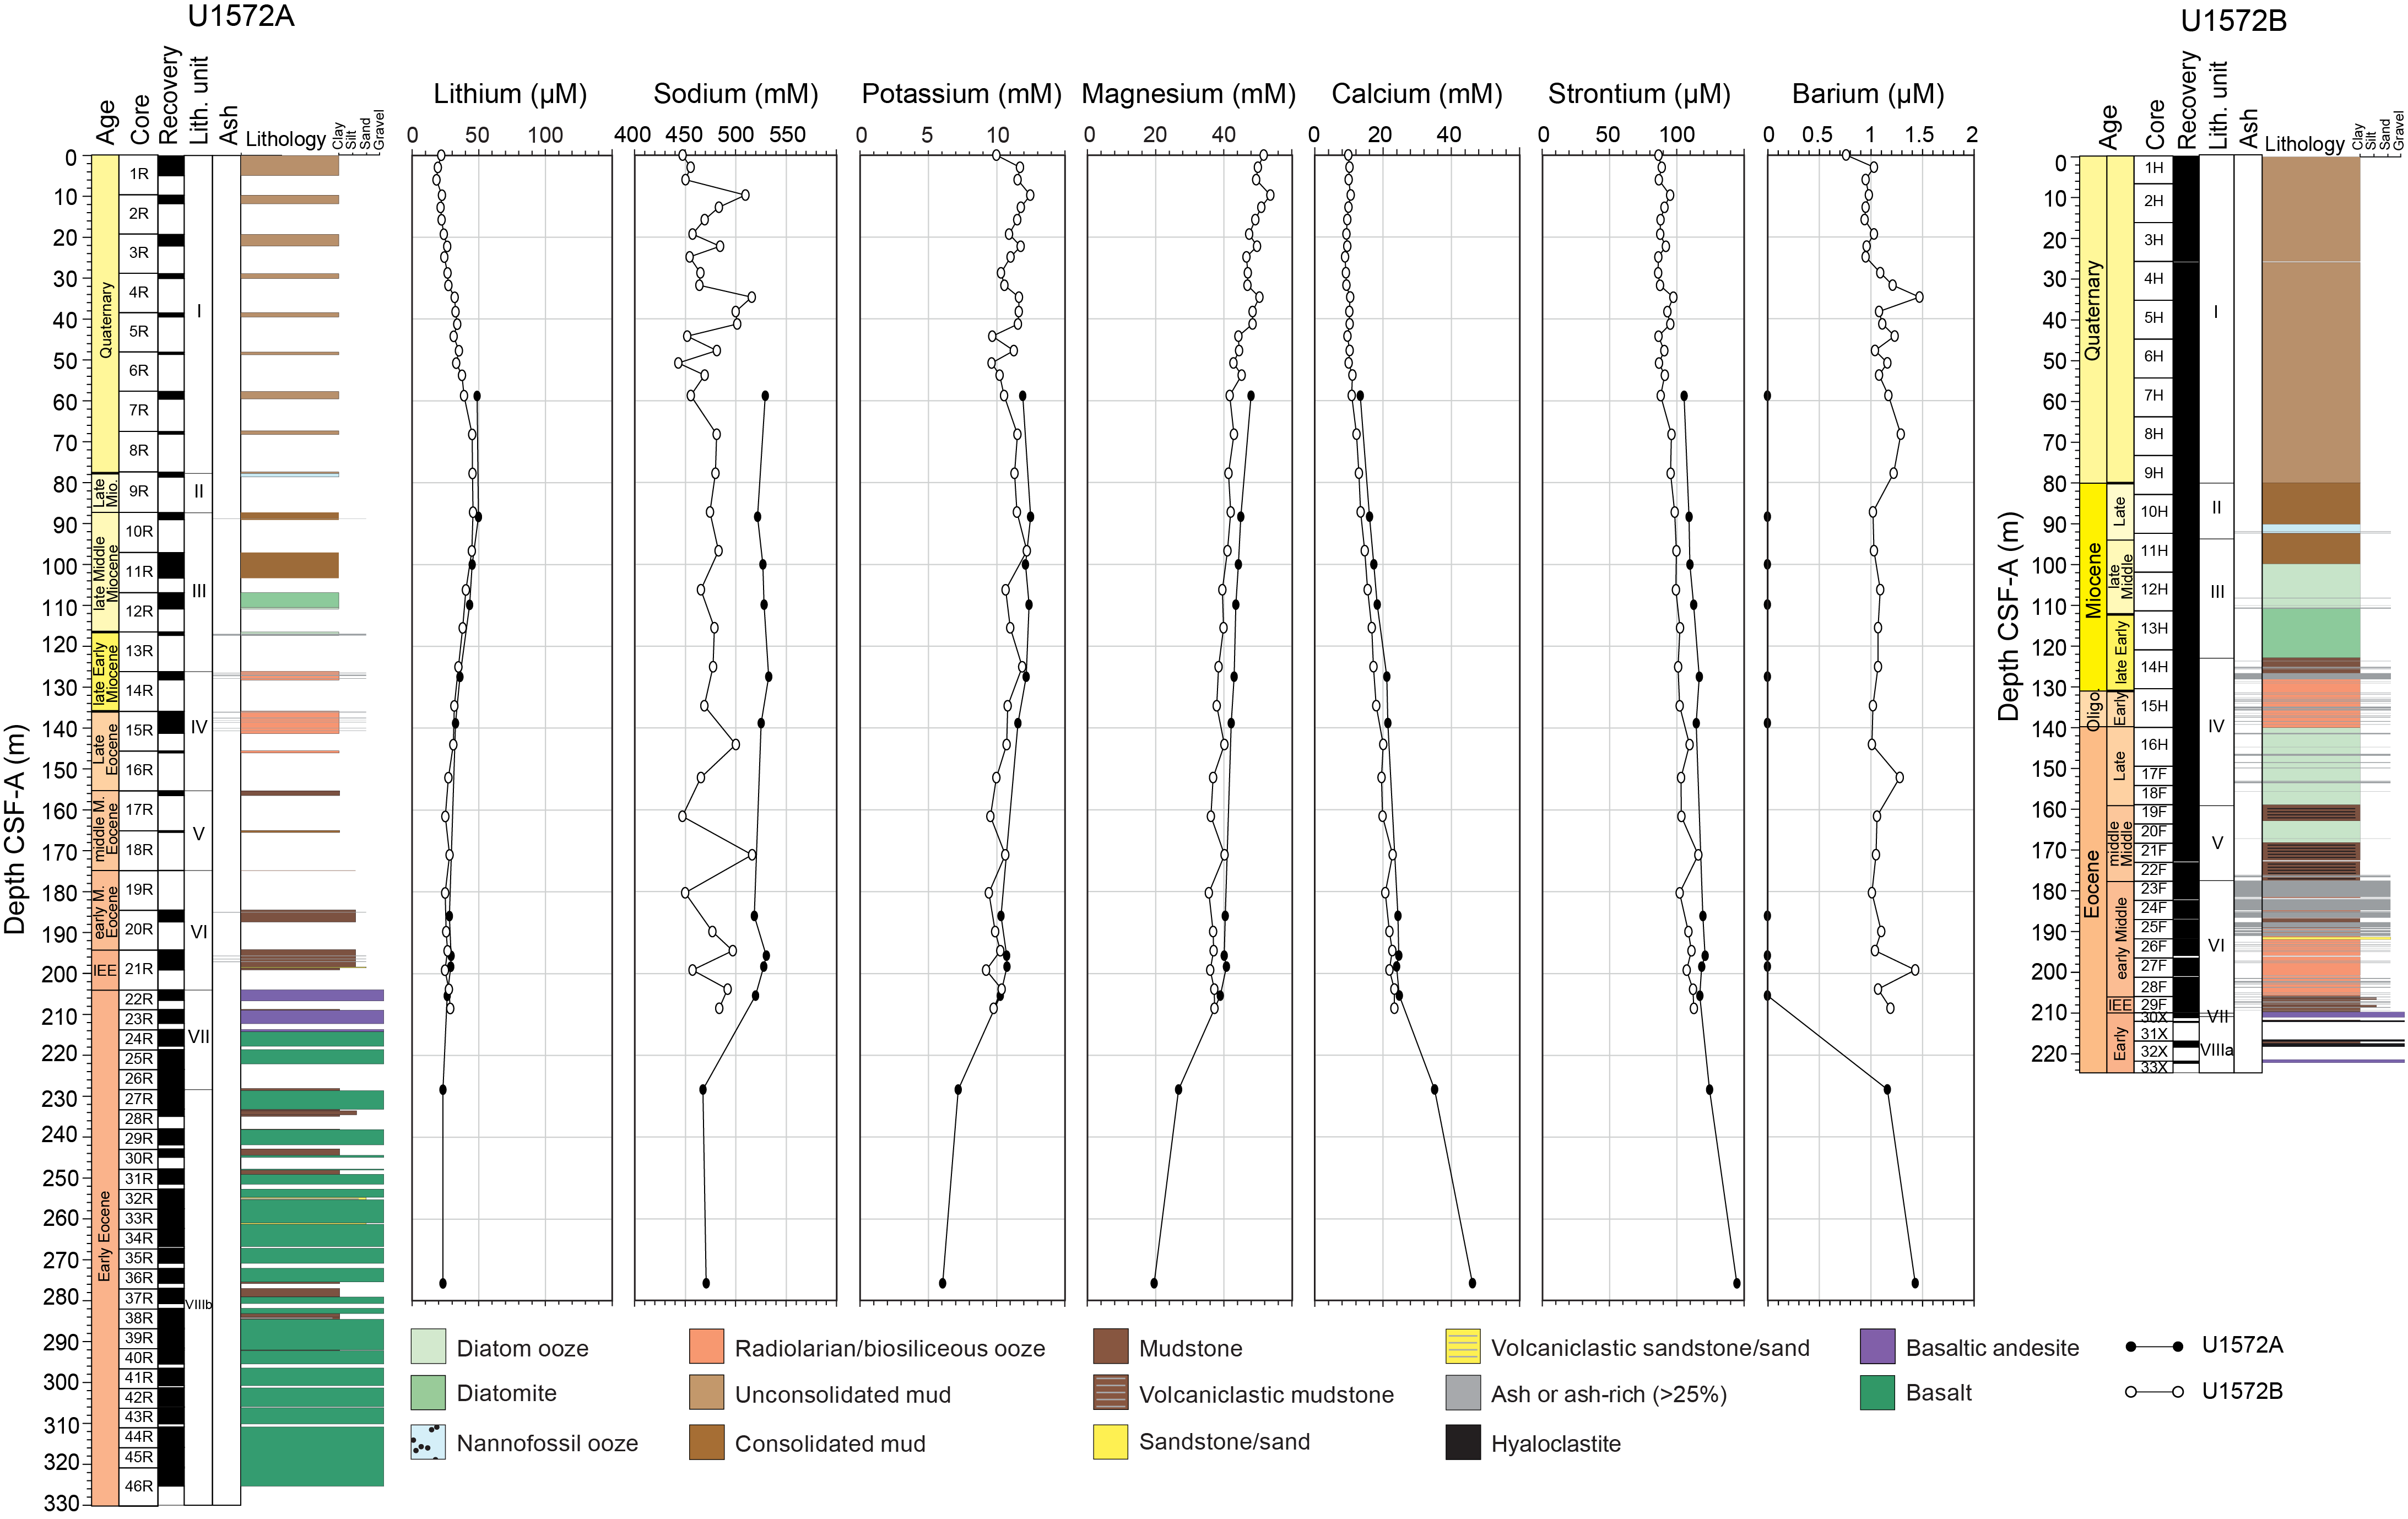
Figure F40. Alkali and alkali earth metals, Site U1572.
Bromide and Cl concentrations increase with depth, rising from 0.84 to 0.89 mM and from 560 to 755 mM, respectively, through the sediment package (Figure F38). For both Br and Cl, there is a short period of rapid rise and fall in concentrations centered on 25 m CSF-A. Sodium content also rises from 200 to 500 mM in the uppermost 25 m of sediment before stabilizing around 500 mM for the remainder of the strata. As at Site U1571, the increased concentration of these elements close to the basalt likely results from their release during clay mineral authigenesis (Lyons et al., 2000; Seyfried and Bischoff, 1979).
Lithium content shows a similar profile to alkalinity content, rising in the upper 50 m of the sediment (from 20 to 50 µM) and then falling to 25 µM by 150 m CSF-A (Figure F39). Interstitial Li content then remains low for the remainder of the samples. Dissolved Si profiles display the most variability of the IW constituents measured, rising in the upper 25 m of sediment from 200 to 500 µM before a sharp drop to around 200 µM by 50 m CSF-A (Figure F39). This is followed by an increase to around 800 µM by 100 m CSF-A. Below this depth, Si content remains high but is much more variable, and concentrations are between 600 and 1000 µM through Units III–V to the sediment/basalt interface. Below this transition, Si content is below 200 µM. The high dissolved Si content again occurs where diatomite and ash contents are high.
Iron and Mn again show different profiles from the rest of the analyzed elements (Figure F39). Both are enriched in the upper 100 m of the sediment (Fe as high as 100 µM and Mn as high as 120 µM) before dropping sharply to much lower values (<10 µM for Fe and around 20 µM for Mn). Concentrations remain low for the remainder of the sediments but show a small increase in the values of both elements between 180 and 200 m CSF-A, which is potentially linked to alteration of the basaltic basement. Barium content does not show a significant trend; most values are between 0.9 and 1.2 µM, and nearly all measurements from Hole U1572A are below the detection limit, with the two deepest samples centering on 1.2–1.5 µM in agreement with measurements from Hole U1572B.
6.1.3. Deconvolved natural gamma radiation
NGR spectra were deconvolved to attain estimates of the K, Th, and U content of the rocks recovered from the two sites. The downcore profiles of K and Th content display similar trends and have an interval of slow decrease between the top of the holes, where values are between 2 and 3 wt% for K and between 6 and 8 ppm for Th, and close to 100 m CSF-A, where K content is around 1.5 wt% and Th is 4 ppm (Figure F41). A short interval of enrichment for both elements at 100–115 m CSF-A corresponds to the nannofossil and radiolarian ooze reported in Lithostratigraphy. Below this depth, K and Th contents are low and values are around 1 wt% and 2 ppm, respectively, for the remainder of the core. Below 210 m CSF-A and corresponding to the shift to basalts, values remain low but exhibit much higher variability. U content shows a similar trend, falling from 3 ppm at the top of the sediment to below 1 ppm below 115 m CSF-A.
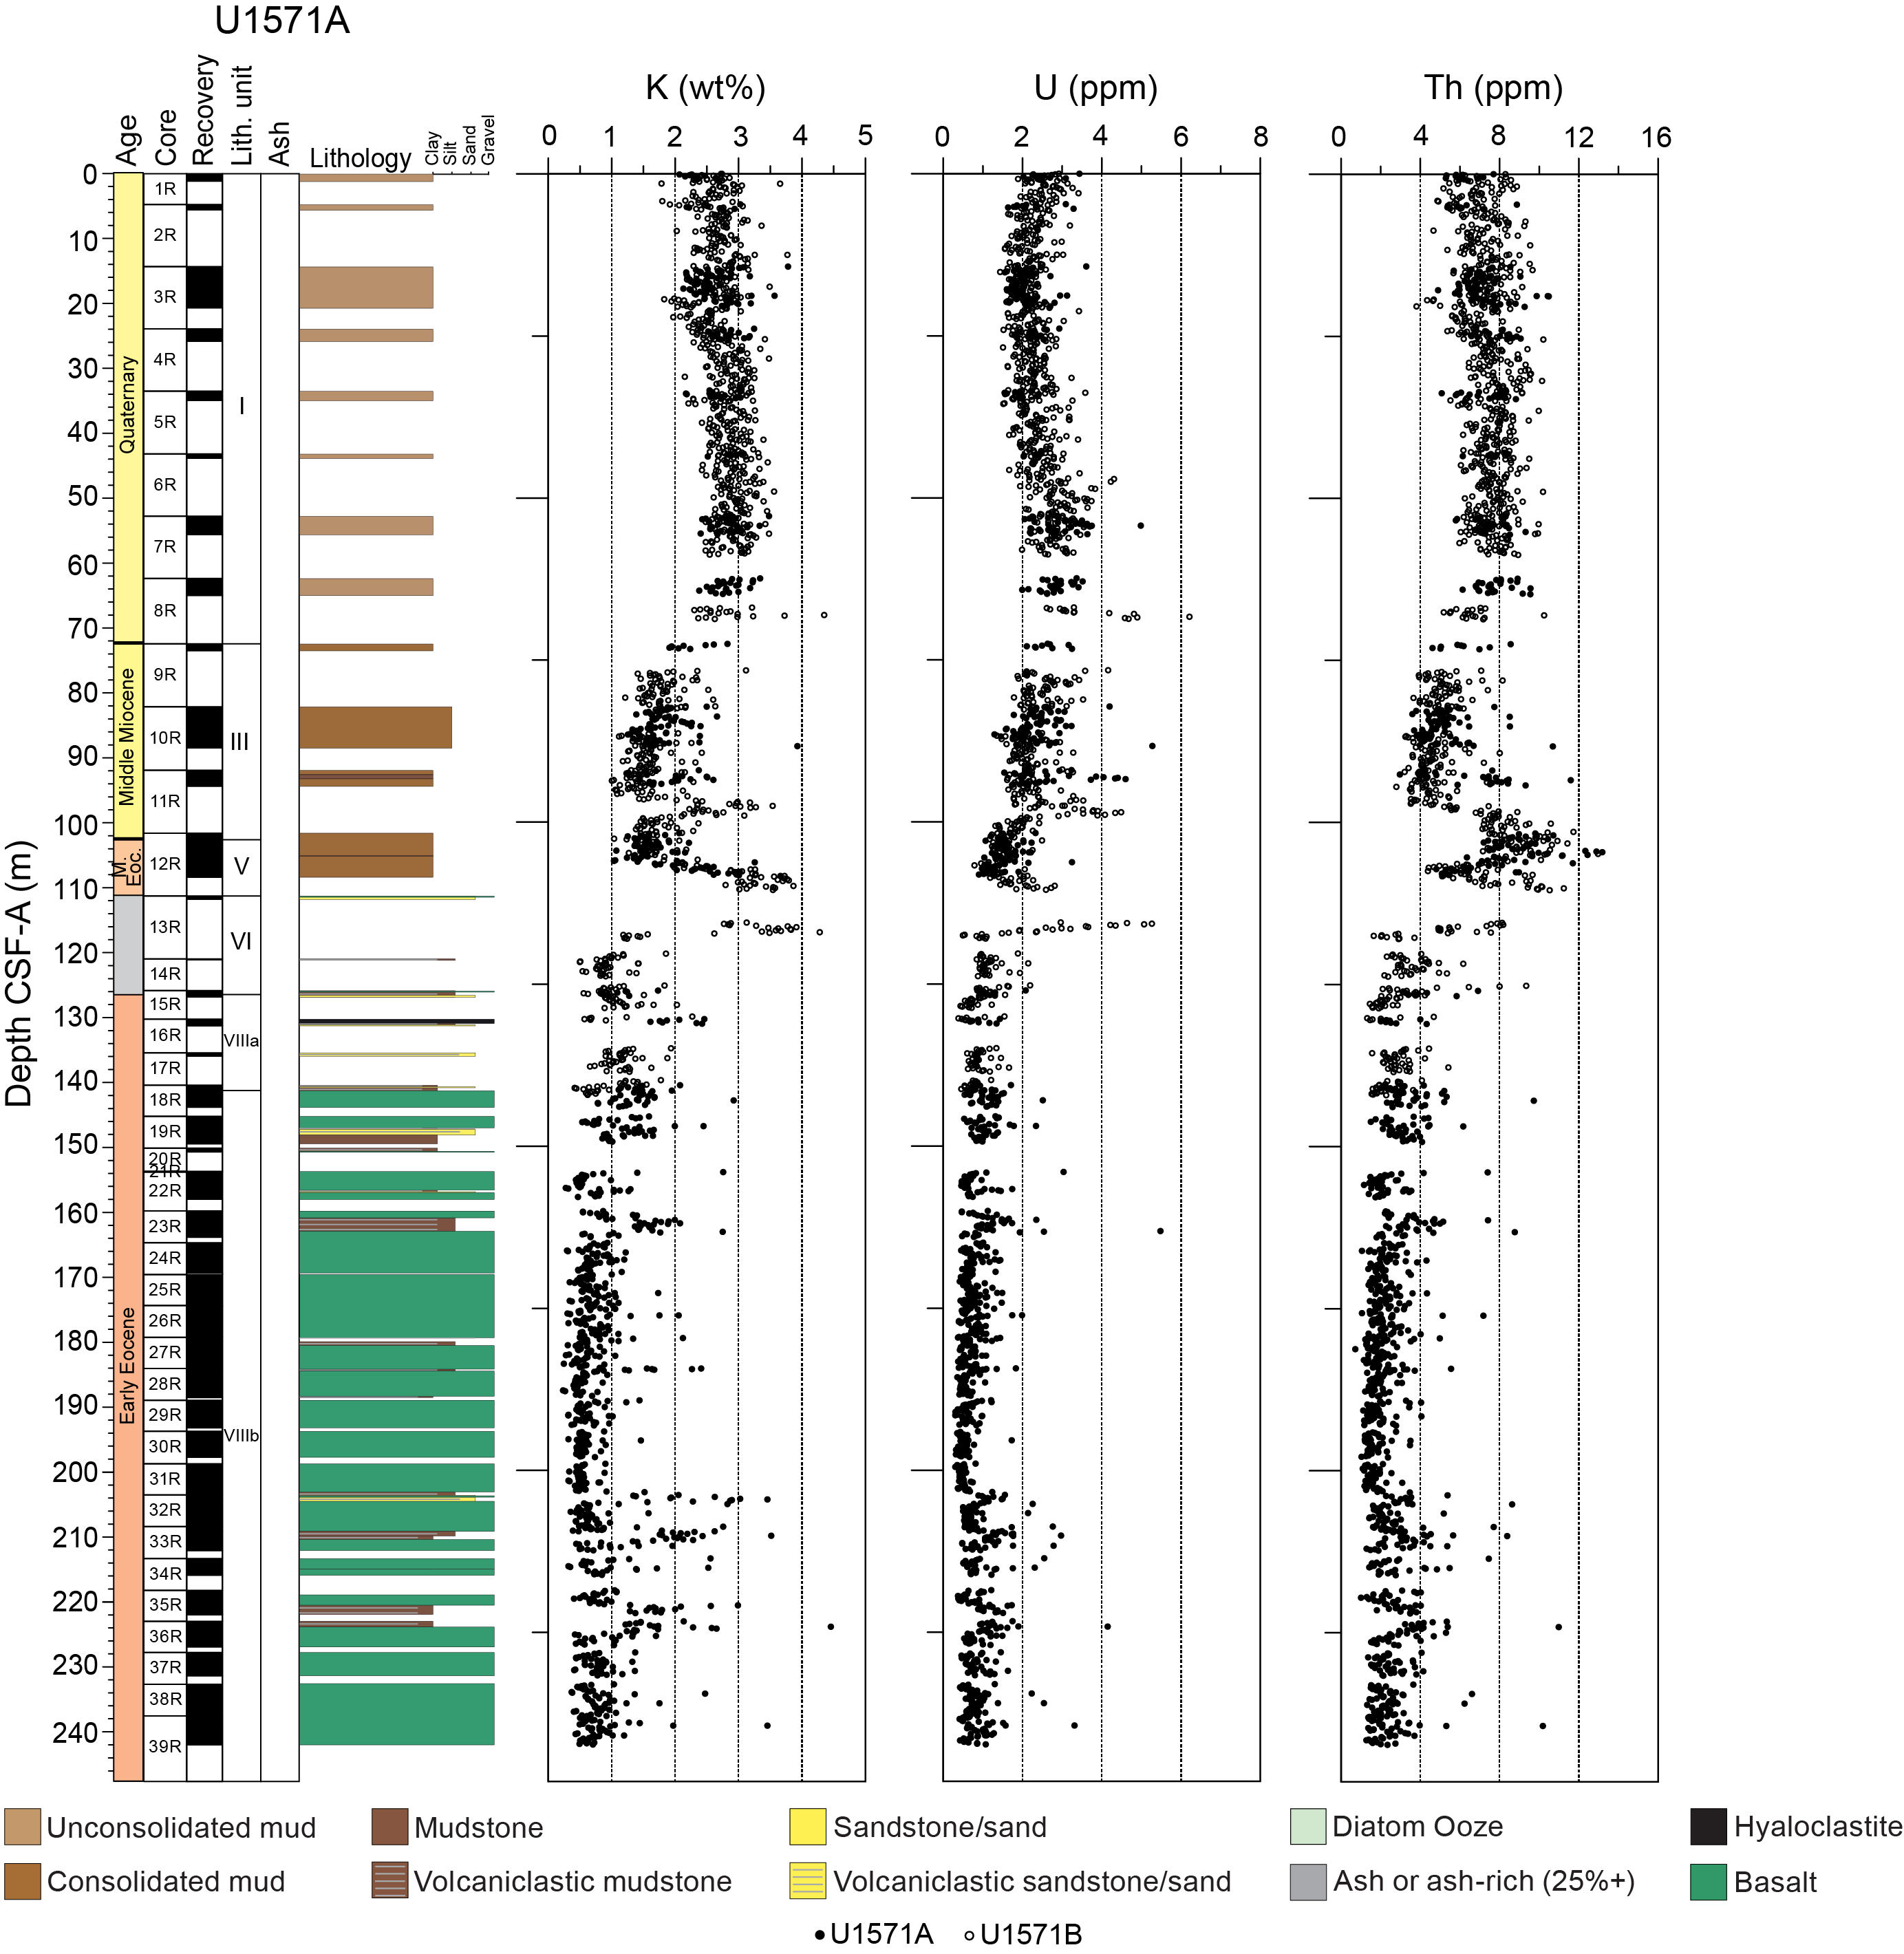
Figure F41. K, U, and Th, Site U1571.
In Holes U1572A and U1572B, a similar general trend is present. Values of all elements are relatively stable for the uppermost 75 m (K = 2–4 wt%, U = 1–3 ppm, and Th = 6–9 ppm) before dropping sharply to low concentrations at 90 m CSF-A. Between 90 and 205 m CSF-A, variability in the concentrations of all elements is higher. K ranges 0.5–4.5 wt%, U is between 1 and 7 ppm, and Th is between 2 and 14 ppm. This variability appears to be associated with the range of lithologies present in the holes. Below 205 m CSF-A in Hole U1572A and corresponding to the shift into the underlying basalt, the concentrations of all elements drop (Figure F42). For the remainder of the hole, K content is below 1 wt%, U is below 1 ppm, and Th is below 3 ppm.
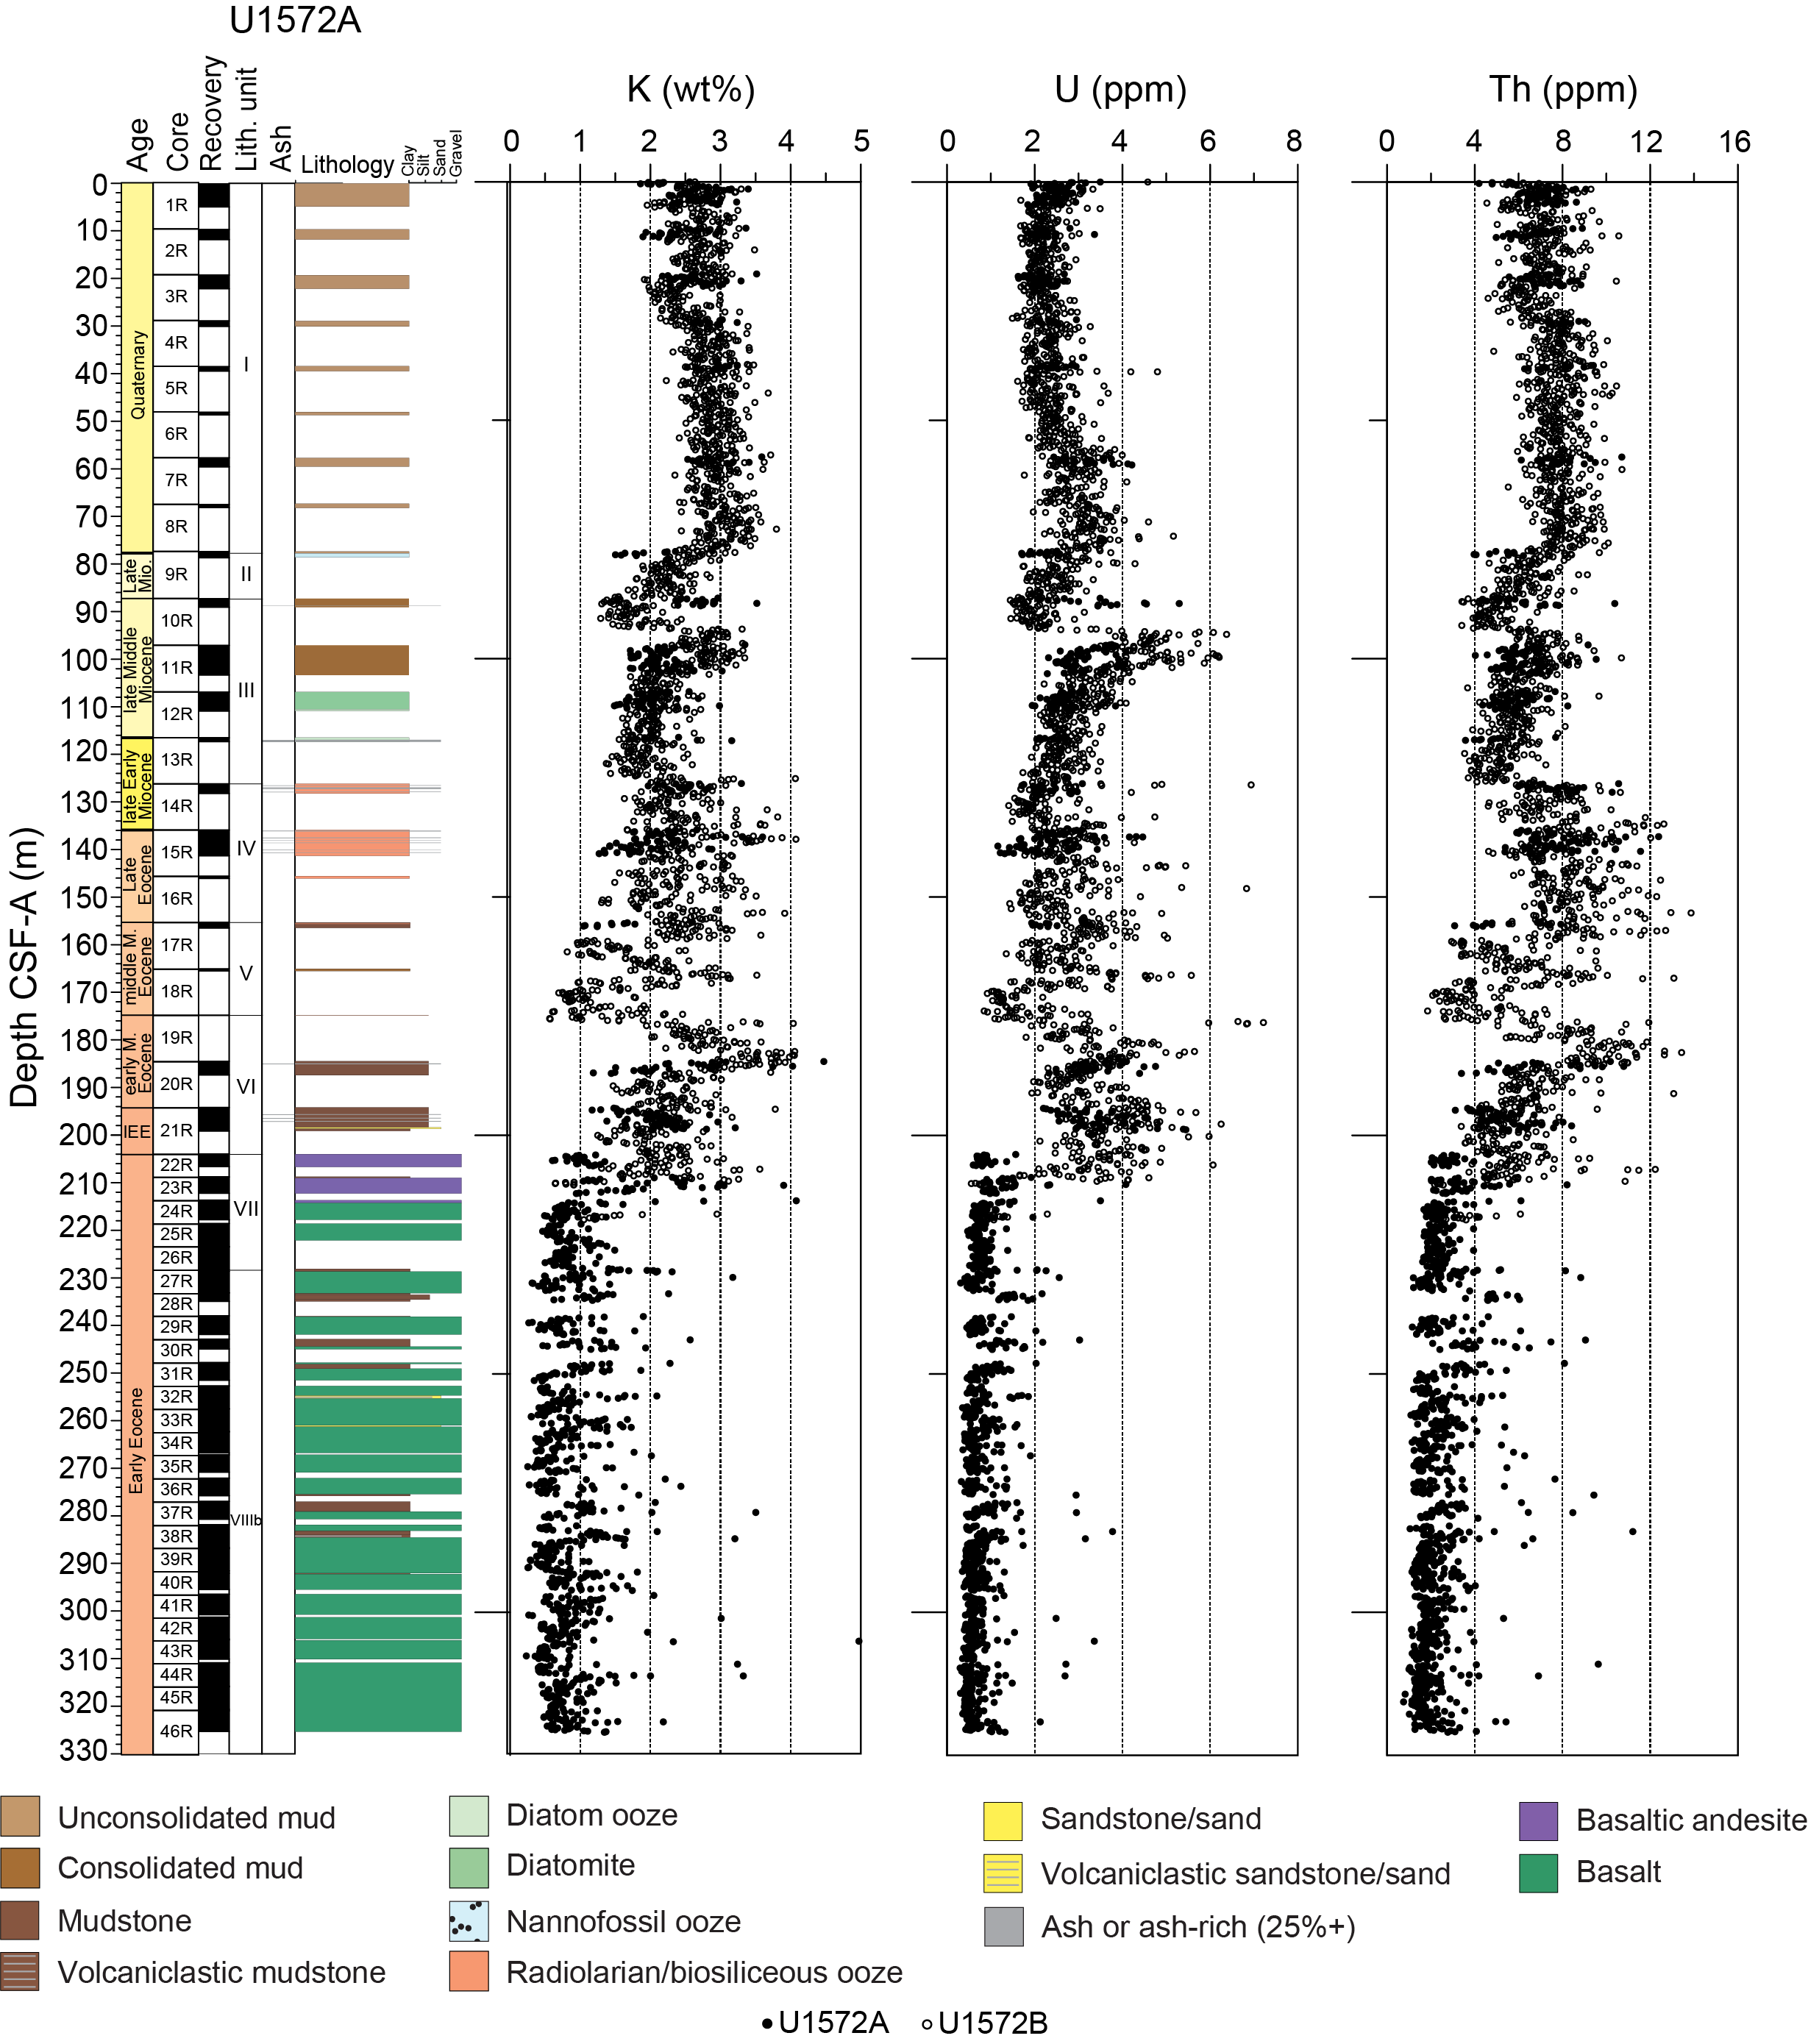
Figure F42. K, U, and Th, Site U1572.
6.1.4. X-ray diffraction
XRD analyses of the sediments at Site U1571 show that the sedimentary package is dominated by quartz, muscovite, and clays such as montmorillonite and kaolinite. Closer to the sediment/basalt interface, sediments are dominated by the products of volcanic alteration such as smectite and zeolites, with some primary minerals from the basalt such as labradorite and spinel. At Site U1572, quartz, albite, and muscovite are the primary components of the sediment, and calcite is present in the nannofossil ooze (Section 396-U1572A-9R-1). Again, close to the sediment/basalt interface the mineralogy is dominated by alteration products such as smectite and some primary volcanic minerals.
6.2. Hard rock geochemistry
6.2.1. Site U1571
For Hole U1571A, a total of 27 samples of igneous rocks from different basaltic lava flows in Unit VIII were analyzed for major and trace elements using ICP-AES (Table T15). Weight loss on ignition (LOI) serves as a rough indicator of the overall level of alteration, and LOI values for unaltered basaltic lithologies are typically <1 wt% (Rhodes, 1996). Some of the samples have LOI as high as 7 wt% (Sample 16R-1, 31–32.5 cm), but the majority of samples have low alteration values of 1–3 wt% LOI (Table T15). The effects of alteration on the suite of elements measured appear to be strongest on the distribution of potassium. Sample 16R-1, 31–32.5 cm, has the greatest K2O content in the basaltic lava flows, reaching 2.1 wt%. In all samples with low LOI values (0–3 wt%), K2O content varies between 0.1 and 0.4 wt% (Table T15). This corroborates the evidence of K-depletion by uptake into secondary clays in IW (Figure F36).
On a total alkalis (Na2O + K2O) versus SiO2 (TAS) diagram (Le Maitre, 1989) (Figure F43A), the samples from Units VII and VIII are plotted in subalkaline basalt to basaltic andesite with normalized SiO2 concentrations ranging from 47 to 58 wt%. On a diagram of V versus Ti (Shervais, 1982) (Figure F43B), samples from Hole U1571A plot in the mid-ocean-ridge basalt (MORB) and back-arc basalt field. When plotted using Ti versus Zr (Pearce and Cann, 1973), a few samples plot in the MORB field (Figure F43C). However, most samples plot outside the typical basalt discrimination fields because of high Ti contents that are indicative of parts of large igneous provinces (Callegaro et al., 2017).
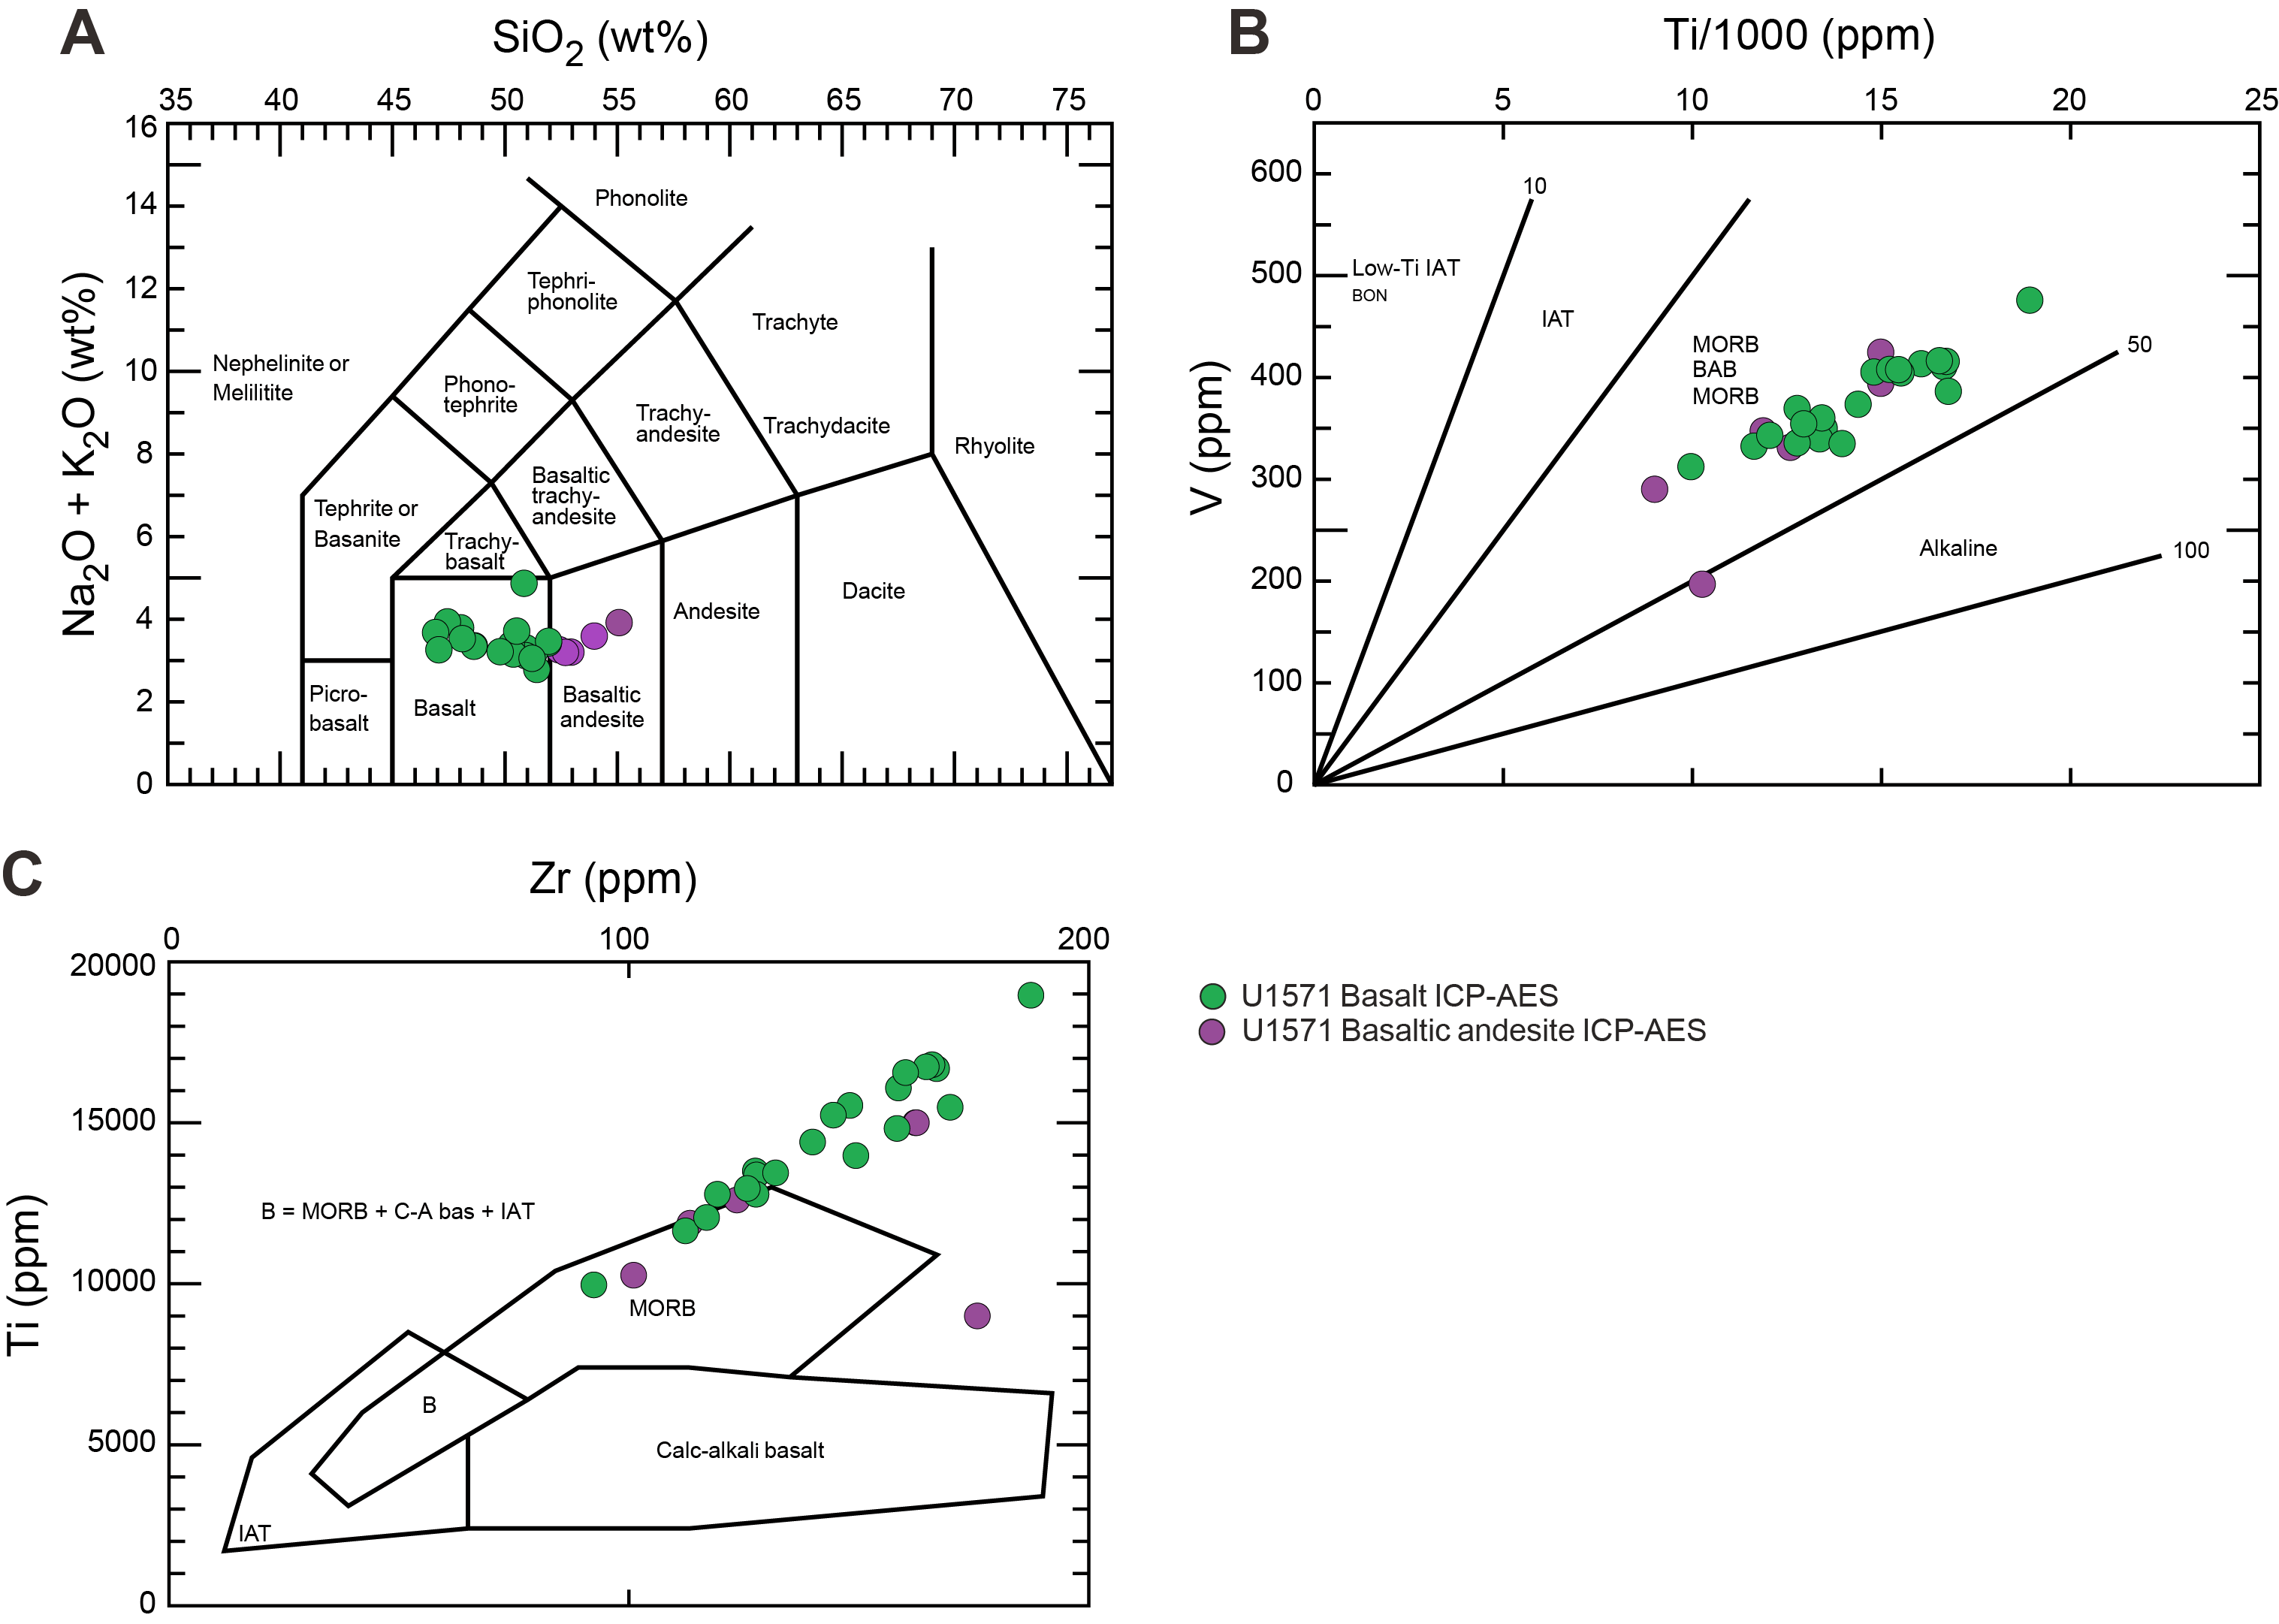
Figure F43. Volcanic rocks, Hole U1571A.
6.2.2. Site U1572
In Hole U1572A, a total of 24 igneous samples were analyzed from different basaltic lava flows in Units VII and VIII (Table T16). LOI varies from 1 to 5 wt%, except for two altered samples (23R-1, 89–92 cm, and 24R-1, 33–35 cm) that have LOI >8 wt%. The basaltic lithologies at Site U1572 have similar chemical compositions to those found at Site U1571. A TAS diagram shows compositions in Units VII and VIII varying from basalt to basaltic andesite in composition and normalized SiO2 concentrations ranging from 43 to 54 wt% (Figure F44A). Site U1572 samples plot in the same MORB/back-arc basalt field as Site U1571 in a V versus Ti diagram (Figure F44B). The same is true for a Ti versus Zr diagram (Figure F44C), although it appears as though there are fewer Ti-enriched samples from the Hole U1572A data set compared to Hole U1571A.
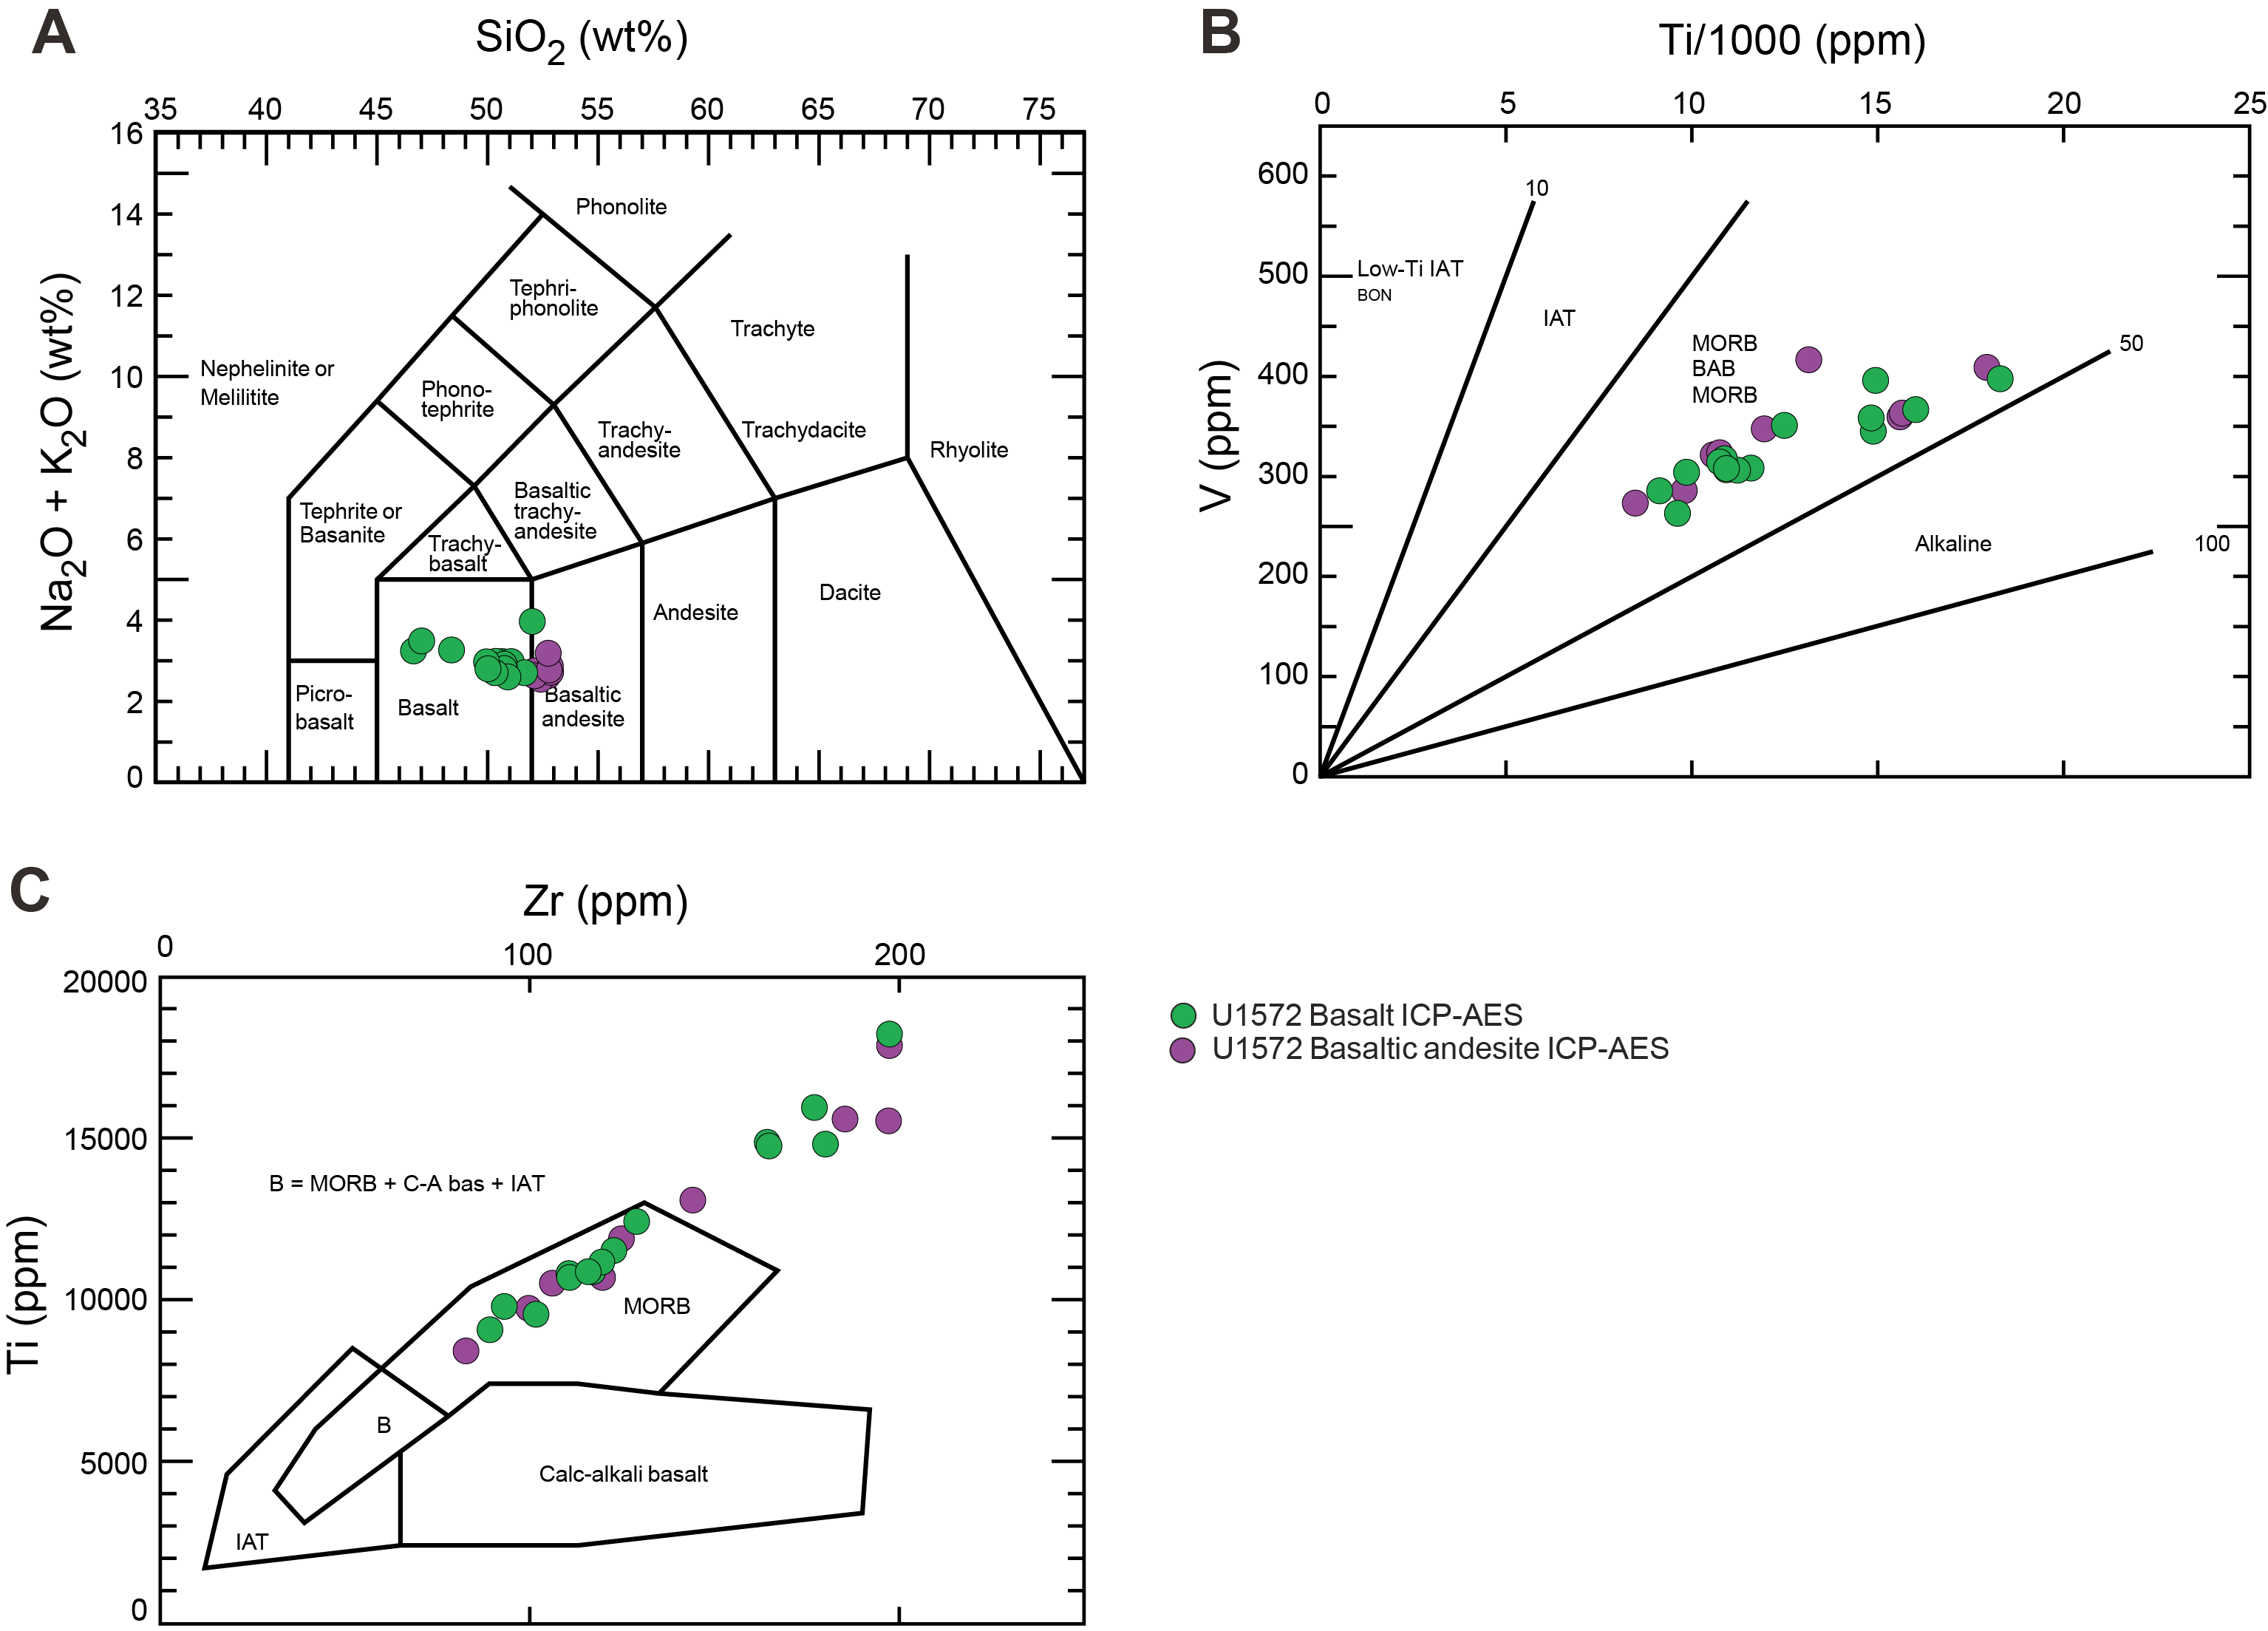
Figure F44. Volcanic rocks, Hole U1572A.
6.2.3. Comparison between hard rock samples
In a TiO2 versus Mg# diagram (Mg# = Mg/[Mg + Fe2+] × 100, assuming FeO/Fe2O3 = 0.85) (Tegner et al., 1998), all the basalts from Holes U1571A and U1572A have TiO2 ranging 1.8–3 wt% and Mg# between 50 and 62 wt% (Figure F45A). When comparing the ICP-AES data from Sites U1571 and U1572 with the upper series of ODP Hole 642E (Meyer et al., 2009) and flood basalts from East Greenland (Tegner et al., 1998), these new data plot mostly in the high-Ti field (>2 wt% TiO2) (Callegaro et al., 2017) but relatively low for the East Greenland suite that have TiO2 contents as high as 6 wt% (Tegner et al., 1998). When plotted on an Mg# versus SiO2 diagram (Figure F45B), most basalts from both sites fall in the range of basic to intermediate composition.
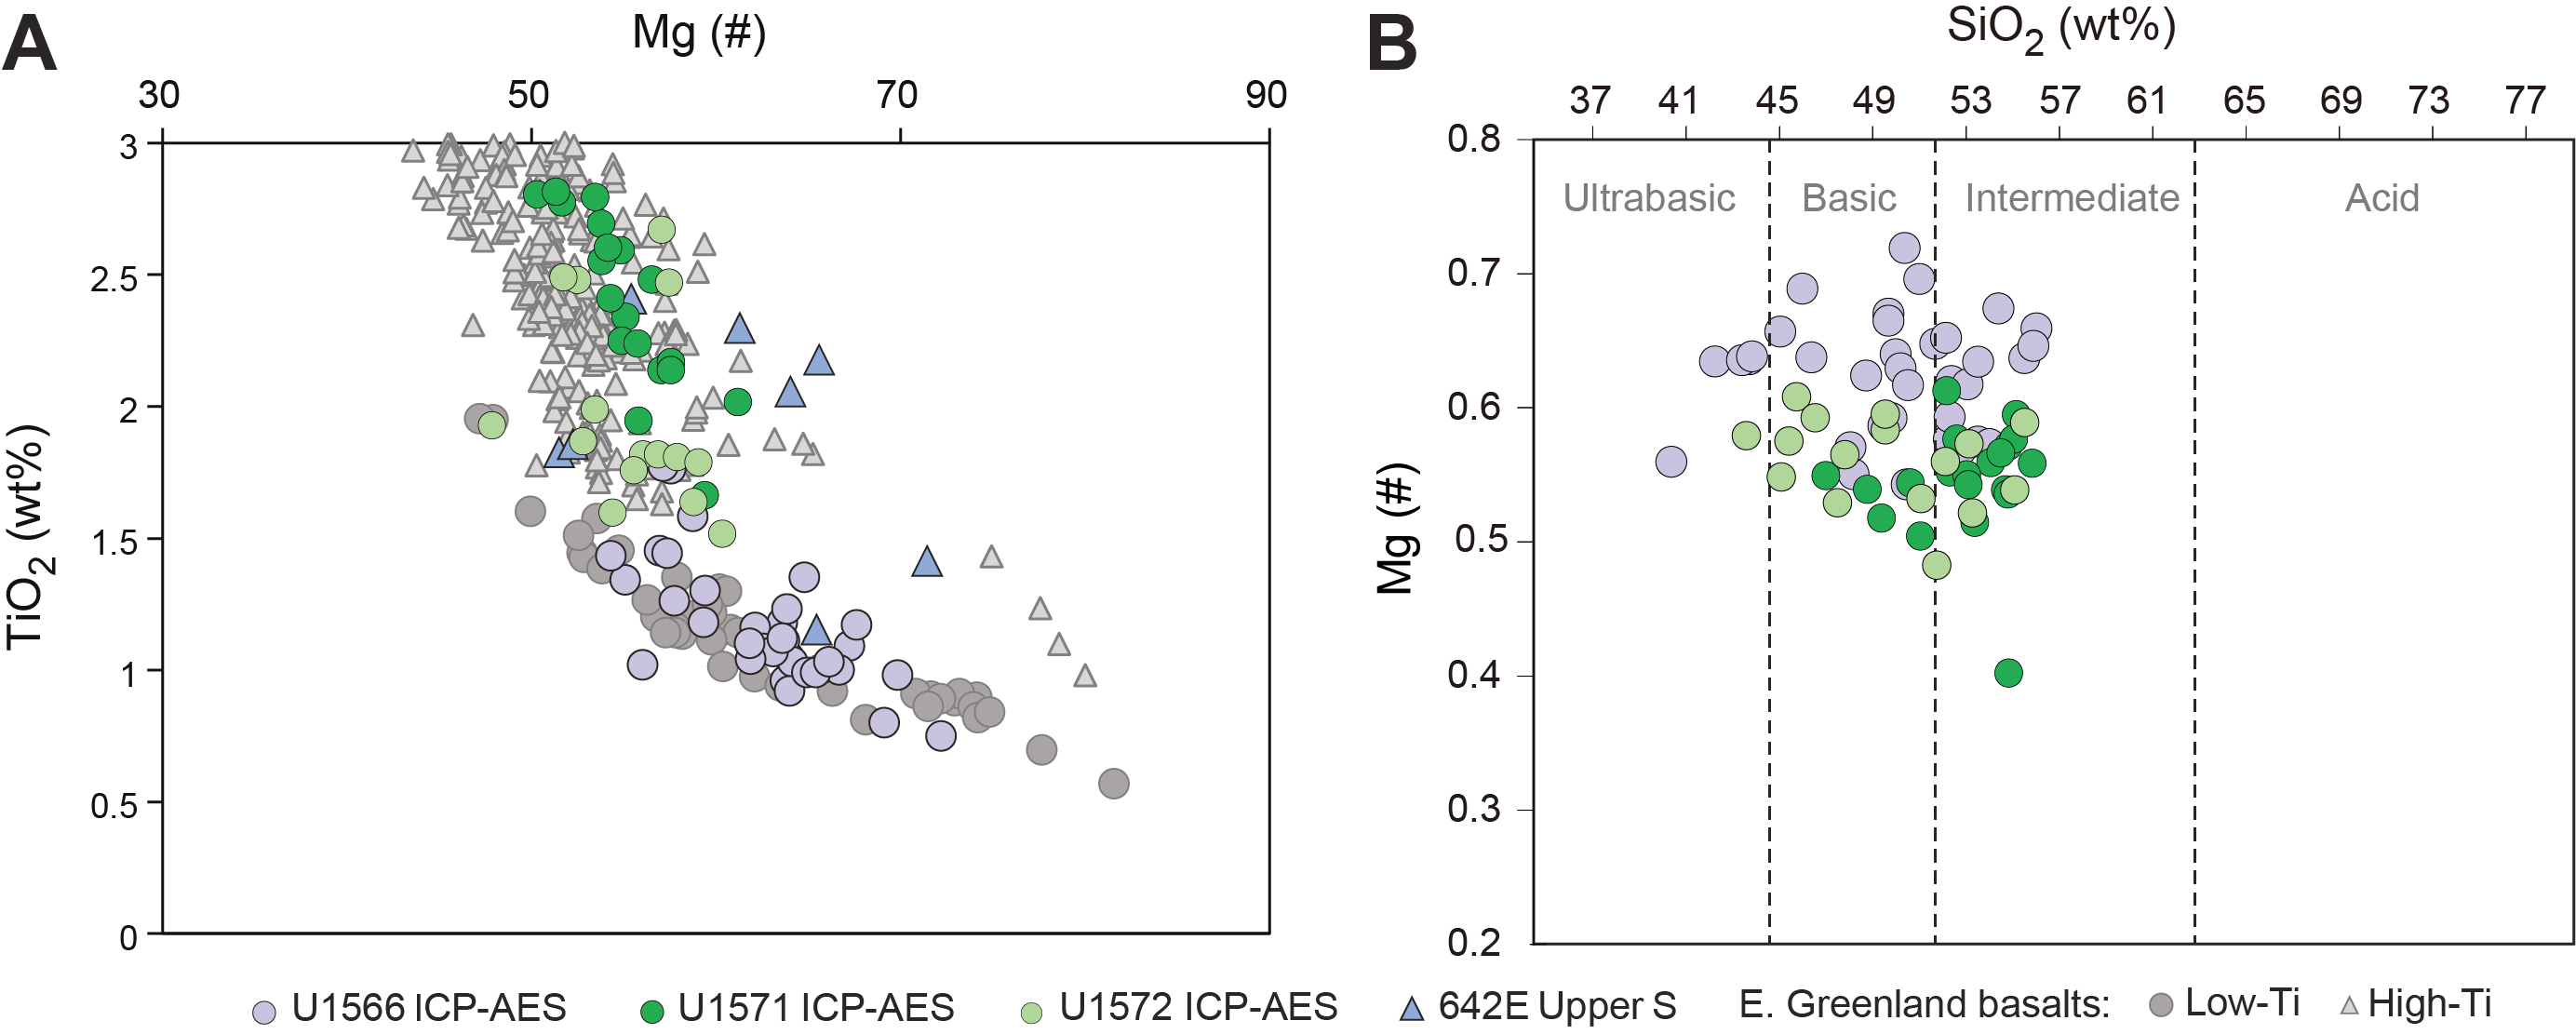
Figure F45. Mg# vs. TiO2 and Mg# vs. SiO2 for basalts.
Even though the lavas at Sites U1571 and U1572 show chemical similarities that indicate a similar provenance (see Lithostratigraphy), the downhole profiles for TiO2 differ considerably. In Hole U1572A, TiO2 concentrations decrease from ~3.0 to ~1.6 wt% from Unit VII to Unit VIII. Unit VII is believed to be present at Site U1571 but has no recovery (see Physical properties). In Unit VIII in Hole U1571A, TiO2 concentrations increase with depth from 1.7 to 2.8 wt% at a linear regression rate of ~1 wt% TiO2 per 52.4 m CSF-A (R2 = 0.47) (Table T15). In contrast, in Hole U1572A there is no discernible downhole trend in Unit VIII TiO2 concentrations (Table T16). The disparity in Unit VIII could be explained by a thicker volcanic sequence at Site U1572 than at Site U1571, such that the increasing TiO2 with depth observed in Hole U1571A occurs deeper than the drilling depth in Hole U1572A.
6.3. Organic geochemistry
6.3.1. Headspace gas
Samples for routine headspace analysis were taken from Hole U1571A. All methane concentrations were below 4 ppmv, so no headspace samples were taken from Hole U1571B.
6.3.2. Carbon, nitrogen, and sulfur
6.3.2.1. Site U1571
At Site U1571, CaCO3 values are high in the upper 60 m of the recovered holes, representative of preserved biogenic carbonate (Figure F46). In Hole U1571A, low levels (<2 wt%) of CaCO3 are present below 55 m CSF-A, and all samples below 40 m CSF-A in Hole U1571B are similarly low in carbonate. One period of slight enrichment occurs at ~100 m CSF-A, which may correspond to authigenic carbonate precipitation at the basalt/sediment boundary. All total organic carbon (TOC) contents were low (<0.5 wt%) for intervals between the top of the holes and 60 m CSF-A and near zero for intervals below 100 m CSF-A (Figure F46). A small section of relative enrichment, with values reaching as high as 2 wt% TOC, is present in both holes between 70 and 100 m CSF-A. Total nitrogen (TN) content mirrors the TOC content, showing 0.04 wt% in the upper portion, between 0.1 and 0.14 wt% at 0–100 m CSF-A, and near zero below 100 m CSF-A. These high TOC and TN content layers are also the only layers which contain any S, and concentrations as high as 2 wt% occur in these intervals (Table T17).
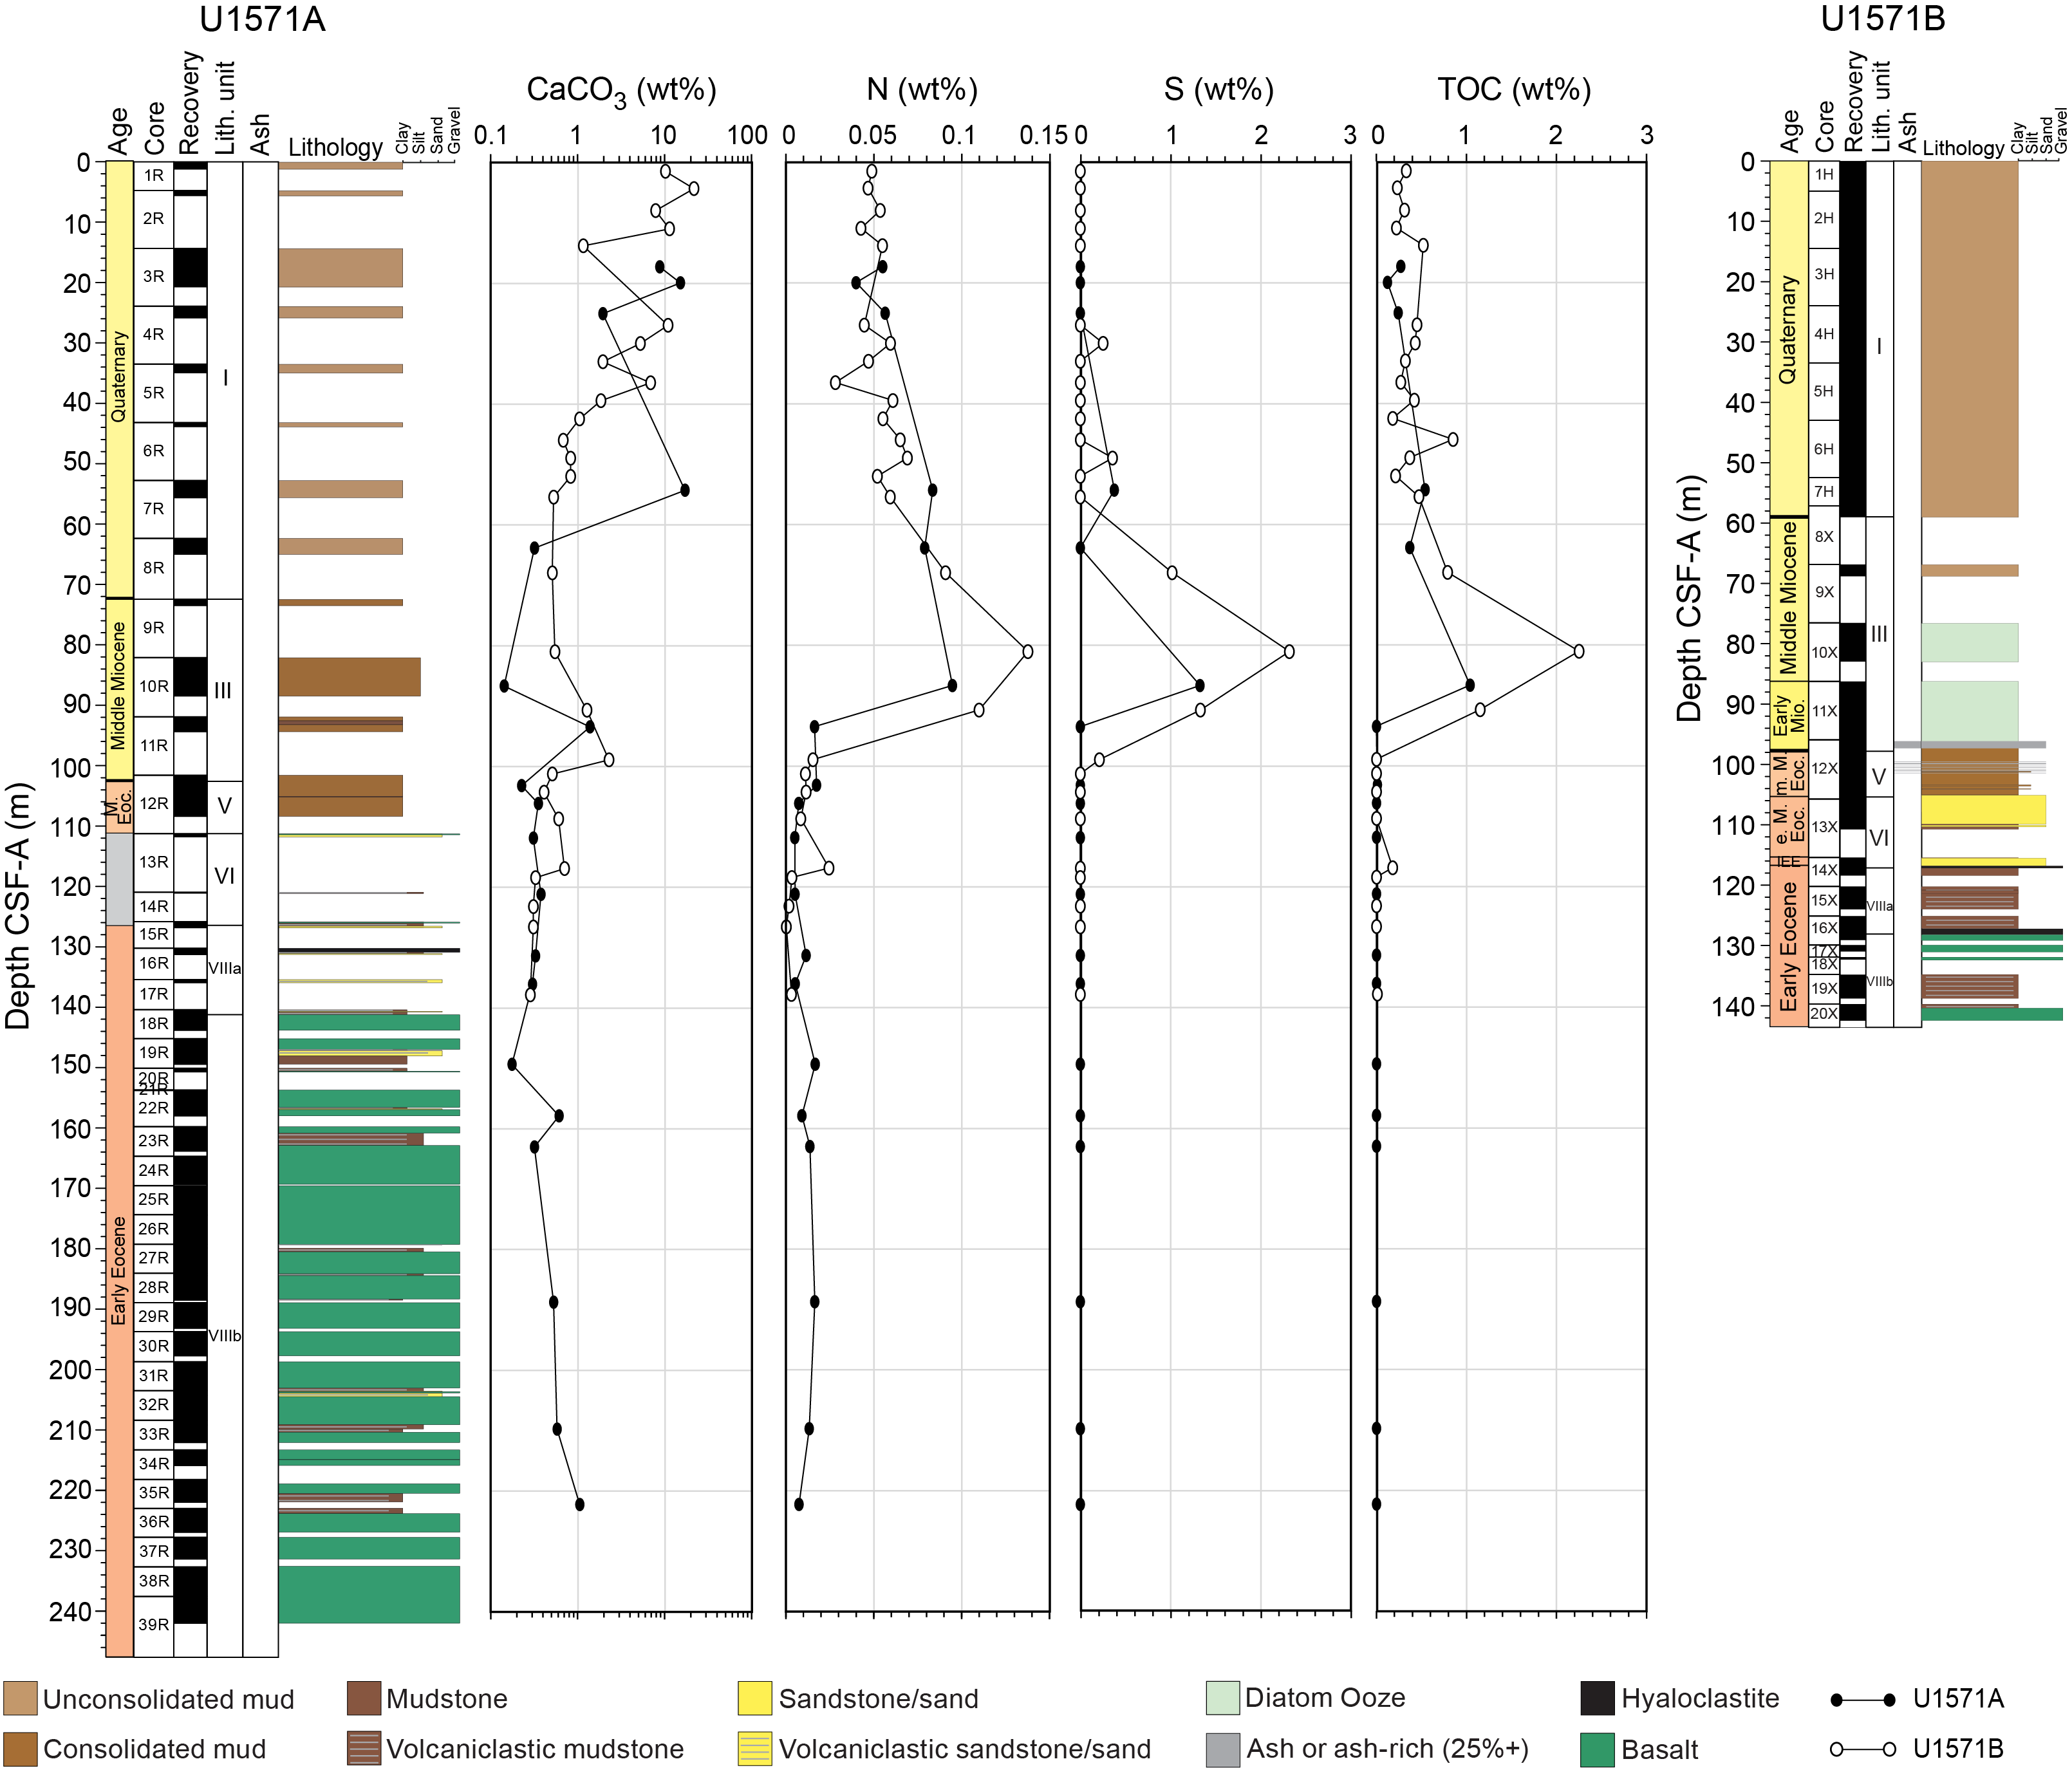
Figure F46. Carbon, nitrogen, and sulfur, Site U1571.
6.3.2.2. Site U1572
Calcium carbonate content at Site U1572 is high in the uppermost 45 m of the cored sediment package, typically around 10 wt% but rising to 25 wt% in some intervals (Figure F47). For the remainder of the sediment column, CaCO3 is below 1 wt% except for a short interval at 85–100 m CSF-A, where concentrations are between 11 and 45 wt% (Figure F47). All these enriched intervals appear to be related to biogenic carbonate, with an interval of as high as 45 wt% carbonate designated as a calcareous nannofossil ooze (see Lithostratigraphy). TOC is low (<1 wt%) for most of the holes, especially in the upper 45 m. At 45–55 m CSF-A, a small enrichment is recorded with TOC as high as 1.3 wt%. The largest peak in the record is found between 110 and 115 m CSF-A, where TOC reaches 7 wt% in an organic-rich diatom ooze in the lower part of Unit III (Figure F47). A final period of values above 1 wt% is observed between 185 and 200 m CSF-A, potentially linked to the sediment/basalt interface. TN in sediments is typically between 0.04 and 0.07 wt% for the upper 100 m of the sediment, followed by a large peak as high as 0.4 wt% at 110–115 m CSF-A that coincides with high TOC concentrations. This is followed by a drop to below 0.05 wt% for the remainder of the sediment, with one exception between 185 and 200 m CSF-A, where a slight enrichment is present. Sulfur content is zero in the upper 25 m, followed by values as high as 2 wt% at 25–35 m CSF-A. This peak is followed by low concentrations (<1 wt%) for the remainder of the holes. In this period there are two exceptions: values are as high as 3 wt% between 110 and 120 m CSF-A and 6.3 wt% between 180 and 200 m CSF-A (Table T18).
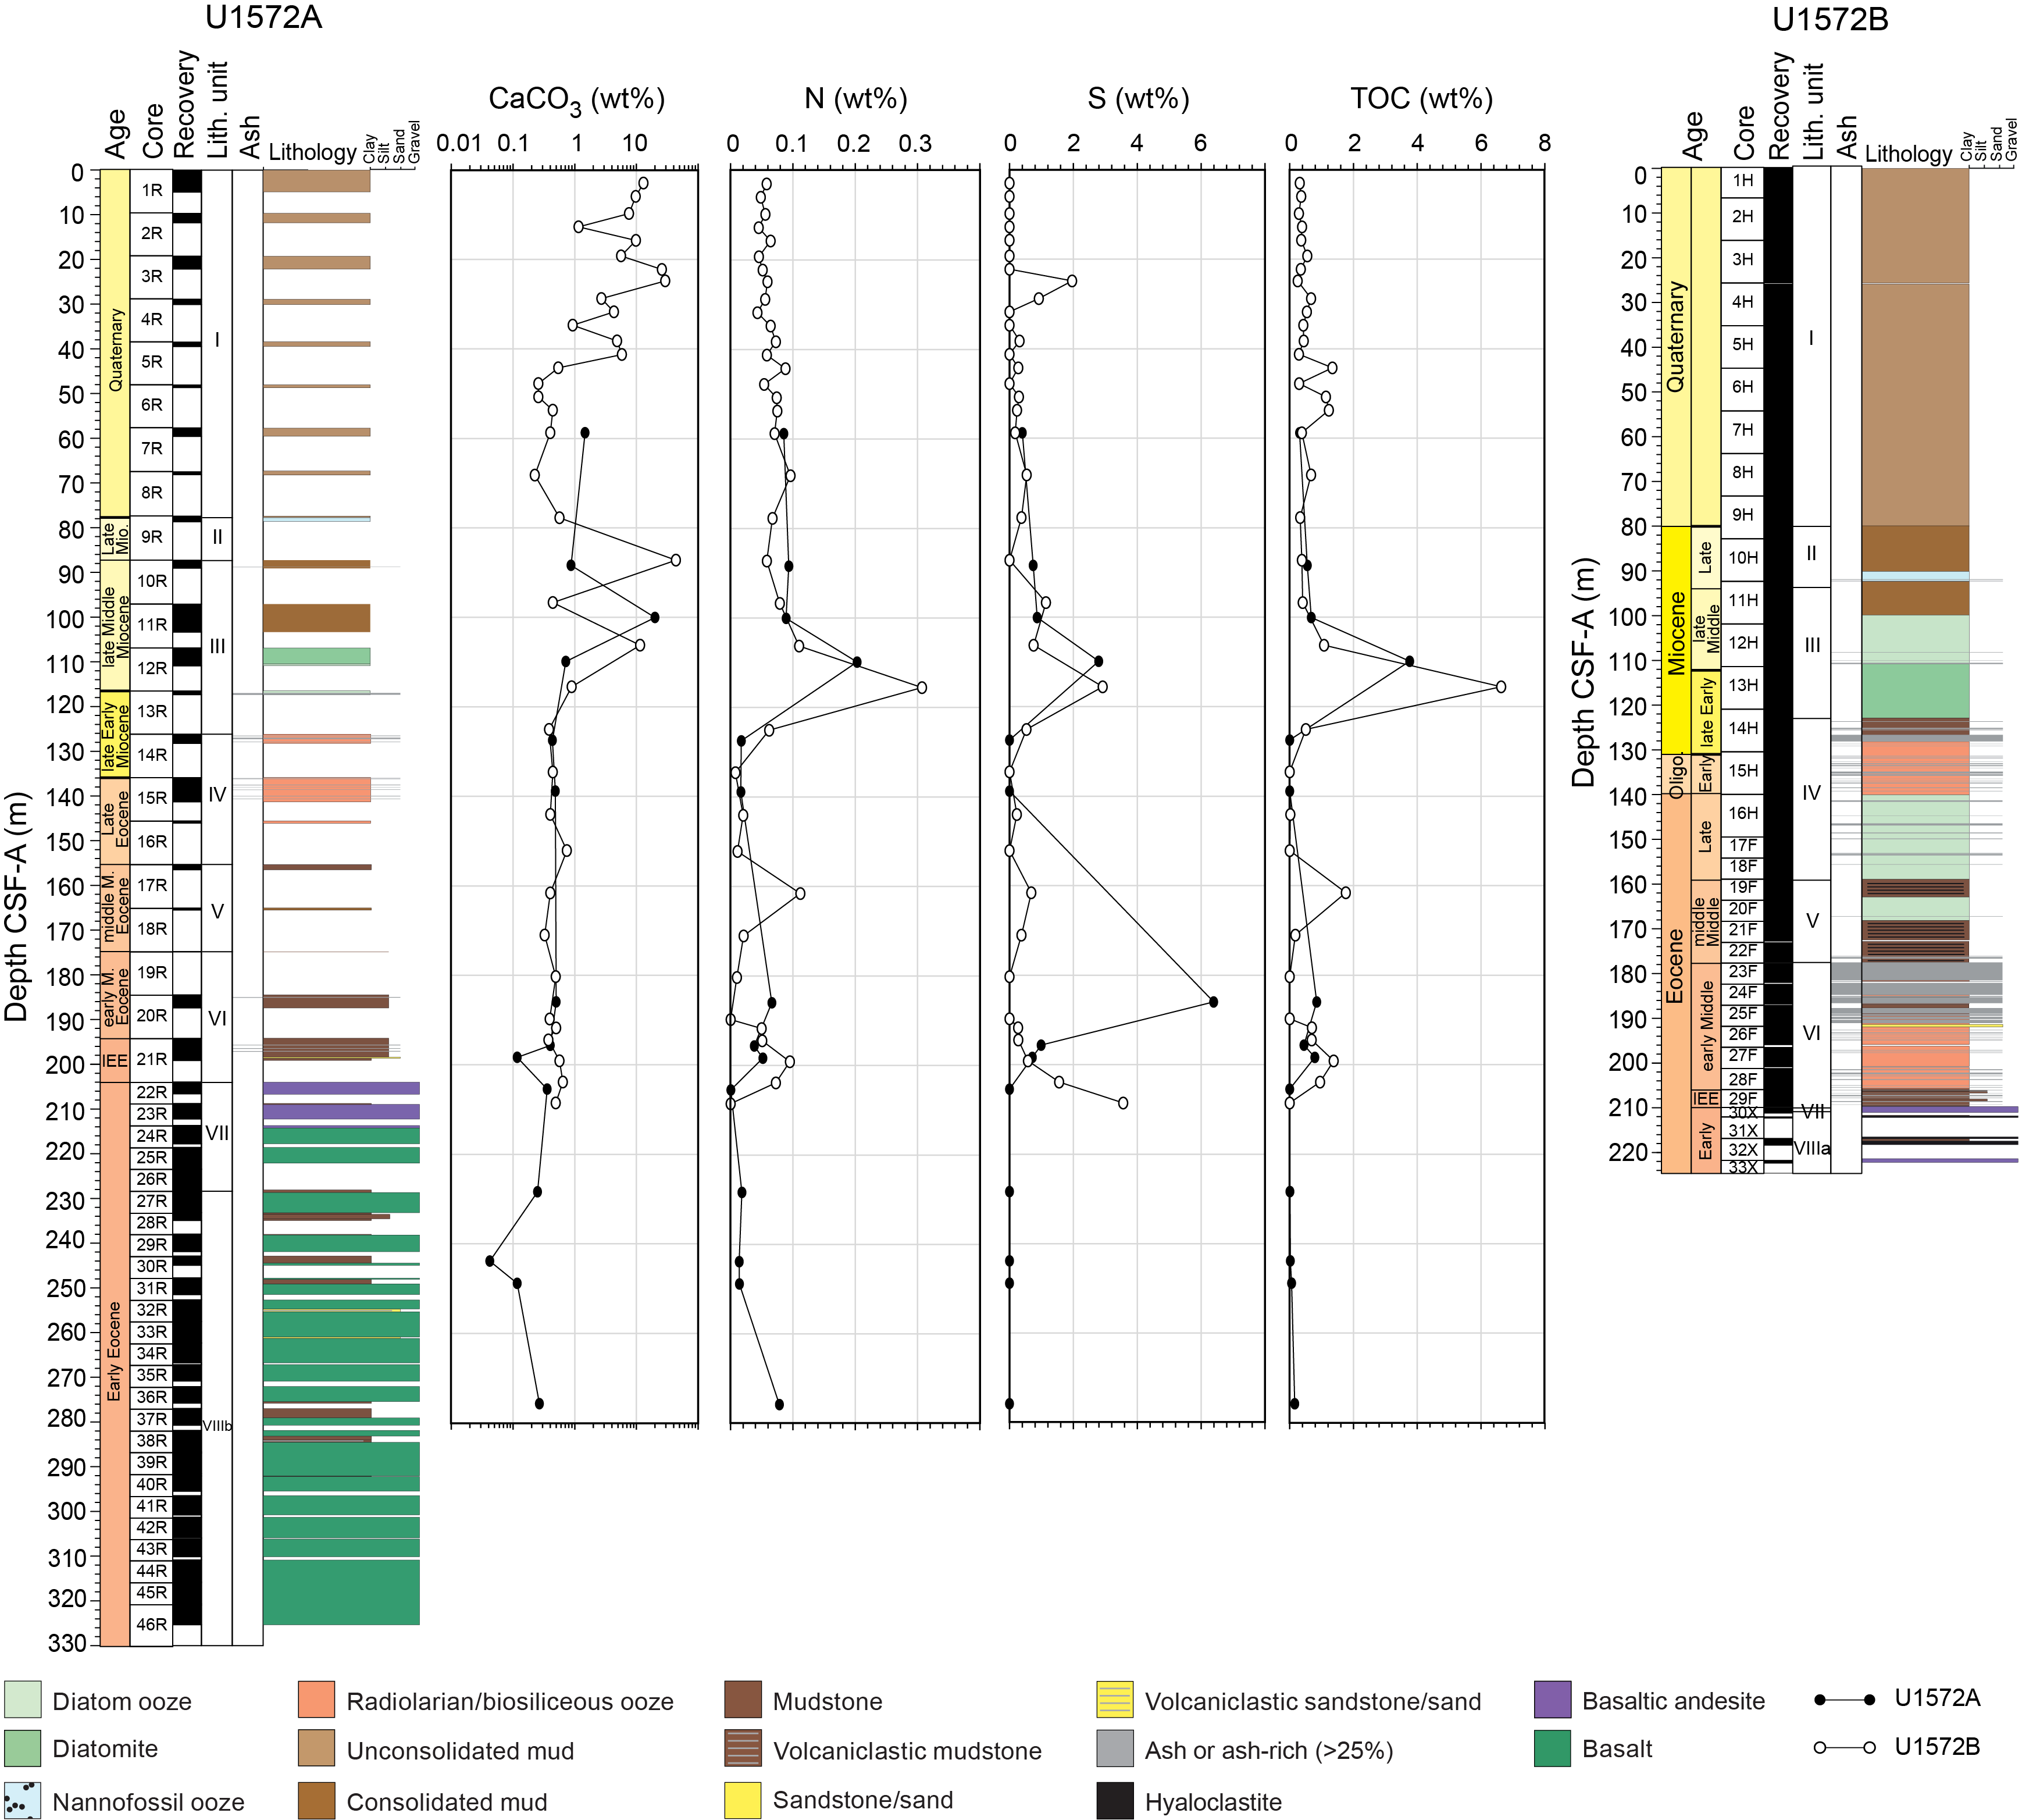
Figure F47. Carbon, nitrogen, and sulfur, Site U1572.
6.4. Microbiology
One sample from Hole U1571A was taken for microbiological analysis and Fe reduction analysis from the interbasalt sediments of Core 14R. Four other samples were taken from Hole U1571B. At Site U1572, 13 ash and sediment layers were sampled for microbiological analysis and another 6 were taken for Fe reduction. All samples were immediately frozen, although the sample for Fe reduction was first flushed with nitrogen.
6.5. Site summary
The recovered basalt sequences from the Skoll High show chemical and spatial variations between Sites U1571 and U1572. For example, TiO2 concentrations indicate the presence of occasional high-Ti basalts, which are synonymous with large igneous provinces and correlate well with flows in East Greenland and those found during previous drilling in the region of Hole 642E. IW recovered from interbasalt sediments shows unusually high pH and low alkalinity for saline water. Basalt alteration and associated clay authigenesis at Sites U1571 and U1572 appears to impact the IW compositions, resulting in enriched IW Ca contents (released during clay formation) and depleted Mg and K concentrations as these elements are incorporated into the clays. Other elements in IW samples above the basalt–sediment transition show largely conservative behavior downcore. Dissolved Si concentrations are sporadically enriched, and these intervals correspond to ash- and/or diatom-rich strata (e.g., Unit III). This may be indicative of marine silicate weathering, with the high interstitial Si content preserving some original features of volcanic glass, diatoms, and organic matter.
7. Physical properties
Sites U1571 and U1572 on the Skoll High included four holes (U1571A, U1571B, U1572A, and U1572B). At each site, a succession of overburden sediments was penetrated overlying hard rock–dominated sequences comprising interbedded lava flows and volcaniclastic sediments. Hole A at each site was drilled using the RCB system to optimize recovery of hard rocks, and Hole B was drilled using the APC system to improve soft sediment overburden recovery.
Eight lithostratigraphic units (I–VIII) were identified in the subsurface (see Lithostratigraphy). The summary of physical properties penetrated by each borehole is presented below. A statistical summary of physical properties for each of the units is given in Table T19.
7.1. Data summary and processing
Out of 946 m drilled in four holes at Sites U1571 and U1572, more than 500 m of sediments and hard rocks were recovered, including 262.5 m of sedimentary overburden (128.1 m of which are Eocene sediments) and 196.3 m of volcanic sequences dominated by lava flows with interlayered volcaniclastic sediments. The recovered cores were characterized for their physical properties through a total of 22,523 GRA bulk density, 22,310 MS, 8,332 P-wave velocity, and 6,024 NGR whole-round track measurements. In addition, 272 individual thermal conductivity readings were taken on either whole-round (soft sediments) or working-half (hard sediments or basalts) sections, typically with three readings per section. These measurements were supplemented by 2,036 Section Half Measurement Gantry (SHMG) P-wave velocity measurements and 20,470 point MS (MSP) measurements on the working halves, followed by analysis of 289 moisture and density (MAD) samples and more than 200 triaxial P-wave velocity measurements on discrete cubic samples.
Standard data reduction and screening procedures (see Physical properties in the Expedition 396 methods chapter [Planke et al., 2023a]) removed 2454 GRA bulk density data points (1512 within 1.5 cm of a bin liner, 937 below a cutoff of 1.2 g/cm3, and 5 with relative errors >20%), 243 points from the P-wave velocity data sets (2 within 1.5 cm of a bin liner, 15 below a cutoff of 1480 m/s for Whole-Round Multisensor Logger [WRMSL], and 226 below a cutoff of 1480 m/s for SHMG P-wave caliper [PWC]), and 131 negative MS values. Processed data are presented unless stated otherwise.
7.2. Hole U1571A
The physical properties for Hole U1571A are summarized in Figure F48. Lithostratigraphic Units I, III, V, VI, and VIII were described from Hole U1571A (see Lithostratigraphy).
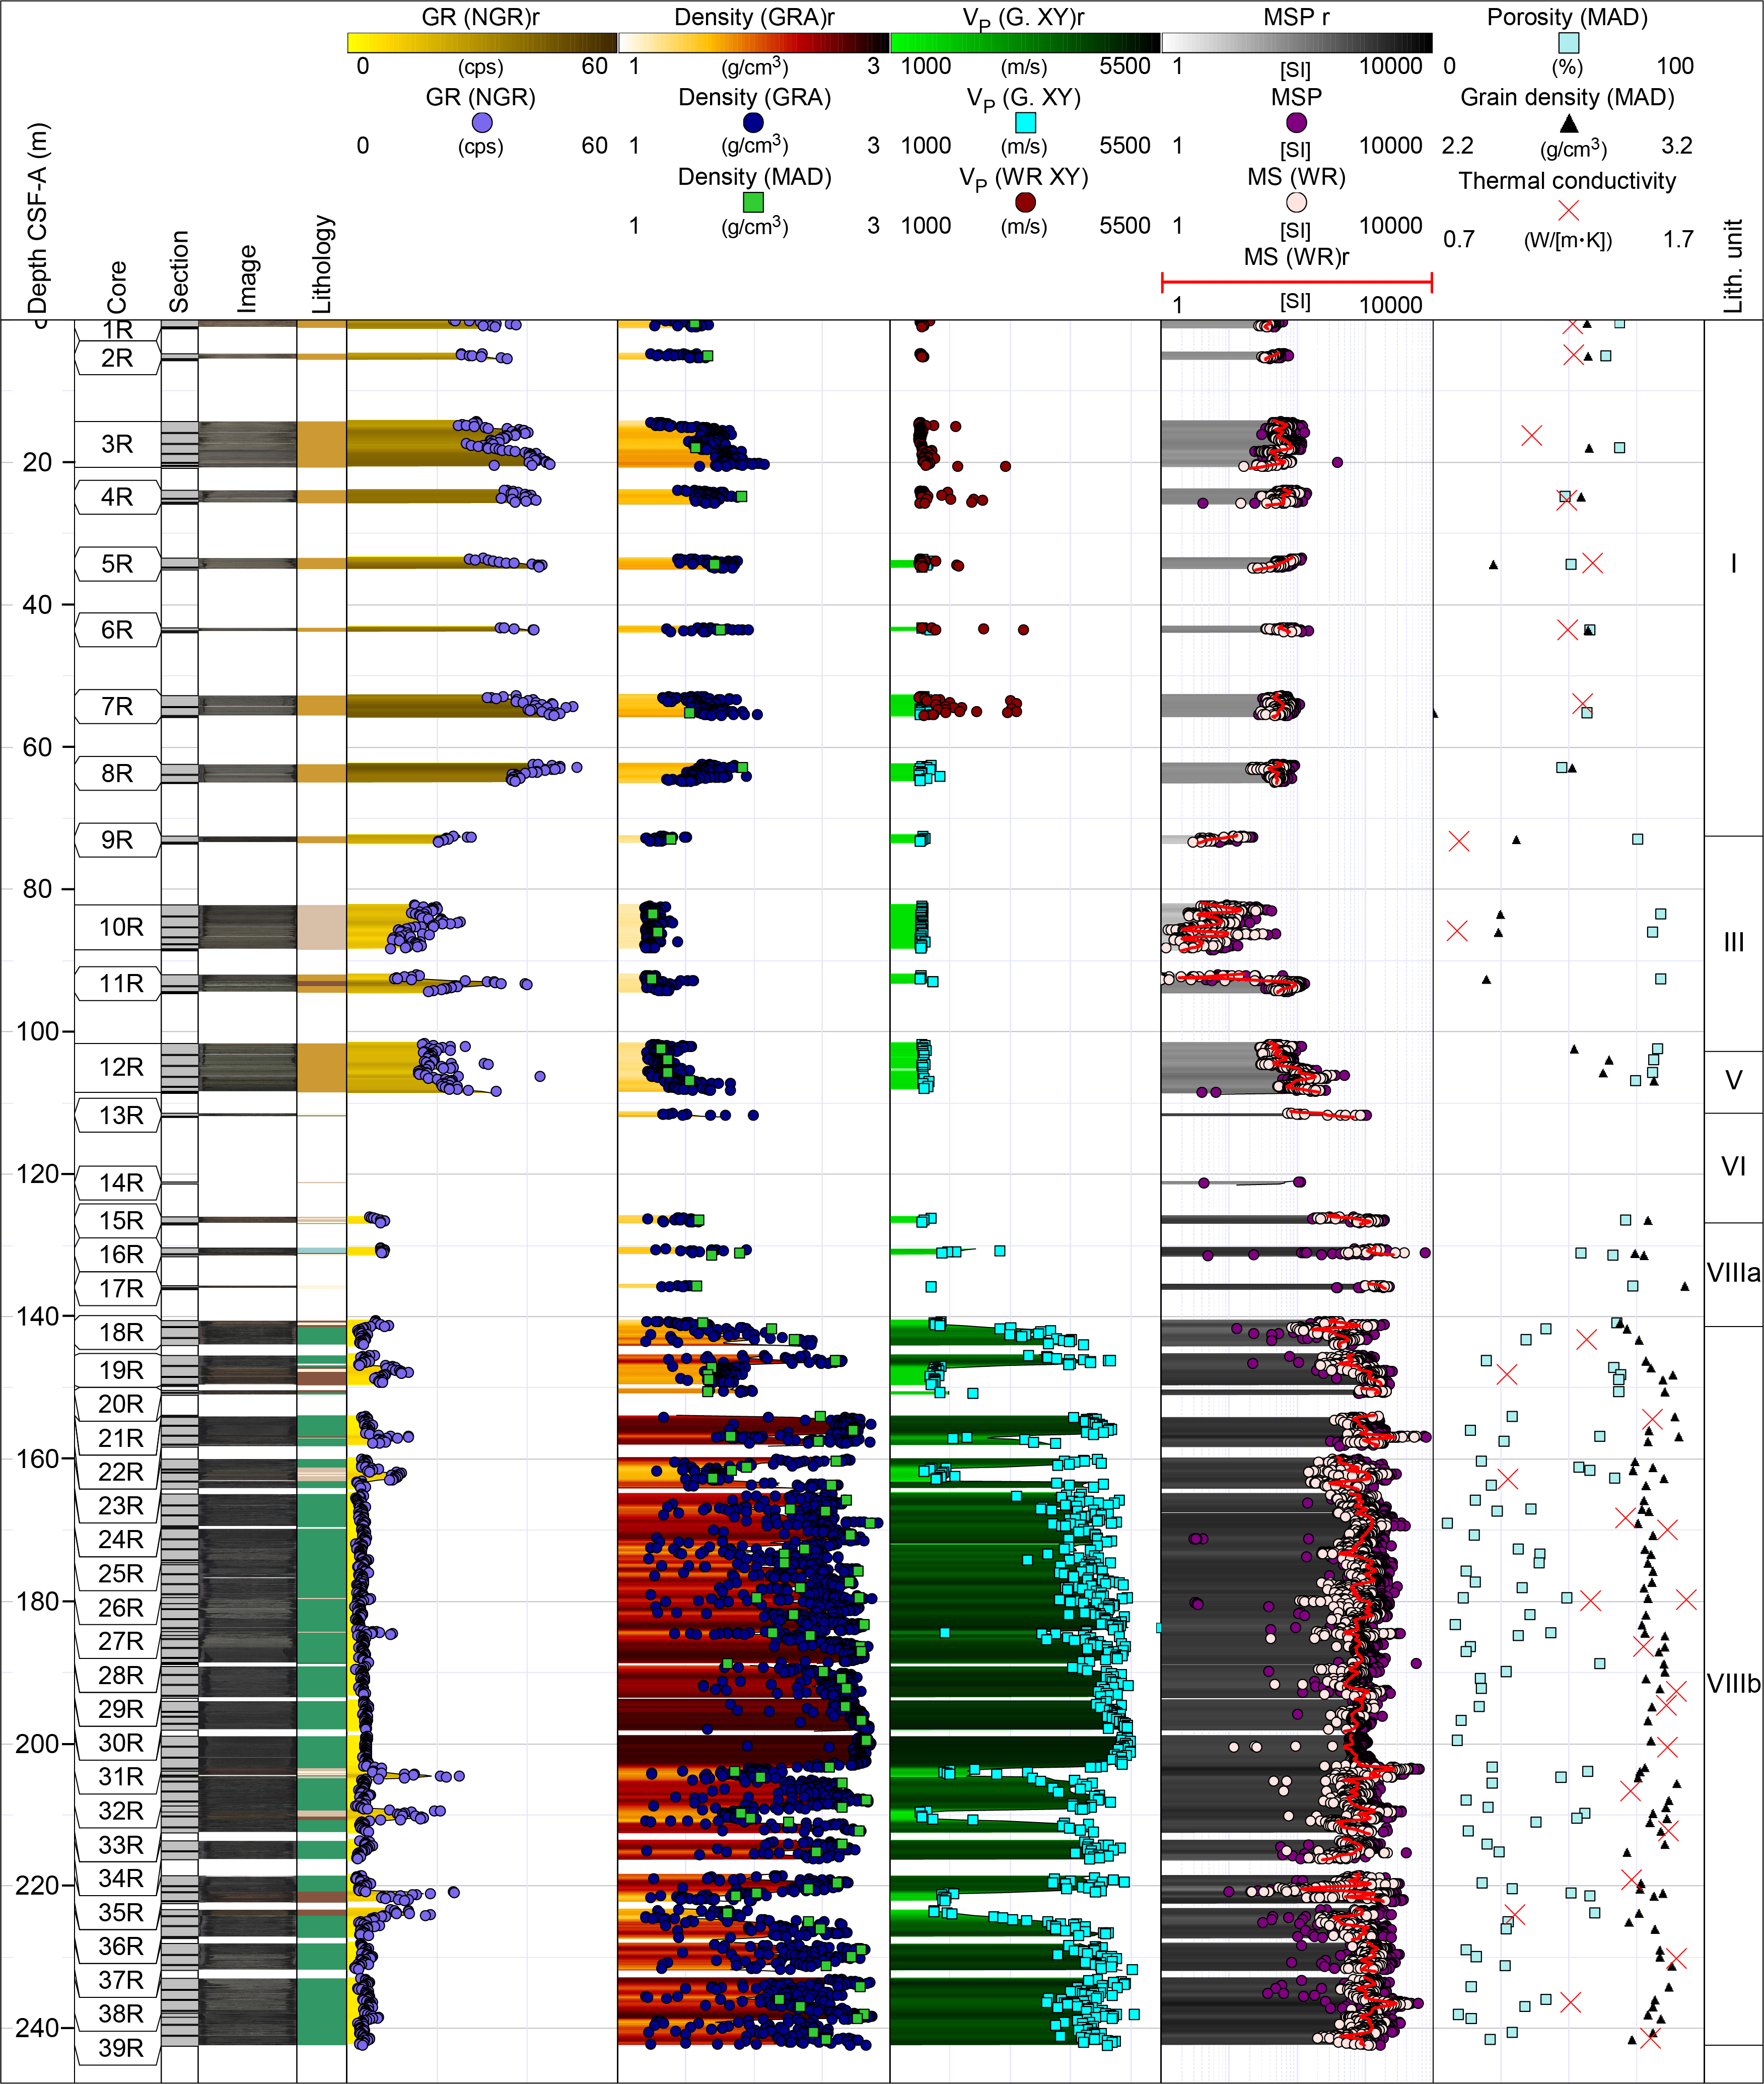
Figure F48. Physical properties, Hole U1571A.
The uppermost ~15 m is marked by GRA bulk densities of ~1.5 g/cm3 and low P-wave velocities (~1525 m/s), MS (40 × 10−5 [SI]), and NGR (~35 counts/s). Slightly higher values are observed for the interval covered by Sections 396-U1571A-3R-1 through 8R-CC (14.3–72.5 m CSF-A), which corresponds to the majority of the clay-rich Pleistocene Unit I. Here, GRA bulk densities average ~1.7 g/cm3, MS averages 70 × 10−5 [SI], NGR increases from ~35 to ~45 counts/s, and P-wave velocities are ~1550 m/s with occasional spikes to ~2000 m/s. A decrease in all physical properties marks the transition from Unit I to Unit III.
Miocene Unit III is composed of consolidated clays and silts with nannofossil ooze. The middle part of this unit (~82–90 m CSF-A) is characterized by generally low P-wave velocities and continued downward trends in GRA bulk density, MS, and NGR values, which reach minima of ~1.2 g/cm3, ~5 × 10⁻⁵ [SI], and 20 counts/s, respectively. The lowermost sequences of the unit (~90–102 m CSF-A) are marked by an increase in MS, with peaks higher than 200 × 10−5 [SI], and GRA bulk density increases by ~0.3 g/cm3 across the sequences.
Unit V is ~9 m thick; it has an average bulk density of ~1.4 g/cm3 and P-wave velocity of 1562 m/s. Three MAD samples from this unit have a high mean porosity of 79%. MS averages at ~95 × 10−5 [SI], but MSP measurement peaks correlating to ash layers feature maxima of ~500 × 10−5 [SI].
Higher ash related maxima are observed for the early Middle Eocene Unit VI, where MSP and MS values reach maxima of 1540 × 10−5 and 1890 × 10−5 [SI], respectively. Bulk densities over the ~111–127 m CSF-A interval are slightly higher at 1.5 g/cm3, and P-wave velocities remain constant at ~1592 m/s. Low NGR values are recorded between 5 and 8.5 counts/s.
A marked change in properties is observed after the transition to Unit VIII at 127 m CSF-A. Subunit VIIIa is linked to higher P-wave velocity (average = ~1900 m/s), GRA bulk density (mean = 1.52 g/cm3), and MSP (ranging from ~5 × 10⁻⁵ to 7800 × 10−5 [SI]) values than those of the overlying sediments, and to consistently low NGR (<10 counts/s) values. The top of Subunit VIIIb (Figure F49), corresponding to basalt flows and interlayered sediments, occurs at 141.3 m CSF-A. Individual lava flows comprising tops, interiors, and bases, as well as interflow sediments, are readily identified through characteristic P-wave and GRA bulk density responses, as seen in the interval covered by Cores 396-U1571A-27R through 29R. P-wave velocities and GRA bulk densities typically slowly increase throughout the lava flow tops before reaching maxima of ~5000 m/s and ~2.5 g/cm3, respectively, for the interiors of each flow. A short interval marked by an abrupt decrease to ~3500 m/s and 2 g/cm3, respectively, then marks the base of the lava flow, and further decreased values are observed for the interflow sediments such as volcaniclastic siltstone (~204 and ~210 m CSF-A). The typical P-wave velocities in the interbasaltic sediments are ~2000 m/s, GRA bulk densities are ~1.75 g/cm3, and NGR shows peaks above 20 counts/s from the basalt baseline of ~5 counts/s NGR.
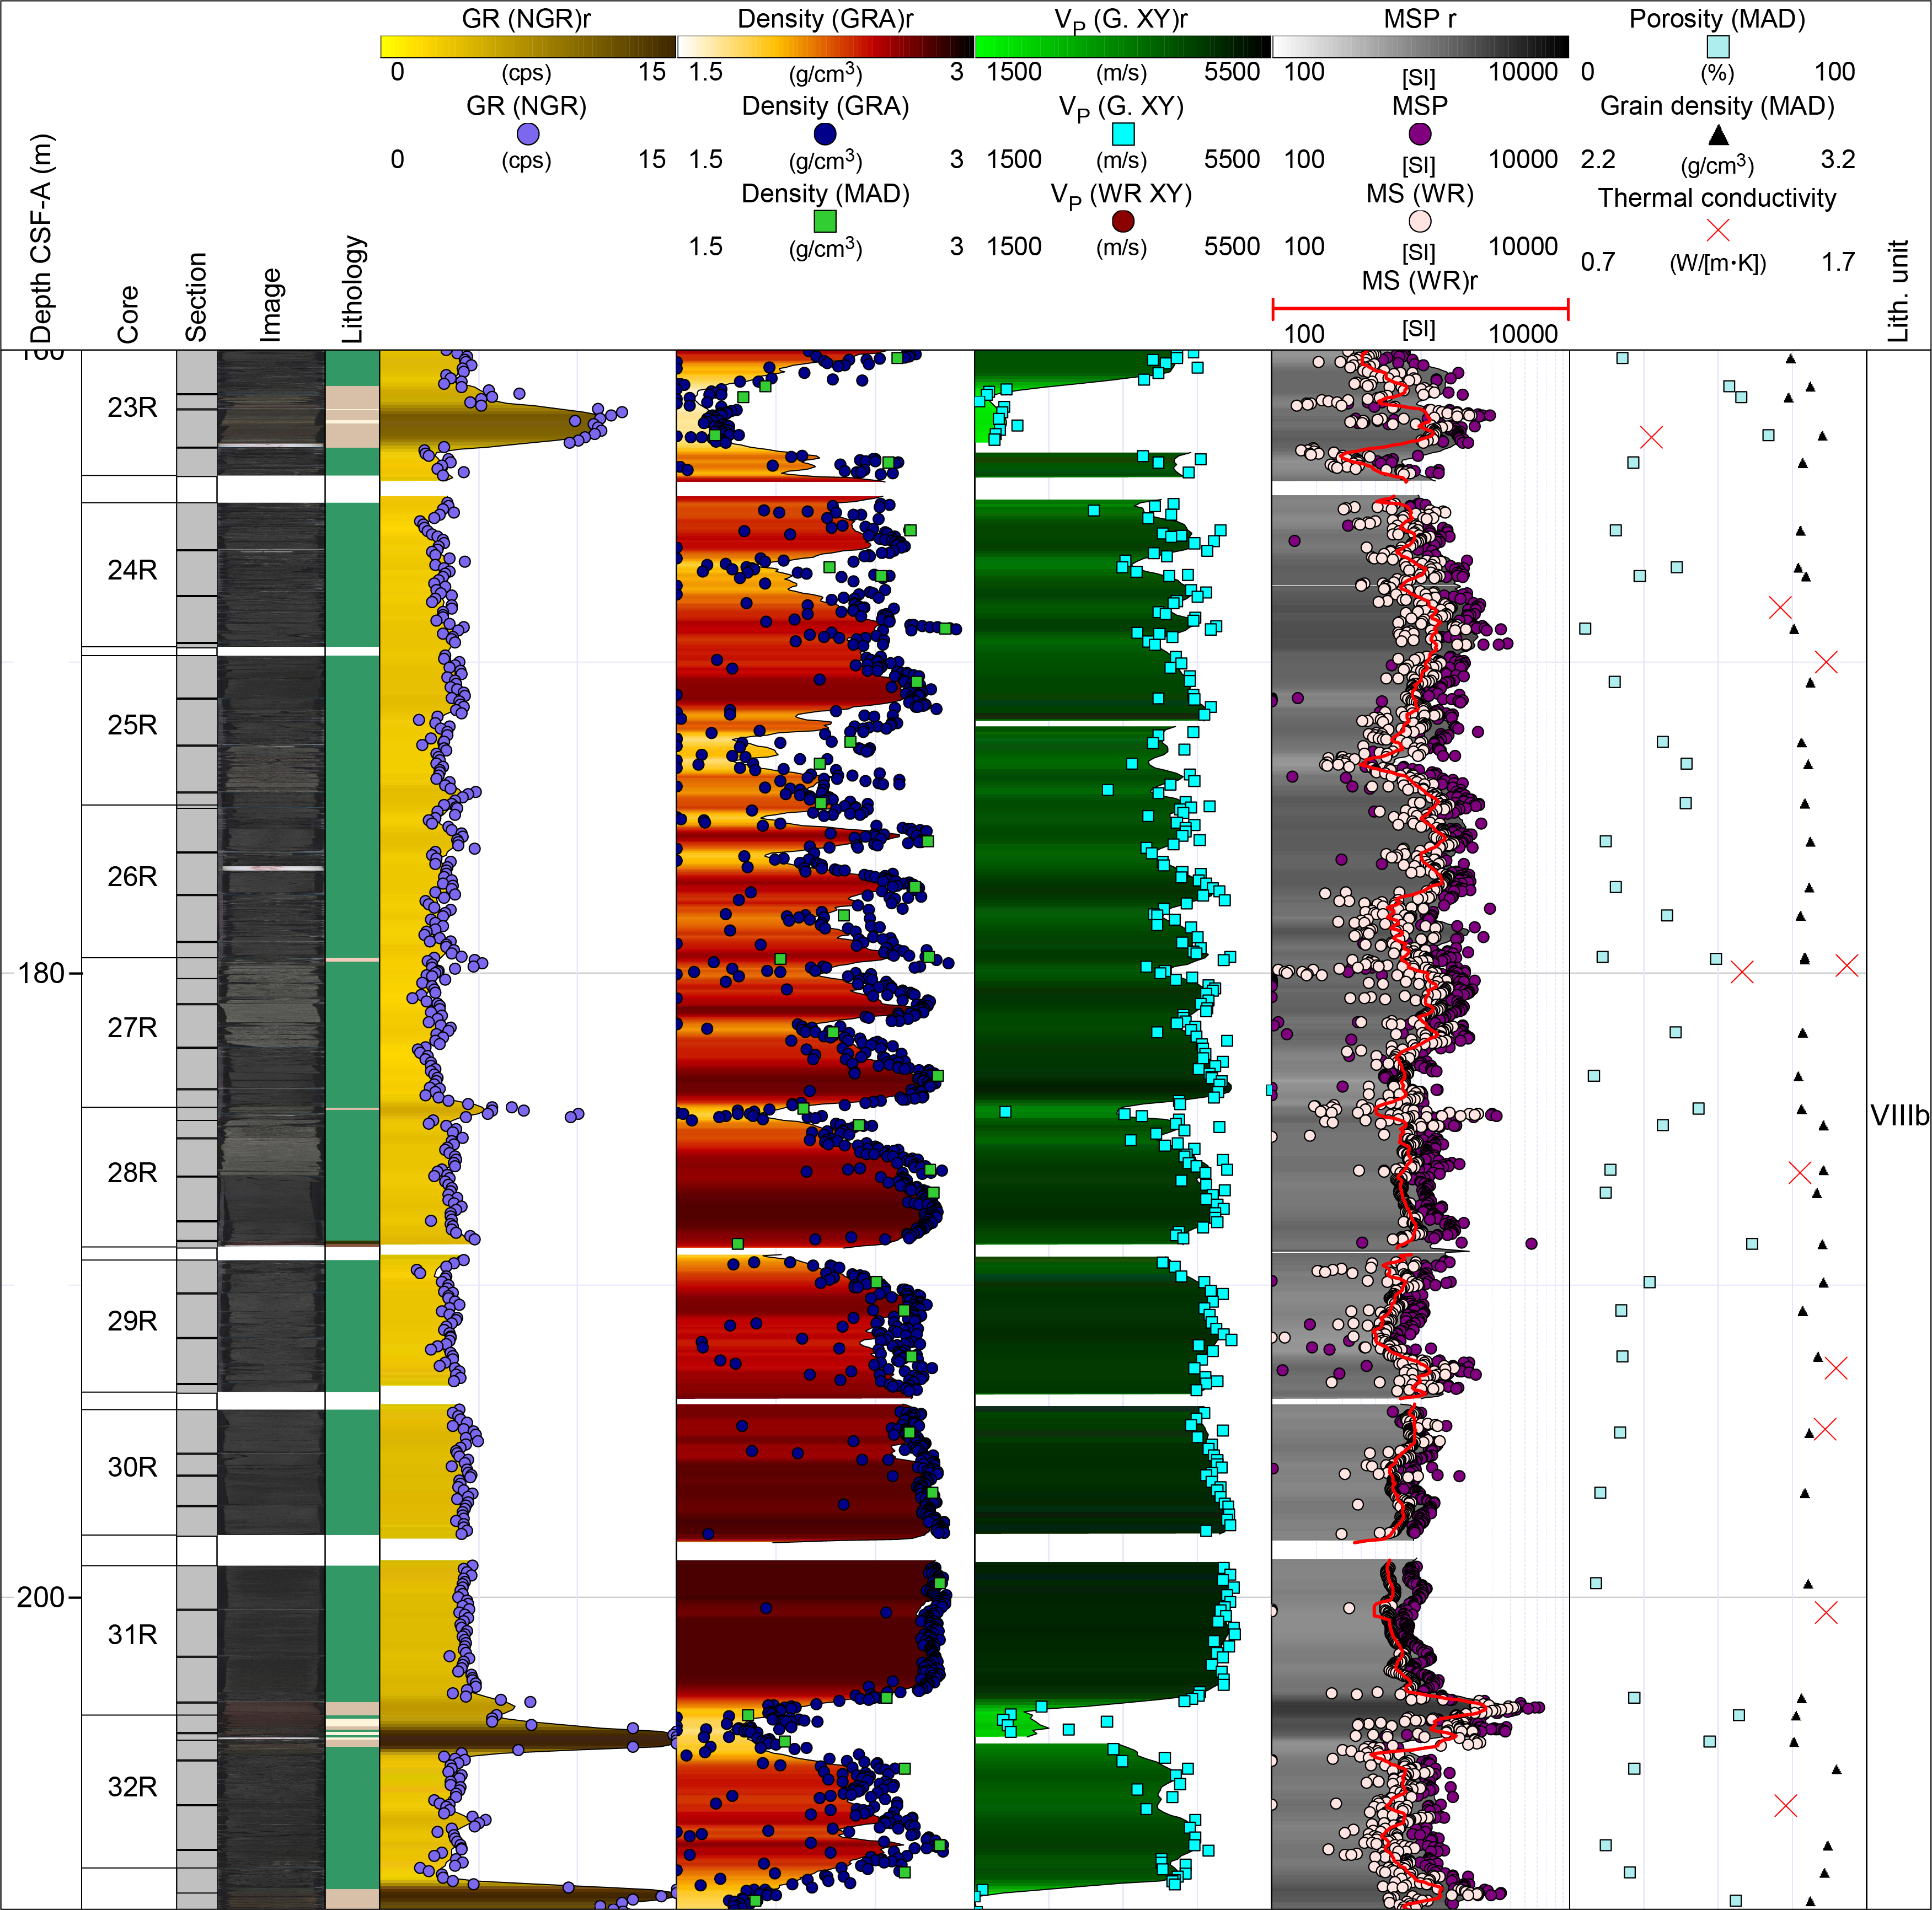
Figure F49. Basaltic and interbasaltic physical properties, Hole U1571A.
A total of 92 discrete samples were taken for MAD analyses, 76 from basalt-dominated Unit VIII. MAD bulk densities of the sediment sequences (Units I, II, and IV) and basaltic Subunit VIIIb correspond well with the GRA derived bulk densities. Mean MAD bulk density is, however, 12% greater than the mean GRA bulk density in Subunit VIIIa (~111–141 m CSF-A). Automated processing only corrects reduced diameters of the harder sediments and rocks across intervals for which binned pieces have been registered in the Laboratory Information Management System (LIMS) database. The flagging of hard rock sequences only began at Core 396-U1571A-18R, and the resulting deviation is related to the lack of core diameter correction for these harder units cored using the RCB system (see Physical properties in the Expedition 396 methods chapter [Planke et al., 2023a]). These values should be manually corrected prior to further analyses. MAD porosity determinations for vesicular basalt samples with unfilled vesicles typically range 20%–60% porosity depending on the vesiculation of the chosen sample and clearly highlight the potential for high primary porosity in the lava sequence.
Nine thermal conductivity measurements were taken for the sedimentary units, including seven in Unit I with thermal conductivity ranging 1.06–1.29 W/(m·K), and two further measurements were taken in Unit III that feature slightly lower values of 0.79 W/(m·K). Thermal conductivities were generally higher for Unit VIII (n = 19), where a mean thermal conductivity of 1.4 W/(m·K) was recorded.
7.3. Hole U1571B
Hole U1571B targeted the sedimentary sequences overlying the basalt (Unit VIII) through APC coring. The hole yielded the same lithostratigraphic successions as Hole U1571A but with much improved recovery. Physical properties recorded for the hole are summarized in Figure F50.
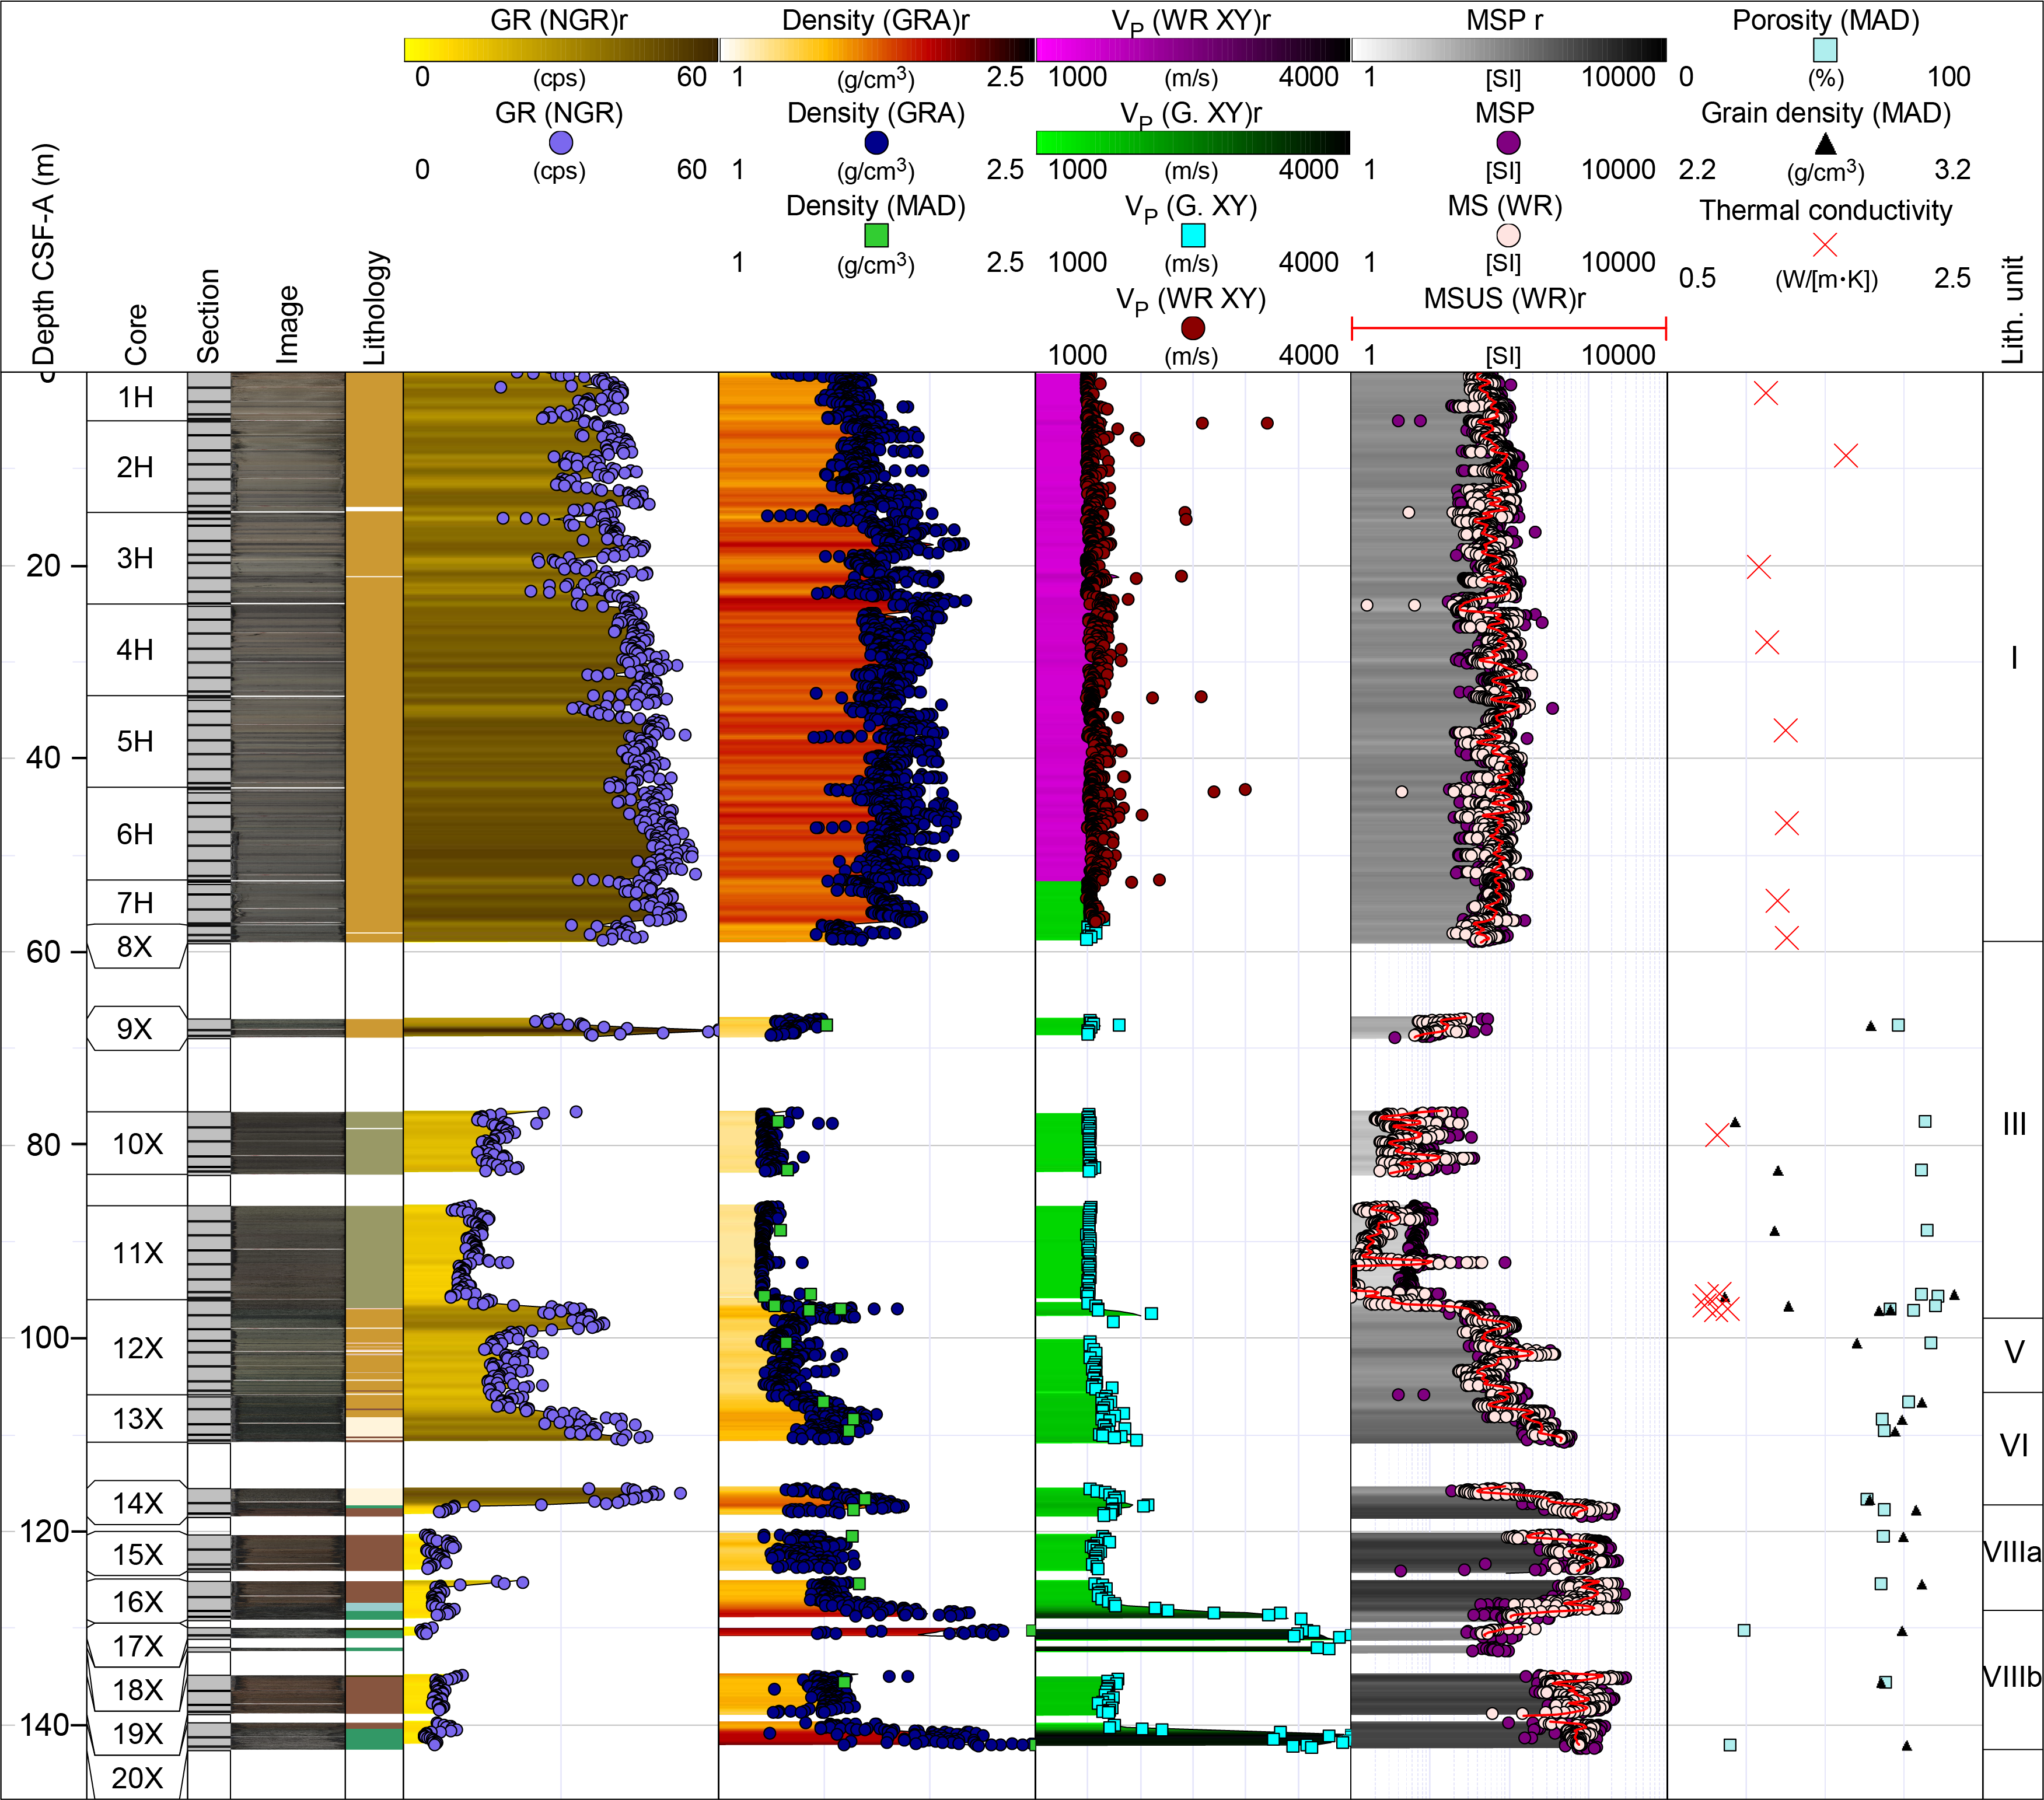
Figure F50. Physical properties, Hole U1571B.
The uppermost ~60 m in Hole U1571B is characterized by scattered P-wave velocities, GRA bulk densities, and MS that define the Pleistocene Unit I. P-wave velocity values, GRA bulk densities, and NGR values follow increasing trends throughout the ~0–52 m CSF-A interval, increasing by 200 m/s, 0.5 g/cm3, and 20 counts/s, respectively. Average P-wave velocities are relatively low (~1550 m/s), and GRA bulk density (mean = 1.78 g/cm3) and NGR (mean = 42 counts/s) feature some of the highest values found throughout the drilled sedimentary successions. MS fluctuates mainly around ~70 × 10−5 [SI], with spikes occasionally higher than 200 × 10−5 [SI]. Decreasing trends for each of the physical properties are observed for the lower part of Unit I and the upper part of Unit III (~52–76 m CSF-A), coincident with decreasing standard deviations.
The lower part of Unit III (~76–98 m CSF-A) features average GRA bulk densities of 1.27 g/cm3, P-wave velocities of 1524 m/s, a mean NGR of 18 counts/s, a mean MSP of 11 × 10−5 [SI], and a mean loop MS of 7 × 10⁻⁵ [SI]. Notably, both P-wave velocity and GRA bulk density values increase along the upper part of this interval, although no change in baseline is observed for either NGR or MS. These trends reverse over the ~86–96 m CSF-A interval, where P-wave velocity, GRA bulk density, MS, and NGR all feature slight reductions in baseline trends. The bulk densities of eight analyzed MAD samples correlate well with GRA bulk density data. The samples have an average grain density of 2.61 g/cm3 and porosity of ~77%.
The transition into Unit V occurs at ~98 m CSF-A. P-wave velocity and MS increase throughout the unit toward its base at ~106 m CSF-A, reaching average values as high as 1600 m/s and 100 × 10−5 [SI], respectively. The increase continues throughout Unit VI (~106–117 m CSF-A), where some scattering in physical properties corresponding to ash layers is observed. P-wave velocity, bulk density, MS, and NGR feature steady increases over this interval.
The top of the ~11 m thick hyaloclastite Subunit VIIIa is at 117.22 m CSF-A. It has an average P-wave velocity of 1680 m/s, GRA bulk density of 1.51 g/cm3, MSP of 982 × 10−5 [SI], loop MS of 920 × 10−5 [SI], and a mean NGR of 7.5 counts/s. Three MAD samples were collected from the interval and indicate average grain densities of 2.98 g/cm3 and porosities of 68%.
The lowermost Subunit VIIIb consists of the sedimentary-interlayered basalt sequences. Significant differences are observed between the interbasaltic sediments, which have low velocities (~2000 m/s) and GRA bulk densities (~1.5 g/cm3), and the basalt flows, for which velocities (~3750 m/s) and GRA bulk densities (~1.8 g/cm3) are much higher. MS data follows a reverse trend, with maxima above 700 × 10−5 [SI] for the sediments and minima below 50 × 10−5 [SI] in the basaltic flows. Little variation around the average (~7 counts/s) is observed in the NGR data (standard deviation = 1.7). Three MAD samples were collected from throughout the unit and returned an average grain density of 2.92 g/cm3 and porosity of ~38%.
Because no hard rock segments were identified and flagged in the LIMS database, no diameter correction was applied to the GRA bulk densities of the harder sediments and rocks in Unit VIII. This is underlined by the comparison between average MAD and GRA bulk densities, where the former have ~10%–20% greater density.
7.4. Hole U1572A
The physical properties for Hole U1572A are summarized in Figures F51 and F52. This hole was drilled using the RCB system, which impacted the recovery of the sedimentary section. All eight units were sampled in this hole except for Subunit VIIIa. In general, the physical properties of the upper six units are less constrained in this core with respect to adjacent Hole U1572B, which was drilled using the APC system. Despite this, the same general trends can be noted in physical properties across the sedimentary section.
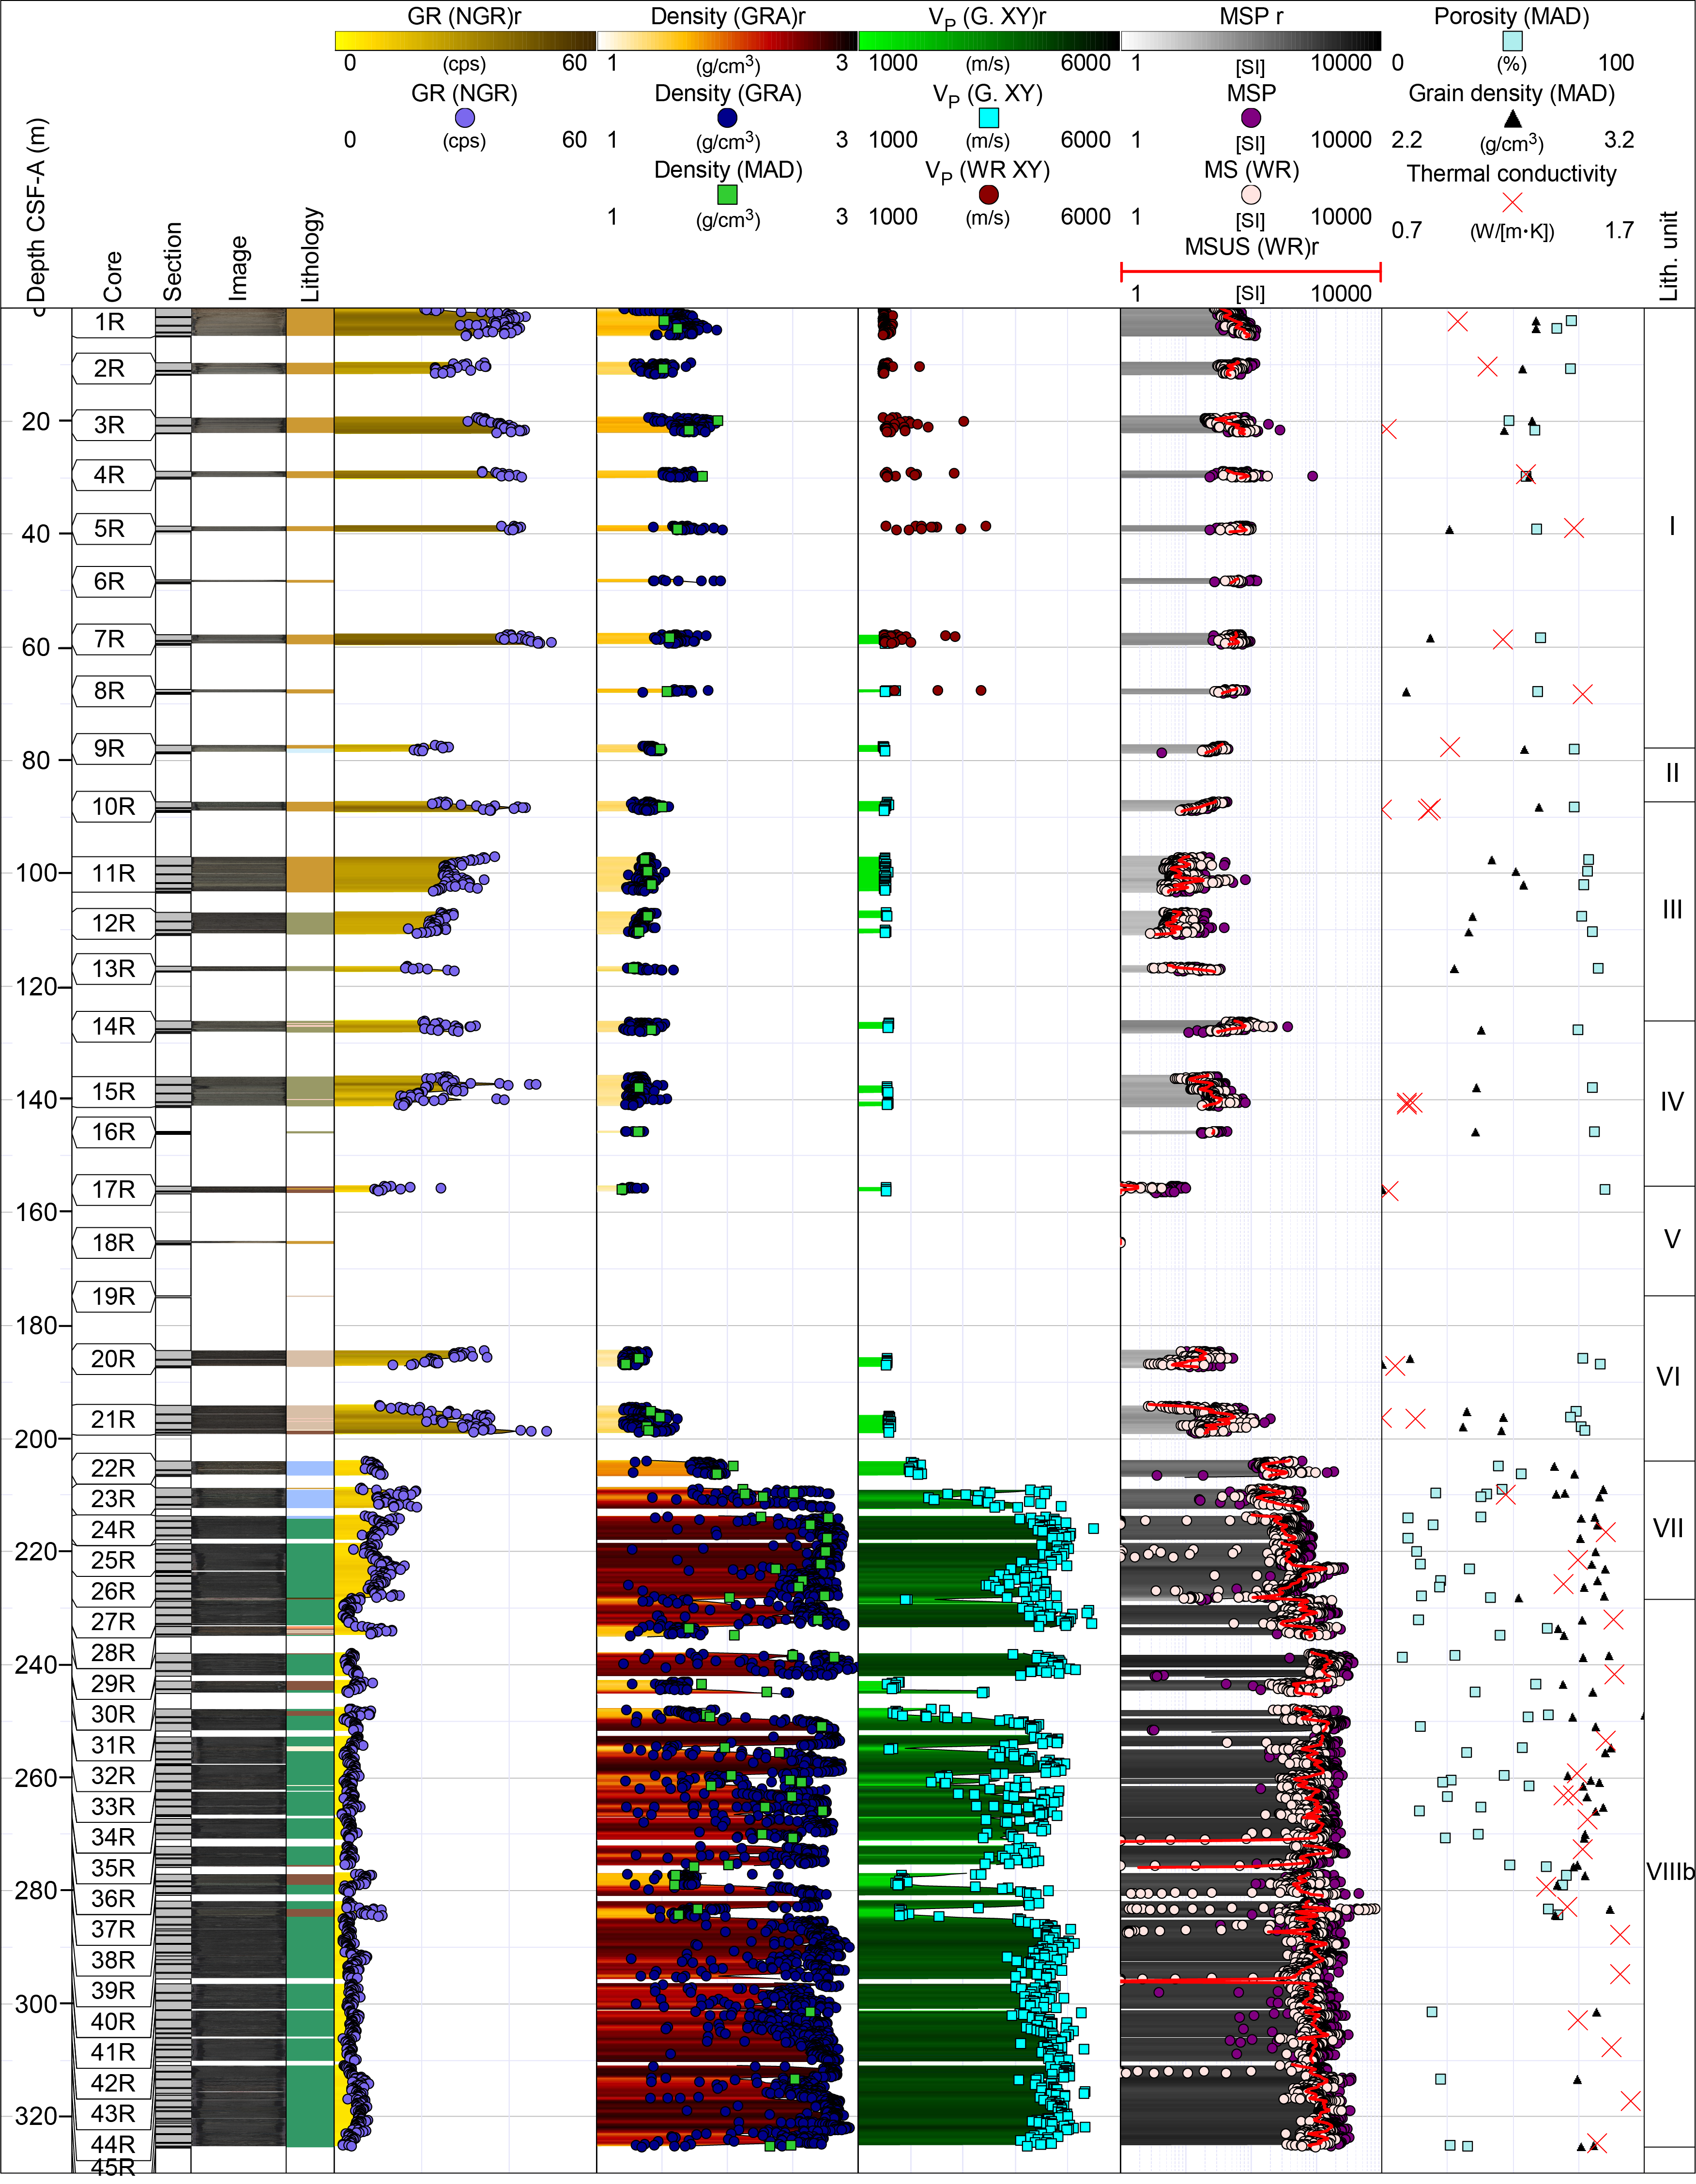
Figure F51. Physical properties, Hole U1572A.
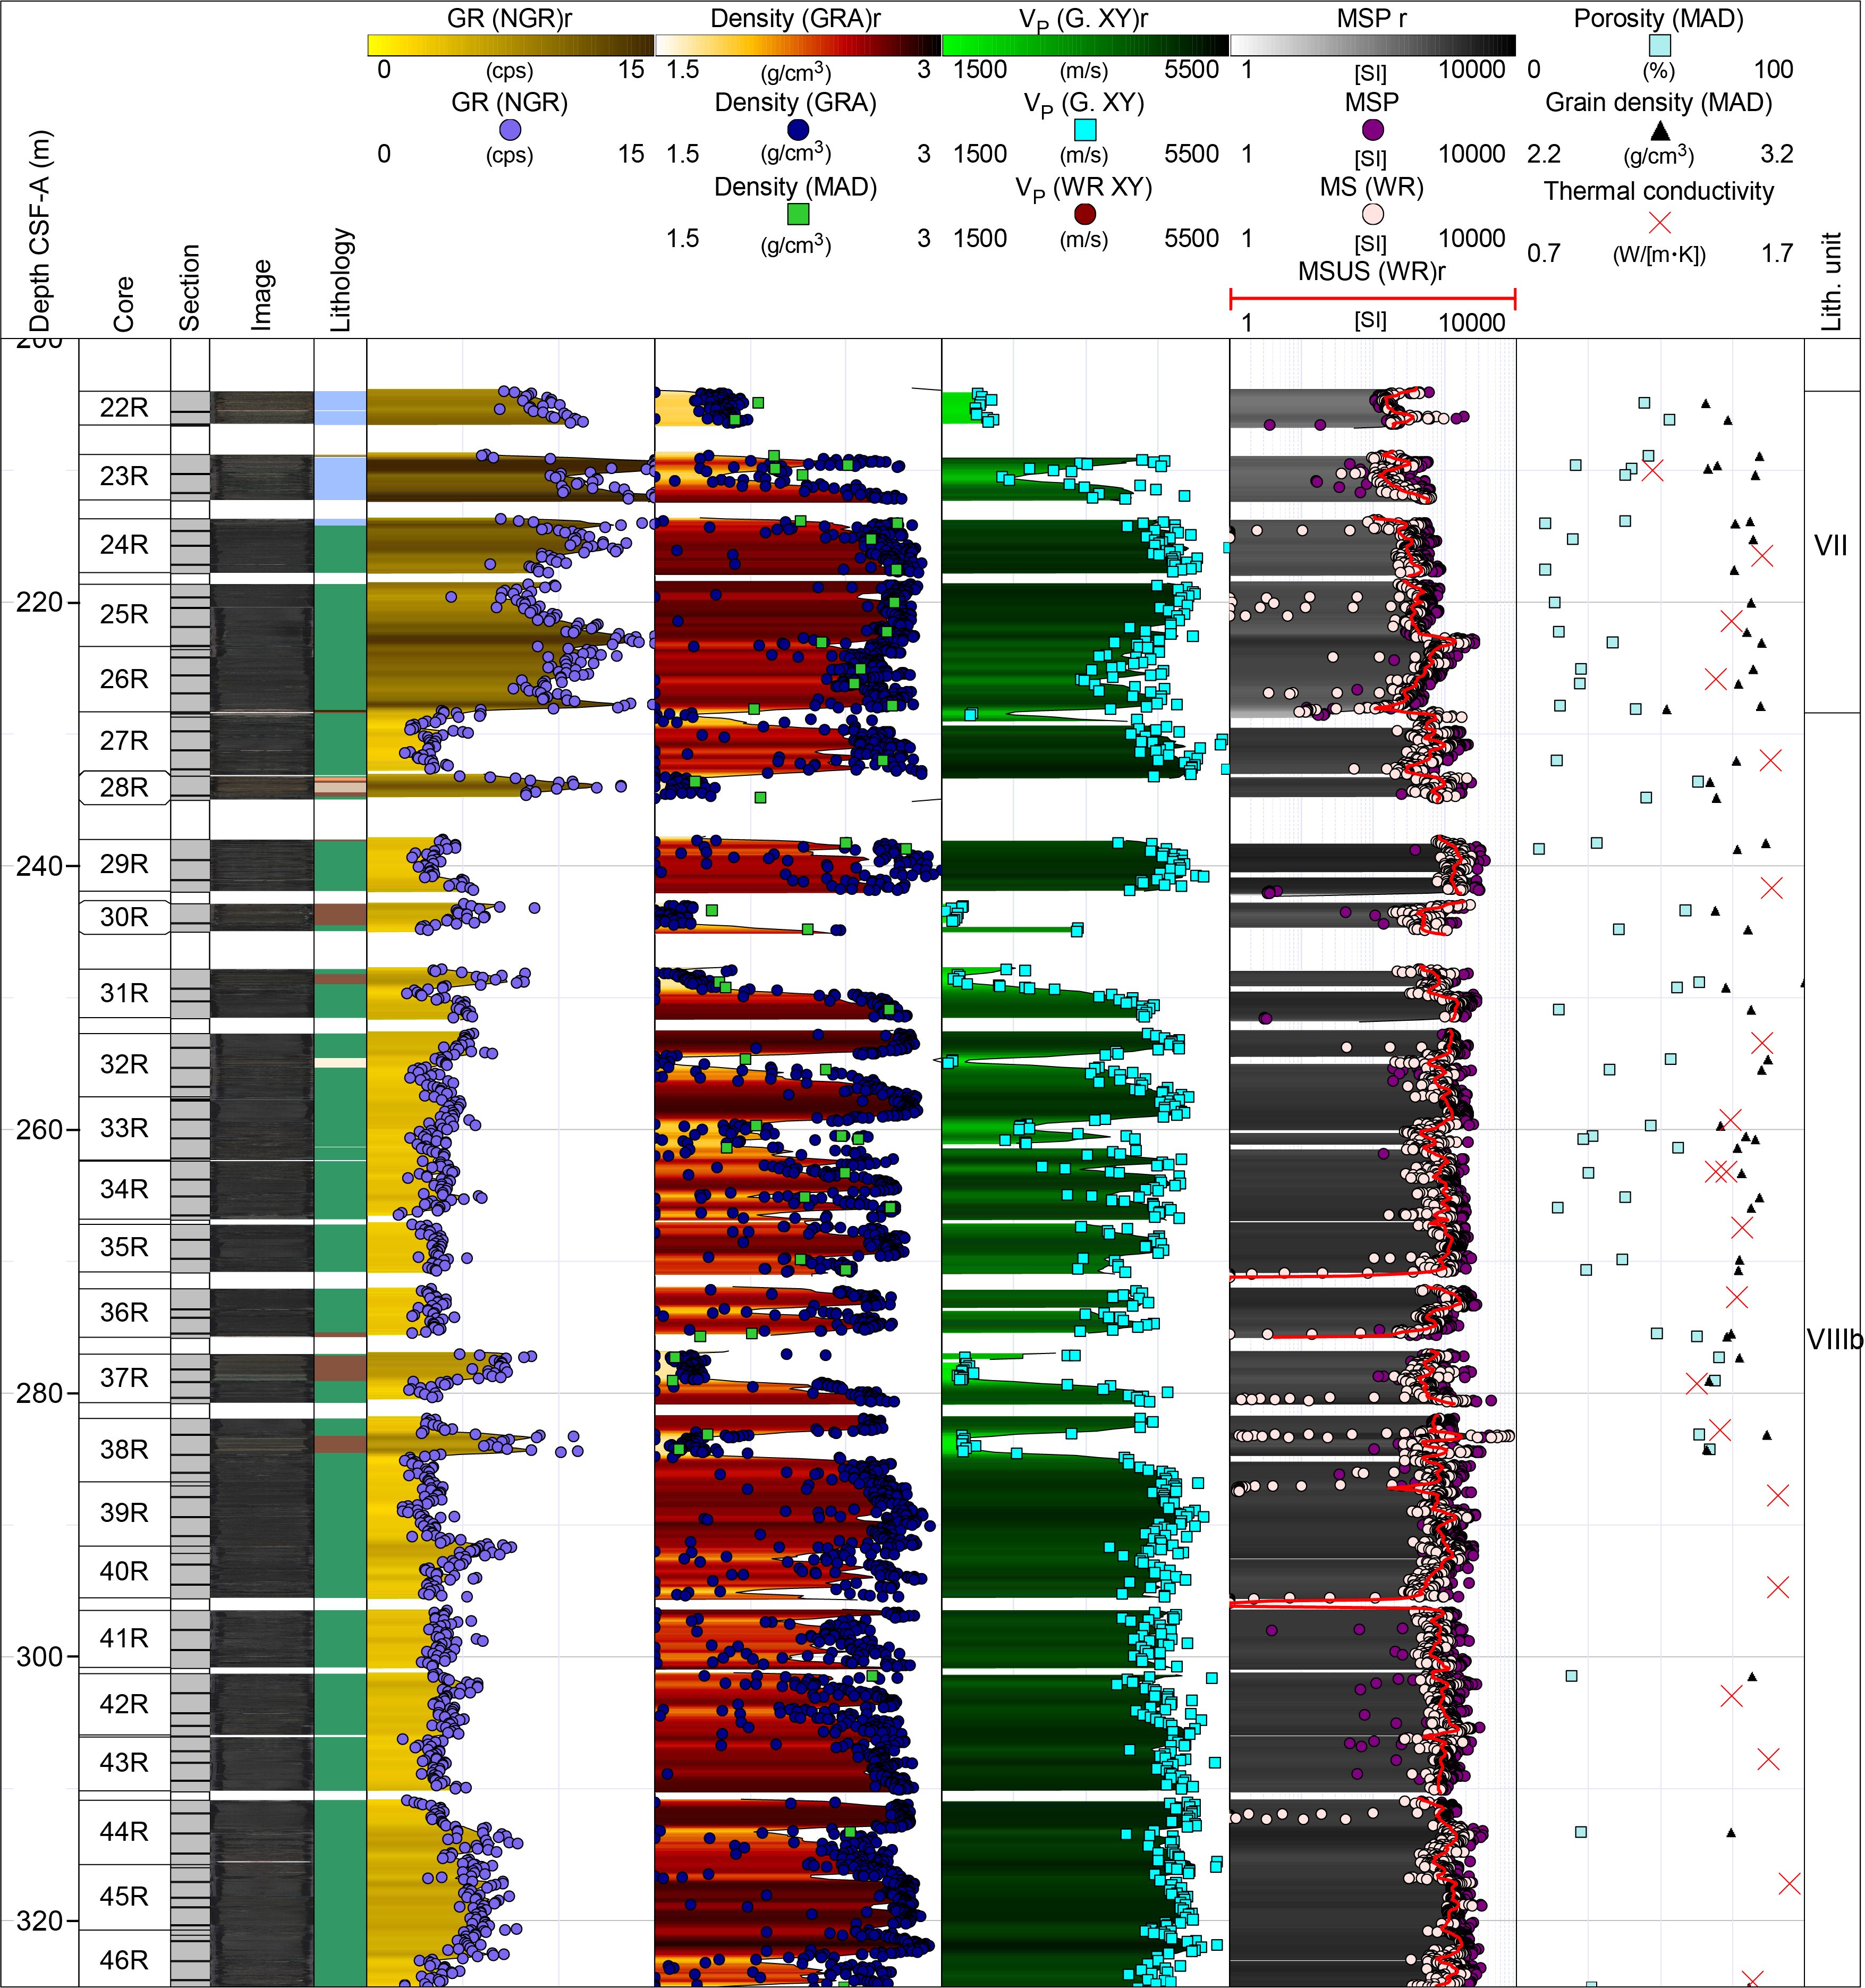
Figure F52. Basaltic and interbasaltic physical properties, Hole U1572A.
Unit I, the top lithostratigraphic layer covering the 0–78 m CSF-A interval, has relatively high bulk densities (mean = 1.6 g/cm3) and NGR values (average = 36 counts/s). P-wave logger (PWL) P-wave velocity of the interval varies from 1480 to 1600 m/s with the occasional peak above 3000 m/s. MS is generally low (mean = ~60 × 10−5 [SI]). Nine MAD samples collected from this unit indicate an average grain density of 2.63 g/cm3 and porosity of 61%, which is broadly consistent with values recorded in both holes at Site U1571.
Unit II is less than 1 m thick in this hole (77.88–78.65 m CSF-A). The few acquired P-wave velocities (average = 1503 m/s), MS (average = 27 × 10−5 [SI]), and GRA bulk densities (average = 1.44 g/cm3) indicate lower values than for Unit I. Unit III (87.33–126.20 m CSF-A) is characterized by a general decrease in GRA bulk density with depth from 1.5 to ~1.3 g/cm3 and relatively constant P-wave velocities (mean = ~1520 m/s) and MS (mean = ~10 × 10−5 [SI]).
Units IV–VI (~126–204 m CSF-A) had limited recovery (22%), limiting physical properties data acquisition. NGR remains constant at ~25 counts/s, peaking at 49 counts/s directly before the transition from Unit VI to Unit VII. P-wave velocities follow a similar trend, only slightly deviating from the ~1540 m/s average across the interval associated with Units IV and V (~126–175 m CSF-A) before increasing to 1600 m/s in Unit VI, and are much higher for the units below. MS (~28 × 10−5 [SI]) and GRA bulk densities (1.32 g/cm3) remain constant at ~126–155 m CSF-A before decreasing respectively to 1.26 g/cm3 and ~3 × 10⁻⁵ [SI] at 164 m CSF-A, and then returning to 1.34 g/cm3 and ~28 × 10−5 [SI] in Unit VI.
Unit VII consists of an ~25 m thick basaltic andesite sequence. The andesite has high P-wave velocities (mean = 4107 m/s), GRA bulk densities (2.53 g/cm3), MSP (536 × 10−5 [SI]), and WRMSL MS (368 × 10−5 [SI]) and low NGR (~10 counts/s). Thermal conductivities range ~1.17–1.55 W/(m·K) (average = 1.4 W/[m·K]). The boundary with lowermost Unit VIII does not result in a noticeable change in P-wave velocities and GRA bulk densities. However, the basaltic lava flow units and interbedded sedimentary successions do have unique responses that allow the identification of flow tops, interiors, bases, and sediment layers. P-wave velocities and bulk densities are highest and most constrained for the interiors, gradual changes are observed for the flow tops, and abrupt changes are observed for the flow bases typical of subaerial lava flow units (Planke, 1994).
From Unit VII to Subunit VIIIb (Figure F52), average MSP increases from ~532 × 10−5 to ~1416 × 10−5 [SI], average MS increases from 382 × 10−5 to 914 × 10−5 [SI], and average NGR decreases from 10 to 4.4 counts/s. A total of 67 MAD measurements were collected across Unit VII and Subunit VIIIb. Calculated porosities range from 3% for aphyric basalts to 70% for interbedded clay-rich sediments, and grain densities are slightly higher at 2.99 g/cm3 versus those recorded in Unit VII (2.99 g/cm3; n = 17). Abundant primary vesicular porosity is seen throughout Unit VIII, and porosities often exceed 30%.
7.5. Hole U1572B
The physical properties for Hole U1572B are summarized in Figure F53. This hole was drilled using the APC system, resulting in a much higher recovery rate for the sediment sequences (97.35%). All eight lithostratigraphic units were identified in the recovered intervals except for Subunit VIIIb. Deviating slightly from protocol (see Physical properties in the Expedition 396 methods chapter [Planke et al., 2023a]), SHMG P-wave velocity measurements were made for at least one section per core. This was done partly to appraise the outcome of the PWL component of the WRMSL after some maintenance procedures (mostly affecting Core 10H) and to better constrain the key transition from 60 to 100 m CSF-A.
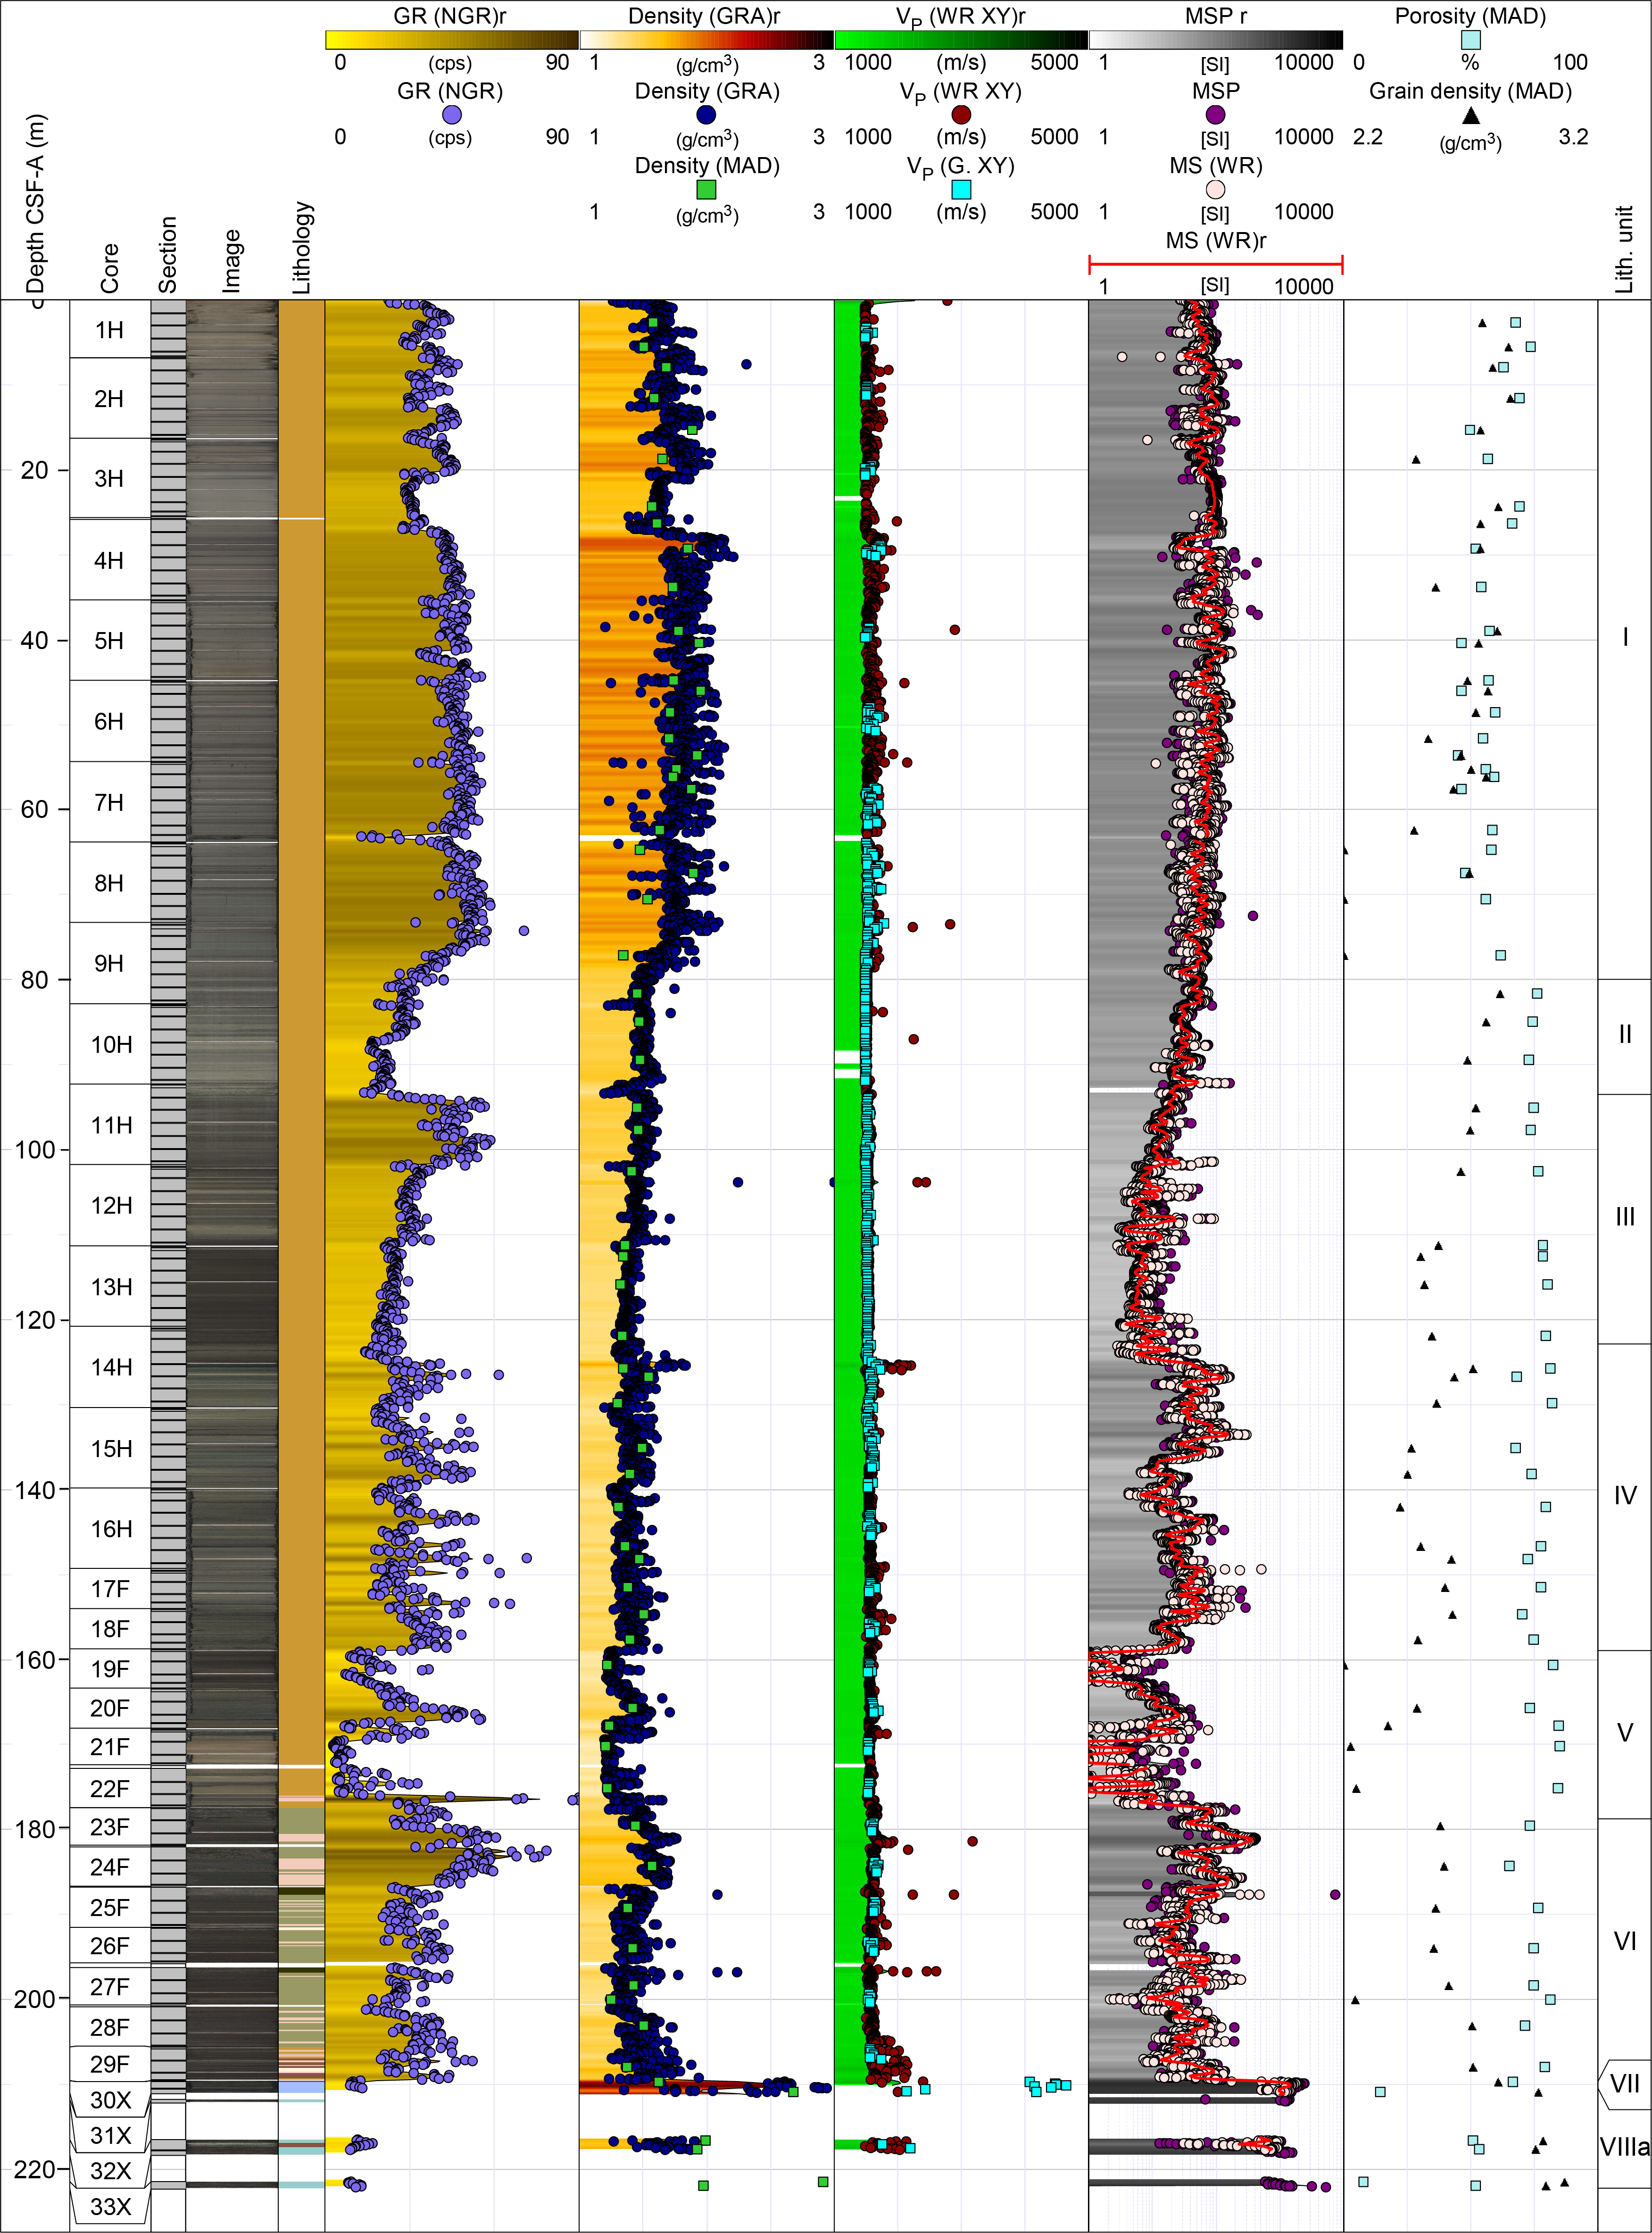
Figure F53. Physical properties, Hole U1572B.
High GRA bulk density and NGR values are recorded for Unit I (0–80 m CSF-A). The upper part of the unit is defined by increasing P-wave velocities and GRA bulk densities to ~20 m CSF-A. The ~20–28 m CSF-A interval features reveal decreasing P-wave velocity (100 m/s), GRA bulk density (by 0.2 g/cm3), and NGR (by 10 counts/s) baselines, and the MS baseline lies ~100 × 10−5 [SI] higher compared to the overlying interval. A return to the baseline of the uppermost section is seen at ~28 m CSF-A, with NGR slightly increasing throughout the remainder of Unit I, whereas MS and GRA bulk density feature slightly declining trends. A total of 28 MAD samples were taken throughout the unit. Bulk densities are in line with those measured by GRA bulk density. MAD measurements indicate an average grain density of 2.62 g/cm3 and porosity of 57%.
P-wave velocities, GRA bulk densities, MS, and NGR values decrease throughout Unit II (~80–93 m CSF-A), reaching minima of ~1480 m/s, 1.24 g/cm3, 11 × 10−5 [SI], and 14 counts/s, respectively. The unit has an average P-wave velocity of ~1500 m/s, and the mean GRA bulk densities and MS are 1.49 g/cm3 and ~36 × 10−5 [SI], respectively.
The start of Unit III is marked by a sharp increase in NGR, briefly returning to ~50 counts/s at 94–102 m CSF-A. Neither average P-wave velocities, GRA bulk densities, nor MS show a clear change with respect to Unit II, in stark contrast to NGR, which increases and stabilizes at ~60 counts/s and then decreases to ~30 counts/s throughout the remainder of Unit III (102–123 m CSF-A).
Unit IV is characterized by more scattered NGR (mean = 32 counts/s) and MS (mean = 37 × 10−5 [SI]). Peaks and scatter, correlated to the occurrence of ash beds, is most pronounced for the MS data. P-wave velocities step up slightly at 123–159 m CSF-A.
The transition into Unit V at ~159 m CSF-A is marked by a decrease in the mean values of all measured physical properties: bulk density = 1.33 g/cm3, thermal conductivity = ~15 × 10−5 [SI], P-wave velocity = ~1565 m/s, and NGR = 22 counts/s. The measured physical properties all feature a broad peak toward the middle of the unit (~164–170 m CSF-A) followed by a general increase below the transition to Unit VI. Units VI and VII feature similar responses as those observed for the ash-rich, high-scatter interval identified as Unit IV.
7.6. Lithostratigraphic unit summaries
Unit I is as thick as 80 m and of Pleistocene age. This unit has characteristic high bulk densities (mean = 1.74 g/cm3) and NGR values (average = 42 counts/s) and relatively low P-wave velocities (~1560 m/s) and MS (70 × 10−5 [SI]). A total of 44 MAD samples collected throughout this unit show an average bulk density of 1.69 g/cm3, grain density of 2.63 g/cm3, and porosity of 58%.
Unit II was sampled only in the two holes at Site U1572. It comprises consolidated muds and nannofossil ooze of Miocene age. Its thickness varies from less than 1 m in Hole U1572A to as thick as 13 m in Hole U1572B. Average P-wave velocities, GRA bulk densities, MSP and MS, and NGR are ~1500 m/s, 1.49 g/cm3, ~35 × 10−5 [SI], and 24 counts/s, respectively. Analysis of four MAD samples indicated an average porosity of 74% and a grain density of 2.75 g/cm3.
The thickness of diatomite Unit III varies from ~11 to 29 m between the four holes. Mean bulk densities (1.37 g/cm3) and P-wave velocities (~1525 m/s) were recorded, and the unit features one of the lowest mean MS values (~10 × 10−5 [SI]) of all units. The top of this unit is characterized by a sharp increase in NGR.
Unit IV was penetrated in all four holes and is characterized by a significant scatter in NGR data (average = 30 counts/s). Mean bulk densities and P-wave velocities of the unit are 1.39 g/cm3 and ~1573 m/s, respectively. Noticeably, increased scattering in MS (as high as ~400 × 10−5 to 500 × 10−5 [SI] from the average of ~36 × 10−5 [SI]) correlated well to ash beds.
Eocene Units V and VI were only penetrated in Holes U1572A and U1572B. Unit V consistently features low physical properties responses, with mean values for P-wave velocity, bulk density, MS, and NGR of 1565 m/s, 1.33 g/cm3, 41 10−5 [SI], and 21 counts/s respectively. In contrast, Unit VI features a general increase in all physical properties, with mean values for P-wave velocity, bulk density, MS, and NGR of 1620 m/s, 1.46 g/cm3, ~90 × 10−5 [SI], and 33 counts/s, respectively. MAD sample analyses indicated porosities of 81% and 73% for Units V (n = 10) and VI (n = 20).
Basaltic andesite–dominated Unit VII is characterized by high GRA bulk densities (2.53 g/cm3) and P-wave velocities (4120 m/s) and low NGR (11 counts/s) in line with the data recorded for the basalt interiors found in Subunit VIIIb. MSP (592 × 10−5 [SI]) and MS (401 × 10−5 [SI]) are a factor of 10 higher than for the overlying units, but about half that observed for the underlying Unit VIII.
A clear distinction is seen between the hyaloclastite Subunit VIIIa and basalt-dominated Subunit VIIIb. The former has relatively low P-wave velocities (~1800 m/s) and GRA bulk densities (~1.55 g/cm3) more in line with the low velocity, low bulk density interbasaltic sediments than with the 5000 m/s basalt flow interiors (~2.5 g/cm3). Basalt flow tops, interiors, and bases are readily identifiable through their characteristic asymmetrical physical properties responses in velocity and density, and they reveal abundant open pore spaces in the form of primary vesicles that are filled with secondary minerals in some cases.
7.7. Summary
Drilling at Skoll High Sites U1571 and U1572 recovered a comprehensive suite of cores through a postvolcanic Early Eocene to Quaternary sedimentary sequence along with >100 m of interlayered basalt-dominated lava flows and interlayered volcaniclastic sediments of the breakup-related volcanic sequence. Extensive data collection through the volcanic sequences at Sites U1571 and U1572 enabled robust characterization of the physical properties of the breakup volcanism during this time interval, including the identification of key lava flow characteristics such as the scales and distributions of open primary porosities that commonly exceed 40%. The collected data will enable enhanced future appraisal of both the seismic properties and distribution of breakup volcanic facies and will also enable reservoir property characterization of the volcanic units for future carbon capture and storage potential.
8. Downhole measurements
On the Skoll High, wireline logging was conducted in Holes U1571A and U1572A to 247.6 and 330.5 m drilling depth below seafloor (DSF), respectively.
After coring was completed, Hole U1571A was prepared for logging and the drill pipe was pulled back to a logging depth of 87 m DSF. Wireline logging using the triple combo, FMS-sonic, and UBI logging tool strings was undertaken without incident (Table T20). The hole remained fully open, enabling each logging run to reach the base of the hole (the UBI tool string was lowered to within ~10 m of bottom to avoid sensor damage). Each tool string recorded a down pass from just above seafloor with calipers closed, followed by a main and repeat pass (repeat pass first, followed by main pass to seafloor with gamma ray (GR) measured through casing). GR was logged through the drill pipe to identify the seafloor by its clear increase in GR. This transition was used to zero all logging runs to seafloor.
After coring operations were concluded in Hole U1572A, the hole was conditioned and the drill string raised to 81 m DSF for wireline logging. Wireline logging using the triple combo, FMS-sonic, and UBI logging tool strings was planned. However, only the triple combo could be run because of deteriorating hole conditions. The depth scale for all wireline data is presented as wireline log matched depth below seafloor (WMSF) in meters, whereas the associated core data uses the CSF-A depth scale in meters.
The first down log was run using the triple combo from just above seafloor to 256 m DSF, at which point the tool reached soft mud/sediment that had already backfilled the hole by ~80 m. A repeat pass was logged followed by a main pass from 256 m DSF to the seafloor with the calipers closed at 104 m WMSF before entering the casing. During ascent, the calipers encountered a tight undergauge interval at ~110 m WMSF just below casing, signaling (along with the backfill) that the borehole had begun to collapse and was not safe to reenter for further logging runs. The logging summary for Site U1572 is presented in Table T21.
Data were sent for processing, depth matching, and quality control to Columbia University’s Lamont-Doherty Earth Observatory, and the processed data were returned to the onboard logging team. No depth matching between core and wireline data is presented in this chapter, and comparisons between data sets are therefore only indicative.
In addition to wireline logging in Holes U1571A and U1572A, the advanced piston corer temperature (APCT-3) tool was run in Hole U1572B. The APCT-3 was deployed with the APC system and returned three robust temperature values for the formation at 35.3, 73.3, and 111.3 m DSF. Increased overpull encountered while retrieving the core barrel required changing to the HLAPC system from 149.3 m DSF, and temperature measurements were therefore suspended.
8.1. Logging units
The six logging units defined in Hole U1571A are constrained by a combination of the lithostratigraphy, physical properties, and wireline data (see Lithostratigraphy and Physical properties). Logging units are restricted to broad GR based inferences above the drill string casing. In the main open hole logged interval in Hole U1571A, the wireline properties reveal several clear transitions that are typically offset from lithostratigraphic units and, at least in part, relate to the very poor core recovery in the sedimentary sequence that overlies the hard rock volcanic sequence at the base of the well.
The available data for Hole U1572A reveals a sequence with clear similarities but also differences in wireline properties compared to Hole U1571A. Five logging units are defined in Hole U1572A, including a division of Logging Unit 3 into Subunits 3a and 3b, and the sequential numbering is broadly similar to Hole U1571A with the exception of Logging Unit 7, which was not clearly defined because of hole conditions. Based on the logging characteristics alone, a unique correlation of logging units between the two sites is not attempted, and unit numbering should therefore be regarded as indicative only.
8.1.1. Hole U1571A
In Figure F54, a summary of key logging data from the main open hole logged section in Hole U1571A is presented, highlighting the <140 m of continuous data. The closure of the single arm caliper at ~99 m clearly affects all data curves collected as part of the triple combo tool string above this depth and should be appraised only subjectively. The borehole condition is generally very good, and minor hole washouts are highlighted by the caliper in the open hole sediment-dominated interval ~100–140 m WMSF. Over this same section, the background borehole shape gradually narrows from a 2 to a 3 inch enlargement to become essentially on gauge at the top of the main volcanic-dominated sequence (~153 m WMSF) where it remains consistent and on gauge to total depth. GR, MS, and borehole caliper wireline traces are presented alongside core-derived measurements in Figure F55, including the interval of GR data measured behind casing to the seafloor. The attenuated nature of wireline GR run behind casing to seafloor is clearly seen at ~87 m WMSF, where GR drops from ~17 to ~5 gAPI. In Figure F56, wireline bulk density (RHOM), P-wave velocity (VP), photoelectric effect (PEF), and acoustic impedance (AI) (density × VP) are presented alongside core-derived measurements for the open hole section of Hole U1571A. The logged interval reveals very good correlation between bulk density and velocity through the lava flow–dominated volcanic sequence below ~153 m WMSF and very good correspondence between core- and wireline-derived properties both in terms of absolute values and systematic trends with depth. Provisional comparisons indicate depth discrepancies are relatively limited between wireline and core, and differences beyond the driller to logger depth shift (−1.1 m) typically remain within the 1–2 m or less range. The FMS and UBI image log data collected in Hole U1571A are presented alongside resistivity and GR in Figure F57. Generally, very good imaging was achieved over an open hole interval of ~125 m using the FMS tool, whereas the UBI delivered lower resolution imaging with which only broader scale facies variations are distinguishable. Both image log data sets pick out individual lava flow lobes extremely well, which clearly link to other physical properties trends.
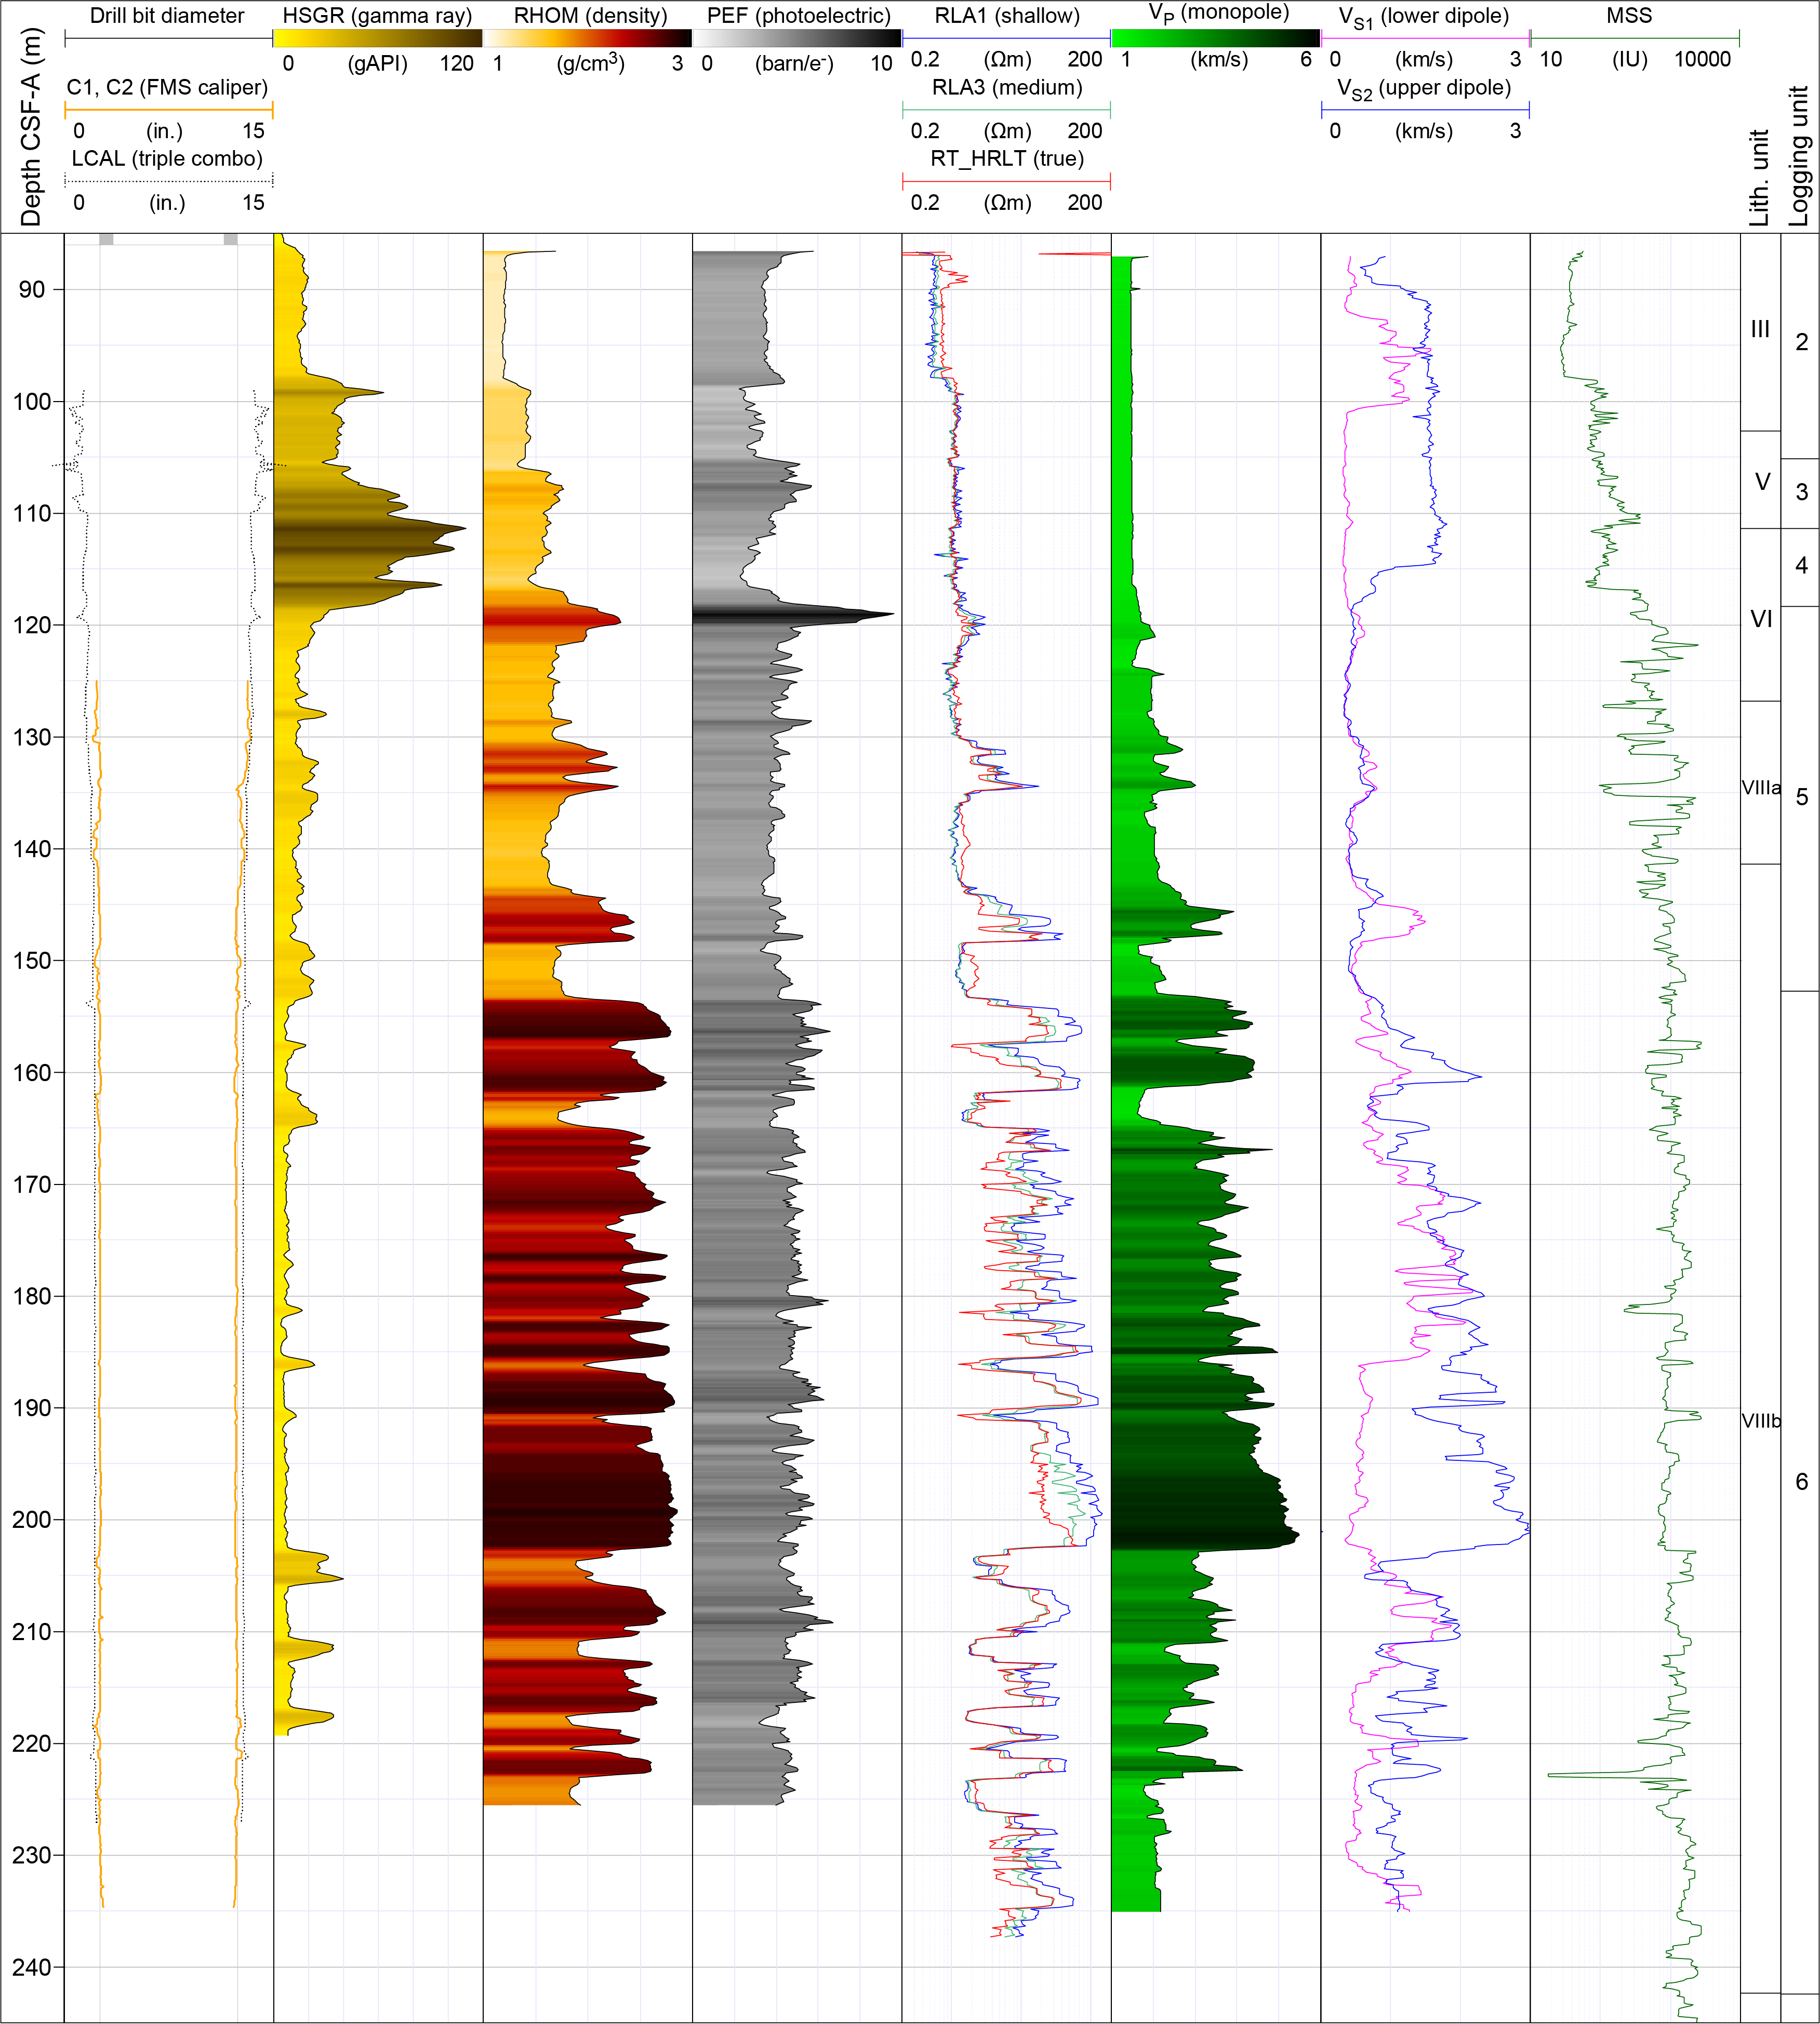
Figure F54. Wireline logging, Hole U1571A.
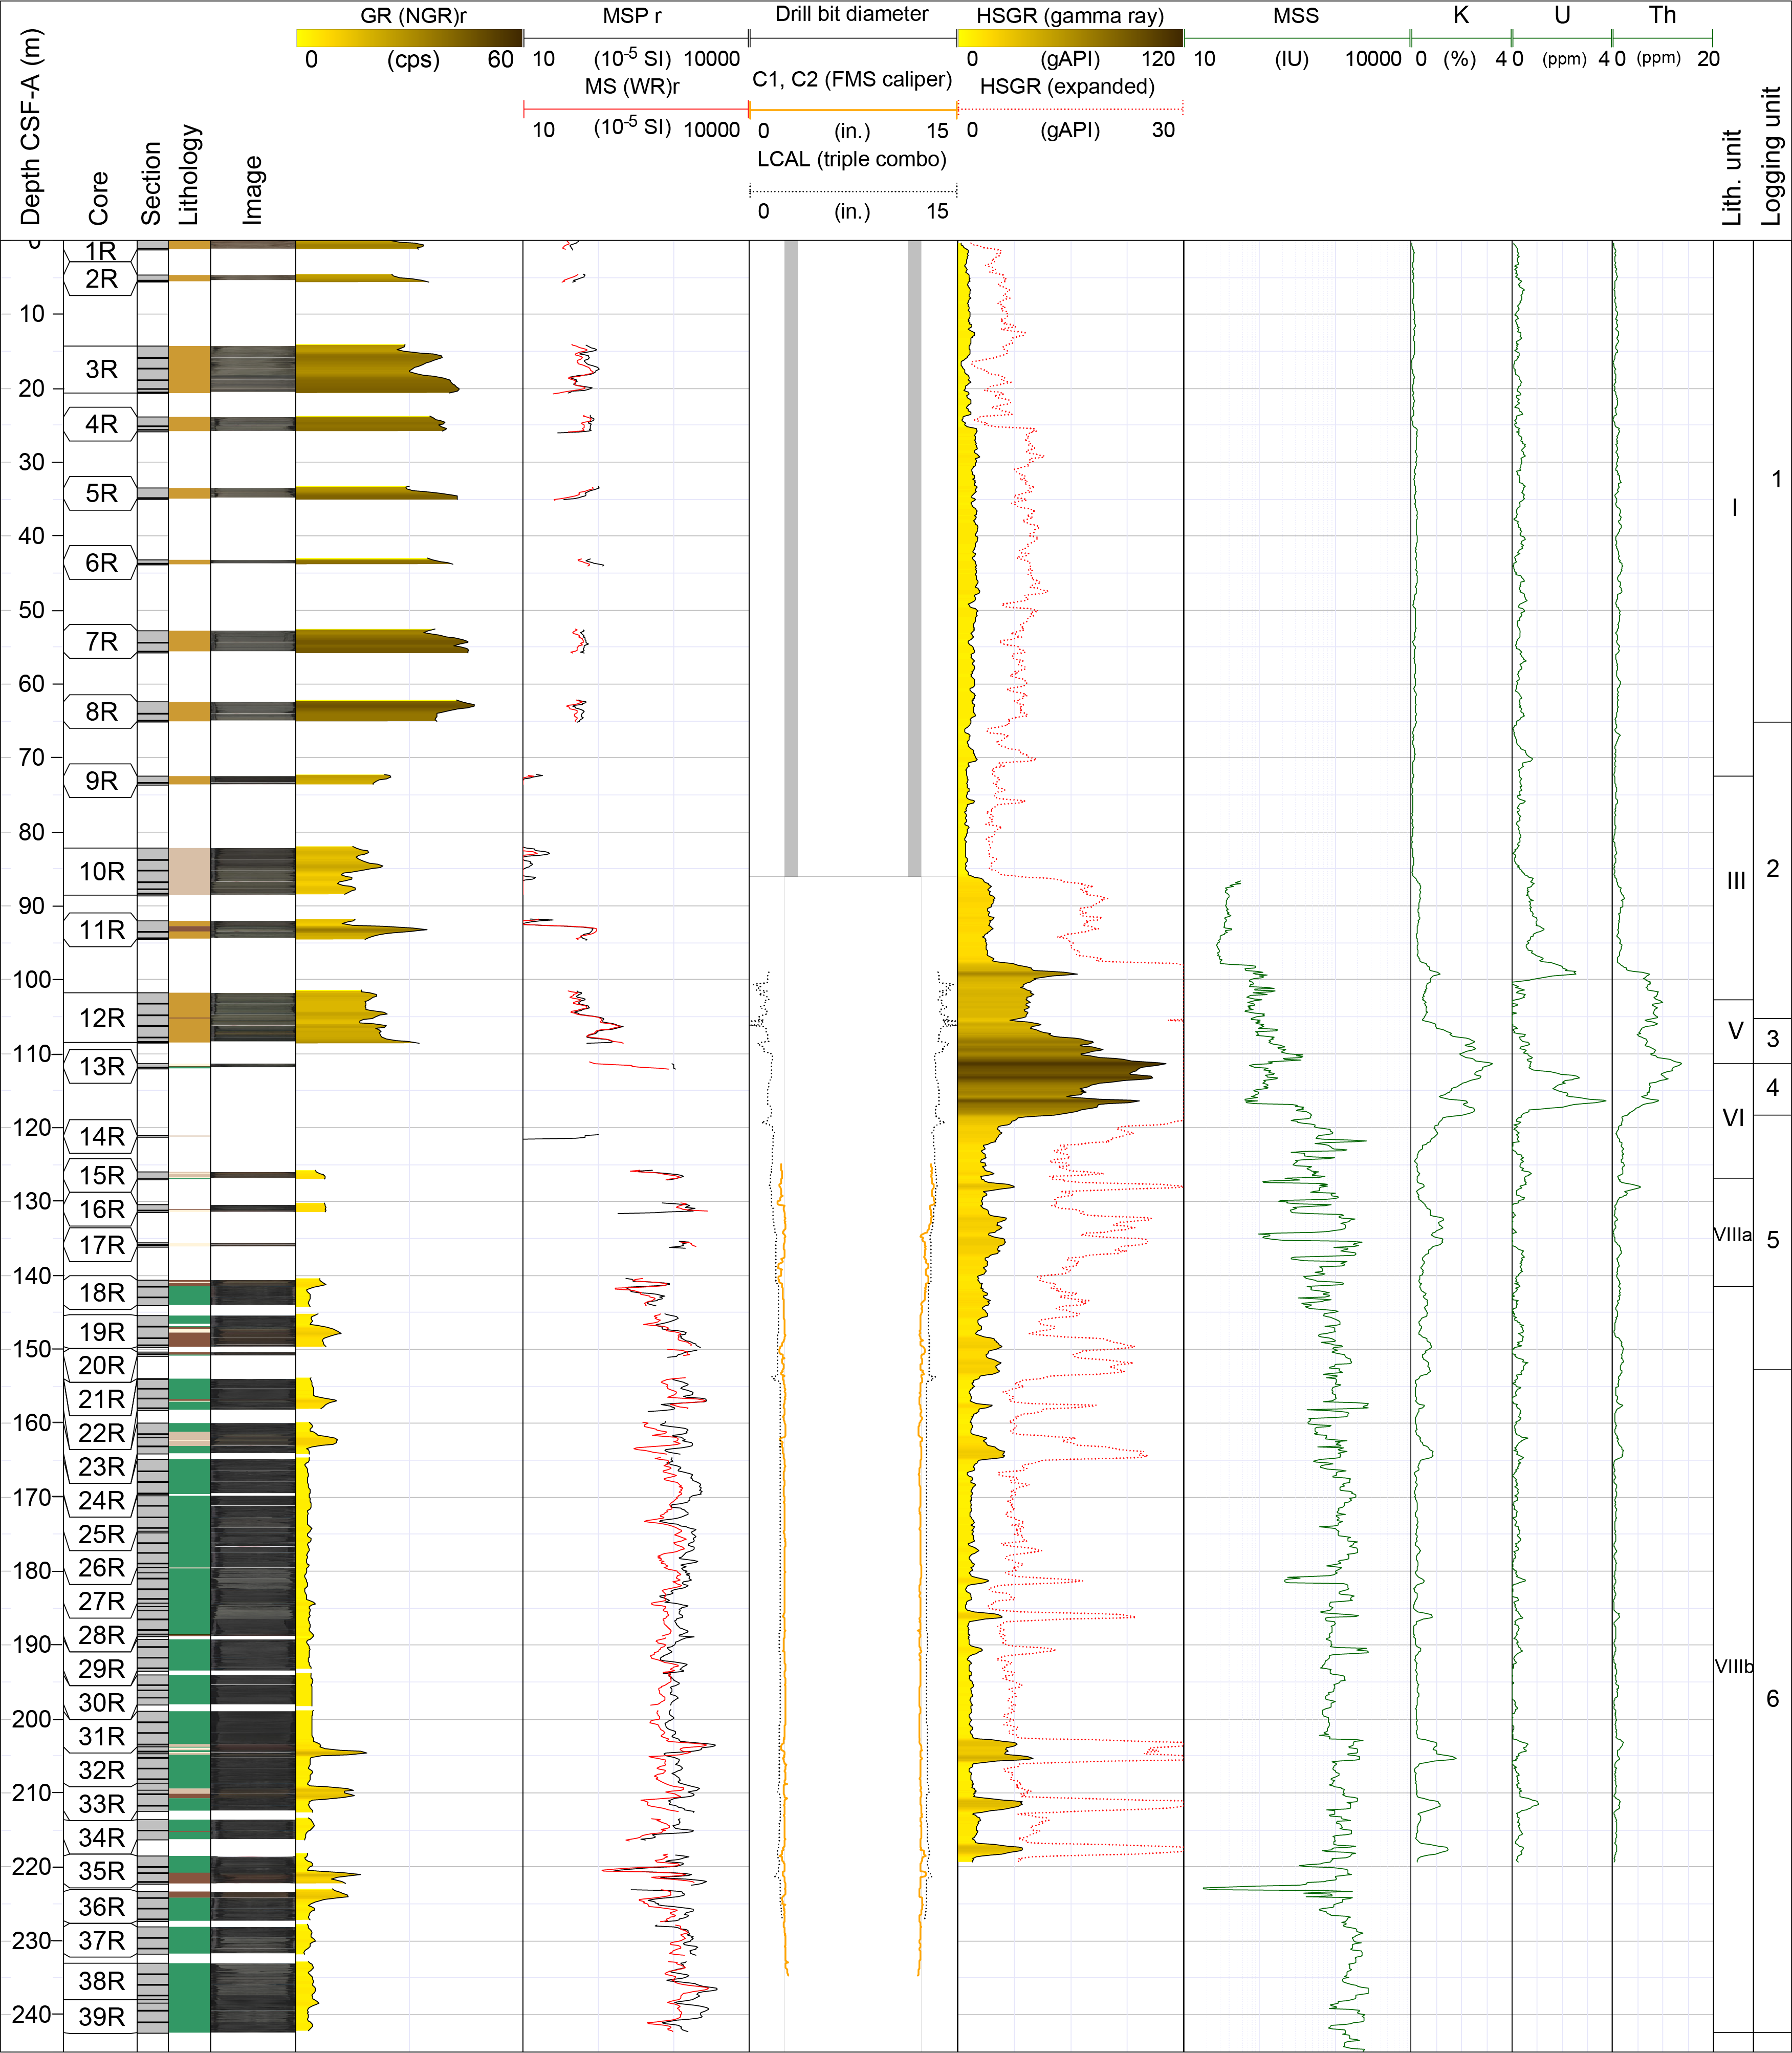
Figure F55. Wireline GR and MS, Hole U1571A.
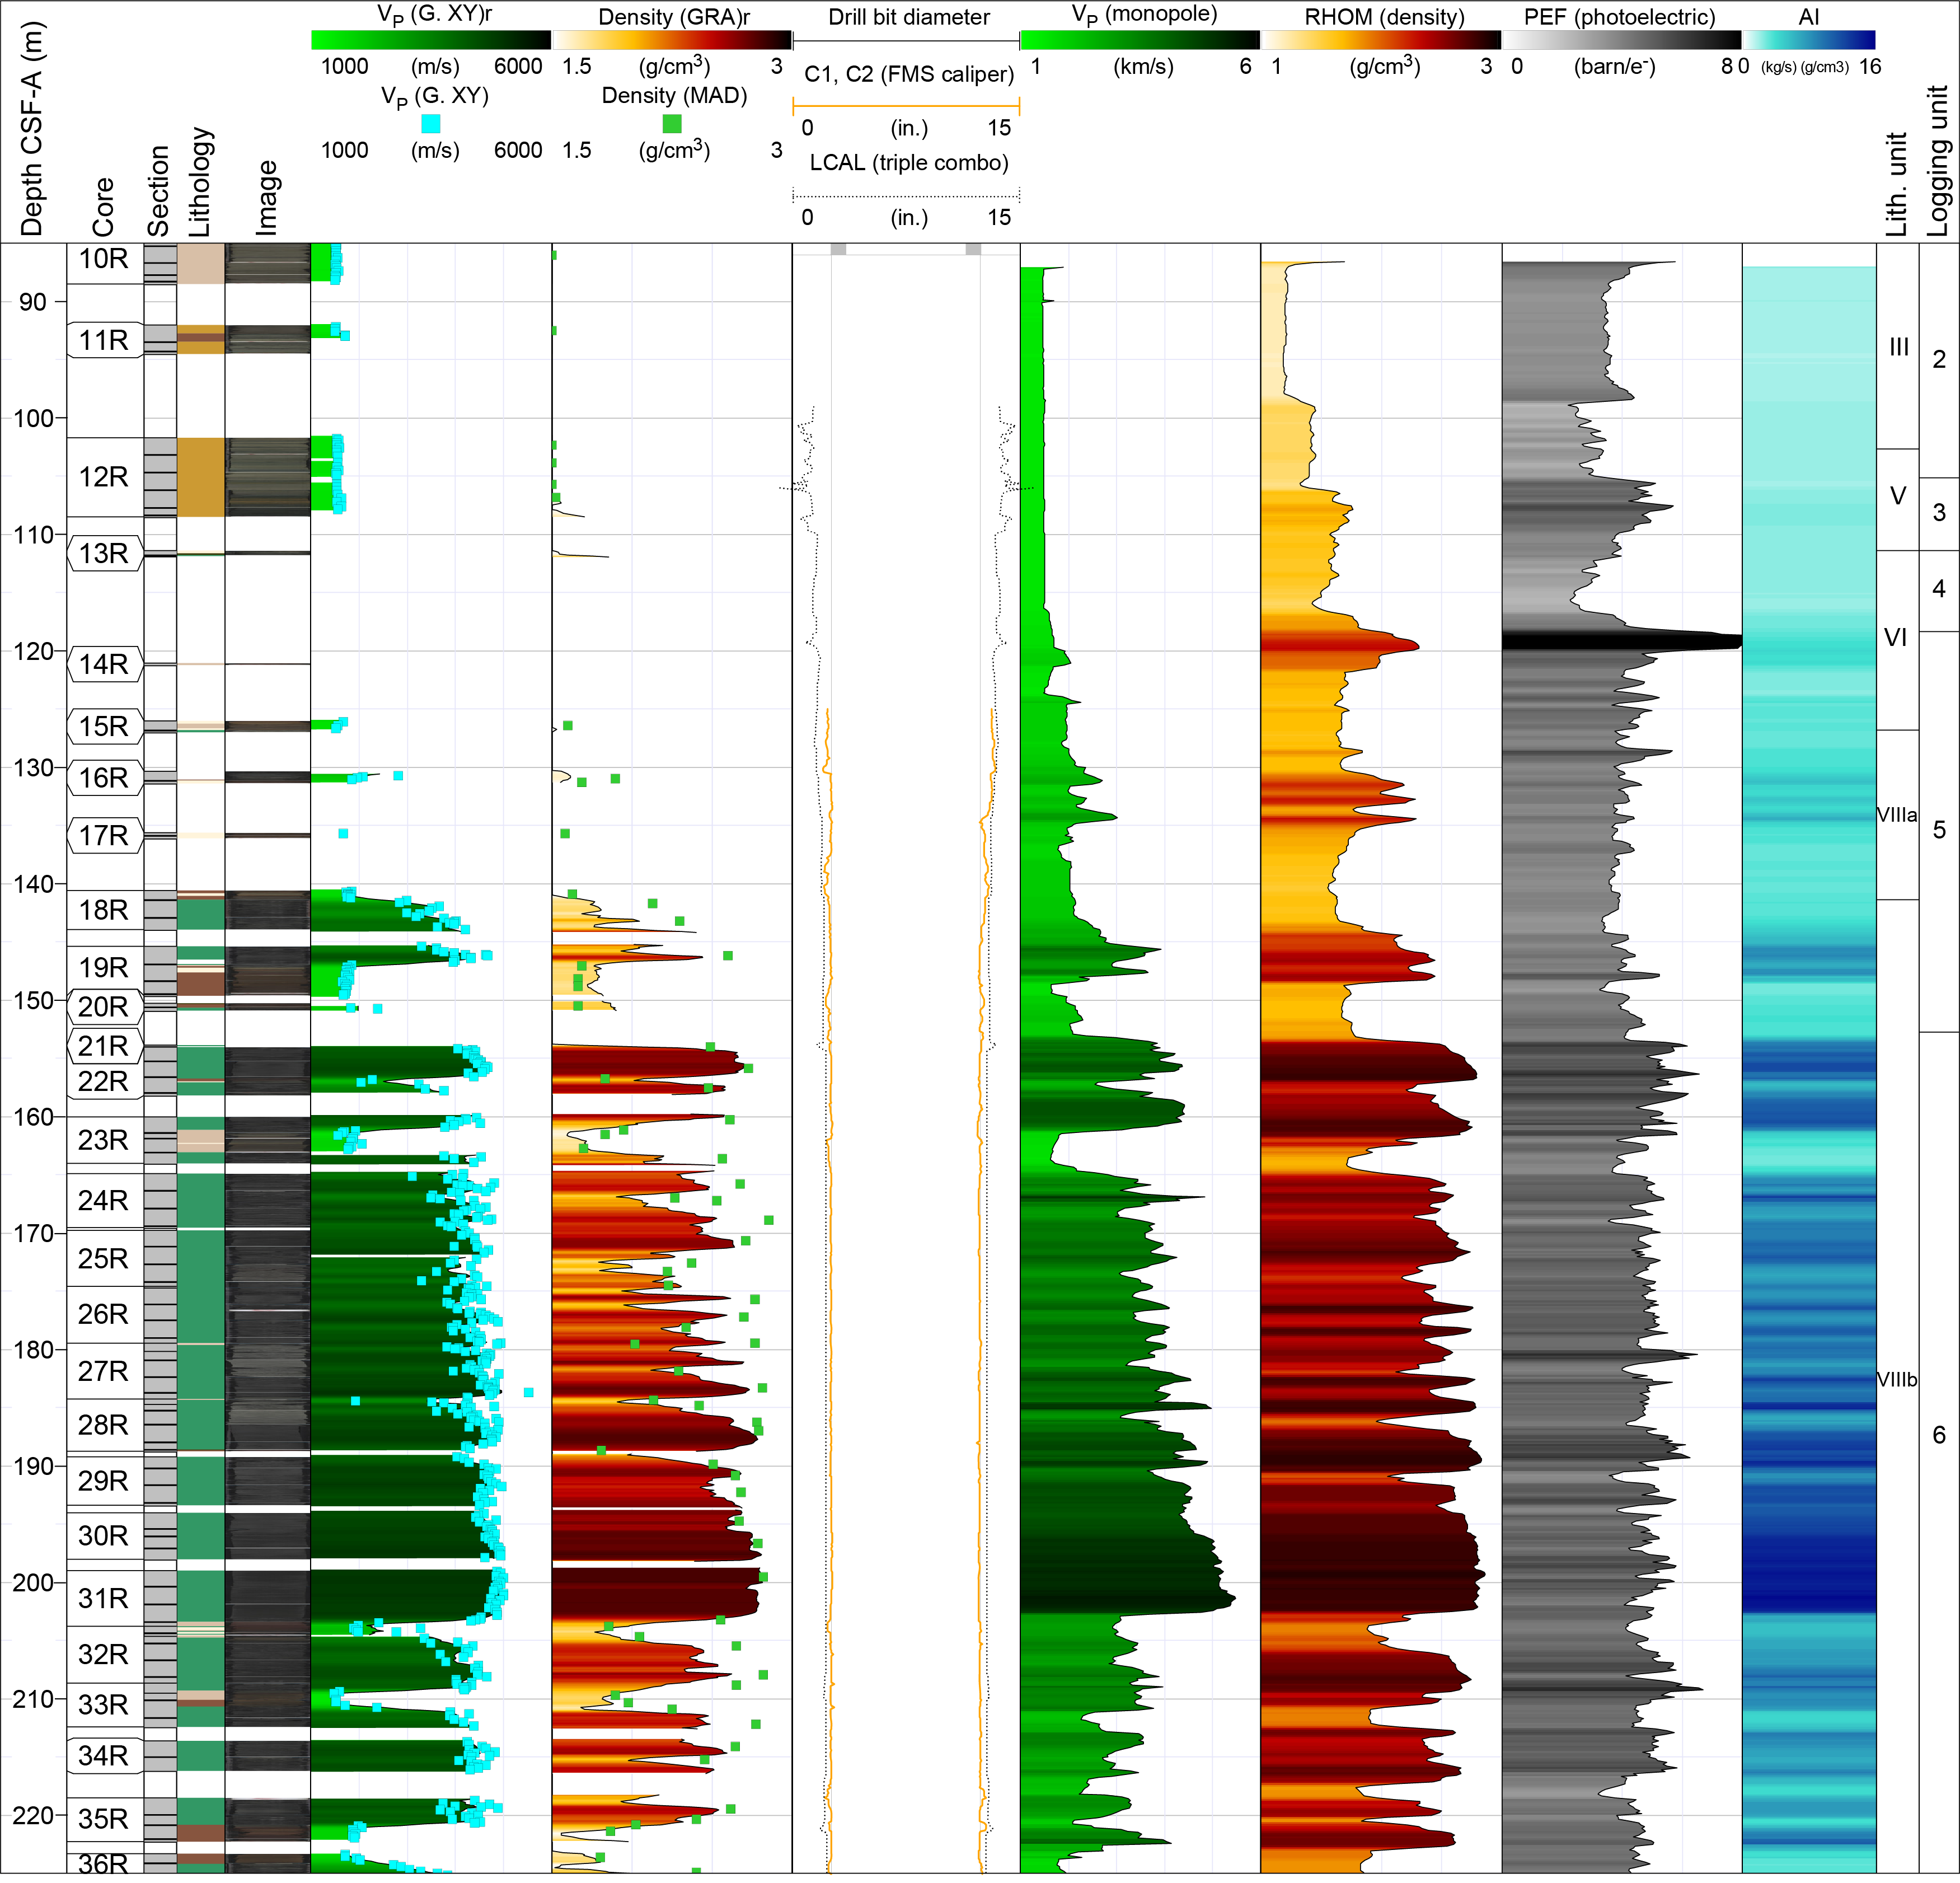
Figure F56. RHOM, PEF, sonic P-wave, and calculated AI.
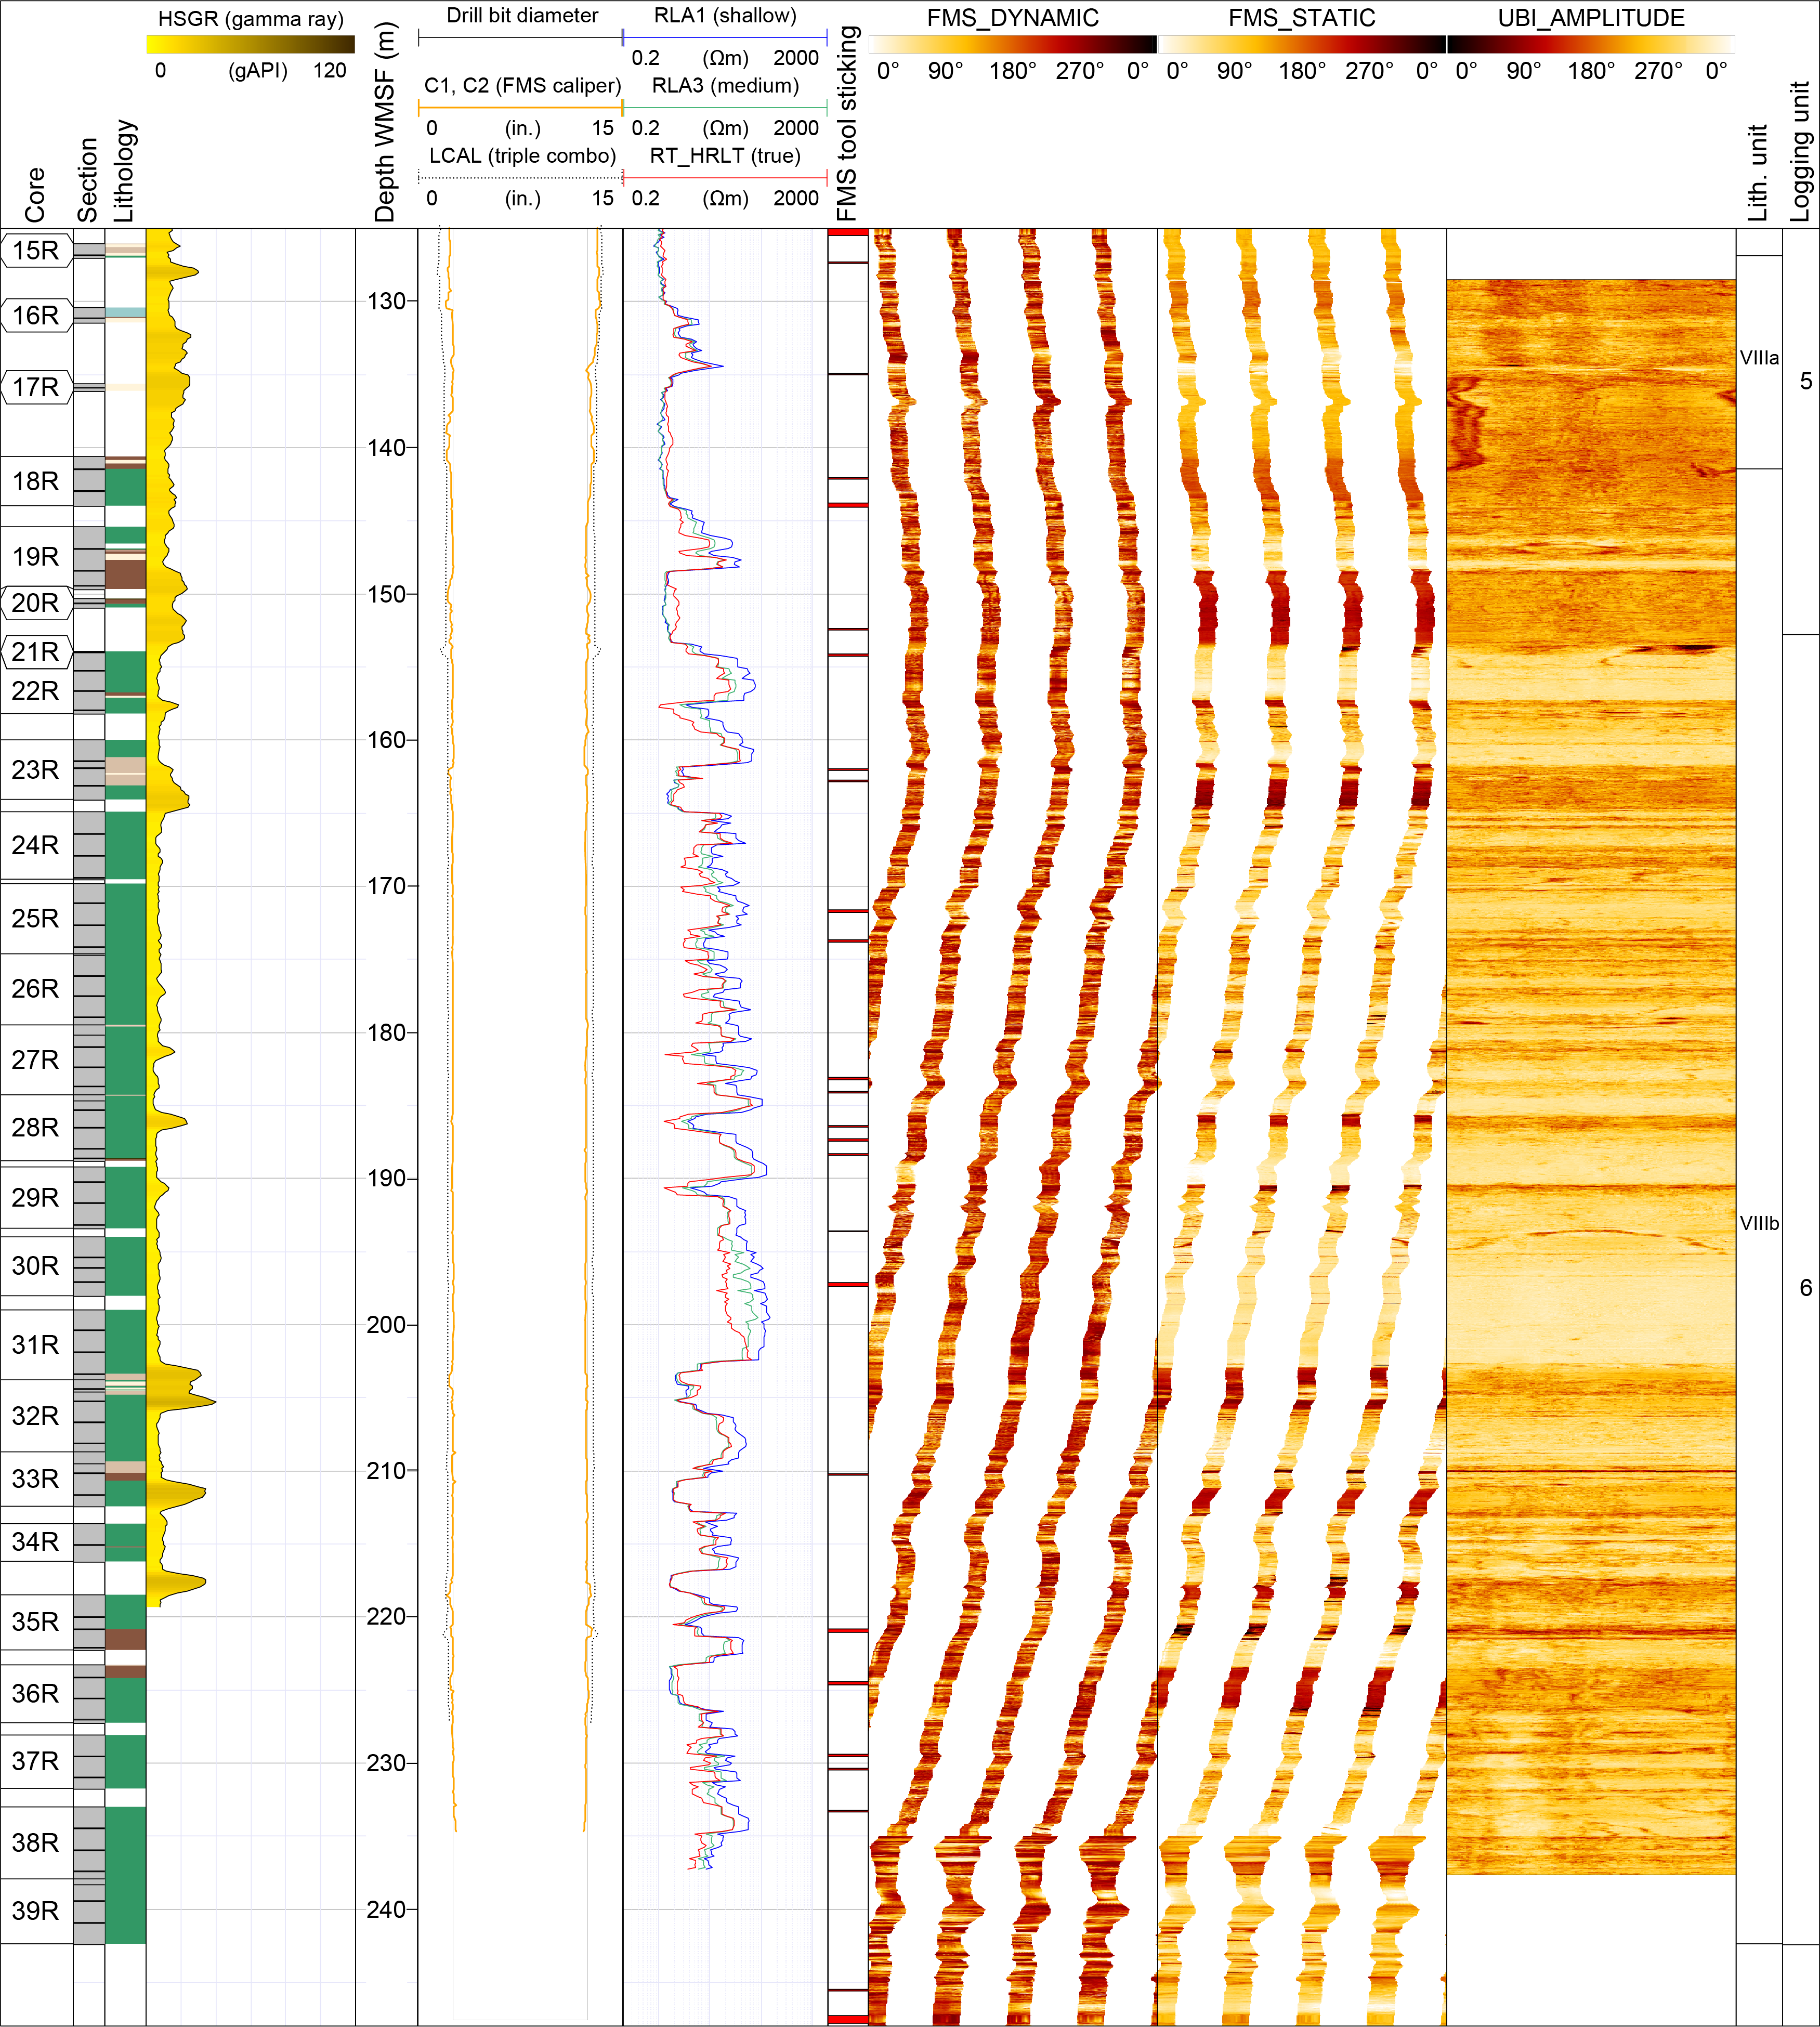
Figure F57. Wireline GR, resistivity, FMS, and UBI image.
8.1.1.1. Logging Units 1 and 2
Logging Units 1 and 2 comprise fine-grained clay-rich sediments and are constrained by GR data run fully and partially behind casing, respectively. Unit 1 reveals a stepwise downward increase in GR from ~5 to ~9 gAPI at 25 m WMSF. Logging Unit 2 is linked to a reduction in GR to ~5 gAPI close to the top of Lithostratigraphic Unit III and continues over the casing- and caliper-related jumps in GR to ~105 m WMSF. Logging Unit 2 has generally low VP, density, resistivity, and MS.
8.1.1.2. Logging Units 3 and 4
Logging Unit 3 comprises a thin ~7 m interval dominated by clay with increasing MS from ~85 × 10−5 [SI] to a peak at ~380 × 10−5 [SI] and elevated density and PEF and an associated increase in GR from ~36 to ~75 gAPI. Logging Unit 4 covers an interval with almost no core recovery with traces of basalt, clay, sand, and gravel. The transition from Logging Unit 3 to Logging Unit 4 is accompanied by an abrupt reduction in MS to ~100 × 10−5 [SI] and a significant increase in GR to a peak of ~106 gAPI.
8.1.1.3. Logging Unit 5
Logging Unit 5 comprises an interlayered sequence of three thin basic composition igneous units interlayered with thicker sedimentary layers with a substantial volcaniclastic component. The basaltic or potentially basaltic andesite (see Geochemistry) sequences are poorly recovered in core but are characterized by elevated density (as high as 2.4 g/cm3) and velocity (as high as 3700 m/s) and reveal an associated low GR ~12 gAPI compared to the intervening sediments. The basic composition volcanic layers display asymmetrical log profiles in velocity, density, and resistivity typical of lava flows (Planke, 1994) but have lower peak values than expected in fresh massive crystalline units, and they therefore likely represent either highly altered or porous volcanic facies such as compound lava flows or pillow lava/hyaloclastite (e.g., Nelson et al., 2009; Millett et al., 2016). The intervening sediment layers reveal low and consistent velocity (~2000 m/s) and density (~1.65 g/cm3) and higher GR than the basic composition units but significantly lower GR than the overlying sediments, which have values as high as ~25 gAPI.
8.1.1.4. Logging Unit 6
Logging Unit 6 comprises a thick volcanic sequence dominated by subaerial lava flows interlayered with mixed volcaniclastic sediments (see Lithostratigraphy). The sequence reveals a dominantly very low GR baseline (GR = ~6.5 gAPI) typical of low K basaltic compositions, and the GR baseline is ~5–6 gAPI lower than the overlying basic volcanic units, potentially supporting a slightly more evolved composition for the overlying units. The sequence is dominated by characteristic asymmetrical logging signatures typical of subaerial lava flows with thickness variations from 1 to 11 m and an average thickness of 2.8 m (n = 19) measured over the interval 153–223 m WMSF (interval with full log coverage). Lobes were measured based on characteristic asymmetrical log profiles following the method of Millett et al. (2021); however, several of the thinner profiles may represent compound rather than simple lava flow packages (Nelson et al., 2009). Interlava sediments are documented from the core (see Lithostratigraphy) and can be identified from the wireline logs because of associated increases in GR, and based on these characteristics, at least 9 interbeds (average = 1.5 m thick) occur in this interval and have a cumulative thickness of 13.5 m, representing almost 20% of the sequence.
The image log data over Logging Unit 6 reveals several additional observations that help to constrain the nature of the volcanic package. Figure F58 shows an example of a simple lava flow with clear asymmetrical variations in both resistivity (FMS) and acoustic amplitude (UBI). Toward the top of the unit, an extremely clearly imaged conductive spotted texture associated with empty vesicles at the flow top is seen. These observations fit with core observations on either side of this depth, where the majority of the vesicles are empty, and highlight the importance of good imaging for intervals such as this, where no core was recovered over this flow top.
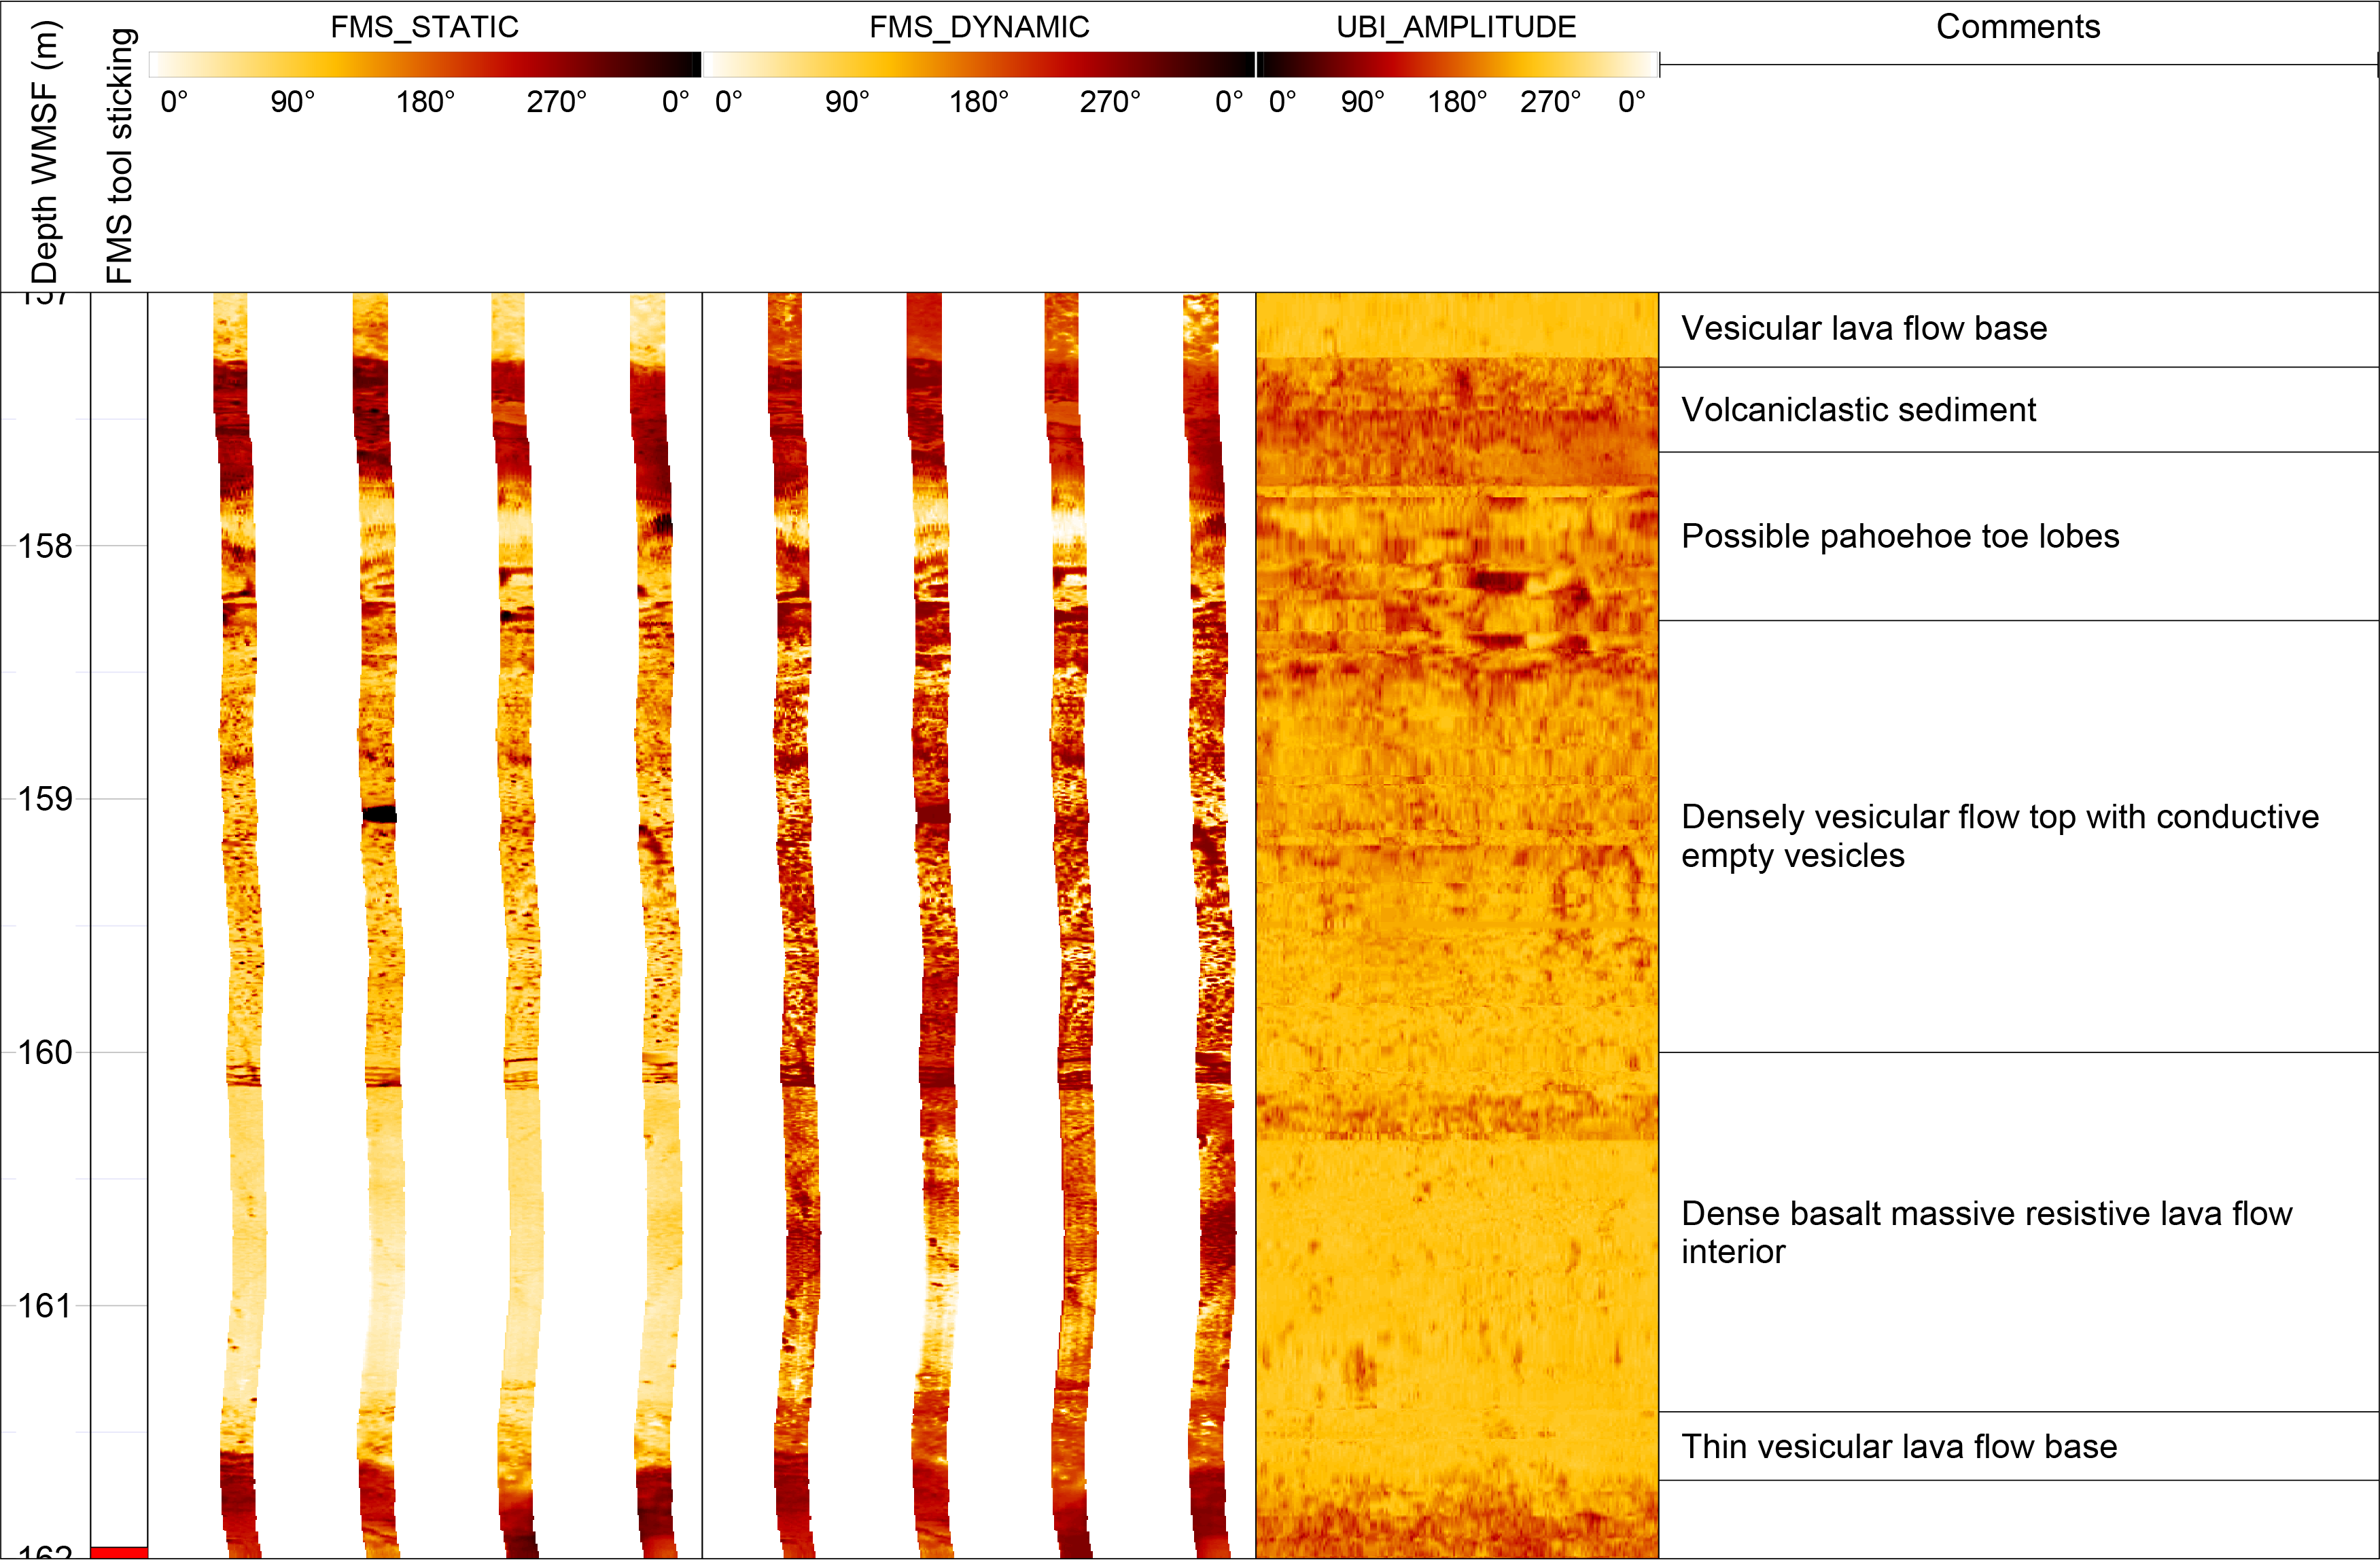
Figure F58. FMS and UBI image of simple lava flow unit.
Figure F59 reveals an interval where the spotted nature of the lava unit is not completely dominated by conductive spots; instead, the spotted nature is in some places replaced by highly resistive (white) spots and veins. Core recovery over this interval reveals several layers where vesicles and fractures are filled with calcite (see Figure F60); therefore, it appears that at least in some cases the FMS image log can be used to assess the degree of secondary mineralization of original pore spaces, which may have important applications for appraising reservoir properties for carbon capture and storage.
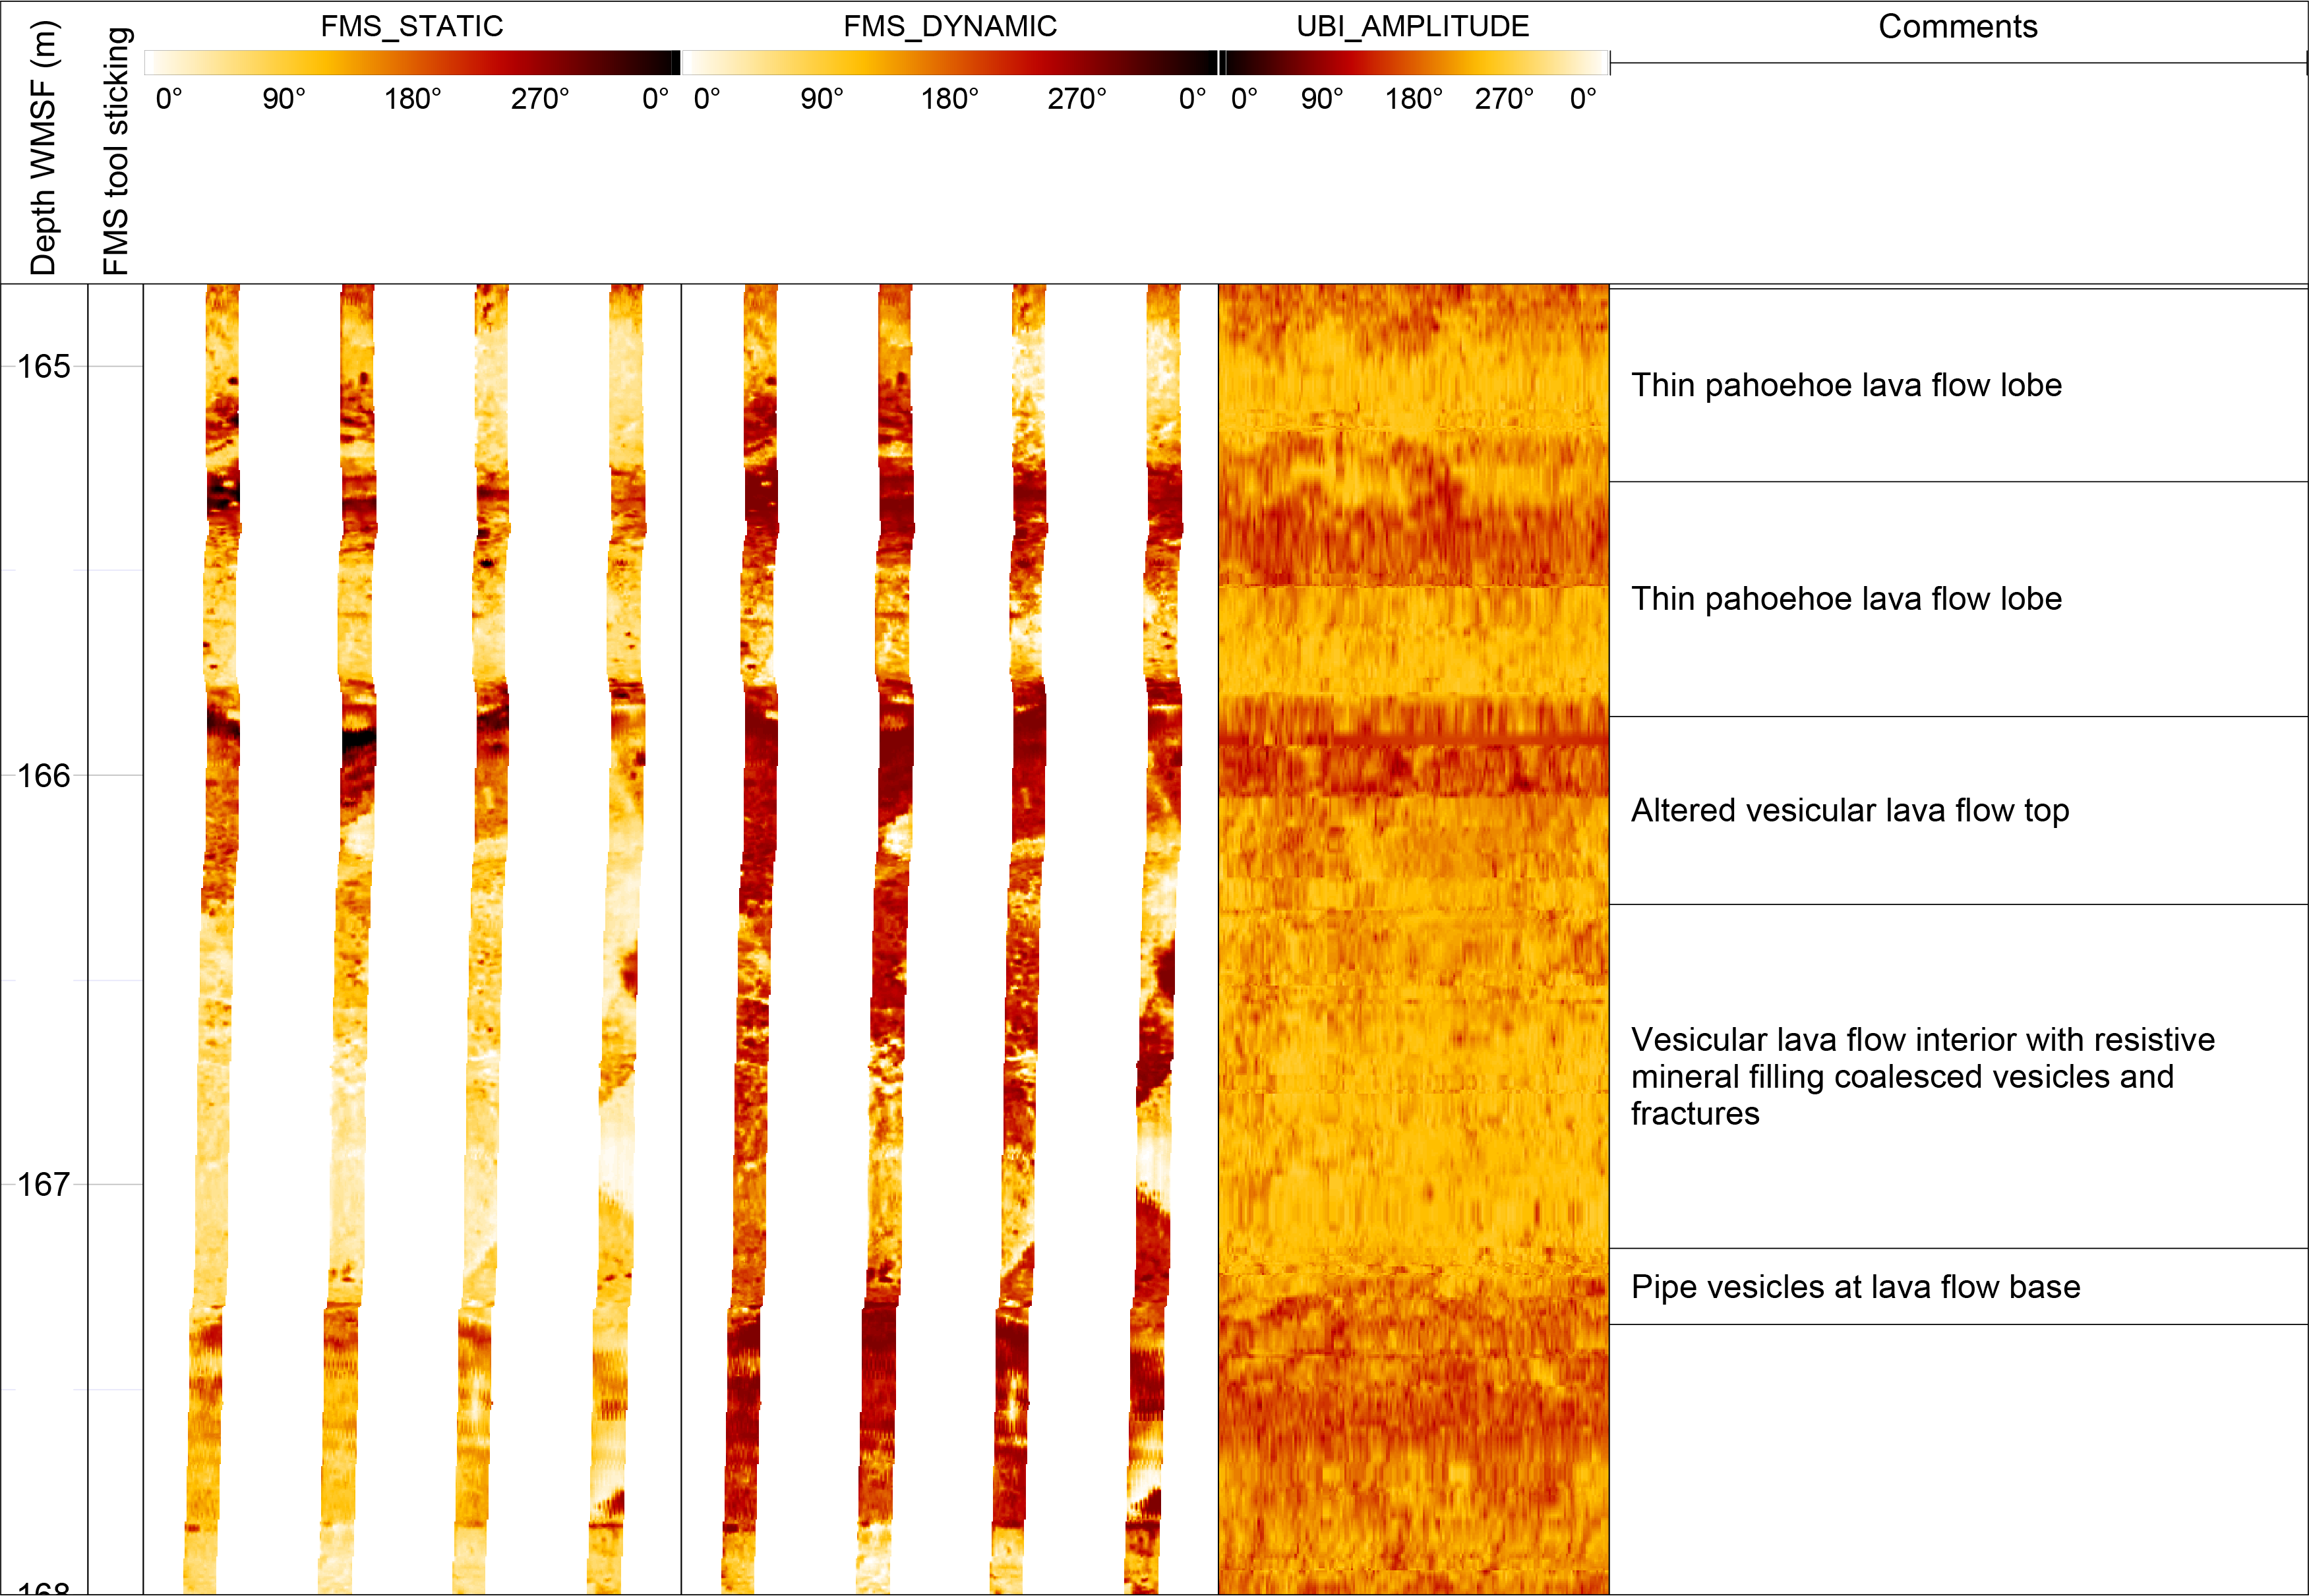
Figure F59. FMS and UBI image of thin pahoehoe lava flow unit.
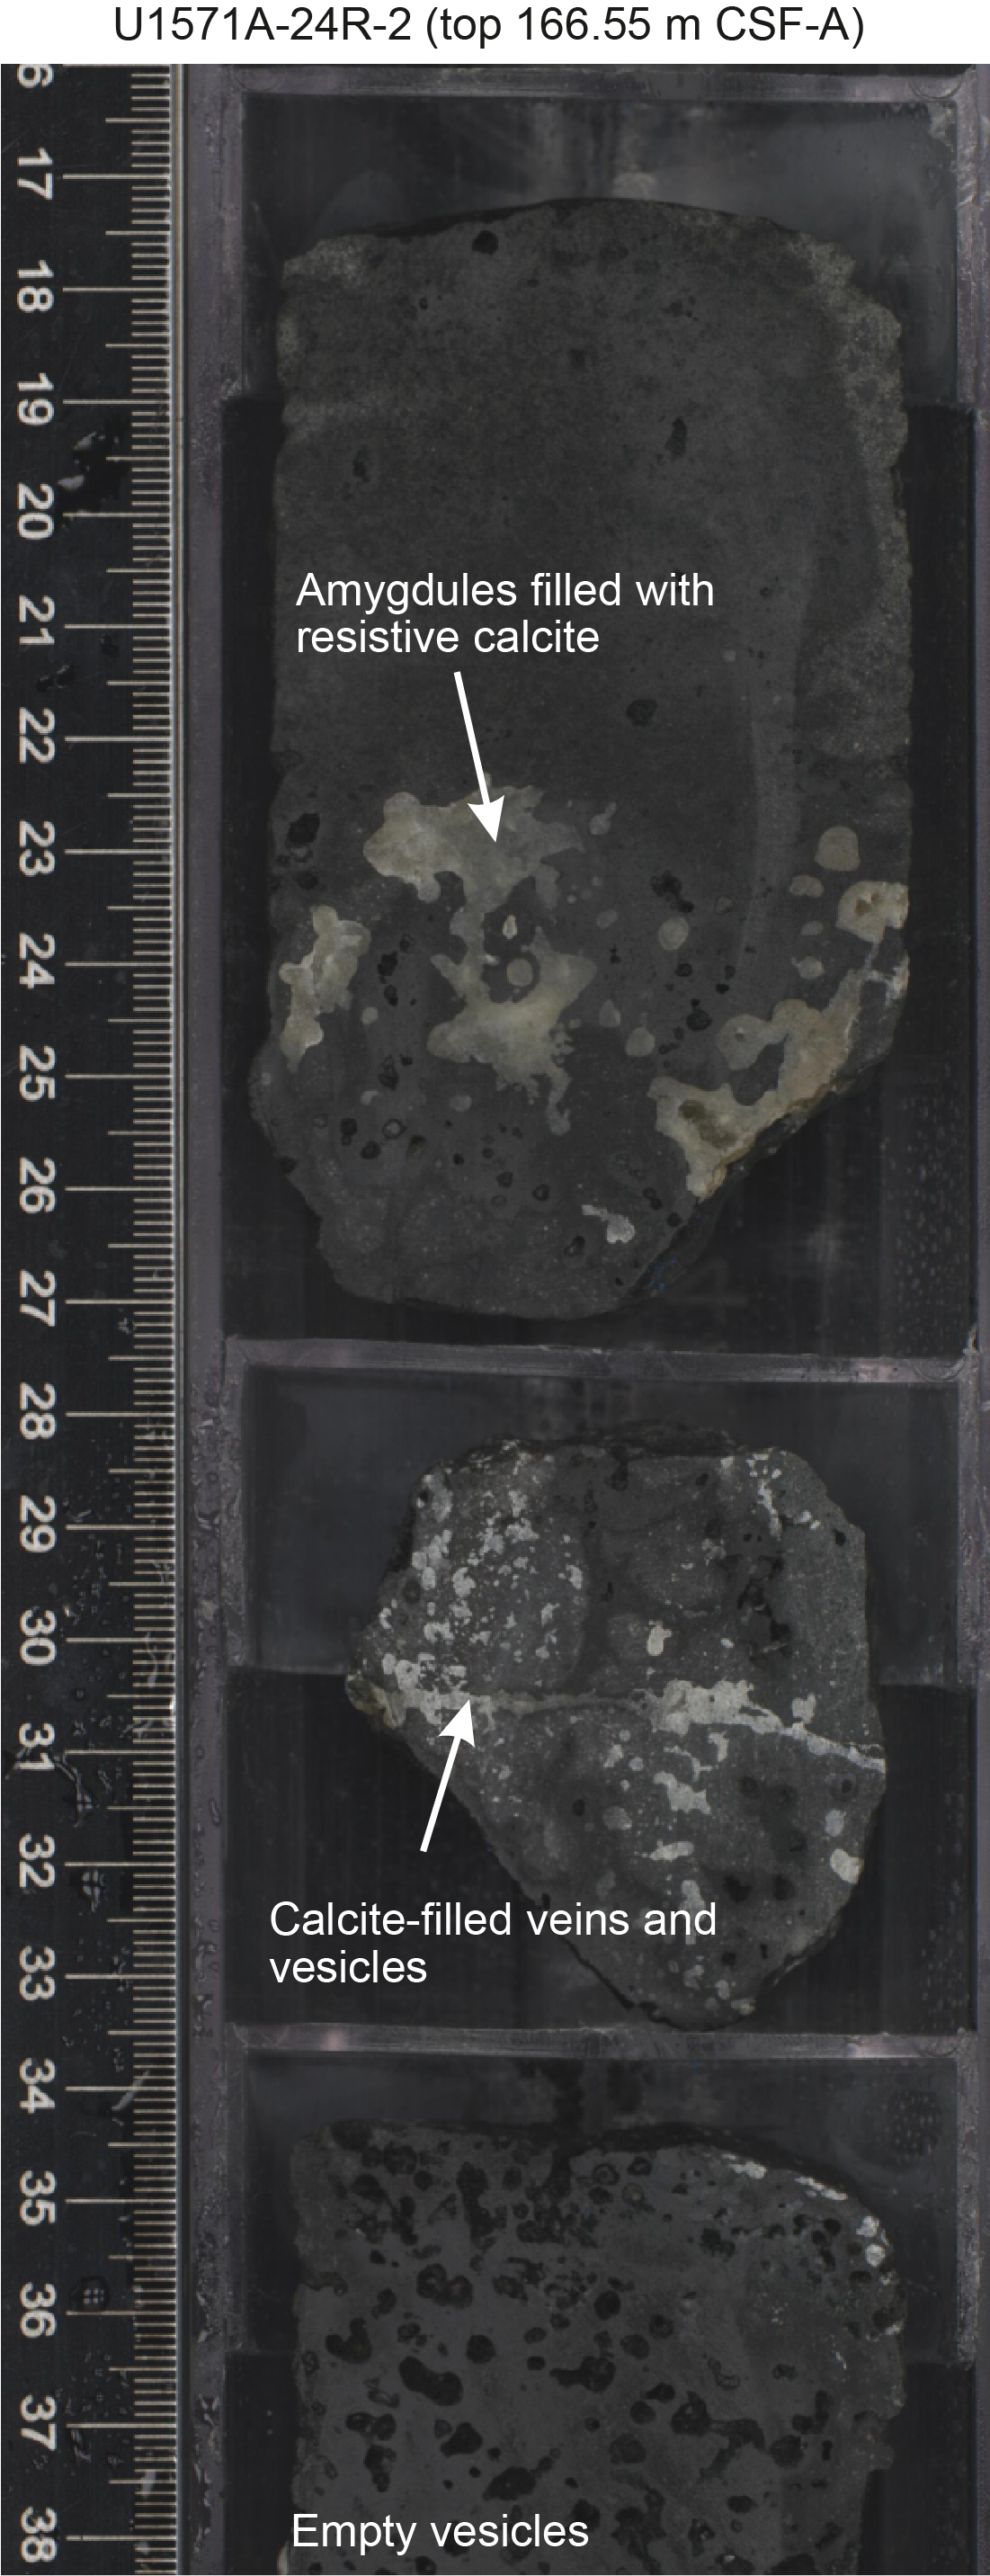
Figure F60. Vesicles and fractures.
Logging Unit 6 is clearly dominated by lava flows. However, in some cases image log and core data reveal features that may be indicative of other volcanic facies and emplacement environments. In Figure F61, an interval of the borehole reveals several interesting features such as bulbous zoned conductivity units alongside more angular and brecciated character formation. These units resemble pillow lavas but could also potentially represent pahoehoe lava toe lobes. Core observations from this depth give additional information in the form of concentrically distributed pipe vesicles, and clearly “downgoing” pipe vesicles are observed in some cases (see Figure F62). Radially distributed pipe vesicles are common in pillow lava flows but may also occur in intrusions and potentially invasive lava flows (Millett et al., 2021); however, downgoing pipe vesicles are never seen in subaerial lava flows. Therefore, combining the FMS image log evidence for bulbous pillow forms with the core-based vesicle distribution evidence, it appears likely that this interval of Logging Unit 6 comprises a pillow lava complex invoking lava-water interactions at this stage of the volcanic evolution.
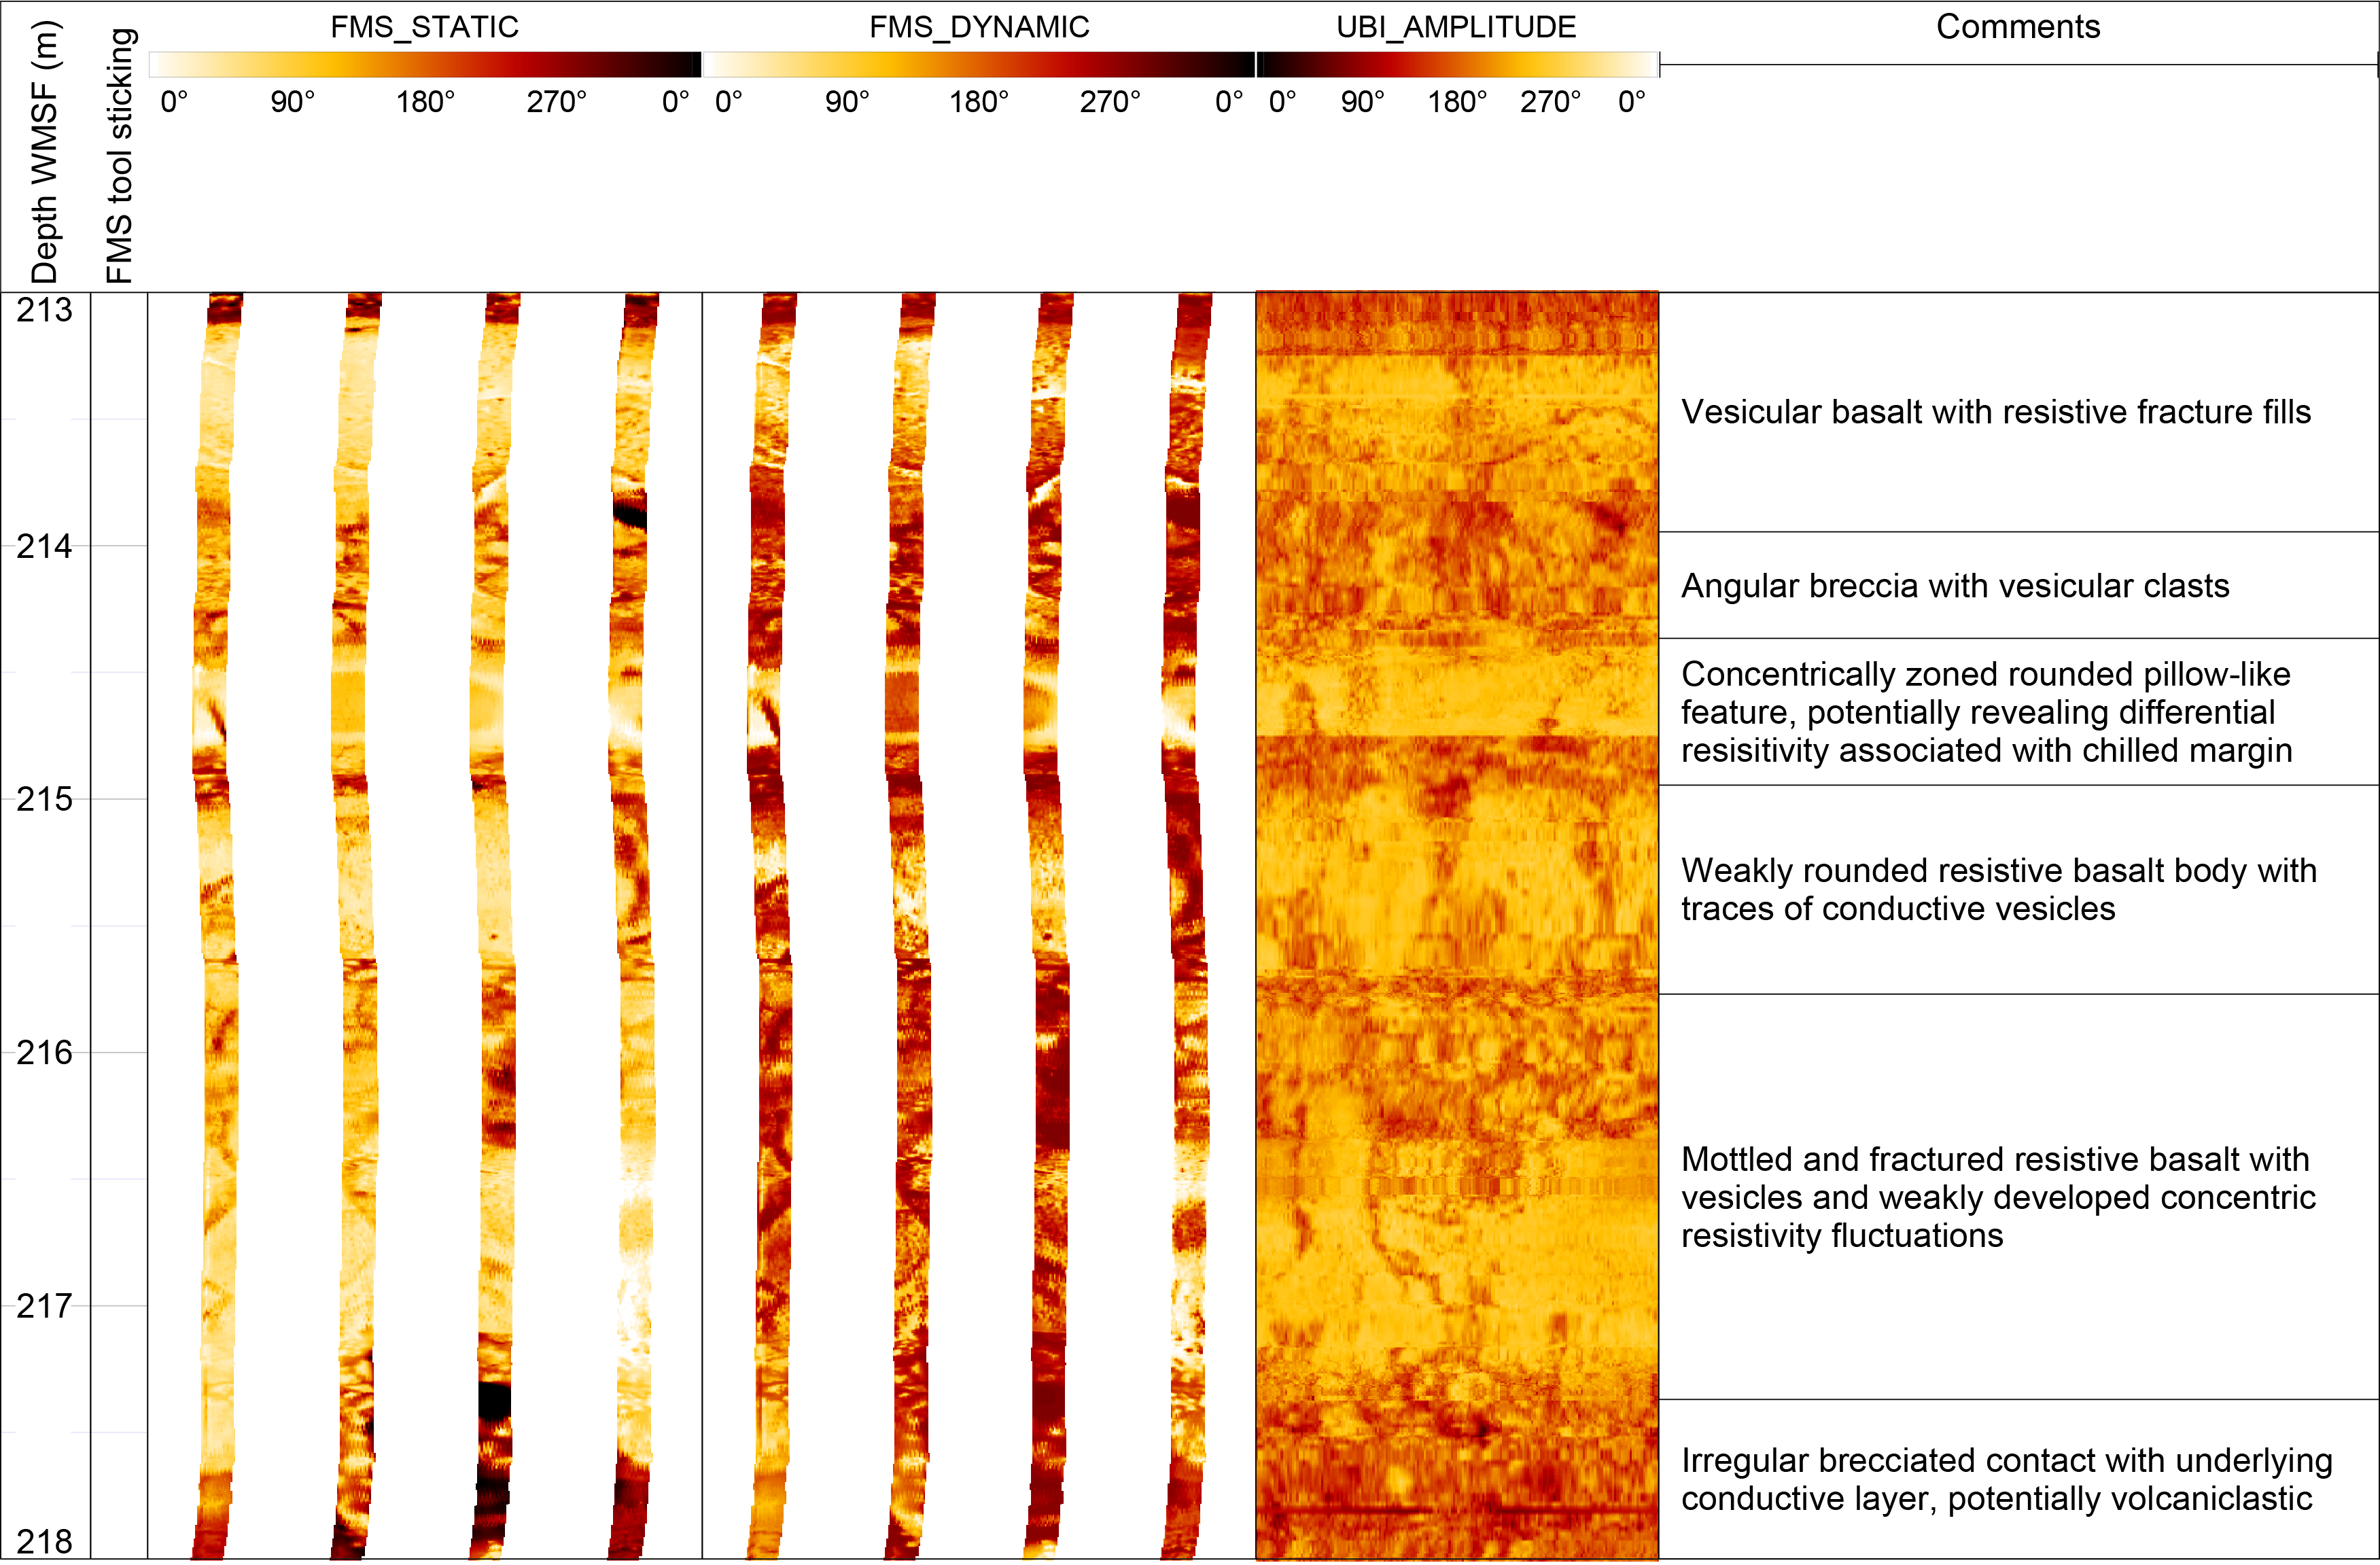
Figure F61. FMS and UBI image of possible pillow lava features.
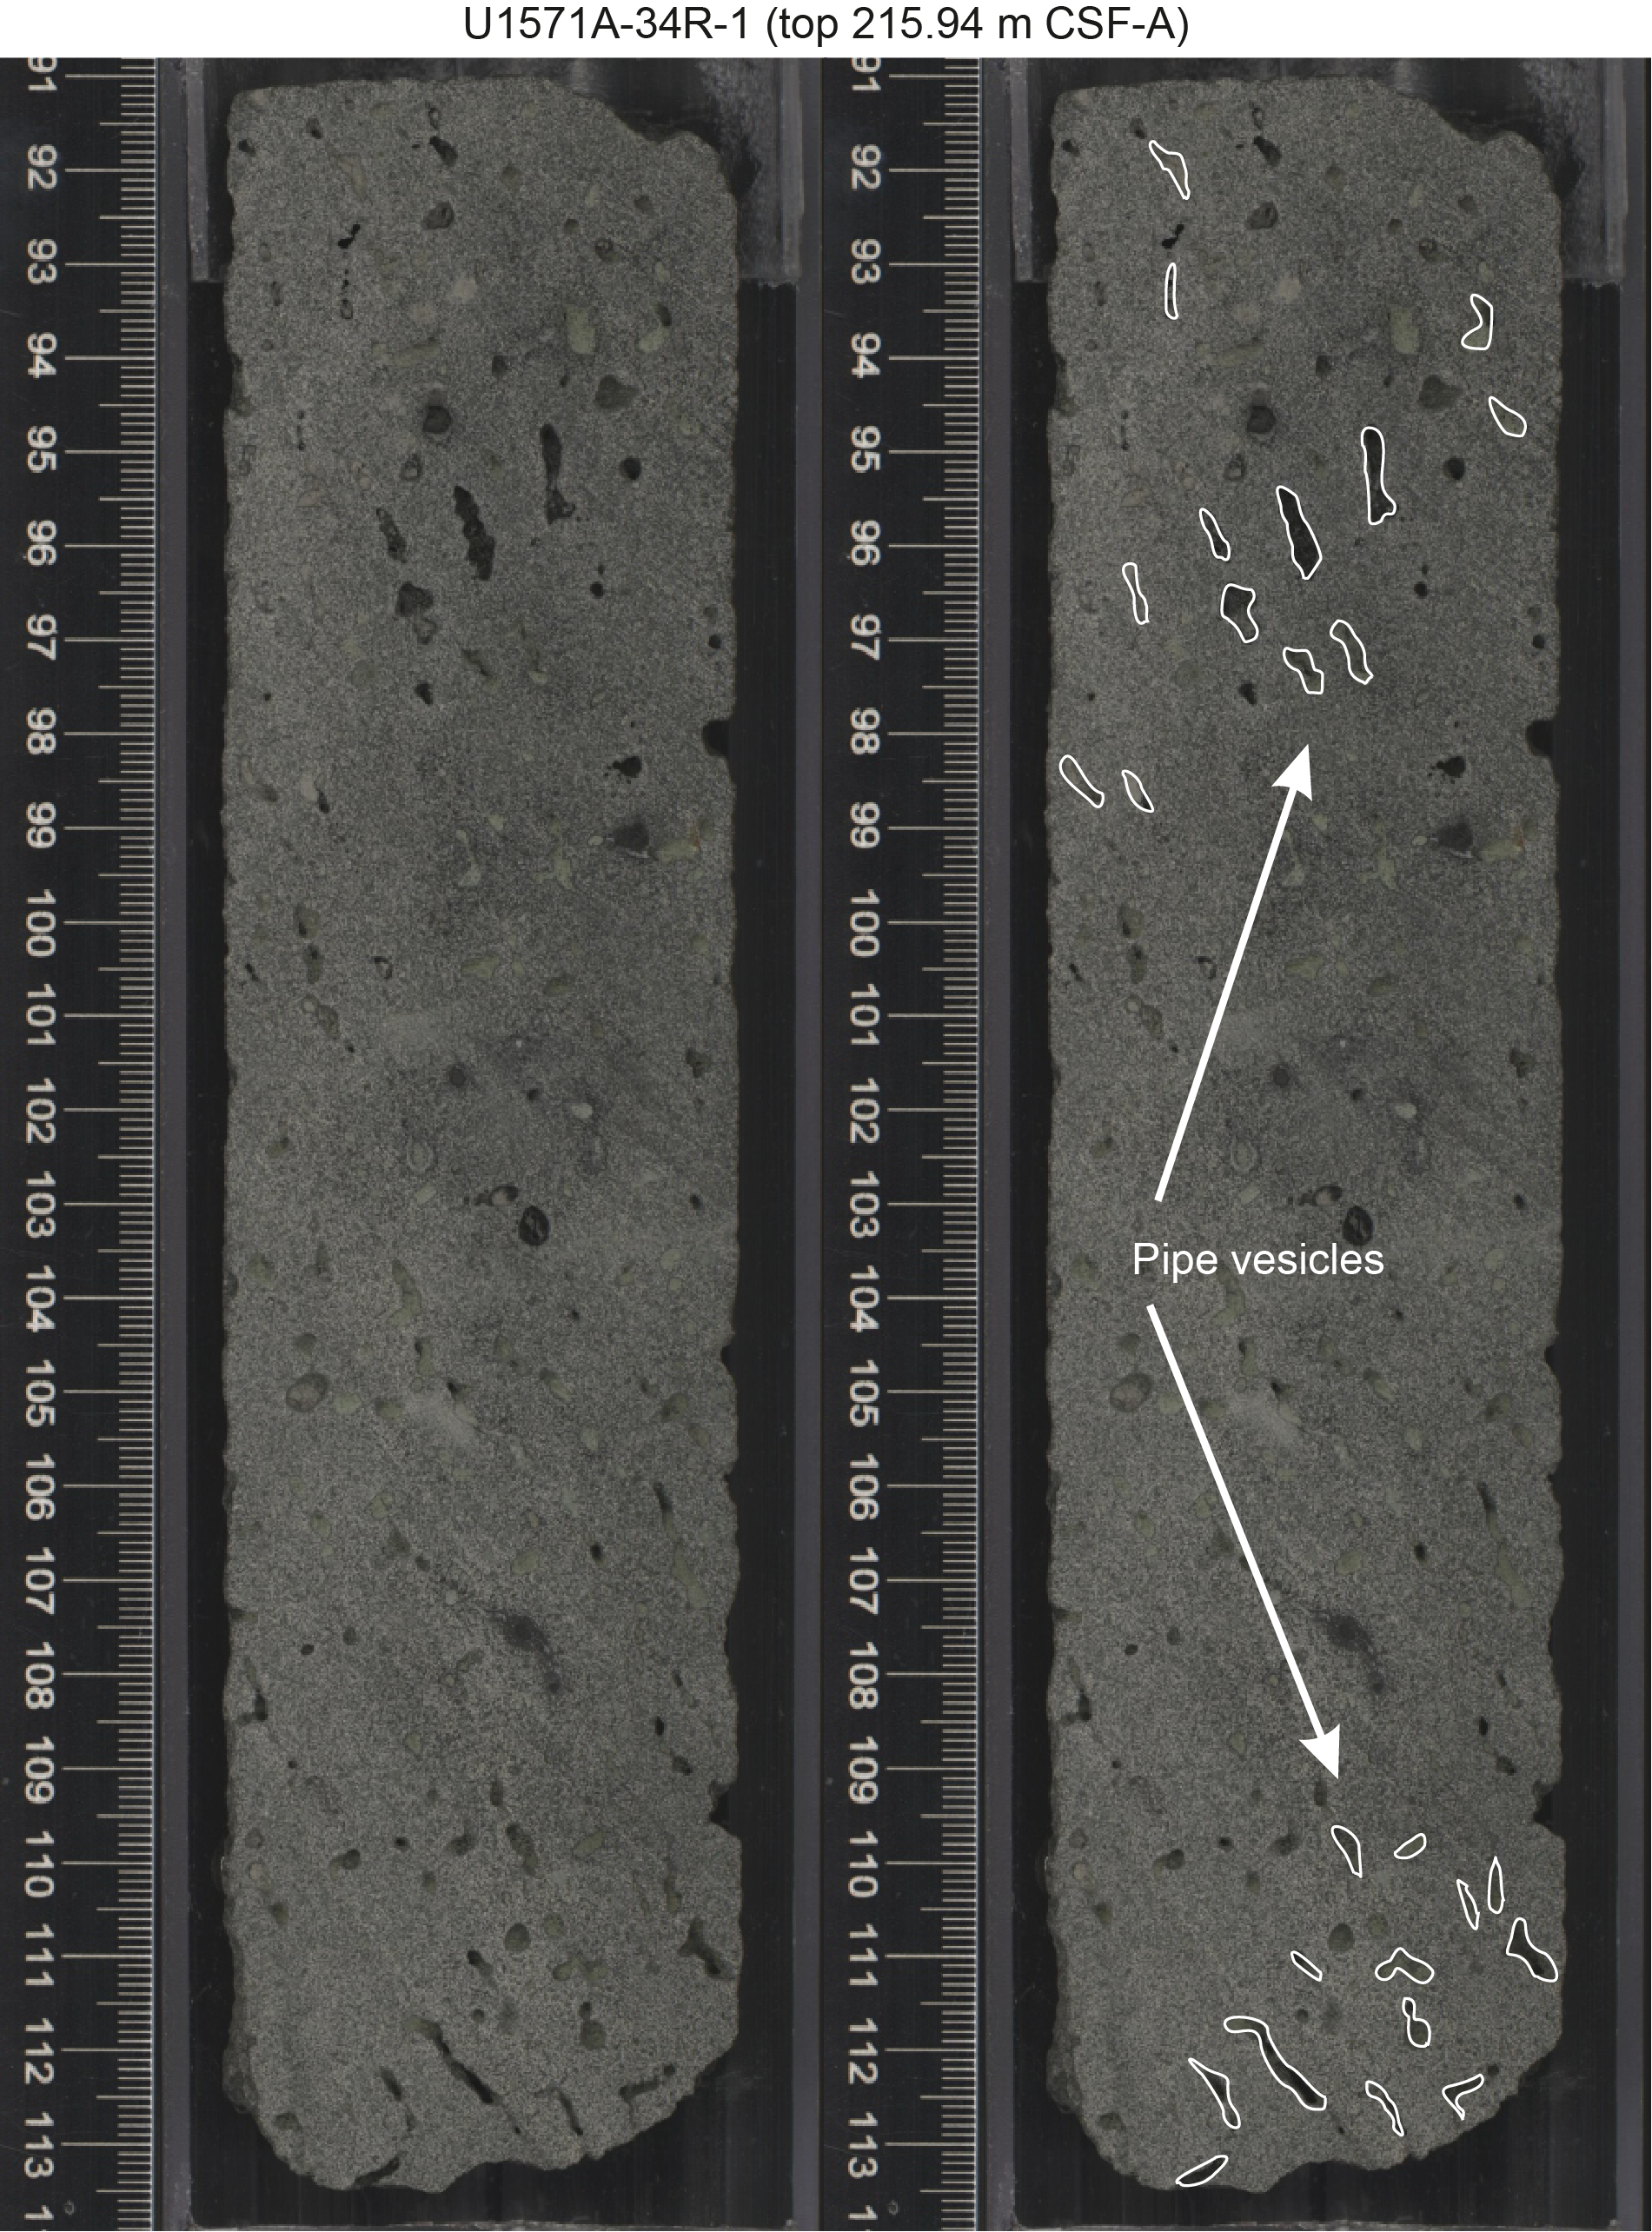
Figure F62. Traces of concentrically distributed pipe vesicles.
8.1.2. Hole U1572A
A summary of selected wireline traces for the main open hole logged interval of Hole U1572A are presented in Figure F63. As highlighted previously, the borehole condition was generally poor, with sediment infill affecting logging tools at the base and much of the hole above ~210 m WMSF revealing washouts of 6–13 cm wider diameter than the bit diameter. In addition, a tight spot at ~108 m WMSF read as significantly undergauge, indicating imminent borehole collapse. GR, MS, and borehole caliper wireline traces are presented alongside core-derived measurements in Figure F64, including the upper ~87 m of the borehole to the seafloor, which was logged from within the drill string. The highly attenuated nature of wireline GR run behind casing to seafloor is clearly seen where the GR drops from ~20 to ~6 gAPI.
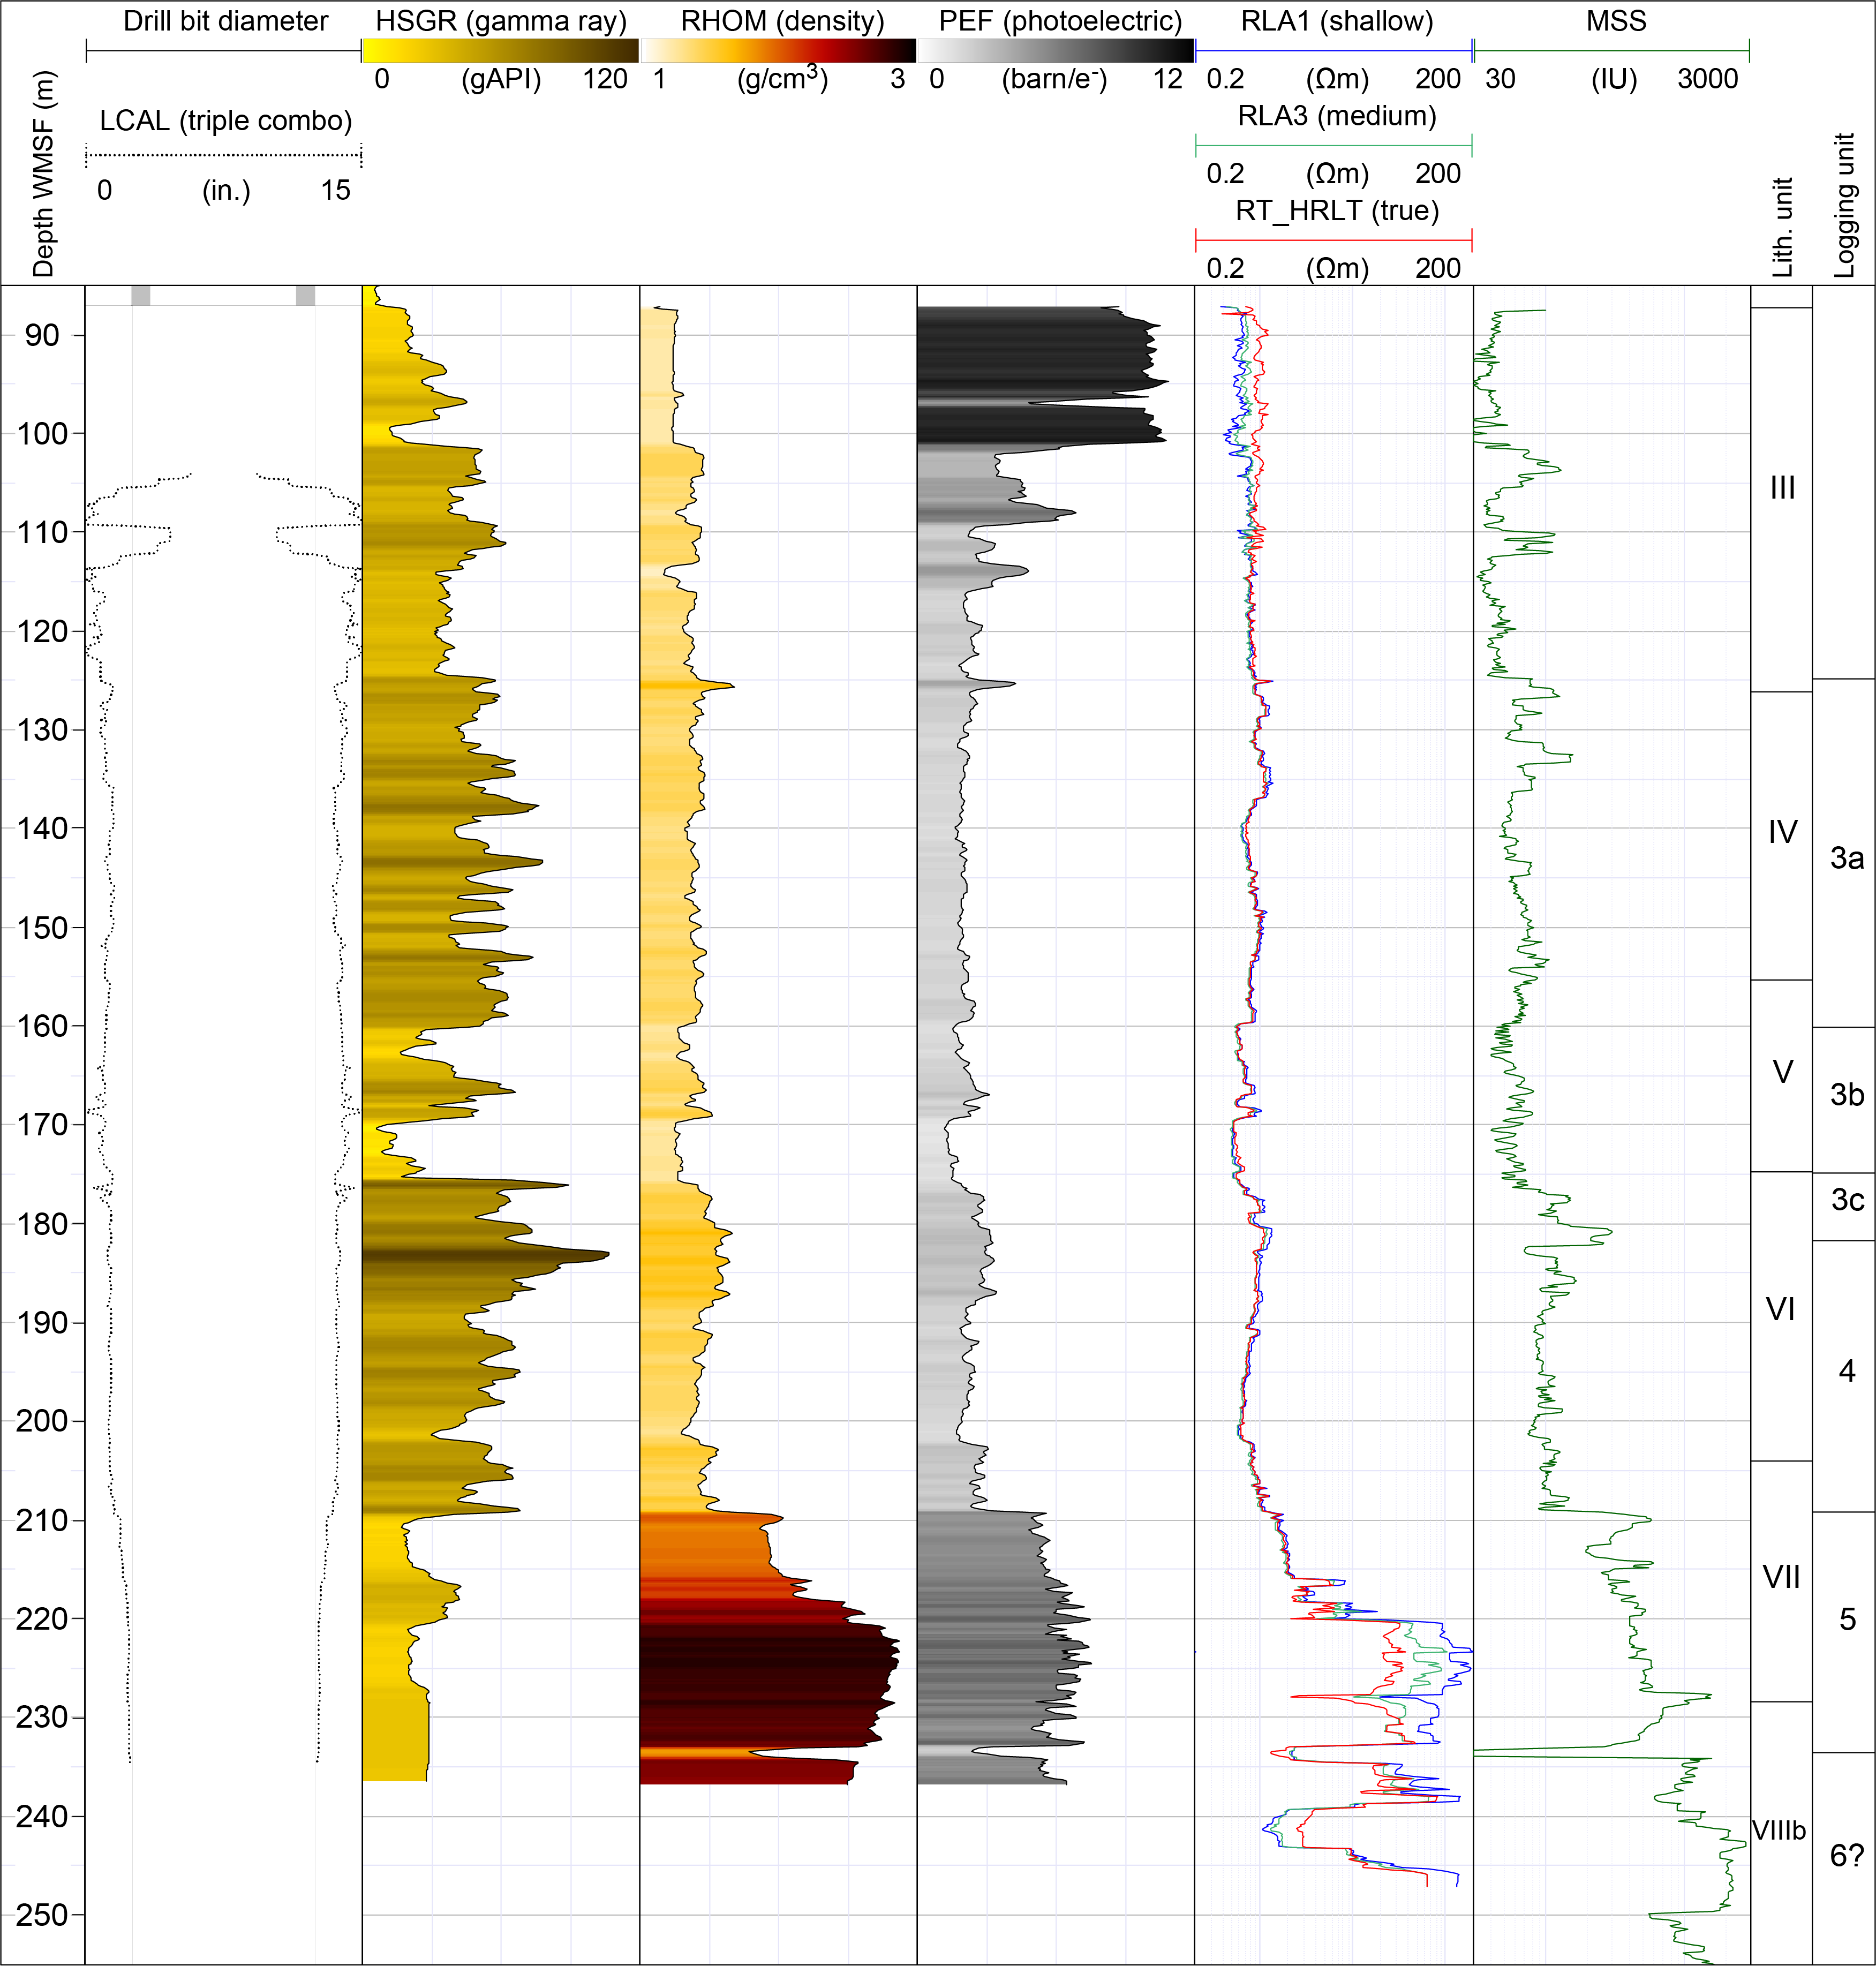
Figure F63. Wireline logging, Hole U1572A.
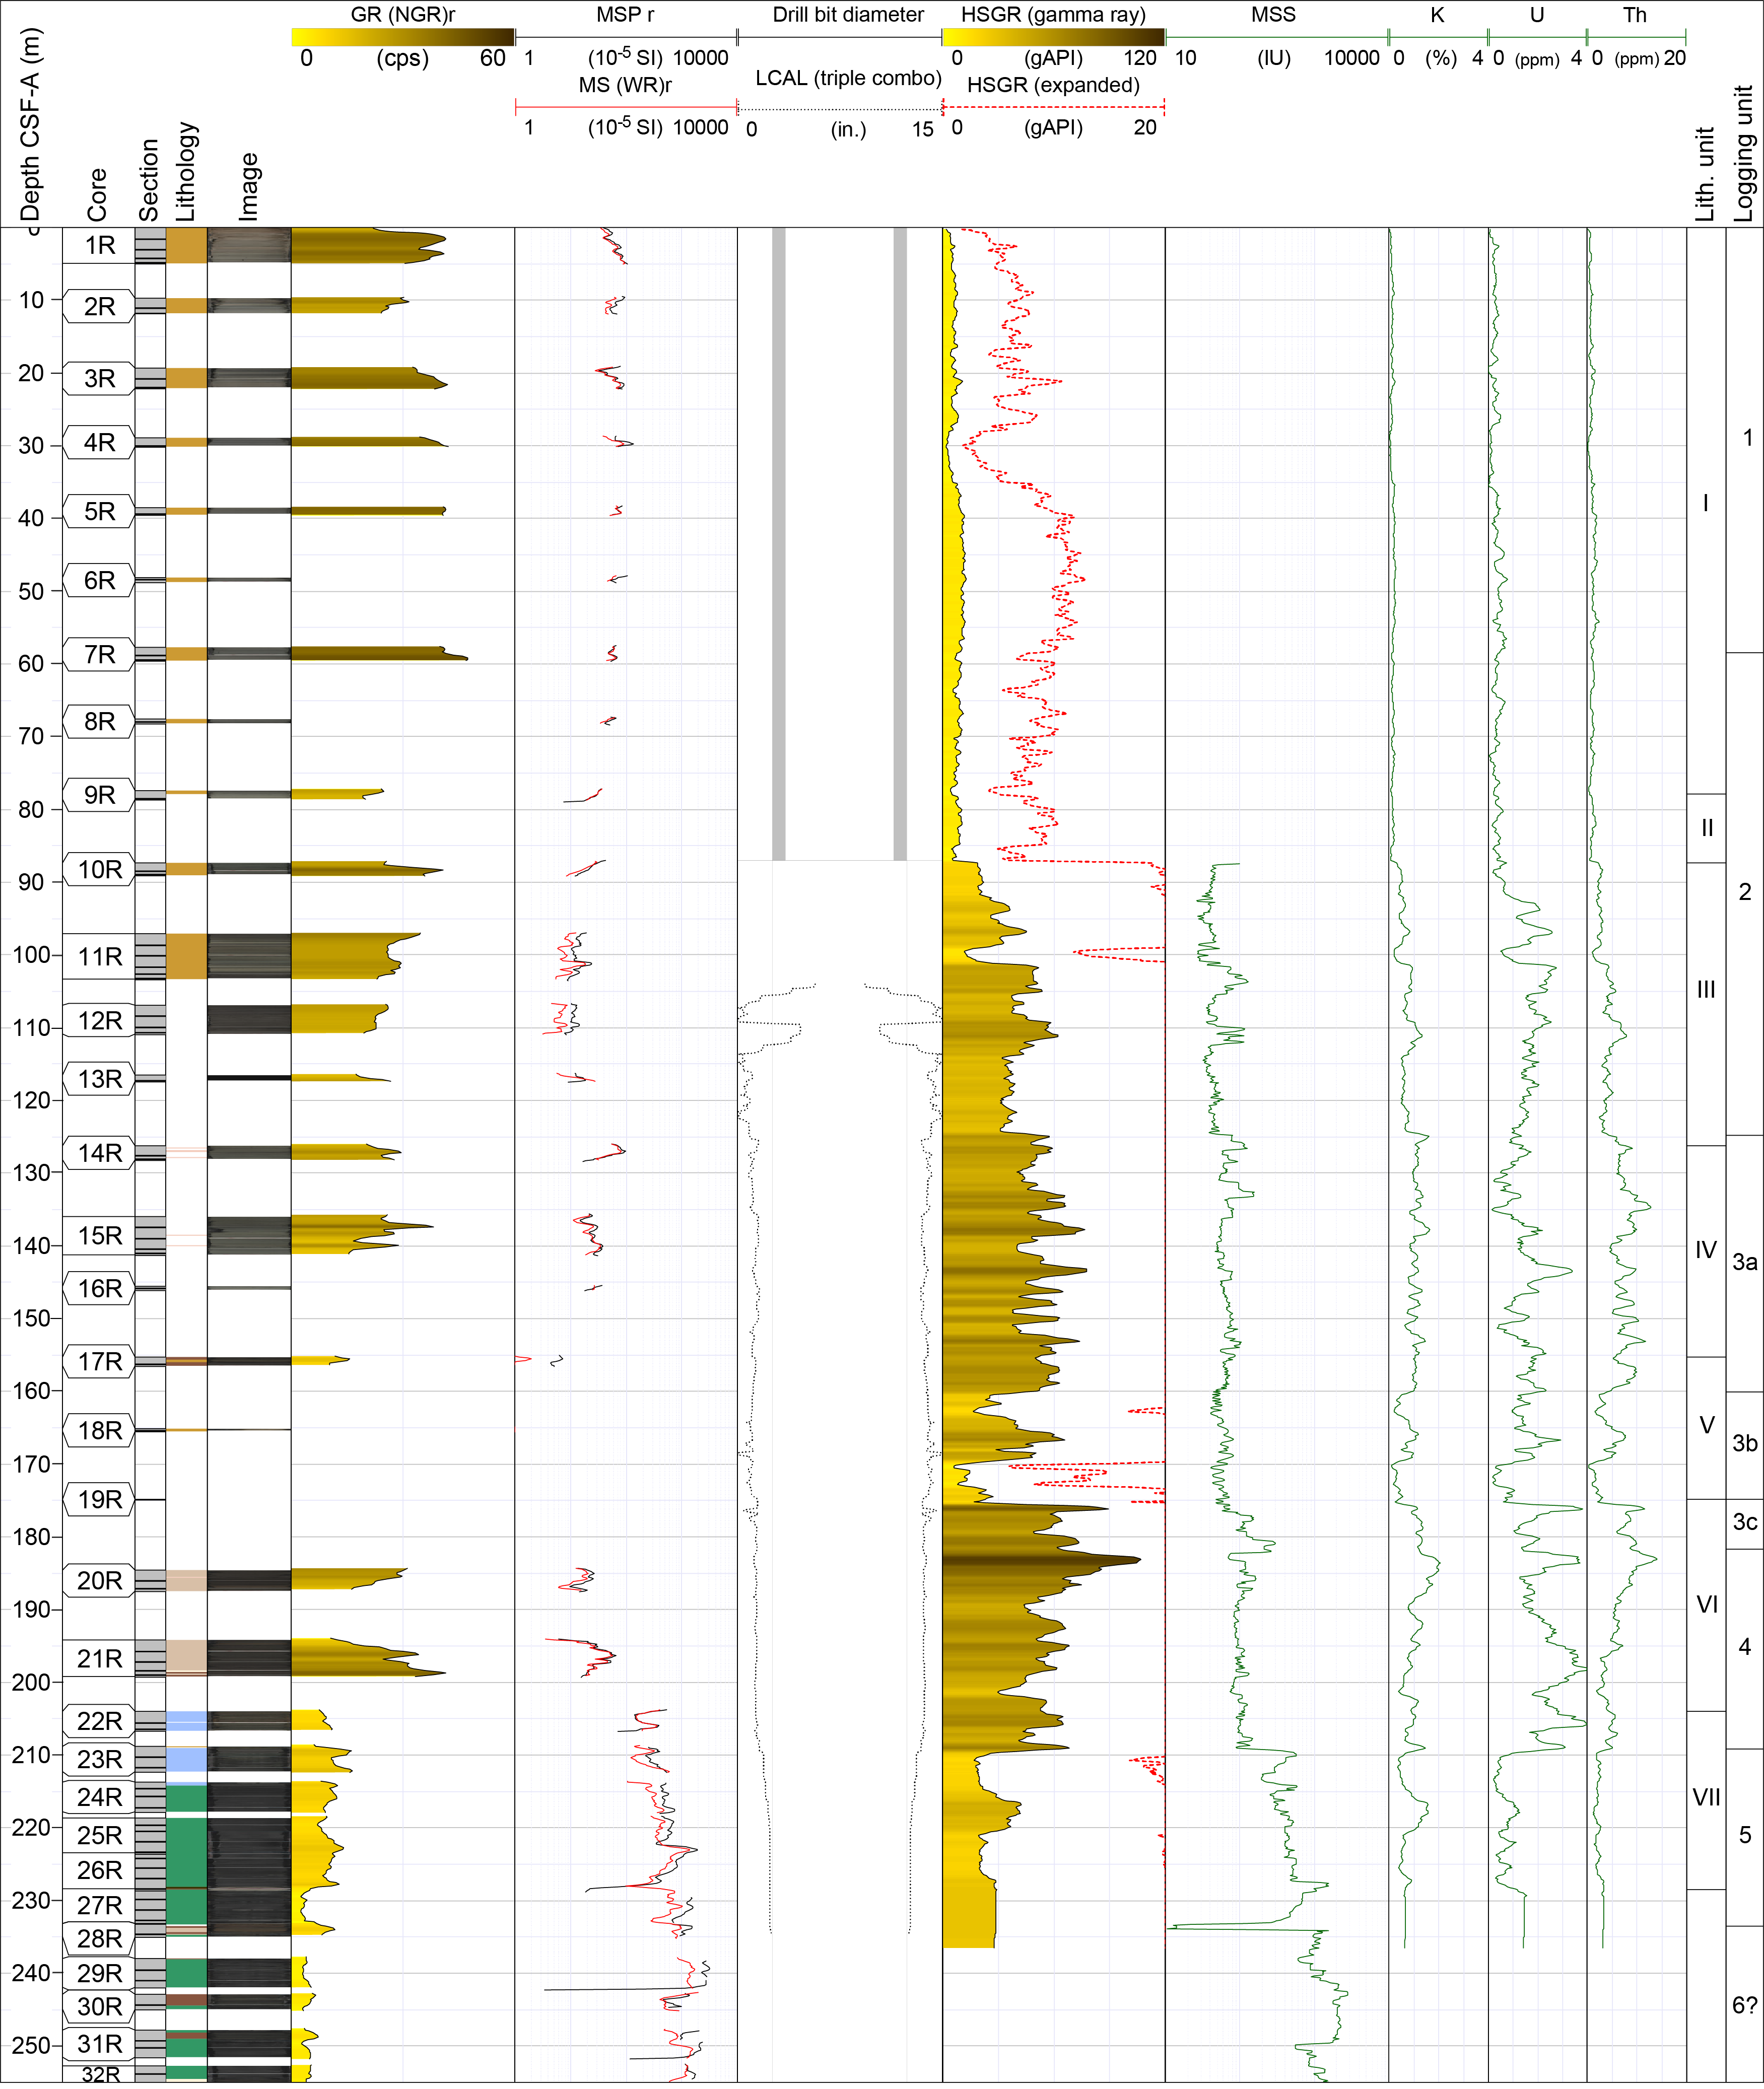
Figure F64. Wireline GR and MS, Hole U1572A.
8.1.2.1. Logging Units 1 and 2
Similar to Hole U1571A, the GR in Logging Unit 1 comprises an overlying lower ~6 gAPI GR interval underlain (below ~30 m WMSF) by a higher ~11 gAPI GR interval. The Logging Unit 2 transition is less clearly defined and was picked at ~58 m, below which GR reduces slightly (~8 gAPI) and becomes more serrated. Logging Unit 2 extends beyond the interval of logging data affected by the caliper closure beneath the drilling pipe casing point to ~125 m WMSF. GR fluctuates between 35 and 60 gAPI in the interval unaffected by caliper, and associated fluctuations are observed in MS and PEF, although the PEF log has clearly been influenced more than others by the tight spot, potentially affecting the caliper-based correction factor.
8.1.2.2. Logging Unit 3
Logging Unit 3 is divided into Subunits 3a–3c because it comprises a significantly expanded interval compared to that present in Hole U1571A. Logging Subunit 3a comprises a serrated GR profile that oscillates from ~40 to 77 gAPI and shows consistently low density of ~1.4 g/cm3, low resistivity, and generally low MS of ~60 × 10−5 [SI] with occasional spikes as high as ~150 × 10−5 [SI]. Subunit 3b is defined by an abrupt reduction in GR, density, PEF, and MS. The thin ~15 m unit includes two low GR (as low as ~10 gAPI) layers separated by a higher GR interval and overlaps with Lithostratigraphic Unit V. Logging Subunit 3c comprises a thin ~7 m interval corresponding to a spike in MS from ~60 × 10−5 to 290 × 10−5 [SI], which is accompanied by an abrupt increase in density and GR to ~85 gAPI.
8.1.2.3. Logging Unit 4
Logging Unit 4 comprises a high GR clay-rich sedimentary interval that decreases from an initial peak of ~105 gAPI to a fluctuating value around 30–60 gAPI. Density and resistivity gradually decrease through the interval, with bulk density decreasing from ~1.6 to 1.4 g/cm3.
8.1.2.4. Logging Units 5 and 6
An abrupt increase in density (from ~1.5 to ~2 g/cm3), PEF, and MS (from ~100 × 10−5 to ~550 × 10−5 [SI]) and an associated drop in GR (from 65 to 18 gAPI) marks the upper contact of Logging Unit 5. Core observations (offset by at least 5.8 m; DSF depth scale compared to WMSF depth scale) record basaltic andesite compositions at the transition into Lithostratigraphic Unit VII that appear consistent with Logging Unit 5 comprising a slightly more evolved composition than the main low NGR (core measurements) of lava flows beneath. An elevated ~40 gAPI GR interval is present between the two lower ~18 gAPI intervals, which appear very similar in composition and general physical properties to the thin igneous layers in Logging Unit 5 in Hole U1571A, potentially pointing toward linkages between the evolution of both sites, although with clear differences in terms of thickness and logging profiles.
Density increases to ~2.8 g/cm3 over the upper ~10 m of Logging Unit 5 along with associated increases in PEF and MS followed by an abrupt increase in resistivity that appears to signal the transition into a more massive crystalline unit. Below this depth, logging data becomes gradually less complete due to the logging string reaching the maximum log interval. Logging Unit 6 remains poorly constrained based on wireline data alone. However, because the transition to Lithostratigraphic Subunit VIIIb occurs around this depth, along with changes in associated physical properties, a provisional transition into the more basic composition Logging Unit 6 is tentatively added.
8.2. Temperature measurements
A preliminary APCT-3 measurement evaluation was carried out on board using the TP-Fit v.3 software (Heesemann, 2008). This involved picking the entry time and two points on the temperature equilibration path to capture the temperature decay after the frictional heating caused by lance entry and the second frictional heat pulse caused by lance retrieval. No obvious signs of secondary movement were observed at first inspection, and most of the 10 s temperature measurement intervals were used for all three deployments (Figures F65, F66, F67).
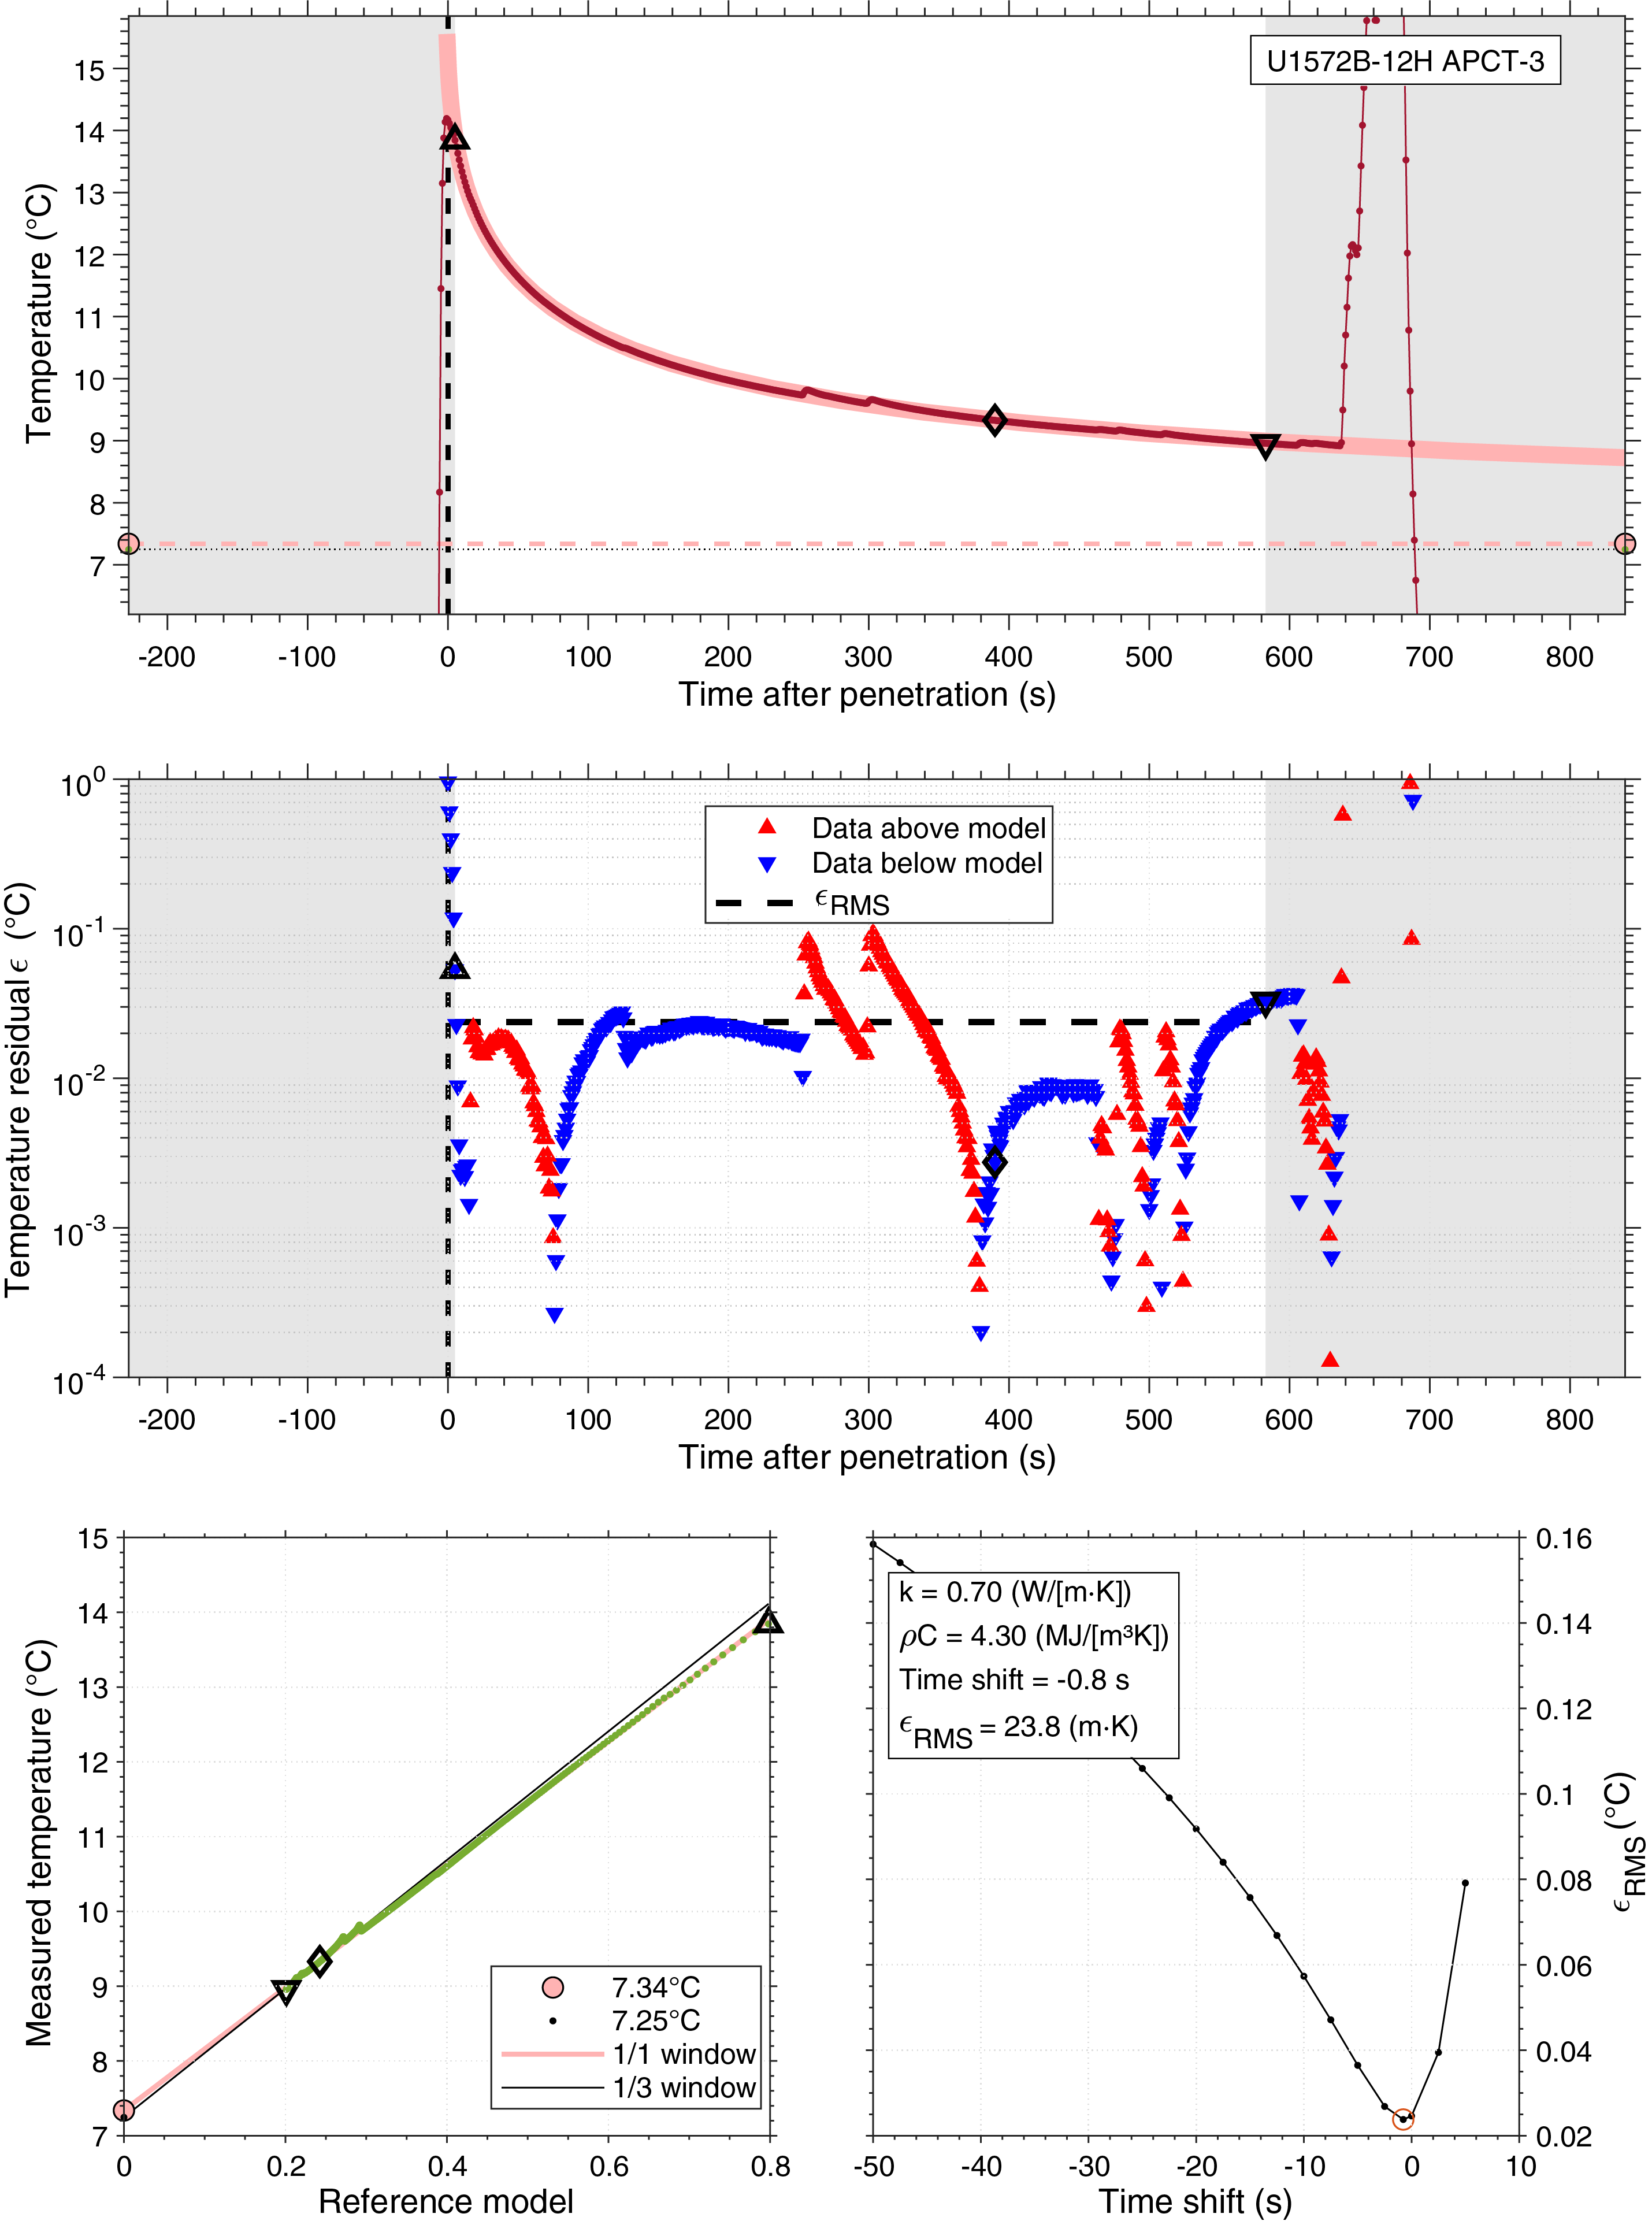
Figure F65. APCT-3 temperature, 396-U1572B-12H-CC.
Figure F66. APCT-3 temperature, 396-U1572B-4H-CC.
Figure F67. APCT-3 temperature, 396-U1572B-8H-CC.
The resulting formation temperatures are 1.88° ± 0.043°C at 35.3 m DSF (Section 396-U1572B-4H-CC), 4.5° ± 0.023°C at 73.3 m DSF (Section 8H-CC), and 7.34° ± 0.024°C at 111.3 m DSF (Section 12H-CC). Deployment for Core 16H had to be canceled because of significant overpull. The estimated thermal conductivity for the three measurements is 2.4, 0.9, and 0.7 W/(m·K), respectively. Compared to these in situ measurements, calculated thermal conductivities measured on cores in this interval yielded averages of 1.268 W/(m·K) at 37.4 m CSF-A and 1.004 W/(m·K) at 77.03 m CSF-A (see Physical properties).
Because the shallowest temperatures may be influenced by seasonal to centennial temperature changes (Vogt and Sundvor, 1996; Berndt et al., 2014), we used only the two lowermost temperature measurements to estimate the geothermal gradient to 74.7°C/km. Assuming a thermal conductivity of 1 W/(m·K) yields a heat flow of 74.7 mW/m2, which agrees well with regional heat flow compilations (Sundvor et al., 2000).
8.3. Summary
Logging operations at the Skoll High delivered a comprehensive wireline logging data set spanning a thick basaltic lava flow–dominated sequence with subordinate volcaniclastic sediments. GR logging data aided in constraining the nature and distribution of more evolved andesitic igneous compositions in the uppermost interval of mixed volcanic and sedimentary interlayers. A key objective of the Skoll High sites was to constrain the nature of different seismic facies associated with the top basalt reflection between the two sites, in particular the “pitted surface” seismic horizon associated with Hole U1572A. The transition from sediment- to volcanic-dominated sequences in Hole U1571A comprises an expanded ~35 m sequence of interlayered volcanic units (P-wave velocity = ~2000–4000 m/s) and softer sediments (P-wave velocity = ~2000 m/s).
In contrast, the transition from overburden sediments to the volcanic sequence is more abrupt in Hole U1572A, with an initially sharp increase in density, PEF, and MS followed by a gradual increase in density over the following ~10 m that culminates in a sharp increase in resistivity at ~220 m WMSF and signals the transition into the underlying hard basaltic-dominated sequence. Core observations suggest lava-water interaction, and the wireline observations may therefore be interpreted in the context of a relatively massive subaqueous flow overlain by dense volcaniclastic units in Hole U1572A transitioning laterally to a potentially more distal volcaniclastic-dominated facies in Hole U1571A.
FMS image log data provided high-resolution imaging of intricate volcanic intrafacies features such as ubiquitous unfilled vesicles, mineralized amygdules, pipe vesicles, and pillow lava features indicative of aqueous eruptions during the volcanic pile evolution.
References
Abdelmalak, M.M., Meyer, R., Planke, S., Faleide, J.I., Gernigon, L., Frieling, J., Sluijs, A., Reichart, G.J., Zastrozhnov, D., Theissen-Krah, S., Said, A., and Myklebust, R., 2016a. Pre-breakup magmatism on the Vøring margin; insight from new sub-basalt imaging and results from Ocean Drilling Program Hole 642E. Tectonophysics, 675:258–274. https://doi.org/
Abdelmalak, M.M., Planke, S., Faleide, J.I., Jerram, D.A., Zastrozhnov, D., Eide, S., and Myklebust, R., 2016b. The development of volcanic sequences at rifted margins: new insights from the structure and morphology of the Vøring Escarpment, mid-Norwegian Margin. Journal of Geophysical Research: Solid Earth, 121(7):5212–5236. https://doi.org/
Barke, J., Abels, H.A., Sangiorgi, F., Greenwood, D.R., Sweet, A.R., Donders, T., Reichart, G.-J., Lotter, A.F., and Brinkhuis, H., 2011. Orbitally forced Azolla blooms and middle Eocene Arctic hydrology: clues from palynology. Geology, 39(5):427–430. https://doi.org/
Barron, J.A., Stickley, C.E., and Bukry, D., 2015. Paleoceanographic, and paleoclimatic constraints on the global Eocene diatom and silicoflagellate record. Palaeogeography, Palaeoclimatology, Palaeoecology, 422:85–100. https://doi.org/
Berndt, C., Feseker, T., Treude, T., Krastel, S., Liebetrau, V., Niemann, H., Bertics, V.J., Dumke, I., Dünnbier, K., Ferré, B., Graves, C., Gross, F., Hissmann, K., Hühnerbach, V., Krause, S., Lieser, K., Schauer, J., and Steinle, L., 2014. Temporal constraints on hydrate-controlled methane seepage off Svalbard. Science, 343(6168):284–287. https://doi.org/
Berndt, C., Planke, S., Alvestad, E., Tsikalas, F., and Rasmussen, T., 2001. Seismic volcanostratigraphy of the Norwegian Margin: constraints on tectonomagmatic break-up processes. Journal of the Geological Society (London, UK), 158(3):413–426. https://doi.org/
Bijl, P.K., 2022. DINOSTRAT: a global database of the stratigraphic and paleolatitudinal distribution of Mesozoic–Cenozoic organic-walled dinoflagellate cysts. Earth Syst. Sci. Data, 14(2):579–617.
Bjørklund, K., 1976. Radiolaria from the Norwegian Sea, Leg 38 of the Deep Sea Drilling Project. In Talwani, M., Udintsev, G., et al., Initial Reports of the Deep Sea Drilling Project, 38: Washington, DC (US Government Printing Office), 1101–1168. https://doi.org/
Boiron, T., Bascou, J., Camps, P., Ferré, E.C., Maurice, C., Guy, B., Gerbe, M.-C., and Launeau, P., 2013. Internal structure of basalt flows: insights from magnetic and crystallographic fabrics of the La Palisse volcanics, French Massif Central. Geophysical Journal International, 193(2):585–602. https://doi.org/
Brinkhuis, H., Schouten, S., Collinson, M.E., Sluijs, A., Sinninghe Damsté, J.S., Dickens, G.R., Huber, M., Cronin, T.M., Onodera, J., Takahashi, K., Bujak, J.P., Stein, R., van der Burgh, J., Eldrett, J.S., Harding, I.C., Lotter, A.F., Sangiorgi, F., van Konijnenburg-van Cittert, H., de Leeuw, J.W., Matthiessen, J., Backman, J., and Moran, K., 2006. Episodic fresh surface waters in the Eocene Arctic Ocean. Nature, 441(7093):606–609. https://doi.org/
Bujak, J., and Mudge, D., 1994. A high-resolution North Sea Eocene dinocyst zonation. Journal of the Geological Society (London, UK), 151(3):449–462. https://doi.org/
Butler, R.F., 1992. Paleomagnetism: Magnetic Domains to Geologic Terranes: Boston (Blackwell Science Publishing).
Caballero-Miranda, C.I., Alva-Valdivia, L.M., González-Rangel, J.A., Gogitchaishvili, A., Urrutia-Fucugauchi, J., and Kontny, A., 2016. Vertical AMS variation within basalt flow profiles from the Xitle volcano (Mexico) as indicator of heterogeneous strain in lava flows. Journal of Volcanology and Geothermal Research, 311:9–28. https://doi.org/
Callegaro, S., Marzoli, A., Bertrand, H., Blichert-Toft, J., Reisberg, L., Cavazzini, G., Jourdan, F., Davies, J.H.F.L., Parisio, L., Bouchet, R., Paul, A., Schaltegger, U., and Chiaradia, M., 2017. Geochemical constraints provided by the Freetown Layered Complex (Sierra Leone) on the origin of high-Ti tholeiitic CAMP magmas. Journal of Petrology, 58(9):1811–1840. https://doi.org/
Chadima, M., and Hrouda, F., 2006. Remasoft 3.0 a user-friendly paleomagnetic data browser and analyzer. Travaux Géophysiques, 27:20–21.
Dybkjær, K., Rasmussen, E.S., Eidvin, T., Grøsfjeld, K., Riis, F., Piasecki, S., and Śliwińska, K.K., 2021. A new stratigraphic framework for the Miocene – Lower Pliocene deposits offshore Scandinavia: a multiscale approach. Geological Journal, 56(3):1699–1725. https://doi.org/
Dzinoridze, R.N., Jouse, A.P., Koroleva-Golikova, G.S., Kozlova, G.E., Nagaeva, G.S., Petrushevskaya, M.G., and Strelnikova, N.I., 1978. Diatom and radiolarian Cenozoic stratigraphy, Norwegian Basin: DSDP Leg 38. In Talwani, M., Udintsev, G., et al., Initial Reports of the Deep Sea Drilling Project, 38: Washington, DC (US Government Printing Office), 289–427. https://doi.org/
Egger, L.M., Sliwinska, K.K., van Peer, T.E., Liebrand, D., Lippert, P.C., Friedrich, O., Wilson, P.A., Norris, R.D., and Pross, J., 2016. Magnetostratigraphically-calibrated dinoflagellate cyst bioevents for the uppermost Eocene to lowermost Miocene of the western North Atlantic (IODP Expedition 342, Paleogene Newfoundland sediment drifts). Review of Palaeobotany and Palynology, 234:159–185. https://doi.org/
Eldholm, O., Thiede, J., Taylor, E., and the Shipboard Scientific Party, 1987. Summary and preliminary conclusions, ODP Leg 104. In Eldholm, O., Thiede, J., Taylor, E., et al., Proceedings of the Ocean Drilling Program, Initial Reports, 104: College Station, TX (Ocean Drilling Program), 751–771. https://doi.org/
Eldrett, J.S., and Harding, I.C., 2009. Palynological analyses of Eocene to Oligocene sediments from DSDP Site 338, Outer Vøring Plateau. Marine Micropaleontology, 73(3–4):226–240. https://doi.org/
Eldrett, J.S., Harding, I.C., Firth, J.V., and Roberts, A.P., 2004. Magnetostratigraphic calibration of Eocene–Oligocene dinoflagellate cyst biostratigraphy from the Norwegian–Greenland Sea. Marine Geology, 204(1–2):91–127. https://doi.org/
Gernigon, L., Zastrozhnov, D., Planke, S., Manton, B., Abdelmalak, M.M., Olesen, O., Maharjan, D., Faleide, J.I., and Myklebust, R., 2021. A digital compilation of structural and magmatic elements of the mid-Norwegian continental margin. Norwegian Journal of Geology, 101. https://doi.org/
Gregg, T.K.P., and Keszthelyi, L.P., 2004. The emplacement of pahoehoe toes: field observations and comparison to laboratory simulations. Bulletin of Volcanology, 66(5):381–391. https://doi.org/
Heesemann, M., 2008. Advances in the acquisition and processing of subseafloor temperature and pressure data and their interpretation in the context of convergent margin processes [PhD dissertation]. University of Bremen, Bremen, Germany.
Heilmann‐Clausen, C., and Van Simaeys, S., 2005. Dinoflagellate cysts from the middle Eocene to ?lowermost Oligocene succession in the Kysing research borehole, central Danish basin. Palynology, 29(1):143–204. https://doi.org/
Hinz, K., and Weber, J., 1976. Zum geologischen Aufbau des Norwegischen Kontinentalrandes und der Barents See nach Reflexionsseismischen Massungen. Petroleum and Coal, Natural Gas, Petrochemistry, 29:3–29.
Hrouda, F., Chlupáčová, M., Schulmann, K., Šmíd, J., and Závada, P., 2005. On the effect of lava viscosity on the magnetic fabric intensity in alkaline volcanic rocks. Studia Geophysica et Geodaetica, 49(2):191–212. https://doi.org/
Köthe, A., Gaedicke, C., and Lutz, R., 2008. Erratum: the age of the Mid-Miocene Unconformity (MMU) in the G-11-1 borehole, German North Sea sector. Zeitschrift der Deutschen Gesellschaft für Geowissenschaften, 159(4):687–689. https://doi.org/
Lazarus, D., Barron, J., Renaudie, J., Diver, P., and Türke, A., 2014. Cenozoic planktonic marine diatom diversity and correlation to climate change. PloS One, 9(1):e84857. https://doi.org/
Le Maitre, R.W. (Ed.), 1989. A Classification of Igneous Rocks and Glossary of Terms: Boston (Blackwell).
LeHuray, A.P., 1989. Native copper in ODP Site 642 tholeiites. In Eldholm, O., Thiede, J., Taylor, E., et al., Proceedings of the Ocean Drilling Program, Scientific Results, 104: College Station, TX (Ocean Drilling Program), 411–417. https://doi.org/
Longman, J., Gernon, T.M., Palmer, M.R., Jones, M.T., Stokke, E.W., and Svensen, H.H., 2021. Marine diagenesis of tephra aided the Palaeocene-Eocene Thermal Maximum termination. Earth and Planetary Science Letters, 571:117101. https://doi.org/
Lyons, T.W., Murray, R.W., and Pearson, D.G., 2000. A comparative study of diagenetic pathways in sediments of the Caribbean Sea: highlights from pore-water results. In Leckie, R.M., Sigurdsson, H., Acton, G.D., and Draper, G. (Eds.), Proceedings of the Ocean Drilling Program, Scientific Results, 165: College Station, TX (Ocean Drilling Program). https://doi.org/
Manum, S.B., Boulter, M.C., Gunnarsdottir, H., Rangnes, K., and Scholze, A., 1989. Eocene to Miocene palynology of the Norwegian Sea (ODP Leg 104). In Eldholm, O., Thiede, J., Taylor, E., et al., Proceedings of the Ocean Drilling Program, Scientific Results, 104: College Station, TX (Ocean Drilling Program), 611–662. https://doi.org/
Meyer, R., Hertogen, J., Pedersen, R.B., Viereck-Götte, L., and Abratis, M., 2009. Interaction of mantle derived melts with crust during the emplacement of the Vøring Plateau, N.E. Atlantic. Marine Geology, 261(1–4):3–16. https://doi.org/
Millett, J.M., Hole, M.J., Jolley, D.W., Schofield, N., and Campbell, E., 2016. Frontier exploration and the North Atlantic Igneous Province: new insights from a 2.6 km offshore volcanic sequence in the NE Faroe–Shetland Basin. Journal of the Geological Society, 173(2):320–336. https://doi.org/
Millett, J.M., Jerram, D.A., Manton, B., Planke, S., Ablard, P., Wallis, D., Hole, M.J., Brandsen, H., Jolley, D.W., and Dennehy, C., 2021. The Rosebank Field, NE Atlantic: volcanic characterisation of an inter‐lava hydrocarbon discovery. Basin Research, 33(6):2883–2913. https://doi.org/
Millett, J.M., Manton, B.M., Zastrozhnov, D., Planke, S., Maharjan, D., Bellwald, B., Gernigon, L., Faleide, J.I., Jolley, D.W., Walker, F., Abdelmalak, M.M., Jerram, D.A., Myklebust, R., Kjølhamar, B.E., Halliday, J., and Birch-Hawkins, A., 2022. Basin structure and prospectivity of the NE Atlantic volcanic rifted margin: cross-border examples from the Faroe–Shetland, Møre and Southern Vøring Basins. In Krmíček, L., and Chalapathi Rao, N.V. (Eds.), Lamprophyres, Lamproites and Related Rocks: Tracers to Supercontinent Cycles and Metallogenesis. Geological Society Special Publication, 495. https://doi.org/
Munsterman, D.K., and Brinkhuis, H., 2004. A southern North Sea Miocene dinoflagellate cyst zonation. Geologie en Mijnbouw, 83(4):267–285. https://doi.org/
Nelson, C.E., Jerram, D.A., and Hobbs, R.W., 2009. Flood basalt facies from borehole data: implications for prospectivity and volcanology in volcanic rifted margins. Petroleum Geoscience, 15(4):313–324. https://doi.org/
Pearce, J.A., and Cann, J.R., 1973. Tectonic setting of basic volcanic rocks determined using trace element analyses. Earth and Planetary Science Letters, 19(2):290–300. https://doi.org/
Planke, S., 1994. Geophysical response of flood basalts from analysis of wire line logs: Ocean Drilling Program Site 642, Vøring volcanic margin. Journal of Geophysical Research: Solid Earth, 99(B5):9279–9296. https://doi.org/
Planke, S., Berndt, C., and Alvarez Zarikian, C.A., 2021. Expedition 396 Scientific Prospectus: Mid-Norwegian Continental Margin Magmatism: International Ocean Discovery Program https://doi.org/
Planke, S., Berndt, C., Alvarez Zarikian, C.A., Agarwal, A., Andrews, G.D.M., Betlem, P., Bhattacharya, J., Brinkhuis, H., Chatterjee, S., Christopoulou, M., Clementi, V.J., Ferré, E.C., Filina, I.Y., Frieling, J., Guo, P., Harper, D.T., Jones, M.T., Lambart, S., Longman, J., Millett, J.M., Mohn, G., Nakaoka, R., Scherer, R.P., Tegner, C., Varela, N., Wang, M., Xu, W., and Yager, S.L., 2023a. Expedition 396 methods. In Planke, S., Berndt, C., Alvarez Zarikian, C.A., and the Expedition 396 Scientists, Mid-Norwegian Margin Magmatism and Paleoclimate Implications. Proceedings of the International Ocean Discovery Program, 396: College Station, TX (International Ocean Discovery Program). https://doi.org/
Planke, S., Berndt, C., Alvarez Zarikian, C.A., Agarwal, A., Andrews, G.D.M., Betlem, P., Bhattacharya, J., Brinkhuis, H., Chatterjee, S., Christopoulou, M., Clementi, V.J., Ferré, E.C., Filina, I.Y., Frieling, J., Guo, P., Harper, D.T., Jones, M.T., Lambart, S., Longman, J., Millett, J.M., Mohn, G., Nakaoka, R., Scherer, R.P., Tegner, C., Varela, N., Wang, M., Xu, W., and Yager, S.L., 2023b. Site U1573. In Planke, S., Berndt, C., Alvarez Zarikian, C.A., and the Expedition 396 Scientists, Mid-Norwegian Margin Magmatism and Paleoclimate Implications. Proceedings of the International Ocean Discovery Program, 396: College Station, TX (International Ocean Discovery Program). https://doi.org/
Planke, S., Berndt, C., Alvarez Zarikian, C.A., Agarwal, A., Andrews, G.D.M., Betlem, P., Bhattacharya, J., Brinkhuis, H., Chatterjee, S., Christopoulou, M., Clementi, V.J., Ferré, E.C., Filina, I.Y., Frieling, J., Guo, P., Harper, D.T., Jones, M.T., Lambart, S., Longman, J., Millett, J.M., Mohn, G., Nakaoka, R., Scherer, R.P., Tegner, C., Varela, N., Wang, M., Xu, W., and Yager, S.L., 2023c. Site U1574. In Planke, S., Berndt, C., Alvarez Zarikian, C.A., and the Expedition 396 Scientists, Mid-Norwegian Margin Magmatism and Paleoclimate Implications. Proceedings of the International Ocean Discovery Program, 396: College Station, TX (International Ocean Discovery Program). https://doi.org/
Planke, S., Millett, J.M., Maharjan, D., Jerram, D.A., Mansour Abdelmalak, M., Groth, A., Hoffmann, J., Berndt, C., and Myklebust, R., 2017. Igneous seismic geomorphology of buried lava fields and coastal escarpments on the Vøring volcanic rifted margin. Interpretation, 5(3):SK161–SK177. https://doi.org/
Planke, S., Symonds, P.A., Alvestad, E., and Skogseid, J., 2000. Seismic volcanostratigraphy of large-volume basaltic extrusive complexes on rifted margins. Journal of Geophysical Research: Solid Earth, 105(B8):19335–19351. https://doi.org/
Rhodes, J.M., 1996. Geochemical stratigraphy of lava flows sampled by the Hawaii scientific drilling project. Journal of Geophysical Research: Solid Earth, 101(B5):11729–11746. https://doi.org/
Scherer, R.P., and Koç, N., 1996. Late Paleogene diatom biostratigraphy and paleoenvironments of the northern Norwegian-Greenland Sea. In Thiede, J., Myhre, A.M., Firth, J.V., Johnson, G.L., and Ruddiman, W.F., Proceedings of the Ocean Drilling Program, Scientific Results, 151: College Station, TX (Ocean Drilling Program), 75–99. https://doi.org/
Schrader, H.-J., and Fenner, J., 1976. Norwegian Sea Cenozoic diatom biostratigraphy and taxonomy: Part I: Norwegian Sea Cenozoic diatom biostratigraphy. In Andrews, J.E., Packham, G. et al., Initial Reports of the Deep Sea Drilling Project, 38: Washington, DC (US Government Printing Office), 921–1099. https://doi.org/
Seyfried, W.E., and Bischoff, J.L., 1979. Low temperature basalt alteration by sea water: an experimental study at 70°C and 150°C. Geochimica et Cosmochimica Acta, 43(12):1937–1947. https://doi.org/
Seyfried, W.E., and Mottl, M.J., 1982. Hydrothermal alteration of basalt by seawater under seawater-dominated conditions. Geochimica et Cosmochimica Acta, 46(6):985–1002. https://doi.org/
Shervais, J.W., 1982. Ti-V plots and the petrogenesis of modern and ophiolitic lavas. Earth and Planetary Science Letters, 59(1):101–118. https://doi.org/
Skogseid, J., and Eldholm, O., 1987. Early Cenozoic crust at the Norwegian continental margin and the conjugate Jan Mayen Ridge. Journal of Geophysical Research: Solid Earth, 92(B11):11471–11491. https://doi.org/
Skogseid, J., and Eldholm, O., 1989. Vøring Plateau continental margin: seismic interpretation, stratigraphy, and vertical movements. In Eldholm, O., Thiede, J., Taylor, E., et al., Proceedings of the Ocean Drilling Program, Scientific Results, 104: College Station, TX (Ocean Drilling Program), 993–1030. https://doi.org/
Śliwińska, K.K., 2019. Early Oligocene dinocysts as a tool for palaeoenvironment reconstruction and stratigraphical framework – a case study from a North Sea well. Journal of Micropalaeontology, 38(2):143–176. https://doi.org/
Spiegler, D., and Jansen, E., 1989. Planktonic foraminifer biostratigraphy of Norwegian Sea sediments: ODP Leg 104. In Eldholm, O., Thiede, J., Taylor, E., et al., Proceedings of the Ocean Drilling Program, Scientific Results, 104: College Station, TX (Ocean Drilling Program), 681–696. https://doi.org/
Sundvor, E., Eldholm, O., Gladczenko, T.P., and Planke, S., 2000. Norwegian-Greenland Sea thermal field. In Nøttvedt, A. (Ed.), Dynamics of the Norwegian Margin. Geological Society Special Publication, 167: 397–410. https://doi.org/
Talwani, M., Udintsev, G., et al., 1976. Initial Reports of the Deep Sea Drilling Project, 38: Washington, DC (US Government Printing Office). https://doi.org/
Tegner, C., Lesher, C.E., Larsen, L.M., and Watt, W.S., 1998. Evidence from the rare-earth-element record of mantle melting for cooling of the Tertiary Iceland plume. Nature, 395(6702):591–594. https://doi.org/
Thomsen, E., Abrahamsen, N., Heilmann-Clausen, C., King, C., and Nielsen, O.B., 2012. Middle Eocene to earliest Oligocene development in the eastern North Sea Basin: biostratigraphy, magnetostratigraphy and palaeoenvironment of the Kysing-4 borehole, Denmark. Palaeogeography, Palaeoclimatology, Palaeoecology, 350–352:212–235. https://doi.org/
Torres, M.E., Hong, W.-L., Solomon, E.A., Milliken, K., Kim, J.-H., Sample, J.C., Teichert, B.M.A., and Wallmann, K., 2020. Silicate weathering in anoxic marine sediment as a requirement for authigenic carbonate burial. Earth-Science Reviews, 200:102960. https://doi.org/
Van Mourik, C.A., Brinkhuis, H., and Williams, G.L., 2001. Mid- to Late Eocene organic-walled dinoflagellate cysts from ODP Leg 171B, offshore Florida. In Kroon, D., Norris, R.D., and Klaus, A. (Eds.), Western North Atlantic Palaeogene and Cretaceous Palaeoceanography. Geological Society Special Publication, 183: 225–251. https://doi.org/
Vogt, P.R., and Sundvor, E., 1996. Heat flow highs on the Norwegian-Barents-Svalbard continental slope: deep crustal fractures, dewatering, or “memory in the mud”? Geophysical Research Letters, 23(24):3571–3574. https://doi.org/
Walker, G.P.L., 1987. Pipe vesicles in Hawaiian basaltic lavas: their origin and potential as paleoslope indicators. Geology, 15(1):84–87. https://doi.org/
Westerhold, T., Röhl, U., Donner, B., and Zachos, J.C., 2018. Global extent of Early Eocene hyperthermal events: a new Pacific benthic foraminiferal isotope record from Shatsky Rise (ODP Site 1209). Paleoceanography and Paleoclimatology, 33(6):626–642. https://doi.org/
White, J.D.L., McPhie, J., and Skilling, I., 2000. Peperite: a useful genetic term. Bulletin of Volcanology, 62:65–66. https://doi.org/
Williams, G.L., Stover, L.E., and Kidson, E.J., 1993. Morphology and stratigraphic ranges of selected Mesozoic-Cenozoic dinoflagellate taxa in the Northern Hemisphere. Geology. https://doi.org/
Witkowski, J., 2018. From museum drawers to ocean drilling: Fenneria gen. nov. (Bacillariophyta) offers new insights into Eocene marine diatom biostratigraphy and paleobiogeography. Acta Geologica Polonica, 68(1):53–88.
Zastrozhnov, D., Gernigon, L., Gogin, I., Planke, S., Abdelmalak, M.M., Polteau, S., Faleide, J.I., Manton, B., and Myklebust, R., 2020. Regional structure and polyphased Cretaceous-Paleocene rift and basin development of the mid-Norwegian volcanic passive margin. Marine and Petroleum Geology, 115:104269. https://doi.org/
Zijderveld, J.D.A., 2013. A. C. demagnetization of rocks: analysis of results. In Collinson, D.W., Creer, K.M., and Runcorn, S.K. (Eds.), Methods in Paleomagnetism. Developments in Solid Earth Geophysics, 3: New York (Elsevier), 254–286. https://doi.org/