Planke, S., Berndt, C., Alvarez Zarikian, C.A., and the Expedition 396 Scientists
Proceedings of the International Ocean Discovery Program Volume 396
publications.iodp.org
https://doi.org/10.14379/iodp.proc.396.108.2023
Site U15731
![]() S. Planke,
S. Planke,
![]() C. Berndt,
C. Berndt,
![]() C.A. Alvarez Zarikian,
C.A. Alvarez Zarikian,
![]() A. Agarwal,
A. Agarwal,
![]() G.D.M. Andrews,
G.D.M. Andrews,
![]() P. Betlem,
P. Betlem,
![]() J. Bhattacharya,
J. Bhattacharya,
![]() H. Brinkhuis,
H. Brinkhuis,
![]() S. Chatterjee,
S. Chatterjee,
![]() M. Christopoulou,
M. Christopoulou,
![]() V.J. Clementi,
V.J. Clementi,
![]() E.C. Ferré,
E.C. Ferré,
![]() I.Y. Filina,
I.Y. Filina,
![]() J. Frieling,
J. Frieling,
![]() P. Guo,
P. Guo,
![]() D.T. Harper,
D.T. Harper,
![]() M.T. Jones,
M.T. Jones,
![]() S. Lambart,
S. Lambart,
![]() J. Longman,
J. Longman,
![]() J.M. Millett,
J.M. Millett,
![]() G. Mohn,
G. Mohn,
![]() R. Nakaoka,
R. Nakaoka,
![]() R.P. Scherer,
R.P. Scherer,
![]() C. Tegner,
C. Tegner,
![]() N. Varela,
N. Varela,
![]() M. Wang,
M. Wang,
![]() W. Xu,
W. Xu,
![]() S.L. Yager2
S.L. Yager2
1 Planke, S., Berndt, C., Alvarez Zarikian, C.A., Agarwal, A., Andrews, G.D.M., Betlem, P., Bhattacharya, J., Brinkhuis, H., Chatterjee, S., Christopoulou, M., Clementi, V.J., Ferré, E.C., Filina, I.Y., Frieling, J., Guo, P., Harper, D.T., Jones, M.T., Lambart, S., Longman, J., Millett, J.M., Mohn, G., Nakaoka, R., Scherer, R.P., Tegner, C., Varela, N., Wang, M., Xu, W., and Yager, S.L., 2023. Site U1573. In Planke, S., Berndt, C., Alvarez Zarikian, C.A., and the Expedition 396 Scientists, Mid-Norwegian Margin Magmatism and Paleoclimate Implications. Proceedings of the International Ocean Discovery Program, 396: College Station, TX (International Ocean Discovery Program). https://doi.org/10.14379/iodp.proc.396.108.2023
2 Expedition 396 Scientists’ affiliations.
1. Background and objectives
Site U1573 is located in the southern part of the Lofoten Basin just north of the Vøring Plateau (Figure F1 in the Sites U1571 and U1572 chapter [Planke et al., 2023b]) at a 3167 m water depth. This part of the Vøring Margin has hardly been explored since the 1960s and 1970s. Site U1573 is located on Magnetic Anomaly 23 on the border between the Vøring and Lofoten margins. Compared to the Vøring Margin, the Lofoten Margin is characterized by a narrower rift system, less extensive breakup related magmatic crustal thickening, and a rapid increase of water depth from the shelf into the Lofoten Basin (Figure F1). The Lofoten Margin consists of three segments that are characterized by different fault dip directions and separated by crustal transfer systems (Tsikalas et al., 2001). The southernmost transfer system, the Bivrost Lineament, separates the Lofoten Margin from the Vøring Margin.
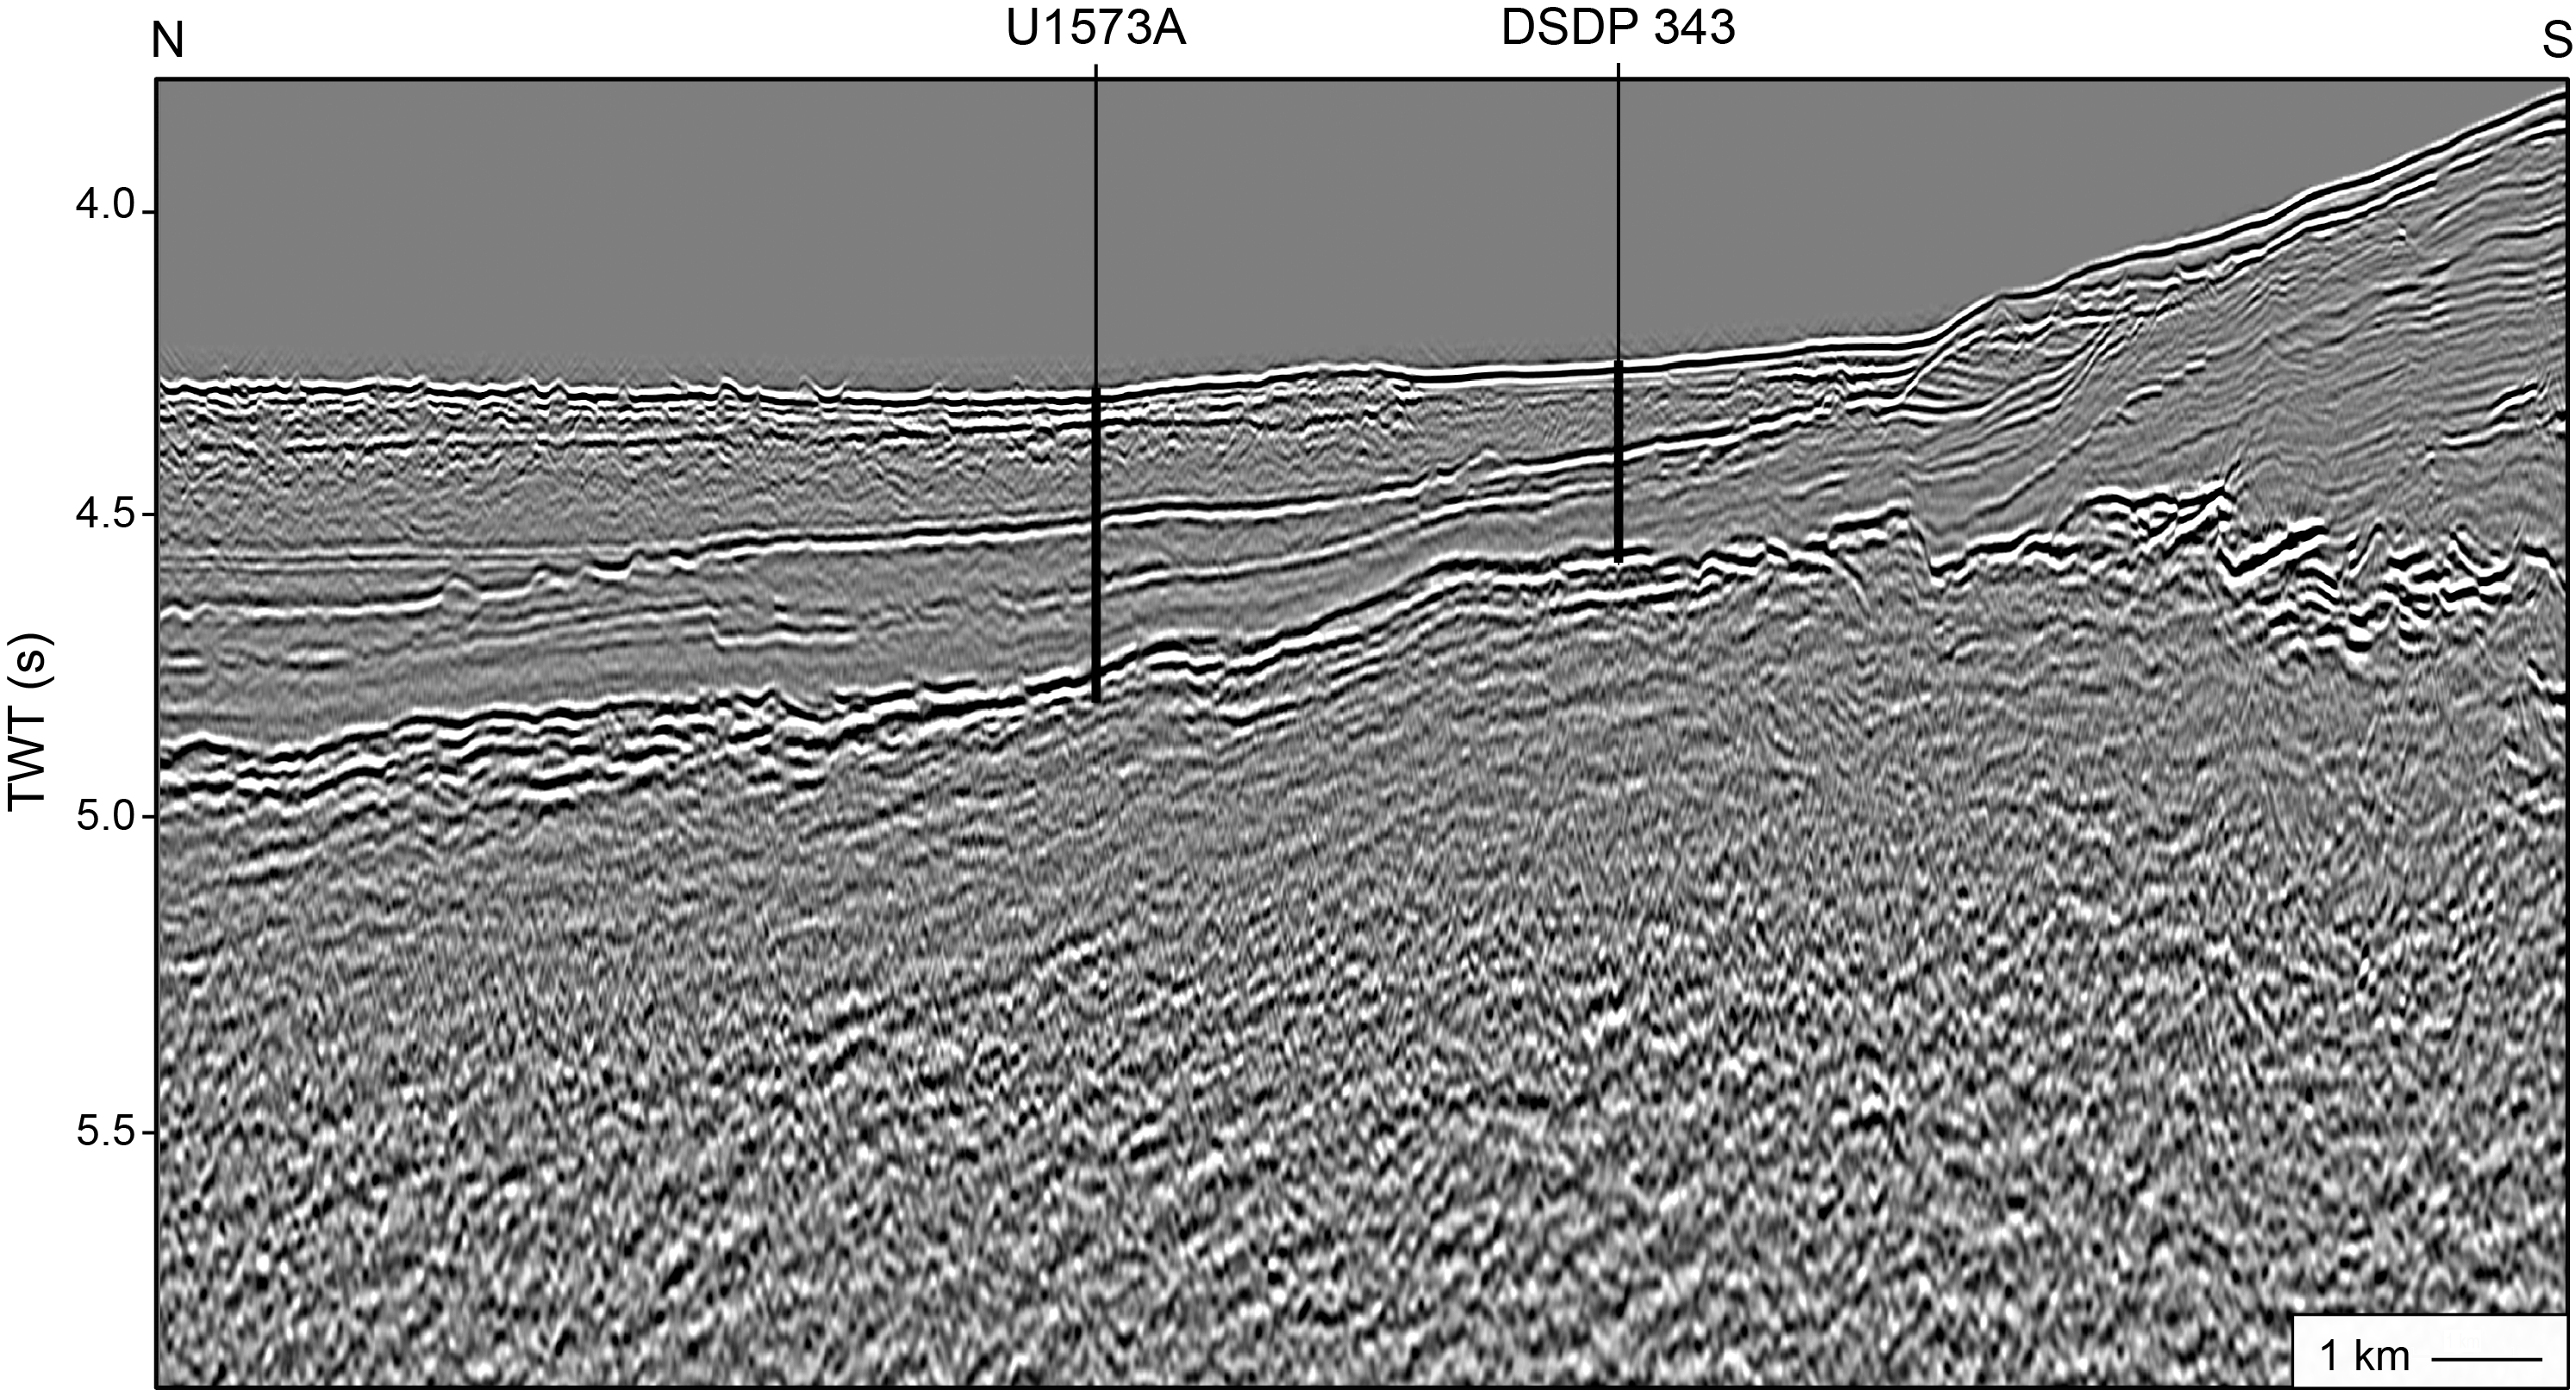
Figure F1. Seismic Line HV96-6.
Wide-angle seismic data suggest a ~12 km thick oceanic crust in the southern part of the Lofoten Basin, much thinner than the ~20 km thick crust of the Vøring Plateau (Breivik et al., 2009). This should have resulted in a very different vertical movement history of the Lofoten Margin than for the Vøring Margin.
Tsikalas et al. (2008) calculated a distinct Early Eocene bathymetric gradient from the Vøring Margin to the Lofoten Margin and a 500–1000 m water depth on the Lofoten Margin during breakup. This would imply submarine lava emplacement on the Lofoten Margin as opposed to the subaerial volcanic emplacement environment on the Vøring Margin (Eldholm et al., 1989). Tsikalas et al. (2008) attributed this bathymetric gradient to rapid initial margin subsidence along a deep-rooted low-angle detachment fault. Reflection seismic data reveal a horizontal basement reflection underlain by seaward-dipping reflectors (SDR) with lower seismic amplitude and shorter lateral extent than the main set of SDR on the Vøring Margin. These Outer SDR are a common feature of volcanic rifted margins and were interpreted as submarine lava flows (Berndt et al., 2001).
The only available basement samples prior to Expedition 396 are from Deep Sea Drilling Project (DSDP) Leg 38 Site 343 (Talwani et al., 1976). Basement was drilled from 253 to 284 meters below seafloor (mbsf), and about 5 m of highly altered basalts that were interpreted to be part of a sill intrusion were recovered.
The stark difference between the observed subaerial lava flows at Site 642 and the submarine conditions predicted by gravity modeling require a distinctly different subsidence history for the Vøring and Lofoten margins. Therefore, the first objective of drilling Site U1573 was to obtain information on the emplacement environment based on the facies of the recovered basalt and sediments. As such, reaching this first objective directly tests the predictions of the concept of seismic volcanostratigraphy. The second objective was to establish the timing of volcanism on the Lofoten Margin, in particular whether there is evidence of a time gap between the emplacement of the SDR of the Vøring Margin on Skoll High (Sites U1571 and U1572) and the Outer SDR. The third objective of Site U1573 was to constrain the conditions in the melt region during the presumably late phase of breakup volcanism. This includes not only any constraints on the composition of the mantle before melting and the ambient temperature and pressure from the geochemistry and petrology of the encountered rocks, but also any signs of evolution of the melts in crustal magma chambers during breakup volcanism.
2. Operations
2.1. Transit to Site U1573
Before arriving at Site U1573, we requested permission from the Environmental Protection and Safety Panel (EPSP) to drill without coring to 300 mbsf. We requested this change to our original operations plan because Site U1573 was our last major outstanding objective of the expedition, which was to core as much as 100 m into Outer SDR identified in the seismic lines. However, the weather forecast predicted high seas (>6 m waves) and more than 40–50 kt winds for 20–23 September 2021, which overlapped the time when we would be starting to core into basement had we cored the upper 300 m. Moreover, the long-term weather forecast did not suggest another continuous 4 day window until the end of the expedition, although this turned out to be wrong and we were able to drill another site afterward (U1574). Drilling down with a center bit without core recovery to 300 mbsf followed by coring allowed us to achieve our basement objectives before the bad weather set in. An additional rationale for our strategy was that Site U1573 was only 5.3 km away from DSDP Site 343, which was spot cored to basement (240 mbsf) during DSDP Leg 38 without any significant indication of hydrocarbon gas, and both sites were located on the same seismic line, which suggested no differences in sedimentary conditions between the two sites. The EPSP approved the drill down as we arrived on site at 0130 h (all times are provided in UTC + 0 h) on 17 September after completing a 99 nmi transit from Site U1572 in 8.8 h. The drill floor was cleared for operations at 0157 h, beginning Hole U1573A.
2.2. Site U1573
Site U1573 consists of a single hole, which was drilled first without coring using the rotary core barrel (RCB) system with a center bit from the seafloor to 300.0 m core depth below seafloor, Method A (CSF-A), and then cored to a final depth of 440.9 m CSF-A, including 59 m into basement. The average penetration rate in the basement section was ~1.82 m/h. There were frequent jammed liners and core catchers, which contributed to relatively low core recovery rates in the basement (average = 43.3%). Coring in Hole U1573A was terminated at 1830 h on 20 September 2021 because of severe weather and heavy sea conditions that were expected over the operational area for the following day. The last core recovered was Core 19R at 1925 h on 20 September. The drill string was pulled back on board by 2200 h. The bottom-hole assembly (BHA) was broken down, and the drill collars were secured in the drill collar rack. The rig floor was secured at 0705 h on 21 September, ending Hole U1573A and Site U1573. A total of 101.0 h or 4.2 days were recorded while on site. A total of 18 cores were recovered using the RCB system over 140.9 m, recovering 101 m (72%) (Table T1).
2.2.1. Hole U1573A
After being cleared for operations from the bridge at 0157 h, the rig crew began assembling the RCB BHA. The depth for Hole U1573A obtained from the ship’s precision depth recorder (PDR) was 3167.2 meters below sea level (mbsl). The BHA was deployed to 172.1 meters below rig floor (mbrf) with a new RCB bit before we continued to lower the drill pipe, filling it with seawater at 20 stand intervals during the trip to the seafloor. With the bit at 3146 mbrf, the top drive and drilling knobbies were installed, and the bit was spaced out to spud Hole U1573A. A core barrel dressed with a center bit was dropped, and Hole U1573A was spudded at 1140 h on 17 September. The PDR measurement was used for the official seafloor depth. Drilling continued through the night, and the bit reached 300.0 mbsf at 0330 h on 18 September. The center bit was retrieved by wireline, and a nonmagnetic RCB core barrel was dropped to begin coring in the hole. We RCB cored with full-length advances through Core 3R while the weather and seas continued to build. At 0800 h, the decision was made to stop coring, pull up off bottom, and wait on the weather to subside. The wind and vessel pitch made working conditions on the drill floor and in the derrick too dangerous for operations to continue. The forecast was favorable for later in the day, and after evaluating the weather, we resumed operations at 1200 h. RCB coring with full-length cores continued from 318.4 to 386.5 mbsf (Cores 4R–10R). Because of the slow penetration rate on Core 11R, the core barrel was pulled after a 2.2 m advance. The recovery for the core was 1.6 m of basalt with no other indications of a problem. The next core finished coring out the single joint of drill pipe to 396.2 mbsf. Combined, both cores together required 240 min of coring to complete the 9.7 m advance. Coring resumed with full-length advances through Core 15R to 425.4 mbsf. For Cores 16R–19R, half-length advances were used to improve our overall recovery. Coring was ended after Core 19R (440.9 mbsf) because of impending bad weather. The forecast was severe enough to force the abandonment and departure from Site U1573. The last core was on deck at 1925 h on 20 September. During coring, 50 bbl of high-viscosity mud was used for hole cleaning. After laying out the last core, the coring systems were secured, the top drive was set back, and the bit was pulled clear of the seafloor at 2200 h. The pipe trip continued to 172.1 mbrf. The BHA was broken down and laid out on the main deck because of the impending rough weather. The rig floor was secured for transit, and the bridge was notified of the end of operations in Hole U1573A at 0705 h on 21 September. The time spent on Hole U1573A was 101.0 h or 4.2 days.
3. Lithostratigraphy
Site U1573 consists of a single hole that was drilled to 440.45 m CSF-A and cored from 300.00 to 440.45 m CSF-A. This 140.45 m thick succession consists of sediments and basalts that are divided into four lithostratigraphic units (Table T2). Units are divided on the basis of significant lithologic changes, which are supported by physical properties variability. A lithologic summary of recovered core material from Hole U1573A is shown in Figure F2.
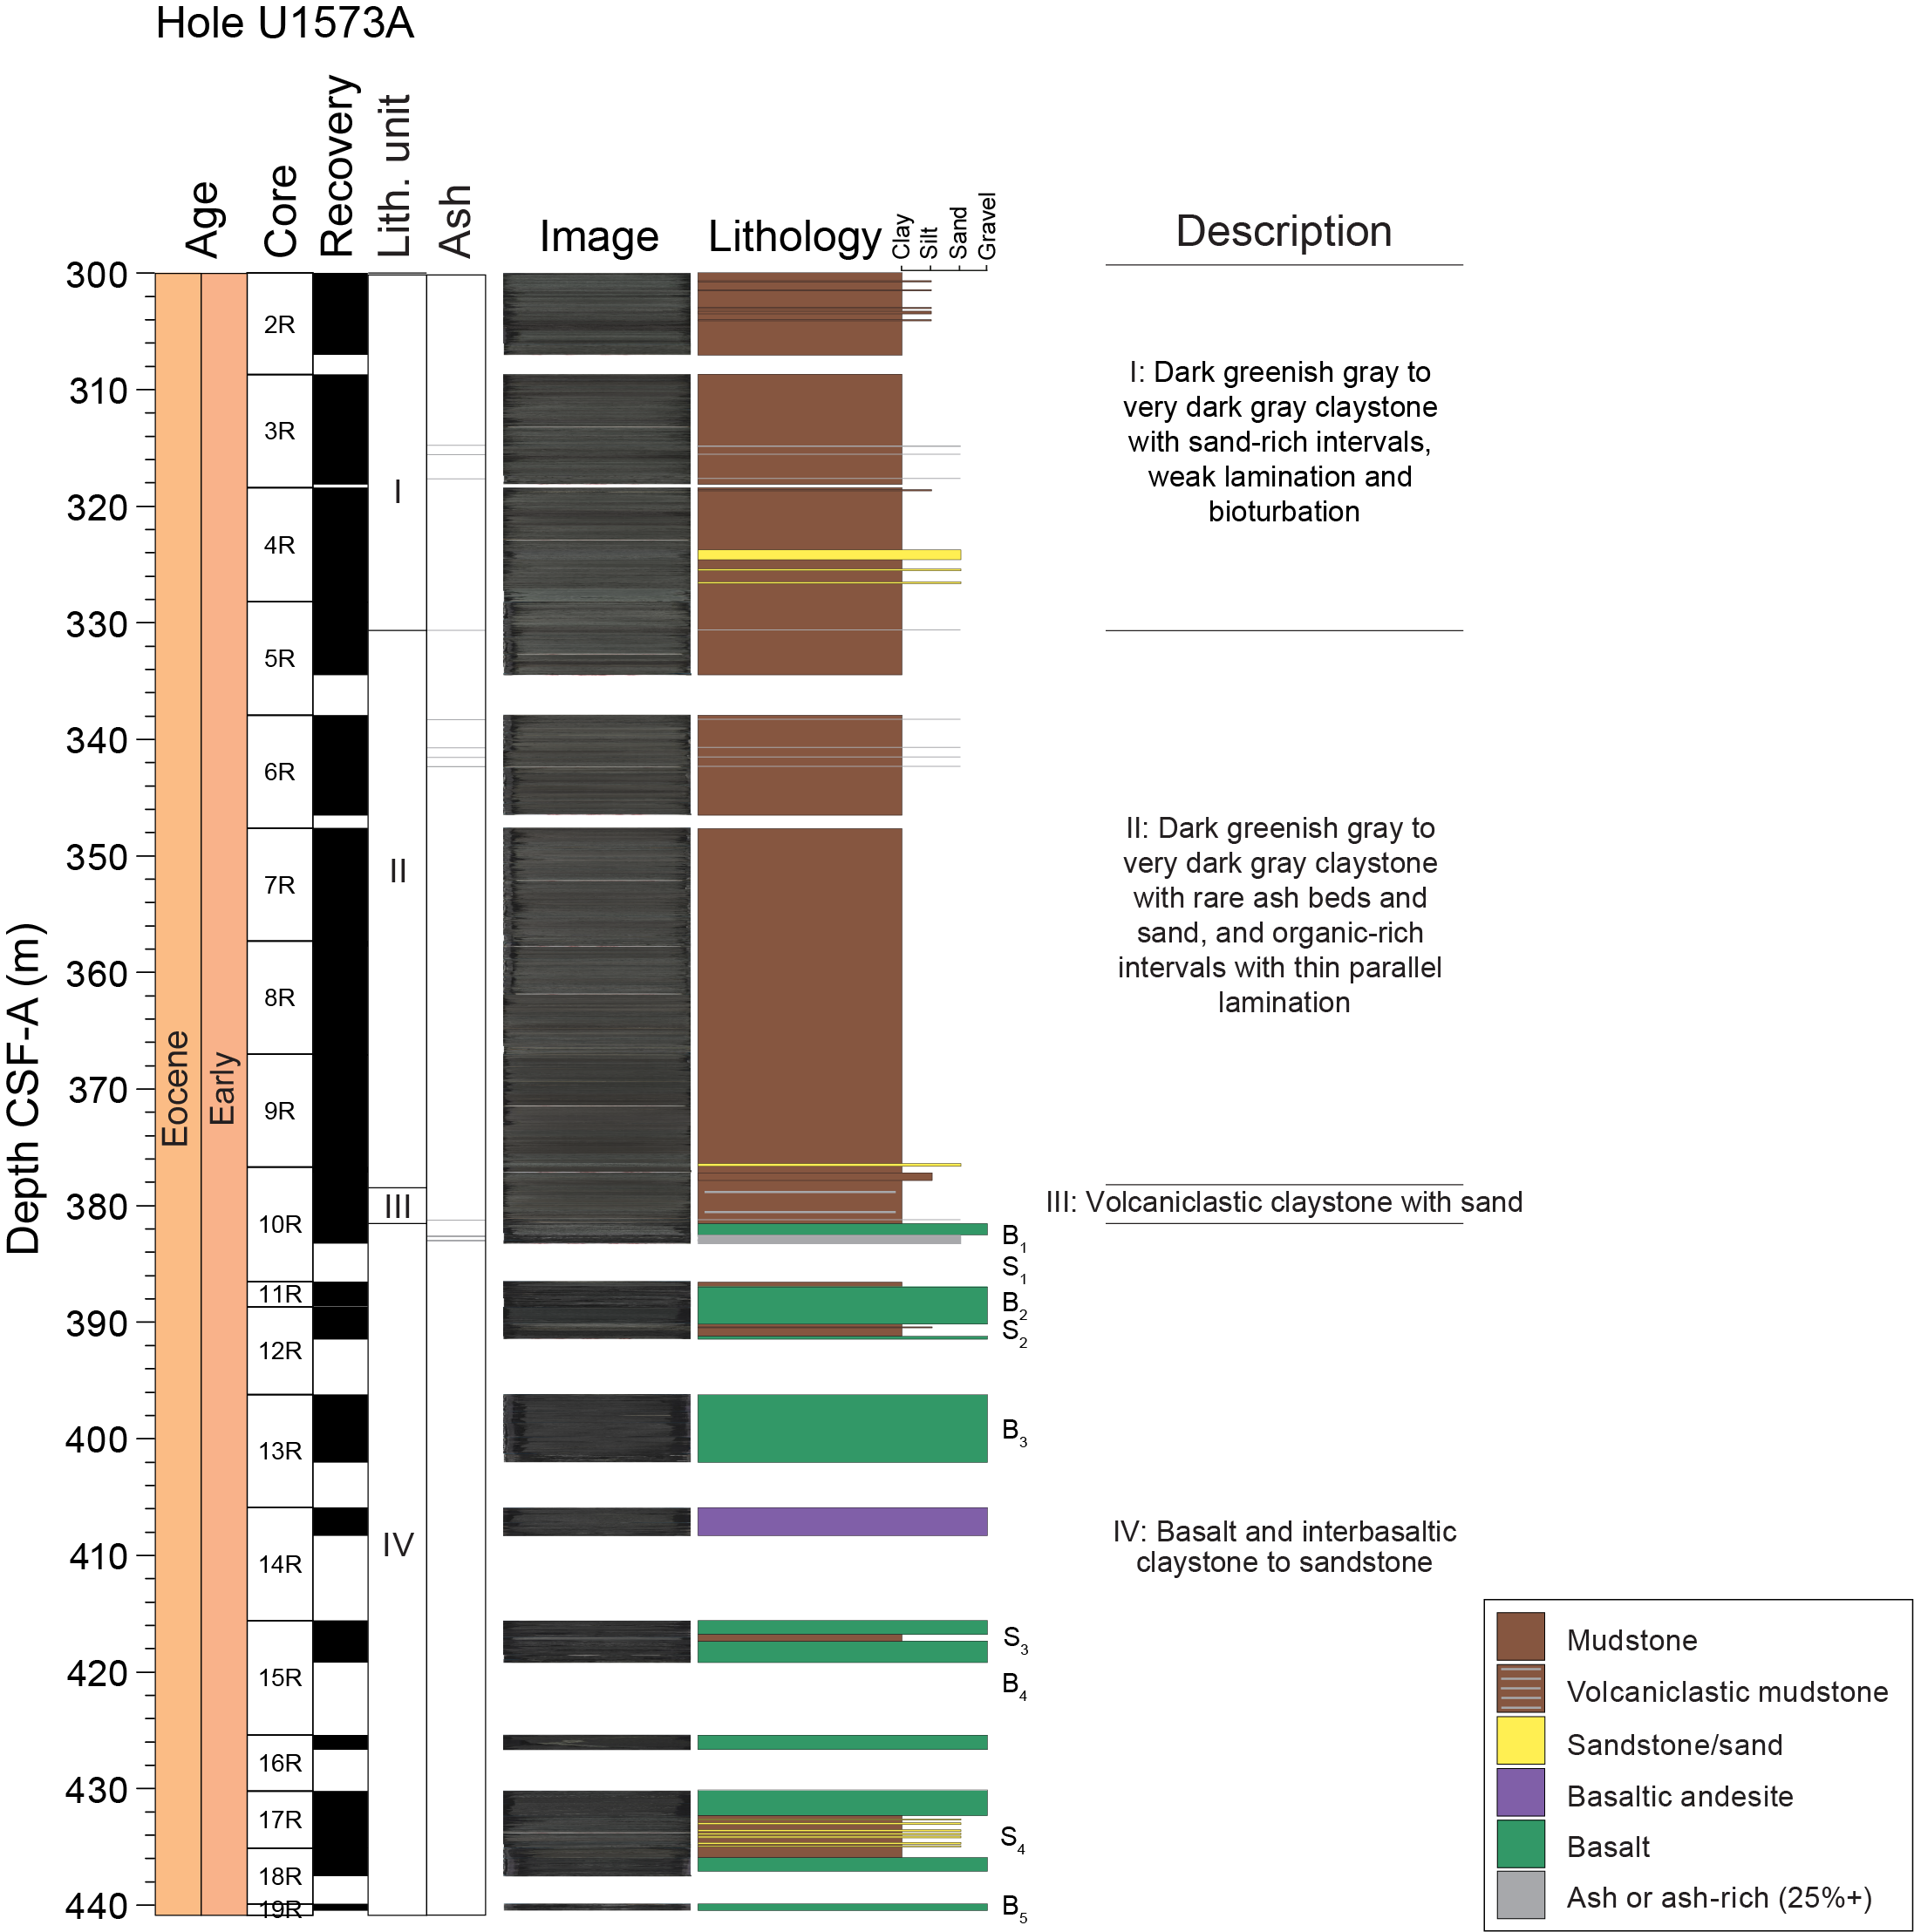
Figure F2. Lithostratigraphic column.
Unit intervals, depths, and descriptions are provided in Table T2. Units I–III are sedimentary, and Unit IV consists of basalt and interbasaltic sediments.
The lithology at Site U1573 is as follows:
- Unit I consists of dark greenish gray to very dark gray claystone with sand-rich intervals, rare weak parallel lamination, or fining-upward sequences. Slight to heavy bioturbation is present throughout the unit, and diagenetic pyrite is observed locally.
- Unit II consists of dark greenish gray to very dark gray claystone with moderate bioturbation alternating with very dark gray organic-rich claystone with thin parallel lamination. Rare ash beds or ash-rich beds are present locally.
- Unit III consists of very dark gray to very dark bluish gray volcaniclastic claystone with sand.
- Unit IV consists mainly of gray to very dark gray aphyric basalt and interbasaltic claystone to sandstone.
The lithostratigraphic highlights of Site U1573 are as follows:
- An expanded (>80 m) Early Eocene sediment interval is recovered, indicating very high sedimentation rates.
- Unit IV is characterized by a succession of basalt, consisting of sheet flows with veins, and interbasaltic sediments that contain black ash beds.
- Intervals of more differentiated basalts are observed in the uppermost and lowermost intervals of Unit IV.
- Interval: 396-U1573A-2R-1, 0 cm, to 5R-2, 86 cm
- Depth: 300.00–330.59 m CSF-A
- Age: Early Eocene
3.1. Lithostratigraphic Unit I
Lithostratigraphic Unit I consists of dark greenish gray to very dark gray claystone with varying amounts of silt and sand. Rare dark greenish gray clay-rich ash beds, dark bluish gray clay-rich sandstone with carbonate, and dark greenish gray biosiliceous-rich claystone are present locally. Weak parallel lamination and fining-upward sequences are common. The unit is moderately to heavily bioturbated throughout. Cores 396-U1573A-2R through 8R primarily contain swelling clay that causes sediments to expand after retrieval, resulting in over 100% recovery. Pyrite was commonly observed in this unit, including a 6 cm nodule present in Section 4R-1.
- Interval: 396-U1573A-5R-2, 86 cm, to 10R-2, 30 cm
- Depth: 330.59–378.47 m CSF-A
- Age: Early Eocene
3.2. Lithostratigraphic Unit II
Lithostratigraphic Unit II consists of dark greenish gray to very dark gray claystone with moderate bioturbation, which alternates with very dark gray organic-rich claystone with thin parallel lamination (Figure F3). Dispersed ash and ash-rich beds are present in Cores 396-U1573A-5R and 6R, and claystone with sand is present in Cores 6R–9R. The transition from Unit I to Unit II is marked by the first observation of organic-rich laminated claystone downhole. Organic content is confirmed microscopically through smear slide analysis. The bioturbated dark greenish gray to very dark gray claystone in Unit II is similar to that in Unit I. Localized rare siderite nodules, diagenetic pyrite, and dewatering structures are present in Core 9R.
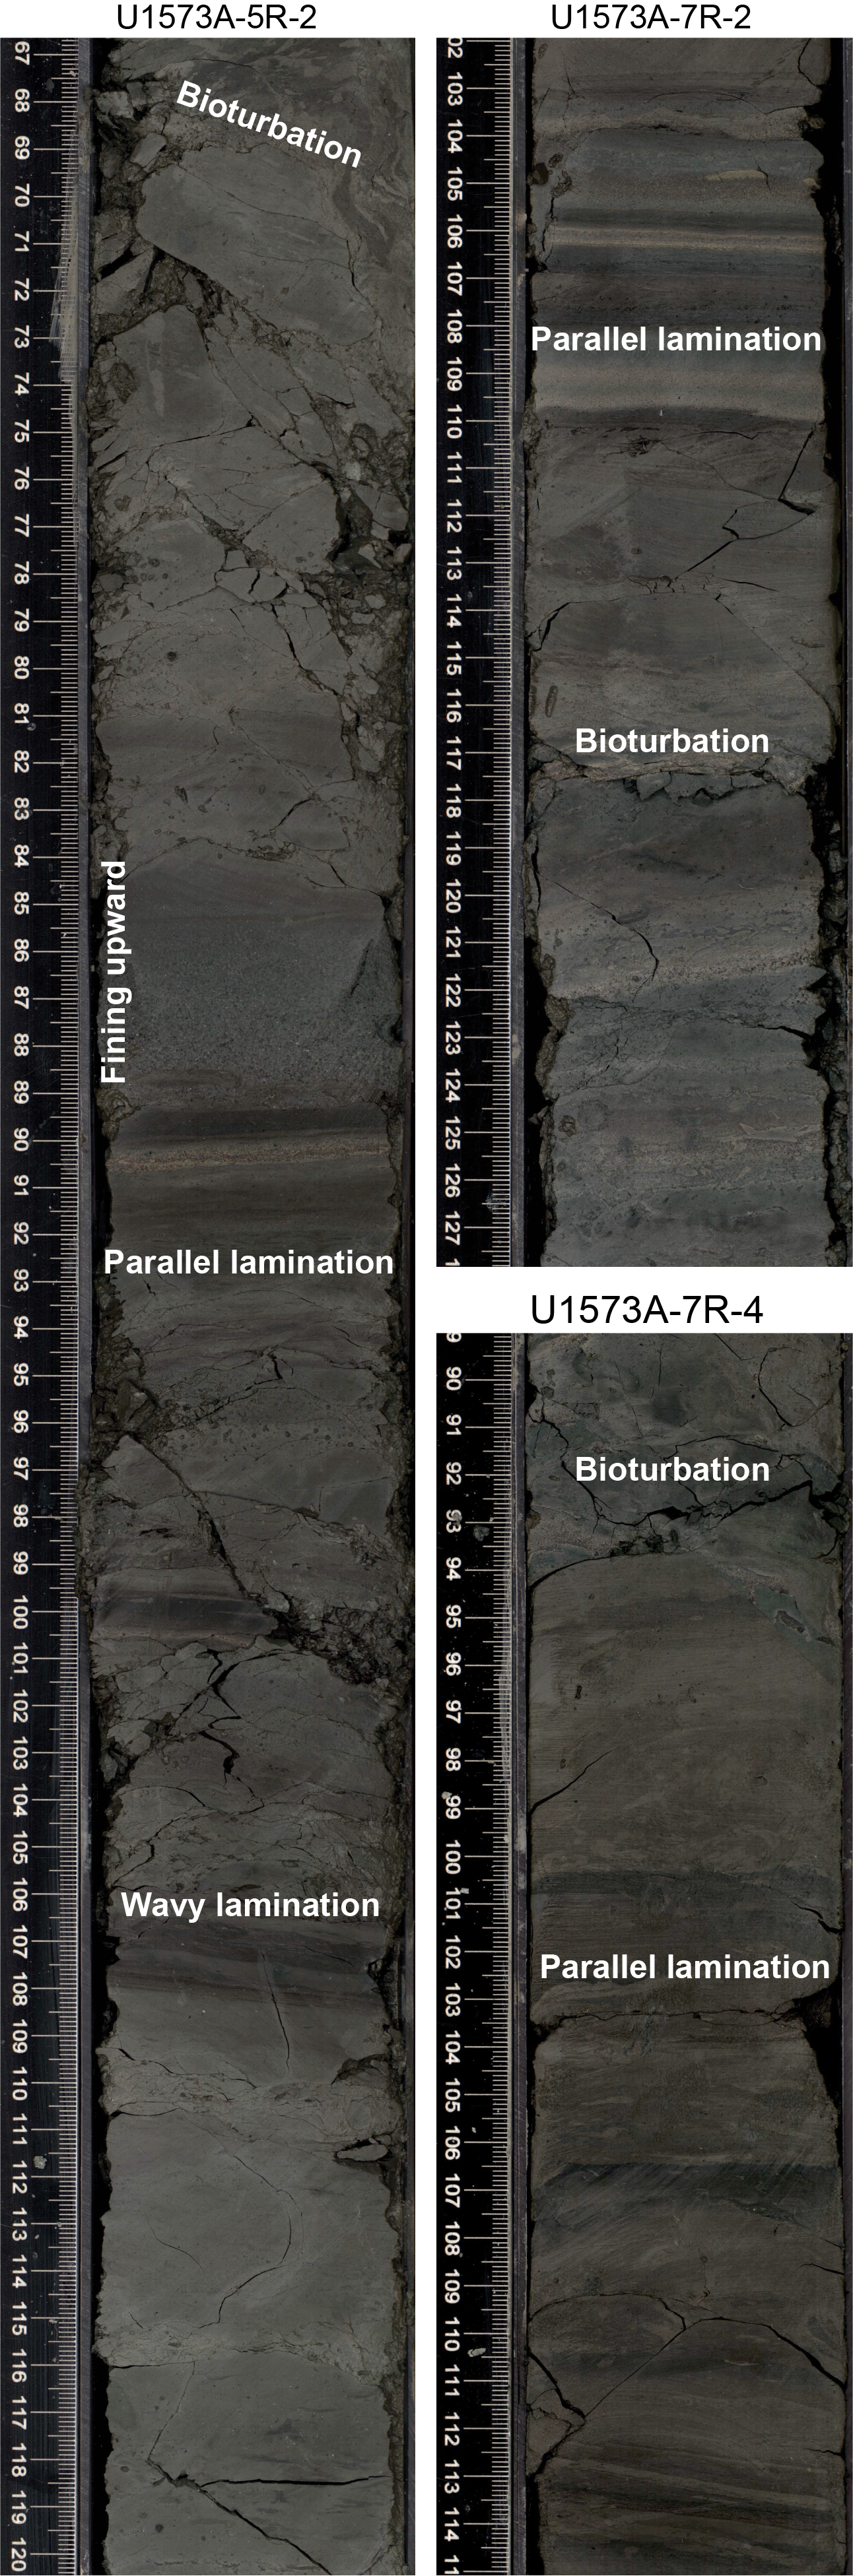
Figure F3. Bioturbation and lamination.
3.3. Lithostratigraphic Unit III
Lithostratigraphic Unit III consists of dark bluish gray to very dark gray volcaniclastic claystone with sand, very dark gray claystone with silt, and trace ash. Parallel or cross lamination and fining-upward sequences are common. Slight to heavy localized bioturbation is present. Unit III overlies the basalt and interbasaltic sediments of Unit IV (Figure F4).
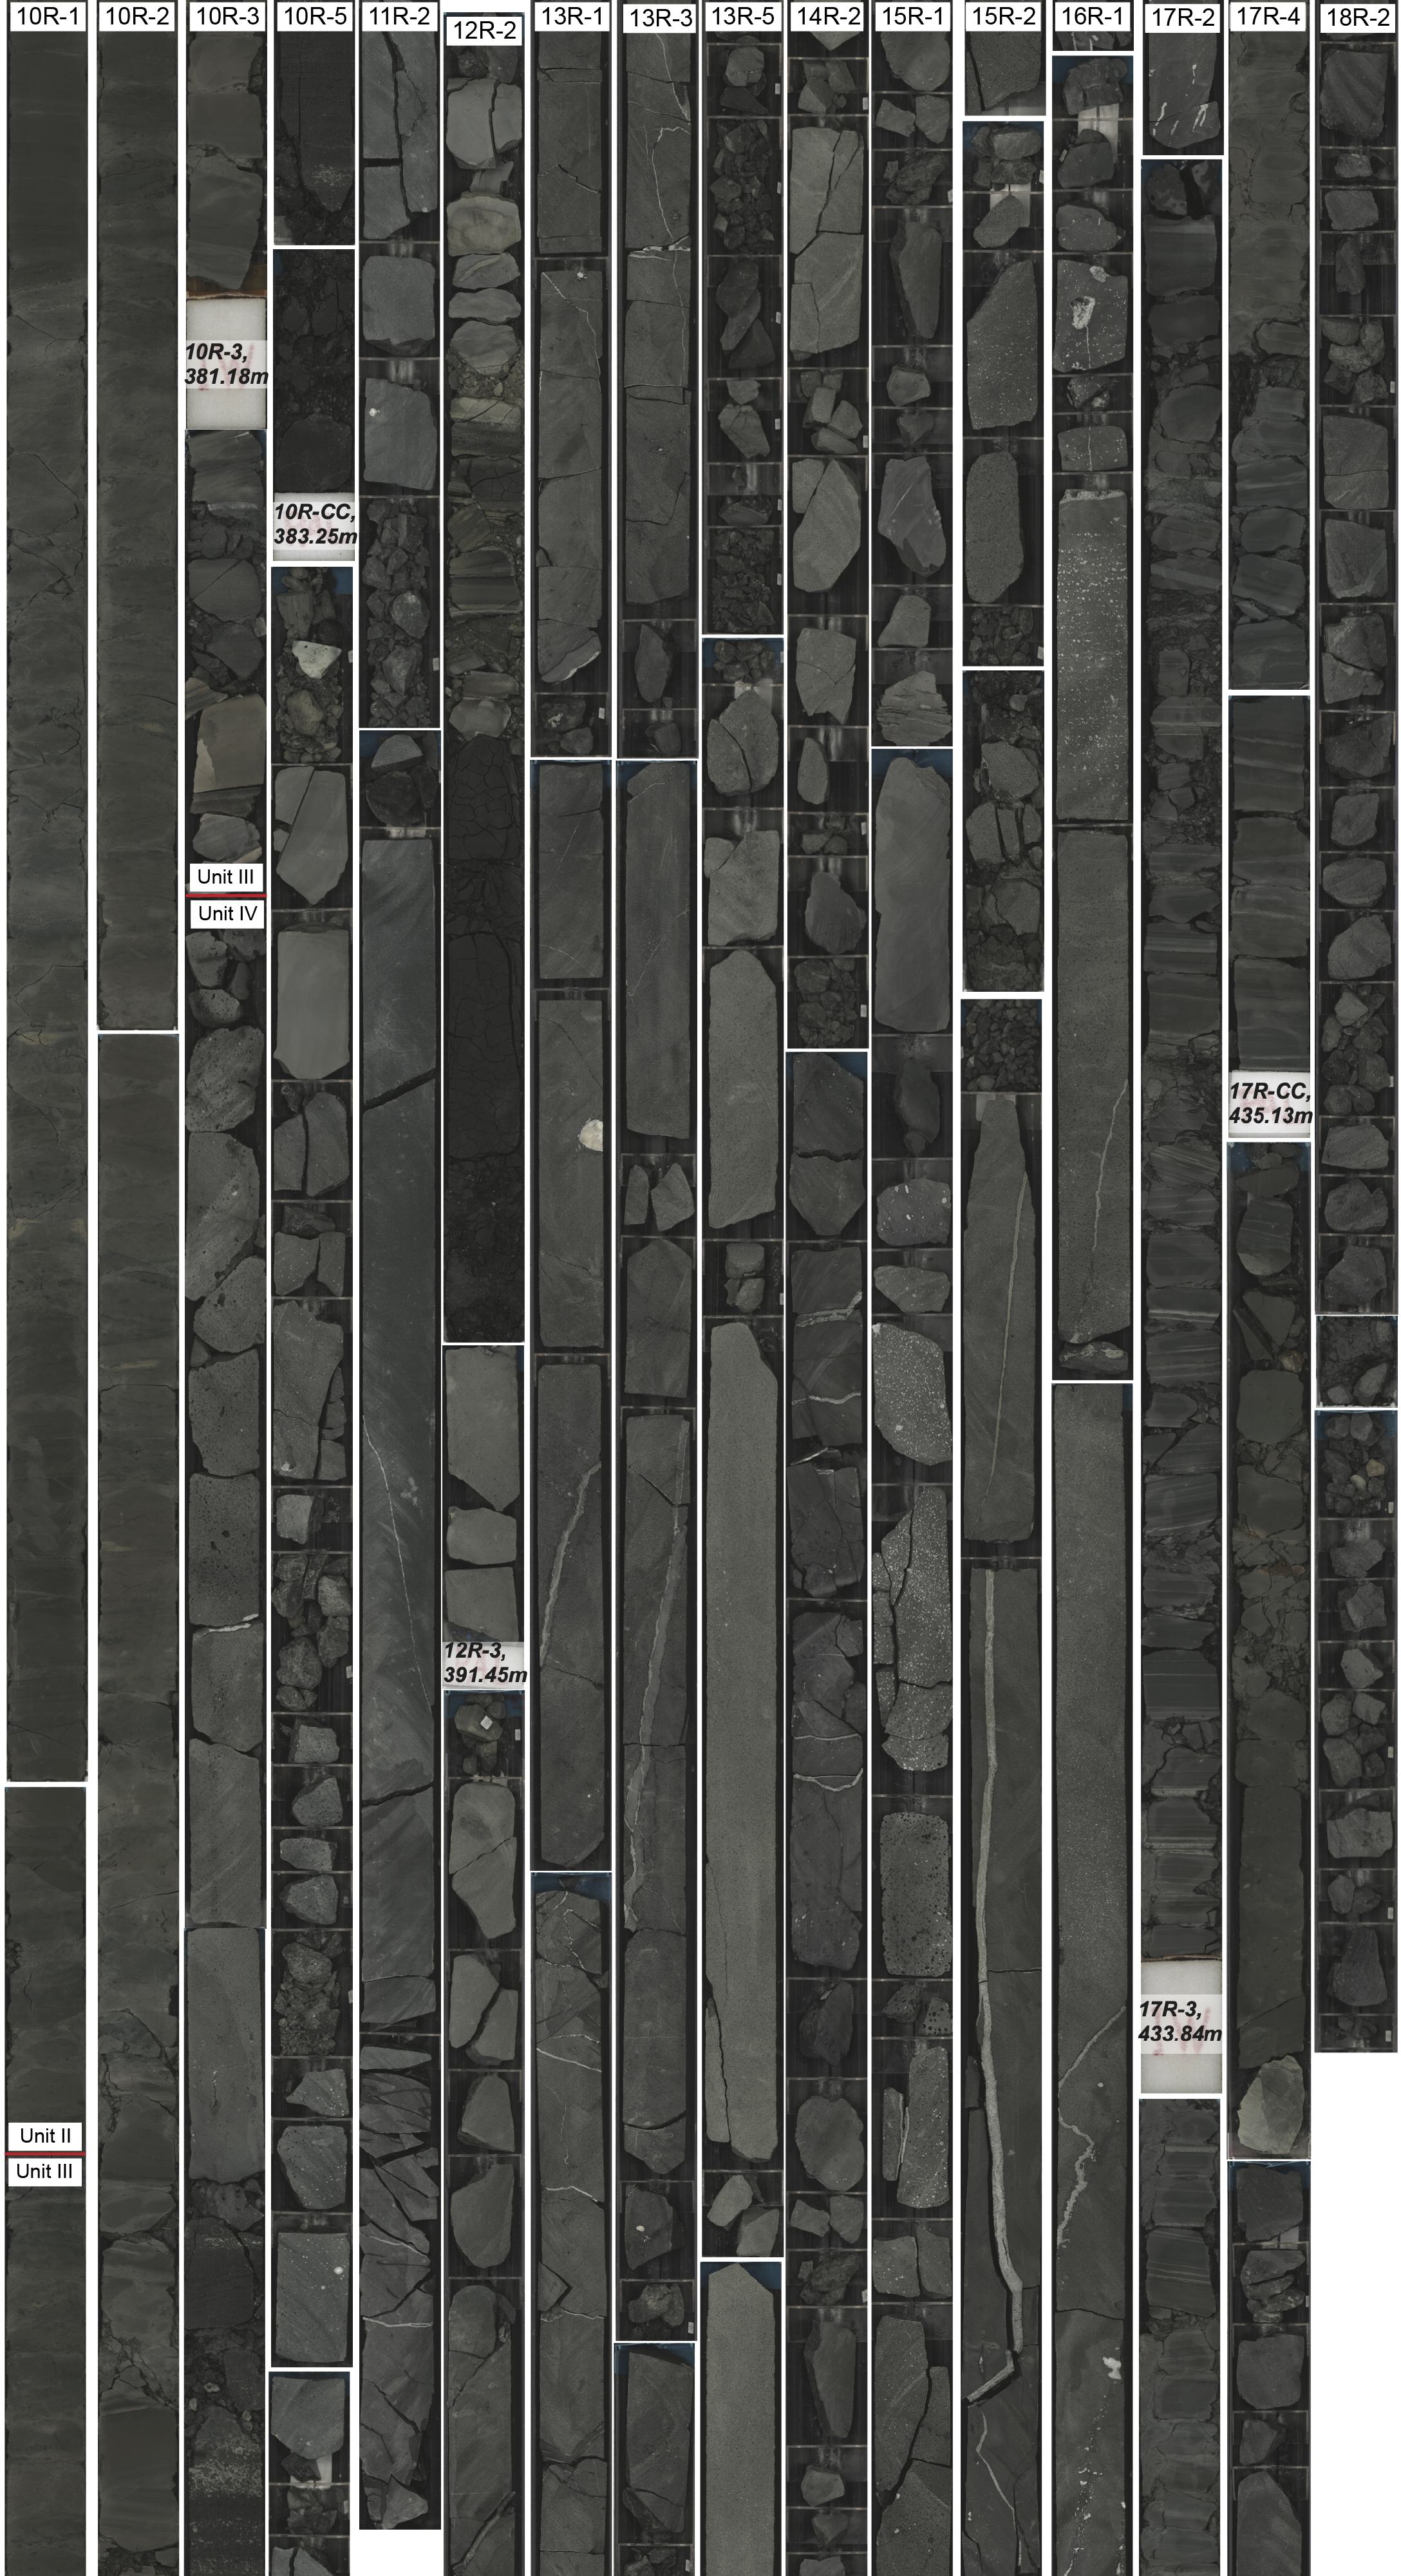
Figure F4. Unit II–IV core composite.
3.4. Lithostratigraphic Unit IV
- Interval: 396-U1573A-10R-4, 37 cm, to 19R-1, 55 cm (bottom of hole)
- Depth: 381.51–440.45 m CSF-A
- Age: Early Eocene
Unit IV is the only igneous unit in Hole U1573A. It consists of aphyric aphanitic to phaneritic basalt and interbasaltic sediments. It is divided into five basaltic subunits (Bi) and four sedimentary subunits (Si) and has a total cored thickness of 58.94 m (Figure F4). Each subunit is progressively numbered downhole (i.e., B1, S1, B2, S2, B3, S3, B4, S4, and B5; Table T3; Figure F2).
3.4.1. Petrology: igneous subunits
3.4.1.1. Macroscopic observations
The top basaltic subunit (B1; interval 396-U1573A-10R-4, 37 cm, to 10R-5, 23 cm) is a highly vesicular discrete lava flow overlying an ash bed and sediments (Subunit S1) (Figure F4). The lava flow is sparsely augite-plagioclase phyric. Xenocrysts of olivine (millimeter scale) are also observed (Figure F5A). Downhole, the recovered successions consist of gray to dark gray aphyric aphanitic to phaneritic basalt. The basaltic rocks range from non- to highly vesicular. Vesicles are filled nearly entirely by green clay minerals and zeolite, white carbonate, and gypsum and to a lesser extent pyrite.
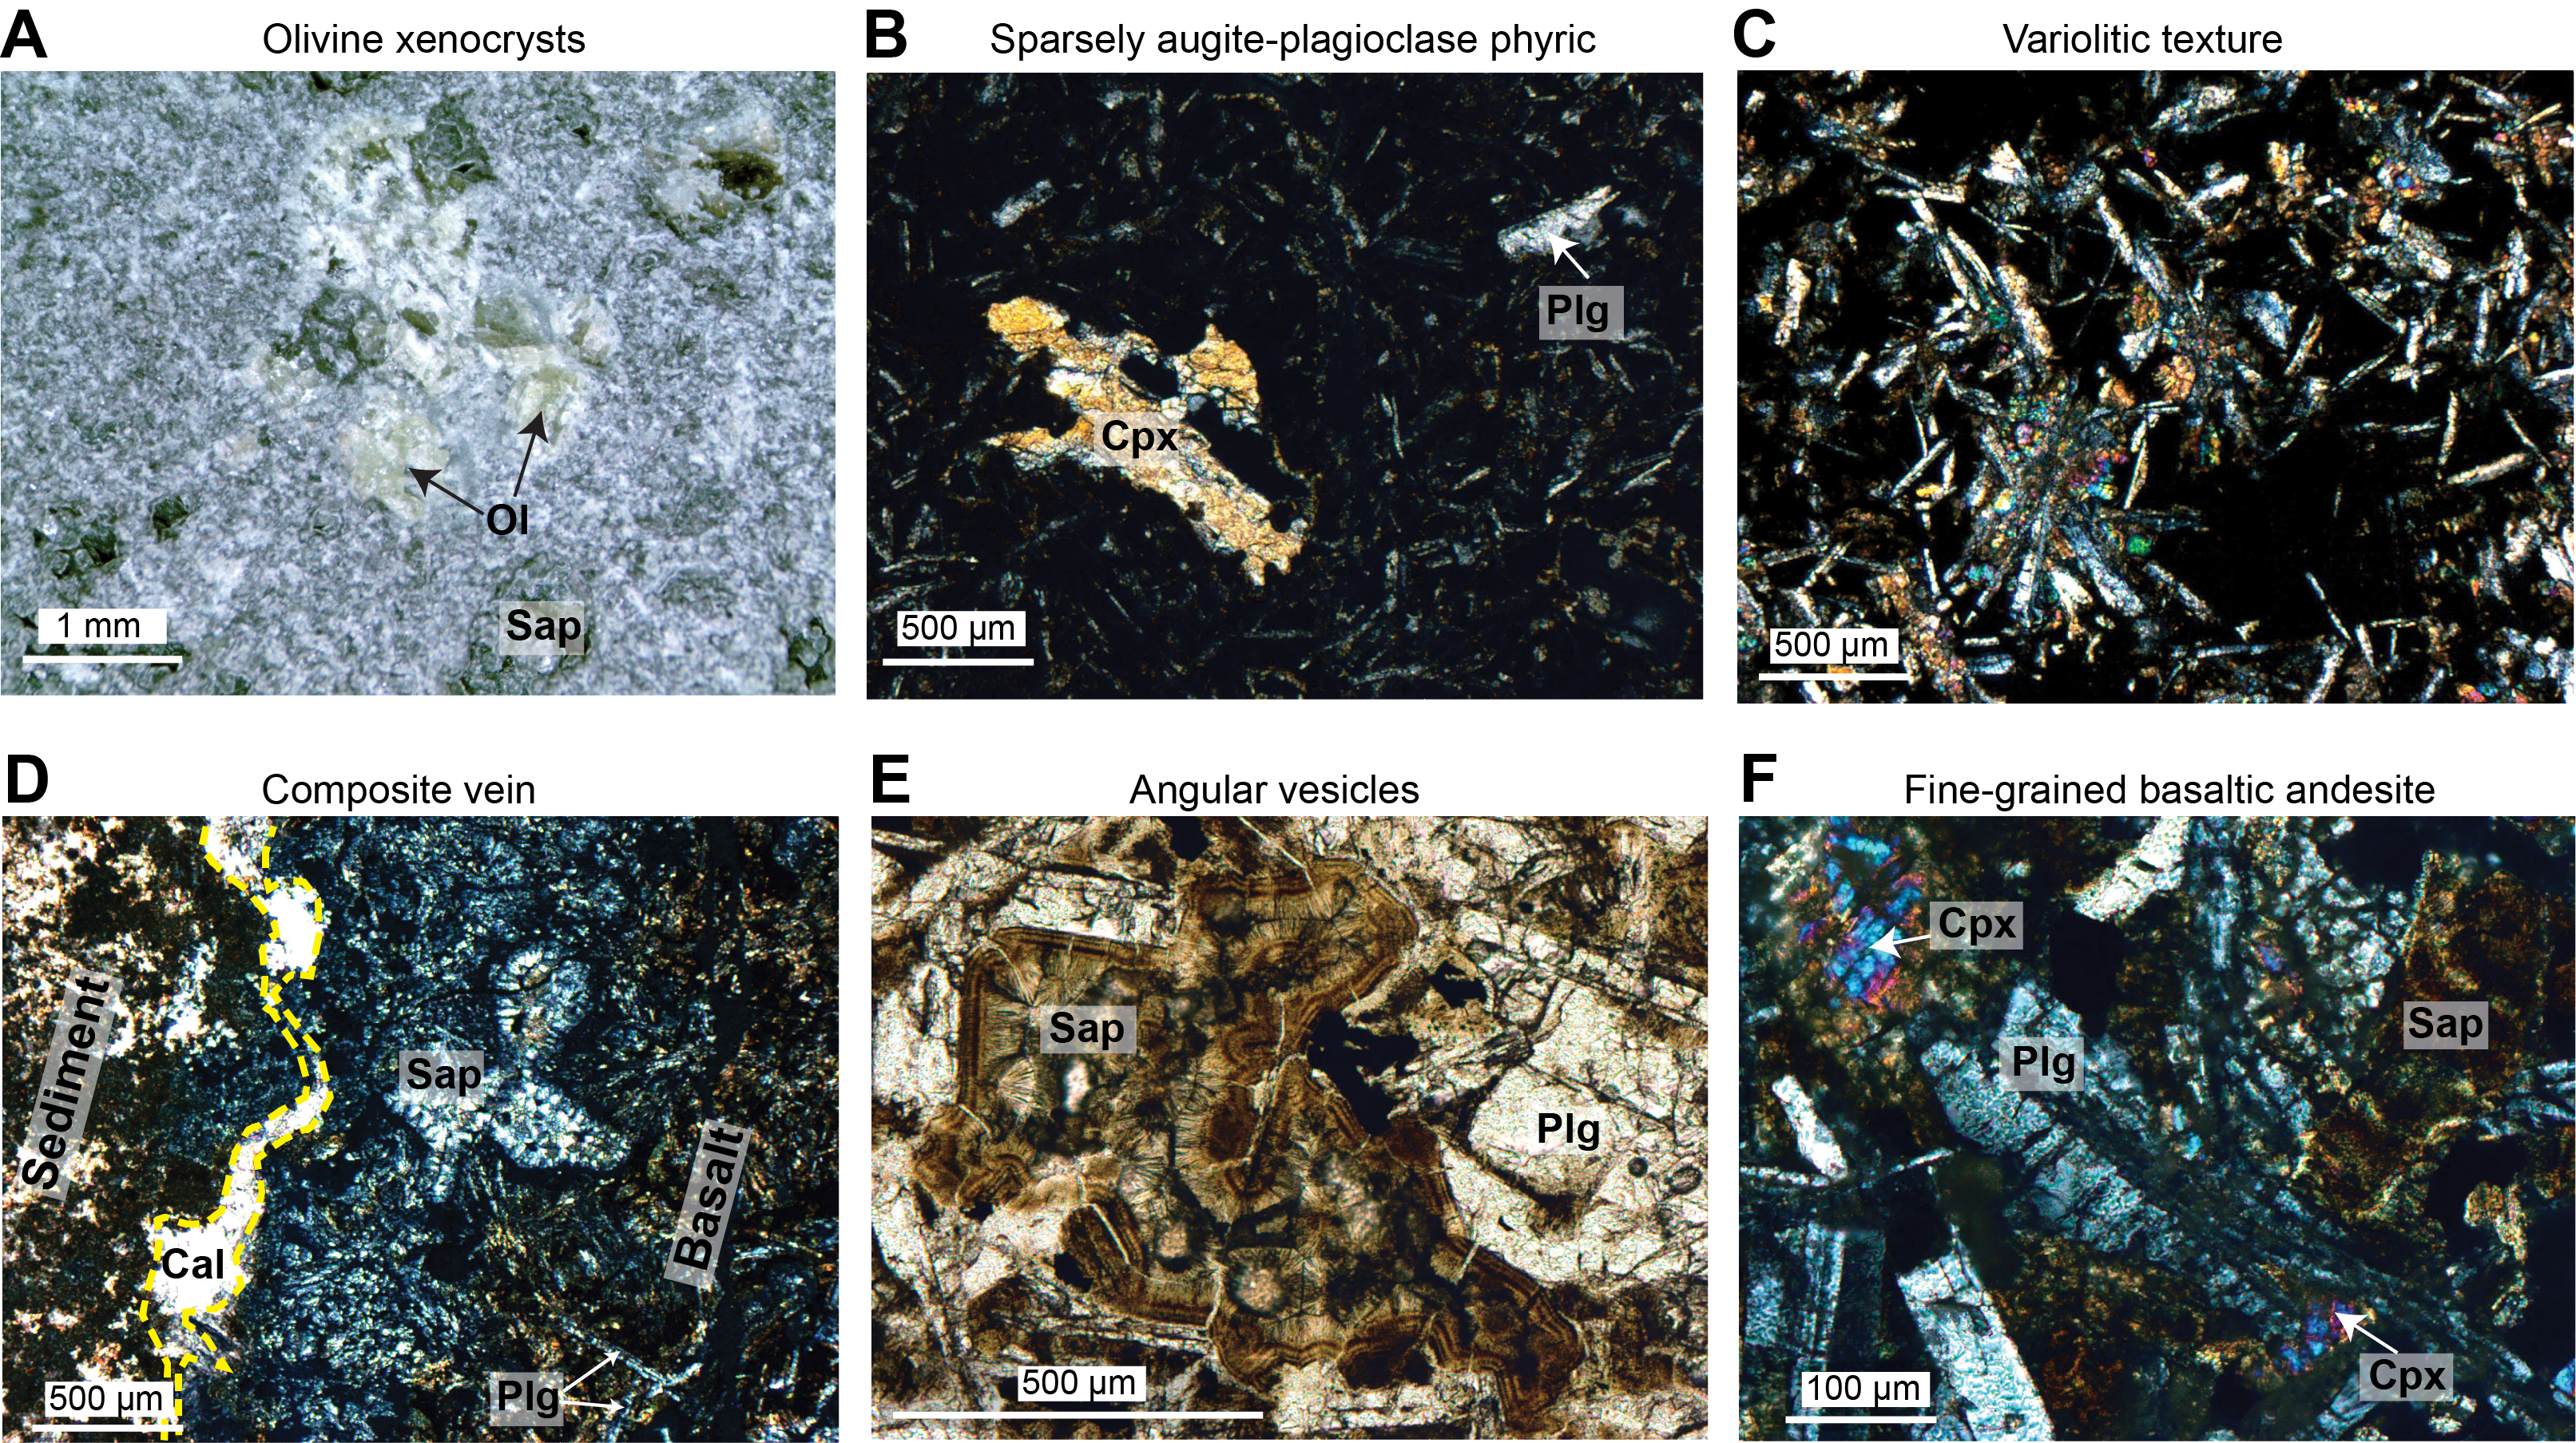
Figure F5. Unit IV basaltic sequence mineralogy and texture.
Core 396-U1573A-14R is dominated by a basaltic andesite single lava flow distinguished by its dark greenish gray color and the presence of chilled margins at the top and bottom.
Discrete lava flows are observed, as in Core 396-U1573A-17R, which contains key identifying characteristics including, from top to bottom (Figure F6), (1) aphanitic basalt that may correspond to a chilled margin, (2) highly vesicular phaneritic basalt, (3) non- to sparsely vesicular phaneritic basalt at the core transitioning, and (4) pipe to segregation vesicles at the base. No unambiguous pillow margin has been identified in the igneous unit; the volume and repetition of vesicles are consistent with emplacement of subaqueous sheet flows. The basalt shows a slight to moderate degree of alteration, as suggested by the appearance of plagioclase and pyroxene crystals in the groundmass.
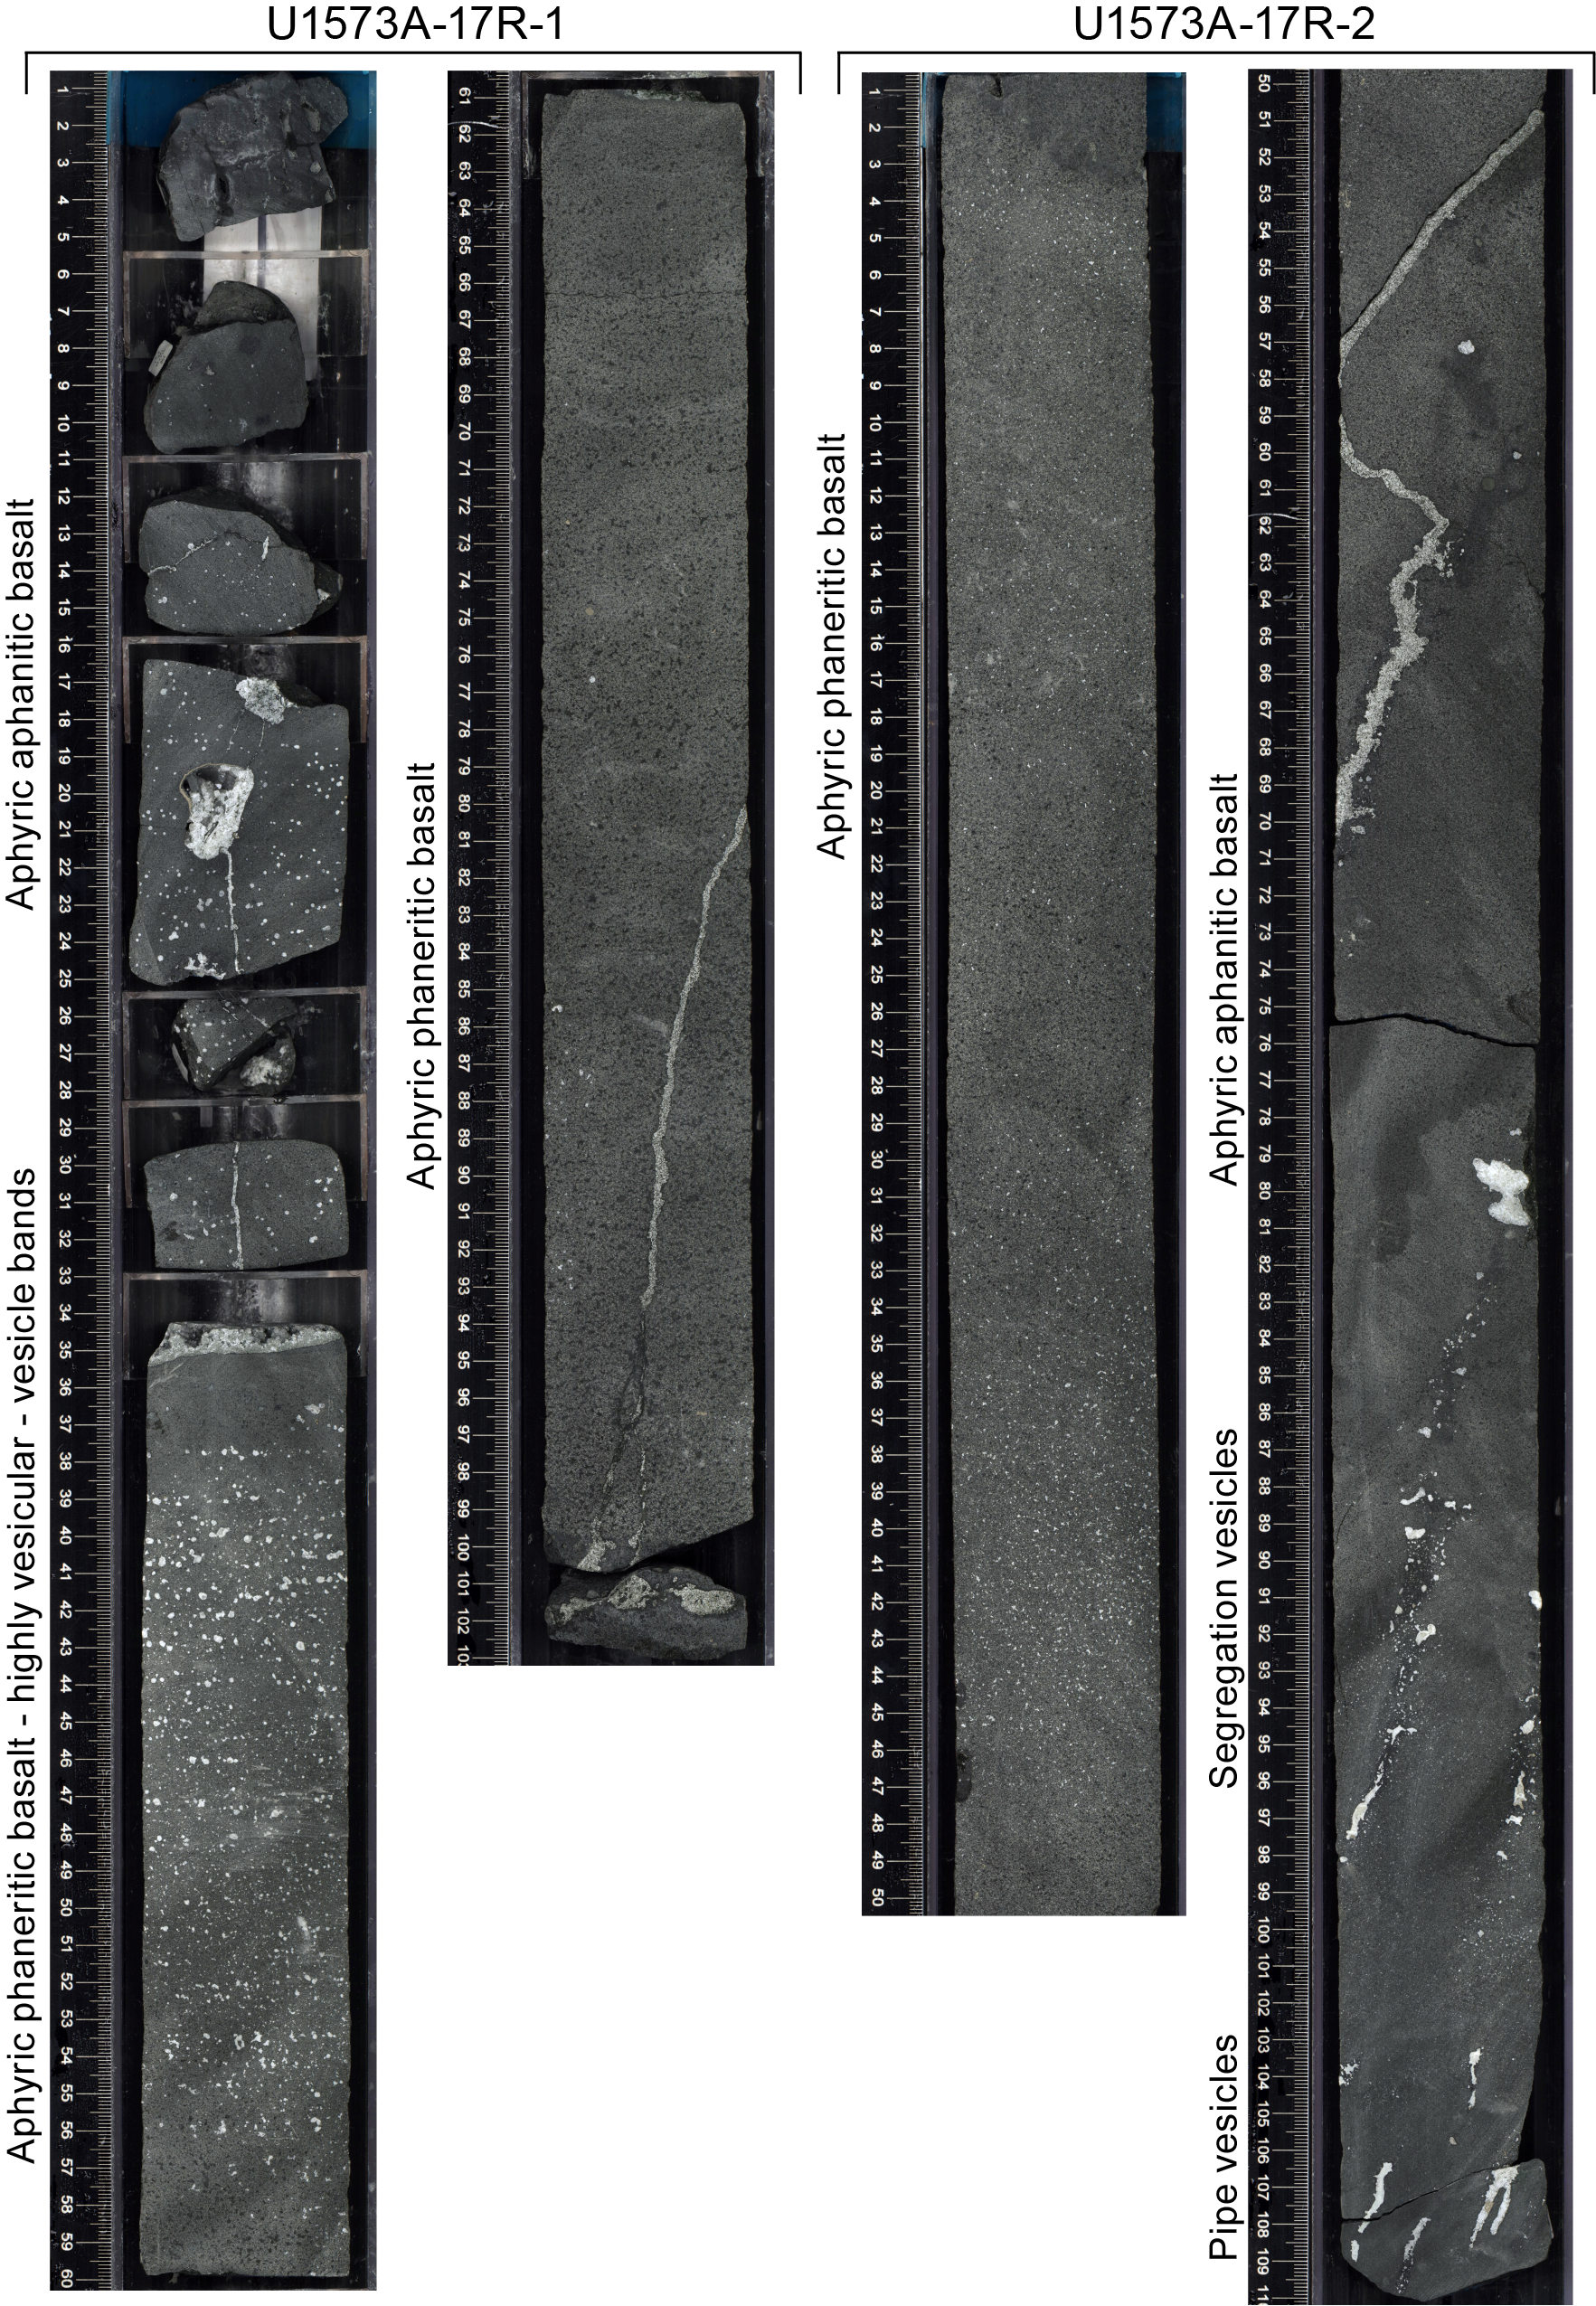
Figure F6. Change of vesicularity in a single lava flow.
Different types of veins are observed in the basalt (Figure F7). Section 396-U1573A-13R-4 is characterized by the occurrence of centimeter-wide subvertical veins. Thin section observations suggest that these veins likely consist of silica and carbonate, and they are interpreted as possible sedimentary dikes within the basalt (Figure F4). A succession of carbonate veins with branched connectivity occurs in Section 13R-3. Downhole, in Core 16R, centimeter-wide polycrystalline subvertical veins composed of carbonate, gypsum, and pyrite are observed.
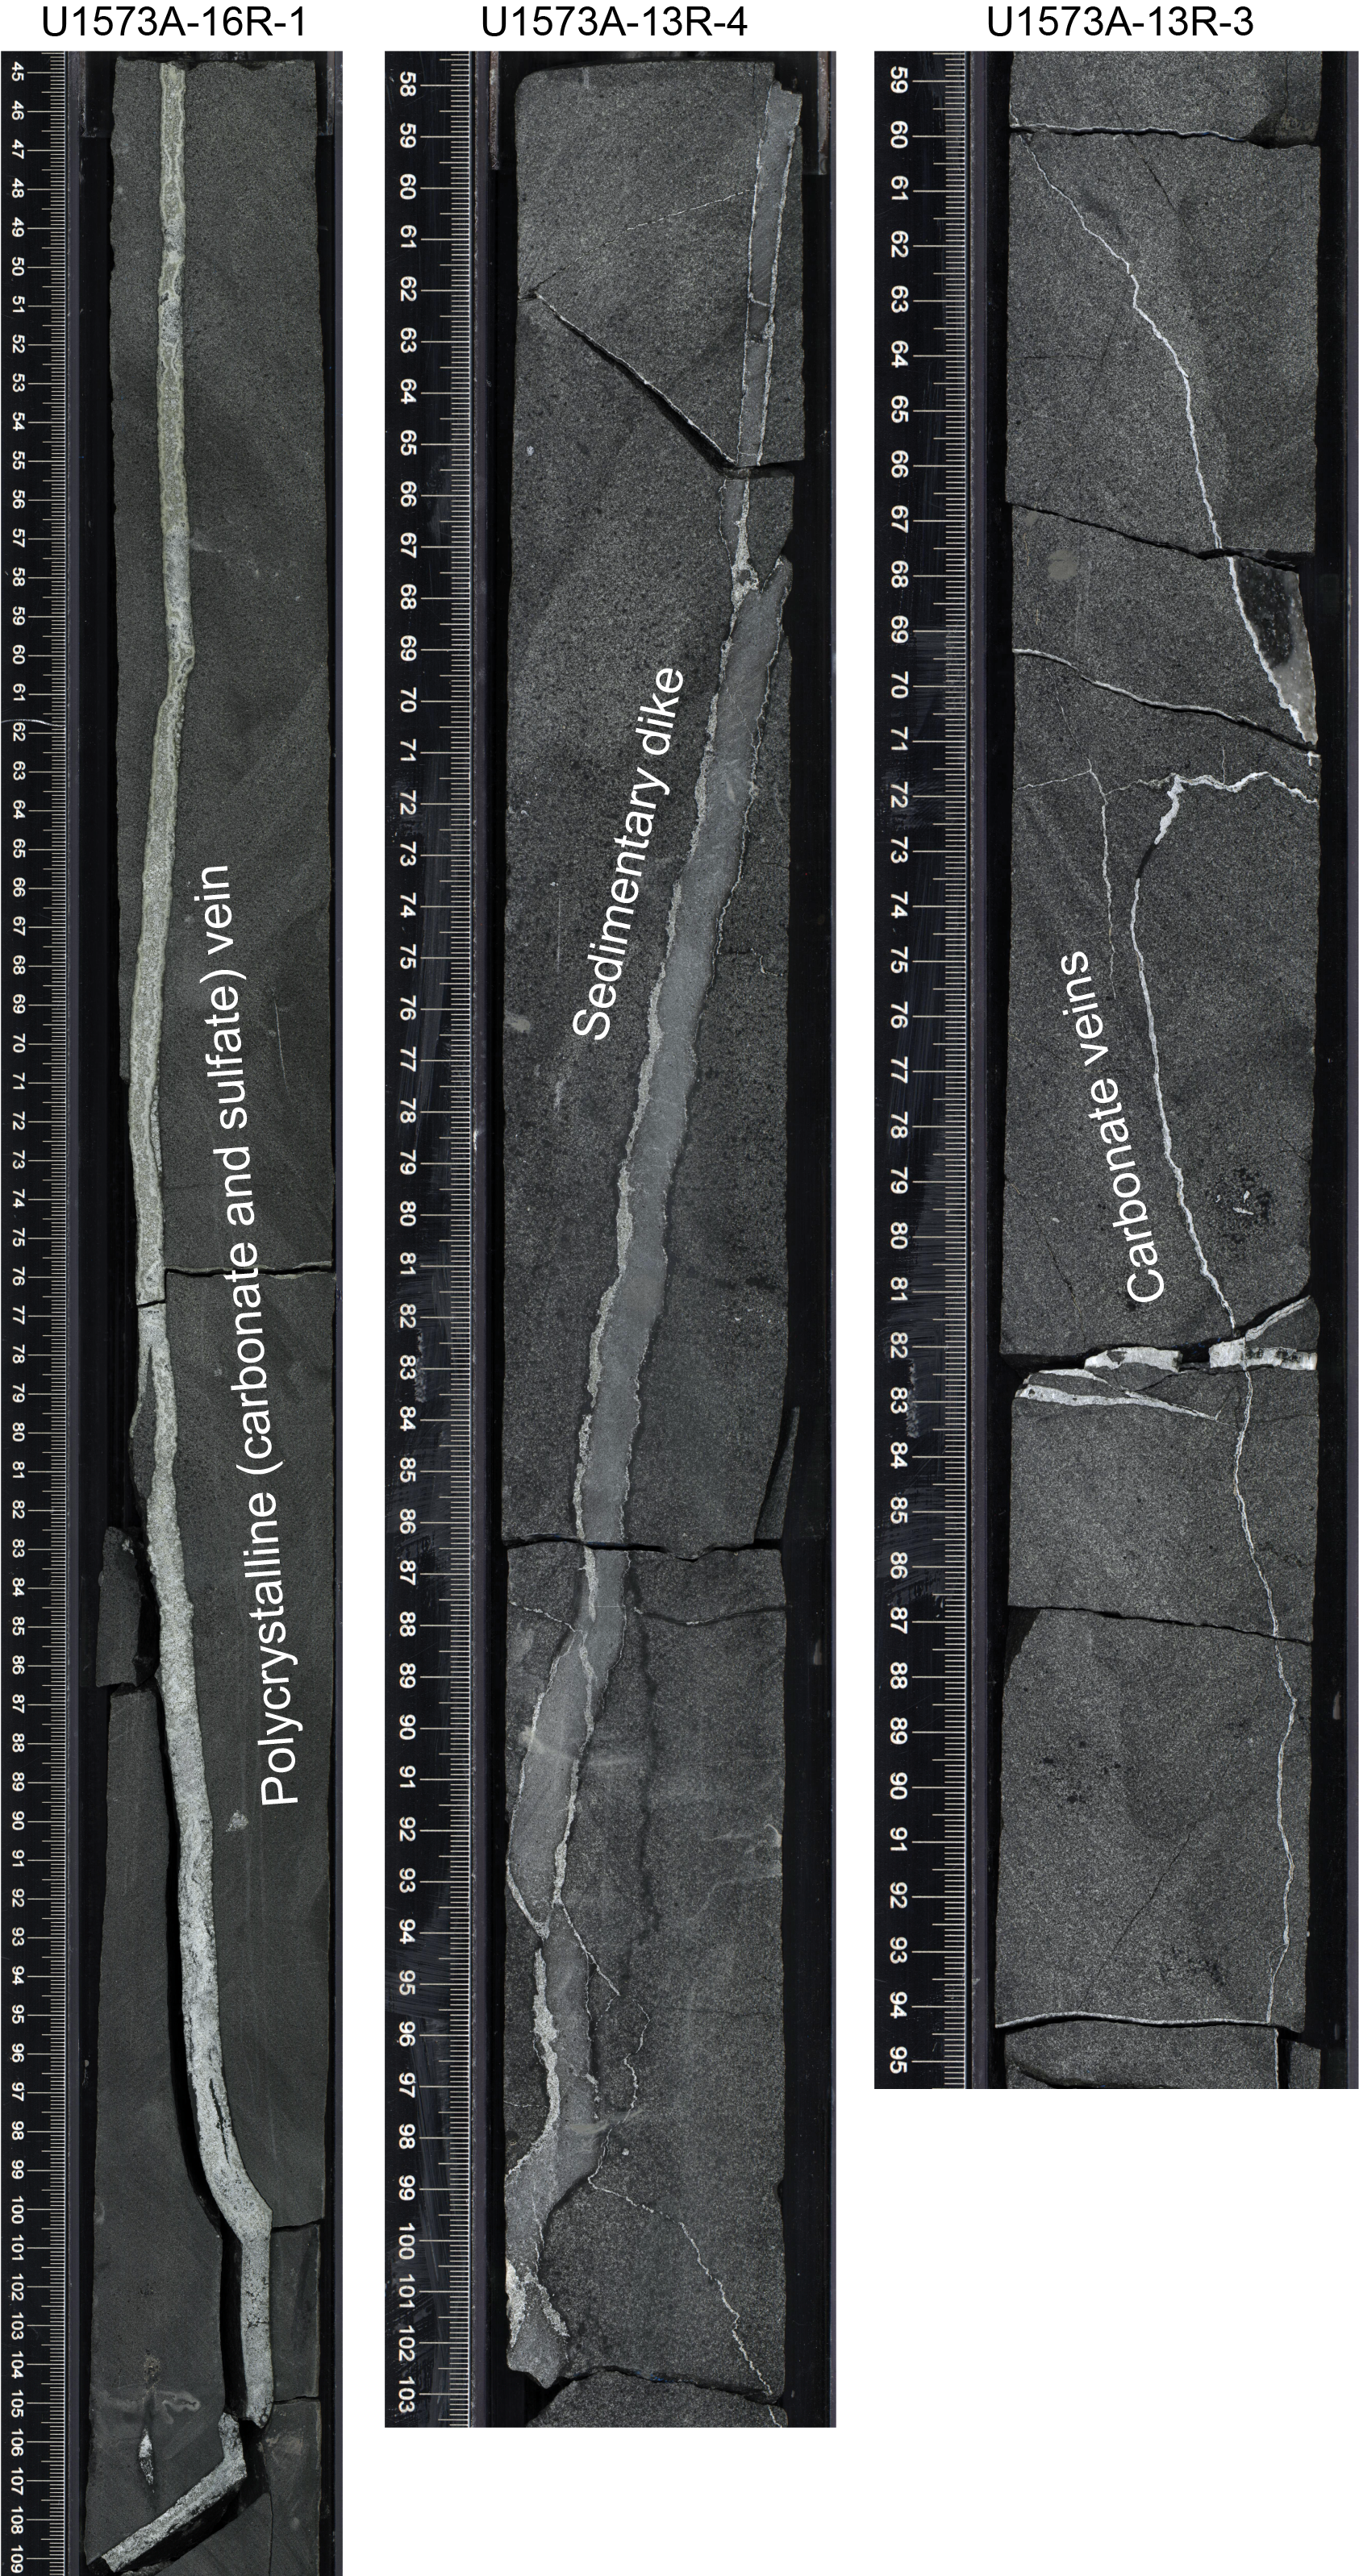
Figure F7. Types of veins encountered in Unit IV.
3.4.1.2. Microscopic observations
The sparsely augite-plagioclase basalt is characterized by anhedral fragmented clinopyroxene and subhedral plagioclase microphenocrysts in a cryptocrystalline matrix (Figure F5B). The phaneritic basalt is mostly composed of subhedral plagioclase and anhedral, highly fractured, clinopyroxenes. Basalts in contact with the sediment veins show variolitic texture (i.e., radial arrangement of the plagioclase and clinopyroxene microliths; Figure F5C, F5D), indicating a rapid cooling of the flow. The andesite lava flow (interval 396-U1573A-14R-1, 4 cm, to 14R-2, 91 cm) is characterized by a larger proportion of plagioclase relative to clinopyroxene, larger grain size, and very angular vesicles filled with saponite (Figure F5E, F5F).
3.4.1.3. Geochemical observations
Unit IV is characterized by low Ni content (<90 ppm) and a low Ni*1000/Mg ratio (<2). Three main basaltic sequences can be distinguished from the chemical stratigraphy (Figure F8). The top sequence (Subunit B1) shows a distinct composition, including high TiO2 (>1.7 wt%) and Zr (>100 ppm), in comparison to the rest of the unit. The more differentiated nature of this lava flow also confirms that the observed olivine grains are xenocrysts. Downhole, despite the poor recovery and the microstructural variations (Figure F9), the unit is characterized by three relatively homogeneous basaltic sequences (Subunits B2–B4) to 432.34 m CSF-A (interval 396-U1573A-11R-1, 55 cm, to 17R-2, 110 cm) with high Mg# (as high as 77) and low Zr (<70 ppm) and TiO2 (<1.5 wt%). The last basaltic sequence (Subunit B5; from 435.96 m CSF-A to the bottom of the hole), shows Mg# and NiO progressively decreasing and TiO2, Zr, Sr, and Y progressively increasing downhole.
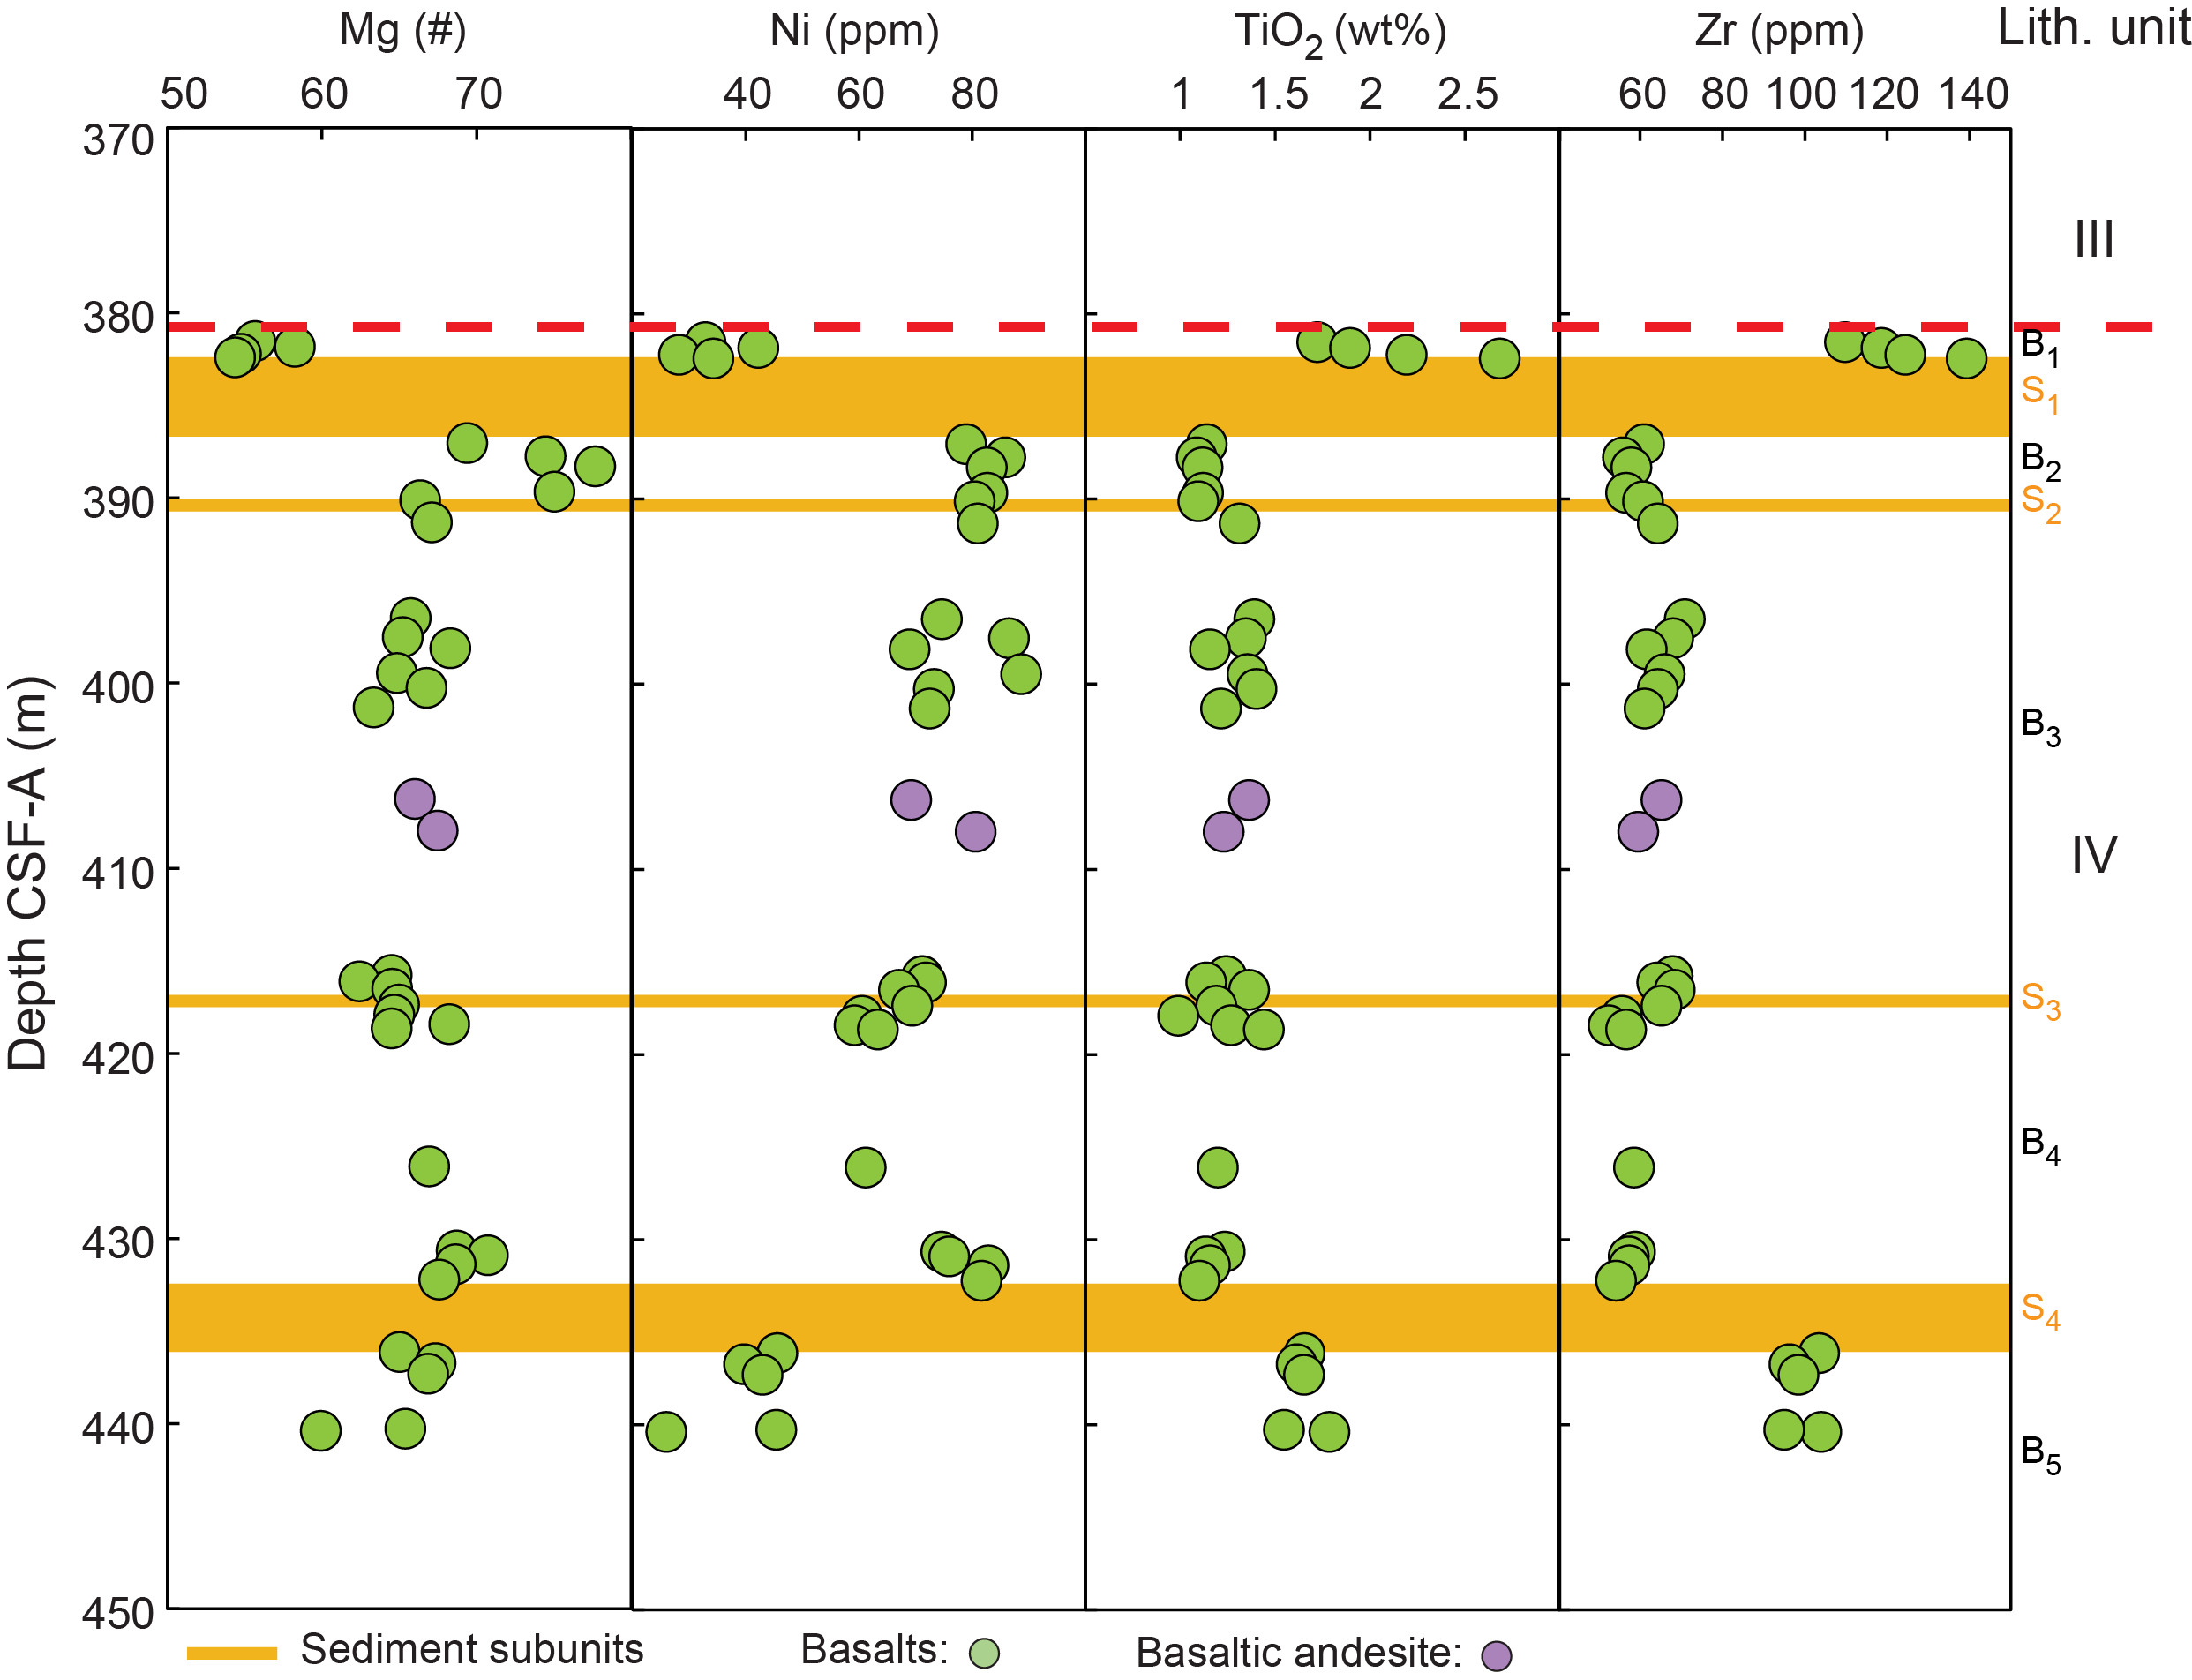
Figure F8. Unit IV chemical stratigraphy.
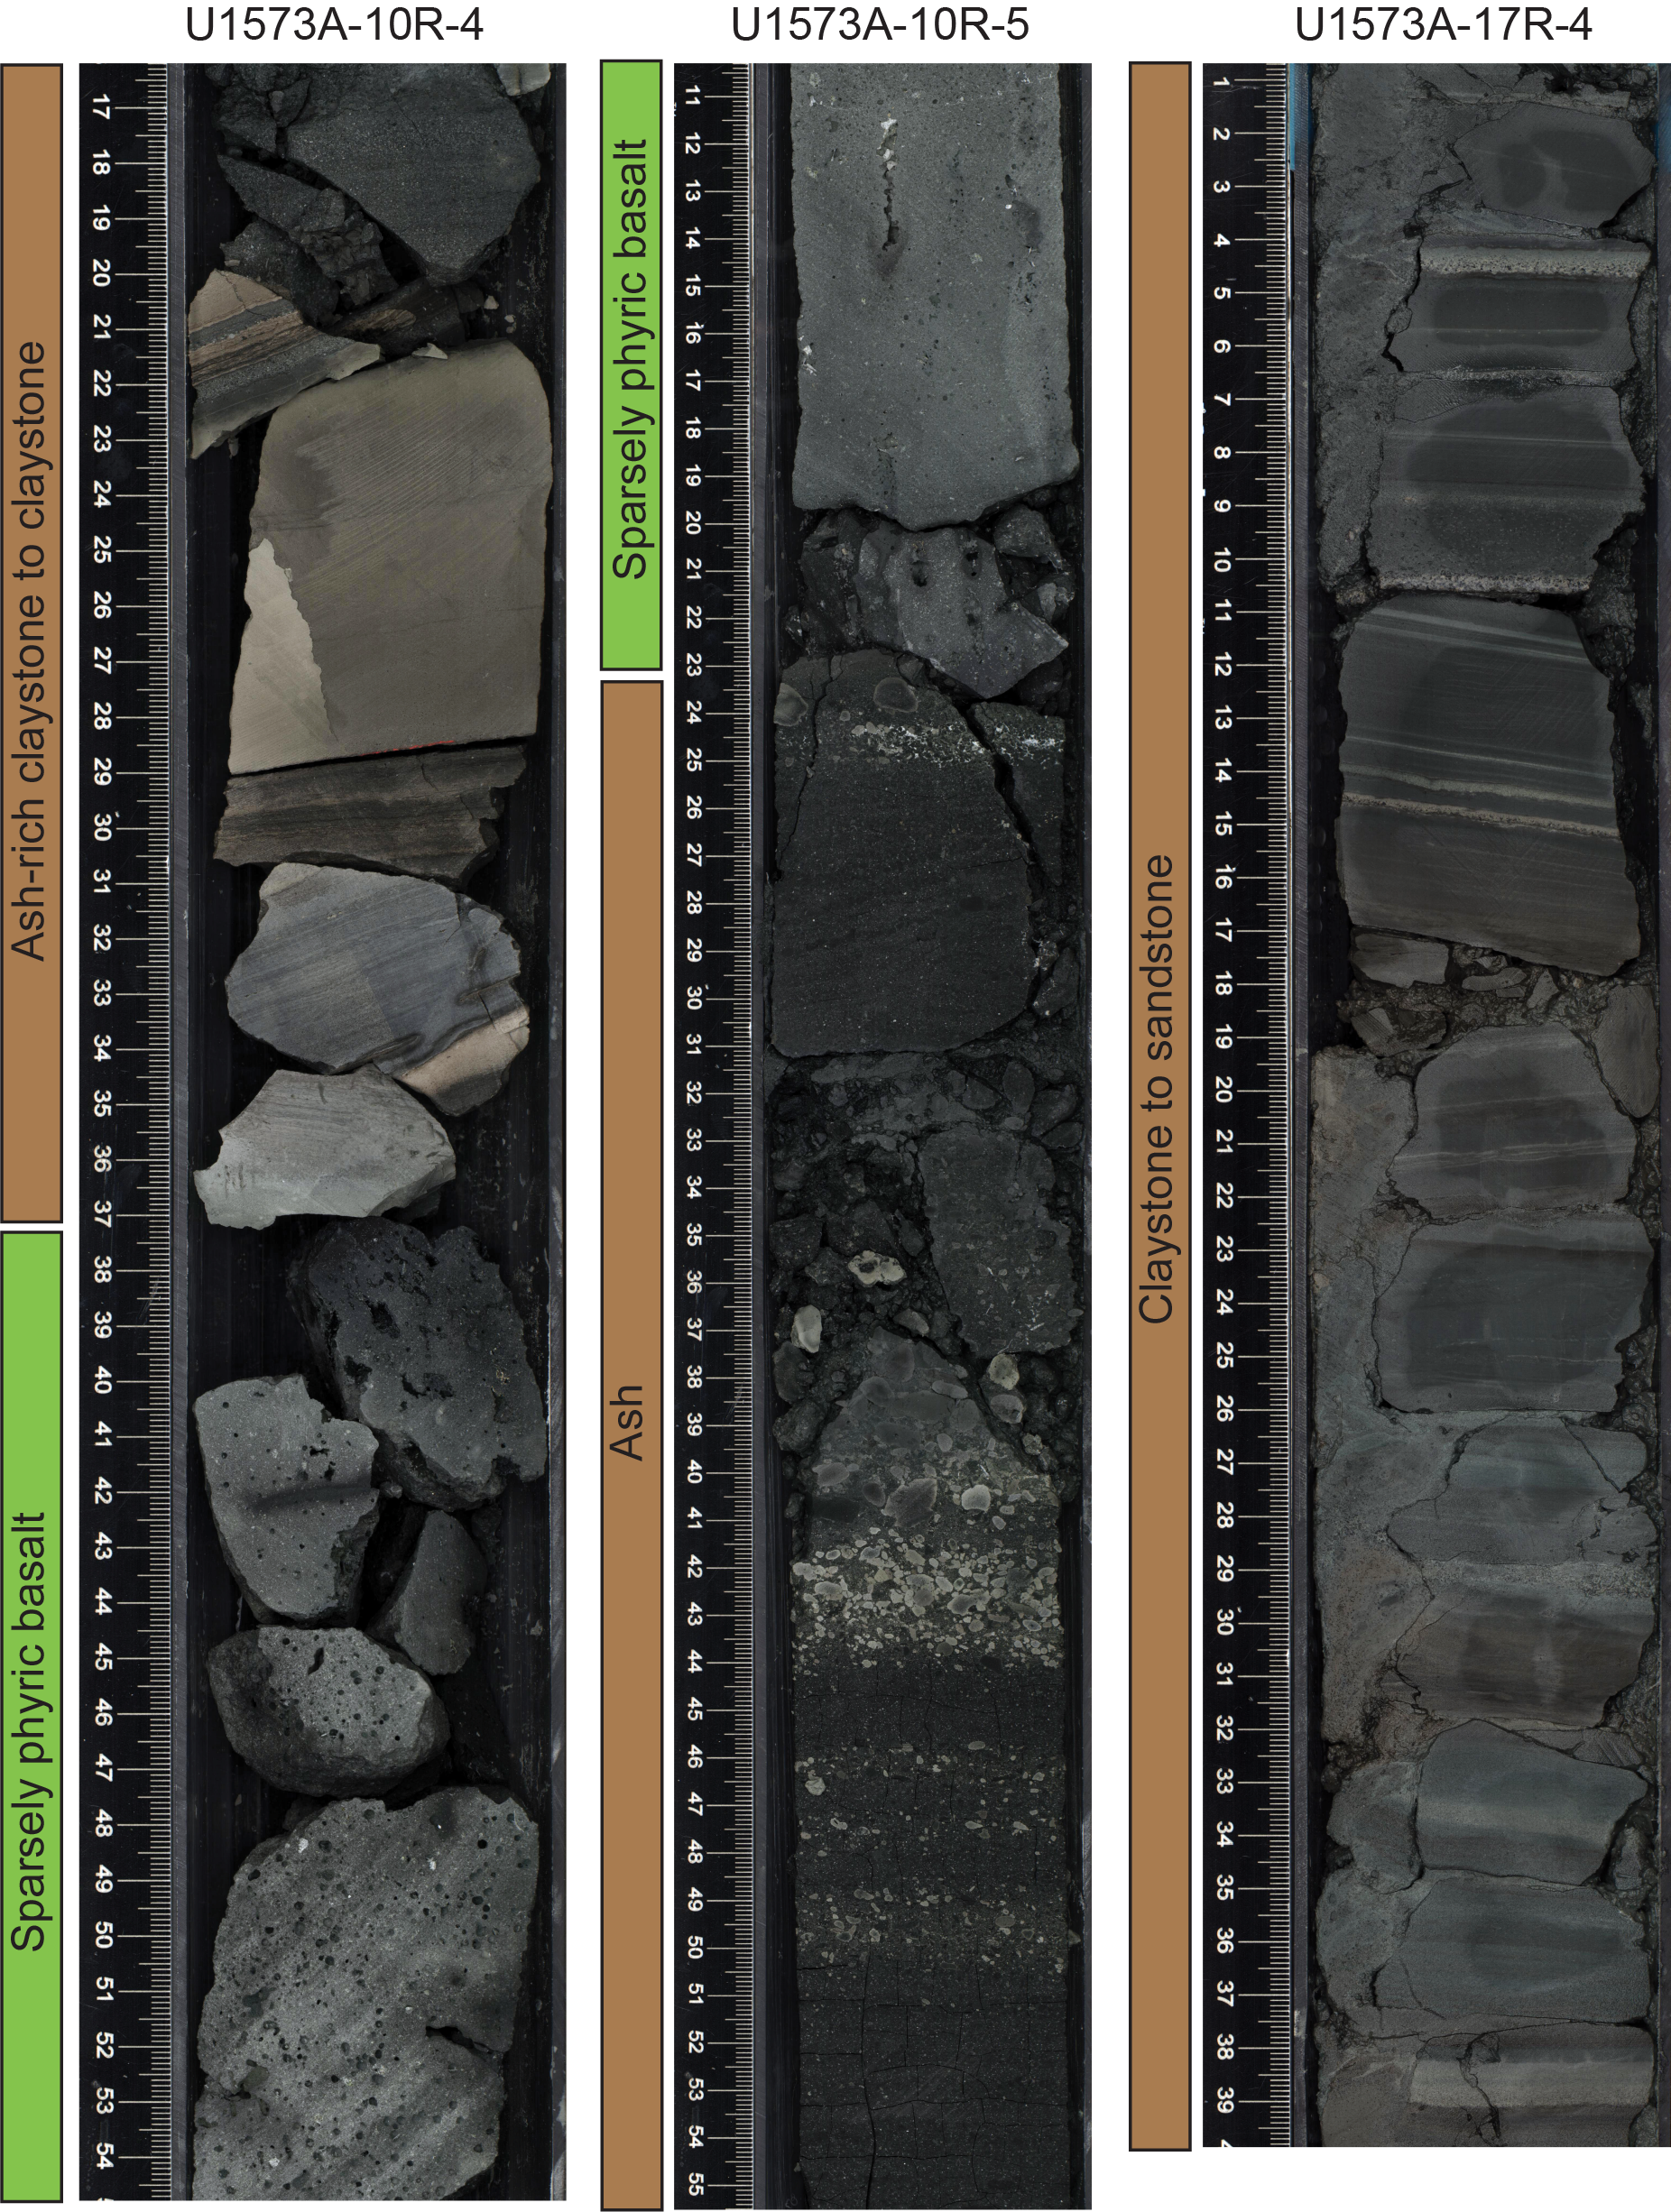
Figure F9. Unit IV interbasaltic sediments.
3.4.2. Interbasaltic sediments
Interbasaltic sediments consist primarily of claystone with intervals of strong parallel lamination (e.g., Section 396-U1573A-17R-4; Figure F9). Ashes and ash-rich volcaniclastic intervals are present in much of the uppermost interbasaltic sediments (e.g., Subunit S1 in Section 10R-5; Figure F9). Some intervals contain evidence of soft-sediment deformation and dewatering structures, although some laminations may also be disturbed through bioturbation, primarily intervals in Subunits S1 and S4. These sediments become coarser grained with depth, and Cores 17R–18R contain beds of sands and sandstone. Authigenic pyrite is present throughout much of the interbasaltic sediments. Small (<5 mm offset) normal faults are observed in Subunits S3 (interval 15R-1, 135–143 cm) and S4 (interval 17R-CC, 1–10 cm).
4. Biostratigraphy
Hole U1573A sediment was washed down to 300 mbsf before coring started. Little calcareous or siliceous biotic remains occur in the sediments recovered. All biostratigraphic information comes from palynology. All sedimentary core catcher samples and selected samples from intercalated sedimentary beds in the igneous facies from Hole U1573A were processed for palynology, a total of 12 samples. The samples were assigned a late Early Eocene age (Subzone E3b of Bujak and Mudge, 1994) based on dinocyst marker species. A summary of microfossil abundances in Hole U1573A is given in Table T4.
4.1. Siliceous microfossils
Smear slides and processed samples from Hole U1573A are almost entirely devoid of siliceous microfossils throughout, with the exception of rare pyritized debris in the lowermost recovered cores.
4.2. Palynology
All sedimentary core catcher samples and selected samples from intercalated sedimentary beds in the igneous facies from Hole U1573A were processed for palynology, for a total of 12 samples (Table T5). These were processed using the standard hydrofluoric acid (HF) technique (see Biostratigraphy in the Expedition 396 methods chapter [Planke et al., 2023a]). Most samples, including some from between the igneous facies, yielded age diagnostic dinocysts, which overall indicate a late Early Eocene age for the entire interval (Table T4). Only semiquantitative analyses were conducted in light of the highly variable yield and processing results.
The uppermost core catcher sample (396-U1573A-2R-CC) yielded substantial amounts of remains of the freshwater fern Azolla (massulae and glochidia), accompanied by chronostratigraphic index taxa such as Eatonicysta ursulae and Diphyes ficusoides, implying a latest Early Eocene to earliest Middle Eocene age (approximately middle Chron C21r to middle C22n; cf. Eldrett et al., 2004) for this sample. Remains of Azolla are not found in abundance farther down the record, but dinocyst index species are present throughout. For example, we can rely on the occurrence of Charlesdowniea columna in Sample 3R-CC (first occurrence [FO] = ~51.4 Ma), Charlesdowniea clathrata in Sample 9R-CC (FO = ~49.8 Ma), and D. ficusoides in Samples 2R-CC, 3R-CC, and 9R-CC (FO = ~49.5 Ma) and the continuous presence of E. ursulae (average FO = 53.3 Ma; Bijl, 2022) above the igneous facies encountered in Sample 10R-CC (Samples 2R-CC to 9R-CC).
Sedimentary layers in the igneous sequence (Samples 396-U1573A-10R-CC, 17R-CC, 19R-CC, and 11R-1, 0–16 cm) are variably productive. Two samples are virtually barren, but Samples 10R-CC and 17R-CC yielded a fairly rich dinocyst assemblage. Although there are a few notable exceptions, these assemblages differ only slightly from those found above the igneous facies. The main difference with the overlying strata is that the lowermost productive sample (17R-CC) yielded consistent Membranilarnacia (occasionally referred to as “Eatonicysta”) glabra and Membranilarnacia compressa, but not the morphologically related species E. ursulae. Still, we can tentatively place all analyzed samples within Subzone E3b of Bujak and Mudge (1994), possibly to Subzone E3a (Sample 17R-CC) given the distribution pattern of M. compressa and M. glabra. Although Sample 19R-CC contains an impoverished assemblage, E. ursulae is still found in this sample, and no obvious differences with the more productive Sample 17R-CC are apparent. We find no evidence for a break in the stratigraphy between the sedimentary interbeds in the igneous facies and the lowermost sedimentary strata nor in the sedimentary strata above Core 10R.
4.3. Environmental considerations and other remarks
Many palynomorphs appear to have been thermally altered to some degree. Extremely mature specimens are rare, however, and no obvious change is found between the levels above and in between the igneous facies. We surmise that the thermal alteration is predominantly the result of burial, perhaps in combination with a steep geothermal gradient.
Apart from the mass abundance of remains of the freshwater fern Azolla, also encountered at Sites U1571 and U1572, many nearby International Ocean Discovery Program (IODP) holes, and a wide range of industry wells in the area (Brinkhuis et al., 2006; Barke et al., 2011), we record the abundant presence of Senegalinium cf. laevigatum, which may have been endemic to the Arctic (Barke et al., 2011) around the same time. This species is not recorded at Sites U1571 and U1572, and we speculate that its appearance may be useful to assess whether an open connection to the Arctic existed at that time.
Farther down the succession, many of the palynological associations are dominated by terrestrial elements. Typical offshore, oceanic, dinocysts are rare throughout the cored succession.
4.4. Planktonic foraminifers
Samples 396-U1573A-2R-CC, 3R-CC, and 4R-CC were analyzed for planktonic foraminifers. Benthic foraminifers are noted in Sample 4R-CC. All other samples are barren. Sample 2R-CC has abundant pyrite. No mudline was taken because drilling took place following washing down to 300 mbsf.
4.5. Calcareous nannofossils
Smear slides prepared for diatom analysis were examined for biogenic calcite. One sample (396-U1573A-9R-CC), just overlying volcanic rocks, contains few nannofossils.
4.6. Ostracods
Ostracods were absent from all the samples analyzed for foraminifers.
4.7. Summary
All sedimentary core catcher samples and selected samples from intercalated sedimentary beds in the igneous facies from Hole U1573A were processed. Calcareous and siliceous biogenic material was largely absent. Most samples were productive for palynology, however, including some from between the igneous facies, and most yielded age diagnostic dinocysts, which overall indicate a late Early Eocene age (Subzone E3b of Bujak and Mudge, 1994) for the entire interval (Table T4). Preliminary data from paleomagnetic analyses suggest a predominance of normal polarity at the top of the cored succession, which we can tentatively assign to Magnetochron C22n (48.57–49.34 Ma).
5. Paleomagnetism
5.1. Shipboard measurements
Shipboard paleomagnetic investigations combined two complementary approaches (see Paleomagnetism in the Expedition 396 methods chapter [Planke et al., 2023a]): (1) measurement and in-line alternating field (AF) demagnetization of archive-half sections on the pass-through 2G Enterprises superconducting rock magnetometer (SRM) at a 2.5 cm spacing and (2) measurement and AF demagnetization of 13 oriented discrete samples on the AGICO spinner magnetometer (JR-6A). A total of seven of these discrete samples were measured for anisotropy of magnetic susceptibility (AMS) using the AGICO KLY 4S Kappabridge.
We used the directional and intensity data of archive halves (measured at 20 mT) to determine magnetic polarity. AF demagnetization steps were 5, 10, 15, and 20 mT for sediments and 2, 4, 6, 8, 10, 15, and 20 mT for igneous rocks. The variations of magnetic parameters toward the ends of sections and the ends of pieces are a measurement artifact. We use the I20mT/natural remanent magnetization (NRM) ratio as a crude proxy for magnetic coercivity.
Directional and intensity data from discrete samples were used to validate the polarities inferred from section measurements. Directional data were analyzed using Zijderveld diagrams (Zijderveld, 2013). Characteristic remanent magnetization (ChRM) direction(s) were determined using the Remasoft 3.0 software (Chadima and Hrouda, 2006).
5.2. Demagnetization behavior
The synthesis of SRM paleomagnetic data on sections is shown in Figure F10.
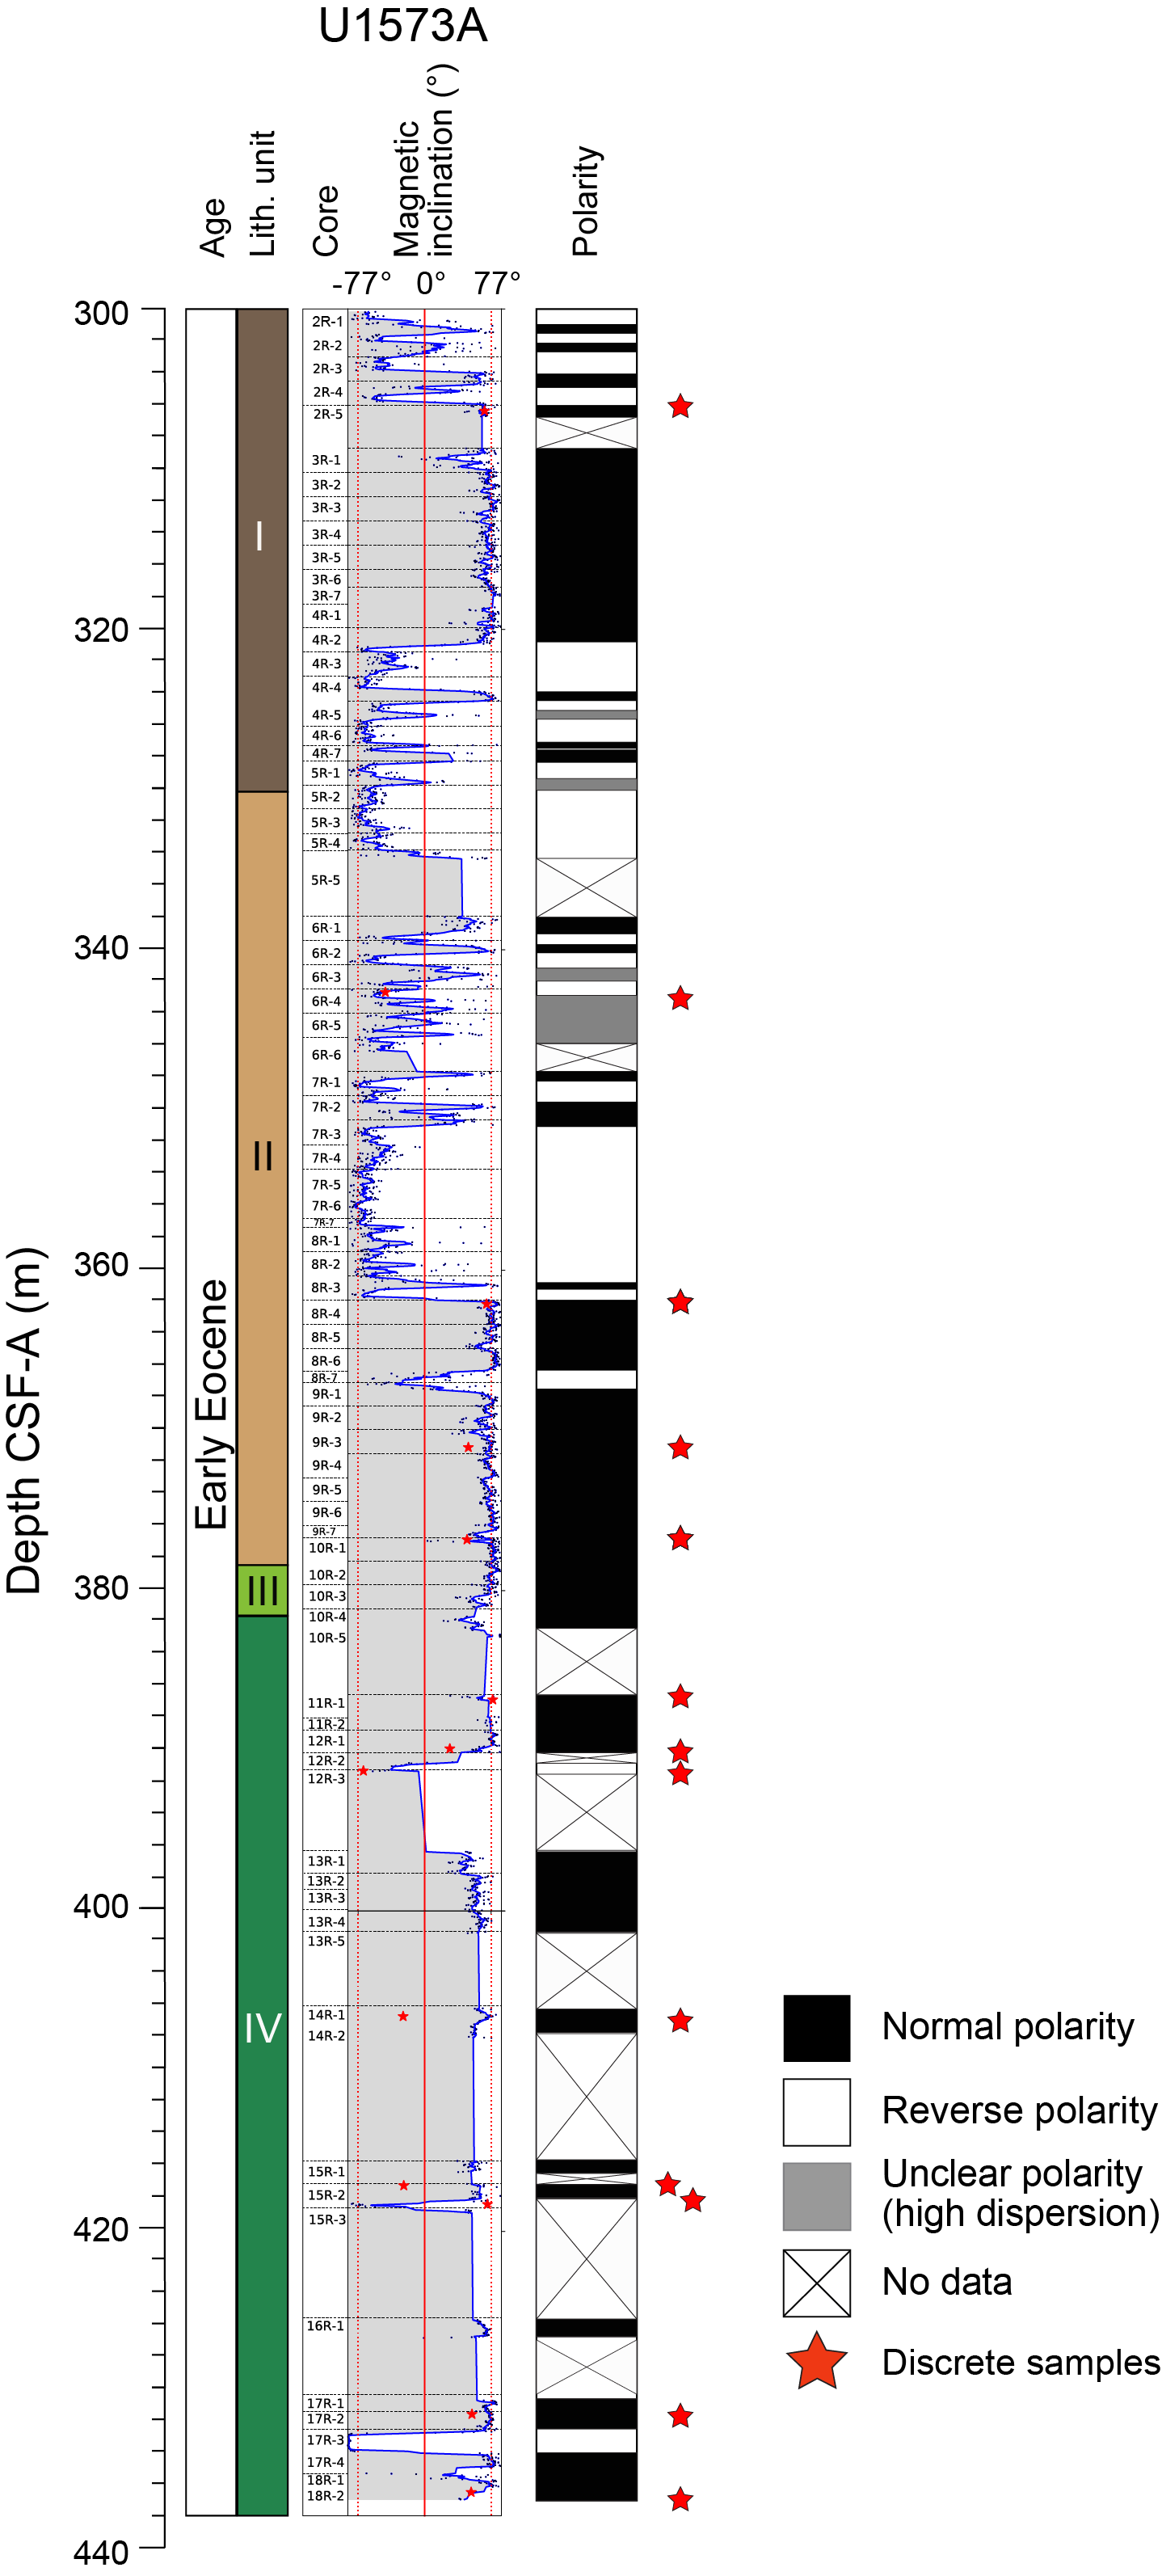
Figure F10. Litho- and magnetostratigraphy.
Lithostratigraphic Unit I is primarily mudstone with clay-rich sandstone and shows mostly reverse polarity in the upper 6 m (Core 396-U1573A-2R; 306.01 m CSF-A). For the next 15 m (Core 4R; 321.01 m CSF-A), the polarity is dominantly normal. Polarity then remains reverse to the end of Unit I (Core 5R; 330.59 m CSF-A). This unit has an average intensity of magnetization of 0.05 A/m and median coercivity of 2.73. This high coercivity may be attributable to sedimentary hematite or goethite. An unstable remanent magnetization was presented by the unique discrete sample (2R-5, 35–37 cm) measured for this unit.
Lithostratigraphic Unit II is primarily mudstone with ash beds and shows short alternating episodes of normal and reverse magnetic polarity to 361.68 m CSF-A (Core 396-U1573A-8R). Farther downhole, to the bottom of the unit (Core 10R; 378.47 m CSF-A), the magnetic polarity is mostly normal. Unit II has an average intensity of magnetization of 0.05 A/m. The coercivity increase with depth (Figure F11) suggests an important change in the magnetic assemblage that may reflect a climatic change. The median coercivity (3.04) is higher than in Unit I, perhaps because of a higher goethite/hematite ratio and/or larger iron sulfide (e.g., pyrrhotite) population in the ash. Multiple minerals carrying magnetic remanence are evident from the three types of remanent magnetization identified in four discrete samples. The low-coercivity component, observed in all four samples, is erased by an AF of 20 mT. This component may be due to viscous or weathering-related chemical remanent magnetization. The medium coercivity component (Samples 6R-4, 22–24 cm; 8R-4, 24–26 cm; and 10R-1, 12–14 cm) is stable up to a 70 mT field. The high-coercivity component (Sample 9R-3, 111–113 cm) is stable throughout the demagnetization process (i.e., in a 120 mT field). The high-coercivity component may represent the original magnetization attained during the formation of the rocks.
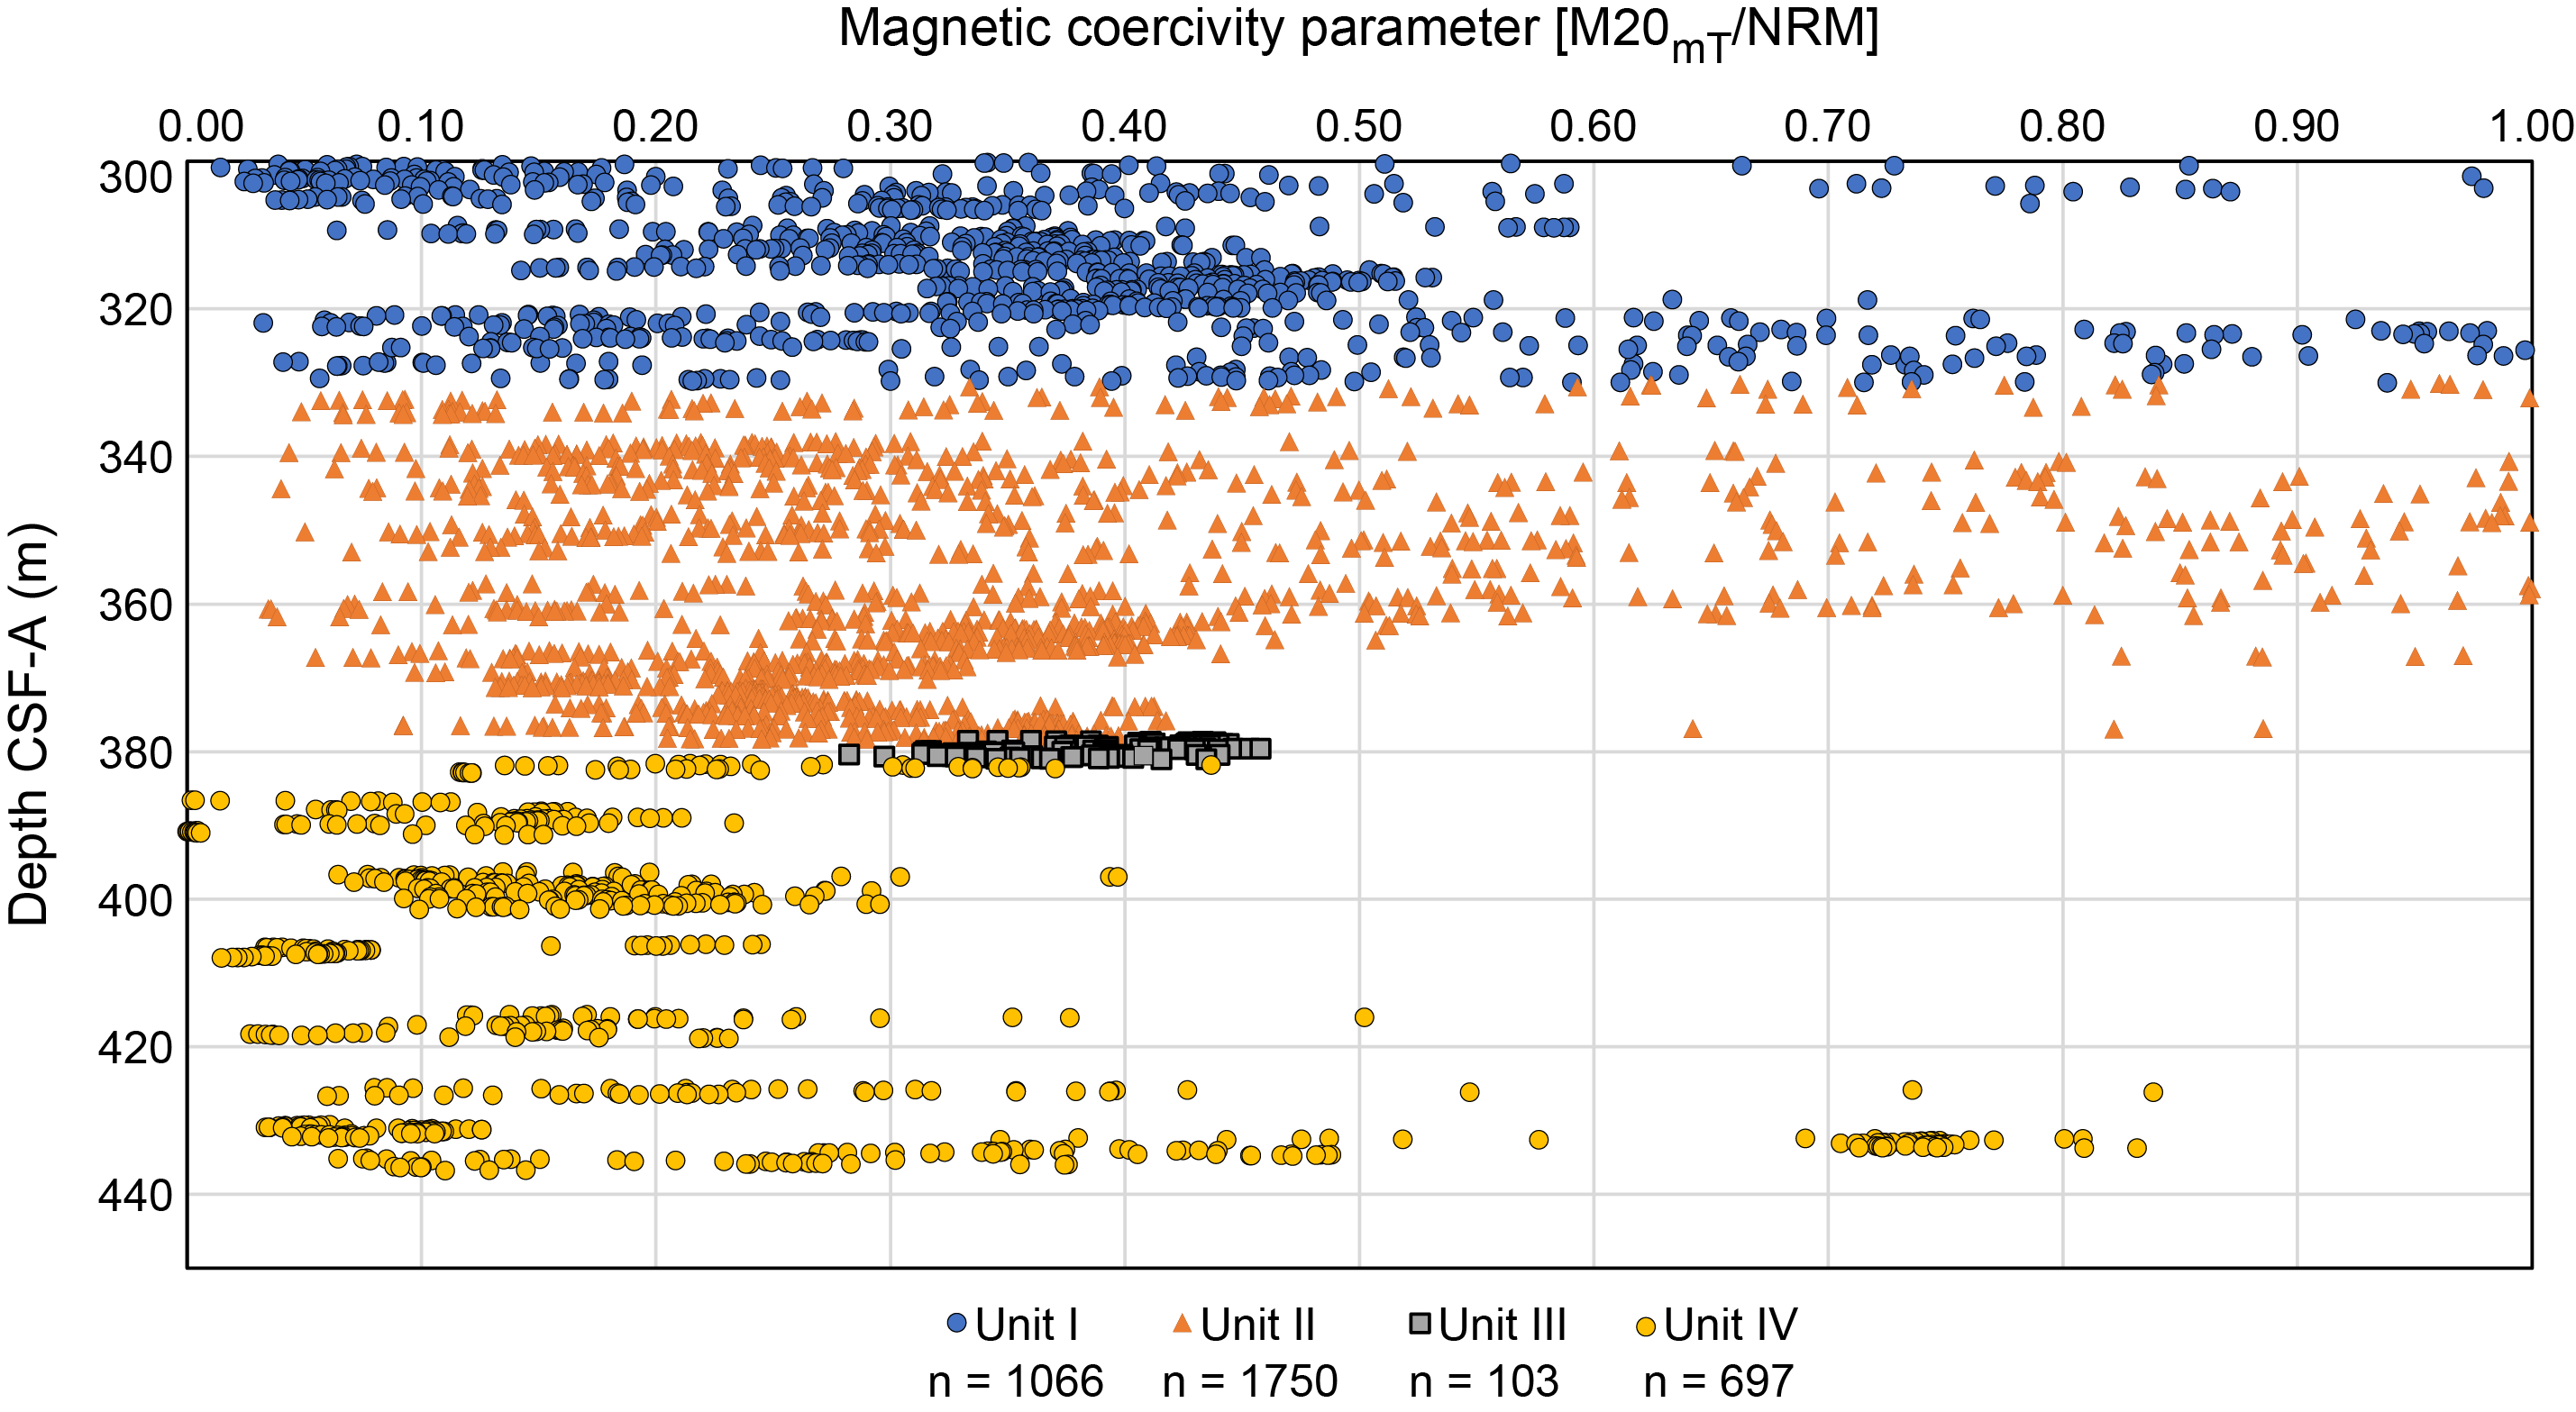
Figure F11. Unit I–IV magnetic coercivity parameters.
Lithostratigraphic Unit III is primarily volcaniclastic mudstone and has a normal polarity. This unit has an average magnetization intensity of ~0.07 A/m, which is slightly higher than the average for Units I and II. In contrast, the coercivity is lower than in Units I and II. The lower coercivity can be related to a greater proportion of volcanic material, which tends to be richer in iron sulfide (e.g., pyrrhotite) but poorer in goethite and hematite. Note that goethite and hematite have higher magnetic coercivity than iron sulfide. No discrete samples were measured.
Lithostratigraphic Unit IV is dominantly basalt with interbedded mudstone and sand. It shows normal polarity. Noteworthy are the high average magnetization intensity (2.6 A/m) and median coercivity (6.02). Such high coercivities may be due to a larger goethite/hematite ratio. Unit IV shows the highest bulk magnetic susceptibility (κ), most likely due to the high abundance of magnetite. However, the corrected degree of anisotropy (P′) is the lowest among all the units. This indicates that the magnetic fabrics are dominated by magnetite, whereas pyrrhotite and hematite are minor contributors. Three magnetization components are conspicuous from the demagnetization behavior of the discrete samples. The weaker component is removed by an applied field of 20 mT. This component may correspond to a viscous remanent magnetization. The medium component is stable in a field up to 70 mT, and the high-coercivity component is stable in an applied field of 120 mT. This remanent magnetization component may be due to magnetite and hematite.
5.3. Anisotropy of magnetic susceptibility
In Lithostratigraphic Unit I, the only discrete sample measured has an average κ (0.447 × 10⁻³ [SI]) in the ferromagnetic + paramagnetic range. The corrected degree of anisotropy is low (average P′ = 1.042). The magnetic foliation is subhorizontal, dipping 3°. The magnetic lineation plunges 3° due 154°.
Lithostratigraphic Unit II has magnetic susceptibility (MS) (κ = <1.03 × 10⁻³ [SI]) up to an order of magnitude higher than Unit I, perhaps due to some contributions from magnetite. The corrected degree of anisotropy (P′ = <1.105) is also higher than in Unit I. The high coercivity and P′ may be due to a higher goethite/hematite ratio and/or a larger iron sulfide (e.g., pyrrhotite) population in the ash. The magnetic foliation is subhorizontal, dipping 2° to 8° due north to north-northeast.
In one discrete sample from Lithostratigraphic Unit IV (396-U1573A-15R-2, 128–130 cm), the magnetic foliation is subhorizontal, dipping 7° due 301°. Bulk MS and P′ are 0.45 × 10⁻³ [SI] and 1.032, respectively. These values are similar to those from Unit I, even though Unit II is basaltic and Unit I is sedimentary. Other discrete samples present inclined magnetic foliations, perhaps because of drilling disturbances.
5.4. Summary
The magnetic polarization at Site U1573 is independent of the lithostratigraphic units and consists of a 21 m thick mainly normal polarity upper interval followed by a 40 m thick reverse polarity interval and normal polarity to the base of the sediments at 379 m CSF-A. The lowermost 61 m at Site U1573 penetrated basalts with normal magnetic polarity. Unit I has an average intensity of magnetization of 0.05 A/m. These high values of coercivity point to sedimentary hematite or goethite. The coercivity increase with depth in Lithostratigraphic Unit II suggests an important change in the magnetic assemblage that may reflect a climatic change. The basalts show high average magnetization intensity (2.6 A/m) and a high coercivity. High coercivities may be explained by a larger goethite/hematite ratio. Unit IV is strongly ferromagnetic with high bulk MS pointing to high magnetite content.
6. Geochemistry
Site U1573 consists of a single hole (U1573A) drilled to 440.45 m CSF-A; core recovery was completed between 300 and 440.45 m CSF-A. Because core recovery did not start until 300 m CSF-A, no mudline sample was collected and analyzed. Below 300 m CSF-A, 10 interstitial water (IW) samples were taken from the sedimentary cover (300–382 m CSF-A) and 1 was taken from interbasaltic sediment at 433.7 m CSF-A. Carbonate and carbon-hydrogen-nitrogen-sulfur (CHNS) analysis was completed on squeeze cake samples from all corresponding IWs. The hard rock geochemistry of 11 samples was investigated using inductively coupled plasma–atomic emission spectrometry (ICP-AES), supported by 37 analyses using portable X-ray fluorescence (pXRF) measurements. A total of 29 samples were analyzed using X-ray diffraction (XRD) to investigate mineralogy of the sediments comprising the upper section of the hole. A total of 10 samples were taken for routine headspace analysis in Hole U1573A.
6.1. Inorganic geochemistry
The alkalinity content in Hole U1573A displays a near-linear decrease through the sediment package (Figure F12) from 2.1 mM at 300 m CSF-A to 0.7 mM at 380 m CSF-A just above the first sediment–basalt transition at 383 m CSF-A. The single interbasaltic sediment sample has slightly higher alkalinity than the lowermost sediment (1 mM). The pH of IW in Hole U1573A has four distinct intervals. The first sample taken (Section 2R-3) at 304.46 m CSF-A has a pH of 7.52 (Figure F12; Table T6). Cores 3R–5R are characterized by high (>8) pH, followed by an interval of lower values (between 7.5 and 7.7) that persists to 370 m CSF-A. The final interval, below 370 m CSF-A, displays a return to high (>8) pH values, including the interbasaltic sediment. The Cl and Br profiles display similar trends to each other downcore but are inversely correlated to changes in pH (Figure F12). A discrete interval of lower Cl (551–556 mM) and Br (0.85–0.86 mM) concentrations between ~310 and 335 m CSF-A corresponds to the high pH conditions. These changes may be tied to lithologic shifts because the sediment is much sandier in this interval of low Cl and Br than the surrounding claystones (see Lithostratigraphy).
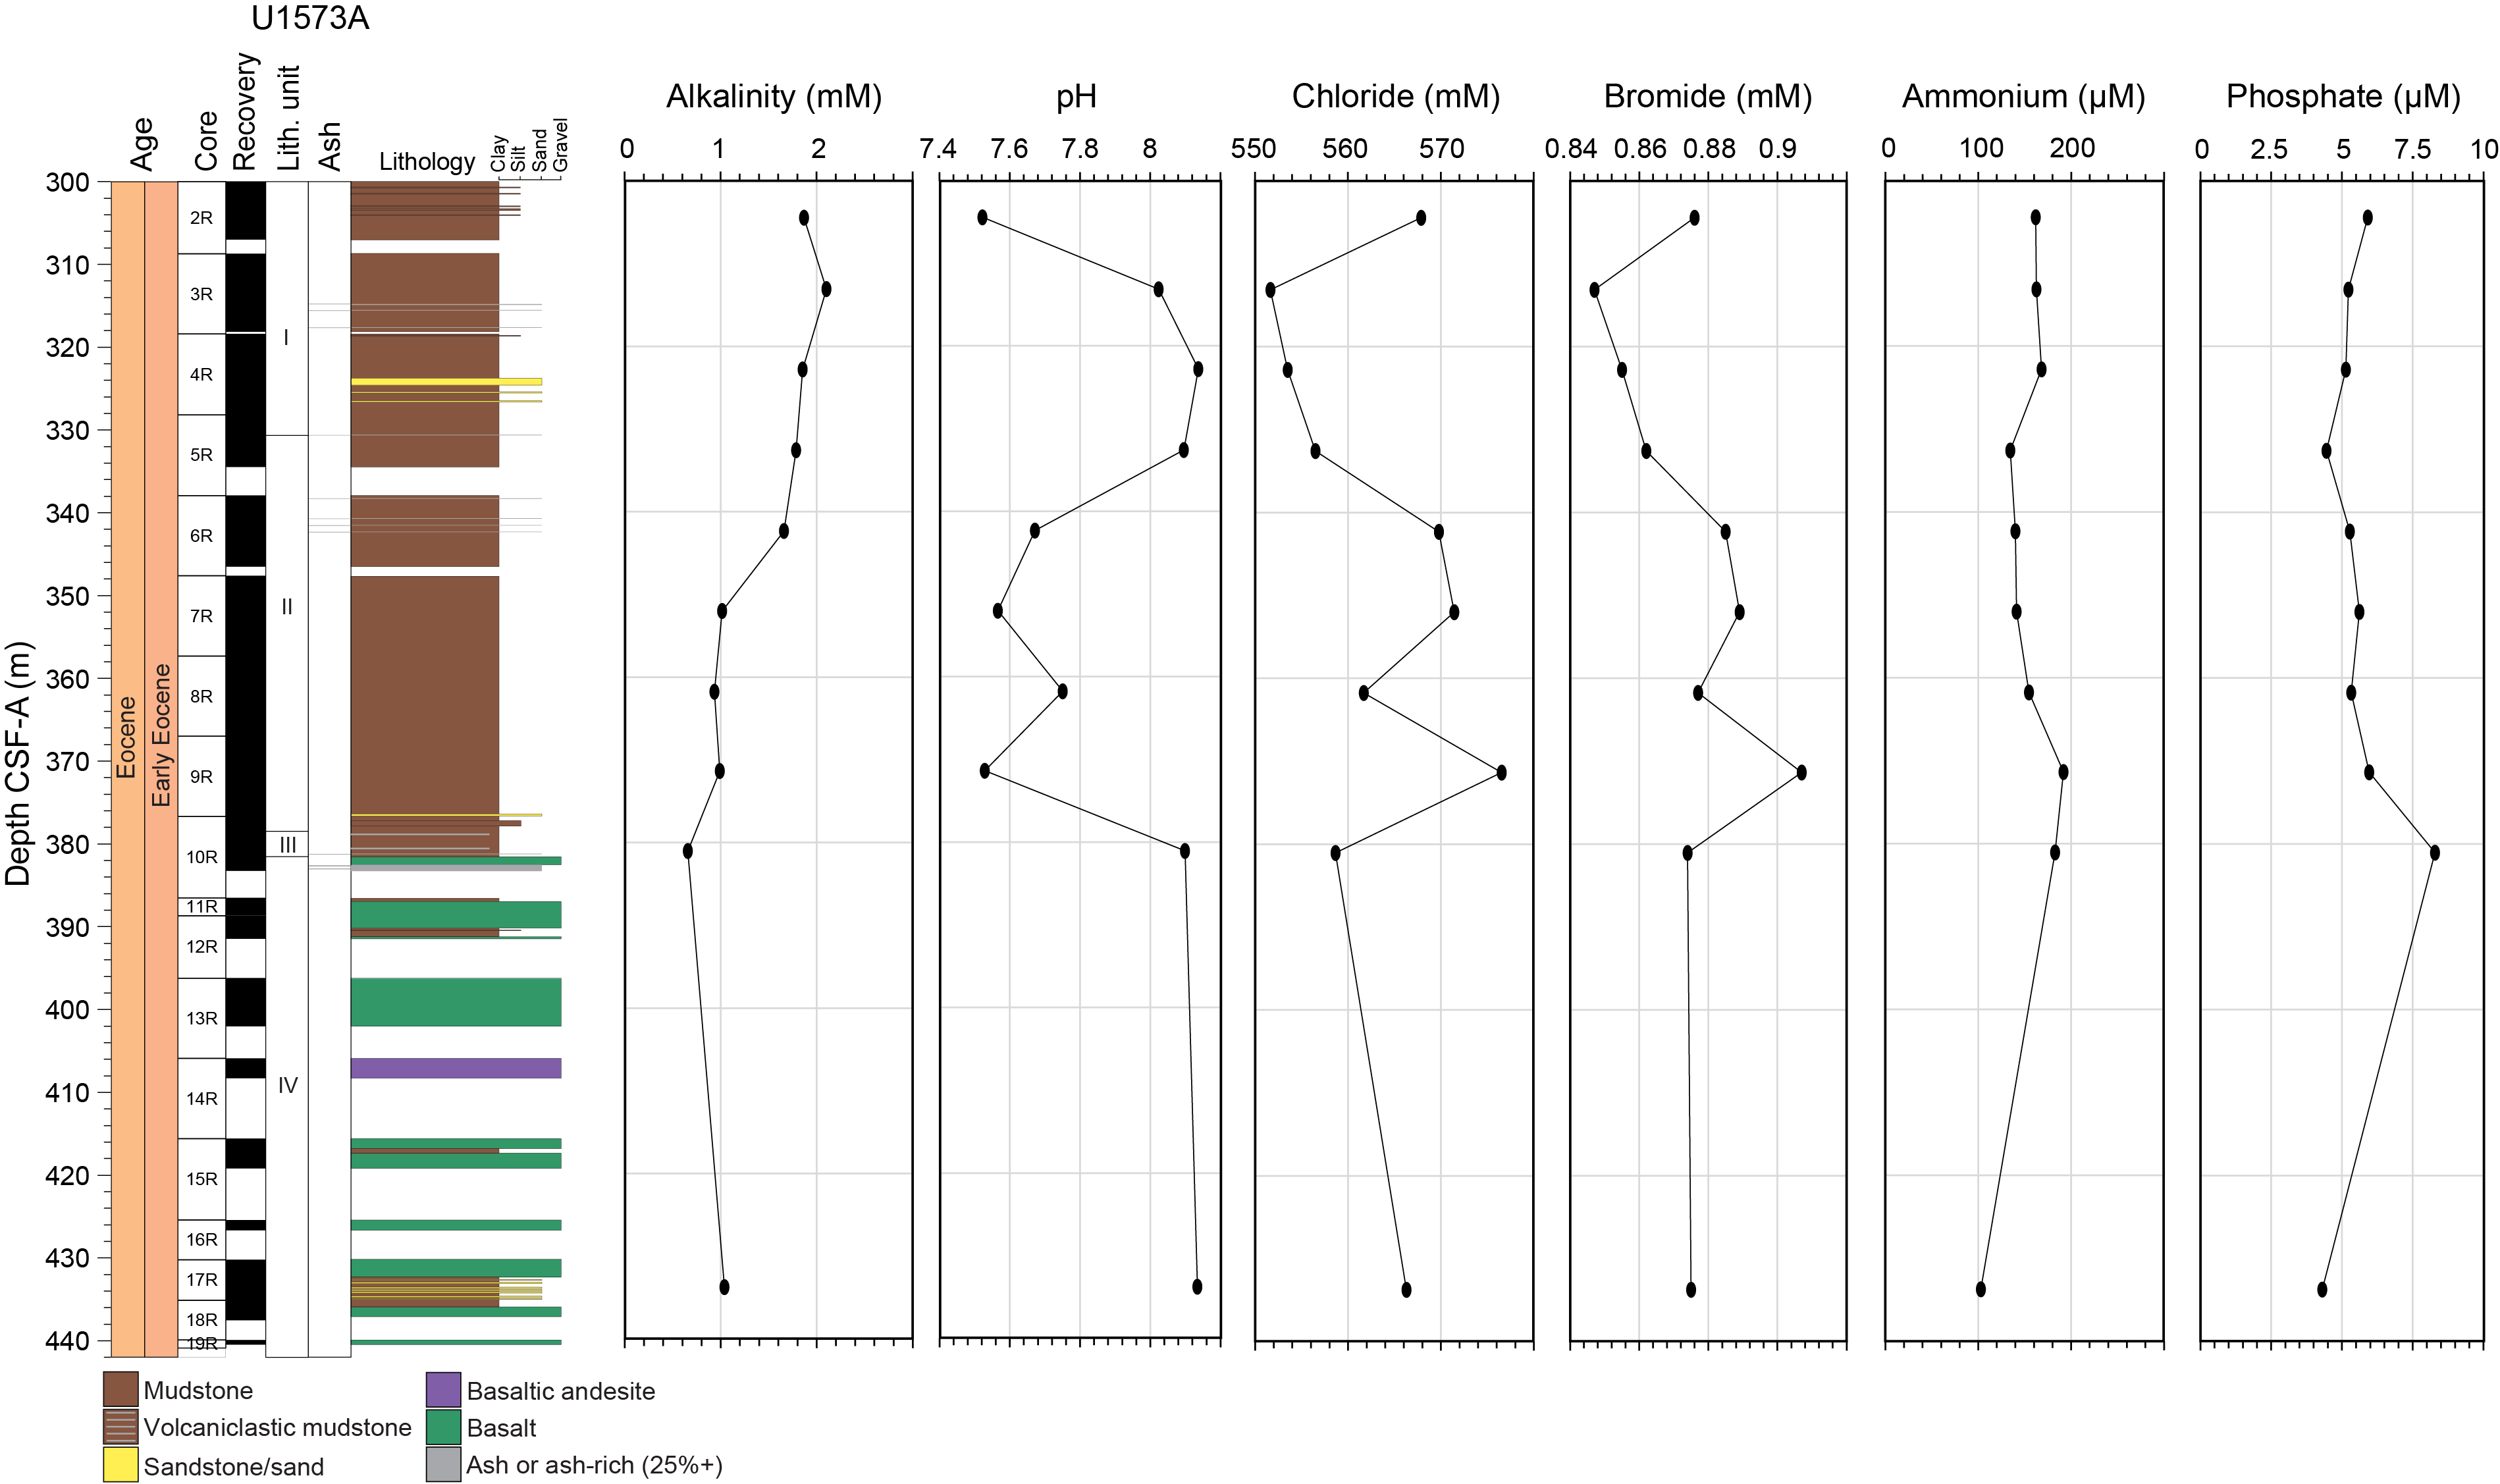
Figure F12. IW alkalinity, pH, Cl, Br, NH4+, and PO43−.
Ammonium does not show much variation with depth and has comparatively high values (~160 µM) between 300 and 325 m CSF-A followed by low concentrations (between 130 and 140 µM) to 370 m CSF-A. A return to concentrations above 160 µM occurs below this interval before a fall to 100 µM in the interbasaltic sediment. Phosphate concentrations are between 4 and 6 µM for most of the hole, except for one enriched sample (>8 µM) directly above the basalts. Combined, these data point toward the alteration of basaltic material, with carbonate formation consuming alkalinity from pore waters in the overlying sediment above the basalt–sediment transition at ~380 m CSF-A (Seyfried and Mottl, 1982; Lyons et al., 2000).
Additional evidence for basalt alteration comes from the elemental analyses of the IW compositions (Figure F13). Ca (30–40 mM), Na (435–445 mM), and Sr (150–190 µM) all increase in concentration downcore, attributable to release from the clay-forming reactions occurring at the basalt/sediment interface (Seyfried and Mottl, 1982; Seyfried and Bischoff, 1979). Ca and Sr concentrations increase further in the interbasaltic sediment sample, reaching 70 mM and 250 µM, respectively (Figure F13). Na concentrations decrease in the interbasaltic sediment, showing a concentration of 415 mM. The profile of Mg shows the opposite trend, decreasing from 38 to 32 mM downcore, with a further decrease to 23 mM in the interbasaltic sediment.
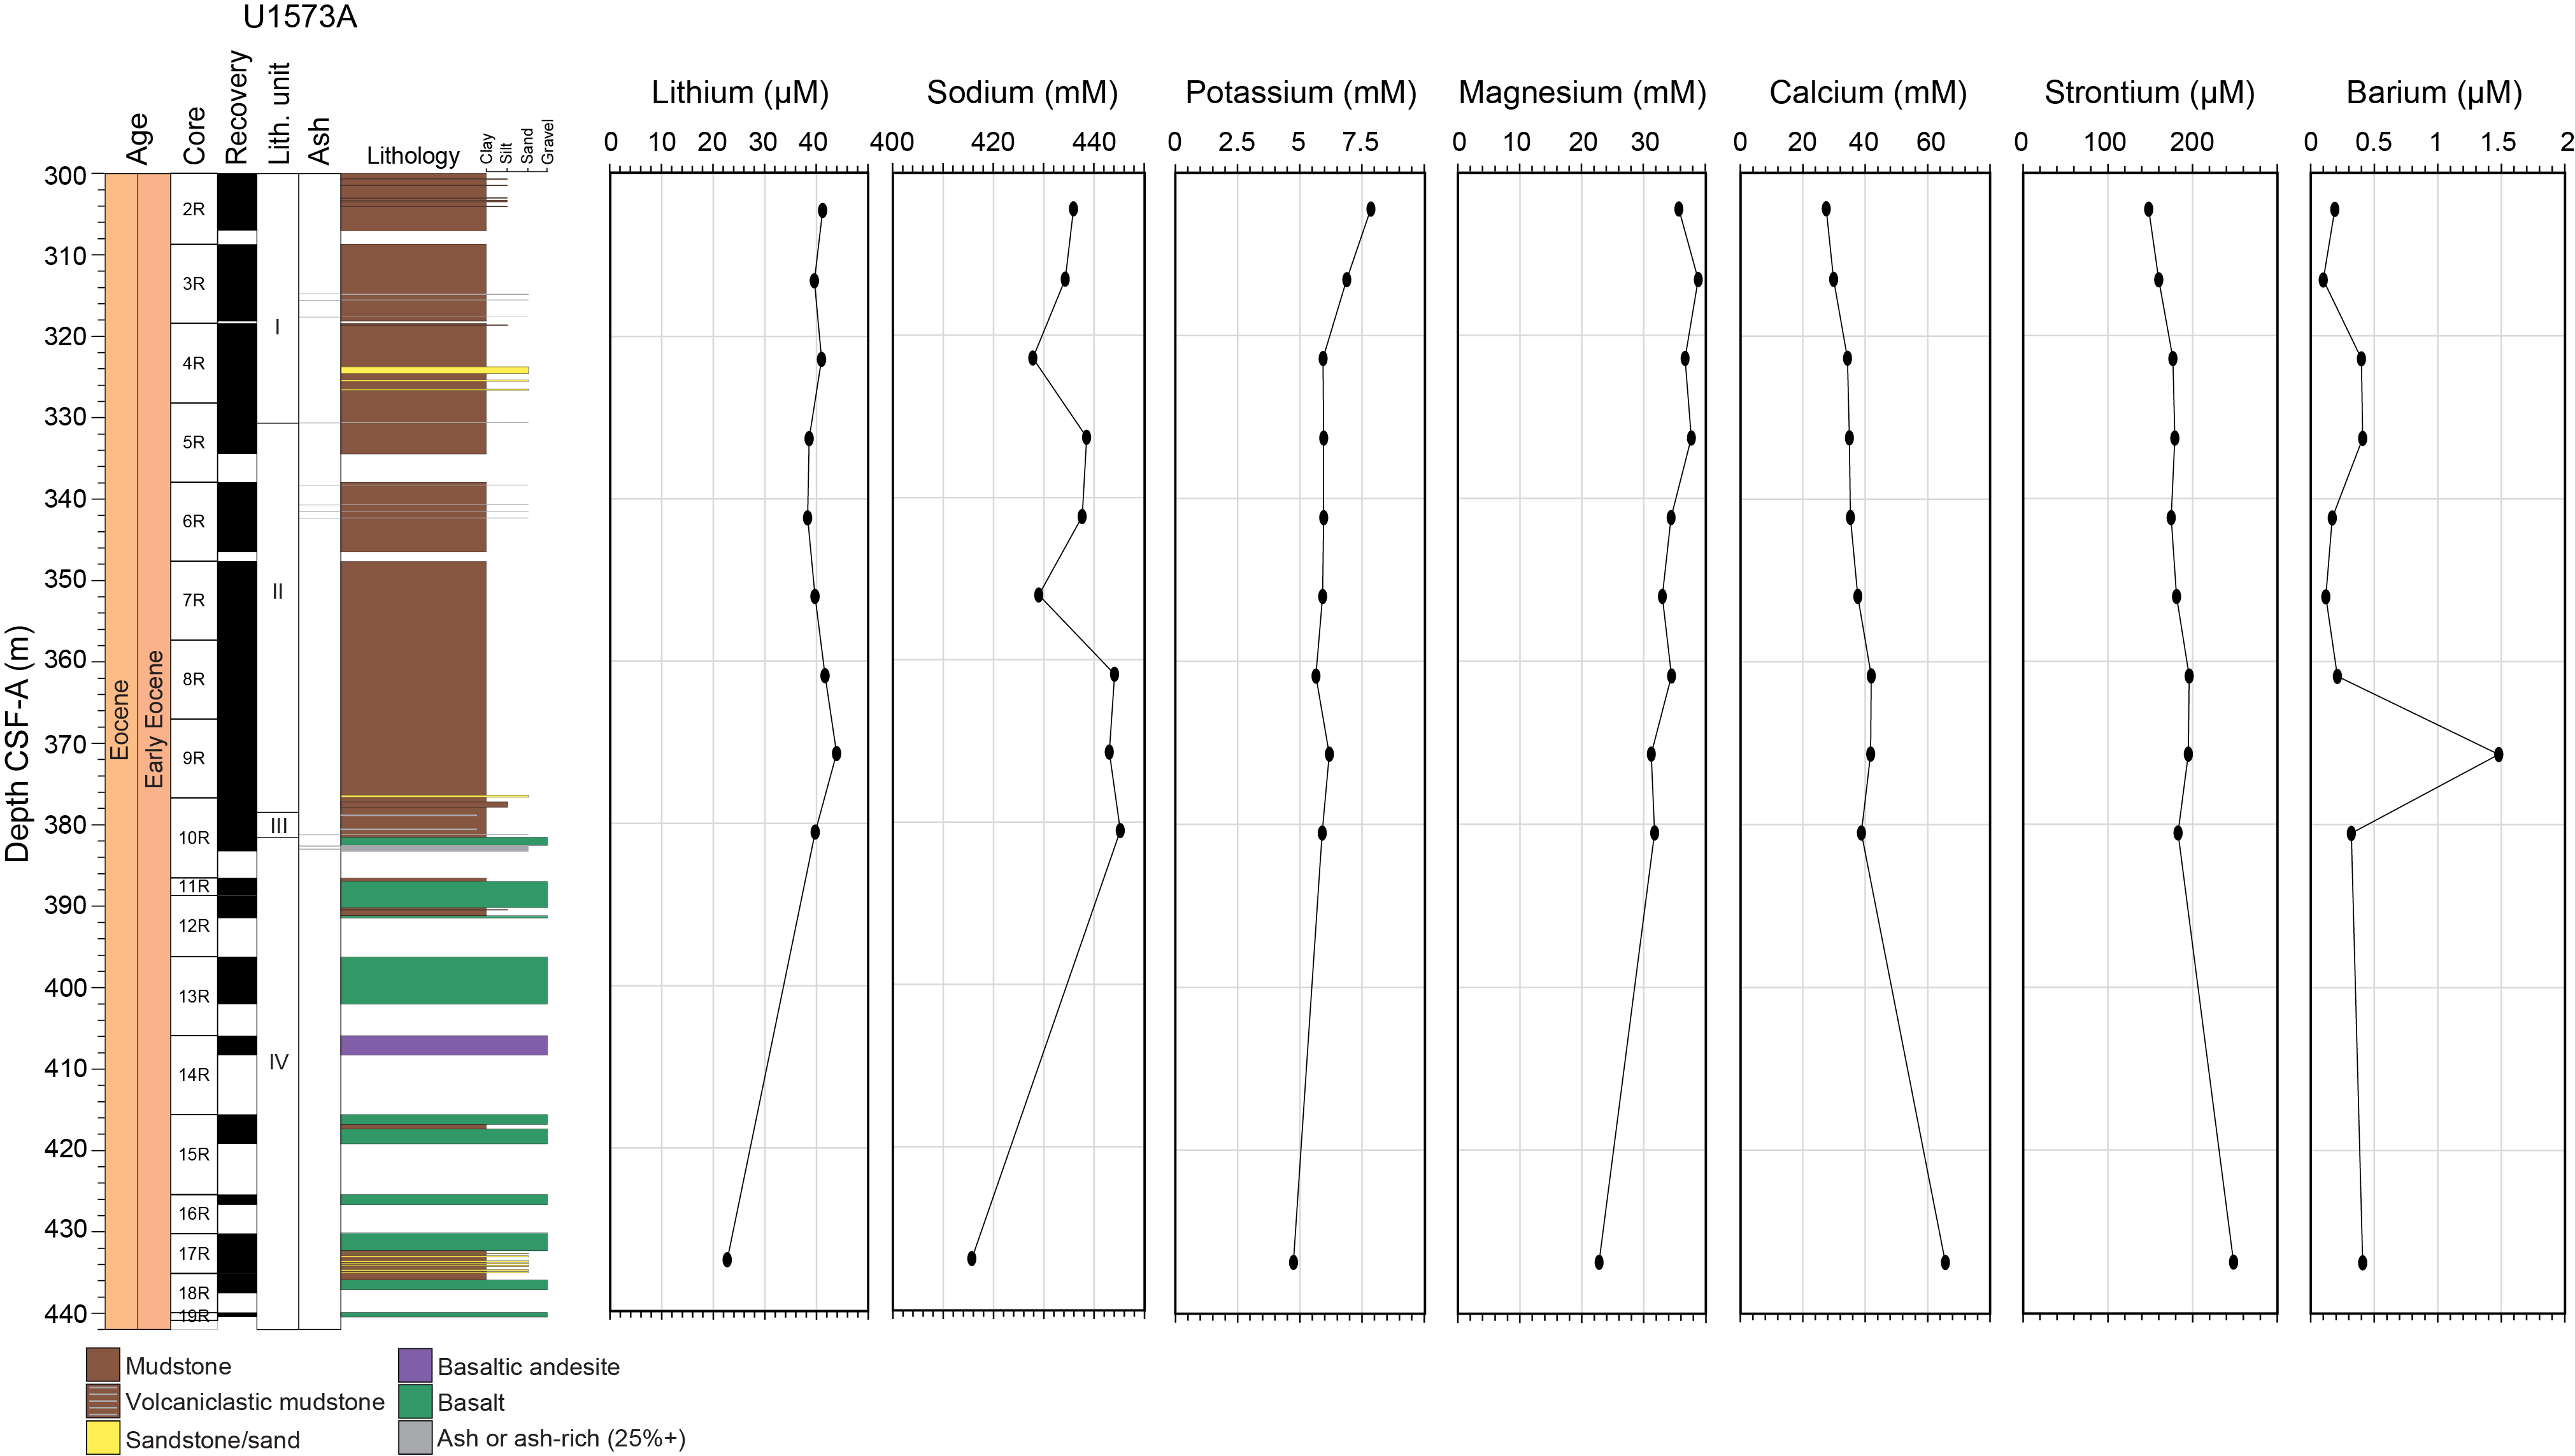
Figure F13. IW content of alkali and alkali earth metals.
As with Mg, a further subset of elements (B, K, Si, and S) display decreasing trends but with much greater intersample variability (Figures F13, F14). These elemental profiles are characterized by high concentrations for the first 30 m of analyzed core (as high as 400 µM for B, 8 mM for K, and 400 µM for Si). Below 330 m CSF-A, B concentrations decrease to 180 µM, K falls to 5.5 mM, and Si drops to ~100 µM. These values persist for the rest of the hole, albeit with slight variations. Lithium concentrations are relatively constant throughout the sediments, and all values are around 40 µM, except for the interbasaltic sediments, where concentrations drop to 20 µM (Figure F13). The profile of Mn is similar, fluctuating between 80 and 120 µM to the interbasaltic sediment samples, where concentrations are as low as 20 µM. This is noteworthy because Mn has only been reported above trace values below 50 m at all other sites. Ba content is low (0.2–0.4 µM) for most of the hole, except for the sample immediately above the basalt–sediment transition, where Ba content is 1.5 µM (Figure F13). Iron content is below detection limits in all but one sample.
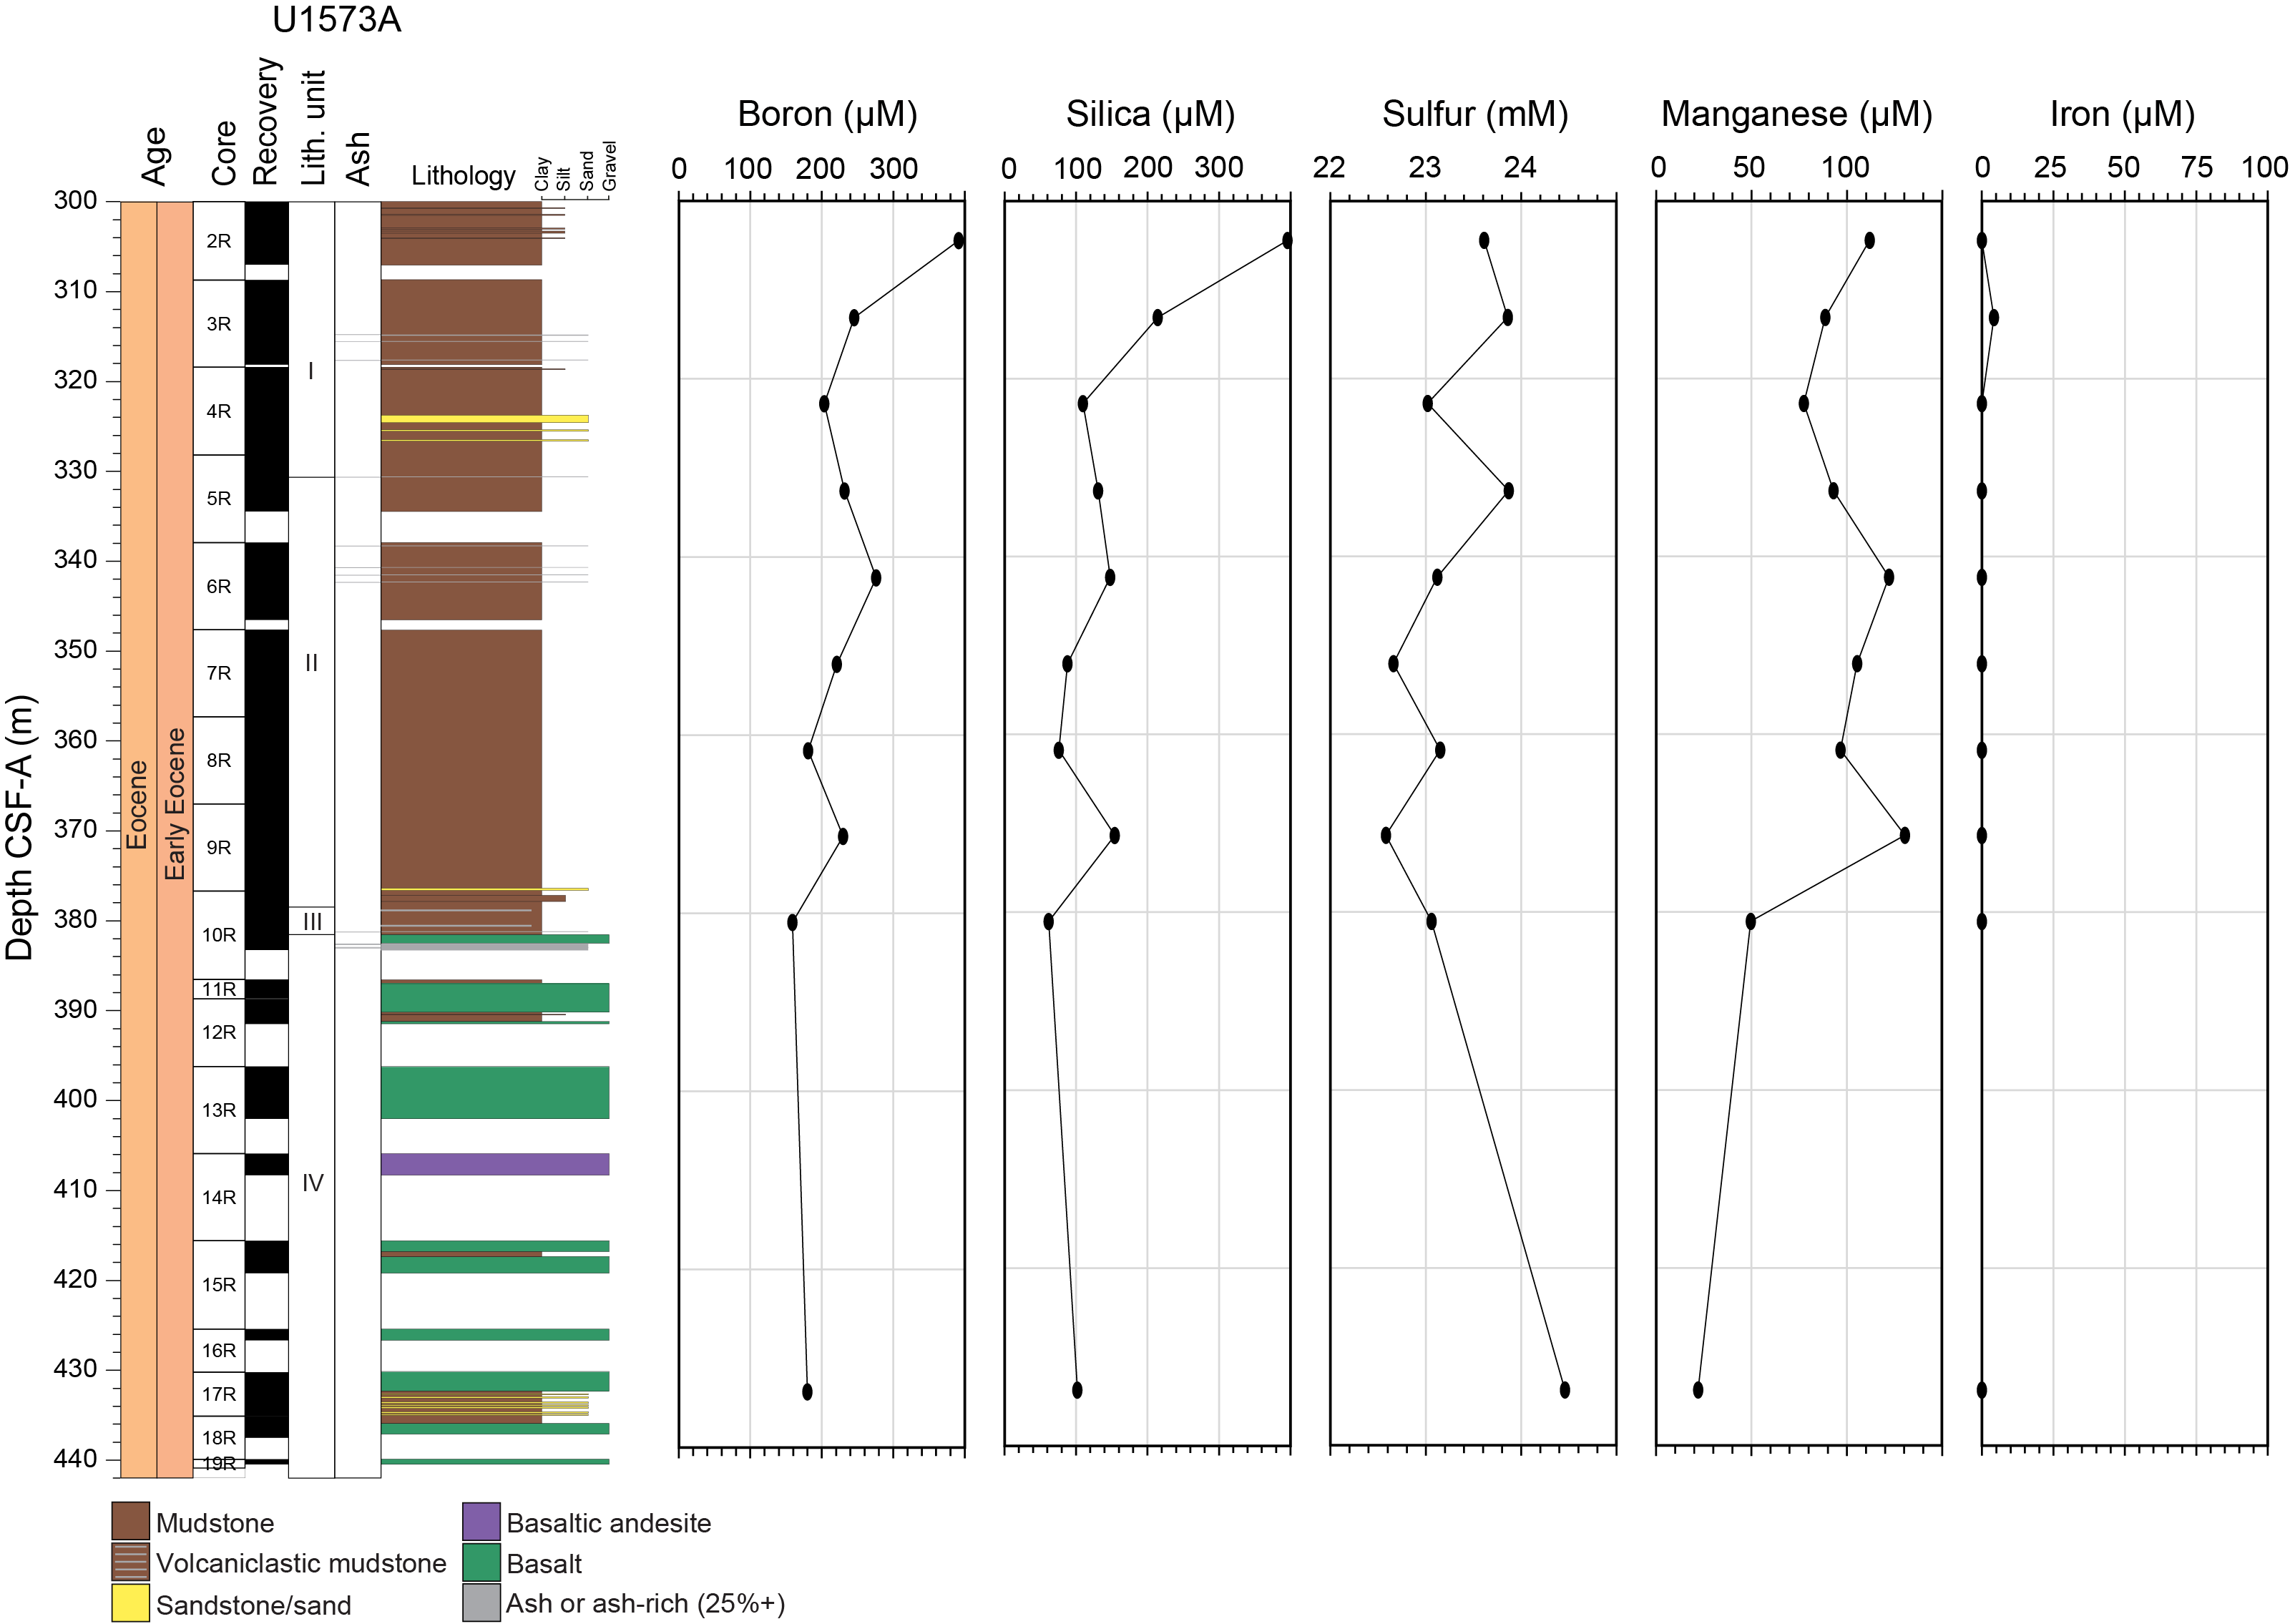
Figure F14. IW contents of B, Si, S, Mn, and Fe.
6.1.1. Deconvolved natural gamma radiation
Deconvolution of the natural gamma radiation (NGR) data provides estimates of K, Th, and U concentration in the solid samples (Figure F15). For all three elements, the profiles are similar and indicate relatively chemically homogeneous sedimentary deposition in the recovered samples. For U, values are between 2 and 4 ppm for the entirety of the sedimentary package, and Th concentrations are between 4 and 8 ppm. K content is between 2 and 3 wt% to 335 m CSF-A, where it increases to between 4 and 5 wt% for the remainder of the sediment package. This appears reflective of the shift to sandier and ashier sediments in this interval of the core (see Lithostratigraphy). The clear shift into basaltic lithology is well defined by considerable decreases in the content of all three measured elements, and low values for K (<1 wt%), U (<2 ppm), and Th (<4 ppm) characterize the geochemistry of these rocks.
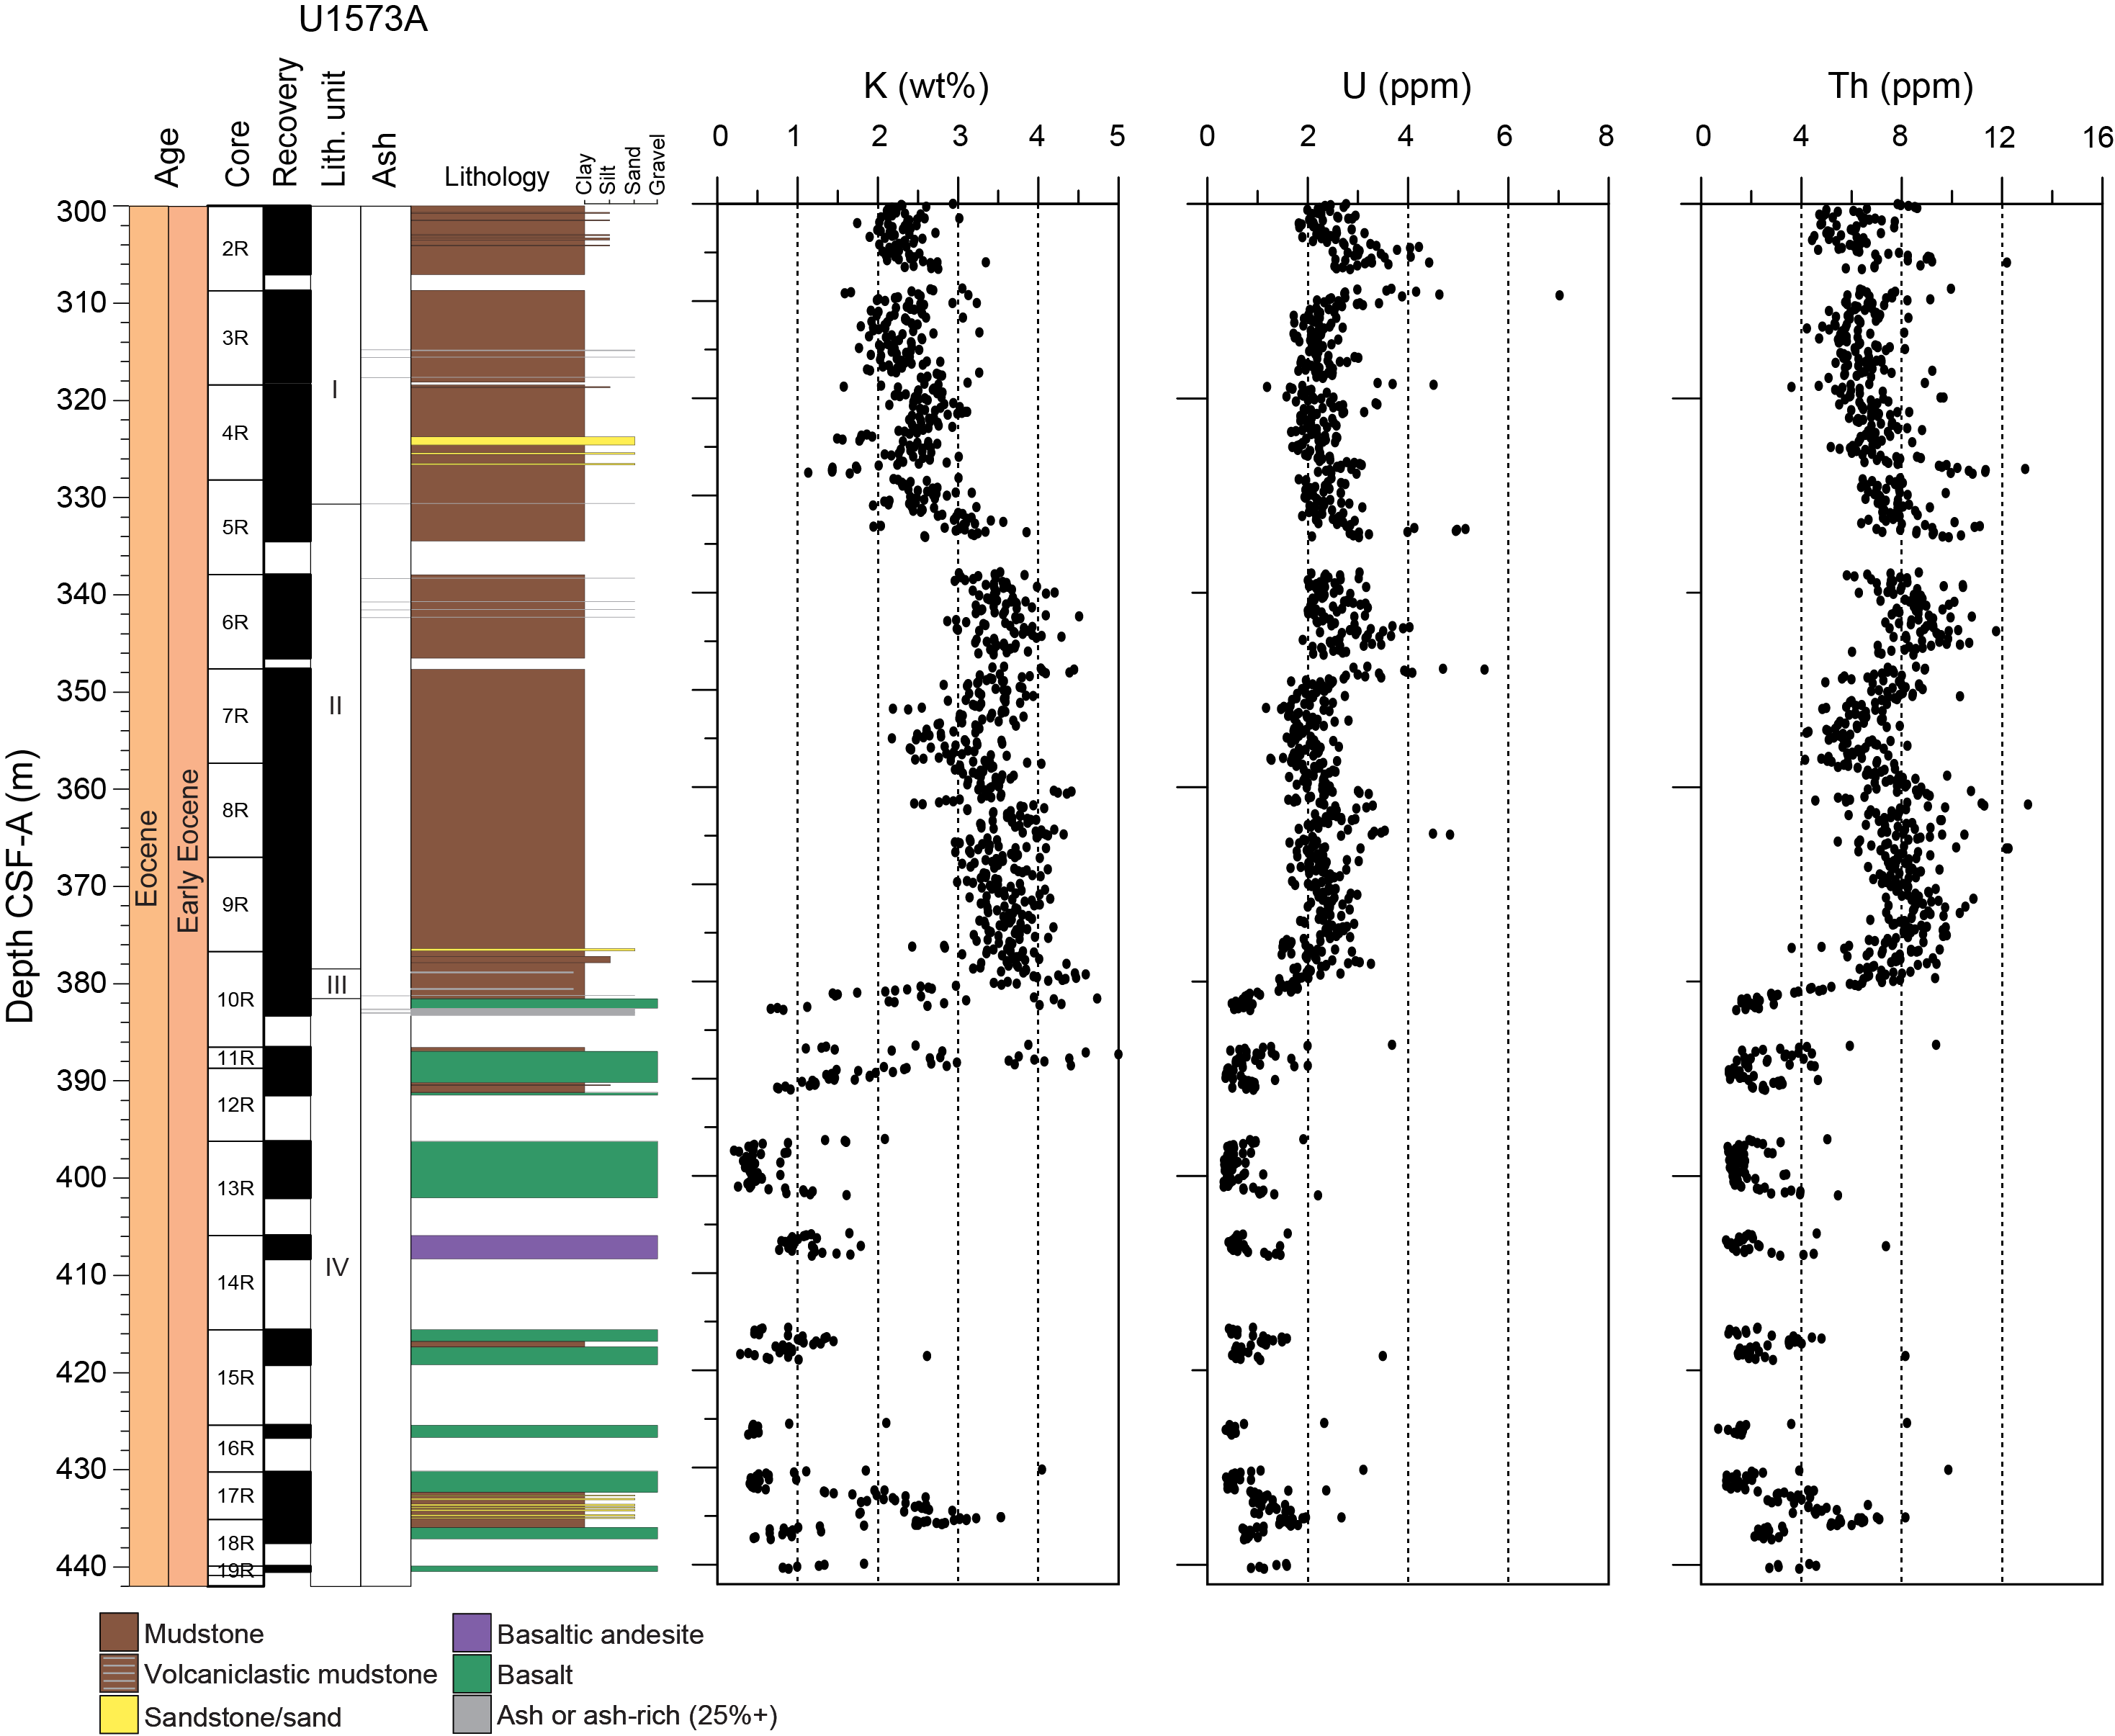
Figure F15. K, U, and Th.
6.1.2. X-ray diffraction
XRD analysis of the sediments indicates the predominance of clay minerals, specifically smectite, illite, and montmorillonite, along with quartz and, to a lesser degree, muscovite. In the upper interval (300–330 m CSF-A), clinoptilolite is present, suggesting alteration of volcanic material, either tephra or basalt. The strongest evidence for authigenic clay is present in the basaltic layers, along with primary volcanic material (e.g., diopside, pyroxene, and labradorite).
6.1.3. Hard rock geochemistry
A total of 11 igneous rock samples from different basaltic lava flows in Unit IV, Hole U1573A, were analyzed for major and trace elements using ICP-AES (Table T7). Loss on ignition (LOI) varied between 1 and 2 wt%, indicating relatively low levels of alteration. Two samples had LOI as high as 4 wt% (11R-1, 136–138 cm, and 12R-1, 117–119 cm), which, in addition to high K concentrations, is indicative of alteration. All but one sample plot in the subalkaline basalt to basaltic andesite fields (Figure F16A), with normalized SiO2 concentrations ranging 47–56 wt%. One sample (10R-1, 98–100 cm) is plotted in the basaltic-trachy andesite field, but because this sample was collected from the sediment/basalt boundary and contains higher amounts of K2O relative to unaltered basalt (i.e., 2.47 wt%), this classification is likely related to the presence of increased secondary clays in the sample.
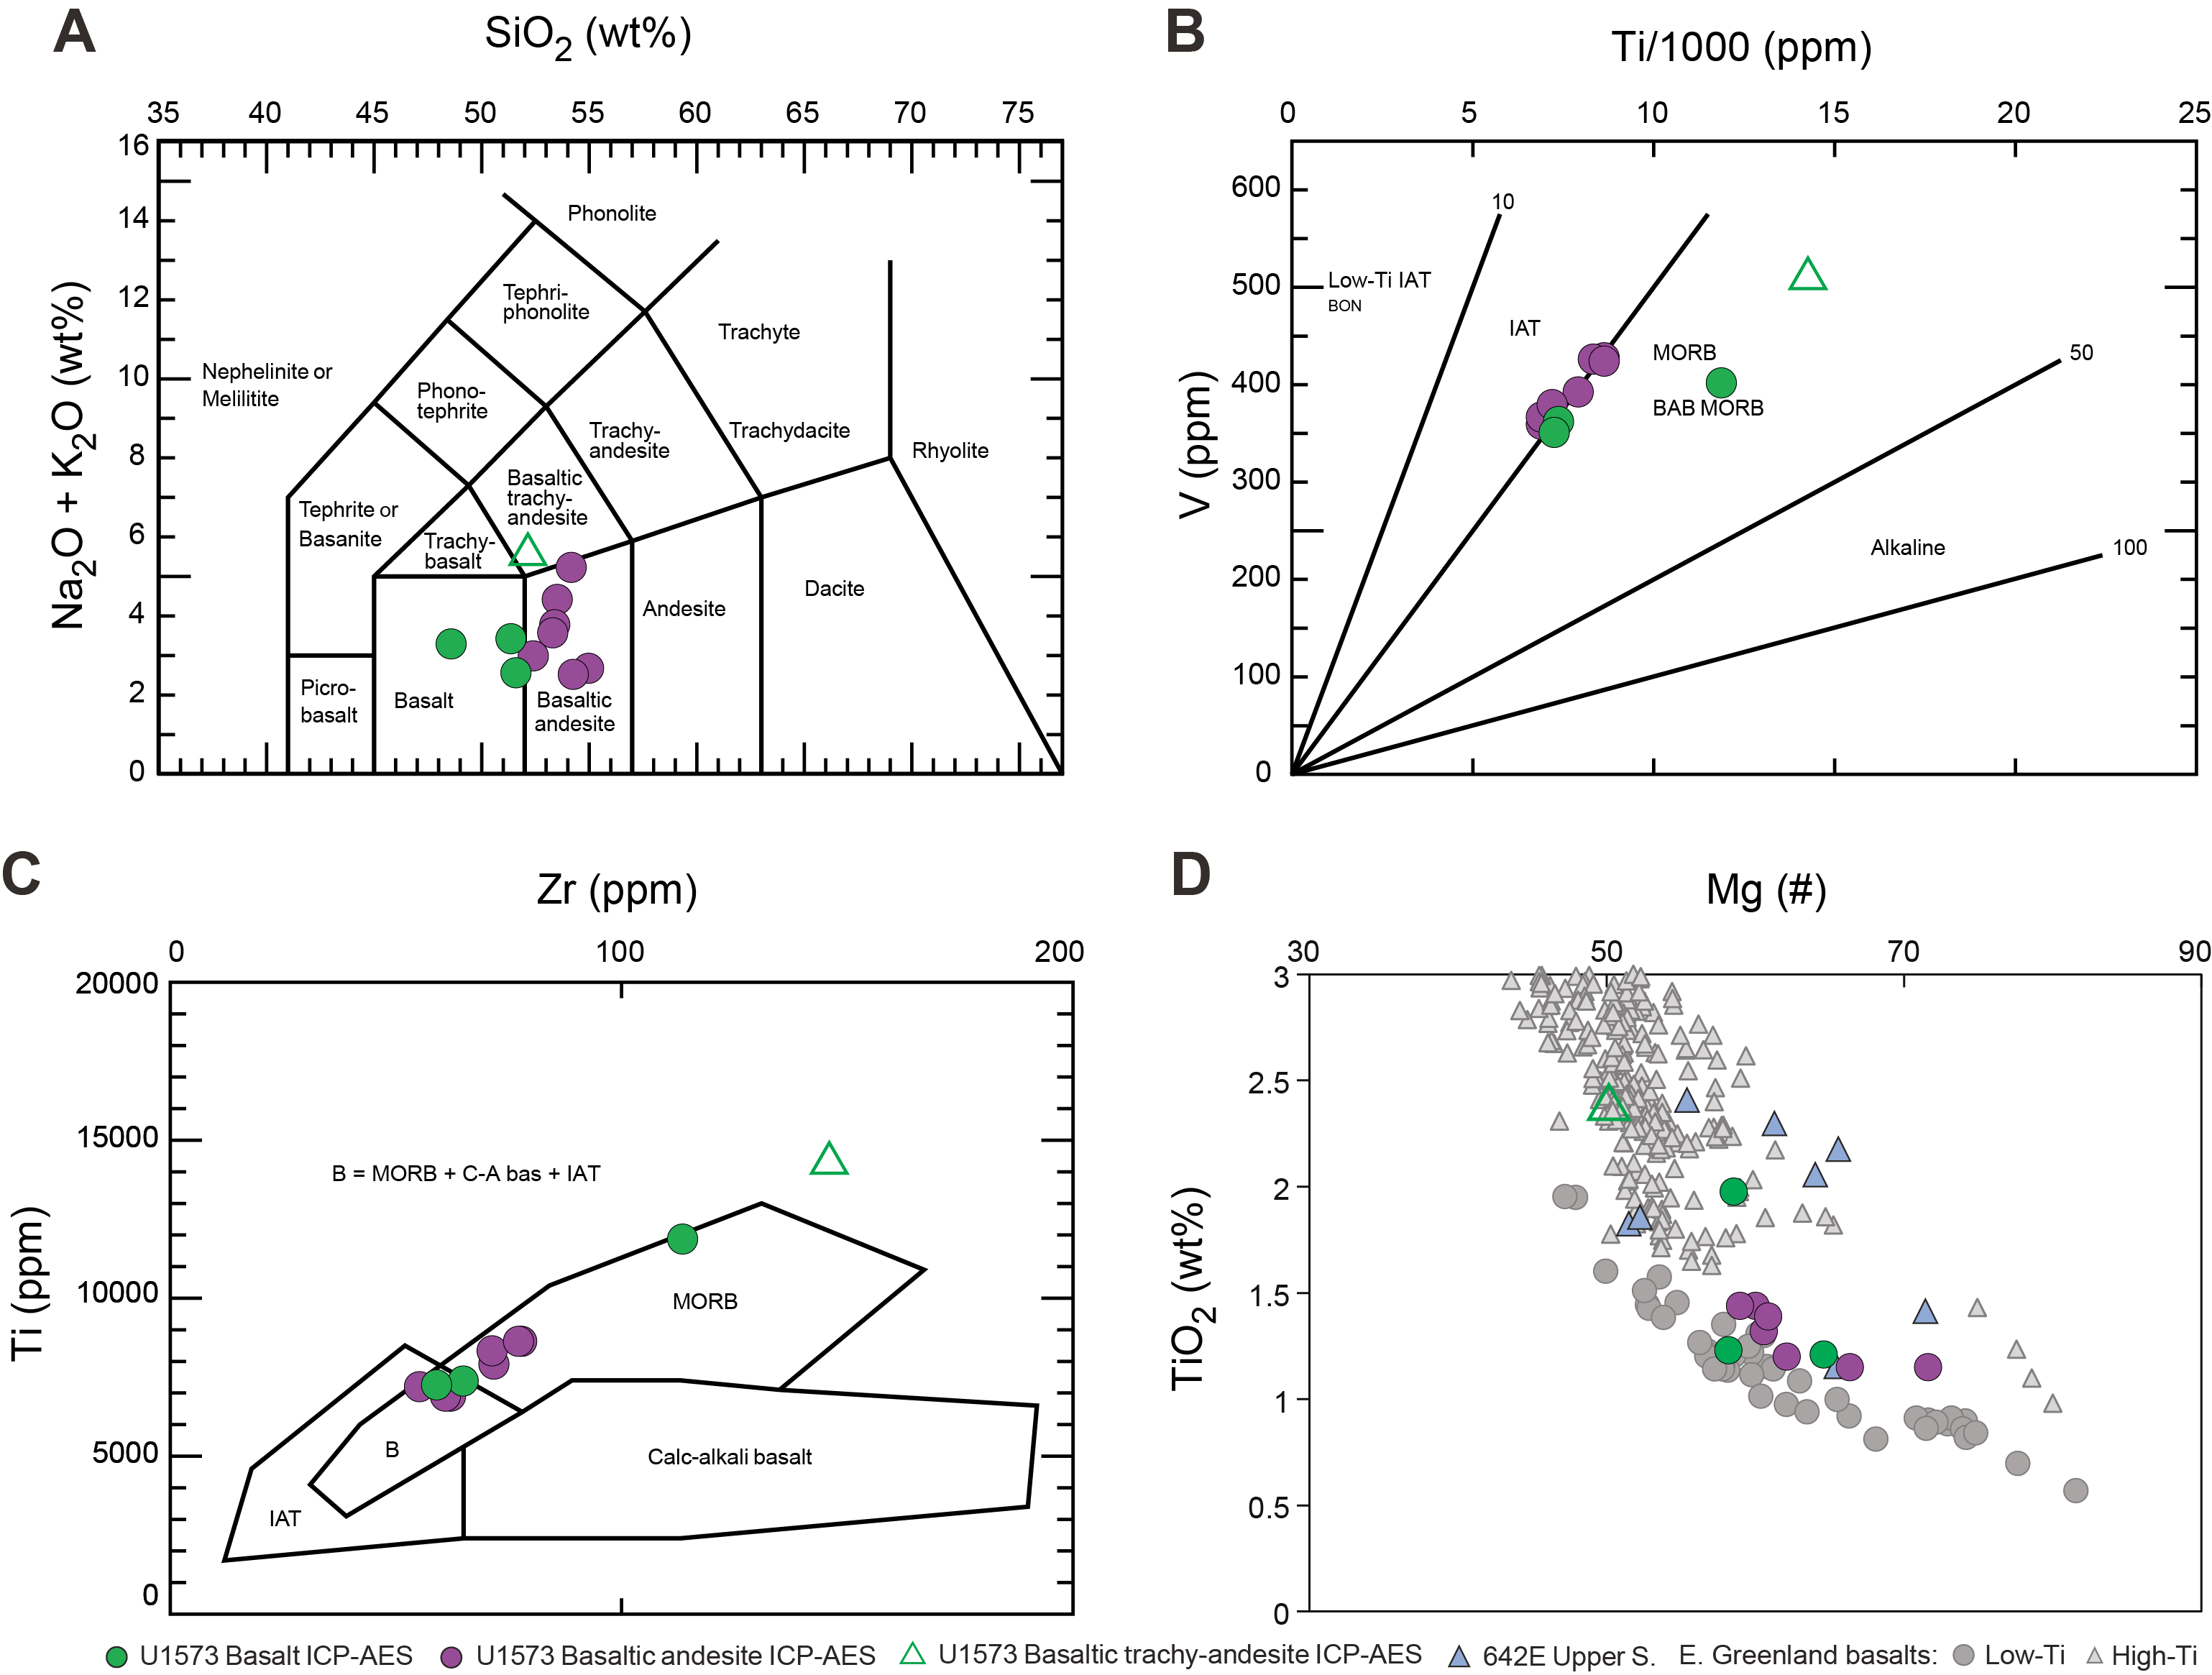
Figure F16. Volcanic rocks.
On a diagram of V versus Ti (Figure F16B), samples from Hole U1573A plot close to the boundary between the island-arc tholeiite (IAT) and mid-ocean-ridge basalt (MORB) fields, which is a different chemical signature from previous Expedition 396 sites (U1566, U1571, and U1572). When plotted in the Ti versus Zr space (Figure F16C), a few samples plot within the MORB field, whereas most Ti/Zr ratios are not indicative of a specific origin. Two samples (one basalt and the basaltic andesite) plot outside the typical basalt discrimination fields because of high Ti contents that are indicative of part of the suite of rocks associated with large igneous provinces (Callegaro et al., 2017). In a TiO2 versus Mg# diagram (Mg# = Mg/[Mg + Fe2+] × 100, assuming FeO/Fe2O3 = 0.85), most of the lithologies have TiO2 below 2 wt% and Mg# between 58 and 72 wt% (Figure F16C). When compared to basalts from the upper series in Ocean Drilling Program (ODP) Hole 642E (Meyer et al., 2009) and flood basalts from East Greenland (Tegner et al., 1998), the majority of samples overlap with the low-Ti basalts of Greenland.
Downhole plots of the Unit IV basalts show discontinuities in Mg#, TiO2, Ni, and Zr at ~390 and 430 m CSF-A (see Lithostratigraphy; Figure F8). These results are consistent with those derived from pXRF analysis. Three basaltic sequences can be inferred from the downhole chemistry. These three sequences could reflect upwardly evolving units of magma intruded in individual events. In Hole U1573A, TiO2 does not show much variation, showing comparatively high values (~2.4 wt%) at 382 m CSF-A in the upper sequence and then consistent values between 1.15 and 1.4 wt% throughout the middle sequence. The same trend is shown in Zr concentrations, whereas Mg# and Ni values decrease slightly downhole.
6.2. Organic geochemistry
6.2.1. Headspace gas
Samples for routine headspace analysis were taken from the same intervals as the IW sample. The analyses yield methane concentrations below 2 ppmv, and all other measured gases are below detection limits.
6.2.2. Carbon, nitrogen, and sulfur
Total carbon values are below 0.5 wt% for a majority of the samples analyzed at Site U1573 (Figure F17; Table T8). Calcium carbonate concentrations are generally below 0.4 wt%, with the exception of two samples at 352 m CSF-A (396-U1573A-7R-3, 140–150 cm) and 381 m CSF-A (10R-3, 140–150 cm), where CaCO3 content is high, comprising 25 wt% in the former and 75 wt% in the latter. It is likely the upper sample represents a biogenic carbonate layer, whereas the second (located directly above the basalt) is likely linked to authigenic carbonate precipitation, a process that is interpreted to have led to bicarbonate depletion (and alkalinity decrease) in the IW from this interval.
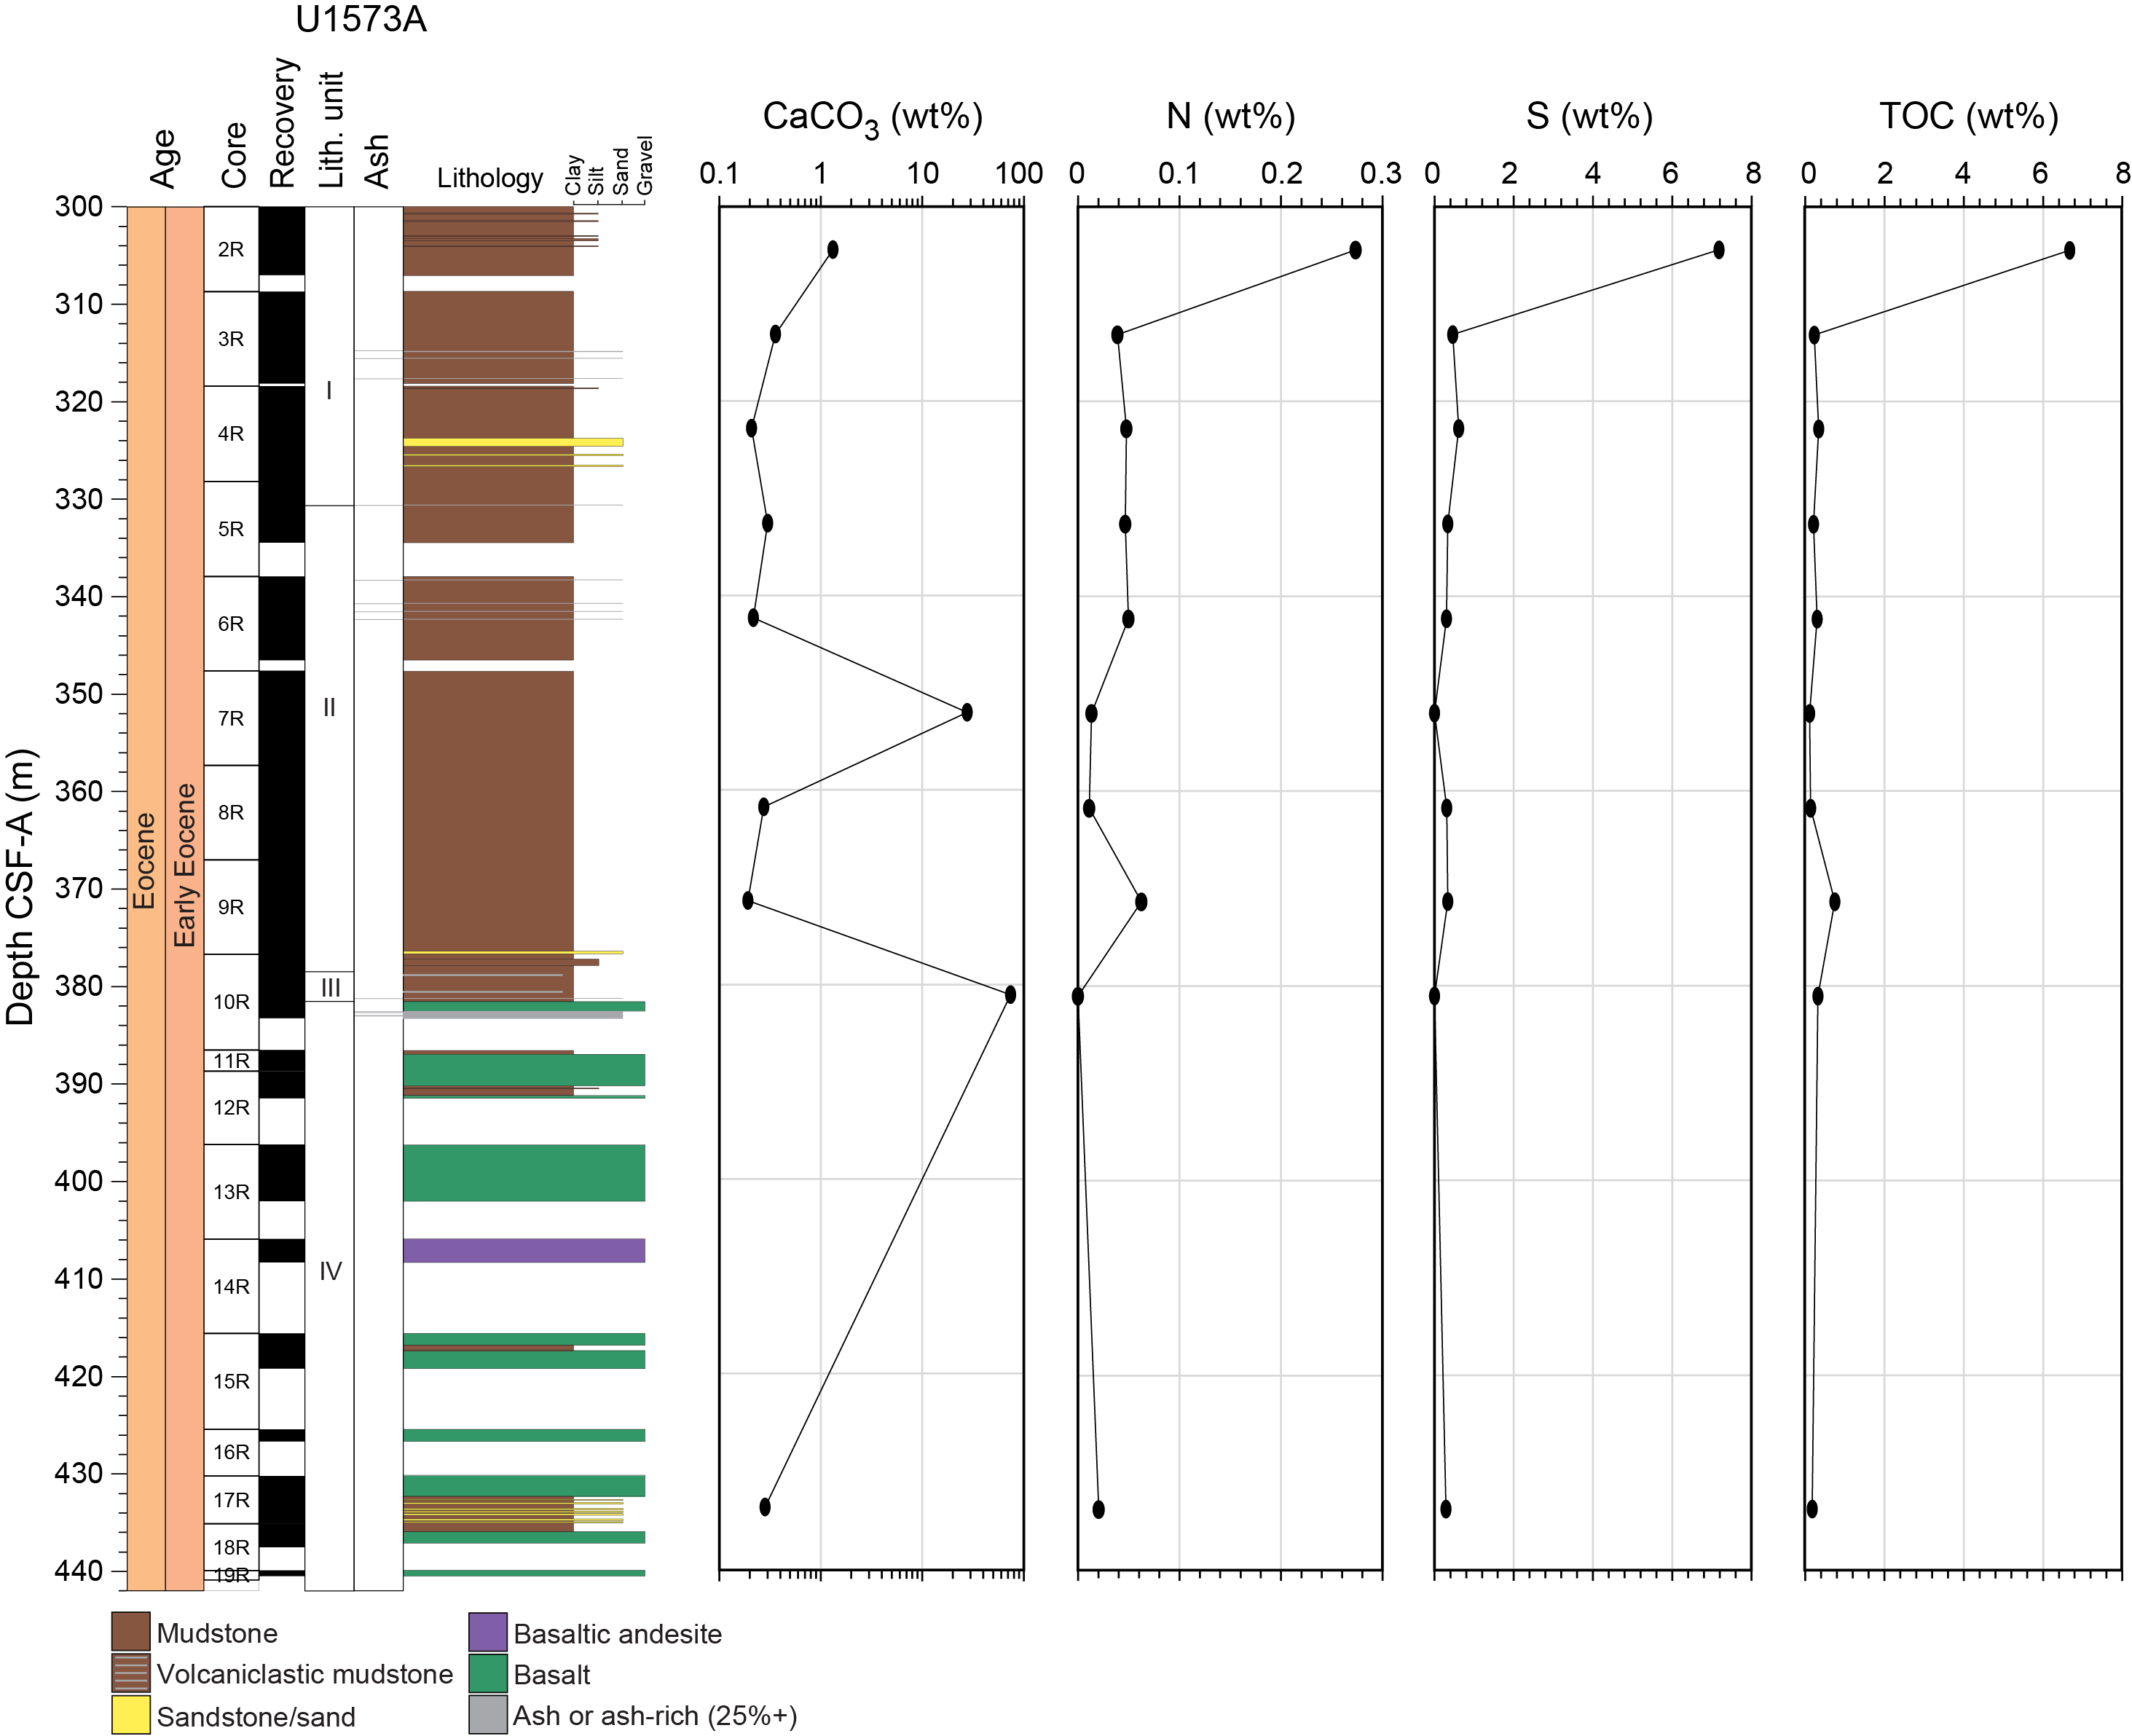
Figure F17. Carbon, nitrogen, and sulfur.
Total organic carbon (TOC) is below 0.3 wt% throughout the entire core, with the exception of the uppermost analyzed sample (396-U1573A-2R-3, 146–151 cm). This interval contains 6 wt% TOC, an order of magnitude greater than any other sample. Sulfur is also enriched in the uppermost sample, where it comprises more than 7 wt% of the sediment. In all other samples, it is lower than 0.5 wt%. Nitrogen content exhibits the same trend, showing 0.27 wt% in the top sample and below 0.05 wt% thereafter. These enrichments in the uppermost sample correspond to a layer with volcaniclastic sediments (Figure F17). Similar enrichments are common near volcaniclastic sediments at previous sites. This suggests that the deposition of volcanic material may be elevating organic matter production and/or preservation (Jones and Gislason, 2008; Hembury et al., 2012; Longman et al., 2019).
6.3. Microbiology
Four samples were taken for microbiological analysis from ash and sediment layers in Sections 396-U1573A-4R-4 and 4R-5. They were sampled using a cutoff syringe and immediately transferred to a freezer for storage.
6.4. Summary
Site U1573 in the Lofoten Basin provided a unique opportunity to sample an Outer SDR sequence on a magma-rich passive continental margin. Geochemically, the sampled lavas are noteworthy in that the higher silica and low-Ti compositions are distinct from both typical MORBs and large igneous province magmatism.
The sedimentary package recovered above the lavas is limited to 100 m. As seen at previous sites, high organic matter production and/or preservation is found in volcaniclastic sediments, suggesting a causal relationship. Similar to the sediments at Sites U1571 and U1572, the IW samples show a diagenetic environment controlled by basalt weathering, with processes consuming alkalinity in the overlying sedimentary strata. There is also strong evidence of authigenic carbonate formation above the sediment/basalt contact, linked to the liberation of Ca during the weathering of primary silicates.
7. Physical properties
Site U1573 targeted the seismically defined Outer SDR on the Vøring Margin (Berndt et al., 2001). Hole U1573A was drilled using the RCB system, and the uppermost 300 m were washed. The cored interval of Hole U1573A (300–440.45 m CSF-A) comprises a succession of ~82 m of Early Eocene sediments (recovery = ~92%) overlying a ~59 m hard rock–dominated sequence of interbedded basalt units and volcaniclastic sediments (recovery = ~43.6%). Four lithostratigraphic units were identified in the cored interval, including three in the overburden sediments (Units I–III) and one in the hard rock volcanic sequence (Unit IV; see Lithostratigraphy). A summary of the associated physical properties is presented in Figure F18 and Table T9.
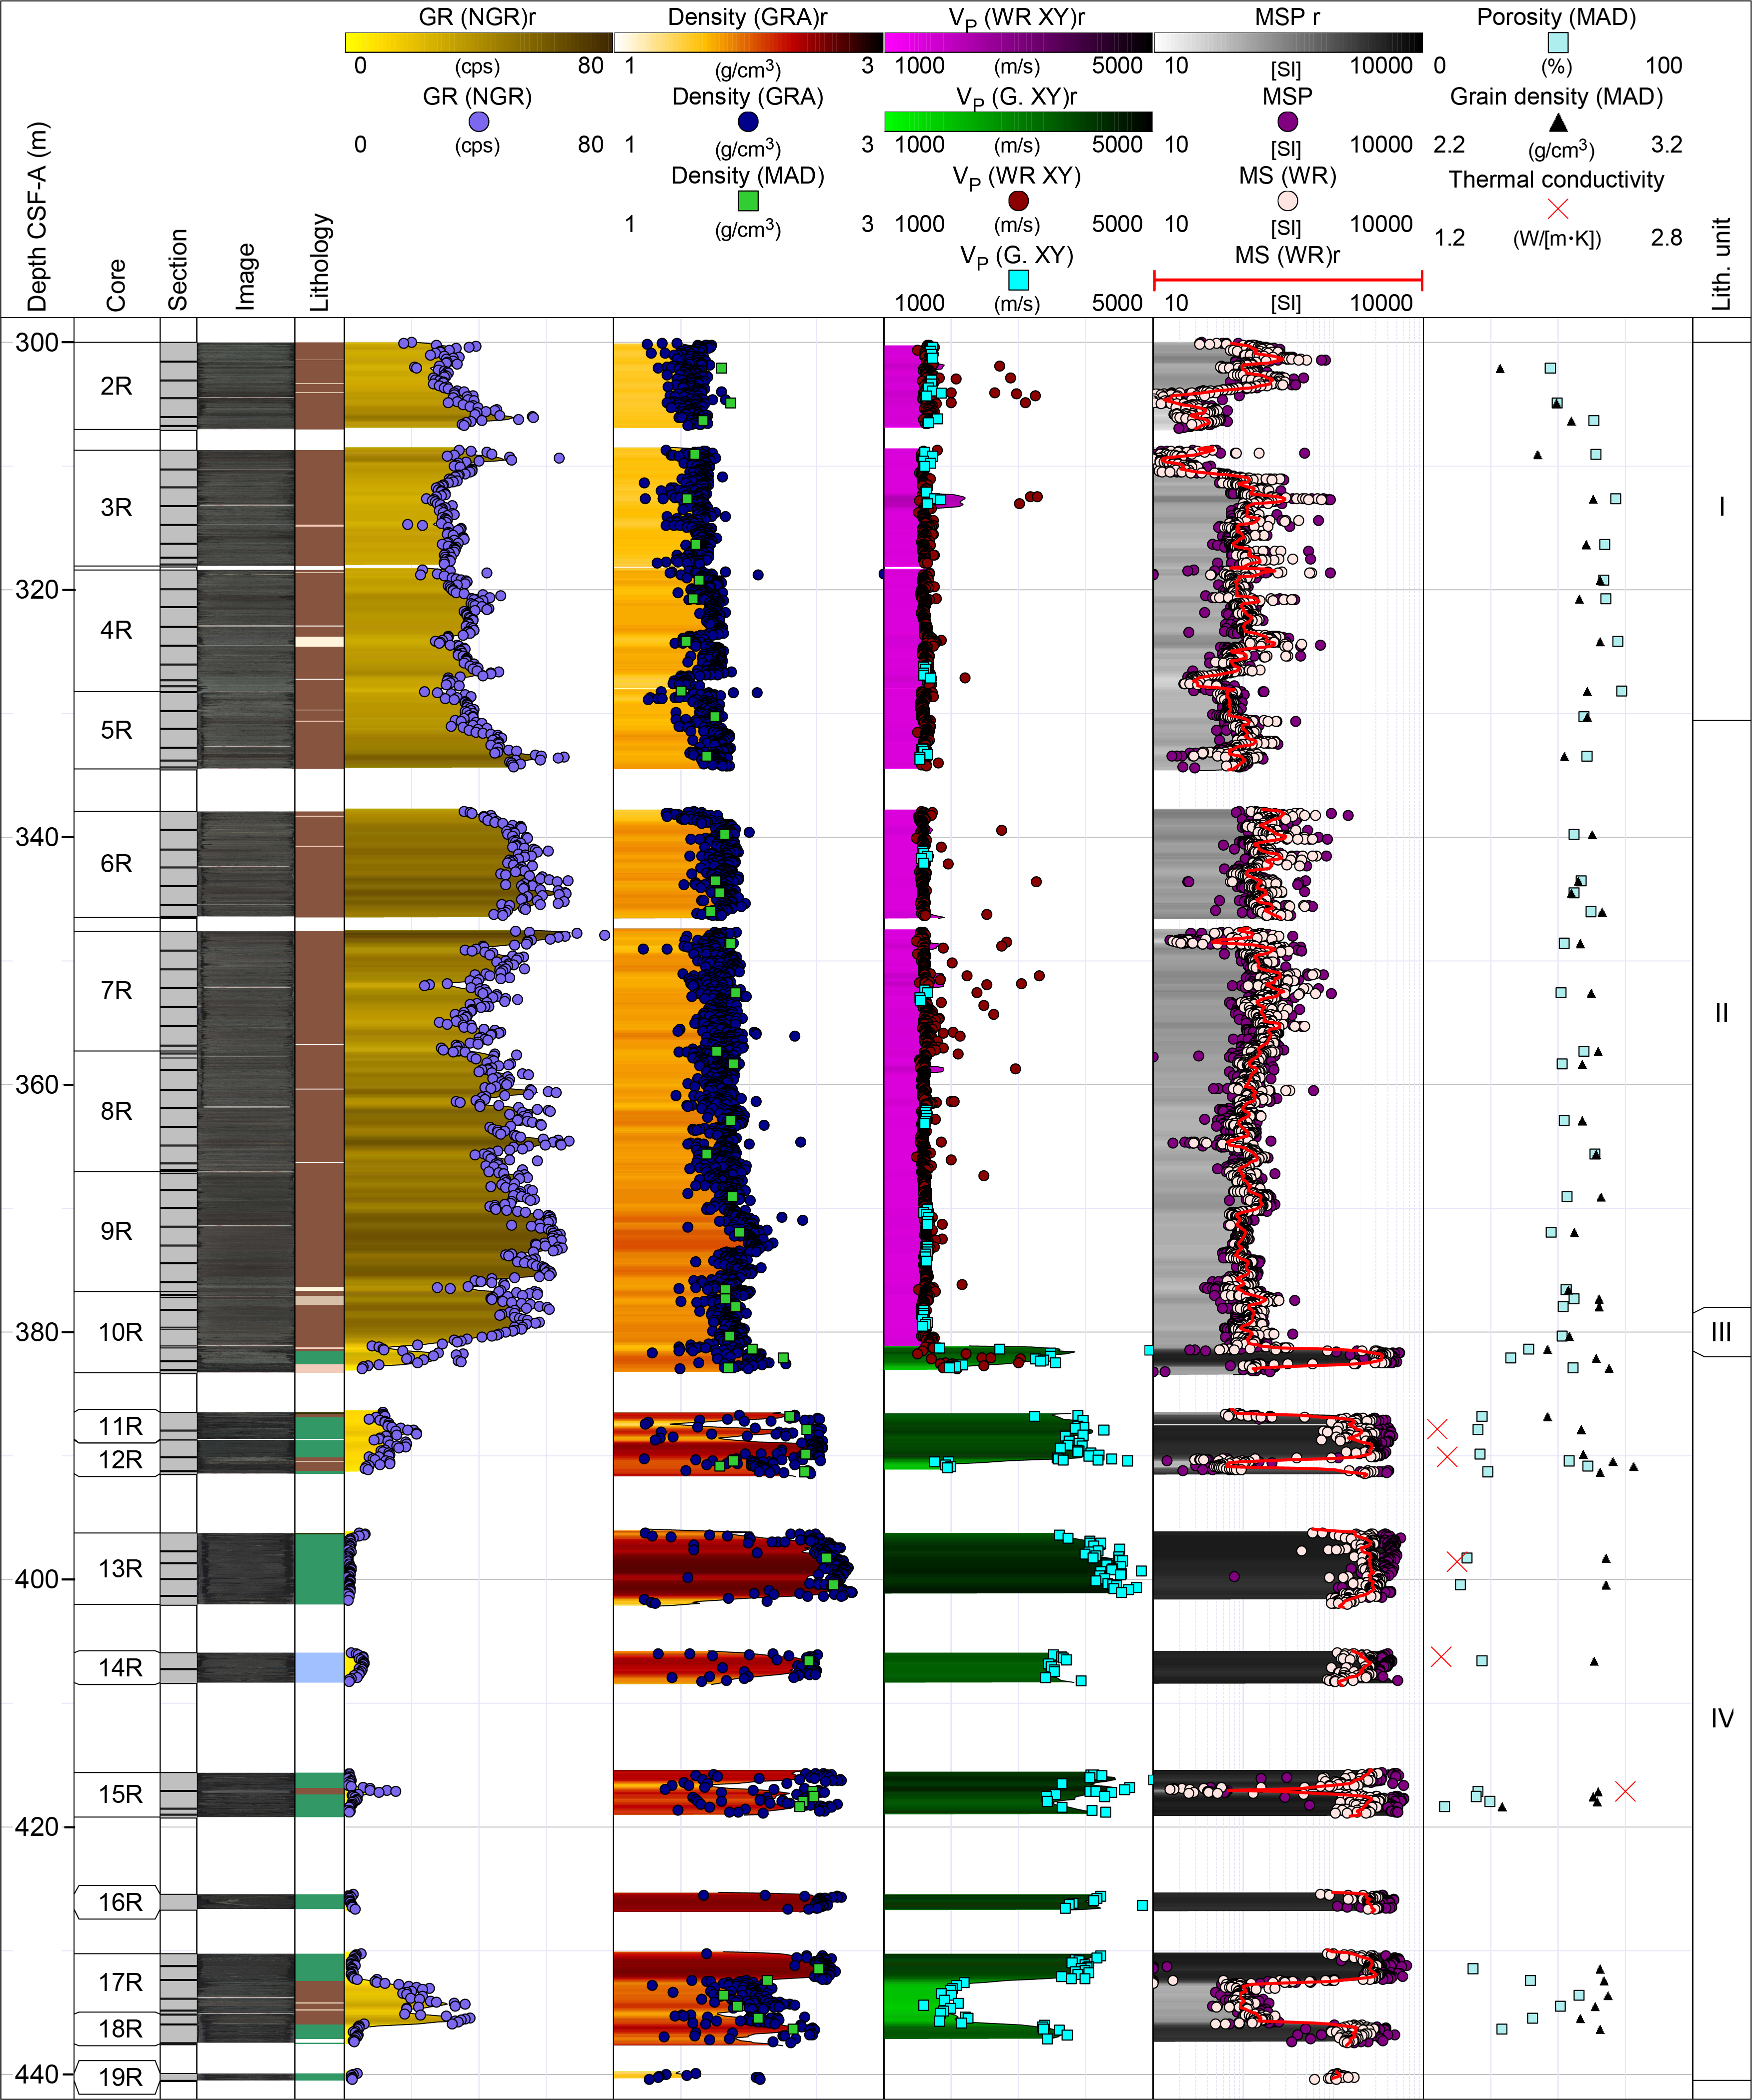
Figure F18. Physical properties summary.
7.1. Data summary and processing
The recovered rocks and sediments were characterized for their physical properties through a total of 3869 gamma ray attenuation (GRA) bulk density, 3834 MS, 2348 P-wave velocity (VP), and 1053 NGR whole-round measurements. In addition, eight thermal conductivity readings were taken on either whole-round (soft sediments) or section-half (hard sediments or basalts) cores, with as many as three readings for each measured interval. These were supplemented by 219 Section Half Measurement Gantry (SHMG) P-wave velocity measurements and 3666 point MS (MSP) measurements on the section-half cores, followed by analysis of 50 moisture and density (MAD) samples and 26 triaxial P-wave velocity measurements on discrete cubic hard rock samples.
Standard data reduction and screening procedures (see Physical properties in the Expedition 396 methods chapter [Planke et al., 2023a]) removed 253 GRA bulk density data points (158 within 1.5 cm of a bin liner, 95 with a lower cutoff of 1.2 g/cm3, and 12 with relative errors of >20%), 31 points from the P-wave velocity data sets (28 within 1.5 cm of a bin liner and 3 below a cutoff of 1480 m/s for the Whole-Round Multisensor Logger [WRMSL]), and 4 negative MS values.
7.2. Unit physical properties
The average bulk densities of the recovered sedimentary overburden (Lithostratigraphic Units I–III) steadily increases from ~1.6 g/cm3 at the top of the recovered section (~300 m CSF-A) to ~1.9 g/cm3 at the base of Unit IV (381.51 m CSF-A).
Unit I (300–330.59 m CSF-A) consists primarily of clay-rich siltstones, sandstones, and mudstones. It has an average GRA bulk density of 1.64 g/cm3, and the biggest deviation and increasing baseline shift (~0.1 g/cm3) occurs between Cores 396-U1573A-3R and 4R. Bulk densities derived from 11 discrete MAD samples (mean = 1.64 g/cm3) correlate well with the GRA bulk densities measured using the WRMSL. The grain densities of the sedimentary overburden are consistently high (average = 2.75 g/cm3). Porosity varies from 47% to 64% (mean = 73%). The WRMSL P-wave velocity of this layer (mean = ~1640 m/s) decreases slightly throughout the unit; it is highest throughout Core 2R (~1670 m/s). MS (mean = ~100 × 10−5 [SI]) and NGR (mean = 34 counts/s) follow inverse trends, which are best seen at 303–310 m CSF-A, where MS decreases to ~5 × 10⁻⁵ [SI] and NGR peaks above 50 counts/s.
The transition into ash-rich Unit II is associated with increased MS values and scatter throughout the ~330–357 m CSF-A interval, with MSP peaking at 1467 × 10−5 [SI] (mean = 135 × 10−5 [SI]) and gradually decreasing throughout the unit. NGR has a mean of 49 counts/s across the unit, with minima of 24 counts/s where average MS increases and maxima of 77 counts/s where average MS decreases. GRA bulk density increases from 1.7 g/cm3 at the top to close to 2.0 g/cm3 at the base of Unit II, corresponding reasonably well with discrete MAD analyses (1.82 g/cm3; n = 16). P-wave velocity remains fairly constant around the average of 1625 m/s, increasing locally by as much as 100 m/s.
Unit III, which comprises volcaniclastic mudstone with sand (378.47–381.51 m CSF-A), forms the transition into basaltic Unit IV. MS values and NGR are slightly lower than for Unit II at ~120 × 10−5 [SI] and 41 counts/s, respectively, although no change is observed in P-wave velocities and GRA bulk densities between the lowermost part of Unit II and Unit III.
Unit IV comprises basalt sequences and interbasaltic sediments (Figure F19). NGR is generally low (~2 counts/s), confirming the basaltic nature of much of the interval, but increases to ~6 counts/s over the basaltic andesite compositions (Core 396-U1573A-14R) and jumps to ~40 counts/s over the interbasaltic claystone sequences (e.g., Sections 17R-3 through 18R-1). MS values of the volcanic units (~1000 × 10−5 to 5000 × 10−5 [SI]) are over an order of magnitude higher than both the overlying sediments and the interlayered sediments (~2 × 10⁻⁵ to 200 × 10−5 [SI]). The average GRA bulk density of this unit is 2.28 g/cm3, which is in line with discrete MAD measurements (interbasaltic sediments = 1.79 g/cm3; basalts = 2.63 g/cm3; average = 2.26 g/cm3; n = 21). P-wave velocities range from ~2000 m/s over the clay-rich intervals to ~4400 m/s for basaltic flows. P-wave velocities and bulk densities are highest and most constrained for the interiors.
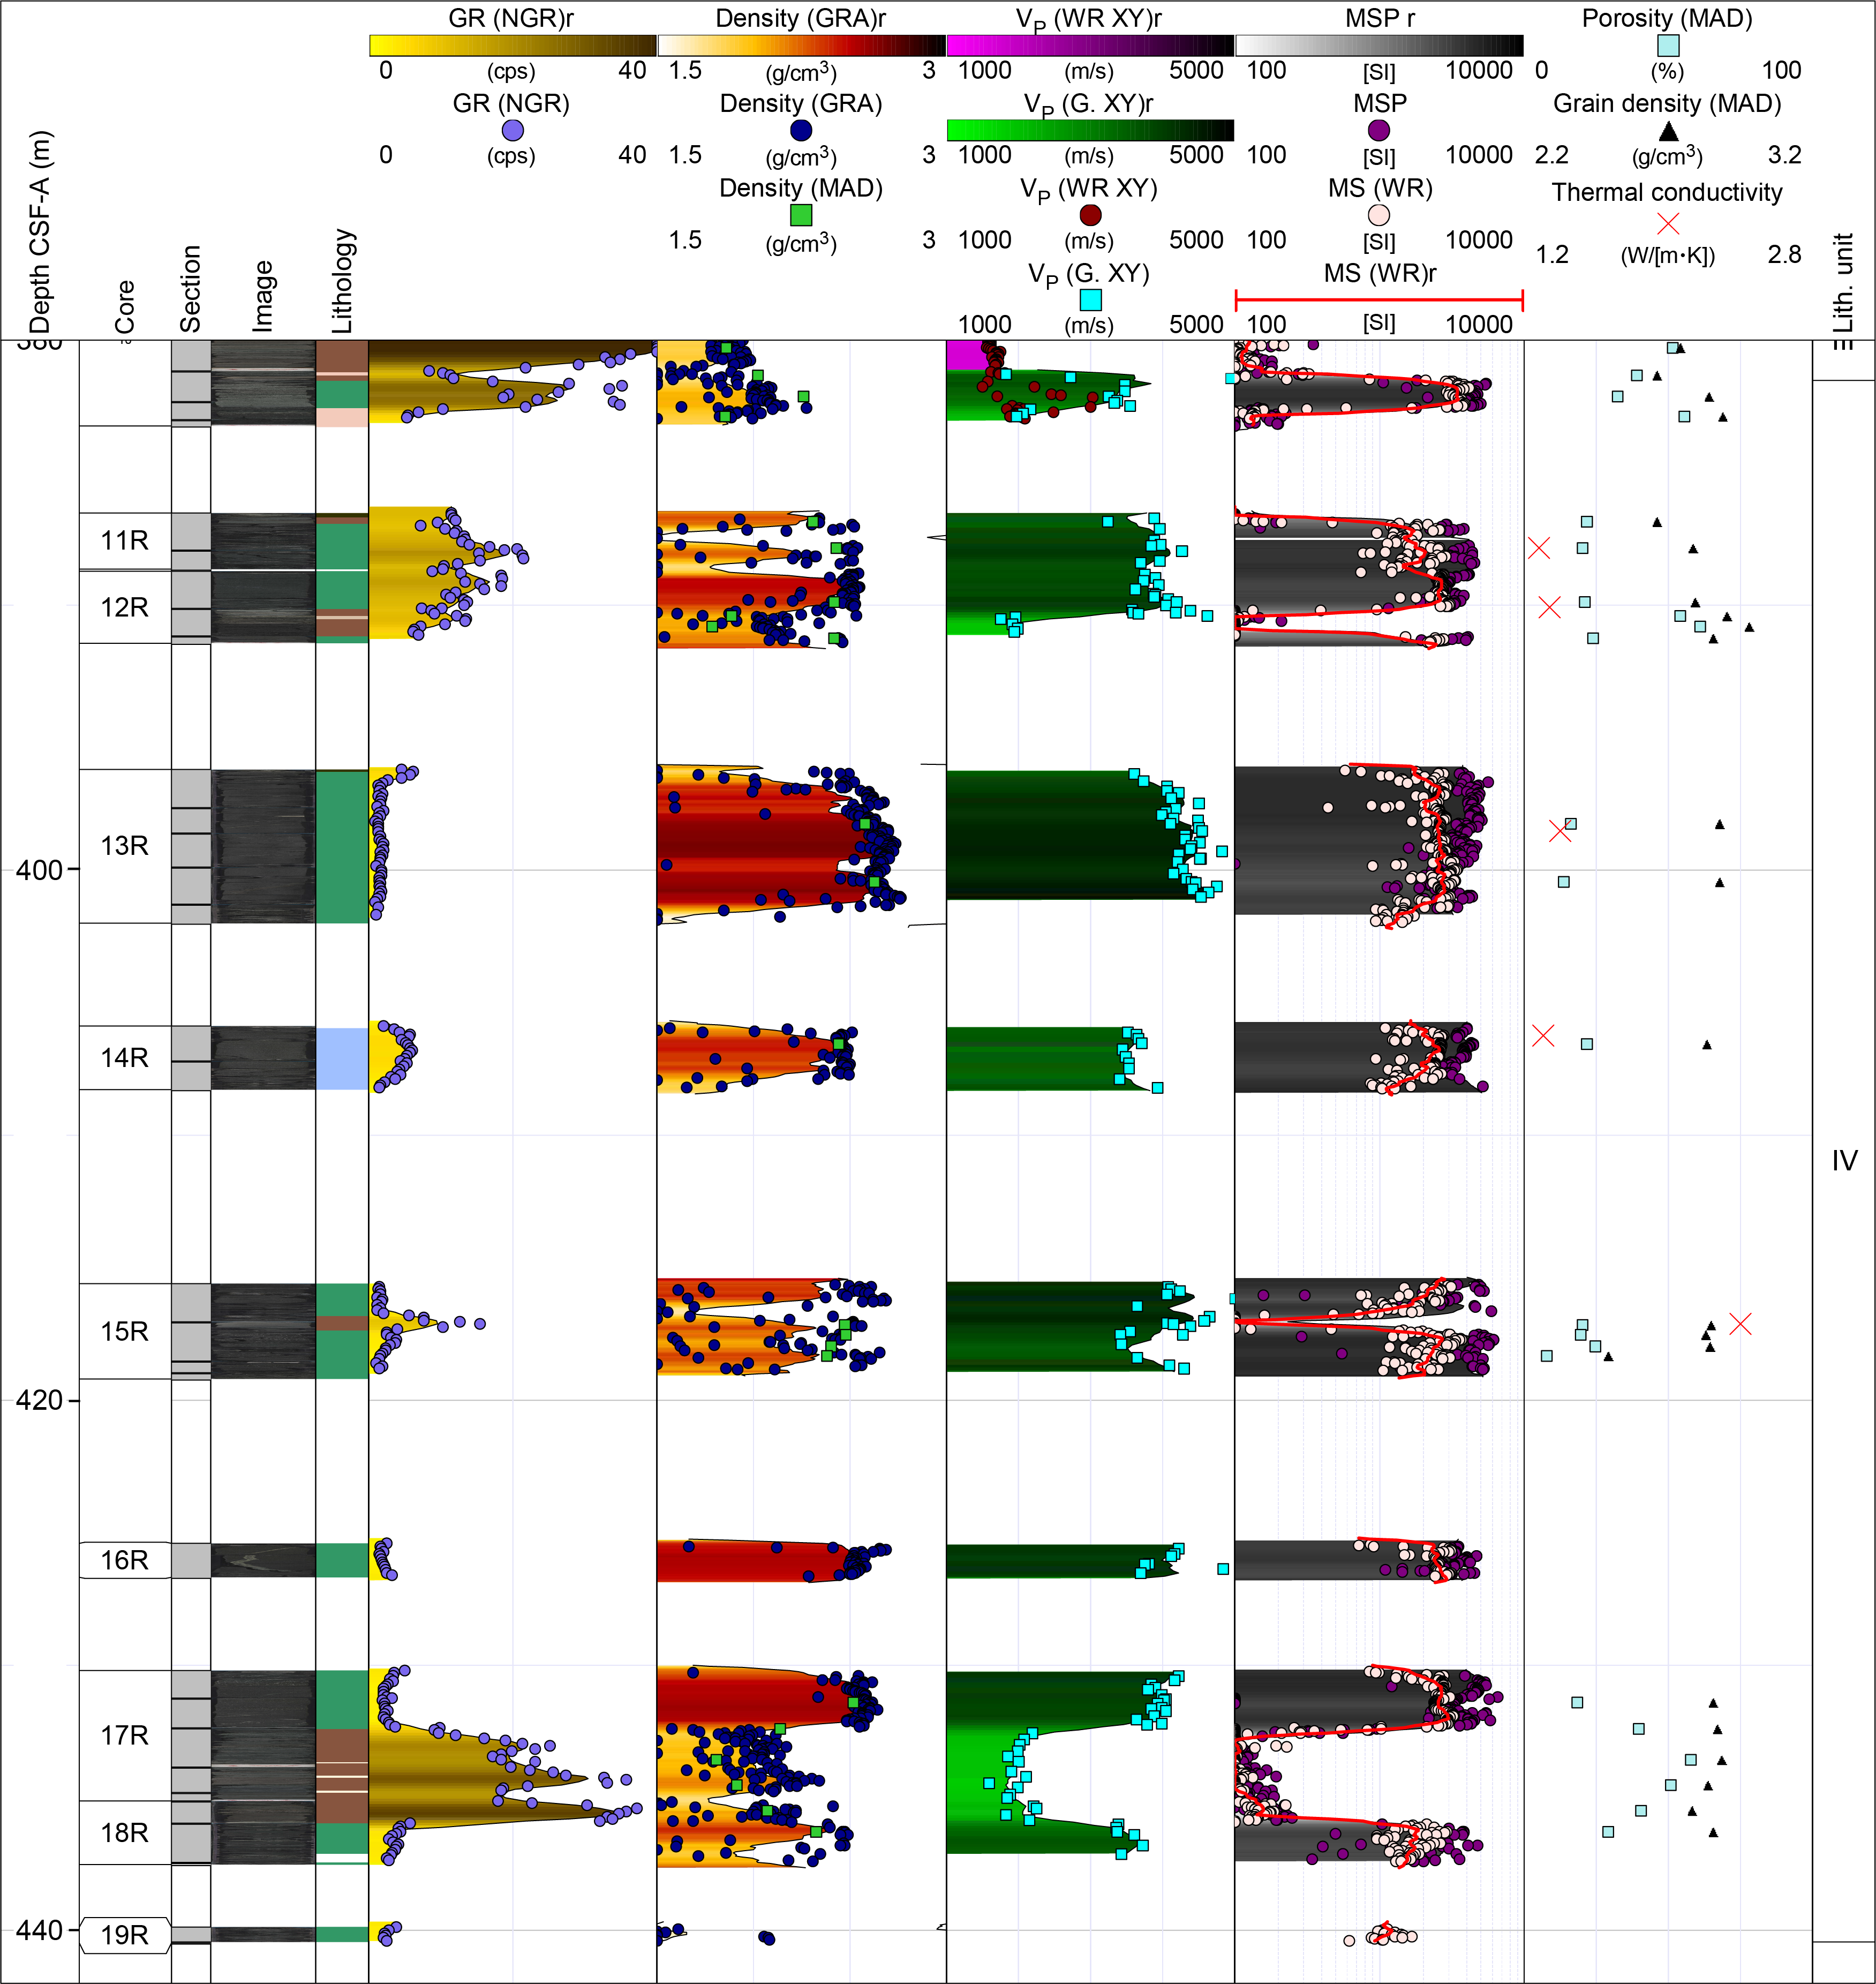
Figure F19. Unit IV physical properties measurements spanning the basaltic and interbasaltic sequences.
Basaltic andesite recovered in Core 396-U1573A-14R (~406–408 m CSF-A) was discretely sampled and yielded a grain density (2.84 g/cm3) slightly lower than that of the overlying aphyric basalt (2.88 g/cm3). P-wave velocities across the interval are generally lower (~3600 m/s) than for the overlying aphyric basalts, although these may partially relate to porosity differences (22% versus 14%).
Five thermal conductivity measurements of the basaltic samples were performed for the upper portion of this unit (Cores 396-U1573A-11R through 14R) (average = 1.55 W/[m·K]). Thermal conductivity measurements through the rest of this lithostratigraphic unit were not successful.
7.3. Summary
Measured core data reveal generally increasing density with depth consistent with increasing compaction for the recovered sedimentary overburden. Ash-rich intervals are associated with increased scatter in MS in the sedimentary section. The igneous basement reveals low NGR consistent with its basalt-dominated composition and has correspondingly high densities and velocities. A prominent sedimentary interbed near the base of the borehole (Cores 396-U1573A-17R and 18R) in Lithostratigraphic Unit IV reveals high NGR and considerably lower P-wave velocity (~2000 m/s) compared to the higher velocity basaltic flows (~4500 m/s) and reduced densities. A basaltic andesite interval reveals slightly elevated NGR compared to the basalt compositions and has slightly lower P-wave velocity (~3500 m/s), revealing physical properties indicators for compositional variations in the Inner SDR sequence.
References
Barke, J., Abels, H.A., Sangiorgi, F., Greenwood, D.R., Sweet, A.R., Donders, T., Reichart, G.-J., Lotter, A.F., and Brinkhuis, H., 2011. Orbitally forced Azolla blooms and middle Eocene Arctic hydrology: clues from palynology. Geology, 39(5):427–430. https://doi.org/
Berndt, C., Planke, S., Alvestad, E., Tsikalas, F., and Rasmussen, T., 2001. Seismic volcanostratigraphy of the Norwegian Margin: constraints on tectonomagmatic break-up processes. Journal of the Geological Society (London, UK), 158(3):413–426. https://doi.org/
Bijl, P.K., 2022. DINOSTRAT: a global database of the stratigraphic and paleolatitudinal distribution of Mesozoic–Cenozoic organic-walled dinoflagellate cysts. Earth System Science Data, 14(2):579–617. https://doi.org/
Breivik, A.J., Faleide, J.I., Mjelde, R., and Flueh, E.R., 2009. Magma productivity and early seafloor spreading rate correlation on the northern Vøring Margin, Norway — constraints on mantle melting. Tectonophysics, 468(1–4):206–223. https://doi.org/
Brinkhuis, H., Schouten, S., Collinson, M.E., Sluijs, A., Sinninghe Damsté, J.S., Dickens, G.R., Huber, M., Cronin, T.M., Onodera, J., Takahashi, K., Bujak, J.P., Stein, R., van der Burgh, J., Eldrett, J.S., Harding, I.C., Lotter, A.F., Sangiorgi, F., van Konijnenburg-van Cittert, H., de Leeuw, J.W., Matthiessen, J., Backman, J., and Moran, K., 2006. Episodic fresh surface waters in the Eocene Arctic Ocean. Nature, 441(7093):606–609. https://doi.org/
Bujak, J., and Mudge, D., 1994. A high-resolution North Sea Eocene dinocyst zonation. Journal of the Geological Society (London, UK), 151(3):449–462. https://doi.org/
Callegaro, S., Marzoli, A., Bertrand, H., Blichert-Toft, J., Reisberg, L., Cavazzini, G., Jourdan, F., Davies, J.H.F.L., Parisio, L., Bouchet, R., Paul, A., Schaltegger, U., and Chiaradia, M., 2017. Geochemical constraints provided by the Freetown Layered Complex (Sierra Leone) on the origin of high-Ti tholeiitic CAMP magmas. Journal of Petrology, 58(9):1811–1840. https://doi.org/
Chadima, M., and Hrouda, F., 2006. Remasoft 3.0 a user-friendly paleomagnetic data browser and analyzer. Travaux Géophysiques, 27:20–21.
Eldholm, O., Thiede, J., and Taylor, E., 1989. Evolution of the Vøring volcanic margin. In Eldholm, O., Thiede, J., Taylor, E., et al., Proceedings of the Ocean Drilling Program, Scientific Results. 104: College Station, TX (Ocean Drilling Program), 1033–1065. https://doi.org/
Eldrett, J.S., Harding, I.C., Firth, J.V., and Roberts, A.P., 2004. Magnetostratigraphic calibration of Eocene–Oligocene dinoflagellate cyst biostratigraphy from the Norwegian–Greenland Sea. Marine Geology, 204(1–2):91–127. https://doi.org/
Hembury, D.J., Palmer, M.R., Fones, G.R., Mills, R.A., Marsh, R., and Jones, M.T., 2012. Uptake of dissolved oxygen during marine diagenesis of fresh volcanic material. Geochimica et Cosmochimica Acta, 84:353–368. https://doi.org/
Jones, M.T., and Gislason, S.R., 2008. Rapid releases of metal salts and nutrients following the deposition of volcanic ash into aqueous environments. Geochimica et Cosmochimica Acta, 72(15):3661–3680. https://doi.org/
Le Maitre, R.W., 1989. A Classification of Igneous Rocks and Glossary of Terms: Boston (Blackwell).
Longman, J., Palmer, M.R., Gernon, T.M., and Manners, H.R., 2019. The role of tephra in enhancing organic carbon preservation in marine sediments. Earth-Science Reviews, 192:480–490. https://doi.org/
Lyons, T.W., Murray, R.W., and Pearson, D.G., 2000. A comparative study of diagenetic pathways in sediments of the Caribbean Sea: highlights from pore-water results. In Leckie, R.M., Sigurdsson, H., Acton, G.D., and Draper, G. (Eds.), Proceedings of the Ocean Drilling Program, Scientific Results, 165: College Station, TX (Ocean Drilling Program). https://doi.org/
Meyer, R., Hertogen, J., Pedersen, R.B., Viereck-Götte, L., and Abratis, M., 2009. Interaction of mantle derived melts with crust during the emplacement of the Vøring Plateau, N.E. Atlantic. Marine Geology, 261(1–4):3–16. https://doi.org/
Planke, S., Berndt, C., Alvarez Zarikian, C.A., Agarwal, A., Andrews, G.D.M., Betlem, P., Bhattacharya, J., Brinkhuis, H., Chatterjee, S., Christopoulou, M., Clementi, V.J., Ferré, E.C., Filina, I.Y., Frieling, J., Guo, P., Harper, D.T., Jones, M.T., Lambart, S., Longman, J., Millett, J.M., Mohn, G., Nakaoka, R., Scherer, R.P., Tegner, C., Varela, N., Wang, M., Xu, W., and Yager, S.L., 2023a. Expedition 396 methods. In Planke, S., Berndt, C., Alvarez Zarikian, C.A., and the Expedition 396 Scientists, Mid-Norwegian Margin Magmatism and Paleoclimate Implications. Proceedings of the International Ocean Discovery Program, 396: College Station, TX (International Ocean Discovery Program). https://doi.org/
Planke, S., Berndt, C., Alvarez Zarikian, C.A., Agarwal, A., Andrews, G.D.M., Betlem, P., Bhattacharya, J., Brinkhuis, H., Chatterjee, S., Christopoulou, M., Clementi, V.J., Ferré, E.C., Filina, I.Y., Frieling, J., Guo, P., Harper, D.T., Jones, M.T., Lambart, S., Longman, J., Millett, J.M., Mohn, G., Nakaoka, R., Scherer, R.P., Tegner, C., Varela, N., Wang, M., Xu, W., and Yager, S.L., 2023b. Sites U1571 and U1572. In Planke, S., Berndt, C., Alvarez Zarikian, C.A., and the Expedition 396 Scientists, Mid-Norwegian Margin Magmatism and Paleoclimate Implications. Proceedings of the International Ocean Discovery Program, 396: College Station, TX (International Ocean Discovery Program). https://doi.org/
Seyfried, W.E., and Bischoff, J.L., 1979. Low temperature basalt alteration by sea water: an experimental study at 70°C and 150°C. Geochimica et Cosmochimica Acta, 43(12):1937–1947. https://doi.org/
Seyfried, W.E., and Mottl, M.J., 1982. Hydrothermal alteration of basalt by seawater under seawater-dominated conditions. Geochimica et Cosmochimica Acta, 46(6):985–1002. https://doi.org/
Shervais, J.W., 1982. Ti-V plots and the petrogenesis of modern and ophiolitic lavas. Earth and Planetary Science Letters, 59(1):101–118. https://doi.org/
Talwani, M., Udintsev, G., et al., 1976. Initial Reports of the Deep Sea Drilling Project, 38: Washington, DC (US Government Printing Office). https://doi.org/
Tegner, C., Lesher, C.E., Larsen, L.M., and Watt, W.S., 1998. Evidence from the rare-earth-element record of mantle melting for cooling of the Tertiary Iceland plume. Nature, 395(6702):591–594. https://doi.org/
Tsikalas, F., Faleide, J.I., and Kusznir, N.J., 2008. Along-strike variations in rifted margin crustal architecture and lithosphere thinning between northern Vøring and Lofoten margin segments off mid-Norway. Tectonophysics, 458(1–4):68–81. https://doi.org/
Tsikalas, F., Inge Faleide, J., and Eldholm, O., 2001. Lateral variations in tectono-magmatic style along the Lofoten–Vesterålen volcanic margin off Norway. Marine and Petroleum Geology, 18(7):807–832. https://doi.org/
Zijderveld, J.D.A., 2013. A. C. demagnetization of rocks: analysis of results. In Collinson, D.W., Creer, K.M., and Runcorn, S.K. (Eds.), Methods in Paleomagnetism. Developments in Solid Earth Geophysics, 3: New York (Elsevier), 254–286. https://doi.org/