Hodell, D.A., Abrantes, F., Alvarez Zarikian, C.A., and the Expedition 397 Scientists
Proceedings of the International Ocean Discovery Program Volume 397
publications.iodp.org
https://doi.org/10.14379/iodp.proc.397.105.2024
Site U13851
![]() D.A. Hodell,
D.A. Hodell,
![]() F. Abrantes,
F. Abrantes,
![]() C.A. Alvarez Zarikian,
C.A. Alvarez Zarikian,
![]() H.L. Brooks,
H.L. Brooks,
![]() W.B. Clark,
W.B. Clark,
![]() L.F.B. Dauchy-Tric,
L.F.B. Dauchy-Tric,
![]() V. dos Santos Rocha,
V. dos Santos Rocha,
![]() J.-A. Flores,
J.-A. Flores,
![]() T.D. Herbert,
T.D. Herbert,
![]() S.K.V. Hines,
S.K.V. Hines,
![]() H.-H.M. Huang,
H.-H.M. Huang,
![]() H. Ikeda,
H. Ikeda,
![]() S. Kaboth-Bahr,
S. Kaboth-Bahr,
![]() J. Kuroda,
J. Kuroda,
![]() J.M. Link,
J.M. Link,
![]() J.F. McManus,
J.F. McManus,
![]() B.A. Mitsunaga,
B.A. Mitsunaga,
![]() L. Nana Yobo,
L. Nana Yobo,
![]() C.T. Pallone,
C.T. Pallone,
![]() X. Pang,
X. Pang,
![]() M.Y. Peral,
M.Y. Peral,
![]() E. Salgueiro,
E. Salgueiro,
![]() S. Sanchez,
S. Sanchez,
![]() K. Verma,
K. Verma,
![]() J. Wu,
J. Wu,
![]() C. Xuan, and
C. Xuan, and
![]() J. Yu2
J. Yu2
1 Hodell, D.A., Abrantes, F., Alvarez Zarikian, C.A., Brooks, H.L., Clark, W.B., Dauchy-Tric, L.F.B., dos Santos Rocha, V., Flores, J.-A., Herbert, T.D., Hines, S.K.V., Huang, H.-H.M., Ikeda, H., Kaboth-Bahr, S., Kuroda, J., Link, J.M., McManus, J.F., Mitsunaga, B.A., Nana Yobo, L., Pallone, C.T., Pang, X., Peral, M.Y., Salgueiro, E., Sanchez, S., Verma, K., Wu, J., Xuan, C., and Yu, J., 2024. Site U1385. In Hodell, D.A., Abrantes, F., Alvarez Zarikian, C.A., and the Expedition 397 Scientists, Iberian Margin Paleoclimate. Proceedings of the International Ocean Discovery Program, 397: College Station, TX (International Ocean Discovery Program). https://doi.org/10.14379/iodp.proc.397.105.2024
2 Expedition 397 Scientists' affiliations.
1. Background and objectives
During Expedition 339, Site U1385 (37°34.2849′N, 10°7.5616′W) was drilled to a maximum penetration of 151.5 meters below seafloor (mbsf) (Expedition 339 Scientists, 2013) (Figure F1). Site U1385 was a proof of concept to test the continuity and fidelity of the sedimentary record and to support further drilling on the Iberian margin. Results from Site U1385 demonstrated the great promise of the Iberian margin to yield long, continuous records of millennial climate variability (MCV) and detailed land-sea comparisons. Almost exactly 11 y later, we reoccupied Site U1385 (37°34.0128′N, 10°7.6580′W) during Expedition 397 to deepen the sequence. We elected to retain the same site designation, beginning with Hole U1385F, and distinguish the two sites as Site 339-U1385 and Site 397-U1385. Site 397-U1385 is located <1 km southwest of Site 339-U1385 (Figure F2), and seismic data indicate the stratigraphy is continuous between the two locations.
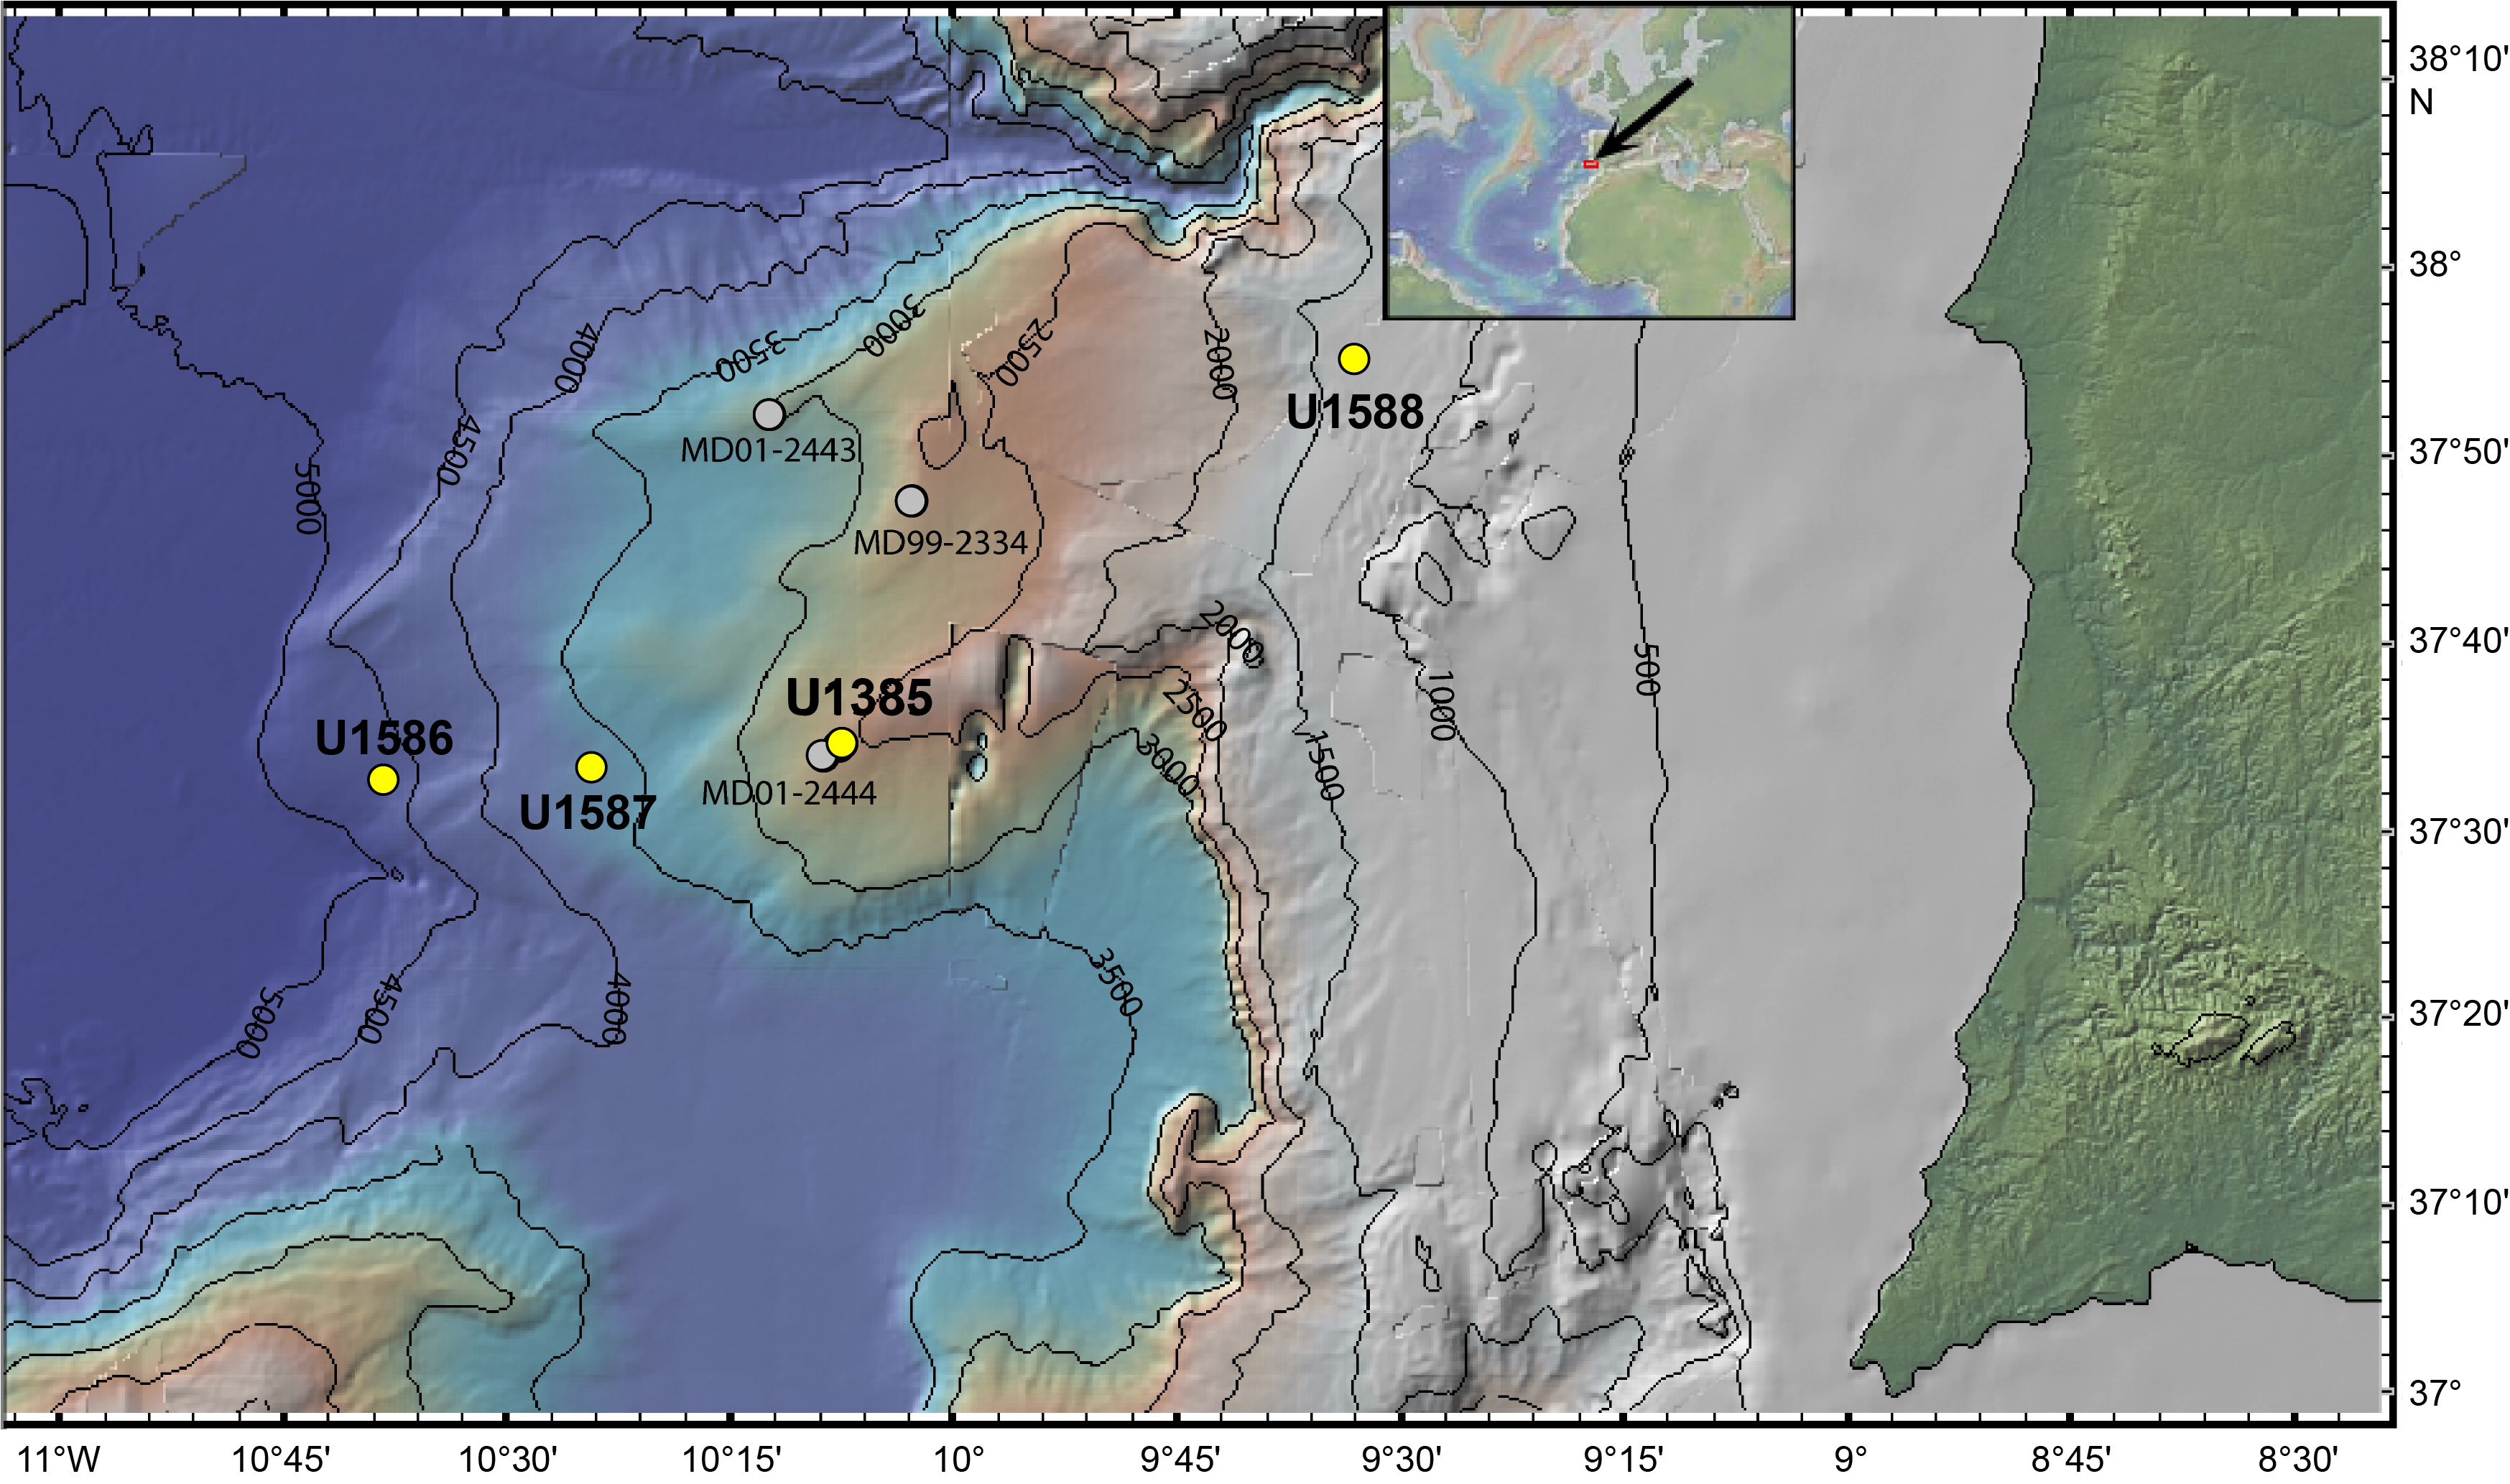
Figure F1. Site U1385.
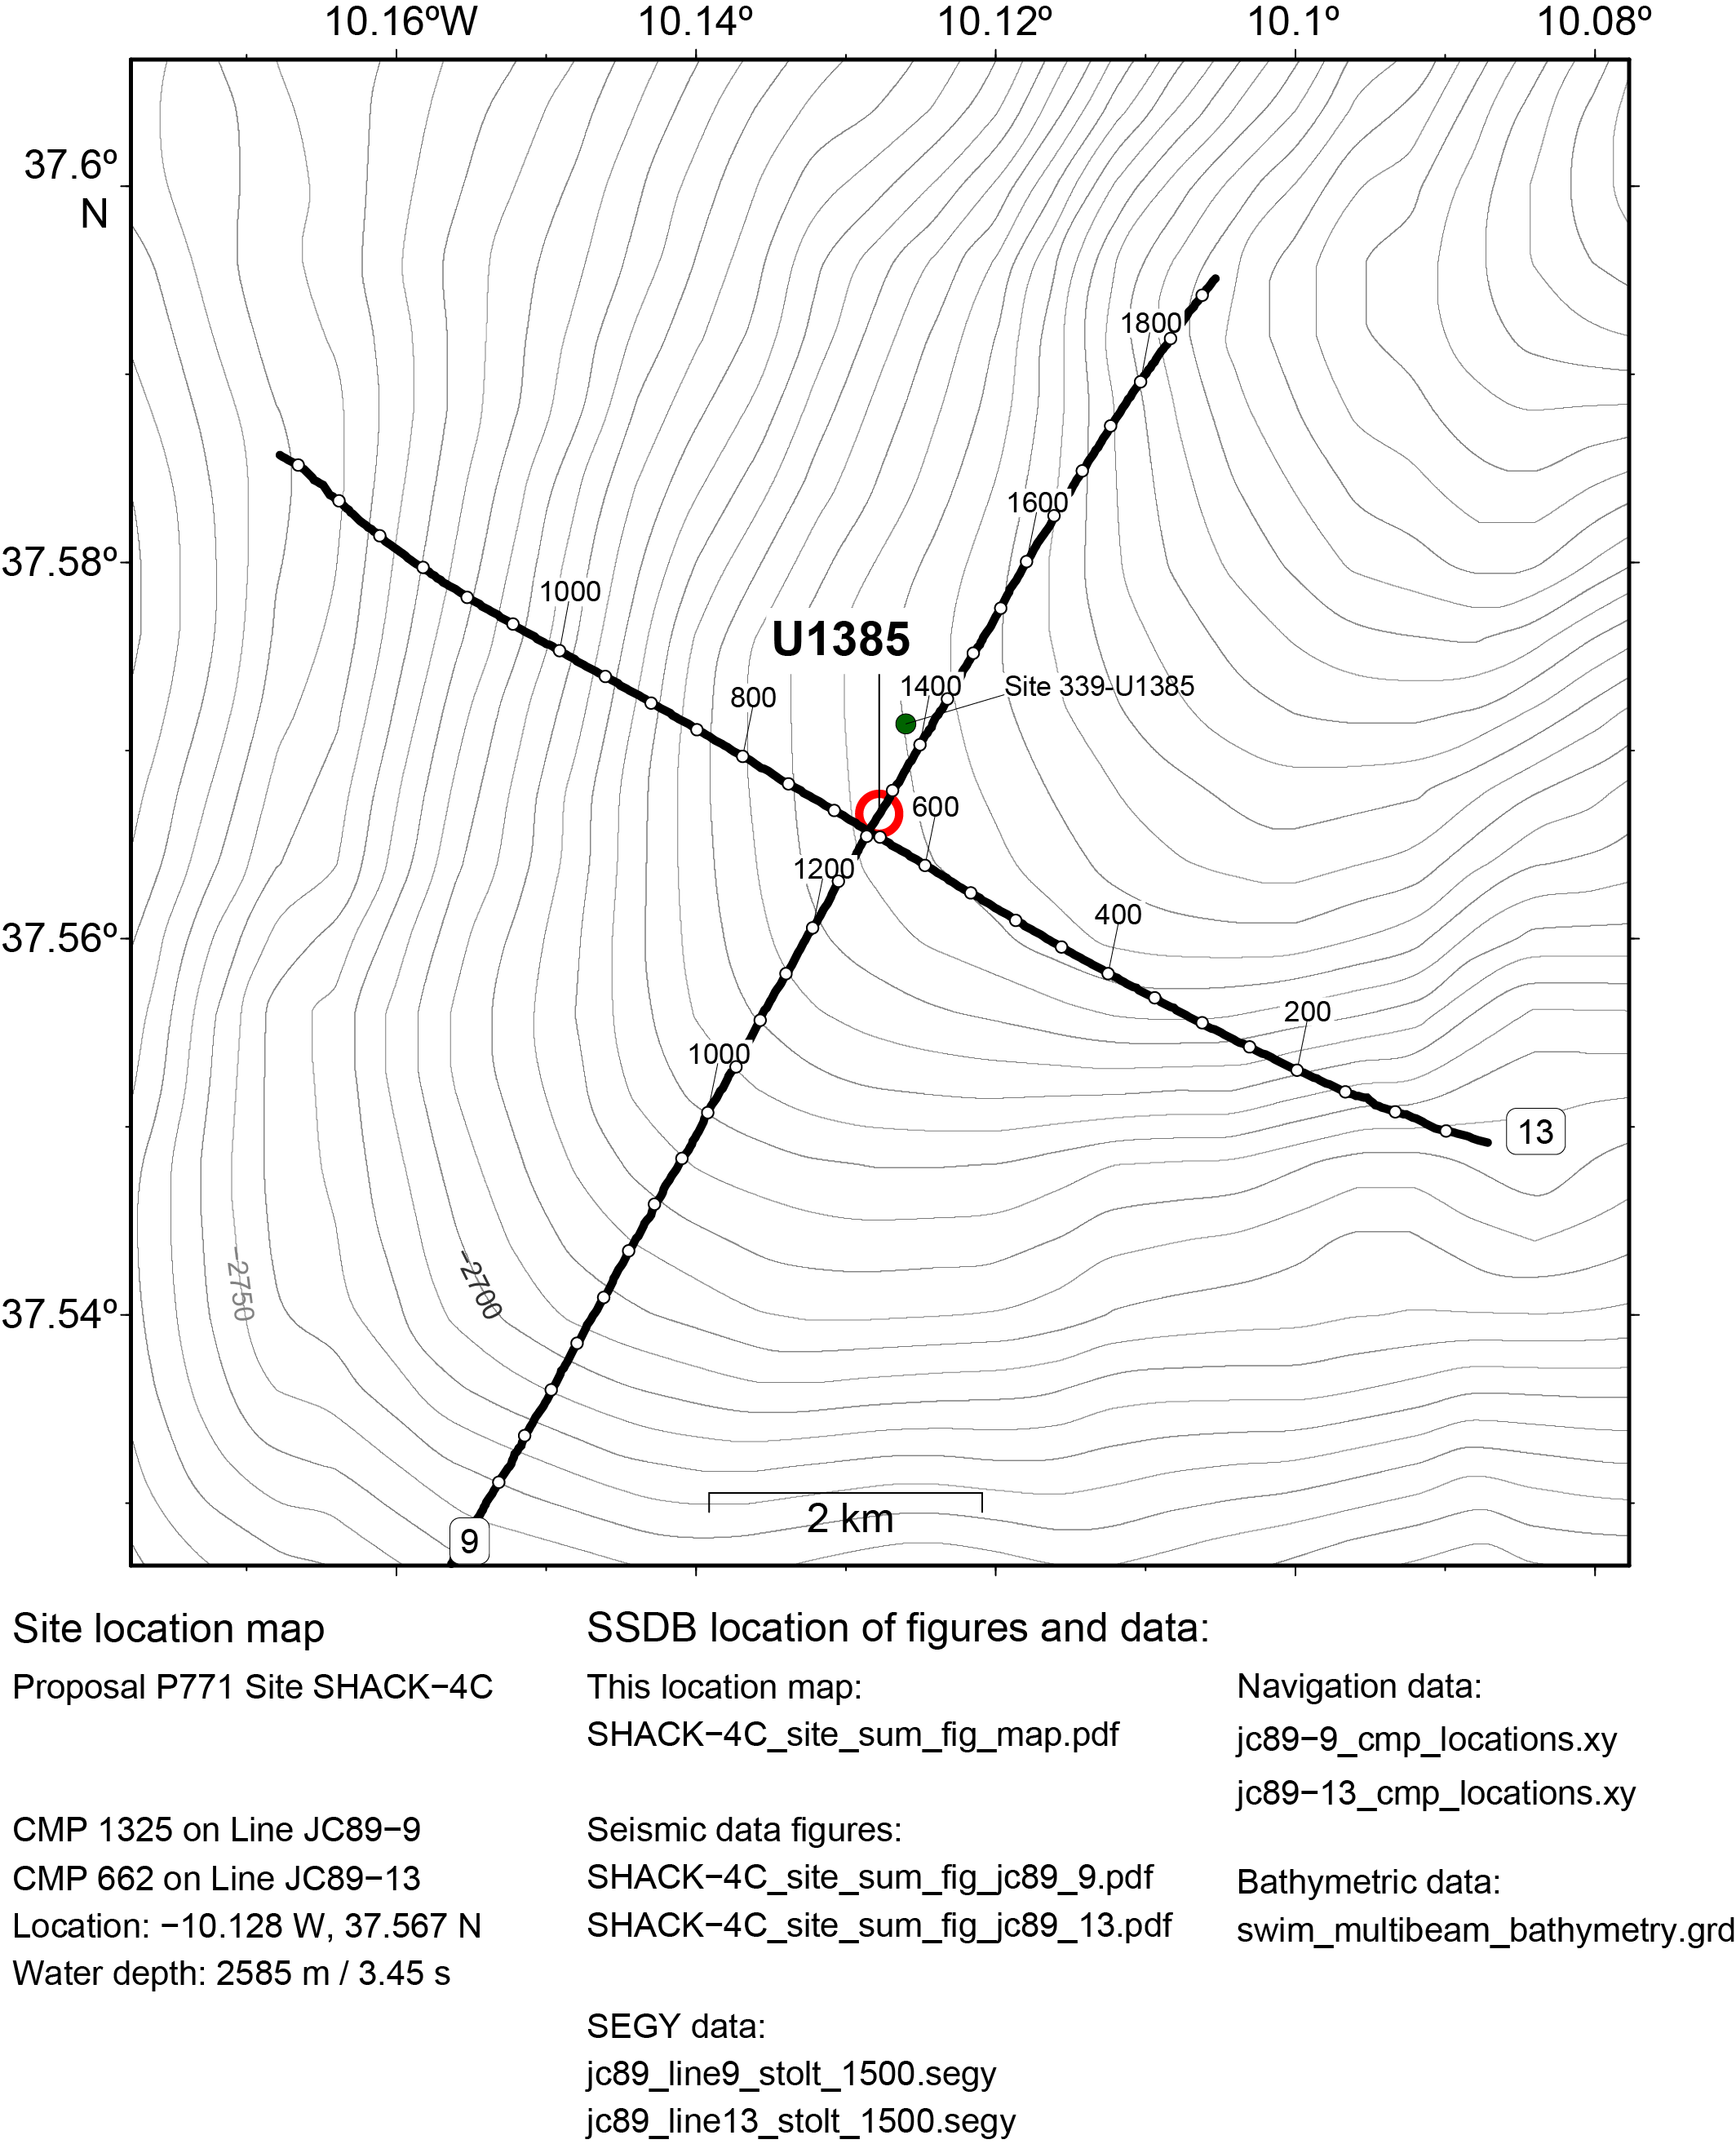
Figure F2. Seismic Lines 9 and 13.
On 25–29 November 2011, Site 339-U1385 was drilled in the lower slope of the Portuguese margin to provide a marine reference section of Pleistocene MCV. Five holes were cored (Holes U1385A–U1385E) using the advanced piston corer (APC) system (Figure F3) (Expedition 339 Scientists, 2013). Hole U1385C consisted of a single core in an attempt to retrieve the mudline. With only 4 days of drilling for Site 339-U1385, we were only able to drill to a maximum depth of 156 mbsf. A composite section was constructed using all holes to 166.5 corrected revised meters composite depth (crmcd) by correlating elemental ratios (Ca/Ti) measured by core scanning X-ray fluorescence (XRF) at 1 cm resolution (Hodell et al., 2015). For Site 397-U1385, we eventually intend to correlate the top part of the section to the holes drilled during Expedition 339 and provide an integrated composite reference splice (Hodell et al., 2015). This will permit isotope and other proxy measurements from existing Expedition 339 Holes U1385A–U1385E to be integrated with new data from Expedition 397 Holes U1385F–U1385J.
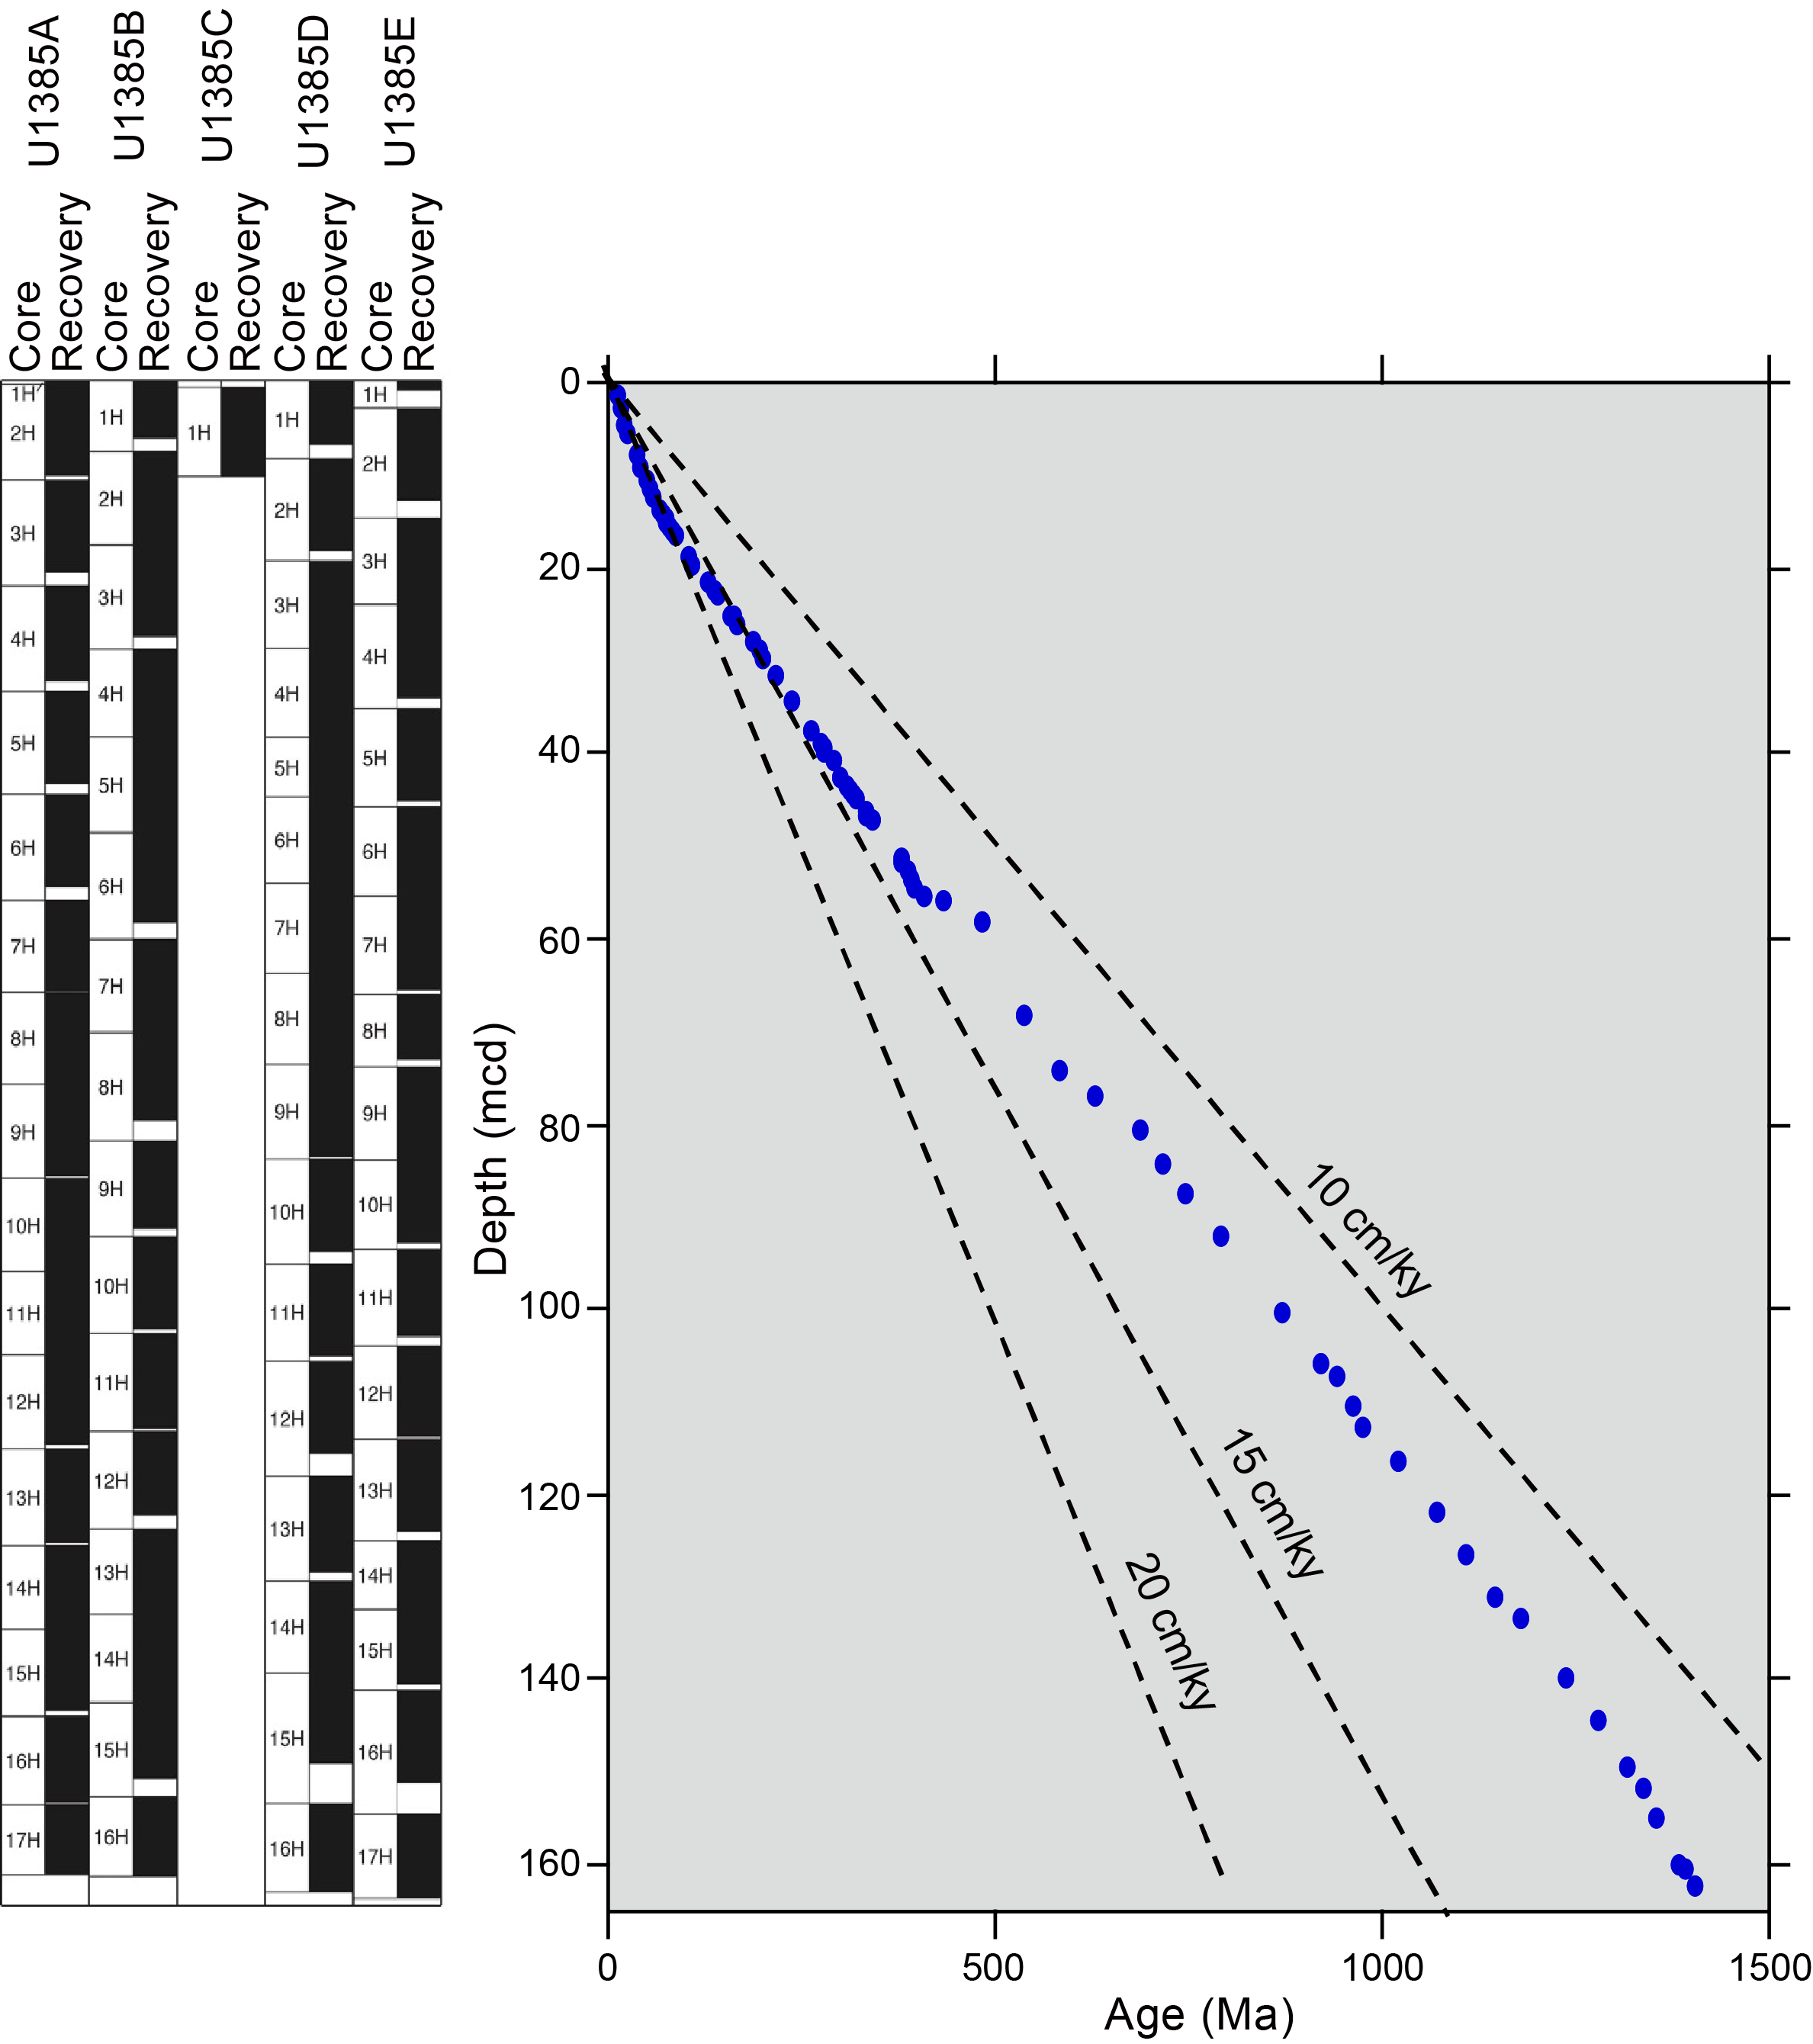
Figure F3. Core recovery and age depth.
The Site 339-U1385 record extends to 1.45 Ma (Marine Isotope Stage [MIS] 47) with an average sedimentation rate of 11 cm/ky (Figures F3, F4). Sedimentation rates are expected to be similar throughout the Quaternary. The record is mostly complete except for a short hiatus at Termination V that has removed part of late MIS 12 and early MIS 11. It is hoped that drilling at the new location of Site 397-U1385 would avoid this hiatus and provide a continuous sequence, filling the gap at Site 339-U1385.
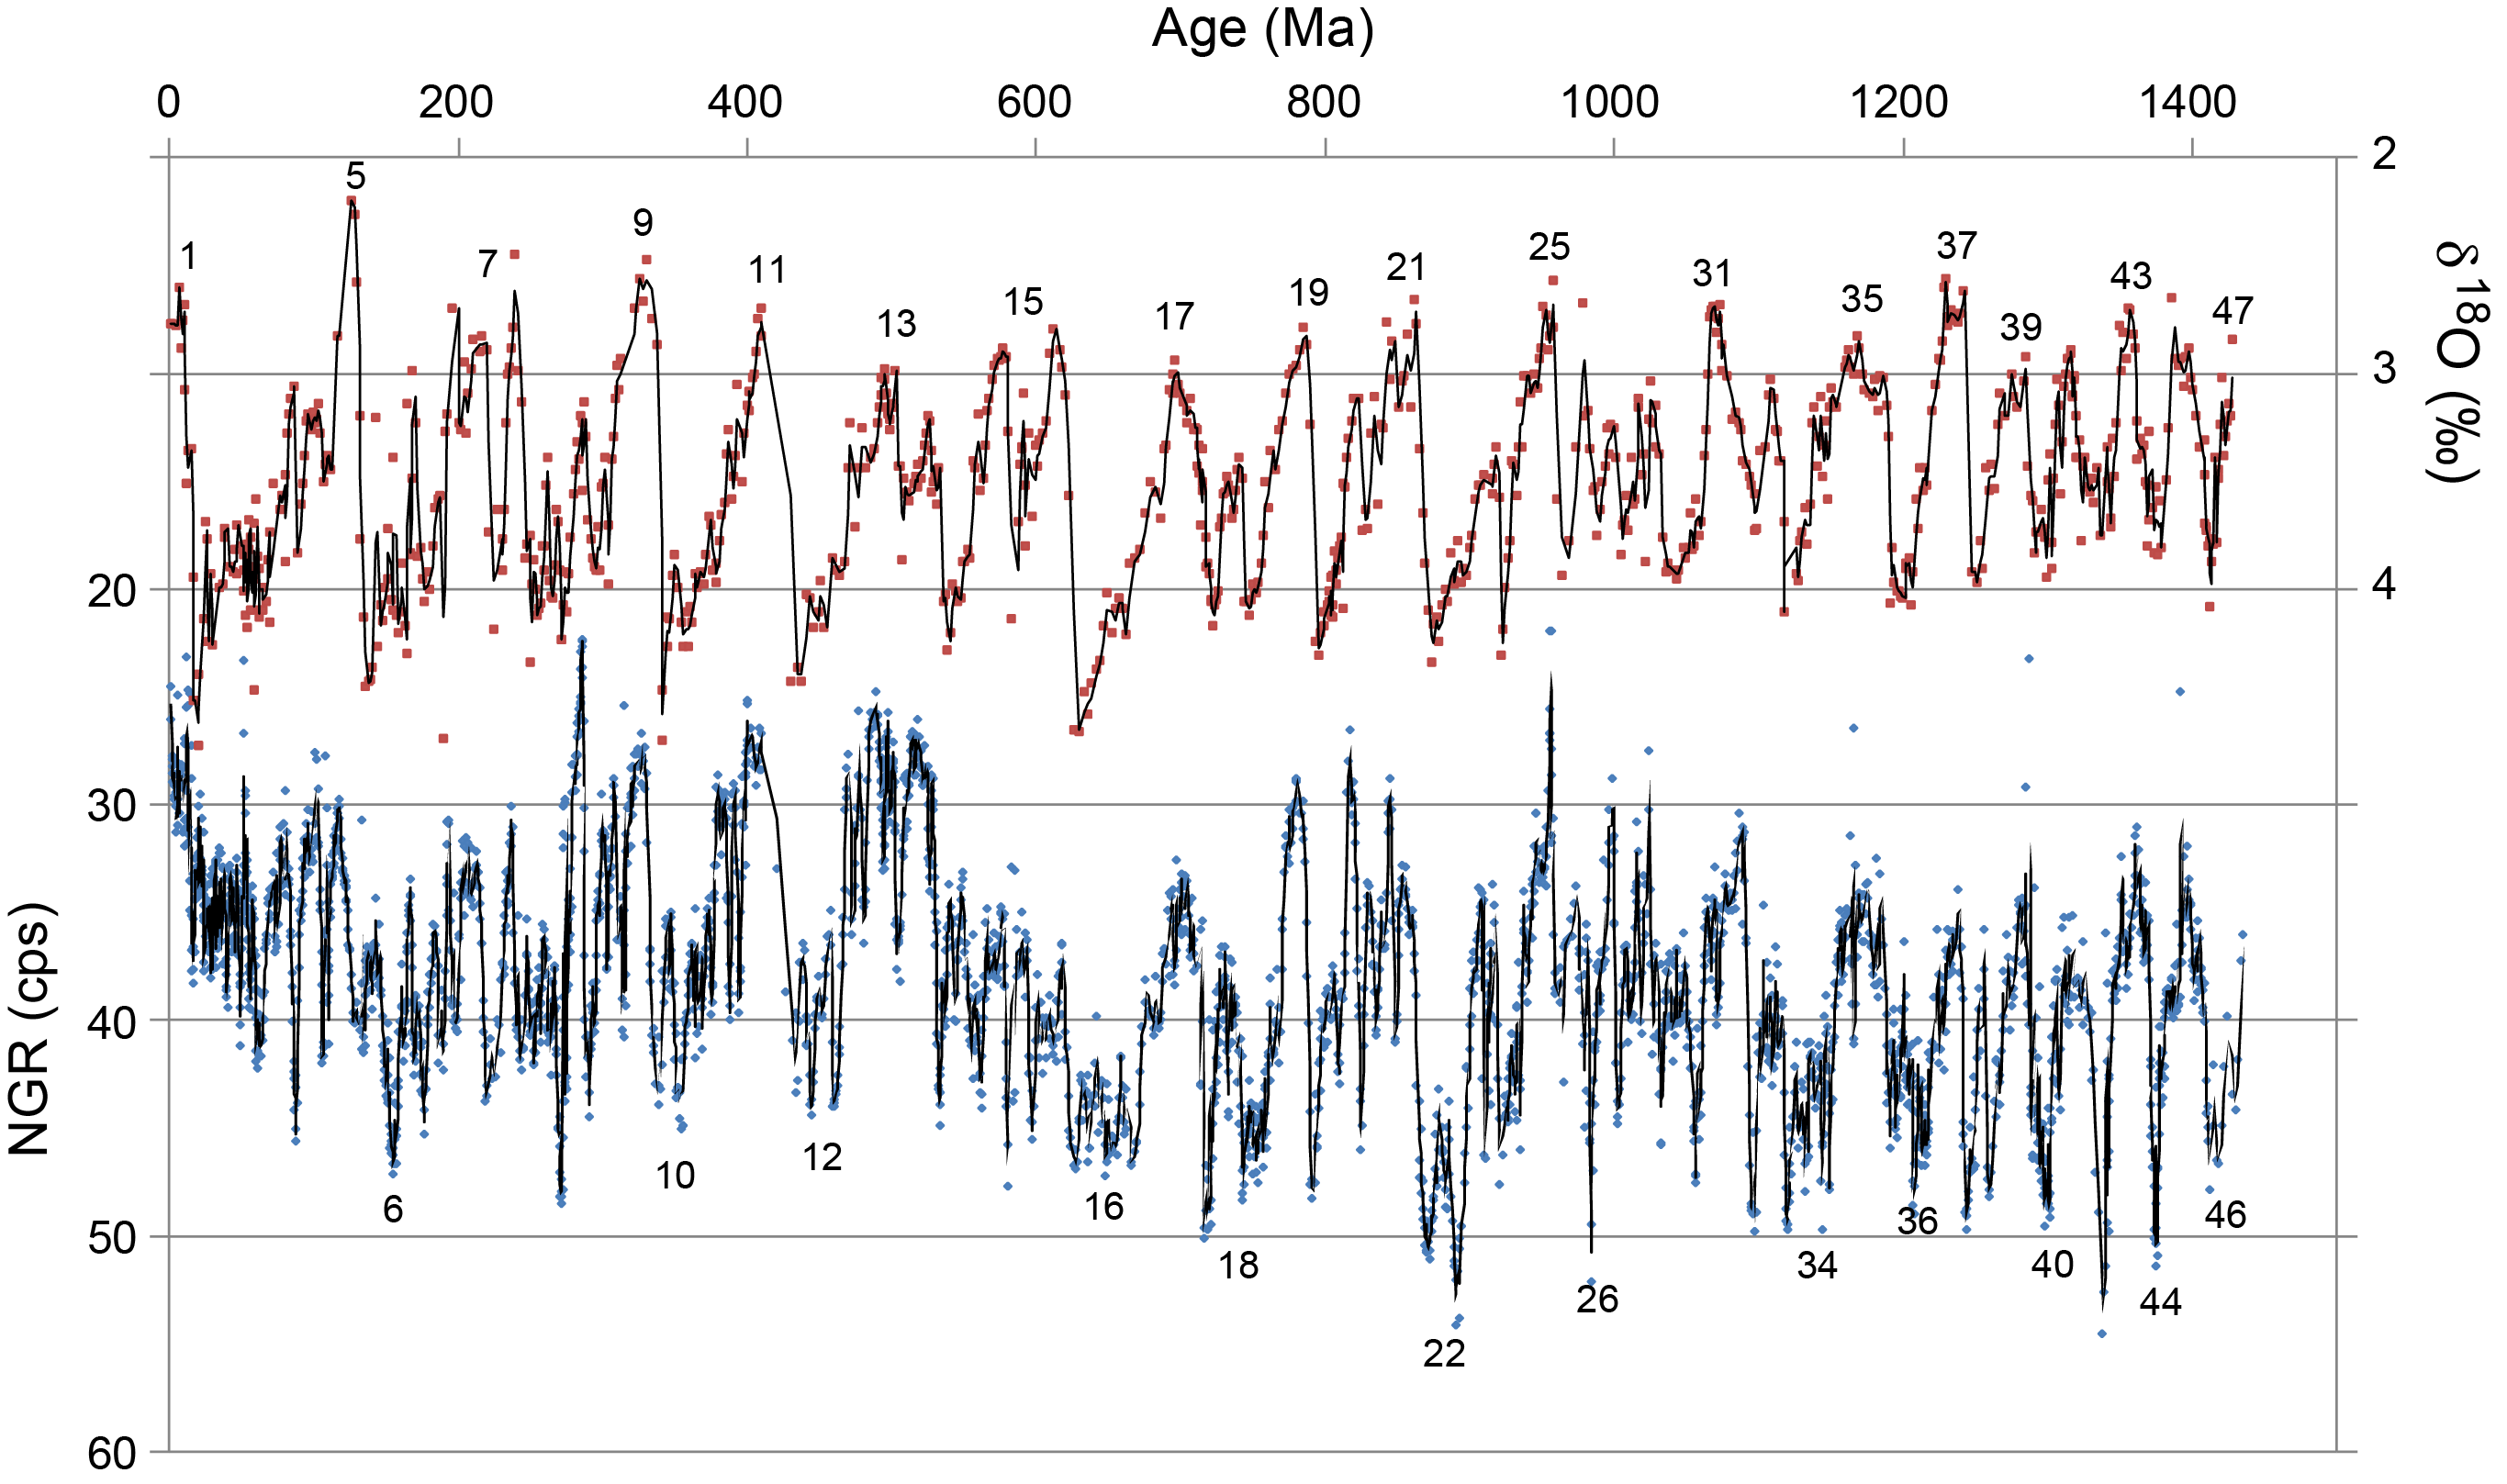
Figure F4. Benthic oxygen isotope record.
Because the existing working halves of Expedition 339 Holes U1385A–U1385E have been largely depleted to meet intense sampling demand, the uppermost 150 m were duplicated at Site 397-U1385 to provide additional sediment for future studies. Site 339-U1385 has been studied extensively since it was recovered over a decade ago (see the Expedition 339 Expedition-related bibliography [Stow, Hernández-Molina, Alvarez Zarikian, and the Expedition 339 Scientists, 2013]) and has provided a high-resolution benchmark record of MCV for the past 1.45 My (Hodell et al., 2023). Extending this remarkable sediment archive further back in time was the primary goal of reoccupying Site U1385 during Expedition 397.
Site 397-U1385 is located ~1 km southwest of Expedition 339 Site U1385 at a water depth of 2591 meters below sea level (mbsl), placing it in the core of Lower Northeast Atlantic Deep Water (LNEADW) today (Figure F5). It is the second shallowest site along the Expedition 397 bathymetric transect (paleo-conductivity-temperature-depth [paleo-CTD]) (Figure F6) and is located along an elevated ridge (Figure F7), thereby decreasing the chances of disturbance by downslope transport. It is located on Seismic Line JC089-9 close to the intersection of Seismic Line JC089-13 (Figure F2) and near the position of Piston Core MD01-2444 (Figure F1). The objective is to recover the deeper part of the section below Site 339-U1385 to the base of the Pliocene (orange reflector) at 400 mbsf (Figures F8, F9), which will more than double the section recovered at Site 339-U1385.
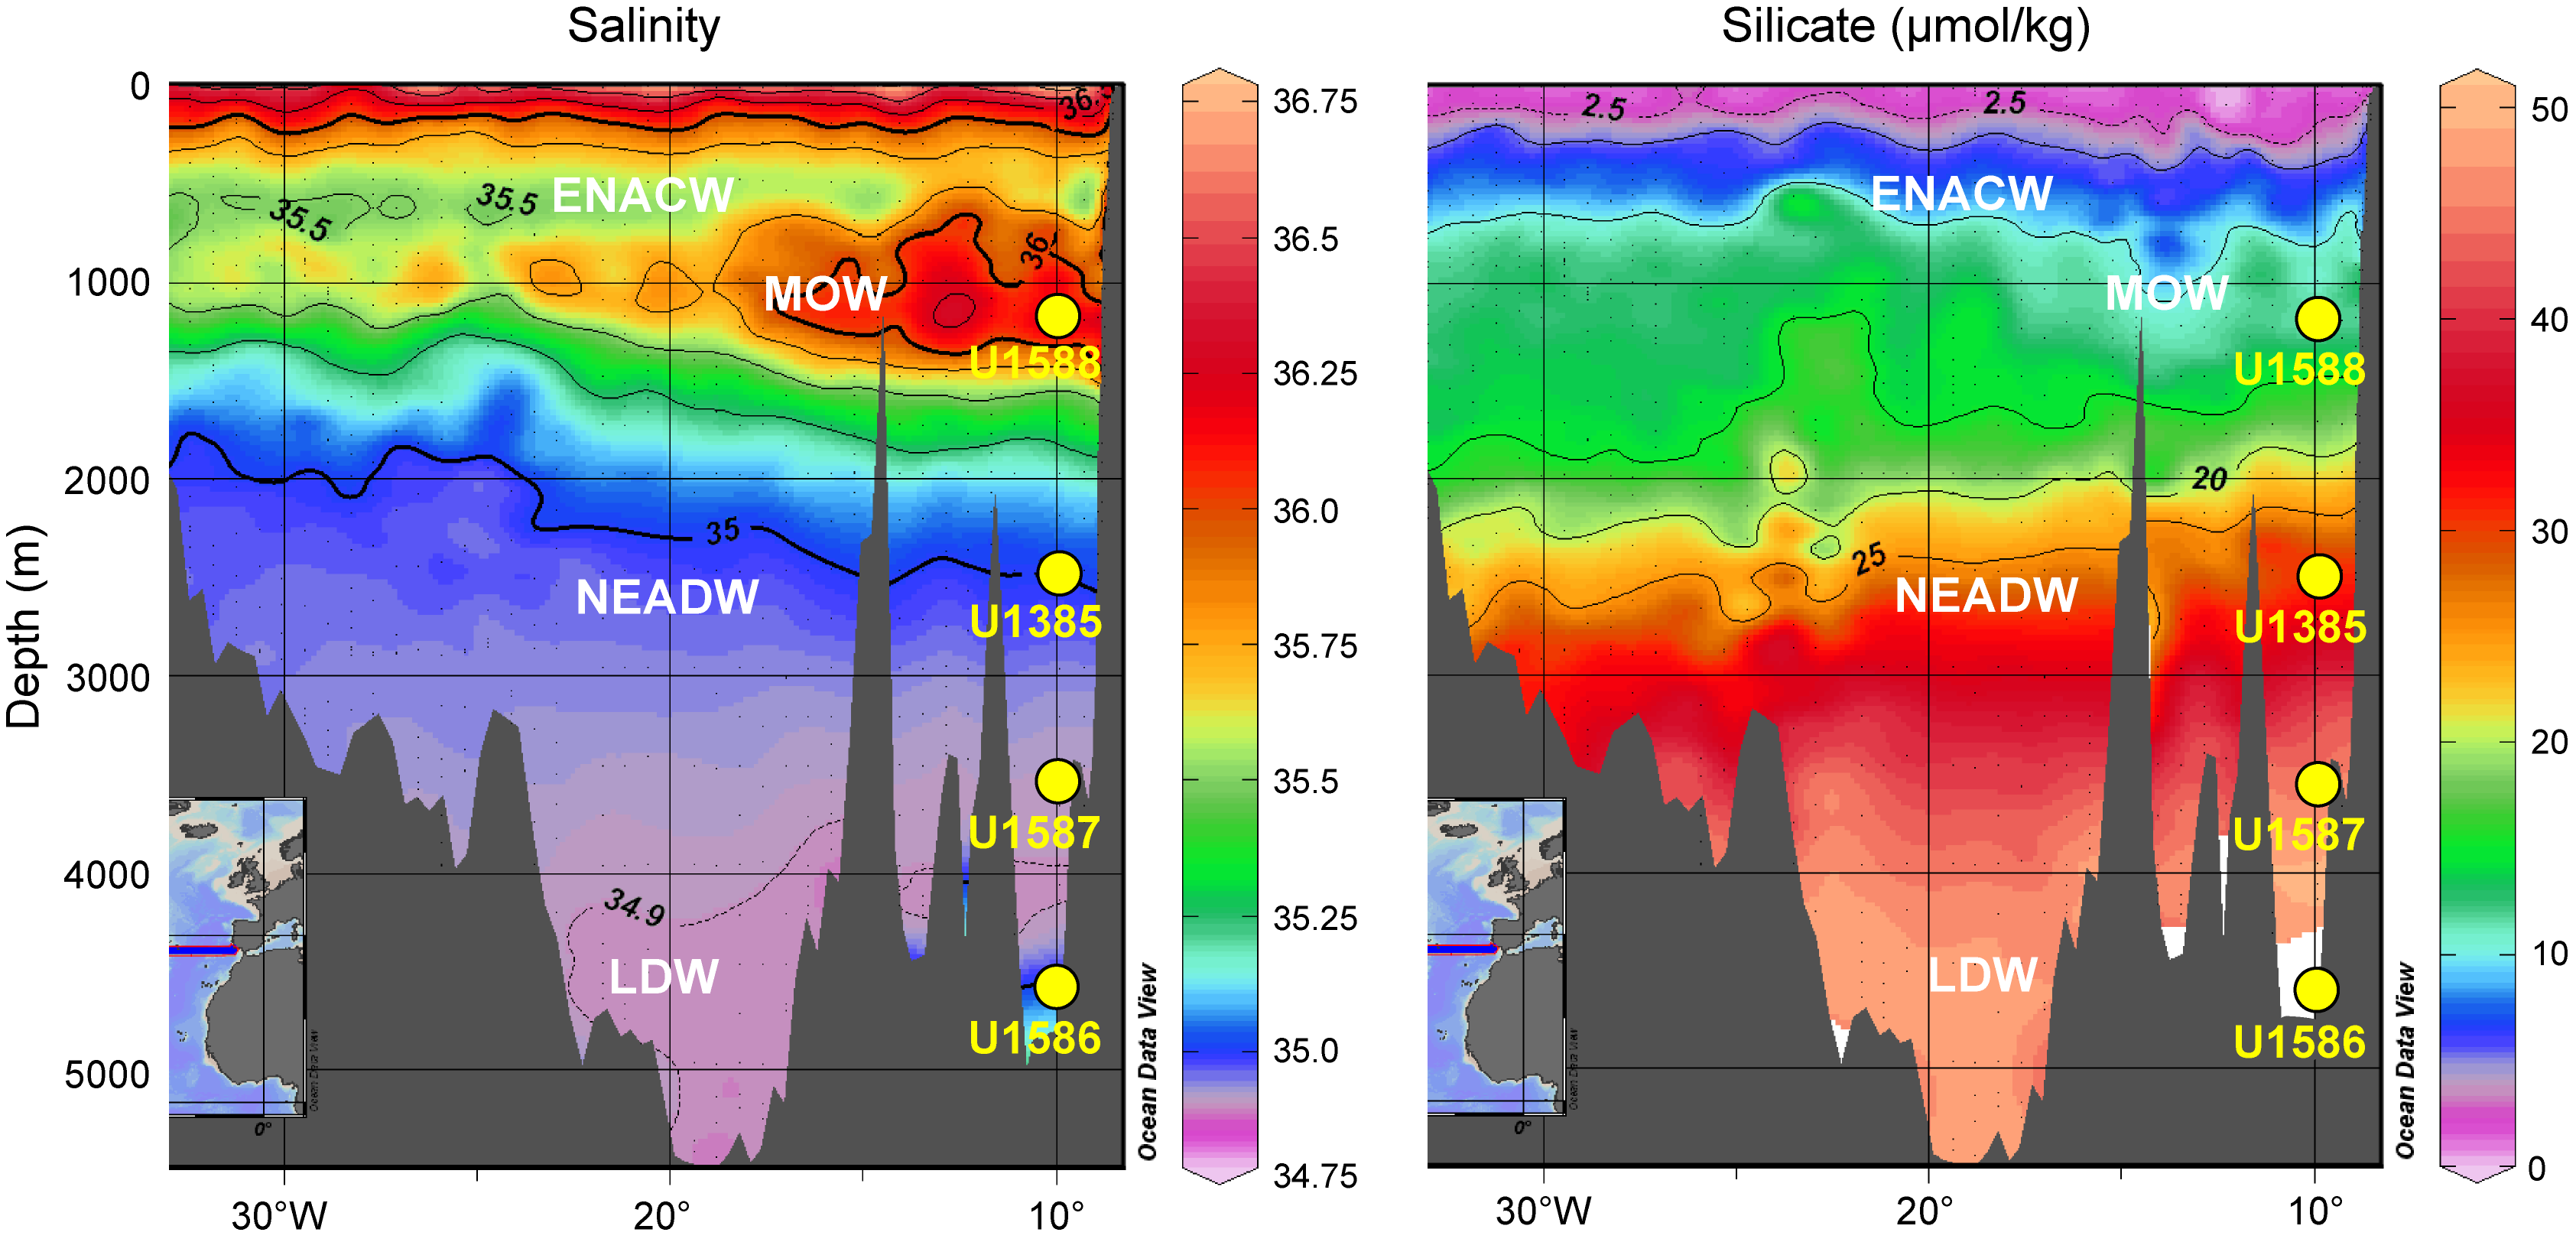
Figure F5. Salinity and silicate profiles.
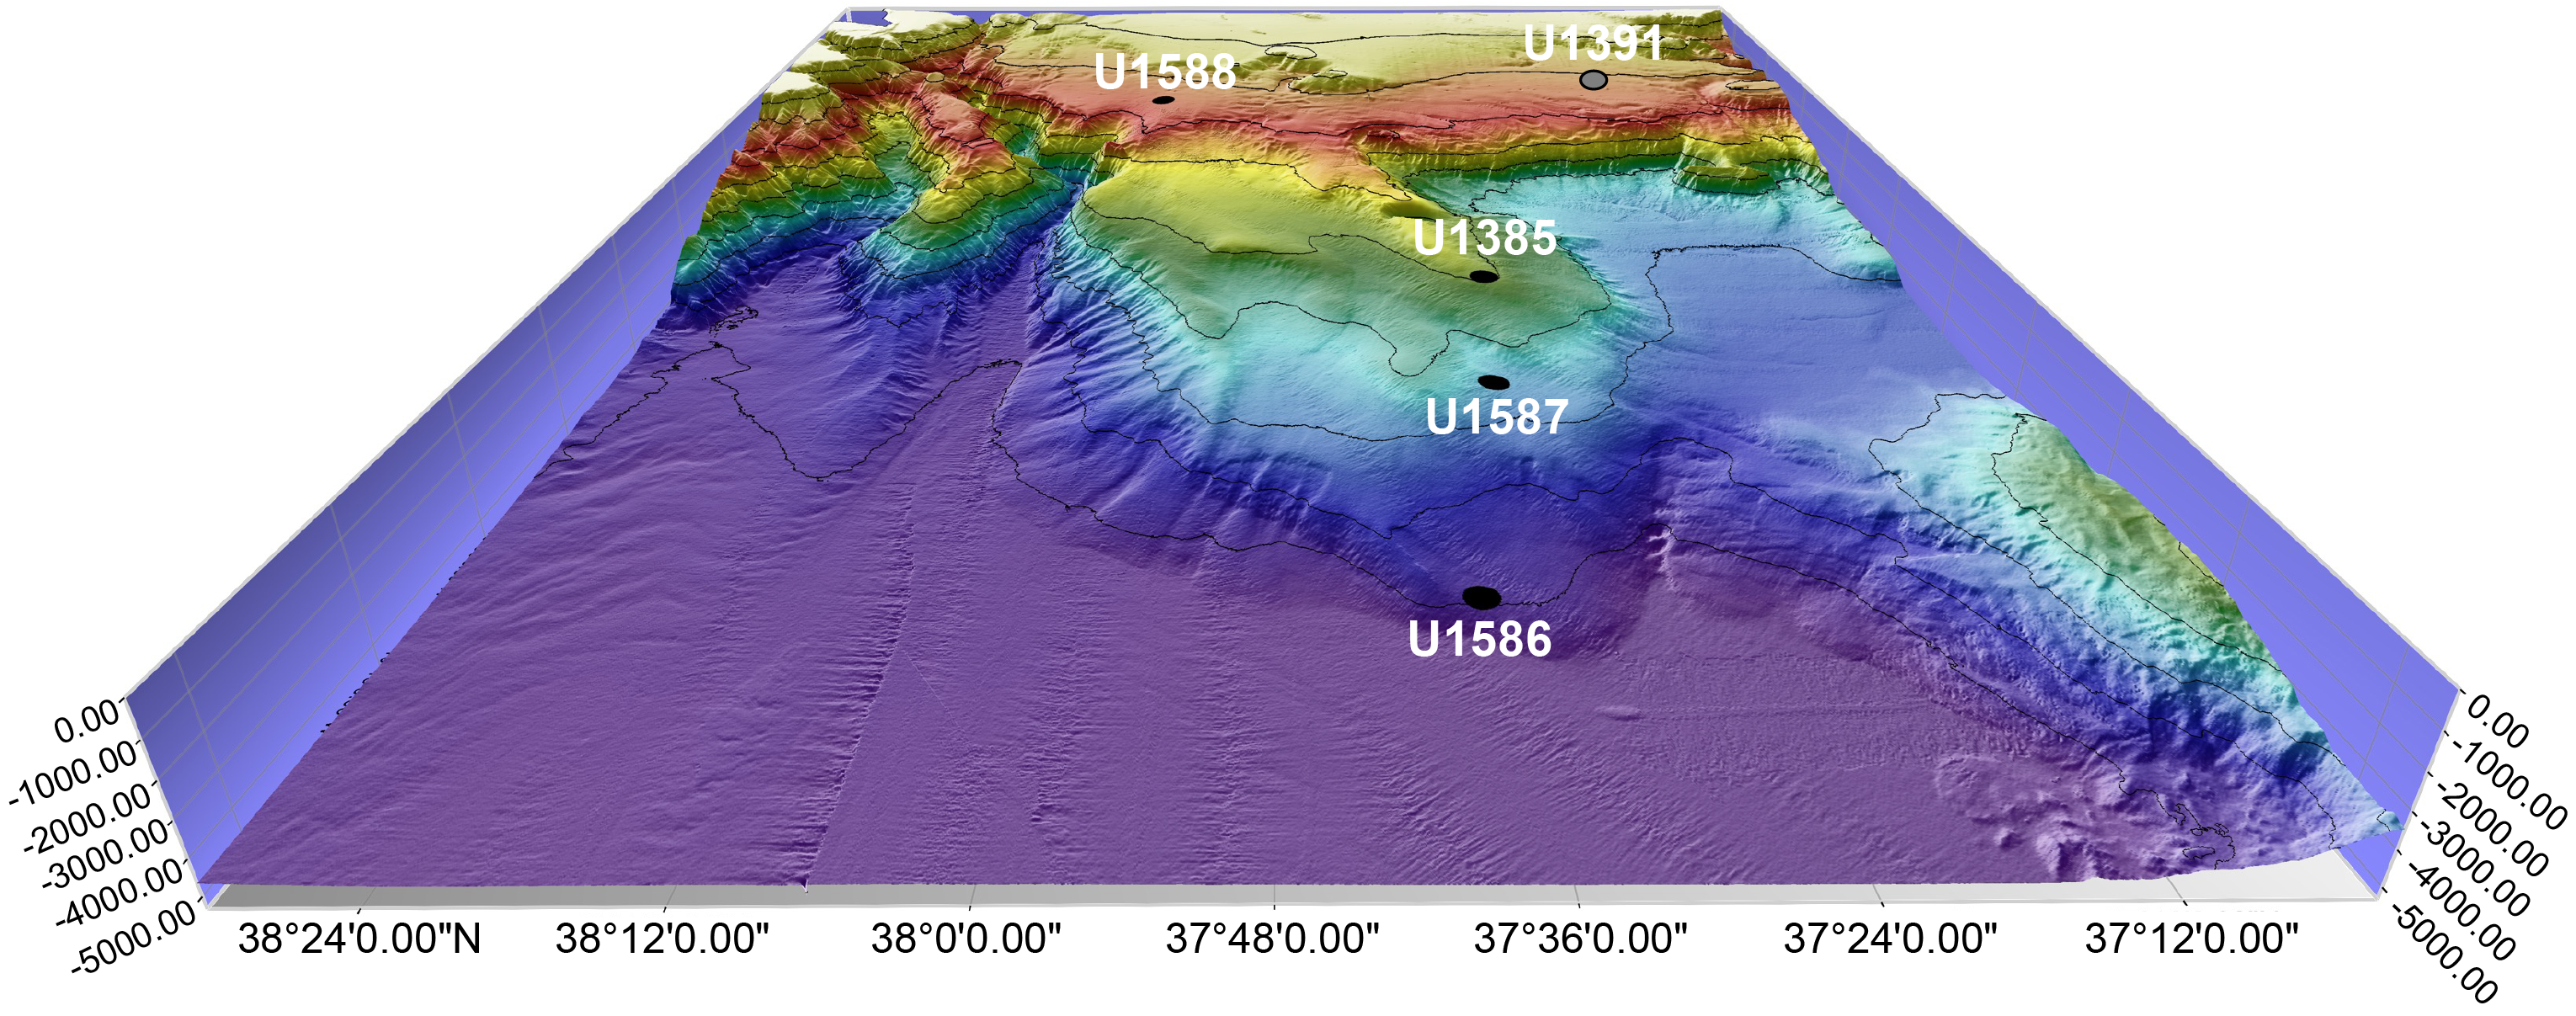
Figure F6. Bathymetric transect of Expedition 397 sites.
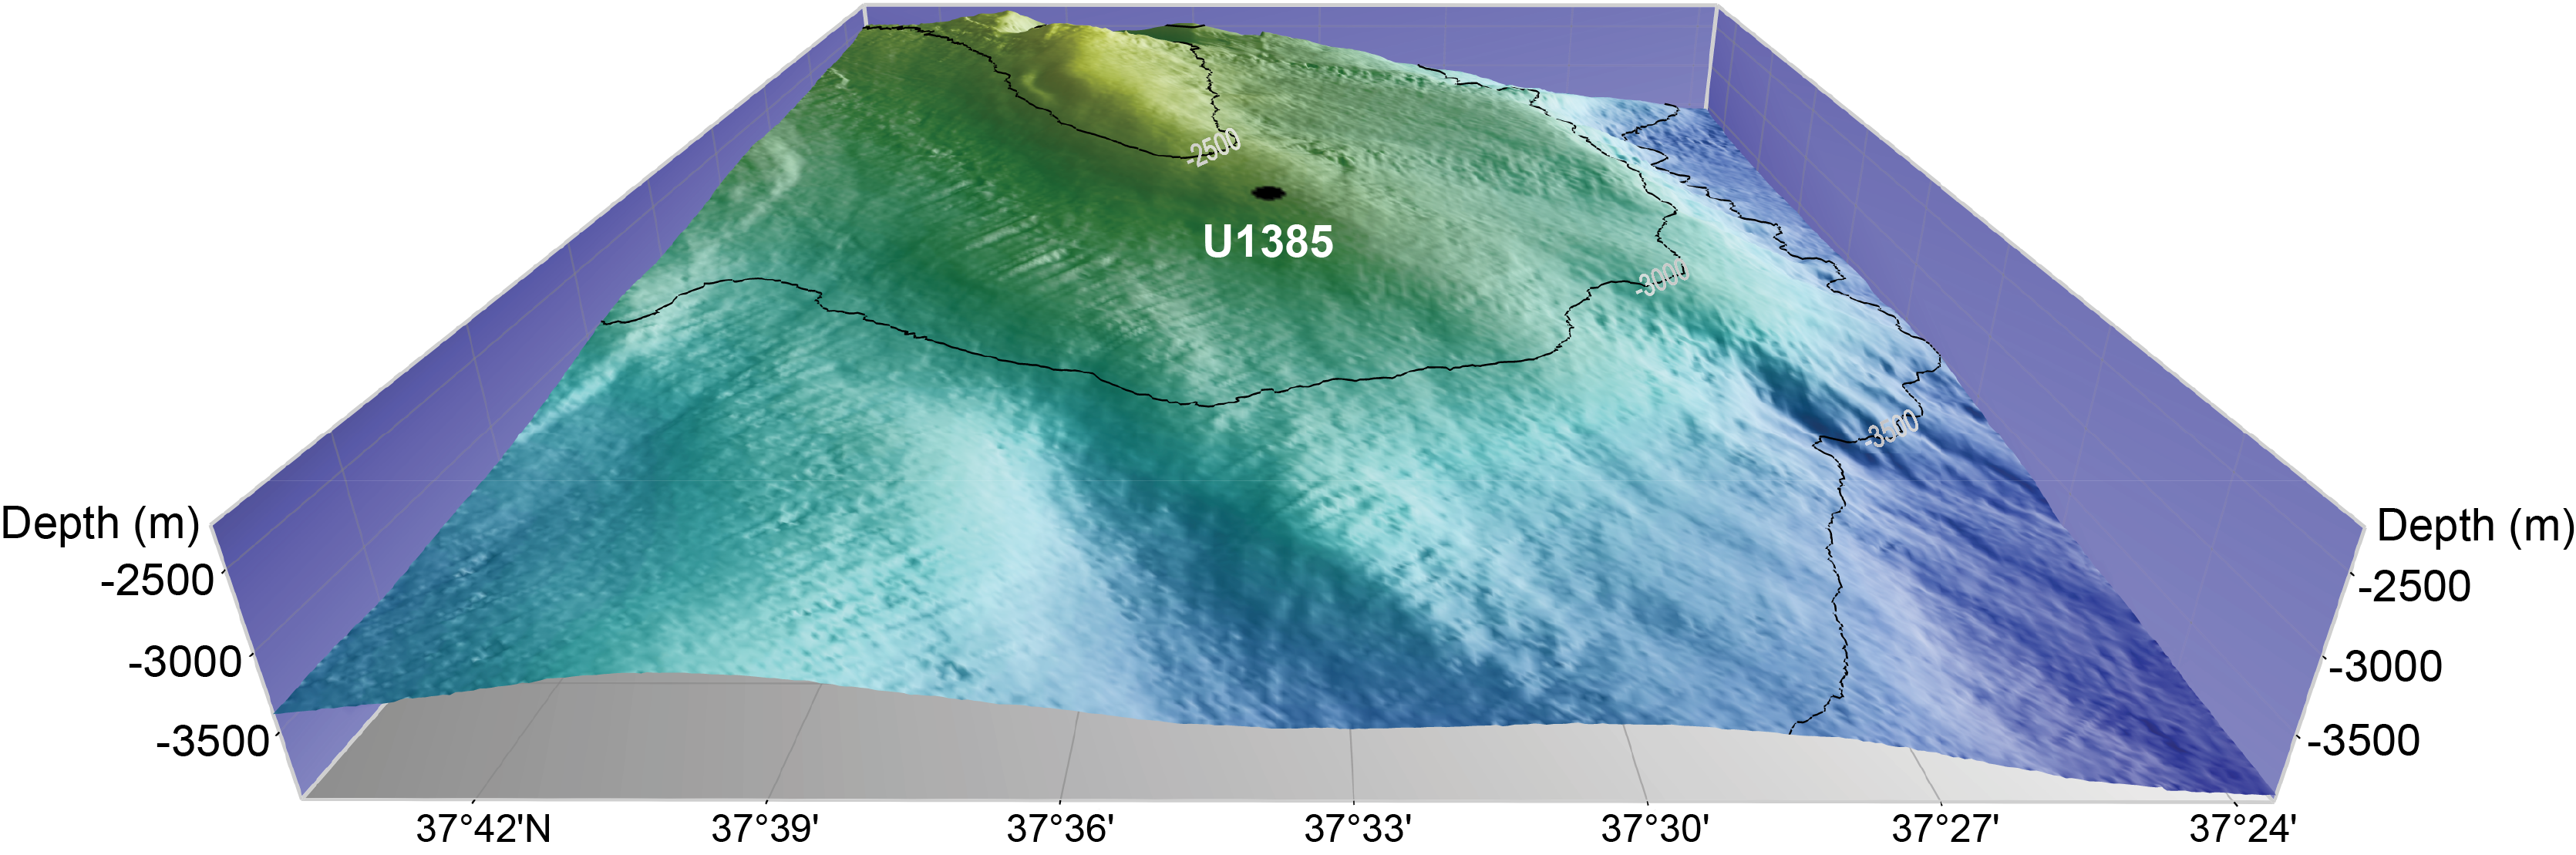
Figure F7. Site U1385 location.
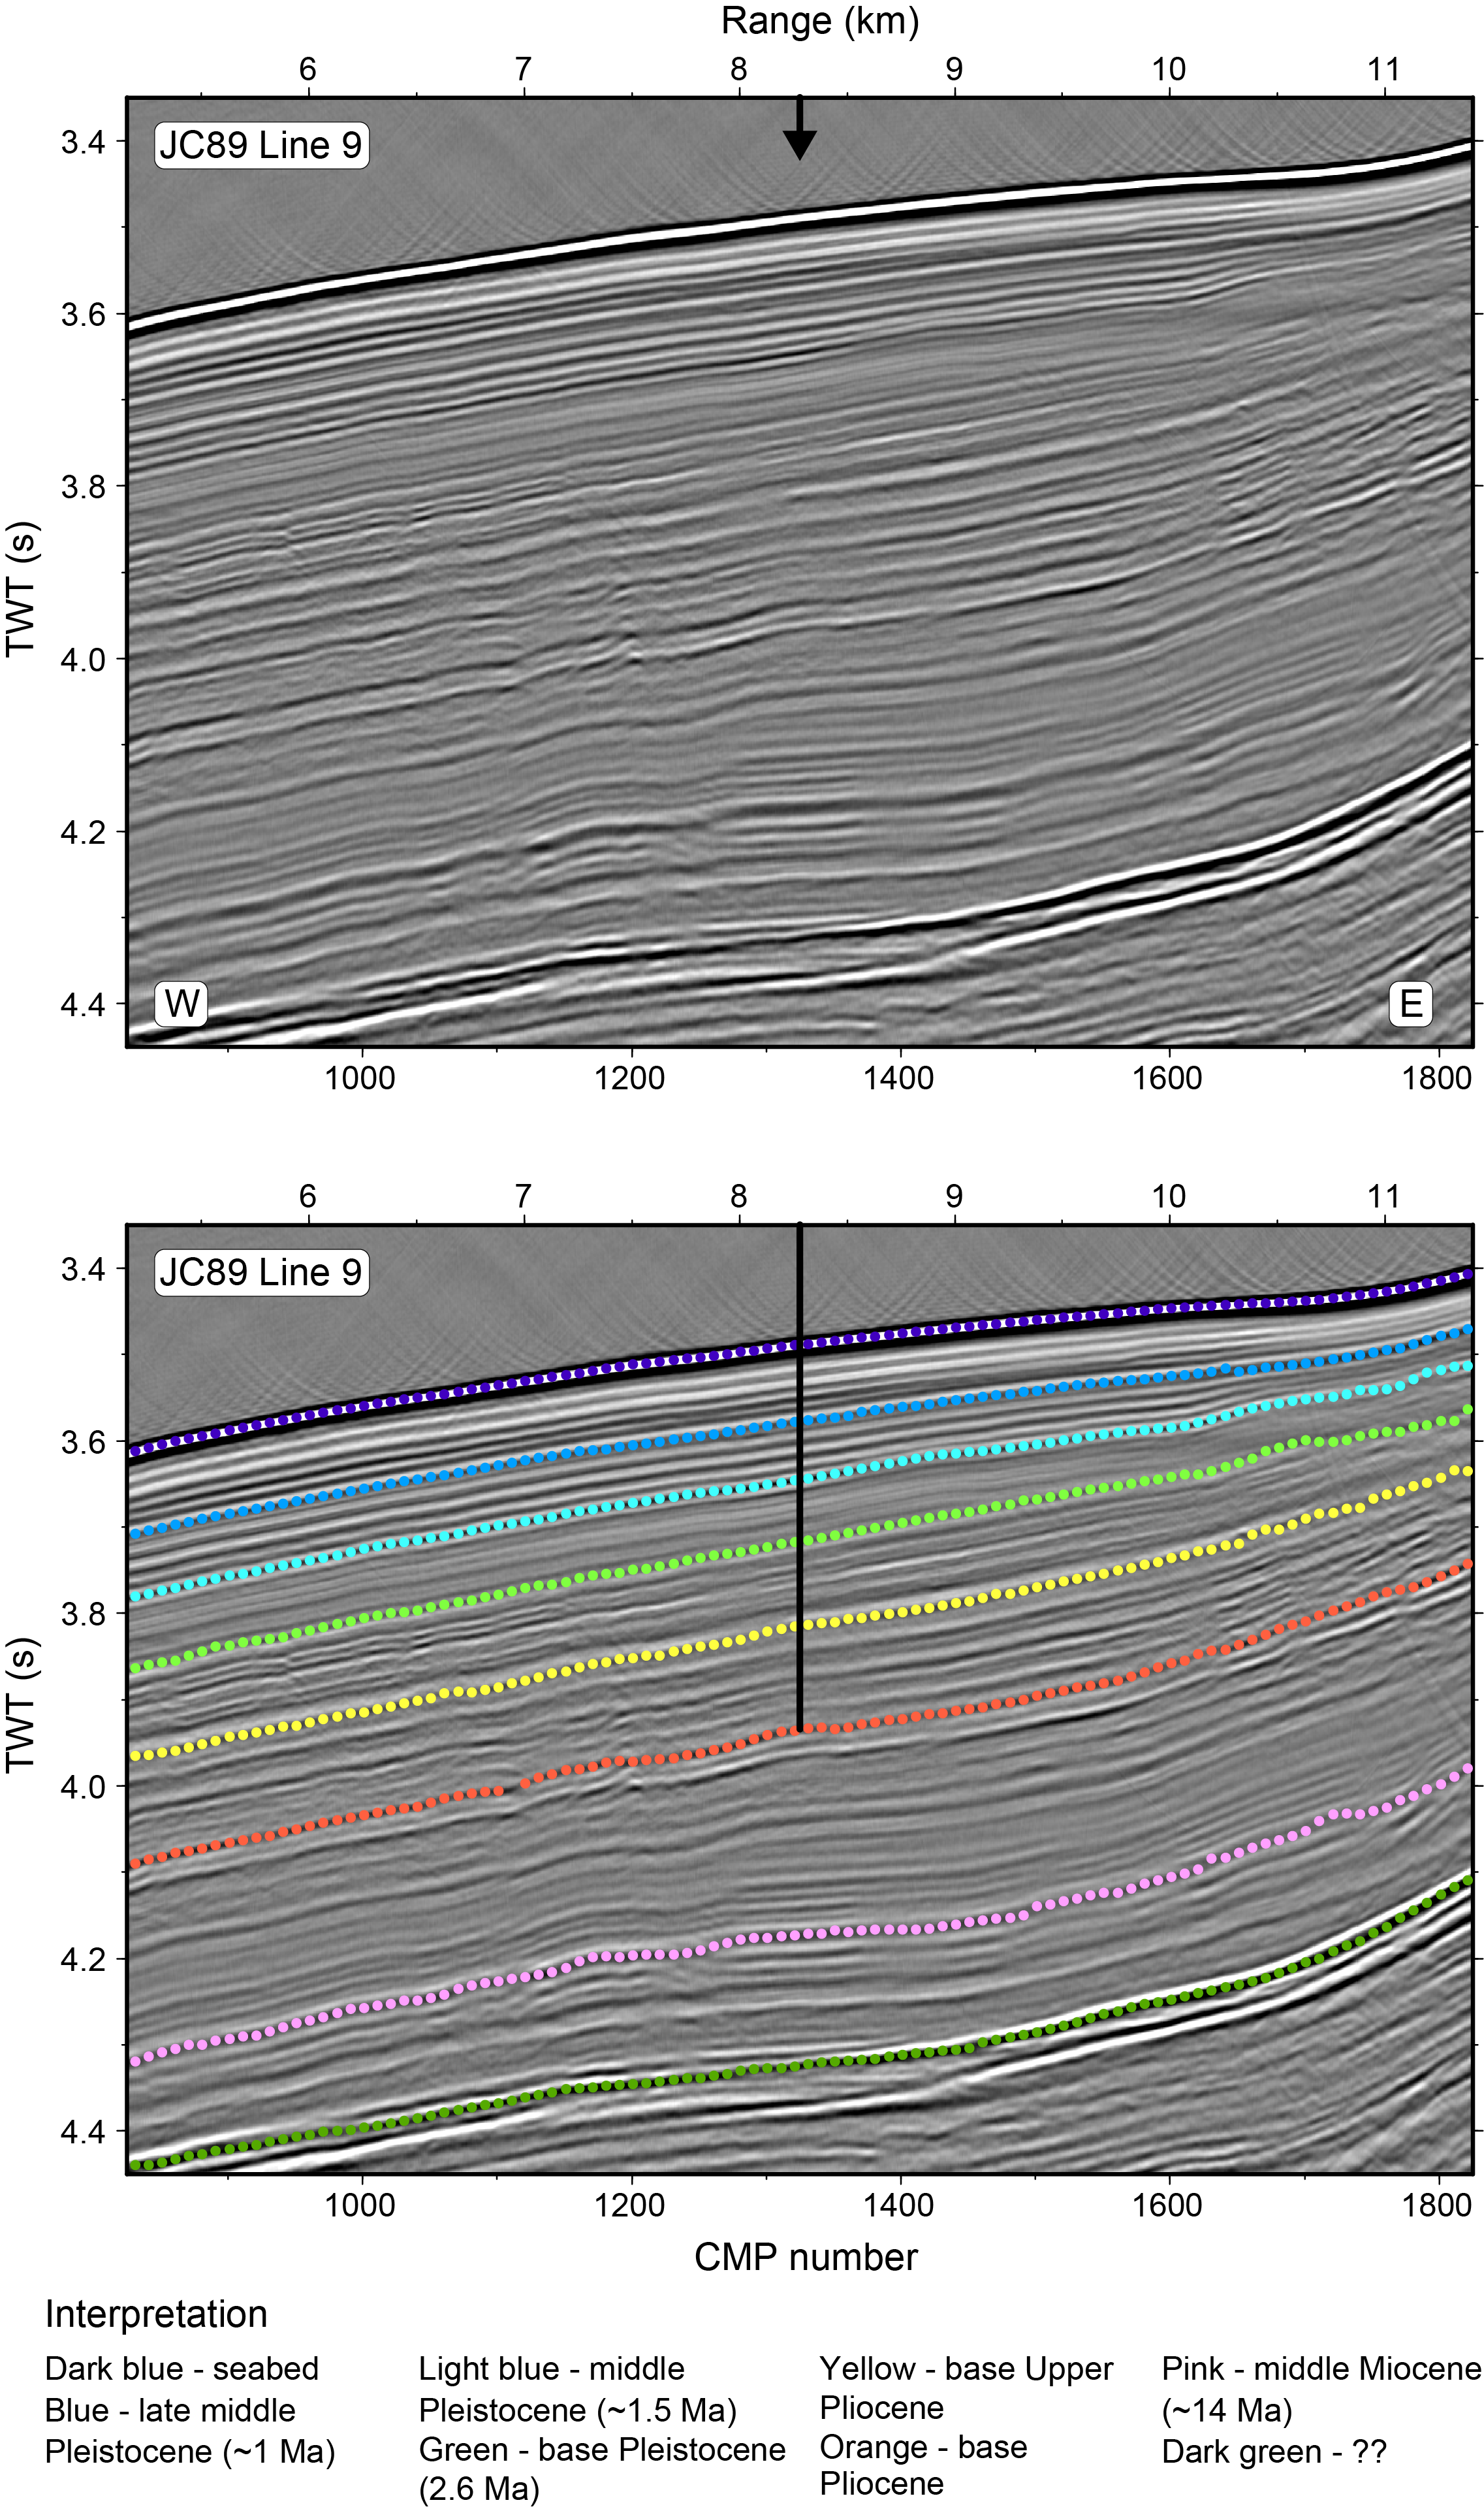
Figure F8. Seismic Profile JC89-9.
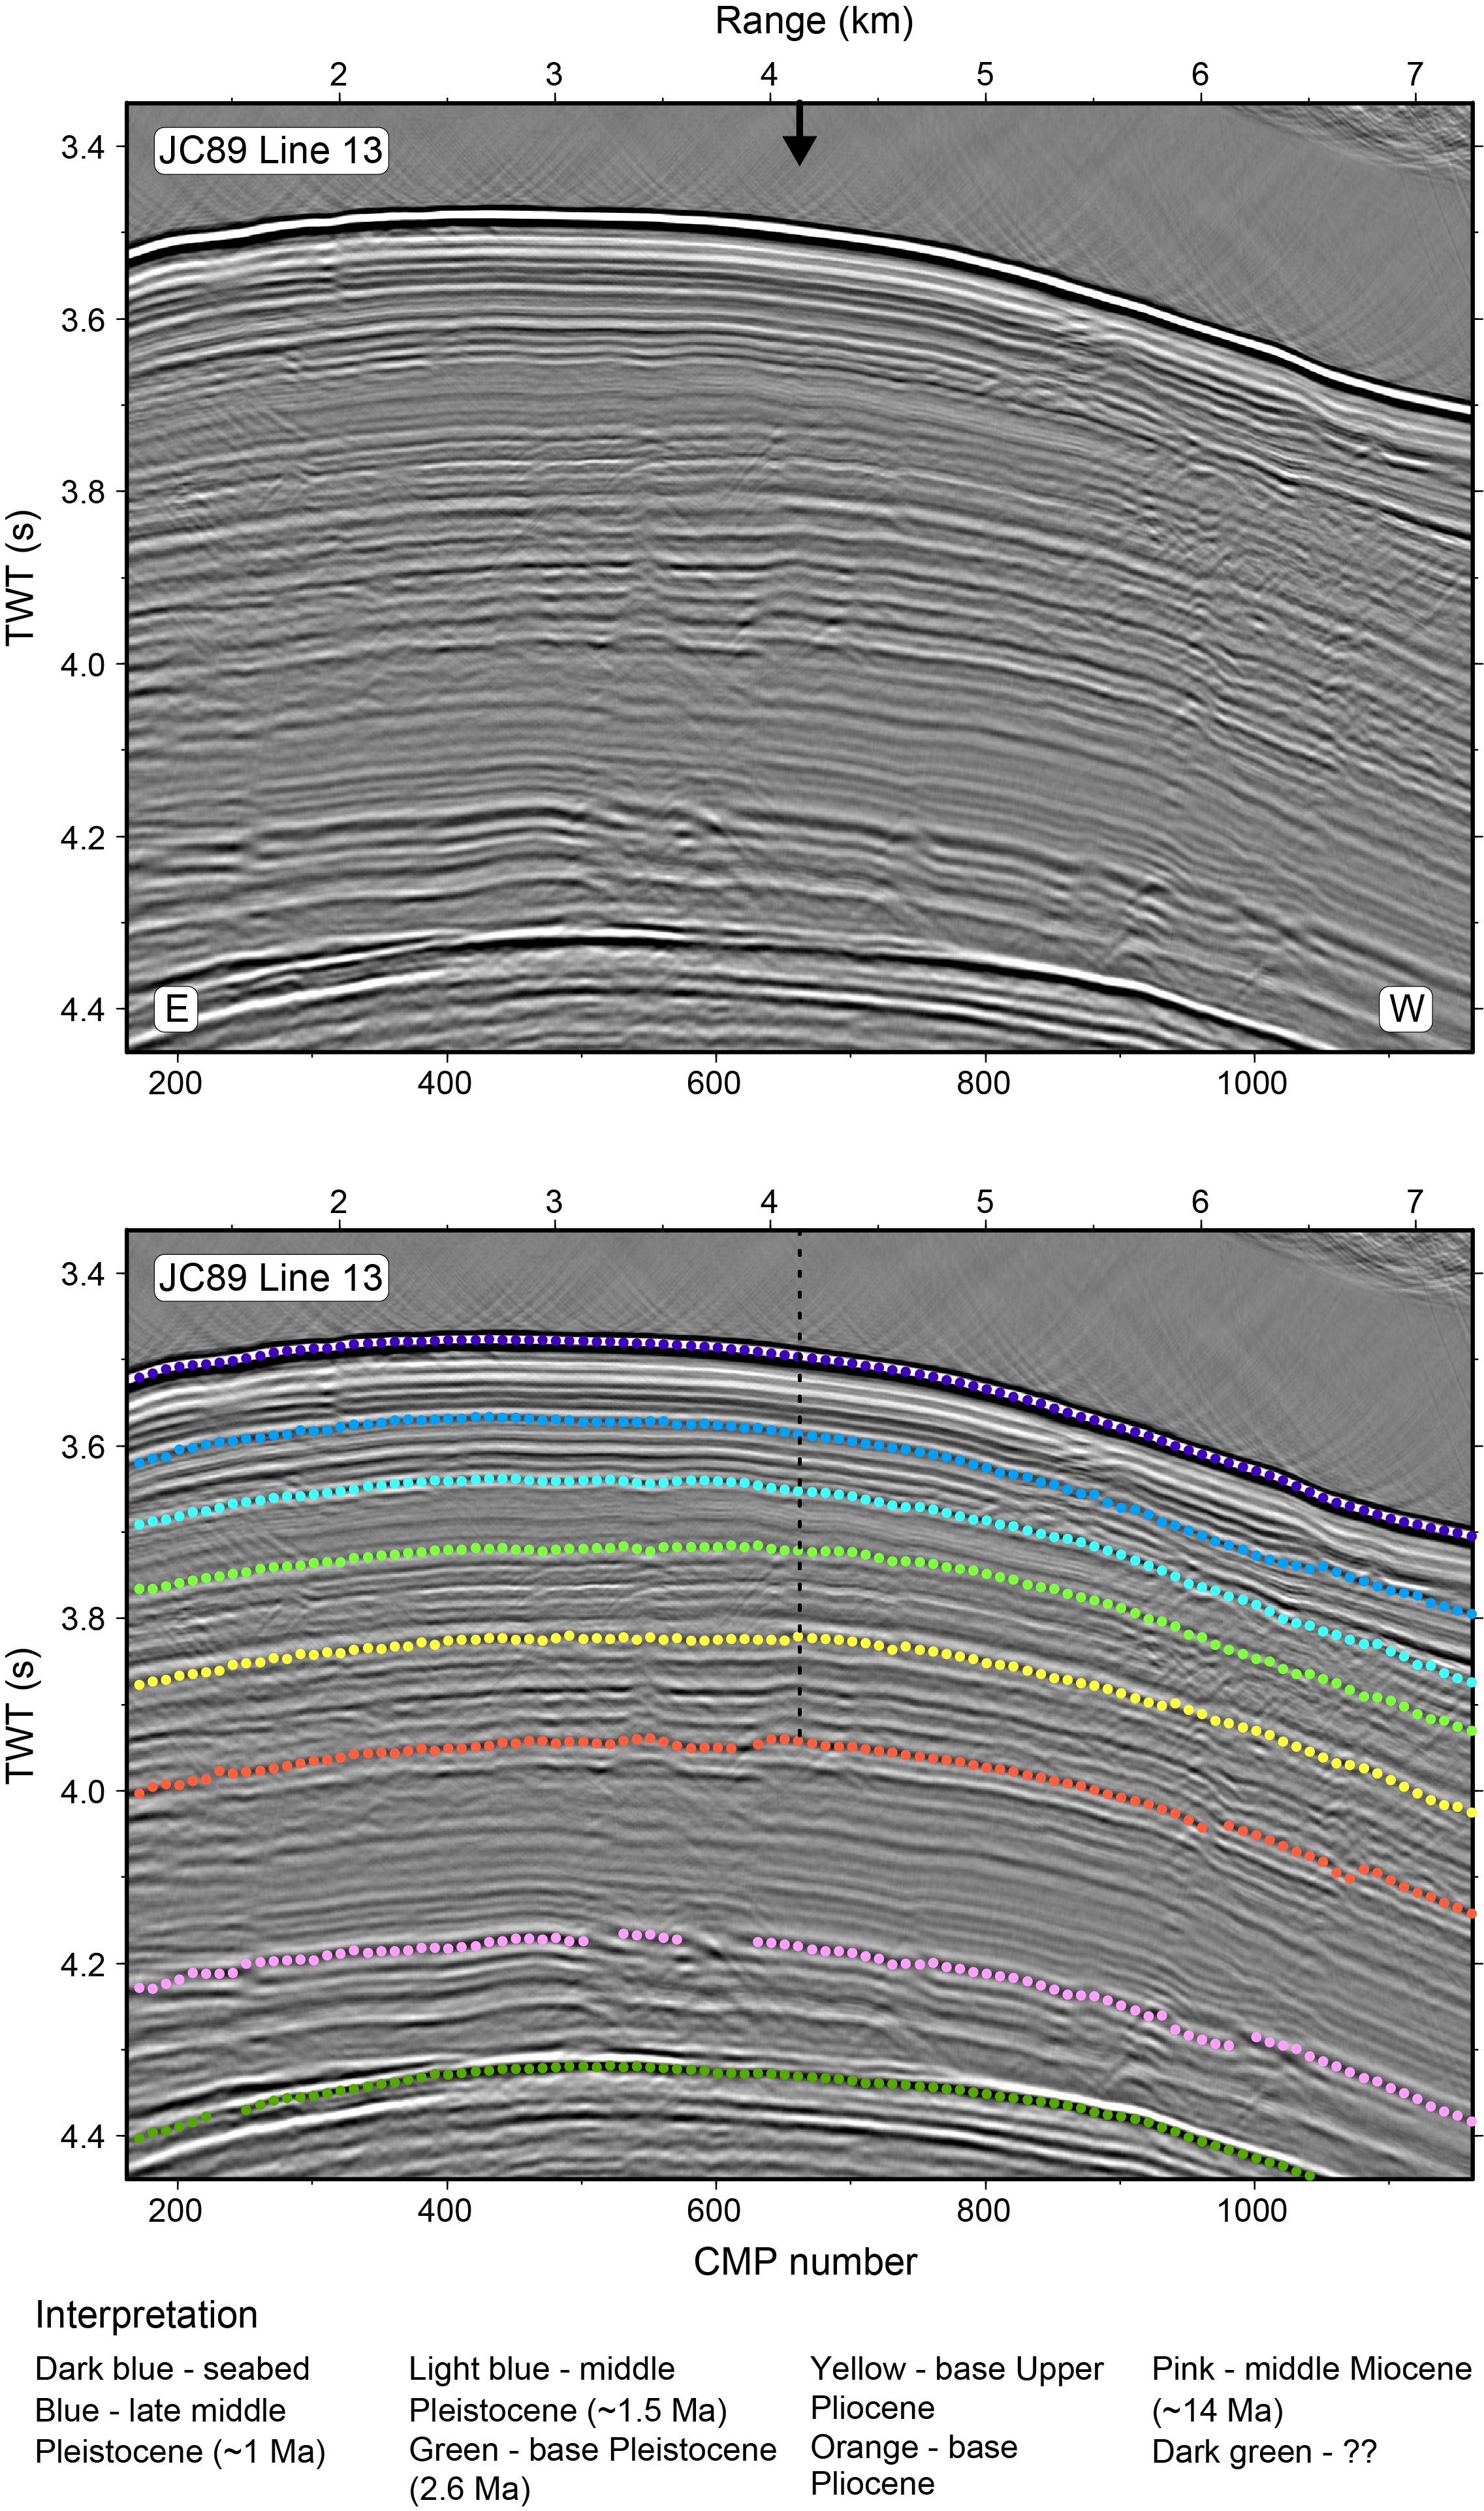
Figure F9. Seismic Profile JC89-13.
The specific objectives of Site 397-U1385 are as follows:
- Document the nature of MCV for older glacial cycles of the Quaternary beyond the penetration limit of Site 339-U1385 (1.45 Ma).
- Derive a marine sediment proxy record for Greenland and Antarctic ice cores to examine the amplitude and pacing of MCV during the Quaternary.
- Determine interhemispheric phase relationships (leads/lags) by comparing the timing of proxy variables that monitor surface (linked to Greenland) and deepwater (linked to Antarctica) components of the climate system.
- Study how changes in orbital forcing and glacial boundary conditions affect the character of MCV and, in turn, how MCV interacts with orbital geometry to produce the observed glacial-to-interglacial patterns of climate change.
- Determine how MCV evolved during the Pliocene–Pleistocene as glacial boundary conditions changed with the progressive intensification of Northern Hemisphere glaciation (NHG).
- Reconstruct the history of changing local dominance of northern-sourced versus southern-sourced deep water by comparing Site U1385 with the other sites along the bathymetric transect (Figure F6).
- Investigate climate during past interglacial periods, including the warm Pliocene period prior to the intensification of NHG.
- Link terrestrial, marine, and ice core records by analyzing pollen and terrestrial biomarkers that are delivered to the deep-sea environment of the Iberian margin.
- Develop an orbitally tuned age model by correlating sediment physical properties at Site U1385 to eccentricity-modulated precession and integrating this record into Mediterranean cyclostratigraphy.
2. Operations
The vessel moved to Site U1385 with the thrusters deployed in dynamic positioning (DP) mode. The move took 12.75 h, and the vessel arrived on site at 0220 h on 16 November 2022.
Site U1385 was previously occupied during Expedition 339, when five holes were cored (Figure F10). Expedition 397 began operations with Hole U1385F. The plan for the reoccupation of Site U1385 was to core four holes using the APC system to refusal (estimated at ~135 mbsf) and then core to 400 mbsf using the extended core barrel (XCB) system. Orientation was planned for all APC cores in all four holes, and downhole measurements with the triple combination (triple combo) tool string were planned for Hole U1385I.
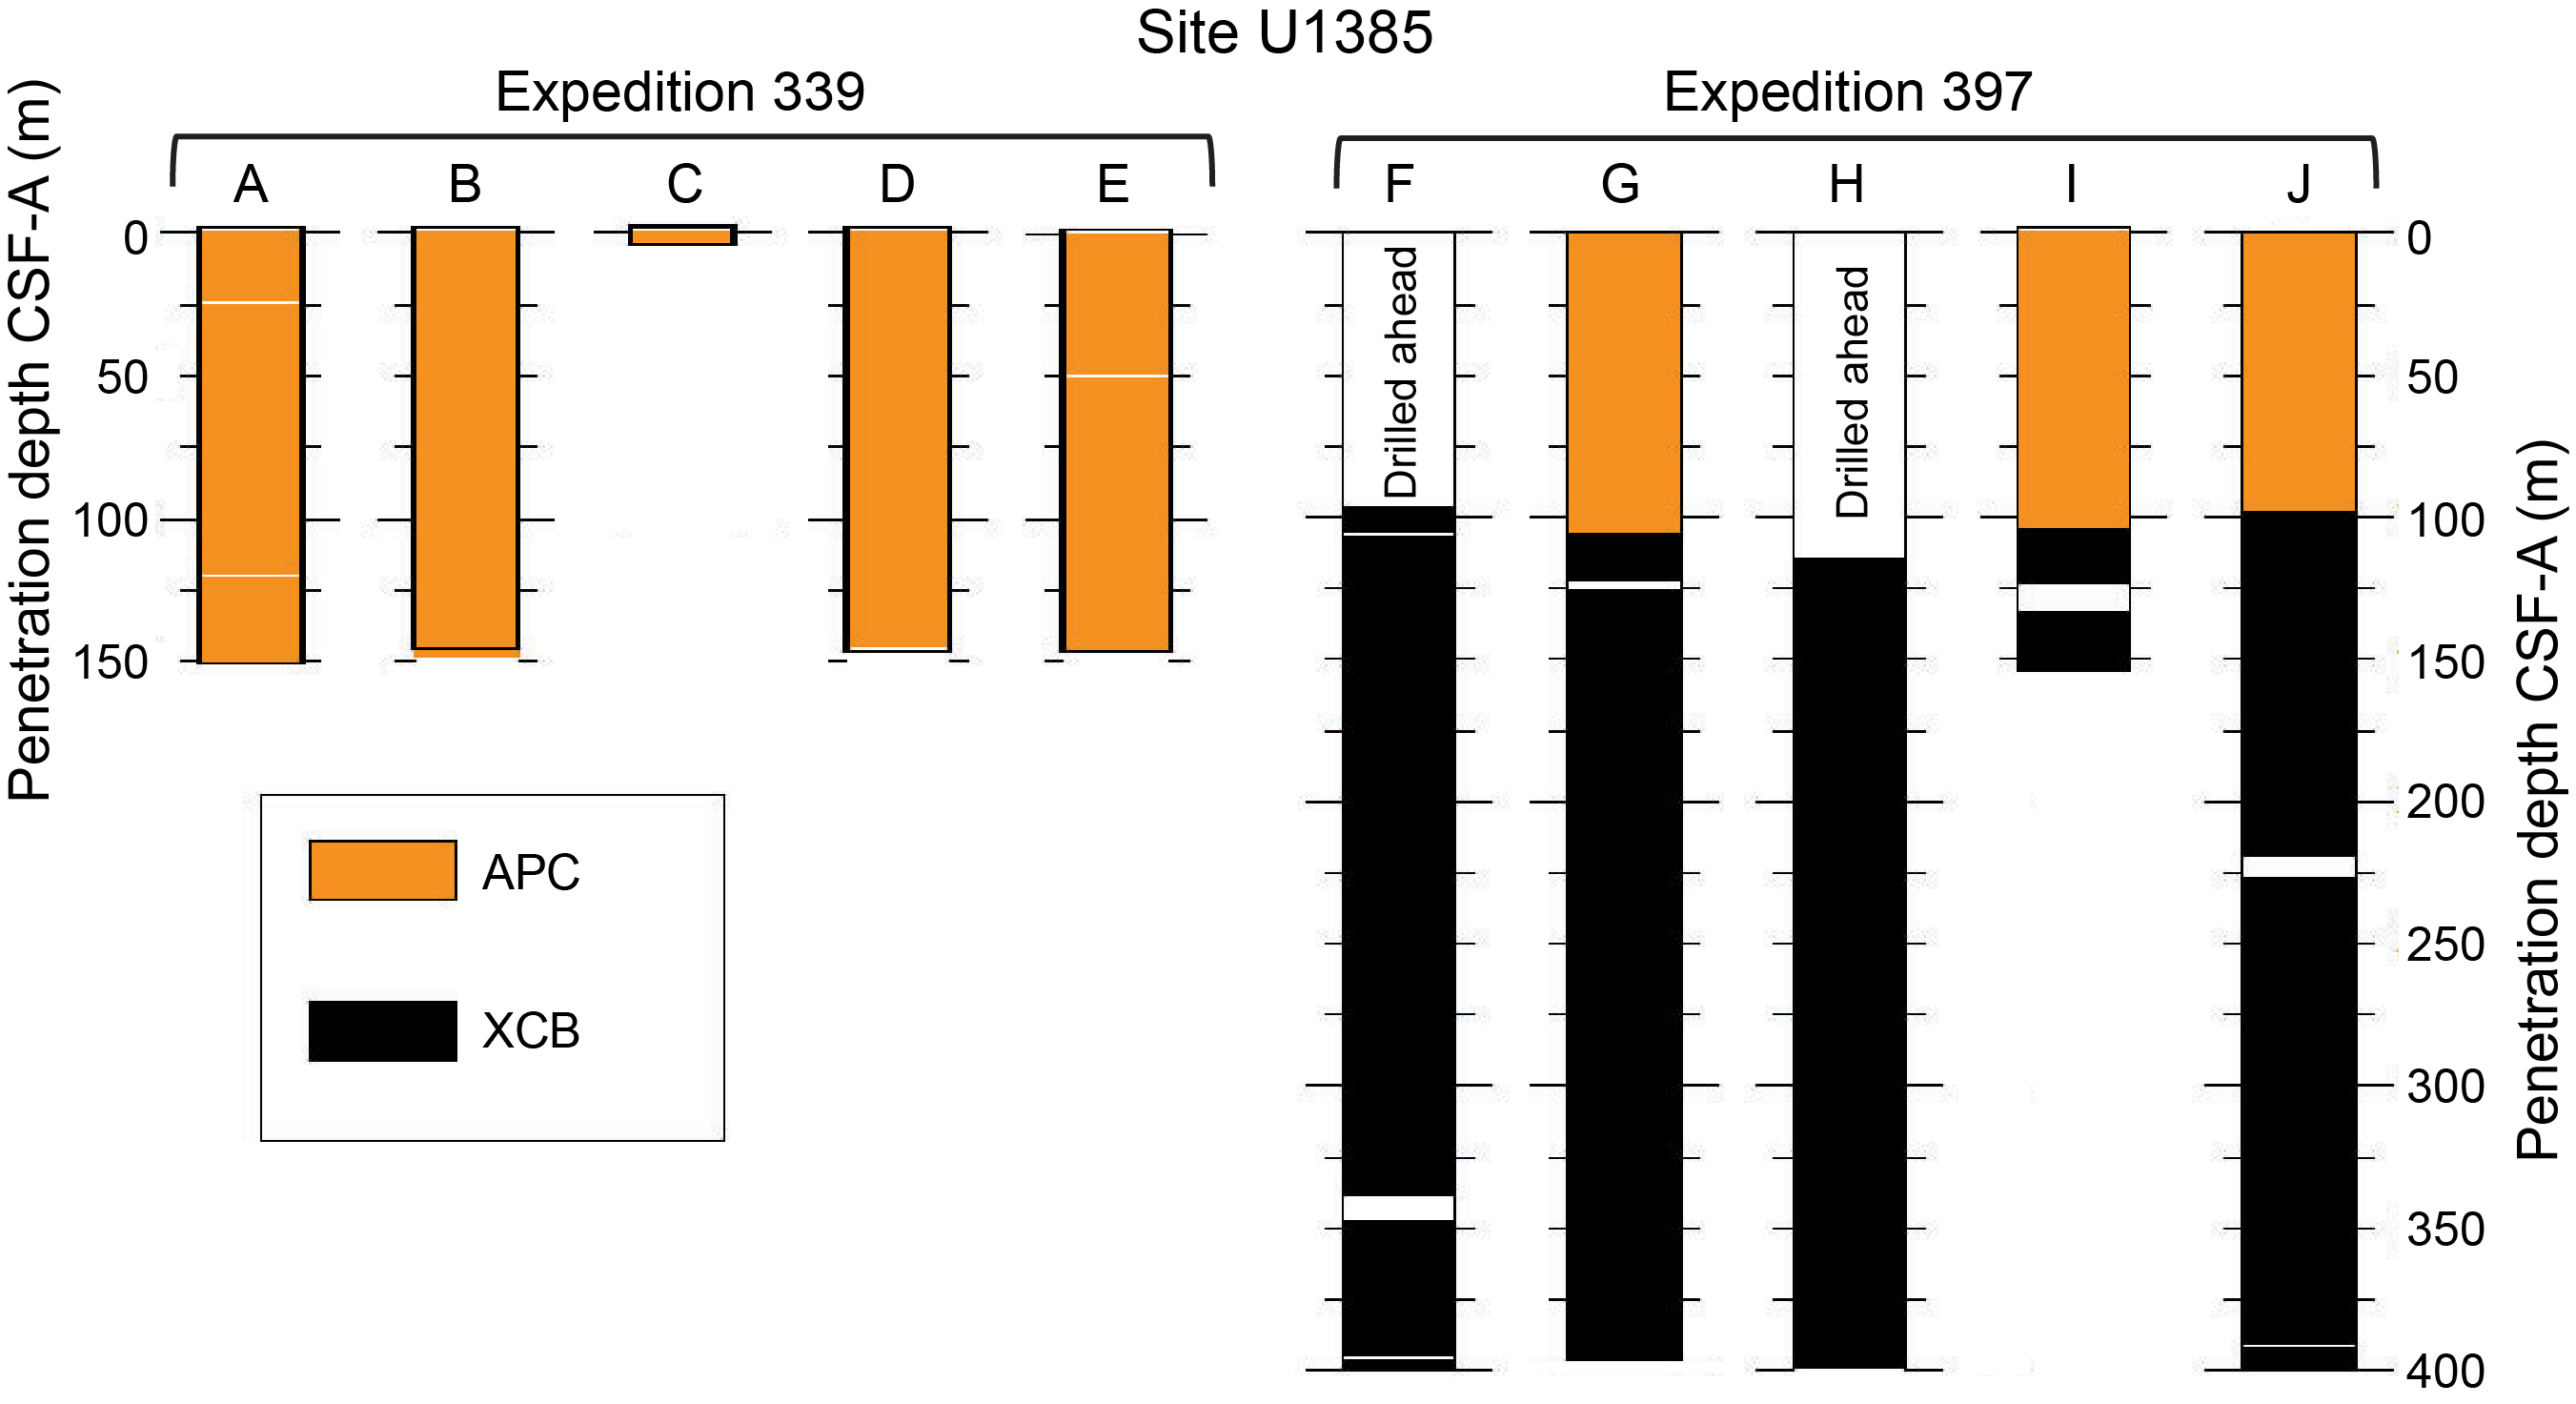
Figure F10. Core recovery.
Once on site, weather conditions and high seas caused some delay and forced an adjustment to the coring strategy to take advantage of all operational time to acquire the best possible core quality. Five holes were cored (Table T1). Two holes were drilled ahead without APC core recovery (Hole U1385F to 96.9 m core depth below seafloor, Method A [CSF-A], and Hole U1385H to 114.6 m CSF-A) to allow XCB coring in the lower section of the holes to total depth (Figure F10). The other three holes were fully cored according to the original plan with the APC system until the first partial stroke was registered, followed by XCB coring to total depth. Logging was attempted in Hole U1385D using the triple combo tool string, but the tools could not exit the drill pipe, forcing logging to be abandoned.
All APC cores used nonmagnetic core barrels and were oriented using the Icefield MI-5 core orientation tool. In total, 1537.5 m were cored using the APC and XCB systems (99% recovery). Site U1385 took 336.0 h (14.0 days) to complete, including 101.0 h (4.2 days) waiting on weather.
2.1. Hole U1385F
The vessel arrived at Site U1385 at 0220 h on 16 November 2022. With the seas deteriorating, an extra knobby was picked up and run through the guide horn. The vessel began waiting on weather with the bit at 2557.5 meters below rig floor (mbrf) at 0330 h on 16 November and continued until the heave subsided enough to begin coring operations at 0015 h on 17 November. With the heave still above 3 m, APC coring was not possible, so it was decided to drill ahead. Hole U1385G (37°33.9999′N, 010°07.6587′W) was spudded at 0220 h on 17 November and advanced without coring to 96.9 mbsf. An XCB barrel was dropped, and coring began with Core 2X from 96.9 to 106.6 mbsf.
After deploying the next core barrel and making a connection, the driller slacked off the top drive with the pipe still in the elevators on the rig floor. Approximately 55,000 lb was set down on the drill pipe and knobbies, causing a significant bend between the top drive and elevators. The toolpusher stopped the driller and had him raise the top drive. The knobbies and one stand of 5½ inch drill pipe were removed and taken out of service, and new ones were installed.
Coring continued with Cores 397-U1385F-3X through 33X (106.6–400.0 m CSF-A). Core 27X had no recovery. The bit was pulled out of the hole, clearing the seafloor at 2335 h on 19 November and ending Hole U1385F.
In total, 32 cores were taken over a 303.1 m interval using the XCB coring system (96% recovery). Core 397-U1385F-27X had no recovery. The core fell out as the core barrel was retrieved because the core catcher was stuck open. There was one drilled interval, from the seafloor to 96.9 mbsf.
2.2. Hole U1385G
The vessel was offset 20 m north of Hole U1385F, the top drive was picked up, and the bit was spaced out to 2596.0 mbrf. Hole U1385G was spudded at 37°34.0108′N, 010°07.6656′W at 0200 h on 20 November 2022. The seafloor was calculated at 2603.7 mbrf (2592.4 mbsl) based on recovery from Core 1H. APC coring continued to 106.3 m CSF-A with Core 12H, followed by XCB coring to a total depth of 397.3 mbsf. Coring was terminated at this point, and the bit was pulled out of the hole, clearing the seafloor at 0300 h on 22 November, ending Hole U1385G.
A total of 42 cores were taken over a 397.3 m interval (99.7% recovery). A total of 12 APC cores were taken over a 106.3 m interval (103.5% recovery). All APC cores used nonmagnetic core barrels and were oriented using the Icefield MI-5. An additional 30 cores were taken using the XCB system over a 291.0 m interval (98.4% recovery).
2.3. Hole U1385H
The vessel was offset another 20 m north, the bit was spaced out, and Hole U1385H was spudded at 37°34.0223′N, 010°07.6641′W at 0345 h on 22 November with a 114.6 m drilled interval. The hole was cored to a total depth of 399.2 mbsf using the XCB system (Cores 2X–32X). The bit was pulled out of the hole, clearing the seafloor at 0015 h on 24 November and ending Hole U1385H.
A total of 31 cores were taken over a 284.6 m interval (100.1% recovery). All were taken using the XCB coring system. There was one drilled interval, from the seafloor to 114.6 mbsf.
2.4. Waiting on weather
Seas increased significantly with heave reaching above 5 m, causing operations to pause. During the next 56.75 h, heave increased to over 9 m, finally decreasing enough to start operations again at 0900 h on 26 November 2022.
2.5. Hole U1385I
The vessel was offset 20 m east of Hole U1385H, the bit was spaced to 2600.0 mbrf, and Hole U1385I was spudded at 37°34.0205′N, 010°07.6505′W at 1103 h on 26 November 2022. The seafloor was calculated at 2604.5 mbrf (2589.1 mbsl) based on recovery in Core 1H. The hole was cored to 104.0 mbsf using the APC system before a partial stroke on Core 11H signaled APC refusal. Hole U1385I was cored to a final depth of 152.5 using the XCB system.
A total of 16 cores were taken over a 152.5 m interval, and the APC system was used for 11 cores over 104.0 m (102.7% recovery). The XCB system was deployed for five cores over a 48.5 m interval (79.5% recovery). Core 14X had no recovery.
2.6. Hole U1385J
The vessel was offset 20 m south of Hole U1385I, the bit was spaced to 2598.0 mbrf, and Hole U1385J was spudded at 37°34.0103′N, 010°07.6513′W at 0455 h on 27 November 2022. A seafloor depth of 2593.1 mbsl was calculated based on 3 m of material recovered in Core 1H. APC coring continued, retrieving Cores 2H–11H from 3 to 98 mbsf and recovering 102.53 m (105%). Because Core 11H registered a partial stroke, the XCB system was deployed, and Cores 12X–43X were cut to a final depth of 400 mbsf. The total core recovery for Hole U1385J was 397.77 m (99%), and the total core recovered at Site U1385 was 1515.2 m (99%). Nonmagnetic core barrels were used on all APC cores. The Icefield MI-5 was used to orient all APC cores.
2.6.1. Downhole measurements
After coring was completed in Hole U1385J, a 30 bbl sweep of high-viscosity mud was pumped to clean the hole and the bit was pulled to a logging depth of 78.3 mbsf. Scaffolding was constructed on the rig floor for the logging tool assembly, and the prejob safety meeting and toolbox talk were conducted.
A triple combo tool string was rigged up and deployed, and the source was loaded before running in the hole. As the string reached the bit, a decrease in tension at the logging head and at the surface was observed, indicating that the total weight of the string was being supported by something other than the wireline. The string was picked up a few meters, another attempt to pass the bit was made, and the tools were moved partially out of the drill pipe. Next, an attempt was made to raise the tools, but pulling them back into the pipe was impossible. During the subsequent 3 h, several attempts were made to pull the tools back into the pipe without success, and each attempt caused a sharp increase in tension, indicating that the tools were hanging on something inside the drill pipe.
With all options exhausted, the Kinley crimper and cutter were deployed to crimp and then sever the wireline at the tool head. The operation was successful, and the wireline was retrieved. The pipe and tools were then tripped to the surface, where it became clear that most of the tool string was below the bit. The connection closest to the bit was broken, but the radioactive source was safely removed, and the tools were laid out.
The Kinley equipment was accessible when the drill collar connection was broken and towed, allowing the removal of the crimping tool and indicating that the crimper had not supported the weight of the tools as designed but rather that the tools were stuck somewhere below. Further investigation revealed that a portion of a bow spring centralizer had broken and wedged in the lockable float valve, trapping the tool string. The tools were removed from the lockable float valve, and the rig floor was secured for transit by 0245 h on 30 November, ending Hole U1385J and Site U1385.
3. Lithostratigraphy
Two lithofacies were identified using visual descriptions, smear slides, and color (RGB values). Lithofacies 1 and 2 can be represented as a mixed ratio between two end-members: Lithofacies 1 (100% nannofossil ooze) and Lithofacies 2 (100% clay/silt). One lithostratigraphic unit was defined at Site 397-U1385 (hereafter Site U1385). Unit I spans 0–400 m CSF-A. Most sediments from Site U1385 are from Lithofacies 1 and primarily consist of nannofossil ooze, with clay varying cyclically downcore. The abundance of nannofossil ooze with varying amounts of clay indicates the dominance of hemipelagic sedimentation at Site U1385 through the Pleistocene and Pliocene. Foraminifers, diagenetic features (dark patches and pyrite), and color banding are disseminated throughout all cores. Bioturbation varies from absent to heavy and generally increases downhole. Deformational sedimentary structures are rare. Drilling disturbance is present through most cores in all holes, varies from slight to severe, and is influenced by the drilling type, operation conditions, and methane contents of sediments.
3.1. Introduction
Two lithofacies were identified using visual observation of sediments, microscopic examination of smear slides, and color (RGB values), complemented with X-ray diffraction (XRD), carbonate data and sediment physical properties. The sediments are categorized into two lithofacies according to their primary lithologies: nannofossil ooze and clay. Two smear slides were taken per core for Hole U1385F (96.9–399.6 m CSF-A) and Cores 397-U1385G-1H through 13X (0–116.13 m CSF-A). One smear slide was taken per core for the remainder of Hole U1385G (116.13–396.16 m CSF-A). In Holes U1385H–U1385J, smear slides were taken only in specific intervals to confirm lithologies. Two carbonate samples and one XRD sample were taken per core for Hole U1385G.
Site U1385 consists of one lithostratigraphic unit spanning the early Pliocene to the Quaternary, and nannofossil ooze is the dominant principal lithology. Lithologies vary between darker intervals of nannofossil ooze with varying amounts of clay to lighter intervals consisting of nannofossil ooze. The cyclicity between these lithologies is evident in the color reflectance and physical properties, including natural gamma radiation (NGR), magnetic susceptibility (MS), and L* (see Physical properties and Downhole measurements).
Based on constraints from biostratigraphic and paleomagnetic data, the basal ages of Holes U1385F–U1385H and U1385J are estimated to be 4.5 Ma. No major deformational structures were observed across or within holes, and decimeter-scale features are found in only a few sections. Sedimentation rates at Site U1385 were estimated based on onboard age models to be 10.8 cm/ky at 0–220 m CSF-A, 4 cm/ky at 220–230 m CSF-A, 9 cm/ky at 230–330 m CSF-A, and 10 cm/ky at 330–400 m CSF-A (see Biostratigraphy). Drilling disturbance was present through many cores in all holes, from slight to severe, and varied with drilling method, sea conditions, and methane contents of sediments.
3.2. Lithofacies description
Two lithofacies were identified at Site U1385 (Table T2). Lithofacies 1 and 2 can be represented by a mixed ratio of two end-members: a 100% nannofossil ooze and a 100% clay comprised of siliciclastics. Most sediments at Site U1385 belong to Lithofacies 1. Lithofacies 2 occurs in only 10 sections in Cores 397-U1385F-3X and 13X. Lithofacies 2 constitutes 2.7% of all lithofacies in Hole U1385F and less than 1% of all lithofacies at Site U1385.
3.2.1. Lithofacies 1
Lithofacies 1 consists principally of nannofossil ooze with varying amounts of clay and detrital carbonate. Lithologies within this lithofacies are clayey nannofossil ooze, nannofossil ooze with clay, nannofossil ooze with clay and carbonate, nannofossil ooze with carbonate, and nannofossil ooze (Figure F11). Sediments are light to dark gray, greenish gray, and brownish gray. Foraminifers are disseminated throughout the sediment cores in this lithofacies. Bioturbation ranges from absent to heavy. Trace fossils such as Zoophycos, Chondrites, Planolites, Thalassinoides, and Ophiomorpha are commonly observed (Figure F12). Color banding, dark patches, nodules, and pyrite are observed, but the occurrence of these features varies with depth (Figure F13).
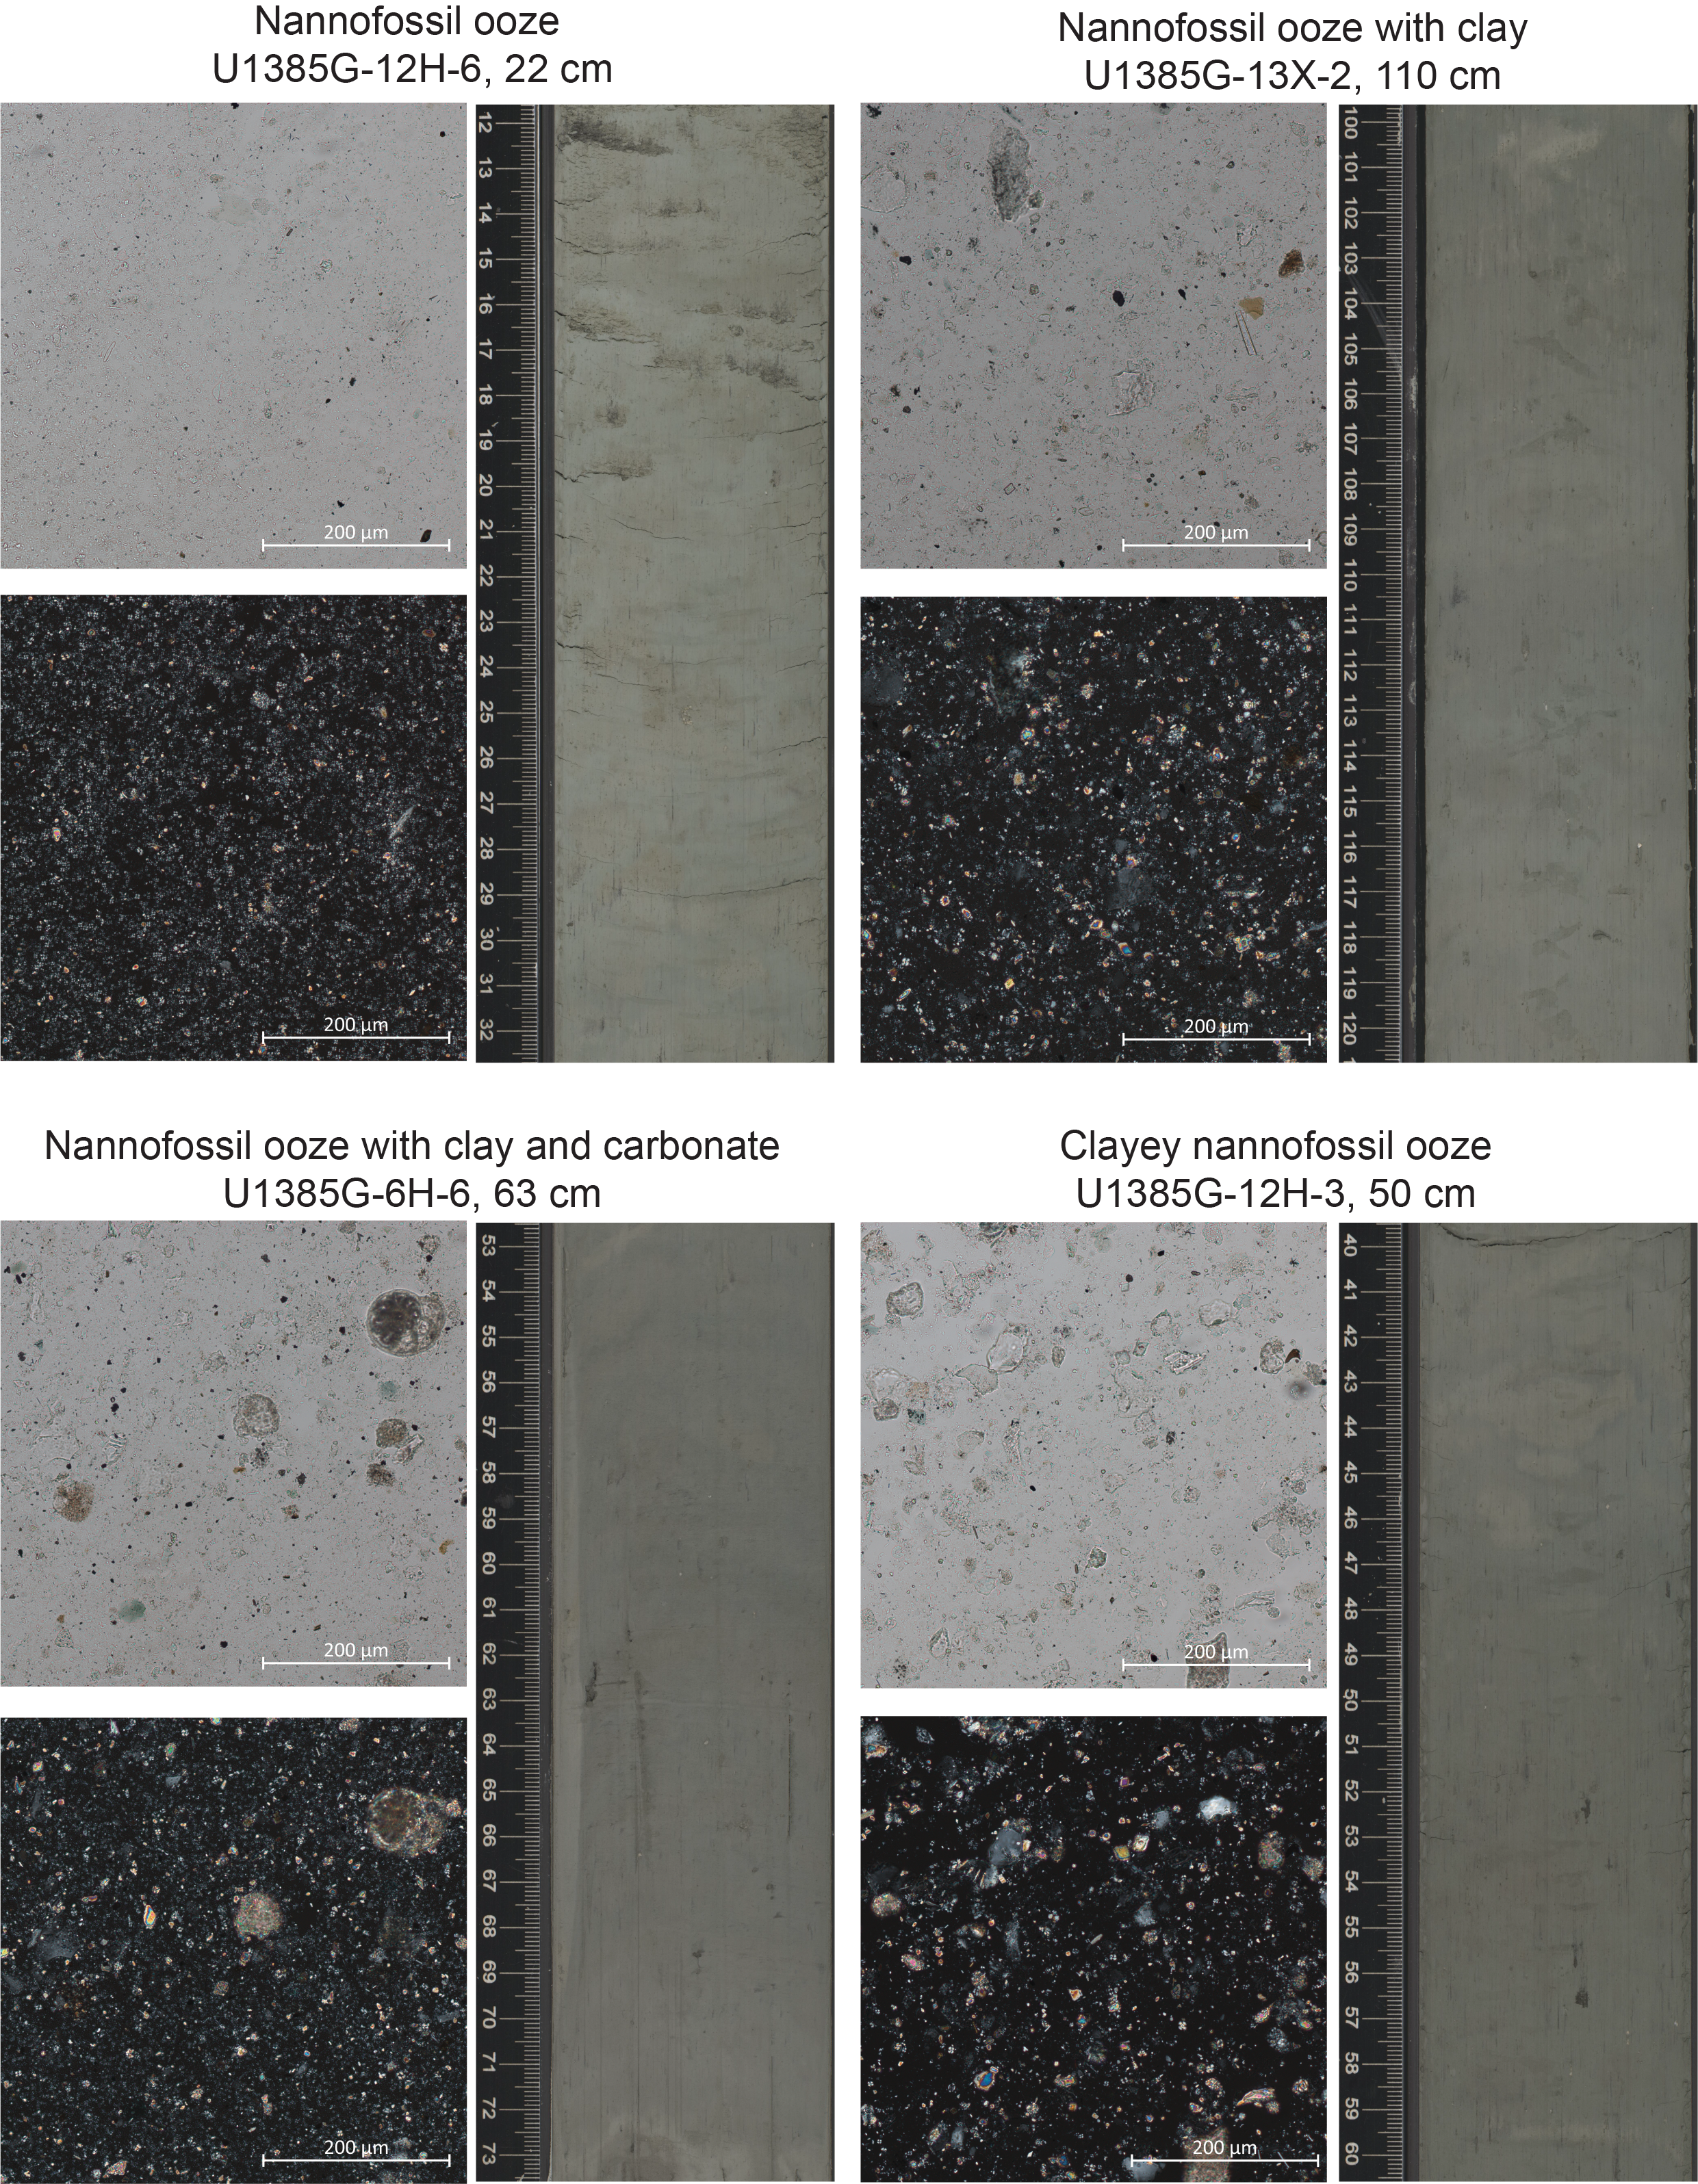
Figure F11. Lithofacies 1.
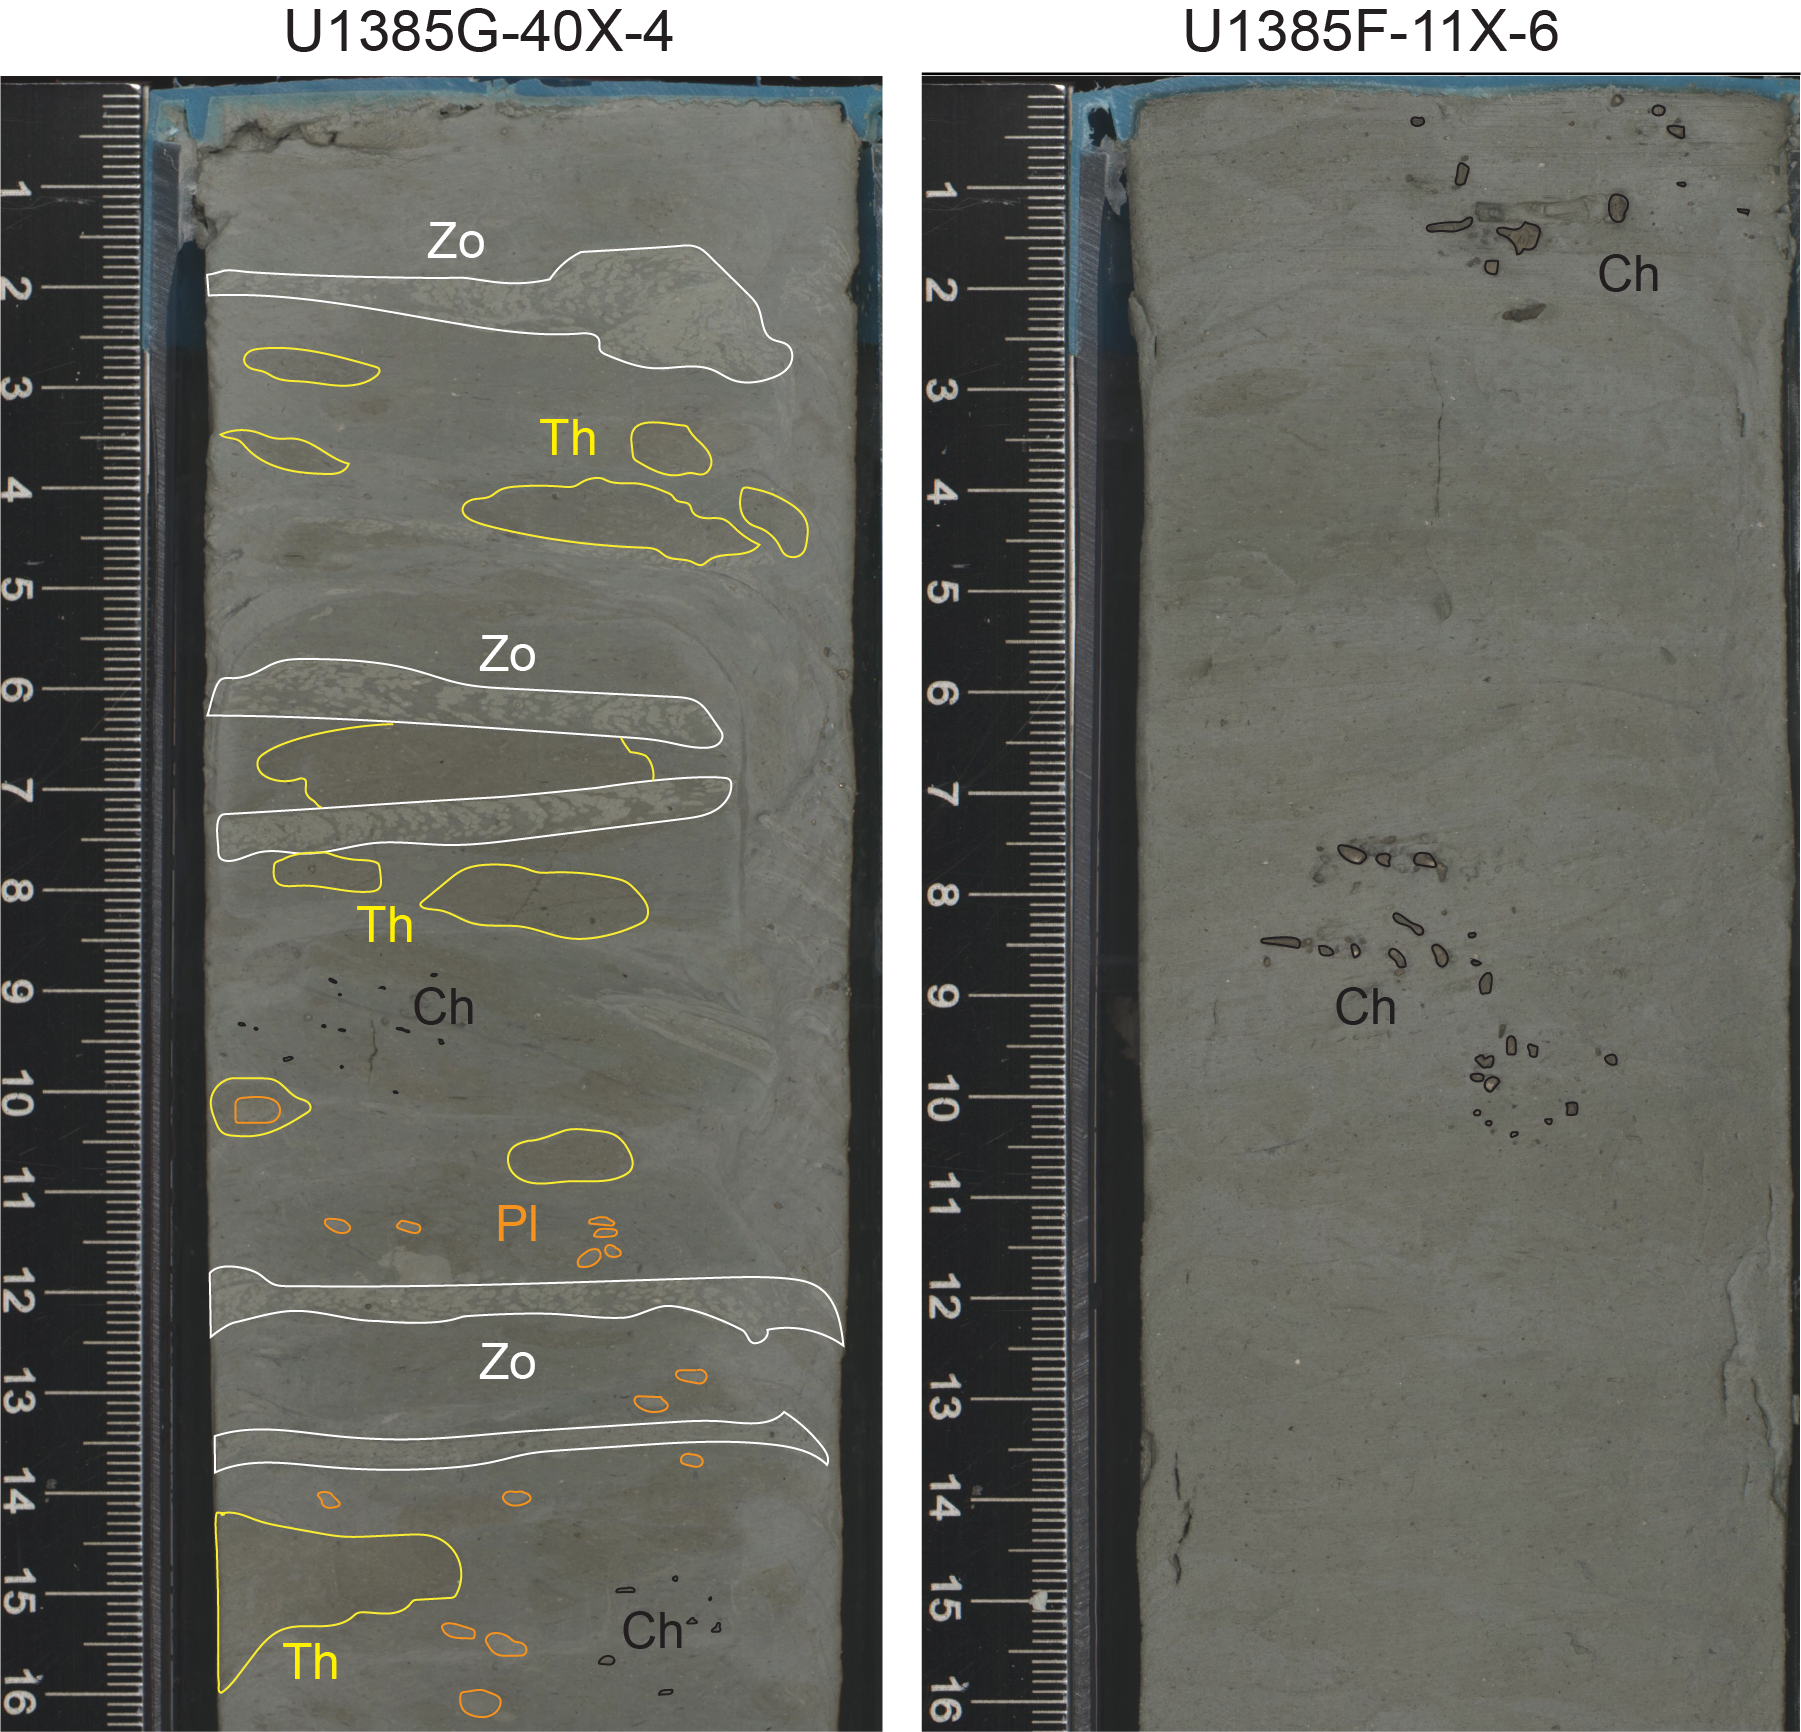
Figure F12. Fossils.
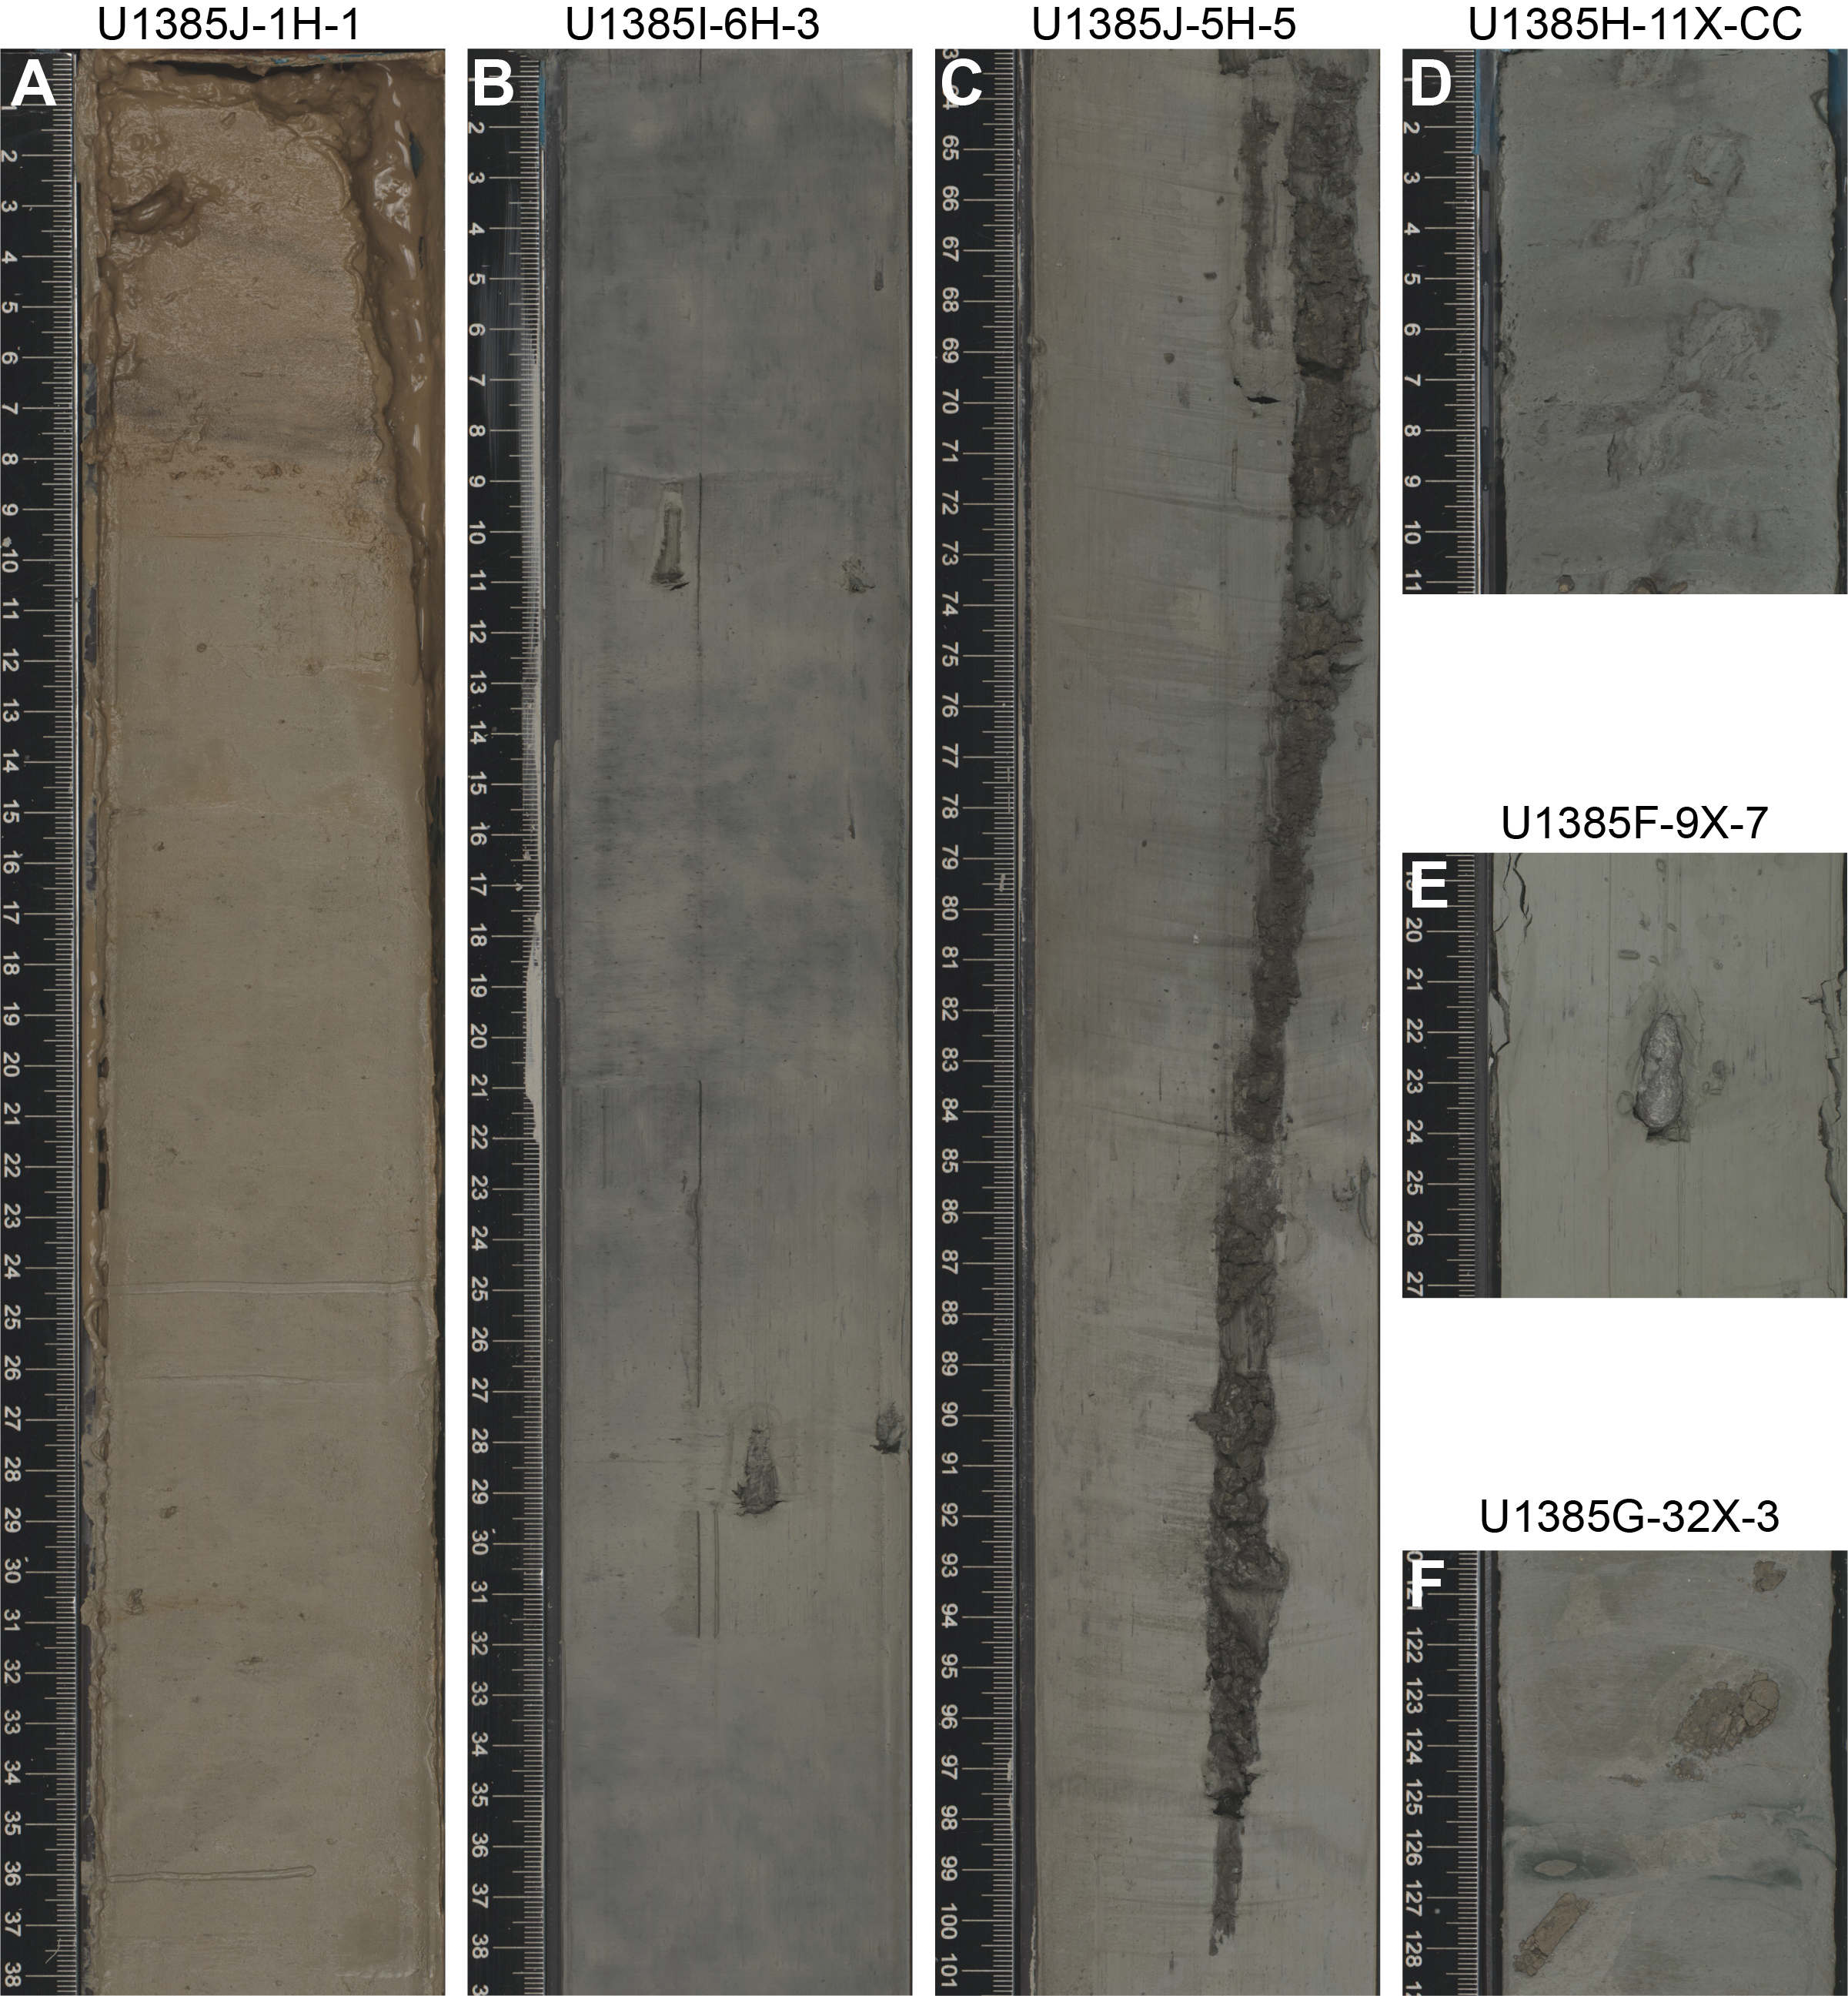
Figure F13. Diagenetic features.
3.2.1.1. Smear slides
Nannofossils are the dominant (>50%) component in Lithofacies 1. Siliciclastic components range from trace (≤1%) to abundant (>25%–50%), and detrital carbonate ranges from trace (≤1%) to common (>10%–25%). Foraminifers and authigenic minerals (pyrite, dolomite, glauconite, and iron oxides) range from trace (≤1%) to rare (>1%–10%). Authigenic minerals and foraminifers are present in most samples. Diatom abundance is trace (≤1%) in five smear slides, rare (>1%–10%) in one, and common (>10%–25%) in six (Samples 397-U1385G-12H-6, 10 and 50 cm; 397-U1385I-12X-2, 89 and 142 cm; and 397-U1385J-13X-2, 11 and 64 cm). Sponge spicules are the most frequent biogenic siliceous component at all those levels, and their abundance ranges from trace (≤1%) to common (>10%–25%). Other siliceous biogenic components, such as radiolarians, range in abundance from trace (≤1%) to rare (>1%–10%). For all (biogenic and siliciclastic) components, 50%–90% of grains are in the clay-size fraction, 5%–40% are in the silt-size fraction, and 1%–15% are in the sand-size fraction.
3.2.2. Lithofacies 2
Lithofacies 2 consists of sediments that are principally clay composed of siliciclastics with varying amounts of nannofossils and detrital carbonate. The dominant lithology is clay with nannofossil ooze (Figure F14). Sediments are predominantly dark gray. Lithofacies 2 includes the same sedimentary structures, bioturbation, trace fossils, and diagenetic features described in Lithofacies 1.
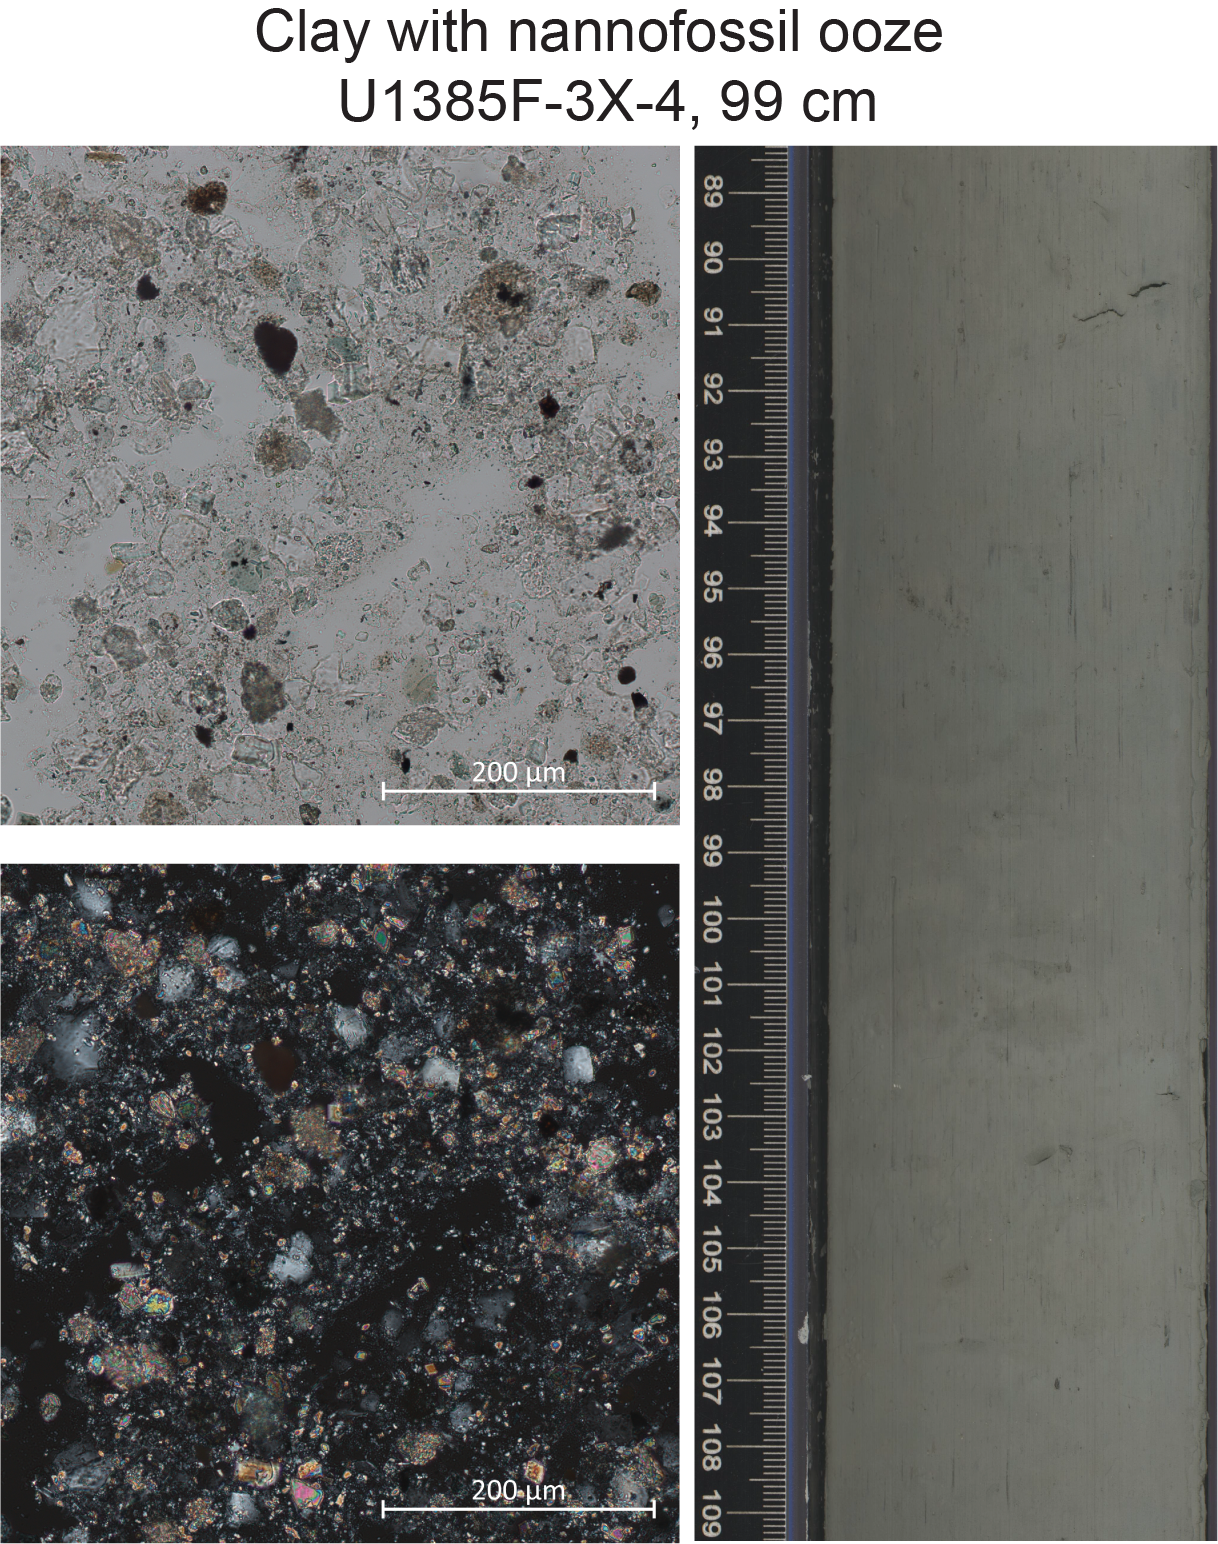
Figure F14. Clay with nannofossil ooze.
3.2.2.1. Smear slides
Siliciclastic grains are the dominant (>50%) component in Lithofacies 2 and are only present in two smear slides from Samples 397-U1385F-3X-4, 99 cm, and 13X-5, 52 cm. Detrital carbonate abundance ranges from rare (>1%–10%) to common (>10%–25%). Nannofossils are abundant (>25%–50%). Foraminifers and sponge spicules are rare (>1%–10%). Authigenic minerals and diatoms occur in trace (≤1%) amounts. For all (biogenic and siliciclastic) components, 55%–70% of grains are in the clay-size fraction, 20%–35% are in the silt-size fraction, and 10% are in the sand-size fraction.
3.3. Lithostratigraphic Unit I
- Intervals: 397-U1385F-2X through 33X; 397-U1385G-1H through 42X; 397-U1385H-2X through 32X; 397-U1385I-1H through 16X; 397-U1385J-1H through 43X
- Depths: Hole U1385F = 96.9–399.6 m CSF-A; Hole U1385G = 0–396.16 m CSF-A; Hole U1385H = 114.6–399.3 m CSF-A; Hole U1385I = 0–152.69 m CSF-A; Hole U1385J = 0–399.9 m CSF-A
- Thickness: Hole U1385F = 302.7 m; Hole U1385G = 396.16 m; Hole U1385H = 284.6 m; Hole U1385I = 152.69 m; Hole U1385J = 399.9 m
- Age: Quaternary to Pliocene (0–4.5 Ma)
- Primary lithofacies: 1, 2
The sedimentary sequence at Site U1385 is contained within a single lithostratigraphic unit (Table T2). Lithostratigraphic Unit I spans 0–400 m CSF-A across all holes and consists primarily of Lithofacies 1 (>99% of sediment depths) with minor occurrences of Lithofacies 2 (<1% of sediment depths). Contacts between lithologies are color boundaries or bioturbated, straight to irregular, and gradational to sharp. Foraminifers and color banding are common throughout. Variations in sediment composition between and within lithofacies (i.e., between light and dark intervals) generally occur at the decimeter to meter scale.
Sediments from ~0–35 m CSF-A (Cores 397-U1385G-1H through 4H, 397-U1385I-1H through 4H, and 397-U1385J-1H through 4H) consist mostly of nannofossil ooze with clay, are brownish gray, and do not display a clear cyclicity in color or lithology. Sediments from ~35–300 m CSF-A (Cores 397-U1385F-2X through 22X, 397-U1385G-5H through 32X, 397-U1385H-2X through 21X, 397-U1385I-5H through 16X, and 397-U1385J-5H through 33X) consist mostly of dark layers of nannofossil ooze with clay (and/or carbonate), clayey nannofossil ooze, or clay with nannofossils intercalated with light layers of nannofossil ooze. Sediments across this interval are gray to greenish gray. Sediments from ~300–400 m CSF-A (Cores 397-U1385F-23X through 33X, 397-U1385G-33X through 42X, 397-U1385H-21X through 32X, and 397-U1385J-34X through 43X) consist mostly of nannofossil ooze with clay and nannofossil ooze, and the clay component decreases downhole. Sediments across this interval are also gray to greenish gray.
From 0 to 35 m CSF-A in all holes, red color values are typically greater than green, which in turn are greater than blue. The differences between the magnitudes of RGB values decrease downhole in all holes. The increase in RGB values to 300 m CSF-A in all holes is consistent with a decrease in the clay component and an increase in the lightness of sediments.
3.3.1. Biosilica
Intervals with siliceous microfossils were observed in Sections 397-U1385F-2X-5 (104.1 m CSF-A), 397-U1385G-12H-6 (104.5, 104.7, and 105 m CSF-A), 397-U1385I-12X-2 (106.3 and 106.9 m CSF-A), and 397-U1385J-13X-2 (102.6 and 103.1 m CSF-A). Smear slide observations reveal the rare to common occurrence of siliceous organisms, including diatoms such as forms of the genera Thalassionema, Rhizosolenia, Stephanopyxis, Azpeitia, Nitzschia, Thalassiosira, and Chaetoceros; Chaetoceros resting spores; fragments of large Coscinodiscus; species like Actinoptychus senarius, Alveus marinus, and Paralia sulcata; and radiolarians, sponge spicules, ebridian flagellates, and silicoflagellates (Figure F15).
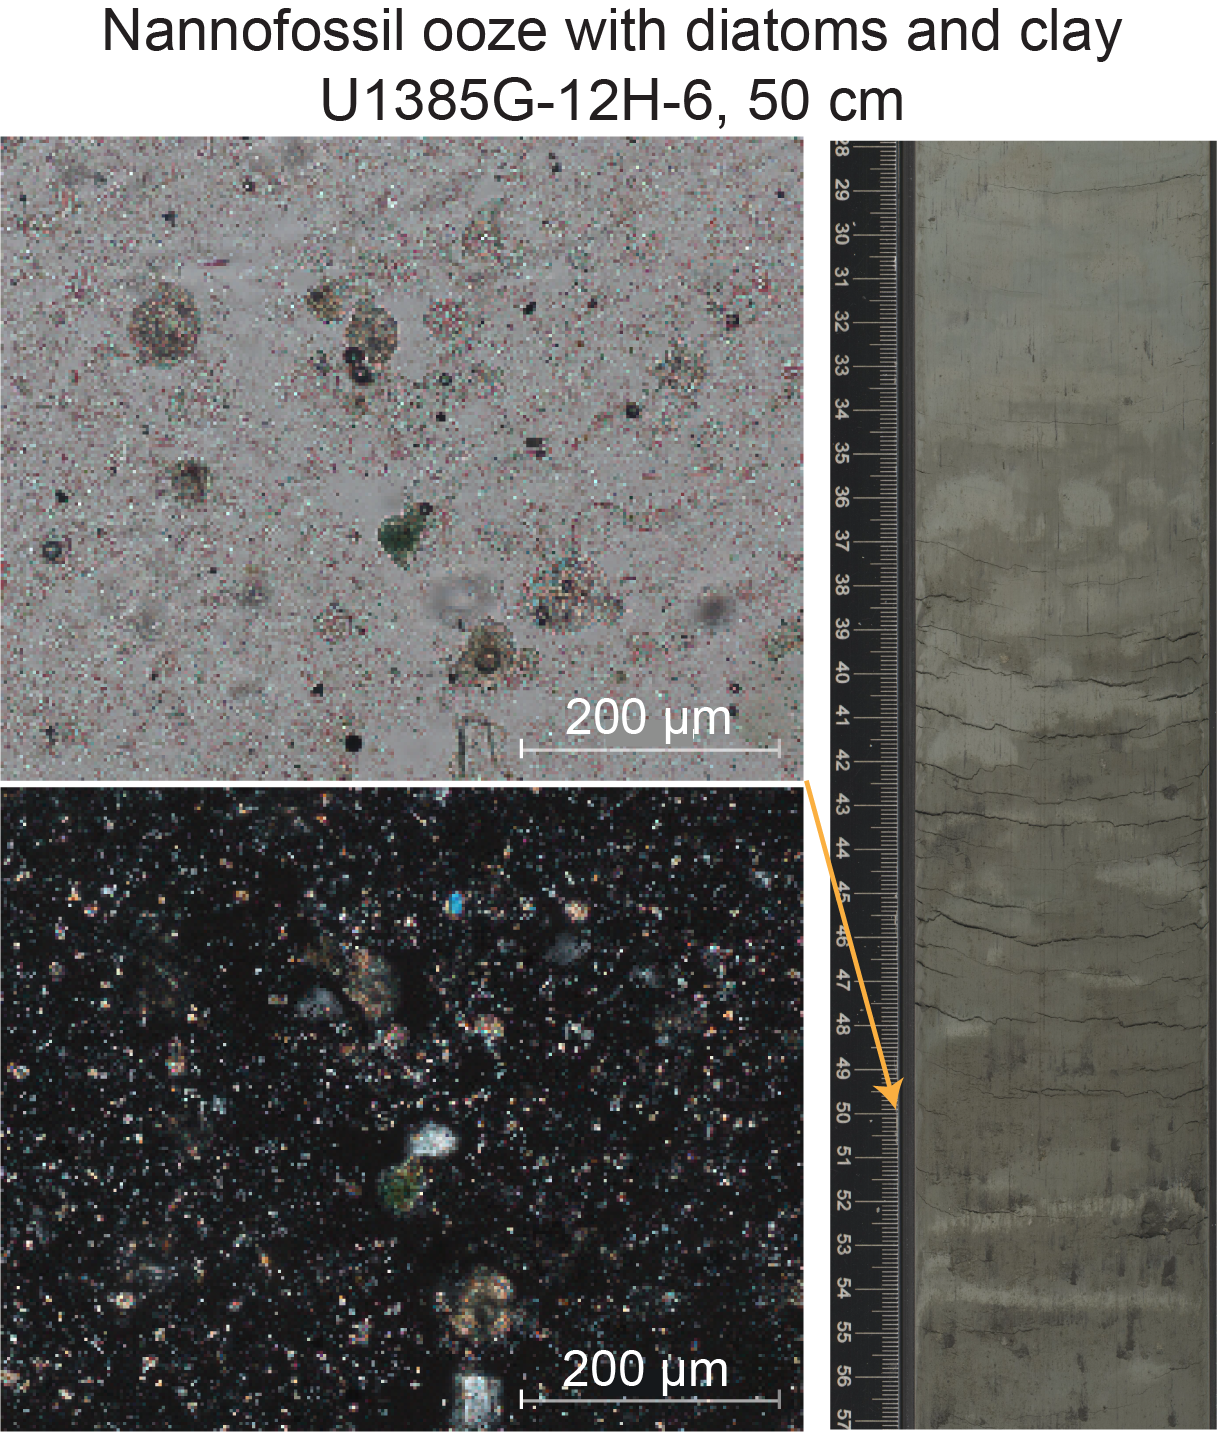
Figure F15. Nannofossil ooze with diatoms and clay.
3.3.2. Diagenetic features
A surface oxidized layer of brownish gray sediment is present at approximately 0–10 cm CSF-A in Sections 397-U1385G-1H-1, 397-U1385I-1H-1, and 397-U1385J-1H-1 (Figure F13). Large dark patches (centimeter to decimeter scale) are present from 0 to 75 m CSF-A in Cores 397-U1385G-1H through 9H, 397-U1385I-1H through 8H, and 397-U1385J-1H through 8H. Small dark patches (centimeter scale), which outline trace fossils and burrows, are found throughout sediments at Site U1385. Grainy pyrite clusters, nodules of pyrite, and pyritized burrows are also found throughout Site U1385, except in the uppermost tens of meters in Cores 397-U1385G-1H through 2H (0–21.23 m CSF-A), 397-U1385I-1H through 6H (0–57.03 m CSF-A), and 397-U1385J-1H through 3H (0–22.45 m CSF-A).
In macro (visual) description, pyrite occurs as discrete burrow fills, isolated nodules, grainy pyrite clusters. Clearly crystallized pyrite nodules are evident along the face of the split core and in X-ray images. Both pyrite nodules and crystallized pyrite can co-occur, with crystallized pyrite becoming more evident in more consolidated sediments. For example, grainy pyrite clusters are present from approximately 20 to 180 m CSF-A (Cores 3H–21X) and larger pyrite nodules are more evident as sediments become more lithified, from approximately 180 to 400 m CSF-A (Cores 21X–42X) (Figure F16).
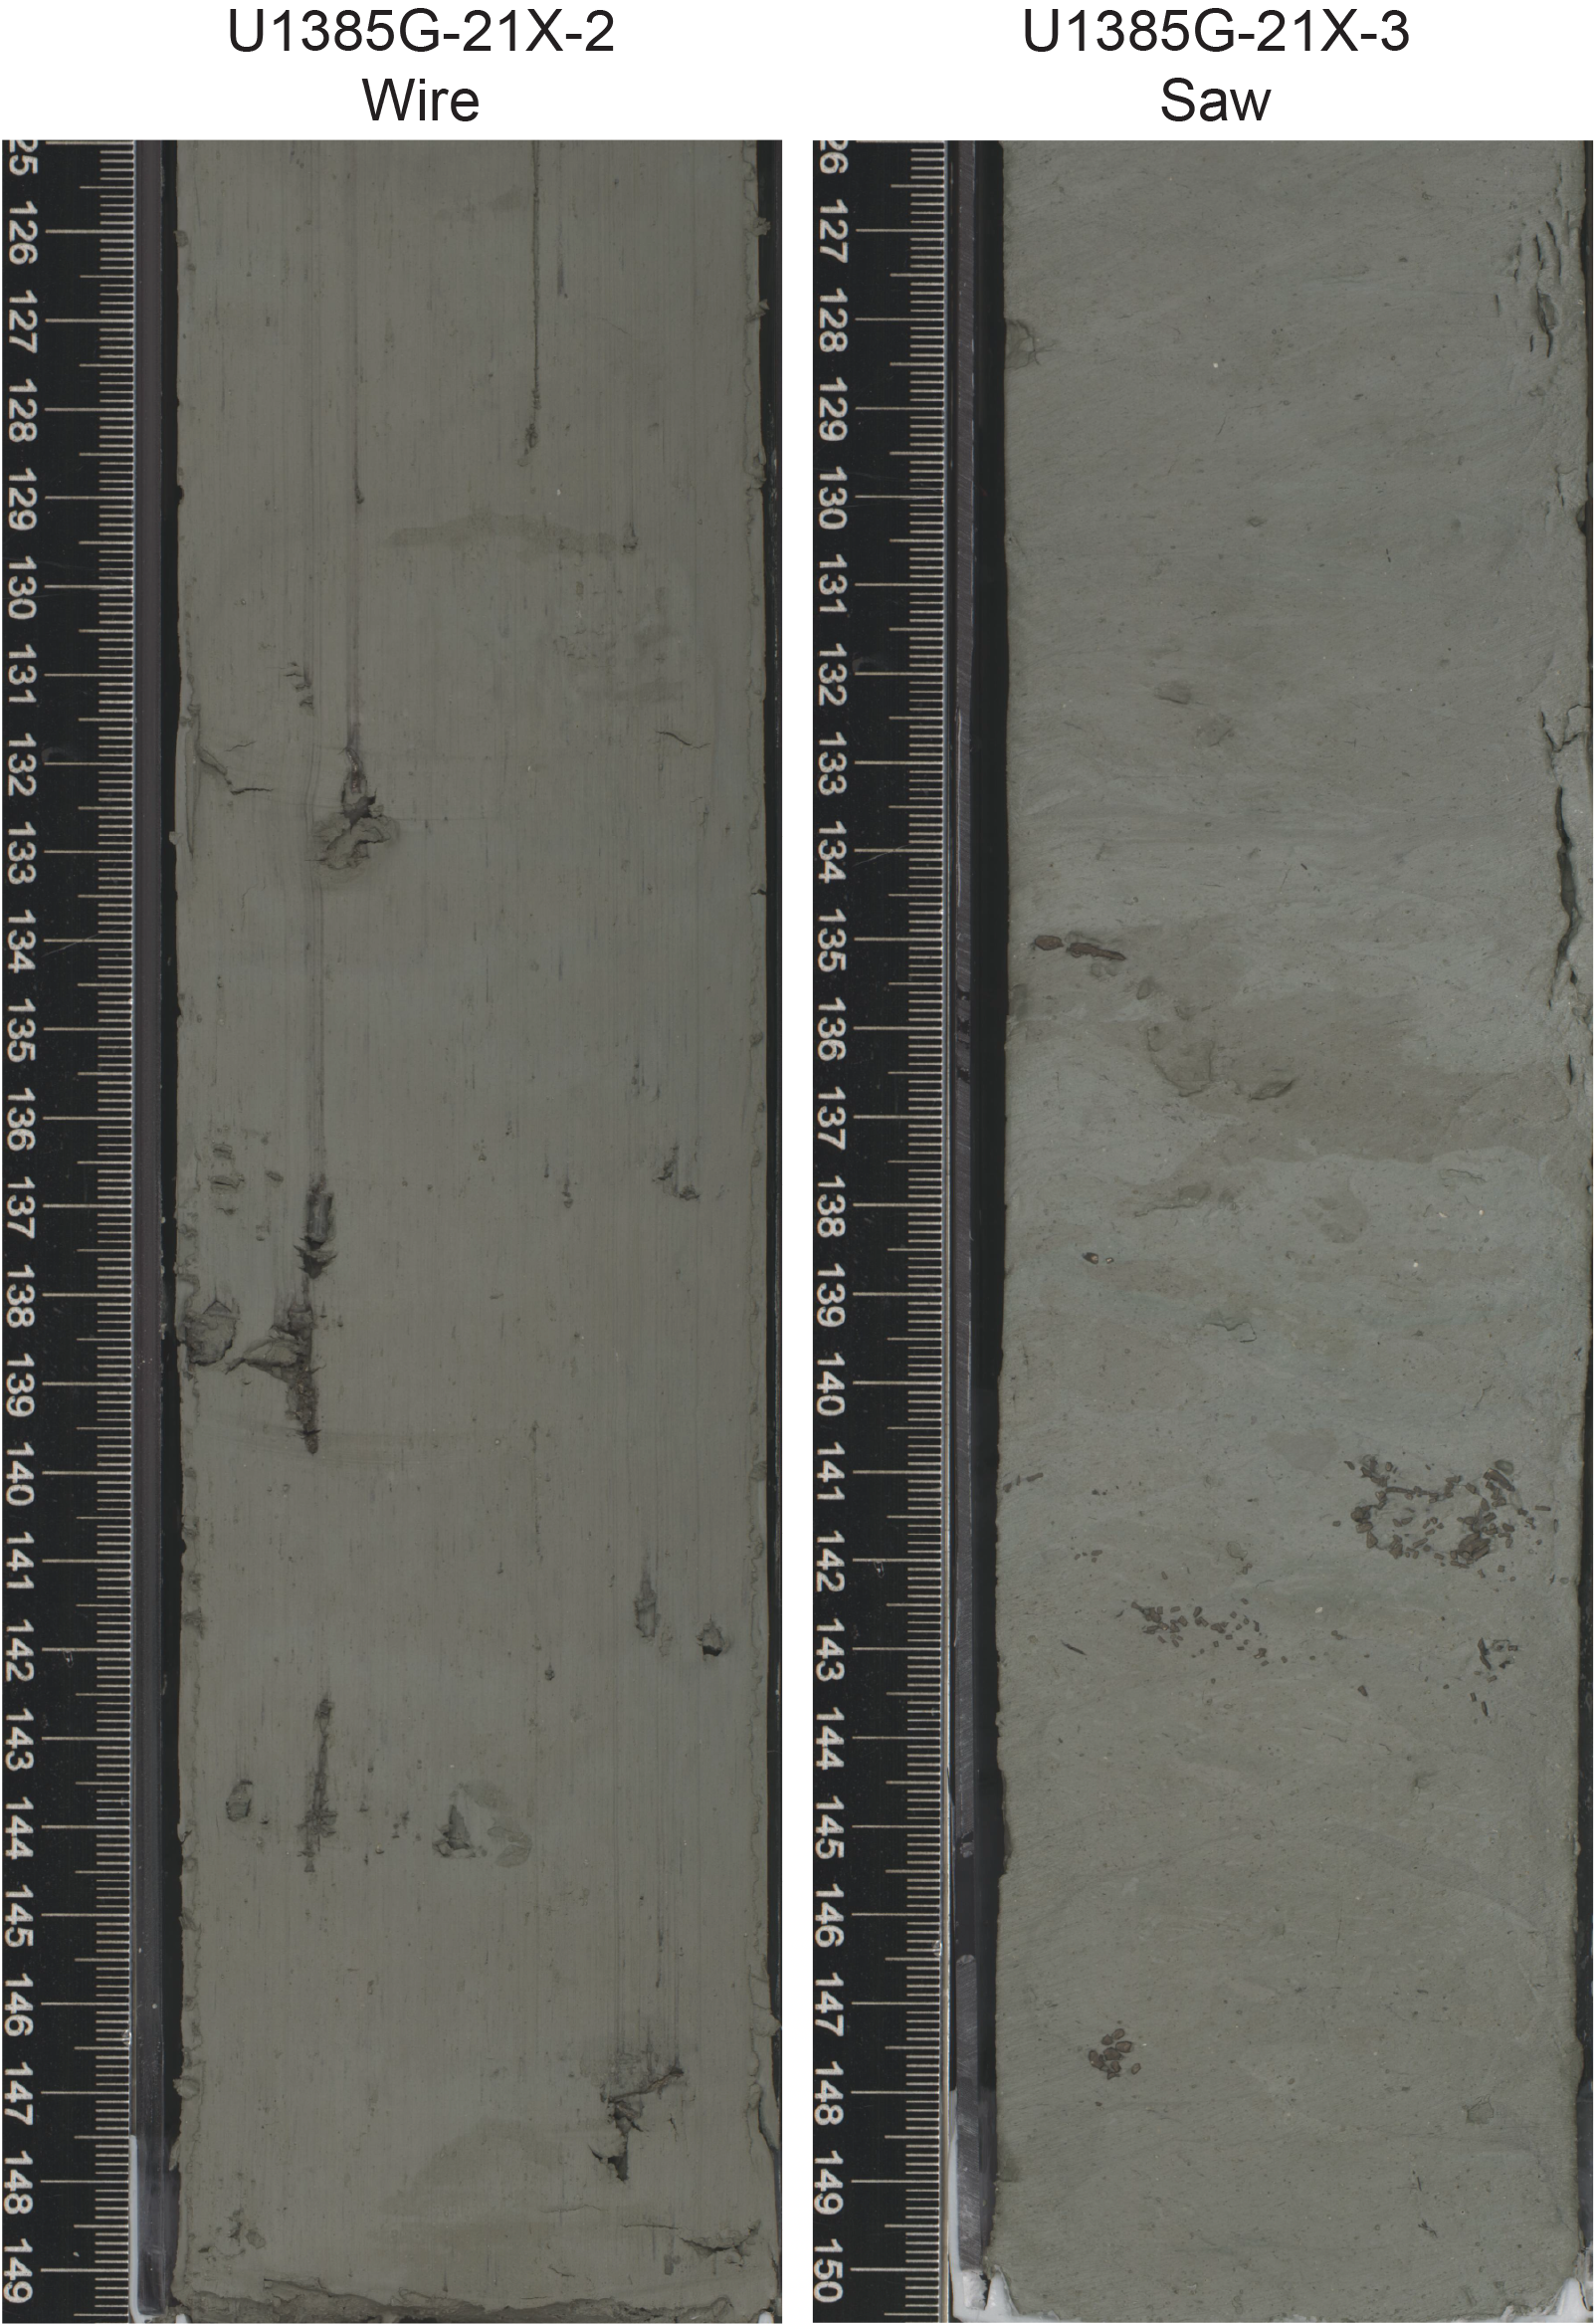
Figure F16. Split cores.
3.3.3. Bioturbation, trace fossils, and macro fossils
Bioturbation varies from absent to heavy. At 0–3.3 m CSF-A in Hole U1385G (Sections 1H-1 through 2H-2), 0–9 m CSF-A in Hole U1385I (Core 1H), and 0–2.89 m CSF-A in Hole U1385J (Sections 1H-1 through 1H-2), round and unfilled burrows are present and bioturbation is absent to slight. Bioturbation is sparse to slight at 2.8–20.1 m CSF-A in Hole U1385G (Section 2H-3 through Core 3H), 9–18.5 m CSF-A in Hole U1385I (Core 2H), and 2.89–12.6 m CSF-A in Hole U1385J (Section 1H-2 through Core 2H), and trace fossils, which can be nondistinctive, are present. Bioturbation is generally moderate but ranges from slight to heavy from approximately 20 m CSF-A to the bases of all holes. Trace fossils of Chondrites, Planolites, Zoophycos, and Thalassinoides are common and generally become more distinctive downhole (Figure F12). Trace fossil burrows range from millimeter to, in rare cases, decimeter scale and occasionally exhibit diagenetic features such as pyritization or dark outlining (Figures F12, F13). Shells and shell fragments are present in several cores at Site U1385. A whole gastropod shell is found in Section 397-U1385G-18X-4, 121 cm, and a pyrite-filled shell is present in Section 30X-3, 31–33 cm (Figure F17).
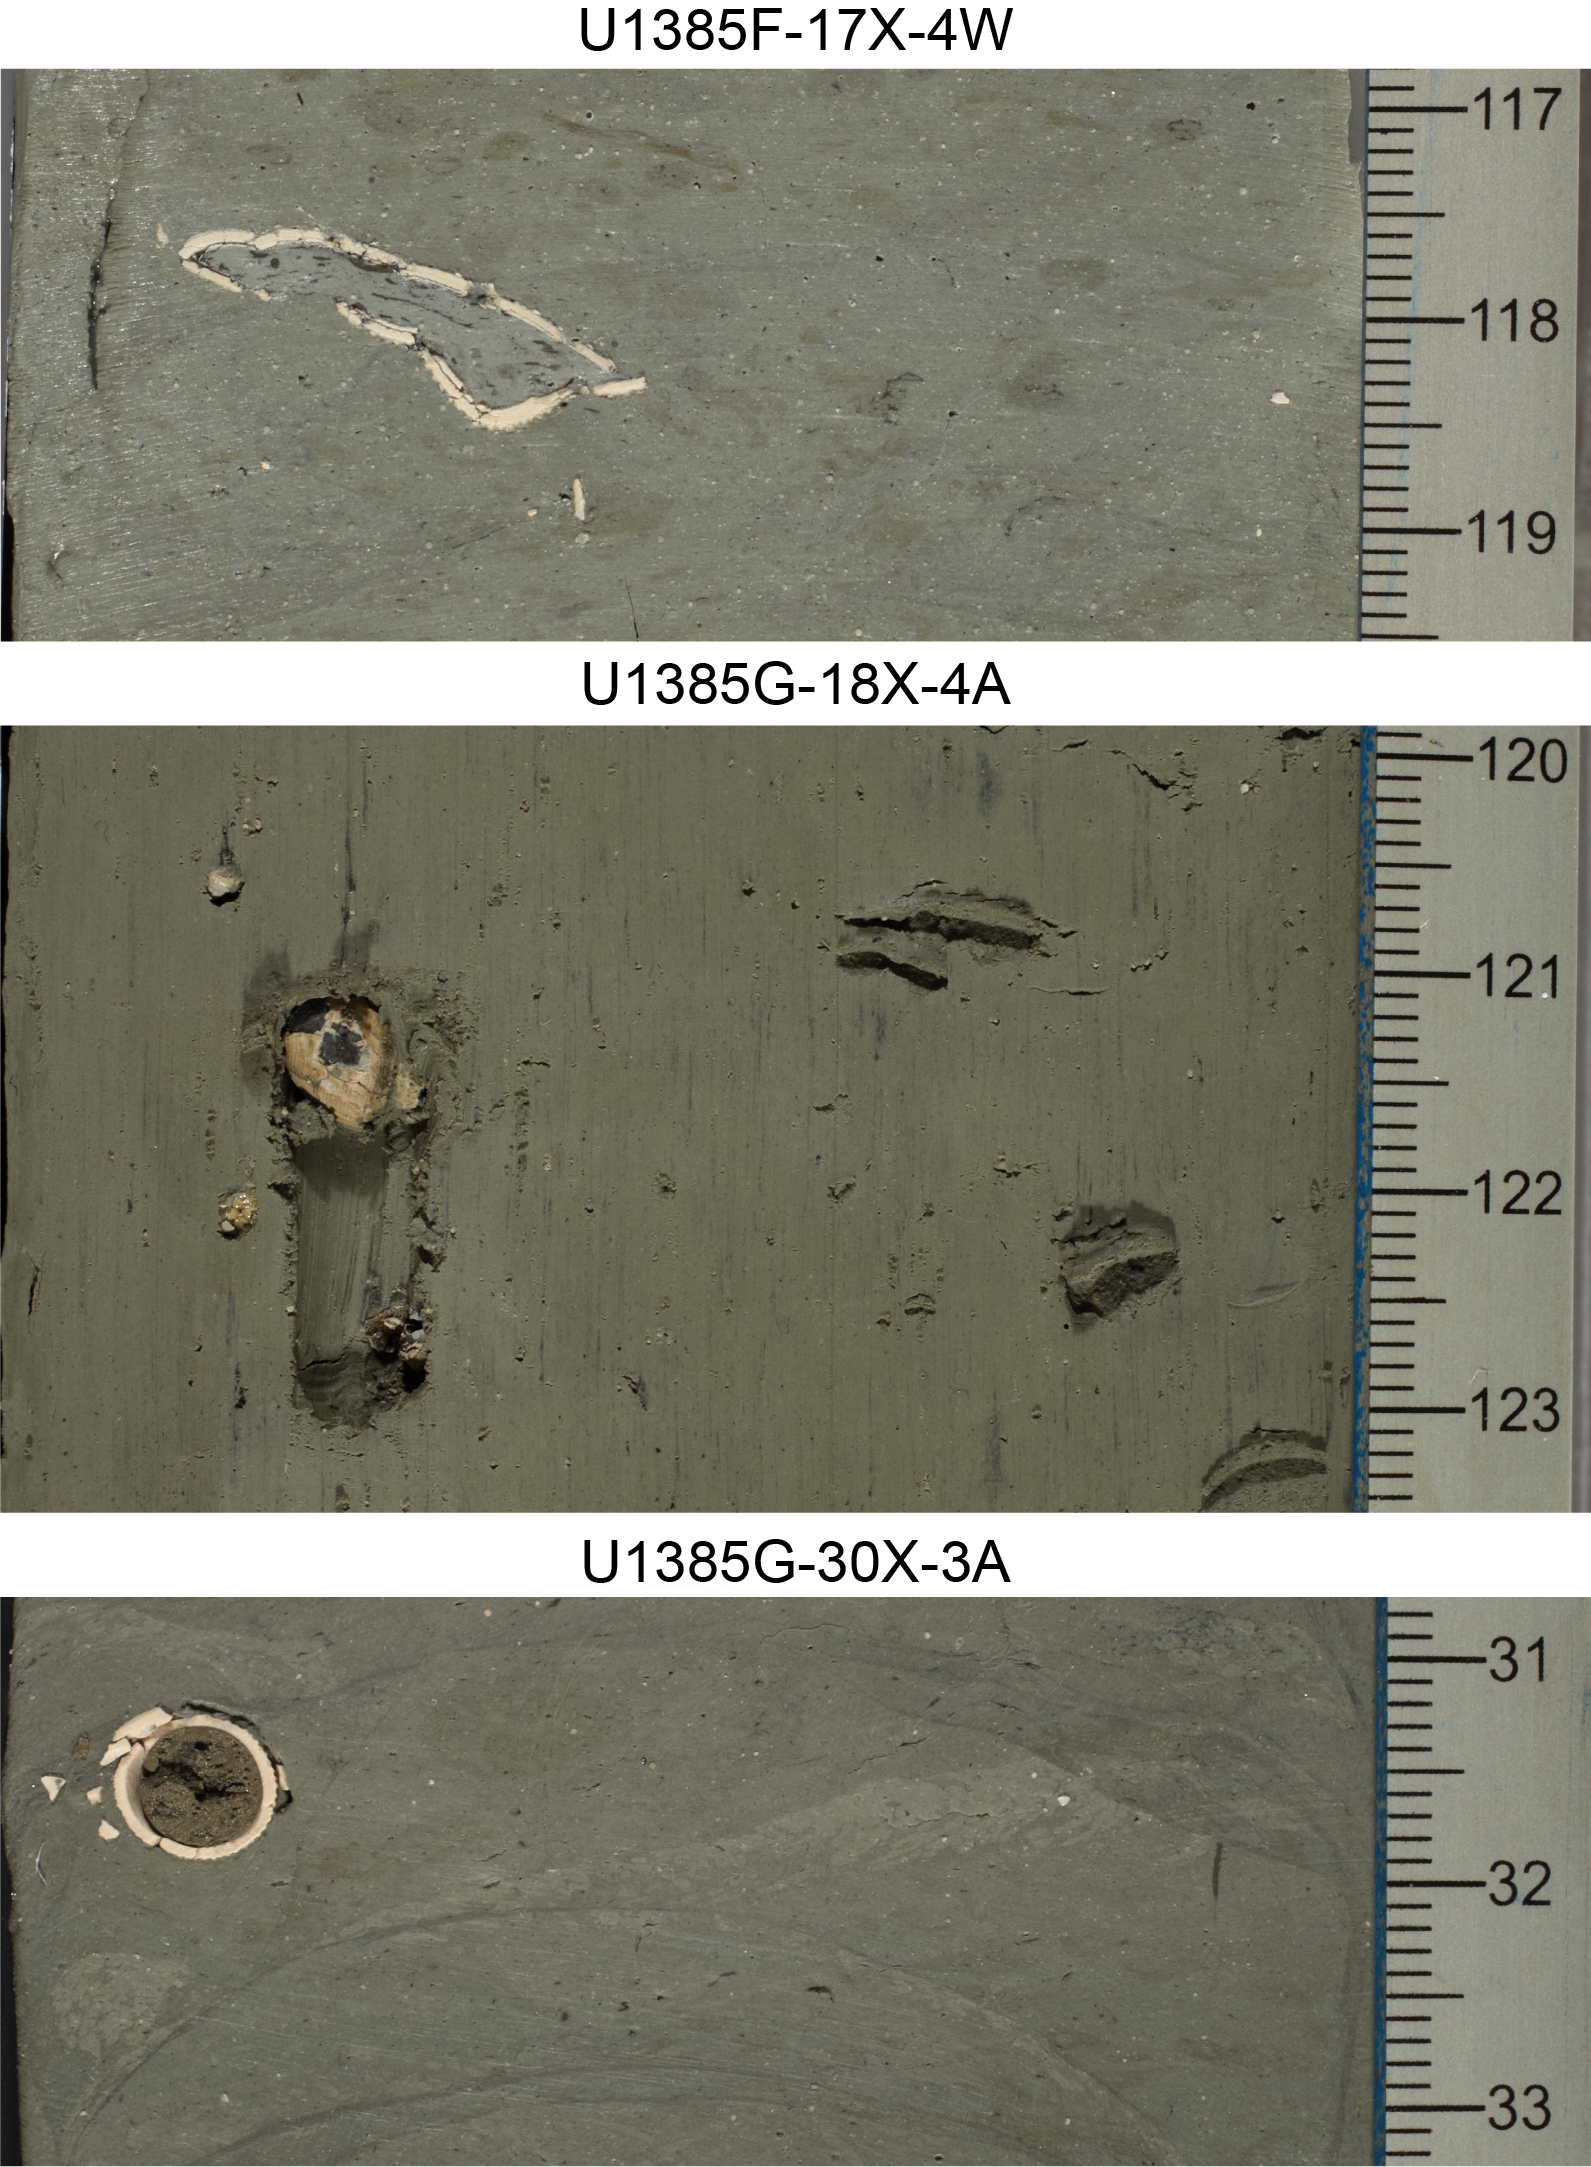
Figure F17. Macrofossils.
3.3.4. Deformational structures
A distinctive inclined deformed bed is present in Sections 397-U1385G-3H-5, 87–98 cm (18.16 m CSF-A) (Figure F18) and 17X-2, 130 cm (148.09 m CSF-A). No other deformational structures were observed at Site U1385.
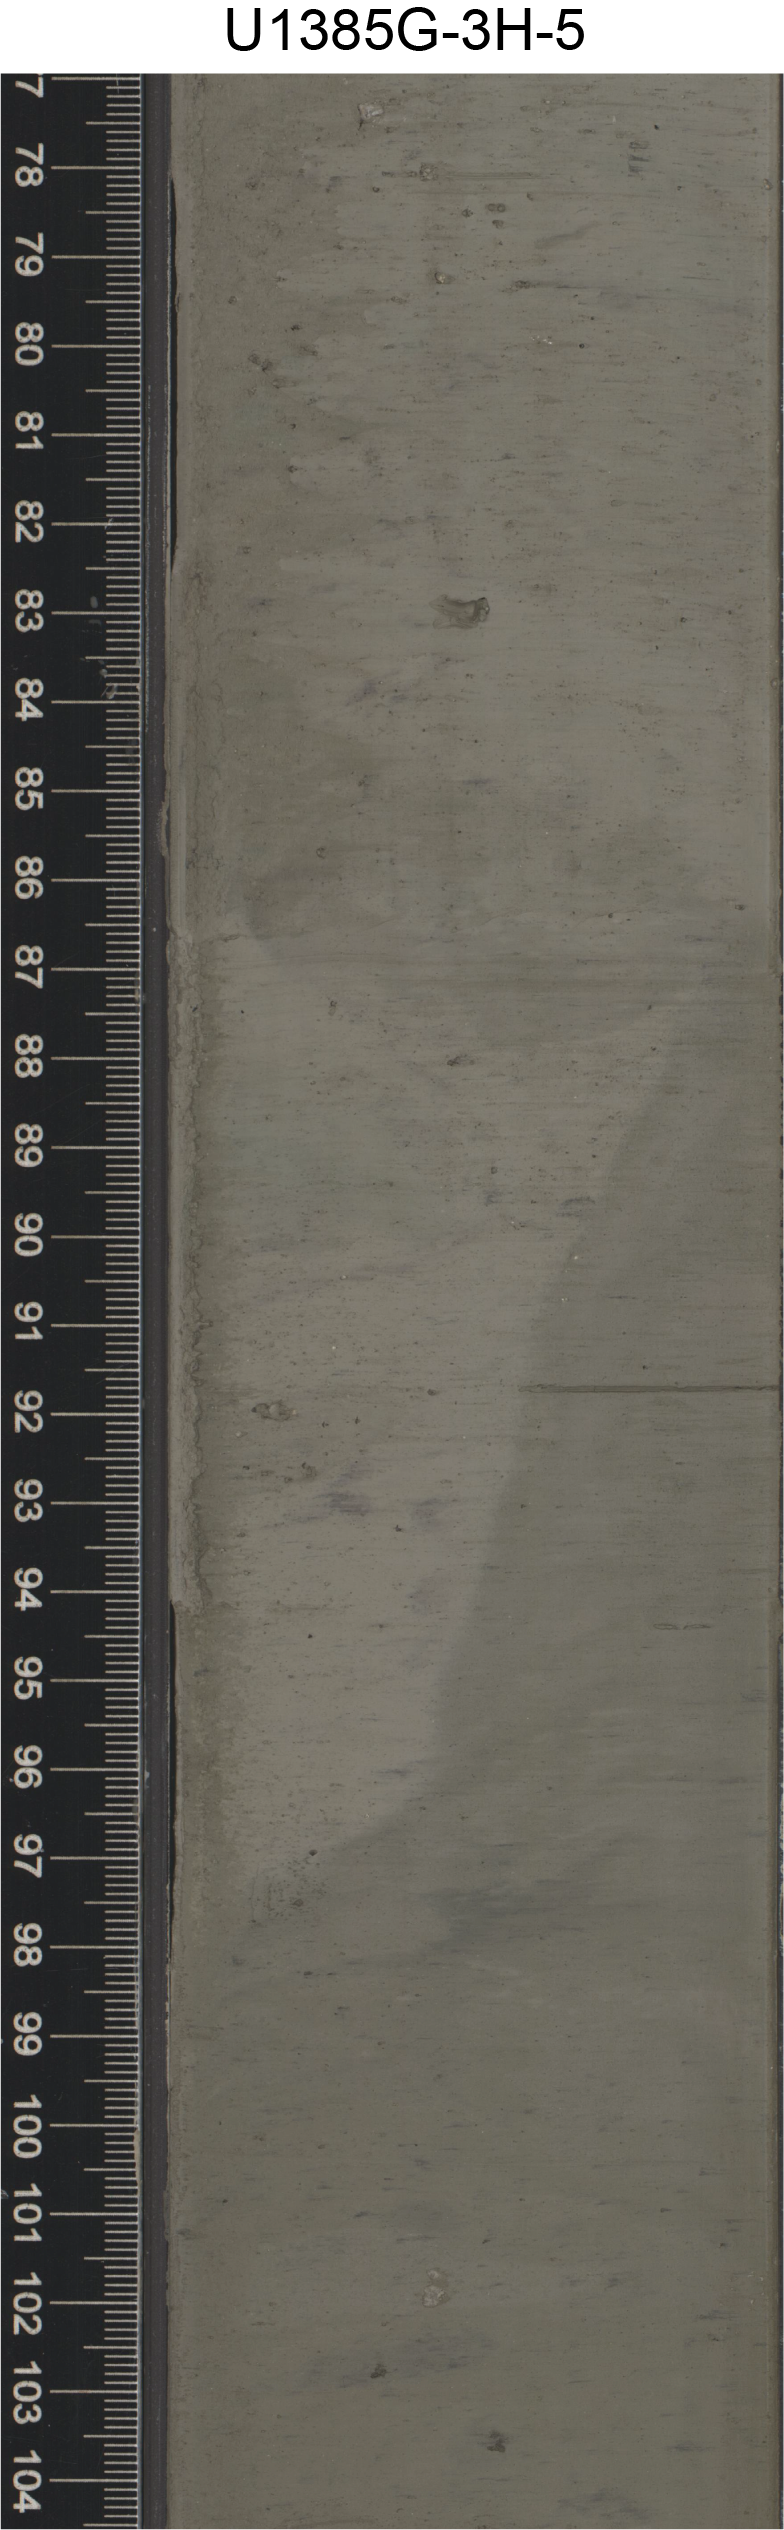
Figure F18. Deformed bedding.
3.4. Complementary analyses
3.4.1. Drilling and other disturbance
Drilling disturbance is found throughout Site U1385 and varies with coring type, depth in hole, and sea state. Drilling and other forms of disturbance for all cores are detailed in Tables T3, T4, T5, T6, and T7. Slightly disturbed strata have been omitted. Representative images of drilling disturbance types are shown in Figure F19.
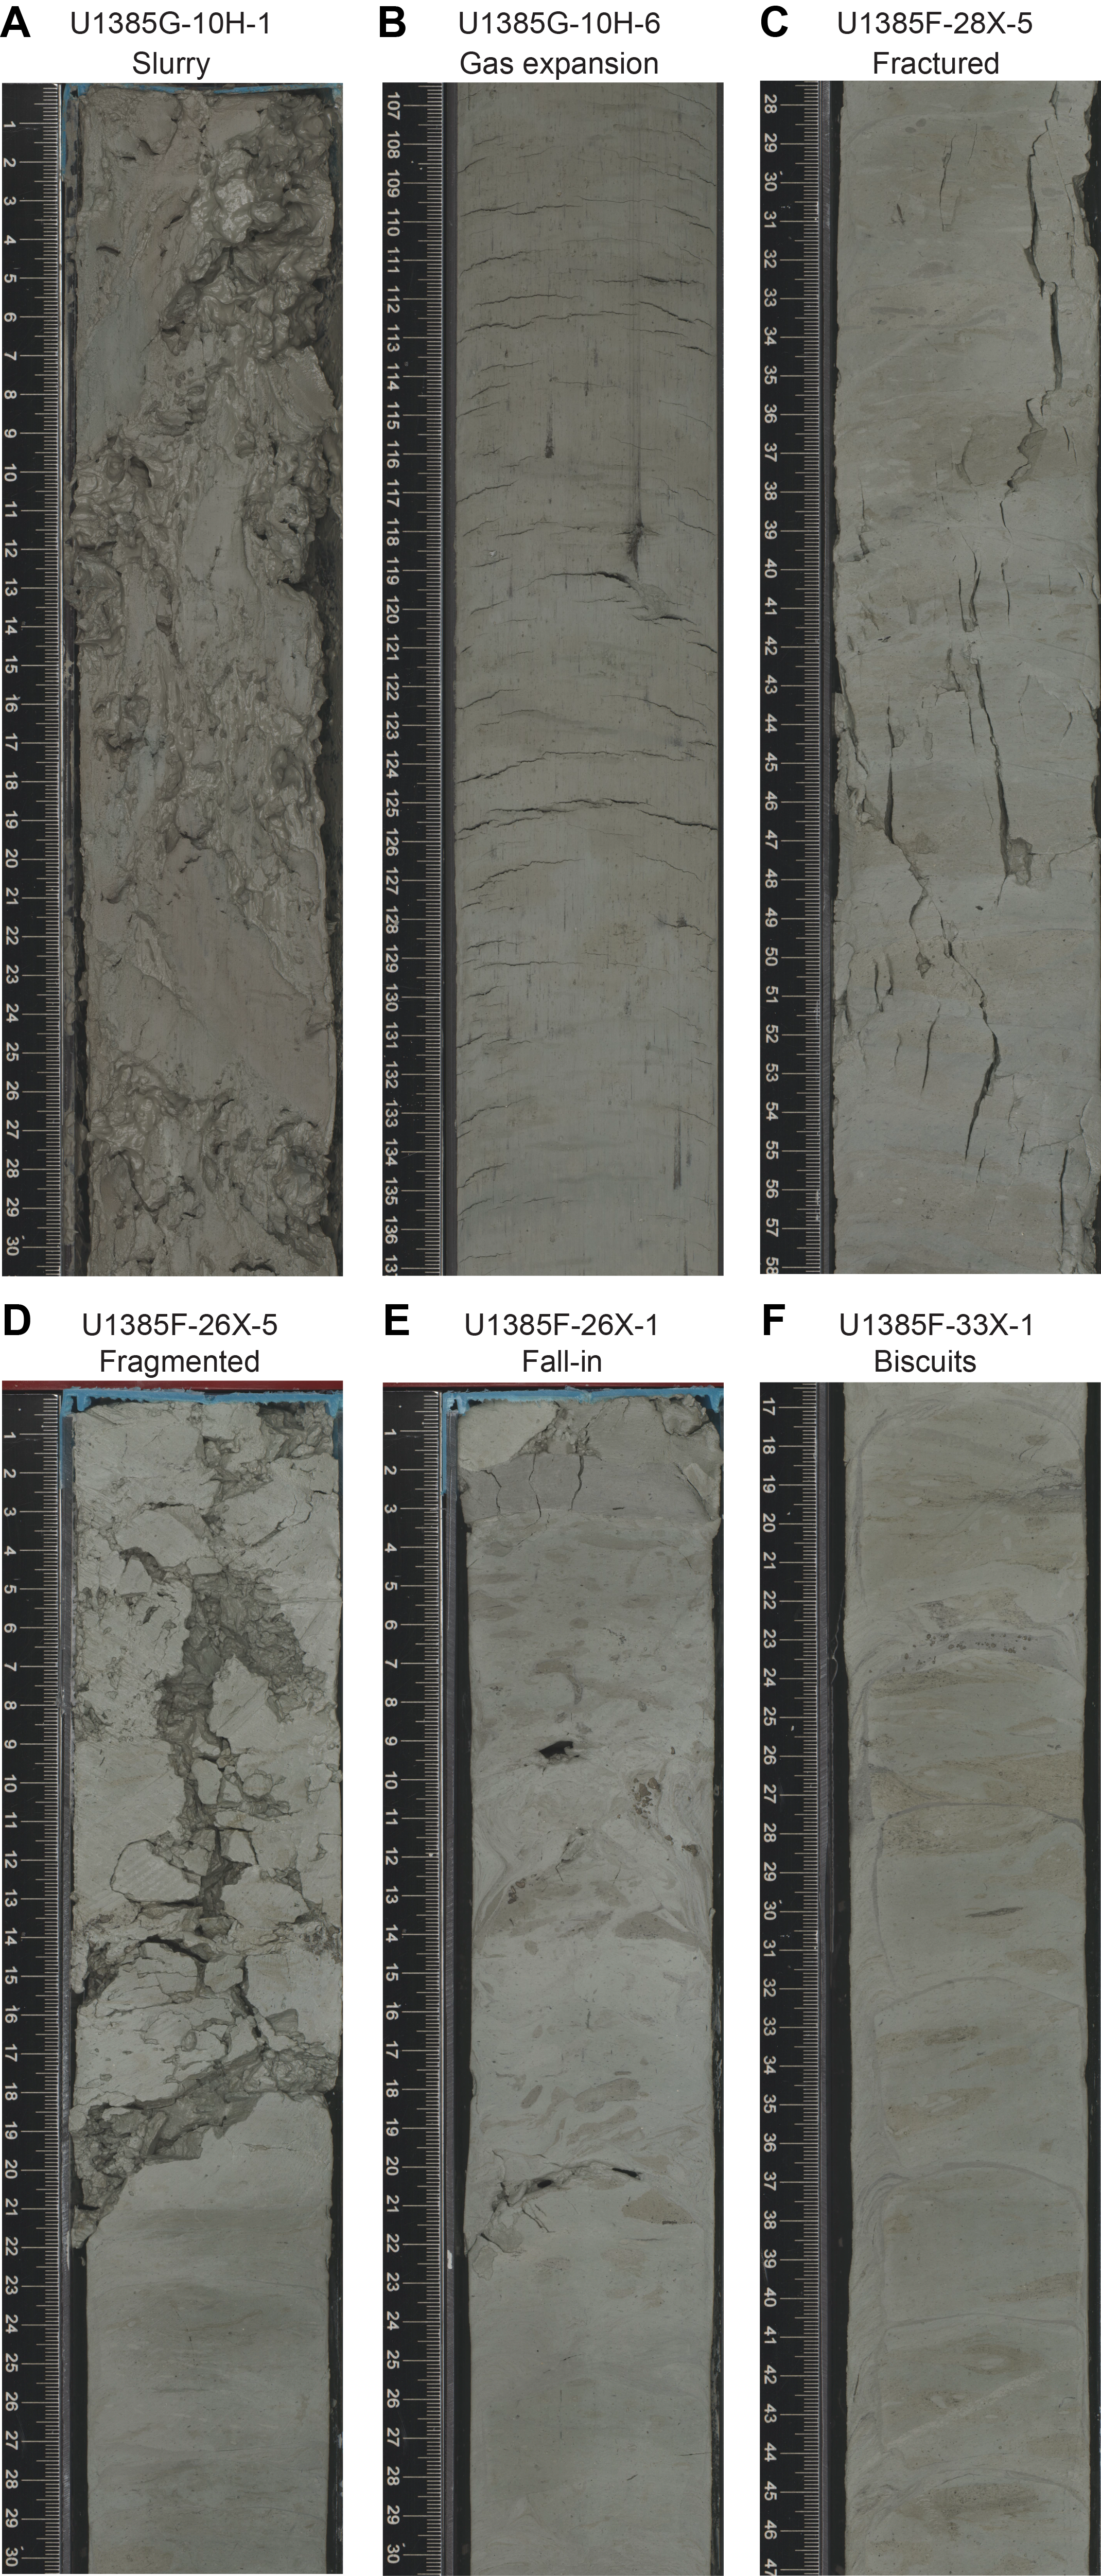
Figure F19. Drilling disturbance.
Fall-in is present throughout the APC and XCB cores, particularly in the first sections. Cores 397-U1385G-1H through 14X (0–122.26 m CSF-A), 397-U1385I-1H through 4H (0–37.9 m CSF-A), and 397-U1385J-3H through 9H (12.5–79.61 m CSF-A) contain soupy and slurry intervals that range from slight to strong in severity and are commonly in the first sections of APC cores. Up-arching is slight to moderate in APC Cores 397-U1385G-2H through 6H (1.8–49.7 m CSF-A), 397-U1385I-2H through 11H (9–103.02 m CSF-A), and 397-U1385J-2H through 5H (3–41.35 m CSF-A). Other drilling disturbance types increase in Cores 397-U1385F-20X through 33X (270.1–399.6 m CSF-A) and 397-U1385G-33X through 42X (300.3–396.16 m CSF-A), and severe to moderate core extension, fragmentation, and fracturing become more common downcore.
Biscuiting is present in most XCB cores from Site U1385. Biscuiting was observed at and downhole of Cores 397-U1385F-10X (174.5 m CSF-A), 397-U1385G-17X (145.1 m CSF-A), 397-U1385H-2X (114.6 m CSF-A), 397-U1385I-12X (104.35 m CSF-A), and 397-U1385J-12X (98 m CSF-A). Biscuiting is generally slight to moderate and increases downhole as the sediment becomes more lithified (Figure F16; Table T8). Biscuiting is strong to severe in Cores 397-U1385H-6X, 8X, 9X, 16X–20X, 24X, and 397-U1385J-34X through 41X, likely due to high heave conditions at the time of drilling.
Gas expansion was observed in Cores 397-U1385F-2X through 9X (96.9–174.49 m CSF-A), 397-U1385G-8H through 12H (58.8–107.02 m CSF-A), 397-U1385I-8H through 12X (66.39–113.27 m CSF-A), and 397-U1385J-7H through 11X (60.5–98 m CSF-A) and was slight to strong.
3.4.2. X-ray diffraction mineralogy
The major minerals in XRD samples from Hole U1385G are calcite, quartz, feldspar, mica (mainly muscovite), and various clay minerals such as illite, kaolinite, smectite, and chlorite. The minor minerals are birnessite, pyrite, dolomite, magnetite, siderite, glauconite, titanite, and ankerite. The major mineral assemblage indicated by XRD analysis is similar to that observed in smear slides. Some minor minerals, including pyrite, dolomite, and glauconite, were also observed in smear slides.
3.4.3. Carbonate content
Calcium carbonate (CaCO3) varies from 15 to 63 wt% and generally increases downhole in Hole U1385G (Figure F20; see Geochemistry). CaCO3 is low (<36 wt%) in sediments from 0 to 35 m CSF-A, and values are less variable relative to those farther downhole. The low carbonate contents and lack of variability are consistent with the dominance of nannofossil ooze with clay from Sections 1H-1 through 5H-3 (0–34.81 m CSF-A). Deeper than 250 m CSF-A, CaCO3 exceeds 33 wt%. This is consistent with the observations of lithologic changes in Hole U1385G, where clay contributions decrease downhole, especially below 300 m CSF-A.
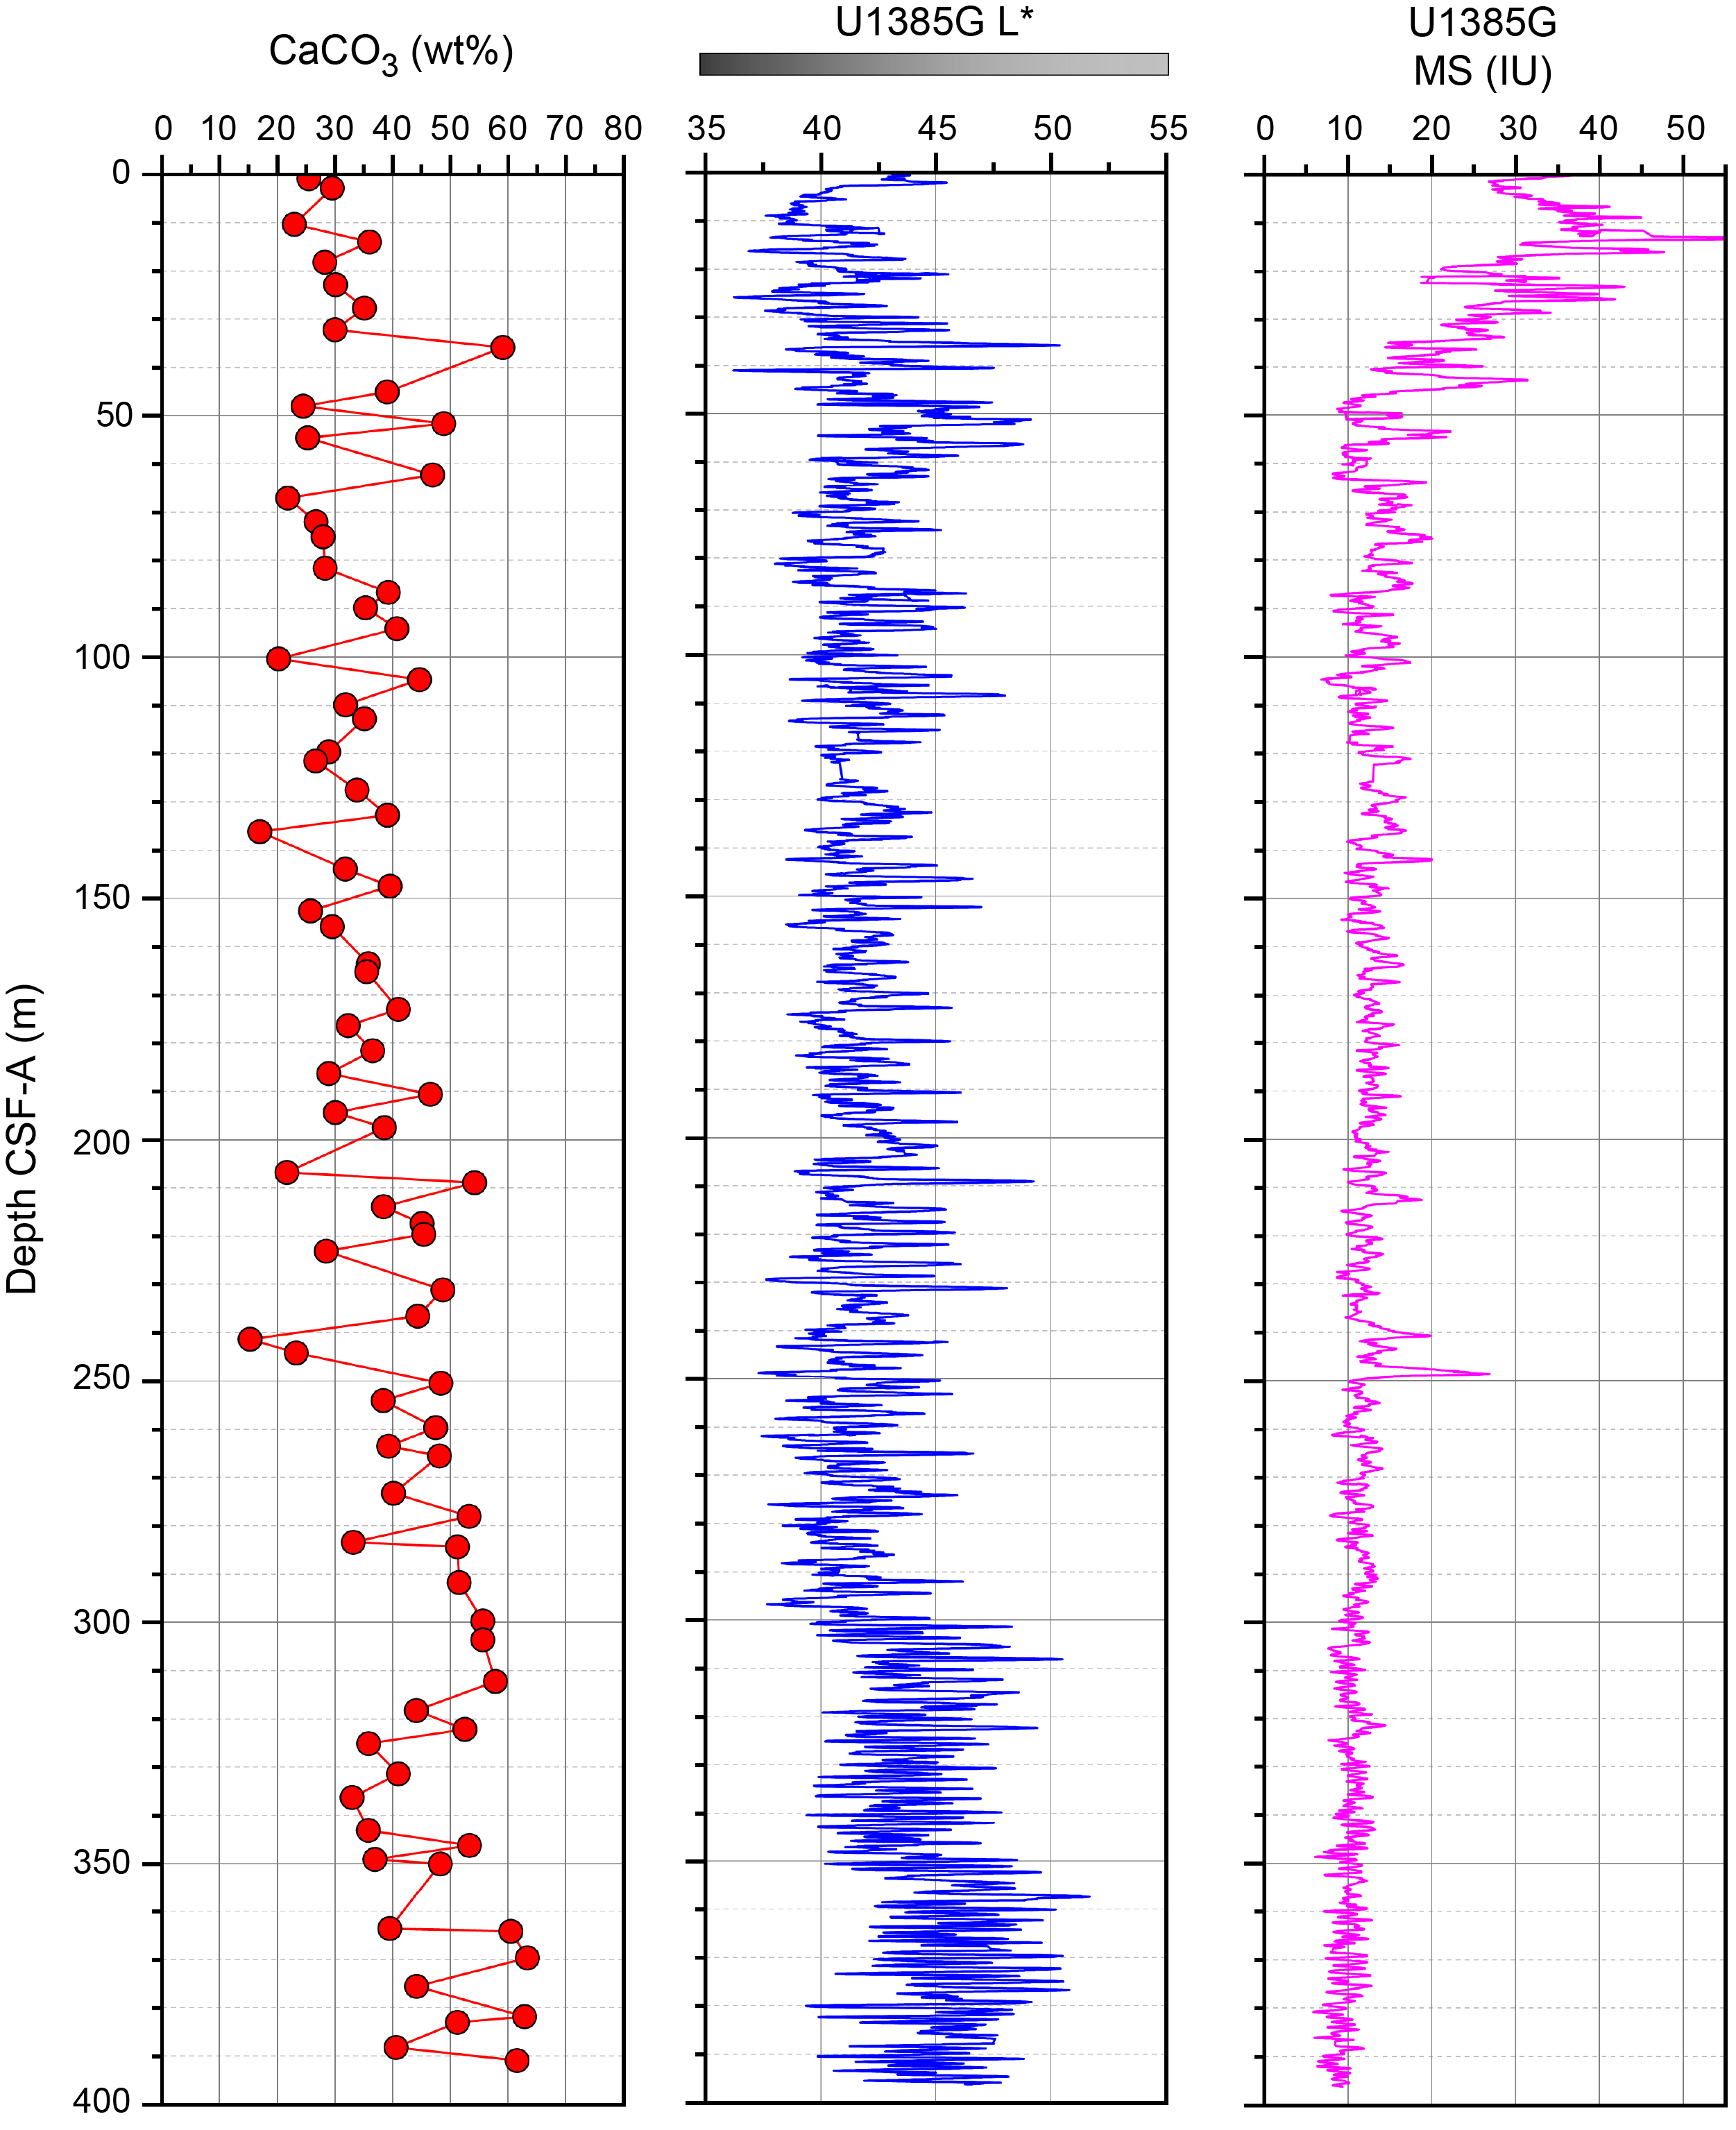
Figure F20. CaCO3 weight percent, L*, and MS.
Smear slides and carbonate samples were taken at the same depths in Hole U1385G for comparison. Smear slides that were described as nannofossil ooze (n = 15) had an average CaCO3 of 44.2 ± 11.5 wt% (1 standard deviation [1σ]). Smear slides that were described as nannofossil ooze with clay and/or carbonate (n = 24) had an average CaCO3 of 34 ± 8.6 wt%. Smear slides that were described as clayey nannofossil ooze (n = 7) had an average CaCO3 of 23.3 ± 6.6 wt%.
3.4.4. Integrating physical properties measurements with lithofacies observations
The different lithologies observed at Site U1385 were compared to downcore physical properties measurements (Figure F20), including NGR intensity, porosity, moisture and density (MAD), gamma ray attenuation (GRA) bulk density, MS from both loop (Whole-Round Multisensor Logger [WRMSL]) and point (Section Half Multisensor Logger [SHMSL]) detectors, color variations (RGB), and color reflectance L*a*b* (see Physical properties).
Changes in physical properties are associated with the two lithofacies identified at Site U1385, as well as with variations in the siliciclastic clay content of the nannofossil ooze that is predominant throughout sediments recovered in all holes at the site. Each characteristic displays persistent decimeter- to meter-scale cycles that generally diminish in amplitude downhole. Greater clay content within the nannofossil ooze is associated with a decrease in RGB values, increase in MS and NGR, and decrease in L*. Color reflectance L* (which increases), a*, b*, and MS (which all decrease) all display marked shifts in the uppermost 50–60 m and then continue to vary cyclically around respective mean values that display little change from 50 to 300 m CSF-A. Below this depth, MS declines to the lowest values in each hole, and L* increases sharply to vary around higher values as the relatively clay-rich portion of each cycle decreases from abundant (>25%–50%) to common (>10%–25%). The general decrease in the clay (siliciclastic) components downcore is associated with a broad increase in RGB values, notably from 300 to 400 m CSF-A. CaCO3 content also increases beneath 300 m CSF-A.
3.5. Discussion
3.5.1. Lithology
The abundance of Lithofacies 1 indicates the dominance of hemipelagic sedimentation at Site U1385 throughout the Pliocene and Pleistocene (Figure F21). Siliciclastic input was likely relatively high or carbonate input (or preservation rates) was low during the last 320 ky, as indicated by the higher proportion of clay in the uppermost 35 m. Siliciclastic input was likely relatively low or carbonate input (or preservation rates) was high in the early Pliocene, as indicated by the increased proportion of nannofossil ooze and lightness of sediments from 300 to 400 m CSF-A. Recurring variations of layers of nannofossil ooze with different clay abundances may suggest a link between sediment composition and orbital cyclicity, which is also consistent with previous findings from Expedition 339 Holes U1385A–U1385E (Expedition 339 Scientists, 2013) and with variations in physical properties (see Stratigraphic correlation). Comparison of smear slide descriptions to carbonate data in Hole U1385G suggests that analysis of smear slides may overestimate CaCO3 in samples, but no micro or macro descriptions were altered in the context of these results.
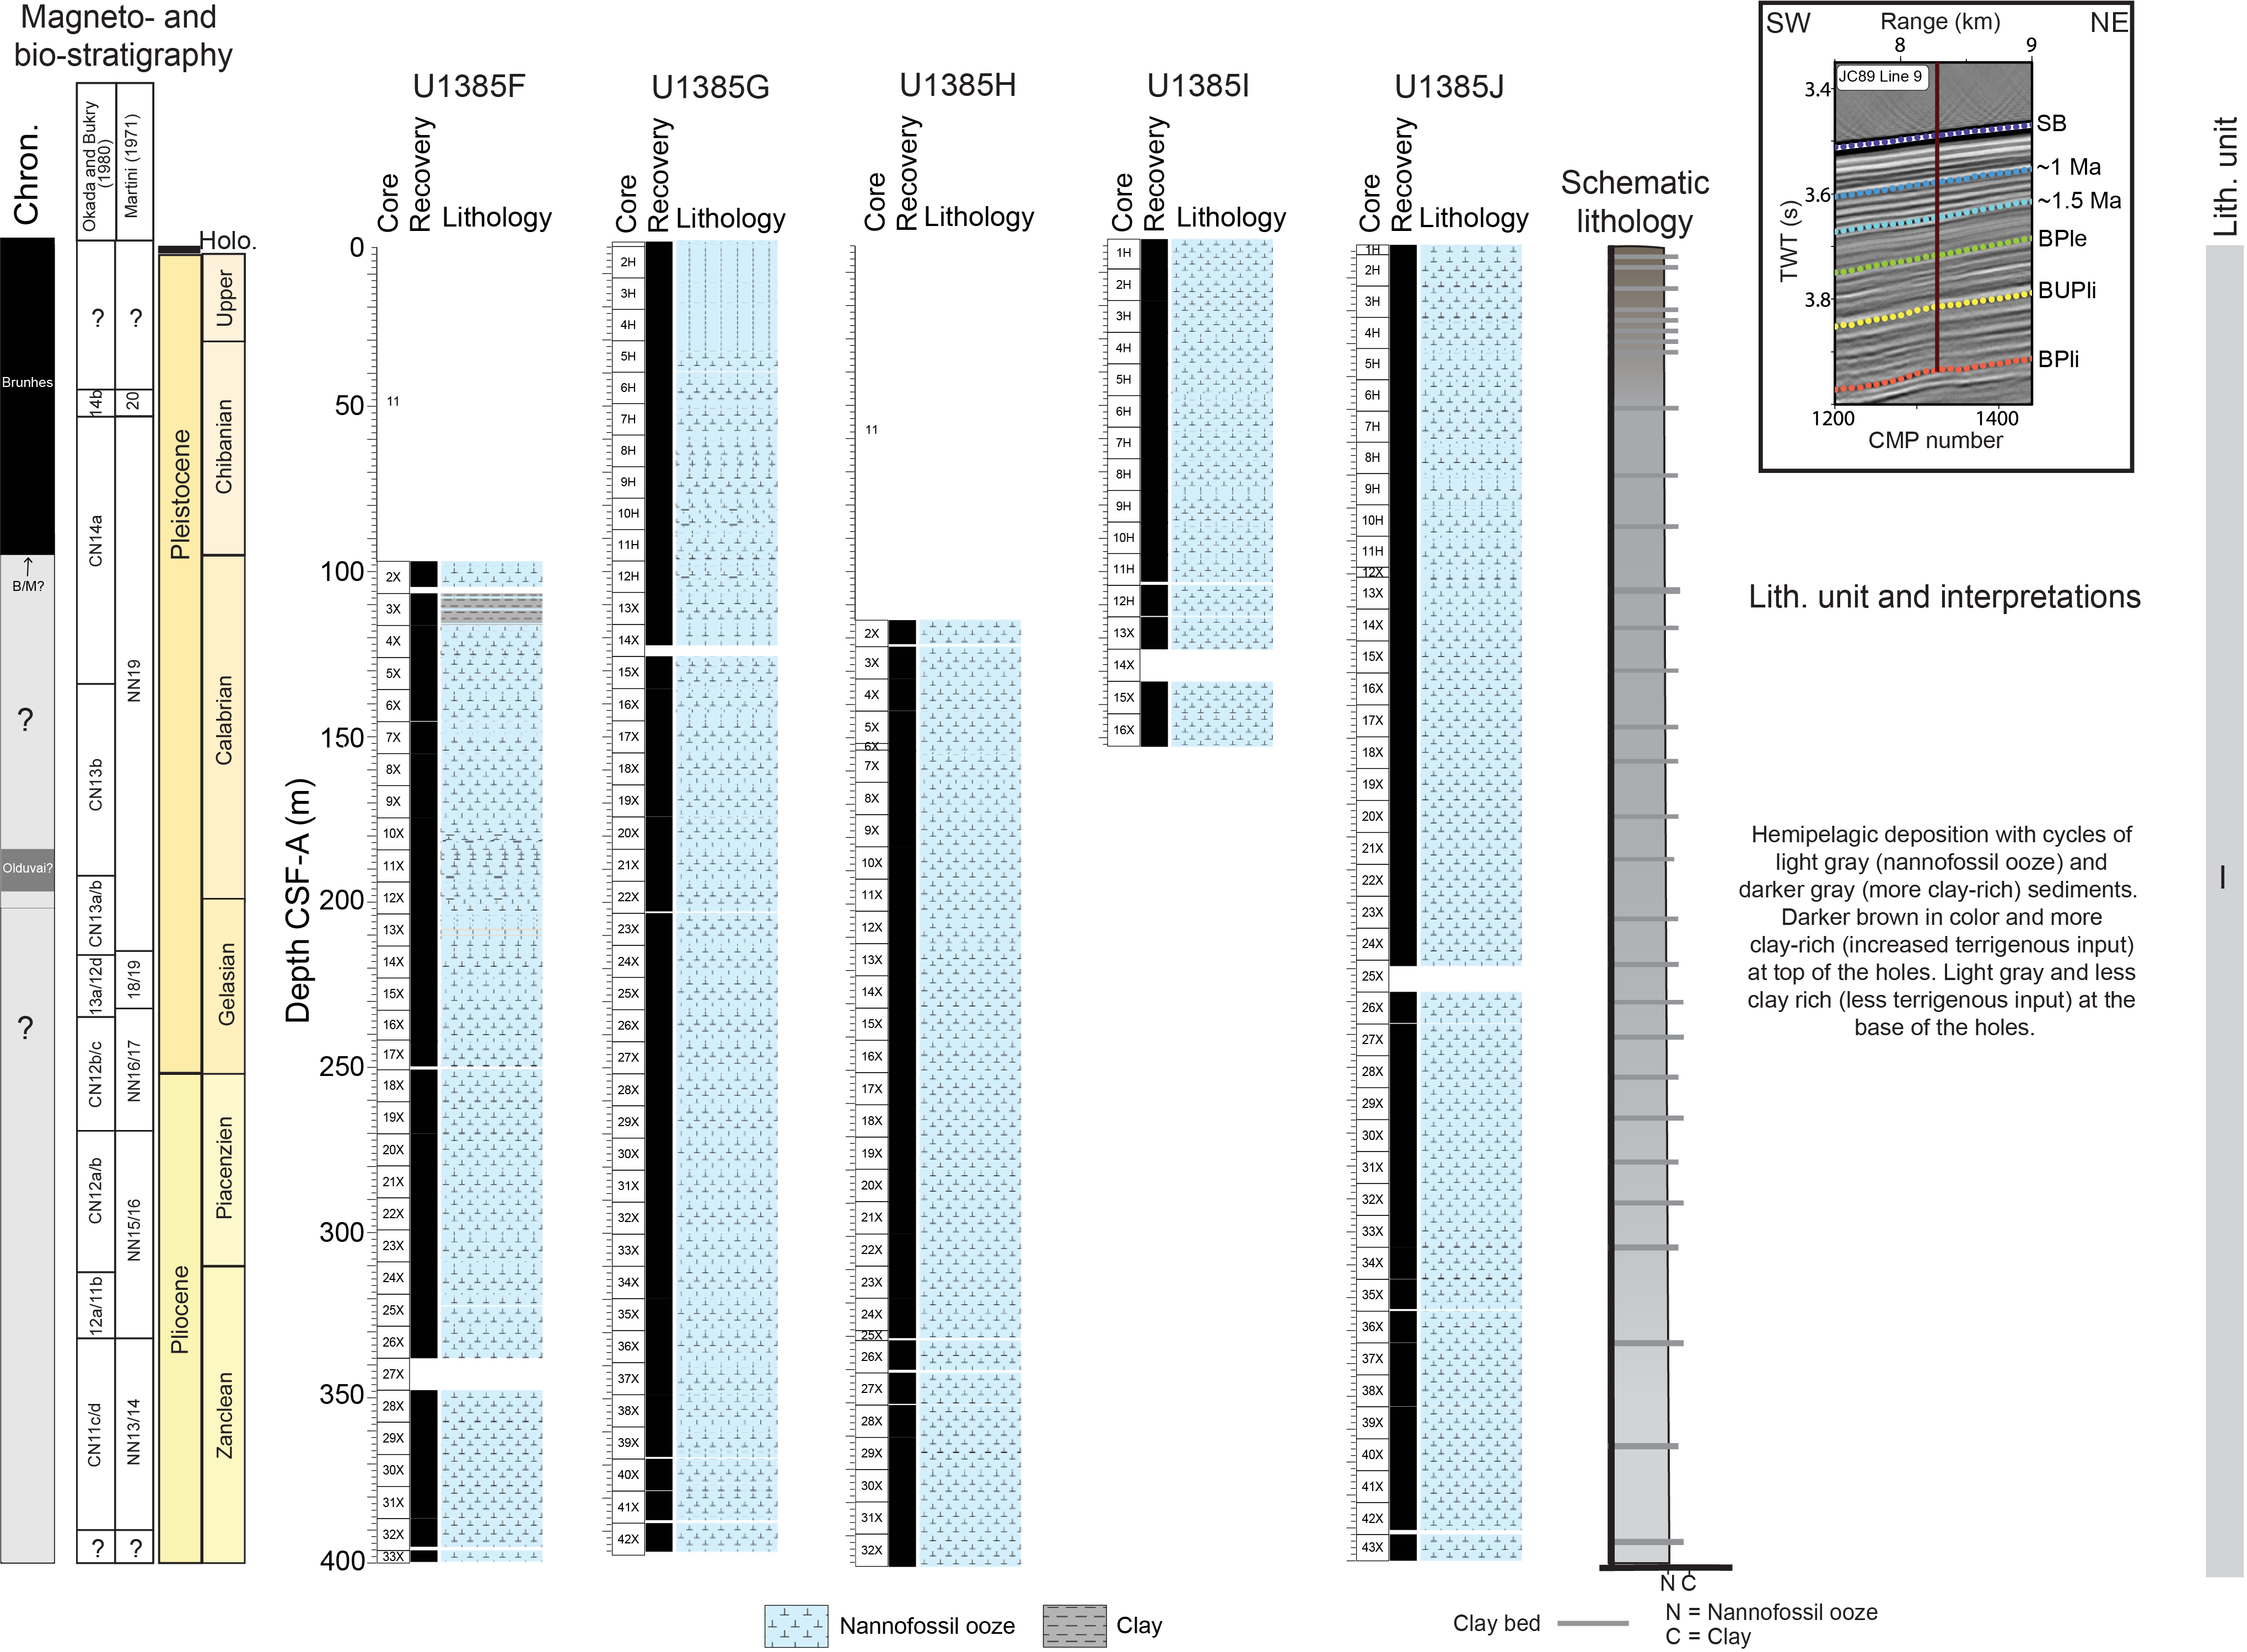
Figure F21. Lithologic summary.
Bioturbation is present in almost all sediments from Site U1385, and its intensity generally increases or becomes more distinct downhole. Trace fossil assemblages are typical of marginal marine environments (Heard et al., 2014).
The opal-bearing layers, as observed in Sections 397-U1385F-2X-5 (104.1 m CSF-A), 397-U1385G-12H-6 (104.5, 104.7, and 105.0 m CSF-A), 397-U1385I-12X-2 (106.3 and 106.9 m CSF-A), and 397-U1385J-13X-2 (102.6 and 103.1 m CSF-A) (Figure F15), were possibly deposited during the transition from MIS 24 to MIS 23 (Termination XI), as inferred from the shipboard age model (see Biostratigraphy), color reflectance, and MS (see Physical properties). Past studies suggested that productivity increased in the Iberian margin and Northwest Africa region during glacial–interglacial transitions (Abrantes, 1991a, 1991b, 2000). Peaks in diatom abundance have been documented in other terminations such as MIS 10/9 (Termination IV), MIS 6/5 (Termination II) (Thomson et al., 2000), and MIS 26/25 (Termination XII) (Abrantes et al., 2017; Ventura et al., 2017). A possible explanation for increased primary production is enhanced coastal upwelling at these glacial terminations, as evidenced by the presence of Chaetoceros spores. The enhanced upwelling may reflect the strengthening of the Canary Current upwelling system, which would provide nutrient-rich waters during those deglaciations. Alternatively, nutrients could be introduced to the site region through flooding of continental shelves related to rising sea level during deglaciation (Abrantes, 2000; Thomson et al., 2000). However, an increase in diatom preservation due to the presence of more Si-rich bottom waters cannot be excluded (Abrantes et al., 2017).
3.5.2. Diagenetic features
The brownish gray layer of sediments at ~0–10 cm CSF-A in Holes U1385G, U1385I, and U1385J is likely a result of downward penetration of oxygen from overlying deep waters.
The oxygen in these sediments would be eventually depleted by organic matter respiration. The gray sediments below this 10 cm horizon are inferred to be reducing, leading to the mobilization of redox-sensitive elements including iron and manganese. These mobilized elements diffuse upward and precipitate out at the boundary with the oxic layer above, forming a redox horizon that migrates upward as sediment accumulates. The redox horizon may migrate upward or downward relative to the seafloor as ocean ventilation and organic carbon export vary through geologic time.
The occurrence of pyrite (FeS2) is a common feature at Site U1385. Pyrite occurs as discrete elongated burrow fills and as isolated nodules evident along the face of the split core. The presence of pyrite suggests relatively reducing conditions in the burrows related to the decomposition of the organic matter via sulfate reduction (see Sulfate, iron, manganese, barium). Reaction of H2S produced with Fe results in the precipitation of iron monosulfides and pyrite. The discrete occurrence of pyrite suggests the presence of local microenvironments typically associated with benthic organisms.
4. Biostratigraphy
At Site U1385, the ~400 m thick sedimentary succession recovered ranges in age from the early Pliocene to Pleistocene. A total of 26 bioevents were identified from analyses of calcareous nannofossils and planktonic foraminifers in core catcher samples from Hole U1385F and split core samples from Holes U1385F and U1385G. Both nannofossils and foraminifers are common to very abundant and show good preservation. The zonal schemes of calcareous nannofossils and planktonic foraminifers are in good agreement. Integrated calcareous microfossil bioevents are illustrated in Figure F22, and the datums are reported in Tables T9 (nannofossils) and T10 (foraminifers). Pleistocene markers were identified in Cores 397-U1385F-5X through 16X. Pliocene markers were identified in Cores 16X–32X.
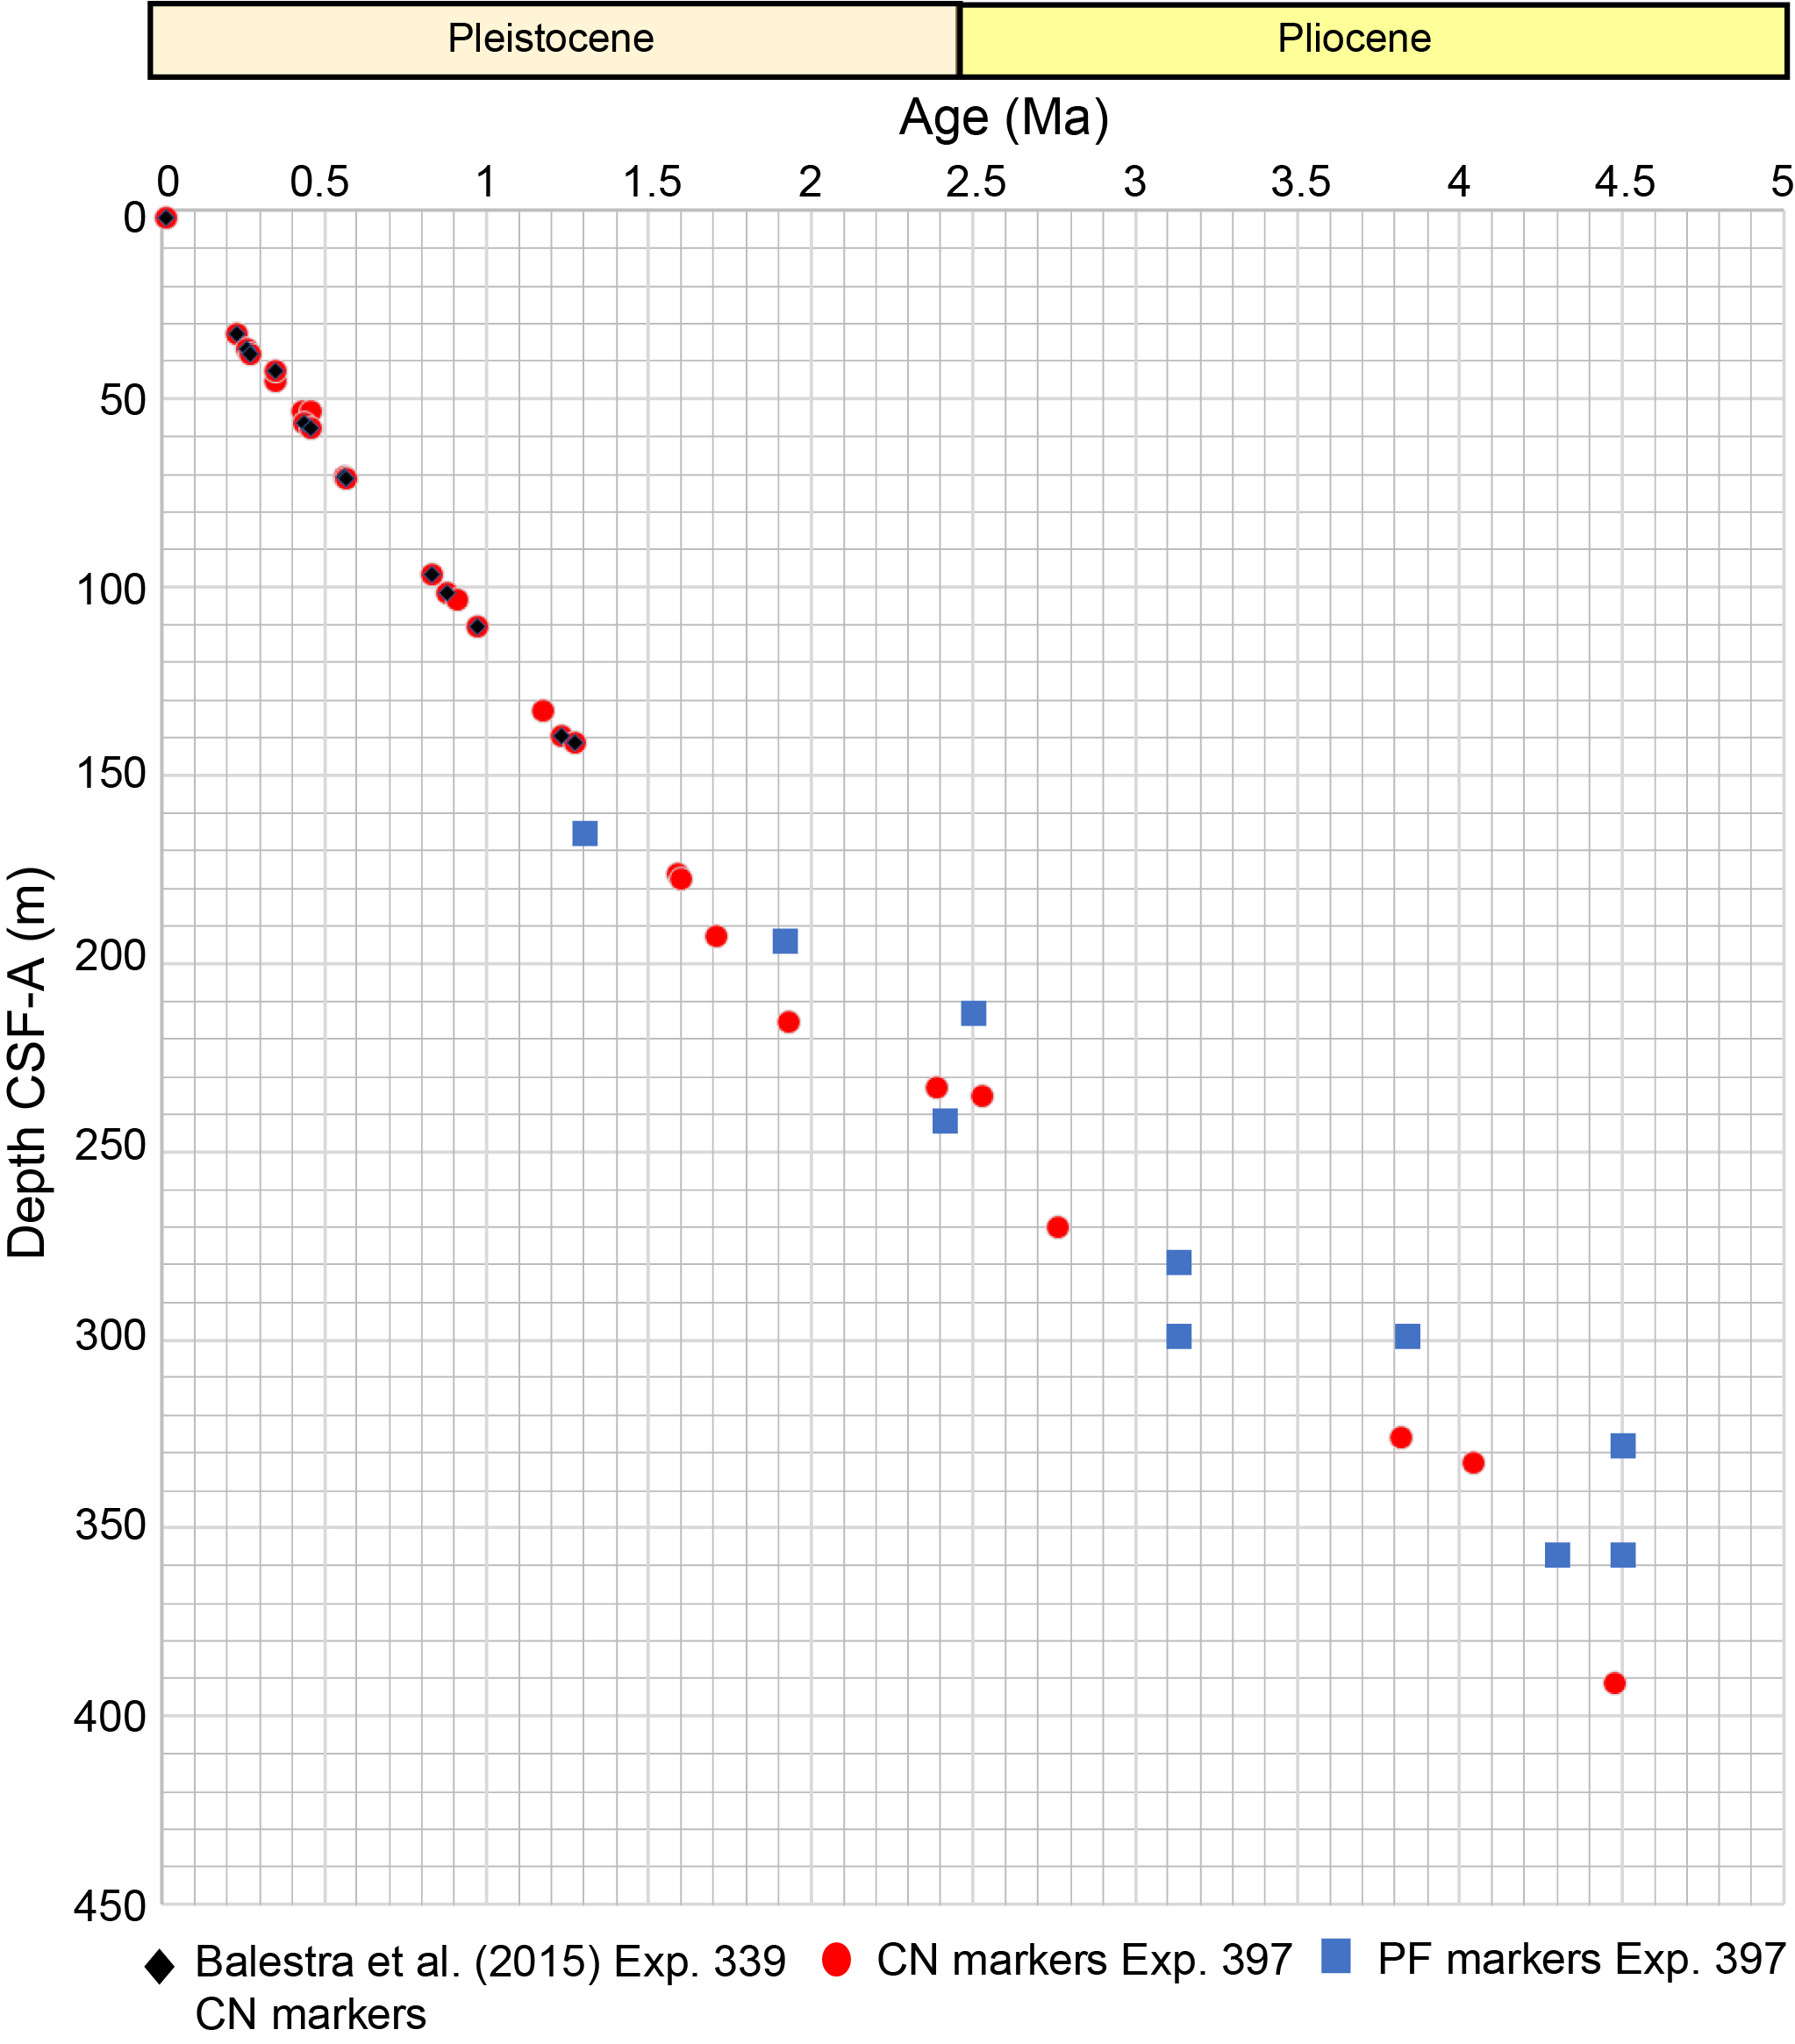
Figure F22. Preliminary age model.
4.1. Calcareous nannofossils
Calcareous nannofossil biostratigraphy at Site U1385 is based on analyses of 33 core catchers and more than 250 split core samples taken from selected intervals from Holes U1385F and U1385G. All samples were processed into smear slides using standard techniques. Shipboard biostratigraphic results from the Upper Pleistocene section cored in Hole U1385G were compared with results from Expedition 339 Holes U1385A–U1385E and found to be in good agreement with the age model developed by Balestra et al. (2015). The complete biostratigraphic sequence is shown in Figure F22.
The nannofossil assemblage in Holes U1385F and U1385G is defined by 29 groups/taxa and morphotypes, including Emiliania huxleyi, Gephyrocapsa caribbeanica, Gephyrocapsa spp. (small <4 µm, medium, and large >5.5 µm), Pseudoemiliania lacunosa, Reticulofenestra (<3, 3–5, 5–7, and >7 µm), Reticulofenestra pseudoumbilicus, Coccolithus pelagicus, Calcidiscus leptoporus, Calcidiscus macintyrei, Ceratolithus armatus, Helicosphaera inversa, Helicosphaera sellii, Sphenolithus abies/neoabies, Syracosphaera spp., Scyphosphaera spp., Discoaster spp., Discoaster variabilis, Discoaster brouweri, Discoaster pentaradiatus, Discoaster surculus, Discoaster tamalis, Discoaster asymmetricus, Amaurolithus delicatus, and occasionally less abundant taxa.
A total of 15 calcareous nannofossil events were identified within the studied section. These events were dated using age calibrations of Balestra et al. (2015), Raffi et al. (2006), and Gradstein et al. (2020) (Table T9; see also Plate P1 in the Site U1586 chapter [Abrantes et al., 2024b]). Additionally, the standard biozones of Martini (1971) and Okada and Bukry (1980) were identified. For these assignments, only taxa or morphotypes with biostratigraphic significance were considered (Table T11).
4.1.1. Pleistocene
Nannofossils are very abundant and show good preservation throughout the Pleistocene interval (135–237 m CSF-A; Samples 397-U1385F-5X-7, 21 cm, to 6X-1, 75 cm). There is significant reworking of Cretaceous to Pliocene nannofossils throughout the section.
In Cores 397-U1385G-1H through 12H, Zone CN14b-14a/NN19-20 is placed based on the highest occurrence (HO) of P. lacunosa above Sample 7H-3, 124 cm. The simultaneous occurrence of the HO of P. lacunosa and the lowest occurrence (LO) of H. inversa within the same sample indicates a short hiatus, previously recognized at Site U1385 during Expedition 339 (Hodell et al., 2023). Zone CN13b/NN19 is placed based on the HO and LO of large Gephyrocapsa (>5.5 µm) and the HO of C. macintyrei, above Samples 397-U1385F-6X-1, 75 cm, 10X-2, 75 cm, and 10X-2, 74 cm, respectively, although the LO of large Gephyrocapsa and the HO of C. macintyrei appear to co-occur due to the low-resolution sampling and the high sedimentation rate.
Zone CN13a-12d/NN18 is based on the HO of D. brouweri above Sample 397-U1385F-14X-3, 71 cm. Zone CN12c/NN17-18 is placed based on the HO of D. pentaradiatus in Sample 16X-3, 80 cm, and Zone CN12c-12b/NN16-17 is based on the HO of D. surculus in Sample 16X-4, 80 cm. Because of the near simultaneous occurrence of these markers during an interval of high sedimentation rate, we cannot discard a hiatus; on the other hand, sampling resolution prevents more precise interpretation.
4.1.2. Pliocene
The Pliocene interval (237–400 m CSF-A; Hole U1385F) contains abundant well-preserved nannofossils with significant reworking of Cretaceous–Miocene fossils.
Zone CN12b-12a/NN16 is based on the HO of D. tamalis in Sample 397-U1385F-20X-1, 75 cm. Zone CN12a-CN11b/NN15-16 is based on the HO of R. pseudoumbilicus >7 µm in Sample 25X-6, 71 cm. The establishment of this limit was defined to coincide with the drastic reduction of specimens of this species (Table T11). R. pseudoumbilicus continues to appear intermittently in a low proportion above this limit and is considered reworked. This event is normally synchronous with the HO of Sphenolithus spp. (e.g., Raffi et al. 2006), which was sporadically identified in Cores 24X–33X and therefore not utilized as a bioevent at Site U1385. This sporadic identification of Sphenolithus spp. is similar to the placement of this bioevent in Hole U1587A. Finally, Zones CN11a-11b/NN13-14 are based on the lowest common occurrence (LcO) of D. asymmetricus in Sample 26X-4, 80 cm.
A characteristic early Pliocene assemblage, which is found just above the Miocene/Pliocene boundary, is identified at the base of Hole U1385F but without marker taxa.
4.2. Planktonic foraminifers
Planktonic foraminifer biostratigraphy is based on 32 core catchers from Hole U1385F and 1 from Hole U1385G. The relative abundance of taxa and estimation of assemblage preservation is presented in Table T12 (see Plate P2 in the Site U1586 chapter [Abrantes et al., 2024b]). Planktonic foraminifers are abundant and well preserved in all the studied samples.
Eleven bioevents are identified based on Wei (1994), Wade et al. (2011), and BouDagher-Fadel (2015). The key biostratigraphic species and associated ages are presented in Table T10. The upper part of the section from 164.86 m CSF-A (Sample 397-U1385F-8X-CC) is assigned to the Calabrian Stage (1.3 Ma), as evidenced by the HO of Globigerinoides obliquus. The LO of Globorotalia truncatulinoides is recorded during the Gelasian Stage (1.92 Ma) at 193.84 m CSF-A in Sample 11X-CC. The Pliocene/Pleistocene boundary is estimated to be between 213.37 and 242.55 m CSF-A in Samples 13X-CC through 16X-CC based on the HO of Globorotalia puncticulata (2.41 Ma) and Neogloboquadrina acostaensis (2.5 Ma).
Three bioevents recorded between Samples 397-U1385F-20X-CC and 22X-CC (279.8–299.2 m CSF-A), including the LO of Globoconella inflata (3.1 Ma), the HO of Dentoglobigerina altispira (3.1 Ma), and the HO of Globorotalia margaritae (3.84 Ma), are assigned to the Piacenzian Stage. Four other bioevents are recorded in the lower part of the cored section below 308.99 m CSF-A in Samples 397-U1385F-23X-CC to 28X-CC; the LO of Globorotalia crassaformis (4.3 Ma) and G. puncticulata (4.5 Ma) and the HO of Globoturborotalita nepenthes (4.36 Ma) and Sphaeroidinellopsis kochi (4.52 Ma) assign this interval to the Zanclean Stage.
The mudline sample is dominated by well-preserved planktonic foraminifers. The assemblage is characterized by typical temperate North Atlantic fauna including Globorotalia inflata, Neogloboquadrina pachyderma, Globigerina bulloides, G. truncatulinoides, and G. crassaformis and the presence of Globigerinoides ruber and Orbulina universa (Table T12).
The early Pleistocene assemblages show a gradual change between species typical of North Atlantic waters (e.g., Globorotalia inflata, N. pachyderma, and Turborotalita quinqueloba) and species from temperate to subtropical waters (e.g., Globorotalia scitula and Trilobatus sacculifer plexus) (Table T12). The abundance of typical North Atlantic species increases at the Pliocene/Pleistocene boundary, whereas the Pliocene is marked by dominance of subtropical to tropical species (T. sacculifer plexus, G. ruber, and Trilobatus trilobus; G. nepenthes and G. bulloides present in lower abundance).
4.3. Benthic foraminifers
Benthic foraminifers were examined in core catchers from Holes U1385F (26 samples) and the mudline. Their presence in the >150 µm sediment size fraction is summarized in Table T13. Abundance is generally low compared to planktonic foraminifers but increases in the Pliocene. Rare agglutinated taxa are continuously observed through the cores, suggesting good preservation conditions. Overall, the assemblages indicate lower bathyal to abyssal paleodepths throughout the Pleistocene and Pliocene (see Plates P3 and P4 in the Site U1586 chapter [Abrantes et al., 2024b]).
A total of 42 benthic foraminifer taxa were identified. Cibicidoides spp. (mainly Cibicidoides wuellerstorfi), Gyroidinoides spp., Melonis spp., Oridorsalis spp., Pyrgo spp., and Uvigerina spp. are continually observed (Table T13; see also Plates P3 and P4 in the Site U1586 chapter [Abrantes et al., 2024b]).
Mudline core top samples from Holes U1385G, U1385I, and U1385J were gently washed to preserve fragile agglutinated specimens. Tubular organically cemented agglutinated foraminifers, some stained with rose bengal, dominate the mudline benthic foraminifer assemblage. Hyaline and porcelaneous benthic foraminifers, stained with rose bengal, are also found, such as the Uvigerina, Pyrgo, Oridorsalis, Melonis, Lenticulina, Lagena, Cibicidoides, Cassidulina, Bulimina, and Bolivina species. The mudline samples also contain sponge spicules regularly found in the downcore samples from Hole U1385F and Hole U1385G. The presence of well-preserved stained pteropods in the core top confirms the excellent calcareous preservation in the mudline samples.
4.4. Ostracods
Ostracods were examined in the sand fraction of 32 core catchers from Holes U1385F (Samples 2X-CC to 33X-CC; 104.5–399.5 m CSF-A) and the mudline samples of Holes U1385G, U1385I, and U1385J. The core catcher samples from Hole U1385F span from the middle Pleistocene to the early Pliocene. Ostracod abundance is low, ranging from absent to just 15 specimens per sample. The mudline samples have a combined yield of 34 specimens. Despite their low abundance, ostracods are generally well preserved. Overall, the assemblage consists of Krithe (61%, 5 species), Henryhowella (16%, 1 species), Argilloecia (9%, 3 species), and Cytherella (6%, 1 species). These results are comparable to the observations noted for the upper 145 m of the sedimentary succession studied at Site U1385 during Expedition 339 (Expedition 339 Scientists, 2013). The ostracod range chart is shown in Table T14.
5. Paleomagnetism
Paleomagnetic investigations of sediments retrieved during the reoccupation of Site U1385 focused on measuring the natural remanent magnetization (NRM) of archive-half sections from Holes U1385F and U1385G at every 2 cm interval and Holes U1385H–U1385J at 4 cm intervals. We measured all archive-half sections except Section 397-U1385G-14X-1 (which was heavily disturbed during coring) and sections from core catchers. NRM measurements were made before and after 20 mT alternating field (AF) demagnetization (see Table T15). Cores 397-U1385G-1H through 12H, 397-U1385I-1H through 11H, and 397-U1385J-1H through 11H were oriented with the Icefield MI-5 (see Paleomagnetism in the Expedition 397 methods chapter [Abrantes et al., 2024a]). The APC core orientation data for all oriented cores are reported in Table T16.
We collected and measured the NRM of 44 cube samples from Hole U1385G and 7 cube samples from Hole U1385I. Squares in Figures F23 and F24 mark the depth levels where cube samples were taken (about one cube sample per core in Hole U1385G). Demagnetization steps used for the NRM measurements of the cubes (11–22 steps with peak fields up to 50 or 80 mT) vary depending on what instrument was used (the superconducting rock magnetometer [SRM] or the JR-6A spinner magnetometer) and are summarized in Table T15.
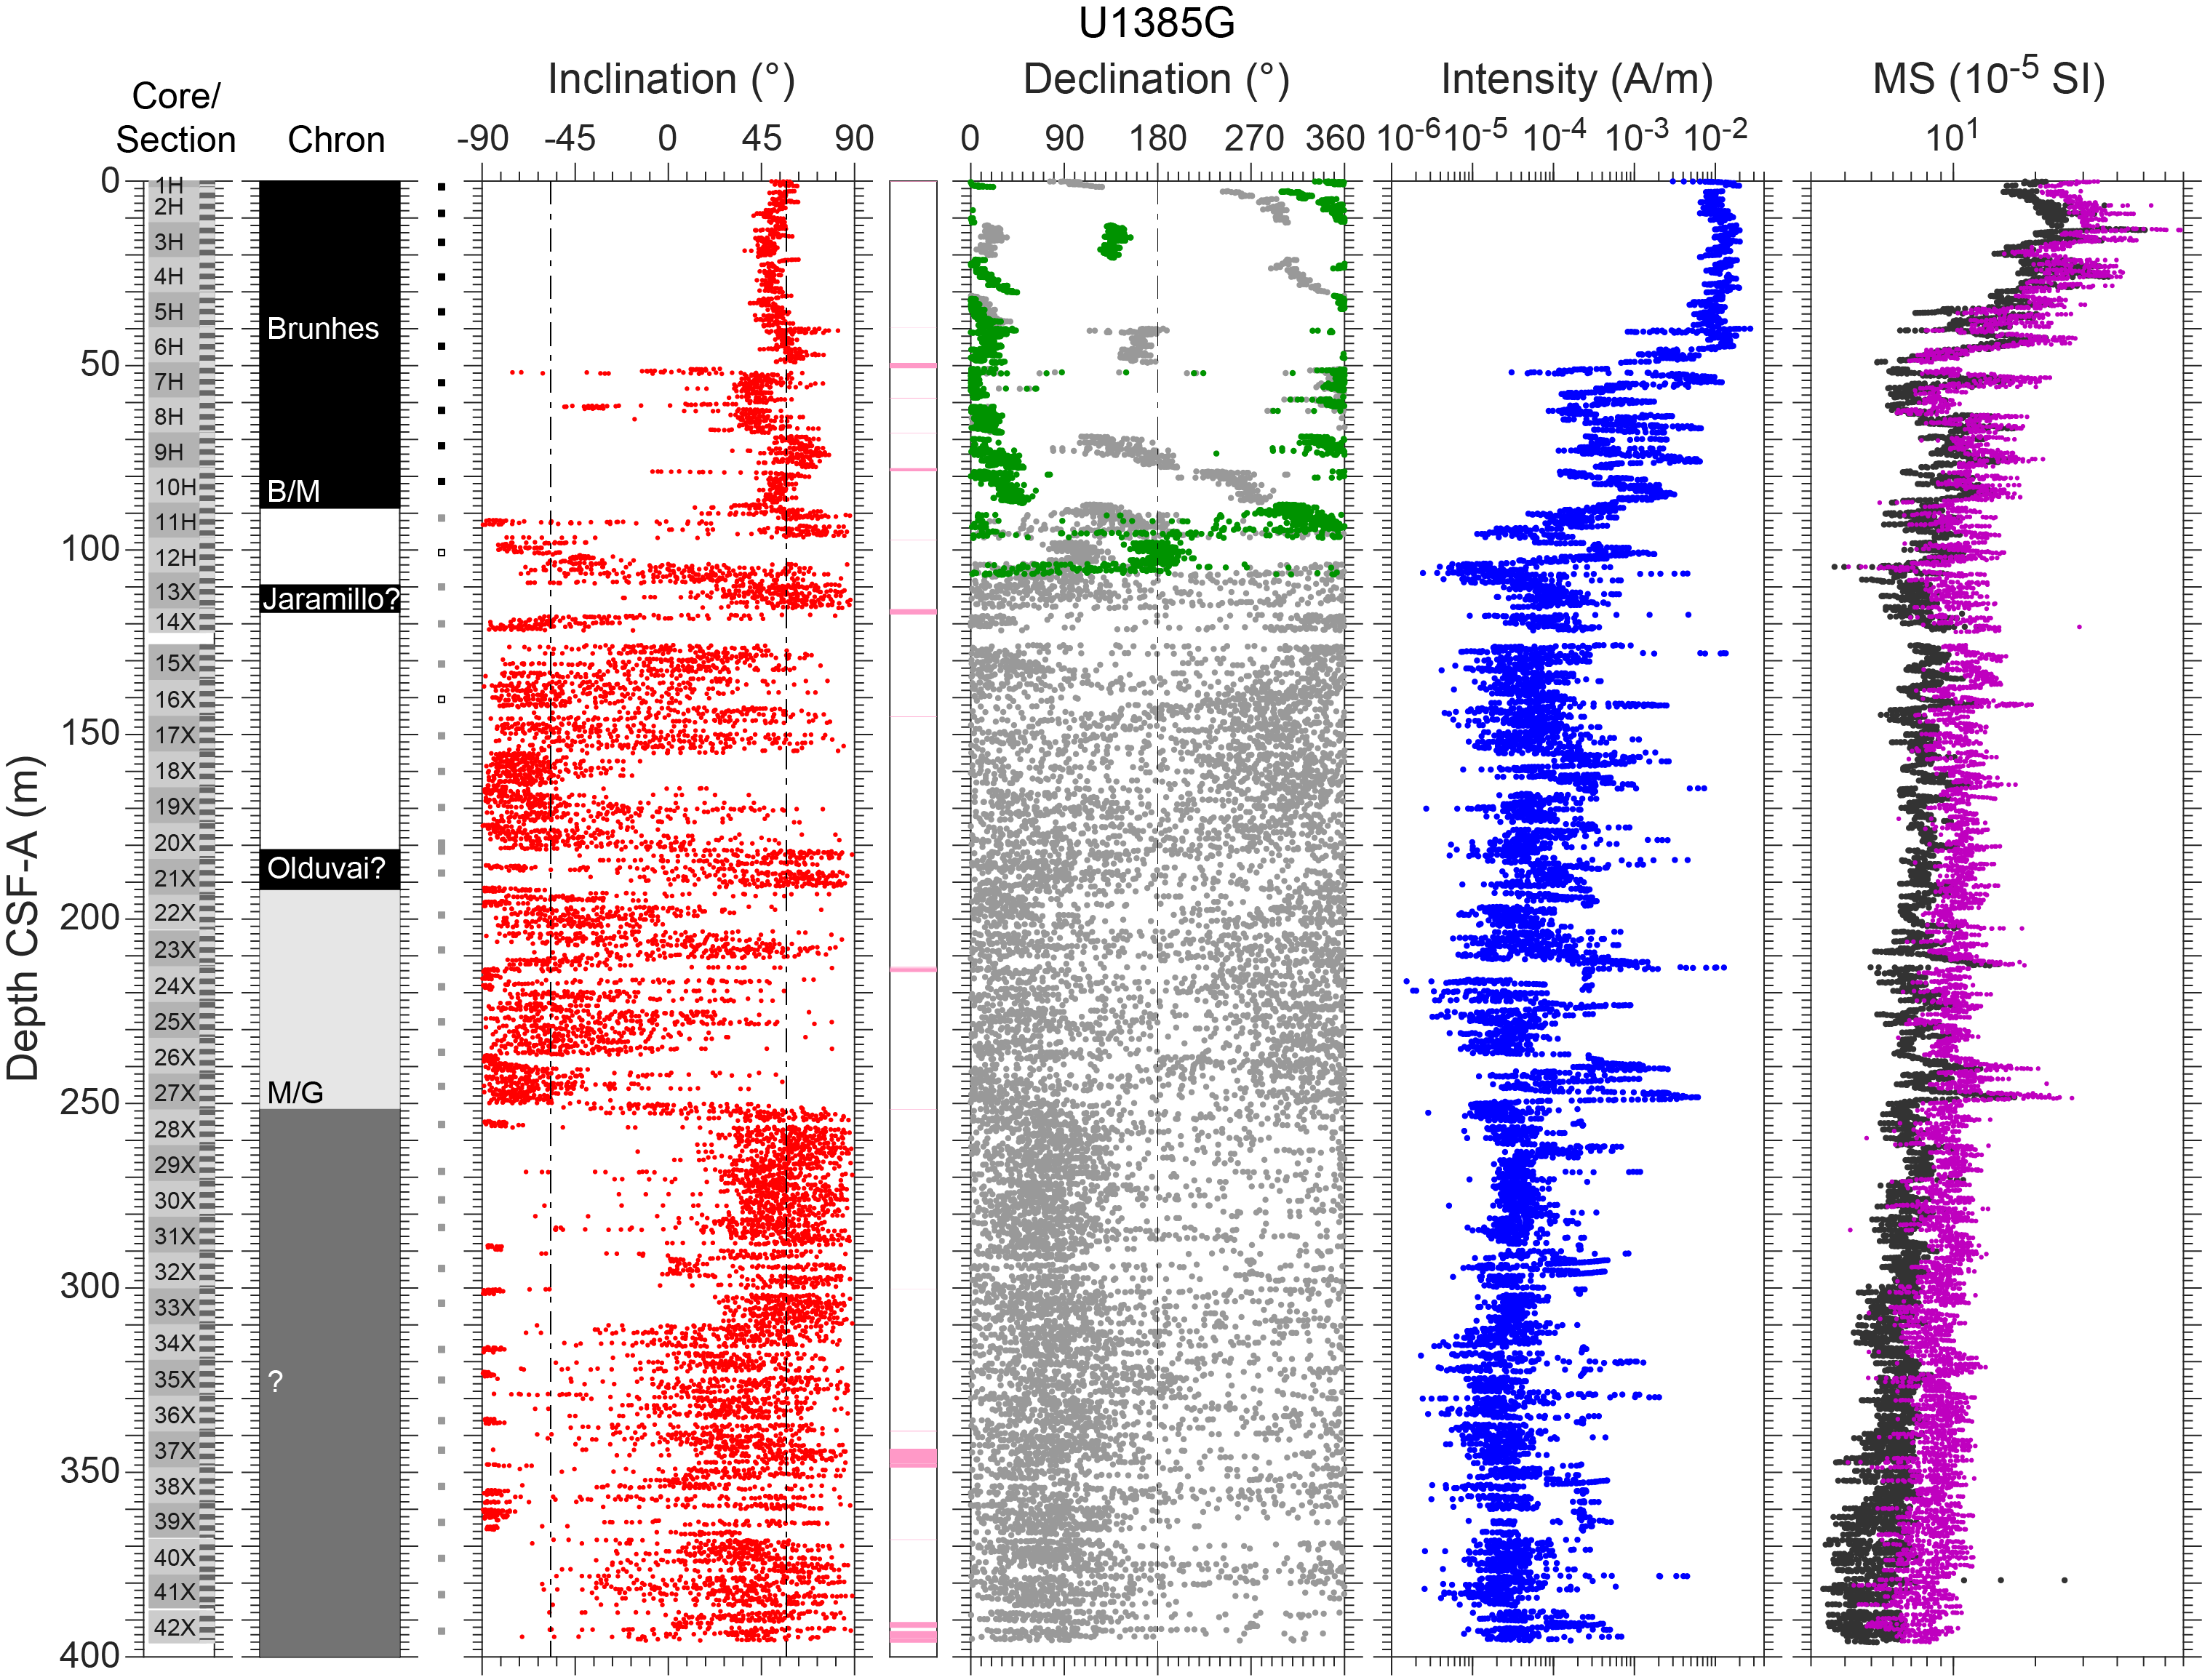
Figure F23. AF demagnetization, Hole U1385G.
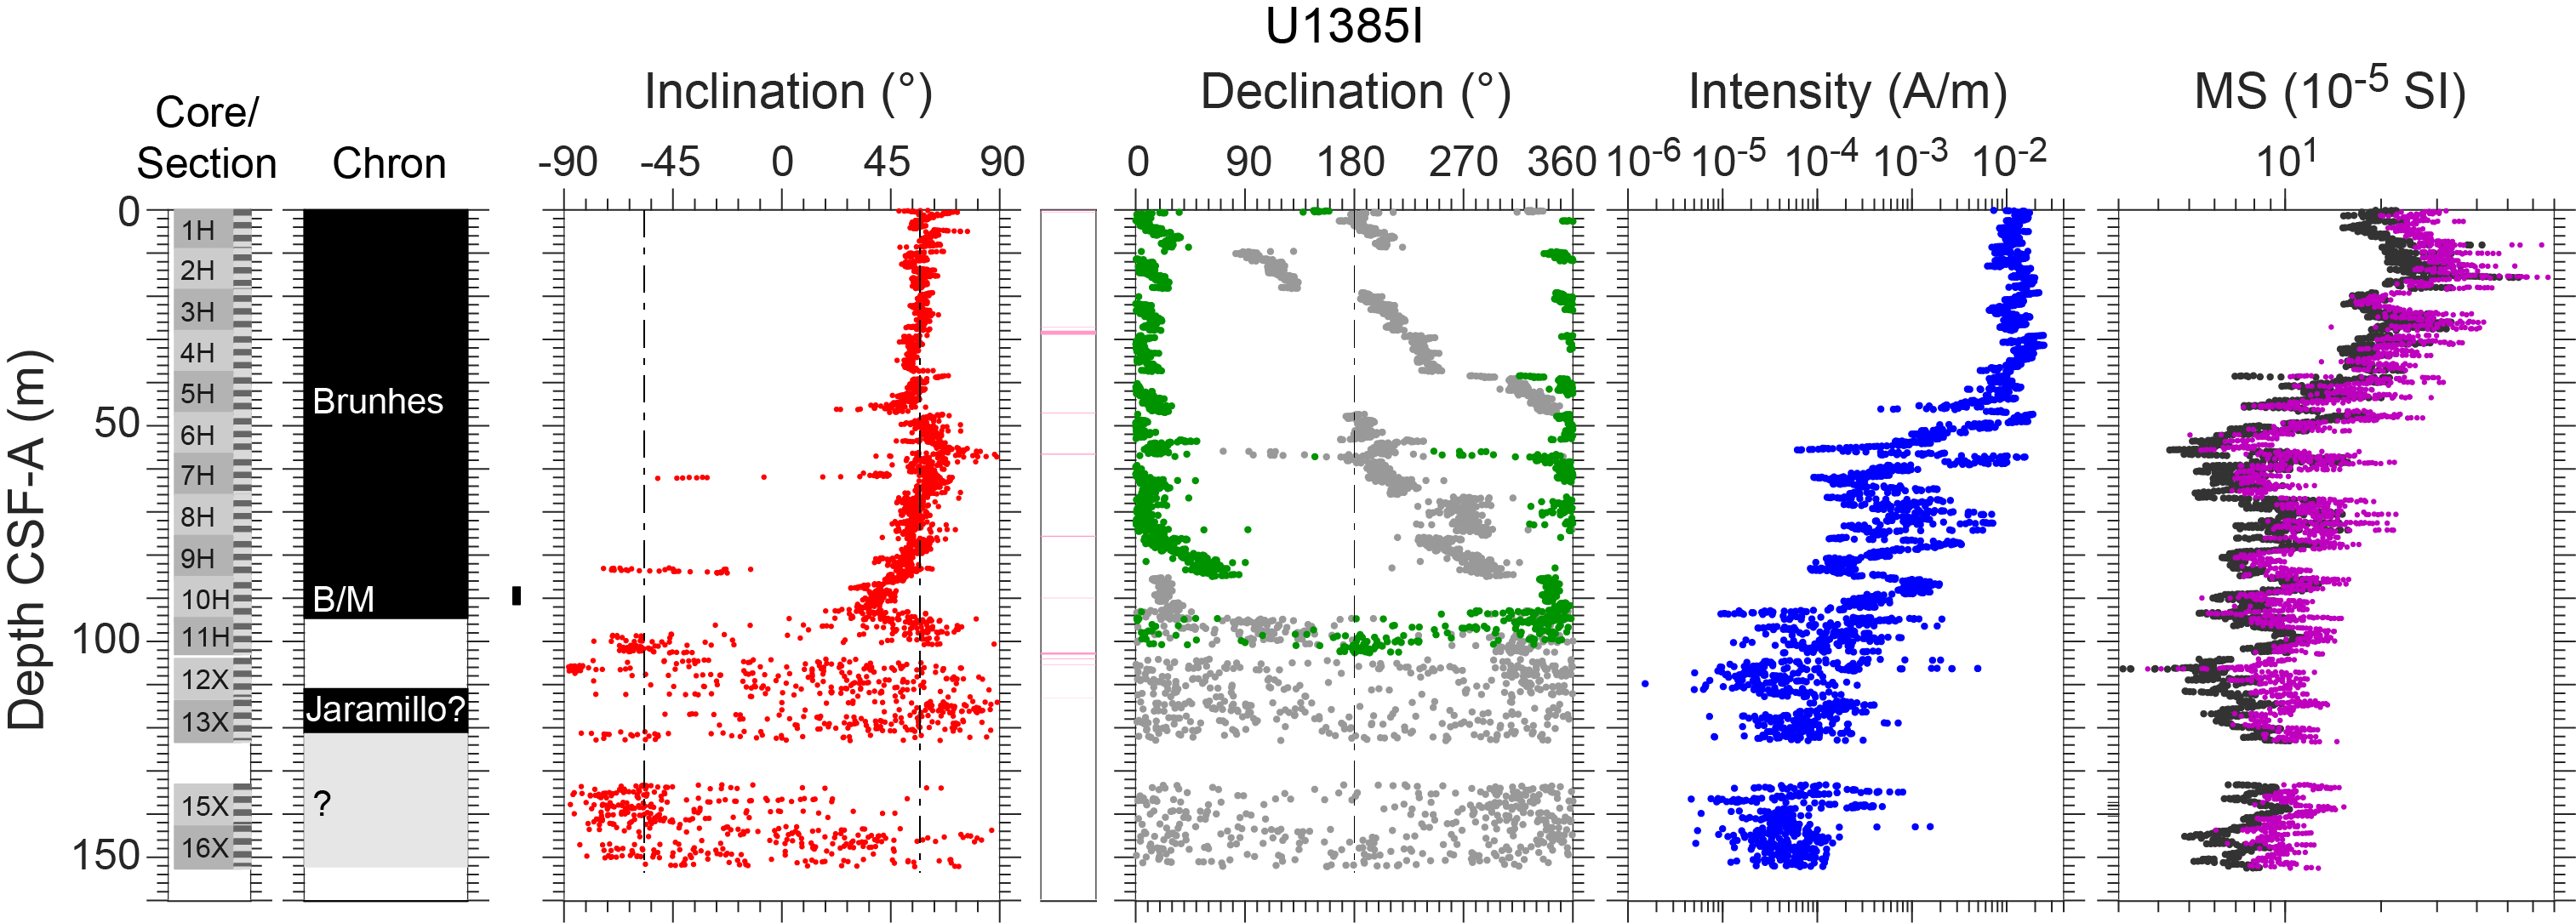
Figure F24. AF demagnetization, Hole U1385I.
We processed archive-half data extracted from the shipboard Laboratory Information Management System (LIMS) database by removing all measurements collected from (1) void intervals caused by whole-round sampling (i.e., interstitial water [IW] and paleontology [PAL] samples), (2) disturbed core top intervals in APC cores (Table T17), and (3) the top and bottom 6 cm (8 cm if measurements were collected at 4 cm intervals) of each section and an extra 6 (or 8) cm for the void and disturbed core top intervals. Intervals that were severely/strongly disturbed during coring (see Lithostratigraphy) are indicated in Figures F23, F24, F25, F26, and F27, and data from these intervals are typically not used for magnetostratigraphic interpretation. A significant number of the NRM measurements of archive halves and cube samples were compromised due to flux jumps. We avoided using data from sections influenced by this measurement problem for interpretation and removed the compromised NRM demagnetization step data from cube samples. A flux jump occurred (in the −Z-direction) during section background measurement on 20 November 2022 and affected SRM data collected for Sections 397-U1385G-4H-5 through 23X-2 (26.77–206.3 m CSF-A). This flux jump led to apparent steep inclinations for the affected sections, especially for sediments with weak magnetizations. We corrected the NRM data of these sections using the section background measurement made on 21 November 2022. For measurements of sections from Hole U1385J, we repeated the 20 mT step if flux jumps compromised measurements. We note that most flux jumps occurredalong the −Z-direction, and the jump appears to be one flux count, equivalent to 3.8825 × 10⁻⁸ Am2.
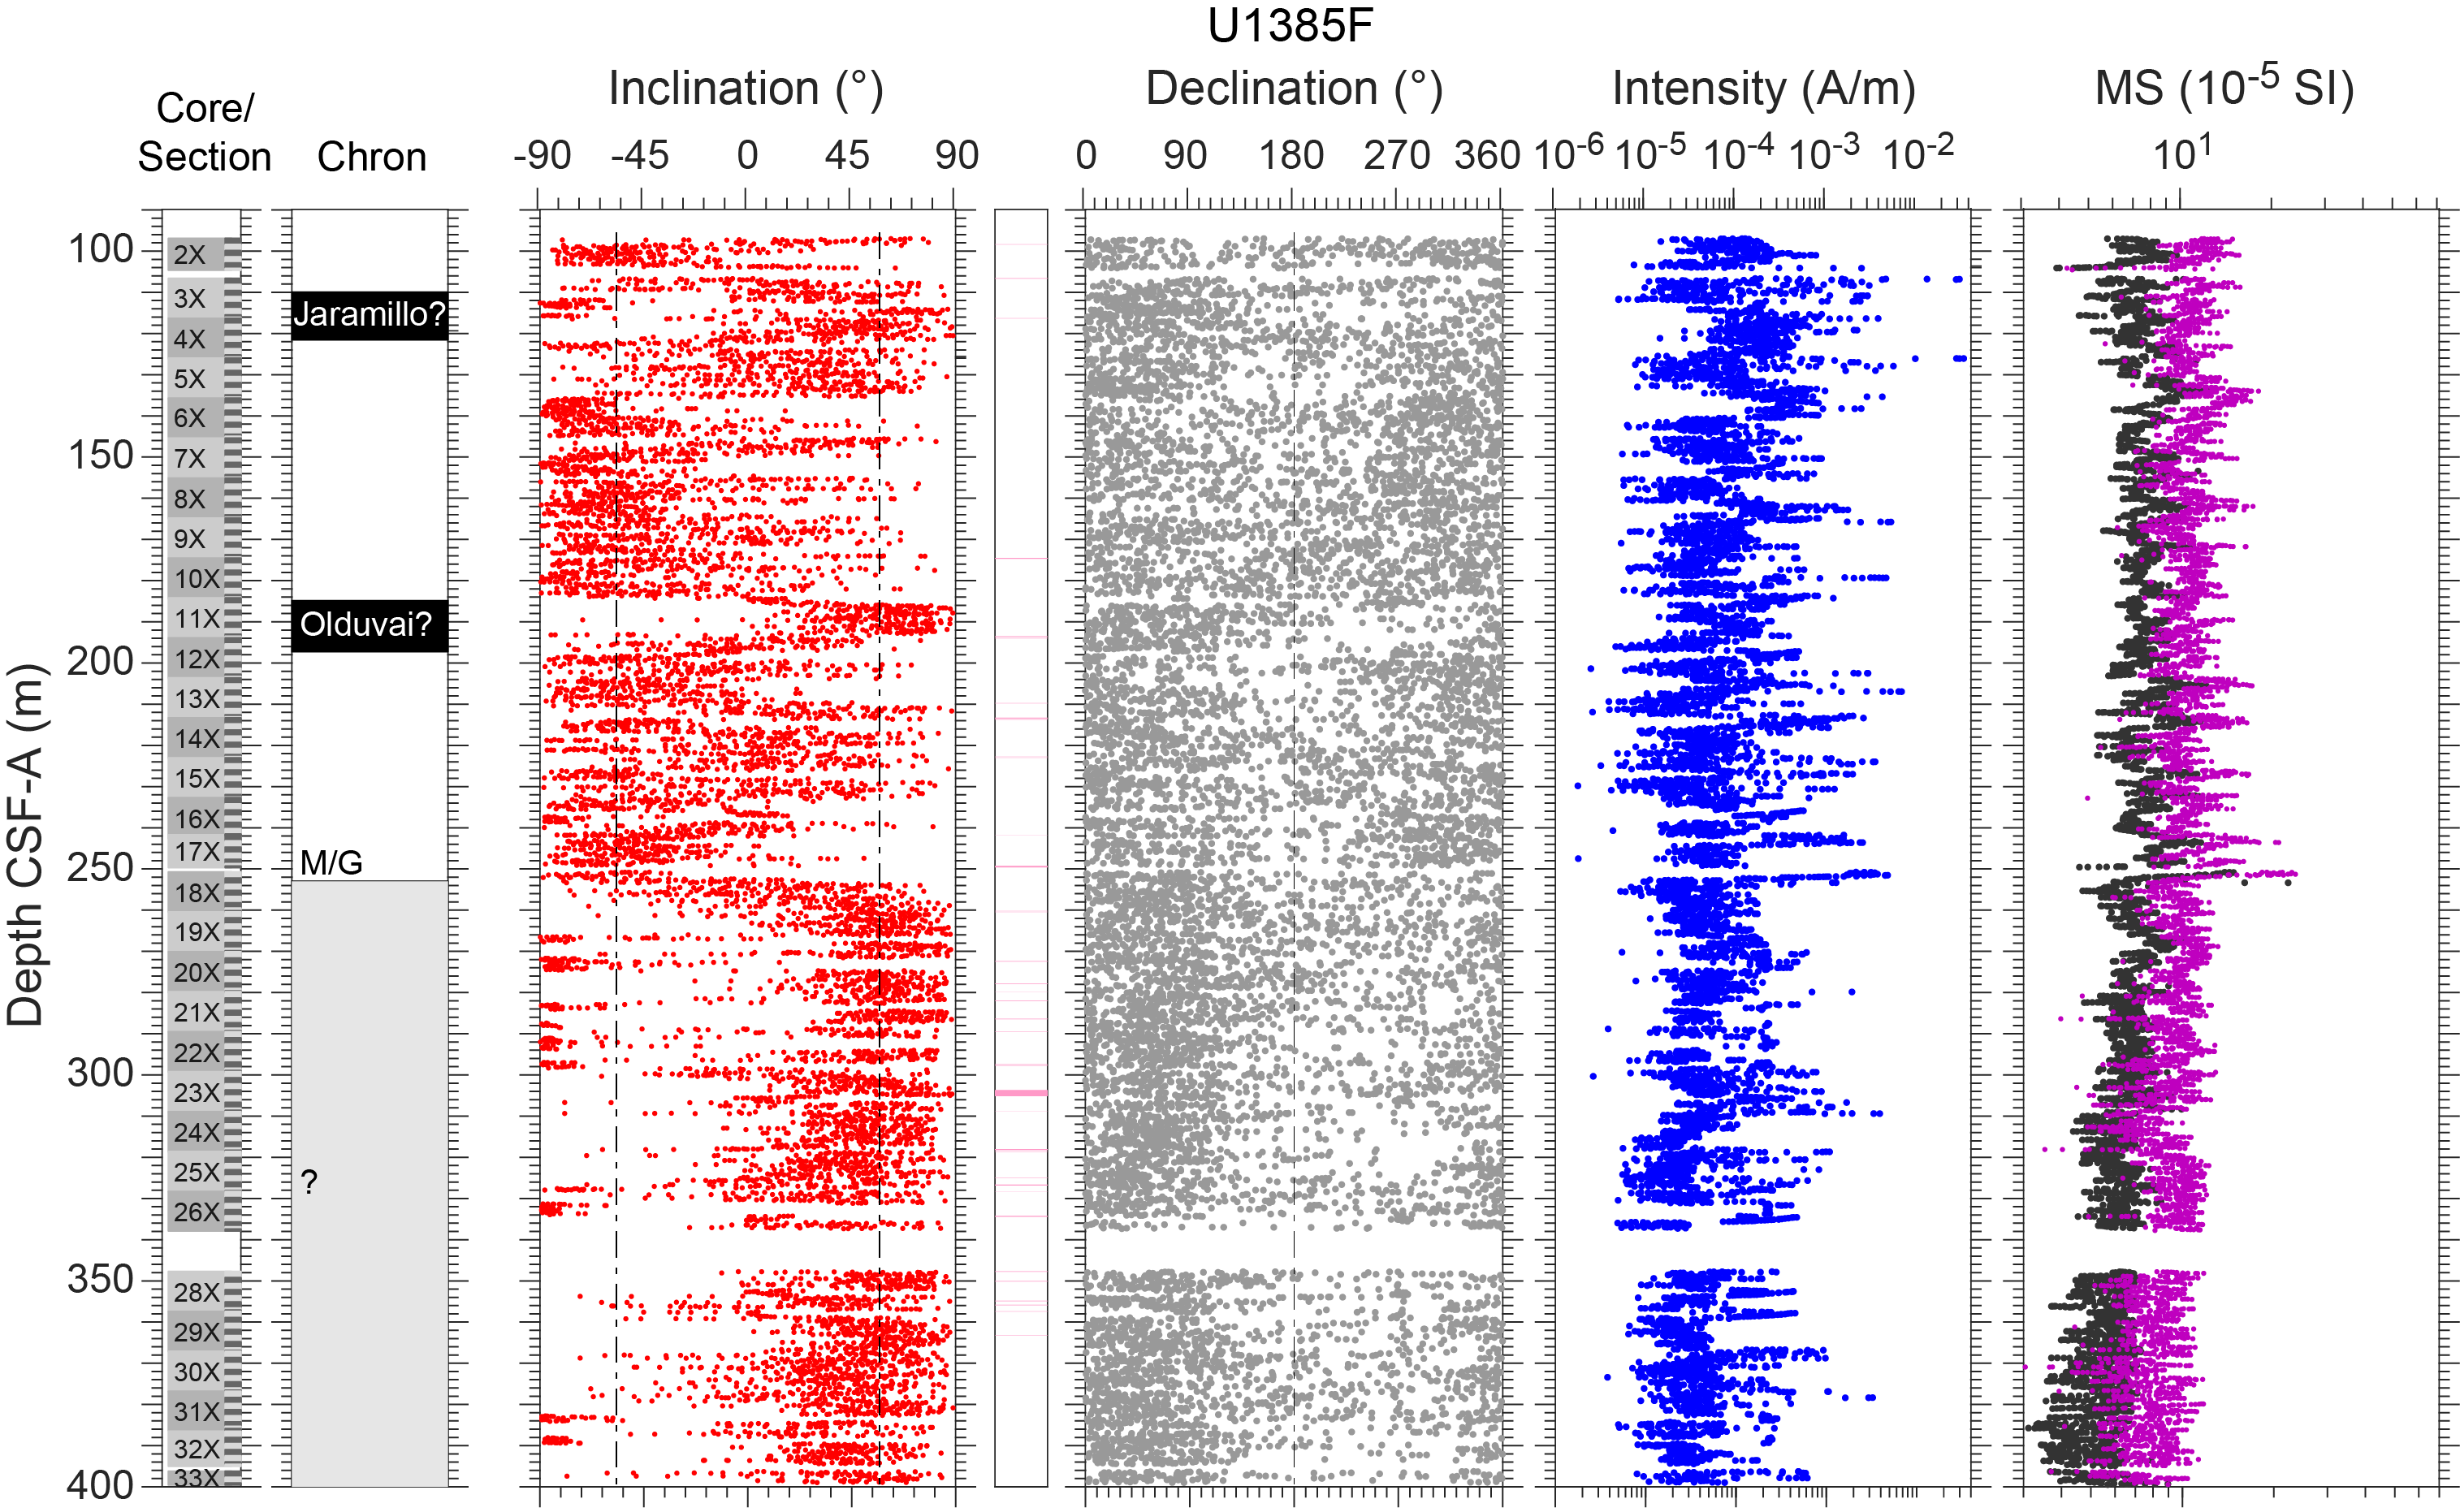
Figure F25. AF demagnetization, Hole U1385F.
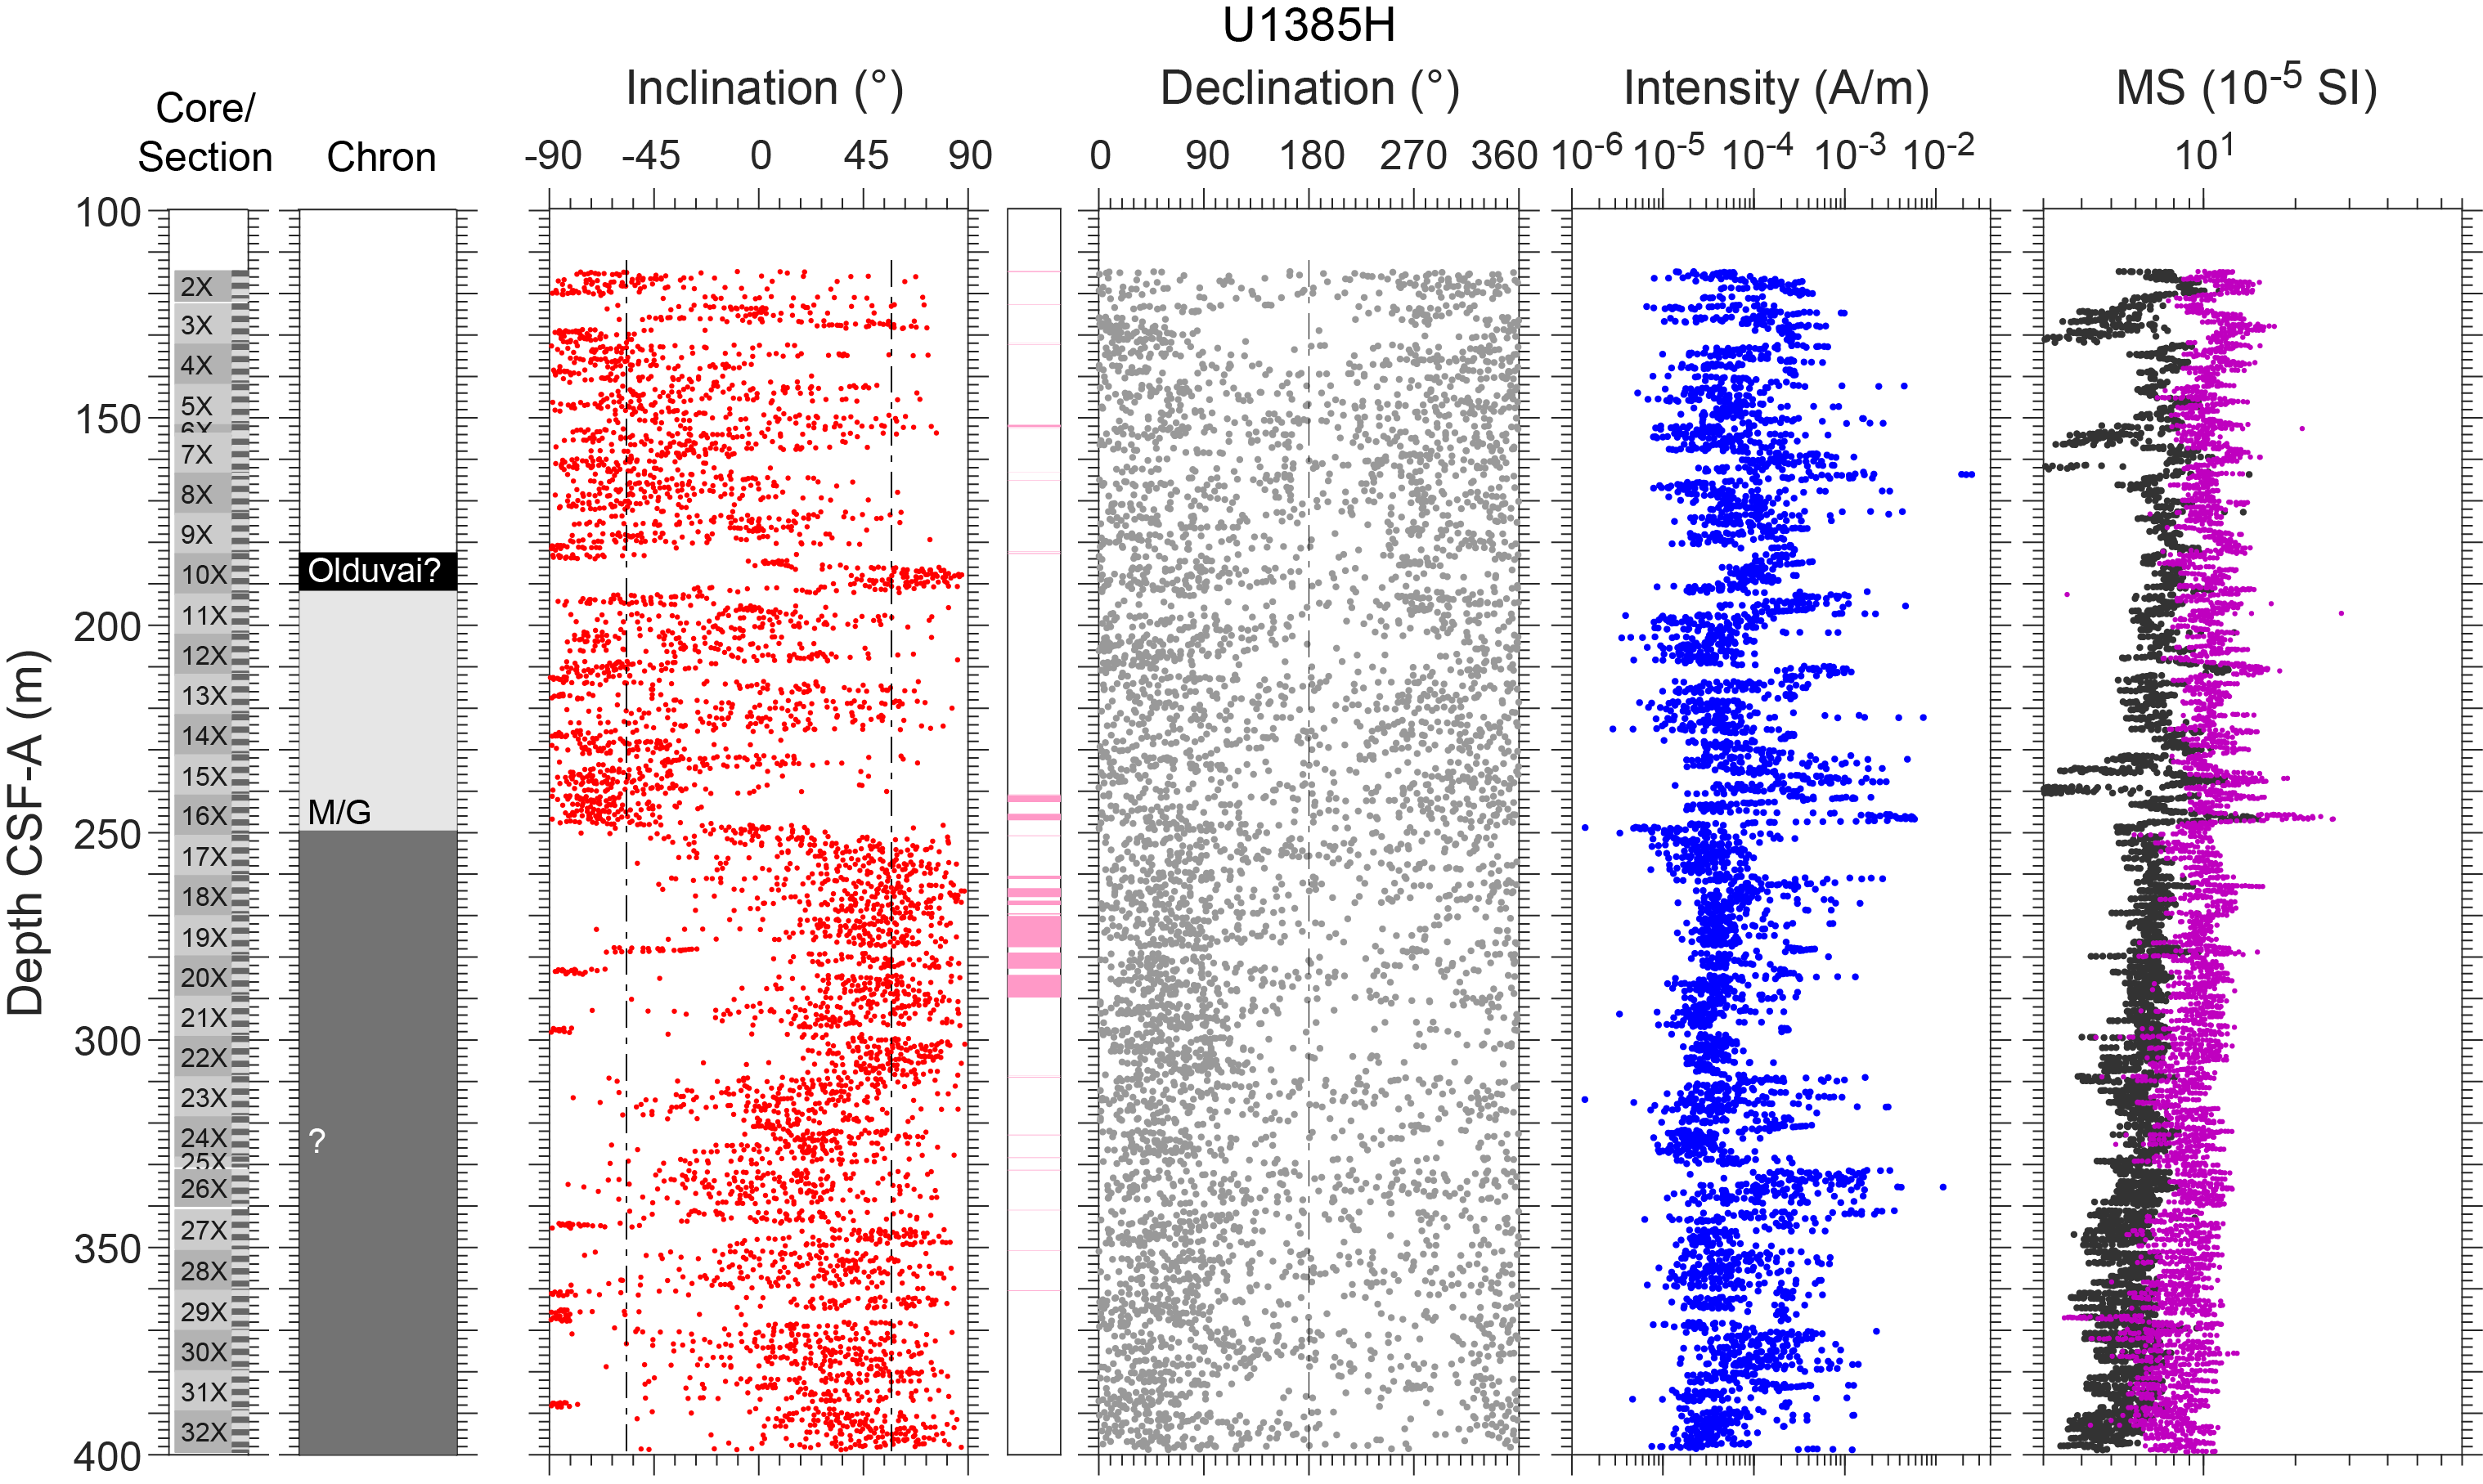
Figure F26. AF demagnetization, Hole U1385H.
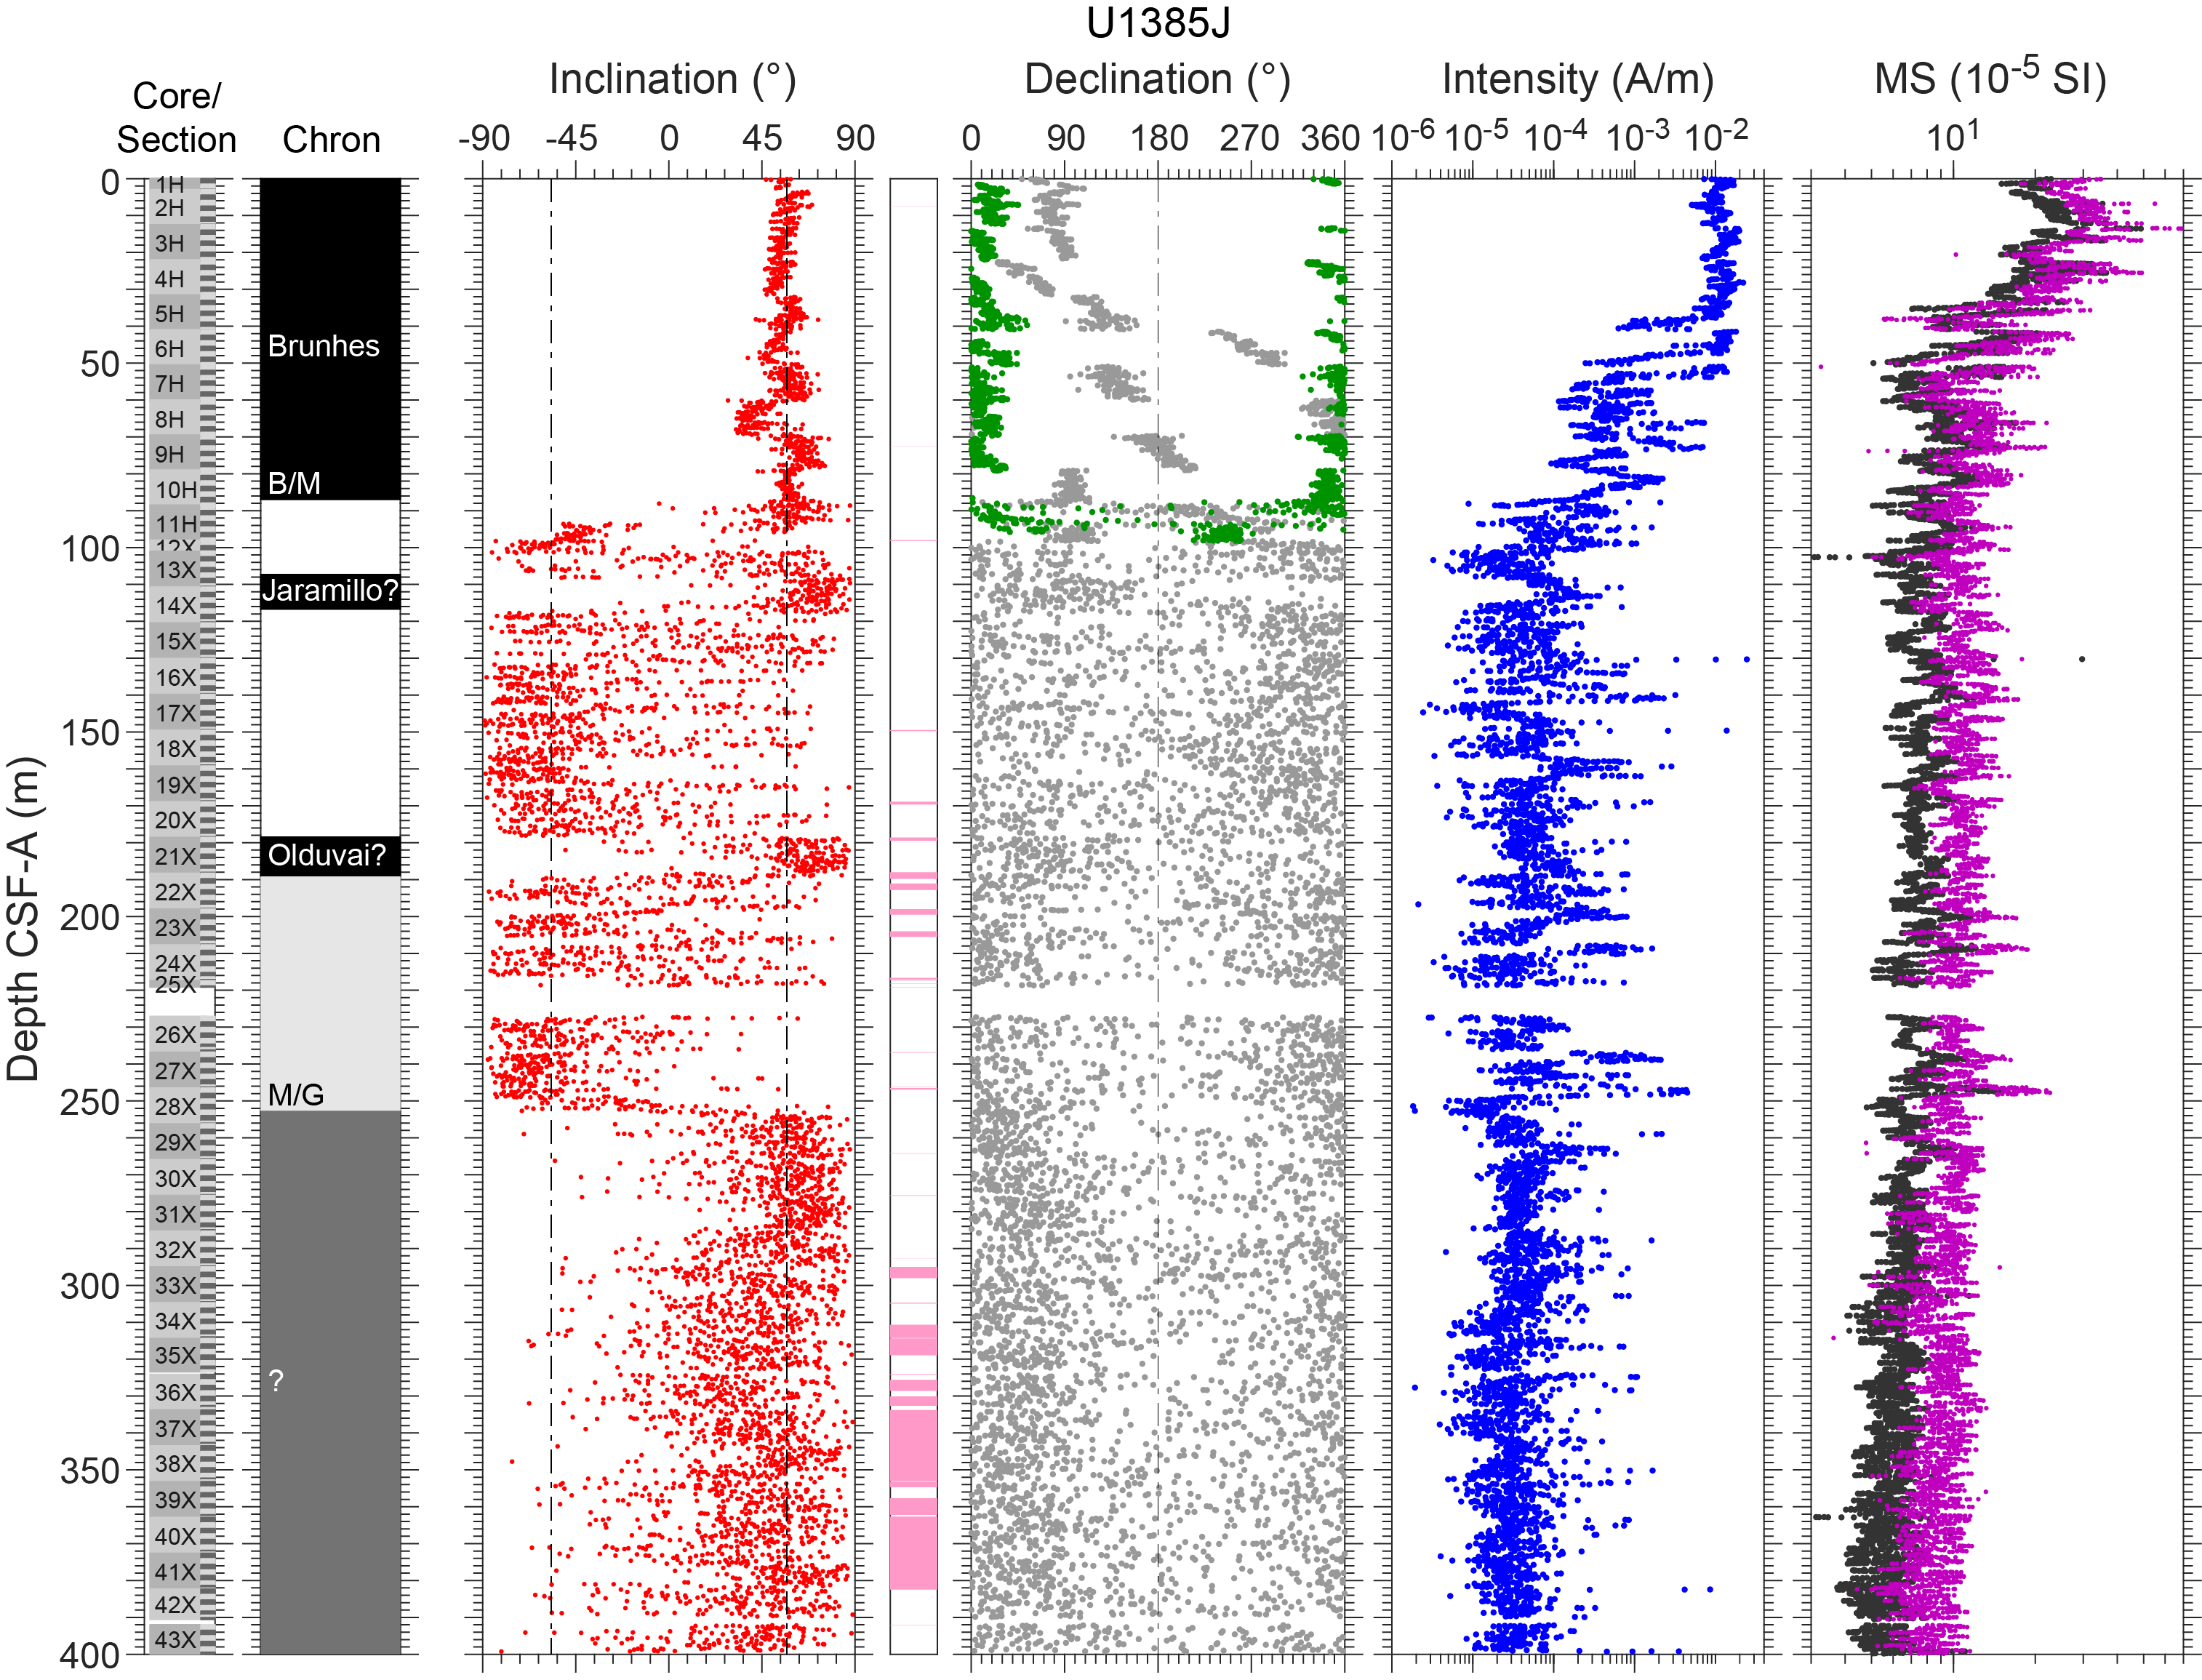
Figure F27. AF demagnetization, Hole U1385J.
Declination data from APC cores where Icefield MI-5 orientation data are available were corrected for each core using the estimated orientation angles and the current declination value at the site according to the 2020 International Geomagnetic Reference Field (IGRF2020) (see Paleomagnetism in the Expedition 397 methods chapter [Abrantes et al., 2024a]). To analyze the NRM data from both the section-half and discrete cube samples, we used a modified version of the UPmag software (Xuan and Channell, 2009). The processed NRM inclination, declination (including orientation-corrected declination where available), and intensity data after 20 mT AF demagnetization are shown in Figures F23, F24, F25, F26, and F27. The processed cube sample NRM data are shown in Figures F28 and F29.
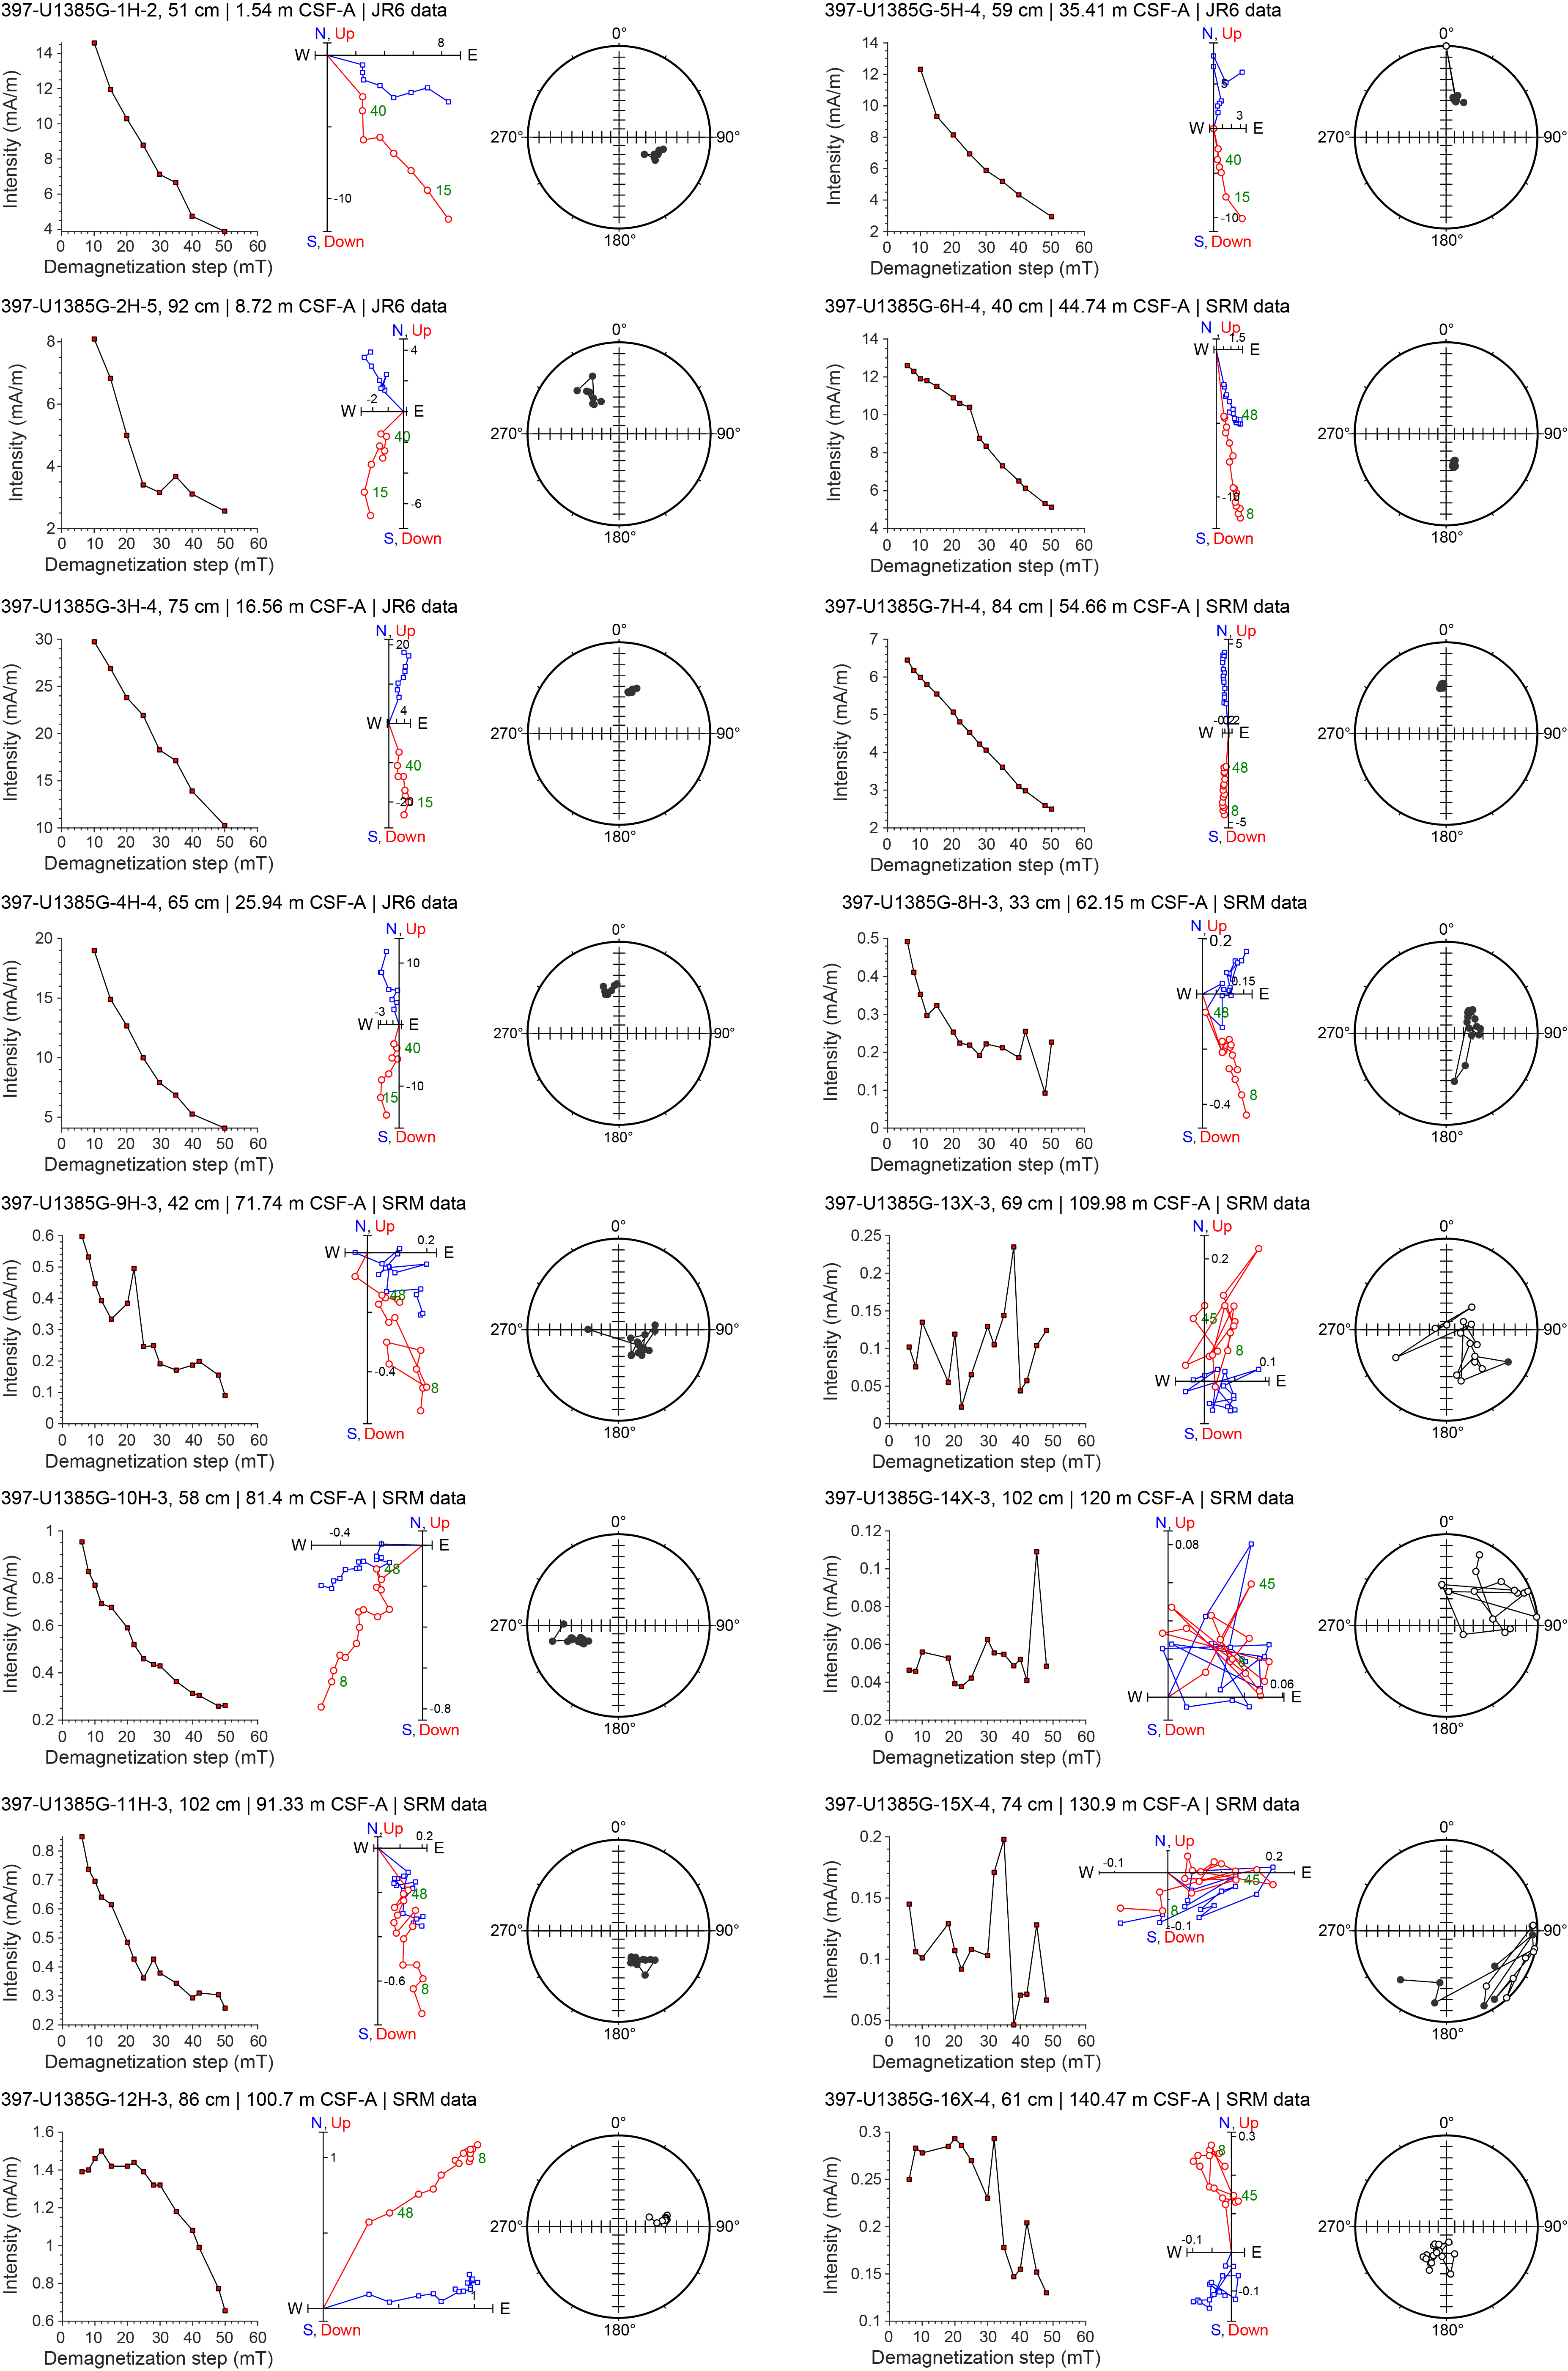
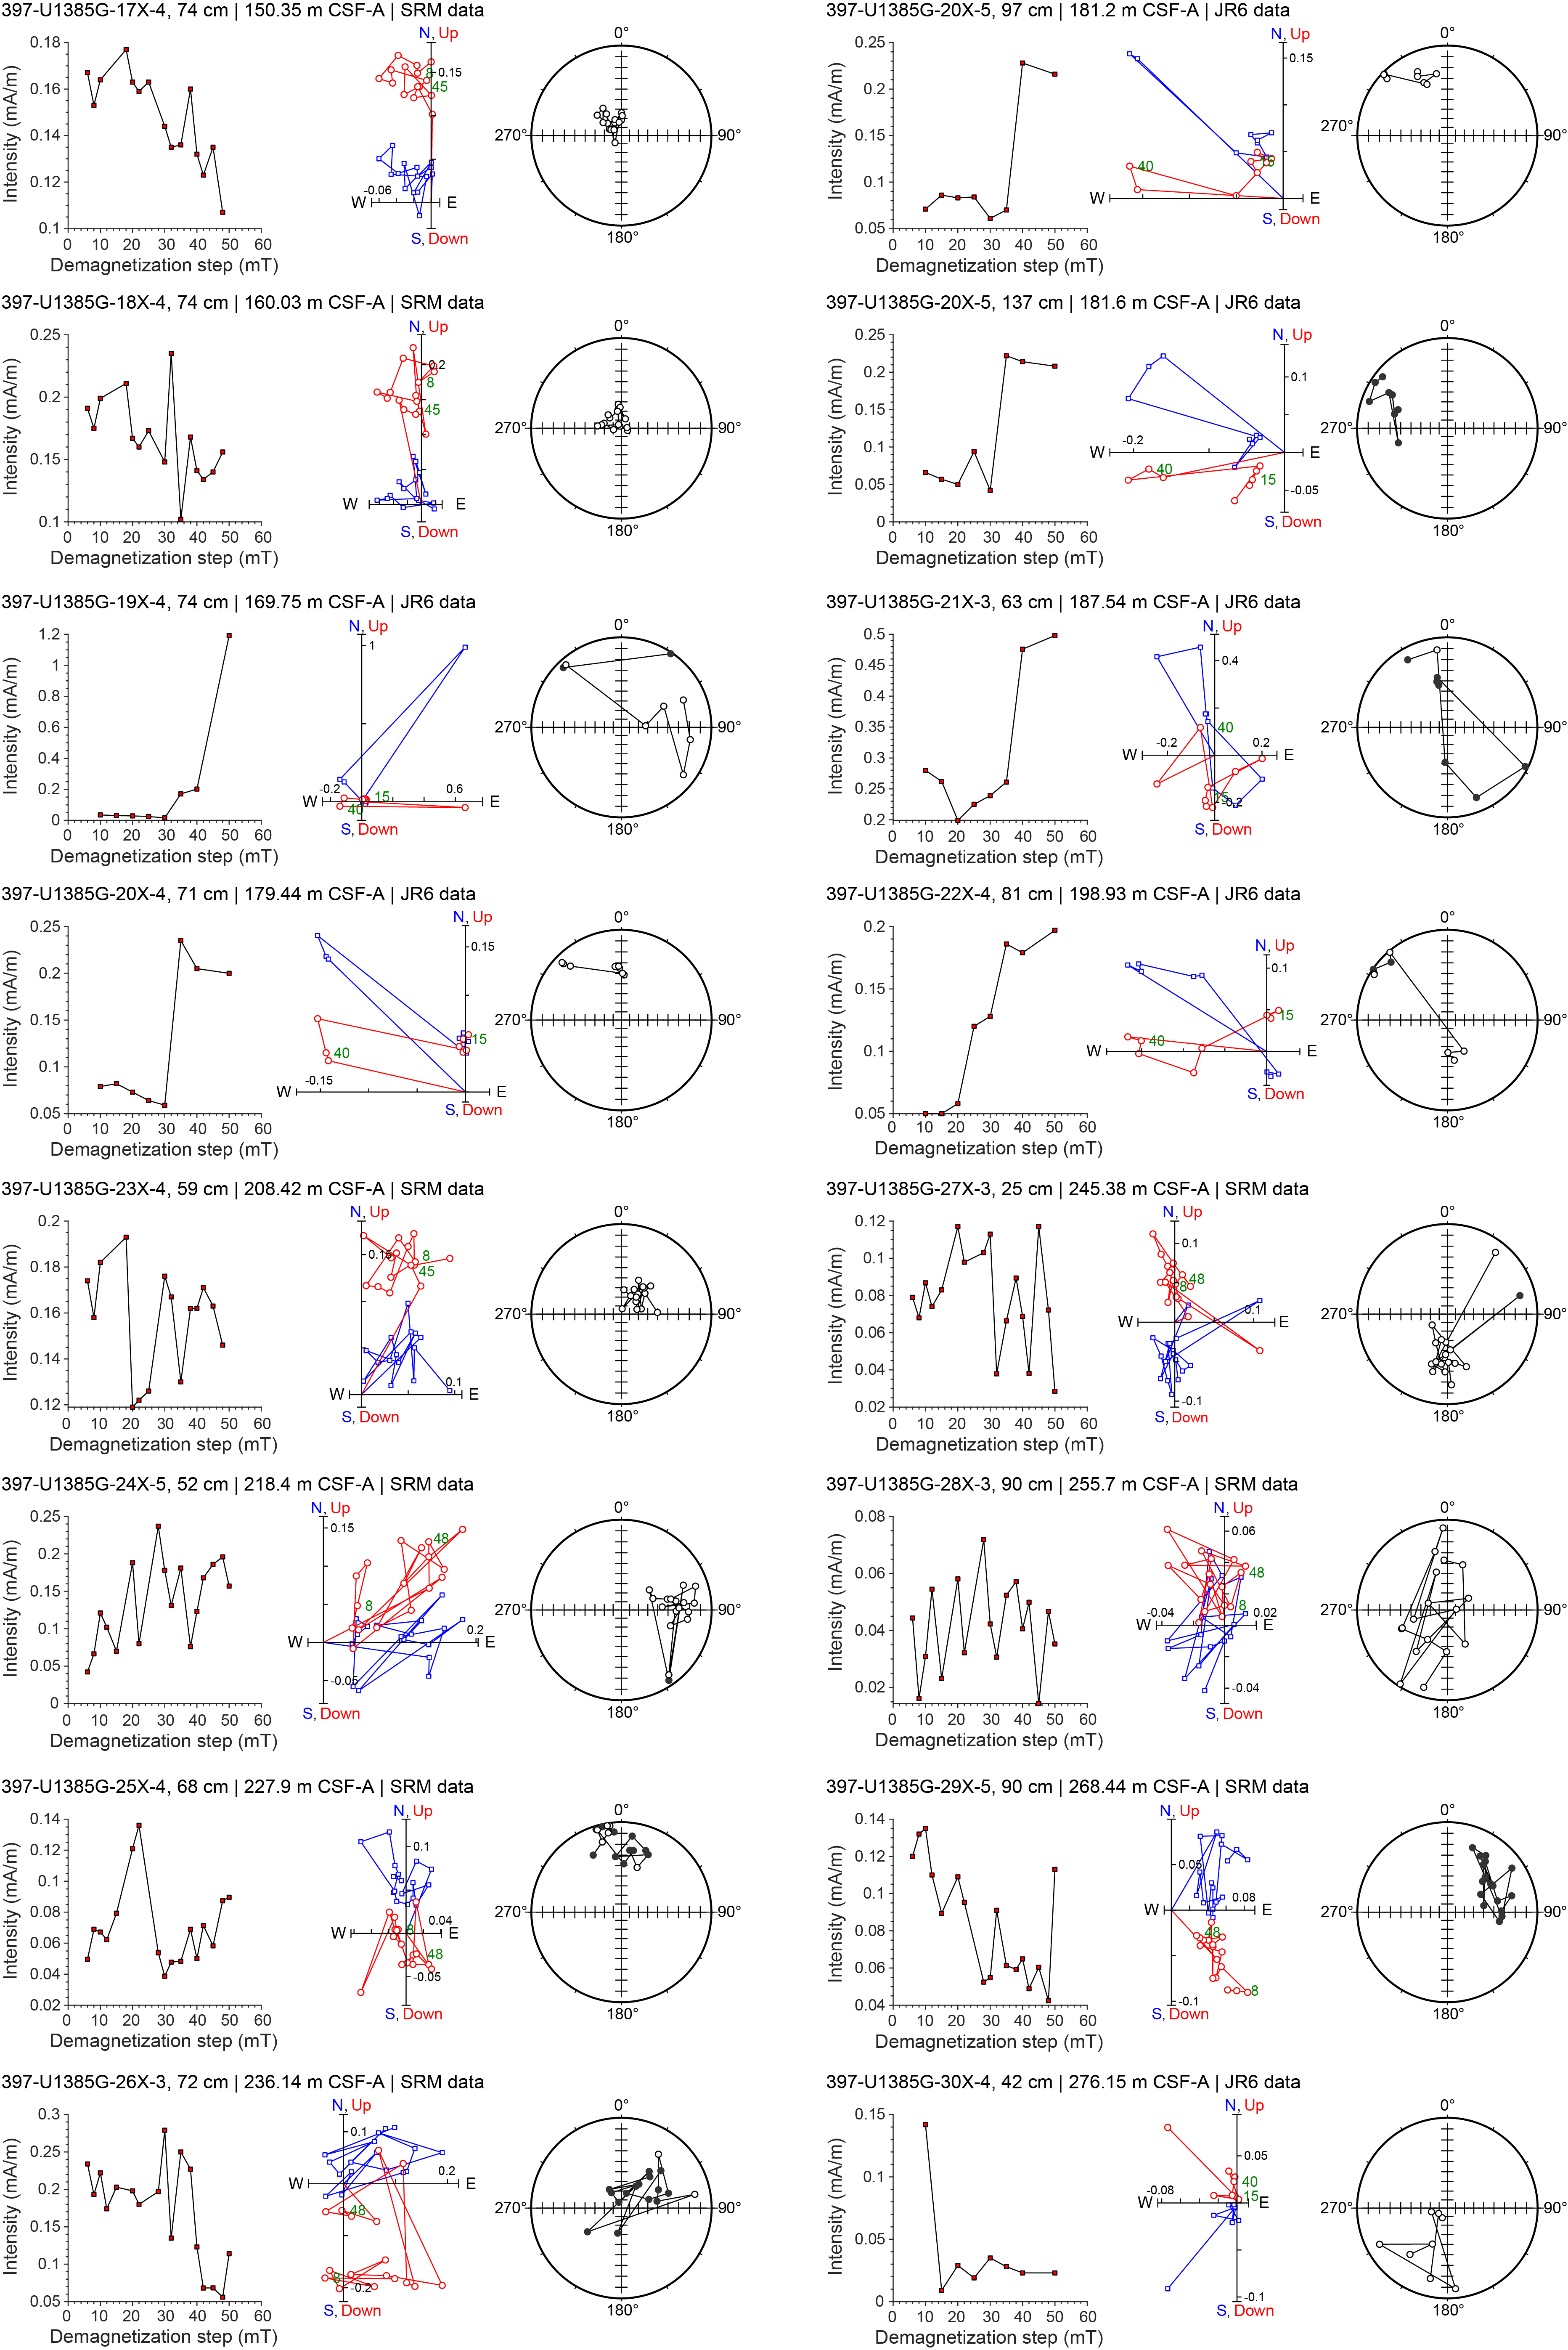
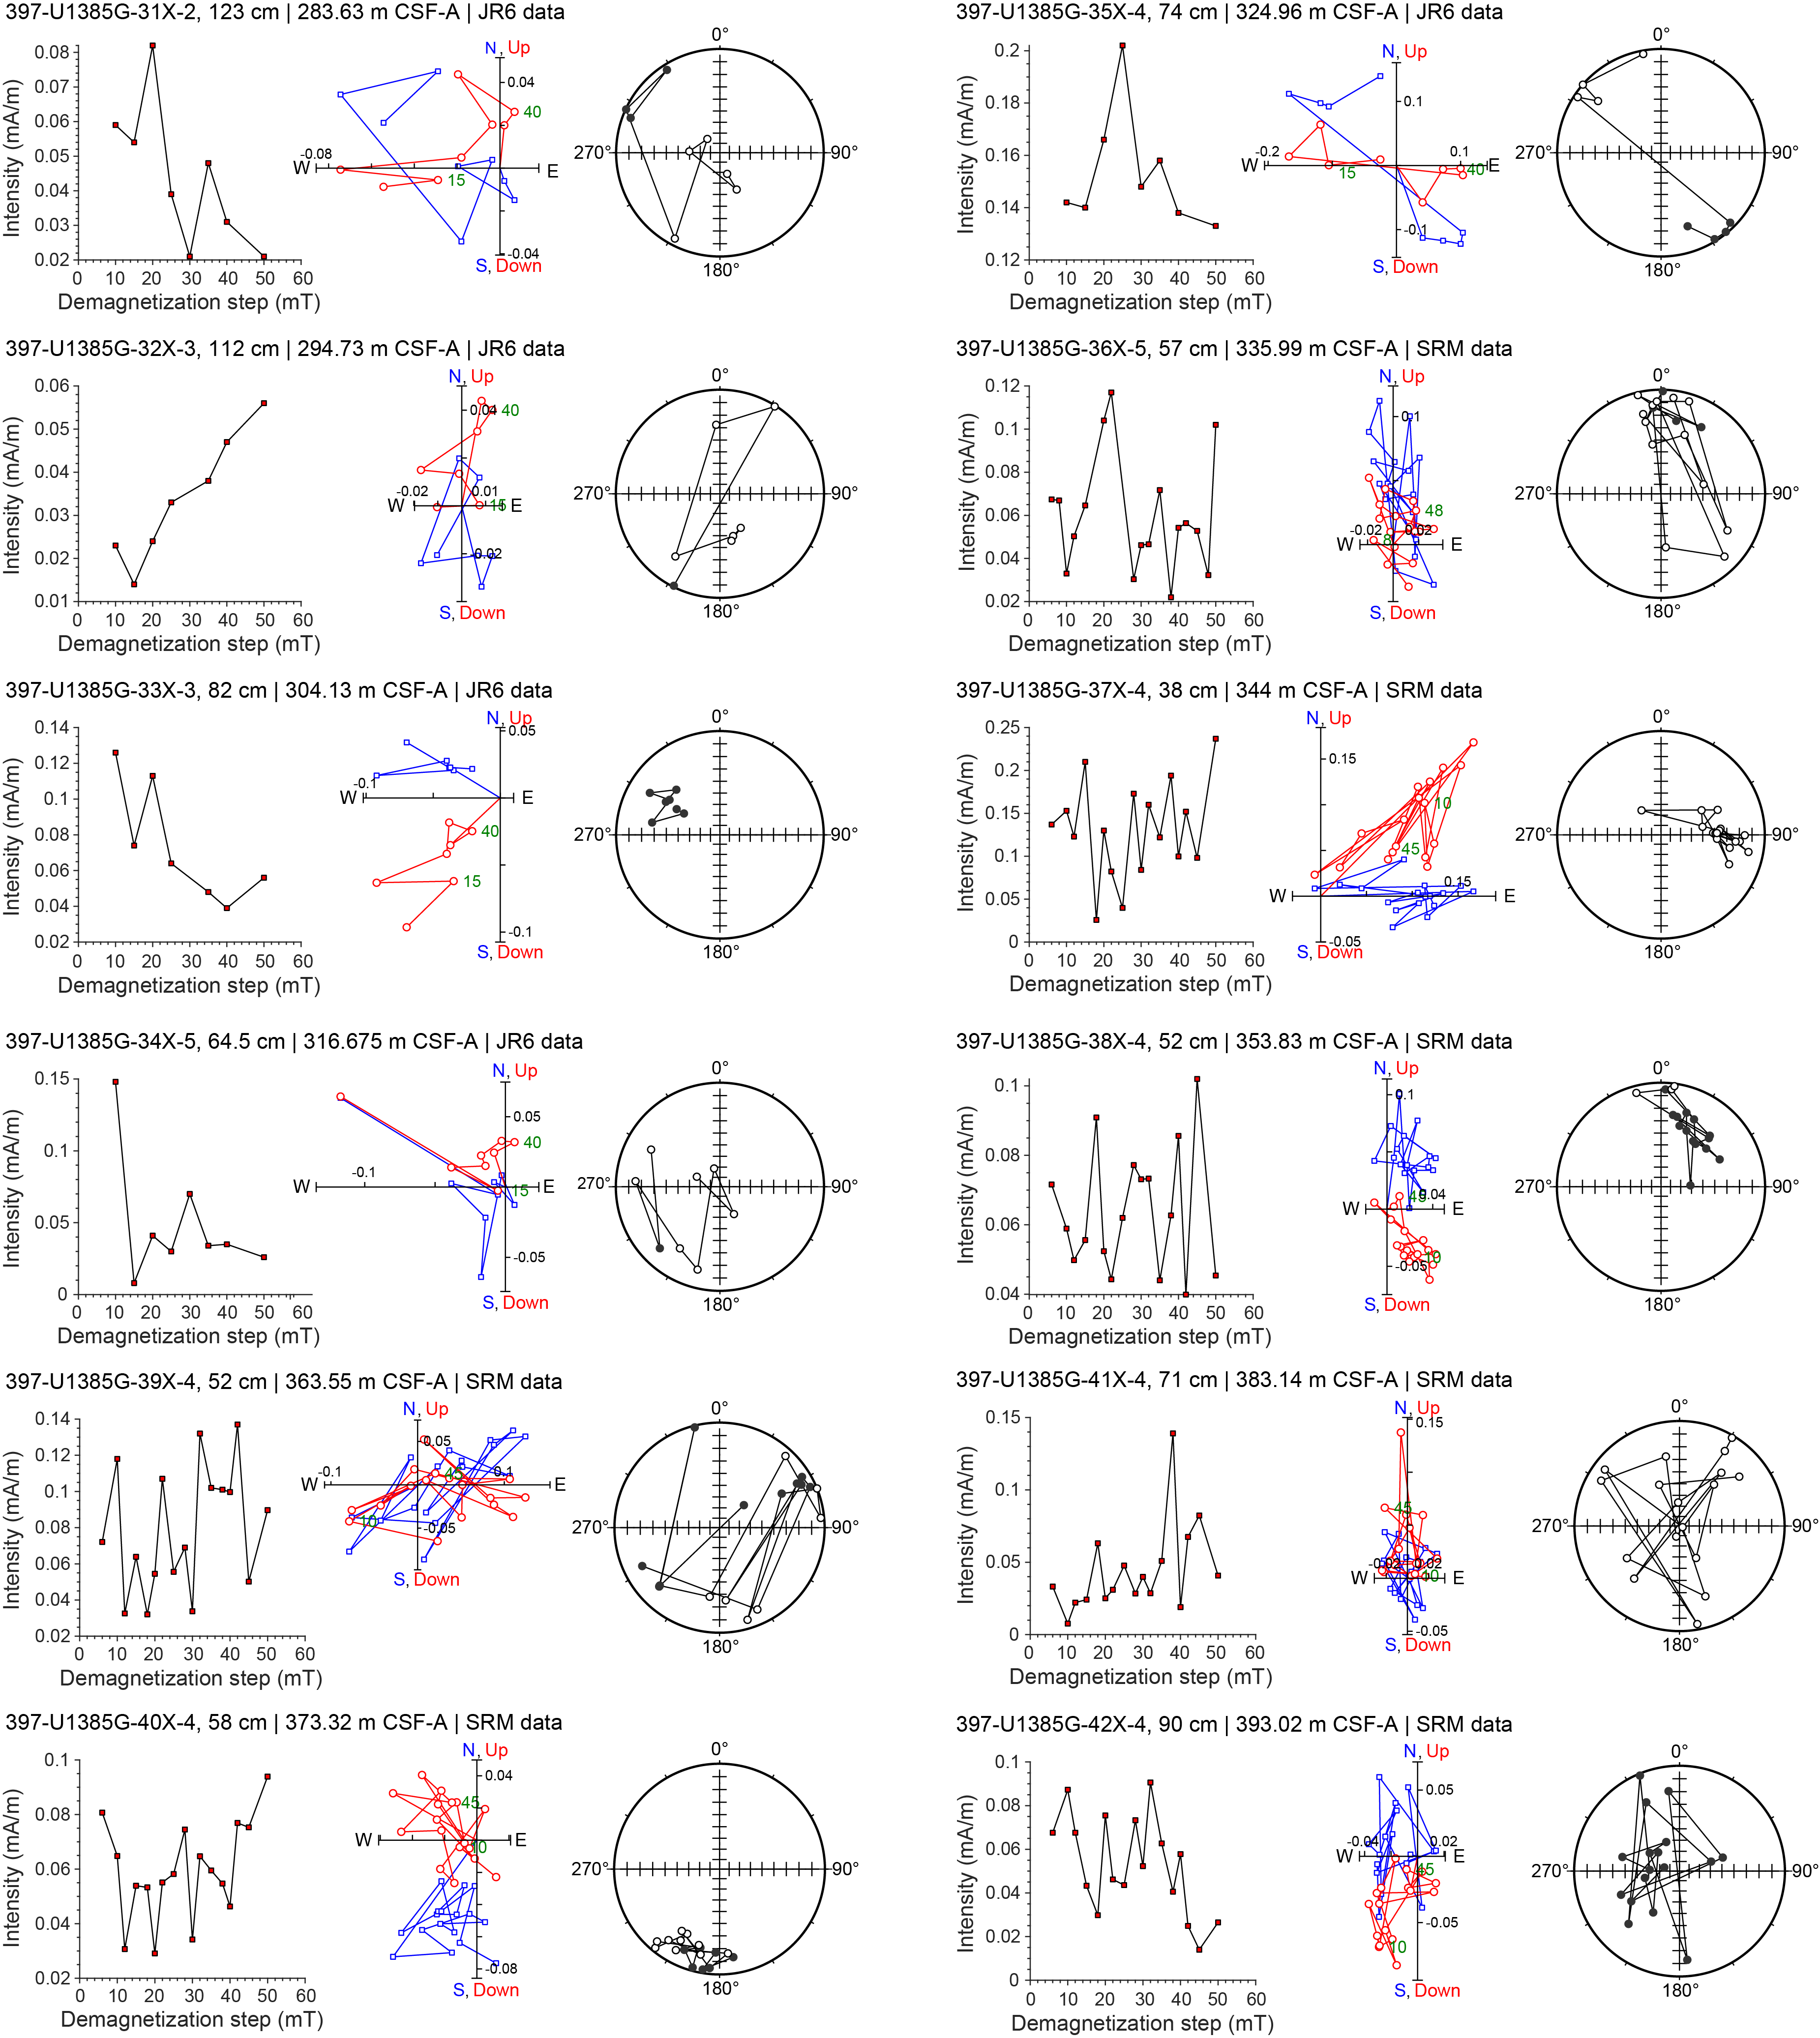
Figure F28. Discrete cube sample AF demagnetization, Hole U1385G.
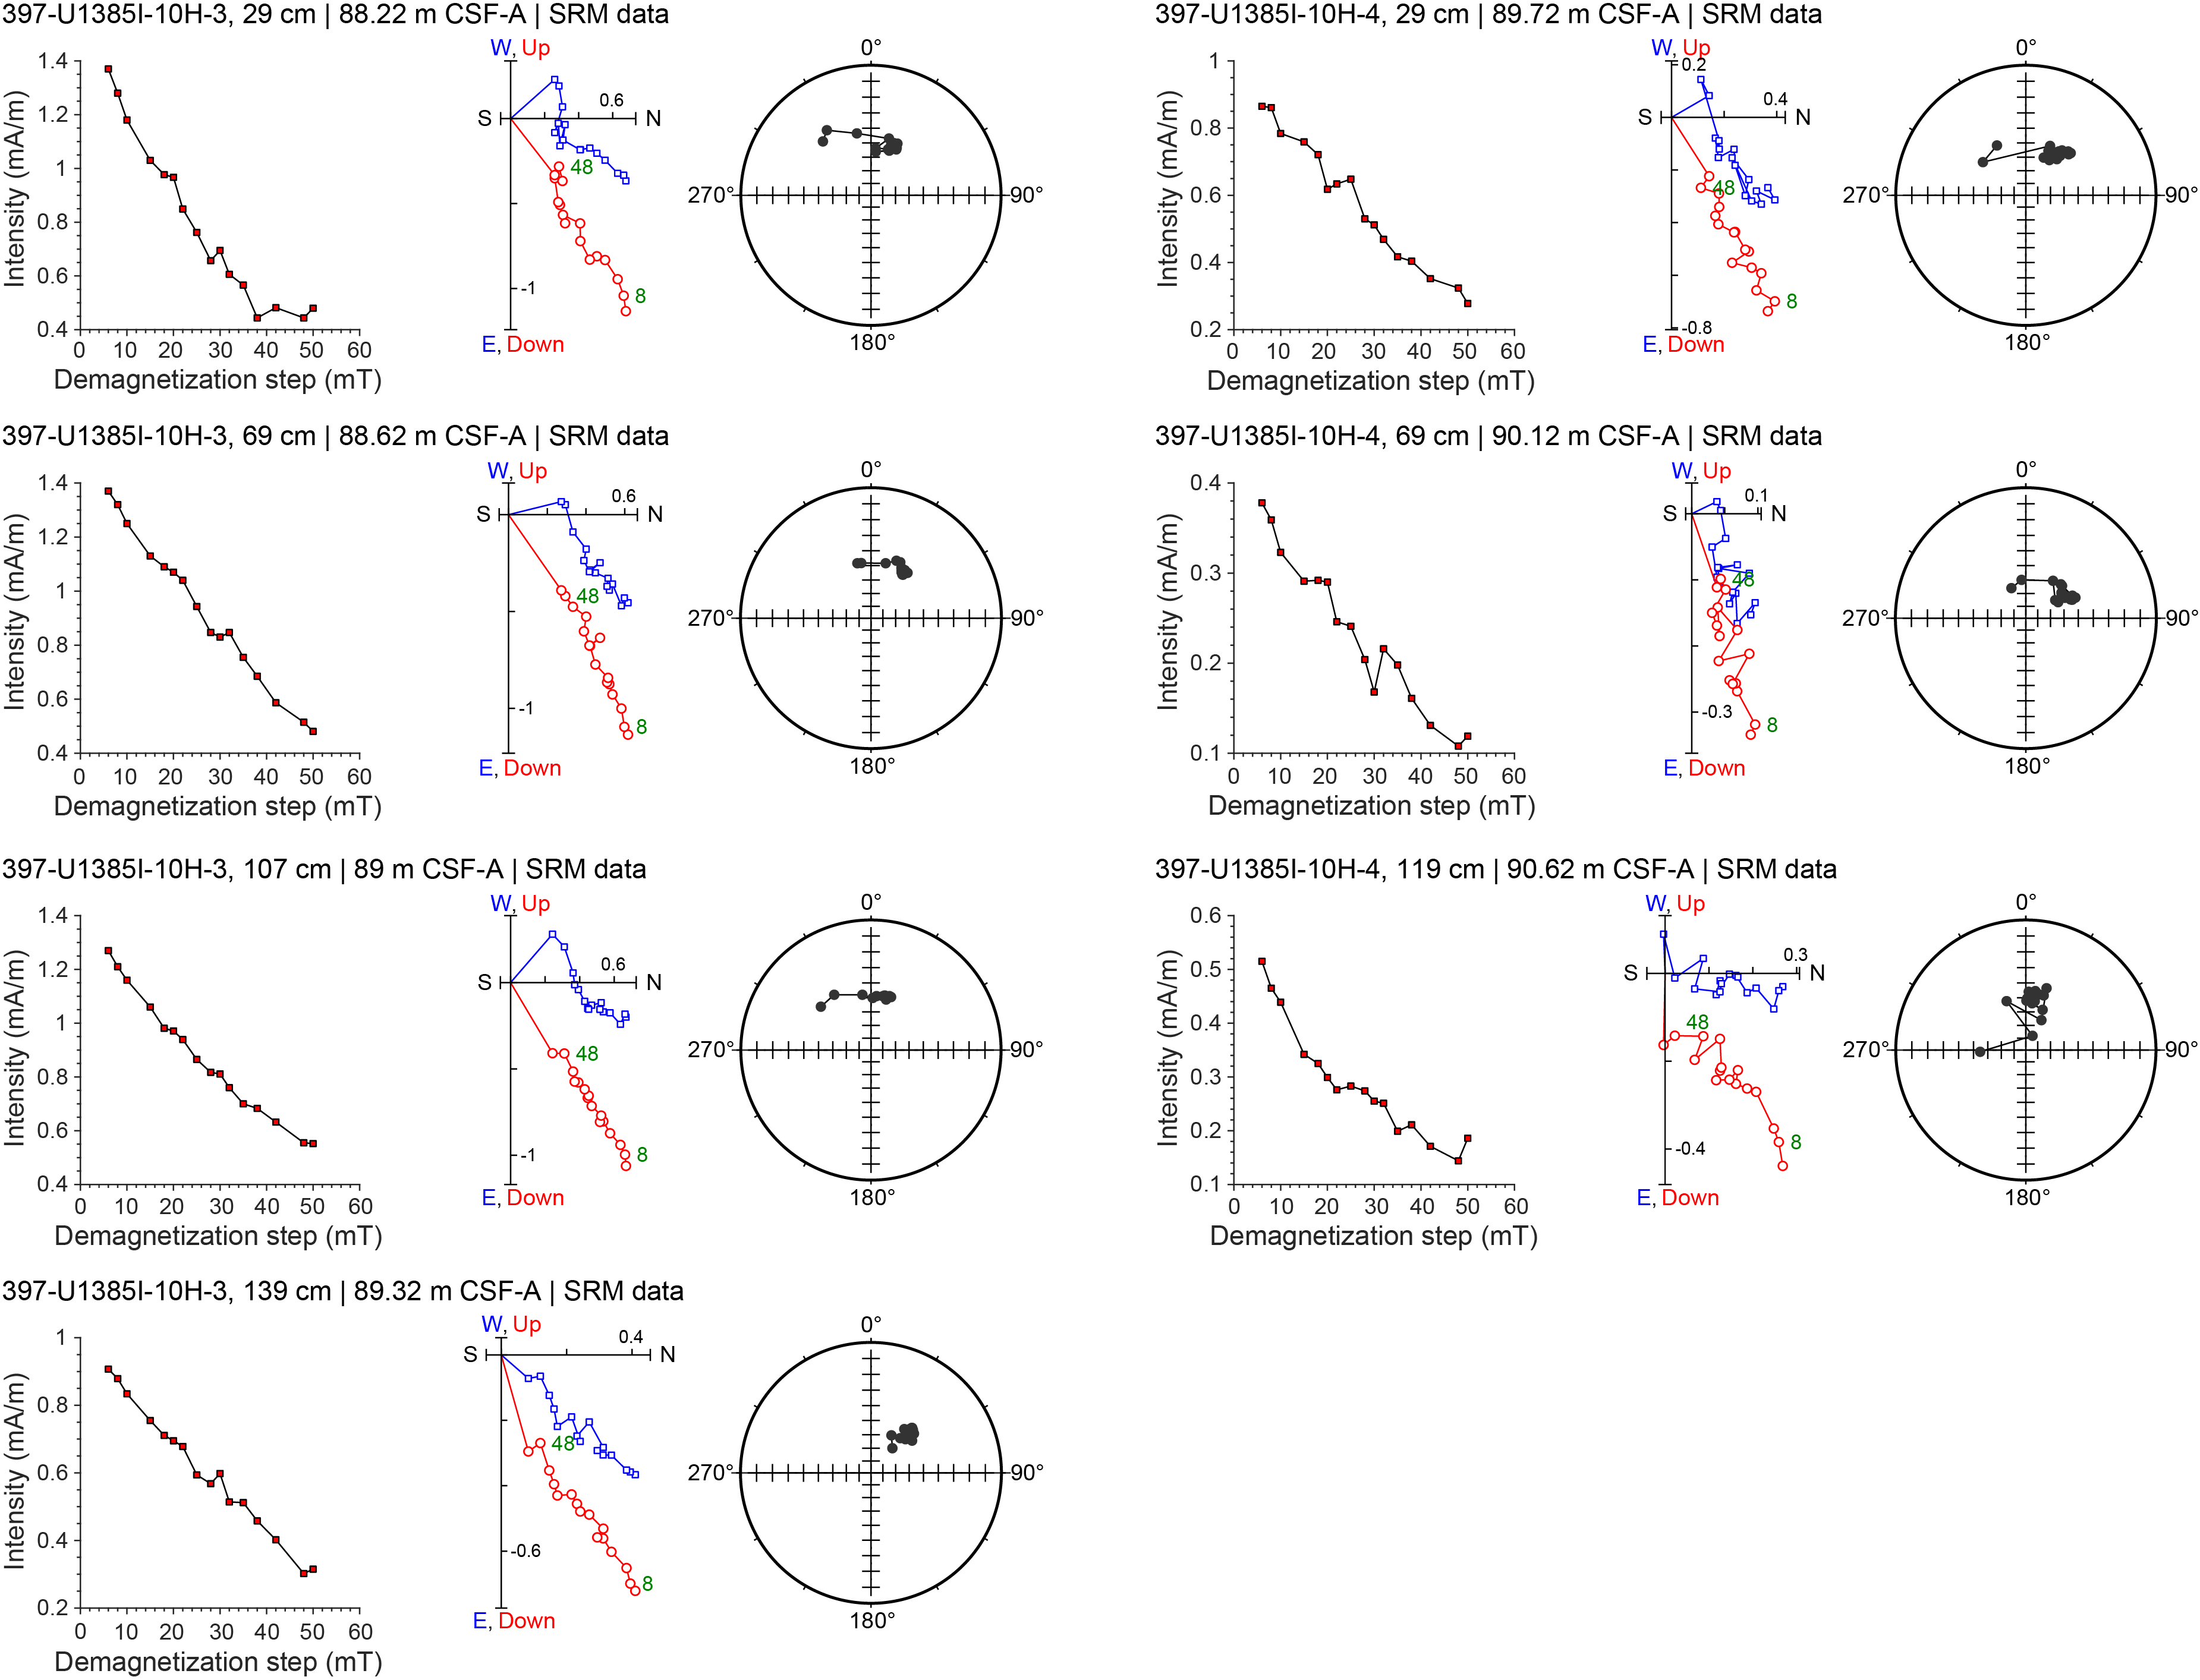
Figure F29. Discrete cube sample AF demagnetization, Hole U1385I.
5.1. Natural remanent magnetization intensity and magnetic susceptibility
Intensities of NRM after 20 mT AF demagnetization (NRM20mT) for cores from Holes U1385F–U1385J are similar in magnitude for overlapping depth intervals (Figures F23, F24, F25, F26, F27). In Holes U1385G, U1385I, and U1385J, NRM20mT intensity is on the order of 10−2 A/m for the upper ~45 m and decreases downhole to the order of 10−4 to 10−3 A/m between ~45 and 100 m CSF-A. Below ~100 m CSF-A in all holes (including Holes U1385F and U1385H, which started with XCB coring at ~97 and ~115 m CSF-A, respectively), NRM20mT intensity drops to 10−5 to 10−4 A/m and shows a general downhole decreasing trend.
Figures F23, F24, F25, F26, and F27 also show MS measured on whole-round cores using the WRMSL and on archive-half sections using the SHMSL (see Physical properties). The WRMSL and SHMSL acquired susceptibility values were multiplied by 0.68 × 10⁻⁵ and (67/80) × 10−5, respectively, to convert them to the dimensionless volume SI unit (Blum, 1997). MS measurements are generally consistent between the two instruments and across the different holes for overlapping depth intervals and vary mostly between 5 × 10⁻⁵ and 50 × 10−5 SI. Susceptibility peaks of ~30 × 10−5 SI are visible at ~250 m CSF-A in Holes U1385F–U1385H and U1385J. Variabilities in MS of the sediments generally mimic those of the NRM20mT intensity, suggesting that magnetic minerals in these sediments that carry NRM are similar to those that dominate MS.
5.2. Magnetostratigraphy
Magnetostratigraphic interpretations are based on combined NRM (after 20 mT demagnetization) inclination and (orientation-corrected) declination data from archive-half sections and stepwise NRM demagnetization (up to 50 or 80 mT) data from cube samples. The geomagnetic field at the latitude of Site U1385 (37.57°N) has an expected inclination of 57° (−57°) during normal (reversed) polarity, assuming a geocentric axial dipole (GAD) field model. The AF demagnetization behavior of cube samples is illustrated in Figures F28 and F29. A steep normal overprint appears to be largely removed after AF demagnetization with peak fields of ~5–20 mT. Polarity information determined based on the cube data is indicated by black (normal), white (reversed), and gray (uncertain) colored squares in Figures F23 and F24. Identified polarity reversals at Site U1385 are shown in the Chron column in Figures F23, F24, F25, F26, and F27 and summarized in Table T18. The interpreted magnetostratigraphy is generally consistent with the biostratigraphy of the site (see Biostratigraphy).
The Brunhes/Matuyama (B/M) boundary (0.773 Ma) is recorded at ~88.6, ~92, and ~87 m CSF-A in Holes U1385G, U1385I, and U1385J, respectively. Above the B/M boundary, NRM20mT inclinations of sections from these holes vary closely around the expected GAD inclination of ~57° (Figures F23, F24, F27). Below the B/M boundary, NRM20mT is dominated by shallow/negative inclinations, except core sections for which NRM20mT measurements were likely compromised by flux jumps and show very steep inclinations. In these three holes, the B/M boundary is accompanied by large changes in declinations. In Hole U1385G, cube samples from above the boundary show well-defined characteristic remanence with positive inclinations, whereas cube samples from below the boundary show mostly uncertain or reversed polarity components (Figure F28). The seven cube samples from Hole U1385I (AF demagnetized with peak field up to 50 mT) yielded positive inclination components (Figure F29), which is consistent with the interpreted B/M boundary in the hole based on section data. The depth levels of the B/M boundary in Holes U1385G, U1385I, and U1385J are ~8–10 m shallower compared with those in Holes U1385A, U1385B, U1385D, and U1385E recovered during Expedition 339 (Expedition 339 Scientists, 2013), but they are generally consistent with those updated by Hodell et al. (2015).
The intervals at ~110–121.5, ~109.5–117, ~111–121 and ~107–117 m CSF-A in Holes U1385F, U1385G, U1385I, and U1385J, respectively, are dominated by positive inclinations (Figures F23, F24, F25, F27). Cube samples from this interval in Hole U1385G mostly yielded uncertain polarity (Figures F23, F28). We interpret these intervals as the Jaramillo Subchron (0.99–1.07 Ma). This interpretation is consistent with the biostratigraphy (see Biostratigraphy). The Jaramillo Subchron is not identified in Hole U1385H. The depth levels of the interpreted Jaramillo Subchron in Holes U1385F, U1385G, U1385I, and U1385J are generally consistent with those for Holes U1385A, U1385B, U1385D, and U1385E recovered during Expedition 339 (Expedition 339 Scientists, 2013).
The Olduvai Subchron (1.775–1.934 Ma) is identified at ~185–197, ~181–192, ~182.5–192, and ~178.5–189 m CSF-A in Holes U1385F, U1385G, U1385H, and U1385J, respectively. These intervals are dominated by positive inclinations, largely scattering around 57°. NRM20mT of sections from the top and bottom of these intervals is characterized by downhole shifts of negative/positive inclinations to shallow/opposite direction inclinations. Cube samples from these depth intervals in Hole U1385G mostly yielded uncertain polarity (Figures F23, F28). In Hole U1385G, the top of the Olduvai Subchron appears to coincide with a sharp change in sediment color.
We placed the Matuyama/Gauss (M/G) boundary (2.595 Ma) at ~253, ~251.5, ~249.5, and ~253 m CSF-A in Holes U1385F, U1385G, U1385H, and U1385J, respectively. This interpretation is mainly based on the downhole inclination change from dominantly negative to positive values in these four holes at these depth levels. However, cube samples around this boundary in Hole U1385G yielded mostly uncertain polarities (Figures F23, F28).
6. Geochemistry
Geochemical analysis at Site U1385 involved collection and measurements of IW samples for salinity, alkalinity, pH, major ions (Na, K, Ca, Cl, and SO4), nutrients (NH4 and PO4) and trace elements (Sr, Li, Fe, Mn, B, and Ba); headspace gases for methane (CH4) concentrations; volatile hydrocarbons for routine drilling safety monitoring; and bulk sediment samples for total organic carbon (TOC), total inorganic carbon (TIC)/CaCO3, total nitrogen (TN), total sulfur (TS), bulk mineralogical abundance (using XRD), and elemental composition (by inductively coupled plasma–atomic emission spectrometry [ICP-AES]). In total, 59 IW samples were taken from Hole U1385G (see Geochemistry in the Expedition 397 methods chapter (Abrantes et al., 2024a). A 5 or 10 cm whole-round sample was taken at the base of every section for the upper 30 m, at the base of Sections 2 and 6 to 49 m CSF-A, and at the base of Section 6 (i.e., the second to last section recovered from every core) to the bottom of the hole.
IW alkalinity, NH4, and PO4 concentrations increase in the upper 50 m, whereas SO4 shows a two-step decrease in the upper 50 m, indicating organic matter respiration, with sulfate reaching zero and remaining low below 50 m CSF-A. In contrast, the CH4 concentrations increase to about 35,000 ppmv at 100 m CSF-A and remain high to 280 m CSF-A before gradually decreasing to the bottom of the hole.
CaCO3 content ranges 15.2–63.3 wt% (average = 38.8 wt%). This coulometer-determined CaCO3 content shows consistent results with stoichiometric CaCO3 calculated from the elemental Ca concentrations measured by ICP-AES, and it correlates positively with L* reflectance and negatively with NGR. TOC, TN, and TS contents at Site U1385 are generally low, ranging 0–0.97 wt% TOC (mean = 0.48 wt%), 0–0.11 wt% TN (mean = 0.005 wt%), and 0–0.49 wt% TS (mean = 0.115 wt%). Organic C/N ratios (0–482; mean = 20.2) suggest that organic matter is marine/lacustrine dominated with higher terrestrial input in the upper 75 m of the hole.
Elemental SiO2, K2O, MgO, Fe2O3, and TiO2 from bulk sediment content show strong positive correlations with Al2O3, indicating the dominance of terrigenous detritus. This is also observed for minor elements, including Zn, Cr, V, Sc, Y, and Zr. Meanwhile, Na2O shows weaker correlations with Al2O3 because of the widespread presence of authigenic and biogenic phases (i.e., pyrite, dolomite/Mg-calcite, halite). Bulk sediment elemental Ca concentration primarily represents biogenic CaCO3, and because of the incorporation of Sr into biogenic CaCO3, both elements show an inverse relationship with Al. Ba is weakly correlated with Al or Ca, likely due to the presence of barite (BaSO4). Mn seems to be mainly associated with CaCO3. Elemental ratios of Ca/Ti, Si/Al, Ti/Al, Zr/Al, K/Al, Sr/Ca, and estimated biogenic Ba are identified as potential proxies for provenance, weathering, and productivity.
6.1. Headspace hydrocarbon gases
Headspace samples were collected from the basal section of each core from Holes U1385F and U1385G. CH4 concentrations peak between 100 and 250 m CSF-A at around 35,000 ppmv (Figure F30). Ethane (C2H6) is detectable between 95 and 376 m CSF-A, but C1/C2 (i.e., CH4/C2H6) ratios remain high (12,800–49,000), indicating that there is no danger to drilling (Table T19).
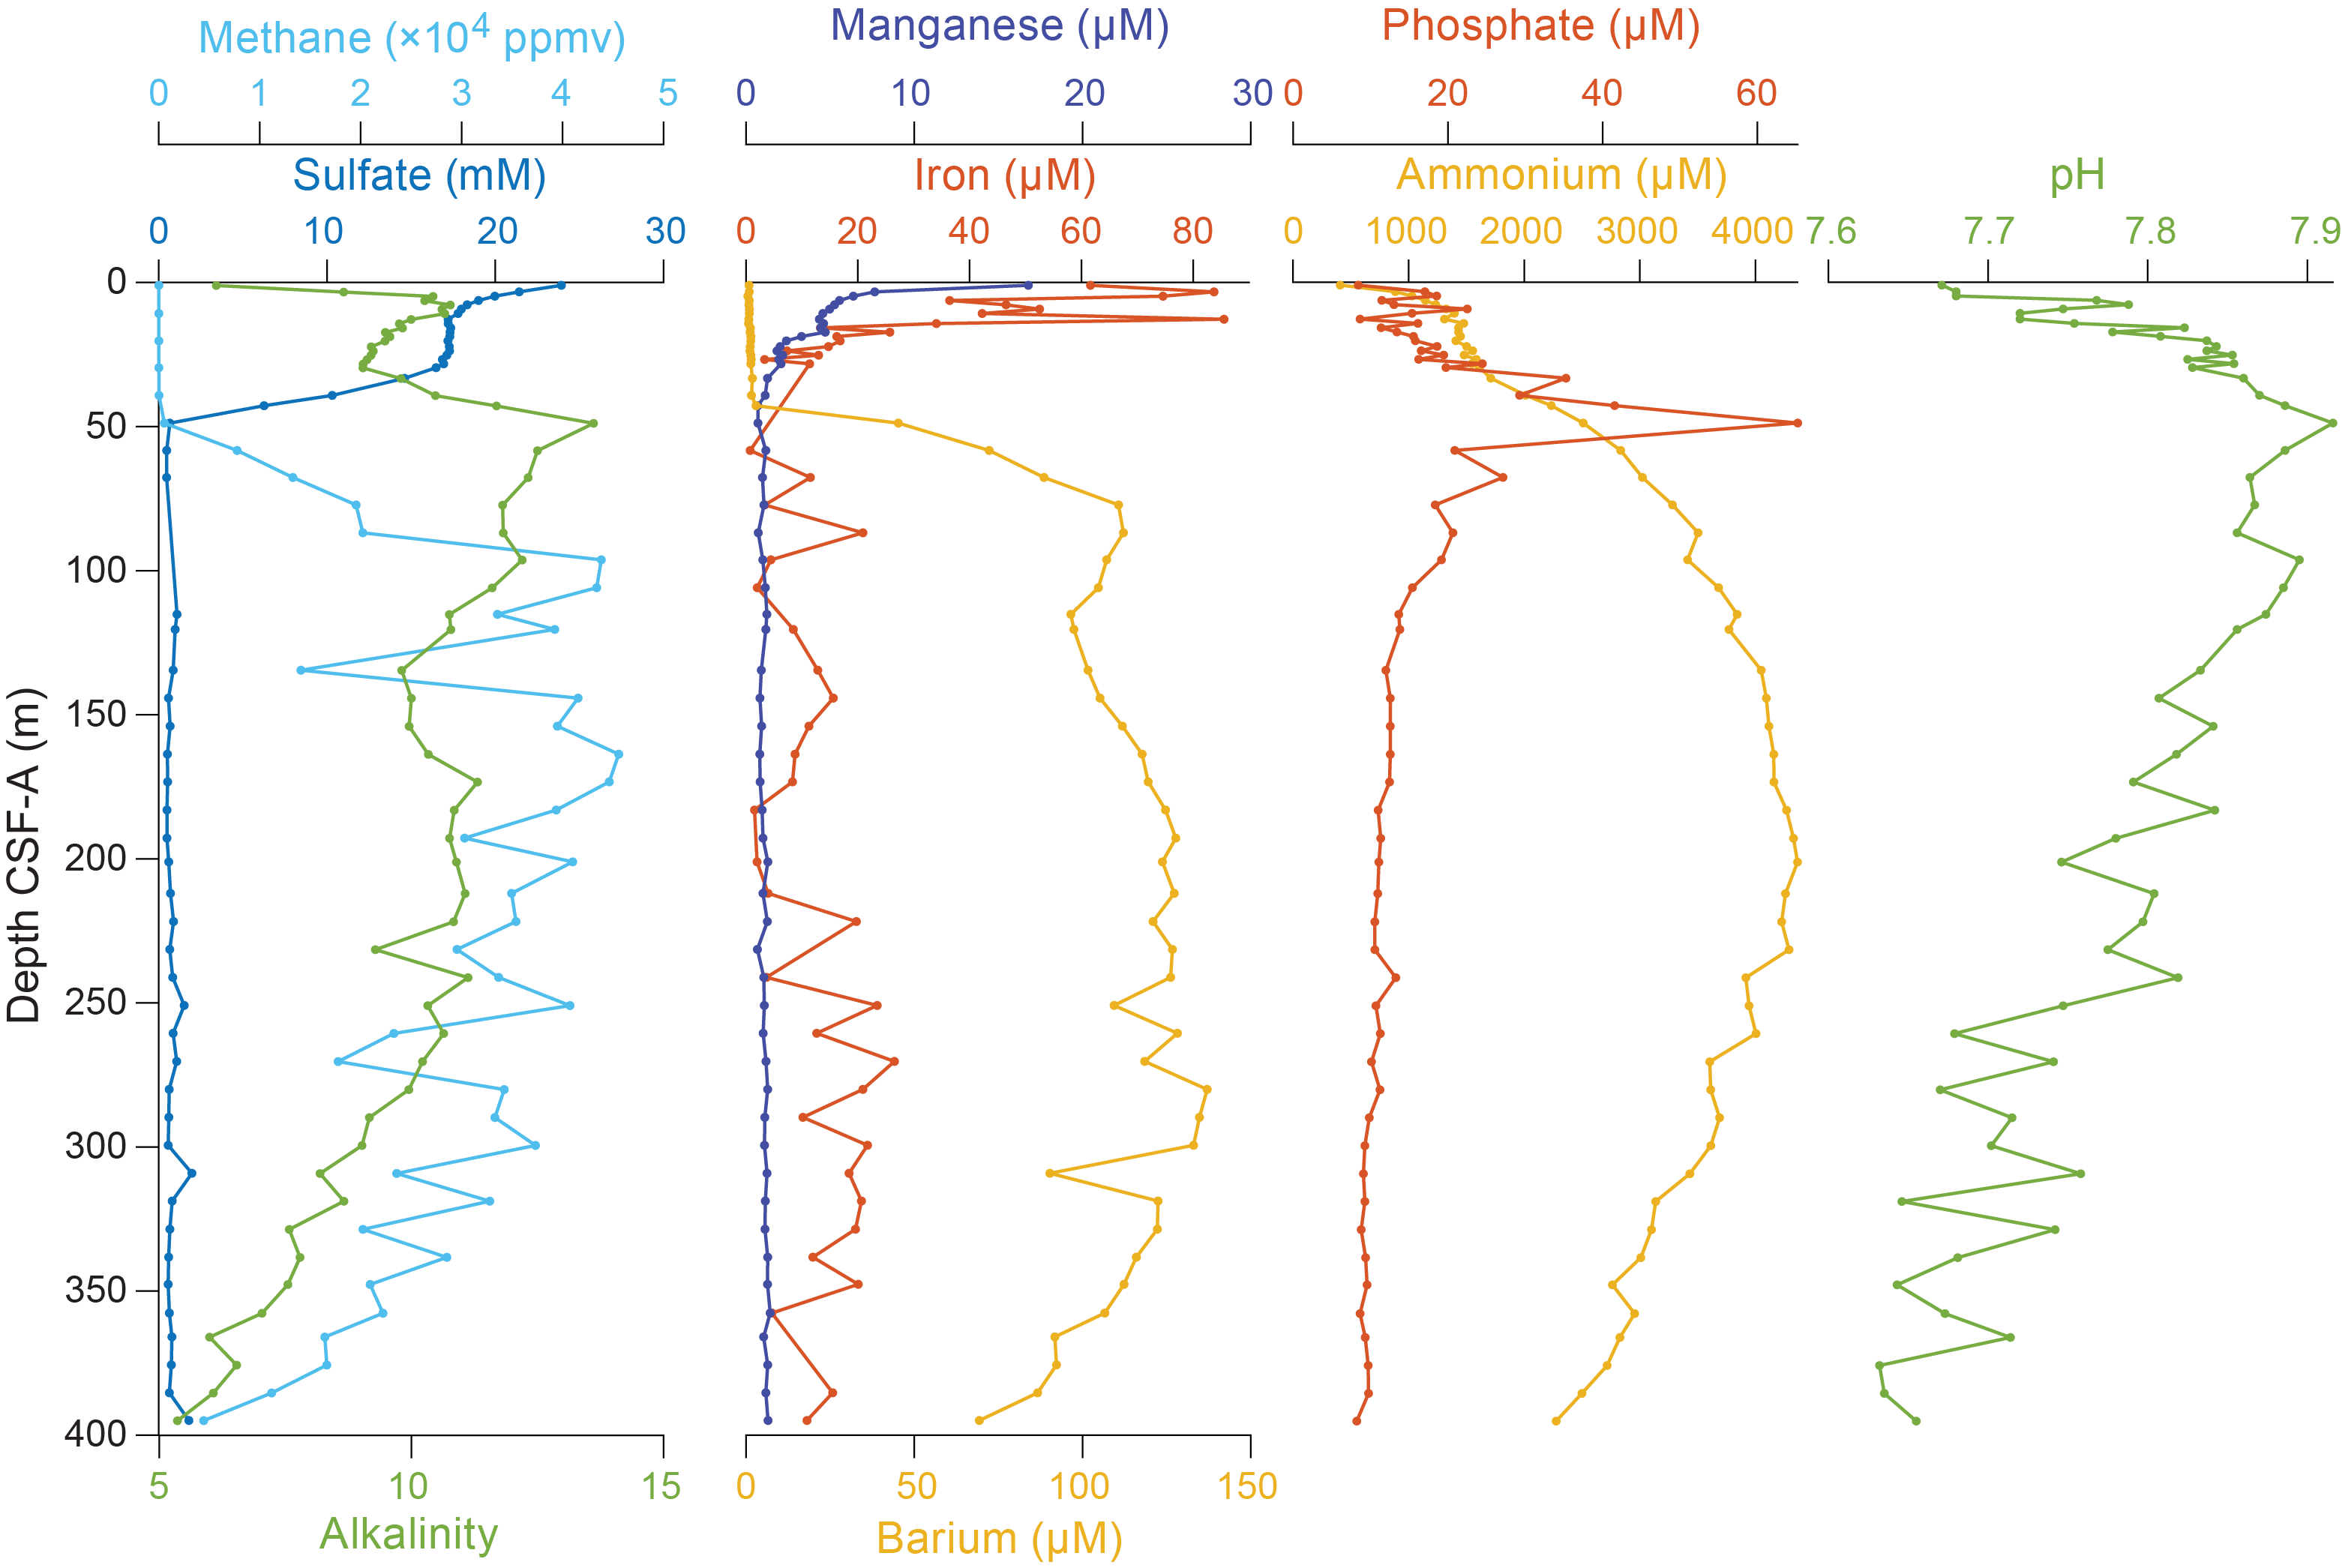
Figure F30. Dissolved SO4, alkalinity, headspace CH4, Fe, Mn, and Ba and NH4, PO4, and pH.
6.2. Interstitial water geochemistry
Shortly after extracting IW, aliquots of the recovered water were set aside for salinity, chlorinity, alkalinity, and pH measurements. In addition, the major and minor elemental compositions were measured by ion chromatography (IC) and ICP-AES, and NH4 and PO4 were measured by spectrophotometry (Table T20). Some of the significant trends are highlighted below. IW data measured during this expedition are plotted with those that were measured during the initial occupation of Site U1385 during Expedition 339 (see Geochemistry in Expedition 339 Scientists [2013]). Overall, the data from Site U1385 during Expeditions 339 and 397 overlap and are in good agreement with each other.
6.2.1. Salinity, sodium, potassium, chloride
Salinity, Na, and Cl concentrations are relatively constant in Hole U1385G at values close to seawater (Figure F31). Na measured by IC has a mean value of 479.6 ± 1.8 (± 1σ) mM and is slightly offset toward lower values than data measured by ICP-AES (502.6 ± 8.9 mM). Cl measured by IC has a mean value of 559.1 ± 3.2 mM, which is nearly identical to values measured by AgNO3 titration (561.6 ± 5.6 mM). K declines downhole from near 11.5 mM at the top of the hole to about 7 mM at the bottom.
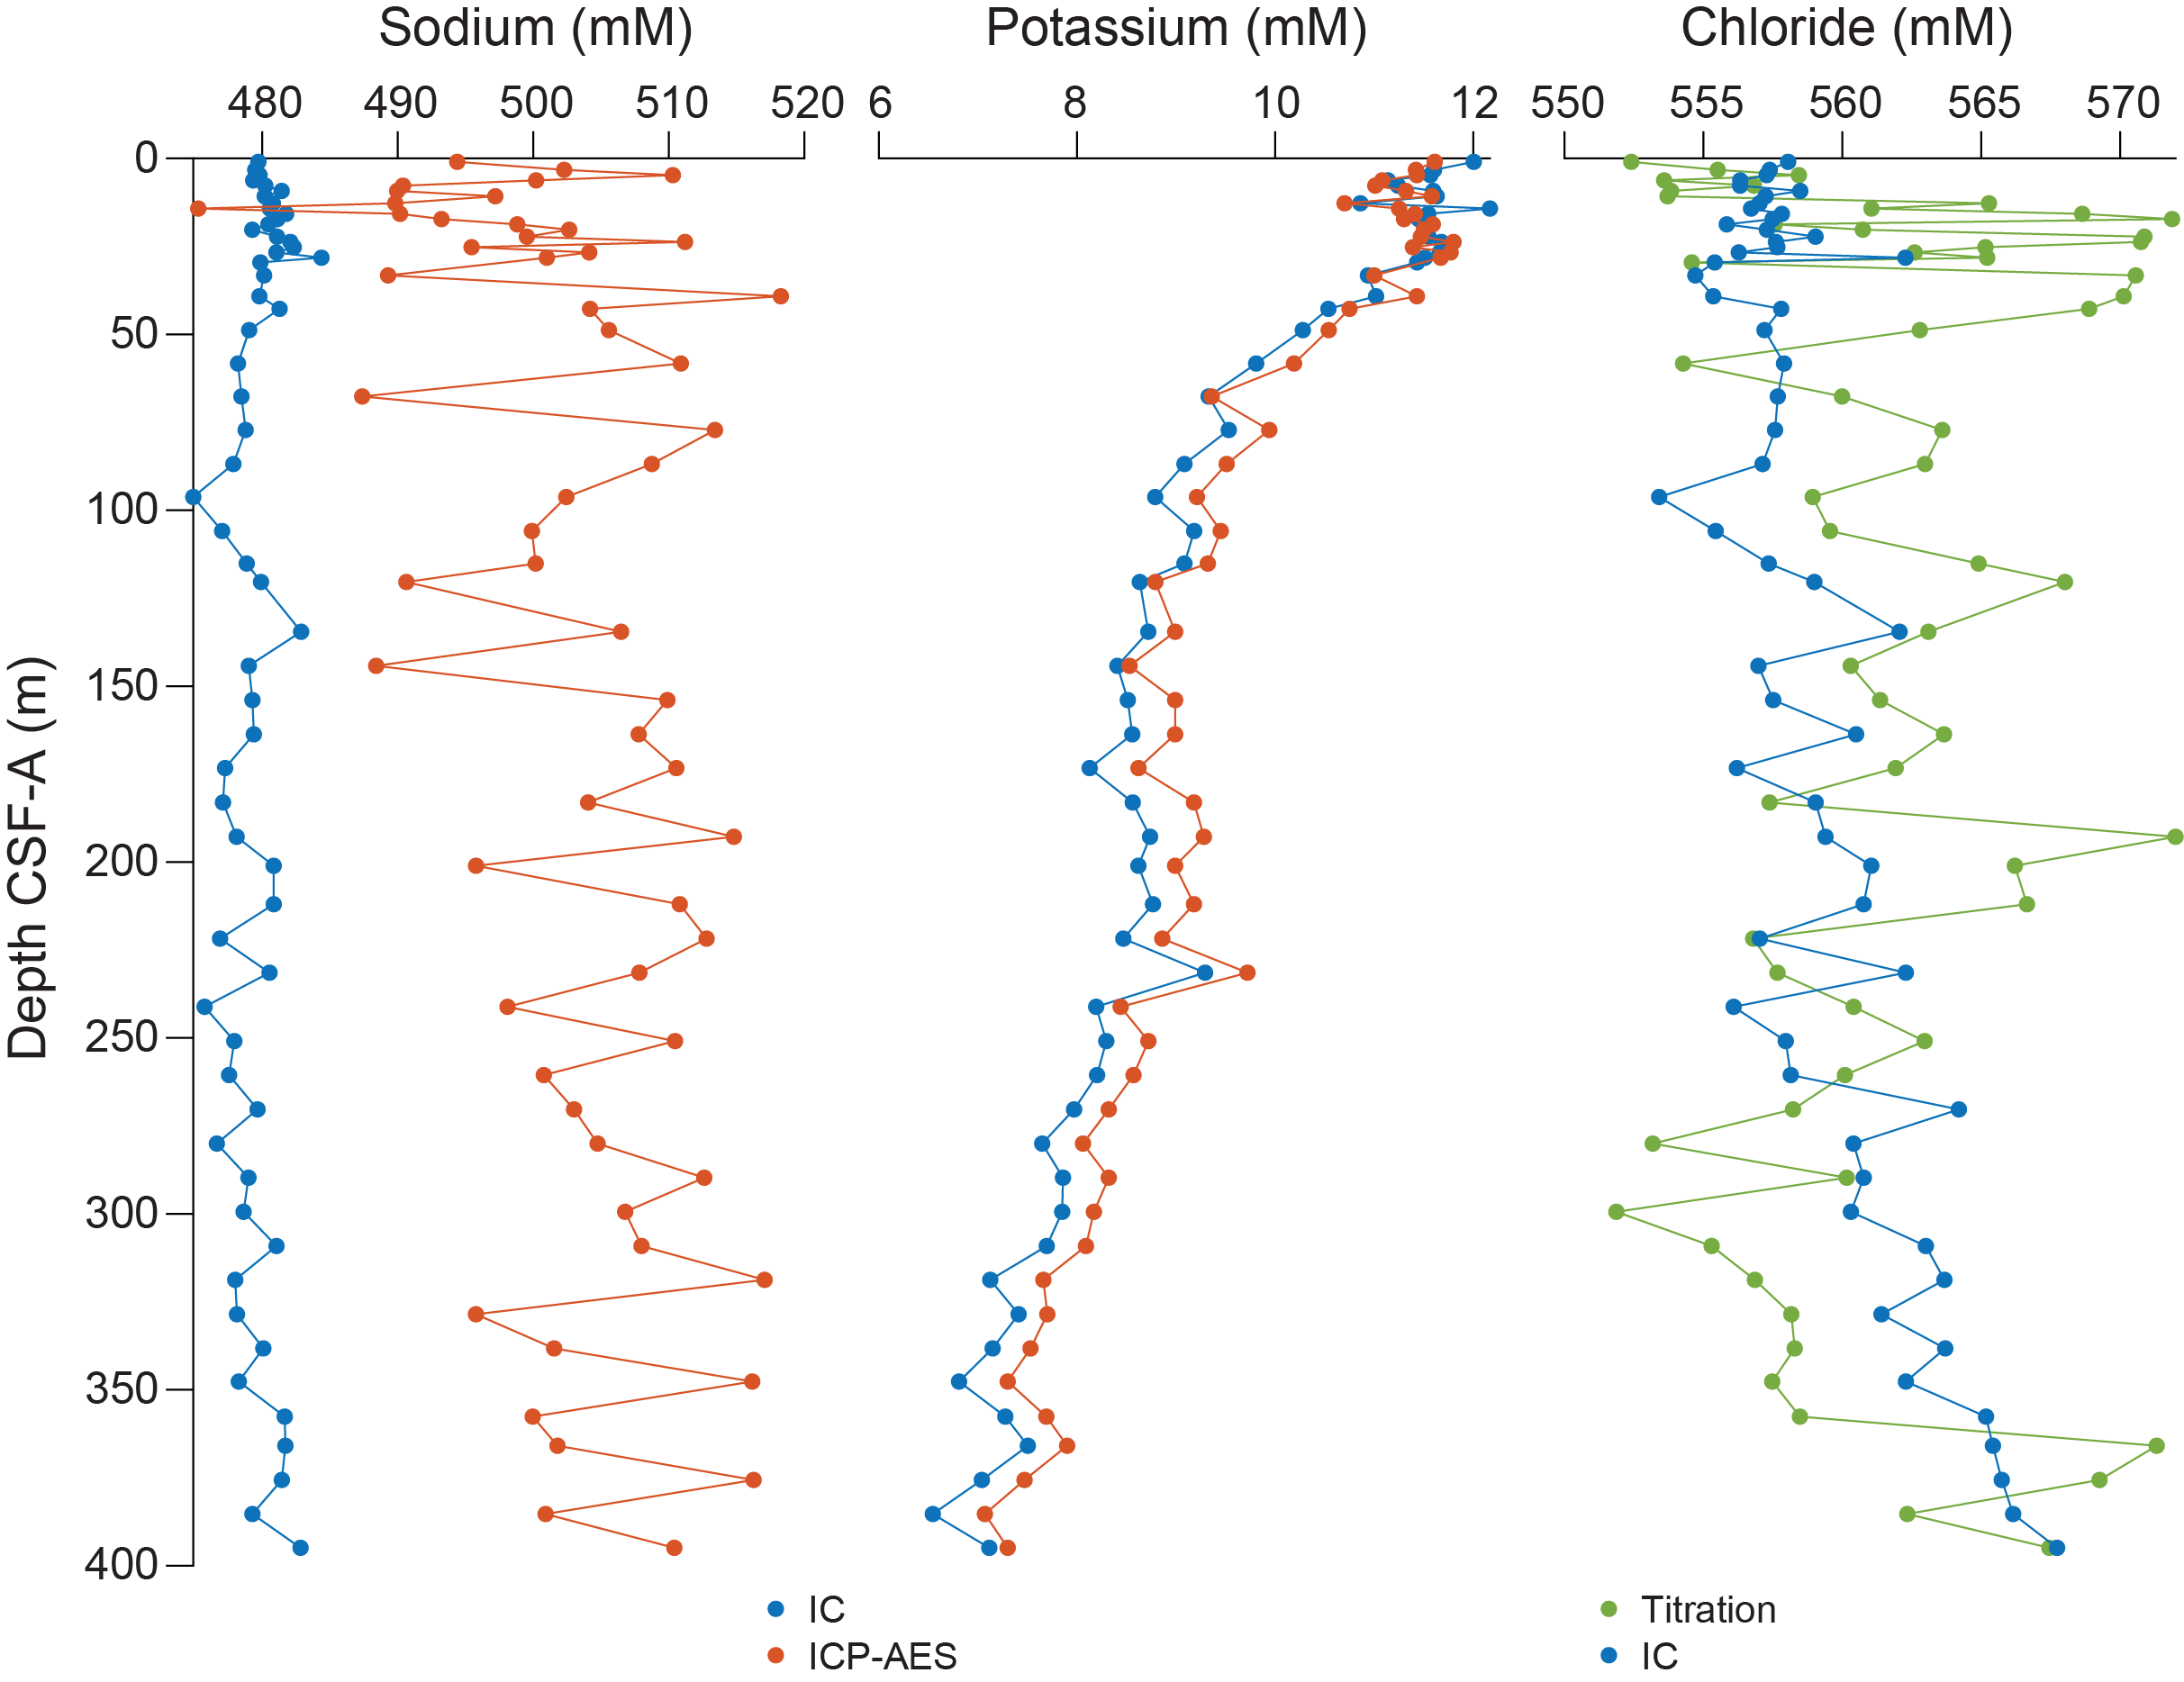
Figure F31. Dissolved Na, K, and Cl.
6.2.2. Alkalinity, pH, ammonium, phosphate
Alkalinity, pH, NH4, and PO4 concentrations increase rapidly from the top of the hole (Figure F30). Alkalinity increases rapidly from 6.1 mM at the top of the hole to 10.7 mM at 7.7 m CSF-A, declines slightly, and then increases sharply again to 13.6 mM at 48.4 m CSF-A. Below this peak, alkalinity declines slightly and plateaus around 11 mM at ~150–250 m CSF-A before declining to the bottom of the hole, reaching 5.4 mM in the lowermost sample (397-U1385G-42X-5, 133–143 cm). pH values increase from 7.67 in the uppermost sample to a maximum of 7.92 at 48.8 m CSF-A and then decrease with some scatter to about 7.6 at the bottom of the hole. NH4 is 408 µM in the uppermost sample, increases to a broad maximum of ~4200 μM at 134.5–260.6 m CSF-A, and decreases to 2276 μM in the lowermost sample at 395 m CSF-A. PO4 is 8.4 µM in the uppermost sample and peaks shallower than NH4, with a maximum value of 65.2 µM at 48.8 m CSF-A. Below ~100 m CSF-A, PO4 values are relatively constant at 10.7 ± 1.6 µM.
The increases in alkalinity, NH4, and PO4 concentrations in the upper part of Hole U1385G are the result of organic matter respiration, which, assuming a generic composition of (CH2O)106(NH3)16(H2PO4), produces alkalinity (in the form of HCO3−), PO4, and NH4.
6.2.3. Sulfate, iron, manganese, barium
SO4 concentrations are near seawater values (23.9 mM) in the uppermost sample (397-U1385G-1H-1, 97–102 cm) and then decrease rapidly in two stages: they first decline to ~17 mM by 12.8 m CSF-A, remain roughly constant to 28.2 m CSF-A, and then decrease to zero by 48.8 m CSF-A (Figure F30). At this depth, CH4 increases, reaching maximum values of ~35,000 between 100 and 280 m CSF-A. Ba concentrations are near zero to 48.8 m CSF-A, the depth at which SO4 reaches zero, and then increase rapidly to ~110 µM. Ba concentrations vary somewhat but remain >50 µM to the bottom of the hole. Fe and Mn concentrations decrease in the uppermost ~30 m. Mn concentrations decrease faster than Fe, likely reflecting the more favorable reduction of Mn oxides over Fe oxides under anoxic pore water conditions.
These patterns, combined with the observed increase in alkalinity in the upper part of the sediment column, indicate intense SO4 reduction and methanogenesis. The two-stage decrease in SO4 matches observations from the previous occupation of Site U1385 during Expedition 339 (Expedition 339 Scientists, 2013). The first (shallower) decrease in SO4 has been linked to organoclastic SO4 reduction, whereas the second (deeper) decline is attributed to anaerobic oxidation of CH4 (Turchyn et al., 2016). The increase in Ba coincident with SO4 concentrations reaching zero indicates BaSO4 dissolution associated with intense SO4 reduction. Peaks in redox-sensitive elements such as Fe and Mn indicate microbially mediated respiration reactions within the sediment.
6.2.4. Calcium, magnesium, strontium
Ca concentrations in IW decrease in two steps in the upper 49 m from 9.2 mM in the uppermost sample (397-U1385G-1H-1, 97–102 cm) to 2.6 mM at 48.8 m CSF-A and then increase to 9.5 mM at the bottom of the hole (Figure F32). The first decline in Ca corresponds to the initial decrease in SO4, and the second decline in Ca corresponds to the point at which SO4 decreases to zero. Mg declines slightly from 51.8 mM in the uppermost sample to 48.5 mM at 12.8 m CSF-A and then decreases sharply to 39.6 mM at 48.8 m CSF-A, coincident with the second decline in SO4. Below 50 m CSF-A, Mg concentrations are roughly constant at around 35 mM. Sr is roughly constant at ~80 µM from the top of the hole to ~50 m CSF-A and then increases to 515 µM at the bottom of the hole. The decreases in Ca and Mg in the upper 50 m could result from authigenic CaCO3 precipitation, driven by high pore water alkalinity associated with SO4 reduction.
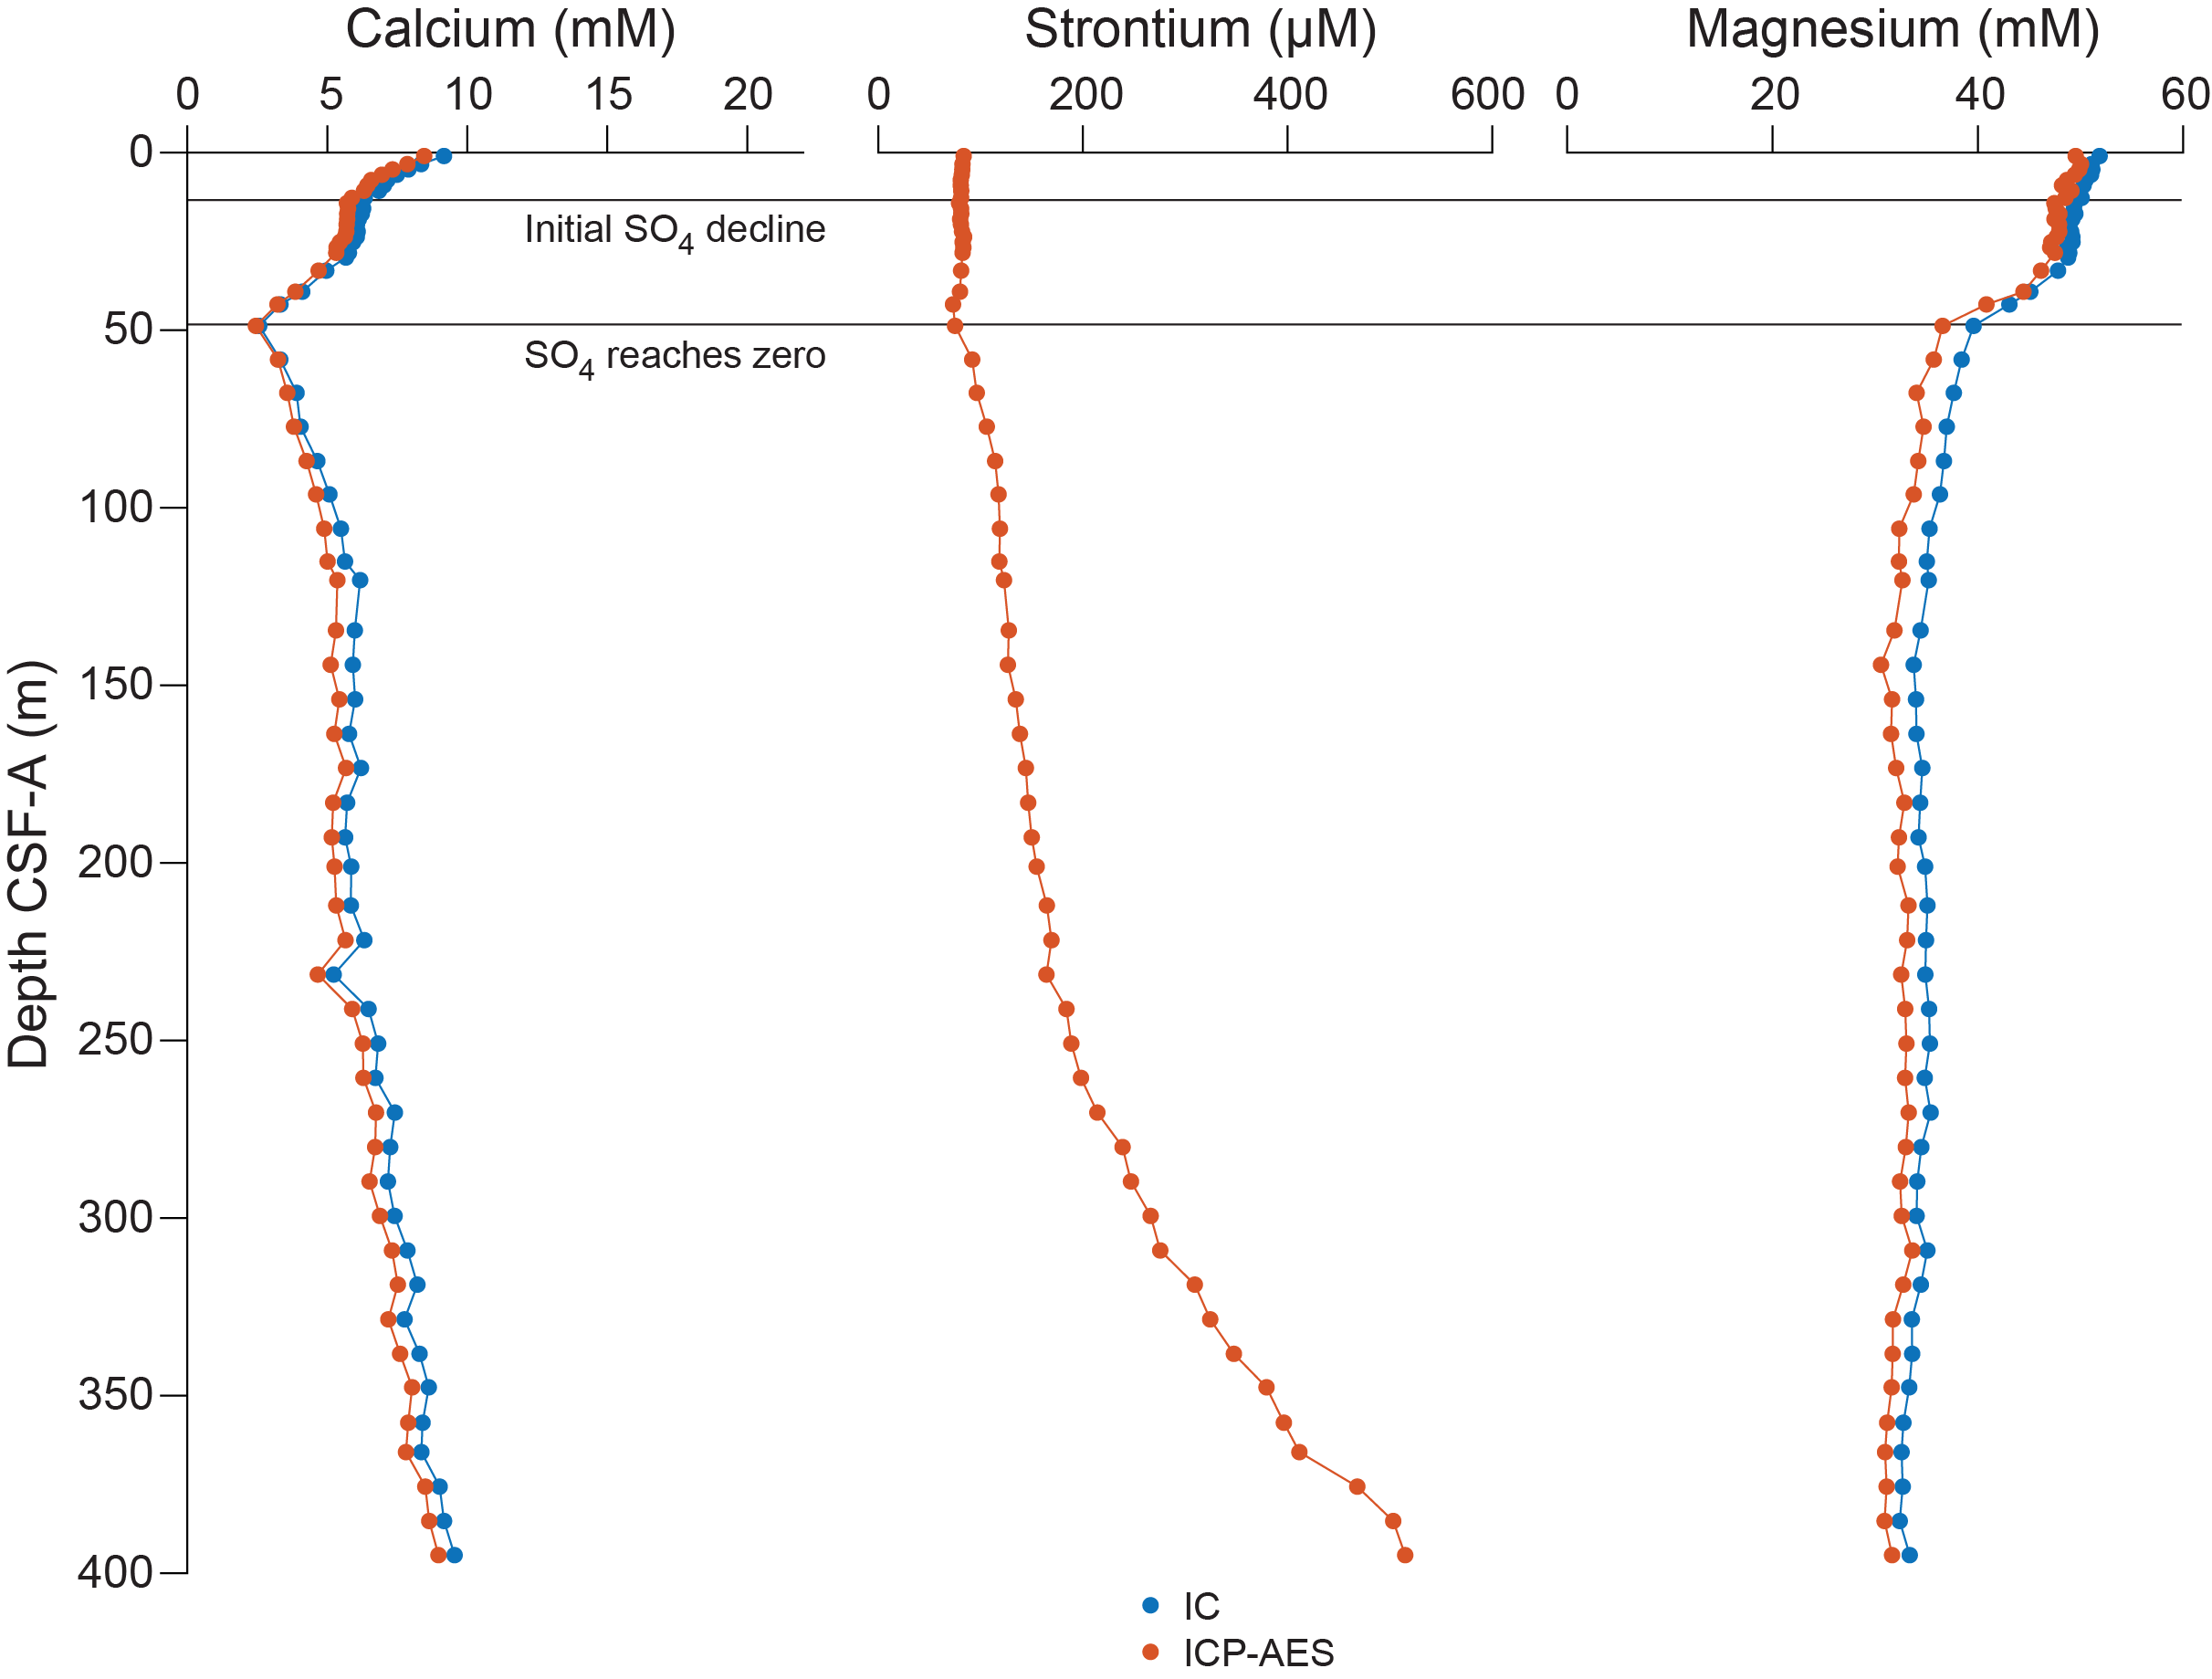
Figure F32. Dissolved Ca, Mg, and Sr.
6.2.5. Silicon, lithium, boron
Si concentrations vary downhole, with a minimum value of 192.4 µM in the uppermost sample and a maximum of 538 µM at 105.9 m CSF-A (Figure F33). Li concentrations are relatively constant in the uppermost 50 m of the hole at ~24 µM, increase to a maximum of 85 µM at 280 m CSF-A, and then decrease slightly to 75 µM at the bottom of the hole. B concentrations are high at the top of the hole with values around 550 µM, decline to a minimum of 261 µM at 231 m CSF-A, and then increase toward the bottom of the hole.
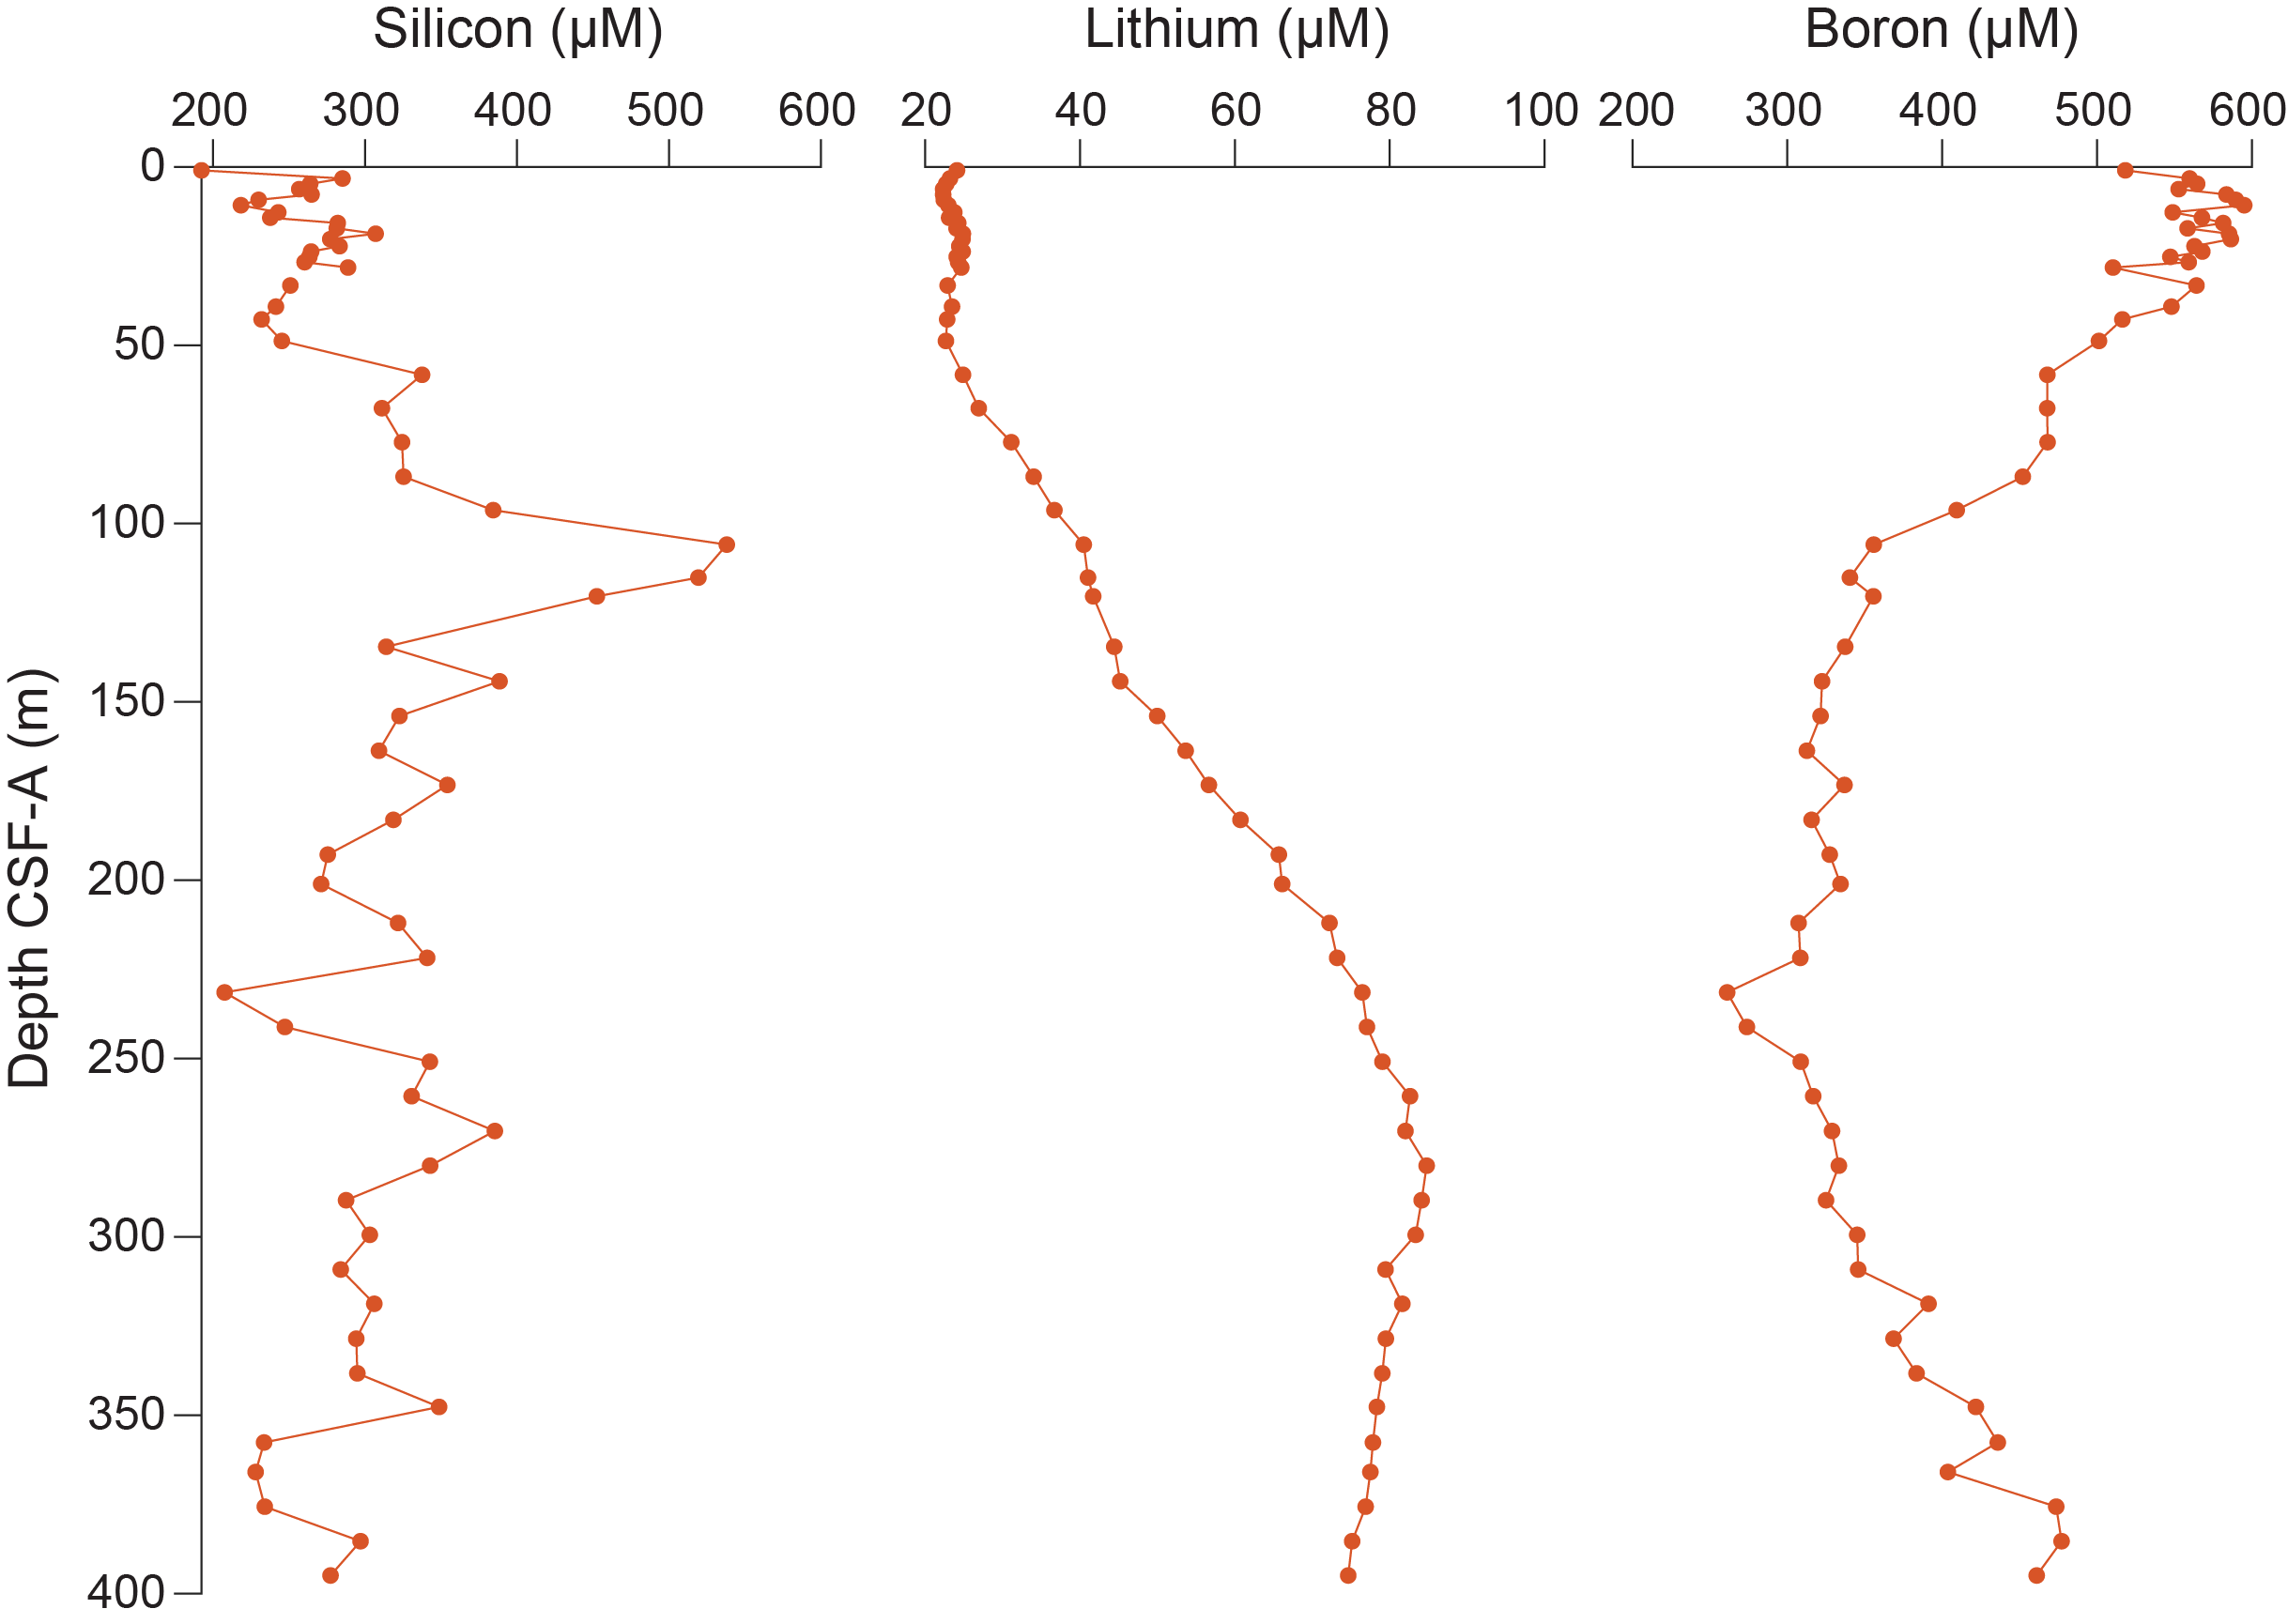
Figure F33. Dissolved Si, Li, and B.
6.3. Bulk sediment geochemistry
6.3.1. Calcium carbonate (total inorganic carbon)
In Hole U1385G, TIC and TC/TN/TS were measured in samples taken from the working half of split core sections at a resolution of 2 per core (Table T21). We targeted light and dark intervals to improve correlations with other physical properties. A 100% CaCO3 standard was analyzed every ~10 samples (mean = 99.98 ± 1.09 wt%; n = 11) (Table T22). Samples were not measured until the standard was within ~1.5% of 100 wt%.
The mean CaCO3 from Site U1385 is 38.8 wt% (range = 15.3–63.3 wt%), but variability is high (±1σ = 11.3 wt%). CaCO3 is relatively constant in the uppermost ~200 m (mean = 33.3 ± 8.35 wt%), and then increases below ~250 m CSF-A (Figures F34, F35; Table T23). CaCO3 correlates positively with L* reflectance (adjusted R2 = 0.474) and negatively with NGR (adjusted R2 = 0.615) (Figures F35, F36; see Figures F27, F28, F29, and F31 in the Site U1587 chapter [Hodell et al., 2024]). The uppermost ~25 m shows more scatter in the crossplot with NGR; below this depth the regression is slightly strengthened (adjusted R2 = 0.721) (Figure F37). Using the measured elemental Ca concentrations from the ICP-AES data, stoichiometric CaCO3 was calculated to compare with the shipboard-measured total carbonate weight percent by coulometer (Figures F34, F35). Although the absolute numbers are not the same, the data show a similar overall trend. Coulometer CaCO3 values and trends from Holes U1385A and U1385B correspond closely to data from the uppermost 150 m of Hole U1385G (Figure F38).
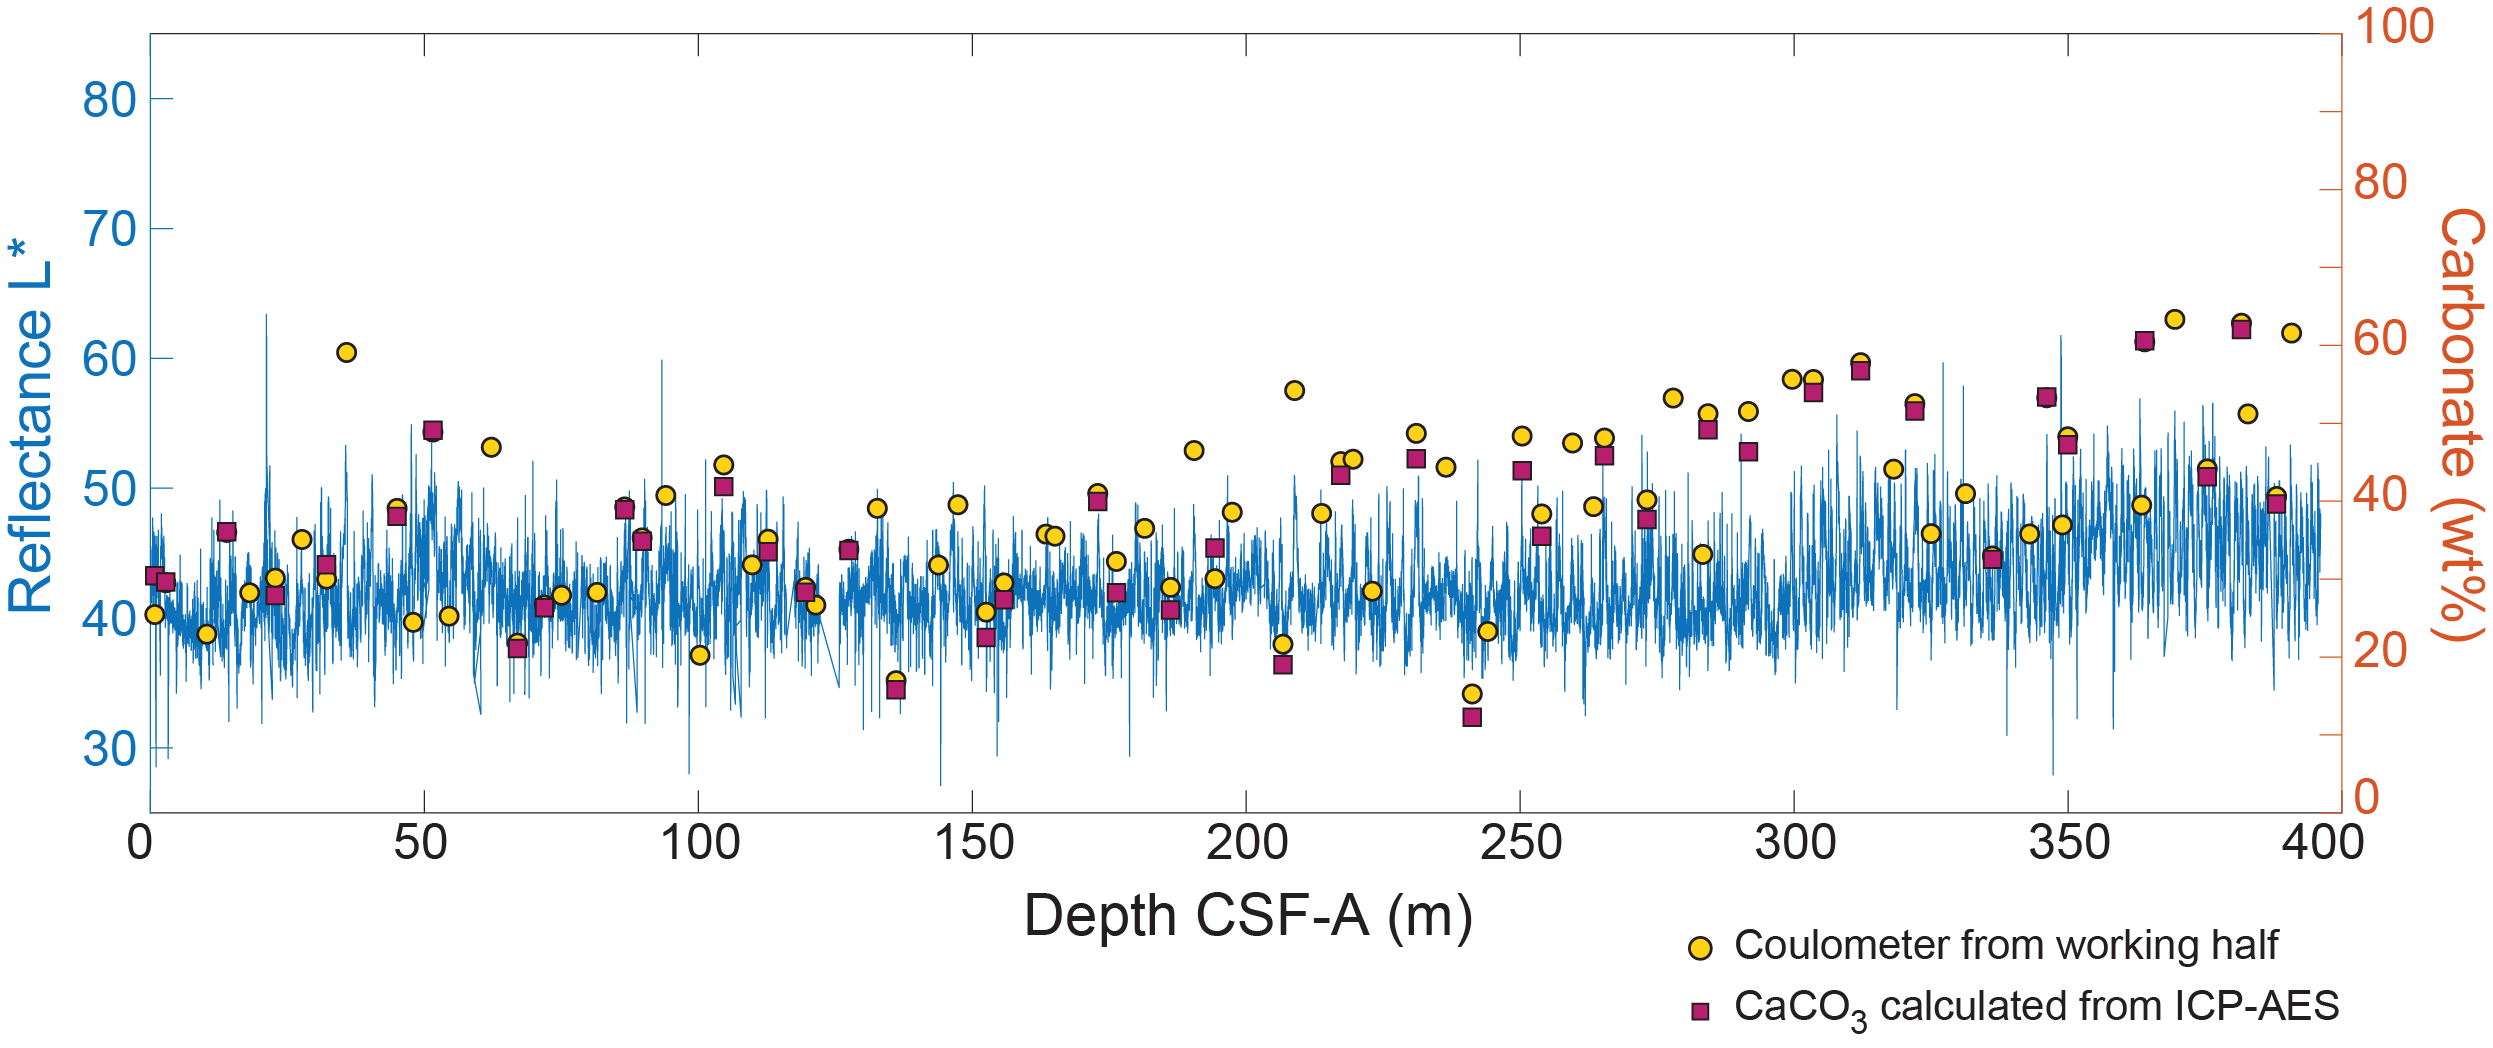
Figure F34. CaCO3 with L*.
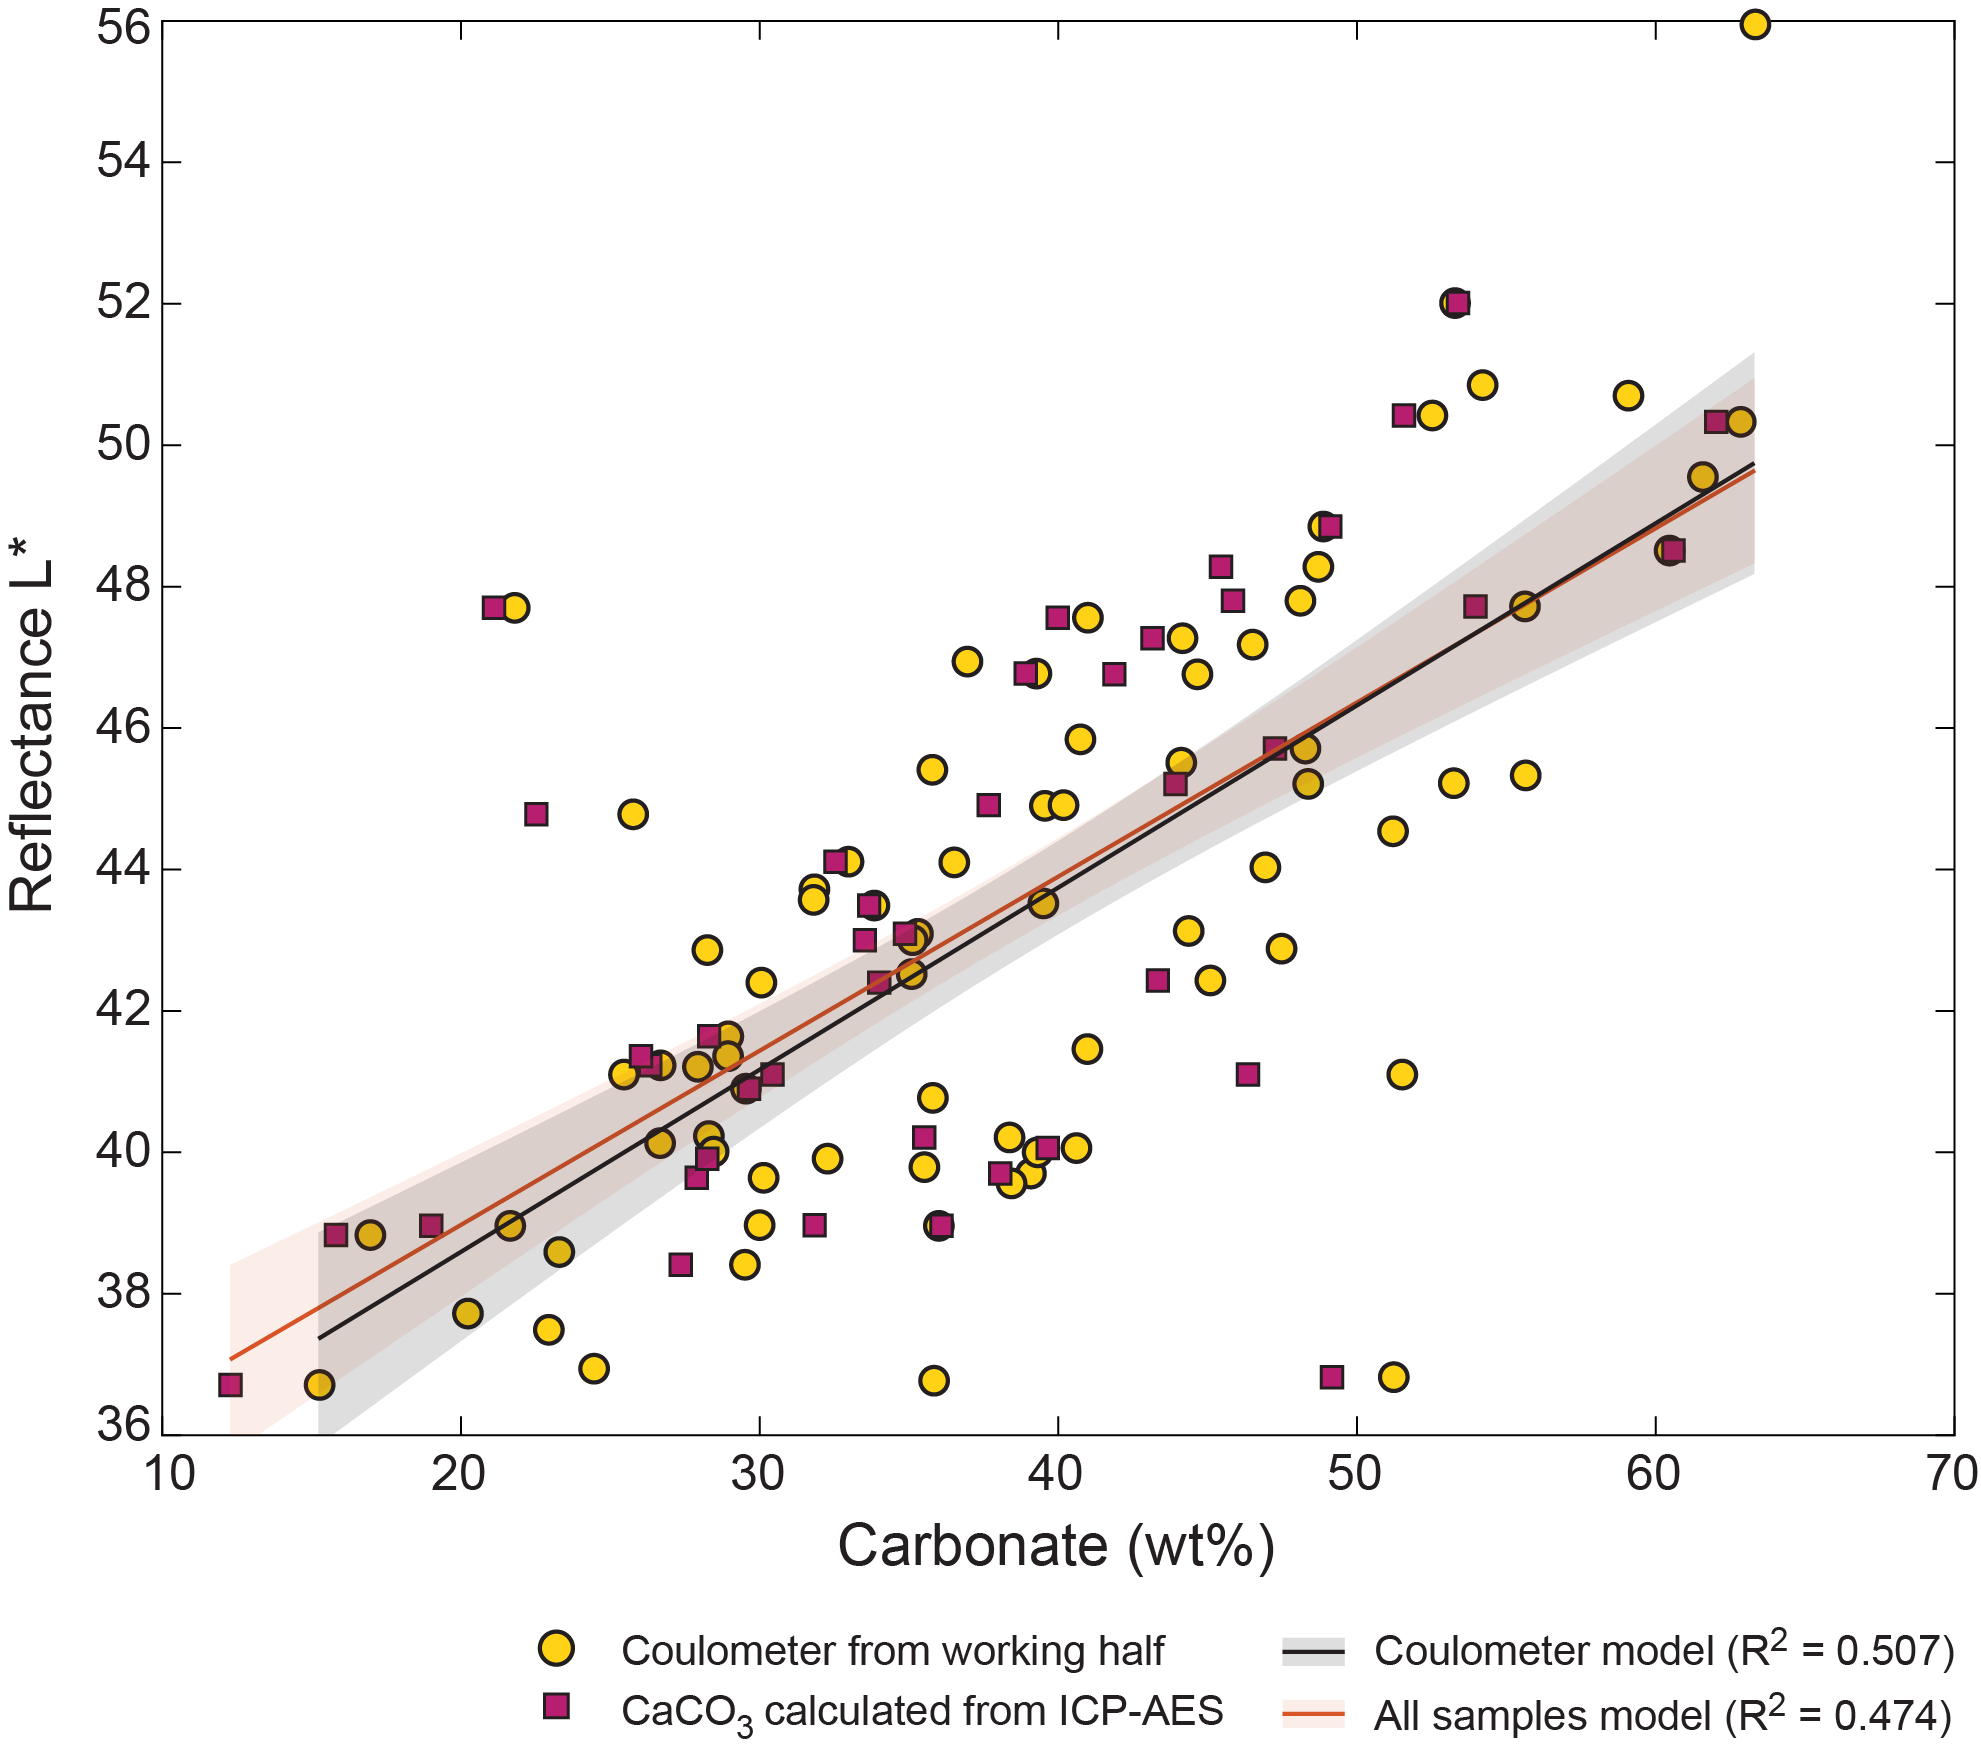
Figure F35. Cross-plot and linear regression of CaCO3 and L*.
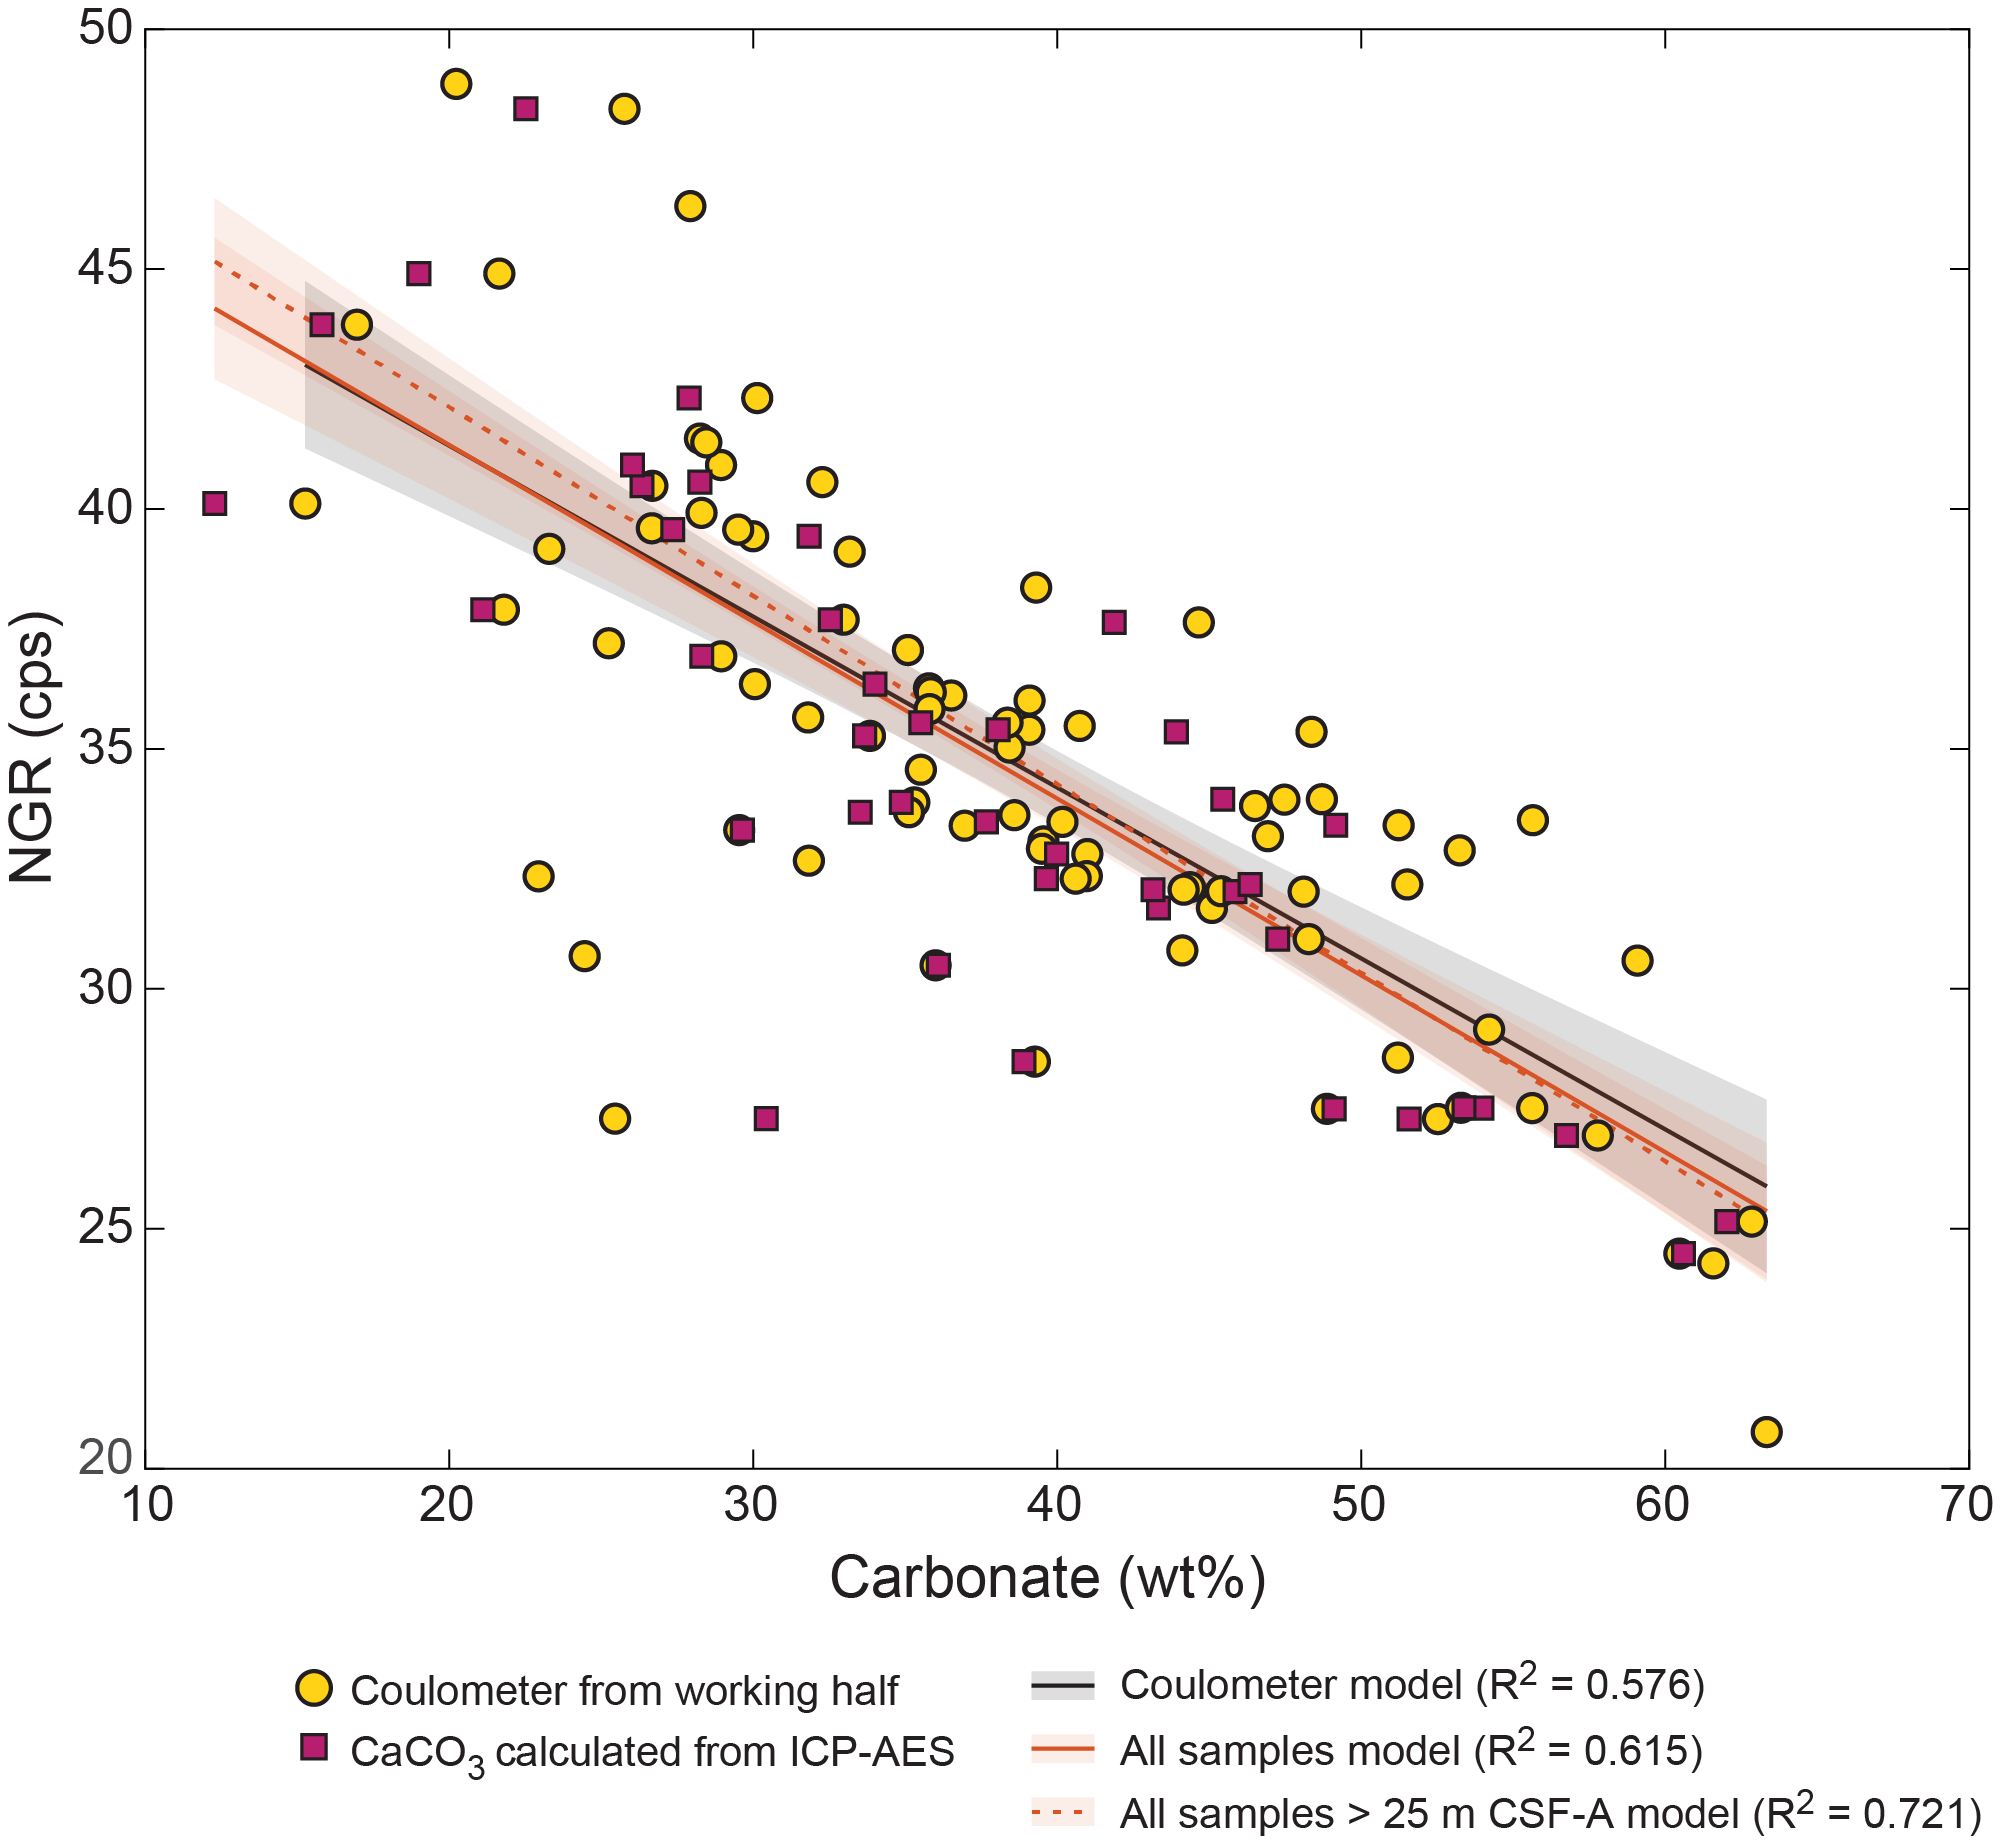
Figure F36. Cross-plot and linear regression of CaCO3 and NGR.
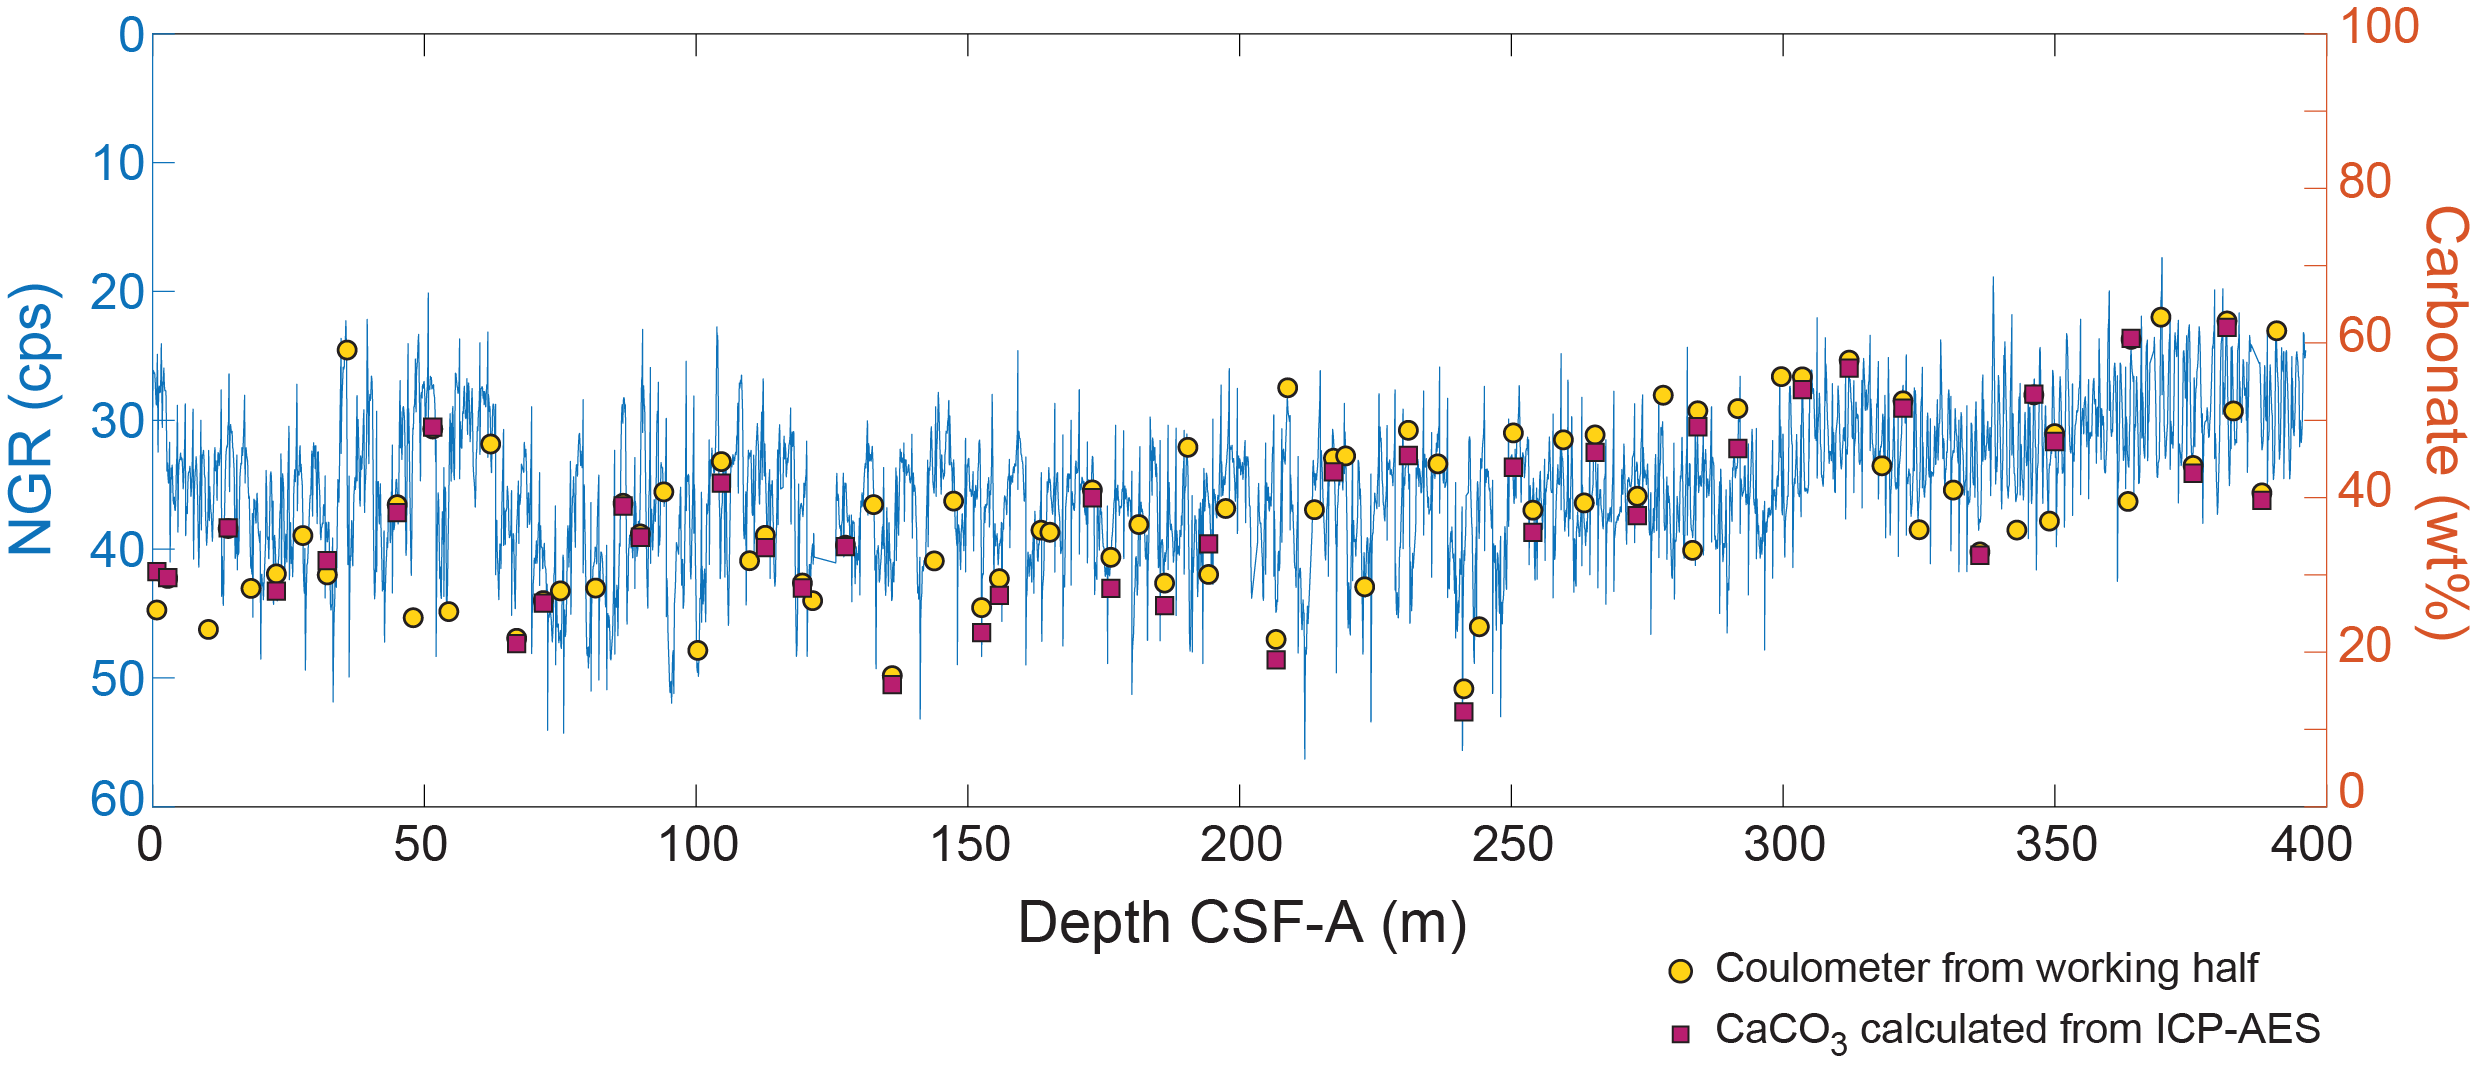
Figure F37. CaCO3 with NGR.
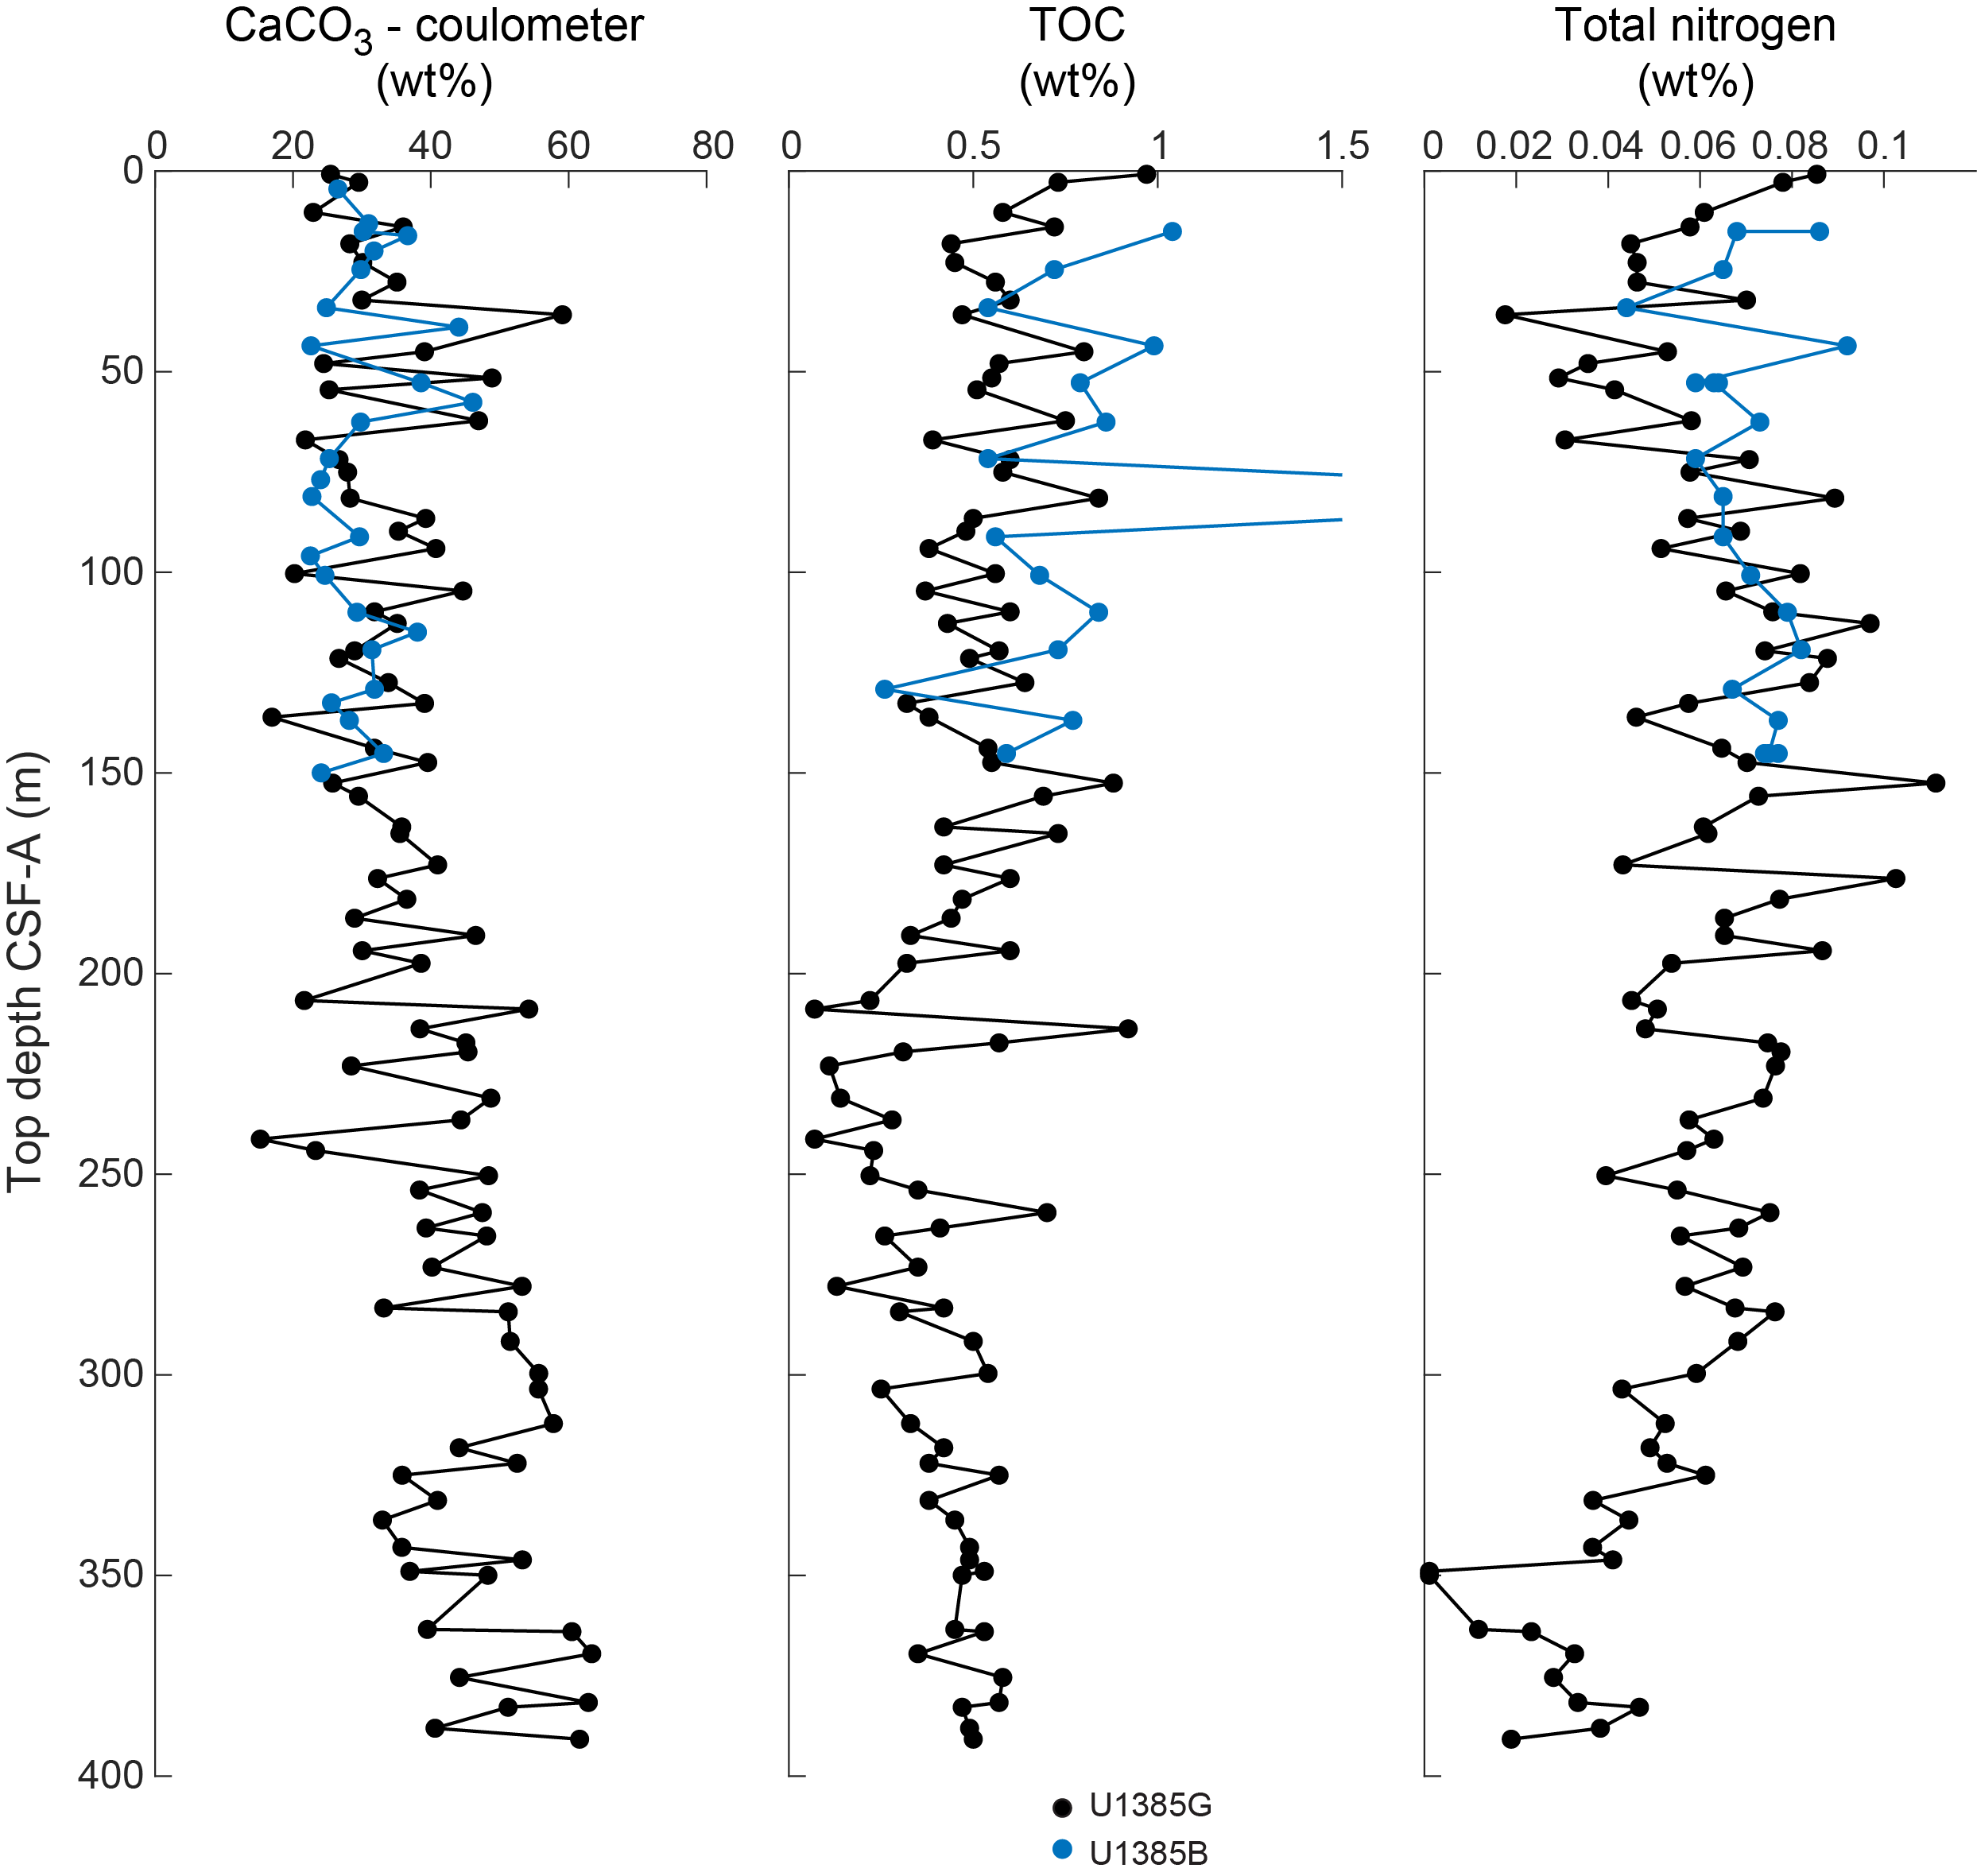
Figure F38. CaCO3, TOC, and TN.
6.3.2. Total organic carbon
All samples were simultaneously analyzed for TC alongside TIC, TN, and TS (Figure F39). TOC is defined as the difference between TC and TIC. Two internal standards (sulfanilamide and Buffalo River Sediment [BRS]) were used to calibrate the elemental analyzer. BRS was used to assess the reproducibility of TC, TN, and TS and was run at least every ~10 samples; the 1σ of TC in NIST BRS (n = 14) is 0.052 wt% (Table T24). TOC content in Hole U1385G is generally low (mean = 0.48 ± 0.18 wt%; range = 0.07–0.97 wt%). TOC declines from 0.59 ± 0.16 wt% in the upper 100 m to 0.29 ± 0.25 wt% between 200 and 250 m CSF-A and then recovers to 0.49 ± 0.07 wt% in the lowermost 25 m (Figure F39; Table T25). CaCO3 and TOC are not strongly correlated (R2 = 0.04). TOC values and trends from Holes U1385A and U1385B correspond closely to data from the uppermost 150 m of Hole U1385G (Figure F38).
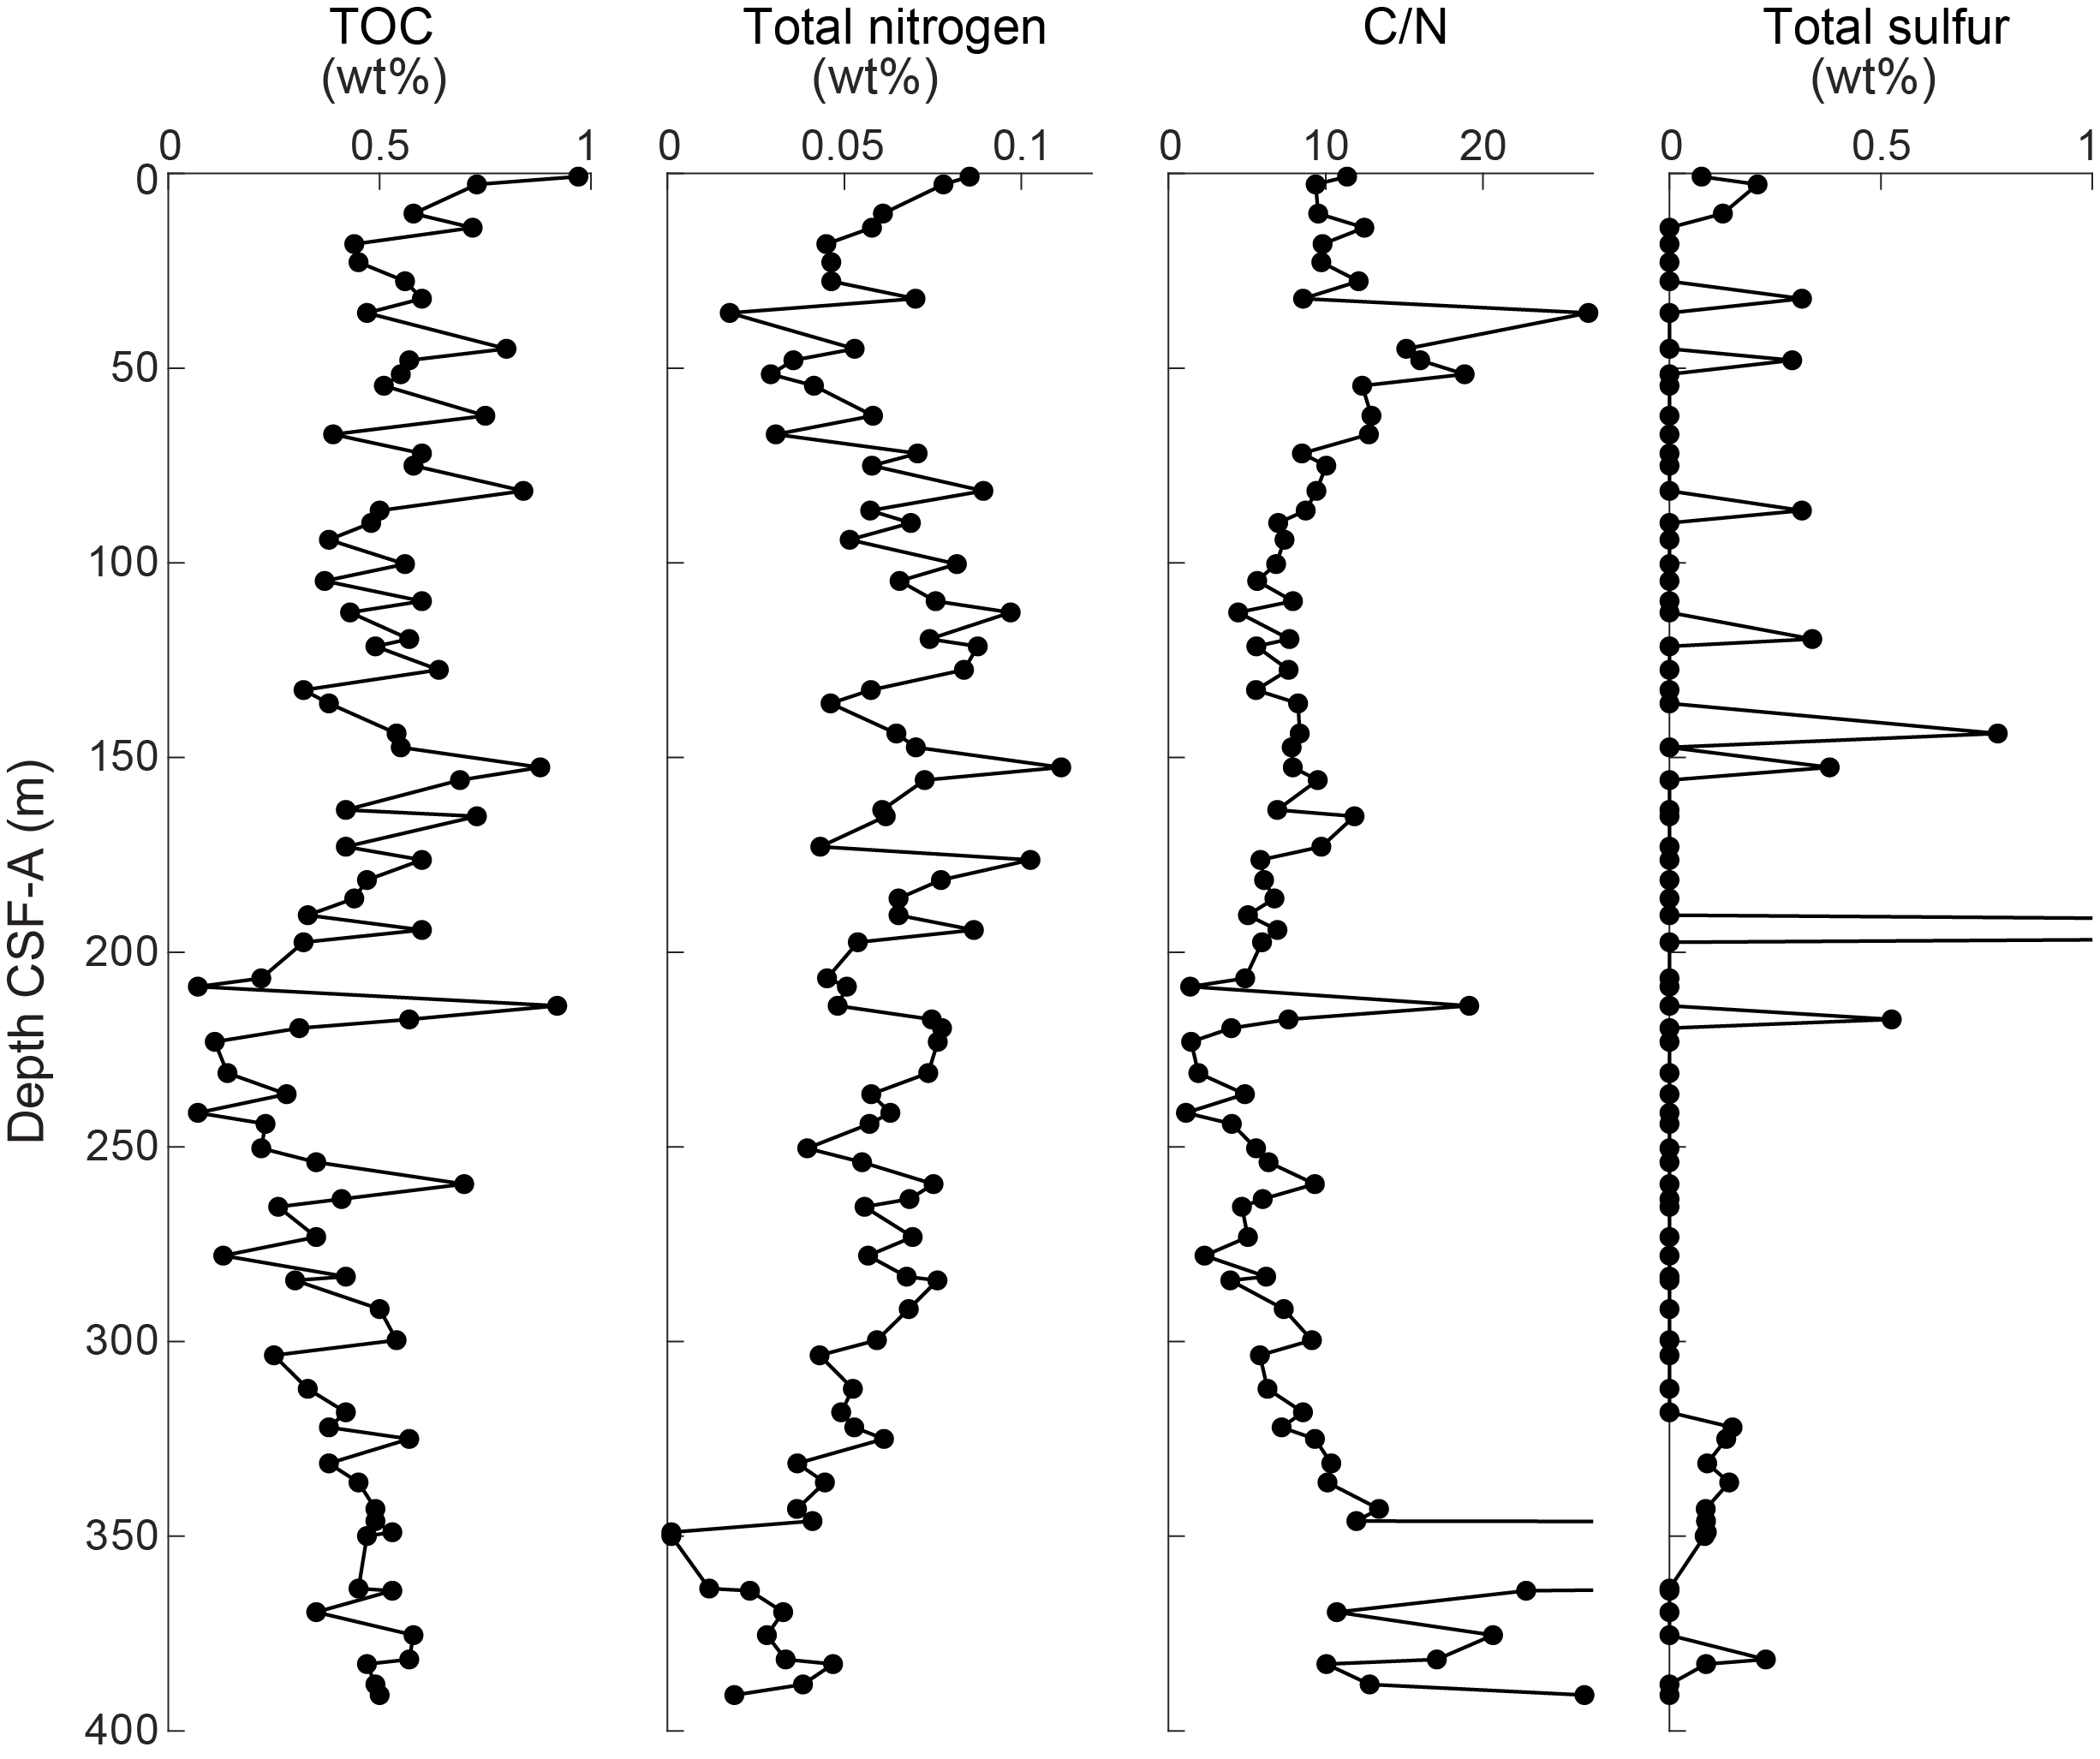
Figure F39. Sedimentary TOC, Tn, C/N, and TS.
6.3.3. Total nitrogen
All sedimentary nitrogen is assumed to be organic. The 1σ of TN in NIST BRS (n = 14) is 0.012 wt% (Table T24). TN contents in Hole U1385G are also very low (mean = 0.057 ± 0.021 wt%; range = 0.001–0.111 wt%) (Table T26). TN increases from 0.052 ± 0.018 wt% in the upper 75 m to 0.070 ± 0.019 wt% between 125 and 200 m CSF-A then declines to 0.024 ± 0.015 wt% in the lowermost 350–390 m CSF-A (Figure F39). TN values and trends from Holes U1385A and U1385B correspond closely to data from the uppermost 150 m of Hole U1385G (Figure F38).
6.3.4. Organic C/N ratios
The ratio of sedimentary TOC/TN (C/N) can fingerprint particulate organic matter: marine and lacustrine algae have ratios 0–10, whereas terrestrial plants exist in a much broader C/N space (25–75) (Meyers, 1994, 1997). The mean C/N is 20.2 ± 69.1 (range = 1.11–482) (Table T27). C/N trends mirror TOC (see Total organic carbon; Figure F39), indicating that C/N is generally driven by TOC, although two anomalously large C/N values result from very low TN rather than high TOC. C/N values are largely diagnostic of marine/lacustrine algal sources with higher terrestrial inputs in the uppermost 75 m and lowermost 50 m.
6.3.5. Total sulfur
The 1σ of TS in NIST BRS (n = 14) is 0.080 wt% (Table T24). Similar to TOC and TN, TS content is very low (mean = 0.115 ± 0.558 wt%; range = 0–4.994 wt%); TS levels were below the instrument's detection limit for the majority of the samples from Hole U1385G (Table T28). Excluding an anomalously high TS sample (4.994 wt%) at 92 m CSF-A, the range is 0–0.777 wt% (mean = 0.055 ± 0.131 wt%). TS was highest in the upper 218 m of the hole (0.177 ± 0.736 wt%); below this, only 10 samples had detectable amounts (Figure F39). The spikiness of the TS record reflects the occurrence of burrows filled with iron monosulfides and pyrite.
6.3.6. Major and minor elements
The concentrations of major and minor elements were measured on 42 samples from Hole U1385G using ICP-AES (Table T29). Replicate analyses of eight international reference standards (n = 18) show relative standard deviations (RSDs) <3% for all major elements (except for P2O5) and <10% for most of the minor elements reported.
Most elements show a strong positive correlation against Al2O3 with a near-zero intercept, indicating the dominance of terrigenous detritus input (Figure F40). This is also generally observed for the minor elements, including Zn, Cr, V, Sc, Y, and Zr. A regression of Na2O against Al2O3 exhibits high scatter due to the widespread presence of authigenic and biogenic phases, that is, pyrite, dolomite and/or Mg-bearing calcite, and halite (NaCl) precipitated from seawater. The Fe2O3 appears to be enriched relative to the upper continental crust, likely due to particulate Fe shuttling. Two data points (Samples 397-U1385G-8H-6, 67–68 cm; and 16H-1, 70–71 cm) show high Si, Ti, and Zr contents relative to Al2O3, likely due to the presence of coarse refractory minerals (e.g., quartz, titanite, rutile, zircon). Bulk sediment Ca primarily represents biogenic CaCO3, and because of the incorporation of Sr into biogenic CaCO3, both elements are inversely related to Al. Ba is weakly correlated with Al or Ca, likely due to the presence of BaSO4. Mn seems to be mainly associated with CaCO3, as suggested by the generally positive relationship between Mn and Ca (Figure F40).
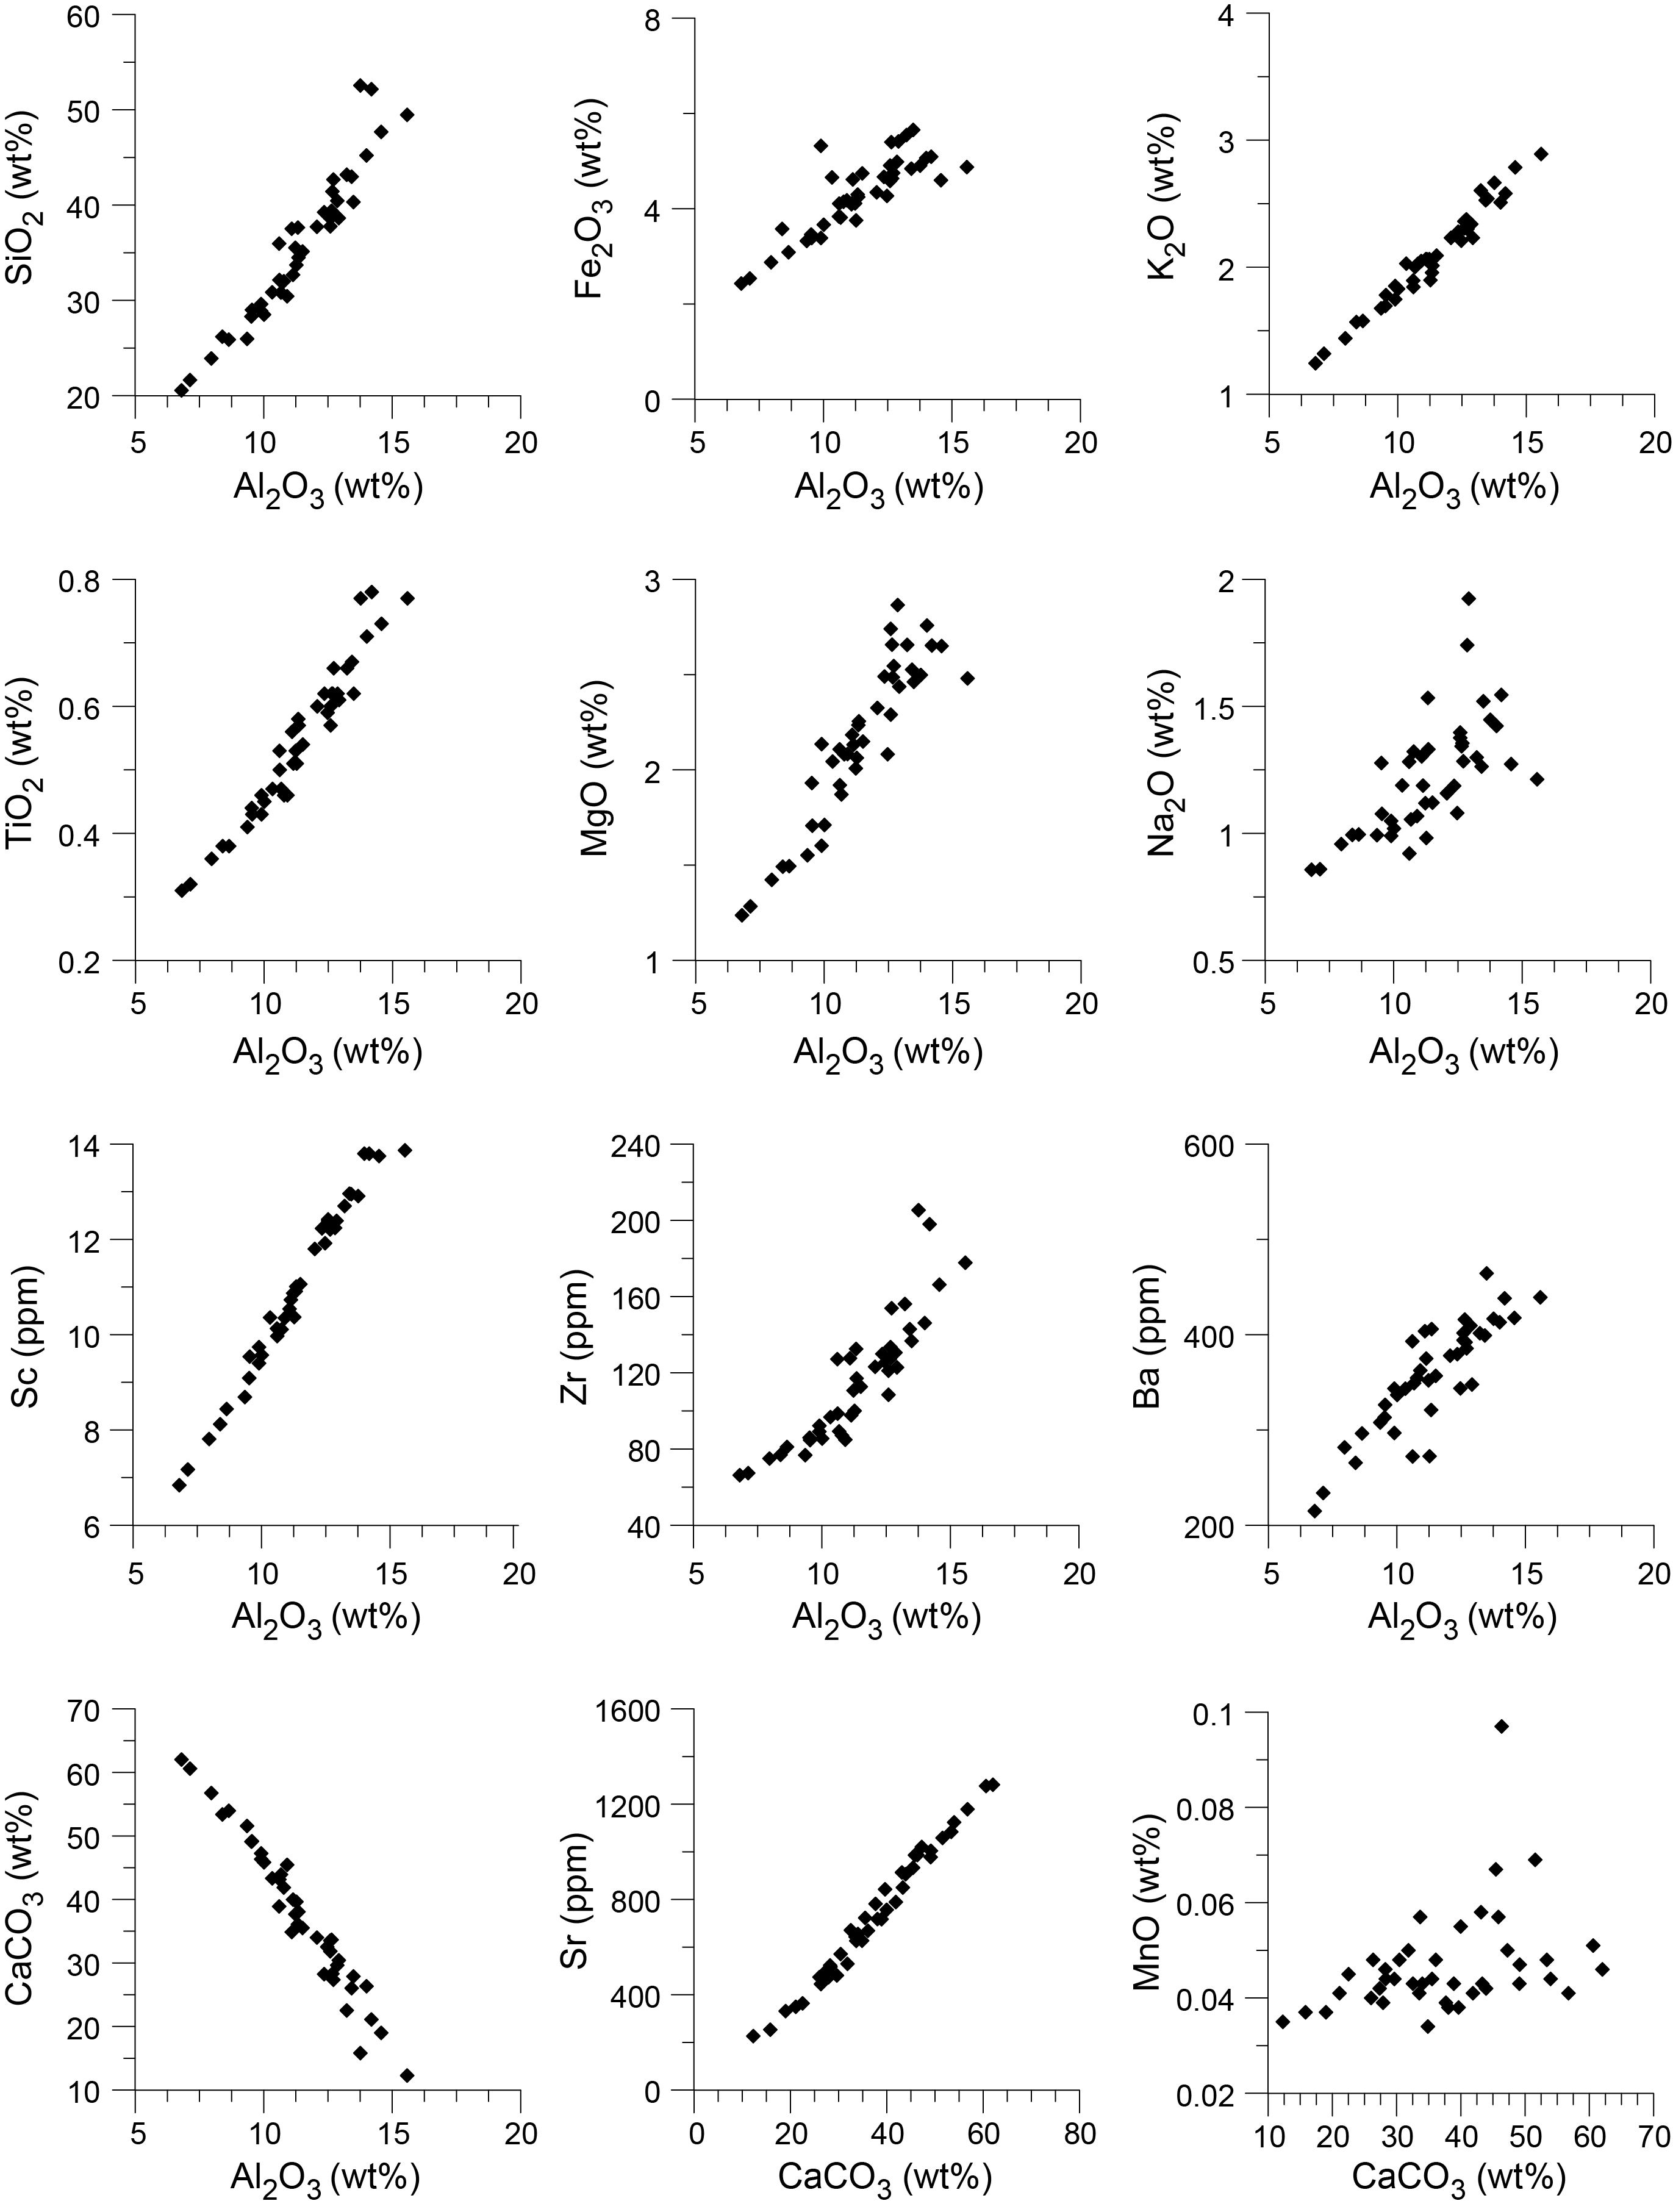
Figure F40. Major and minor element concentrations.
The Ca/Ti ratio, which reflects the relative contributions of CaCO3 versus terrigenous detritus in sediment, shows a three-stage pattern in Hole U1385G (Figure F41). Specifically, Ca/Ti shows relatively low values and small variability in the upper 50 m but larger variations for the interval from ~50 to 240 m CSF-A, followed by a gradual increase (~40–120) to the bottom of the hole.
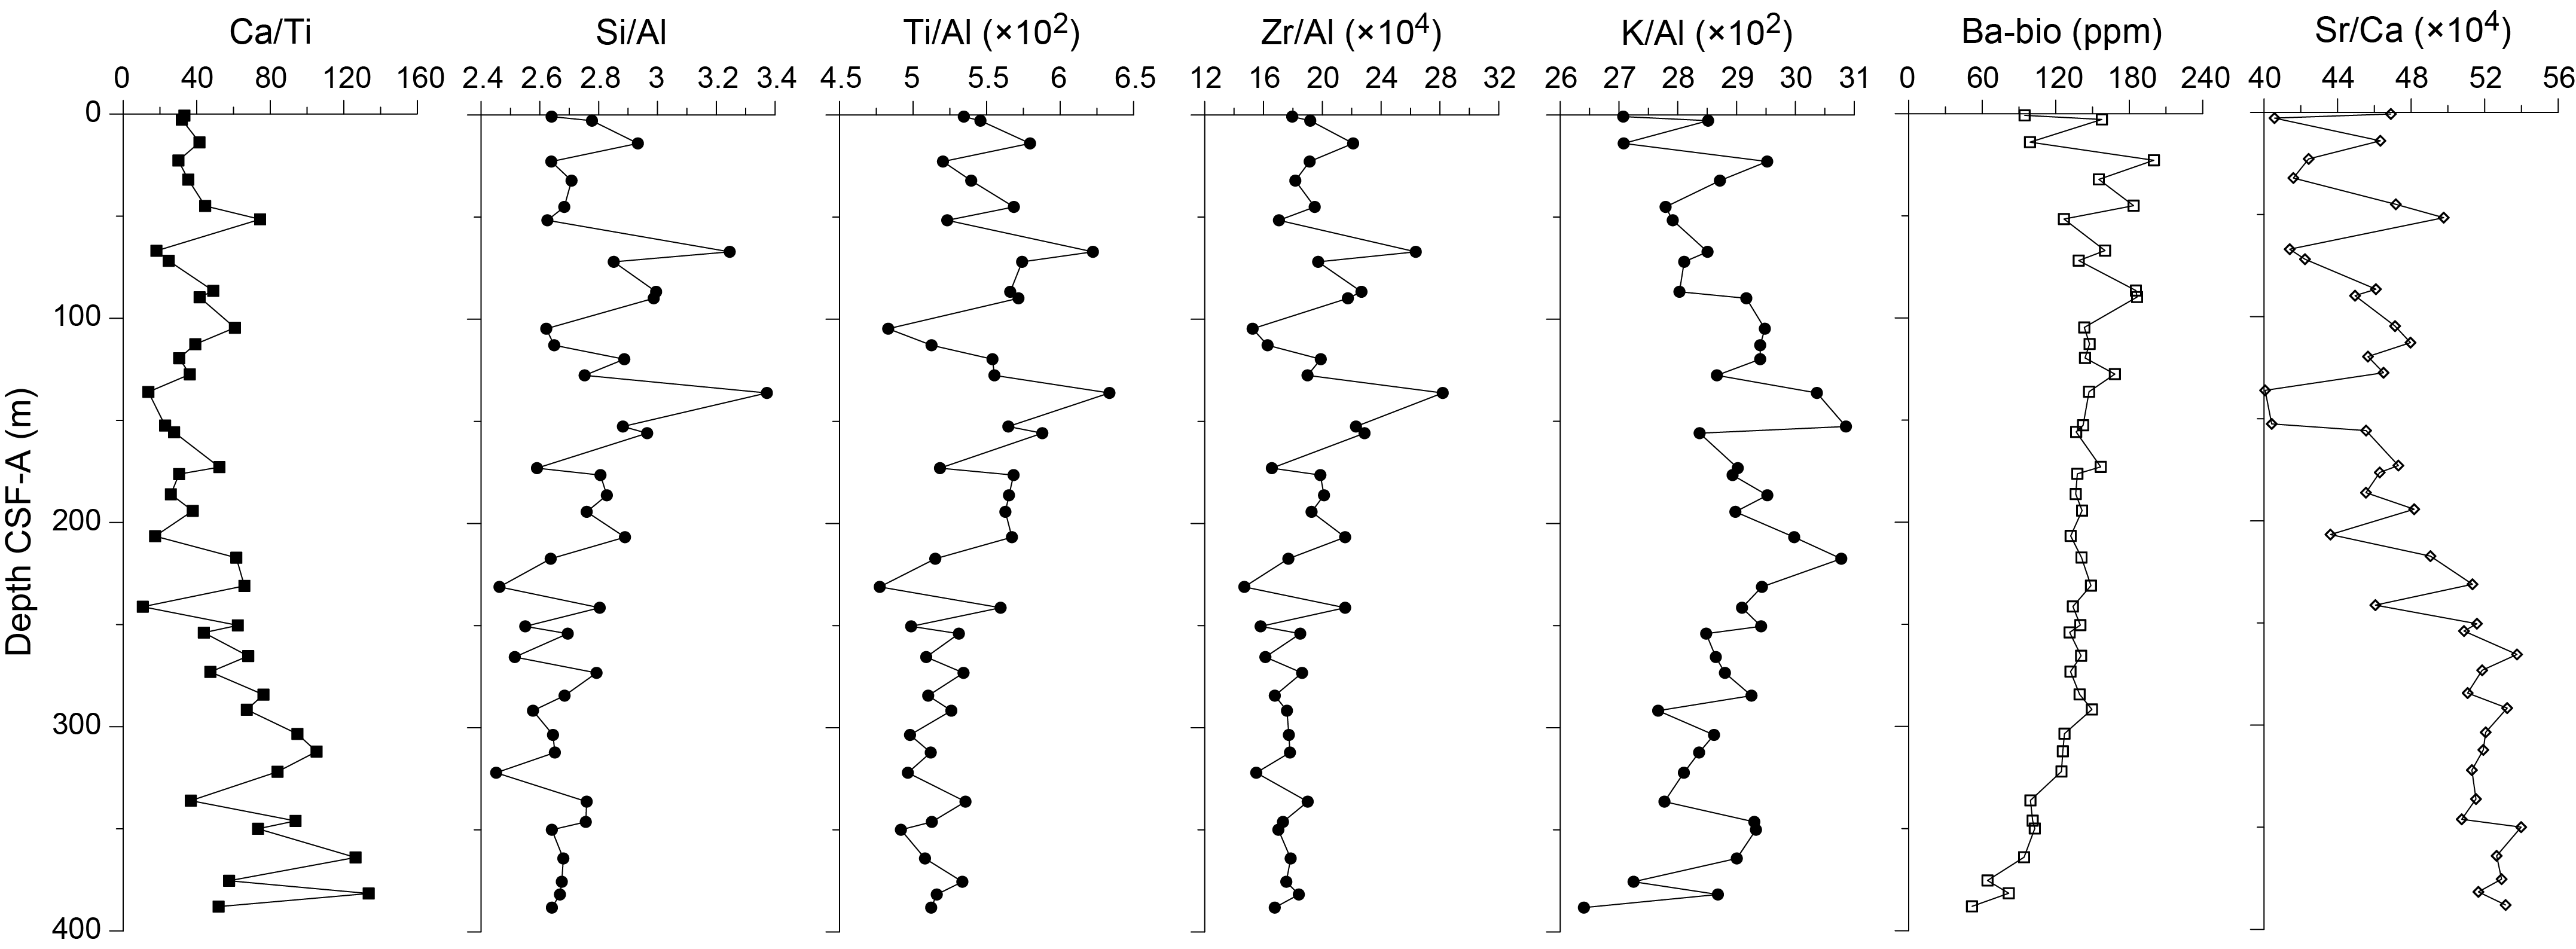
Figure F41. Bulk sedimentary Ca/Ti, Si/Al, Ti/Al, Zr/Al, K/Al, biogenic Ba, and Sr/Ca.
Selected lithogenic elements are normalized to Al as a proxy for provenance, weathering, and productivity (Figure F41). In addition, the Si/Al ratio may serve as a proxy for grain size, mainly reflecting the abundance of quartz versus clay minerals. The three-stage pattern observed for Ca/Ti is also observed for Si/Al, which shows low values and small changes in the upper 50 m, significantly larger variations between ~50 and 240 m CSF-A, and a subsequent gradual decrease in values and variability to the bottom of the hole. The Ti/Al and Zr/Al ratios in this area are widely recognized as indicators of North African dust, whereas the K/Al ratio is often used to reflect the input of river-borne material and associated chemical weathering intensity (Wu et al., 2016). The three-stage pattern similar to Si/Al is also observed for Ti/Al and Zr/Al profiles, which may suggest concurrent changes in dust flux and wind intensity. In contrast, the K/Al ratios gradually increase downhole for the upper 250 m followed by a gradual decrease to the bottom of the hole (Figure F41).
BaSO4 content in marine sediments is a widely recognized proxy for export productivity (Paytan and Griffith, 2007). Assuming a constant Ba/Al ratio of 0.0037 for the terrigenous aluminosilicate component (Reitz et al., 2004), the biogenic Ba (i.e., Ba-bio, mostly BaSO4) can be calculated. Ba-bio values are relatively high, and high variances (90–200 ppm) in the upper 100 m are nearly constant (~130 ppm) from ~100 to 280 m CSF-A before values decrease to the bottom of the hole. However, the Ba-bio profile shows little similarity to that of TOC. The Sr/Ca profile is more variable in the upper 150 m and gradually increases downhole, probably because of changes in aragonite content.
7. Physical properties
Physical properties measurements were made on whole-round cores, split cores, and discrete samples. High-resolution (2 or 4 cm steps) nondestructive measurements of GRA bulk density and MS were made on whole-round sections from all holes. NGR was measured at a 10 cm resolution for all whole-round sections. P-wave caliper (PWC) and MAD measurements were taken at a resolution of one measurement per core for Cores 397-U1385F-2X through 33X (96.9–400 m CSF-A) and 397-U1385G-1H through 12H (0–106.3 m CSF-A). Thermal conductivity was measured for Cores 397-U1385F-2X through 33X. Color reflectance spectrophotometry and split core point MS (MSP) measurements were carried out at 2 cm steps on all archive-half sections. X-ray images of whole-round sections were taken for Cores 397-U1385F-2X through 33X (96.9–400 m CSF-A) and 397-U1385G-1H through 22H (0–203.3 m CSF-A). Because sediment was not recovered in Core 397-U1385F-27X (338.0–347.7 m CSF-A), we took X-ray images and made PWC, thermal conductivity, and MAD measurements on the equivalent depth interval in Hole U1385G (Cores 36X and 37X).
7.1. Bulk density
Bulk density values were measured using the WRMSL and Special Task Multisensor Logger (STMSL) for GRA bulk density and discrete samples for MAD bulk density.
GRA bulk density was measured at 2 or 4 cm resolution on all whole-round sections from all holes. Measured GRA bulk density gradually increases from ~1.2 g/cm3 at the top of the section to ~1.9 g/cm3 around 100 m CSF-A (Figure F42). At 106 m CSF-A in Hole U1385G, GRA bulk density drops from ~1.9 to ~1.3 g/cm3, but this trend is not observed in MAD bulk density measurements. This decrease in GRA bulk density coincides with the change in coring system from the APC to the XCB system because the WRMSL and STMSL do not correct for the difference in the actual diameter of the APC and XCB cores. Additionally, GRA bulk density decreases where there is drilling disturbance, such as core expansion cracks, voids, soupy textures, and basal flow-ins (see Lithostratigraphy). During XCB coring, GRA bulk densities decreased at some depths, for example, from ~1.8 g/cm3 in Core 397-U1385J-33X to ~1.7 g/cm3 in Core 34X (295.0–314.4 m CSF-A), which might be attributed to changes in various operational parameters such as rotary speed, drilling circulation, and heave and/or weather conditions.
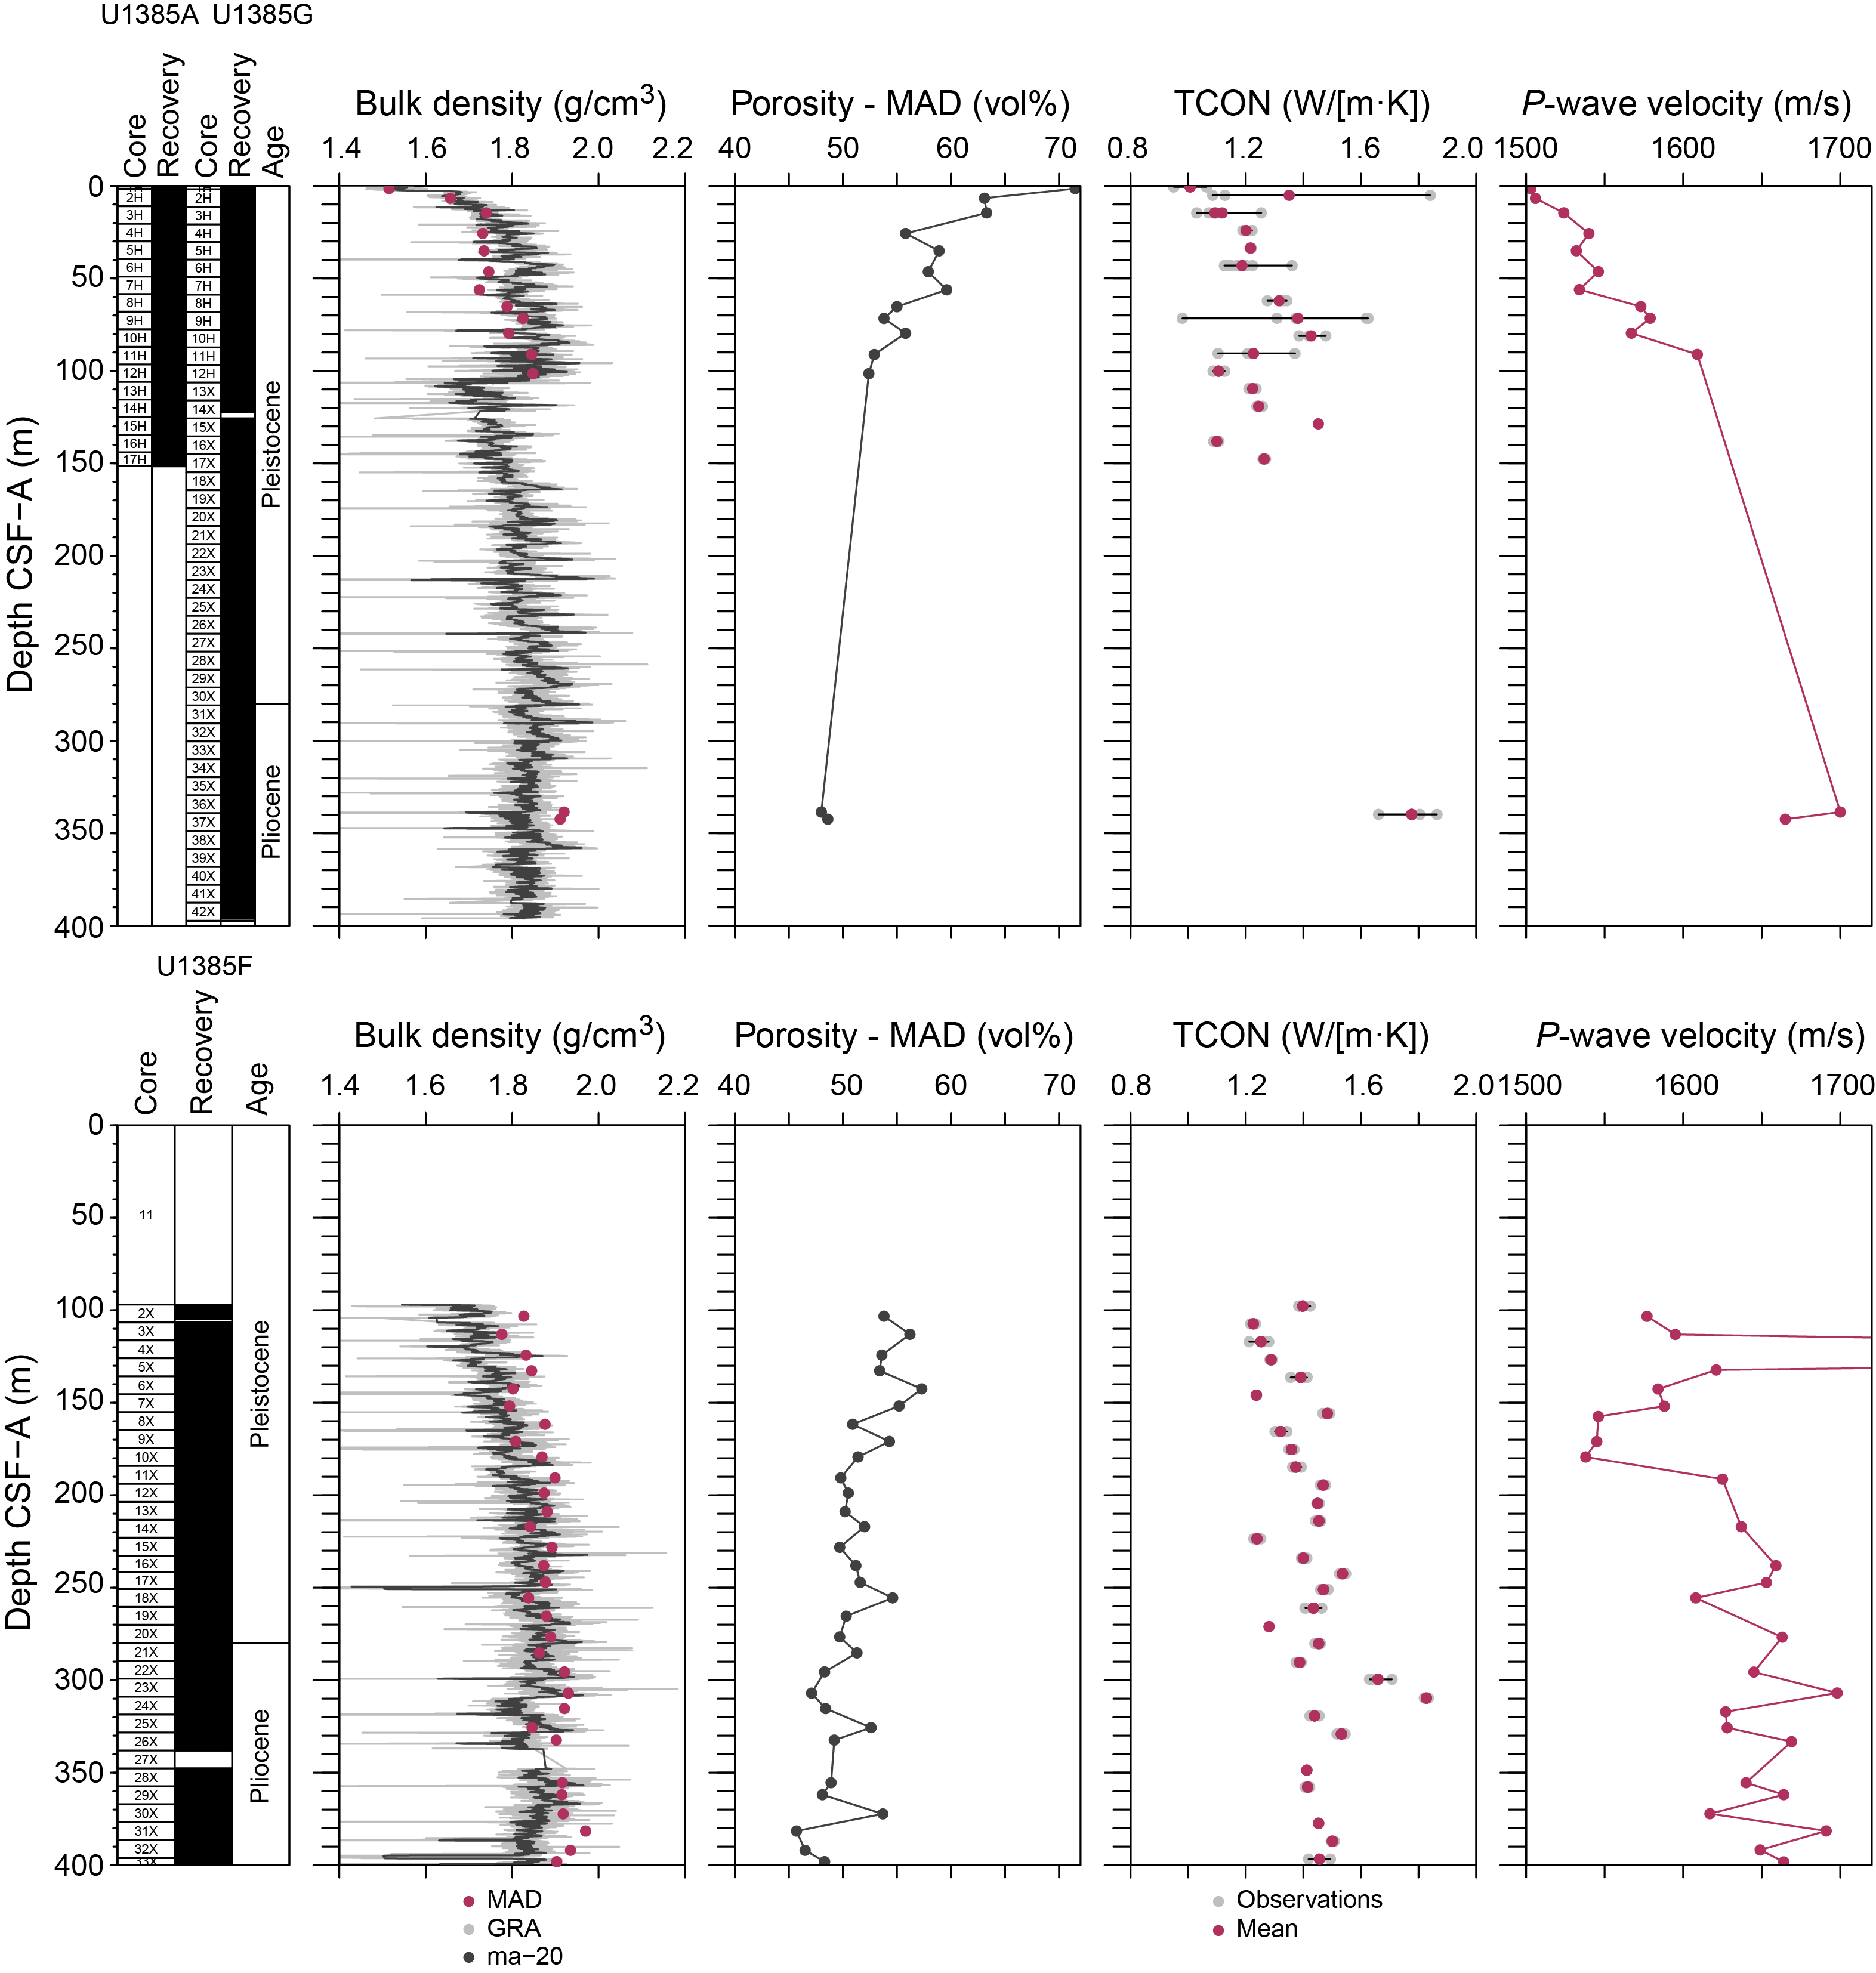
Figure F42. GRA and MAD bulk density, porosity, thermal conductivity, and PWC.
MAD measurements were taken using 10 cm3 discrete samples at a sampling resolution of one per core in Cores 397-U1385F-2X through 33X, 397-U1385G-36X through 37X (96.9–400 m CSF-A), and 1H–12H (0–106.3 m CSF-A). MAD samples were taken from fine-grained sediment while avoiding locations of noticeable drilling disturbance. These samples were measured for wet mass, dry mass, and dry volume to calculate wet density, dry density, grain density, porosity, and void ratio. The measured bulk densities from the discrete samples range ~1.5–1.9 g/cm3 and show a gradual increase downhole in bulk density (Figure F42).
Overall, both GRA and MAD bulk density measurements show an increasing trend downhole, which reflects sediment compaction.
7.2. Magnetic susceptibility
MS was measured on all cores using the WRMSL and STMSL at a 2 or 4 cm resolution (Figure F43). The measured MS is characterized by cyclic variations on the order of tens of centimeters to a few meters.
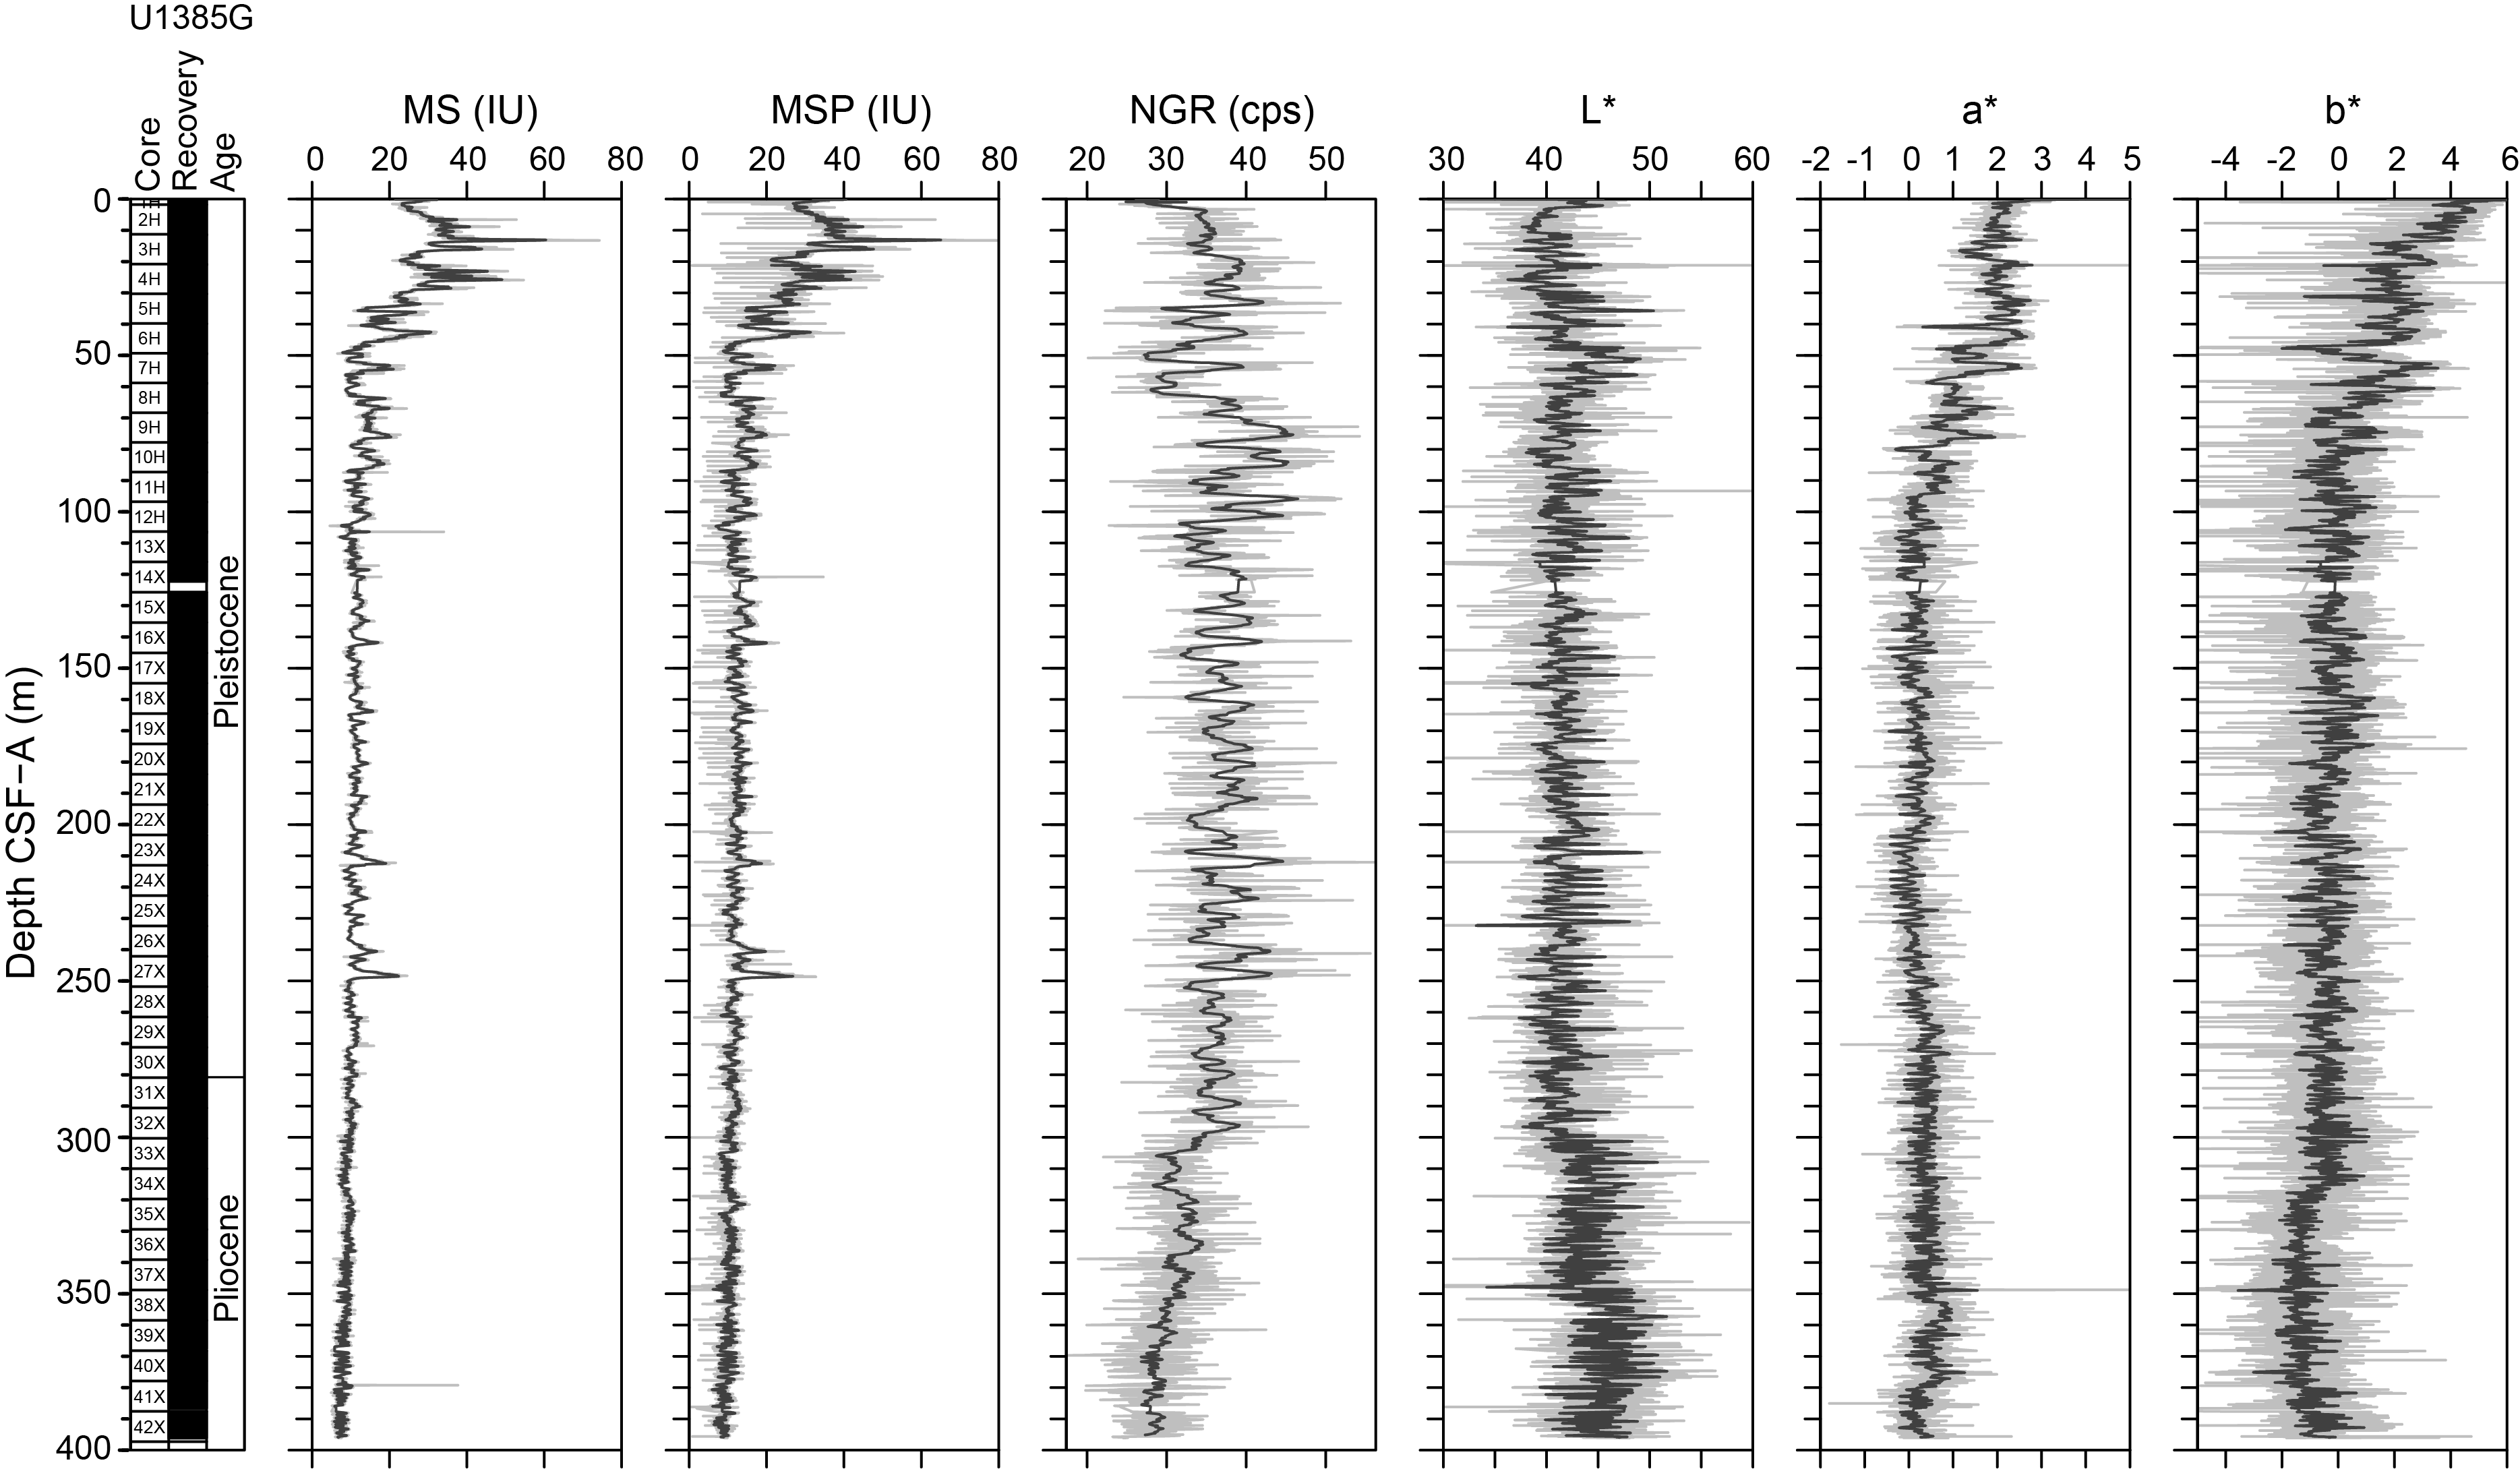
Figure F43. MS, MSP, NGR, and L*a* b* values.
The overall downhole trends at Site U1385 include two main intervals: (1) a reduction of MS values from ~70 to ~10 IU with decreasing amplitude of cyclic variations from 20 to 60 m CSF-A and (2) a consistently low MS signal of ~10 IU from 60 to 400 m CSF-A. The reduction of MS in the upper 60 m is synchronous with decreased sulfate concentrations in IW as a result of sulfate reduction accompanied by increased concentrations of methane (see Geochemistry). MS values are generally relatively higher in darker layers, showing quasiperiodic variation throughout the hole.
Whole-round MS data for all holes was acquired before the cores were equilibrated to room temperature, which may result in an underestimation of MS absolute values. It is therefore recommended that postcruise quantitative analyses should use section-half MS data (MSP) because they are expected to be the most accurate MS measurements.
7.3. Porosity
Porosity was calculated using the MAD of 10 cm3 discrete samples taken at a sampling resolution of one per core for Cores 397-U1385F-2X through 33X (96.9–400 m CSF-A), 397-U1385G-1H through 12H (0–106.3 m CSF-A), and 36X through 37X (329.4–348.8 m CSF-A). Porosity ranges 45.7%–71.5% and decreases gradually with depth. At the top of the sediment sequence, porosity is 71.5% (1.5 m CSF-A), and it decreases to <55% below 160 m CSF-A (Figure F42). The decreasing porosity trend downhole primarily reflects compaction and dewatering of the sediment.
7.4. P-wave velocity
P-wave velocity was measured once per split core with the PWC for Cores 397-U1385F-2X through 33X, 397-U1385G-1H through 12H (0–106.3 m CSF-A), and 36X through 37X (106.6–400 m CSF-A) (Figure F42). P-wave velocity acquired with the PWC shows a steady increase from 1503 m/s at the top of the hole to >1650 m/s toward the bottom. The gradually increasing P-wave velocity reflects the compaction of sediments with depth. Anomalously high P-wave velocity (2416 m/s) was recognized at ~124 m CSF-A, but it is likely to be inaccurate data due to gas expansion.
7.5. Natural gamma radiation
NGR measurements were made with the Natural Gamma Radiation Logger (NGRL) on all core sections from all holes at a 10 cm resolution and analyzed with an integration time of 300 s/measurement. Overall, most NGR values range 20–50 counts/s with clear cyclicity in intensity for most of the cores (Figure F43). NGR values are relatively constant at 30–42 counts/s between 120 and 300 m CSF-A. There is also a gradual decrease downhole from ~35 counts/s at 300 m CSF-A to ~25 counts/s at 400 m CSF-A. The cyclic variation of NGR intensity correlates with MS and mirrors L* values. Because L* is often related to the carbonate content in sediment (see Geochemistry), a higher carbonate content within the sediment likely explains the low NGR and MS. That is, sediment physical properties parameters such as MS and NGR are closely tied to changes in lithology. Lower NGR and MS values can be interpreted as sediments dominated by calcareous microfossils (nannofossil ooze), whereas higher NGR and MS are interpreted as sediments with higher clay content (e.g., clayey nannofossil ooze).
Concentrations of K, Th, and U were extracted from the NGR spectra using the method of De Vleeschouwer et al. (2017). Downhole trends of K, Th, and U are similar to that of NGR at Site U1385 (Figure F44). U/Th and K/Th ratios are constant throughout the hole.
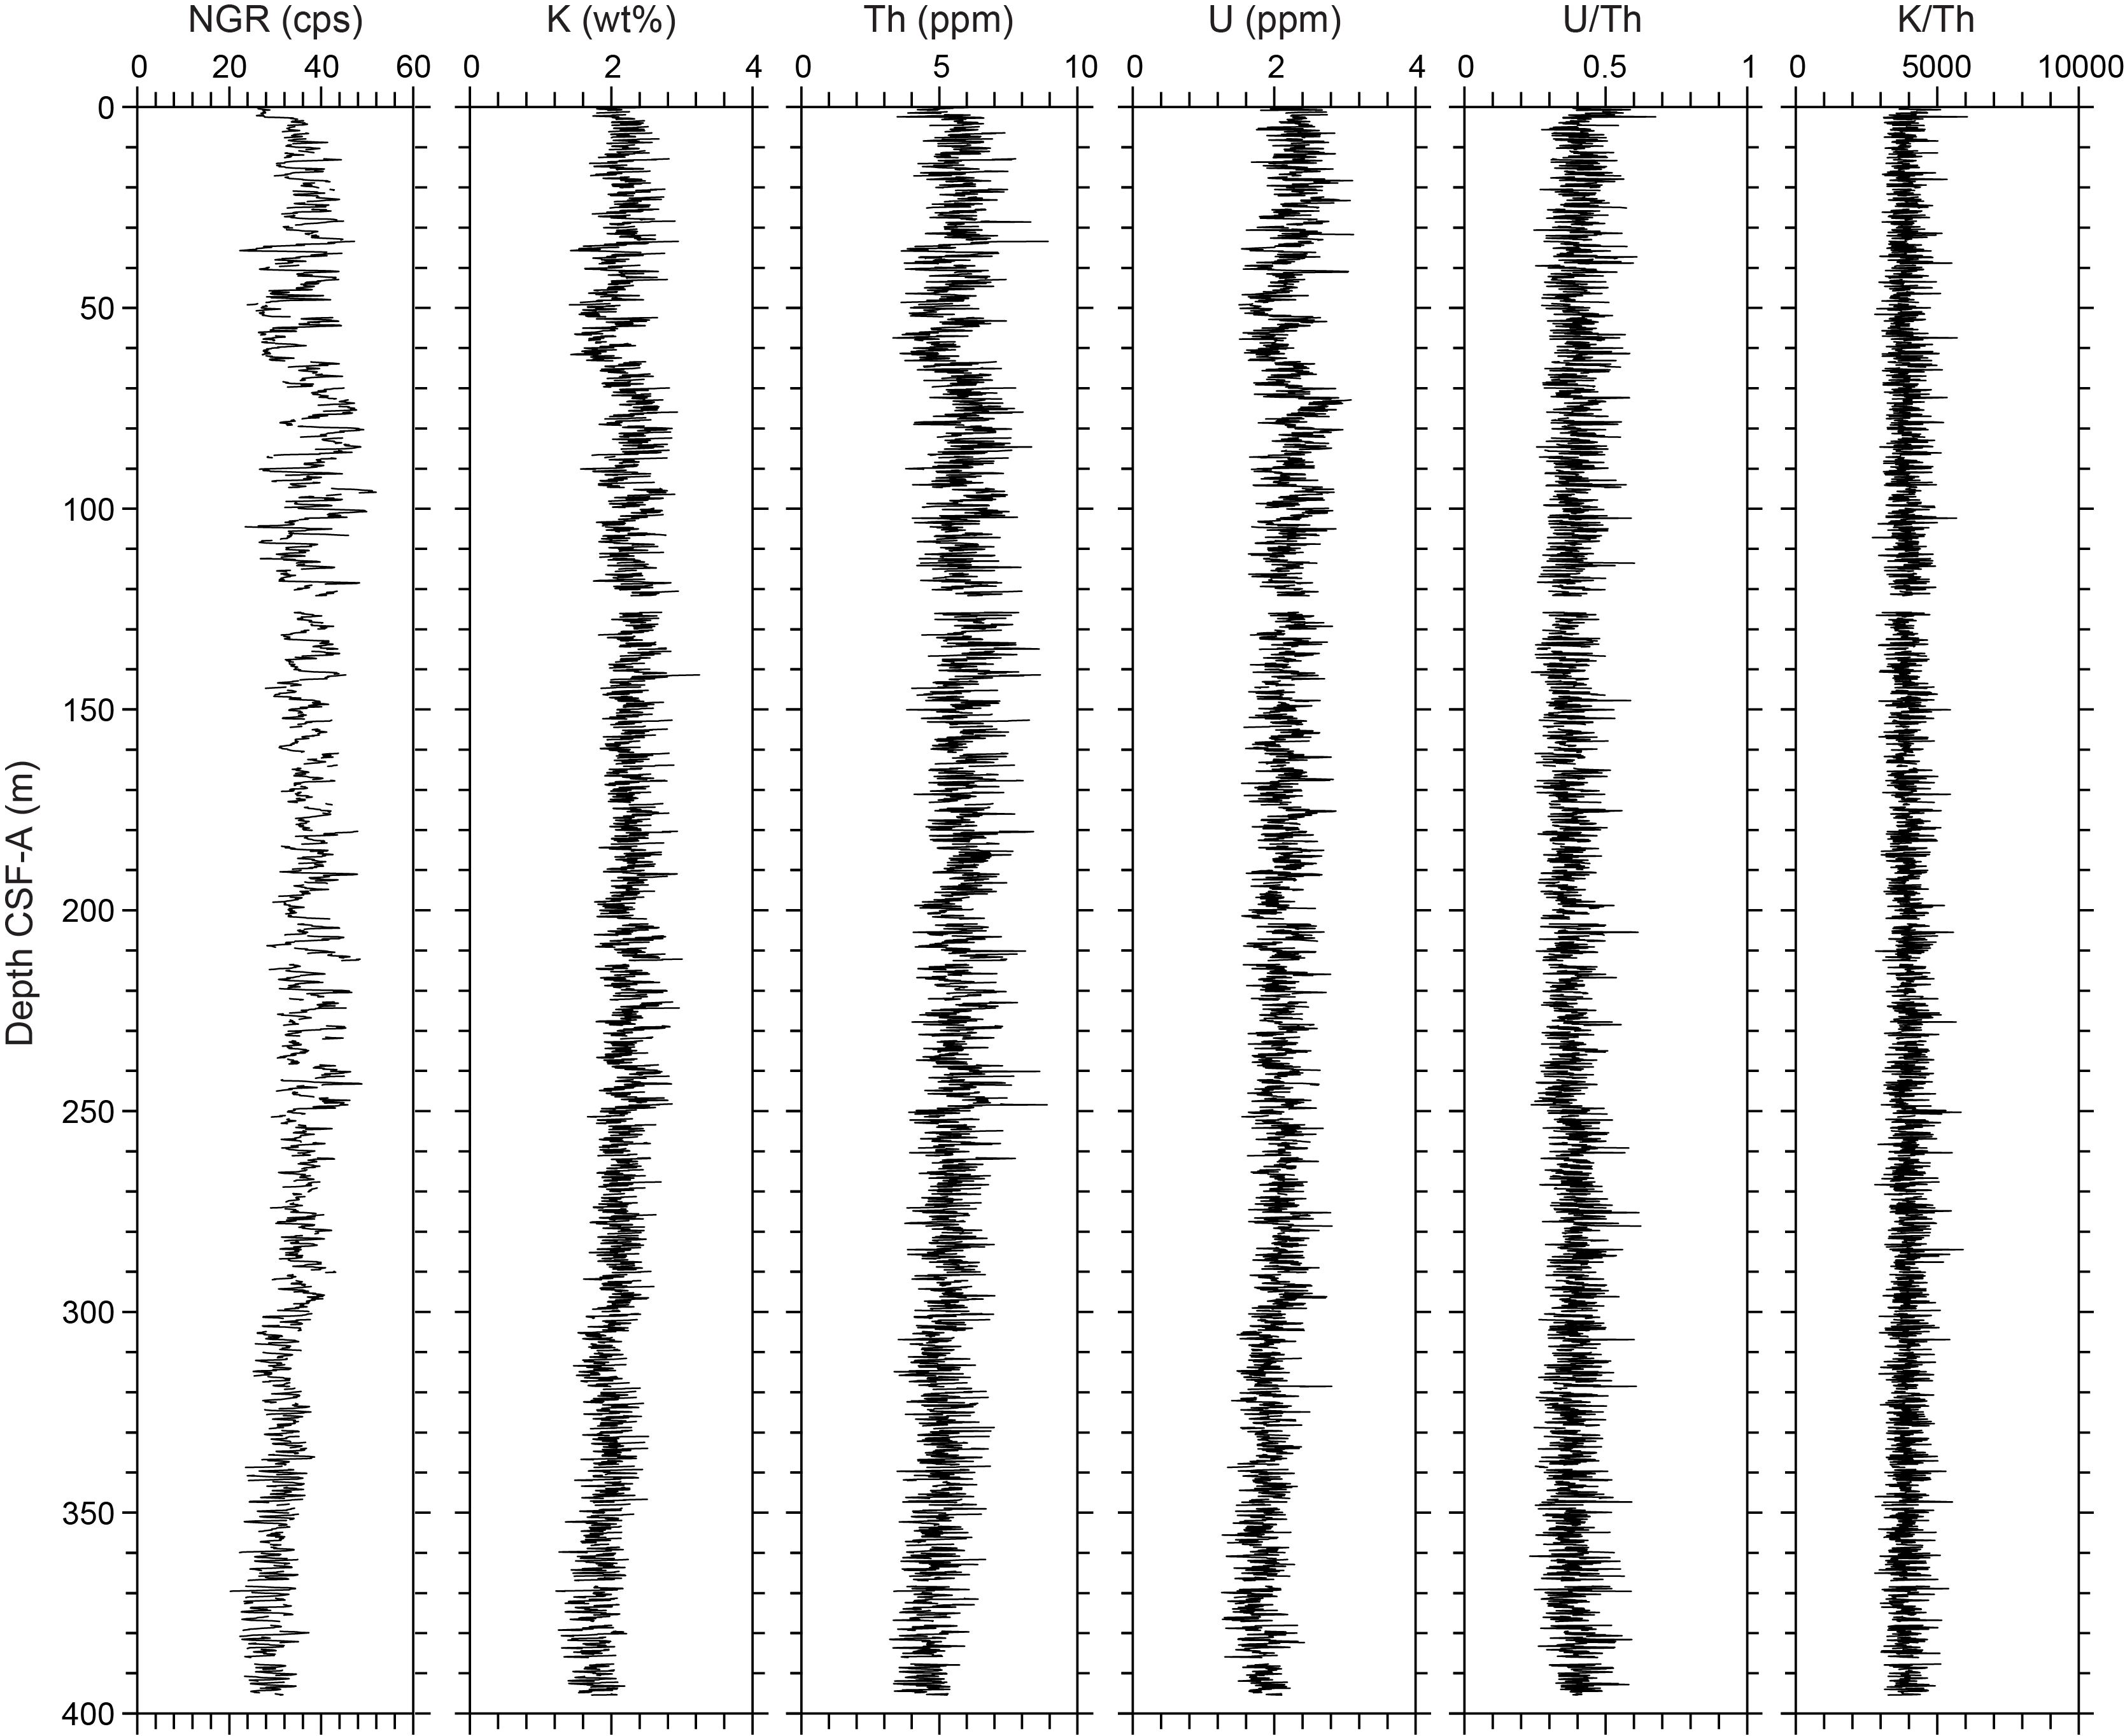
Figure F44. NGR, K, Th, and U and U/Th and K/Th ratios.
7.6. Thermal conductivity
Thermal conductivity was measured in triplicate at one position per core for Cores 397-U1385F-2X through 33X and 397-U1385G-36X through 37X (106.6–400 m CSF-A) using a mini puck sensor on the split core surface of working halves. The values of thermal conductivity range 1.2–1.8 W/(m·K), showing an increasing trend with depth (Figure F42), similar to the patterns of bulk density and P-wave velocity. The downhole trend in thermal conductivity may thus reflect the compaction and consolidation of sediments with depth.
7.7. Color reflectance
Color reflectance data was collected at 2 cm intervals using the SHMSL on all archive halves. Values of a* and b* decrease from 30 to 90 m CSF-A and are stable from 110 to 400 m CSF-A. Amplitudes of L* values increase by about 20% below 300 m CSF-A. L* values are negatively correlated with MS and NGR (Figure F43). CaCO3 concentrations (see Geochemistry) are high in intervals where L* values are high, suggesting that the change in sediment lightness is related to carbonate content. Carbonate content in the sediment can be affected by one of two ways: either through the dilution of potassium- and thorium-bearing detrital material (clay) by varying carbonate contents, or, conversely, through the dilution of carbonate by varying detrital mineral flux (Thomson et al., 1999).
7.8. X-ray imaging
All whole-round sections from Hole U1385F (96.9–400 m CSF-A; Cores 2X–33X) and between 0 and 203.3 m CSF-A in Hole U1385G (Cores 1H–22H) were imaged using the X-ray Logger (XMAN). X-ray images were also taken as requested from selected archive-half sections. The X-ray images reveal the presence of authigenic mineral grains, the morphology of lithologic contacts, burrows, and drilling disturbances such as biscuits and gas expansion. Gas expansion was noted in X-ray core images from 60 to 350 m CSF-A, with the most extreme gas expansion from 70 to 140 m CSF-A (Figure F45). Authigenic mineral grains, likely pyrite, were found throughout Site U1385 and were more common from 160 to 400 m CSF-A. Those grains were generally a few millimeters to 2 cm in size and were present as discrete grains and burrow fillings.
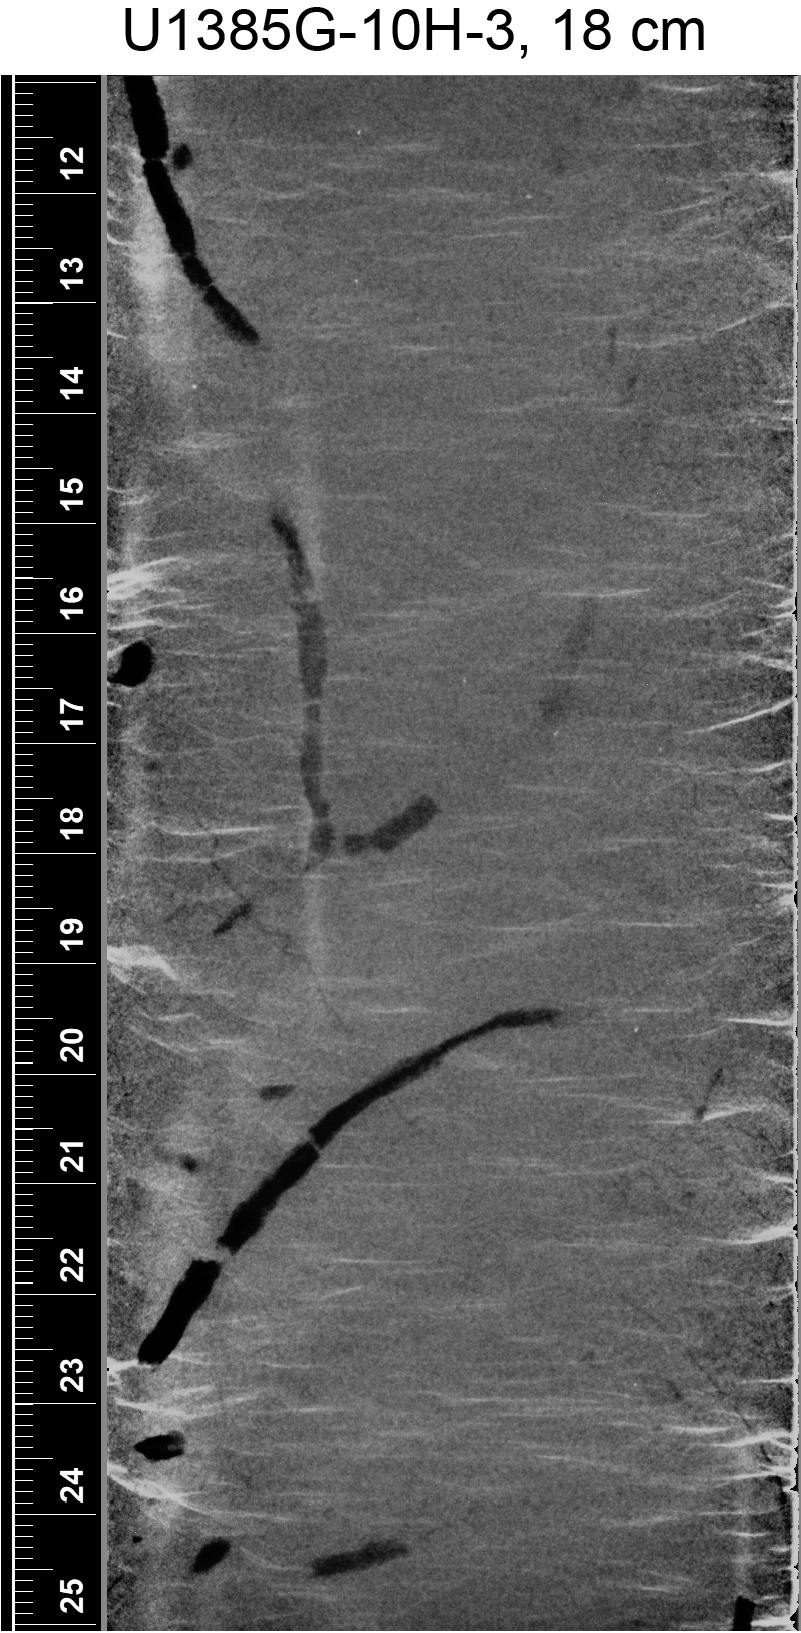
Figure F45. Authigenic minerals.
7.9. Comparison of Expedition 339 and 397 physical properties
Bulk density, MS, NGR, and P-wave velocity measurements from Expedition 397 Holes U1385F–U1385J are in good agreement with those of Expedition 339 Holes U1385A–U1385E (Expedition 339 Scientists, 2013) (Figure F46). In both Holes U1385A and U1385G, GRA bulk density increases from 1.4 to 1.8 g/cm3 in the upper 40 m and is relatively stable below 50 m CSF-A. One key difference in GRA bulk density, however, is that Expedition 397 measurements decrease at 107 m CSF-A in Hole U1385G, reflecting the change in coring system from the APC to XCB. In all holes, MS values decrease from 70 IU around 10–20 m CSF-A to <20 IU to 50 m CSF-A and are relatively stable at lower values of <20 IU below 50 m CSF-A. Overall, NGR values increase with depth, but two distinct intervals can be distinguished. The first interval corresponds to the upper 60 m, and values range 25–45 counts/s. In the second interval, 60–150 m CSF-A, NGR values are slightly higher, ranging 30–50 counts/s. PWC values of Holes U1385F and U1385G show a trend similar to that of Expedition 339 Hole U1385D. P-wave velocities closely follow GRA bulk densities, with a steady increase from ~1490 m/s in the uppermost part of the holes to >1560 m/s below 70 m CSF-A.
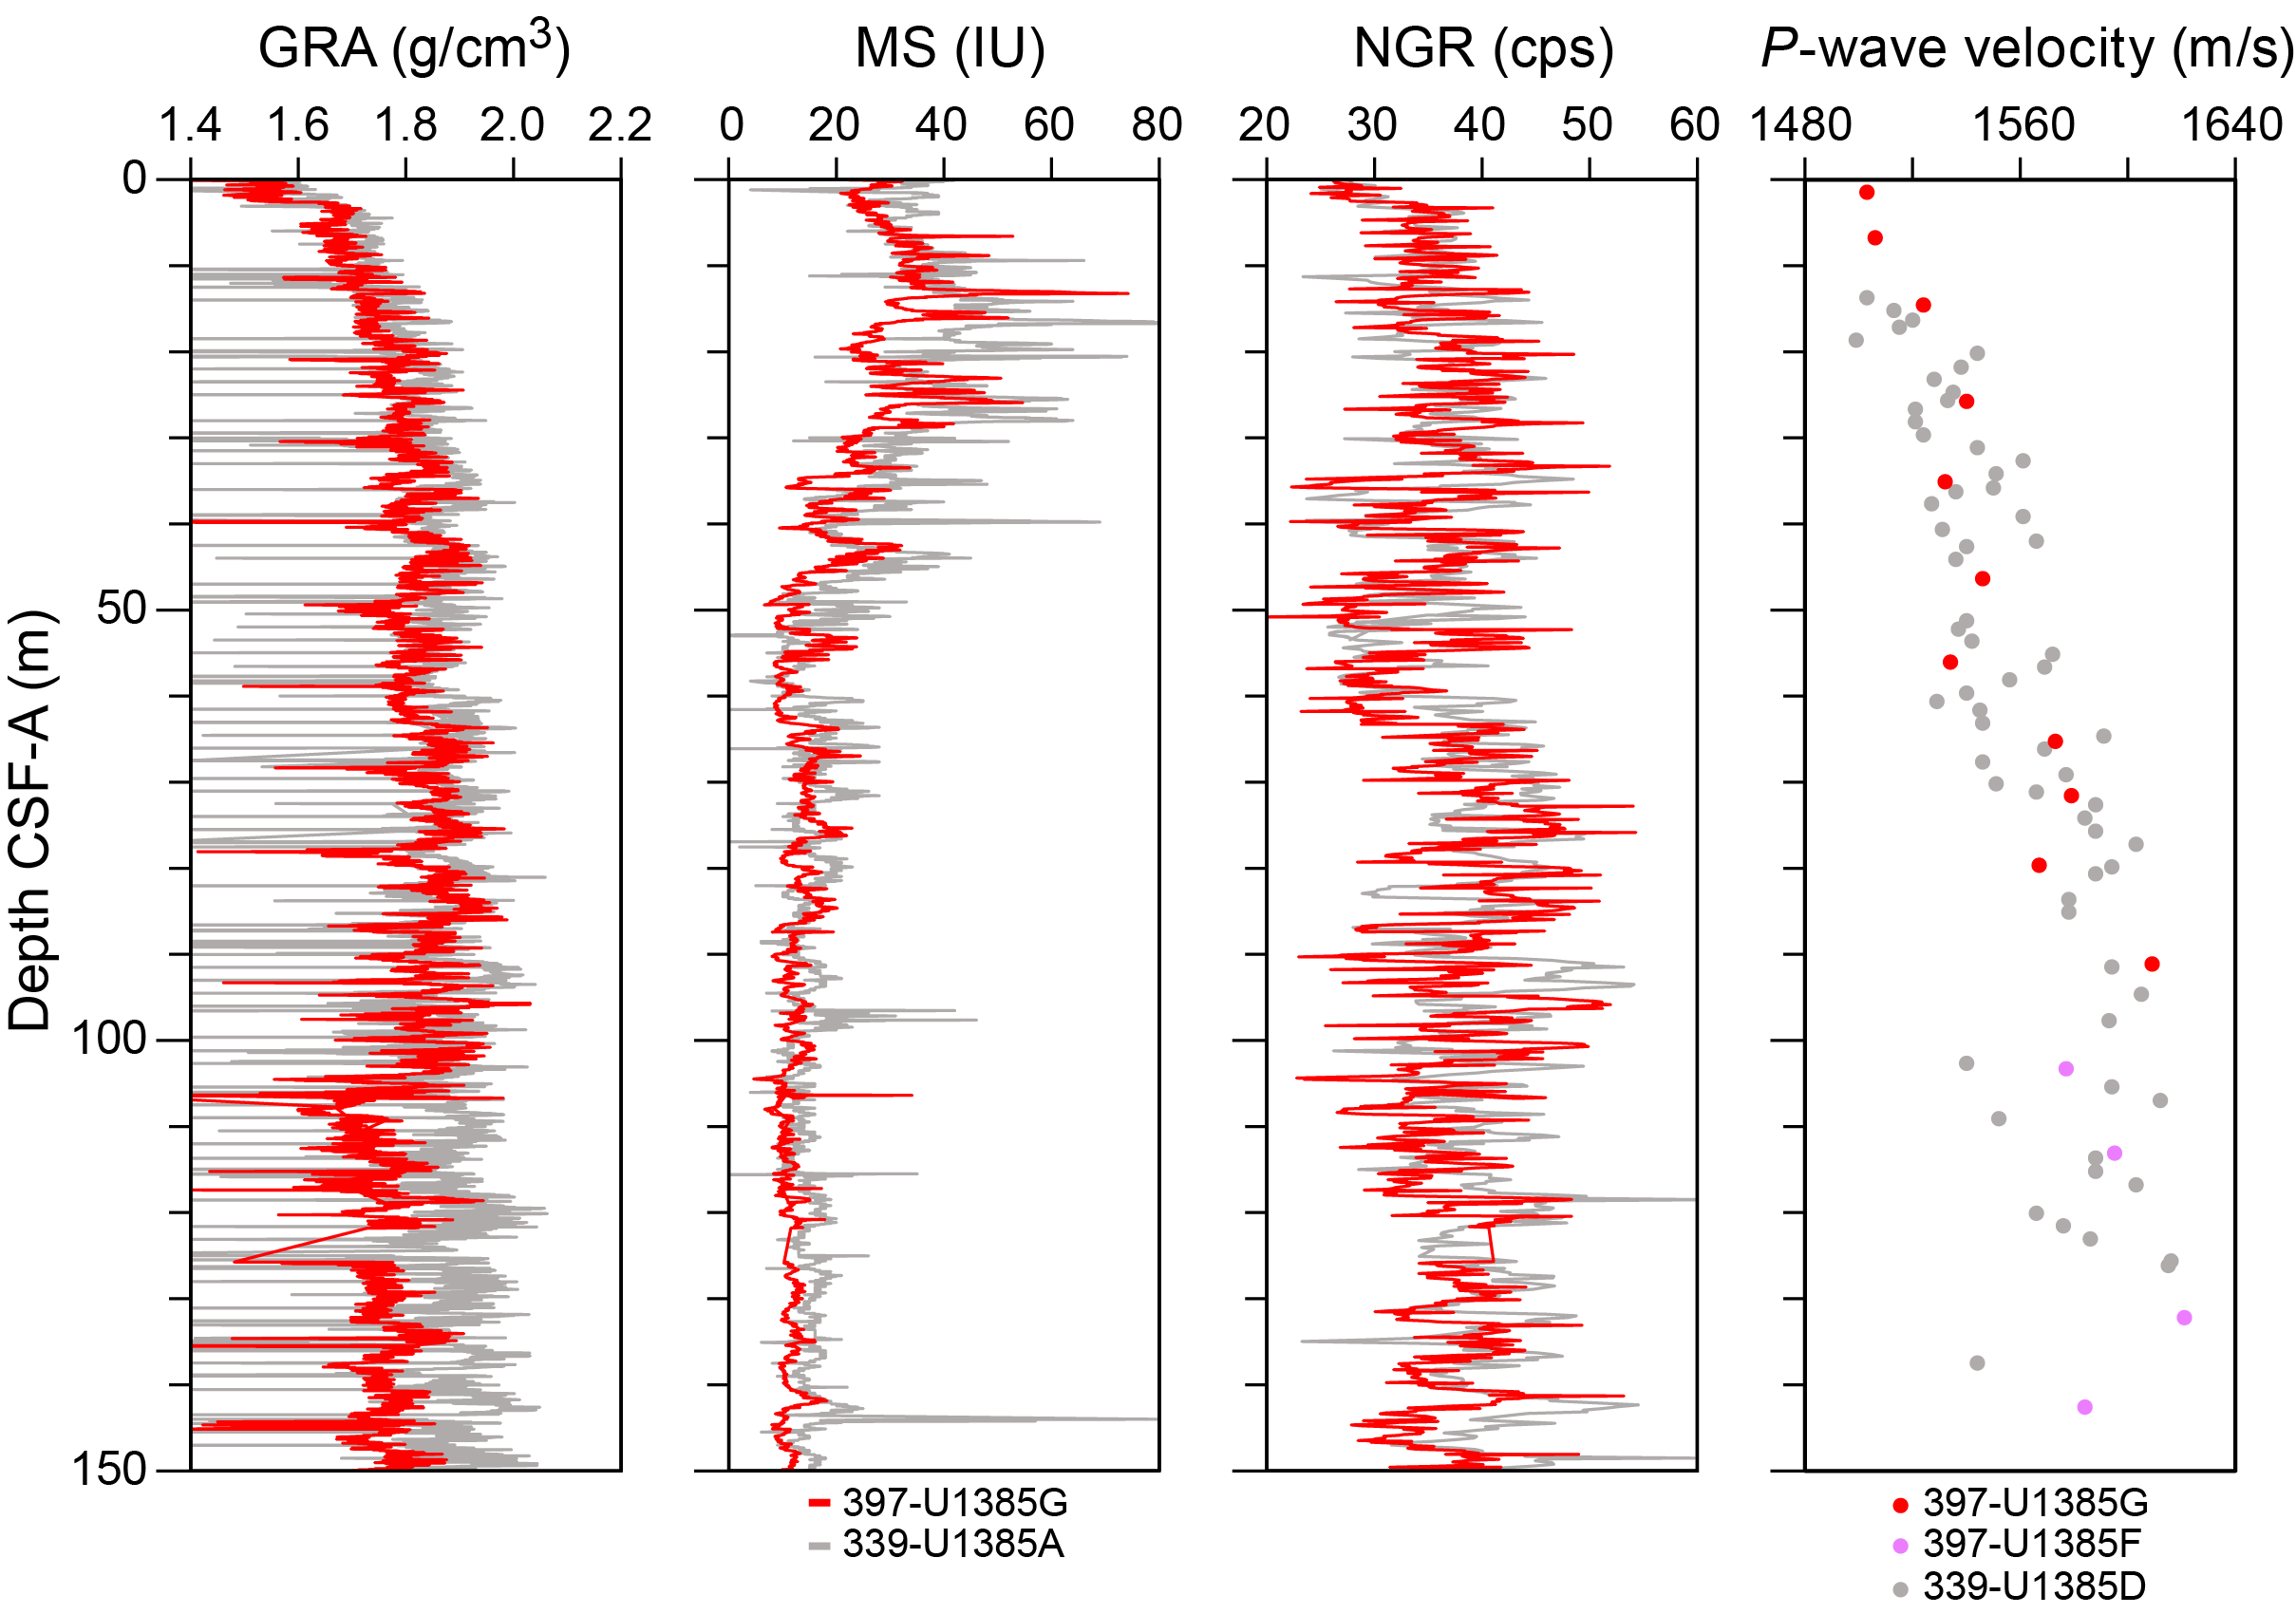
Figure F46. Physical properties.
8. Downhole measurements
Downhole logging was attempted in Hole U1385J using the triple combo tool string, but the tools were unable to exit the drill pipe into the open hole and logging was abandoned (see Operations). Because borehole temperature and the geothermal gradient were measured at Site U1385 during Expedition 339 (Expedition 339 Scientists, 2013), no new measurements were taken at Site U1385 during Expedition 397.
9. Stratigraphic correlation
Correlations between holes at Site U1385 were accomplished using Correlator software (version 4.0.1). Tie points were established using L* color reflectance, whole-round MS, and the blue color channel extracted from the core images (RGB blue) (Figure F47; Table T30). We constructed a splice from 0 to 452.7 m core composite depth below seafloor, Method A (CCSF-A), using all five of the newly drilled holes at the site (U1385F–U1385J) (Figures F47, F48, F49; Table T31). The Expedition 397 data from Site U1385 will be integrated postcruise with Expedition 339 Holes U1385A–U1385E to produce a common splice. The Pliocene sequence correlates cycle-for-cycle to data from Sites U1586 and U1587.
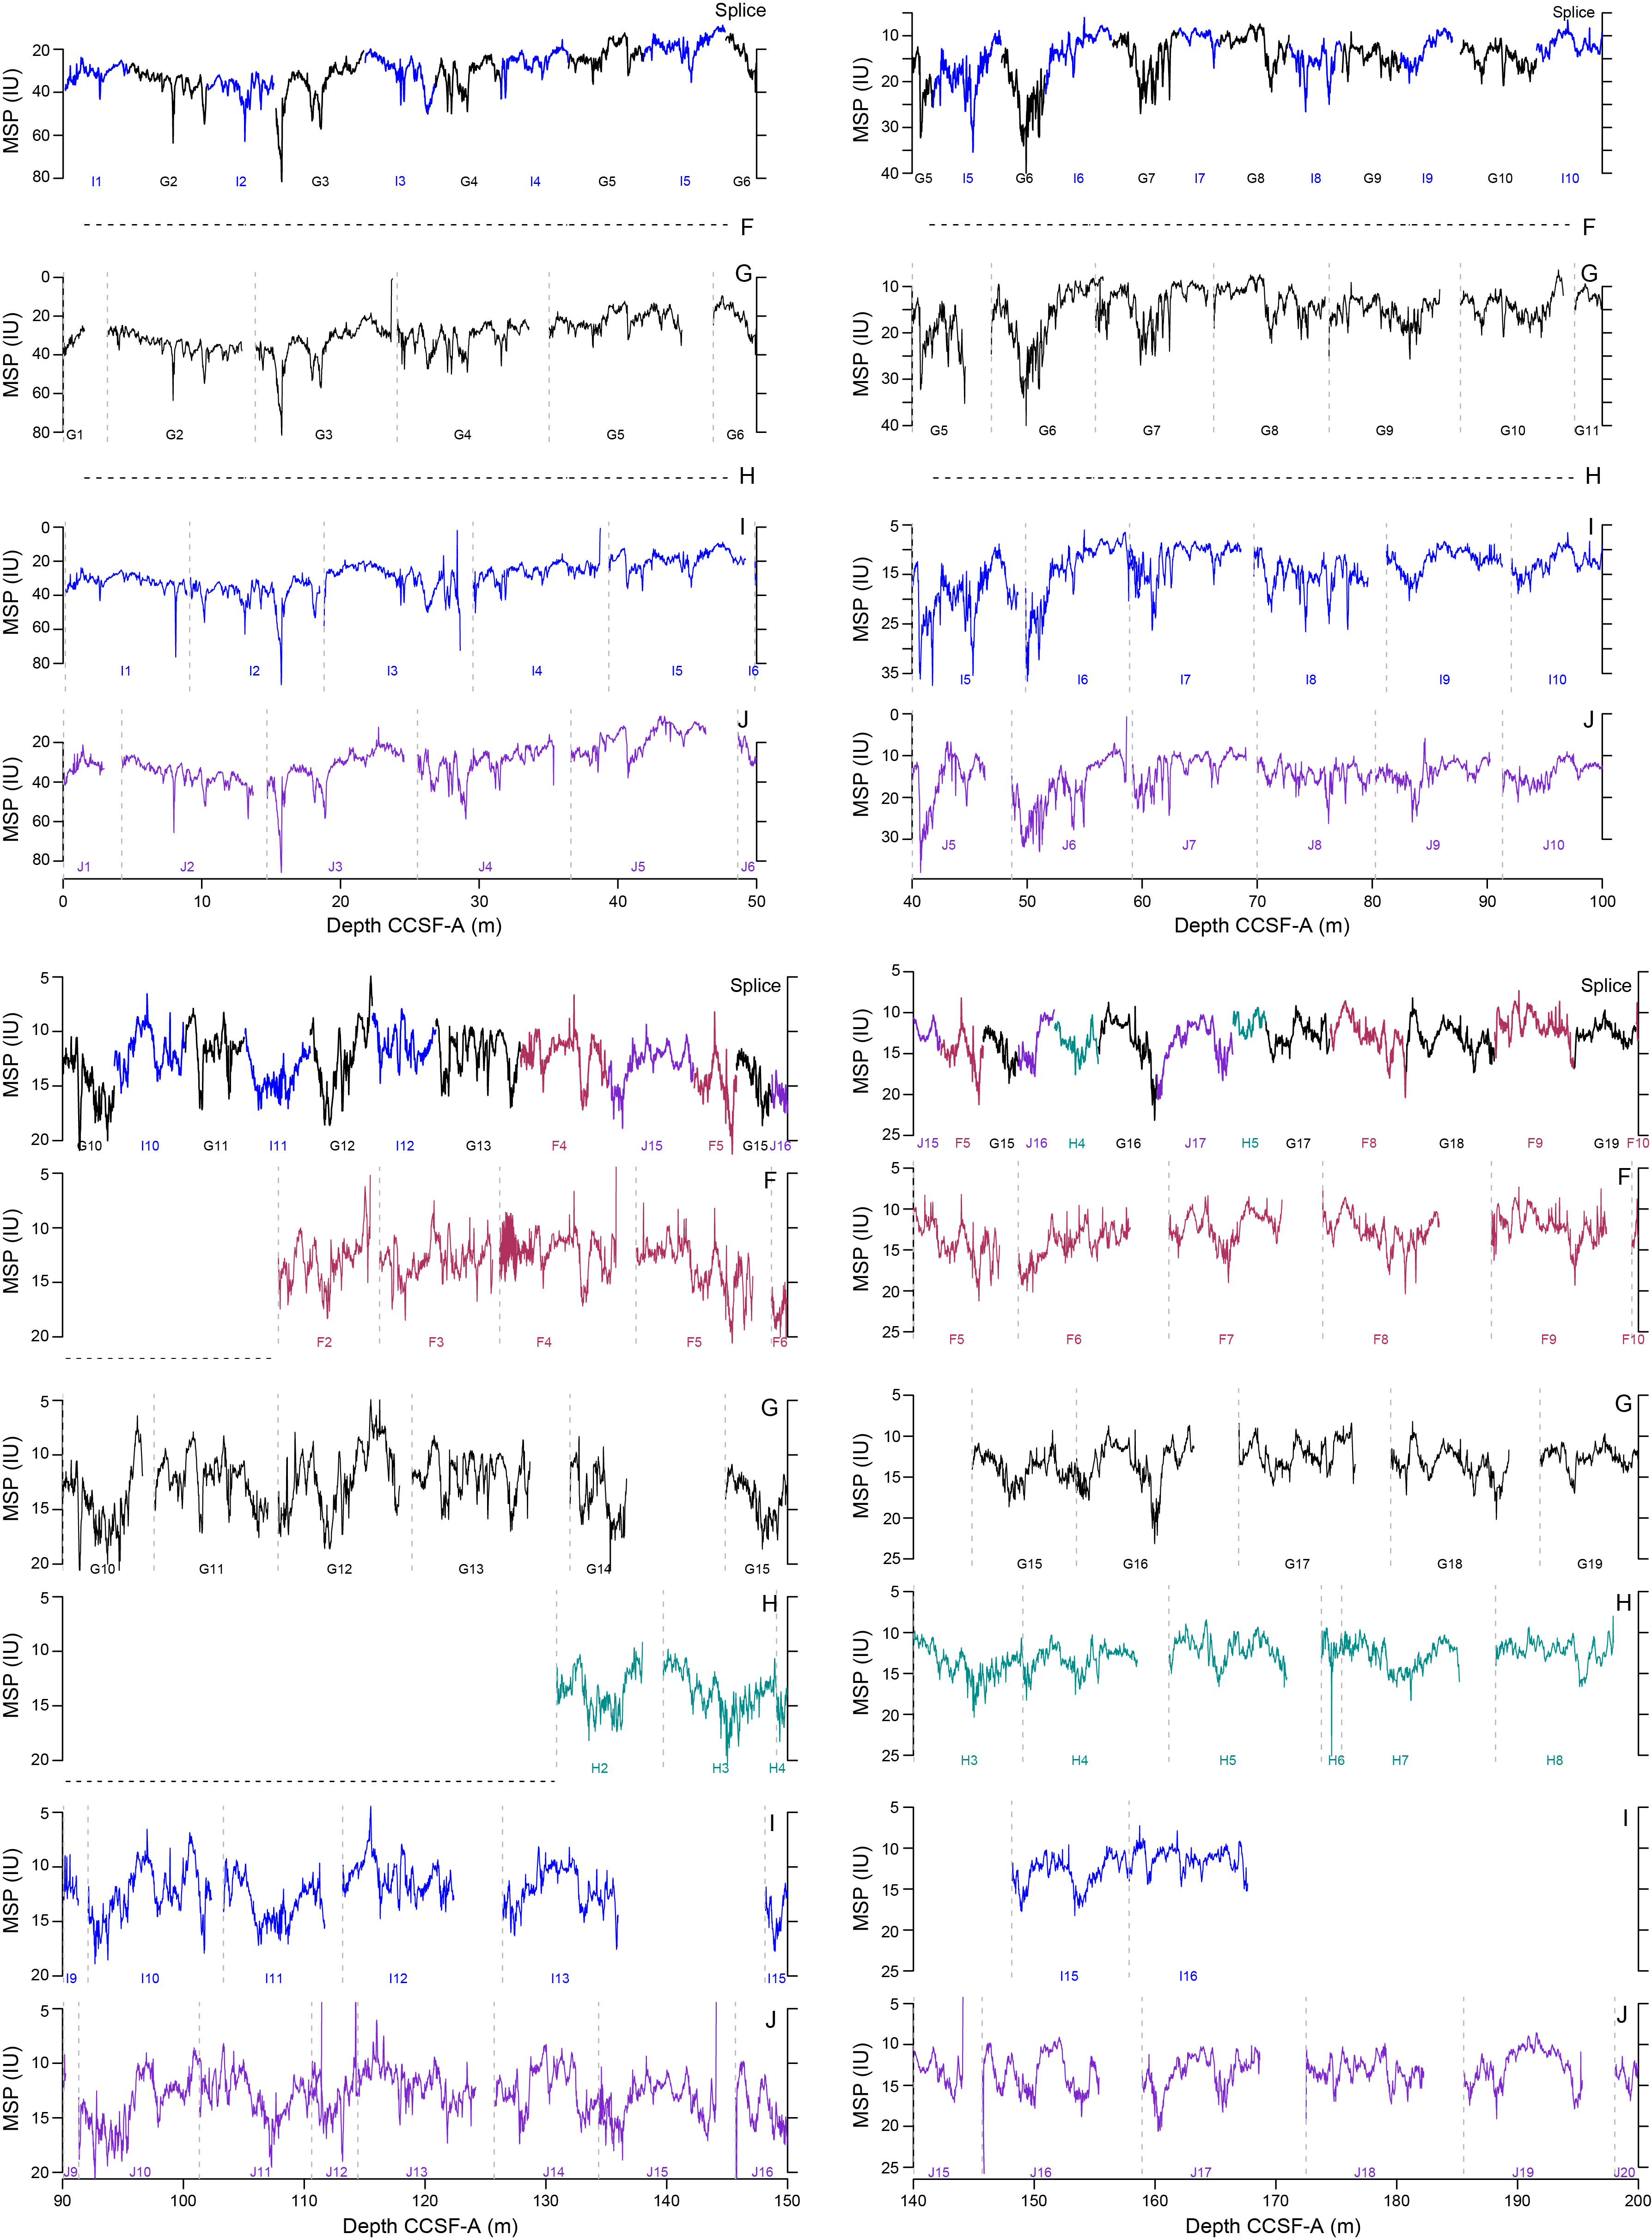
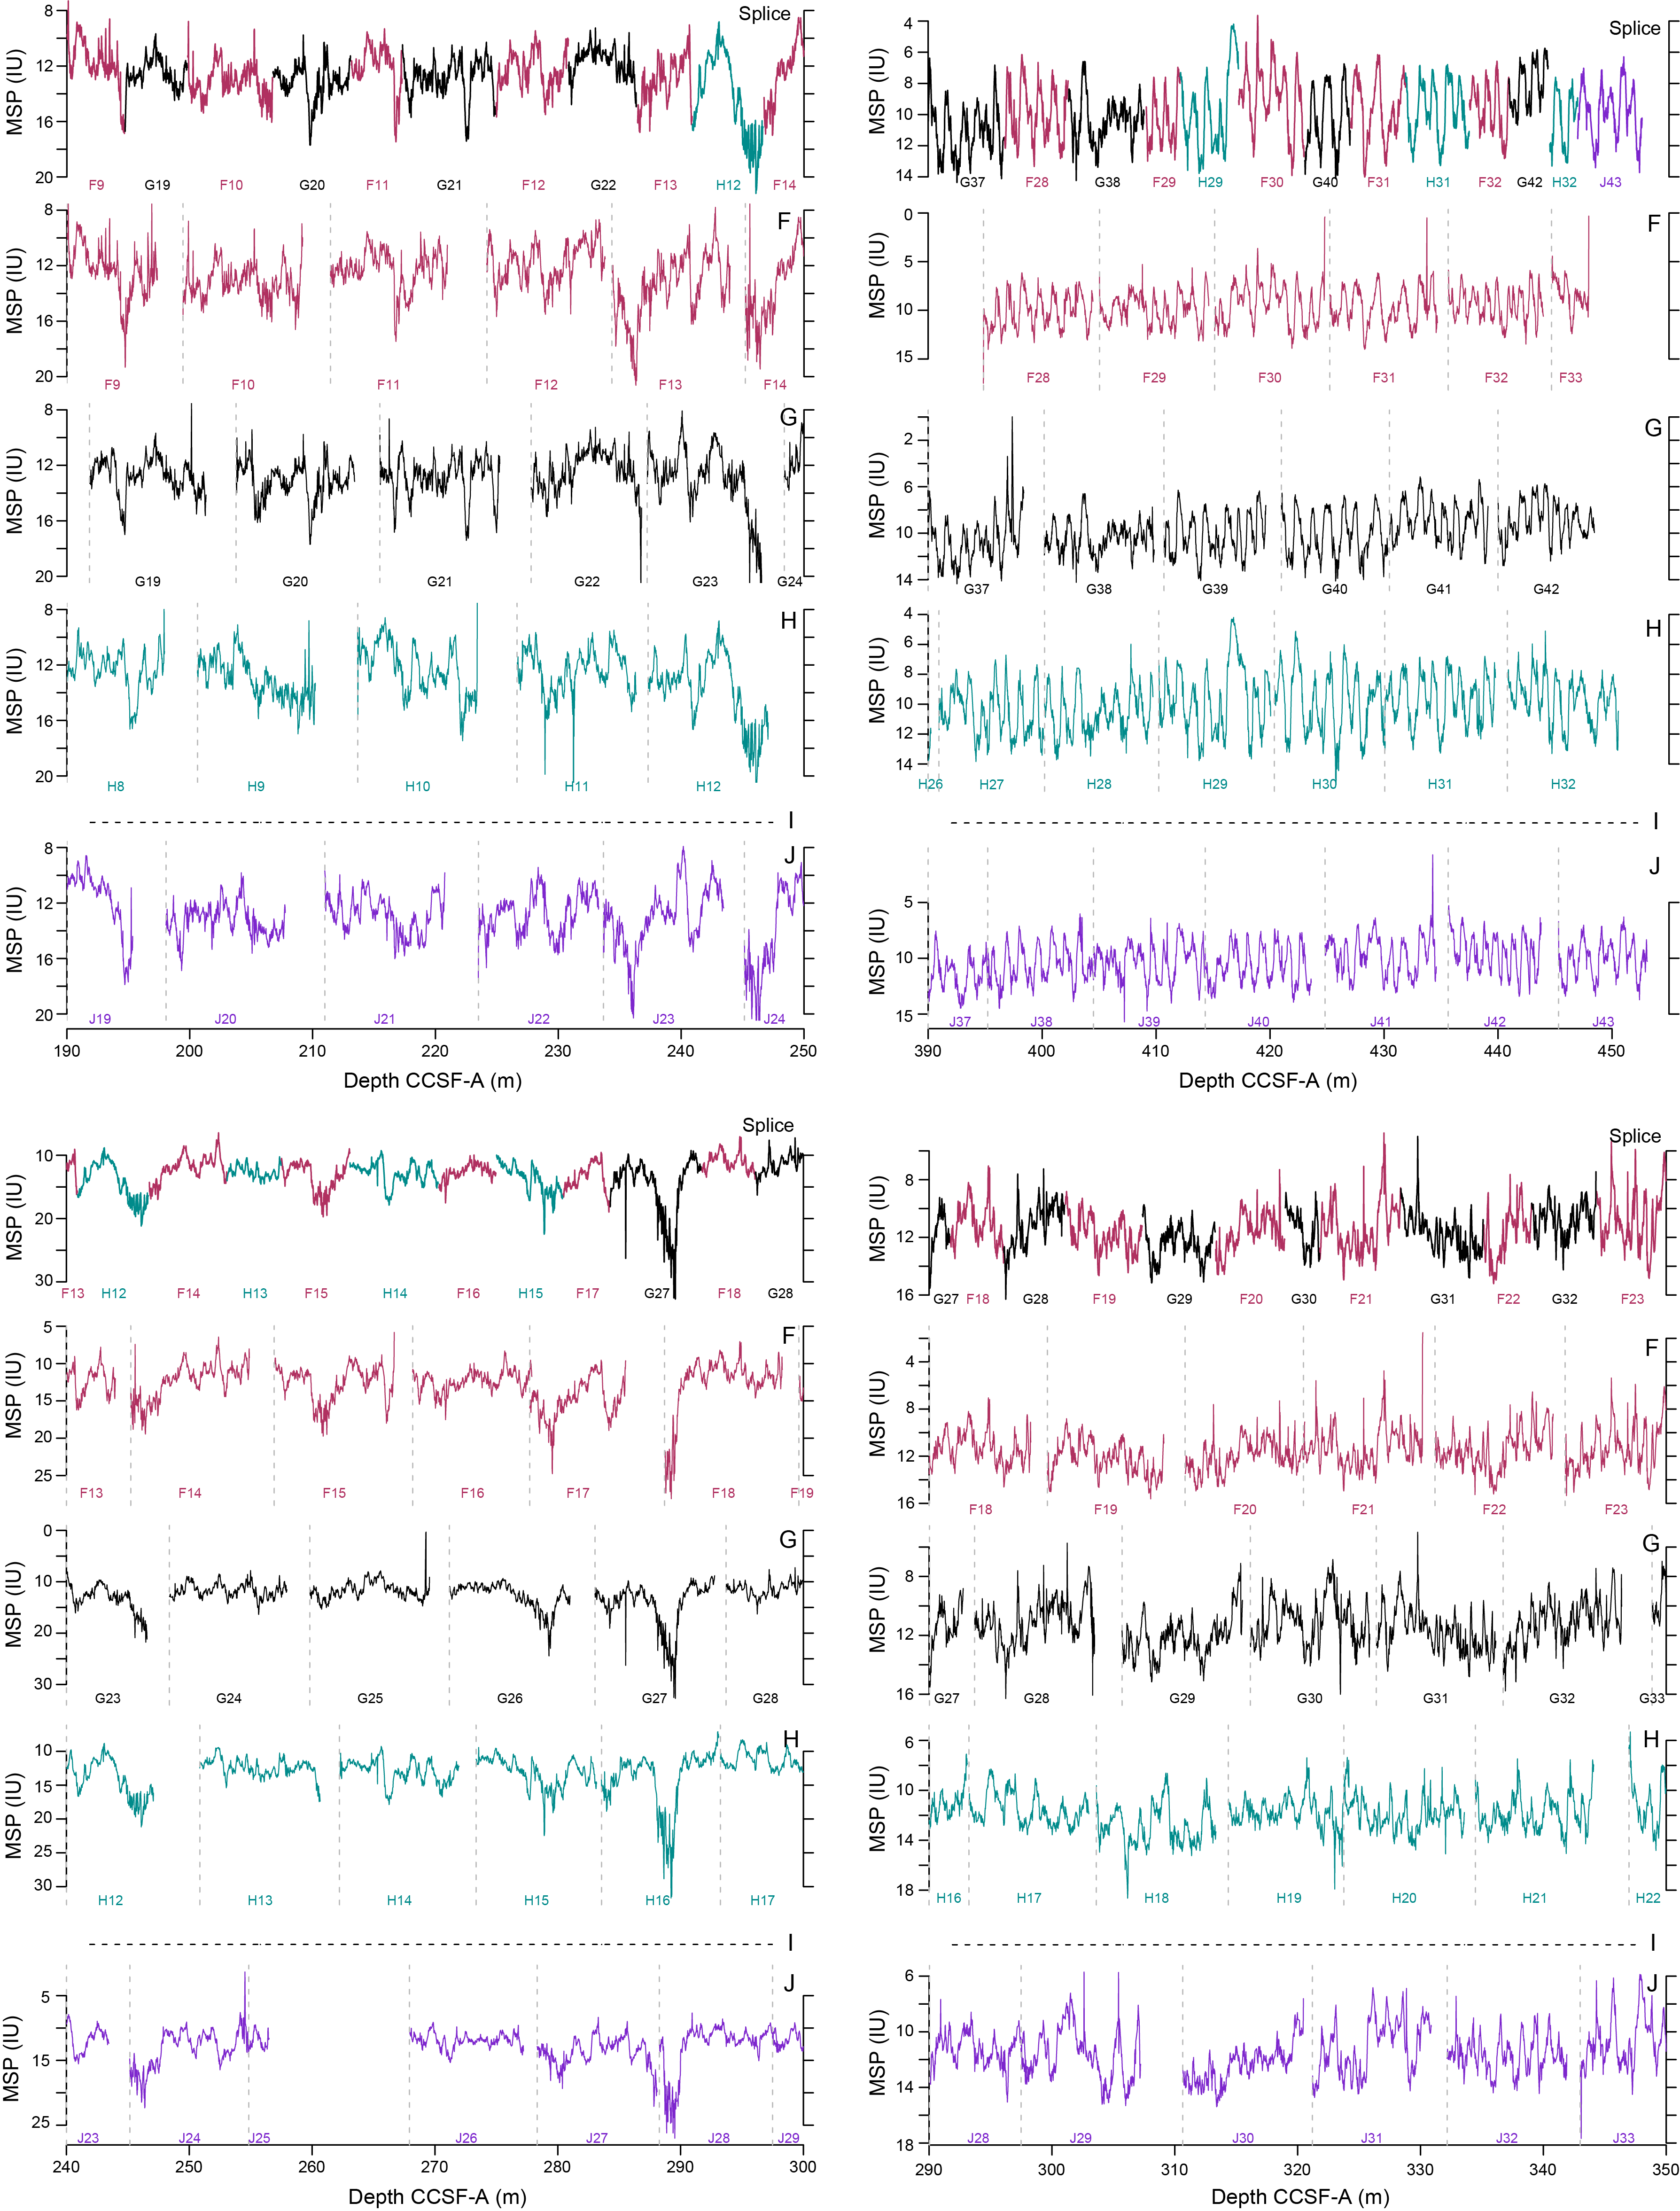
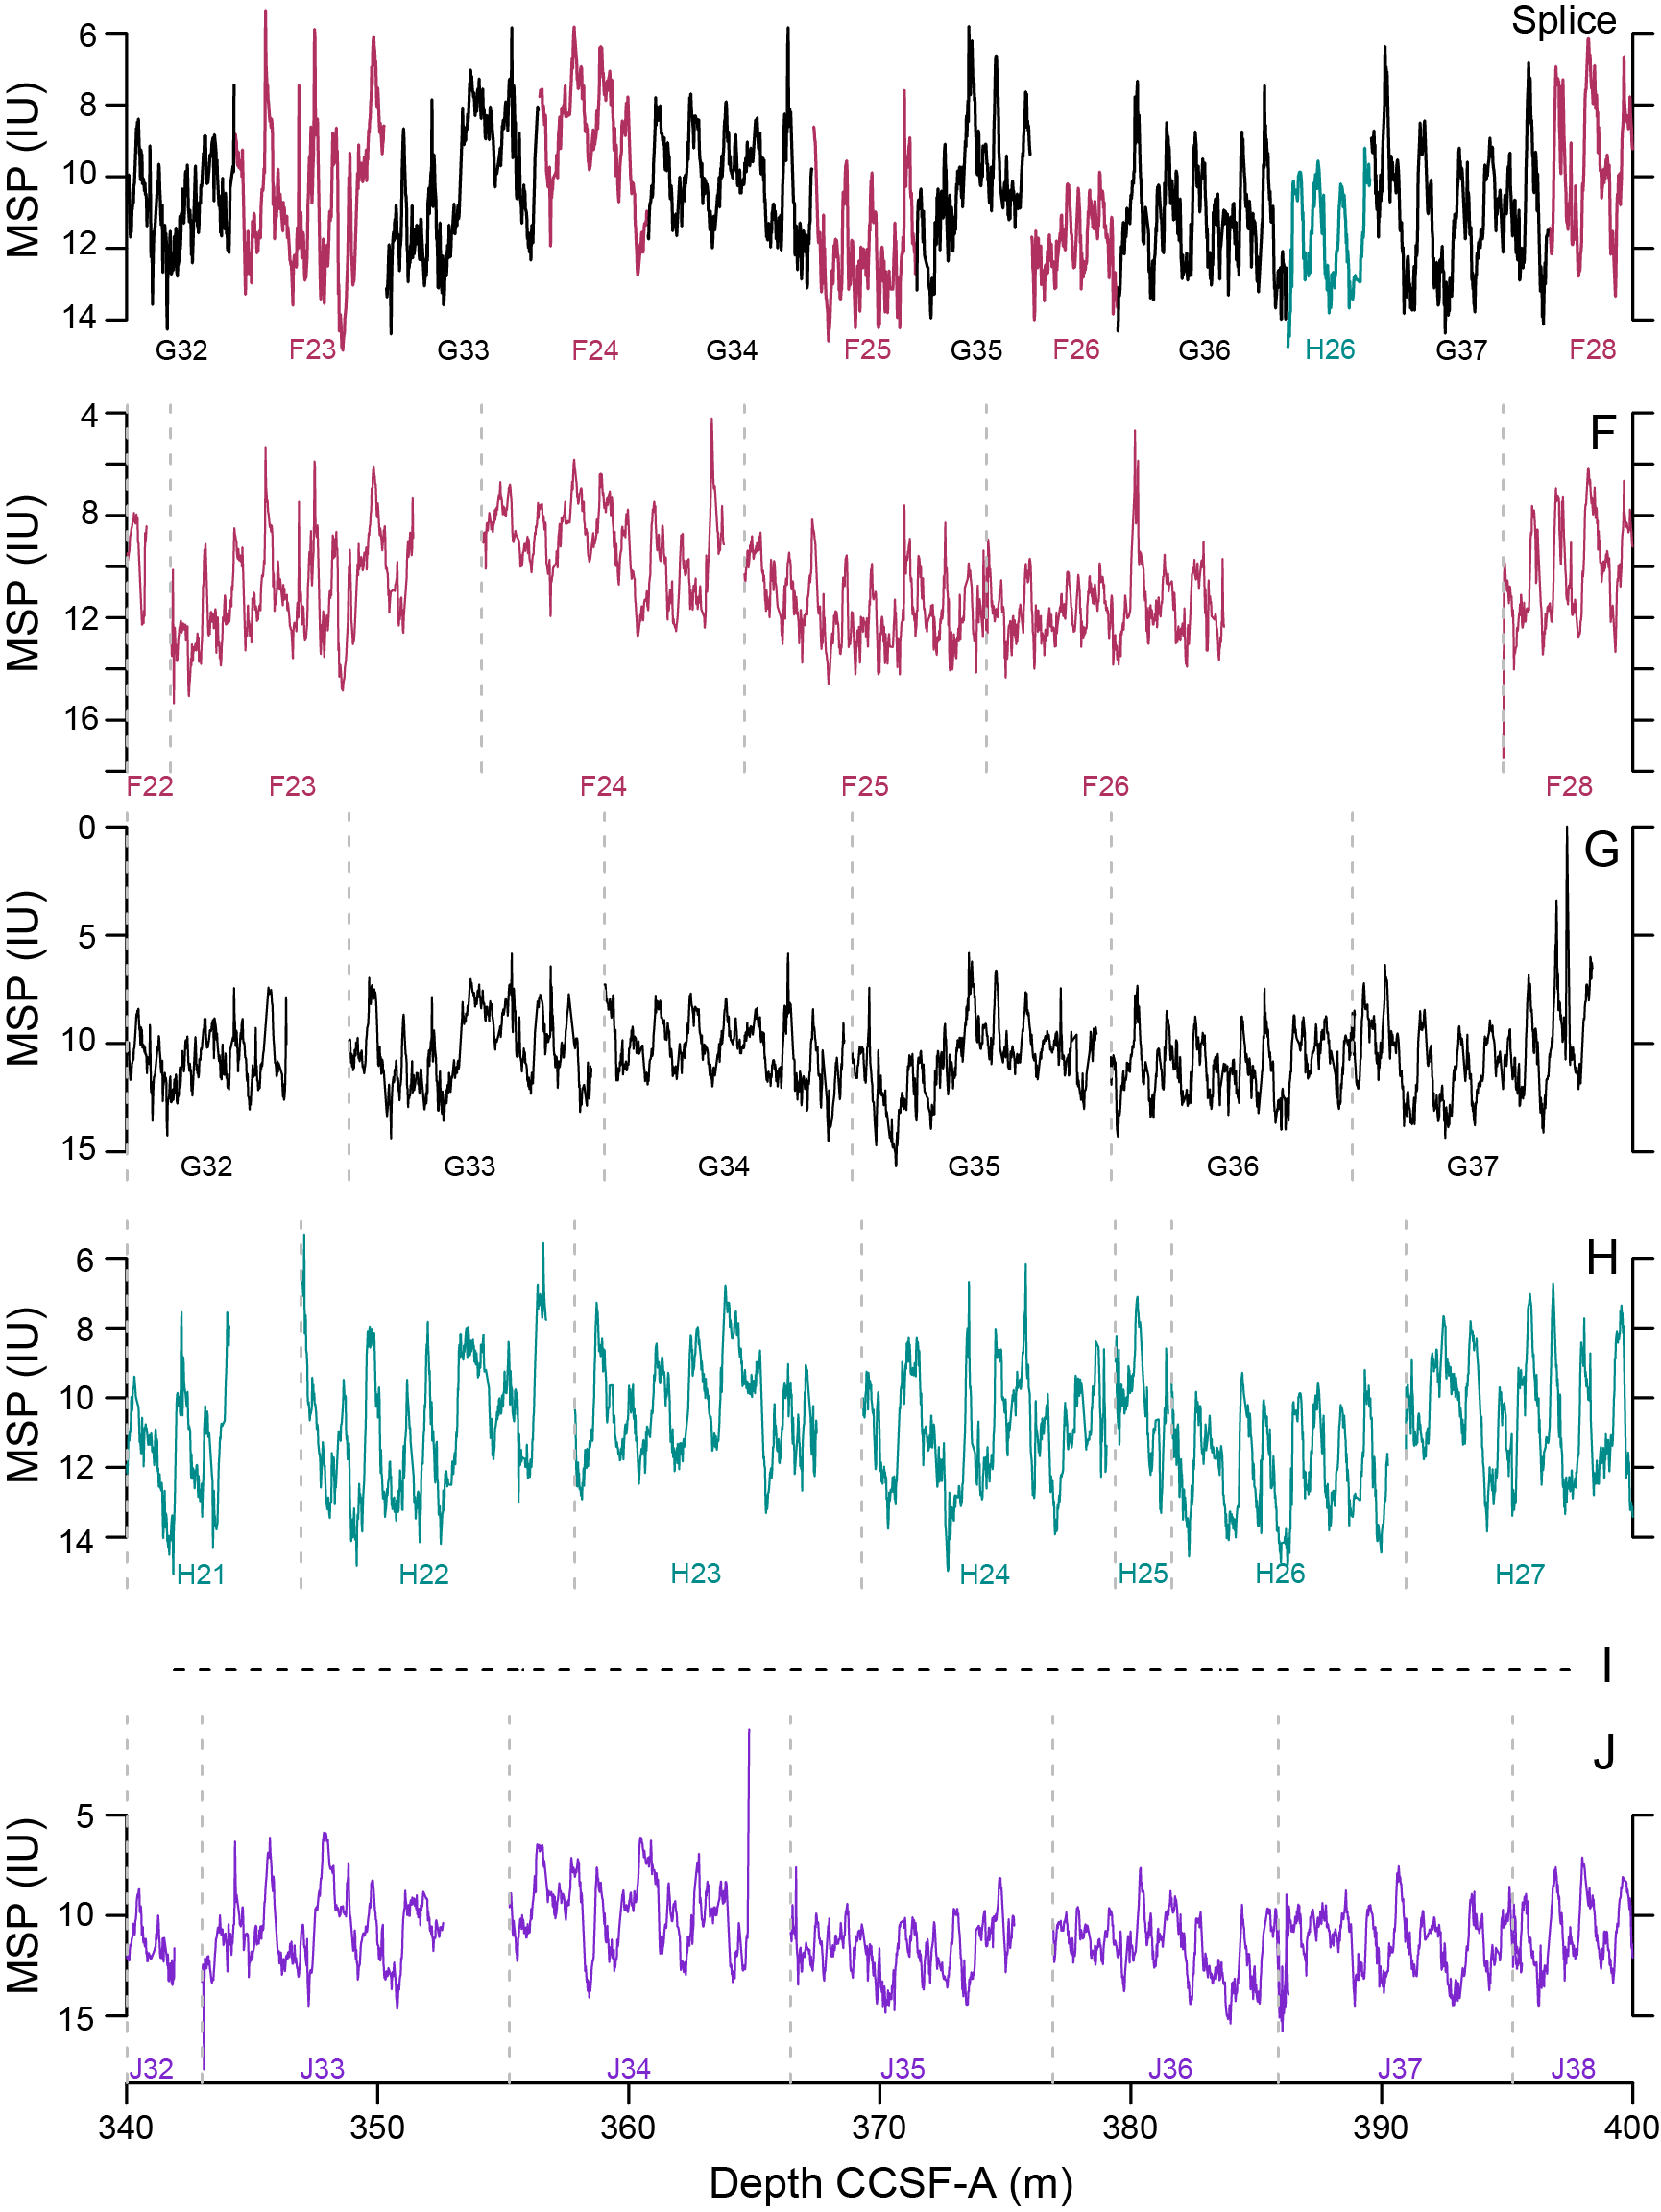
Figure F47. Composite construction.
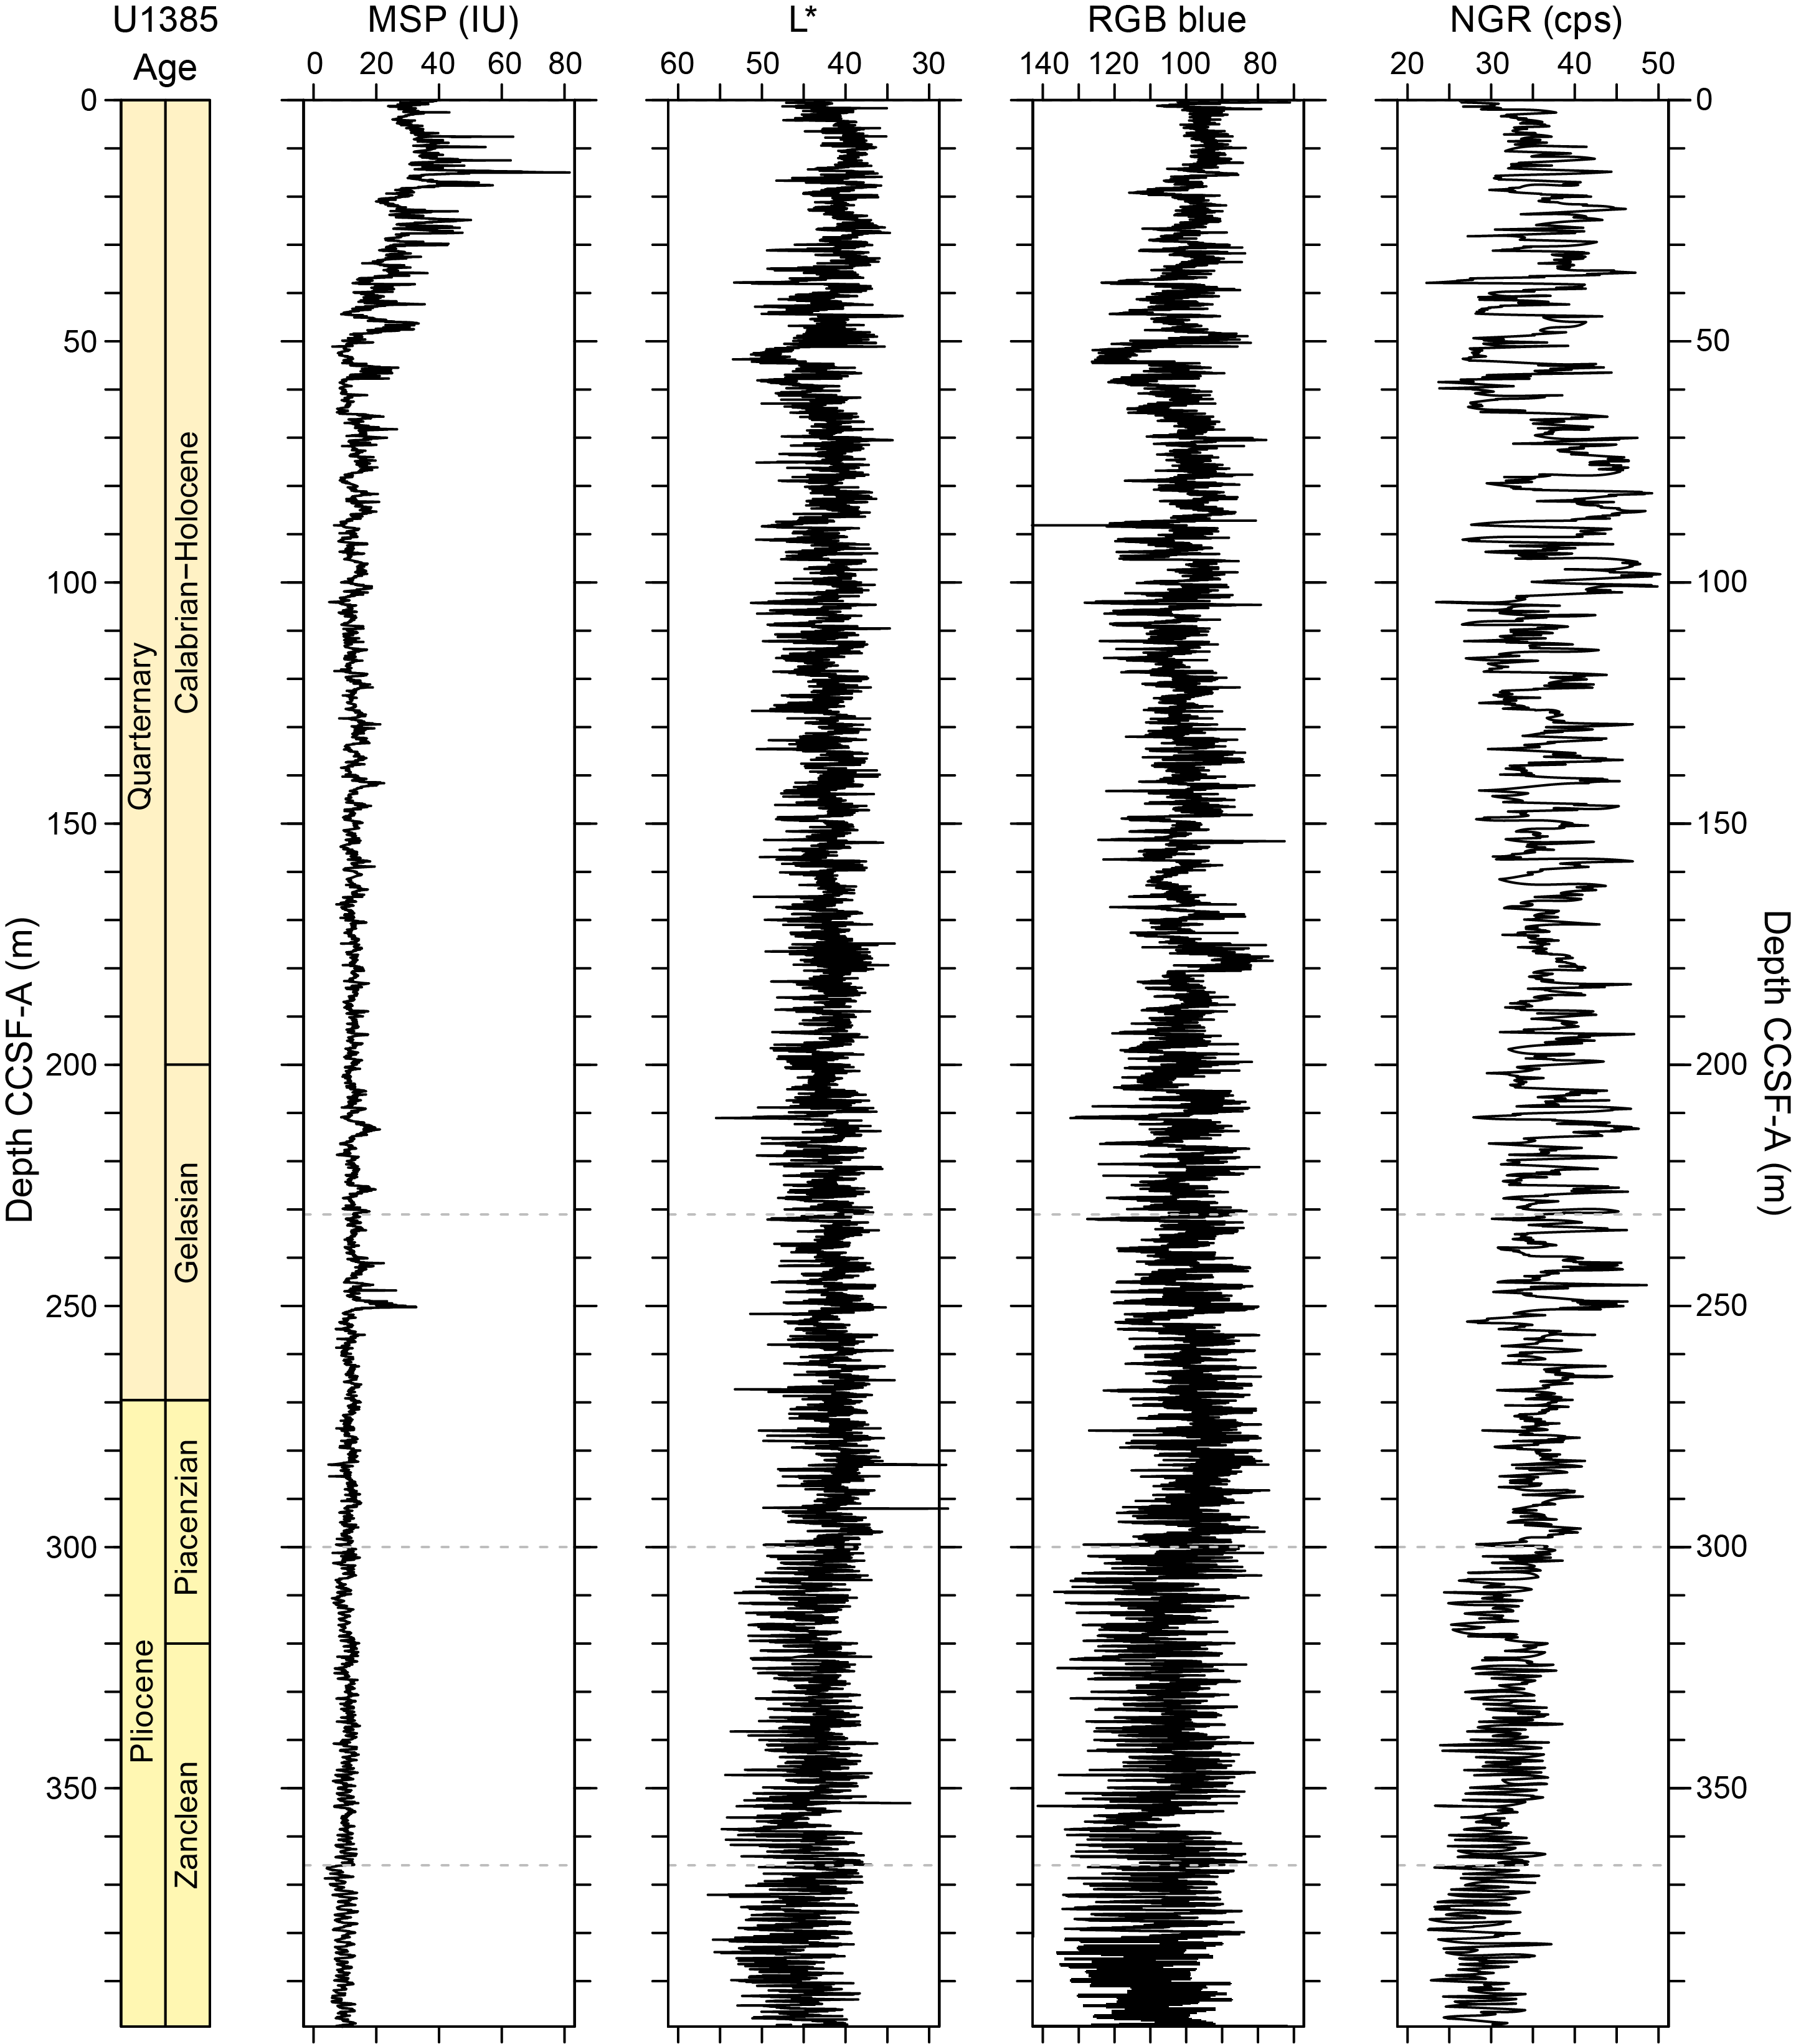
Figure F48. Spliced composite records of SHMSL MSP, L*, RGB blue, and NGR.
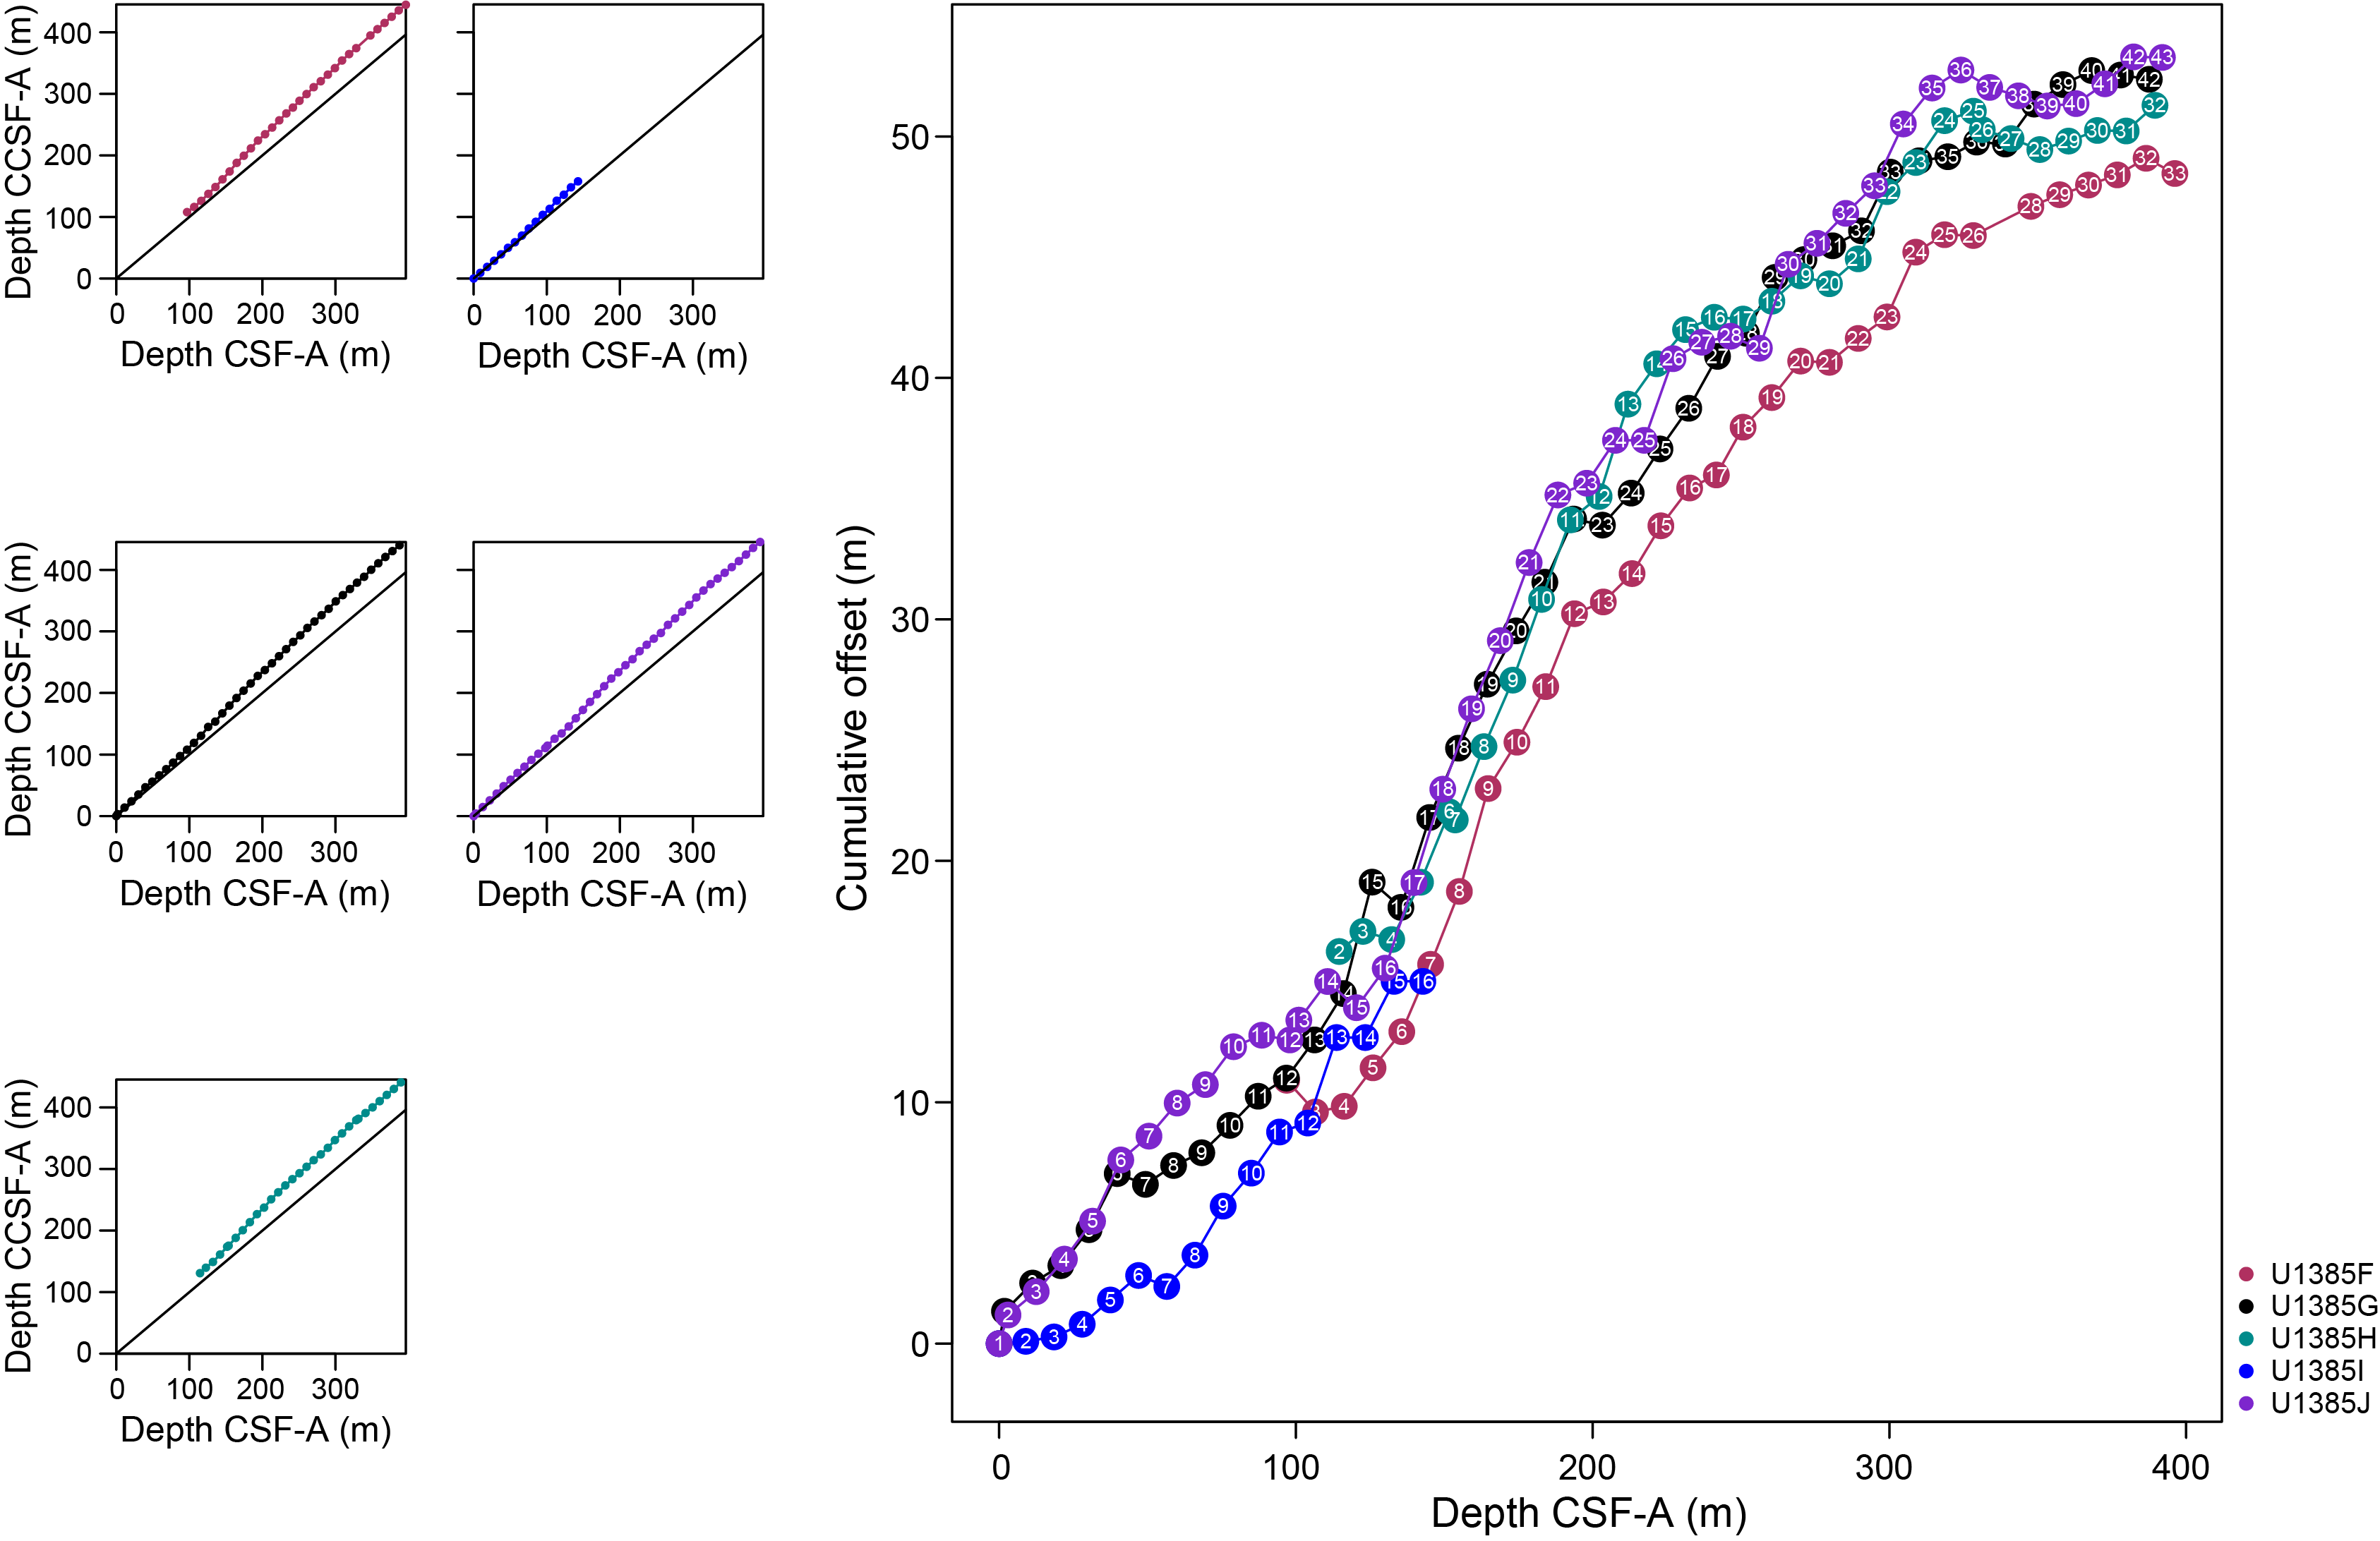
Figure F49. Depth scale comparison.
9.1. Approach
The CCSF-A depth scale is anchored to the mudline of Core 397-U1385I-1H, which is assigned the depth of 0 m CCSF-A. From this anchor, we worked downhole using Correlator to establish a composite stratigraphy on a core-by-core basis. Our general approach was to avoid placing ties (1) on section edges as much as possible, (2) in sections sampled for IW measurements, and (3) in core catcher sections.
A major aid in correlation came from strong high frequency variability in all physical properties signals (MS, NGR, and color reflectance) (Figure F48). All are controlled to the first order by CaCO3 content. In the Pleistocene, this led to a recognizable sequence of events readily correlated to MISs. In the Pliocene, strong amplitude modulation of lithologic variability was observed, likely from eccentricity modulation of precessional pacing. The modulations led to diagnostic packets of higher and lower amplitude lithologic cycles that aided correlation between offset holes.
Note that all volume/mass core measurements (NGR, GRA bulk density, MS, and MSP) will need to be corrected/adjusted for the core diameter change when switching from the APC to the XCB system at each hole. In addition, cores were not thermally equilibrated during WRMSL logging, which may affect the whole-round MS values.
9.2. Gaps
Because of the large number of offset holes, the composite section is very robust and will be checked and further refined with postcruise XRF scanning.
9.3. Growth rate and cumulative offset
The cumulative offset between the CSF-A and CCSF-A depth scales is nearly linear for Holes U1385F–U1385J (Figure F49, left). The growth factor averages 1.1 but varies by core and hole. It grows about 12% in the upper 240 m (285 m CCSF-A) and then negligibly below 300 m CSF-A (350 m CCSF-A) in a pattern very similar to that seen at Sites U1586 and U1587 (Figure F49, right; see Figure F56 in the Site U1586 chapter [Abrantes et al., 2024b]). To compensate for composite section growth, we adopted a strategy similar to that used during Expedition 339 (Expedition 339 Scientists, 2013): converting the CSF-A to a modified CCSF-A scale to bring measurements back to a scale more closely approximating driller's depth. Because of the significant curvature in the depth-depth relationship, a third-order polynomial was required to achieve a good relationship that ran through the origin at the top of the Site U1385 sequence (Figure F50). This modified CCSF-A (CCSF-A*) depth scale is used in Figure F48 because it represents the closest match to the driller's depth. A table for conversion of CCSF-A composite depths to the CCSF-A* depth scale is given in Table T32. Calculation of mass accumulation rates based on the CCSF-A depth scale should account for differential expansion by dividing apparent depth intervals by the appropriate growth factor or by converting to the CCSF-A* scale.
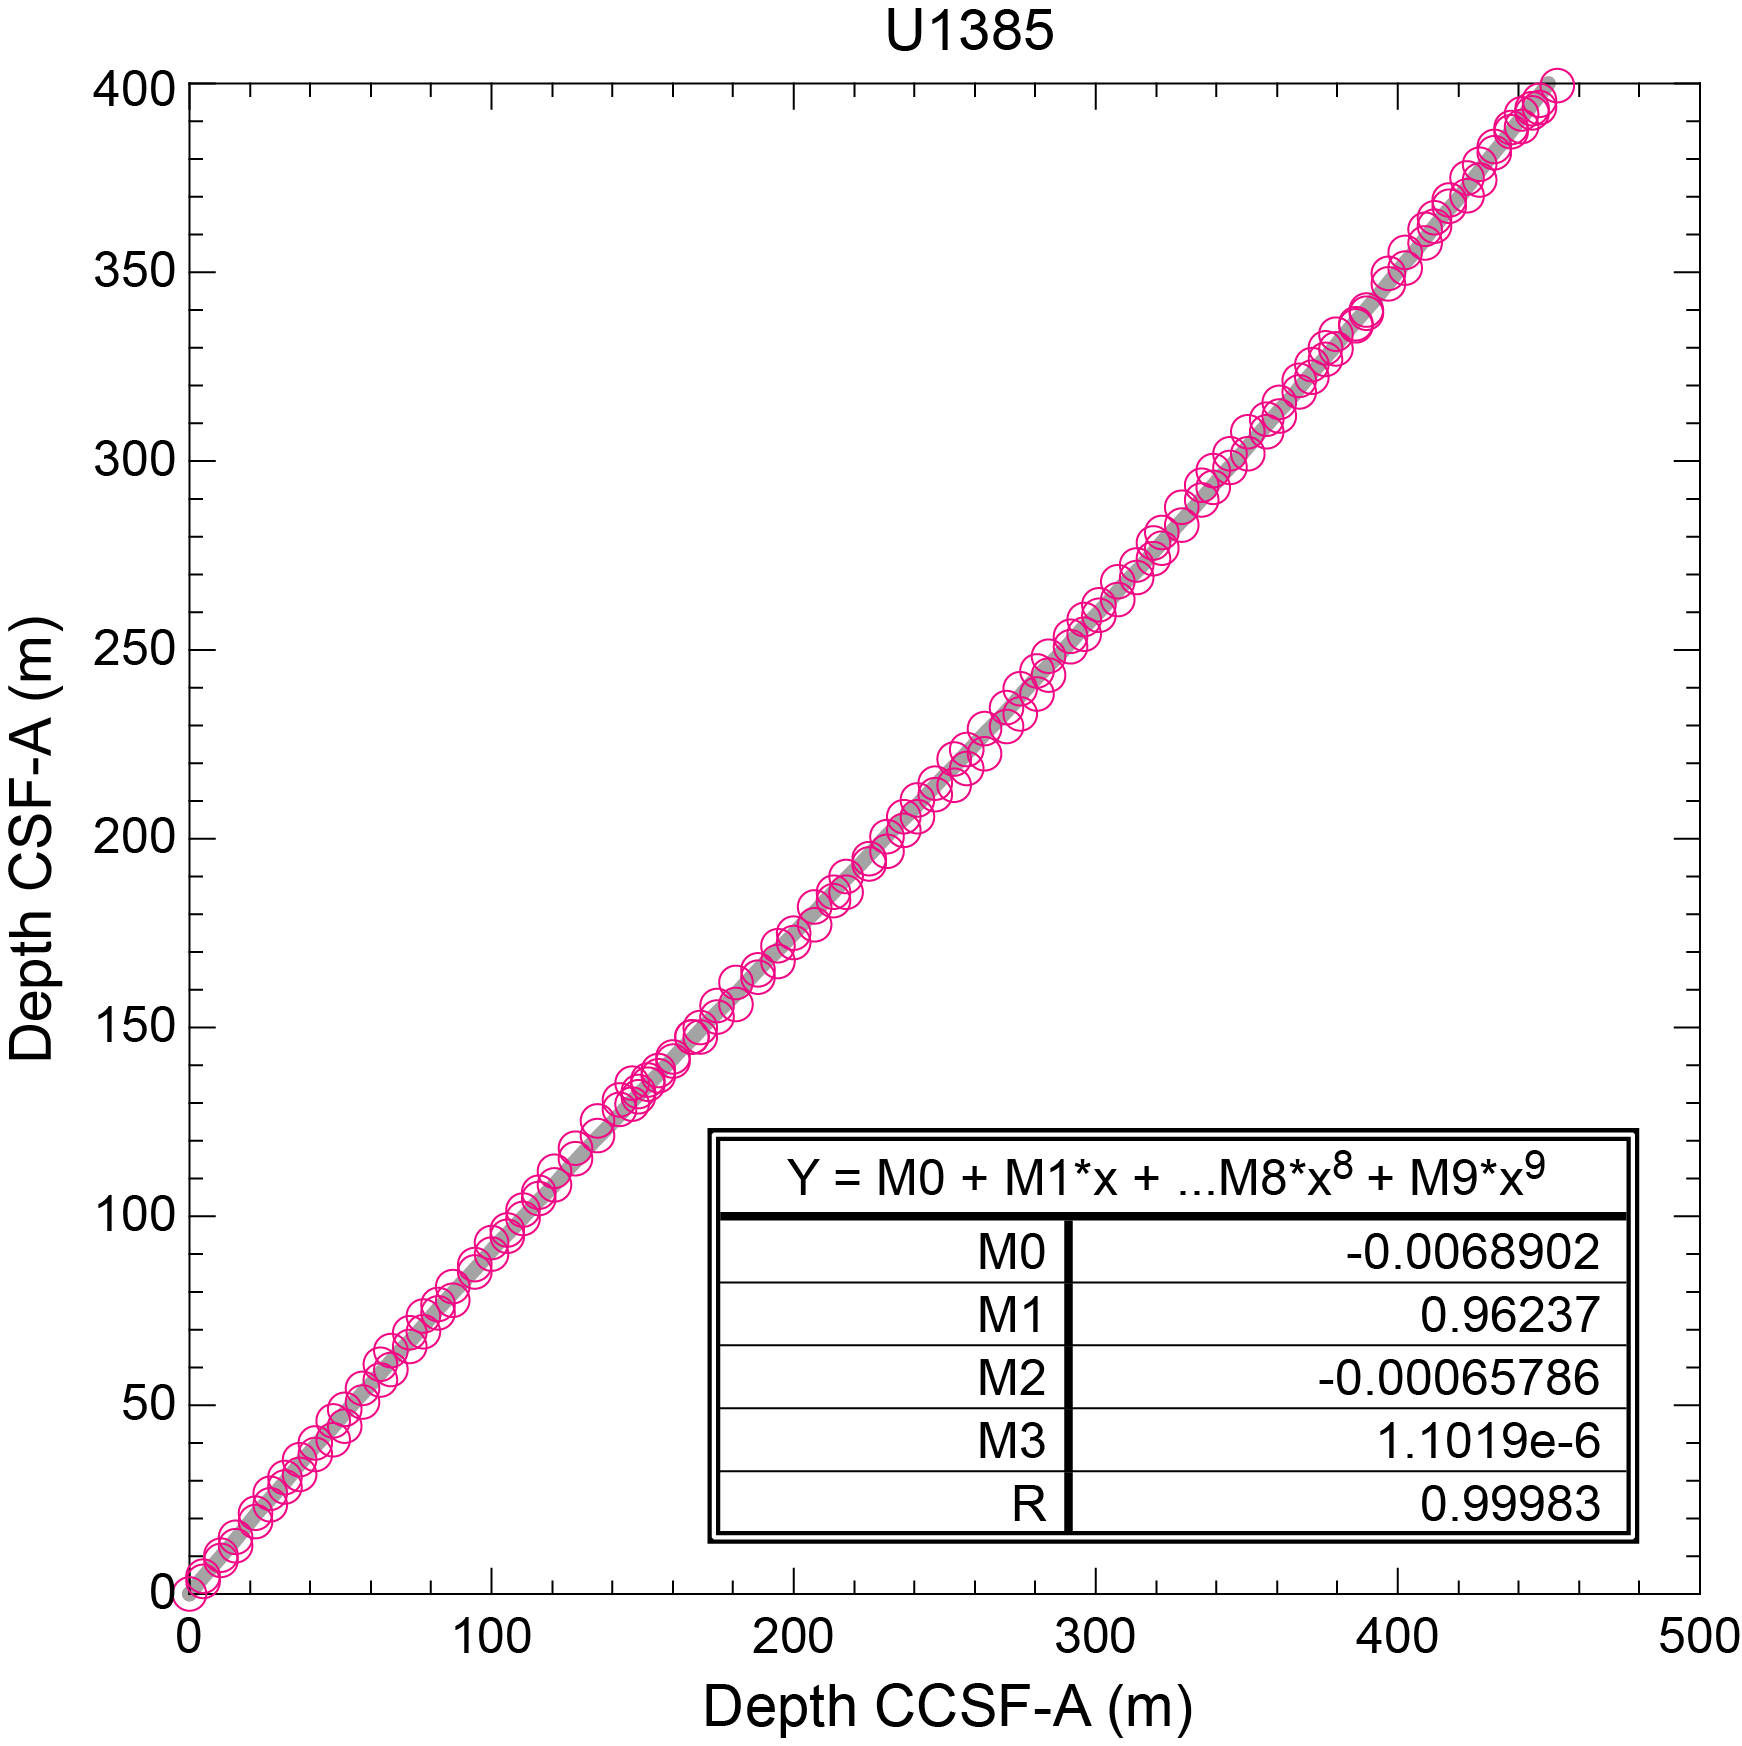
Figure F50. Correlation of splice depth to driller's depth.
References
Abrantes, F., 1991a. Increased upwelling off Portugal during the last glaciation: diatom evidence. Marine Micropaleontology, 17(3–4):285–310. https://doi.org/10.1016/0377-8398(91)90017-Z
Abrantes, F.F., 1991b. Variability of upwelling off NW Africa during the Latest Quaternary: Diatom Evidence. Paleoceanography, 6(4):431–460. https://doi.org/10.1029/91PA00049
Abrantes, F., 2000. 200,000 yr diatom records from Atlantic upwelling sites reveal maximum productivity during LGM and a shift in phytoplankton community structure at 185 000 yr. Earth and Planetary Science Letters, 176(1):7–16. https://doi.org/10.1016/S0012-821X(99)00312-X
Abrantes, F., Hodell, D.A., Alvarez Zarikian, C.A., Brooks, H.L., Clark, W.B., Dauchy-Tric, L.F.B., dos Santos Rocha, V., Flores, J.-A., Herbert, T.D., Hines, S.K.V., Huang, H.-H.M., Ikeda, H., Kaboth-Bahr, S., Kuroda, J., Link, J.M., McManus, J.F., Mitsunaga, B.A., Nana Yobo, L., Pallone, C.T., Pang, X., Peral, M.Y., Salgueiro, E., Sanchez, S., Verma, K., Wu, J., Xuan, C., and Yu, J., 2024a. Expedition 397 methods. In Hodell, D.A., Abrantes, F., Alvarez Zarikian, C.A., and the Expedition 397 Scientists, Iberian Margin Paleoclimate. Proceedings of the International Ocean Discovery Program, 397: College Station, TX (International Ocean Discovery Program). https://doi.org/10.14379/iodp.proc.397.102.2024
Abrantes, F., Hodell, D.A., Alvarez Zarikian, C.A., Brooks, H.L., Clark, W.B., Dauchy-Tric, L.F.B., dos Santos Rocha, V., Flores, J.-A., Herbert, T.D., Hines, S.K.V., Huang, H.-H.M., Ikeda, H., Kaboth-Bahr, S., Kuroda, J., Link, J.M., McManus, J.F., Mitsunaga, B.A., Nana Yobo, L., Pallone, C.T., Pang, X., Peral, M.Y., Salgueiro, E., Sanchez, S., Verma, K., Wu, J., Xuan, C., and Yu, J., 2024b. Site U1586. In Hodell, D.A., Abrantes, F., Alvarez Zarikian, C.A., and the Expedition 397 Scientists, Iberian Margin Paleoclimate. Proceedings of the International Ocean Discovery Program, 397: College Station, TX (International Ocean Discovery Program). https://doi.org/10.14379/iodp.proc.397.103.2024
Abrantes, F., Rodrigues, T., Ventura, C., Santos, C., Roell, U., Voelker, A., and Hodell, D., 2017. Past productivity conditions off SW Iberia at the transition from the 41 ky to the 100 ky world: the record of IODP Sites U1385 and U1391. Geophysical Research Abstracts, 19:EGU2017-9743. https://meetingorganizer.copernicus.org/EGU2017/EGU2017-9743.pdf
Balestra, B., Flores, J.A., Hodell, D.A., Hernández Molina, F.J., and Stow, D.A.V., 2015. Pleistocene calcareous nannofossil biochronology at IODP Site U1385 (Expedition 339). Global and Planetary Change, 135:57–65. https://doi.org/10.1016/j.gloplacha.2015.10.004
Blum, P., 1997. Physical properties handbook: a guide to the shipboard measurement of physical properties of deep-sea cores. Ocean Drilling Program Technical Note, 26. https://doi.org/10.2973/odp.tn.26.1997
BouDagher-Fadel, M.K., 2015. Biostratigraphic and Geological Significance of Planktonic Foraminifera: London (UCL Press). https://doi.org/10.14324/111.9781910634257
De Vleeschouwer, D., Dunlea, A.G., Auer, G., Anderson, C.H., Brumsack, H., de Loach, A., Gurnis, M.C., Huh, Y., Ishiwa, T., Jang, K., Kominz, M.A., März, C., Schnetger, B., Murray, R.W., Pälike, H., and Expedition 356 Shipboard Scientists, 2017. Quantifying K, U, and Th contents of marine sediments using shipboard natural gamma radiation spectra measured on DV JOIDES Resolution. Geochemistry, Geophysics, Geosystems, 18(3):1053–1064. https://doi.org/10.1002/2016GC006715
Expedition 339 Scientists, 2013. Site U1385. In Stow, D.A.V., Hernández-Molina, F.J., Alvarez Zarikian, C.A., and the Expedition 339 Scientists, Proceedings of the Integrated Ocean Drilling Program. 339: Tokyo (Integrated Ocean Drilling Program Management International, Inc.). https://doi.org/doi:10.2204/iodp.proc.339.103.2013
Gradstein, F.M., Ogg, J.G., Schmitz, M.D., and Ogg, G.M. (Eds.), 2020. The Geologic Time Scale 2020: Amsterdam (Elsevier BV). https://doi.org/10.1016/C2020-1-02369-3
Heard, T.G., Pickering, K.T., and Clark, J.D., 2014. Ichnofabric characterization of a deep-marine clastic system: a subsurface study of the middle Eocene Ainsa System, Spanish Pyrenees. Sedimentology, 61(5):1298–1331. https://doi.org/10.1111/sed.12101
Hodell, D., Lourens, L., Crowhurst, S., Konijnendijk, T., Tjallingii, R., Jiménez-Espejo, F., Skinner, L., Tzedakis, P.C., and the Shackleton Site Project Members, 2015. A reference time scale for Site U1385 (Shackleton Site) on the SW Iberian Margin. Global and Planetary Change, 133:49–64. https://doi.org/10.1016/j.gloplacha.2015.07.002
Hodell, D.A., Abrantes, F., Alvarez Zarikian, C.A., Brooks, H.L., Clark, W.B., Dauchy-Tric, L.F.B., dos Santos Rocha, V., Flores, J.-A., Herbert, T.D., Hines, S.K.V., Huang, H.-H.M., Ikeda, H., Kaboth-Bahr, S., Kuroda, J., Link, J.M., McManus, J.F., Mitsunaga, B.A., Nana Yobo, L., Pallone, C.T., Pang, X., Peral, M.Y., Salgueiro, E., Sanchez, S., Verma, K., Wu, J., Xuan, C., and Yu, J., 2024. Site U1587. In Hodell, D.A., Abrantes, F., Alvarez Zarikian, C.A., and the Expedition 397 Scientists, Iberian Margin Paleoclimate. Proceedings of the International Ocean Discovery Program, 397: College Station, TX (International Ocean Discovery Program). https://doi.org/10.14379/iodp.proc.397.104.2024
Hodell, D.A., Crowhurst, S.J., Lourens, L., Margari, V., Nicolson, J., Rolfe, J.E., Skinner, L.C., Thomas, N.C., Tzedakis, P.C., Mleneck-Vautravers, M.J., and Wolff, E.W., 2023. A 1.5-million-year record of orbital and millennial climate variability in the North Atlantic. Climate of the Past, 19(3):607–636. https://doi.org/10.5194/cp-19-607-2023
Lancis, C., and Flores, J.-A., 2006. A new biostratigraphically significant calcareous nannofossil species in the Early Pliocene of the Mediterranean. Micropaleontology, 52(5):477–481. https://doi.org/10.2113/gsmicropal.52.5.477
Martini, E., 1971. Standard Tertiary and Quaternary calcareous nannoplankton zonation. Proceedings of the Second Planktonic Conference, Roma, 1970:739–785.
Meyers, P.A., 1994. Preservation of elemental and isotopic source identification of sedimentary organic matter. Chemical Geology, 114(3–4):289–302. https://doi.org/10.1016/0009-2541(94)90059-0
Meyers, P.A., 1997. Organic geochemical proxies of paleoceanographic, paleolimnologic, and paleoclimatic processes. Organic Geochemistry, 27(5–6):213–250. https://doi.org/10.1016/S0146-6380(97)00049-1
Okada, H., and Bukry, D., 1980. Supplementary modification and introduction of code numbers to the low-latitude coccolith biostratigraphic zonation (Bukry, 1973; 1975). Marine Micropaleontology, 5(3):321–325. https://doi.org/10.1016/0377-8398(80)90016-X
Paytan, A., and Griffith, E.M., 2007. Marine barite: recorder of variations in ocean export productivity. Deep Sea Research, Part II: Topical Studies in Oceanography, 54(5–7):687–705. https://doi.org/10.1016/j.dsr2.2007.01.007
Raffi, I., Backman, J., Fornaciari, E., Pälike, H., Rio, D., Lourens, L., and Hilgen, F., 2006. A review of calcareous nannofossil astrobiochronology encompassing the past 25 million years. Quaternary Science Reviews, 25(23):3113–3137. https://doi.org/10.1016/j.quascirev.2006.07.007
Reitz, A., Pfeifer, K., de Lange, G.J., and Klump, J., 2004. Biogenic barium and the detrital Ba/Al ratio: a comparison of their direct and indirect determination. Marine Geology, 204(3–4):289–300. https://doi.org/10.1016/S0025-3227(04)00004-0
Stow, D.A.V., Hernández-Molina, F.J., Alvarez Zarikian, C.A., and the Expedition 339 Scientists, 2013. Proc. IODP, 339: Tokyo (Integrated Ocean Drilling Program Management International, Inc.). https://doi.org/10.2204/iodp.proc.339.2013
Thomson, J., Nixon, S., Summerhayes, C.P., Rohling, E.J., Schönfeld, J., Zahn, R., Grootes, P., Abrantes, F., Gaspar, L., and Vaquiero, S., 2000. Enhanced productivity on the Iberian margin during glacial/interglacial transitions revealed by barium and diatoms. Journal of the Geological Society, 157(3):667–677. doi:10.1144/jgs.157.3.667
Thomson, J., Nixon, S., Summerhayes, C.P., Schönfeld, J., Zahn, R., and Grootes, P., 1999. Implications for sedimentation changes on the Iberian margin over the last two glacial/interglacial transitions from (230Thexcess)0 systematics. Earth and Planetary Science Letters, 165(3):255–270. https://doi.org/10.1016/S0012-821X(98)00265-9
Turchyn, A.V., Antler, G., Byrne, D., Miller, M., and Hodell, D.A., 2016. Microbial sulfur metabolism evidenced from pore fluid isotope geochemistry at Site U1385. Global and Planetary Change, 141:82–90. https://doi.org/10.1016/j.gloplacha.2016.03.004
Ventura, C., Abrantes, F., Loureiro, I., and Voelker, A.H.L., 2017. Data report: diatom and silicoflagellate records of marine isotope stages 25–27 at IODP Site U1387, Faro Drift. In Stow, D.A.V., Hernández-Molina, F.J., Alvarez Zarikian, C.A., and the Expedition 339 Scientists, Proceedings of the Integrated Ocean Drilling Program. 339: Tokyo (Integrated Ocean Drilling Program Management International, Inc.). https://doi.org/10.2204/iodp.proc.339.202.2017
Wade, B.S., Pearson, P.N., Berggren, W.A., and Pälike, H., 2011. Review and revision of Cenozoic tropical planktonic foraminiferal biostratigraphy and calibration to the geomagnetic polarity and astronomical time scale. Earth-Science Reviews, 104(1–3):111–142. https://doi.org/10.1016/j.earscirev.2010.09.003
Wei, K.-Y., 1994. Stratophenetic tracing of phylogeny using SIMCA pattern recognition technique: a case study of the late Neogene planktic foraminifera Globoconella clade. Paleobiology, 20(1):52–65. https://www.jstor.org/stable/2401150
Wu, J., Böning, P., Pahnke, K., Tachikawa, K., and de Lange, G.J., 2016. Unraveling North-African riverine and eolian contributions to central Mediterranean sediments during Holocene sapropel S1 formation. Quaternary Science Reviews, 152:31–48. https://doi.org/10.1016/j.quascirev.2016.09.029
Xuan, C., and Channell, J.E.T., 2009. UPmag: MATLAB software for viewing and processing u channel or other pass-through paleomagnetic data. Geochemistry Geophysics Geosystems, 10:Q10Y10. https://doi.org/10.1029/2009GC002584
Zitellini, N., Gràcia, E., Matias, L., Terrinha, P., Abreu, M.A., DeAlteriis, G., Henriet, J.P., Dañobeitia, J.J., Masson, D.G., Mulder, T., Ramella, R., Somoza, L., and Diez, S., 2009. The quest for the Africa–Eurasia plate boundary west of the Strait of Gibraltar. Earth and Planetary Science Letters, 280(1–4):13–50. https://doi.org/10.1016/j.epsl.2008.12.005