Hodell, D.A., Abrantes, F., Alvarez Zarikian, C.A., and the Expedition 397 Scientists
Proceedings of the International Ocean Discovery Program Volume 397
publications.iodp.org
https://doi.org/10.14379/iodp.proc.397.106.2024
Site U15881
![]() F. Abrantes,
F. Abrantes,
![]() D.A. Hodell,
D.A. Hodell,
![]() C.A. Alvarez Zarikian,
C.A. Alvarez Zarikian,
![]() H.L. Brooks,
H.L. Brooks,
![]() W.B. Clark,
W.B. Clark,
![]() L.F.B. Dauchy-Tric,
L.F.B. Dauchy-Tric,
![]() V. dos Santos Rocha,
V. dos Santos Rocha,
![]() J.-A. Flores,
J.-A. Flores,
![]() T.D. Herbert,
T.D. Herbert,
![]() S.K.V. Hines,
S.K.V. Hines,
![]() H.-H.M. Huang,
H.-H.M. Huang,
![]() H. Ikeda,
H. Ikeda,
![]() S. Kaboth-Bahr,
S. Kaboth-Bahr,
![]() J. Kuroda,
J. Kuroda,
![]() J.M. Link,
J.M. Link,
![]() J.F. McManus,
J.F. McManus,
![]() B.A. Mitsunaga,
B.A. Mitsunaga,
![]() L. Nana Yobo,
L. Nana Yobo,
![]() C.T. Pallone,
C.T. Pallone,
![]() X. Pang,
X. Pang,
![]() M.Y. Peral,
M.Y. Peral,
![]() E. Salgueiro,
E. Salgueiro,
![]() S. Sanchez,
S. Sanchez,
![]() K. Verma,
K. Verma,
![]() J. Wu,
J. Wu,
![]() C. Xuan, and
C. Xuan, and
![]() J. Yu2
J. Yu2
1 Abrantes, F., Hodell, D.A., Alvarez Zarikian, C.A., Brooks, H.L., Clark, W.B., Dauchy-Tric, L.F.B., dos Santos Rocha, V., Flores, J.-A., Herbert, T.D., Hines, S.K.V., Huang, H.-H.M., Ikeda, H., Kaboth-Bahr, S., Kuroda, J., Link, J.M., McManus, J.F., Mitsunaga, B.A., Nana Yobo, L., Pallone, C.T., Pang, X., Peral, M.Y., Salgueiro, E., Sanchez, S., Verma, K., Wu, J., Xuan, C., and Yu, J., 2024. Site U1588. In Hodell, D.A., Abrantes, F., Alvarez Zarikian, C.A., and the Expedition 397 Scientists, Iberian Margin Paleoclimate. Proceedings of the International Ocean Discovery Program, 397: College Station, TX (International Ocean Discovery Program). https://doi.org/10.14379/iodp.proc.397.106.2024
2 Expedition 397 Scientists' affiliations.
1. Background and objectives
Site U1588 lies on the broad, gently inclined middle-slope region of the Promontório dos Príncipes de Avis (PPA) on the southwestern Iberian margin (Figures F1, F2, F3, F4). It is the shallowest (1339 meters below sea level [mbsl]) and the closest site to the coast drilled during Expedition 397. Seismic data indicate the location is part of an extensive plastered sediment drift deposit formed under the influence of Mediterranean Outflow Water (MOW) that extends from the Gulf of Cádiz along the Portuguese margin (Hernández-Molina et al., 2003, 2006; Llave et al., 2006).
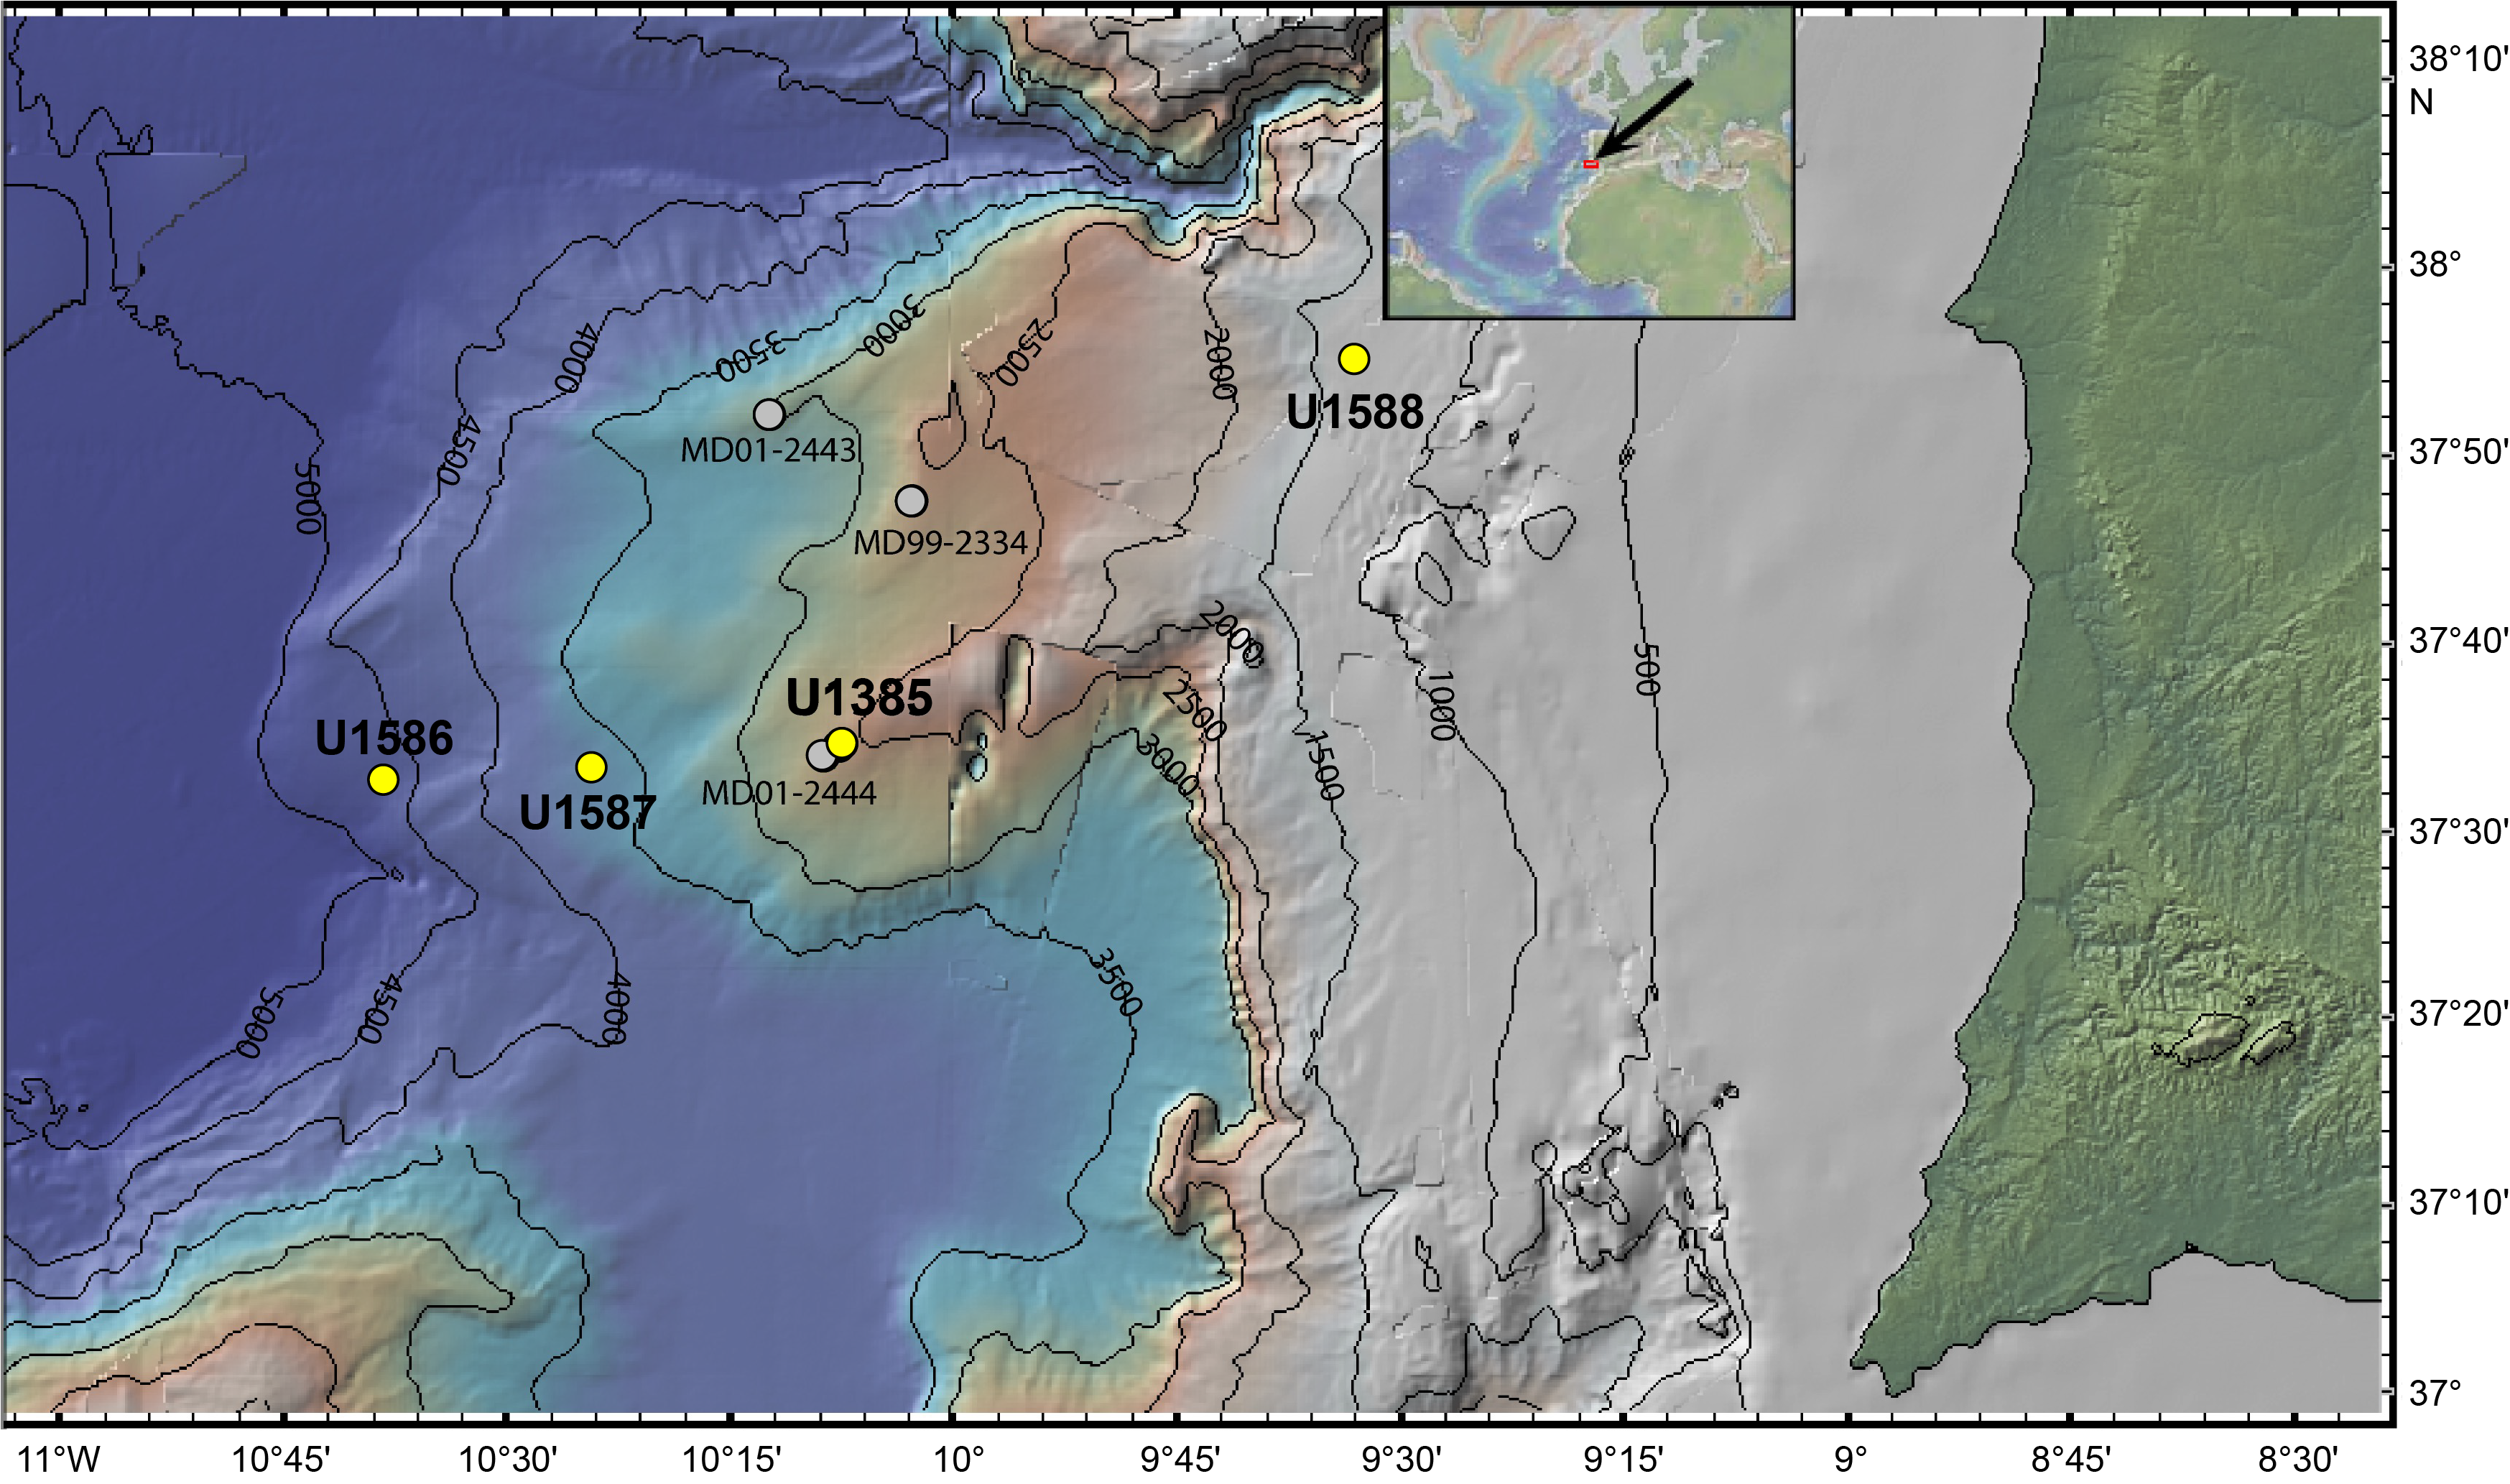
Figure F1. Sites U1586, U1587, U1385, U1588, and U1391.
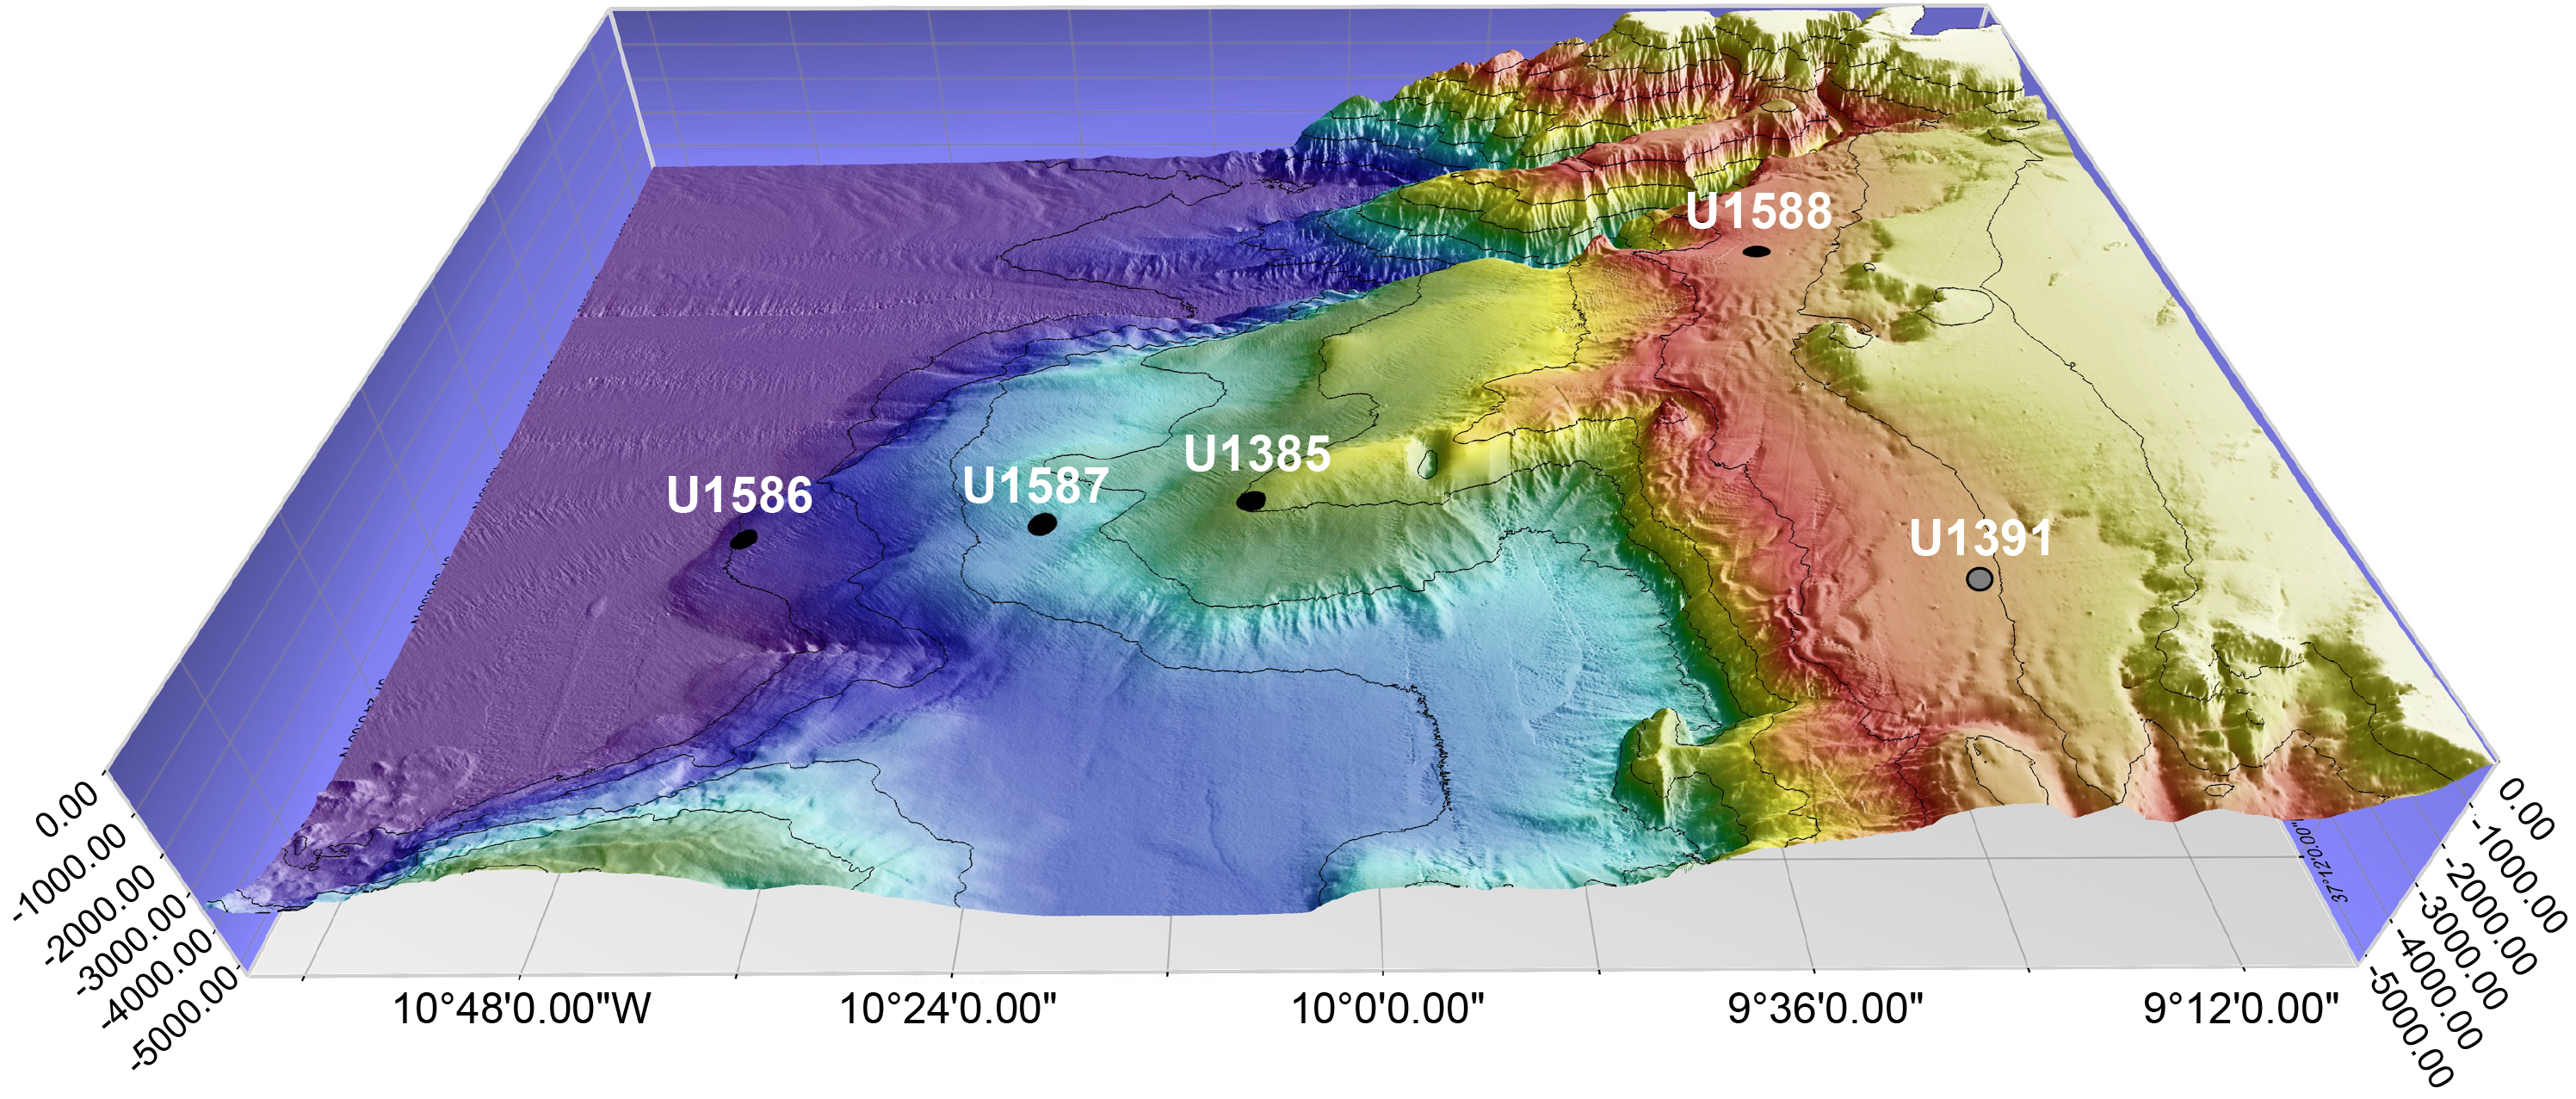
Figure F2. Expedition 397 sites.
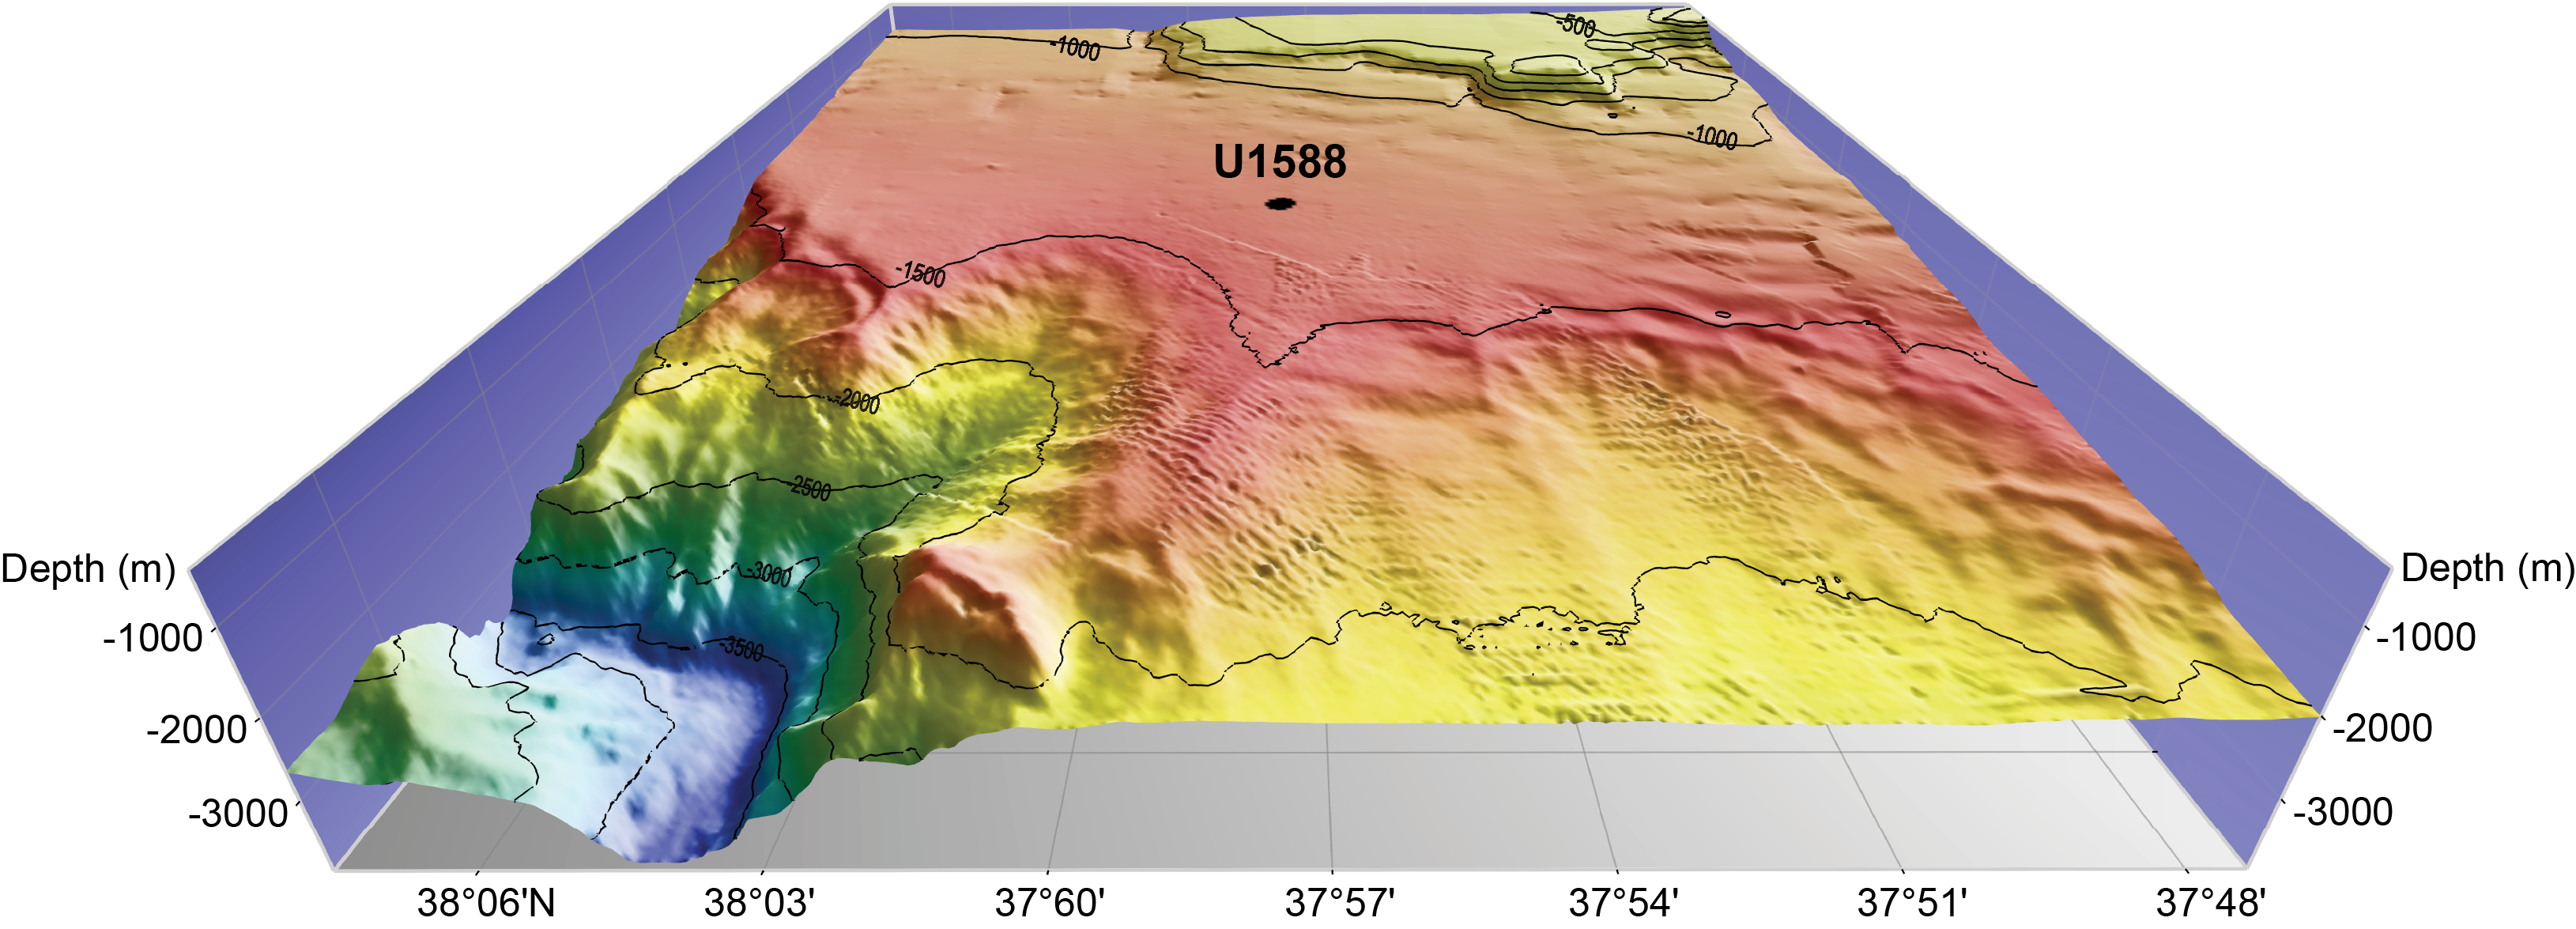
Figure F3. Site U1588 location.
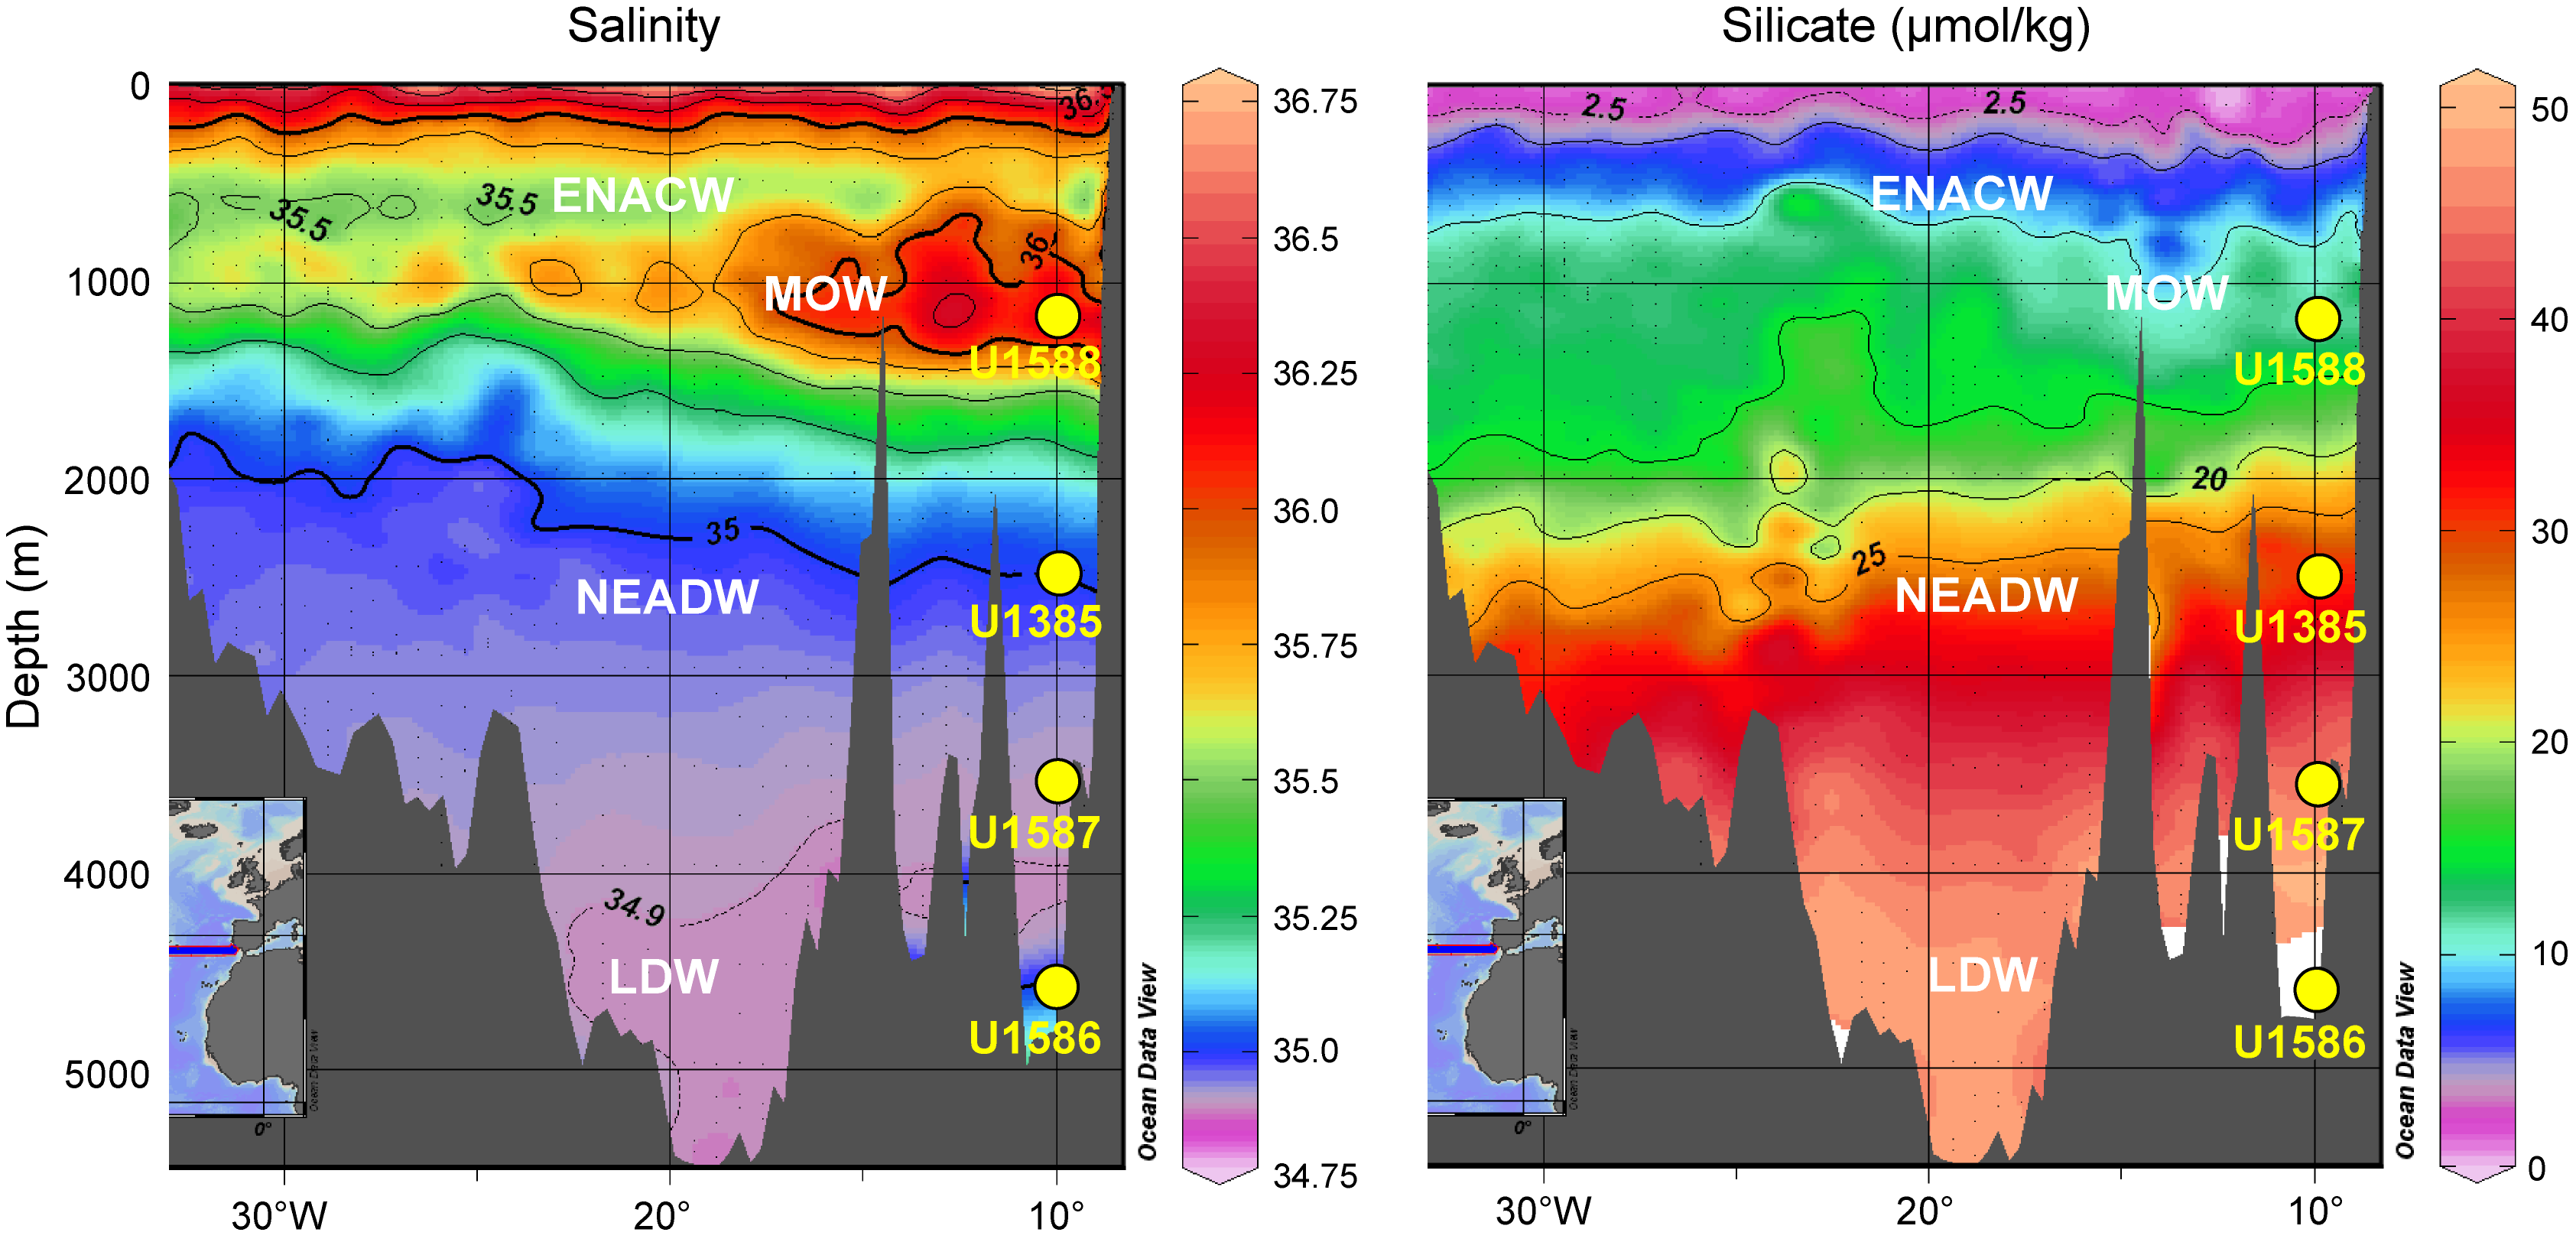
Figure F4. Salinity and silicate profiles.
Site U1588 is positioned on Seismic Line TGS-NOPEC PD00-613 (Figures F5, F6) about 8 km northeast of the intersection with Seismic Line TGS-NOPEC PD00-510 (Figure F7), where the distal part of the contourite depositional system occurs as a highly expanded sedimentary record (Hernández-Molina et al., 2014). The combination of Site U1588 (1339 mbsl) and the intermediate, MOW-influenced sites drilled during Expedition 339 (560–1073 mbsl) span the full depth range of the MOW. The record of Site U1588 will be compared with the deeper sites of Expedition 397 (2591–4692 mbsl), which are removed from contourite input and are under the influence of Northeast Atlantic Deep Water (NEADW) and Lower Deep Water (LDW) (Figure F4). Expedition 339 and 397 sites will constitute a bathymetric transect from 560 to 4691 mbsl to be used for paleoconductivity-temperature-depth (paleo-CTD) studies.
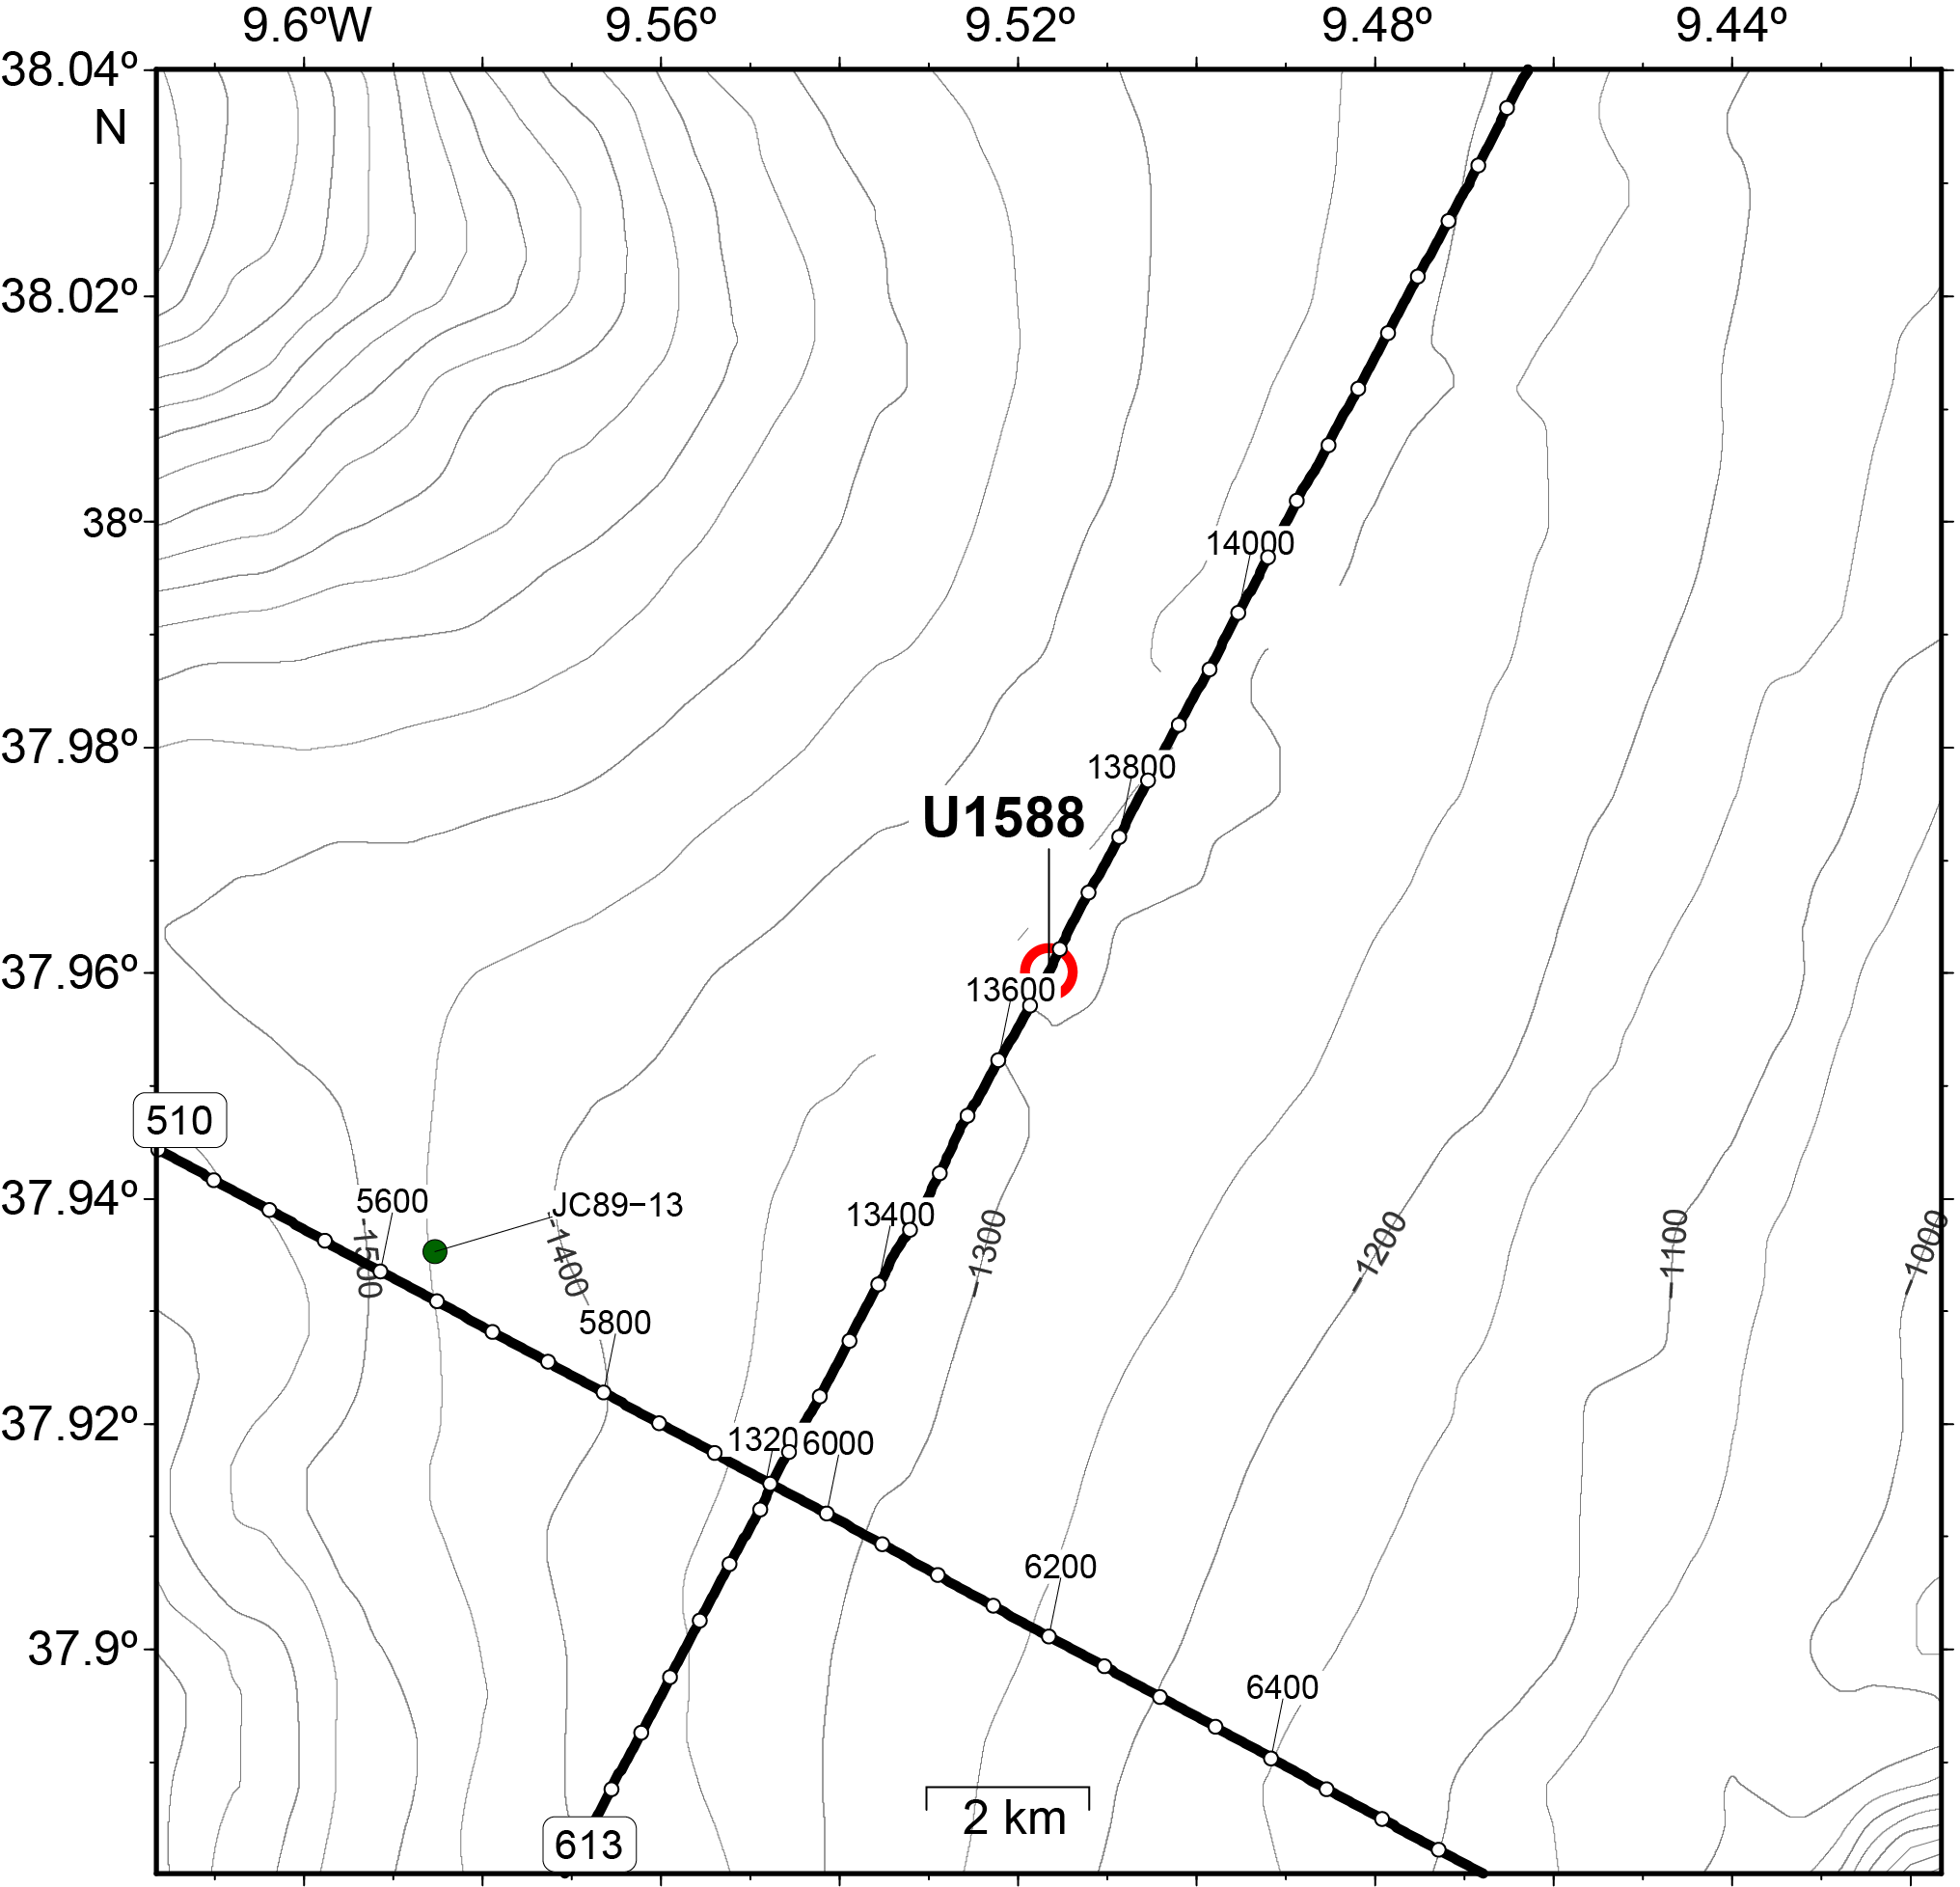
Figure F5. Seismic Lines TGS-NOPEC PD00-613 and TGS-NOPEC PD00-510.
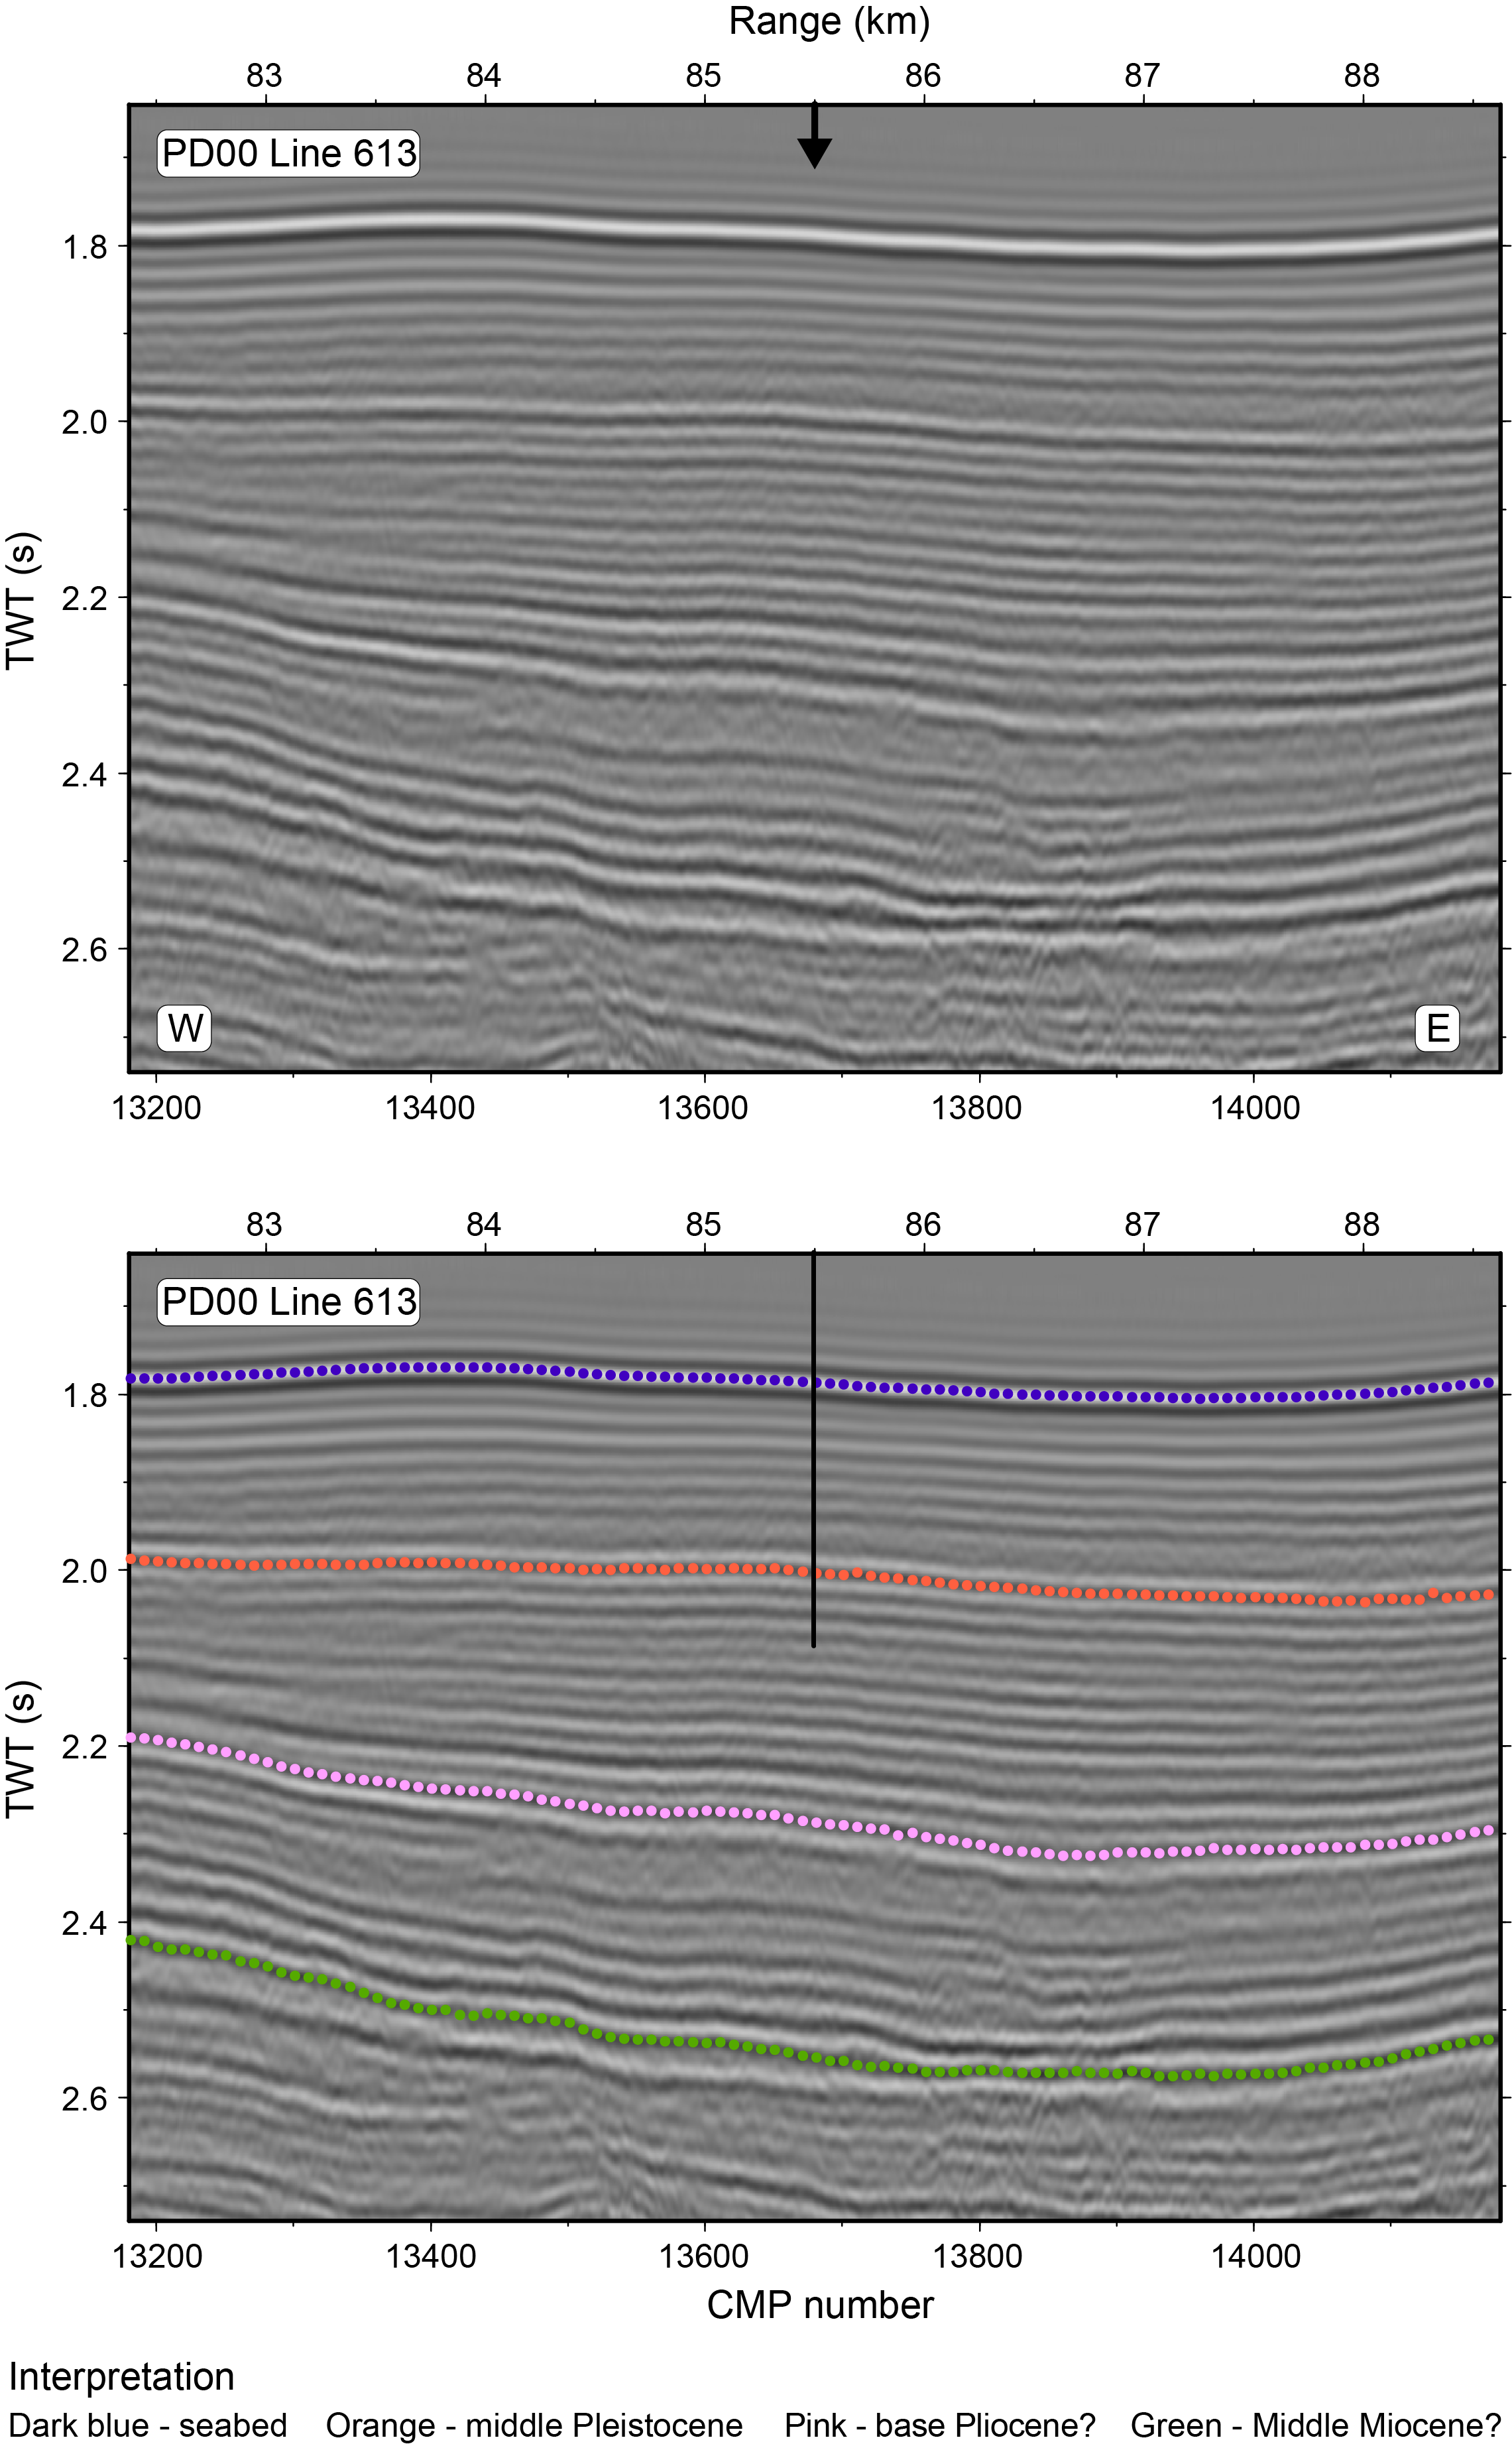
Figure F6. Seismic Profile TGS-NOPEC PD00-613.
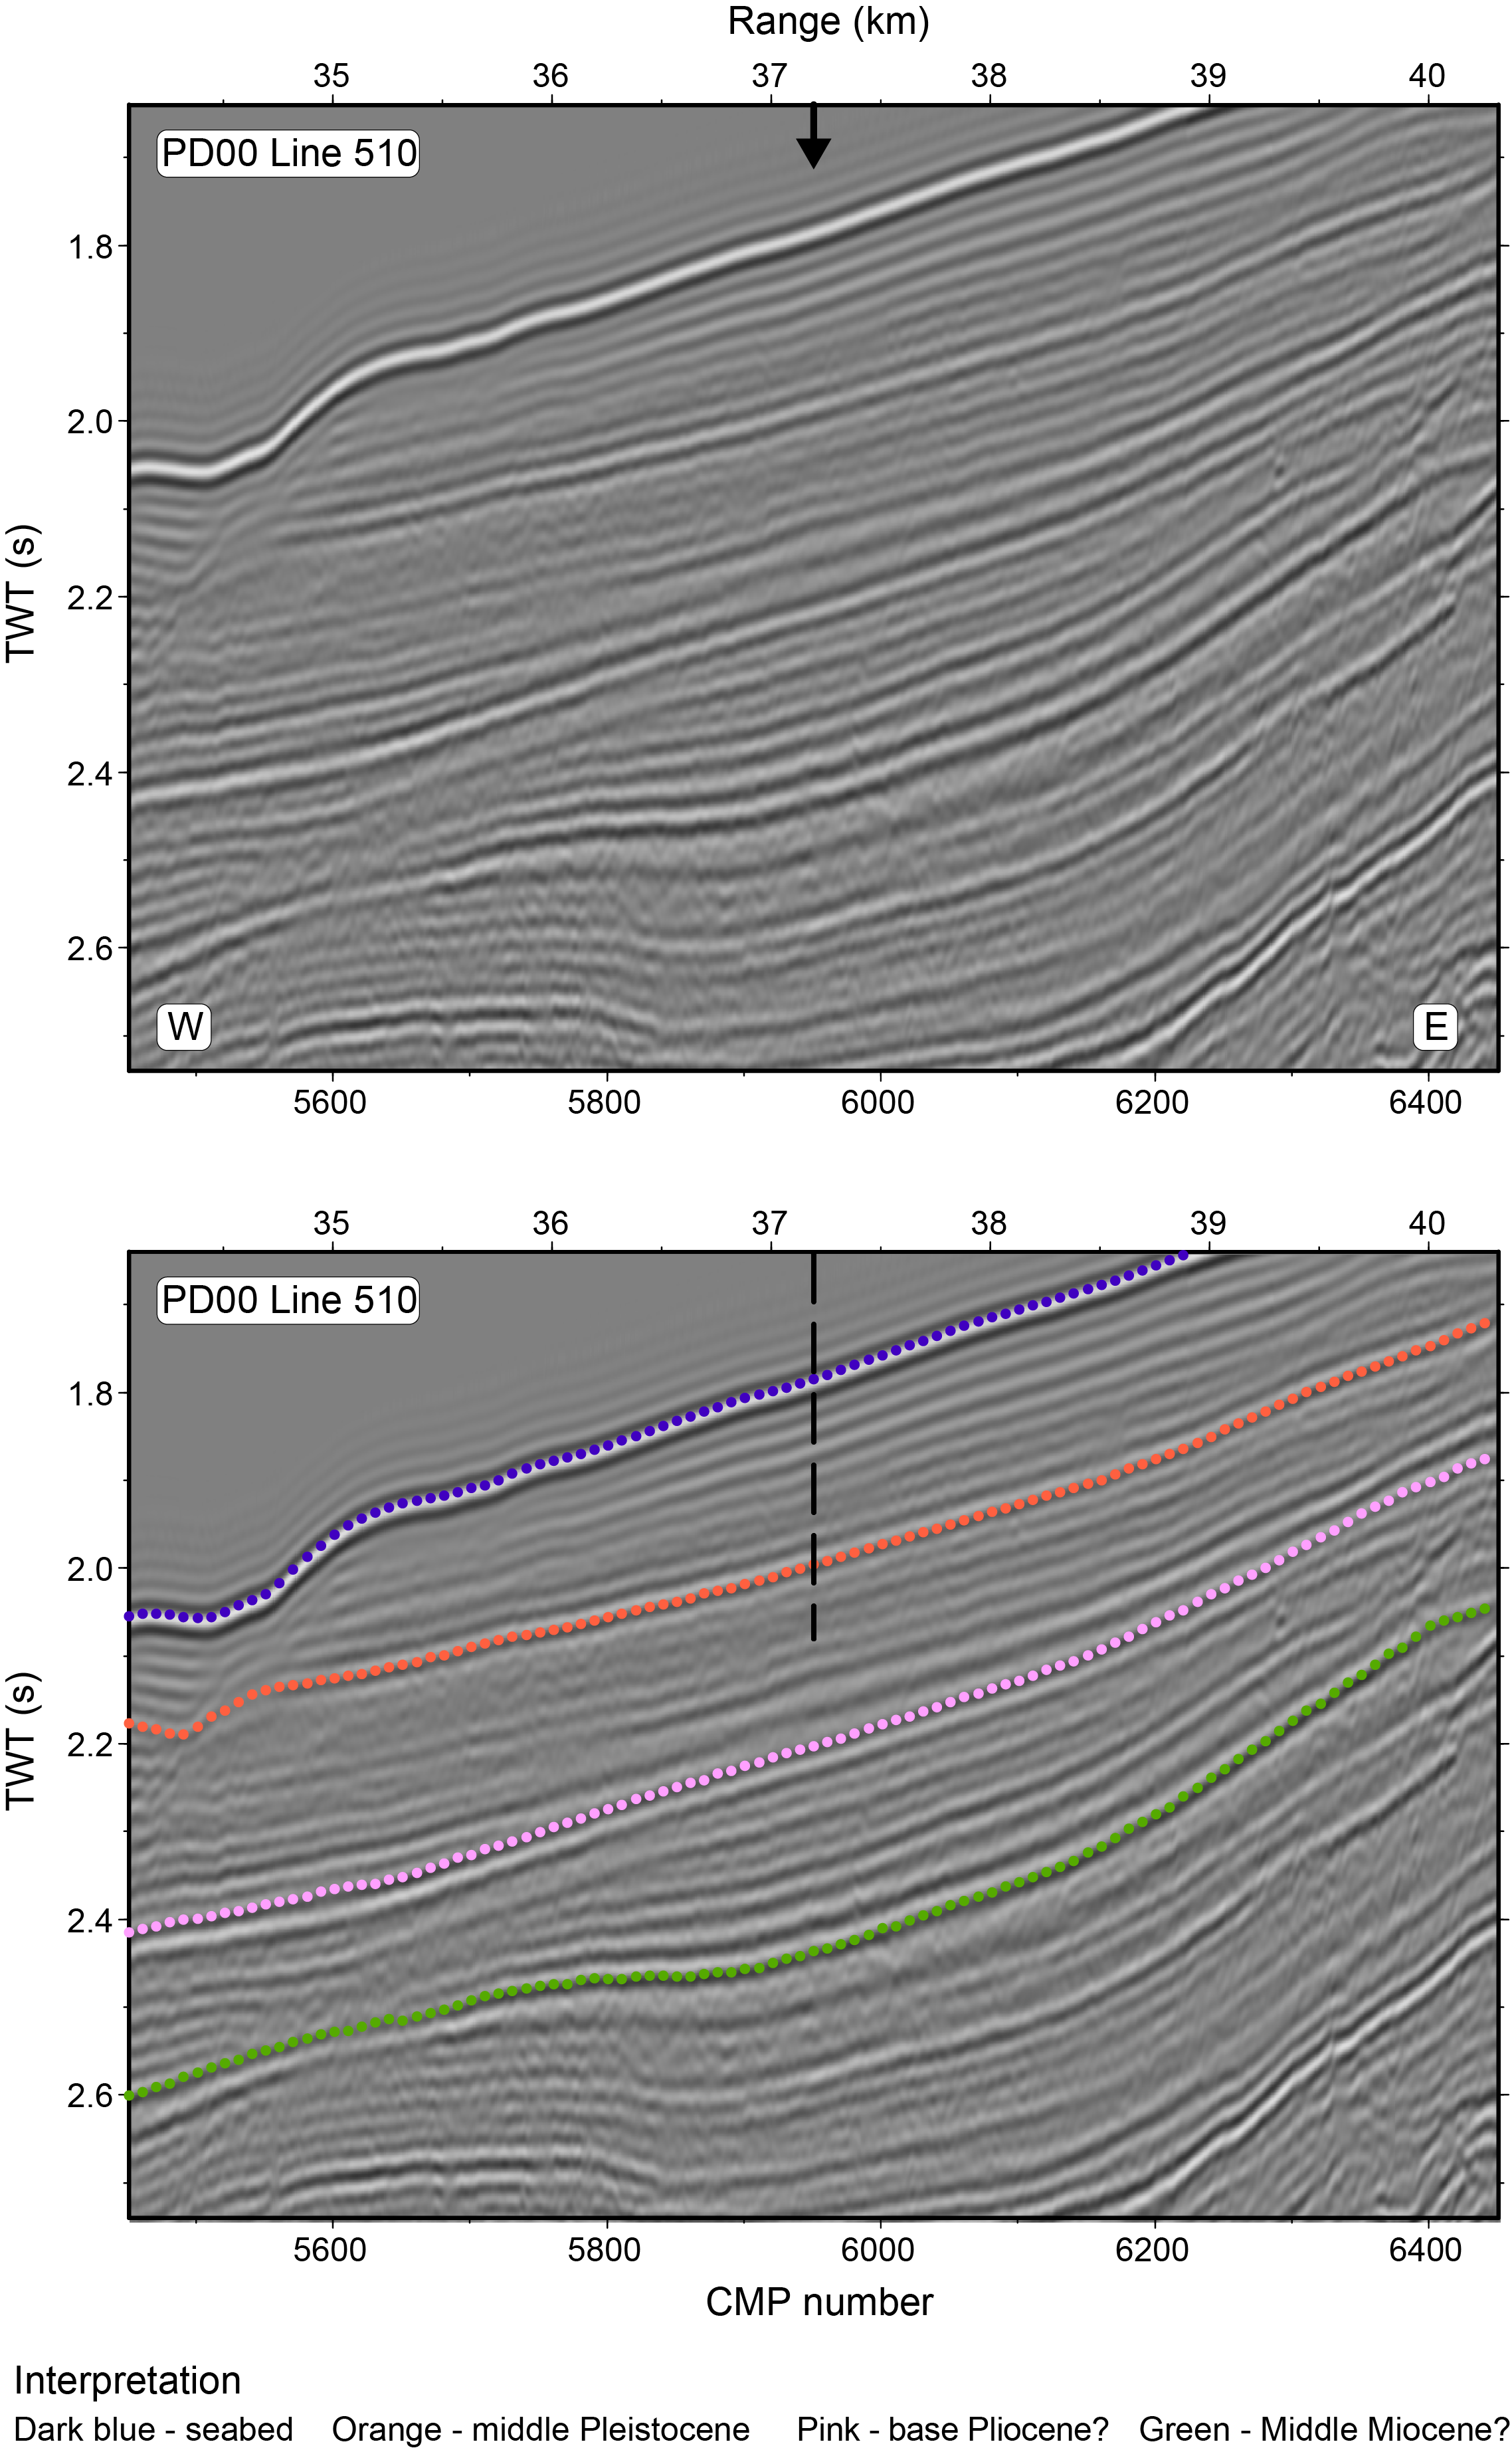
Figure F7. Seismic Profile TGS-NOPEC PD00-510.
The record at Site U1588 is expected to be similar to that of Integrated Ocean Drilling Program Site U1391, which was drilled 70 km south–southeast of Site U1588 at a water depth of 1085 mbsl (Figure F2). Three holes were cored and drilled to a total depth of 672 mbsf, spanning the middle Pliocene to Holocene with sedimentation rates of 13–17 cm/ky (Expedition 339 Scientists, 2013). We expected similarly high sedimentation rates at Site U1588. The high accumulation rates associated with contourite deposition provide an expanded sedimentary record to reconstruct millennial climate variability (MCV) with a resolution of a hundred years. In addition, the shallow depth of Site U1588 compared to other Expedition 397 sites is expected to yield excellent preservation of carbonate microfossils.
The primary objective of Site U1588 was to drill to 500 mbsf and recover an expanded Pliocene–Pleistocene sedimentary succession formed under the influence of lower MOW (Hernández-Molina et al., 2014). The sediments of Site U1588 and those collected during Expedition 339 provide valuable material for studying how the depth and intensity of the MOW has varied on orbital and millennial timescales. Site U1588 will also provide a marine reference section for studying Quaternary climate variability at high stratigraphic resolution. Surface temperature proxies of Site U1588 will document MCV well beyond the base of the polar ice core. Because Site U1588 is closest to the coast, we expect preservation of terrestrial pollen and biomarkers that will allow linkage of the continental and marine records. Site U1588 should also preserve an MCV record of coastal upwelling along the Portuguese margin.
2. Operations
The operational plan for Site U1588 was to core three holes to 500 mbsf (the deepest hole was to be logged with the triple combination [triple combo] tool string) and two holes to 250 mbsf with the advanced piston corer (APC) and extended core barrel (XCB) systems. Owing to time constraints toward the end of the expedition and unexpectedly high methane gas content in the cored sediments at this site, the coring plan was shortened to three holes to ~350 mbsf and a fourth hole cored as deeply as possible (412.5 mbsf) in the remaining time. Downhole logging was canceled.
Significant core expansion and curatorial difficulties encountered in Hole U1588A due to high methane gas content in the sediment led to a change in the XCB coring strategy starting with Core 397-U1588A-25X and continuing through all subsequent holes at the site. All subsequent XCB cores were taken using half advances to give the core room to expand inside the core liner as gas was released.
Holes U1588A, U1588B, and U1588D were APC cored to 154.2, 81.8, and 90.5 mbsf, respectively, and then XCB cored to their final depths. Because of deteriorating sea state, APC coring was canceled in Hole U1588C in favor of drilling ahead to 92.0 mbsf before starting to XCB core the lower section.
A total of 242 cores were taken at the site, 37 APC and 205 XCB (Table T1). All APC cores used nonmagnetic core barrels and were oriented using the Icefield MI-5 core orientation tool. In total, 1377.1 m was cored, recovering 1748.93 m (127%). Formation temperature measurements using the advanced piston corer temperature (APCT-3) tool were taken in Hole U1588A. Site U1588 took 186.75 h (7.8 days) to complete.
2.1. Hole U1588A
The transit from Site U1385 to Site U1588 began at 0245 h on 30 November 2022 and ended with the thrusters down and the vessel heading controlled by dynamic positioning (DP) at 0700 h. The 37.4 nmi transit was completed in 3.6 h with an average speed of 10.4 kt.
The drill crew made up an APC/XCB bottom-hole assembly (BHA), deployed the bit to 1308 meters below rig floor (mbrf), picked up the top drive, and, after spacing the bit to 1343.4 mbrf, spudded Hole U1588A (37°57.6044′N, 9°30.9961′W) at 1330 h on the same day. Based on recovery in Core 1H, the seafloor was calculated at 1339.3 mbsl. Coring continued with the APC system through Core 17H, where a partial stroke signaled APC refusal at 154.2 mbsf. The XCB system was deployed beginning with Core 18X at 154.2 mbsf. High expansion rates caused by gas in the cores led to a change in coring strategy. Beginning with Core 25X, half advances were used to allow the cores to expand in the core liner. Core expansion of 30%–40% over the cored interval was observed for the remainder of the hole. Coring was terminated at the Co-Chief Scientists' request after Core 49X at 0045 h on 2 December. The bit was pulled to the surface, clearing the seafloor at 0245 h and ending Hole U1588A. Formation temperature measurements were taken on Cores 4H (31 mbsf), 7H (59.97 mbsf), 10H (87.92 mbsf), and 13H (116.18 mbsf).
2.2. Hole U1588B
The vessel was offset 20 m north, and Hole U1588B (37°57.6149′N, 9°30.9956′W) was spudded at 0445 h on 2 December 2022 with the bit positioned at 1347.0 mbrf. Based on the 5.8 m recovered in Core 1H, the seafloor was calculated at 1339.3 mbsl. APC coring continued through Core 9H at 81.8 mbsf, where the XCB coring system was deployed to mitigate the effects of gas expansion in the cores. Cores 10X–64X were cut from 81.8 to 350.0 mbsf. Half advances were used on all XCB cores, and core expansion of 30%–40% over the cored interval was observed for all XCB cores. The bit was raised out of the hole, clearing the seafloor at 2243 h on 3 December and ending Hole U1588B. A total of 64 cores were taken over a 350 m interval (130% recovery).
2.3. Hole U1588C
After clearing the seafloor, the drill line was slipped and cut and the core winch line was cut and reheaded. The vessel was then offset 20 m east of Hole U1588B. The top drive was picked up, and the bit was spaced out for spudding. The seafloor depth was assumed to be the same as that in Holes U1588A and U1588B. Hole U1588C (37°57.6160′N, 9°30.9814′W) was spudded at 0320 h on 4 December and drilled ahead without recovery to 92.0 mbsf. The wash barrel was pulled to the surface, an XCB barrel was deployed, and coring began with Core 2X at 92.0 mbsf. Coring continued through Core 54X to a total depth of 353.6 mbsf. The bit then was raised to 1308 mbrf, clearing the seafloor at 1650 h on 5 December and ending Hole U1588C. Half advances were used on all XCB cores. A total of 53 cores were taken over a 261.6 m interval (132% recovery).
2.4. Hole U1588D
The vessel was offset 20 m south of Hole U1588C. The top drive was picked up, and the bit was spaced to 1345 mbrf. An APC core barrel was lowered, and Hole U1588D (37°57.6023′N, 9°30.9820′W) was spudded at 1845 h on 5 December 2022. The seafloor was calculated at 1338.5 mbsl based on recovery from Core 1H (4.51 m). Coring continued with the APC system to 90.5 mbsf with Core 11H. An XCB barrel was deployed, and coring continued to 421.5 mbsf (Cores 12X–76X) at 1800 h on 7 December, when coring was terminated to prepare for departure. The bit was then pulled out of the hole, clearing the seafloor at 2050 h on 7 December. The rig floor was secured for transit at 0138 h on 8 December, ending Hole U1588D and Site U1588. A total of 76 cores were taken over a 412.5 m interval, and the APC system was used for 11 cores over 90.5 m (110% recovery). The XCB system was deployed for 65 cores over a 322.0 m interval (146% recovery), and half advances were used to mitigate core disturbance caused by gas.
The thrusters were raised, and at 0224 h on 8 December the R/V JOIDES Resolution began the sea passage to Tarragona, Spain. The 783 nmi transit was completed on 11 December 2022 at 0700 h with the first line ashore at Muelle de Baleares in Tarragona, Spain.
3. Lithostratigraphy
Three lithofacies were identified using visual descriptions, smear slides, and color (RGB values). The majority of sediments are characterized as Lithofacies 1 and 2, which can be represented as mixed ratio of two end-members: Lithofacies 1 (100% nannofossil ooze) and Lithofacies 2 (100% clay/silt). Lithofacies 3 is minor in occurrence and consists of sediments mainly composed of carbonate grains. One lithostratigraphic unit was defined. Unit I spans 0–412.5 m core depth below seafloor, Method B (CSF-B). Most sediments from Site U1588 are from Lithofacies 1 and contain varying amounts of inorganic/detrital/recrystallized calcium carbonate of indeterminate origin (hereafter carbonate) and clay. The abundance of nannofossil ooze with substantial amounts of clay and carbonate indicates the persistence of hemipelagic sedimentation and an indeterminate (recrystallized or detrital) source of carbonate at Site U1588 through the Pleistocene. Foraminifers, diagenetic features (dark patches, pyrite), and rare, subtle color banding are disseminated throughout the cores. Bioturbation varies from absent to heavy and generally increases downhole. Deformational sedimentary structures are rare and, when present, are at a decimeter scale. Drilling disturbance is present in most cores in all holes, varies from slight to severe, and is influenced by the drilling type, operation conditions, and methane gas contents of sediments.
3.1. Introduction
Three lithofacies were identified using visual observation of sediments, microscopic examination of smear slides, and RGB data, complemented with X-ray diffraction (XRD) and carbonate analyses and compared to the sediment physical properties. The sediments are categorized into three lithofacies according to their primary lithologies: nannofossil ooze, clay, and carbonate. In Hole U1588A, two smear slides were taken per APC and full-advance XCB core (9.7 m) and one was taken per half-advance XCB core (4.9 m). Additional smear slides were taken when necessary to confirm lithologies in Holes U1588B–U1588D. To complement smear slide analysis and visual descriptions, two CaCO3 samples and one XRD sample were taken per APC core and full-advance XCB Cores 397-U1588A-1H through 24X, one CaCO3 sample was taken per half-advance XCB Cores 25X–49X, and one XRD sample was taken from each of the even-numbered half-advance XCB cores in Hole U1588A.
Site U1588 consists of one lithostratigraphic unit that spans the Quaternary to the Pleistocene. The dominant principal lithology of Unit I is nannofossil ooze. Lithologies vary between generally darker intervals of nannofossil ooze with varying amounts of clay to generally lighter intervals consisting of nannofossil ooze. Cyclicity between these lithologies is seen in color reflectance and physical properties data, including natural gamma radiation (NGR), magnetic susceptibility (MS), and L* (see Physical properties).
Based on constraints from biostratigraphy and paleomagnetic data, the basal ages of Holes U1588A–U1588C are estimated at 1.9 Ma and the basal age of Hole U1588D is estimated at ~2.2 Ma. The average sedimentation rate at Site U1588 is estimated at ~18 cm/ky based on onboard age models (see Biostratigraphy). No major deformational structures were observed across or within holes, and decimeter-scale features are found in only a few sections. Drilling disturbance was present throughout many cores in all holes, was slight to severe, and varied with the drilling type, sea conditions, and methane content of sediments, with gas expansion as the most prominent disturbance.
3.2. Lithofacies description
Three lithofacies were identified at Site U1588 (Table T2). Lithofacies 1 and 2 can be represented as a mixing ratio of two end-members: 100% nannofossil ooze and 100% clay comprising a range of siliciclastic constituents. Lithofacies 3 is primarily carbonate with a variable secondary proportion of nannofossil ooze and clay. By far the most common sediments at Site U1588 are from Lithofacies 1. Lithofacies 2 and 3 only occur in a few sections (Lithofacies 2 = Sections 397-U1588A-19X-2 and 21X-2; Lithofacies 3 = Sections 6H-7, 9H-3, 23X-4, 24X-1 through 24X-4, 24X-7, 25X-4, and 25X-CC), constituting ~1% and ~3% of lithologies, respectively, at Site U1588.
3.2.1. Lithofacies 1
Lithofacies 1 consists principally of nannofossil ooze with varying amounts of clay, detrital carbonate, and diatoms. Lithologies in this lithofacies are clayey nannofossil ooze with carbonate, nannofossil ooze with carbonate, nannofossil ooze with carbonate and clay, nannofossil ooze with clay, carbonate nannofossil ooze with clay, carbonate nannofossil ooze, diatom nannofossil ooze, and diatom nannofossil ooze with biosilica (Figure F8). Sediments are light to dark gray, greenish gray, and brownish gray, often with foraminifers disseminated throughout the sediment. Bioturbation ranges from absent to heavy. Trace fossils including Chondrites, Ophiomorpha, Planolites, Thalassinoides, and Zoophycos are commonly observed. Dark patches, nodules, and pyrite are observed throughout, although the occurrence of these features varies with depth.
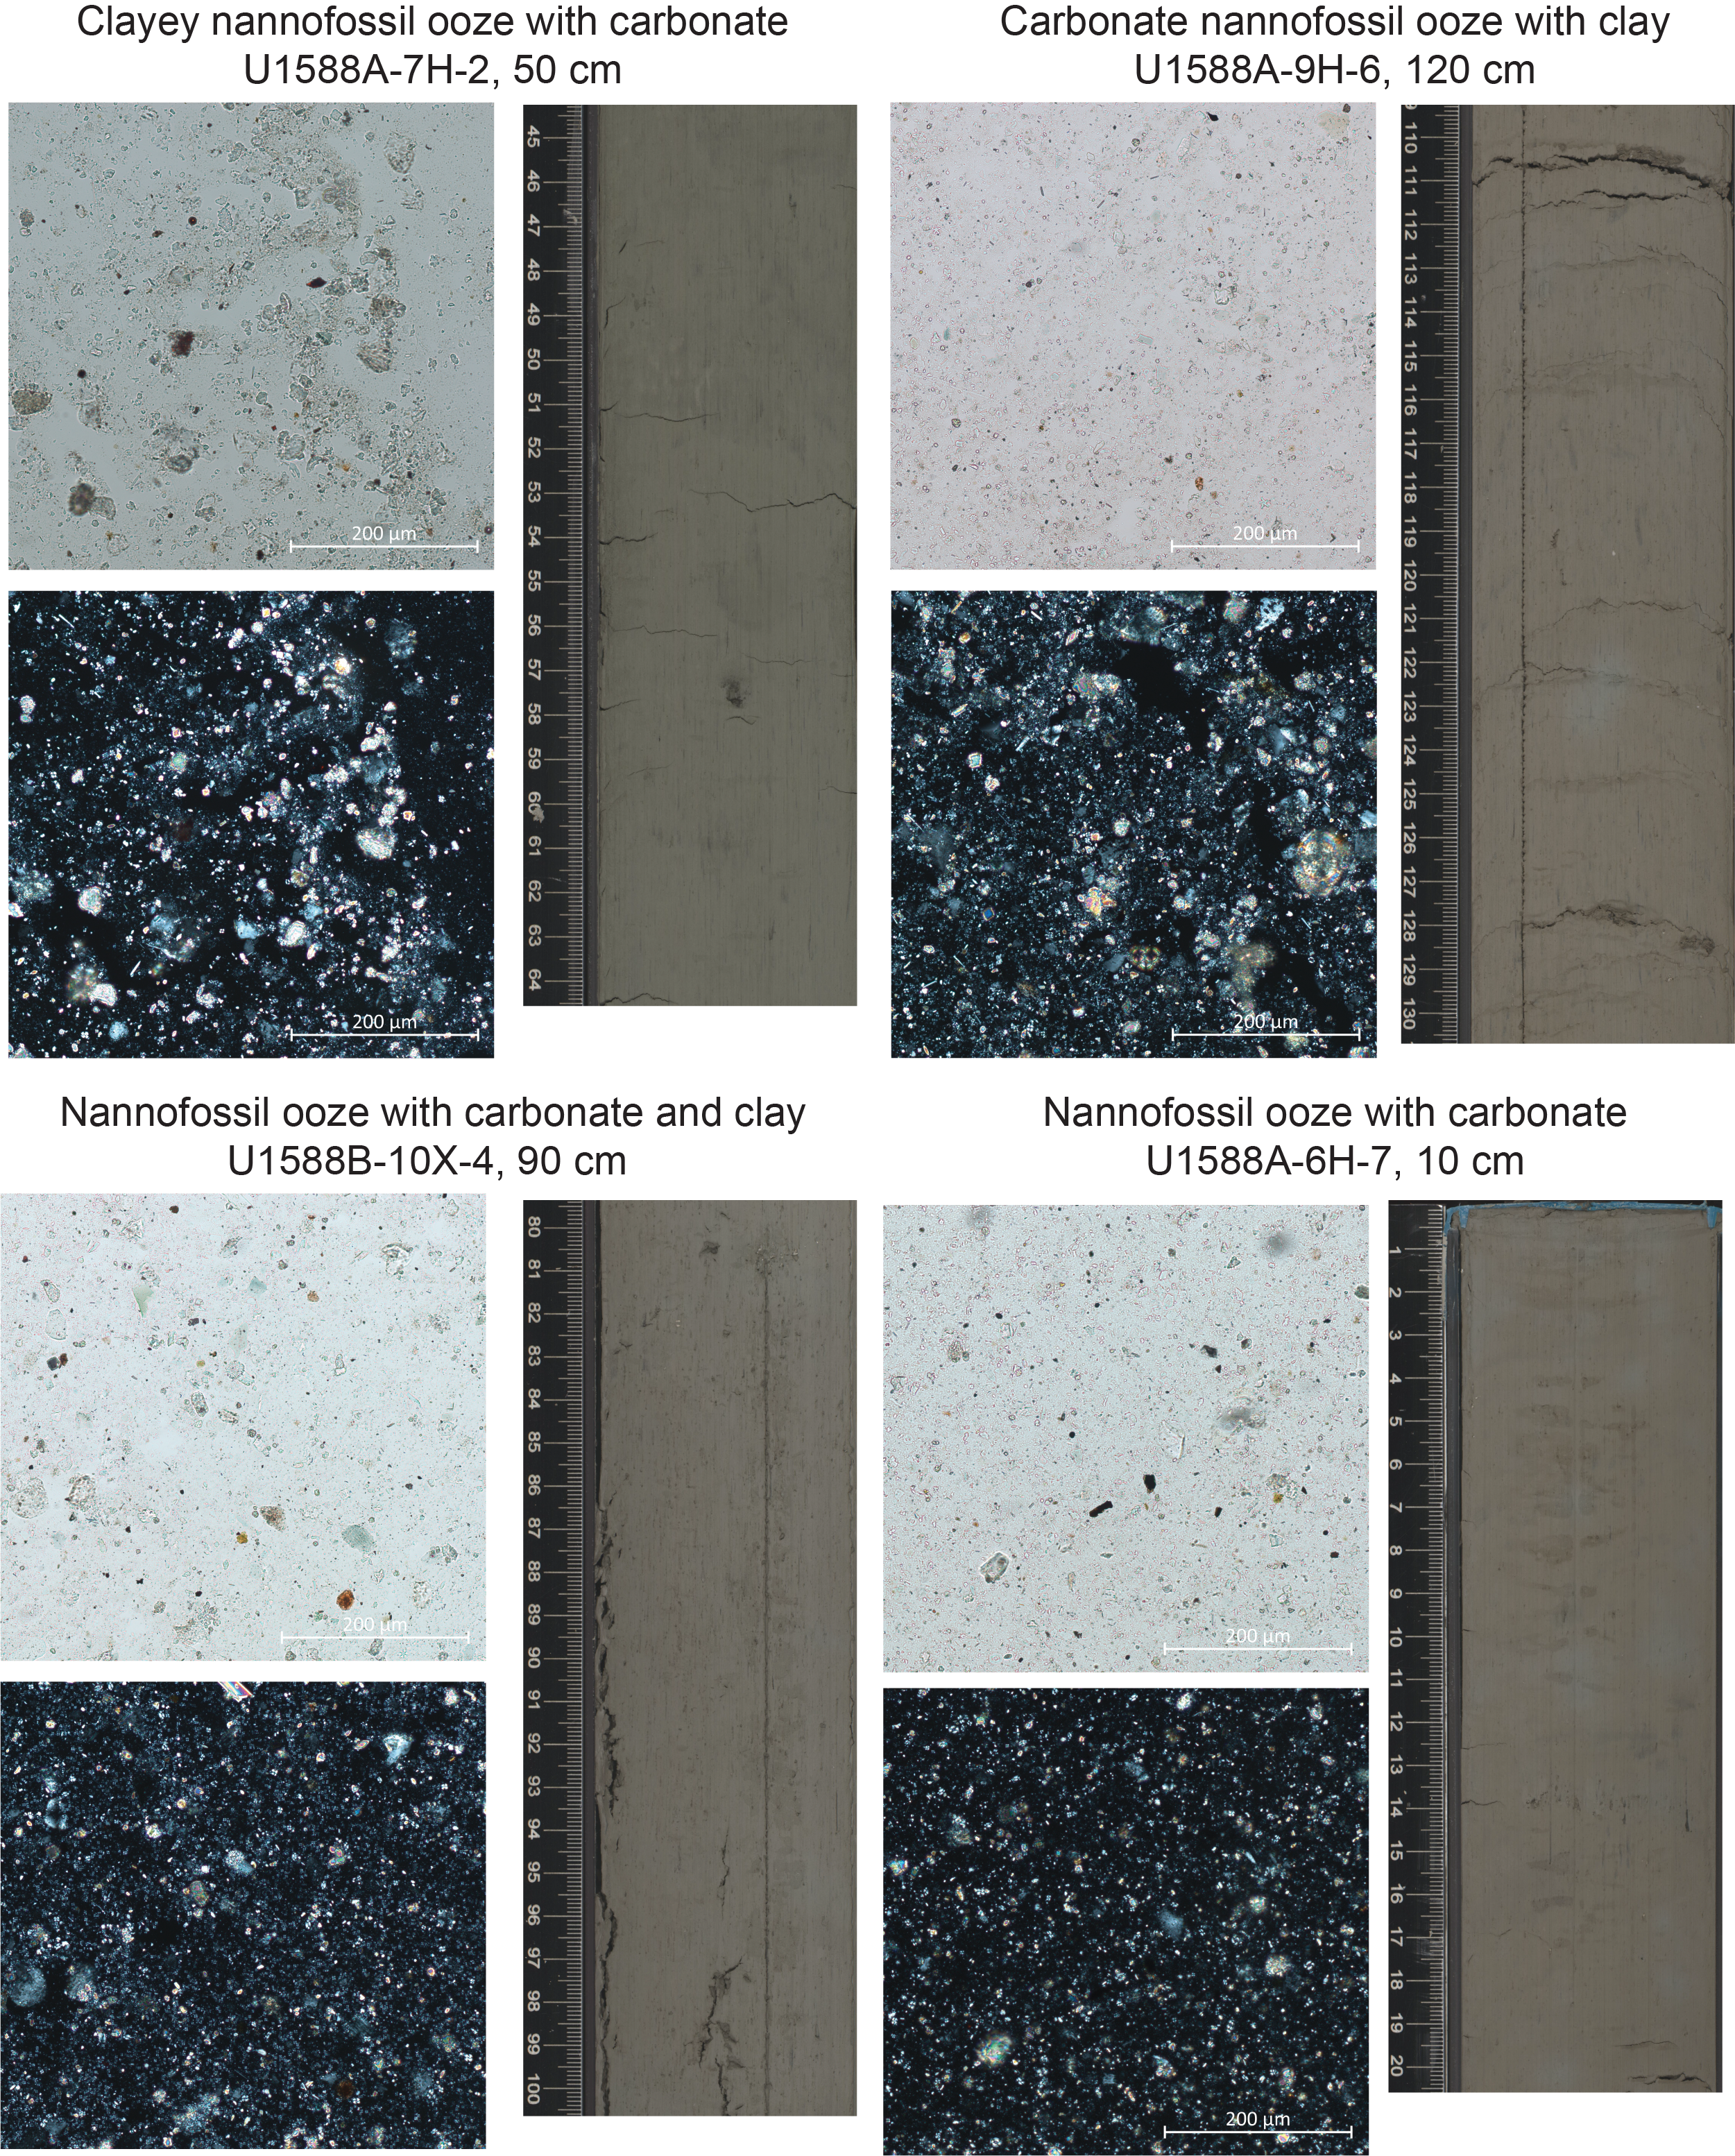
Figure F8. Lithofacies 1.
3.2.1.1. Smear slides
Nannofossils are the dominant (>50%) component in the Lithofacies 1. Siliciclastic components range in abundance from trace (≤1%) to abundant (>25%–50%), and carbonate ranges from rare (>1%–10%) to abundant (>25%–50%). Foraminifers and authigenic minerals (pyrite, dolomite, glauconite, and iron oxides) are present in most of the samples and range from trace (≤1%) to rare (>1%–10%). Diatoms are present in one smear slide at a trace level (≤1%), in one as rare (>1%–10%), and in two as abundant (>10%–25%) (Samples 397-U1588A-20X-CC, 60 cm, and 21X-4, 65 cm). Sponge spicules and other siliceous biogenic components such as radiolarians range from trace (≤1%) to rare (>1%–10%). For all (biogenic and siliciclastic) components taken together, 50%–90% of grains are in the clay-size fraction, 5%–40% are in the silt-size fraction, and 1%–15% are in the sand-size fraction.
3.2.2. Lithofacies 2
Lithofacies 2 consists of sediments that are principally clay comprising a range of siliciclastics with varying amounts of nannofossils and carbonate. Lithologies include carbonate clay with nannofossils, and clay with nannofossil and carbonate. Sediments are predominantly dark gray. Lithofacies 2 includes the same sedimentary structures, bioturbation, trace fossils, and diagenetic features described in Lithofacies 1.
3.2.2.1. Smear slides
Siliciclastic grains are the dominant (>50%) component in Lithofacies 2 and are present in two smear slides in Samples 397-U1588A-19X-2, 40 cm, and 21X-2, 48 cm. Carbonate abundance is common (>10%–25%) to abundant (>25%–50%). Nannofossils are common (>10%–25%). Foraminifers are trace (≤1%) to rare (>1%–10%). Authigenic minerals are rare (>1%–10%). For all (biogenic and siliciclastic) components, 70%–85% of grains are in the clay-size fraction, 15%–30% are in the silt-size fraction, and 1%–2% are in the sand-size fraction.
3.2.3. Lithofacies 3
Lithofacies 3 consists of sediments that are principally carbonate grains with varying amounts of siliciclastics and nannofossils. Lithologies include clayey carbonate with nannofossils and, in one instance, nannofossil carbonate with clay. Sediments are predominantly dark greenish or bluish gray. Lithofacies 3 includes the same sedimentary structures, bioturbation, trace fossils, and diagenetic features described in Lithofacies 1.
3.2.3.1. Smear slides
Carbonate grains are the dominant (>50%) component in Lithofacies 3 and are present in five smear slides in Samples 397-U1588A-6H-7, 10 cm; 9H-3, 120 cm; 23X-4, 60 cm; 24X-3, 38 cm; and 25X-4, 100 cm. Siliciclastics are abundant (>25%–50%), and nannofossils are common (>10%–25%). Foraminifers and sponge spicules are rare (>1%–10%). Authigenic minerals and diatoms occur in trace abundance (≤1%). For all (biogenic and siliciclastic) components, 50%–80% of grains are in the clay-size fraction, 20%–45% are in the silt-size fraction, and 1%–5% are in the sand-size fraction.
3.3. Lithostratigraphic Unit I
- Intervals: 397-U1588A-1H through 49X; 397-U1588B-1H through 64X; 397-U1588C-2X through 54X; 397-U1588D-1H through 76X
- Depths: Hole U1588A = 0–353 m CSF-B; Hole U1588B = 0–352.8 m CSF-B; Hole U1588C = 92–354.8 m CSF-B; Hole U1588D = 0–412.5 m CSF-B
- Thickness: Hole U1588A = 353 m; Hole U1588B = 352.8 m; Hole U1588C = 262.8 m; Hole U1588D = 412.5 m
- Age: Quaternary to Pleistocene (~0–2.2 Ma)
- Primary lithofacies: 1
The sedimentary sequence at Site U1588 is contained within a single lithostratigraphic unit (Table T2). Unit I encompasses sediments from 0 to 350 m CSF-B in Holes U1588A–U1588C and to 412.5 m CSF-B in Hole U1588D and consists primarily of Lithofacies 1 (>95% of sediment depths), with minor occurrences of Lithofacies 2 (~1% of sediment depths) and Lithofacies 3 (~3% of sediment depths). Contacts between lithologies are color boundaries or bioturbated, straight to irregular, and gradational to sharp. Foraminifers are common throughout, and subtle color bands occur irregularly. Variations in sediment composition between and within the lithofacies (i.e., between intervals of light and dark sediments) generally occur at the decimeter to meter scale.
Sediments from ~0–75 m CSF-B (Cores 397-U1588A-1H through 8H, 397-U1588B-1H through 8H, and 397-U1588D-1H through 8H) consist mostly of clayey nannofossil ooze with carbonate, are dark gray, and do not display a clear cyclicity in color or lithology. Sediments from ~75–160 m CSF-B (Cores 397-U1588A-9H through 18X, 397-U1588B-9H through 25X, 397-U1588C-2X through 21X, and 397-U1588D-9H through 29X) consist of light gray layers of nannofossil ooze with carbonate (major) and gray or brown carbonate nannofossil ooze with clay (minor). Sediments from ~160–412 m CSF-B (Cores 397-U1588A-19X through 49X, 397-U1588B-26X through 64X, 397-U1588C-22X through 54X, and 397-U1588D-30X through 76X) consist mostly of nannofossil ooze with carbonate and clay, and other lithologies such as clayey carbonate with nannofossil and clayey nannofossil ooze with carbonate constitute a very small fraction. Sediments throughout this interval are light-to-dark gray and do not display any clear cyclicity in color or lithology.
3.3.1. Biosilica
Smear slides observations reveal the rare-to-abundant occurrence of siliceous organisms, including diatoms, radiolarians, sponge spicules, and silicoflagellates (Figure F9). Intervals with abundant siliceous microfossils were observed in Sections 397-U1588A-20X-CC, 60 cm, and 397-U1588C-20X-2, 6 cm. In these intervals, the diatom nannofossil ooze and the diatom nannofossil ooze with carbonate and clay has an olive-green color and a coarser texture, with the occurrence of the diatom genus Coscinodiscus as abundant. Other genera forms observed in these intervals are Actinoptychus senarius and Triceratium. In Section 397-U1588C-20X-2, 100 cm, the nannofossil ooze with carbonate, clay, and biosilica has a dark olive-green color and a fine texture, with common occurrence of diatoms (Figure F9). In these intervals, forms of the genera Rhizosolenia, Stephanopyxis, Thalassiosira, and Chaetoceros, as well as Chaetoceros resting spores, are observed.
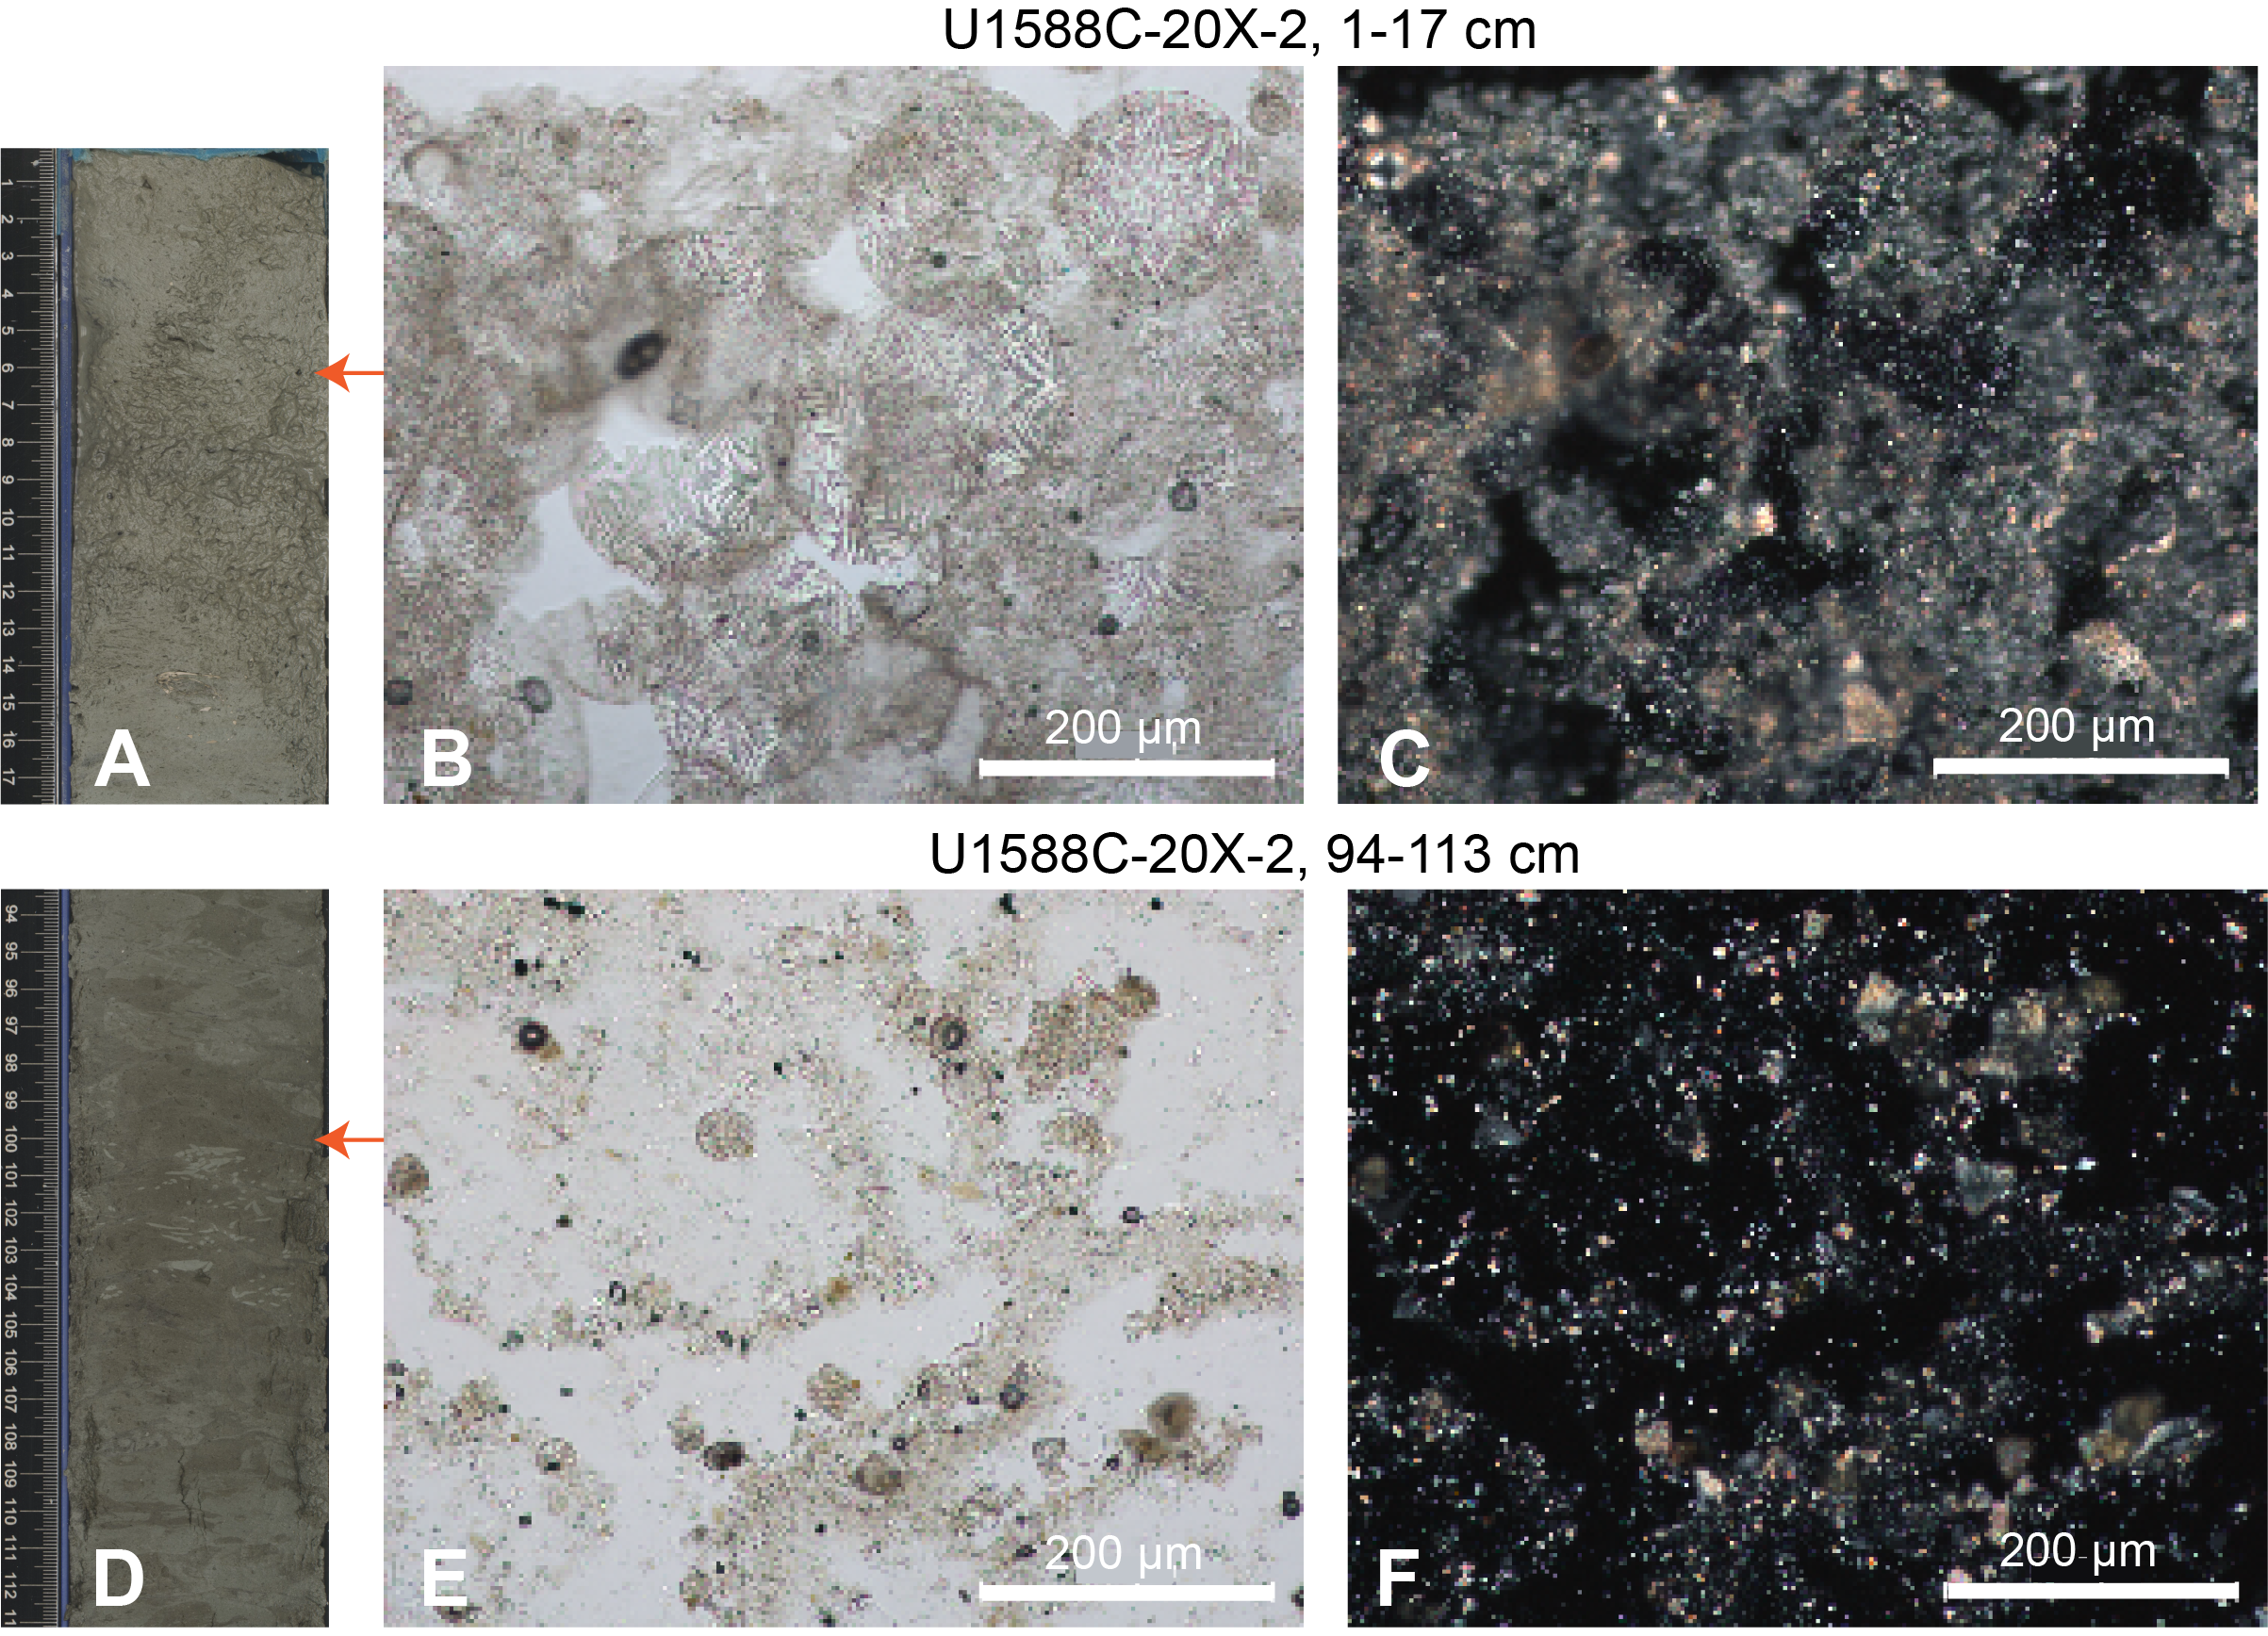
Figure F9. Nannofossil ooze with diatoms and clay.
3.3.2. Diagenetic features
A layer of dark orange-brown sediment is present from approximately 0 to 100 cm CSF-B in Sections 397-U1588A-1H-1, 397-U1588C-1H-1, and 397-U1588D-1H-1. Small dark patches (centimeter scale), which often outline trace fossils and burrows, are found throughout sediments at Site U1588. Pyrite nodules and pyritized burrows are also found throughout Site U1588 (Figure F10), except in the uppermost few tens of meters of Cores 397-U1588A-1H through 5H (0–40.23 m CSF-B), 397-U1588B-1H through 3H (0–30.0 m CSF-B), and 397-U1588D-1H through 3H (0–15.0 m CSF-B), in which only dark patches occur. An extraordinarily large pyritized burrow is seen in Sections 397-U1588C-37X-3 and 37X-4 (Figure F10).
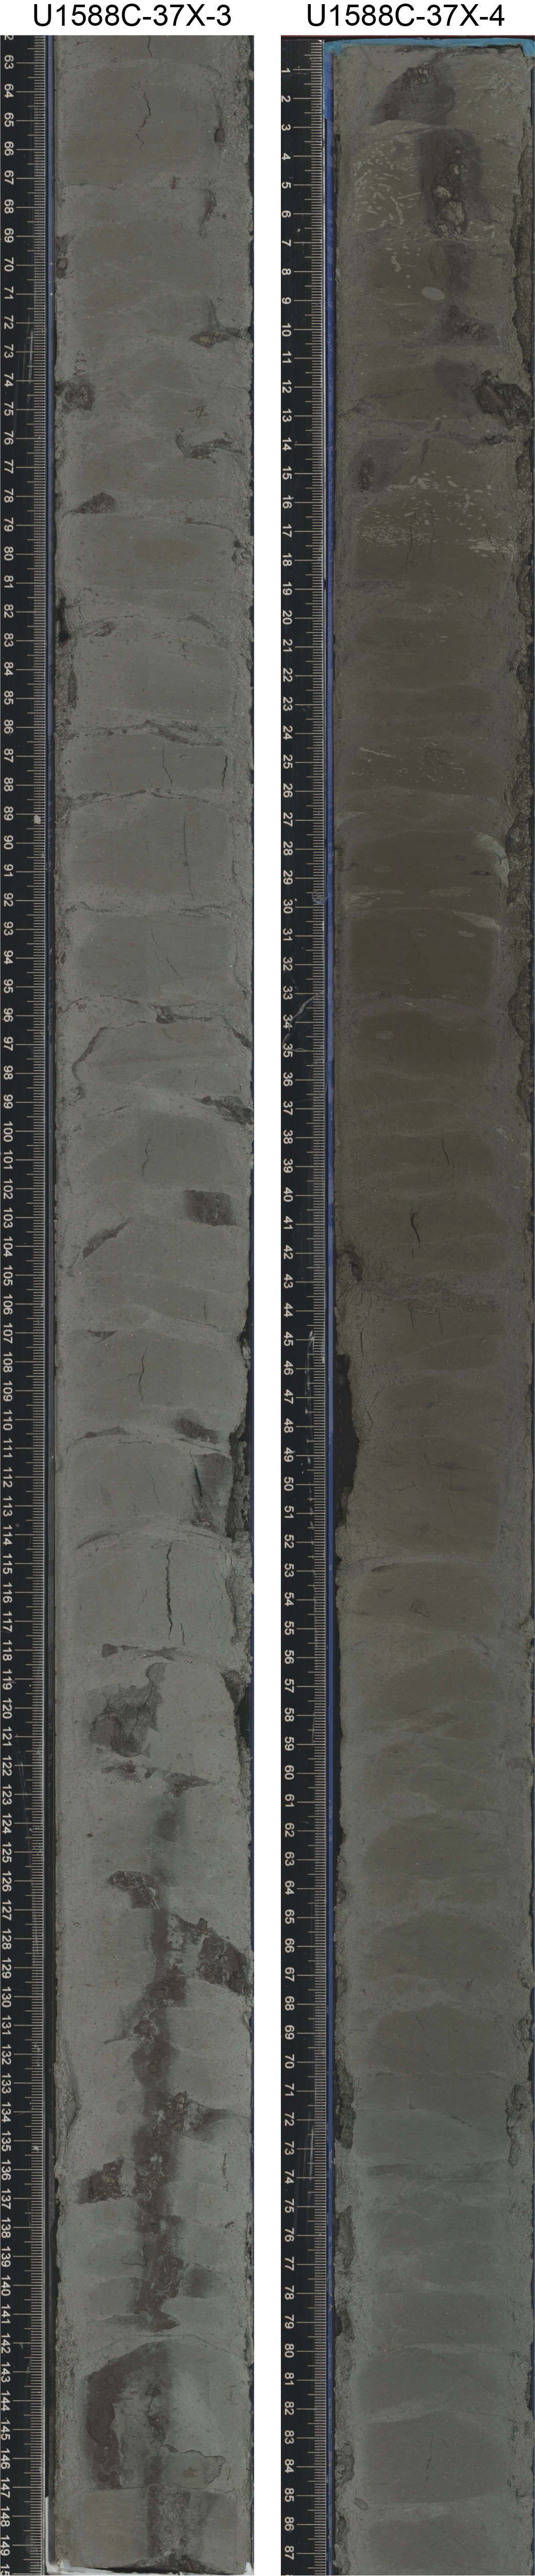
Figure F10. Pyritized burrow.
3.3.3. Bioturbation, trace fossils, and macrofossils
Bioturbation varies from sparse to heavy throughout. The majority of core in all holes shows slight to moderate bioturbation. At the tops of sections particularly in APC cores (397-U1588A-1H through 17H, 397-U1588B-1H through 9H, and 392-U1588C-1H through 11H) and shallow XCB cores containing soft sediment (e.g., Cores 397-U1588A-18X and 19X), burrow features are less clear and classification is uncertain. Trace fossils of Chondrites, Planolites, Zoophycos, and Thalassinoides/Ophiomorpha are common and generally become more distinctive downhole. Minor Terebellina and Diplocraterion are recognized. Trace fossil burrows range from millimeter to, in rare cases, decimeter scale and often exhibit diagenetic features such as pyritization or dark outlining. Shells and shell fragments are present in many cores at Site U1588. A whole Turritella shell is found in interval 397-U1588A-3H-3, 36–37 cm. A deep-sea coral is seen in interval 397-U1588B-3H-1, 33–37 cm, hosted in sediments from Marine Isotope Stage (MIS) 4. The deep-sea coral is unlikely to be in situ, but the exact speciation is yet to be identified (Figure F11).
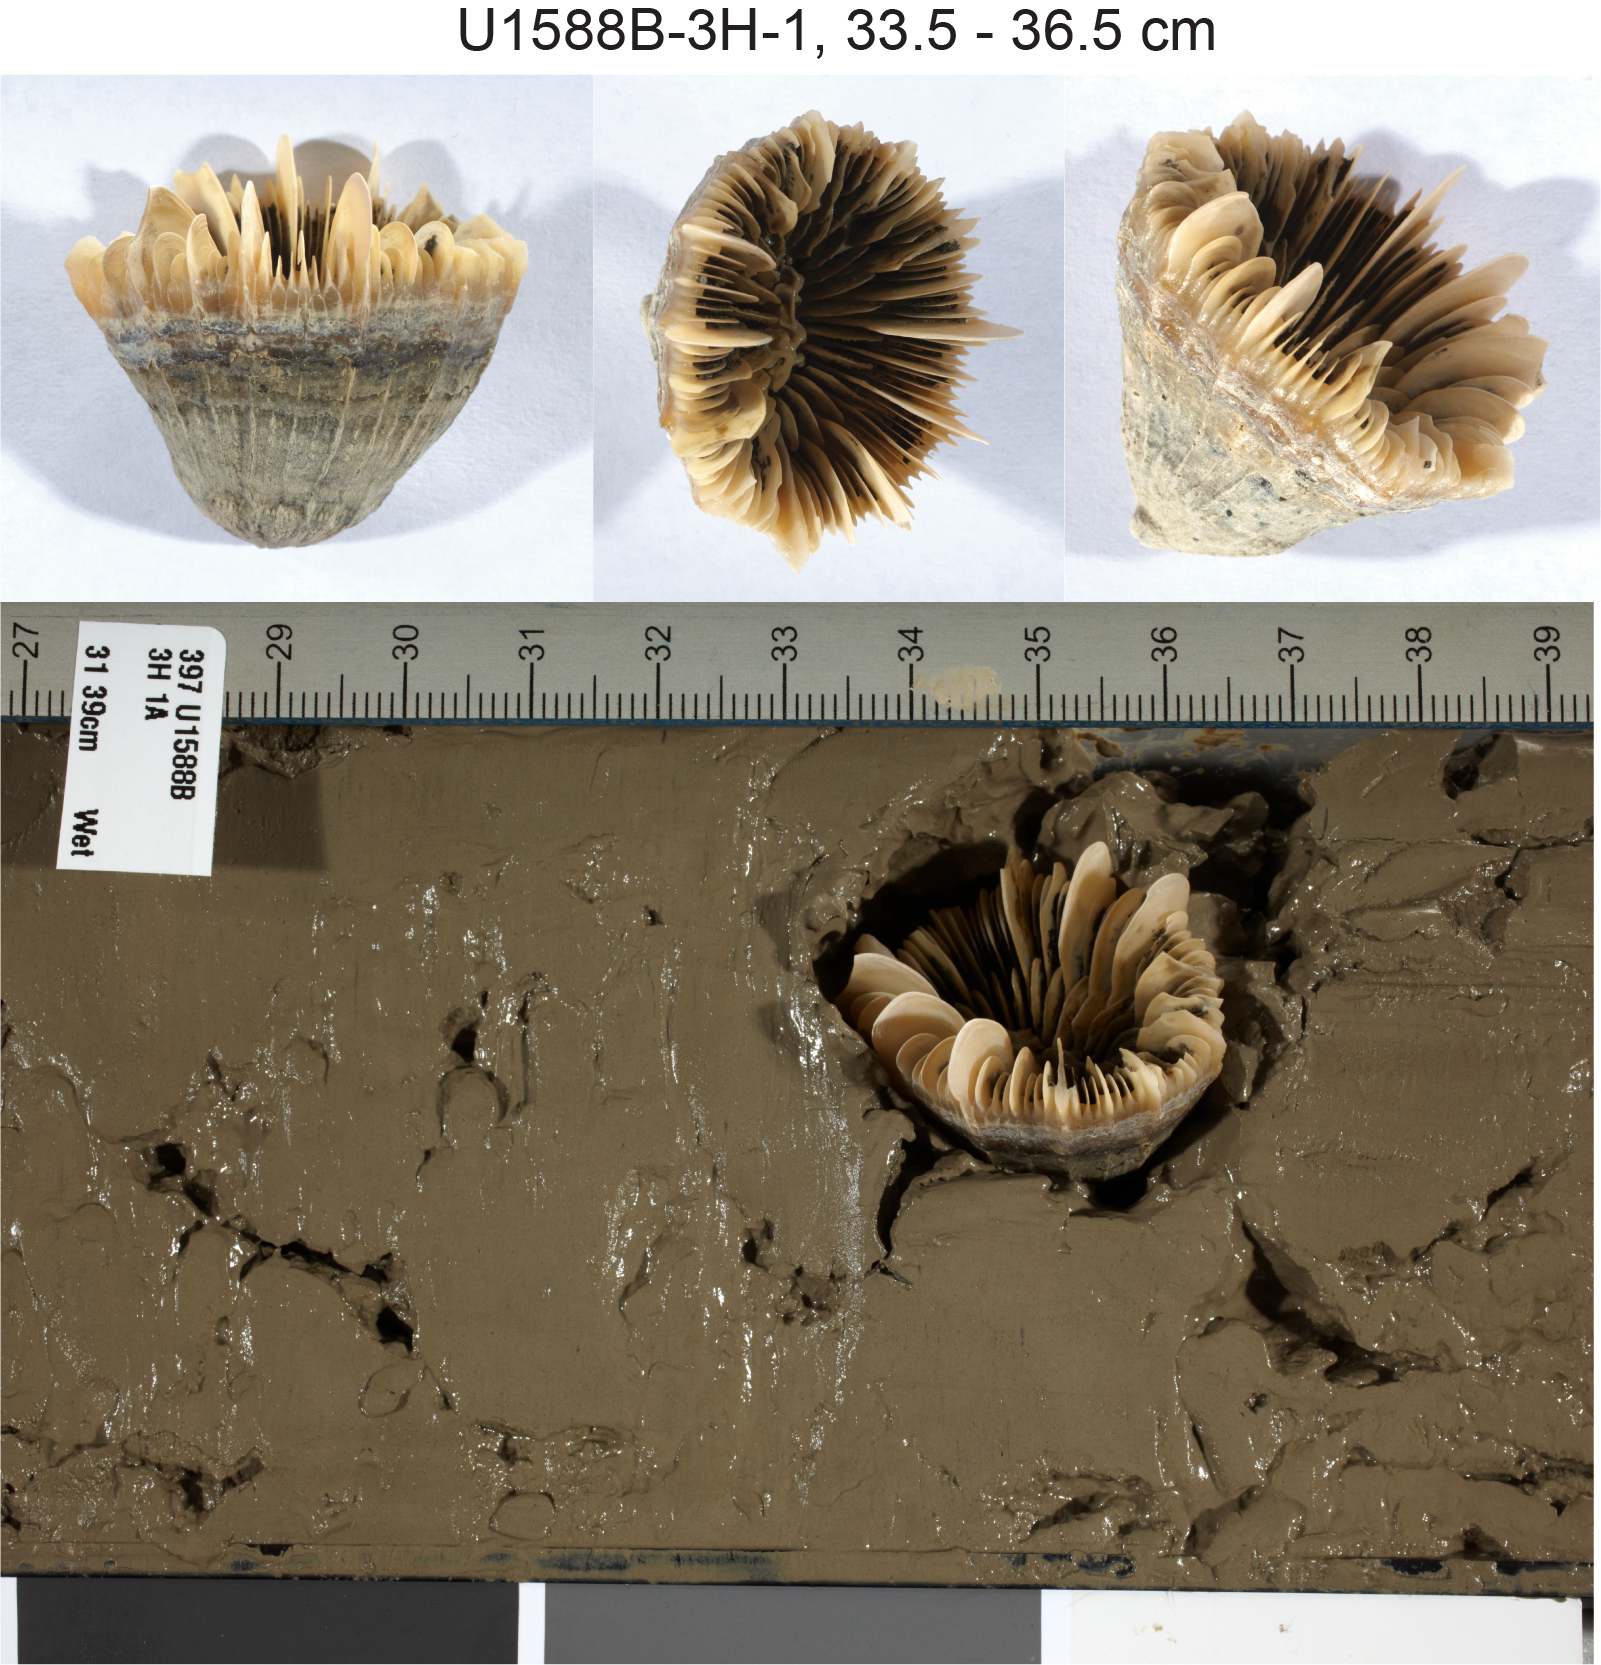
Figure F11. Deep-sea coral.
3.4. Complementary analyses
3.4.1. Drilling and other disturbance
Drilling disturbance is found throughout Site U1588 and varies with coring type, depth in hole, and sea state. Gas expansion is widespread throughout both APC and XCB cores at this site. Biscuiting is present in most XCB cores, with severity ranging from slight to moderate. Biscuiting is more easily observed in more consolidated sediments (XCB cores split by saw), rather than in soft sediments (split by wire). Fall-in is present throughout both APC and XCB cores, particularly in the uppermost sections of cores. In the first sections of APC cores, disturbed bedding and soupy and slurry intervals, ranging from slight to strong in severity, are often seen. Drilling and other forms of disturbance for all cores are described in Tables T3, T4, T5, and T6. Slightly disturbed strata have been omitted. Representative images of drilling disturbance types are shown in Figure F12.
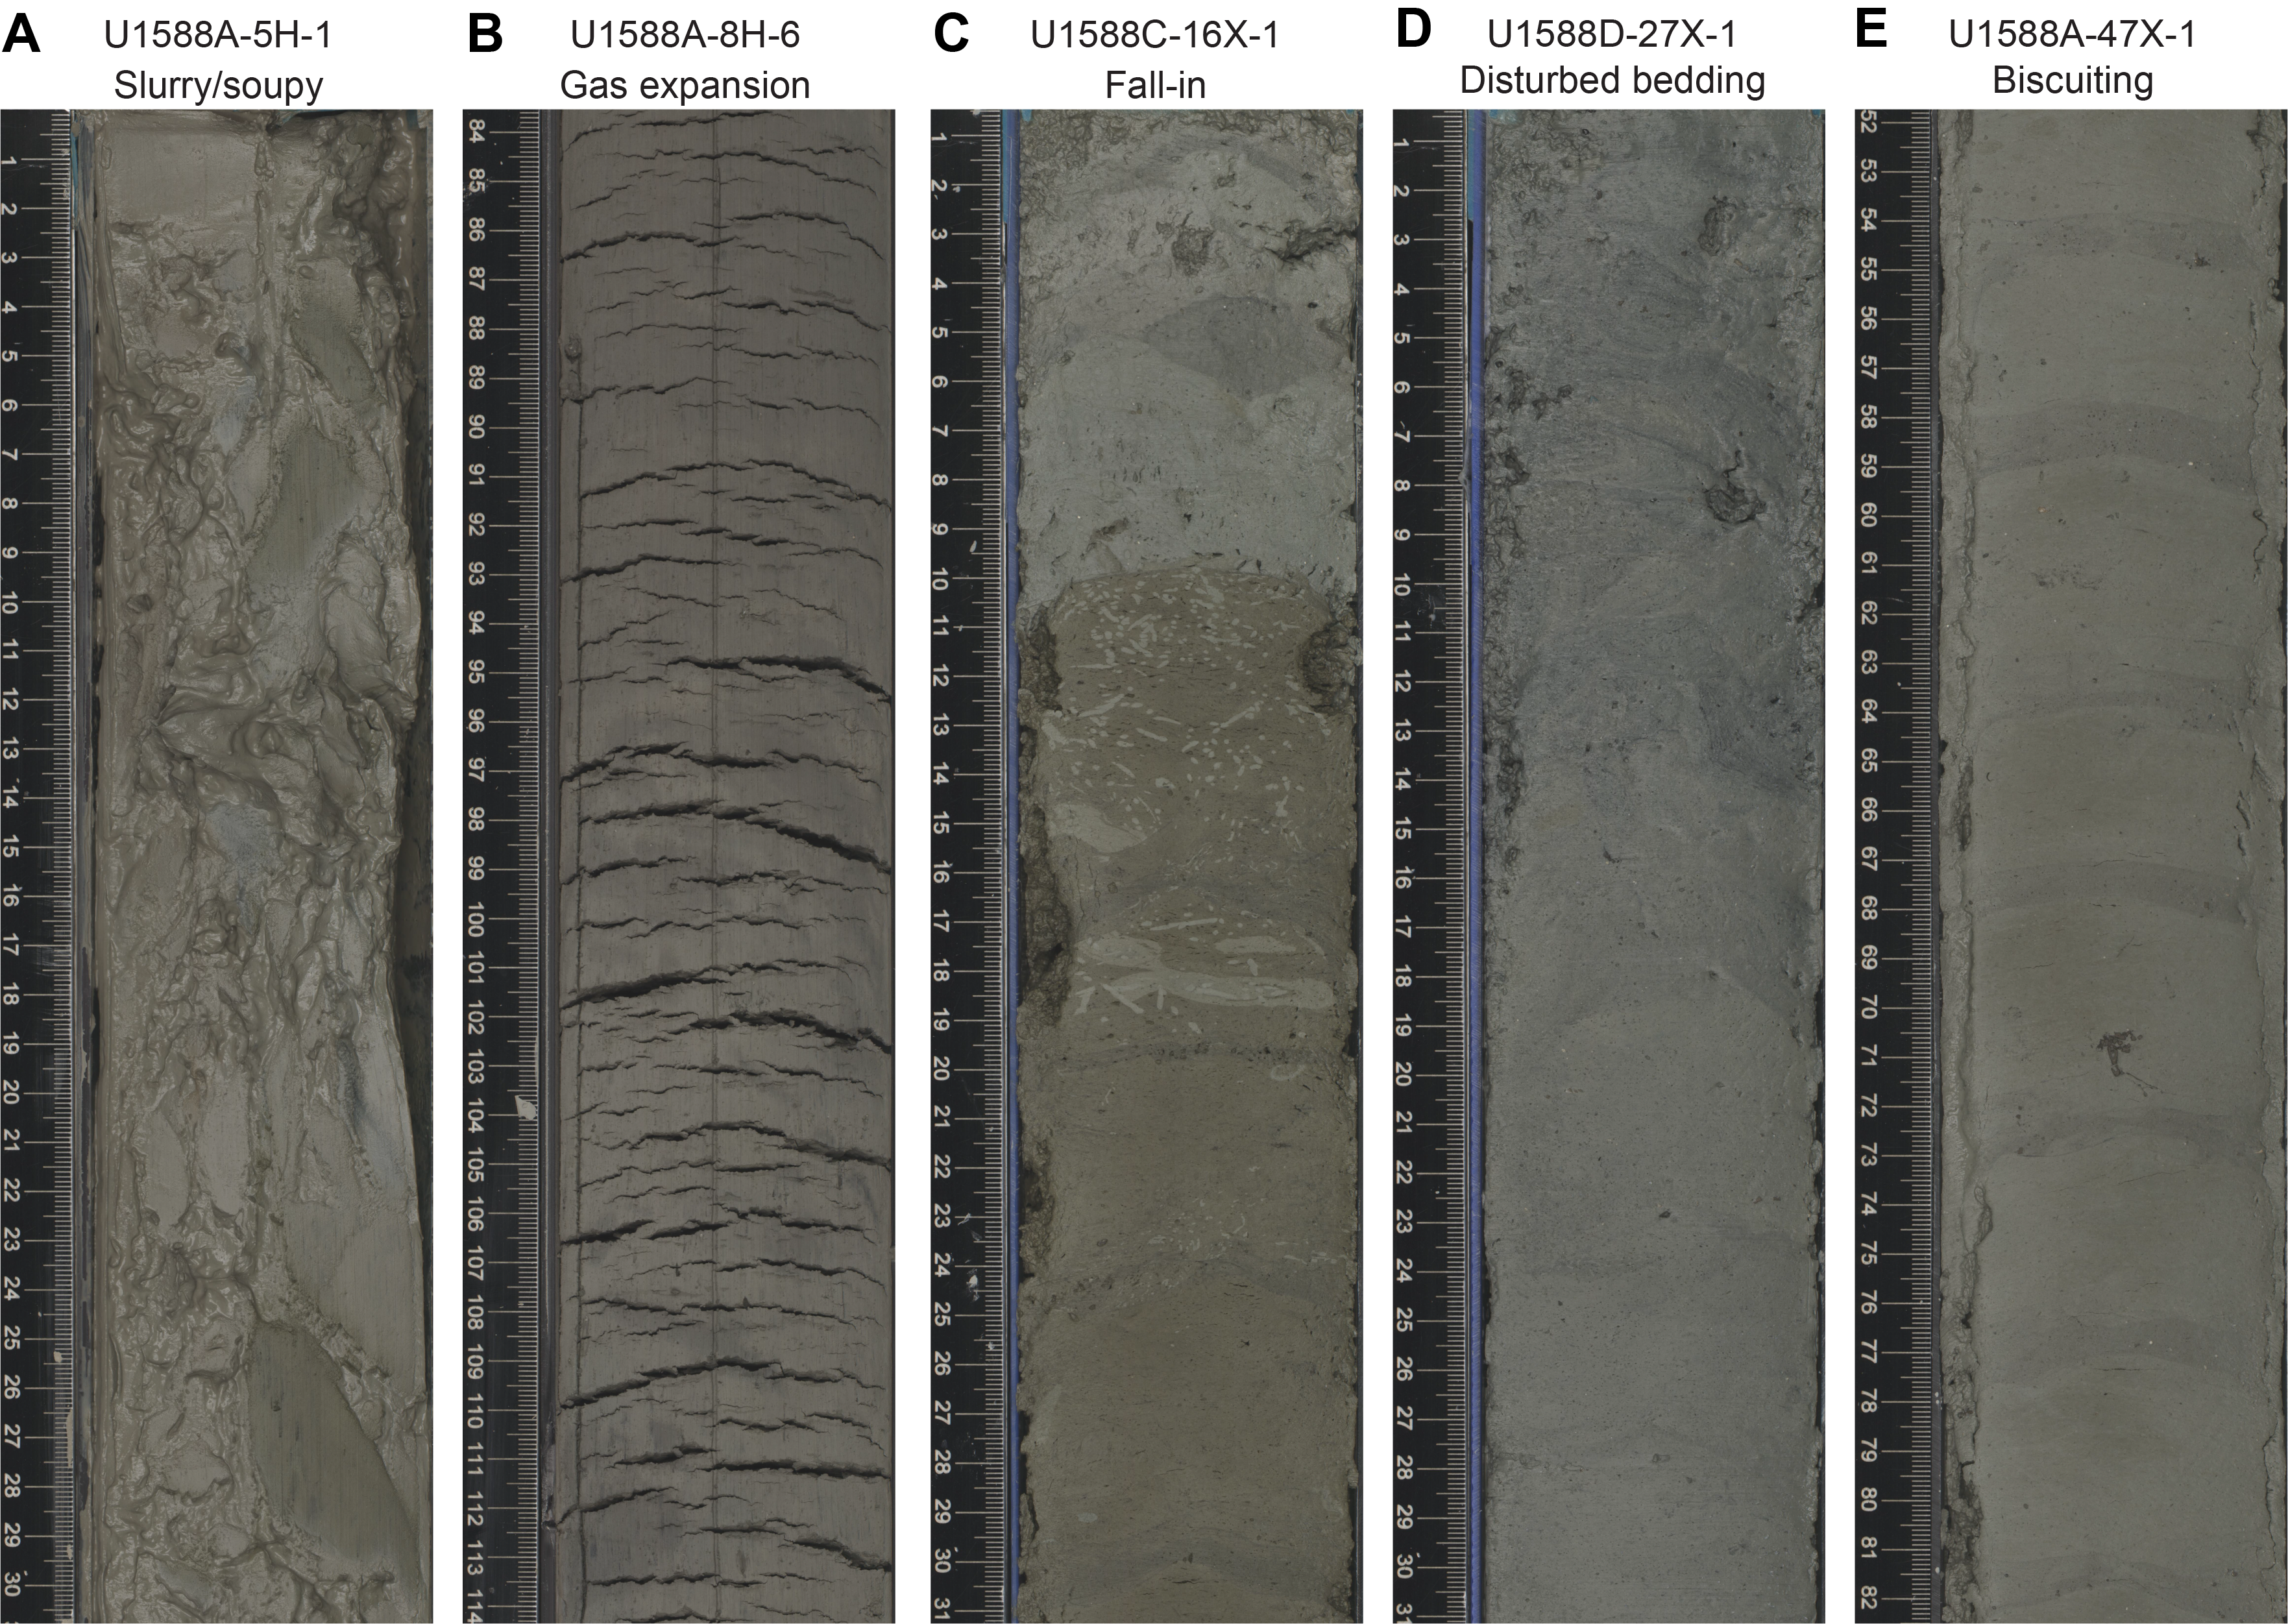
Figure F12. Drilling disturbance.
3.4.2. X-ray diffraction mineralogy
The major minerals in XRD samples from Hole U1588A are calcite, quartz, feldspars, mica (mainly muscovite), and various clay minerals such as illite, kaolinite, smectite, and chlorite. Minor minerals include birnessite, pyrite, dolomite, siderite, titanite, magnetite, and ankerite. The major mineral assemblage indicated using XRD analyses is similar to that observed in smear slides.
The feldspars are mainly composed of Ca-bearing albite to Na-bearing anorthite. Some Rb-rich silicates are often observed, particularly in sediments taken from Sections 397-U1588A-1H-2, 5H-6, 6H-6, 10H-2, 14H-3, 19X-2, 22X-6, 23X-4, 24X-3, 38X-2, 42X-2, 43X-6, 47X-3, and 49X-3. Birnessite (Mn oxide hydrate, i.e., MnOOH) is seen throughout the hole. Mn-related mineral siderite (MnCO3) is seen in Sections 23X-4 and 43X-6. Mg-bearing calcite and/or dolomite are present in sediments from Sections 1H-2, 2H-3, 5H-6, 10H-2, 13H-6, 16H-2, 18X-3, and 49X-3. Ankerite is seen in samples from Sections 4H-6, 10H-2, and 24X-3; aragonite is seen in Section 40X-1; and minor phases of titanite and rutile/anatase are seen in Sections 1H-2, 9H-6, and 44X-3. Pyrite is abundant in samples from Sections 7H-2, 20X-4, 21X-4, 40X-1, 44X-3, and 46X-2, and magnetite and/or other Fe oxides minerals are seen in Sections 24X-3 and 36X-3. Finally, Zn-related minerals (e.g., Zn oxides) are seen in samples from Sections 20X-4 and 26X-2, and Zn-bearing chlorite is seen in Sections 5H-6, 12H-1, 14H-3, 15H-2, 17H-7, 26X-2, 30X-2, 32X-3, 38X-2, and 46X-2, which is confirmed by bulk sediment inductively coupled plasma spectrometry data showing Zn enrichment in some samples (see Geochemistry).
3.4.3. Carbonate content
CaCO3 varies from ~20 to ~50 wt% and shows little long-term trend downhole in Hole U1588A (Figure F13; see Geochemistry). The highest CaCO3 values are seen at ~70 m CSF-B, corresponding to MIS 9. Sediment CaCO3 appears to vary more strongly at ~60–220 m CSF-B than at shallower and deeper depths, which is also reflected in lithologies. Shallower than ~60 m CSF-B, sediments are dominantly clayey nannofossil ooze with carbonate. Deeper than ~220 m CSF-B, sediments are almost entirely nannofossil ooze with carbonate and clay. In contrast, in sediments from ~60 to 220 m CSF-B, lithologies are more variable and include nannofossil ooze with carbonate, carbonate nannofossil ooze with clay, nannofossil ooze with carbonate and clay, and clayey nannofossil ooze with carbonate. Over the entire length of sediments drilled, the correlation between CaCO3 and L* is less clear than those seen at deeper sites from Expedition 397, which may be related to the location of Site U1588. Located closer to the continent at a shallower water depth, Site U1588 sediments may be composed of various types of terrigenous inputs (e.g., clay minerals and carbonates) with different color brightness, which weakens the L* to CaCO3 correlation.
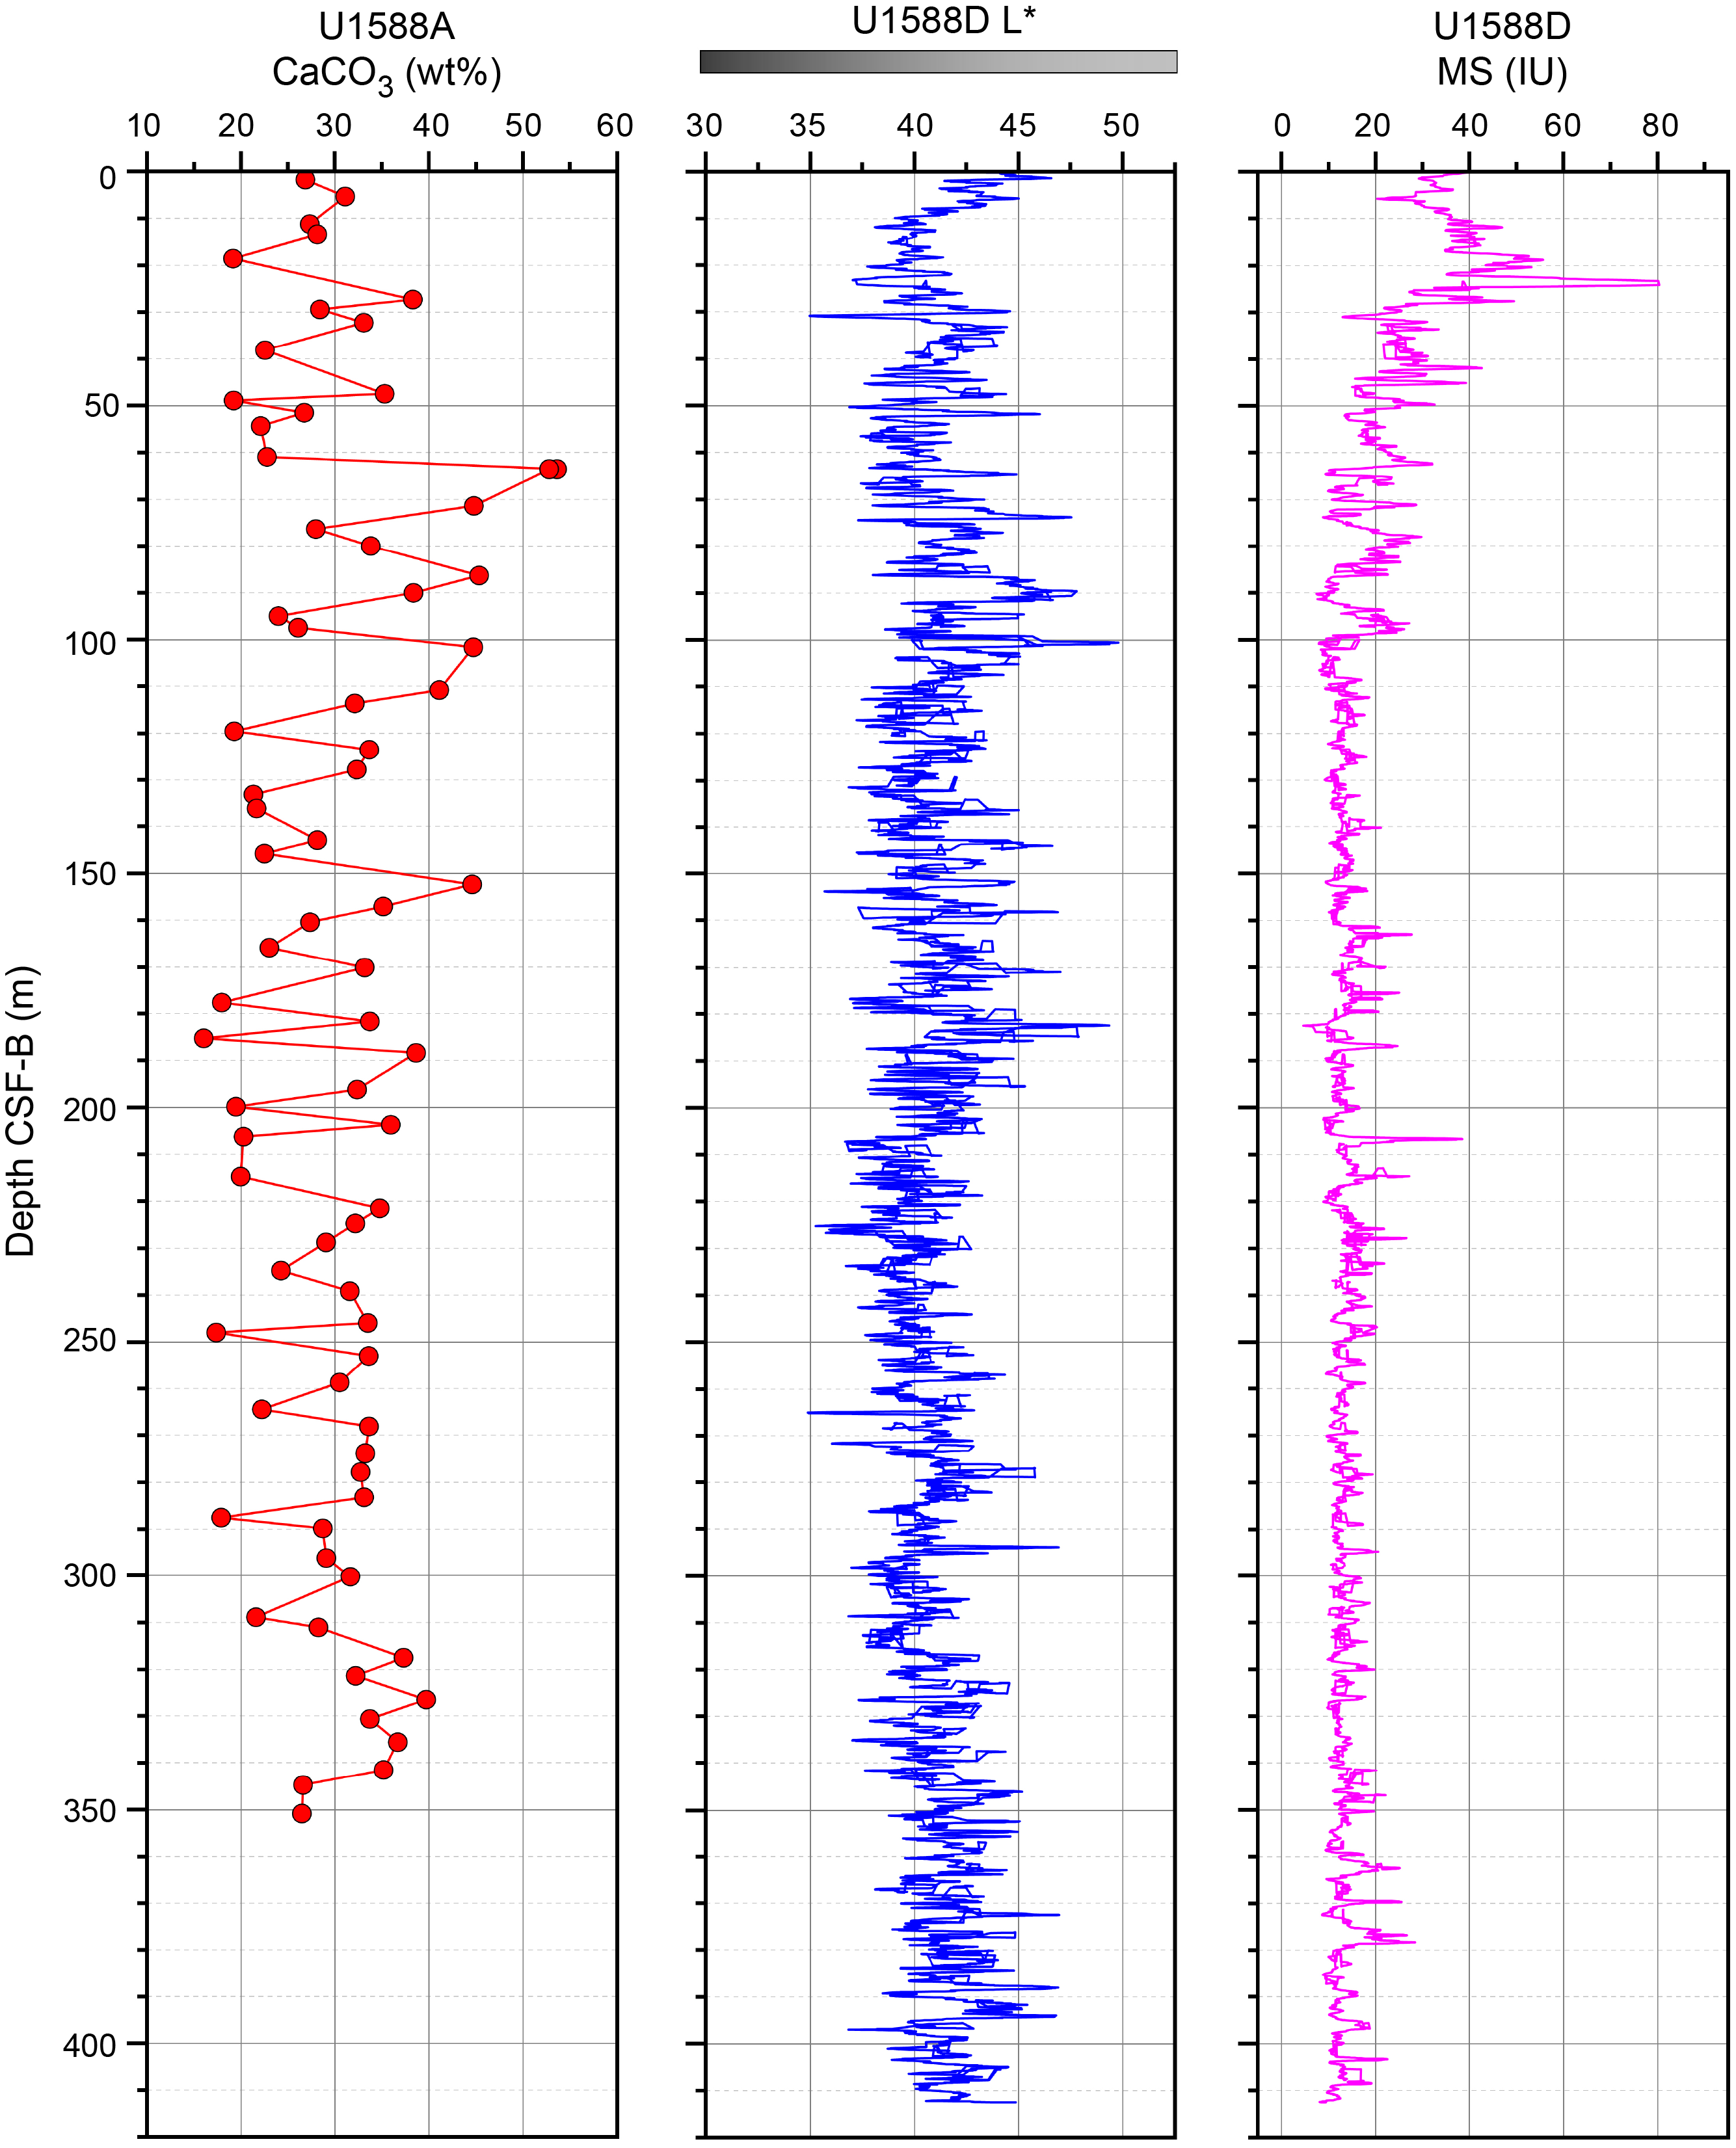
Figure F13. CaCO3, L*, and MS.
3.4.4. Integrating physical properties measurements with lithofacies observations
Variations in and between lithologies observed at Site U1588 were compared to downcore physical properties measurements, including NGR intensity, moisture and density (MAD) porosity and density, gamma ray attenuation (GRA) bulk density, MS from both loop (Whole-Round Multisensor Logger [WRMSL) and point (Section Half Multisensor Logger [SHMSL]) detectors, color variations (RGB) and color reflectance L*a*b* (see Physical properties).
Changes in physical properties are associated with variations in the siliciclastic clay content of the nannofossil ooze that is predominant throughout sediments recovered in all holes at Site U1588 (Figure F13). Each characteristic displays persistent decimeter- to meter-scale cycles that generally diminish in amplitude downhole. Greater clay content in the nannofossil ooze is associated with a decrease in RGB values, increase in MS and NGR, and decrease in L*. The color reflectance L* (increase) and a*, b*, and MS (decrease) all display marked shifts in the uppermost 50–60 m and then continue to vary cyclically about respective mean values that display little change from 50–412.5 m CSF-B. Calcium carbonate content similarly varies around a mean that remains approximately constant throughout each hole at Site U1588.
3.5. Discussion
3.5.1. Lithology
The abundance of Lithofacies 1 indicates the dominance of hemipelagic sedimentation at Site U1588 throughout the last 2 My of the Pleistocene (Holes U1588A–U1588D) (Figure F14). Siliciclastic input was likely relatively high or carbonate input (or preservation rates) was relatively low during the last 250 ky at Site U1588, as indicated by the higher values of clay content, L*, and MS in the upper 50 m CSF-B (Holes U1588A, U1588B, and U1588D). Siliciclastic input and carbonate input (or preservation) appear to have varied in similar fashion throughout the preceding portion of the Pleistocene, as indicated by the relatively constant mean values of nannofossils, clay, and lightness of sediments from 50 to 412.5 m CSF-B (Holes U1588A–U1588D). Recurring variations of layers of nannofossil ooze with differing clay abundances may suggest a link between sediment composition and orbital cyclicity, which is also consistent with previous findings from Sites U1586, U1587, and U1385, as well as with variations in physical properties (see Stratigraphic correlation).
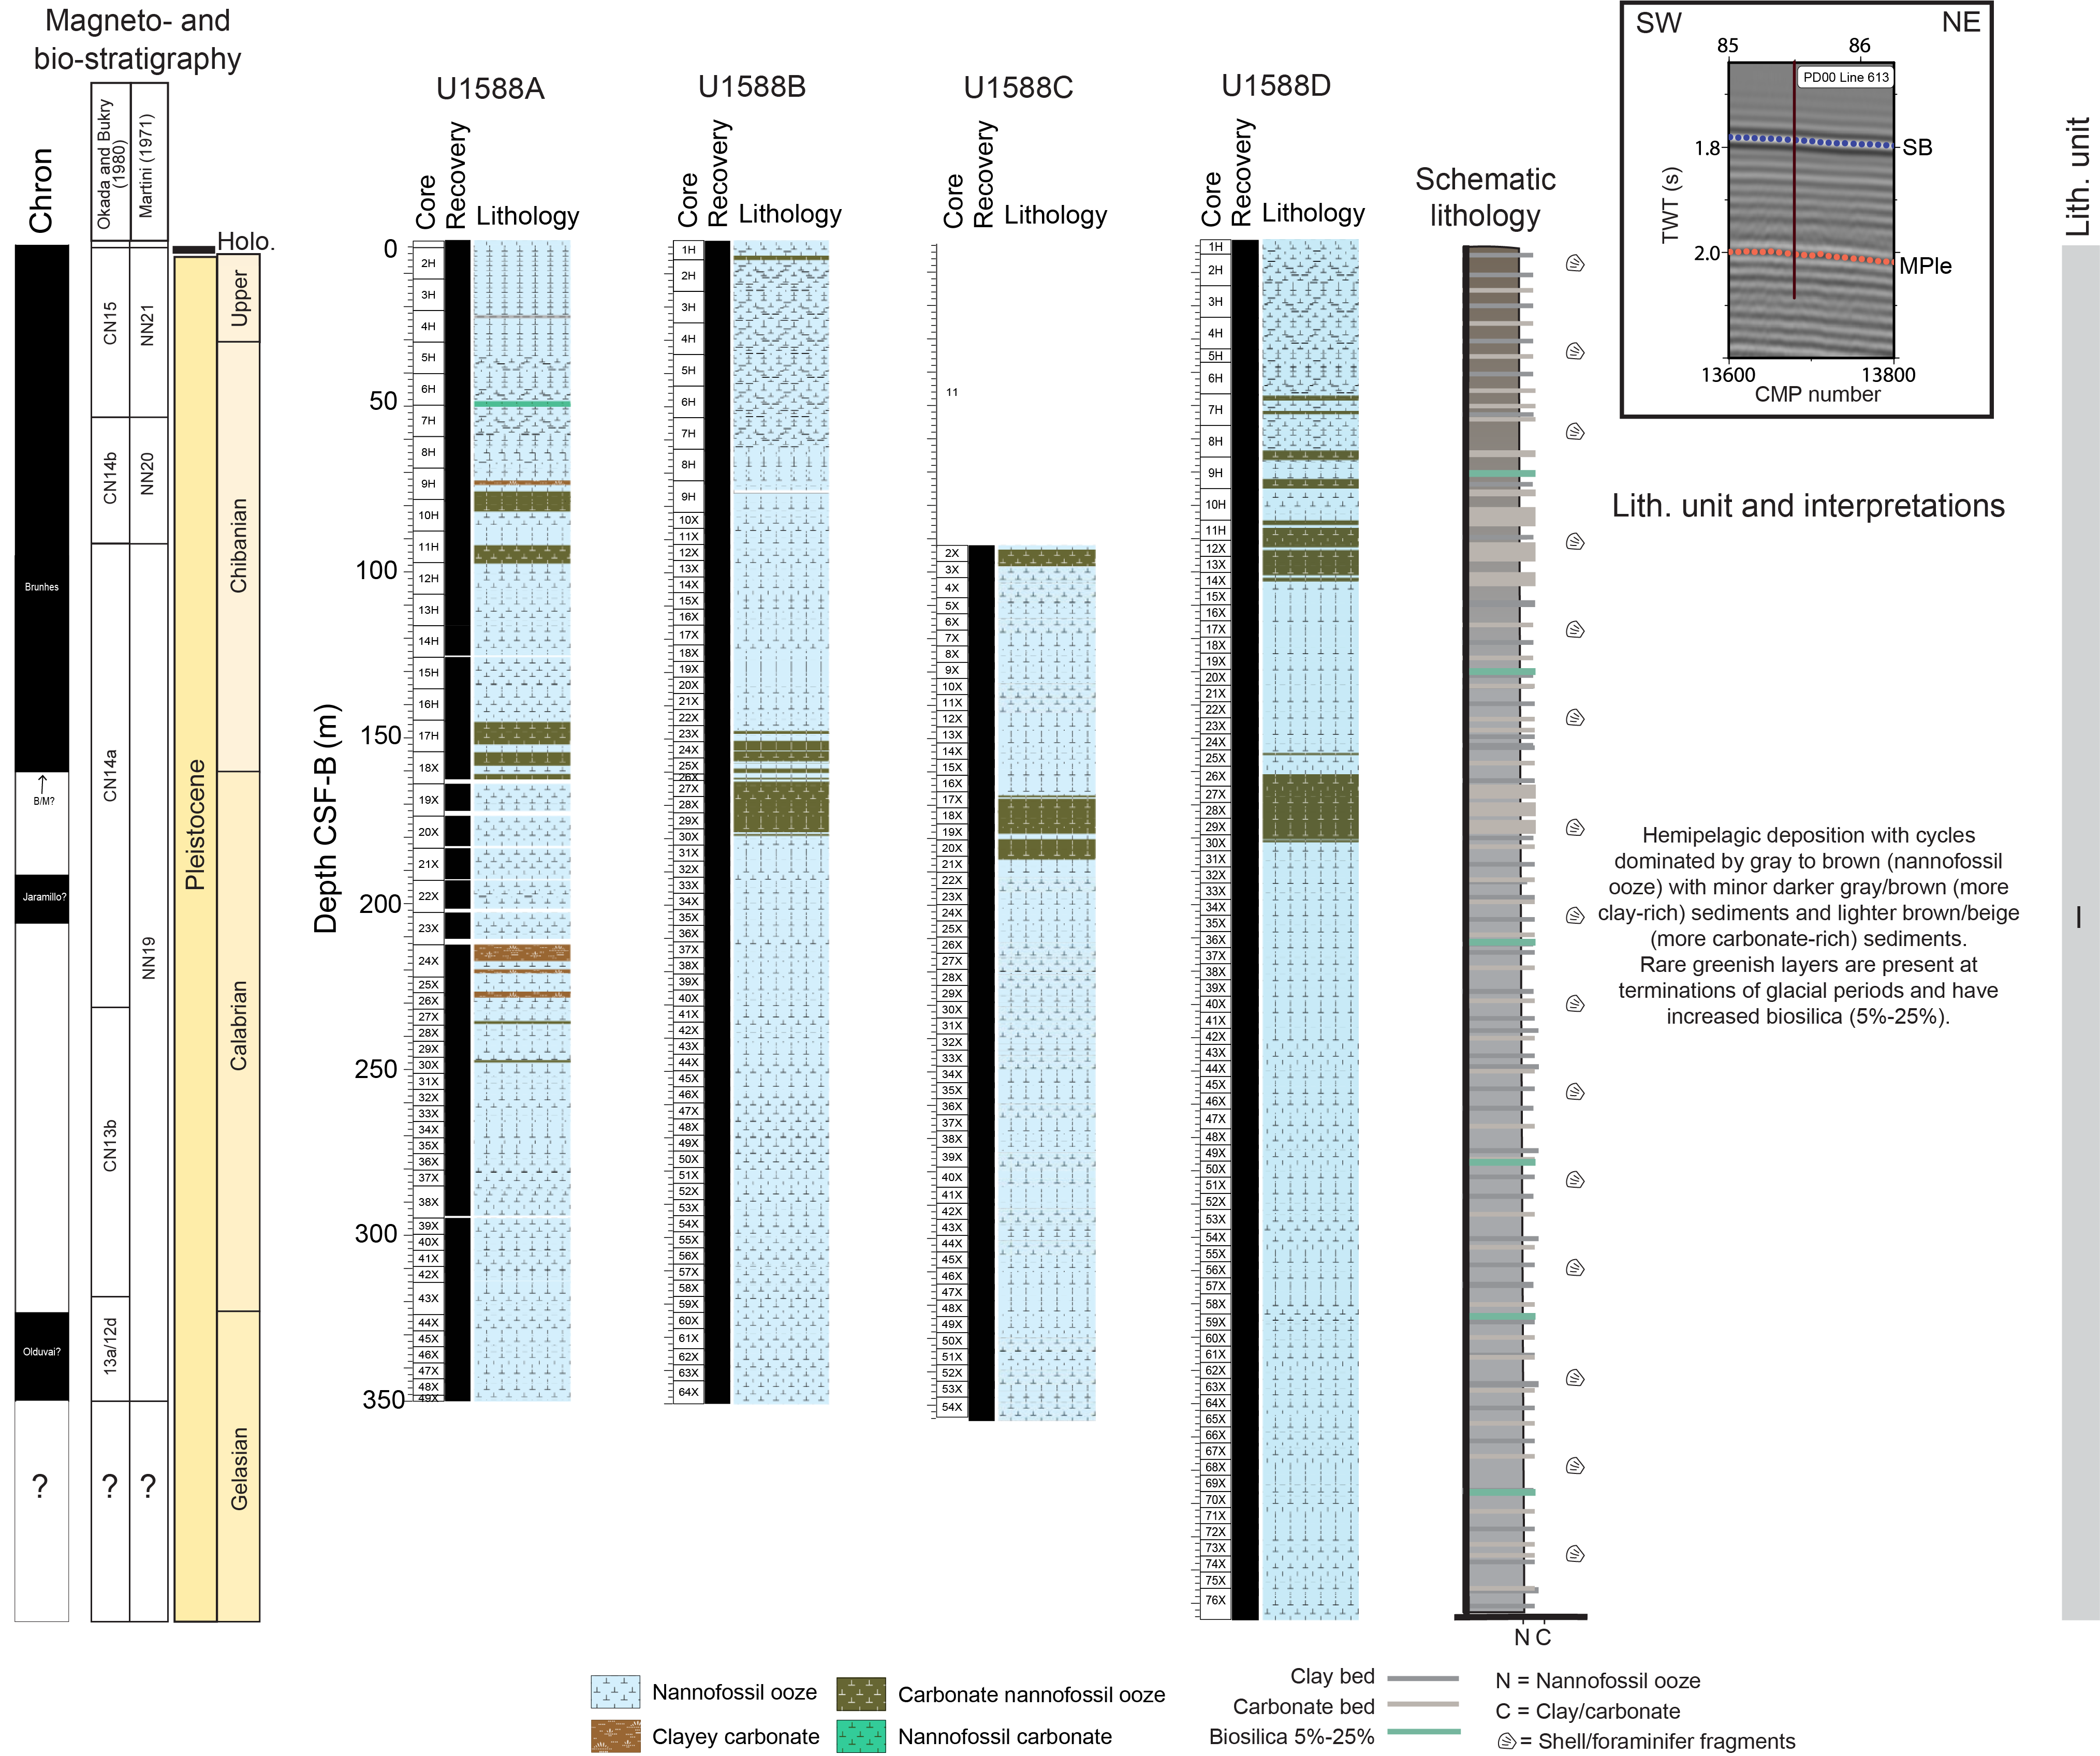
Figure F14. Lithologic summary.
The opal-bearing layers identifiable from sediment color are recognized on color reflectance and magnetic data in Sections 397-U1588A-20X-CC and 397-U1588C-20X-2. These were potentially deposited during MIS 26 to MIS 25 (Termination XII) and MIS 25, respectively (for age model, see Biostratigraphy). Past studies suggested increased productivity in the Iberian margin and Northwest Africa region during glacial–interglacial transitions (Abrantes, 1991a, 1991b, 2000). Peaks in diatom abundance have been documented in other terminations, such as MIS 10/9 (Termination IV), 6/5 (Termination II) (Thomson et al., 2000), and MIS 26/25 (Termination XII) (Ventura et al., 2017; Abrantes et al., 2017). A possible explanation for increased primary production is enhanced coastal upwelling at these glacial terminations, as evidenced by the presence of Chaetoceros spores. The stronger upwelling may reflect the enhancement of the Canary Current Upwelling System and a more nutrient-rich source water during some deglaciations. Alternatively, nutrients could be introduced to the site region through flooding of continental shelves related to rising sea level during deglaciation (Abrantes, 2000; Thomson et al., 2000). However, an increase in diatom preservation due to the presence of more Si-rich bottom waters cannot be excluded (Abrantes et al., 2017).
3.5.2. Diagenetic features
The orange brownish sediments in the uppermost meter or two of the first core in Holes U1588A, U1588B, and U1588D is likely a result of downward penetration of oxygen into the sediment column from the overlying seawater. The oxygen in these sediments would eventually be depleted by organic respiration. The gray sediments below this upper horizon are inferred to be reducing, leading to the mobilization of redox-sensitive elements including iron and manganese. These mobilized elements diffuse upward and precipitate out at the boundary with the oxic layer above, forming a redox horizon that migrates upward or downward relative to the seafloor as ocean ventilation and organic carbon export vary through time. This transition is gradual rather than sharp at Site U1588, possibly related to the sufficiently rapid accumulation of sediments to prevent a distinct boundary to be maintained through time at any subseafloor depth.
Pyrite (FeS2) is a common feature at Site U1588. Pyrite occurs as discrete elongated burrow fills and as isolated nodules, evident along the face of nearly every split core below ~40 m CSF-B. The presence of pyrite suggests relatively reducing conditions in sediment pore waters. Such conditions may result from increased oxygen consumption driven by enhanced surface-ocean organic carbon export and subsequent respiration at depth and in pore waters. Abundant discrete occurrences of pyrite suggest the presence of local microenvironments, typically associated with benthic organisms. The absence of pyrite in the shallowest few cores in Holes U1588A, U1588B, and U1588D may be related to generally greater influence of oxygen in these pore waters, although the abundance of amorphous iron monosulfide patches suggests that the transition to pyrite downcore may be more related to kinetic influences on pyrite formation.
3.5.3. Drilling and other disturbance
Gas expansion is one of the most widespread drilling disturbances at Site U1588 in both APC and XCB cores. Drilling disturbance is influenced by operation conditions (weather) and thus may not show any consistency between holes. Bioturbation is present in almost all sediments from Site U1588, and its intensity generally increases or becomes more distinct downhole. Trace fossil assemblages are typical of marginal marine environments (Heard et al., 2014).
4. Biostratigraphy
At Site U1588, the ~415 m thick cored sedimentary succession ranges in age from the Holocene to early Pleistocene (Cores 397-U1588A-1H through 397-U1588D-76X). Split core and core catcher samples accounted for 21 calcareous nannofossil and 1 benthic and 5 planktonic foraminifer bioevents. Nannofossils are very abundant to common, well preserved, and generally well distributed throughout the succession. Planktonic foraminifers also are abundant and well preserved.
The zonal schemes of calcareous nannofossils and planktonic foraminifers generally agree. Integrated calcareous microfossil bioevents are provided in Figure F15, with nannofossil and planktonic foraminifer datums reported in Tables T7, T8, and T9.
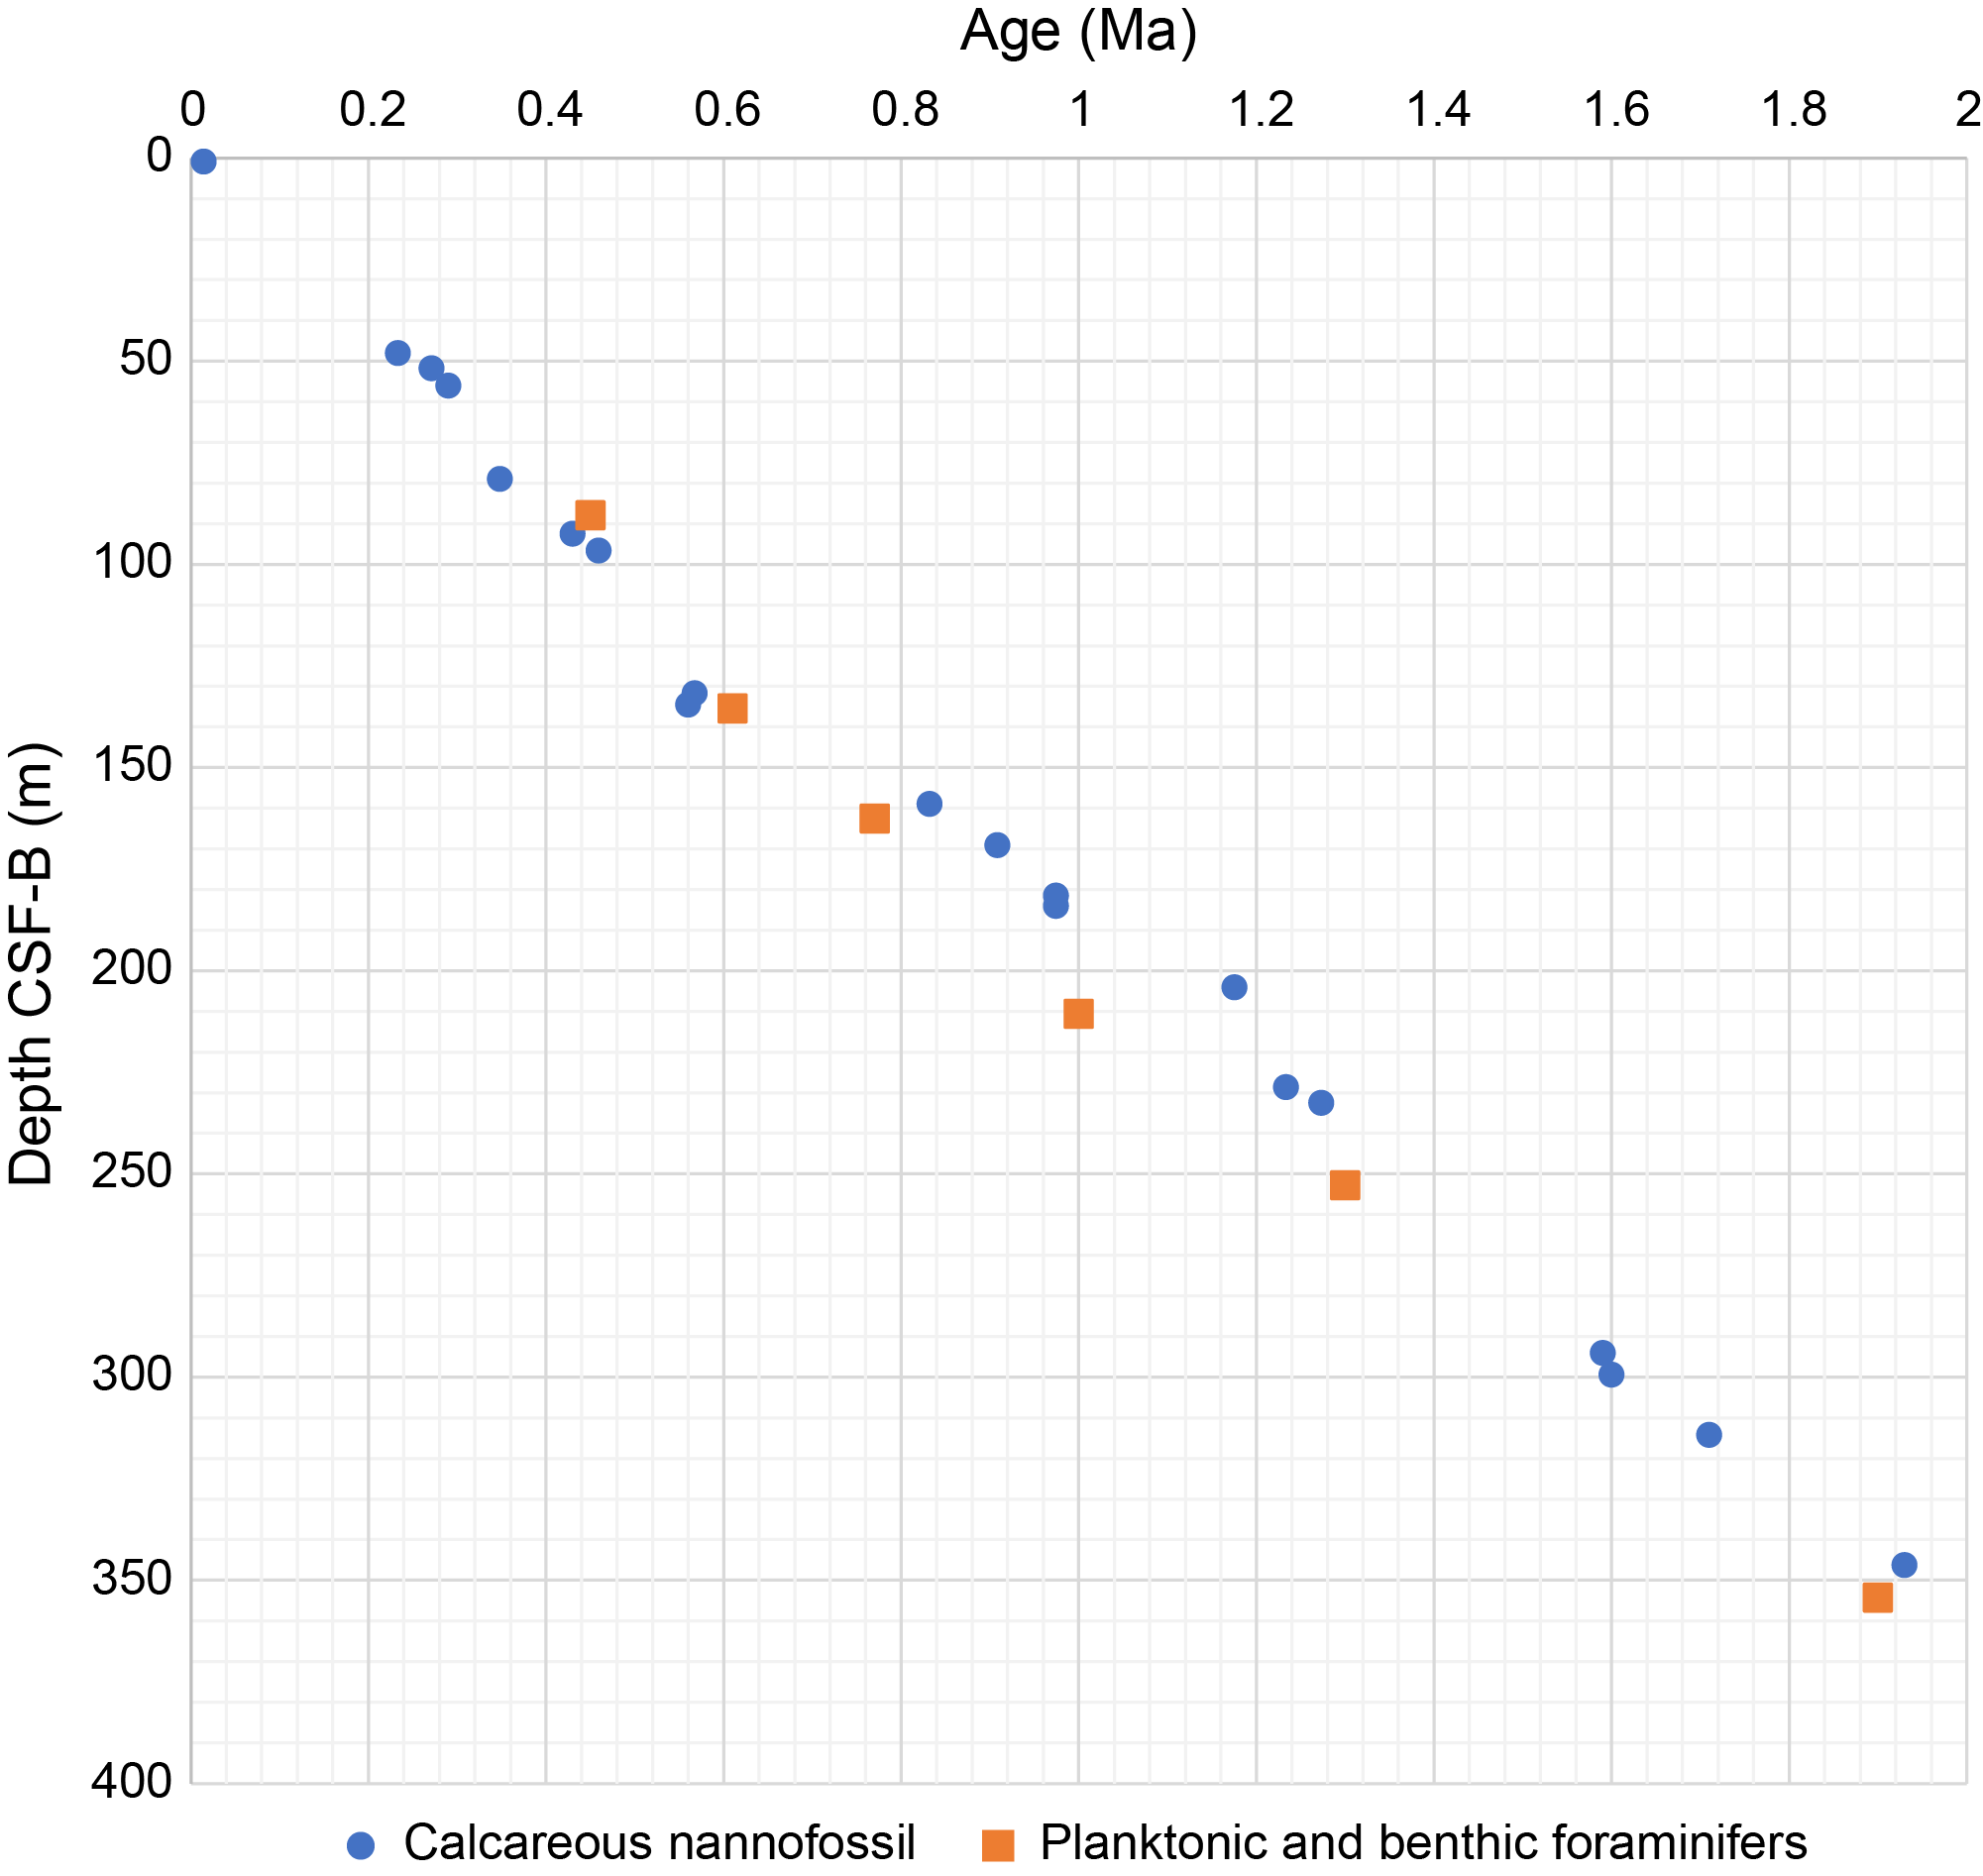
Figure F15. Age model.
4.1. Calcareous nannofossils
Calcareous nannofossil biostratigraphy at Site U1588 is based on 49 core catchers and more than 150 split core samples taken from Hole U1588A. All the samples were processed into smear slides using the standard techniques.
The nannofossil assemblage in Hole U1588A is defined by 21 groups/taxa-morphotypes, including Emiliania huxleyi, Gephyrocapsa caribbeanica gr., Gephyrocapsa spp. (small < 4 µm, medium, and large > 5.5 µm), Gephyrocapsa omega, Pseudoemiliania lacunosa, Reticulofenestra (<3, 3–5, 5–7, and >7 µm), Reticulofenestra asanoi, Coccolithus pelagicus, Calcidiscus leptoporus, Calcidiscus macintyrei, Helicosphaera inversa, Helicosphaera sellii, Syracosphaera spp., Scyphosphaera spp., Discoaster spp., Discoaster brouweri, and occasionally less abundant taxa (see Plate P1 in the Site U1586 chapter [Abrantes et al., 2024b]).
A total of 21 calcareous nannofossil events were identified within the studied section. These events were dated using age calibrations by Balestra et al. (2015), Raffi et al. (2006), and Gradstein et al. (2020) (Table T7). Additionally, the standard biozones of Martini (1971) and Okada and Bukry (1980) were identified. For these attributions, only taxa or morphotypes with biostratigraphic significance were considered (Table T8).
4.1.1. Pleistocene
Nannofossils are very abundant and show good preservation throughout the Pleistocene interval (19–348 m core depth below seafloor, Method A [CSF-A]; 397-U1588A-3H-6, 76 cm, to 48X-4, 75 cm). There is significant reworking throughout the section, and Cretaceous to Pleistocene nannofossils are identified.
Zone CN15/NN21 is based on the highest common occurrence (HcO) of large E. huxleyi (>4 µm) found in Sample 397-U1588A-1H-1, 80 cm. Zone CN14b/NN20-21 is identified based on the HcO, lowest occurrence (LO), and highest occurrence (HO) of G. caribbeanica, E. huxleyi, and H. inversa found in Samples 7H-4, 75 cm, 7H-6, 75 cm, and 10H-2, 75 cm, respectively. Zone CN14b-14a/NN19-20 is based on the HO of P. lacunosa above Sample 11H-5, 75 cm. Zone CN14a/NN19 is defined by the presence of several nannofossil markers including the LO of H. inversa in Sample 12H-1, 75 cm, the HO of G. omega in Sample 15H-1, 75 cm, the lowest common occurrence (LcO) of G. caribbeanica in Sample 15H-6, 75 cm, the temporary absence of G. omega in Sample 18X-5, 72 cm, the HcO of R. asanoi in Sample 19X-5, 75 cm, and the LcO of R. asanoi in Sample 23X-3, 60 cm.
Zone CN13b/NN19 is based on the HO and LO of large Gephyrocapsa (>5.5 µm) and the HO of C. macintyrei above Samples 397-U1588A-39X-1, 77 cm, and 40X-1, 71 cm, respectively. Zone CN13a-12d/NN18 is based on the HO of D. brouweri above Sample 48X-4, 75 cm. The same calcareous nannofossil assemblage is observed in Samples 397-U1588C-52X-CC, 11–17 cm, 53X-CC, 13–19 cm, and 54X-CC, 11–17 cm; however, the scarcity of D. brouweri and the high abundance of reworked specimens determines that this HO should be cautiously considered (Table T8).
4.1.2. Planktonic foraminifers
Planktonic foraminifer biostratigraphy is based on 49 core catchers from Hole U1588A. The relative abundance of taxa and estimation of assemblage preservation is presented in Table T10. Planktonic foraminifers are abundant and well preserved in all the studied samples. Scanning electron microscope (SEM) images of the biostratigraphic species are shown in Plate P2 in the Site U1586 chapter (Abrantes et al., 2024b).
Five planktonic foraminifer bioevents are identified, and the key biostratigraphic species and associated ages defined by Wade et al. (2011) are presented in Table T8. The upper part of the section, to 87.66 m CSF-B (Sample 397-U1588A-10H-CC), is assigned to the late middle Pleistocene (0.45 Ma) as evidenced by the LO of Globorotalia hirsuta. The HO of Globorotalia tosaensis belongs to the middle Pleistocene (0.61 Ma) and is recorded in Sample 15H-CC (135.16 m CSF-B). The interval between Samples 15H-CC and 23X-CC (210.55 m CSF-B) is assigned an age of 1 Ma based on the LO of Globorotalia excelsa. Sample 30X-CC (251.17 m CSF-B) is assigned to the Calabrian Stage (1.3 Ma) based on the HO of Globigerinoides obliquus. The lowermost sample, 49X-CC (352.97 m CSF-B), is estimated to be younger than 1.92 Ma based on the presence of Globorotalia truncatulinoides.
The mudline samples from Holes U1588A and U1588D are dominated by well-preserved planktonic foraminifers. The assemblage is characterized by a typical temperate North Atlantic fauna, including Globorotalia inflata, Neogloboquadrina pachyderma, Globigerina bulloides, and the presence of Globigerinoides ruber, G. truncatulinoides, and Orbulina universa (Table T10).
The Pleistocene assemblages show rapid changes between species typical of North Atlantic waters (e.g., G. inflata, N. pachyderma, and Turborotalita quinqueloba) and species from temperate to subtropical waters (e.g., Globorotalia scitula, G. ruber, and Trilobatus sacculifer plexus) (Table T10). A high concentration of large diatoms dominates Sample 397-U1588A-20X-CC (182.575 m CSF-B). Sample 21X-CC (192.585 m CSF-B) records N. pachyderma (s) that can be linked to a cold event. A high-resolution study is required to document the changes in the surface condition.
4.2. Benthic foraminifers
Benthic foraminifers were examined in core catchers from Hole U1588A (49 samples) and the mudline from Holes U1588A and U1588D. The presence of benthic foraminifers in the >150 µm fraction is summarized in Table T11. Abundance is generally low compared to planktonic foraminifers. The assemblages are characterized by genera of Bulimina, Cassidulina, Cibicidoides, Globobulimina, Melonis, Sphaeroidina, and Uvigerina in varying proportions (see Plates P3 and P4 in the Site U1586 chapter [Abrantes et al., 2024b]). The benthic foraminifers are well preserved, and the "Stilostomella extinction" event (0.58–0.7 Ma) (Hayward, 2002; Kawagata et al., 2005) is placed in Sample 397-U1588A-19H-CC (162.455 CSF-B).
Mudline core top samples from Holes U1588A and U1588D were gently washed to preserve fragile agglutinated specimens with low fossilization potential. In Holes U1588A and U1588D, few benthic specimens are recorded. Some hyaline specimens are stained with rose bengal and dominate the benthic foraminifer mudline assemblage such as Uvigerina, Oridorsalis, Melonis, Cibicidoides, Cassidulina, and Bulimina species. A few tubulars, organically cemented agglutinated benthic foraminifers, are also found. The mudline samples also contain sponge spicules regularly found in the downcore samples from Hole U1588A. The presence of well-preserved pteropods in the mudline and the uppermost nine core catchers confirms the excellent calcareous preservation in the samples.
4.3. Ostracods
Ostracods were examined in the sand fraction of all 49 core catcher samples from Hole U1588A (Cores 1H–49X) and the mudline samples from Holes U1588A and U1588D. They are present (as many as 110 specimens) in most samples. Overall, ostracods are more abundant and diverse in the upper half of the sequence and their preservation is generally good. The predominant genera are Krithe (58%, five species, including Krithe keyi, a species that has been associated with MOW) (Laprida et al., 2002), Cytherella (11%, one species), Argilloecia (6%, three species), Echinocythereis (4%, one species), Neonesidea (4%, two species), Henryhowella (2%, one species), Cytheropteron (2%, three species), and Buntonia (2%, three species). The ostracod taxa are listed in Table T12.
5. Paleomagnetism
Paleomagnetic investigations of sediments from Site U1588 focused on measuring the natural remanent magnetization (NRM) of archive-half sections from Holes U1588A–U1588D at 4 cm intervals. We measured all archive-half sections except Section 397-U1588A-24X-1 (which was heavily disturbed during coring) and sections from core catchers. NRM measurements were made before and after 20 mT alternating field (AF) demagnetization for sections from Hole U1588A and Sections 397-U1588B-1H-1 through 11X-2. Because of increased core flow, Sections 397-U1588B-11X-3 through 64X-7 and sections from Holes U1588C and U1588D were measured only after 20 mT demagnetization (Table T13). Cores 397-U1588A-1H through 17H, 397-U1588B-1H through 9H, and 397-U1588D-1H through 11H were oriented with the Icefield MI-5 (see Paleomagnetism in the Expedition 397 methods chapter [Abrantes et al., 2024a]). The APC core orientation data for all oriented cores are reported in Table T14.
We collected and measured the NRM of 35 cube samples from Hole U1588A. Squares in Figure F16 mark the depths where cube samples were taken (about one cube sample per full core in Hole U1588A). A total of 22 demagnetization steps (with peak field up to 50 mT) were used for NRM measurements of the cube samples (Table T13).
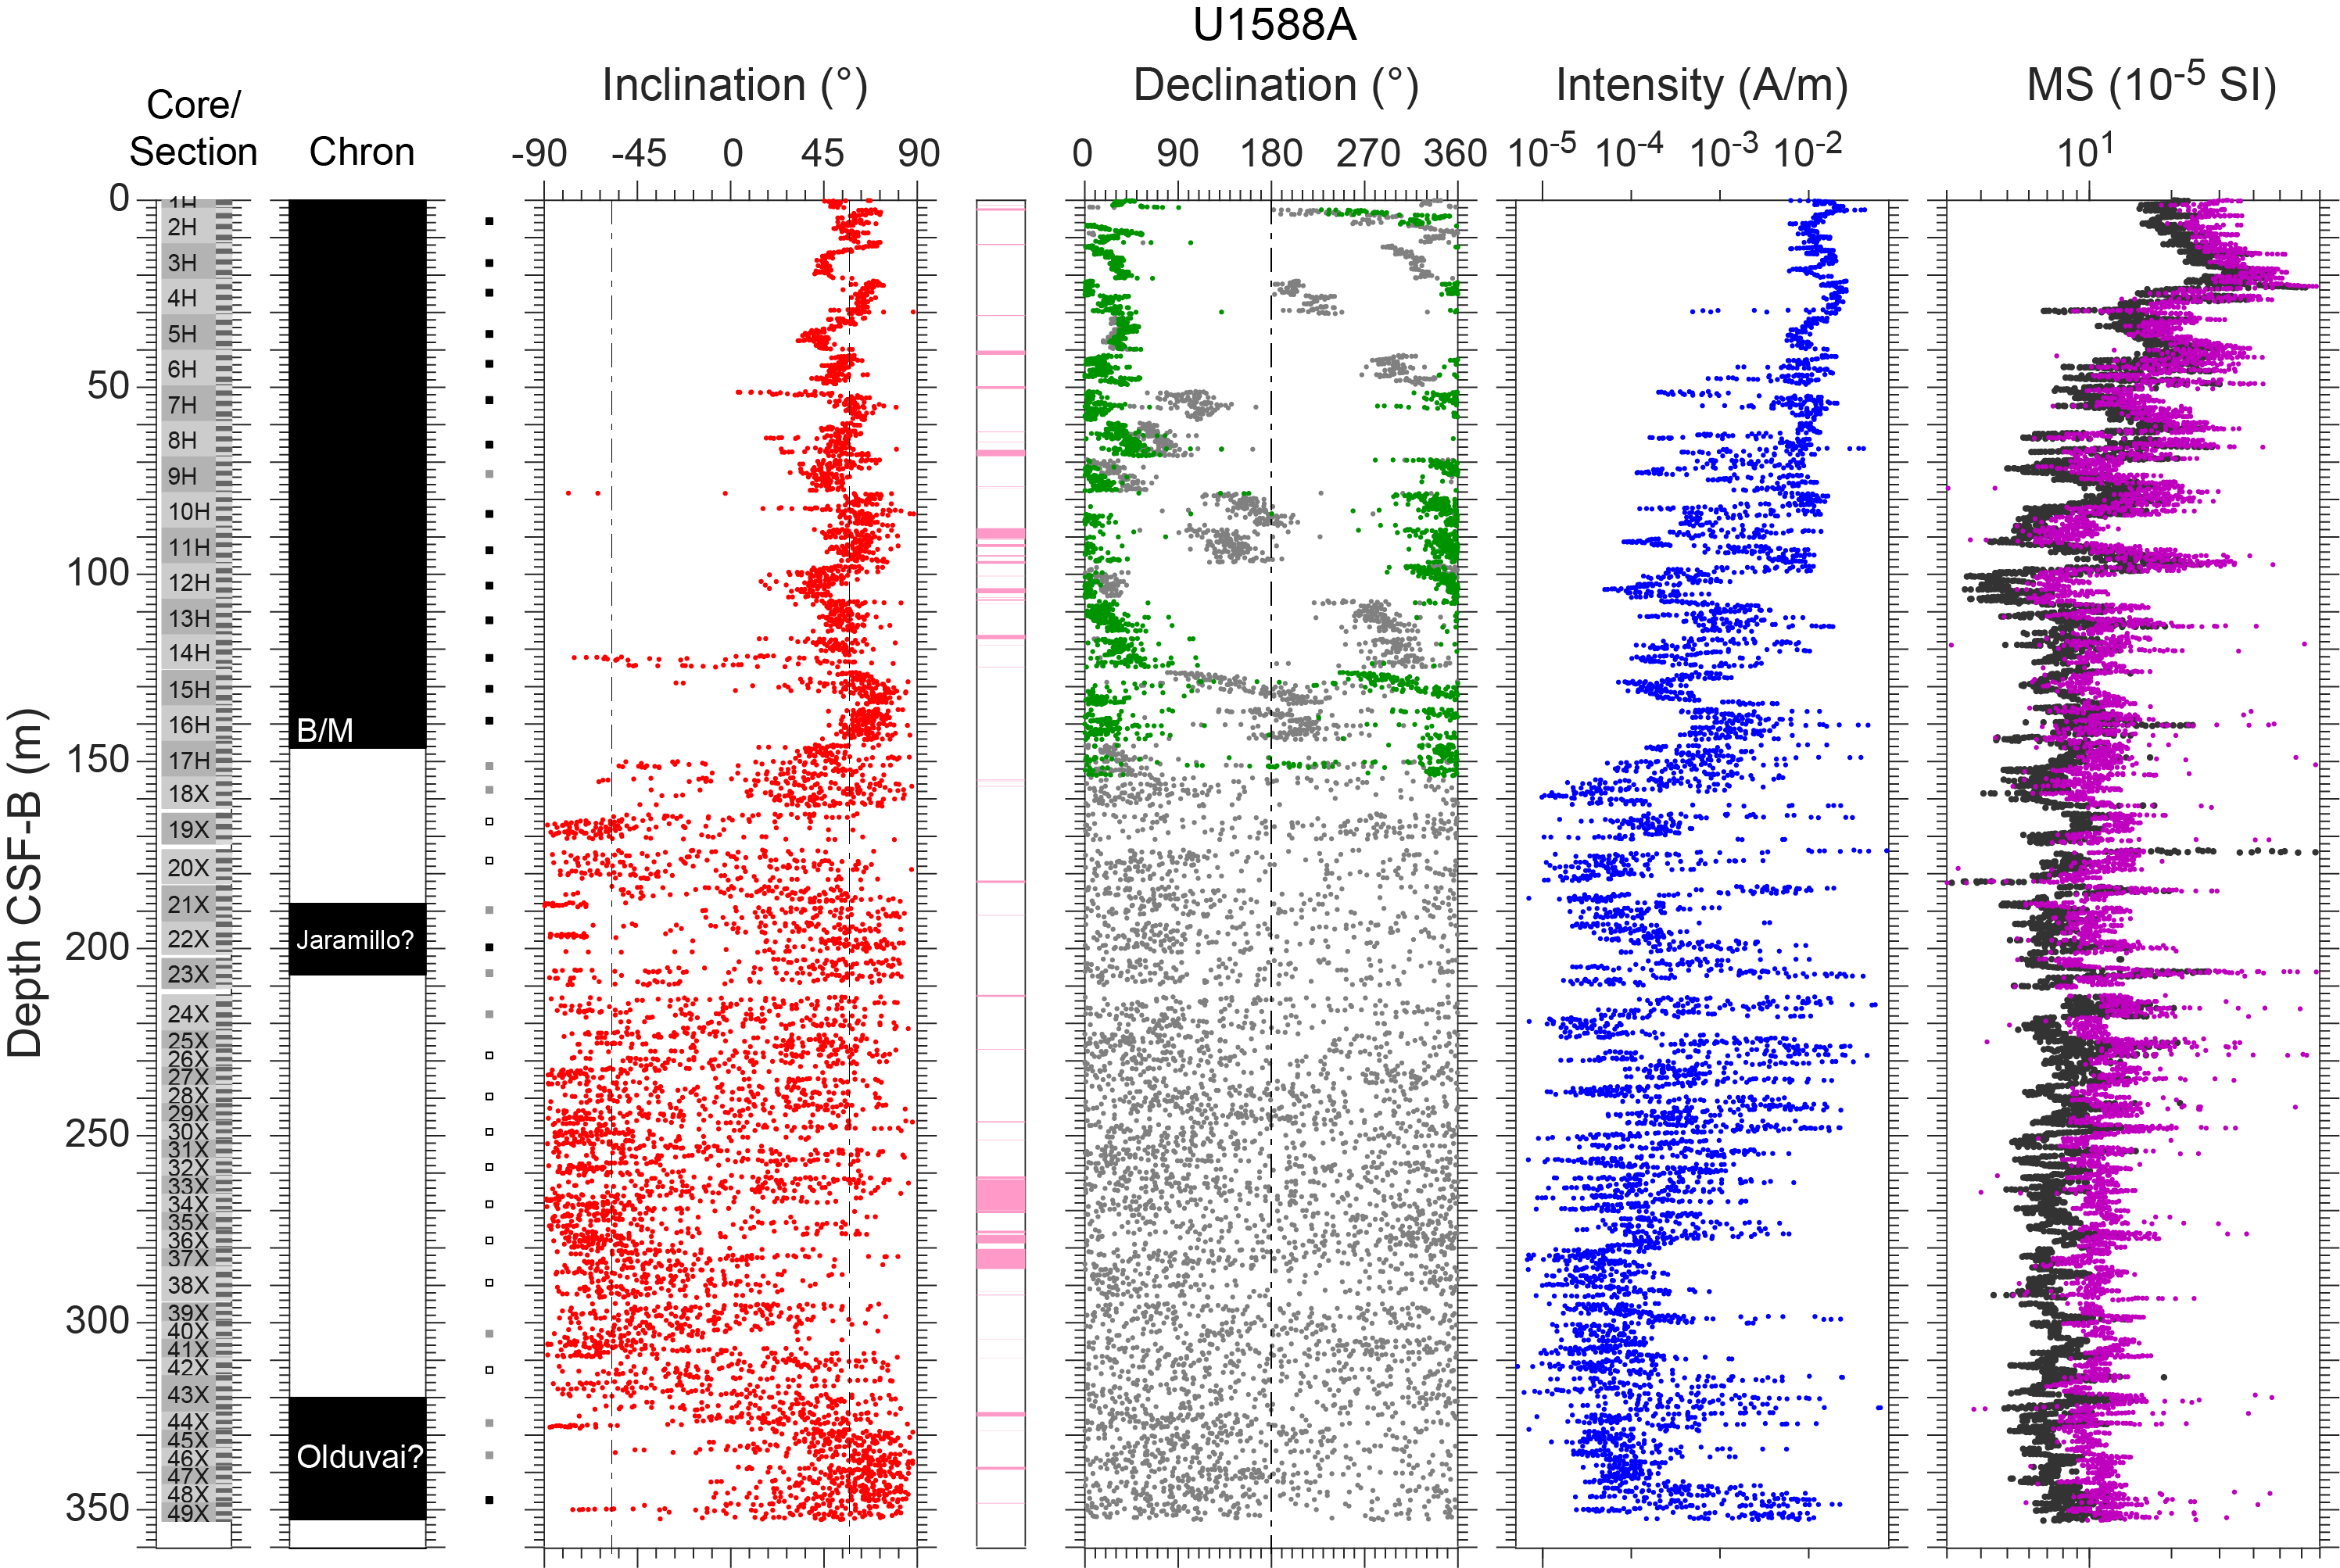
Figure F16. AF demagnetization, Hole U1588A.
We processed archive-half section data extracted from the shipboard Laboratory Information Management System (LIMS) database by removing all measurements collected from (1) void intervals caused by whole round core sampling (i.e., interstitial water [IW] and paleontology [PAL] samples), (2) disturbed core top intervals in APC cores summarized in Table T15, and (3) the top and bottom 8 cm of each section and an extra 8 cm for the void and disturbed core top intervals. Intervals that were severely/strongly disturbed during coring (see Lithostratigraphy) are indicated in Figures F16, F17, F18, and F19, and data from these intervals are typically not used for magnetostratigraphic interpretation. In addition, a significant number of NRM measurements of section-half and cube samples on the SRM were compromised due to flux jumps. We avoided using data from sections influenced by this measurement problem for interpretation and removed data from compromised demagnetization steps for NRM of cube samples.
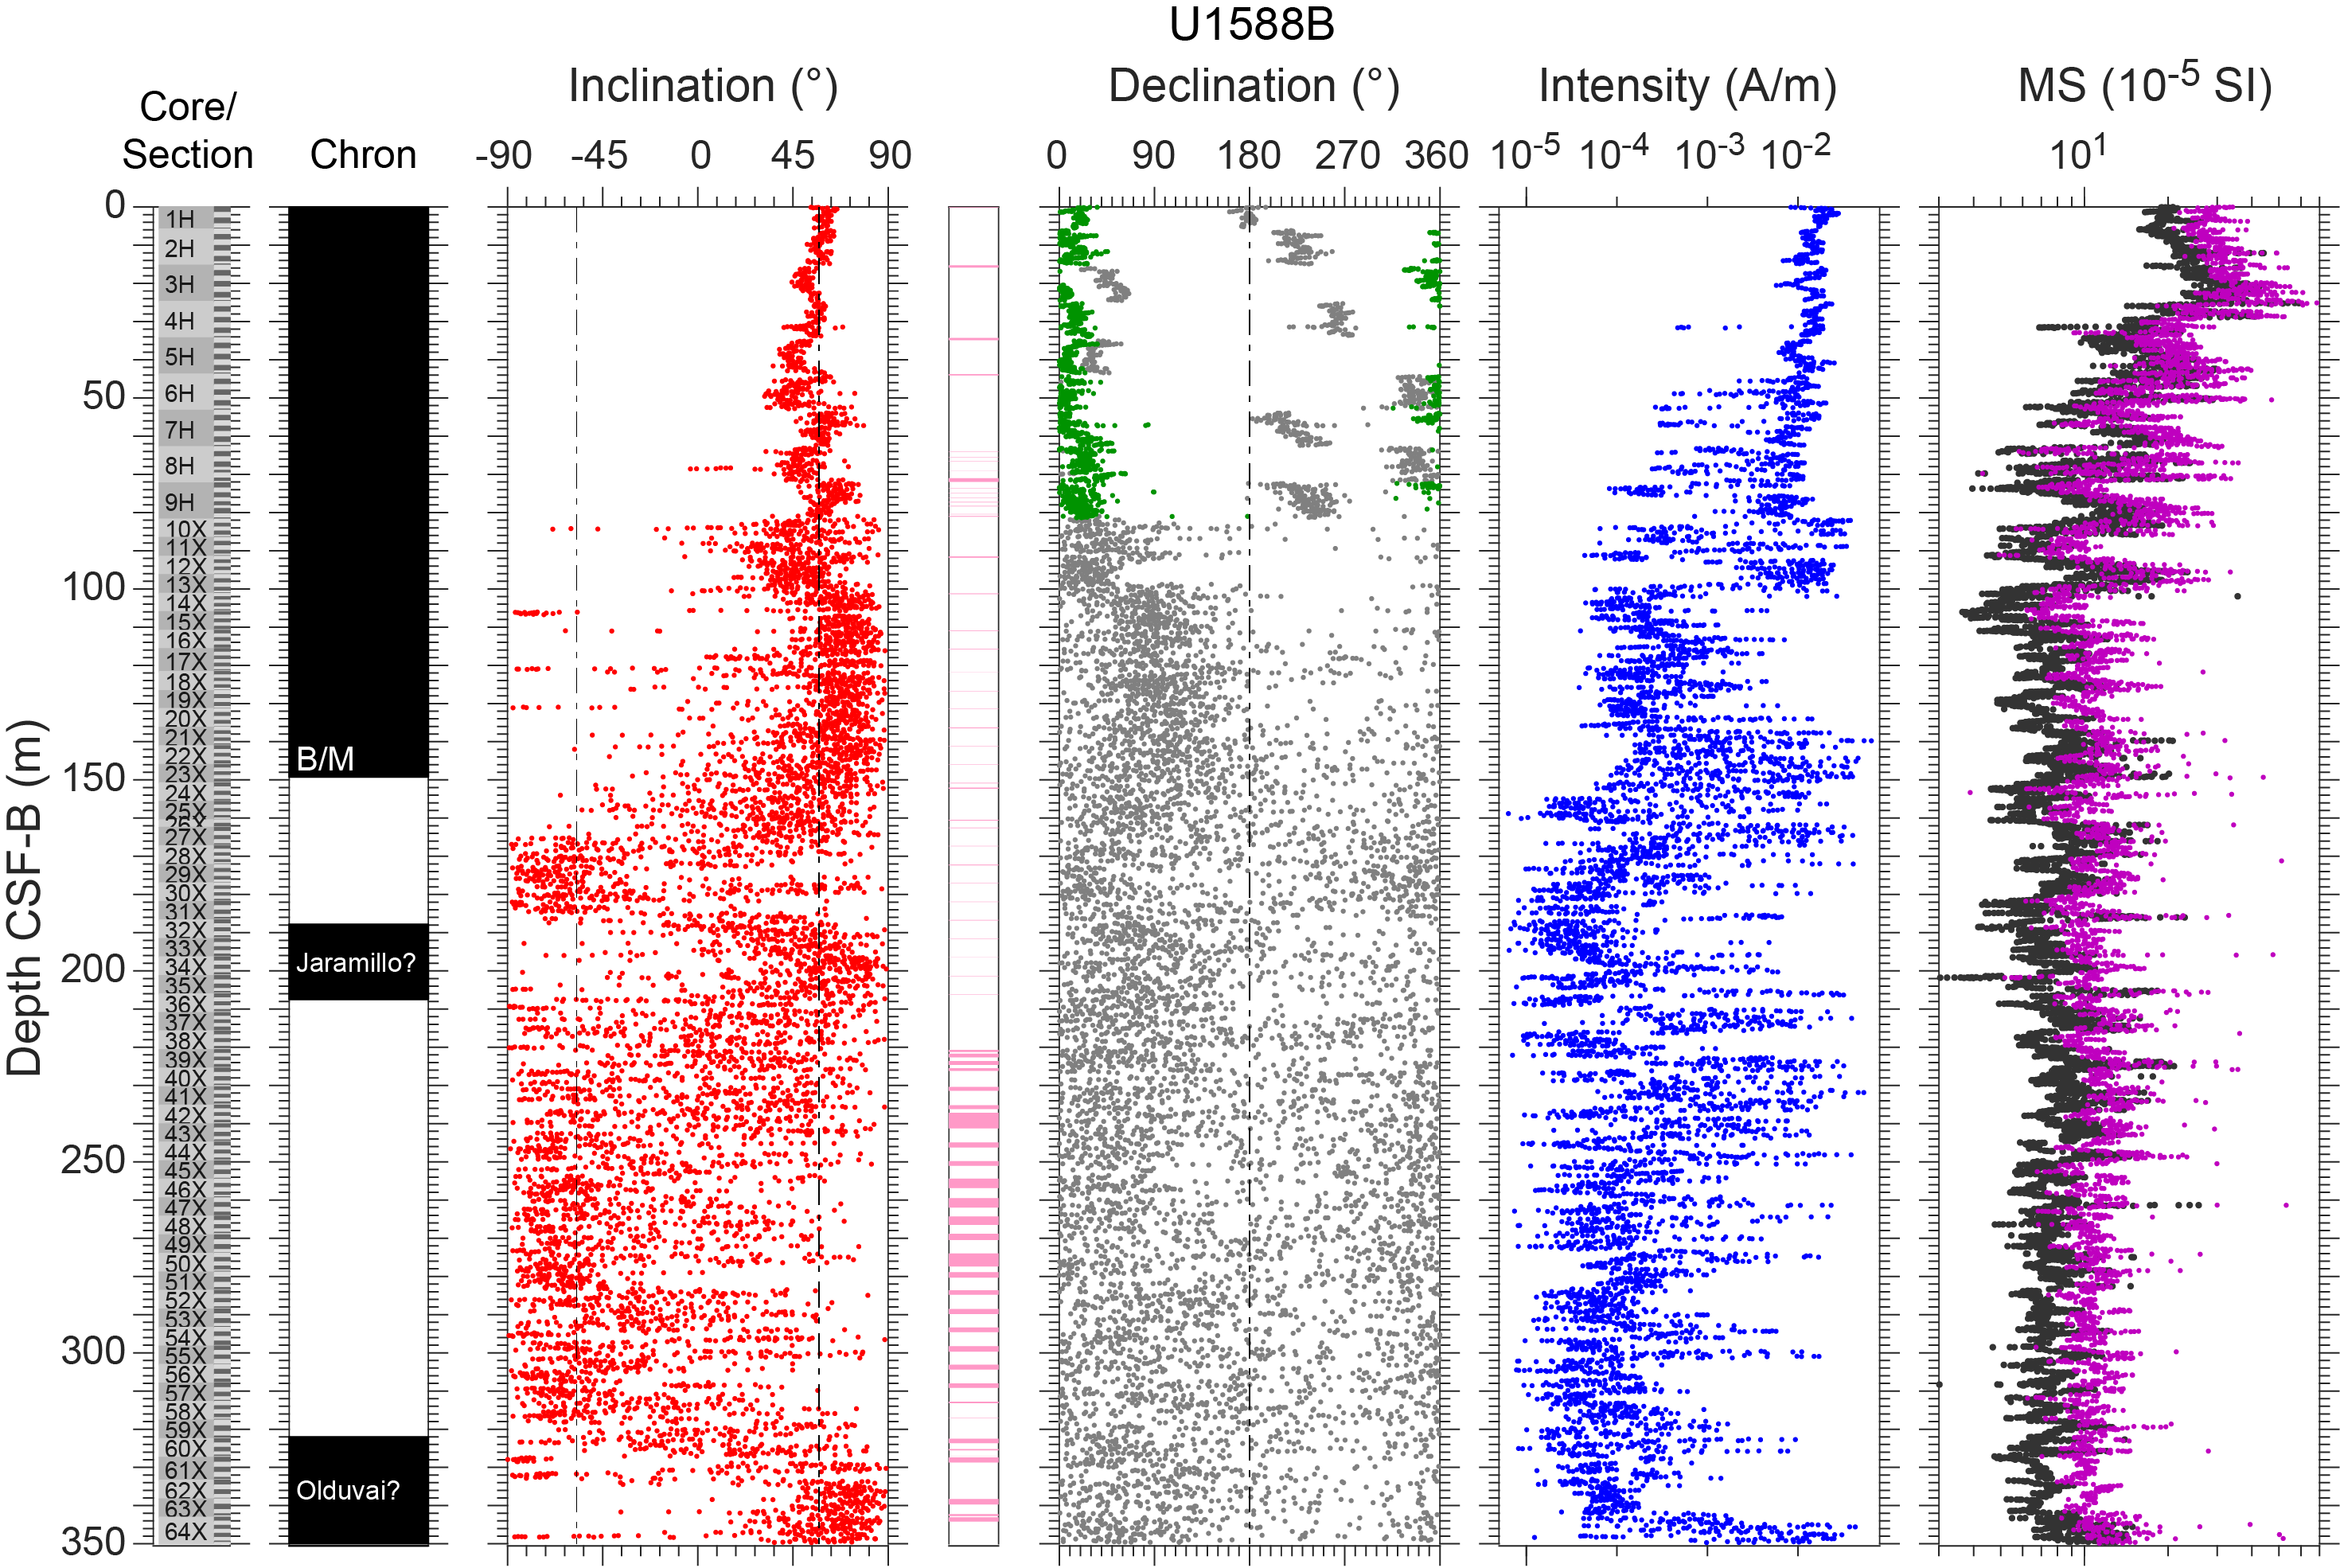
Figure F17. AF demagnetization, Hole U1588B.
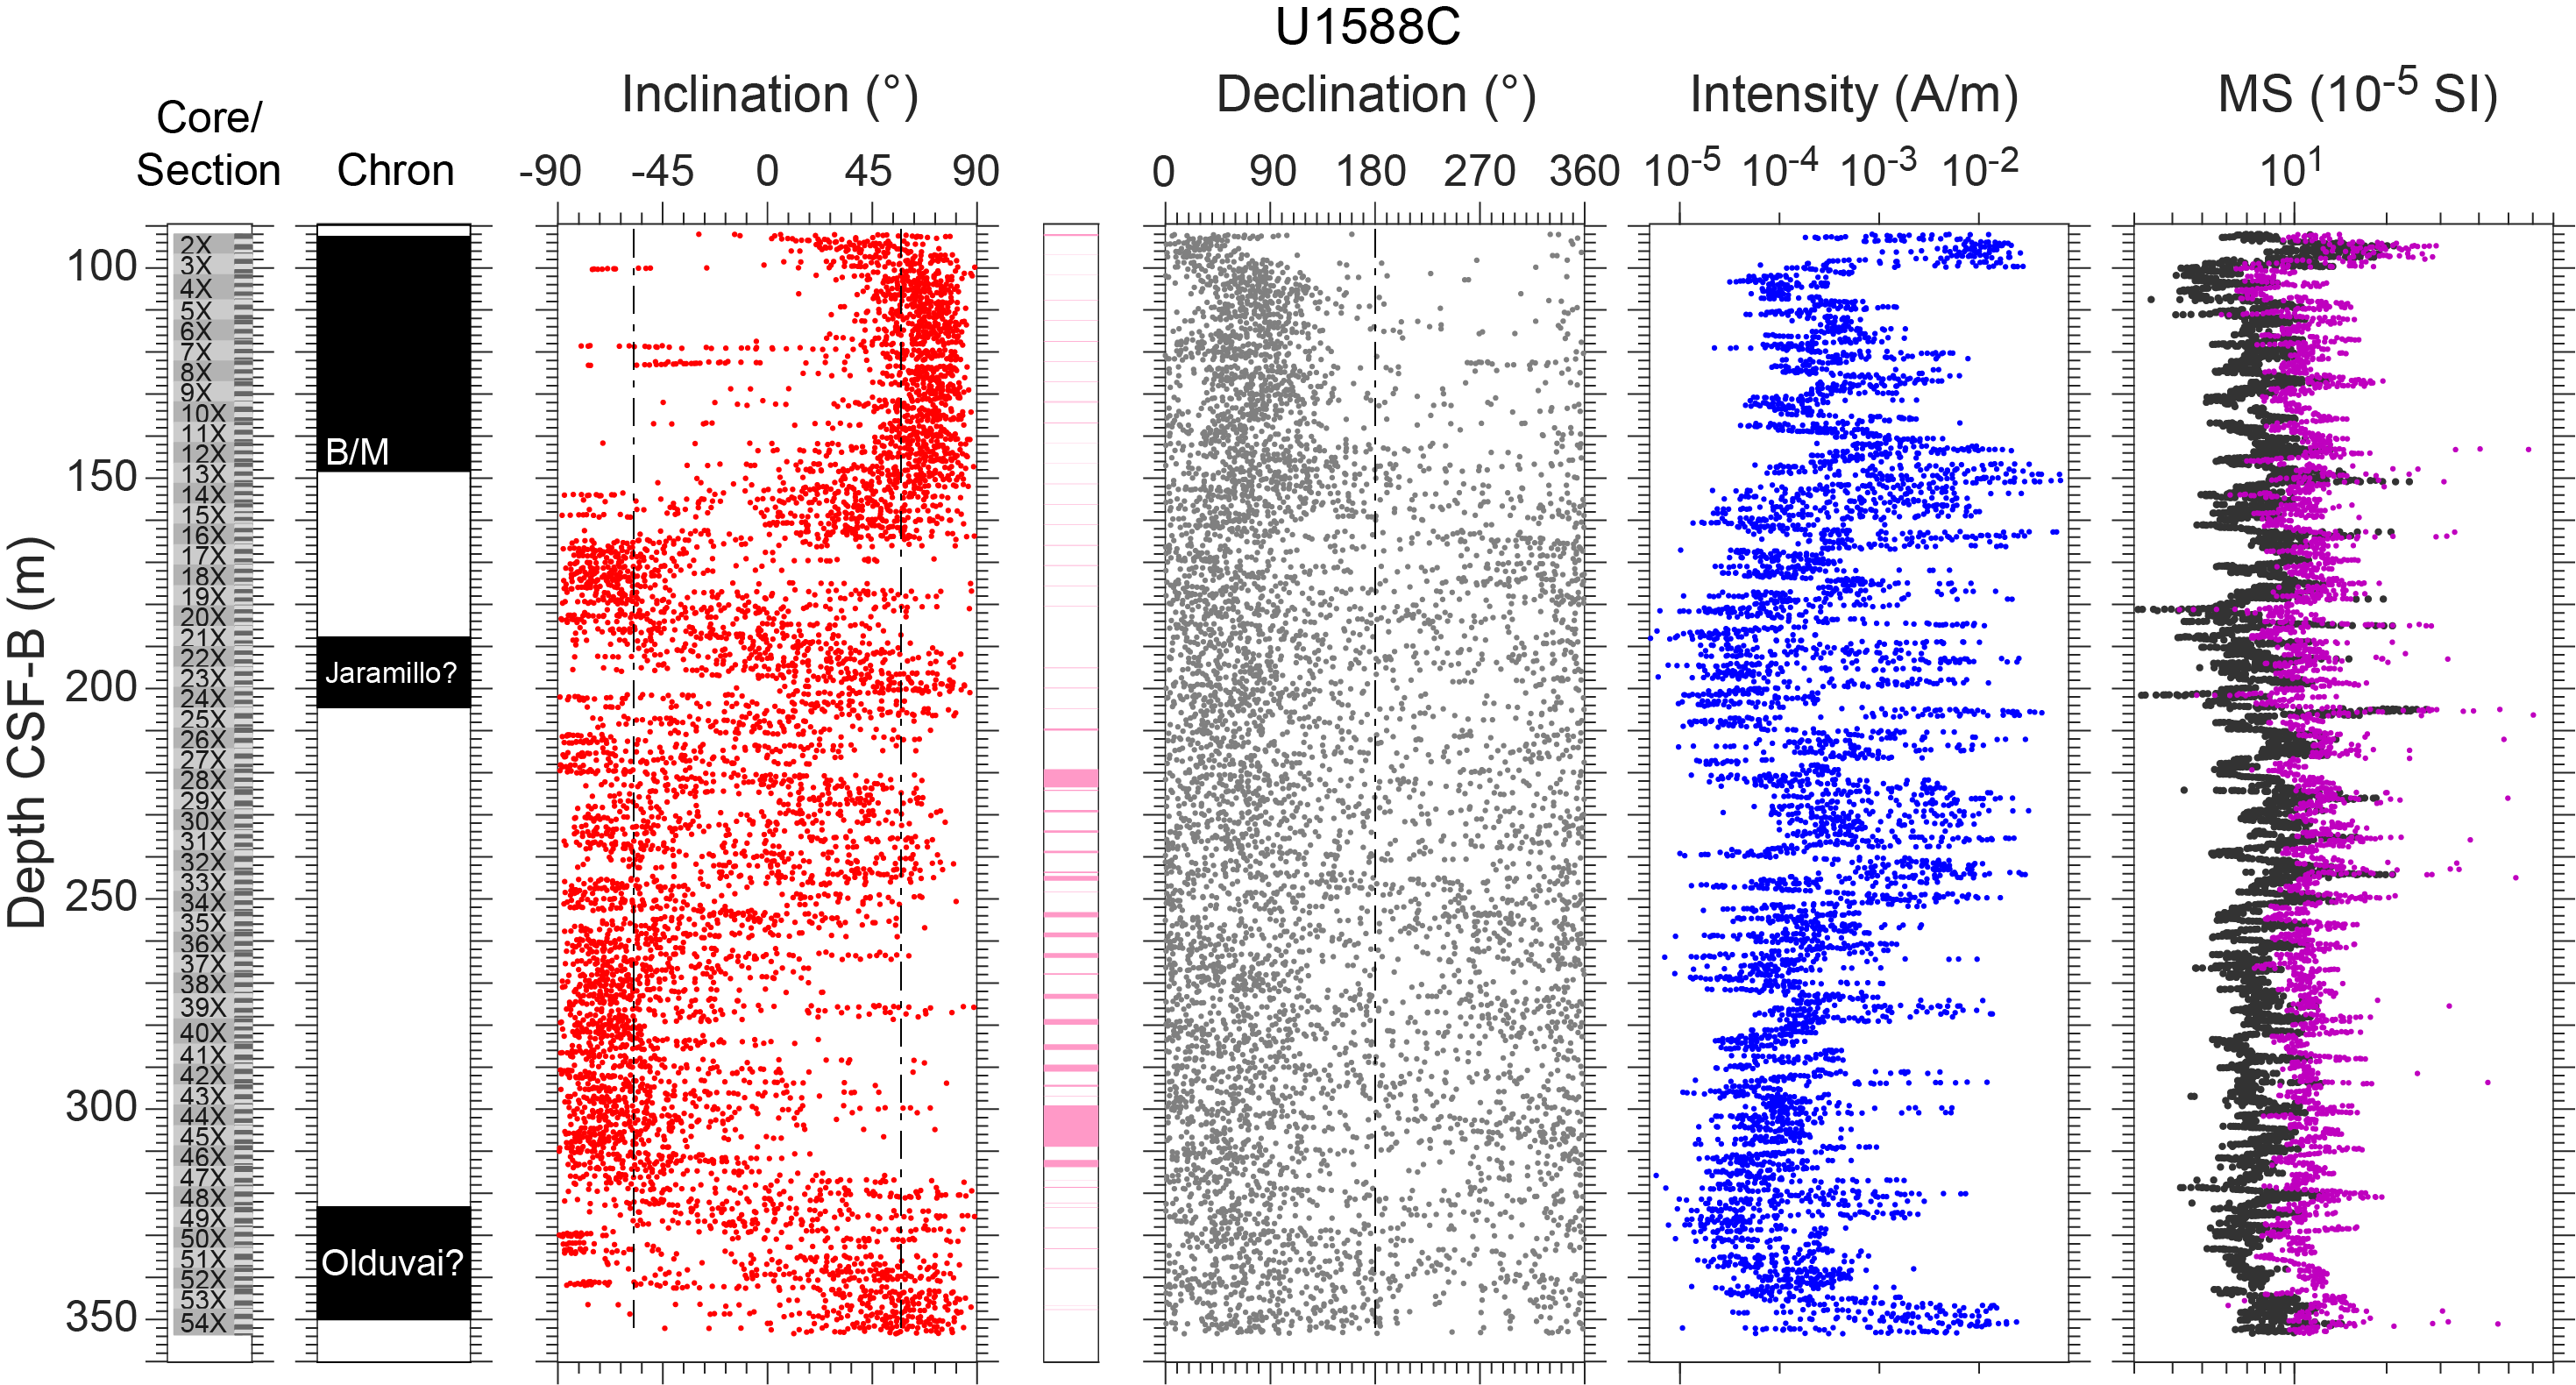
Figure F18. AF demagnetization, Hole U1588C.
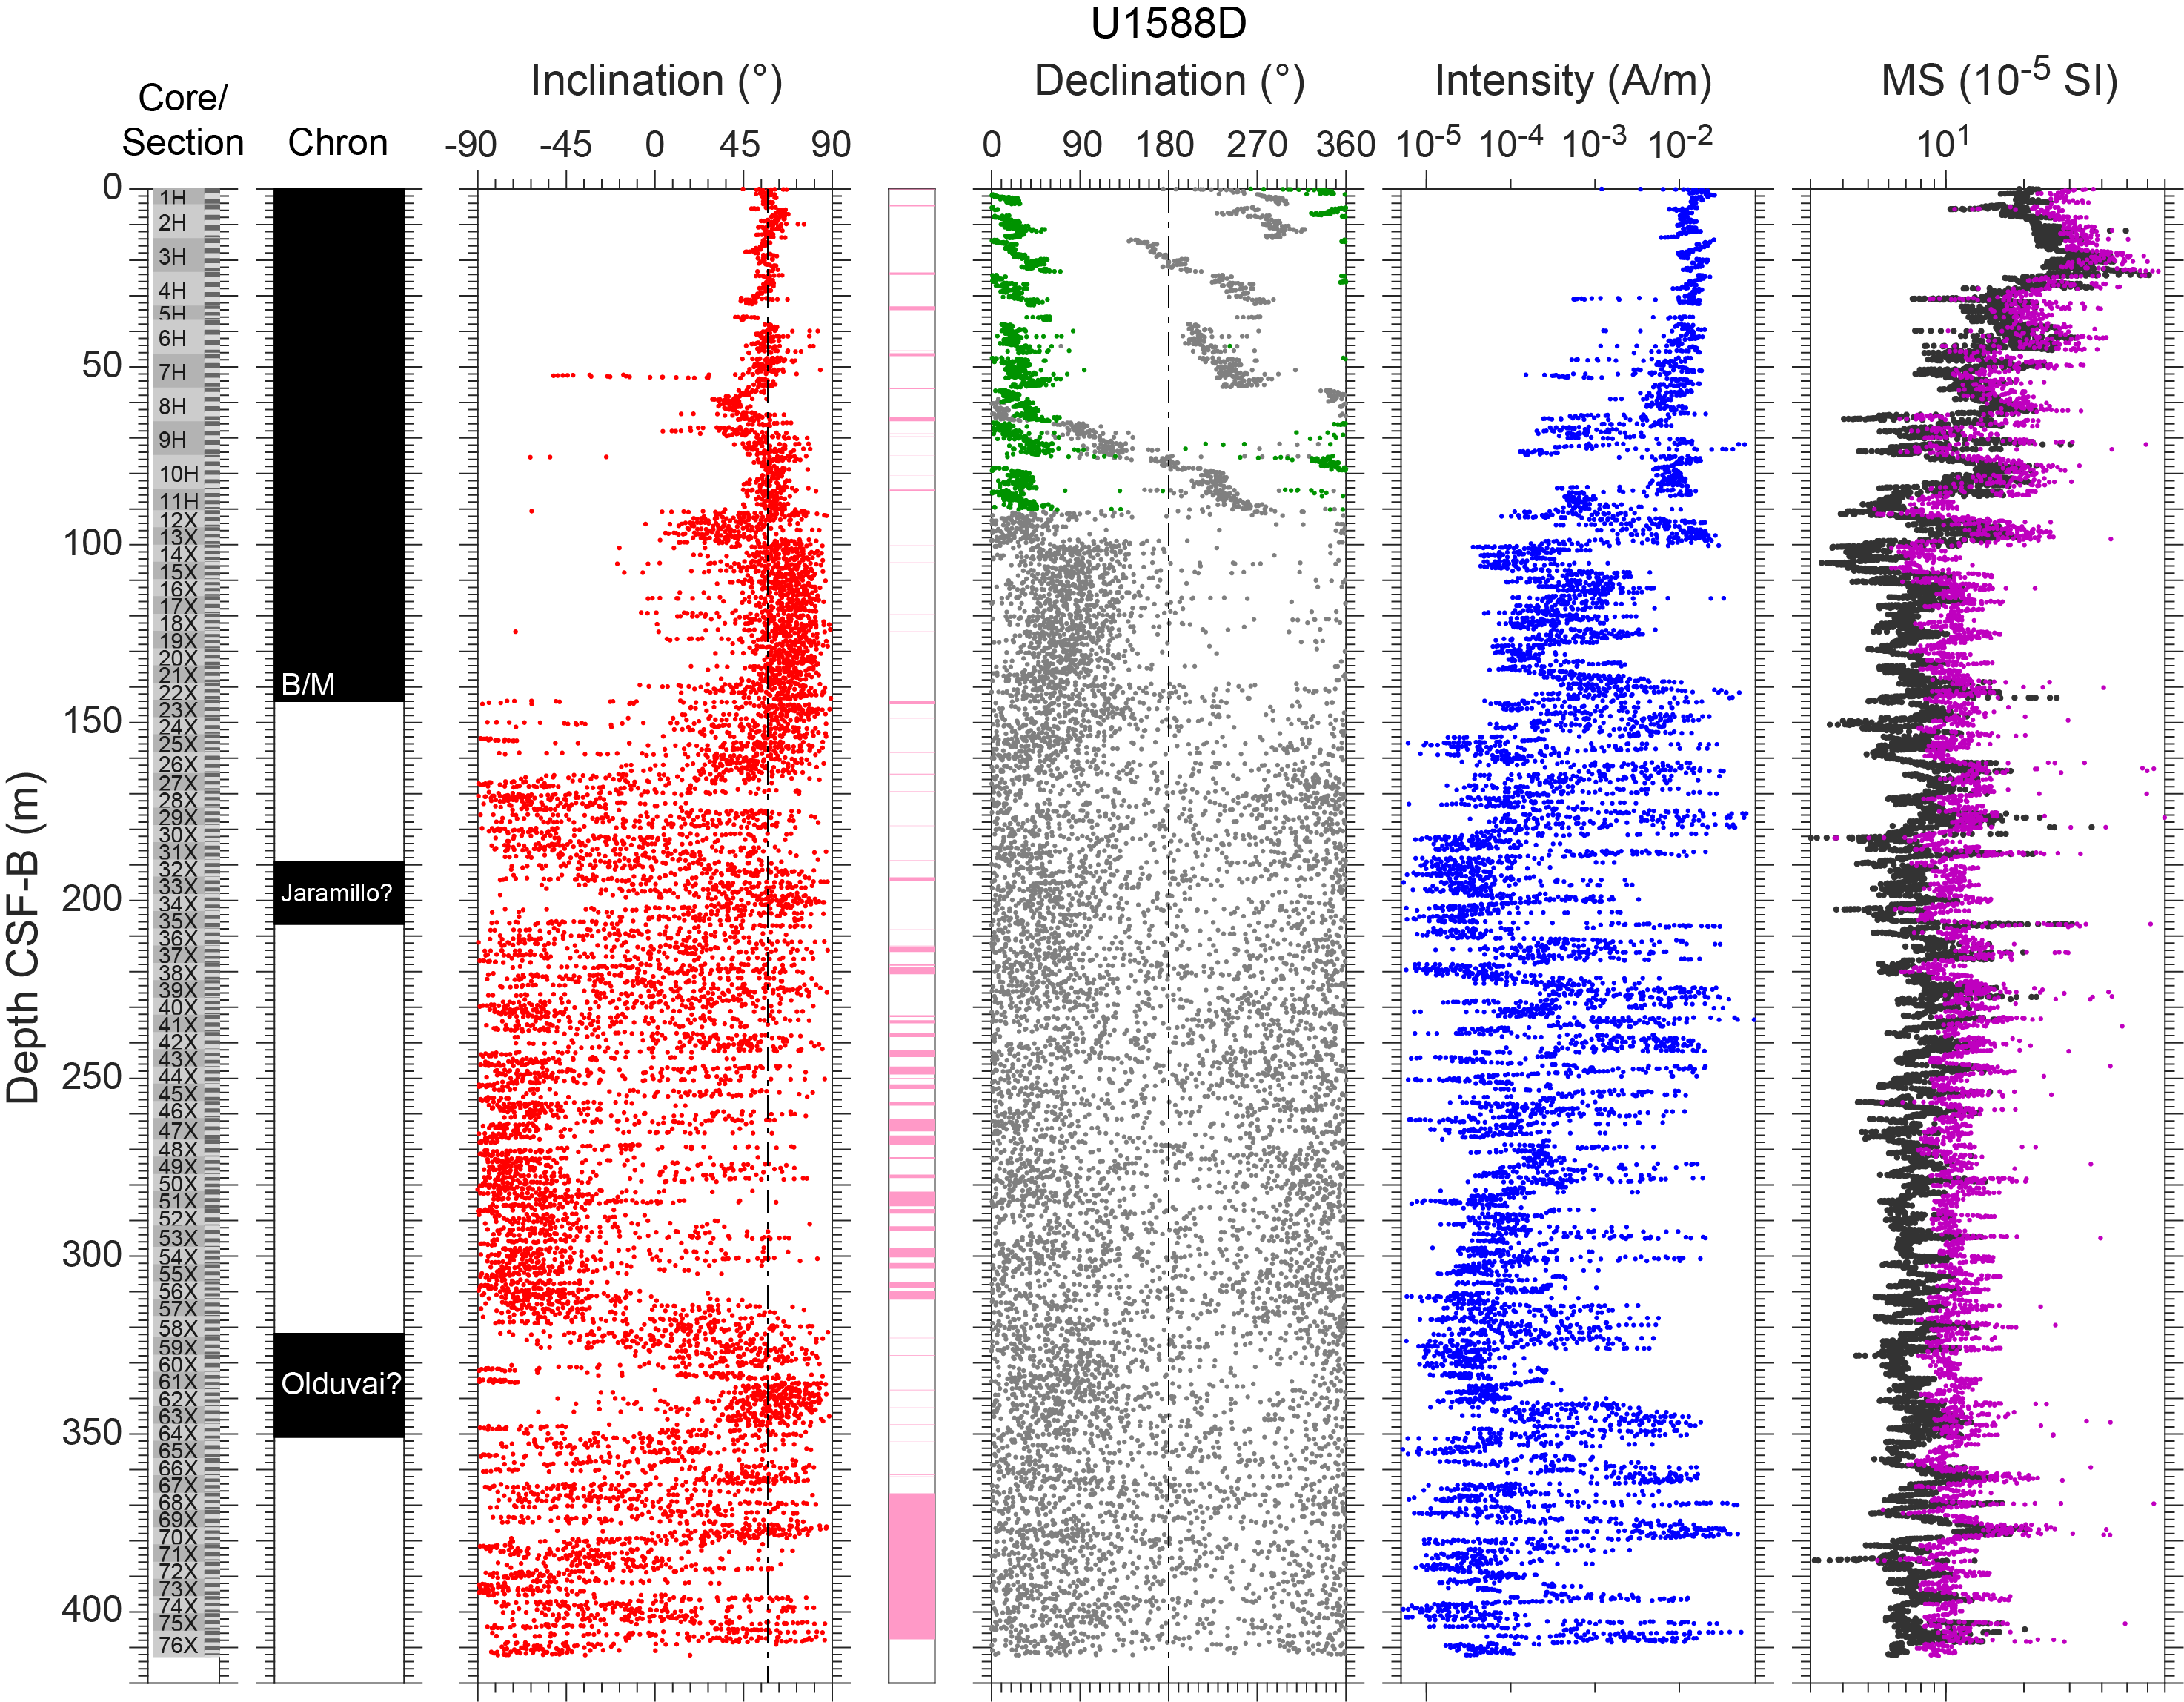
Figure F19. AF demagnetization, Hole U1588D.
Declination data from APC cores where Icefield MI-5 core orientation data are available were corrected for each core using the estimated orientation angles and the current declination value at the site according to the 2020 International Geomagnetic Reference Field (IGRF2020) (see Paleomagnetism in the Expedition 397 methods chapter [Abrantes et al., 2024a]). To analyze the NRM data of both the section-half and the discrete cube samples, we used a modified version of the UPmag software (Xuan and Channell, 2009). The processed NRM inclination, declination (including orientation-corrected declination where available), and intensity data after 20 mT AF demagnetization are shown in Figures F16, F17, F18, and F19. The processed NRM data of the cube samples are shown in Figure F20. Because of the high gas expansion in the cores (see Lithostratigraphy), we used the CSF-B depth scale for figures and tables in this chapter to avoid significant overlap in the CSF-A depth scale between adjacent cores.
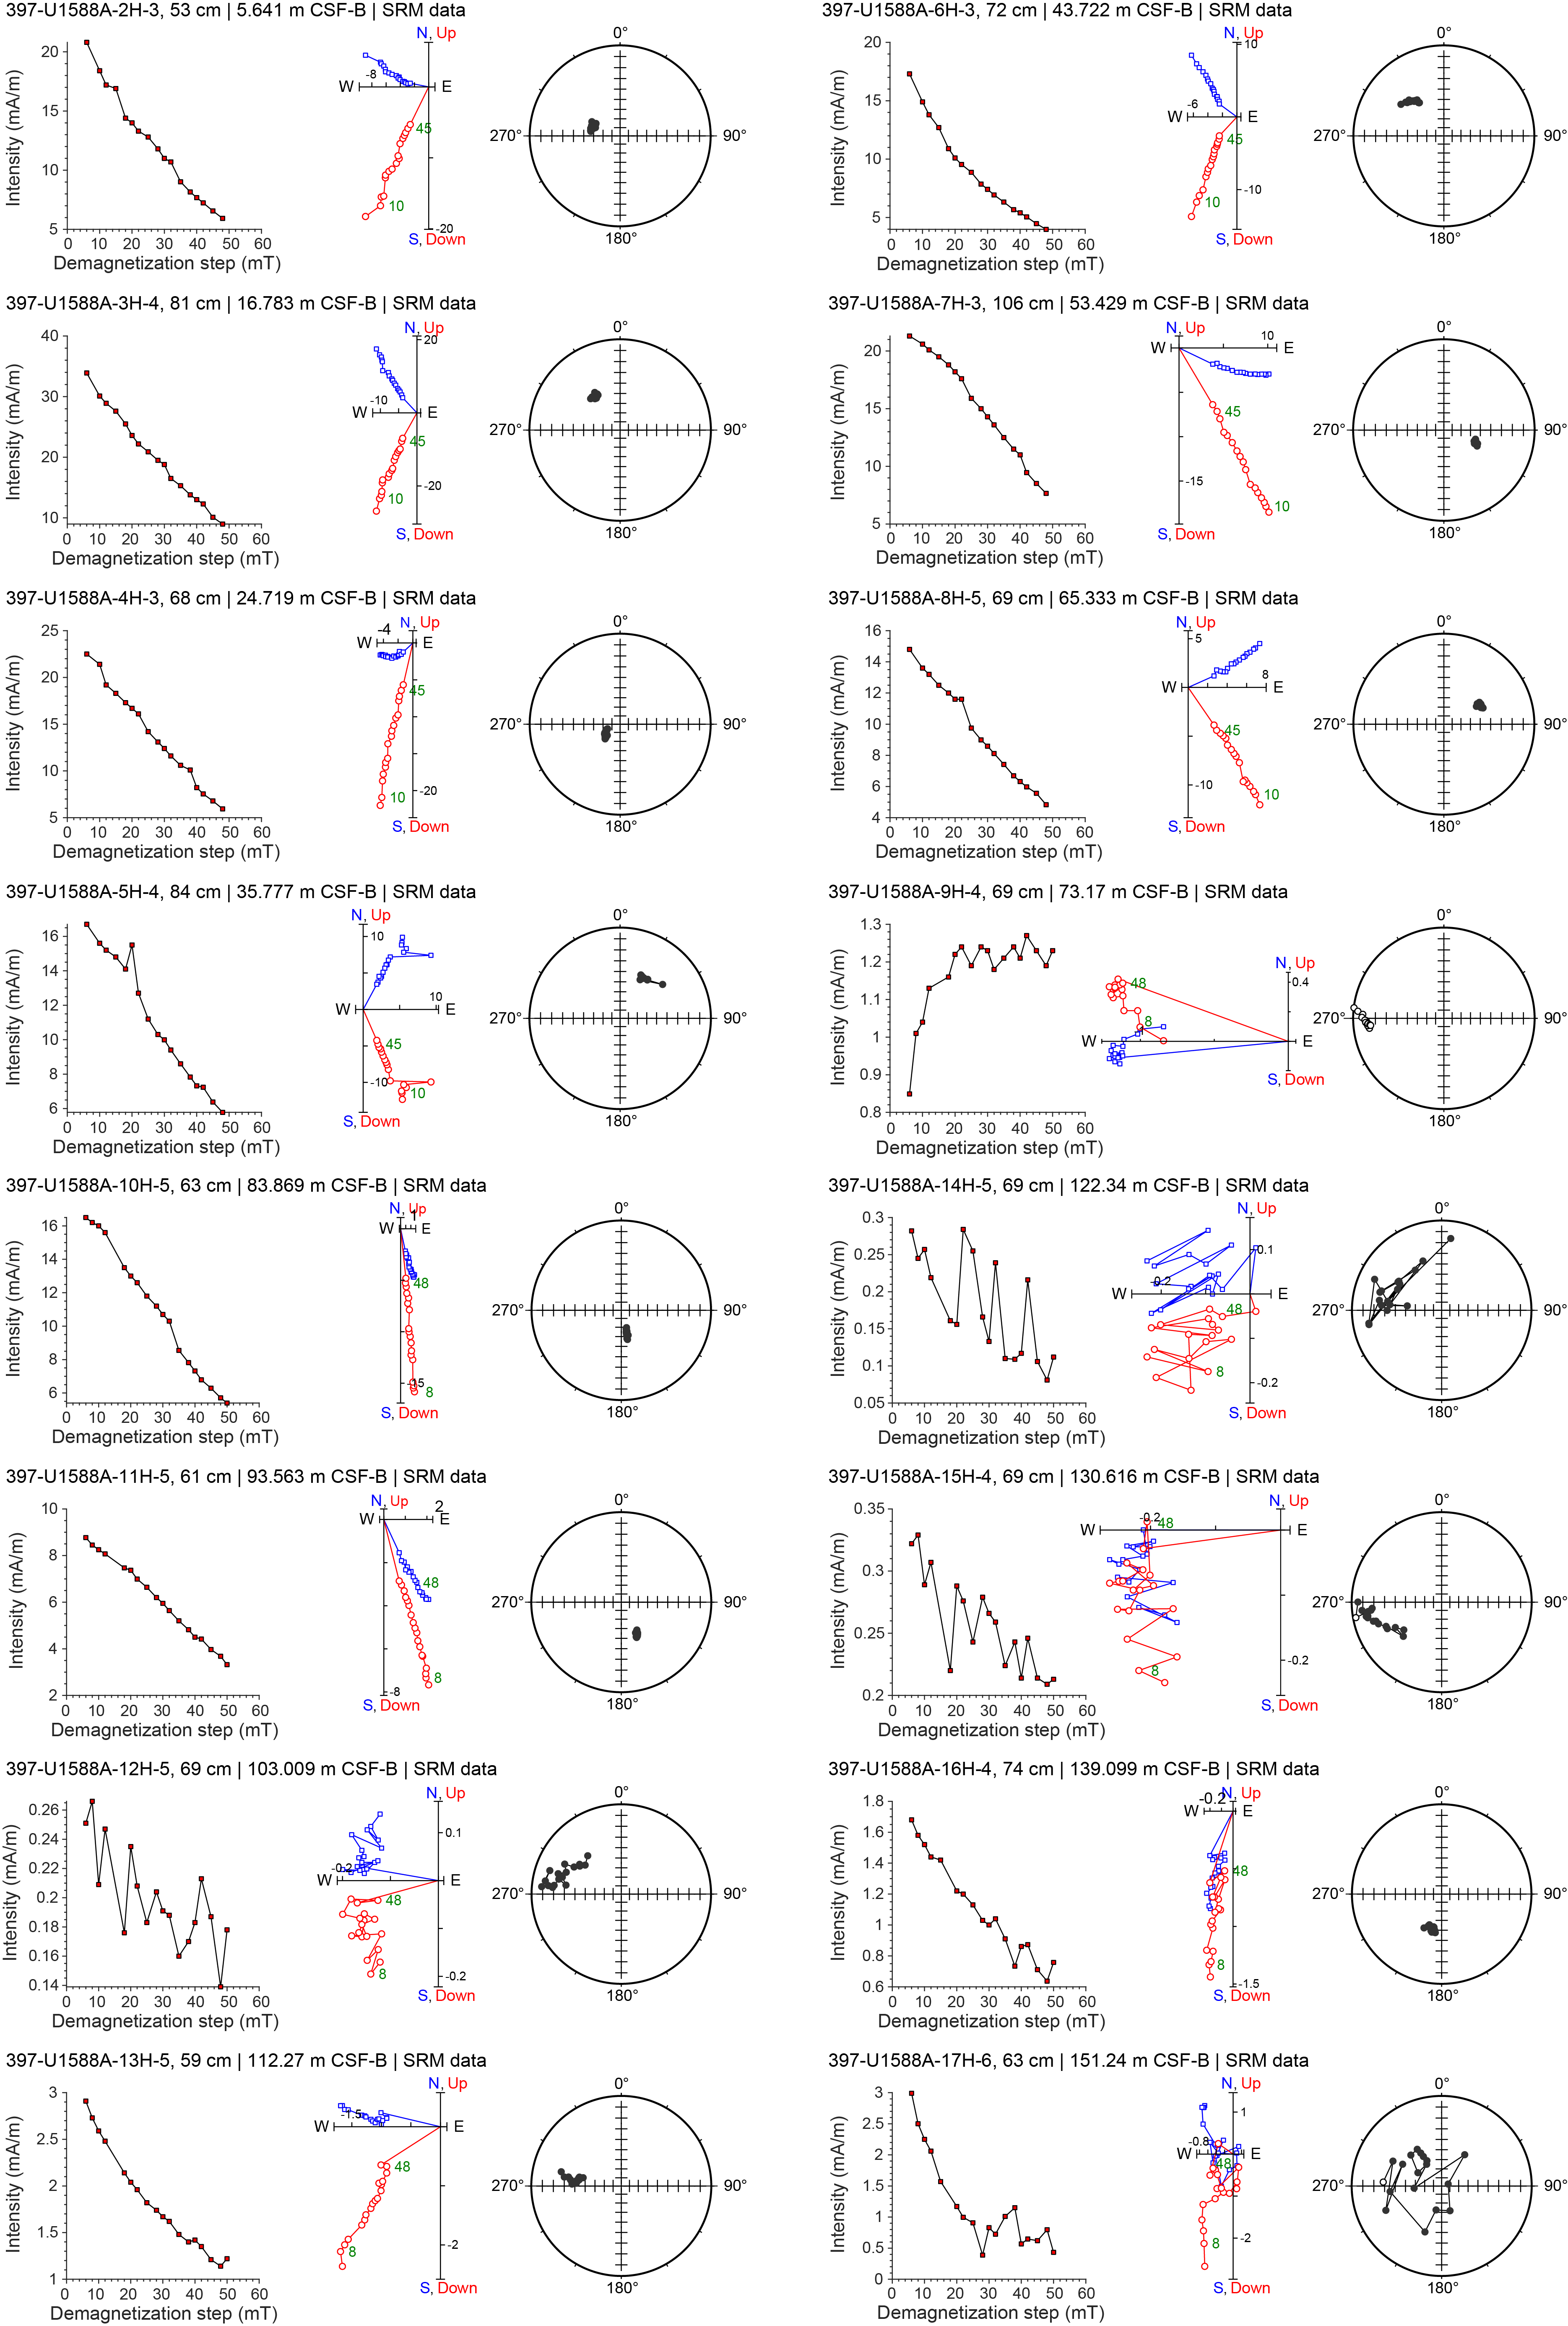
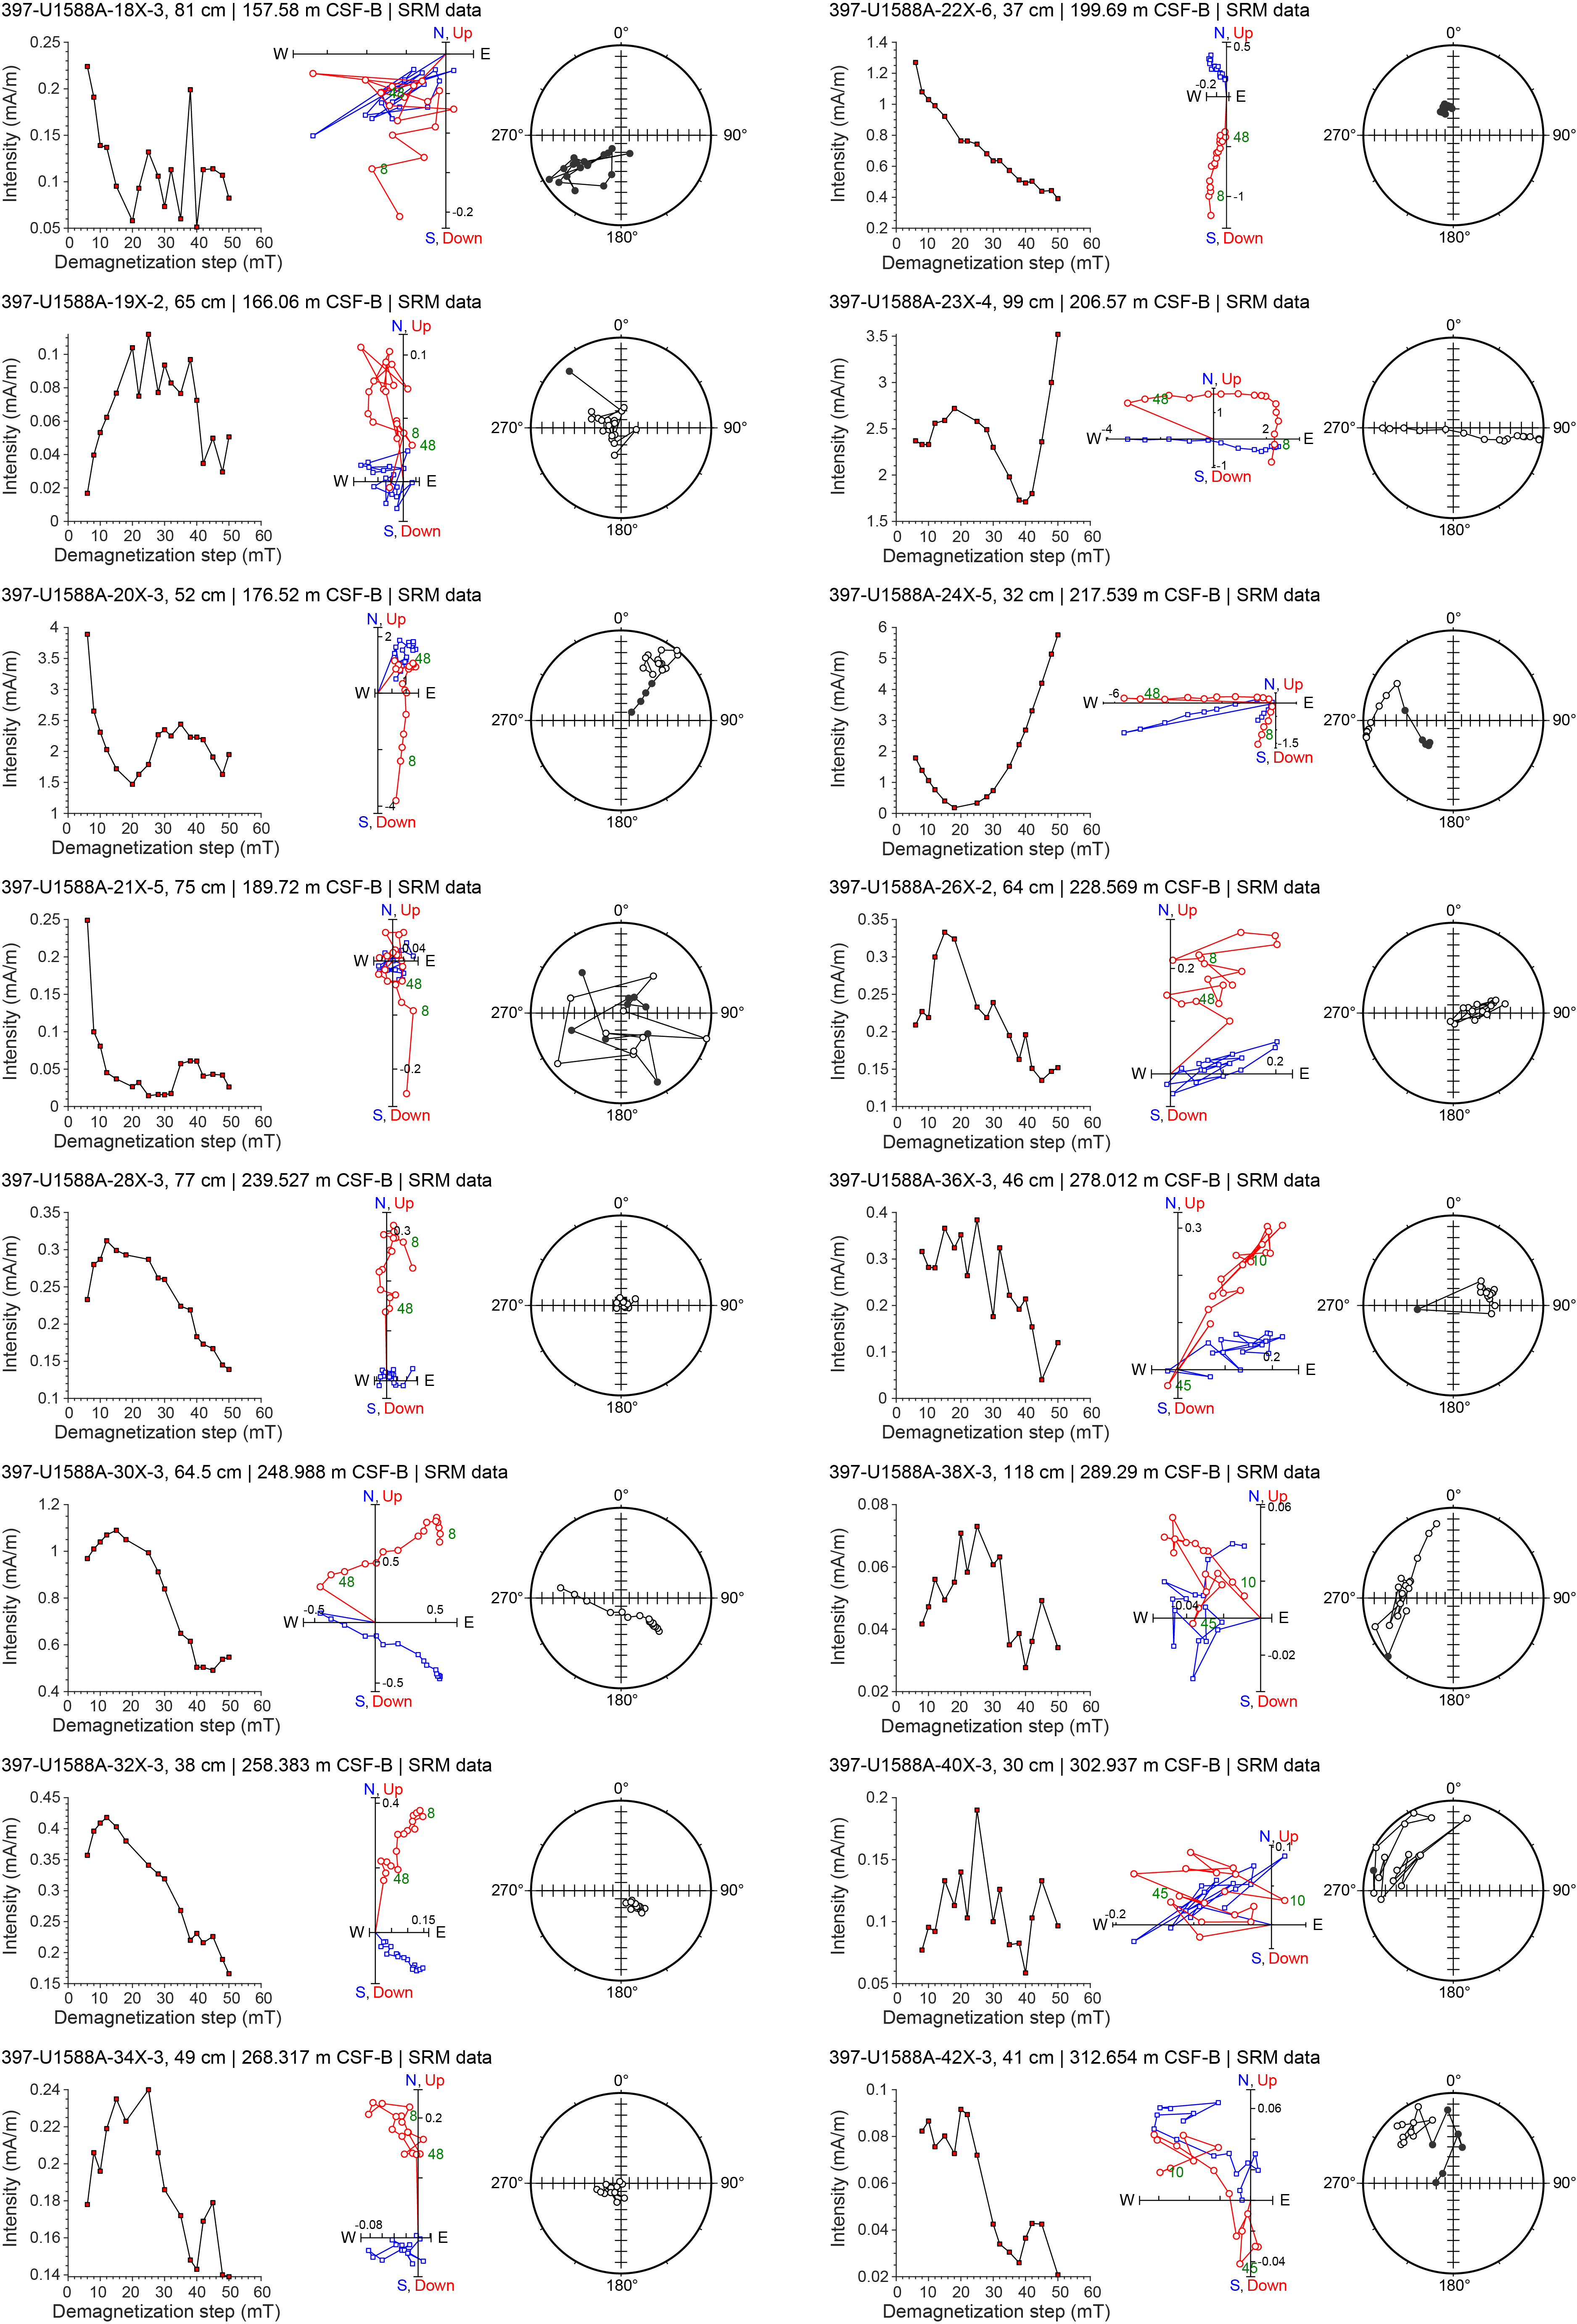
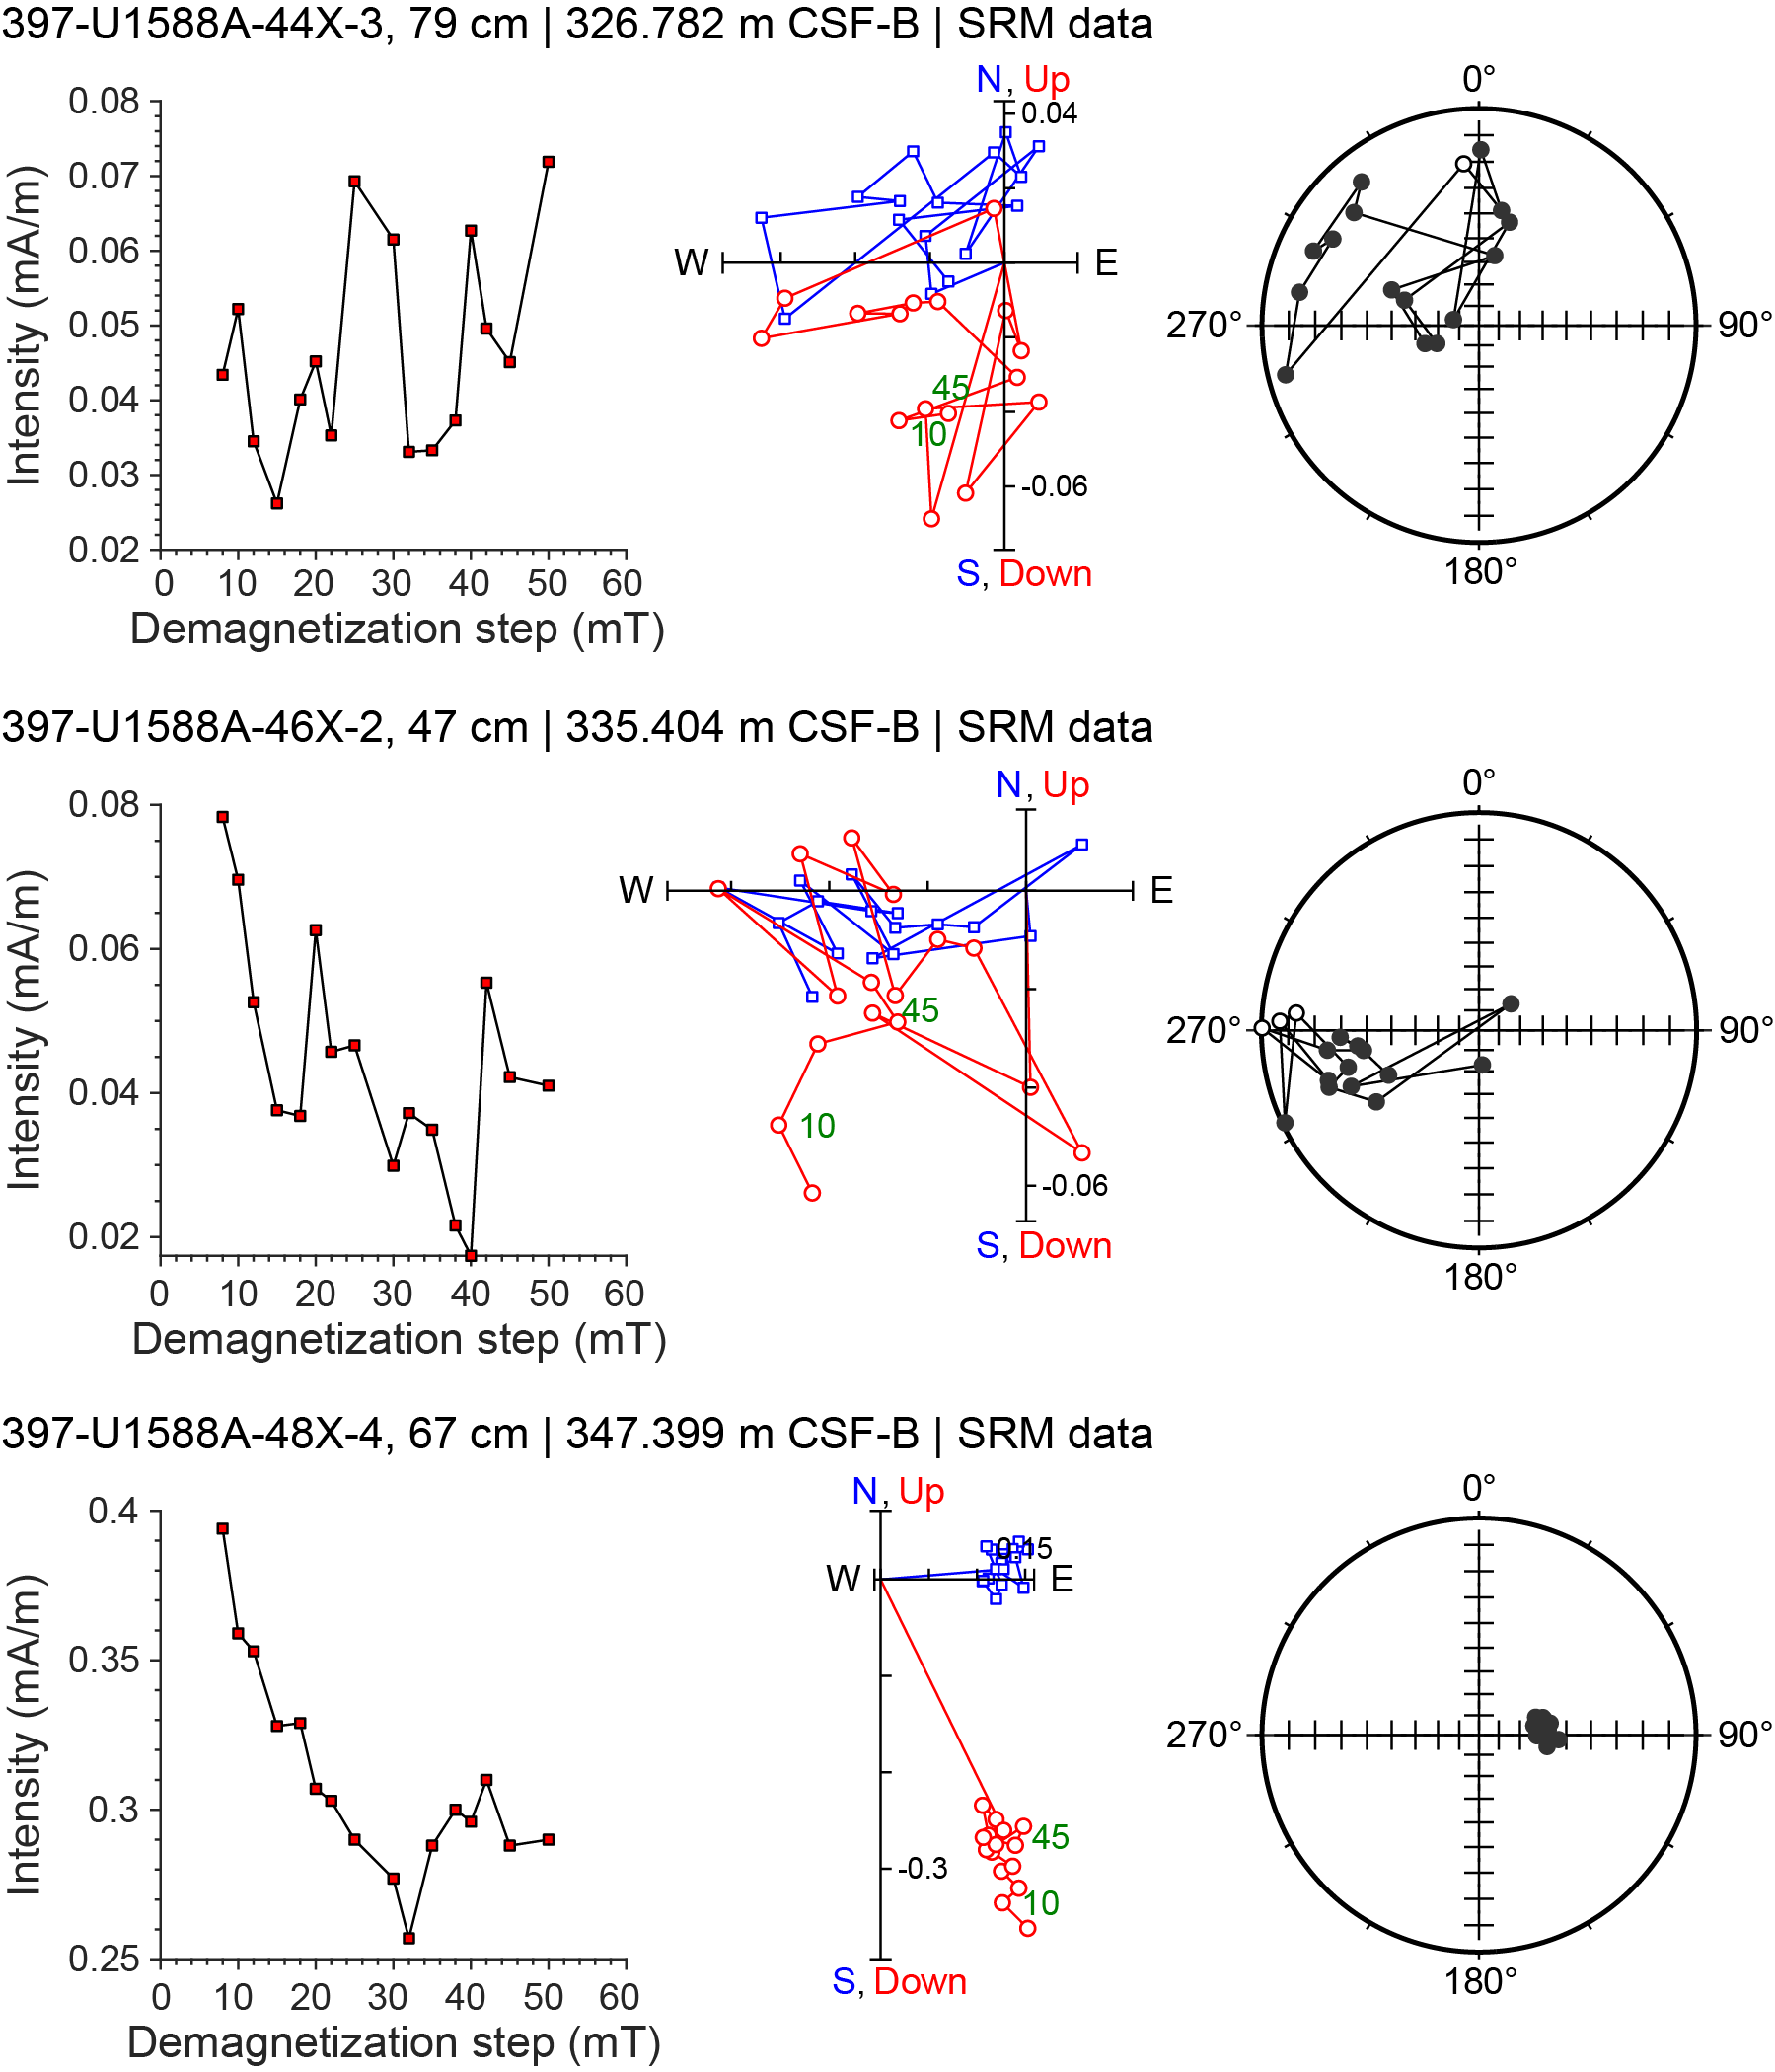
Figure F20. Discrete cube sample AF demagnetization.
5.1. Natural remanent magnetization intensity and magnetic susceptibility
Intensities of NRM after 20 mT AF demagnetization (NRM20mT) for cores from Holes U1588A–U1588D are similar in magnitude for overlapping depth intervals (Figures F16, F17, F18, F19). NRM20mT intensity is on the order of 10−2 A/m for the upper ~50 m and decreases downhole to the order of 10−4 to 10−2 A/m between ~50 and 150 m CSF-B. Below ~150 m CSF-B, NRM20mT intensity is mostly on the order of 10−5 to 10−3 A/m.
Figures F16, F17, F18, and F19 also show MS measured on whole-round cores using the WRMSL and on archive-half sections using the SHMSL (see Physical properties). The WRMSL- and SHMSL-acquired susceptibility values were multiplied by 0.68 × 10⁻⁵ and (67/80) × 10−5, respectively, to convert to the dimensionless volume SI unit (Blum, 1997). MS measurements are generally consistent between the two instruments and across the different holes for overlapping depth intervals and vary mostly between 5 × 10⁻⁵ and 50 × 10−5 SI. Variabilities in MS of the sediments generally mimic those of the NRM20mT intensity, suggesting that magnetic minerals in these sediments that carry NRM are similar to those that dominate MS.
5.2. Magnetostratigraphy
Magnetostratigraphic interpretations are based on combined NRM (after 20 mT demagnetization) inclination and (orientation-corrected) declination data from archive-half sections and stepwise NRM demagnetization (up to 50 mT) data from cube samples. The geomagnetic field at the latitude of Site U1588 (37.96°N) has an expected inclination of 57° (−57°) during normal (reversed) polarity, assuming a geocentric axial dipole (GAD) field model. The AF demagnetization behavior of cube samples is illustrated in Figure F20. A steep normal overprint appears to be largely removed after AF demagnetization with peak fields of ~5–20 mT. Polarity information determined based on the cube sample data is indicated by black (normal), white (reversed), and gray (uncertain) squares in Figure F16. Identified polarity reversals at Site U1588 are shown in the Chron column in Figures F16, F17, F18, and F19 and summarized in Table T16. The interpreted magnetostratigraphy is generally consistent with the biostratigraphy of the site (see Biostratigraphy).
The Brunhes/Matuyama (B/M) boundary (0.773 Ma) is recorded at ~146, ~149, ~148.5, and ~144 m CSF-B in Holes U1588A, U1588B, U1588C, and U1588D, respectively. Above the B/M boundary, the NRM20mT inclination of all holes varies closely around the expected GAD inclination of ~57° except for core sections for which NRM measurements were likely compromised by flux jumps (Figures F16, F17, F18, F19). Below the B/M boundary, NRM of sections from all four holes is dominated by shallow/negative inclinations. In Hole U1588A, cube samples above the boundary show well-defined characteristic remanence with positive inclinations, whereas cube samples below the boundary show uncertain or reversed polarity components (Figure F20).
The intervals at ~188–207, ~187.8–207.5, ~187.8–204.5, and ~189–206.7 m CSF-B in Holes U1588A, U1588B, U1588C, and U1588D, respectively, are dominated by positive inclinations (Figures F16, F17, F18, F19). Cube samples from this interval in Hole U1588A yielded normal or uncertain polarity (Figures F16, F20). We interpret these intervals as the Jaramillo Subchron (0.99–1.07 Ma). This interpretation is consistent with the biostratigraphy (see Biostratigraphy).
The top of the Olduvai Subchron (1.775 Ma) is identified at ~320, ~322, ~323, and ~322 m CSF-B in Holes U1588A, U1588B, U1588C, and U1588D, respectively. At these depths, the NRM20mT inclination shifts downhole from mostly negative to positive values, scattering around 57°. NRM of cube samples from Hole U1588A above the top of Olduvai Subchron is dominated by reversed polarity components, whereas NRM of cube samples from below this depth mainly shows uncertain or normal polarity components (Figure F20). The bottom of the Olduvai Subchron (1.934 Ma) is identified only in the deepest Hole U1588D at ~351 m CSF-B, where NRM20mT of sections appears to shift downhole from mainly positive inclinations to dominantly shallow or negative inclinations (Figure F19). The Matuyama/Gauss boundary was not identified in any of the holes, indicating that the base of the section is younger than 2.6 Ma (Table T16).
6. Geochemistry
Geochemistry at Site U1588 involved collection and measurements of IW samples for salinity, alkalinity, pH, major ions (Na, K, Ca, Cl, and SO4), nutrients (NH4 and PO4), and trace elements (Sr, Li, Fe, Mn, B, and Ba); headspace gases for methane (CH4) concentrations; and bulk sediment samples for total organic carbon (TOC), total inorganic carbon (TIC)/CaCO3, total nitrogen (TN), total sulfur (TS), and for bulk mineralogical abundance (by XRD) and elemental composition (by inductively coupled plasma–atomic emission spectrometry [ICP-AES]). In total, 54 IW samples were taken from Hole U1588A (see Geochemistry in the Expedition 397 methods chapter [Abrantes et al., 2024a]). A 5 or 10 cm sample was taken at the base of every section for the upper 30 m, at the base of Sections 2 and 6 to 49 m CSF-A, and then at the base of Section 6 (i.e., the second to last section recovered from every core) to the bottom of the hole. IW samples show evidence of microbially mediated respiration and other diagenetic reactions.
IW alkalinity, ammonium (NH4), and phosphate (PO4) increase in the upper 50 m, whereas SO4 shows a two-step decrease in the upper 50 m, indicating organic matter respiration. At this site, SO4 reaches zero and remains low, whereas CH4 levels increase to about 45,000 ppmv at 50 m CSF-B but decline to ~5,000 ppmv by 100 m CSF-B to the bottom of the hole.
CaCO3 content ranges 16.0–53.6 wt% (average = 30.2 wt%). This coulometer-determined CaCO3 content shows consistent results with stoichiometric CaCO3 calculated from the elemental Ca concentrations measured by ICP-AES, and it is positively correlated with L* reflectance and negatively correlated with NGR. TOC, TN, and TS values at Site U1588 are generally low, ranging 0.30–1.89 wt% TOC (mean = 0.74 wt%), 0.042–0.189 wt% TN (mean = 0.085 wt%), and 0–3.18 wt% TS (mean = 0.291 wt%). Organic C/N ratios (3.04–16.5; mean = 8.97) suggest that organic matter is marine/lacustrine dominated.
Bulk sediment SiO2, K2O, and TiO2 contents show strong positive correlations with Al2O3, indicating dominance of terrigenous detritus. This is also generally observed for minor elements including Sc, Y, Cr, V, and Zr. Relatively weak correlations of Fe2O3, MgO, Na2O, MnO, and Ba with Al2O3 are observed, due to the widespread presence of authigenic and biogenic phases; that is, pyrite, dolomite, and/or Mg-bearing calcite, halite (NaCl) precipitated from seawater, Mn hydroxides, and barite (BaSO4), respectively. Bulk sediment Ca primarily represents biogenic carbonate (CaCO3), and because of the incorporation of Sr into biogenic carbonates, both elements show an inverse relationship with Al. Elemental ratios of Ca/Ti, Si/Al, Ti/Al, Zr/Al, K/Al, Sr/Ca, and estimated biogenic Ba are selected as useful proxies for provenance, weathering, and productivity.
6.1. Headspace and void hydrocarbon gases
Headspace samples were collected from the lowermost section of each core (or every other half core) from Holes U1588A and U1588D. CH4 concentrations peak around 50 m CSF-B, with values around 45,000 ppmv (Figure F21). Headspace gas data should be treated with caution at this site because cores fractured due to high gas concentrations, opening voids upon recovery. As a result, holes were drilled in the core liner on the catwalk, venting void gas and leaving sediment with residually low gas concentrations. Since headspace samples were taken after void gas was vented and cores were split, the gas concentrations in these samples are likely much lower than in situ values. However, void gas was sampled in 7 cores, and results show they almost entirely comprise CH4 (Table T17).
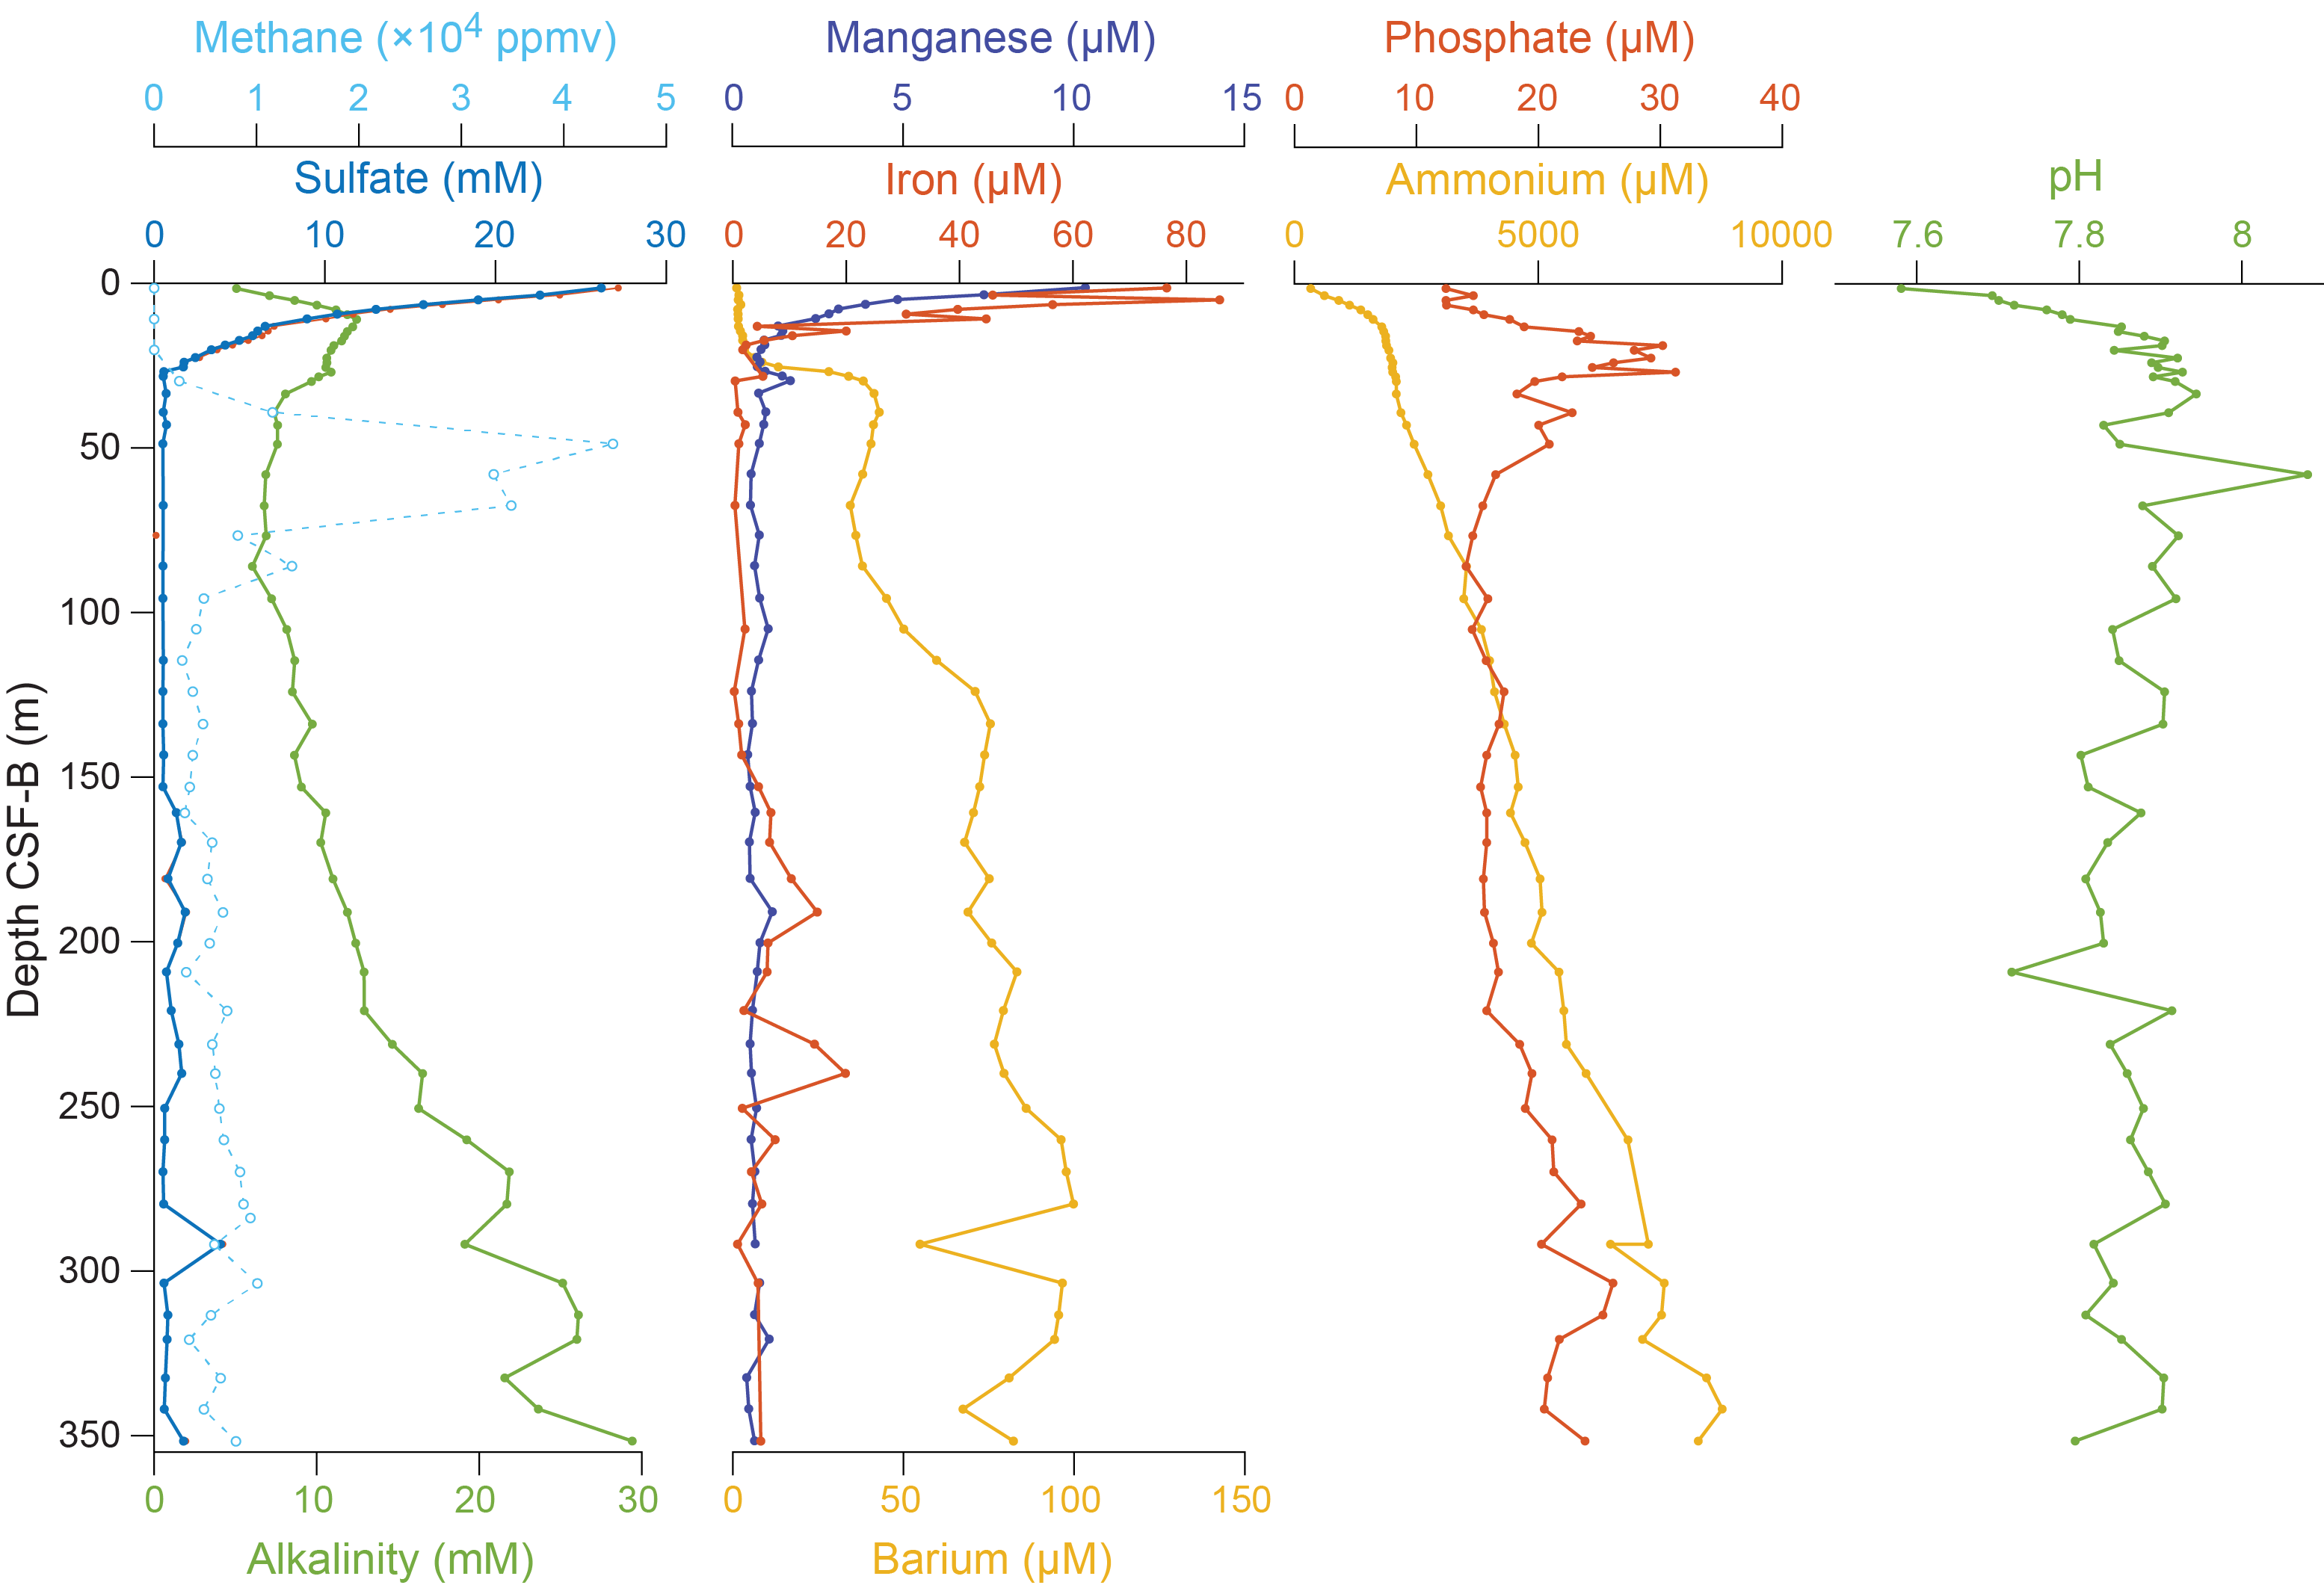
Figure F21. SO4, alkalinity, CH4, Fe, Mn, Ba, NH4, PO4, and pH.
Despite gas loss, the methane/ethane ratios should not be affected by low absolute gas concentrations. Ethane is detectable between 49 and 412 m CSF-B, but C1/C2 (i.e., CH4/C2H6) ratios remain high (3,500–20,000), indicating that there is no danger to drilling.
6.2. Interstitial water geochemistry
Shortly after extracting IW, aliquots of the recovered water were apportioned for salinity, chlorinity, alkalinity, and pH measurements. In addition, major and minor elemental composition were measured with ion chromatography (IC) and ICP-AES and for NH4 and PO4 by spectrophotometry (Table T18). Some of the significant trends are highlighted below.
6.2.1. Salinity, sodium, potassium, chloride
Salinity, Na, and Cl concentrations are relatively constant in Hole U1588A, with values close to seawater (Figure F22). Na measured with IC has a mean value of 491.9 ± 4.3 mM and is slightly offset toward lower values than data obtained using ICP-AES (504.6 ± 6.3 mM). Cl measured with IC has a mean value of 563.4 ± 7.8 mM, which is nearly identical to values obtained using AgNO3 titration (557.0 ± 6.9 mM). K declines in the upper part of Hole U1588A from a value near 11.5 mM at the top of the hole to a minimum of 7.64 at 169.8 m CSF-B and then increases to the bottom, reaching values similar to those observed at the top of the hole.
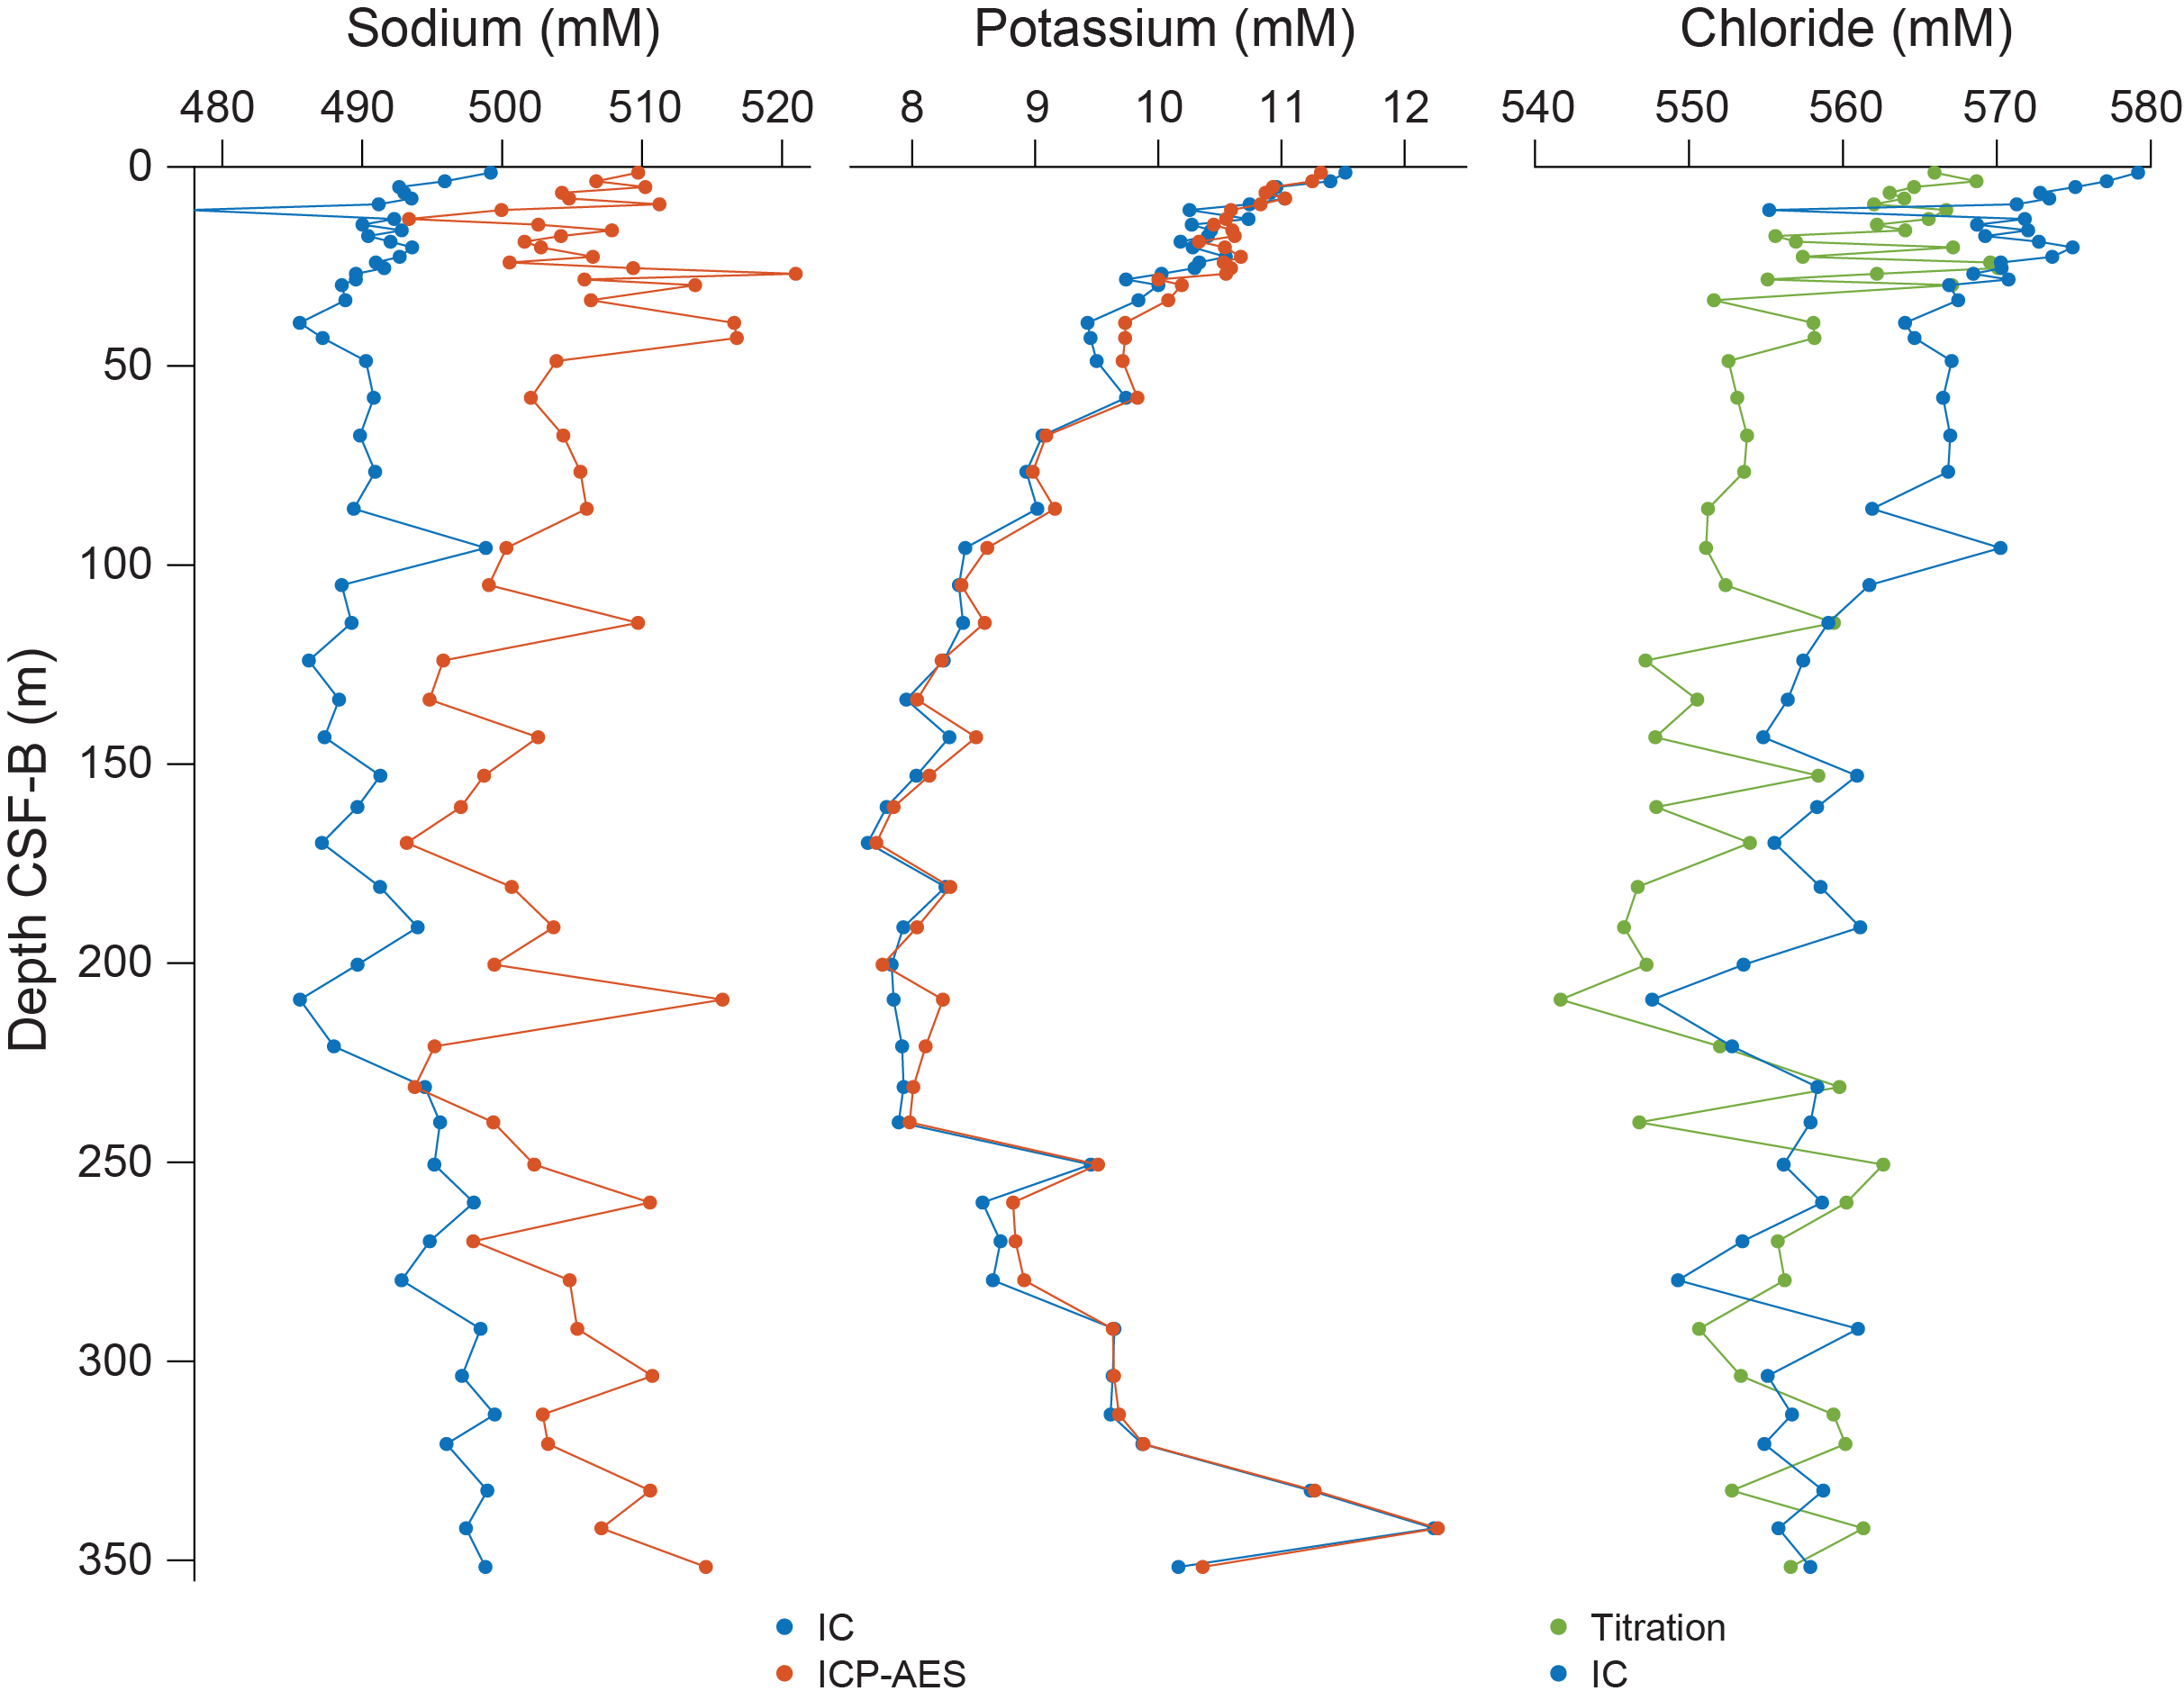
Figure F22. Na, K, and Cl concentrations.
6.2.2. Alkalinity, pH, ammonium, phosphate
Alkalinity, pH, NH4, and PO4 increase rapidly at the top of Hole U1588A and trend with depth (Figure F21). Alkalinity increases from 5.1 mM at the top of the hole to 12.5 mM at 10.8 m CSF-B, declines slightly to 6 mM at 85.9 m CSF-B, and then increases steadily, reaching a maximum of 29.4 mM in the lowermost sample (397-U1588A-49X-3, 140–150 cm). pH values increase from 7.58 in the uppermost sample to 7.92 at 22.58 m CSF-B then remain roughly constant, averaging 7.87 ± 0.06, to the bottom of the hole. NH4 concentrations are lowest in the uppermost sample, 333.5 µM, increase rapidly along with alkalinity to a value of 1790.8 µM at 13.1 m CSF-B, and then continue to increase downhole at a slower rate, reaching a maximum of 8770.7 µM at 341.9 m CSF-B. The highest calibration standard run with the NH4 samples had a concentration of 3000 µM, so all higher reported values are based on extrapolating the calibration, and exact values should thus be treated with caution. PO4 is 12.4 µM in the uppermost sample and peaks slightly deeper than the shallow alkalinity maximum at values around 30 µM between 18.8 and 22.6 m CSF-B. PO4 concentrations average 15.6 ± 0.8 µM between 76.5 and 200.4 m CSF-B and then increase slightly to the bottom of the hole.
The increases in alkalinity, NH4, and PO4 in the upper part of Hole U1588A are the result of organic matter respiration associated with SO4 reduction, assuming a generic composition of (CH2O)106(NH3)16(H2PO4), which produces alkalinity (in the form of HCO3−), PO4, and NH4. However, the high alkalinity and NH4 values observed deeper in the hole cannot be explained by SO4 reduction and therefore must have another source (Figure F21).
6.2.3. Sulfate, iron, manganese, barium
SO4 values are near seawater in the uppermost sample (26.2 mM in 397-U1588A-1H-1, 143–148 cm) and then decrease rapidly, reaching zero by 26.8 m CSF-B (Figure F21). The SO4 decline at Site U1588 is not as pronounced as at Site U1385 but not as consistent as at Site U1587. The decrease from 0 to 13.1 m CSF-B is steeper than that between 13.1 and 26.8 m CSF-B, and the change in slope is nearly coincident with the peak in alkalinity at 10.8 m CSF-B. When SO4 reaches zero, CH4 increases, reaching a maximum of 44,800 ppmv at 48.8 m CSF-B. However, as discussed in Headspace and void hydrocarbon gases, the CH4 data are unreliable owing to sediment fracturing due to gas expansion. Ba concentrations are <5 µM to 20.2 m CSF-B and increase rapidly to 42.9 µM at 39.2 m CSF-B, coinciding with the abrupt SO4 decrease. This indicates the dissolution of BaSO4. Fe and Mn concentrations decrease in the uppermost ~20 m. Mn concentrations decline faster than Fe, likely reflecting the more favorable reduction of Mn oxides over Fe oxides under anoxic pore water conditions.
These patterns, combined with the observed increase in alkalinity in the upper part of the sediment column, indicates intense SO4 reduction and methanogenesis. The BaSO4 dissolution due to the rapid and intense SO4 reduction is also evident. Peaks in redox-sensitive elements such as Fe and Mn indicate microbially mediated respiration reactions within the sediment.
6.2.4. Calcium, magnesium, strontium
Ca concentrations in the IW decrease in the upper 27 m from a value of 10.1 mM in the uppermost sample (397-U1588A-1H-1, 143–148 cm) to 3.0 mM at 26.8 m CSF-B (Figure F23). There is a slight change in the steepness of the Ca decline at 13.1 m CSF-B, which coincides with the change in steepness of the SO4 decline and is slightly deeper than the shallow alkalinity peak at 10.8 m CSF-B. Below ~25 m CSF-B, Ca concentrations are around 25 mM with only slight variability. Mg concentrations decline in the upper part of the hole from 54.9 mM in the uppermost sample to 31.4 mM at 95.7 m CSF-B and then remain roughly constant at nearly 30 mM. Sr concentrations decline from 88.0 µM in the uppermost sample to a minimum value of 62.7 µM at 22.6 m CSF-A, following a similar pattern to Ca. Below this depth, Sr steadily increases to a maximum value of 146.4 µM in the lowermost sample (49X-3, 140–150 cm). The Ca, Mg, and Sr decreases in the upper 20 m could be the result of authigenic CaCO3 precipitation, driven by high pore water alkalinity associated with SO4 reduction.
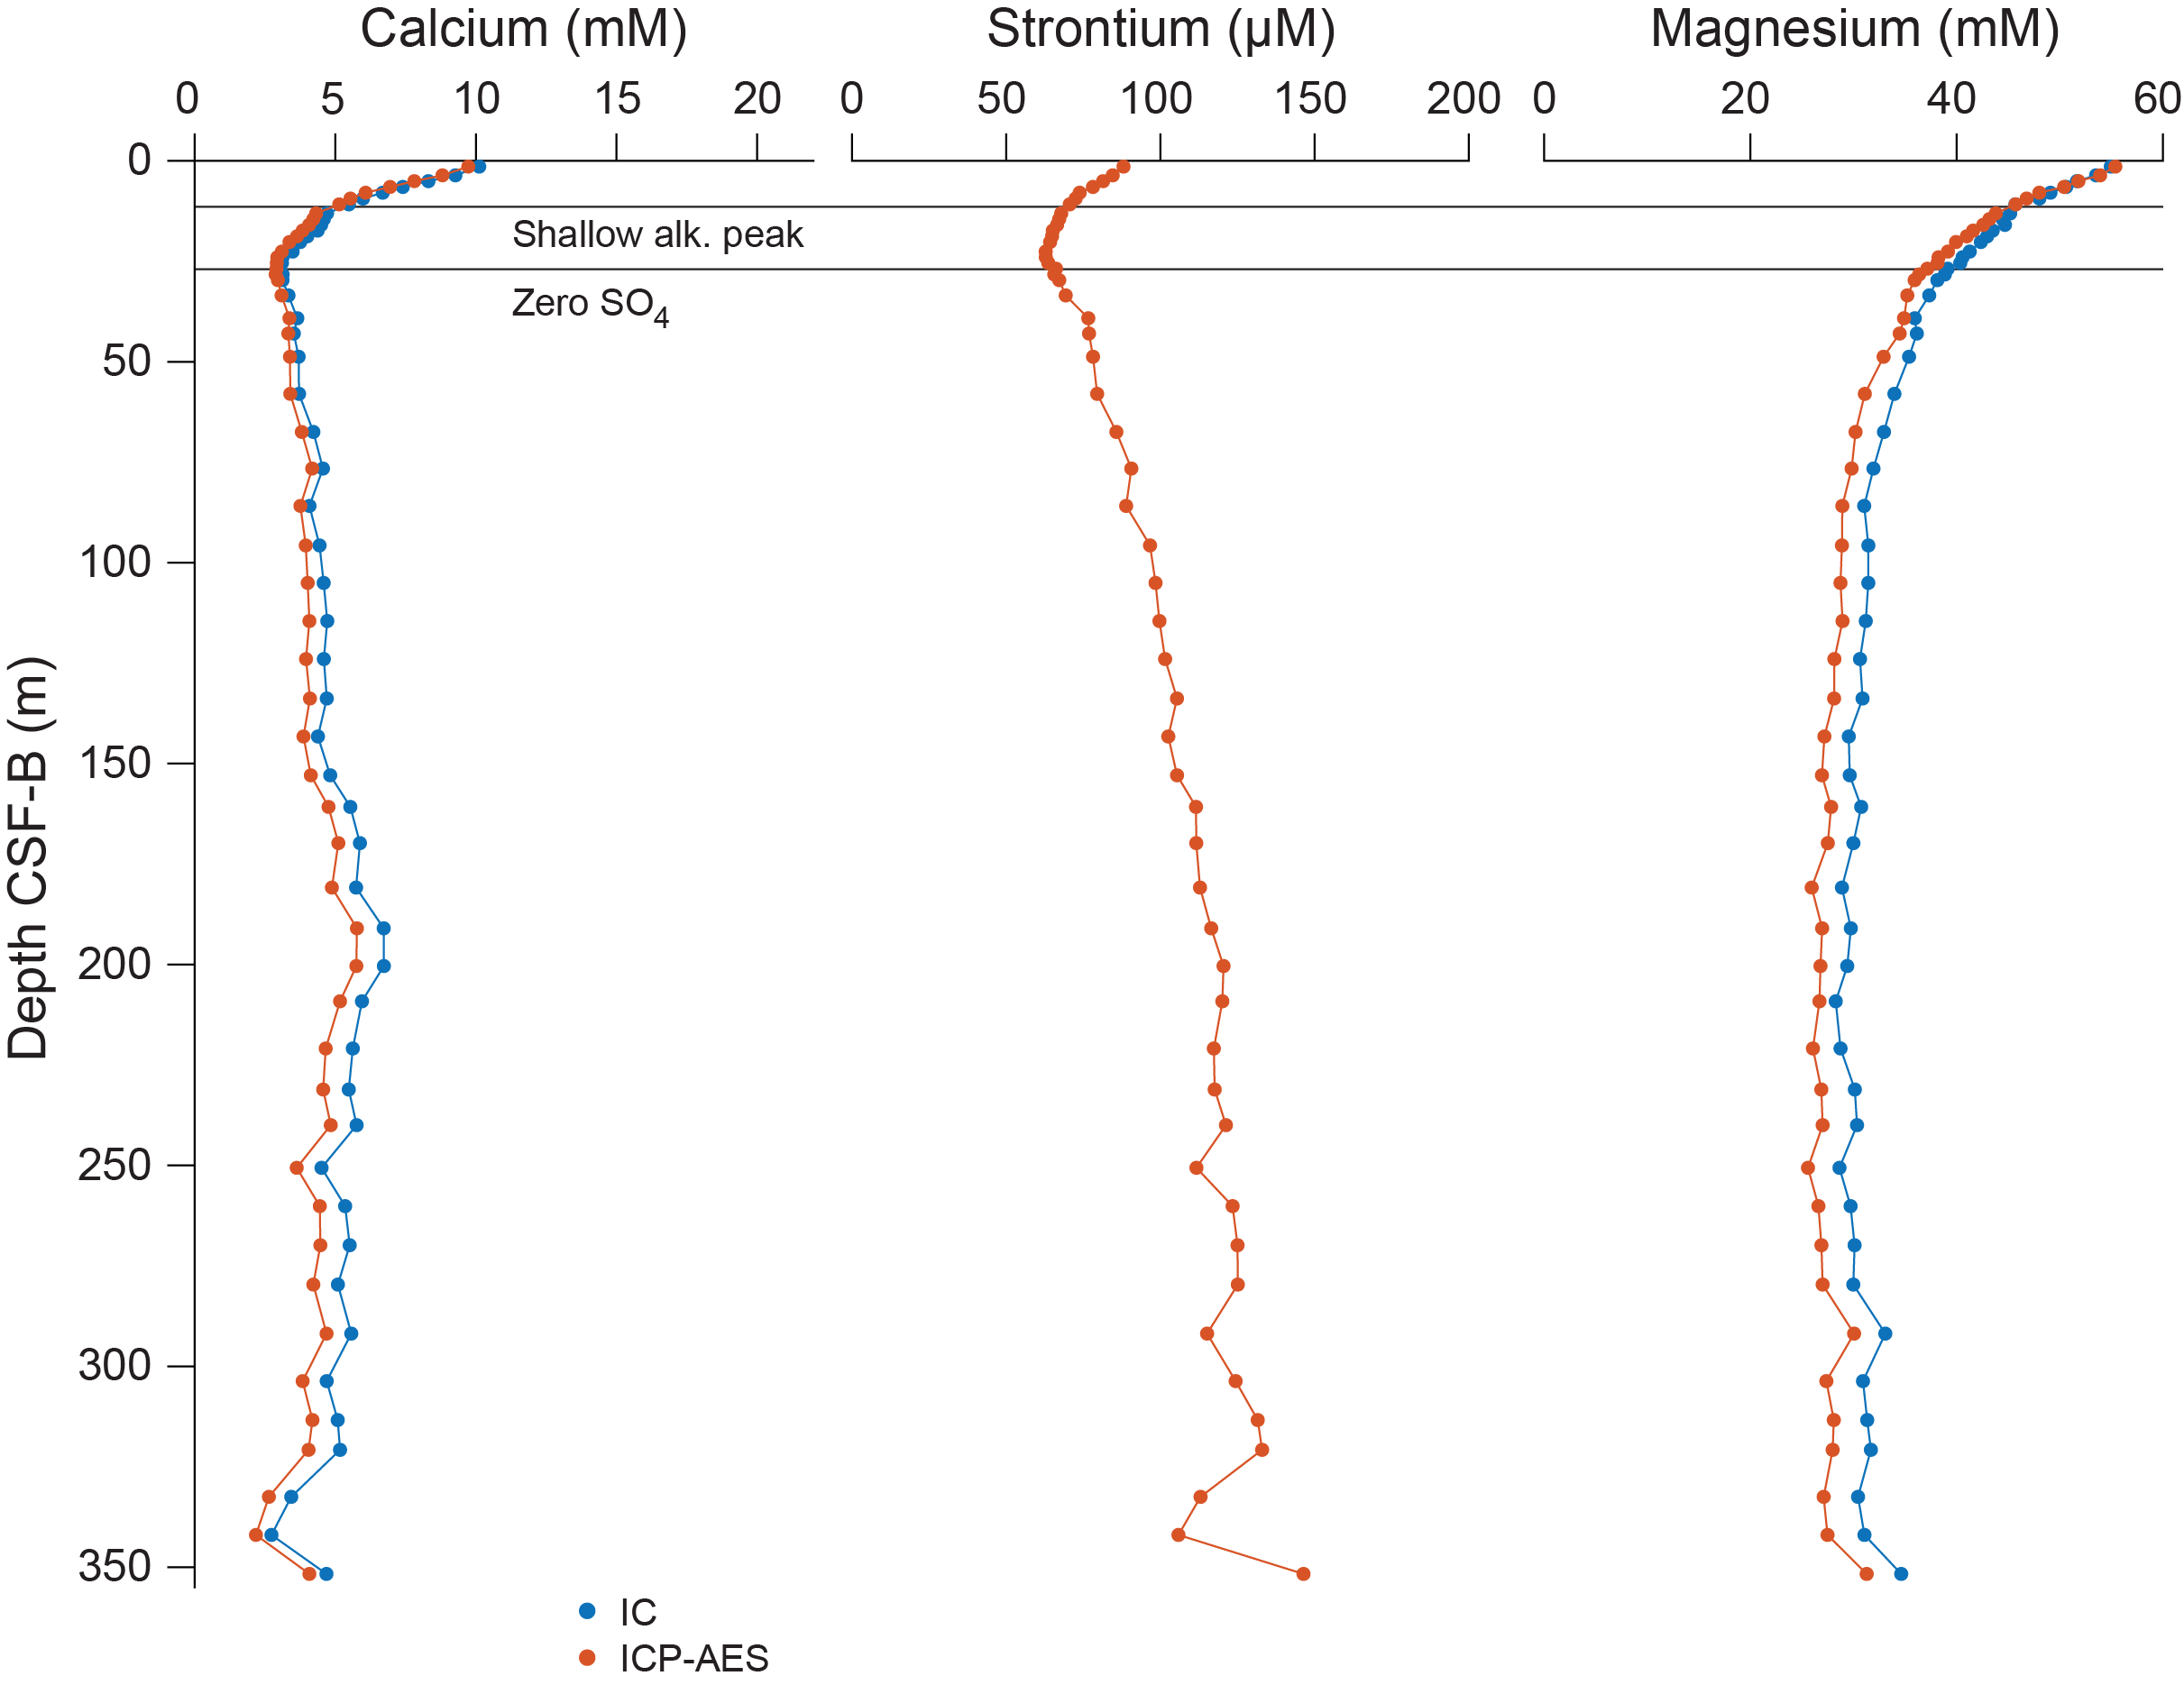
Figure F23. Ca, Sr, and Mg.
6.2.5. Silicon, lithium, boron
Si concentrations vary downhole, with lower values (average = 194.3 ± 78.3 µM) in the upper ~150 m CSF-B and higher values (average = 458.1 ± 87.2 µM) deeper in the hole (Figure F24). Li concentrations are relatively constant (~23 µM) in the top ~100 m of Hole U1588A and increase to a maximum of 212.4 µM at the bottom of the hole. B concentrations increase sharply in the upper 13.3 m from 496.0 µM in the uppermost sample to a maximum of 569.0 µM, and then concentrations decline and plateau at 260 µM by ~200 m CSF-B.
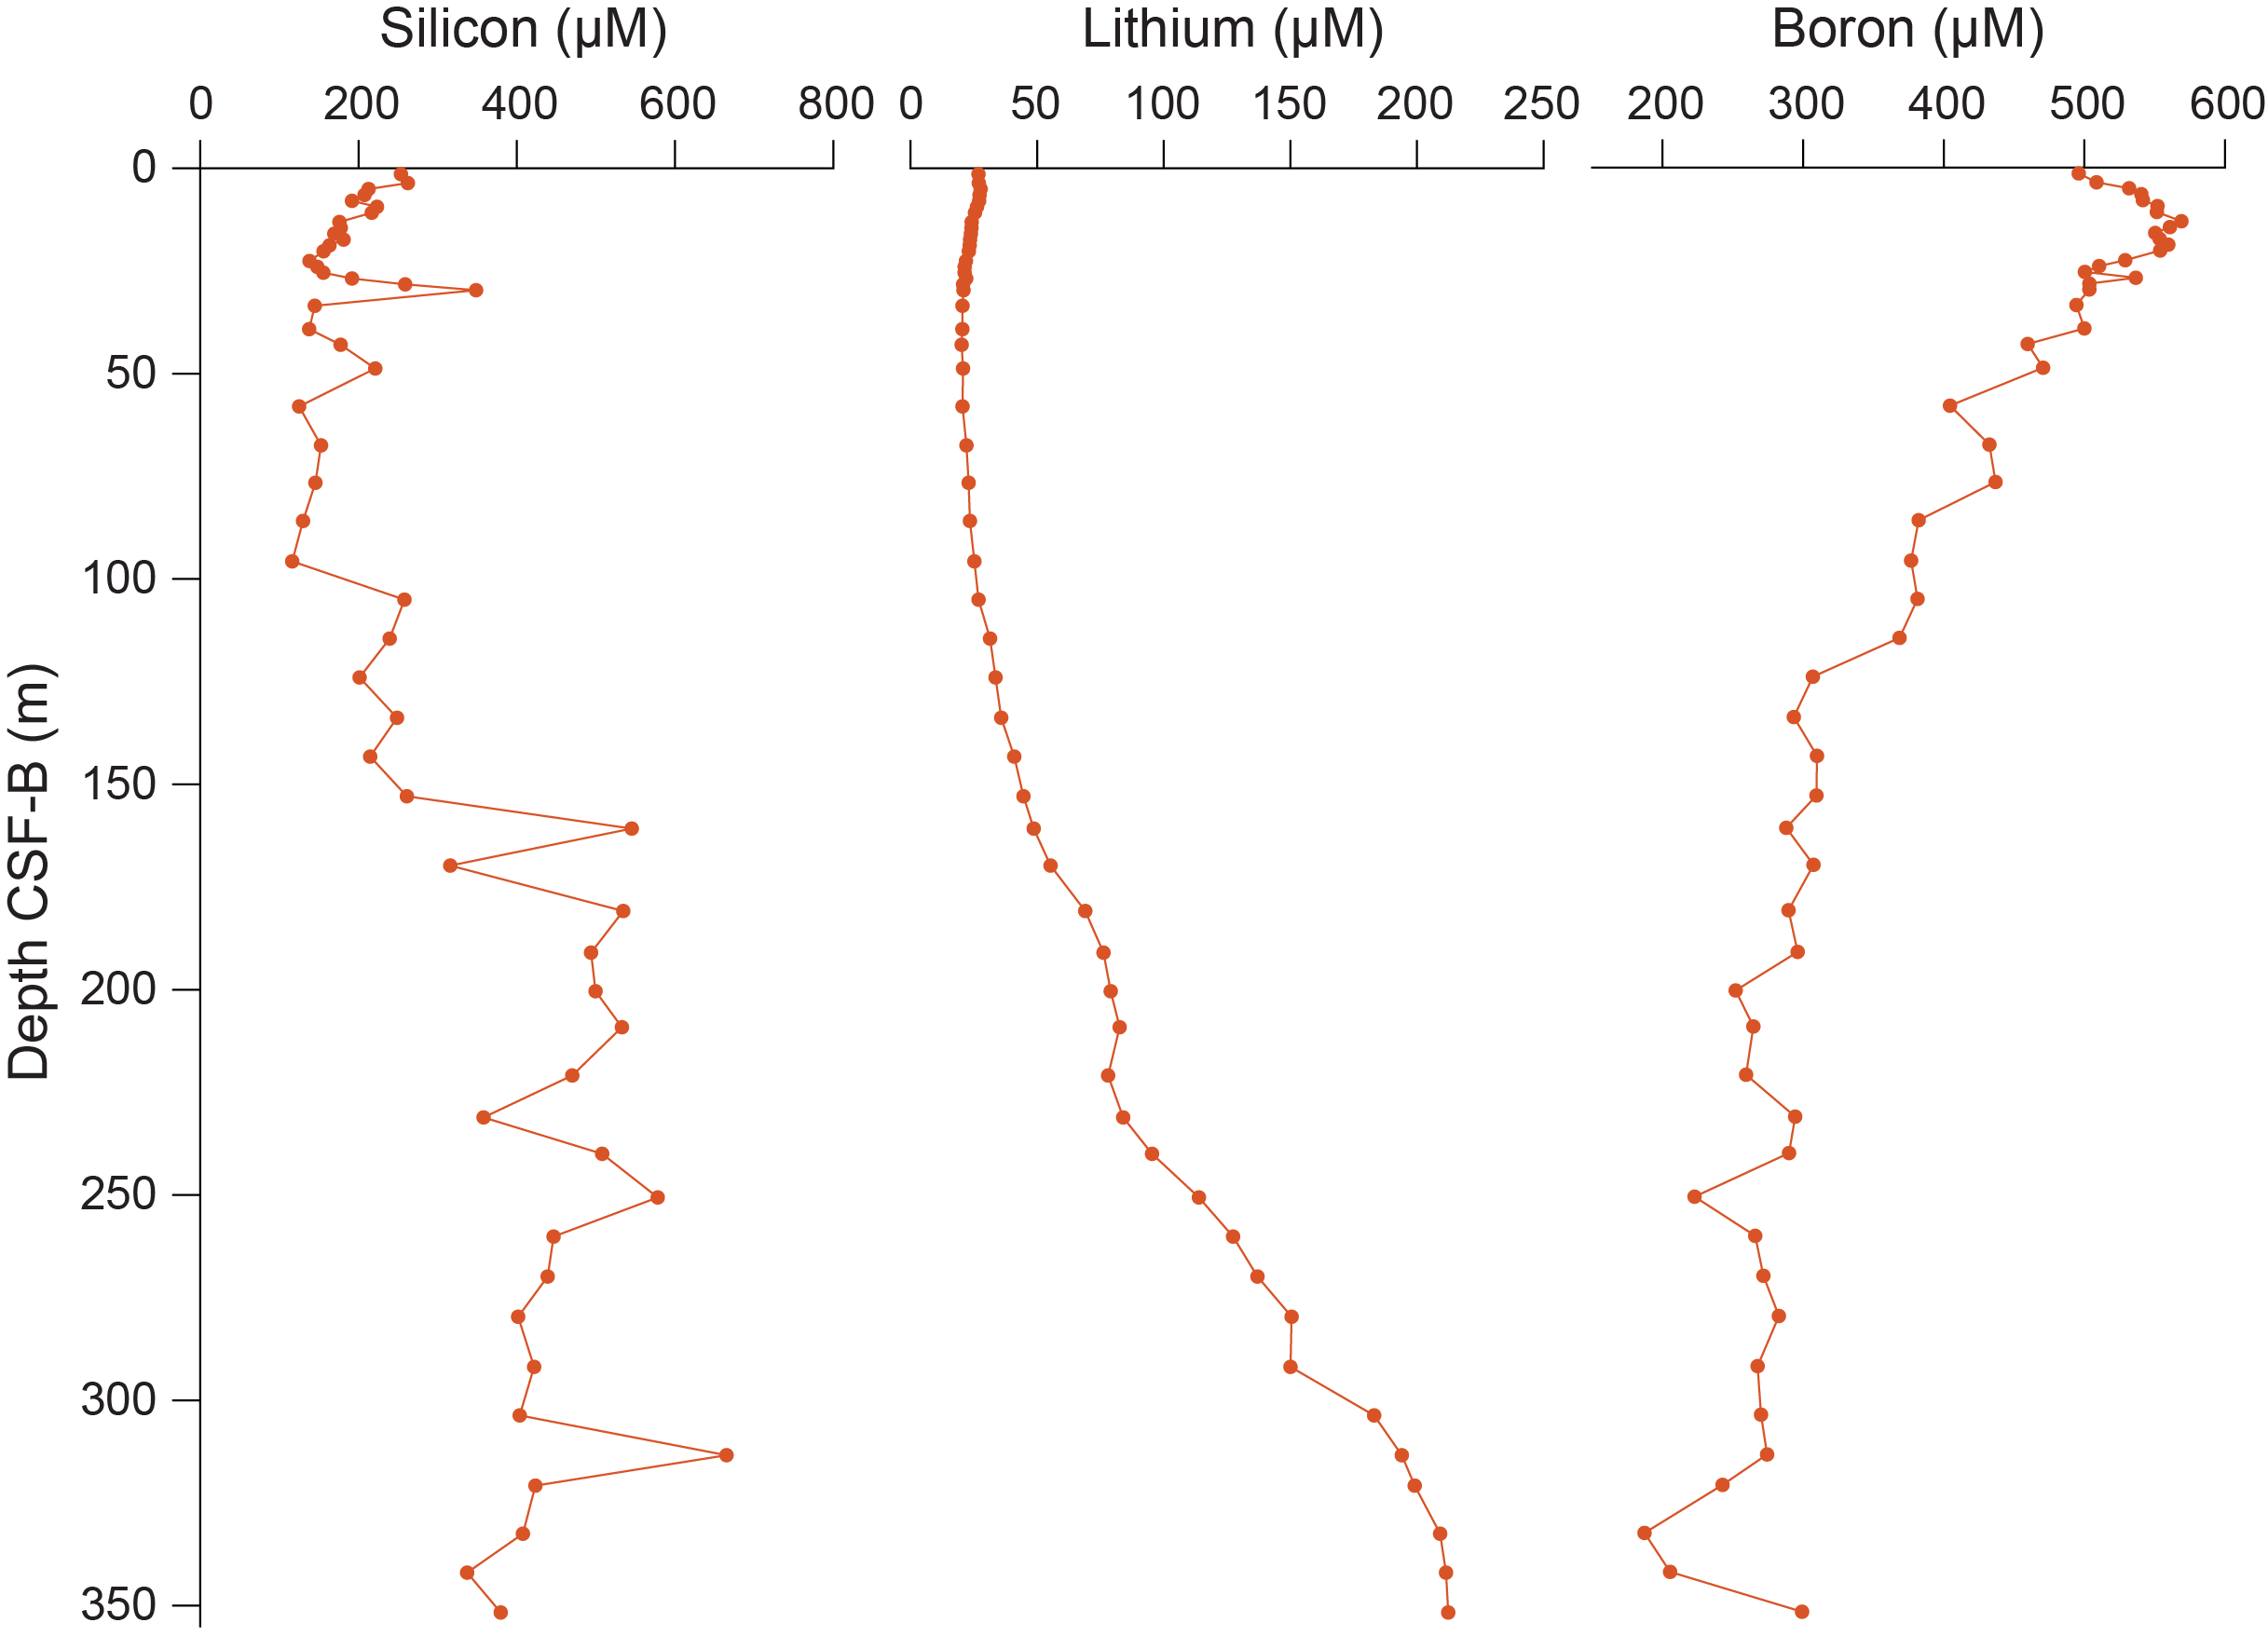
Figure F24. Si, Li, and B.
6.3. Bulk sediment geochemistry
6.3.1. Calcium carbonate (total inorganic carbon)
In Hole U1588A, TIC and TC/TN/TS were measured in samples taken from the working half of split core sections at a resolution of two per core/one per half core. Again, the light and dark intervals were targeted to improve correlations with other physical properties.
A 100% CaCO3 standard was analyzed every ~10 samples (mean = 99.99 ± 1σ [standard deviation] = 0.98 wt%; n = 12) (Table T19). Samples were not measured until the standard was within ~1.5% of 100 wt%.
The mean CaCO3 content from Hole U1588A is 30.2 wt%, but variability is high (±1σ = 8.06 wt%; range = 16.0–53.6 wt%). CaCO3 content and variability are relatively constant throughout (Figures F25, F26; Table T20). CaCO3 correlates positively with L* reflectance (adjusted R2 = 0.265) and negatively with NGR as documented at Site U1587 (adjusted R2 = 0.780) (see Figures F26, F27, F28, and F29 in the Site U1587 chapter [Hodell et al., 2024]). Using the measured elemental Ca concentrations from ICP-AES data, the stoichiometric CaCO3 was calculated to compare with the shipboard-measured total CaCO3 weight percent by coulometer (Figures F25, F26, F27, F28). Although the absolute numbers are not the same, trends in the data are similar.
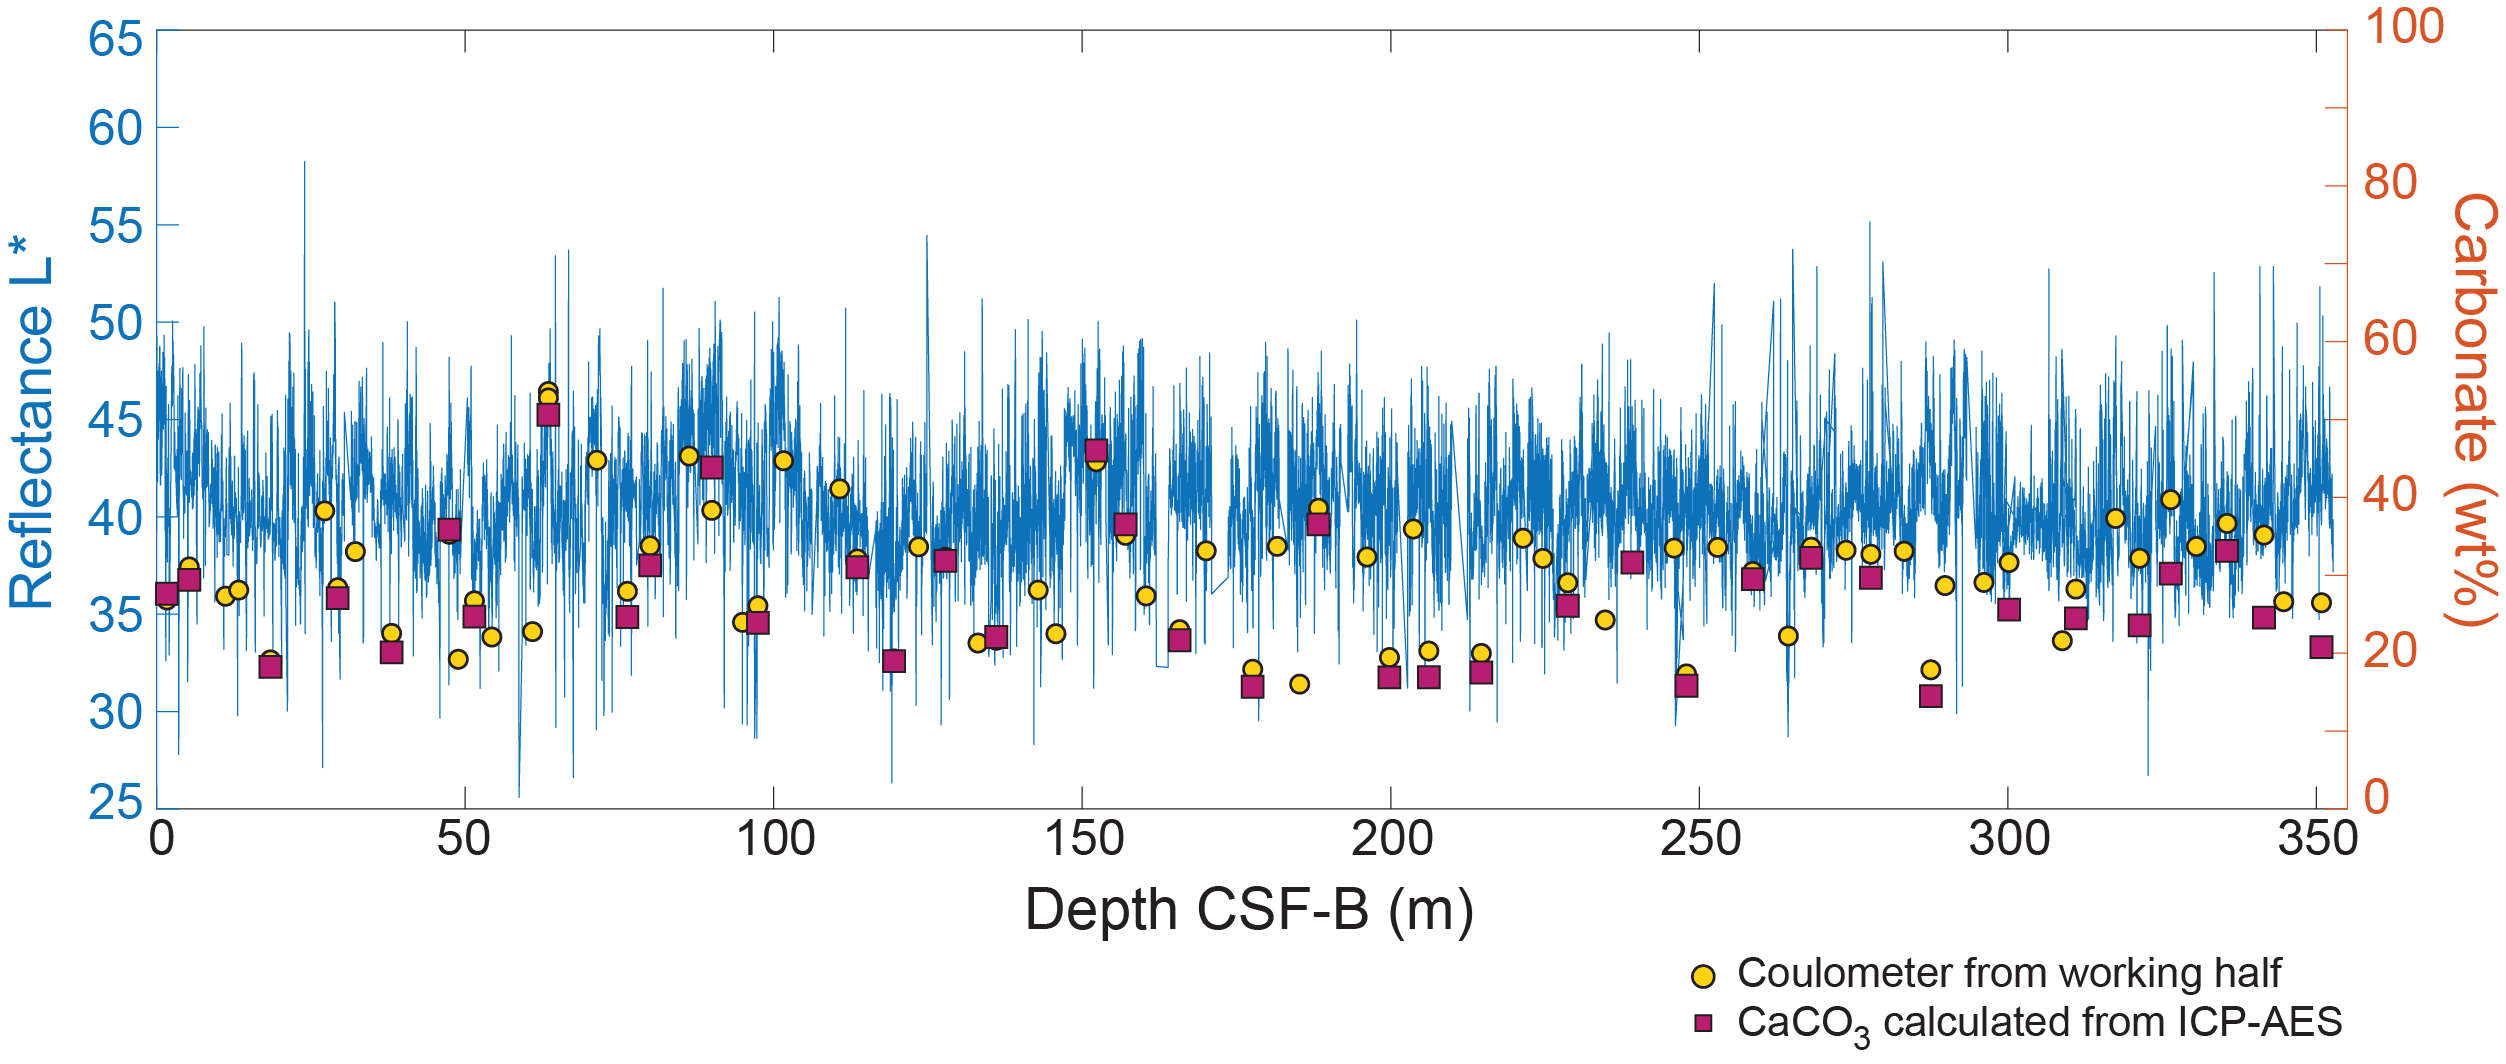
Figure F25. CaCO3.
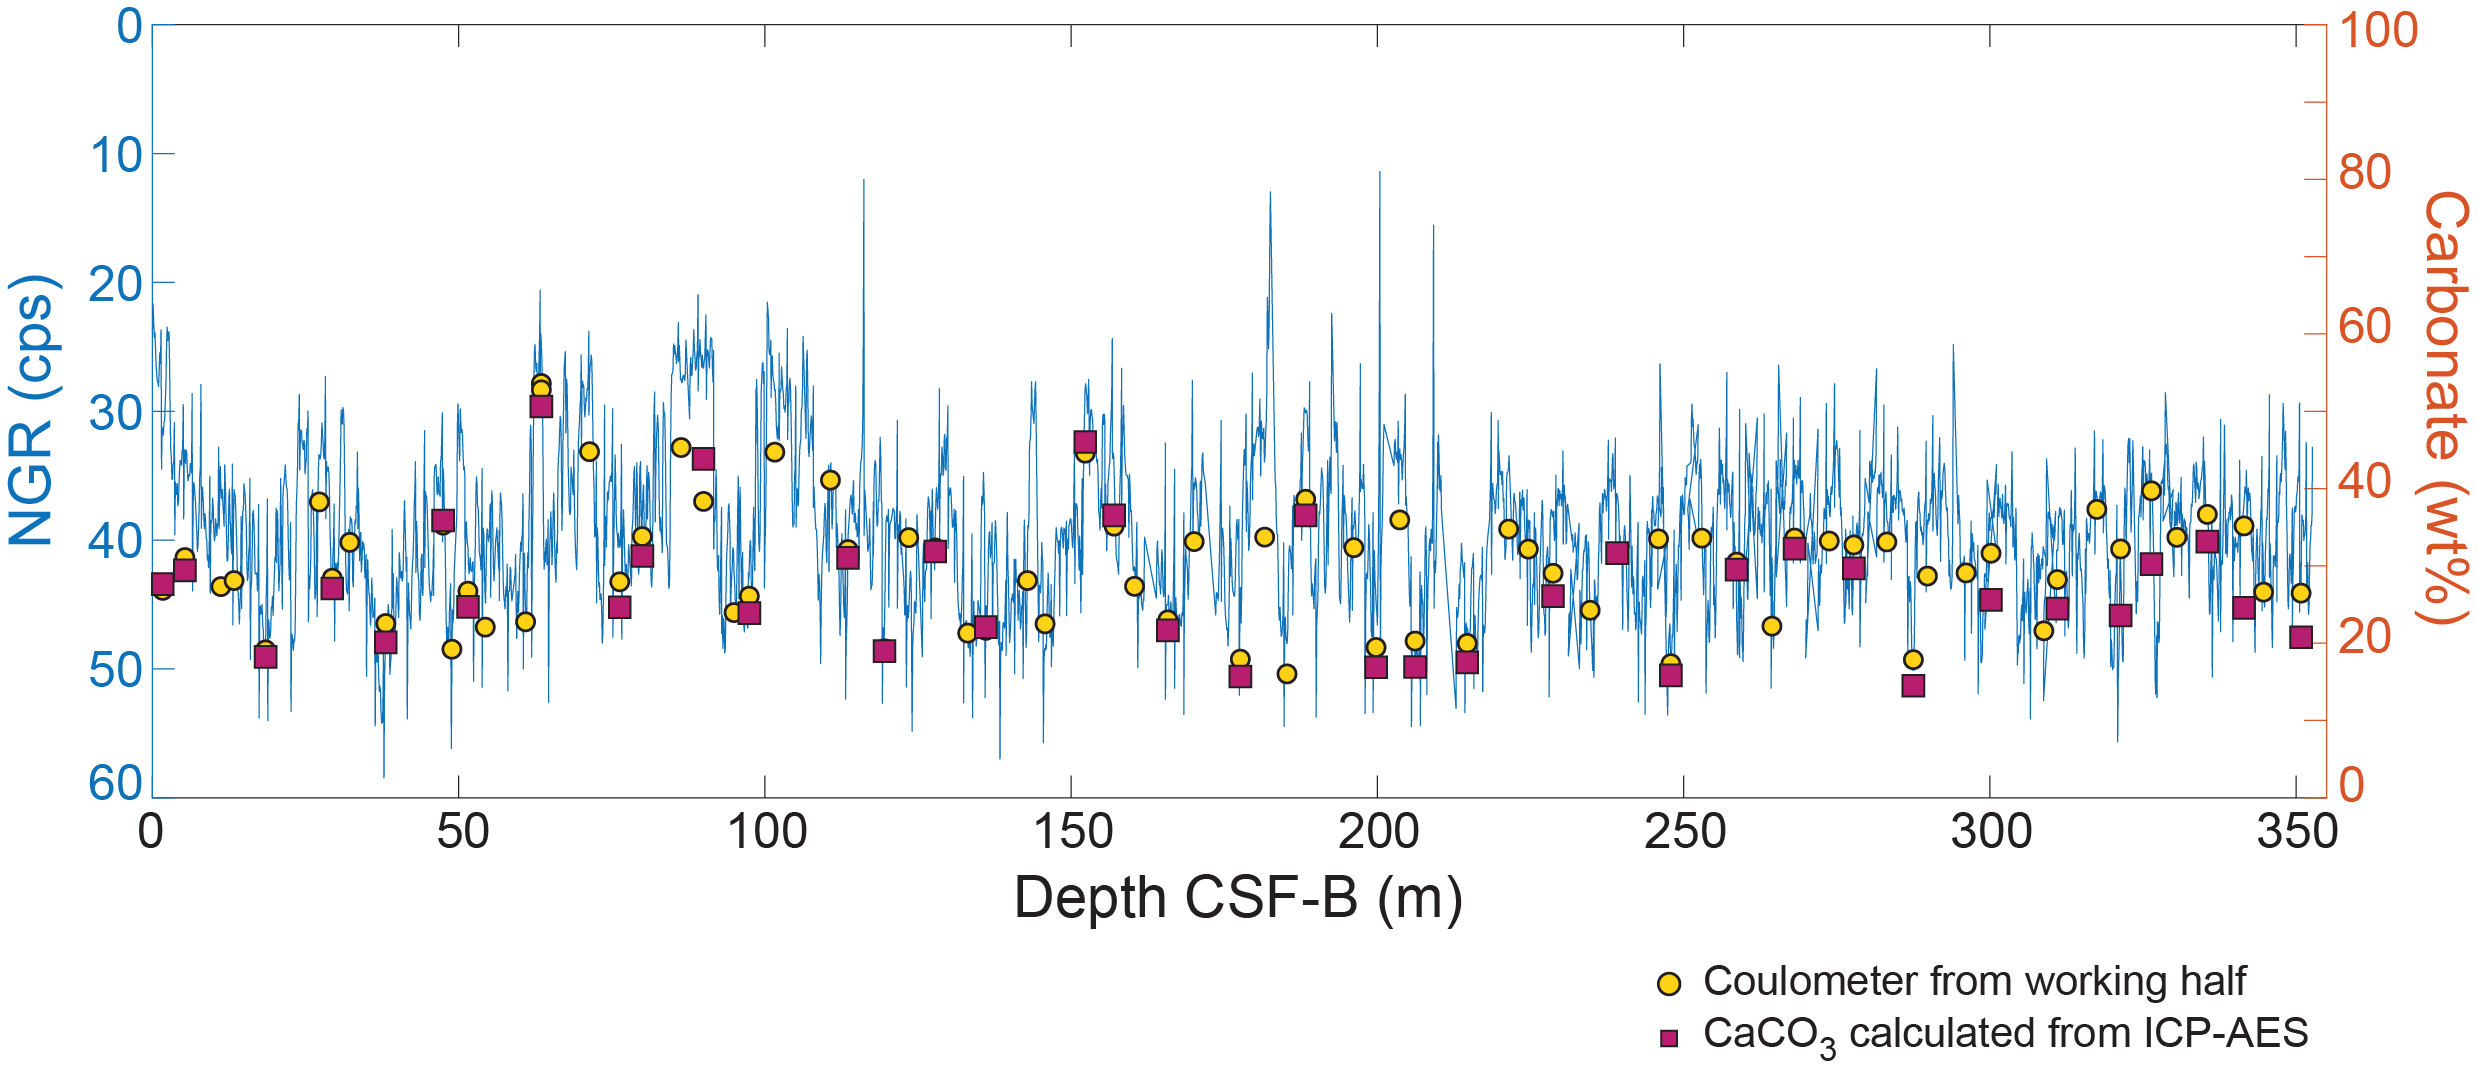
Figure F26. CaCO3 with NGR.
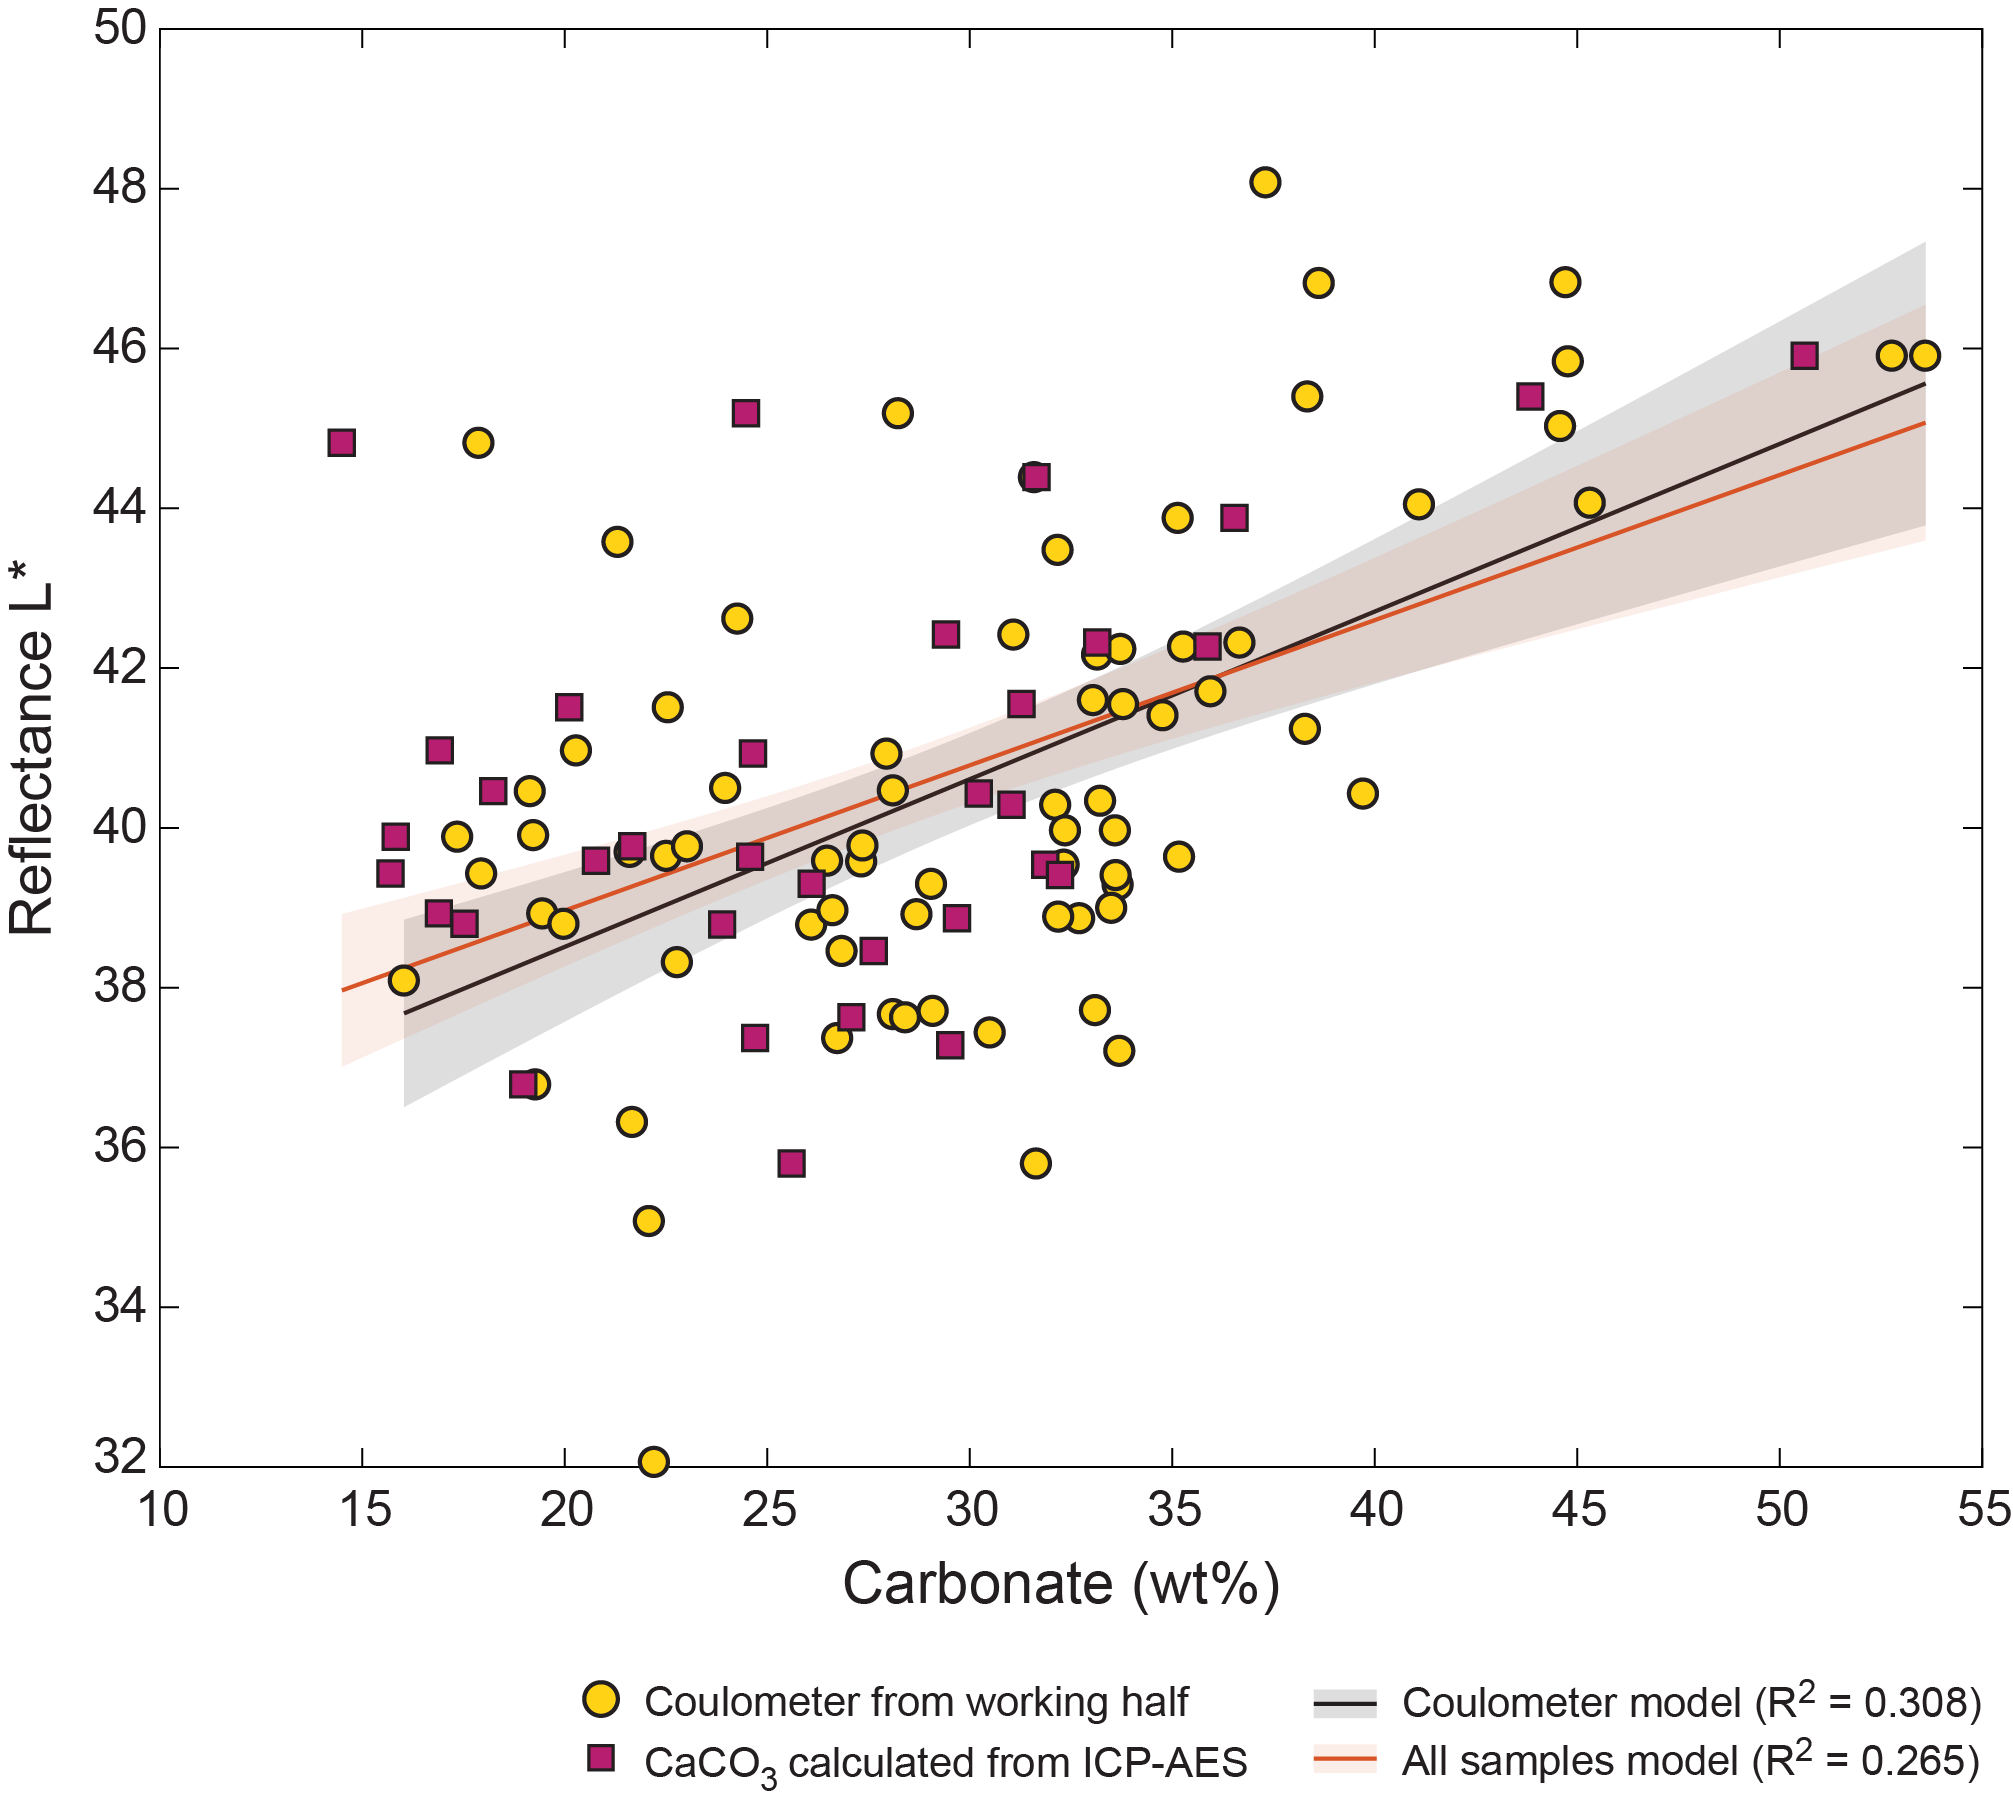
Figure F27. Crossplot and linear regression of CaCO3 and L*.
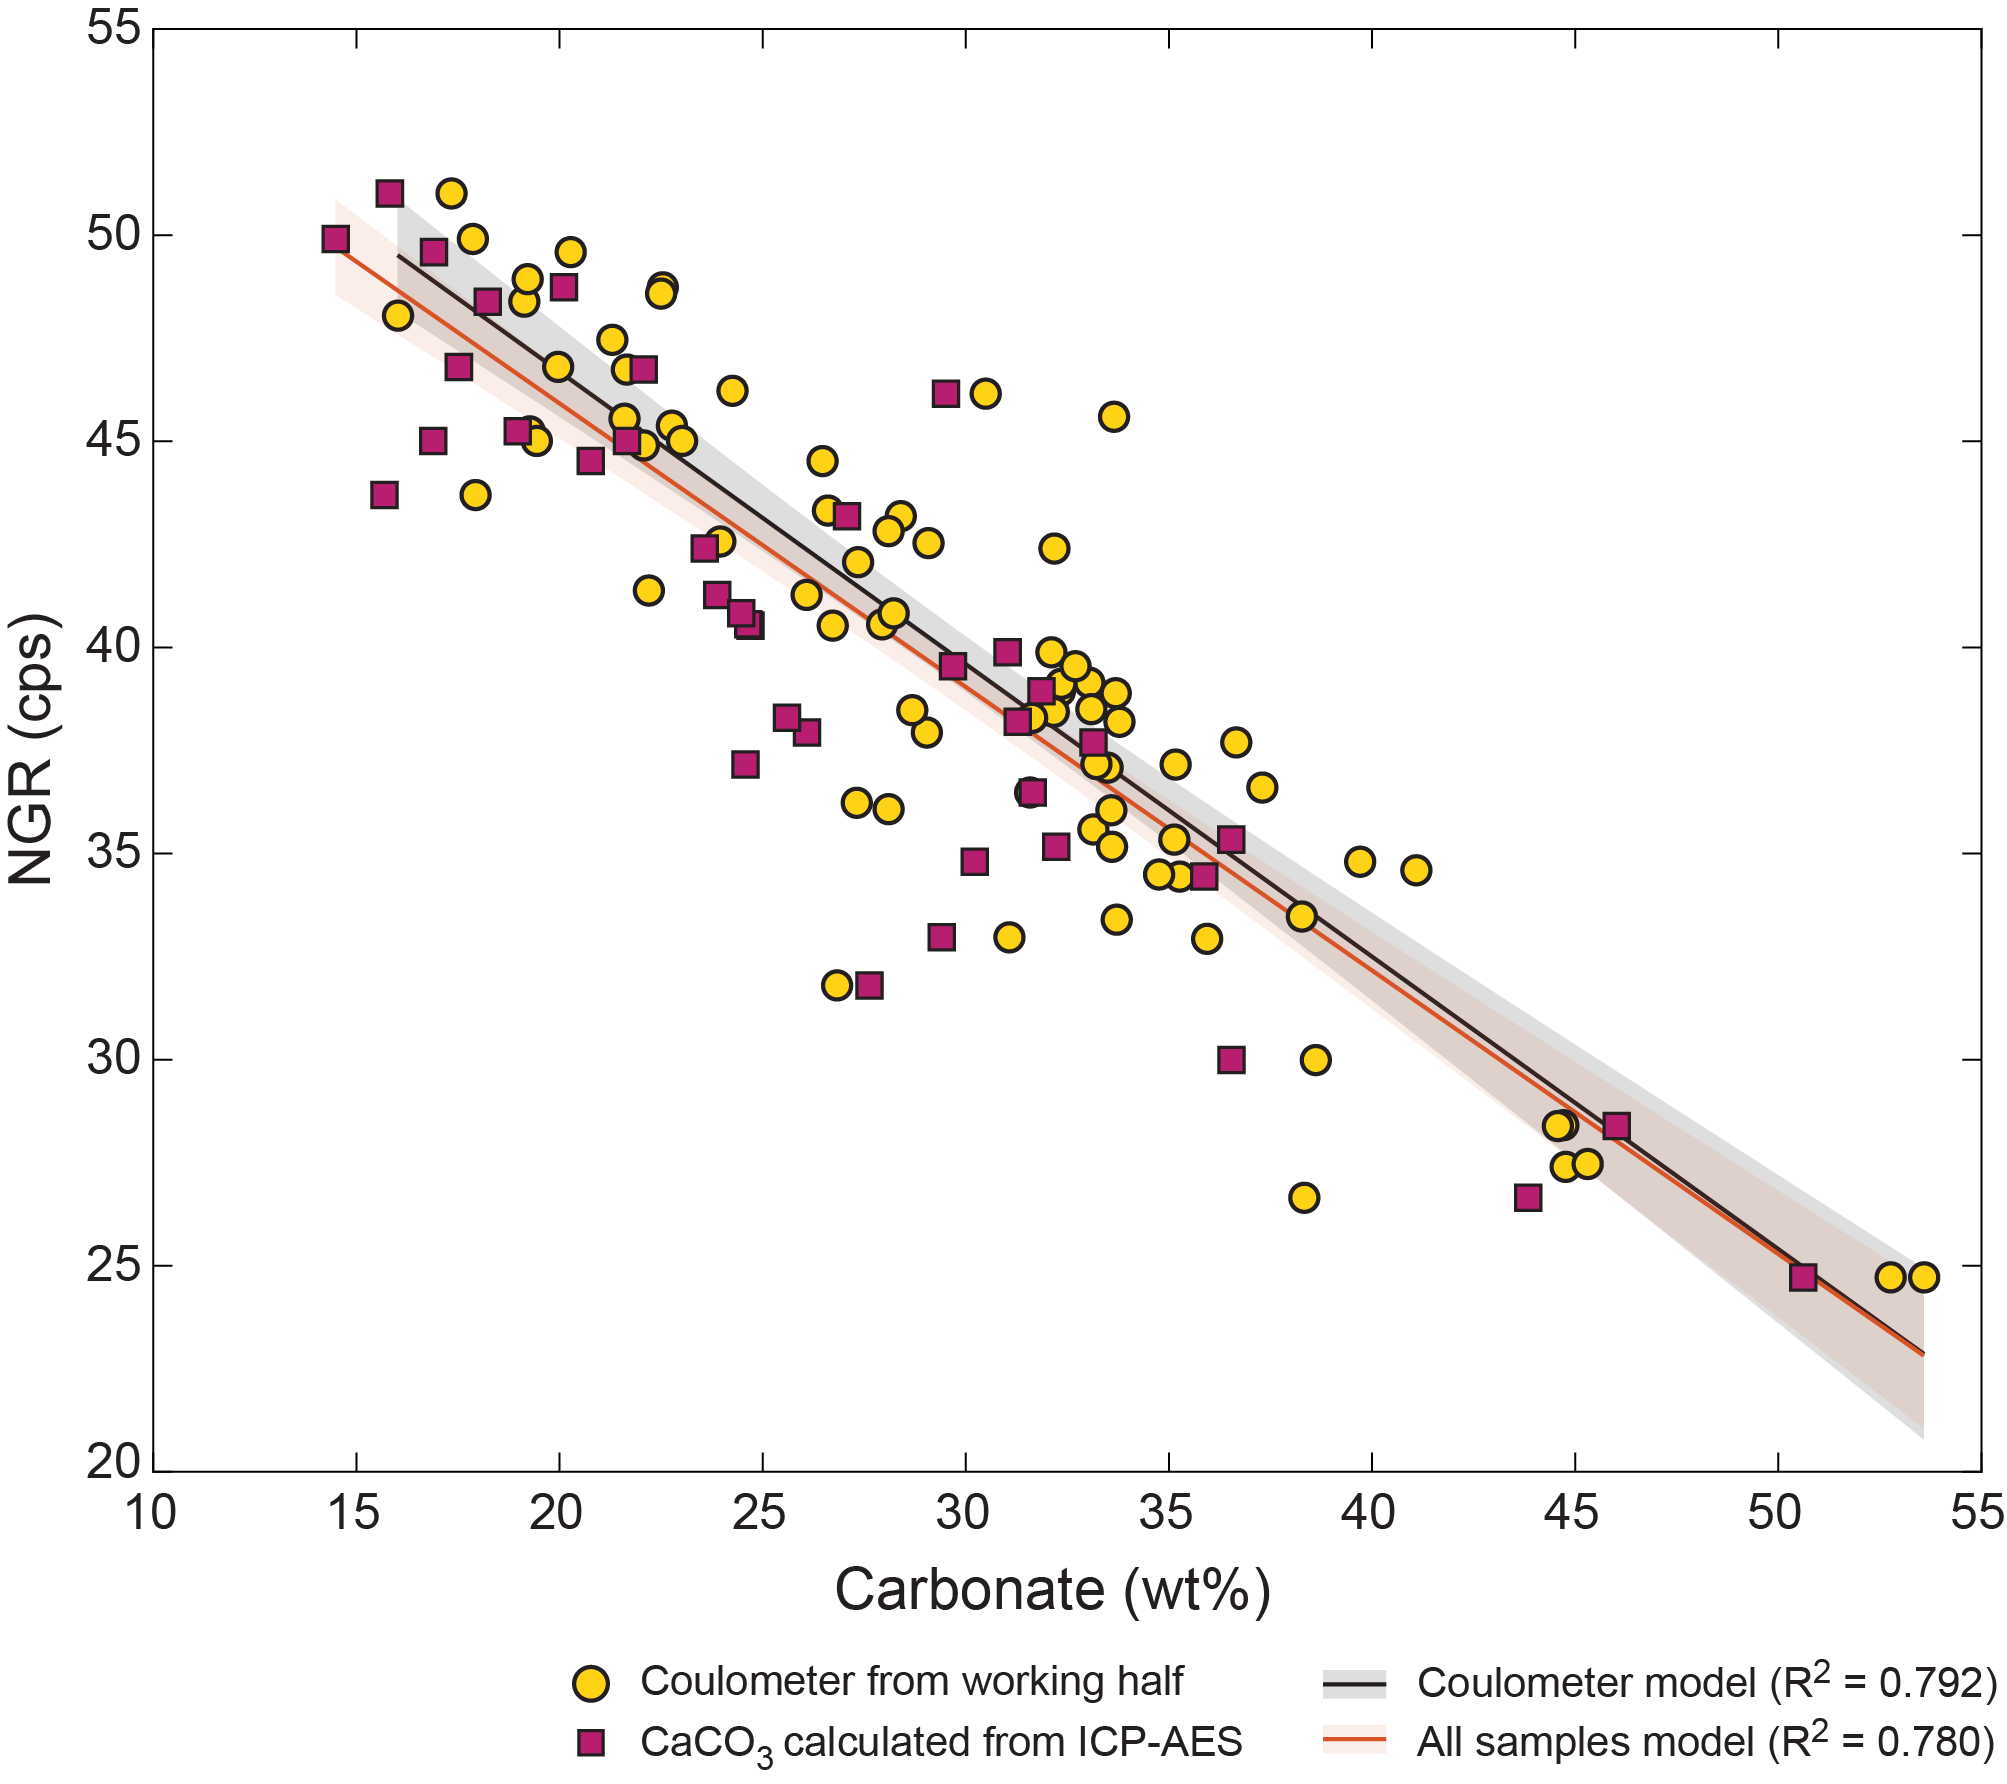
Figure F28. Crossplot and linear regression of CaCO3 and NGR.
6.3.2. Total organic carbon
All samples were simultaneously analyzed for TC alongside TIC, TN, and TS (Figure F29; Table T21). TOC is defined as the difference between TC and TIC.
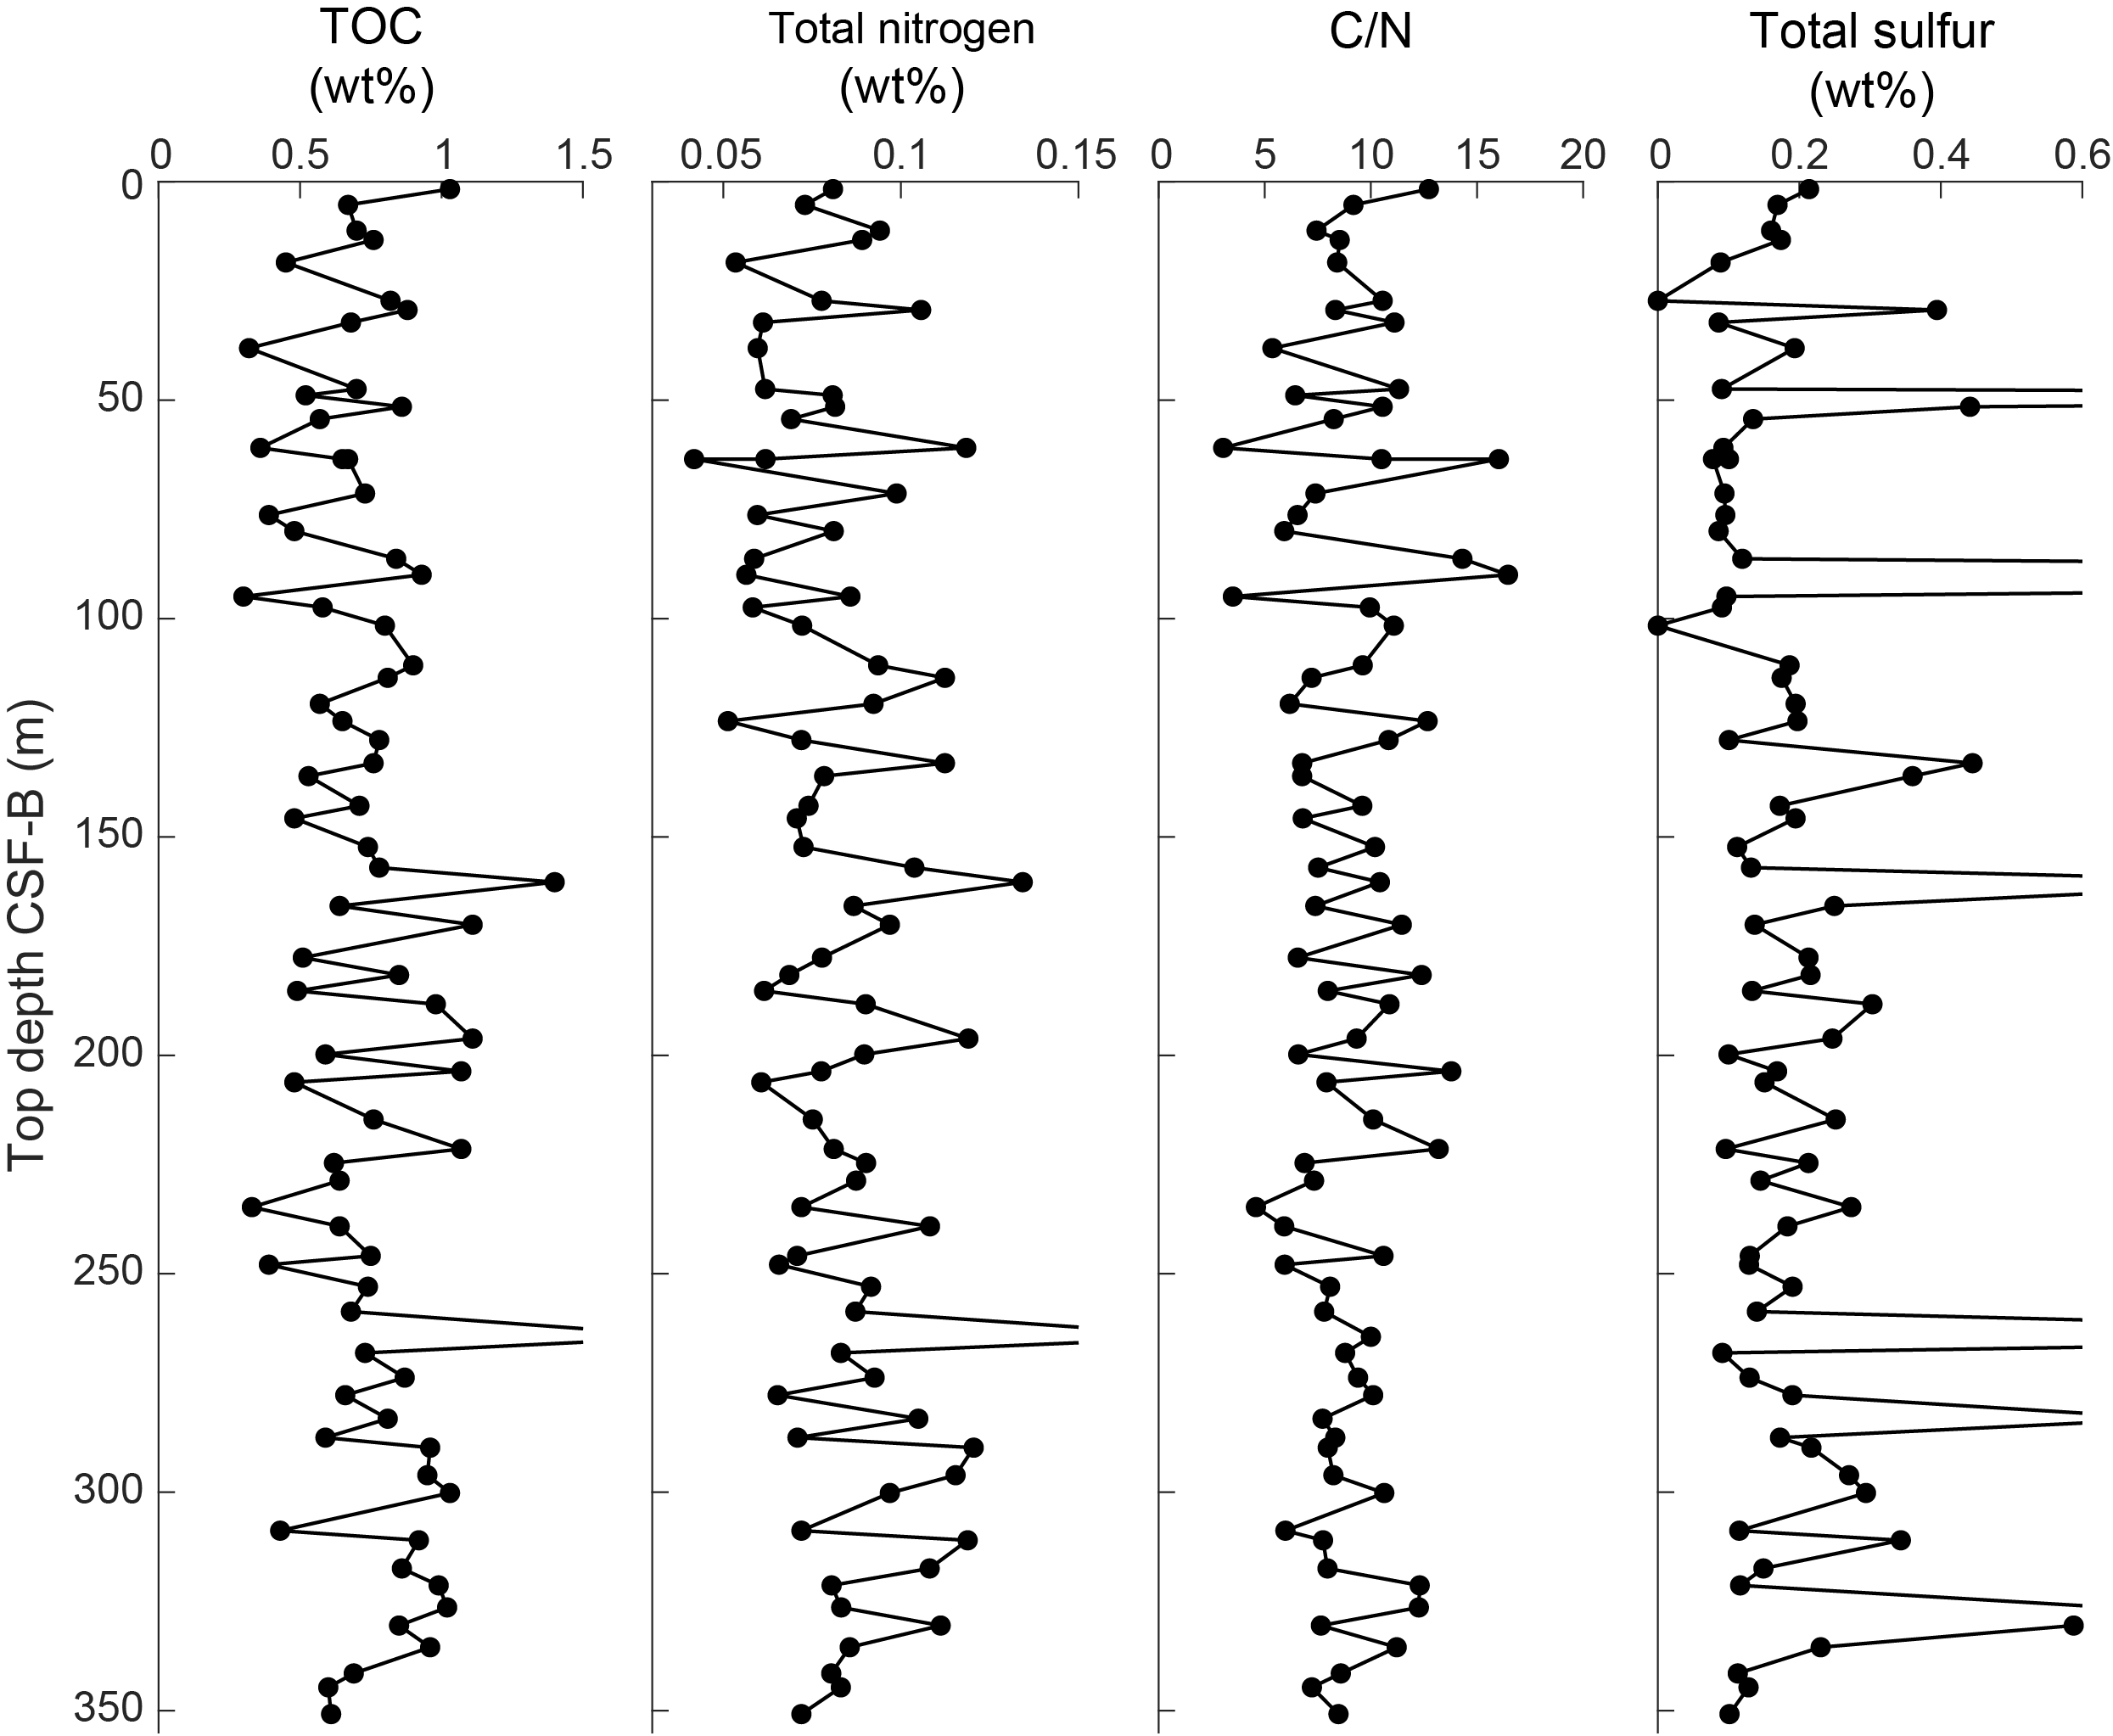
Figure F29. TOC, TN, C/N, and TS.
Two internal standards (sulfanilamide and Buffalo River Sediment [BRS]) were used to calibrate the elemental analyzer. BRS was used to assess the reproducibility of TC, TN, and TS and was run at least every ~10 samples; the 1σ of TC in NIST BRS (n = 10) is 0.074 wt% (Table T22). TOC content in Hole U1588A is generally low (mean = 0.74 ± 0.25 wt%; range = 0.30–1.89 wt%). TOC content and variability are relatively constant throughout (Figure F29; Table T23). CaCO3 and TOC are not strongly correlated (R2 = 0.10).
6.3.3. Total nitrogen
All sedimentary nitrogen is assumed to be organic. The 1σ of TN in NIST BRS (n = 10) is ±0.013 wt% (Table T22).
TN levels in Hole U1588A are also very low (mean = 0.085 ± 0.023 wt%; range = 0.042–0.189 wt%) (Table T24). TN content and variability are relatively constant throughout (Figure F29).
6.3.4. Organic C/N ratios
The ratio of sedimentary TOC/TN (C/N) can fingerprint particulate organic matter: marine and lacustrine algae have ratios of 0–10, whereas terrestrial plants exist in a much broader C/N space (25–75) (Meyers 1994, 1997).
The mean C/N is 8.97 ± 2.62 (range = 3.04–16.5) (Table T25). C/N ratios and variability are relatively constant throughout (Figure F29) and diagnostic of marine/lacustrine algal sources.
6.3.5. Total sulfur
The 1σ of TS in NIST BRS (n = 10) is ±0.073 wt% (Table T22).
Similar to TOC and TN, TS concentrations are very low (mean = 0.291 ± 0.487 wt%; range = 0–3.18 wt%) (Table T26). TS content and variability are relatively constant throughout (Figure F29).
6.3.6. Major and minor elements
Major and minor element concentrations were measured on 38 samples from Hole U1588A using ICP-AES (Table T27). Replicate analyses of 8 international reference standards (n = 18) have relative standard deviations (RSD) of <5% for all major elements (excerpt for P2O5) and <10% for most of the minor elements reported.
The elemental oxides of SiO2, K2O, and TiO2 show robust positive correlation against Al2O3 with a near-zero intercept, indicating the dominance of terrigenous detritus (Figure F30). This is also generally observed for the minor elements including Sc, Y, Cr, V, and Zr. Relatively weak correlations are observed for Fe2O3, MgO, Na2O, MnO, and Ba against Al2O3, due to the widespread presence of authigenic and biogenic phases, that is, pyrite, dolomite, and/or Mg-bearing calcite, halite (NaCl) precipitated from seawater, Mn hydroxides, and BaSO4, respectively. The bulk sediment Ca primarily represents biogenic CaCO3, and because of the incorporation of Sr into biogenic carbonates, both elements show an inverse relationship with Al. In the plot of CaCO3 vs. Al2O3, the deviating data points are due to detrital CaCO3 (Figure F30).
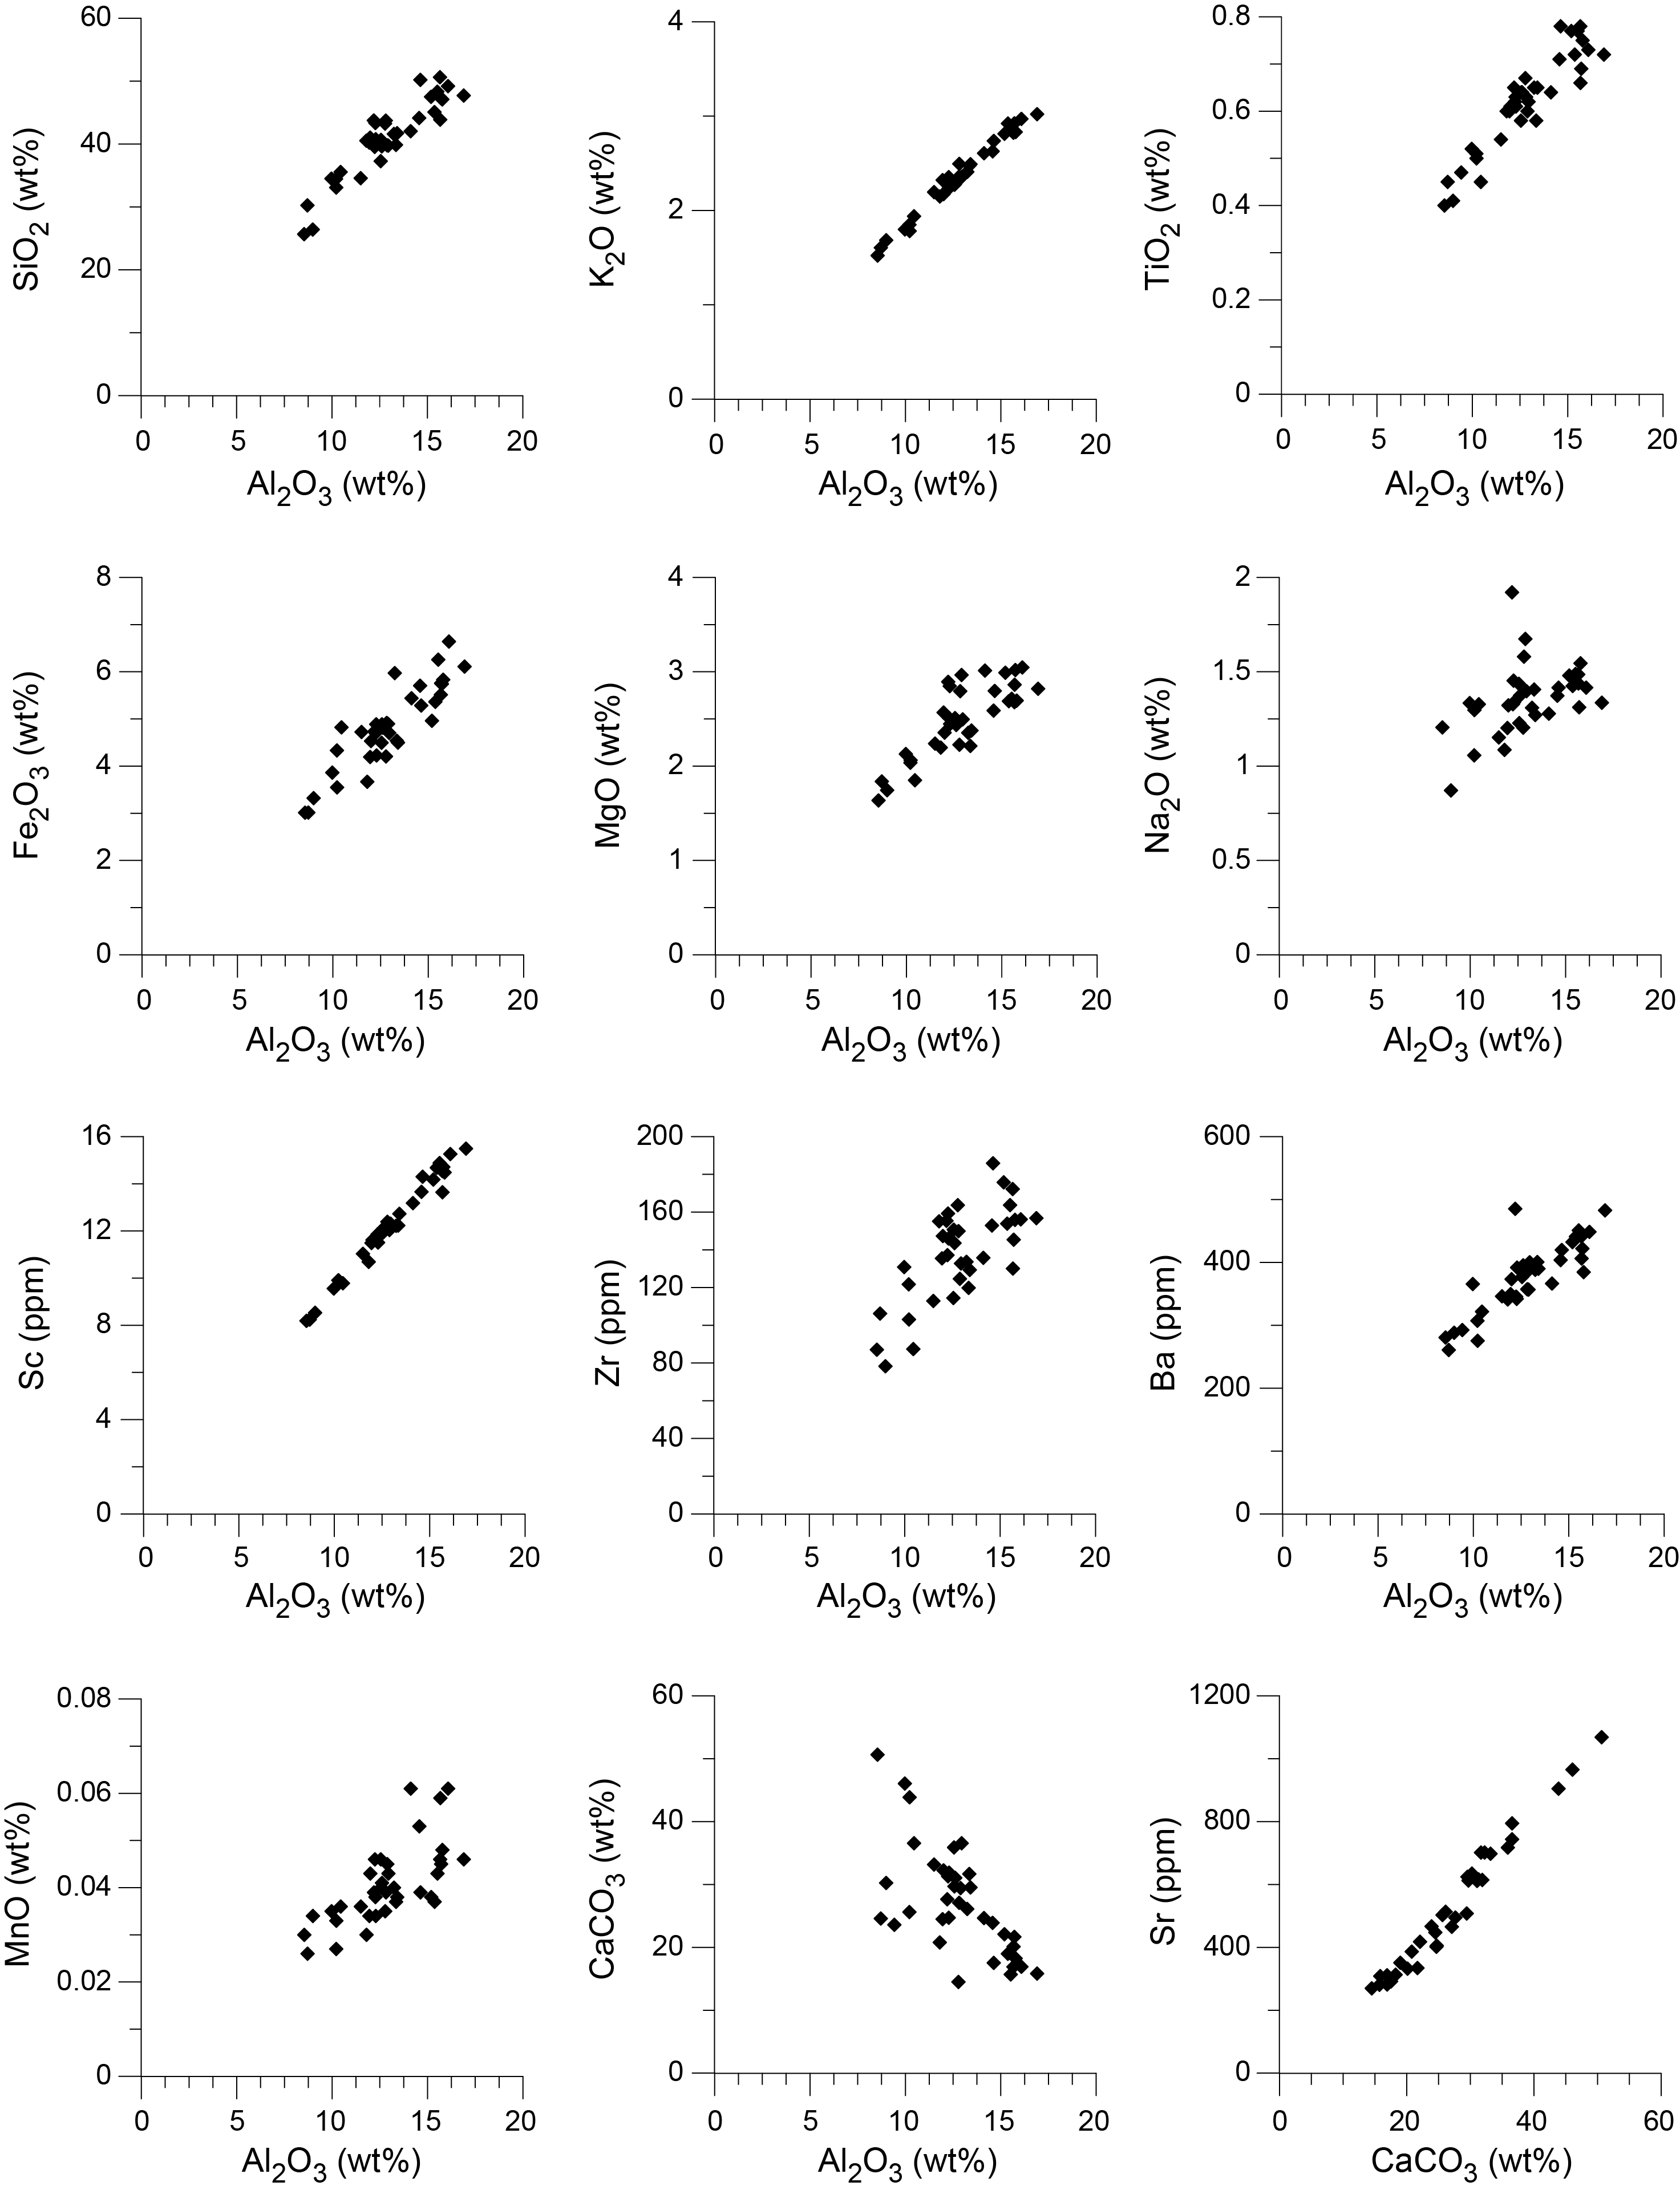
Figure F30. Major and minor element concentrations.
The Ca/Ti ratio reflects the relative contributions of CaCO3 versus terrigenous detritus in the sediments. The Ca/Ti ratios range ~13–84, with larger variations at ~50–200 m CSF-B and smaller variations in the upper 50 m and ~200–350 m CSF-B (Figure F31). Selected lithogenic elements are normalized to Al as a proxy for provenance, weathering, and productivity (Figure F31). In addition, the Si/Al ratio may serve as a proxy for grain size, mainly reflecting the abundance of quartz versus clay minerals. The Ti/Al and Zr/Al ratios in this area are widely recognized as indicators of North African dust, and the K/Al ratio is used to reflect the input of river-borne material and associated chemical weathering intensity (Wu et al., 2016). Similarities between Si/Al, Ti/Al, and Zr/Al profiles indicate changes in dust input and wind intensity. Si/Al, Ti/Al, and Zr/Al have no discernible long-term downhole trend. The K/Al profile shows larger variations in the upper 100 m and the lowermost 50 m and smaller variations at ~100–300 m CSF-A.
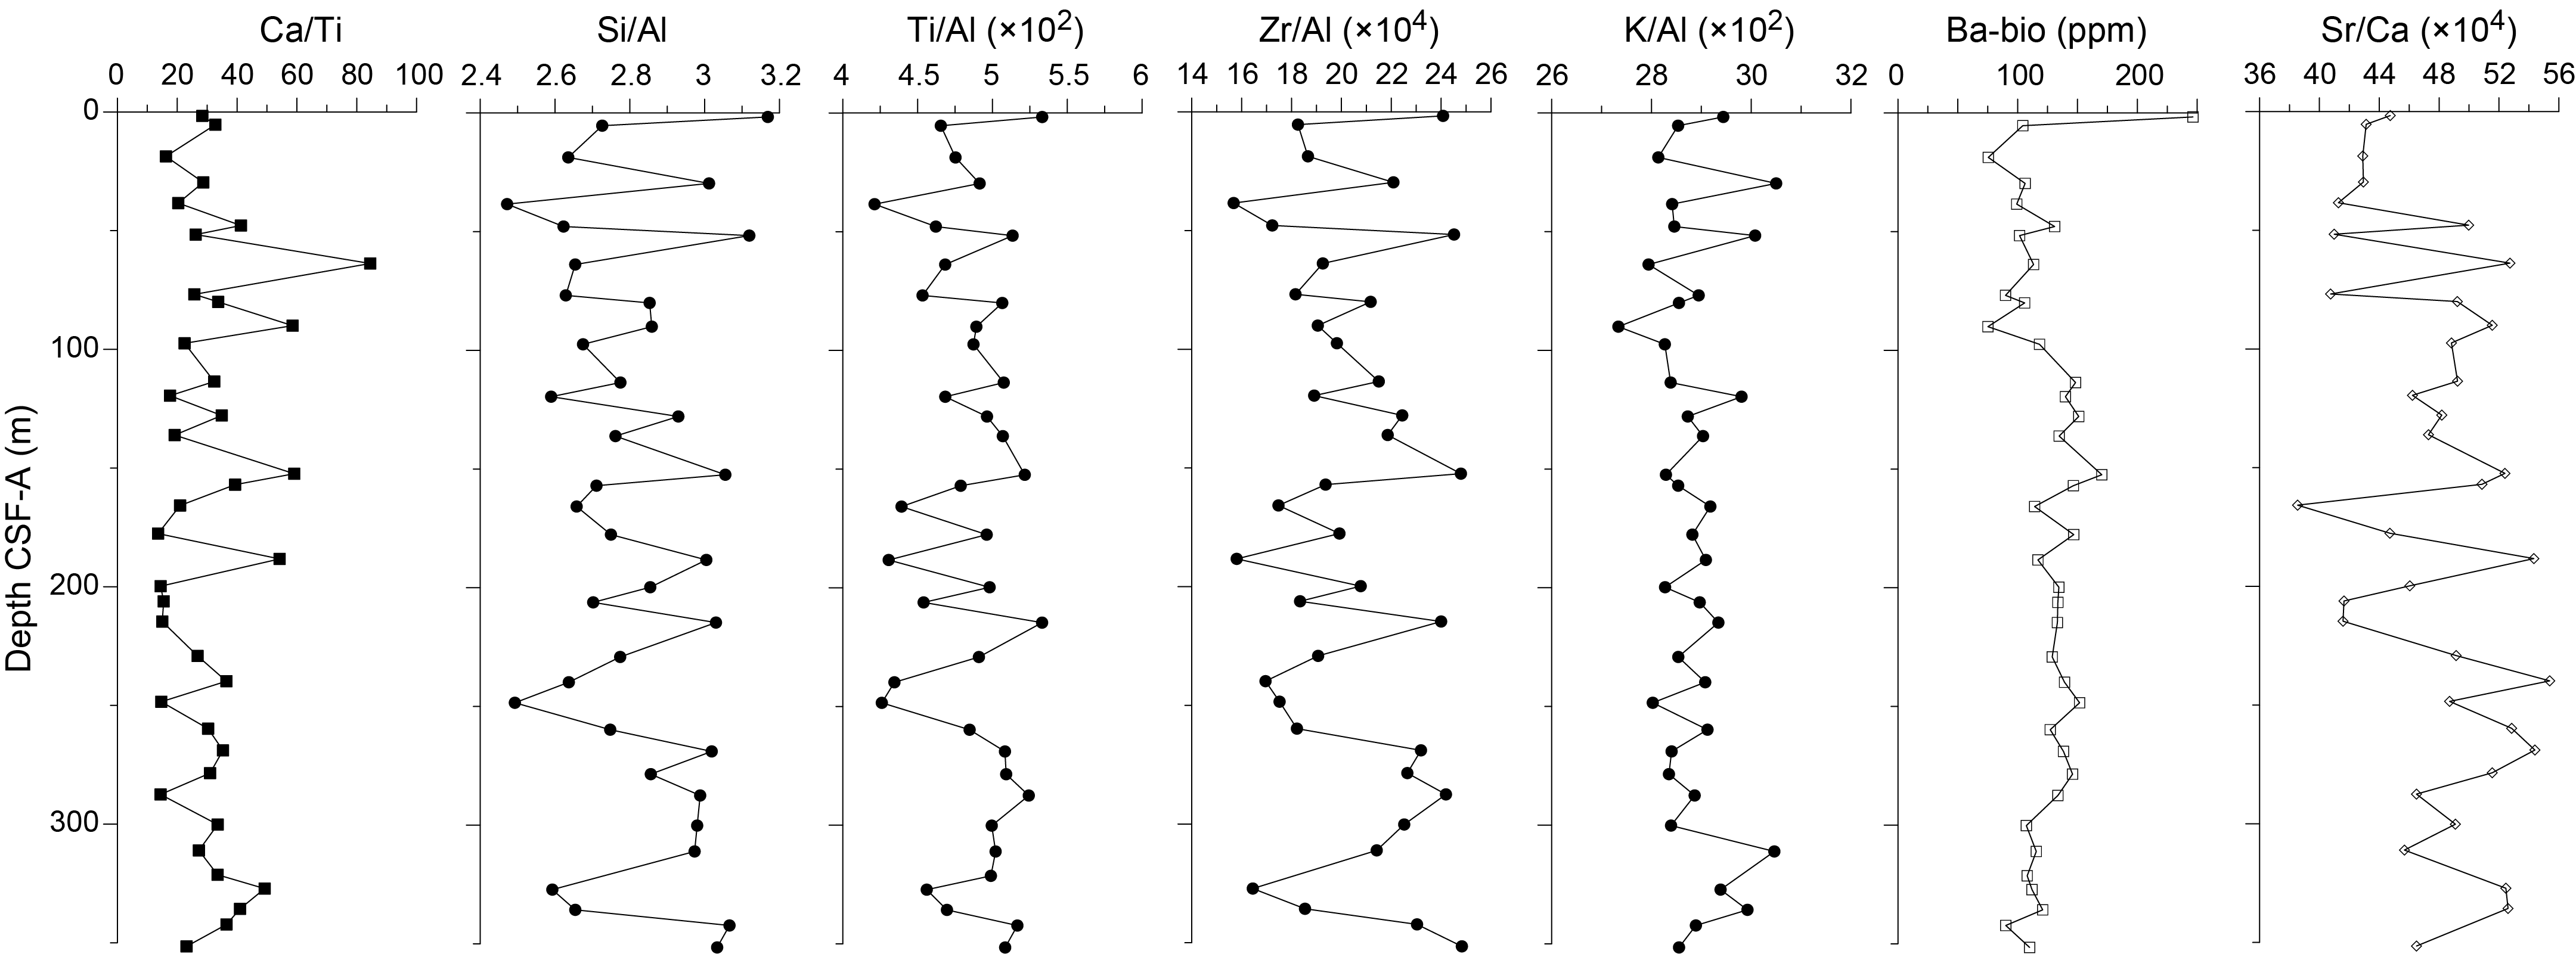
Figure F31. Bulk sedimentary Ca/Ti, Si/Al, Ti/Al, Zr/Al, K/Al, biogenic Ba (Ba-bio), and Sr/Ca.
BaSO4 content in marine sediments is a widely recognized proxy for export productivity (Paytan and Griffith, 2007). Assuming a constant Ba/Al ratio of 0.0037 for the terrigenous aluminosilicate component (Reitz et al., 2004), the biogenic Ba (i.e., Ba-bio, mostly BaSO4) can be calculated. Despite possible BaSO4 dissolution at this site (Figure F21), there may still be ~70–200 ppm residual BaSO4 with relatively small changes downhole. The Sr/Ca profile shows larger variations downhole, probably linked to changes in aragonite content.
7. Physical properties
Physical properties measurements were made on whole-round cores, split cores, and discrete samples. High-resolution (2 or 4 cm steps) nondestructive measurements of GRA bulk density and MS were made on whole-round sections from all holes. NGR was measured on all whole-round sections at a 10 or 20 cm resolution. P-wave caliper (PWC) measurements were taken at a resolution of one per core. However, only the data from Cores 397-U1588A-1H through 7H were recorded because of extreme core expansion below Core 8H. MAD discrete samples were measured at a resolution of one measurement per core for all cores from Hole U1588A. Thermal conductivity was measured once per core for all cores from Hole U1588A. Color reflectance spectrophotometry and split core point MS (MSP) measurements were carried out at 2, 4, or 5 cm steps on all archive halves. X-ray images of whole-round sections were taken for all core sections from Hole U1588A and Cores 397-U1588D-64X through 76X. In this site chapter, we use the CSF-B depth scale instead of the CSF-A depth scale because severe sediment expansion due to the high gas content resulted in a significant overlap of the physical properties data between cores when plotted on the CSF-A depth scale.
7.1. Bulk density
Bulk density values were measured using the WRMSL and Special Task Multisensor Logger (STMSL) for GRA bulk density and discrete samples for MAD bulk density.
GRA bulk density was measured at 2 or 4 cm resolution on all whole-round sections from all holes. Measured GRA bulk density increases from ~1.4 g/cm3 at the top of Hole U1588A to ~1.9 g/cm3 around 20 m CSF-B (Figure F32). GRA bulk density is highly variable from 20 m to the bottom of the hole due to decreases of sediment volumes in intervals of severe core expansion. Likewise, GRA bulk density also decreases with other drilling disturbances, such as cracks, voids, soupy textures, and basal flow-ins (see Lithostratigraphy). Despite significant core expansion, downhole cyclic variations are still visible on GRA bulk density data averaged over 20 points.
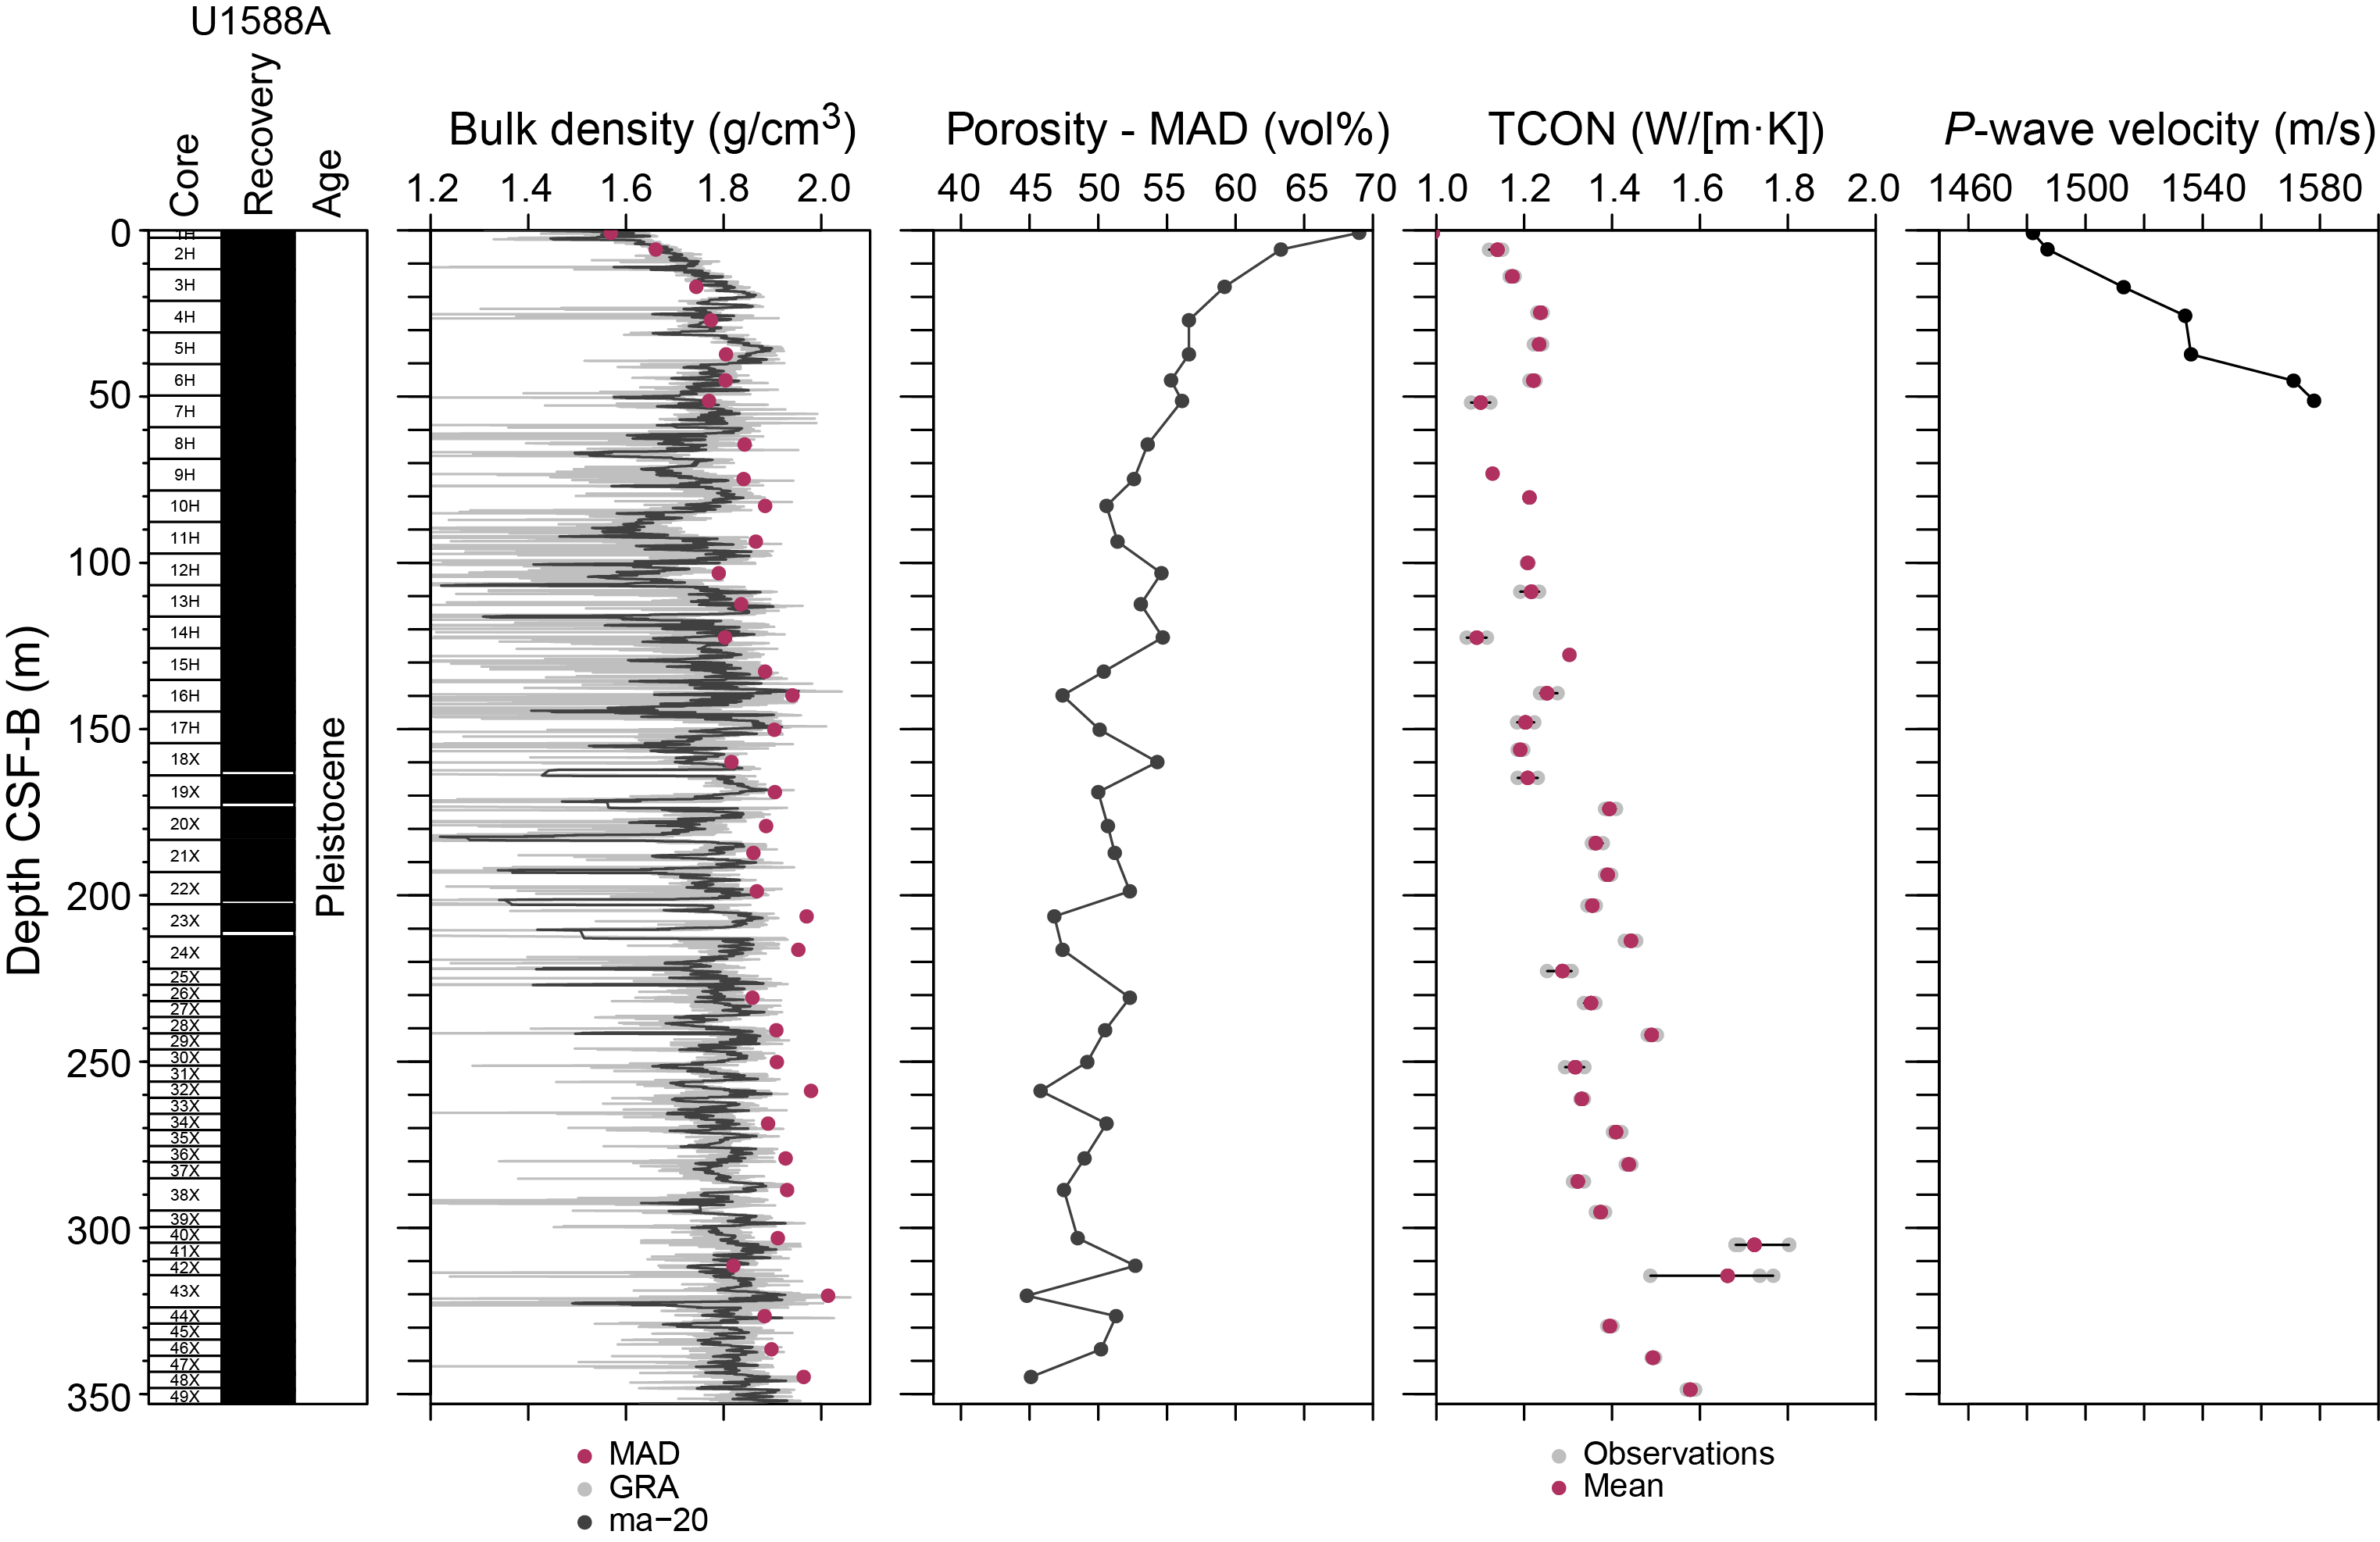
Figure F32. GRA and MAD bulk density, porosity, thermal conductivity, and P-wave velocity.
MAD measurements were taken as 10 cm3 discrete samples at a sampling resolution of one every 10 m from Hole U1588A cores. MAD samples were taken from fine-grained sediment while avoiding locations of noticeable drilling disturbance. These samples were measured for wet mass, dry mass, and dry volume to calculate wet density, dry density, grain density, porosity, and void ratio. The grain density is nearly constant throughout Hole U1588A, ranging 2.71–2.83 g/cm3. The measured bulk densities from the discrete samples range 1.57–2.01 g/cm3 and show a gradual downhole increase in bulk density (Figure F32). Overall, the downhole increasing trends of both GRA and MAD bulk densities are likely attributed to sediment compaction.
7.2. Magnetic susceptibility
MS was measured on all whole-round cores using the WRMSL and STMSL at 2 or 4 cm resolution (Figure F33). In addition, split core MSP measurements were carried out on all archive halves using the SHMSL. Three different resolutions were used for the MSP measurements: 2 cm for all cores from Hole U1588A and Cores 397-U1588B-1H through 9H, 4 cm for Sections 10X-1 through 10X-3, and 5 cm for all subsequent sections from Holes U1588B–U1588D. The measured MS is characterized by cyclic variations from tens of centimeters to a few meters.
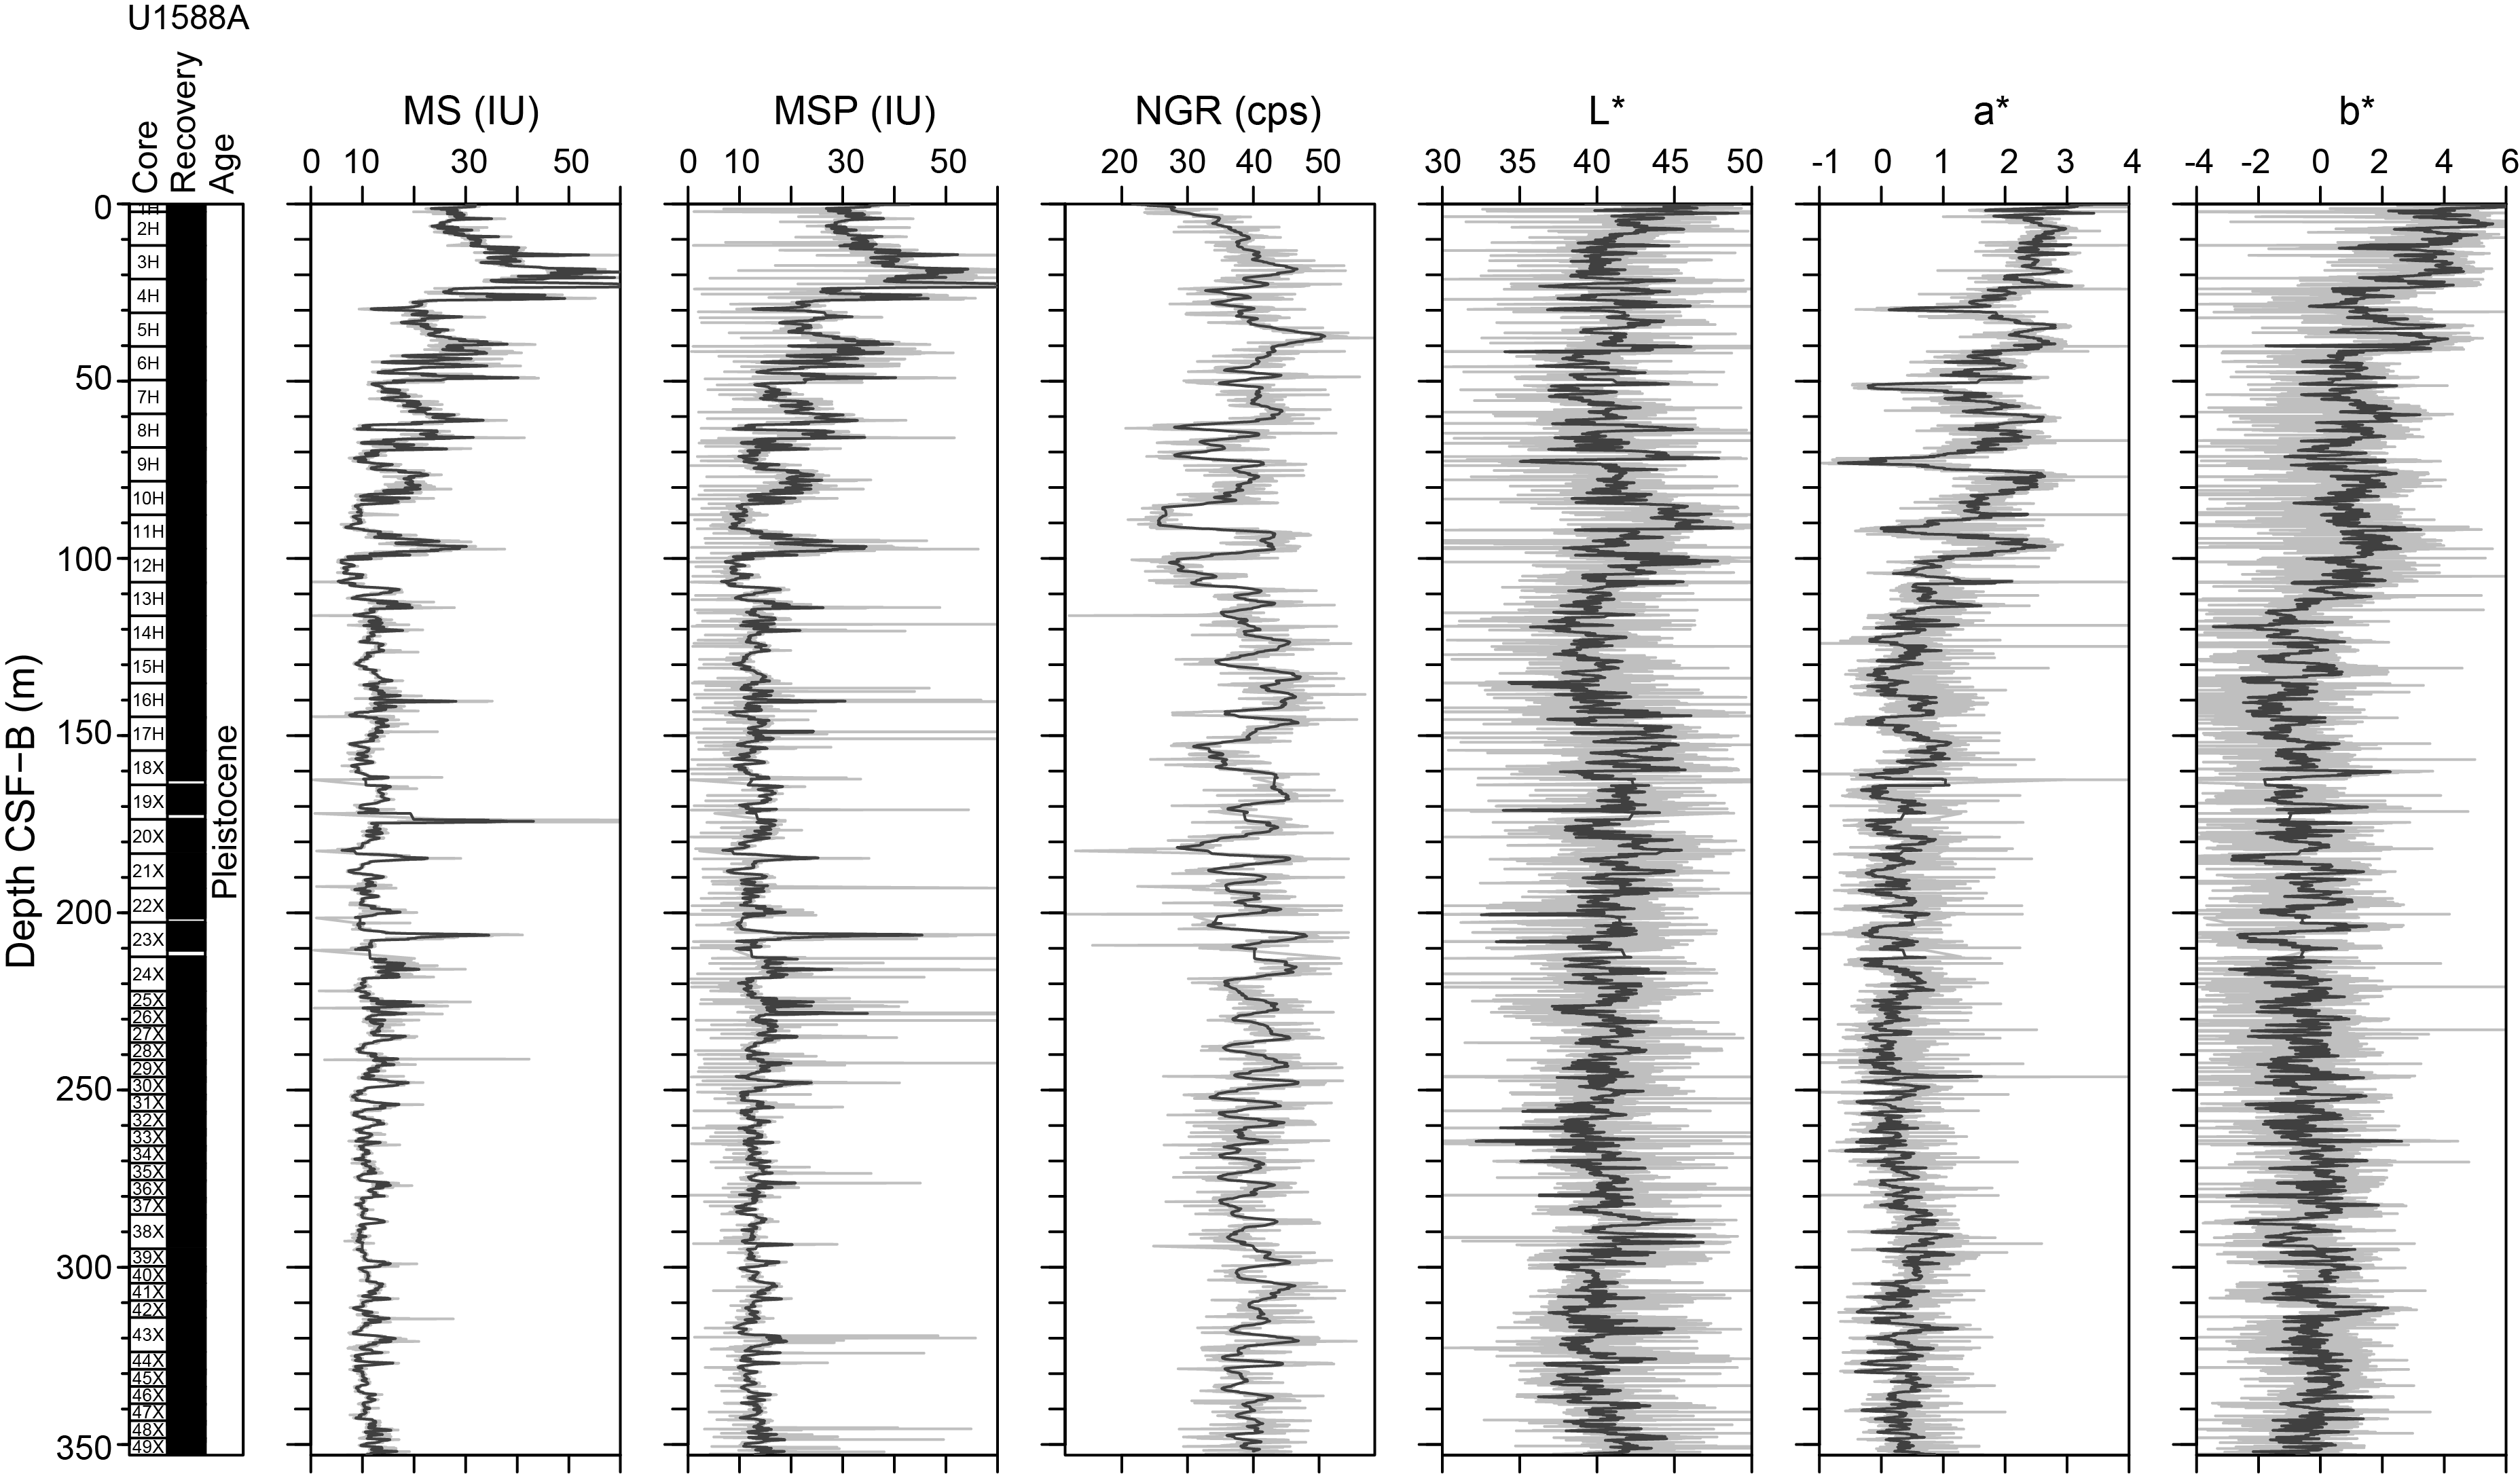
Figure F33. MS, MSP, NGR, and L*a*b* values.
The overall downhole trends at Site U1588 include two main intervals: a reduction of MS values from ~90 to ~15 IU with decreasing amplitude of cyclic variations from 20 to 100 m CSF-B and a consistently low MS signal of ~15 IU from 100 to 350 m CSF-B (Figure F33). The decreased MS in the upper 100 m is synchronous with decreased sulfate concentrations in IW due to sulfate reduction and is accompanied by increased methane concentrations (see Geochemistry). MS values are generally relatively higher in darker layers, showing quasiperiodic variation throughout the hole.
Whole-round MS data for all holes were acquired before the cores were equilibrated to room temperature, which may result in underestimation of MS absolute values. It is therefore recommended that postcruise quantitative analyses should use section-half MS data (MSP) because they are expected to be the most accurate MS measurements.
7.3. Porosity
Porosity was calculated using the MAD measurements of 10 cm3 discrete samples taken at a sampling resolution of one per core for all Hole U1588A cores. Porosity ranges 44.8%–69% and decreases gradually with depth. At the top of the sediment, porosity is 69% (0.73 m CSF-B), and then it reaches <55% below 65 m CSF-B (Figure F32). The decreasing porosity downhole trend primarily reflects compaction and dewatering of the sediment.
7.4. P-wave velocity
PWC measurements were attempted at a resolution of one per core for all Hole U1588A cores; however, only the data from Cores 1H–7H are reliable because of significant core expansion below Core 8H. The P-wave velocity acquired with the PWC shows a steady increase from 1482 m/s at the top of the hole to 1578 m/s at 51 m CSF-B (Figure F32). The gradually increasing P-wave velocity reflects the compaction of sediments with depth in the upper 50 m.
7.5. Natural gamma radiation
NGR measurements were made with the Natural Gamma Radiation Logger (NGRL) on all core sections from all holes at a 10 or 20 cm resolution and analyzed with an integration time of 300 s/measurement. Most NGR values range 30–55 counts/s with clear cyclicity in intensity for the majority of the cores (Figure F33). The NGR values downhole are relatively constant and decrease in amplitude below 100 m CSF-B.
The cyclic variation of NGR intensity correlates with MS and mirrors L* values (Figure F33). Because L* is often related to the carbonate content in sediment (see Geochemistry), a higher carbonate content likely explains the low NGR and MS signals. That is, sediment physical properties parameters such as MS and NGR are closely tied to changes in lithology. Lower NGR and MS values can be interpreted as sediments dominated by calcareous microfossils (nannofossil ooze), whereas higher NGR and MS are interpreted as sediments with higher clay content (e.g., clayey nannofossil ooze).
Concentrations of K, Th, and U were calculated from the NGR spectra using the method of De Vleeschouwer et al. (2017). Downhole trends of K, Th, and U are similar to that of NGR in Hole U1588A (Figure F34). U/Th and K/Th ratios are essentially constant throughout the hole.
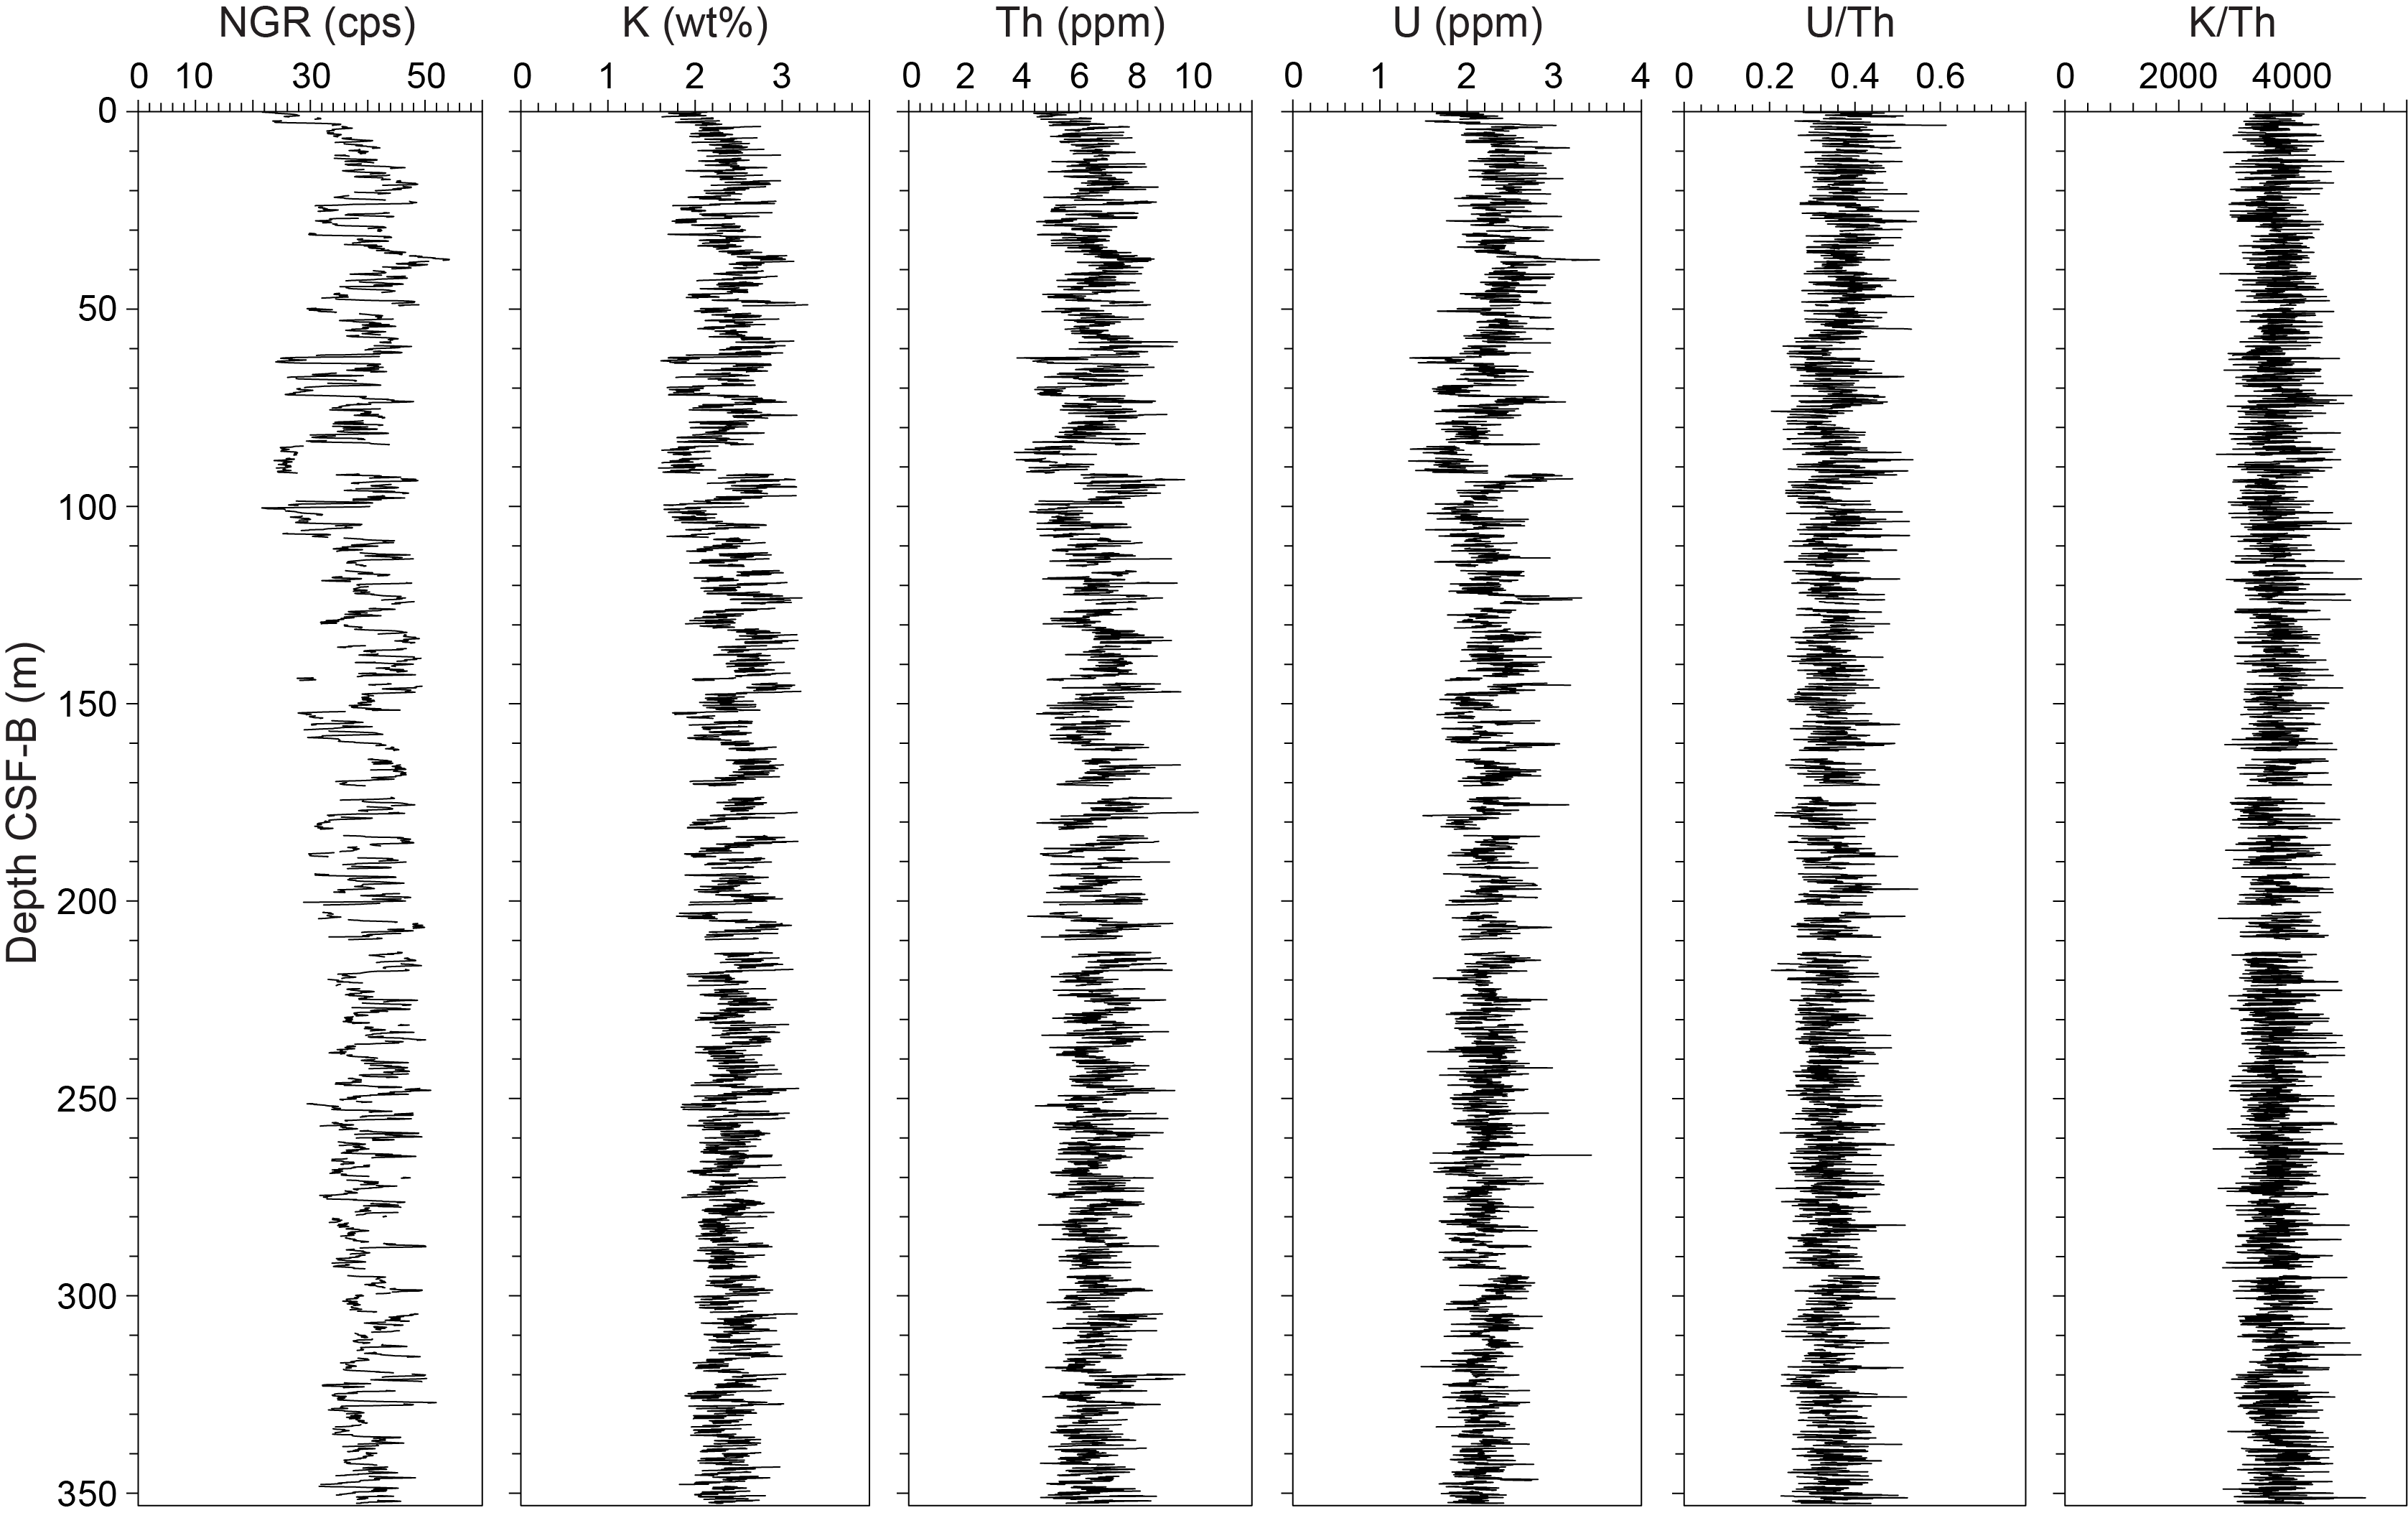
Figure F34. NGR, K, Th, and U and U/Th and K/Th ratios.
7.6. Thermal conductivity
Thermal conductivity was measured in triplicate at one position every 10 m CSF-B from all Hole U1588A cores using a needle probe on whole rounds (Cores 1H–19X) and a mini-puck sensor on the split core surface of working halves (Cores 20X–49X). Thermal conductivity ranges 1.01–1.72 W/(m·K), showing an increasing trend with depth (Figure F32), which is similar to the patterns of MAD bulk density.
7.7. Color reflectance
Color reflectance spectrophotometry measurements were carried out on all archive halves using the SHMSL. Three measurement resolutions were used: 2 cm for all cores from Hole U1588A and Cores 397-U1588B-1H through 9H, 4 cm for Sections 10X-1 through 10X-3, and 5 cm for all subsequent sections from Holes U1588B–U1588D.
The values of a* and b* decrease at ~100 m CSF-B in Hole U1588A and are then stable from 120 m CSF-B to the bottom of the hole (Figure F33).
L* values are negatively correlated with NGR (Figure F33). Calcium carbonate concentrations (see Geochemistry) are high in intervals where L* values are high, suggesting that the change in sediment lightness is related to the carbonate content. Carbonate content in the sediment can be affected in one of two ways: either through the dilution of potassium- and thorium-bearing detrital material (clay) by varying carbonate contents, or conversely, through the dilution of carbonate by varying detrital mineral flux (Thomson et al., 1999).
7.8. X-ray imaging
All whole-round sections from Hole U1588A (0–353.0 m CSF-B) and Cores 397-U1588D-64X through 76X (347.3–412.5 m CSF-B) were imaged using the X-Ray Logger (XMAN). The X-ray images revealed the presence of authigenic mineral grains and the morphology of lithologic contacts, burrows, and drilling disturbances such as biscuits and gas expansion. The gas expansion deformation was imaged on Cores 397-U1588A-4H through 49X, with the most extreme gas expansion disturbance observed for Cores 6H and 24X (Figure F35). The disturbance caused by gas expansion was still present but decreased significantly for Cores 25X–49X after transitioning to half-length XCB coring. Authigenic mineral grains, likely pyrite, were found throughout the entire depth range of Hole U1588A.
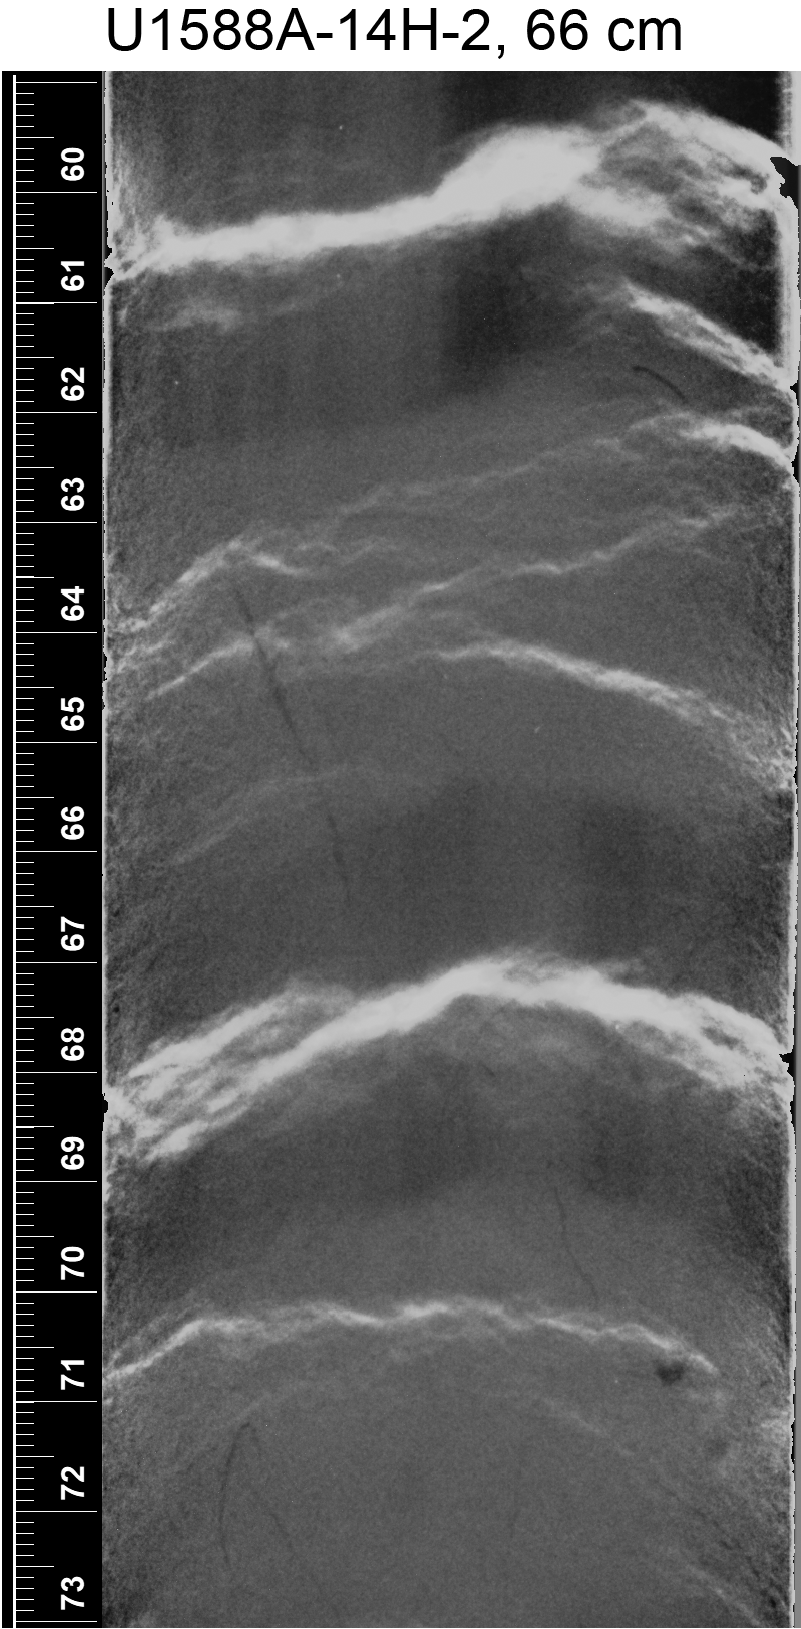
Figure F35. Extreme gas expansion.
8. Downhole measurements
8.1. In situ temperature and heat flow
Four downhole temperature measurements were made in Hole U1588A using the APCT-3 tool. The calculated in situ sediment temperatures ranged from 12.12°C at 30.7 m CSF-A to 14.88°C at 116.2 m CSF-A (Table T28), resulting in a geothermal gradient of 33.2°C/km (Figure F36). The bottom water temperature (mudline temperature) averages 10.78°C and is calculated from the minimum temperatures of the four APCT-3 profiles. In situ thermal conductivity was estimated using methods described in Physical properties in the Expedition 397 methods chapter (Abrantes et al., 2024a). Thermal resistance was calculated by cumulatively adding the inverse of the in situ thermal conductivity values from 0 to 110 m CSF-A (Figure F36). A calculated heat flow of 37.8 mW/m2 for Hole U1588A was obtained from the slope of the linear fit to the in situ temperature versus thermal resistance (Figure F36) (cf. Pribnow et al., 2000). This value is comparable but slightly lower than the heat flows of 49.6 mW/m2 at Site U1587 (see Downhole measurements in the Site U1587 chapter [Hodell et al., 2024]) and 47.5 mW/m2 at Site U1385 (Expedition 339 Scientists, 2013), and it is also slightly lower than the heat flow range (45–76 mW/m2) reported for the Portuguese margin (Grevemeyer et al., 2009).
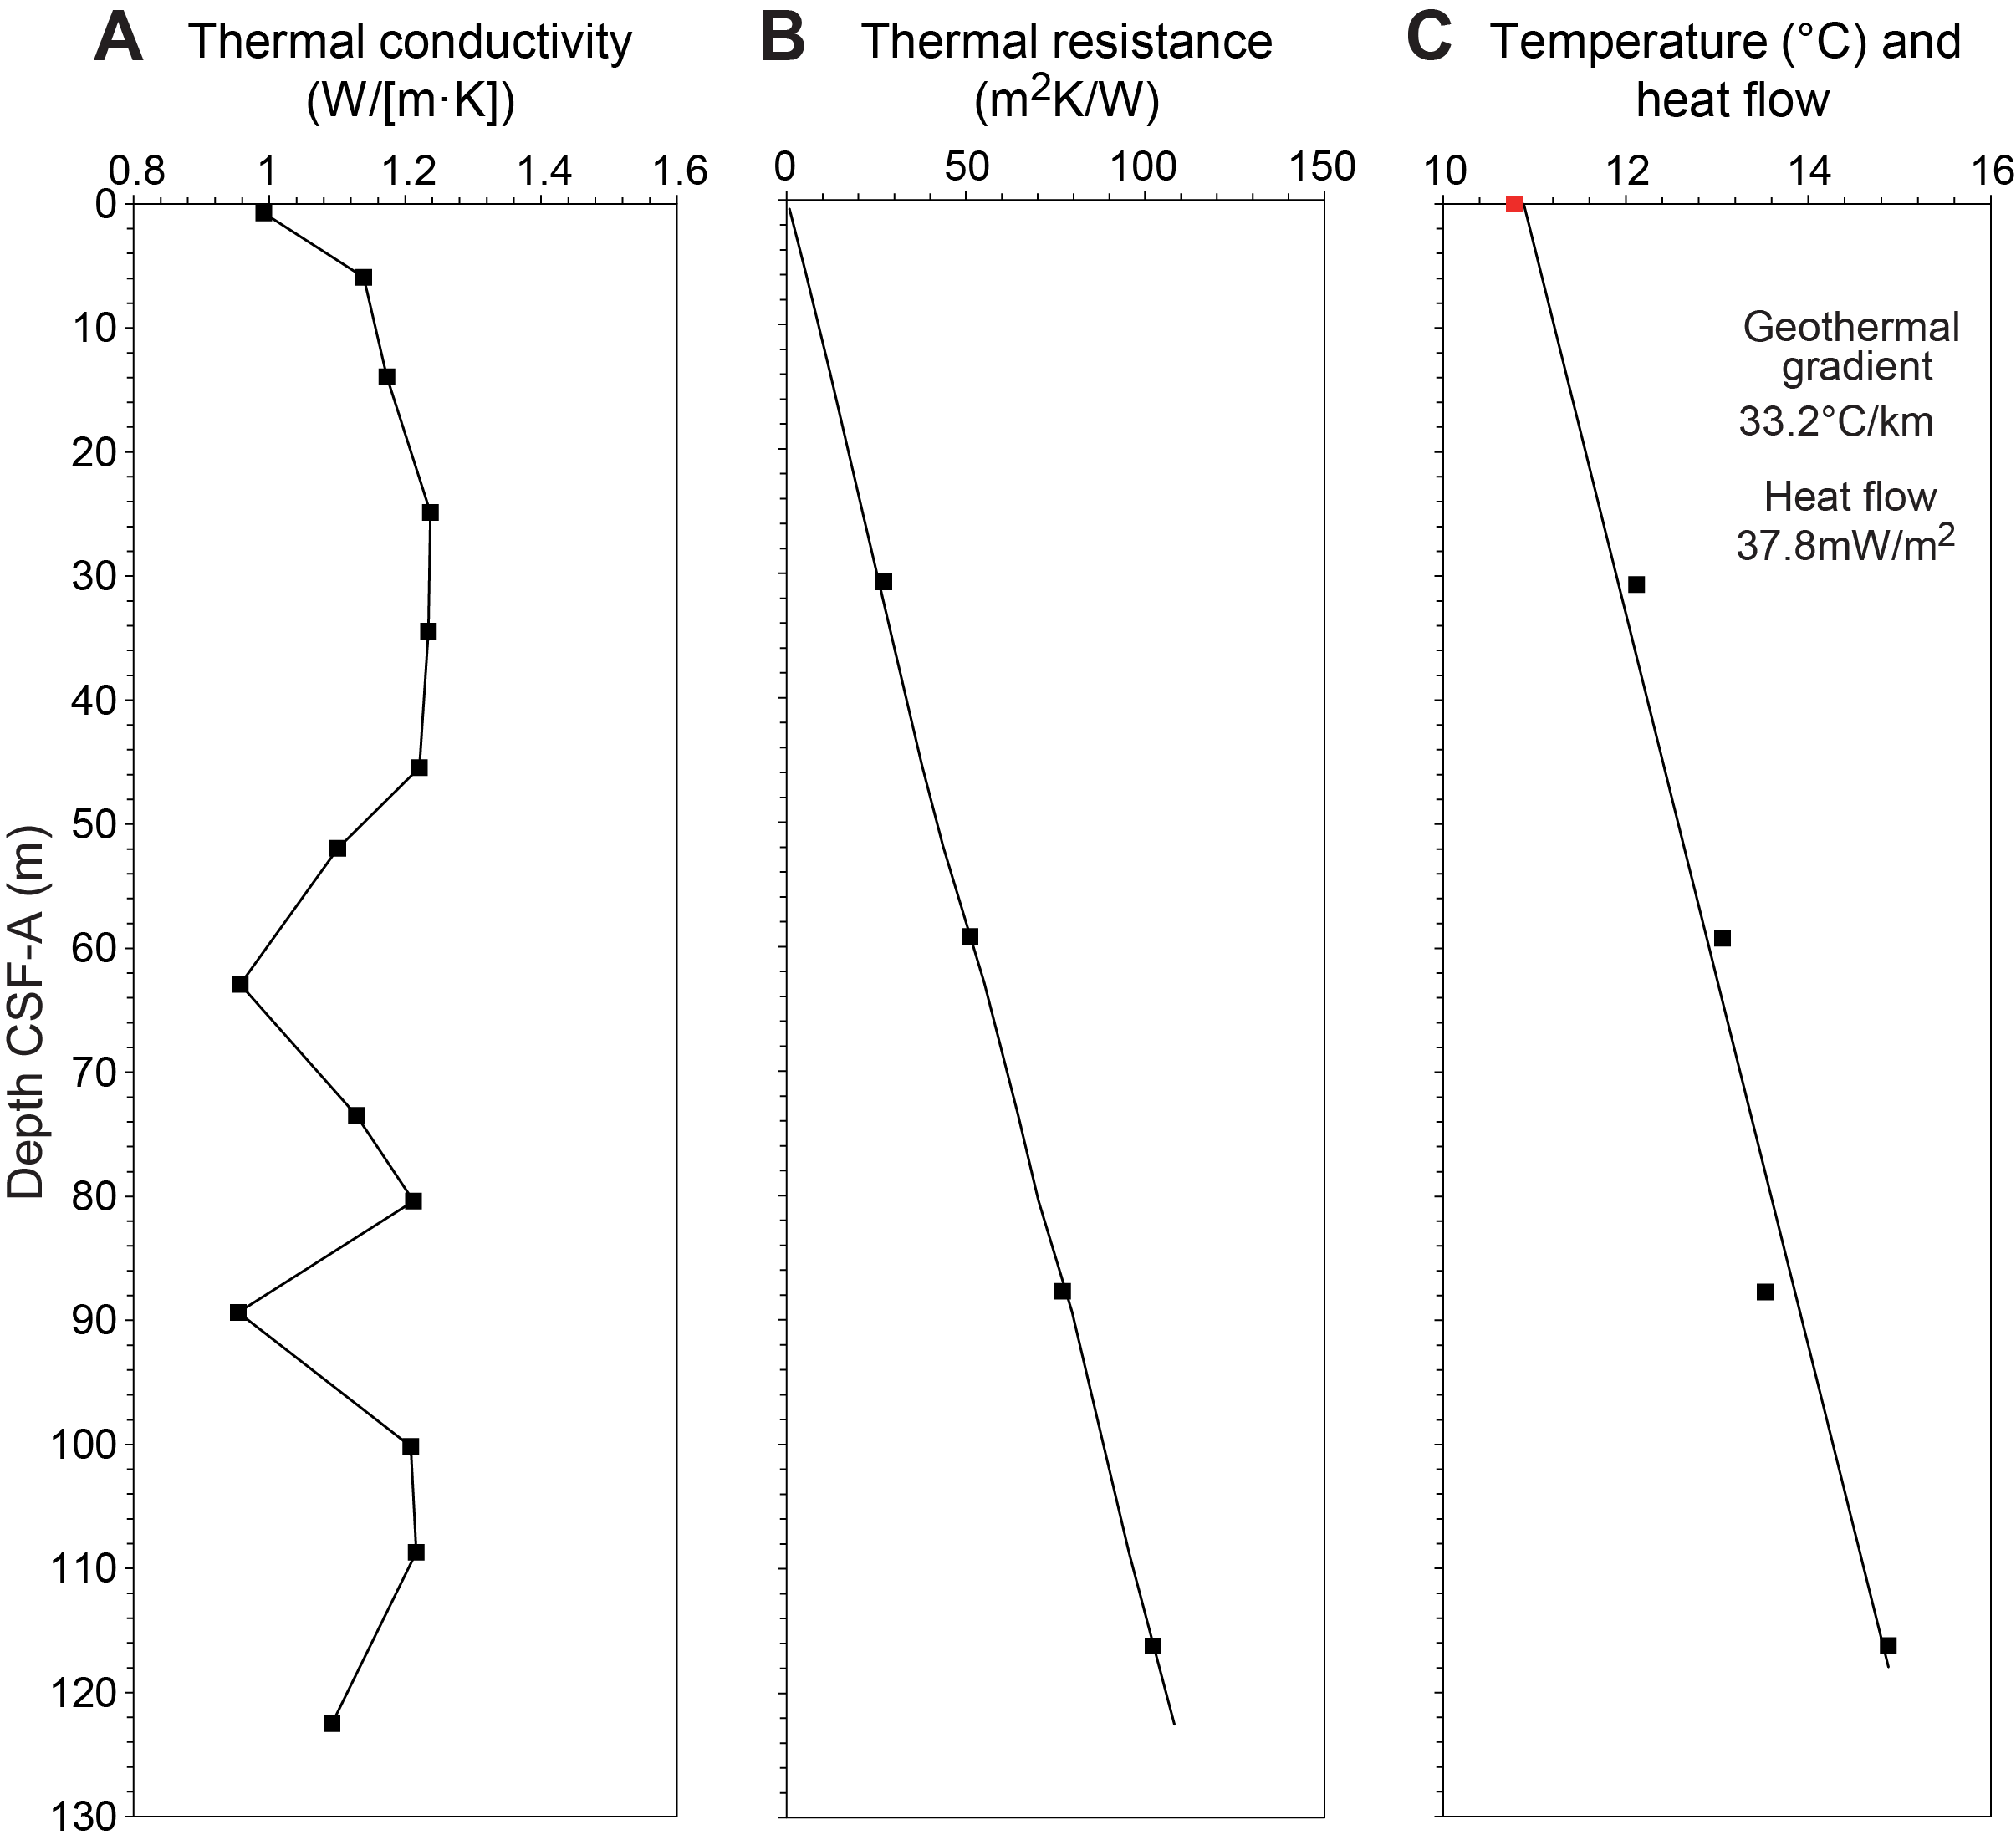
Figure F36. APCT-3 heat flow calculations.
Four downhole temperature measurements were made in Hole U1588A using the APCT-3 tool. The calculated in situ sediment temperatures ranged from 12.12°C at 30.7 m CSF-A to 14.88°C at 116.2 m CSF-A (Table T28), resulting in a geothermal gradient of 33.2°C/km (Figure F36). The bottom water temperature (mudline temperature) averages 10.78°C and is calculated from the minimum temperatures of the four APCT-3 profiles. In situ thermal conductivity was estimated using methods described in Physical properties in the Expedition 397 methods chapter (Abrantes et al., 2024a). Thermal resistance was calculated by cumulatively adding the inverse of the in situ thermal conductivity values from 0 to 110 m CSF-A (Figure F36). A calculated heat flow of 37.8 mW/m2 for Hole U1588A was obtained from the slope of the linear fit to the in situ temperature versus thermal resistance (Figure F36) (cf. Pribnow et al., 2000). This value is comparable but slightly lower than the heat flows of 49.6 mW/m2 at Site U1587 (see Downhole measurements in the Site U1587 chapter [Hodell et al., 2024]) and 47.5 mW/m2 at Site U1385 (Expedition 339 Scientists, 2013), and it is also slightly lower than the heat flow range (45–76 mW/m2) reported for the Portuguese margin (Grevemeyer et al., 2009).
9. Stratigraphic correlation
Correlations between holes at Site U1588 were accomplished using Correlator software (version 4.0.1). Tie points were established using the MS from the WRMSL and NGR (Figure F37; Table T29). We constructed a splice from 0 to 366 m core composite depth below seafloor, Method B (CCSF-B), using Holes U1588A–U1588D (Figures F37, F38, F39; Table T30). The drilling and correlation strategies were unique at this site because of severely expanded cores. A mixture of APC, full-advance XCB, and half-advance XCB coring was used for different degrees of core expansion at each hole. Core expansion due to high methane contents presented a challenge to creating a composite section. Instead of the standard core composite depth below seafloor, Method A (CCSF-A), depth scale, the CSF-B depth scale was used for the correlation to compensate for apparent recoveries of up to 192%. For CSF-B, the core top is set to the driller's depth and core recovery was compressed to the nominal driller's penetration. Considering the high quality XCB cores and the high sedimentation rate at this site, the composite section (CCSF-B) is nearly complete with one potential small gap.
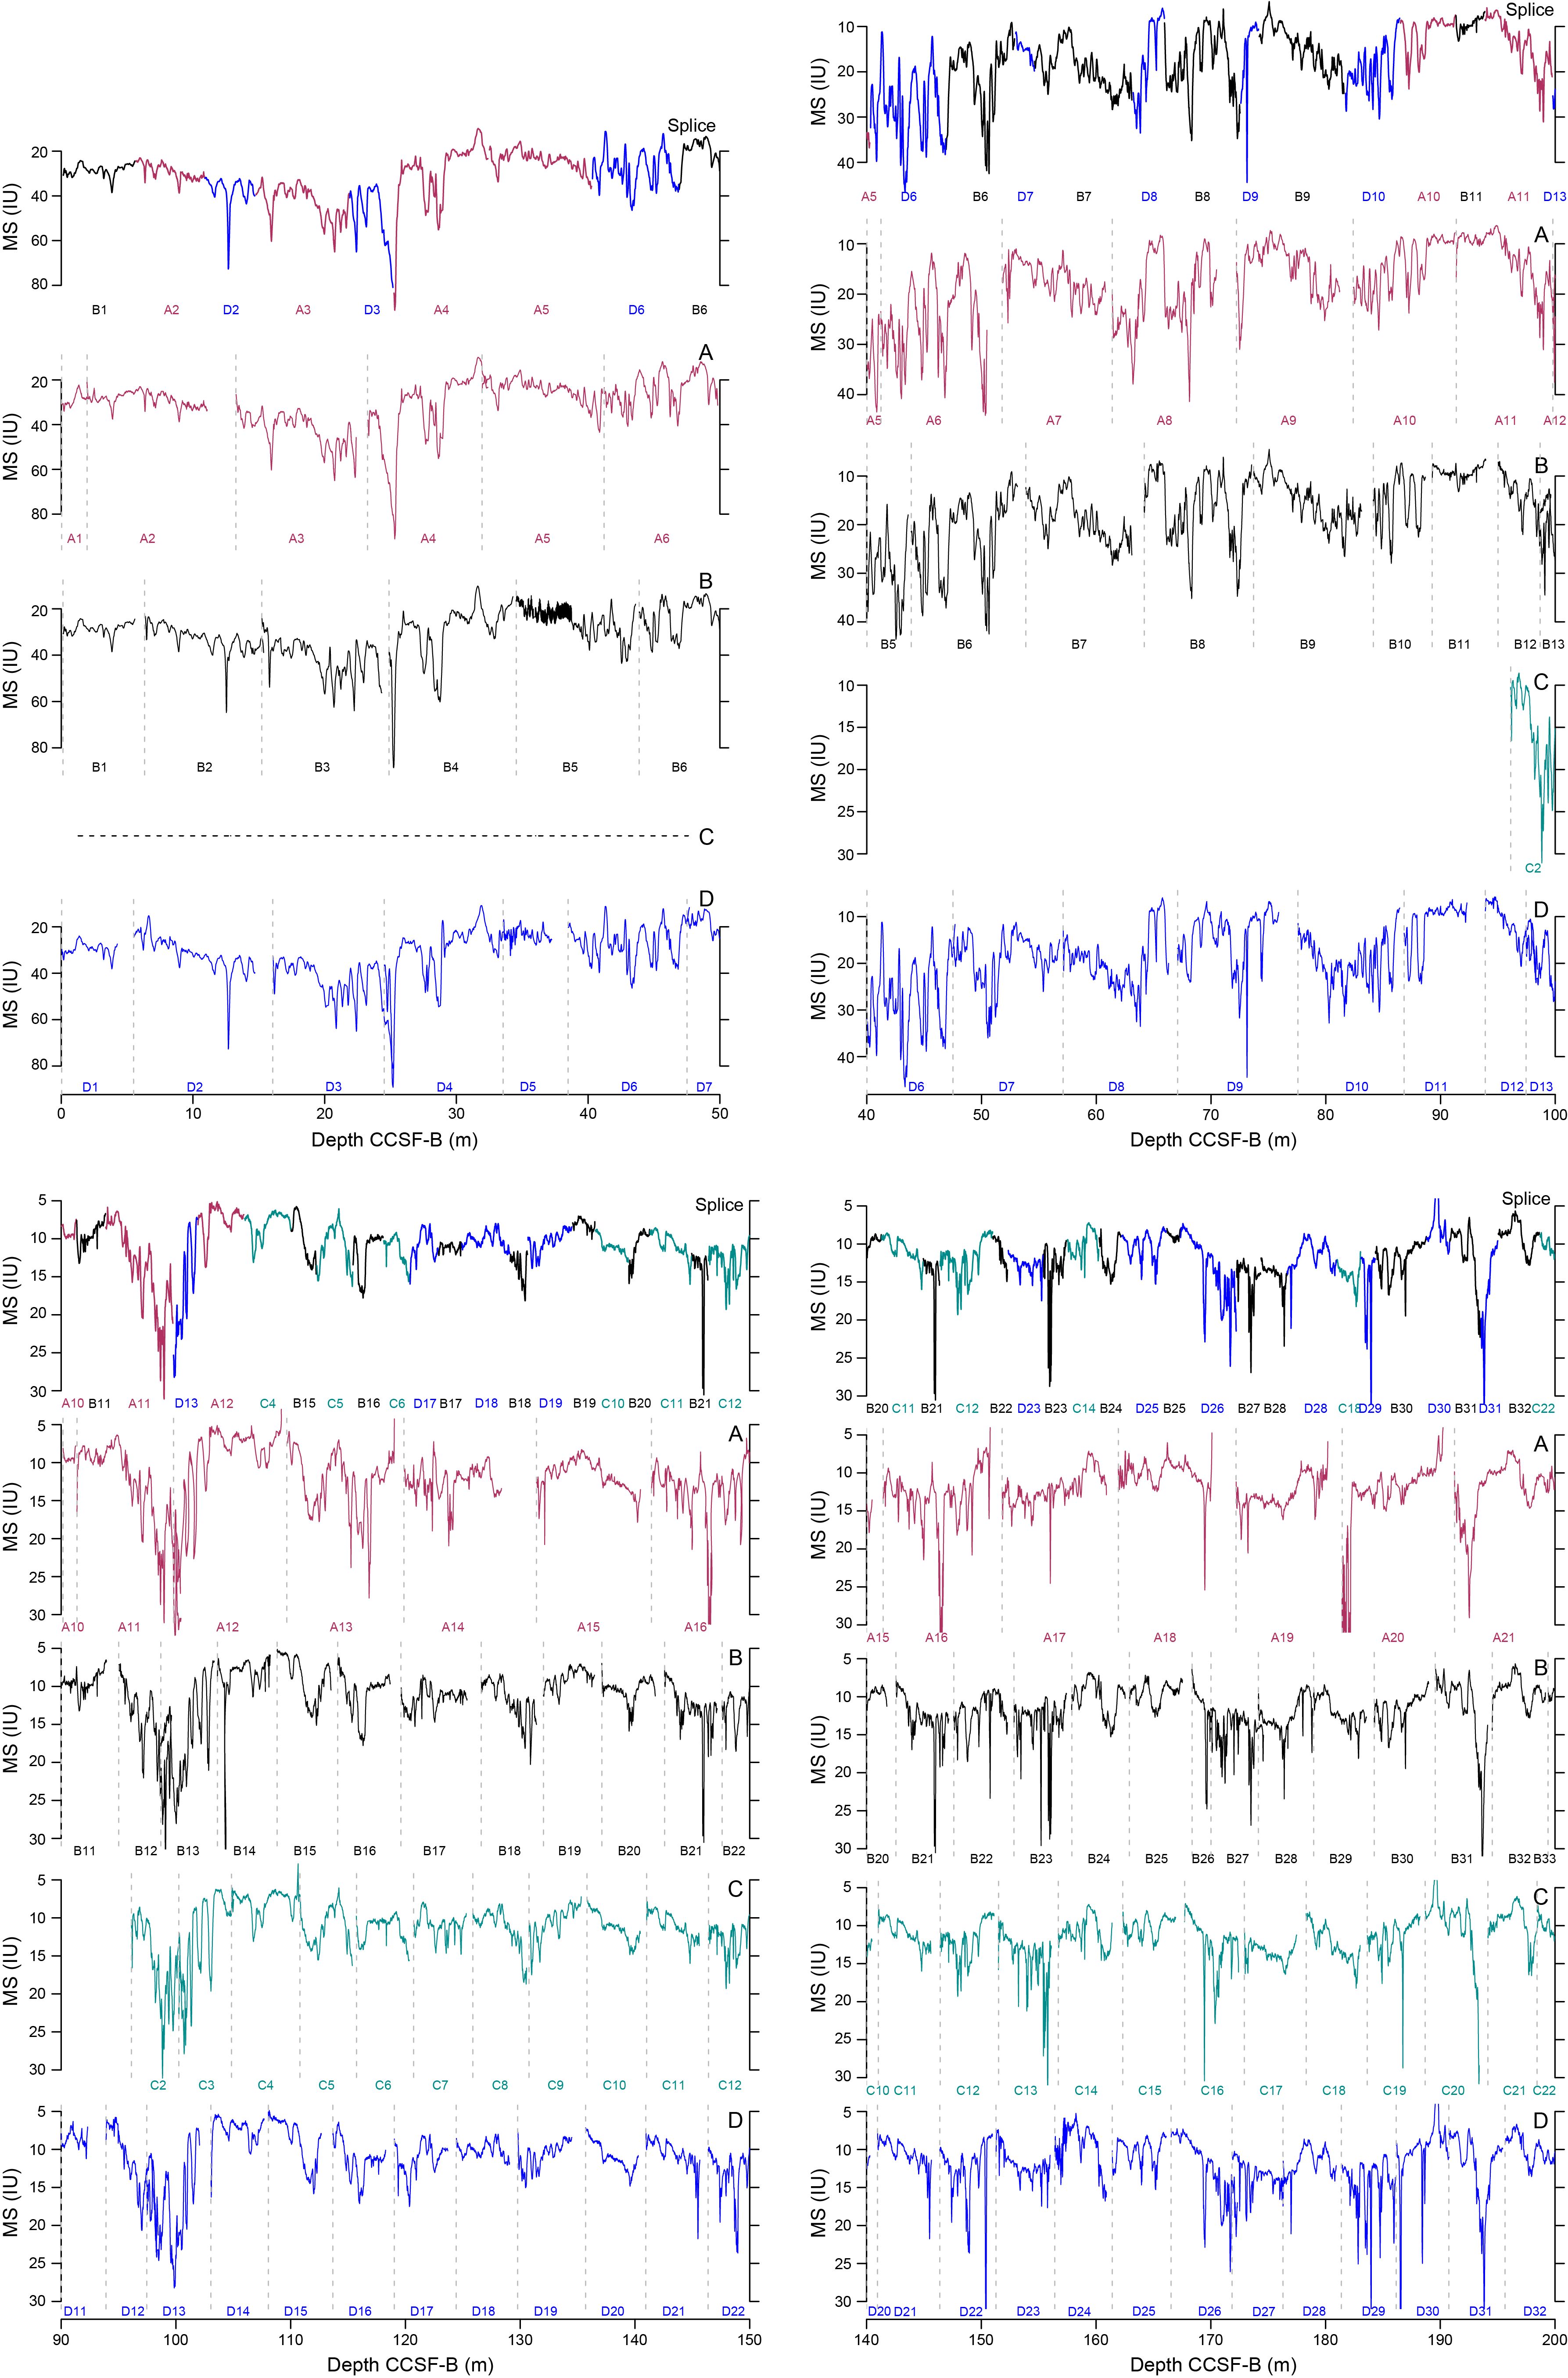
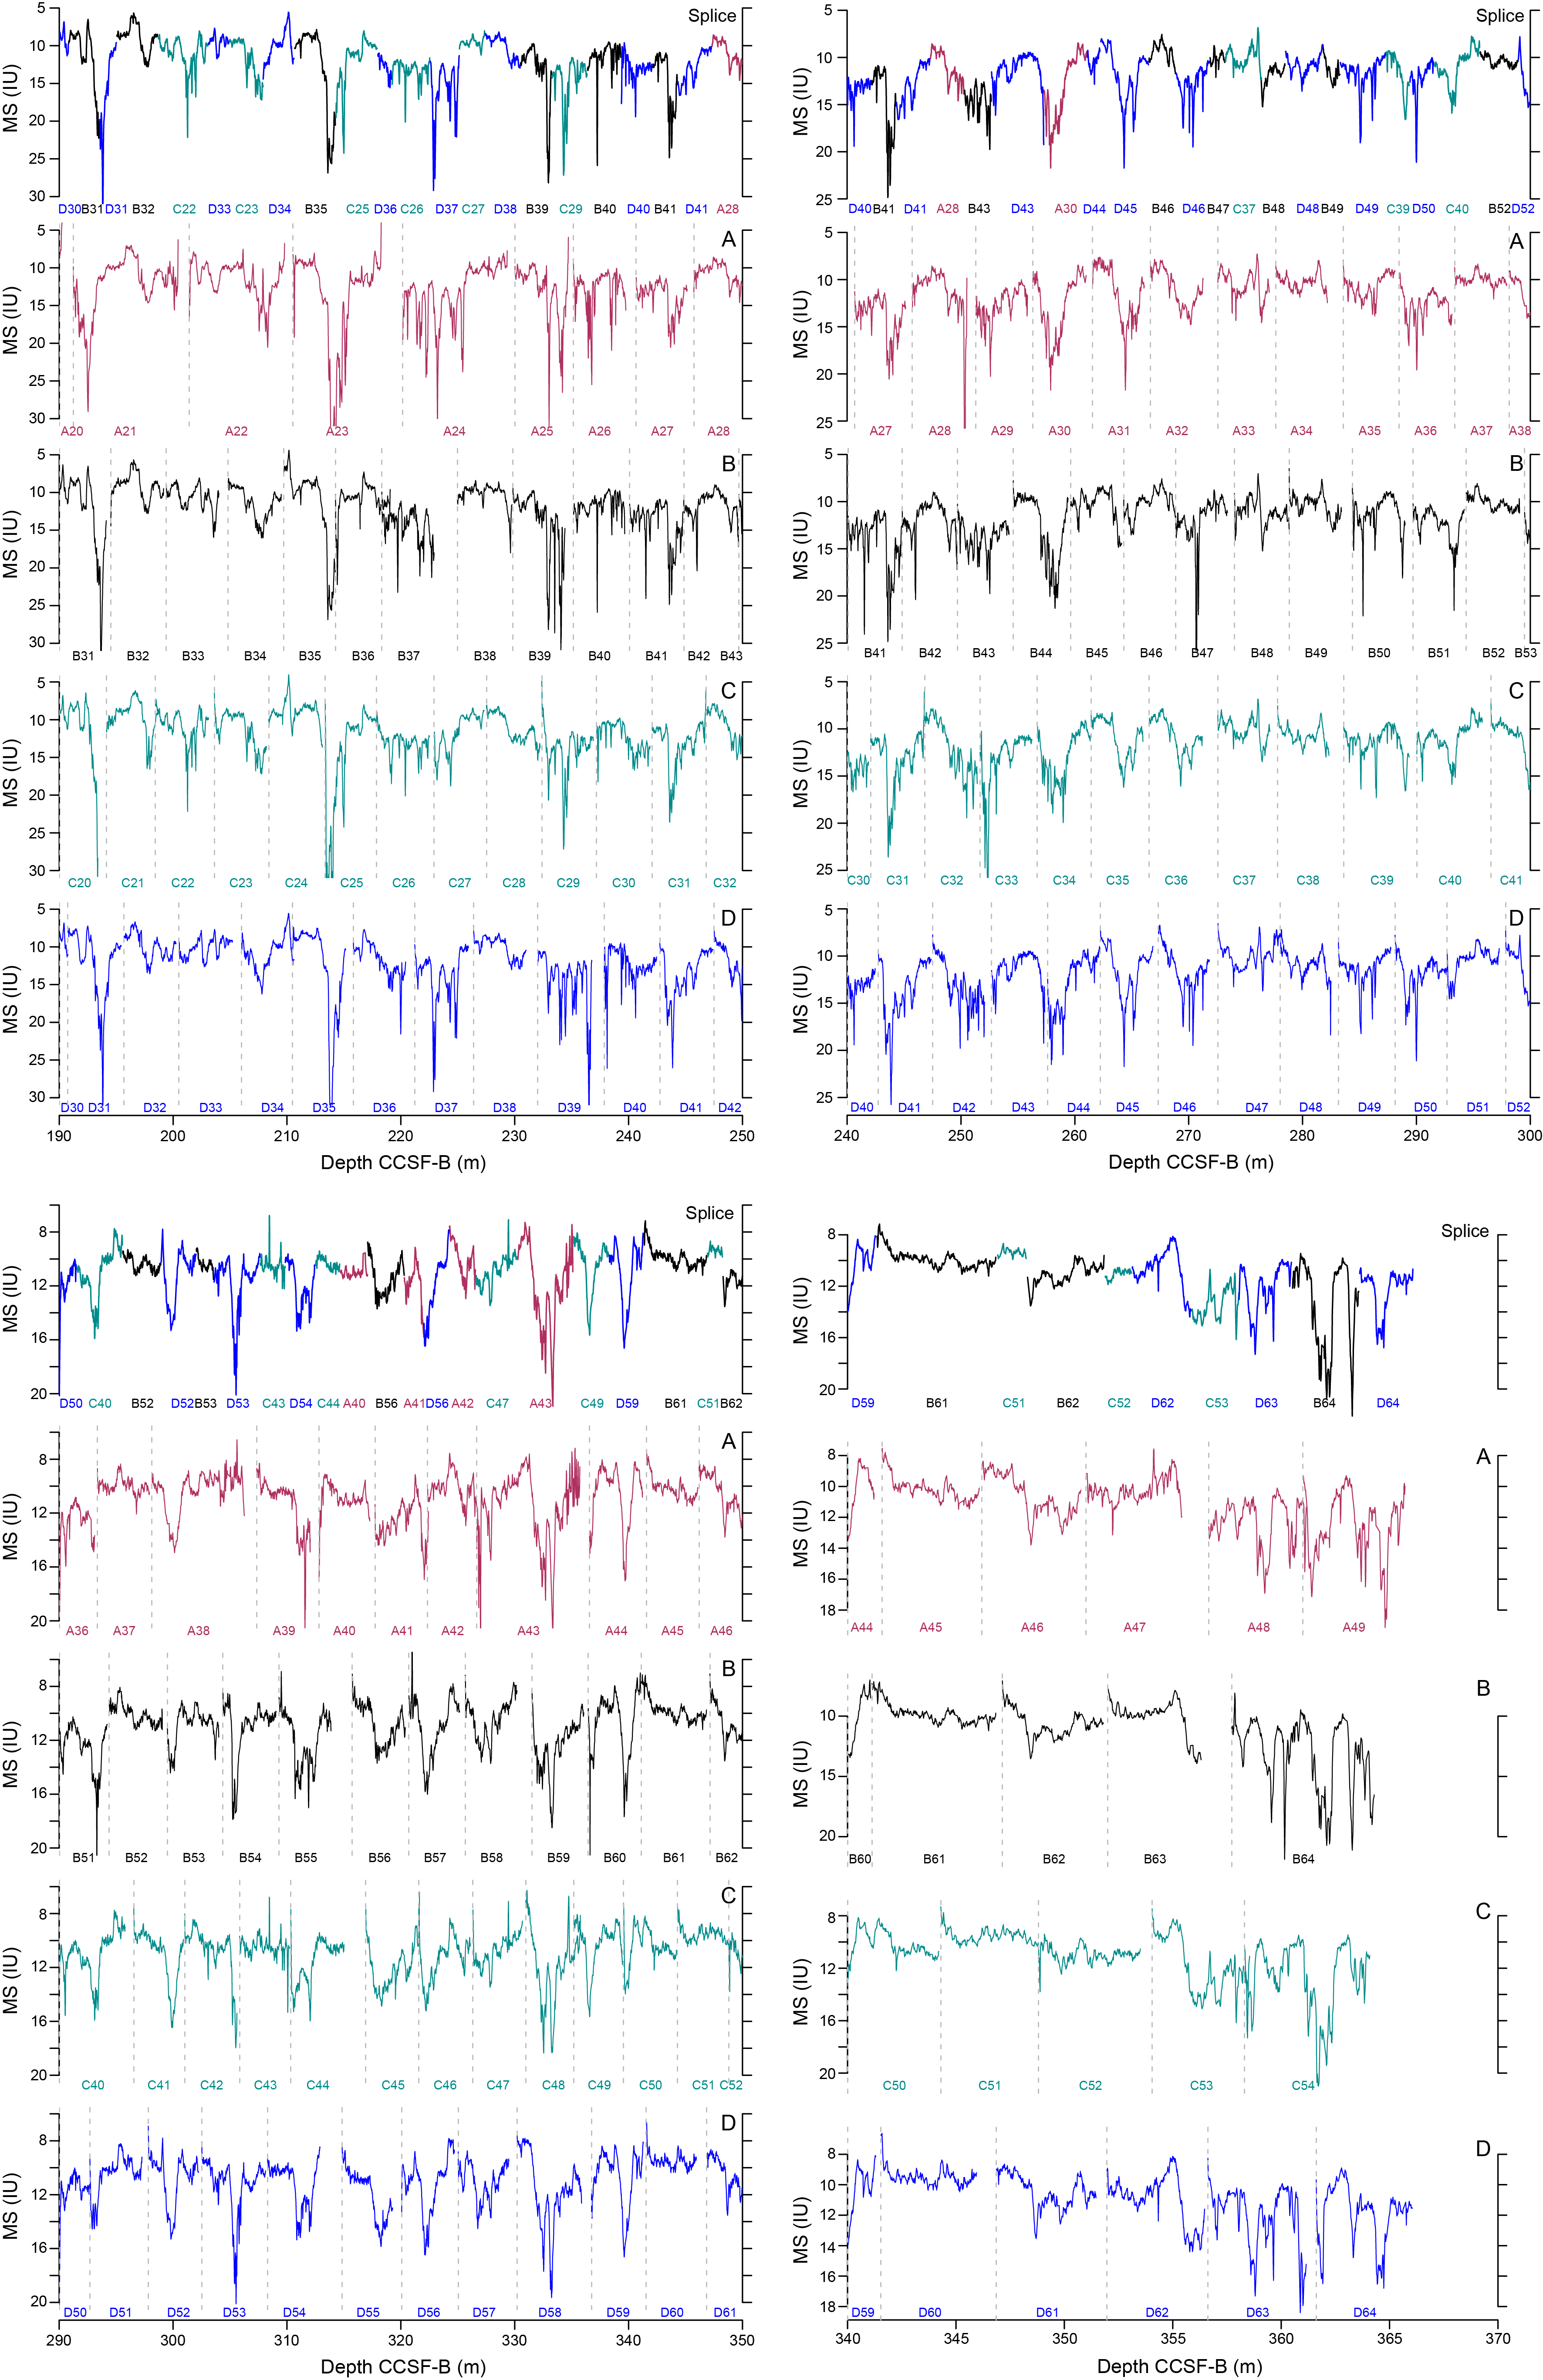
Figure F37. Composite construction.
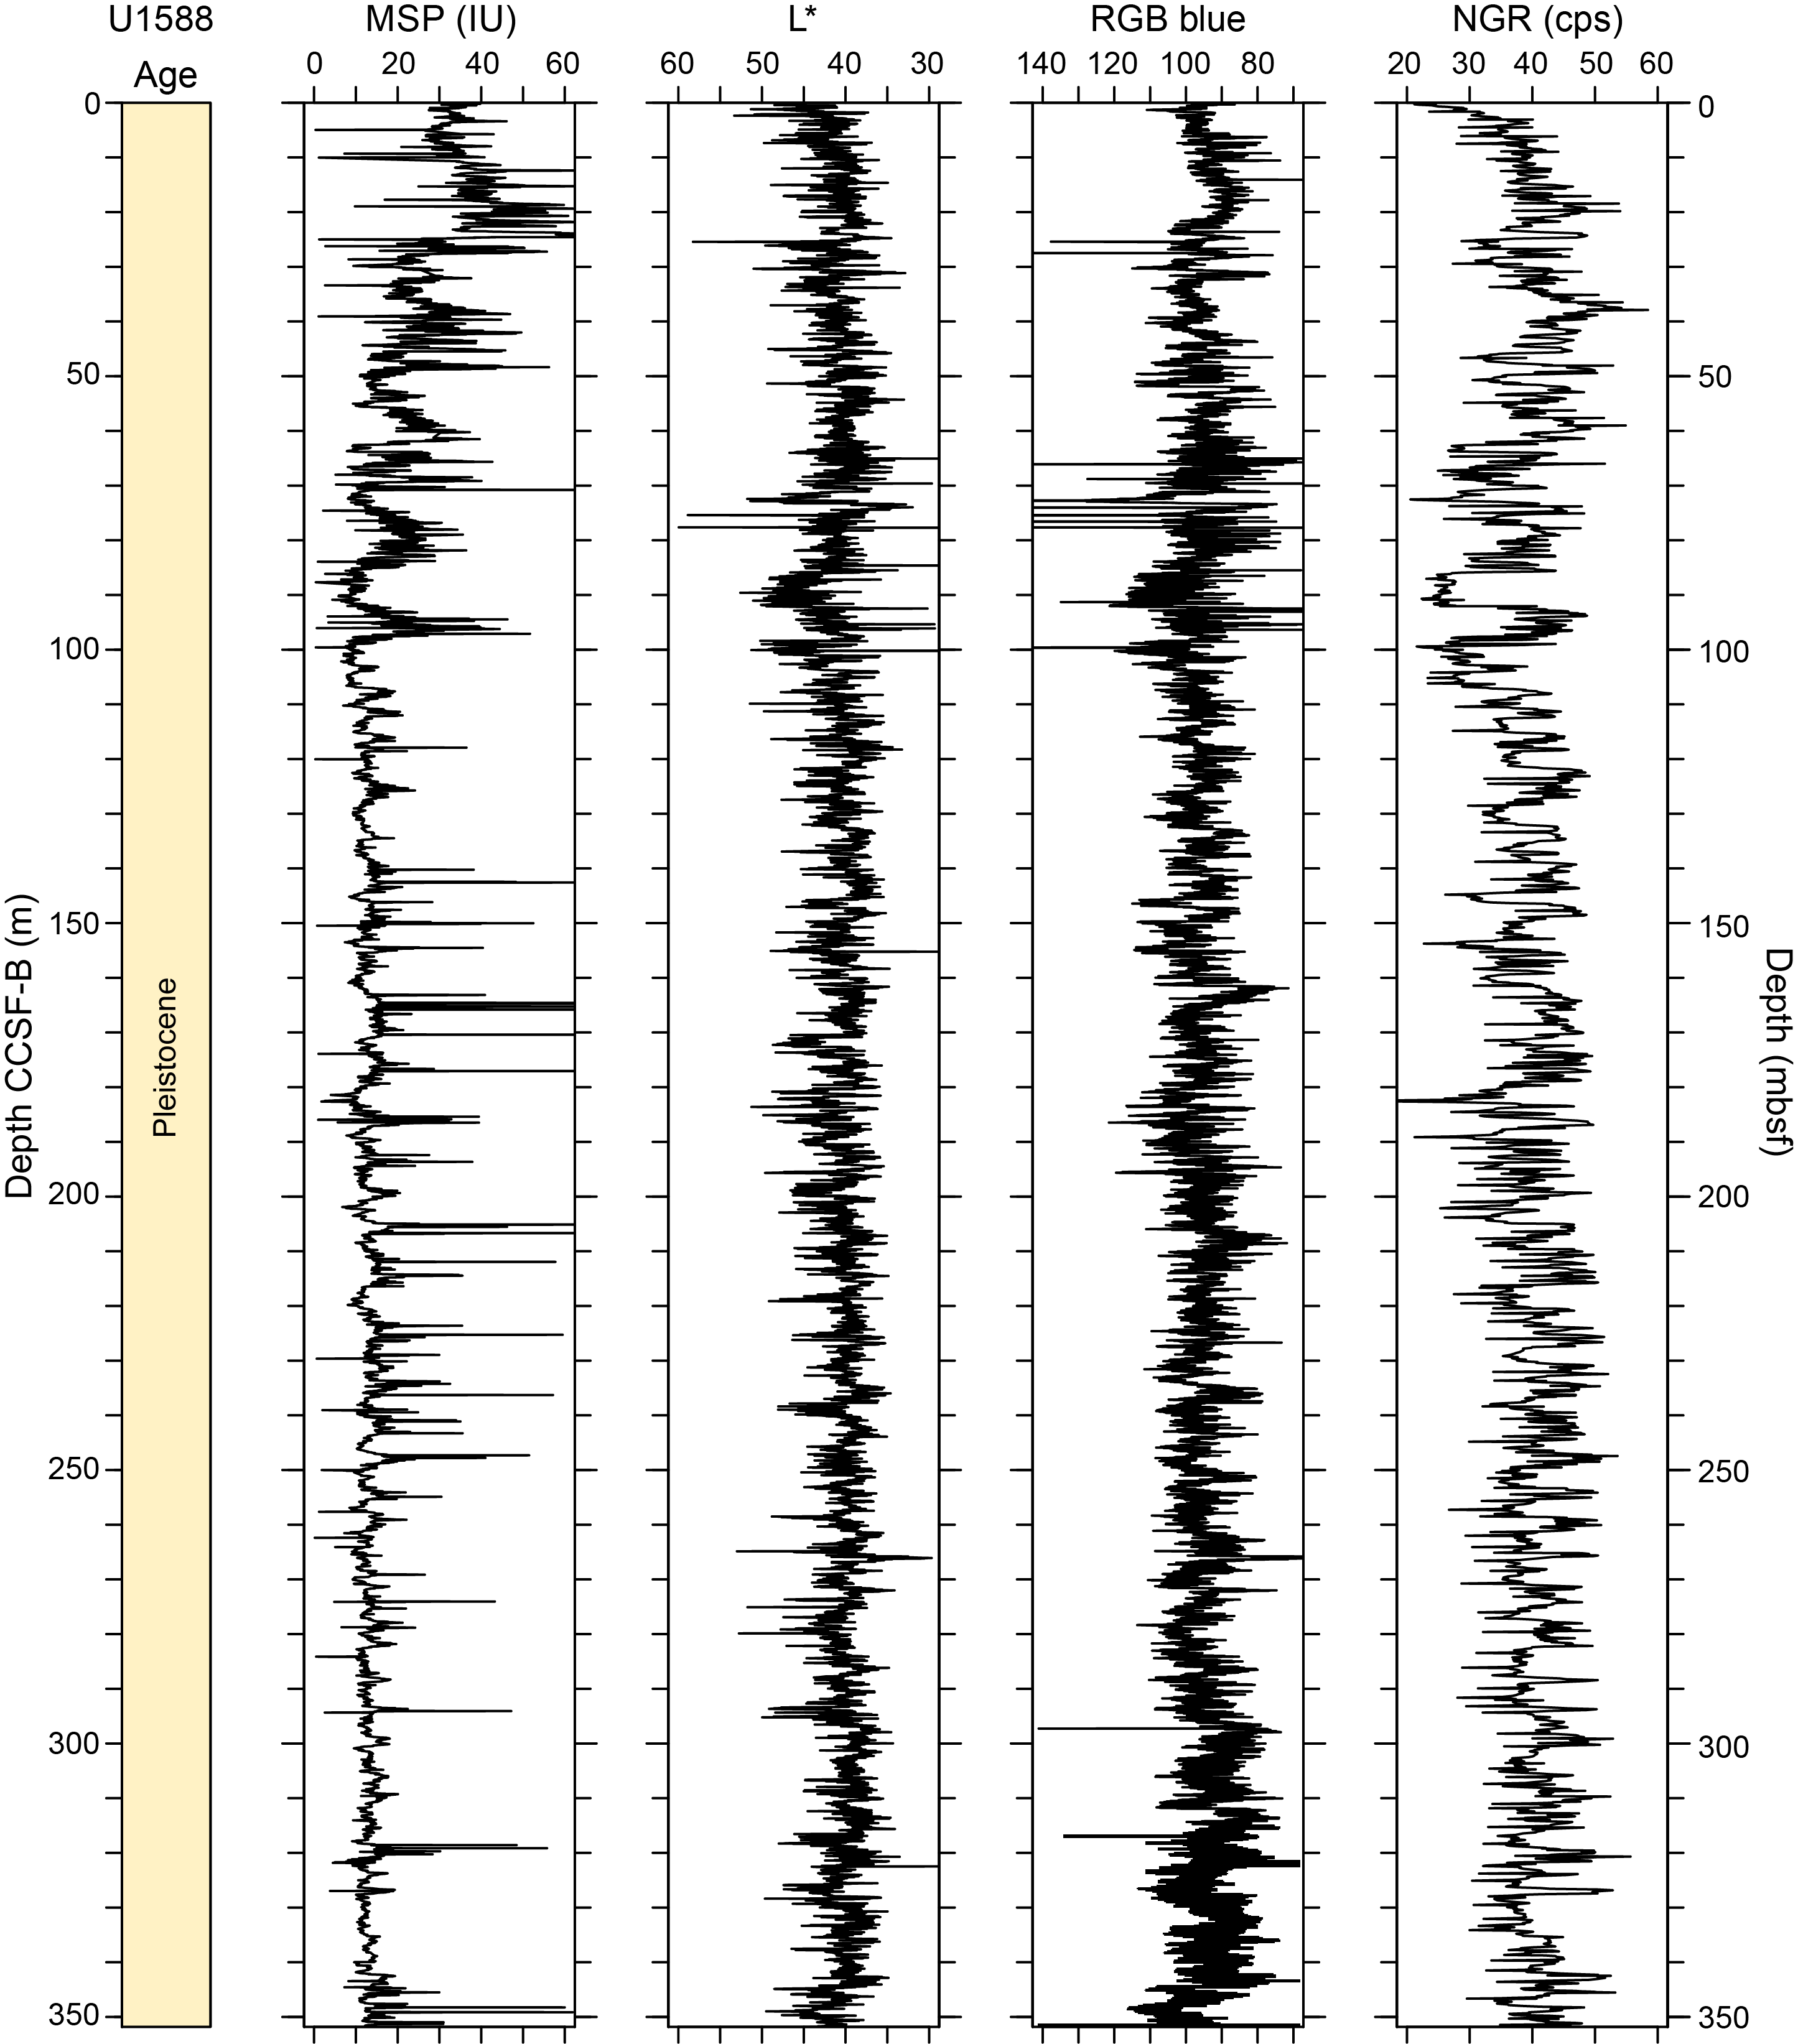
Figure F38. Spliced composite records of WRSML MS, L*, RGB blue, and NGR.
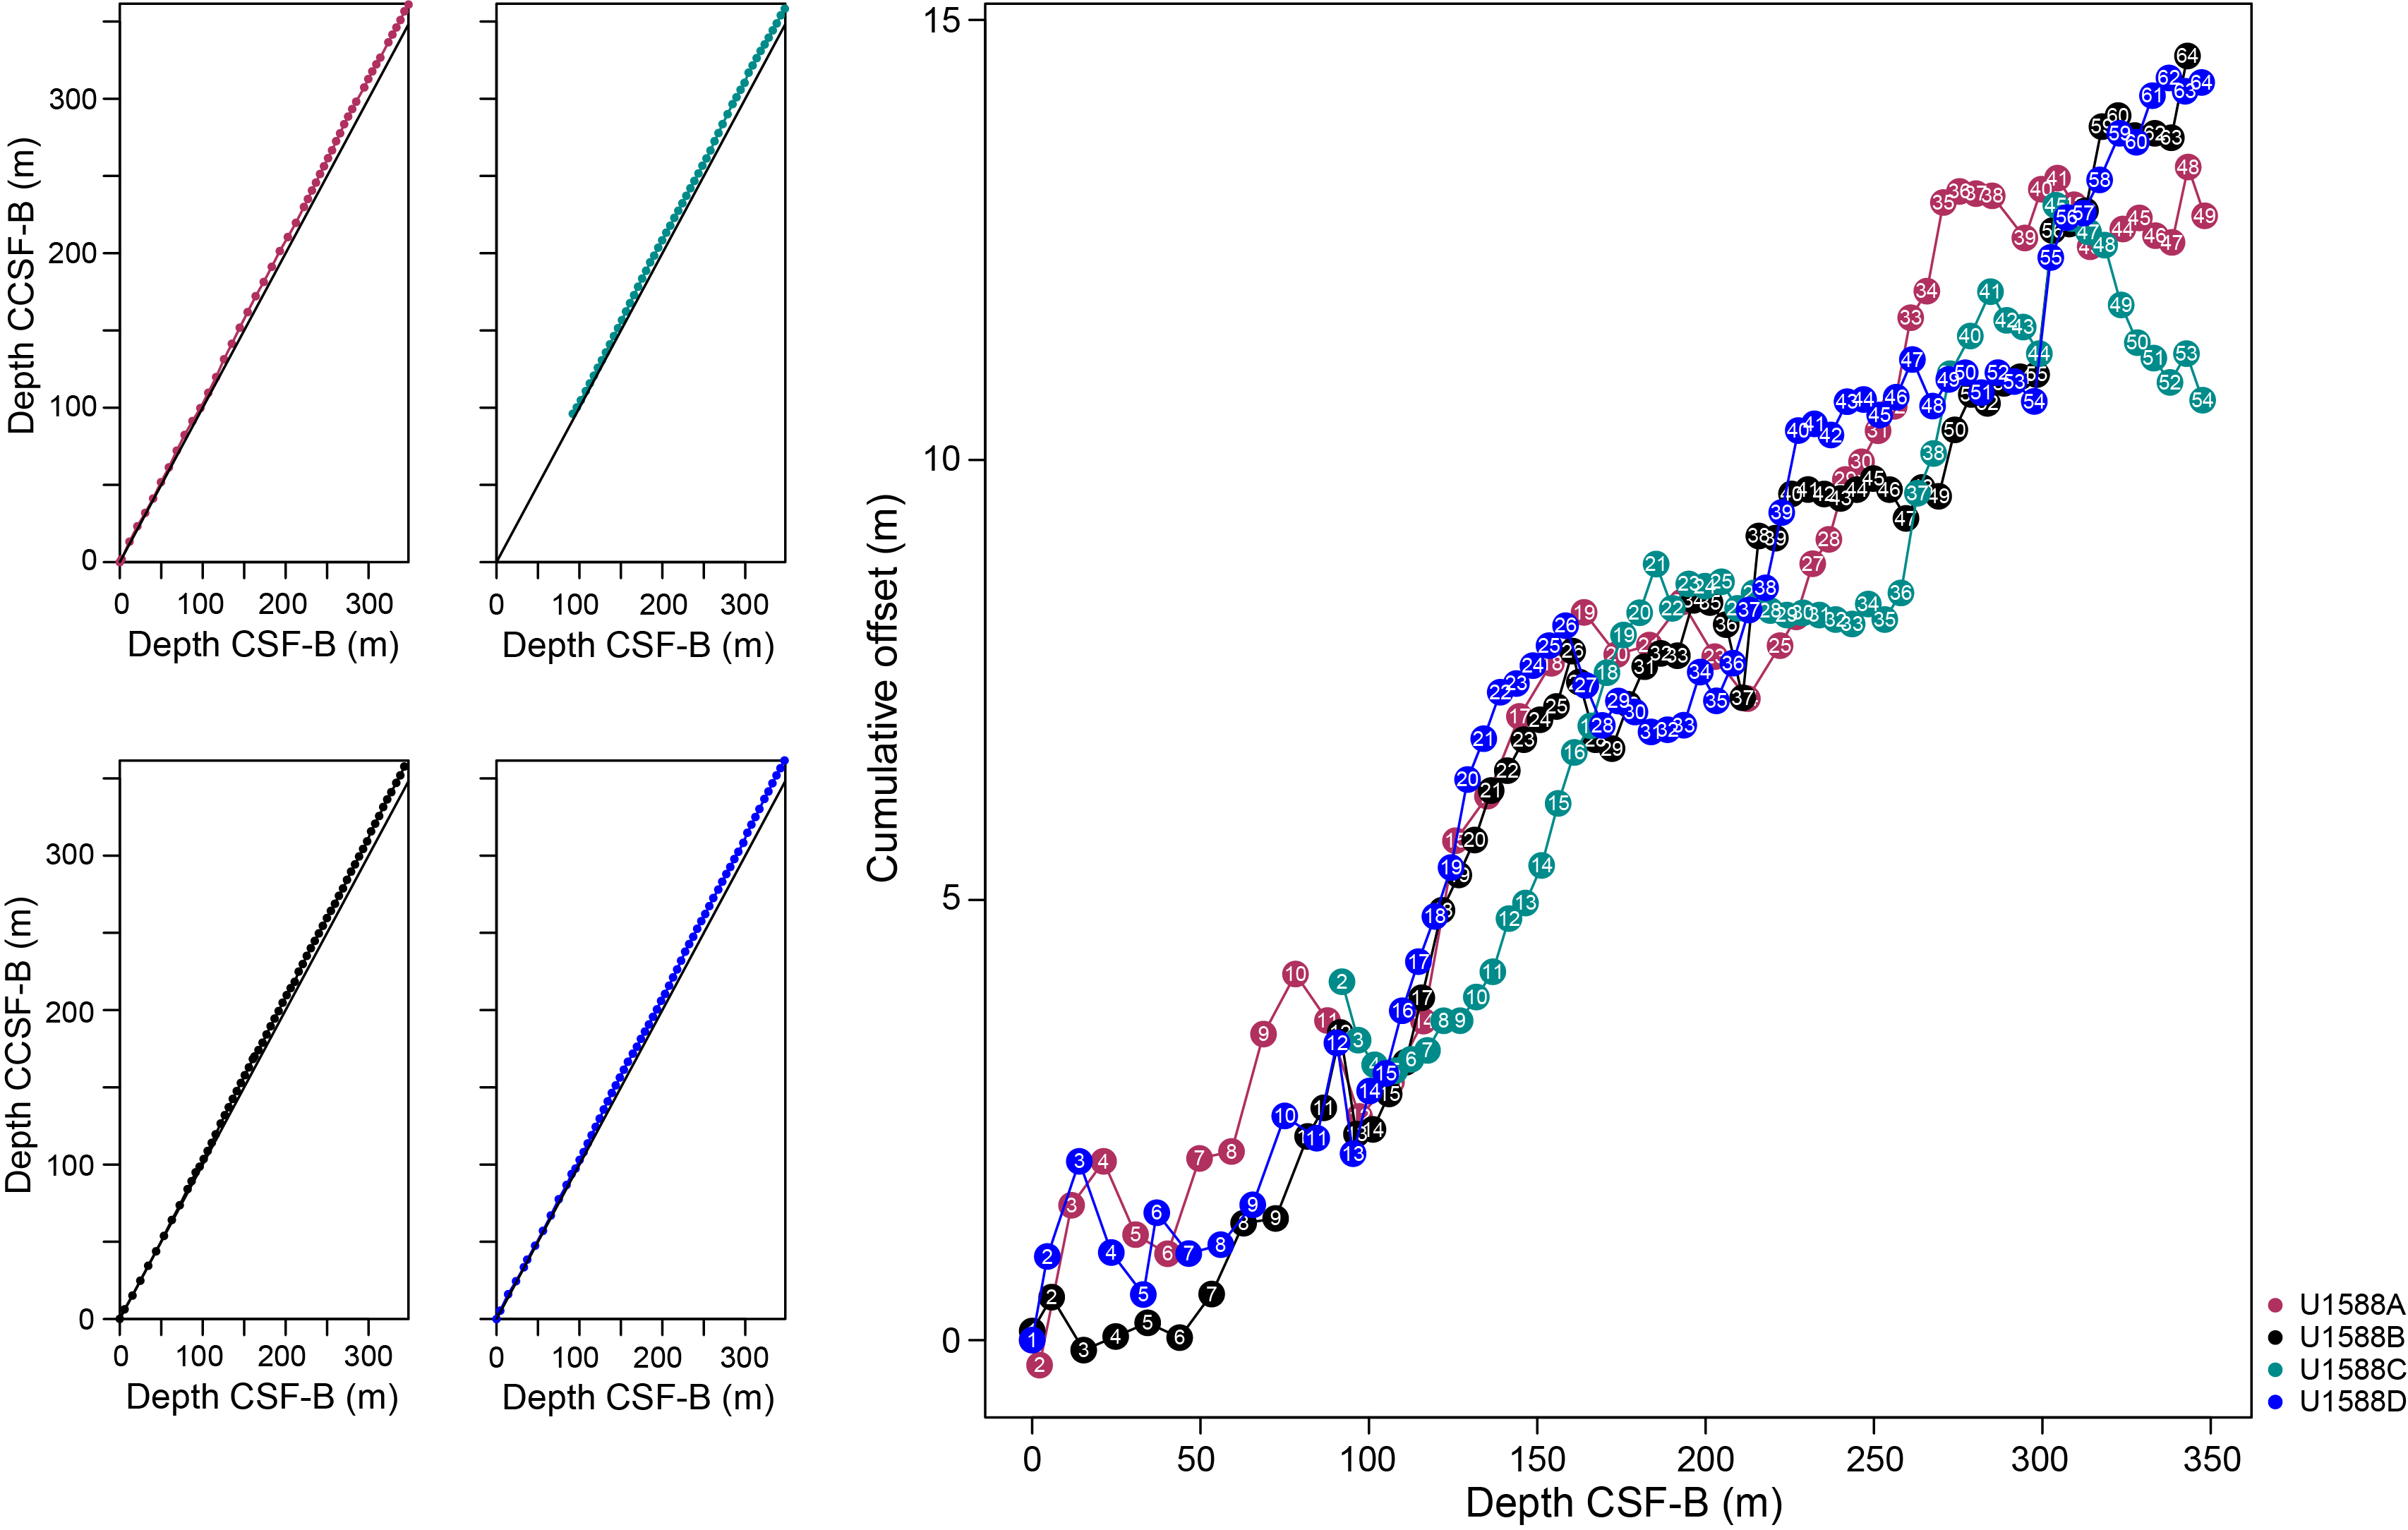
Figure F39. Depth scale comparison.
9.1. Approach
The CCSF-B depth scale is anchored to the mudline of Core 397-U1588B-1H, which is assigned the depth of 0 m CSF-A. From this anchor, we worked downhole using Correlator to establish a composite stratigraphy on a core-by-core basis using the CSF-B (compressed) scale. Our general approach was to avoid placing ties (1) near the section breaks as much as possible and (2) in sections where whole-round samples were taken for IW (only done throughout Hole U1588A). We also avoided full-advance XCB cores (397-U1588A-18X through 24X, 38X, and 43X) because these extruded sediment out of the core liners substantially.
A major aid in correlation came from strong, high-frequency variability in all proxy signals (MS, NGR, and color reflectance) (Figure F38). Fundamentally, all are controlled to first order by calcium carbonate content. After removing the spurious points at section edges in NGR, we found it especially useful when the noise of MS varies largely between holes.
9.2. Gaps
Because of the high quality XCB cores and the high sedimentation rate at this site, the composite section is overall robust with one potential small gap where the tie is uncertain. This is the tie point from Cores 397-U1588B-49X to 397-U1588D-49X in the splice, which affects Cores 397-U1588A-34X through 35X, 397-U1588B-49X through 50X, 397-U1588C-38X through 39X, and 397-U1588D-48X through 49X. In spite of the large gas expansion evident, gaps between cores are surprisingly small.
9.3. Growth rate and cumulative offset
The CSF-B depth scale compresses the core depth back to the driller's depth. The cumulative offset between the CSF-B and CCSF-B depth scales grows nearly linearly for Holes U1588A–U1588D to ~100 m CSF-B (Figure F39, left). The growth factor averages 1.026% but varies by core and hole. There are small changes in the growth factor and therefore in the cumulative offset with depth (Figure F39, right). Calculation of mass accumulation rates based on the recalculated meters below seafloor (mbsf*) depth scale (Expedition 339 Scientists, 2013) should account for differential expansion by dividing apparent depth intervals by the appropriate growth factor.
References
Abrantes, F., 1991a. Increased upwelling off Portugal during the last glaciation: diatom evidence. Marine Micropaleontology, 17(3–4):285–310. https://doi.org/10.1016/0377-8398(91)90017-Z
Abrantes, F., 2000. 200,000 yr diatom records from Atlantic upwelling sites reveal maximum productivity during LGM and a shift in phytoplankton community structure at 185 000 yr. Earth and Planetary Science Letters, 176(1):7–16. https://doi.org/10.1016/S0012-821X(99)00312-X
Abrantes, F.F., 1991b. Variability of upwelling off NW Africa during the Latest Quaternary: Diatom Evidence. Paleoceanography, 6(4):431–460. https://doi.org/10.1029/91PA00049
Abrantes, F., Hodell, D.A., Alvarez Zarikian, C.A., Brooks, H.L., Clark, W.B., Dauchy-Tric, L.F.B., dos Santos Rocha, V., Flores, J.-A., Herbert, T.D., Hines, S.K.V., Huang, H.-H.M., Ikeda, H., Kaboth-Bahr, S., Kuroda, J., Link, J.M., McManus, J.F., Mitsunaga, B.A., Nana Yobo, L., Pallone, C.T., Pang, X., Peral, M.Y., Salgueiro, E., Sanchez, S., Verma, K., Wu, J., Xuan, C., and Yu, J., 2024a. Expedition 397 methods. In Hodell, D.A., Abrantes, F., Alvarez Zarikian, C.A., and the Expedition 397 Scientists, Iberian Margin Paleoclimate. Proceedings of the International Ocean Discovery Program, 397: College Station, TX (International Ocean Discovery Program). https://doi.org/10.14379/iodp.proc.397.102.2024
Abrantes, F., Hodell, D.A., Alvarez Zarikian, C.A., Brooks, H.L., Clark, W.B., Dauchy-Tric, L.F.B., dos Santos Rocha, V., Flores, J.-A., Herbert, T.D., Hines, S.K.V., Huang, H.-H.M., Ikeda, H., Kaboth-Bahr, S., Kuroda, J., Link, J.M., McManus, J.F., Mitsunaga, B.A., Nana Yobo, L., Pallone, C.T., Pang, X., Peral, M.Y., Salgueiro, E., Sanchez, S., Verma, K., Wu, J., Xuan, C., and Yu, J., 2024b. Site U1586. In Hodell, D.A., Abrantes, F., Alvarez Zarikian, C.A., and the Expedition 397 Scientists, Iberian Margin Paleoclimate. Proceedings of the International Ocean Discovery Program, 397: College Station, TX (International Ocean Discovery Program). https://doi.org/10.14379/iodp.proc.397.103.2024
Abrantes, F., Rodrigues, T., Ventura, C., Santos, C., Roell, U., Voelker, A., and Hodell, D., 2017. Past productivity conditions off SW Iberia at the transition from the 41 ky to the 100 ky world: the record of IODP Sites U1385 and U1391. Geophysical Research Abstracts, 19:EGU2017-9743. https://meetingorganizer.copernicus.org/EGU2017/EGU2017-9743.pdf
Balestra, B., Flores, J.A., Hodell, D.A., Hernández Molina, F.J., and Stow, D.A.V., 2015. Pleistocene calcareous nannofossil biochronology at IODP Site U1385 (Expedition 339). Global and Planetary Change, 135:57–65. https://doi.org/10.1016/j.gloplacha.2015.10.004
Blum, P., 1997. Physical properties handbook: a guide to the shipboard measurement of physical properties of deep-sea cores. Ocean Drilling Program Technical Note, 26. https://doi.org/10.2973/odp.tn.26.1997
De Vleeschouwer, D., Dunlea, A.G., Auer, G., Anderson, C.H., Brumsack, H., de Loach, A., Gurnis, M.C., Huh, Y., Ishiwa, T., Jang, K., Kominz, M.A., März, C., Schnetger, B., Murray, R.W., Pälike, H., and Expedition 356 Shipboard Scientists, 2017. Quantifying K, U, and Th contents of marine sediments using shipboard natural gamma radiation spectra measured on DV JOIDES Resolution. Geochemistry, Geophysics, Geosystems, 18(3):1053–1064. https://doi.org/10.1002/2016GC006715
Expedition 339 Scientists, 2013. Site U1385. In Stow, D.A.V., Hernández-Molina, F.J., Alvarez Zarikian, C.A., and the Expedition 339 Scientists, Proceedings of the Integrated Ocean Drilling Program. 339: Tokyo (Integrated Ocean Drilling Program Management International, Inc.). https://doi.org/10.2204/iodp.proc.339.103.2013
Gradstein, F.M., Ogg, J.G., Schmitz, M.D., and Ogg, G.M. (Eds.), 2020. The Geologic Time Scale 2020: Amsterdam (Elsevier BV). https://doi.org/10.1016/C2020-1-02369-3
Grevemeyer, I., Kaul, N., and Kopf, A., 2009. Heat flow anomalies in the Gulf of Cadiz and off Cape San Vincente, Portugal. Marine and Petroleum Geology, 26(6):795–804. https://doi.org/10.1016/j.marpetgeo.2008.08.006
Hayward, B.W., 2002. Late Pliocene to middle Pleistocene extinctions of deep-sea benthic Foraminifera ("Stilostomella extinction") in the Southwest Pacific. Journal of Foraminiferal Research, 32(3):274–307. https://doi.org/10.2113/32.3.274
Heard, T.G., Pickering, K.T., and Clark, J.D., 2014. Ichnofabric characterization of a deep-marine clastic system: a subsurface study of the middle Eocene Ainsa System, Spanish Pyrenees. Sedimentology, 61(5):1298–1331. https://doi.org/10.1111/sed.12101
Hernández-Molina, F.J., Llave, E., Stow, D.A.V., García, M., Somoza, L., Vázquez, J.T., Lobo, F.J., Maestro, A., Díaz del Río, V., León, R., Medialdea, T., and Gardner, J., 2006. The contourite depositional system of the Gulf of Cádiz: A sedimentary model related to the bottom current activity of the Mediterranean outflow water and its interaction with the continental margin. Deep Sea Research Part II: Topical Studies in Oceanography, 53(11):1420–1463. https://doi.org/10.1016/j.dsr2.2006.04.016
Hernández-Molina, F.J., Stow, D.A.V., Alvarez-Zarikian, C.A., Acton, G., Bahr, A., Balestra, B., Ducassou, E., Flood, R., Flores, J.-A., Furota, S., Grunert, P., Hodell, D., Jimenez-Espejo, F., Kim, J.K., Krissek, L., Kuroda, J., Li, B., Llave, E., Lofi, J., Lourens, L., Miller, M., Nanayama, F., Nishida, N., Richter, C., Roque, C., Pereira, H., Sanchez Goñi, M.F., Sierro, F.J., Singh, A.D., Sloss, C., Takashimizu, Y., Tzanova, A., Voelker, A., Williams, T., and Xuan, C., 2014. Onset of Mediterranean outflow into the North Atlantic. Science, 344(6189):1244–1250. https://doi.org/10.1126/science.1251306
Hernández-Molina, J., Llave, E., Somoza, L., Fernández-Puga, M.C., Maestro, A., León, R., Medialdea, T., Barnolas, A., García, M., Díaz del Río, V., Fernández-Salas, L.M., Vázquez, J.T., Lobo, F., Alveirinho Dias, J.M., Rodero, J., and Gardner, J., 2003. Looking for clues to paleoceanographic imprints: a diagnosis of the Gulf of Cadiz contourite depositional systems. Geology, 31(1):19–22. https://doi.org/10.1130/0091-7613(2003)031%3C0019:LFCTPI%3E2.0.CO;2
Hodell, D.A., Abrantes, F., Alvarez Zarikian, C.A., Brooks, H.L., Clark, W.B., Dauchy-Tric, L.F.B., dos Santos Rocha, V., Flores, J.-A., Herbert, T.D., Hines, S.K.V., Huang, H.-H.M., Ikeda, H., Kaboth-Bahr, S., Kuroda, J., Link, J.M., McManus, J.F., Mitsunaga, B.A., Nana Yobo, L., Pallone, C.T., Pang, X., Peral, M.Y., Salgueiro, E., Sanchez, S., Verma, K., Wu, J., Xuan, C., and Yu, J., 2024. Site U1587. In Hodell, D.A., Abrantes, F., Alvarez Zarikian, C.A., and the Expedition 397 Scientists, Iberian Margin Paleoclimate. Proceedings of the International Ocean Discovery Program, 397: College Station, TX (International Ocean Discovery Program). https://doi.org/10.14379/iodp.proc.397.104.2024
Hodell, D.A., Crowhurst, S.J., Lourens, L., Margari, V., Nicolson, J., Rolfe, J.E., Skinner, L.C., Thomas, N.C., Tzedakis, P.C., Mleneck-Vautravers, M.J., and Wolff, E.W., 2023. A 1.5-million-year record of orbital and millennial climate variability in the North Atlantic. Climate of the Past, 19(3):607–636. https://doi.org/10.5194/cp-19-607-2023
Kawagata, S., Hayward, B.W., Grenfell, H.R., and Sabaa, A., 2005. Mid-Pleistocene extinction of deep-sea foraminifera in the North Atlantic Gateway (ODP Sites 980 and 982). Palaeogeography, Palaeoclimatology, Palaeoecology, 221(3):267–291. https://doi.org/10.1016/j.palaeo.2005.03.001
Laprida, C., Carbonel, P., and Azpilicueta, M., 2002. Dinámica de los ostrácodos mediterráneos en el golfo de Vizcaya, océano Atlántico nororiental. Revista Espanola de Micropaleontologia, 34(2):201–214.
Llave, E., Schönfeld, J., Hernández-Molina, F.J., Mulder, T., Somoza, L., Díaz del Río, V., and Sánchez-Almazo, I., 2006. High-resolution stratigraphy of the Mediterranean outflow contourite system in the Gulf of Cadiz during the late Pleistocene: The impact of Heinrich events. Marine Geology, 227(3):241–262. https://doi.org/10.1016/j.margeo.2005.11.015
Martini, E., 1971. Standard Tertiary and Quaternary calcareous nannoplankton zonation. Proceedings of the Second Planktonic Conference, Roma, 1970:739–785.
Meyers, P.A., 1994. Preservation of elemental and isotopic source identification of sedimentary organic matter. Chemical Geology, 114(3–4):289–302. https://doi.org/10.1016/0009-2541(94)90059-0
Meyers, P.A., 1997. Organic geochemical proxies of paleoceanographic, paleolimnologic, and paleoclimatic processes. Organic Geochemistry, 27(5–6):213–250. https://doi.org/10.1016/S0146-6380(97)00049-1
Okada, H., and Bukry, D., 1980. Supplementary modification and introduction of code numbers to the low-latitude coccolith biostratigraphic zonation (Bukry, 1973; 1975). Marine Micropaleontology, 5(3):321–325. https://doi.org/10.1016/0377-8398(80)90016-X
Paytan, A., and Griffith, E.M., 2007. Marine barite: recorder of variations in ocean export productivity. Deep Sea Research, Part II: Topical Studies in Oceanography, 54(5–7):687–705. https://doi.org/10.1016/j.dsr2.2007.01.007
Pribnow, D.F.C., Kinoshita, M., and Stein, C.A., 2000. Thermal data collection and heat flow recalculations for ODP Legs 101–180: Hannover, Germany (Institute for Joint Geoscientific Research, GGA). http://www-odp.tamu.edu/publications/heatflow/
Raffi, I., Backman, J., Fornaciari, E., Pälike, H., Rio, D., Lourens, L., and Hilgen, F., 2006. A review of calcareous nannofossil astrobiochronology encompassing the past 25 million years. Quaternary Science Reviews, 25(23):3113–3137. https://doi.org/10.1016/j.quascirev.2006.07.007
Reitz, A., Pfeifer, K., de Lange, G.J., and Klump, J., 2004. Biogenic barium and the detrital Ba/Al ratio: a comparison of their direct and indirect determination. Marine Geology, 204(3–4):289–300. https://doi.org/10.1016/S0025-3227(04)00004-0
Thomson, J., Nixon, S., Summerhayes, C.P., Rohling, E.J., Schönfeld, J., Zahn, R., Grootes, P., Abrantes, F., Gaspar, L., and Vaquiero, S., 2000. Enhanced productivity on the Iberian margin during glacial/interglacial transitions revealed by barium and diatoms. Journal of the Geological Society, 157(3):667–677. https://doi.org/10.1144/jgs.157.3.667
Thomson, J., Nixon, S., Summerhayes, C.P., Schönfeld, J., Zahn, R., and Grootes, P., 1999. Implications for sedimentation changes on the Iberian margin over the last two glacial/interglacial transitions from (230Thexcess)0 systematics. Earth and Planetary Science Letters, 165(3):255–270. https://doi.org/10.1016/S0012-821X(98)00265-9
Ventura, C., Abrantes, F., Loureiro, I., and Voelker, A.H.L., 2017. Data report: diatom and silicoflagellate records of marine isotope stages 25–27 at IODP Site U1387, Faro Drift. In Stow, D.A.V., Hernández-Molina, F.J., Alvarez Zarikian, C.A., and the Expedition 339 Scientists, Proceedings of the Integrated Ocean Drilling Program. 339: Tokyo (Integrated Ocean Drilling Program Management International, Inc.). https://doi.org/10.2204/iodp.proc.339.202.2017
Wade, B.S., Pearson, P.N., Berggren, W.A., and Pälike, H., 2011. Review and revision of Cenozoic tropical planktonic foraminiferal biostratigraphy and calibration to the geomagnetic polarity and astronomical time scale. Earth-Science Reviews, 104(1–3):111–142. https://doi.org/10.1016/j.earscirev.2010.09.003
Wu, J., Böning, P., Pahnke, K., Tachikawa, K., and de Lange, G.J., 2016. Unraveling North-African riverine and eolian contributions to central Mediterranean sediments during Holocene sapropel S1 formation. Quaternary Science Reviews, 152:31–48. https://doi.org/10.1016/j.quascirev.2016.09.029
Xuan, C., and Channell, J.E.T., 2009. UPmag: MATLAB software for viewing and processing u channel or other pass-through paleomagnetic data. Geochemistry Geophysics Geosystems, 10:Q10Y10. https://doi.org/10.1029/2009GC002584
Zitellini, N., Gràcia, E., Matias, L., Terrinha, P., Abreu, M.A., DeAlteriis, G., Henriet, J.P., Dañobeitia, J.J., Masson, D.G., Mulder, T., Ramella, R., Somoza, L., and Diez, S., 2009. The quest for the Africa–Eurasia plate boundary west of the Strait of Gibraltar. Earth and Planetary Science Letters, 280(1–4):13–50. https://doi.org/10.1016/j.epsl.2008.12.005