McCaig, A.M., Lang, S.Q., Blum, P., and the Expedition 399 Scientists
Proceedings of the International Ocean Discovery Program Volume 399
publications.iodp.org
https://doi.org/10.14379/iodp.proc.399.104.2025
Site U16011
![]() S.Q. Lang,
S.Q. Lang,
![]() A.M. McCaig,
A.M. McCaig,
![]() P. Blum,
P. Blum,
![]() N. Abe,
N. Abe,
![]() W. Brazelton,
W. Brazelton,
![]() R. Coltat,
R. Coltat,
![]() J.R. Deans,
J.R. Deans,
![]() K.L. Dickerson,
K.L. Dickerson,
![]() M. Godard,
M. Godard,
![]() B.E. John,
B.E. John,
![]() F. Klein,
F. Klein,
![]() R. Kuehn,
R. Kuehn,
![]() K.-Y. Lin,
K.-Y. Lin,
![]() C.J. Lissenberg,
C.J. Lissenberg,
![]() H. Liu,
H. Liu,
![]() E.L. Lopes,
E.L. Lopes,
![]() T. Nozaka,
T. Nozaka,
![]() A.J. Parsons,
A.J. Parsons,
![]() V. Pathak,
V. Pathak,
![]() M.K. Reagan,
M.K. Reagan,
![]() J.A. Robare,
J.A. Robare,
![]() I.P. Savov,
I.P. Savov,
![]() E. Schwarzenbach,
E. Schwarzenbach,
![]() O.J. Sissmann,
O.J. Sissmann,
![]() G. Southam,
G. Southam,
![]() F. Wang, and
F. Wang, and
![]() C.G. Wheat2
C.G. Wheat2
1 Lang, S.Q., McCaig, A.M, Blum, P., Abe, N., Brazelton, W., Coltat, R., Deans, J.R., Dickerson, K.L., Godard, M., John, B.E., Klein, F., Kuehn, R., Lin, K.-Y., Lissenberg, C.J., Liu, H., Lopes, E.L., Nozaka, T., Parsons, A.J., Pathak, V., Reagan, M.K., Robare, J.A., Savov, I.P., Schwarzenbach, E., Sissmann, O.J., Southam, G., Wang, F., and Wheat, C.G., 2025. Site U1601. In McCaig, A.M., Lang, S.Q., Blum, P., and the Expedition 399 Scientists, Building Blocks of Life, Atlantis Massif. Proceedings of the International Ocean Discovery Program, 399: College Station, TX (International Ocean Discovery Program). https://doi.org/10.14379/iodp.proc.399.104.2025
2 Expedition 399 Scientists' affiliations.
1. Background and objectives
1.1. Site summary
Site U1601 is located on a flat region near the southern wall at the top of the Atlantis Massif at a water depth of 700–800 m (Figure F1). Mass wasting along the southern edge of the massif has created steep cliffs that expose a 3000 m cross section of the internal structure. The southern wall is predominantly composed of variably altered peridotite with intermittent mafic plutonic intrusions (Blackman et al., 2002; Schroeder and John, 2004; Früh-Green et al., 2003, 2018; Boschi et al., 2006; Karson et al., 2006).
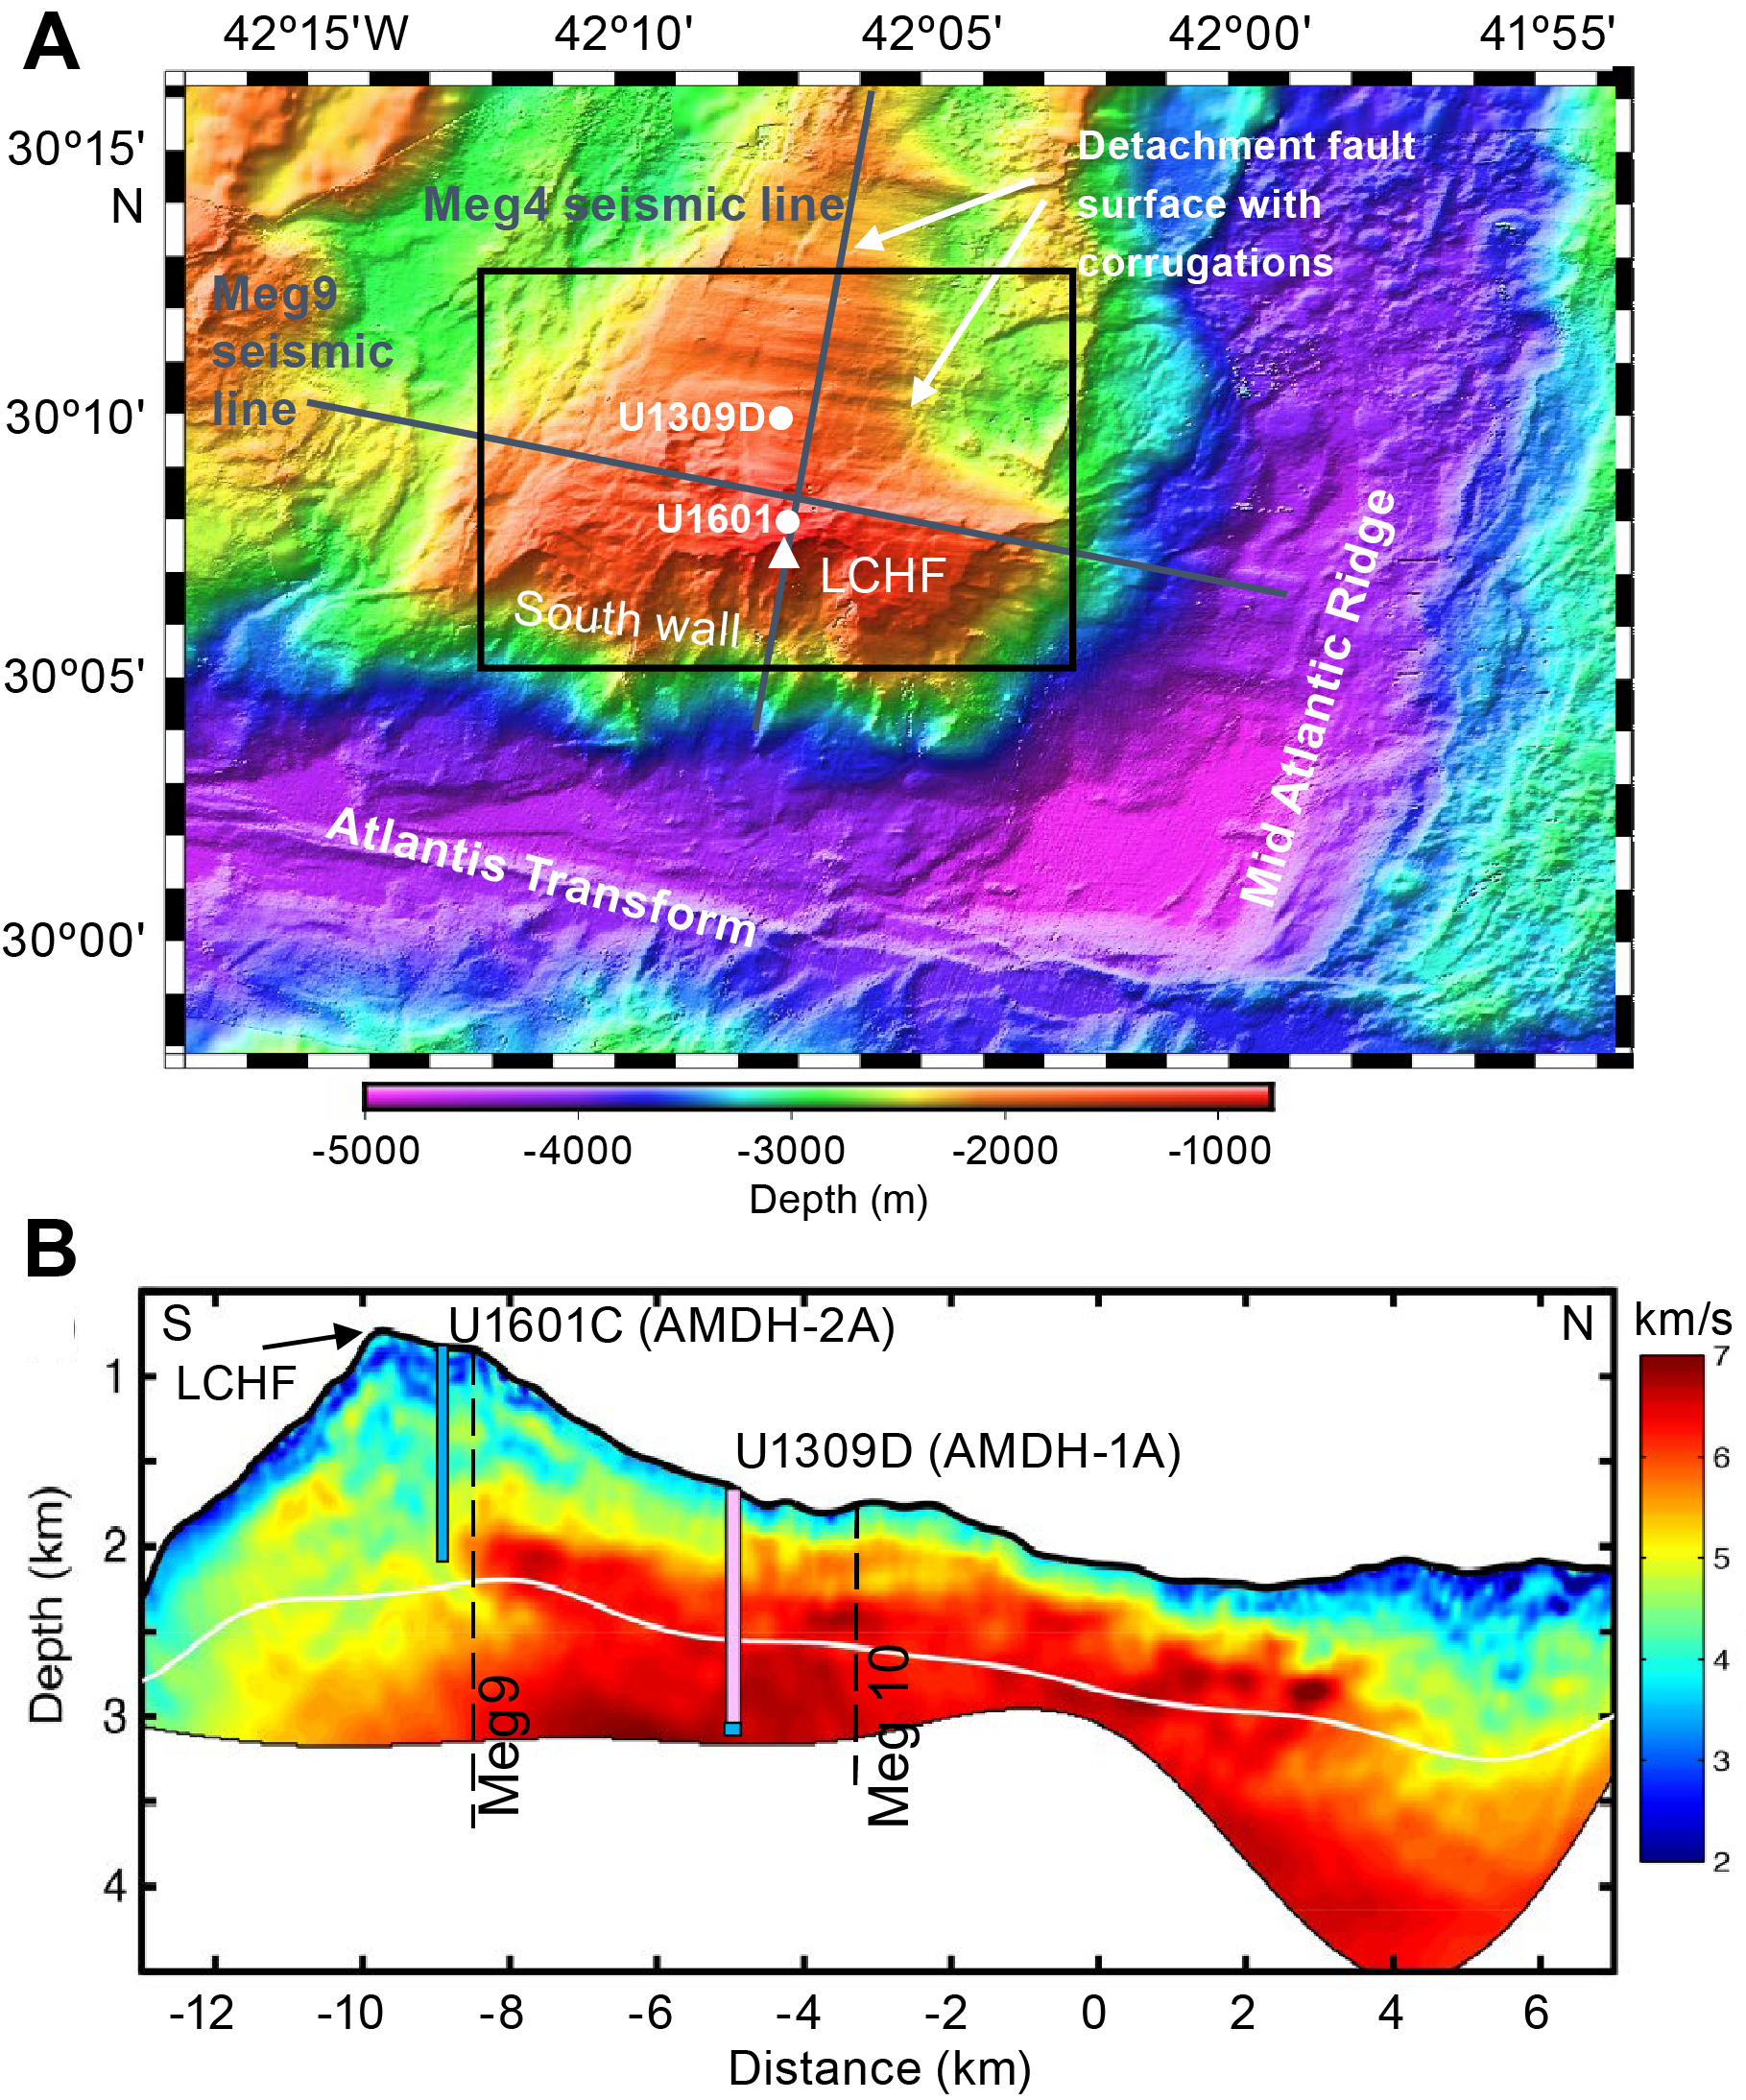
Figure F1. Atlantis Massif.
The location of Site U1601 was chosen in part based on the success of drilling in this region during International Ocean Discovery Program (IODP) Expedition 357. The central IODP Holes M0069A, M0072B, and M0076B were drilled to 12.4–16.4 meters below seafloor (mbsf), with recoveries between 52% and 75% (Früh-Green et al., 2017) (Figure F2). Recovered cores contained diverse lithologies with upper layers that included calcareous sediments, basalt, and dolerite. Serpentinized harzburgite was recovered in the deeper sections of all three boreholes (Früh-Green et al., 2017), and concentrations of H2 were elevated to ~40 nM in the water column above these locations (Lang et al., 2021), suggesting that deeper drilling may encounter rocks undergoing active serpentinization. Thus, a hole located near one of the central sites could address many of the primary goals of the expedition.
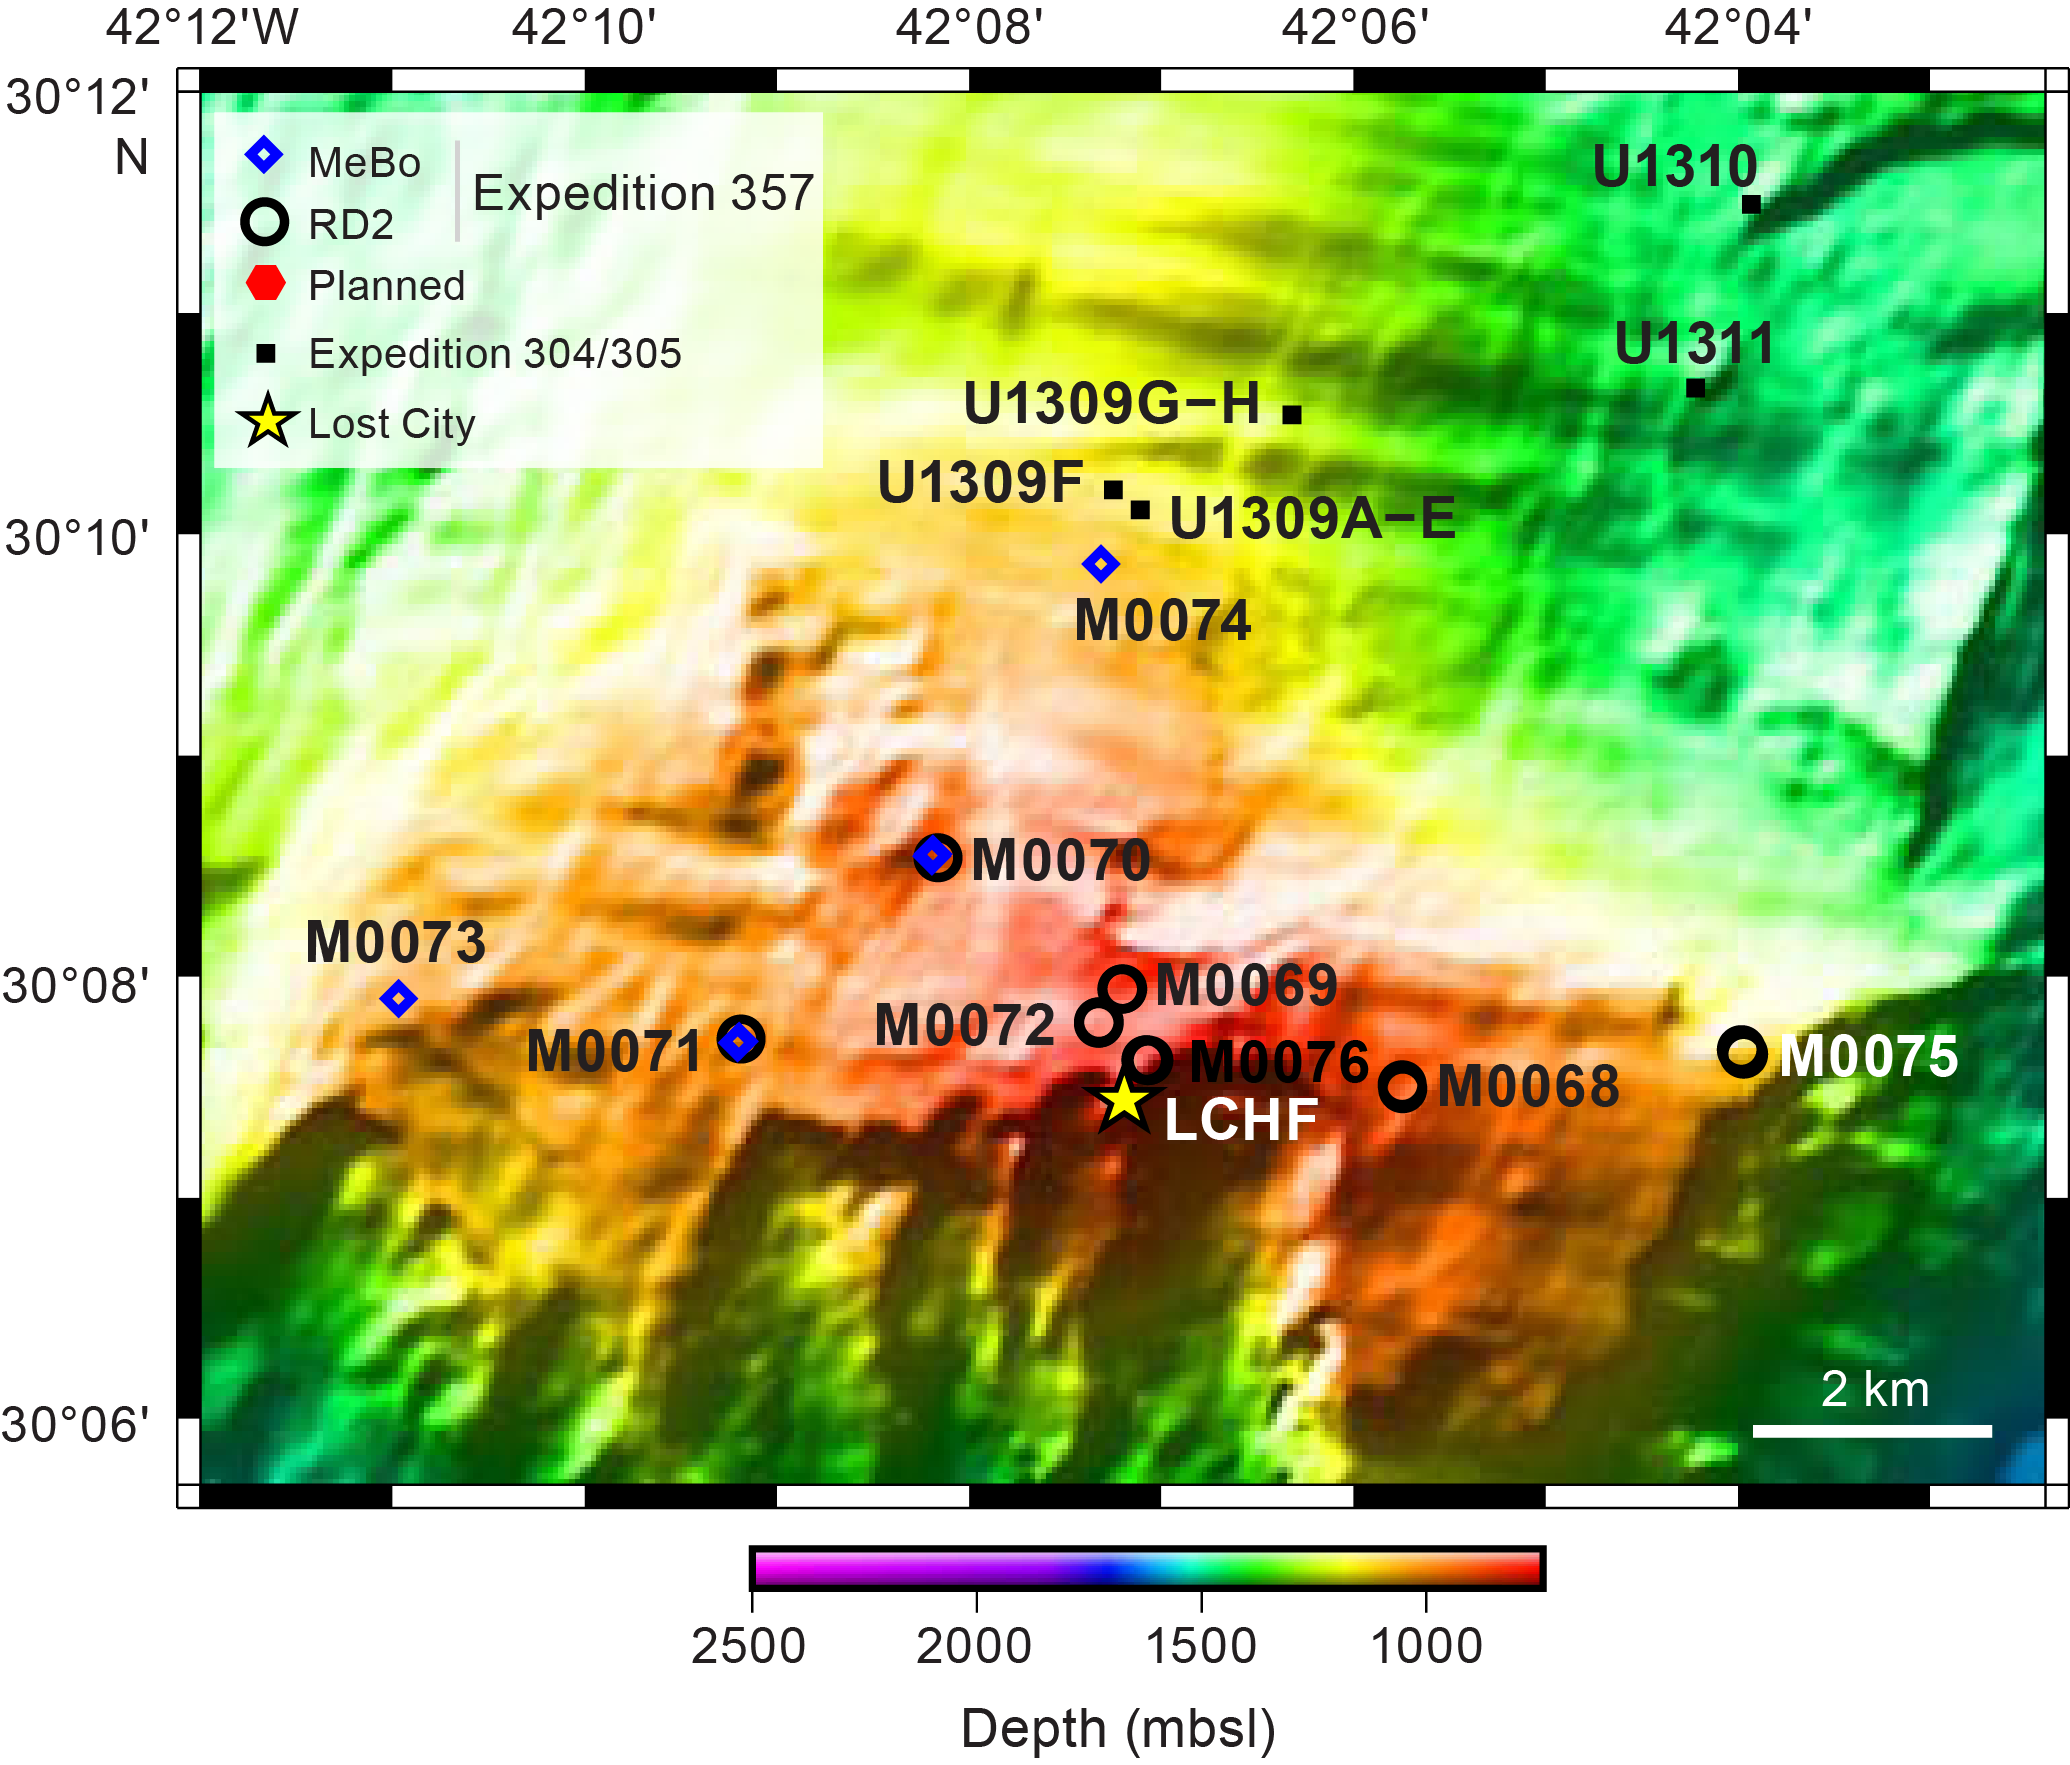
Figure F2. Location of previous drilling.
A location adjacent to Hole M0069A was specifically targeted because it had some of the best recovery during Expedition 357. It was also the site with the deepest serpentinite sample subjected to microbiological analyses (14.6 mbsf), revealing cell densities of 10–24 cells/cm3 (Früh-Green et al., 2018) (Figure F3). Genes from putative indigenous subsurface organisms were identified from Core 357-M0069A-92R (Goordial et al., 2021) and other nearby drilling locations (Motamedi et al., 2020).
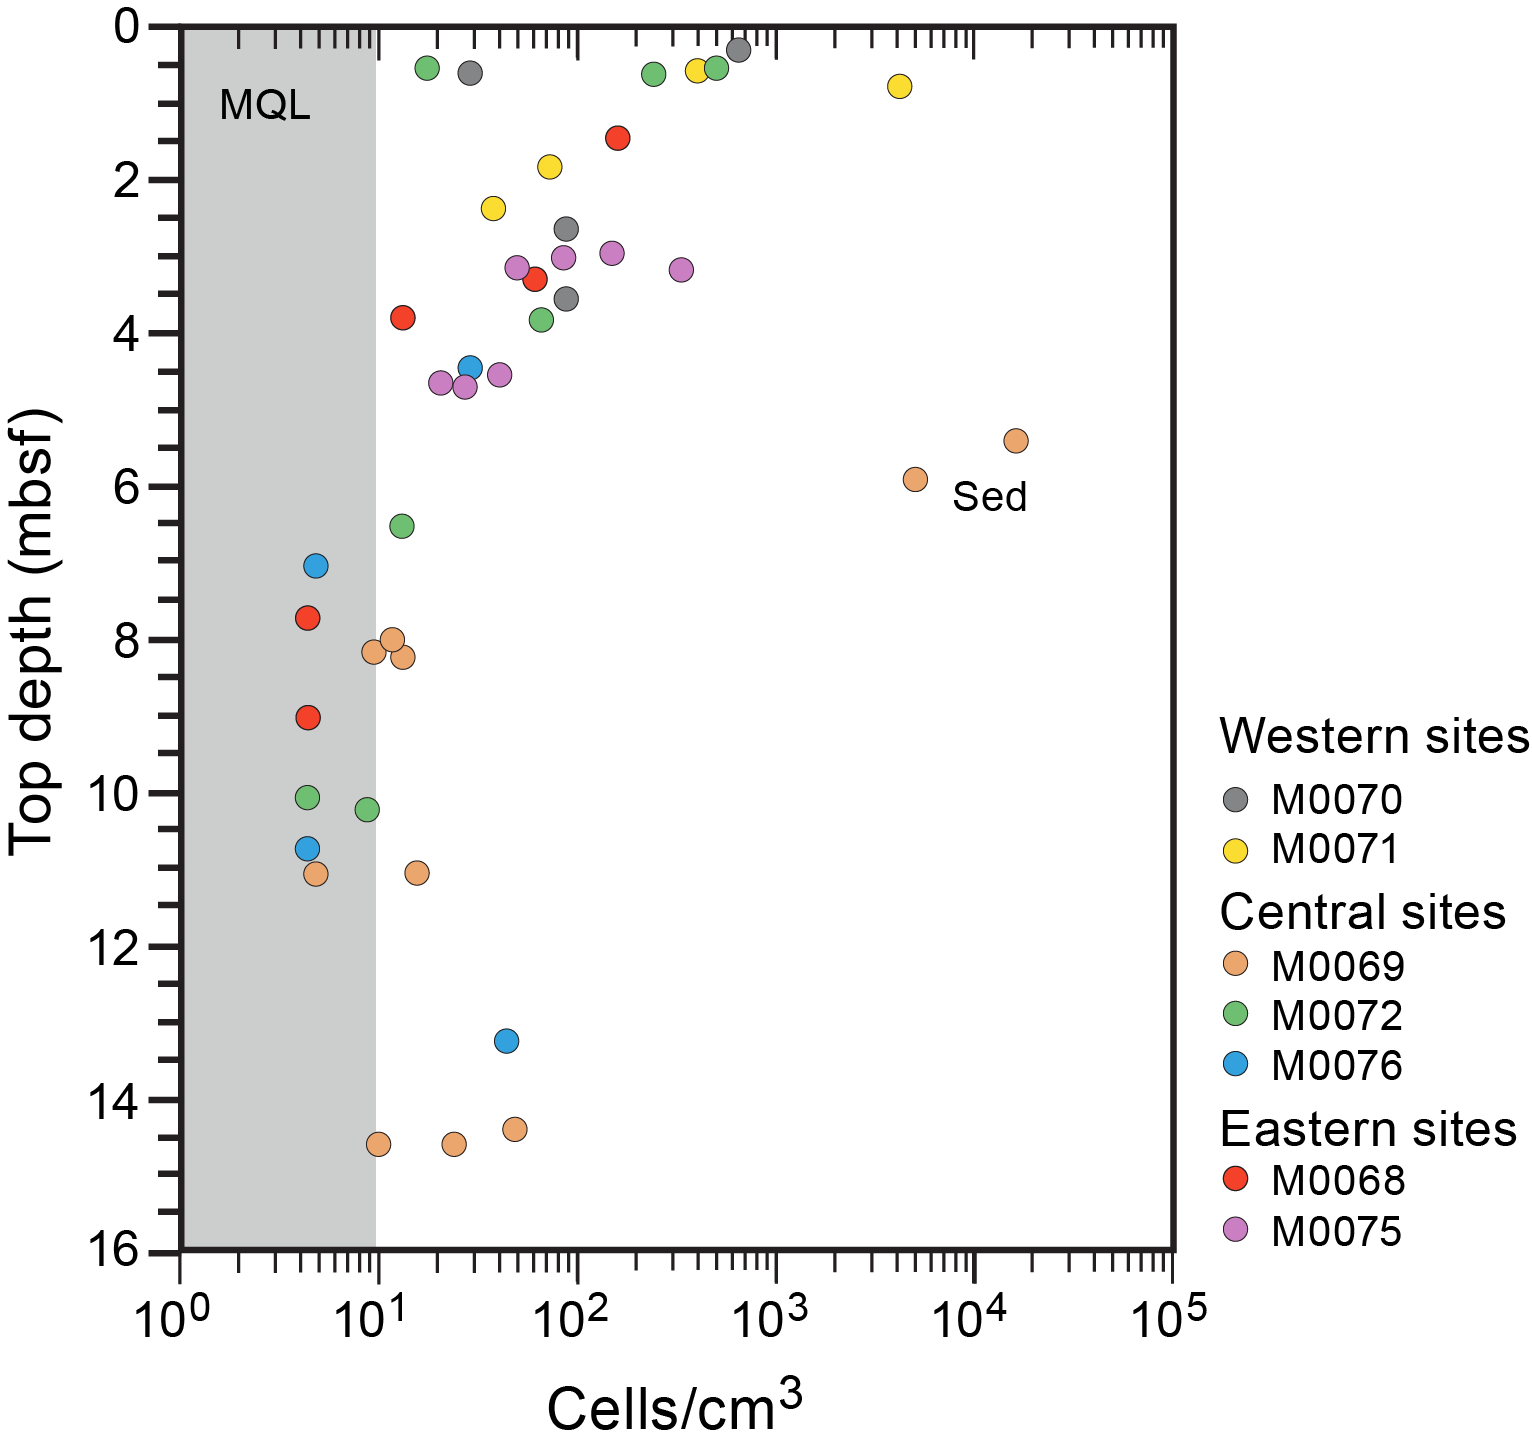
Figure F3. Cell counts, Expedition 357.
The scientific objectives for Site U1601 were initially intended to complement the goal of deepening Integrated Ocean Drilling Program Hole U1309D by targeting a zone with thermal and geochemical conditions more conducive to microbial activity and the potential abiotic synthesis of organic molecules. Recovering a section through the 50–100 m thick detachment fault zone (Schroeder and John, 2004; Karson et al., 2006) would also allow for more complete characterization of the core complex. The high recovery and rapid progress while drilling Hole U1601C provided an opportunity to expand the initial objectives to those originally intended for Hole U1309D. In addition, the unexpected depth of Hole U1601C opened the possibility to identify large-scale structural, igneous, and alteration relationships across a long section of serpentinized peridotite and to access material representative of the hydrothermal reaction zone supplying fluids to the Lost City hydrothermal system.
Objectives of operations at Site U1601 include the following:
- Drill a section of serpentinized ultramafic crust to 200 mbsf, the initial goal of Expedition 357, to provide a complete section through the oceanic detachment system into less deformed rocks below.
- Characterize the abundances and distributions of microorganisms and carbon associated with ultramafic rocks at temperatures more conducive to biological activity and abiotic formation of organic molecules than those at the bottom of Hole U1309D.
- Collect wireline logging and paleomagnetic data to reconstruct subseafloor data in regions of incomplete recovery, allow reorientation of the core, and provide temperature profiles for future hydrogeologic modeling efforts.
- Conduct a continuous and consistent survey of abundances and distributions of microorganisms and carbon across a long downcore profile to document the changes as temperatures and geochemical conditions become more challenging to life.
- Identify potential signs of fluid flow, and characterize formation fluid geochemistry.
- Characterize the igneous, structural, geochemical, and alteration characteristics of a largely continuous section of abyssal peridotite to document lithology, mineralogy, bulk-rock compositions, structural evolution, and indications of hydrothermal alteration.
Objectives 1–3 represent our initial expedition goals for this site, and Objectives 4–6 emerged as Hole U1601C reached greater depths than expected.
2. Operations
2.1. Port call and transit to Site U1601
Expedition 399 (Building Blocks of Life, Atlantis Massif) began in Ponta Delgada, Portugal, at 0800 h on 12 April 2023 with the R/V JOIDES Resolution tied up at the Dock 12, NATO Berth. Port call activities were minimal because most of the activities occurred during the tie up in Tarragona, Spain. All oncoming scientists and JOIDES Resolution Science Operator (JRSO) staff boarded the vessel on 13 April. All personnel received a Coronavirus Disease 2019 (COVID-19) self-test kit the night before to be used before joining the group and boarding the bus to the ship. The COVID-19 Mitigation Protocols Established for Safe JR Operations (COPE) were followed, which included daily antigen tests and masking for all personnel for at least 6 days. Once on board, general welcome and introductions including ship and laboratory safety presentation and tours were conducted. One member of the Science Party disembarked the vessel. At 1400 h on 15 April, after a first lifeboat drill, the voyage to Site U1601 began. We arrived at Site U1601 at 0530 h on 19 April, completing the 937 nmi transit from Ponta Delgada at an average speed of 10.7 kt. The ship was in dynamic positioning mode (DP) mode by 0551 h, starting operations at Site U1601. The COVID mitigation period ended at 1815 h.
2.2. Hole U1601A
The objective at Site U1601 was to core a 200 m deep hole through the detachment fault at the Atlantis Massif. We chose IODP Site M0069 as a reference location, which was drilled in 2015 with the British Geological Survey RockDrill2 during Expedition 357 on the RSS James Cook. The operational plan called for a reentry system installation, which required drilling a ~50 m deep pilot hole to assess the formation (Table T1; Figure F4).
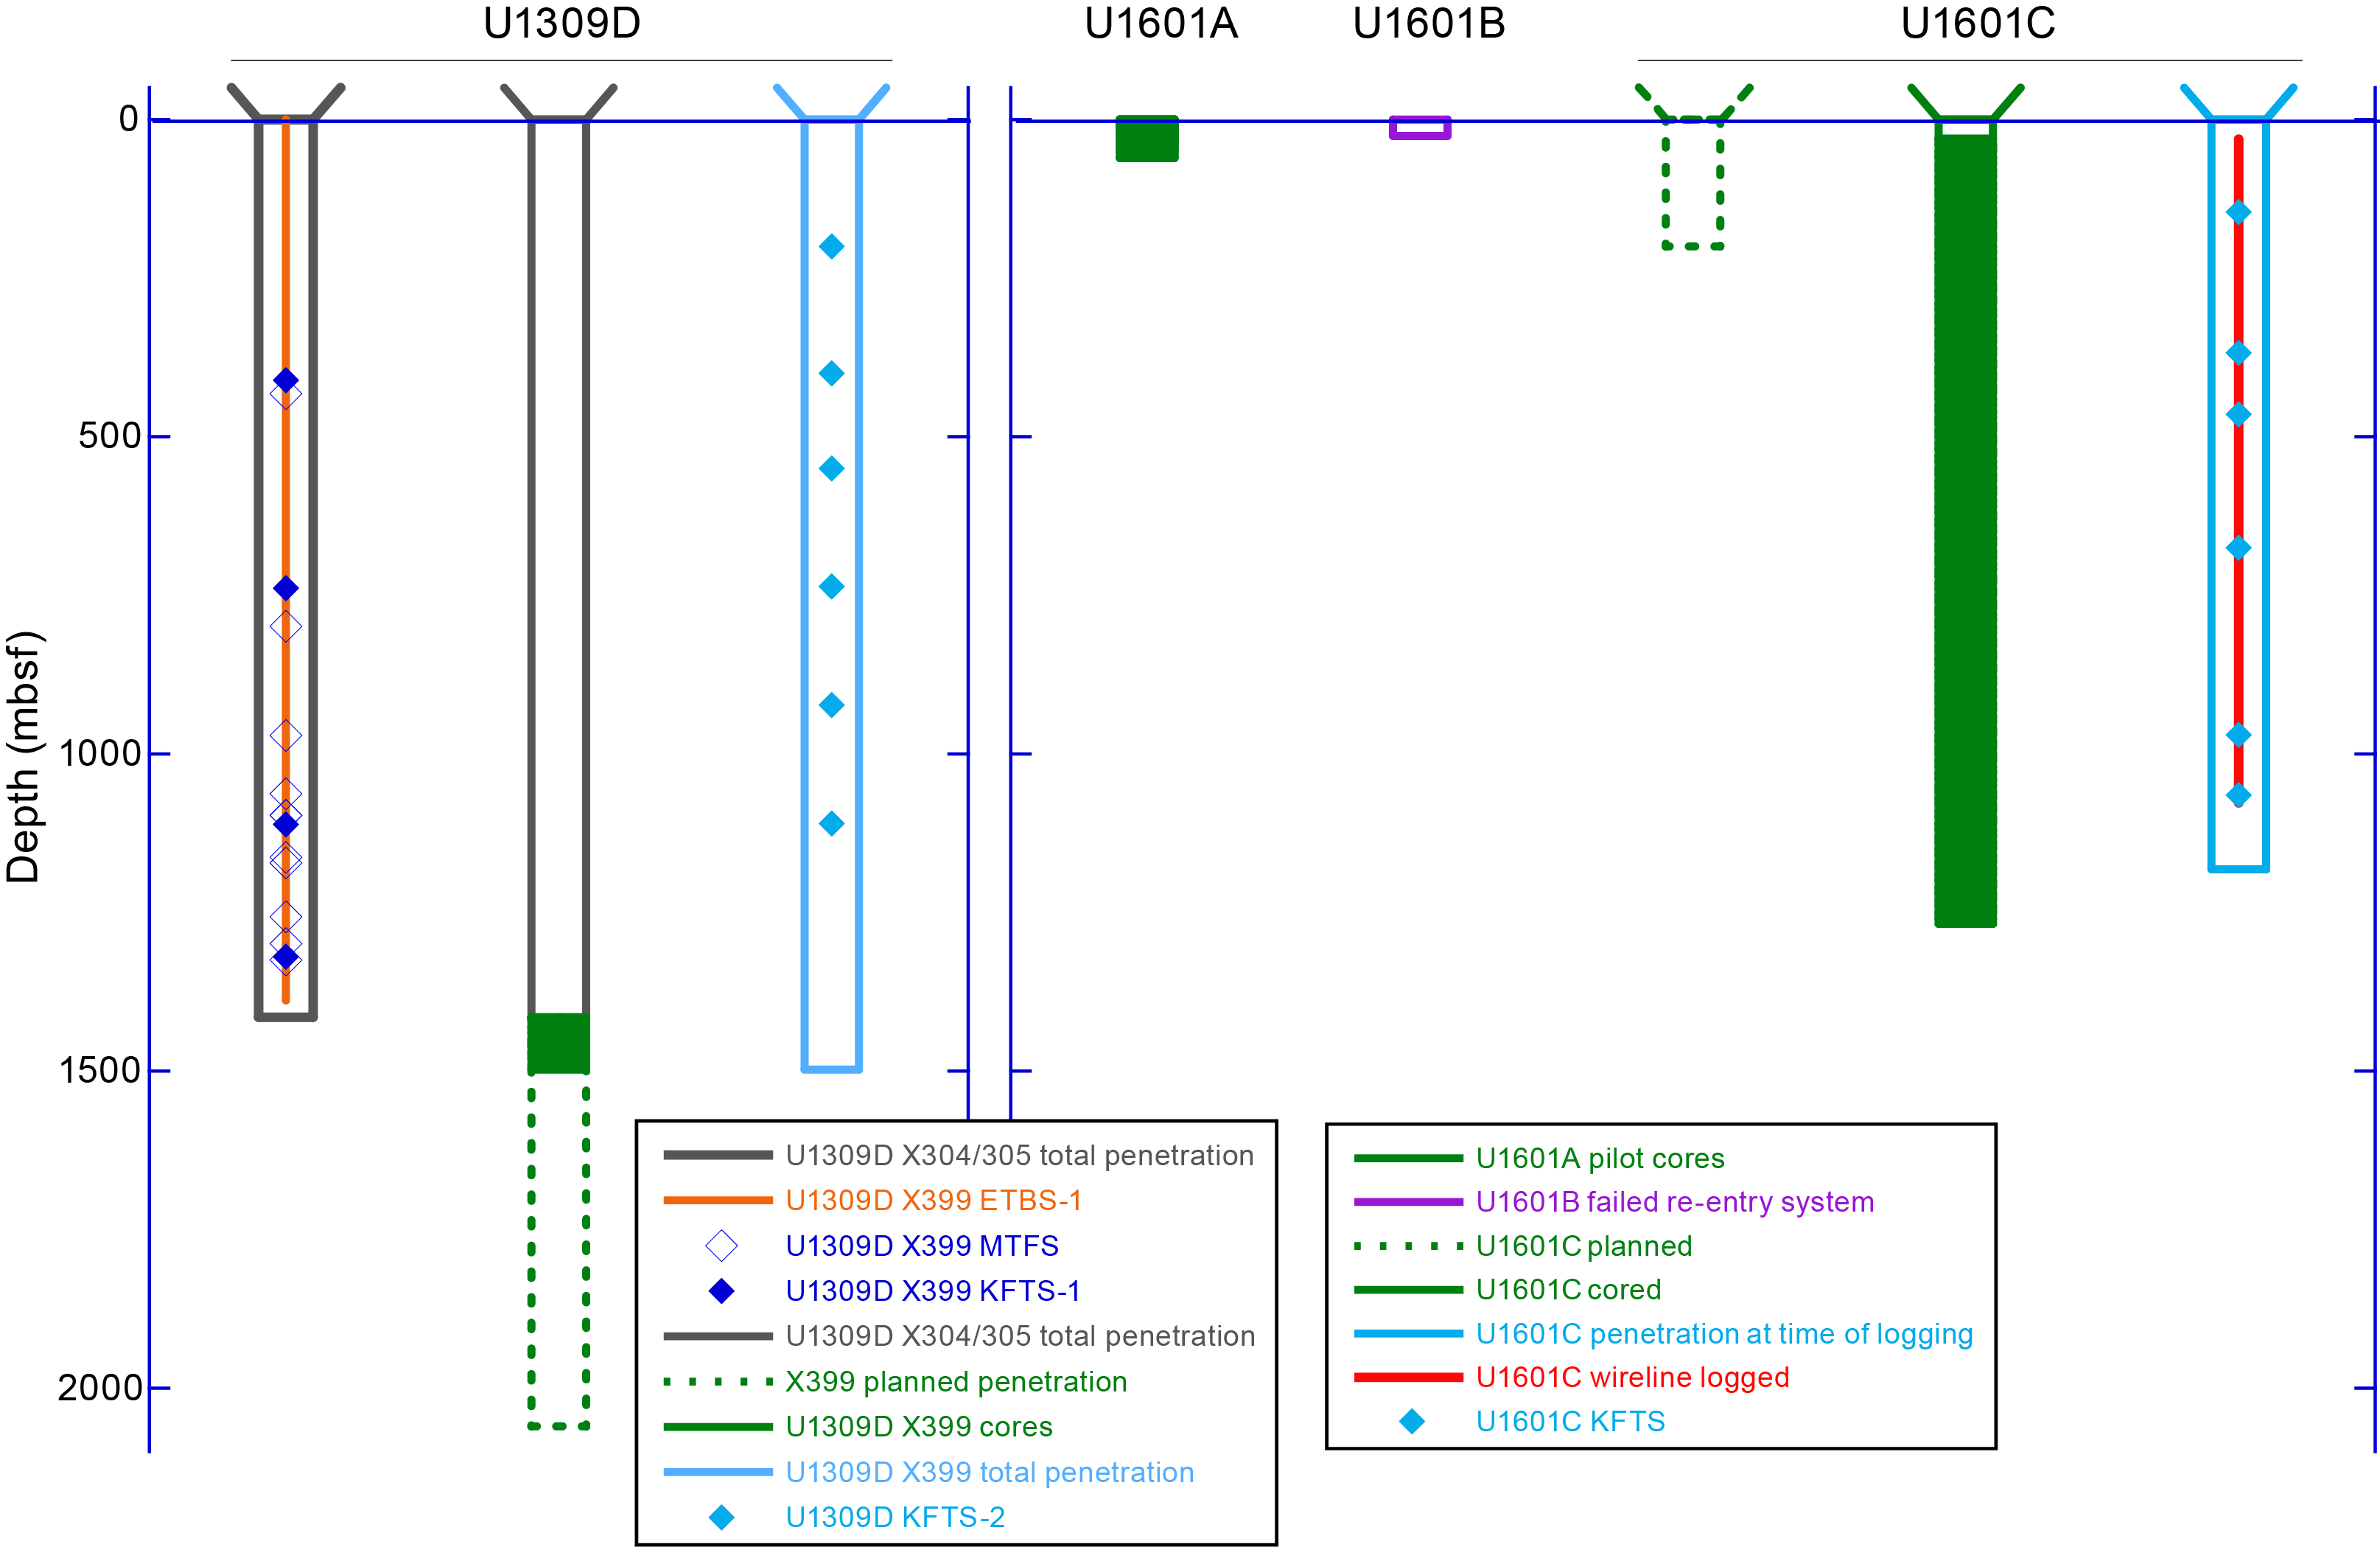
Figure F4. Operations summary.
On 19 April 2023, the rig crew assembled a bottom-hole assembly (BHA) with a rotary core barrel (RCB) and C-7 drill bit and deployed it to 854 meters below rig floor (mbrf) near the seafloor. The subsea camera was deployed for a brief seafloor survey. Site M0069 was immediately located thanks to several meters of pipe sticking out of the 2015 hole as well as various skid marks and sampling spots left by the remotely operated vehicle (ROV) Jason in 2018. Our survey line extended 60 m southwest of Site M0069 and showed sand waves along the seafloor, which were also seen more clearly on the 2018 ROV footage. No prohibitive obstructions or hazards were identified. As was true for most deployments of the subsea camera, two Niskin bottles attached to the camera frame were triggered to collect bottom water samples before the frame was retrieved (Table T2). The seafloor was tagged at 861 mbrf. Operations in the pilot Hole U1601A began by pushing the bit into the sediment with minimal rotation (5 rpm) and minimal pump (5 strokes/min) for 2.4 m. The core barrel for Core 399-U1601A-1R was retrieved at 2045 h and was empty. Core 2R was advanced 9.7 m, and subsequent Cores 3R–12R, recovered on 20 and 21 April, advanced 4.8 or 4.9 m each to a total depth of 60.6 mbsf. Recovery ranged 1%–72%, with an average of 26%, and increased downhole. At 1245 h on 21 April and at 56.3 mbsf, the bit became stuck. The rig crew tried to free the bit for the remainder of the day, without success. At 0045 h on 22 April, the decision was made to deploy the Schlumberger pipe severing tool. The first two severing attempts failed, and the third attempt at 1243 h succeeded in severing the pipe at 10.1 mbsf. The drill string was retrieved, and the end of the pipe cleared the rig floor at 1730 h, ending operations in Hole U1601A.
2.3. Hole U1601B
Assembly of the drill-in casing system began late on 22 April 2023. The upper guide horn was removed to create the space in the moonpool area needed to assemble the ~22 m long 13⅜ inch casing string, hydraulic release tool (HRT), landing platform, and free-fall funnel (FFF). The stinger BHA, including a mud motor, underreamer, and 12¼ inch bit, were assembled and tested. The reentry system was lowered to the seafloor, and drilling in Hole U1601B began at 1455 h on 23 April. Sepiolite mud sweeps were pumped every ~4 m. At 1215 h on 24 April, we reached the target depth of 26.0 mbsf. The "go-devil" trigger tool used to release the HRT from the reentry system was dropped and pumped down the drill string with 25 strokes/min until it landed, with a pressure drop indicating that the release had occurred. However, several attempts to pull the stinger subassembly out of the casing subassembly were unsuccessful despite turning the pumps on and off several times to work the underreamer. At 1430 h, the decision was made to retrieve the subsea camera and then the entire reentry assembly back to the rig floor. The rig crew started to disassemble the reentry system, with the stinger bit at the rig floor at 2353 h on 24 April. The mud motor was severely damaged: the lower section of the housing holding the bearing support, a 12 inch long cylindrical piece, had broken off and was missing.
The rig crew needed time to assess the situation, identify an alternative method for deploying a reentry system at Site U1601, and build that system. We decided that while this was happening, we would move to Hole U1309D to conduct the fluid sampling program and, depending on conditions, initialize coring.
2.4. Hole U1601C
After operating in Hole U1309D from 25 April to 1 May 2023, we returned to Site U1601 to deploy a reentry system in a new hole (U1601C). This was a different system from the one we were not able to release in Hole U1601B. It did not have a mud motor, underreamer, or a casing release tool. Instead, the plan was to drill a 14¾ inch ~22 m deep hole with a drilling bit, reenter the hole with a 9⅞ inch coring bit, drop a casing-cone assembly by letting it free fall into the hole using the drill string as a guide, and begin coring (Table T1; Figure F4). By 2254 h on 1 May, the ship had moved the 2 nmi from Hole U1309D to Hole U1601C in DP mode. Hole U1601C is located 20 m northeast of Hole U1601B.
2.4.1. Summary of bit runs with coring bit
Below is a summary of the bit runs in Hole U1601C, with the following information for the coring runs (bit runs with a coring bit): the number of hours the bit was cutting core at the bottom of the hole, the cores retrieved, the interval cored in meters below seafloor, and the average recovery:
- Bit Run 1: drill casing hole.
- Bit Run 2: coring Run 1 (50 h, Cores 399-U1601C-2R through 55R, 23–284.9 mbsf, and 60% recovery).
- Bit Run 3: coring Run 2 (54 h, Cores 56R–132R, 284.9–658.4 mbsf, and 84% recovery).
- Bit Run 4: coring Run 3 (50 h, Cores 133R–197R, 658.4–973.6 mbsf, and 74% recovery).
- Bit Run 5: coring Run 4 (50 h, Cores 198R–240R, 973.6–1182.2 mbsf, and 62% recovery).
- Bit Run 6: wireline logging and water sampling.
- Bit Run 7: milling.
- Bit Run 8: coring Run 5 (44 h, Cores 242R–259R, 1182.2–1267.8 mbsf, and 63% recovery).
2.4.2. Bit Run 1: drill casing hole
At 0130 h on 2 May 2023, assembly of the BHA with a 14¾ inch drilling bit was complete. After reinstalling the upper guide horn once more, deployment of the drill string began at 0315 h, was paused at 0400 h for general rig servicing, and was complete at 0630 h. Drilling the initial 14¾ inch wide and 23 m deep hole progressed slowly but steadily and was complete at 0615 h on 3 May. The drill string was retrieved, with the bit clearing the rig floor at 1025 h.
2.4.3. Bit Run 2: install casing and first coring run
Two joints of 10¾ inch casing, with a 10¾ to 13⅜ inch crossover at the top, were welded together and staged in the moonpool area. An RCB BHA with a new 9⅞ inch C-7 bit was made up and deployed through the casing, starting at 1345 h. The subsea camera was launched at 1610 h. While the ship was maneuvered to the Hole U1601C coordinates, we passed Hole U1601B, which had a hole in the center of a cuttings cone. At the Hole U1601C coordinates 20 m northeast, a "pond" of white sepiolite slurry came into sight but the hole was not visible. After a short period of poking into the pond, the bit reentered Hole U1601C at 1925 h and reached the bottom of the hole without detecting any fill. The bit was raised 8.7 m, and the camera frame was retrieved. The rig crew installed the FFF around the drill string and attached it to the top of the 13⅜ inch casing crossover. At 2334 h, the casing-cone assembly was dropped into the moonpool and down the drill string. At 0005 h on 4 May 2023, the subsea camera was launched to confirm that the reentry assembly had properly landed in the predrilled 23 m deep hole, which was visually confirmed. The camera frame and Niskin samples were retrieved, and the first core barrel was dropped. Unusually high pressure was indicated, which could have resulted from plugged jet nozzles. A second barrel was dropped without incident, and coring began. Coring progressed remarkably well, far exceeding expectations by reaching 284.9 mbsf during the first coring run. The subsea camera was launched once more while the drill string was being retrieved to confirm a clean exit of the bit from the reentry cone, confirming that the reentry system installation was fully successful. With the camera near the seafloor, we also briefly navigated over Holes U1601A and U1601B, identified the cutting cones, and confirmed that the seafloor was clear of any artifacts. The drill string was retrieved, clearing the rig floor at 1830 h.
2.4.4. Bit Runs 3–5: coring Runs 2–4
Despite having exceeded the planned penetration of 200 m at this site with the first coring run, the Science Party decided repeatedly to continue deepening Hole U1601C. Three more coring runs were completed from 8 to 25 May 2023, followed by bit Runs 6 and 7 for wireline logging and water sampling and for milling junk at the bottom of the hole, respectively. A fifth and final coring run with bit Run 8 was conducted from 29 May to 2 June.
All 4-stand coring BHAs were equipped with new C-7 coring bits. All reentries were successful. Approximately 20–30 m of soft bridges or hole fill were tagged after each reentry but never posed a significant problem to wash down. Down to Core 399-U1601C-178R (881.5 mbsf), 30 bbl mud sweeps were pumped every ~10 m of coring. Subsequent sweeps used 20 bbl of mud every ~10 m to conserve mud. Likewise, the final 50 bbl sweep at the end of each run was reduced to 30 bbl below that depth. Mud sweeps were followed with 2–7× the open hole volume of seawater at the end of each run. The bit used for Run 4 (coring Run 3) returned with 16 tungsten carbide teeth missing, a degree of wear considered acceptable and not traceable to any particular event. The bit used for Run 5 had lost the tips of all four roller cones. One of the cones had kicked inward, losing parts of the bearing, including the plug seal. Dozens of tungsten carbide teeth were missing or damaged. This led to the decision to conduct the milling bit Run 7.
After bit Run 4, we tested the Elevated Temperature Borehole Sonde (ETBS), which malfunctioned during previous deployments and had been repaired in the meantime. The test deployment inside the drill string returned valid temperature data, closely following the temperature profile measured by the Conductivity-Temperature-Depth (CTD) tool ~6 h later outside the drill string.
After bit Run 5, the hole was flushed with 6× the open hole volume (2223 bbl; 19,000 strokes) and then 1.5× the volume with freshwater (550 bbl; 4,710 strokes) to improve the resistivity contrast during subsequent wireline logging. When the drill string was retrieved to 55.5 mbsf, another 20 bbl of freshwater were pumped to top off the hole.
2.4.5. Bit Run 6: wireline logging and water sampling
We decided to conduct a full suite of wireline logging operations as well as borehole water sampling in Hole U1601C before attempting a final coring run in this hole. The intent of this sequencing was to minimize the various risks of not gathering the logging data for this >1 km deep legacy hole. On 26 May 2023, a 3-stand BHA with a logging bit was assembled without a floating valve and including a large-bore landing saver. The rig was serviced, the drill string was deployed, the subsea camera was launched, and Hole U1601C was reentered for the fifth time at 0406 h. The bit was positioned at 30.9 mbsf, and the camera was retrieved.
The first wireline logging tool string was assembled including the Schlumberger logging equipment head-mud temperature (LEH-MT) for borehole and tool temperature, Hostile Environment Natural Gamma Ray Sonde (HNGS) tool, and Hostile Environment Litho-Density Sonde (HLDS) for bulk density and photoelectric factor. We also added the IODP ETBS to the bottom of the tool string. The ETBS does not transmit data in real time. Logging started at 0715 h and ended at 1530 h on 26 May. The downward pass tagged hard at 1077 mbsf (105 m above the bottom of the hole). During both the downward and the upward passes, the tool string was held every 100 m for 10 min for the ETBS to acquire temperature equilibration time series.
The second logging tool string, including the neutron Accelerator Porosity Sonde (APS), High-Resolution Laterolog Array (HRLA) resistivity tool, and Ultrasonic Borehole Imager (UBI), started at 1700 h and was completed at 0225 h on 27 May. The tool string tagged at 1071.5 mbsf, slightly shallower than the first run. Logging with the third tool string, including the HNGS and the Magnetic Susceptibility Sonde (MSS), began at 0300 h and ended at 0830 h. This run reached 1075.5 mbsf. For the fourth tool string, including the Versatile Seismic Imager (VSI), we targeted the daylight hours to comply with marine wildlife protection protocols. At 1030 h, the protected species watch and preparation of the air guns began. At 1400 h, the logging attempt was aborted and postponed because of issues with cabling or software. Instead, we deployed the Formation MicroScanner (FMS) and Dipole Shear Sonic Imager (DSI) as the fourth logging tool string. This run began at 1445 h and ended at 2350 h with two upward passes completed. This fourth run reached 1070.0 mbsf. The hole is deviated a total of 10°. The tools were rigged down at 0045 h on 28 May.
We still had the postponed VSI to run as the fifth and final logging tool string. However, this required daylight, so we proceeded with borehole water sampling objectives instead (Table T3). The plan was to deploy the Kuster Flow-Through Sampler (KFTSs) assemblage, with two bottles in series plus the ETBS at the bottom, using the coring line. We planned to do this three times for a total of 6 sampling stations down the borehole. The CTD was added to the assemblage on the first, shallowest lowering but was removed for subsequent deployments to prevent exposing it to higher temperatures. The first run started at 0205 h on 28 May and ended at 0340 h. After laying out the tools, removing the water samples, and resetting the tools, the second deployment started at 0515 h and ended at 0725 h. The third deployment started at 0830 h and ended at 1225 h. Details of deployment depths are given below.
The prior issues with the VSI had been resolved, and the rig was again readied for wireline logging. The protected species watch began at 1430 h on 28 May, and the fifth logging tool string was deployed at 1435 h. An issue with the telemetry head required retrieval of the VSI string at 1515 h and replacement of the telemetry head. The air guns were prepared, and at 1640 h the tool string was redeployed to 1069 mbsf. Given the remaining daylight hours, the measurement stations on the upward pass were set at 100 m intervals. The run was completed at 2105 h.
We decided to conduct a fourth water sampling run because one of the samplers from a previous run only recovered ~5% of the chamber volume and the results from the other water samples were encouraging. The dual KFTS and ETBS configuration was deployed once more at 2215 h and was back on deck at 0055 h on 29 May. We retrieved the drill string equipped with the logging bit, which cleared the rig floor at 0335 h. This ended wireline logging and water sampling bit Run 6. The borehole water sampling effort in Hole U1601C yielded a total of 8 samples at 6 targeted depths intervals: 146, 368, 465, 675 (sampled twice with ~5% and 100% recovery, respectively), 970, and 1074–1065 mbsf (repeated at 1065 mbsf to avoid mud sampled at 1074 mbsf) (Table T3).
2.4.6. Bit Run 7: milling
Before the next attempt to deepen Hole U1601C, we needed to clear the hole of metal debris left behind by previous coring runs, particularly the last one, which left behind a cone bearing. A BHA was assembled with two junk baskets and a 9⅝ inch junk mill. The drill string was lowered to the seafloor at 0430 h on 29 May 2023, filling the pipe every 15 stands from the rig. The subsea camera was launched at 0527 h, and Hole U1601C was reentered for the sixth time at 0704 h on 29 May. The bit was further lowered in the hole, and a hard tag was encountered at 1074 mbsf. While washing down to the bottom of the hole at 1182.2 mbsf, hard spots were encountered at 1084, 1094, 1123, and 1145 mbsf. Milling, which included slowing circulation and rotating and lifting the pipe twice an hour, was carried out from 1430 to 1945 h. The hole cleaning action ended with pumping a 30 bbl mud sweep with 2× the hole volume of seawater. At 1945 h, we began retrieving the drill string, with the mill back on the rig floor at 0050 h on 30 May. The junk baskets contained several metal pieces among the rock cuttings, and some were clearly parts of the lost cone bearing.
2.4.7. Bit Run 8: coring Run 5
A BHA with a new C-7 coring bit was assembled. At 0330 h on 30 May 2023, after rig maintenance, the drill string was deployed to the seafloor, and Hole U1601C was reentered for the seventh time at 0554 h. The drill string was lowered in the hole and encountered a bridge at 1053.6 mbsf. After washing down to the bottom at 1182.2 mbsf, including a 30 bbl mud sweep, the wash core barrel was retrieved (ghost Core 399-U1601C-241G) and a new barrel was dropped. At 1445 h, coring in Hole U1601C resumed with Core 242R. Coring continued until the bit had accumulated 43.8 h on the bottom, and we decided to end coring with Core 259R at 1267.8 mbsf on 2 June. Cores 242R–259R recovered 53.9 m of the 85.6 m cored, with core recoveries ranging 31%–97% (average recovery of 63%). Mud sweeps of 20 bbl were pumped every ~10 m, with a final 30 bbl mud sweep followed by pumping 7× the hole volume of seawater. The last core barrel was retrieved at 1230 h, and the pipe was retrieved with the bit clearing the rig floor at 1800 h. This concluded operations in Hole U1601C, and the ship returned to Hole U1309D (see Hole U1309D (second visit) in the Site U1309 chapter [McCaig et al., 2025]).
2.5. Changes to shipboard processing on recognition of chrysotile
During coring operations at Site U1601, core describers identified and reported the presence of chrysotile veins in the recovered serpentinized peridotite cores. This led to major disruptions of core handling with almost daily changes to procedures, and required follow-up shore-based work for several months, as described in the Expedition 399 methods chapter (Lang et al., 2025).
3. Igneous petrology
Drilling at Site U1601 recovered a long in situ section of mantle rocks with subordinate igneous intrusions. Combined, the two holes (U1601A and U1601C) are dominated by serpentinized peridotites, with 57% harzburgite, 9% orthopyroxene-bearing dunite, and 3% dunite (Figure F5). Gabbroic bodies form 31% in total and occur on a range of scales, from millimeter-sized veins to bodies tens of meters in size. Ultramafic veins and diabase plus basalt are rare (0.1% and 0.4%, respectively).
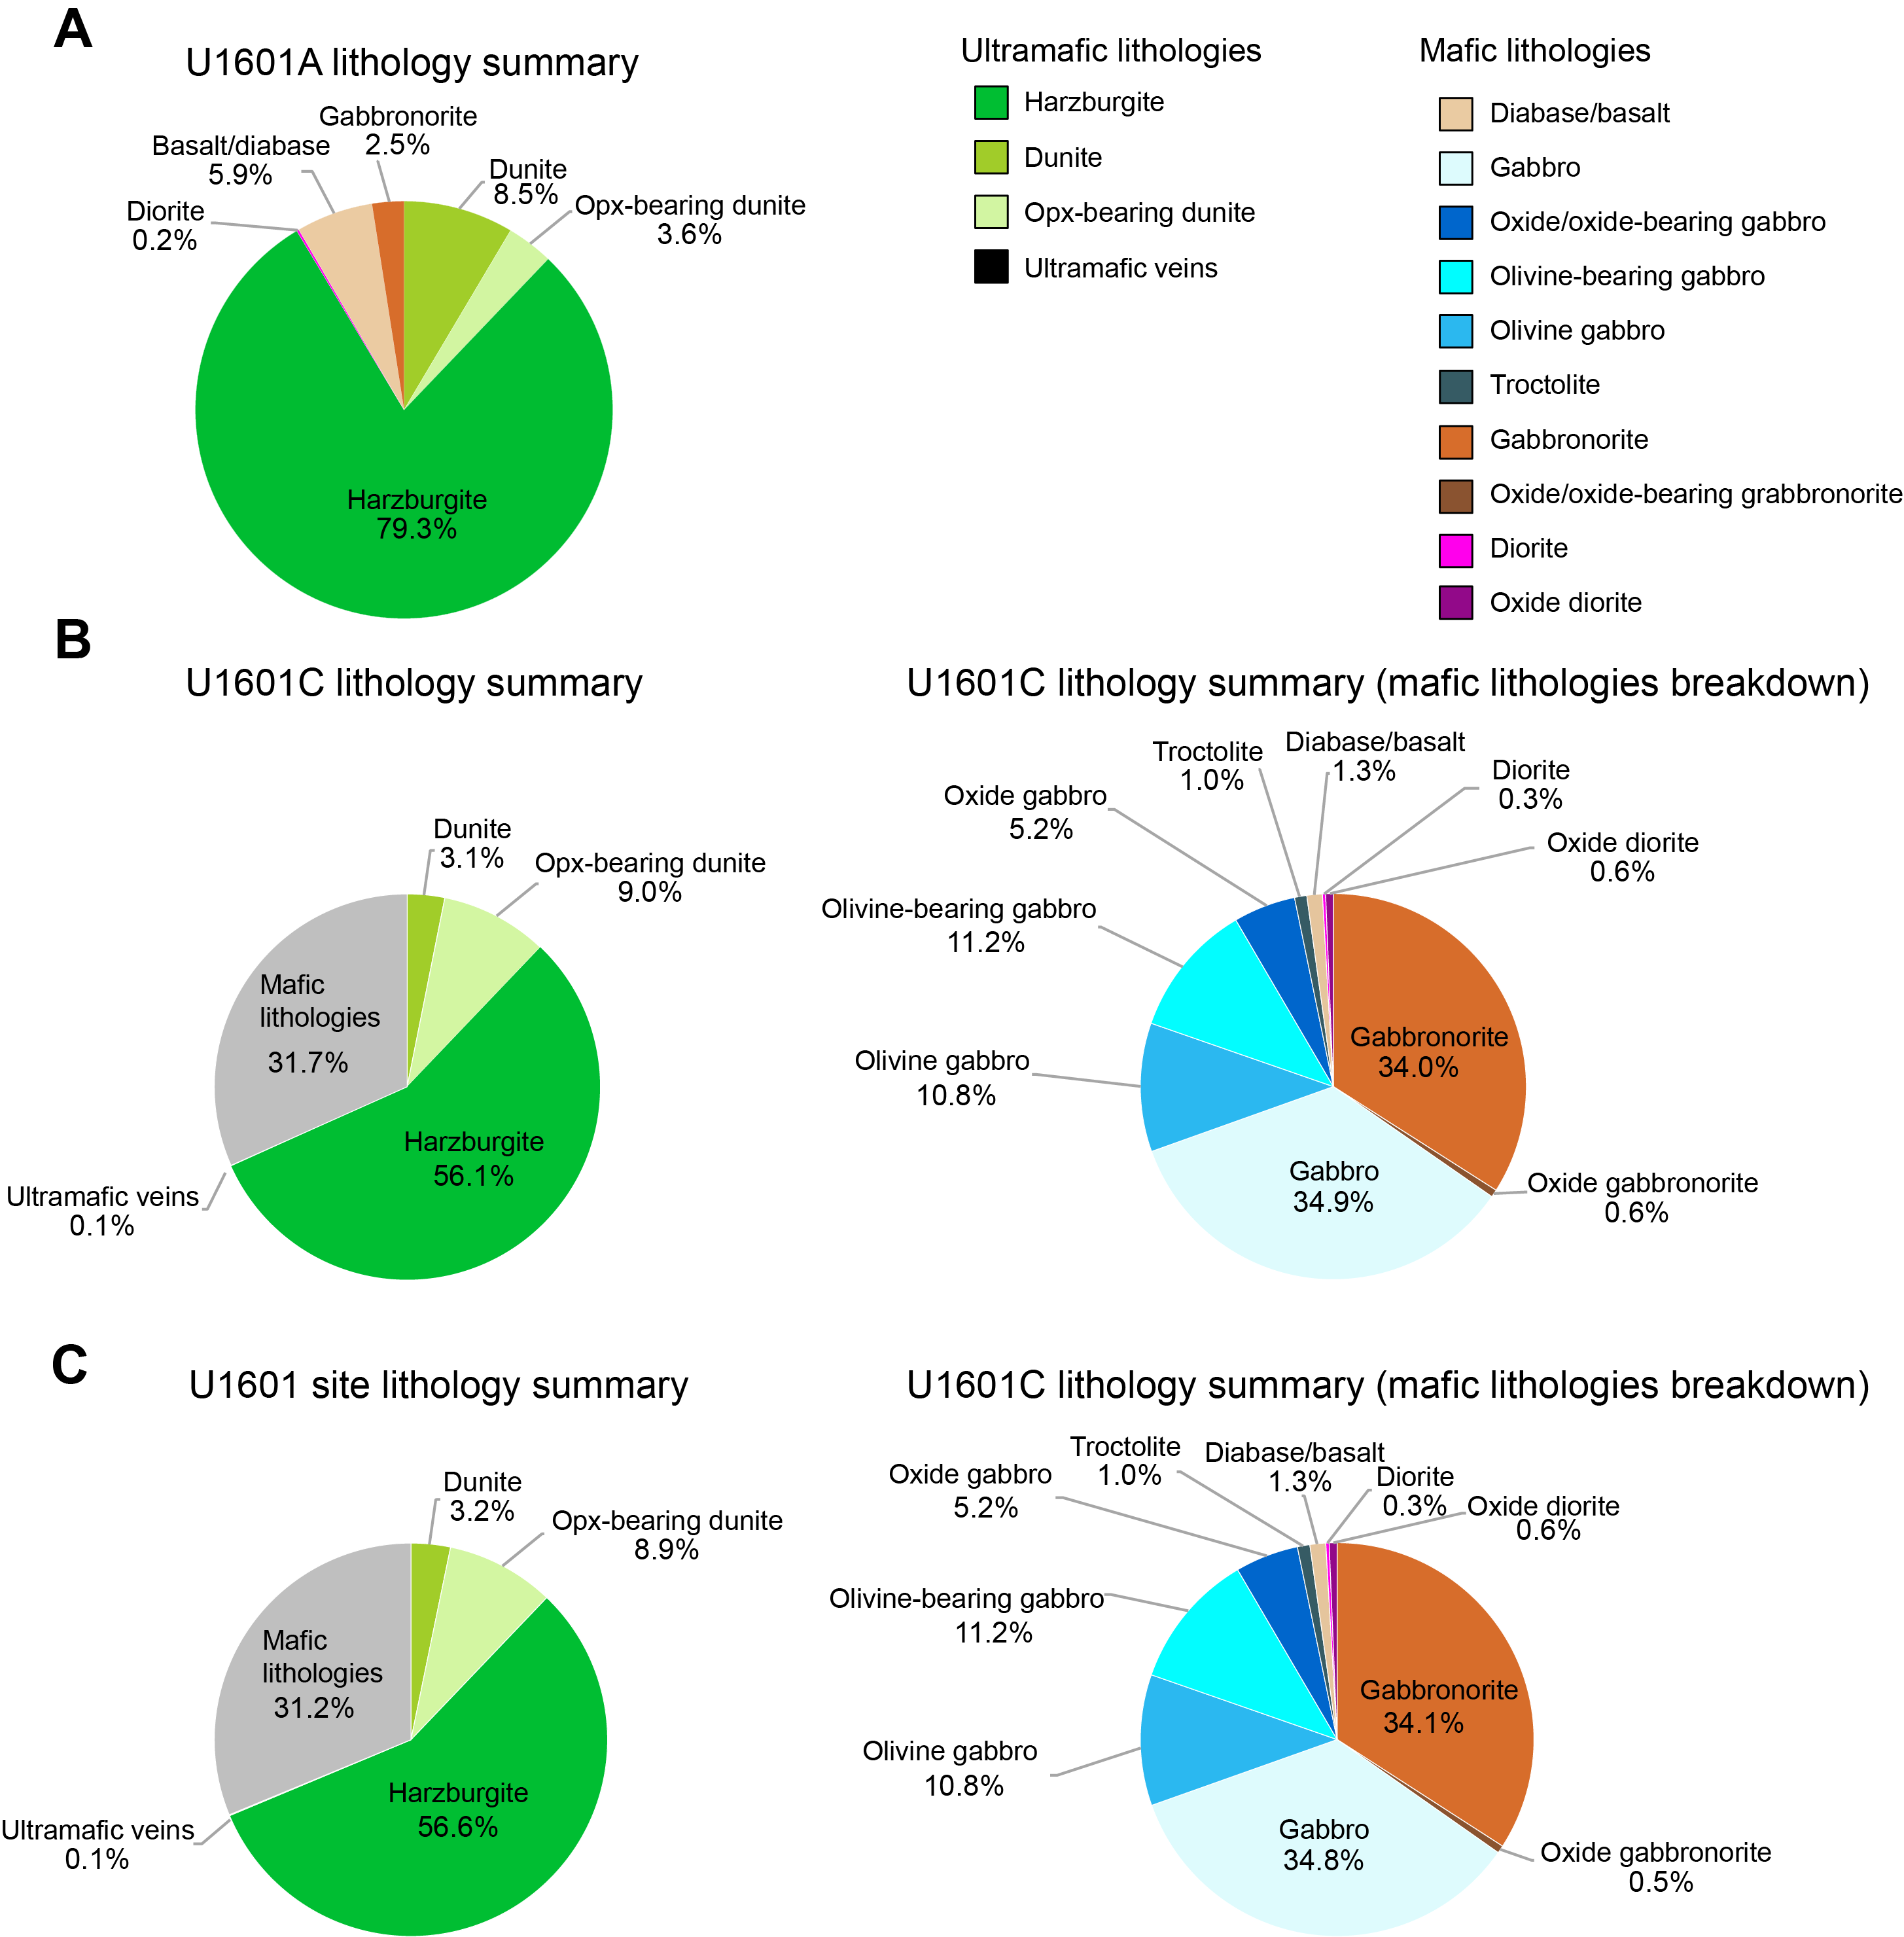
Figure F5. Lithologic percentages.
3.1. Hole U1601A lithostratigraphy
Hole U1601A cores are composed of a series of serpentinized peridotites (harzburgite to dunite; 91.4% of recovered lithologies in total) with subordinate basalt (5.9%), gabbronorite (2.5%), and diorite (0.2%) (Figure F5A). Eight lithologic units were defined within the sequence, primarily on the basis of changes in lithology (Figure F6). Subunits were defined in some of these units where significant modal changes occurred within units, a small interval of a different lithology occurred within a unit, or veins crosscut a unit.
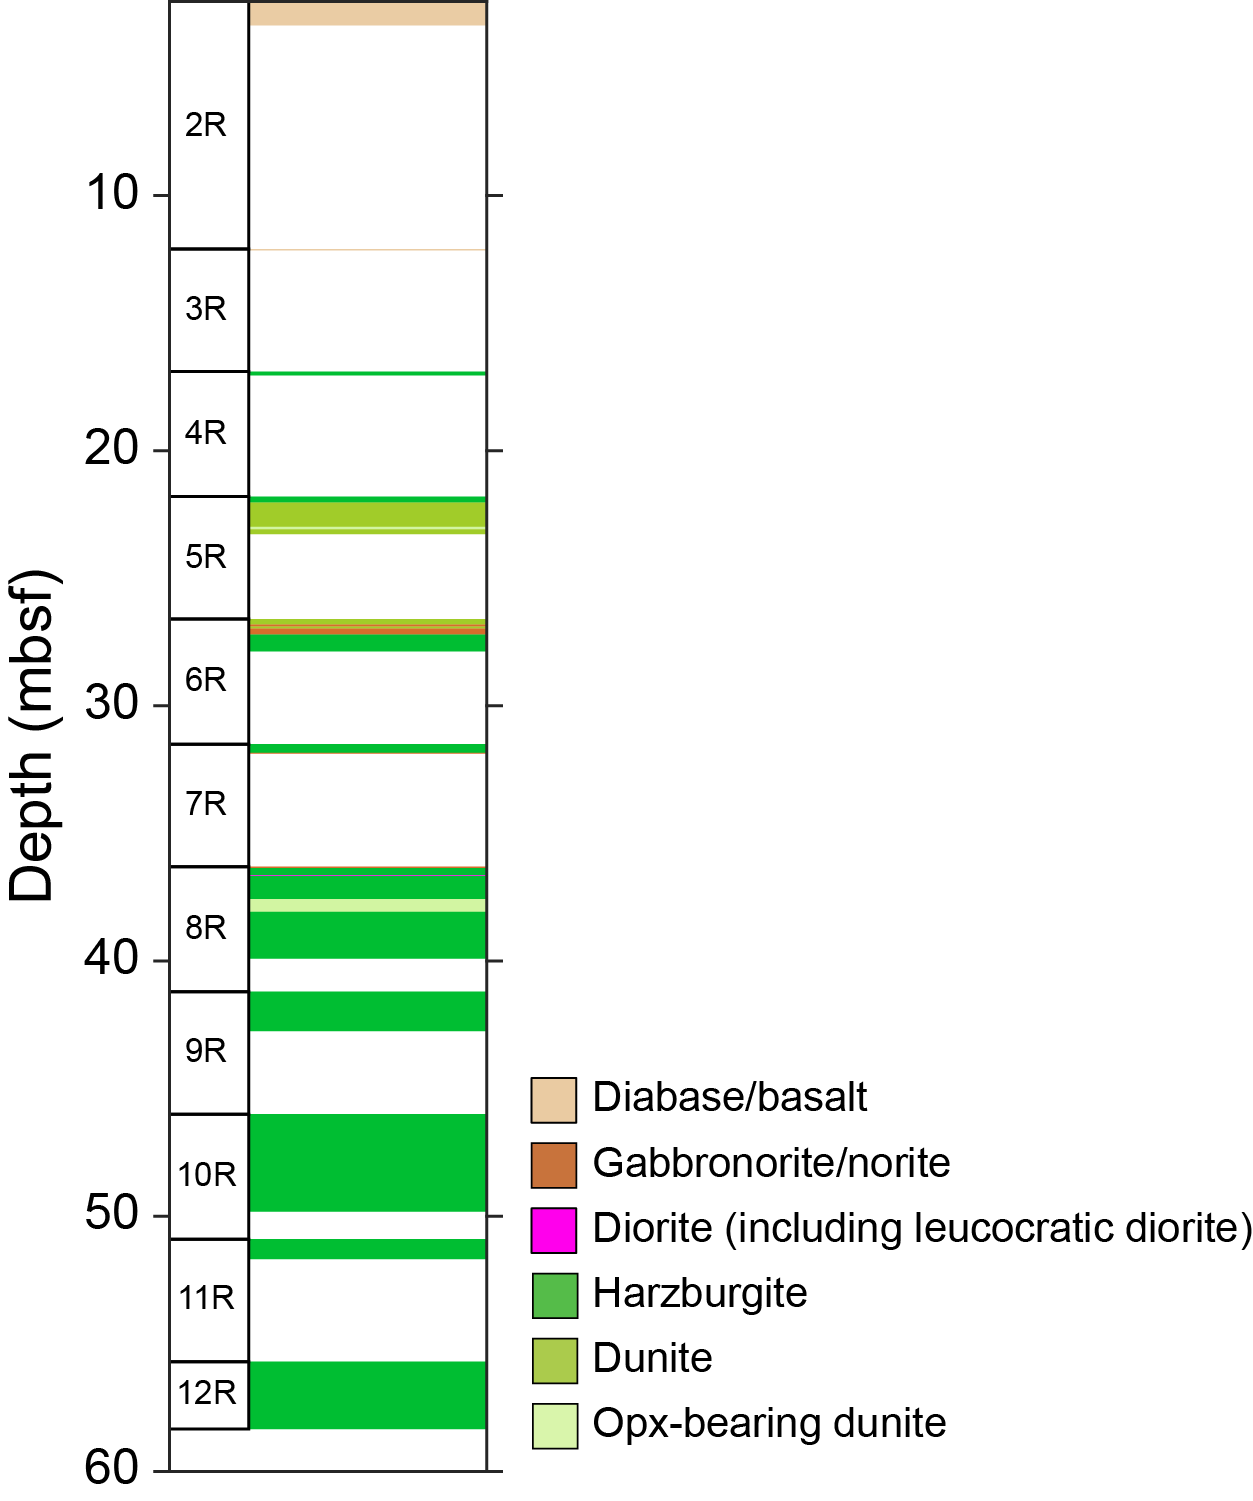
Figure F6. Lithostratigraphy, Hole U1601A.
3.1.1. Unit 1
The first unit is microcrystalline aphyric basalt with approximately 3% filled vesicles (Subunit 1A; Figure F7). Texturally, the basalt is microcrystalline, with 300–500 µm sized, highly elongate plagioclase crystals intergrown with altered groundmass that likely included former pyroxene. It is unclear whether this unit is extrusive or intrusive. Immediately below is a second aphyric basaltic rock (Subunit 1B). In contrast to Subunit 1A, it contains no vesicles. Instead, it is characterized by a network of millimeter-wide veins filled with basalt of slightly coarser grain size (Figure F8). These were interpreted to be segregation veins formed during cooling and crystallization of the unit. Based on the absence of vesicles and the slightly coarser grain size, the most likely origin of this basalt is intrusive. These basaltic units may correlate with the metadolerite recovered from the upper part of nearby Hole M0069A drilled during Expedition 357 (Früh-Green et al., 2017).
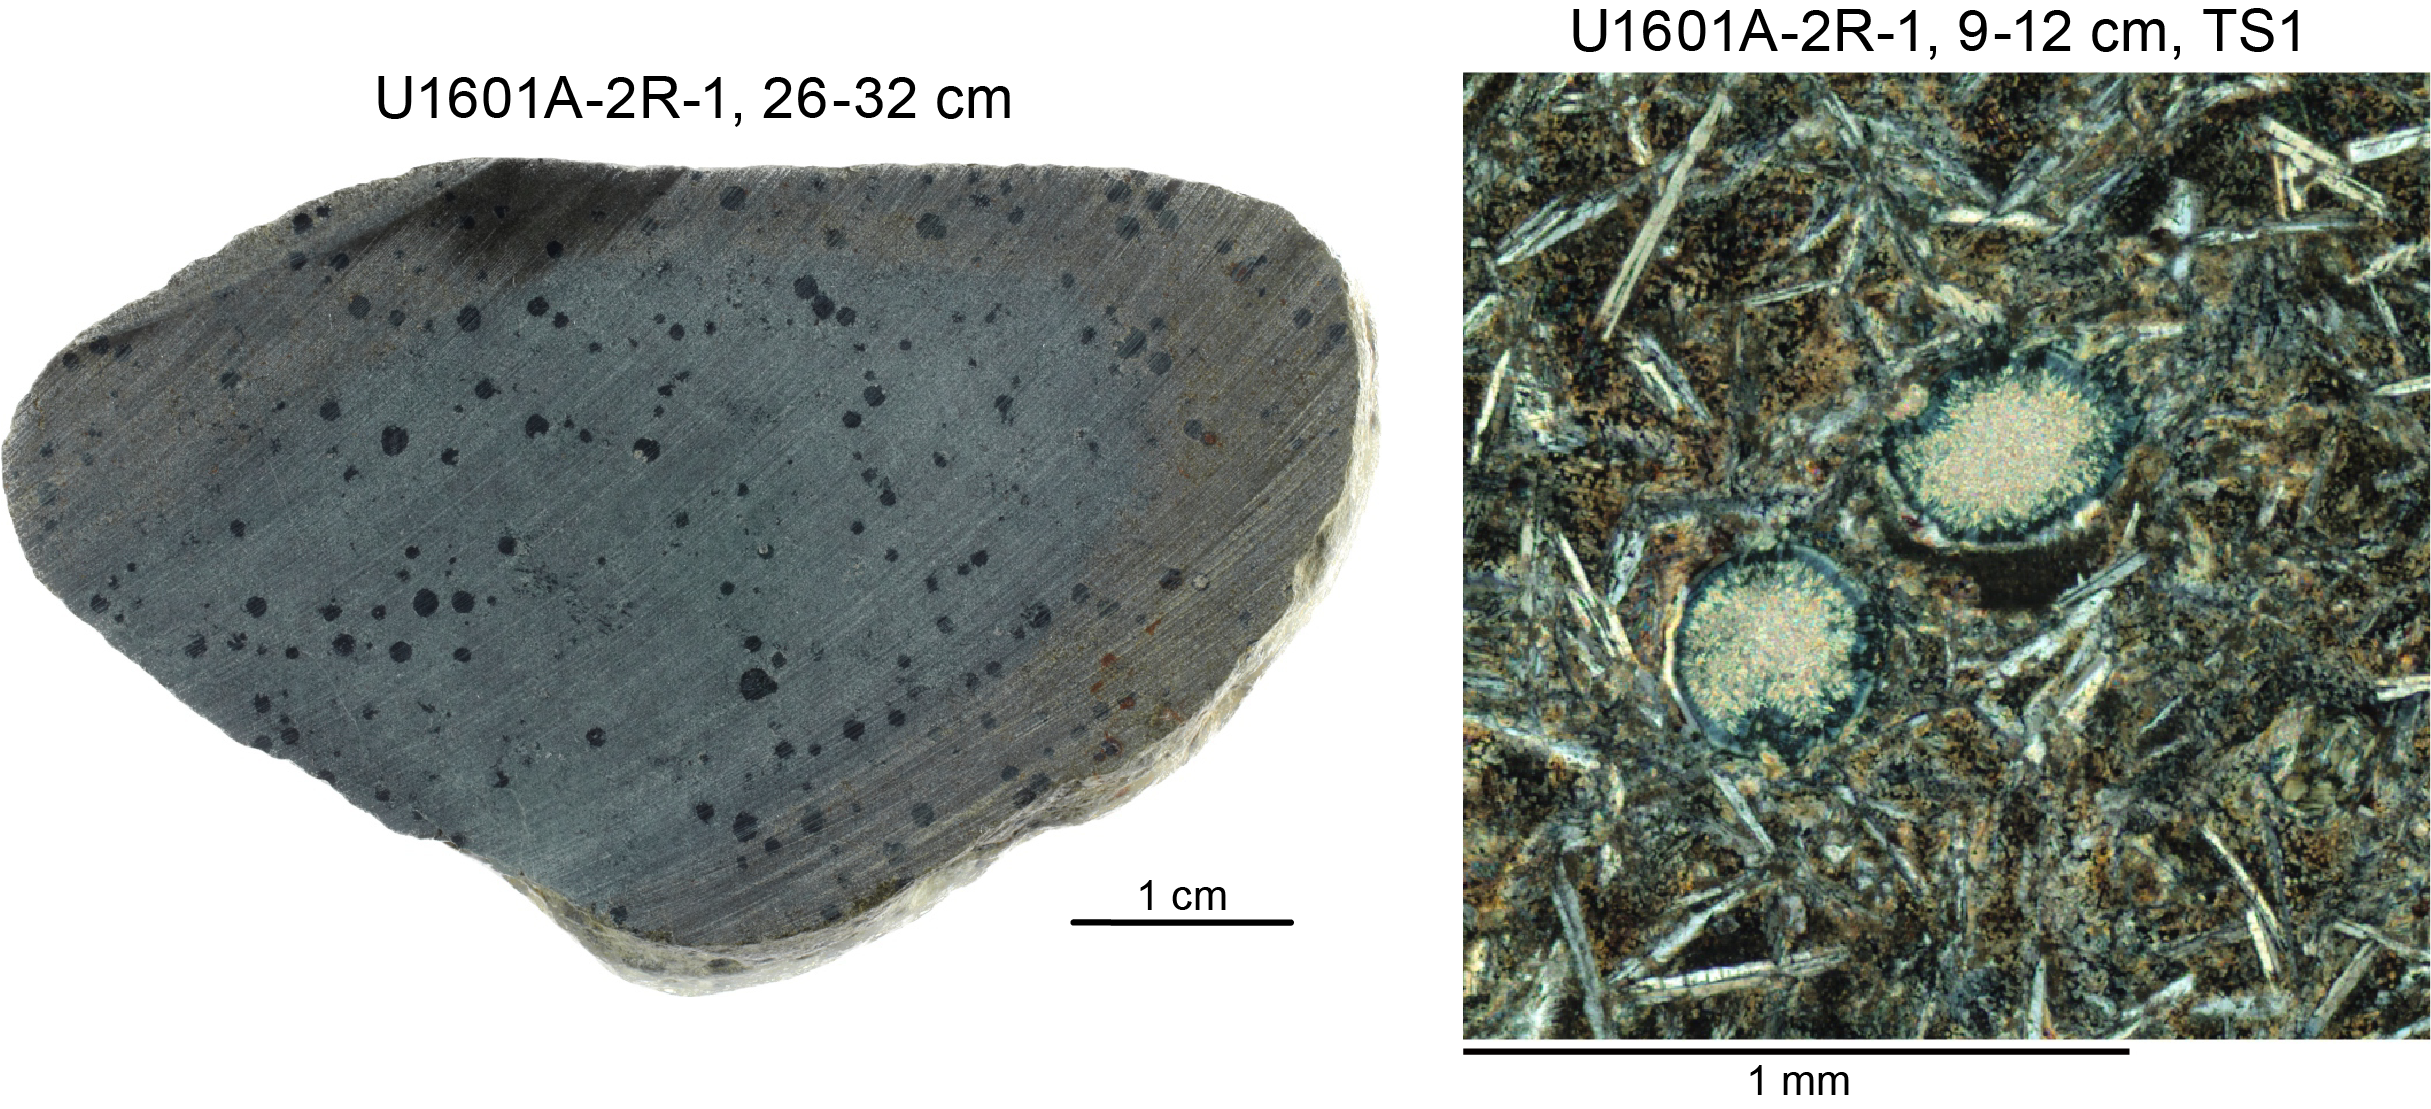
Figure F7. Basalt with filled vesicles.
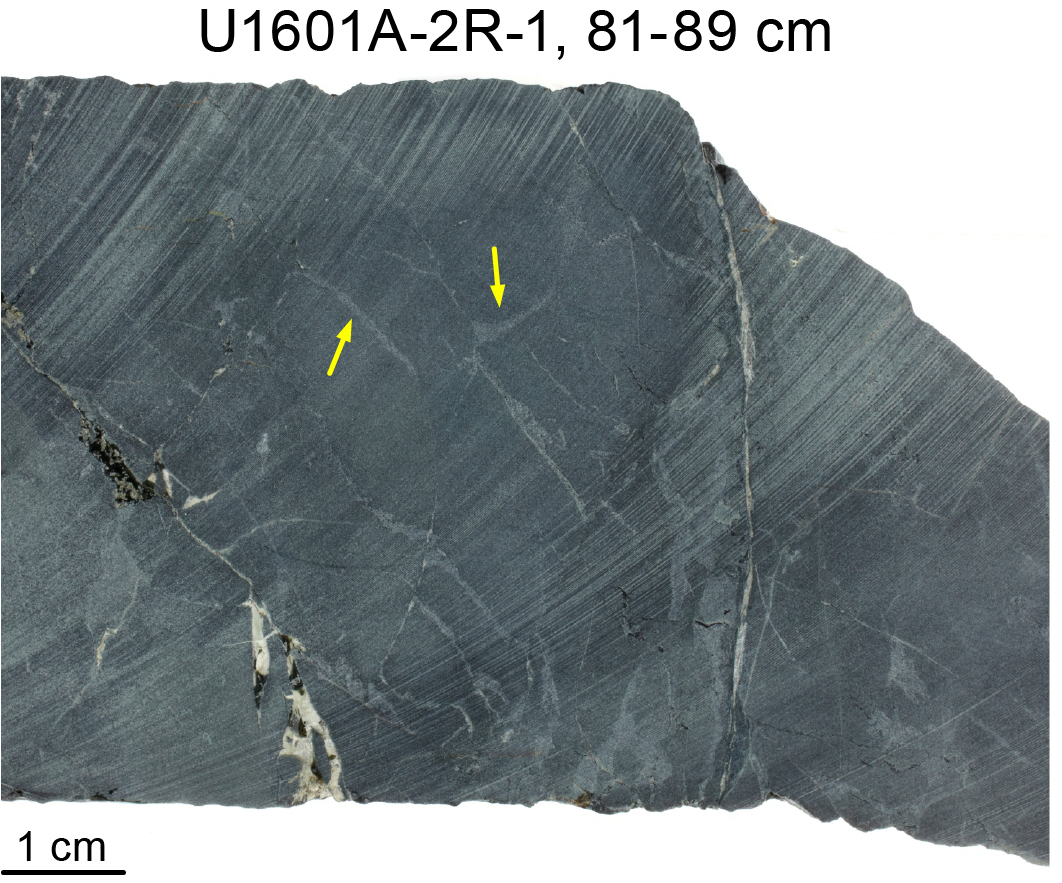
Figure F8. Potential segregation veins.
3.1.2. Unit 2
Below the basalt is a series of peridotites, the primary textures of which are strongly overprinted by alteration. The first peridotite unit (2) is highly altered and weathered harzburgite. The harzburgite contains no apparent clinopyroxene and has a trace amount of Cr-spinel.
3.1.3. Unit 3
The Unit 2 harzburgite grades into dunite, designated Unit 3. The dunite contains patches and trails of Cr-spinel (Figure F9A). Overall, the Cr-spinel concentration is 1%–3%, but patches can contain up to 10% Cr-spinel locally (Figure F9B, F9C). The Cr-spinel generally forms 1–3 mm amoeboid aggregates, often surrounded by plagioclase coronas (Figure F9B) and altered to magnetite. The dunite contains no apparent clinopyroxene and is mostly orthopyroxene poor (Subunit 3A) but grades into orthopyroxene-bearing dunite (Subunit 3B; Figure F10).
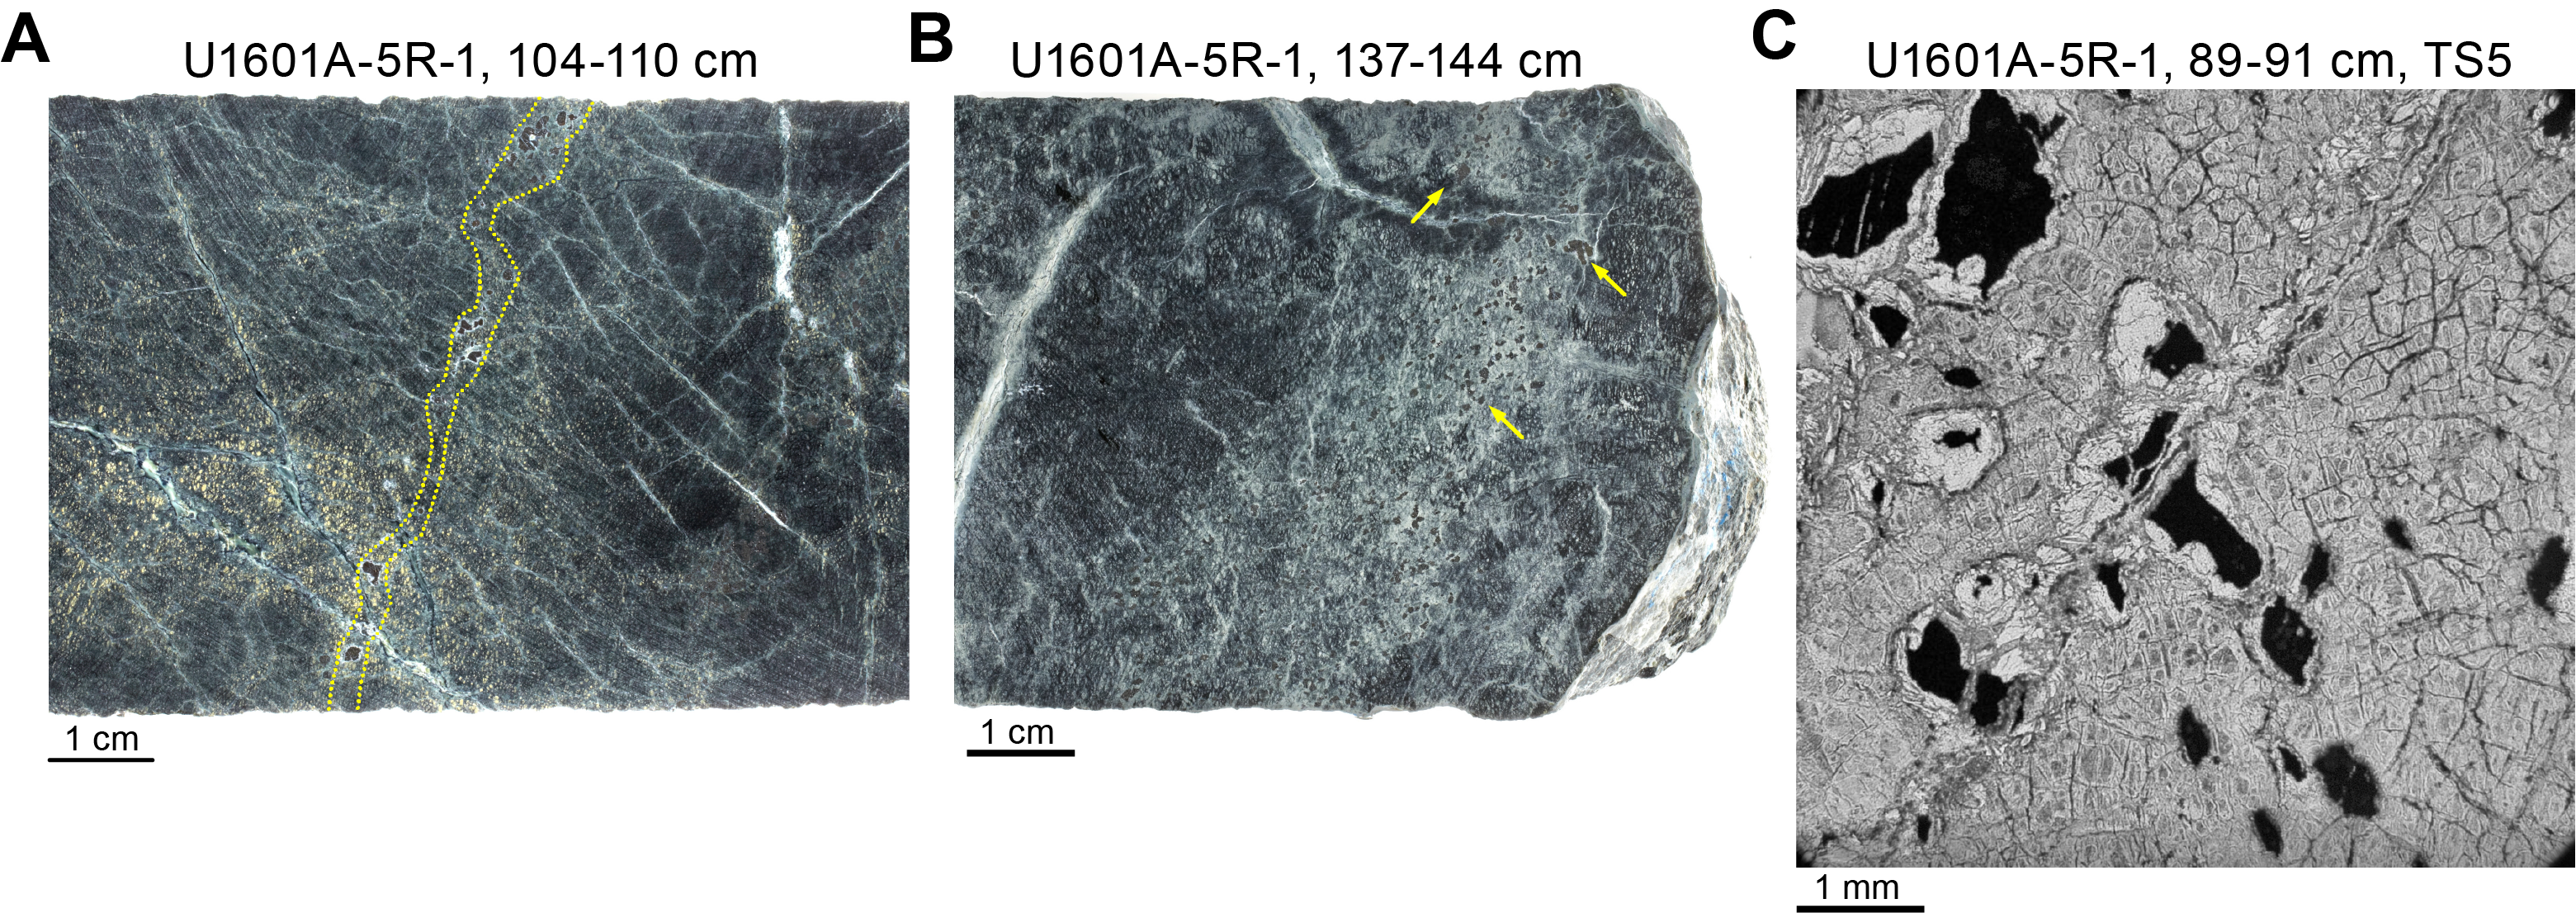
Figure F9. Spinel distribution in dunites, Hole U1601A.
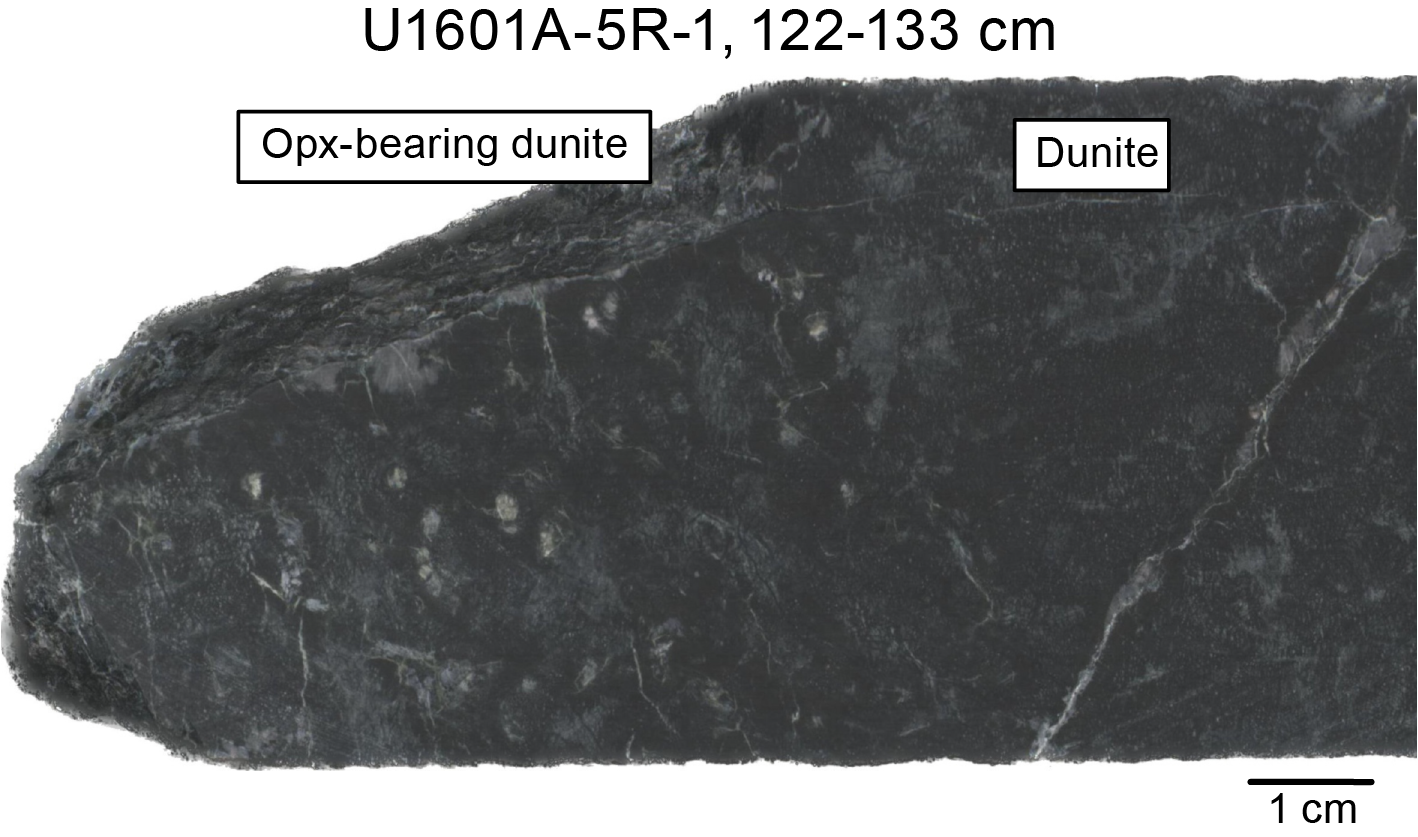
Figure F10. Orthopyroxene-bearing dunite/dunite boundary.
3.1.4. Unit 4
Unit 4 comprises two narrow intervals of highly deformed and altered gabbronorite (Unit 4; Figure F11) separated by a single pebble of dunite (Subunit 4B). The gabbronorite is medium grained but preserves few other primary properties.
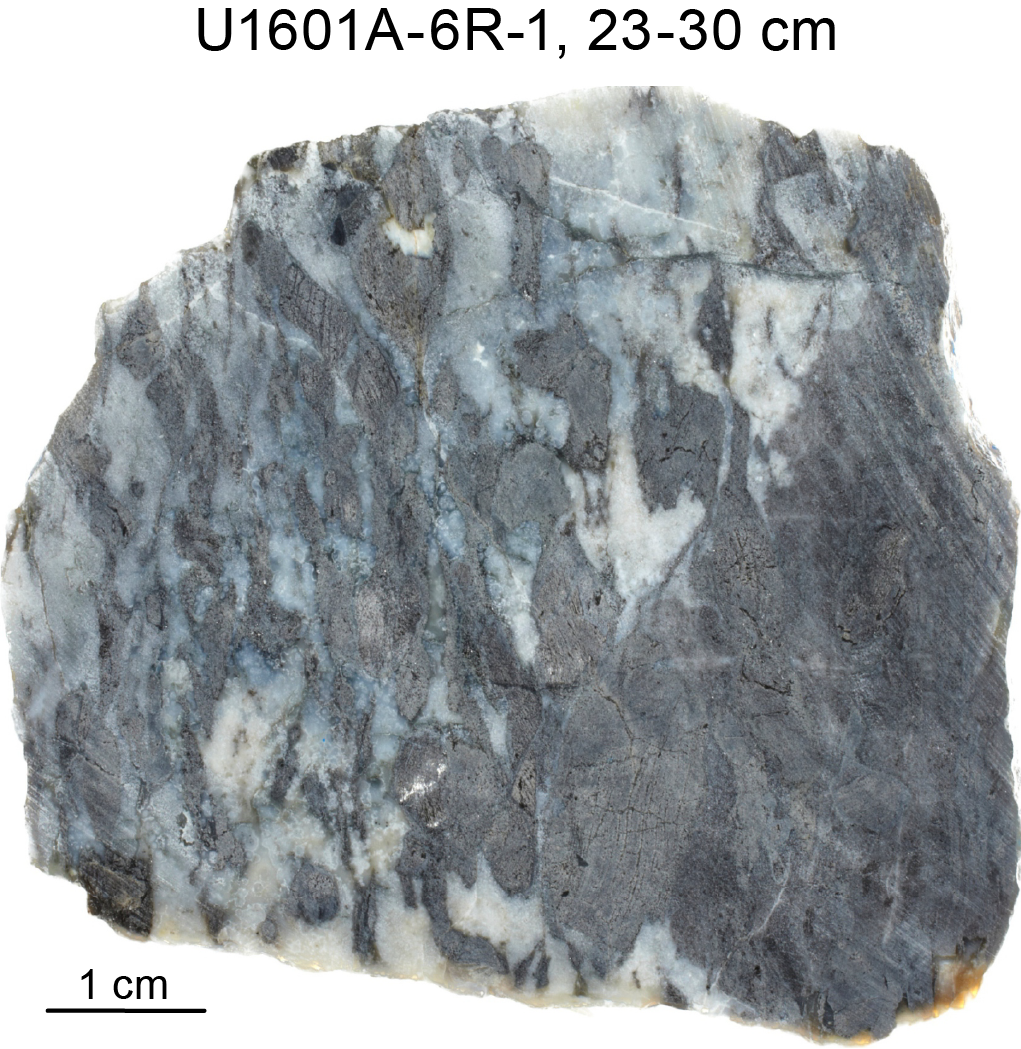
Figure F11. Deformed gabbronorite.
3.1.5. Units 5 and 6
The remainder of the hole is dominated by harzburgite. Initially highly altered and weathered (Unit 5), it becomes slightly less altered from 27.68 mbsf (Unit 6). Unit 6 is dominated by harzburgite with variable proportions of pyroxene and associated variations in texture. In the first Subunit (6A), orthopyroxene proportions vary at the scale of a few to tens of centimeters (10%–21%; average = 15%). Locally, orthopyroxene proportions are less than 10% and the harzburgite grades into orthopyroxene-bearing dunite (Subunit 6D). Orthopyroxene is generally granular, equant to subequant, and often rounded as a result of crystal-plastic deformation (Figure F12), with size ranging 1–16 mm (average = 4.5 mm). Clinopyroxene is rare and was only identified as a minor phase (1%) around 39 mbsf (Section 399-U1061A-8R-3), where it forms small (1–3 mm; average = 2 mm), apple green grains with anhedral to subhedral shapes and equant to subequant habits. Some clinopyroxene is intergrown with orthopyroxene. Cr-spinel occurs as a trace phase, predominantly as amoeboid grains and aggregates 1–3 mm in size. Some Cr-spinel is intergrown with orthopyroxene.
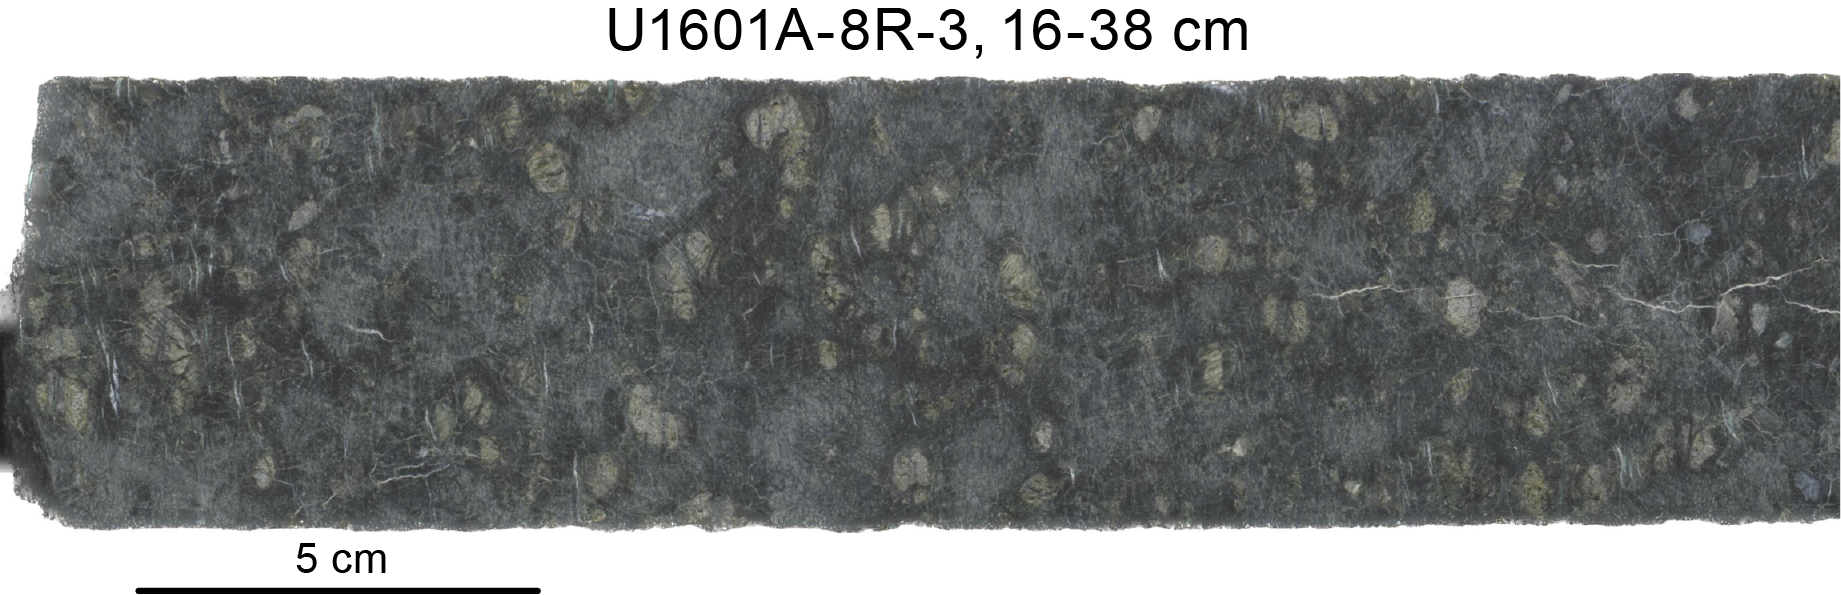
Figure F12. Harzburgite with granular orthopyroxene.
From Section 399-U1061A-10R-1 (49 mbsf), two different orthopyroxene textures appear to be present in the harzburgite (Subunit 6E). The first occurs as granular, equant to subequant, often rounded, typically ~5 mm sized grains that have been strongly deformed during crystal-plastic deformation. This is the typical occurrence of orthopyroxene in the hole, and we consider these orthopyroxenes to be residual. In contrast, the second type of orthopyroxene ranges from granular grains with interstitial rims to entirely interstitial grains (Figure F13). Throughout the expedition, this orthopyroxene texture was referred to as interstitial. The interstitial orthopyroxene is distributed unevenly throughout the core, concentrated in particular zones.
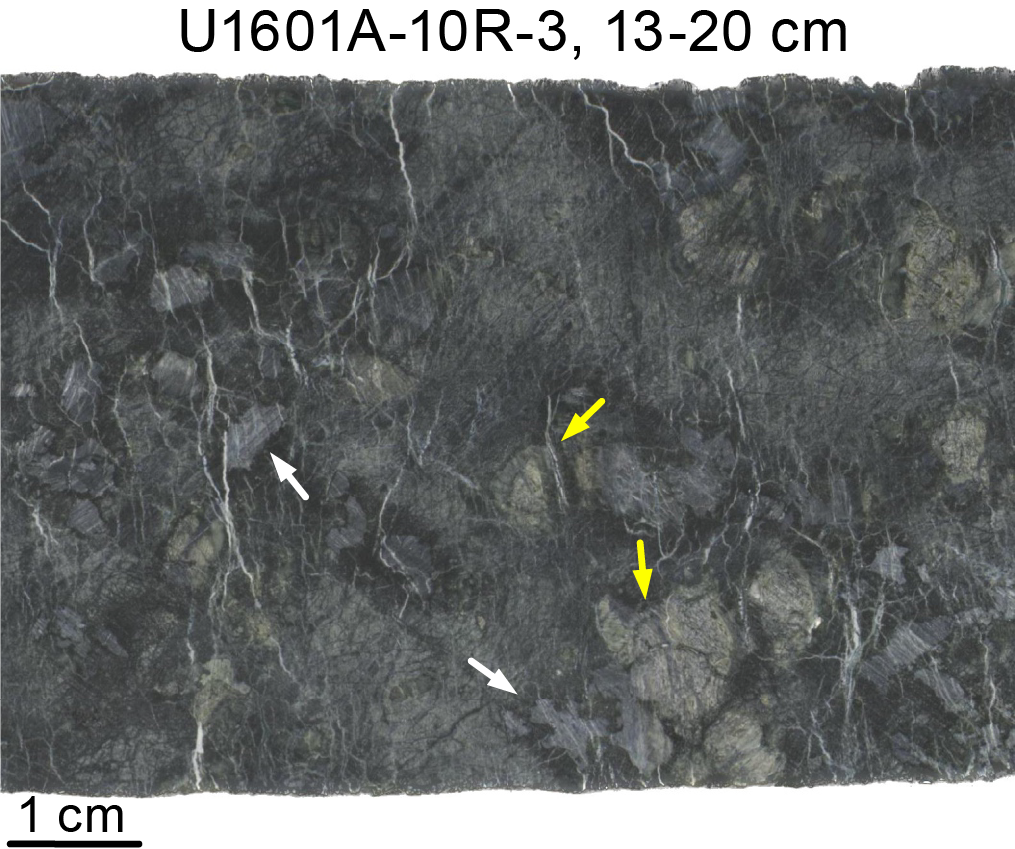
Figure F13. Harzburgite containing orthopyroxene.
The Unit 6 harzburgite contains a narrow interval of deformed medium-grained gabbronorite (Subunit 6B) crosscut by a centimeter-wide medium-grained olivine gabbronorite vein (Subunit 6C). Thin section observations show that the gabbronorite vein contains zones of serpentine throughout; hence, the vein may have formed by impregnation of melt into the surrounding harzburgite, crystallizing plagioclase and clinopyroxene within an olivine-orthopyroxene framework.
3.2. Hole U1601C lithostratigraphy
Like Hole U1601A, Hole U1601C is dominated by serpentinized peridotites (56% harzburgite, 9% orthopyroxene-bearing dunite, and 3% dunite; Figure F5B). However, Hole U1601C contains a larger proportion of gabbroic rocks (32%). The distribution of the various rock types in the section is uneven (Figures F14, F15). The uppermost 180 m contains abundant dunite with a number of gabbroic intrusions between ~120 and ~195 mbsf. Between 200 and 640 mbsf, the section is dominated by harzburgite with only rare dunites and gabbros. The proportion of gabbroic rocks gradually increases again from ~640 mbsf; gabbros are particularly prevalent below ~950 mbsf.
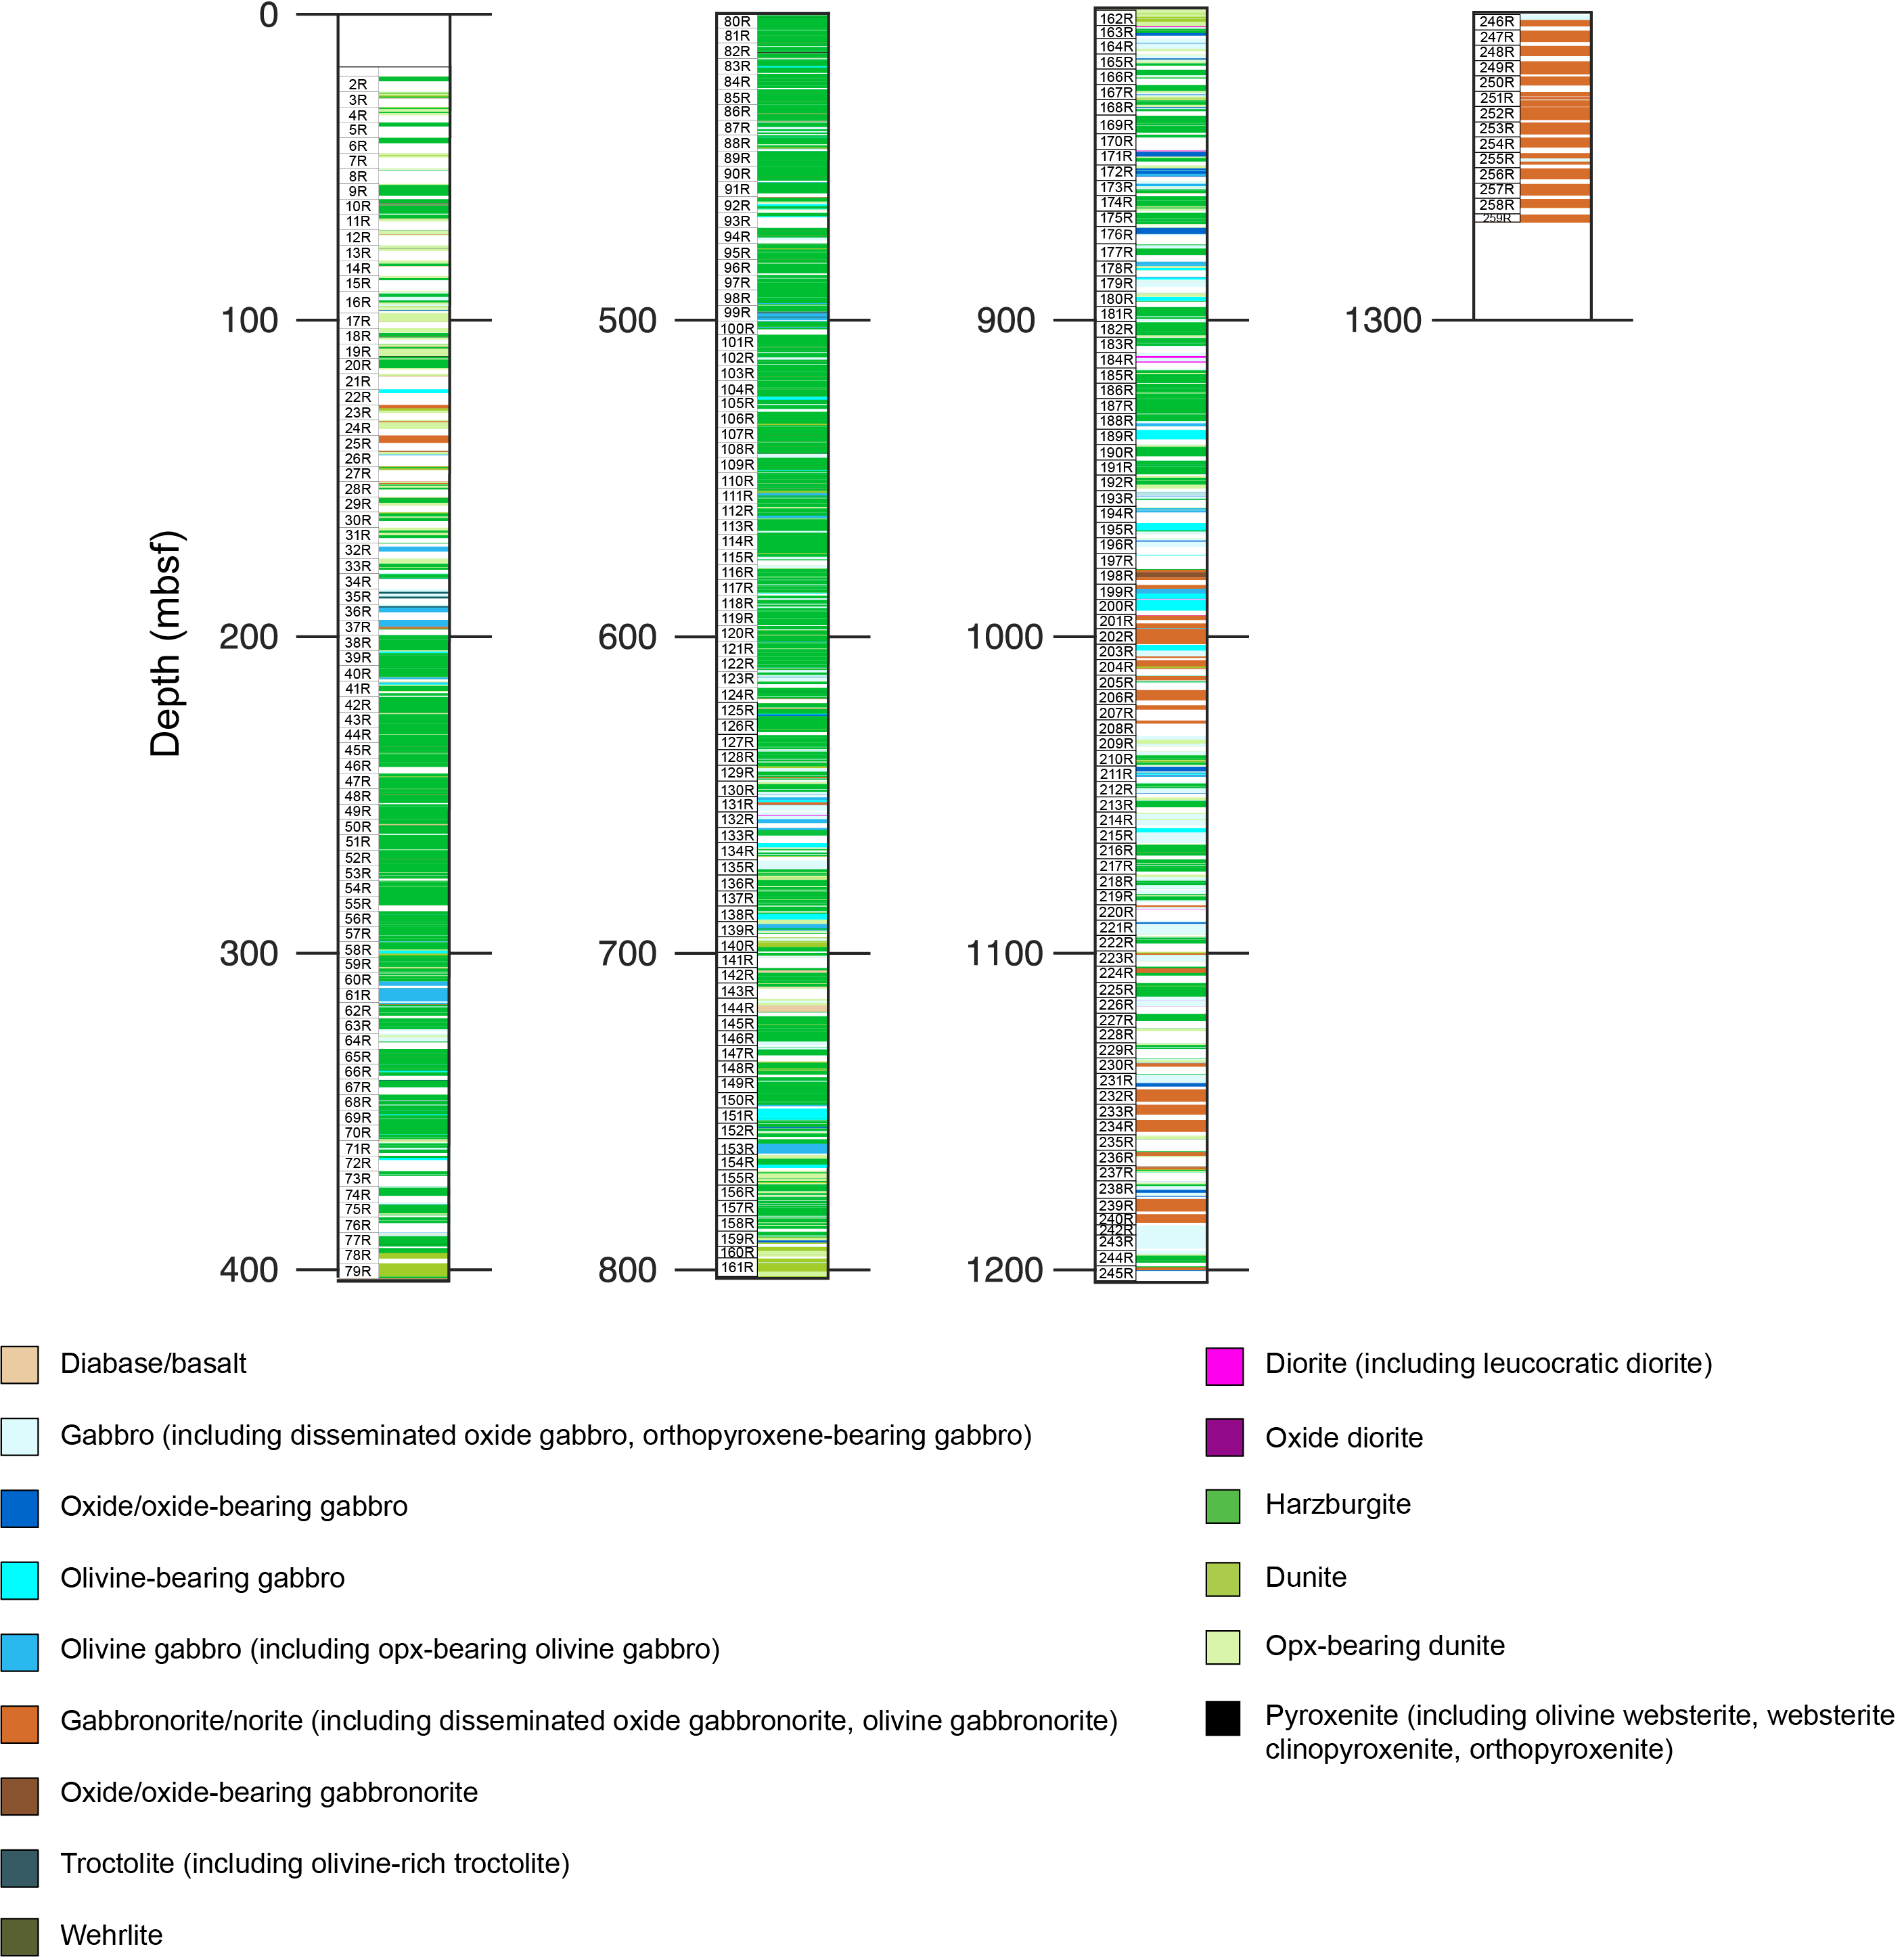
Figure F14. Lithostratigraphy, Hole U1601C.
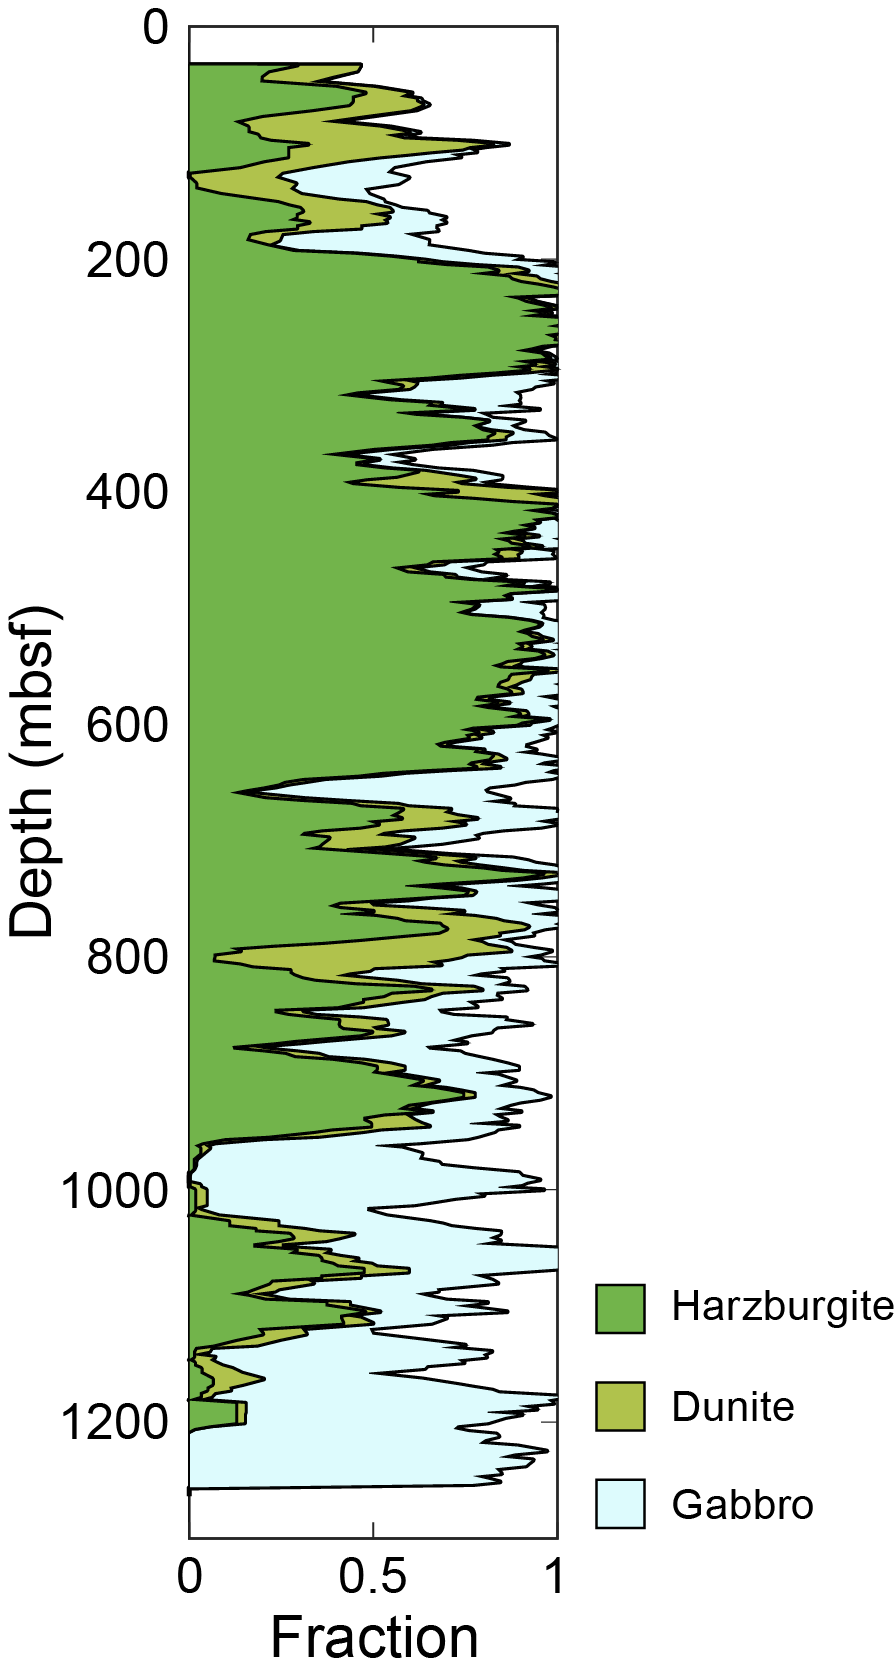
Figure F15. Running average, harzburgites, dunites, and gabbroic rocks.
For unit designation purposes, we assumed that the hole represents a long section of mantle rocks that we designated as a single unit (2), with subunits for the different peridotite lithologies and textures (Subunit 2A = harzburgite, Subunit 2B = orthopyroxene-bearing dunite, Subunit 2C = dunite, Subunit 2D = harzburgite with interstitial orthopyroxene, and Subunit 2E = orthopyroxene-bearing dunite with interstitial orthopyroxene). Mafic (gabbroic rocks or diabase) and nonperidotite ultramafic rocks (e.g., pyroxenite and olivine websterite) occur throughout and were designated as units and numbered sequentially. Exceptions are thin gabbroic veins, which were usually treated as domains within a section or interval.
Below, we first describe the peridotites before summarizing the petrologic features of the gabbroic intrusions and veins. The latter are further divided into subtypes of veins based on their occurrence and petrologic features. Finally, diorites and diabase are described.
3.2.1. Peridotites
Unit 2 comprises the mantle peridotite unit and includes harzburgite (82%), orthopyroxene-bearing dunite (13%), and dunite (5%). It is the predominant unit in the hole (68%; Figure F5B). These lithologies alternate at various scales and frequencies, as summarized in Figures F14 and F15. Mineral proportions are somewhat variable, but most rocks define an array of harzburgite to dunite with variable olivine:orthopyroxene ratios (Figure F16). Olivine is highly serpentinized in much of the unit; hence, olivine properties (habit and grain size) were not determined. Orthopyroxene varies in abundance, grain size, and grain shape. These variations occur on a wide range of scales: within individual sections, orthopyroxene grain size and/or mode vary on a centimeter to decimeter scale; section-to-section variations represent meter-scale variations; and on the scale of the entire hole, variations are evident with distinct orthopyroxene lows at 0–200 and 800–1200 mbsf and highs around 230, 410, and 750 mbsf (Figure F17). There is a broad correlation between orthopyroxene abundance and grain size, with smaller grain size (generally 2–5 mm) in orthopyroxene-bearing dunites and grain sizes of 5–8 mm in the most orthopyroxene-rich (>25% orthopyroxene) harzburgites (Figure F18). Grain size distribution for orthopyroxene also differs in the different lithologies, with the grain size for dunites lowest and harzburgite highest (Figure F19). Similar to Hole U1601A, both granular and interstitial orthopyroxene grains were identified. Where interstitial orthopyroxene was present in harzburgites and orthopyroxene-bearing dunites, it frequently occurred alongside granular orthopyroxene, but some intervals contained interstitial orthopyroxene only. Clinopyroxene is often absent, and when present it is generally rare: macroscopic core descriptions yield an average clinopyroxene abundance of 0.3% (maximum = 2%; Figure F17); however, thin section observations indicate that the true clinopyroxene proportion is closer to ~1% (see Microscopic observations). Cr-spinel mostly occurs in trace amounts (≤0.1%) as ~1 mm sized amoeboid to vermicular aggregates in harzburgite (Figure F17). In orthopyroxene-bearing dunites and dunites Cr-spinel may reach higher proportions (1%–3%, up to 5% maximum), occasionally forming trails or clusters within which relatively large (5–10 mm) subhedral grains or aggregates are observed (Figure F20).
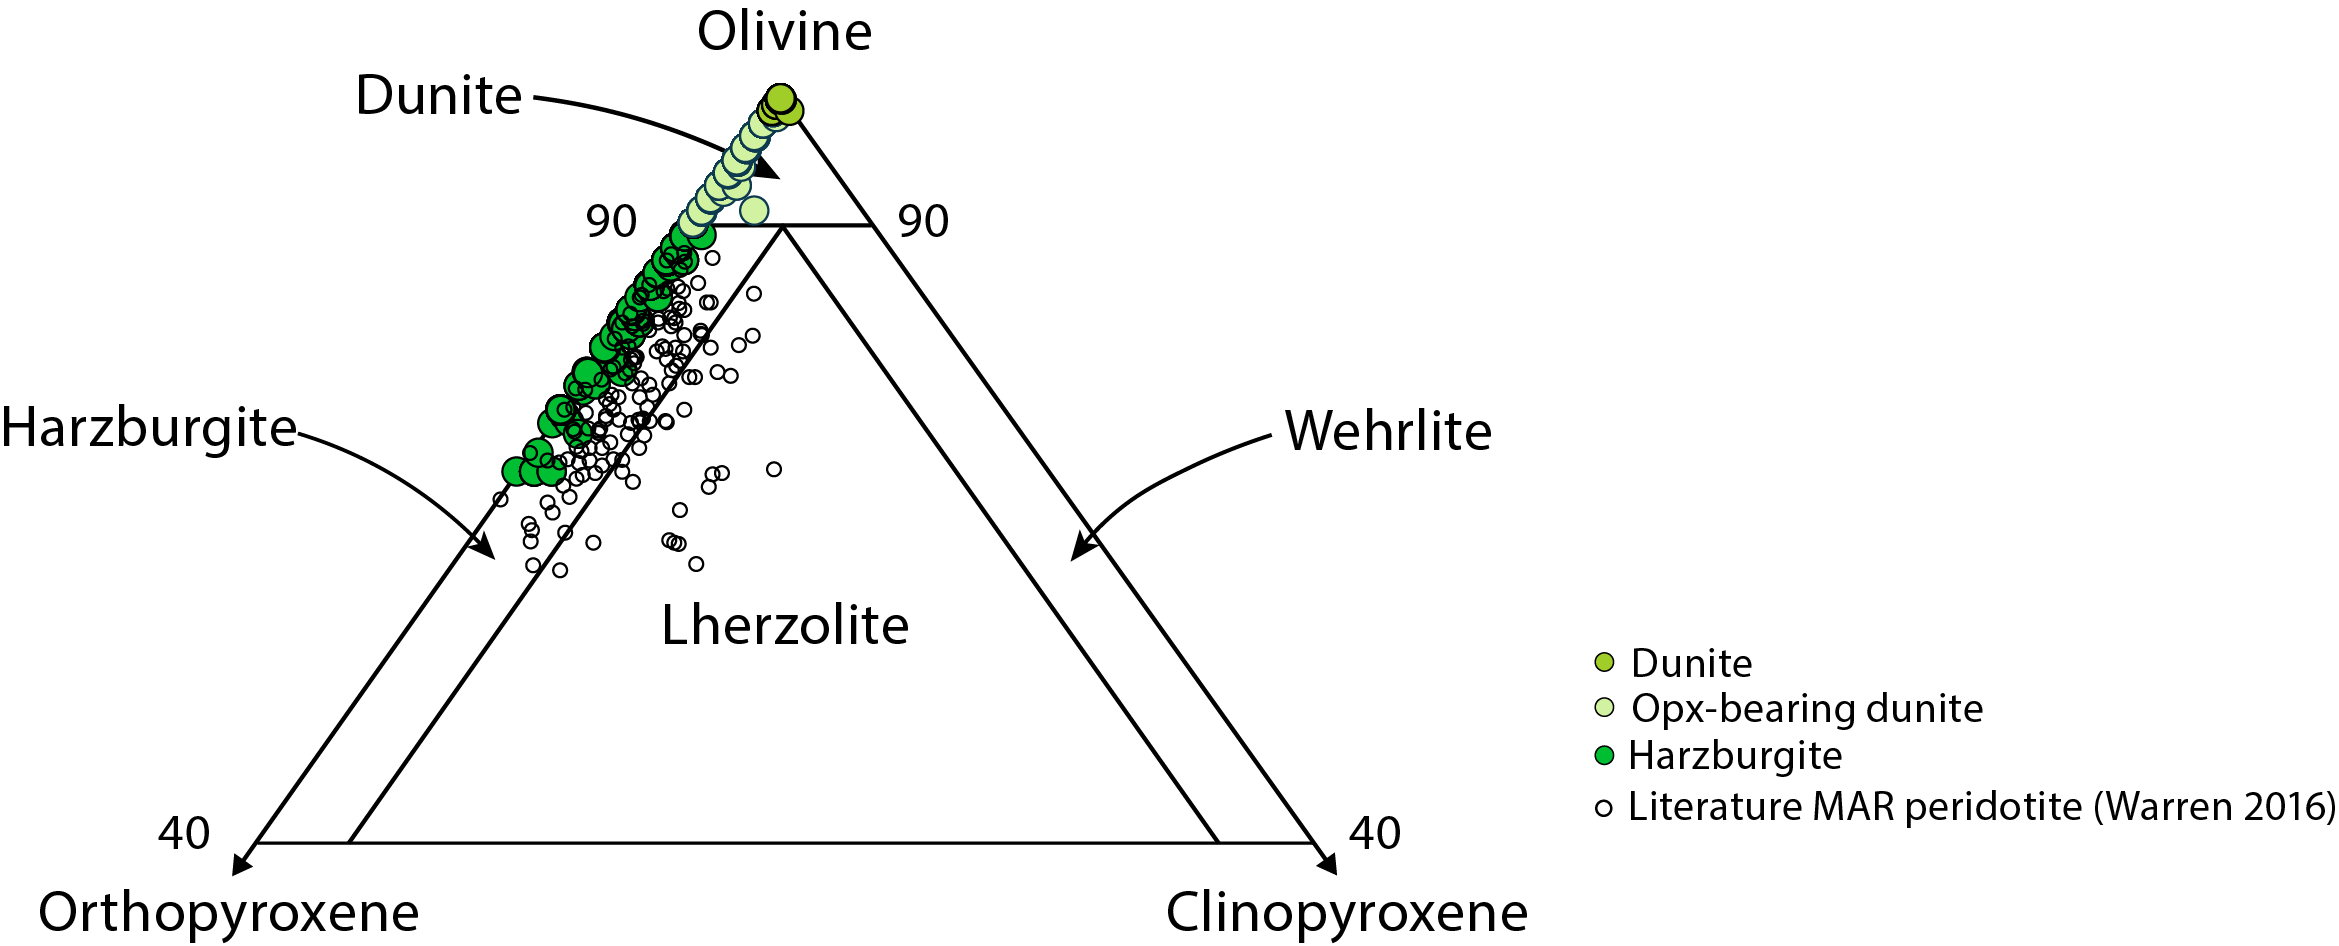
Figure F16. Modal proportions of ultramafic rocks.
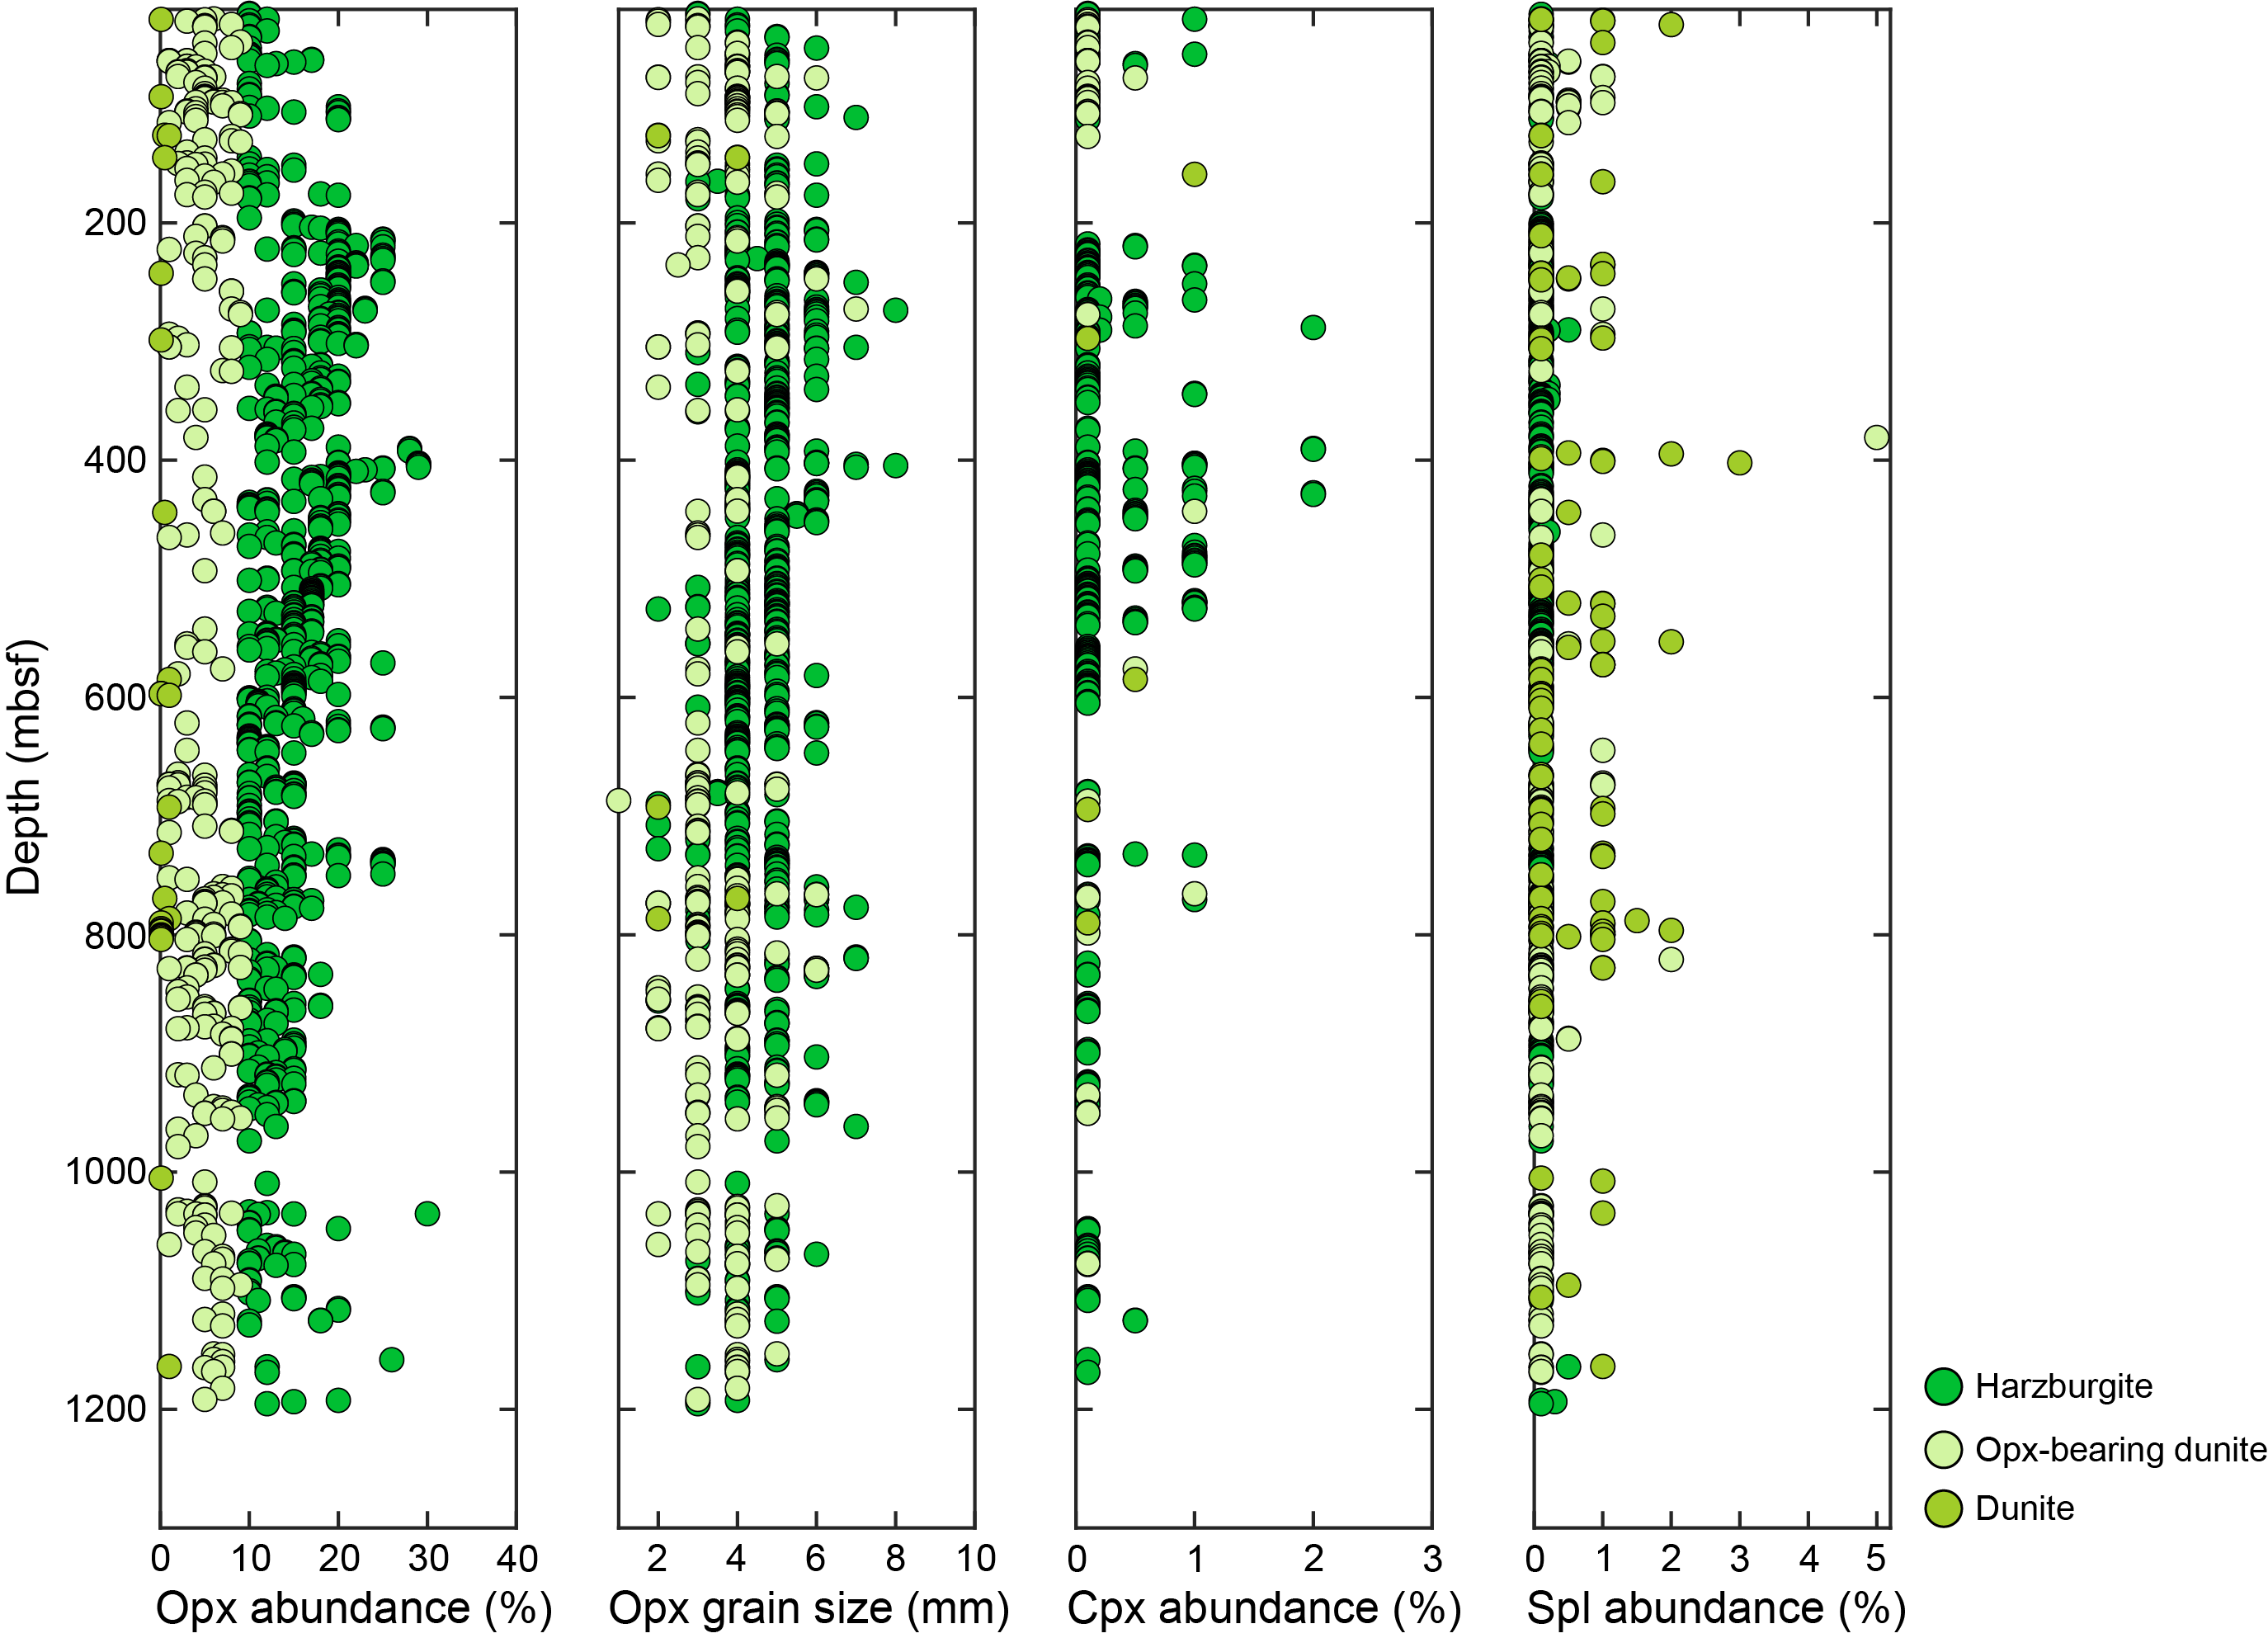
Figure F17. Abundance and grain size in peridotites.
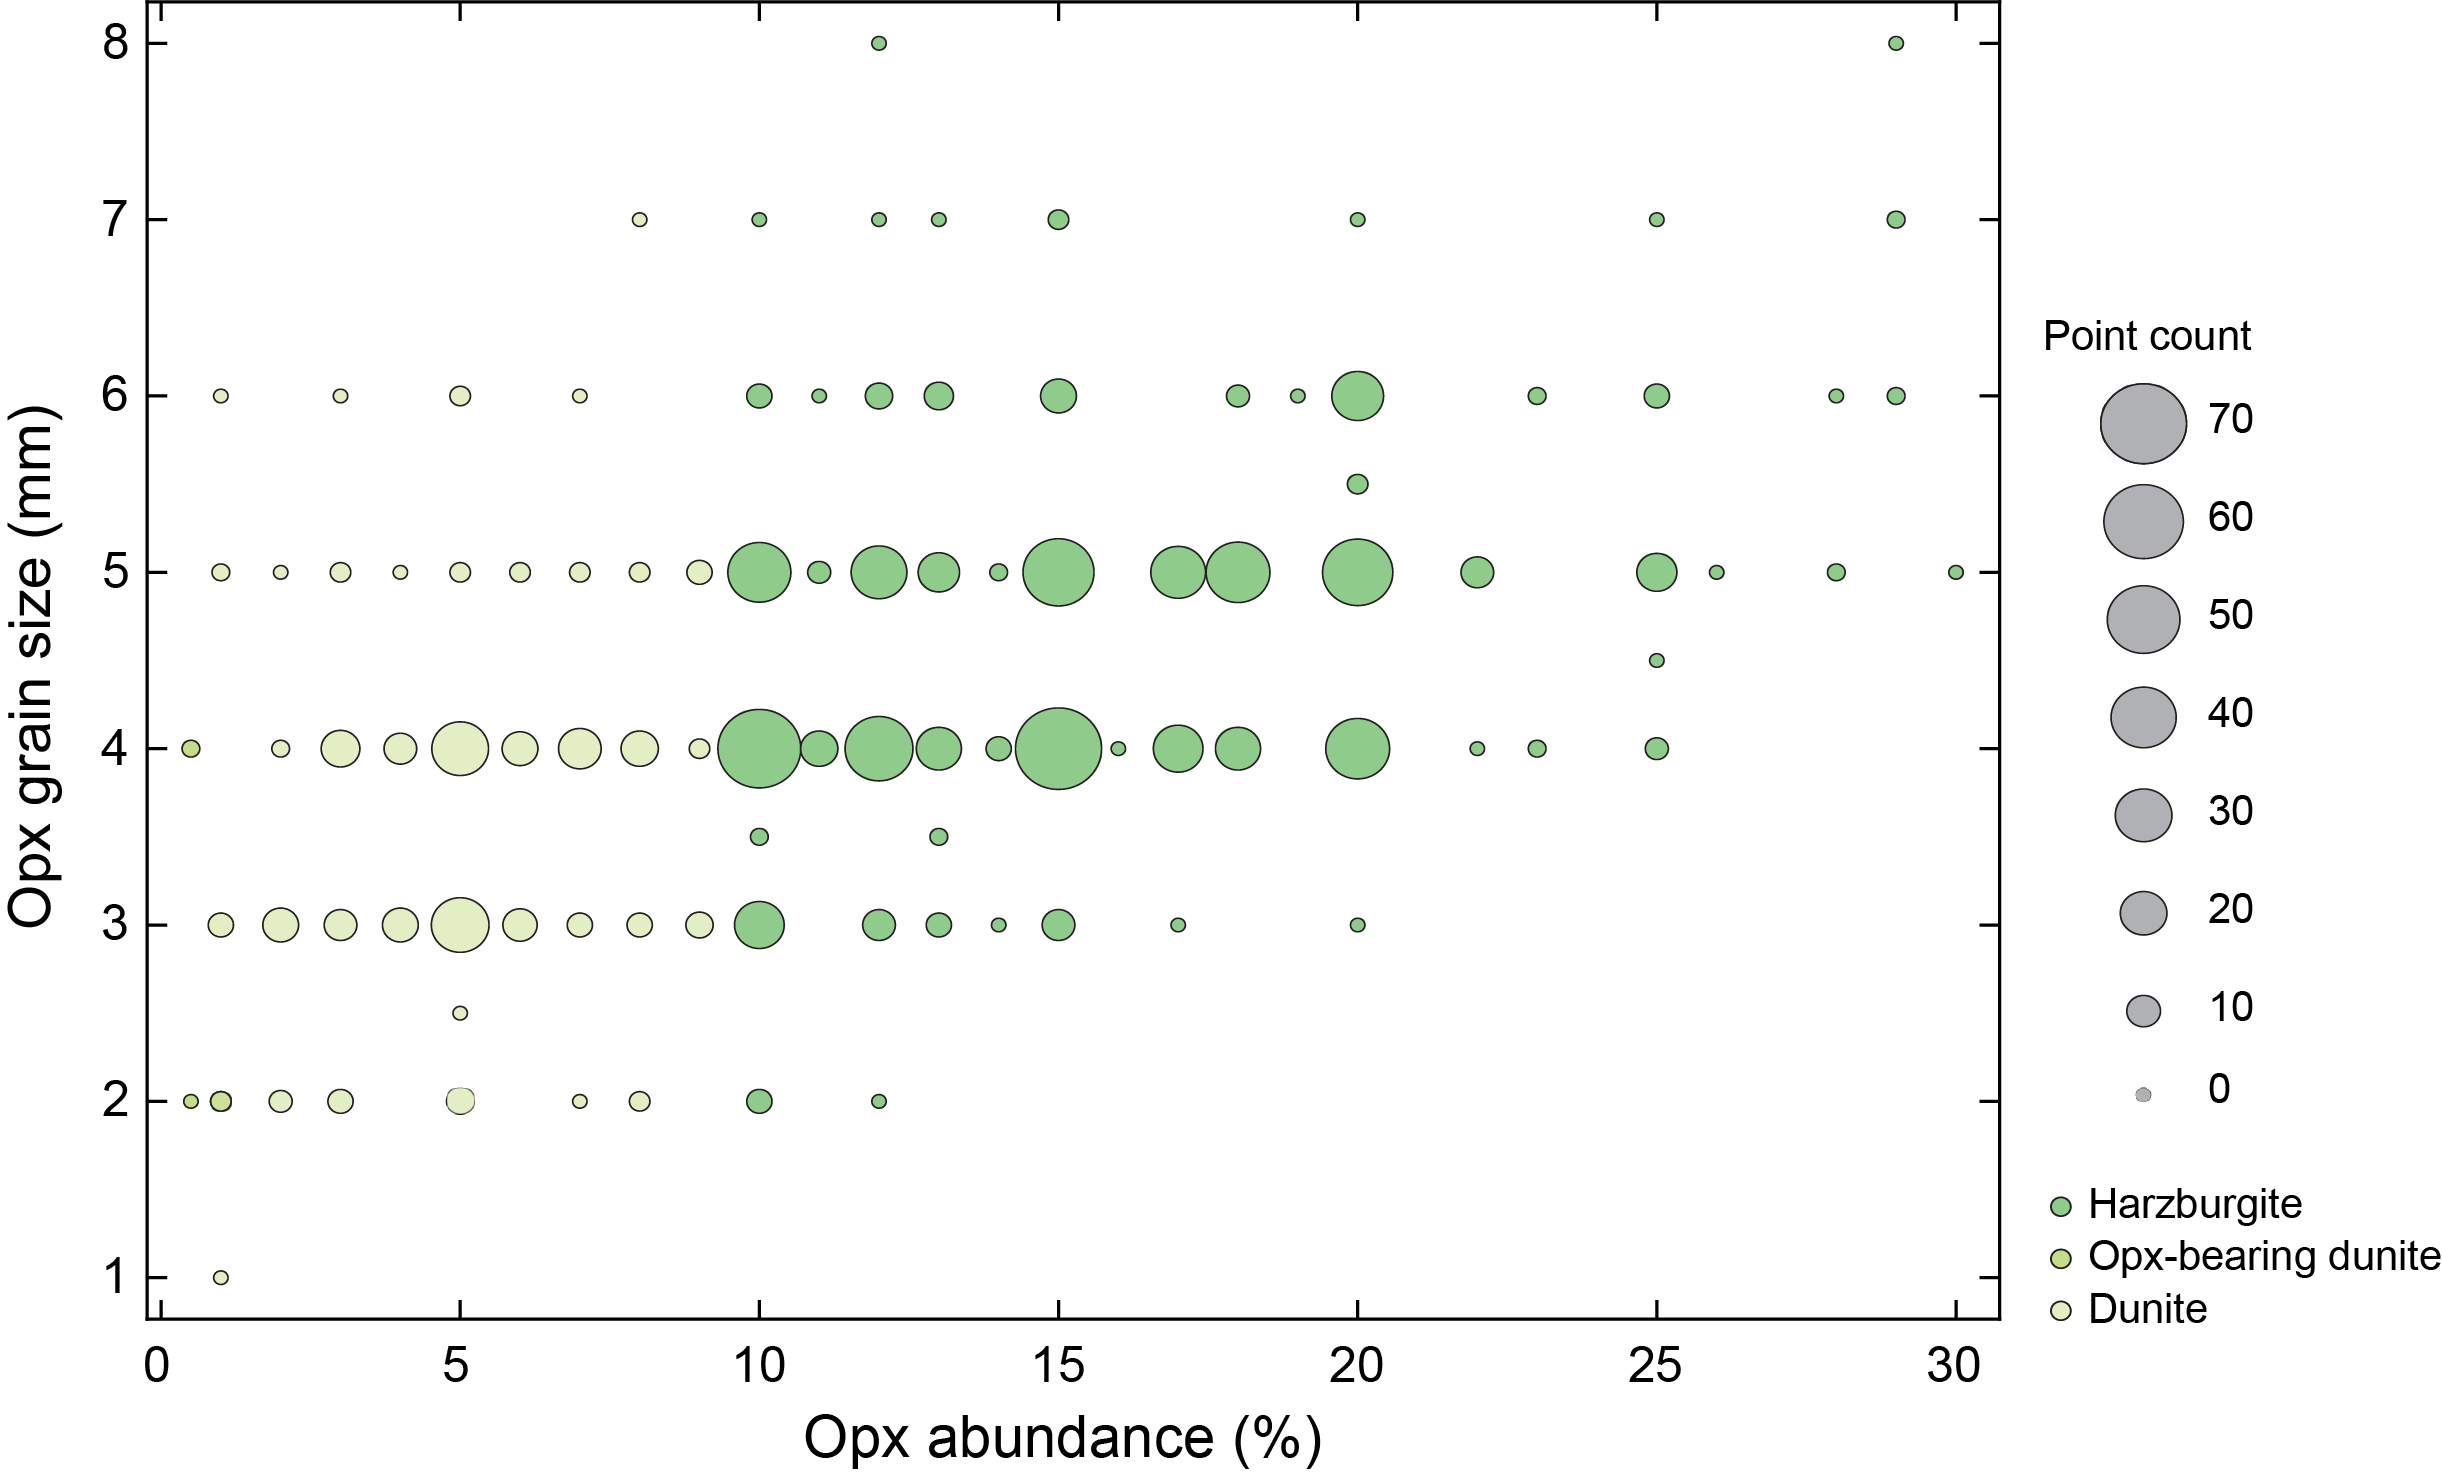
Figure F18. Abundance-size relationships, orthopyroxene.
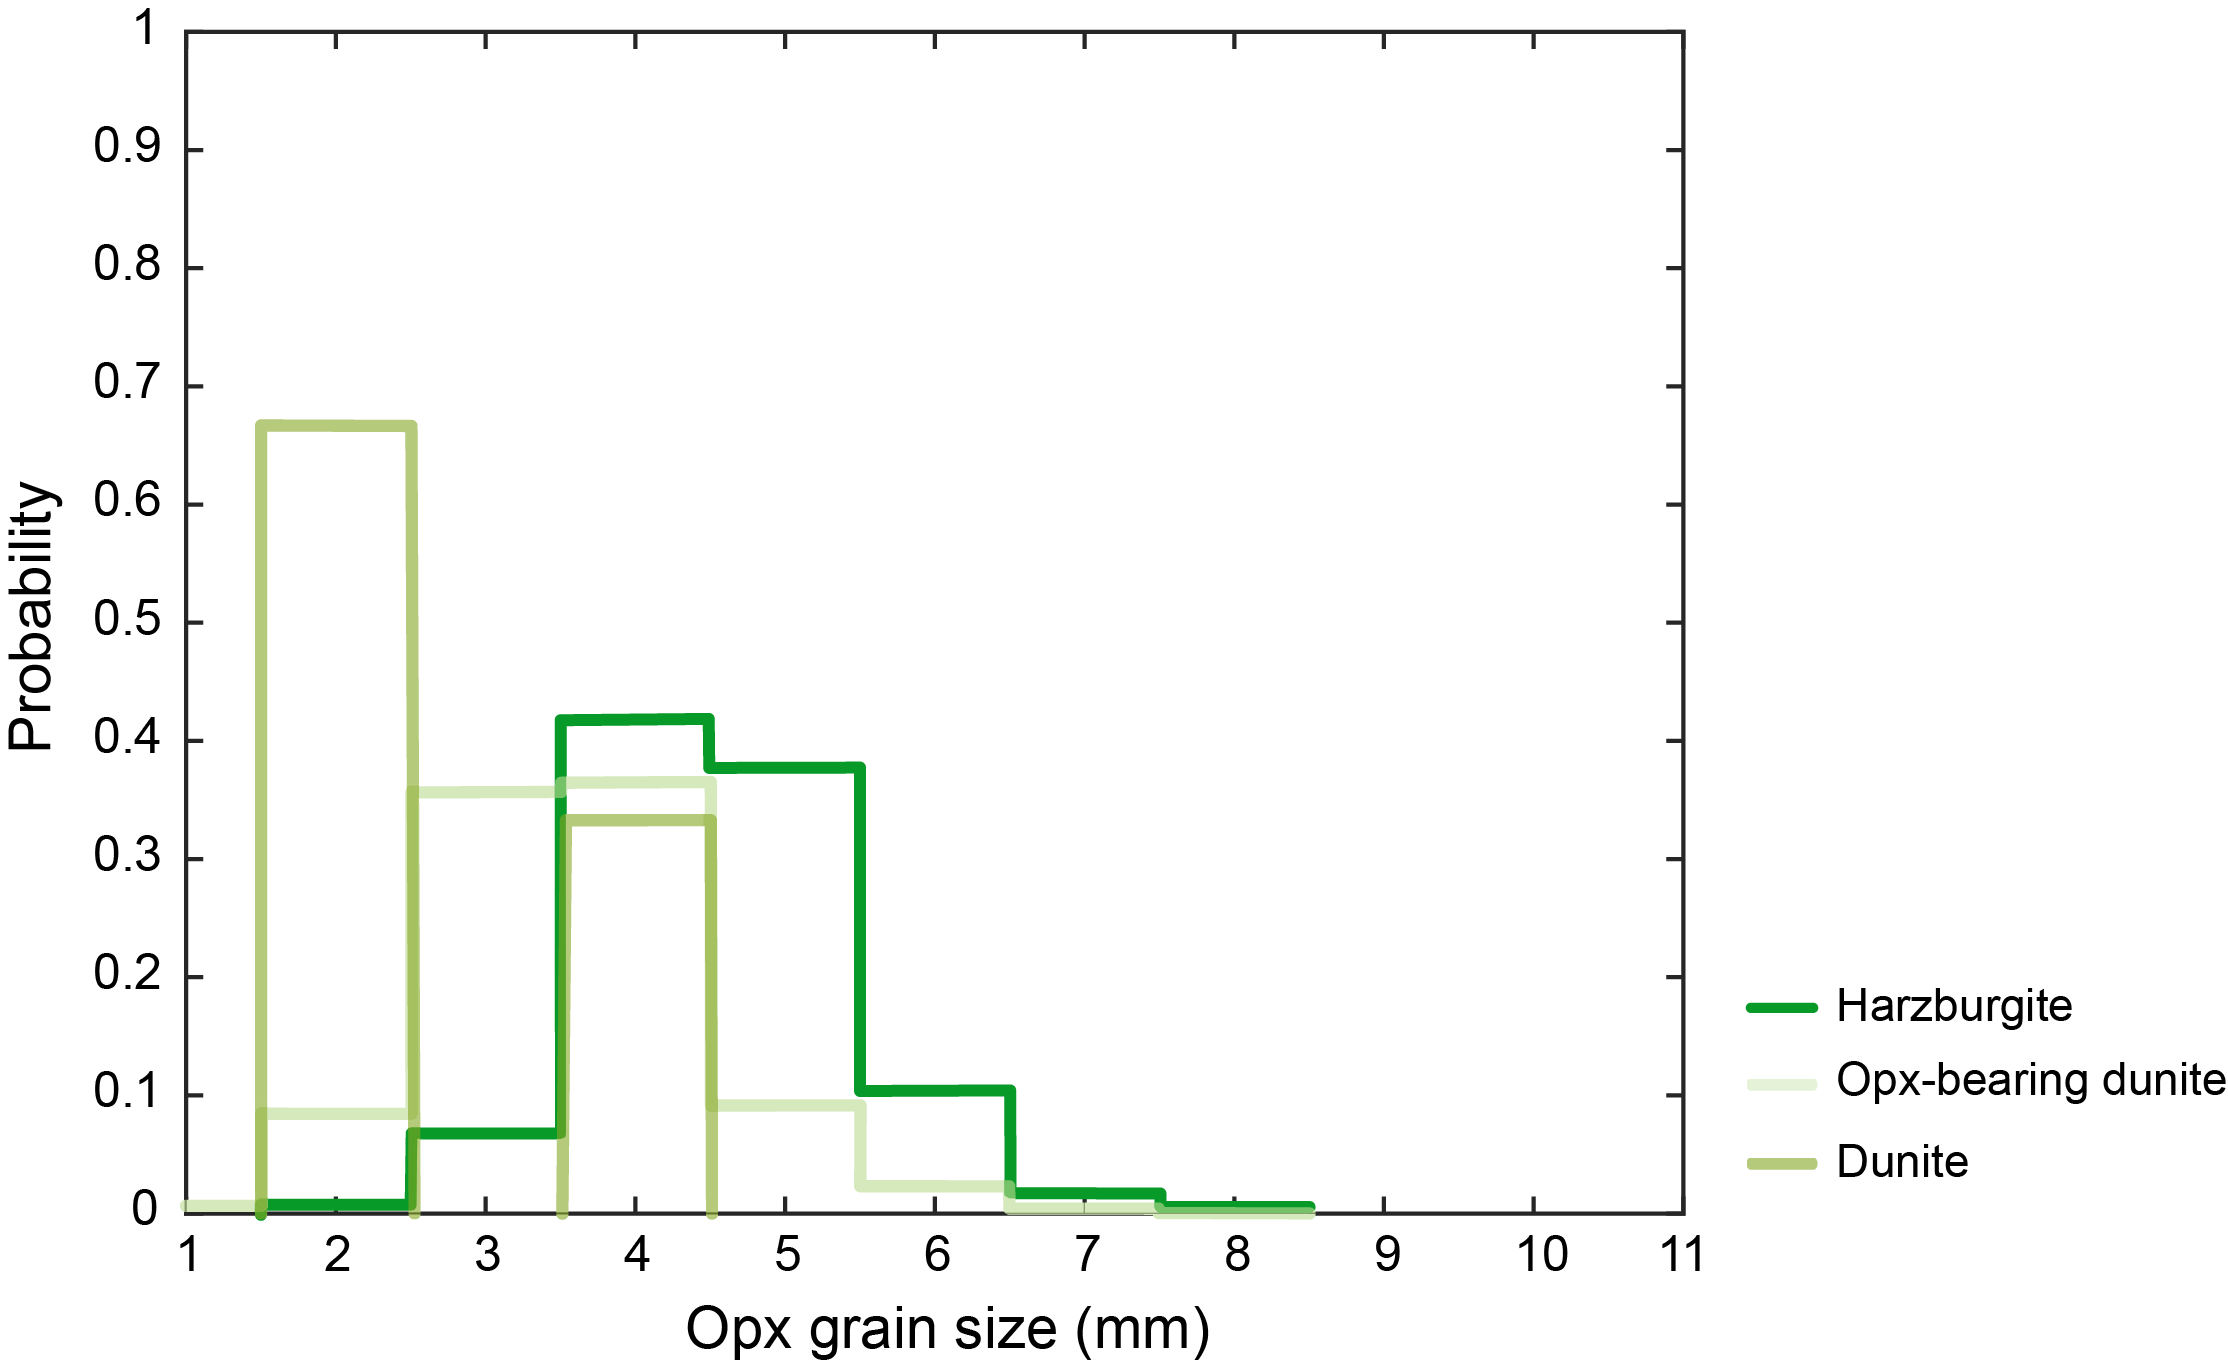
Figure F19. Orthopyroxene grain size distribution.
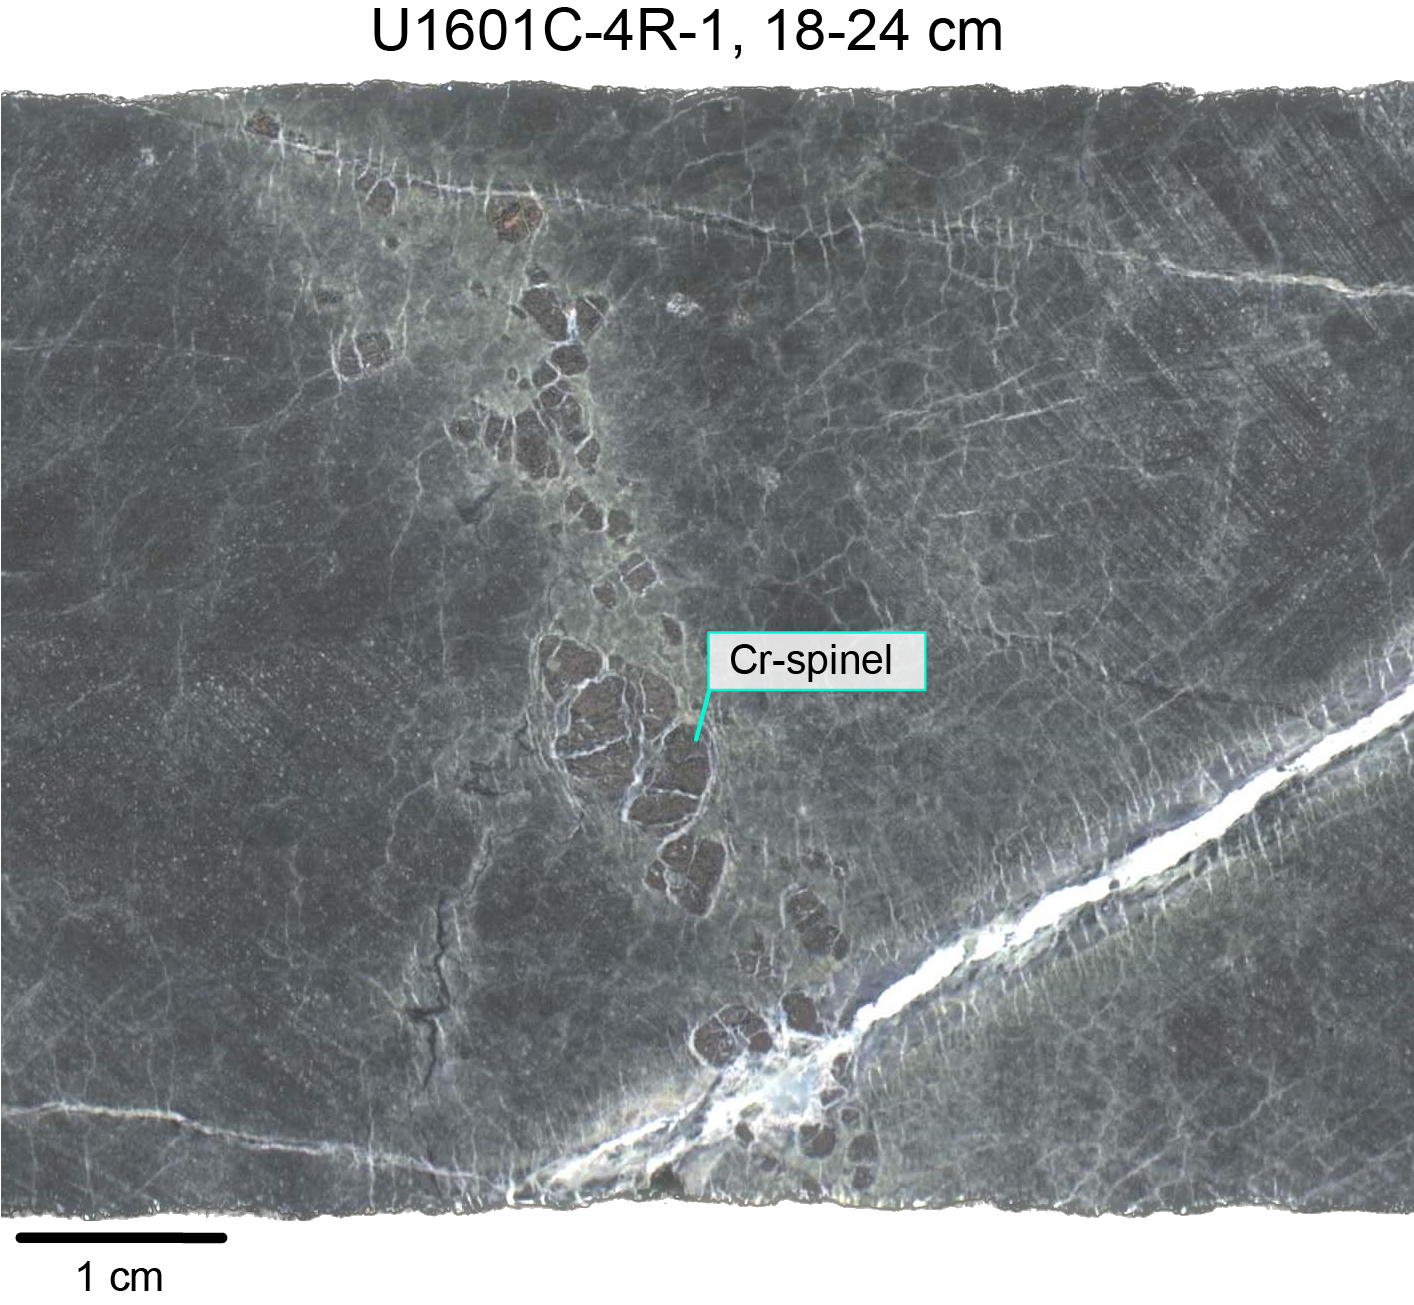
Figure F20. Coarse-grained Cr-spinel trail.
Subunit 2A is harzburgite with average modal proportions of 84.4% olivine, 15.3% orthopyroxene, and trace amounts of clinopyroxene and spinel. Olivine is often strongly to pervasively altered to a serpentine mesh texture that obscures its primary size, shape, and habit. Orthopyroxene proportions vary from 10% to 30% with significant variation throughout the section (Figure F17). On average, orthopyroxene is medium grained (2–8 mm; average = 4.5 mm) (Figure F17). Orthopyroxene is anhedral and, like in Hole U1601A, occurs as granular and interstitial textures (Figure F21). The granular grains typically have rounded to subrounded and equant to subequant habits (Figure F21A), whereas the interstitial grains have varied shapes and cuspidate rims (Figure F21B, F21C). Clinopyroxene modal abundance is 0.1% on average (maximum = 2%), and average grain size is 2.2 mm; the true grain size is likely to be smaller, given that thin sections revealed the presence of small clinopyroxene films along orthopyroxene grain boundaries. There is no systematic variation in clinopyroxene proportions downhole, nor is there a clear correlation with orthopyroxene abundance; nonetheless, within harzburgites only most of the relatively clinopyroxene rich harzburgites are those also rich in orthopyroxene (Figure F21B, F21C). Trace amounts of spinel are found in forms of amoeboid to vermicular aggregates with grain size averaging 1 mm.
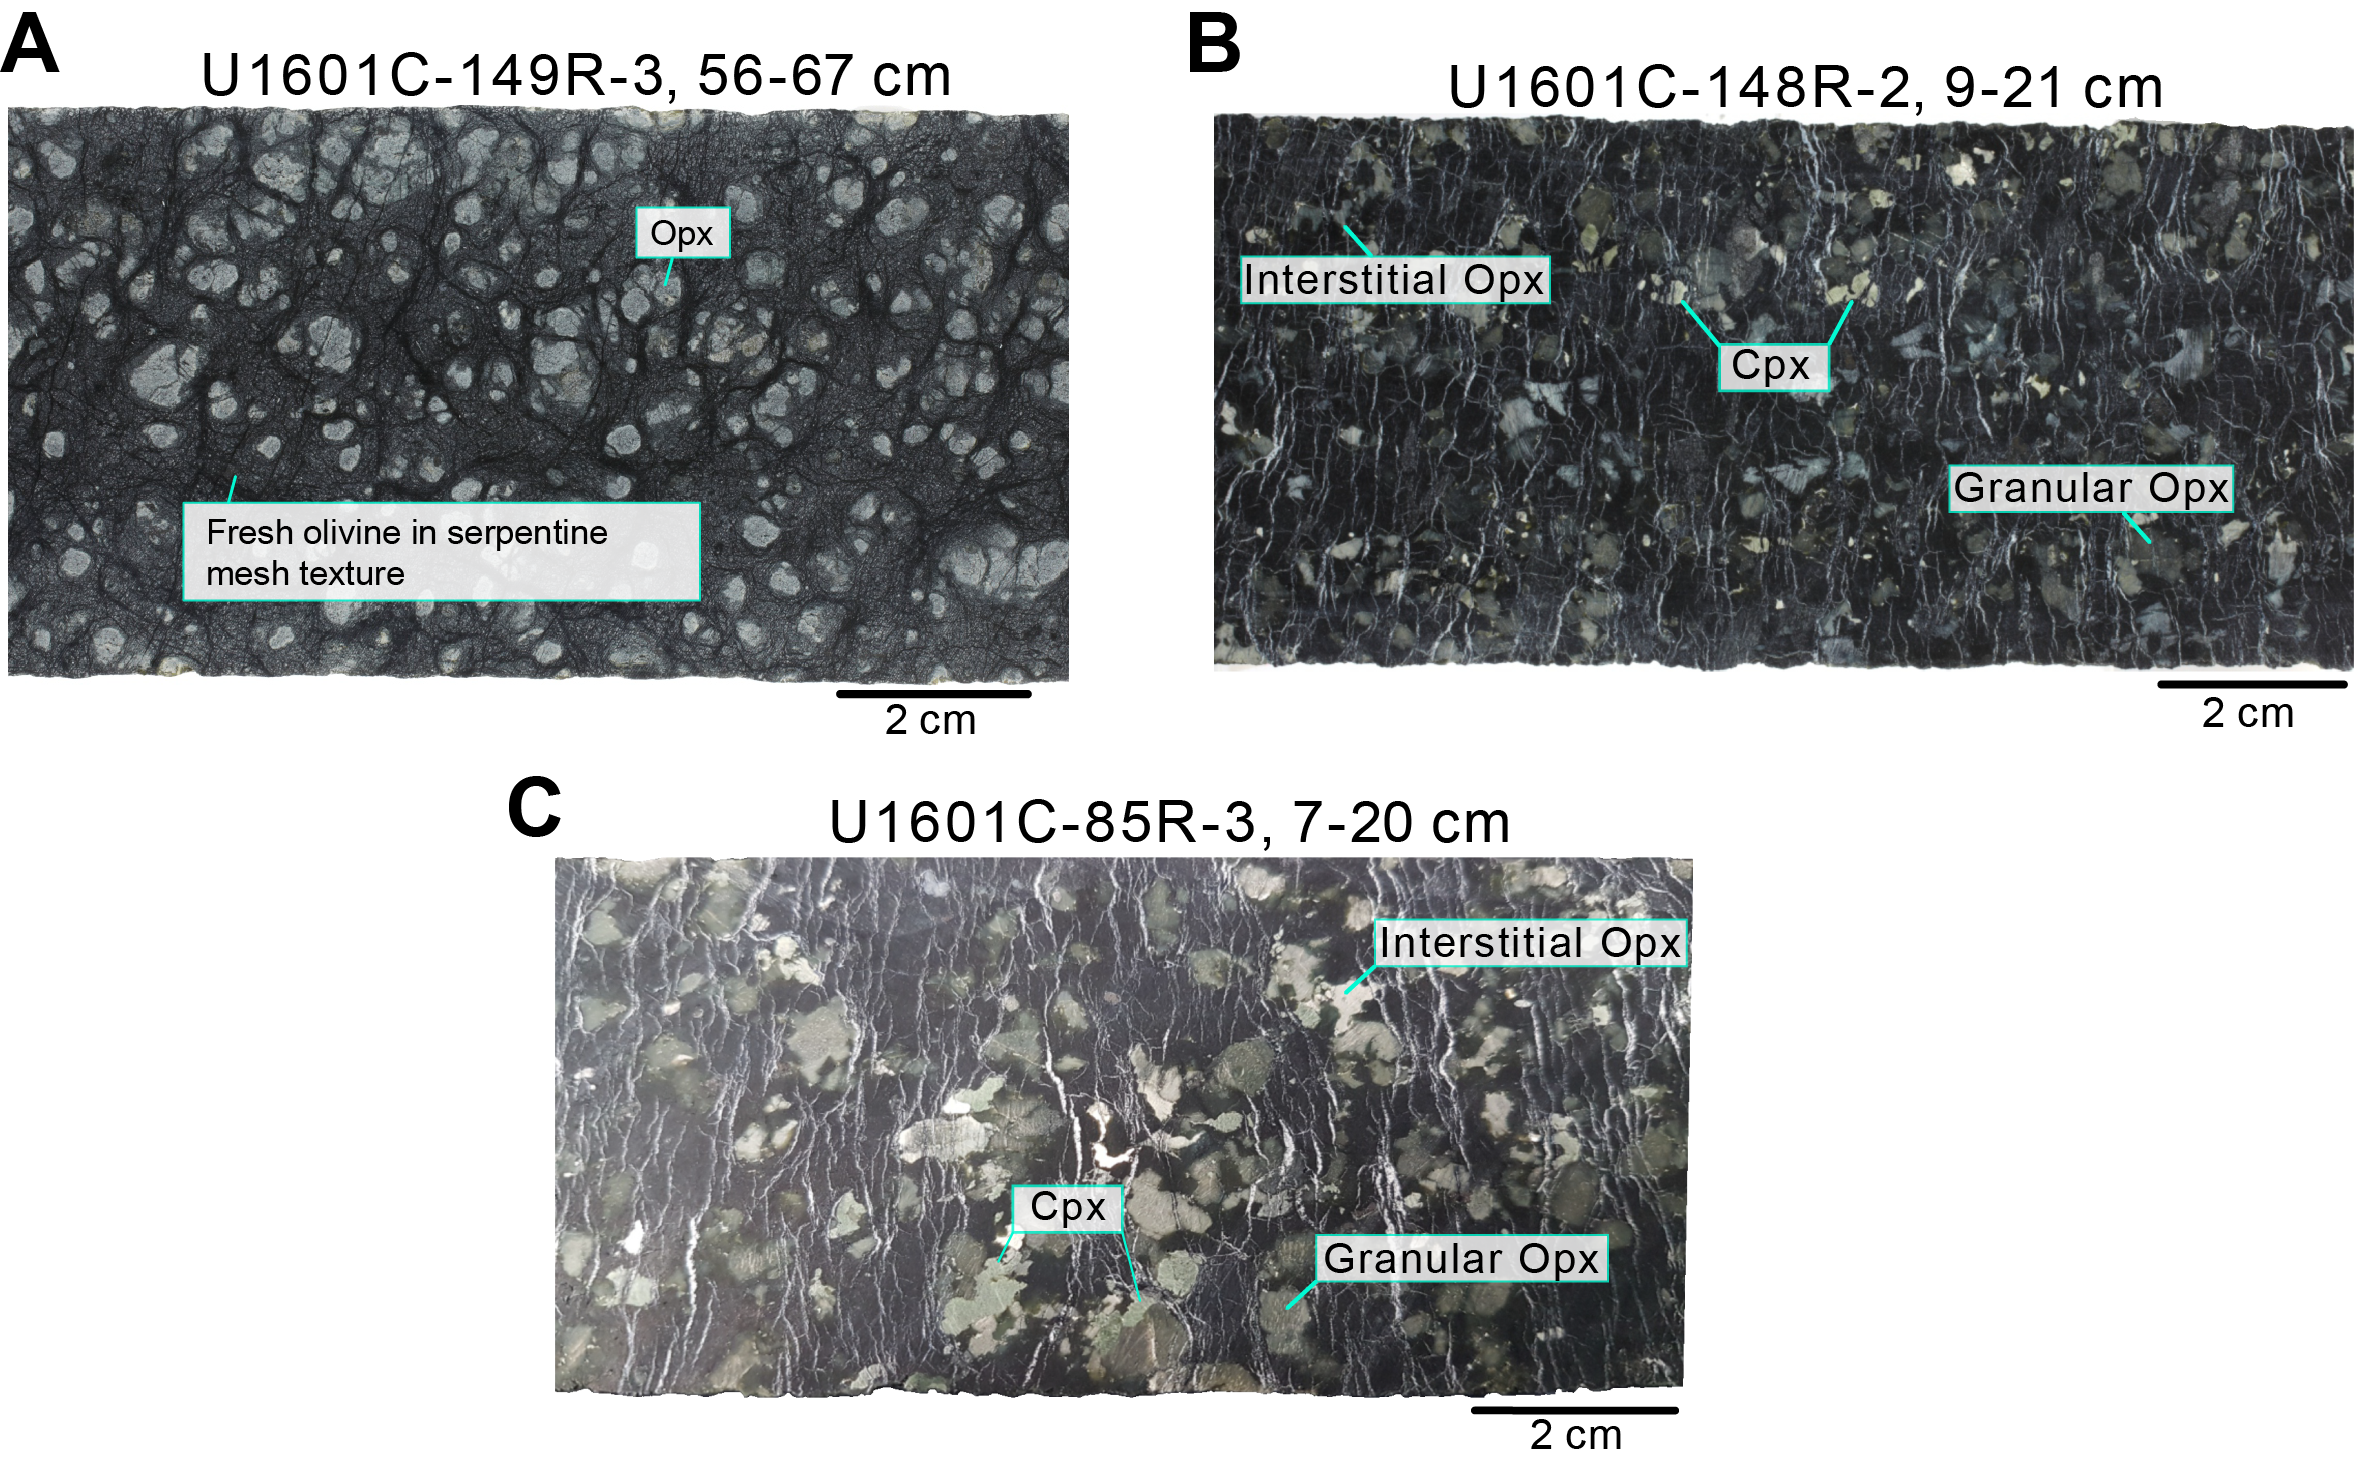
Figure F21. Textural types of harzburgite.
Subunit 2B is composed of orthopyroxene-bearing dunite with average modal abundance of 95.0% olivine and 5.0% orthopyroxene and trace amounts of clinopyroxene and spinel. The modal proportion of orthopyroxene is variable and ranges 1%–10%. Orthopyroxene in orthopyroxene-bearing dunite has slightly finer grain size (average = 3.6 mm) than in harzburgite. Similar to the harzburgite, two textures of orthopyroxene (granular and interstitial) are present. The contact relationships between orthopyroxene-bearing dunite and both harzburgite and dunite are gradational and part of a complete spectrum of orthopyroxene abundance (Figures F16, F17, F22). From Sections 399-U1601C-160R-1 through 162R-2, orthopyroxene-bearing dunite with a distinct texture differs significantly from the other peridotite units. It is characterized by irregularly shaped but generally round to amoeboid and relatively small (average = 3 mm) orthopyroxene grains. Their distribution is uneven, forming trains and concentrations rather than being evenly distributed through the dunitic matrix (Figure F23). Orthopyroxene abundance in a single section can vary from 0.1% to 9%. This rock type was informally referred to as the "paint splatter dunite."
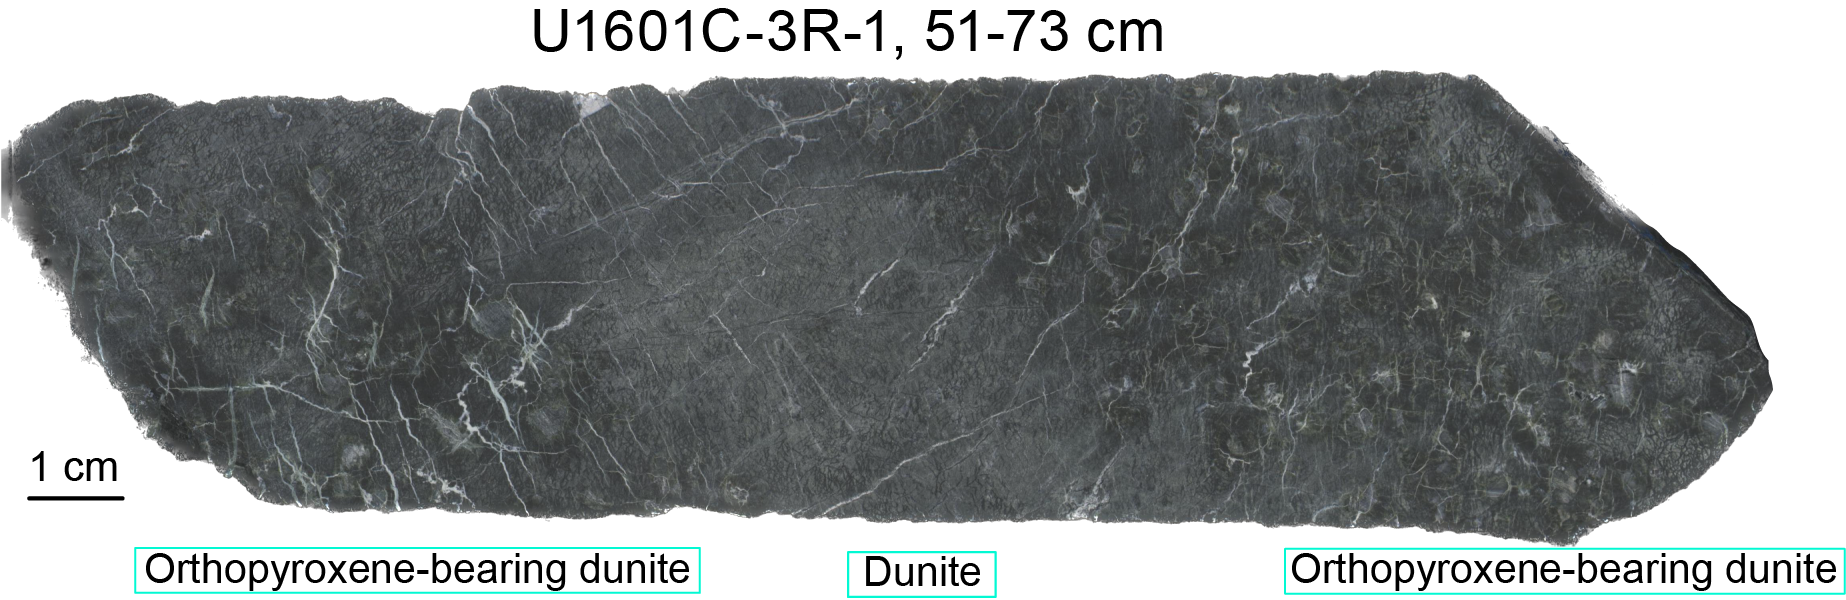
Figure F22. Dunite interval.
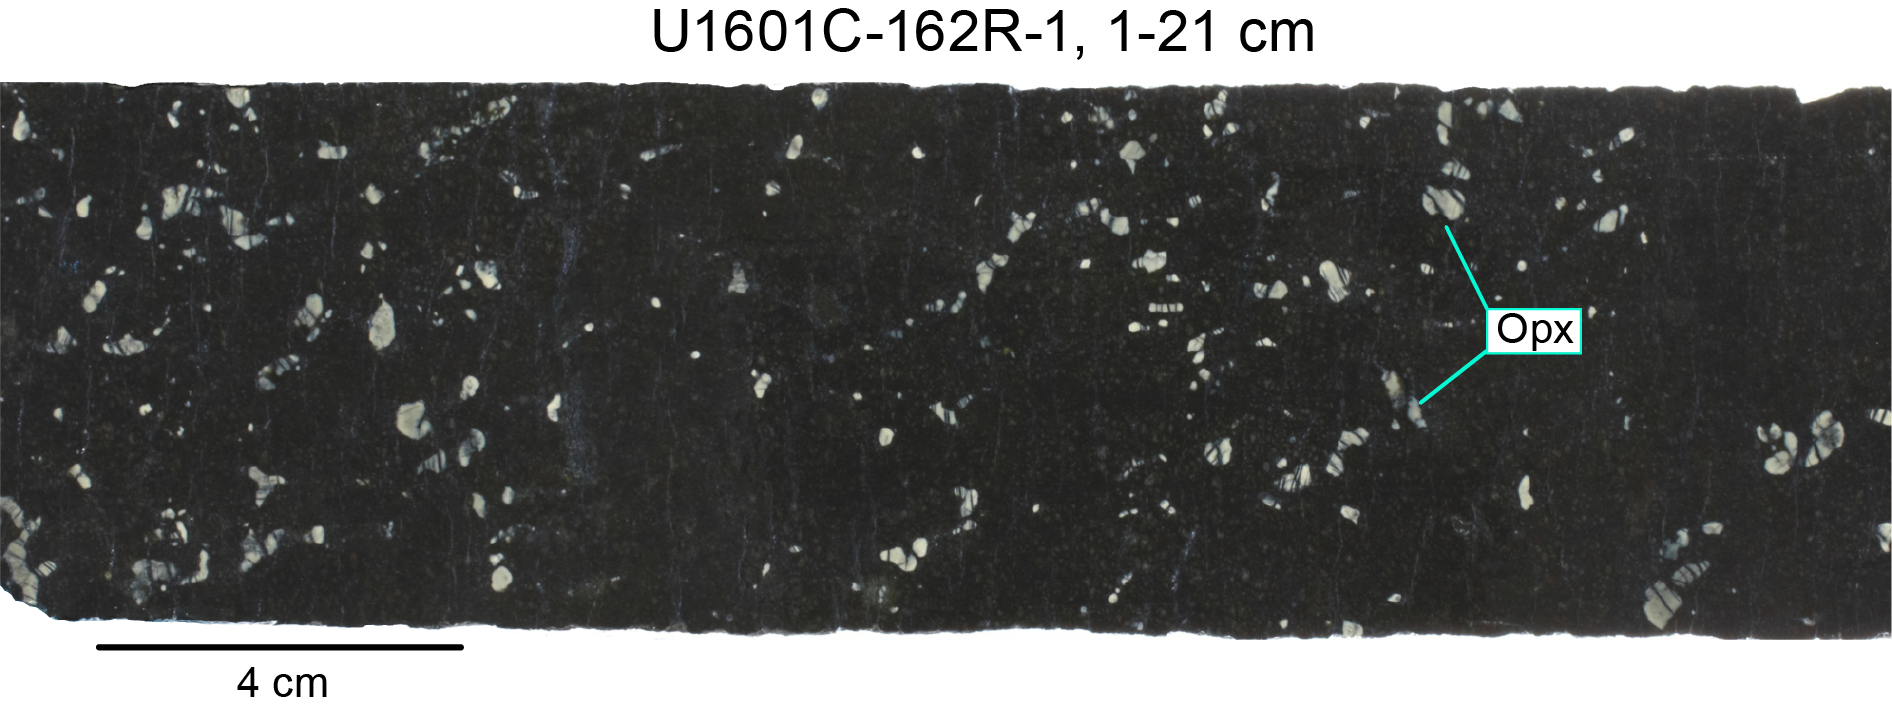
Figure F23. Paint splatter dunite.
Subunit 2C comprises dunite, which, in the methods used during Expedition 399, refers to a rock made up of olivine (± Cr-spinel) with <1% pyroxene. On average, dunite contains 0.1% orthopyroxene and 0.5% Cr-spinel with rare traces of clinopyroxene, although it should be noted that modal estimates for trace phases are subject to relatively large uncertainties. Cr-spinel often occurs as trails or patches and can have relatively large grain size (Figure F20). The dunite occurs as zones in harzburgite and more frequently in orthopyroxene-bearing dunite (Figure F22). These zones are typically tens of centimeters in size. The contacts between the dunite and the surrounding peridotite is nearly always gradational; orthopyroxene proportions decrease over centimeters to decimeters (Figure F22). Locally, contacts are relatively sharp (Figure F24). The well-defined dunite zones are an end-member of a continuum of variations in orthopyroxene content in the mantle rocks, and the full spectrum of harzburgite to dunite is preserved in the core. For example, some parts of the harzburgite record local and small-scale (~5 cm) decreases in orthopyroxene content, leading to the formation of orthopyroxene-bearing dunite with some dunite patches (Figure F25). Where orthopyroxene proportions are lower still, dunite zones with sparse orthopyroxene form (Figure F25). These could be considered protodunite zones.
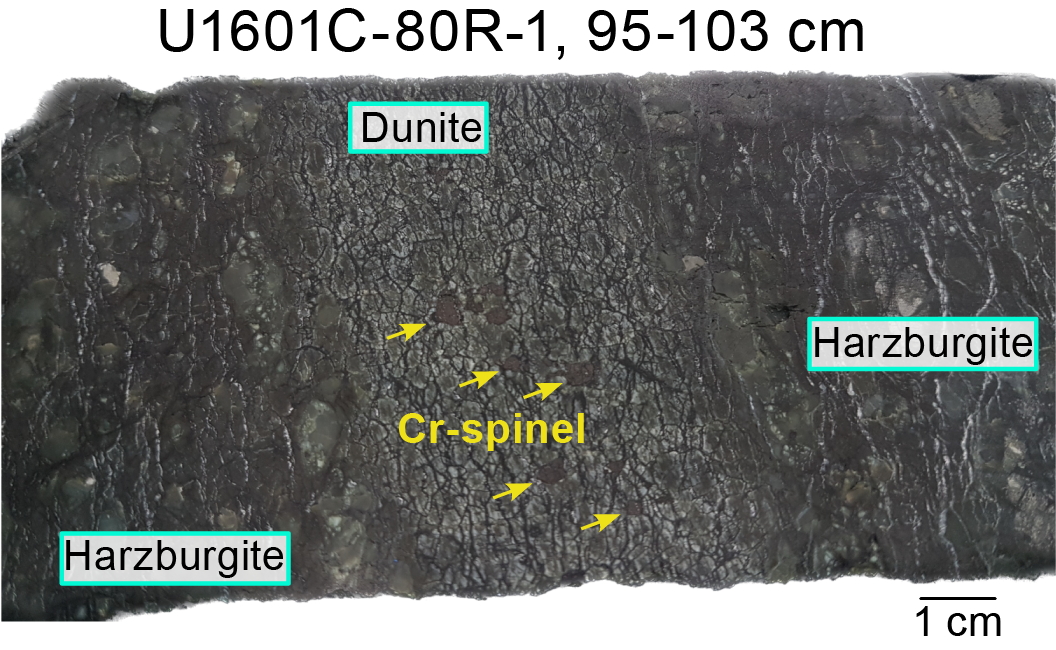
Figure F24. Dunite with sharp contact.
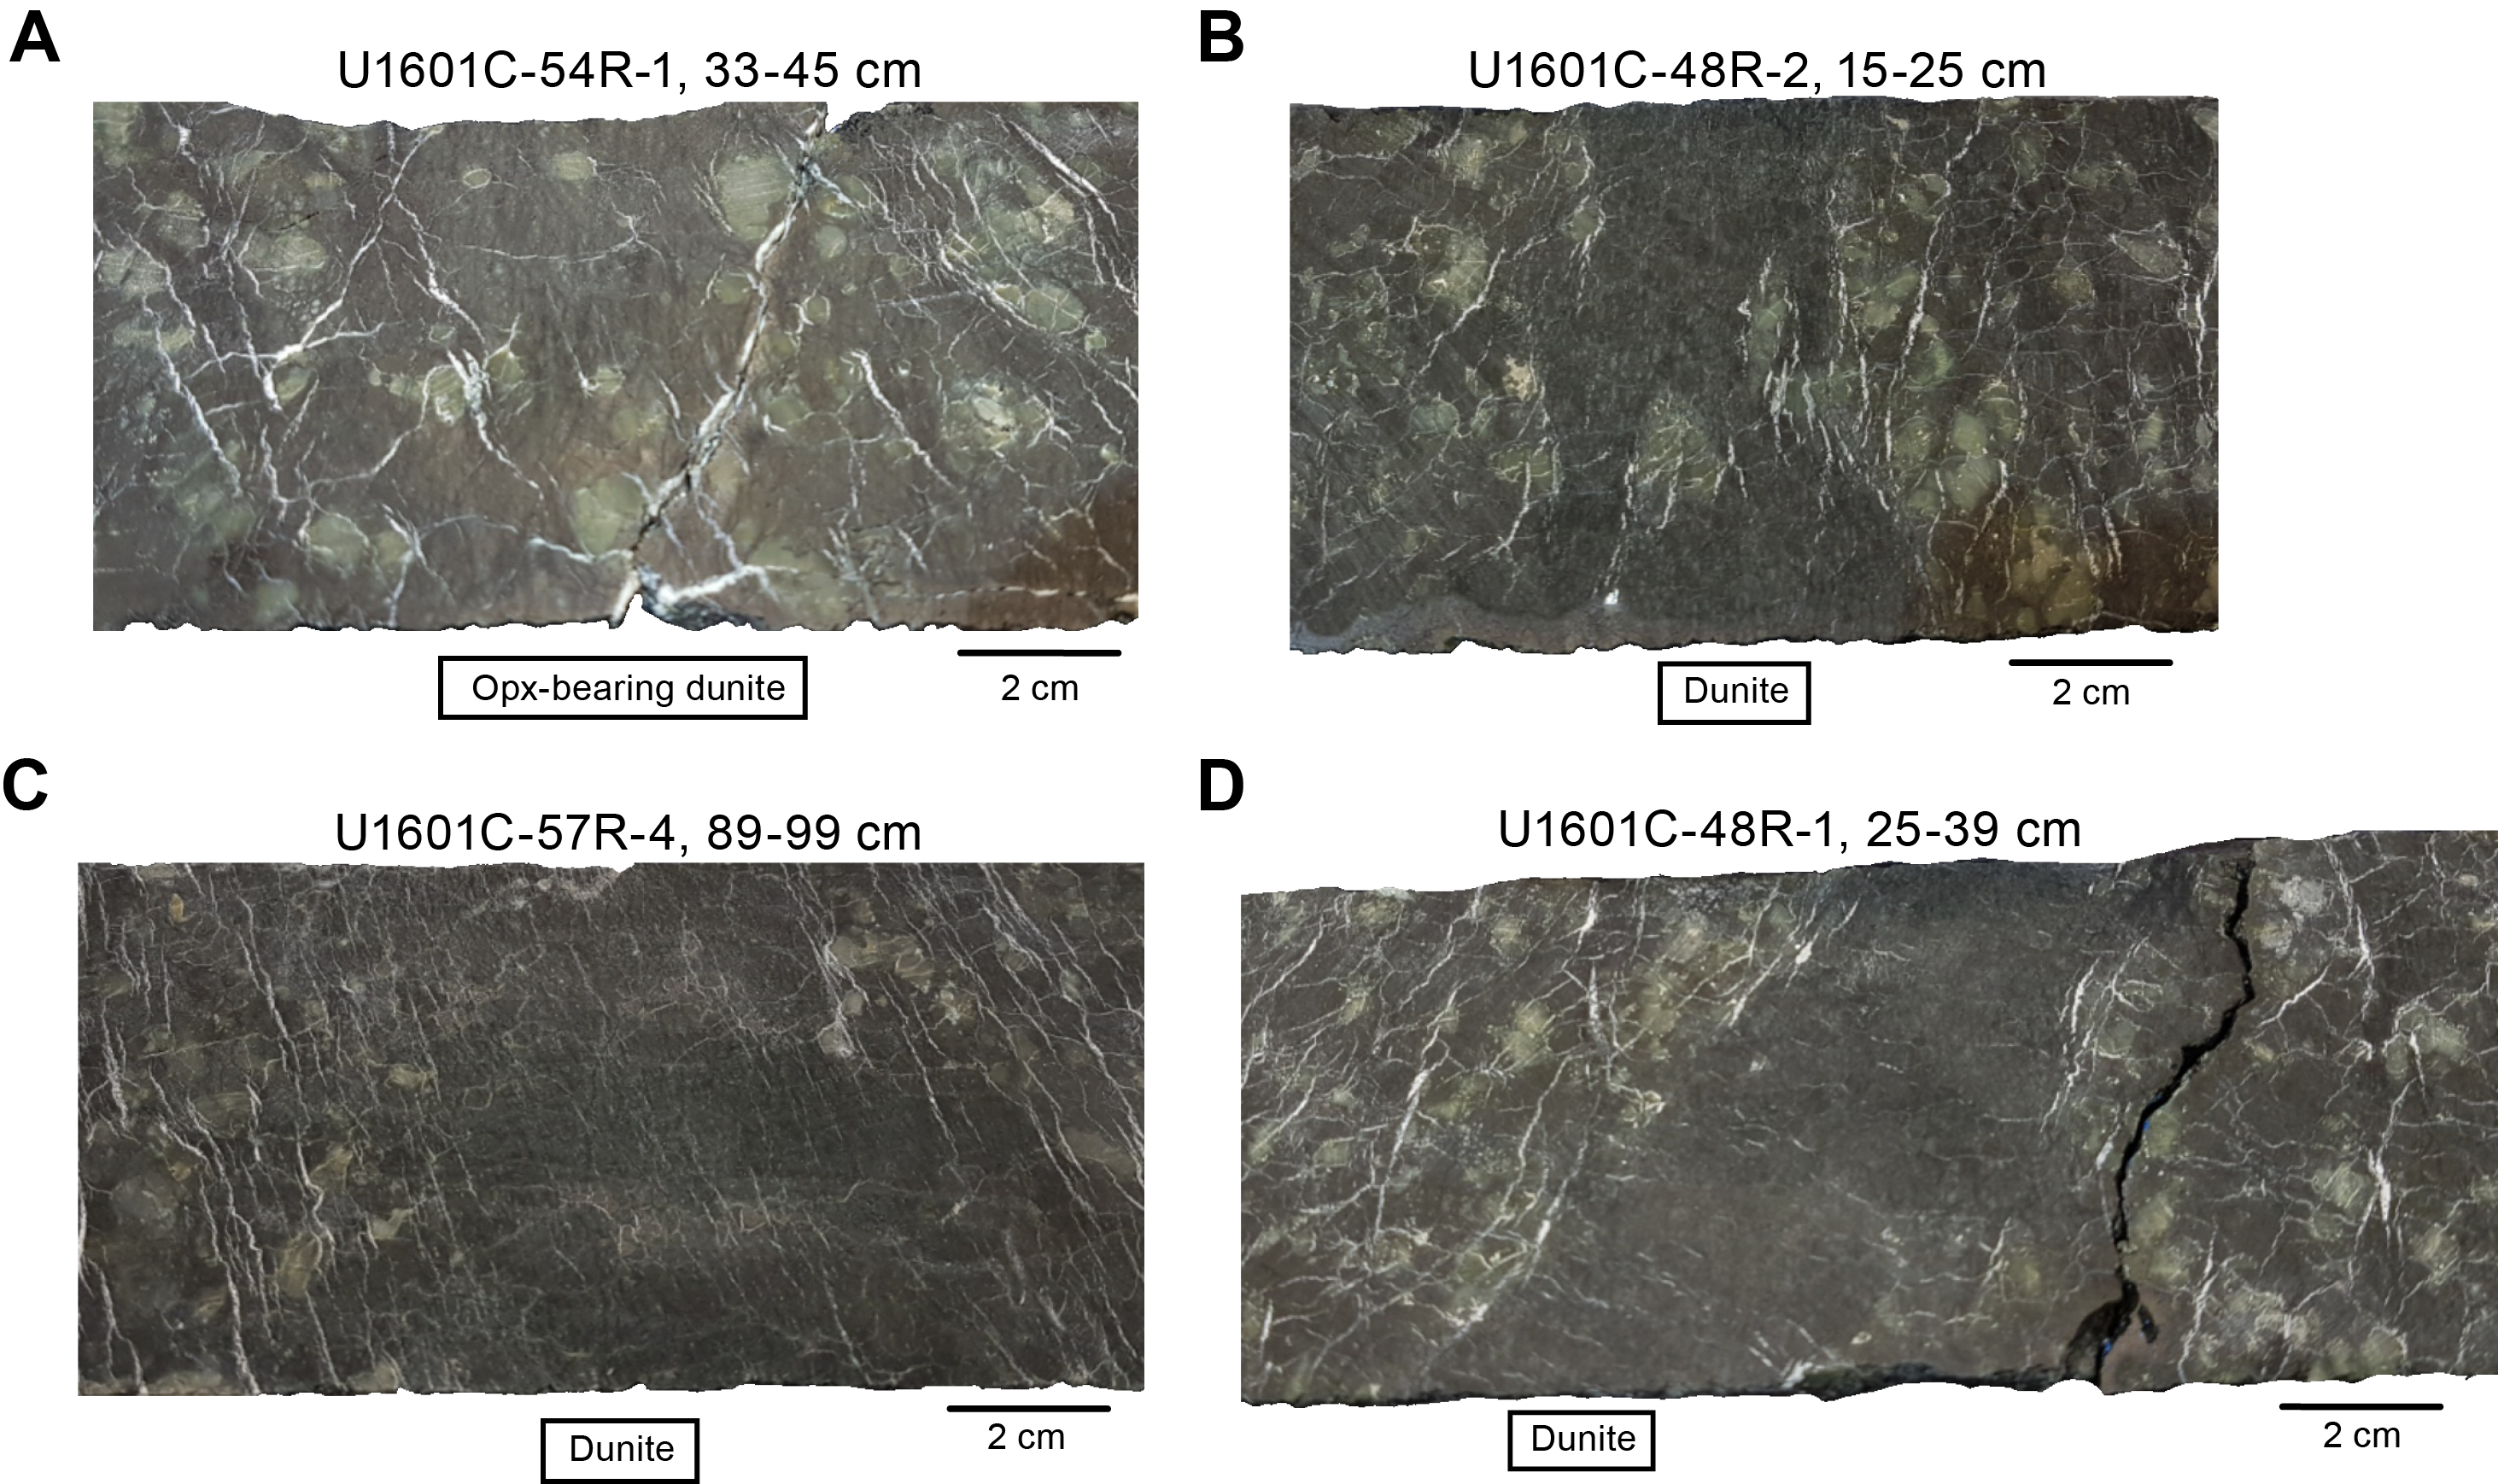
Figure F25. Progressive decrease in orthopyroxene.
Subunit 2D is a harzburgite unit that resembles Subunit 2A but contains only interstitial orthopyroxene (Figure F26). This harzburgite was only observed in the shallow part of the hole (between Cores 399-U1601C-5R and 27R) and tends to be found adjacent to orthopyroxene-bearing dunite.
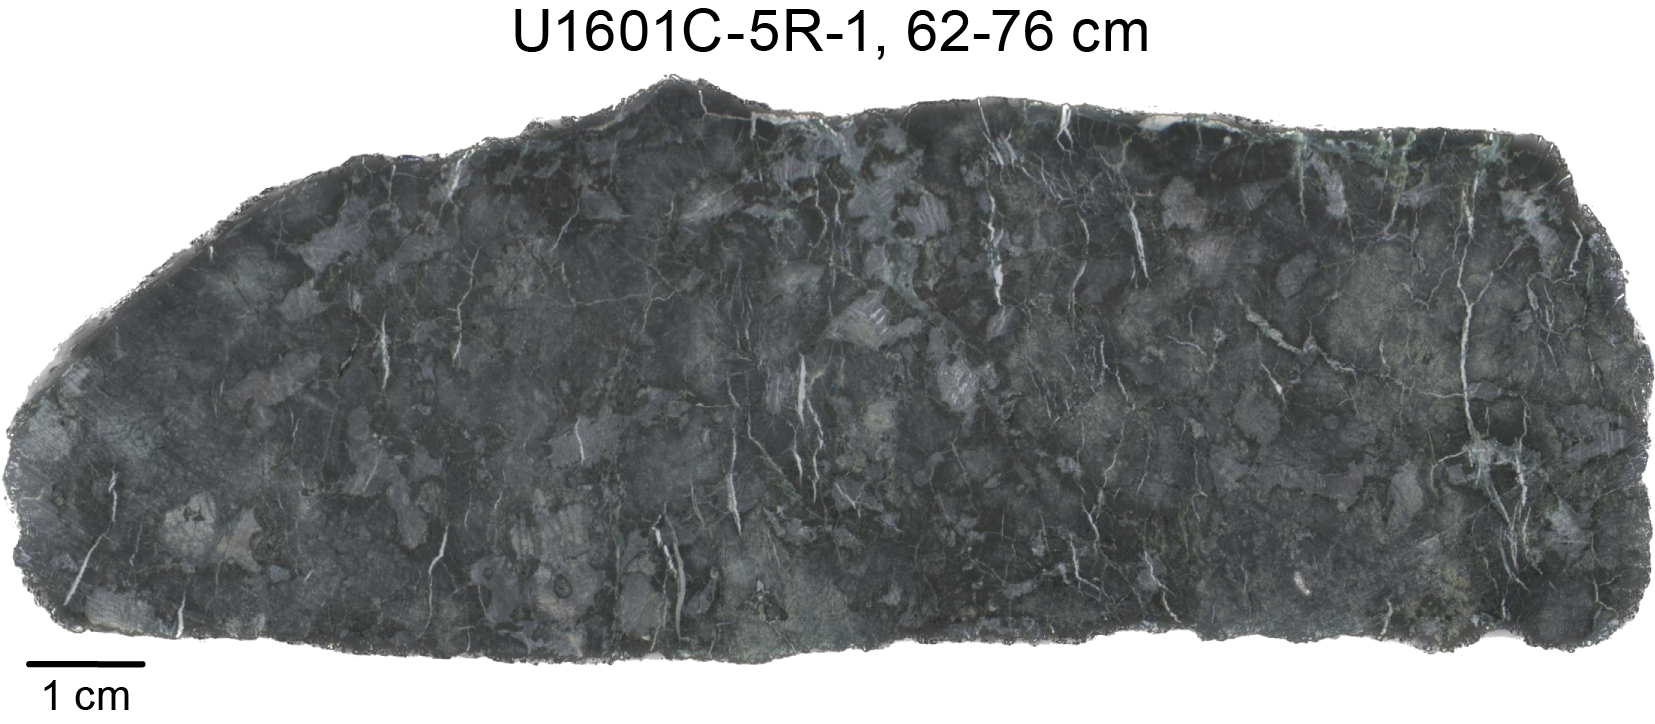
Figure F26. Harzburgite with orthopyroxene.
3.2.2. Other ultramafic rocks
Minor amounts of other ultramafic lithologies were recovered in Hole U1601C. They comprise only 0.1% of the hole (Figure F5) and only occur in the upper 800 m. These rocks show a range of modal abundances ranging from websterite and olivine websterite to orthopyroxenite and wehrlite (Figures F16, F27). They typically occur as veins within the host peridotite and collectively preserve a continuum from diffuse impregnated crystals to more discrete crosscutting veins, indicative of a melt-infiltration origin.
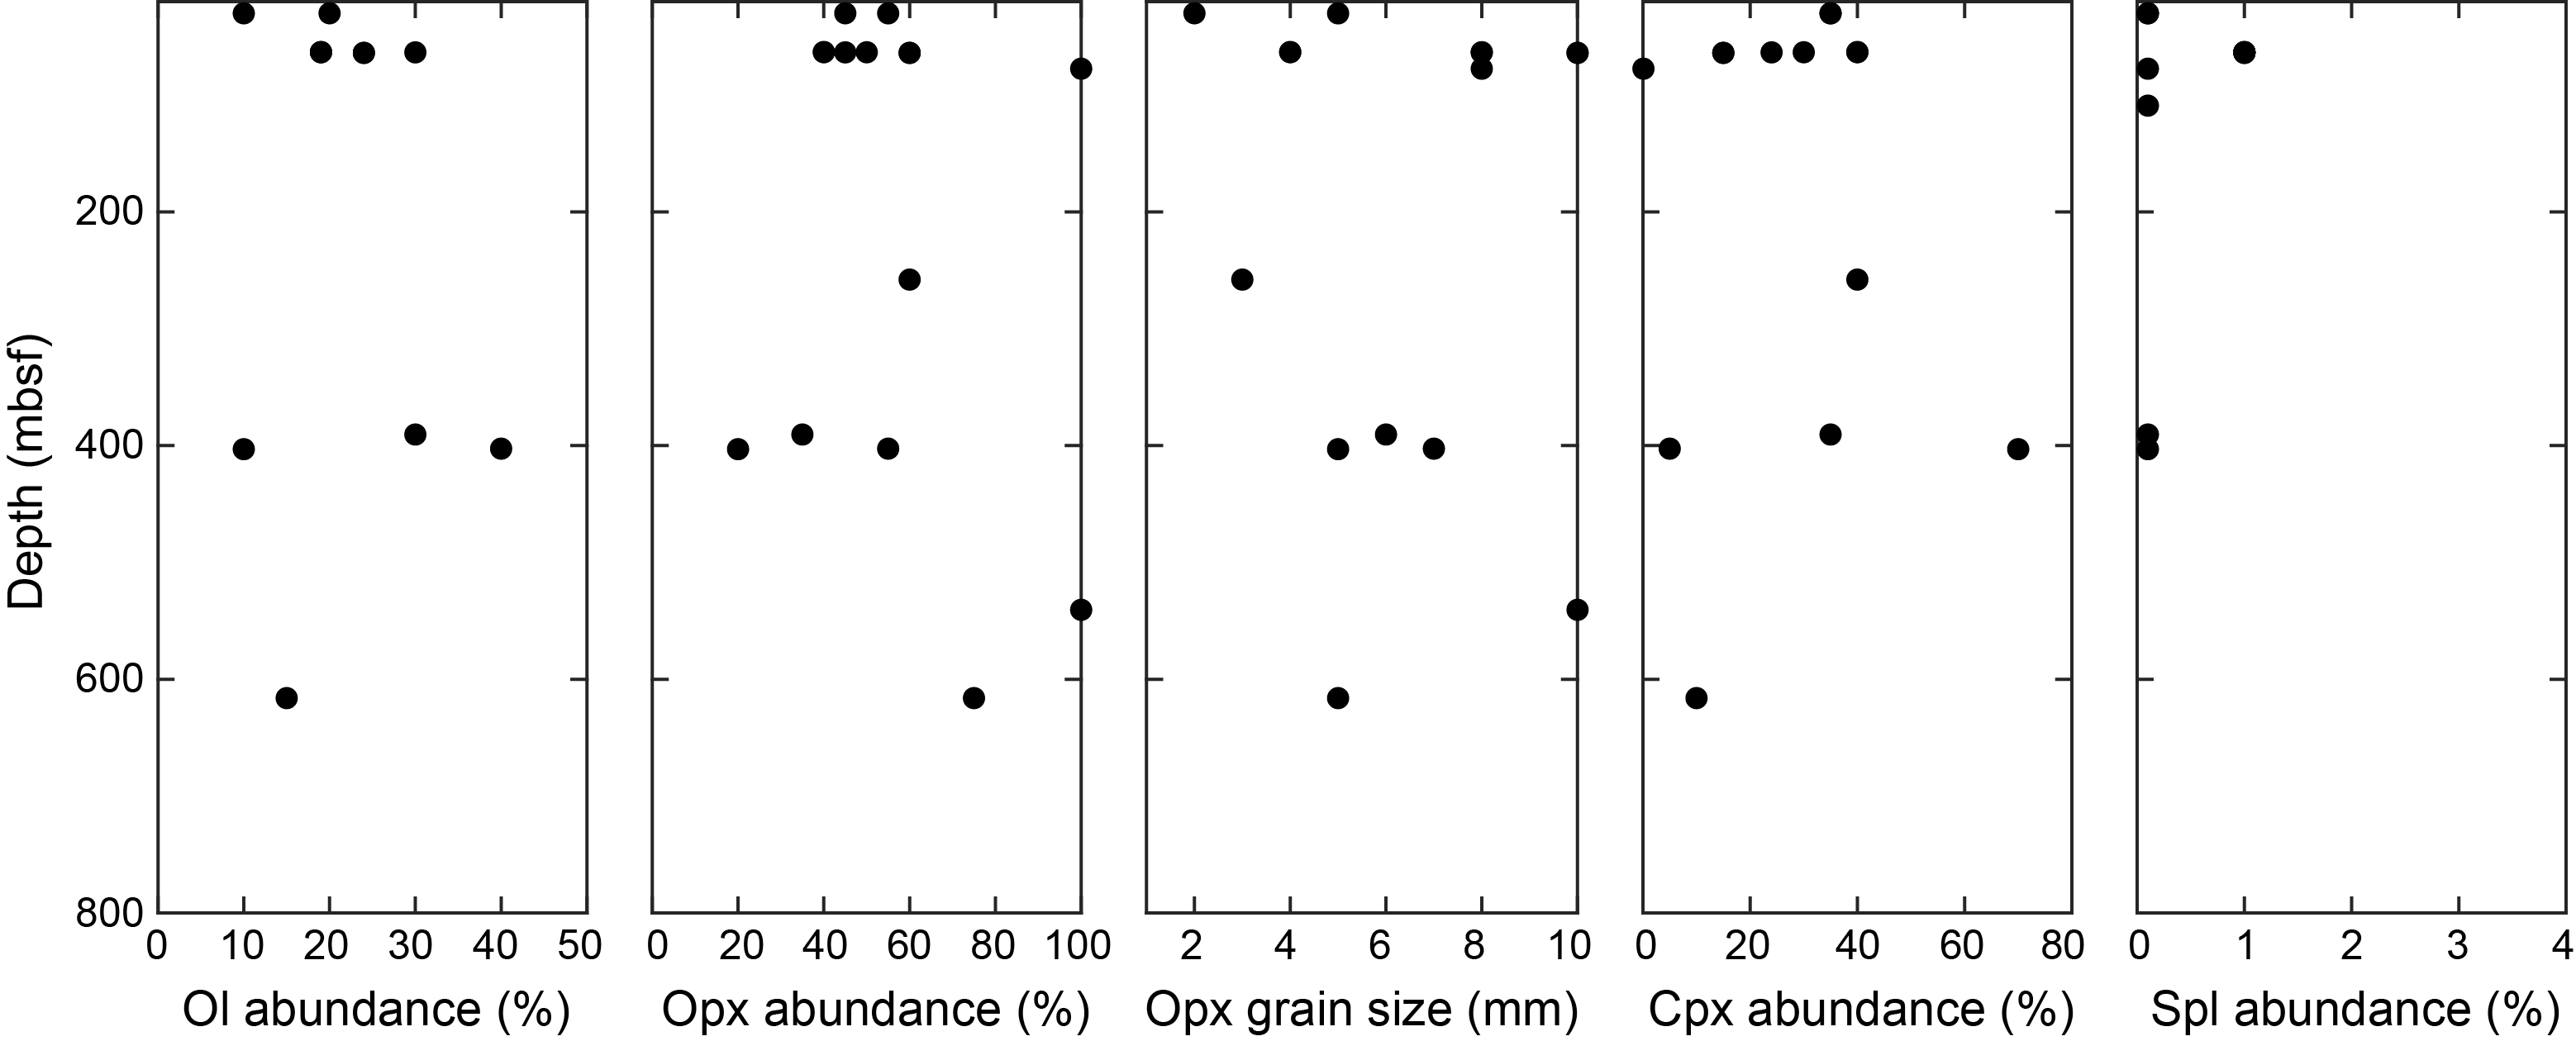
Figure F27. Mineral abundance and orthopyroxene grain size.
Websterite was only identified in Units 59 and 220 (Sections 399-U1601C-50R-2 and 155R-1, respectively). Unit 59 is a 1 cm wide vein containing medium-grained orthopyroxene and clinopyroxene that crosscuts the host harzburgite. Unit 220 comprises centimeter-sized, apparently discontinuous clots of websterite within orthopyroxene-bearing dunite.
Olivine websterite occurs as clots and veins in harzburgite and dunite (Figure F28). Subunit 3A is an olivine websterite vein in Section 3R-2 containing 10%–20% olivine, 35% clinopyroxene, and 45%–55% orthopyroxene. Olivine occurs in patches, which may suggest it is derived from the adjacent dunite. Both pyroxenes are medium grained (average = ~3 mm). Subunit 3B (Sections 10R-2 and 10R-3) is a series of olivine websterite intervals within dunite (Figure F28A, F28B) with the average modal abundance olivine = 23%, clinopyroxene = 27%, orthopyroxene = 49%, and spinel = 1%. Average clinopyroxene and orthopyroxene grain sizes are 3.7 and 7.3 mm, respectively. Orthopyroxene tends to form more equant grains, clinopyroxene can range from subequant to interstitial, and spinel occurs in amoeboid aggregates. Unit 99 comprises websterite clots within harzburgite. These clots are medium- to coarse-grained granular intergrowths of orthopyroxene and clinopyroxene contained in olivine-rich matrix (Figure F28C, F28D). The linear alignment of these clots, coupled with their oval shape, is consistent with the hypothesis that they represent small boudins of once-continuous websterite veins. The deepest olivine websterite occurrence is Unit 170, which is a dunite-hosted, 2–3 cm wide olivine websterite vein that is similar to Subunit 3B but with higher orthopyroxene proportions.
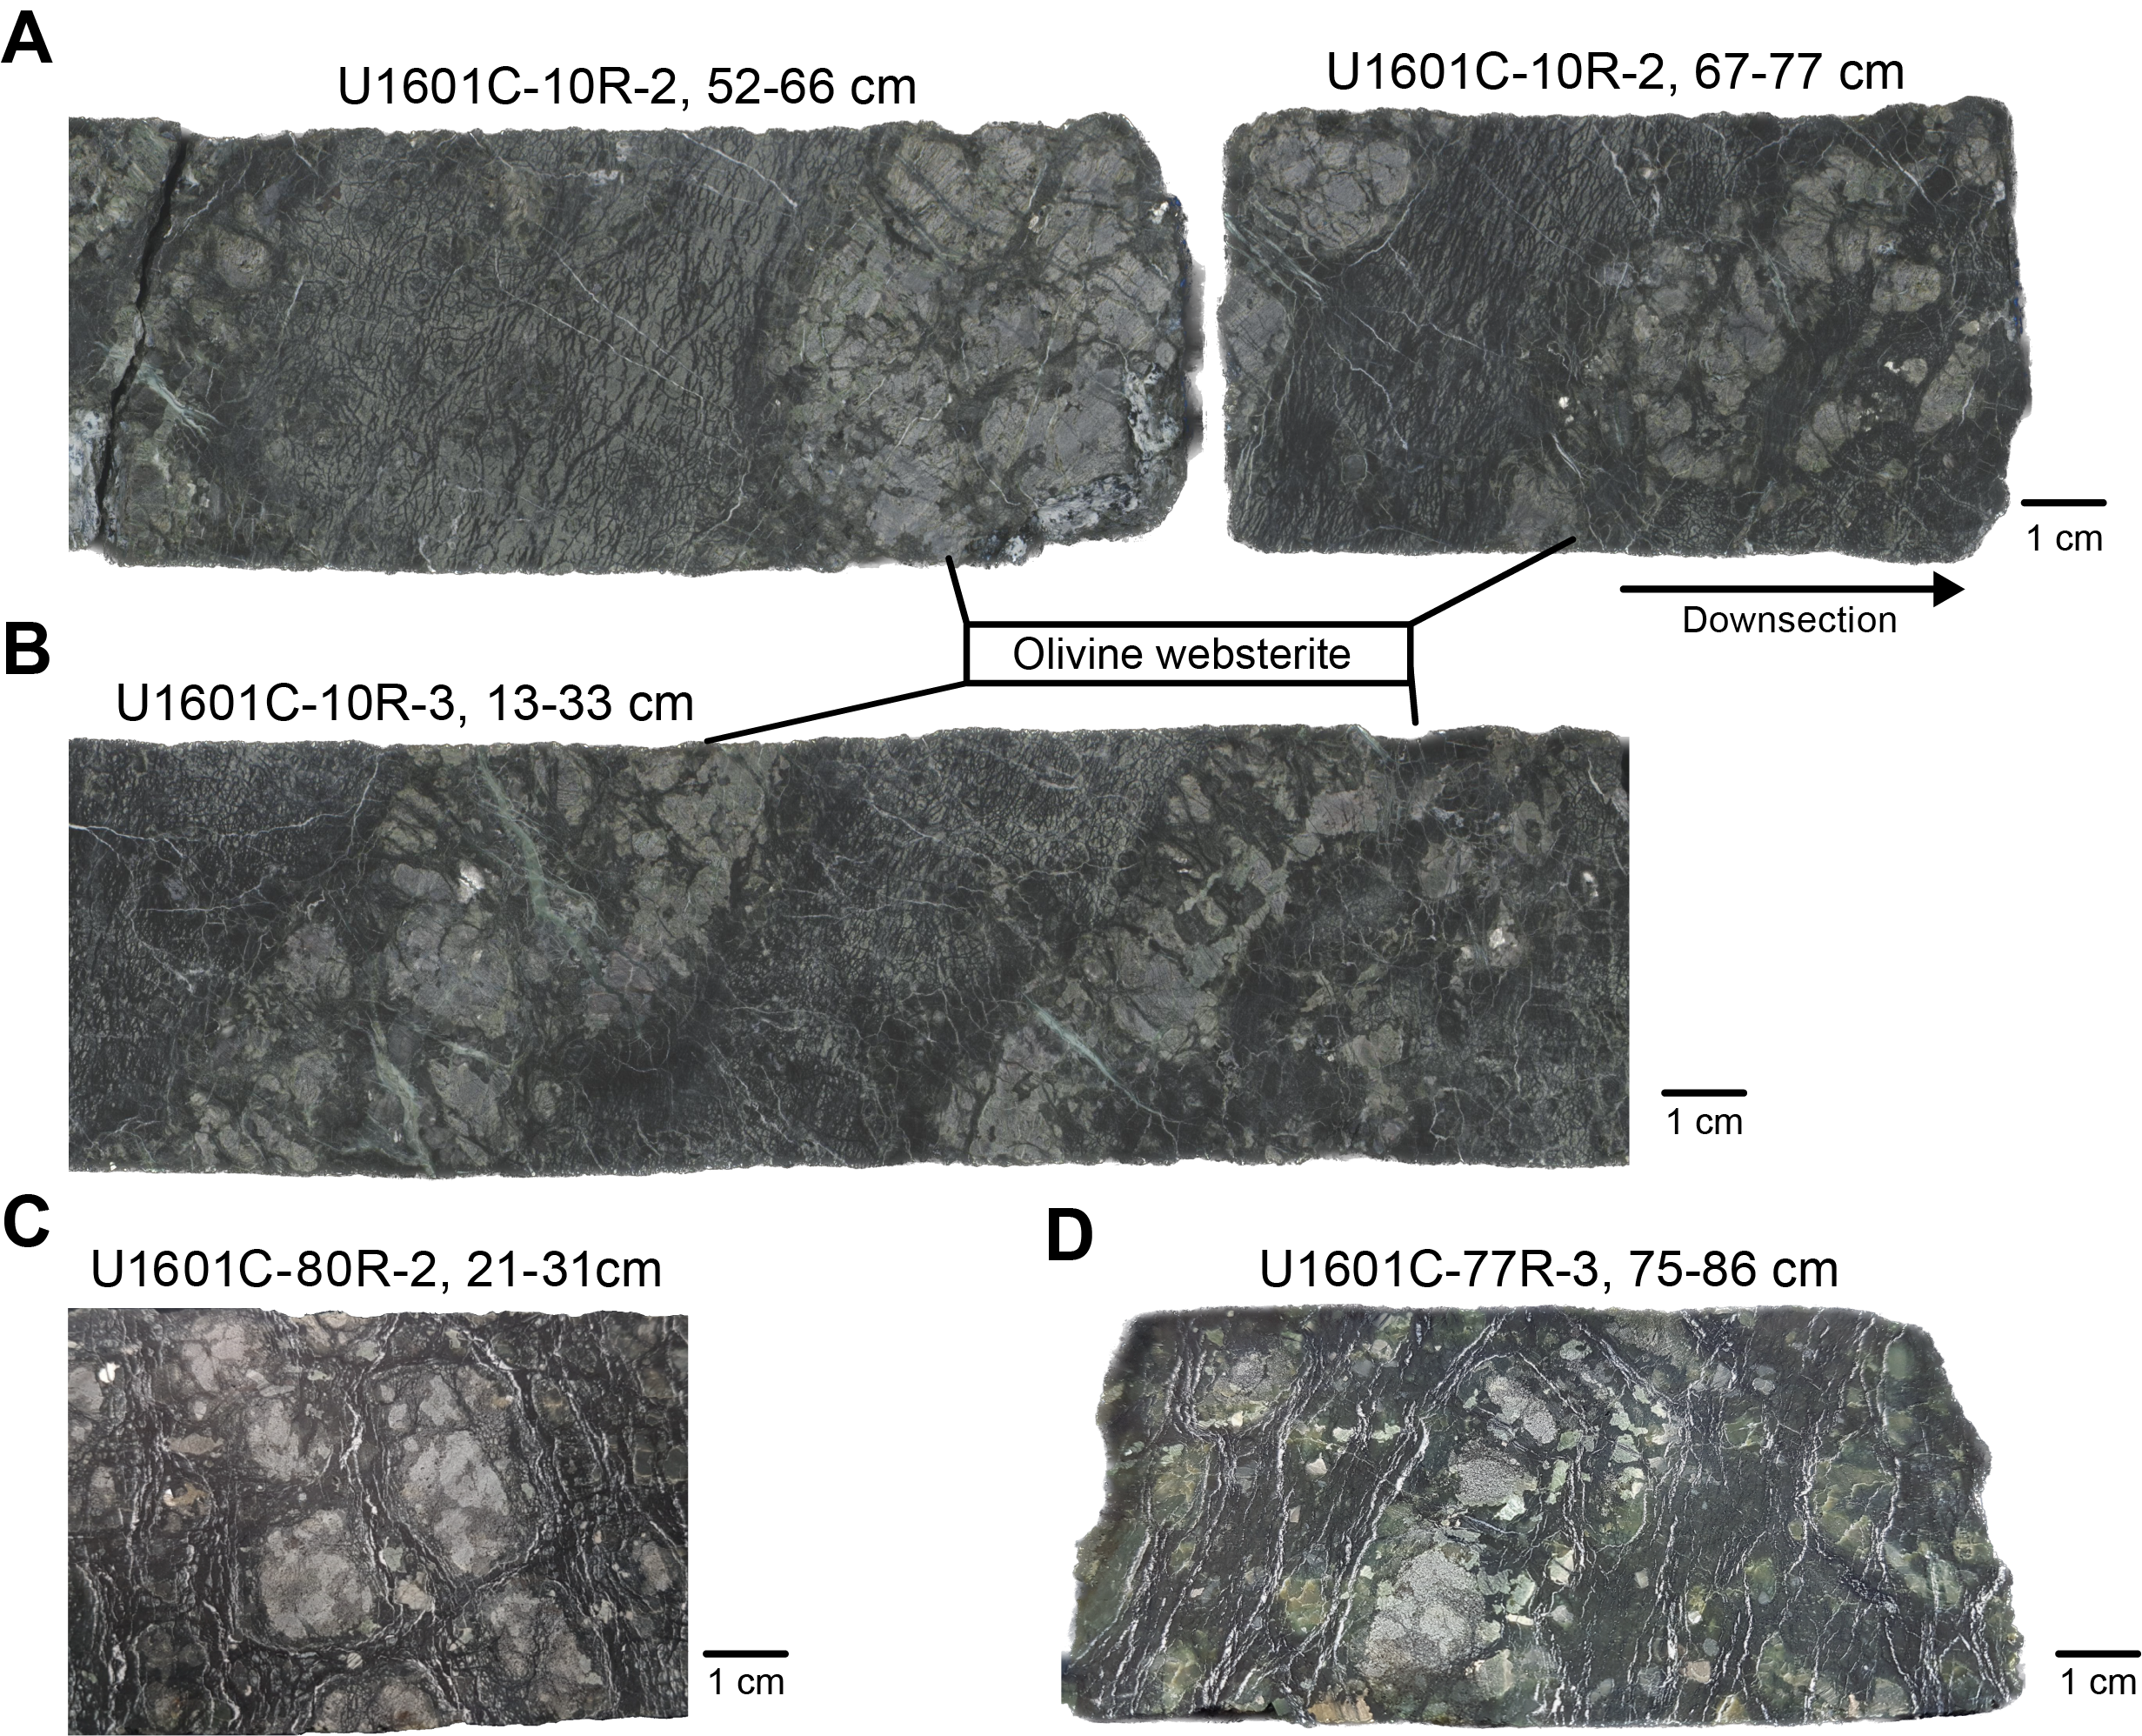
Figure F28. Olivine websterite intervals.
Orthopyroxenite was identified in Units 6, 14, and 146. Unit 6 (Section 13R-1) contains monomineralic orthopyroxenite with anhedral, subequant orthopyroxene grains (average = 8 mm). Trace amounts of spinel were observed. Unit 14 (Section 19R-3) is a 1–2 cm wide orthopyroxenite vein that infiltrates harzburgite (Figure F29). Unit 146 (Section 108R-3) is a less well preserved aggregate of coarse-grained orthopyroxene within a harzburgite.
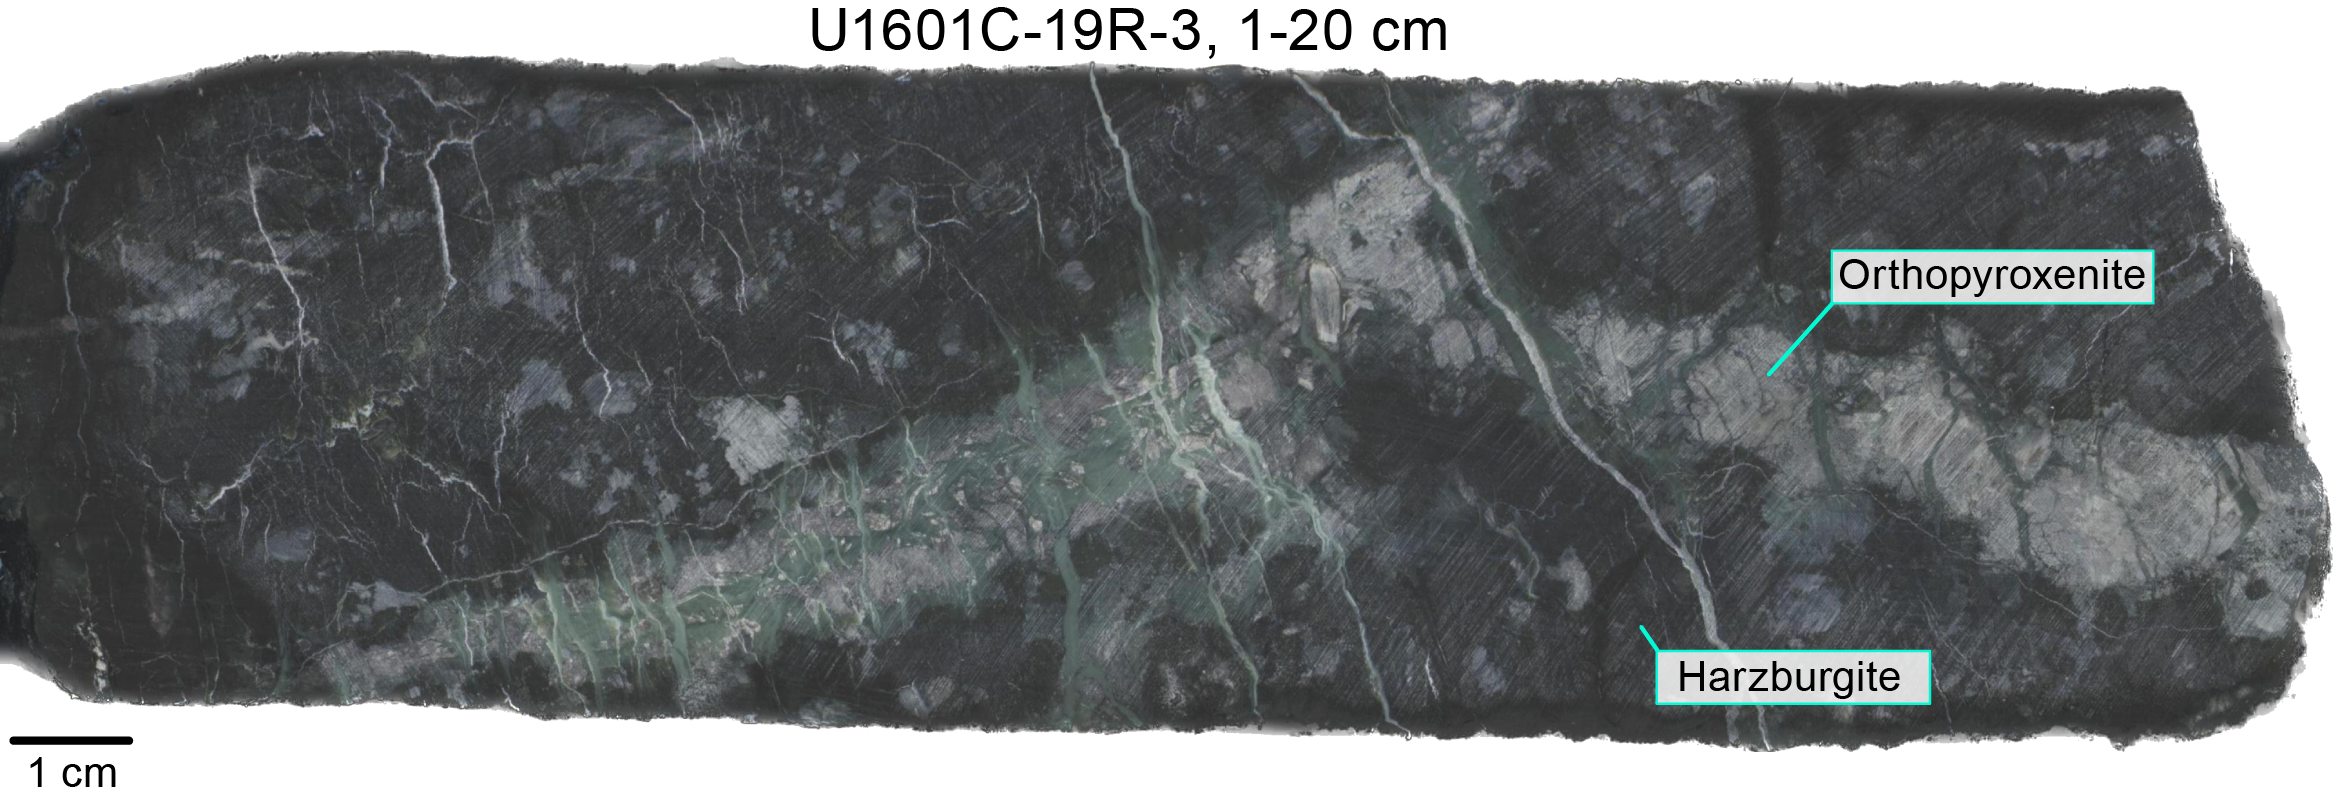
Figure F29. Orthopyroxenite vein.
Wehrlite was only identified in Unit 148 (Section 111R-1). It comprises trails of clinopyroxene crystals (~35%) within host harzburgite (Figure F30).
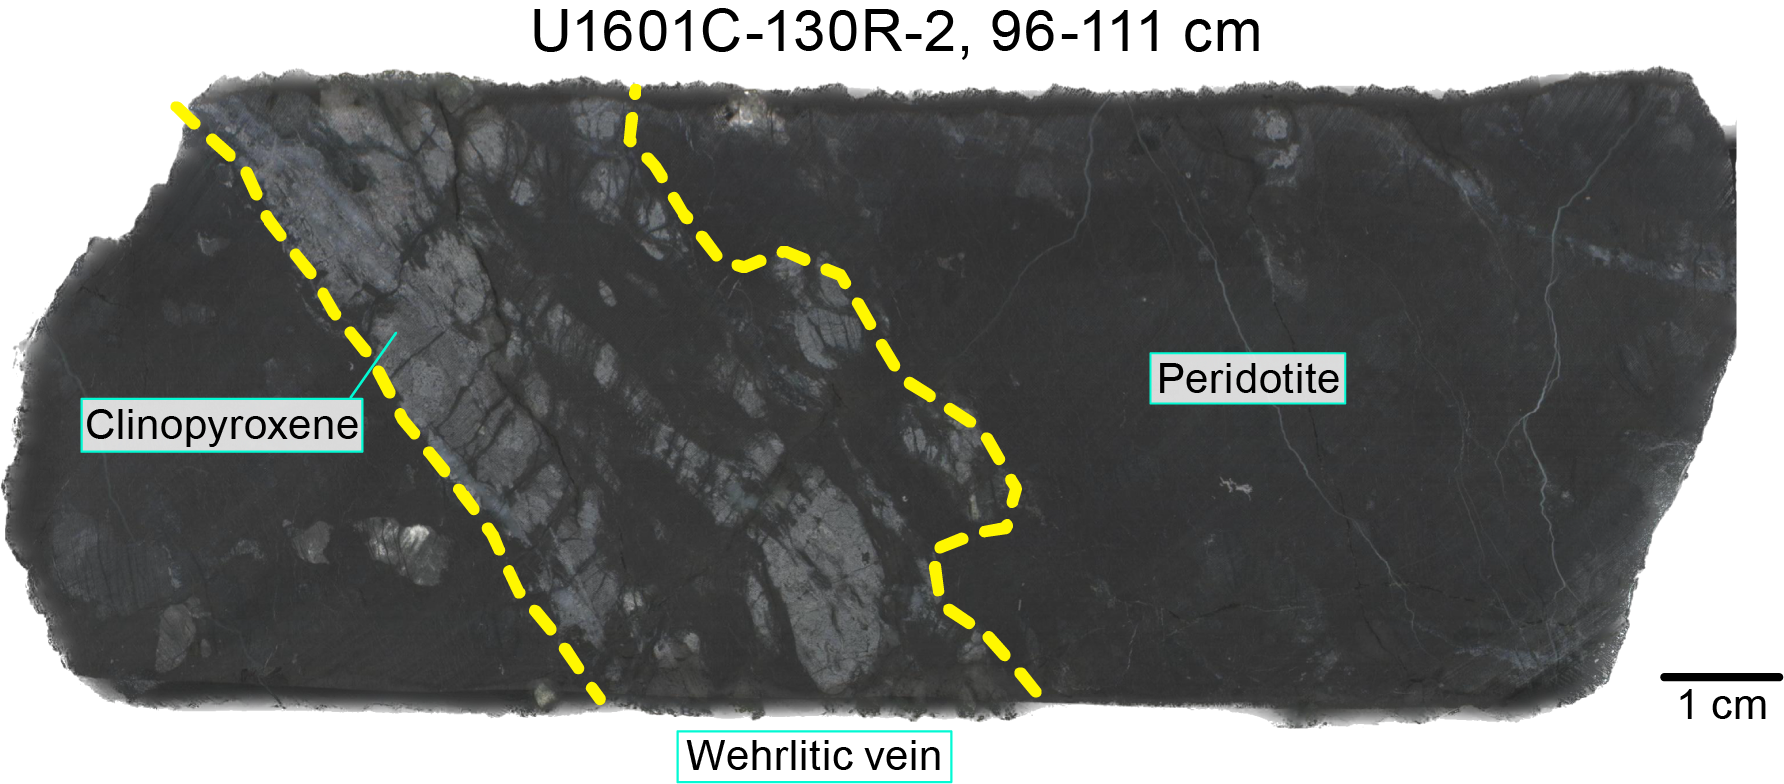
Figure F30. Wehrlitic vein.
3.2.3. Gabbroic rocks
Gabbroic bodies and veins crosscut the peridotites of Unit 2 throughout the section and are particularly concentrated toward the bottom of the hole (>950 mbsf). In total, we recorded 265 gabbroic intervals that together represent a recovered thickness of 298.8 m (Figure F31). To provide an estimate of the size and size distribution of gabbroic intervals in the hole, we calculated the thickness of intervals in which only gabbroic rocks were recovered; hence, a gabbroic interval starts at the top of the first gabbro appearance below an interval of peridotite and ends where the next peridotite appears. Gabbro thickness was calculated as the sum of the recovered gabbroic rocks in these intervals; nonrecovery was not counted toward interval thickness. We note that the number of gabbroic intervals is underestimated; for instance, in the common case where millimeter- to centimeter-sized veins occurred repeatedly in a section of peridotite they were logged as a single domain within the peridotite. Hence, they do not comprise an interval and were not included in the calculations. As a result, the true number of gabbroic bodies is significantly greater than 265.
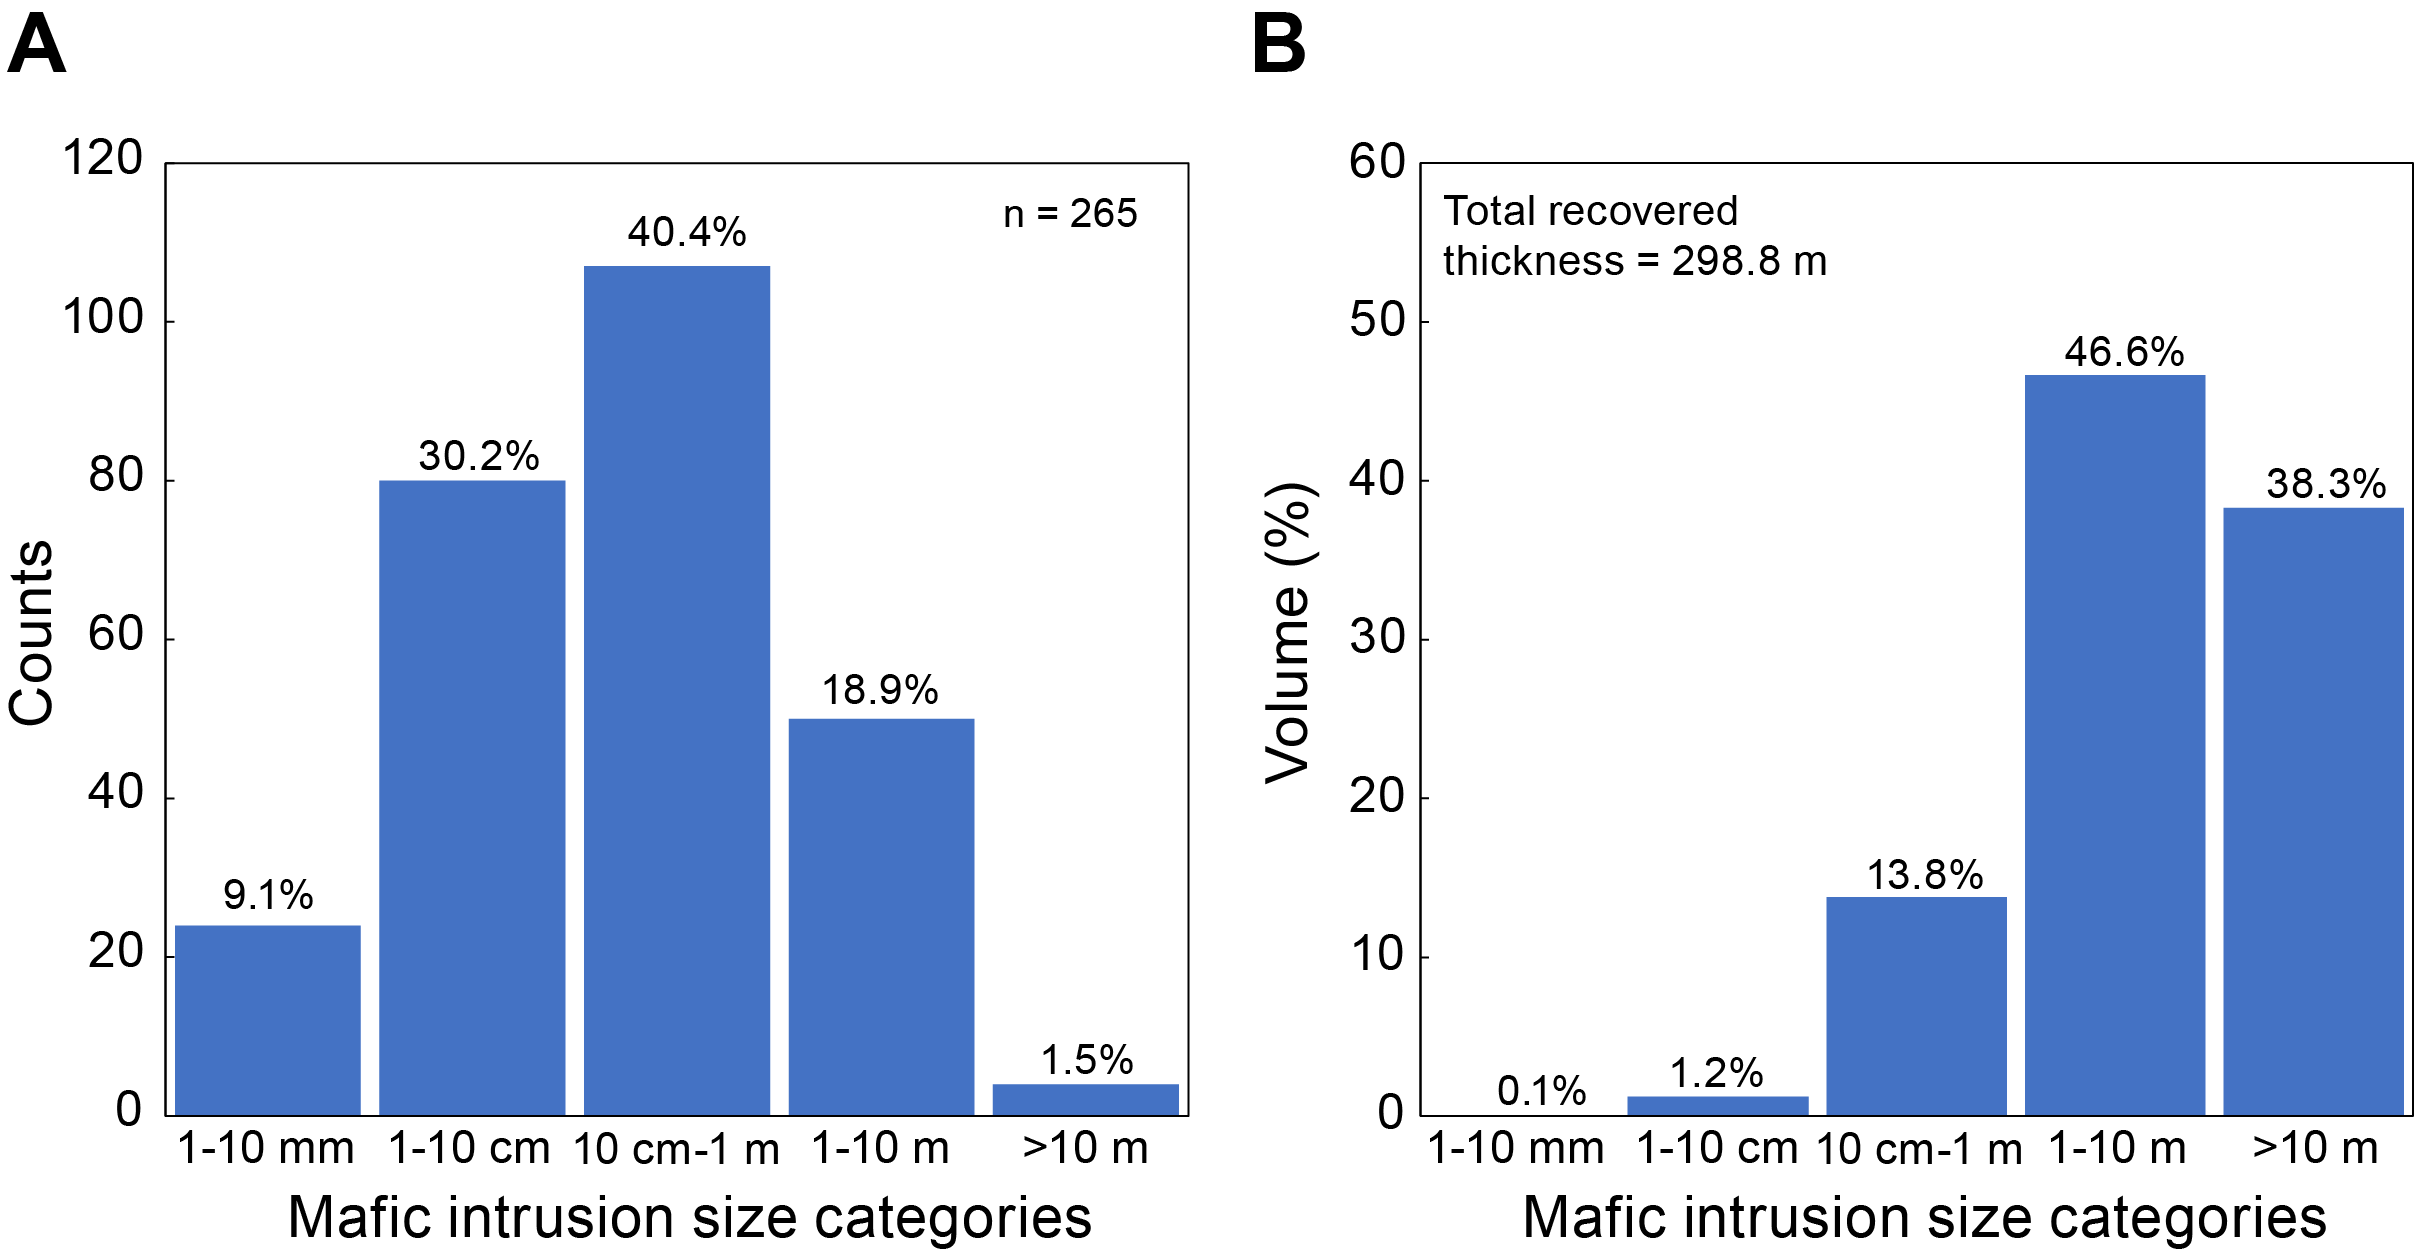
Figure F31. Size distribution, gabbroic intervals.
The size distribution shows that a substantial majority of gabbroic intervals have an interval thickness of <1 m (80%) with progressively fewer gabbroic intervals with a thickness of 1–10 m (19%) and >10 m (2%) (Figure F31A). However, the larger gabbroic intervals dominate the volumetric proportions, with intervals >1 m thick forming 85% of the recovered gabbro volume (Figure F31B).
Lithologically, the gabbroic rocks are dominated by gabbro (46%; including olivine-bearing gabbro) and gabbronorite (35%; including oxide-bearing gabbronorite) with lesser olivine gabbro (11%) and oxide gabbro (5%) (Figure F5B). Other gabbroic lithologies (e.g., troctolite and diorite) are 1% or less each. The different lithologies occur in intervals of different size (Figure F32): gabbro occurs across the size spectrum (millimeters to tens of meters), but olivine gabbro occurs predominantly in decimeter- to meter-sized intervals. Gabbronorite skews toward small interval sizes (<0.5 m), whereas troctolite and diorite occur only as components of larger gabbroic intervals (0.1–10 m).
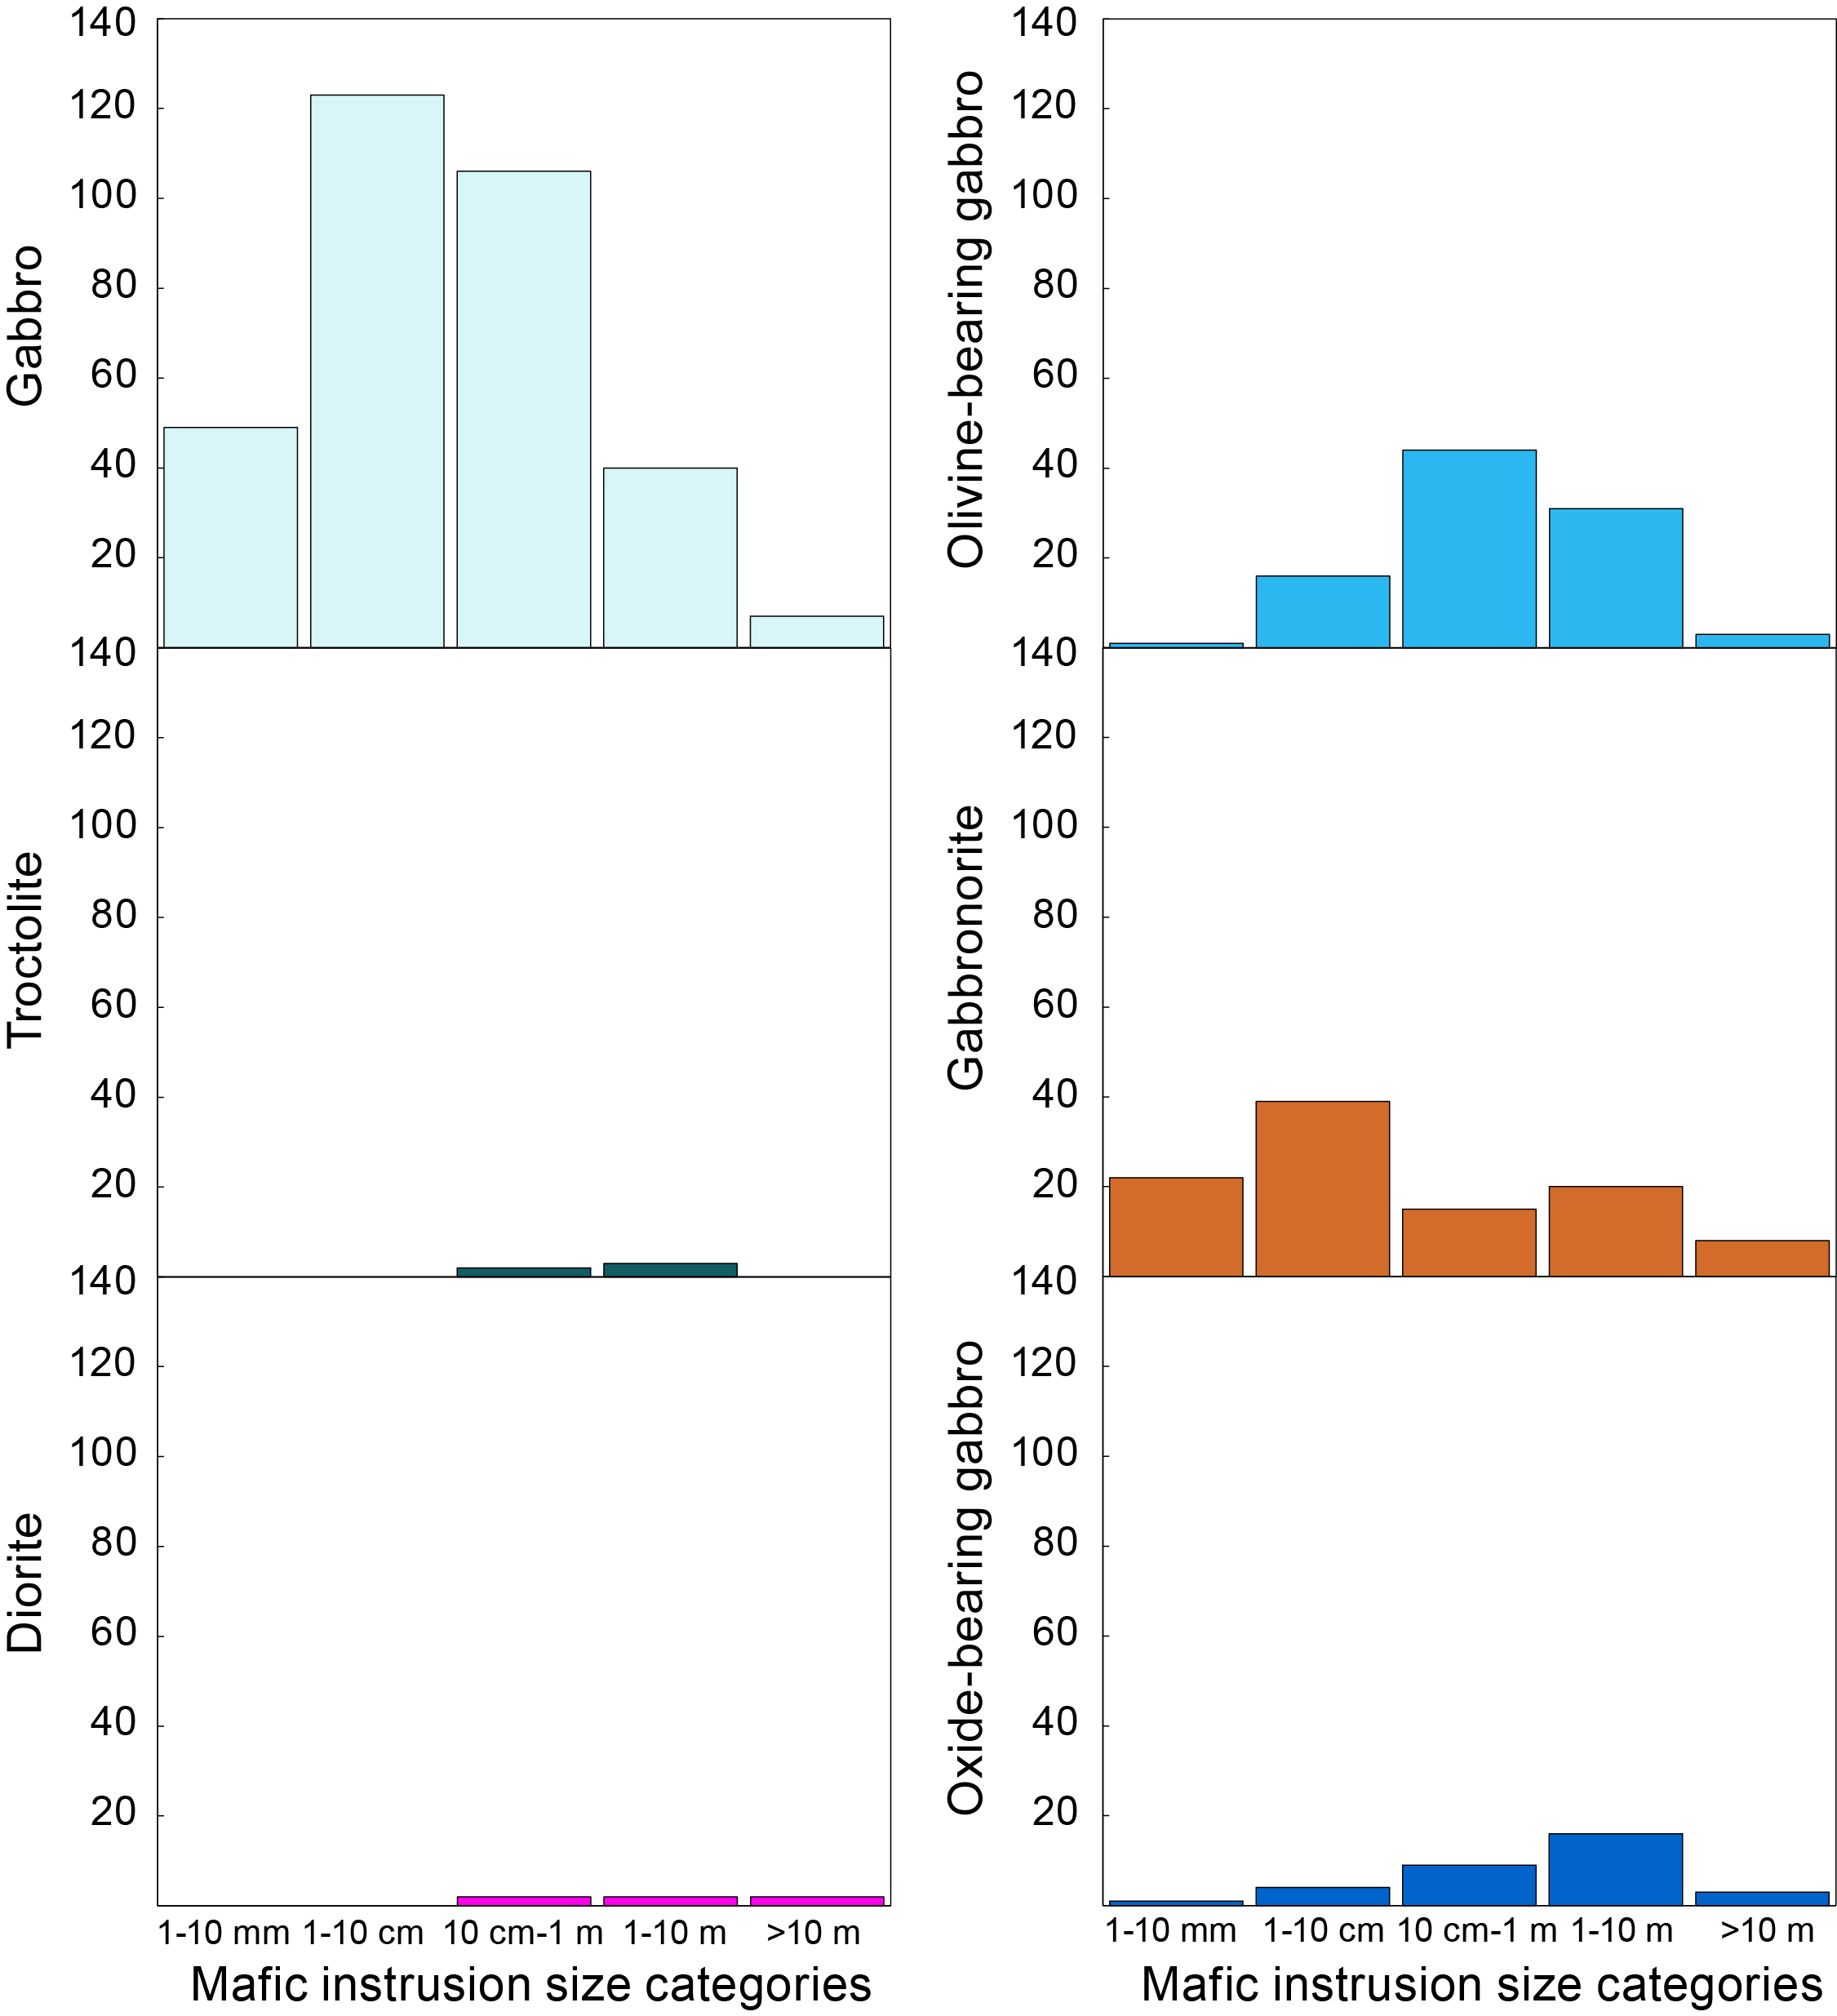
Figure F32. Gabbroic interval size.
Gabbro is the most common type of intrusive rock. It occurs throughout the hole and covers the full range of sizes of gabbroic intervals seen in Hole U1601C, from veins <1 mm to plutons >20 m (Figure F32). Gabbros also span the entire grain size spectrum observed in plutonic rocks in the hole (Figure F33A), ranging from fine grained to pegmatitic; no systematic variations are observed downhole (Figure F34). Mineralogically, plagioclase:clinopyroxene ratios are slightly variable, but generally plagioclase proportions exceed those of clinopyroxene. Although some gabbros have small amounts of olivine or Fe-Ti oxides (both <1%), most are simple combinations of plagioclase + clinopyroxene.
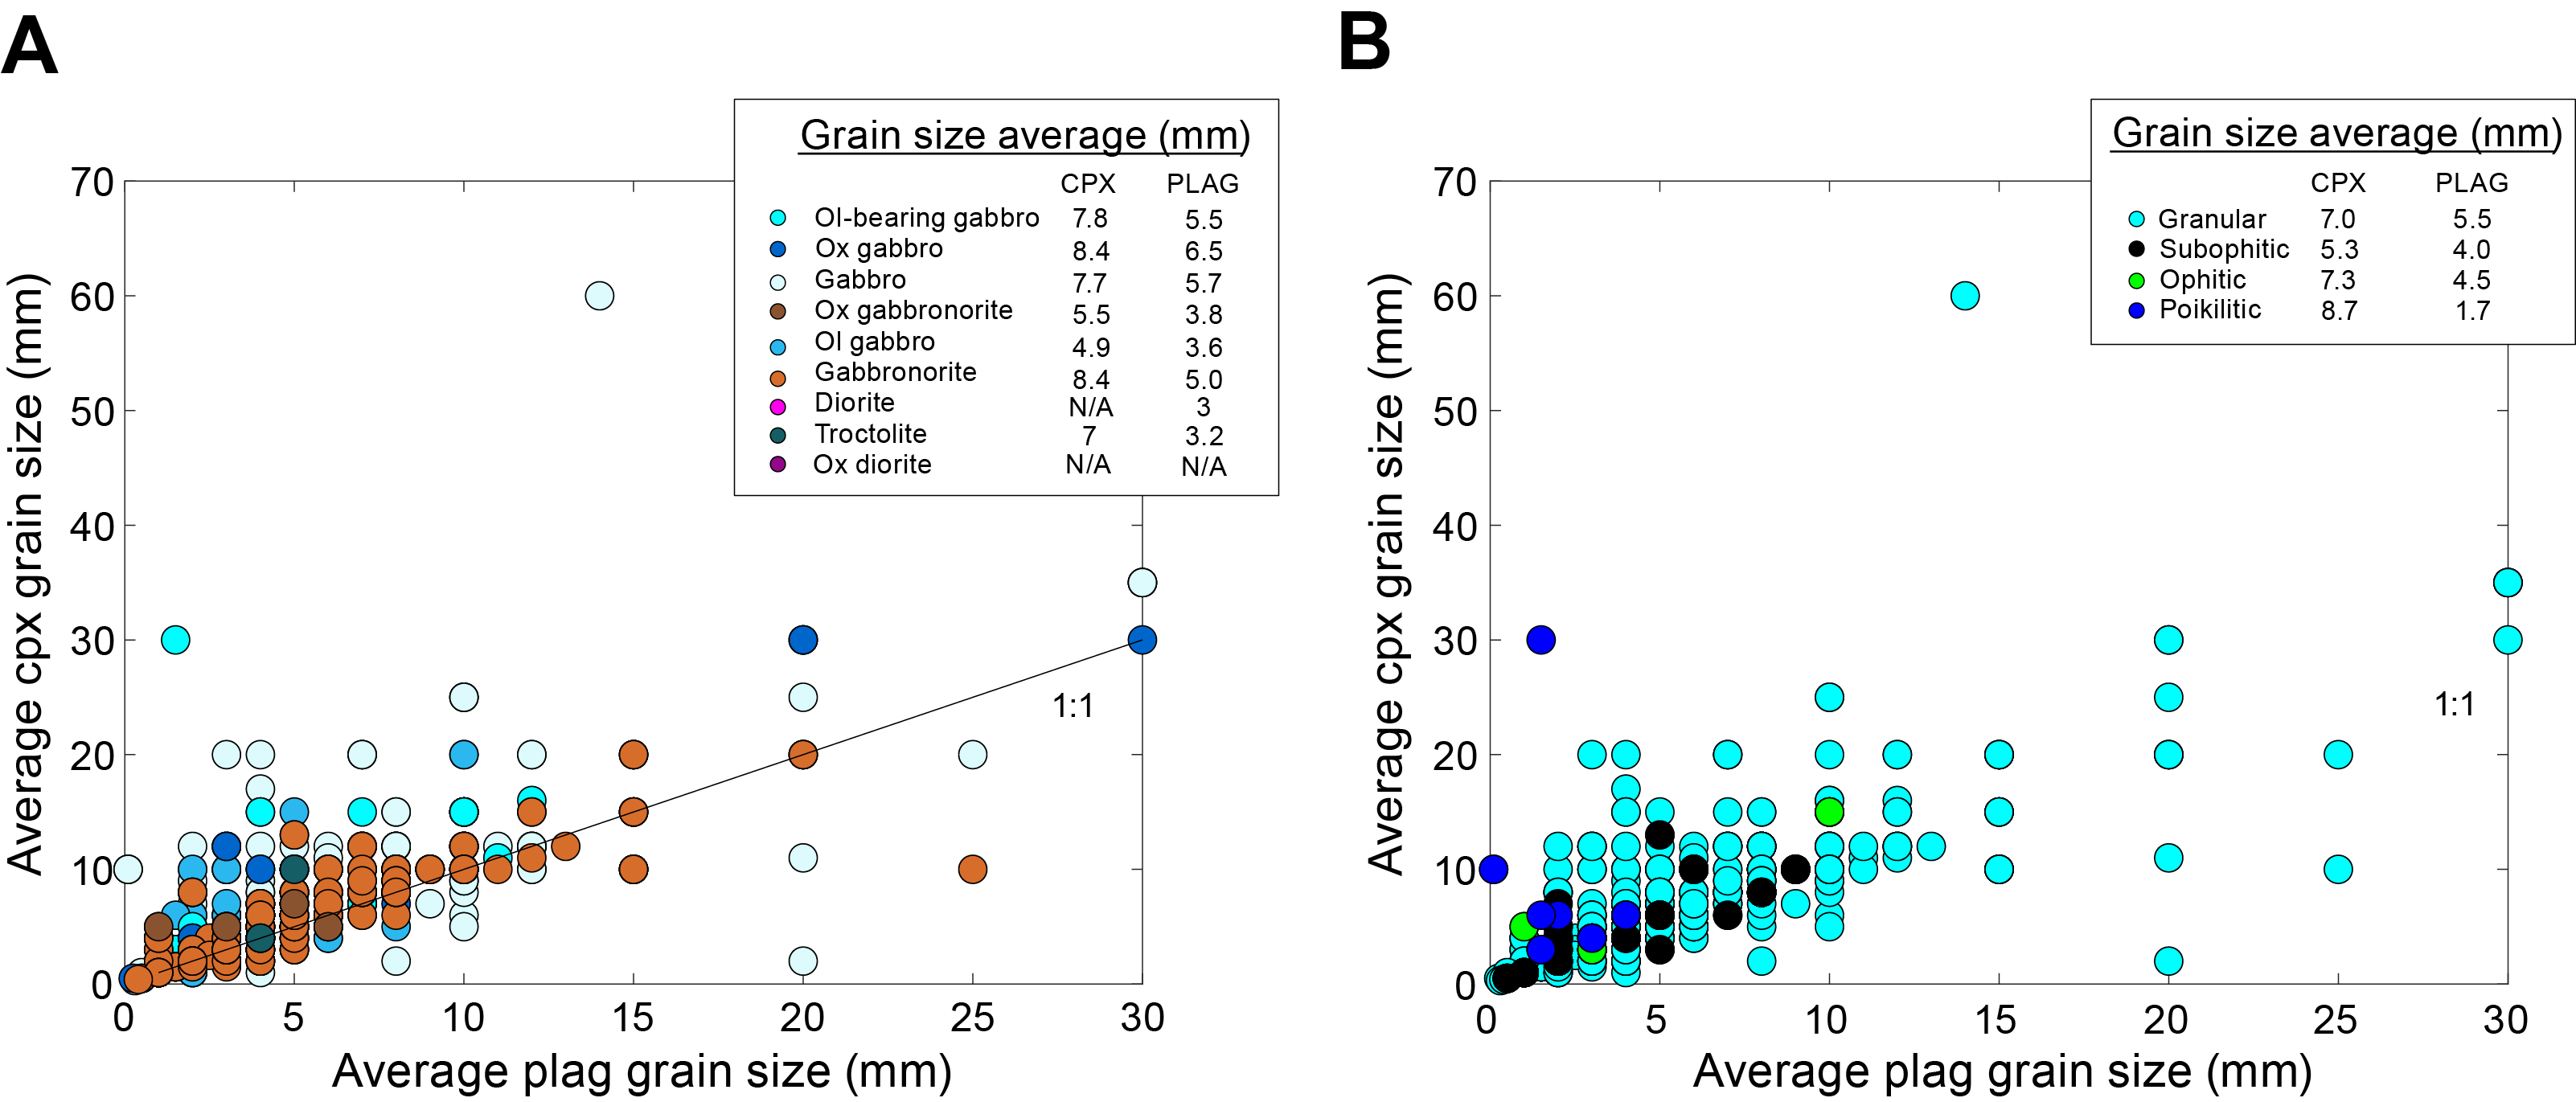
Figure F33. Grain size of plagioclase and clinopyroxene.
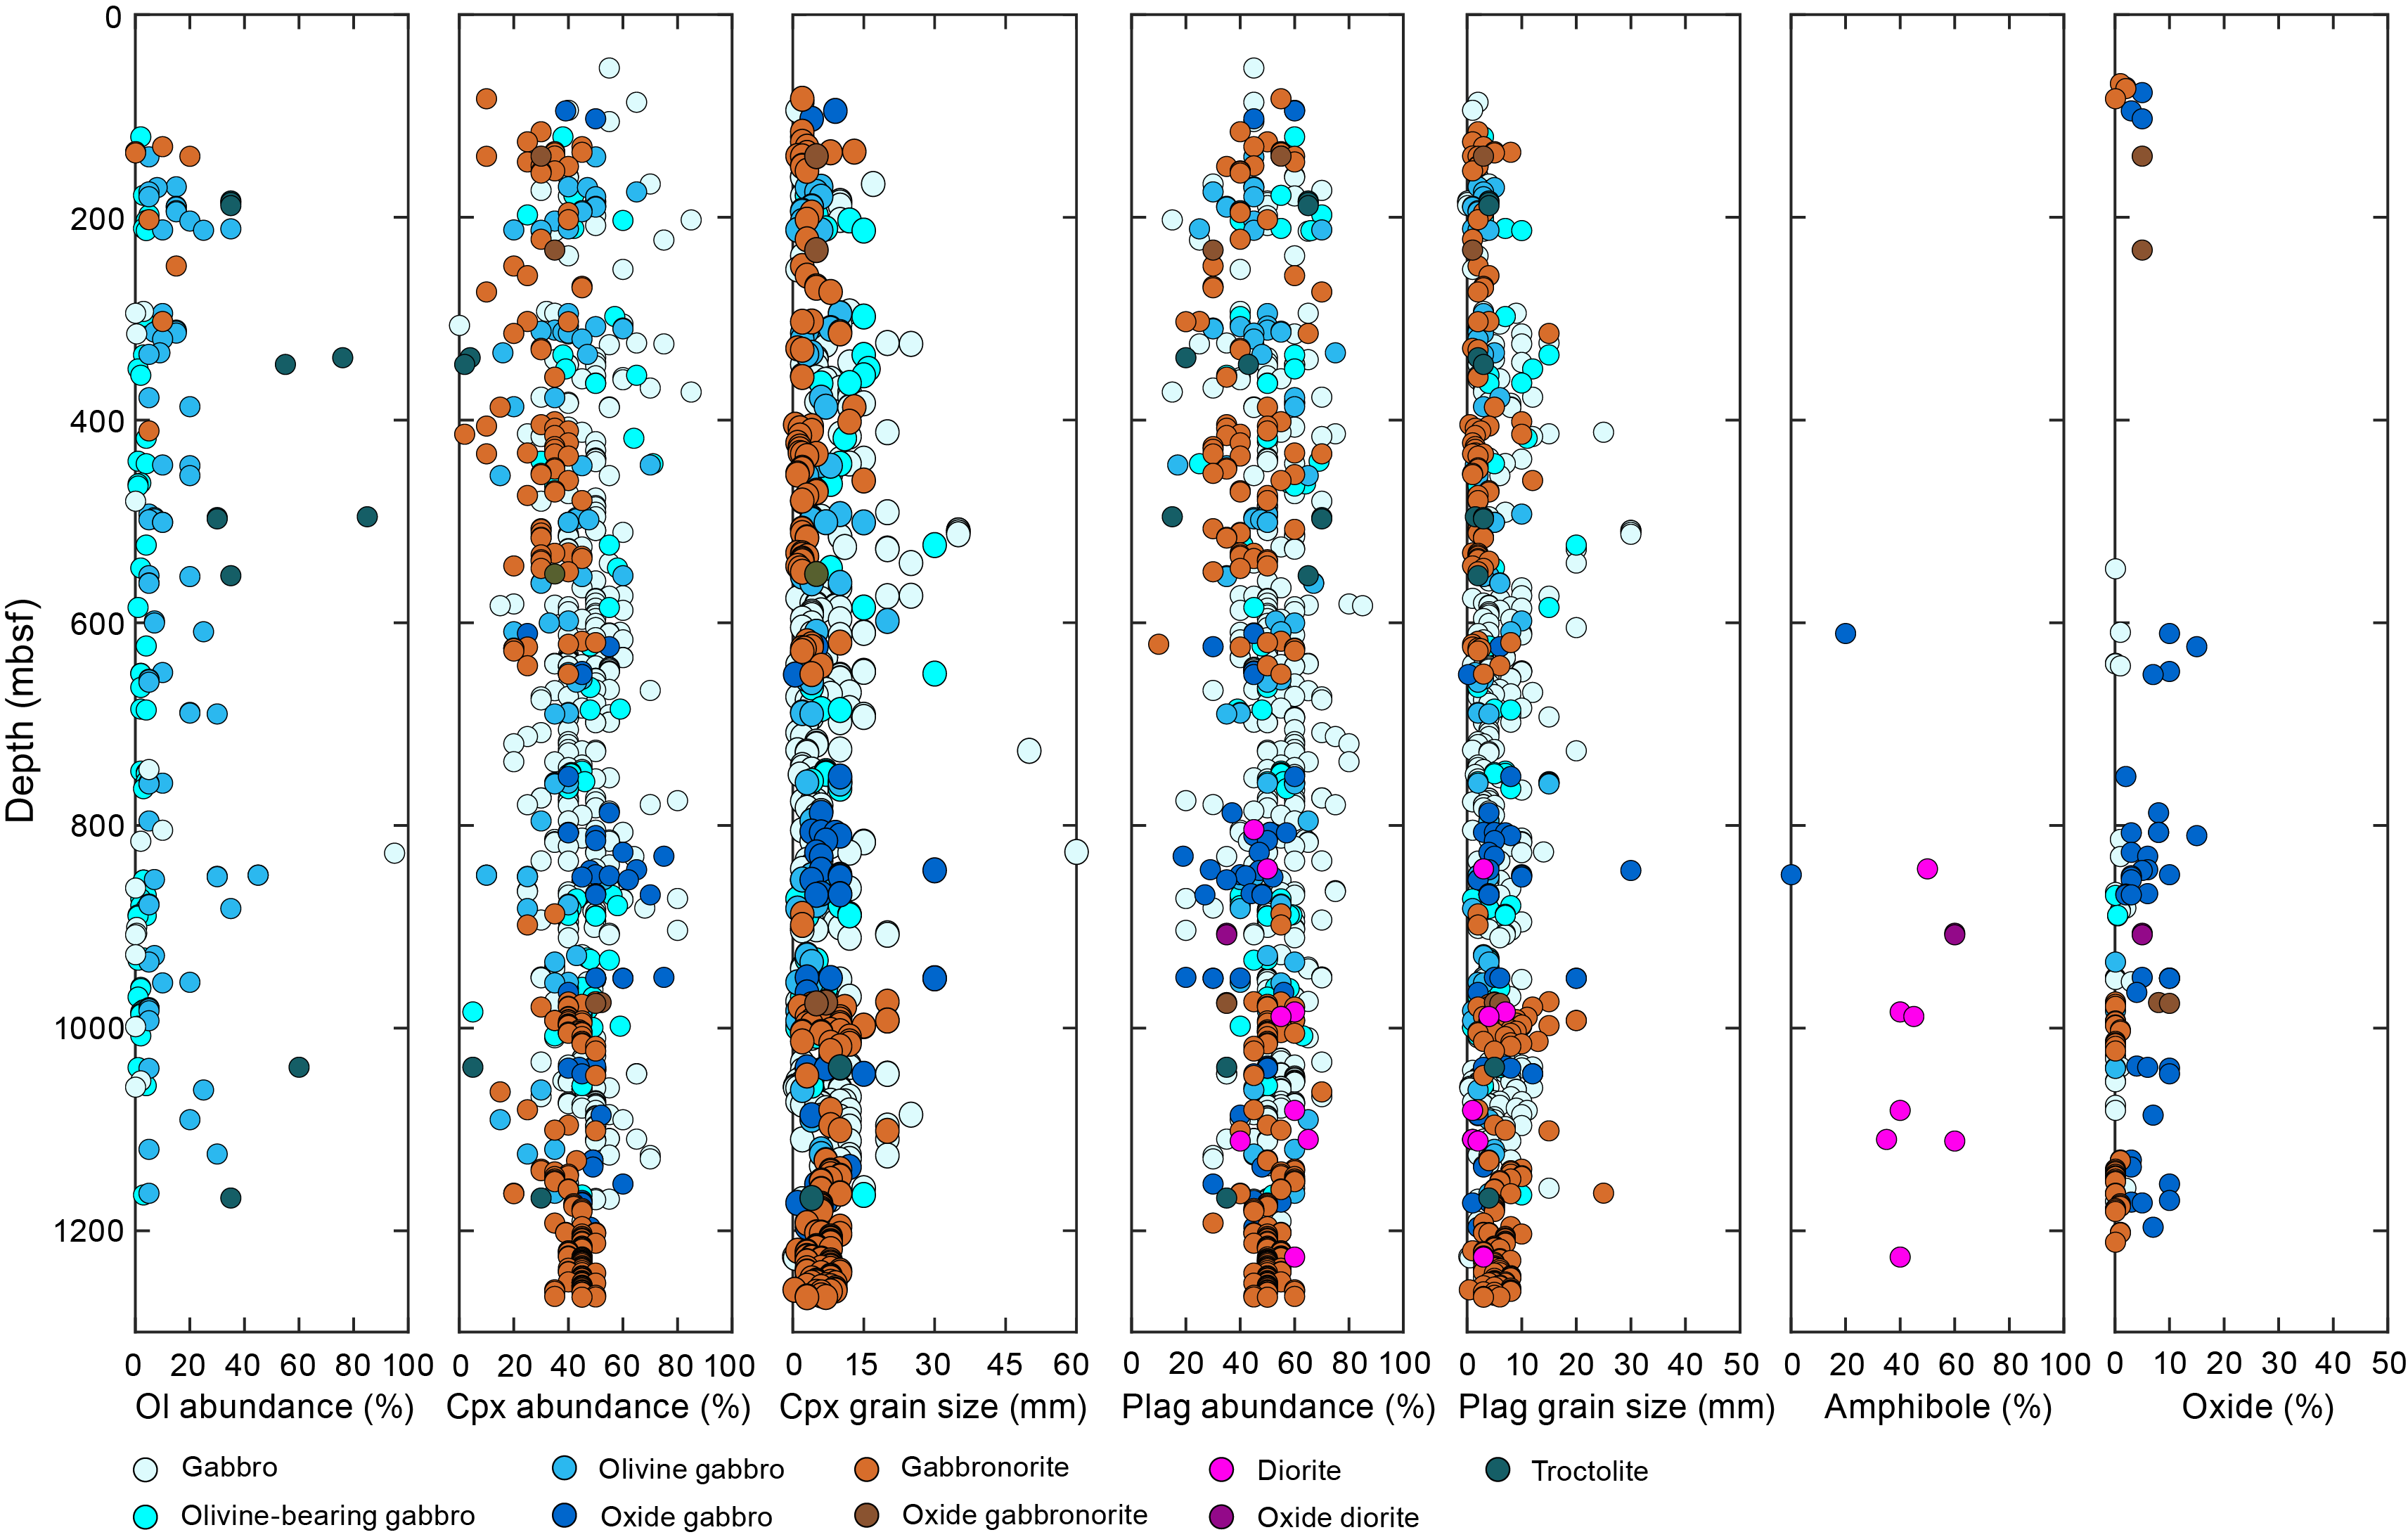
Figure F34. Abundance and grain size in mafic intrusions.
Olivine gabbro occurs throughout the section as both individual intrusions on the decimeter to meter scale and components of larger gabbroic intervals. Olivine content is typically between 5% and 15% but is as high as 45% (average = 13%; Figure F34). Olivine gabbro is highly variable in texture and occurrence. Some rocks are relatively uniform medium-grained (Figure F35A), whereas others show strong small-scale variations in grain size and/or modal proportions, ranging from troctolite to gabbro over centimeters (e.g., Unit 26). Clinopyroxene in olivine gabbros ranges from millimeter-sized granular grains to large (up to 6 cm) oikocrysts (e.g., Unit 217). Unit 252 olivine gabbro is characterized by a distinct texture of anhedral, equant olivine + plagioclase with a small proportion of clinopyroxene (Figure F35B). Its texture is reminiscent of the olivine-rich troctolites reported in Hole U1309D. A final type of olivine gabbro occurs near the contacts of gabbro bodies with peridotite; these are further discussed below.
Figure F35. Textural variation in olivine gabbro.
Gabbronorite occurs in veins as well as larger intrusions. Its most common occurrence is in veins, and it is one of the most common lithologies in millimeter-sized discrete veins (Figure F36). High degrees of alteration make primary mineralogy difficult to estimate in veins, but the original presence of both orthopyroxene and clinopyroxene is inferred from the occurrence of both green and brown altered pyroxene. Gabbronorite in these veins is generally medium grained and granular. Gabbronorite also occurs as components of larger gabbroic intervals; a good example is Unit 326, where gabbronorite occurs, along with oxide-bearing and oxide gabbronorite, as coarse-grained granular rocks forming a 7.8 m sized intrusive body in peridotite. It also dominates the thickest gabbroic body that occurs at the bottom of the hole (Unit 338; 51.5 m). Overall, the abundance of gabbronorite in the hole is likely underestimated; orthopyroxene was difficult to identify during macroscopic core description because clinopyroxene was frequently brown. Hence, some gabbronorites may have inadvertently been classified as gabbros.
Figure F36. Gabbronorite vein in harzburgite.
Troctolite is rare and occurs predominantly as domains in other lithologies rather than as separate intervals. The two predominant modes of occurrence are as domains in some of the larger gabbroic bodies (Figure F37) and at contacts between gabbro and peridotite. Where troctolite forms domains in gabbro bodies (e.g., Units 31 and 141), it is typically plagioclase rich (65%–70%) and medium grained. Texturally, it is characterized by granular plagioclase with anhedral and often interstitial olivine (e.g., Figure F37A), which was shown to be largely polycrystalline aggregates by thin section analysis. At gabbro/peridotite contacts, troctolite occurs as narrow (centimeter sized) bands separating the two lithologies (see below). A final occurrence of troctolite is as a larger (17 cm) screen (Subunit 294D) between two gabbroic subunits. This troctolite is dominated by olivine (60%), with plagioclase occurring as anhedral, irregularly shaped, and locally amoeboid plagioclase. These properties suggest that it may be an impregnated peridotite rather than a cotectic crystallization product of a melt.
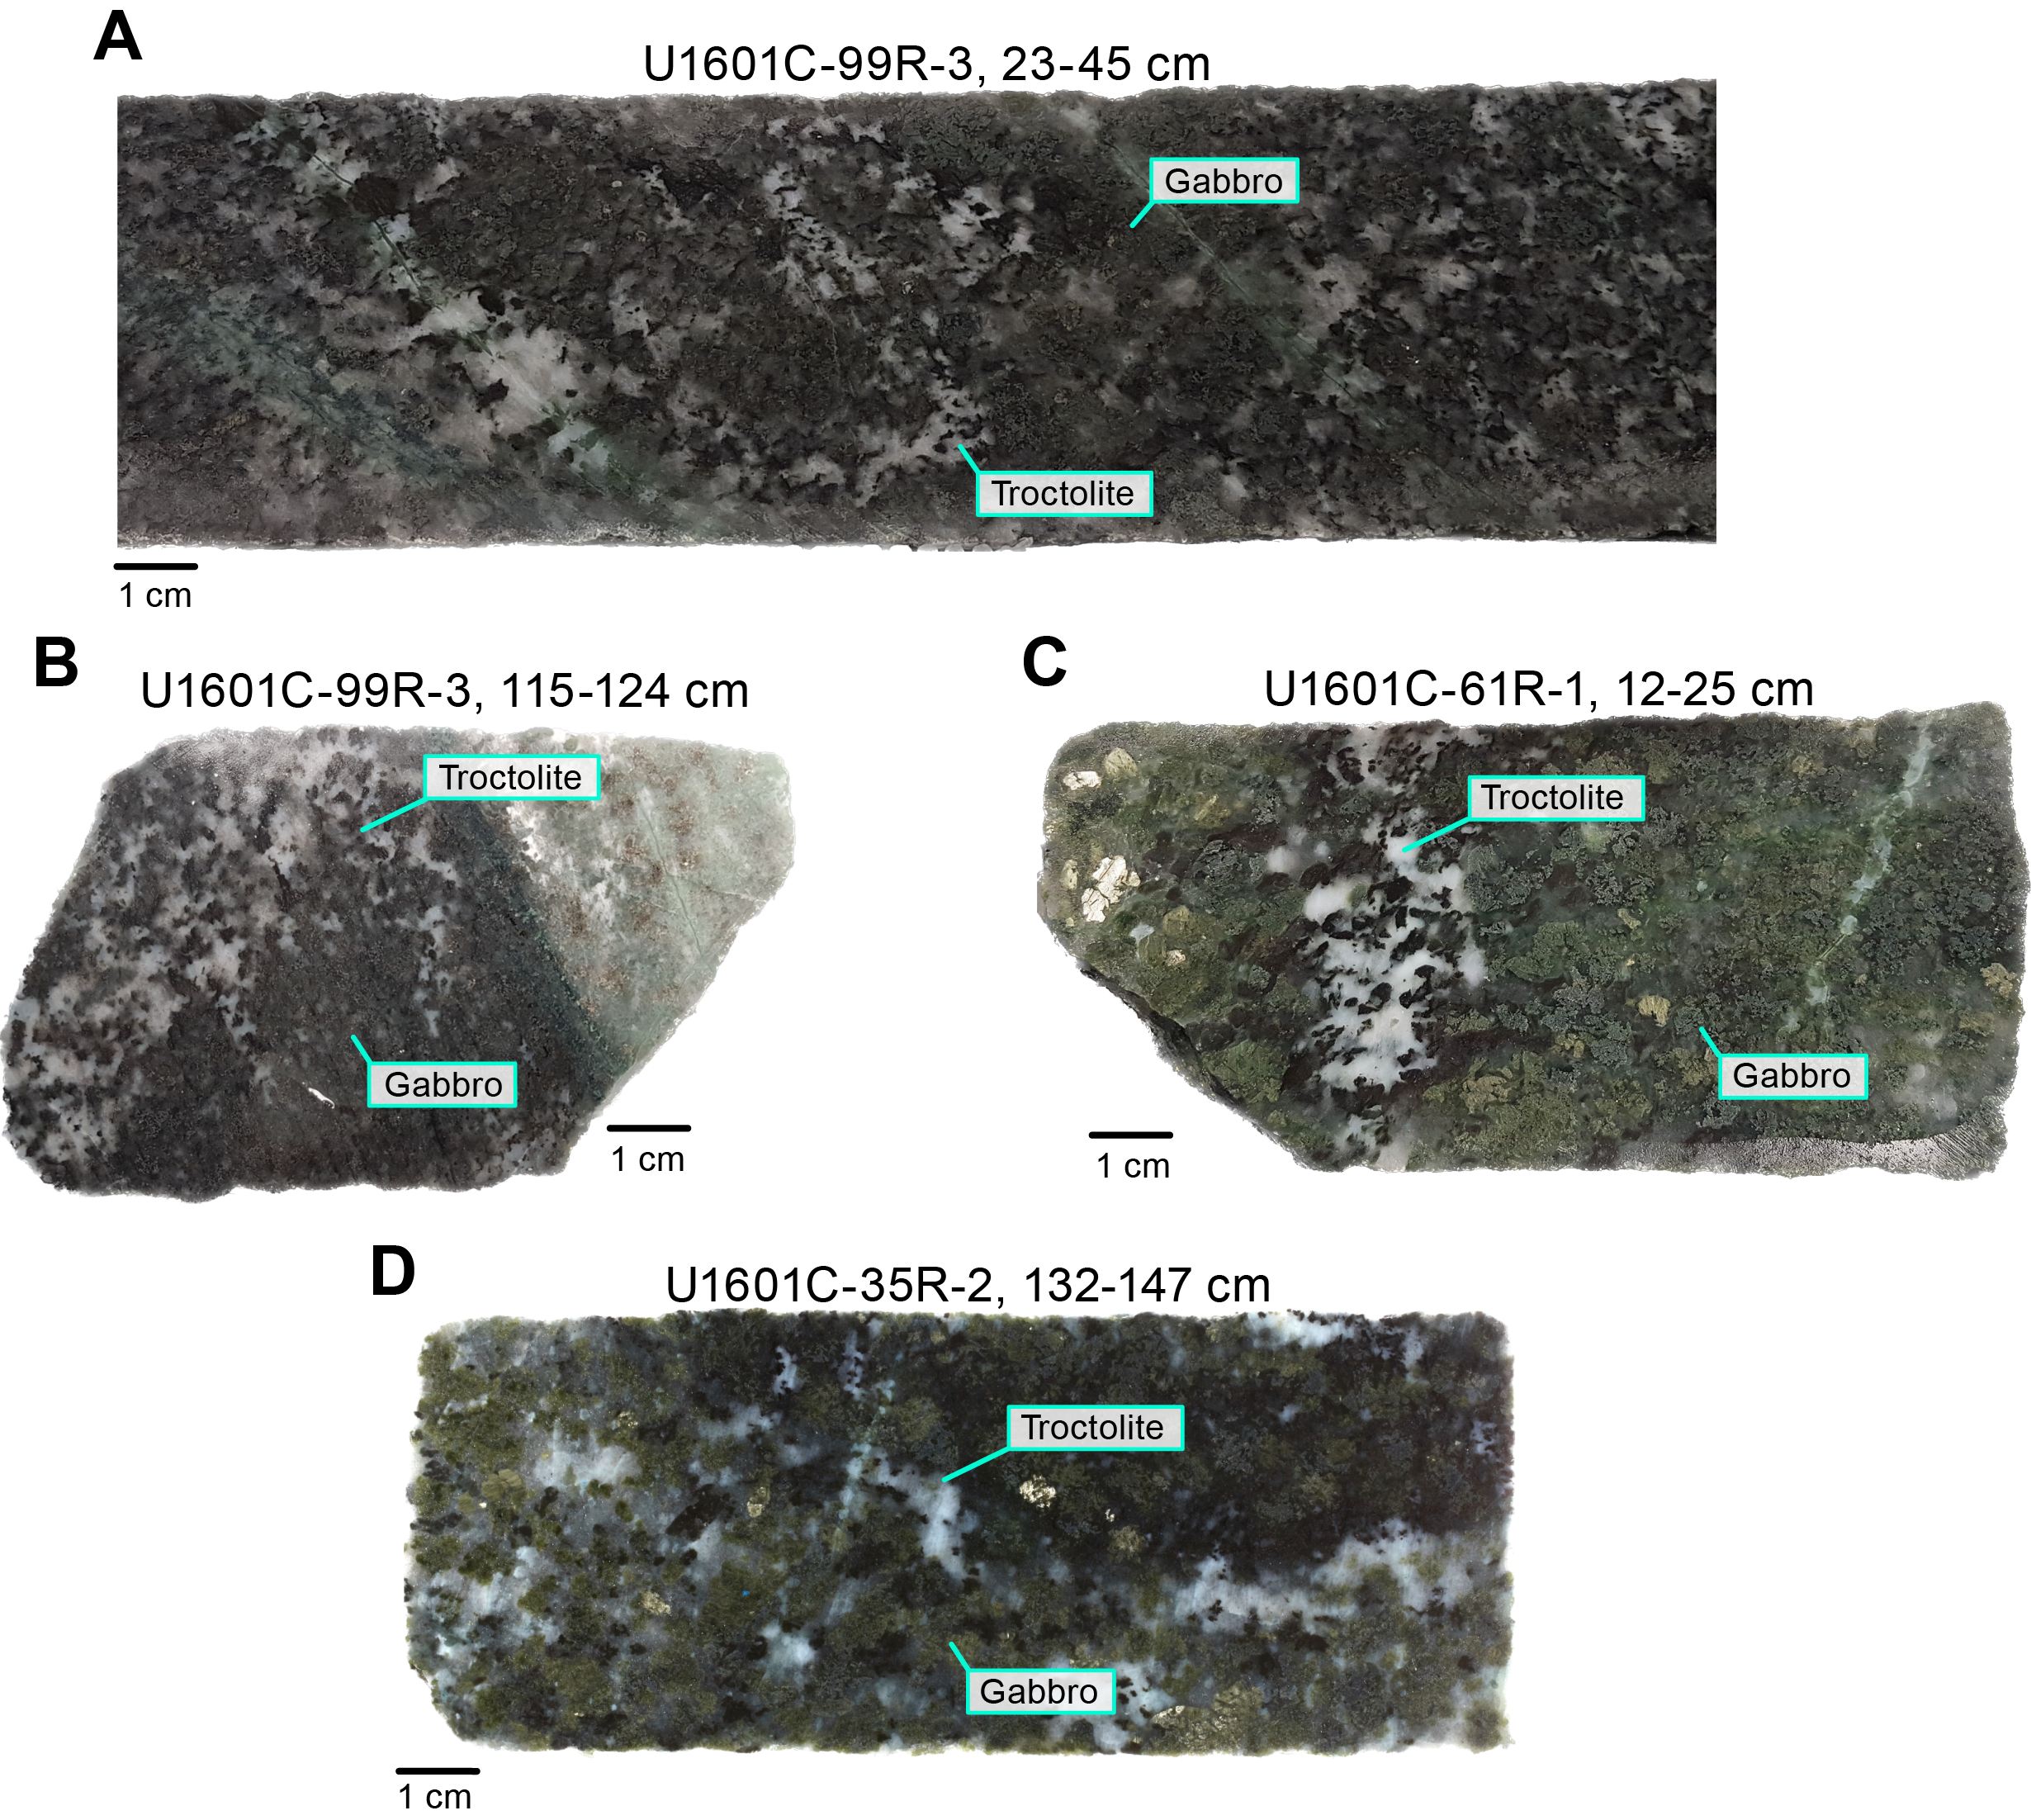
Figure F37. Troctolite domains within gabbros.
Oxide gabbro and oxide gabbronorite occur predominantly below 600 mbsf and are particularly concentrated between ~800 and 1200 mbsf, where they form part of larger gabbroic bodies. They form part of a continuum from gabbro(norite) through disseminated oxide gabbro(norite) and oxide-bearing gabbro(norite) to oxide gabbro(norite). Typically, oxide-bearing or oxide gabbro(norite) forms zones of tens of centimeters in size; only rarely do these zones exceed 1 m in thickness (e.g., Subunits 238B and 238C). Fe-Ti oxide proportions in these lithologies range 2%–15% (average = 6%). In undeformed rocks, Fe-Ti oxides are often interstitial (e.g., Figure F38). However, oxide gabbros are frequently deformed (see Structural geology), and in mylonitic rocks, oxides occur as recrystallized strings with plagioclase and clinopyroxene.
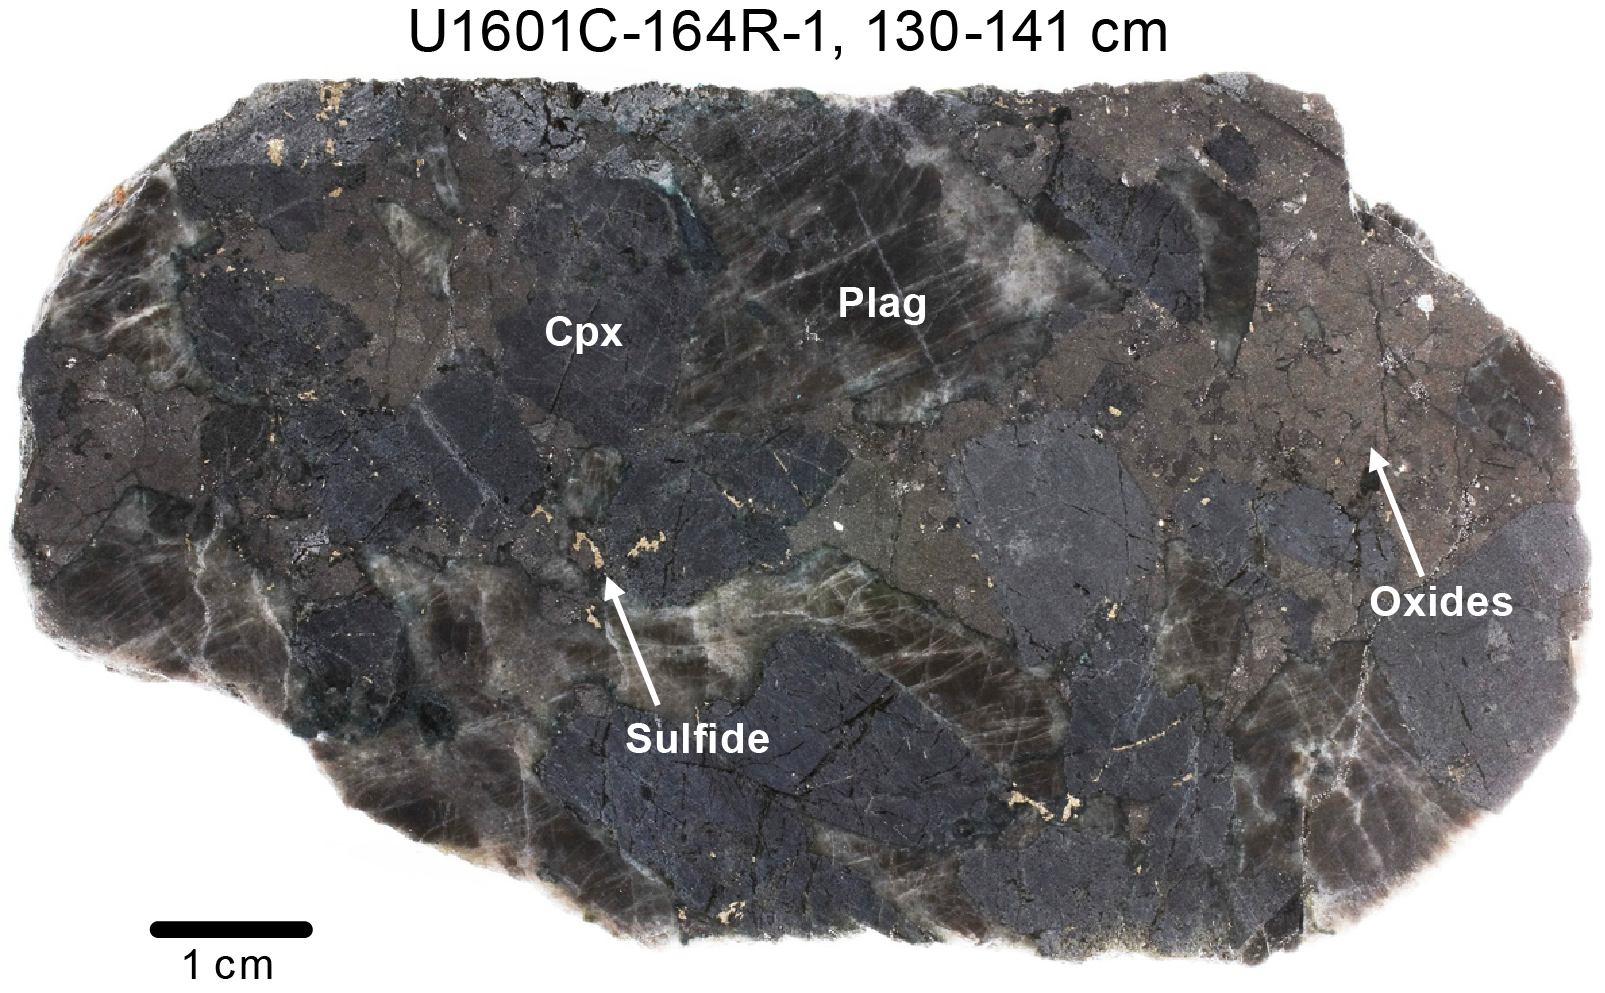
Figure F38. Oxide gabbro.
Contacts between gabbroic rocks (veins aside) and their host peridotites are generally sutured and planar to irregular and fall into three categories:
- Gabbroic rocks are coarse grained right up until the contact with peridotite, showing no grain size reduction (GSR). Given that many gabbros are coarse grained, this leads to remarkable grain size contrasts across the contacts (Figure F39). This contrast is further amplified in some gabbros by the fact that the grain size increases toward the contact with peridotite (e.g., Unit 91). Along some of the gabbro/peridotite contacts, clinopyroxene forms very large (up to 9 cm) and elongate crystals that are oriented perpendicular to the contacts (Figure F40).
- Observed frequently, gabbroic rock is separated from peridotite by a zone of troctolite or olivine gabbro (Figure F41). These zones are generally centimeter sized and medium grained.
- Relatively rare, gabbros fine toward the contacts. Along one contact (Unit 111), coarse-grained gabbro intrudes medium-grained veins into the harzburgite.
Figure F39. Coarse-grained gabbro.
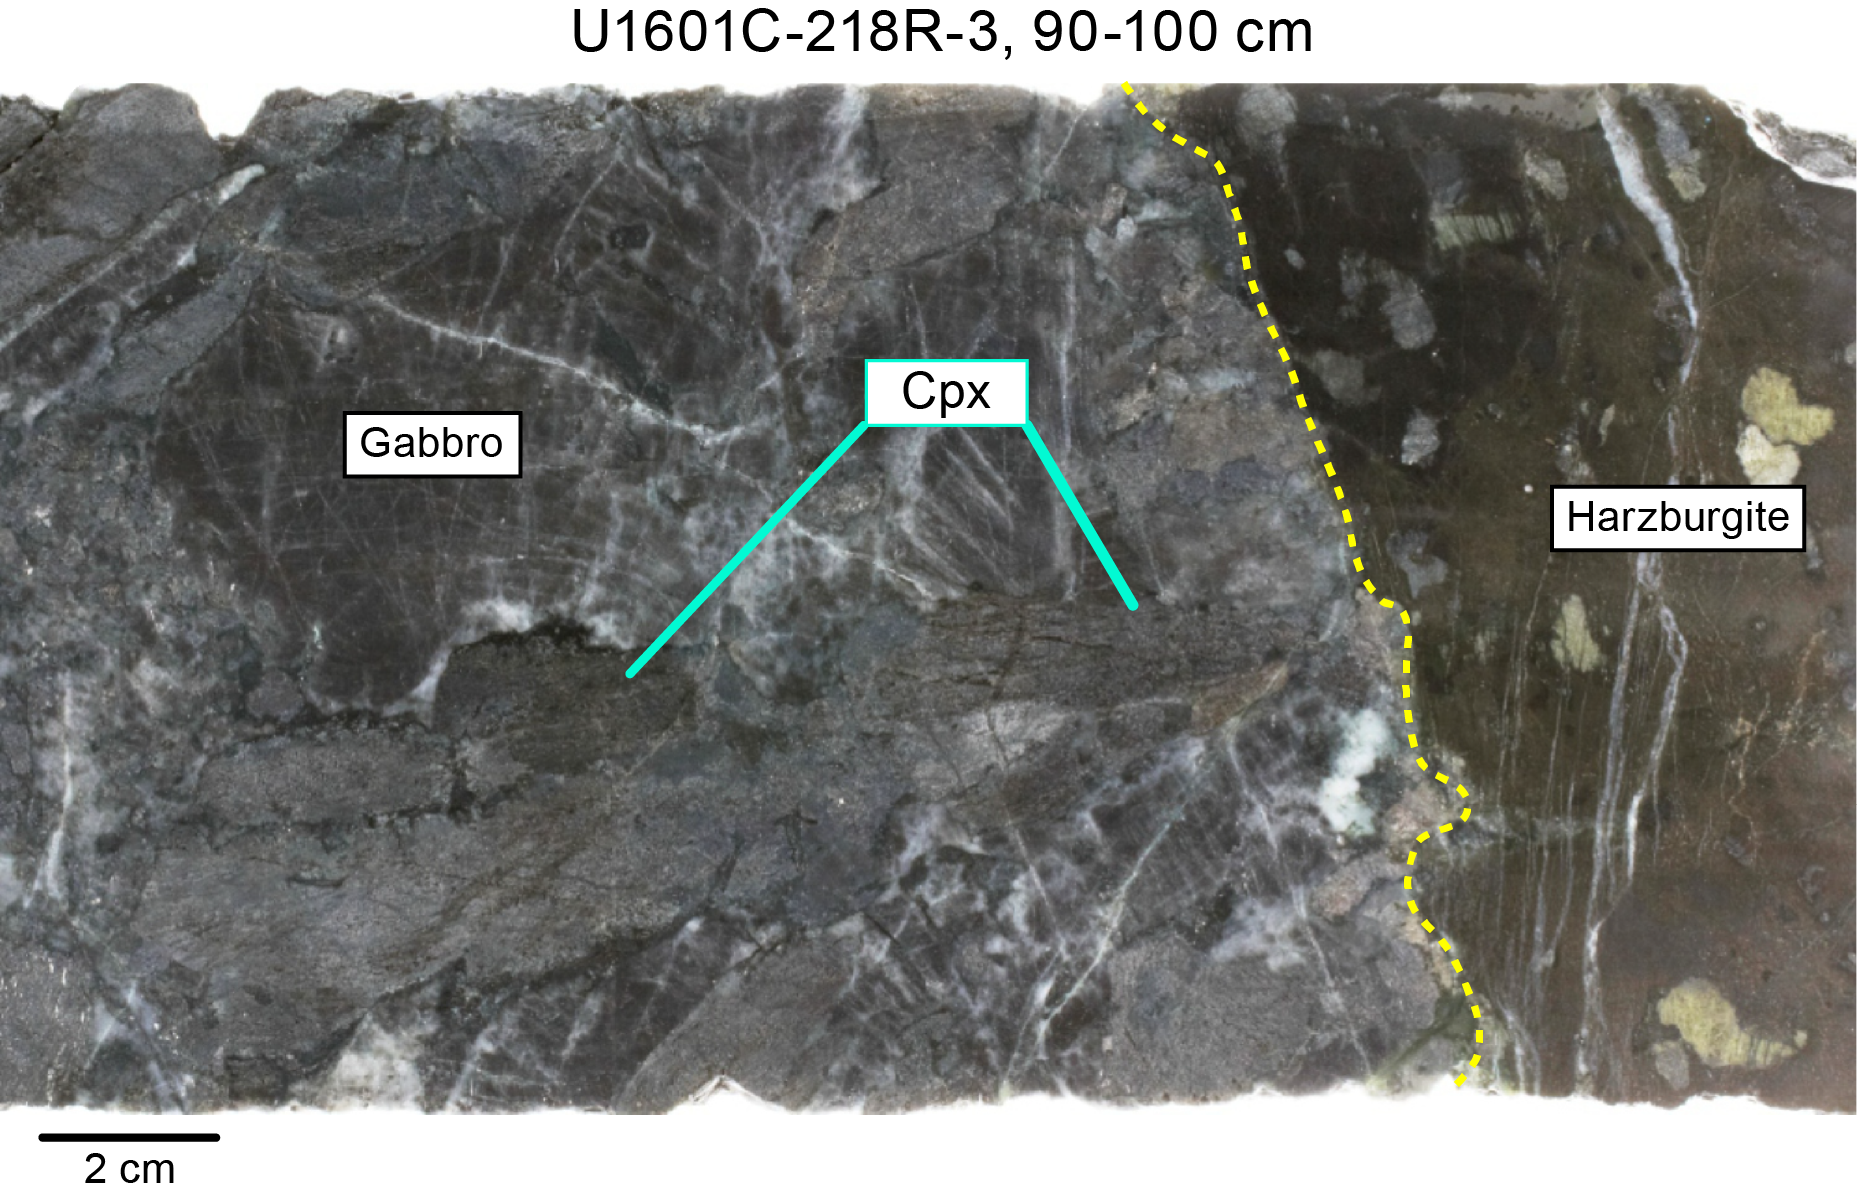
Figure F40. Large clinopyroxene.
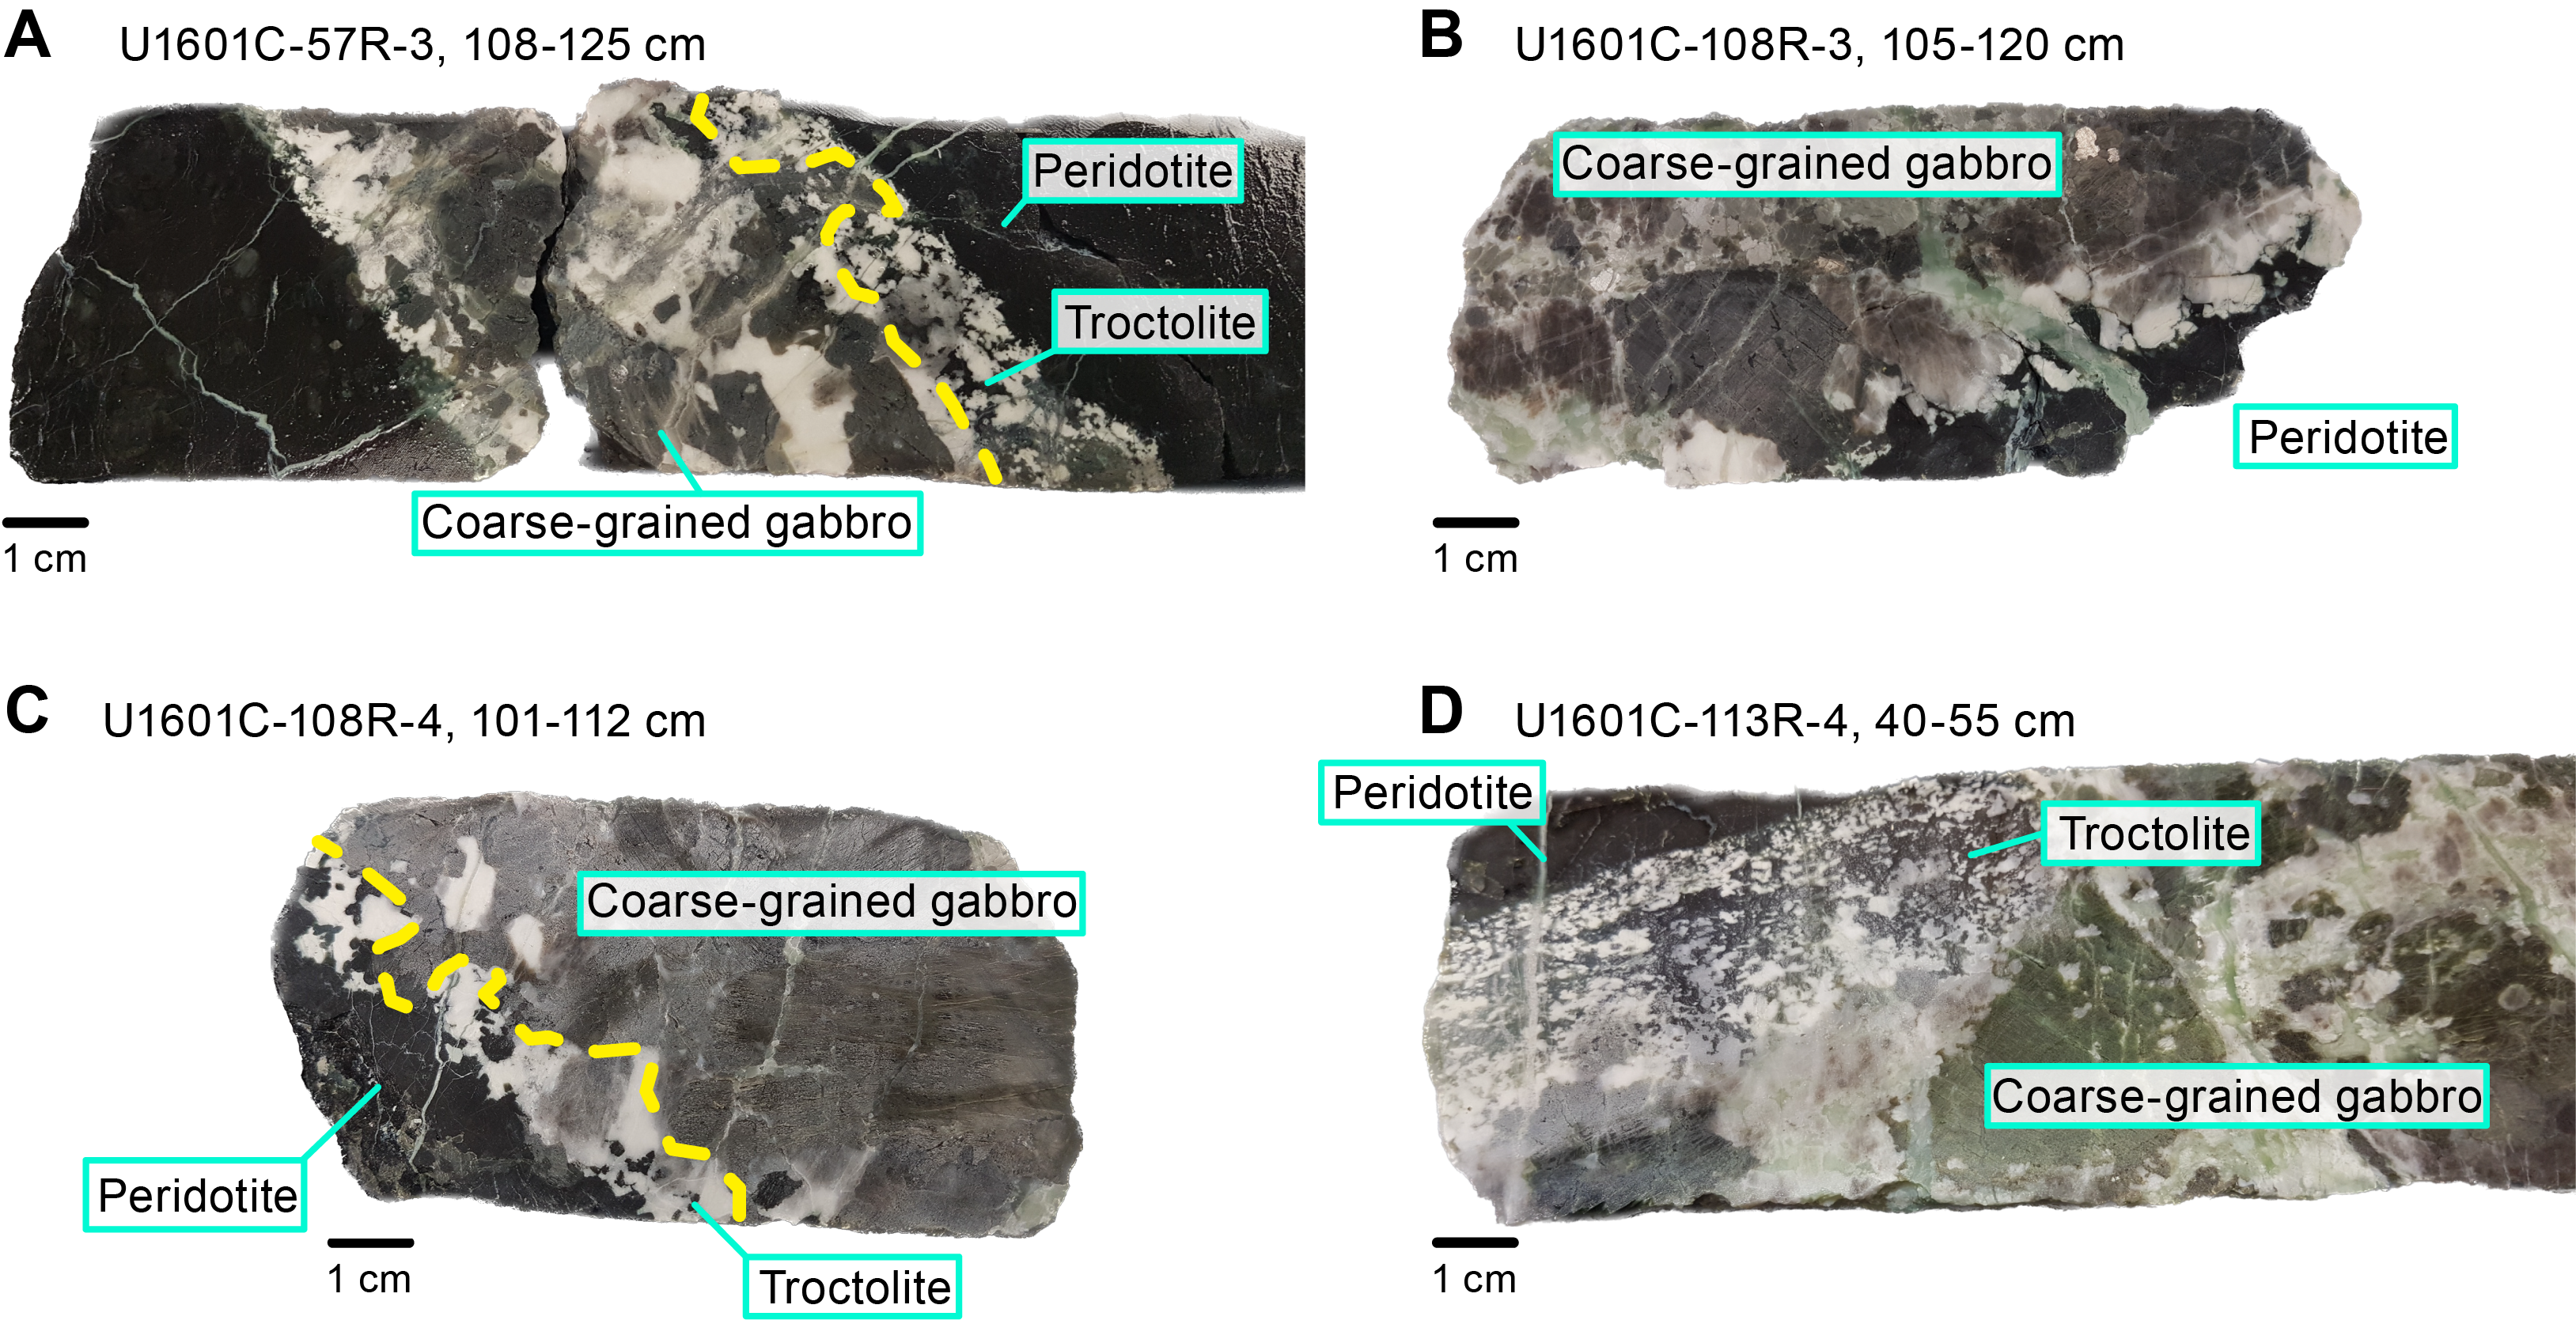
Figure F41. Troctolite contacts.
Texturally, the gabbroic rocks in Hole U1601C are dominated by coarse average grain sizes and granular textures (Figures F33, F42). There are some relationships between grain size and both lithology and texture (Figure F33). Lithologically, average grain sizes vary by a factor of ~2 across the different rock types; gabbro (including olivine-bearing gabbro) and oxide gabbro are the coarsest and troctolite is the finest (Figure F33A). Texturally, granular rocks are coarser grained on average than subophitic rocks (Figure F33B). Poikilitic rocks are characterized by small average grain size for plagioclase but coarser clinopyroxene. There are also relationships between average grain size and intrusion size; coarse average grain sizes are particularly dominant in the smaller (decimeter to meter scale) intrusions (Figure F43), and in larger plutons average grain size decreases (Figure F44). Average grain sizes of 2 cm or more are almost fully confined to intrusions of size range 0.1–1 m; no pluton larger than ~1 m reaches this average grain size. Fine-grained gabbros are sparse. Among the different phases, clinopyroxene tends to be coarser than associated plagioclase (Figure F33). In rare occurrences of grain size layering, particularly in Section 399-U1601C-199R-1 (Unit 285), medium- and coarse-grained gabbros alternate on a scale of tens of centimeters (Figure F45A). There are also patchy variations in grain size (Figure F45B). Seriate grain size distributions are the norm in larger gabbroic intervals (Figure F46); veins are more commonly equigranular (Figure F36).
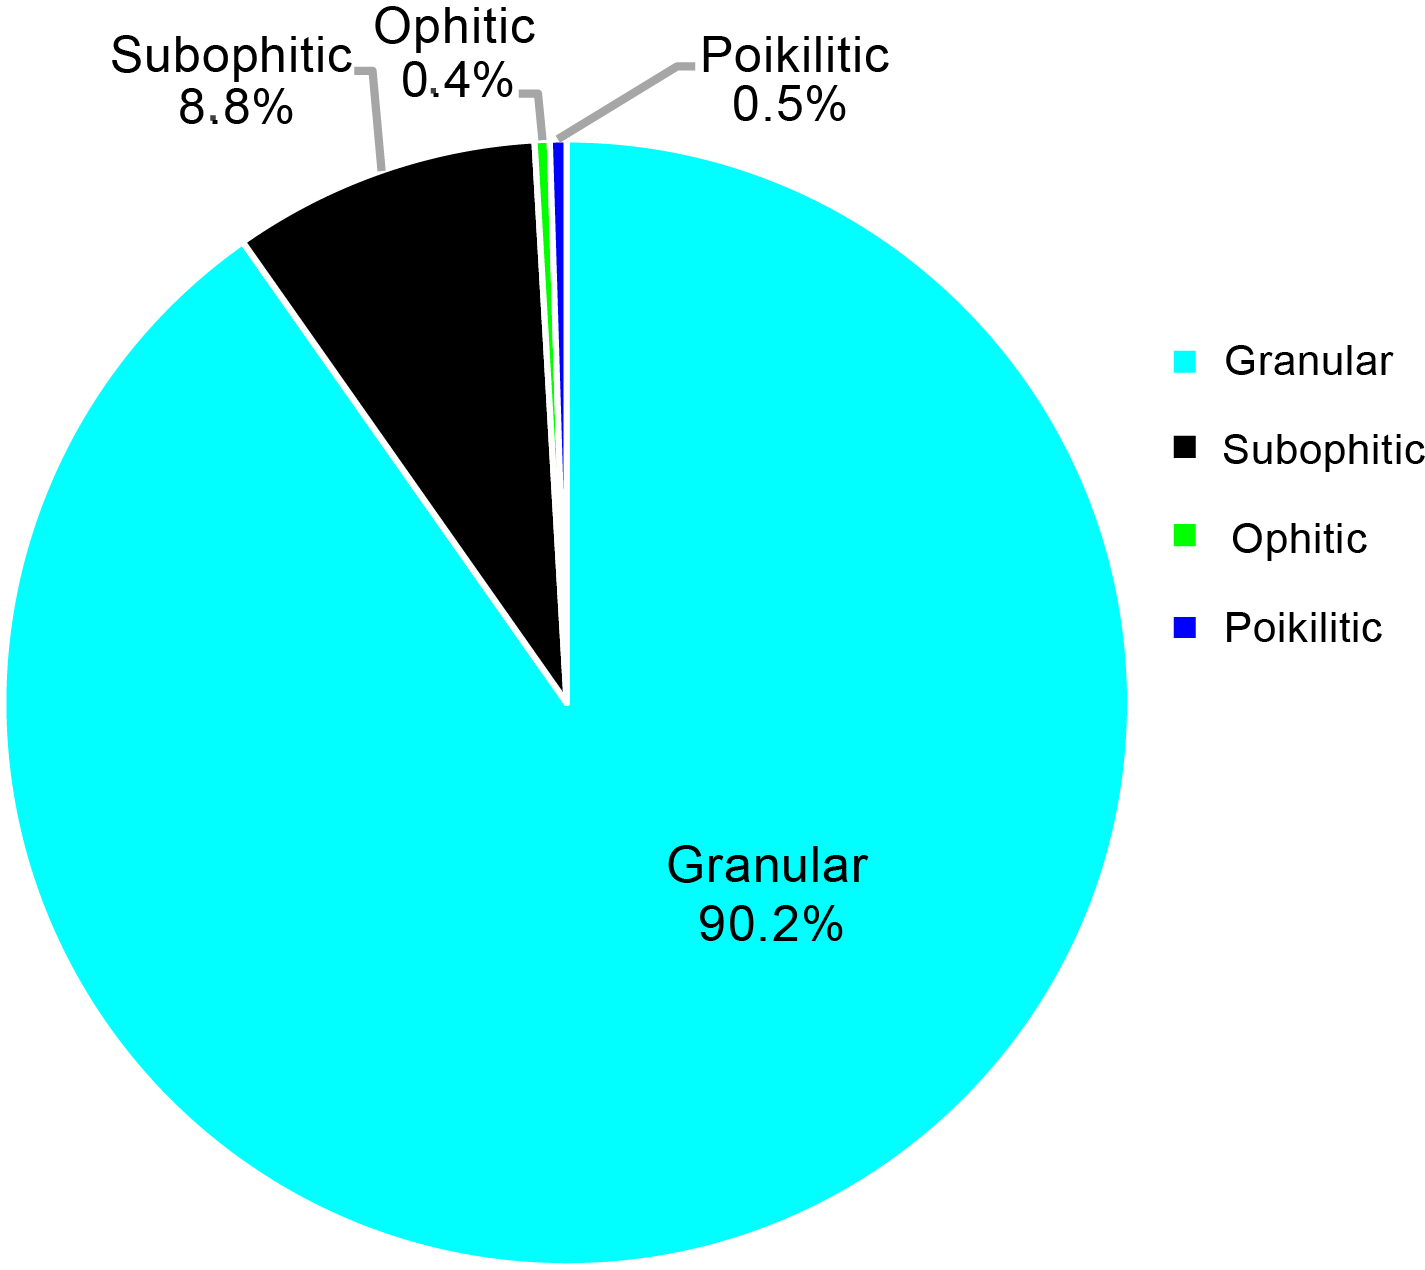
Figure F42. Abundance of different textures.
Figure F43. Pegmatitic clinopyroxene crystals.
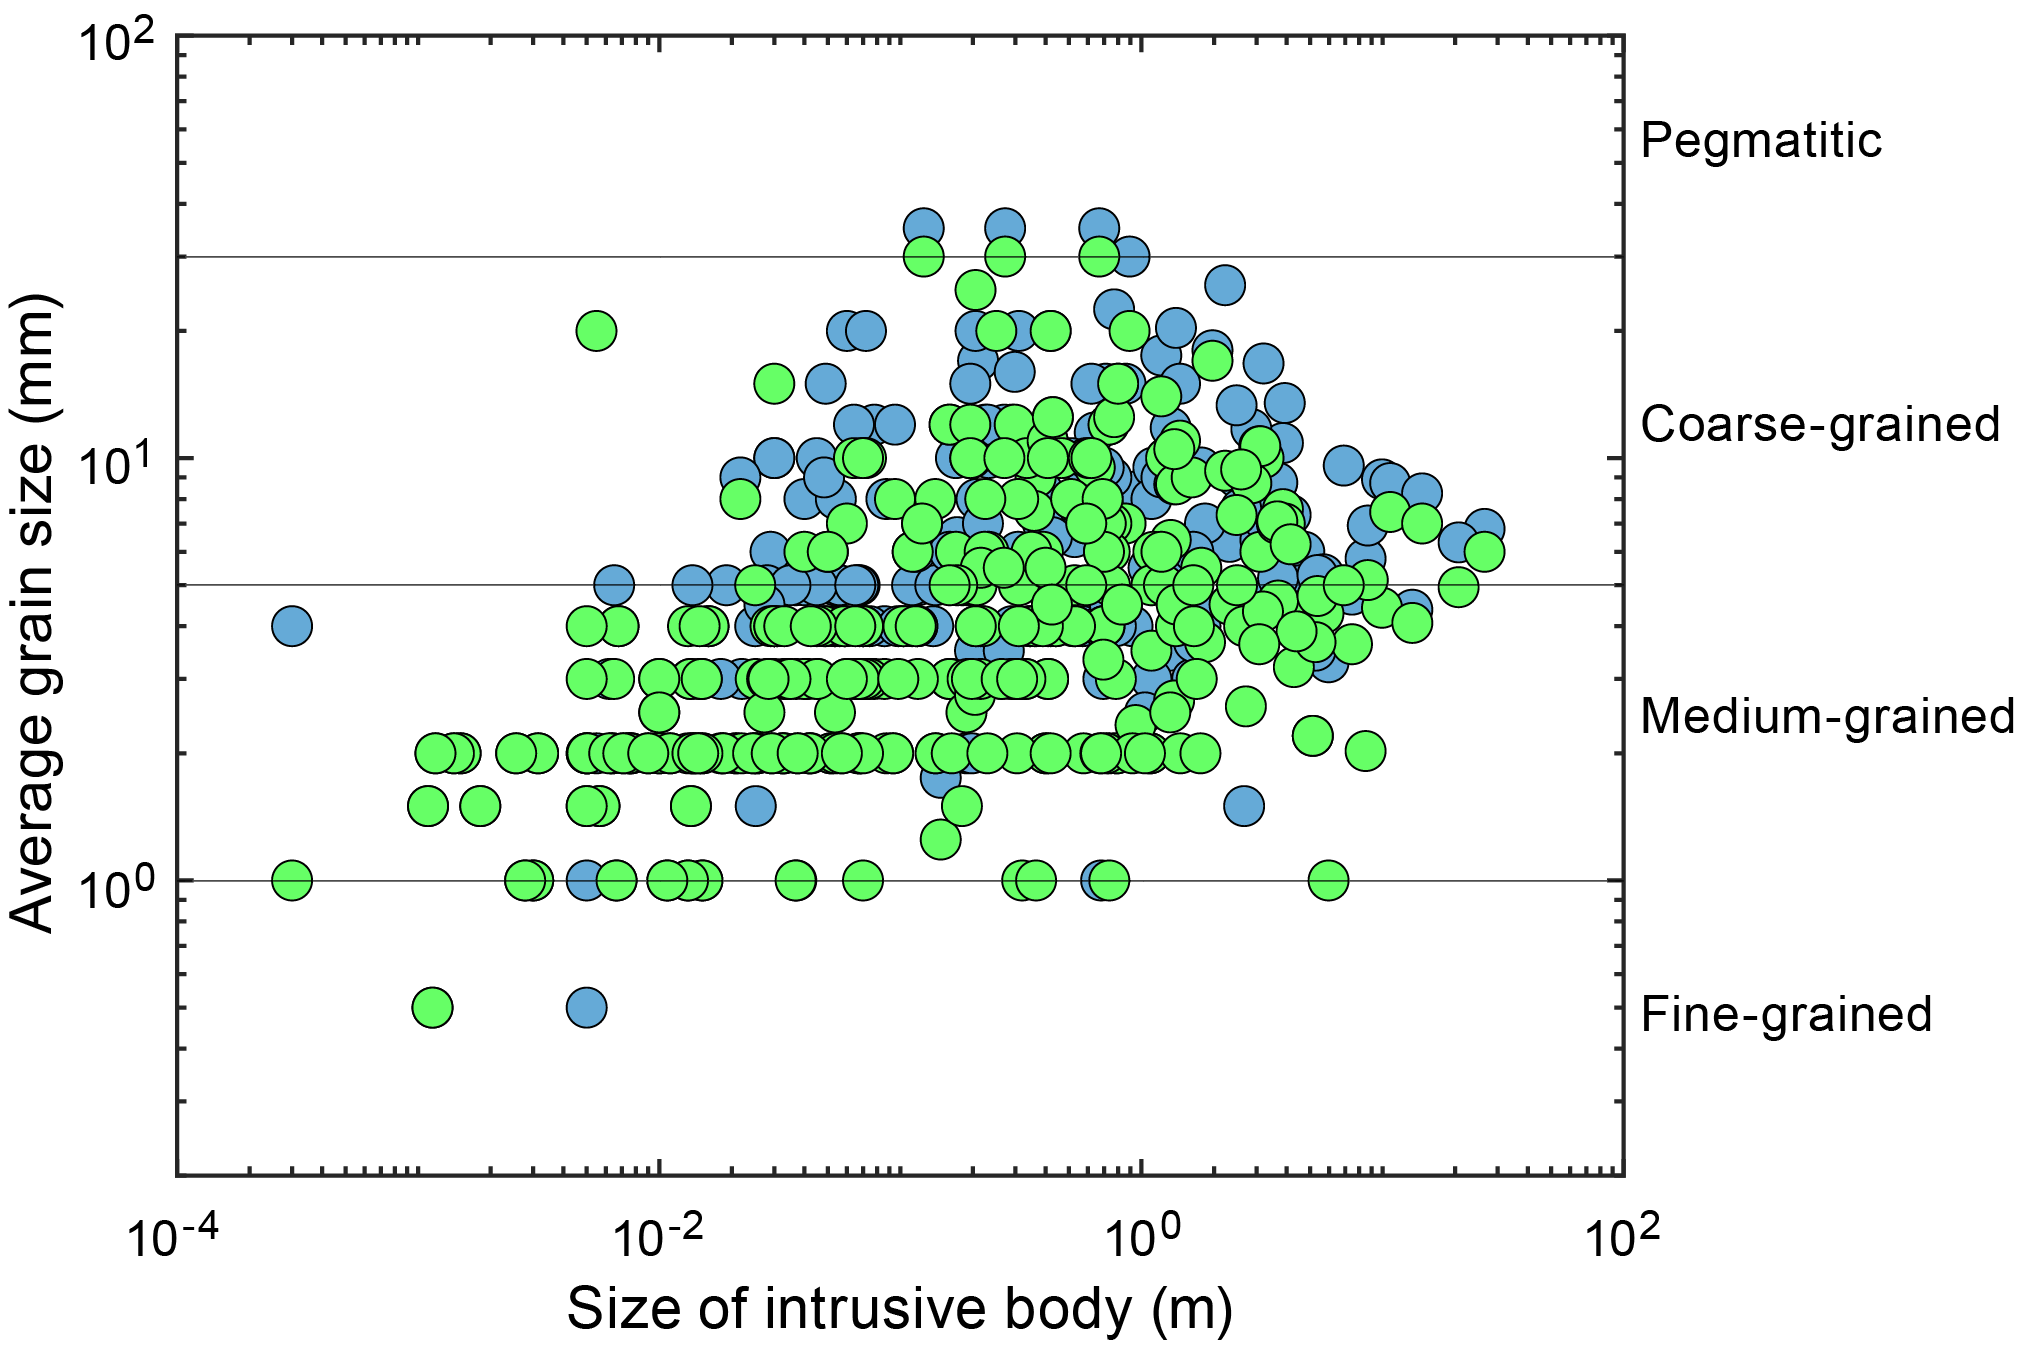
Figure F44. Gabbroic interval size vs. plagioclase and clinopyroxene grain size.
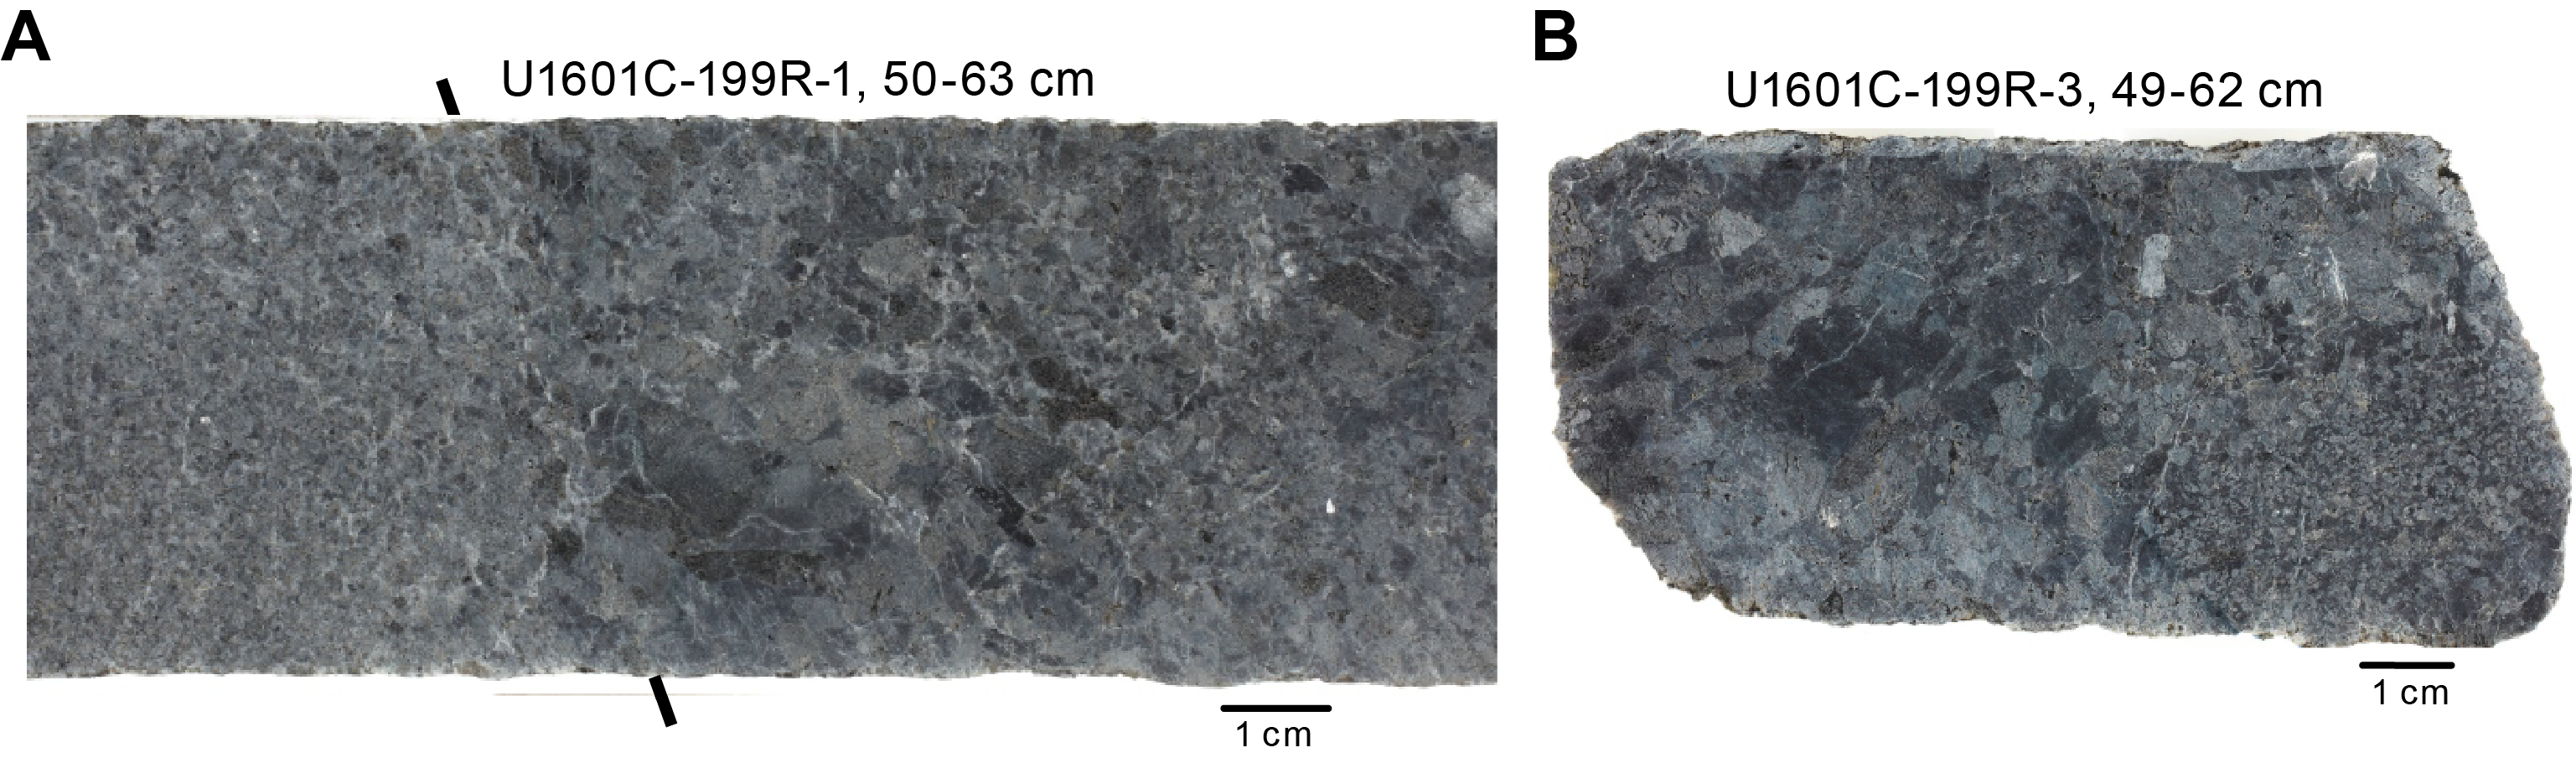
Figure F45. Grain size layering.
Figure F46. Grain size distribution, clinopyroxene.
Larger gabbroic intervals contain a range of lithologies and textures. Some intervals are relatively simple, comprising a single rock type and texture throughout. This was often the case for the relatively small (tens of centimeters) intervals in the middle of the hole (~500–900 mbsf). Other gabbroic intervals are complex, particularly those that are more than a few meters thick. Examples of complexity include variations in lithology as well as textures. For example, Unit 31 contains poikilitic microgabbro with large clinopyroxene oikocrysts as well as medium-grained granular troctolite. These two distinct lithologies occur as domains intermingling on a centimeter scale (Figure F37). Below, the unit becomes a more homogeneous, medium-grained, granular olivine gabbro (though with variable grain size) before returning to more complex olivine-rich and olivine-poor domains at its bottom. Other gabbroic intervals, particularly those in the deeper part of the hole, contain alternating gabbro and oxide gabbro (e.g., Unit 294).
Below, brief descriptions are provided of gabbroic intervals with a recovered thickness exceeding 5 m.
3.2.3.1. Units 31 and 32
Units 31 and 32 (Sections 35R-1 through 37R-3; 183.10–195.615 mbsf) comprise a gabbroic interval with a recovered thickness of 8.3 m. Unit 31 contains domains of fine-grained gabbro, medium-grained granular troctolite, and medium-grained olivine gabbro with igneous contacts. The different domains are intermingled, particularly near the top and bottom of the unit, leading to complex relationships; the middle is more homogeneous olivine gabbro. The fine-grained gabbro has clinopyroxene oikocrysts enclosing microcrystalline plagioclase, forming a poikilitic texture. The olivine gabbro and troctolites are medium grained with granular textures. Grain sizes vary on a scale of tens of centimeters. The olivine in both domains is anhedral and interstitial. Trace sulfide was observed in the olivine gabbro. Unit 32 marks a significant change in grain size and modal mineralogy and comprises medium- to coarse-grained gabbronorite.
3.2.3.2. Unit 181
Unit 181 (Sections 130R-3 through 133R-1; 647.17–659.025 mbsf) is a 9.98 m thick gabbroic unit. This unit consists of medium- to coarse-grained gabbro (Subunit 181A), medium-grained olivine gabbro (Subunit 181B), and olivine-bearing gabbro (Subunit 181C). Subunit 181A contains a short interval of fine-grained oxide gabbro mylonite (5% oxide) with trace sulfides. Relict clinopyroxene porphyroclasts in the oxide gabbro are up to 8 mm in length. Subunit 181B olivine gabbro has clinopyroxene oikocrysts as large as 60 mm. In Section 131R-1, olivine proportions decrease downward from olivine gabbro toward olivine-bearing gabbro. The contact between Subunits 181B and 181C is modal, gradational, and irregular, whereas the boundary between olivine-bearing gabbro and gabbro is sheared, sharp, and planar. The textures of this unit are variable. Subunit 181A is predominantly granular but ranges to ophitic and poikilitic. Subunit 181B is mainly poikilitic and also shows subophitic to granular textures. Subunit 181C has subophitic to poikilitic textures. This unit is mainly composed of plagioclase (45%–55%) and clinopyroxene (40%–55%) with lesser amounts of olivine (<10%) and oxide (<7%).
3.2.3.3. Unit 238
Unit 238 (Sections 163R-2 through 164R-3; 805.36–811.71 mbsf) is a 5.11 m thick gabbroic interval. This unit consists of three subunits with varying mineral compositions and grain sizes. Subunit 238A is a coarse-grained granular gabbro with an average size around 9 mm. It is mainly composed of plagioclase and clinopyroxene with proportions varying 40%–55% and 45%–60%, respectively, and may contain a small proportion (up to 4%) orthopyroxene. Subunit 238B is a medium-grained granular oxide gabbro with varying grain sizes. This subunit becomes more deformed downward, starting from Section 163R-2, 75 cm. Subunit 201C is a coarse-grained oxide-bearing gabbro that locally contains up to 4% orthopyroxene.
3.2.3.4. Unit 278
Unit 278 (Sections 188R-2 through 190R-1; 927.21–934.83 mbsf) is a 5.22 m thick gabbroic unit that mainly consists of medium-grained gabbro to olivine gabbro with subophitic to granular textures (Subunit 278A). Two pieces of coarse-grained gabbro (Subunit 278B) were present at intervals 189R-3, 1–9 cm, and 189R-3, 44–55 cm. The average crystal sizes are 12 mm for clinopyroxene and 10 mm for plagioclase.
3.2.3.5. Unit 281
Unit 281 (Sections 193R-1 through 195R-2; 949.4–961.41 mbsf) is a gabbroic unit with a few screens of peridotite; hence, it is not a continuous interval. The contact between this unit and the adjacent orthopyroxene-bearing dunite (Subunit 2B) is sharp and irregular. This unit comprises a series of predominantly medium- to coarse-grained granular gabbroic intervals (Subunit 281A) with fewer intervals of medium- to coarse-grained granular oxide gabbro (Subunit 281B) and medium-grained olivine gabbro (Subunit 281C). Subunit 281A consists of plagioclase (35%–70%) and clinopyroxene (30%–65%), with trace oxide and locally olivine (up to 2%) and/or orthopyroxene (up to 5%). Subunit 281B (0.16 m long; Section 193R-1) has similar plagioclase (20%–40%) and clinopyroxene (50%–75%) modal compositions but much higher oxide proportions (5%–10%). Subunit 281C (two intervals in Section 194R-1) is characterized by the presence of olivine (10%–20%).
3.2.3.6. Unit 285
Unit 285 (Sections 198R-1 through 204R-2; 973.84–1004.67 mbsf; recovered thickness = 26.48 m, ignoring a few orthopyroxene-bearing dunite pebbles at the top of Section 199R-1) primarily consists of gabbronorite with varying modal, grain size, and textural characteristics and subordinate orthopyroxene-bearing gabbro and olivine-bearing and olivine gabbro. The unit was divided into six subunits (285A–285F) that occur as layers ranging from a few centimeters to 10 or more centimeters in thickness, typically with igneous boundaries that vary from gradational to sharp. Grain sizes vary on the meter to centimeter scale, with locally well-developed grain size layering and patchy grain size variations. The top of the unit, close to the contact with harzburgite, is coarse-grained and granular gabbronorite (Subunit 285A). Multicentimeter-long clinopyroxene crystals are attached to and elongate perpendicular to the contact. Most of the unit is medium-grained granular to subophitic and ophitic gabbronorite to olivine-bearing gabbro (Subunit 285B) with intervals of coarse-grained gabbronorite (Subunit 285D), coarse-grained granular to subophitic (disseminated) oxide gabbronorite (Subunit 285C), and fine-grained gabbronorite (Subunit 285E). The medium-grained granular gabbronorite (Subunit 285B) contains trace oxide and/or sulfide (interval 198R-1, 38–85 cm). Subunit 285F is olivine gabbro with 5% olivine and predominantly granular textures. Overall, modal proportions range 35%–60% for plagioclase, 30%–59% for clinopyroxene, and <10% for oxide. Orthopyroxene proportions were estimated at 0%–10% based on subtle color differences in the pyroxenes, but these are uncertain. Sulfide typically occurs only in trace amounts. Texturally, this unit is predominantly granular with rarer subophitic, ophitic, and poikilitic textures.
3.2.3.7. Unit 291
Unit 291 (Sections 205R-2 through 209R-1; 1010.01–1028.16 mbsf) is a gabbronoritic unit with a recovered thickness of 7.23 m. This unit mainly consists of coarse-grained granular gabbronorite to gabbro with a few subophitic intervals (Subunit 291A). Many intervals of this subunit have trace oxide, with local concentrations. Two patches of a medium-grained granular gabbro domain are present at intervals 206R-1, 7–10 cm, and 206R-1, 25–33 cm; these were designated Subunit 291B.
3.2.3.8. Unit 301
Unit 301 (Sections 214R-2 through 215R-4; 1053.58–1060.69 mbsf) is a gabbroic unit with a recovered thickness of 6.3 m. The unit was divided into three subunits. Subunit 301A is a medium- to coarse-grained granular to subophitic gabbro with a seriate grain size distribution. Most of the subunit is olivine free, but locally olivine proportions reach 4%. Subunit 301B is a fine-grained granular to subophitic gabbro. Subunit 301C is a coarse-grained subophitic gabbro with a few clinopyroxene oikocrysts up to 48 mm in diameter. The grain size of this unit ranges from fine through medium to coarse (average = 5 mm).
3.2.3.9. Unit 310–314
Together, Units 310–314 (Sections 238R-1 through 244R-1; 1168.49–1191.59 mbsf) comprise a gabbroic interval with a recovered thickness of 6.19 m. Unit 310, a coarse-grained granular gabbro, is underlain by Unit 311, a coarse-grained gabbronorite with seriate grain size distribution. Unit 312 makes up much of the rest of the interval under discussion here. It is largely a medium- to coarse-grained gabbro with one pegmatitic interval bearing clinopyroxene crystals up to 10.5 cm in length. Textures in this unit range from granular to subophitic. It is separated from Unit 310 and the upper boundary of Unit 313 by shear zones. Unit 313 is a coarse-grained diorite domain within an interval dominated by Unit 312. Unit 314 makes up 50 cm of the central portion of Section 221R-1 and is bounded on both sides by Unit 312. It is a medium-grained granular oxide gabbro, with about 1% sulfide concentrated at its base.
3.2.3.10. Units 325 and 326
Together, Units 325 and 326 (Sections 238R-1 through 244R-1; 1168.49–1191.59 mbsf) comprise a gabbroic interval with a recovered thickness of 15.90 m (ignoring harzburgite pebbles at the top of Section 231R-1). Unit 325 is a thin interval of coarse-grained granular to subophitic disseminated oxide gabbro(norite) and oxide-bearing gabbro. Unit 326 below predominantly consists of generally mylonitic gabbronorite, some with disseminated oxide, with subordinate disseminated oxide gabbro to oxide gabbro. This unit has a seriate grain size distribution, varying from medium- to coarse-grained (average = 8 mm; the largest clinopyroxene crystal is ~45 mm). In the mylonitic gabbro the primary orthopyroxene proportions are difficult to estimate because both orthopyroxene and clinopyroxene are brown. However, the presence of orthopyroxene was confirmed by portable X-ray fluorescence spectrometer (pXRF). Unit 326 is predominantly composed of plagioclase (48%–60%), clinopyroxene (30%–49%) with small amounts of orthopyroxene (<10%), and oxide (<3%). Texturally, it is mostly granular with rare subophitic textures.
3.2.3.11. Units 333–335
Units 333–335 (Sections 238R-1 through 244R-1; 1168.49–1191.59 mbsf) are treated together as a continuous 20.51 m thick gabbroic interval. This assumes that the dunitic orthopyroxene-bearing dunite pebble at the top of Section 242R-1, which separates Units 333 and 334, is not in situ and that the fine-grained gabbro of Unit 335 represents a cooling margin at the bottom of the intrusion. Overall, the interval is dominated by (orthopyroxene-bearing) gabbro and gabbronorite. Unit 333 comprises medium- to coarse-grained gabbro (Subunit 333A) with intervals of oxide(-bearing) gabbro (Subunit 333B). Below, orthopyroxene proportions increase, defining orthopyroxene-bearing gabbro (Subunit 333C) and then gabbronorite (Subunit 333D). Trace amounts of oxides are ubiquitous, and olivine occurs in small proportions locally. Unit 334 is composed of coarse-grained, granular to subophitic orthopyroxene-bearing gabbro with trace oxides. Unit 335 below is a predominantly fine-grained gabbro that contains some poikilitic clinopyroxene throughout.
3.2.3.12. Unit 337 and 338
Together, Units 337 and 338 (Sections 245R-1 through 259R-2; 1195.46–1265.64 mbsf) comprise a gabbroic interval with a recovered thickness of 51.48 m; it is dominated by gabbronorite and orthopyroxene-bearing gabbro. The top of the interval is defined by a fine-grained gabbronorite that coarsens downsection away from the contact with the peridotite (Unit 337). Following short intervals of medium-grained oxide gabbro (Subunit 338A) and medium-grained orthopyroxene-bearing gabbro (Subunit 338B), the body comprises gabbronorite with grain size alternating between medium (with rare fine-grained intervals) and coarse grained. These recurring changes in grain size were logged as subunits, with Subunits 338C, 338E, 338G, 338I, 338K, 338M, 338O, 338S, 338U, and 338W showing coarse grain size and Subunits 338D, 338F, 338H, 338J, 338L, 338N, 338P, 338R, 338T, 338V, and 338X showing medium grain size. Texturally, the gabbronorite is granular with equigranular to seriate grain size distributions and local occurrence of varitextured gabbronorite (Subunit 338N). Orthopyroxene proportions were difficult to estimate, though its presence was confirmed by pXRF; hence, it was assumed to be 5%. Oxides are rare and concentrated toward the top of the interval.
Two ~15–20 cm thick fine-grained gabbro intervals occur within Unit 338 (Sections 251R-1 and 251R-3), designated Unit 339. The contact is marked by relatively abrupt changes in grain size. On this basis, they are interpreted to represent intrusions.
Gabbroic veins are very common in Hole U1601C. These veins were divided into three broad categories, but they form part of a continuum. The first type, relatively rare, are impregnation veins that are discontinuous and marked by trails of gabbroic minerals (e.g., plagioclase and clinopyroxene) in peridotite (Figure F47). The second type, much more common, are diffuse veins characterized by diffuse margins, where the boundary between vein and host peridotite is indistinct (Figure F48). This may in part relate to a hydrothermal overprint and the associated growth of secondary minerals over the contact. The third type are discrete veins with well-defined and relatively sharp and planar to irregular margins (Figure F36). In detail, the contacts of the discrete veins are nearly always sutured. Veins are nearly always composed of a single lithology, with gabbro and gabbronorite by far the most predominant; however, gabbro or gabbronorite veins may locally contain olivine derived from the host peridotite and hence be olivine gabbro(norite) or contain troctolitic rims against the host peridotite.
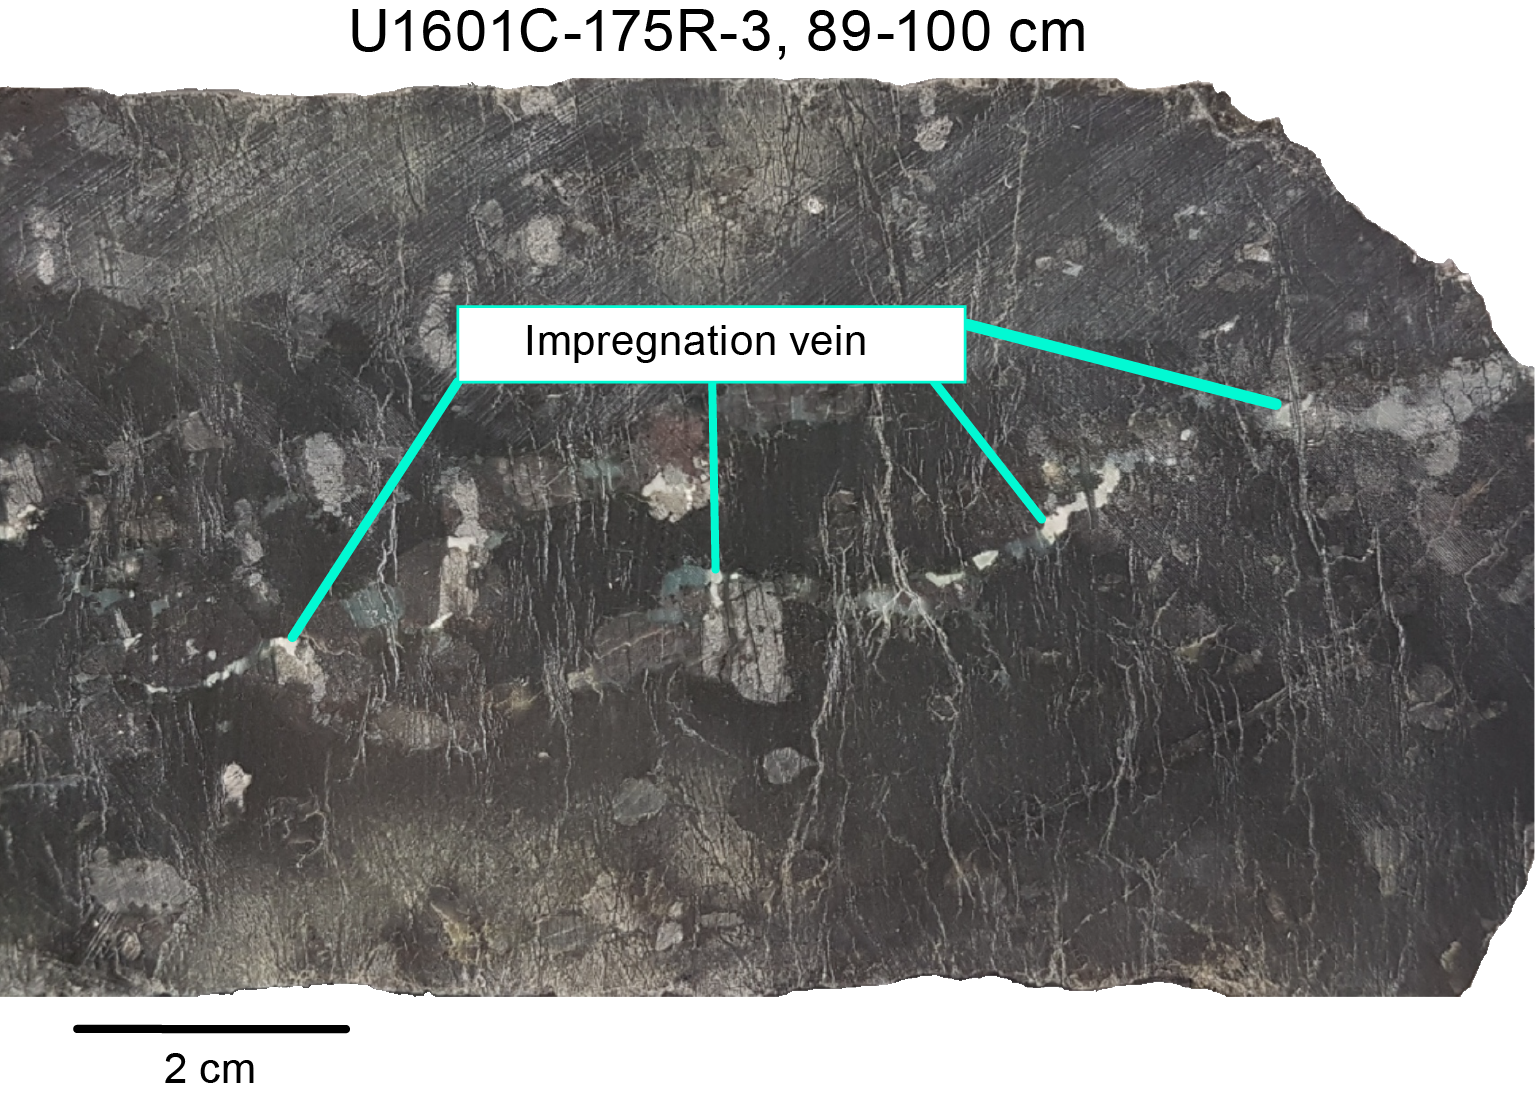
Figure F47. Impregnation vein.
Figure F48. Diffuse gabbroic vein.
3.2.4. Diorite, tonalite, and trondhjemite
Diorite is rare in the drilled interval at Site U1601 and is always found within and bounded by other gabbroic units. Plagioclase is the only high-temperature felsic phase in these diorites. The primary mafic phase in the diorites is amphibole that is black in hand specimen and brown in thin section. Thus, this amphibole was likely hornblende. The diorites have irregular and gradational contacts with the surrounding gabbros. Along the gabbroic side of the contact, gray clinopyroxene interiors are rimmed by black amphibole exteriors (e.g., Figure F49). Brown to green amphibole pseudomorphs of clinopyroxene were observed in thin section (TS) (e.g., Sample 399-U1601C-176R-2, 136–138 [TS107]). Hornblende was also commonly observed in vein networks around and in interstices near plagioclase and was typically crystallized along with Fe-Ti oxides (e.g., interval 163R-1, 11–15 cm). Plagioclase grains in these rocks commonly show evidence of fragmentation and annealing. The most unusual rock of this type, recovered in interval 132R-1, 96–110 cm (Figure F50A), consists of rounded to angular plagioclase polycrystalline plagioclase domains in a matrix composed of amphibole and ilmenite with minor titanite, plagioclase, and sulfides (Figure F50B). The rock overall has ~20% TiO2 based on pXRF analysis.
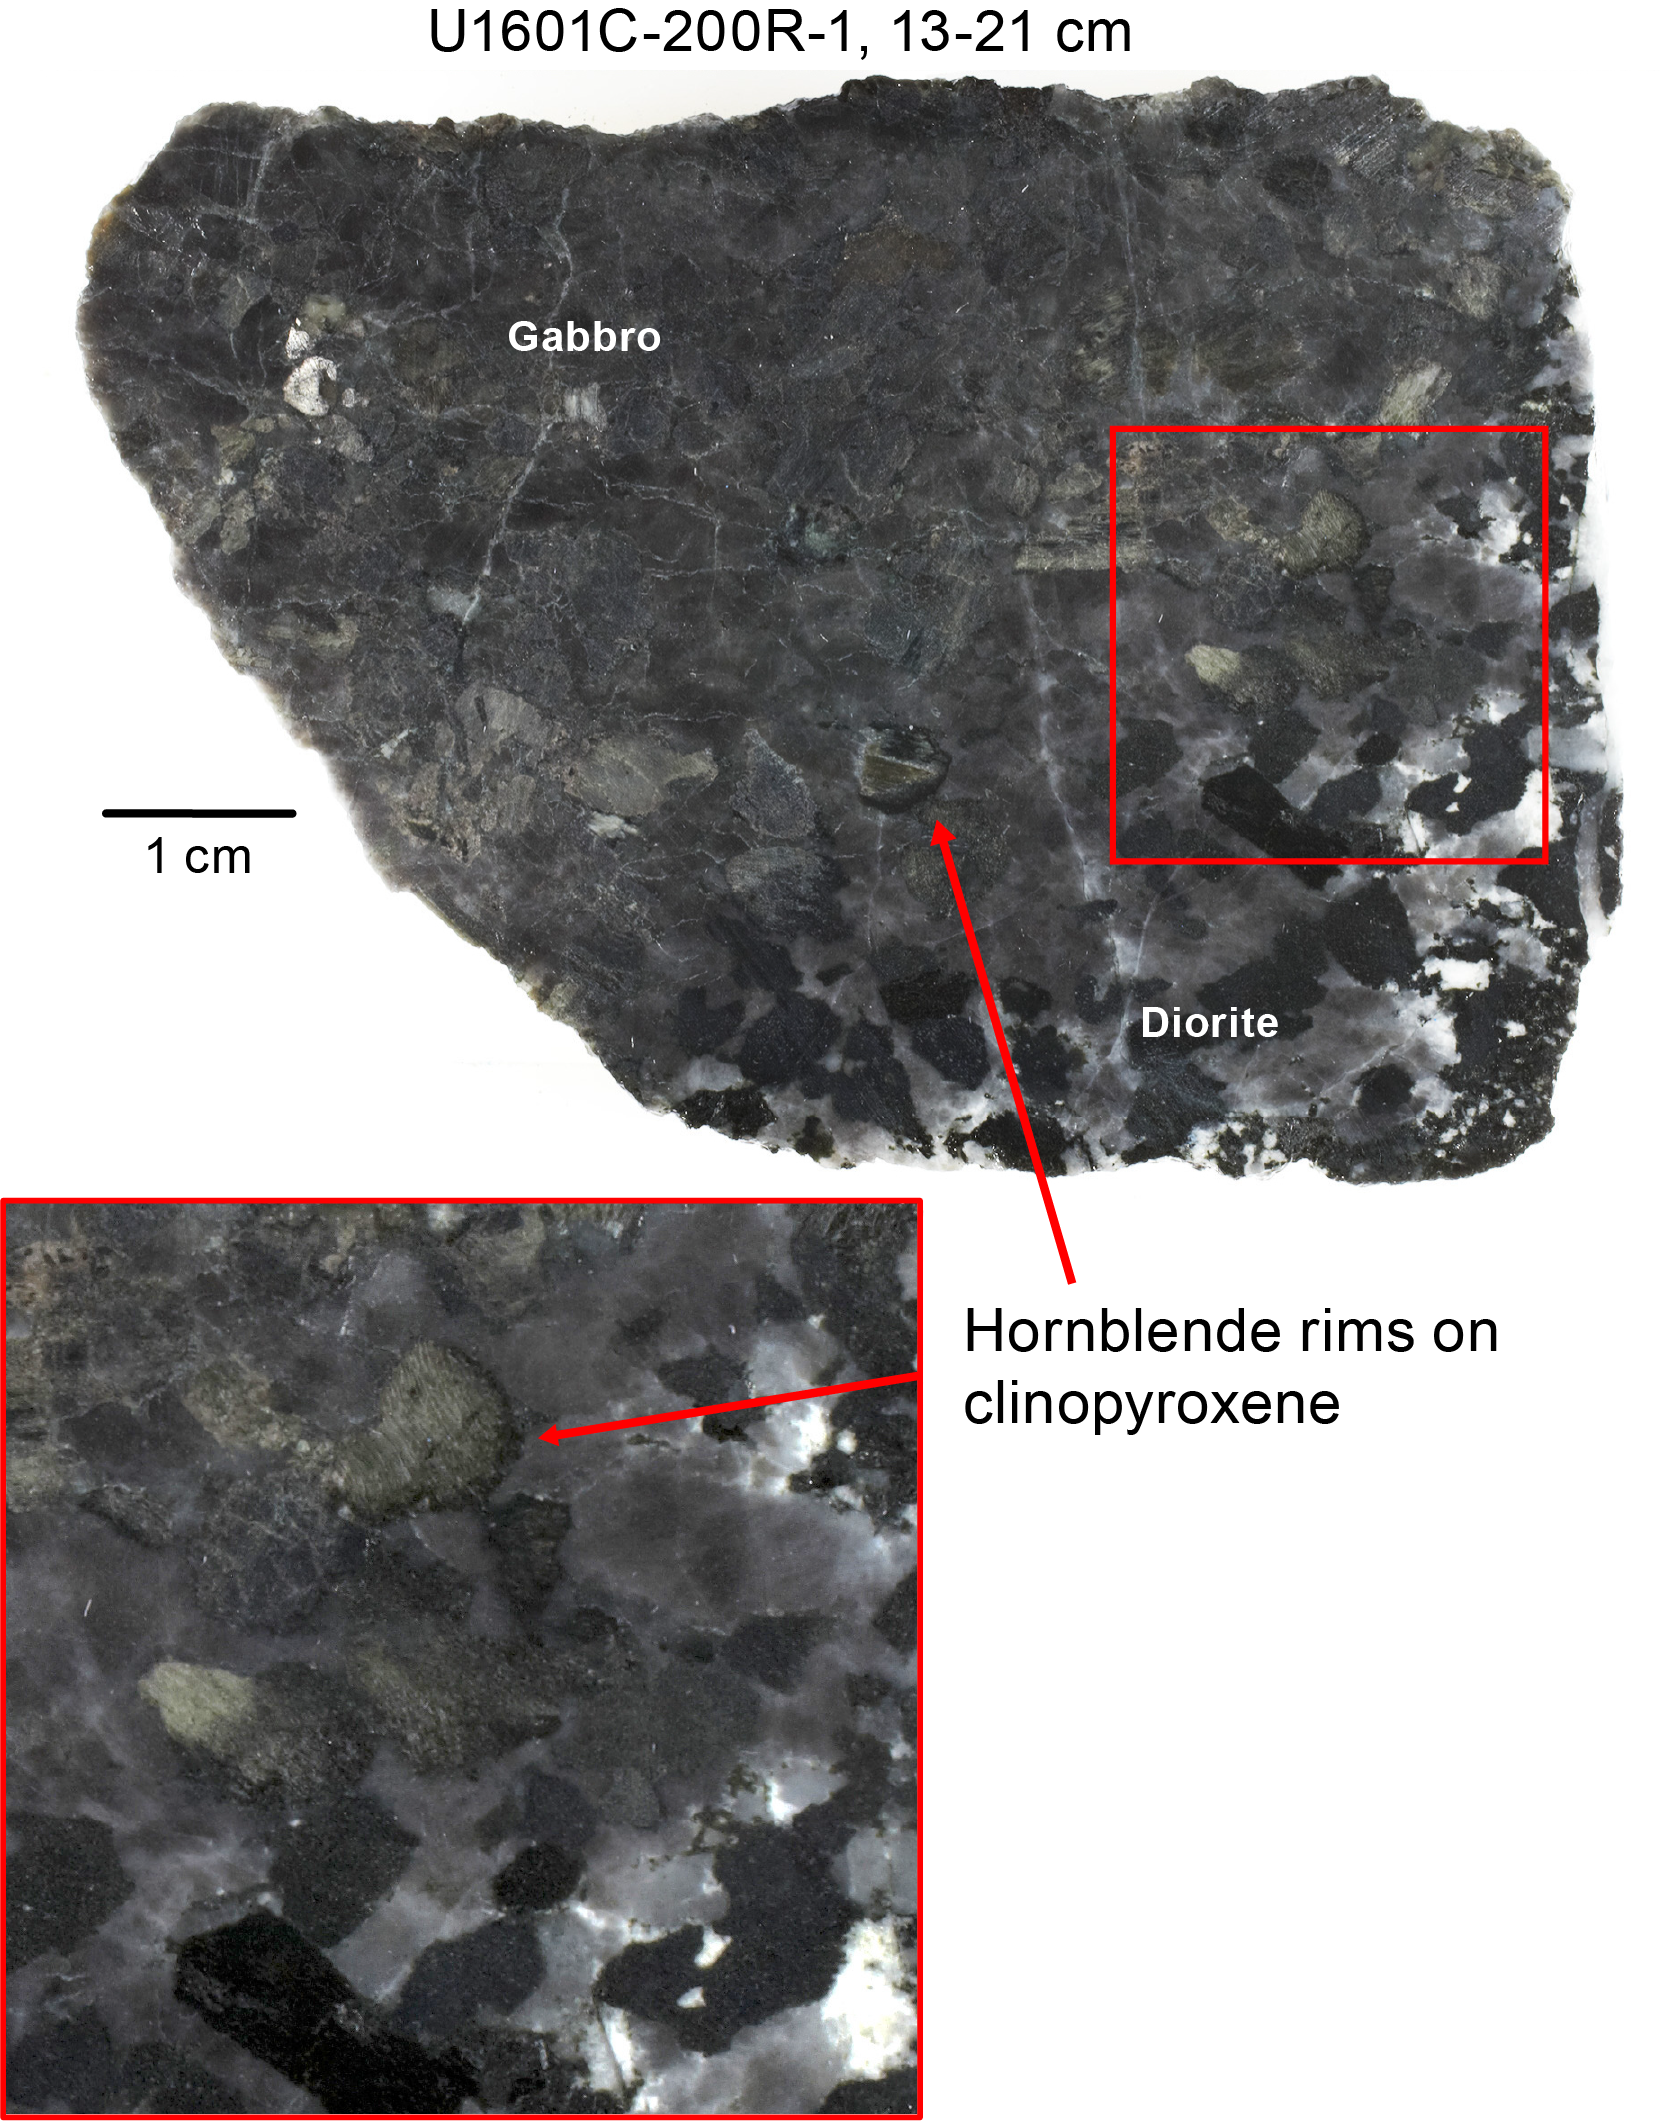
Figure F49. Contact between gabbro and diorite domains.
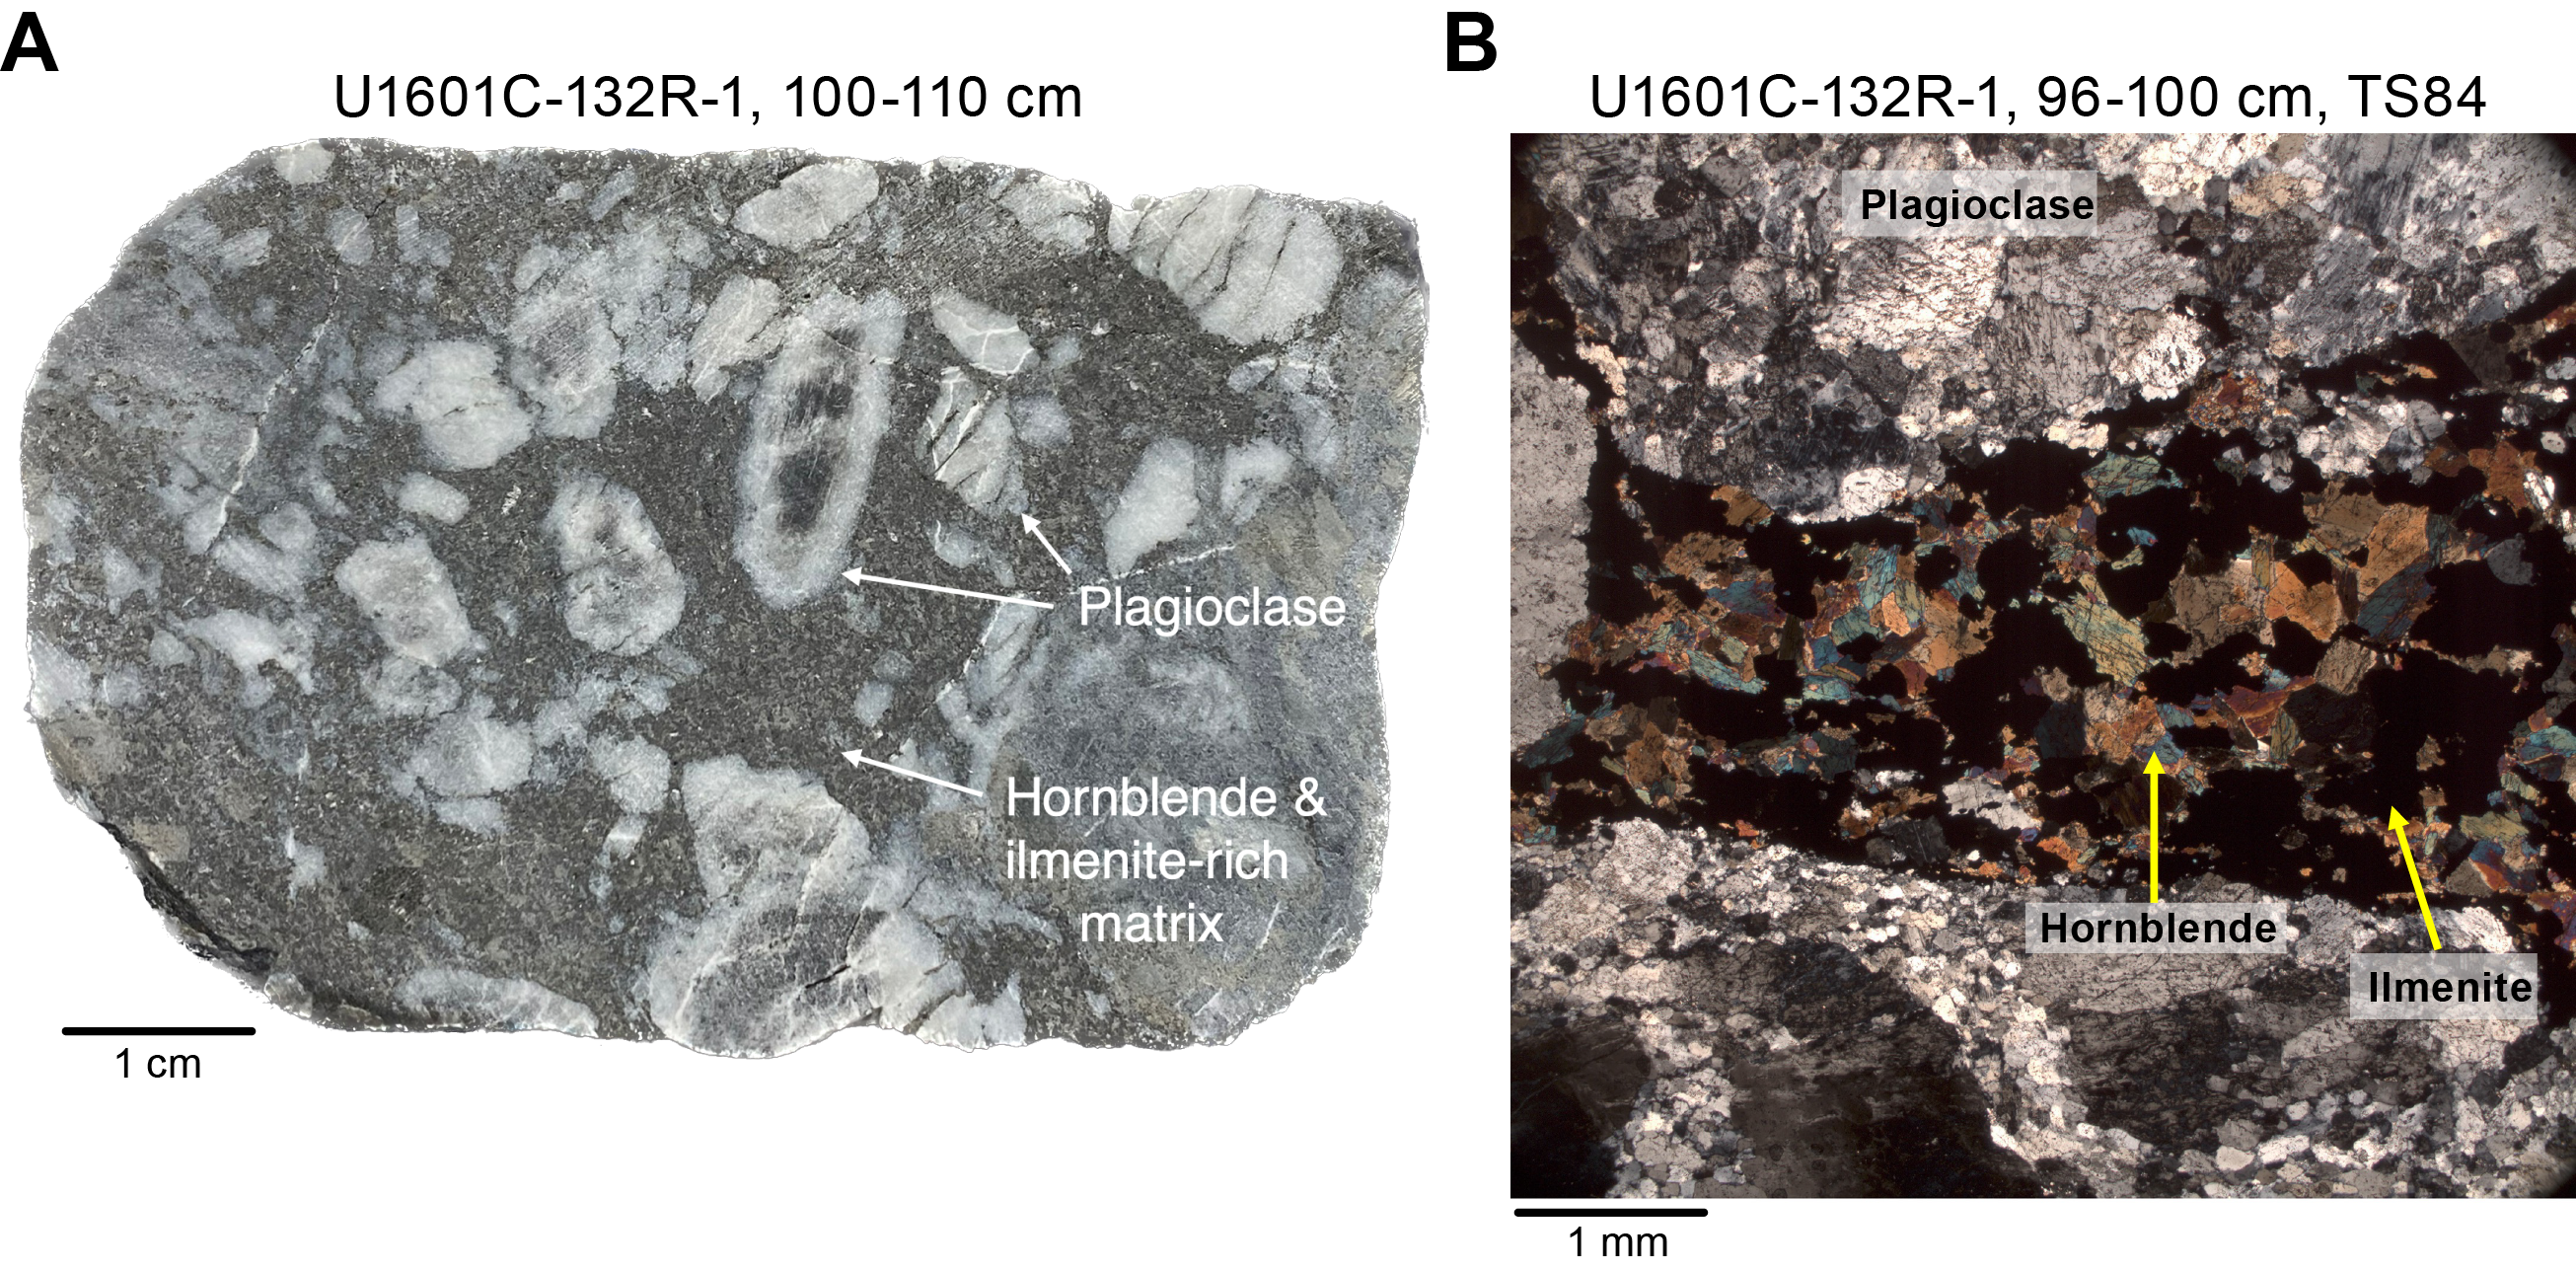
Figure F50. Hornblende-ilmenite diorite.
Tonalite occurs as a single centimeter-wide vein intruding gabbronorite of Unit 338, forming Unit 343. The vein has an irregular sutured contact with the gabbronorite and is medium grained with a granular texture. Trondhjemite intrudes the same gabbronorite unit, forming a few irregular centimeter-sized domains (Unit 342). However, this unit is highly altered and primary properties are obscured, making mineralogy, grain size texture, and lithologic interpretations uncertain.
3.2.5. Diabase
Diabase units occur at 23–854.61 mbsf in Hole U1601C, forming Units 1, 178, 198, 200, 205, 227, 237, 249, and 255, as are listed in Table T4. Diabase unit thicknesses range 5–2.1 m. Unit 178 shows a sharp and irregular contact with gabbro (Unit 177), which is the only recovered contact of diabase units. Diabase units are mainly aphanitic and aphyric to microcrystalline, with few fine-grained diabase units with limited amount of olivine phenocrysts. Diabase Unit 200, the thickest diabase, occurs in an intermingling of diabase with bimodal grain size distributions (aphanitic and fine grained). Unit 200 is highly brecciated with abundant carbonate-prehnite-chlorite-sulfide veins.
3.3. Microscopic observations
3.3.1. Peridotite
Peridotite thin section descriptions are largely consistent with hand specimen observations. Nevertheless, distinguishing between orthopyroxene and clinopyroxene is clearer in thin section, and clinopyroxene was found to make up as much as 7% of thin sections; thus, exceedingly rare lherzolites are present in the core. Nevertheless, many thin sections lack clinopyroxene altogether, and the overall average clinopyroxene mode in thin section was approximately 1%.
Alteration of olivine to serpentine was commonly complete, and most serpentinized rocks have less than a few percent of relict olivine. The freshest thin sections, however, are only ~40 serpentinized (Figure F51). In these fresher samples and samples where small remnant olivine grains have optical continuity in the core of serpentine-magnetite mesh segments, enabling the measurement of grain size (Figure F52), original grain size ranges 0.3–5 mm (average = 2.4 mm). The largest olivine grain size observed was 9 mm. The most common location to observe fresh olivine is adjacent to orthopyroxene grains.
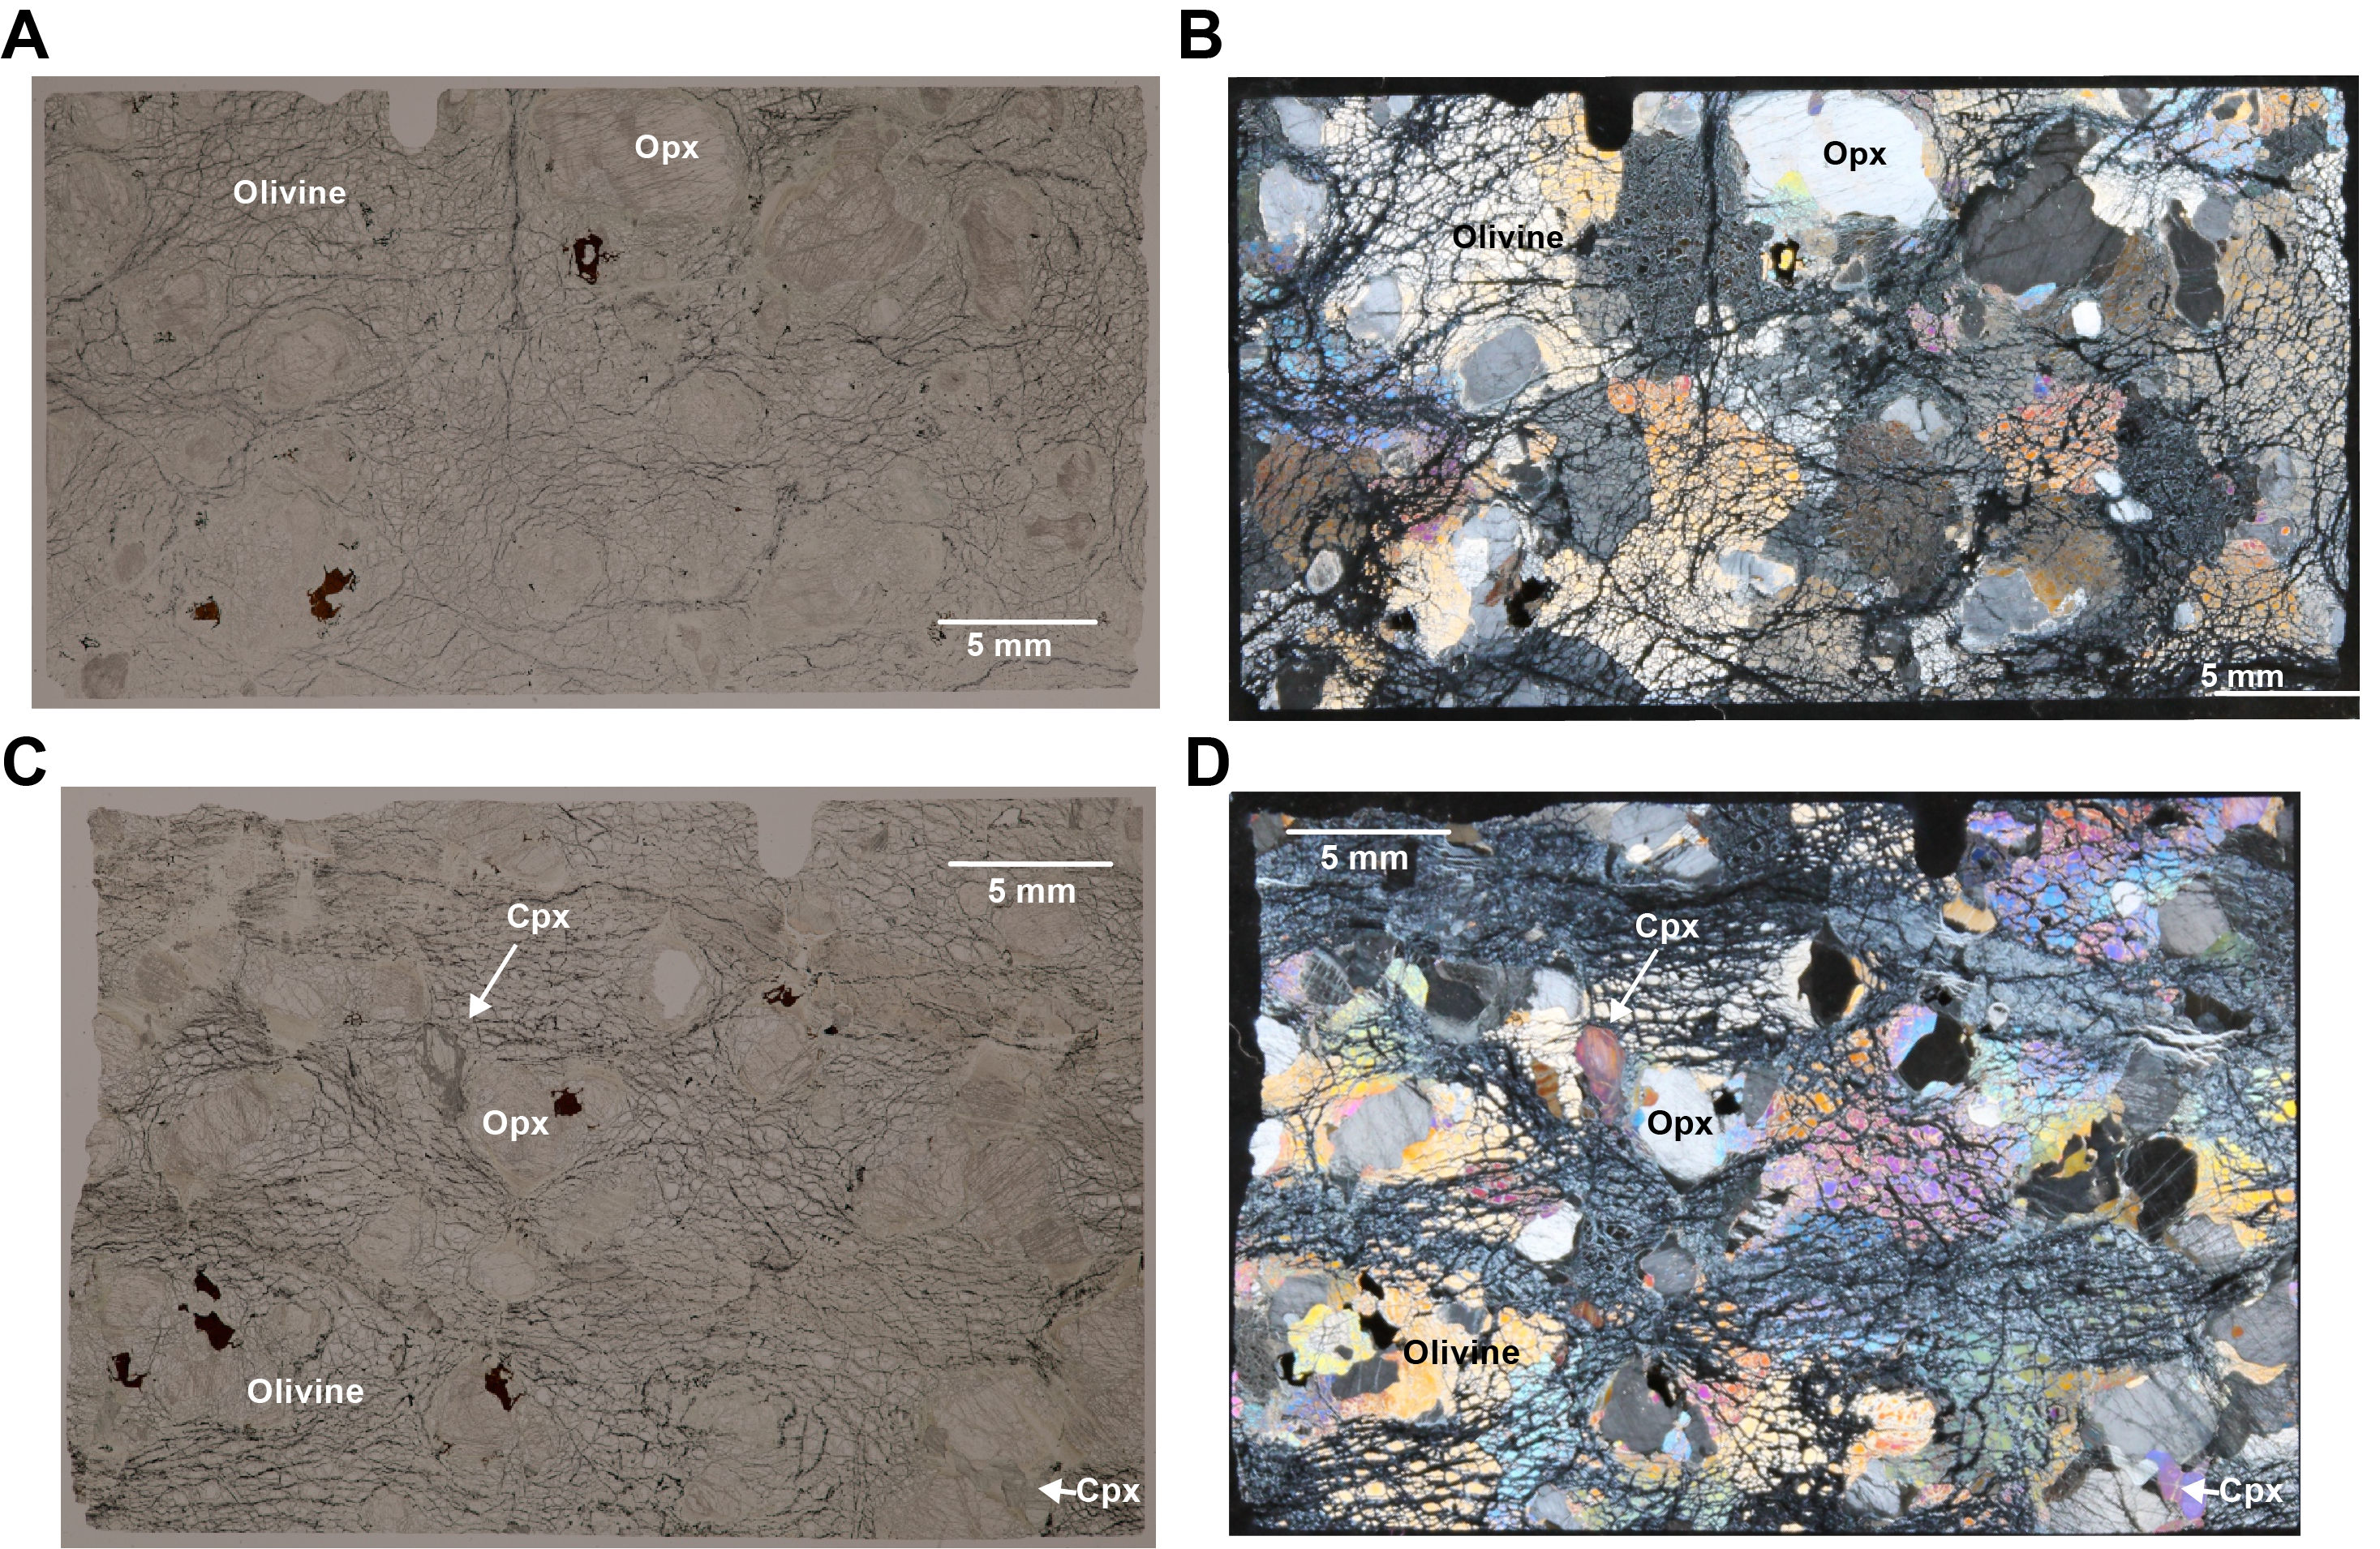
Figure F51. Relatively fresh harzburgite.
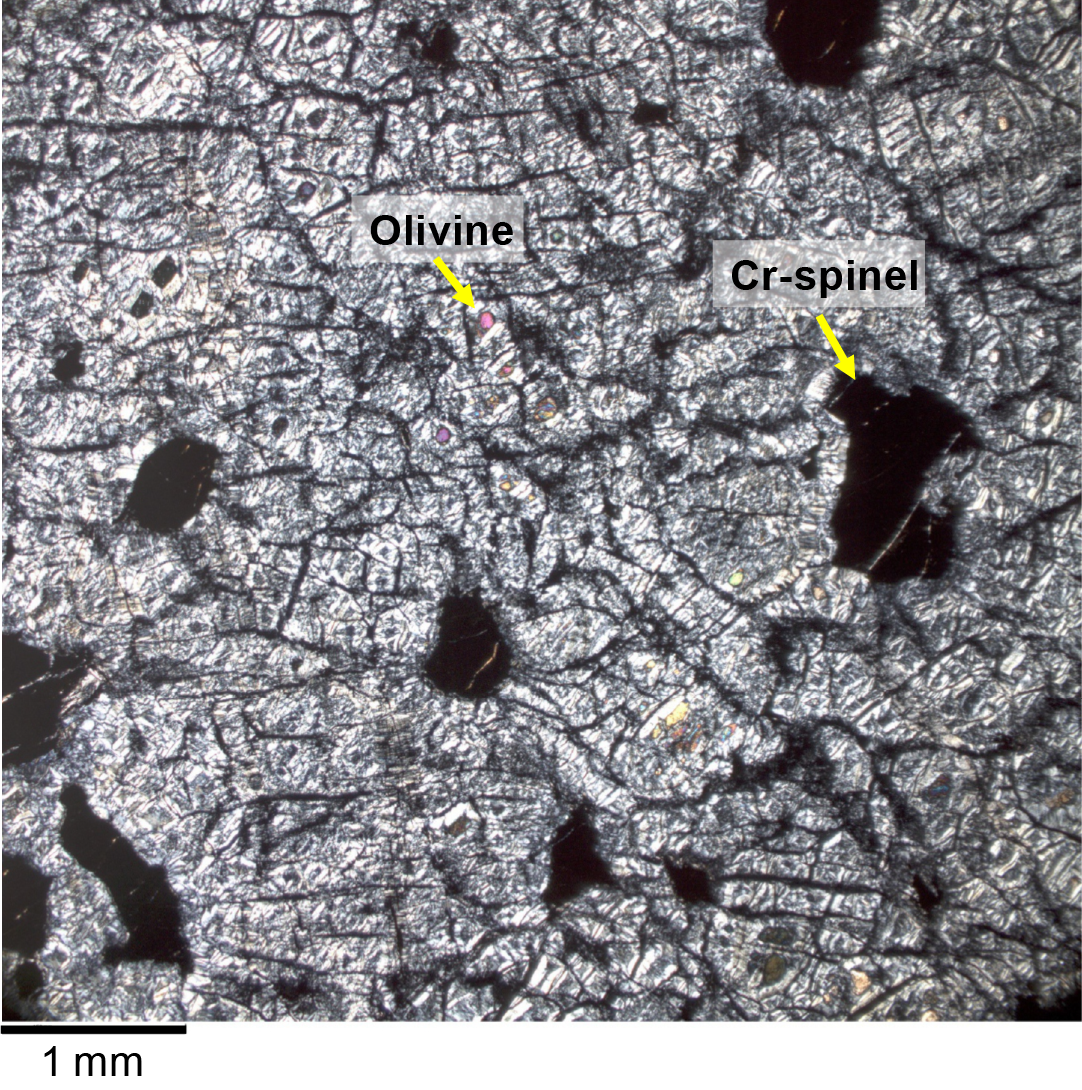
Figure F52. Serpentinized dunite.
Orthopyroxene grains were also significantly serpentinized, with varying proportions of remnant mineral left. The remnant orthopyroxene commonly forms somewhat rounded cores of grains (Figure F53) with pronounced cleavage and fine to coarse clinopyroxene exsolution lamellae. Clinopyroxene exsolution lamellae are less commonly present in serpentinized rims. These rims often have cleavage that is continuous with that of the fresh core, but it is more subdued. Granular grains in hand specimen descriptions are generally elliptical or rounded in shape altogether. Interstitial grains are those with rounded fresh cores and thick serpentinized zones forming cuspate boundaries with adjacent olivine or serpentine-magnetite mesh after olivine.
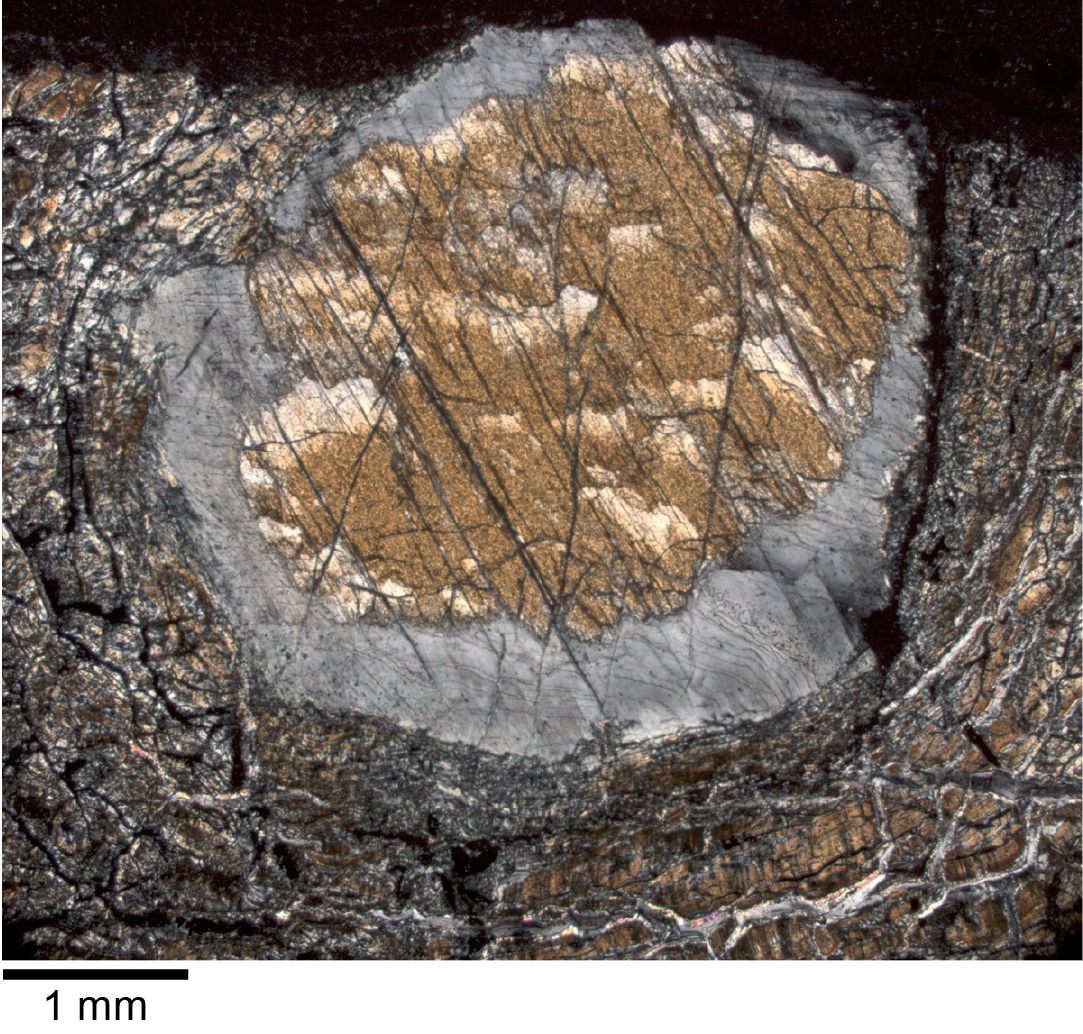
Figure F53. Orthopyroxene-bearing dunite.
Anhedral clinopyroxene is commonly present within or adjacent to orthopyroxene (Figure F54), although isolated anhedral clinopyroxene grains are found in some harzburgite and lherzolite samples. Several thin sections have interstitial clinopyroxene, which may form discontinuous rims on orthopyroxene, as well as anhedral, rounded discrete grains. Discrete clinopyroxene grains may also form inclusions within orthopyroxene. Clinopyroxene is more commonly fresh in thin section compared with orthopyroxene. Where clinopyroxene is altered, it is most commonly replaced by amphibole.
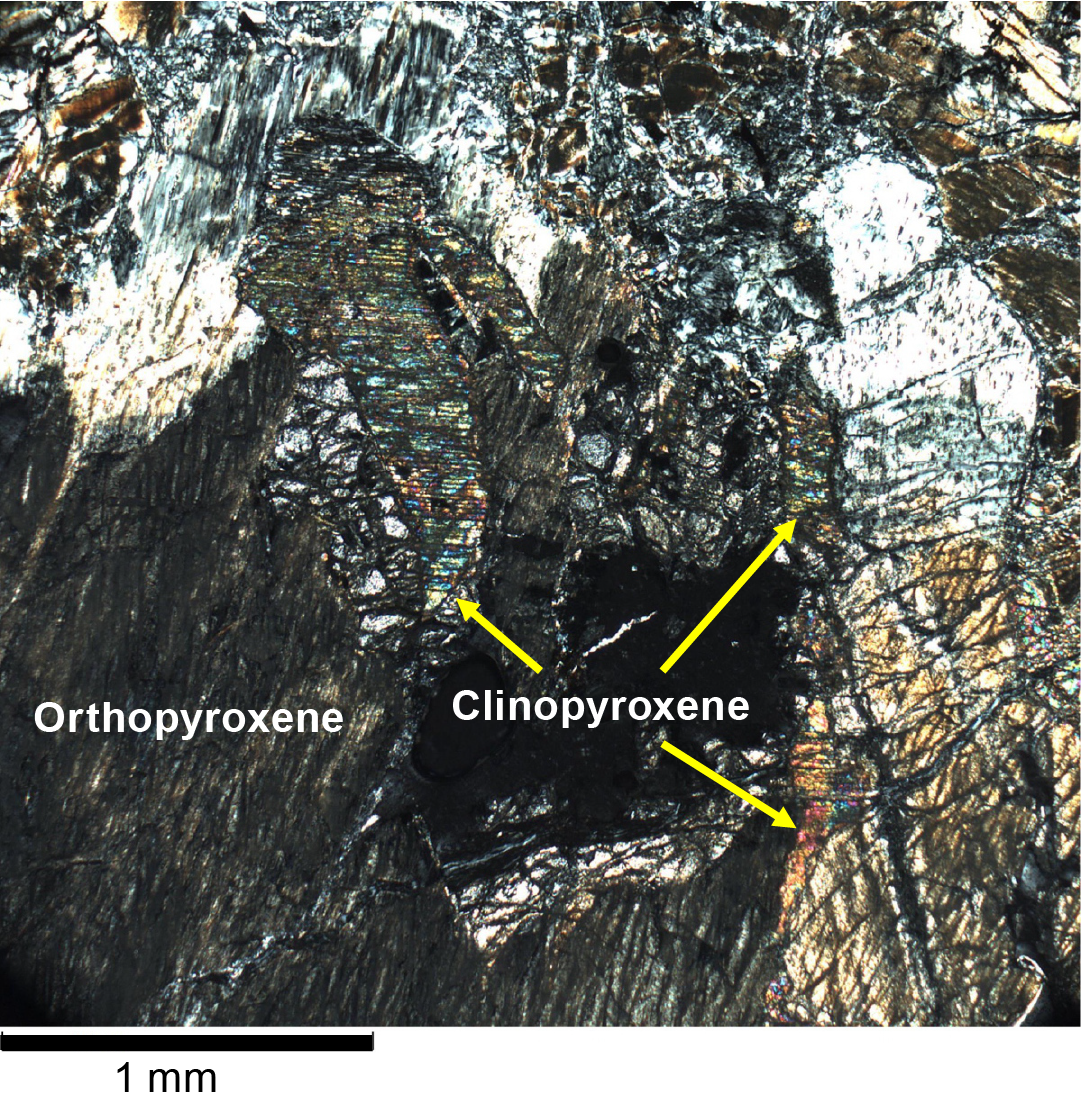
Figure F54. Clinopyroxene associated with orthopyroxene.
Cr-spinel makes up <1% of nearly all peridotite thin sections, but it is most abundant in dunites. It is present as either equant anhedral grains <1 mm in diameter (Figure F52) or amoeboid or vermicular grains (Figure F55). In both cases, several grains may cluster in patches or in trails that may be several millimeters across.
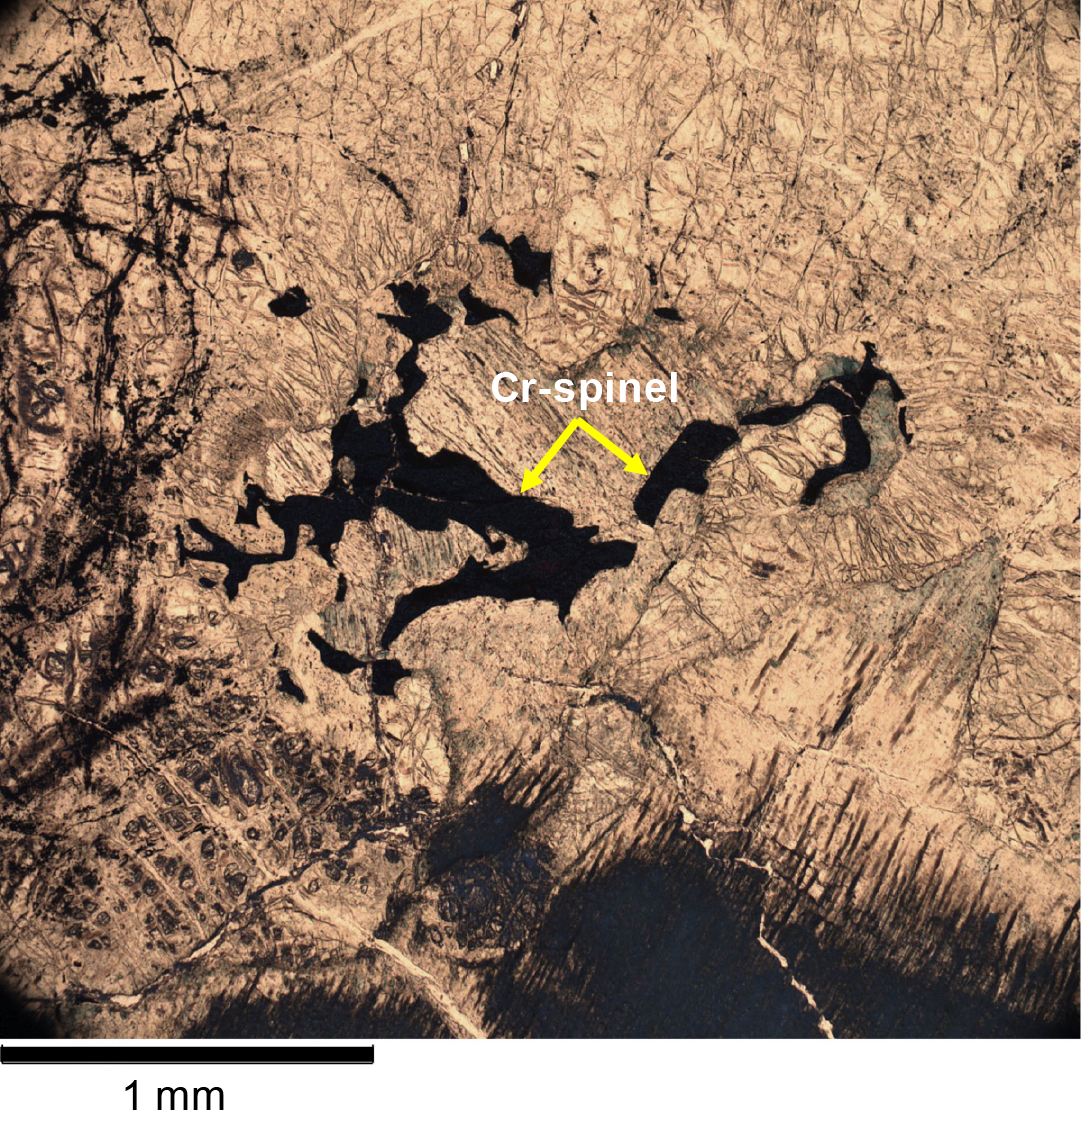
Figure F55. Vermicular Cr-spinel.
3.3.2. Gabbroic rocks
Thin sections of gabbroic rocks are primarily from Hole U1601C. These thin sections illustrate a complex interaction between intrusion, reaction with peridotites, alteration by hydrothermal fluids, and deformation. Many of the gabbroic rocks in thin section are deformed and altered to the point that original igneous features are entirely obscured. Thin sections of less altered and deformed gabbroic samples show them to be mostly medium to coarse grained, although some are fine grained (e.g., Sample 399-U1601C-150R-3, 99–101 [TS90]).
Overall textures can range from granular to subophitic to ophitic, typically with clinopyroxene oikocrysts and plagioclase chadacrysts. In contrast to Site U1309 cores, plagioclase crystals have less obvious compositional zoning (Figure F56), and they more commonly have annealed textures within plagioclase domains. A few thin sections have orthopyroxene oikocrysts that may be partially replaced by clinopyroxene (Figure F57). Several of the deformed rocks have separate plagioclase and mafic mineral domains suggesting that they were coarse-grained gabbros before deformation (Figure F58). Several thin sections have scattered discrete crystals of orthopyroxene, and many have enough orthopyroxene to be gabbronorite. A couple of these thin sections were cut from core taken from shallower than 185 mbsf, but most gabbronorites were collected below 755 mbsf, and gabbronorite composes most of the core below 1200 mbsf. Overall, orthopyroxene is in greater abundance in gabbroic rocks recovered from Site U1601 versus the portion drilled during this expedition at Site U1309. Clinopyroxene exsolution lamellae are common in orthopyroxene. In one thin section, orthopyroxene has two directions of clinopyroxene exsolution lamellae, indicating inversion from pigeonite (Figure F59).
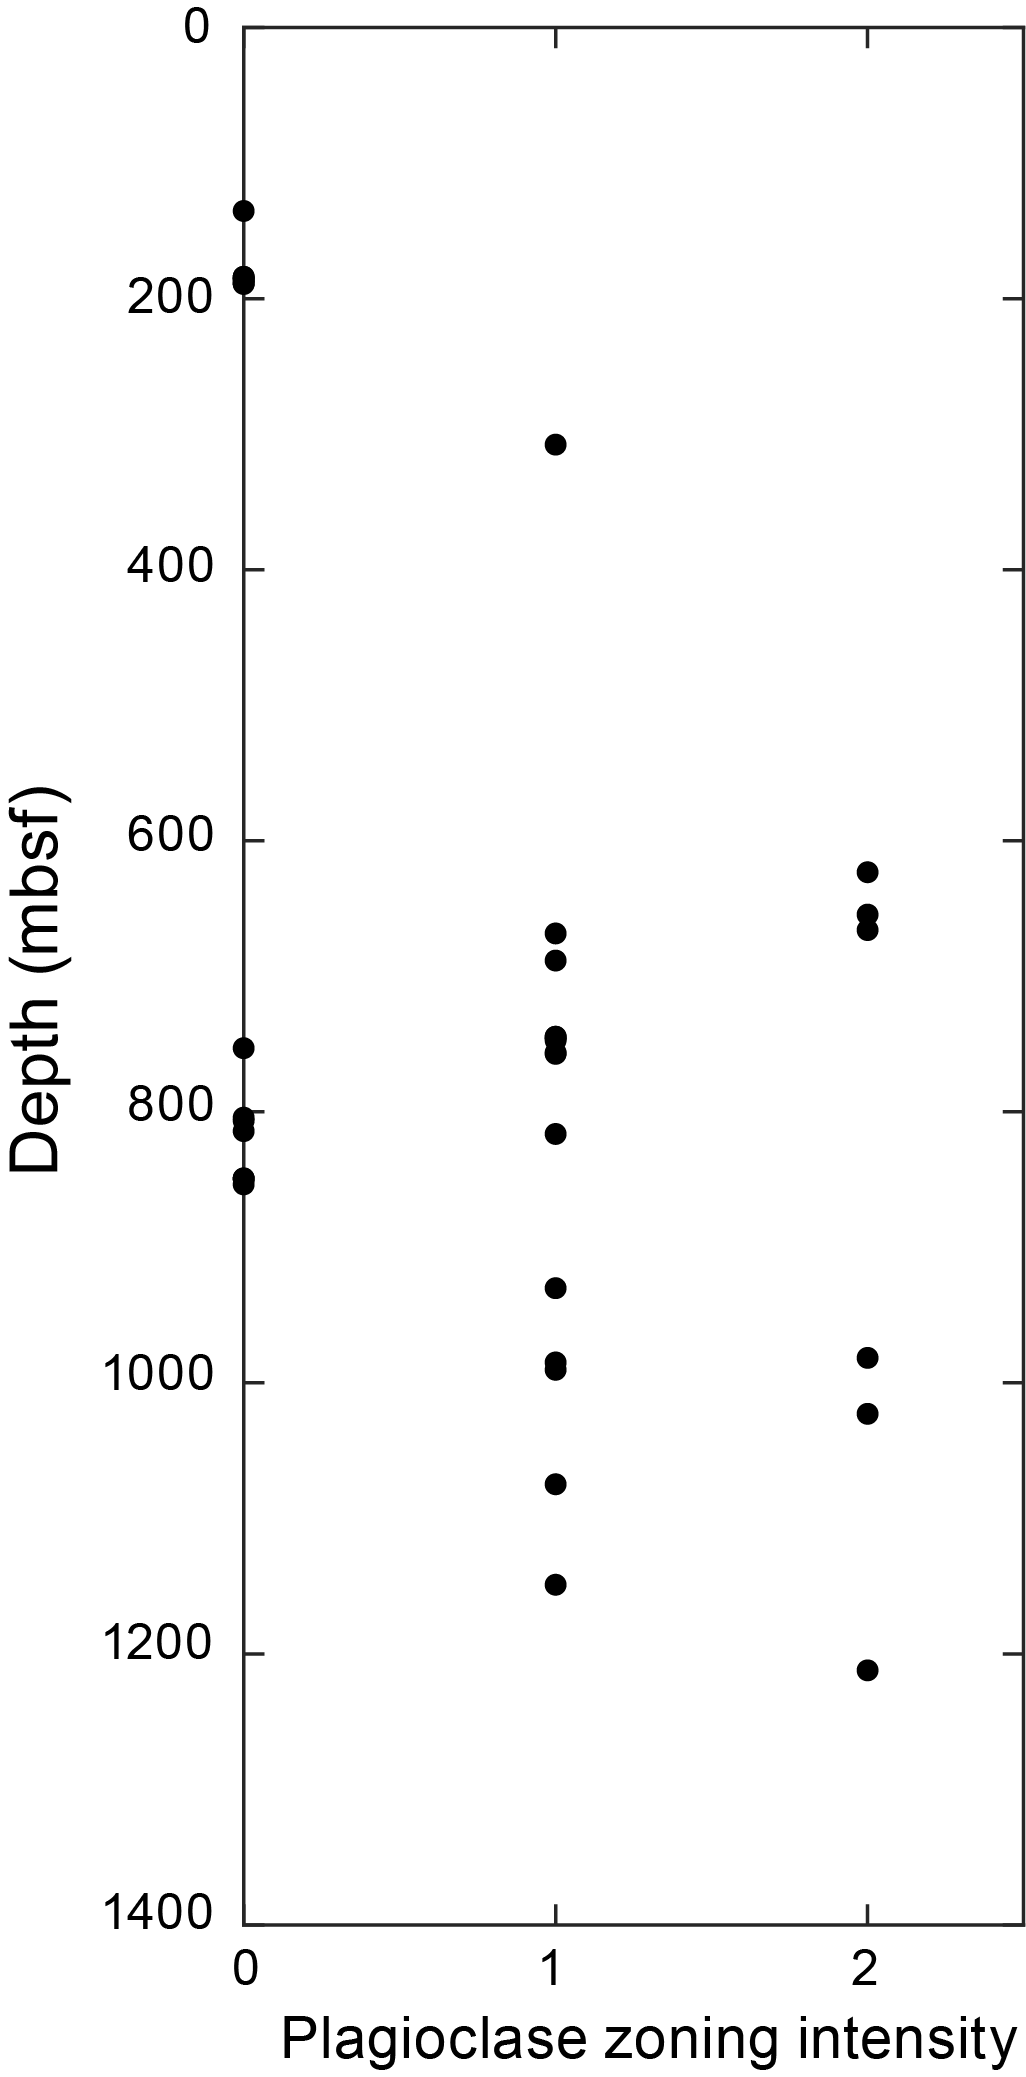
Figure F56. Plagioclase zoning intensity.
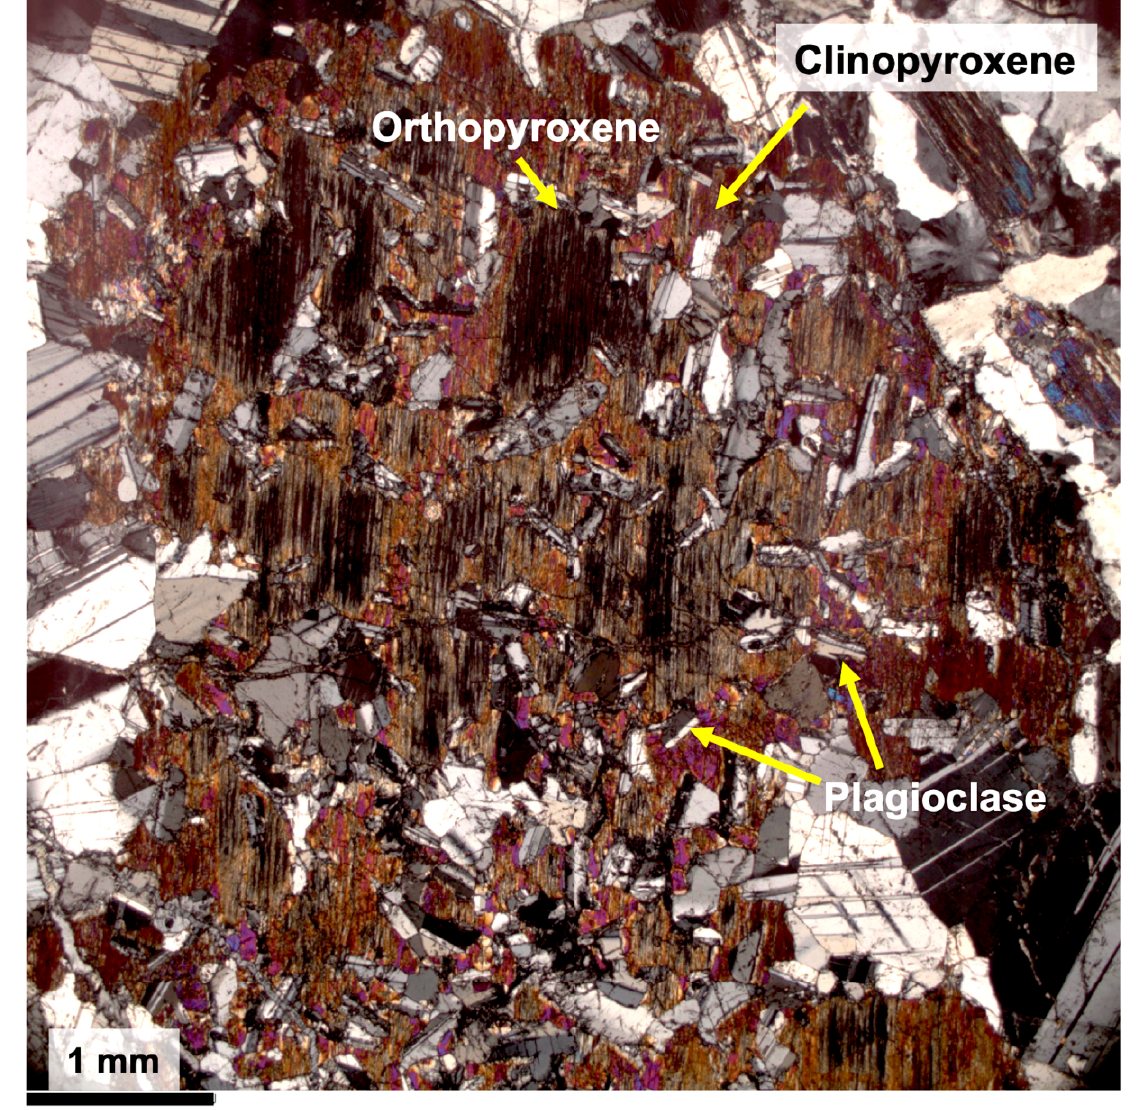
Figure F57. Poikilitic gabbronorite.
Figure F58. Cataclastically deformed gabbro.
Figure F59. Oxide gabbro with inverted pigeonite.
As for samples from Hole U1309D, clinopyroxene commonly has textures consistent with multiple stages of growth. The first generation of clinopyroxene typically has fine-scale orthopyroxene exsolution lamellae (Figure F60). Later generations typically do not.
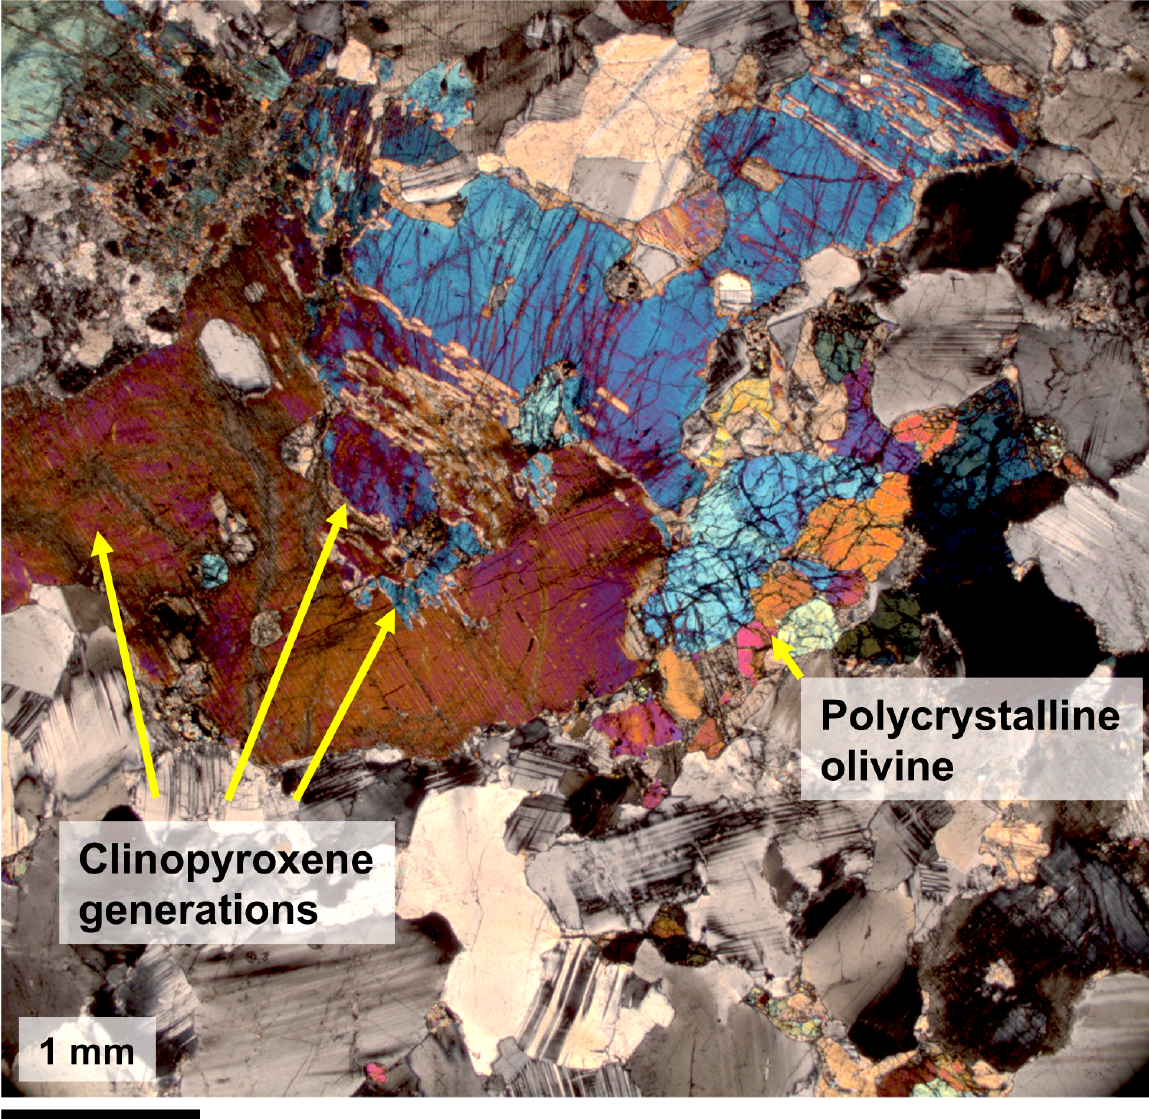
Figure F60. Olivine crystal cluster.
Below ~780 m in Hole U1601C, oxide-bearing and oxide gabbros become relatively common. In most of these thin sections, Fe-Ti oxide was associated with hornblende. A particularly common texture is oxide with or without hornblende surrounding clinopyroxene. In one thin section, clinopyroxene oikocrysts have oxide and plagioclase chadacrysts, with oxide surrounding the clinopyroxene (Figure F61). Thus, in that sample, oxide precipitated before and after primary growth of clinopyroxene. Trace proportions of sulfides are commonly found in oxide-rich areas. One of the most unique rocks thin sectioned on the ship is a hornblende-ilmenite diorite. This rock has centimeter-scale domains of fragmented and annealed plagioclase in a matrix consisting of hornblende and ilmenite, with minor titanite and plagioclase and trace sulfide (Figure F50B).
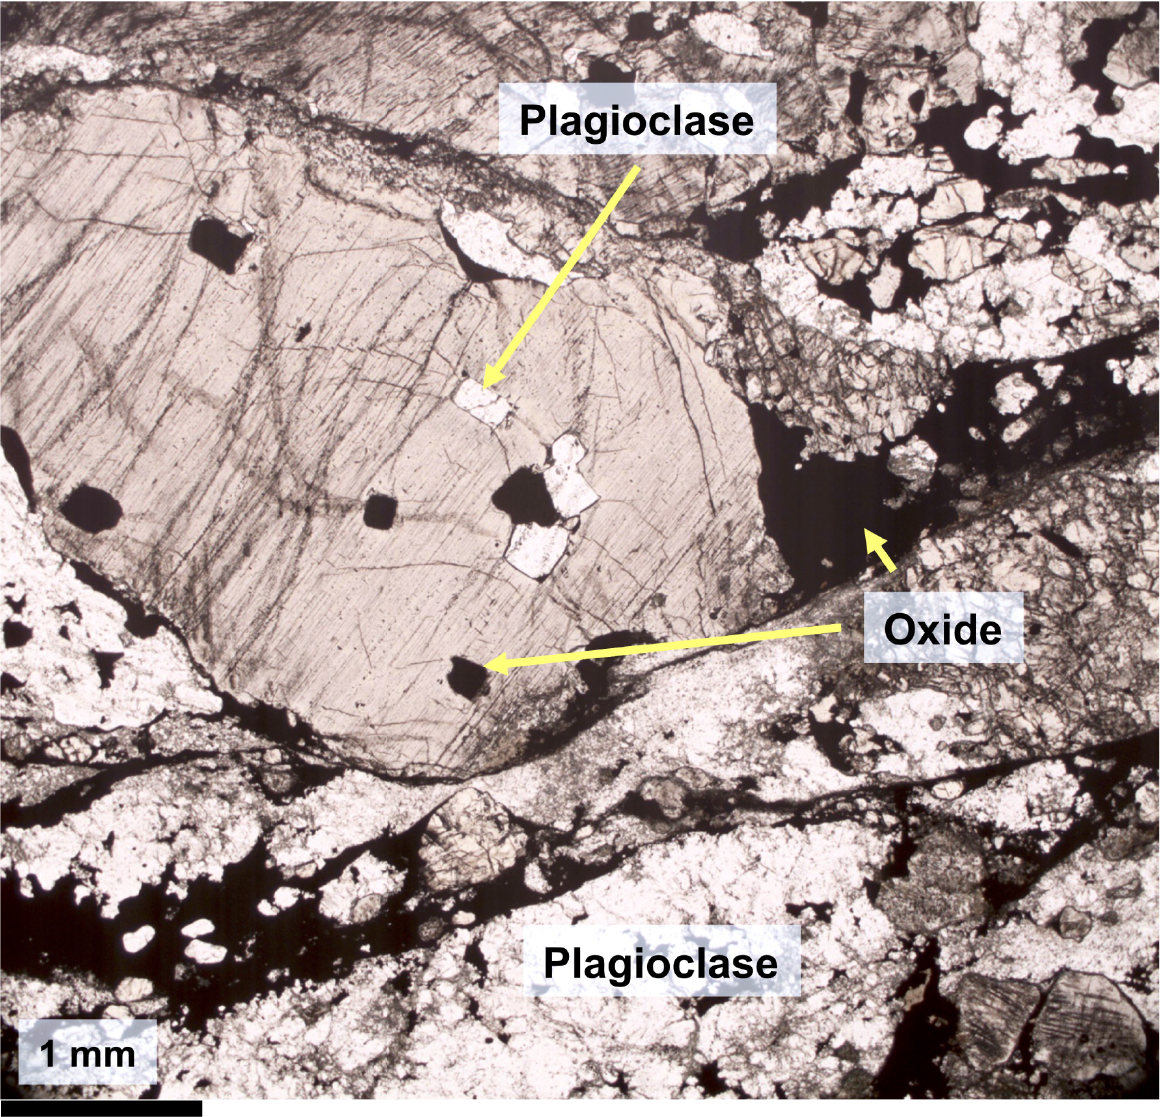
Figure F61. Oxide gabbro with poikilitic clinopyroxene.
Olivine is found dispersed in some gabbros with ophitic or subophitic textures, where it typically forms amoeboid aggregates. Olivine also is found in troctolites and troctolitic boundaries between peridotites and gabbros, where it forms lensoid to irregular polycrystalline aggregates intermingled with polycrystalline plagioclase domains (Figure F62). In all samples, olivine is anhedral, and larger olivine grains are often kink banded. Two options for the origin of the polycrystalline olivine domains are (1) olivine deformation and recrystallization and (2) fine-scale intermingling of mantle and gabbroic domains at or near magmatic temperatures. The former is supported by the observation in several thin sections that coarse-grained olivine is kink banded, whereas smaller grains are not. The latter is supported by the intermingled textures observed on a hand specimen and thin section scale at the contacts of between gabbros and peridotites. Also supporting the latter interpretation is the presence of orthopyroxene adjacent to aggregated olivine in Figure F63.
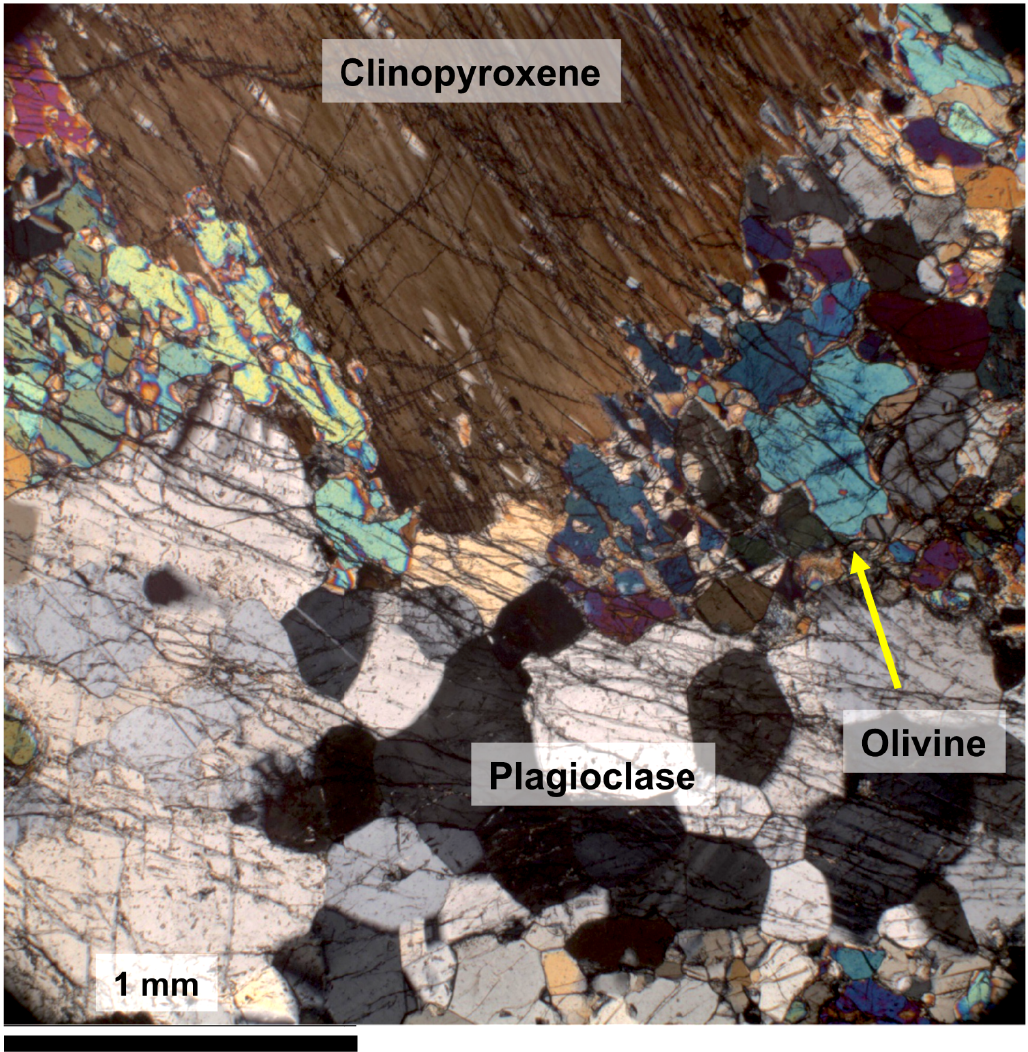
Figure F62. Olivine gabbro with domains.
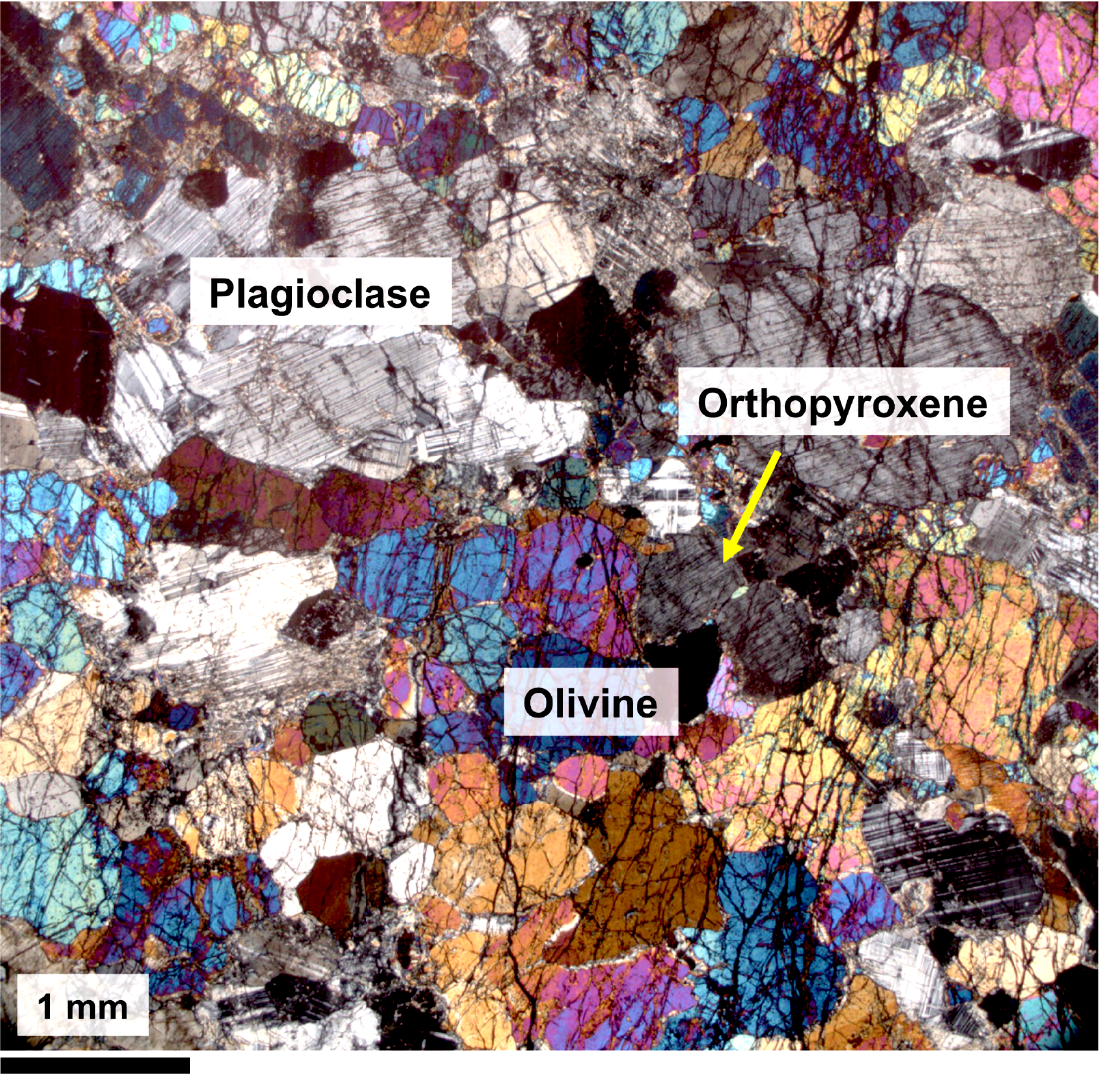
Figure F63. Troctolite with domains.
Minor mafic lithologies encountered in thin section included websterite veins up to a few millimeters thick cutting harzburgite, diabase veins cutting peridotites and gabbroic lithologies that range from moderately fresh to highly altered and sheared, and a hornblendite or amphibolite vein consisting dominantly of pale brown amphiboles with minor clinopyroxene and orthopyroxene.
3.4. Preliminary interpretations
The recovery of a long section of peridotite with gabbroic intrusions at Site U1601, coupled with the high recovery, provides significant insights into the nature of the mantle and peridotite-dominated lithosphere at the Mid-Atlantic Ridge (MAR). In terms of the mantle rocks, the data have established the first-order lithologic proportions of the different peridotite subunits (harzburgite, orthopyroxene-bearing dunite, and dunite) in a long (>1200 m) mantle section. The first significant observation is that all the recovered peridotites are refractory harzburgites with clinopyroxene modal proportions averaging ~1%, which is low even compared to the generally clinopyroxene-poor MAR mantle (Figure F16). This feature also contrasts those of the small peridotite intervals recovered in Hole U1309D, which experienced various extents of clinopyroxene and plagioclase impregnation (Tamura et al., 2008). Furthermore, the data show that the peridotite forms a compositional continuum, controlled by variations in orthopyroxene content. These variations occur on a wide range of scales, from decimeter to kilometer. Dunite formation has been linked to orthopyroxene-dissolving reactions between harzburgite and migrating basaltic melts (Kelemen et al., 1995; Lambart et al., 2009). Both the gradational contact between dunite and harzburgite as well as the textural and mineralogical continuum from harzburgite through protodunite to dunite are consistent with such an origin for dunite.
The Cr-spinels occur pervasively in all the recovered peridotites at all depths and are occasionally found to form in patches and/or elongated trails in dunites. These dunitic spinels show wide variation in grain size (from a few millimeters to a few centimeters) and shape (from vermicular shaped to granular). Their occurrence, shape, and size are comparable with those recovered from other localities, such as Hess Deep on the East Pacific Rise (Arai and Matsukage, 1996), 15°20′ Fracture Zone on the MAR (Abe, 2011), and Southwest Indian Ridge (Payot et al., 2014). These concentrated aggregates of dunite-hosted Cr-spinels are commonly attributed to melt-peridotite reaction in the upper mantle (Arai and Miura, 2016).
Peridotite frequently shows both granular and interstitial orthopyroxene. The granular orthopyroxene grains are often rounded and define mantle fabrics (see Structural geology), suggesting that they are residual in origin. The interstitial orthopyroxene has uneven distribution in the section and has locally been observed to form trails crossing the core. Based on this habit and distribution, we interpret these orthopyroxenes to reflect crystallization from migrating melt. The interstitial orthopyroxene is at least locally deformed, as indicated by folded cleavage and exsolution lamellae, indicating that impregnation predates at least some of the crystal-plastic deformation recorded in the harzburgites.
The amount of pyroxene in the mantle rocks is low. Workman and Hart (2005) estimated that orthopyroxene and clinopyroxene form 28% and 13%, respectively, of the depleted mantle source of mid-ocean-ridge basalts (MORBs). This contrasts with our observation of 15% orthopyroxene and negligible clinopyroxene. Together, this indicates that the peridotites are highly depleted and record a relatively high degree of melting.
The gabbroic rocks at Site U1601 record emplacement of melts into the mantle lithosphere. The data constrain the size of individual intrusions and provide information on melt compositions. The size distribution of gabbroic intervals is heavily weighted toward small veins, with intervals <10 cm forming a minimum of 39% and those <1 m forming at least 80% of the recovered gabbroic intervals (Figure F31). This is in apparent contrast with gabbro-dominated portions of oceanic core complexes (OCCs), such as those drilled in Ocean Drilling Program (ODP) Hole 735B and IODP Holes U1473A (Atlantis Bank, Indian Ocean; Dick et al., 2016) and U1309D (Expedition 304/305 Scientists, 2006b). There, intrusions form series often marked by differentiation trends on a scale of hundreds of meters (Blackman et al., 2011; Dick et al., 2000; John et al., 2009). Hence, it appears that the melt emplacement dynamics of melt-rich and melt-poor parts of slow-spreading lithosphere differ fundamentally. Furthermore, these differences may occur over small spatial scales: Hole U1309D is only ~4 km north of Site U1601.
Compositionally, Hole U1601C is dominated by relatively differentiated plutonic rocks. Rocks that would crystallize from primitive melts, such as troctolites and olivine gabbros, are rare, and many of those rock types at Site U1601 originate by interaction of melts with surrounding mantle peridotites rather than crystallization of primitive melts. Instead, the rock record is dominated by lithologies that are typical of crystallization from more differentiated melts (gabbro, gabbronorite, and oxide gabbro[norite]). This indicates that the melts that were emplaced in the upper part of Atlantis Massif and drilled in the 1268 m section at Hole U1601C were differentiated. This is similar to the observations at the Atlantis Bank OCC (Indian Ocean), where the gabbroic rocks are generally evolved and more differentiated than rocks in equilibrium with MORB (Dick et al., 2000). This raises the question: where are the primitive cumulate rocks required to mass balance the observed evolved gabbroic rocks back to primitive melts? There are two potential explanations. The first is that the primitive cumulates reside deeper in the section and that the 1268 m section drilled in Hole U1601C represents only the upper part of what is a trans-lithospheric plutonic system, with melt delivery and primitive cumulate formation deeper in the lithosphere and an increasing degree of differentiation upward. Alternatively, it may be that the evolved gabbros at Site U1601 are crystallization products of melts that were originally delivered to the center of the massif, where they formed primitive cumulates such as those recovered in Hole U1309D (Expedition 304/305 Scientists, 2006b) and were then transported along axis to intrude the Hole U1601C lithospheric mantle as already differentiated melts. Seismic data lend some support for this scenario. Full waveform inversions show a region of relatively high seismic velocities (6–7 km/s) underlying Hole U1309D at depth (>500 mbsf) (Harding et al., 2016). A small and vertically restricted (~500 m) zone extends south from the main high-velocity zone, projecting to ~1200 mbsf beneath Site U1601 (Harding et al., 2016). Abundant gabbroic rocks were recovered at that level in Hole U1601C (Figure F14). Reprocessed seismic data suggest that this gabbro body may shoal toward the east (i.e., in the direction of the ridge axis; Henig et al., 2012).
In addition to a compositional difference between plutonic rocks from Sites U1309 and U1601, there is also a contrast in igneous textures. Hole U1309D plutonic rocks, at least those recovered during Expedition 399, are predominantly medium to coarse grained (average grain size = 5.8 mm; see Figure F9 in the Site U1309 chapter [McCaig et al., 2025]) and have mostly subophitic textures (see Figure F11 in the Site U1309 chapter [McCaig et al., 2025]). This contrasts with the generally granular and coarser (average grain size = 7.0 mm for intrusions >10 cm) nature of the Hole U1601C gabbroic rocks (Figure F33). The underlying cause of this difference is unclear, but the difference in grain size is more likely related to crystallization dynamics than differences in cooling histories; the small individual gabbros in the magma-poor Hole U1601C would be expected to cool more rapidly than the large gabbroic plutons in the magmatically robust Hole U1309D.
The sutured nature of the contacts between gabbroic rocks, along with the nearly ubiquitous absence of GSR at gabbro/peridotite contacts, indicates that the gabbroic rocks intruded into relatively warm lithosphere. Nonetheless, the observation of large clinopyroxene growing vertically (in the core reference frame [CRF]) away from contacts may indicate a degree of undercooling with respect to the liquidus temperature of the melts.
The common observation of relatively olivine rich zones along many gabbro/peridotite contacts indicates that the interaction between emplaced melts and their lithospheric mantle host rocks played an important role in Hole U1601C. This interaction may have proceeded in two ways that are not mutually exclusive and may have acted in tandem. The first is simple assimilation of olivine grains from the peridotite wall rock. These grains could then be entrained in the gabbro and be present as xenocrysts in gabbros near the contact. The observation in thin section of orthopyroxene associated with polycrystalline olivine domains within olivine gabbro (Figure F63) is consistent with this scenario. The second mechanism involves partial dissolution of olivine of the peridotite, potentially supplemented by diffusive exchange of Fe-Mg between the gabbroic melts and the peridotite. These two processes would induce olivine saturation in the melt and, hence, the crystallization of olivine-bearing assemblages along the contact. A number of observations are consistent with the latter option. This includes the observation that plagioclase-rich parts of the gabbroic rock penetrate the peridotite across the contact (Figure F41A, F41C), the interstitial nature of some of the olivines in the olivine-rich zones (Figure F41A), and the intergrowth of plagioclase laths with olivine across the contact (Figure F41B).
The different gabbroic vein types record intrusion under evolving conditions in the section. The impregnation veins are defined by discontinuous trails of millimeter-sized grains; they mark conditions hot enough for intergranular melts to migrate through the peridotites without freezing. The discrete veins record hydrofracturing yet have sutured contact with the peridotites, indicating relatively high-temperature intrusion. The diffuse veins have indistinct margins with their host peridotites; however, it is not clear whether this is a primary feature or whether it is due to an alteration overprint. In rare sections, discrete veins were observed to turn into diffuse veins as they got thinner; this may suggest that they form part of the same generation.
The latest magmatic activity is marked by the evolved plutonic rocks (diorite, tonalite, and trondhjemite) and diabase. The diorite occurs only as small patches in larger gabbroic bodies. The gradational, irregular contact marked by the progressive replacement of gabbro clinopyroxene by hornblende, as observed both in hand specimen and thin section, indicates that the diorite-forming melt reacted with the gabbro. In principle, this could be a reaction induced by magma migration or a metamorphic reaction induced by fluids. The fact that there are Fe-Ti oxides associated with some of the diorites (e.g., Unit 234) suggests the involvement of late-stage hydrous melts. These form a continuum with mylonitic oxide gabbros, which often include the assemblage of hornblende-Fe-Ti oxide. Hence, evolved melts, often associated with or postdating deformation, were the sources for the diorites by either directly crystallizing or reacting with earlier formed gabbros. The rare diabase at the site postdates this diorite magmatism by a significant amount: the diabase is very fine in grain size, and the only recovered contact is sharp, marking intrusion into cold lithosphere. This is consistent with observations made in Expedition 357 Hole M0069A, drilled nearby, as well as several other Expedition 357 holes and the upper 130 m of Site U1309, where several diabase intrusions are synkinematic with detachment faulting (McCaig and Harris, 2012; Früh-Green et al., 2017).
4. Alteration petrology
Site U1601 includes two holes. Hole U1601A is a pilot hole drilled to 55 mbsf, and Hole U1601C (20 m from Hole U1601A) reached 1268 mbsf. Variably altered peridotites and gabbroic rocks were recovered from both holes at Site U1601. Peridotites include highly serpentinized (> 50 vol% of the total rock volume is serpentinite) harzburgite and minor dunite. In serpentinized peridotites, olivine is highly altered to serpentine, magnetite, and traces of sulfides or alloy, as well as locally clay minerals, and iowaite after brucite. In a few core sections, significant olivine is still preserved (up to 60 vol%). In addition, olivine locally contains abundant fluid inclusions. Orthopyroxene is partially to completely altered to serpentine in bastite texture, in which talc and chlorite can be locally abundant, whereas rare clinopyroxene often shows variable degrees of alteration to serpentine and amphibole.
A distinctive pattern of alteration is seen in the uppermost ~200 m of Holes U1601A and U1601C, where clay minerals are more abundant and magnetite is oxidized to reddish brown iron oxide and iron oxyhydroxide minerals. This is indicative of elevated fO2 conditions near the seafloor and possibly seafloor weathering. At greater depths, magnetite seems less altered, except for serpentinized peridotite that is juxtaposed to gabbroic lithologies where magnetite is locally replaced by sulfide minerals. Overall, the presence of magnetite and sulfides and/or alloy(s) at greater depth in rocks from Site U1601 is indicative of fairly low fO2 conditions.
In addition to variably altered magmatic veins, most serpentinized peridotites are cut by at least two vein generations, an earlier generation composed of serpentine (likely lizardite) and magnetite and a later generation composed of chrysotile or picrolite veins, suggesting that several serpentinization events occurred. In addition, carbonate veins and sulfide (including Cu-Fe sulfide) veins occur locally in the proximity of gabbroic rocks and provide evidence for carbon, sulfur, and base metal mobility between mafic and ultramafic rocks.
Gabbroic rocks, including gabbro, gabbronorite, olivine gabbro, troctolite, and oxide gabbro, show a slight (~3%–20%) to strong (100%) degree of alteration. Gabbro is more extensively altered in intervals with a high degree of ductile and brittle deformation, high density of hydrothermal veins, and at contacts with serpentinite. The main types of veins include amphibole, chlorite, talc, carbonate, and zeolite veins. Brown amphibole coexisting with recrystallized clinopyroxene in deformed gabbroic rocks is possibly of magmatic origin. Localized static alteration associated with hydrothermal veining resulted in the replacement of primary minerals by secondary ones (i.e., olivine by amphibole, talc, serpentine, magnetite, clay minerals, and/or sulfides; pyroxene by amphibole, talc, chlorite, and/or clay minerals; and plagioclase by secondary plagioclase, chlorite, prehnite, and zeolite). In some intervals, the igneous texture has been completely replaced by alteration minerals, with no pseudomorphs observed. Fluid inclusions in olivine are locally abundant.
The observations of mineral assemblages, microscopic textures, fluid inclusions, and crosscutting relationships of the alteration assemblages and hydrothermal veins indicate that sequential alteration and deformation of rocks from Site U1601 took place at conditions ranging from upper amphibolite through greenschist to subgreenschist facies, largely in a water-rich environment.
Although these results are preliminary, the inferred conditions recorded in rocks from Site U1601 have implications for mass transfer between hydrothermal fluid, mafic, and ultramafic rocks, the interplay between alteration and deformation, and the energy landscape of a serpentinite-hosted subseafloor biosphere in the vicinity of the Lost City hydrothermal field, which is ~800 m south of Site U1601. The alteration assemblages observed at this site in both ultramafic and mafic rocks are likely also present along the circulation pathway of Lost City fluids.
4.1. Hole U1601A
4.1.1. General aspects
4.1.1.1. Background alteration
Hole U1601A recovered a range of rock types including basalt, gabbroic rocks, and serpentinized peridotites, all of which show evidence of fluid-rock interaction.
Minor amounts of fine-grained aphyric basalt were recovered in the upper parts of Hole U1601A. Basalt is characterized by heterogeneous patchy alteration which is moderate on average.
Serpentinized harzburgite and dunite are highly altered, with degrees of alteration ranging 68%–98% (calculated based on individual section descriptions) (Figure F64A). The least-altered ultramafic rock consists of dunite (alteration extent = 68%; interval 399-U1601A-6R-1, 0–22 cm); however, on average, harzburgite is less altered than dunite. Orthopyroxene is less serpentinized (average = 79%) compared to olivine (average = 93%; Figure F64A). Overall, the alteration extent decreases from olivine to orthopyroxene, clinopyroxene, and spinel. There are no systematic downhole variations of the total extent of whole-rock serpentinization in Hole U1601A nor of the extent of alteration of individual minerals, except for orthopyroxene, which is less altered in the upper parts of Hole U1601A.
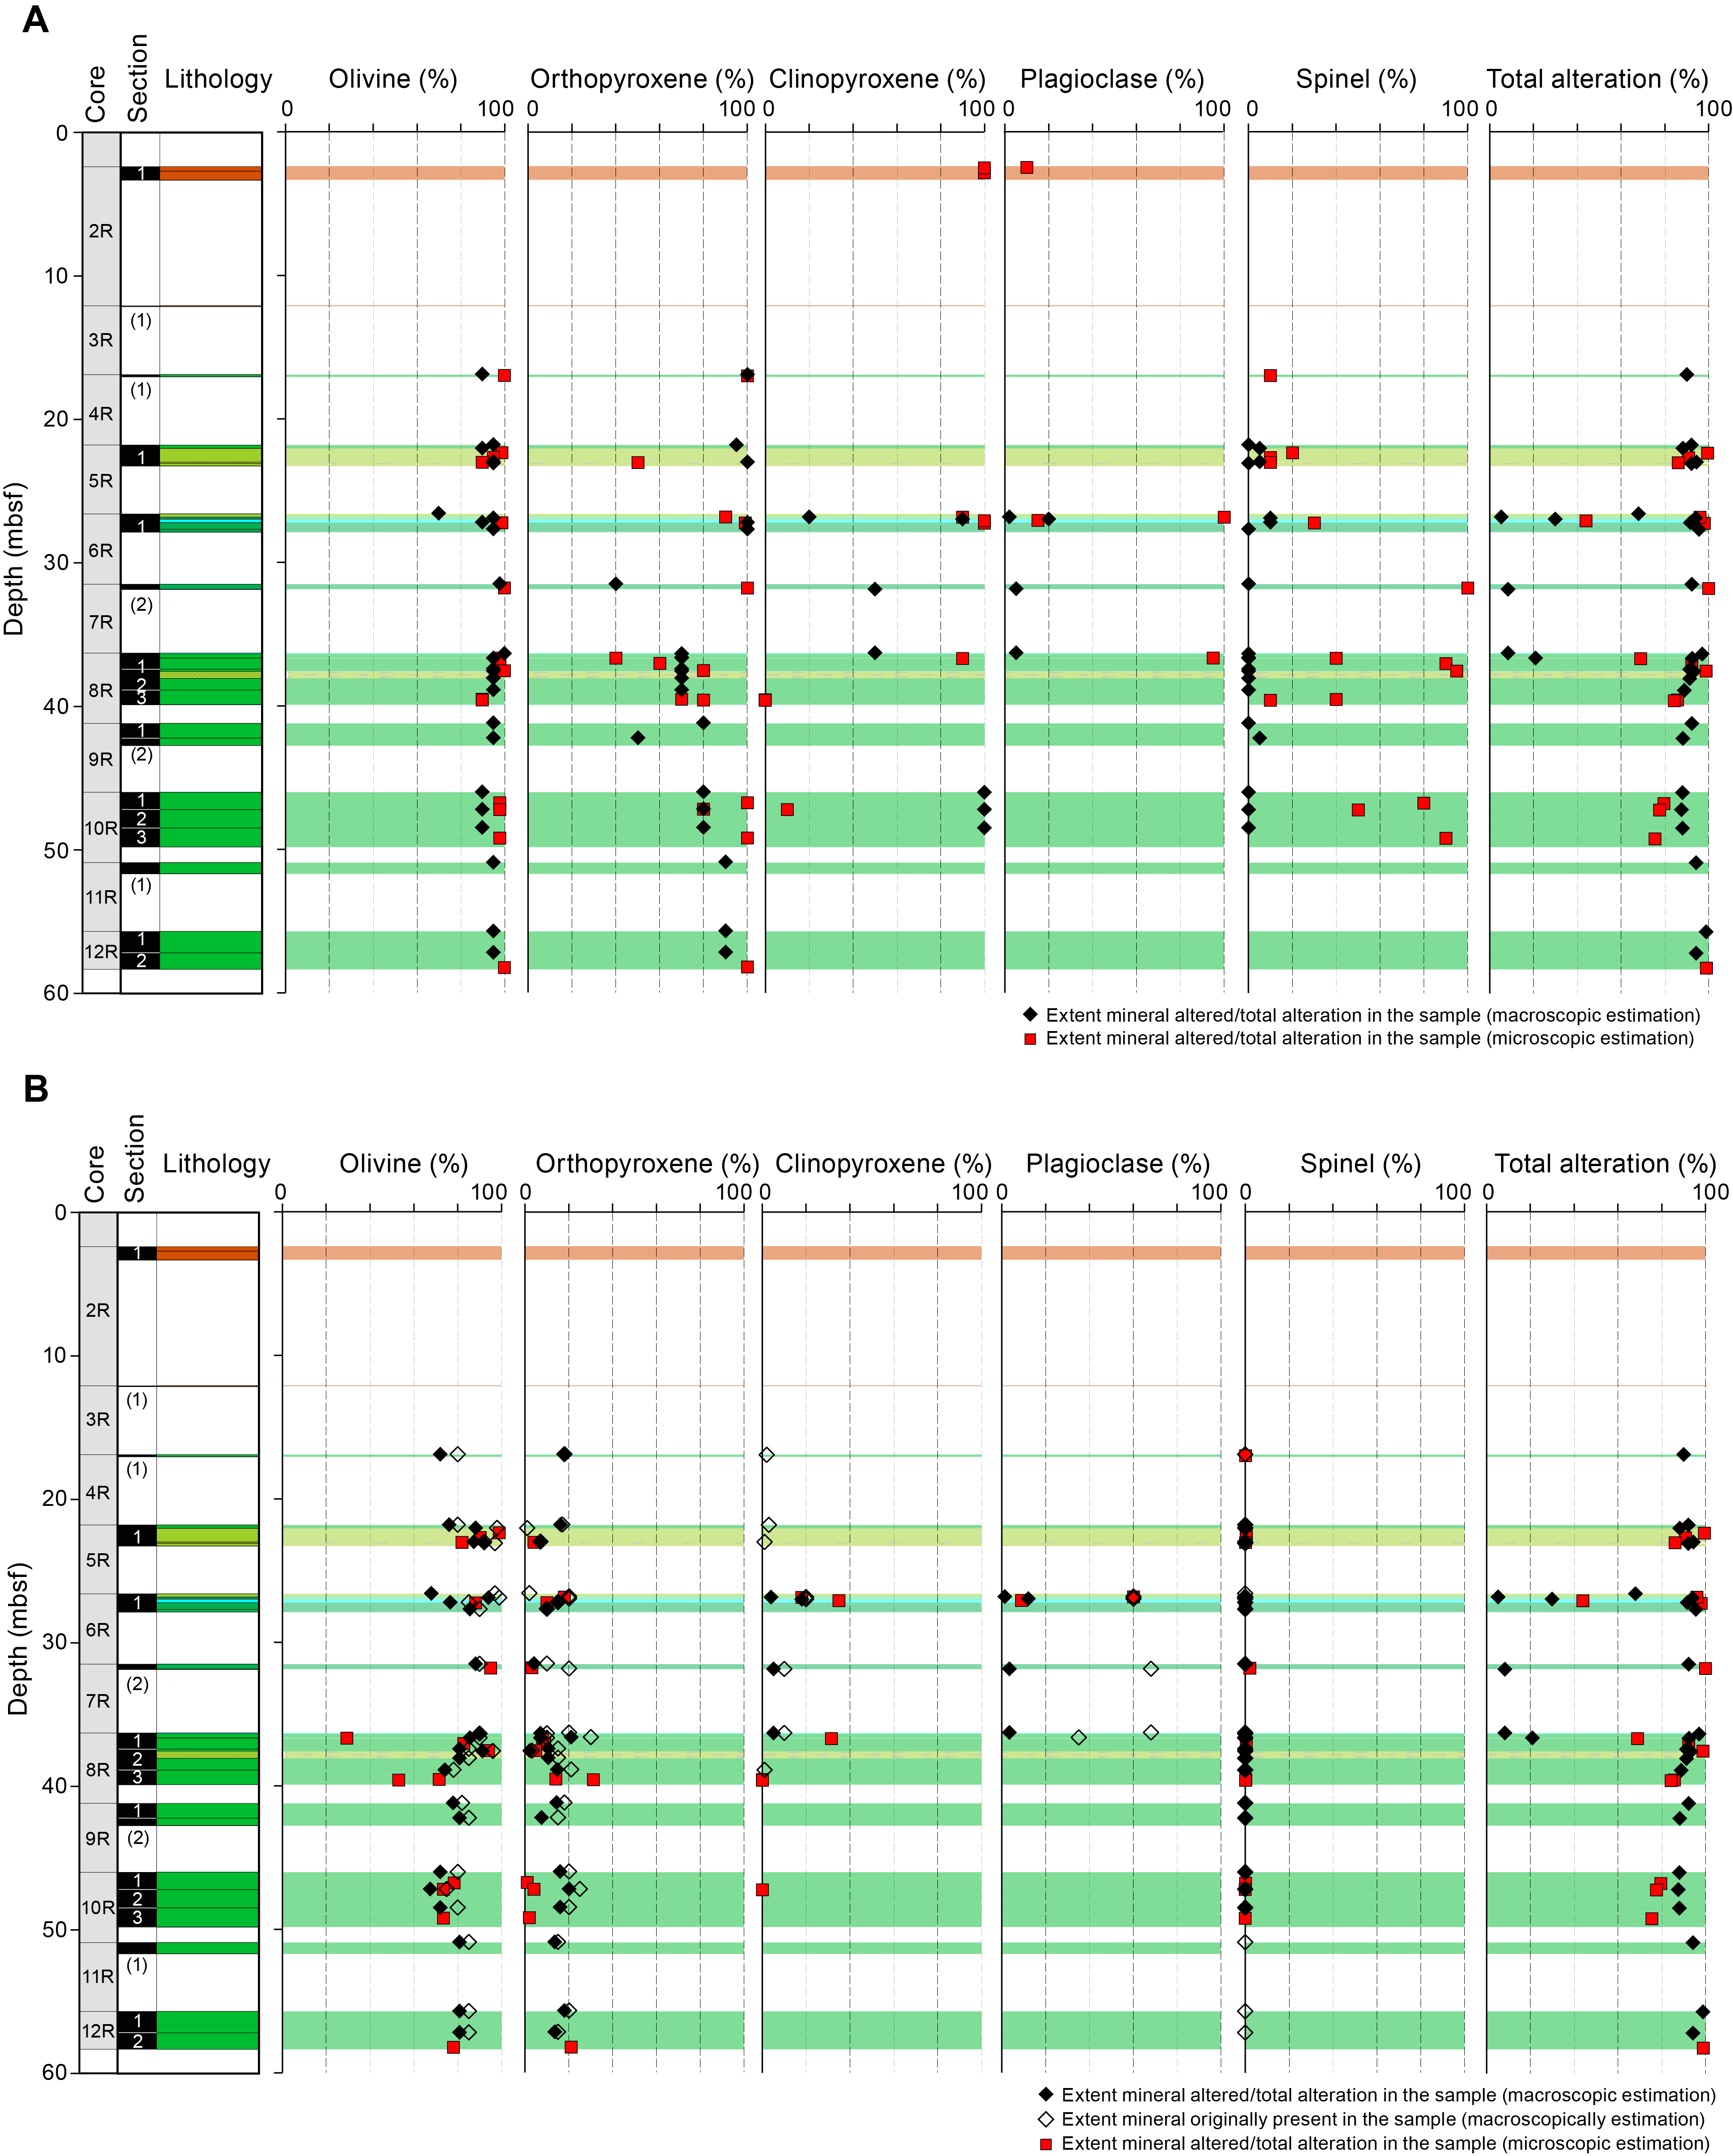
Figure F64. Background alteration, Hole U1601A.
Scarce magmatic intrusions of gabbroic composition are less altered than their peridotite hosts, with extents of alteration ranging ~5%–96% in individual intervals and thin sections. The extent of alteration assessed from microscopic observations was always greater than that determined based on core descriptions, likely due to the difficulty of locally estimating the alteration extent of igneous plagioclase. On average, clinopyroxene tends to be more altered than plagioclase (Figure F64).
4.1.1.2. Veins
Several types of veins are present in serpentinized peridotites, basalt, and gabbroic rocks in Hole U1601A (Figure F65).
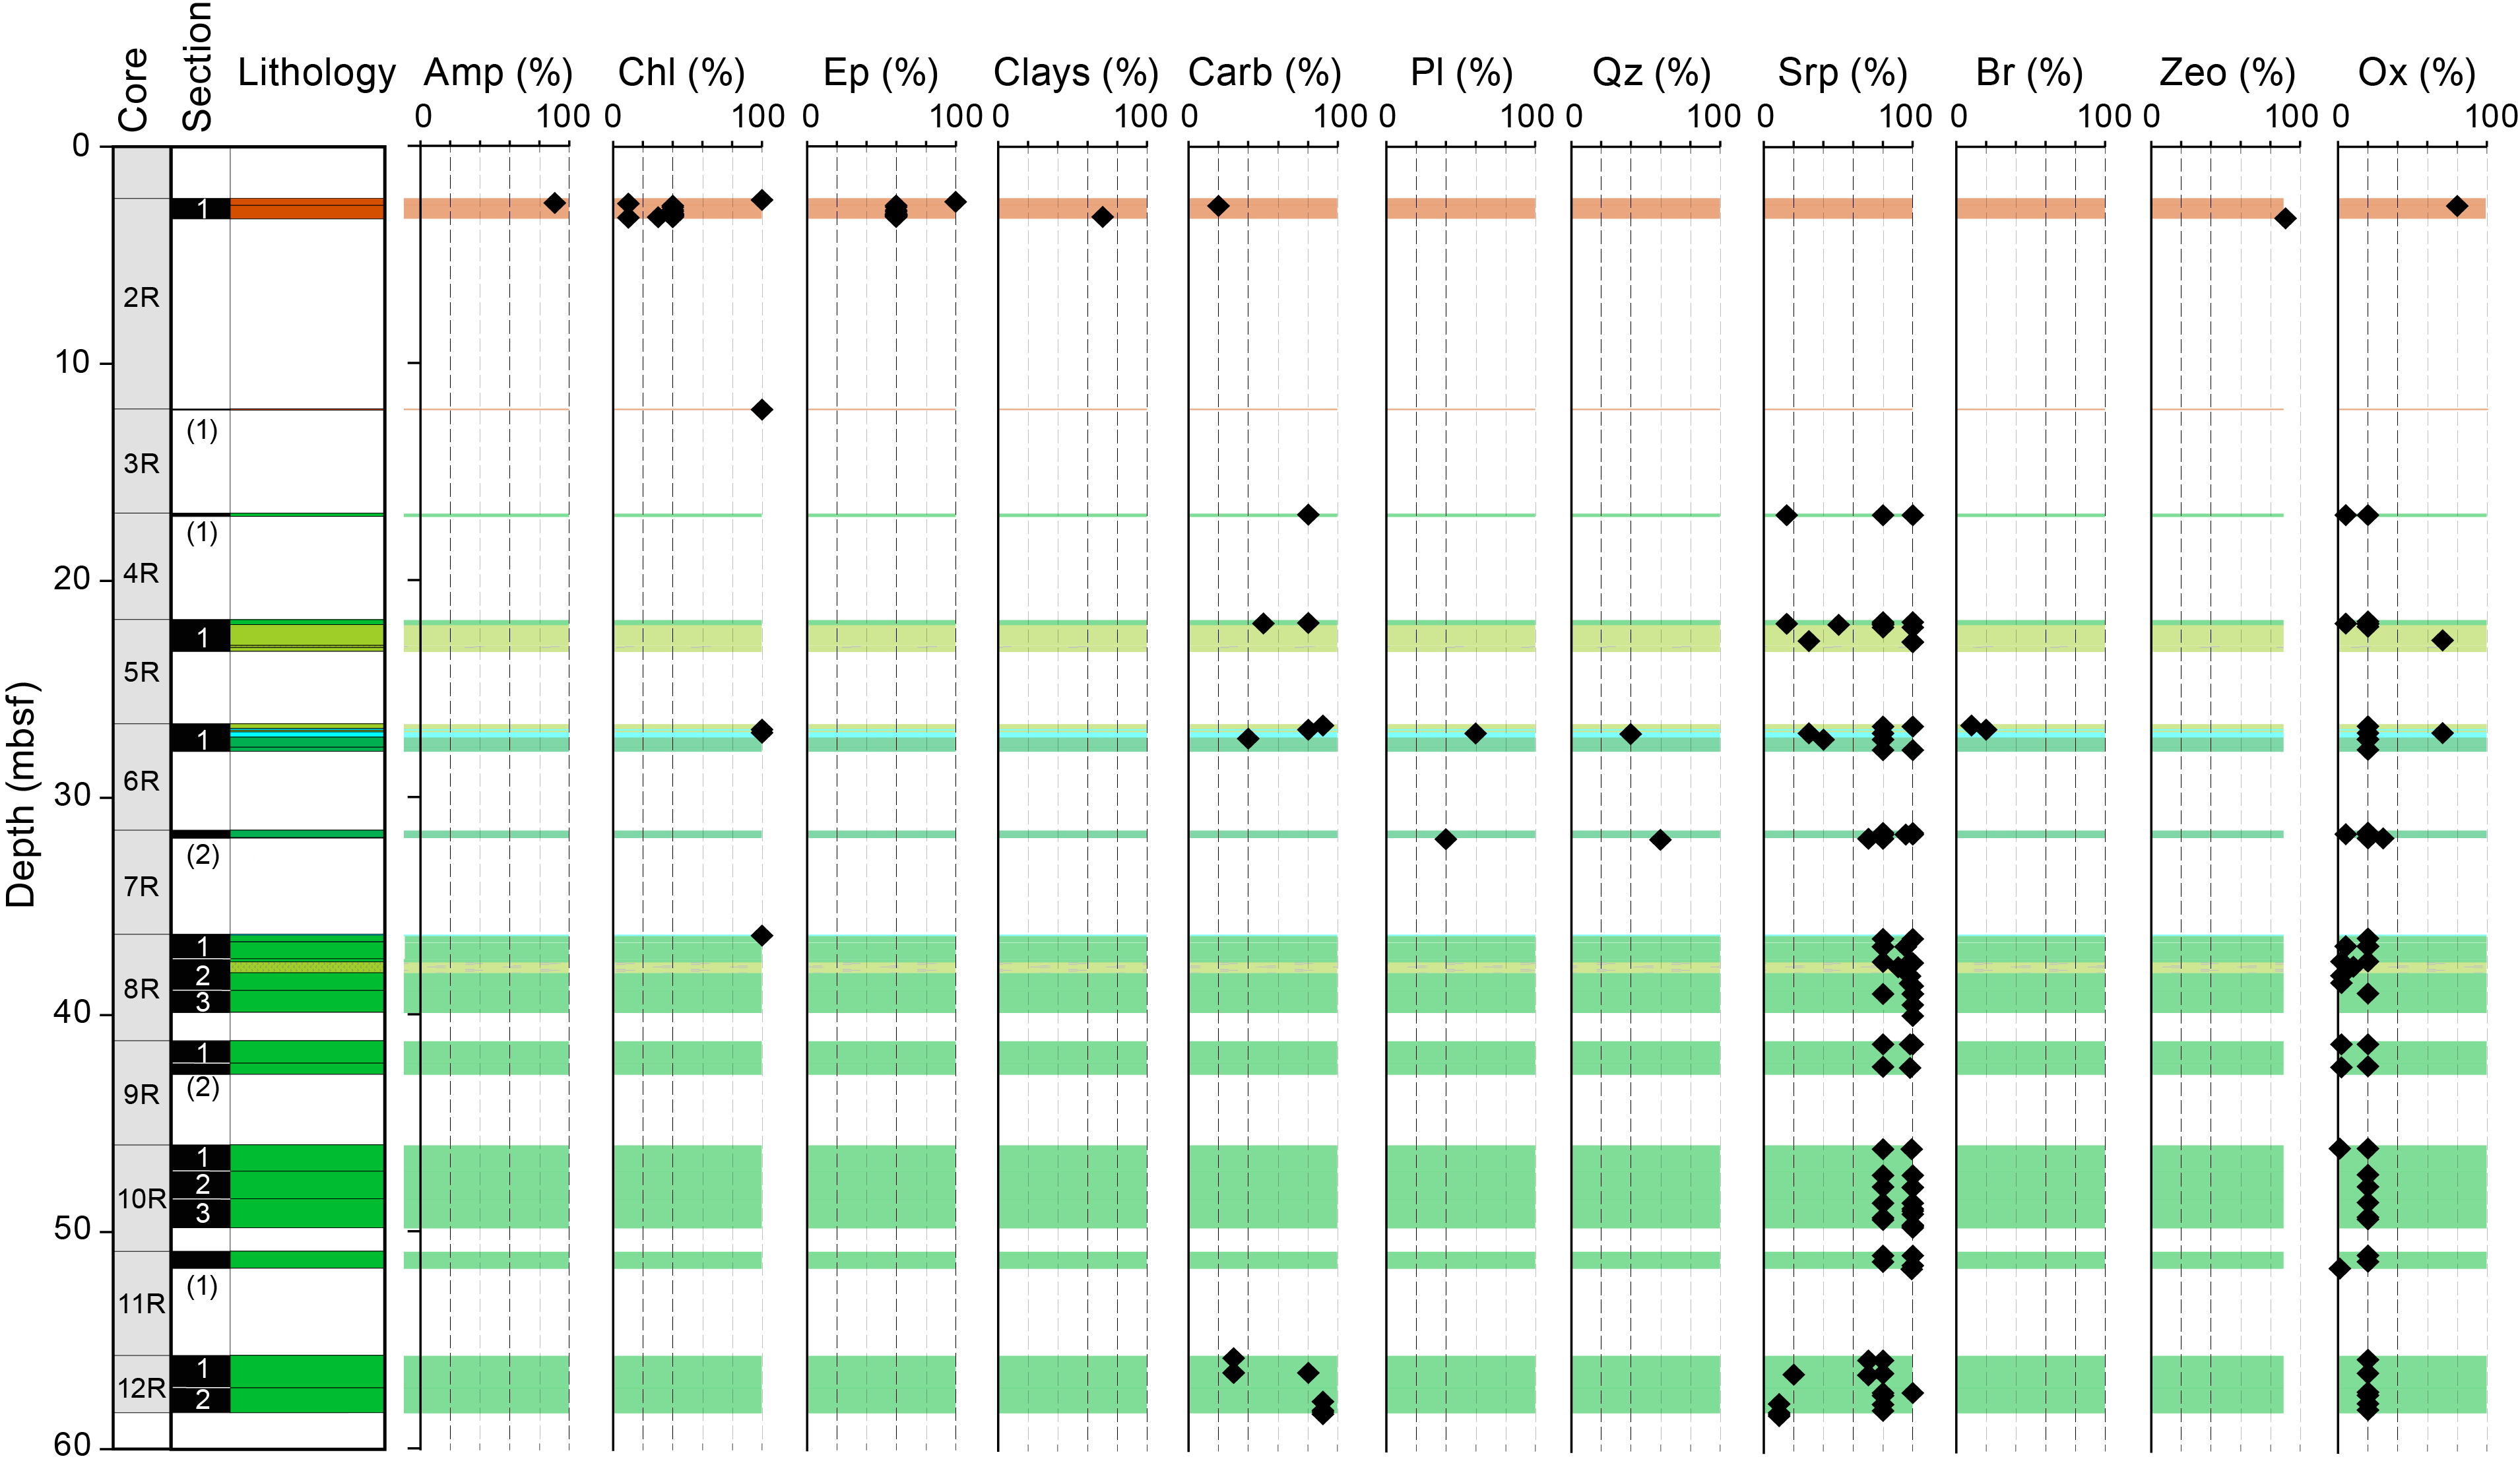
Figure F65. Vein distribution, Hole U1601A.
Basalt contains chlorite-epidote, monomineralic chlorite and epidote veins, and amphibole-chlorite and minor zeolite-chlorite, clay-chlorite, and oxide-carbonate veins (Figure F65). Regardless of the vein-filling minerals, most of the veins are branched (and locally single or overlapping) and their internal structure is mostly polycrystalline (a few are massive). Because basalt is only present in the uppermost part of Hole U1601A, an assessment of downhole variations is not possible.
In serpentinized peridotites, the dominant vein types include serpentine-magnetite, serpentine, and carbonate-serpentine and rare oxide veins (Figure F65). Few carbonate-brucite veins were also identified. Serpentine-magnetite veins (~0.1 mm wide on average) in the mesh texture outline former grain and subgrain boundaries of olivine. Chrysotile forms white to white-black massive to fibrous submillimetric veins as wide as ~3 mm. Their connectivity ranges from individual (single) veins to a set of subparallel veins to a network of veins. They generally form irregular transgranular veins that locally wrap around bastite. Chrysotile locally grades to picrolite in some veins. In some instances, serpentine veins are reopened by carbonate veins, forming composite carbonate-serpentine veins ~1–7 mm wide. There is no systematic downhole variation in terms of vein mineralogy or vein density in serpentinized peridotites in Hole U1601A.
A few chlorite and quartz-plagioclase veins are present in gabbroic rocks (Figure F65). Their low frequency does not allow systematic downhole variation.
4.1.2. Alteration of mafic and ultramafic rocks
4.1.2.1. Ultramafic rocks
Highly to completely serpentinized harzburgite and minor amounts of highly to completely serpentinized dunite were recovered from Hole U1601A (Figure F66). Olivine is highly altered throughout Hole U1601A to serpentine, magnetite, traces of sulfides or alloy, and likely brucite/iowaite. Olivine alteration is evident in pseudomorphic mesh texture, nonpseudomorphic ribbon and interpenetrating textures, and transitional hourglass texture. Serpentine in mesh texture is dominated by lizardite (see the Expedition 399 methods chapter [Lang et al., 2025] for details of mineral identification). Antigorite likely is locally abundant in hourglass, ribbon, and interpenetrating textures. These observations were confirmed by X-ray diffraction (XRD) analyses (Table T5), even if the distinction between lizardite and chrysotile was not possible because of important peak overlap in the XRD spectra. Iowaite was detected in XRD analyses in Hole U1601A, but not brucite was not (the effective detection limit is ~2% in mixed materials). In the thin sections, the former occurrence of brucite, now replaced by iowaite, is inferred from light brown patches in mesh centers and rims (Figure F67). Iowaite is more abundant in deeper parts of Hole U1601A and in sections that do not contain mafic intrusions as confirmed by XRD analyses (Table T5). XRD analyses also identified the presence of stichtite, a Mg-Cr–bearing carbonate, in three samples (399-U1601A-8R-2, 116–127.5 cm; 12R-1, 0–18 cm; and 12R-2, 65–70.5 cm) that also contain iowaite (Table T5). Microscopic opaque minerals, cream-yellow in reflected light (presumably Ni-Fe sulfides and alloys), occur in the mesh texture and are likely of secondary origin where they form associated with olivine alteration.
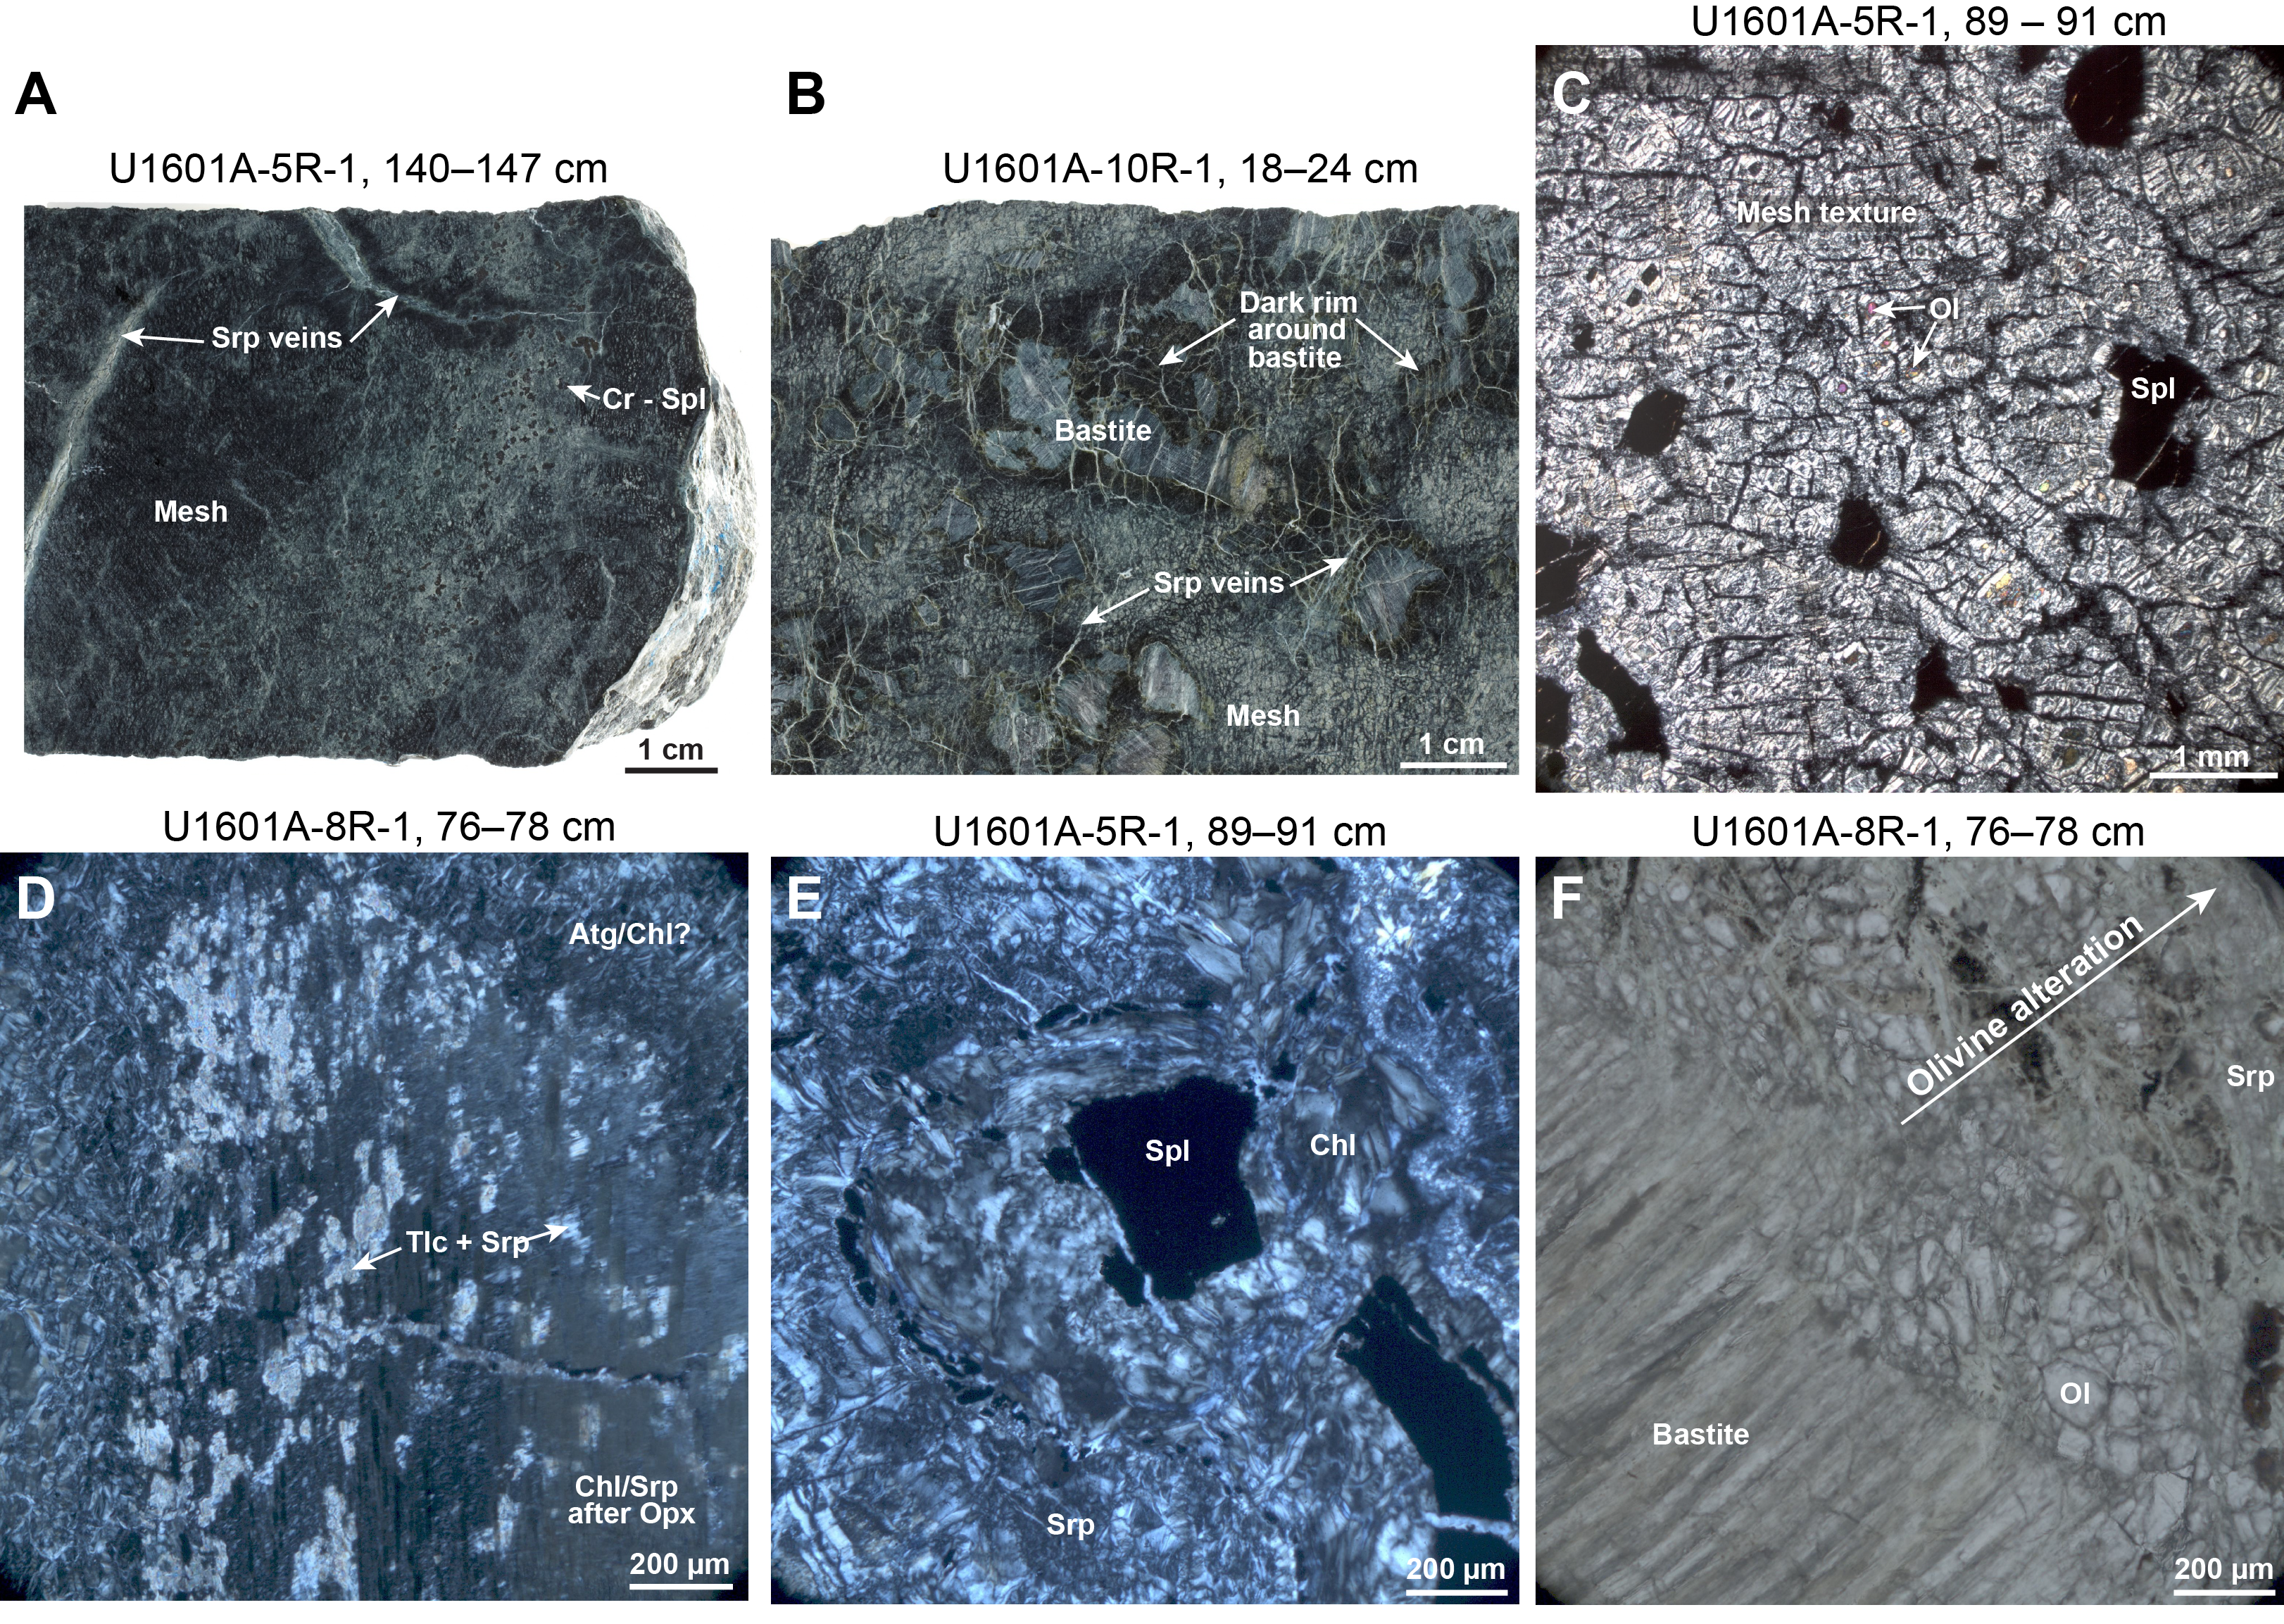
Figure F66. Serpentinized dunite and harzburgite.
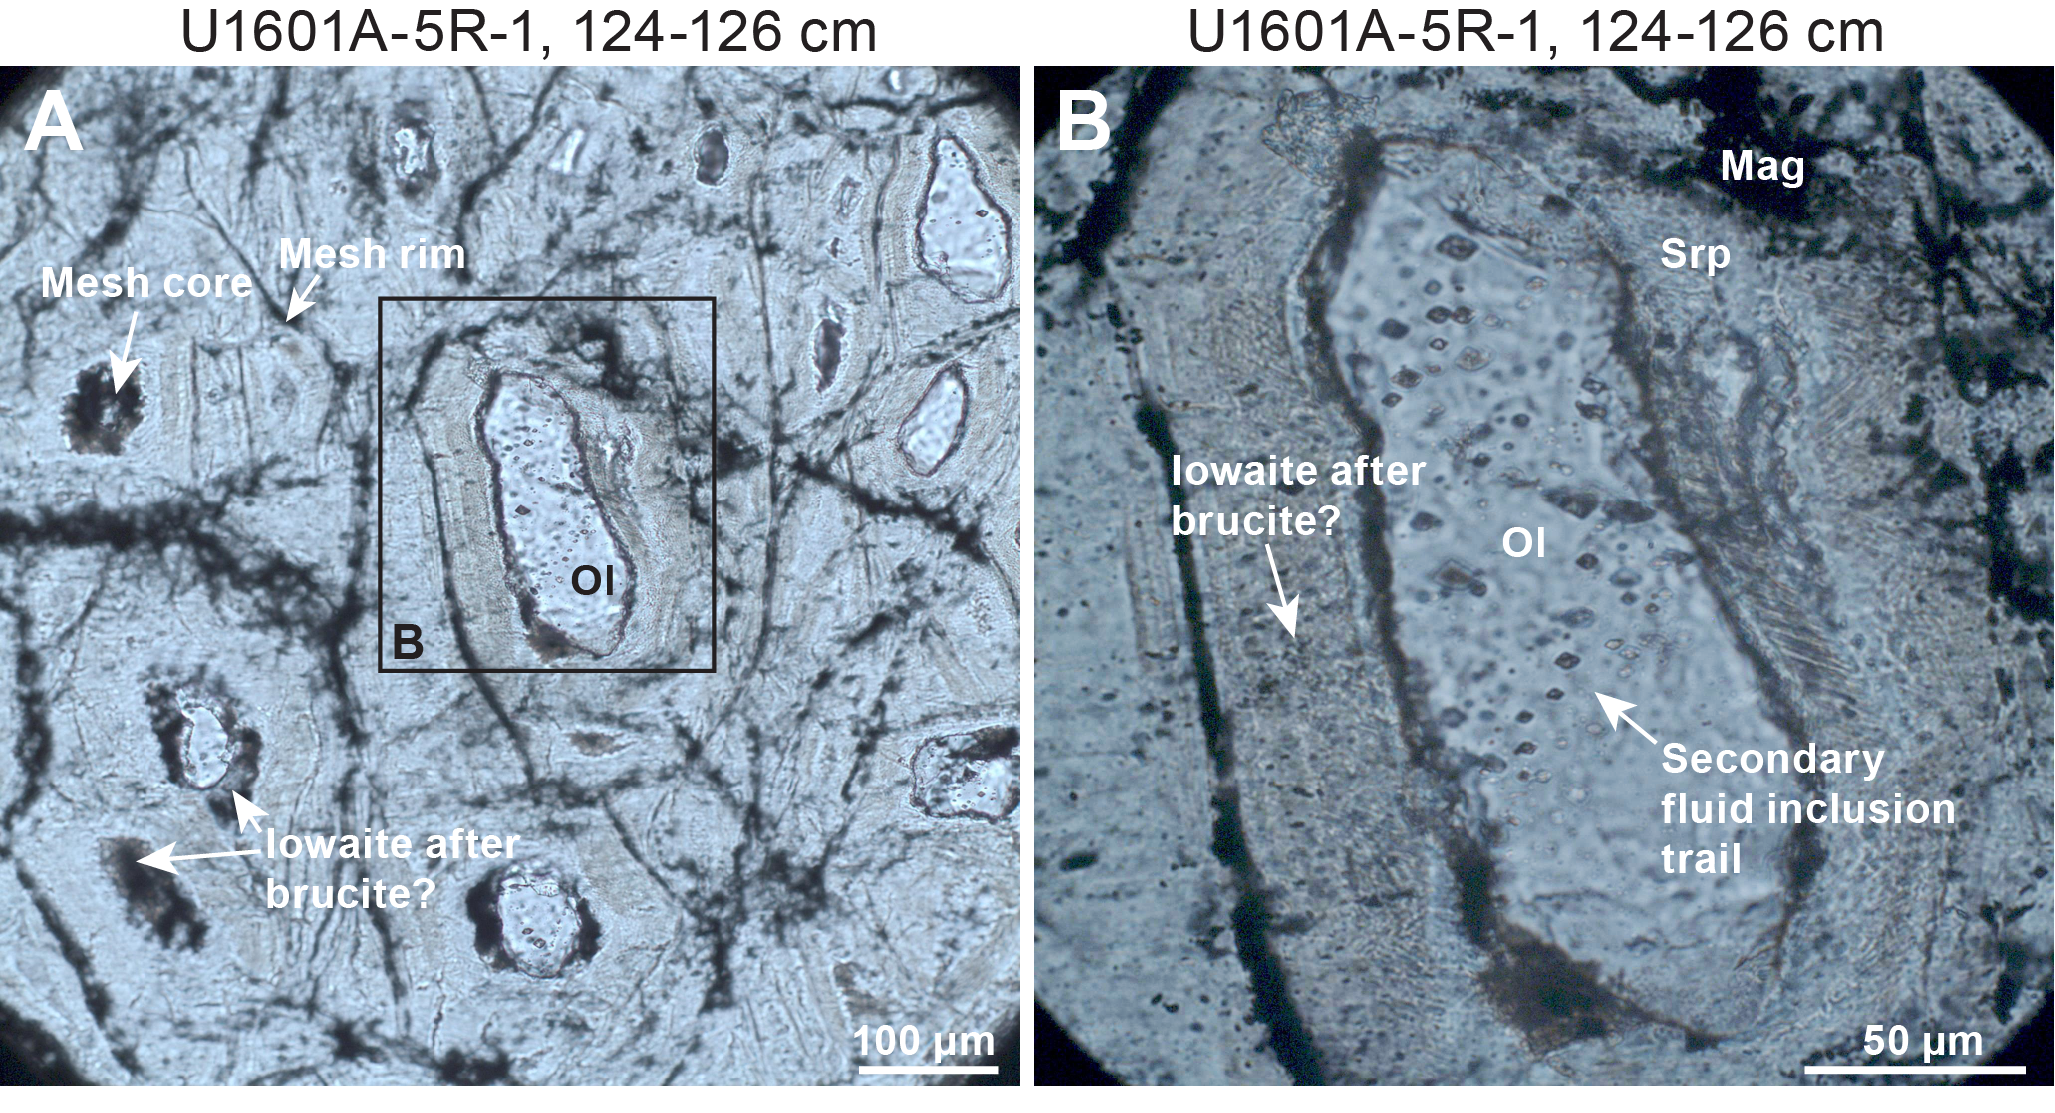
Figure F67. Mesh interiors and olivine relicts.
Orthopyroxene is partially to completely altered to serpentine in bastite texture, whereas talc and chlorite can be locally abundant. The abundance of talc after orthopyroxene is variable and highest in the uppermost parts of Hole U1601A. In the deeper parts of Hole U1601A, serpentine is dominant and in many cases is the only replacement mineral after orthopyroxene. Clinopyroxene exsolution lamellae in orthopyroxene remain either unaltered or are altered to amphibole (± chlorite and serpentine). The extent of Cr-spinel alteration ranges from incipient to complete. The main products of Cr-spinel alteration include ferrichromite, magnetite, and chlorite.
Serpentinized harzburgite and dunite from Hole U1601A show two or more vein generations. The earliest vein generations are typically composed of serpentine and stringers of magnetite. In these veins, antigorite or lizardite are the dominant serpentine-group minerals. A myriad of microscopic serpentine-magnetite veins occur in mesh texture after olivine. The latest generation of veins that formed during serpentinization is commonly composed of chrysotile or, where present, chrysotile-picrolite or picrolite veins. Picrolite is a field term for massive to pseudofibrous translucent to green serpentine present in veins as a fracture filling (O'Hanley, 1996).
Carbonate veins likely postdate serpentinization, as they either follow preexisting serpentine veins or cut them, including the chrysotile veins. Interval 399-U1601A-6R-1, 19–22 cm, contains a 6 mm wide aragonite-brucite vein.
Fluid inclusions are common in olivine but not in pyroxene. In shallow parts of Hole U1601A, fluid inclusions are abundant in relict olivine (Figure F67). Because only a small fraction of the original olivine is conserved, estimating the original fluid inclusion abundances is problematic. Inclusions form trails that cut across grain boundaries and can be categorized as secondary inclusions. Visible fluid inclusions are smaller than 5 µm in diameter and appear dark under the microscope. Daughter minerals, including opaque phases, are visible in some of the larger fluid inclusions (Figure F67).
In the shallower sections of Hole U1601A, magnetite in serpentinite is oxidized to reddish brown iron oxide and iron oxyhydroxides, whereas deeper than 30 mbsf, magnetite is mostly unaltered.
4.1.2.2. Gabbroic rocks
Hole U1601A recovered two types of variably altered gabbroic lithologies (i.e., gabbronorite and gabbroic veins that cut serpentinized peridotite).
Gabbronorite (interval 399-U1601A-6R-1, 23–60 cm) shows well-defined foliation with parallel arrangement of porphyroclasts and fine-grained neoblasts of pyroxene (e.g., interval 6R-1, 23–30 cm; Figure F68A) with evidence of intense hydrothermal alteration (Figure F68B, F68C; Sample 6R-1, 23–28 cm [TS7]). Orthopyroxene and clinopyroxene porphyroclasts are partially to completely replaced by colorless to pale green amphibole. Pyroxene and amphibole are subsequently partially replaced by chlorite (Figure F68C) and locally microscopic sulfide and oxide grains. Some relict fine-grained clinopyroxene neoblasts are surrounded by fine-grained amphibole (Figure F68E). Plagioclase is partially to completely altered to fine-grained prehnite aggregates (Figure F68C–F68E). Spherulitic textures replacing former plagioclase include zones of radiating prehnite, chlorite, and a final opaque rim of uncertain mineralogy lining porosity (Figure F68C, F68F–F68I) interpreted to be macroscopic reaction porosity. Void spaces are also present in veins in several thin sections. Trails of green amphibole appear to delineate the original grain boundaries between plagioclase and pyroxene (Figure F68E). Veins in gabbronorite are composed of prehnite, chlorite, and epidote. Garnet (possibly of the grossular-andradite series) replaces plagioclase in proximity to some prehnite-chlorite veins (Figure F68F; Sample 6R-1, 48–51 cm [TS8]).
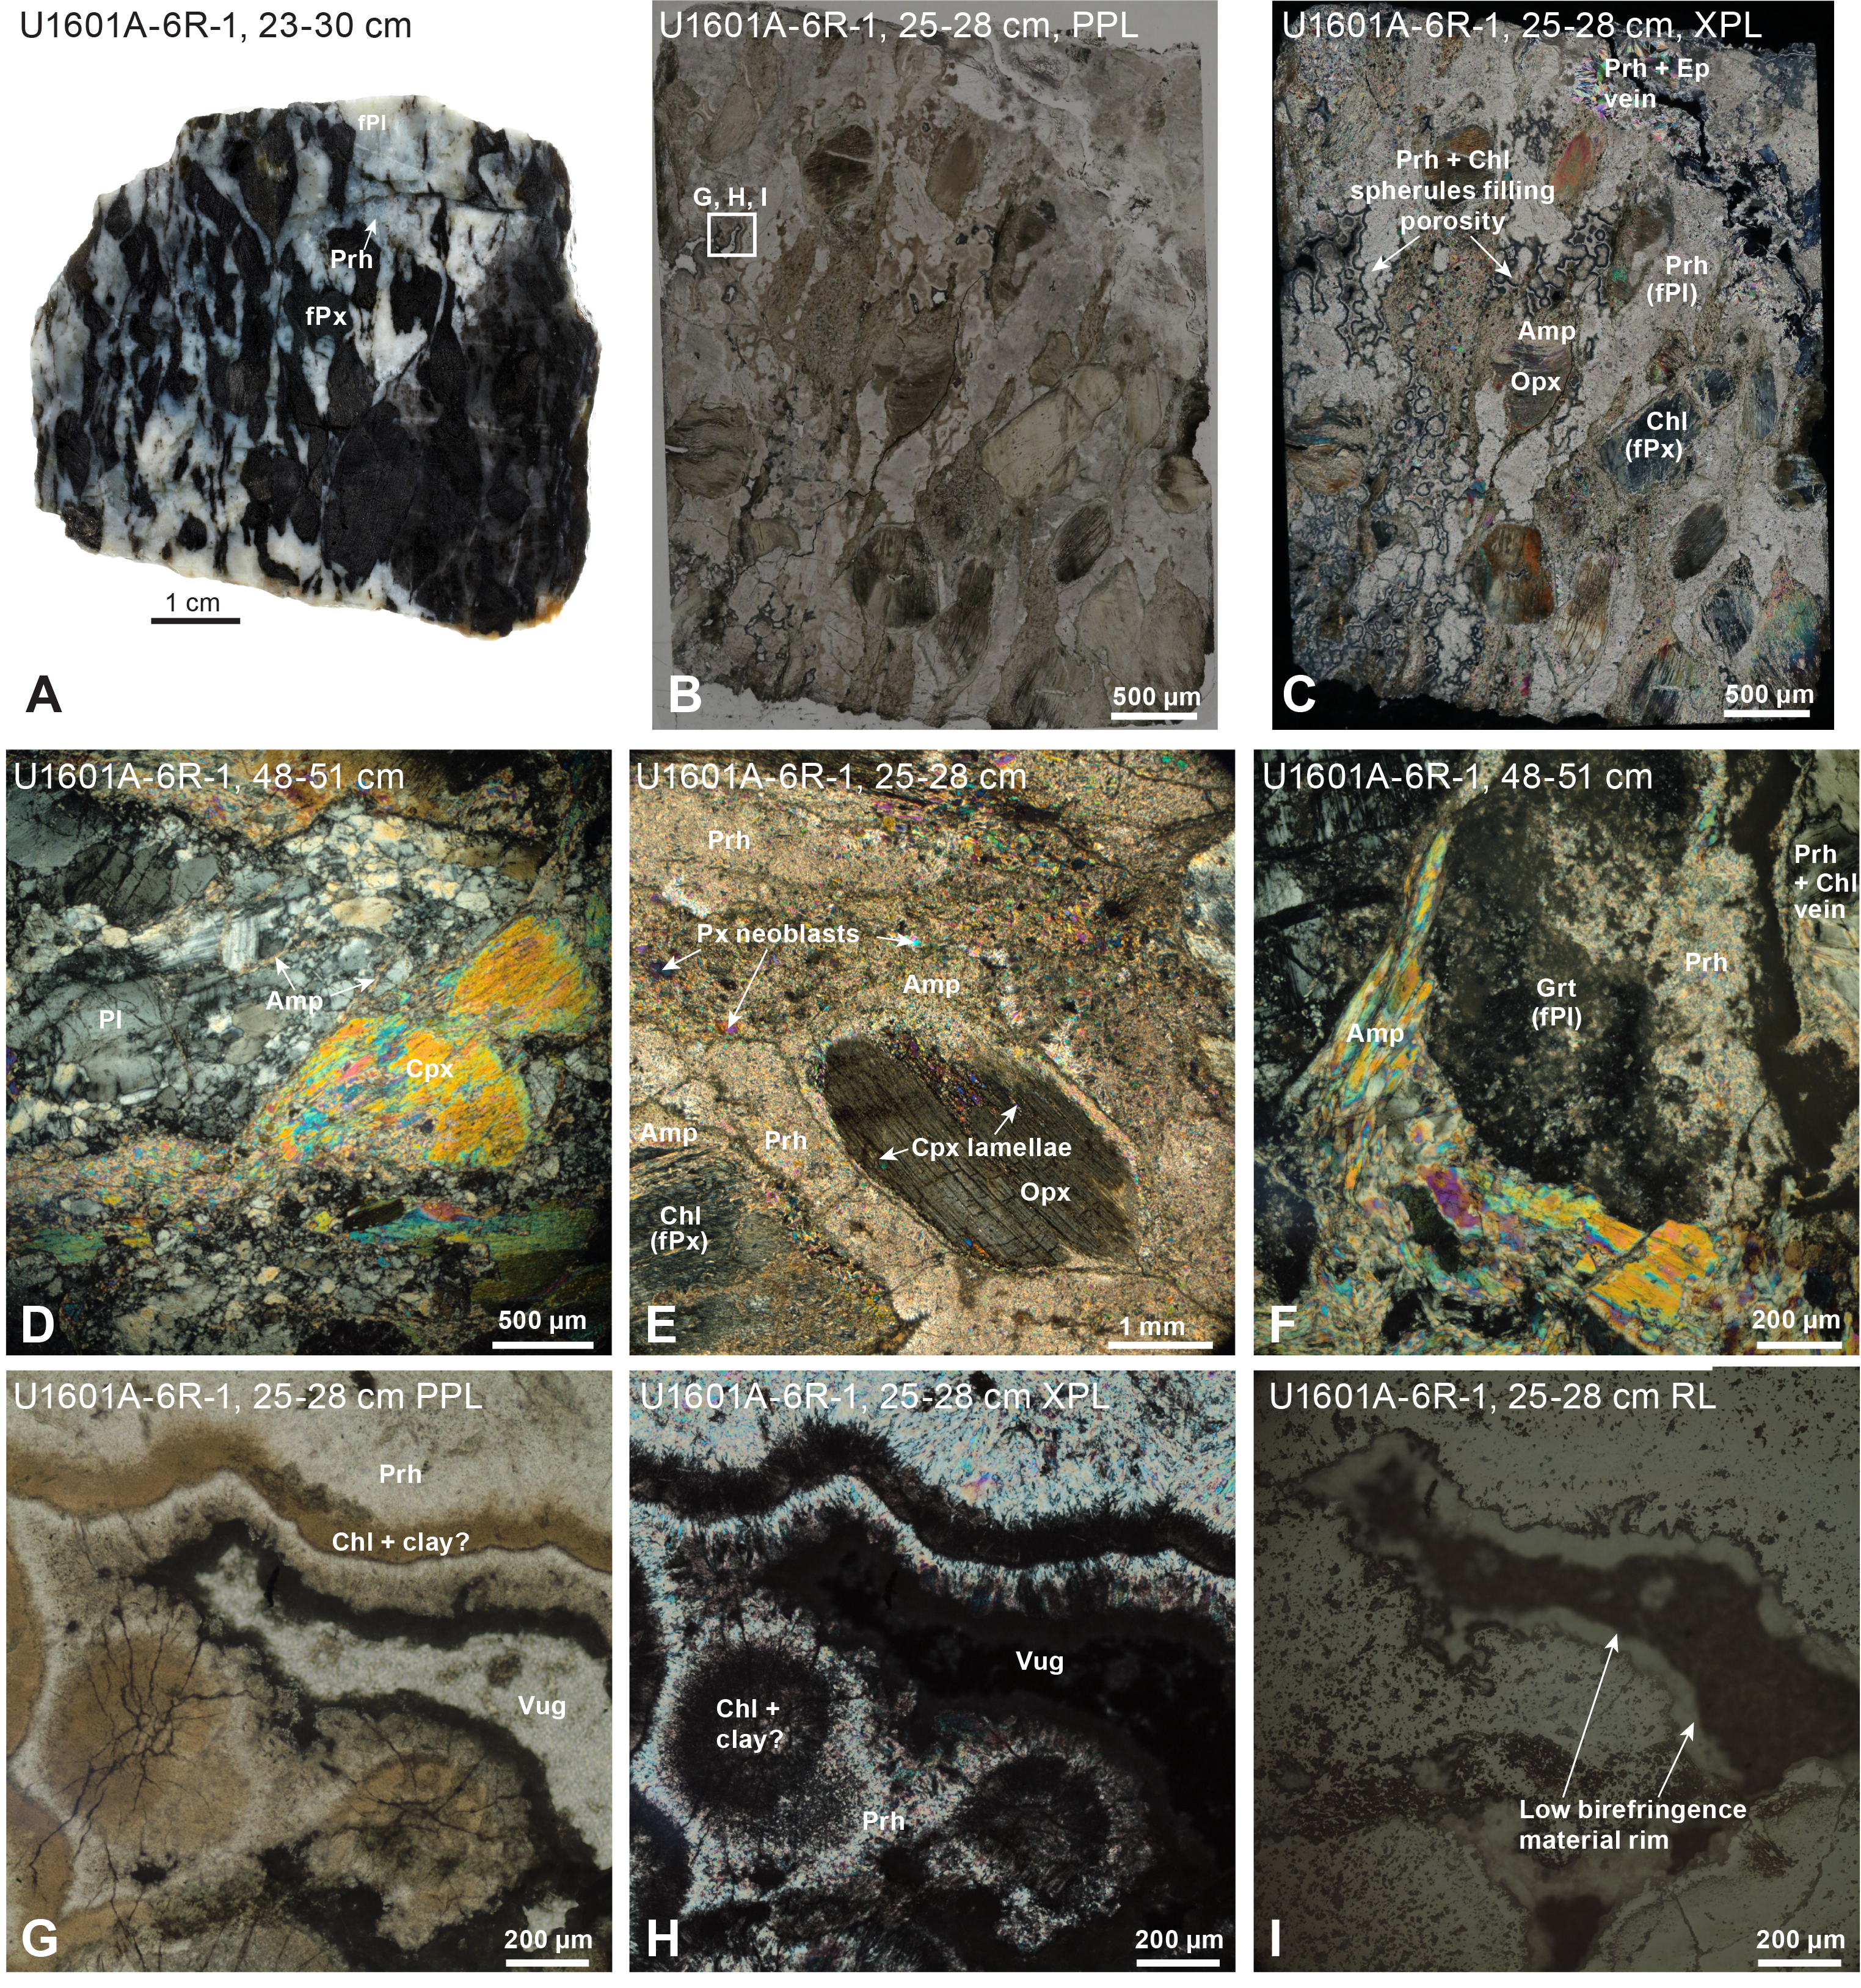
Figure F68. Alteration minerals and textures, altered gabbronorite.
One altered gabbroic vein cuts serpentinized harzburgite in Hole U1601A (~2 cm thick; interval 8R-1, 35–42 cm, Figure F69A). The contact between the altered vein and the serpentinized harzburgite host has a diffuse appearance, suggesting the impregnation of basaltic melt. In the vein, clinopyroxene is altered to amphibole, chlorite, and secondary diopside and plagioclase is altered to garnet (possibly grossular-andradite), chlorite, and secondary diopside (Figure F69B, F69C; Sample 8R-1, 38–40 cm [TS11]). In the host serpentinite of the gabbroic vein, olivine is altered to serpentine, magnetite, and sulfide in mesh and ribbon textures and orthopyroxene is partially altered to serpentine and minor talc (Figure F69D). The altered gabbroic vein and host serpentinite are cut by carbonate (aragonite) veins, chrysotile veins, and composite aragonite-chrysotile veins (Figure F69D).
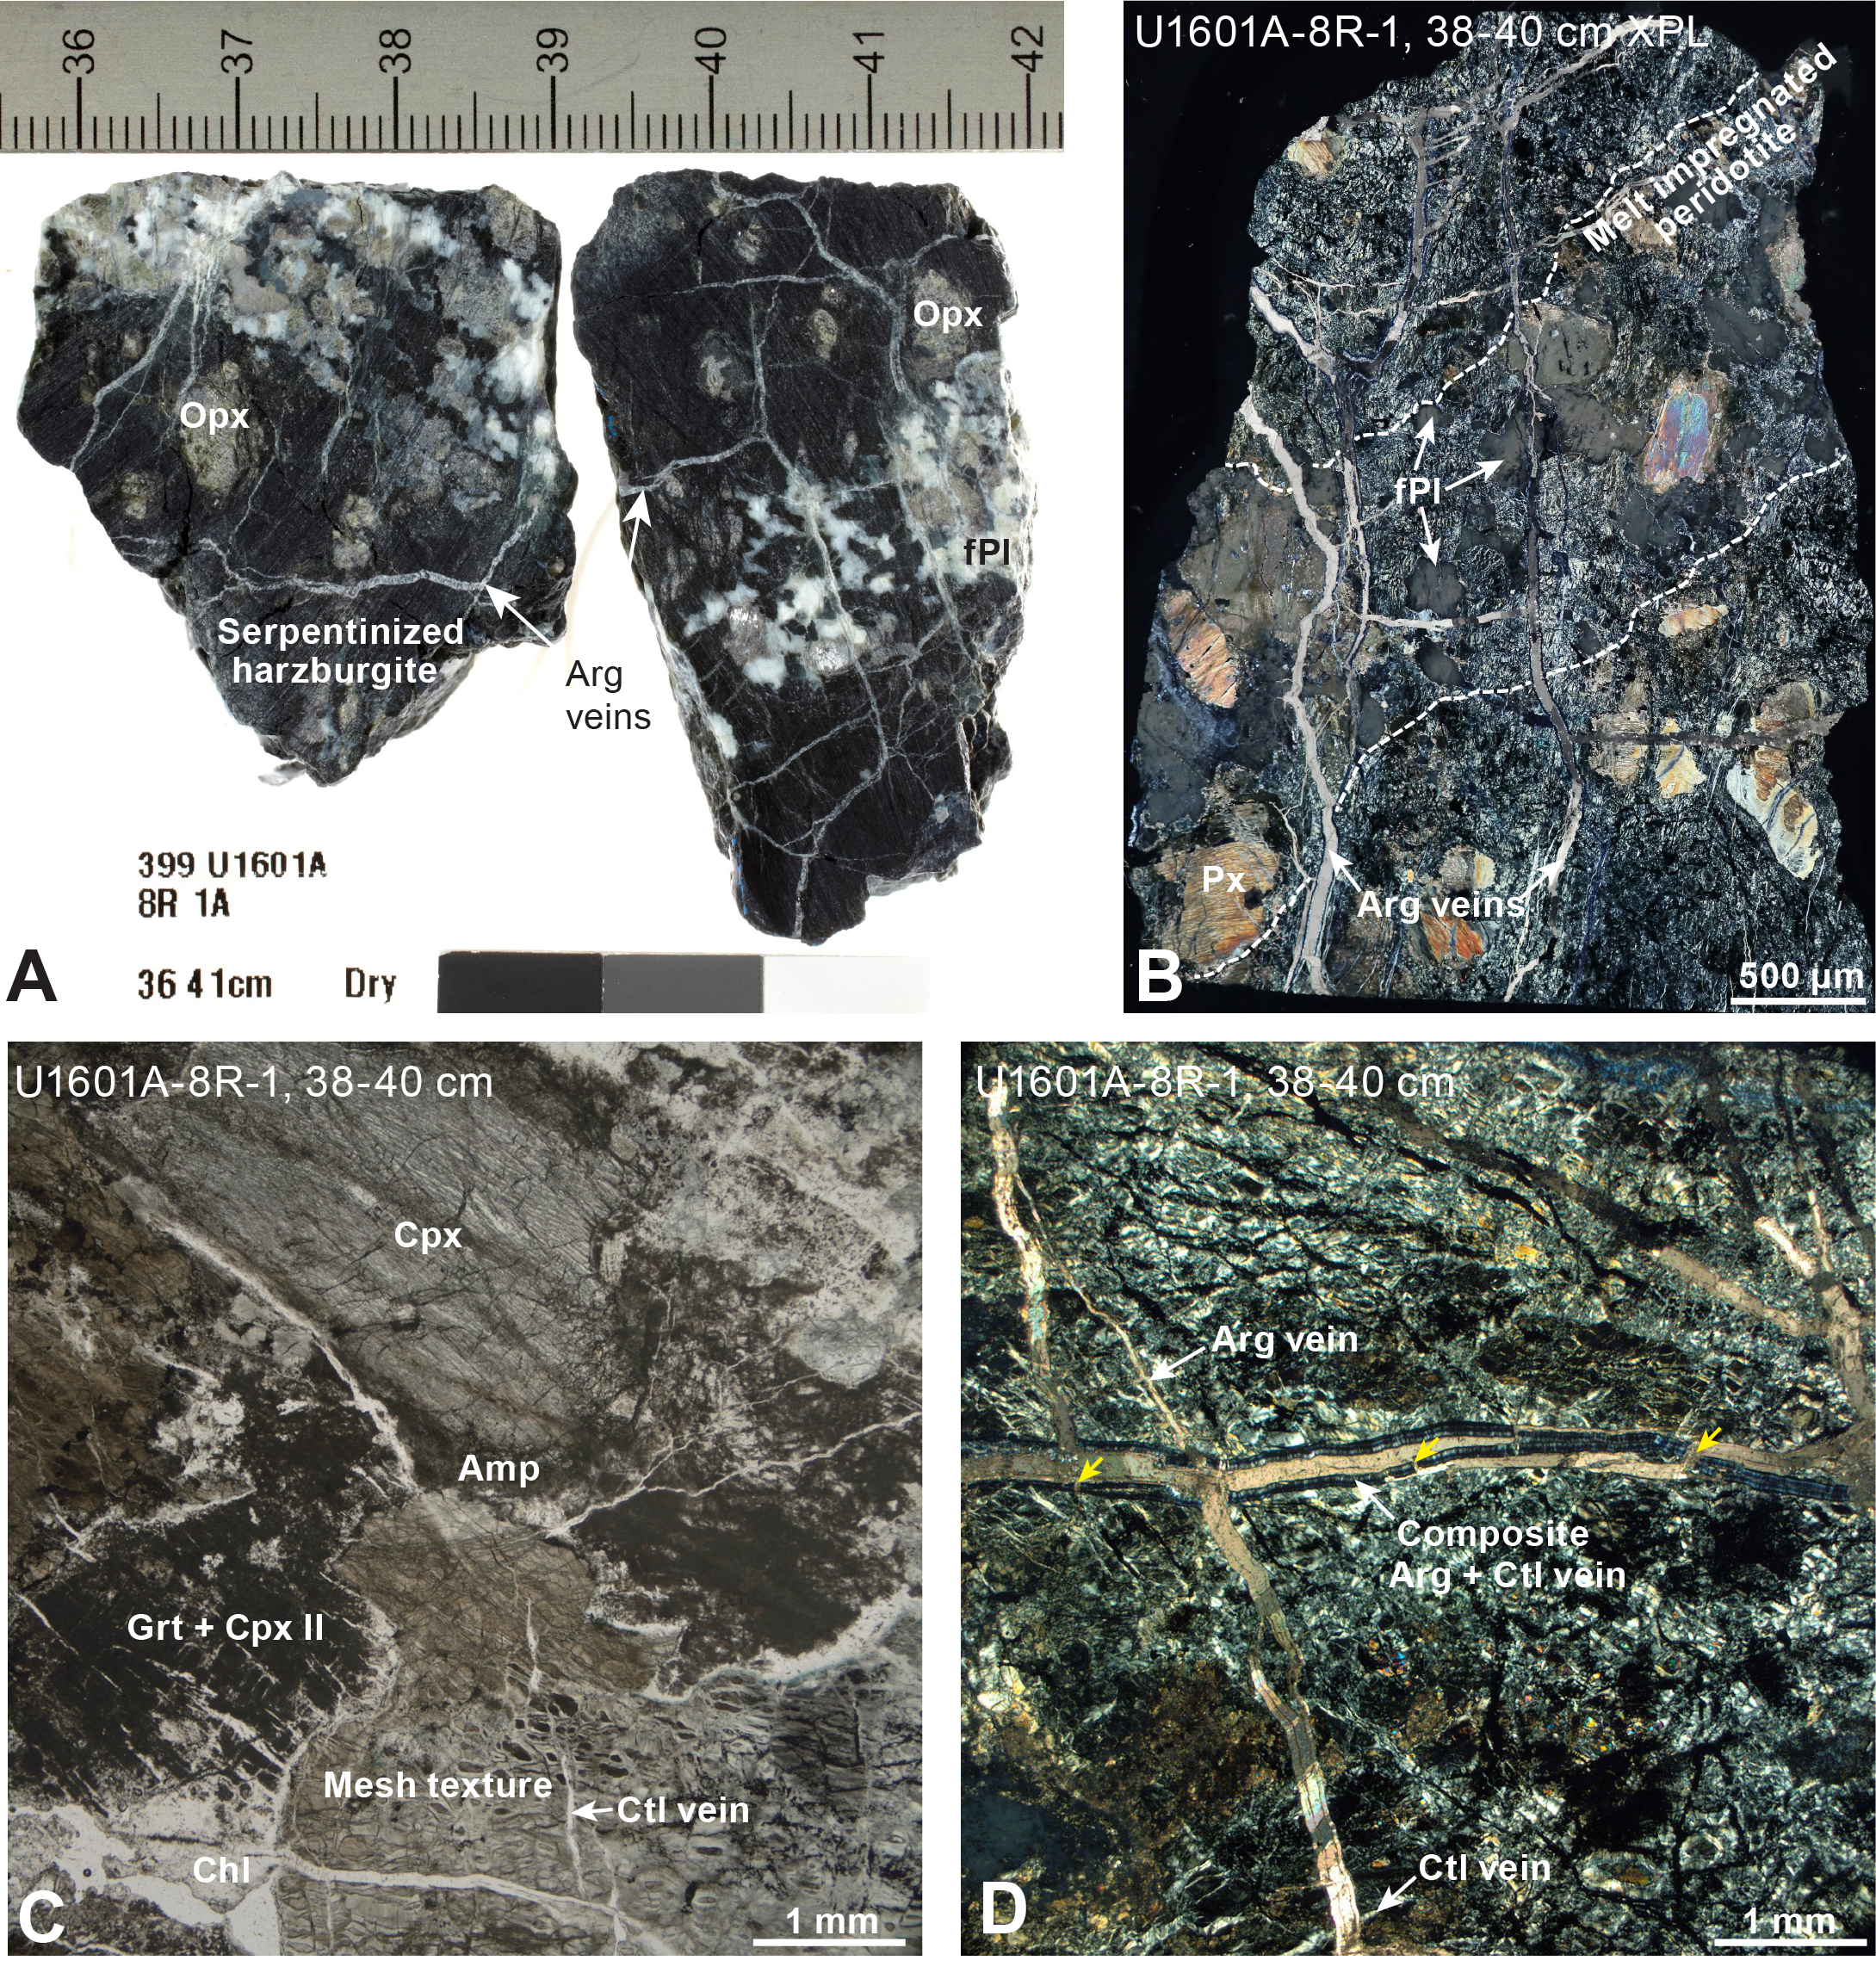
Figure F69. Alteration minerals and textures, gabbroic veins.
4.1.2.3. Basalt
Fine-grained aphyric basalt (intervals 399-U1601A-2R-1, 0–94 cm, and 3R-1, 0–5 cm) shows a heterogeneous patchy alteration pattern (Figure F70A). Vesicles (~1–3 mm in diameter) are filled with chlorite, talc, and possibly quartz (Figure F70B) as suggested by XRD analyses (Sample 2R-1, 10.5–14 cm; Table T5). Primary mafic silicates are altered mainly to acicular pale green amphibole (probably actinolite) and chlorite (Figure F70B–F70D). Primary plagioclase is relatively fresh and partially replaced by secondary plagioclase. In highly altered domains, however, plagioclase is pseudomorphically replaced by epidote (Figure F70E). Titanite is distributed as discrete grains or fringes of oxide (Figure F70B–F70D). Note that this interval was almost certainly also sampled in Expedition 357 Hole M0069A, where it was described as metadolerite.
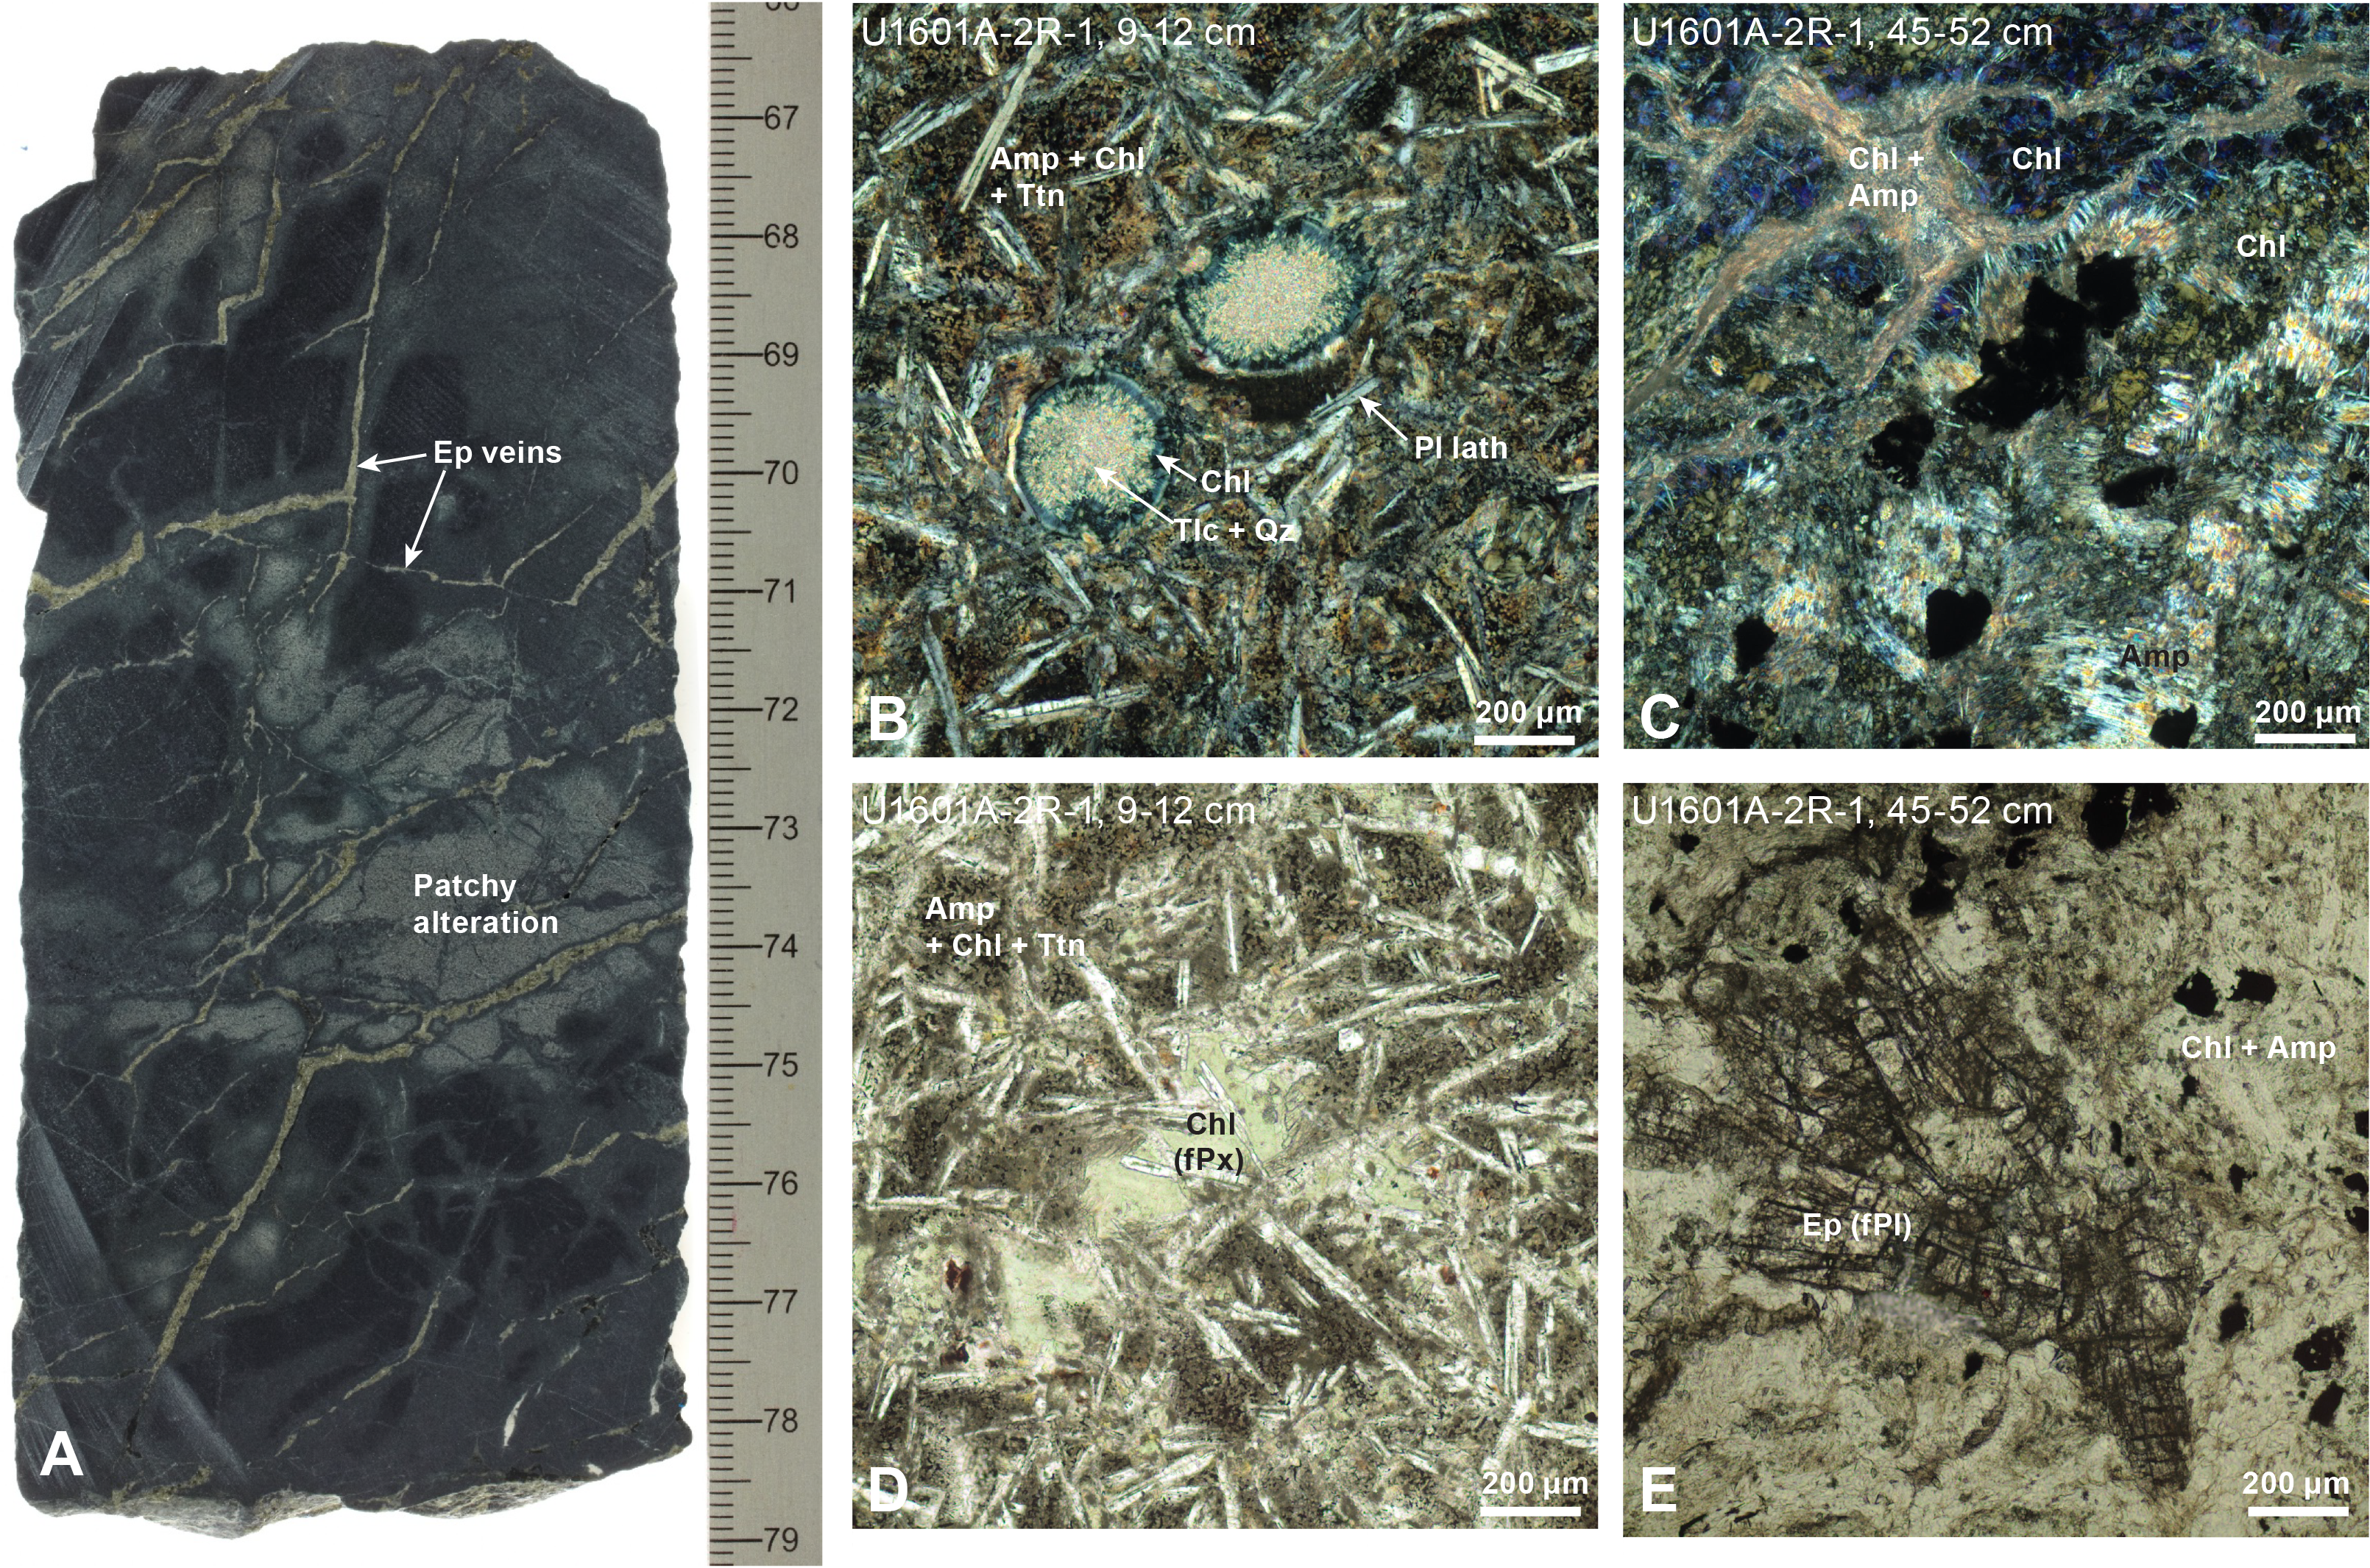
Figure F70. Alteration minerals, textures, and veins, basalt.
4.2. Hole U1601C
4.2.1. General aspects based on macroscopic observations
In Hole U1601C, gabbroic rocks are slightly (3%–20% alteration of the total rock volume) to highly (51%–99% alteration of the total rock volume) altered, whereas throughout the drill hole, serpentinized peridotites are moderately (21%–50%) to completely (100%) altered. Hence, on average, gabbros are less altered than serpentinized harzburgite and dunite. The estimated extent of serpentinization for individual sections is typically between 70% and 95%, which is consistent with the extent of serpentinization estimated from downhole densities (see Petrophysics; Figure F143). No systematic downhole variation of the total extent of whole-rock serpentinization was observed in Hole U1601C nor of the extent of alteration of individual minerals. Rather, degrees of alteration in serpentinized peridotites are generally higher where they are in contact with gabbroic intervals or hydrothermally altered magmatic veins. Gabbros are also usually more highly altered close to contacts with serpentinized peridotites. Hence, the overall average extent of alteration is lower where magmatic intrusions are sparse or lacking. In the vicinity of fault zones, the overall average extent of serpentinization appears to be higher. Estimated extents of alteration based on visual core descriptions are in good agreement with the whole-round measurements of physical properties and grain densities that are around 2.6–2.75 g/cm3 (Figure F143). The bulk rock density decreases as the extent of alteration increases and vice versa (Figure F71).
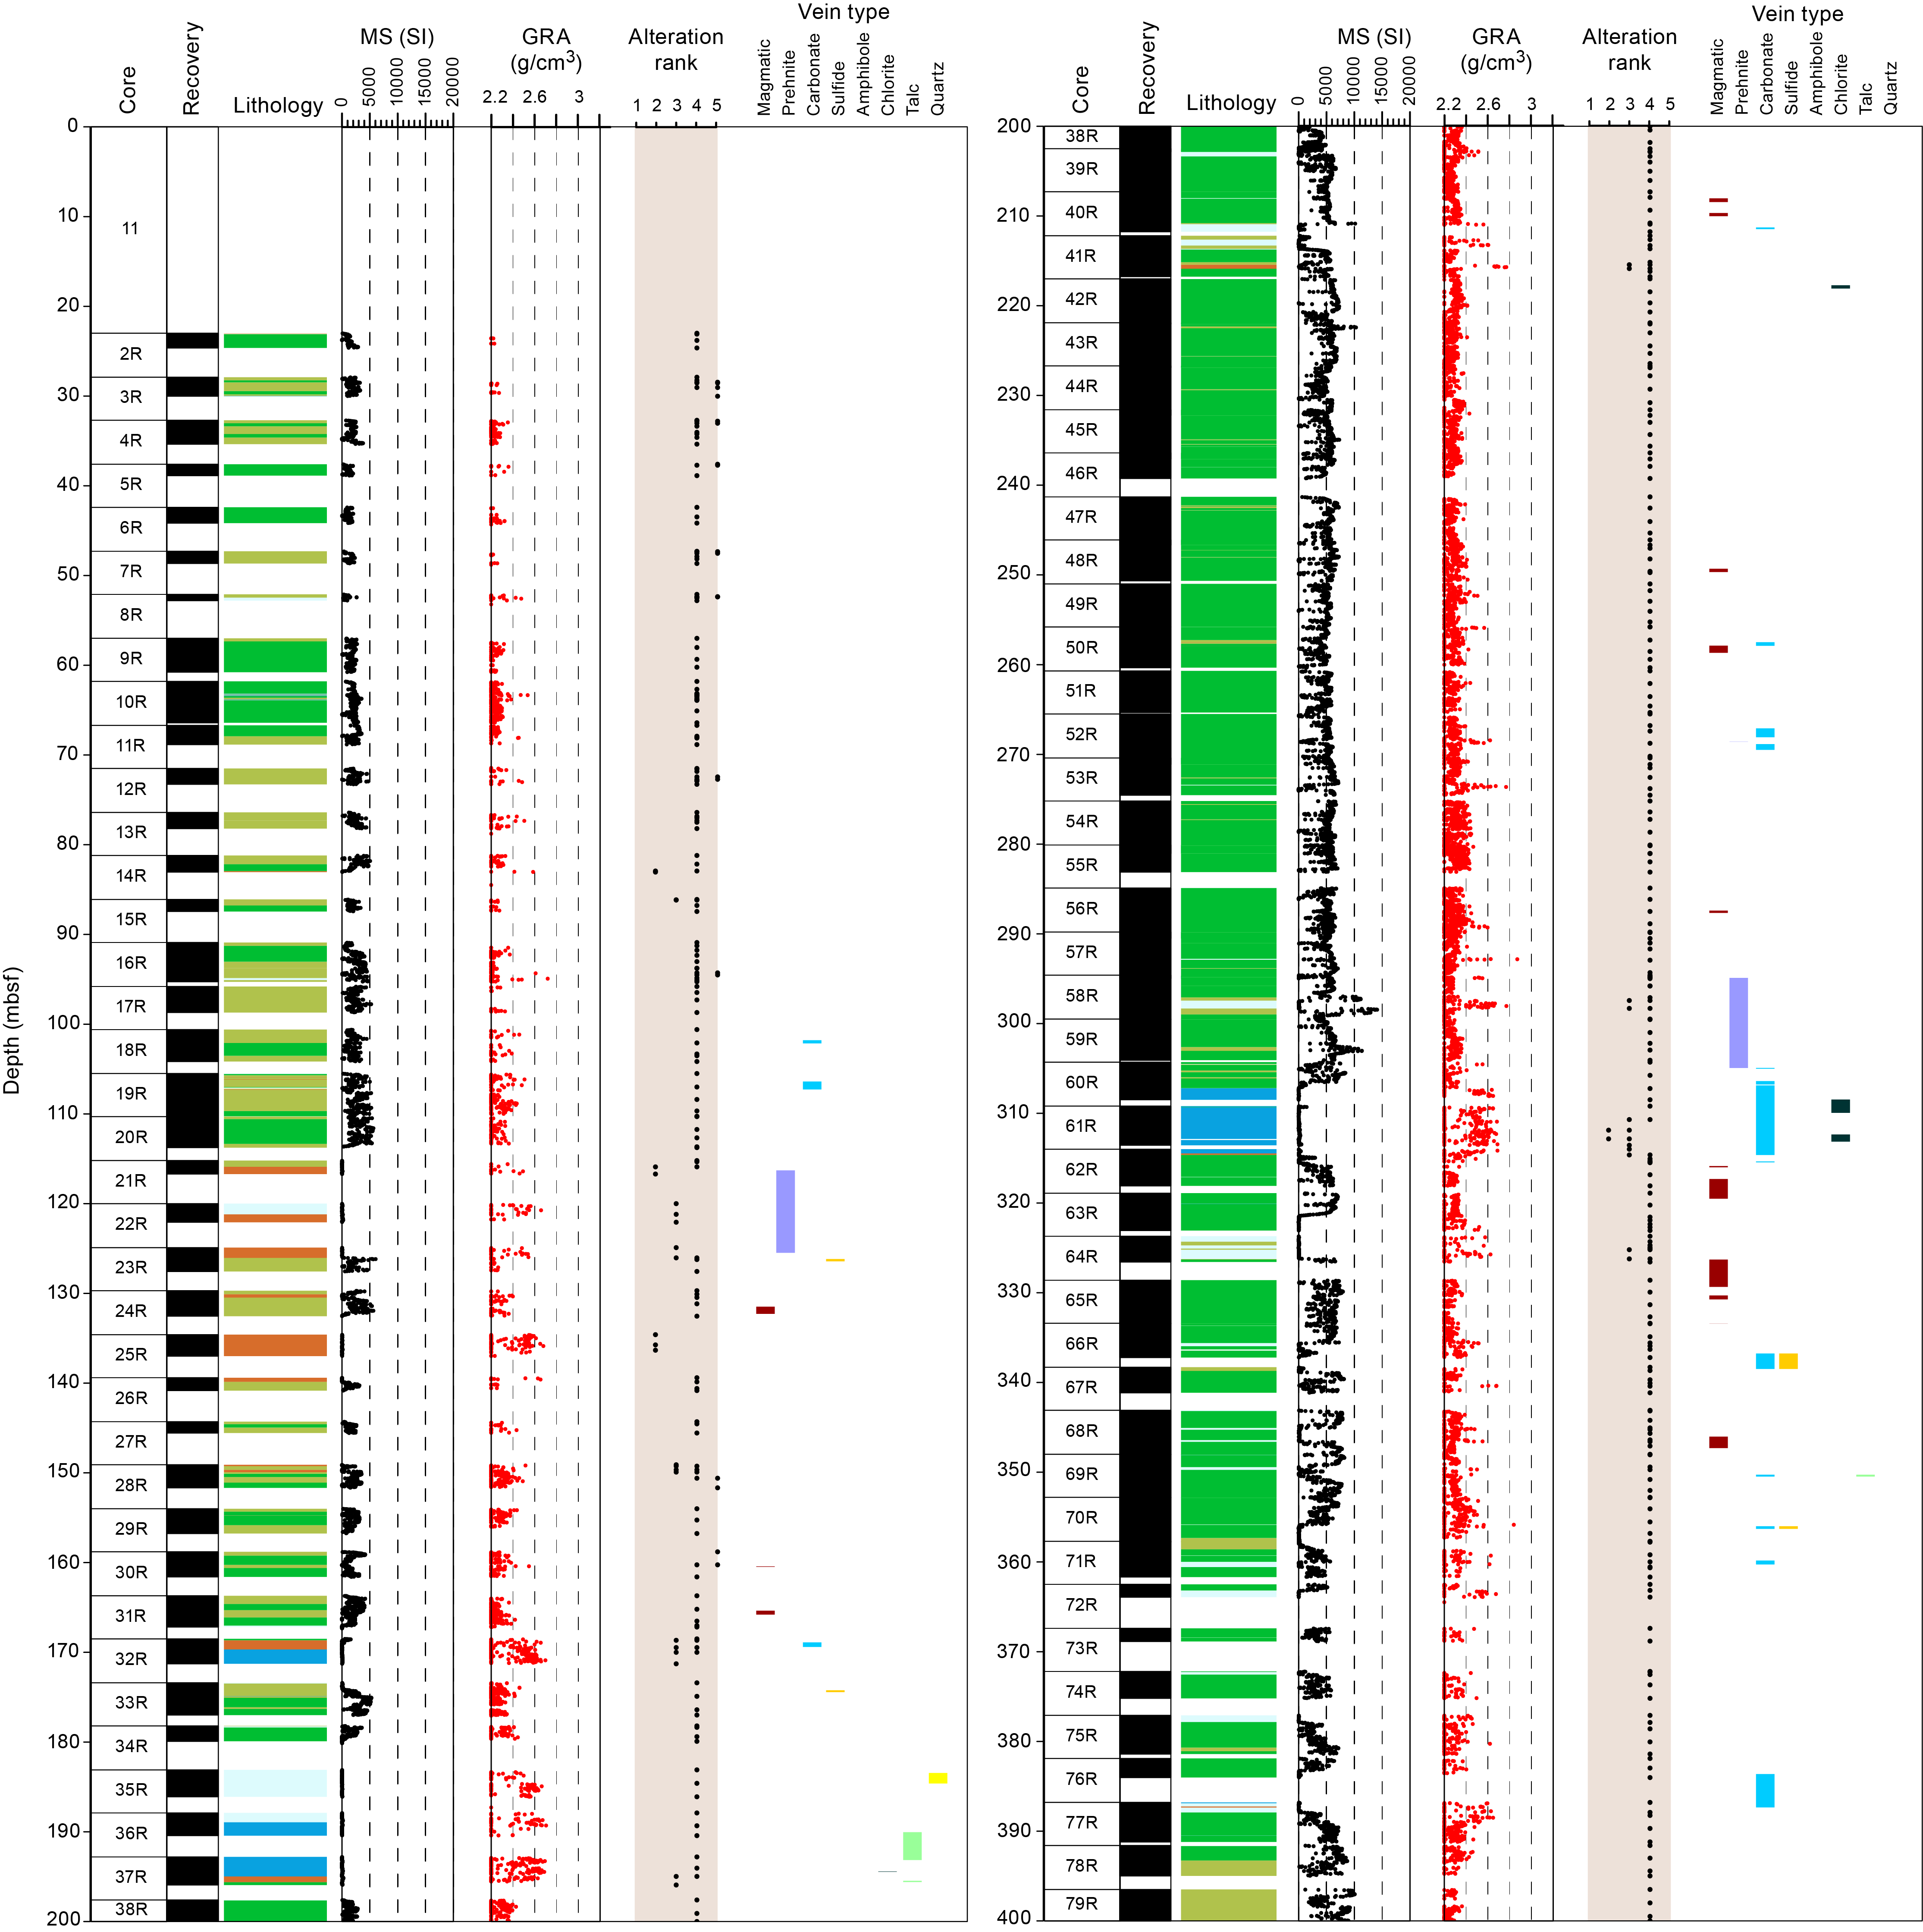
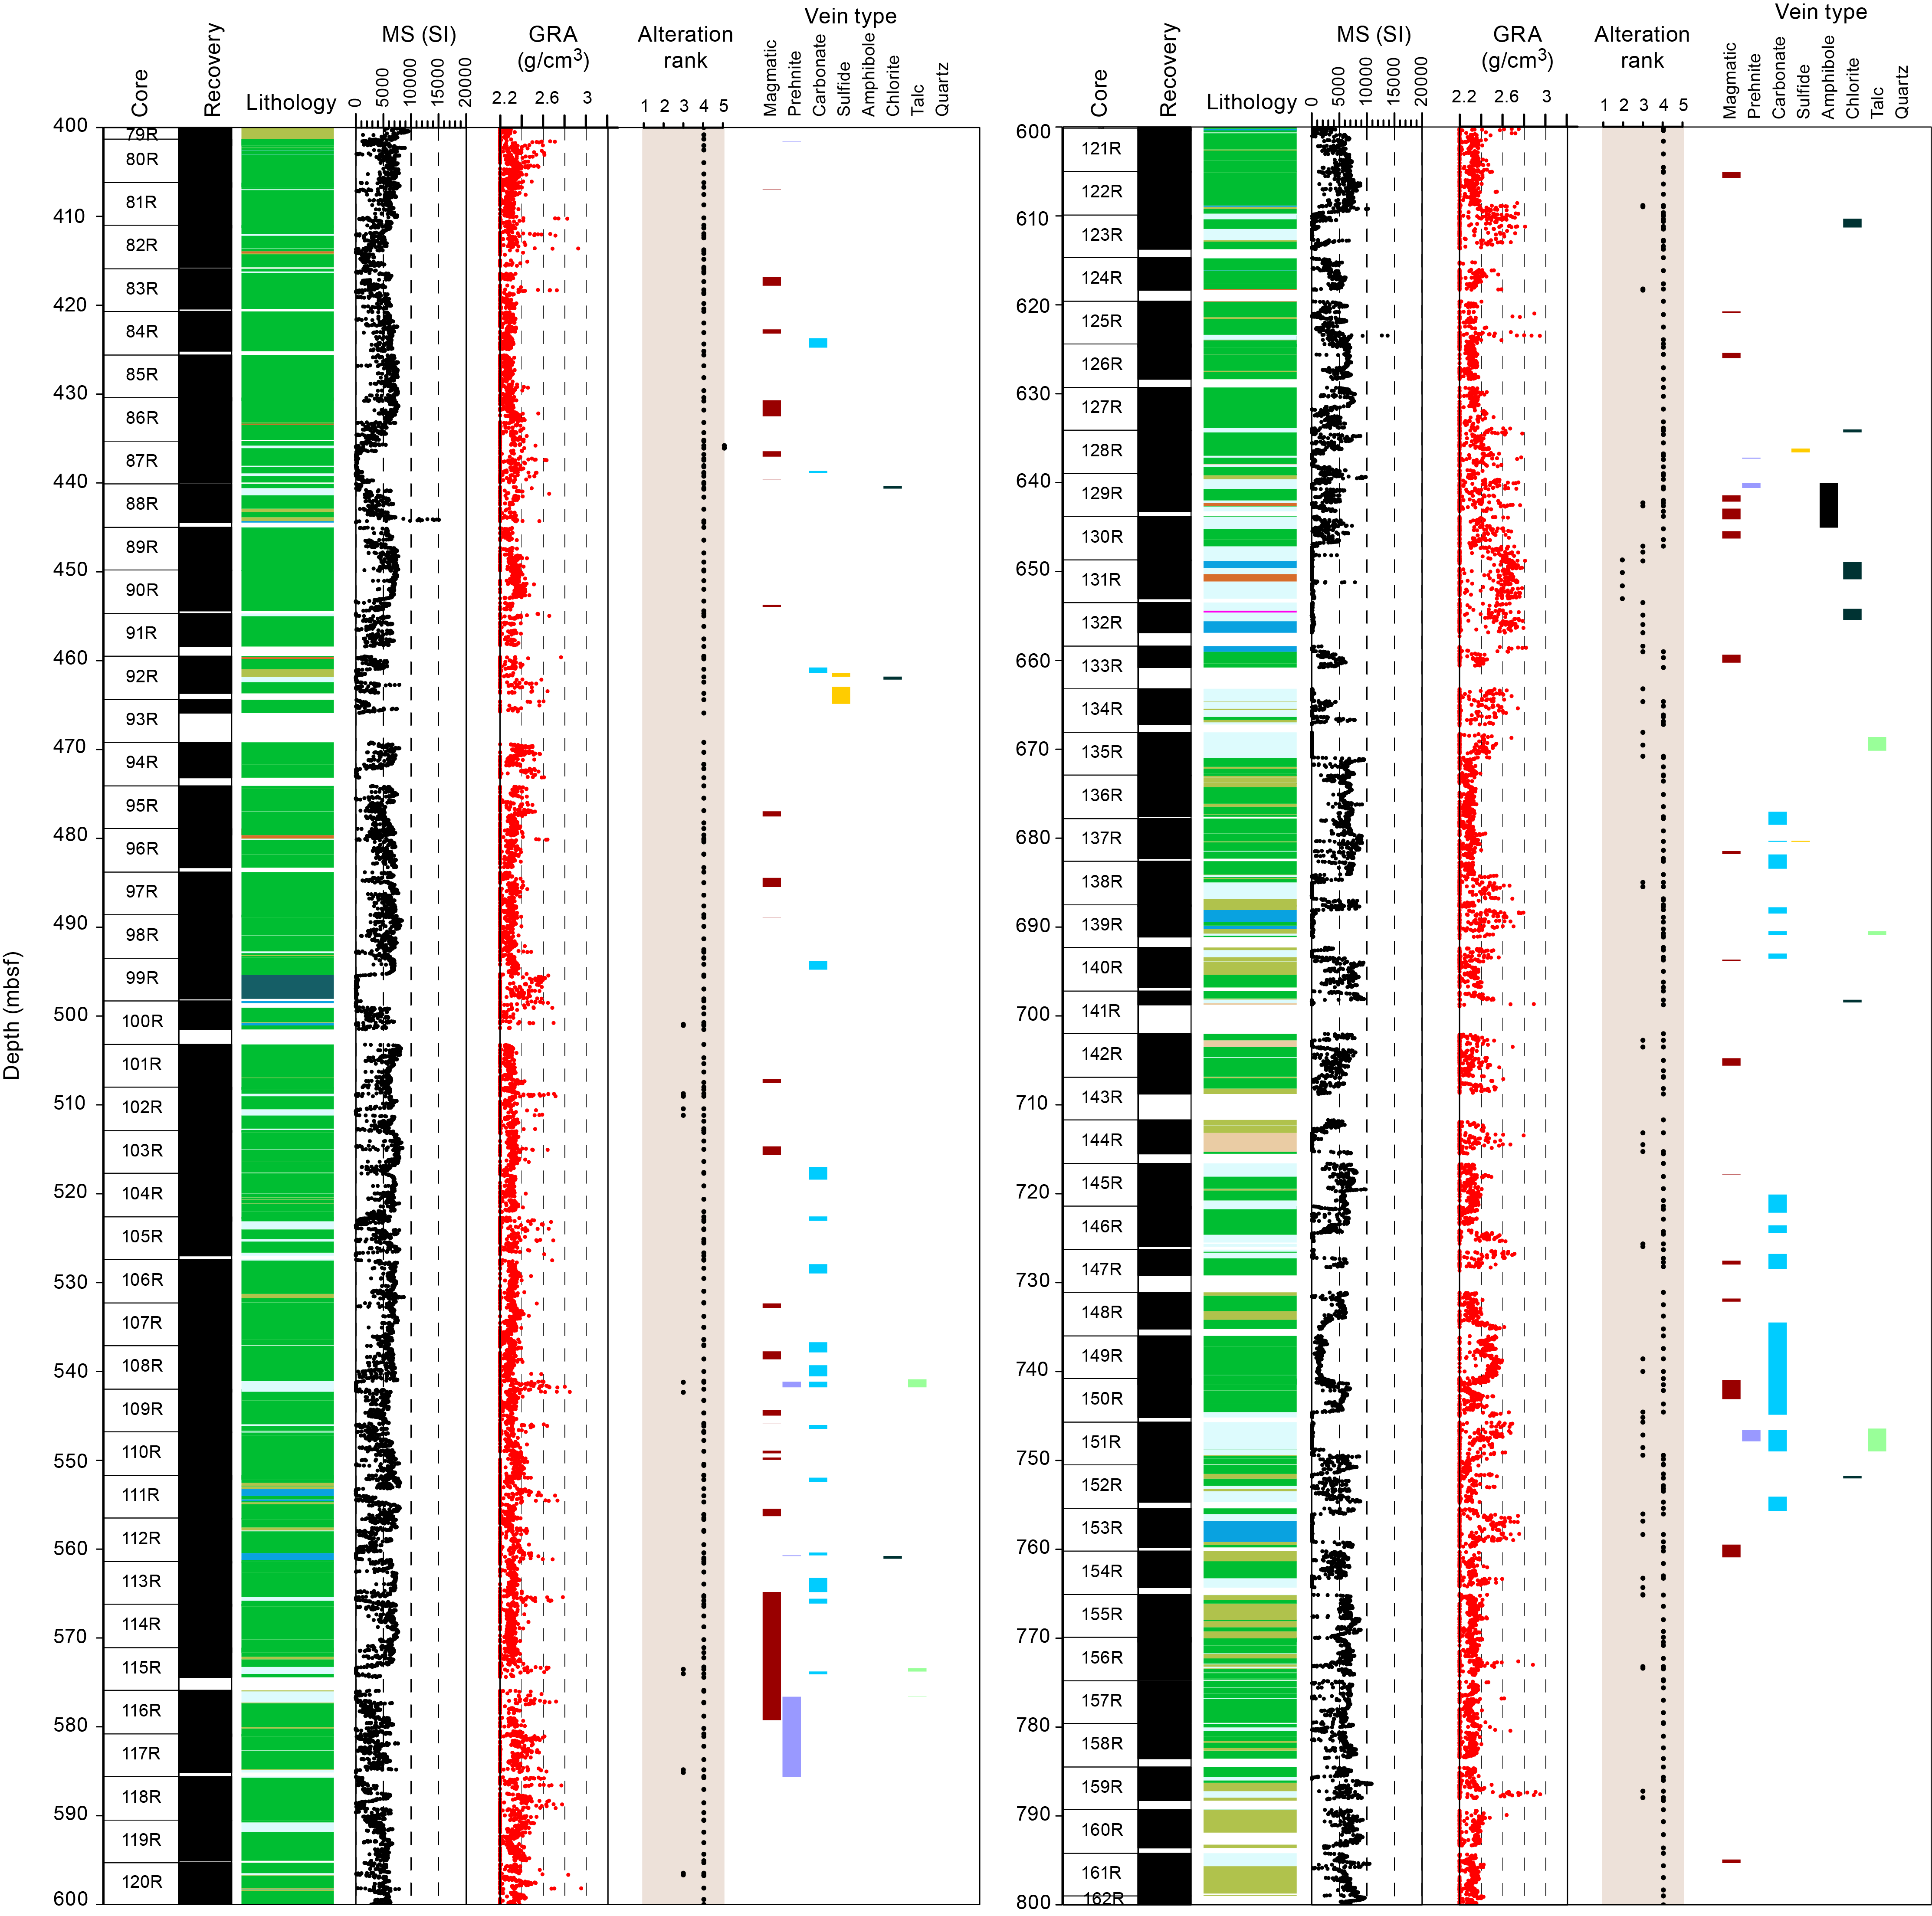
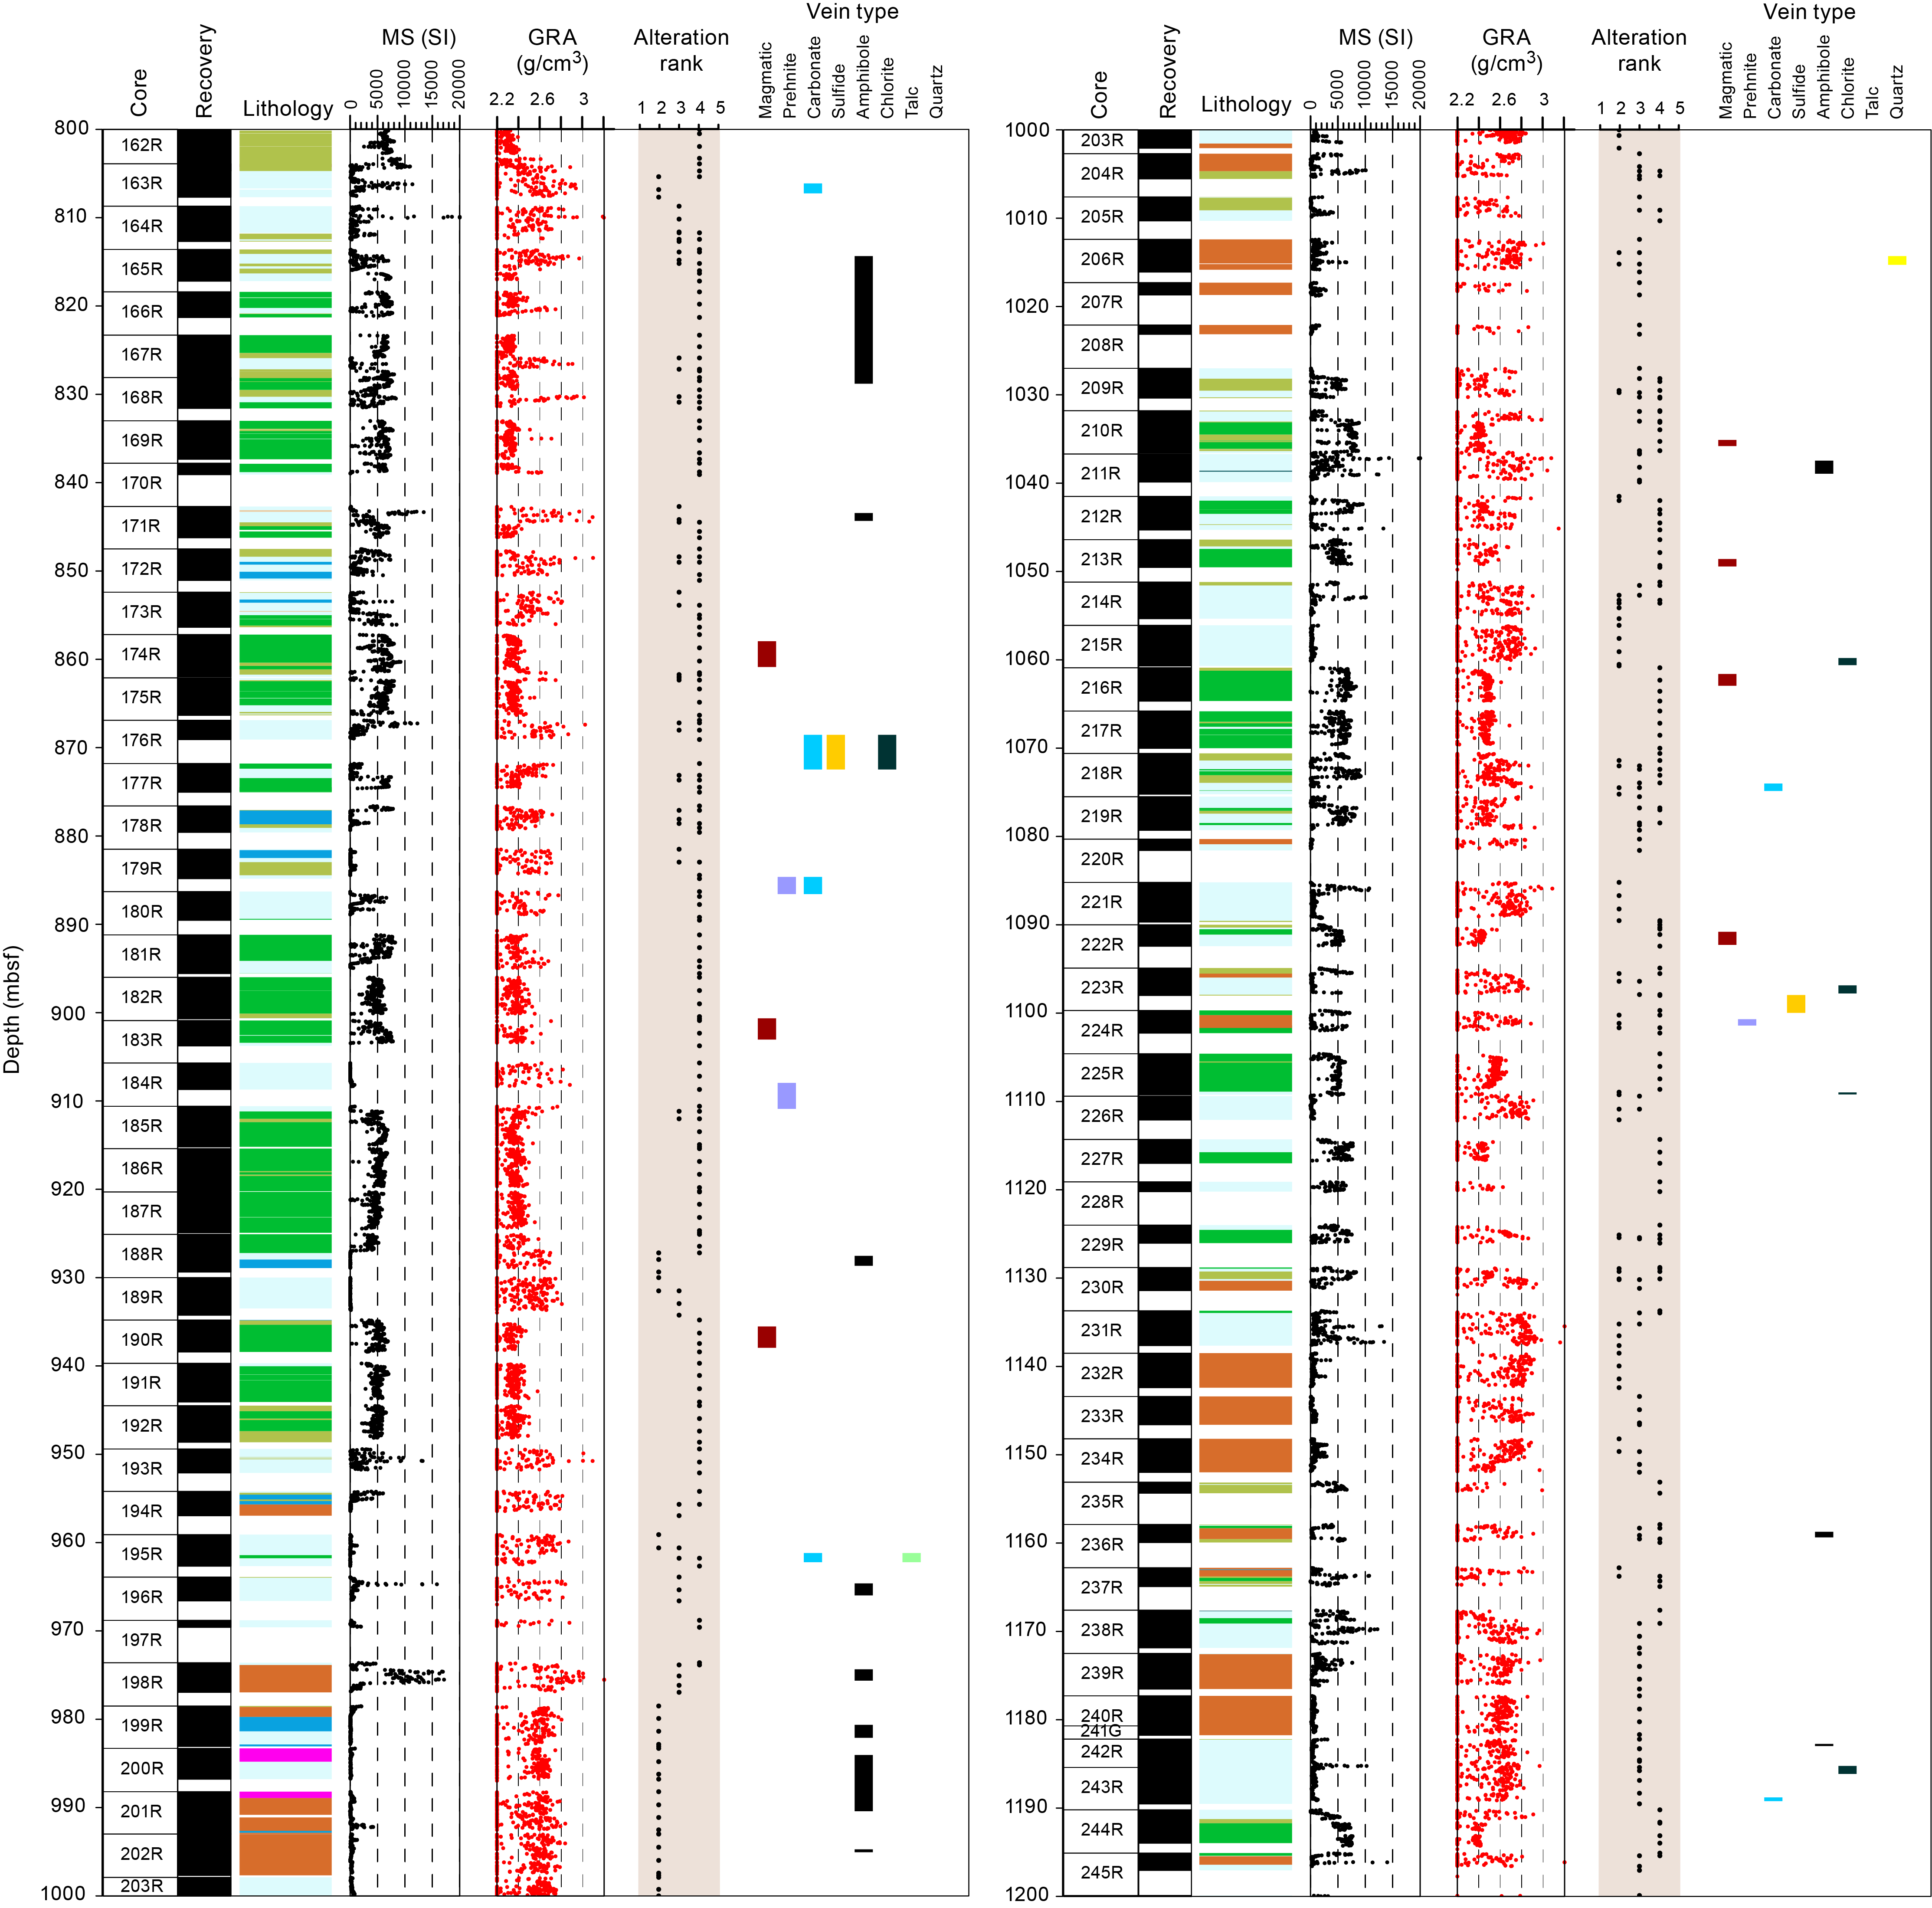
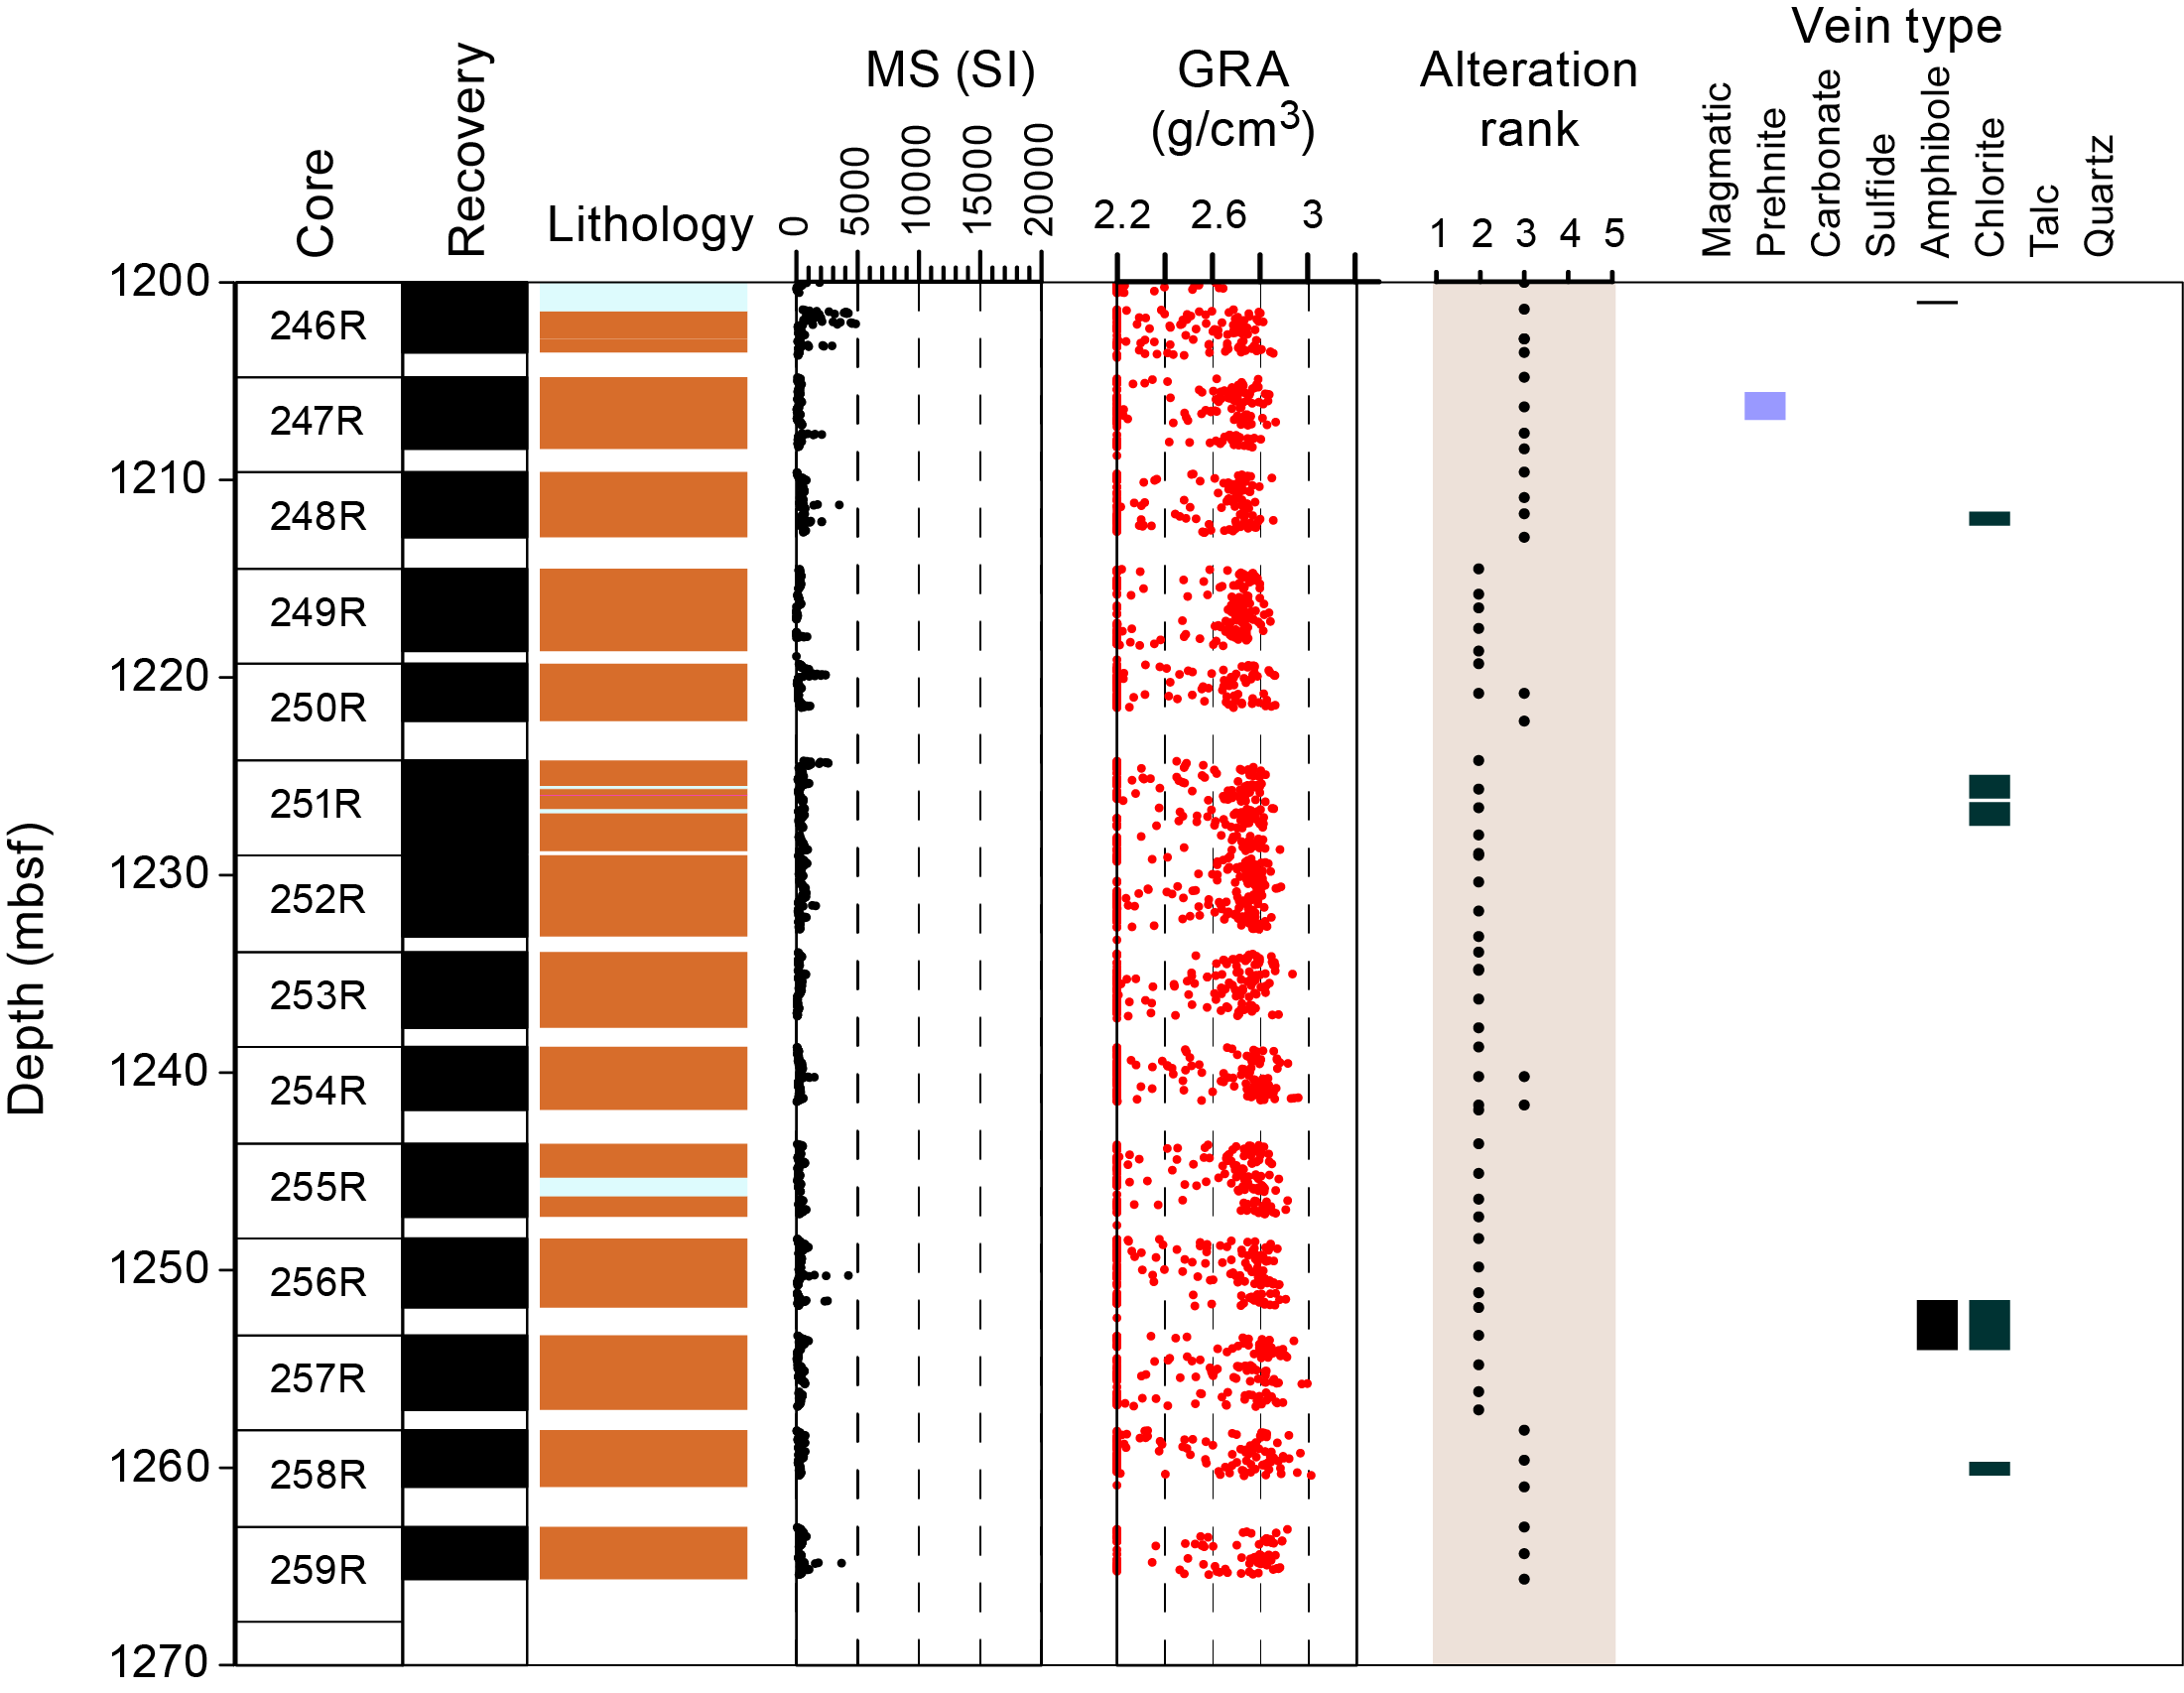
Figure F71. Background alteration and vein distribution, Hole U1601C.
4.2.1.1. Veins
Several types of veins were identified in serpentinized peridotites and gabbroic rocks in Hole U1601C based on macroscopic observations (Figure F72). In serpentinized peridotites, the main vein types include hydrothermally altered magmatic veins, serpentine, serpentine-magnetite, carbonate ± sulfide, and sulfide veins. Serpentine veins can be classified into chrysotile veins (white, fibrous, or massive; Figure F72A) and picrolite veins (greenish and massive; Figure F72B–F72D). Magmatic veins typically form millimeter- to centimeter-wide single veins that are not connected to other magmatic veins or a set of connected veins. They are in many instances cut by picrolite veins (Figure F72B, F72D). Mesh-forming serpentine-magnetite veins typically form a network of submillimeter- to locally millimeter-wide veins. Chrysotile forms a set of white, subparallel veins or a network of veins submillimeters to millimeters thick (Figure F72A). Sulfide and carbonate veins tend to be more abundant in serpentinized peridotites at or close to the contact with gabbros. No evident downhole variation was observed for vein mineralogy, vein density, or vein width.
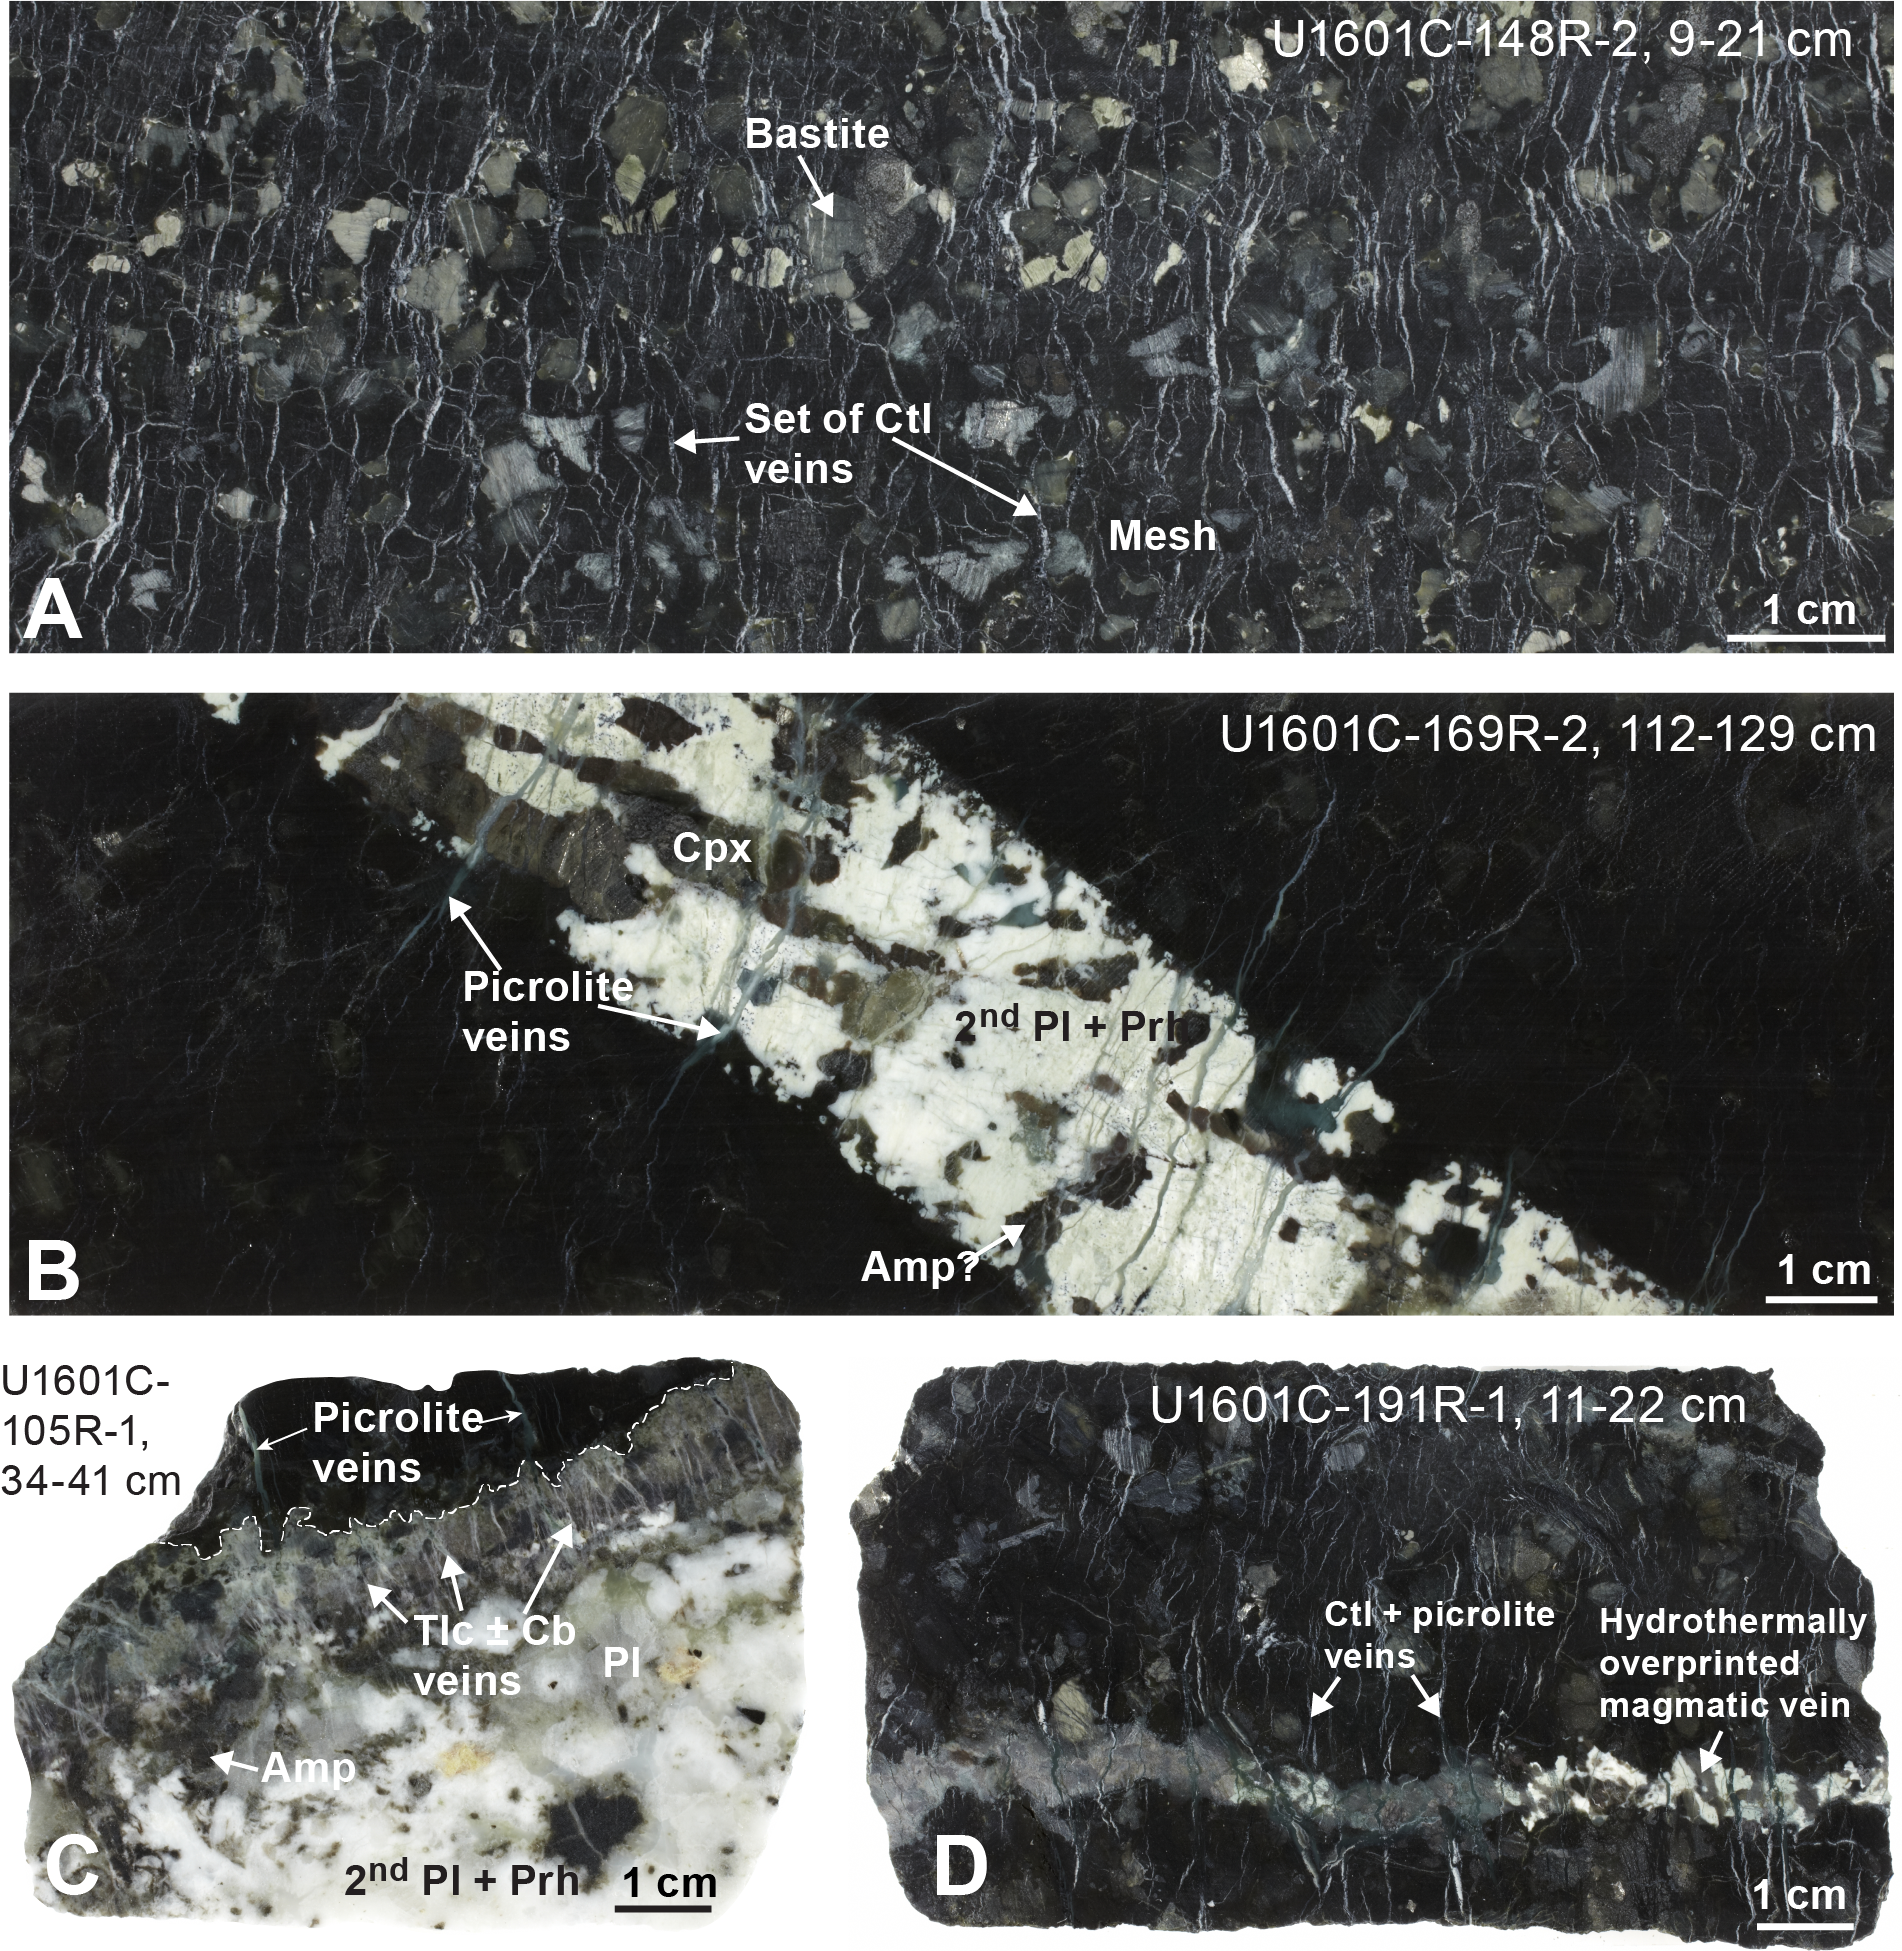
Figure F72. Main vein types in serpentinized peridotites.
In gabbros, the main types of veins include amphibole, chlorite, talc, carbonate, zeolite, talc-carbonate ± sulfide, and possibly clay mineral veins. Minor vein types including quartz, quartz-sulfide, and prehnite veins were locally observed, but their low frequency does not allow forming conclusions regarding downhole variations. Amphibole and chlorite veins typically occur as single veins or a set of veins in gabbroic rocks. They are typically submillimeters to millimeters thick and are rarely up to a centimeter in size. Zeolite veins mainly form a set or a network of submillimeter-thick veins that are present in most of the recovered gabbros. Locally, thicker single zeolite veins were observed. Talc, talc-carbonate, and carbonate veins, locally associated with sulfides, are generally thicker (up to several centimeters wide) than other types of veins. They form single veins or a set of branched veins. No systematic downhole variation of the vein mineralogy, connectivity, or width was observed in gabbroic rocks in Hole U1601C.
It is noteworthy that sulfide veins are relatively rare in the uppermost ~180 m of Hole U1601C (Figure F71A). These shallow intervals correspond to a weathered zone where serpentinized peridotites locally appear reddish. This is supported by the natural gamma ray data recovered during logging in this hole that suggest U enrichment in the upper ~180 m (Figure F143). Weathering near the seafloor likely results in the oxidation of sulfides within the shallow levels of Hole U1601C.
4.2.2. Alteration of mafic and ultramafic rocks
4.2.2.1. Ultramafic rocks
Based on microscopic observations, there is considerable variability in the extent of serpentinization of different mineral phases. In particular, degrees of olivine alteration vary strongly on the thin section scale (Figure F73), ranging 40%–100% (Figure F74). Based on thin section estimates in serpentinized harzburgite and dunite, olivine shows alteration degrees of 90% (±19% [1σ]) on average. Orthopyroxene is slightly less serpentinized (average = 78% ± 25%) compared to olivine, and clinopyroxene shows alteration degrees of 49% (±37%) (all averages calculated based on estimates of thin section observations). Accordingly, the alteration extent decreases from olivine to orthopyroxene, clinopyroxene, and spinel. Average modal abundances of harzburgite (olivine = 84.4%, orthopyroxene = 15.2%, and clinopyroxene = 0.1%), orthopyroxene-bearing dunite (olivine = 95% and orthopyroxene = 5%), and dunite (olivine = 100%) observed in Hole U1601C as reported in Igneous petrology suggests an average alteration of peridotite in Hole U1601C of around 88%. Although there is no systematic downhole variation in the extent of serpentinization, alteration degrees are generally higher in serpentinized peridotites where they are in contact with gabbroic intervals or hydrothermally altered magmatic veins, where olivine shows average alteration degrees of 96% (±9%), orthopyroxene 85% (±23%), and clinopyroxene 64% (±35%). In a few exceptional cases, however, abundant olivine and orthopyroxene are locally preserved in peridotite at the contact with gabbro.
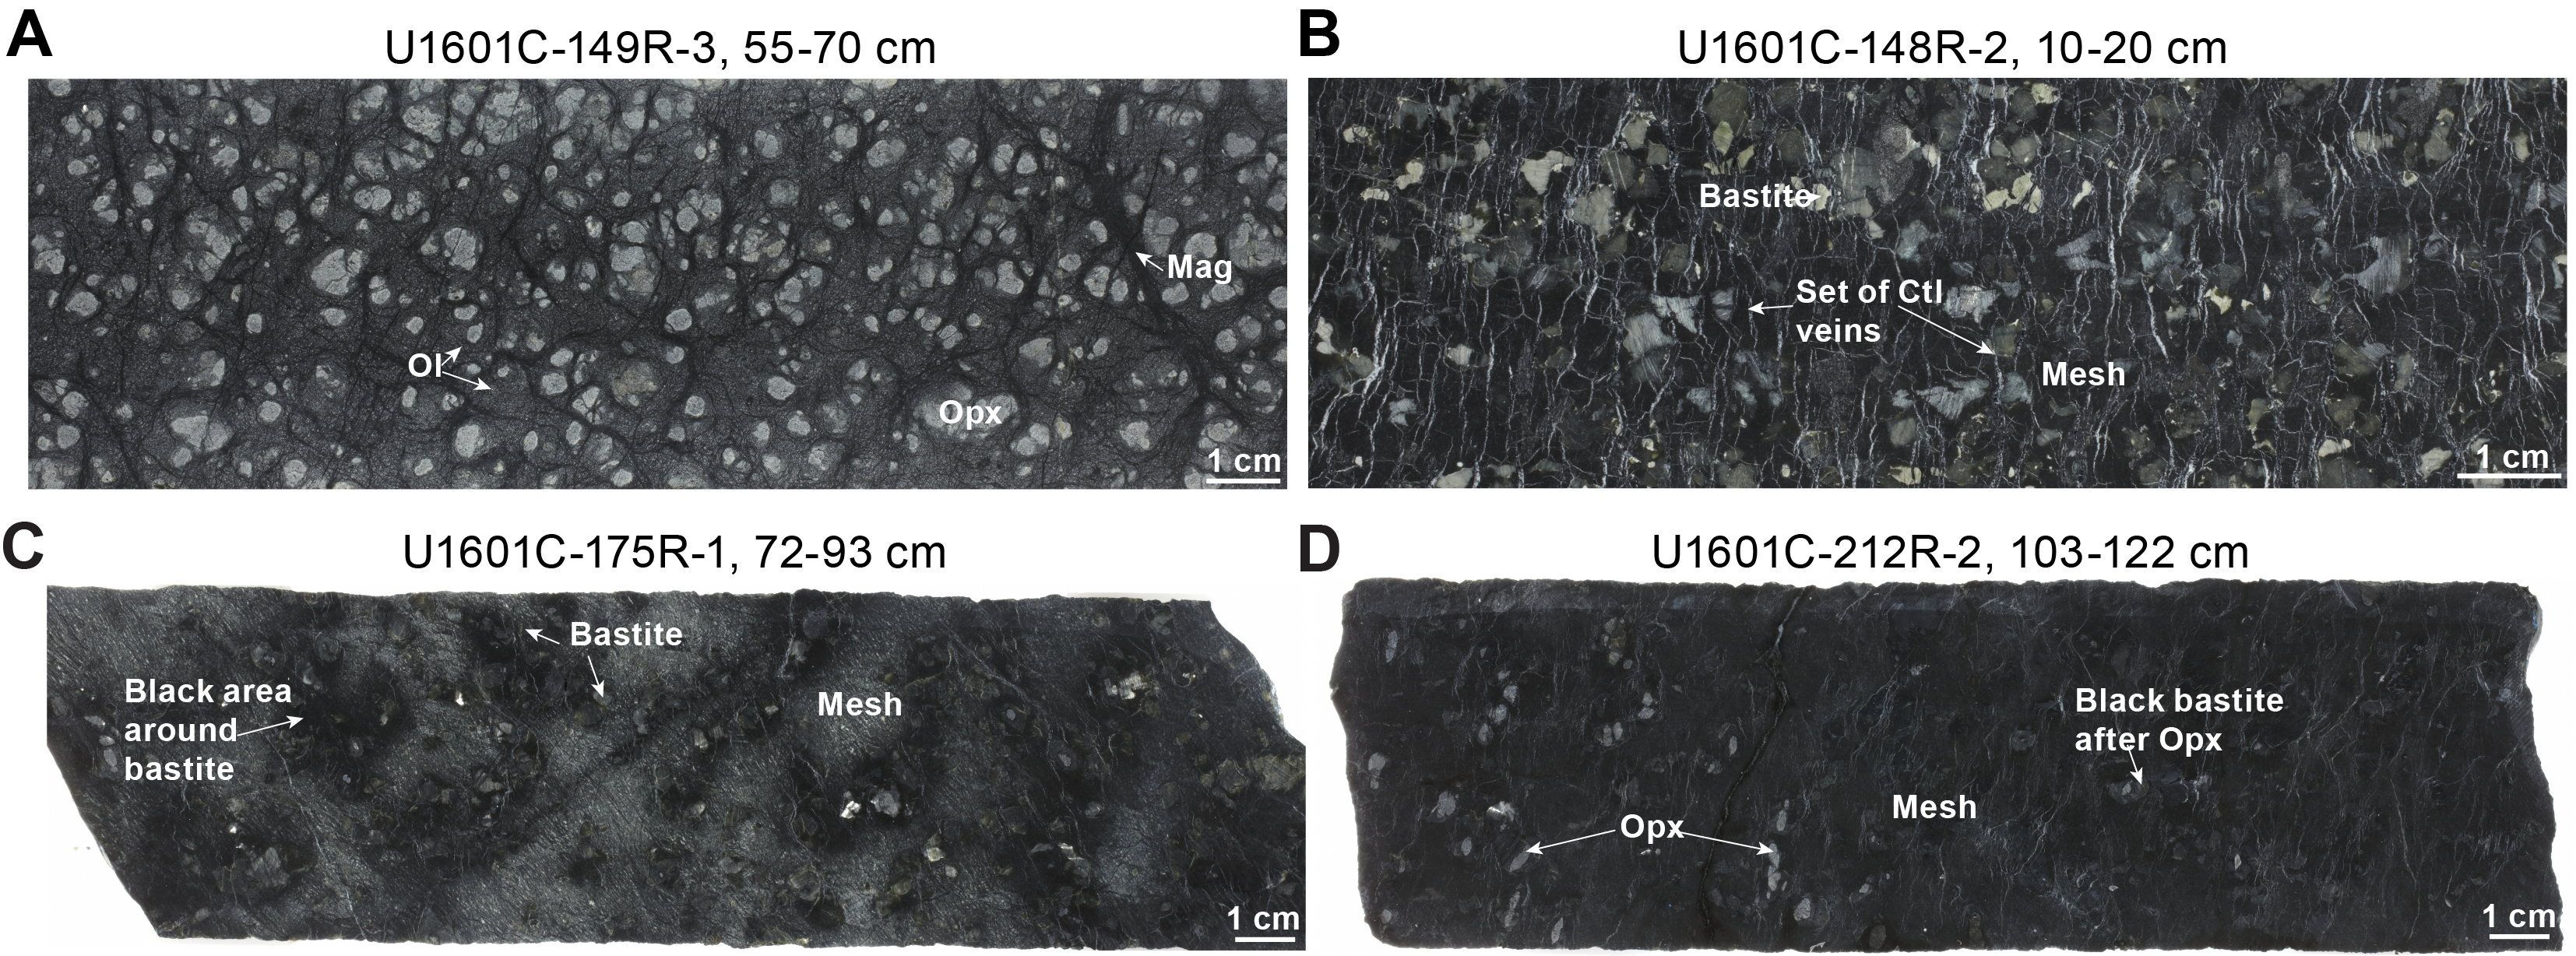
Figure F73. Variably serpentinized peridotite.
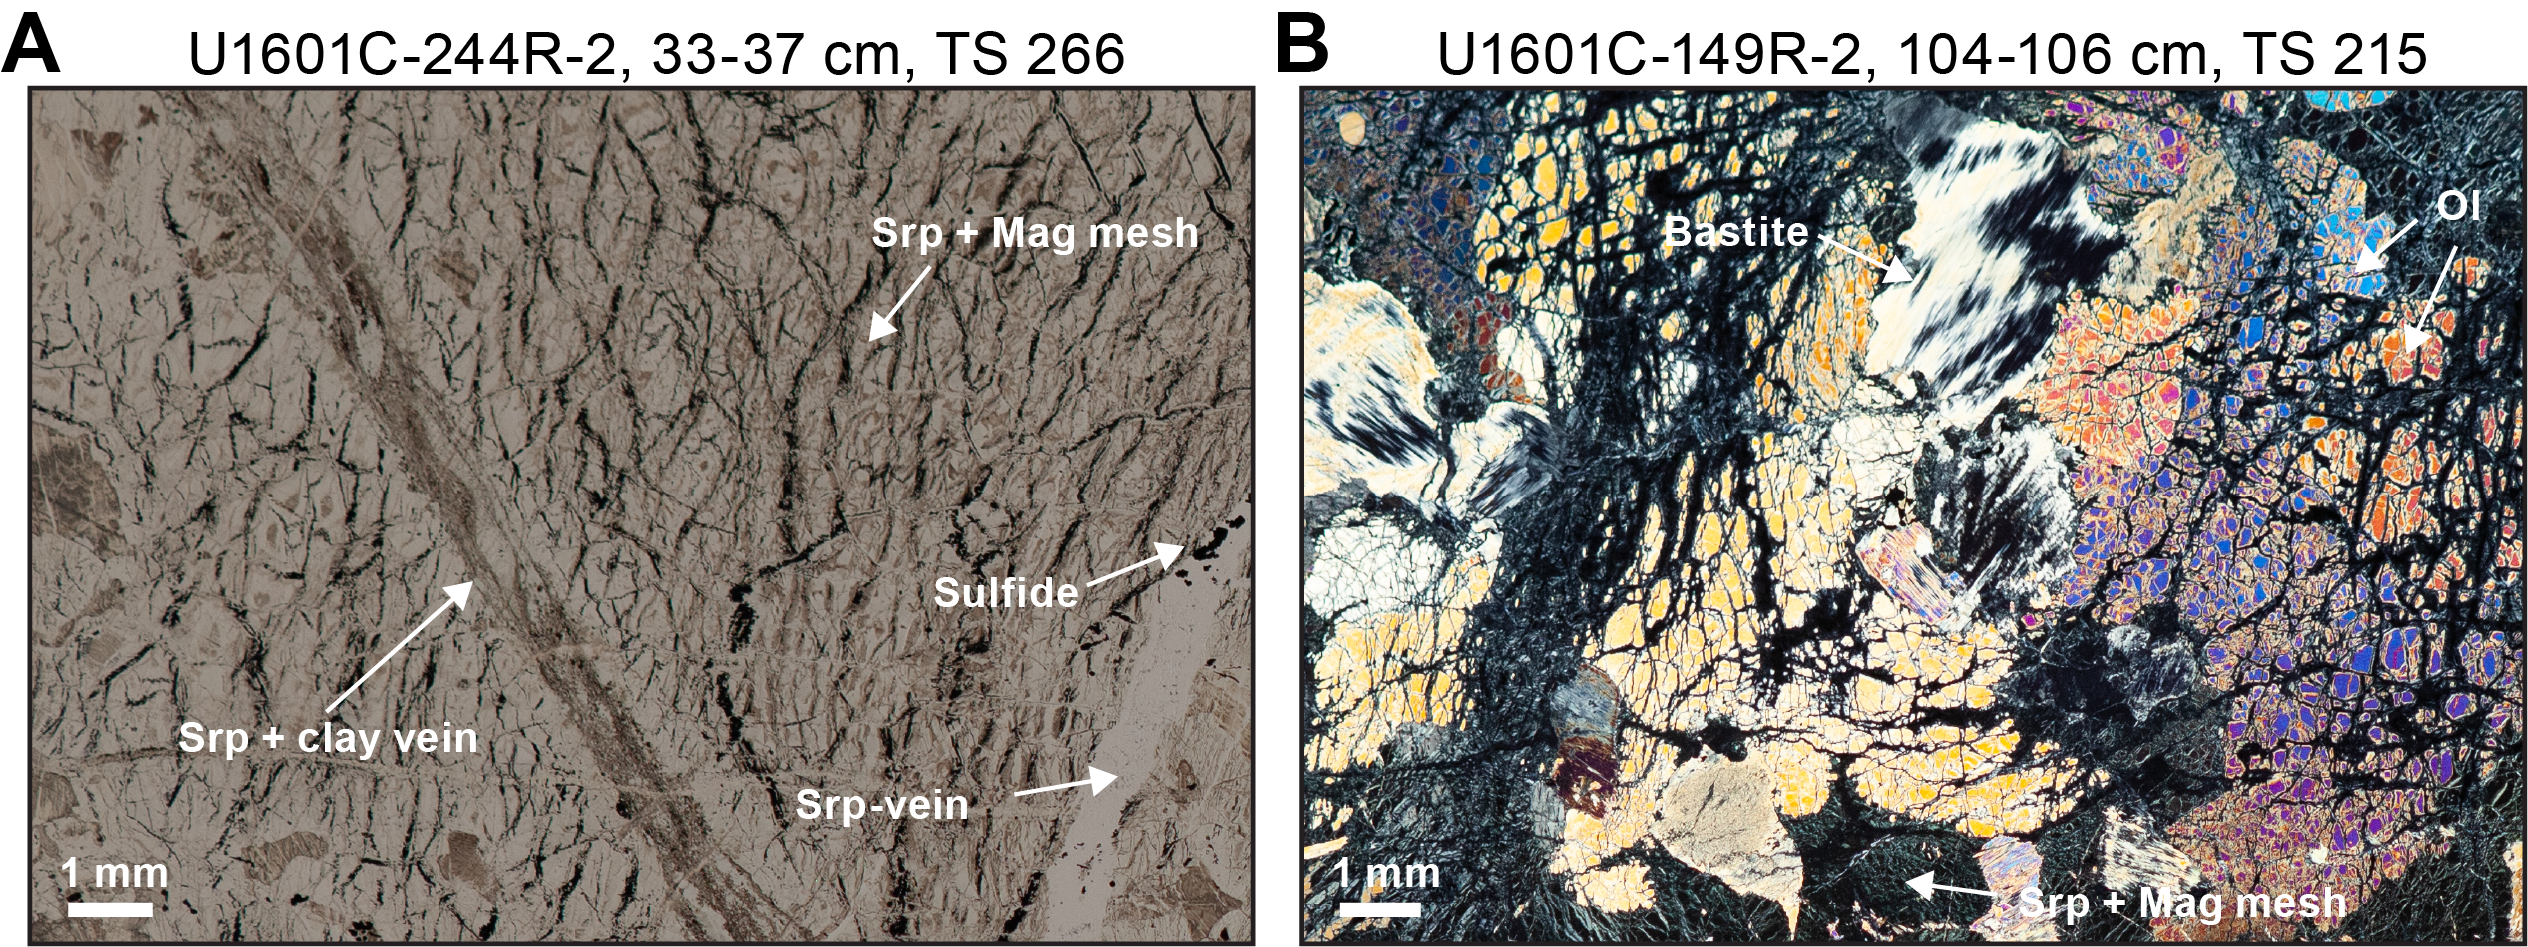
Figure F74. Variation in serpentinization degree.
4.2.2.2. Olivine
Alteration of olivine shows similar textures in Hole U1601C to those observed in Hole U1601A. Olivine is highly altered to serpentine, clay minerals, locally brucite, magnetite, and traces of other opaques. Typically, olivine is replaced by serpentine (lizardite and chrysotile as shown by XRD analyses) and magnetite forming a mesh or hourglass texture and locally ribbon vein textures. Magnetite is most abundant within mesh rims, locally forming stringer veins. Within the shallow drill cores, brown staining of mesh cores suggests late-stage replacement of originally remnant olivine by serpentine and Fe oxyhydroxides, likely due to seafloor weathering. Locally, brucite identified using XRD analyses likely forms in mesh textures replacing former olivine. In addition, in a few serpentinite samples iowaite identified using XRD analyses (Table T5) likely formed by replacement of brucite.
4.2.2.3. Orthopyroxene
Orthopyroxene is partially to completely altered to serpentine and minor talc, chlorite, and clays along cleavage surfaces forming bastite textures. In a few sections where clinopyroxene was detected, it appears largely unaltered with only minor replacement by amphibole and serpentine.
4.2.2.4. Clinopyroxene
Clinopyroxene is rare in the studied harzburgites and dunites and shows the lowest degree of alteration (in comparison to olivine and orthopyroxene), whereby clinopyroxene and clinopyroxene exsolution lamellae can appear largely unaltered. Clinopyroxene is replaced by serpentine, amphibole (likely tremolite/actinolite), and chlorite along cleavage surfaces. In the shallow drill cores, clinopyroxene is replaced by iron oxyhydroxides, suggesting late-stage weathering.
4.2.2.5. Spinel and magnetite
Cr-spinel is variably altered (20%–90%), typically replaced by magnetite, ferrichromite, or chlorite. In the uppermost ~100 m, serpentinite oxidation of secondary magnetite to reddish brown iron oxide and iron oxyhydroxide minerals is common. At greater depths, magnetite seems less altered except for serpentinized peridotite that is juxtaposed with gabbroic lithologies.
4.2.2.6. Veins
Similar to serpentinized harzburgite and dunite from Hole U1601A, two or more vein generations can be distinguished in serpentinized peridotite from Hole U1601C, as already described based on macroscopic observations. Apart from magmatic veins, the earliest vein generation is composed of serpentine and stringers of magnetite in mesh texture after olivine. Locally, high magnetite contents were detected, reaching 43% ± 9% based on Rietveld refinement calculations of XRD data (Table T6). The mesh texture is cut by multiple generations of serpentine veins of different appearance. Macroscopically, white, fibrous chrysotile veins cut the mesh texture and bastites and belong to one of the last vein generations. In thin sections, these veins show intergrowth of a fine-grained brown mineral phase (likely clay minerals) that typically occurs in the center of the vein. Picrolite veins cut the hydrothermally altered magmatic veins perpendicular to the magmatic veins and are fine-grained, forming lens-shaped serpentine veins. Locally, they are composite veins with a very fine grained vein core and a more coarse-grained vein rim. Although the picrolite veins are transparent within the hydrothermally altered magmatic veins that they cut, they contain brown clay minerals where they cut the mesh texture of the surrounding host serpentinite.
Carbonate veins in ultramafic rocks typically postdate serpentinization and are more abundant in the uppermost parts of Hole U1601C and in the vicinity of hydrothermally altered magmatic veins. XRD analyses suggest that carbonates are dominated by calcite with rare aragonite and dolomite. Carbonate veins either form a set of branching veins, coarse grained veins up to several millimeters in width, and locally they occur as composite veins forming the core of serpentine veins suggesting that they reused previous fluid pathways. Associated with the hydrothermally altered magmatic veins, carbonate veins occur both cutting the hydrothermally altered magmatic veins as well as emerging from the magmatic veins and cutting into the surrounding serpentinite mesh texture.
4.2.2.7. Gabbroic rocks
Hole U1601C recovered a range of variably altered gabbroic lithologies including gabbro, gabbronorite, olivine gabbro, troctolite, and oxide gabbro that generally show increased intensity of alteration in intervals of relatively high degree of ductile deformation, high density of hydrothermal veins, and at contacts with serpentinites (Figure F75).
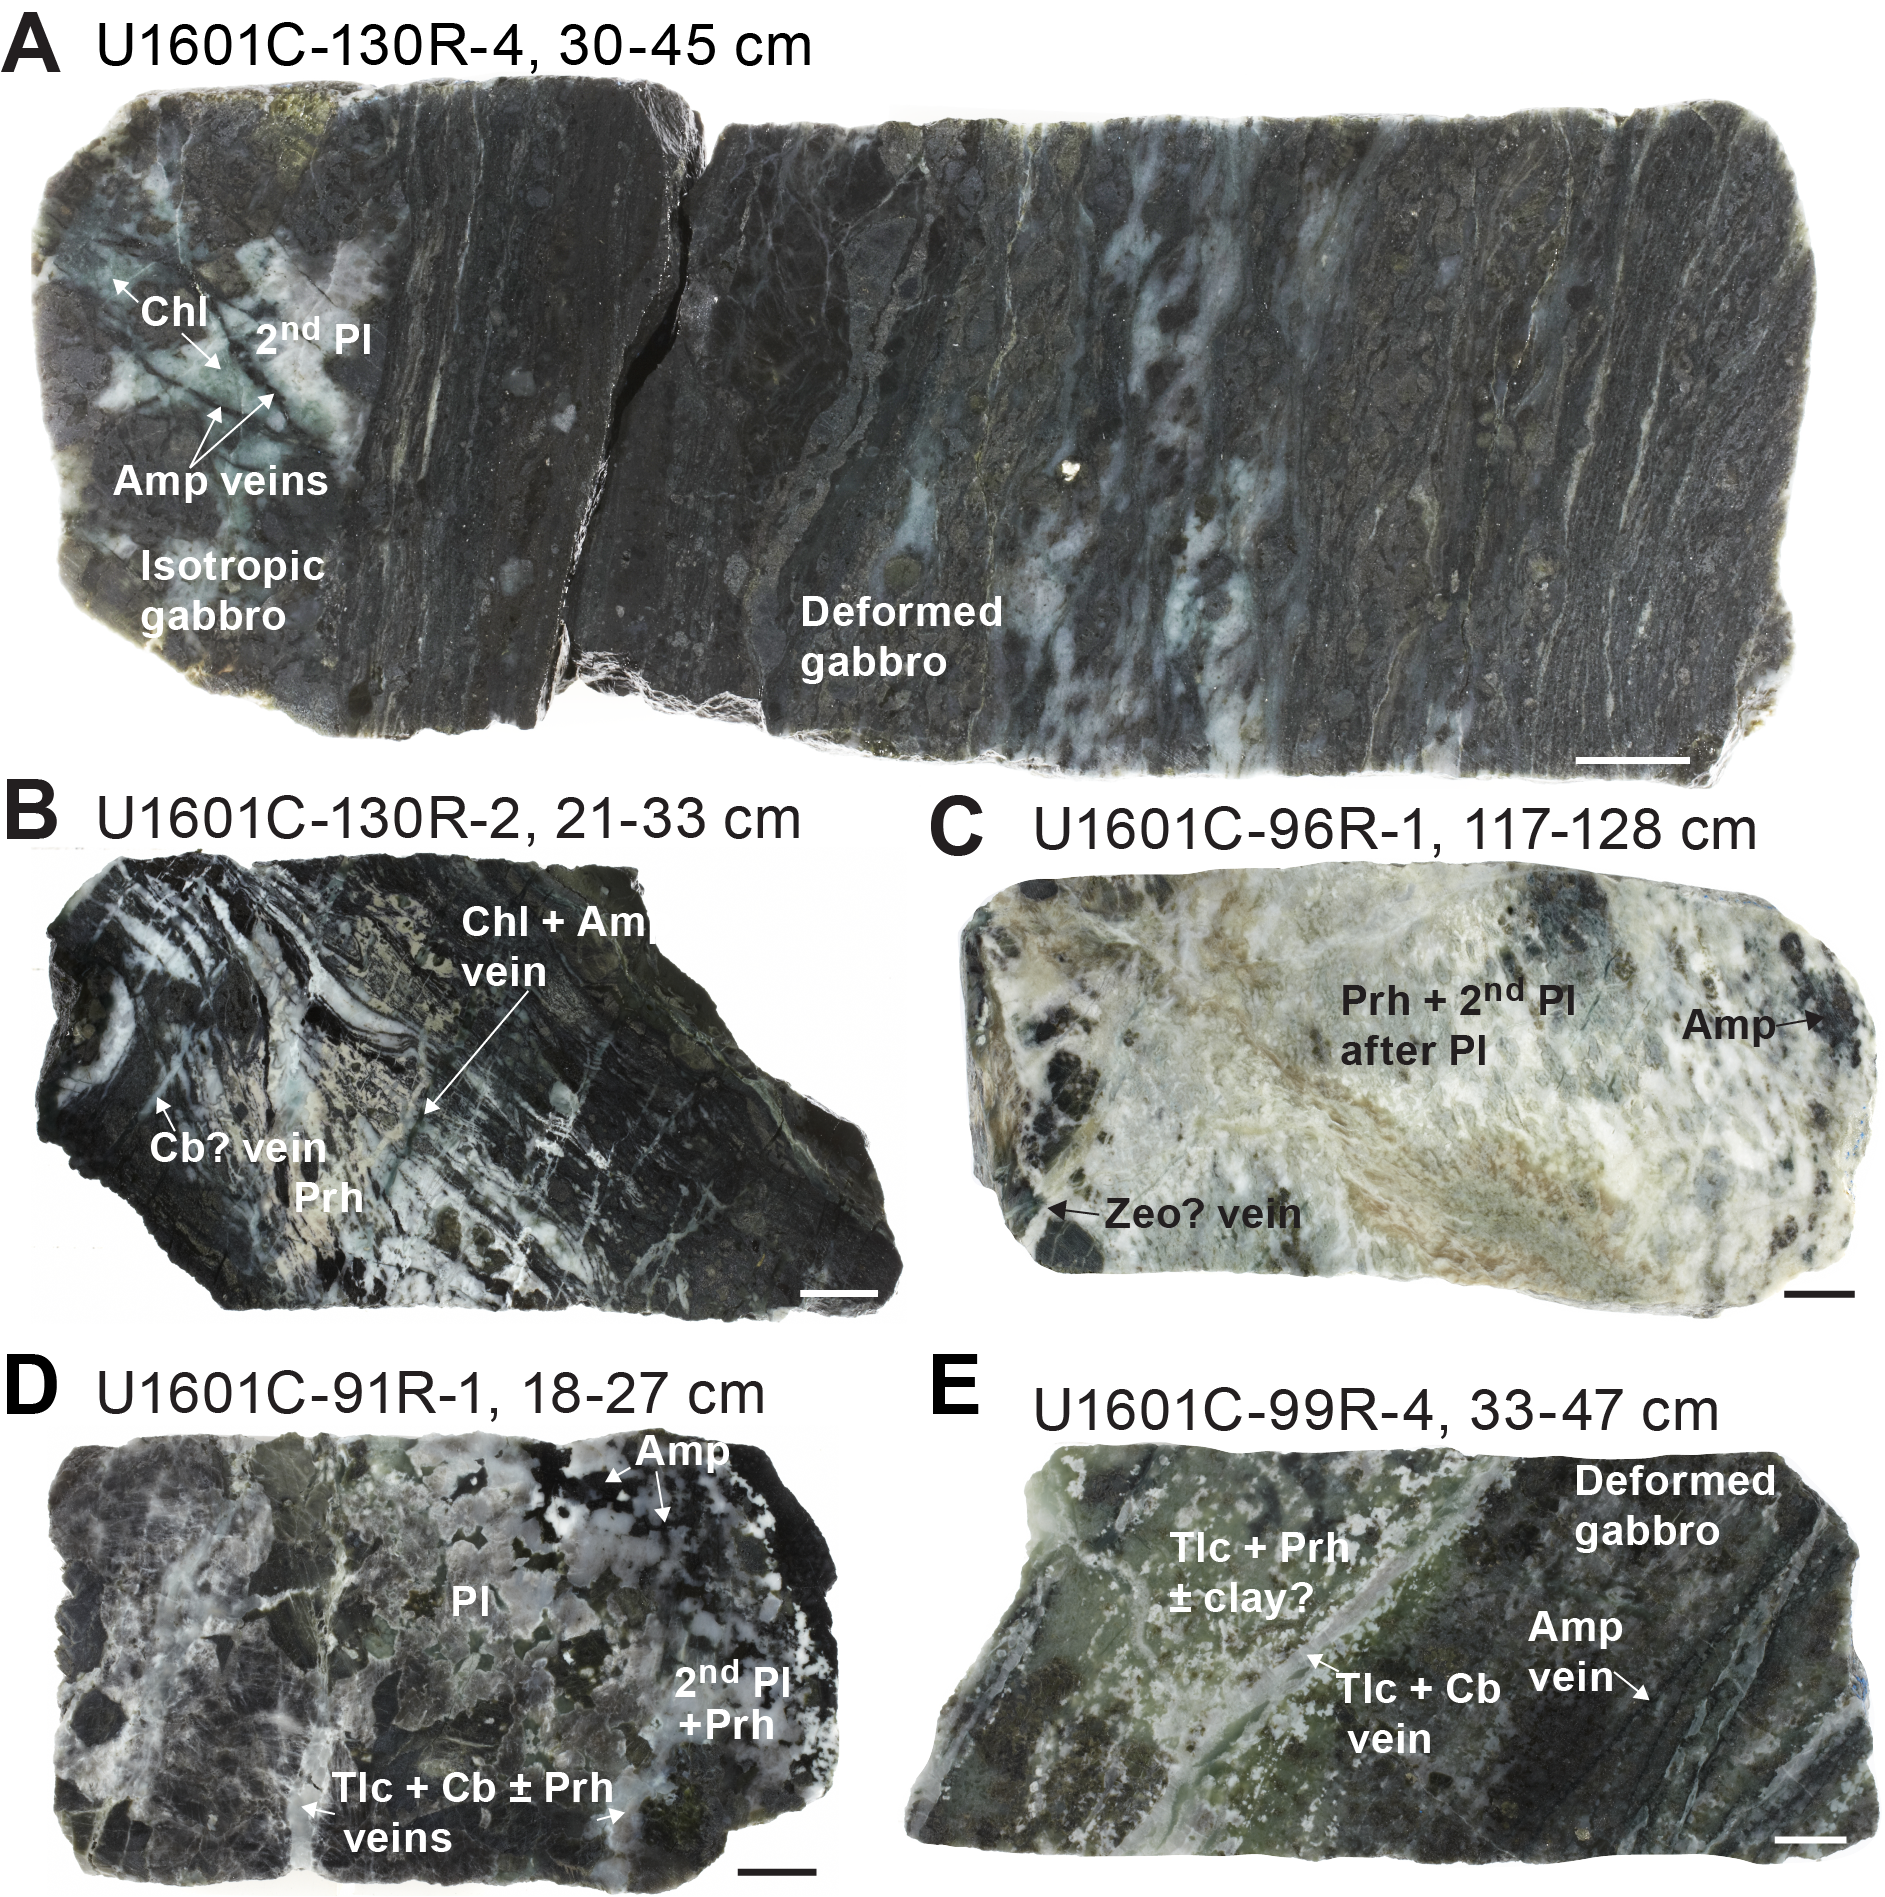
Figure F75. Main alteration features, gabbroic rock contacts.
In the cases of highly deformed rocks, the amount of amphibole replacing pyroxene appears to increase. This might result from hydrothermal alteration during ductile deformation; however, microscopic observations of mylonitic gabbros indicate that ductile deformation took place at higher temperatures than hydrothermal alteration, and subsequently, pyroxene was altered to amphibole by static alteration (see below). Indeed, macroscopic scale amphibole veins are conspicuous where they intrude undeformed isotropic gabbros adjacent to mylonitic gabbros (Figure F75A).
In intervals of high vein density and magmatic intrusive contacts, abundant fractures and lithologic boundaries could provide pathways of hydrothermal fluids, resulting in further alteration under variable temperature conditions (Figure F75B–F75E).
Microscopic observations revealed that the alteration extent of each primary mineral increases in the proximity of hydrothermal veins. In general, olivine is most extensively altered followed by clinopyroxene, orthopyroxene, and plagioclase in order of decreasing alteration extent. For each primary mineral, the alteration paragenesis and texture is described below.
XRD analyses suggest that the main secondary minerals formed in gabbroic rocks include amphibole (of different mineralogy), chlorite (likely clinochlore ± chamosite), talc, prehnite, zeolite, serpentine, and clay minerals (Table T5). However, it was not always possible to distinguish between talc/zeolite and prehnite/zeolite. Overall, alteration phases determined using XRD analyses are in good agreement with microscopic observations where thin sections are available.
4.2.2.8. Olivine
Olivine is replaced by secondary minerals that form three characteristic alteration minerals and textures. Crosscutting relationships between secondary minerals, where observed, indicate the sequence from older to younger described below.
The oldest texture features acicular colorless amphibole + chlorite + oxide ± talc forming a corona texture. Talc is in some instances associated with sulfide. Where olivine is highly altered, aggregates of acicular colorless amphibole with random orientation form pseudomorphs (Figure F76A, F76B). In some cases, the outermost zone of the corona texture consists of a colorless phyllosilicate mineral with high birefringence instead of chlorite (Figure F76C, F76D). It is similar in optical characteristics and mode of occurrence to biotite, which was reported from the Atlantis Bank olivine gabbros (Nozaka et al., 2019).
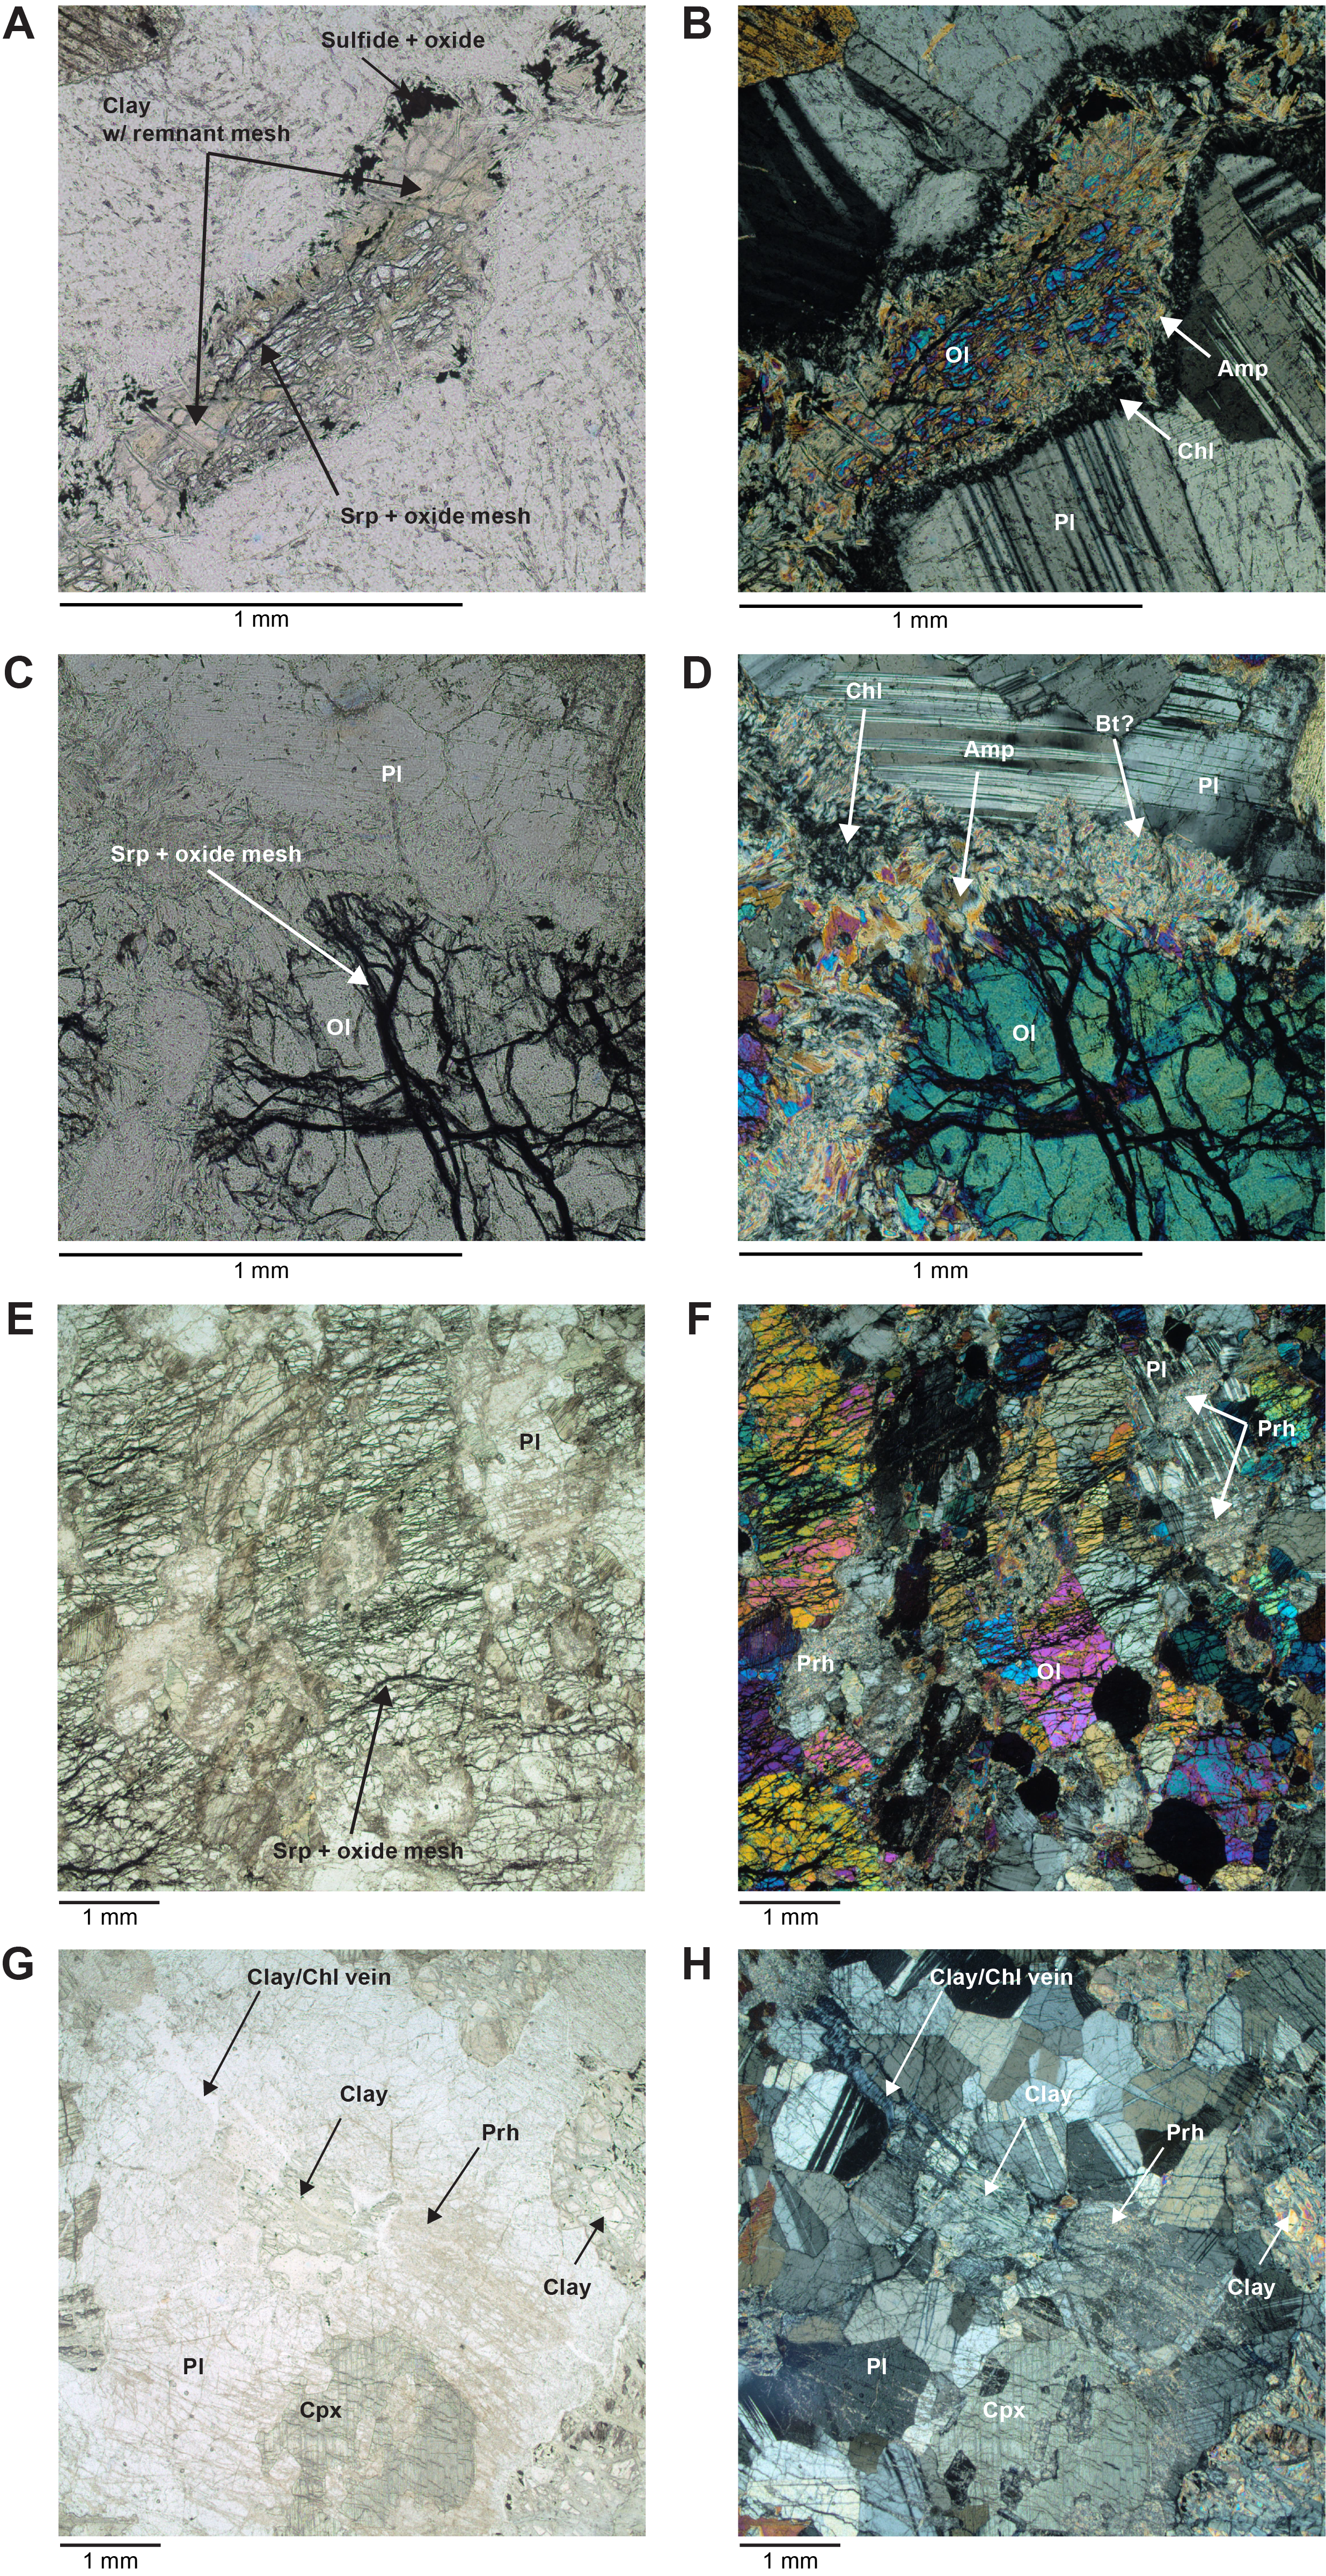
Figure F76. Mode of occurrence, olivine alteration minerals.
The corona texture alteration of olivine is followed by serpentine + oxide/sulfide in mesh texture. In most cases, relatively thick mesh veins appear to be abundant in opaque minerals and show subparallel arrangement within each olivine grain and throughout the thin section (Figure F76E, F76F).
The youngest texture that can be recognized to form after olivine in gabbroic rocks consists of clay + oxide/sulfide forming pseudomorphs after olivine. In many samples, this type of olivine alteration shows a close association with clay/chlorite veins (Figure F76G, F76H). The presence of remnant mesh texture within the clay pseudomorphs indicates that the clay formation postdates serpentinization in mesh texture (Figure F76A, F76B, F76G, F76H). Some of the pseudomorphs are similar in brownish color and high birefringence to the talc-saponite interlayering mixture reported from Hole U1309D (Nozaka et al., 2008; cf. Rouméjon et al., 2018).
4.2.2.9. Pyroxene
A small amount of brown amphibole occurs in association with clinopyroxene in relatively fresh gabbroic rocks (Figure F77A–F77D). Brown amphibole also occurs as granular grains coexisting with recrystallized clinopyroxene neoblasts in mylonitic gabbros (Figure F77E, F77F); however, recrystallized clinopyroxene neoblasts do not coexist with brown amphibole in all mylonitic gabbros. Clinopyroxene and orthopyroxene in proximity to amphibole ± chlorite veins is subjected to static alteration to form green and colorless amphibole and locally brown, pale brown, or greenish brown amphibole (Figure F77G–F77J). Although fine-grained aggregates of amphibole in some samples appear to have been affected by dynamic recrystallization, they are likely pseudomorphs after preexisting clinopyroxene neoblasts because they have greenish or pale colors similar to those of hydrothermal origin and clinopyroxene porphyroclasts and neoblasts still remain in some of the samples.
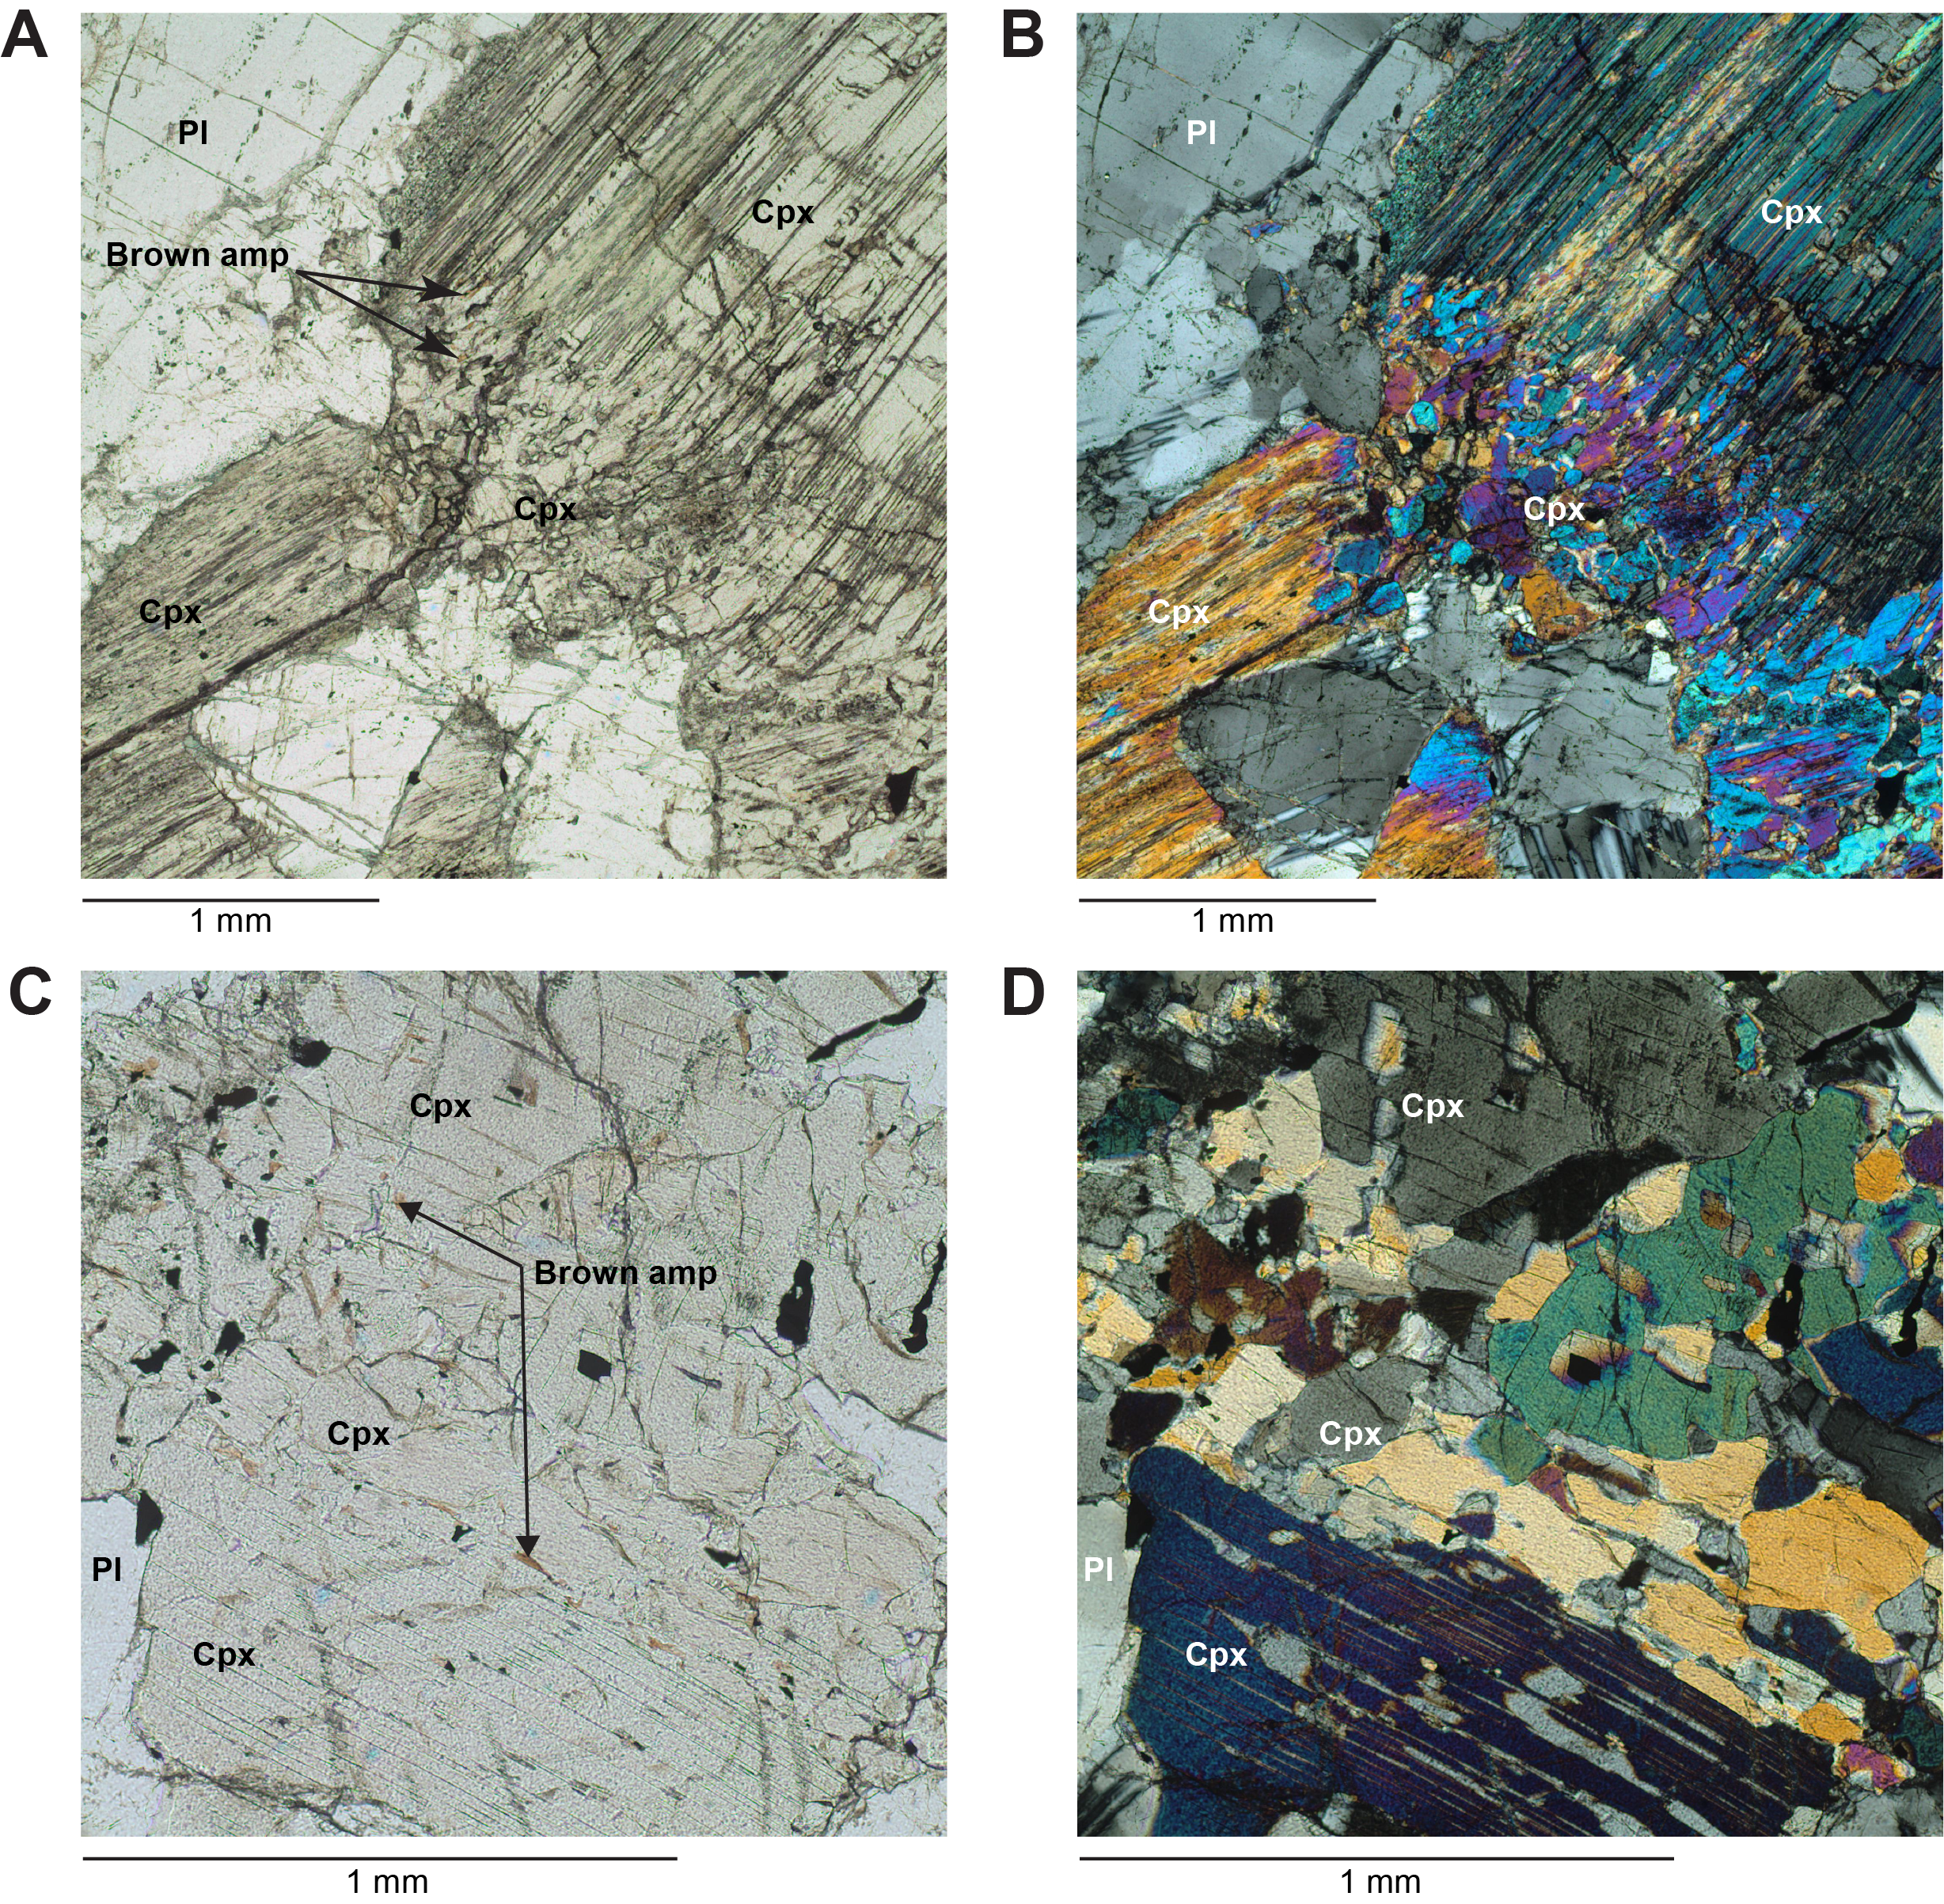
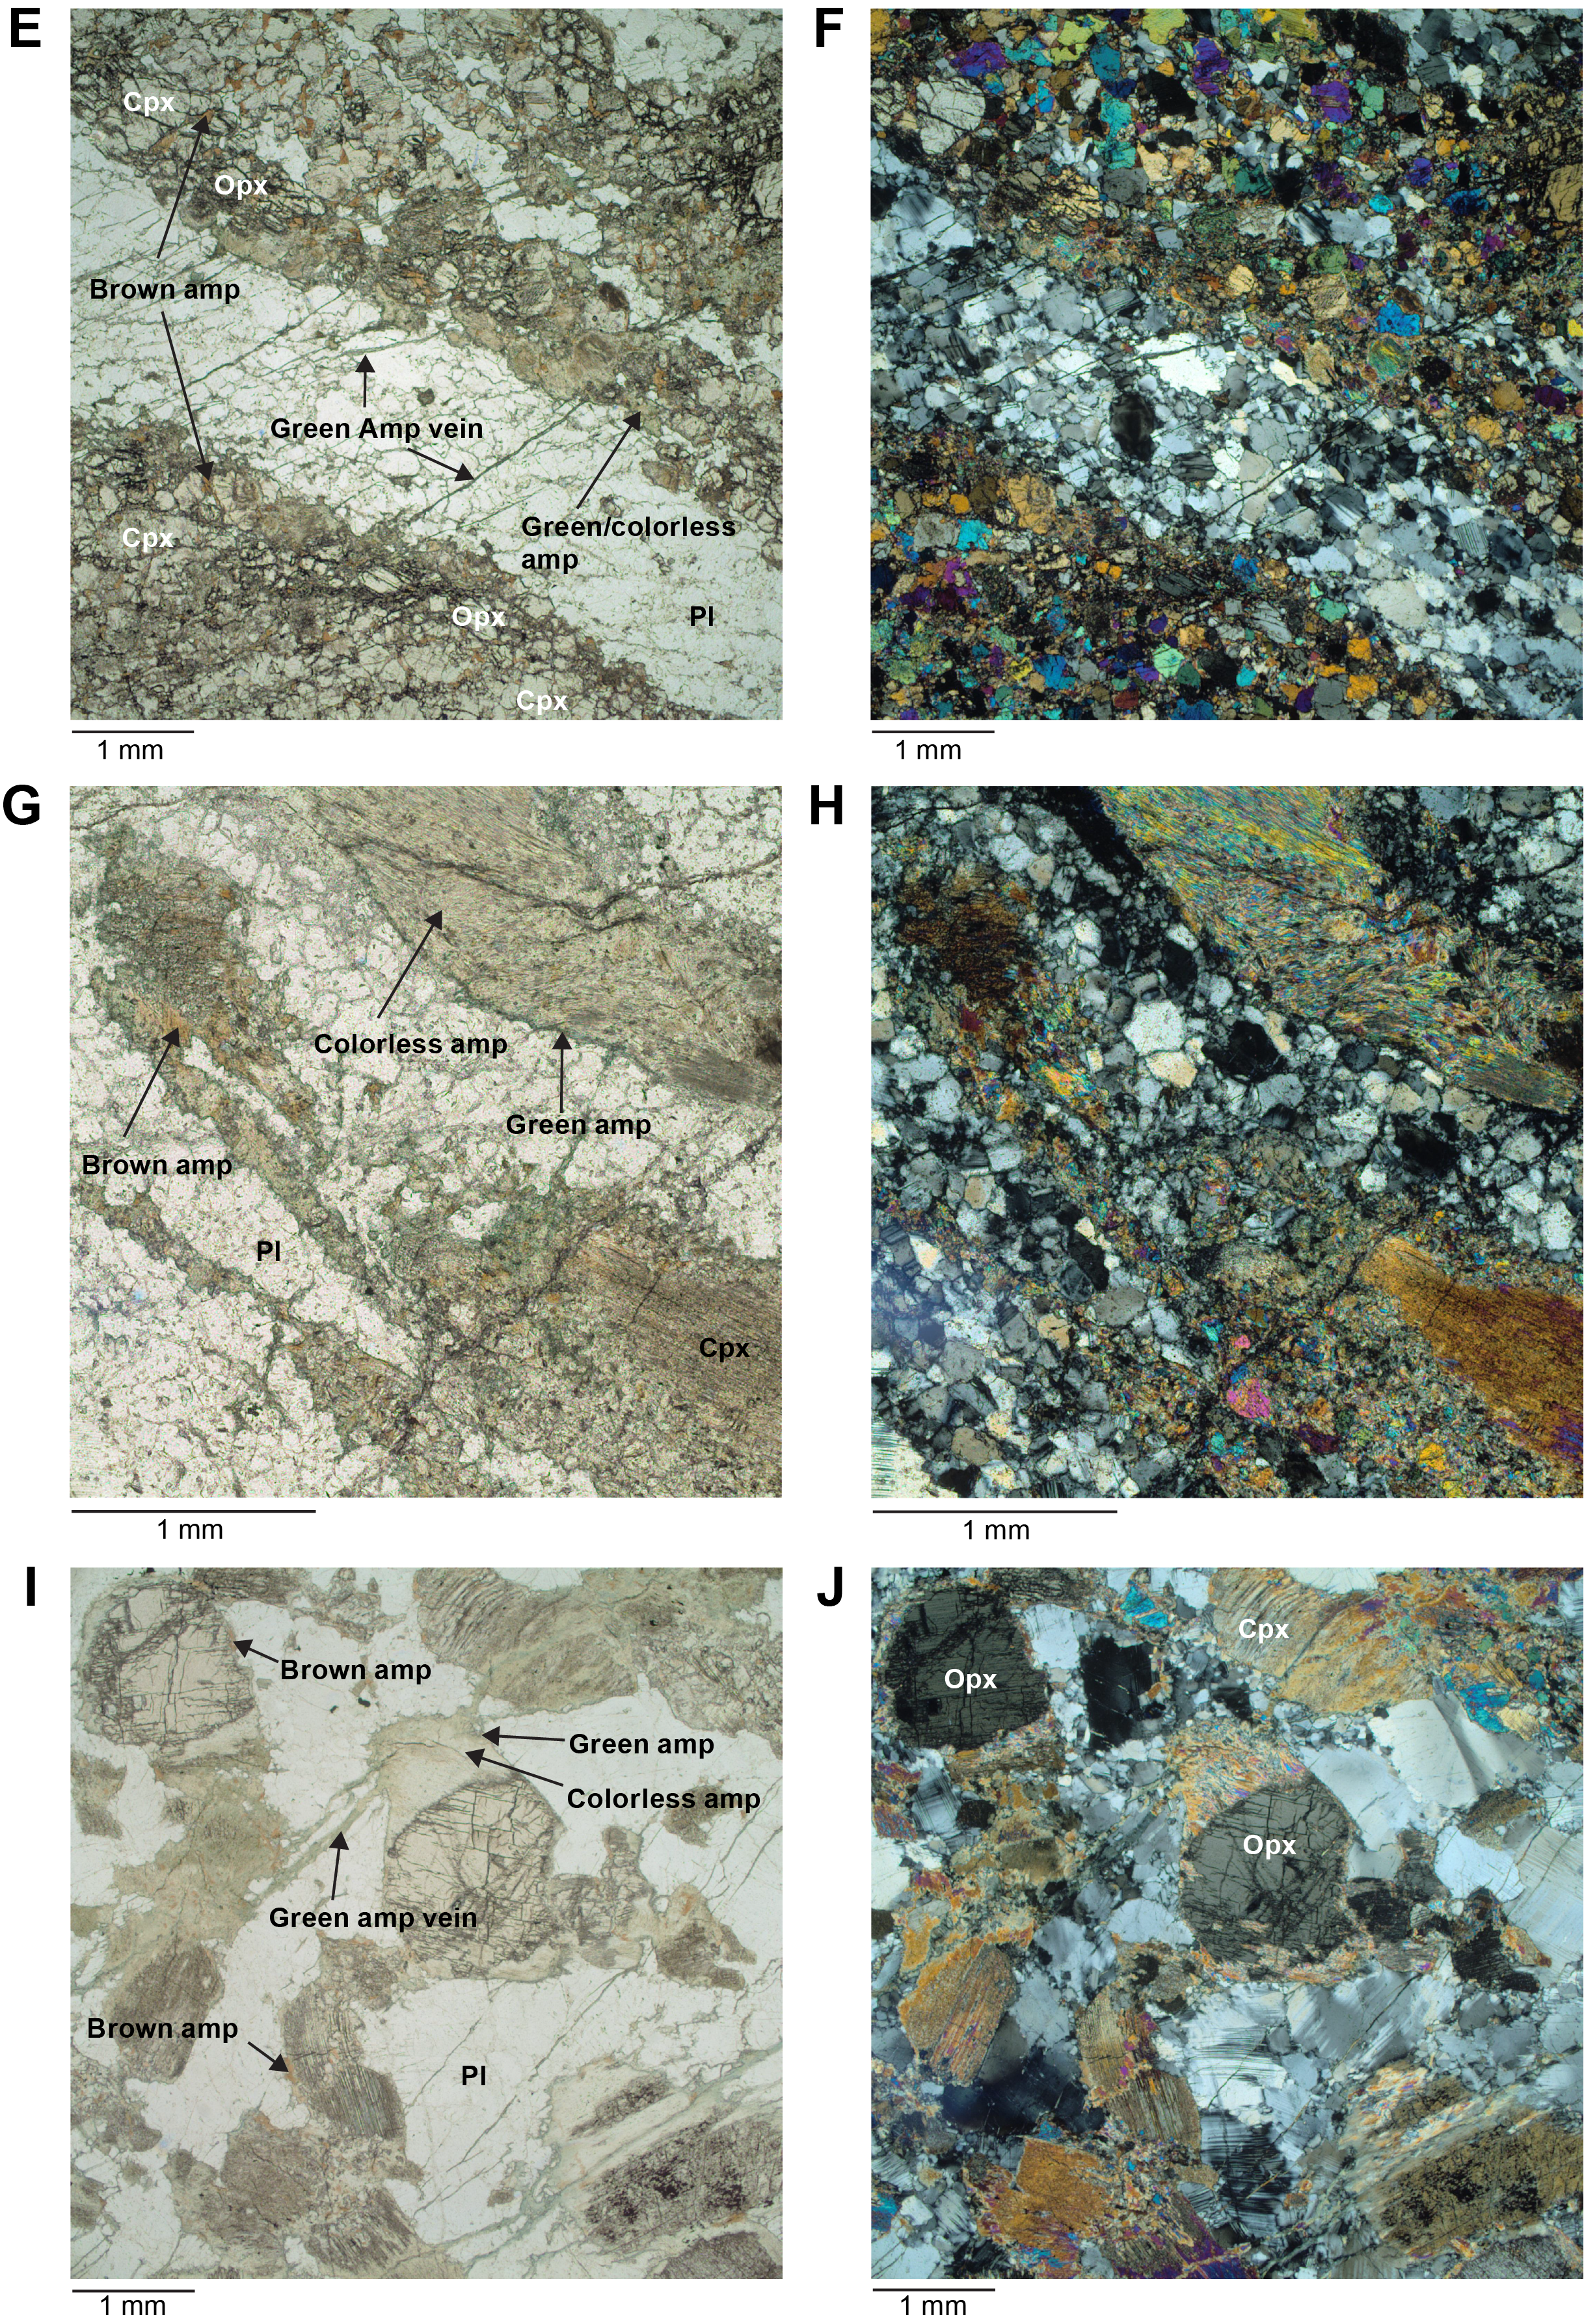
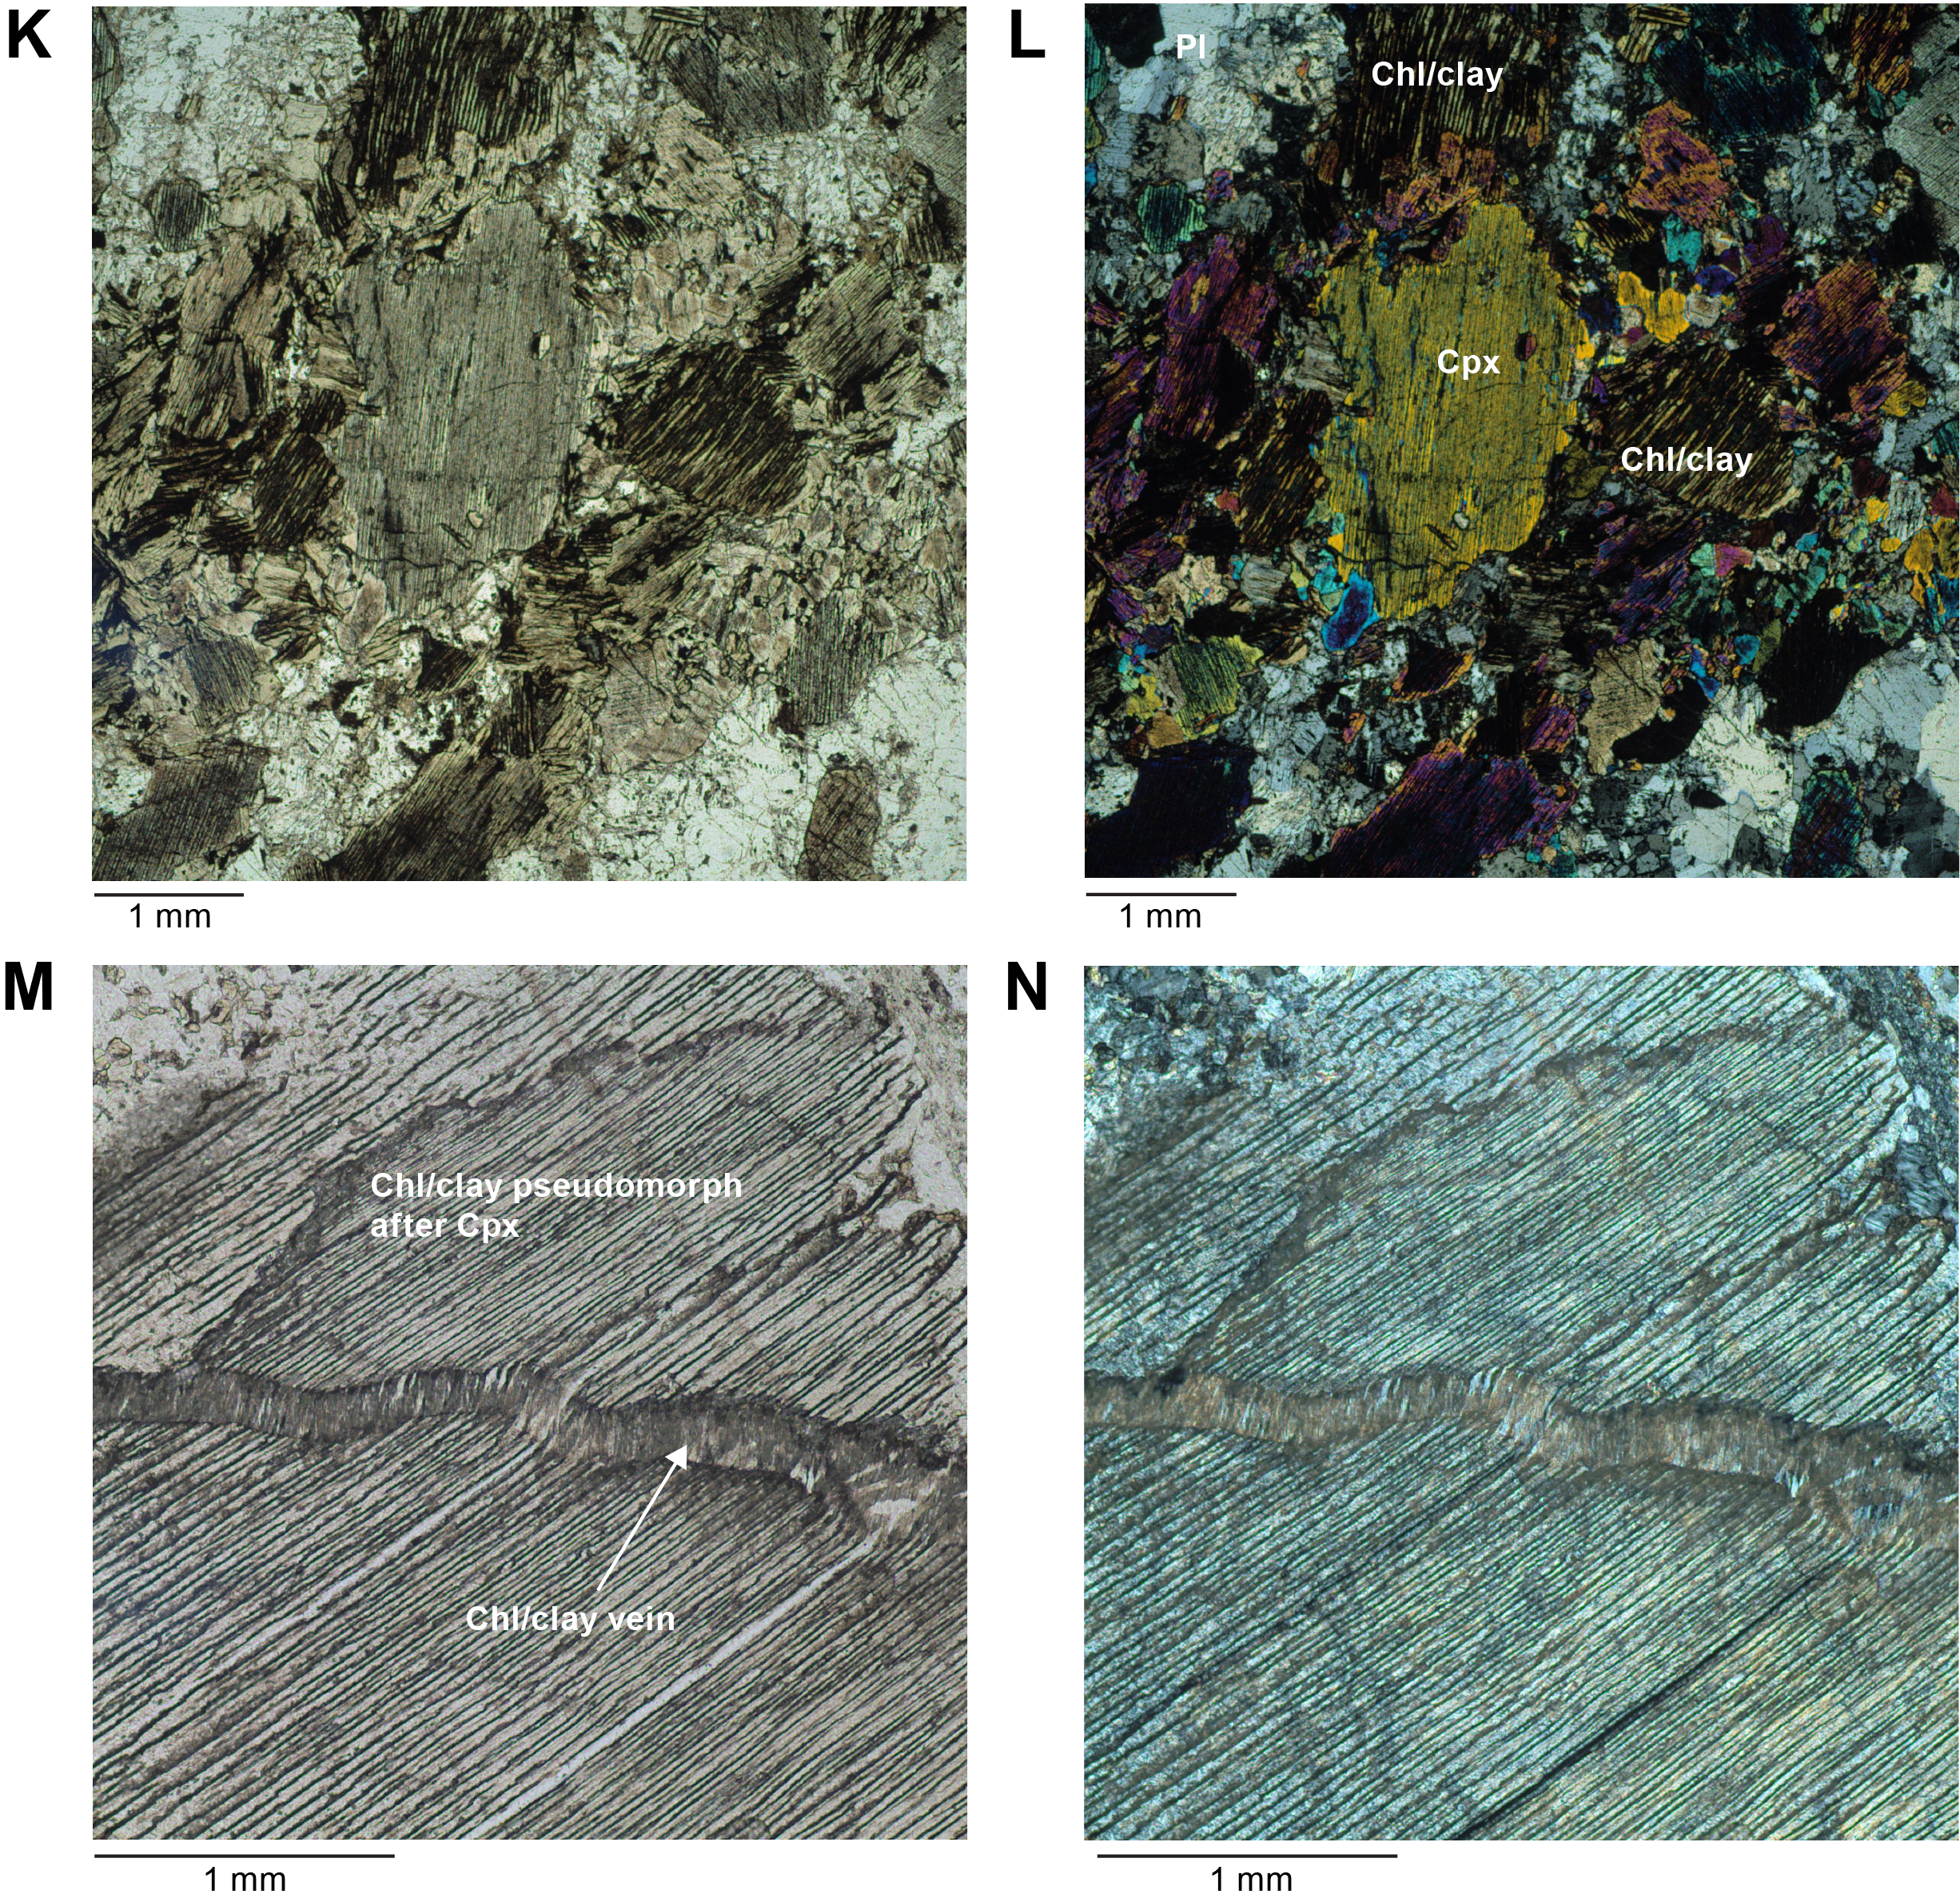
Figure F77. Mode of occurrence, pyroxene alteration minerals.
Clinopyroxene and orthopyroxene are partially altered along microfractures and cleavage surfaces, showing dusty appearance and lower birefringence. It is difficult and in some cases impossible to identify fine-grained alteration products of pyroxene using transmitted light microscopy; however, judged from color, relief, and birefringence, the most probable alteration products include chlorite, clay mineral(s), and stratified mixtures of chlorite and clay minerals, in addition to talc, which forms after orthopyroxene. In proximity to veins composed of chlorite, clay, or mixtures of clay minerals and chlorite, clinopyroxene is completely replaced by chlorite or clay mineral(s) (Figure F77K, F77L). Chlorite and/or clay forming veins can also connect chlorite/clay pseudomorphs after clinopyroxene, such as in Sample 399-U1601C-134R-2, 109–114 cm (TS87) (Figure F77M, F77N).
4.2.2.10. Plagioclase
On average, plagioclase is much fresher than mafic minerals. Even in rocks in which mafic minerals were highly altered (>50% of original amounts), the extent of plagioclase alteration is typically <5%. However, particularly in proximity to zeolite, prehnite, clay/chlorite, and/or carbonate veins, plagioclase alteration degrees can increase to >50%. In some gabbros, generally those in contact with serpentinized peridotite, plagioclase is completely altered.
Plagioclase adjacent to olivine replaced by amphibole is commonly altered to chlorite in a corona texture (Figure F76A, F76B). In plagioclase adjacent to olivine with relatively thick mesh-forming serpentine veins, abundant prehnite formed along microcracks (Figures F76E–F76H, F78A, F78B) as is the case of rodingite reported from Hole U1309D (Frost et al., 2008). In proximity to zeolite, prehnite, clay/chlorite, and/or carbonate veins, replacement of plagioclase by alteration minerals such as secondary plagioclase, zeolite, prehnite, and chlorite is conspicuous (Figure F78C, F78D).
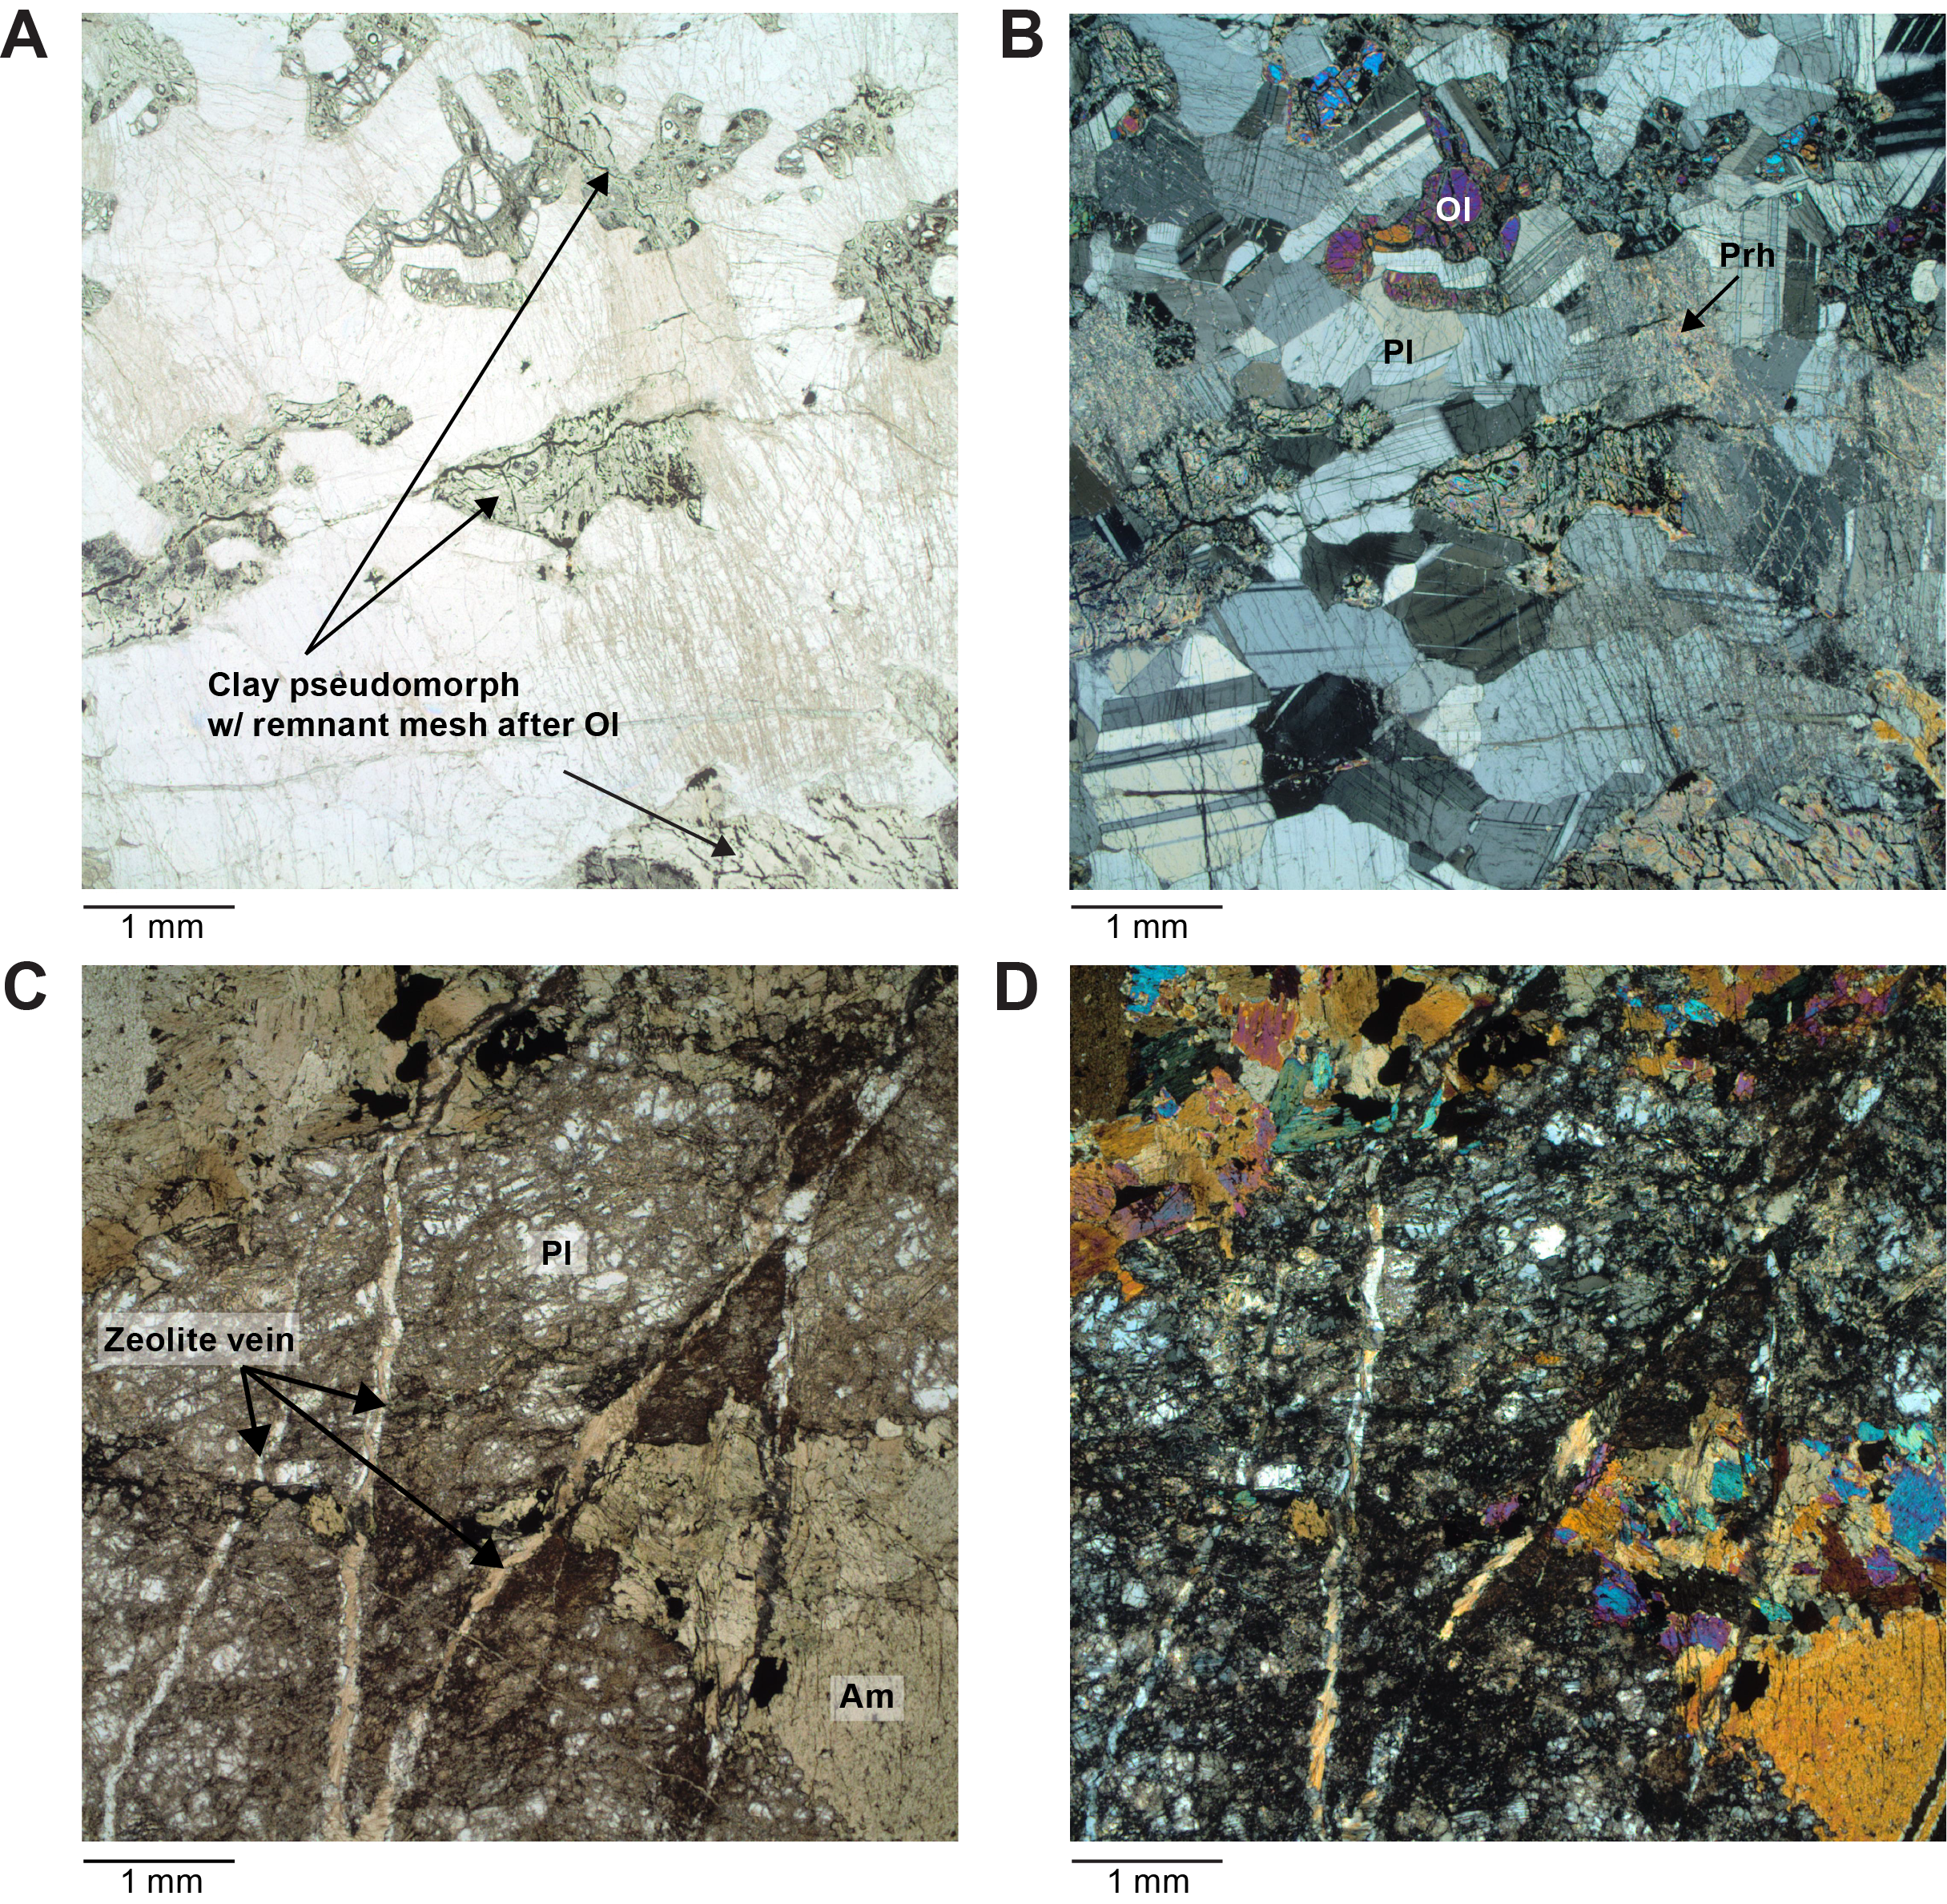
Figure F78. Mode of occurrence, plagioclase alteration minerals.
4.2.2.11. Metasomatism of magmatic veins and serpentinite/gabbro contacts
Many types of hydrothermally altered magmatic veins and metasomatic zones millimeters to several centimeters in size cut the serpentinized peridotites of Hole U1601C, producing various alteration textures and mineral assemblages with colors ranging from pinkish to greenish to white (Figure F79). In some instances, the former magmatic origin is hard to retrieve because of the advanced hydrothermal alteration of the vein or dike (e.g., Figure F79A) (e.g., Samples 177R-1, 34–37 cm [TS142], and 177R-1, 24–26 cm [TS229]). However, the local presence of former pyroxene and rare pseudomorphs and secondary minerals such as amphibole, chlorite, and prehnite locally filling porosity, at least locally suggest the hydrothermal mineral assemblages formed after a former magmatic vein. Hand specimen observation of spherules suggests macroscopic reaction porosity may be quite common in the altered gabbros of Hole U1601C.
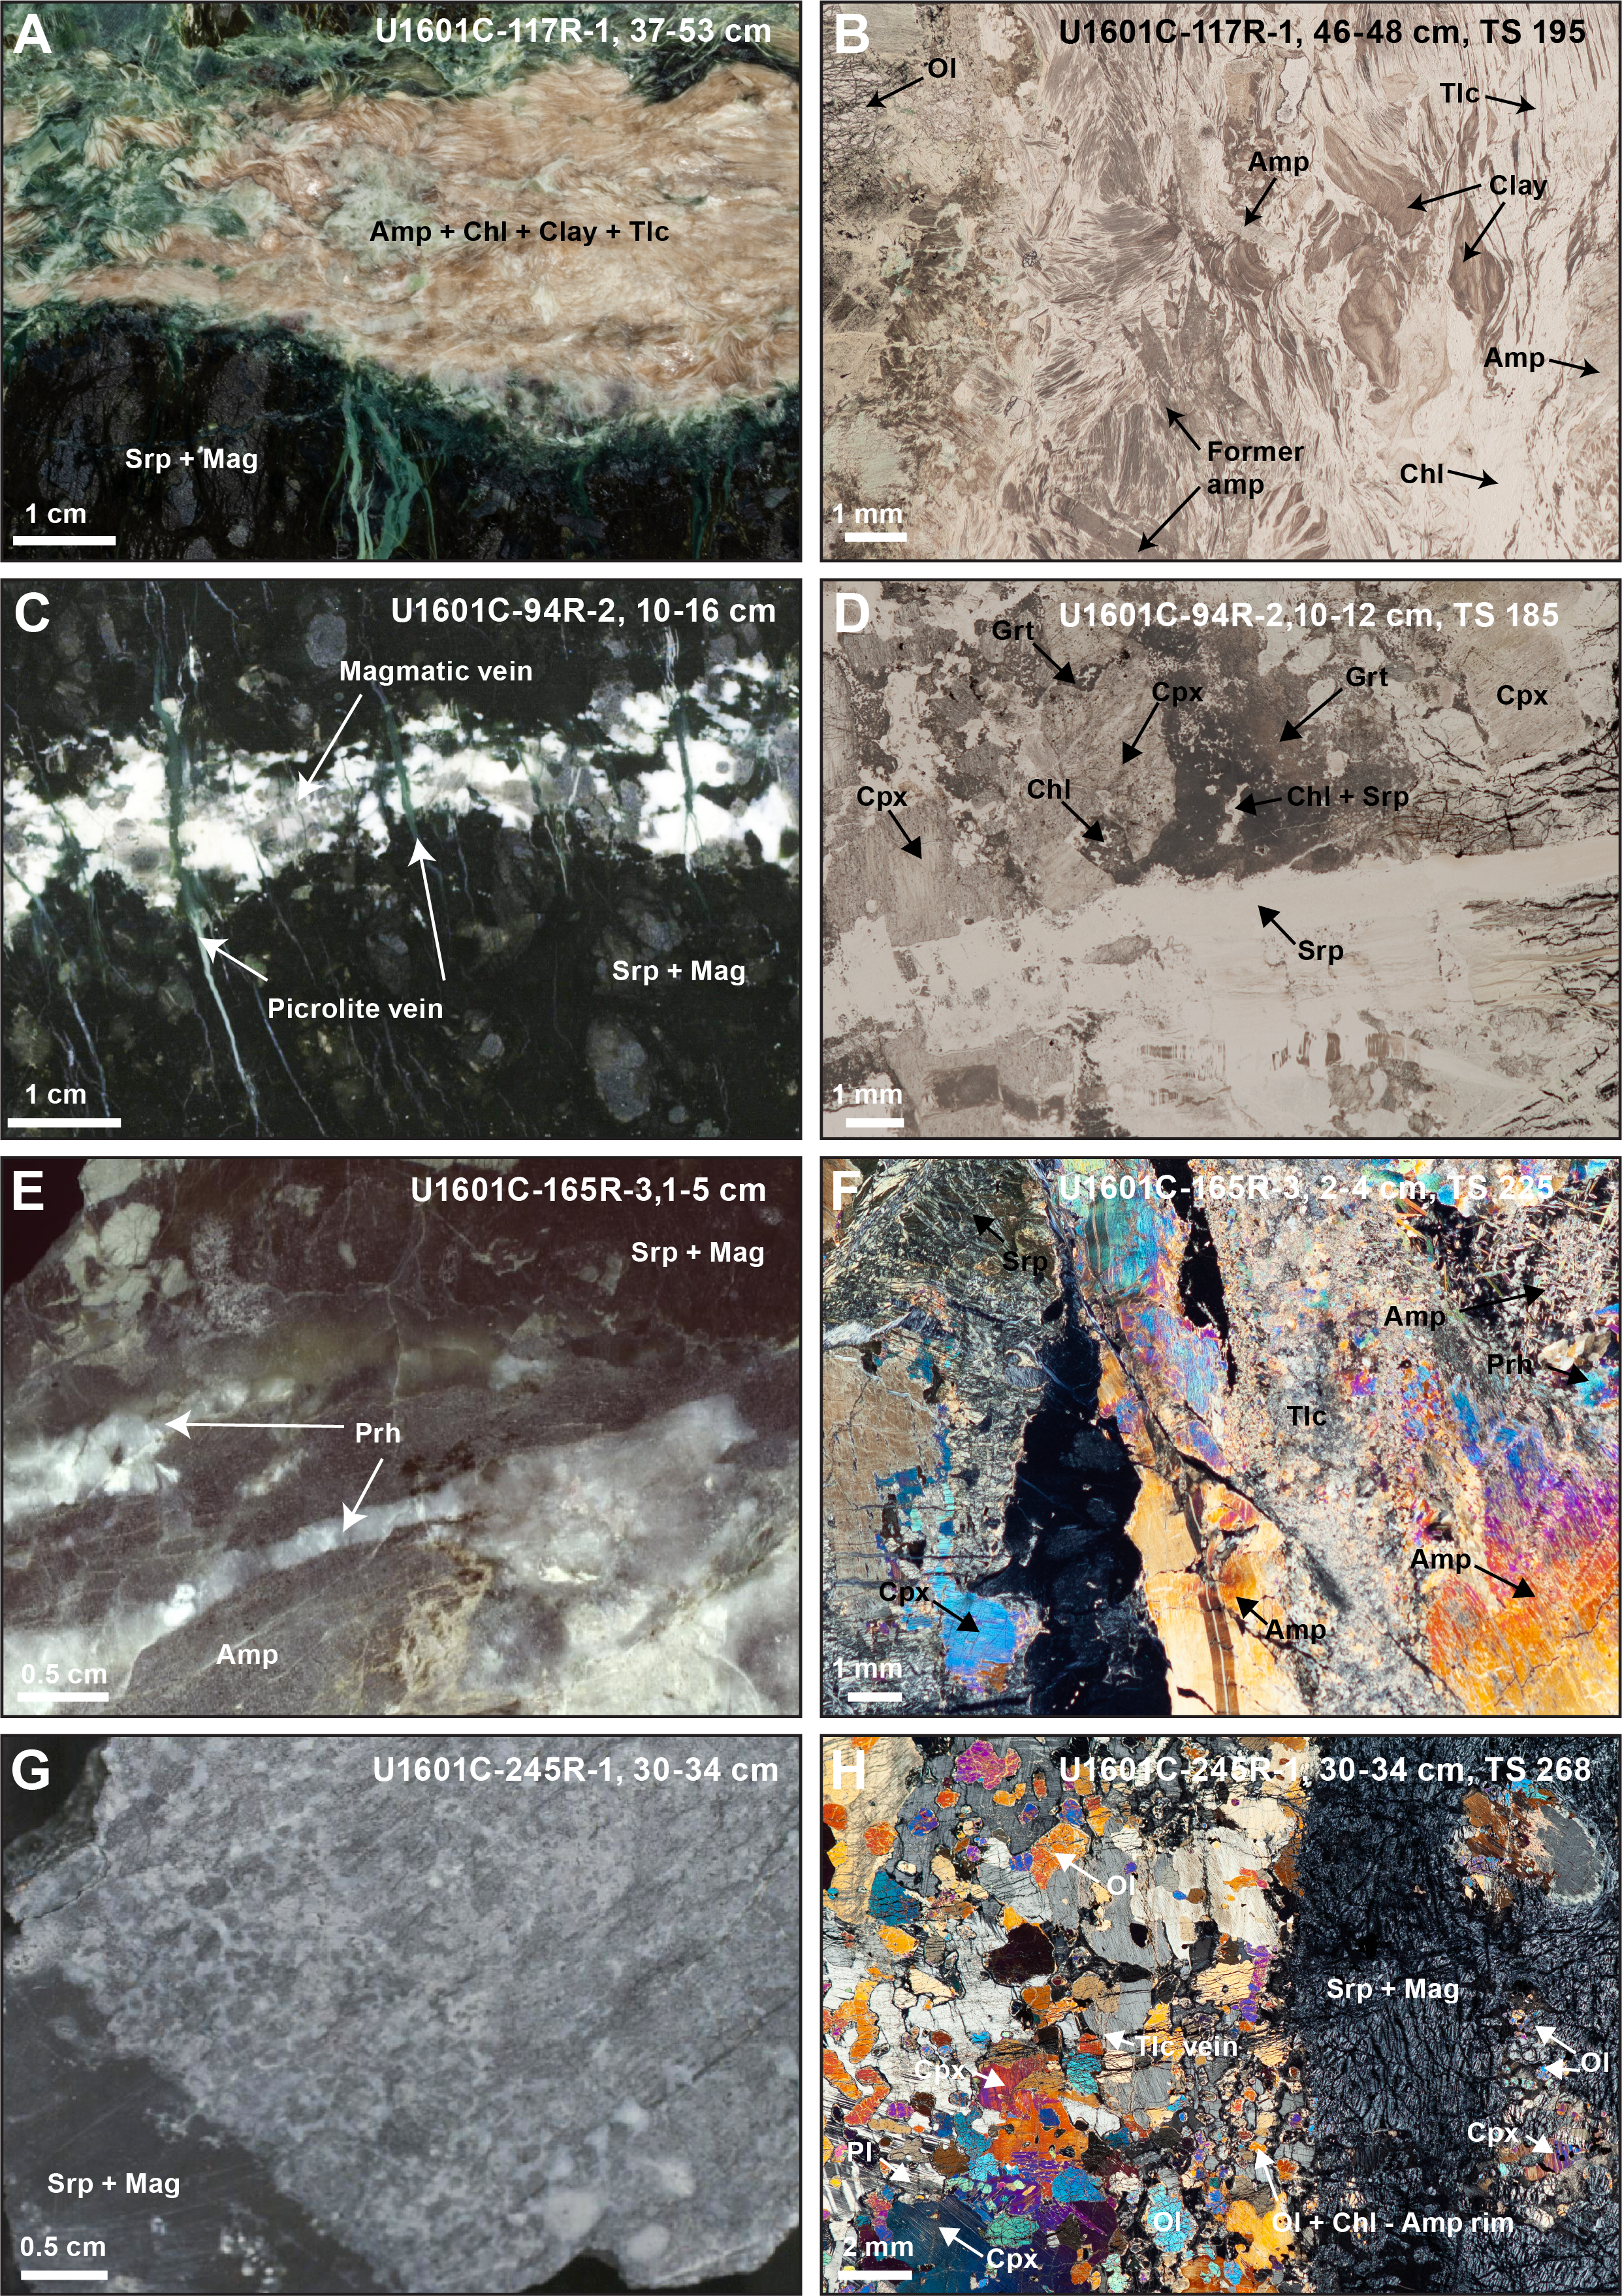
Figure F79. Hydrothermally altered magmatic veins.
Hydrothermally altered magmatic veins can either display deformation-assisted alteration (Figure F79A, F79B) or alteration under static conditions (Figure F79C–F79F). Veins of schistose aspect, composed of fibrous to weakly laminated minerals, generally consist of a mixture of chlorite and amphibole of variable proportions. Locally, chlorite of variable chemical composition comprises up to 90% of the hydrothermal vein. Serpentine, talc, and likely white mica occur to a lesser extent, whereas putative hydrothermal zircon has also been observed in one vein (Sample 199R-3, 123–125 cm [TS234]). Apart from white mica and zircon, these mineral assemblages were confirmed by XRD analyses (Table T6). Chlorite and amphibole can form kinked grains reaching up to several millimeters in size (Figure F79F). Generally, amphibole and chlorite form after clinopyroxene, and if present in the protolith, plagioclase is completely replaced by chlorite. The hydrothermal veins are cut by locally composite serpentine and/or clay mineral veins and locally also by carbonate veins. In one sample (122R-4, 37–40 cm [TS198]), late ilvaite veins accompanied by a pleochroic, green, low-relief mineral, possibly a phyllosilicate, also cut through the altered magmatic vein. There, ilvaite and this unidentified mineral seem to replace olivine, and ilvaite is also observed as a rim around sulfide associated with olivine. Locally, a green aureole (2–3 mm thick) composed of Fe-rich serpentine is present along the contact between a chlorite-amphibole vein and the serpentinized peridotite (Sample 149R-2, 104–106 cm [TS215]).
In the statically altered magmatic veins, primary magmatic textures are often relatively well preserved and plagioclase is generally more altered than clinopyroxene. The latter is variably altered to amphibole and chlorite, whereas plagioclase is highly to completely altered to garnet (possibly hydrogrossular), chlorite, and minor prehnite (Figure F79C–F79F). In one sample, abundant (up to 10%) disseminated epidote was found as tiny grains (<50 µm) surrounded by a chlorite-amphibole groundmass (Sample 173R-3, 83–85 cm [TS227]). In this sample, titanite is observed as a minor phase and the vein contains abundant disseminated opaque minerals. As observed in the schistose metasomatic zones, these rodingite-like veins are in turn cut by serpentine and/or clay mineral veins (i.e., identified as picrolite veins in macroscopic descriptions).
In some instances, in hydrothermally altered magmatic veins regardless of the static or deformation-assisted alteration, a mineralogical gradient is present with the core of the vein being richer in amphibole, whereas going toward the contact with the serpentinized peridotite, chlorite becomes more abundant and is locally the only mineral phase observed.
In addition to these metasomatic zones and rodingite-like veins, another type of hydrothermal alteration occurs at the contact between troctolite and serpentinized peridotite (Figure F79G, F79H). In the troctolite, olivine at the contact with plagioclase displays chlorite coronas and the inner part of olivine is replaced by amphibole (likely tremolite or actinolite) and various amounts of serpentine and opaque minerals (Sample 245R-1, 31–54 cm [TS268]). Talc veins are also observed cutting pyroxene with local talc patches in olivine. The extent of hydrothermal alteration decreases toward the inner part of the troctolite vein, and the extent of hydrothermal alteration of minerals is with increasing extent clinopyroxene, orthopyroxene, plagioclase, and olivine (Figure F79G, F79H). This alteration of the troctolite tends to propagate into the serpentinized peridotite groundmass as chlorite-clay mineral-carbonate veins that locally replace olivine and clinopyroxene. In places where hydrothermal alteration is more advanced, olivine is completely replaced and the core is now composed of serpentine and/or clay minerals and opaque minerals, whereas plagioclase at the contact is replaced by garnet (olivine gabbro Sample 169R-2, 17–19 cm [TS226]).
Interestingly, in a few samples mantle silicates (olivine and pyroxene) tend to be more preserved near former magmatic veins (very few millimeters to centimeters) than in the serpentinized peridotites at increasing distance from the veins. This is particularly striking in Samples 122R-4, 37–40 cm [TS198], and 192R-1, 71–73 cm [TS235]. However, the origin of these silicates could also be due to melt–rock interaction during the percolation of melts from which the magmatic veins crystallized.
Finally, static hydrothermal alteration consisting of talc-carbonate-sulfide was observed in a few samples (e.g., 139R-3, 19–21 cm), whereby dunite is replaced by a fine-grained intergrowth of talc and calcite (based on XRD analyses; Table T6) and overgrown by subhedral to euhedral, up to several millimeters large, sulfide grains. This mineral assemblage seems to overprint serpentinization.
4.2.3. Sulfide occurrences in Holes U1601A and U1601C
Serpentinized peridotites and gabbroic rocks of Holes U1601A and U1601C contain sulfide minerals of igneous (i.e., primary) origin as well as sulfides that formed during hydrothermal alteration (i.e., secondary formation) locally forming pronounced sulfide mineralizations (i.e., host rock containing up to several weight percent S) (Figure F80). Primary sulfides occur as inclusions within primary minerals and as interstitial phases between grain boundaries of primary silicates. However, for sulfides disseminated throughout the cores, their origin is likely related to fluid-rock interaction. The serpentinized peridotites contain what appears to be Ni- or Ni-Fe sulfides often together with magnetite, and in addition possibly alloys as determined macroscopically. However, their small grain size, usually less than 50 µm in diameter, made their identification difficult.
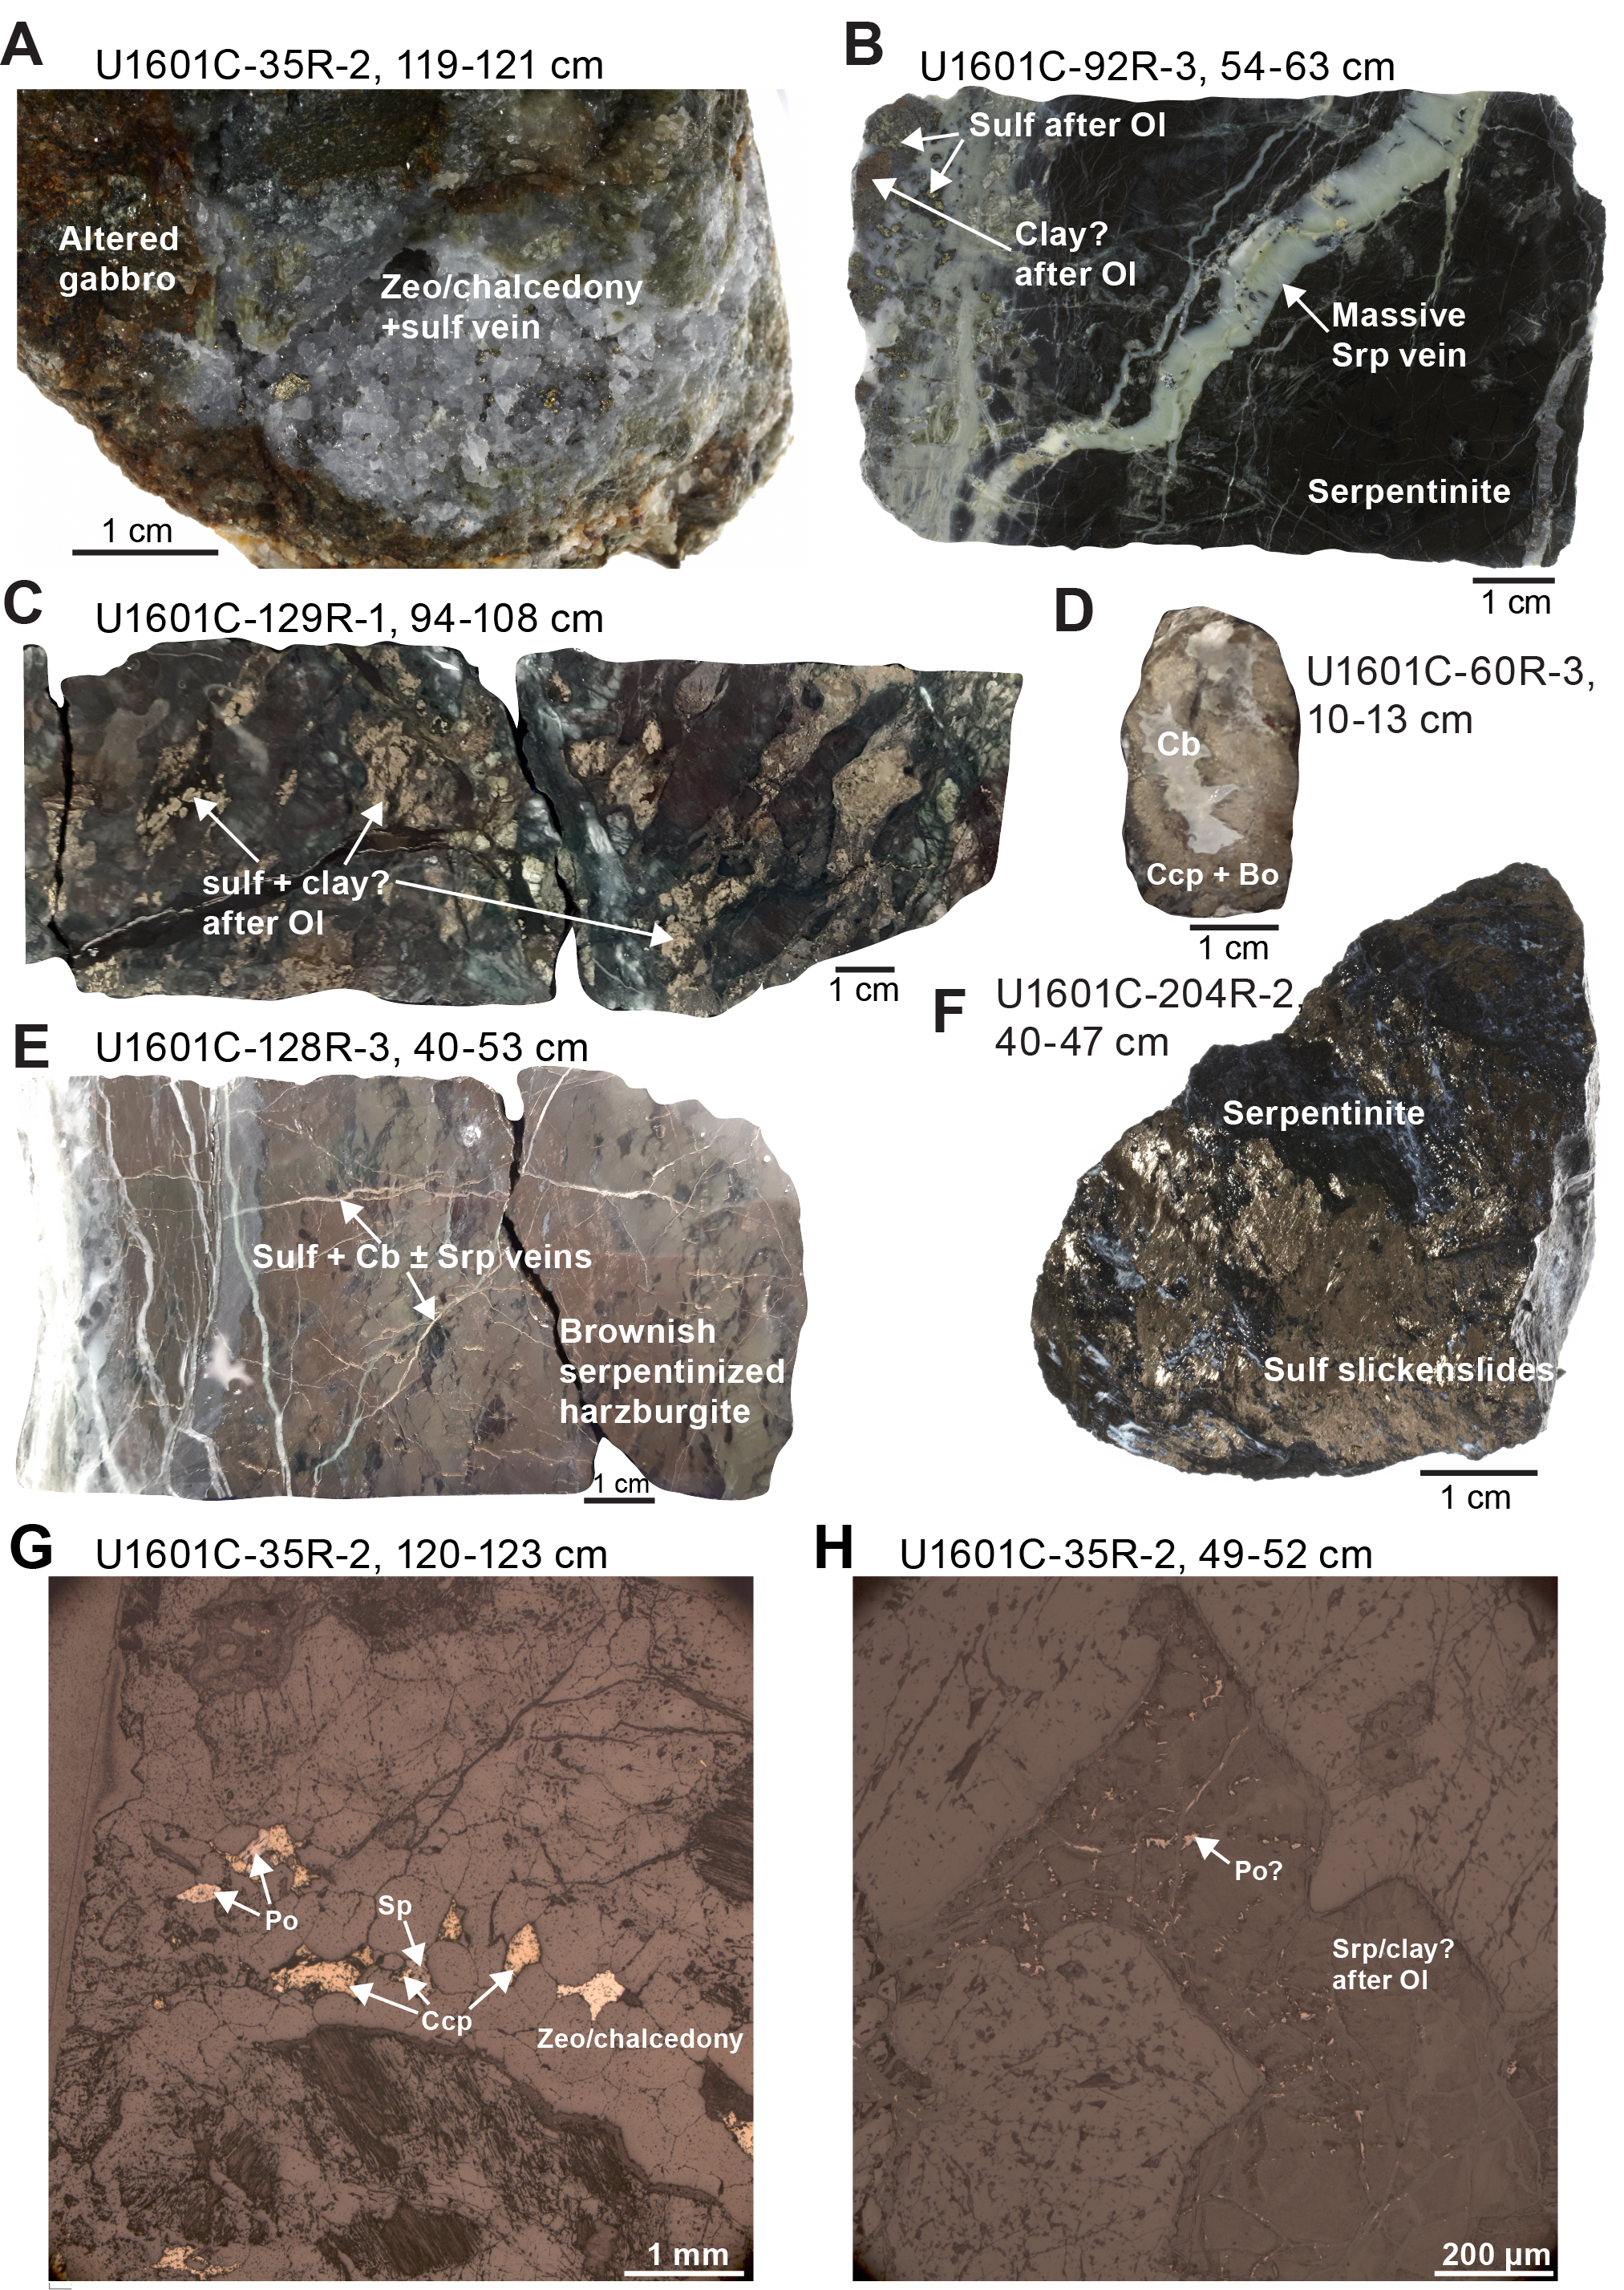
Figure F80. Sulfide mineralization.
The dominant occurrence of secondary sulfides in Hole U1601C is associated with veins with three different modes of occurrence: (1) in veins cutting through serpentinized peridotites at the contact with altered gabbroic rocks or in metasomatized peridotite adjacent to gabbroic rocks, (2) as veins and in mesh texture after olivine in gabbroic rocks, and (3) as veins associated with carbonates without a clear relationship with the host rock.
Sulfide mineralizations in serpentinized peridotite are common near decimeter- or meter-sized gabbroic layers, and they are rare if magmatic veins are thinner than ~10 cm. In the serpentinized peridotites, sulfide veins are locally associated with various proportions of carbonate and serpentine (Figure F80E). The frequency of these veins in each section varies from single veins to a set of several millimeters- to centimeters-thick bronze veins, and in rare cases, they form a network of bronze veins (Figure F80E). At the contact with gabbroic rocks, the serpentinized peridotite hosting the sulfide mineralization displays black to brown mesh that differs from common green to gray mesh observed away from gabbroic rocks. The brown color is likely due to the presence of microscopic-sized disseminated sulfides in the mesh. This is supported by pXRF analyses, which detected as much as 1.9 wt% S in the most strongly brown-colored mesh zones (Section 205R-2, 3 cm). Because most of the sulfides in mantle rocks contain between ~30 and 52 wt% S, the total sulfide content of the rock then corresponds to roughly 4–6 vol% S. Although the exact sulfide mineralogy could not be constrained based on macroscopic and microscopic observations, the presence of chalcopyrite and bornite is inferred based on the golden yellow and purple luster, respectively, in the thickest sulfide veins. Additionally, sulfide is locally observed as fracture coatings in serpentinized peridotite, where sulfides may form slickensides (Figure F80F), possibly after draping former serpentine slickensides.
In some of the thicker gabbro layers, sulfide occurs in different types of veins, including talc-carbonate ± prehnite ± serpentine, carbonate, amphibole, and quartz veins (Figure F80A). Vein width and sulfide grain size are generally larger in gabbro than in serpentinized peridotites; individual sulfide grains can be as large as 1 mm. In one quartz vein that cuts through altered gabbro, associated sulfides consist of pyrrhotite and/or pyrite, chalcopyrite, and minor sphalerite (Figure F80G). Bornite has also been identified based on its distinctive purple luster in some veins cutting through gabbro.
Sulfide minerals are also observed as a replacement product of olivine in gabbroic rocks. There, they either occur close to talc-carbonate ± serpentine veins (Figure F80B) or away from apparent macroscopic veins (Figure F80C). Pervasive sulfide replacement of olivine is macroscopically recognizable by its patchy brown aspect. Interval 129R-3, 95–110 cm, contains >30 vol% of sulfides after olivine, producing a pronounced golden color to the rock (Figure F80C). Where sulfides occur after olivine, the latter is generally partly to completely replaced by a mixture of clays ± serpentine (Figure F80H). Locally, sulfides are also associated with talc (± amphibole?), as observed in olivine in olivine gabbro from Hole U1309D. Regardless of the mineralogical assemblages, based on microscopic observations sulfide is likely pyrrhotite.
Finally, several pieces contain sulfide-carbonate veins (up to 15 mm) (e.g., interval 60R-3, 6–13 cm) (Figure F80D), where sulfide minerals occur as grains as large as 1 cm. Locally, neighboring pieces consist of gabbroic rocks, suggesting that sulfide-carbonate veins formed in fractures cutting through gabbroic rocks and where chalcopyrite and bornite have been identified after macroscopic observations. This was confirmed by pXRF analysis, which yielded S and Cu content of 14 and 15.2 wt%, respectively (interval 60R-3, 11–12 cm). Locally though, sulfide-bearing carbonate veins occur cutting through serpentinized peridotites that are unrelated to mafic lithologies, suggesting that other sulfur cycling processes take place (e.g., microbial sulfate reduction or thermochemical sulfate reduction) as is commonly observed in seawater-exposed peridotites (Schwarzenbach et al., 2012, 2018; Alt and Shanks, 1998) and was also described for Expedition 357 drill cores (Liebmann et al., 2018).
4.2.4. Alteration conditions
4.2.4.1. Alteration conditions of ultramafic rocks
Ultramafic rocks are unstable in the presence of water over a wide range of temperatures and pressures (Frost and Beard, 2007; Jöns et al., 2010). Accordingly, primary minerals dissolve and secondary minerals precipitate, which has fundamental implications for plate tectonics, global geochemical cycles, planetary habitability (including the subseafloor), and the abiotic synthesis of organic compounds (Alt et al., 2013; Escartín et al., 2001; Hirth and Guillot, 2013; Beinlich et al., 2014; Glein and Zolotov, 2020; Grozeva et al., 2020; Lang and Brazelton, 2020; Leong et al., 2021; Andreani et al., 2023). In Holes U1601A and U1601C, ultramafic rocks record a broad range of alteration processes and environmental conditions, from high-temperature interactions with hydrothermal fluids to near-seafloor interactions with seawater.
Fluid inclusions in olivine provide a record of high-temperature fluid–rock interactions in ultramafic rocks. In general, two main groups of fluid inclusions can be distinguished: primary fluid inclusions formed during crystal growth and secondary fluid inclusions formed during healing of fluid-filled fractures (Roedder, 1984) (Figure F81). In ultramafic rocks from Hole U1601A, olivine is the only primary mineral that contains fluid inclusions and all fluid inclusions are of secondary origin. Because fracturing can only occur when olivine undergoes brittle deformation, it constrains the upper temperature limit of fluid entrapment. For olivine, this temperature is ~800°C at ~8000 mbsf to ~600°C at ~2000 mbsf (Harper, 1985). The entrapment of fluids during fracture healing can proceed if the mineral host is (super)saturated in the fluid. For olivine, at subseafloor pressures (10–200 MPa) the minimum temperature at which olivine becomes stable in the presence of heated seawater is approximately 400°C (Allen and Seyfried, 2003; Frost and Beard, 2007; Klein et al., 2013, 2019), which represents the minimum temperature of fluid entrapment. A temperature range of 400°–600° or 800°C is broadly consistent with upper greenschist to (upper) amphibolite facies alteration conditions recorded by some of the gabbroic lithologies in Hole U1601C.
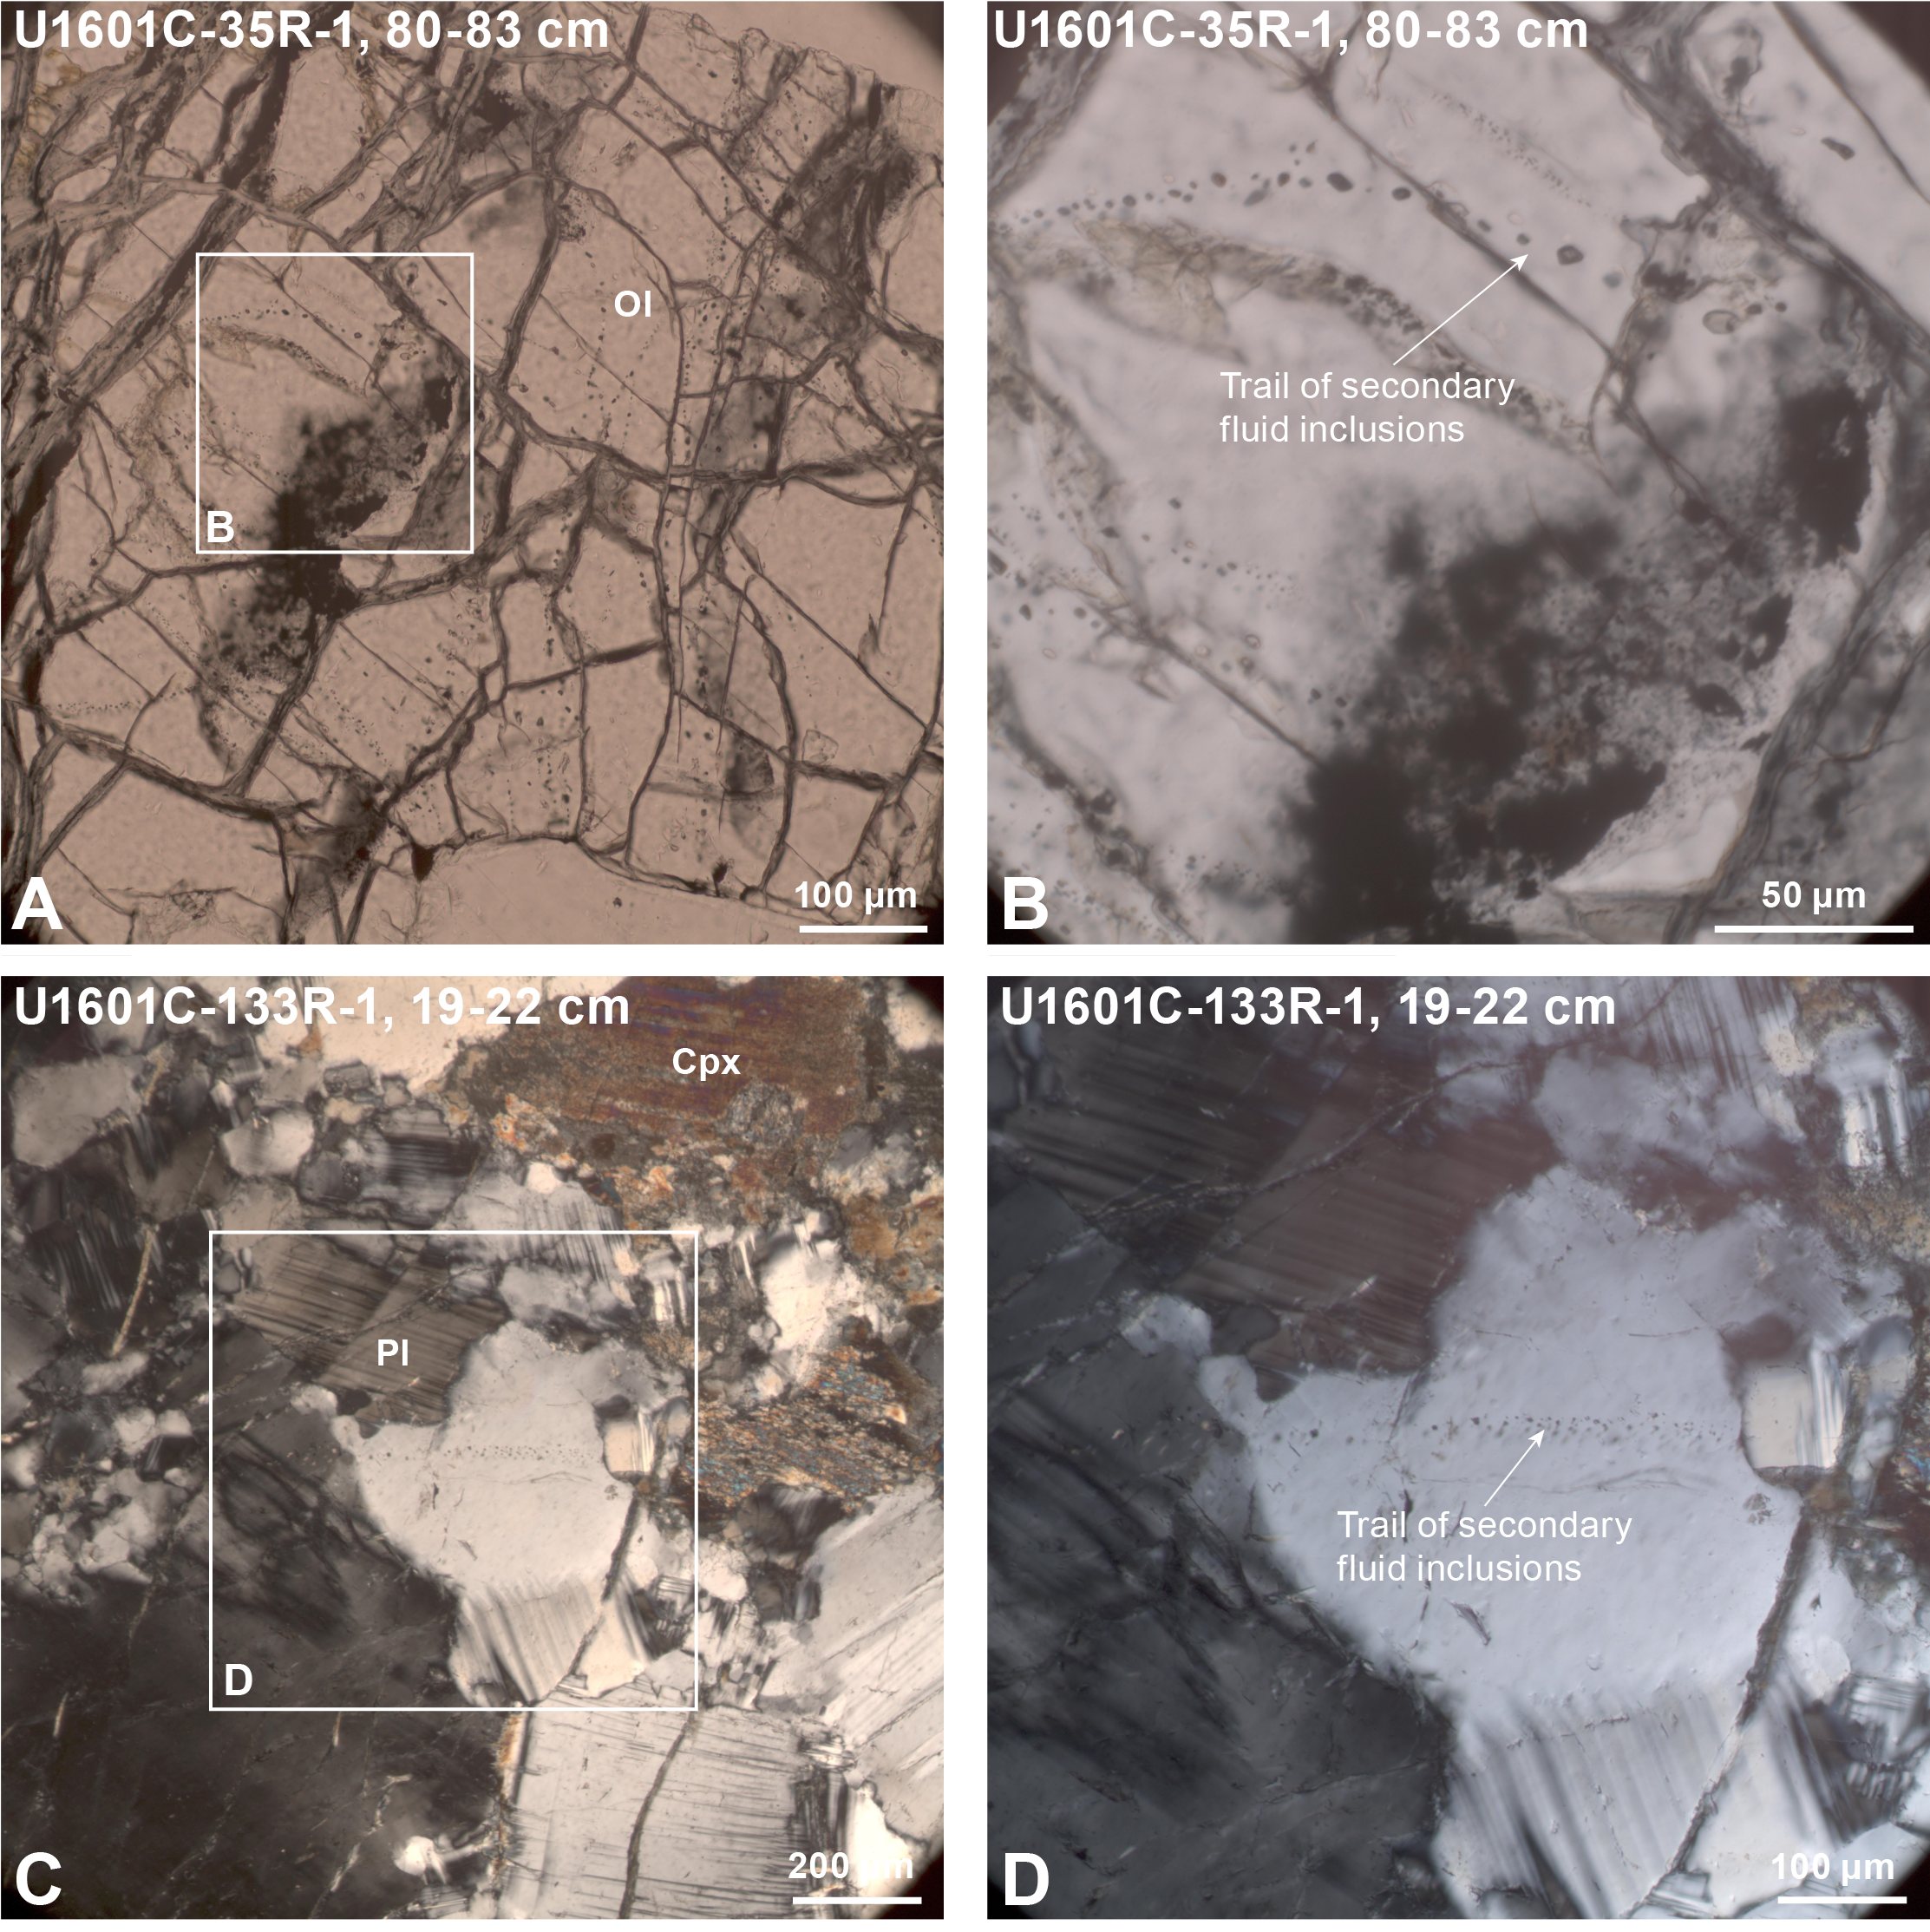
Figure F81. Secondary fluid inclusions.
Serpentinization of orthopyroxene results in the formation of serpentine, minor amounts of chlorite, and talc. During serpentinization of harzburgite and orthopyroxene-bearing dunite, serpentine can form together with talc at the expense of orthopyroxene at temperatures higher than ~400°C but also at lower temperatures if silica is added to the serpentinizing peridotite (e.g., from interaction of fluids with adjacent gabbroic lithologies) (Allen and Seyfried, 2003; Boschi et al., 2006; Jöns et al., 2010; Bach et al., 2006, 2013; Schwarzenbach et al., 2016). In thin sections of serpentinized harzburgite and orthopyroxene-bearing dunite from Hole U1601A, there is no evidence for talc formation via silica-metasomatism associated with gabbroic rocks, neither pervasive nor along veins, even though gabbroic rocks are locally abundant. Hence, the formation of talc along with serpentine (± chlorite and amphibole) in the Hole U1601A peridotites possibly initiated at the expense of orthopyroxene at temperatures exceeding 400°C. In Hole U1601C, at least one sample (139R-3, 19–21 cm) shows Si metasomatism of former serpentinite, as reflected by extensive replacement of the serpentine by talc + calcite. This type of alteration is typically referred to as steatization, which can be related to the alteration of mafic lithologies in the vicinity of serpentinized peridotites as, for example, observed in the Expedition 357 drill cores next to microgabbroic intrusions (Früh-Green et al., 2018; Rouméjon et al., 2018) and commonly observed in the serpentinites from ODP Leg 209 Site 1268 (Bach et al., 2004). Variably altered gabbroic rocks and troctolites occur both in the sections above this interval and below. Hence, Si metasomatism associated with gabbroic intrusions can be a potential mechanism for the talc metasomatism observed in this section.
At temperatures around 400°C, olivine is stable in the presence of water (Bach et al., 2006; Frost and Beard, 2007). In ultramafic rocks from Holes U1601A and U1601C, olivine is moderately to completely serpentinized. The occurrence of serpentine, magnetite, and iowaite/brucite in pseudomorphic mesh texture after olivine indicates a decrease in temperature to below ~320°C (Frost and Beard, 2007). Magnetite is present in serpentinite throughout all cores suggesting that it hosts some of the iron that was originally contained in olivine. If the temperature of serpentinization is ~200°C or below, iron released from olivine preferentially partitions into brucite, as is the case in serpentinite drilled during ODP Leg 173 at the Iberian margin (Klein et al., 2014). Therefore, the presence of abundant magnetite in serpentinite from Site U1601 indicates that the serpentinization of olivine took place at temperatures between ~320° and 200°C. This agrees with the observations in the shallow Expedition 357 drill cores using in situ δ18O analyses of serpentine, which suggested temperatures around 260°–360°C (Rouméjon et al., 2018). In situ isotopic variations within the mesh textures also reflect increases in the fluid-rock ratios during continuous mantle hydration as opposed to temperature variation. A similar range of temperatures from whole-rock oxygen isotope data was suggested for alteration of gabbros (and four serpentinites) in Hole U1309D (McCaig et al., 2010).
Besides the presence of serpentine-magnetite veins forming mesh texture in serpentinites from Holes U1601A and U1601C, different generations of serpentine veins were observed including fibrous to massive chrysotile veins, massive picrolite veins, and veins likely composed of antigorite. Based on microscopic observations, antigorite formation seems to be related to serpentinization of orthopyroxene (Figure F66D). For comparison, in samples from Expedition 357 antigorite cuts the mesh texture, suggesting that antigorite formation continued after much of the peridotite had already been serpentinized (Rouméjon et al., 2018). Hence, it seems likely that antigorite at the Atlantis Massif can form over a wide range of temperatures but that other factors such as Si activity (e.g., supplied by orthopyroxene alteration) also provide a controlling factor on antigorite formation (Rouméjon et al., 2019). Both mesh and antigorite veins are cut by fibrous chrysotile veins forming either a set of subhorizontal veins or a network of veins (Figure F66B). It remains unclear whether these veins form in response to tectonic processes related to detachment faulting or strain induced by volume changes during serpentinization (Klein and Le Roux, 2020; Malvoisin et al., 2020).
The textural and mineralogical variability of serpentine-group minerals in serpentinized peridotites of Holes U1601A and U1601C suggest complex polyphase series of serpentinization processes related to exhumation of the massif, consistent with previous studies of serpentinites from the Atlantis Massif (Rouméjon et al., 2018; Früh-Green et al., 2018; Beard et al., 2009) and at the MAR Kane area (Dilek et al., 1997; Andreani et al., 2007). However, these interpretations are based on petrographic observations in transmitted light made on a limited number of thin sections, and further mineralogical analyses are needed to better constrain the conditions and timing of serpentinization.
In addition to the temperature conditions, petrographic observations made in thin sections of rocks from Holes U1601A and U1601C can provide basic constraints on the redox conditions during serpentinization. Magnetite is pervasive in the recovered serpentinites. Because some of the ferrous iron that was originally contained in olivine is oxidized by water to ferric iron to form magnetite (and serpentine), molecular hydrogen (H2[aq]) is formed as a byproduct. Hydrothermal experiments and theoretical models suggest that serpentinization of ultramafic rocks can generate abundant H2(aq) (Seyfried et al., 2007; Klein et al., 2013, 2015a; McCollom et al., 2020), which is corroborated by the presence of Ni-Fe alloys and Ni-Fe sulfides indicative of low fO2 conditions during serpentinization, enrichments of H2(aq) in diffuse fluids associated with outcrops of serpentinized peridotite on the seafloor, high concentrations of H2(aq) and CH4(aq) in vent fluids, and gaseous H2 and CH4 in olivine-hosted fluid inclusions (Alt and Shanks, 1998; Proskurowski et al., 2008; Klein and Bach, 2009; Seyfried et al., 2015; McDermott et al., 2015; Klein et al., 2019; Lang et al., 2021; Aquino et al., 2022; Andreani et al., 2023; Schwarzenbach et al., 2012, 2014, 2021).
In serpentinized rocks from Hole U1601A, a variety of transition metal sulfides and possibly transition metal alloys, as well as olivine-hosted fluid inclusions, were detected. Although it was not possible to determine the mineralogy of specific transition metal sulfides and alloys or gas contents of fluid inclusions using the analytical techniques available on board during Expedition 399, these observations suggest low fO2 conditions during serpentinization. This is particularly supported by highly elevated concentrations of H2 and CH4 in fluids collected from Hole U1601C (see fluid chemistry in Geochemistry).
However, the formation of iron oxides and oxyhydroxides at the expense of magnetite and the widespread occurrence of carbonate veins in the shallower portions of Site U1601 suggest that conditions probably are more oxidizing close to the seafloor where oxic seawater enters and percolates through the basement (Milliken et al., 1996; Klein et al., 2017; Schwarzenbach et al., 2013). This is supported by the natural gamma ray data recovered during logging in Hole U1601C, suggesting U enrichment in the upper ~180 m (Figure F143). Mixing of serpentinization fluids with seawater likely causes the formation of brucite-aragonite veins, such as those observed in Hole U1601A (interval 6R-1, 90–96 cm), which is equivalent to the formation of carbonate-brucite assemblages in serpentinite from the Iberian margin and in Lost City chimneys (Früh-Green et al., 2003; Ludwig et al., 2006; Klein et al., 2015b).
4.2.4.2. Alteration conditions of gabbroic rocks
Mineral assemblages formed during static alteration of gabbroic rocks recovered from Site U1601 are comparable to those in oceanic lower crustal gabbroic rocks recovered from other drill holes at Atlantis Massif, Atlantis Bank, and Hess Deep rift. Previous studies on the temperature conditions of alteration revealed that (1) amphibole + chlorite after olivine and plagioclase and green amphibole after clinopyroxene are the products of amphibolite facies alteration; (2) serpentine, clay, and/or chlorite replacement after olivine and pyroxene and formation of prehnite, zeolite, and secondary plagioclase after primary plagioclase result from greenschist to subgreenschist facies alteration; and (3) the crosscutting relationships of the alteration assemblages and hydrothermal veins indicate that sequential alteration took place during cooling of the lower crustal rocks (Expedition 304/305 Scientists, 2006a; Blackman et al., 2011; Shipboard Scientific Party, 1999; Gillis et al., 2014; Dick et al., 2017; Nozaka and Fryer, 2011; Nozaka et al., 2008, 2016, 2017, 2019). As such, the widespread occurrence of the assemblage of chlorite + actinolite + plagioclase (albite) + titanite in basalt from Hole U1601A indicates pervasive alteration under greenschist facies conditions. Similarly, the formation of prehnite, garnet (likely grossular-andradite), chlorite, and secondary pyroxene (possibly diopside) after primary plagioclase and pyroxene, which seems to be associated with prehnite-chlorite-epidote veins, indicates later stage alteration at greenschist to subgreenschist facies conditions.
A major difference in alteration and related features between Sites U1601 and U1309 is the abundance of mylonitic gabbros. In mylonitic rocks from Site U1601, brown amphibole coexists with dynamically recrystallized clinopyroxene neoblasts. This suggests the possibility that mylonitization occurred in association with hydrothermal activity under upper amphibolite facies condition. This is also preserved in the foliated gabbronorite from Hole U1601A, where dynamic recrystallization of pyroxene and plagioclase seems to have taken place at temperature conditions that exceed those associated with hydrothermal alteration, as is the case of Atlantis Bank (Dick et al., 2017). However, pyroxene neoblasts do not coexist with amphibole in all the cases, and therefore, mylonitization could have taken place at similar or higher temperature conditions without the input of hydrothermal fluids. Brown amphibole also occurs in weakly deformed gabbros that have plastically deformed crystals and show local GSR recrystallization (Figure F77A–F77D). Similar rocks abundantly occur in Atlantis Bank (Dick et al., 2017) and were interpreted to have been crystallized from differentiated hydrous melts and deformed under hypersolidus conditions (Ferrando et al., 2022). Further differences in alteration features of gabbroic rocks of Site U1601 from those of Site U1309 were observed: less abundant occurrence of amphibole + chlorite ± talc assemblage compared with the relatively shallow levels (<800 mbsf) of Site U1309, in particular in the uppermost levels (<300 mbsf), where olivine is completely replaced by secondary minerals (Expedition 304/305 Scientists, 2006b; Blackman et al., 2011), and the frequent occurrence of a biotite-like phase in addition to amphibole + chlorite in corona-forming assemblages around olivine. The formation of amphibole + chlorite ± talc assemblages was interpreted to be a product of reaction between olivine, plagioclase, and hydrothermal fluids under lower amphibolite facies conditions (Nozaka and Fryer, 2011). The widespread occurrence of amphibole + biotite ± chlorite in corona around olivine was reported from Atlantis Bank and interpreted to be the result of amphibolite-facies metasomatic hydration (Nozaka et al., 2019).
All the above-mentioned differences of Site U1601 from Site U1309 are similar to Atlantis Bank, suggesting overall variations not only in hydrothermal activities but also magmatism and tectonics between the OCCs and even within each complex.
4.2.5. Metasomatism and hydrothermal alteration of magmatic veins
The abundance of strongly altered magmatic veins and metasomatic zones throughout Hole U1601C is very similar to metasomatic zones described in Expedition 357 drill cores, where amphibole, chlorite, and talc-rich assemblages occur near the contact between microgabbroic intrusions and serpentinites (Früh-Green et al., 2018; Rouméjon et al., 2018) and to chlorite-, talc-, and/or amphibole-rich schists and rodingites collected at the southern wall of the Atlantis Massif during several Alvin dives (Blackman et al., 2002; Schroeder and John, 2004; Boschi et al., 2006). Although the samples collected near the summit of the massif represent part of the detachment fault surface, which has an approximate thickness of ~100 m (Schroeder and John, 2004; Boschi et al., 2006), metasomatized serpentinites collected from depths of up to 3000 meters below sea level (mbsl) during Alvin dives may represent analogs to the metasomatic samples collected in Hole U1601C. Overall, the investigated samples from Hole U1601C show lower talc contents compared to samples investigated from Expedition 357 and detachment-related, dredged schists, and there is a distinct absence of talc-rich fault rocks in the studied rocks. This suggests that the metasomatism in the investigated samples is largely unrelated to detachment fault formation and development, where particularly talc is essential for strain localization (Schroeder and John, 2004; MacLeod et al., 2009).
The different mineral assemblages identified in Hole U1601C reflect metasomatic processes where mafic and ultramafic lithologies are in contact. In general, rodingites are characterized by Ca-rich but Si-poor mineral assemblages with the abundance of diopside, tremolite, epidote, (hydro)grossular, vesuvianite, and wollastonite (O'Hanley, 1996; Frost and Beard, 2007). Specifically, these mineral assemblages are associated with Ca-rich and Si-poor fluids that form during serpentinization of peridotite and interact with mafic intrusions at temperatures around 200°–300°C (Bach et al., 2013; Bach and Klein, 2009; Frost and Beard, 2007; Frost et al., 2008). In the studied hydrothermally altered magmatic veins and metasomatic zones, the presence of (hydro)garnet, clinopyroxene, and amphibole (likely tremolite or actinolite) indicates Ca-metasomatism and/or Si loss and suggests considerable mass transfer between mafic and ultramafic lithologies at around 200°–300°C. In contrast, chlorite-rich zones suggest that Ca-rich, Si-poor fluids interacted along mafic/ultramafic boundaries at temperatures >400°C, which can lead to the formation of monomineralic chlorite felses or schists (Bach and Klein, 2009; Bach et al., 2013) (such as found in Sample 59R-3, 39–71 [TS163]), thus suggesting that high-temperature fluids interacted with the recovered lithologies at least locally. Furthermore, the presence of prehnite, amphibole (tremolite), and plagioclase are predicted to form through hydrothermal alteration of gabbros at 300°C and 500 bar, whereas chlorite + talc + prehnite + white mica is predicted to form at 200°C at increasing reaction progress (Bach and Klein, 2009). Overall, the variable mineral assemblages observed indicate that the mafic veins and dikes and the mafic/ultramafic contact zones experience variable degrees of element exchange and that interaction took place at variable temperatures ranging 200°–400°C interacting with slightly different mineral assemblages and mineral modes. Moreover, the mineral textures generally suggest that alteration and element transfer during water-rock interaction postdated the magmatic events. The observation that alteration (including serpentinization and rodingitization) is often most intense at gabbro/peridotite contacts suggests that these alterations probably occurred at the same time because of the high chemical gradients between these lithologies and may be occurring now over a range of temperatures in deeper parts of the Atlantis Massif. Formation waters in the massif may therefore reflect interaction between mafic and ultramafic rock types.
4.2.6. Sulfide-forming processes and sulfide mineralization conditions
The sulfide mineral assemblages observed at Site U1601 are typical for serpentinized harzburgite and dunite reported from numerous serpentinized peridotites recovered during ocean floor drilling and collected in ophiolite sequences (Klein and Bach, 2009; Alt and Shanks, 1998; Schwarzenbach et al., 2012, 2014). The occurrence of sulfide minerals in veins and disseminated in the serpentinite groundmass at Site U1601 indicates that processes such as thermochemical sulfate reduction, S mobilization from mafic lithologies, and possibly microbial sulfate reduction likely took place in the recovered serpentinites, processes which were previously shown to have affected the serpentinites from Expedition 357 (Liebmann et al., 2018), dredged serpentinites from the southern wall (Delacour et al., 2008a), and mafic and ultramafic lithologies from Hole U1309D (Delacour et al., 2008b). The local occurrence of sulfide minerals in late carbonate veins in the shallow drill cores suggests that S cycling processes were at least locally associated with low-temperature fluid-rock interaction (i.e., at temperatures <250°C to possibly even <20°C as observed in other serpentinized peridotites) (Schwarzenbach et al., 2012, 2018; Alt and Shanks, 2003; Bach et al., 2011).
Sulfide mineralization in serpentinized peridotite and gabbroic rocks from Hole U1601C further indicates the circulation of metal-bearing fluids (Fe, Cu, Zn) and the deposition of metals. This observation is not surprising given that sulfide mineralizations have been documented in many places associated with exhumed mantle rocks at slow-spreading ridges, especially along the MAR (see Fouquet et al., 2010, for a review). Even if the absolute timing of sulfide mineralization cannot be determined at this stage, some structural and petrographic observations allow some basic constraints. Sulfide veins cut through gabbroic rocks and hence postdates magmatic inception. In serpentinized peridotites, mineralization occurs in serpentine-carbonate veins or as disseminated grains throughout the mesh. This suggests that ore-forming fluids are genetically linked to at least one event of serpentinization, constraining the temperature of formation below 350°C (e.g., Evans, 2004). Such temperatures are consistent with the formation of talc-prehnite-carbonate ± sulfide veins cutting gabbroic rocks and with sulfide-clays ± serpentine assemblages after olivine. However, the local presence of sulfides associated with talc (± amphibole?) after olivine would suggest higher-temperature formation between 400° and 500°C (Nozaka and Fryer, 2011).
The occurrence of sulfide mineralization either at the gabbro/serpentinized peridotites contacts or in gabbroic rocks suggests strong spatial (and possibly physicochemical) control of gabbroic layers on the mineralization. At this stage, based only on macroscopic descriptions, it is not possible to constrain the exact mechanisms that trigger mineralization at serpentinized peridotite/gabbroic rock contacts. A possible mechanism is the sharp redox and pH contrast between gabbroic rocks and serpentinized peridotites. This derives from the contrasted physicochemical properties of the hydrothermal fluid expected during fluid–mafic rock and fluid–ultramafic rock interactions (e.g., Kelley et al., 2001; Reed and Palandri, 2009). Fluid–mafic rock interaction especially is thought to produce acidic fluids (Reed and Palandri, 2009) that might efficiently leach and mobilize metals (Reed and Palandri, 2006) from the gabbroic rocks. This is in good agreement with reaction porosity (millimeter-sized void spaces) observed in gabbroic rocks in Hole U1601A that suggest intense fluid–mafic rock interaction (Figure F68). However, we cannot rule out that some portion of the metals were sourced in serpentinized peridotites as suggested at the Atlantis Massif (Liebmann et al., 2018; Rouméjon et al., 2018). This needs to be constrained by further geochemical analyses.
5. Structural geology
Site U1601 is located atop the subhorizontal surface of an oceanic detachment fault system exposed at the seafloor on Atlantis Massif. Holes U1601A–U1601C are located along the Southern Ridge of Atlantis Massif, an asymmetric ridge parallel to the adjacent transform fault. Hole U1601A is in proximity (60 m southwest) of Expedition 357 Hole M0069A, which had a maximum depth of 16.44 m (74.76% recovery). The hole comprises 12 cores drilled to 58.34 mbsf (24.8% recovery), hosting diabase and serpentinized peridotite with rare dunite and gabbronorite. Hole U1601C, located approximately 40 m southeast of Hole U1601A, comprises 257 cores to 1267.8 mbsf (71.4% recovery), hosting significant thicknesses of serpentinized harzburgite, dunite, and websterite, cut by younger troctolite, olivine and olivine-bearing gabbro, gabbronorite, gabbro, oxide gabbro, and diabase. The drilled gabbroic cores reveal previously unrecognized structures associated with accretion and deformation of slow-spread ocean crust exposed in the footwall of an OCC.
Both Holes U1601A and U1601C host significant intervals of serpentinized harzburgite, commonly presenting mantle fabrics with subhorizontal to moderate dip and regular to strongly foliated serpentine mesh. Gabbroic intervals with thicknesses ranging from submeter scale to ~80 m are variably deformed by crystal-plastic and brittle deformation. Below 600 mbsf, seven zones of high-strain crystal-plastic deformation were recovered between 634 and 1202 mbsf, with vertical thicknesses between 5 and 32 m. These deformation zones were active at granulite to amphibolite facies conditions and modified the orientations of magmatic veins and contacts.
Despite the two Holes U1601A and U1601C being located along the top of the Southern Ridge near the Lost City vent site, limited evidence of the detachment system was recovered from the site. Prior seafloor mapping and analysis of dive samples collected elsewhere along the Southern Ridge suggests a detachment zone thickness of 50–100 m (Schroeder and John, 2004; Karson et al., 2006). However, the lack of significant structures indicative of high displacement near the surface in Holes U1601A and U1601C by either ductile or brittle processes limits the possible thickness of a fault system that would comprise a detachment fault system over this portion of the Southern Ridge. Poor recovery and/or casing of the upper ~23 m of the footwall in both holes (to the bottom of Section 399-U1601C-7R-1) allows the possibility that this relatively thin zone accommodated very high strain along a dominantly brittle fault. Crystal-plastic deformation between 600 and 1265 mbsf in Hole U1601C indicates that footwall rotation and exhumation during the structural evolution of the Atlantis Massif core complex involved a significant degree of high-strain, high-temperature subdetachment deformation.
Note that Hole U1601A was described using Methods 1 and Hole U1601C was described using Methods 2 (see Structural geology in the Expedition 399 methods chapter [Lang et al., 2025]).
5.1. Hole U1601A
5.1.1. Magmatic veins and fabrics
Igneous rocks (excluding ultramafic mantle rocks) were sampled by Cores 399-U1601A-2R, 3R, 6R, and 8R, with no igneous contacts observed. Basalt and diabase from Cores 2R and 3R (2–4 mbsf) have no visible macroscopic fabric but display an isotropic magmatic fabric in thin section (magmatic fabric index = 0) (Figure F82). Gabbronorite samples from Core 6R (27 mbsf) are strongly deformed and altered and do not preserve a magmatic fabric. In Section 8R-1 (35–38 cm), harzburgite is cut by a thin (1 cm) rodingitized gabbroic dikelet. This vein has straight, sharply defined boundaries and an isotropic magmatic fabric (magmatic fabric index = 0).
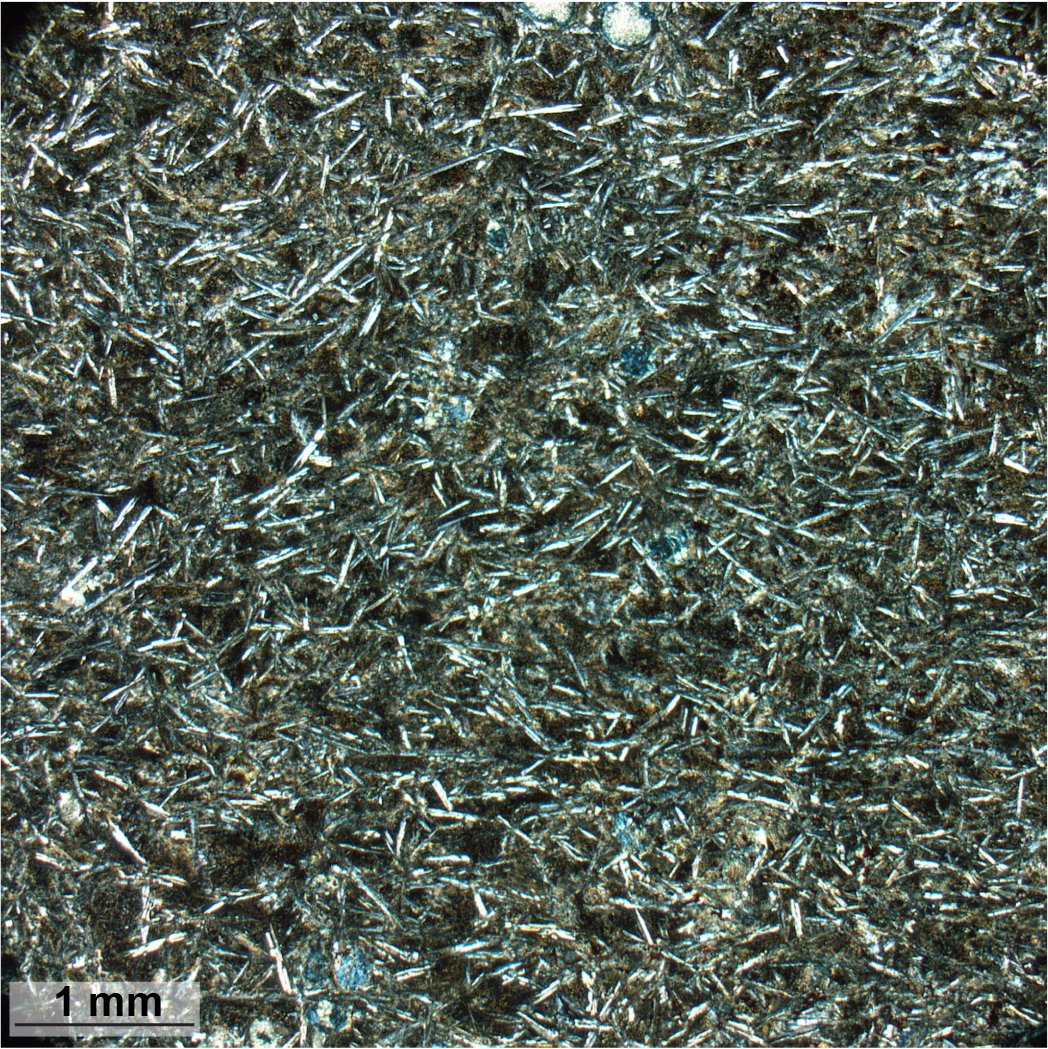
Figure F82. Subophitic diabase.
5.1.2. Mantle fabrics and serpentine foliation
Ultramafic rocks sampled in Cores 399-U1601A-4R through 12R (17–58.8 mbsf) comprise variably serpentinized harzburgite and minor dunite. We measured the intensity and orientation of mantle fabrics and serpentine foliations. Mantle fabrics were identified and measured based primarily on the shape-preferred orientation (SPO) of relict orthopyroxene (Figure F83) and/or planar distributions of Cr-spinel (Figure F84). At 17–36 mbsf, Cores 4R–7R have very low recovery; recovered ultramafic rocks in this interval are strongly serpentinized and typically show no mantle fabric, with the following two exceptions: (1) at 22–23 mbsf, moderately dipping parallel layers of Cr-spinel grains in dunite (Section 5R-1) are interpreted to reflect an original mantle fabric (mantle fabric intensity = 1) with a dip of 27° (Figure F83), as observed in both cores (Figure F84) and thin section specimens; and (2) at 32 mbsf, aligned elongate orthopyroxene porphyroclasts in harzburgite define a subvertical (80° dip), weakly foliated, porphyroclastic mantle fabric (Figure F83).
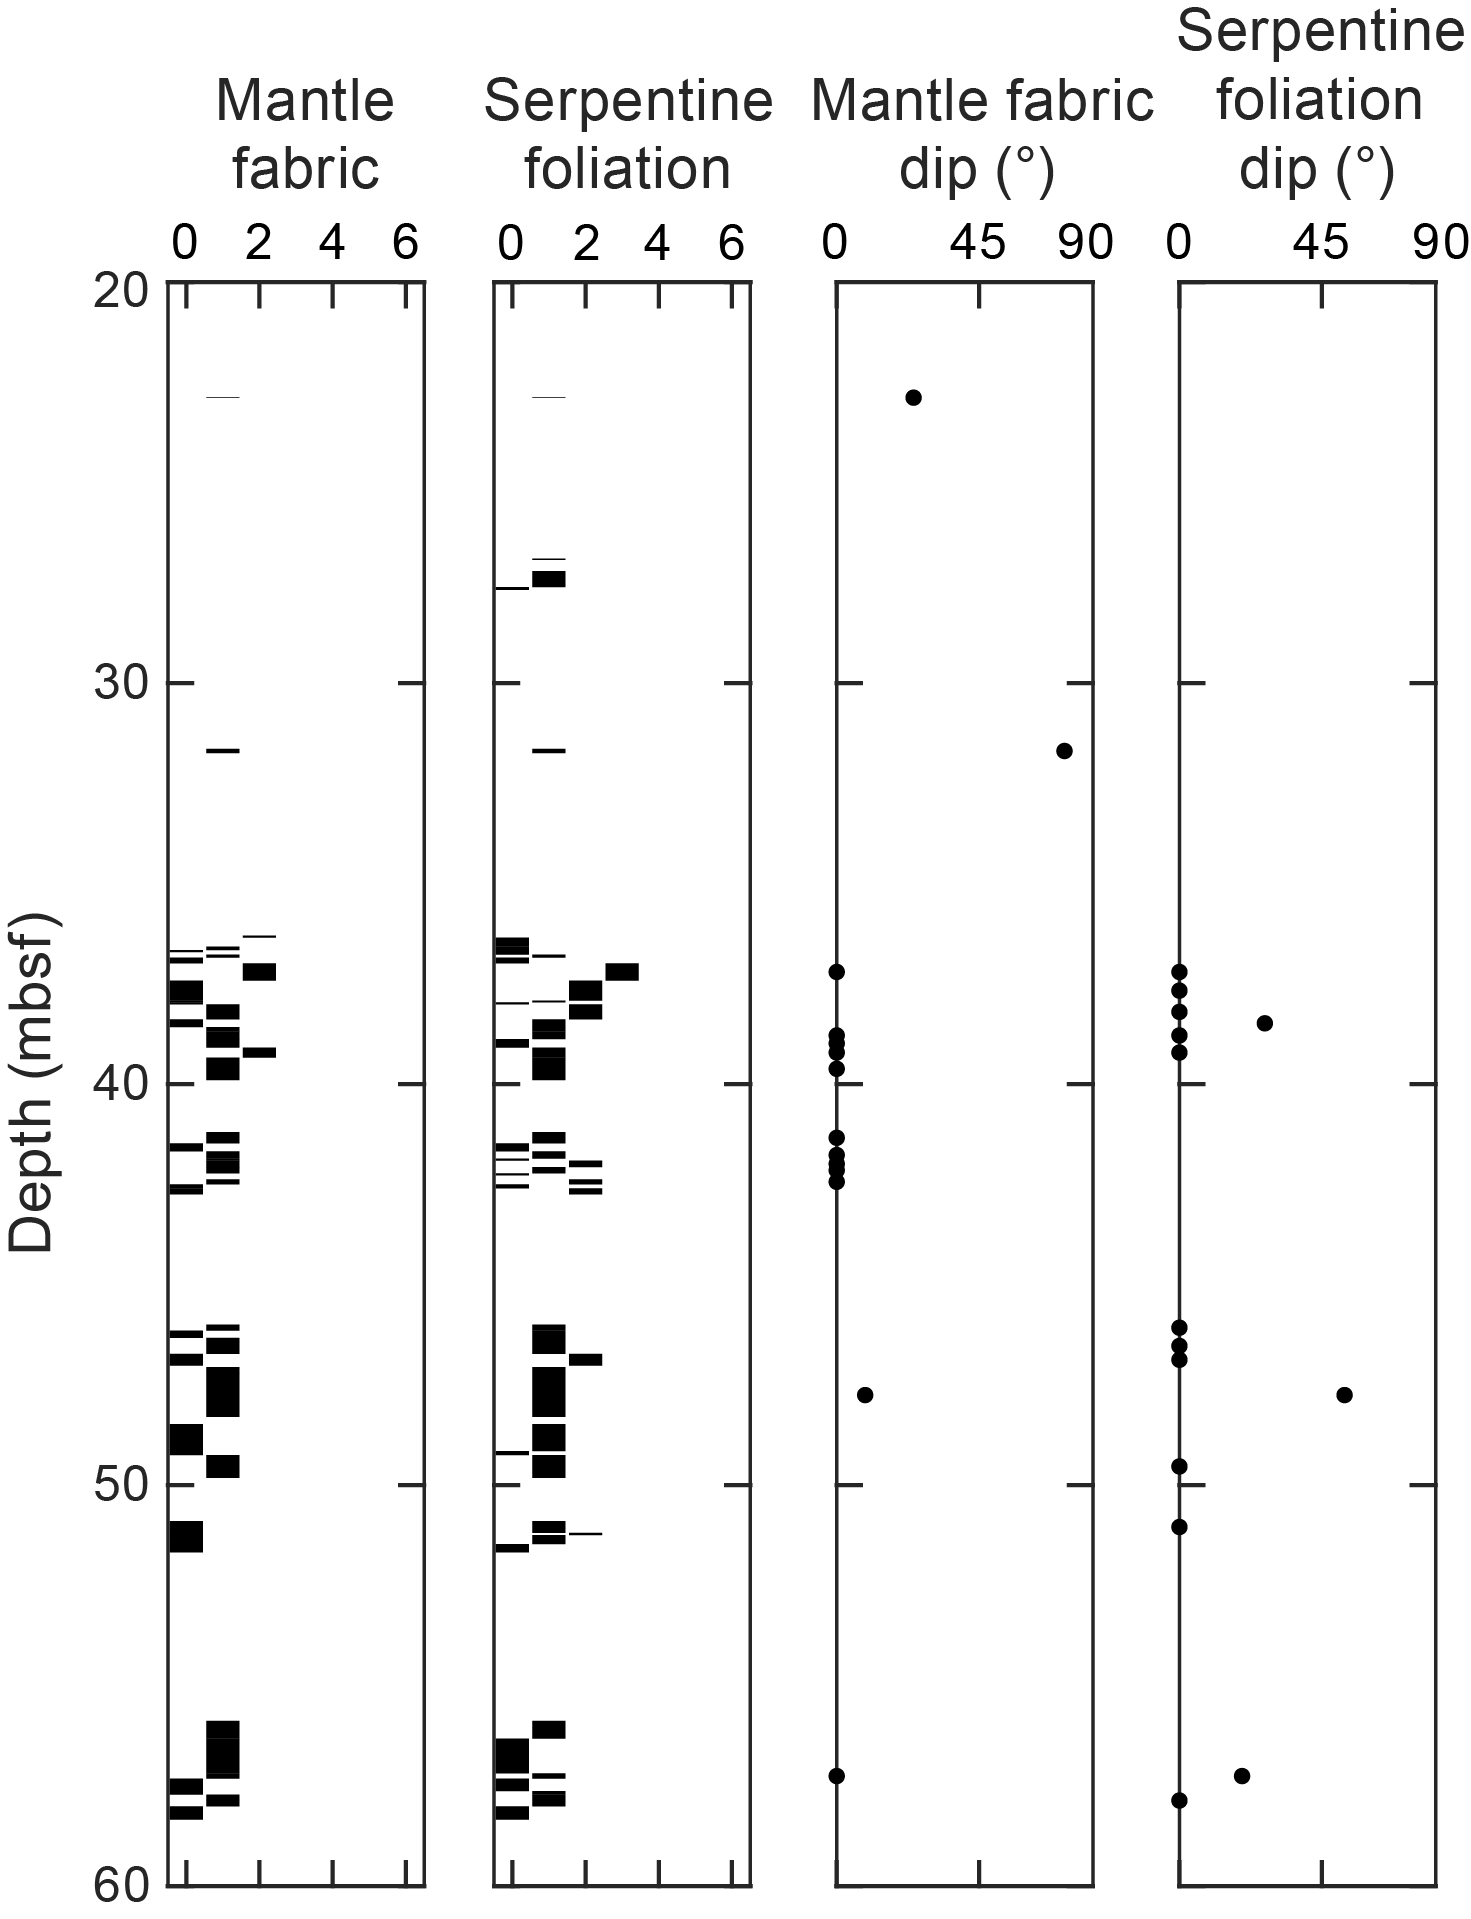
Figure F83. Mantle and serpentine fabric intensity and orientation.
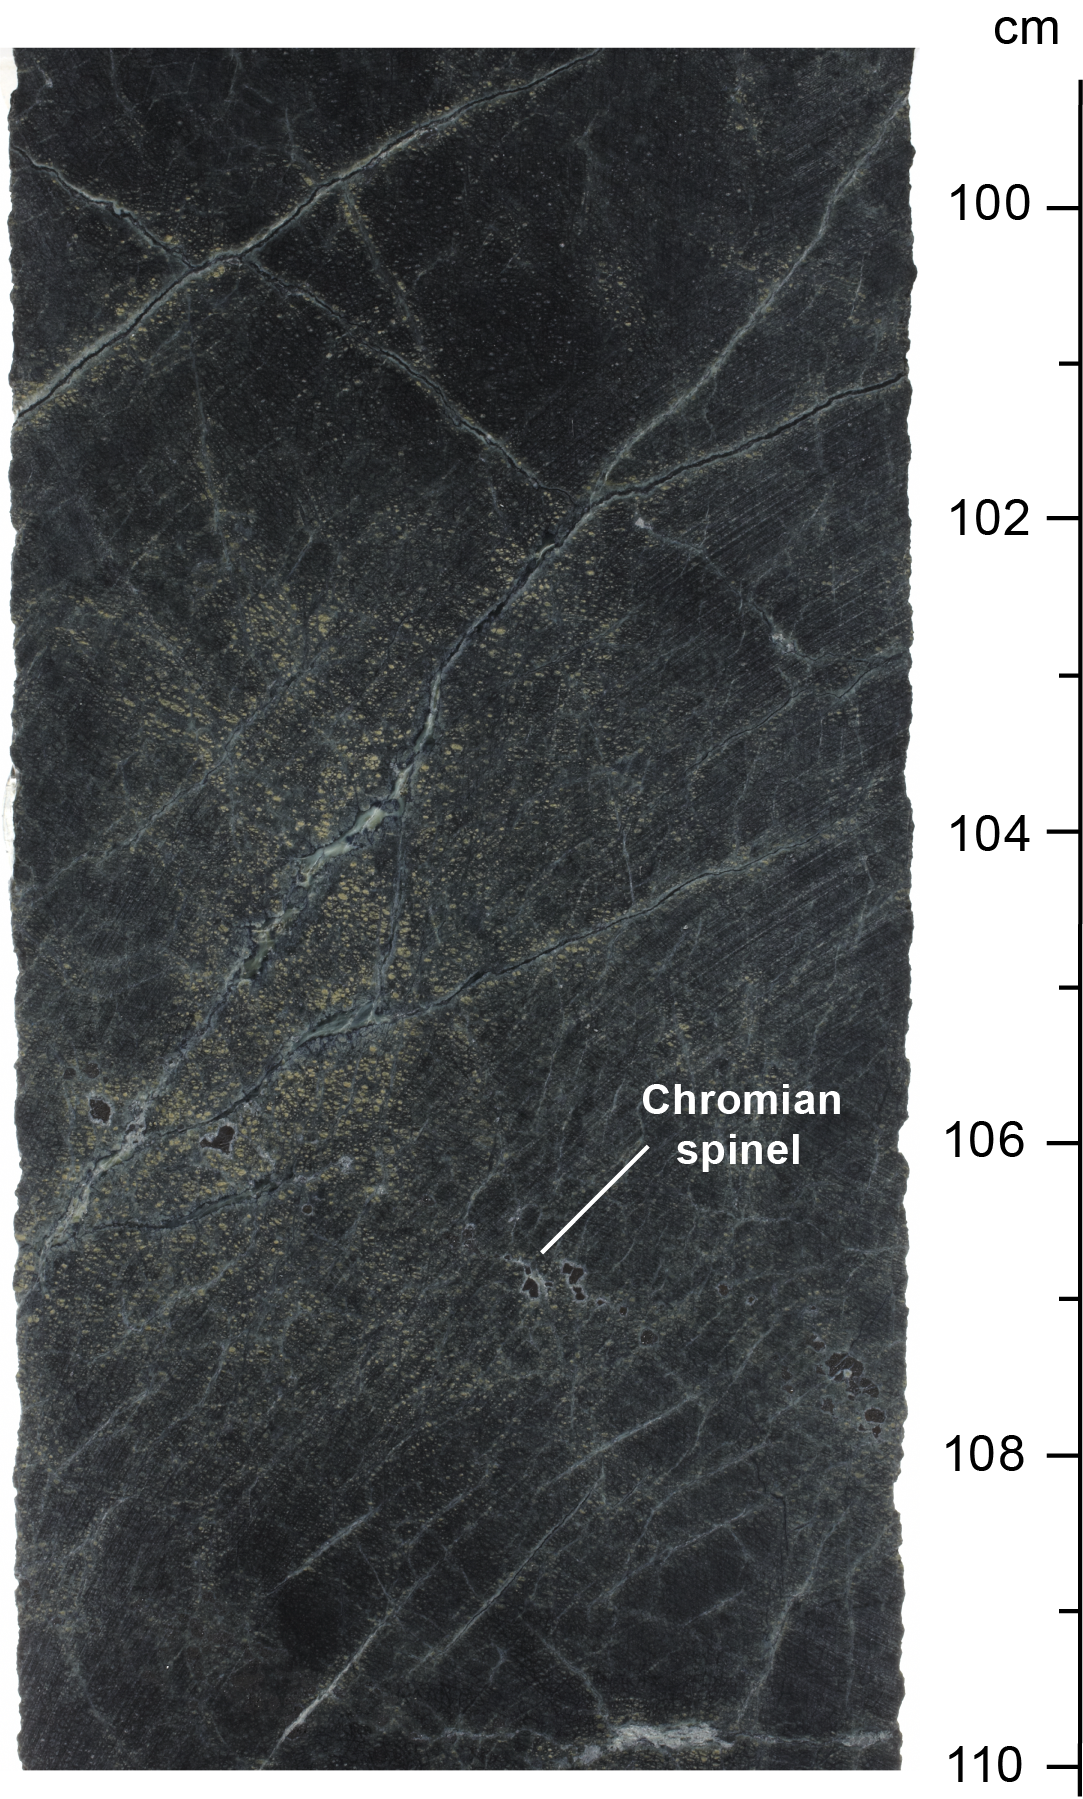
Figure F84. Planar mantle foliation.
Between 36 and 60 mbsf, Cores 8R through 12R have higher recovery; ultramafic rocks from this interval typically display a protogranular to weakly foliated porphyroclastic fabric (mantle fabric intensity = 0–1) (Figure F83) defined by the SPO of pale green orthopyroxene grains (Figure F85). Two thin intervals of strongly foliated porphyroclastic fabric (mantle fabric intensity = 2) are recorded at 37 and 39 mbsf (intervals 8R-1, 69–112 cm, and 8R-3, 21–46 cm). In most cases, the orientations of observed mantle fabrics were measurable and consistently displayed subhorizontal dip (0°–10°) (Figure F83). In thin section, holly leaf textures displayed by Cr-spinel indicate that these peridotites have undergone little to no penetrative, solid-state deformation during or after serpentinization.
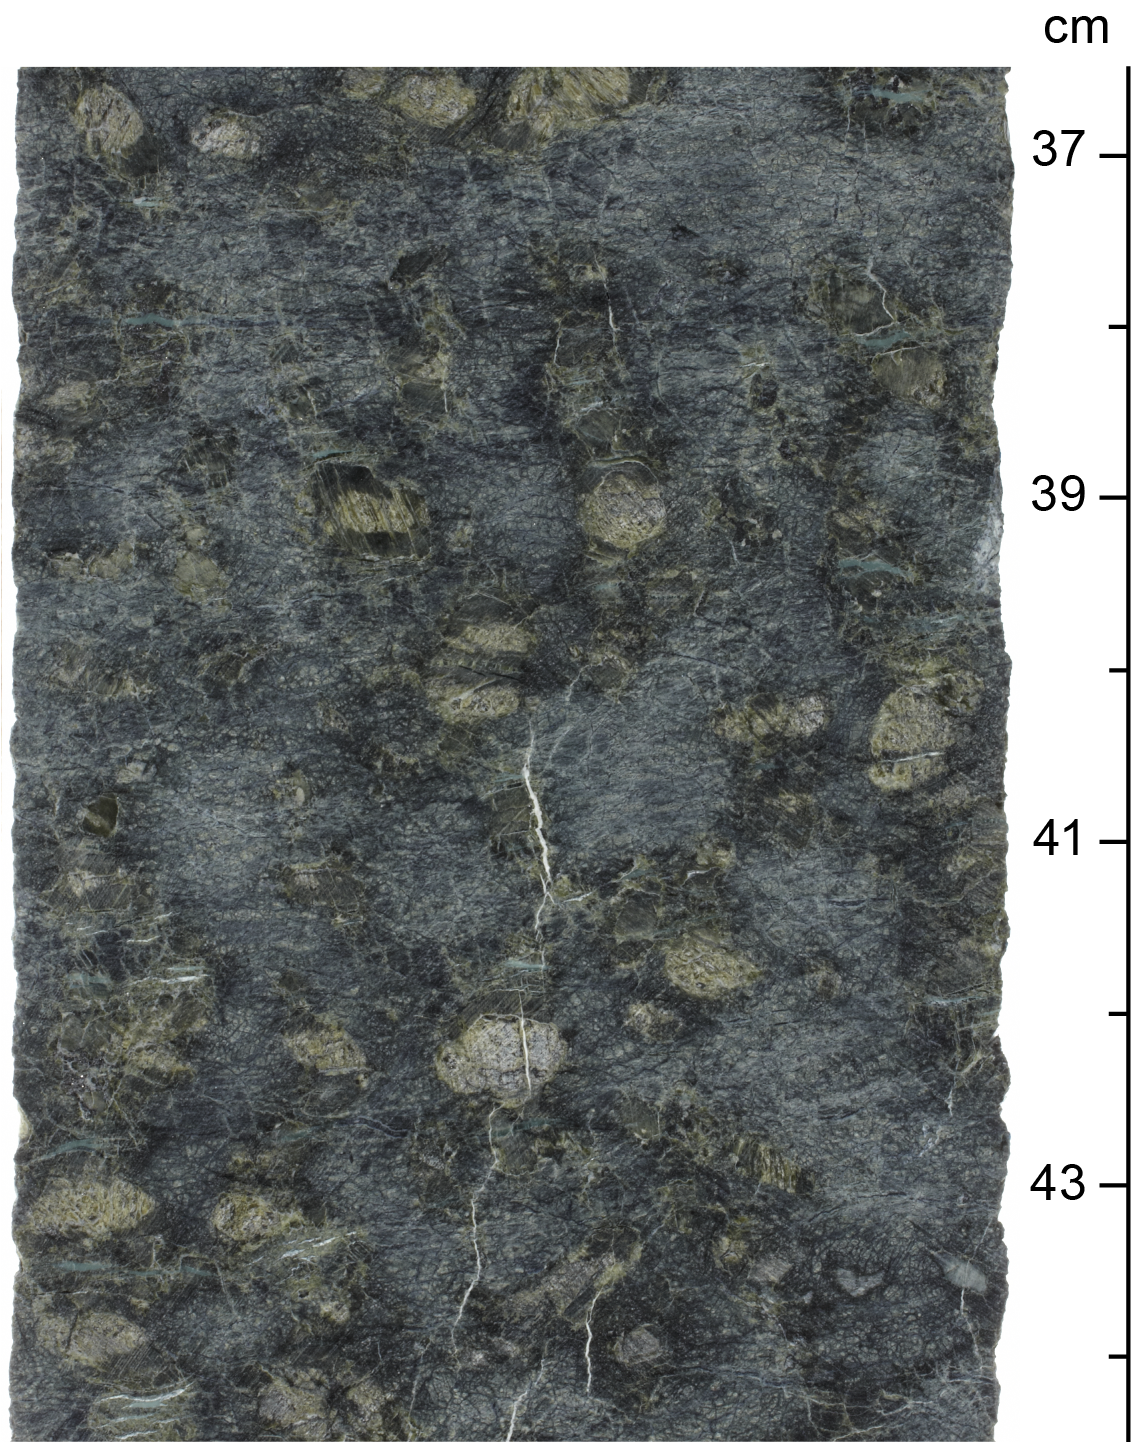
Figure F85. SPO of elongate, pale green orthopyroxene grains.
Between 41 and 60 mbsf (Cores 9R through 12R), harzburgite hosts two generations of orthopyroxene, identified by their color and grain shape (Figure F86). Pale green, rounded, and elongate orthopyroxene typically has an SPO that defines the recorded mantle fabric, also observed in Core 8R. In contrast, a second generation of gray, irregular shaped orthopyroxene in Cores 9R–12R displays no SPO (Figure F86).
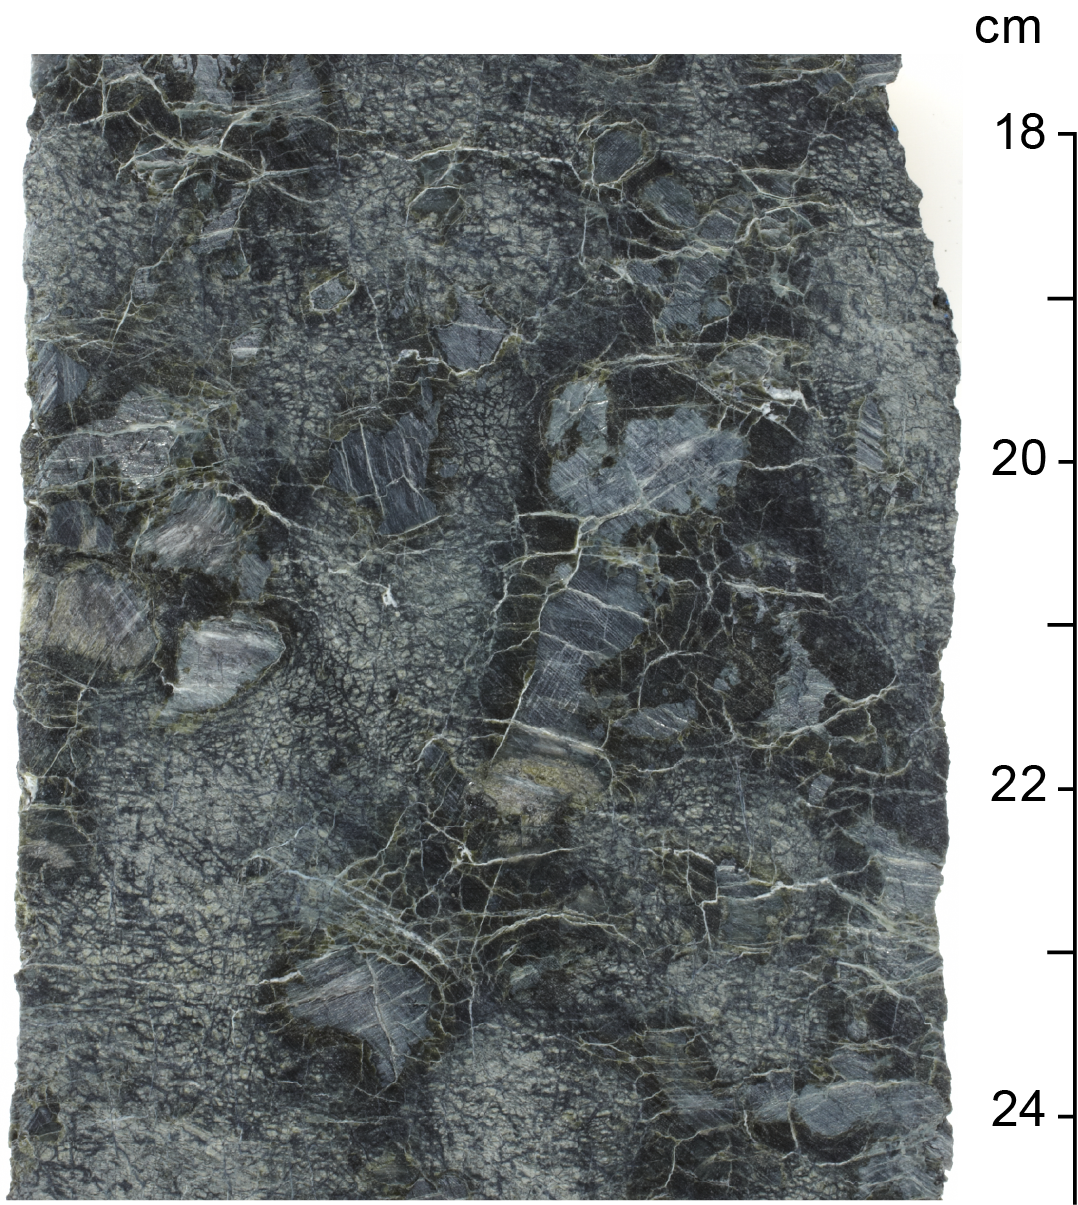
Figure F86. Harzburgite hosting orthopyroxene.
Serpentine mesh textures were observed in ultramafic rocks throughout Cores 4R–12R (17–58.8 mbsf). The foliation intensity of the mesh texture varies between unfoliated to weakly foliated (serpentine foliation index = 0–1), with local zones of moderate to strongly developed serpentine foliation (serpentine foliation index = 2–3) in Cores 8R and 11R between 37 and 51 mbsf (Figure F83). In thin section, serpentine mesh cell size varies from 0.1 to 1 mm in diameter but typically does not exceed 0.6 mm. In some thin sections, the mesh texture forms a well-defined planar serpentine foliation that wraps around elongate bastite grains, mimicking a porphyroclastic mantle fabric. Some mesh cells contain parallel layers of aligned, needle-shaped oxide crystals, which are interpreted to be relict inclusions distributed along former pyroxene cleavage planes (Figure F87). Kernels of relict olivine in the cores of mesh cells can be observed, particularly where aggregates of bastite have apparently shielded olivine from alteration. Some sections display a poorly defined mesh texture devoid of oxides spatially associated with gray amorphous bastite pseudomorphs in Cores 9R–12R and/or calcite veining.
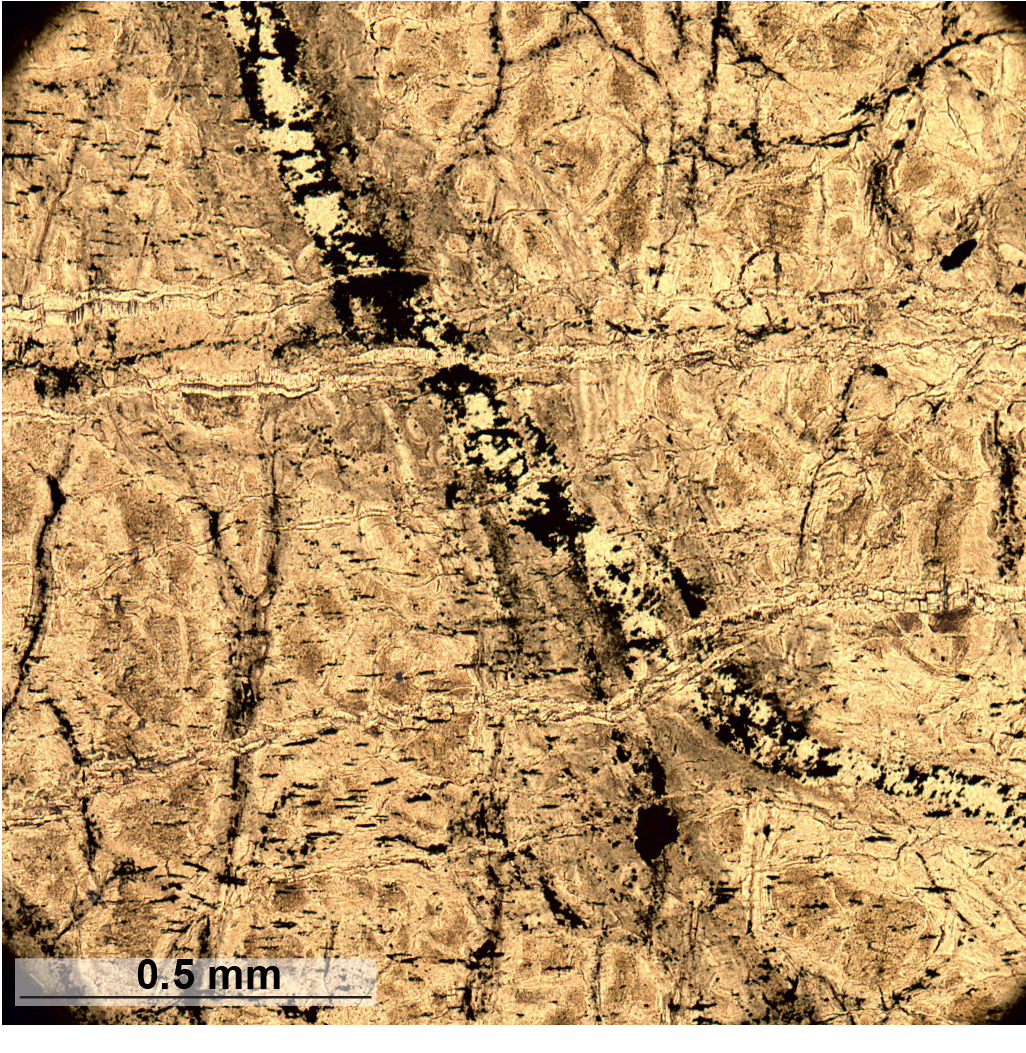
Figure F87. Serpentine mesh texture.
Where measured, serpentine foliation dip is subhorizontal, parallel to mantle fabric defined by orthopyroxene SPO (Figure F83). Notably, at 38, 48, and 58 mbsf (Sections 8R-2, 10R-2, and 12R-2), serpentine foliation is shallow to moderately inclined (22°–58° dip), whereas the mantle fabric defined by orthopyroxene SPO in the same interval maintains a subhorizontal dip (Figure F83). The inclined serpentine foliation in these zones is parallel to one of several generations of chrysotile veins. We see no correlation between the dip of serpentine foliation and intensity. The dip of serpentine foliation is however, never less than that of mantle fabric (Figure F83).
5.1.3. Crystal-plastic fabrics
Crystal-plastic deformation is largely absent from core recovered from Hole U1601A (Figure F88) and where present is restricted to samples of gabbronorite recovered from Section 6R-1 (Pieces 5 and 7–9) at ~27 mbsf and Sections 7R-1 and 8R-1. The latter two occurrences in intervals 7R-1 (34–37 cm; 32 mbsf) and 8R-1 (0–5 cm; 36 mbsf) are small pieces of rubble considered out of place and not included in Figure F88.
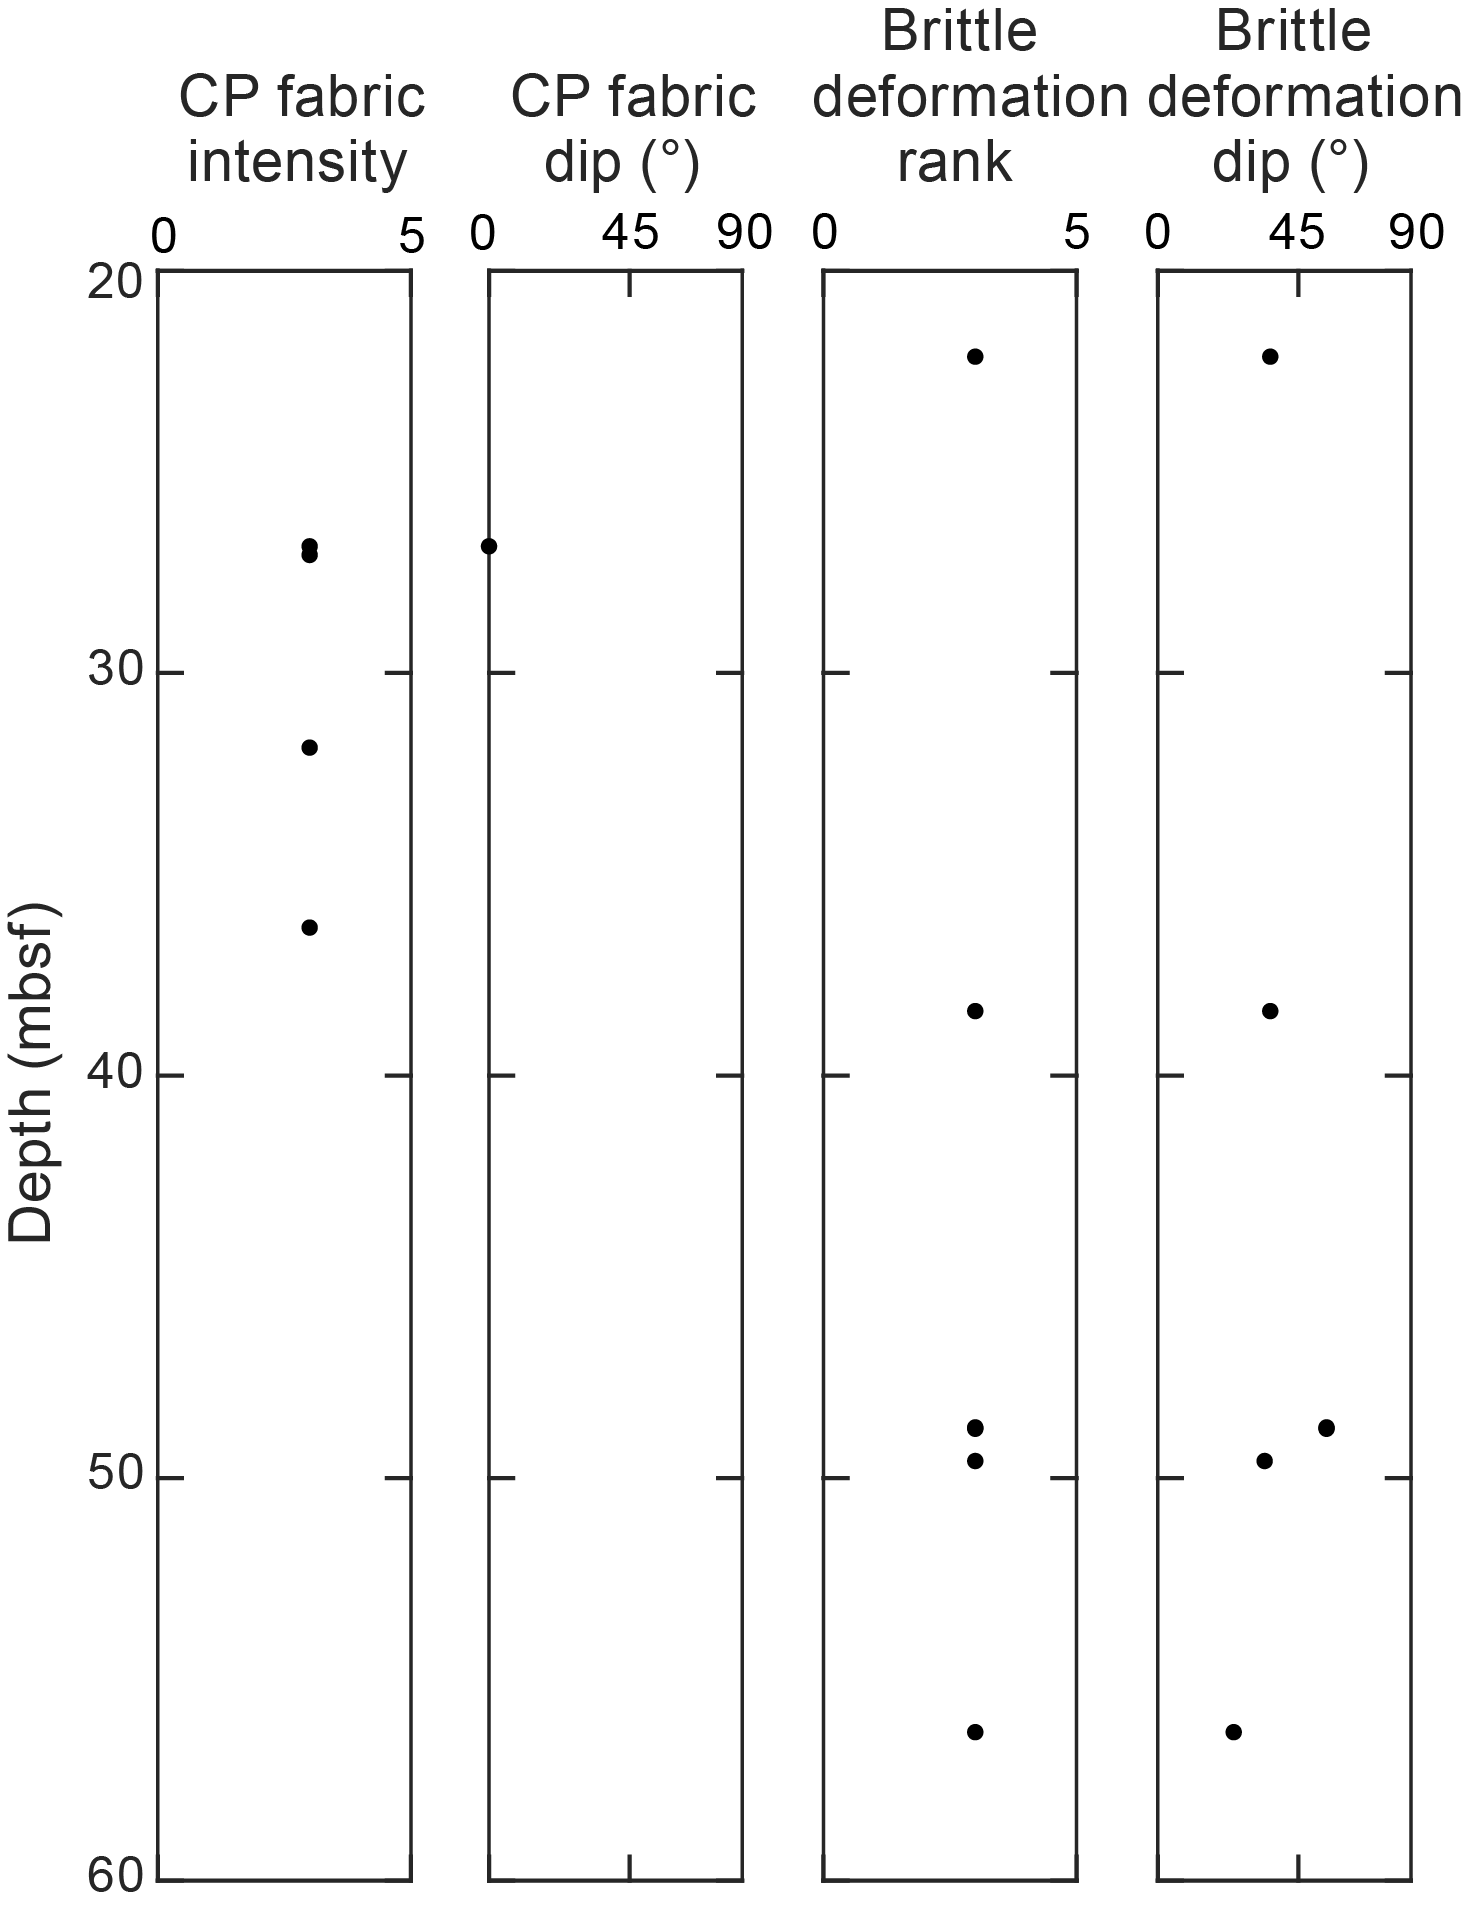
Figure F88. Crystal-plastic fabric intensity and orientation, Hole U1601A.
In Section 6R-1, gabbronorite hosts a subhorizontal, protomylonitic fabric (CPF intensity = 3) (Figure F89). Pyroxene porphyroclasts have equant-elongate fish-shaped grains that form a weak SPO and locally bent cleavage planes (Figures F89, F90A). In thin section, felsic microlithons contain core-mantle structures of 0.5–2.5 mm relict plagioclase grains surrounded by recrystallized plagioclase (Figure F90A). Relict plagioclase grains have a blocky shape with straight to irregular grain boundaries, whereas recrystallized grains are equant with rounded grain boundaries. Fractures, undulose extinction, and subgrains are common in plagioclase, suggesting a subgrain rotation dynamic recrystallization mechanism followed by minor brittle to semibrittle deformation. Relict pyroxene grains, 4–2 mm wide, have bent cleavage planes (Figure F90B). Orthopyroxene strain shadows host 50–100 µm amphibole neoblasts. Brittle faulting cuts the crystal-plastic fabric at this interval. Collectively, these observations suggest that crystal-plastic deformation of samples of gabbronorite occurred at amphibolite facies conditions. Late-stage static alteration overprints the deformation fabrics, replacing felsic microlithons with prehnite rosettes and chlorite; mafic microlithons host very fine grained, massive schistose amphibole and talc. The lack of deformation displayed by these rosettes suggests they represent postkinematic growth/alteration.
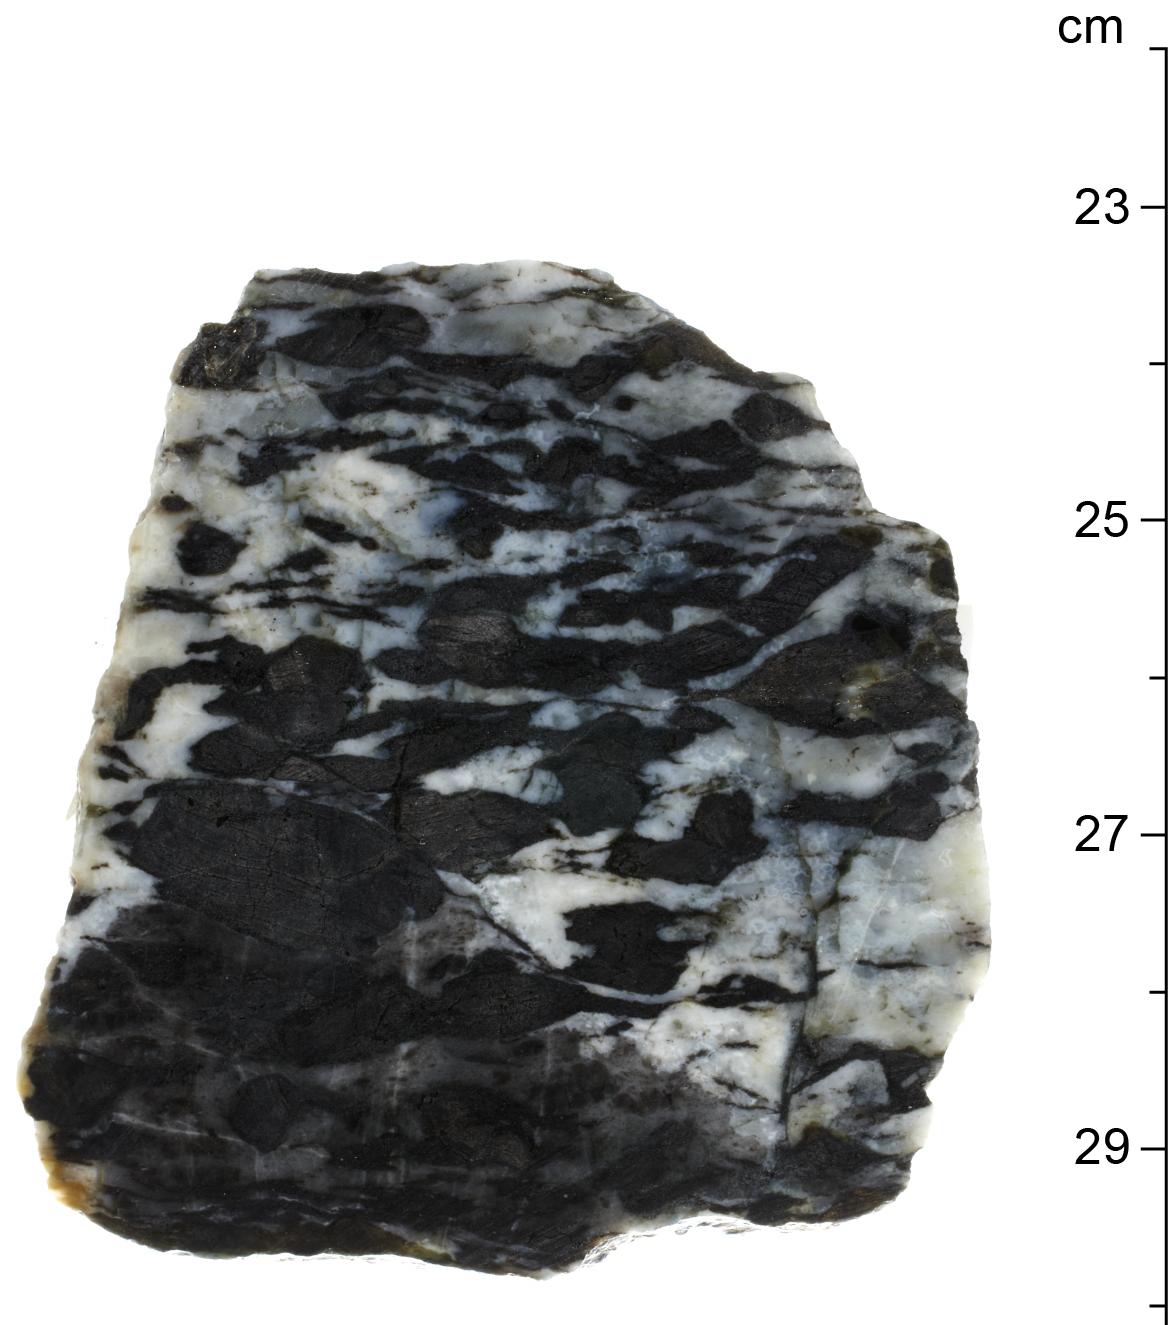
Figure F89. Gabbronorite hosting foliation.
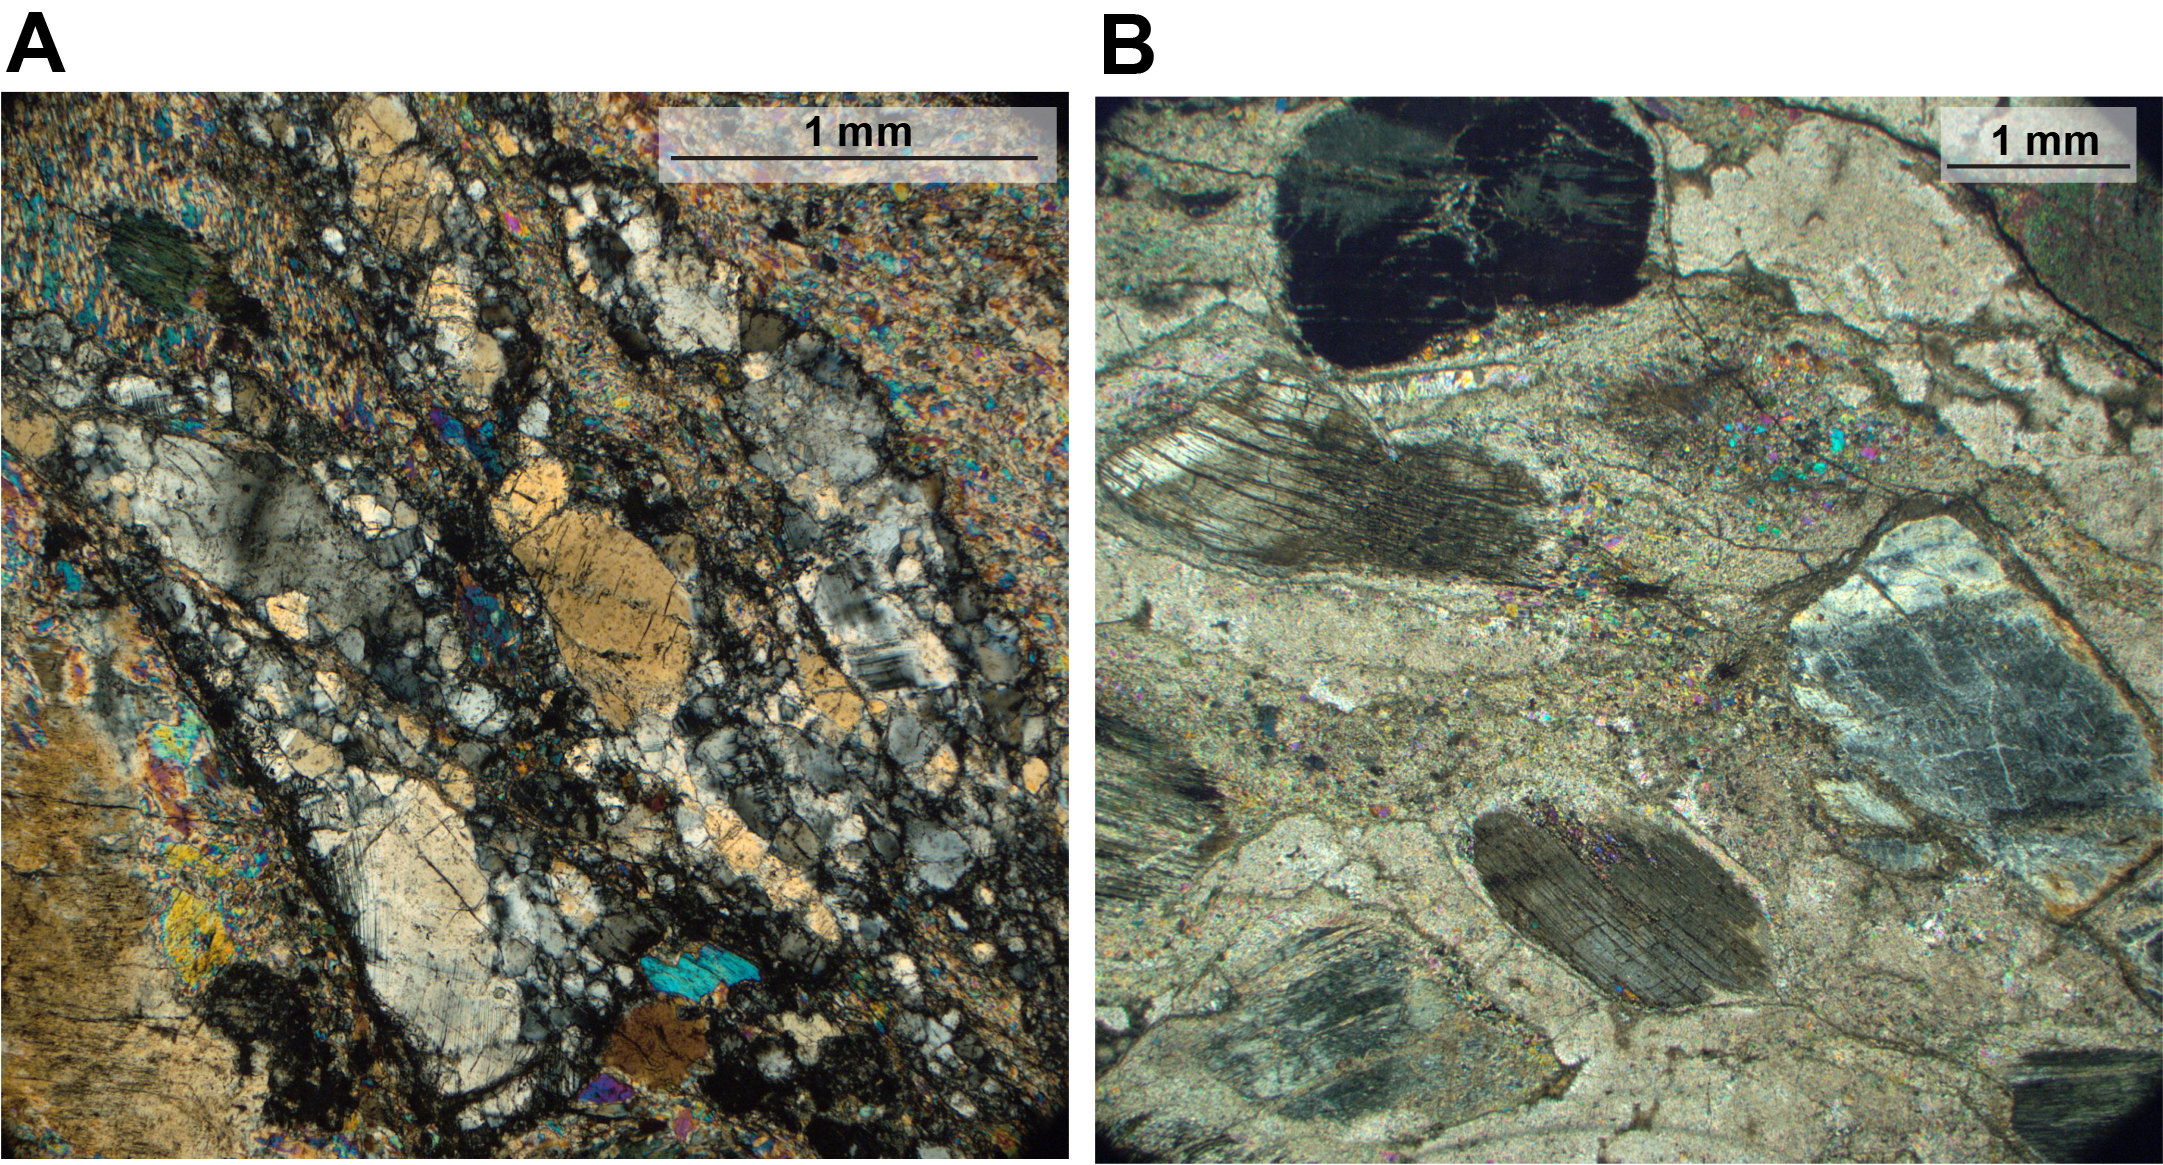
Figure F90. Rare high-temperature, ductile deformation.
5.1.4. Schistose fabrics
Schistose material recovered from Hole U1601A (e.g., talc, chlorite, and tremolite) is restricted to millimeter-scale alteration veins within mafic and ultramafic rocks. Observations of schistose fabrics from these veins are observed only at the microstructural scale and are described below in the alteration veins section.
5.1.5. Brittle deformation: alteration veins, fractures, and faults
Alteration veins are common throughout the recovered core from Hole U1601A. Mafic rocks (diabase/basalt) in Cores 2R and 3R (2–12 mbsf) have a relatively low density of alteration veins, from 1–5 to 6–10 veins/10 cm (Figure F91). Vein density is higher in the ultramafic rocks (Igneous Unit 2); in Cores 5R and 6R (22–28 mbsf), dunite hosts 6–10 to 11–15 veins/10 cm, whereas harzburgite hosts 11–15 to >15 veins/10 cm (Figure F91). In Cores 8R–12R, vein density in harzburgite increases downhole from 6–10 to >15 veins/10 cm in Cores 8R and 9R (36–43 mbsf) to >15 veins/10 cm in Cores 10R–12R (46–60 mbsf) (Figure F91).
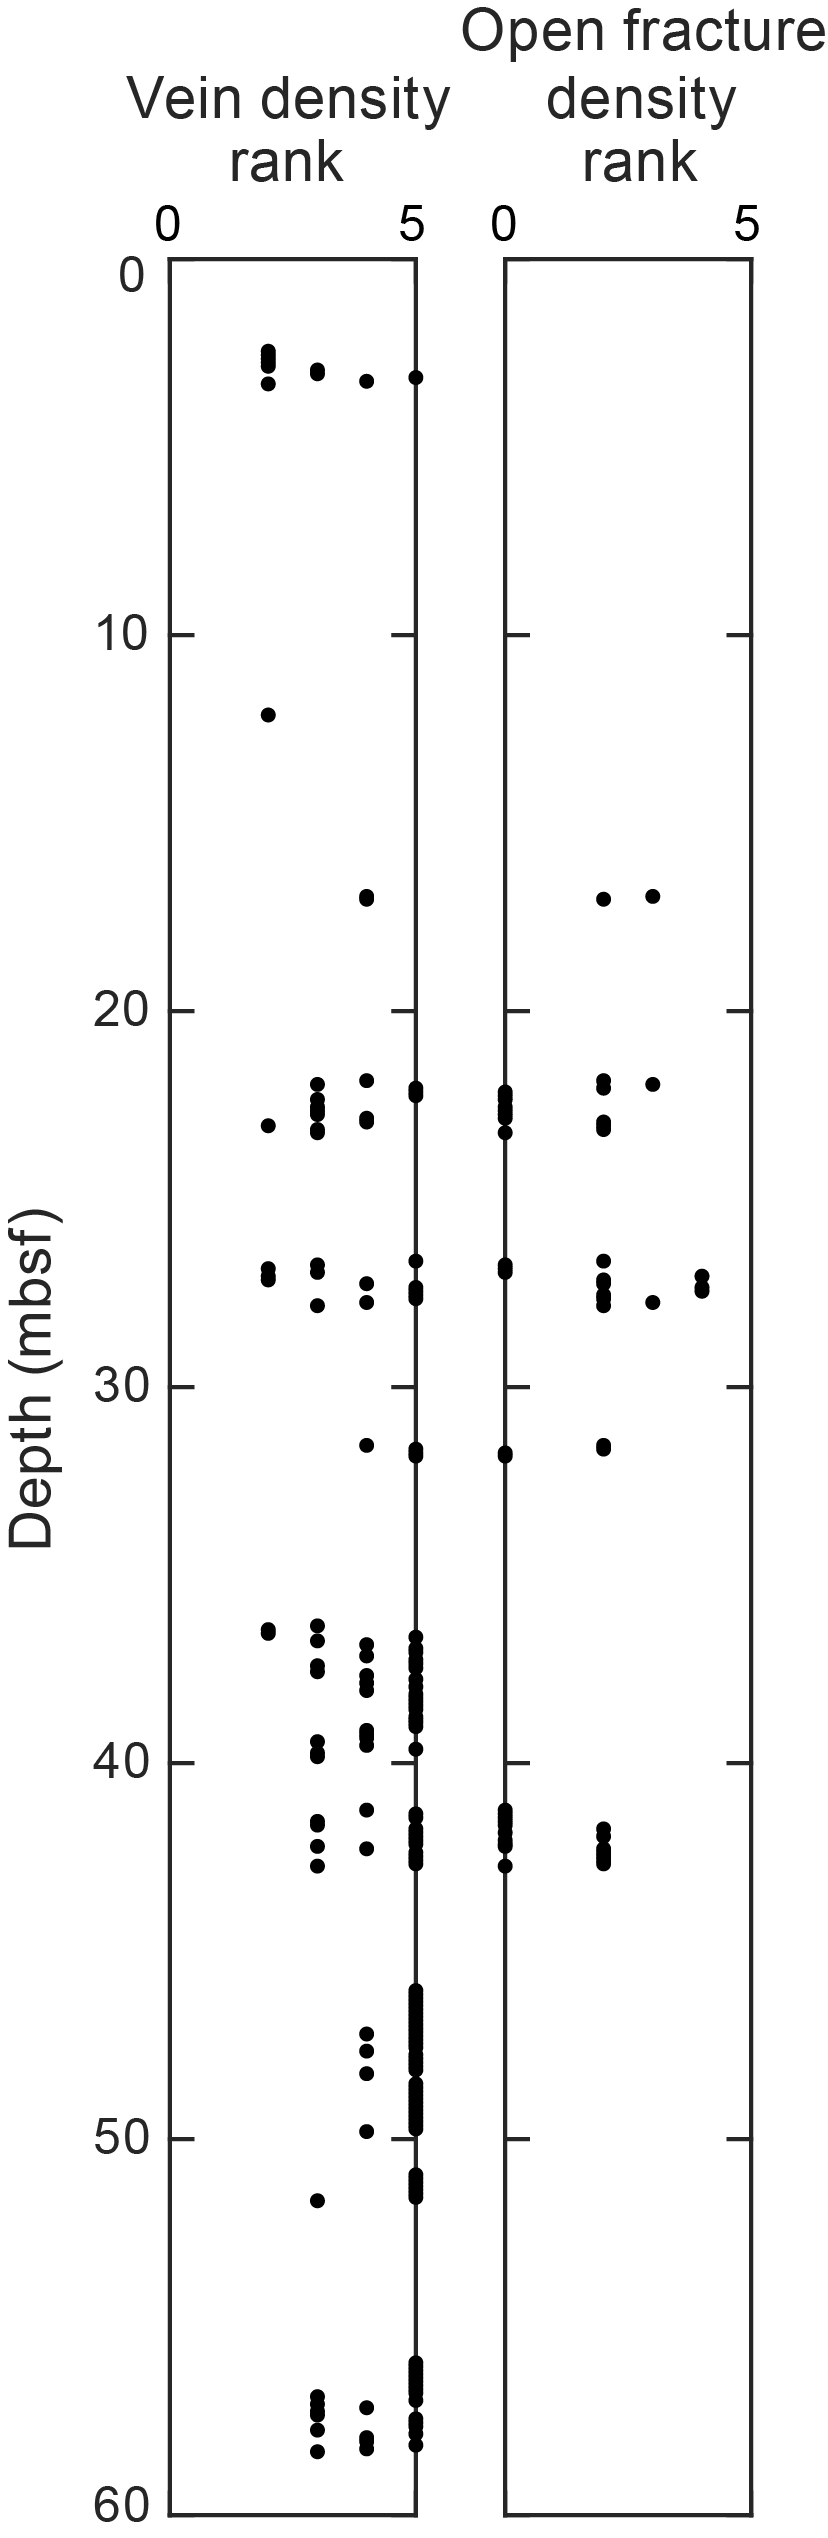
Figure F91. Vein and fracture density rank.
Vein orientations and deformation features vary but display trends likely related to rock type. A network of chlorite-epidote veins in diabase recovered in Core 2R (2–12 mbsf), have moderate to subvertical dips (45°–85°) and local secondary cementation of breccia. In thin section, 1–2 mm thick chlorite veins, observed in the microbiology sample from Section 2R-1 (3 mbsf) have a highly irregular shape, in which 2 mm long euhedral epidote crystals are observed growing from the vein wall (composed of microgabbro) into the vein center, possibly indicating growth into an open space. Weak schistosity displayed by the chlorite suggests the vein may have accommodated minor deformation during chlorite formation.
White veins of serpentine ± oxide ± carbonate in dunite and harzburgite from Cores 4R–7R (17–32 mbsf) have shallow to steep dips (Figure F92) and are sometimes sheared. In thin section, harzburgite in Core 4R (17 mbsf) is cut by veins of serpentine + talc + carbonate + fine-grained brown matrix, which form 1–2 mm wide linear anastomosing en echelon vein networks, suggesting association with brittle faulting.
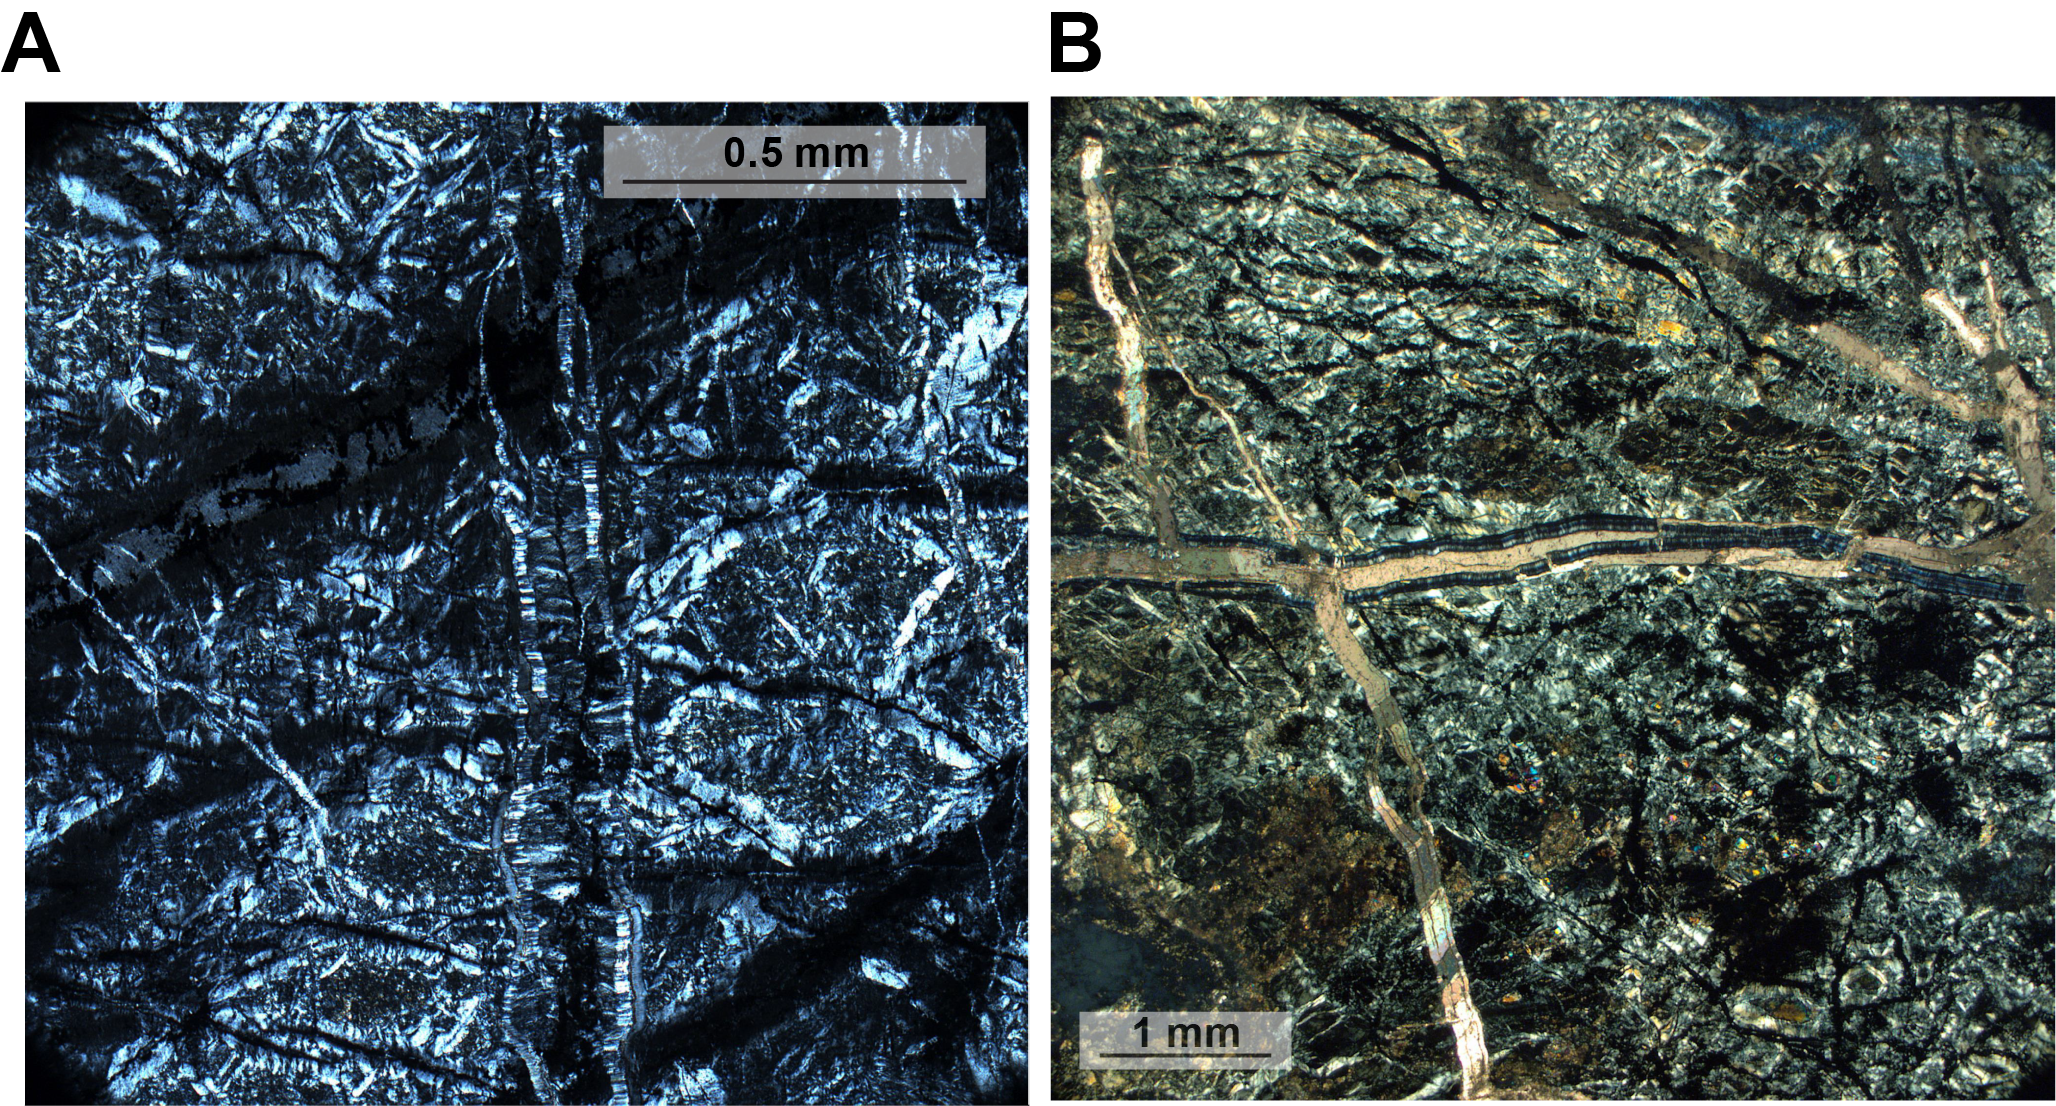
Figure F92. Alteration vein relationships.
In Cores 8R–12R (36–60 mbsf) serpentine ± oxide veins are dominantly subhorizontal to moderately inclined (0°–60°) with most dips <40°. Steep to subvertical serpentine veins (60°–90°) are less common. In thin section, serpentinized peridotites typically display two or three generations of alteration veins. In most cases, identified vein generations include one or more generations of serpentine + oxide veins and one or more generations of serpentine veins without oxide. Where both are present, the oxide-free serpentine veins are typically younger than those with oxides (Figure F92), although the inverse is recognized rarely. Serpentine ± oxide vein networks vary in orientation; a subhorizontal generation of veins is commonly observed, but inclined vein networks crossing each other at 60°–80° are also common. Where the mesh texture produces a strong planar fabric, later serpentine ± oxide veins often parallel the mesh. Locally, thin serpentine veins radiate from the rims of bastite into the surrounding serpentine mesh (Figure F93). Carbonate-bearing veins are observed in four thin sections (Sections 4R-1, 6R-1, 8R-1, and 12R-2); where present, they are always the latest generation of veins and spatially associated with millimeter-scale mineralized faulting and/or brittle deformation.
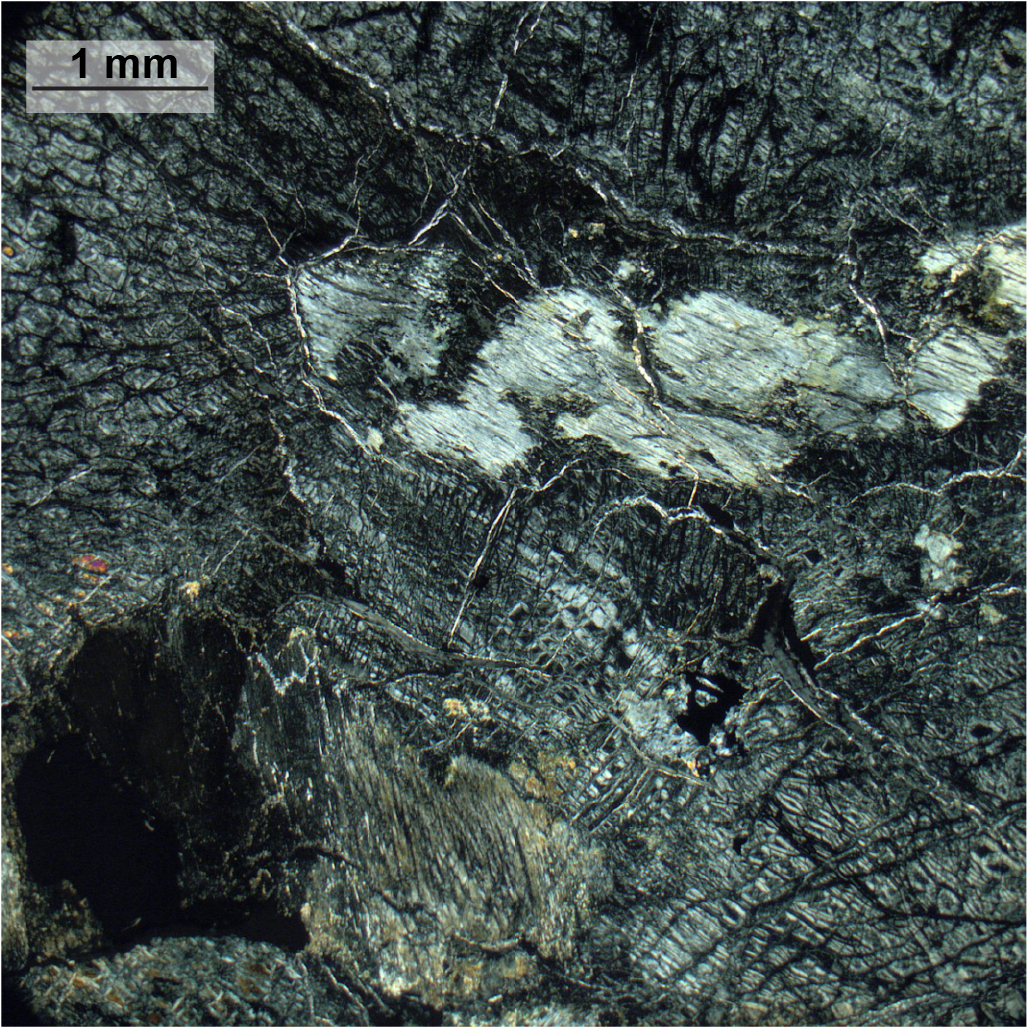
Figure F93. Serpentine veins radiating from bastite.
The abundance of open or healed fractures (i.e., with no mineralization) in Hole U1601A is low and reported only from discrete intervals in Cores 2R, 4R–7R, and 9R (Figure F91). Where observed, fracture density rarely exceeds 1–5 fractures/10 cm, with the highest density in a 50 cm interval of gabbro and harzburgite in Core 6R (27 mbsf) (Figure F91). This interval also hosts the highest intensity, protomylonitic deformation (Rank = 3), displayed by the gabbronorite. Brittle fracturing varies from minor to moderate, with fractures typically <0.1 mm wide, and a planar or stepped morphology that form a branched or anastomosing fracture network.
Recovered evidence of brittle faulting is rare and restricted to core piece ends that locally preserve mineralized fault surfaces with slickenfibers or to millimeter-scale faults identified in thin section. Piece end fault surfaces are reported in Cores 5R, 8R, 10R, and 12R with dips between 27° and 60°, typically defined by chrysotile slickenfibers that indicate dip-slip to slightly oblique normal sense displacement. The association of piece end fault surfaces indicates that select veins may have accommodated some degree of fault slip. This is supported by microstructural observations from Sections 5R-1 (22 mbsf), 6R-1 (27 mbsf), and 12R-2 (58 mbsf) that display millimeter-scale brittle faulting and localized fracture along or spatially associated with alteration veins (Figure F94). Microstructural observations of peridotite samples from Hole U1601A show they commonly host fractured relict olivine and bent or kinked orthopyroxene grains.
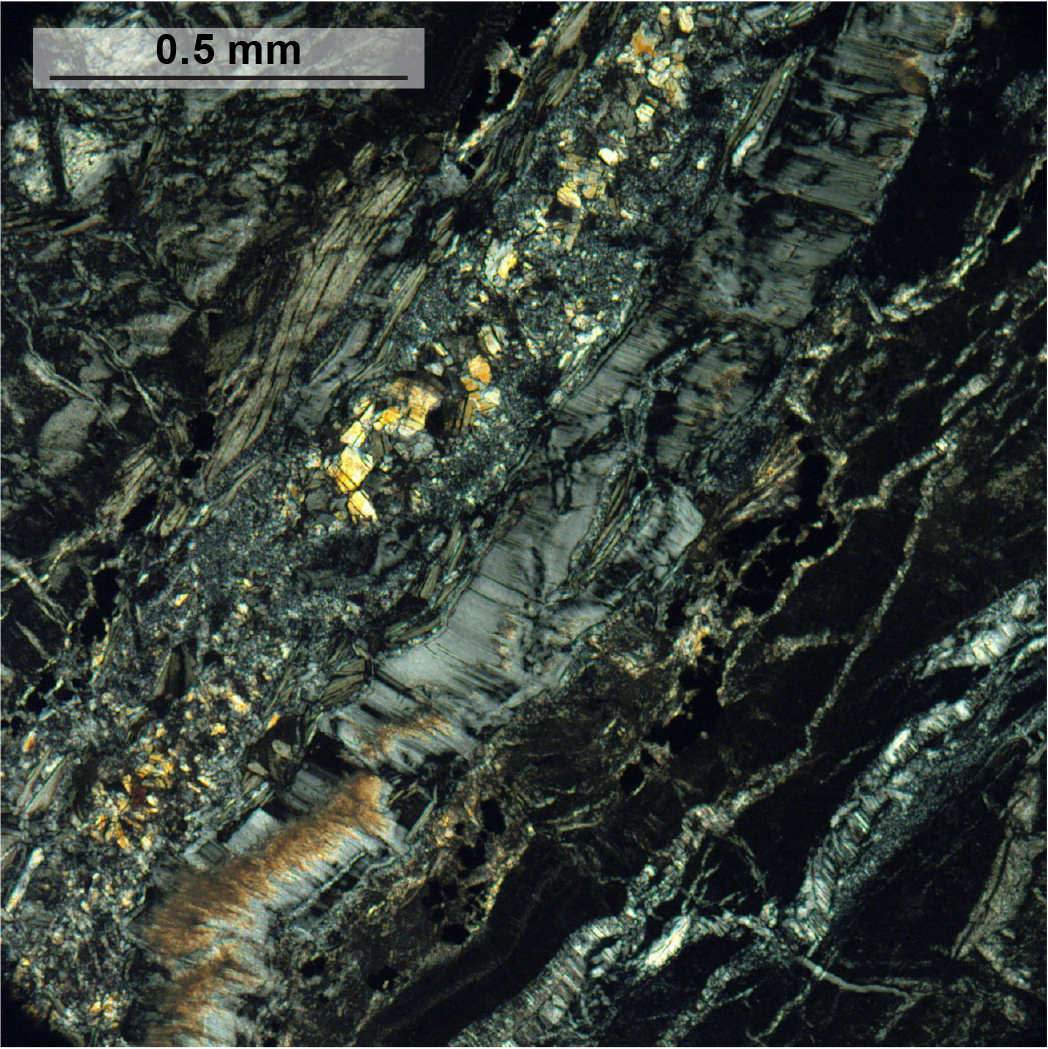
Figure F94. Gently dipping, faulted composite cross-fiber vein.
5.2. Hole U1601C
5.2.1. Magmatic veins, intrusive contacts, and fabrics
Gabbroic rocks sampled throughout Hole U1601C include a spectrum of compositions from troctolite, olivine and olivine-bearing gabbro, gabbronorite, norite, oxide gabbro, and diabase. Intrusive relations throughout the cored interval (1267.8 m) highlight a complex history of magmatism and deformation with repeated phases of crystal-plastic deformation overprinted by magmatism. Together, the drilled gabbroic cores reveal previously unrecognized structures associated with accretion and deformation of slow-spread ocean crust exposed in the footwall of an OCC (Figure F95).
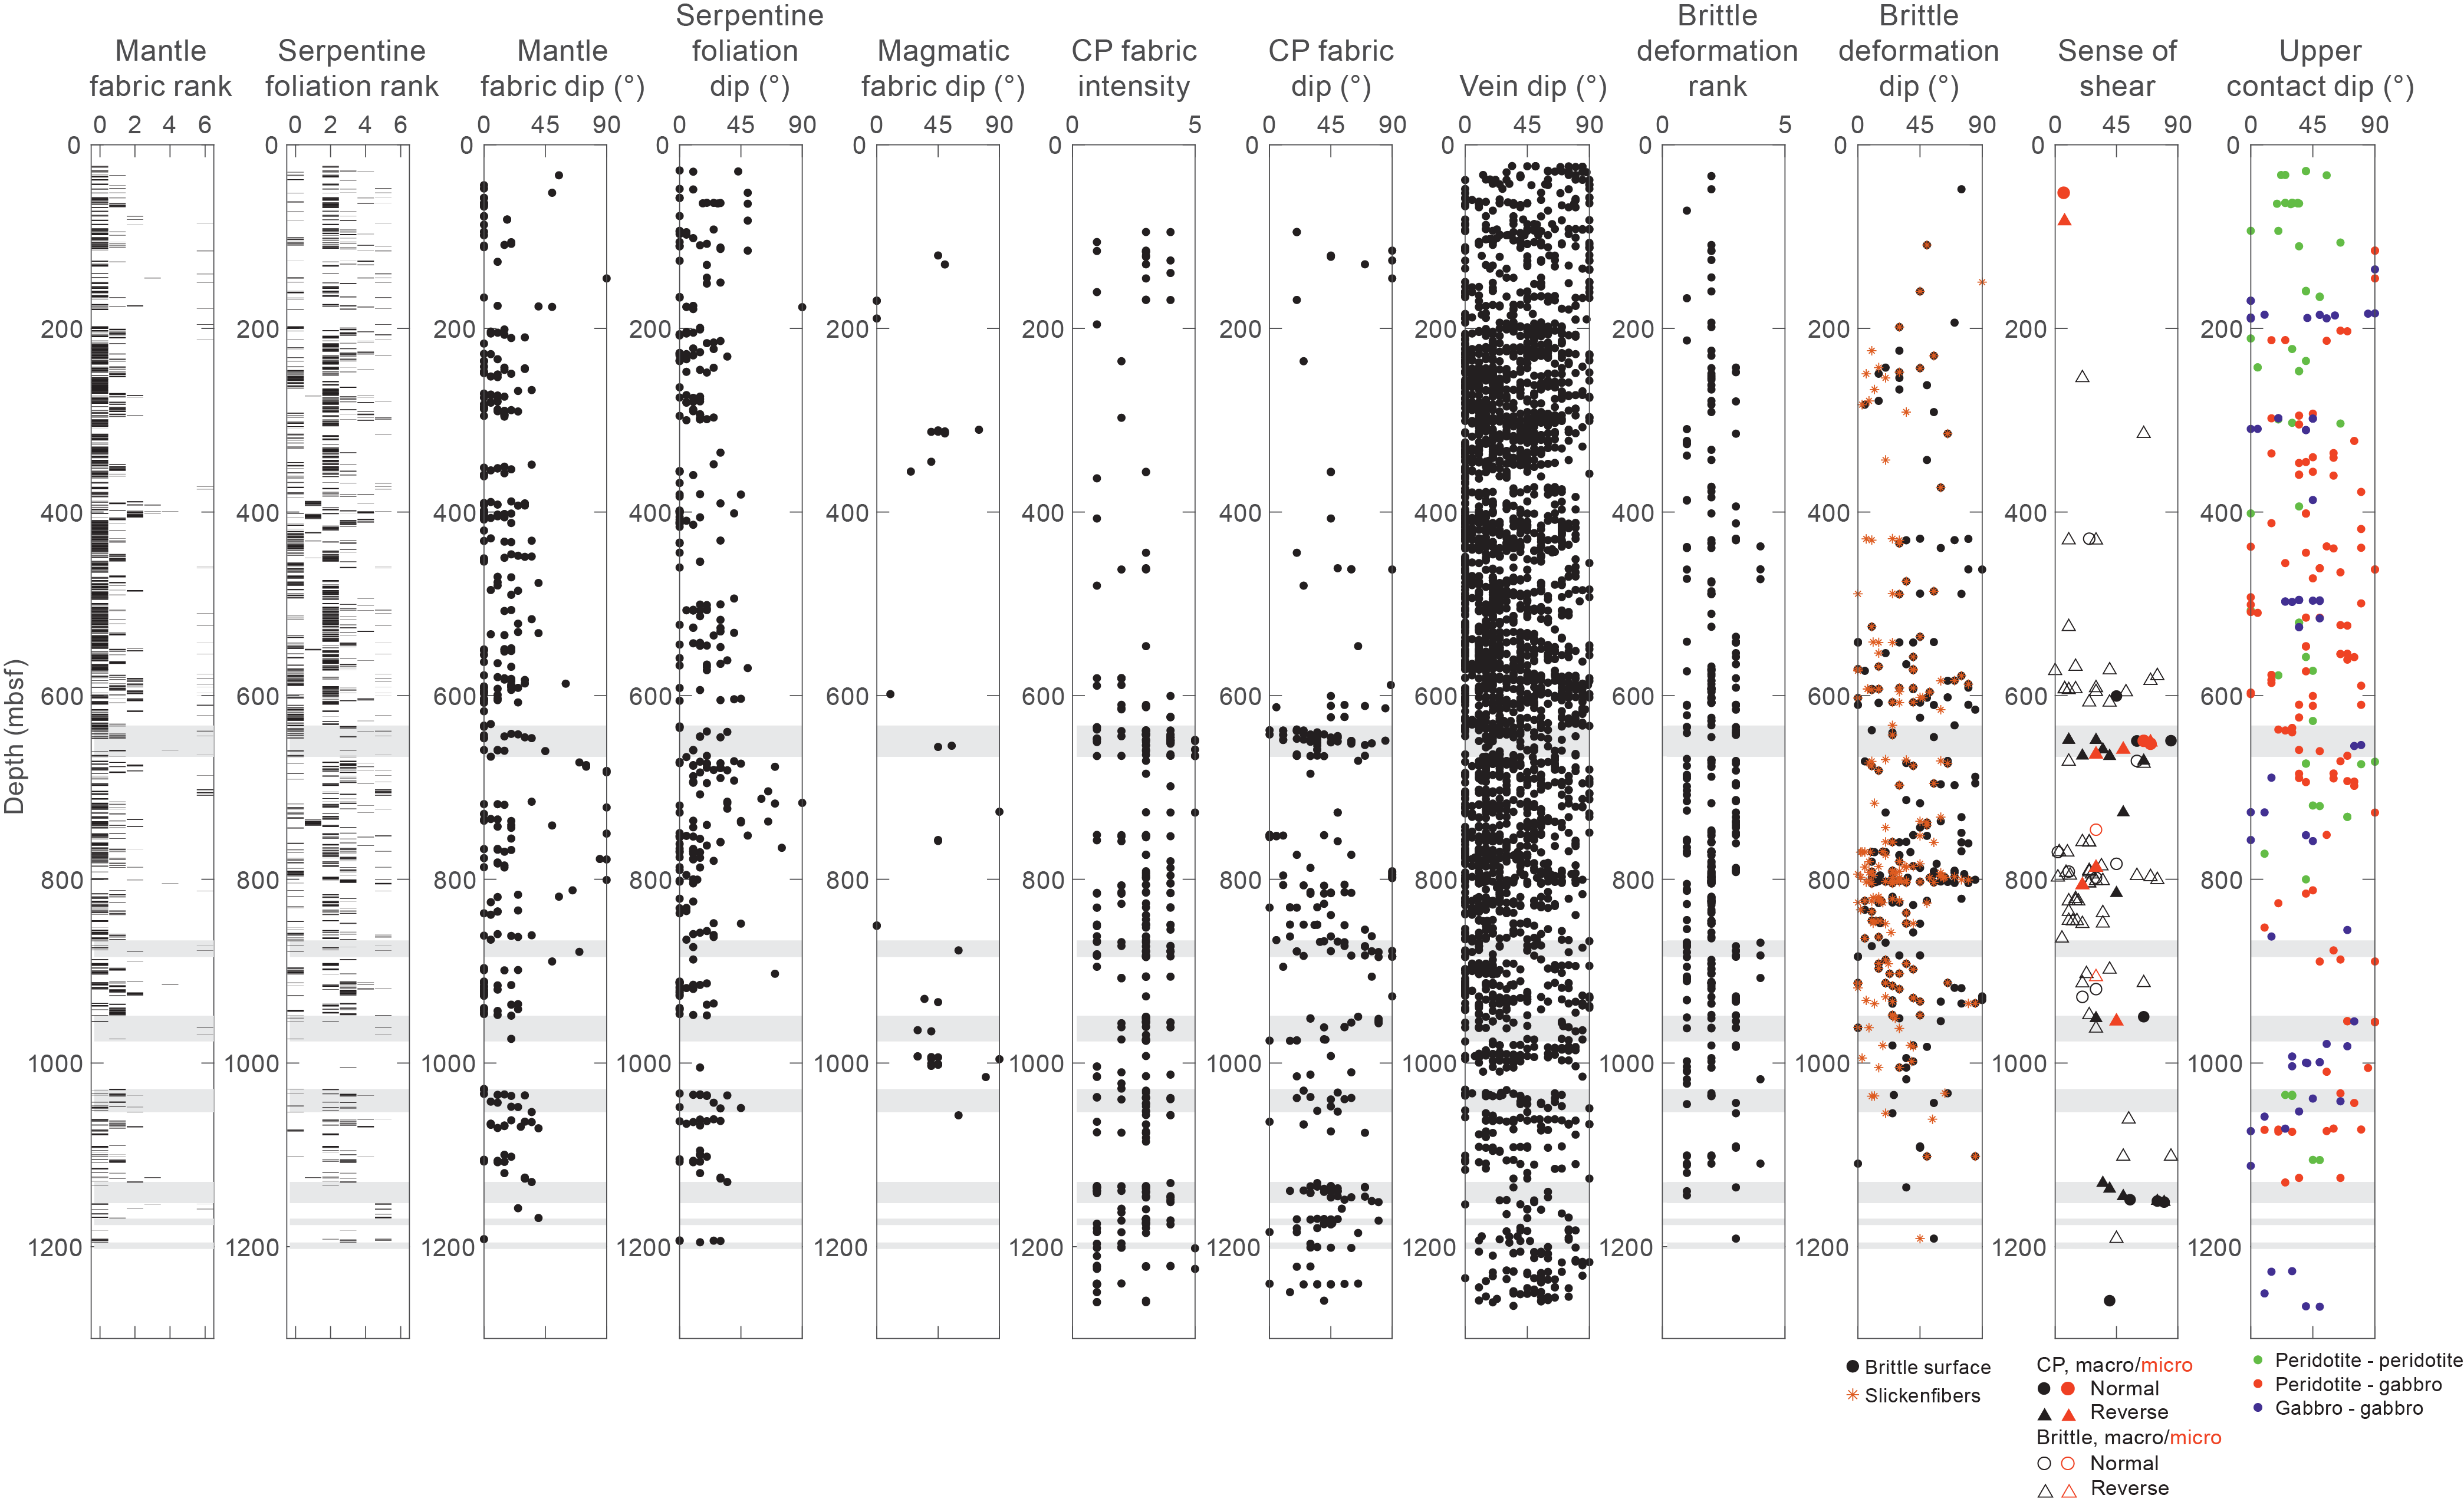
Figure F95. Structural geology measurements.
Thin magmatic veins (<2 mm to 10 cm thick) were recovered throughout Hole U1601C cutting harzburgite and/or earlier gabbroic intrusions from Cores 10R–259R (62–1264 mbsf) with dips of 0°–90° (Figure F96). In many cases these veins were altered and commonly cut by green serpentine veins (Figure F97). Mean magmatic vein dip varies with depth (Figure F96), generally increasing downhole to the deepest recovered interval, with most dips >40° below 800 mbsf.
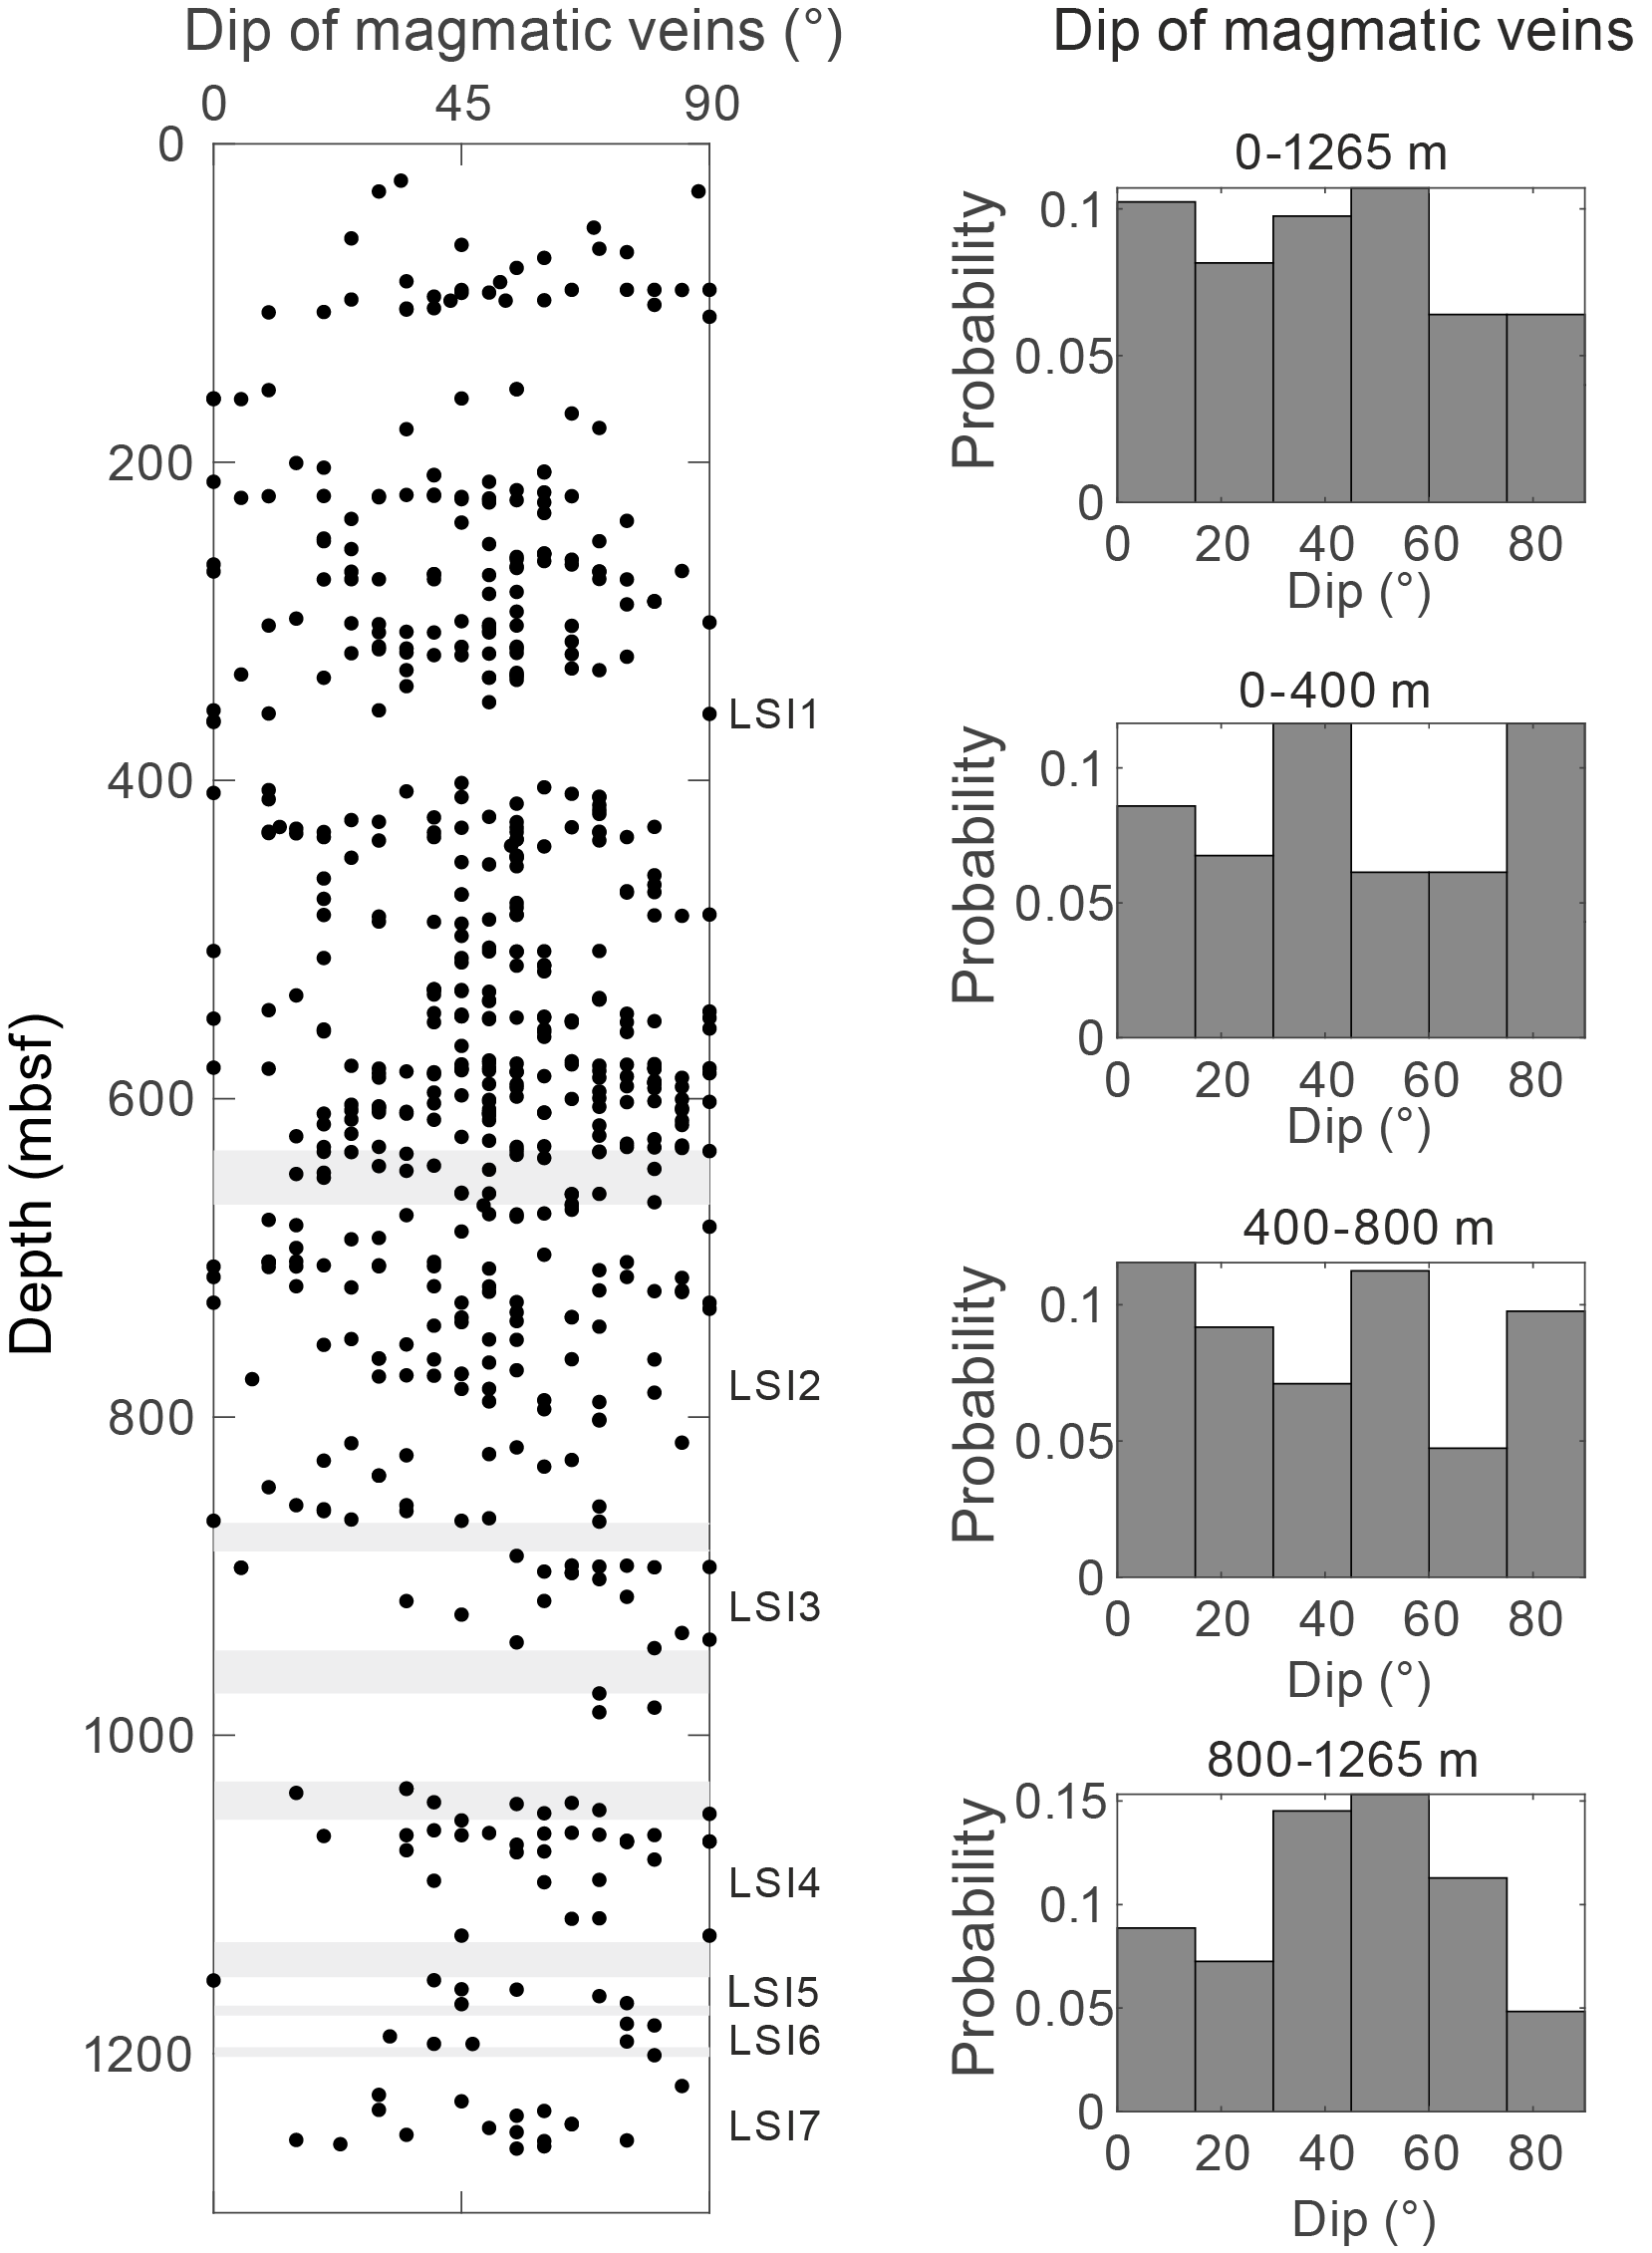
Figure F96. Magmatic vein dip.
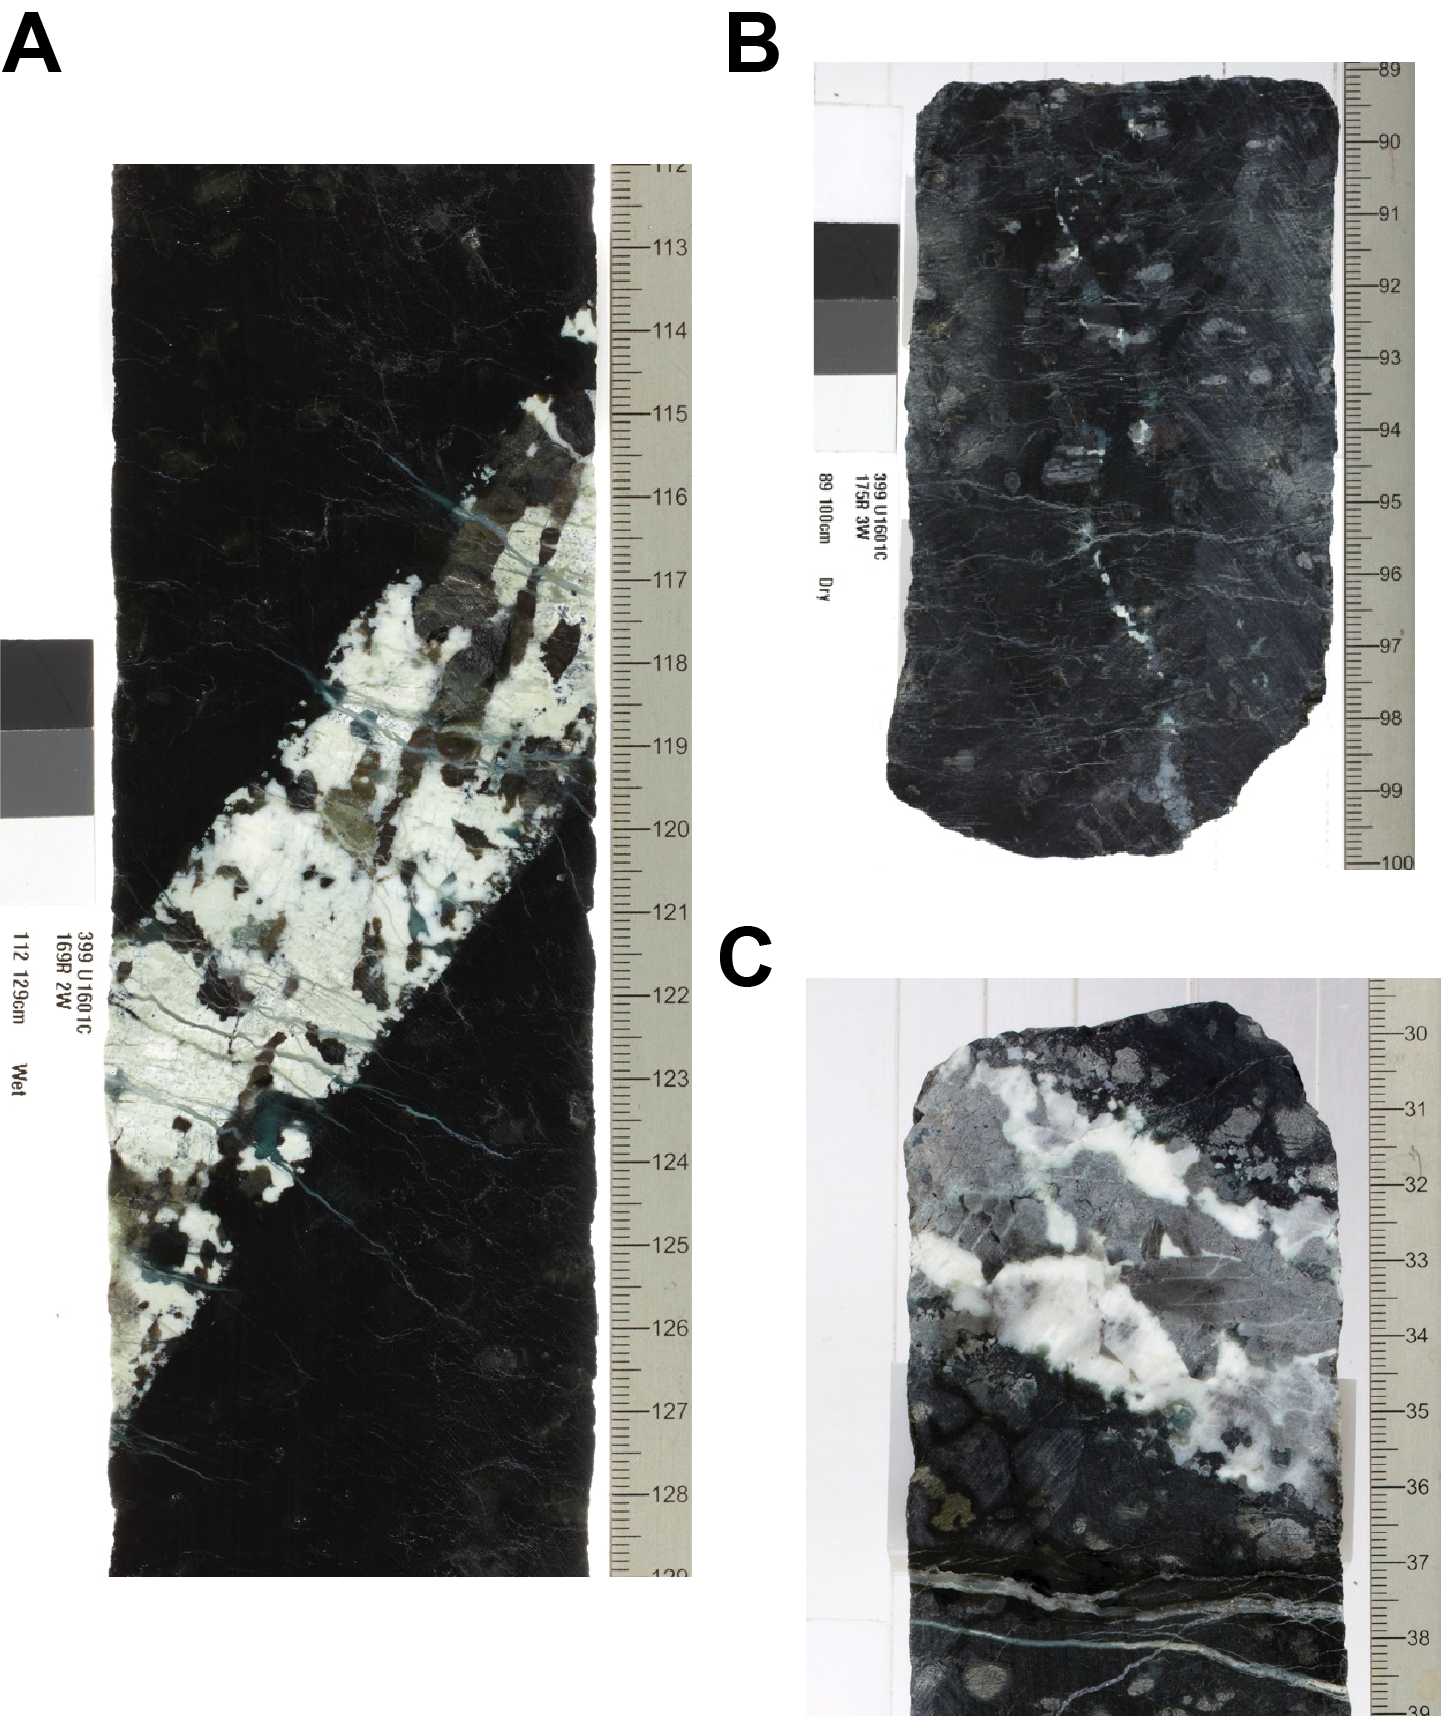
Figure F97. Character of magmatic veins.
With depth, gabbroic bodies hosted in peridotite are increasingly more common and thicker (18% total gabbro at 0–400 mbsf; 32% total gabbro at 400–800 mbsf; 50% total gabbro at 800–~950 mbsf); in Sections 193R-2 through 209R-1 (951–1128 mbsf), an ~80 m thick interval of gabbro with rare thin screens (<40 cm) of serpentinized harzburgite was recovered. Contact dips between gabbroic intervals and host peridotite vary from gentle to vertical throughout Hole U1601C between 146 and 1140 mbsf with no systematic variation with depth (Figure F98, F99). Intragabbroic contacts vary in dip from horizontal to vertical, showing no notable variation with depth (Figure F98).
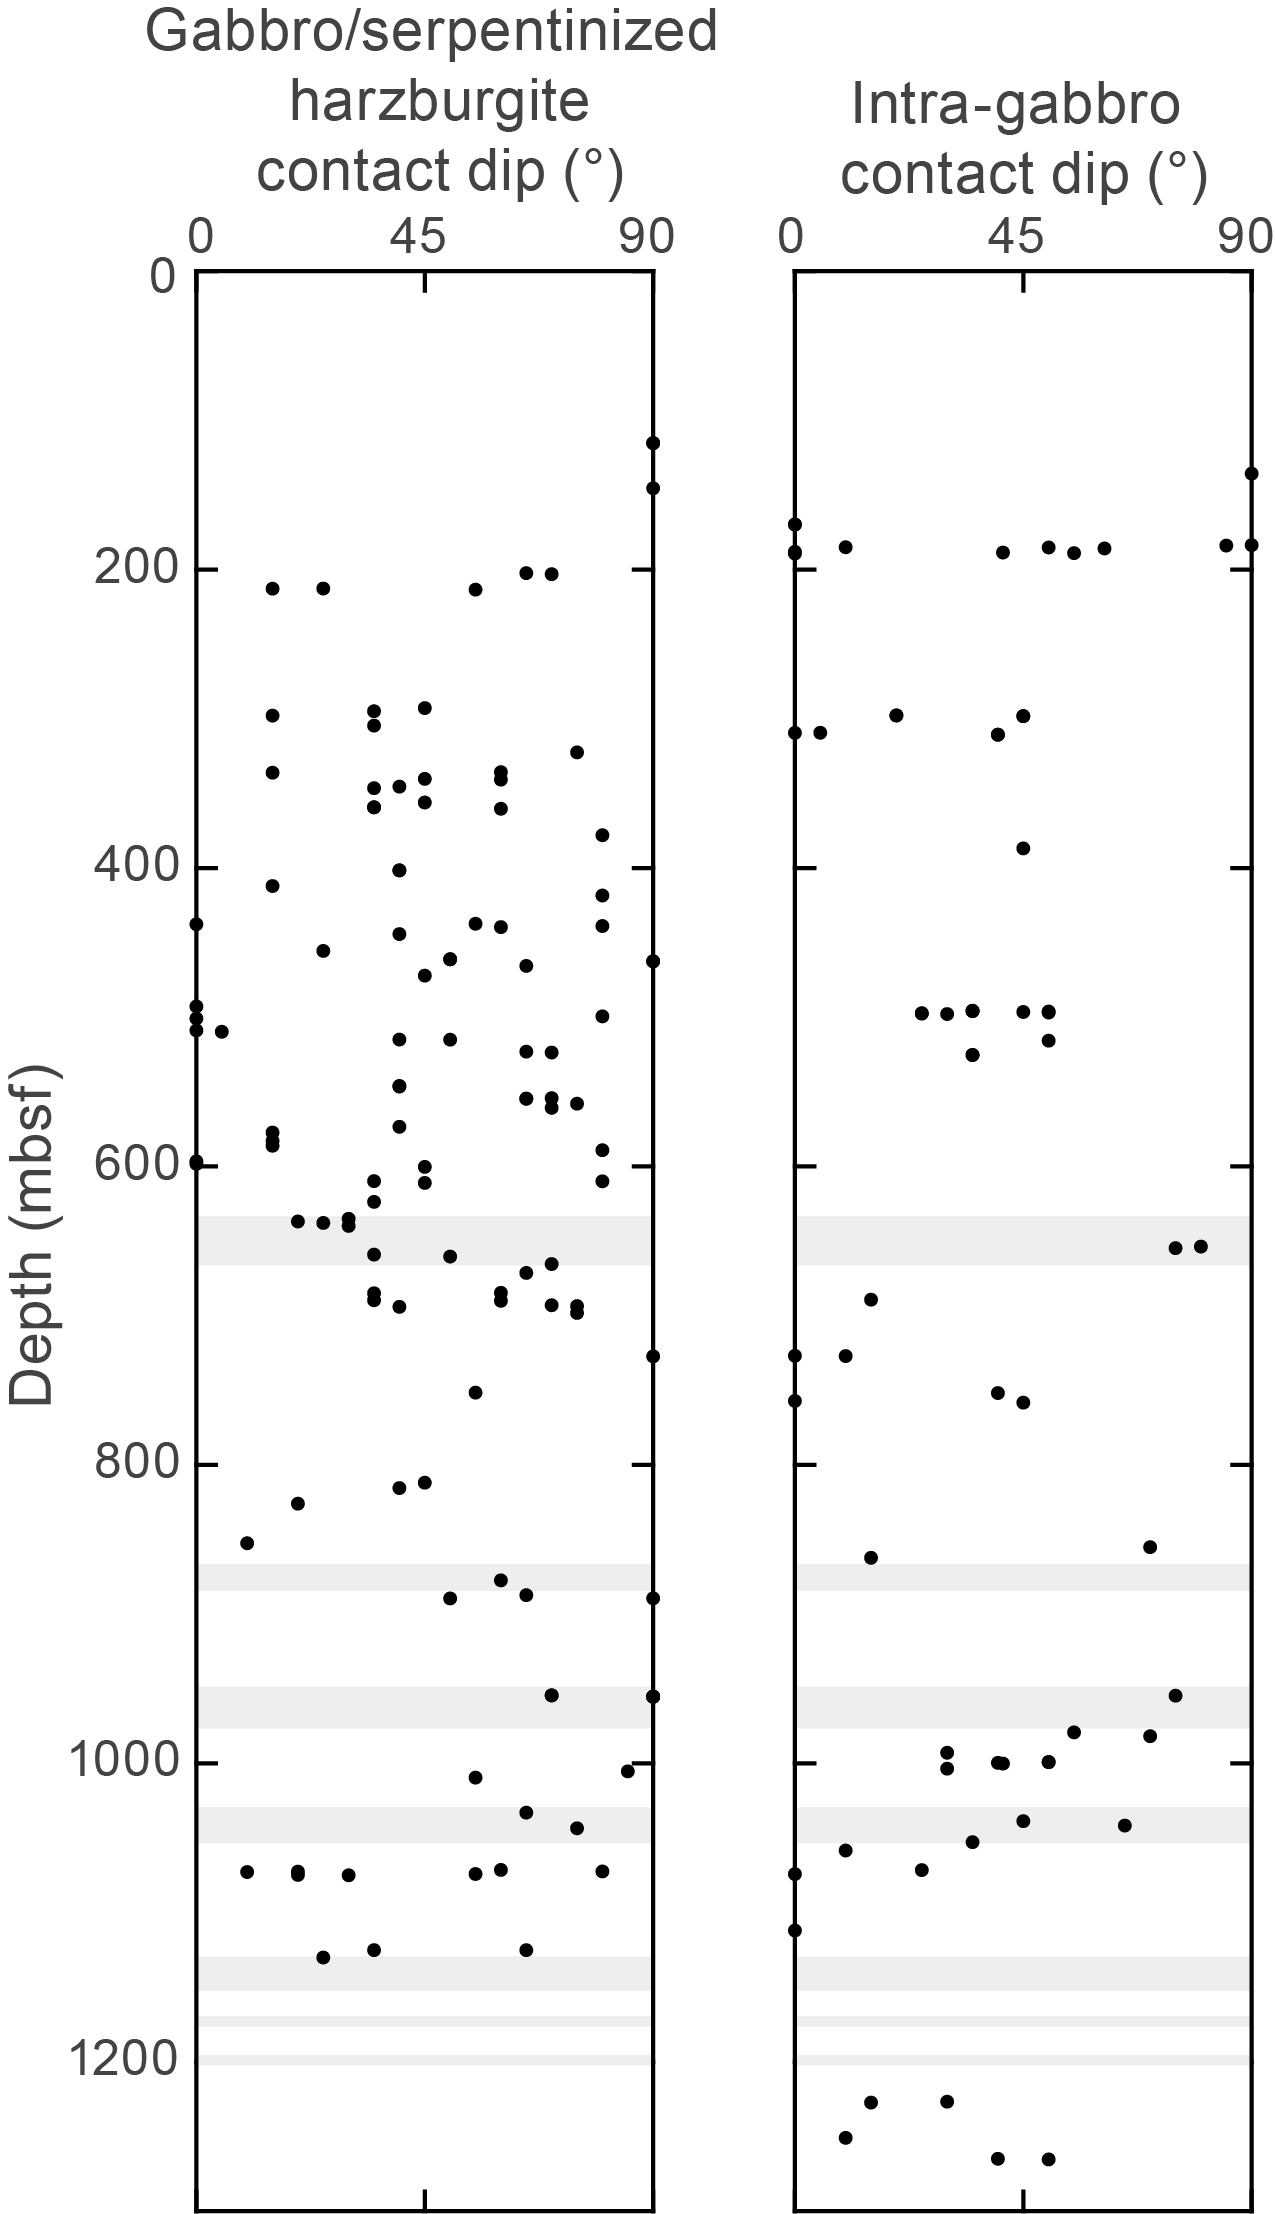
Figure F98. Contact orientations between gabbro and host harzburgite.
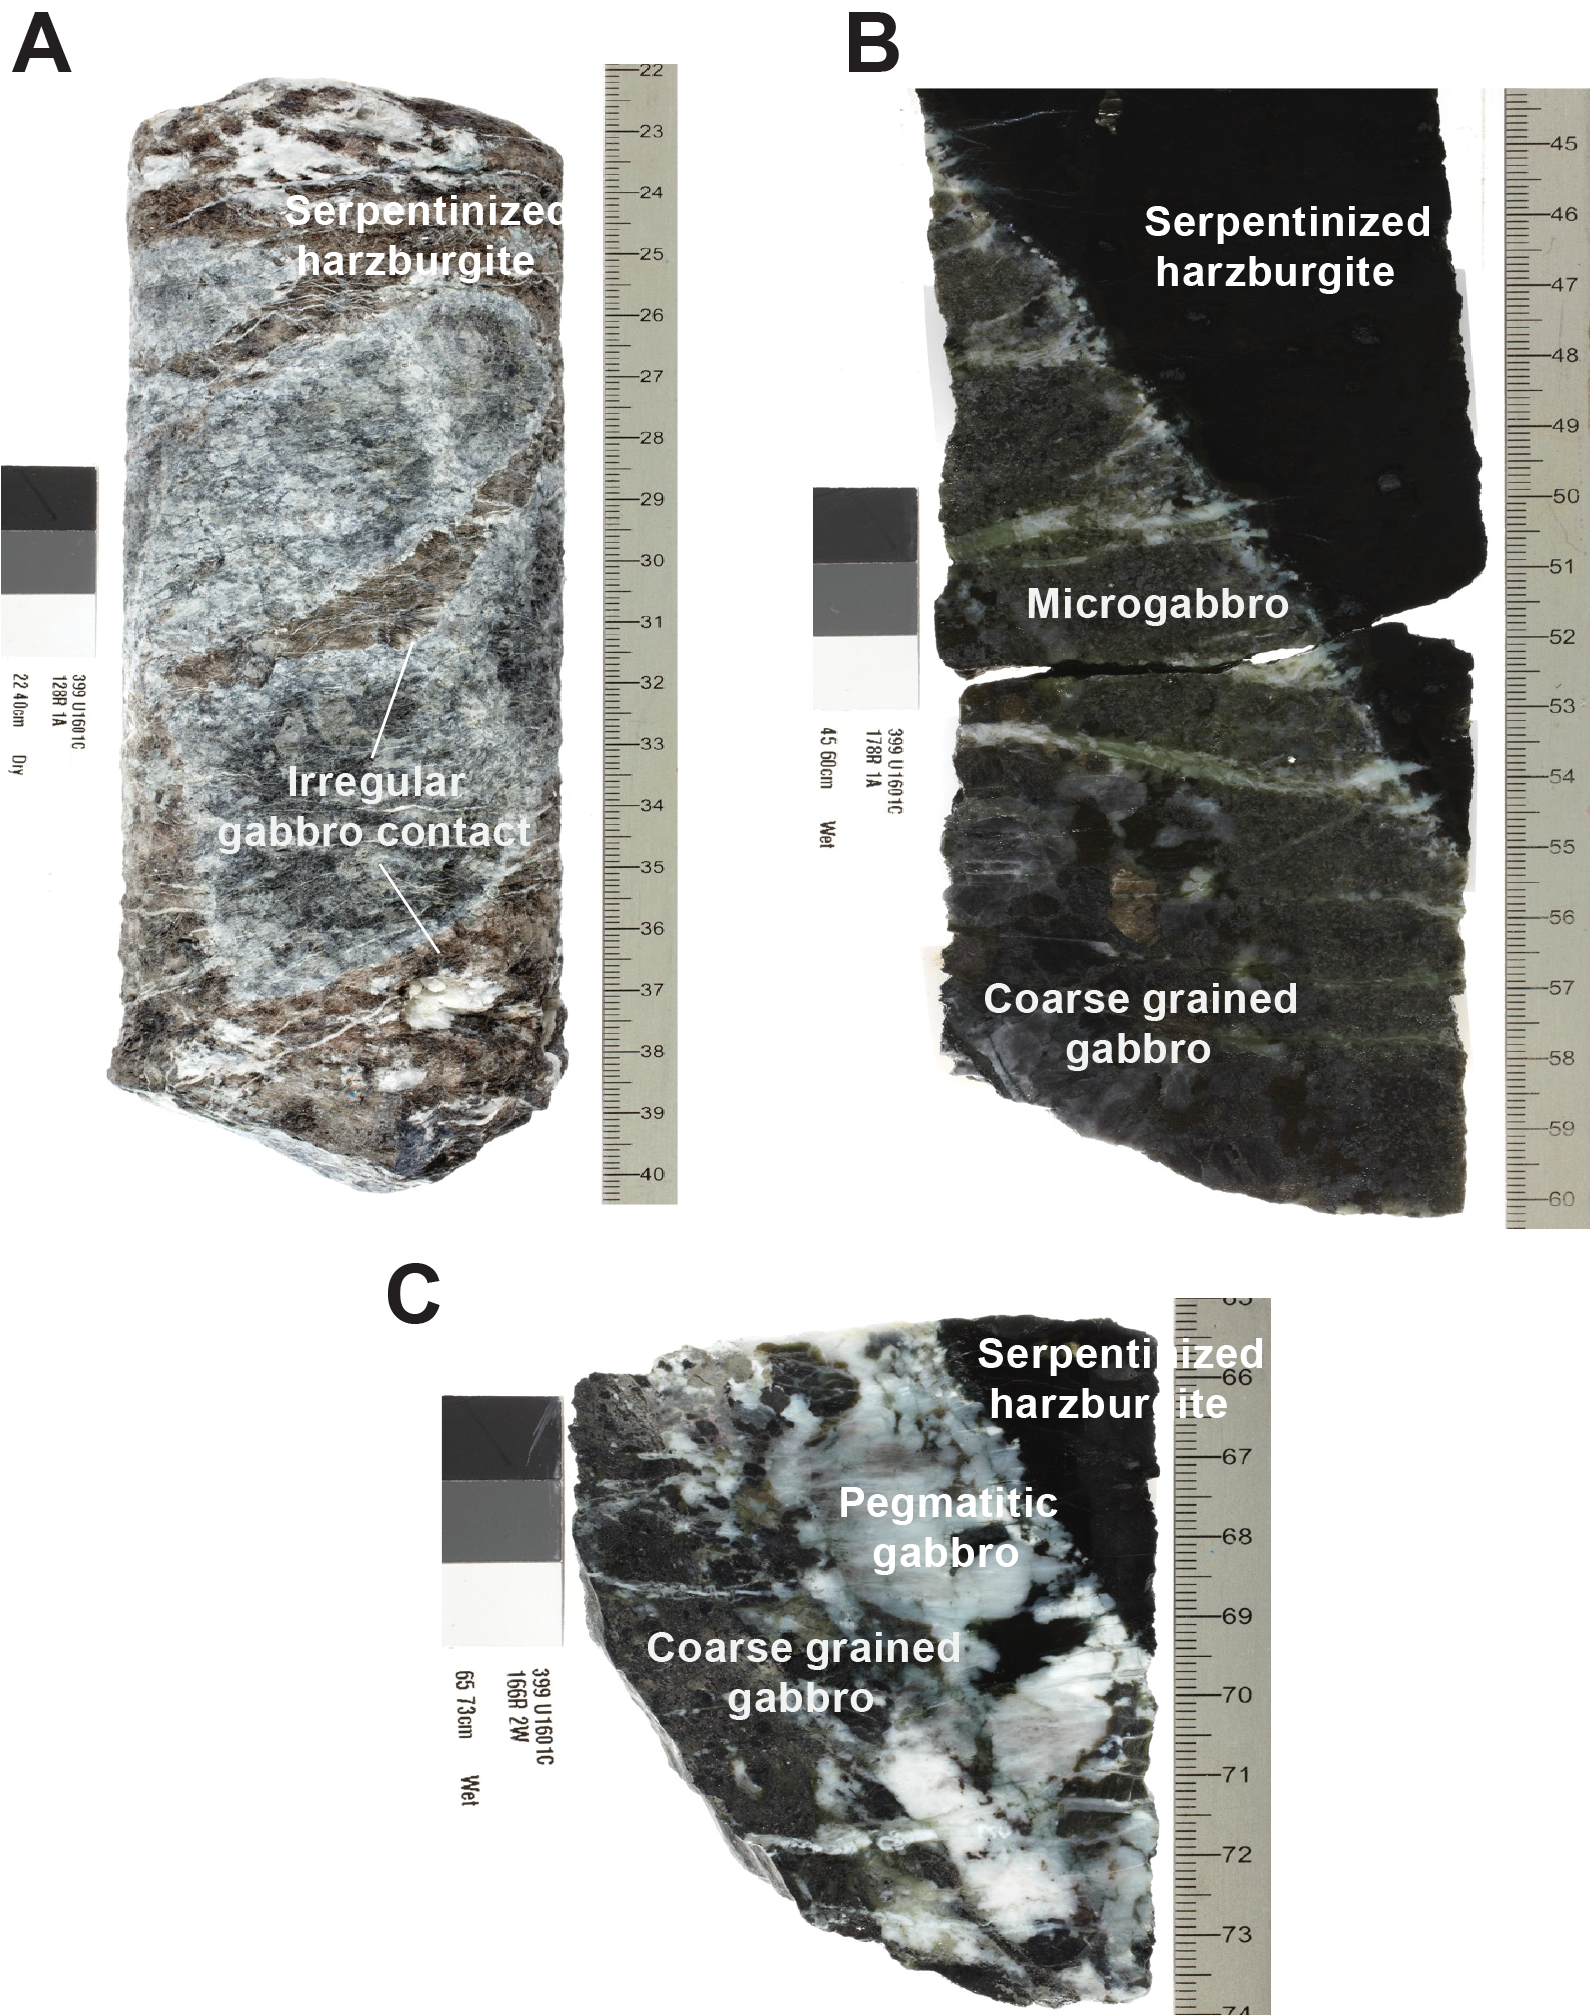
Figure F99. Nature of intrusive contact.
Magmatic foliations (defined by the SPO of plagioclase and/or pyroxene) were recorded in a limited number of intervals (33) of the recovered gabbroic sections between Cores 22R and 251R (Figure F100). Development of SPO with gentle to vertical dips is most common in more evolved gabbroic rocks including gabbro and gabbronorite (>75%) and less frequently observed in olivine- and olivine-bearing gabbro or troctolite (<25%).
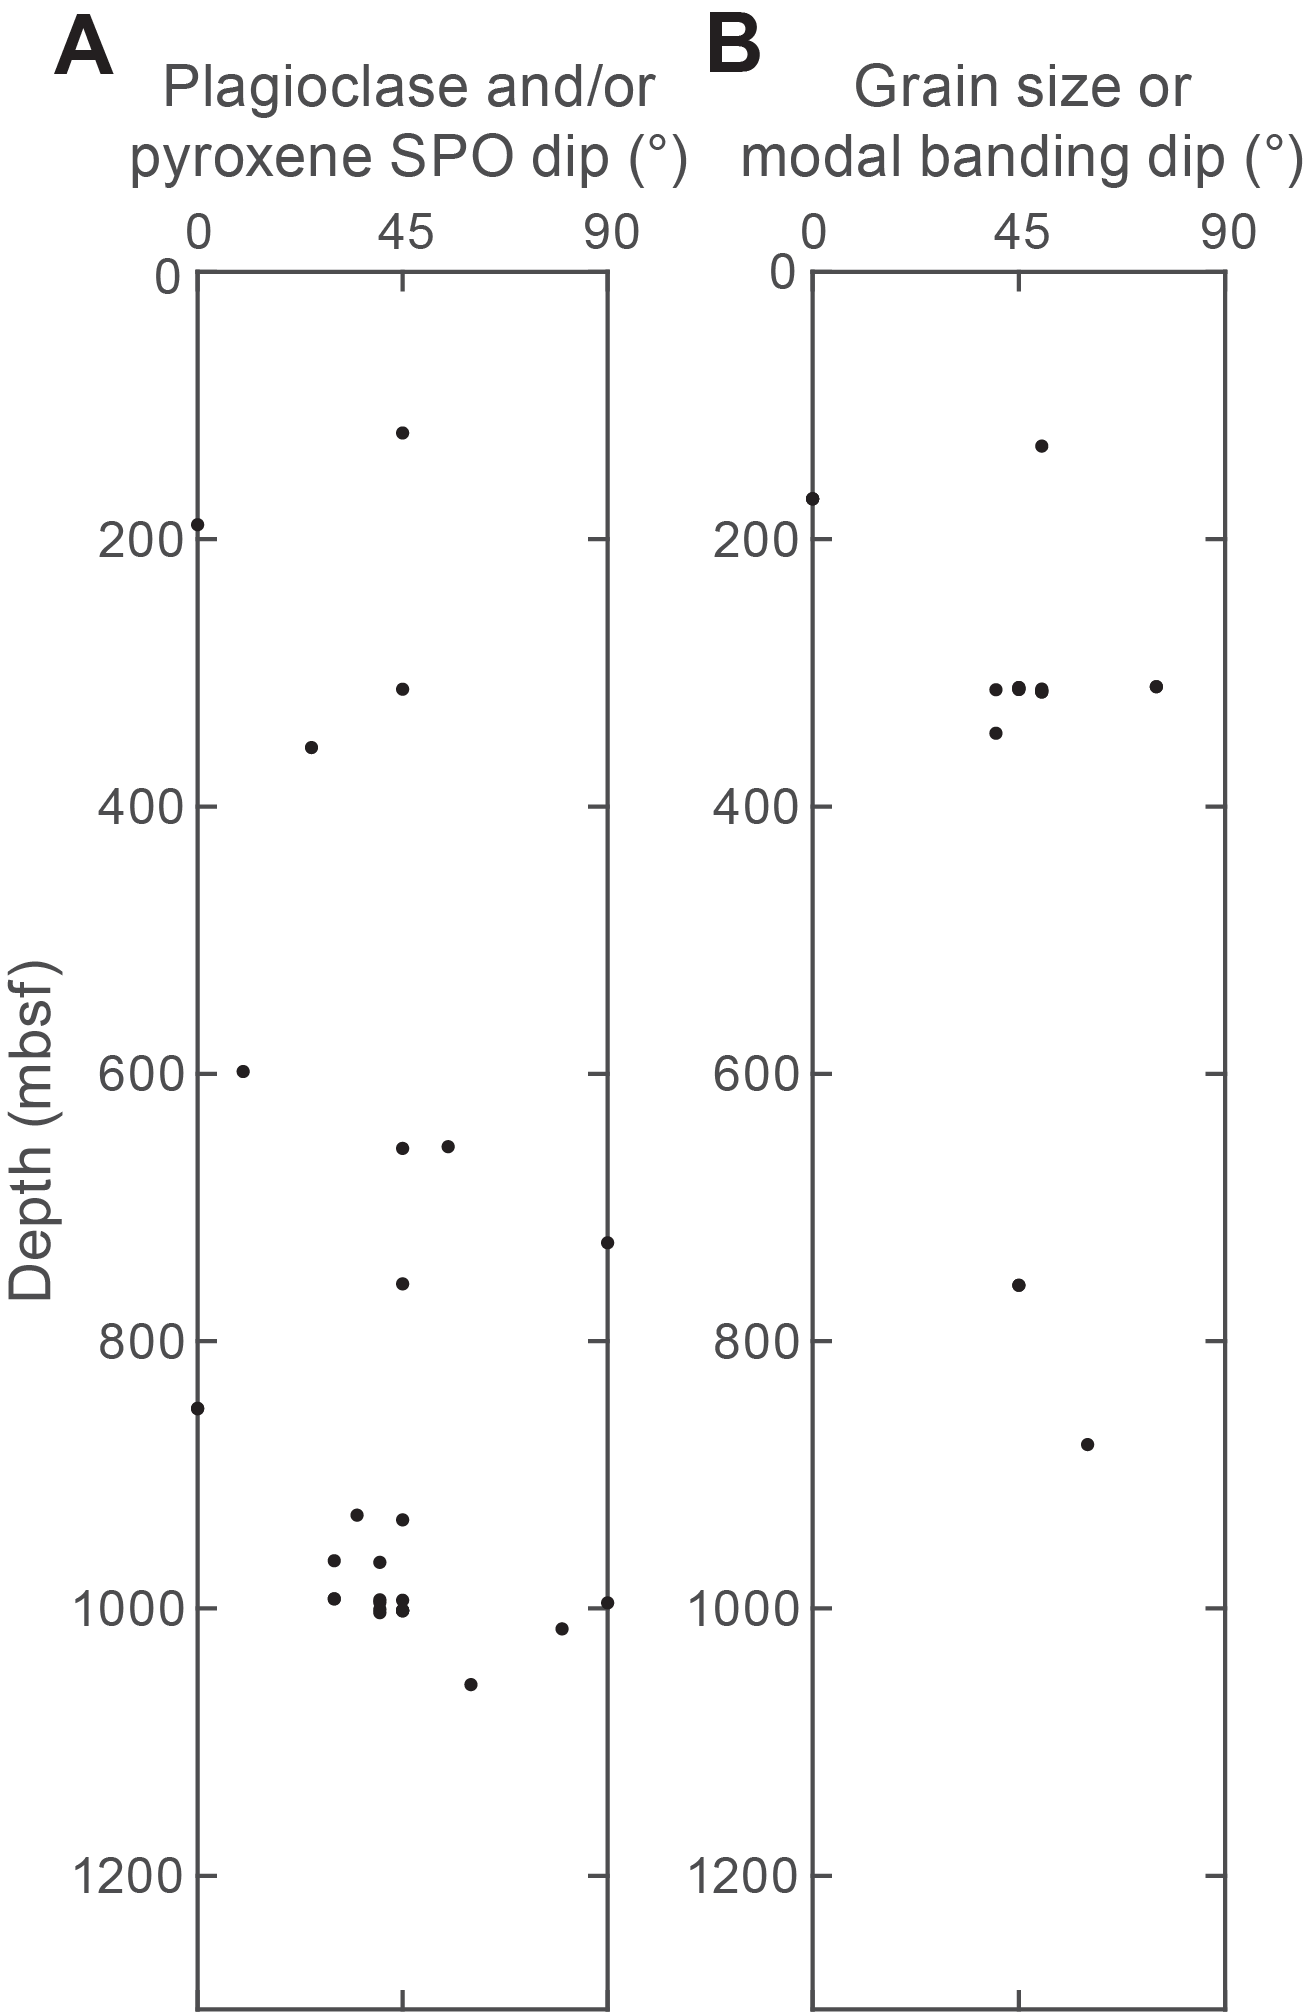
Figure F100. Dip in intervals hosting rarely developed magmatic fabrics.
The majority of the recovered gabbroic section is isotropic, with locally banded intervals defined by grain size and/or difference in modal abundance (Figure F101). However, this modal and/or grain size banding (Figure F100) was only recovered in intervals hosting gabbro of >20–30 cm thickness below ~130 mbsf (Section 24R-1), barring those with crystal-plastic deformation in Hole U1601C. Most contacts between these domains were not recovered, but where observed, their boundaries are typically diffuse over a centimeter scale with an irregular geometry and a variable dip between subhorizontal to subvertical (Figure F101). In contrast to magmatic foliation being preferential in more evolved gabbroic rocks, layering shows no relationship to lithology in the recovered sections.
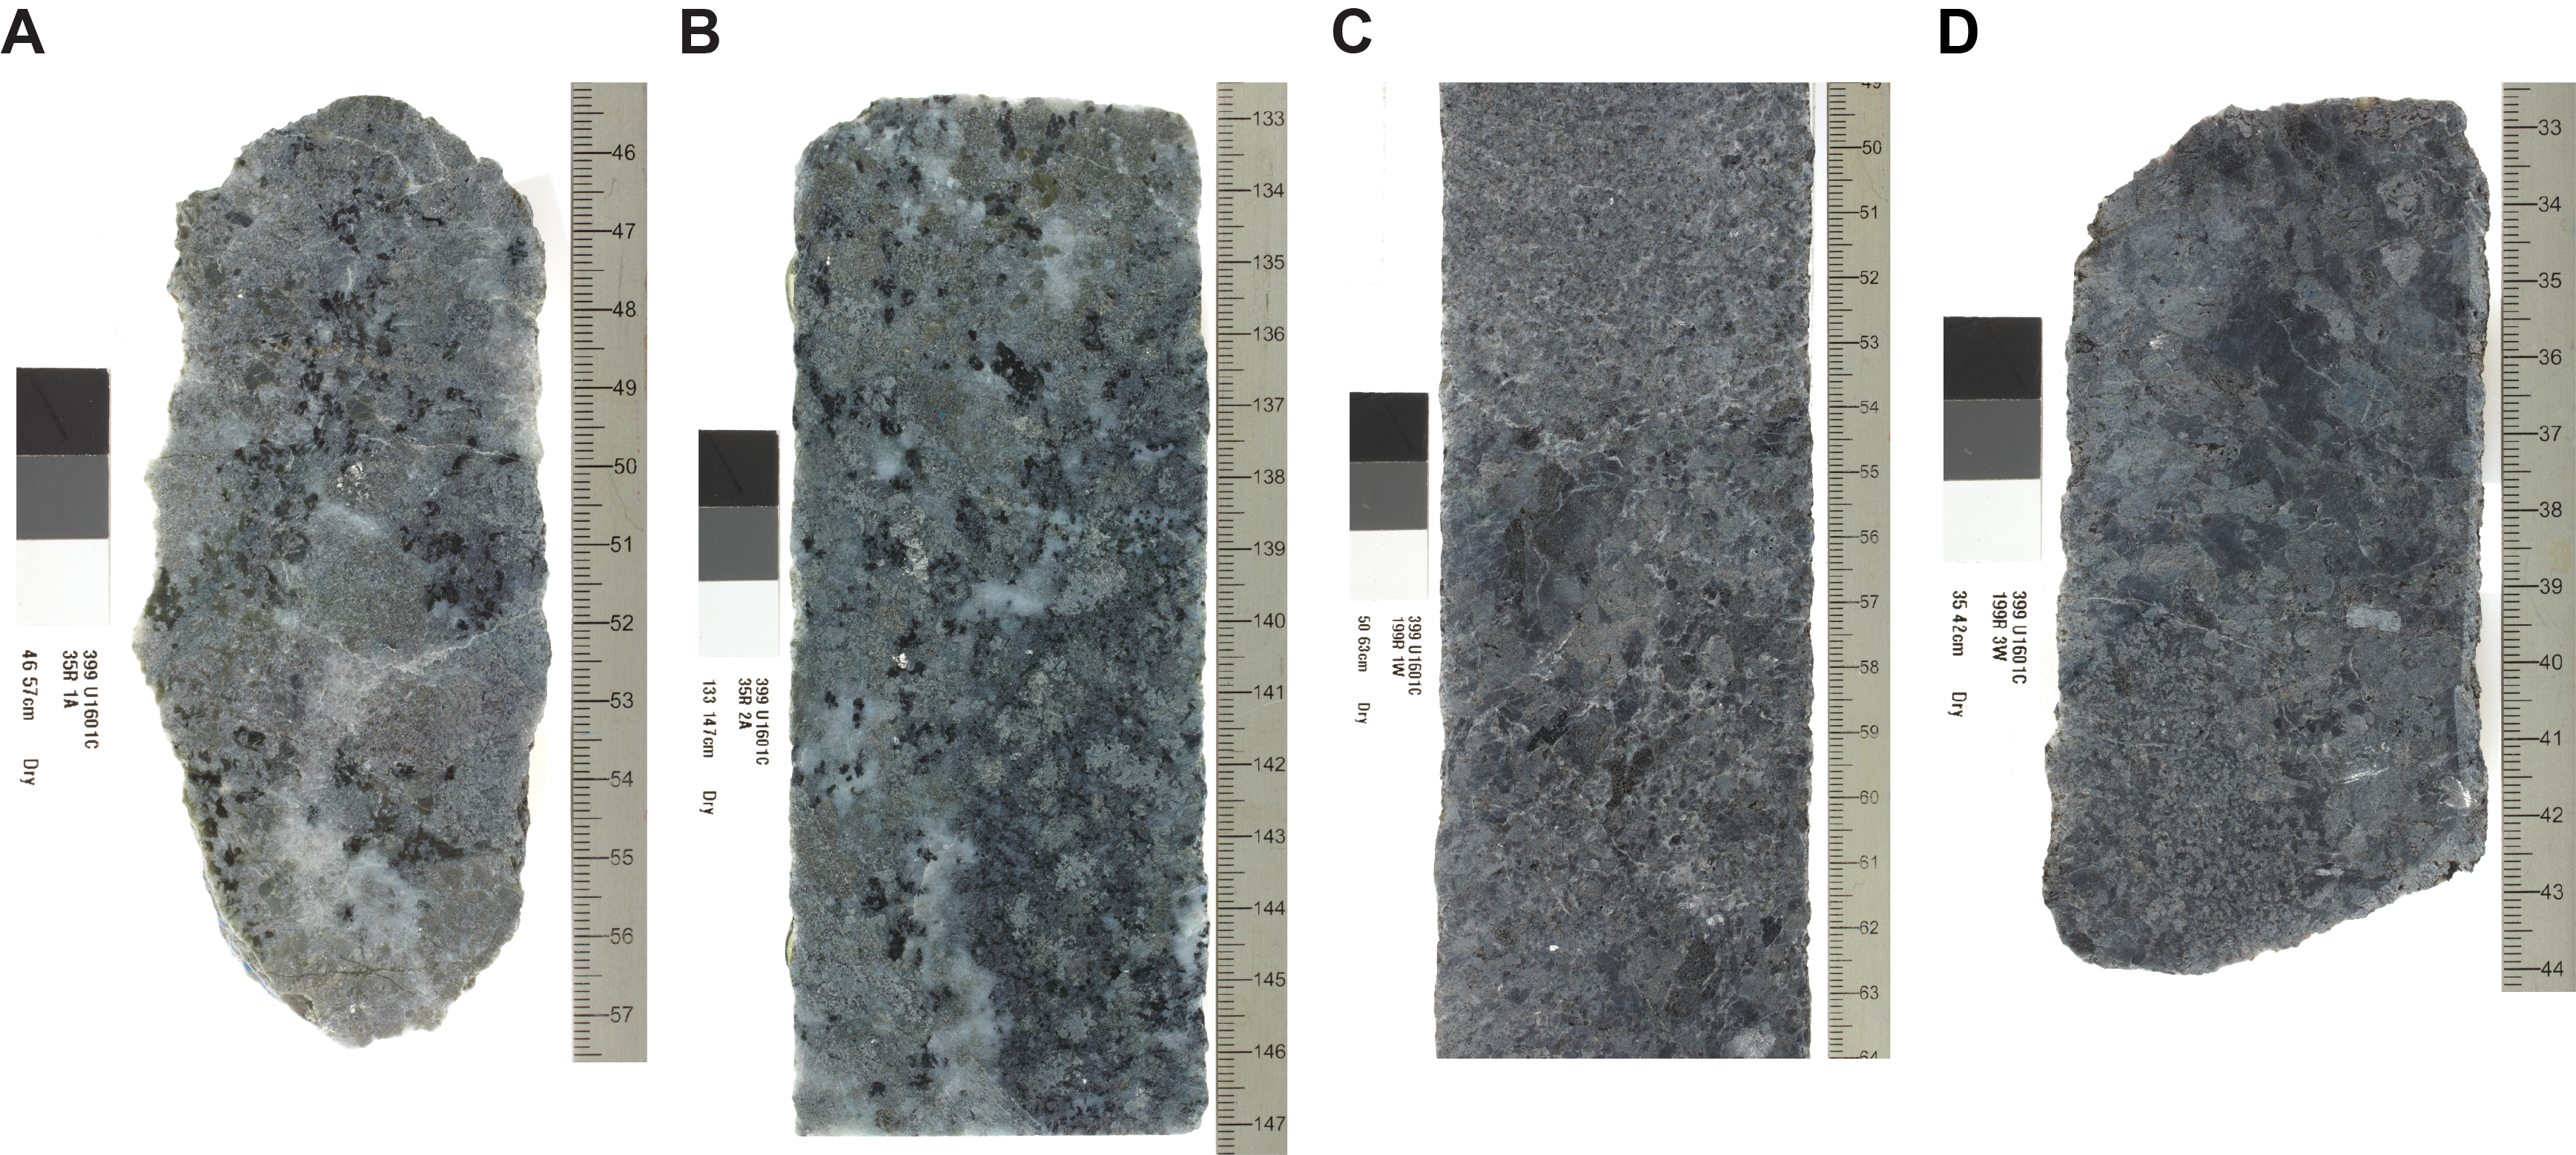
Figure F101. Subvertical modal banding in gabbro.
Thin intervals of diabase (up to 78 cm thick; Section 144R-3) and microgabbro were recovered in Hole U1601C from Sections 2R-1 through 173R-2 (23–854 mbsf) and highlight the variable timing of their emplacement relative to deformation. Diabase is characteristically aphanitic and rarely displays chilled margins. At the local scale (Sample 134R-2, 126–130 cm [TS88]; 665 mbsf), recovered diabase has a mylonitic fabric parallel to that in the host gabbro (Figure F102). Elsewhere, diabase in Sections 144R-2 and 144R-3 (714 mbsf) are highly brecciated, indicating intrusion prior to at least local brittle deformation. Gently dipping (15° dip) diabase at 849 mbsf (Sample 172R-2, 12–15 cm) cuts oxide gabbro mylonite. Undeformed diabase recovered in Sections 128R-3, 144R-3, 158R-1, and 172R-2 indicates emplacement of some of these bodies following both ductile and brittle deformation, implying pulsed magmatism and deformation in the footwall of the detachment system.
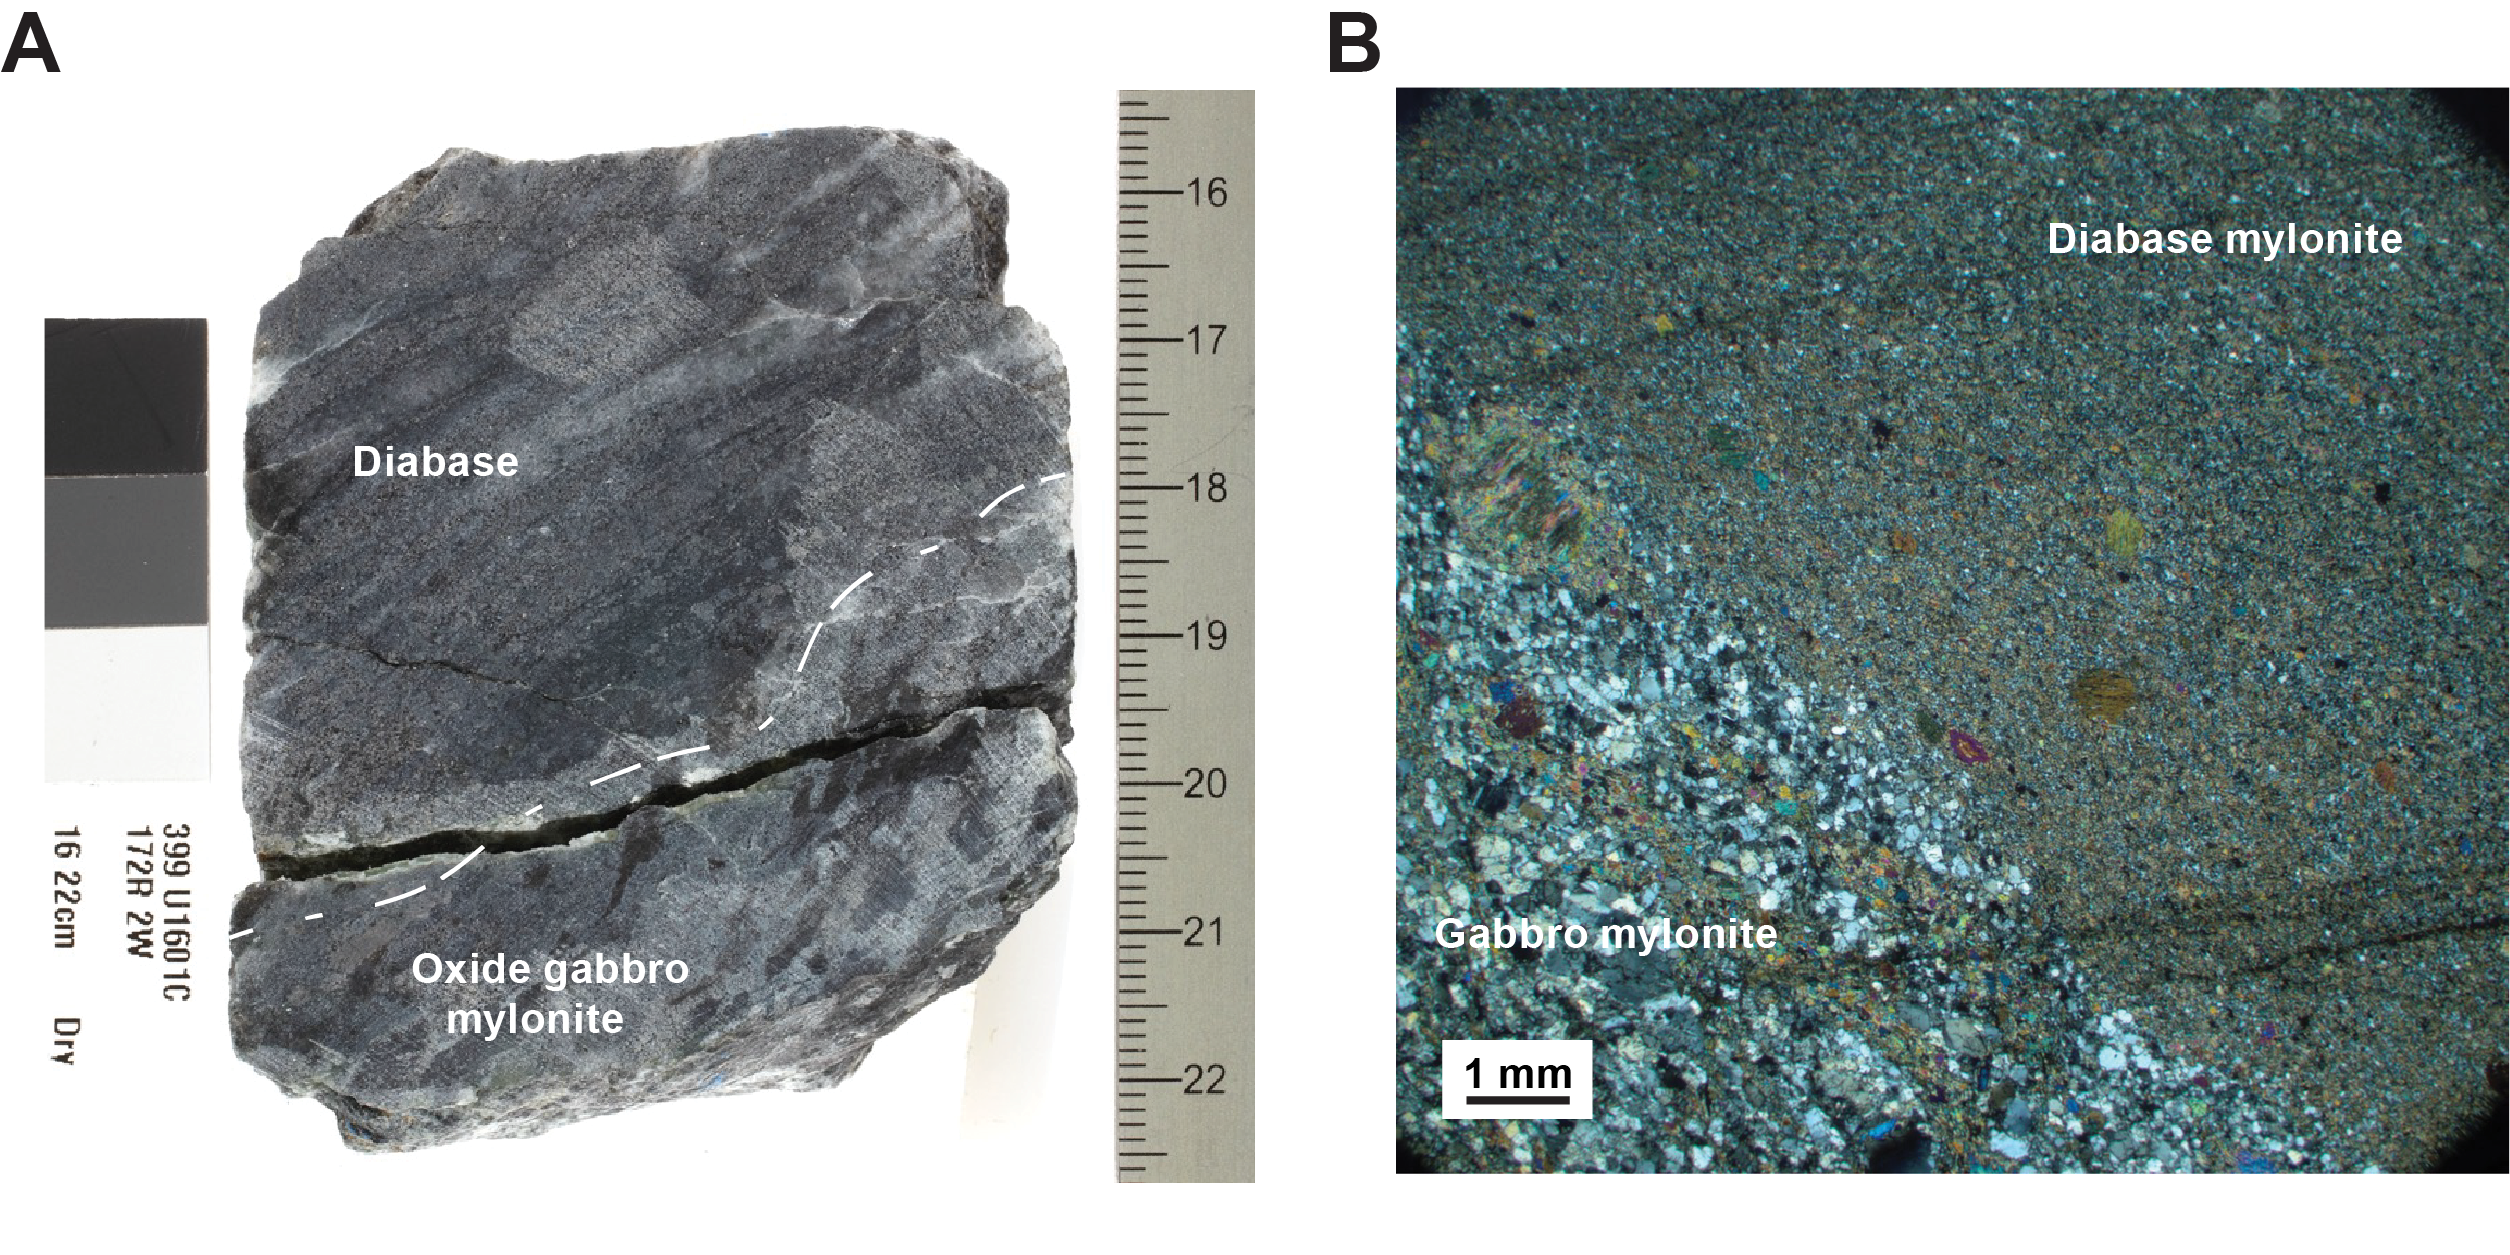
Figure F102. Diabase intrusion(s) and deformation.
5.2.2. Mantle fabrics and serpentine foliation
5.2.2.1. Mantle fabrics
Ultramafic rocks sampled in Hole U1601C cores are dominated by harzburgite with less dunite and minor pyroxenite (see Igneous petrology). Recovered contacts between ultramafic rock types are most common between harzburgite and dunite and nearly always gradational with the proportion of orthopyroxene decreasing over centimeters to decimeters. Harzburgite/dunite contacts have variable orientations, with a mode of 40° (Figure F103B). Identification of mantle fabrics is based on the orientation/alignment of pyroxene grains, and therefore, fabric was only determined in pyroxene-bearing ultramafic intervals, mostly harzburgite. Mantle fabrics identified in these rocks span the range of intensity or rank from protogranular to porphyroclastic, protomylonitic, and mylonitic fabrics (Figures F95, F103). Locally, the mantle fabric is undetermined, as it was obscured by secondary alteration or intense veining. Protogranular fabrics dominate the recovered section, accounting for 71%. Weakly foliated porphyroclastic fabrics account for 21%, strongly porphyroclastic fabrics account for 6%, and protomylonitic to mylonitic fabrics account for the remaining 1% (Figure F104). Alternation between different fabric types occurs on a scale from a few centimeters up to several meters. Most observed mantle fabrics have a subhorizontal to moderately inclined dip (0°–45°; Figure F103C). Significant variability in mantle fabric intensity and orientation is typical (see Structural geology in the Expedition 399 methods chapter [Lang et al., 2025]); no systematic variation in intensity or dip is observed except in the intervals between high-strain Zone 1 and the top of high-strain Zone 2 (634–867 mbsf), which show a significant proportion of steep to subvertical mantle fabric dips, steeper than typically observed elsewhere in the hole (Figure F103). Protogranular fabrics display one to two generations of orthopyroxene and in some cases host an additional generation of clinopyroxene with amoeboidal grain boundaries; grain size ranges from millimeters to 1 cm (Figure F105). The SPO of orthopyroxene in foliated porphyroclastic harzburgite is noted as either elongate pyroxene (or bastite assemblage) grains or as trails of pyroxene (or bastite assemblage) (Figure F106). Thin section observations indicate porphyroclastic foliated mantle fabrics can be formed by undeformed, bent, and/or kinked orthopyroxene with the long-axis orientations of grains parallel or subparallel to the foliation (Figure F106). These kinked and bent orthopyroxene grains indicate deformation prior to serpentinization.
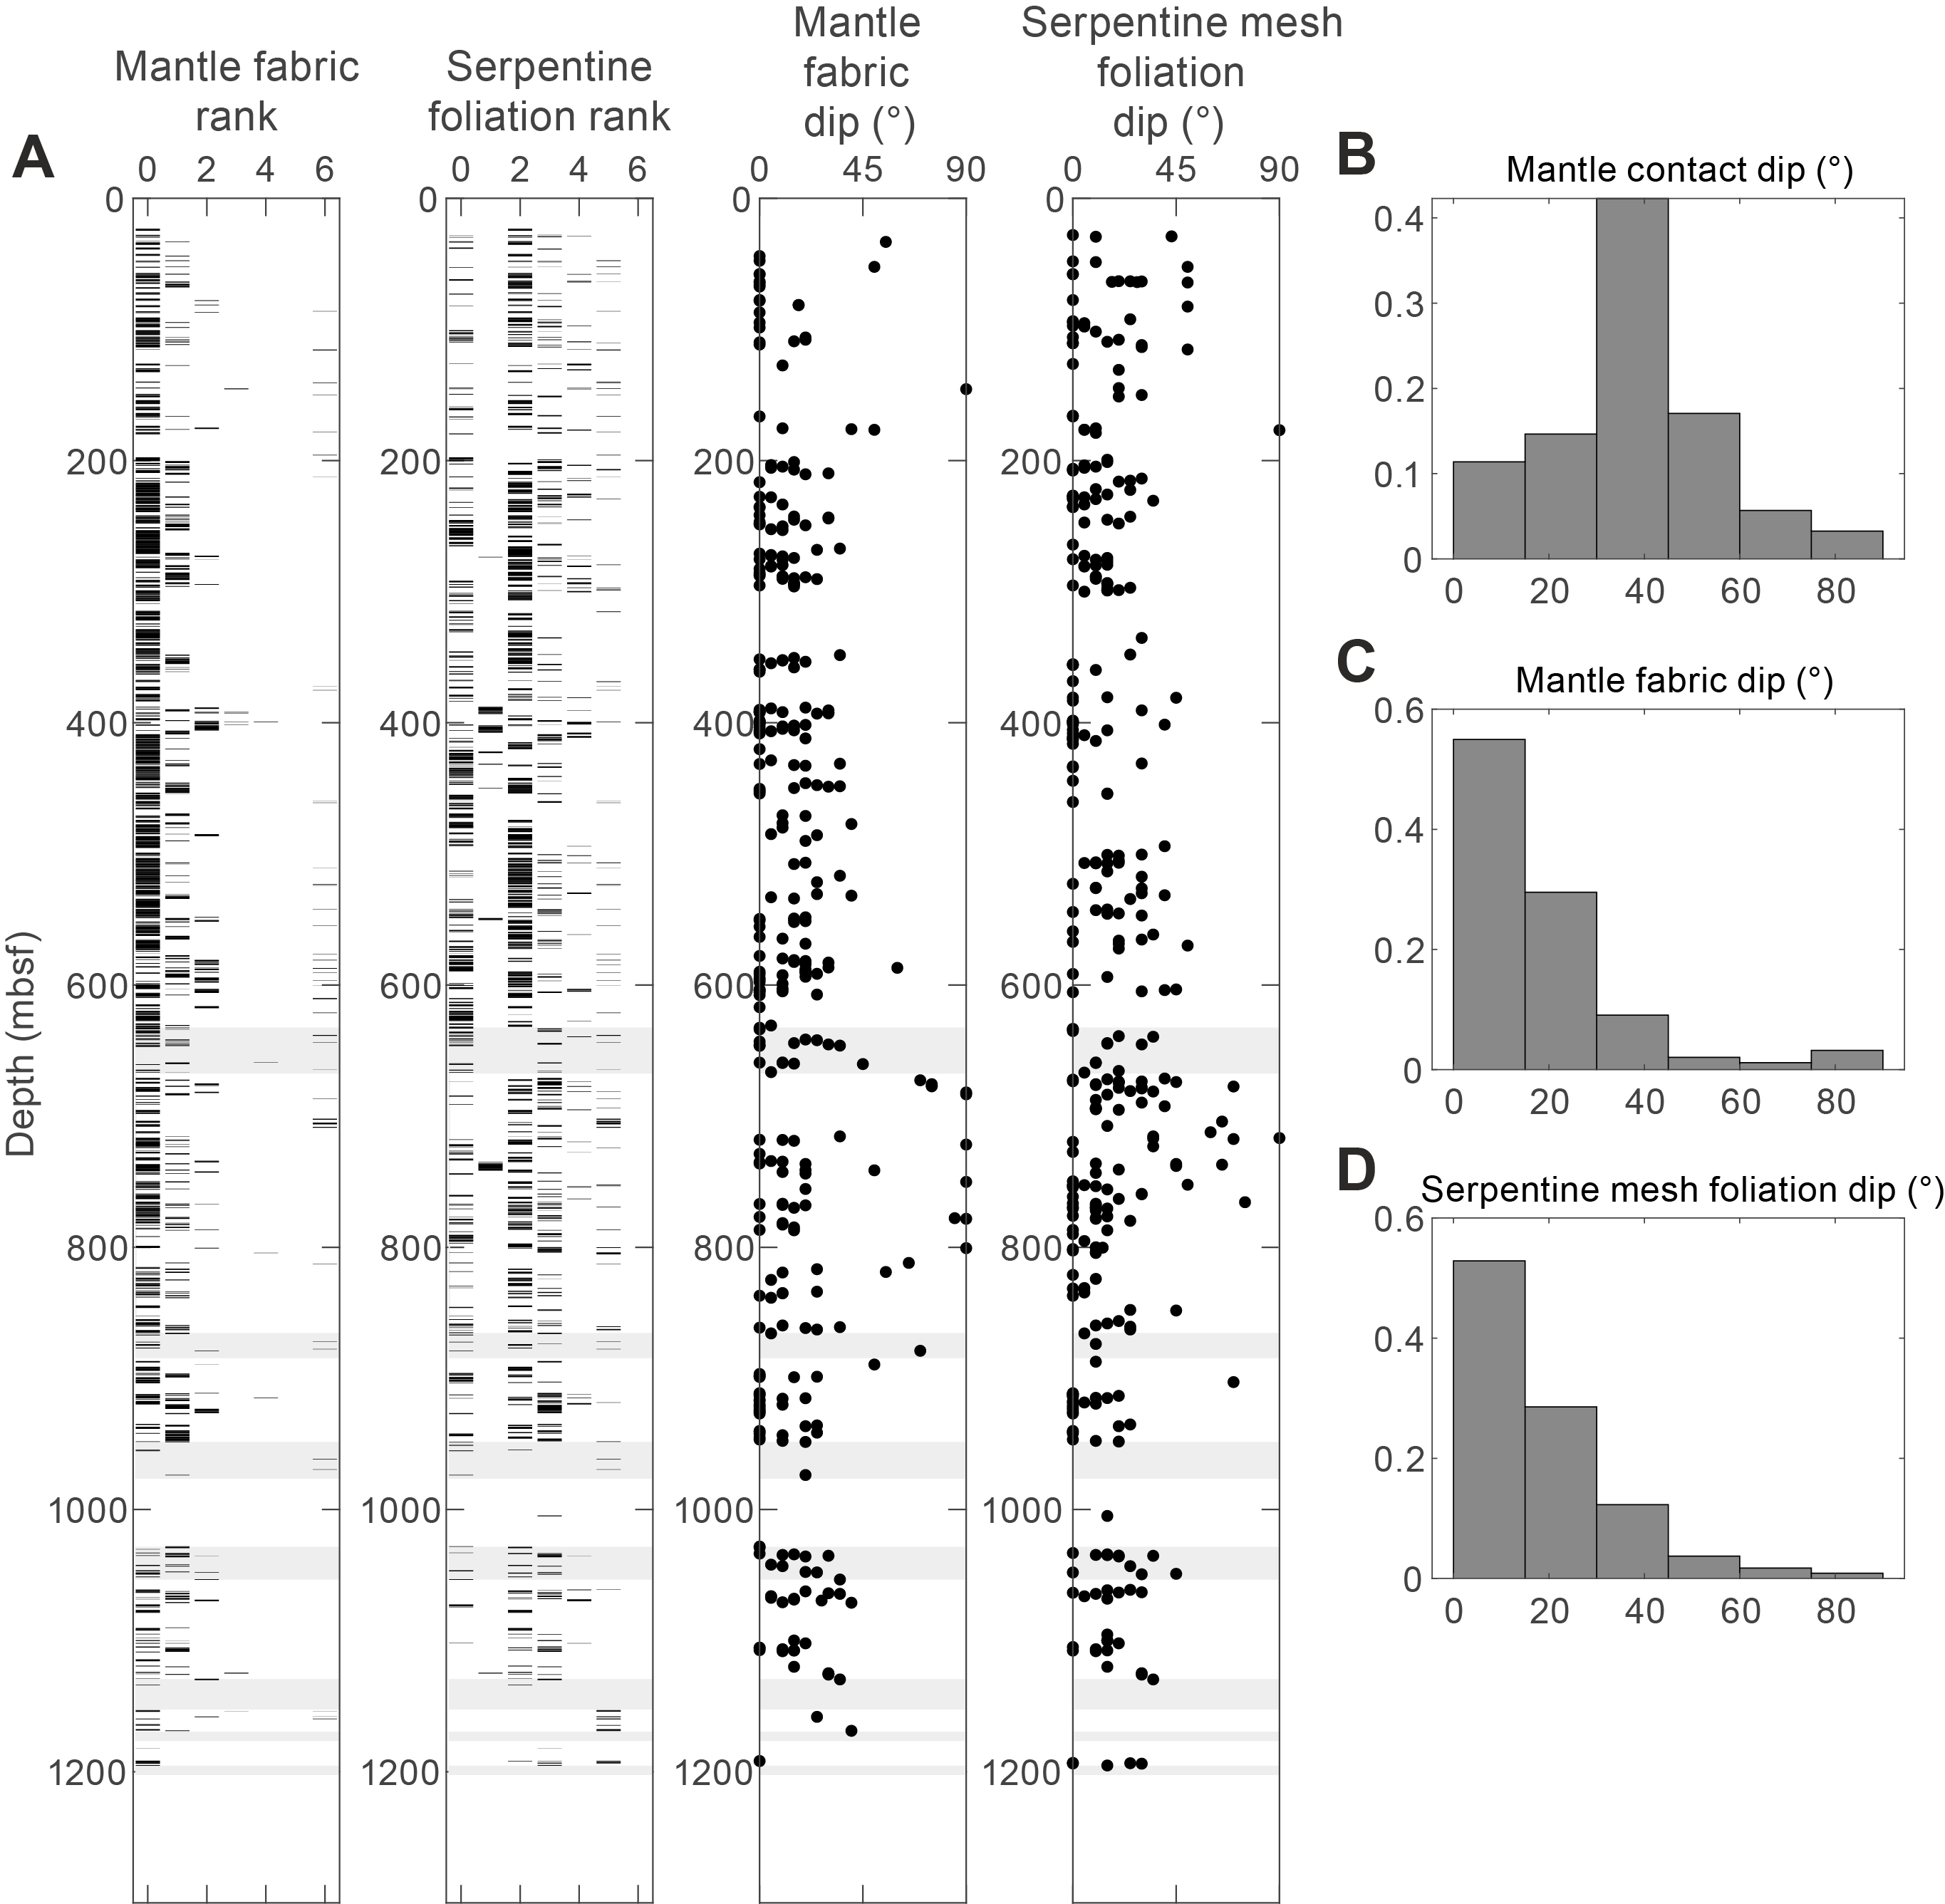
Figure F103. Mantle and serpentine fabrics.
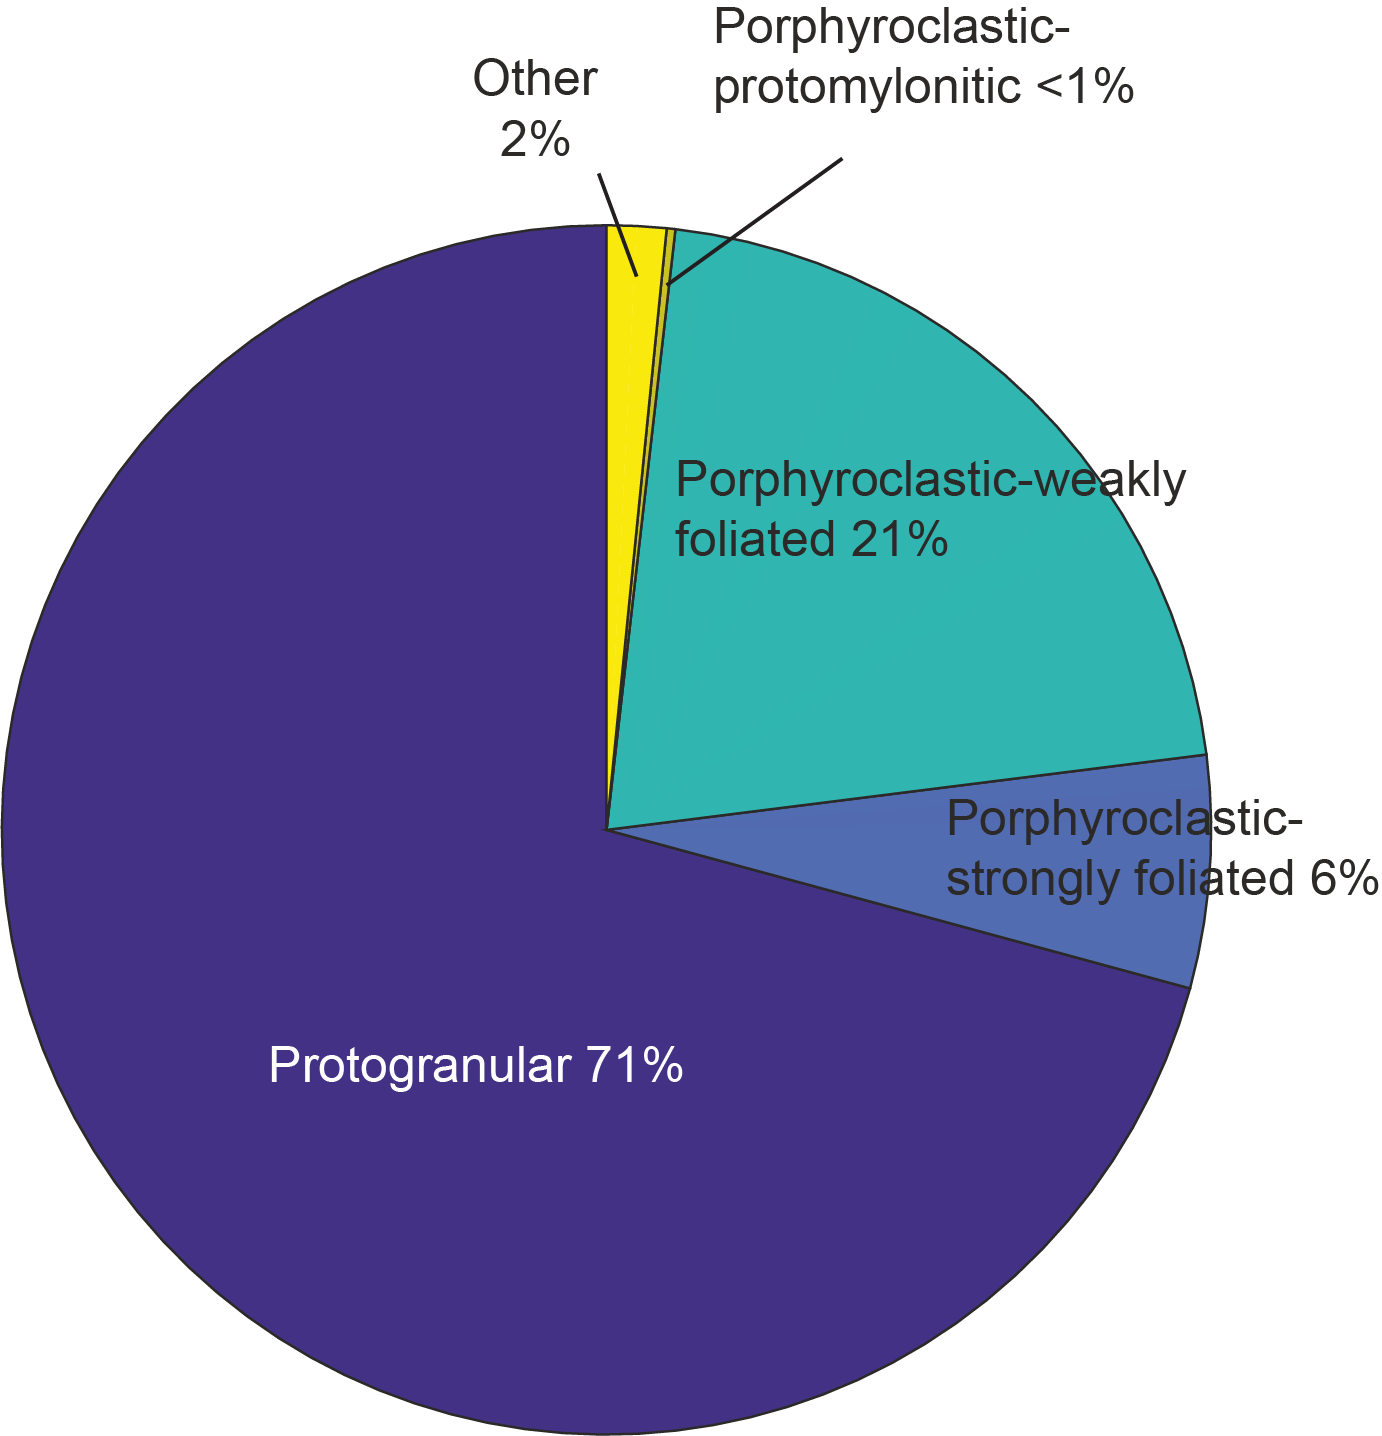
Figure F104. Mantle fabric types in peridotites.
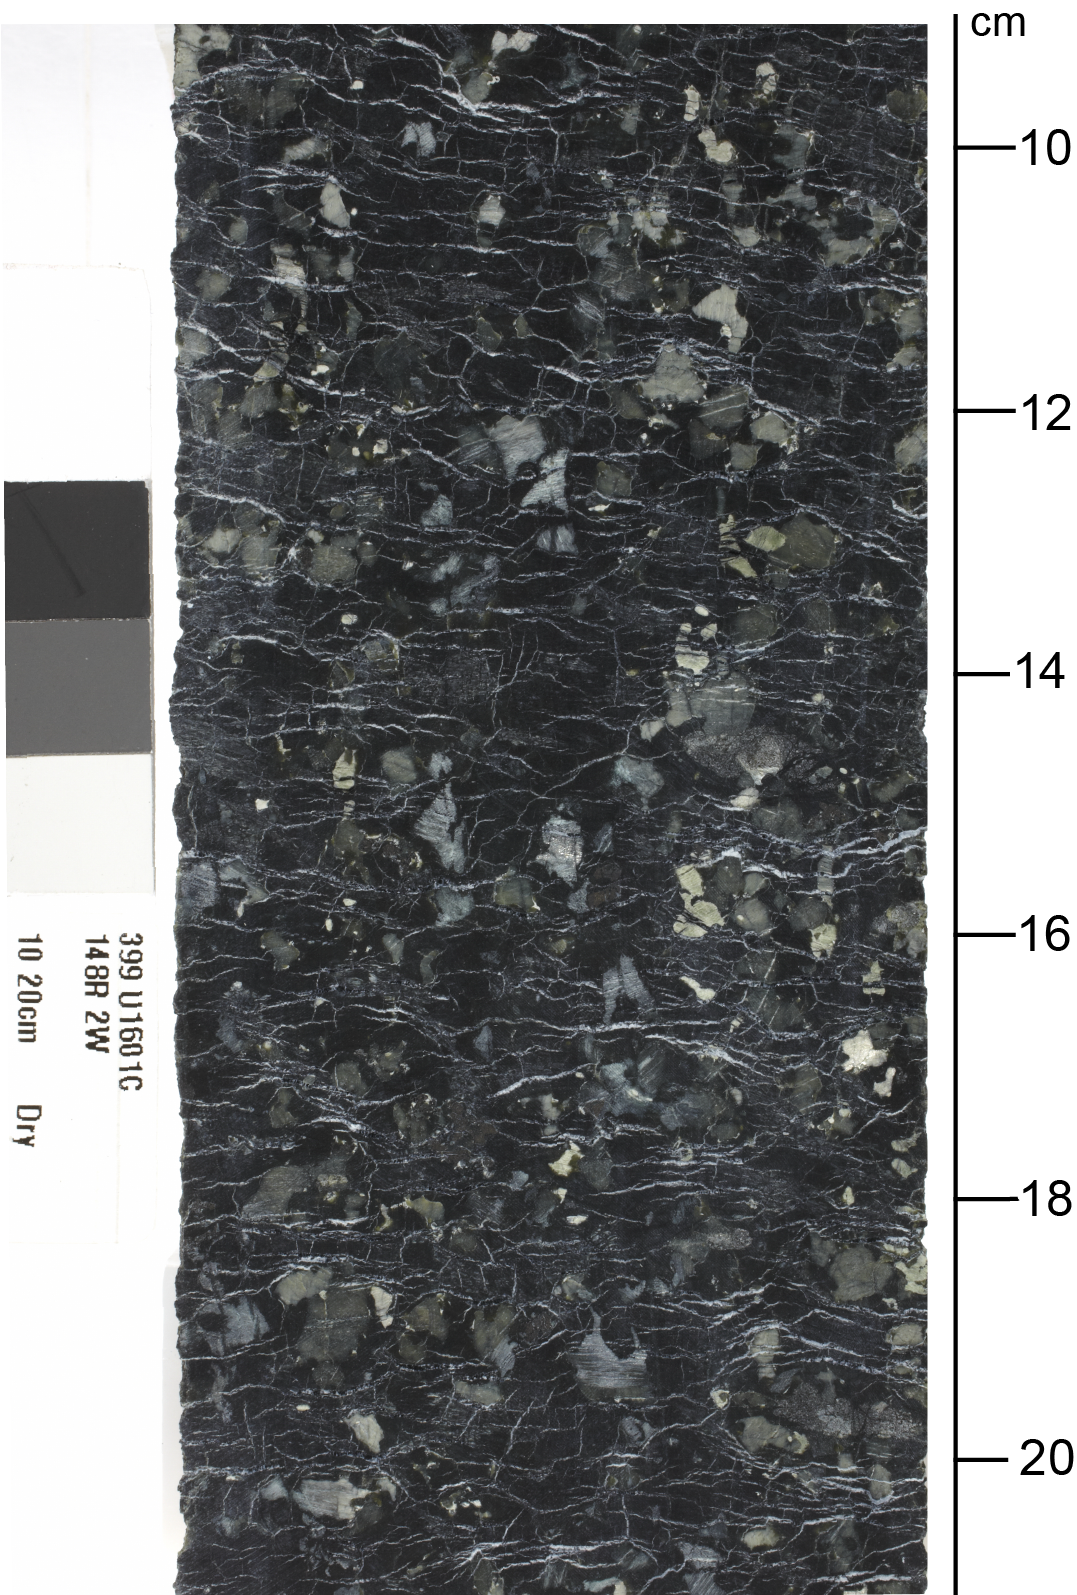
Figure F105. Protogranular fabric in harzburgite.
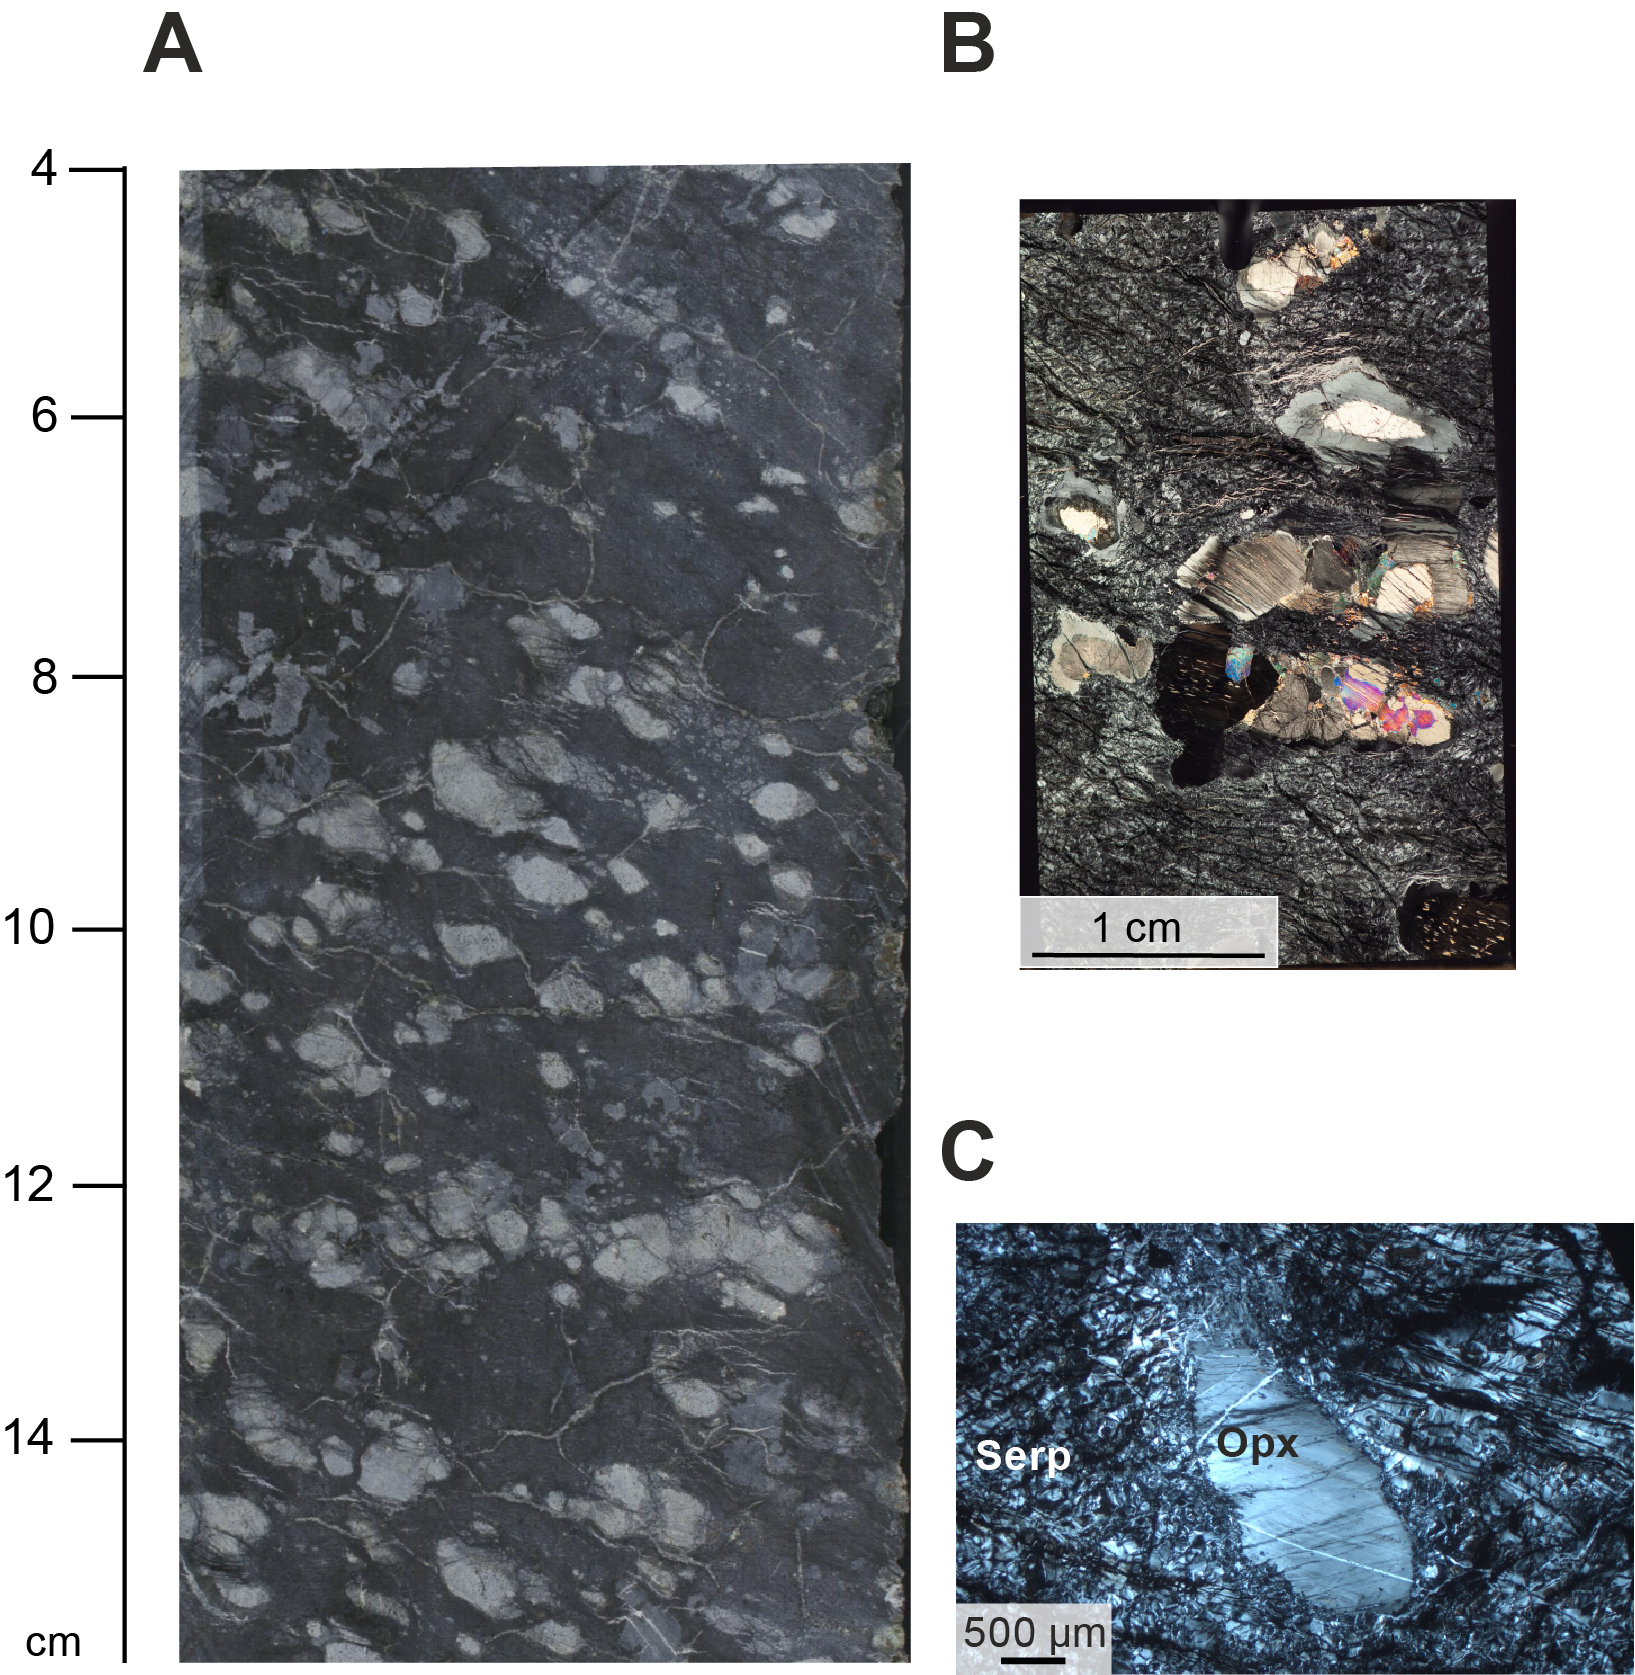
Figure F106. Serpentinized harzburgite with porphyroclastic fabric.
Macroscopic observations of porphyroclastic/protomylonitic serpentinized harzburgite and dunite are reported from six core sections including (intervals 27R-1, 55–90 and 117–126 cm; 78R-1, 23–28, 42–44 cm, and 134–141 cm; 79R-2, 112–128 cm; 79R-4, 75–82 cm; 229R-1, 60–114 cm; and 235R-1, 104–109 cm); mylonitic serpentinized harzburgite and dunite are noted in four core sections (intervals 79R-2, 128–150 cm; 133R-1, 70–84 cm; 163R-1, 37–51 cm; and 185R-3, 125–146 cm), and all show well-aligned, elongate bastite pseudomorphs with very high aspect ratios, suggesting GSR of pyroxene during ductile deformation under mantle conditions (Figure F107). Petrographic observations show that macroscopically defined intervals of protomylonitic/mylonitic deformation in serpentinized peridotite is partially to completely pseudomorphed by serpentinization; consequently, high-strain deformation microstructures of primary mineral assemblages in serpentinized peridotites are yet to be observed (i.e., our reported absence does not preclude their existence).
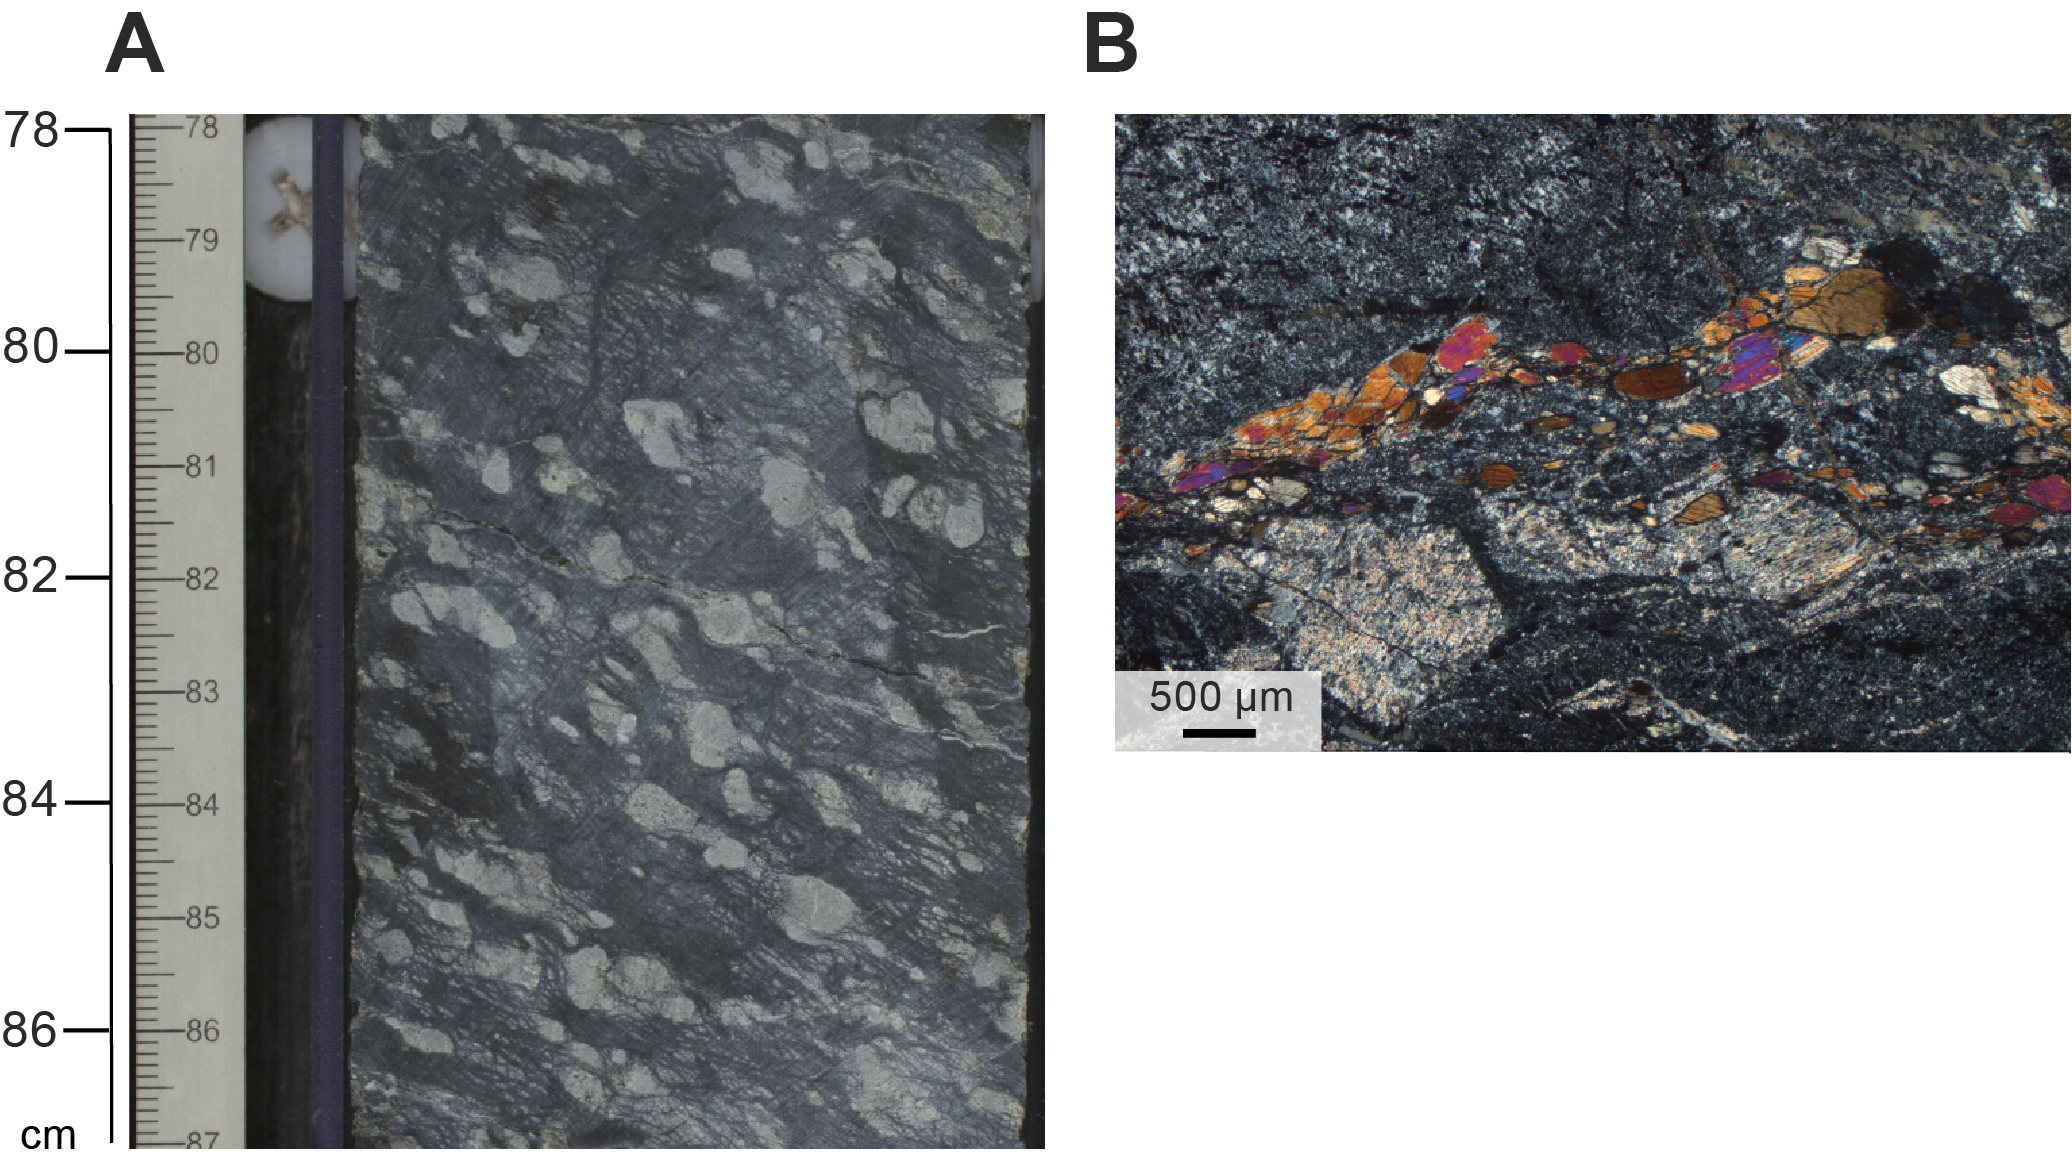
Figure F107. Serpentinized protomylonitic harzburgite.
Intervals of protomylonitic/mylonitic deformation are reported from serpentinized peridotite at contacts with mylonitized gabbro. However, the contiguous nature of this deformation across these contacts and into the adjacent gabbro suggests it is likely associated with the lithospheric denudation of Hole U1601C section rather than deformation in the asthenospheric mantle and is therefore discussed in the crystal-plastic deformation section.
5.2.2.2. Serpentinite foliation
All ultramafic rocks sampled were serpentinized, most strongly serpentinized (average = 88%; see Alteration petrology), and vary in color from green with black magnetite veins to brown, gray, and black.
For serpentine mesh with measurable foliation (~24%; Figure F108), the majority had horizontal to moderately inclined (0°–45°) dips (Figures F95, F103D). Steeper mesh fabrics were recorded at 670–780 mbsf and 900–910 mbsf between high-strain Zones 1, 2, and 3 (Figure F103).
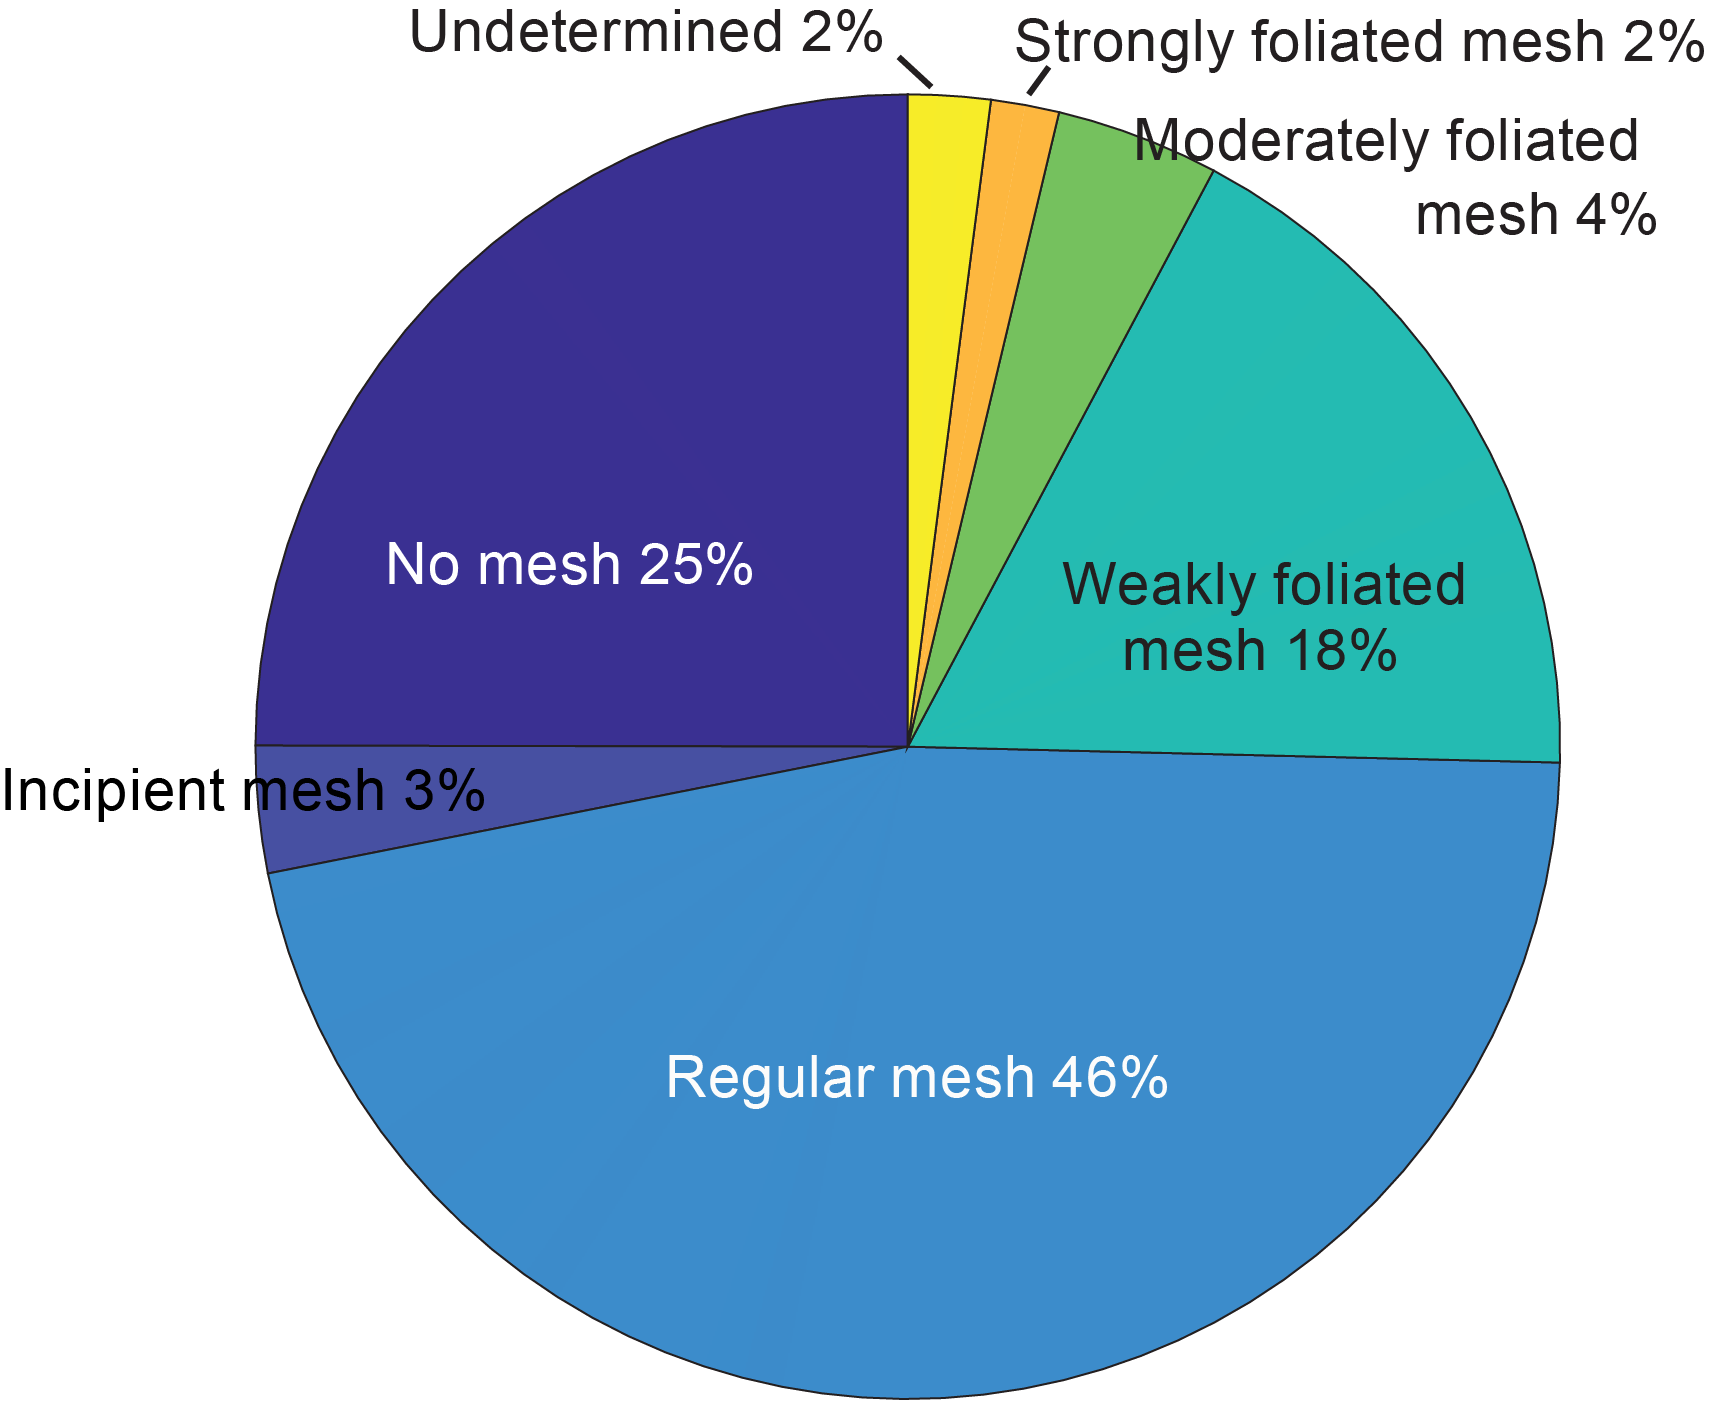
Figure F108. Serpentine mesh foliation types.
Reported serpentinite mesh fabrics show the full range: no mesh, to regular and weakly, moderately, or strongly foliated mesh (Figures F103, F108). Intervals of no mesh were observed in 25% of the recovered peridotites and are common in black and dark brown serpentinites. Petrographic observations in intervals showing no mesh commonly host intense serpentine veining or a very irregular arrangement of magnetite and serpentine. Intervals of incipient mesh were found in 3% of the sampled ultramafic intervals, namely Sections 53R-3, 77R-1 through 77R-3, 78R-1 through 78R-2, 80R-1 through 80R-4, 81R-1, 84R-2, 86R-1, 89R-4, 110R-3, 148R-3, 149R-1 through 149R-4, and 229R-1, which were less altered. In these sections, cores of olivine grains are preserved and surrounded by serpentine (Figure F109). In thin section, incipient mesh is typically defined by continuous but not straight serpentine/magnetite veins between relict olivine (Figure F109).
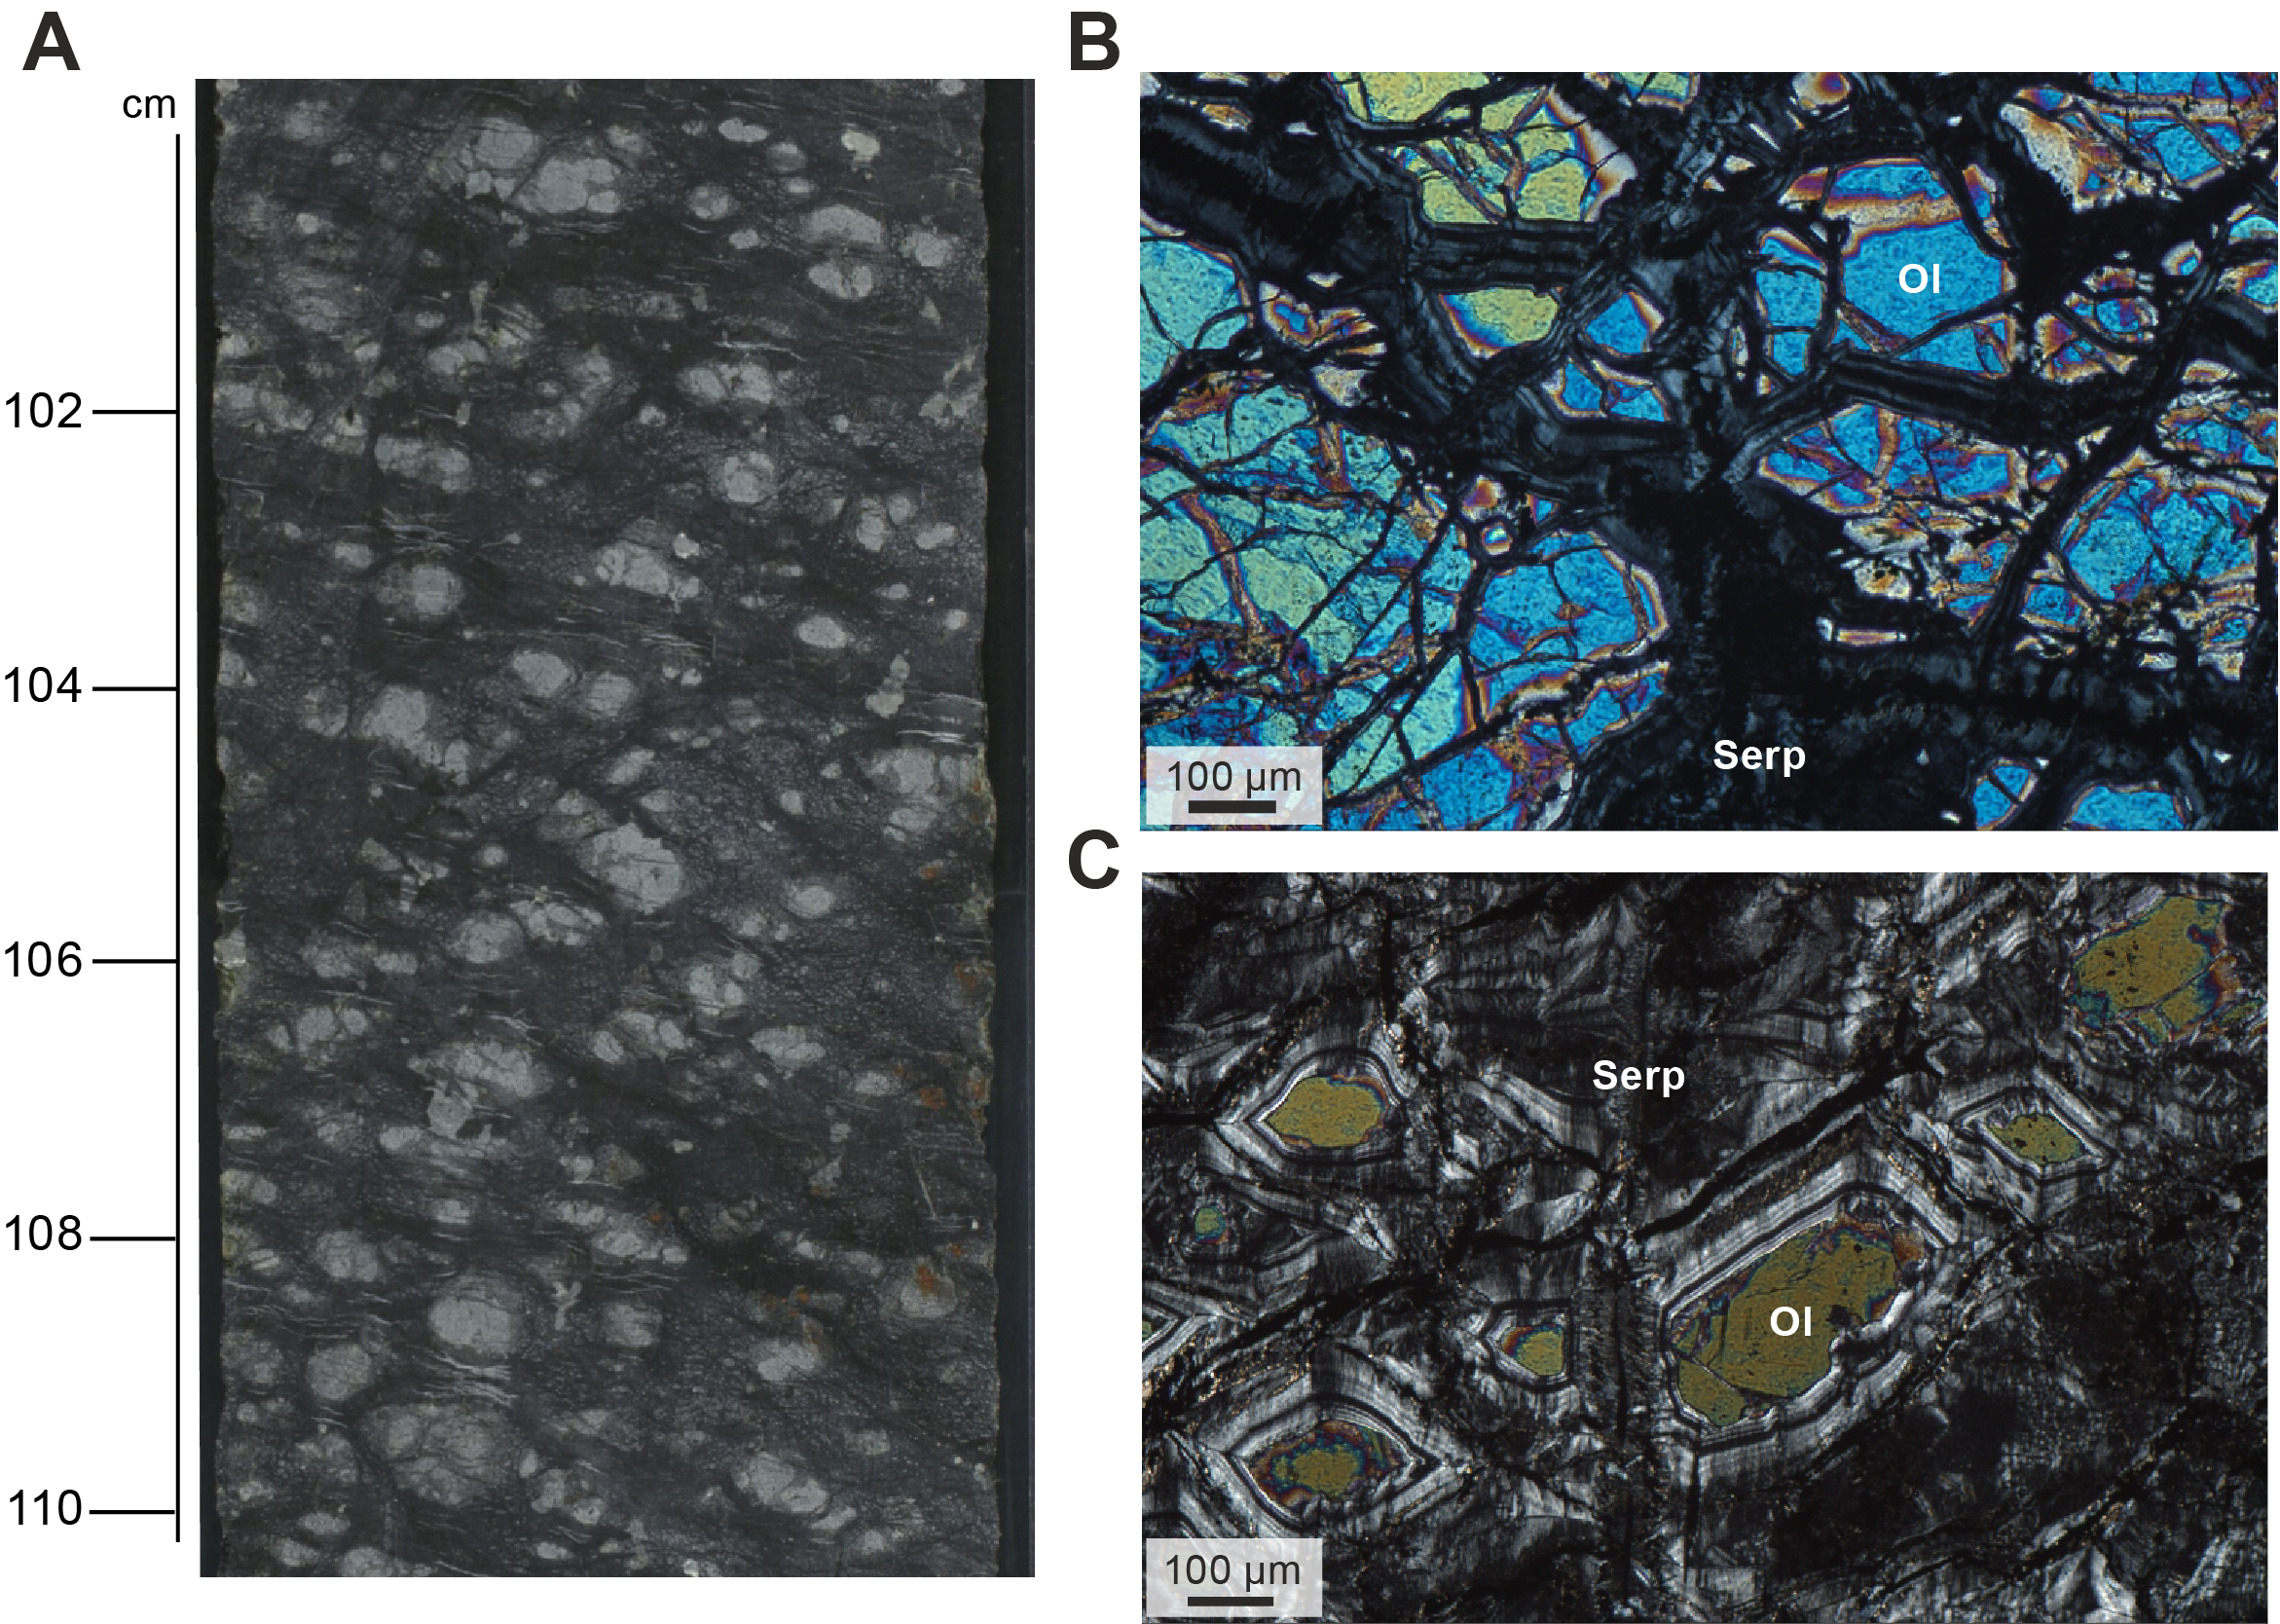
Figure F109. Serpentinized harzburgite with incipient mesh.
Regular mesh was the most abundant mesh type, present in 46% of the described ultramafic rocks. In some cores with high modal pyroxene, regular mesh could only be observed in patches free of pyroxene and is noted as patchy regular mesh (Figure F110). In thin section, regular mesh is composed of a regular arrangement of magnetite aggregates surrounding mesh cells (Figure F110).
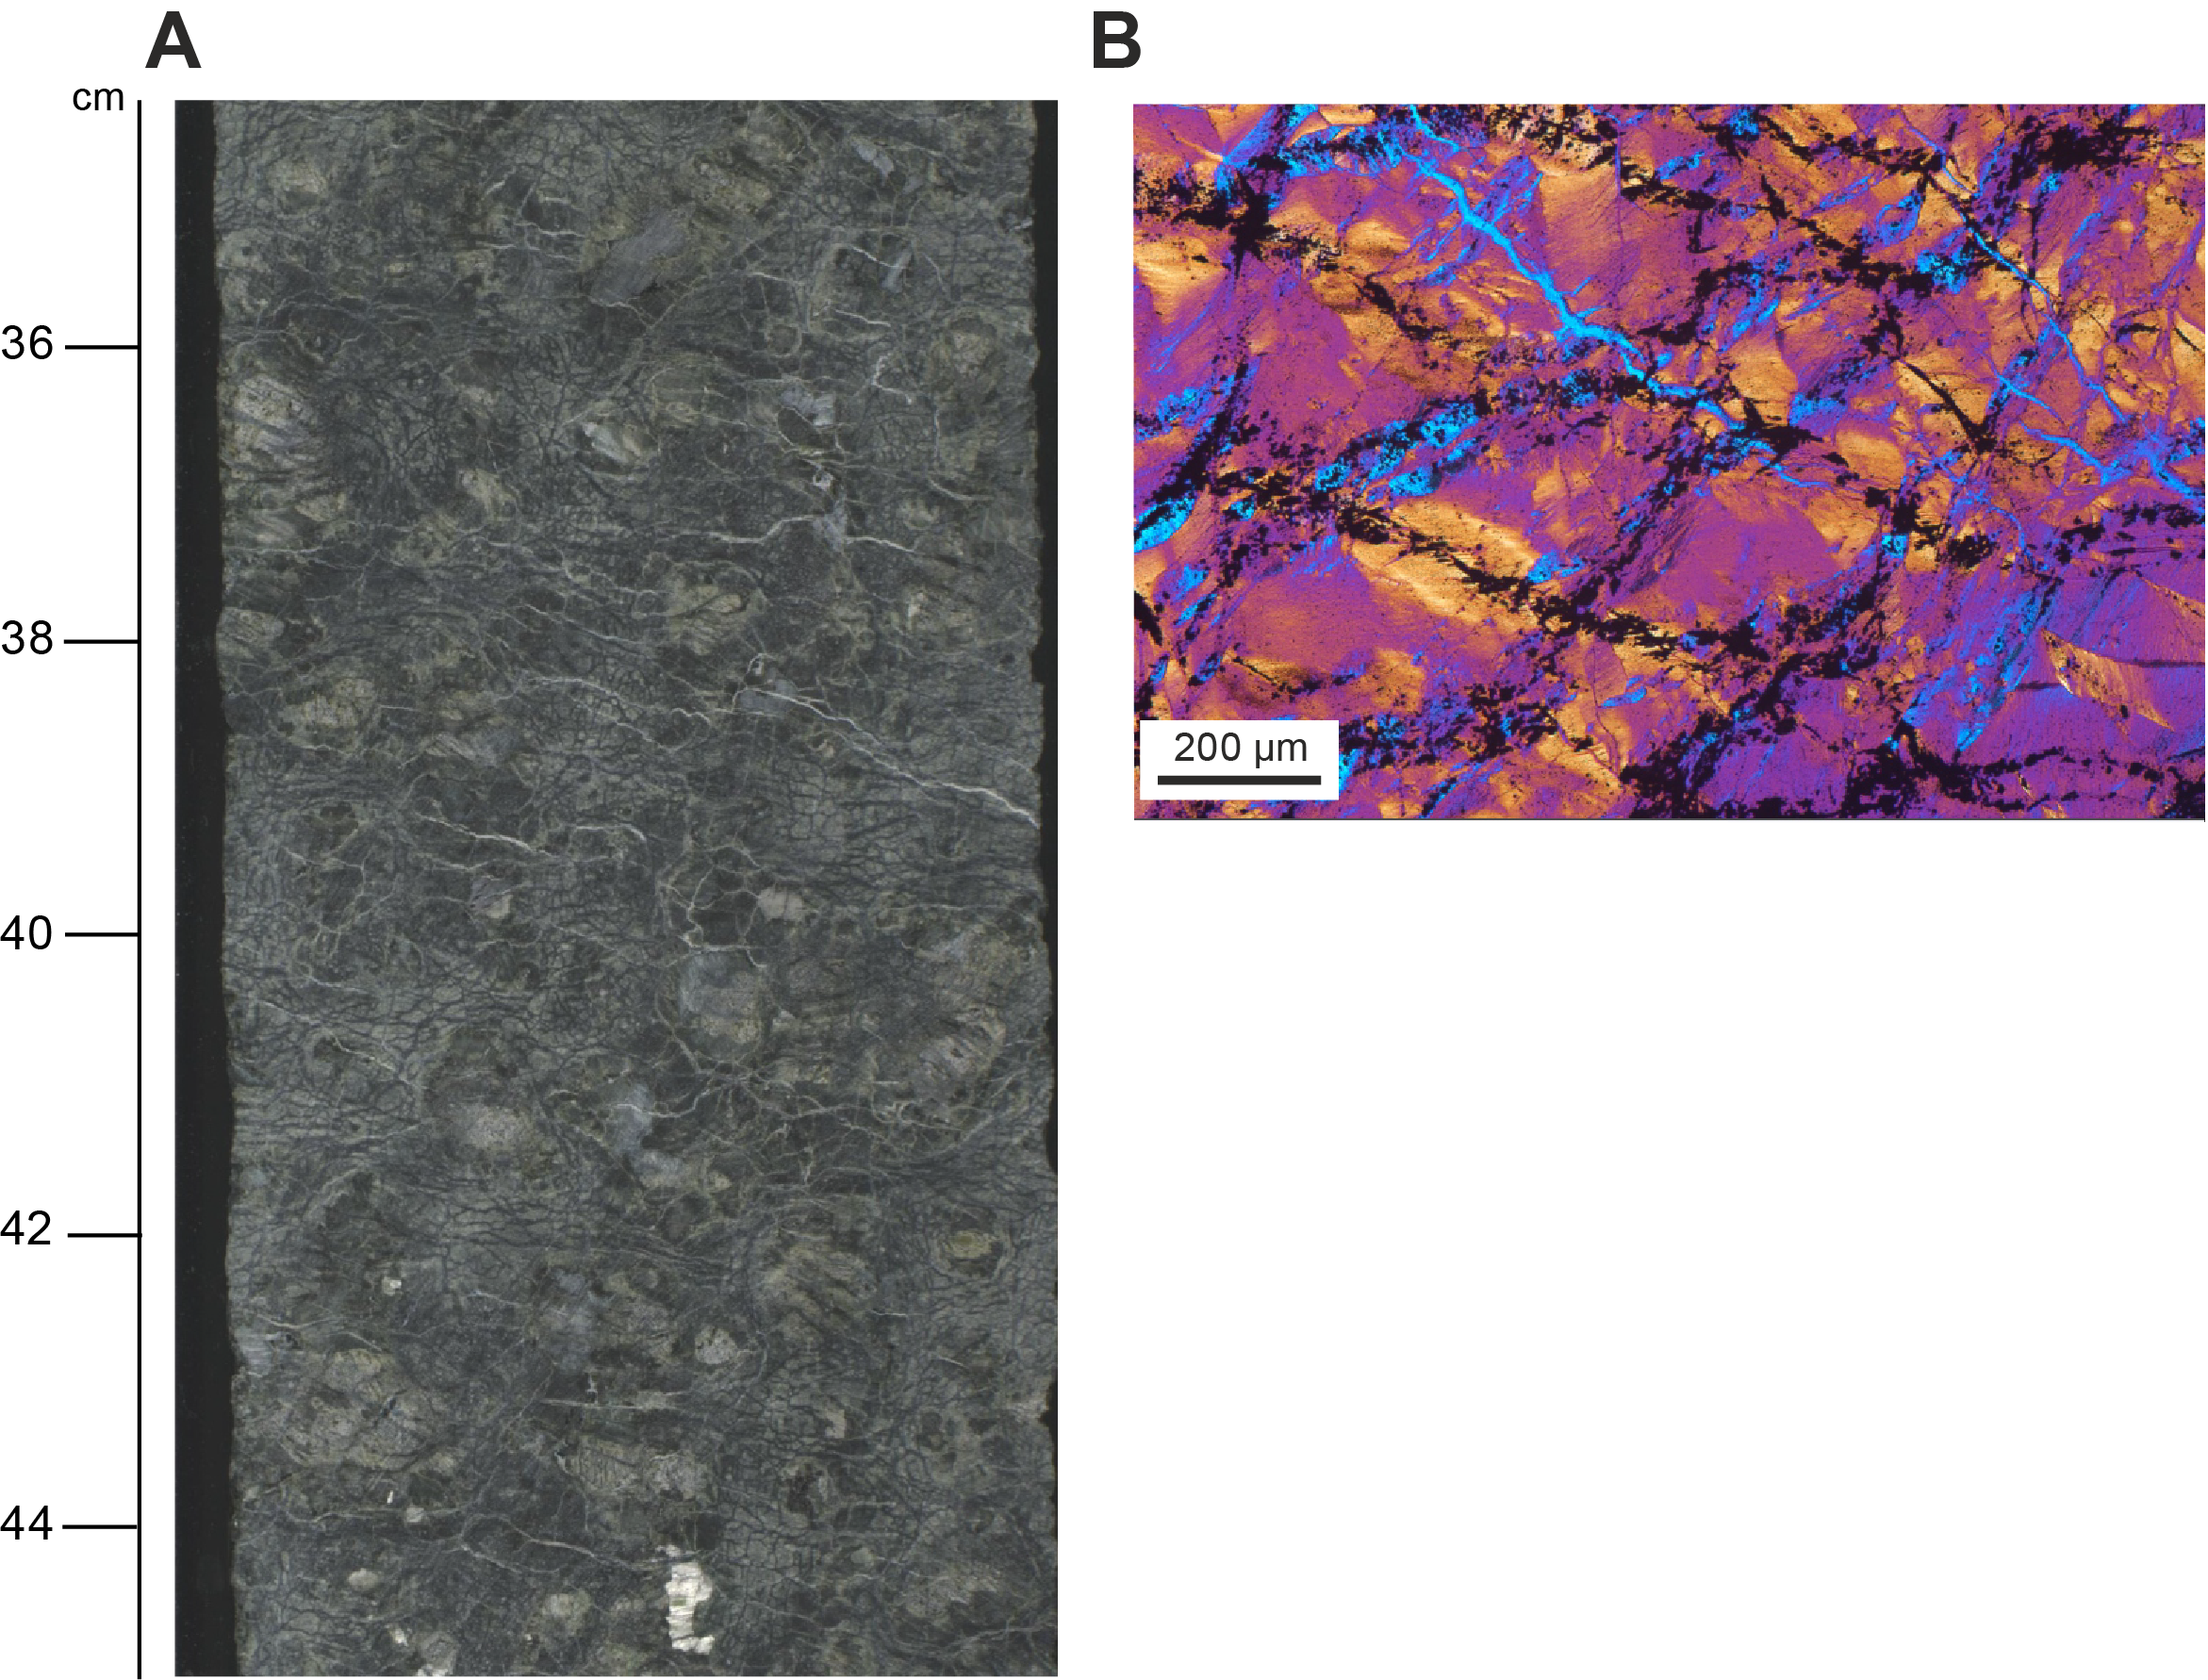
Figure F110. Serpentinized harzburgite with patchy normal mesh.
Foliated mesh in the recovered serpentinized peridotite was classified as weakly (18%), moderately (4%), or strongly (2%) foliated based on the intensity of alignment of magnetite in the mesh/mesh veins (Figures F108, F111). No correlation is noted between the intensity of serpentinite foliation and dip. The majority of all foliation dips between 0° and 45° (Figures F95, F103). In thin section, foliated mesh is characterized by a more parallel arrangement of magnetite aggregates, which can be discontinuous (Figure F111), weakening the foliation. In strongly foliated serpentine mesh, these magnetite aggregates are more continuous, parallel, and often more closely spaced (Figure F111).
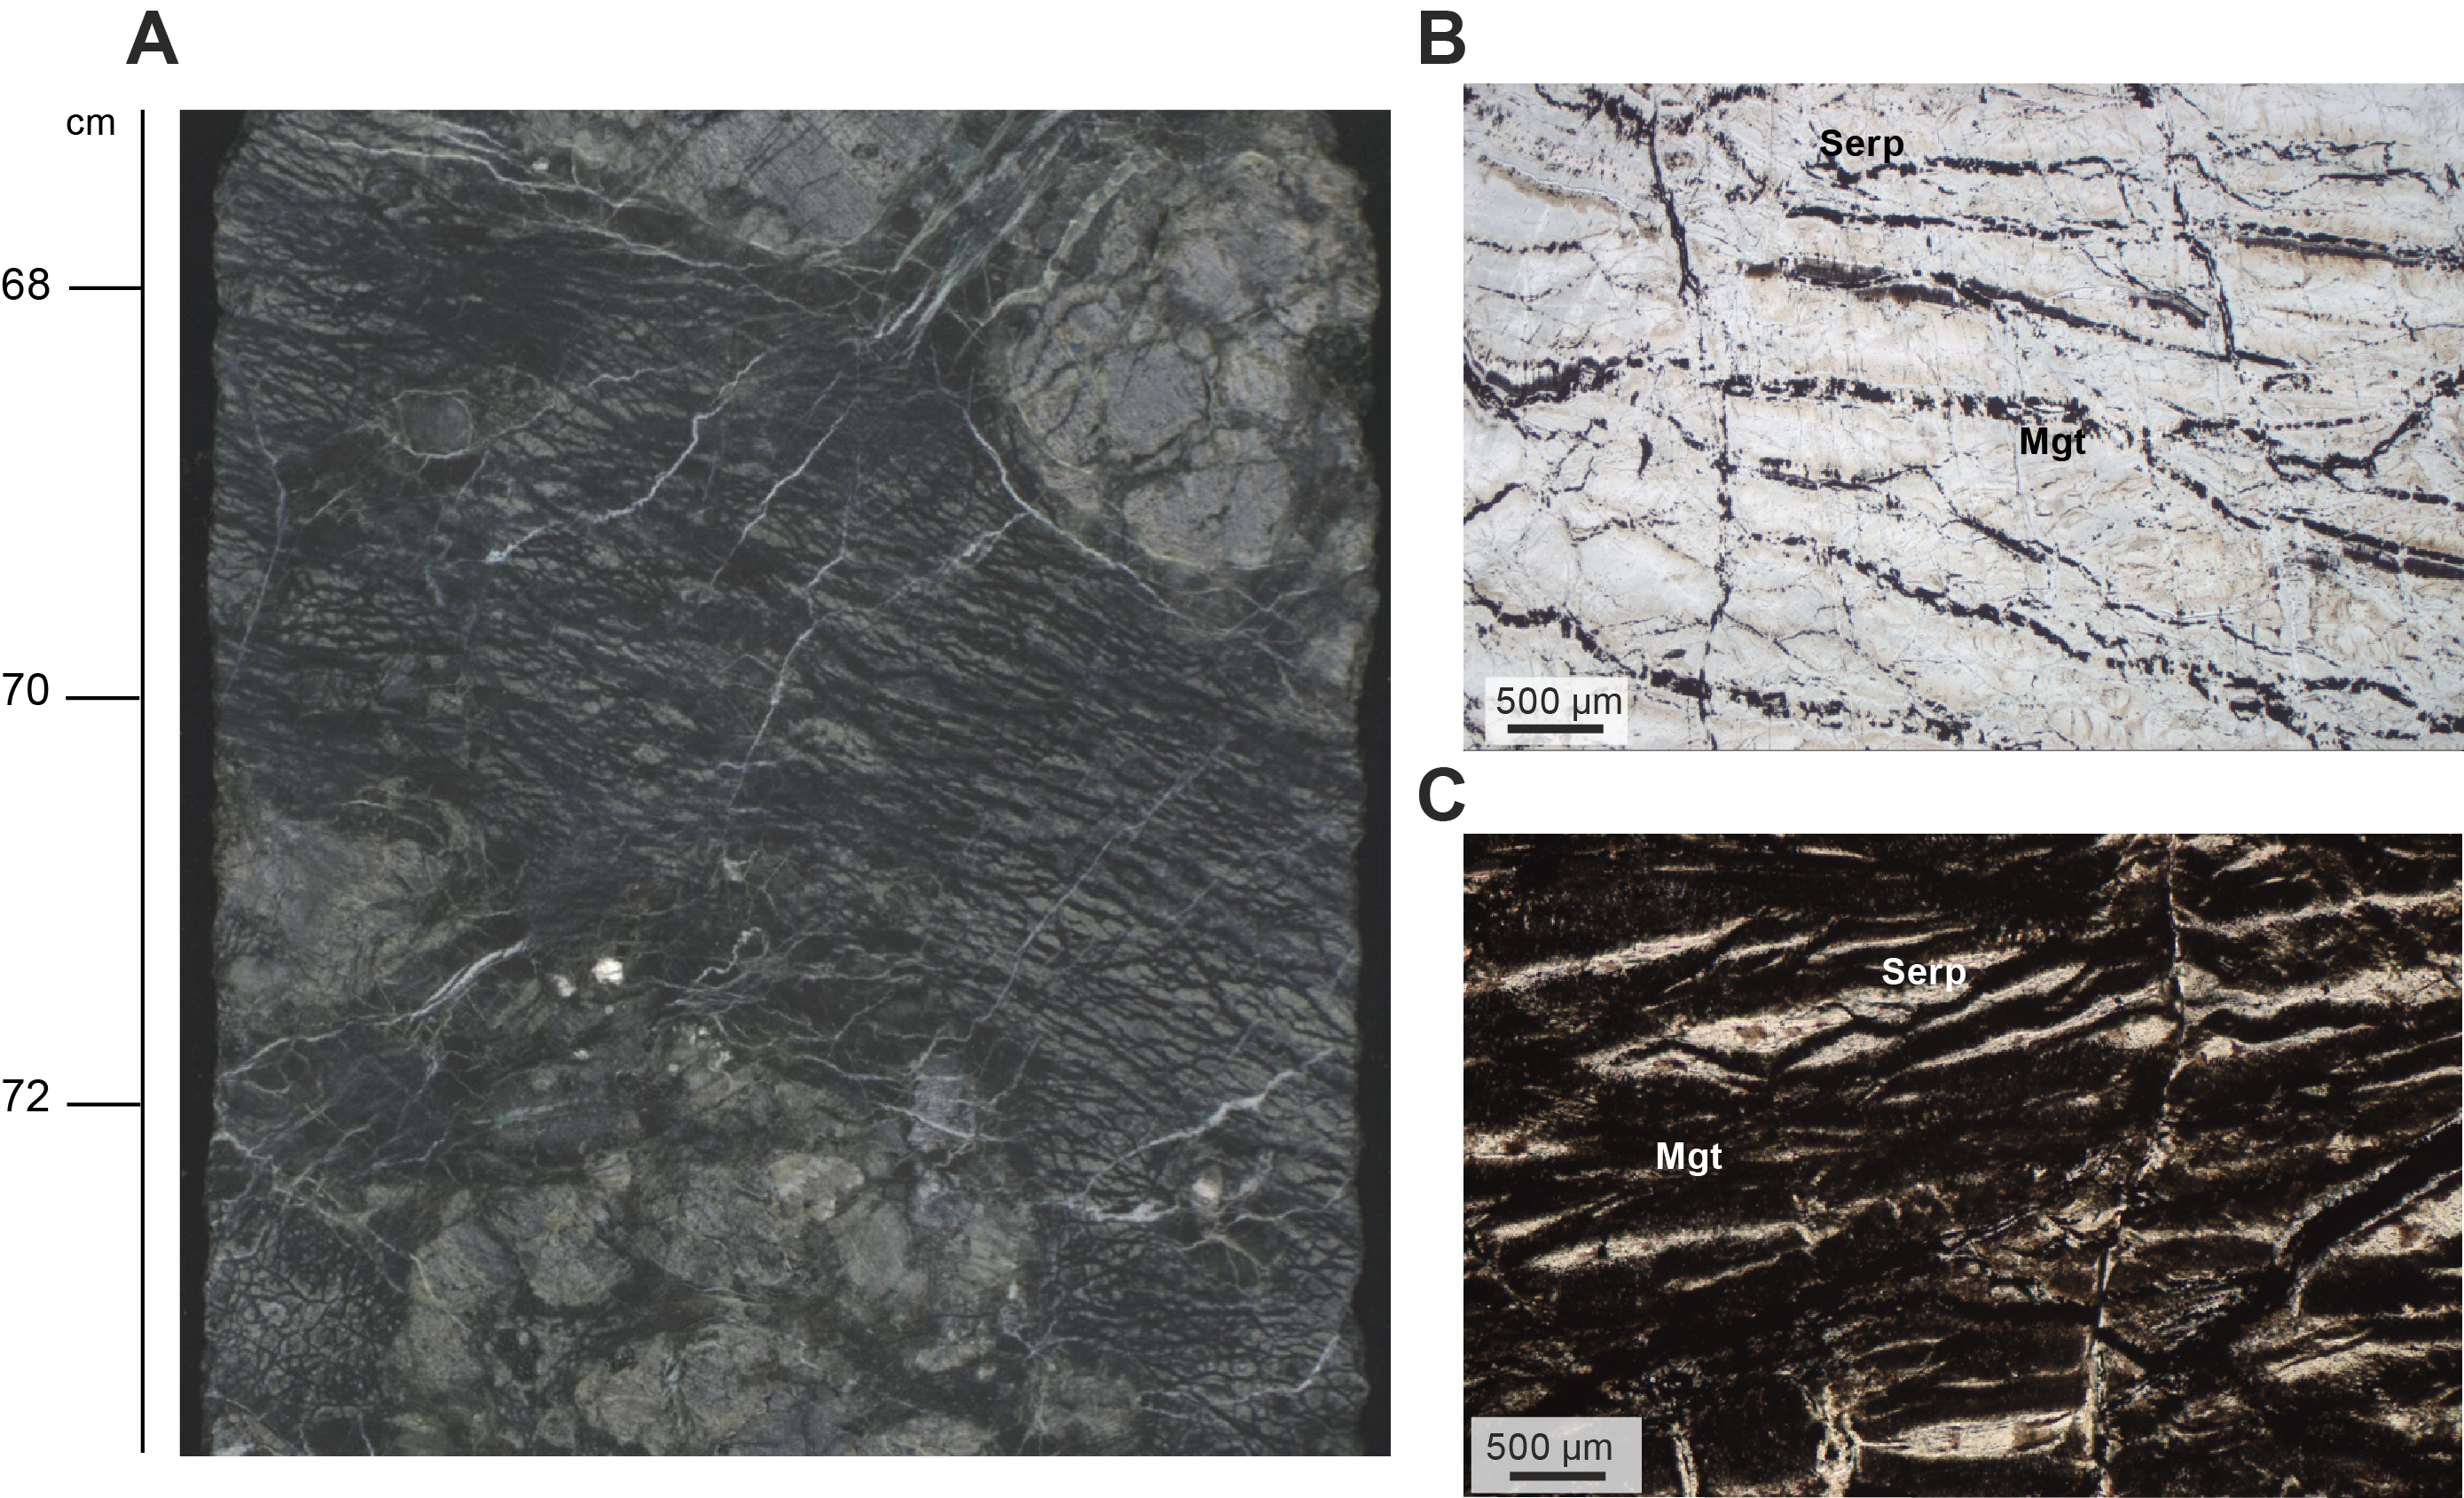
Figure F111. Foliated mesh in dunite interval.
Contacts between serpentinite mesh types were typically gradational and diffuse, and therefore were only measured in two cores (Sections 98R-4 and 114R-4) with dips of 25° and 50°, respectively. Mesh variations were observed over a range in scale from a few centimeters to meters and can be strongly influenced locally by magmatic and alteration veins, where mesh foliations parallel the vein.
5.2.3. Crystal-plastic deformation
Macroscopic crystal-plastic deformation is grouped into low-strain fabrics, including weak to strong solid-state foliation (fabric intensity and rank = 0–2), and high-strain fabrics, including protomylonite, mylonite, and ultramylonite (fabric intensity and rank = 3–5; Figures F95, F112). Throughout the entire 1268 m length of Hole U1601C, crystal-plastic deformation is reported from 9.1% (80.6 m) of the total recovered core length and 6.3% of the total hole length. With respect to high-strain fabrics, protomylonite, mylonite, and ultramylonite is reported from 6.3% (55.6 m) of the total curated length of recovered core and 4.4% of the total hole length.
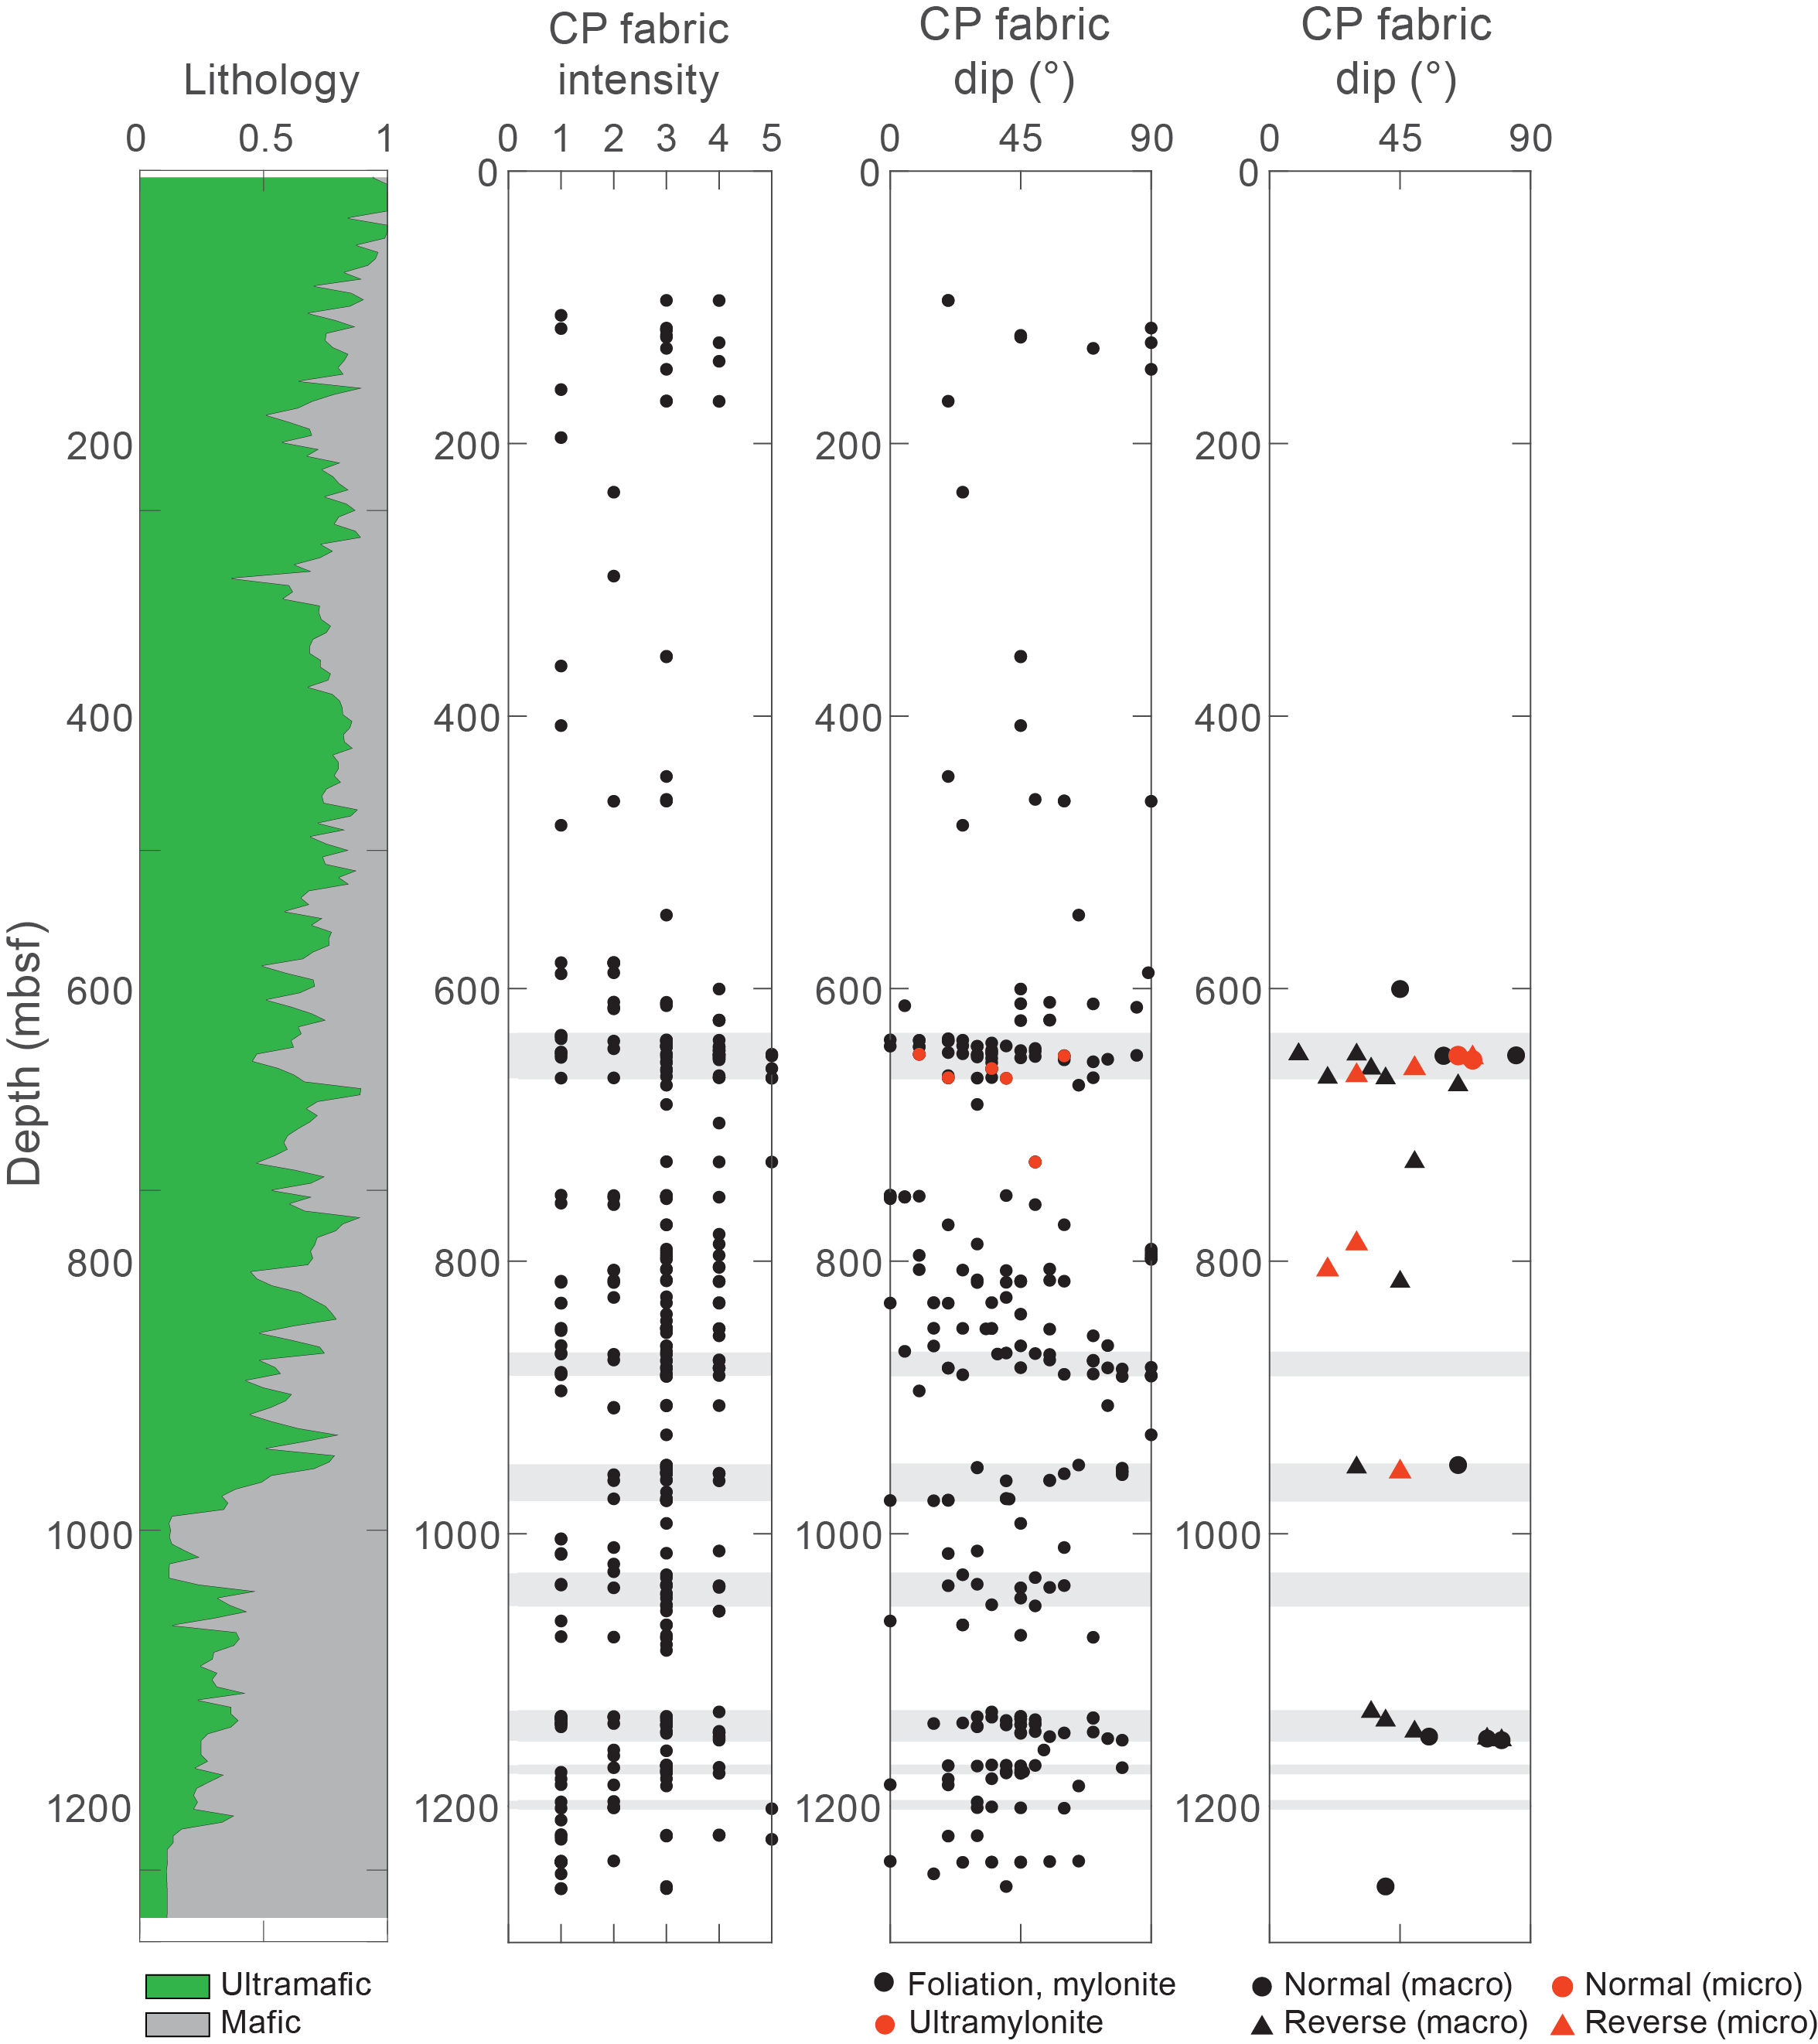
Figure F112. Crystal-plastic fabric intensity, dip, and shear sense, Hole U1601C.
Distribution of the reported macroscopic crystal-plastic deformation is lithologically and spatially variable. Documented crystal-plastic deformation occurs in gabbroic rocks (gabbroic refers to all mafic igneous rock types unless otherwise specified), with only rare instances reported from dunite and harzburgite. Crystal-plastic deformation is clearly partitioned between a relatively undeformed zone above ~634 mbsf (Sections 2R-1 through 127R-4) and a deeper, heterogeneously deformed zone between 634 and 1265 mbsf (Sections 128R-1 through 259R-2); 91% of all recorded crystal-plastic deformation is recorded below 634 mbsf.
Below 634 mbsf, crystal-plastic deformation is localized into seven zones of concentrated crystal-plastic deformation (high-strain zones), separated by lengths of relatively undeformed core (Figure F112). These zones form the basis of our reported observations of crystal-plastic deformation.
5.2.3.1. Low-strain to undeformed zone
Eight undeformed to low-strain zones are defined: 0–634 mbsf (Sections 2R-1 through 127R-4), 666–867 mbsf (Sections 134R-3 through 175R-3), 885–950 mbsf (Sections 180R-1 through 192R-3), 976–1030 mbsf (Sections 198R-3 through 209R-2), 1053–1130 mbsf (Sections 214R-3 through 230R-1) 1152–1170 mbsf (Sections 235R-1 through 238R-1), 1176–1196 mbsf (Sections 240R-1 through 244R-3), and 1202–1265 mbsf (Sections 246R-3 through 259R-2) (Figure F112). These zones are largely devoid of crystal-plastic deformation, barring isolated intervals typically 0.1–0.2 m and no thicker than 0.5 m. Within the top interval of low strain at 0–634 mbsf, the shallowest zone of crystal-plastic deformation is recorded at ~80 mbsf (Section 16R-3) as a 20 cm interval of protomylonite and mylonite in gabbroic rocks. Observations of crystal-plastic deformation in gabbroic rocks characteristic of the low-strain zones deeper in Hole U1601C occur over ~10–20 cm intervals and are typified by weak to strong solid-state foliation, protomylonite, and rare mylonite. The frequency and thickness of crystal-plastic deformation (with intervals up to ~1–1.5 m thick) in low-strain zones increases below 634 mbsf and correlates with increased recovery of gabbroic rocks. Strain gradients in these intervals are recognized locally, commonly showing an increase in fabric intensity from protomylonite to mylonite toward gabbro/peridotite contacts. Where thicker sections of gabbro are observed (>5 m thick), crystal-plastic deformation is typically restricted to the margins of the gabbroic intrusions. Where identified, mylonitic foliations are subparallel to adjacent gabbro/peridotite contacts. A low-strain zone recovered at 976–1009 mbsf (Sections 198R-3 through 205R-1) highlights a 33 m thick interval of undeformed core through an 80 m thick gabbro body with high-strain zones at both the upper and lower contacts.
Crystal-plastic deformation of ultramafic rocks was rarely observed across low-strain zones. The shallowest crystal-plastic deformation recorded in ultramafic rocks was recovered at ~115 mbsf (Section 21R-1) and defined by a 56 cm interval of weakly foliated serpentinized harzburgite. The shallowest zone of high-strain crystal-plastic deformation in ultramafic rocks was recovered at ~359 mbsf (Section 70R-3) and defined by a 33 cm interval of protomylonitic serpentinized harzburgite. Protomylonitic to mylonitic intervals in serpentinized harzburgite and dunite are defined by elongate, lenticular, and rarely sigmoidal orthopyroxene ± a strong serpentine mesh foliation, and are distinct from the grain shape fabrics described in Mantle fabrics and serpentine foliation (above).
The range of recorded crystal-plastic fabric dips in low-strain zones varies from 5° to 90° (n = 114), with a small peak in dip between 45° and 60° (Figures F112, F113). One shear sense indicator in the shallowest low-strain zone and one in the deepest have normal senses of motion (Figure F112). Five shear sense indicators were recorded from crystal-plastic fabrics in the low-strain zone between Zones 1 and 2, all showing reverse sense motion (Figure F112).
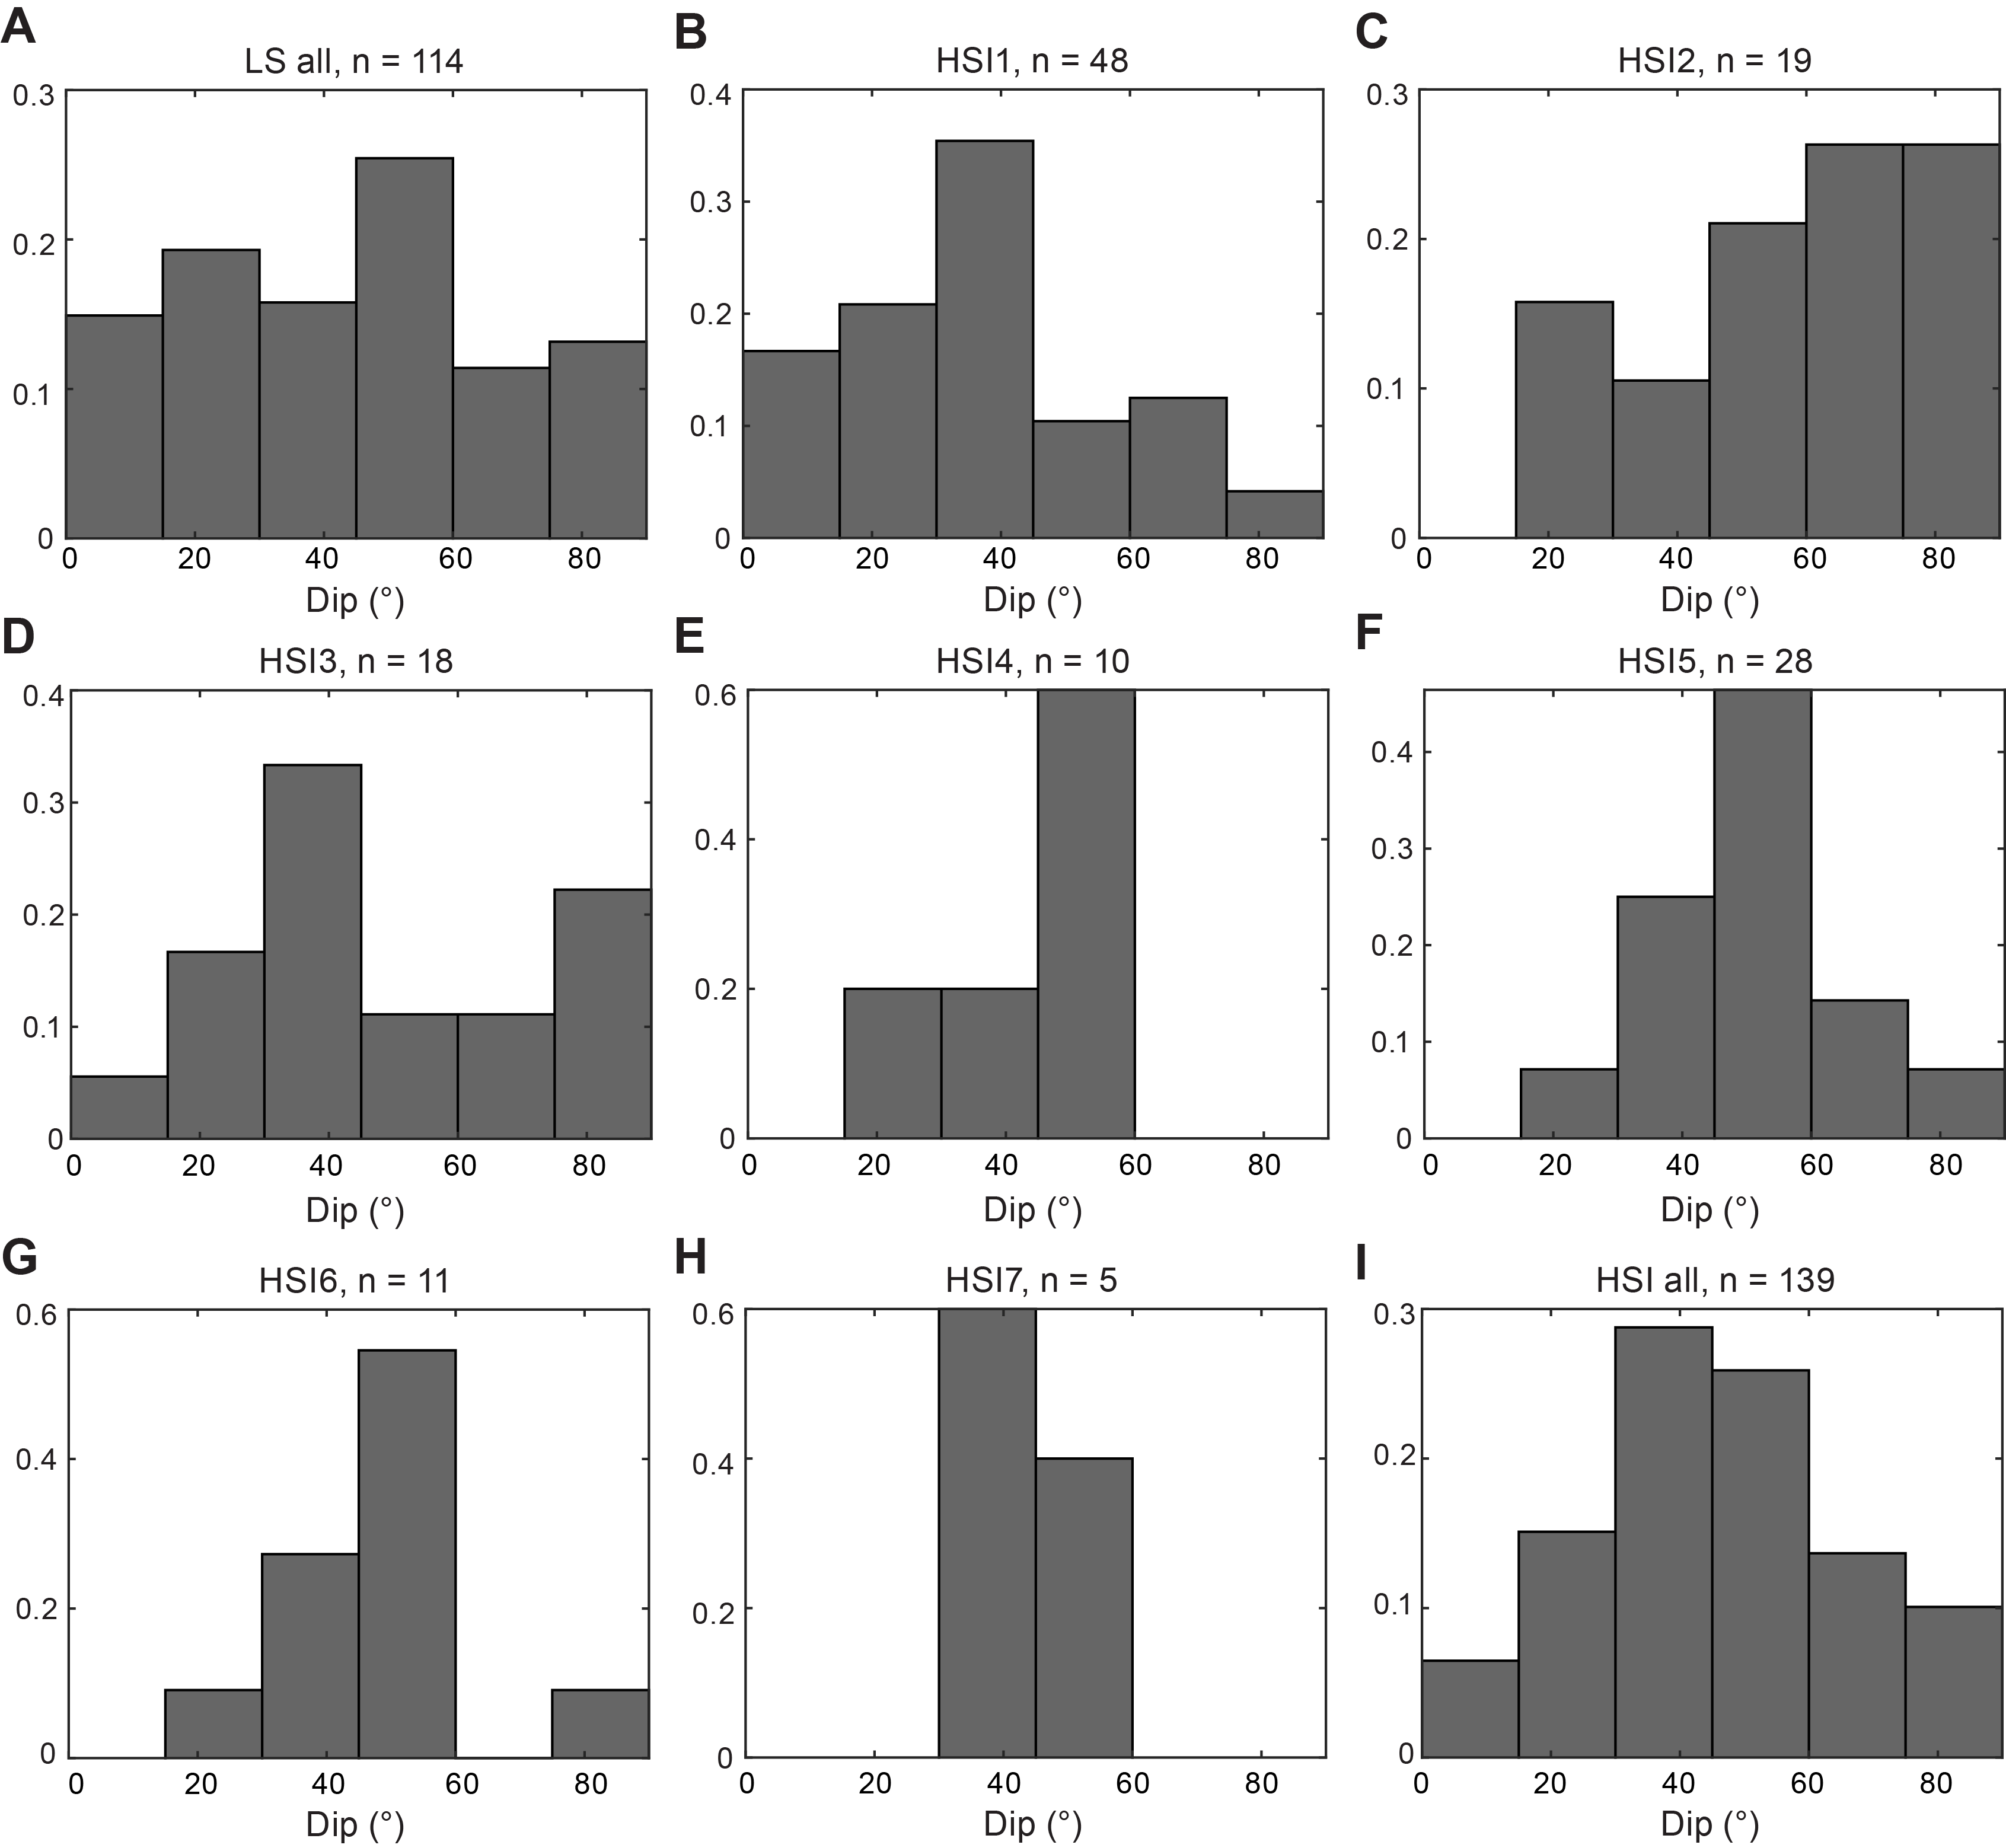
Figure F113. Crystal-plastic fabric dip, Hole U1601C.
5.2.3.2. High-strain zones
Seven high-strain zones, 5–32 m thick, are defined at 634–666 mbsf (Sections 128R-1 through 134R-2), 867–885 mbsf (Sections 176R-1 through 179R-3), 950–976 mbsf (Sections 193R-1 through 198R-2), 1030–1053 mbsf (Sections 209R-3 through 214R-2), 1130–1152 mbsf (Sections 230R-2 through 234R-3), 1170–1176 mbsf (Sections 238R-2 through 239R-3), and 1196–1202 mbsf (Sections 245R-1 through 246R-2) (Figures F112, F113).
High-strain zones have an aggregated downhole thickness of 132.9 m; intervals of crystal-plastic deformation account for 33% of the recovered core, whereas high-strain crystal-plastic deformation (protomylonite, mylonite, and ultramylonite) account for 25% of the recovered section. High-strain zones deform a range of rock types but are typically dominated by gabbroic rocks including several occurrences of deformed oxide gabbro; 91% of the reported crystal-plastic deformation intervals in these high-strain zones occur within gabbroic rocks.
Zone 1 consists of an upper portion of serpentinized peridotite interlayered with thin gabbroic intervals and a lower section of dominantly gabbroic rocks. Zones 2 and 4 comprise interlayered gabbro and serpentinized peridotite. Zones 3, 5, 6, and 7 are almost exclusively characterized by gabbroic rocks.
Intervals of crystal-plastic deformation in these high-strain zones range 10–140 cm thick and are dominated by protomylonitic to mylonitic fabrics. Intervals of ultramylonite are present in Zones 1 and 7. Where interlayered gabbroic and ultramafic rocks are observed, deformation is commonly localized close to or at gabbro/peridotite contacts, subparallel to the contact. Rarely, this crystal-plastic deformation crosses into adjacent peridotite, forming <10 cm intervals of mylonitic serpentinized harzburgite (e.g., Sections 178R-2 and 179R-2). At the meter scale, Zones 3 and 4, Zones 5 and 6, and Zone 7 are notable for forming high-strain zones in the upper and lower portions of 50–80 m thick sections of gabbro (Zone 7 marking the upper portion of a gabbro section that extends below the base of Hole U1601C). Within the larger (>20 cm) intervals of crystal-plastic deformation, well-defined strain gradients are observed, with fabrics showing a progression from protomylonite through to mylonite, and in some cases to ultramylonite, over tens of centimeters (Figure F114E). In Zones 1–3, rare intervals of strongly foliated to protomylonitic serpentinized harzburgite are reported.
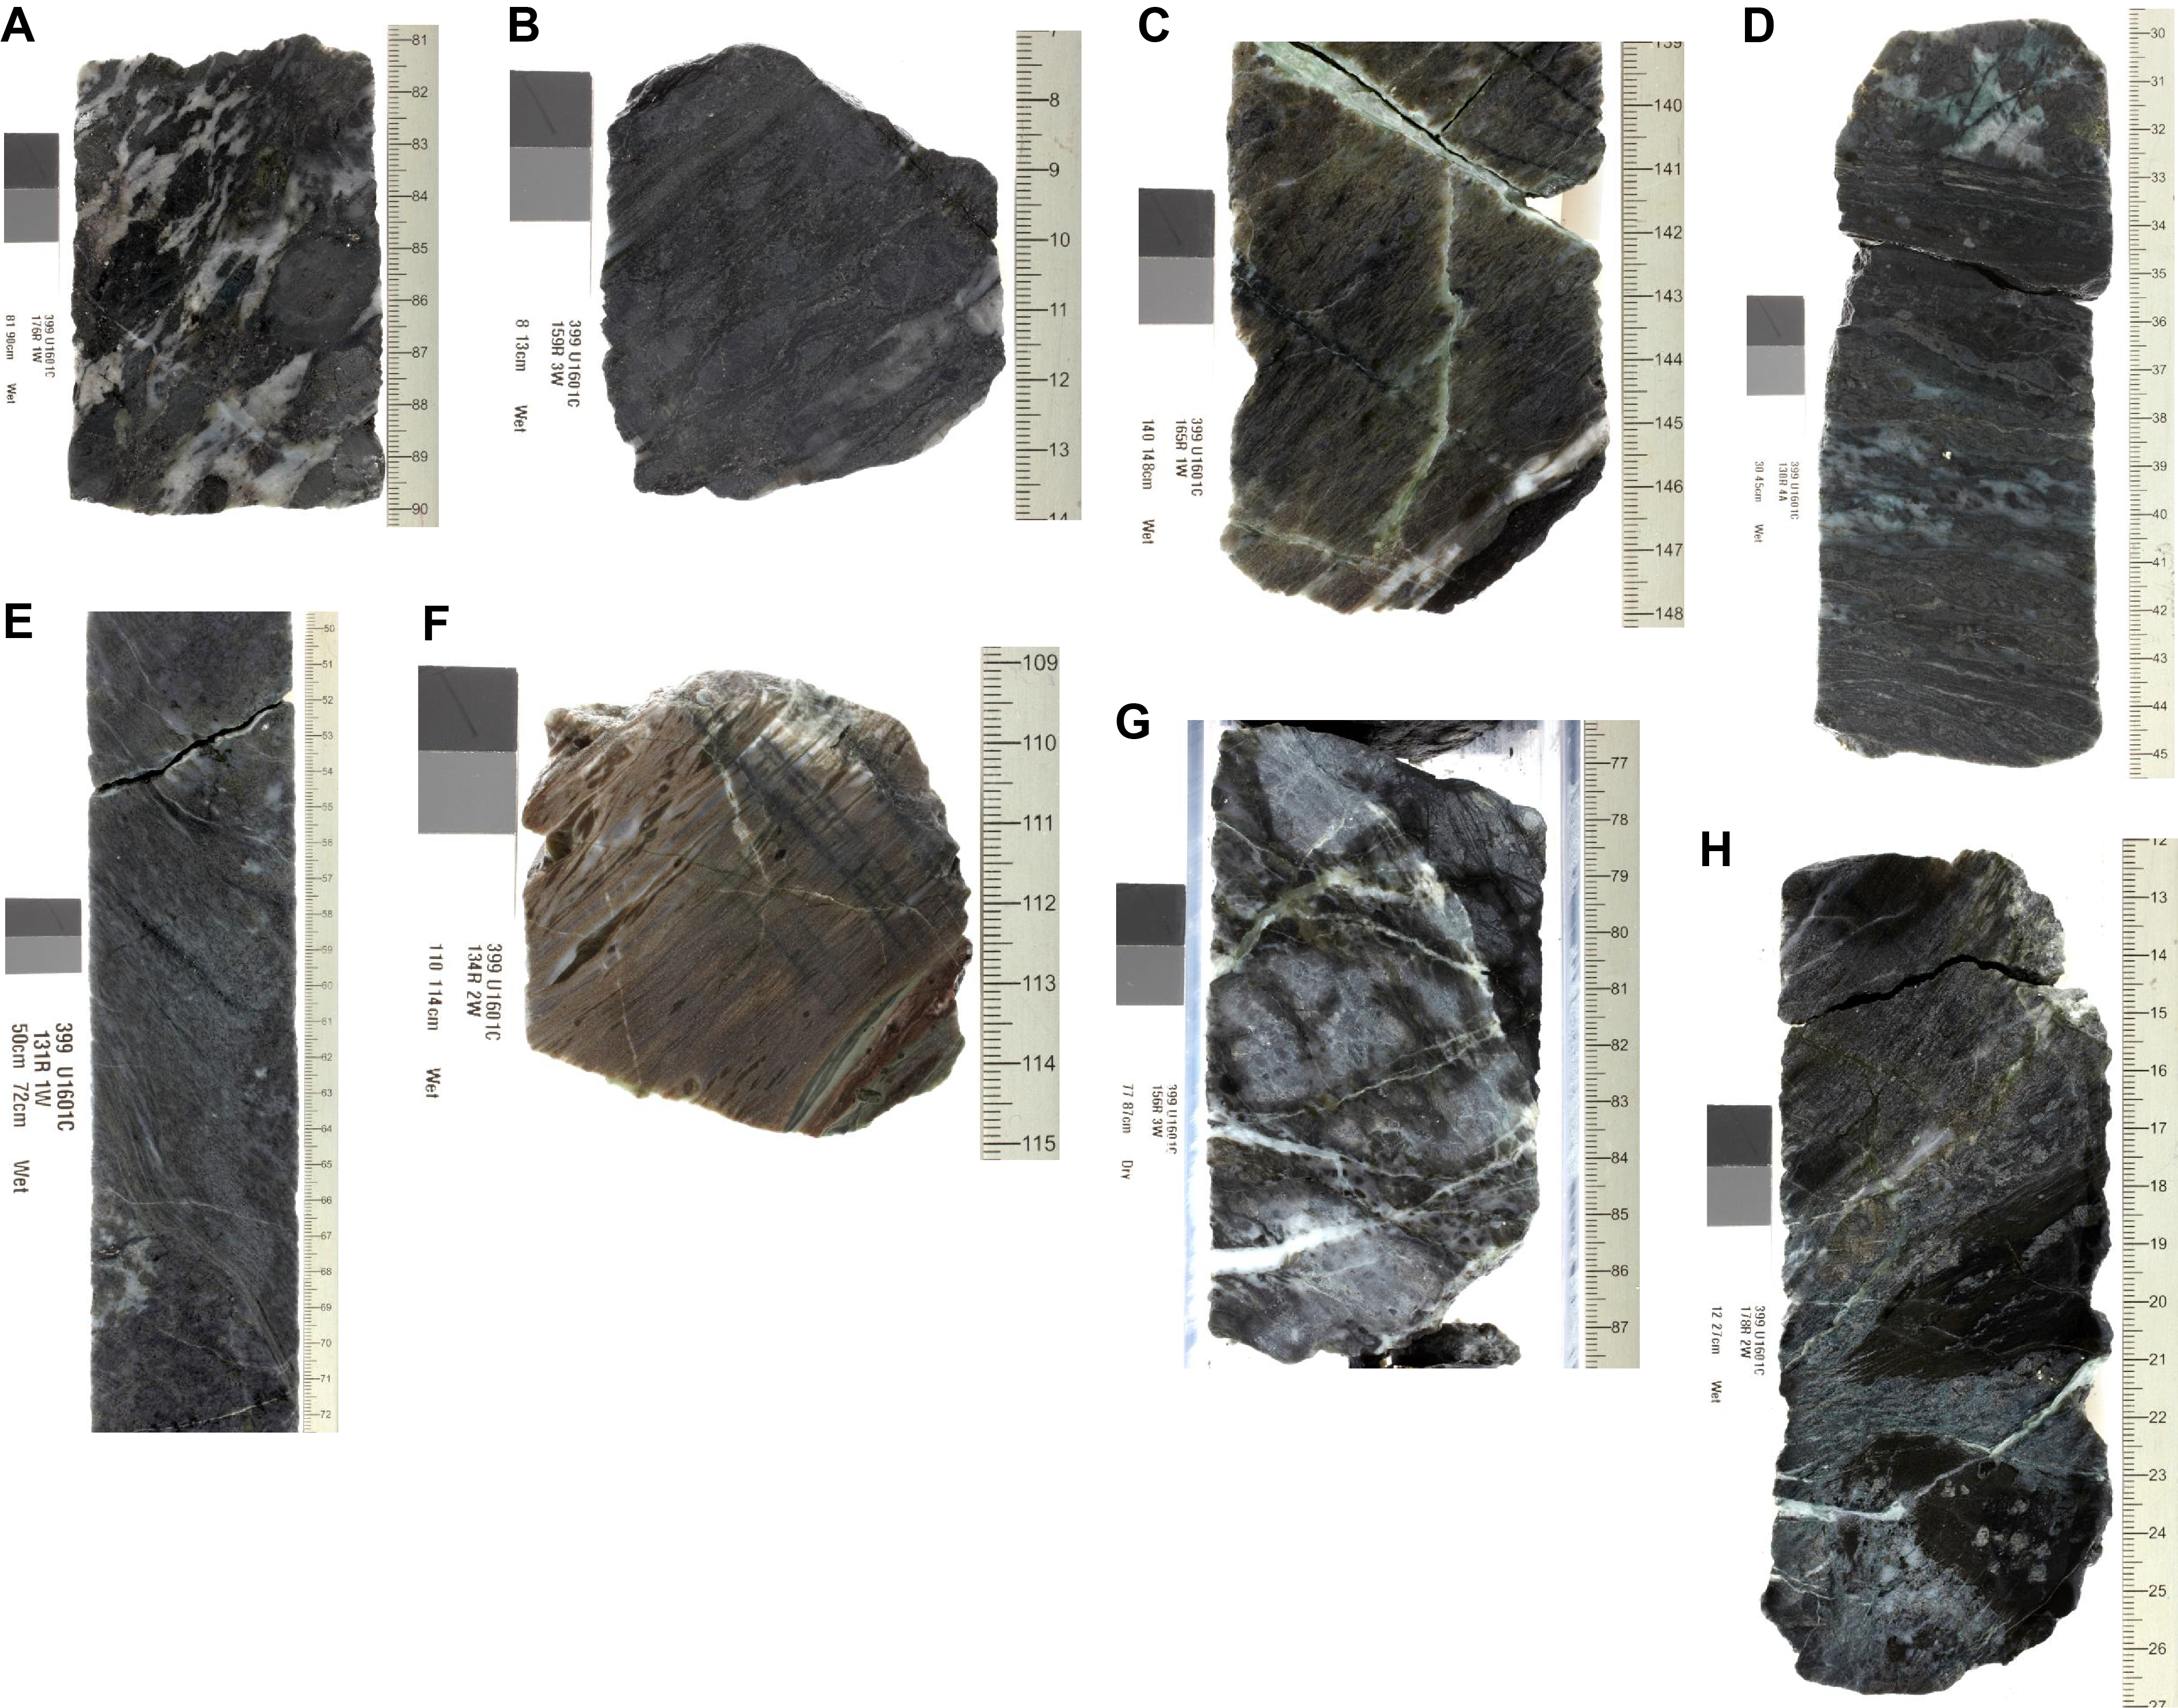
Figure F114. Macroscopic crystal-plastic deformation, Hole U1601C.
The aggregated range of recorded crystal-plastic fabric dips from all high-strain zones (n = 139) varies from 0° to 90° with a peak of intermediate dips between 30° and 60° (Figures F95, F113I). This distribution is mimicked by all individual high-strain zones except for high-strain Zones 2 (n = 19) and 3 (n = 18), which both display notable peaks with 75°–90° dips (Figure F113C, F113D).
Shear sense indicators are recorded from protomylonitic to ultramylonitic intervals in high-strain Zones 1, 3, and 5 and are dominantly reverse sense (Figure F112). A minority of normal sense indicators are also reported from protomylonitic to ultramylonitic intervals in these zones. Reverse sense fabrics have dips of 10°–80°, whereas normal sense indicators have dips of 55°–85°. The temporal relationship between reverse and normal sense crystal-plastic fabrics is unclear. In high-strain Zone 5, normal and reverse indicators are reported from the same mylonitic intervals, which may indicate that the opposing shear sense fabrics formed together, representing local heterogeneities of the same strain field.
5.2.3.3. Microstructural observations of crystal-plastic deformation
Shipboard thin sections of variably deformed gabbroic rocks and, to a lesser extent, serpentinized peridotite from Hole U1601C were analyzed during Expedition 399. Microstructural observations are presented below in terms of increasing crystal-plastic strain from very low strain fabrics in macroscopically undeformed samples to ultramylonite fabrics. Petrographic observations from gabbroic samples are presented first, followed by observations from serpentinized peridotite.
Very low strain crystal-plastic deformation is commonly observed in macroscopically undeformed gabbroic rocks, including those sampled from the macroscopically defined low-strain to undeformed zones. This deformation includes subgrain development in plagioclase, olivine, and pyroxene, deformation twins in plagioclase, and localized occurrences of dynamically recrystallized grains of plagioclase at the rims of larger igneous grains (Figure F115A) (e.g., Samples 22R-1, 101–104 cm [TS70], and 22R-2, 3–7 cm [TS71]).
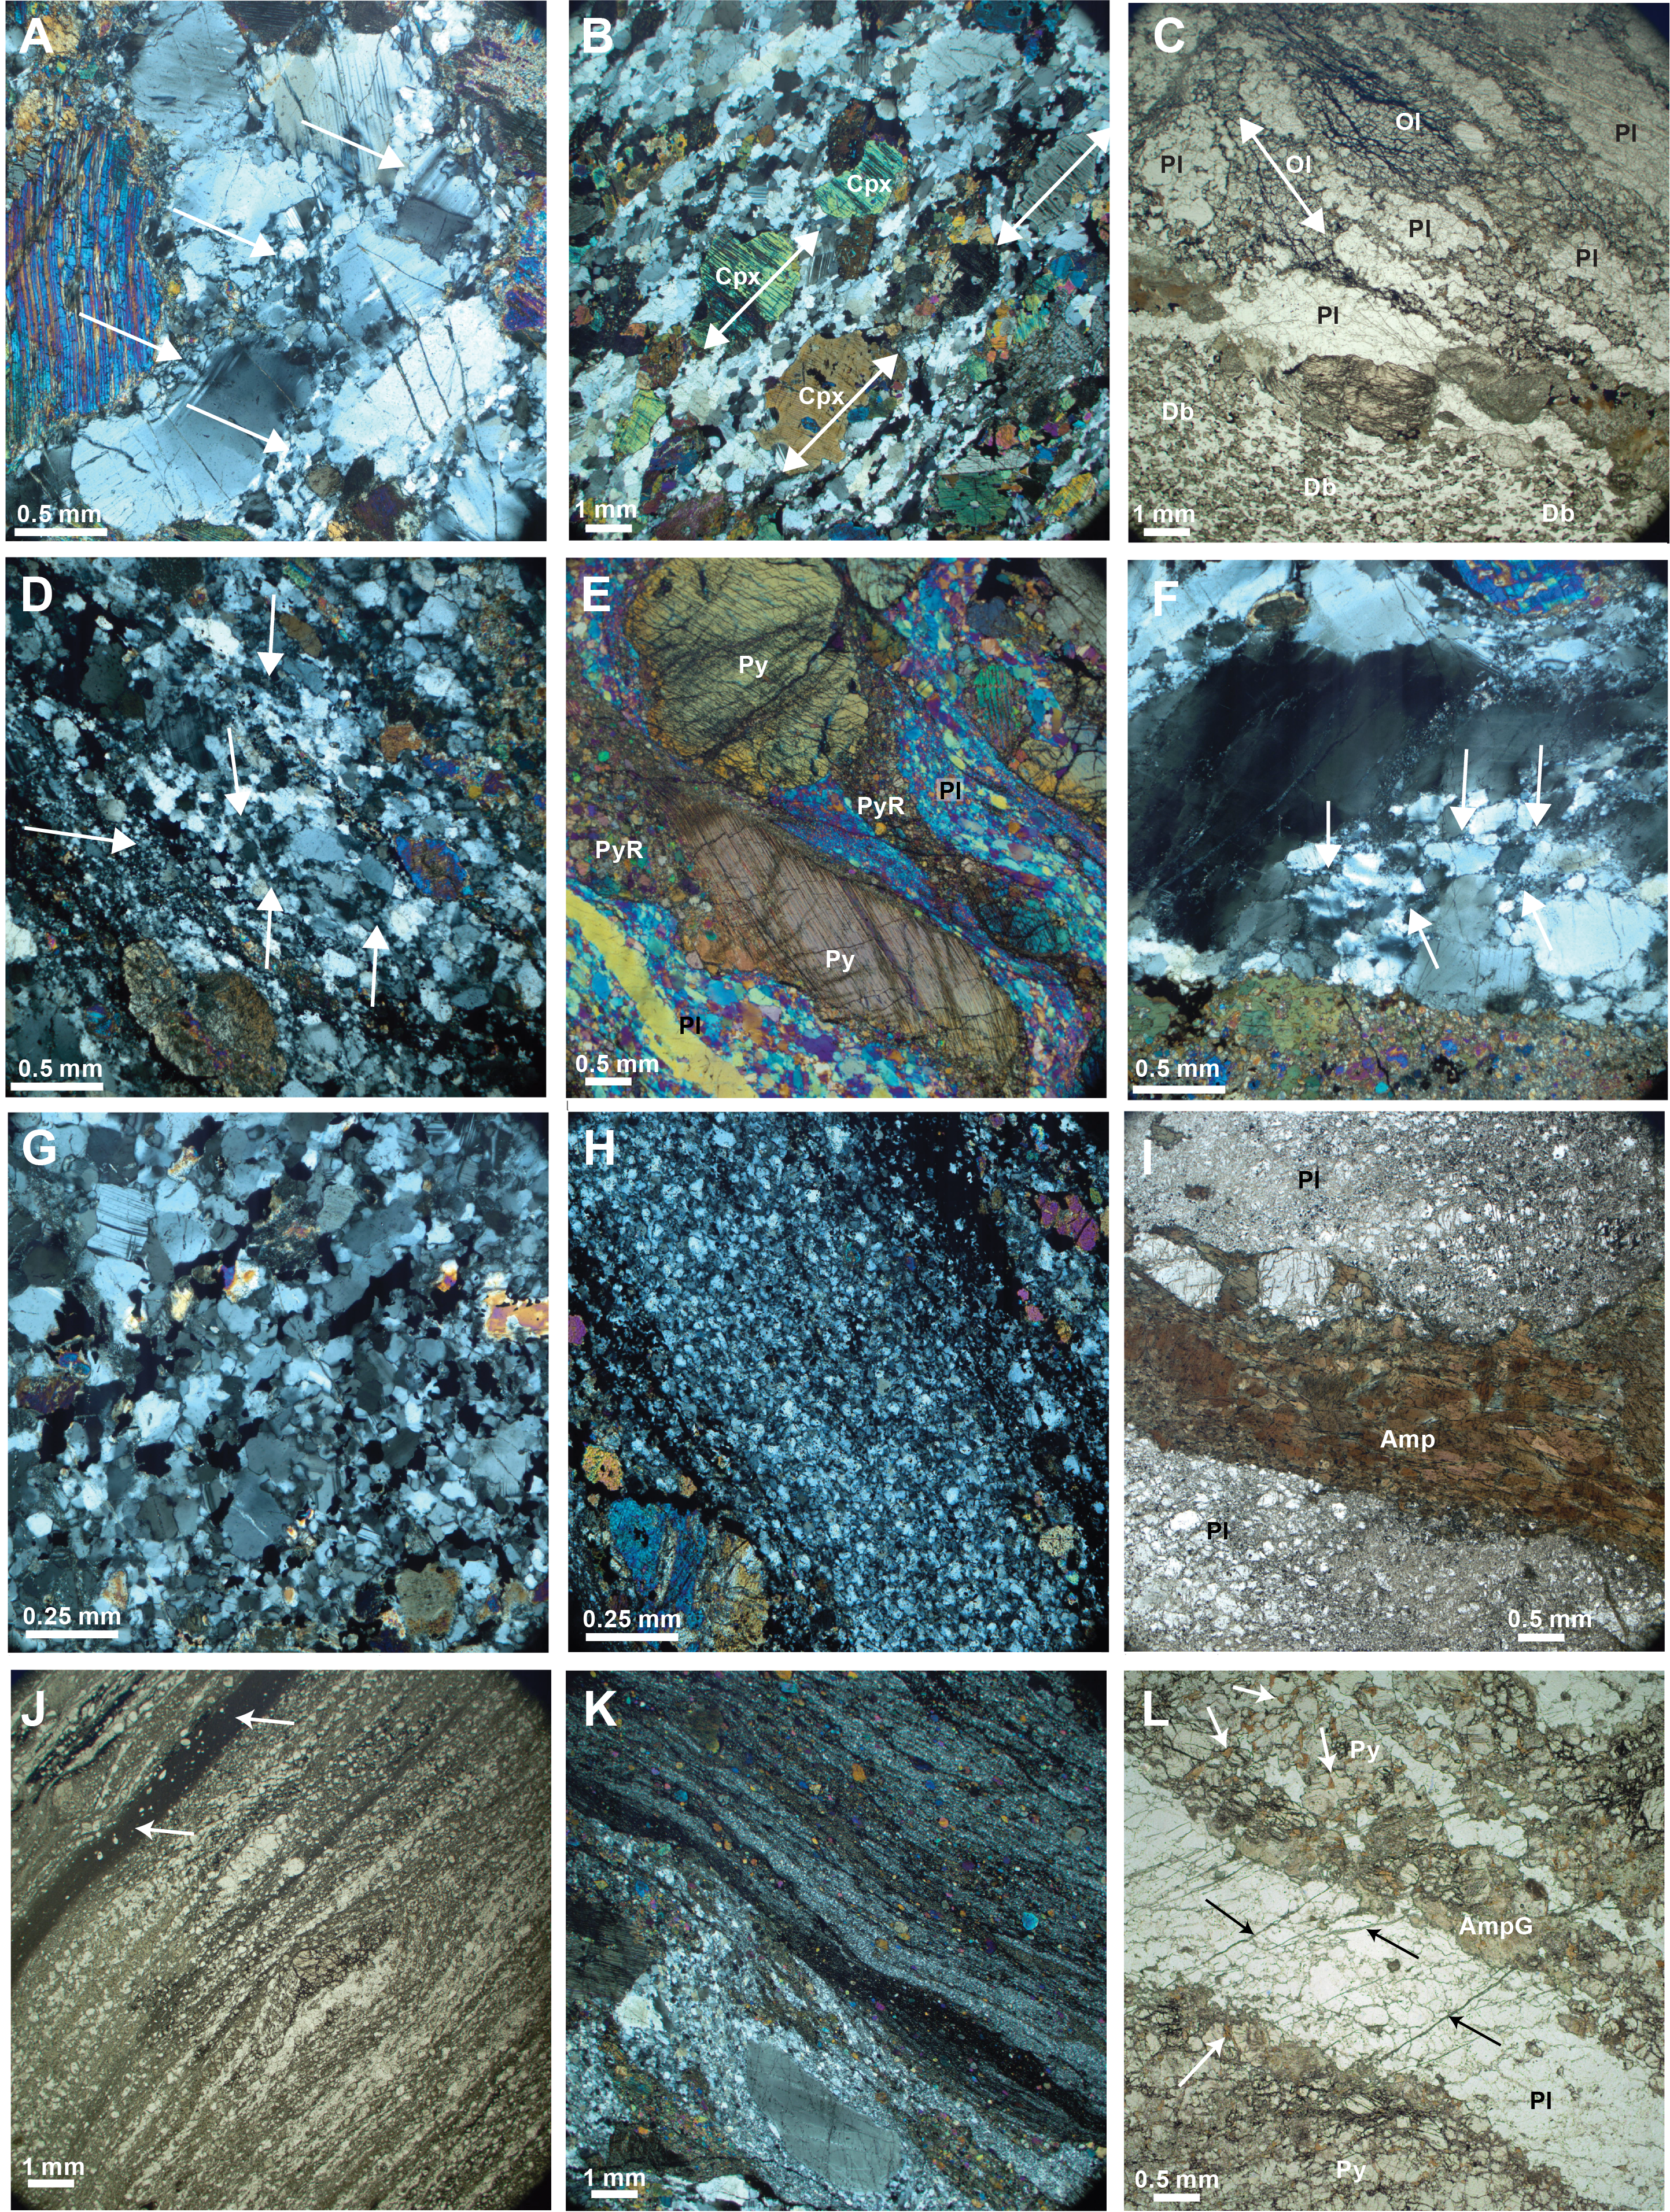
Figure F115. Microscopic crystal-plastic deformation, Hole U1601C.
Within macroscopically defined zones of high strain, macroscopically undeformed to strongly foliated gabbroic rocks commonly show grain-scale crystal-plastic deformation fabrics (e.g., Figure F115B, F115C). This commonly includes localized to pervasive GSR of plagioclase, where recrystallized grains have amoeboidal to serrated grain boundaries and subgrains (e.g., Figure F115D), and a moderate to strong crystallographic preferred orientations (CPO) (identified using a lambda plate). GSR of clinopyroxene is rarely observed. Recrystallized grain sizes vary between 40 and 400 µm. This low-strain GSR fabric is observed in samples with macroscopic foliation defined by elongate pyroxene and olivine that are only partially deformed and show no indication of rotation or shearing. This suggests that the crystal-plastic foliation is overprinting a preexisting magmatic foliation defined by pyroxene and/or olivine (e.g., Figure F115B, F115C).
Protomylonitic to mylonitic fabrics in gabbroic rocks typically display foliation-parallel monomineralic layers of plagioclase and subordinate polyminerallic layers of plagioclase and pyroxene/amphibole after pyroxene. Recrystallized plagioclase microstructures range from amoeboidal grain shapes with serrated grain boundaries to equant, blocky, subhedral grain shapes with straight to curved grain boundaries (Figure F115F, F115H). Typical minimum and maximum recrystallized grain sizes in protomylonitic fabrics are 10–50 and 50–500 µm, respectively, for plagioclase, 10–20 and 100–200 µm, respectively, for pyroxene, and 20–50 and 100–500 µm, respectively, for amphibole after pyroxene. Relict plagioclase and pyroxene are both preserved. In most protomylonitic samples, the volume of recrystallized pyroxene/amphibole after clinopyroxene is low and only present in pressure shadows of pyroxene porphyroclasts, indicating that plagioclase is the dominant weak phase that accommodates mylonitization (e.g., Figure F115E). Similarly, clinopyroxene typically shows a stronger degree of GSR and recrystallization than orthopyroxene when both are present.
In gabbroic samples hosting mylonitic fabrics, minimum and maximum recrystallized grain sizes are 5–25 and 20–300 µm, respectively, for plagioclase, 20–50 and 100–500 µm, respectively, for pyroxene, and 5–50 and 75–200 µm, respectively, for amphibole after pyroxene. Mylonitic fabrics rarely preserve relict plagioclase, whereas relict pyroxene/amphibole after pyroxene grains are common. However, the degree of GSR and recrystallization displayed by pyroxene is significantly greater in mylonitic fabrics, relative to protomylonitic fabrics. In many cases, replacement of recrystallized pyroxene by amphibole is only partial, suggesting that alteration may have occurred during, but likely continued after pyroxene GSR and recrystallization. In oxide gabbro Sample 163R-1, 33–36 cm [TS101] (Figure F115I), coarse brown magmatic amphibole porphyroclasts are mantled by finer grained recrystallized brown amphibole with a foliation-parallel SPO suggesting dynamic recrystallization of brown amphibole during mylonitization.
Gabbroic samples hosting intervals of ultramylonite display a similar fabric to mylonitic samples but with <5% relict clasts and finer recrystallized grain sizes (Figure F115J, F115K). Minimum and maximum recrystallized grain sizes are typically ≤5 and 50–150 µm, respectively, for plagioclase and 10–25 and 25–150 µm, respectively, for pyroxene/amphibole after pyroxene. Relict plagioclase is not observed. Samples of gabbro ultramylonite also display homogeneous millimeter-scale bands of an unidentified mineral (possibly amphibole or plagioclase) with a grain size of <2 µm (Figure F115J).
Grain-scale shear sense indicators are displayed by several gabbroic protomylonitic to ultramylonitic samples. In each case, the recorded microscale shear sense agrees with locally reported macroscale shear sense indicators (Figure F112). With the current sample set, the microstructural fabrics displayed by normal and reverse fabrics are indistinguishable from each other, as are fabrics from the different macroscopically defined shear zones and zones of distributed deformation.
Serpentinized peridotite samples rarely display crystal-plastic deformation. Undulose extinction in relict olivine and pyroxene grains is observed throughout the hole. In rare cases, kinked cleavage is observed in relict orthopyroxene grains. Microstructures characteristic of high-strain crystal-plastic deformation zones in primary pyroxene or olivine in serpentinized peridotite samples are typically not observed; in rare instances they were noted with low confidence along intrusive contacts with mylonitic gabbroic rocks. More often, these examples show that crystal-plastic deformation of the serpentinized peridotites occurred during or after alteration. This includes petrographic observations of (1) lenticular-shaped olivine surrounded by a sigmoidal mantle of talc and amphibole; (2) fish-like tremolite clasts in an unstructured serpentine mass (Figure F107; Sample 128R-3, 54–56 cm [TS202]) that indicate deformation occurred after formation of secondary amphibole and serpentine; and (3) oxide melt infiltration and rare cataclasis of altered pyroxene and secondary amphibole in serpentinized peridotite in the immediate contact to adjacent mylonitized gabbro intrusion.
5.2.3.4. Relationships between magmatism, alteration, and veins
Protolith lithology and crosscutting relationships between crystal-plastic deformation, magmatism, and alteration minerals provide constraints for the localization, relative timing, and conditions of crystal-plastic deformation. Within gabbroic rocks the distribution of deformation varies with protolith grain size and composition. Commonly, coarse-grained intervals in gabbroic rocks are less deformed than finer grained intervals (Figure F115A–F115D). In some sections, a well-developed mylonitic fabric can be observed in fine-grained gabbroic intervals directly above and below a weakly deformed to undeformed coarse-grained interval (Sections 212R-3 and 232R-1) (Figure F115D). Similarly, variations in lithology have an influence, with deformation preferentially localizing in oxide gabbro when modal contacts are observed (Figure F115K).
The relative timing of crystal-plastic deformation and magmatism is constrained by the deformation state of diabase intervals; undeformed gabbroic and diabase intervals are rarely observed cutting deformed sections of gabbro and oxide gabbro (Sections 128R-3, 163R-2, 172R-2, 173R-2, 194R-1, and 219R-1). Mylonitic diabase is also observed (Sections 134R-2 and 147R-1). Similarly rarely, an earlier steep protomylonite fabric is observed cut by a younger, gently dipping protomylonitic fabric with oxide slip planes (Sections 163R-2 and 175R-1). It is therefore likely that both deformation and magmatism were polyphase.
The relationship between localized brown amphibole and mylonitization is intriguing. Brown amphibole is common though not exclusive to oxide gabbro and may be a product of crystallization from evolved melt or late metasomatism (e.g., Gillis and Meyer, 2001; Ferrando et al., 2022). The juxtaposition of brown amphibole with clinopyroxene in some mylonitic fabrics may indicate that the amphibole formed as a product of reaction between clinopyroxene and a more fractionated melt phase, which occurred on a locally restricted scale prior to, during, and after mylonitization.
The relative timing of crystal-plastic deformation and alteration is based on crosscutting relations observed at a microscopic scale; most alteration vein generations (see Alteration veins below) cut crystal-plastic fabrics, with the exception of some green to green-white talc veins and rare amphibole veins. Both undeformed and deformed talc veins are observed cutting mylonitic fabrics in gabbroic intervals (Sections 129R-3, 134R-1, and 165R-1) (Figure F114C, F114G, F114H). Similarly, some macroscopic mylonitic fabrics appear to overprint and exploit preexisting talc alteration (Sections 134R-1 and 129R-3). Some amphibole veins cutting serpentinized peridotite are deformed, displaying a mix of cataclastic and crystal-plastic deformation, including secondary amphibole and talc immediately adjacent to mylonitic gabbroic intervals. In these examples, the surrounding serpentine is unstructured, suggesting deformation occurred postserpentinization. In some cases, oxide veins cut secondary amphibole and talc cataclasite. However, these examples are spatially restricted to very short intervals of serpentinized peridotite (>10–20 cm) at the margins of gabbroic intrusions and are considered relatively low strain with respect to the deformation observed in the adjacent gabbroic intrusions.
The occurrence of both deformed and crosscutting undeformed amphibole veins (e.g., Section 195R-2) provides a qualitative lower bound for the temperature of mylonitization. Likewise, microstructural observations demonstrate that an undeformed, static amphibole ± chlorite alteration and veins overprint many of the mylonitic gabbroic samples (Figure F115L), especially at the contacts between gabbro intrusions and peridotite. In some cases, amphibole + chlorite veins are observed truncating contacts between mylonitic and undeformed gabbro (Section 194R-1). This indicates that whereas gabbro/peridotite contacts were favorable sites of strain localization at hypersolidus to high-temperature conditions, they did not accommodate any significant strain at lower greenschist facies temperatures.
5.2.3.5. Conditions of crystal-plastic deformation
Temperature-dependent microstructures combined with the crosscutting relationships described above provide a means to estimate the conditions of crystal-plastic deformation. The presence of deformed brown amphibole and oxide gabbro may indicate that at least some of the gabbro mylonites formed above their solidus at ~860° ± 30°C (Coogan et al., 2001). Microstructural observations of solid-state deformation detail GSR and recrystallization of plagioclase and pyroxene, including examples both with and without the presence of amphibole (Figure F115E, F115I, F115L), suggesting that mylonitization occurred at granulite through to amphibolite facies pressure-temperature conditions.
5.2.4. Schistose fabrics
Schistose material recovered from Hole U1601C is rare and where reported is restricted to millimeter- to centimeter-scale talc ± carbonate veins within mafic and ultramafic rocks. Observations of schistose fabrics from these veins are reported in Alteration veins.
5.2.5. Brittle deformation
Brittle deformation is noted throughout Hole U1601C from shallower than 100 mbsf to deeper than 1100 mbsf. Direct observations of brittle faulting are restricted to zones of recovered fracturing and cataclasis, microfaults, and piece end faults that locally preserve mineralized fault surfaces with striae (Figures F116, F117, F118). Overall brittle deformation, including fractures and veins, include high-intensity intervals at 225–350 mbsf (Sections 43R-3 through 69R-2), ~600 mbsf (Sections 119R-1 through 122R-4), and ~800 mbsf (Sections 160R-1 through 167R-1) (Figure F118). Intervals of high-intensity fracturing and cataclasis were recovered at 429–430 mbsf (Section 85R-3), 462 mbsf (Sections 92R-2 and 92R-3), 535–542 mbsf (Sections 108R-3 and 108R-4), 638–643 mbsf (Sections 128R-3 through 129R-3), 800 mbsf (Sections 158R-1 through 162R-4), 868 mbsf (Section 176R-2), 907 mbsf (Section 184R-2), 1017 mbsf (Section 207R-1), and 1106–1150 mbsf (intermittent between Sections 226R-1 through 229R-1 and 234R-3) (Figure F118). Only eight zones of cataclasite (brittle deformation rank = 4) were recovered in Hole U1601C, including two in more clustered intervals, the first at 437 mbsf in gabbro (interval 87R-2, 47–64 cm), 462 mbsf in gabbro (interval 92R-2, 126–145 cm; overprints a protomylonite) and 473 mbsf in serpentinized harzburgite (interval 94R-3, 122–150 cm), and the second at 869 mbsf in gabbro (interval 176R-2, 89–106 cm), 882 mbsf in gabbro (interval 179R-1, 136–137 cm), and 907 mbsf in gabbro (interval 184R-2, 17–29 cm). Surprisingly, these rare intervals of intense brittle deformation are outside the zones of higher numbers of piece end faults. Between ~0 and 800 and between ~1150 and 1265 mbsf, intervals hosting brittle deformation are within undeformed to low-strain zones and less commonly within intervals of with crystal-plastic deformation. In contrast, intervals of brittle deformation between ~800 and 1150 mbsf spatially overlap with intervals of crystal-plastic deformation including high-strain Zones 2, 3, and 5 and intervening low-strain zones.
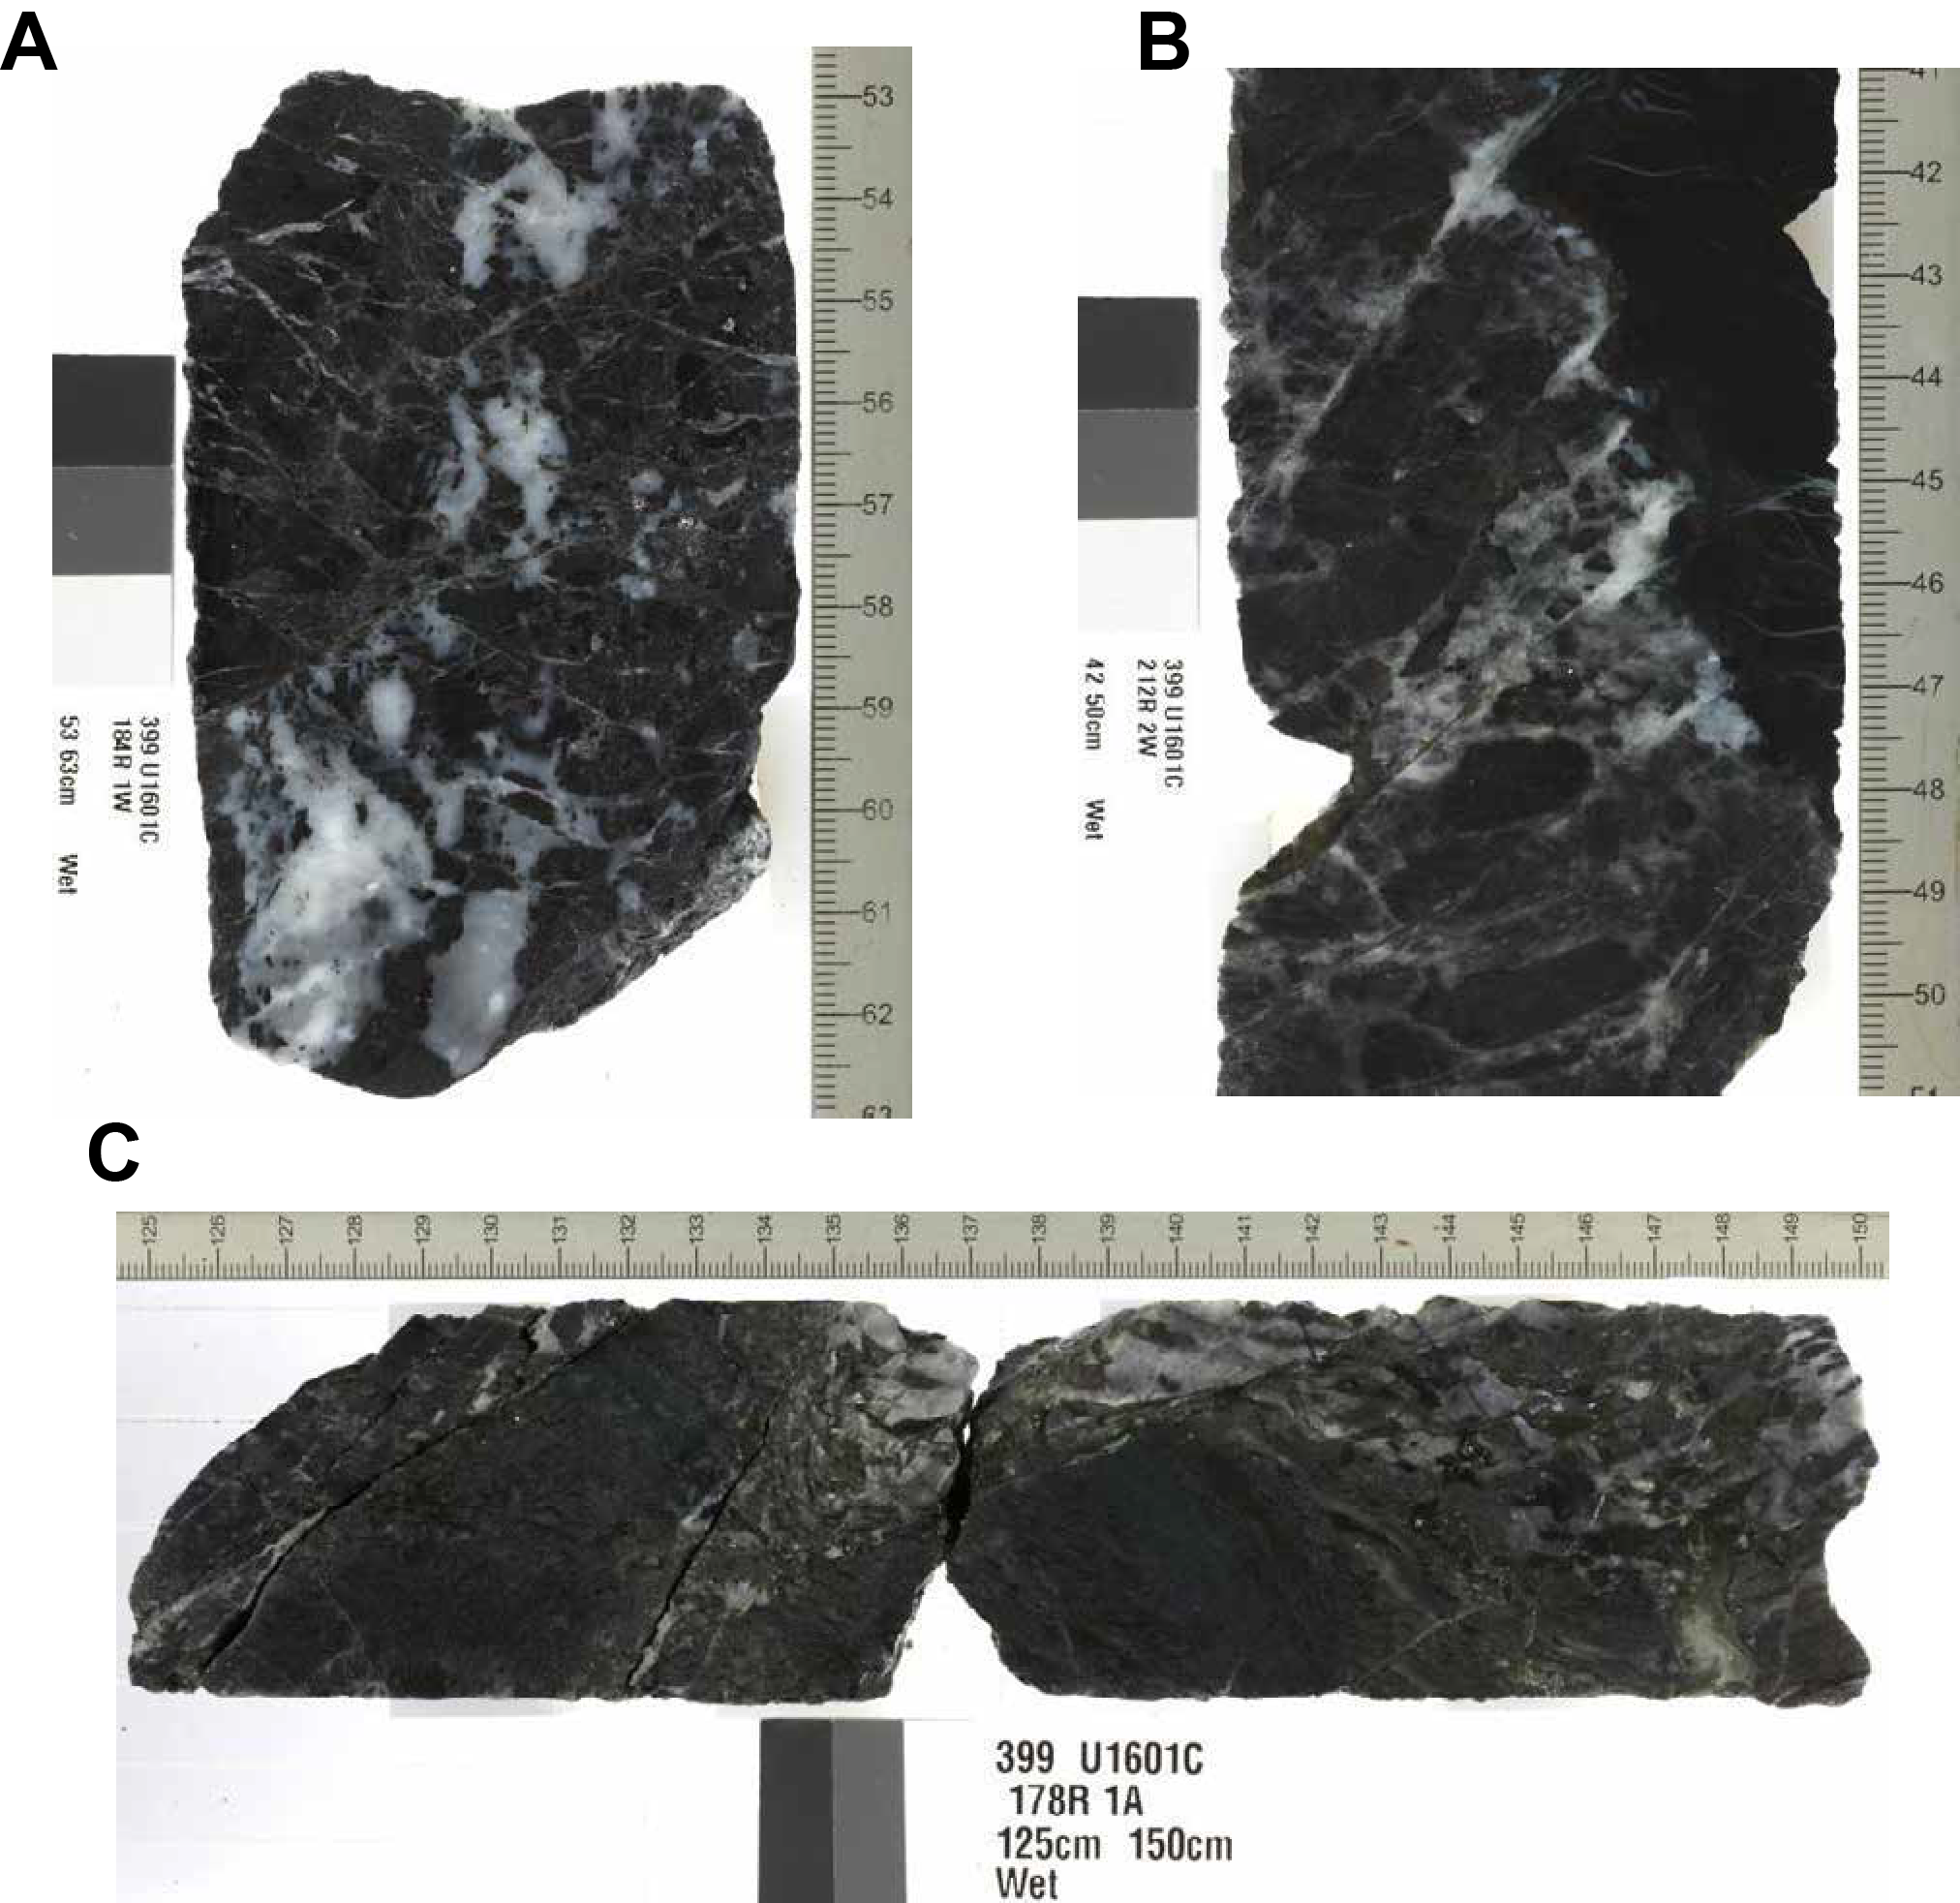
Figure F116. Macroscopic brittle deformation, Hole U1601C.
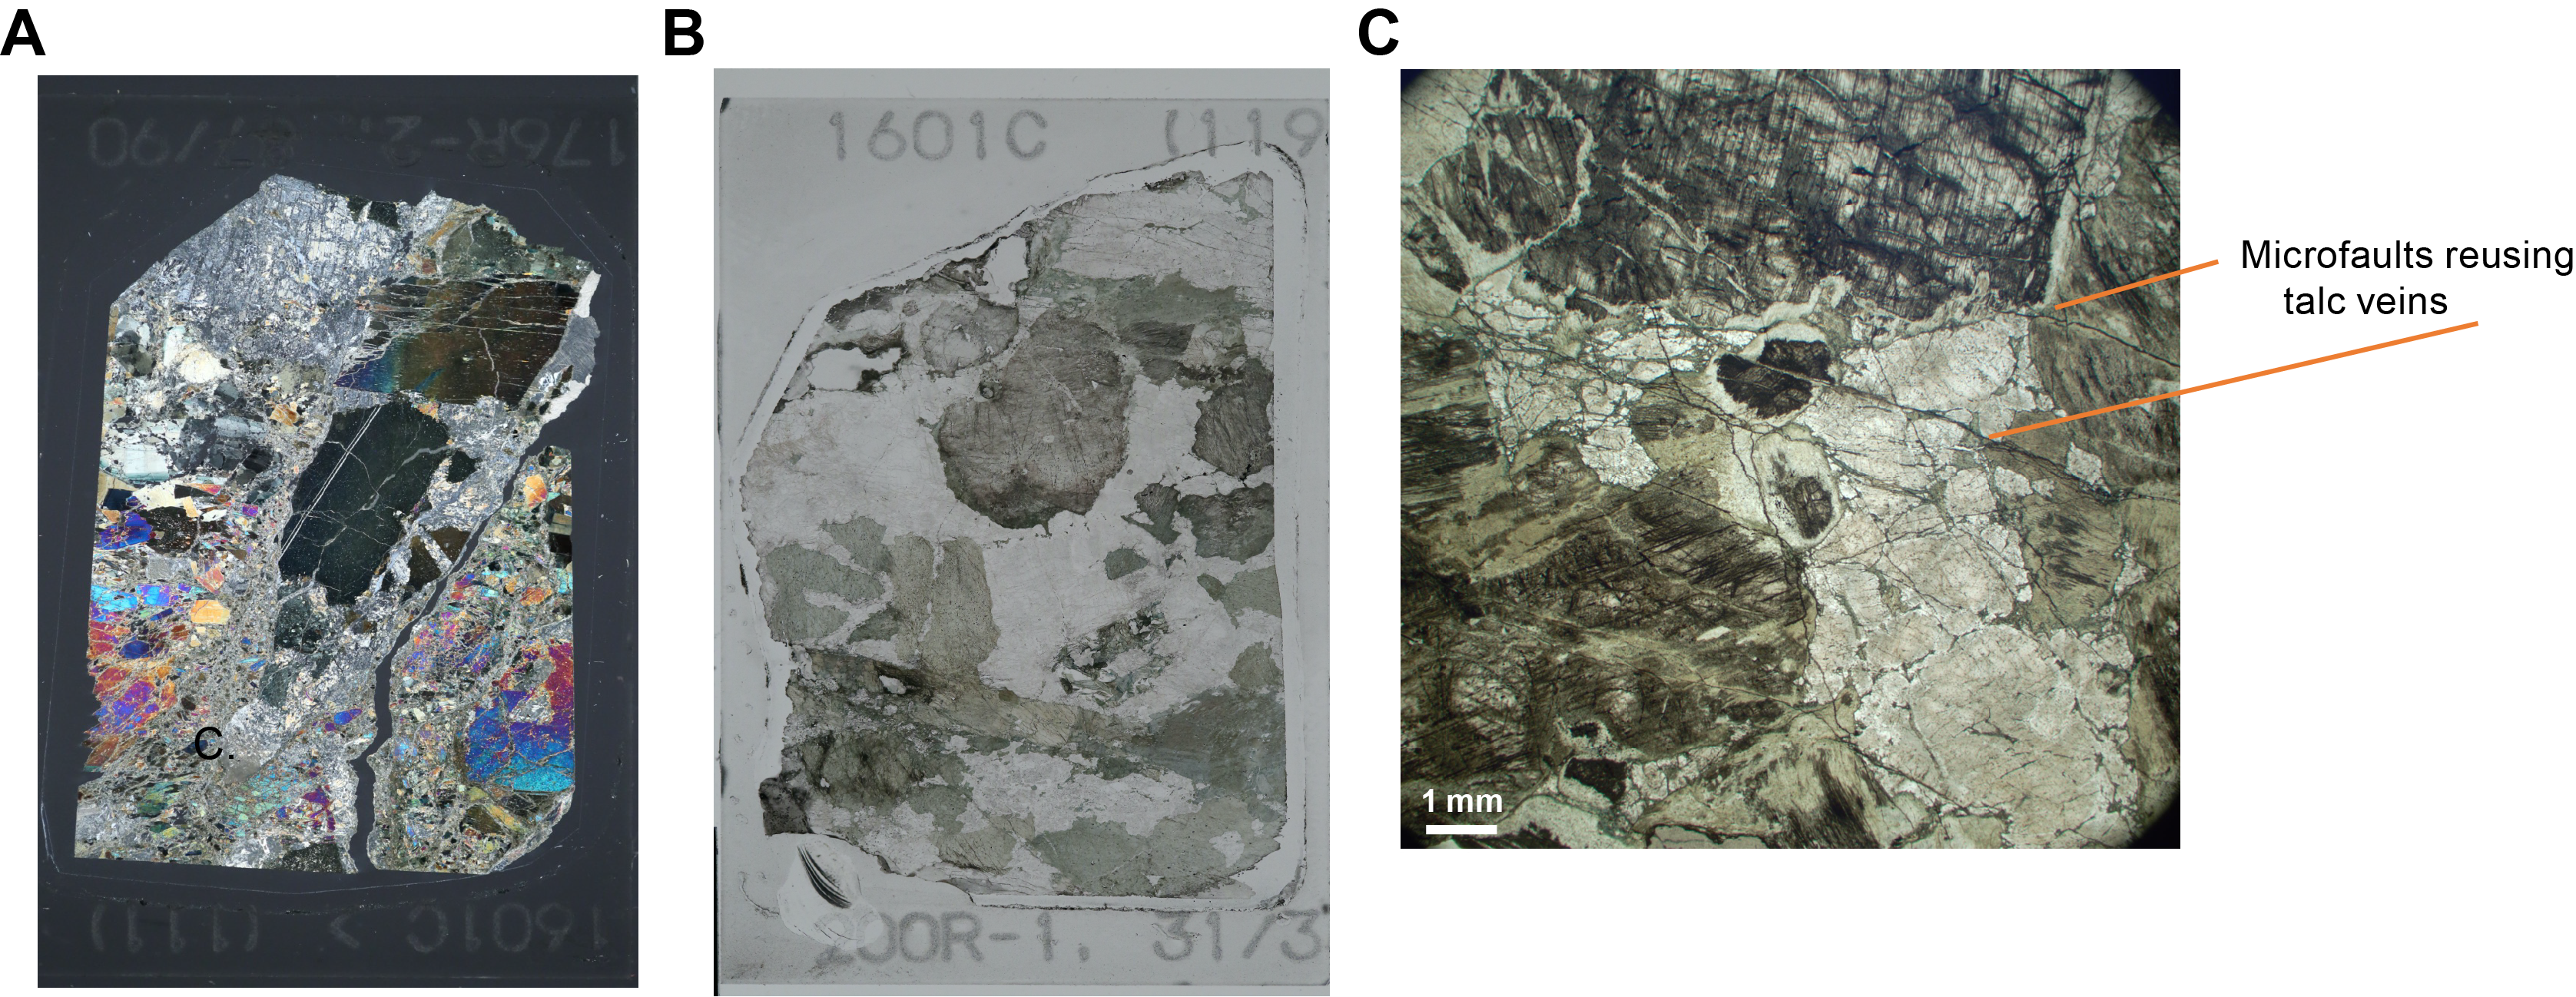
Figure F117. Microscopic brittle deformation, Hole U1601C.
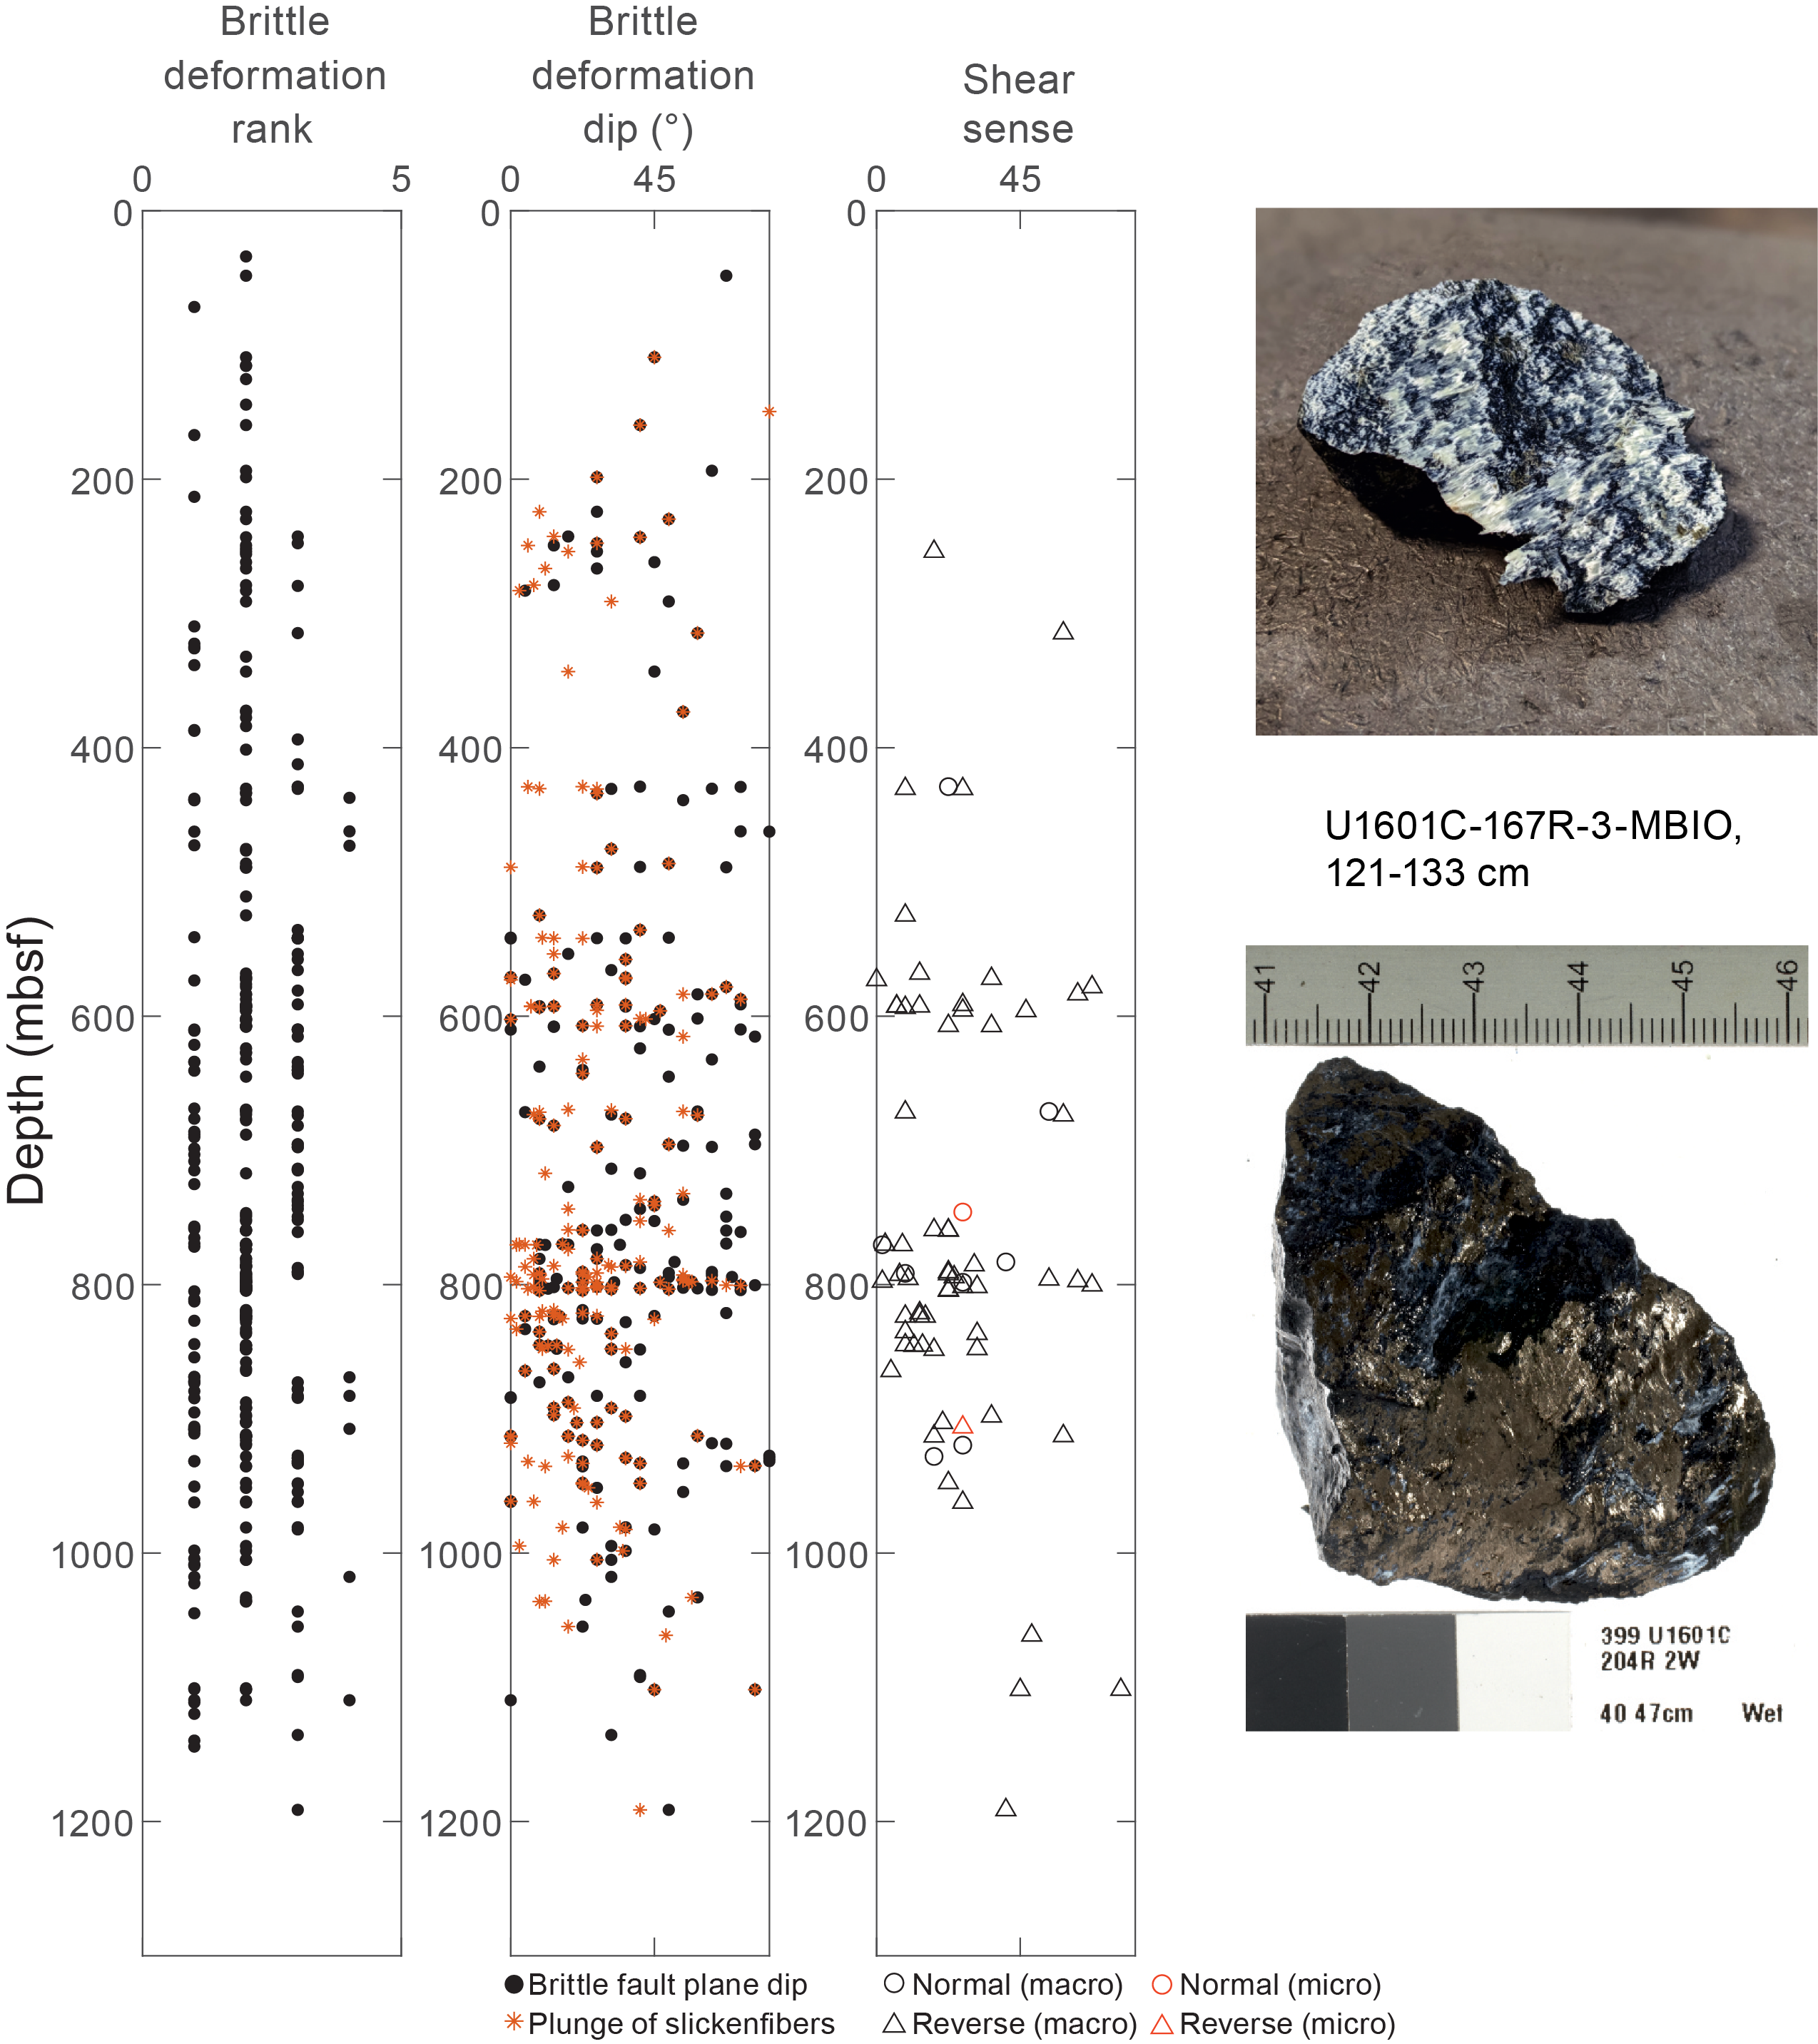
Figure F118. Intensity of brittle structures, dip, and shear sense, Hole U1601C.
Brittle faults and piece end fault surfaces (millimeter-scale faulting localized along or spatially associated with alteration veins) with striae are recorded throughout the hole below 275 mbsf with plunges between 0° and 80° (Figure F118). These sheared veins and piece end faults are concentrated in zones at 420–780 mbsf and 900–1000 mbsf (Figure F118), in serpentinized harzburgite along chrysotile veins, and in gabbro at 420–580 mbsf and 634–666 mbsf, most commonly associated with talc and/or chlorite veins. These surfaces are typically defined by slickenfibers or slickenside striae that record dip-slip to slightly oblique-slip displacement, and most commonly reverse sense motion (61 of 65 surfaces determined) in the core reference frame (Figure F118). The number of piece end faults recorded is likely a minimum since many serpentine veins had slickenfibers when opened. Locally, striae are preserved on surfaces in zones of cataclasis that overprint protomylonitic to mylonitic fabrics (Cores 92R, 117R, 122R, 128R, 141R, 147R, 152R–153R, 177R–179R, 188R, and 193R–194R), confirming at least local deformation across the brittle–ductile transition.
The spatial distribution of localized brittle and crystal-plastic deformation between ~800 and 1150 mbsf indicates that many intervals of plastic deformation, including high-strain Zones 2, 3, and 5, continued to deform within the brittle regime (Figure F95). Localized intervals of brittle deformation also developed where crystal-plastic deformation was not observed, particularly between ~420 and 580 mbsf. However, within these intervals there are no recovered meter-scale intervals of gouge, fault breccia, or cataclasis. This suggests that the total strain accommodated by brittle deformation was dispersed and not in discrete, concentrated zones, perhaps demonstrating a lack of efficient, progressive brittle strain weakening mechanisms during the denudation of rocks in Hole U1601C. However, sections of poor recovery, high porosity, high penetration rate, and/or a kink in the temperature profile noted during logging (see Petrophysics) are concentrated at 120–150, 370, 640–650, 870, and 950 mbsf and may indicate the presence of unrecovered fault zones. Brittle deformation related to detachment faulting has been demonstrated to form in discrete zones within the larger, ductile detachment shear zone (e.g., Schroeder and John, 2004); however, this does not preclude later high-angle faults.
5.2.6. Alteration veins
Alteration veins are common throughout most of the recovered core from Hole U1601C from 23 to 1259 mbsf (Cores 2R through 258R), with lower intensity veining across the seven crystal-plastic high-strain zones, and below 1000 mbsf (Core 225R). Vein type, density, and orientation vary by rock type and depth throughout the hole (Figure F119; see Alteration petrology).
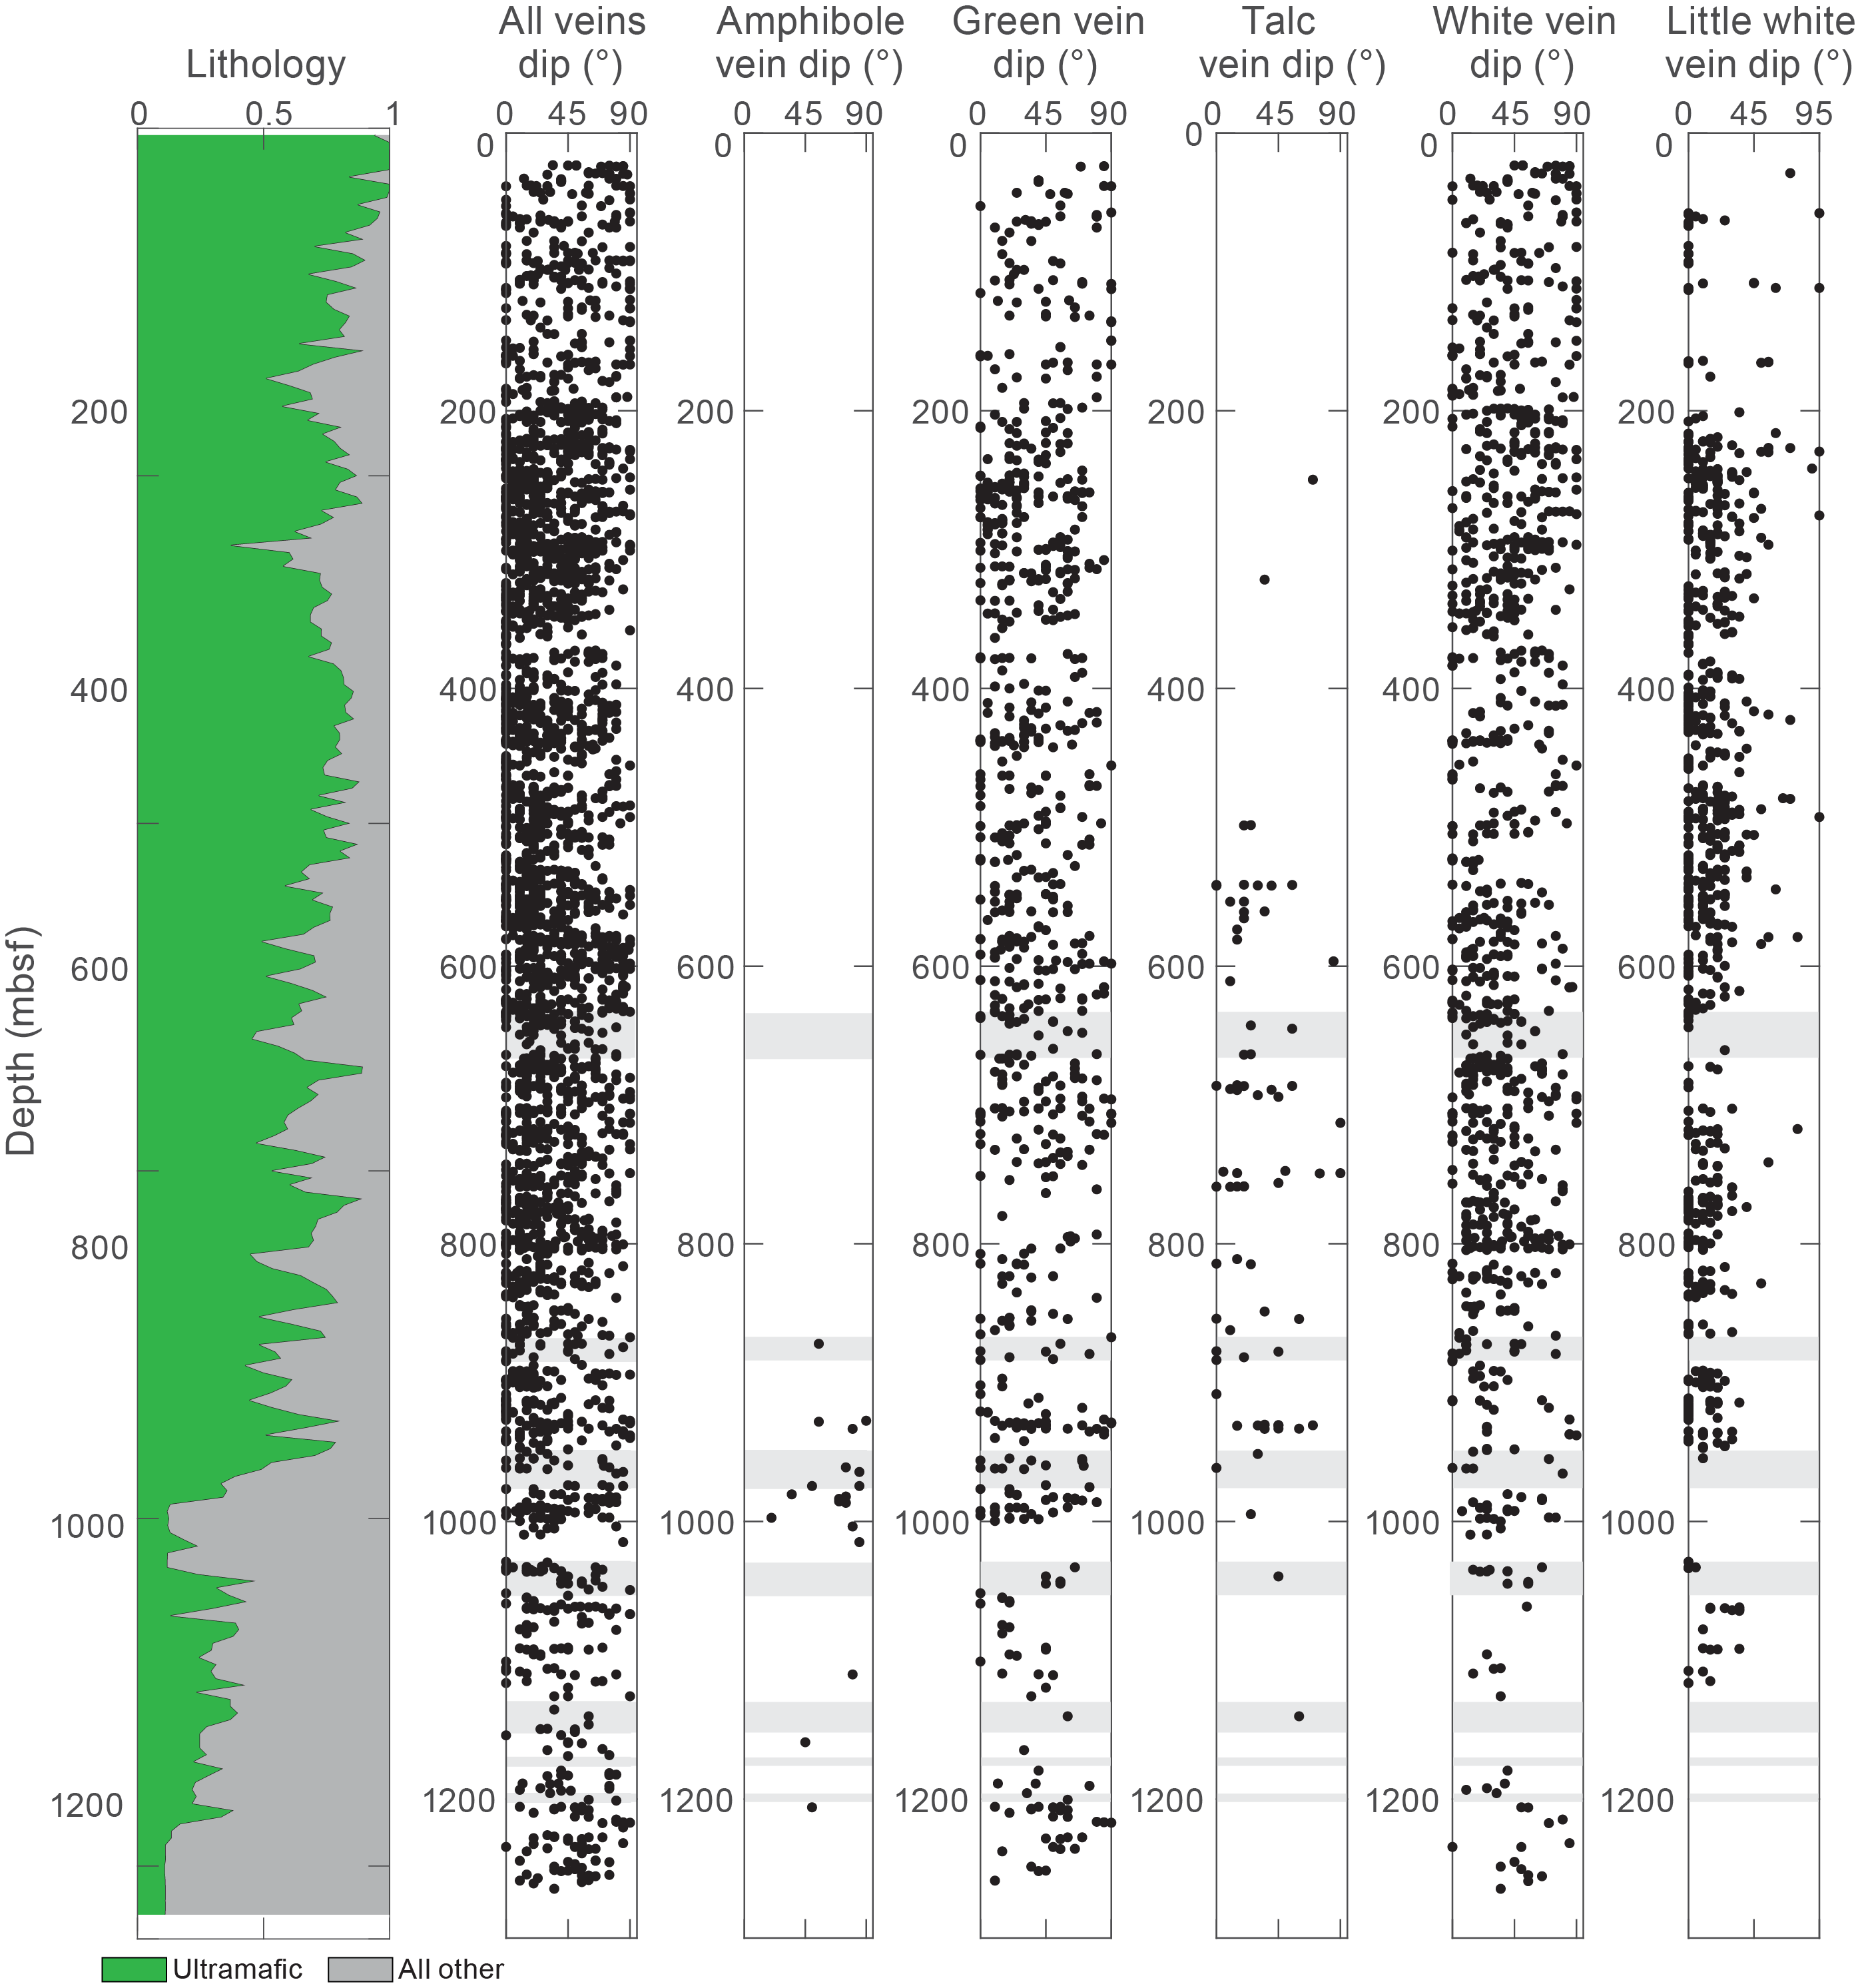
Figure F119. Vein type, Hole U1601C.
Vein types cutting serpentinized harzburgite and dunite include (1) magmatic veins cut by perpendicular pale green picrolite (serpentine) veins; (2) green composite serpentine-magnetite, picrolite (serpentine), and/or rare chlorite veins; (3) white carbonate; and (4) thin white chrysotile veins, as classified by the structural team (Figure F120). Dips in these intervals vary from 0° to 90° with no trend downhole. White chrysotile and carbonate veins are dense in the uppermost 380 m and at 570–810 mbsf and diminish in number with depth. Dips in these intervals vary from 0° to 90° with no trend downhole. Late, thin (<1 mm) white chrysotile veins cutting harzburgite and dunite are common in core hosting peridotite and are characterized by subhorizontal to moderate dips (<45°; Figure F119), with short intervals (<50 cm) hosting local steep dips in Sections 41R-3 (216 mbsf), 50R-1 (256 mbsf), 50R-4 (260 mbsf), 82R-2 (412 mbsf), 98R-4 (492 mbsf), 109R-2 (543 mbsf), 116R-2 (578 mbsf), and 168R-3 (831 mbsf). Dips of these thin chrysotile veins correlate with the local dip of any serpentine fabric. Where variable, changes in vein orientation occur over several centimeters and can vary in core that is otherwise compositionally uniform in lithology and fabric orientation. The abundance of thin white veins also changes with depth, decreasing overall downhole; however, a scarcity near the top of the hole and a large abundance between 200 and 900 mbsf are punctuated by scarce intervals near high-strain Zones 1, 2, and 3.
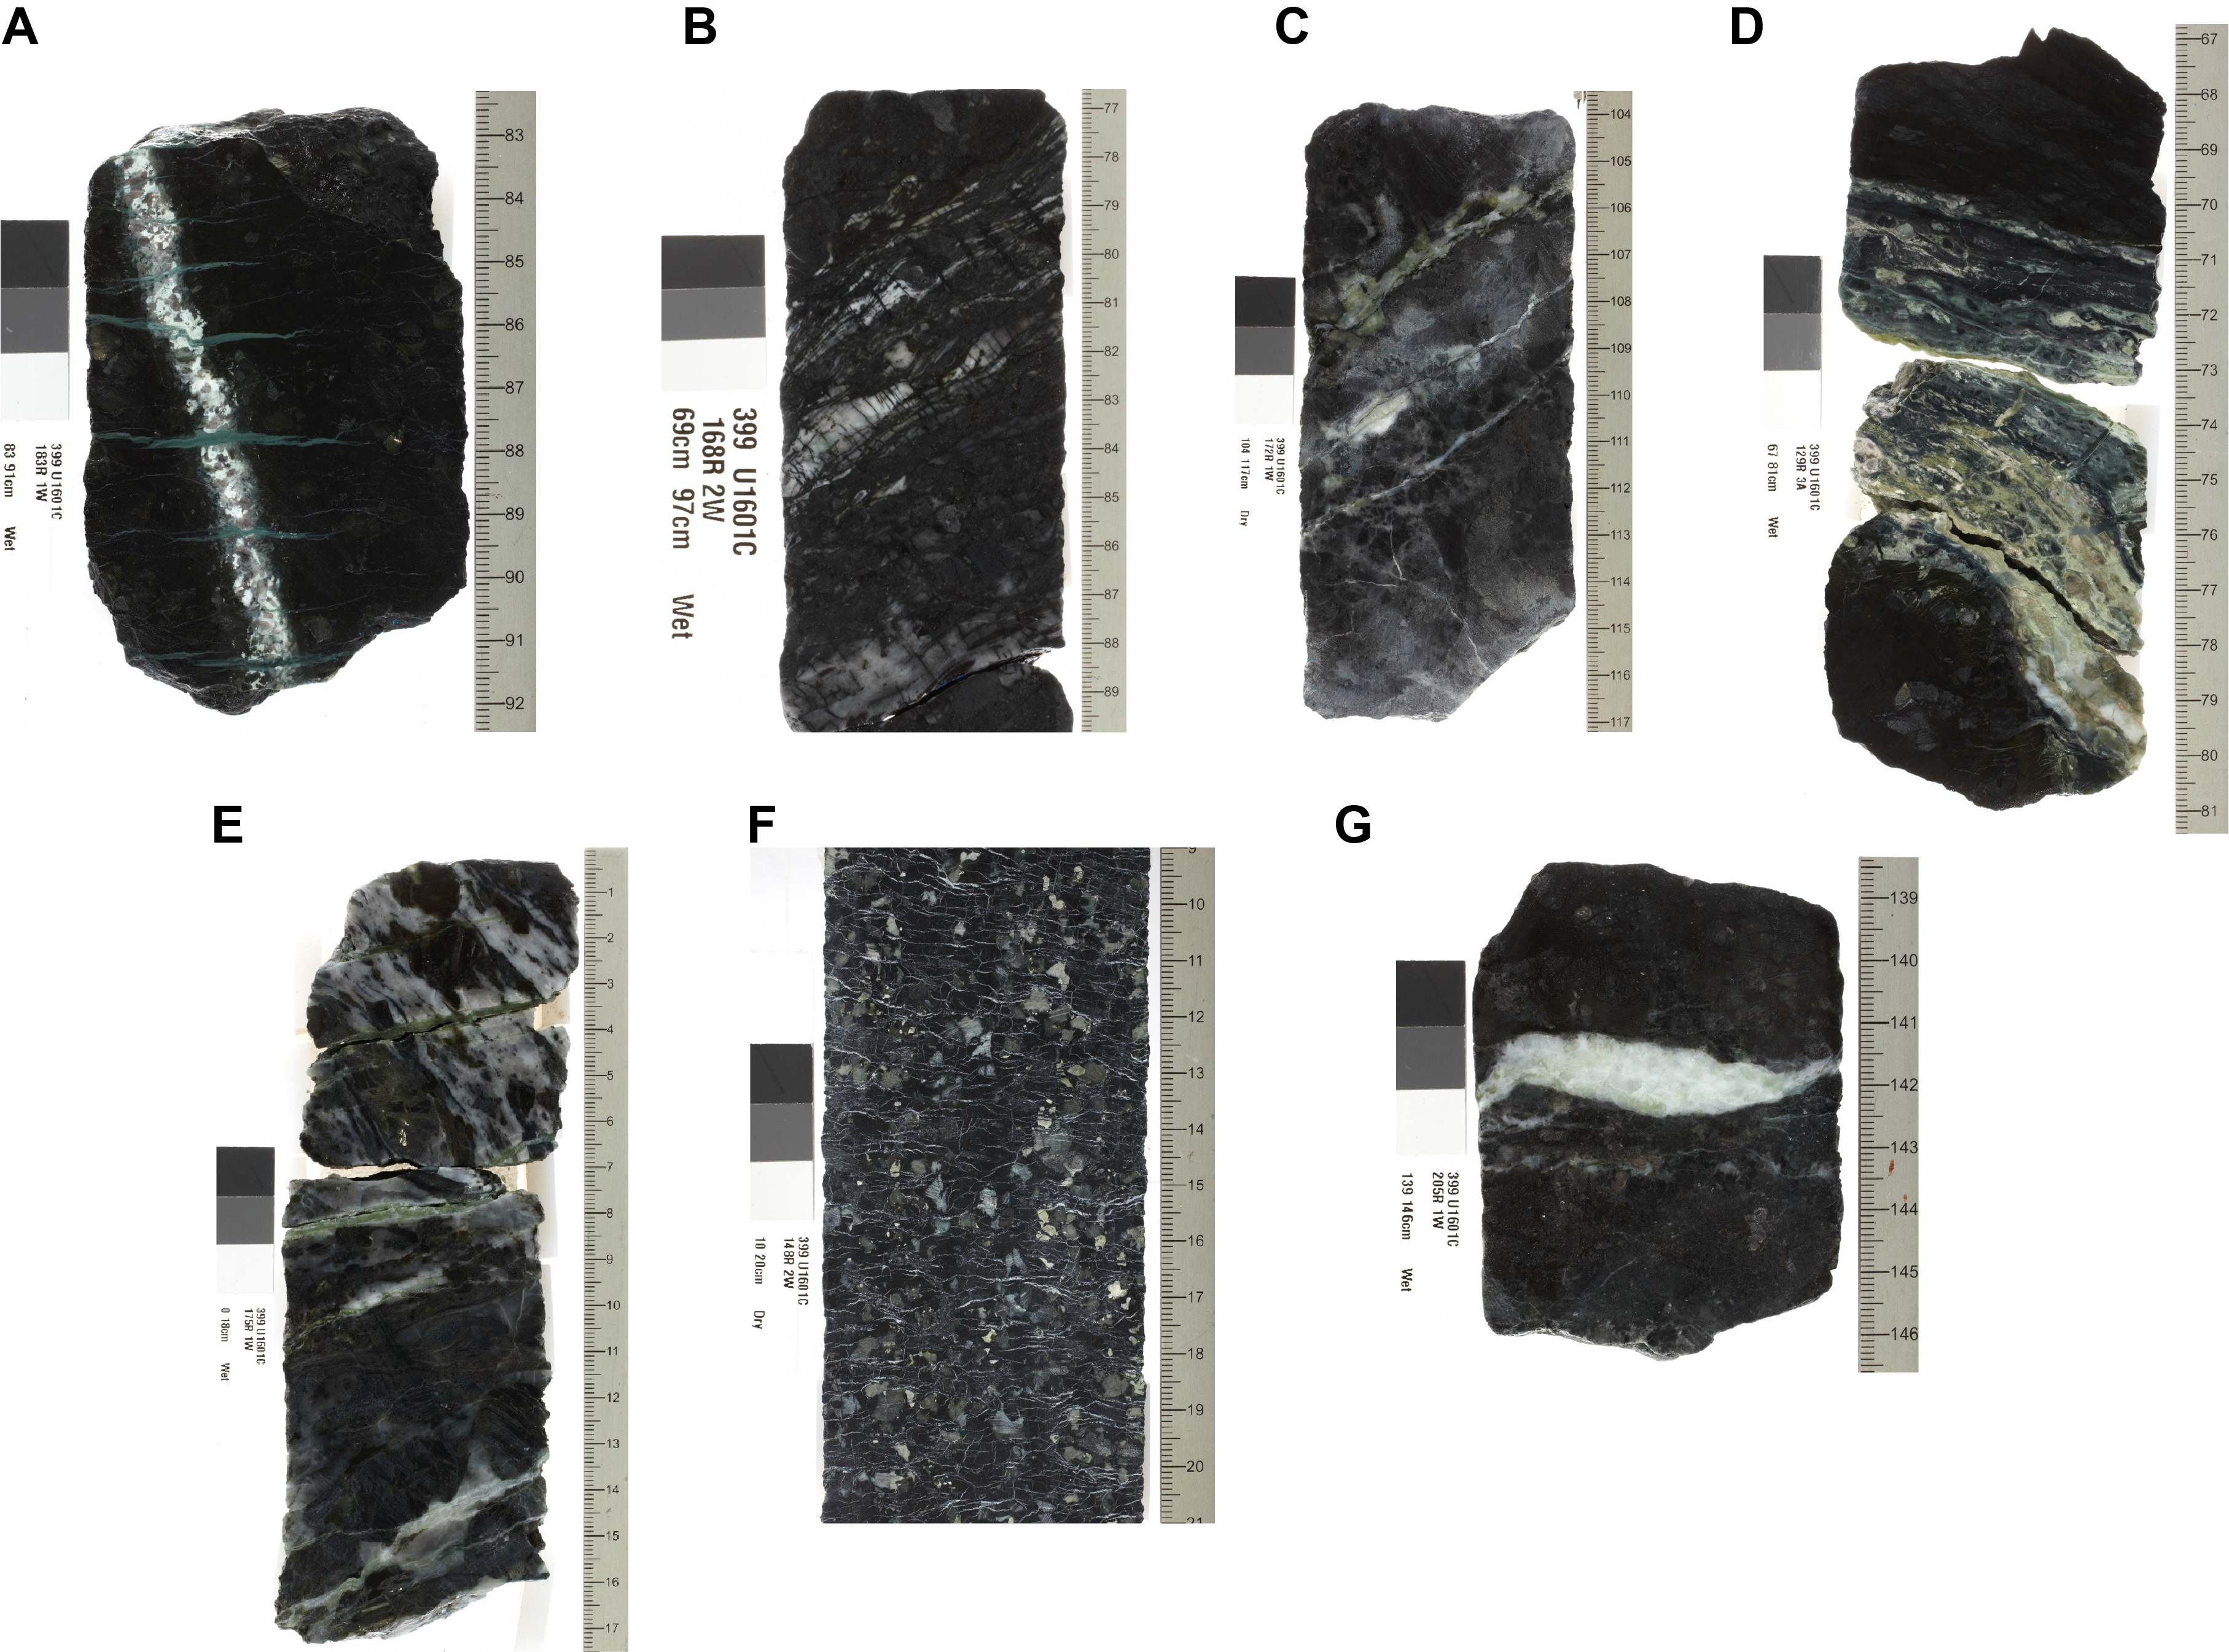
Figure F120. Macroscopic character of veins, Hole U1601C.
Gabbroic cores are cut by (1) black to dark green amphibole, (2) green chlorite veins, (3) green-white talc veins, (4) white carbonate-sulfide and prehnite veins, and (5) white zeolite and clay veins. Amphibole veins are mainly located at 870–1020 mbsf and have variable dip that trends to steeper values. Where amphibole veins cut mylonitic intervals, they are normal to the mylonitic foliation (Figure F120B) and indicate amphibole-stable mylonitic deformation.
Chlorite veins (up to 3 mm thick) are noted in gabbroic sections from 86 mbsf (Section 15R-1) through Hole U1601C with variable dips from horizontal to vertical. Weak schistosity displayed by some of these veins suggests they may have accommodated minor deformation during formation.
In thin section, amphibole and chlorite veins are more commonly observed than suggested by macroscopic observations. In serpentinized peridotite, amphibole veins can display crystal-plastic and/or cataclastic deformation microstructures. Amphibole and chlorite veins show crosscutting relationships with mylonitic fabrics in gabbroic rocks, indicating that all chlorite and some amphibole veins postdate the observed crystal-plastic deformation (Figure F121; see Crystal-plastic deformation).
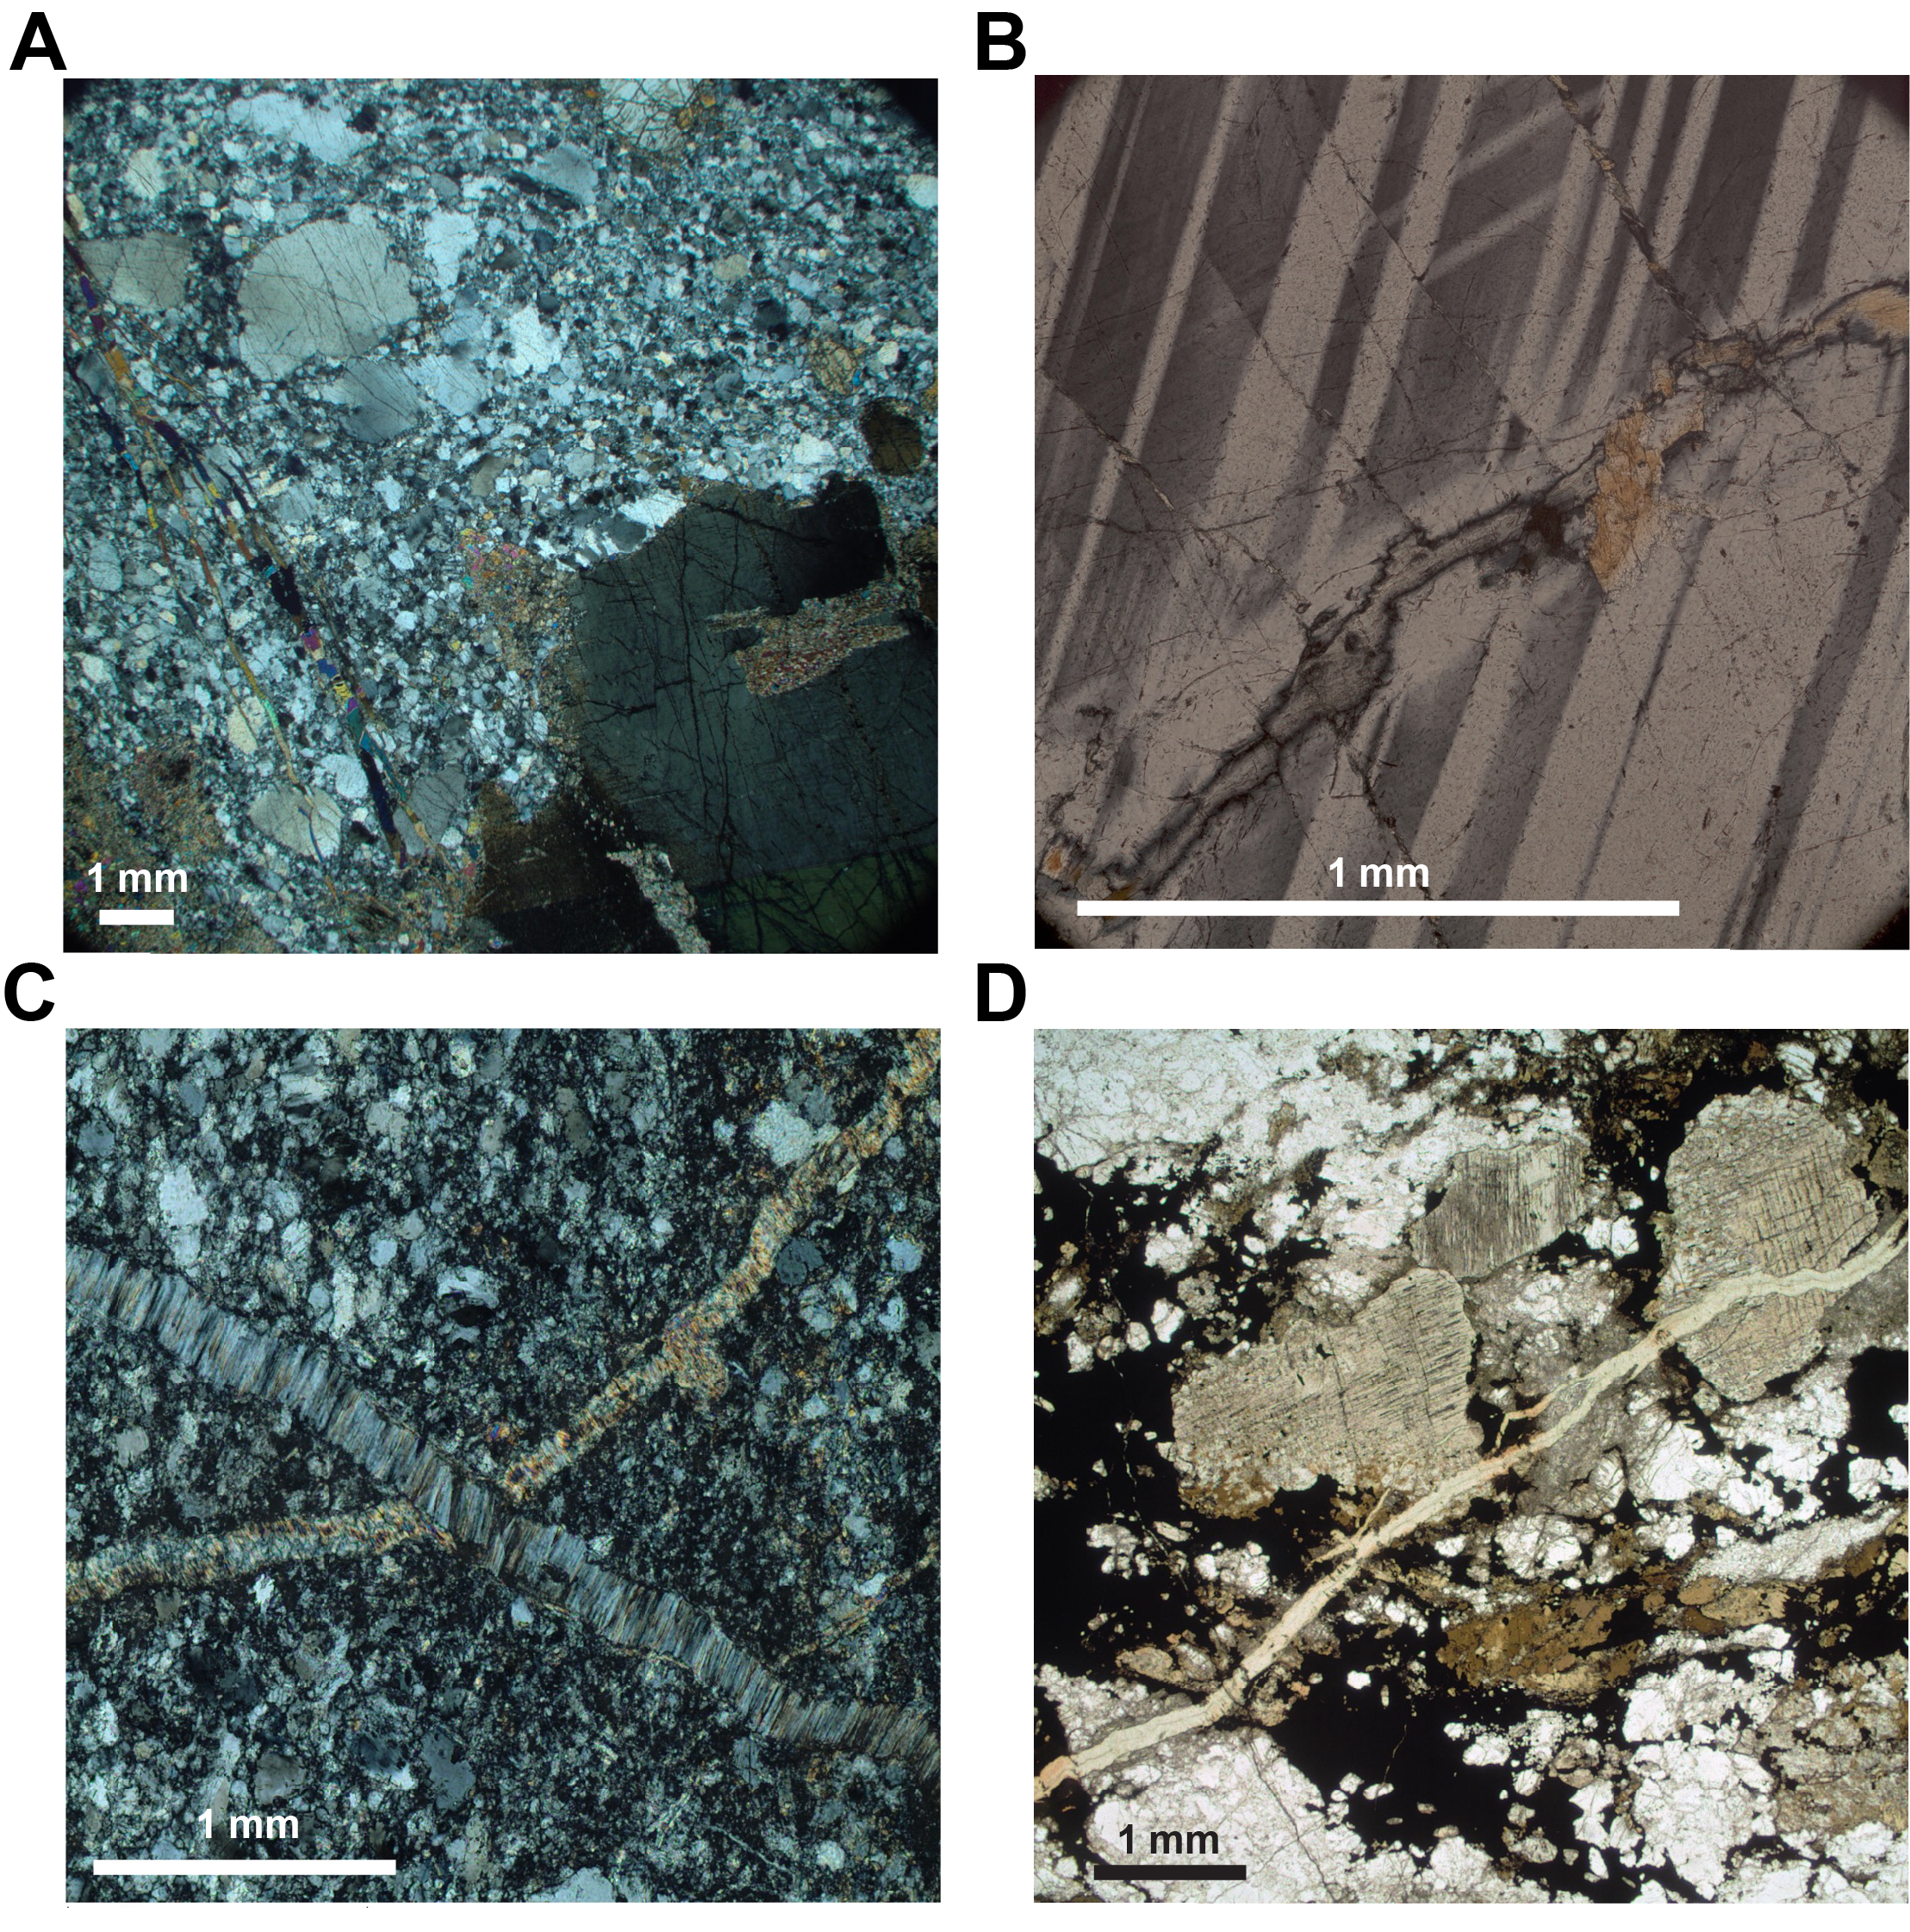
Figure F121. Microscopic character of veins, Hole U1601C.
Thick green-white talc veins (up to ~7 mm; Figure F120D, F120E) recovered in gabbroic intervals between ~500 and 960 mbsf are commonly associated with intervals of host rock brecciation and cataclasis and documented slip (and striae) on piece end faults. The largest of these veins display macroscopic schistosity, sometimes indicating a degree of shearing (e.g., Sections 92R-3, 93R-1, and 129R-3). Many instances of talc veins at the contacts between mafic and ultramafic rocks were recovered, with examples of both undeformed and deformed, crosscutting, and contact-parallel talc veins observed. Dips of talc veins vary from gentle to moderate (0°–50°) throughout this interval, with rare steep veins locally (Figure F119).
Low-temperature zeolite and clay (thin white veins) were recovered from sections of both gabbro and harzburgite throughout Hole U1601C from Sections 23R-1 through 234R-3 (113–1151 mbsf) and record late-stage fracture (dips 0°–90°) and fluid flow.
5.3. Summary of structural history
Between 0 and 55 mbsf, Holes U1601A and U1601C show similar geology in their overlapping intervals, both characterized by serpentinized peridotite and subordinate gabbroic intervals hosting rare zones of crystal-plastic and brittle deformation, and medium- to low-temperature alteration. Below 55 mbsf, the following structural observations are recorded from Hole U1601C (Figure F95).
5.3.1. Magmatism
- Magmatic veins are a common feature throughout Hole U1601C and show variable dips that steepen and are less abundant with depth. Gabbroic intervals increase in thickness and abundance with depth; the largest is ~80 m thick.
- Magmatic foliation defined by plagioclase and/or clinopyroxene SPO is rarely observed and mostly restricted to gabbro and gabbronorite (>75%) and less common in olivine-, olivine-bearing gabbro, and troctolite (<25%).
- Grain size layering/domains are commonly observed and are typically isotropic. Modal layering is less common. Contacts between grain size/modal layers/domains are generally diffuse and irregular in shape with variable orientations.
- Diabase and microgabbro are rare, but where recovered, these thin intervals display both pre- and postdeformation relationships with crystal-plastic fabrics. Brecciated diabase is also observed. Diabase is also observed cutting oxide gabbro, indicating protracted magma emplacement through >1000 m interval of the footwall at Atlantis Massif.
5.3.2. Mantle/serpentine
- Mantle fabrics vary in intensity throughout the hole with subhorizontal to moderate dips; between 630 and 800 mbsf dips are dominantly subhorizontal barring one zone between high-strain Zones 1 and 2, where both steep mantle fabrics and contacts between harzburgite and dunite are noted.
- Contacts between dunite and surrounding peridotite are nearly always gradational, with the proportion decreasing over centimeters to decimeters. Harzburgite/dunite contacts have variable orientations, with a mode of 40° dip. Serpentine foliation intensity varies throughout the sampled peridotites with subhorizontal to moderate dips.
- Mantle deformation fabrics are dominated by protogranular textures (71%) and if present are partially to completely pseudomorphed by later serpentinization.
5.3.3. Crystal-plastic deformation
- A total of 91% of observed crystal-plastic deformation in Hole U1601C occurs in gabbroic rocks and 9% in peridotite. For both rock types, crystal-plastic deformation is typically concentrated at or close to gabbro/peridotite contacts and has contact-subparallel dip. Crystal-plastic deformation is rarely observed above 634 mbsf (1.6% of recovered core thickness). Below 634 mbsf, protomylonitic to ultramylonitic crystal-plastic deformation localizes into seven high-strain zones with variable thicknesses between 5 and 32 m. Intervals of crystal-plastic deformation account for 33.4% (44.4 m) of the aggregated recovered thickness of the seven high-strain zones (132.9 m) and 5.8% (28.9 m) of the aggregated recovered thickness of the intervening low-strain zones below 634 mbsf (498.6 m).
- Shear sense associated with mylonitic fabrics recovered from Hole U1601C are dominantly reverse. High-strain Zones 1, 3, and 5 display both reverse and normal sense of shear. Where present, normal sense mylonitic foliation is steeper (>50°) than reverse sense foliations.
- Macroscopically undeformed gabbroic rocks commonly display only minor plagioclase dynamic recrystallization microstructures. Mylonitic gabbro samples are dominated by dynamic recrystallization microstructures of plagioclase and to a lesser extent pyroxene, olivine, and amphibole.
- Rare instances of undeformed diabase and gabbro cutting mylonitic fabrics are observed, with rare examples of an early steep mylonitic fabric crosscut by a late shallow mylonitic fabric. Amphibole and chlorite veins cut mylonitic fabrics in gabbroic rocks. Some amphibole veins and secondary amphibole in serpentinized peridotite shows cataclastic and/or crystal-plastic deformation, including occurrences at the immediate contact with mylonitized gabbroic intrusions.
- Microstructural fabrics, mineral assemblages, and crosscutting relationships suggest mylonitization of gabbroic rocks occurred at granulite to amphibolite facies pressure-temperature conditions. Crystal-plastic and cataclastic deformation of secondary amphibole, talc, and serpentine is observed in serpentinized peridotites at the immediate contacts with deformed gabbroic intrusions and is considered to be relatively low strain.
5.3.4. Brittle
- Brittle deformation is localized. Between ~800 and 1150 mbsf, brittle deformation spatially overlaps with intervals of crystal-plastic deformation. Above and below that zone, brittle deformation typically localizes in areas with no crystal-plastic deformation.
- Observed slickenfibers record dominantly reverse sense shear in the core reference frame. Brittle deformation is commonly associated with alteration veins, suggesting a causative relationship between the two.
- Total strain accommodated by brittle deformation in the recovered section is largely distributed and appears to be low, possibly indicating lack of an efficient, focused strain weakening mechanism in the brittle regime for rocks recovered from Hole U1601C.
5.3.5. Alteration veins
- Alteration veins are more commonly observed between 200 and 1000 mbsf and generally decrease in abundance with depth. Dips of alteration veins are variable and show no trend with depth.
- Little white chrysotile veins are a common but not ubiquitous feature of serpentinized harzburgite, typically mimicking the orientation of the local serpentine foliation. Dips are usually shallow with a few notable intervals of steep to subvertical dips.
- Talc veins are common in gabbroic intervals and are often found at gabbro/peridotite contacts. Most talc veins are sheared. Some of these veins crosscut mylonitic foliation in gabbro and are undeformed.
- Alteration assemblages of amphibole, chlorite, talc, and zeolite are commonly observed at the contacts between gabbroic intrusions and serpentinized peridotite. In some instances, talc-amphibole assemblages are cataclastically and/or crystal-plastically deformed. Deformation of chlorite and zeolite assemblages is not observed.
5.4. Discussion
The structures and deformation documented in recovered cores in Holes U1601A and U1601C drilled along the Southern Ridge of Atlantis Massif present a new record of OCC formation. Previous observations made during Integrated Ocean Drilling Program Expedition 304/305 (Holes U1309B and U1309D) and Expedition 357 describe a <20 m thick detachment fault with fractured diabase and talc-schist at the surface of the OCC above a relatively undeformed gabbroic section to 1497.86 mbsf. Poor recovery and/or casing of the upper ~23 m of the footwall in Holes U1601A and U1601C allows the possibility that a thin zone accommodated very high strain along a dominantly brittle detachment fault system. Deeper portions of both holes display 1–40 m thick zones of ductile to brittle deformation concentrated in gabbroic intervals throughout the core, particularly between 600 and 1267 mbsf. Collectively, the observed deformation at Site U1601 describes the evolution of strain localization processes during exhumation of Atlantis Massif from high-temperature subsolidus conditions.
The long recovered section of mantle rocks at Site U1601 provides a detailed record of mantle fabrics that vary in intensity throughout the hole with subhorizontal to moderate dips, potentially documenting footwall flexure and rotation of the core complex.
The simplest explanation for the distribution of crystal-plastic deformation of dominantly gabbroic intervals throughout Holes U1601A and U1601C is that the high-strain zones of crystal-plastic deformation represent the deep, ductile root of the Atlantis Massif detachment fault system. The spatial association of crystal-plastic deformation with gabbro/peridotite contacts implies that intrusion of gabbroic magmas is a key process of strain localization. Crystal-plastic deformation fabrics are typically oriented parallel to these intrusive contacts, suggesting that the variability in shear sense and fabric dip represents a form of strain compatibility controlled by the original architecture of the host intrusions. However, the relative absence of crystal-plastic deformation at Site U1309 leaves room for some important questions. First, what is the petrogenetic relationship of gabbroic intrusions at Site U1601 and the nearly 1.5 km thick gabbro pluton in Hole U1309D? Gabbroic intrusions at Site U1601 may represent a net vein complex intruded laterally from Site U1309 gabbro bodies, in which case both sites would have experienced coeval subsolidus conditions. In this case, the question becomes why Hole U1309D does not display similarly thick zones of crystal-plastic deformation observed in core recovered at Site U1601, as well as Site 735 and Site U1463 at Atlantis Bank (SWIR). It is possible that such zones may have existed at depth and were faulted out of the hanging wall by later formation of the Atlantis Massif detachment fault.
6. Geochemistry
Shipboard geochemical analyses were performed on fluids and rocks recovered at Site U1601. Four samples of deep seawater and eight borehole fluids from Hole U1601C were analyzed for pH, alkalinity, volatile content, and inorganic chemical composition. A total of 255 rocks sampled for geochemistry and microbiology were analyzed for major and trace element concentrations, inorganic carbon content, and total carbon and hydrogen contents. The analytical procedures are described in Geochemistry in the Expedition 399 methods chapter (Lang et al., 2025).
6.1. Fluid geochemistry
6.1.1. Borehole and Niskin water samples
The chemical composition of water samples from the KFTS and Niskin samplers are provided in Table T7 and Figure F122. Fluids used to characterize possible mixing end-members are also reported and include surface seawater, deep seawater, drilling mud, and the freshwater fluid that was used to flush the borehole prior to logging and borehole water sampling (see Table T9 in the Site U1309 chapter [McCaig et al., 2025]). Eight KFTS samples were collected within the borehole starting approximately 80 h after the final freshwater flush. Cl concentrations of borehole fluids collected by the KFTS range 150–500 mM. The lowest salinity sample was collected at 465 mbsf, and Cl concentrations increase both above and below that depth. Different depths likely represent a mixture of fluids including the freshwater flush (0.22 mM), the saline surface seawater used during drilling (593 mM), deep seawater (562 mM), and/or formation water.
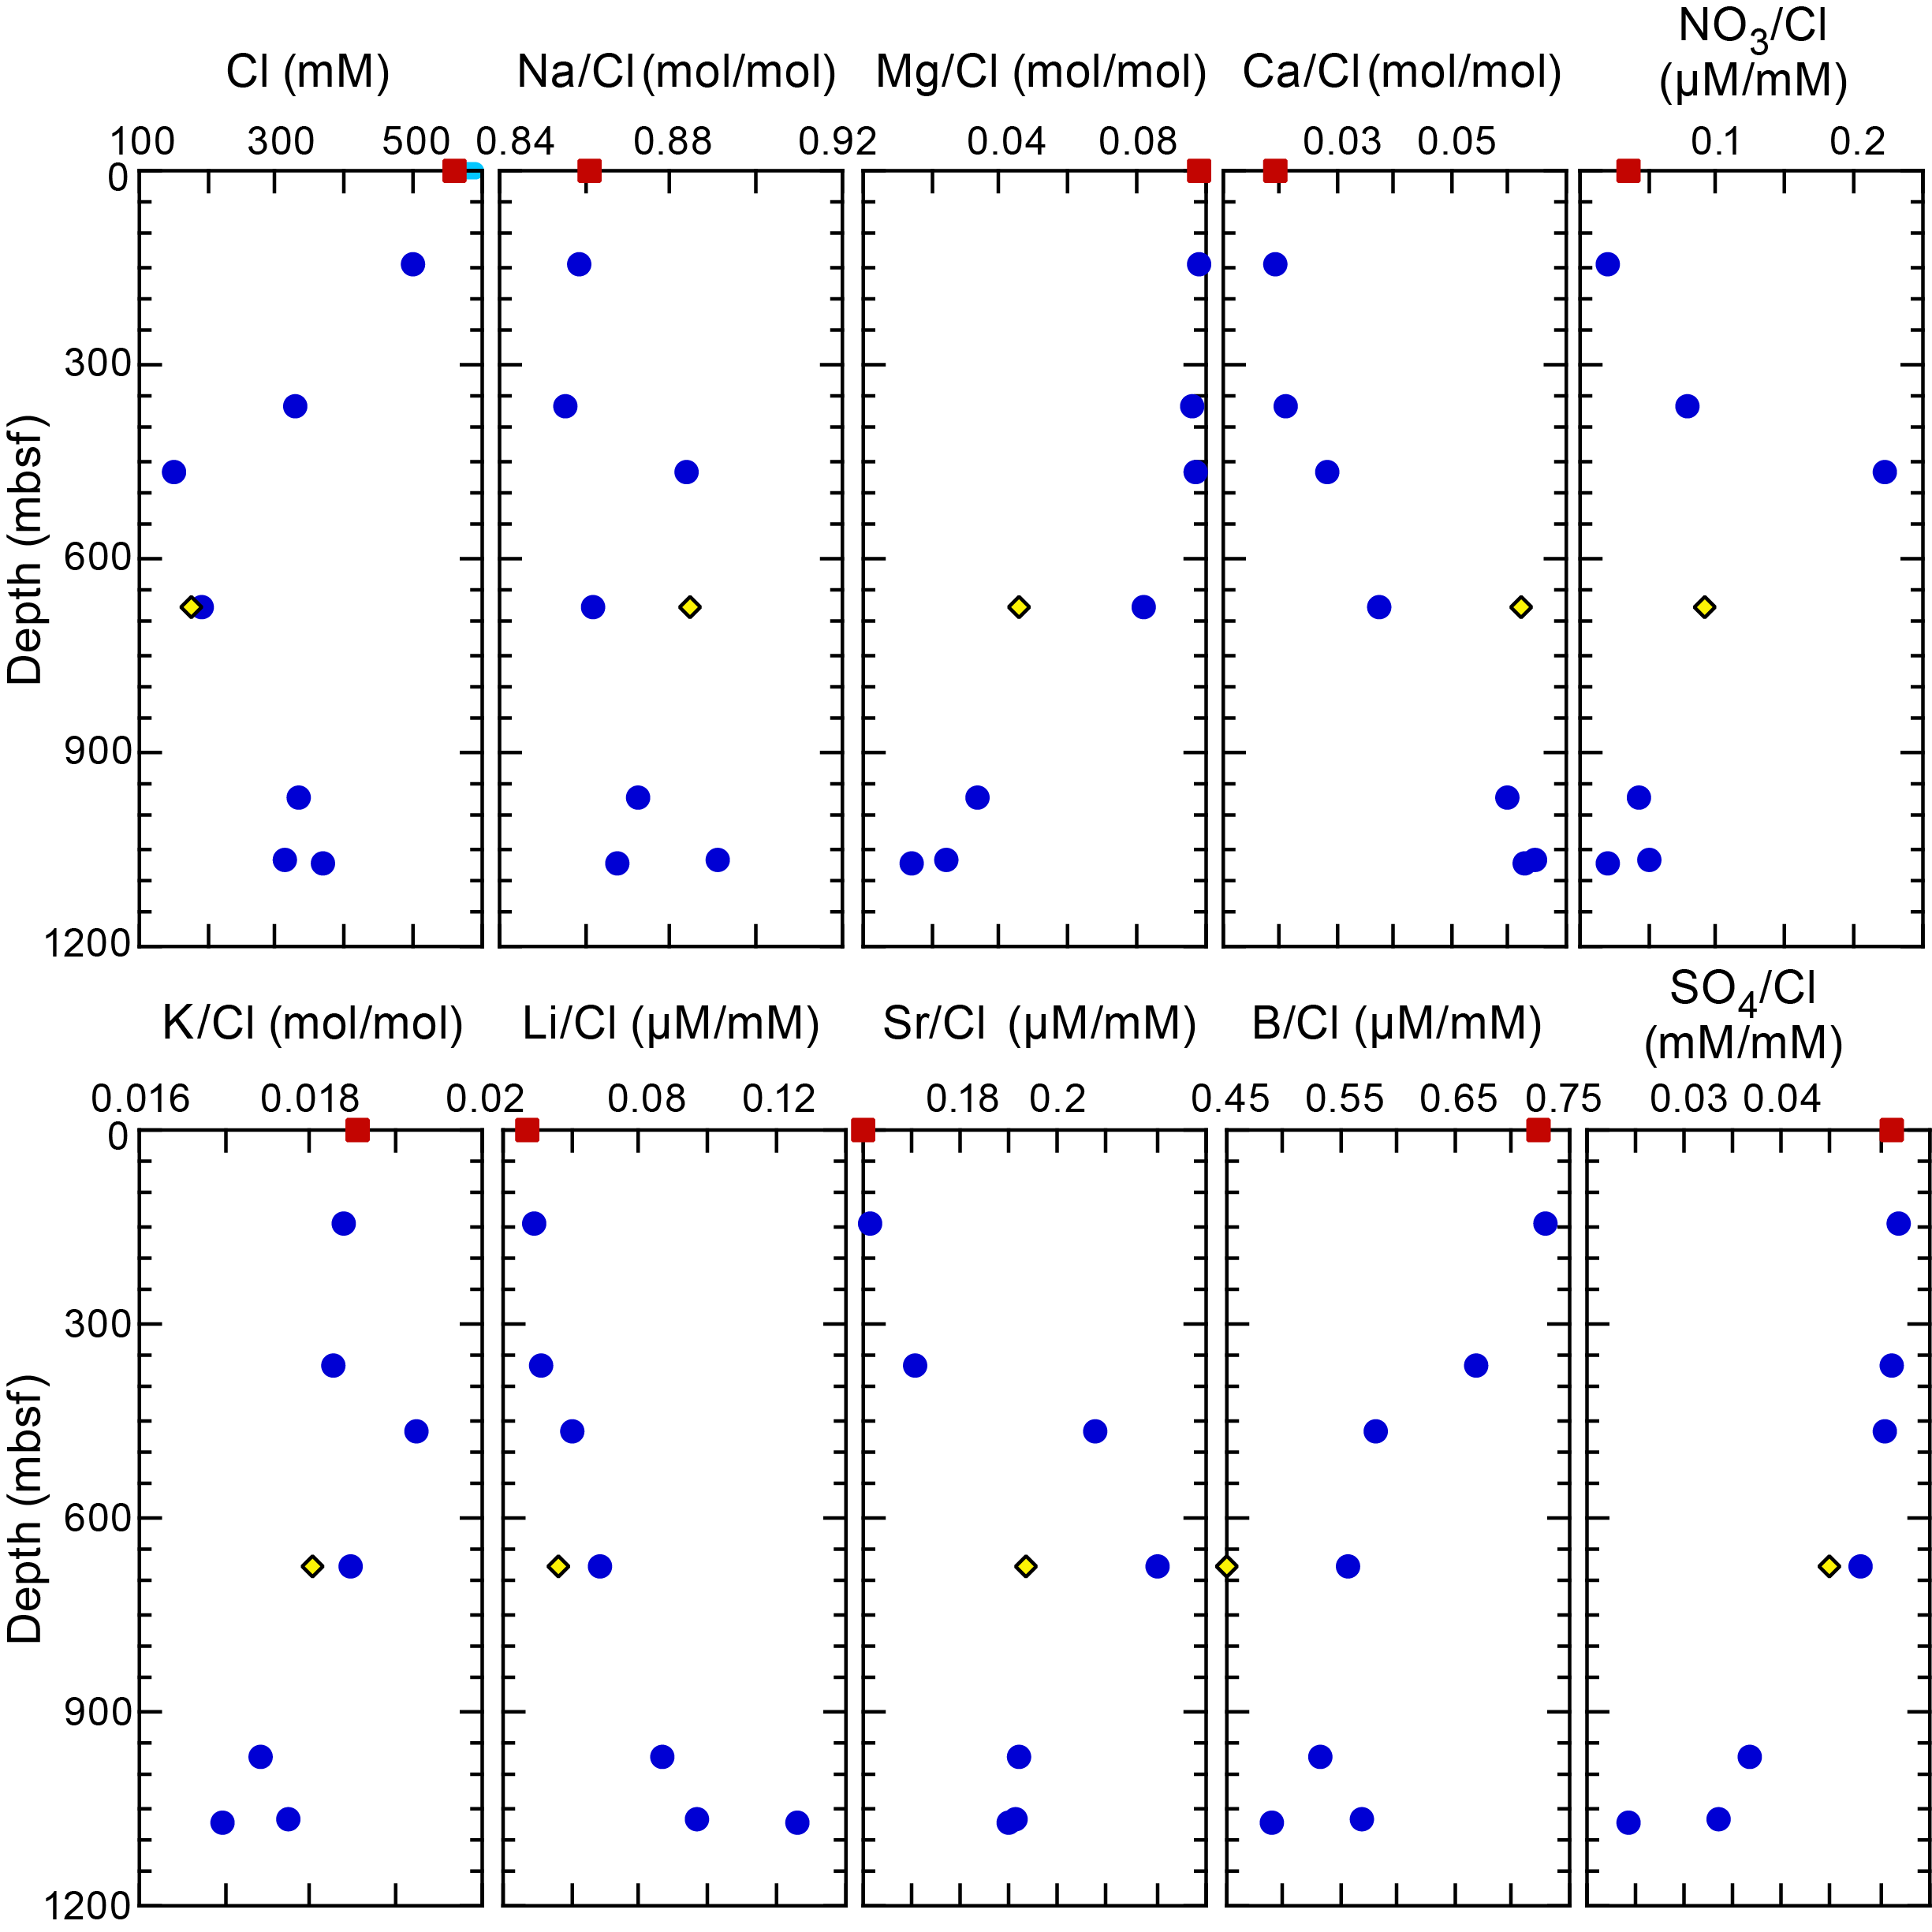
Figure F122. Solute concentration and molar ratios, Hole U1601C.
Solute concentrations were normalized to Cl concentrations to assess the extent of reaction and inputs of an altered fluid relative to the mixing of bottom seawater and freshwater (Figure F122). Shallower samples at depths <600 mbsf form a mixing trend with deep seawater, suggesting mixing and replacement at the top of the borehole. The high salinities in samples from deeper than 600 mbsf could be due to deep seawater that mixed heterogeneously during density-driven overturning of the borehole or to inputs from in situ subseafloor formation fluids. Compared to deep seawater, the deepest fluids have lower concentrations of Mg, B, and sulfate and higher concentrations of Ca, Li, and Sr. The geochemical differences of these deeper fluids could be due to reactions that occurred over the short time frame since drilling operations ceased or could indicate inputs from formation waters at depth. Borehole fluids collected with the KFTS contained detectable H2 and CH4. Concentrations of these two gases increased with depth.
6.1.2. Fluids recovered with cores
Small (2–4 mL) volumes of fluids were recovered from the core liners from most cores while drilling in Hole U1601C. The majority of the fluid was stored frozen for shore-based analyses of organic acid composition and major ion geochemistry. Water was also collected from the core catchers. Hydrogen concentrations were analyzed in these fluids, although samples were not gas- tight, and thus values are a minimum. In these samples H2 concentrations were highly variable and did not increase or decrease with depth.
On seven occasions (Cores 399-U1601C-50R, 94R, 100R, 116R, 146R, 168R, and 222R), obstructions in the core liner resulted in the recovery of larger volumes of fluids (tens to hundreds of milliliters). These fluids were subjected to regular shipboard analysis, and their chemical compositions are provided in Table T7. Cl concentrations of these samples range 588–599 mM, possibly reflecting a more significant contribution from the higher salinity surface seawater (593 mM) used during drilling operations. Their pH values range 8.1–8.4, in some cases slightly elevated over the values of surface seawater (pH = 8.1) and drilling mud (pH = 7.6) used to flush the hole during drilling.
6.2. Igneous and metamorphic rock geochemistry
Whole-rock chemical analyses were performed on 255 samples representative of the different lithologies recovered from Site U1601 for geochemical and microbiological studies.
In Hole U1601A, seven serpentinized peridotites and one basalt were collected as geochemistry samples by the science party and seven serpentinized peridotites and one basalt were collected for microbiology studies. The mineralogy of geochemistry rock samples was evaluated using XRD, and a thin section was located next to each sample to precisely determine its modal composition and degree of alteration (see Igneous petrology and Alteration petrology). An aliquot of all microbiology samples was set aside for mineralogical characterization using XRD and geochemical analyses.
In Hole U1601C, 24 gabbroic rocks and 24 serpentinized peridotites were selected as geochemistry samples by the science party. These samples were processed on board JOIDES Resolution during Expedition 399 (21 gabbroic rocks and diabases) and during IODP Expedition 402 (24 serpentinized peridotites and 3 gabbroic rocks and diabases) according to the same protocol as Hole U1601A samples. In addition, five serpentinized peridotites were processed and measured on shore (Lissenberg et al., submitted). The mineralogy of the gabbroic rock samples processed during Expedition 399 was evaluated using XRD, and a thin section was located next to each sample to precisely determine its modal composition and degree of alteration (see Igneous petrology and Alteration petrology). The 191 rock samples selected as part of the microbiology study (microbiology samples) were categorized by primary lithology using hand sample observations as serpentinized peridotites and serpentine veins (144 samples), variously altered gabbroic rocks (44 samples), and diabases and crosscutting carbonate veins (3 samples). The microbiology serpentinized peridotites and some of the gabbroic rocks were dried for 48 h at 65°C before being crushed to a fine powder instead of being freeze-dried like the Hole U1601A samples.
The 255 samples were analyzed for major and trace element concentrations via inductively coupled plasma–atomic emission spectroscopy (ICP-AES) and for their volatile element content via gas chromatographic separation (CO2 and H2O) and coulometry (ion chromatography [IC]). The analytical procedures, precision, and accuracy of the methods are described in detail in Geochemistry in the Expedition 399 methods chapter (Lang et al., 2025).
The chemical compositions of samples collected for geochemistry and microbiology studies are reported in the Laboratory Information Management System (LIMS) database.
6.2.1. LOI, H2O, and total and inorganic carbon
Loss on ignition (LOI) and measured H2O contents (measured total H recalculated as H2O) are correlated in the analyzed geochemistry rock samples recovered from Site U1601 (Figure F123A). Both vary according to the recovered lithologies. Serpentinized peridotites have LOI ranging 9.9–16.0 wt% and H2O of 10.3–15.4 wt%, the lowest values being measured in the cores recovered from ~350 to 400 mbsf (Cores 399-U1601C-70R through 80R) and at ~730 mbsf (Core 148R). Gabbroic rocks have LOI from −0.01 to 3.52 wt% and H2O of 0.6–4.3 wt%, with olivine gabbros having overall slightly higher LOI and H2O values compared to other gabbroic rocks. The lowest values were measured in samples recovered below 650 mbsf with the exception of gabbro in Sample 244R-1, 124–130 cm (LOI = 3.52 wt%). Diabases have LOI and H2O values in the same range as gabbroic rocks (0.04–1.30 and 1.30–1.99 wt%, respectively). The correlation between LOI and measured H2O indicates that the volatile budget of the geochemistry rock samples recovered from Site U1601 is constituted mostly of H2O (Figure F123) and likely corresponds to the contribution of hydrous minerals. Hydrous minerals are dominantly serpentine (H2O ~13 wt%) in serpentinized peridotites and range from amphibole to chlorite (H2O = 2–12 wt%) in diabases and gabbroic rocks (see Alteration petrology). Carbon was measured in most of the geochemistry samples recovered at Site U1601 (Figures F123, F124). It is dominantly inorganic carbon hosted by carbonate minerals. Serpentinized peridotites and gabbroic rocks have CO2 contents (C recalculated as CO2) of <0.01–0.3 wt% and 0.02–0.16 wt%, respectively. Diabases have the highest CO2 concentrations (up to 1.80 wt%). These values contrast with the rocks recovered from Site U1309 that were overall carbon depleted (below detection limit).
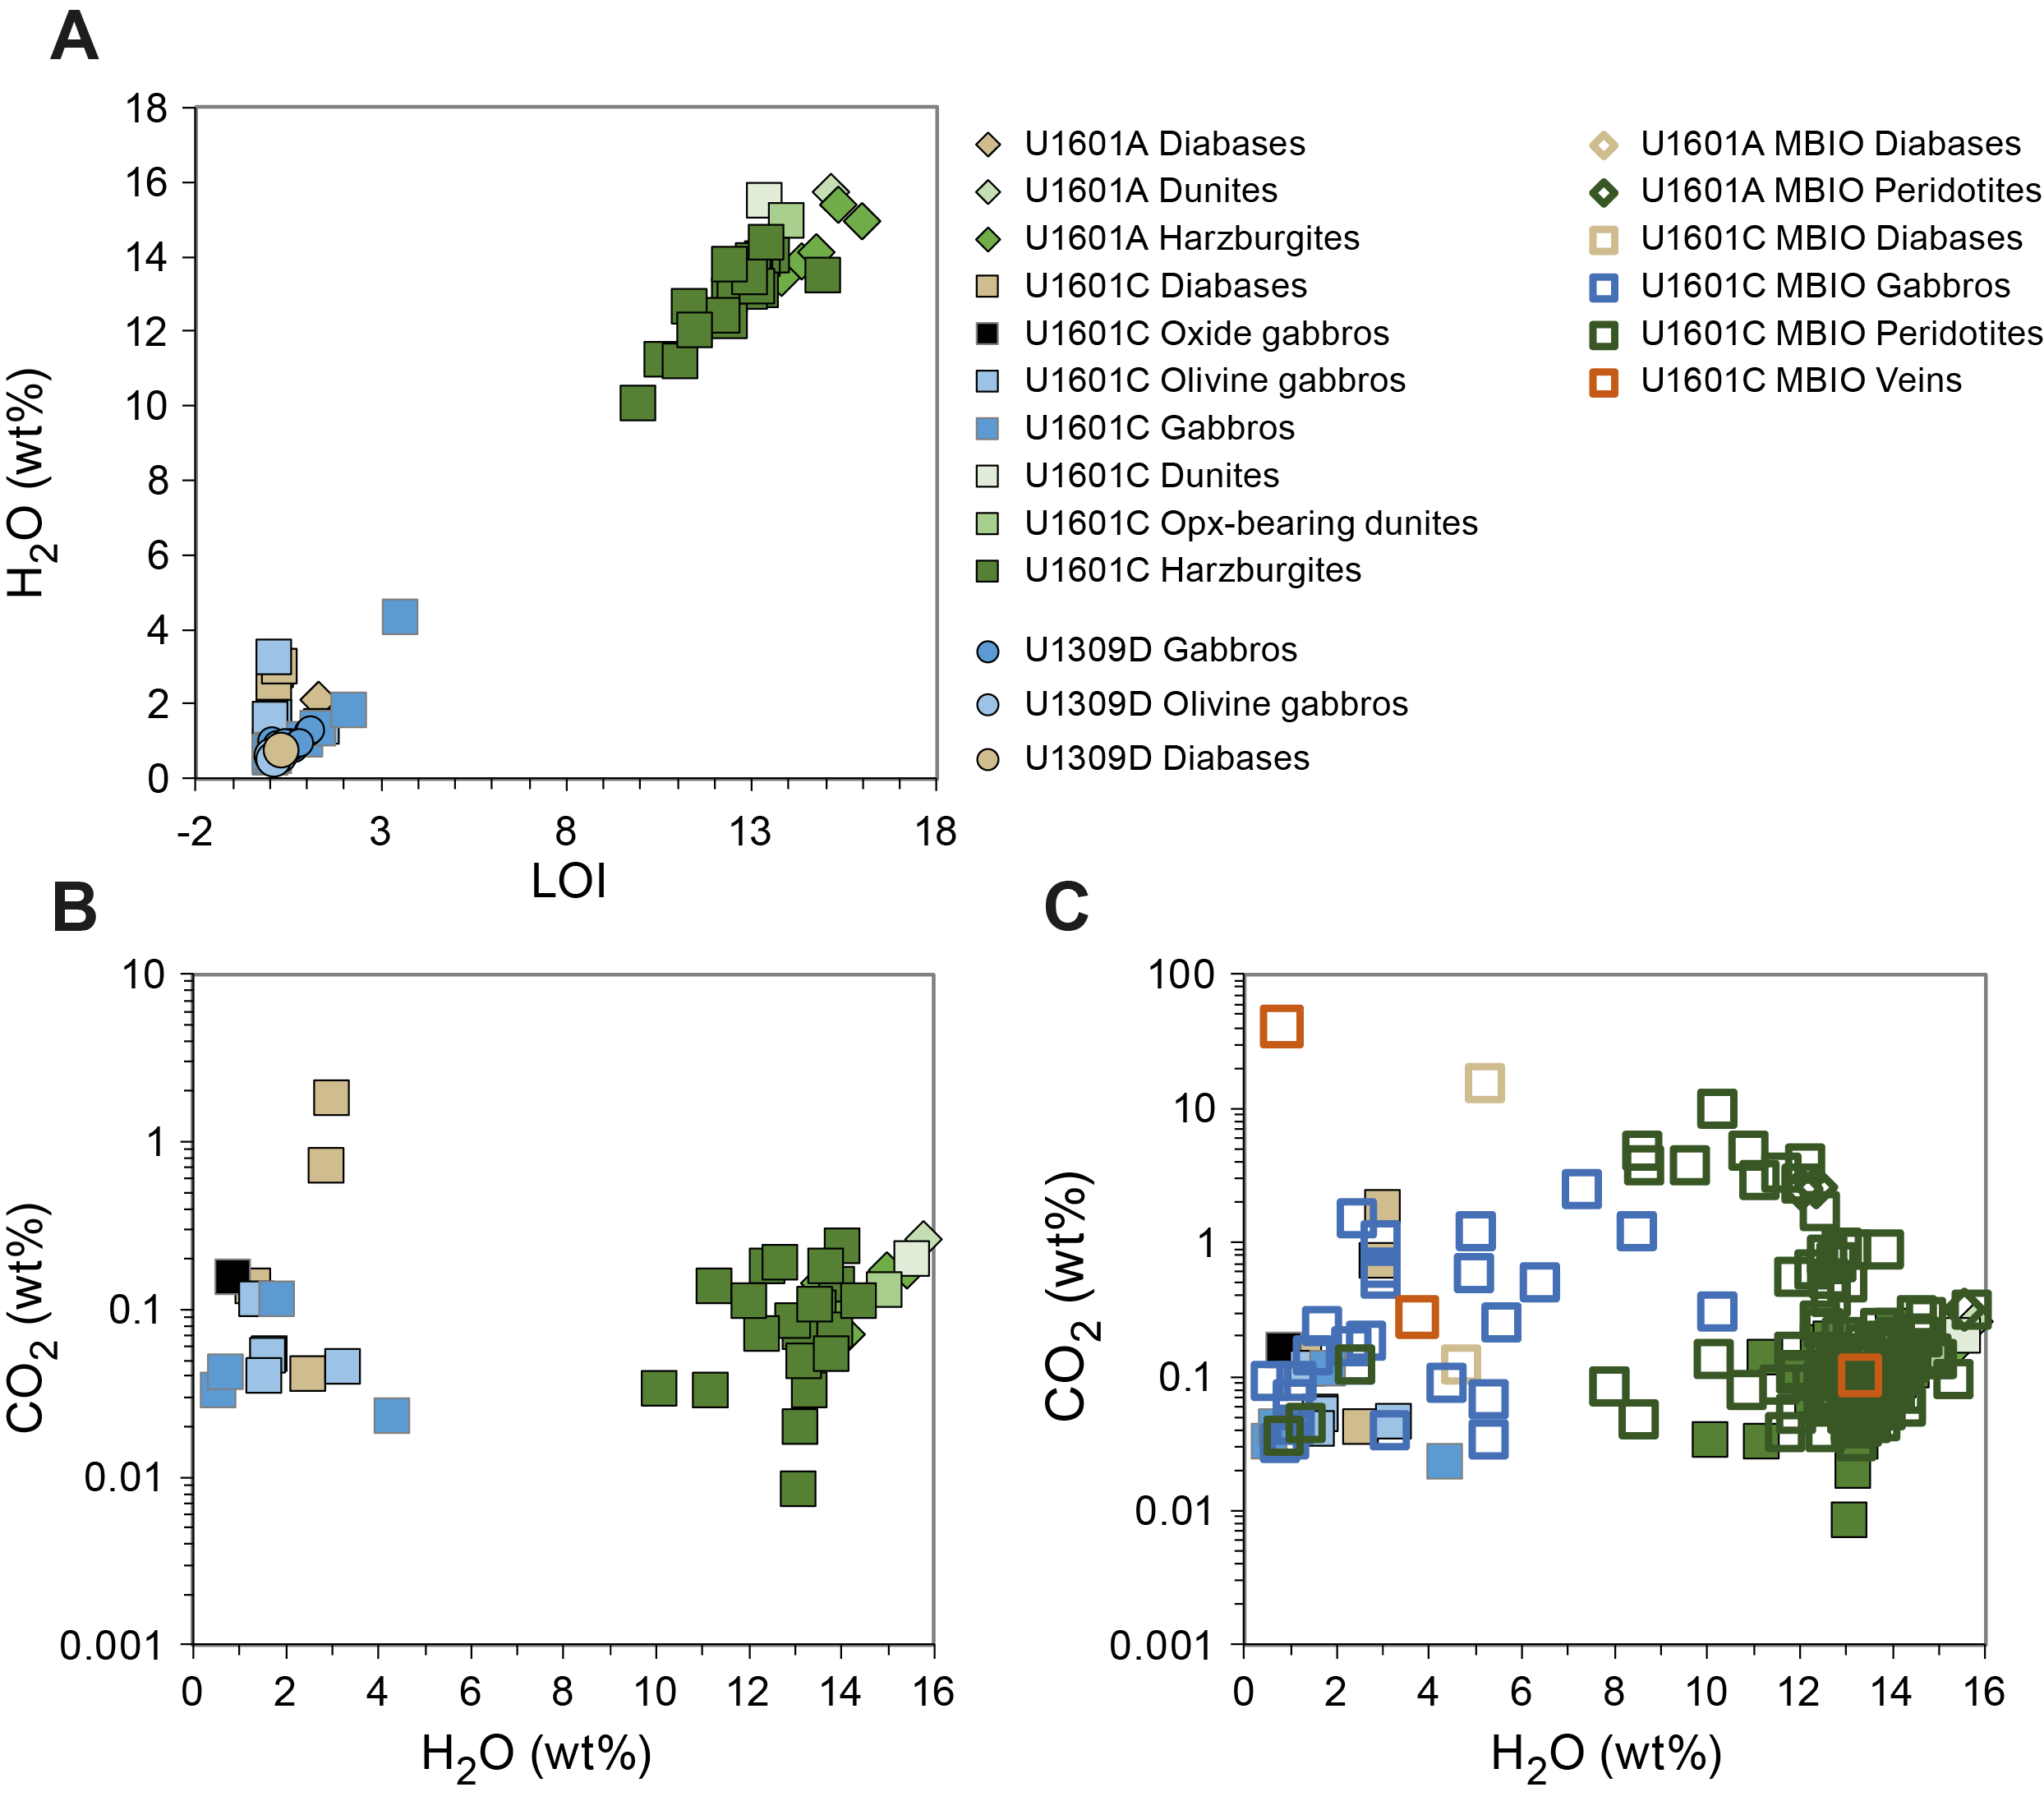
Figure F123. Total H2O vs. LOI and total CO2 vs. total H2O.
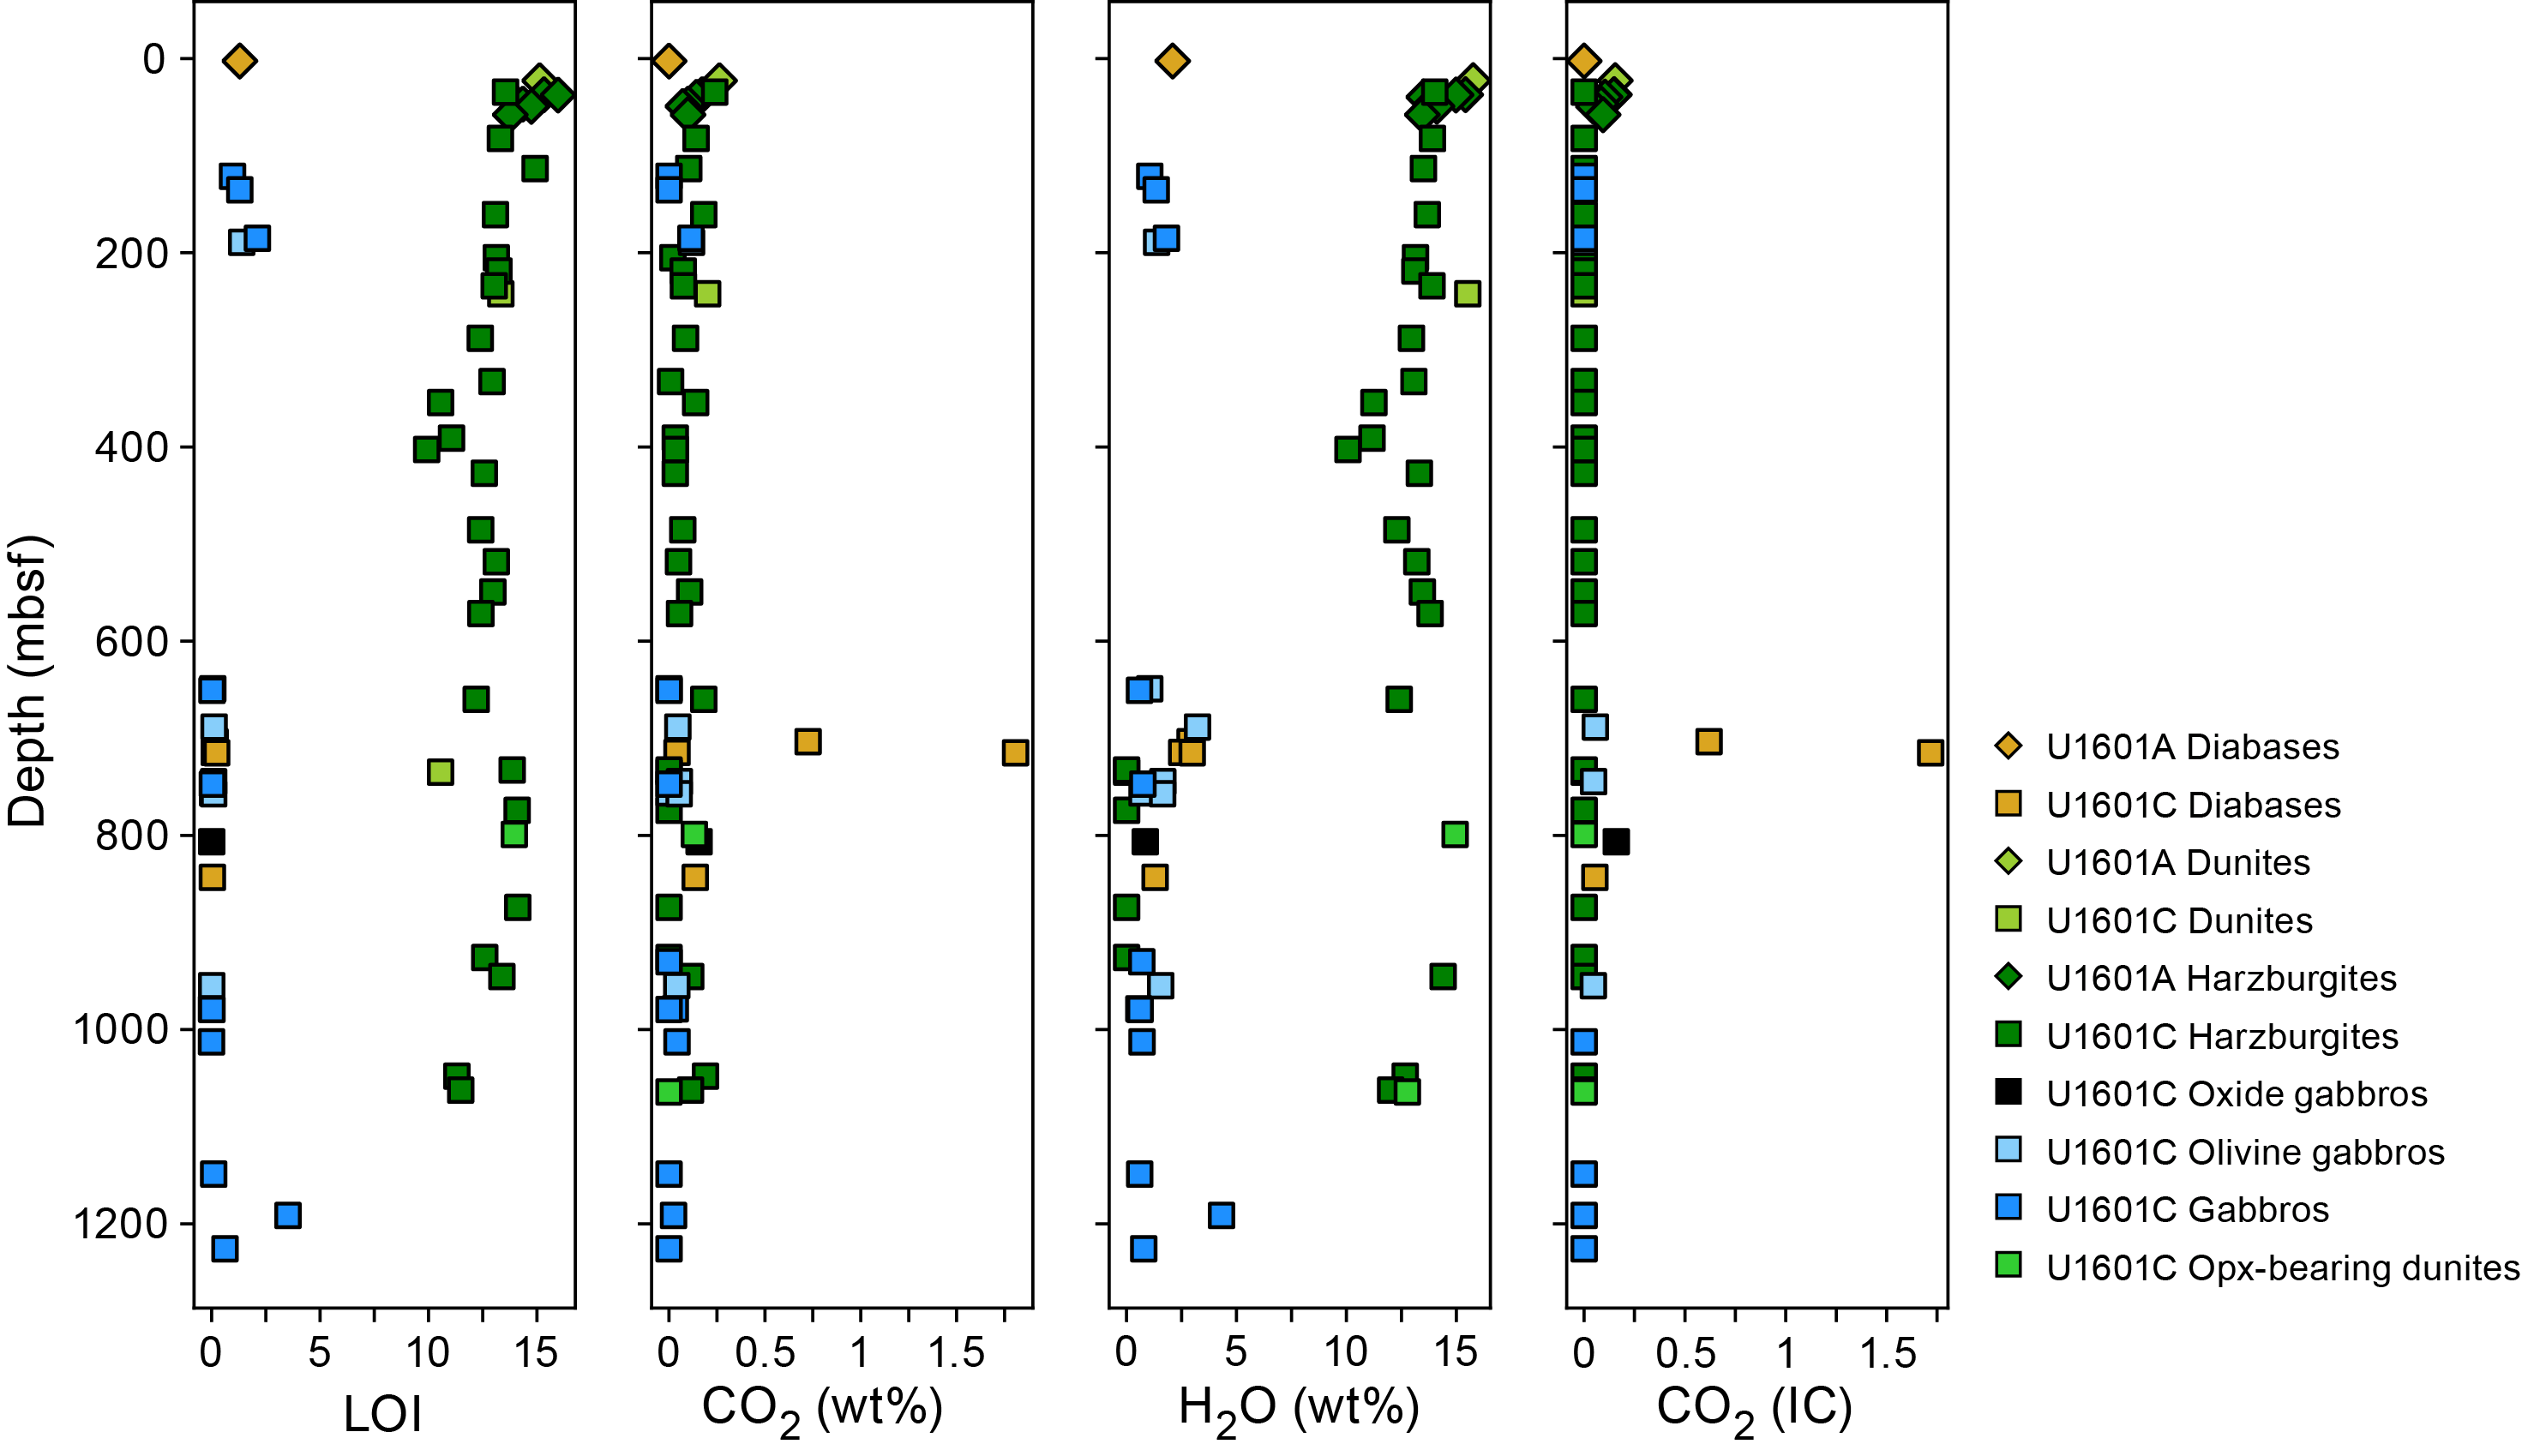
Figure F124. LOI, H2O and CO2, geochemistry samples.
As illustrated on Figures F123 and F125, microbiology samples display higher and more variable volatile contents (H2O and total and inorganic CO2) in all recovered lithologies compared to geochemistry samples. Specifically, they display particularly high carbon contents with CO2 concentrations up to 10 wt% in serpentinized peridotites, up to 2.6 wt% in gabbroic rocks, and up to 15.8 wt% in diabases, indicating that the sampled microbiology intervals were likely more altered and contained more carbon-bearing minerals than the geochemistry sample intervals. The highest carbon values were measured in microbiology rock samples recovered from five intervals: ~100, 420–480, 600–700, ~850, and ~1000 mbsf. It is also worth noting that some of the microbiology samples identified as gabbroic rocks and serpentinized peridotites display H2O concentrations intermediate between the compositions of geochemistry gabbroic rocks and serpentinized peridotites (Figures F123C, F125), suggesting that different fractions of these lithologies composed a single sample.
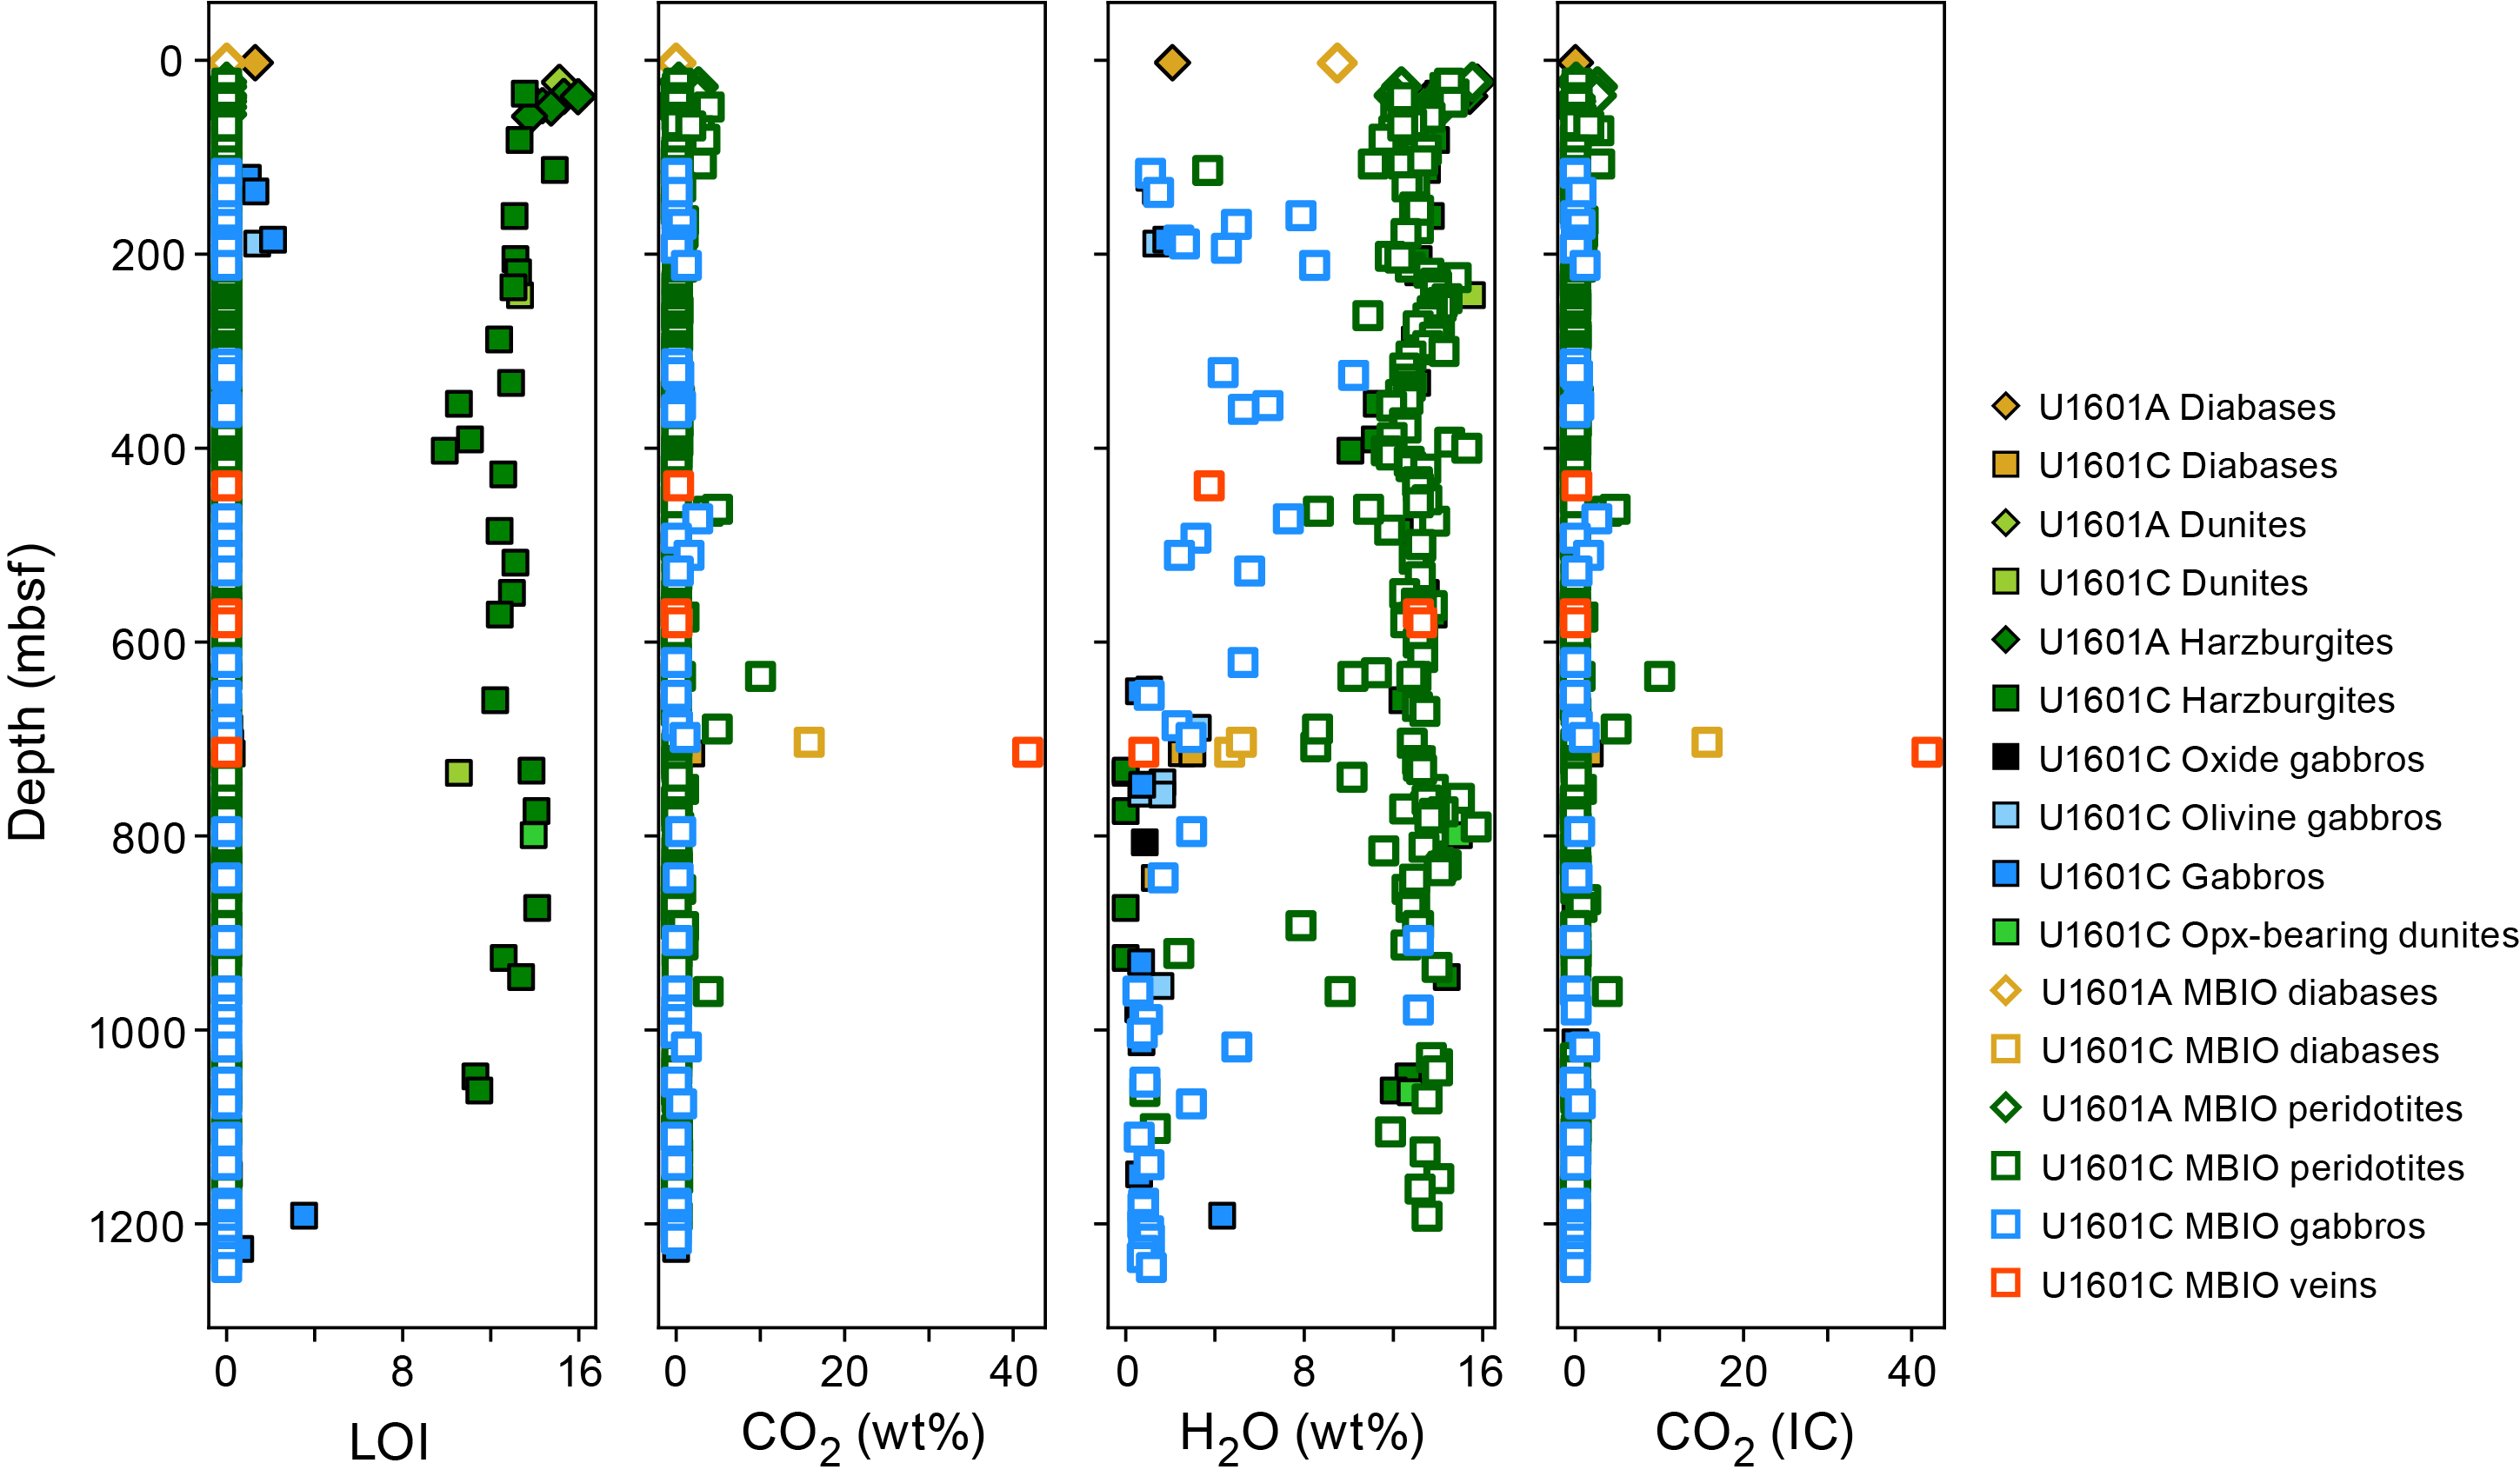
Figure F125. LOI, H2O and CO2, geochemistry and microbiology samples.
6.2.2. Chemical characteristics of the main recovered lithologies
The serpentinized peridotites, gabbroic rocks, and diabases recovered at Site U1601 have distinct compositions in major elements and for compatible (e.g., Ni and Cr) and incompatible elements (e.g., TiO2) as illustrated on Figures F126, F127, F128, F129, F130, F131, F132, F133, F134, F135, and F136. As some of the microbiology samples identified as gabbroic rocks or serpentinized peridotites have intermediate signatures suggesting that a single sample may contain variable fractions of different lithologies or may have been categorized incorrectly, microbiology samples are not taken into account in the characterization of the main lithologic domains hereafter.
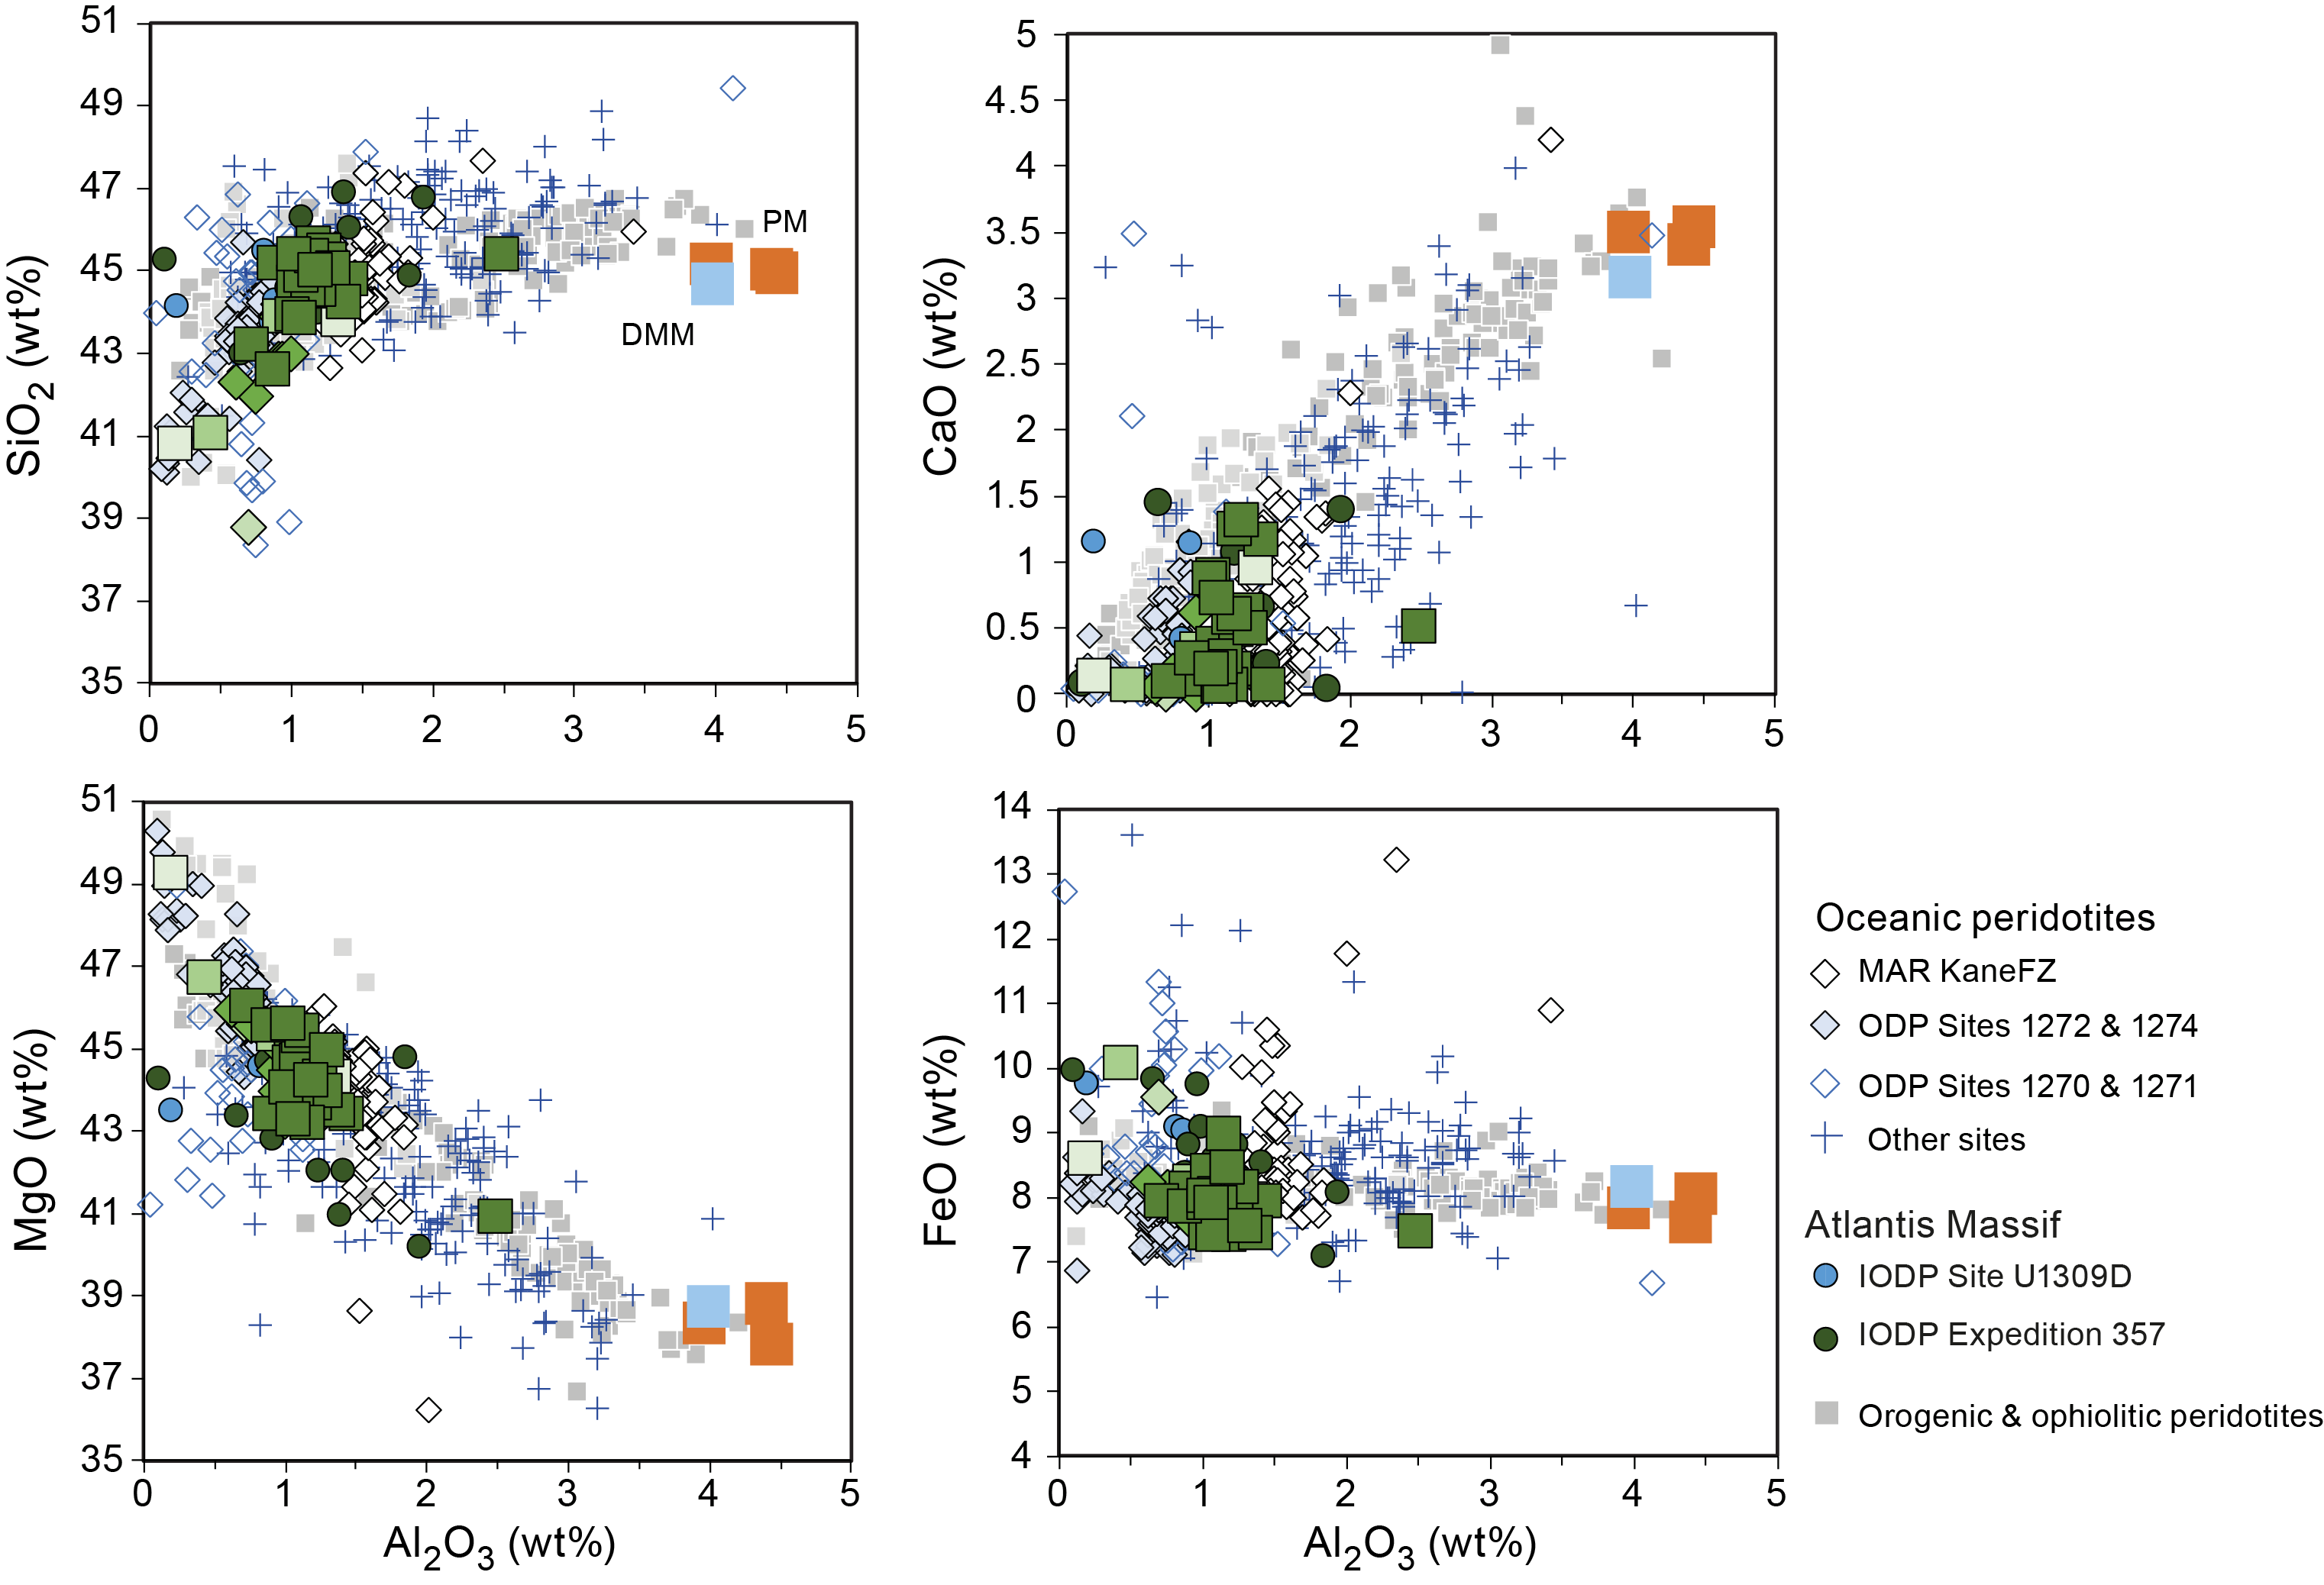
Figure F126. SiO2, CaO, MgO, and FeO vs. Al2O3, geochemistry samples.
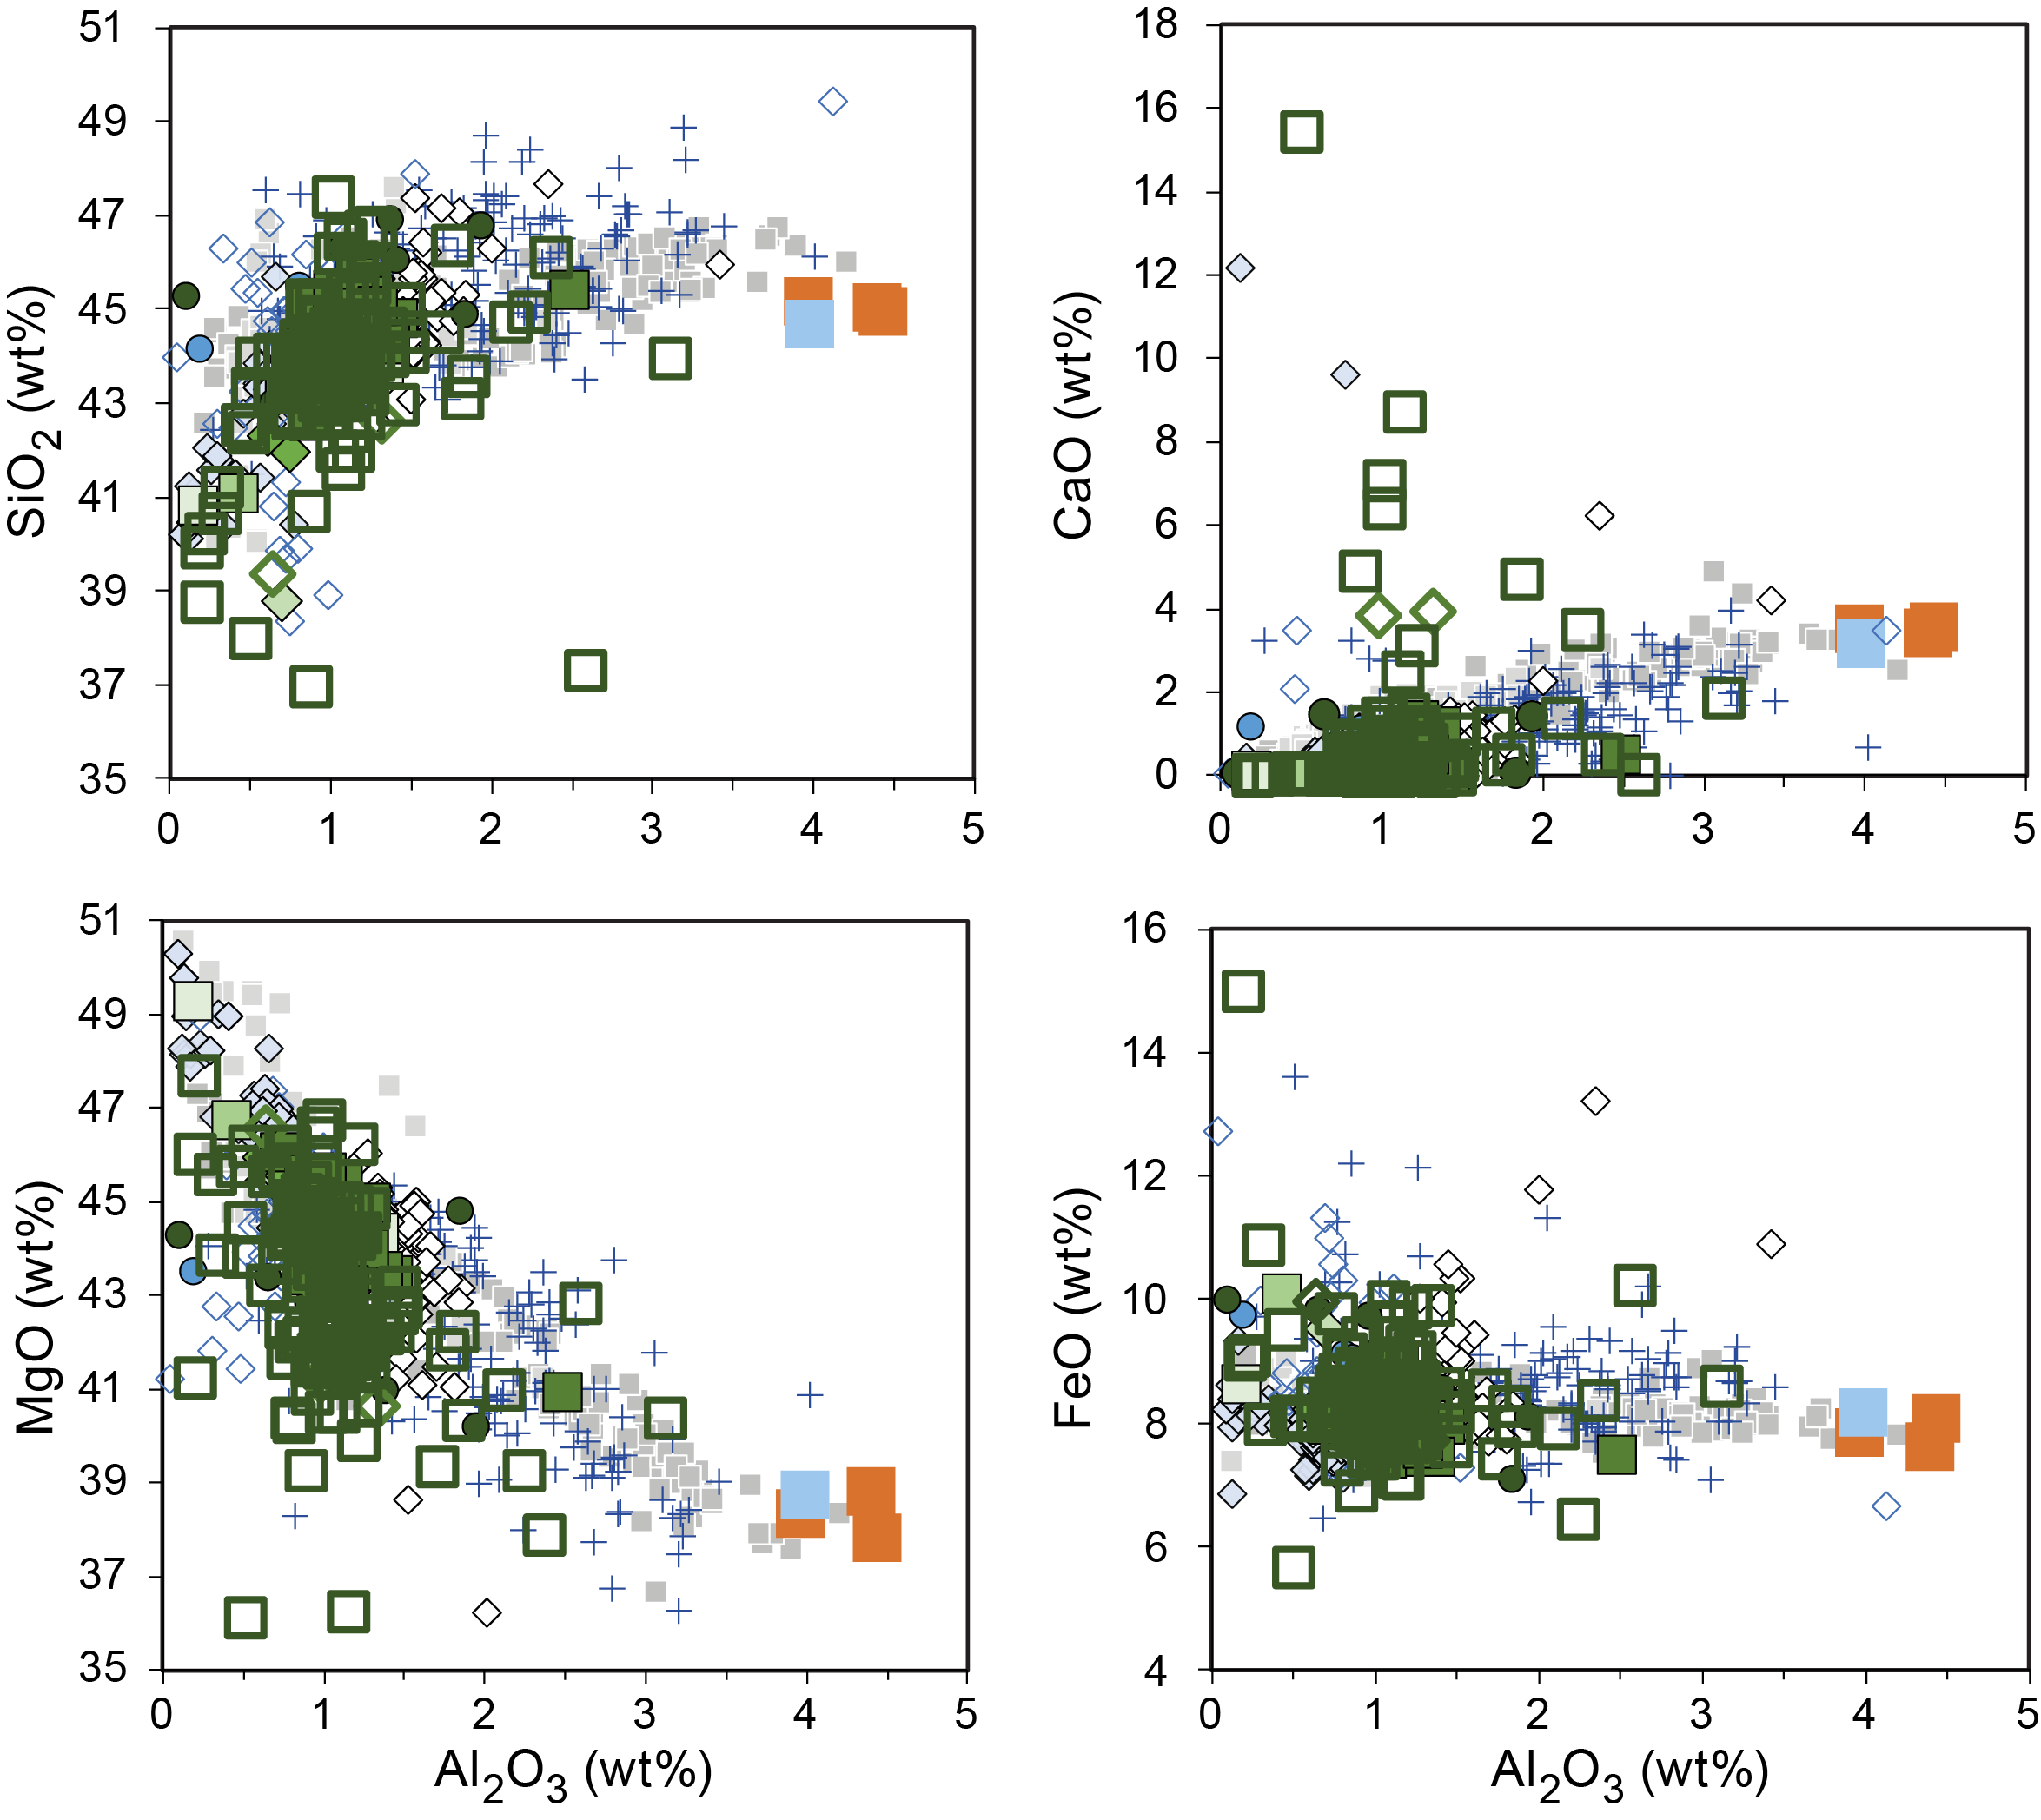
Figure F127. SiO2, CaO, MgO, and FeO vs. Al2O3, geochemistry and microbiology samples.
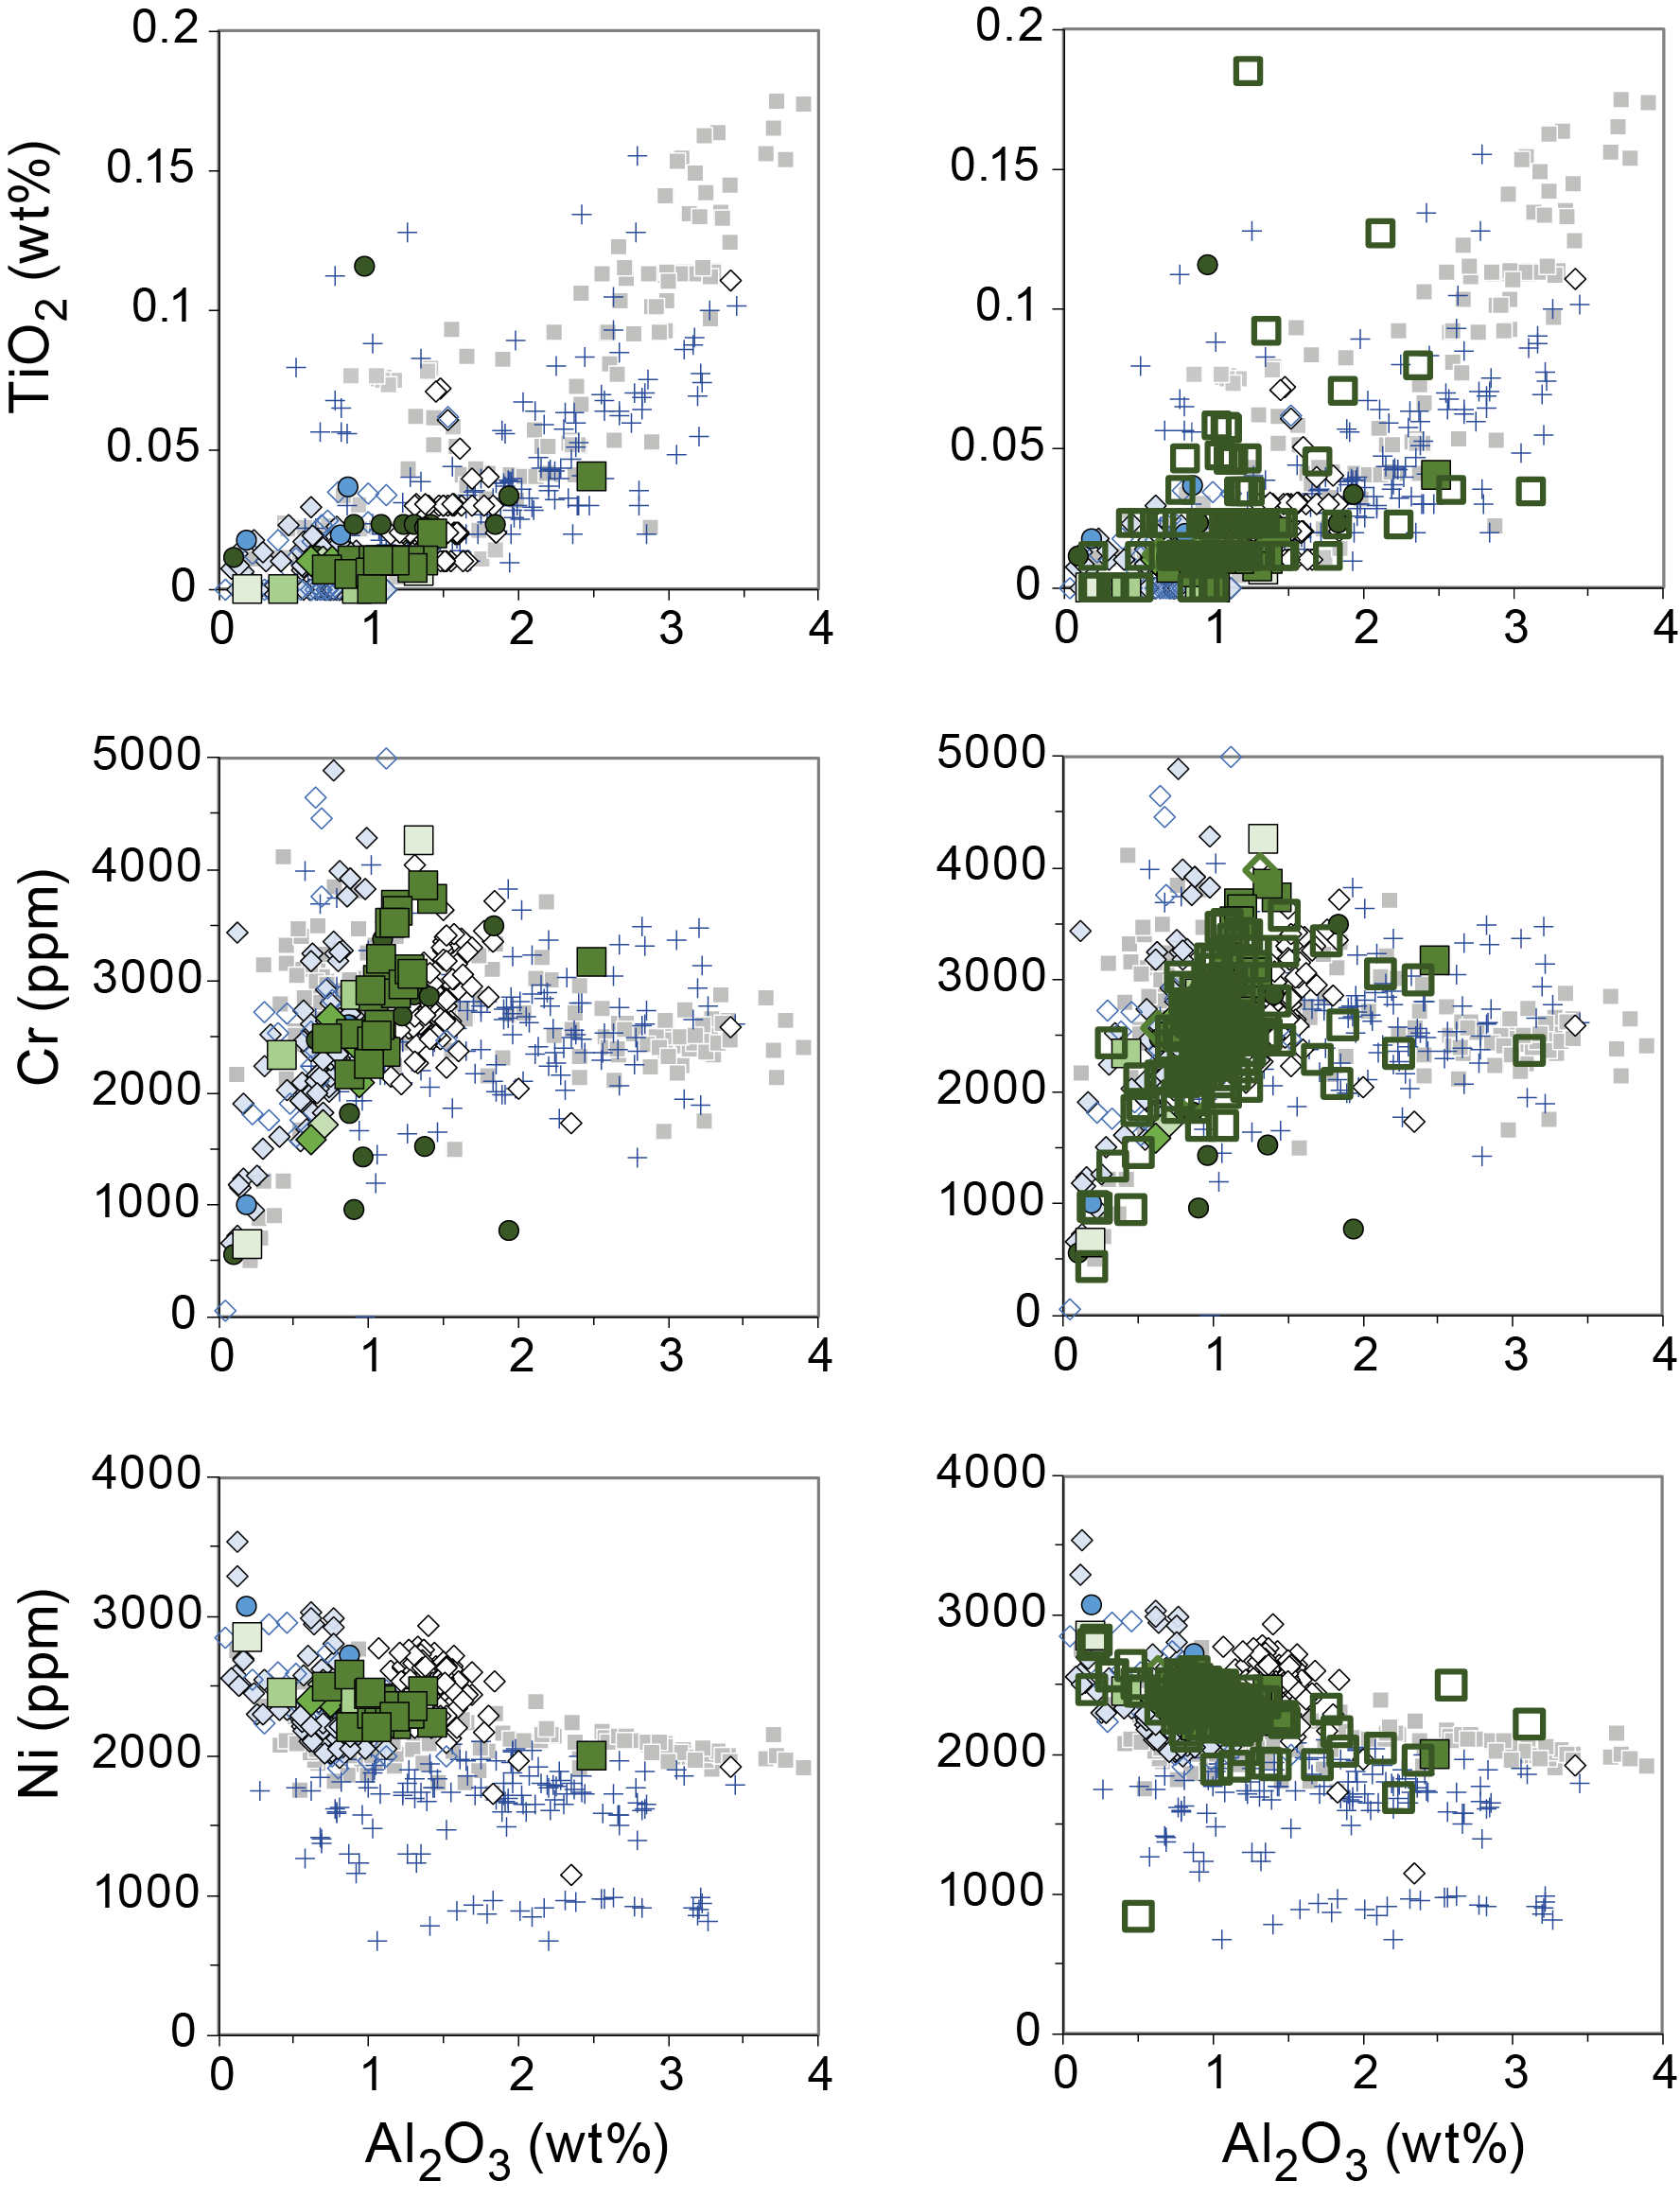
Figure F128. TiO2, C, and Ni vs. Al2O3, serpentinized peridotites.
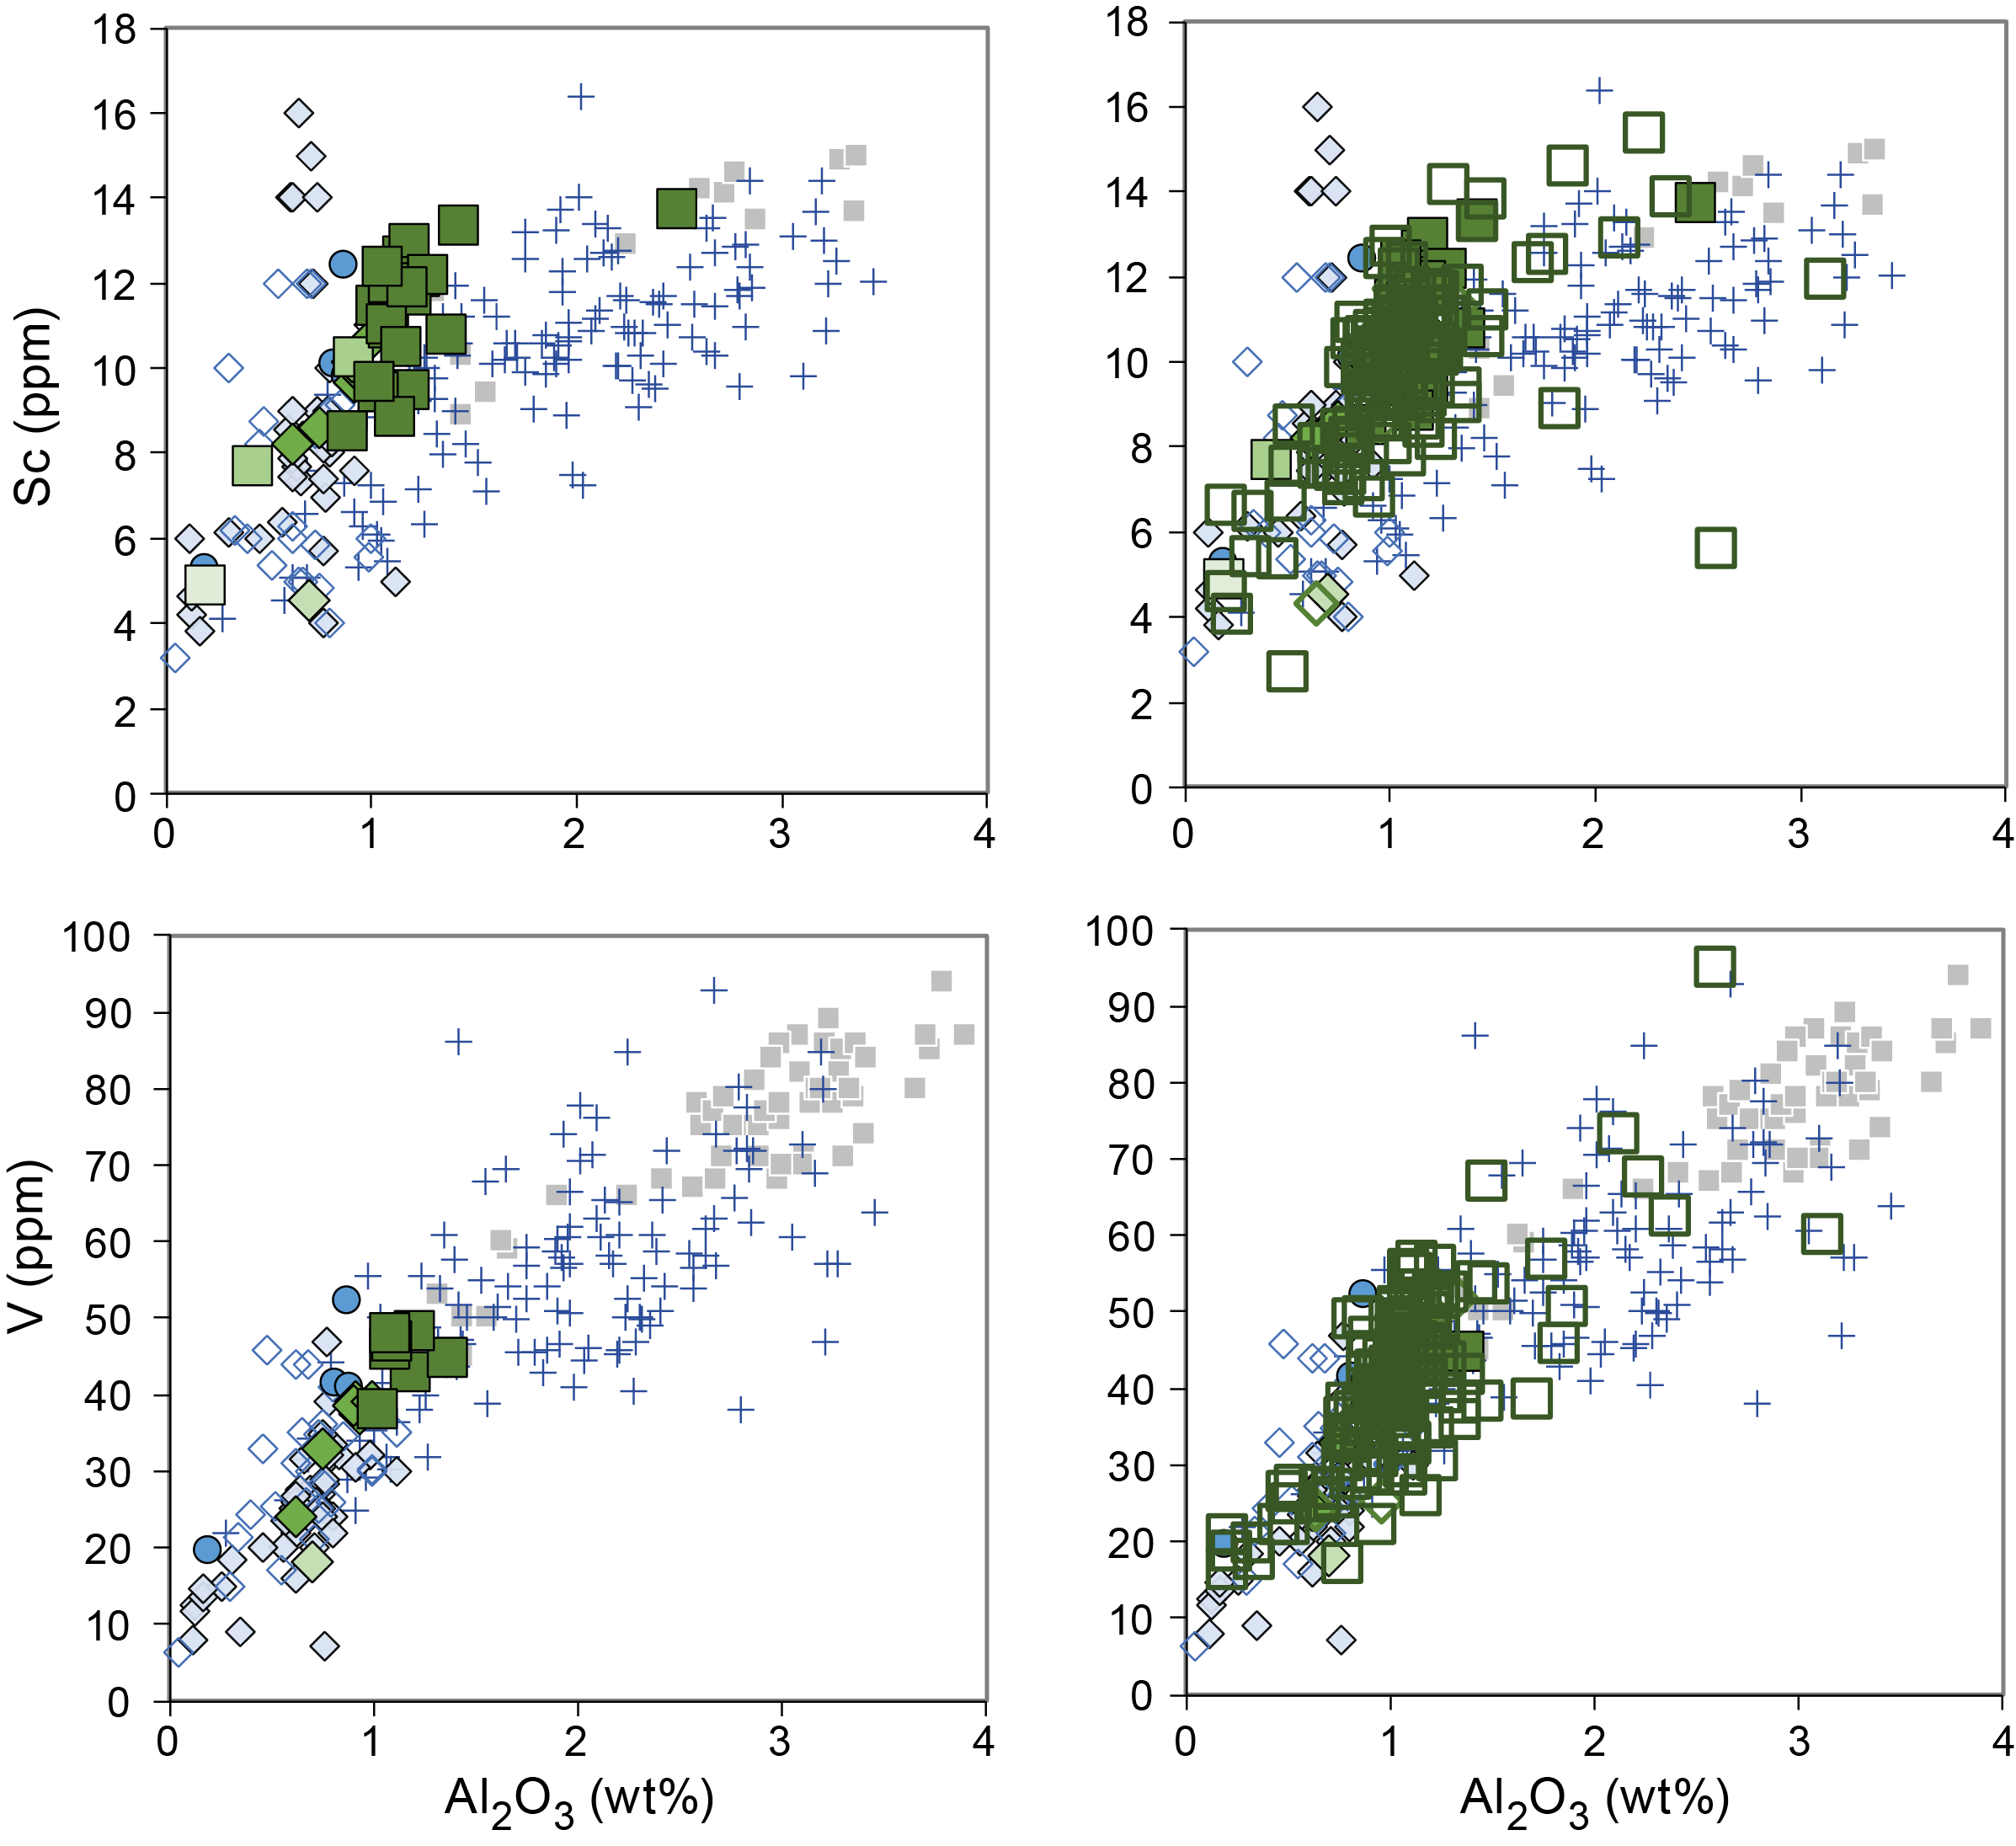
Figure F129. Sc and V vs. Al2O3, serpentinized peridotites.
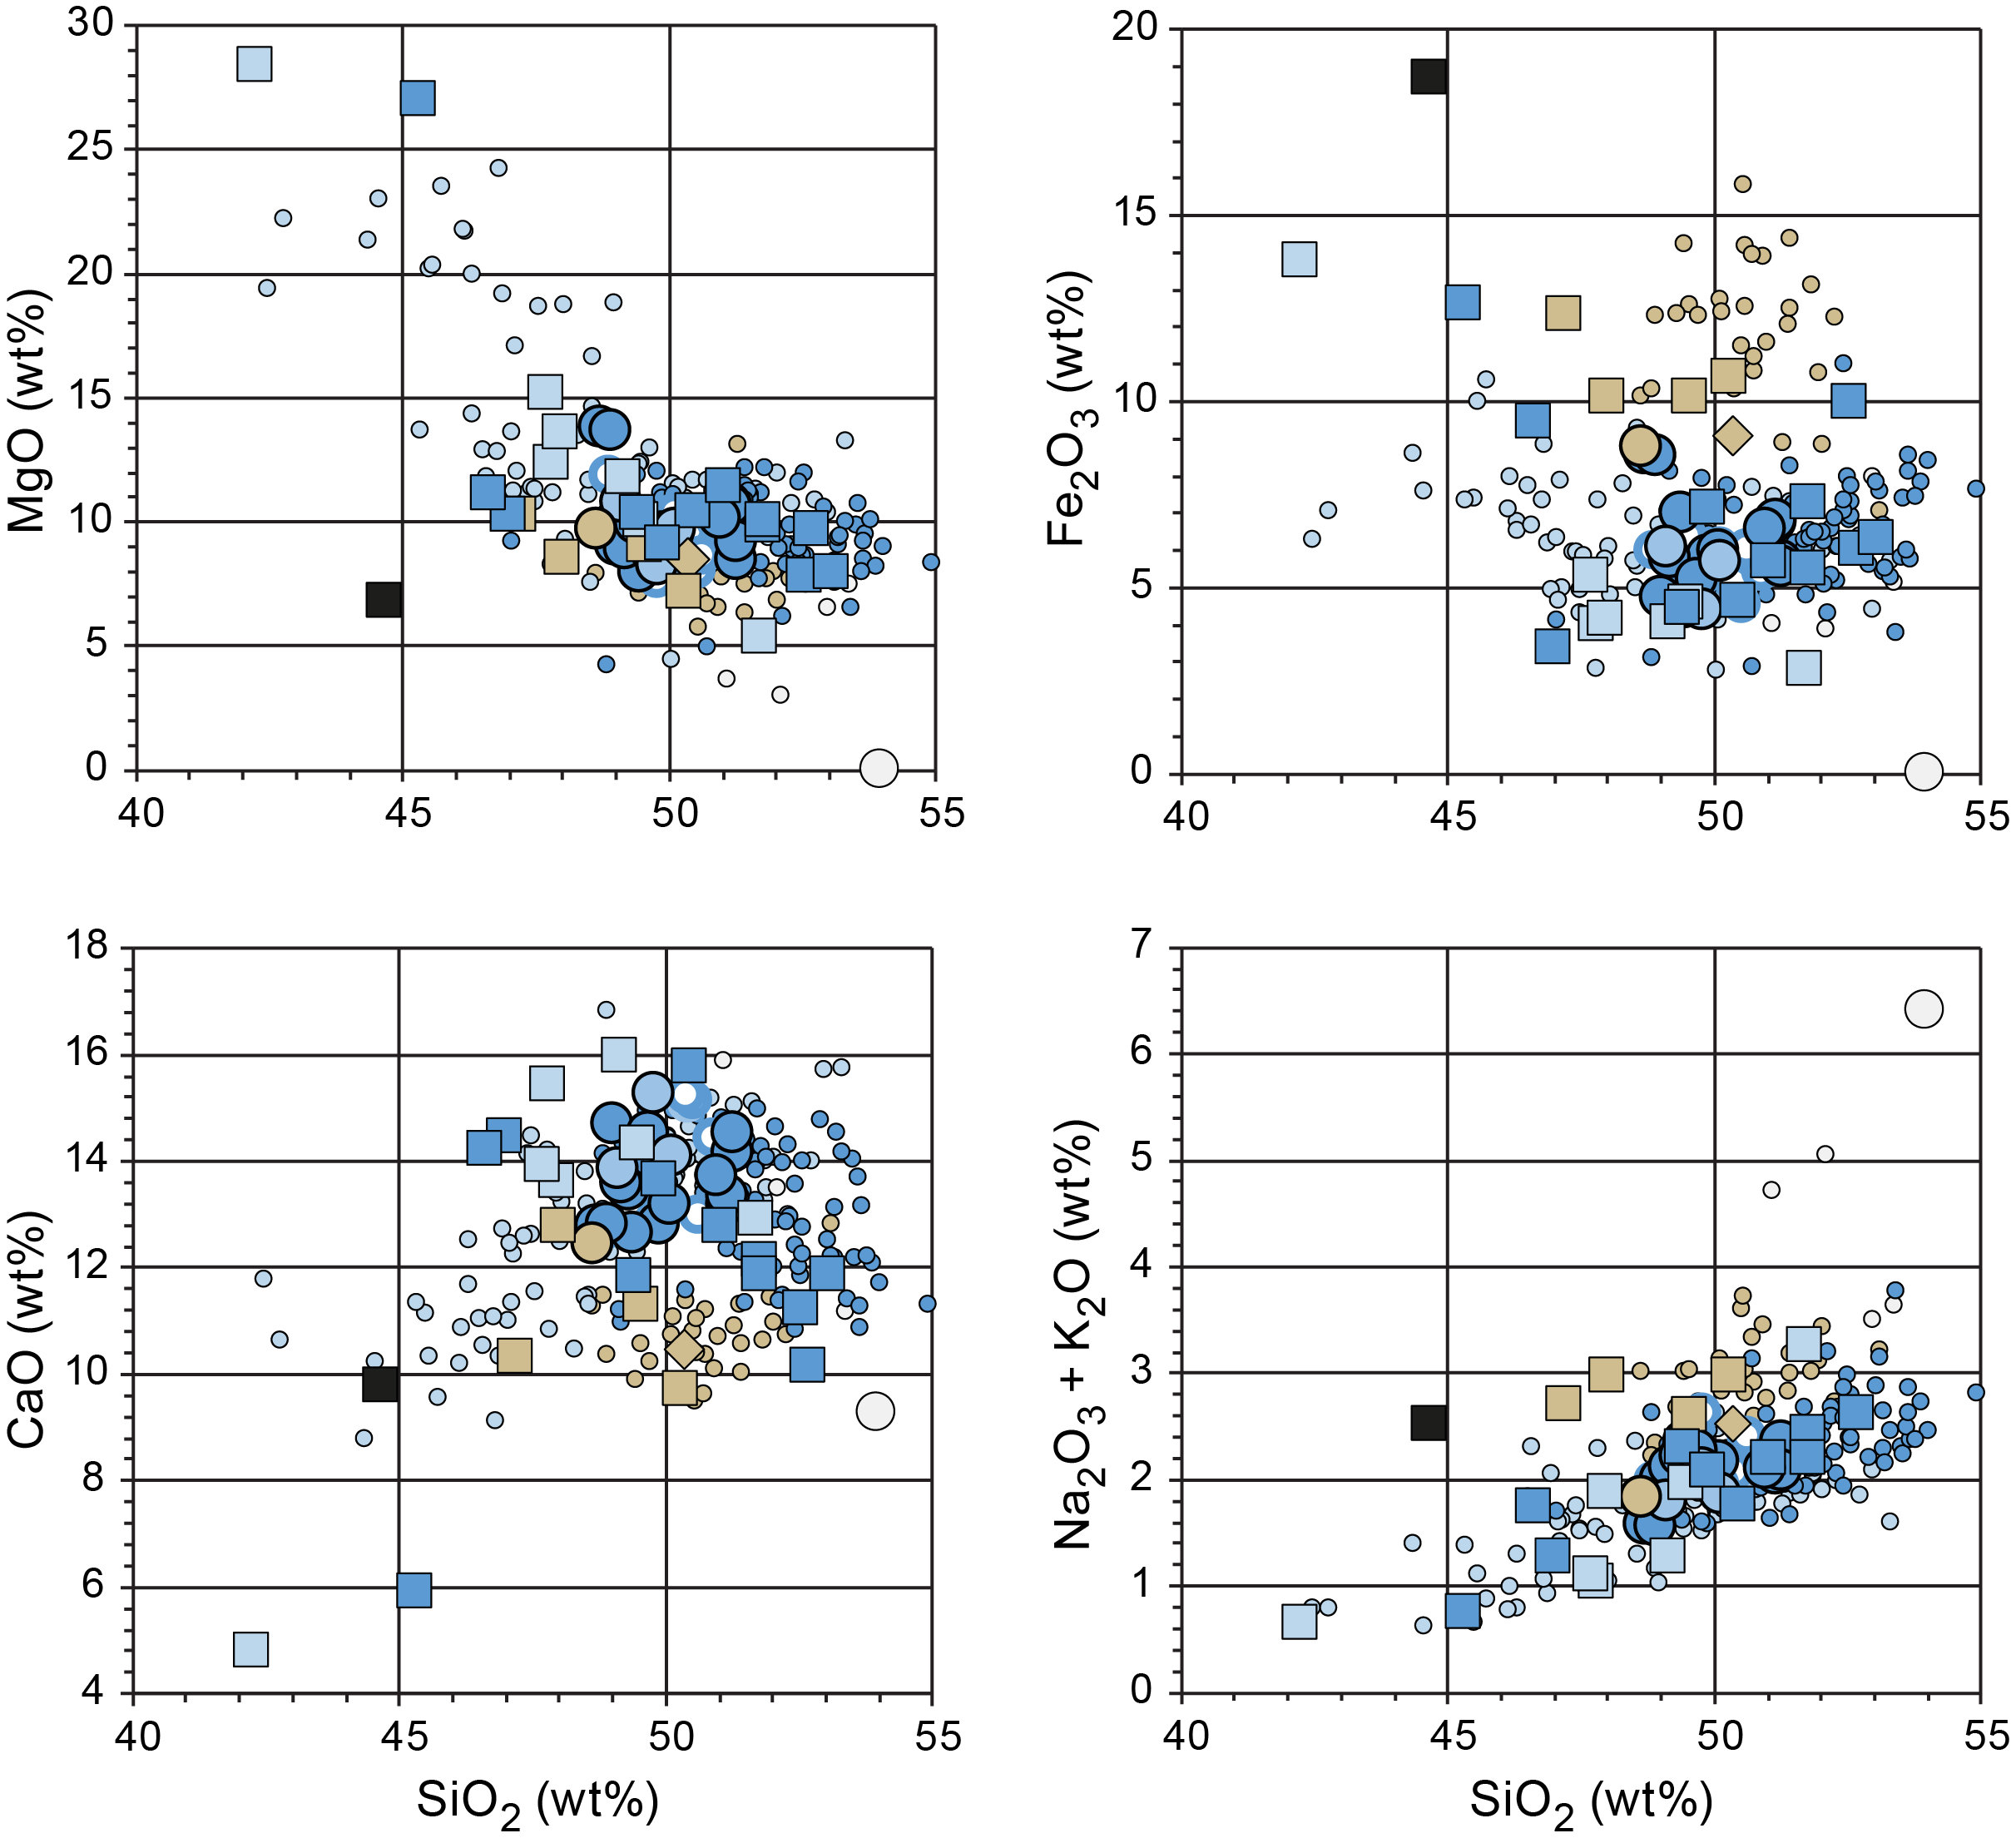
Figure F130. MgO, Fe2O3, CaO, and Na2O + K2O vs. SiO2, geochemistry samples.
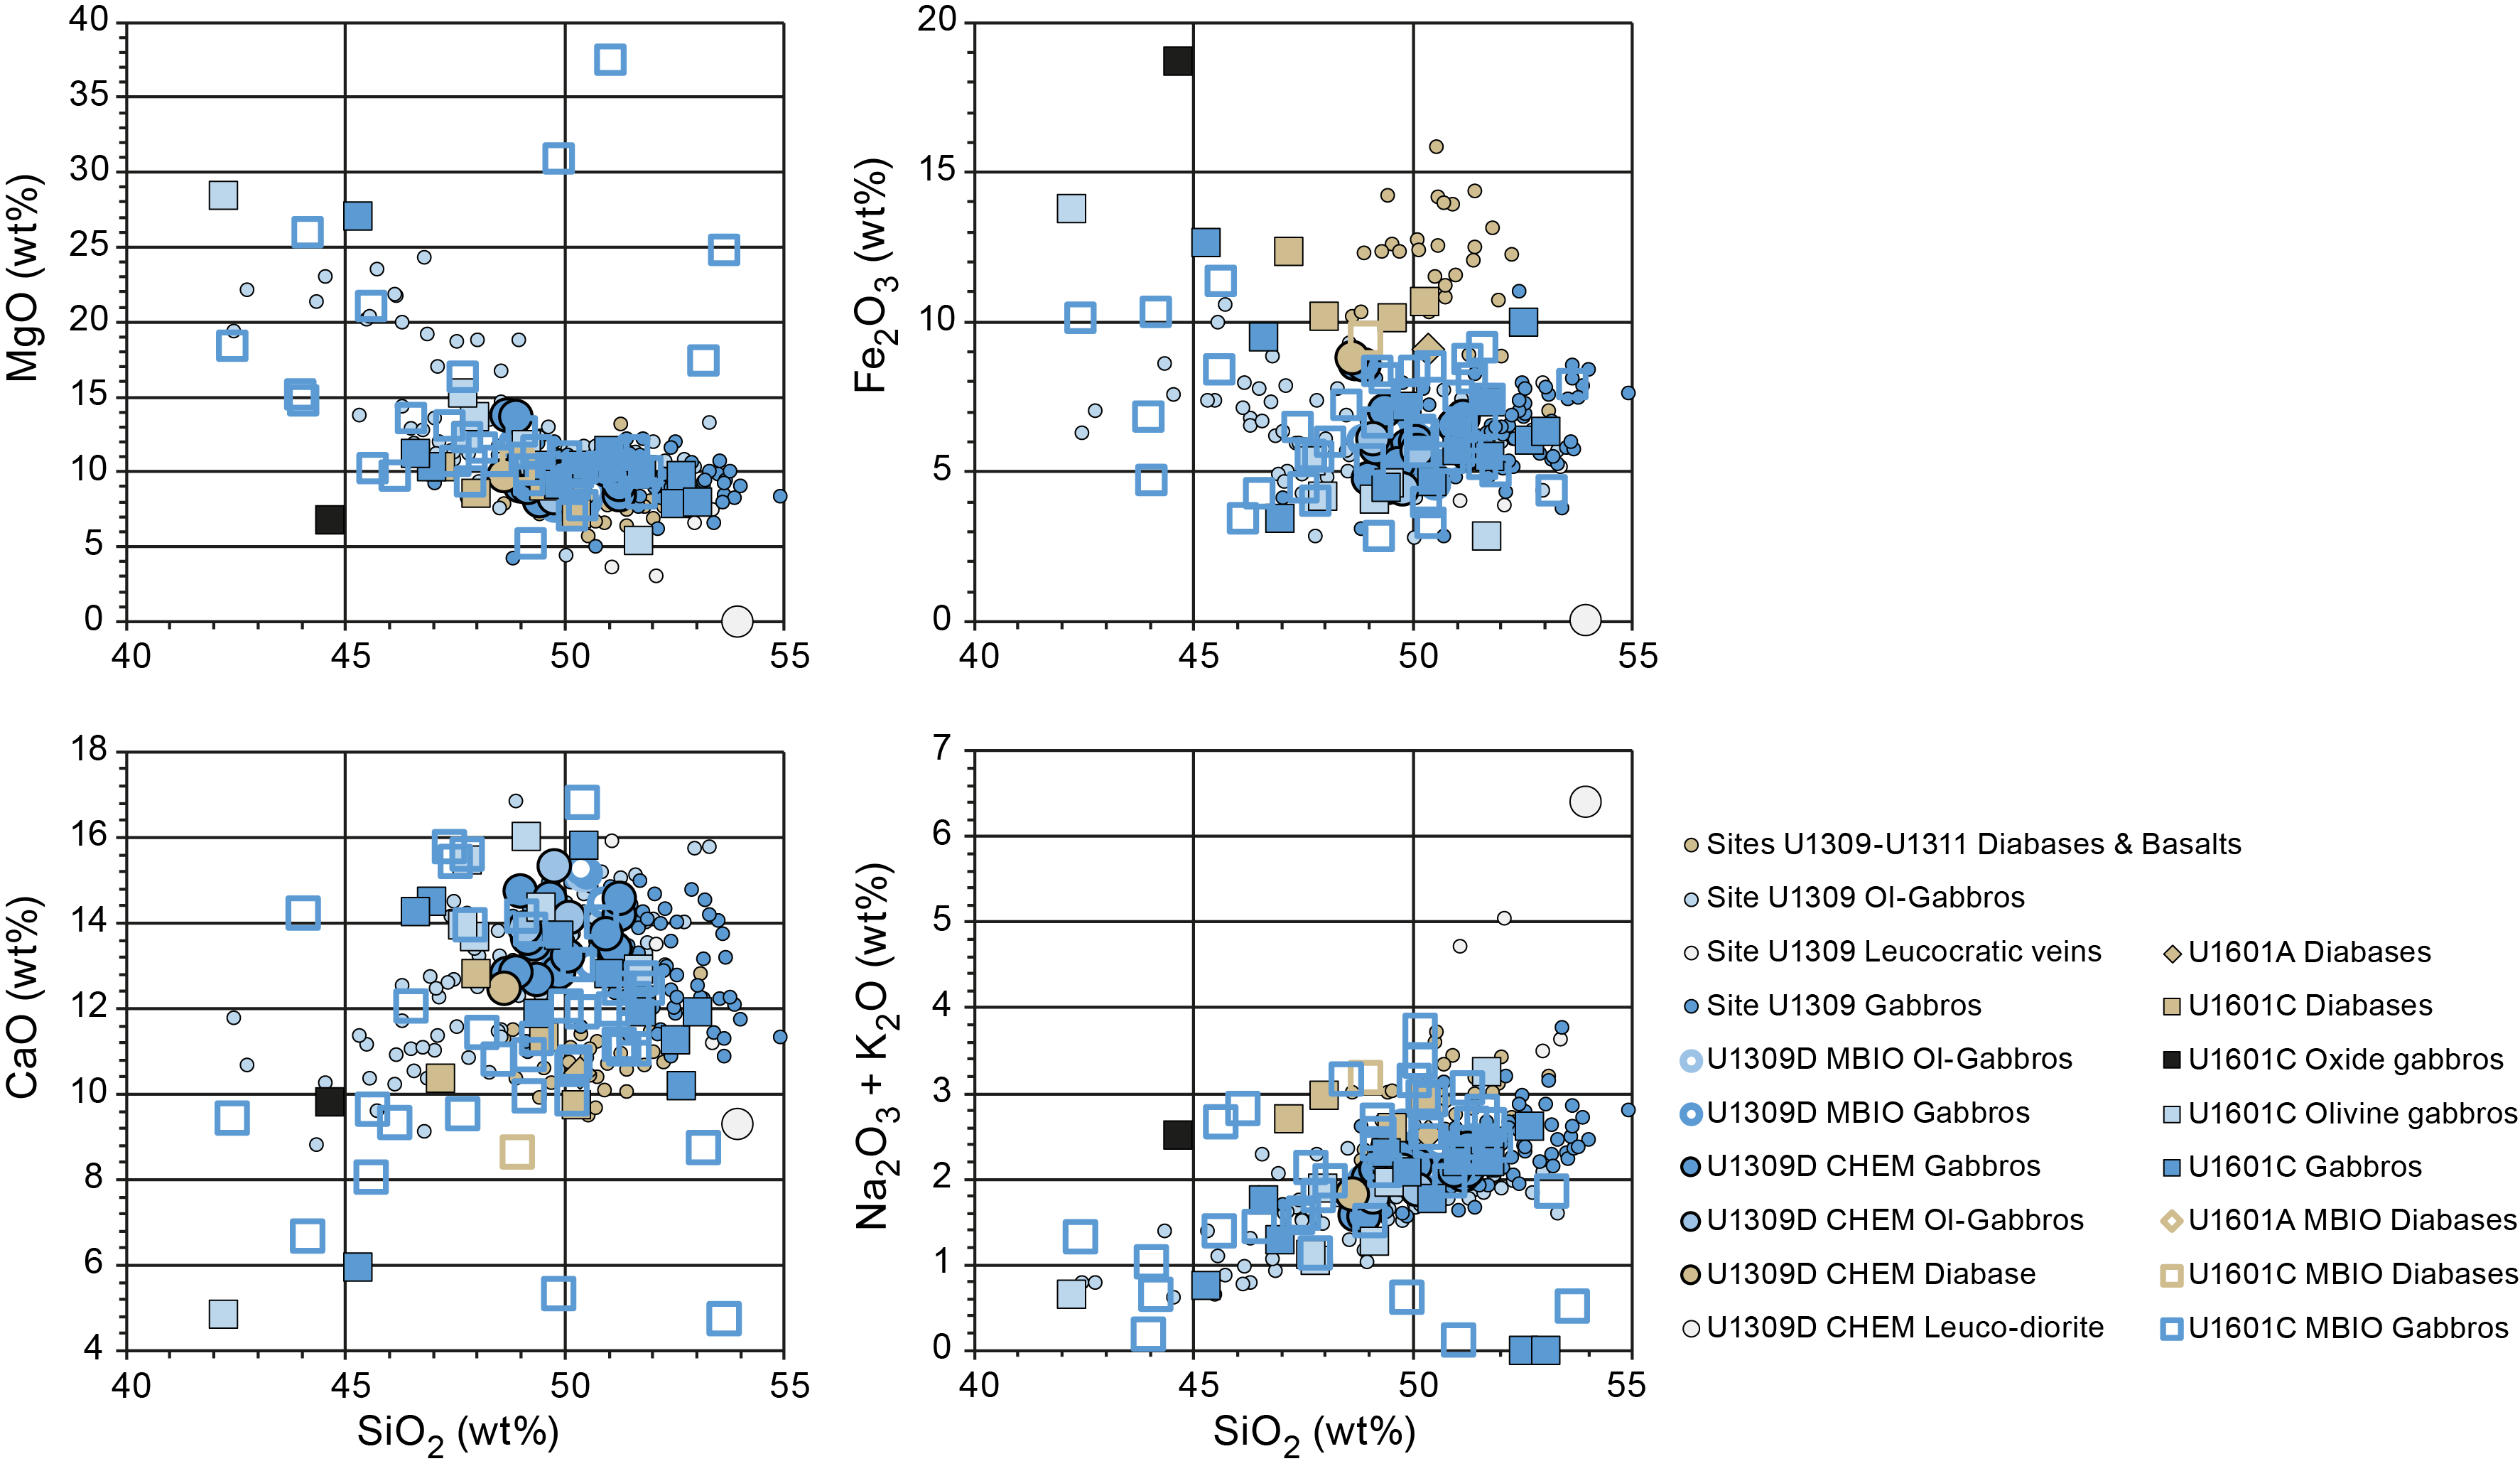
Figure F131. MgO, Fe2O3, CaO, and Na2O + K2O vs. SiO2, geochemistry and microbiology samples.
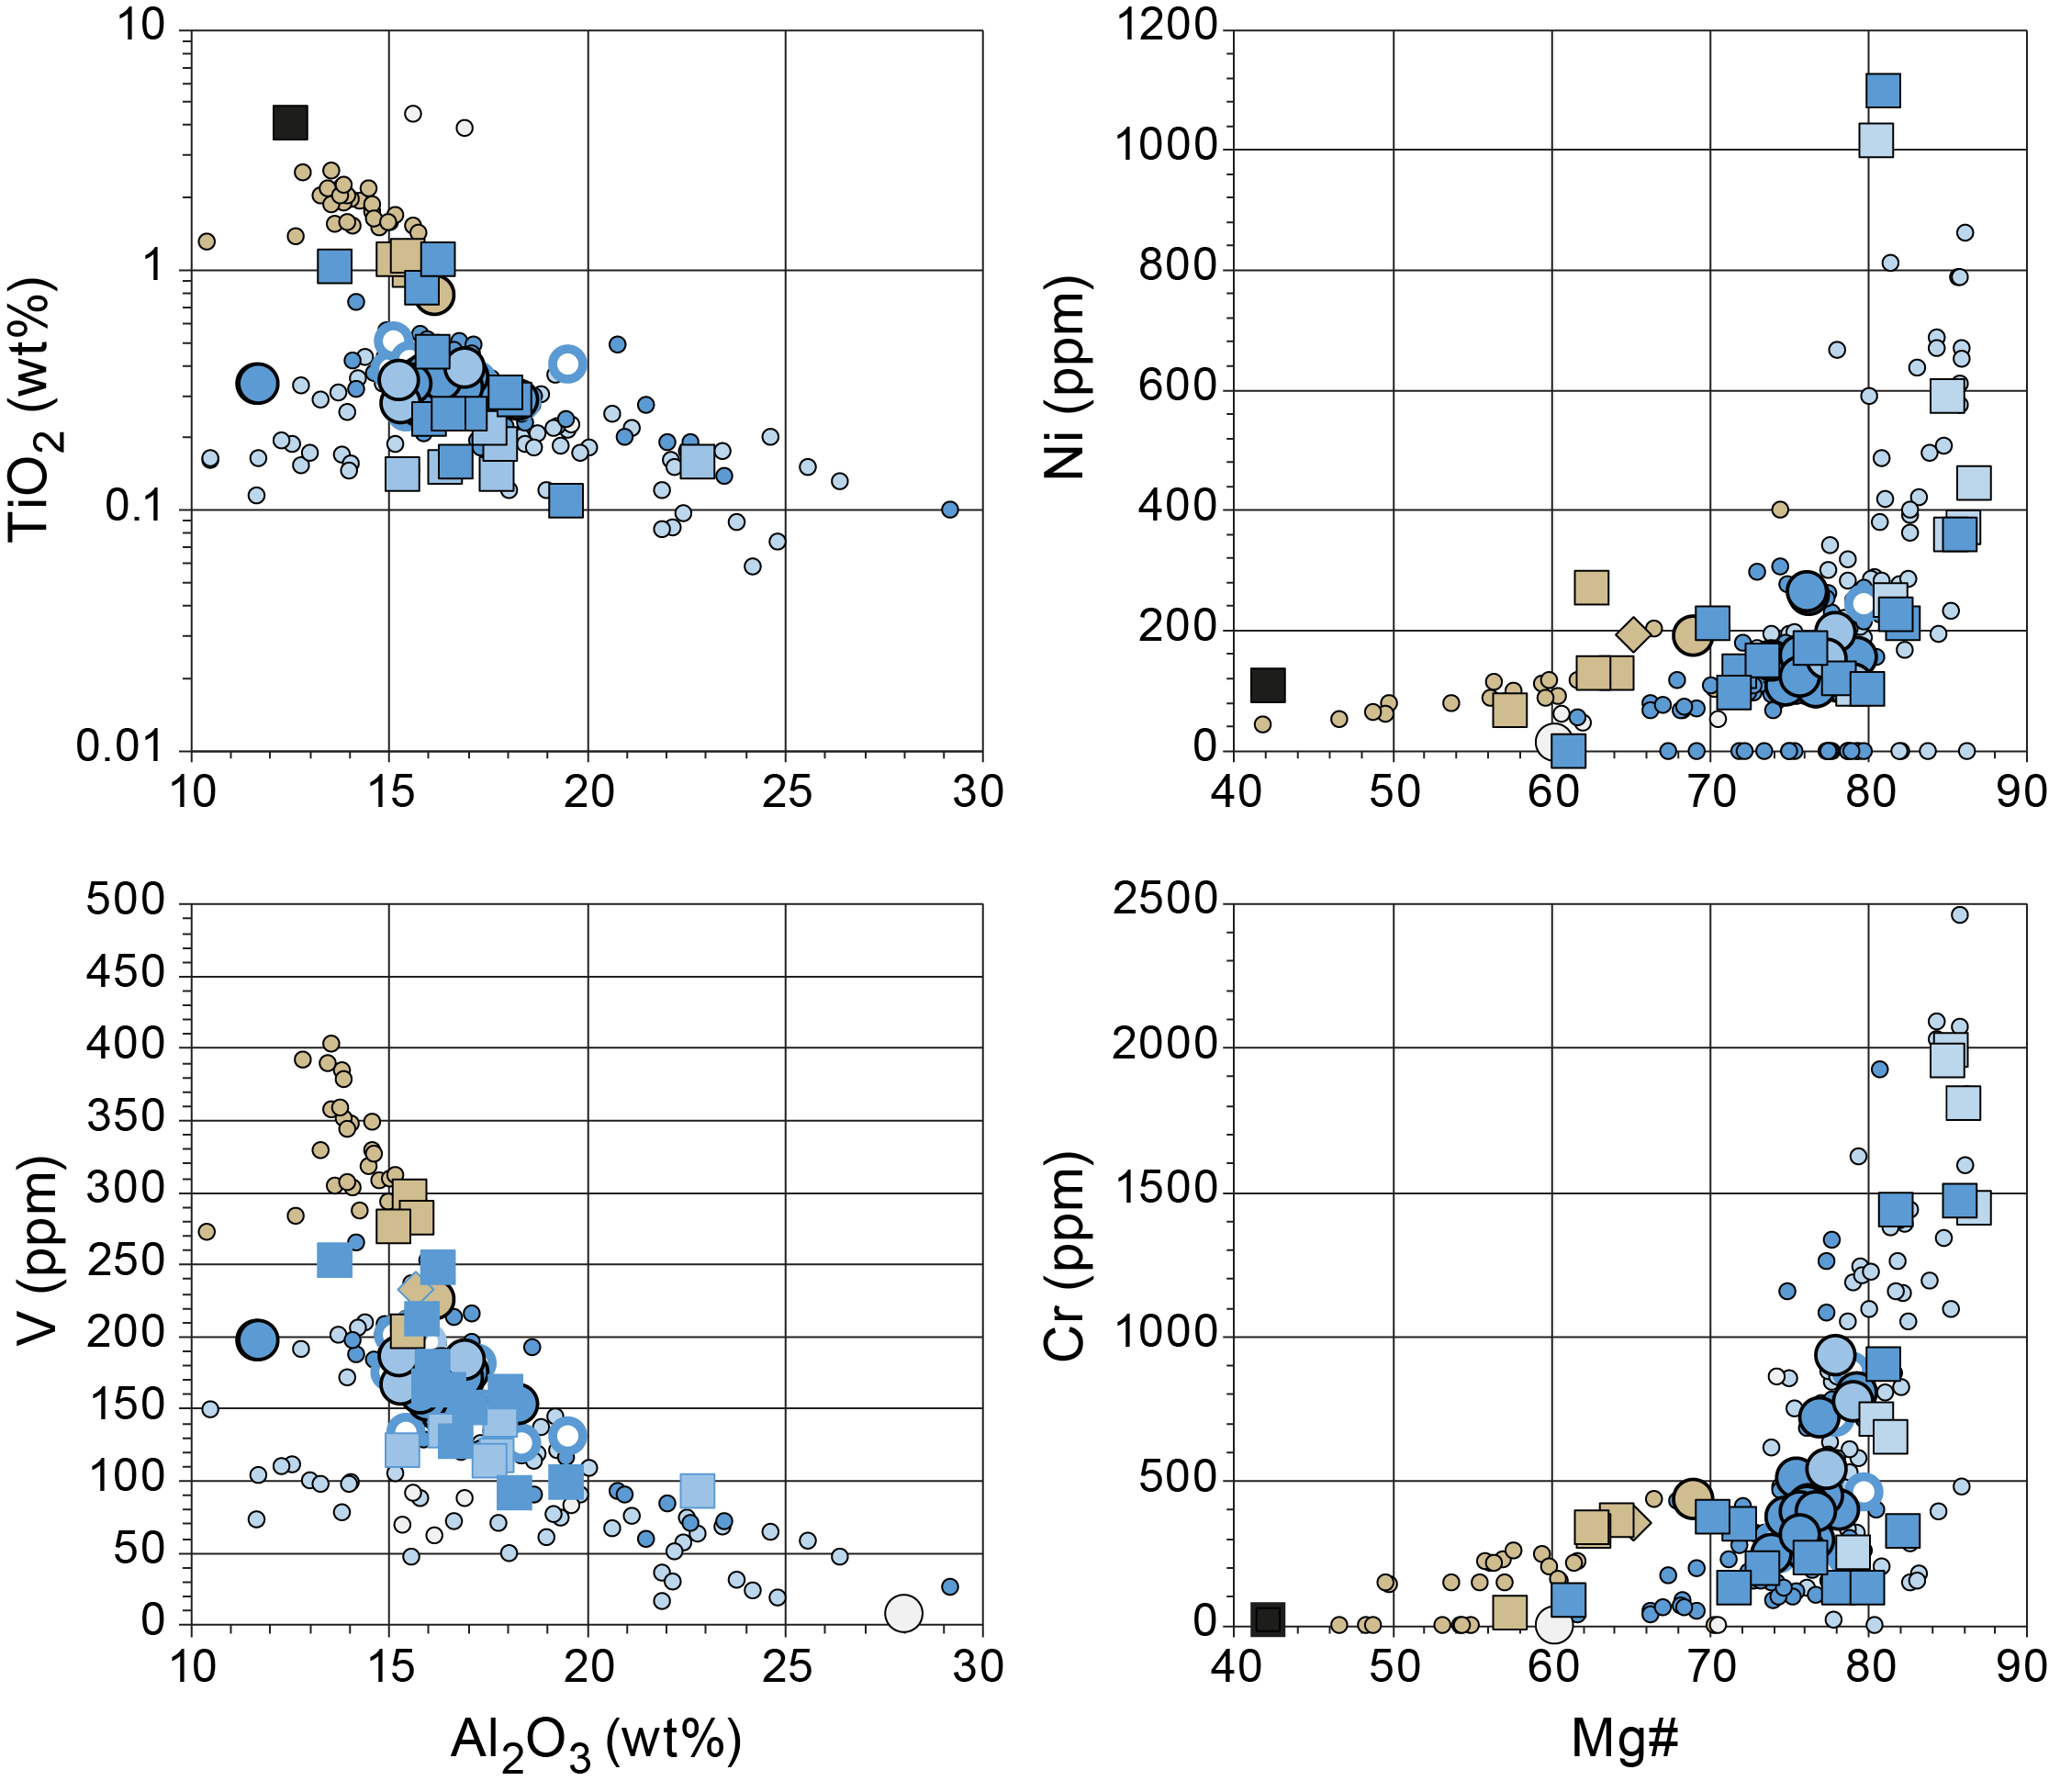
Figure F132. TiO2 and V vs. Al2O3 and Ni and Cr vs. Mg#, geochemistry samples.
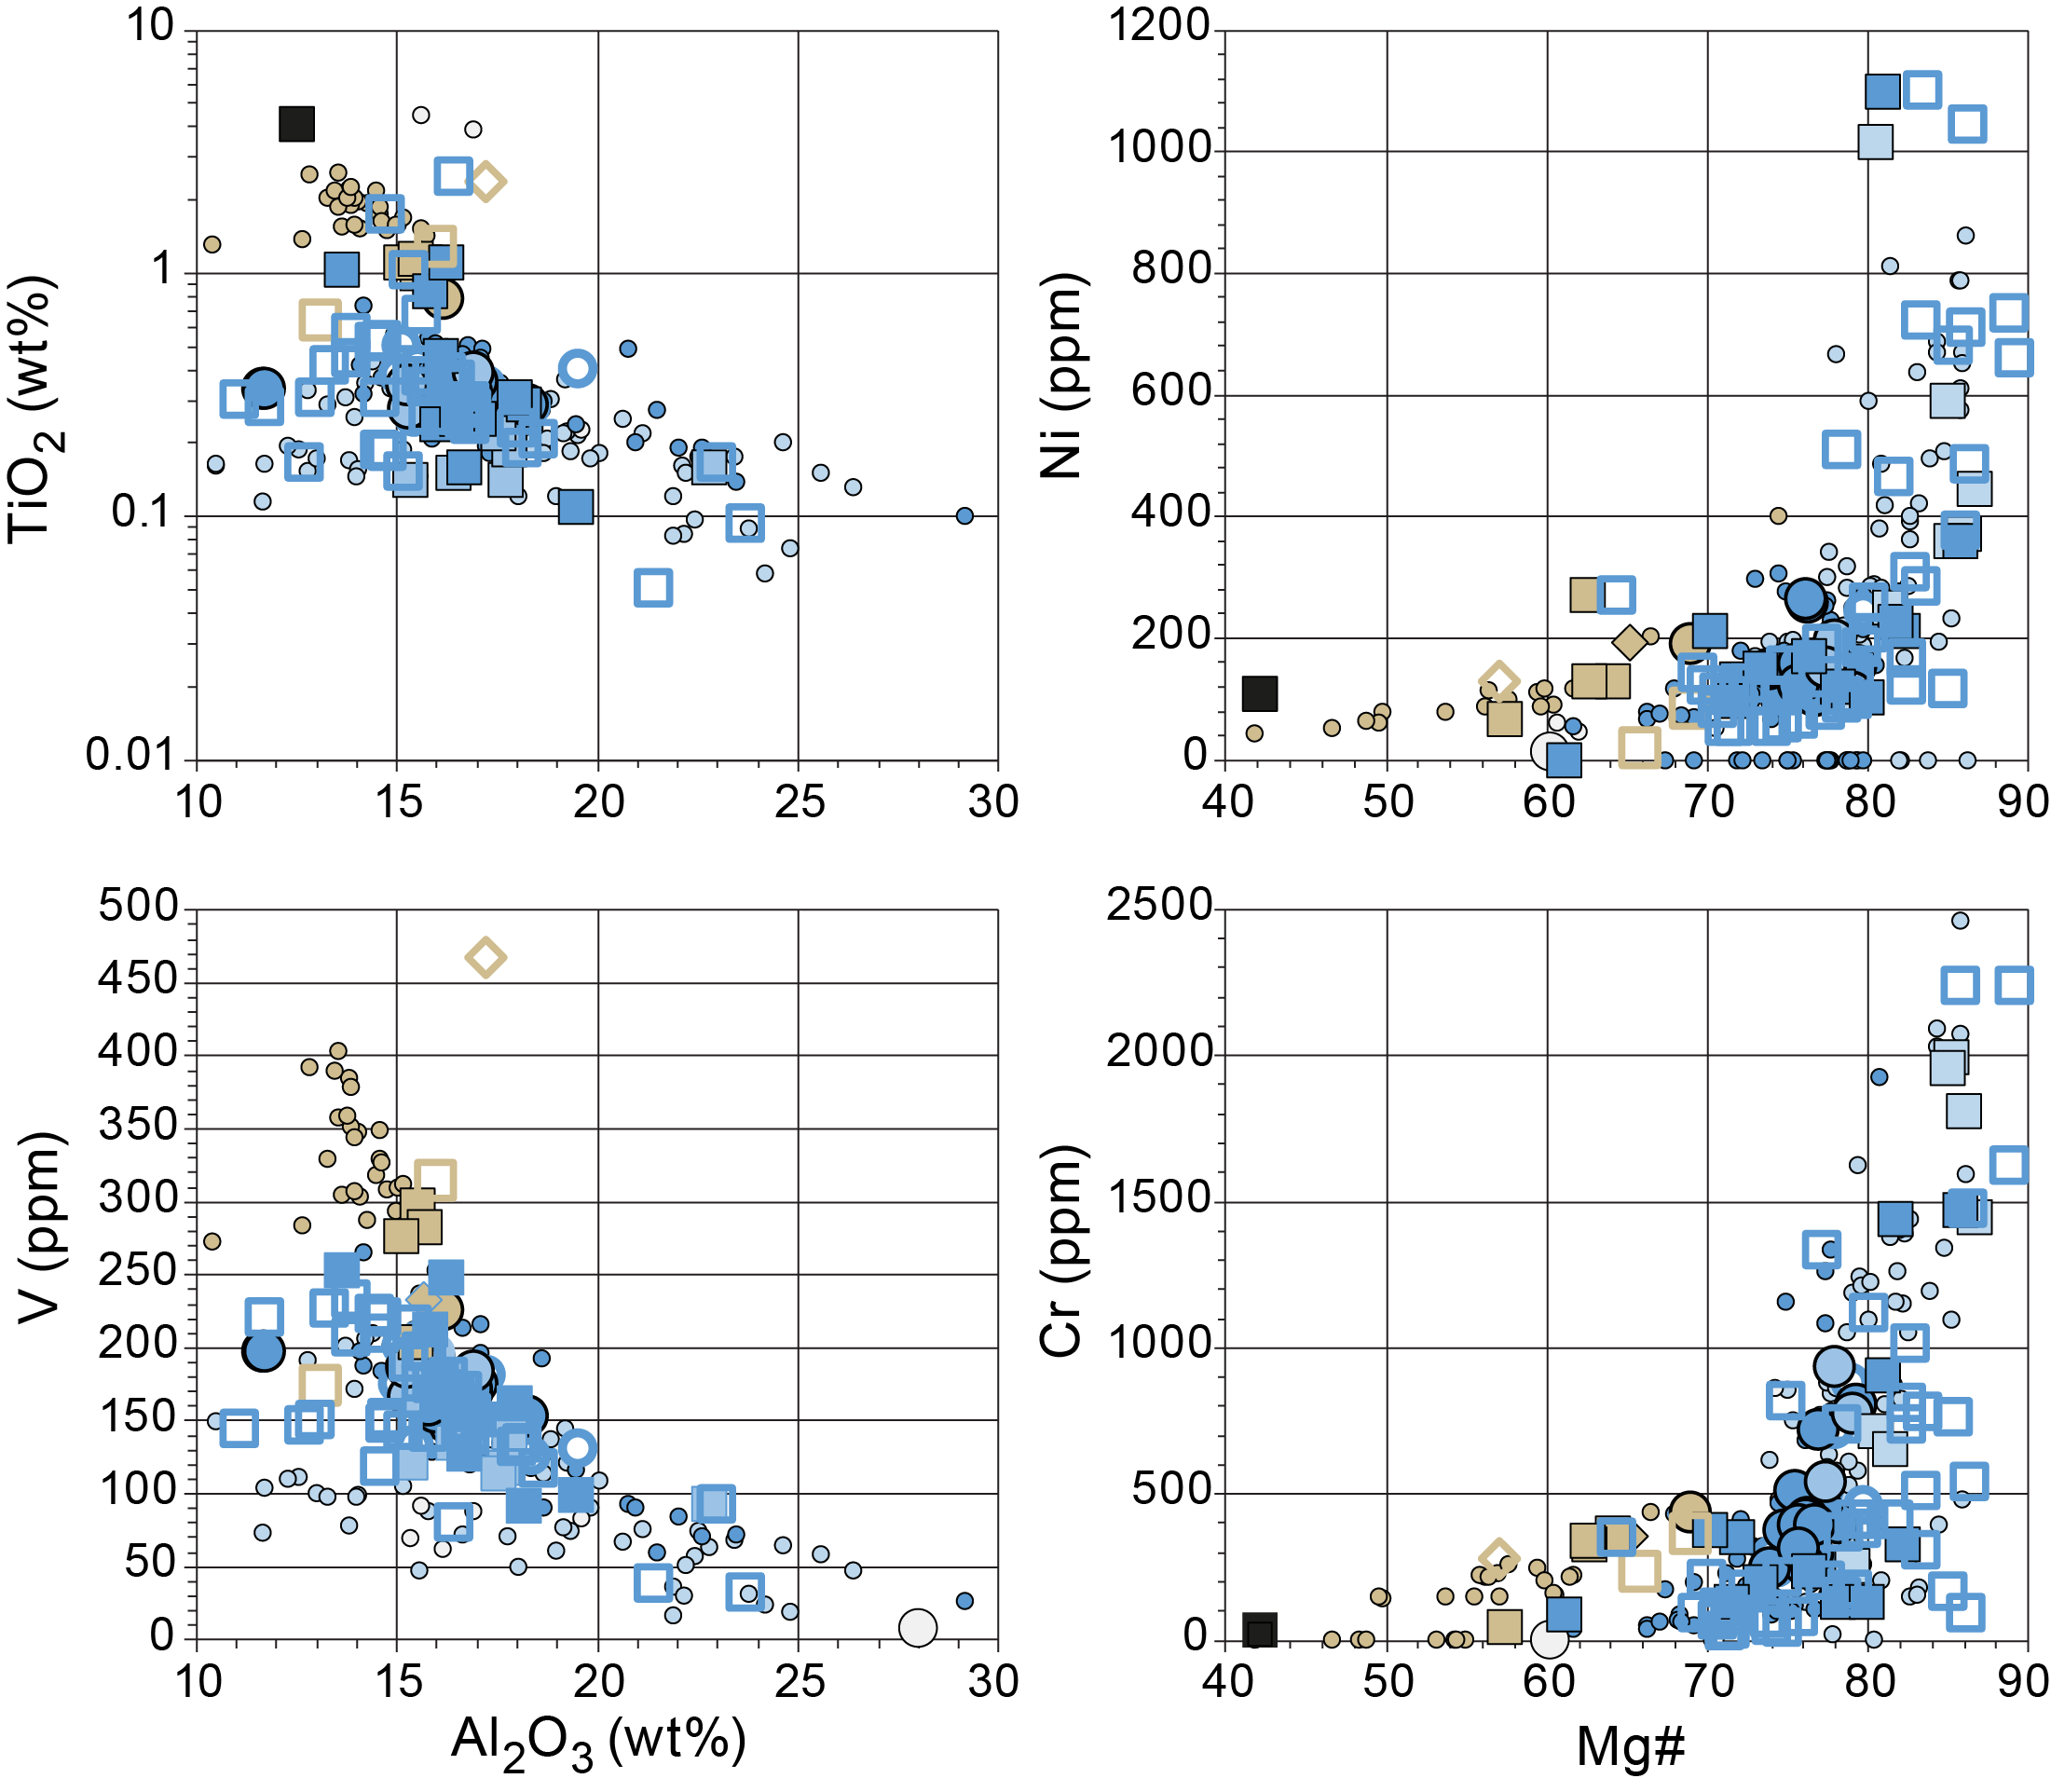
Figure F133. TiO2 and V vs. Al2O3 and Ni and Cr vs. Mg#, geochemistry and microbiology samples.
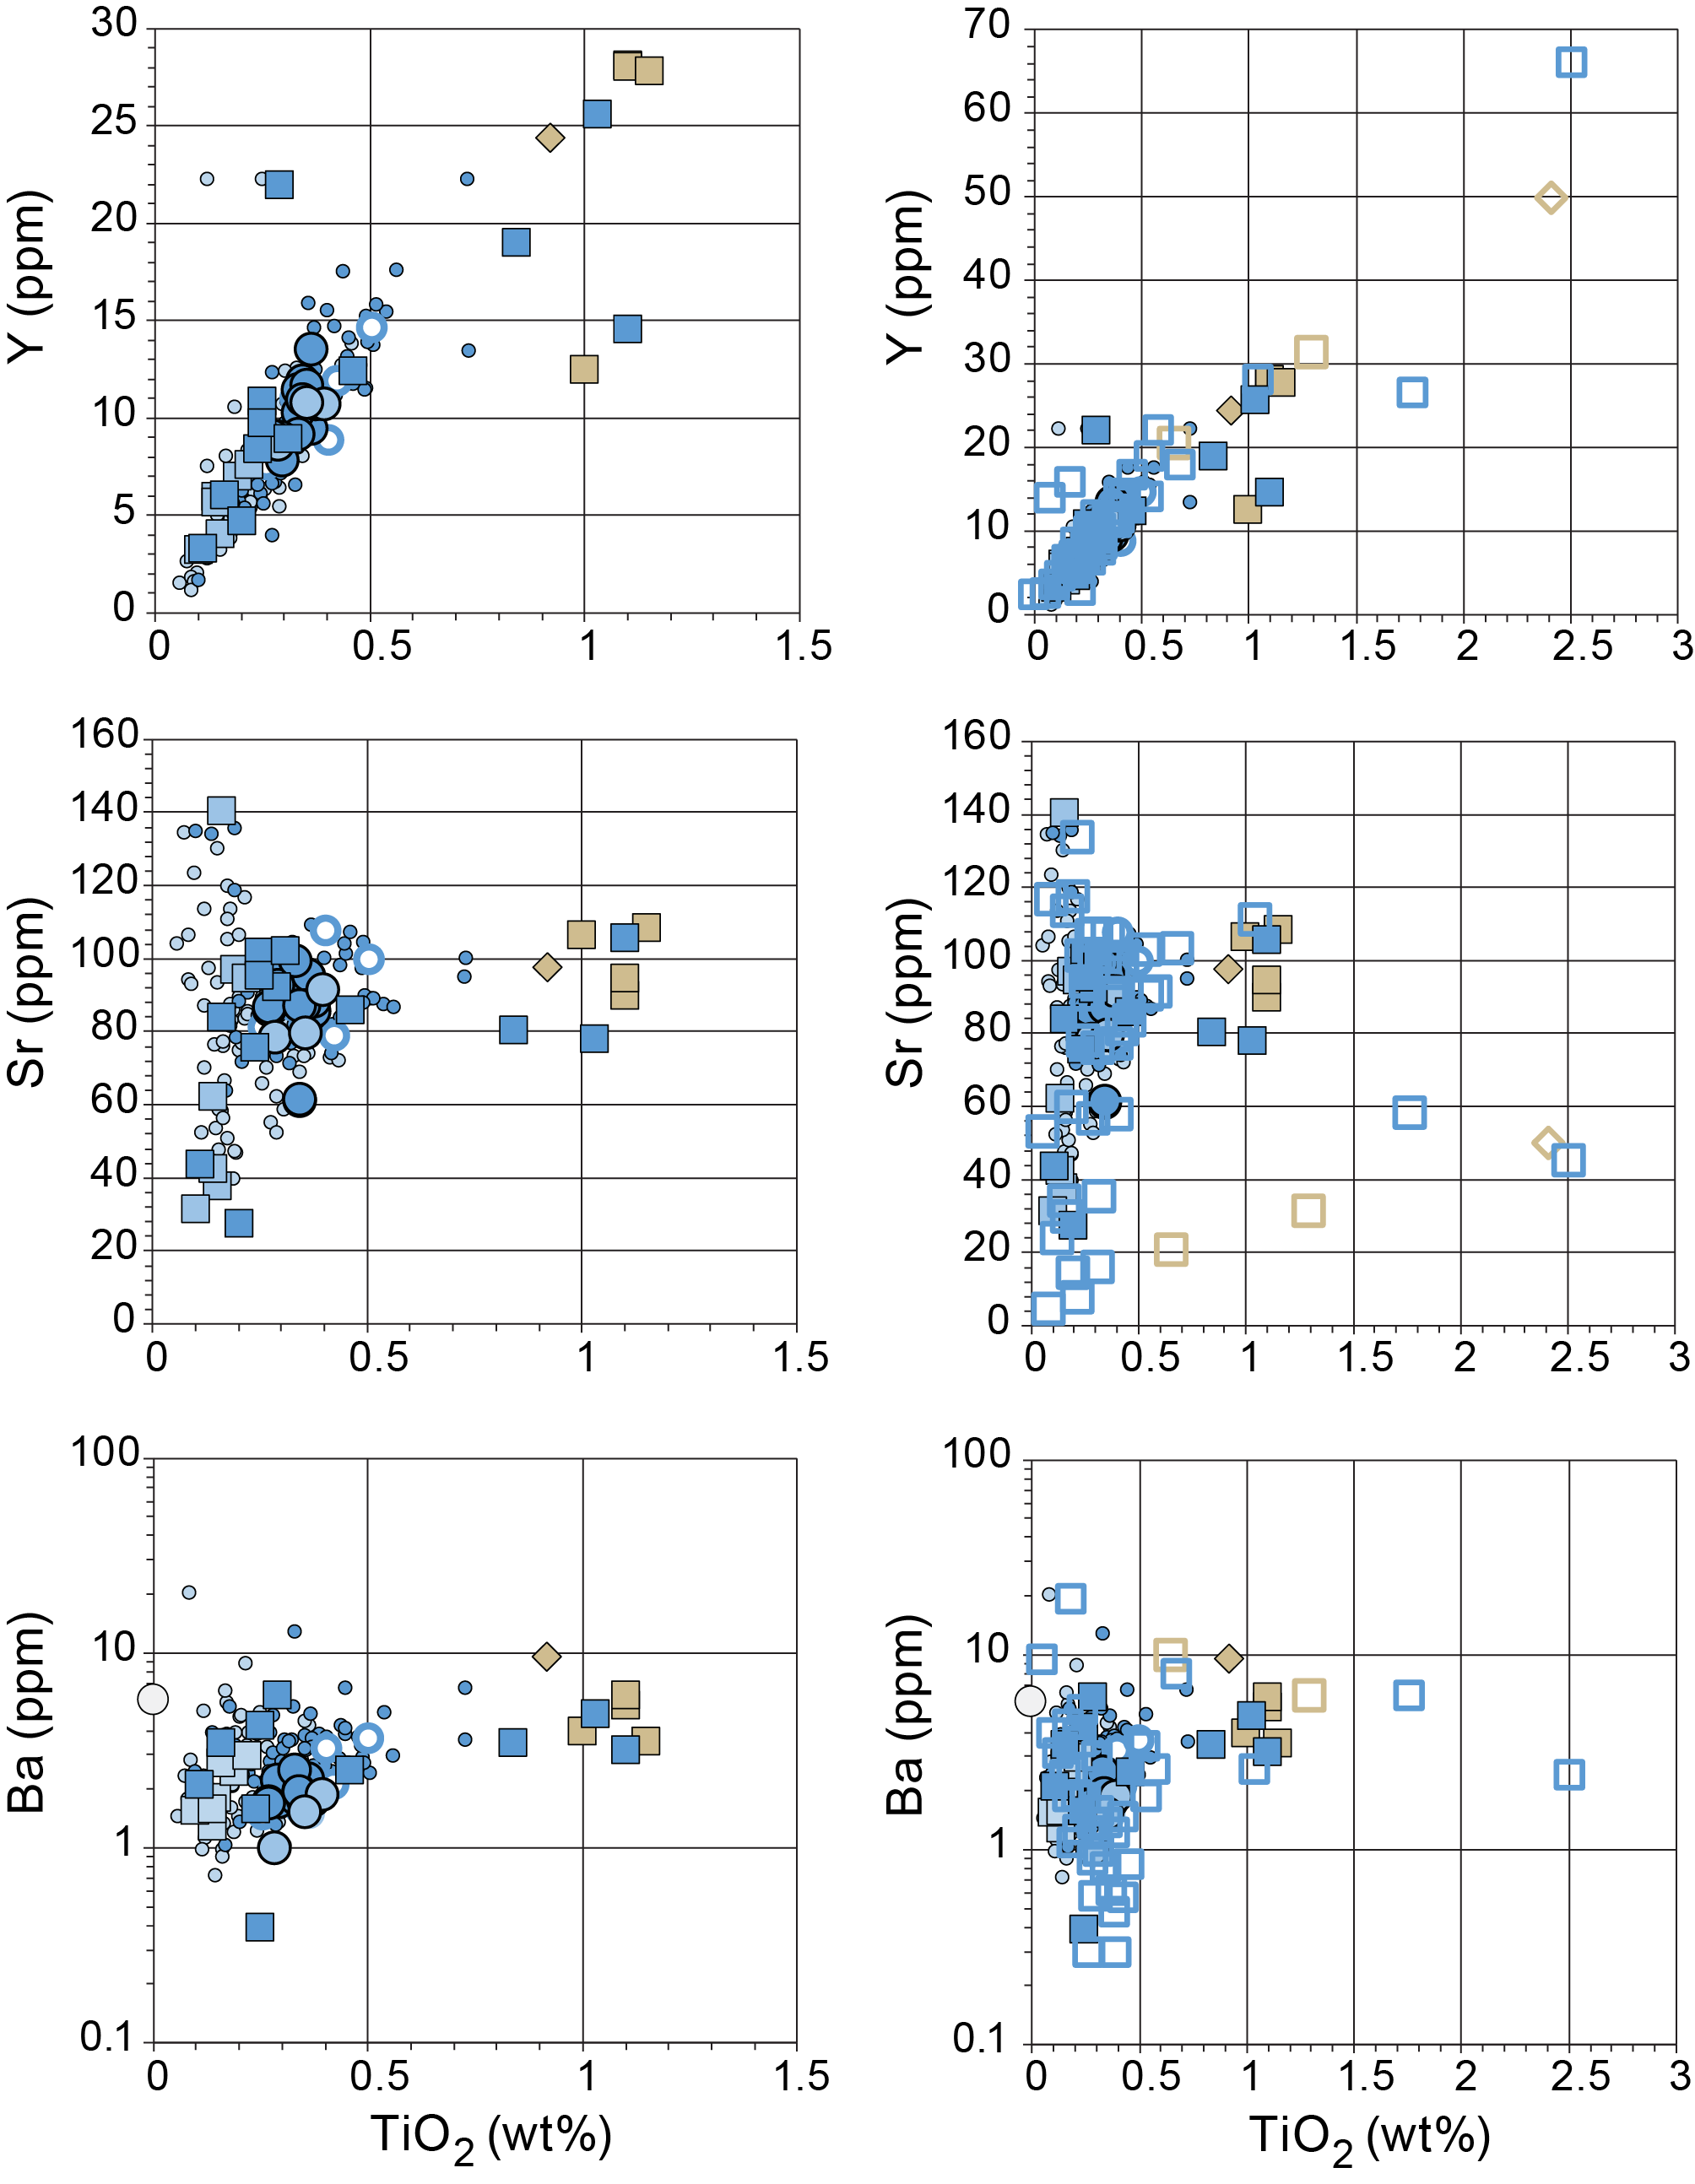
Figure F134. Y, Sr, Ba vs. TiO2.
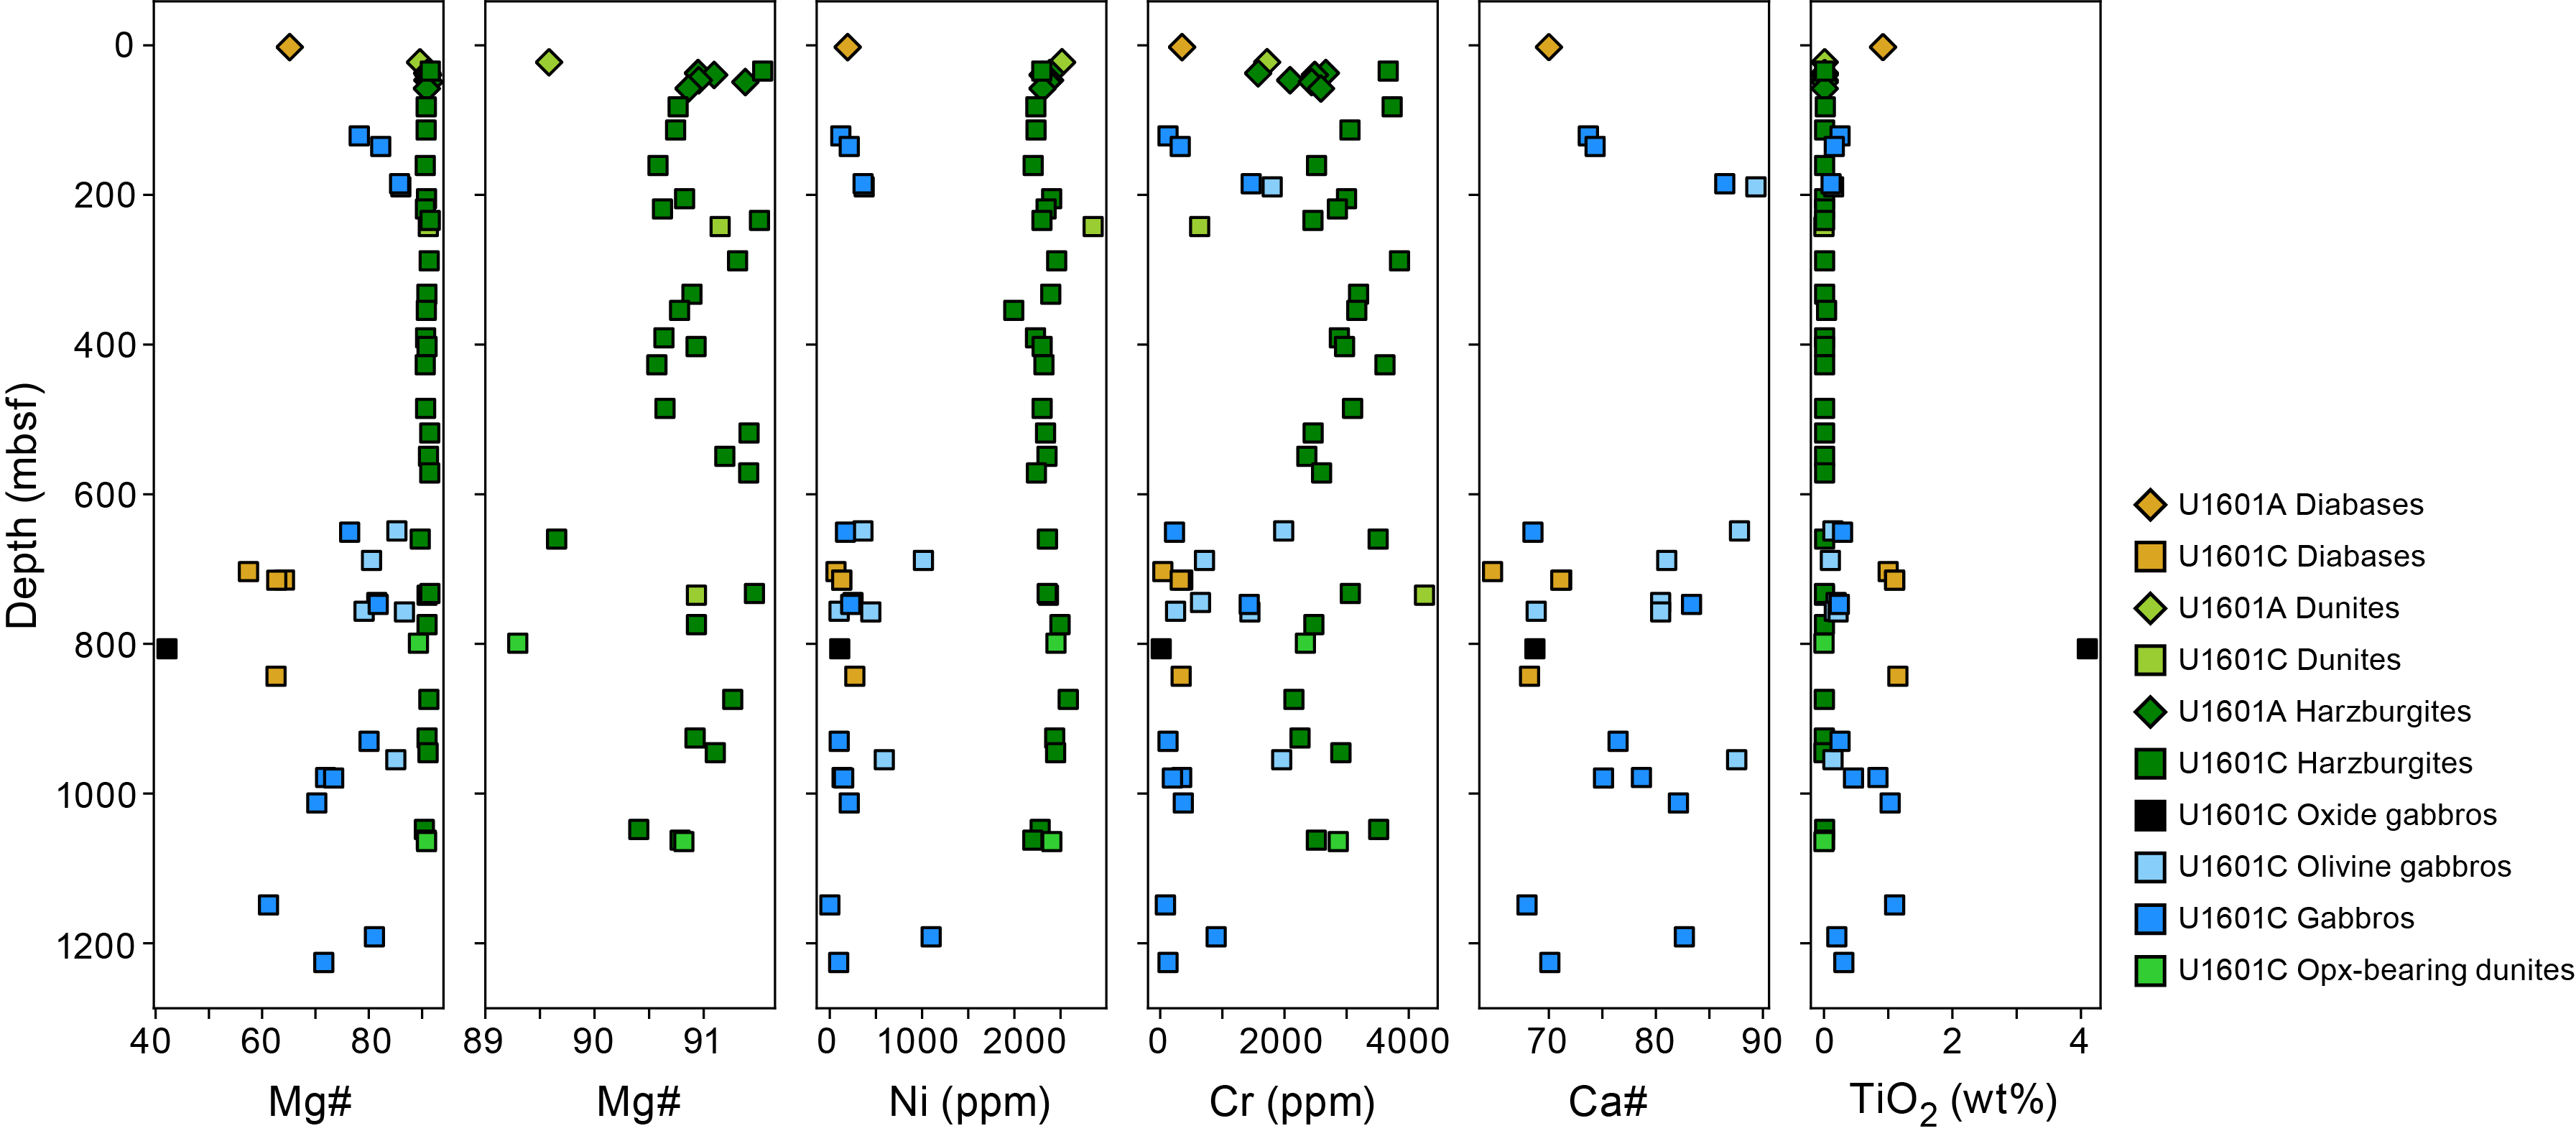
Figure F135. Mg#, Ca#, Ni, Cr, and TiO2, geochemistry samples.
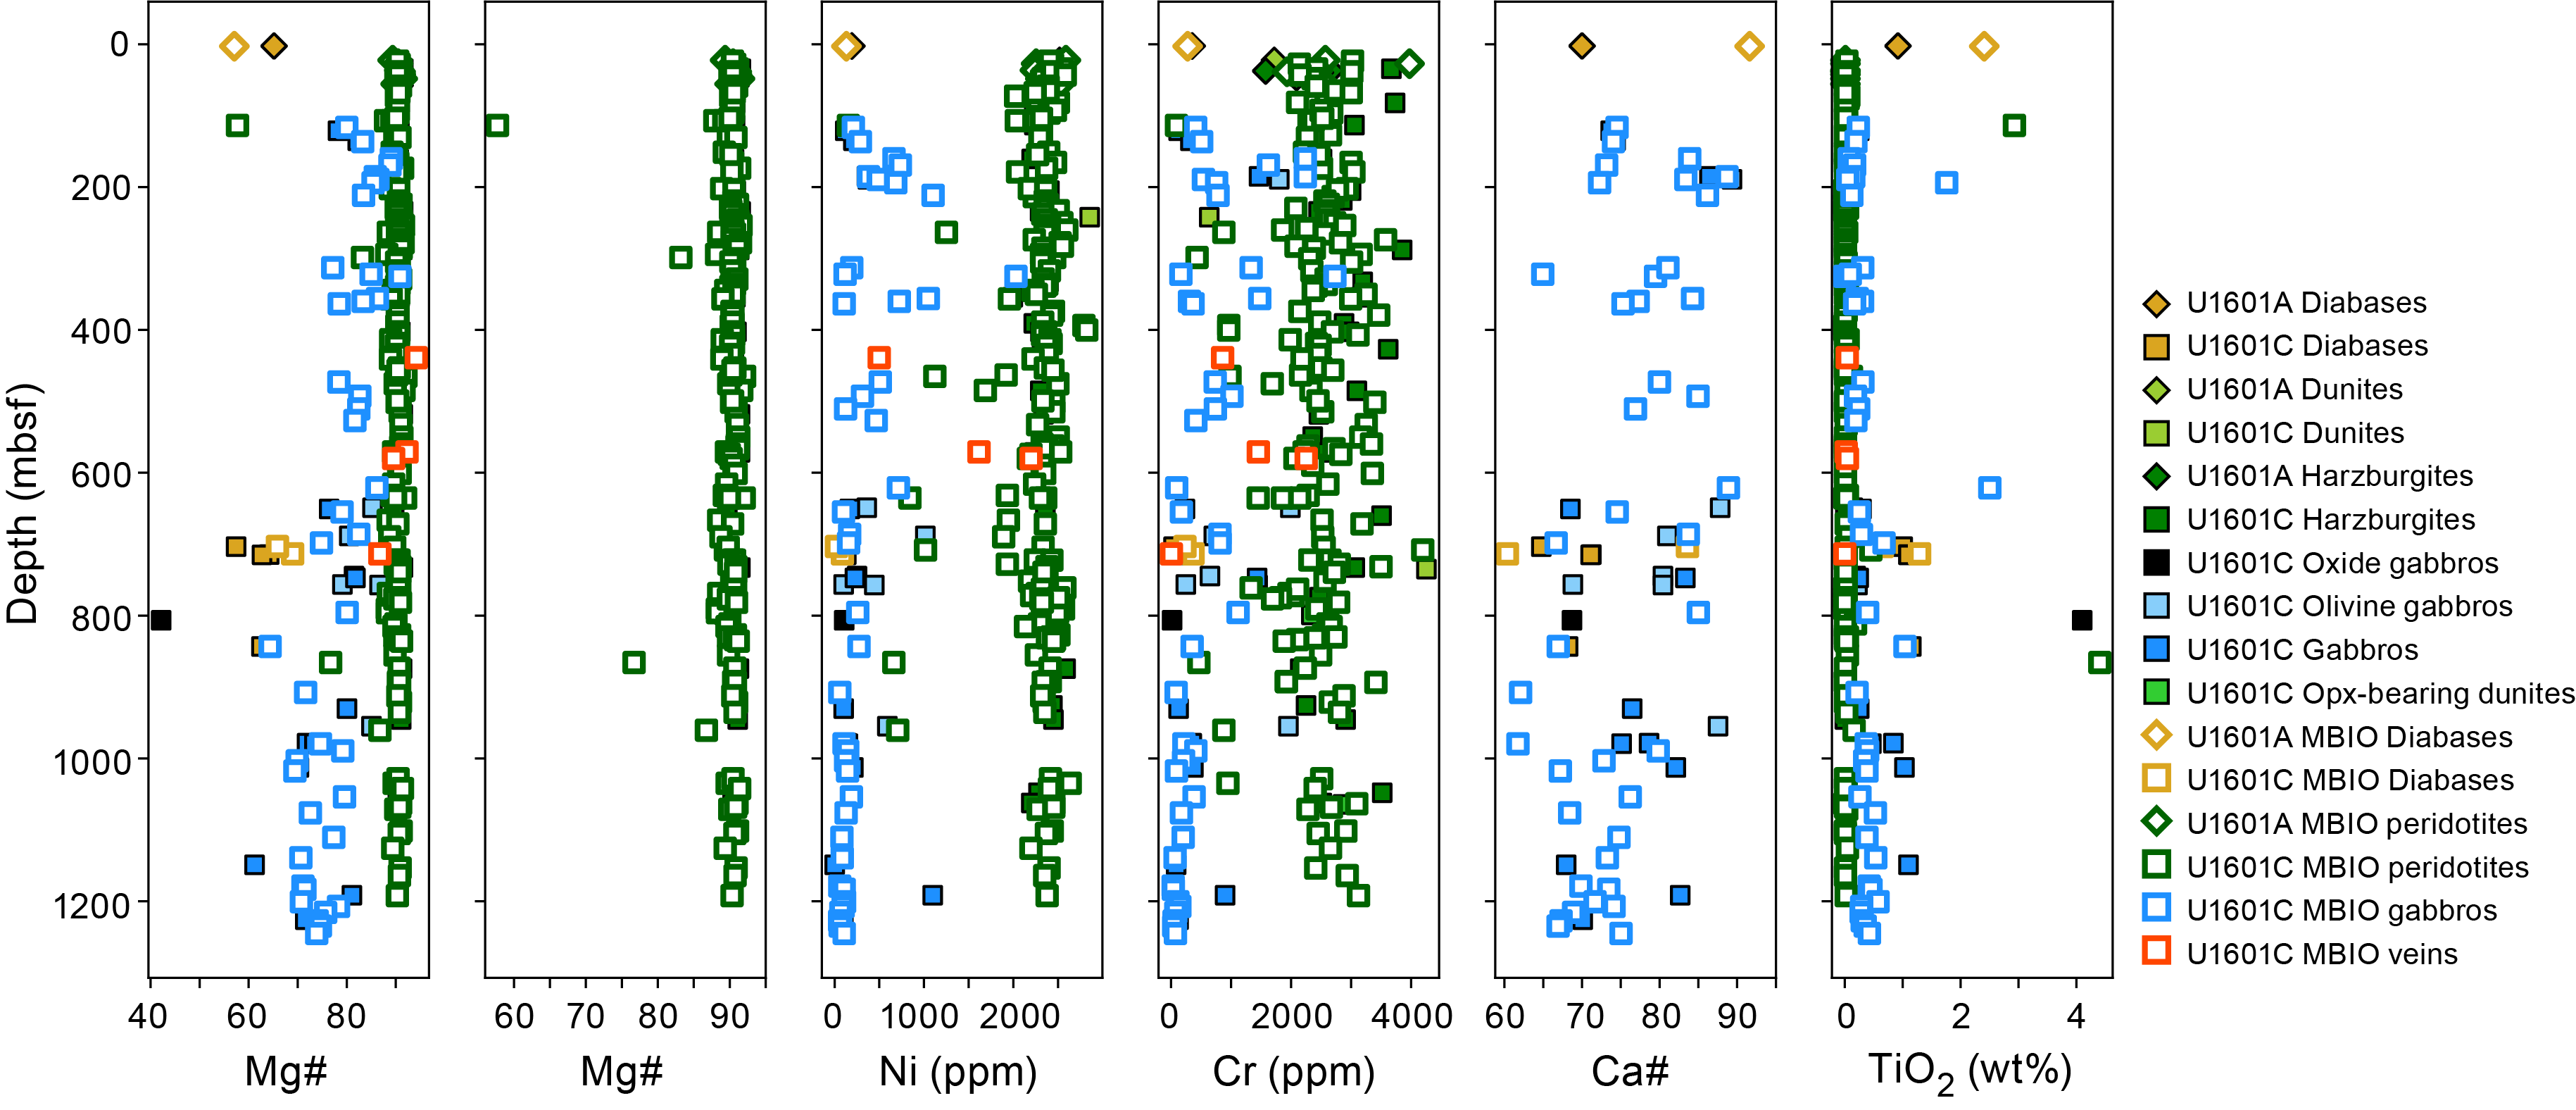
Figure F136. Mg#, Ca#, Ni, Cr, and TiO2, geochemistry and microbiology samples.
6.2.2.1. Serpentinized peridotites
Peridotites were grouped as harzburgites, orthopyroxene-bearing dunites, and dunites (see Igneous petrology). Their composition is illustrated in Figures F126, F127, F128, F129, and F136.
The major and trace element compositions of Site U1601 serpentinized peridotites overlaps that of the serpentinized peridotites previously recovered by drilling on Atlantis Massif during Expeditions 357 and 304/305 (Whattam et al., 2022; Expedition 304/305 Scientists, 2006a; Godard et al., 2009); however, in contrast to previously sampled serpentinized peridotites, the compositions of Site U1601 peridotites are more clustered (Figures F126, F127, F128, F129), suggesting that they may have been little to not affected by late hydrothermal alteration and weathering processes (e.g., Mg loss). The compositions of Site U1601 serpentinized peridotites plot in the field of the most refractory orogenic and ophiolitic peridotites and are characteristic of the most refractory end-members of the oceanic peridotites sampled along slow-spreading ridges. Except for harzburgite Sample 399-U1601C-70R-2, 23–33 cm, Site U1601 peridotites have low Al2O3 (0.2–1.1 wt%) and low concentrations in moderately (e.g., TiO2 = <0.01–0.02 wt%; Figures F128, F129) to highly incompatible (e.g., Zr and Y) elements, the latter being often below the ICP-AES detection limits. They overlap in composition with the highly refractory peridotites drilled during Leg 209 at the 15°20′ Fracture Zone (Shipboard Scientific Party, 2004; Godard et al., 2008) and the depleted end-member of the MARK samples recovered during ODP Leg 153 (e.g., Casey, 1997). These compositions suggest that Site U1601 peridotites underwent high degrees of melt extraction. In contrast, harzburgite Sample 70R-2, 23–33 cm, has relatively fertile compositions with high Al2O3 (2.49 wt%), TiO2 (0.04 wt%), and trace element contents (e.g., Sc = 13 ppm); these fertile compositions likely relate to the high orthopyroxene content of this sample (see Igneous petrology).
Site U1601 serpentinized peridotites display some variations in compositions from one lithology to the other and/or with the same rock type. These compositional variations can be related to different petrogenetic processes and/or simply reflect minor changes in the mineralogy. Hence, dunites and orthopyroxene dunites display the highest Ni (up to 2850 ppm) and lowest trace element contents (e.g., Sc down to 4.5 ppm) consistent with Ni-rich and trace element poor olivine being the dominant mineral. Also, the common correlation of Cr to Al2O3 for low Al2O3 values indicate mainly variations in the amount of spinels in the analyzed sample, the Cr and Al budget being controlled dominantly by this mineral in refractory peridotites. Mg# (Mg# = 100 × cationic Mg/[Mg + Fe]) ranges 89.3–91.5 in Site U1601 serpentinized peridotites, and the lowest Mg# values are found mainly in dunites and orthopyroxene-dunites. Low-Mg# serpentinized peridotites typically have high iron concentrations (FeO up to 10 wt%) compared to average Site U1601 harzburgites (~8 wt%). These iron-rich compositions suggest that some of the recovered dominantly dunitic intervals underwent extensive melt interactions with MORB-type melts.
Site U1601 microbiology peridotites show overall the same trends as Site U1601 geochemistry peridotites but display a broader and more scattered range of compositions when compared to these samples (Figures F127, F128, F129, F136). These variable compositions show the overall higher degrees of alteration of these samples (e.g., high Ca concentrations in carbonate-rich samples, Mg loss associated to weathering) and the abundance of microbiology samples having mixed mafic–ultramafic lithologies.
6.2.2.2. Basalts and diabases
The major and trace element compositions of the five basalt and diabases recovered from Site U1601 overlap those from Expedition 304/305 basalts and diabases and Hole U1309D diabase (Figures F130, F131, F132, F133, F134). They are within the range of MORB (Expedition 304/305 Scientists, 2006a; Godard et al., 2009). However, except for Sample 399-U1601C-171R-1, 55–57 cm, Site U1601 diabases display high alkali contents (Na2O + K2O) of up to 3.00 wt% together with high volatile contents (H2O up to 2.99 wt%; CO2 up to 1.8 wt%), suggesting that their primary composition was probably significantly modified by hydrothermal alteration.
6.2.2.3. Gabbroic rocks
Gabbroic rocks were recovered only in Hole U1601C. The geochemistry samples comprised 7 olivine gabbros, 12 gabbros and gabbronorites, and 1 oxide gabbro (see Igneous petrology). The petrographic description of microbiology gabbroic samples was limited to catwalk observations on whole cores, which did not allow identifications of the different lithologies of analyzed gabbroic rocks. For simplicity, the microbiology Hole U1601C gabbroic rocks were grouped as gabbros.
As illustrated on Figures F130, F131, F132, F133, and F134, the compositions of Hole U1601C gabbros and olivine gabbros overlap for major and measured trace elements. They have SiO2 of 42.2–53.0 wt%, Mg# of 61.2–87.6, Al2O3 of 13.6–22.8 wt% and Ca# (Ca# = 100 × cationic Ca/[Ca + Na]) of 64.7–89.4. Hole U1601C gabbros and olivine gabbros are also characterized by high and variable compositions in moderately to highly incompatible elements, with TiO2 of 0.1–1.1 wt%, Sc of 11.7–41.4 ppm, and V of 40–2503 ppm. Oxide gabbro Sample 163R-2, 120–126 cm, is distinguished by its high concentrations of TiO2 (4.1 wt%) and V (936 ppm) and its low Mg# (42) and Cr concentration (16 ppm) values. The compositions of Hole U1601C gabbroic rocks cover the whole range of compositions of the gabbroic rocks recovered at Site U1309, from troctolites to oxide gabbros (Expedition 304/305 Scientists, 2006b; Godard et al., 2009).
The major and trace element compositions of Site U1601 microbiology gabbros overlap that of the geochemistry gabbroic rocks, but they are significantly more scattered (Figures F130, F131, F132, F133, F134, F135, F136). Similar to the microbiology serpentinized peridotites, these variable compositions primarily reflect their more altered lithologies in addition to mixed rock types within single analyzed samples and/or misidentification of lithologies on hand samples.
6.2.3. Summary
Whole-rock chemical analyses (major and trace element concentrations, total carbon and hydrogen, and inorganic carbon) were performed on 255 samples for geochemical and microbiological studies. In Hole U1601A, seven serpentinized peridotites and one diabase were collected as geochemistry samples and seven serpentinized peridotites and one basalt for microbiology studies. In Hole U1601C, 144 serpentinized peridotites and serpentine veins, 44 variously altered gabbroic rocks, and 3 diabases and crosscutting carbonate veins were sampled as microbiology samples and 24 serpentinized peridotites, 20 gabbroic rocks, and 5 basalt and diabases were selected as geochemistry samples.
Microbiology samples have highly variable compositions compared to geochemistry samples. This can be the result of (1) a bias of sampling toward samples showing the highest degrees of alteration and mixed lithologies and/or (2) catwalk sampling and preparation that did not allow identifying and separating consistently the different lithologies, resulting in samples having mixed mafic–ultramafic signatures and/or incorrect or incomplete descriptions in the microbiology sample logs.
The composition of serpentinized peridotites overlaps the field of refractory 15°20′ Fracture Zone serpentinized peridotites. These compositions suggest that Site U1601 peridotites underwent high degrees of melt extraction. There is chemical evidence of extensive interaction with MORB-type melts (iron enrichment) in several samples, mostly dunites.
The composition of Site U1601 gabbroic rocks overlaps the full range of Site U1309 gabbroic rocks. The most evolved gabbros were recovered at the bottom of Hole U1601C. Except for gabbro Sample 399-U1601C-244R-1, 124–130 cm, the gabbros below 650 mbsf are the least altered of those sampled at Sites U1309 and U1601.
The serpentinized peridotites, gabbroic rocks and other lithologies collected at Site U1601 have variable amounts of carbon, mostly hosted in Ca carbonates, in contrast to the rock samples recovered at Site U1309. The highest carbon values are found in the microbiology samples.
Fluids collected from the series of KFTS runs shortly after logging operations were a mixture of the fresh drill water used to flush the hole, seawater, and possibly formation fluids. Eight cores were returned with significant volumes of fluid due to obstructions between the core and the plastic liner. The geochemistry of these samples was similar to the surface seawater used to flush the hole during drilling, with some samples that had slightly higher pH values. Borehole fluids collected with the KFTS contained detectable H2 and CH4 concentrations that increased with depth. Small fluid volumes that were recovered from the core catcher of most cores contained highly variable H2 concentrations that did not increase or decrease with depth.
7. Microbiology
Microbiological investigations at Site U1601 were intended to explore the potential for life in the shallow subsurface of the Atlantis Massif, at a site where serpentinized rocks were expected to be prevalent. Initial observations of Hole U1601A cores were consistent with this goal. The surprising depth of Hole U1601C provided the unexpected opportunity to document the distribution of life through >1.2 km of the Atlantis Massif, possibly spanning environmental conditions from highly favorable to too extreme for life. Microbiology samples were collected for traditional analyses such as cell counts, cultivation, and DNA sequencing, as well as organic geochemistry analyses intended to document the presence of organic compounds including lipids, organic acids, and amino acids. The dominant lithology of samples was determined by a member of the igneous petrology, structural geology, or alteration team prior to sampling, sometimes through the core liner. Many samples contained more than one lithology; only the dominant lithology is discussed below.
A total of eight microbiology whole-round samples were collected from Hole U1601A from Cores 2R–12R. Most of these samples are predominantly serpentinized harzburgites, plus one diabase and one dunite.
A total of 191 microbiology whole-round samples were collected from 172 different Hole U1601C cores. These samples were chosen with the goal of assembling a sample collection that is balanced with respect to apparent biological potential and geological representation, avoiding pieces that are geologically unique. Most samples are predominantly harzburgites (60%), followed by orthopyroxene-bearing dunites (14%), gabbro (12%), and dunites (5%) (Figure F137). This distribution is moderately skewed in favor of peridotites at the expense of gabbros compared to the overall lithology of Hole U1601C (Figure F5), reflecting the expected greater biological potential of peridotites.
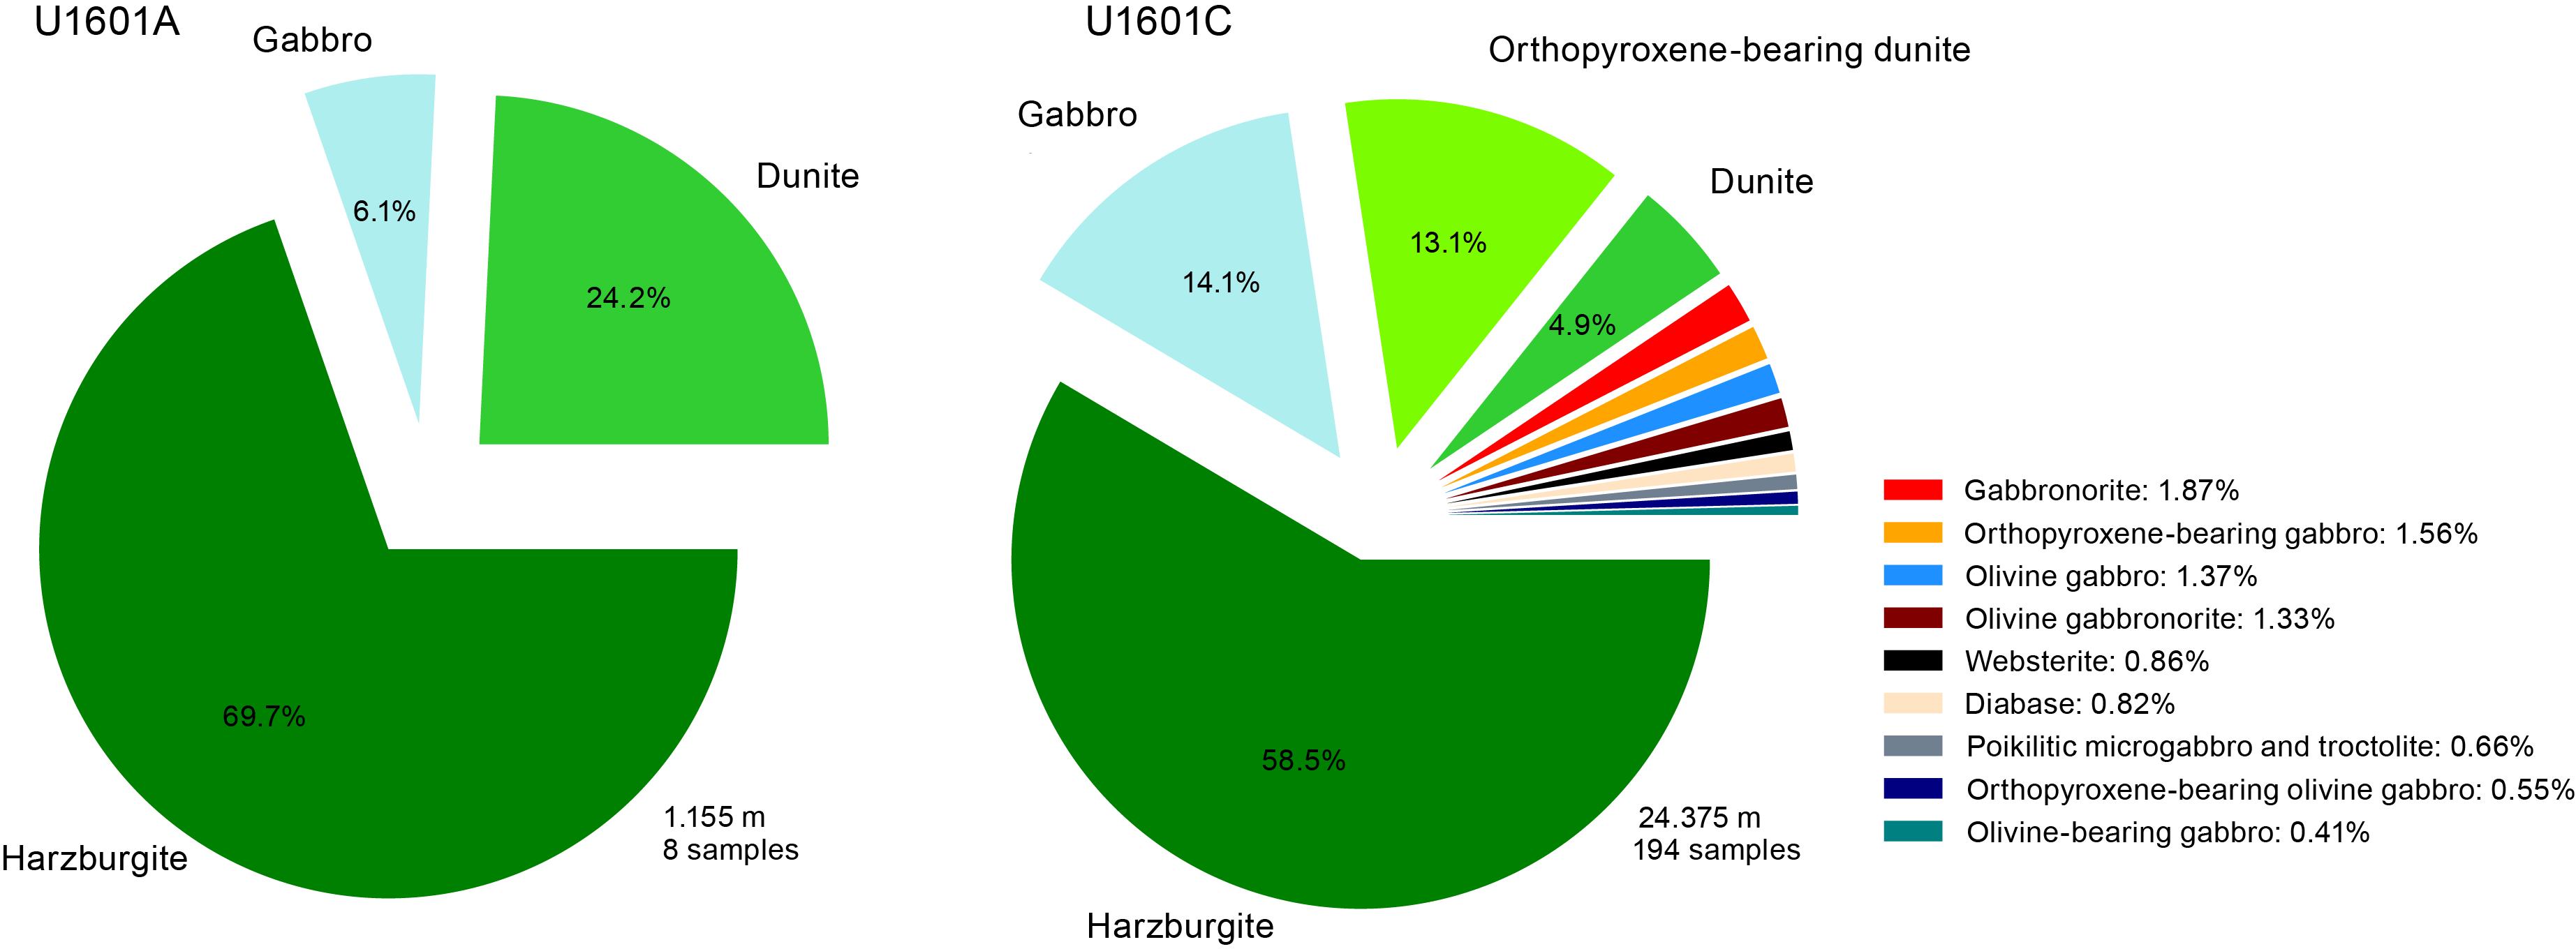
Figure F137. Distribution of predominant lithologies, microbiology samples.
Perfluorocarbon tracer (PFT) assays were conducted with (1) samples of loose rubble collected during the core shakeout, (2) chiseled shavings of the exteriors of microbiology whole-round samples, and (3) crushed interior zones after the exteriors were removed by chiseling. PFT levels in loose rubble samples were in the range of 1–10 ppb in most samples and reached 10–25 ppb in 20 samples. A few extreme outliers up to 257 ppb were the result of accidental increases in the rate of PFT delivery during drilling. The fairly consistent and high levels of PFT in loose rubble samples confirmed the successful delivery of PFT during drilling.
In contrast, PFT was absent or present at only trace levels in nearly all samples of crushed interiors from Holes U1601A and U1601C (Figures F138, F139). PFT levels that were below the level of quantification were divided into two categories: trace (a visible peak was manually identified but could not be quantified) and zero (no peak could be detected, even by manual inspection). Exterior shavings of Hole U1601C samples frequently contained levels of PFT ranging from trace to 5 ppb, whereas most samples of the revealed interiors contained zero PFT. Only two interior samples contained quantifiable PFT levels, and these were very low (0.007 and 0.028 ppb). These results indicate that surface contamination, as measured by PFT, was largely removed from the interior samples.
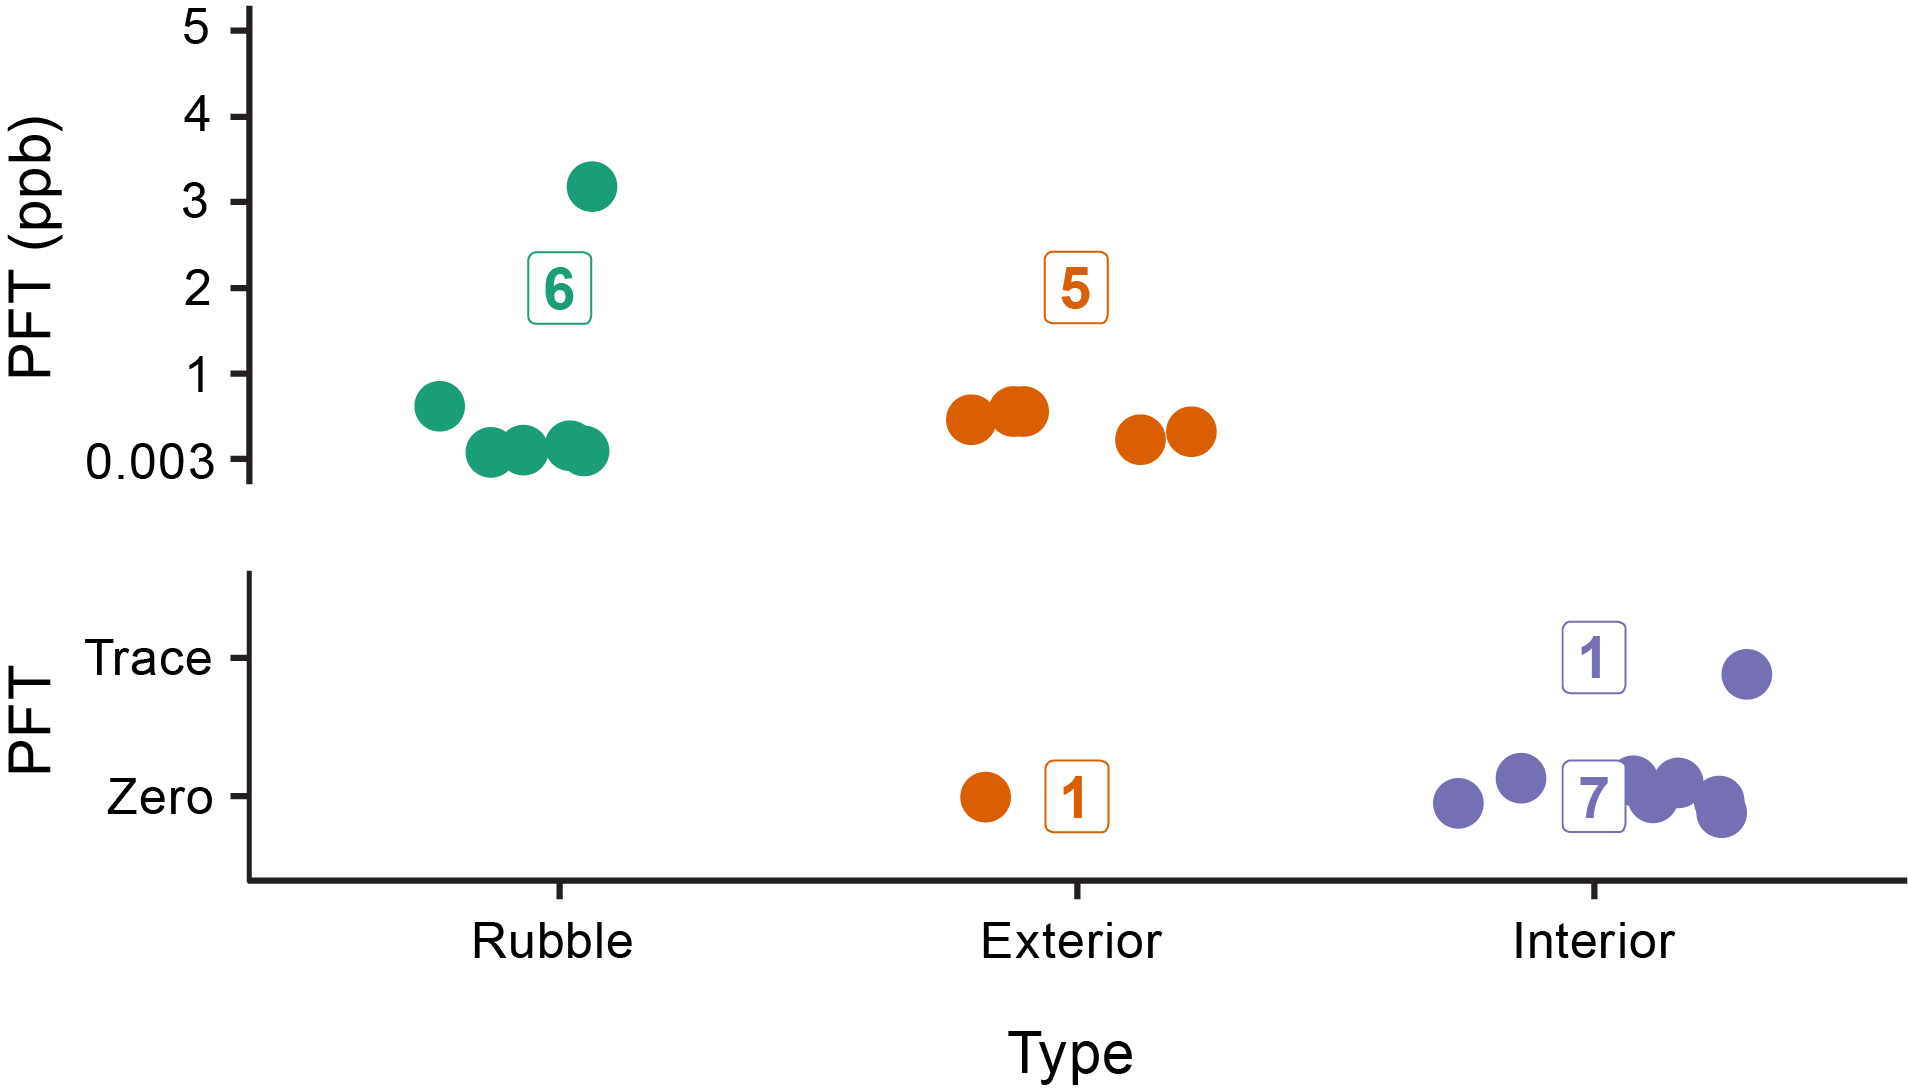
Figure F138. PFT concentrations detected, Hole U1601A.
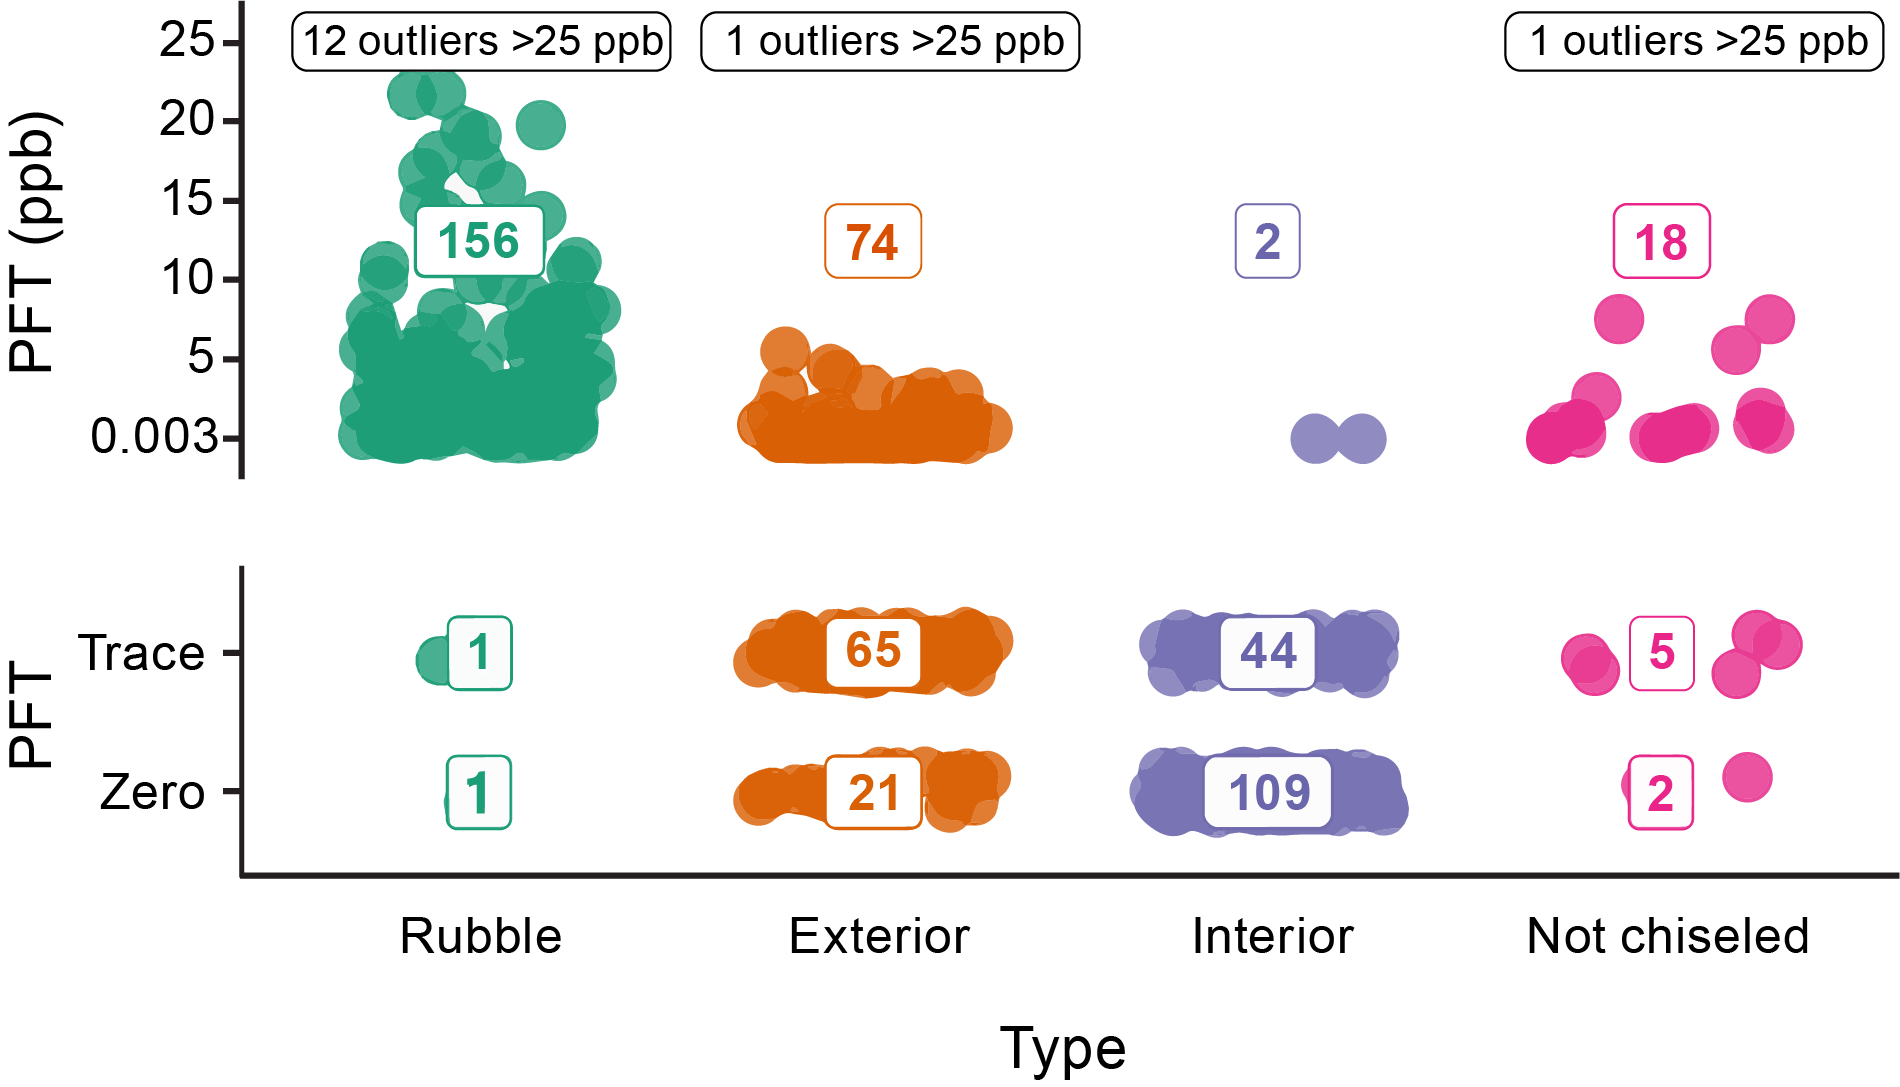
Figure F139. PFT concentrations detected, Hole U1601C.
A subset of 25 microbiology whole-round samples from Hole U1601C could not be chiseled to reveal interior zones because of their unconsolidated, often crumbly compositions. Instead, these samples were rinsed with the sterile 3.5% NaCl solution and then directly crushed and subsampled without sectioning of exterior and interior zones. As expected, PFT levels in these samples were similar to those of exterior shavings and higher than those of isolated interiors (Figure F139). Therefore, downstream microbiological and geochemical results from these samples should be interpreted with caution. Nevertheless, results from these moderately contaminated samples can be useful to identify rare contaminants in cleaner samples. Furthermore, these results demonstrate the necessity of removing the exterior surface of whole-round samples to reveal uncontaminated interior zones.
Most (~160) of the 191 microbiology whole-round samples from Hole U1601C were subsampled for 9–16 different analyses, including microscopy (synchrotron-based microscopy, scanning electron microscopy, and counts of cells and viral-like particles), sorting of single cells, and analyses of DNA, lipids, and organic compounds. A wide range of cultivation experiments were also conducted, including incubations of crushed interiors in 0.2 µm filter-sterilized seawater (157 samples), enrichment incubations (88 samples), high-pressure incubations (5 samples), and stable isotope tracer experiments (33 samples) (Figure F140). A total of 2696 sample records from Hole U1601C are registered in the LIMS database for the microbiology team.
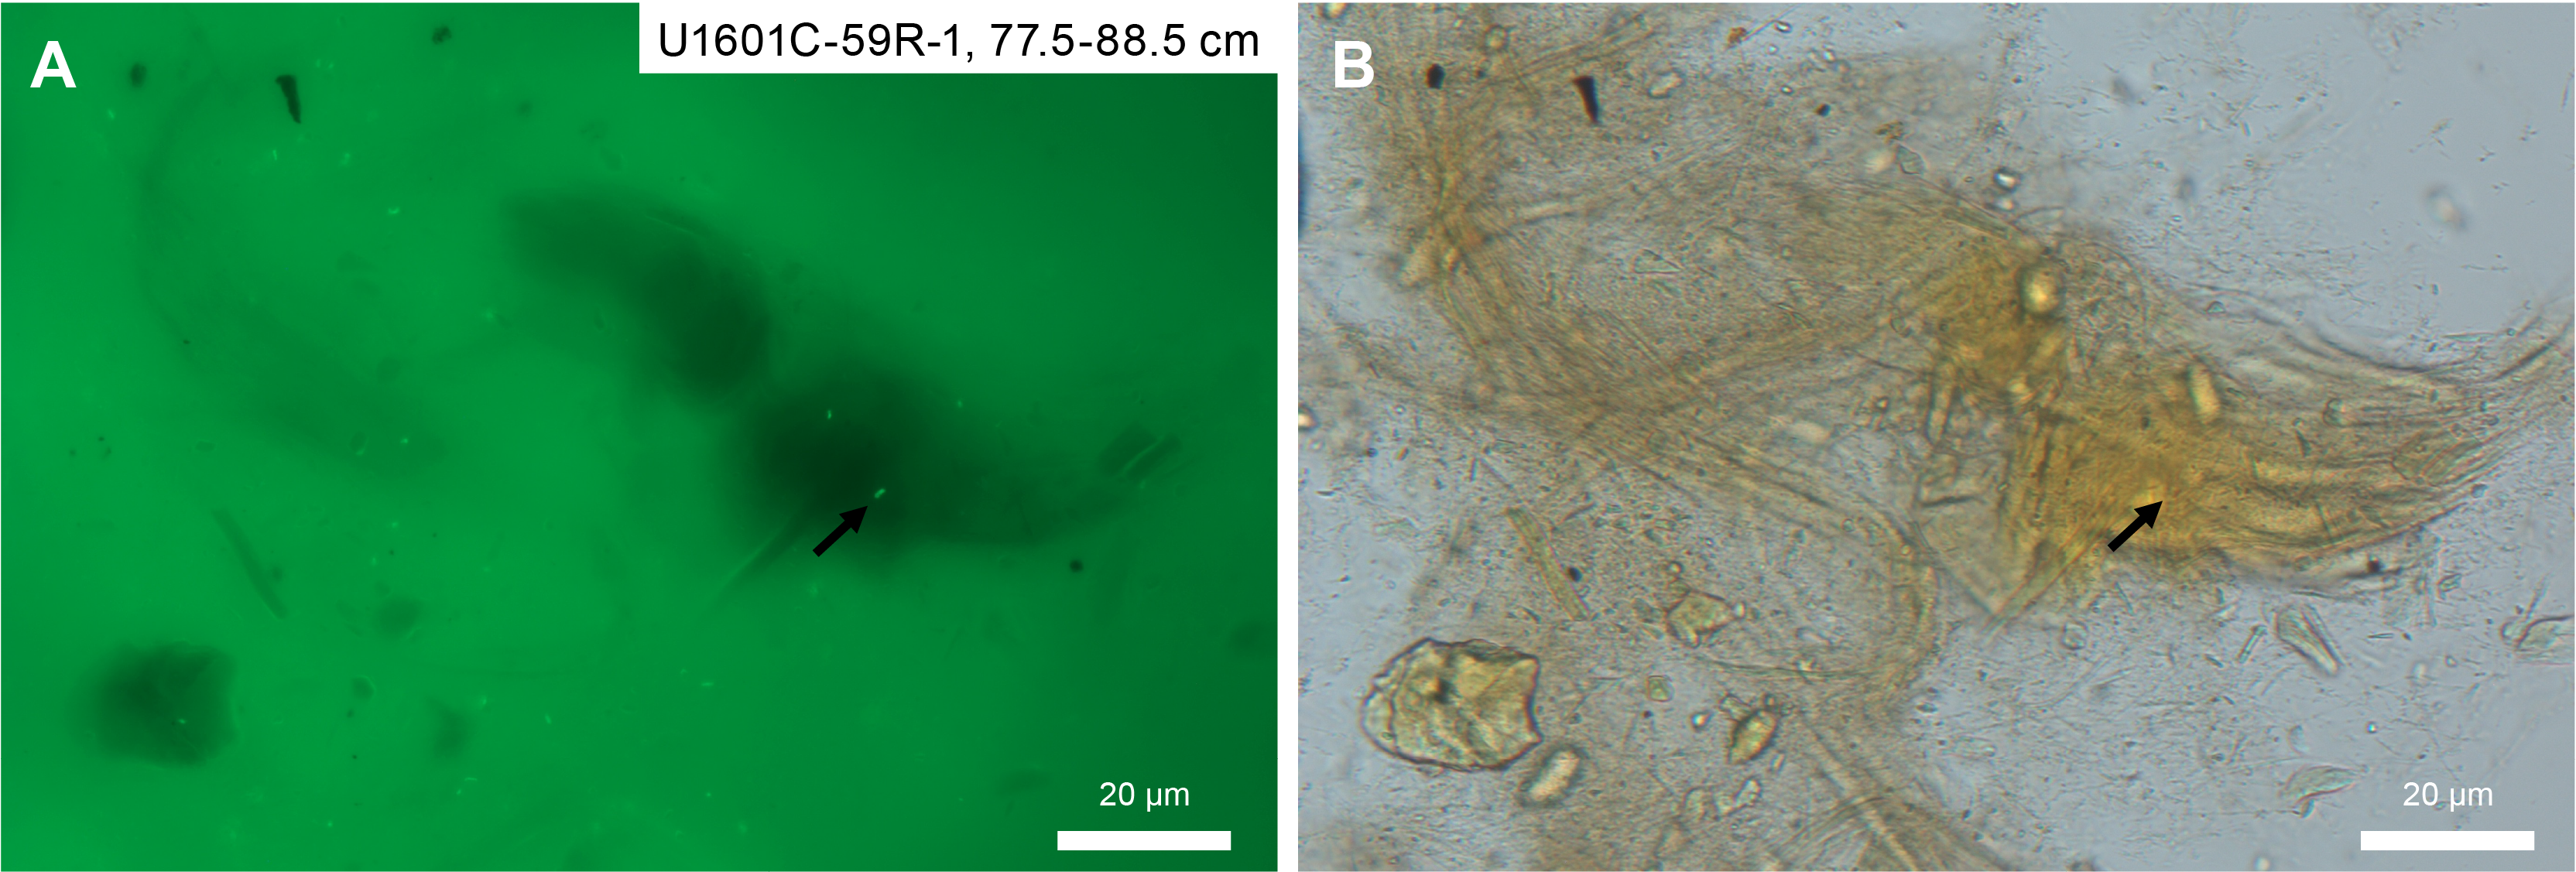
Figure F140. Test enrichment sample.
Samples of borehole water from Hole U1601C were collected with the KFTS to characterize the extent, diversity, and activity of microbial communities within Hole U1601C. Each of the seven successful KFTS samples was subsampled for metabolic activity assays with Redox Sensor Green (RSG) and preserved for single-cell sorting and sequencing. Six of the KFTS samples contained enough water to allow filtering of 250 mL through 0.2 µm Sterivex filter cartridges for DNA sequencing analyses. The filtrate was then used for further geochemical analyses such as radium isotopes. In addition, most of the KFTS samples, depending on the volume of water sample remaining, were subsampled for microscopy, cell counts, and cultivation experiments. Finally, small volumes of fluids collected from the core catcher and analyzed for H2 concentrations were also used for RSG assays and preserved for single-cell sorting and sequencing.
Several samples of deep seawater from a few meters above Hole U1601C were collected in Niskin bottles using the vibration isolated television (VIT) platform after each reentry of the drilling bit. These samples were collected to characterize the ambient seawater in the vicinity of Hole U1601C and to search for potential signs of borehole water expelled from the borehole during reentry of the drilling bit. Niskin water samples were filtered through 0.2 µm Sterivex filter cartridges and preserved for cell counts and sorting of single cells.
8. Petrophysics
The petrophysical properties of rocks at Site U1601 were characterized through measurements on whole-round cores, including NGR, magnetic susceptibility, and gamma ray attenuation (GRA) density. Discrete measurements were completed on rock cubes in Holes U1601A and U1601C and microbiology offcuts in Hole U1601C and included wet mass, dry mass, dry volume, and P-wave velocity. Bulk density, grain density, and porosity were calculated from the mass and volume measurements. P-wave velocity measurements were also completed on archive half pieces when rock cube samples were not available in Hole U1601C. Archive half core pieces >10 cm in length were selected for thermal conductivity measurements. All methods are described in Petrophysics in the Expedition 399 methods chapter (Lang et al., 2025). Rock names reported in this section were assigned by the igneous petrology team (see Igneous petrology). Data for all measurements are summarized in Tables T8, T9, T10, T11, T12, T13, T14, and T15 and Figures F141 and F143 as a function of depth. Downhole temperature logs and five wireline logging runs were completed in Hole U1601C. Downhole fluid sampling was completed in Hole U1601C and results are reported in Geochemistry.
Whole-round measurements required filtering because of spaces between pieces, to some extent fractures, and edge effects on many of the measurements. Filtering was mainly done through a semiautomated MATLAB graphical user interface (GUI) where data was viewed and clipped section by section (see Petrophysics in the Expedition 399 methods chapter [Lang et al., 2025]).
8.1. Hole U1601A
The petrophysical properties were measured in Hole U1601A on serpentinized dunite, serpentinized harzburgite, basalt, and gabbro. A total of 11 cores were analyzed for whole-round and section-half measurements, and a total of 14 rock cubes were measured.
8.1.1. Density and porosity
Bulk density from whole-round measurements of serpentinized dunite and serpentinized harzburgite is ~2.5 g/cm3 without much variation with depth (Figure F141; Tables T8, T9; filtered data are in U1601-H-ST5.xlsx in PETROPHYS in Supplementary material). The bulk density from discrete rock cubes in serpentinized peridotite ranges 2.39–2.53 g/cm3 (average and standard deviation [SD] = 2.48 ± 0.04 g/cm3). Grain density from discrete rock cubes ranges 2.56–2.69 g/cm3 (average and SD = 2.62 ± 0.03 g/cm3). Grain density very slightly increases with depth, but the pattern has a zig-zag shape going back and forth between higher density (>2.65 g/cm3) and lower density (<2.6 g/cm3). Porosity ranges 5.2%–13.4% (average and SD = 8.7 ± 2.4%). Porosity generally increases with depth. Grain density and porosity have a slightly positive correlation. Density overlaps with serpentinized peridotite from Hole U1601C (see below). Porosity in Hole U1601A overlaps on the higher range of porosity in Hole U1601C.
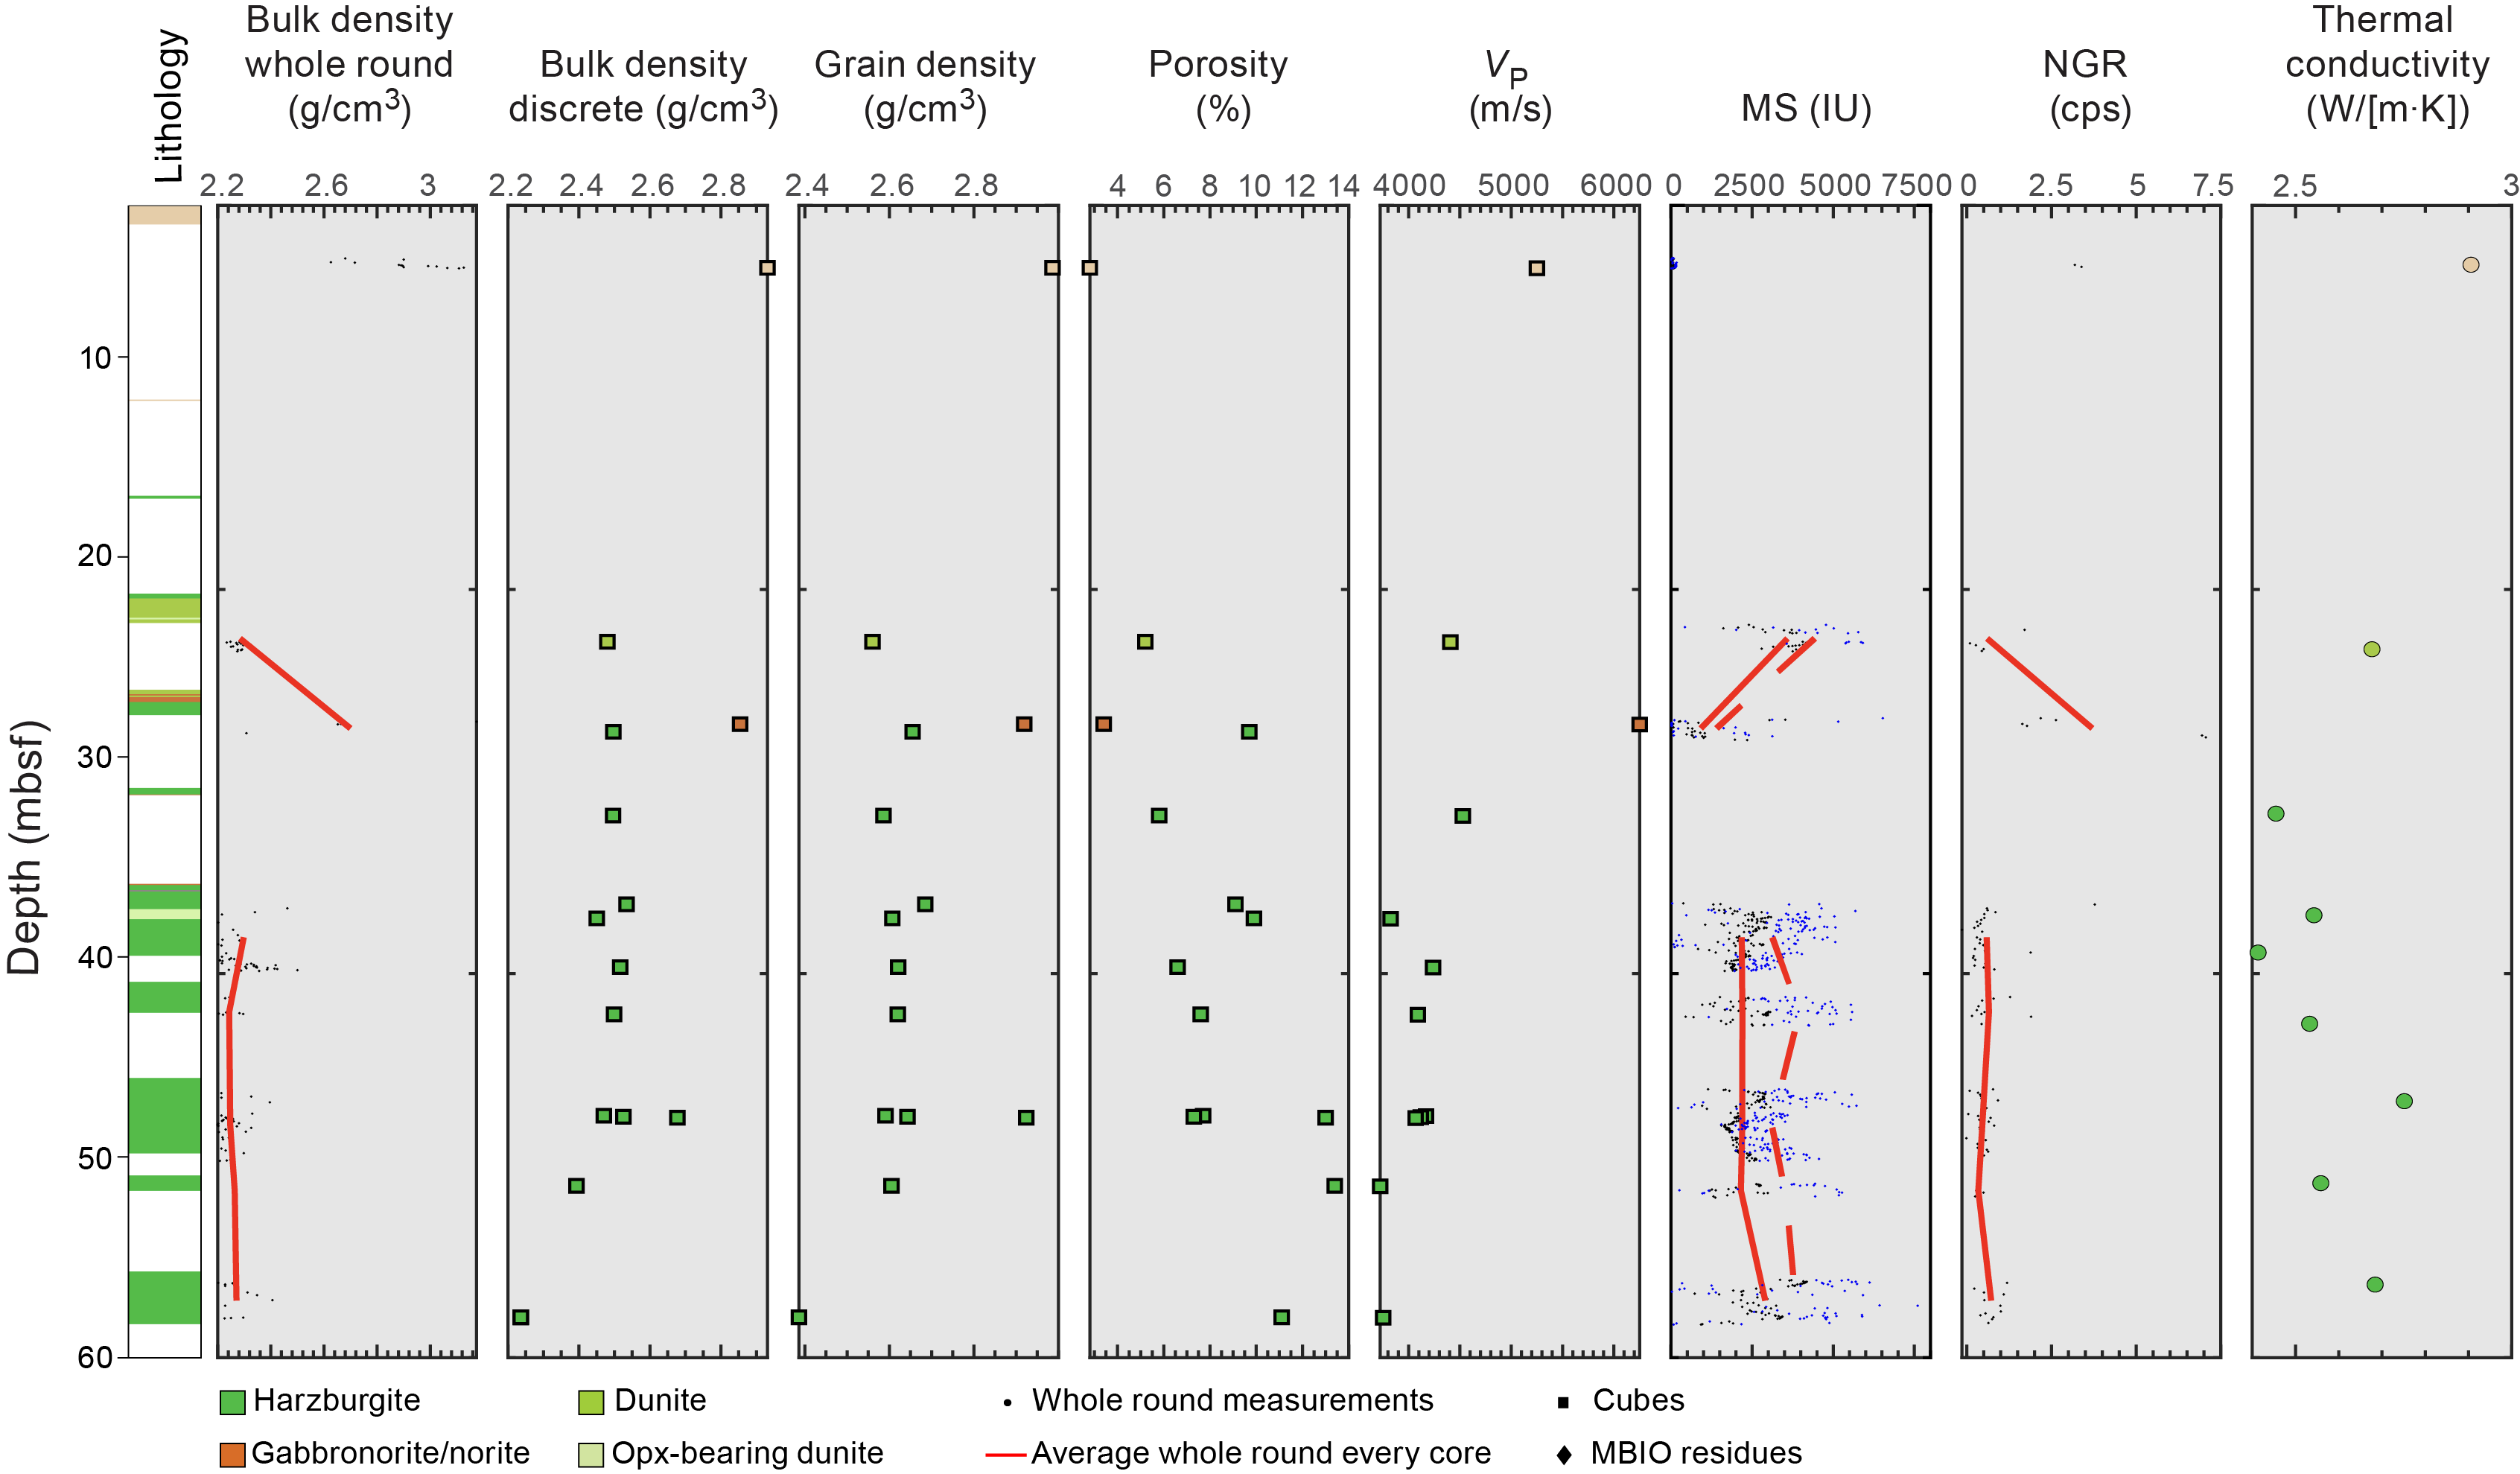
Figure F141. Physical properties, Hole U1601A.
Bulk density measurements from whole rounds of basalt in Section 399-U1601A-2R-1 (3.3 mbsf) and gabbronorite in Section 6R-1 (27.0 mbsf) are ~3.0 g/cm3. These values are in line with measurements from discrete samples with a bulk density of 2.93 g/cm3 for basalt and 2.85 g/cm3 for gabbronorite and a grain density of 2.99 g/cm3 in basalt and 2.92 g/cm3 in gabbronorite. Porosity is 2.8% in basalt and 3.4% in gabbronorite. Density values are comparable to gabbros from Hole U1601C (see below), but the mafic rocks in Hole U1601A exhibit higher porosity.
8.1.2. Sonic velocity
Sonic velocity (P-wave velocity) measurements were taken on 12 discrete cube samples (1 basalt, 1 gabbronorite, 1 dunite, and 9 harzburgite samples) along the three principal directions x, y, and z in the CRF (Figure F2 in the Expedition 399 methods chapter [Lang et al., 2025]). Results are listed in Tables T8 and T10 and plotted in Figures F141 and F142. The average P-wave velocity of the three axes on each sample ranges 3752–6251 m/s (total average = 4368 m/s). P-wave velocities measured in gabbro have an average of 6251 m/s, diabase has an average velocity of 5250 m/s, and harzburgite has an average velocity of 4056 m/s. These values match those measured in Hole U1601C (see below) and those reported for serpentinized peridotite (~4000 m/s) and gabbro (~5500 m/s) from full waveform inversion of Seismic Line Meg 4 that runs north–south near Holes U1601C and U1309D by Harding et al. (2016). The apparent anisotropy of P-wave velocity ranges 2.3%–8.9%. Harzburgite, in particular, displays slightly higher anisotropy (Tables T8, T10; Figure F142) and is slow in the z-axis except for one sample (399-U1601A-7R-1, 27–29 cm).
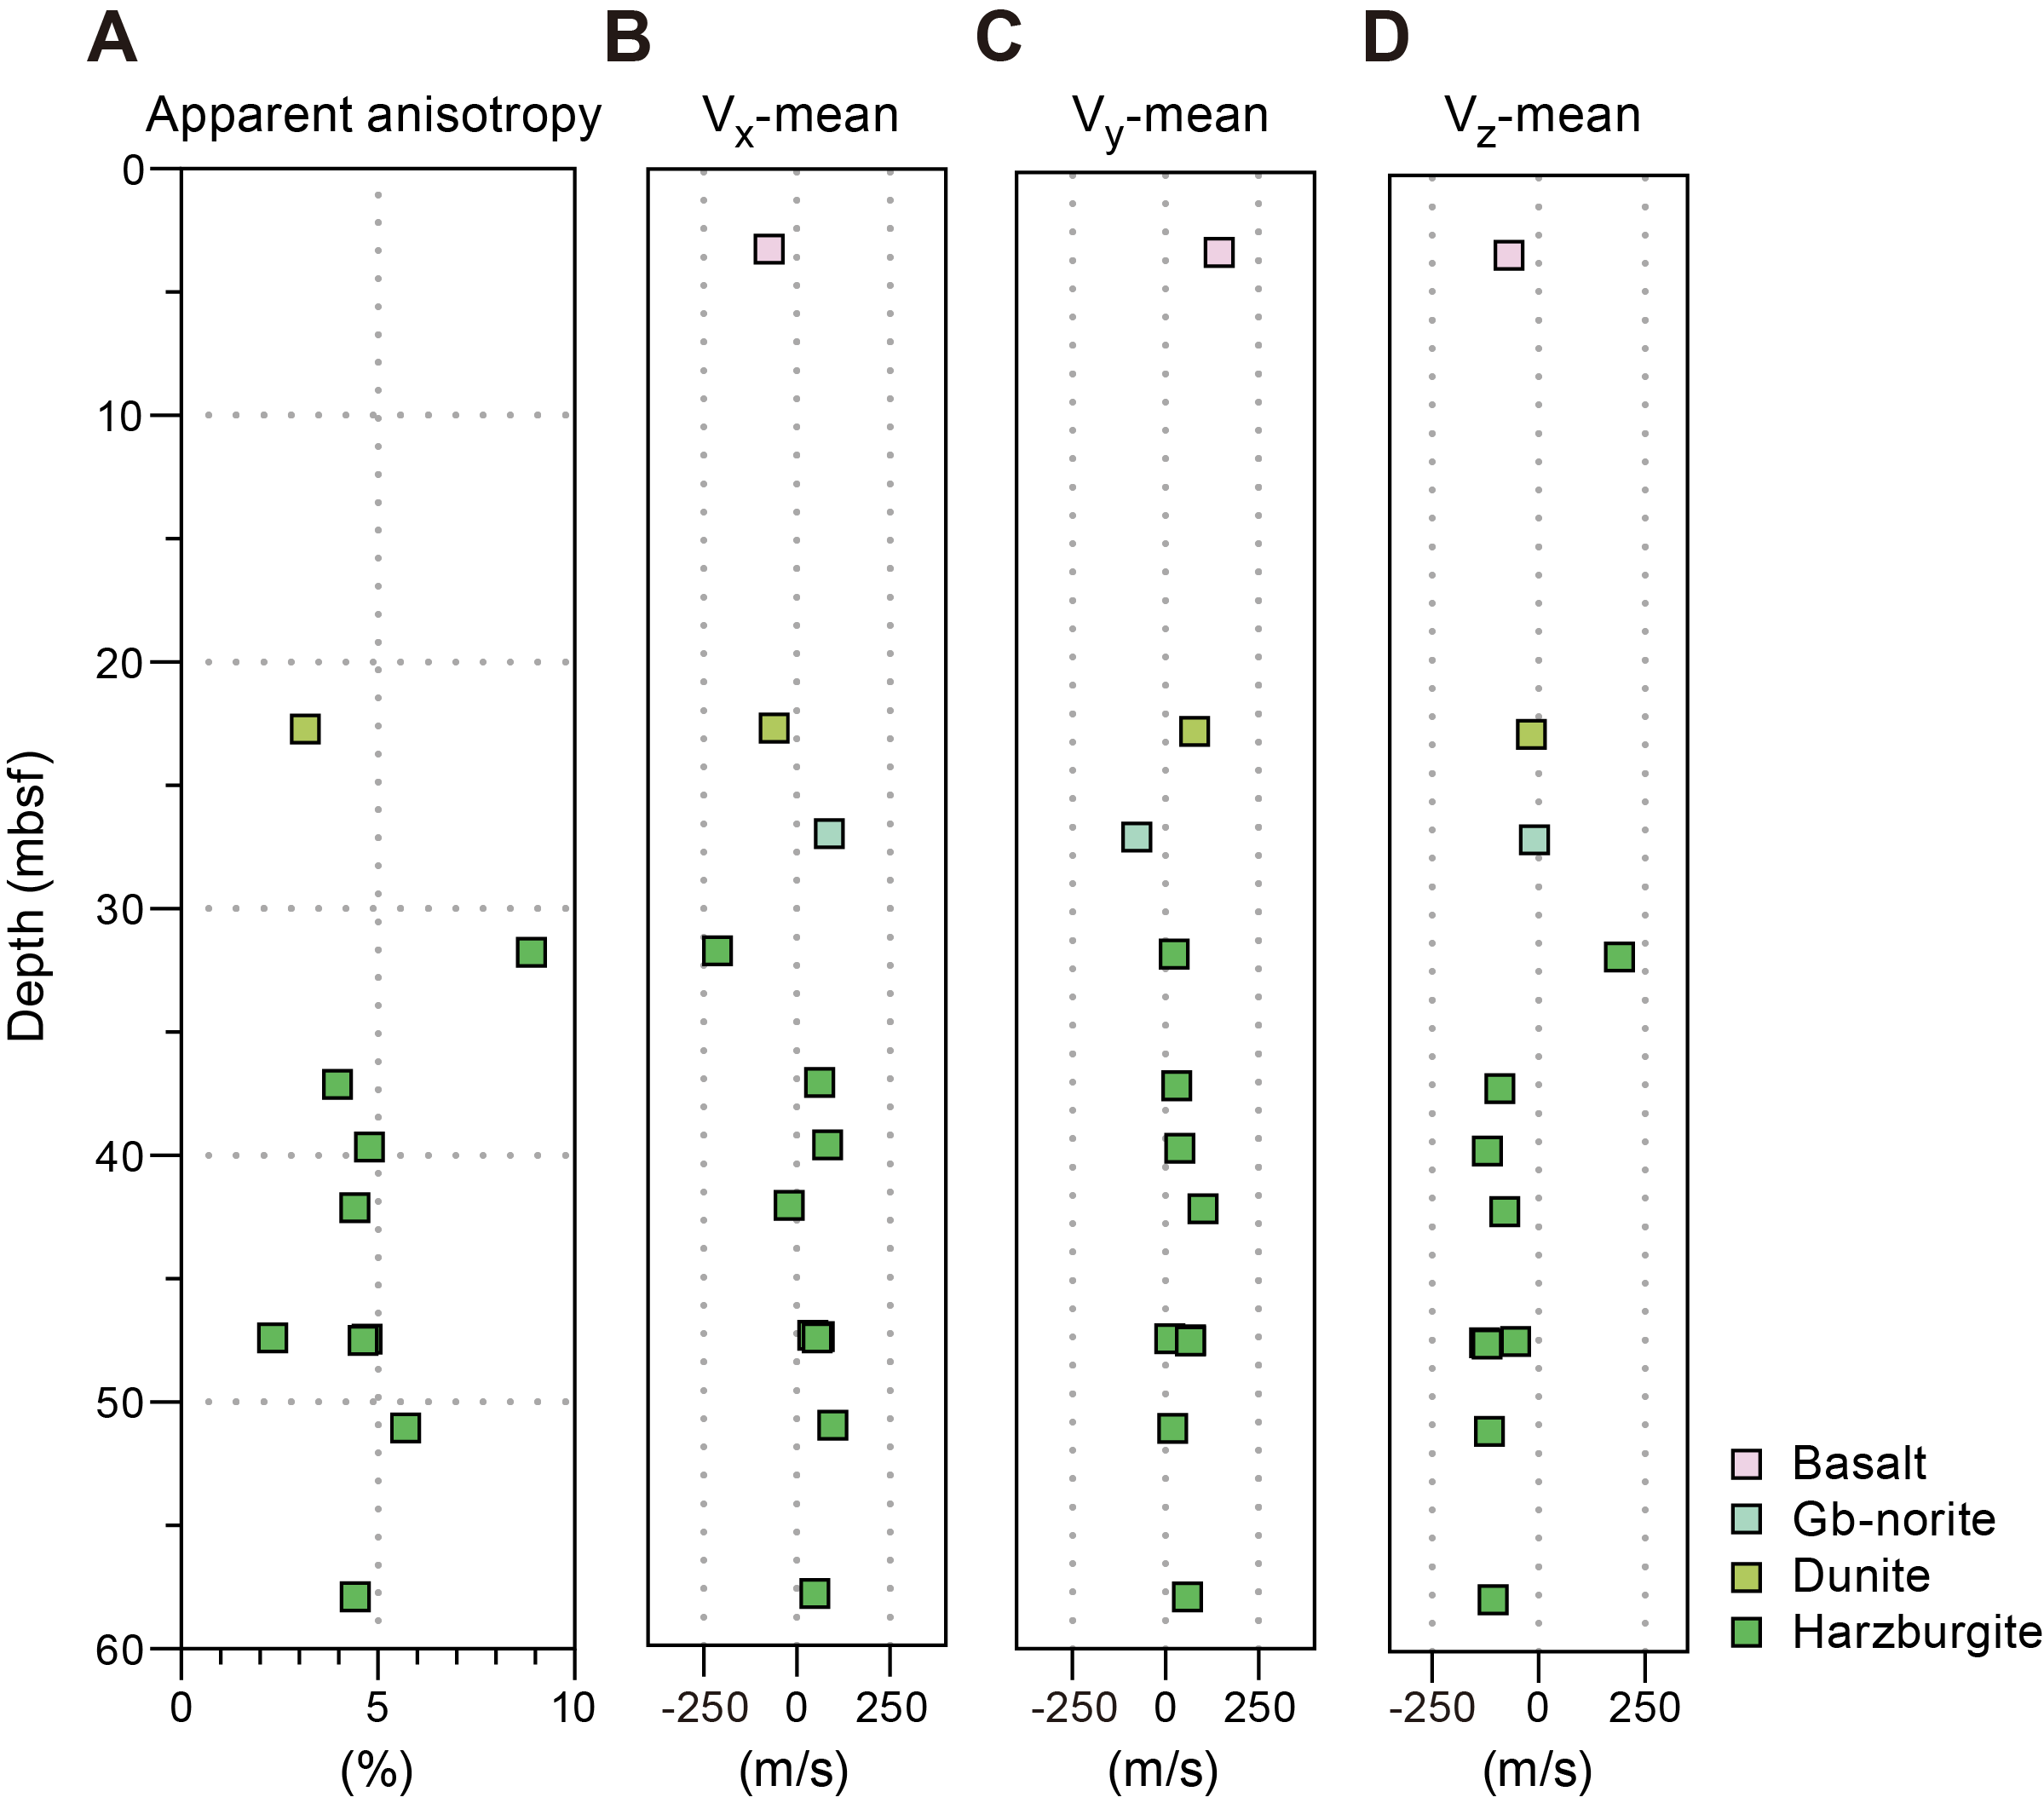
Figure F142. P-wave velocity anisotropy, Hole U1601A.
8.1.3. Magnetic susceptibility
Magnetic susceptibility has a fairly consistent value of ~2400 IU from the pass-through loop magnetic susceptibility (MSL) on whole-round cores and ~4800 IU from the point magnetic susceptibility (MSP) measurements on section halves (Figure F141). There are some changes downhole with lower values (~1600 IU from MSP) in Section 399-U1601A-10R-2 (~48 mbsf). These values are lower compared to those in Hole U1601C.
The magnetic susceptibility in gabbro is overall low with values <4000 IU from the MSL and <8000 IU from the MSP. Basalt and gabbronorite have generally lower values compared to those of serpentinized peridotite.
8.1.4. Natural gamma radiation
NGR values are low and do not exceed 3.5 counts/s in all rock types (Figure F141). The highest values of ~3.5 counts/s are in a serpentinized harzburgite from Section 399-U1601A-6R-1 (~27 mbsf). Other high values are near piece edges (e.g., Section 8R-1; ~38 mbsf) or are in small pieces (e.g., Section 5R-1; ~22 mbsf), which likely indicates they are spurious values (see Petrophysics in the Expedition 399 methods chapter [Lang et al., 2025]).
8.1.5. Thermal conductivity
In Hole U1601A, seven samples were analyzed for thermal conductivity including one basalt sample, five variably serpentinized harzburgites, and one serpentinized dunite. Samples >10 cm in length were measured for thermal conductivity six times with a needle probe, and values shown are generally the mean of these six measurements (see Petrophysics in the Expedition 399 methods chapter [Lang et al., 2025]). Standard deviations for mean values for all samples are <2%. Results are summarized in Tables T8, T11, and T12. The single basalt sample has higher thermal conductivity than all serpentinized peridotites (2.91 and 2.56 ± 0.11 W/[m·K], respectively). Values for the serpentinized peridotites ranged 2.41–2.68 W/(m·K), with a single serpentinized dunite measuring slightly higher than the serpentinized harzburgites. Thermal conductivity of the serpentinized harzburgites generally increases with depth (Figure F141).
8.2. Hole U1601C
Petrophysical properties were measured in Hole U1601C on diabase/basalt, serpentinized peridotite (dunite, orthopyroxene-bearing dunite, harzburgite, wehrlite, and pyroxenite), gabbros (gabbro, oxide gabbro, olivine gabbro, olivine-bearing gabbro, gabbronorite, and troctolite), and other intrusions (diorite and oxide diorite). A total of 257 cores were analyzed for whole-round measurements. A total of 134 discrete measurements were made on 41 cubes and 93 microbiology offcuts. Results are summarized in Table T8 and Figure F143. There are large gaps in the distribution of cubes with the largest gap between 189 and 654 mbsf (Cores 399-U1601C-36R through 131R), where no cube samples were taken (see Operations). Microbiology samples were used starting at Section 19R-2 (107 mbsf). Microbiology samples are very irregular in size and shape compared to cube samples and may not be as suitable for some calculations. The pycnometer is standardized with 10 cm3 spheres. The microbiology offcuts that were used range in volume from 2 to 10 cm3 (average = 5 cm3). This difference may lead to some error in calculations. In three sections a microbiology sample and a cube sample were taken near each other and in the same lithology, including Sections 147R-2 (727.9 mbsf), 157R-2 (776.5 mbsf), and 169R-3 (835.5 mbsf). In these samples grain density varies up to 2% and porosity differences are up to 17%. In most cases, the grain density calculated using microbiology samples is higher and the porosity is lower compared to the cube samples. Considering this, grain density and porosity are plotted for both sample types; however, porosity may not be as reliable in the microbiology samples.
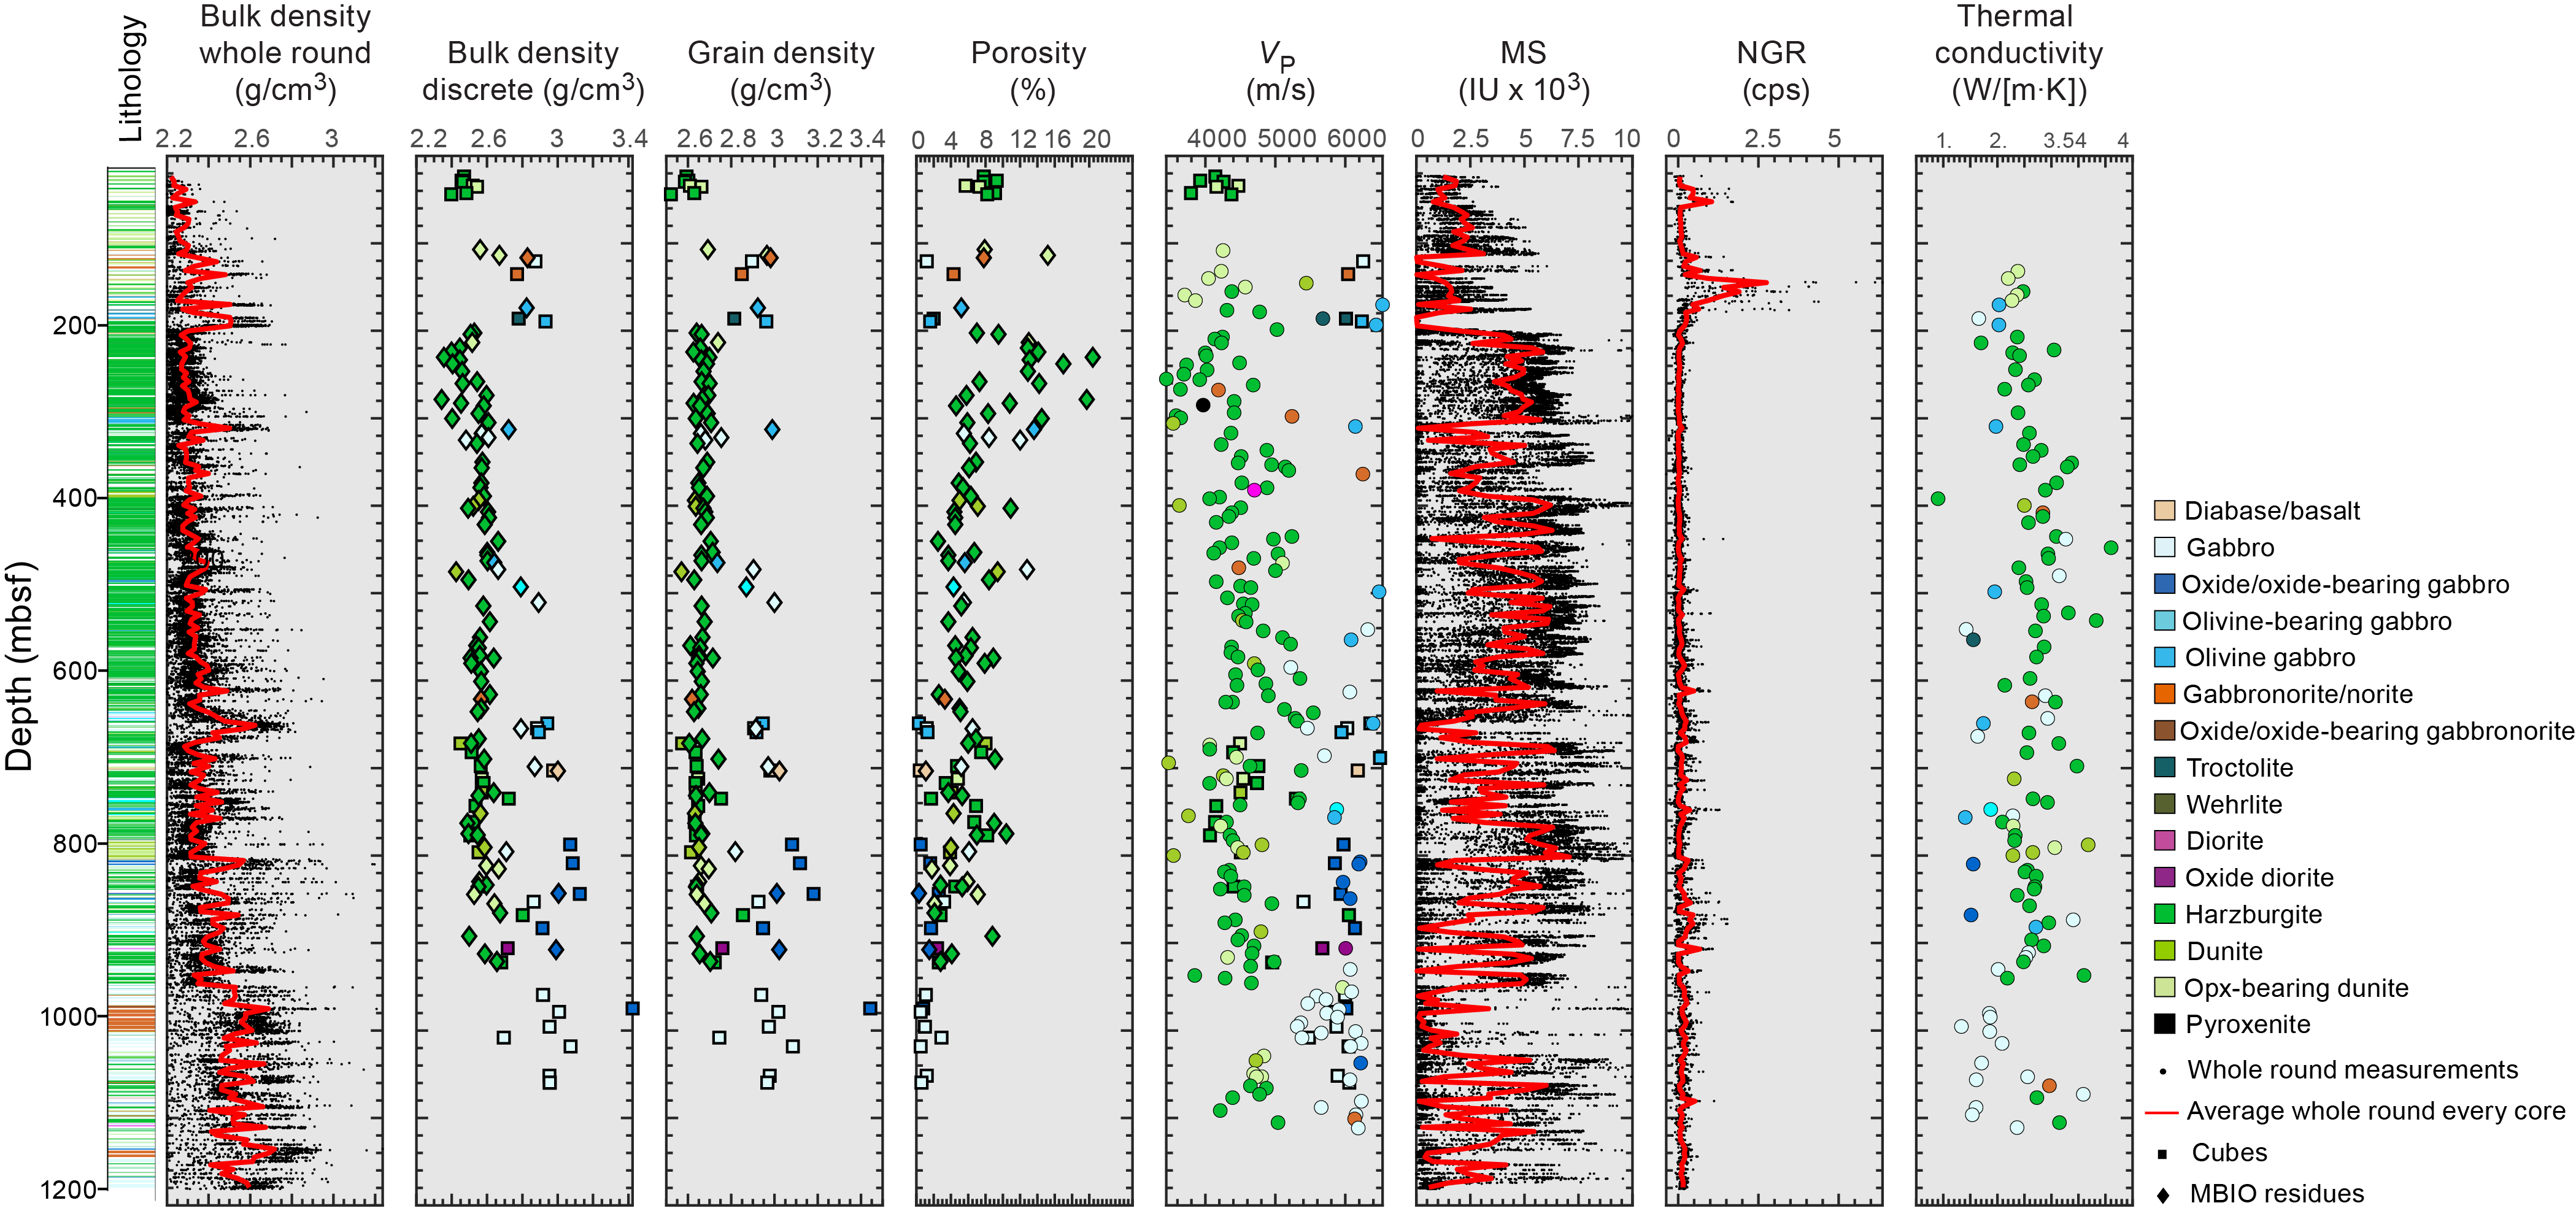
Figure F143. Physical properties, Hole U1601C.
8.2.1. Density and porosity
Bulk density for all rock types and all depths measured on whole-round sections (GRA) ranges 2.1–3.24 g/cm3 (Figure F143). GRA bulk density in serpentinized peridotite ranges 2.1–2.7 g/cm3. The bulk density is the lowest in serpentinized peridotite in the shallowest portions of the hole and has a more consistent value deeper in the hole (Figure F143). The highest bulk density values of ~2.7 g/cm3 occur in Sections 399-U1601C-148R-3 through 150R-2 (734.5–743 mbsf) in serpentinized harzburgite. The bulk density measured on discrete samples in serpentinized peridotite ranges 2.34–2.72 g/cm3 (average and SD = 2.55 ± 0.08 g/cm3). The grain density ranges 2.52–2.97 g/cm3 (average and SD = 2.66 ± 0.05 g/cm3). The average grain density in serpentinized dunite is 2.62 g/cm3 (n = 8). The average grain density of serpentinized orthopyroxene-bearing dunite is 2.69 g/cm3 (n = 11). The average grain density of serpentinized harzburgite is 2.66 g/cm3 (n = 75). The lowest grain density of 2.52 g/cm3, in a serpentinized harzburgite, is in Section 6R-2 (44 mbsf). The highest grain density of 2.97 g/cm3 in serpentinized harzburgite is in Section 20R-3 (113.7 mbsf). This means that the highest and lowest ultramafic grain densities are in the upper 125 m of the hole and are only 70 m apart. The highest bulk density of 2.72 g/cm3 in serpentinized harzburgite was measured in Section 148R-3 (734.9 mbsf). The lowest bulk density of 2.34 g/cm3 in serpentinized harzburgite is in Section 54R-3 (278.5 mbsf). Both bulk and grain density slightly increase downhole as depicted in Figure F143. This trend is more evident in bulk density measured on whole-round sections when each core section is averaged by lithology (see below; Figure F144). Near the top of the hole, the grain density measured on discrete samples clusters at ~2.6 g/cm3 and then increases to a grain density as high as ~2.7 g/cm3 before decreasing again to values ~2.64 g/cm3. A zig-zag pattern in density downhole likely indicates a complex serpentinization history (Miller and Christensen, 1997).
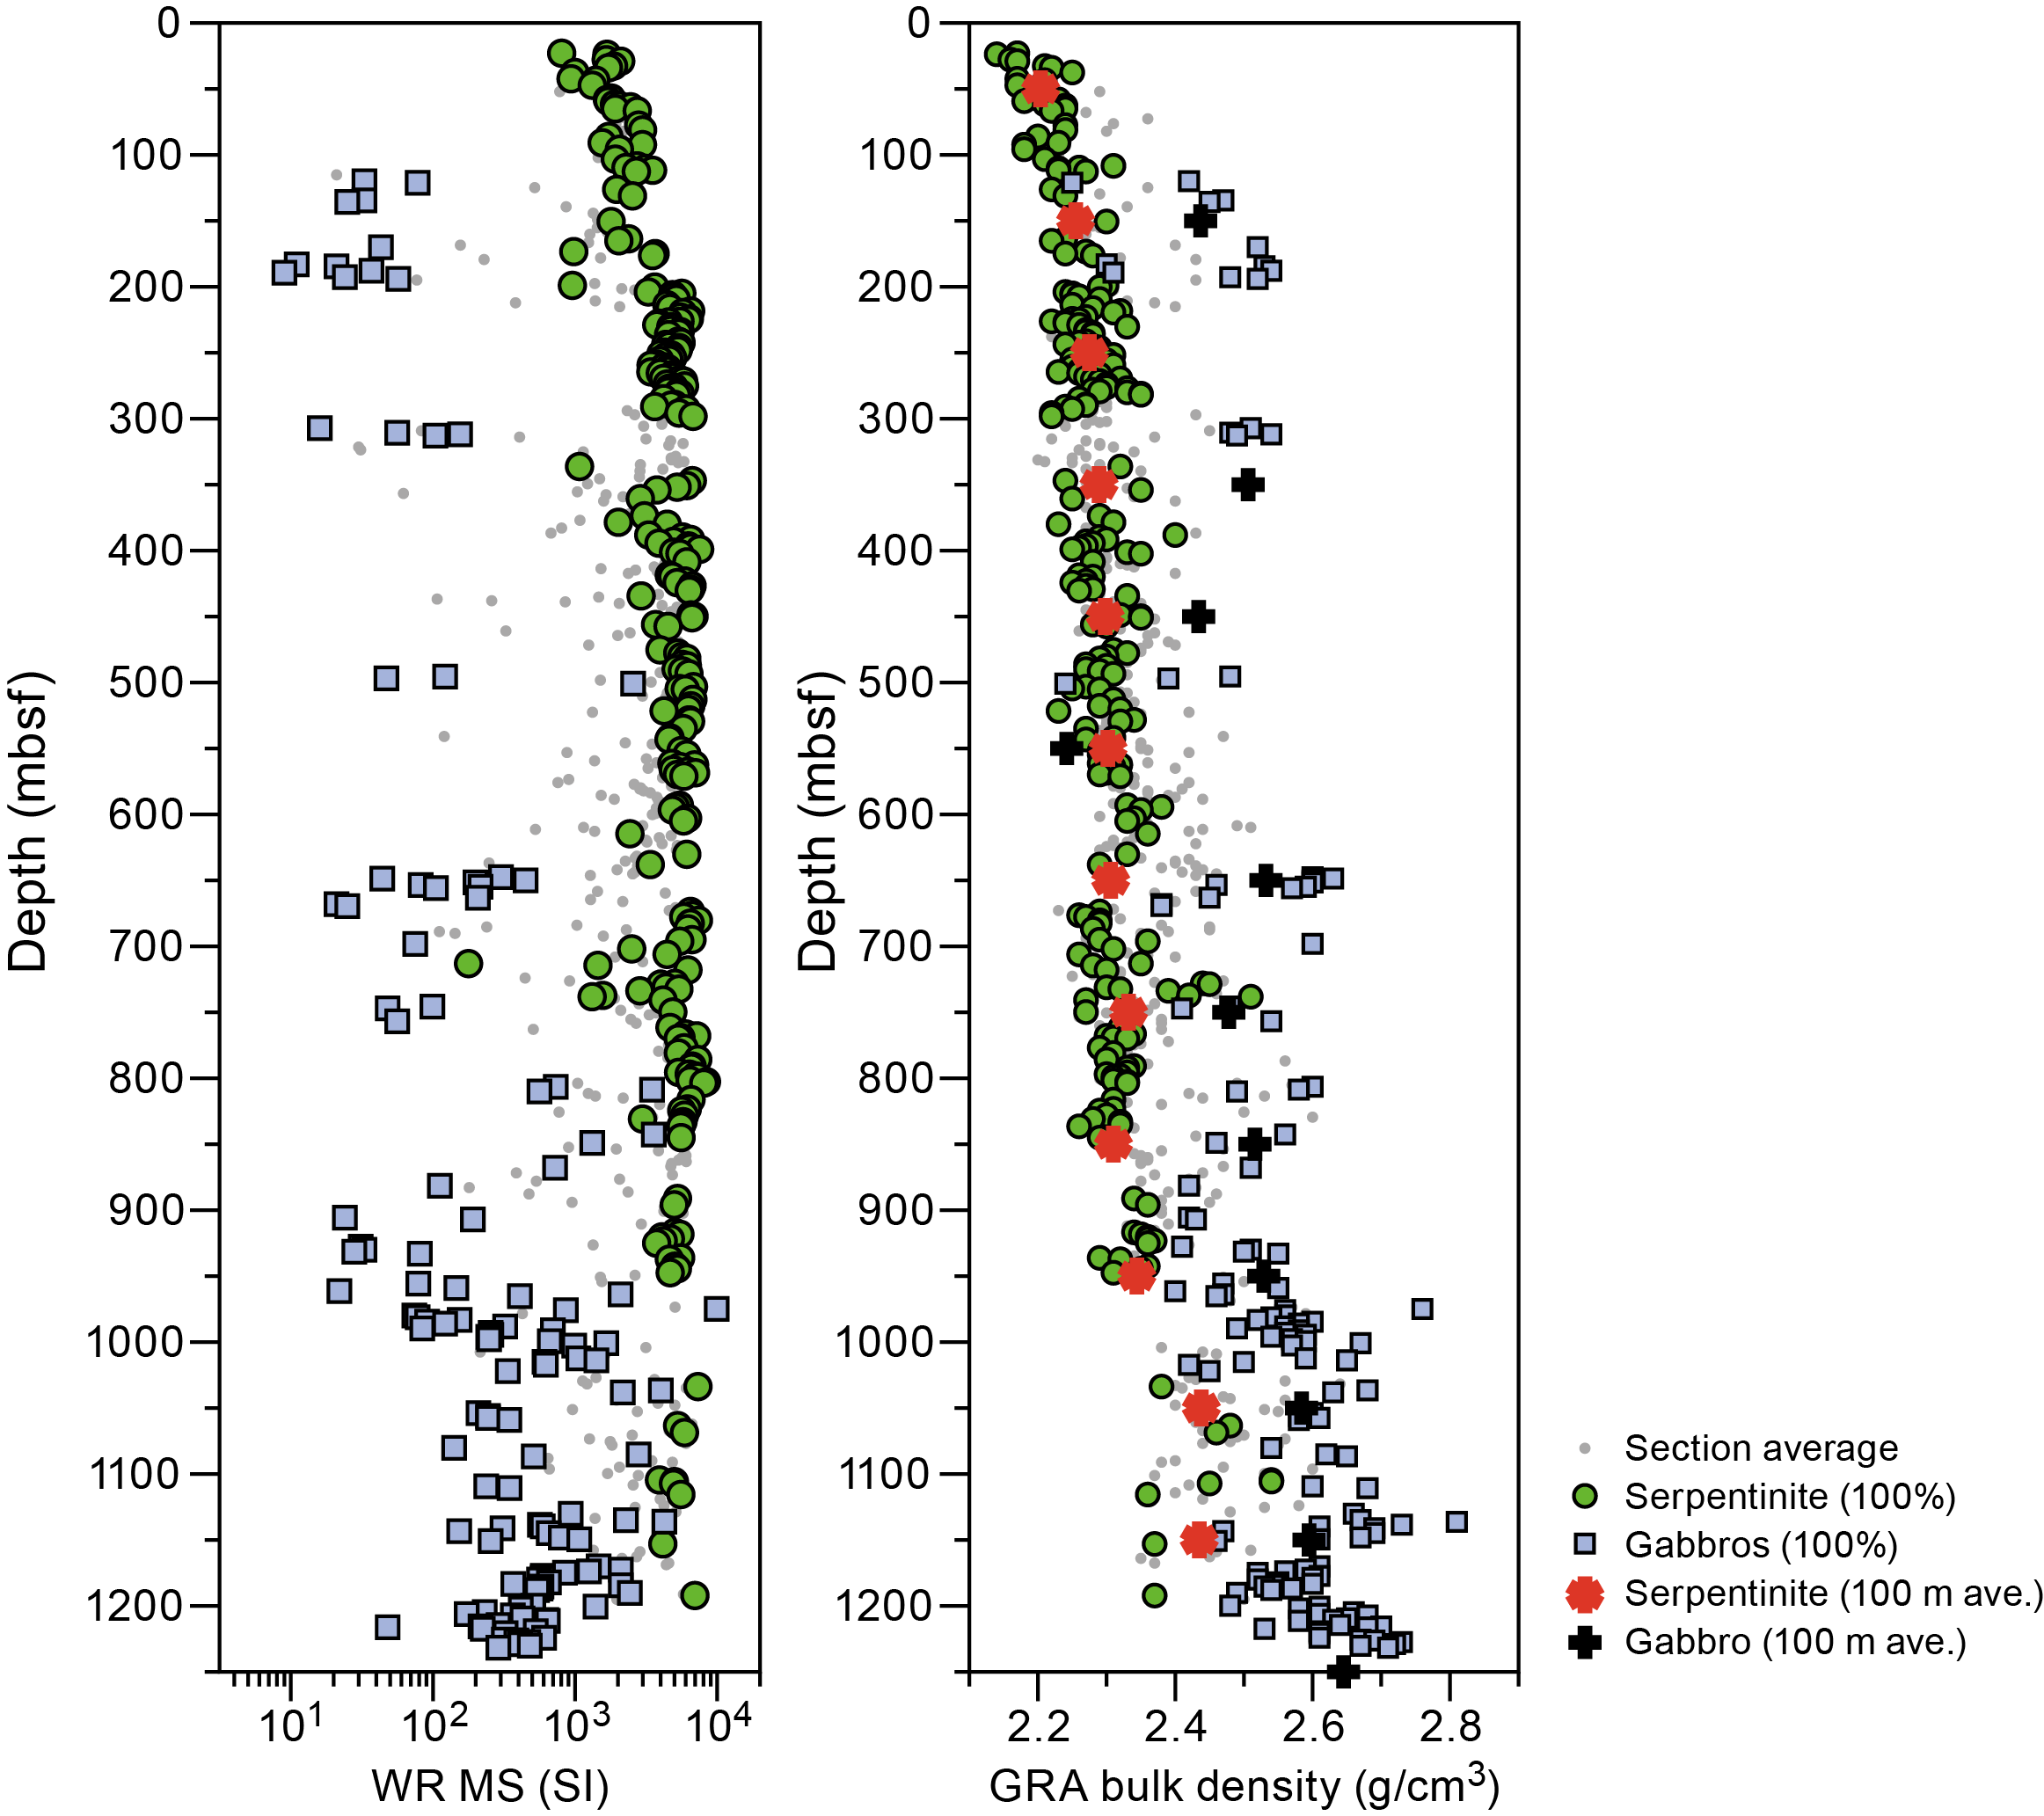
Figure F144. MSL magnetic susceptibility and GRA bulk density.
Bulk density in gabbro measured on whole-round sections (GRA) ranges 2.5–3.24 g/cm3 (Figures F143, F144) and increases with depth. The increase in gabbro proportion with depth causes a large shift in bulk density at ~950 mbsf. Other intervals with a higher proportion of gabbro determined by higher bulk densities include ~190, ~650, and ~800 mbsf. The bulk density measured on discrete samples in gabbro ranges 2.48–3.42 g/cm3 (average and SD = 2.86 ± 0.18 g/cm3). The grain density ranges 2.62–3.44 g/cm3 (average and SD = 2.93 ± 0.15 g/cm3). The majority of gabbro varieties (i.e., gabbro, gabbronorite, olivine-bearing gabbro, and olivine gabbro) have very similar grain densities of ~2.9 g/cm3. The main exceptions are diabase, which has an average grain density of 3.0 g/cm3 (n = 2), and Fe-Ti oxide gabbro, which has an average grain density of 3.1 g/cm3 (n = 7). The highest grain density measured (3.42 g/cm3) is a Fe-Ti oxide gabbro in Section 399-U1601C-198R-1, 123 cm (974.8 mbsf). One Fe-Ti oxide diorite has a grain density of 2.76 g/cm3, and one troctolite has a grain density of 2.81 g/cm3. Grain density in gabbro is variable with depth (Figure F143). Bulk density is also variable, but generally increases with depth when each core section is averaged for lithology (see below; Figure F144). The majority of gabbros have higher density than the serpentinized peridotites; however, in a few intervals, these rocks overlap in grain density values (Sections 64R-1 [324.9 mbsf] and 125R-2 [621.2 mbsf]).
The average GRA bulk density in each whole-round section was calculated for two lithologic groups of serpentinized ultramafic and gabbroic rocks (see U1601-H-ST1.xlsx in PETROPHYS in Supplementary material). The proportion ratio of the two lithology groups was calculated from each core's length of principal lithologies based on the lithologic description (see Igneous petrology). The cores that accounted for more than 95% of the total in each group were chosen and plotted in Figure F144. A subtle downhole increase in the average GRA bulk density is seen in serpentinized ultramafic rocks and in gabbroic rocks (Figure F144). The average GRA density by 100 m depth intervals changes from 2.20 g/cm3 (0–100 mbsf) to 2.44 g/cm3 (1100–1200 mbsf) in serpentinized ultramafic rocks and from 2.44 g/cm3 (100–200 mbsf) to 2.663 g/cm3 (1200–1267 mbsf) in gabbroic rocks.
The porosity of serpentinized peridotite ranges 1.7%–20.4% (average and SD = 7.0 ± 3.7%) (Tables T8, T9). The lowest porosity of 1.7%, in a serpentinized harzburgite, is in Section 148R-3 (734.9 mbsf). The highest porosity of 20.4%, in a serpentinized harzburgite, is in Section 44R-3 (230.3 mbsf). Serpentinized dunite has an average porosity of 5.7% (n = 8). Serpentinized orthopyroxene-bearing dunite has an average porosity of 6.7% (n = 11). Serpentinized harzburgite has an average porosity of 7.2% (n = 74). Porosity is variable downhole but decreases overall, most notably below 400 mbsf (Figure F143). The shallowest samples cluster around a porosity of ~8%. The interval between 200 and 350 mbsf has the largest porosity and the largest variation in porosity. This interval includes the sample with the highest grain density (Section 20R-3; 113.7 mbsf), with a porosity of 15.2%. Porosity and grain density has a large range and shows a general increase in porosity for a similar density (Figure F145).
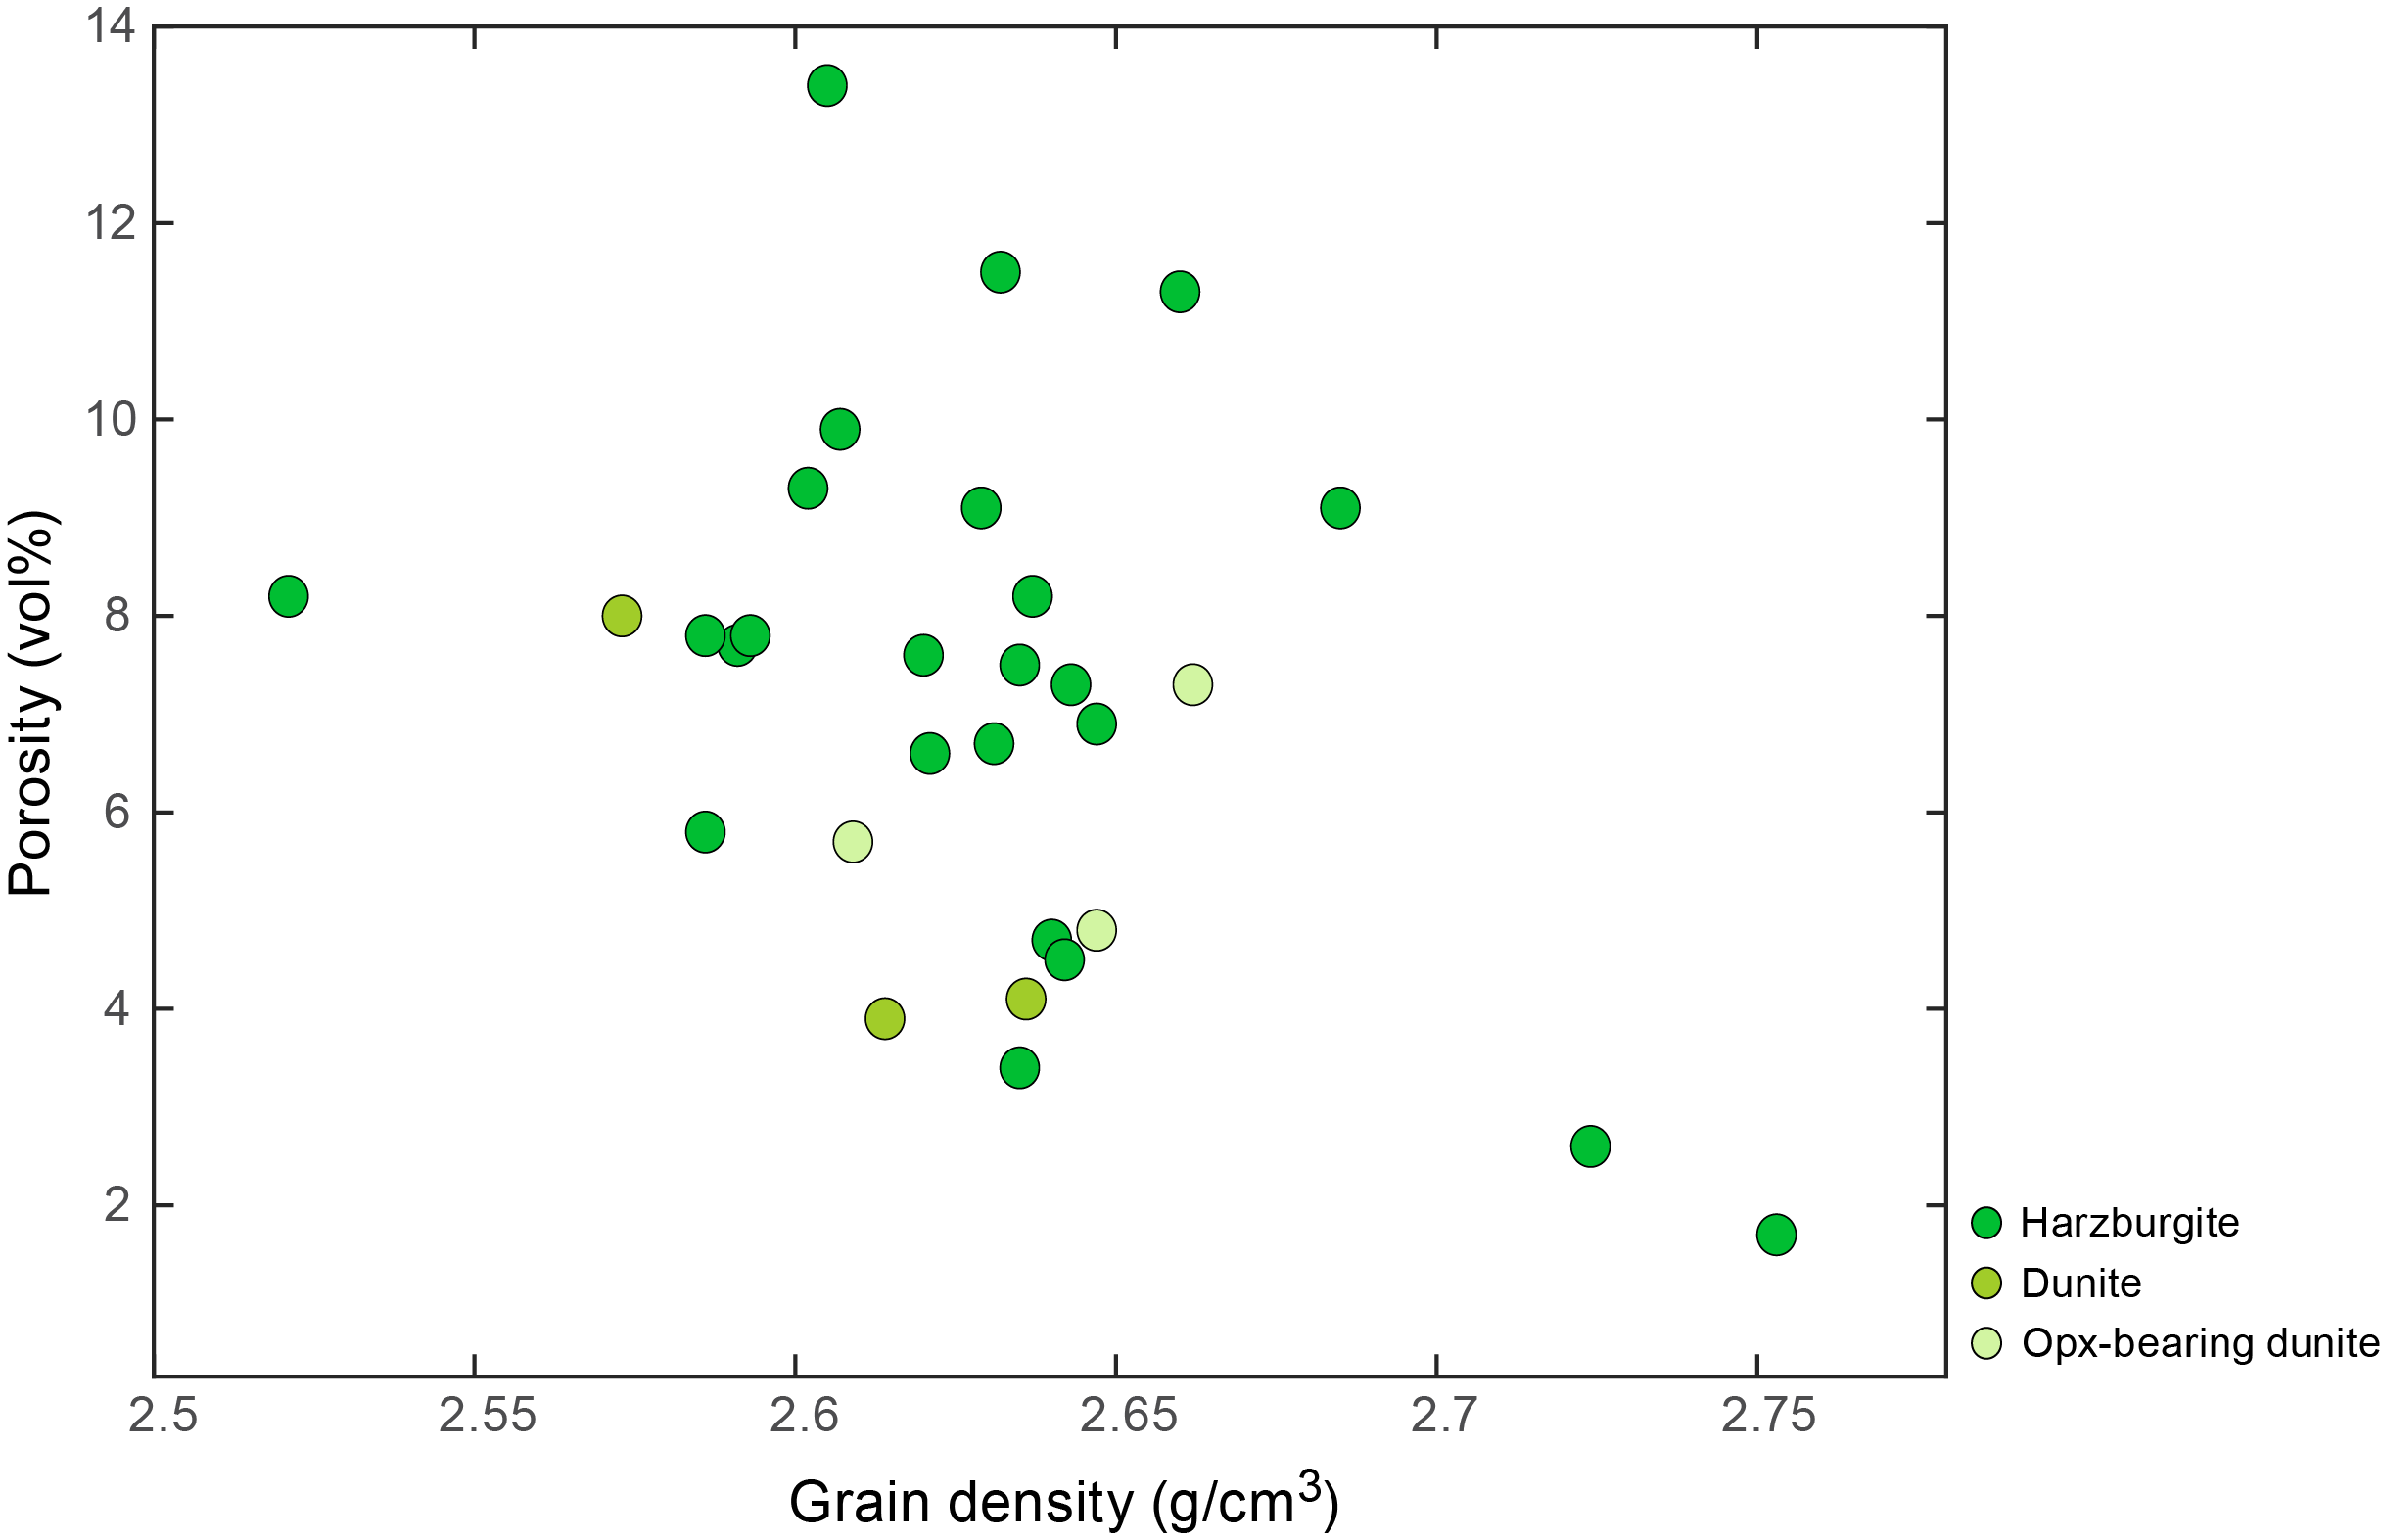
Figure F145. Porosity vs. grain density.
The porosity in gabbro ranges 0.3%–13.6% (average and SD = 3.68 ± 3.5%) (Table T9). The lowest porosity of 0.3% is olivine gabbro in Section 131R-1 (648.8 mbsf). The highest porosity of 13.6% is olivine gabbro in Section 61R-4 (312.9 mbsf). The second highest porosity value, 12.8% in gabbro, occurs in Section 94R-3 (472.9 mbsf). Most gabbro varieties (gabbro, gabbronorite, and olivine gabbro) have an average porosity of ~4.5%. Fe-Ti oxide gabbro has an average porosity of 1.3% (n = 7), and diabase has an average porosity of 0.75% (n = 2). A single troctolite sample has a porosity of 2%, and a single Fe-Ti oxide diorite has a porosity of 2.4%. Downhole variation in porosity is similar to that in serpentinized peridotite with lower porosity at shallower depths, a higher porosity interval between 200 and 300 mbsf, and then a more regular decrease in porosity with depth (Figure F143). This decrease in porosity is consistent with a lower alteration intensity in gabbro with depth (see Alteration petrology).
8.2.2. Sonic velocity
Sonic velocity (P-wave velocity) was measured on 229 samples in total, 45 discrete cube samples, and 185 piece halves from the archive section halves. Sonic velocity on cube samples was measured along the three principal directions x, y, and z in the CRF (see Petrophysics in the Expedition 399 methods chapter [Lang et al., 2025]). Results are listed in Tables T8 and T10 and plotted in Figures F143, F146, F147, and F148. Average sonic velocity ranges 3442 m/s (harzburgite) to 6532 m/s (olivine gabbro); 5281 m/s on cubes and 4830 m/s on pieces. The differences in average between cube and piece samples was because cube samples include a higher proportion of gabbro compared to measured half-core pieces. The average velocity of serpentinized ultramafic rocks is 4480 m/s and ranges 3442 m/s (harzburgite; Section 49R-4; 255.17 mbsf) to 5960 m/s (dunite; Section 193R-1; 950.81 mbsf). The average velocity of gabbroic rocks, 5906 m/s, is higher than that of serpentinized ultramafic rocks, ranging 4187 m/s (gabbronorite; Section 52R-2; 267 mbsf) to 6532 m/s (olivine gabbro; Section 32R-2; 170.27 mbsf). These values are similar to those reported for serpentinized peridotite (~4000 m/s) and gabbro (~5500 m/s) from full waveform inversion of Seismic Line Meg 4 that runs north–south near Holes U1601C and U1309D by Harding et al. (2016). The average sonic velocity of the serpentinite group slightly increases downhole from about 4200 m/s (100–200 m) to about 4800 m/s (1000 mbsf to the end; Figure F143). Thus, the velocity gradient in this interval is about 600 m/s per kilometer. The 100 m running average in the harzburgite-dominant interval (400–700 mbsf) increases from 4590 m/s (400–500 mbsf) to 4635 m/s (600–700 mbsf), with a much more gentle gradient, 150 m/s per kilometer. Based on this velocity gradient, if serpentinite continues from the seafloor down to the mantle, it is estimated that the 8.0 km/s velocity predicted for peridotite, without serpentine, would be reached at a depth of ~6.3 km below the seafloor. The apparent anisotropy of sonic velocity measured on cubes (Figure F146) ranges 0.5% (gabbro; Sample 22R-1, 56.5–58.5 cm; 120.59 mbsf) to 11.8% (harzburgite; Sample 148R-3, 113–115 cm; 734.91 mbsf). The apparent anisotropy of sonic velocity is lower in gabbro than serpentinized peridotite (2.8% compared to 5.6%, respectively; Figure F146).
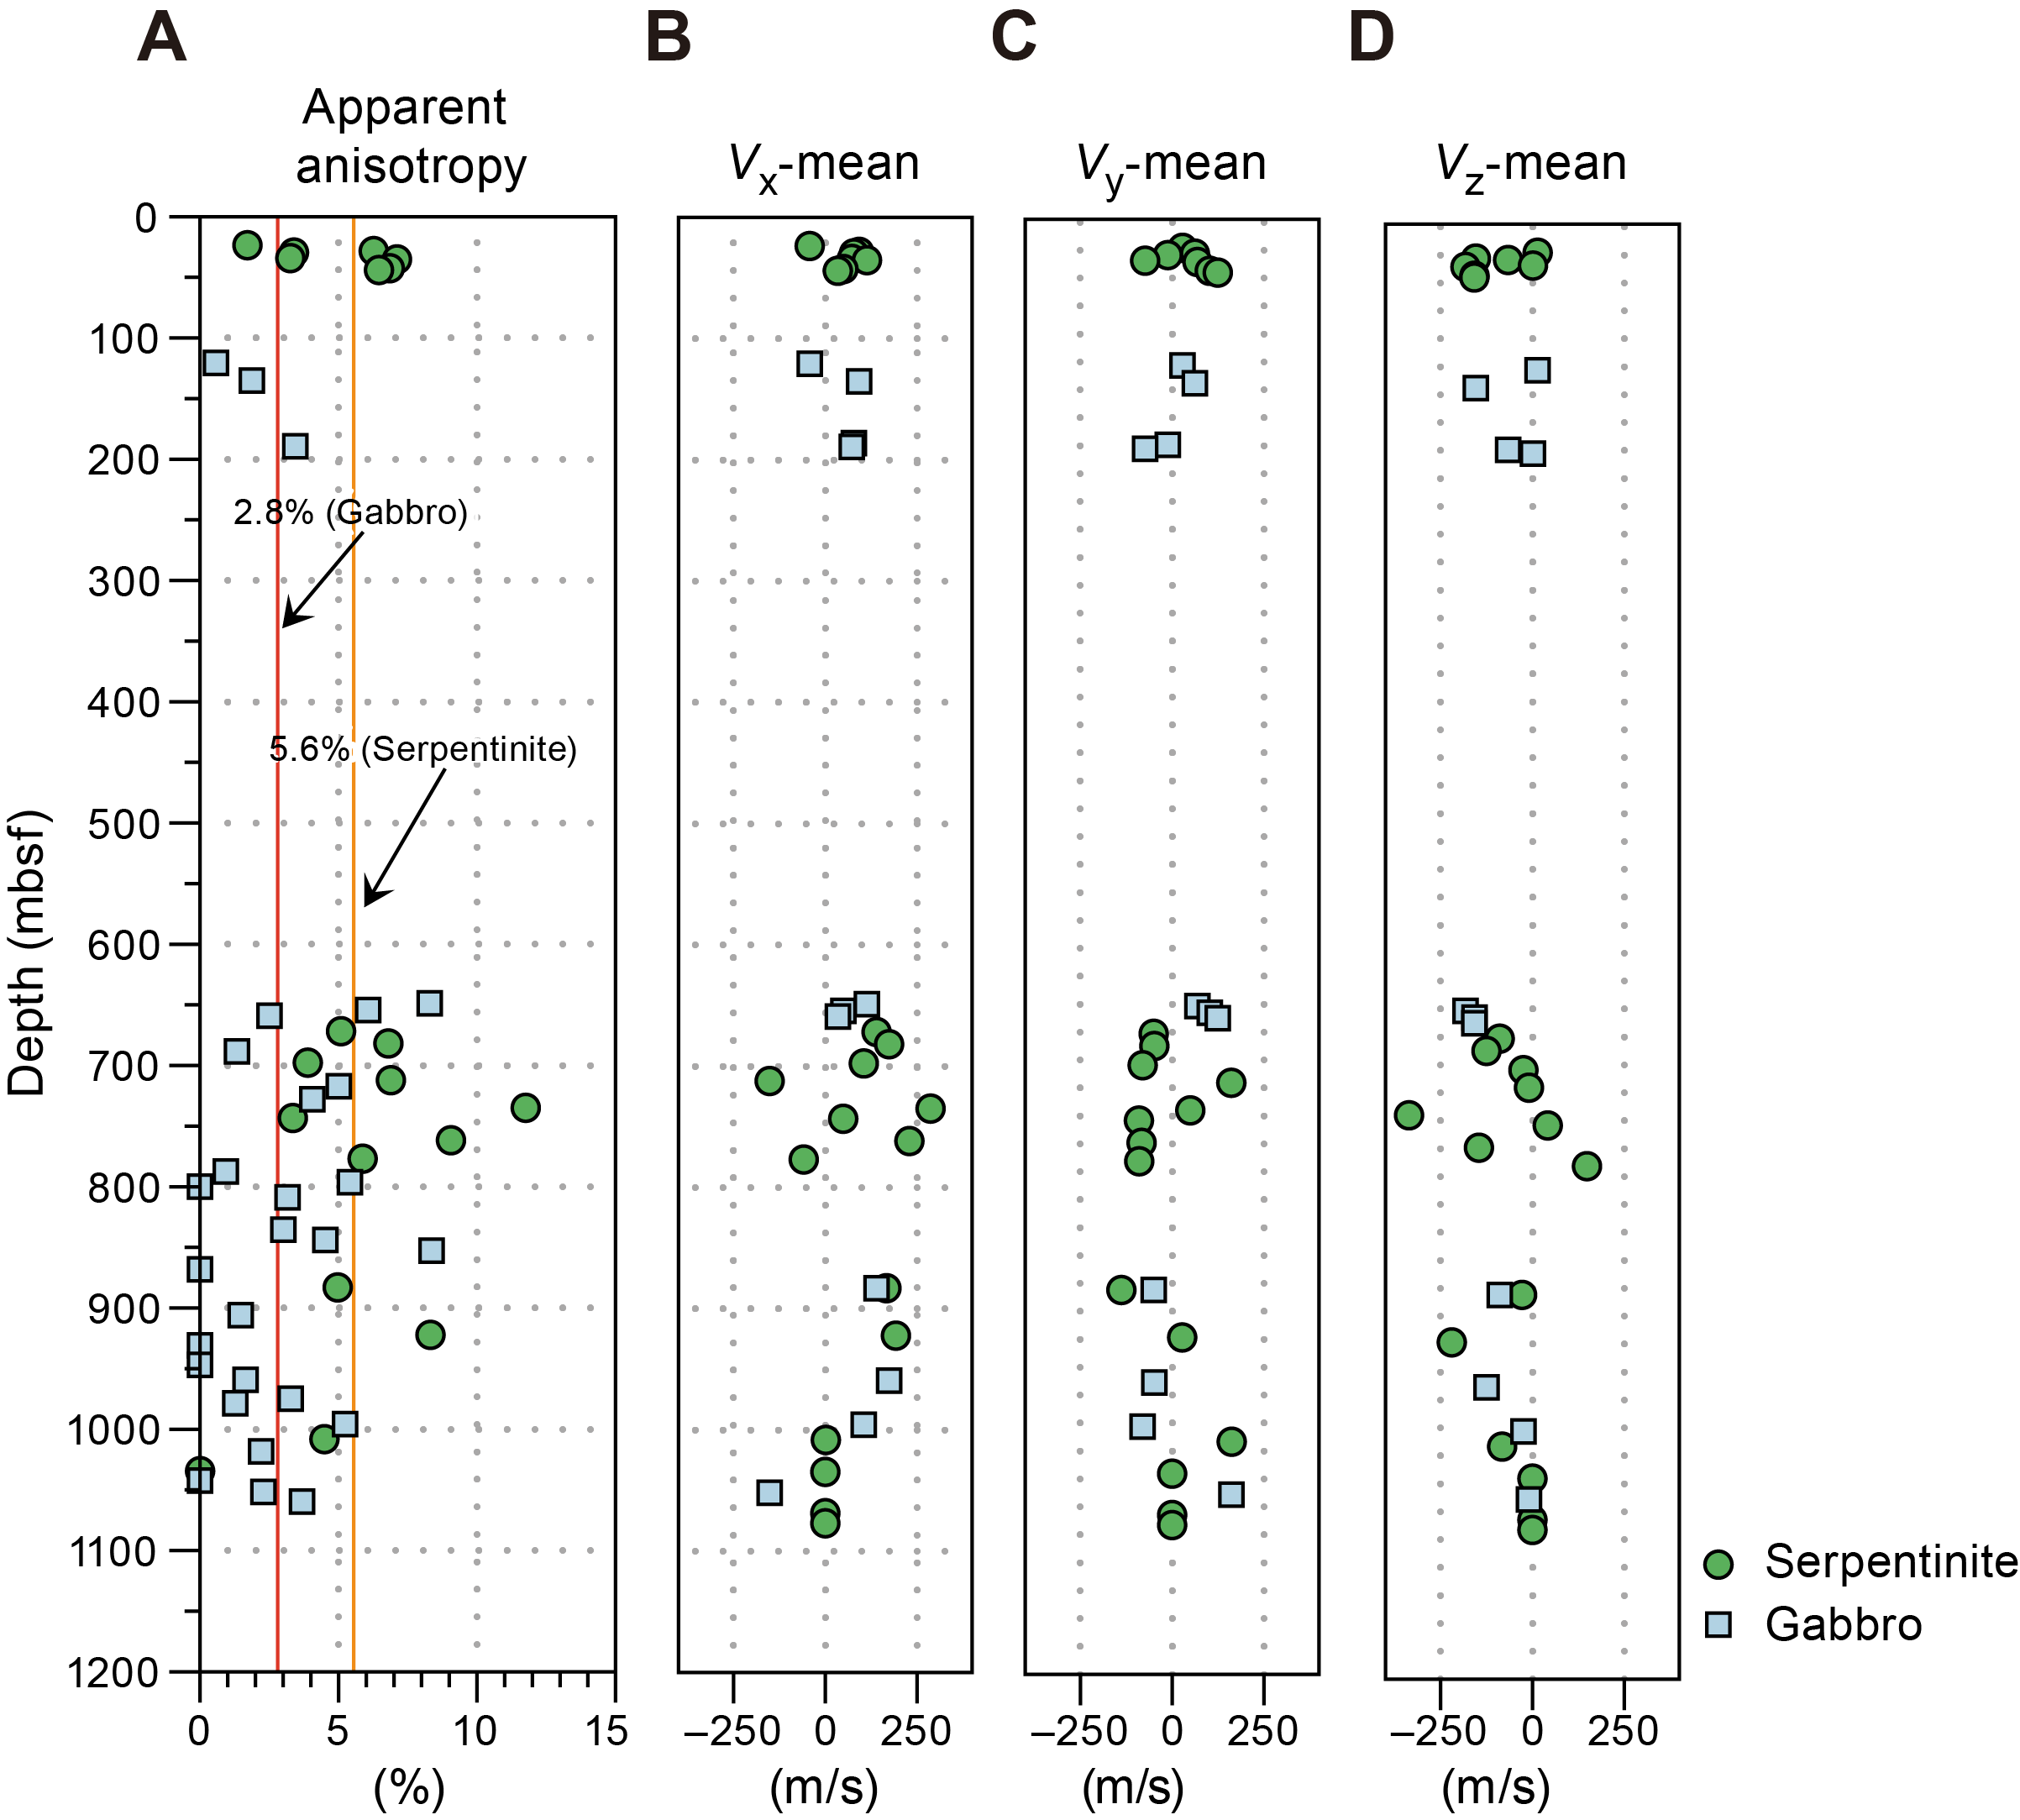
Figure F146. P-wave velocity anisotropy, Hole U1601C.
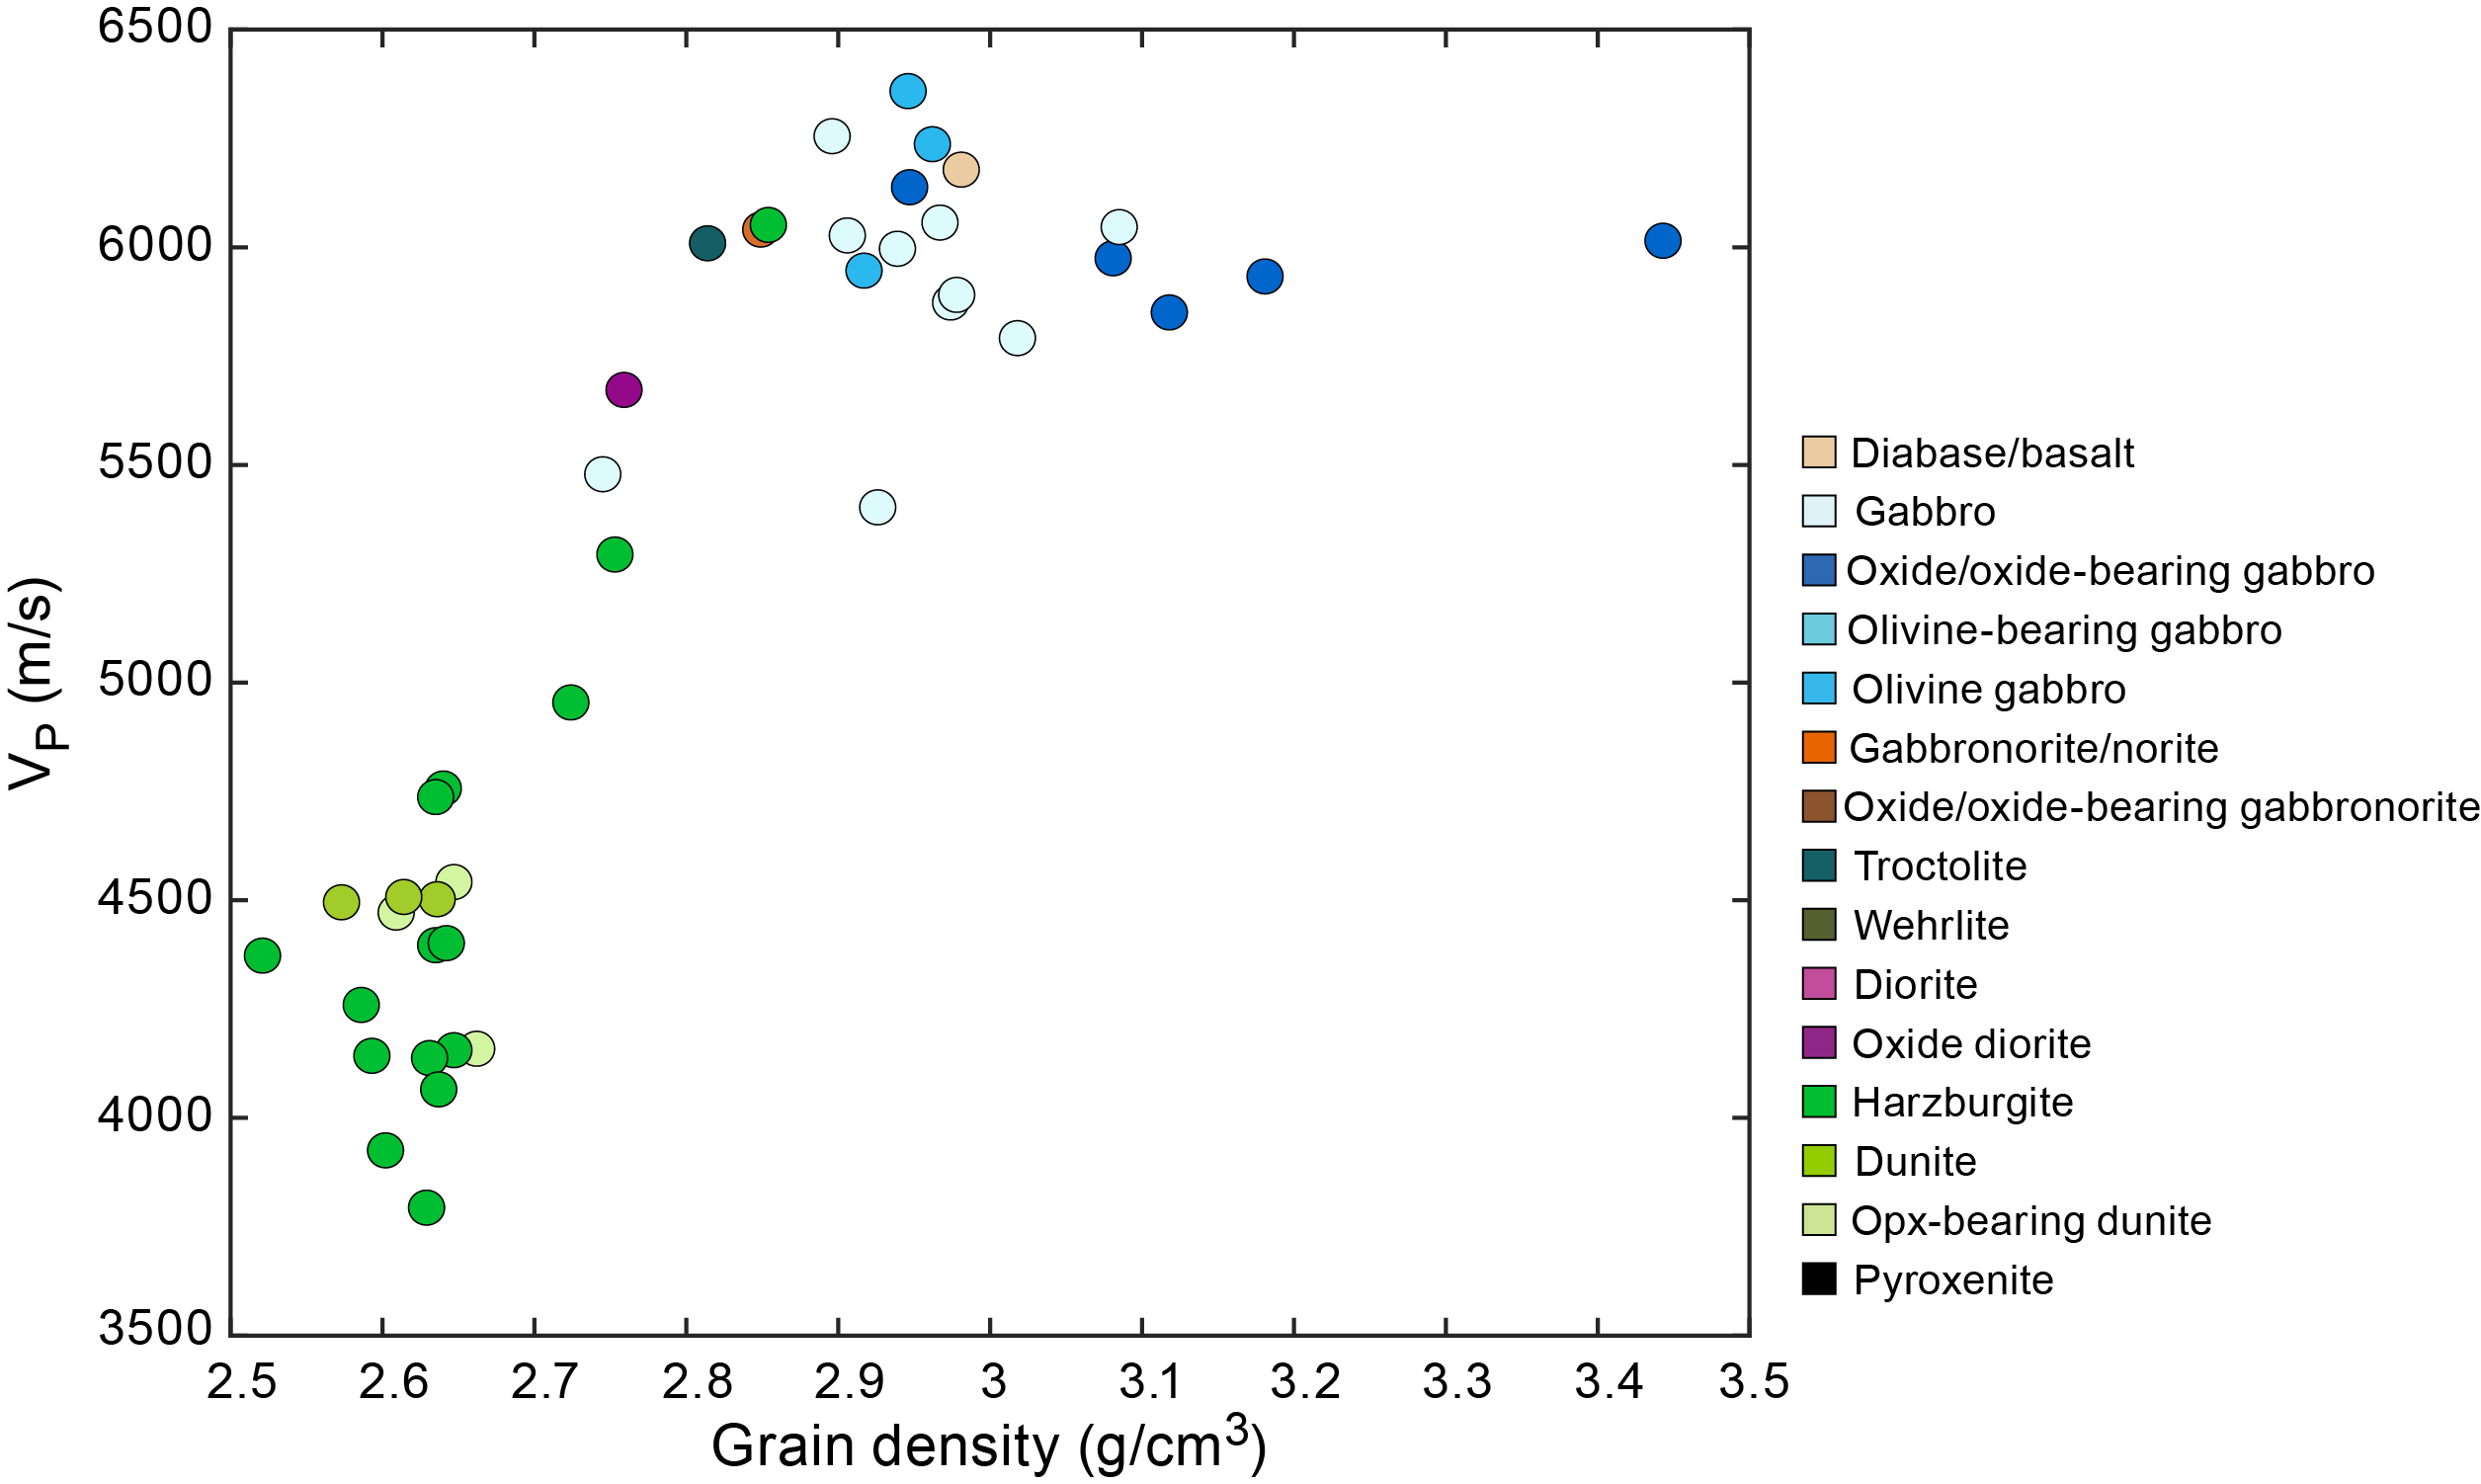
Figure F147. Compressional velocity vs. grain density.
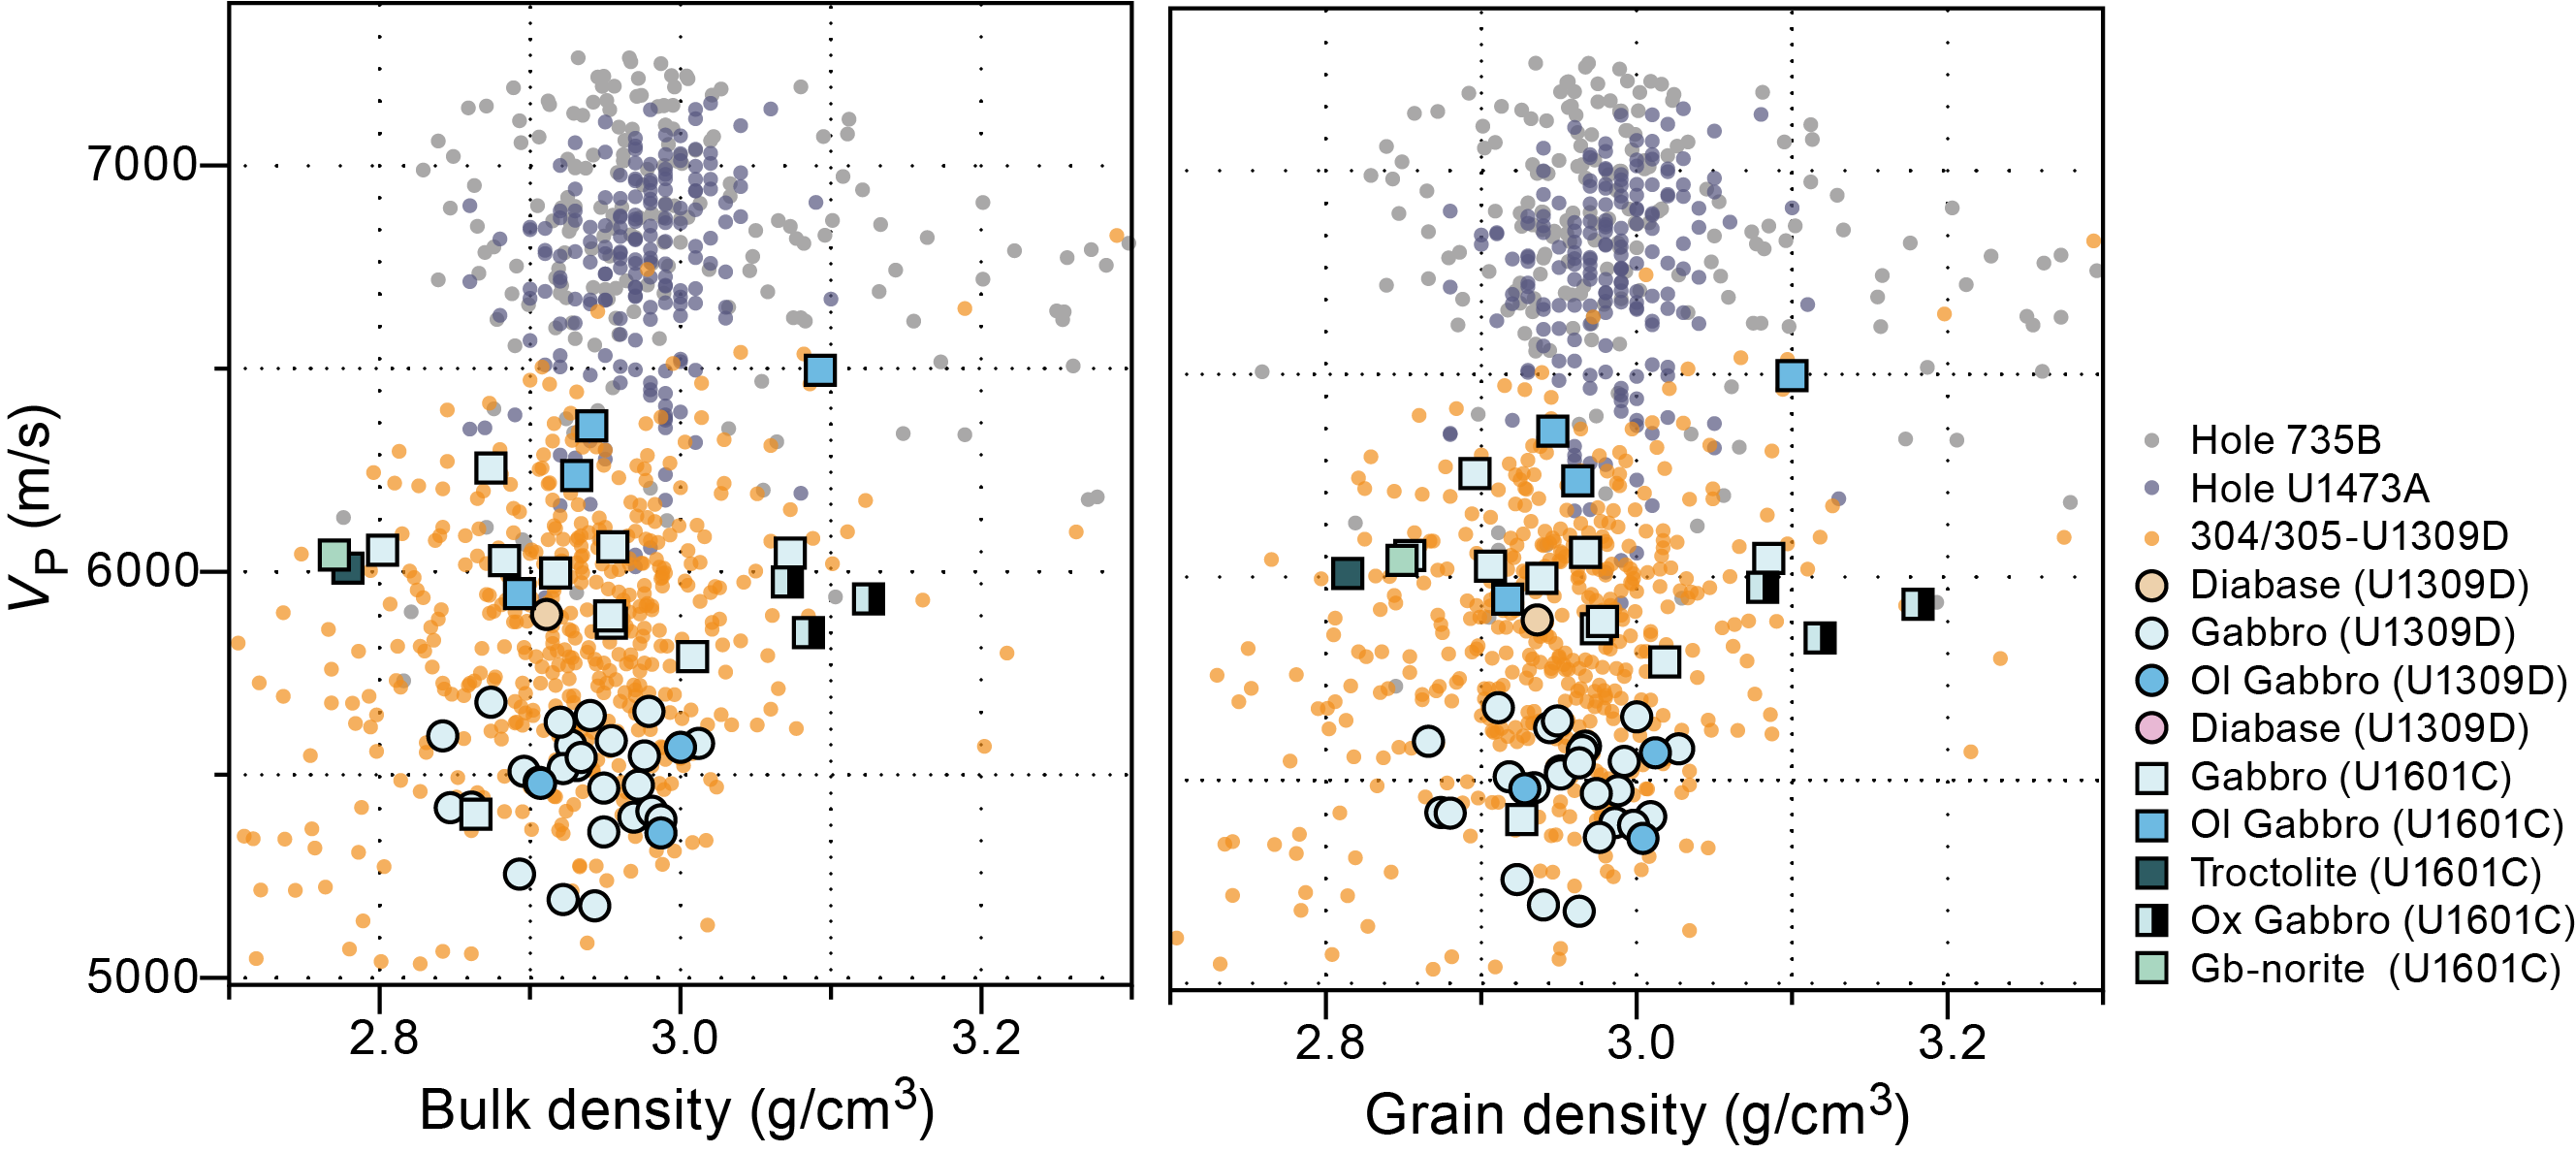
Figure F148. Compressional velocity vs. bulk and grain density.
Sonic velocity versus grain density in Hole U1601C shows clear differences based on lithology (Figure F147). Serpentinized ultramafic rocks show slower velocities and lower densities than those of gabbroic rocks. Sonic velocity data versus bulk density and grain density for gabbroic rocks from Site U1601 compare well with the same data from Expedition 304/305 (Hole U1309D; Expedition 304/305 Scientists, 2006b) (Figure F148). However, sonic velocities are clearly lower than those from the Atlantis Bank, Southwest Indian Ridge (Holes 735B and U1473A [Shipboard Scientific Party, 1989, 1999; MacLeod et al., 2017]) (Figure F148). VP measurements done on board over time vary notably for these hard rock investigations, which may not be solely explained by petrophysical variations.
8.2.3. Magnetic susceptibility
MSP was measured only on Cores 399-U1601C-2R through 16R, 22R, 25R, and 35R–37R (see Petrophysics in the Expedition 399 methods chapter [Lang et al., 2025]), so only MSL from whole-round sections is described here. Magnetic susceptibility ranges for all rock types and all depths from 0 to ~23,500 IU (Figures F143, F144; see U1601-H-ST1.xlsx in PETROPHYS in Supplementary material). Magnetic susceptibility ranges 1,000–15,500 IU in serpentinized peridotite. The lowest magnetic susceptibility values occur in the uppermost 100 m of the hole, which is composed of serpentinized harzburgite, orthopyroxene-bearing dunite, and dunite. The highest magnetic susceptibility values occur throughout the hole typically in serpentinized dunite, with the highest magnetic susceptibility value of 15,500 IU in Section 88R-3 (~444 mbsf). The next highest magnetic susceptibility value is 14,000 IU in Section 58R-4 (~298.5 mbsf). The highest magnetic susceptibility value in serpentinized harzburgite (13,000 IR) is also in this section. Higher magnetic susceptibility was also measured in Cores 159R–162R (784.5–804 mbsf), which consist of serpentinized dunite, orthopyroxene-bearing dunite, harzburgite, and Fe-Ti oxide gabbro and gabbro. Magnetic susceptibility in serpentinized peridotite seems to vary over intervals of ~200 m, starting at lower values, peaking in the middle of the interval, and then decreasing. Examples of this occur over depth intervals 200–400, 400–600, and 700–900 mbsf. Another likely such interval is between 1000 and 1200 mbsf, but the magnetic susceptibility of gabbro seems to disrupt the pattern.
Gabbro has magnetic susceptibility values that range 0–23,500 IU. The vast majority of gabbros have very low to zero magnetic susceptibility values (<100 IU). The main exceptions are Fe-Ti oxide gabbros that have the highest values of any rock type. The highest values recorded are ~23,500 IU in Section 399-U1601C-164R-1 (810 mbsf). Other high magnetic susceptibility values in Fe-Ti oxide gabbro occur in Sections 171R-1 (843.5 mbsf; 13,500 IU), 176R-1 (867.5 mbsf; 12,500 IU), 193R-1 (950 mbsf; 13,250 IU), 196R-1 (964.5 mbsf; 16,000 IU), 198R-1 through 198R-2 (~975 mbsf; 17,250 IU), 211R-1 (1037.5 mbsf; 20,500 IU), and 245R-1 (1196 mbsf; 14,000 IU). The proportion of magnetic phases seems to increase downhole when averaged by lithology (Figure F144).
In general, serpentinized peridotite has lower grain density and higher magnetic susceptibility, both measured on discrete samples, compared to gabbro (Figure F149; see Paleomagnetism). This relationship does change when Fe-Ti oxide gabbros are present, as they have the largest magnetic susceptibility values recorded. However, these are intermittent and can be identified based on their very high values measured on MSL (>10,000 IU). Therefore, the relationship and differences between bulk density and magnetic susceptibility for different rock types makes it a good indicator for the type of rock present (Table T13).
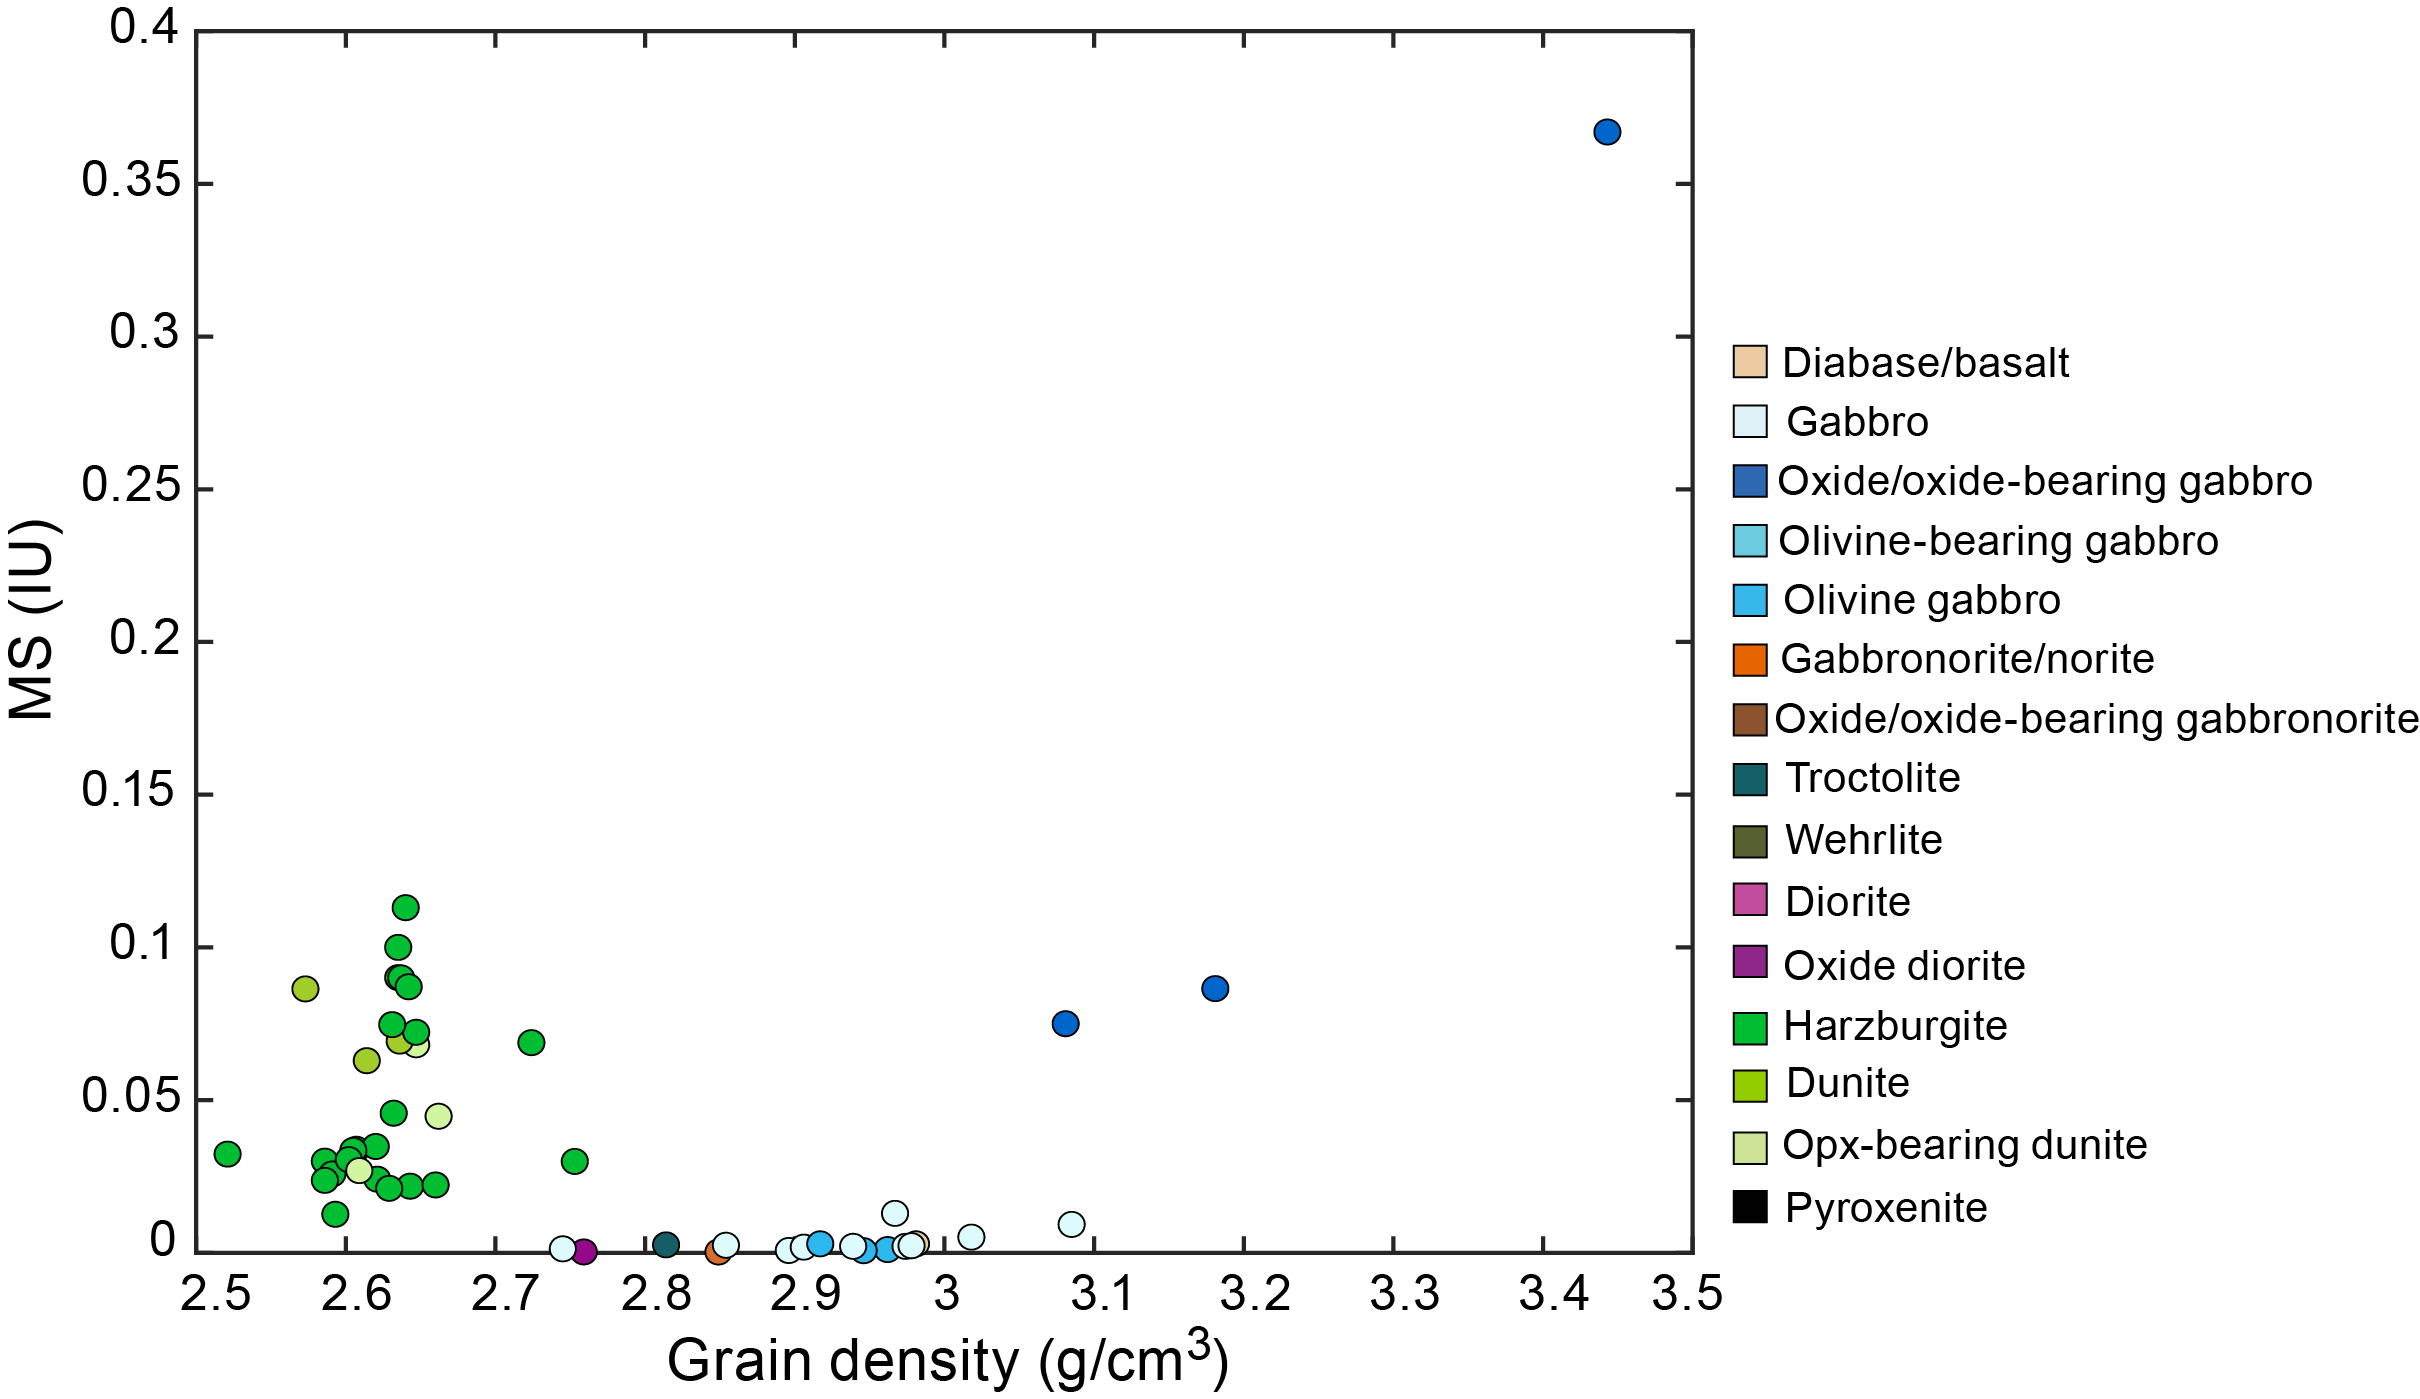
Figure F149. Magnetic susceptibility vs. grain density.
8.2.4. Natural gamma radiation
NGR is overall low in most gabbro and serpentinized peridotite samples, with values <1 counts/s (Figure F143). The highest values of 3–13 counts/s occur over Cores 399-U1601C-24R through 30R (131–161 mbsf), which includes serpentinized dunite, orthopyroxene-bearing dunite, and harzburgite and, with lower counts, troctolite, olivine gabbronorite, and gabbronorite. There are two other intervals with slightly higher counts including the Cores 6R–7R (42.5–48.5 mbsf) with values ~3 counts/s and Cores 176R–181R (868–895 mbsf) with counts as high as ~3.5 counts/s.
NGR counts can be used in concert with bulk density measured on whole-round sections to calculate the concentrations of K, U, and Th based on the diagnostic radiation emitted by each during decay (see Petrophysics in the Expedition 399 methods chapter [Lang et al., 2025]). In Hole U1601C, the concentration of these isotopes was calculated downhole (Figure F150). Peaks in the concentrations of the elements follow the peaks in the overall NGR counts. The large variations in calculated values for each element are due to (1) generally very low radiation of <3 counts/s, which is near the detection limit of the instrument; (2) the uncertainty in the GRA bulk density, which is a minimum value; and (3) the lack of a volume correction for irregular pieces and gaps (see Petrophysics in the Expedition 399 methods chapter [Lang et al., 2025]). The accuracy of the low average concentration values and their downhole variations for K (0–3 wt%), Th (1–3 ppm), and U (0–3 ppm) should therefore be viewed with caution.
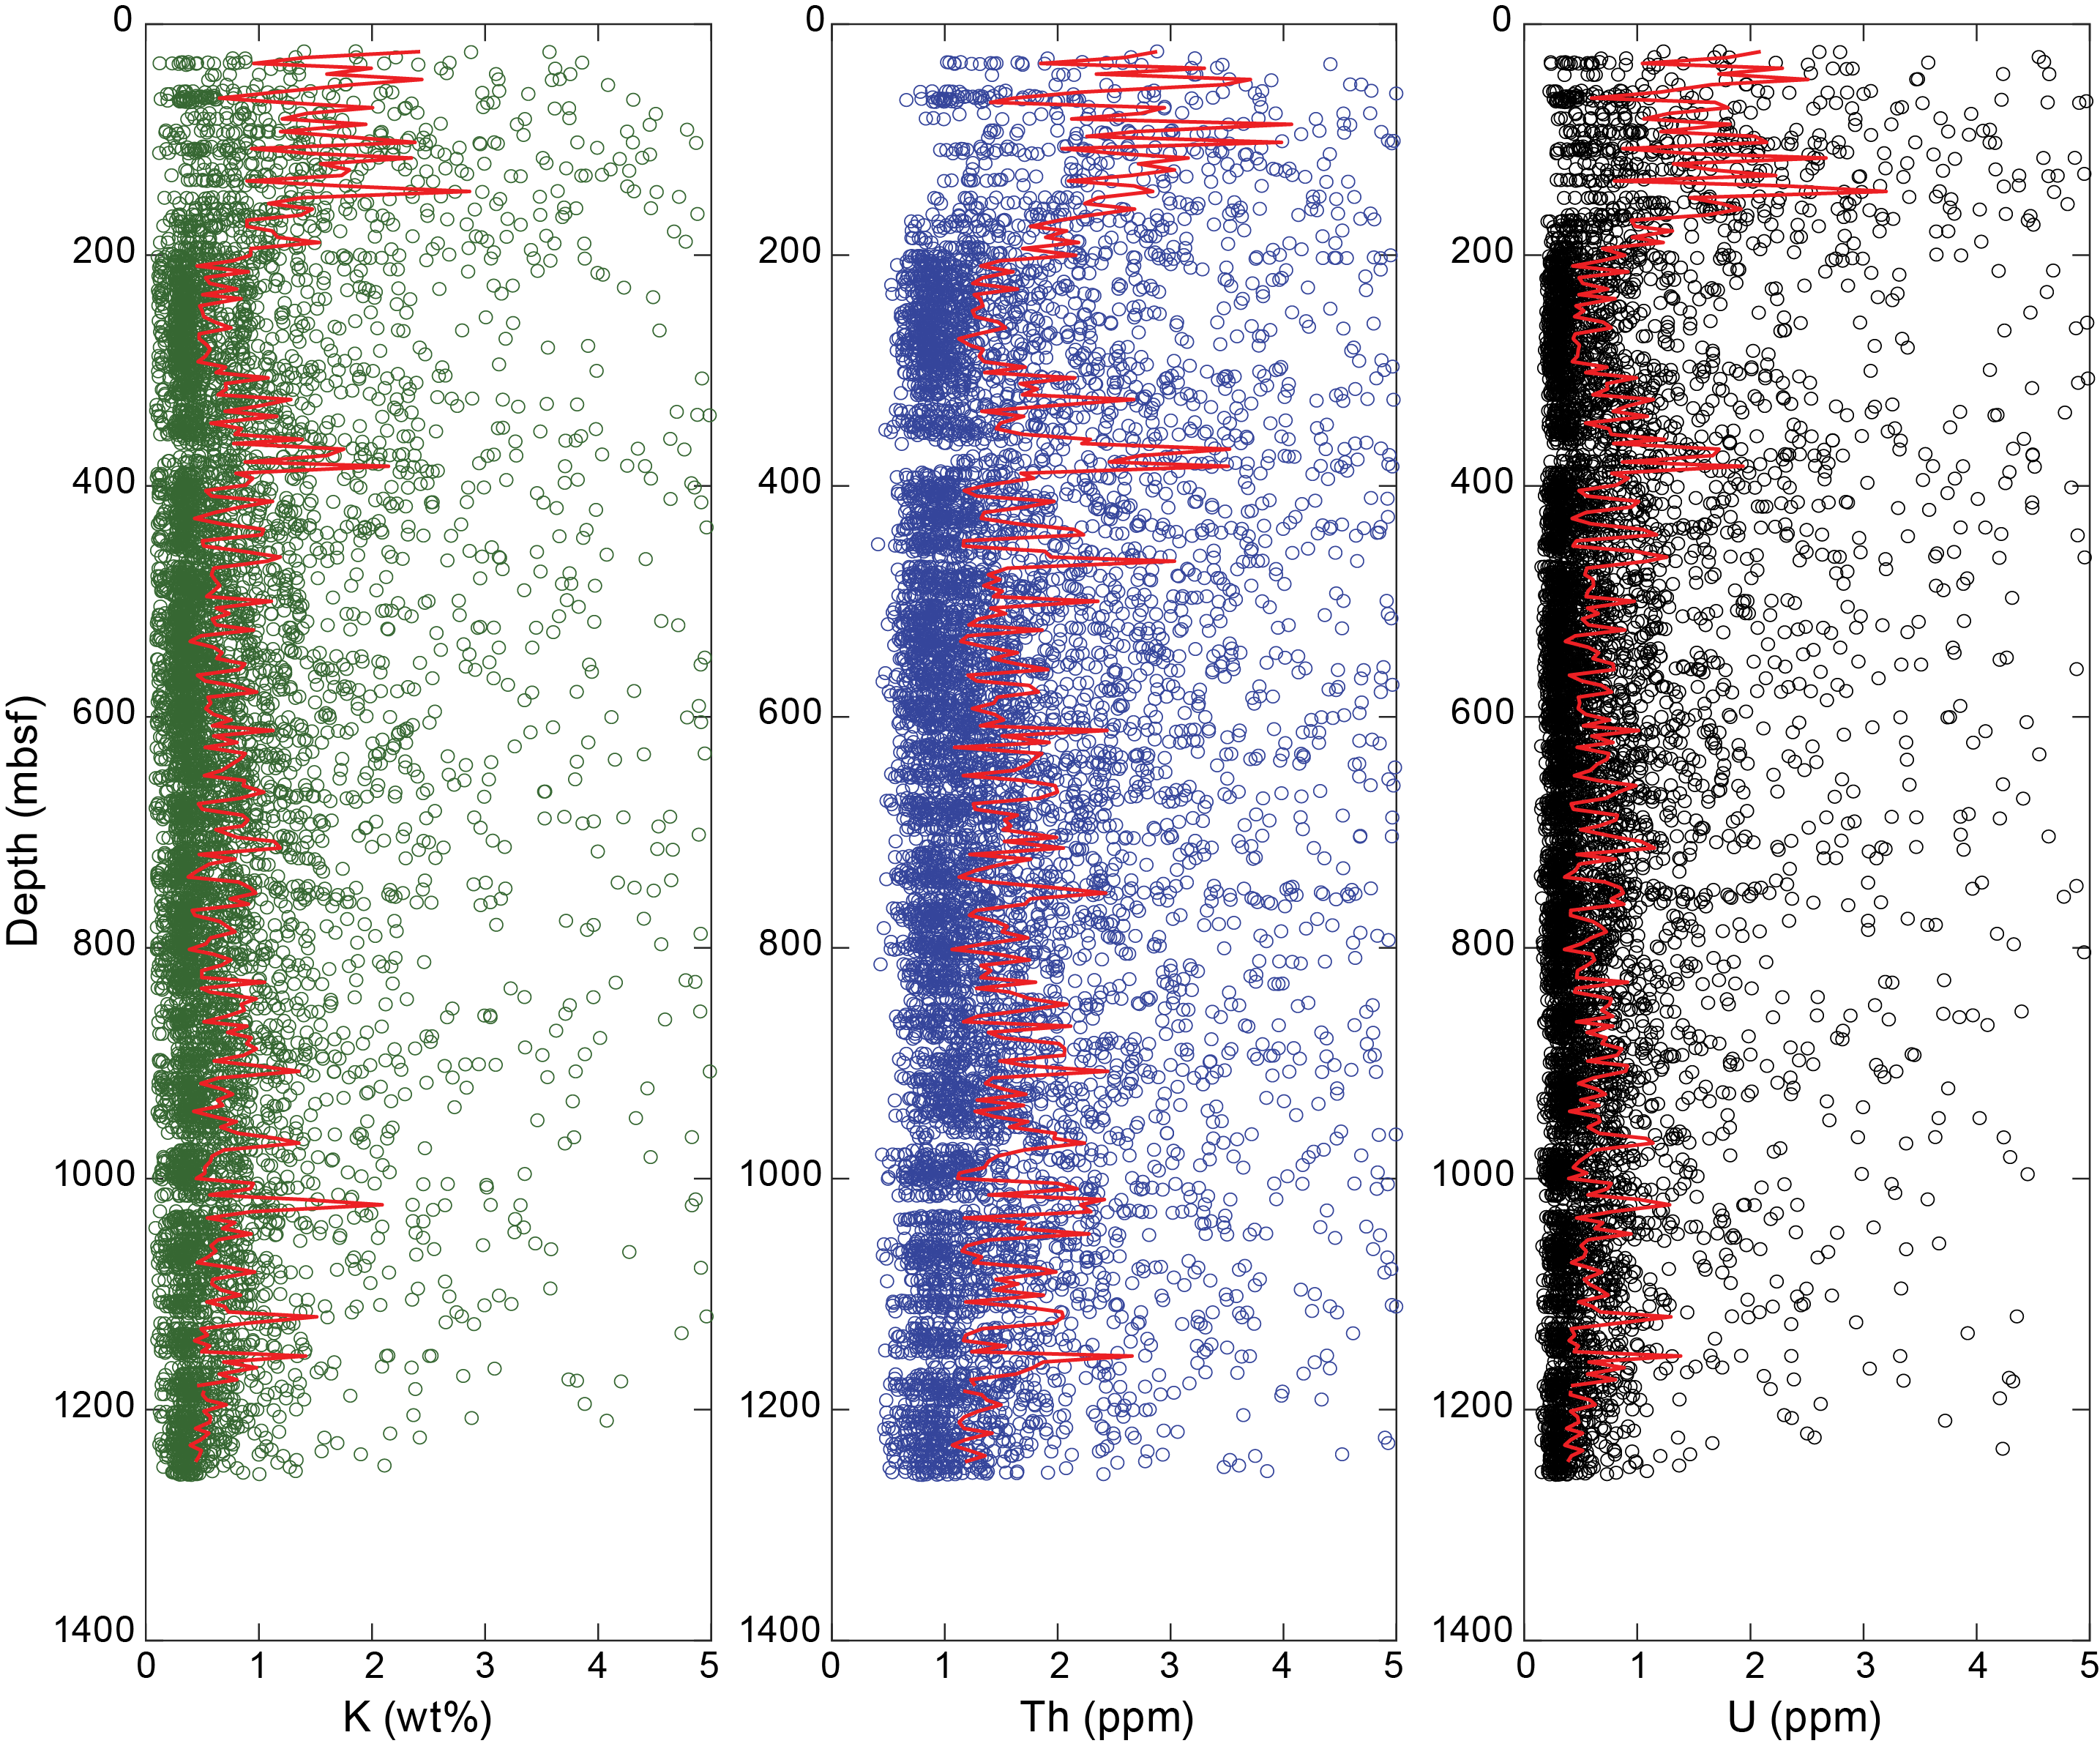
Figure F150. Potassium, thorium, and uranium, NGR.
8.2.5. Thermal conductivity
Thermal conductivity was measured on 58 samples selected from archive section halves at semi-irregular intervals within representative lithologies of Hole U1601C (Figure F143). Data are summarized in Tables T11 and T12 and Figure F151 for all measured lithologies (i.e., oxide-bearing gabbro, gabbro, gabbronorite, olivine gabbro, and variably serpentinized harzburgite, dunite, and orthopyroxene-bearing dunite). Samples >10 cm in length were measured six or four times with a needle probe, and values shown are generally the mean of these measurements (see Petrophysics in the Expedition 399 methods chapter [Lang et al., 2025]). Standard deviations for mean values for all samples are <2%.
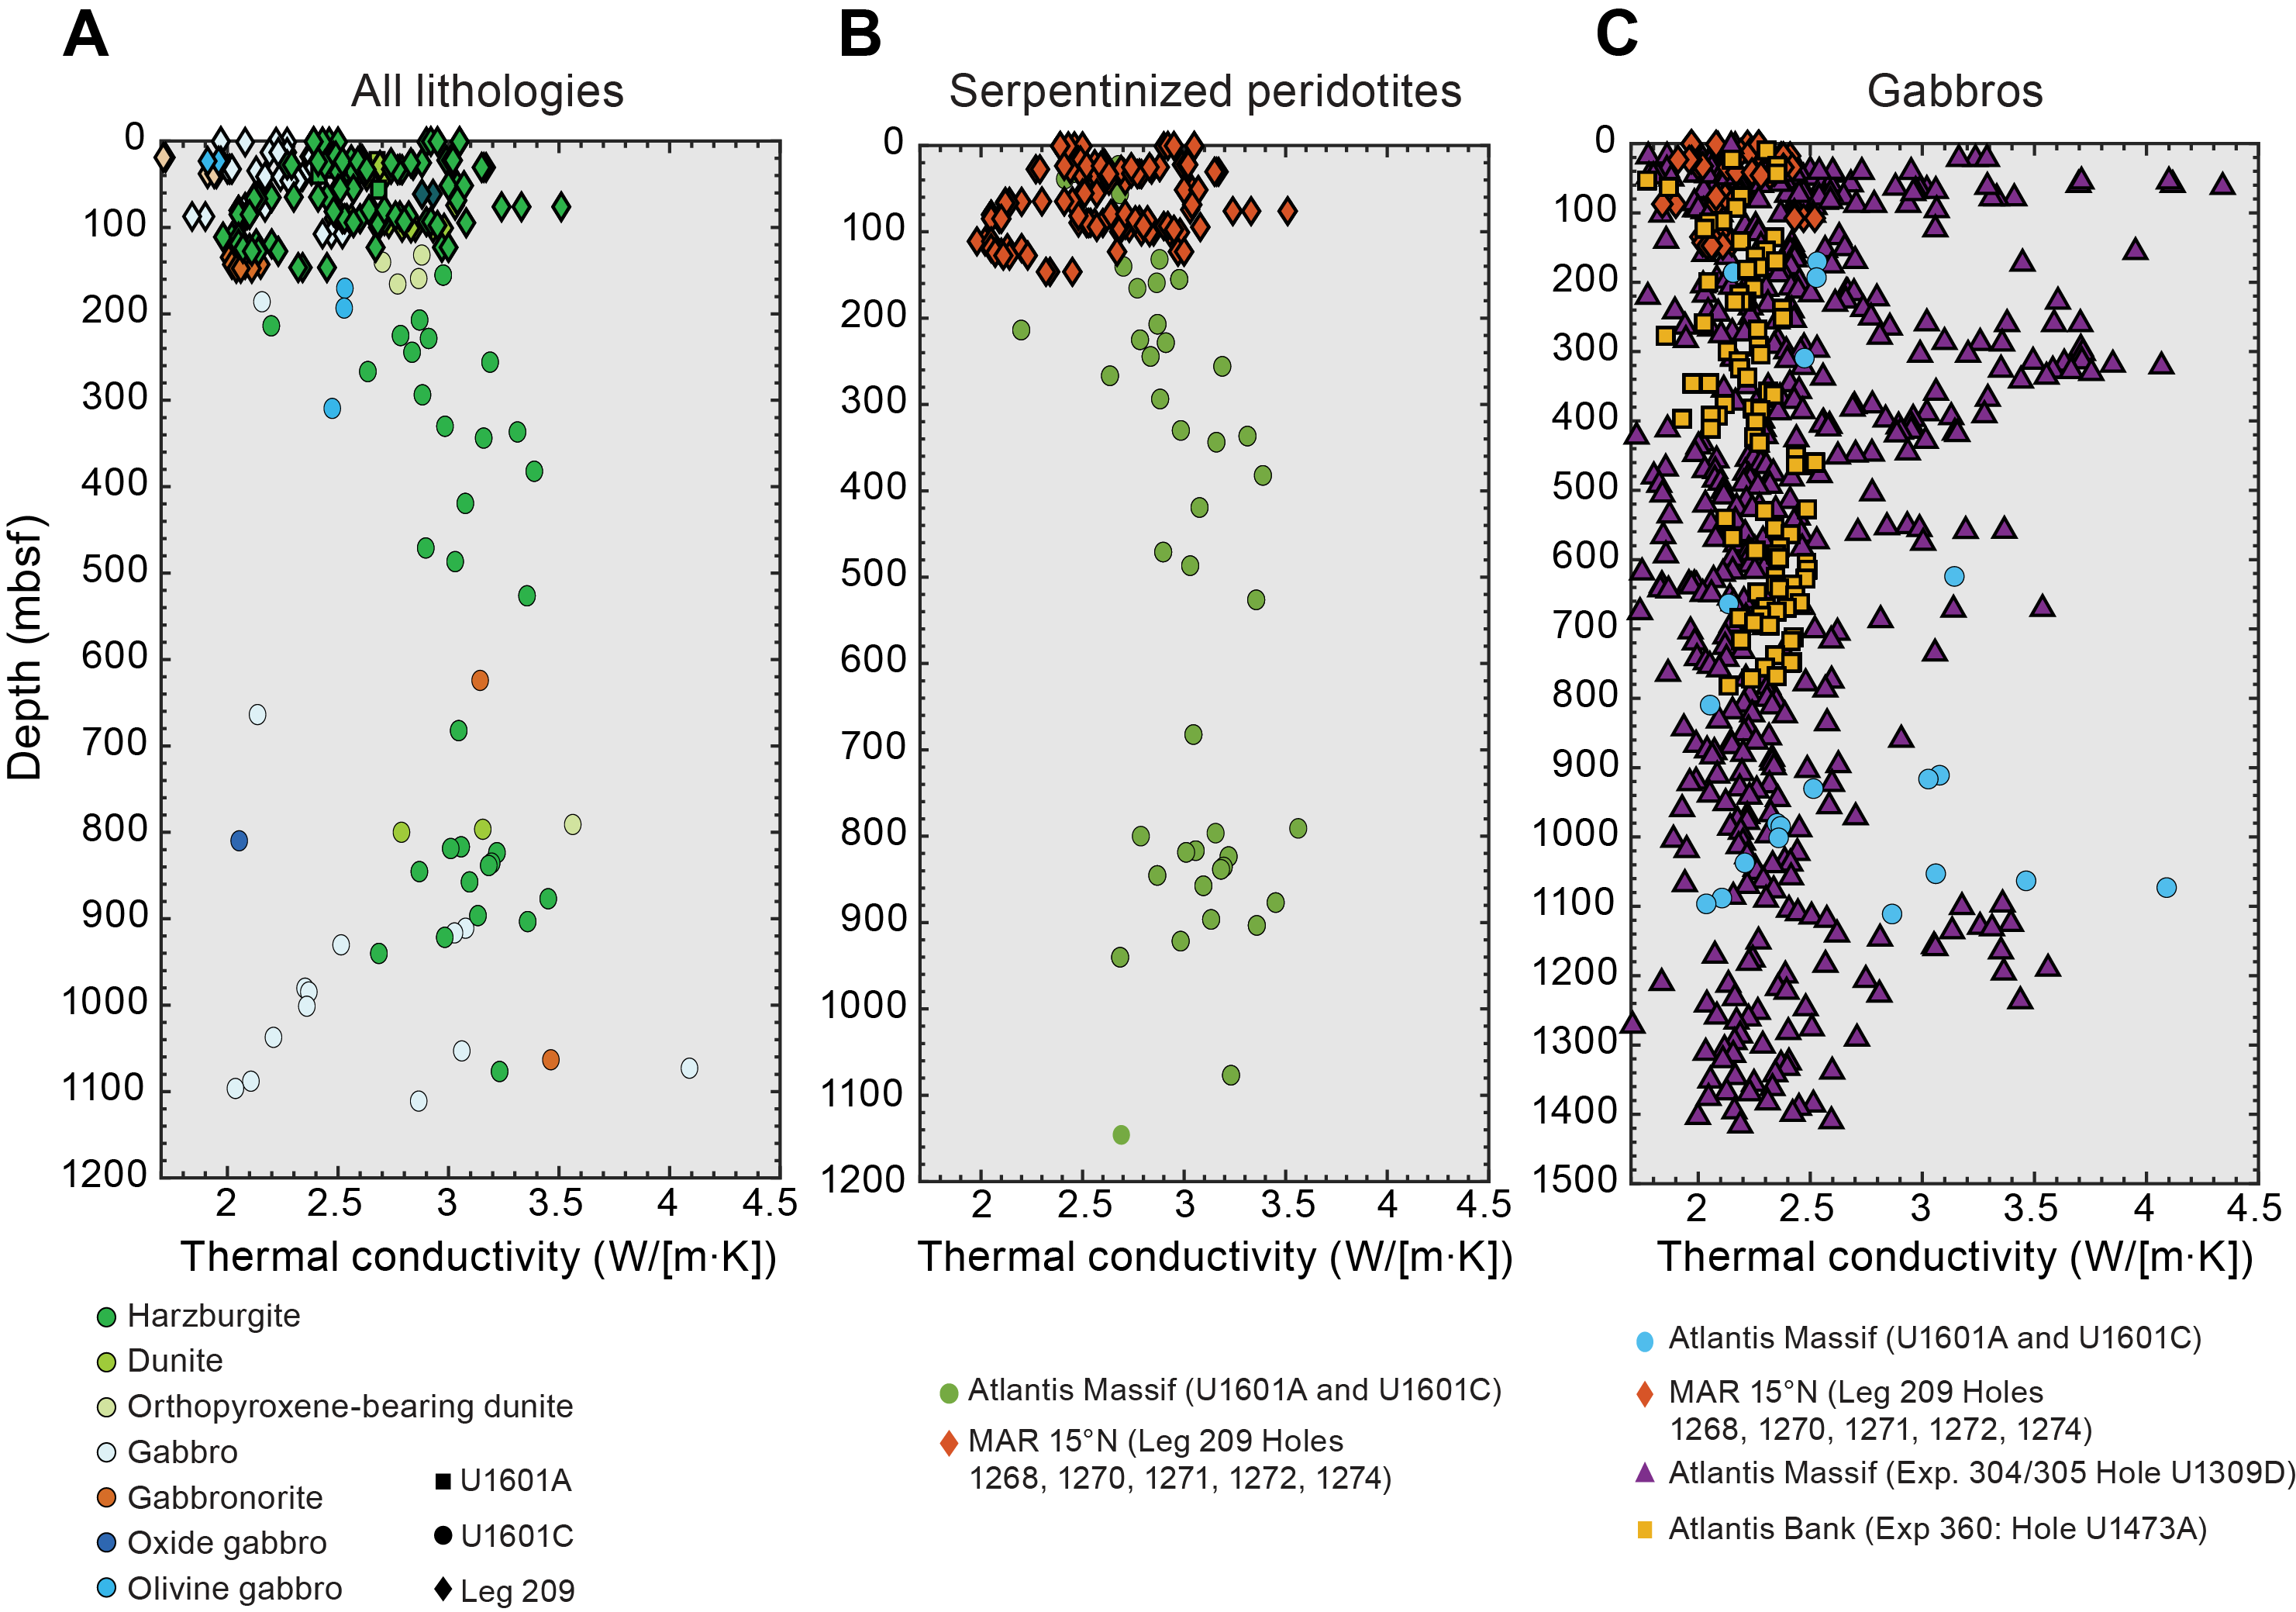
Figure F151. Thermal conductivity.
A total of 38 ultramafic samples measured had thermal conductivity values ranging 2.20–3.56 W/(m·K) (mean and SD = 3.02 ± 0.26 W/[m·K]). Values remained relatively constant between the measured ultramafic lithologies (i.e., variably serpentinized harzburgites, dunites, and orthopyroxene-bearing dunites). Ultramafic samples recovered from Hole U1601C generally show higher thermal conductivity compared to those recovered from Hole U1601A (averaging 3.02 and 2.56 W/[m·K], respectively) (Figure F151A). This is likely associated with depth-related variations in recovered material from each hole, such as variable deformation and/or decreased serpentinization intensity with depth. The lowest ultramafic value of 2.20 W/(m·K) was measured in a serpentinized harzburgite in Section 399-U1601C-41R-2 (213.82 mbsf), and the highest value of 3.56 W/(m·K) was measured in an orthopyroxene-bearing dunite in Section 160R-2 (790.9 mbsf).
A total of 20 gabbroic samples taken from irregularly spaced intrusions throughout Hole U1601C measured generally lower thermal conductivity than the ultramafic samples, averaging 2.63 ± 0.54 W/(m·K), and contain much higher variability, ranging 2.04–4.09 W/(m·K). Most gabbroic samples measured are from deeper sections of the hole (>900 mbsf). The trend in thermal conductivity with depth is less certain in gabbroic samples, and scatter remains high throughout the hole. These results could be related to high variability in deformation and alteration at various depths (see Structural geology and Alteration petrology). Mineral assemblage also appears to have a strong effect on thermal conductivity of gabbroic rocks (Table T12). Values are highest in gabbronorite (average = 3.30 W/[m·K]), moderate in gabbro and olivine gabbro (average = 2.60 and 2.51 W/[m·K], respectively), and lowest in a single oxide-bearing gabbro piece (2.05 W/[m·K]).
Ultramafic samples recovered from the shallower Hole U1601A are in general agreement with thermal conductivity measurements from similar lithologies and depths of other IODP/ODP holes, most notably samples from ODP Sites 1268, 1270, 1271, 1272, and 1274 drilled in the MAR from 14° to 16°N during Leg 209 (Shipboard Scientific Party, 2004) (Figure F151B). Thermal conductivity values in ultramafic samples from the deeper Hole U1601C are considerably greater than those from shallow holes (Hole U1601A and Leg 209), further reflecting an increase in thermal conductivity of serpentinized peridotites with depth.
Thermal conductivity of gabbroic samples recovered from Hole U1601C during Expedition 399 is generally higher and more variable than those recovered during Leg 209 (Shipboard Scientific Party, 2004) and during Expedition 360 at Atlantis Bank (MacLeod et al., 2017) (Figure F151A, F151C). However, the general range of values recorded in Hole U1601C is consistent with measurements from those within the nearby, primarily gabbroic Hole U1309D during Expedition 304/305 (Expedition 304/305 Scientists, 2006b) (Figure F151C) (see Petrophysics and Figure F65, both in the Site U1309 chapter [McCaig et al., 2025]). These observations could reflect a greater variability in gabbroic intrusions of the Atlantis Massif compared to those at other sites.
8.2.6. Rate of penetration
The rate of penetration (ROP) for lithology was analyzed (Figure F152; see U1601-H-ST2.xlsx in PETROPHYS in Supplementary material). The proportion ratio of two lithology groups (serpentinized ultramafic and gabbroic rocks) was calculated from each core's length of principal lithologies (see Igneous petrology; see also U1601-H-ST3.xlsx in PETROPHYS in Supplementary material). The cores that accounted for more than 95% of the total in each lithology group were selected for comparison with the mean ROP of the cores. This yielded an ROP of 2.8 m/h for serpentinized ultramafic rocks and 6.3 m/h for gabbros, with a significant difference in ROP of 3.5 m/h between the two lithologic groups.
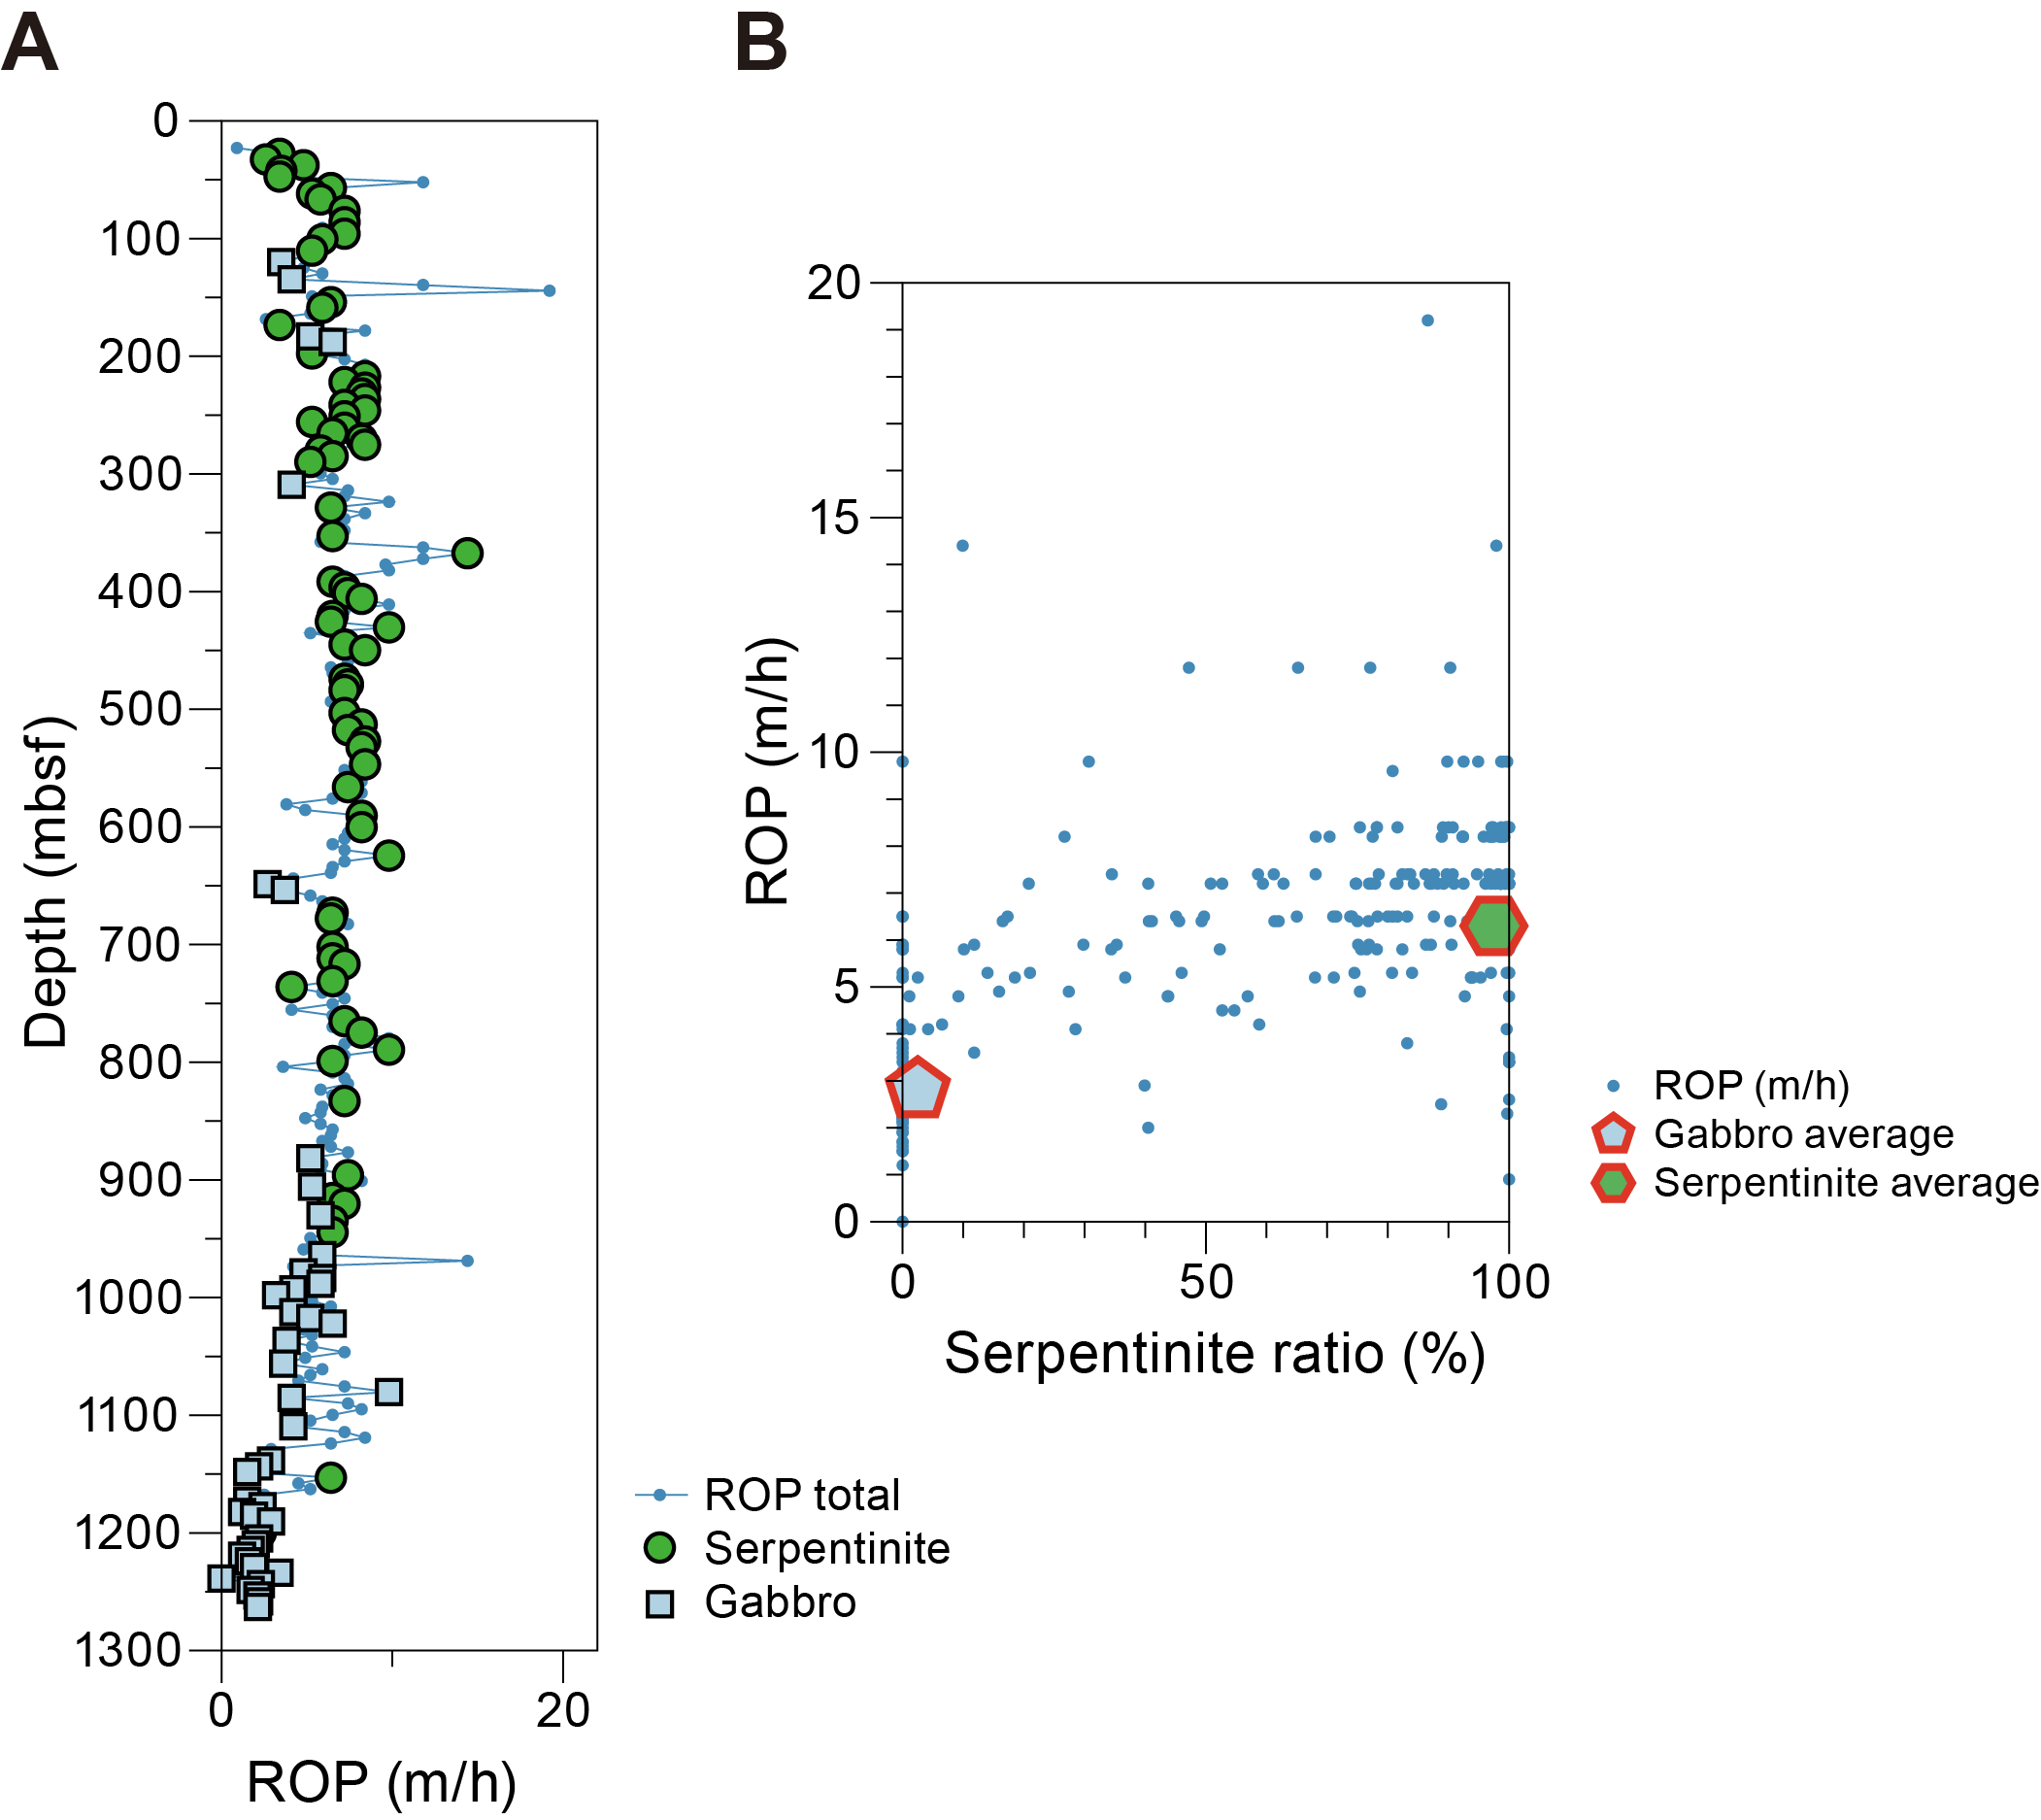
Figure F152. ROP for each core with lithologies.
8.2.7. Downhole temperature logging
Borehole fluid temperatures were measured several times in Hole U1601C in conjunction with borehole logging and fluid sampling (see U1601-H-ST4.xlsx in PETROPHYS in Supplementary material). Following coring of Core 240R (~1180 mbsf), the hole was flushed with freshwater near surface temperature to remove debris left from coring. This led to measured borehole temperatures out of equilibrium with the formation. Therefore, all recorded temperatures in Hole U1601C are minimums, and actual formation temperatures are likely higher. Five runs of the ETBS were conducted including one run with the ETBS attached to the bottom of Schlumberger logging tools (Run 1) during a main logging run and four runs with the ETBS attached to the KFTS during fluid sampling runs (Runs 2–5) (Table T14) (see Operations in the Expedition 399 methods chapter [Lang et al., 2025]). Results from all runs are shown in Figure F153A. During Run 1, the logging tools and ETBS were paused for 5 min every ~100 m to assess sensor response time. During these stops, temperature recordings increased <1°C in the shallowest part of the hole, but this difference rose as the tool was lowered further into the hole. Temperatures increased 2°–3°C during the 5 min stops in deeper sections and increased >5°C during the final stop at ~997.6 mbsf. The sensors did not fully equilibrate at any of these stops. Four subsequent runs were conducted where the ETBS was attached to the bottom of the KFTS (Runs 2–5). For all runs, temperature was measured while the instruments were lowered down the hole and again while pulling back up the hole. In general, temperature profiles recorded on upgoing runs were more reliable because fluid sampling during downgoing runs with the KFTS tool were time-dependent, and therefore, the sensors were not able to equilibrate as long during downgoing runs. Measured values increased with each run as borehole fluid temperatures continued to equilibrate over time. For the same reason, values are higher in each upgoing run compared to corresponding downgoing runs, likely due to a considerable lag in sensor response time (Figure F153A). For Runs 1 and 2, the upgoing run is ~4°–5°C higher than the downgoing run, and this difference is as high as 8°–10°C for Runs 2–5. Likewise, maximum temperatures recorded at the bottom of the borehole change over time, as fluids were warmed by the surrounding formation. Temperature variations with time of each run are summarized by temperature profiles recorded by various ETBS upgoing runs (Figure F153B). Run 1 reached the bottom of the borehole (997.6 mbsf) ~17 h after flushing with cool freshwater had ceased and recorded a maximum temperature of 70.3°C. Run 4 reached a maximum temperature of 88.6°C at similar depths (1009 mbsf) approximately 64 h after flushing. Run 5 recorded a maximum fluid temperature of 91.3°C at the bottom of the borehole (1060 mbsf) ~78 h after flushing (Figure F153B). The gradient in all ETBS thermal profiles noticeably increases at ~370 mbsf.
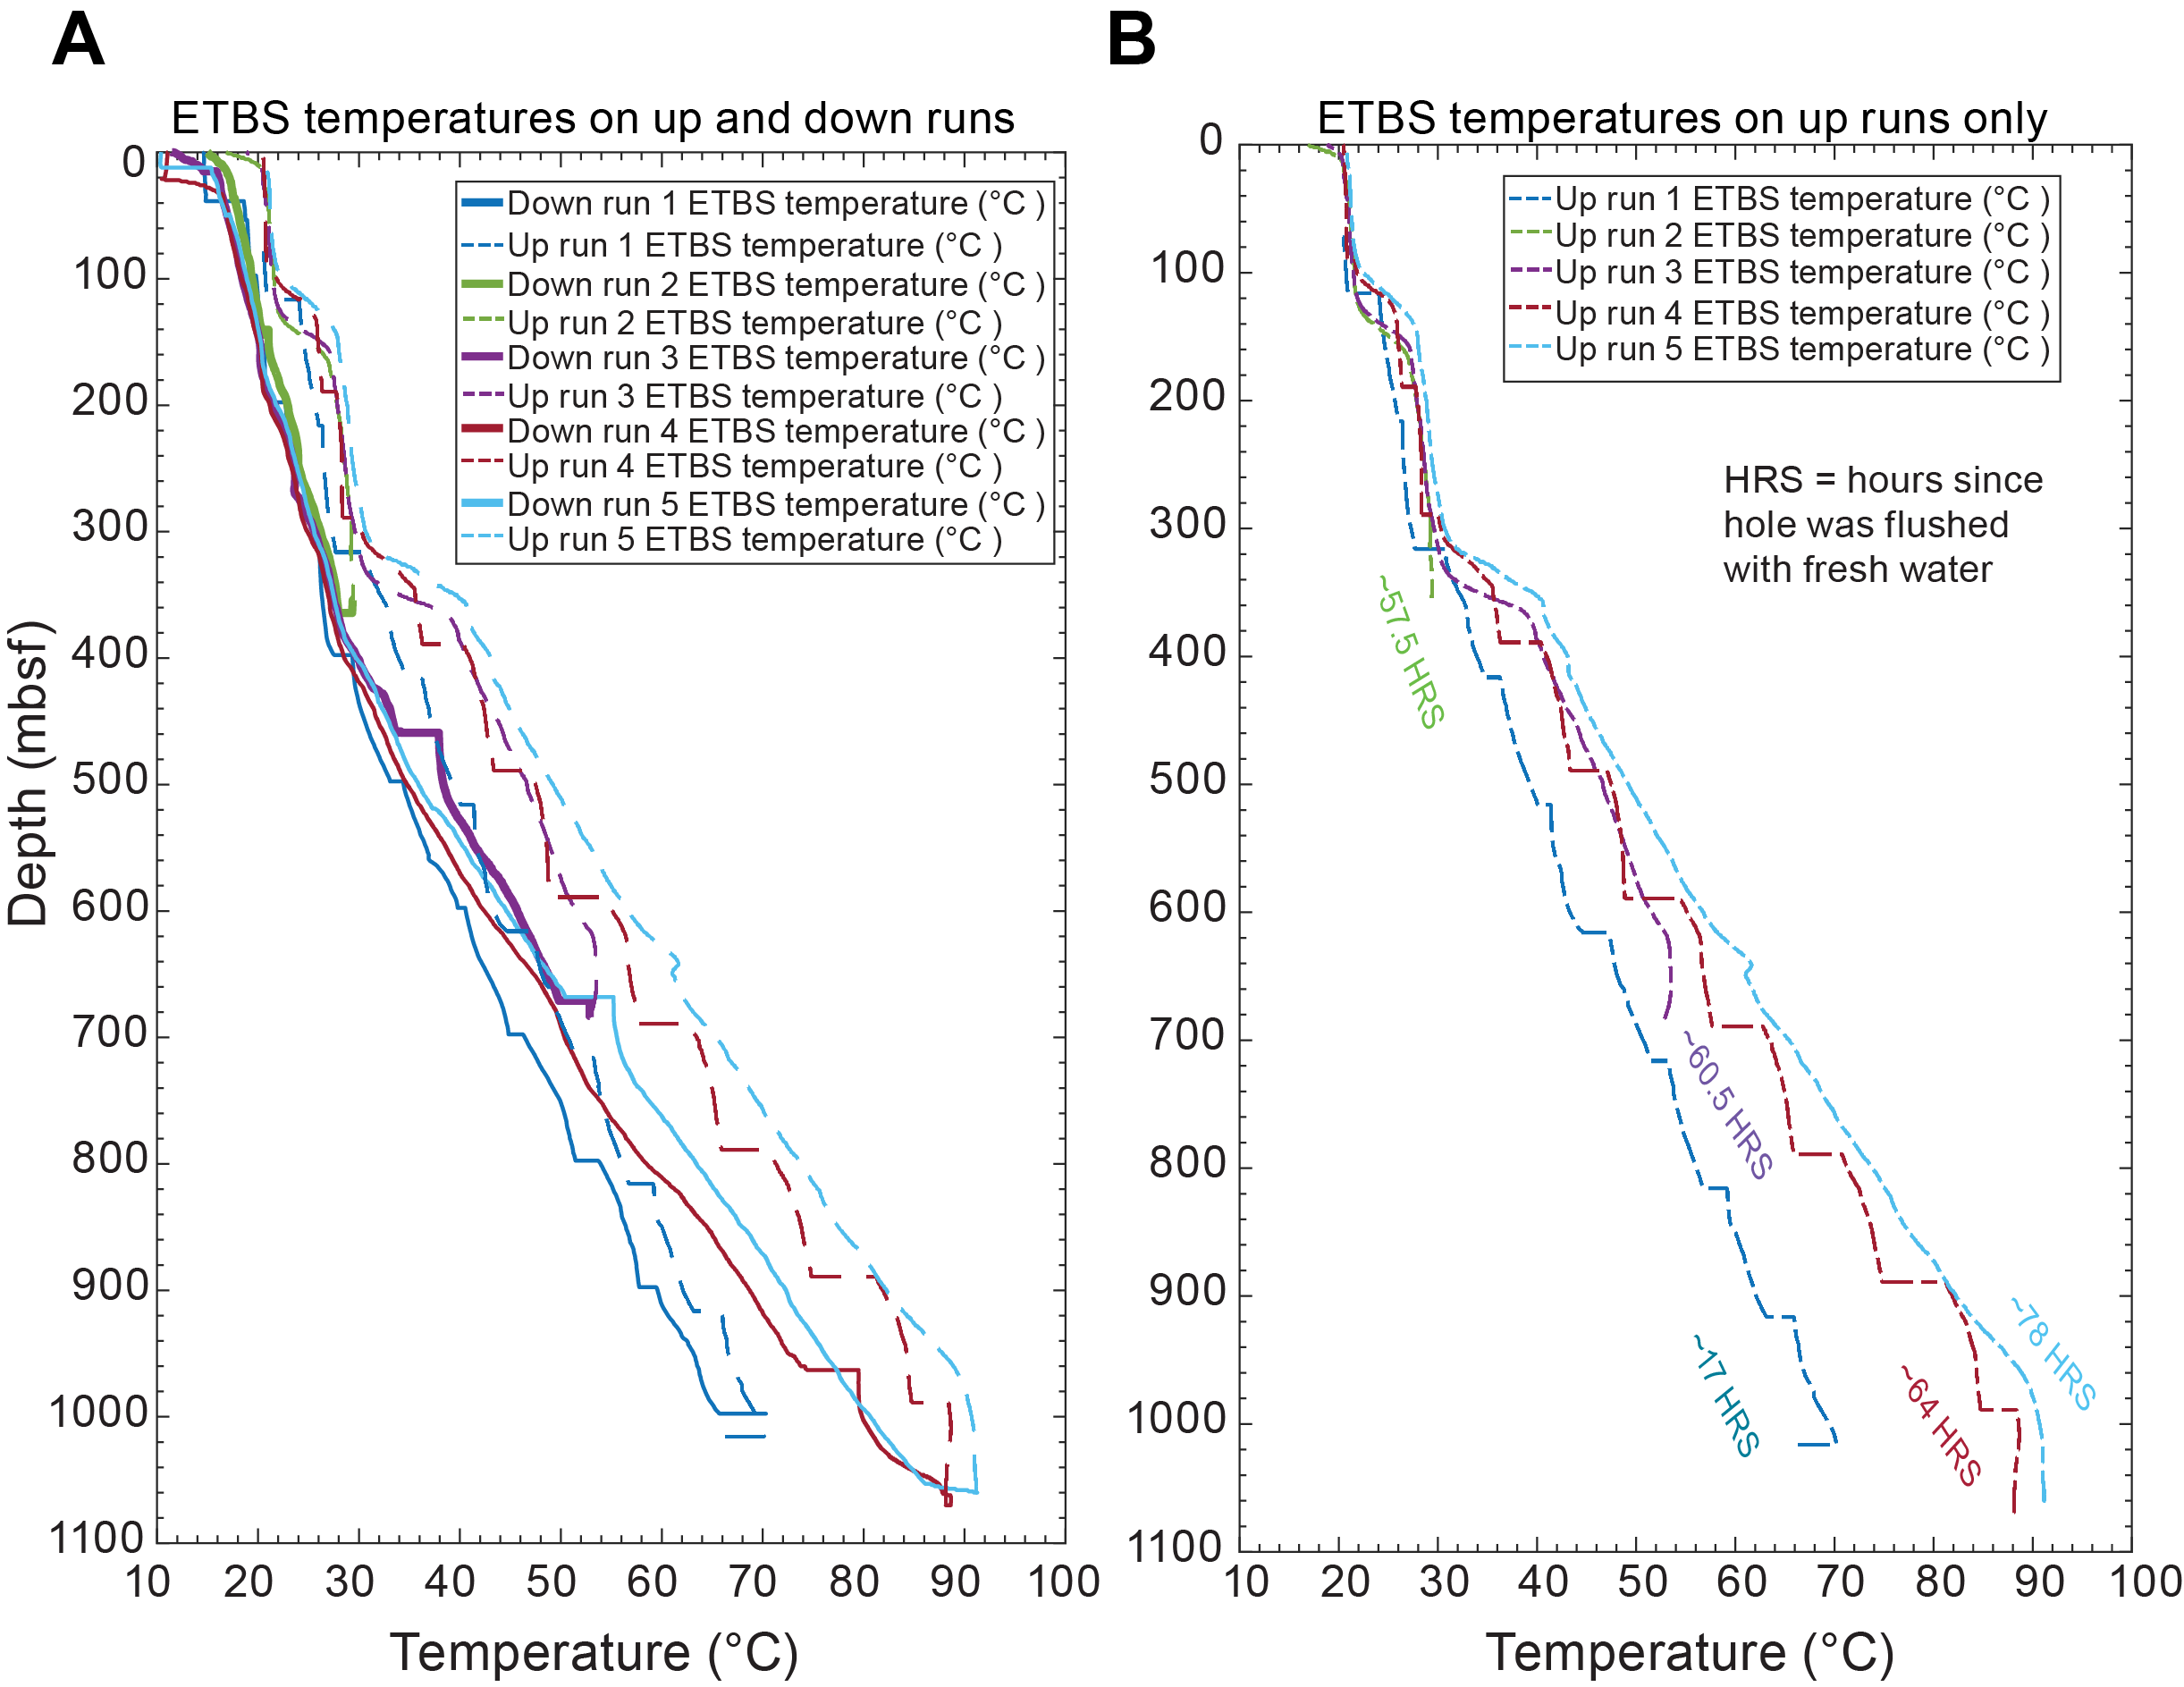
Figure F153. ETBS temperature results.
During Run 2, the CTD tool was also attached to the KFTS and measured temperature and salinity. Because the CTD has a maximum temperature limit, the tools were only lowered to a depth of 347.4 mbsf and maximum temperature of 29.5°C. The CTD generally records with higher precision than the ETBS and indicates ~2°–3°C higher temperatures compared to those recorded by the ETBS (Figure F154). Both temperature and salinity increased during the upgoing runs compared to the downgoing runs, indicating a possible shift in these fluid properties over time. The salinity is high, roughly that of seawater, in the upper ~150 m of the hole and low, roughly that of freshwater, in the 150 m below. These shifts are likely related to a density driven freshwater/seawater overturn after flushing. The inflection in salinity coincides with an inflection in temperature observed in the LEH-MT (see below) and ETBS (see above) data.
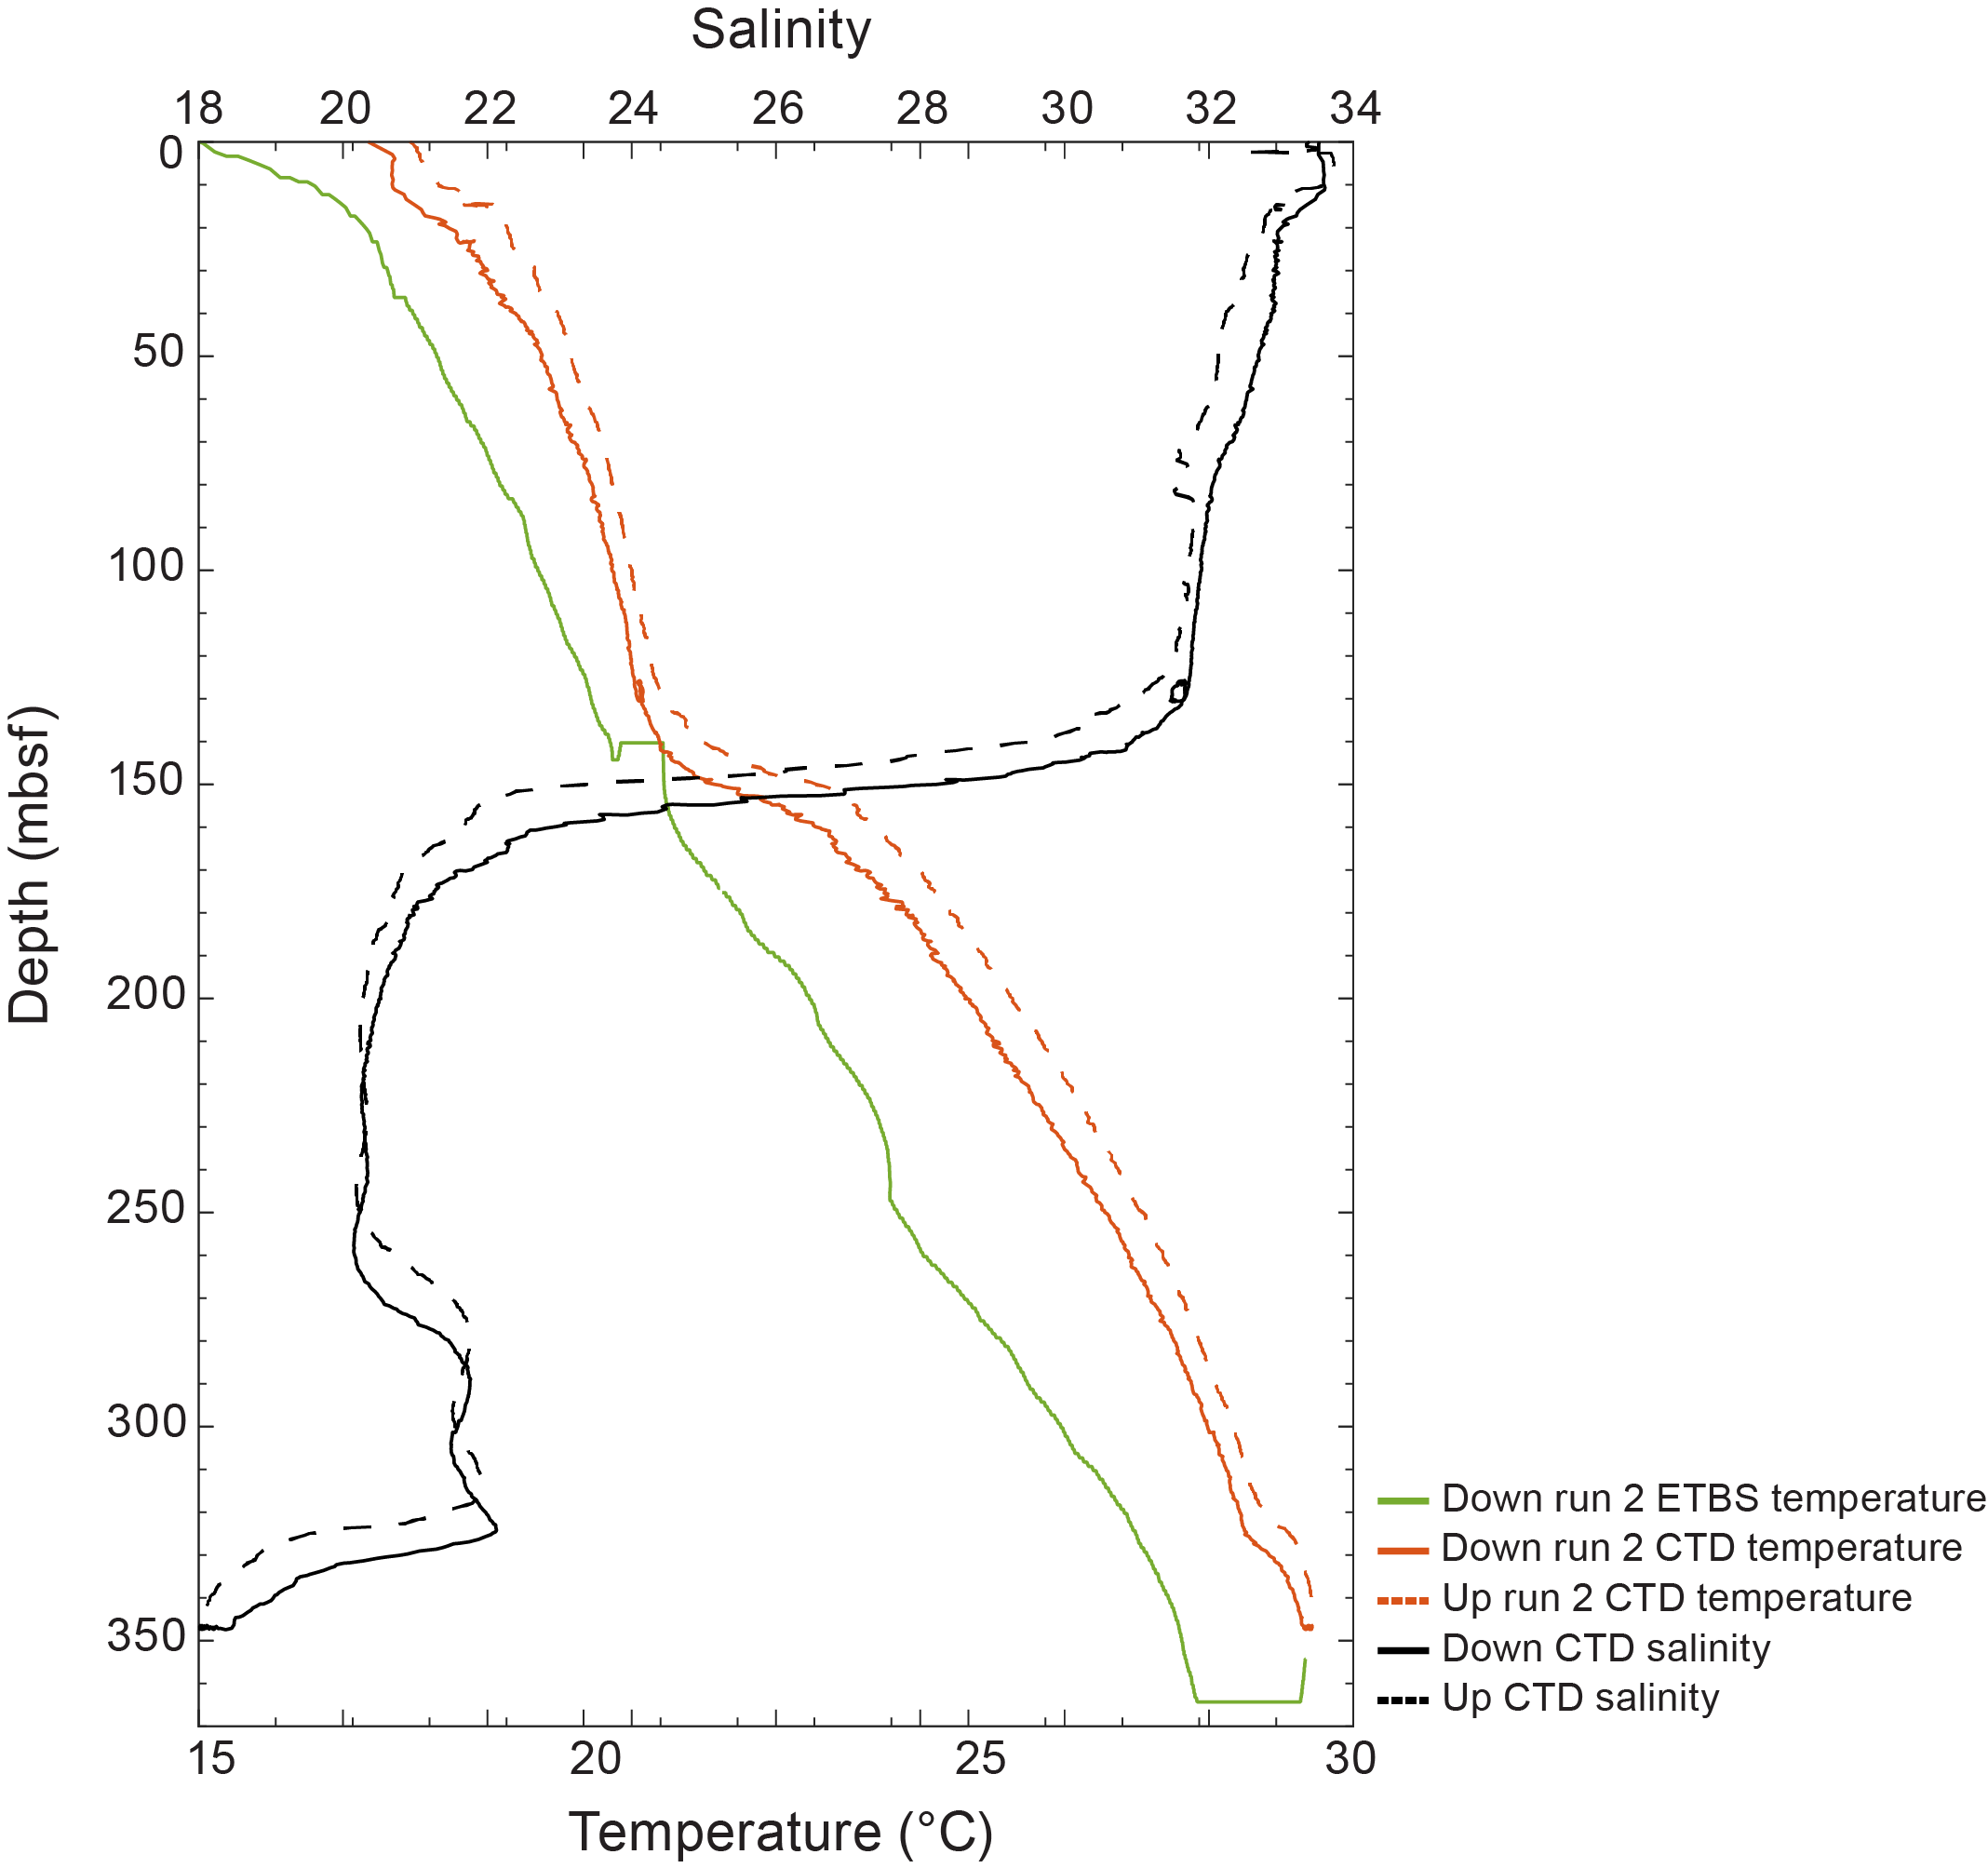
Figure F154. Temperature and salinity.
Additional temperature measurements were recorded during each logging run with the Schlumberger LEH-MT tool, which was attached to the top of the tool string during each logging run. Resulting thermal profiles are displayed in Figure F155. Notably, the difference between up- and downgoing runs using the LEH-MT tool is much lower than with the ETBS tool, likely attributed to a higher sensitivity of the LEH-MT tool's sensor itself. The general trend of temperature with depth is similar in the LEH-MT and ETBS profiles, and the highest recorded temperature by the LEH-MT tool of 88°C at 1069 mbsf is also similar to that of the ETBS (91.3°C at 1060 mbsf). The slightly higher temperature using the ETBS tool is likely because the ETBS runs were conducted several hours after the final logging runs with the LEH-MT, so there was more time for the fluid to be warmed by the formation. The increase in gradient at ~370 mbsf seen with ETBS data is also shown in all LEH-MT log (Figure F155).
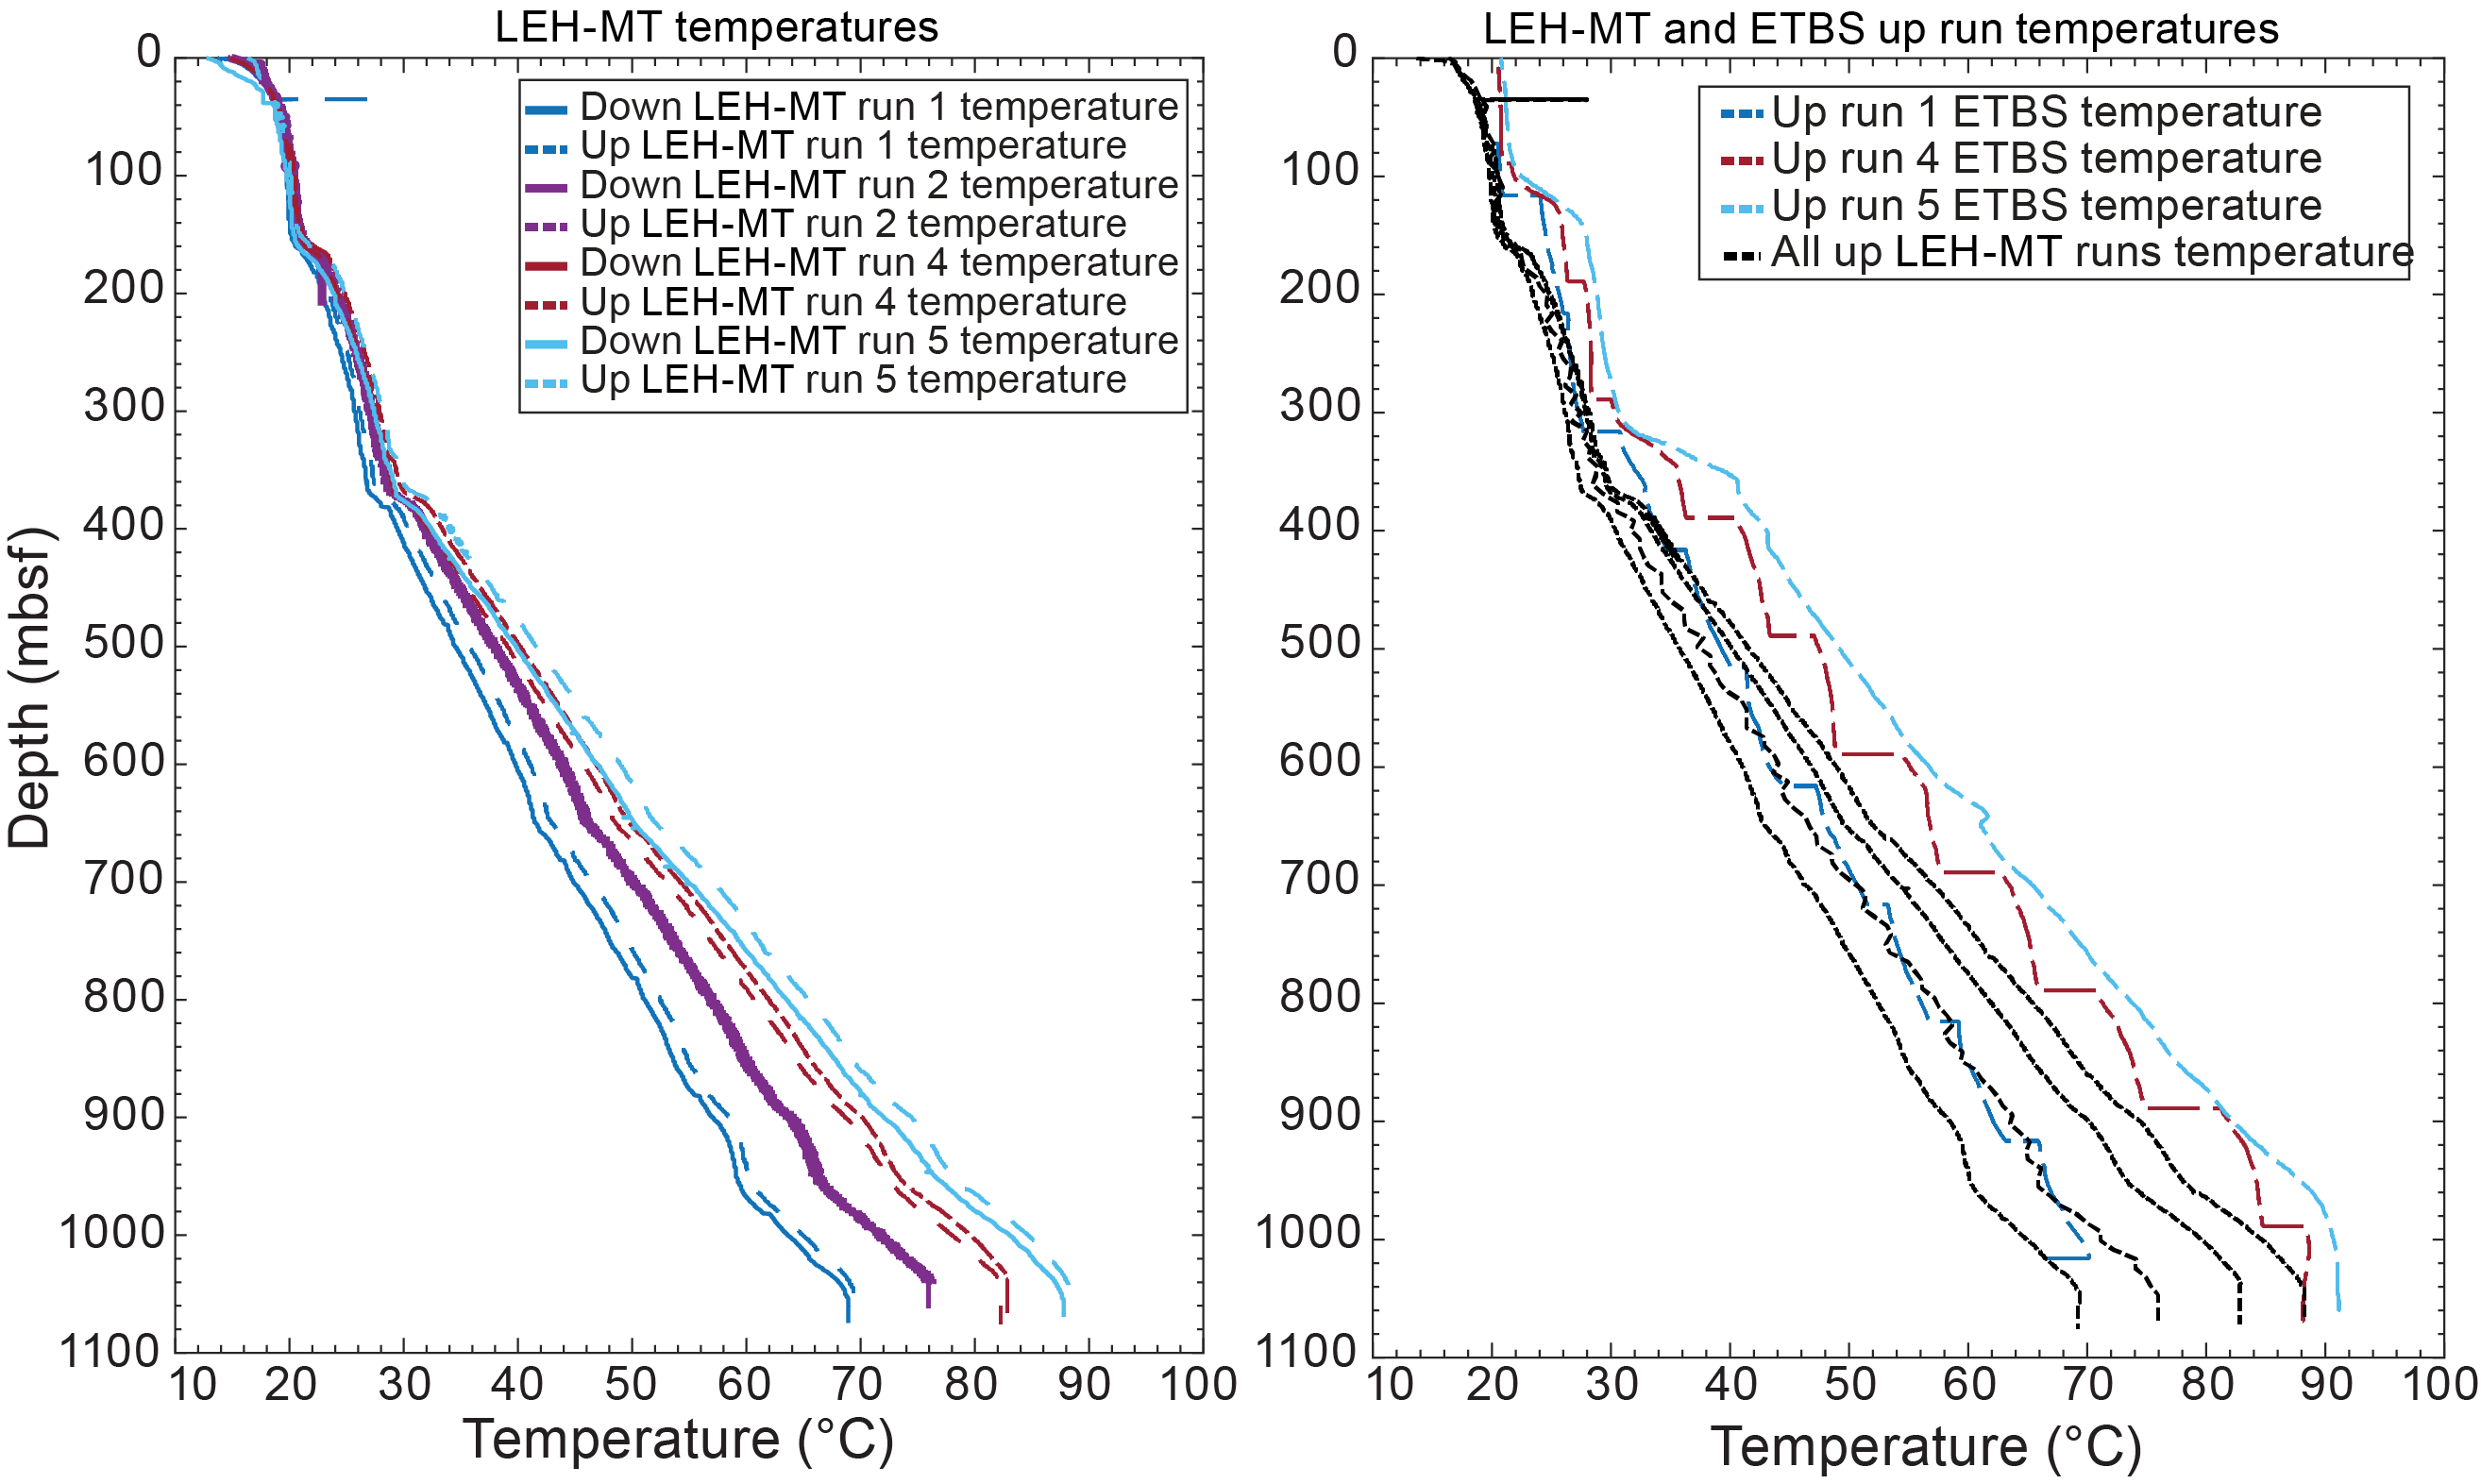
Figure F155. LEH-MT and ETBS temperature results.
8.2.8. Downhole wireline logging
A total of five downhole wireline logging runs were implemented during Expedition 399 in Hole U1601C. The tool strings and tool descriptions are in Petrophysics in the Expedition 399 methods chapter (Lang et al., 2025), and the timing of deployment are in Operations.
Run 1 included the LEH-pressure temperature (PT), HNGS, HLDS, and ETBS. The HNGS and HLDS were flasked because the borehole temperature was unknown before logging. The bottom-hole temperature after the first run indicated ~68°C, so it was determined that all the tools could be run and flasking was not required. Run 2 included the LEH-PT, APS, HRLA, and UBI. Run 3 included the LEH-PT, HNGS, and MSS. Run 4 included the LEH-PT, HNGS, Dipole Shear Sonic Imager Tool (DSST), and FMS. Run 5 included the VSI. The casing depth is ~23 mbsf, and the logging bit was located at ~30 mbsf. The last core before logging was Core 240R (~1180 mbsf). The bottom depth recorded by the tools was typically ~100 m above the bottom of the hole. Considering all of this, the logging was completed over the interval ~30–1080 mbsf.
UBI logs in Hole U1601C were not measured correctly and/or the tool malfunctioned.
The EDTC did not work properly on several runs, so all logging data are tied to a zero point of 861 m drilling depth below rig floor (DRF) or mbrf (see Operations in the Expedition 399 methods chapter [Lang et al., 2025]). An overview of petrophysical downhole measurements is in Figure F156. The diameter of the borehole from caliper measurements is quite regular and is close to the bit size (9.73 inches) with a few larger intervals. The larger intervals are located near the top of the hole at 50–100, ~140, 160, 210–260, 320, 700, and 970 mbsf. None of these intervals deviate much and do not exceed the limit of the caliper (>17 inches), meaning all measurements should be of high quality. The hole is deviated a total of 10° from vertical.
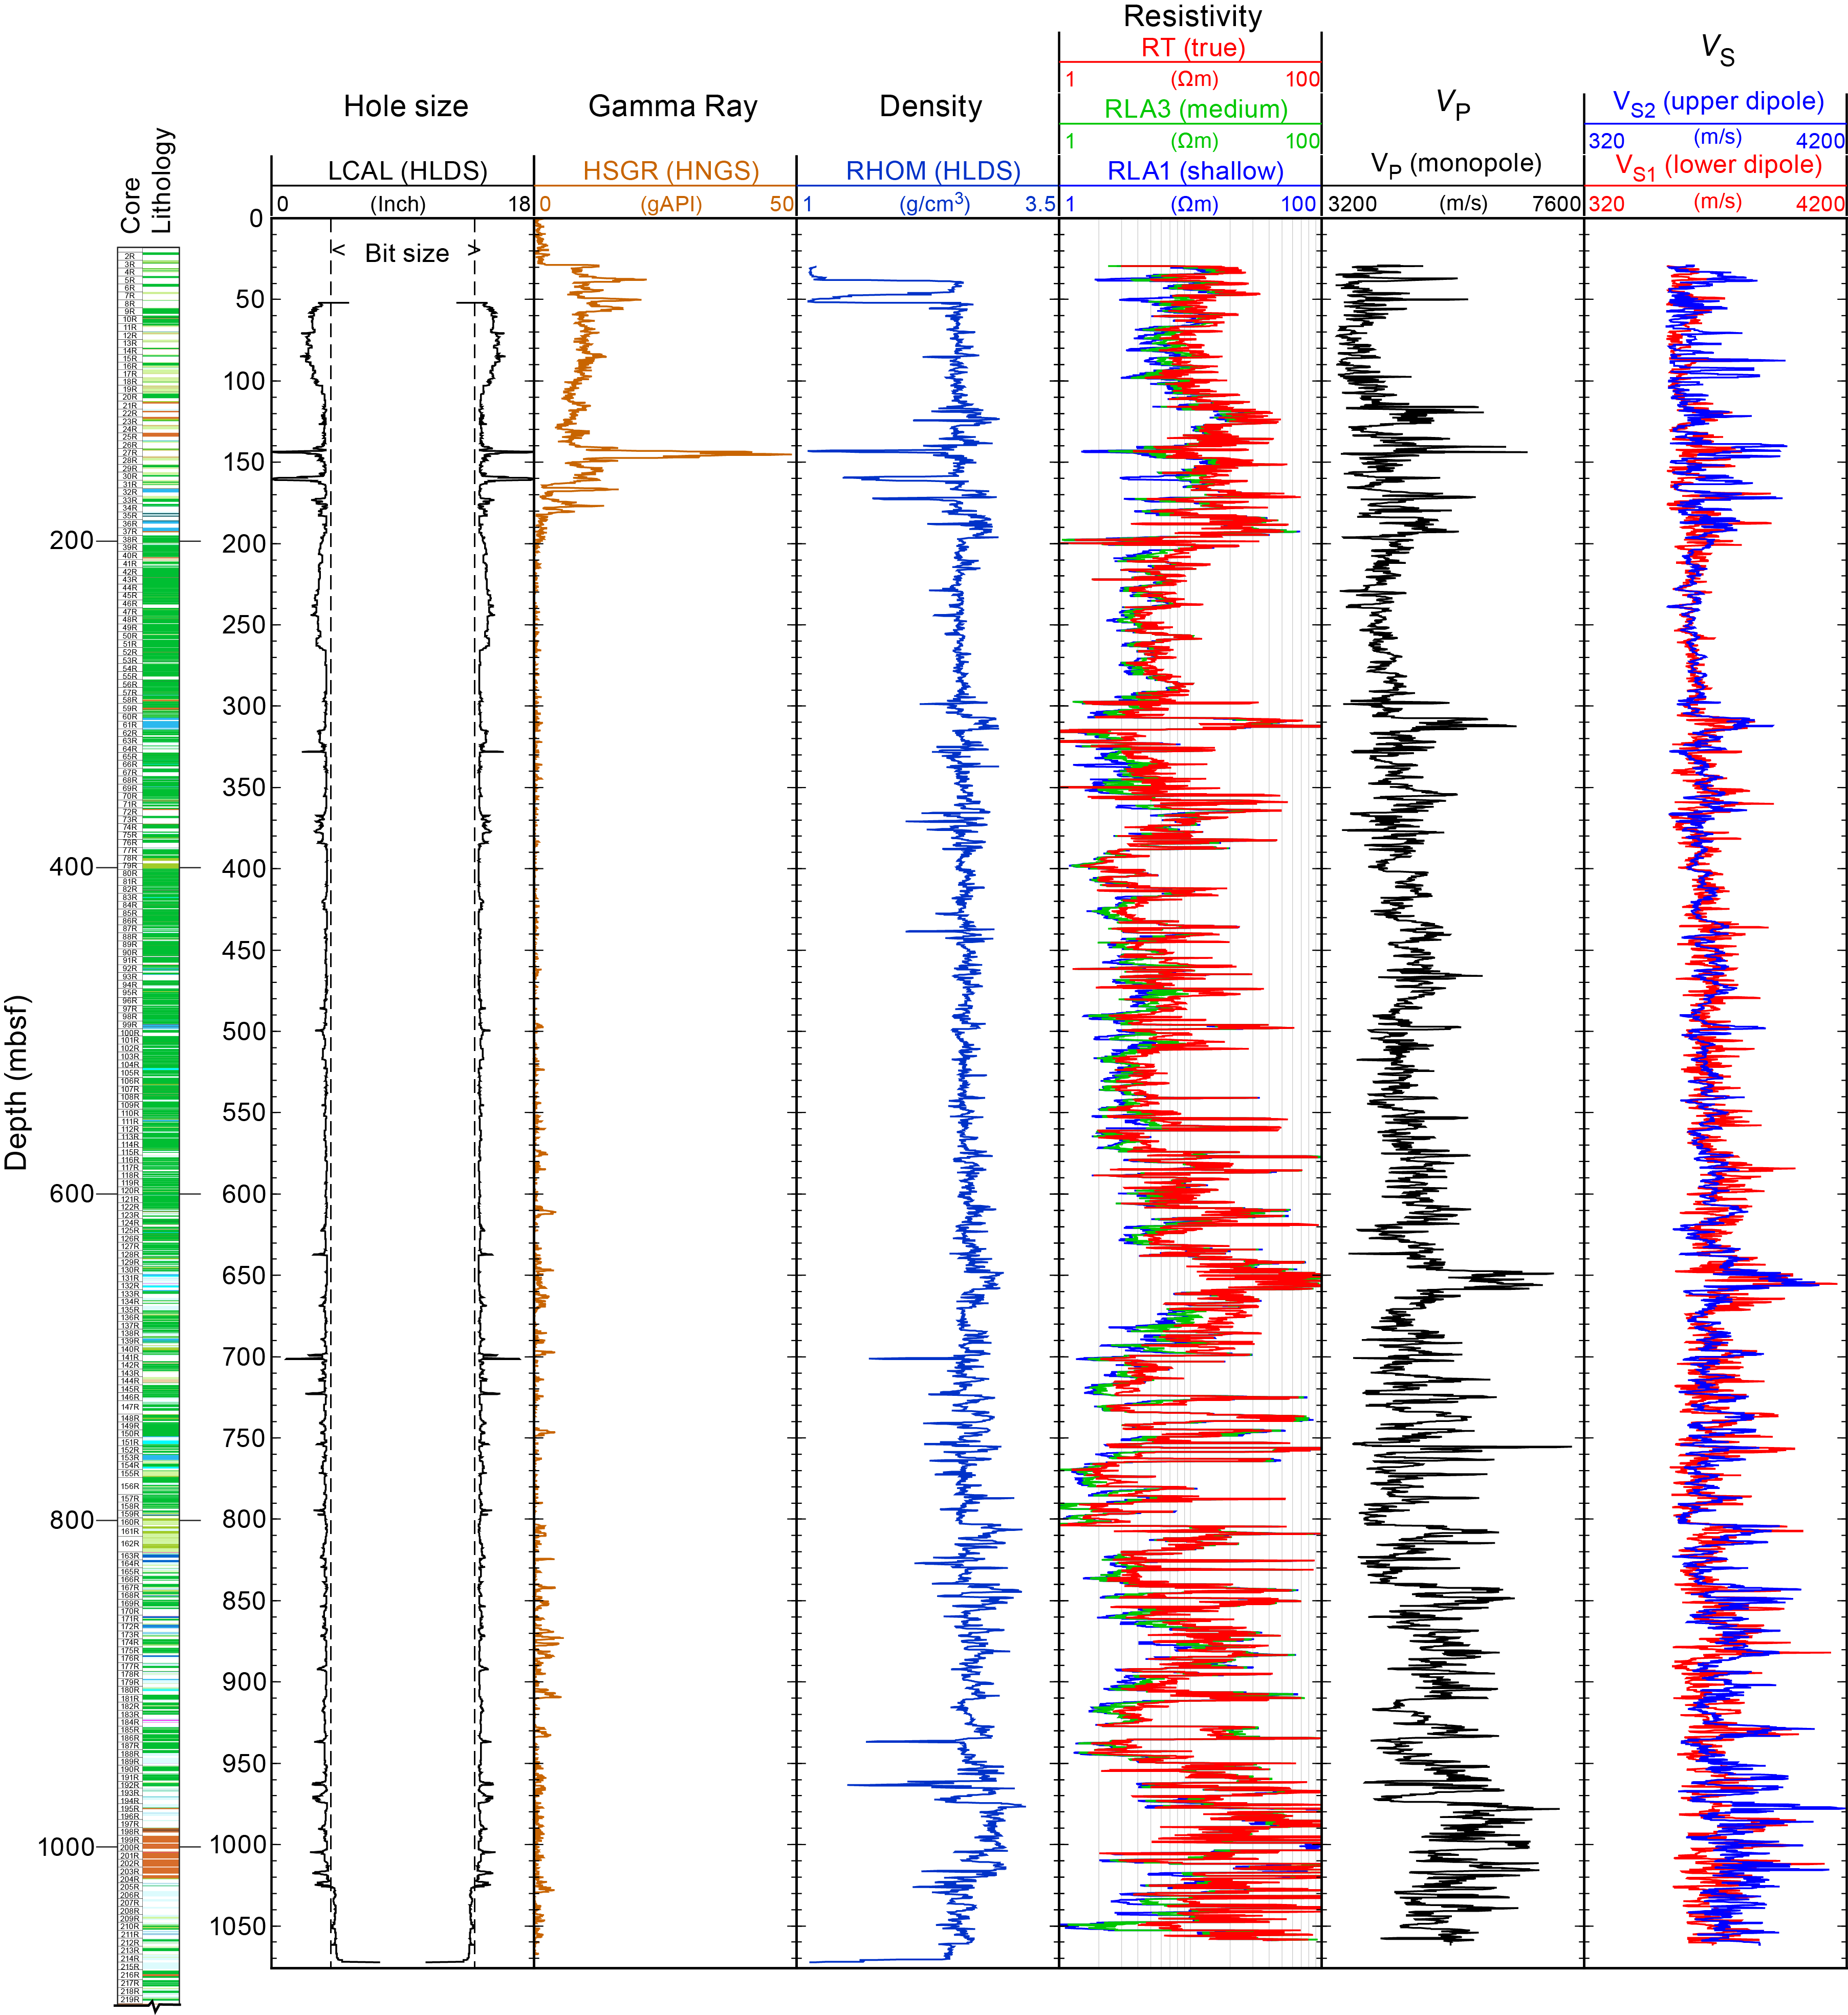
Figure F156. Wireline logging data.
8.2.8.1. Density and porosity
Bulk density was measured using the HLDS during Run 1. The bulk density baseline value was ~2.6 g/cm3, which is indicative of serpentinized peridotite (Figure F156). Inflections in bulk density to higher values are indicative of gabbro. The thicker zones of gabbro are more apparent in the log, for example, where values are ~2.9 g/cm3 in the interval 188–196 mbsf (Cores 36R–37R), ~2.9 g/cm3 in the interval 307–314 mbsf (Cores 60R–61R), and ~3.2 g/cm3 in the interval 950–970 mbsf (Cores 193R–197R) with an intermittent dip in bulk density due to a serpentinized peridotite interval ~959 mbsf (Core 195R). This interval includes several Fe-Ti oxide gabbros (see Igneous petrology) that have higher bulk density observed in logging, whole-round measurements, and discrete samples. The lowest bulk density values occur in serpentinized peridotite of ~1.2 g/cm3 at ~50 mbsf and ~1.2 g/cm3 at ~140 mbsf. Other low bulk density values are ~1.7 g/cm3 at ~157 mbsf, ~1.7 g/cm3 at ~229 mbsf, ~1.9 g/cm3 at ~173 mbsf, and ~1.7 g/cm3 at ~965 mbsf. These results match well with bulk density from whole-round measurements and bulk and grain density measurements on discrete samples.
Hole U1309D, logged during Expedition 304/305, has a baseline density of ~2.8 g/cm3 reflecting the high proportion of gabbro (Expedition 304/305 Scientists, 2006b). The highest bulk density in Hole U1309D is ~3.7 g/cm3, which is higher than values recorded by logging and discrete values in Hole U1601C. The baseline density matches very well with the average bulk density in gabbro from Hole U1601C. Hole U1473A (Atlantis Bank, Southwest Indian Ridge) has a baseline density of ~3.0 g/cm3 reflecting the high proportion of gabbro (MacLeod et al., 2017). This baseline is higher than what was measured in gabbro from Holes U1309D and U1601C. ODP Hole 1272A (14°–16°N, MAR), which has gabbro in the upper 50 m and serpentinized peridotite in the bottom section (50–130 mbsf), has bulk density values from logging between ~2.0 and 2.7 g/cm3 and a general increase downhole (Shipboard Scientific Party, 2004). No obvious difference between gabbro and serpentinized peridotite intervals was reported from Leg 209, but bulk density decreased in a fault zone at ~55 mbsf (Shipboard Scientific Party, 2004). The bulk density logging values in serpentinized peridotite in Hole 1272A matches well with those measured by logging in Hole U1601C.
Porosity was measured using the APS, which is a neutron porosity tool, during Run 2 (see Petrophysics in the Expedition 399 methods chapter [Lang et al., 2025]). The tool did not reach full electrical capacity so the results are spurious.
8.2.8.2. Electrical resistivity
Electrical resistivity was measured using the HRLA during Run 2. In general, there is a baseline value of ~3.7 Ωm, reported as deep penetration, and gabbro is more resistive than serpentinized peridotite. Higher resistivity values occur between ~115 and ~187 mbsf with values of up to ~49 Ωm, ~625–660 mbsf with values up to ~34 Ωm, and ~965–1030 mbsf with values up to ~700 Ωm. There is serpentinized peridotite in the last interval, which causes a lower inflection in resistivity between ~995 and ~1005 mbsf after which the resistivity increases again because of a higher proportion of gabbro. Lower resistivity values occur at ~190 mbsf (as low as ~4 Ωm), ~307 mbsf (as low as ~0.4 Ωm), and ~793 mbsf (as low as ~1.9 Ωm).
In Hole U1309D, logged during Expedition 304/305, resistivity is as high as ~650 Ωm with a baseline of ~27 Ωm (Expedition 304/305 Scientists, 2006b). There are discrete intervals of higher resistivity at 80–390 mbsf and 760–1080 mbsf and lower resistivity at 390–760 mbsf and 1080 mbsf and the bottom of logging (~1380 mbsf) (Expedition 304/305 Scientists, 2006b). In Hole U1473A, resistivity in the upper half of the hole above a fault is ~800 Ωm and then is higher below the fault, ~9000 Ωm (MacLeod et al., 2017). The baseline resistivity value in Hole U1309D is much higher compared to that in Hole U1601C, and discrete resistivity intervals are not as easily discerned in Hole U1601C because of differing proportions of serpentinized peridotite and gabbro dominating the signal. Resistivity values in Hole 1272A range 2.1–4.7 Ωm for deep penetration with no obvious difference in gabbro or serpentinized peridotite (Shipboard Scientific Party, 2004), which is in contrast to the more obvious differences in resistivity between the rock types in Hole U1601C. The baseline resistivity value for serpentinized peridotite in Hole 1272A overlaps with resistivity in Hole U1601C.
8.2.8.3. Sonic velocity
Sonic velocity was measured using the dipole shear sonic imager (DSI) during Run 4. A baseline P-wave velocity of ~4000 m/s and a baseline S-wave velocity of ~2000 m/s are reflective of the high proportion of serpentinized peridotite in the hole. Velocity increases overall with depth. Higher P-wave velocities of up to ~6700 m/s and S-wave velocities of up to ~3500 m/s represent gabbro-rich intervals at ~140, ~307, ~650, ~850–885 mbsf, and below ~950 mbsf. These intervals match well with higher bulk density and higher resistivity (see above) and P-wave velocity measured on discrete samples.
Sonic velocity measured in Hole U1309D during Expeditions 304/305 and 340T show a regular increase in velocity with depth starting at velocities ~4000 m/s and reaching velocities of ~7000 m/s at the bottom of the logged interval (Expedition 304/305 Scientists, 2006b; Expedition 340T Scientists, 2012). S-wave velocities in Hole U1309D have a baseline value of ~3500 m/s. Sonic velocity measured in Hole U1473A has values of ~6500–6900 m/s with a general increase downhole. These values match well with gabbroic intervals in Hole U1601C but are overall faster than the baseline because of more serpentinized peridotite in Hole U1601C. P-wave velocity in Hole 1272A ranges 2100–5200 m/s, a baseline value of ~3000 m/s in serpentinized peridotite, and generally increases with depth. P-wave velocity is higher in gabbro compared to serpentinized peridotite, similar to what is seen in Hole U1601C. However, the P-wave velocity in Hole U1601C in serpentinized peridotite is higher than that measured in Hole 1272A.
8.2.8.4. Seismic check shots
The VSI was deployed during wireline logging Run 5. The seismic source was a Sercel G-gun parallel cluster, composed of two 250 in3 air guns separated by 1 m. It was positioned by one of the ship's cranes on the port side of the ship at a distance of 30.7 m from the centerline of the ship with a 30° crane angle (Figure F157). The setback along the centerline from the top of the wellhead was 46.8 m, and the total horizontal (diagonal) offset from the wellhead was 47.0 m. The air guns were suspended from a float at a water depth of ~7 m, corresponding to a notch frequency of 109 Hz. The average firing pressure was 2000 psi. Minimum firing interval during vertical seismic profile (VSP) operations was 10 s, and pressure recovery after firing was ~5 s, so shot-to-shot variations in pressure were minimal. The bubble pulse interval was ~125 ms. Only one gun was able to be used, and three shots were fired per VSI shuttle location in Hole U1601C. The heading of the ship stayed relatively constant during the experiment at an average of 031°.
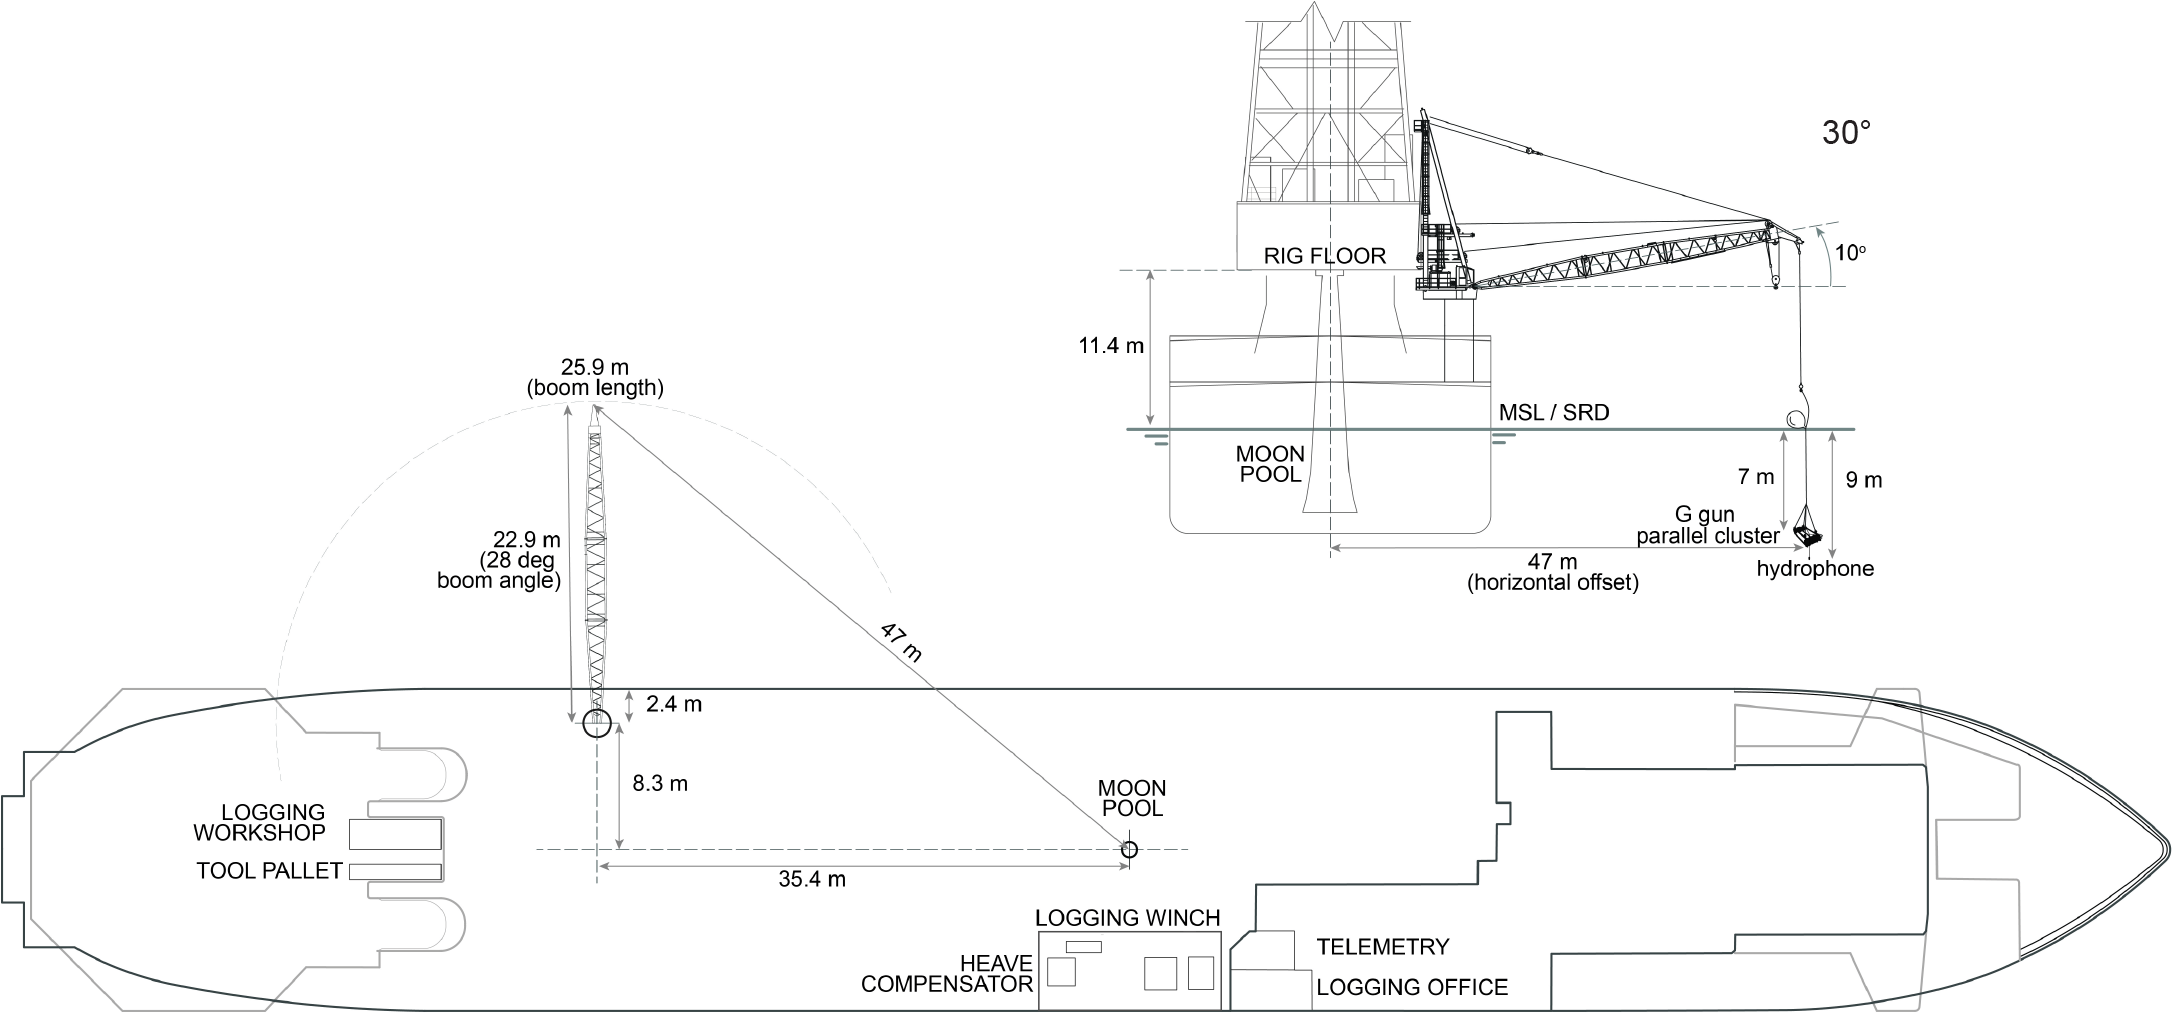
Figure F157. VSI source and ship geometry.
In accordance with the requirements of the National Environmental Policy Act (NEPA) and the Endangered Species Act, all seismic activities were conducted during daytime and protected species observers (PSOs) kept watch for protected species during the entire duration. Any sight of protected species within the exclusion zone of 940 m (defined for water depths > 1000 m) would interrupt the survey for 60 min after the last sighting or until the protected species were seen leaving the exclusion zone. PSOs began observations 1 h prior to the use of the seismic source, which started with a 30 min ramp-up procedure, gradually increasing the operational pressure and firing rate to provide time for undetected protected species to vacate the area. The same ramp-up procedure would be used when resuming activity after any interruption because of the sighting of protected species or whenever the gun was not fired for more than 30 min.
One VSI shuttle was used and the shuttle was stopped every 100 m for measurement starting at 1930 mbrf with a total of 13 stations. P-wave velocity measured using the VSI matches very well with the sonic log (see above; Figure F156). The results of the experiment are shown in Table T15. The average velocity across all stations is ~4500 m/s with a range of 3638 m/s at the shallowest depth (~58 mbsf) to 5299 m/s in the deepest part of the hole (~1070 mbsf).
VSI measurements from Expeditions 304/305 and 340T show a fairly consistent baseline value of ~7000 m/s (Expedition 304/305 Scientists, 2006a; Expedition 340T Scientists, 2012). The most consistent velocities are in the interval ~760–1070 mbsf where gabbro is most consistent in velocity (Expedition 340T Scientists, 2012). The interval that is more olivine rich has lower velocities of ~5300 m/s (Expedition 340T Scientists, 2012), which is more consistent with velocities seen in Hole U1601C. Values measured in Hole U1601C and those reported for serpentinized peridotite (~4000 m/s) and gabbro (~5500 m/s) from full waveform inversion of Seismic Line Meg 4 that runs north–south near Holes U1601C and U1309D by Harding et al. (2016) are a very good match.
8.2.8.5. Magnetic susceptibility
Magnetic susceptibility was measured with the MSS during wireline logging Run 3. The tool is not calibrated, and values cannot be directly compared with the MSL or MSP measured on cores. Magnetic susceptibility values are variable downhole, with a consistent upper value matching higher magnetic susceptibility seen in whole-round measurements from serpentinized peridotite cores. The MSS log matches the MSL signal where both gabbro and serpentinized peridotite occur in the interval ~115–200 mbsf. Several low magnetic susceptibility values correspond with the presence of gabbro, mirrored by higher P-wave velocity, higher bulk density, and higher resistivity in the logging data (see above).
The MSS was not deployed during Expedition 304/305 but was run during Expedition 340T, when the tool was first deployed after being rebuilt (Expedition 340T Scientists, 2012). There is a very good correlation between the MSS log and MSP measurements on cores, which indicates the presence of magnetic minerals. In Hole U1309D, the MSS log was able to be used to discern between Fe-Ti oxide gabbro and serpentinized peridotite (Expedition 340T Scientists, 2012). Gabbro in Hole U1309D does not have high magnetic susceptibility values, especially compared to more consistent, higher values in serpentinized peridotite, namely between ~310 and 335 mbsf (Expedition 304/305 Scientists, 2006b). Magnetic susceptibility measured with the MSS in Hole U1473A has a similar pattern, with most gabbro having lower values and Fe-Ti oxide gabbro having higher values (MacLeod et al., 2017). However, in Hole U1473A, the MSS tool seemed to be inverse, as it reported higher magnetic susceptibility zones as lower values, compared to shipboard measurements, and the baseline gabbro values higher. This inversion does not seem to be the case in Hole U1601C because higher baseline values are associated with serpentinized peridotite and lower values are consistent with gabbro.
8.2.8.6. Natural gamma radiation
NGR was measured using the HNGS during wireline logging Runs 1, 3, and 4. NGR values are low, with a baseline value of ~0.5 American Petroleum Institute gamma radiation units (gAPI), below ~185 mbsf (Figure F156). Above this depth, from 30 mbsf right below the logging bit to ~185 mbsf, the NGR values are higher (up to 35 gAPI) and more variable. The routinely reported values by Schlumberger for K, U, and Th average <0.1 wt%, ~2 ppm, and ~0.6 ppm, respectively. As with the core measurements, these values are very low and error estimates are not provided. Negative concentration values indicate that the accuracy of the elemental yield estimates is questionable. (Figure F158). The interval of higher NGR values correlates with increased resistivity. This matches well with NGR measured on whole-round sections; however, the interval of higher values seen in the core data is limited to ~130–155 mbsf. Another small peak in NGR values is seen at ~873 mbsf and is reflected in NGR values from core measurements.
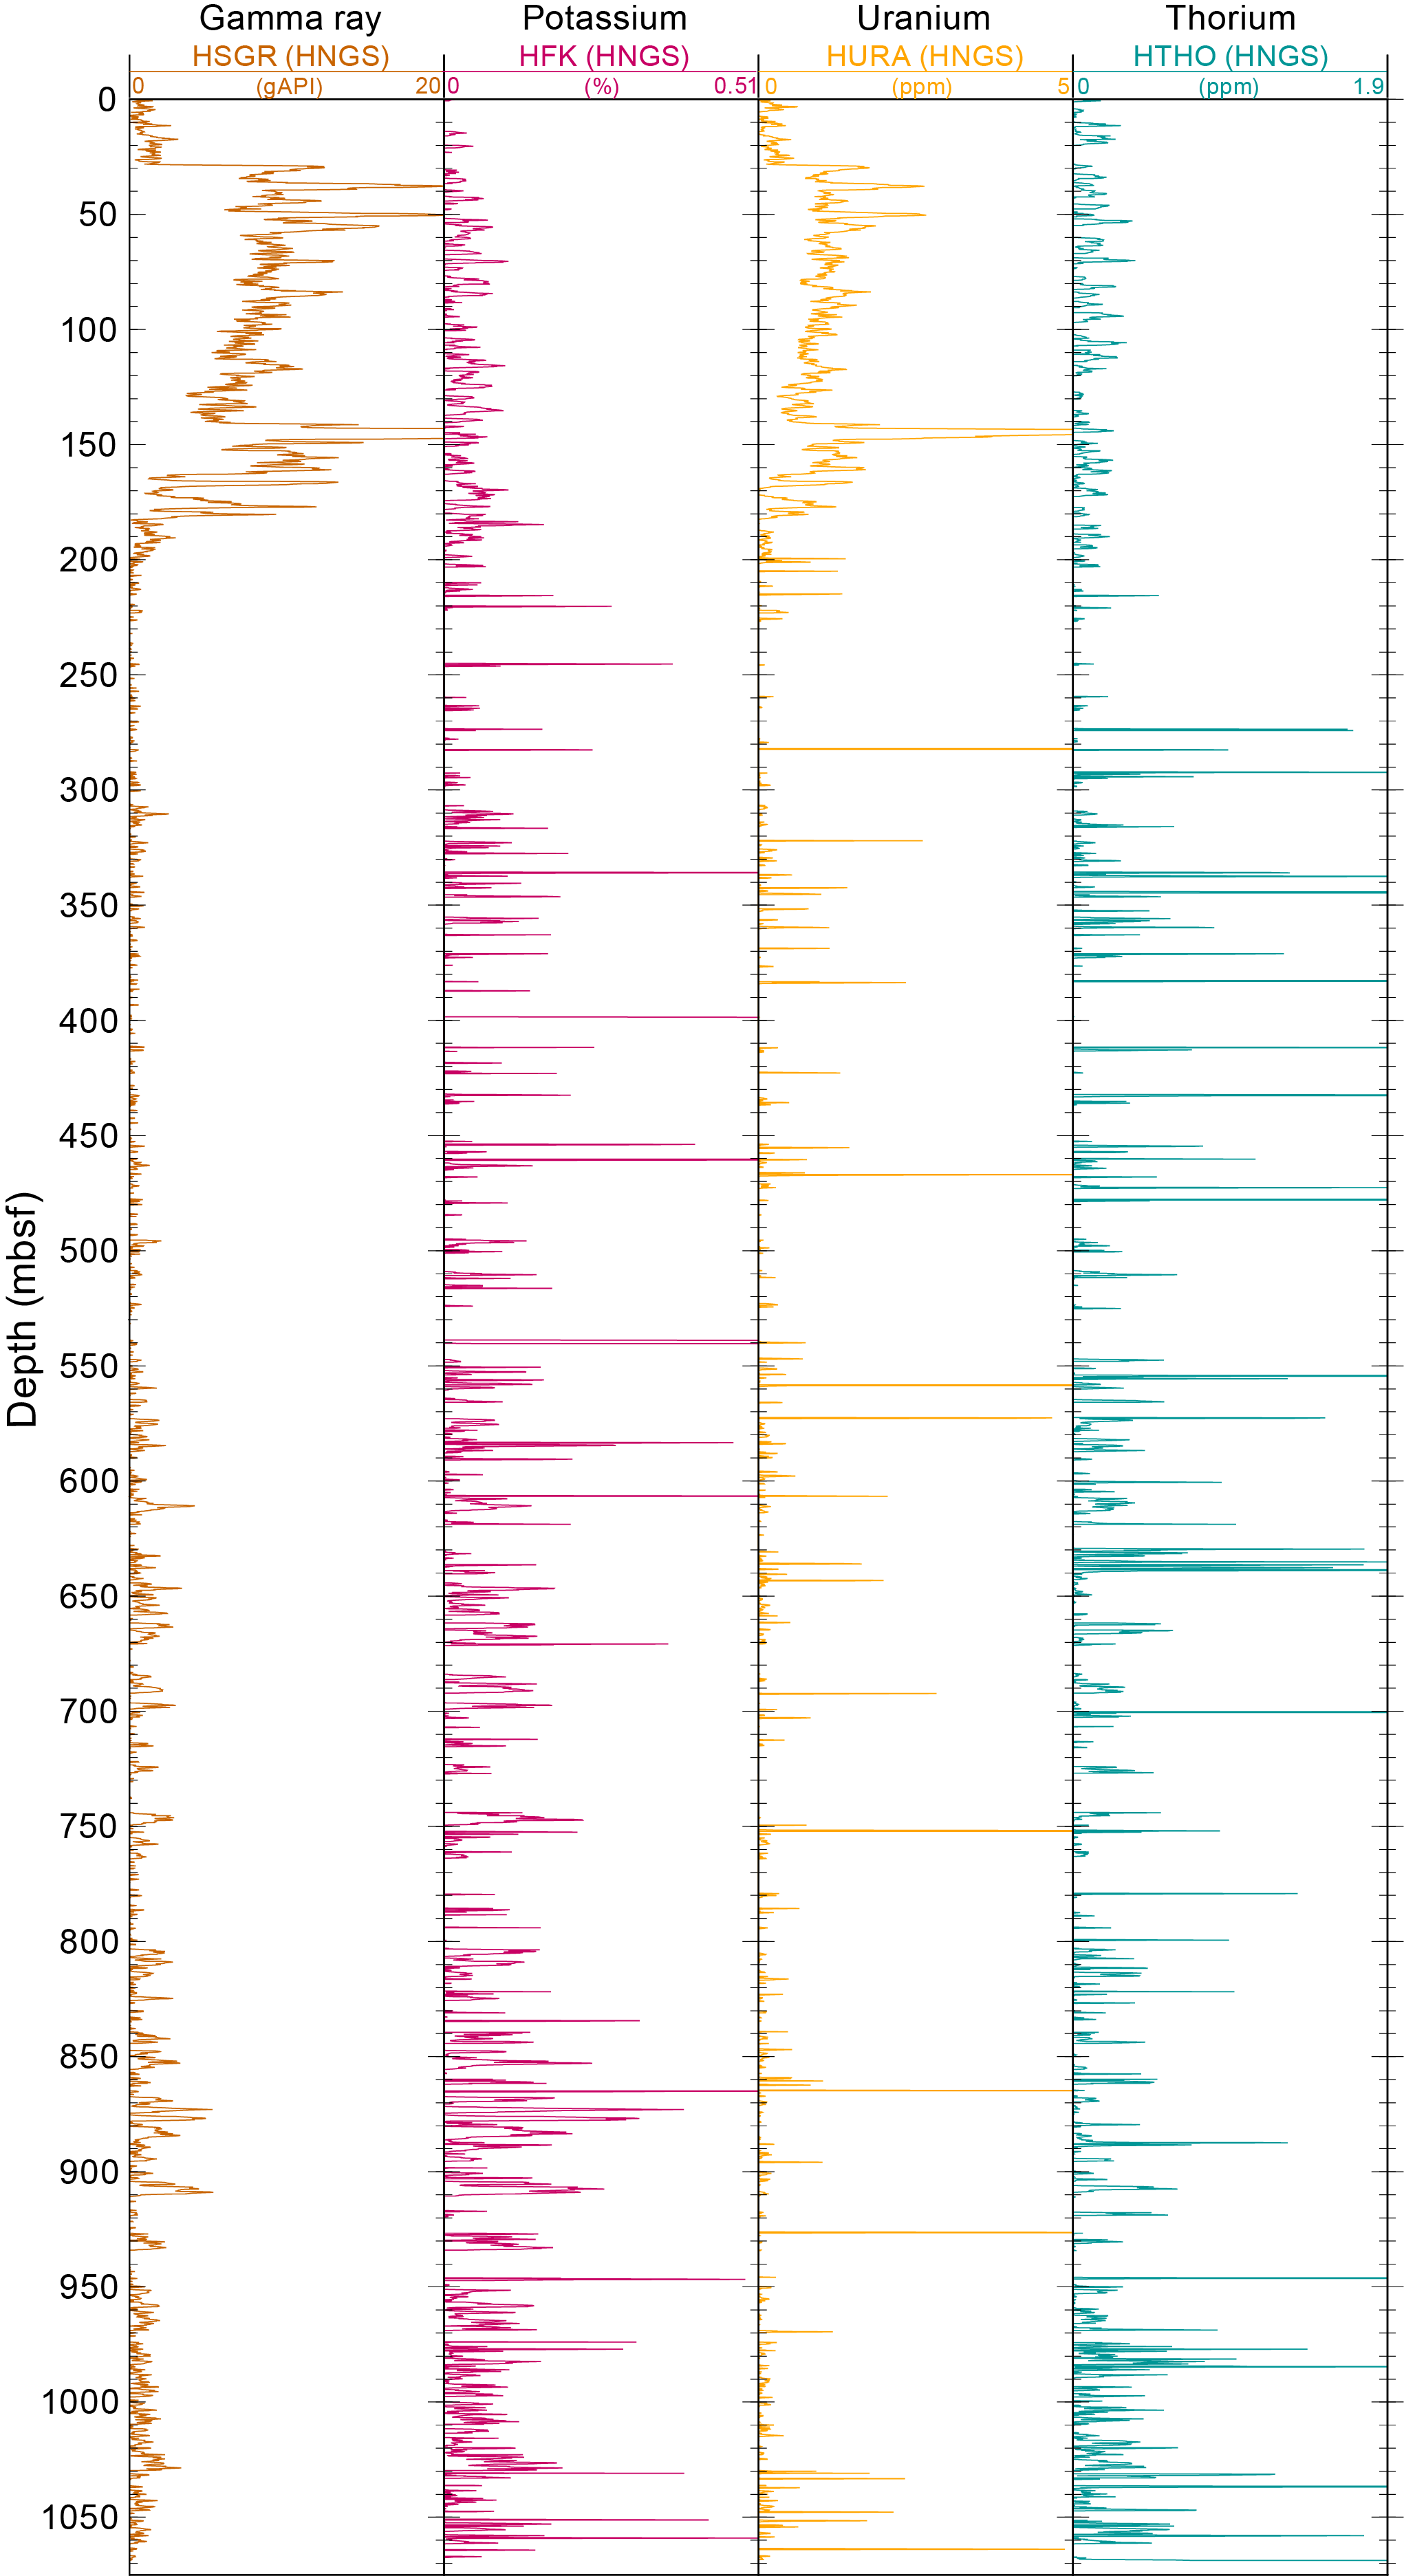
Figure F158. Potassium, thorium, and uranium, wireline logging.
In the logging data from Hole U1309D, NGR values are relatively low, similar to Hole U1601C, with a few peaks that are not interpreted (Expedition 304/305 Scientists, 2006b). Hole U1473A has similar NGR values and a few peaks that are ascribed to increased uranium in magmatic veins (MacLeod et al., 2017). NGR in Hole 1272A is low as well. None of the previous holes have a sustained zone of higher NGR values as seen in the top of Hole U1601C.
8.2.8.7. Image logs
Image logs were acquired using the UBI during wireline logging Run 2 and the FMS during Run 4. The UBI logs have some discernible features, but much of the log is blurred out. It is not clear why this is the case, and these logs may require more postprocessing. Considering these issues, FMS logs are the focus of the discussion below.
The FMS logs are of good quality and cover the depth interval 72–1072 mbsf. The logs show clear differences between rock types with serpentinized peridotite having a mottled appearance, likely reflecting the different resistivities of phases present (i.e., olivine, orthopyroxene, and/or serpentine; Figure F159). Gabbro has a more consistent resistivity response (Figure F159). Contacts between the two rock types can be readily identified (Figure F159). At least four distinct planar features can be identified including conductive planes (darker color), resistive planes (light color), contacts (different textures), and fabrics defined by phases large enough to resolve with the FMS. The dark planar features are most likely fractures filled with water, making them more conductive. The lighter planes are likely veins that are more resistive than their host rock. Fabrics are most easily identified in serpentinized peridotites where phases of different resistivity are aligned (Figure F159).
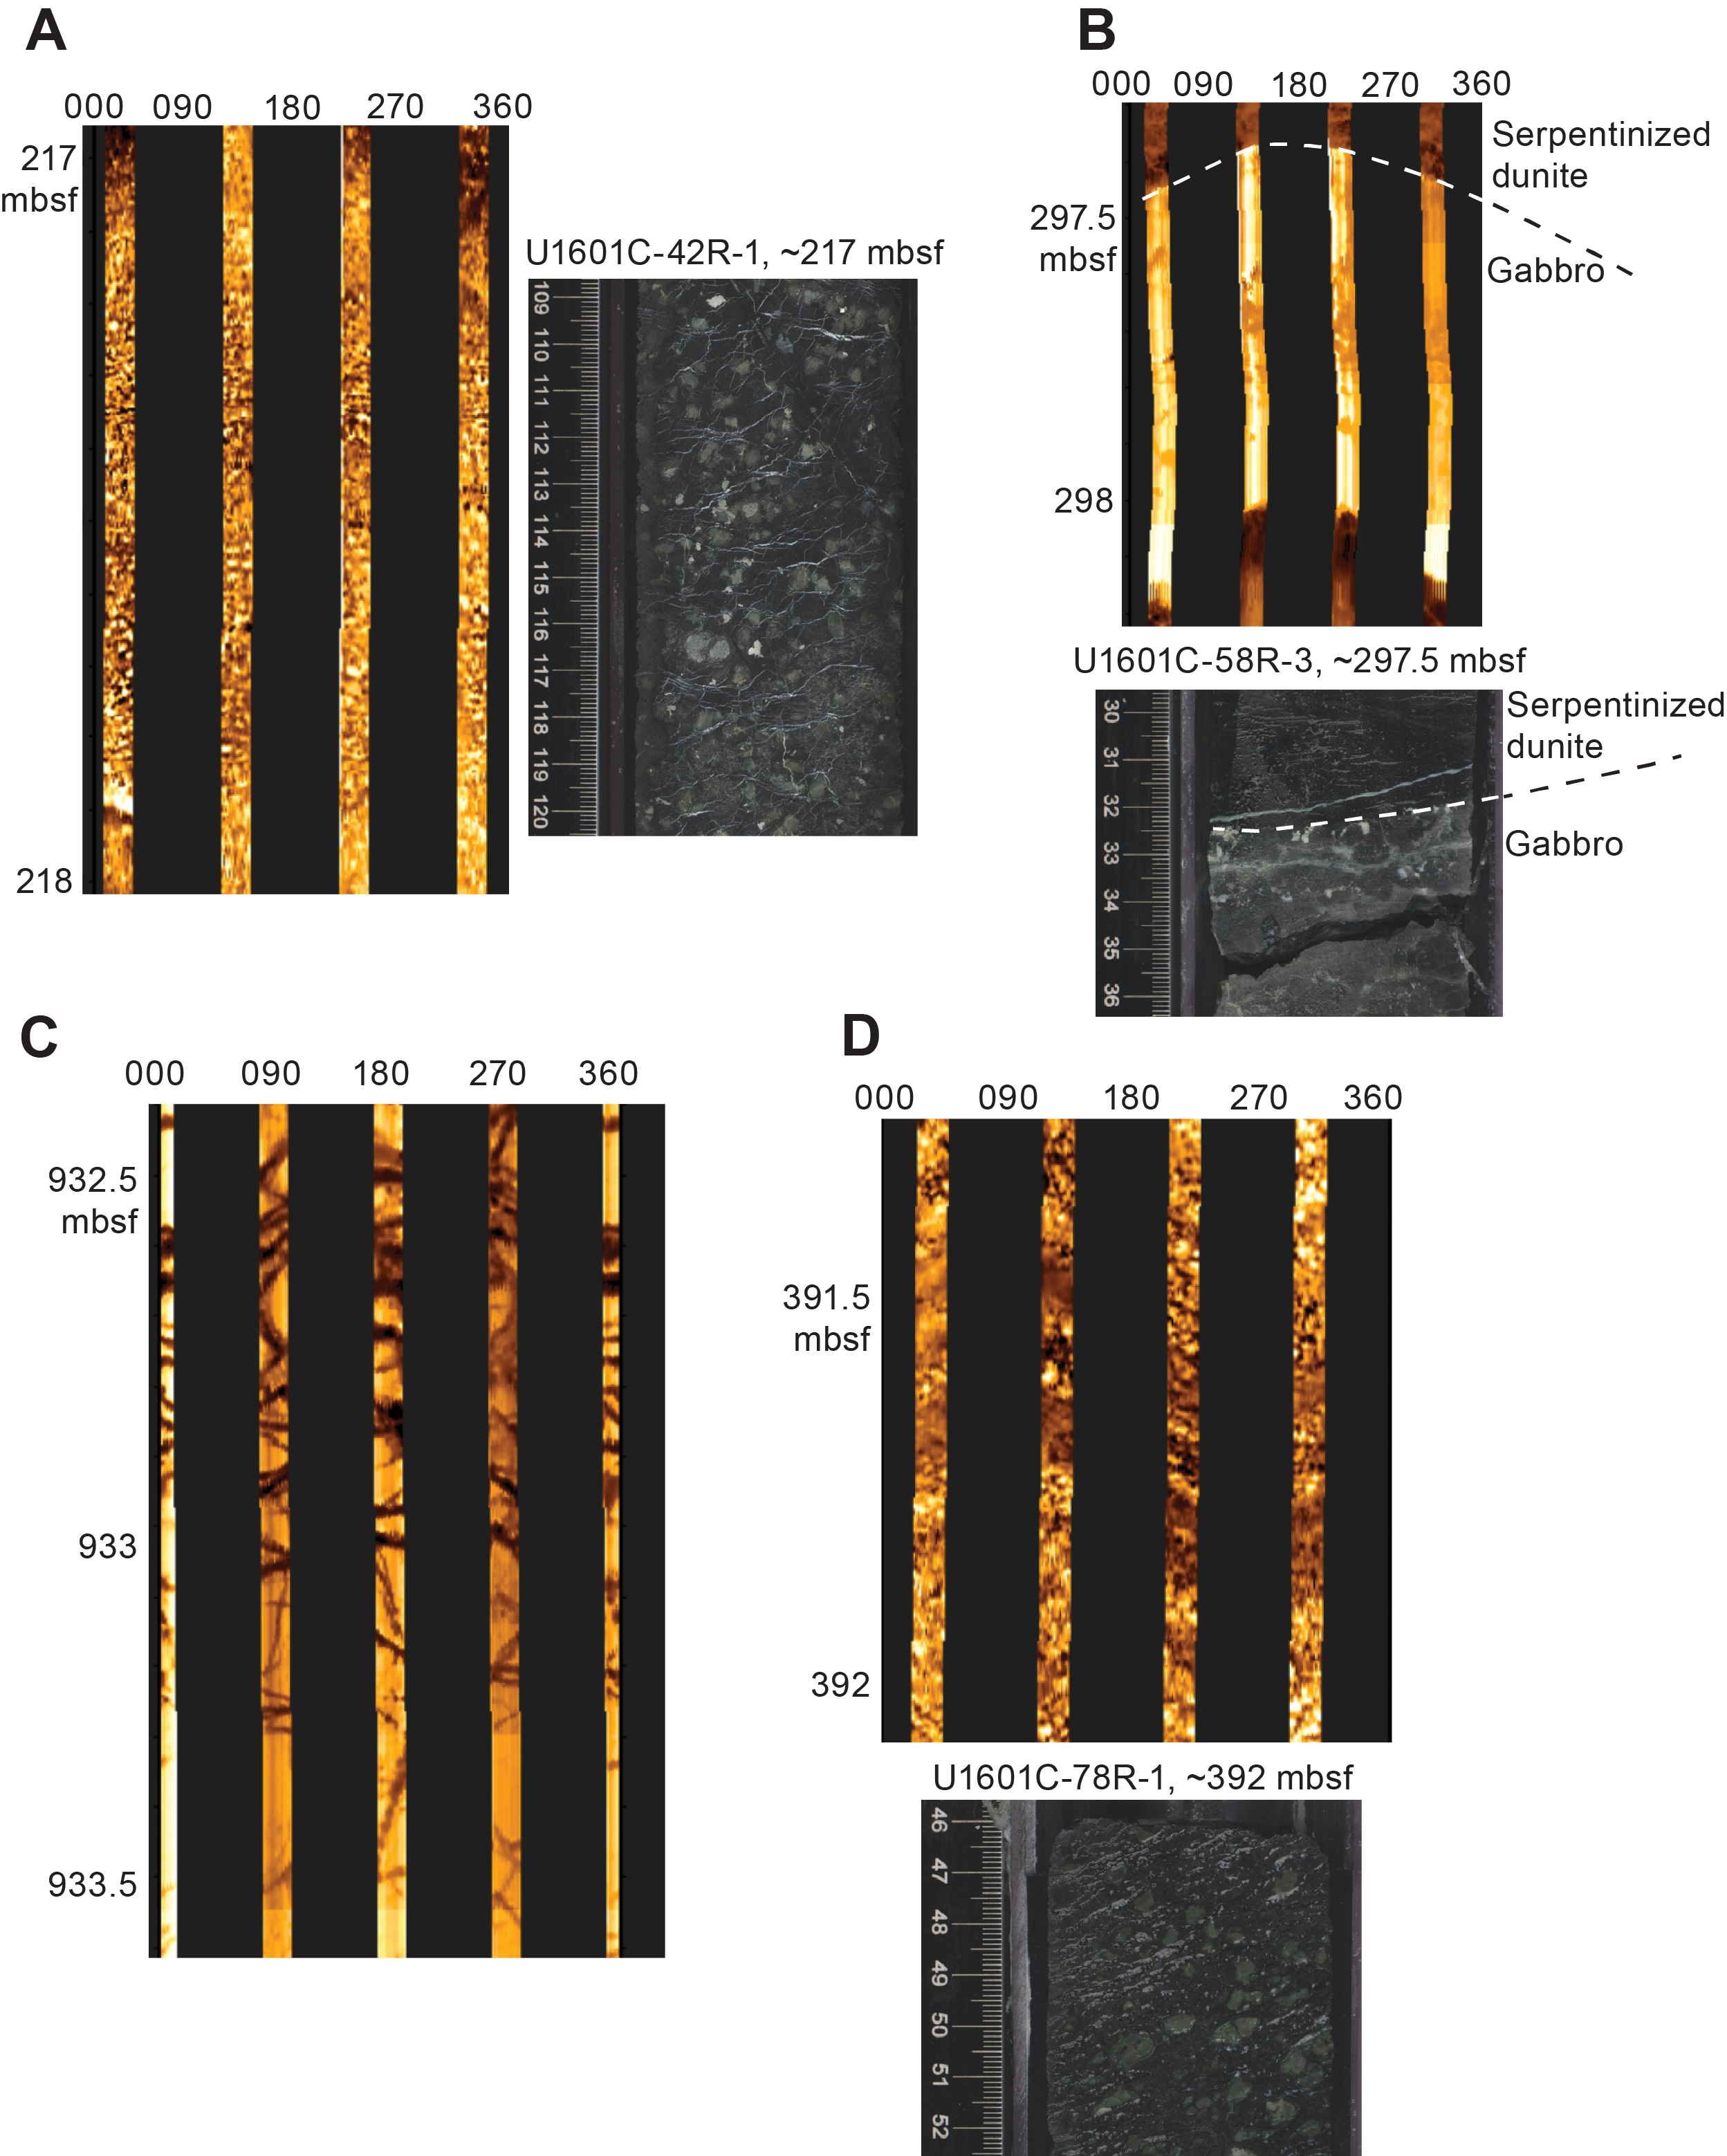
Figure F159. FMS image logs, Hole U1601C.
The FMS logs deployed in Hole 1272A show a similar mottled pattern in serpentinized peridotite (Shipboard Scientific Party, 2004). However, some of these intervals in Hole 1272A are heavily fractured and there was poor recovery, making core-log integration more difficult.
8.2.9. Summary
Considering all the petrophysical measurements and observations above, below are main observations:
- There is a clear change in density due to serpentinization in peridotite; however, the changes in density are not linear downhole indicating a complex serpentinization history at Site U1601.
- There is large scatter in porosity for a small range in grain density in serpentinized peridotites suggesting a process that keeps grain density relatively constant and increases porosity.
- Magnetic susceptibility in serpentinized peridotites is relatively high indicating magnetite formation during serpentinization.
- Gabbroic rocks can be distinguished from serpentinized peridotite because of the increased density and lower magnetic susceptibility in gabbro (except for Fe-Ti oxide gabbro).
- Thermal conductivity is higher and less variable in serpentinized peridotites compared to gabbroic rocks and generally increases with depth.
- Physical properties of Site U1601 serpentinized peridotite are similar to those of Legs 147, 153, and 209 and Expeditions 304/305 and 357.
- Physical properties of Site U1601 gabbros are similar to those of Legs 118, 153, 176, 179, and 209 and Expeditions 304/305 and 360.
- Compressional velocities in gabbro from the Atlantis Massif are slower compared to those in gabbro at Atlantis Bank.
- Compressional velocities measured on serpentinized peridotite using discrete samples, wireline logging, and VSI check shots matches well with that measured from full waveform inversion of Seismic Line Meg 4 that runs north–south near Holes U1601C and U1309D by Harding et al. (2016).
- Borehole fluid temperatures were measured several times after flushing with cool freshwater, and they increased over time as the fluid partially equilibrated with the formation (maximum ~91°C at 1060 mbsf).
9. Paleomagnetism
Paleomagnetic measurements were carried out on core sections from Holes U1601A and U1601C to investigate their natural remanent magnetization (NRM) and overall magnetic behaviors (refer to Table T16 for all abbreviations). The analyzed lithologies included basalt, diabase, gabbro, troctolite, dunite, and harzburgite (see Igneous petrology). Core recovery was sufficient such that measurements could be made on both archive and working half sections. In total for this site, paleomagnetic measurements were made on 687 archive core sections and 103 total discrete cube samples (Tables T17, T18). Measurements were supplemented by NRM measurements and alternating field (AF) demagnetizations of cube samples from the petrophysics team. The combined remanence data from archive halves and discrete samples yielded reliable remanence values used to estimate average inclination and intensity values.
9.1. Remanence sections
Archive sections were analyzed for remanence using the superconducting rock magnetometer (SRM) at 2 cm intervals for pieces longer than ~7 cm. Most pieces were subjected to stepwise AF demagnetizations starting from 5 mT and ending at 50 mT; however, a few sections with particularly variable inclinations and/or stable magnetization intensities were treated up to 80 mT. Whole-round magnetic susceptibility measurements taken by the petrophysics team provided a foundational basis for comparing SRM magnetization intensity measurements.
9.1.1. Hole U1601A remanence results
The NRM inclinations from Hole U1601A clustered along a mean of −22.2° (±13.5°) (Figure F160), significantly shallower than the expected inclination value of −49° (Figures F161, F162). The unexpectedly low inclination may not be representative of the hole with depth and could be skewed because of more recent alteration-related events. The inclination may steepen at greater depths and in sections with lower degrees of alteration.
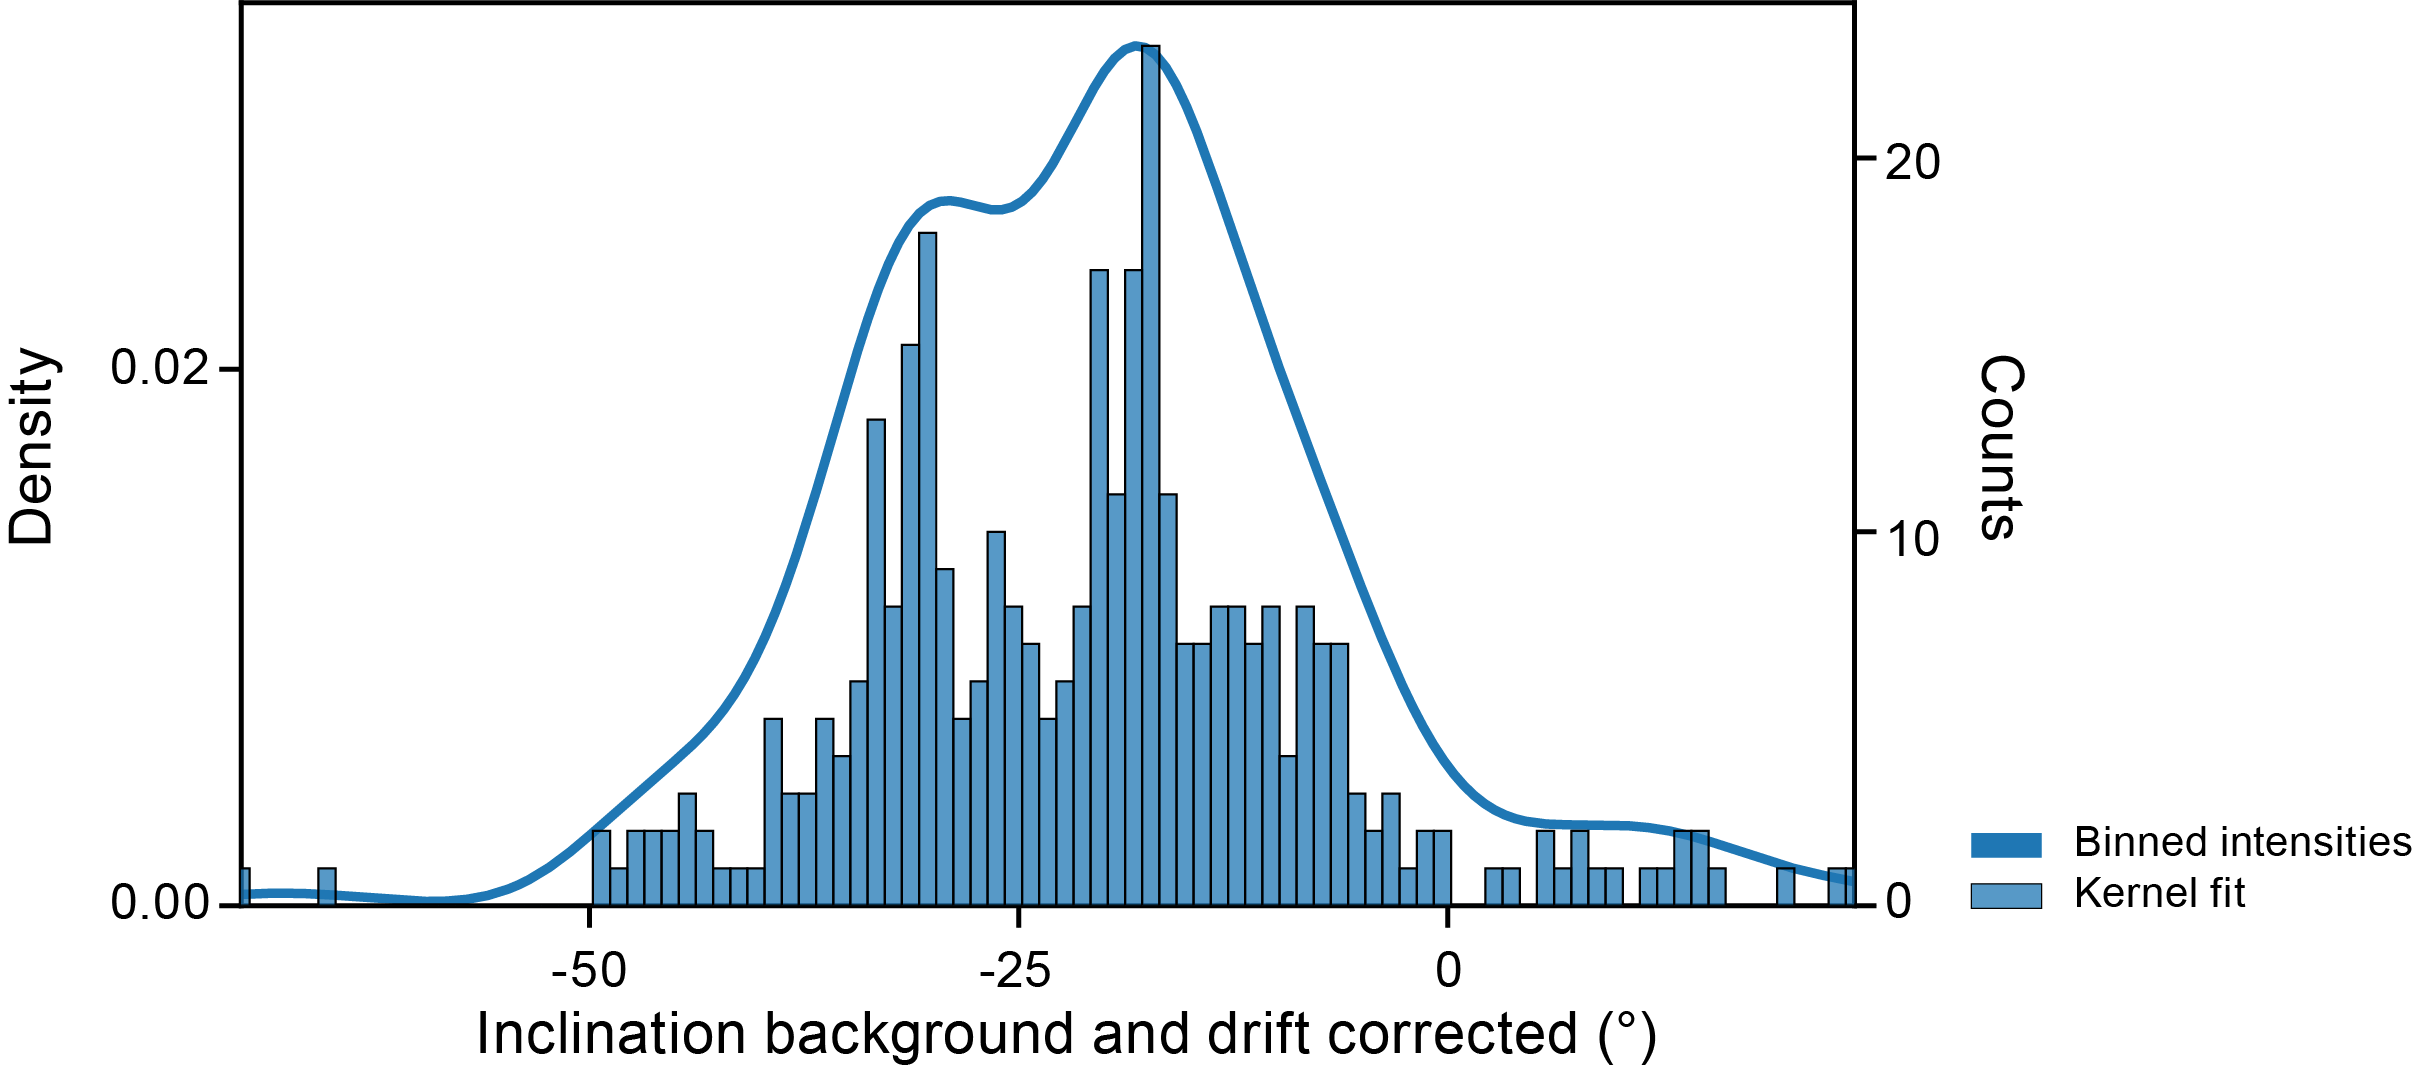
Figure F160. NRM inclination, Hole U1601A.
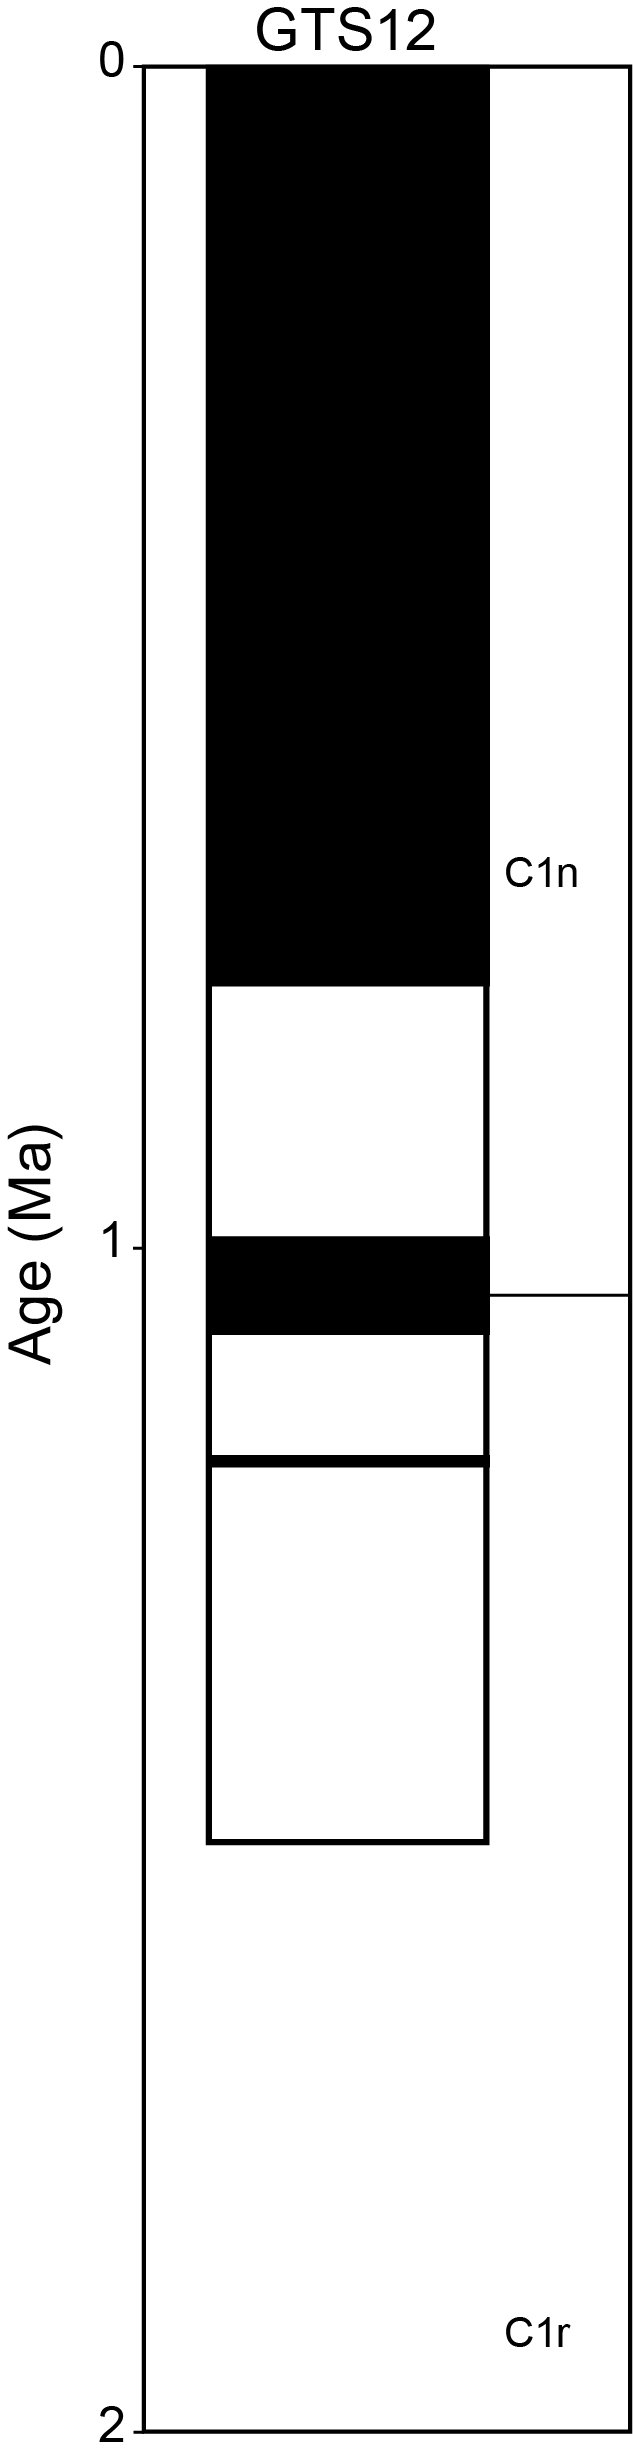
Figure F161. Predicted chrons and subchrons.
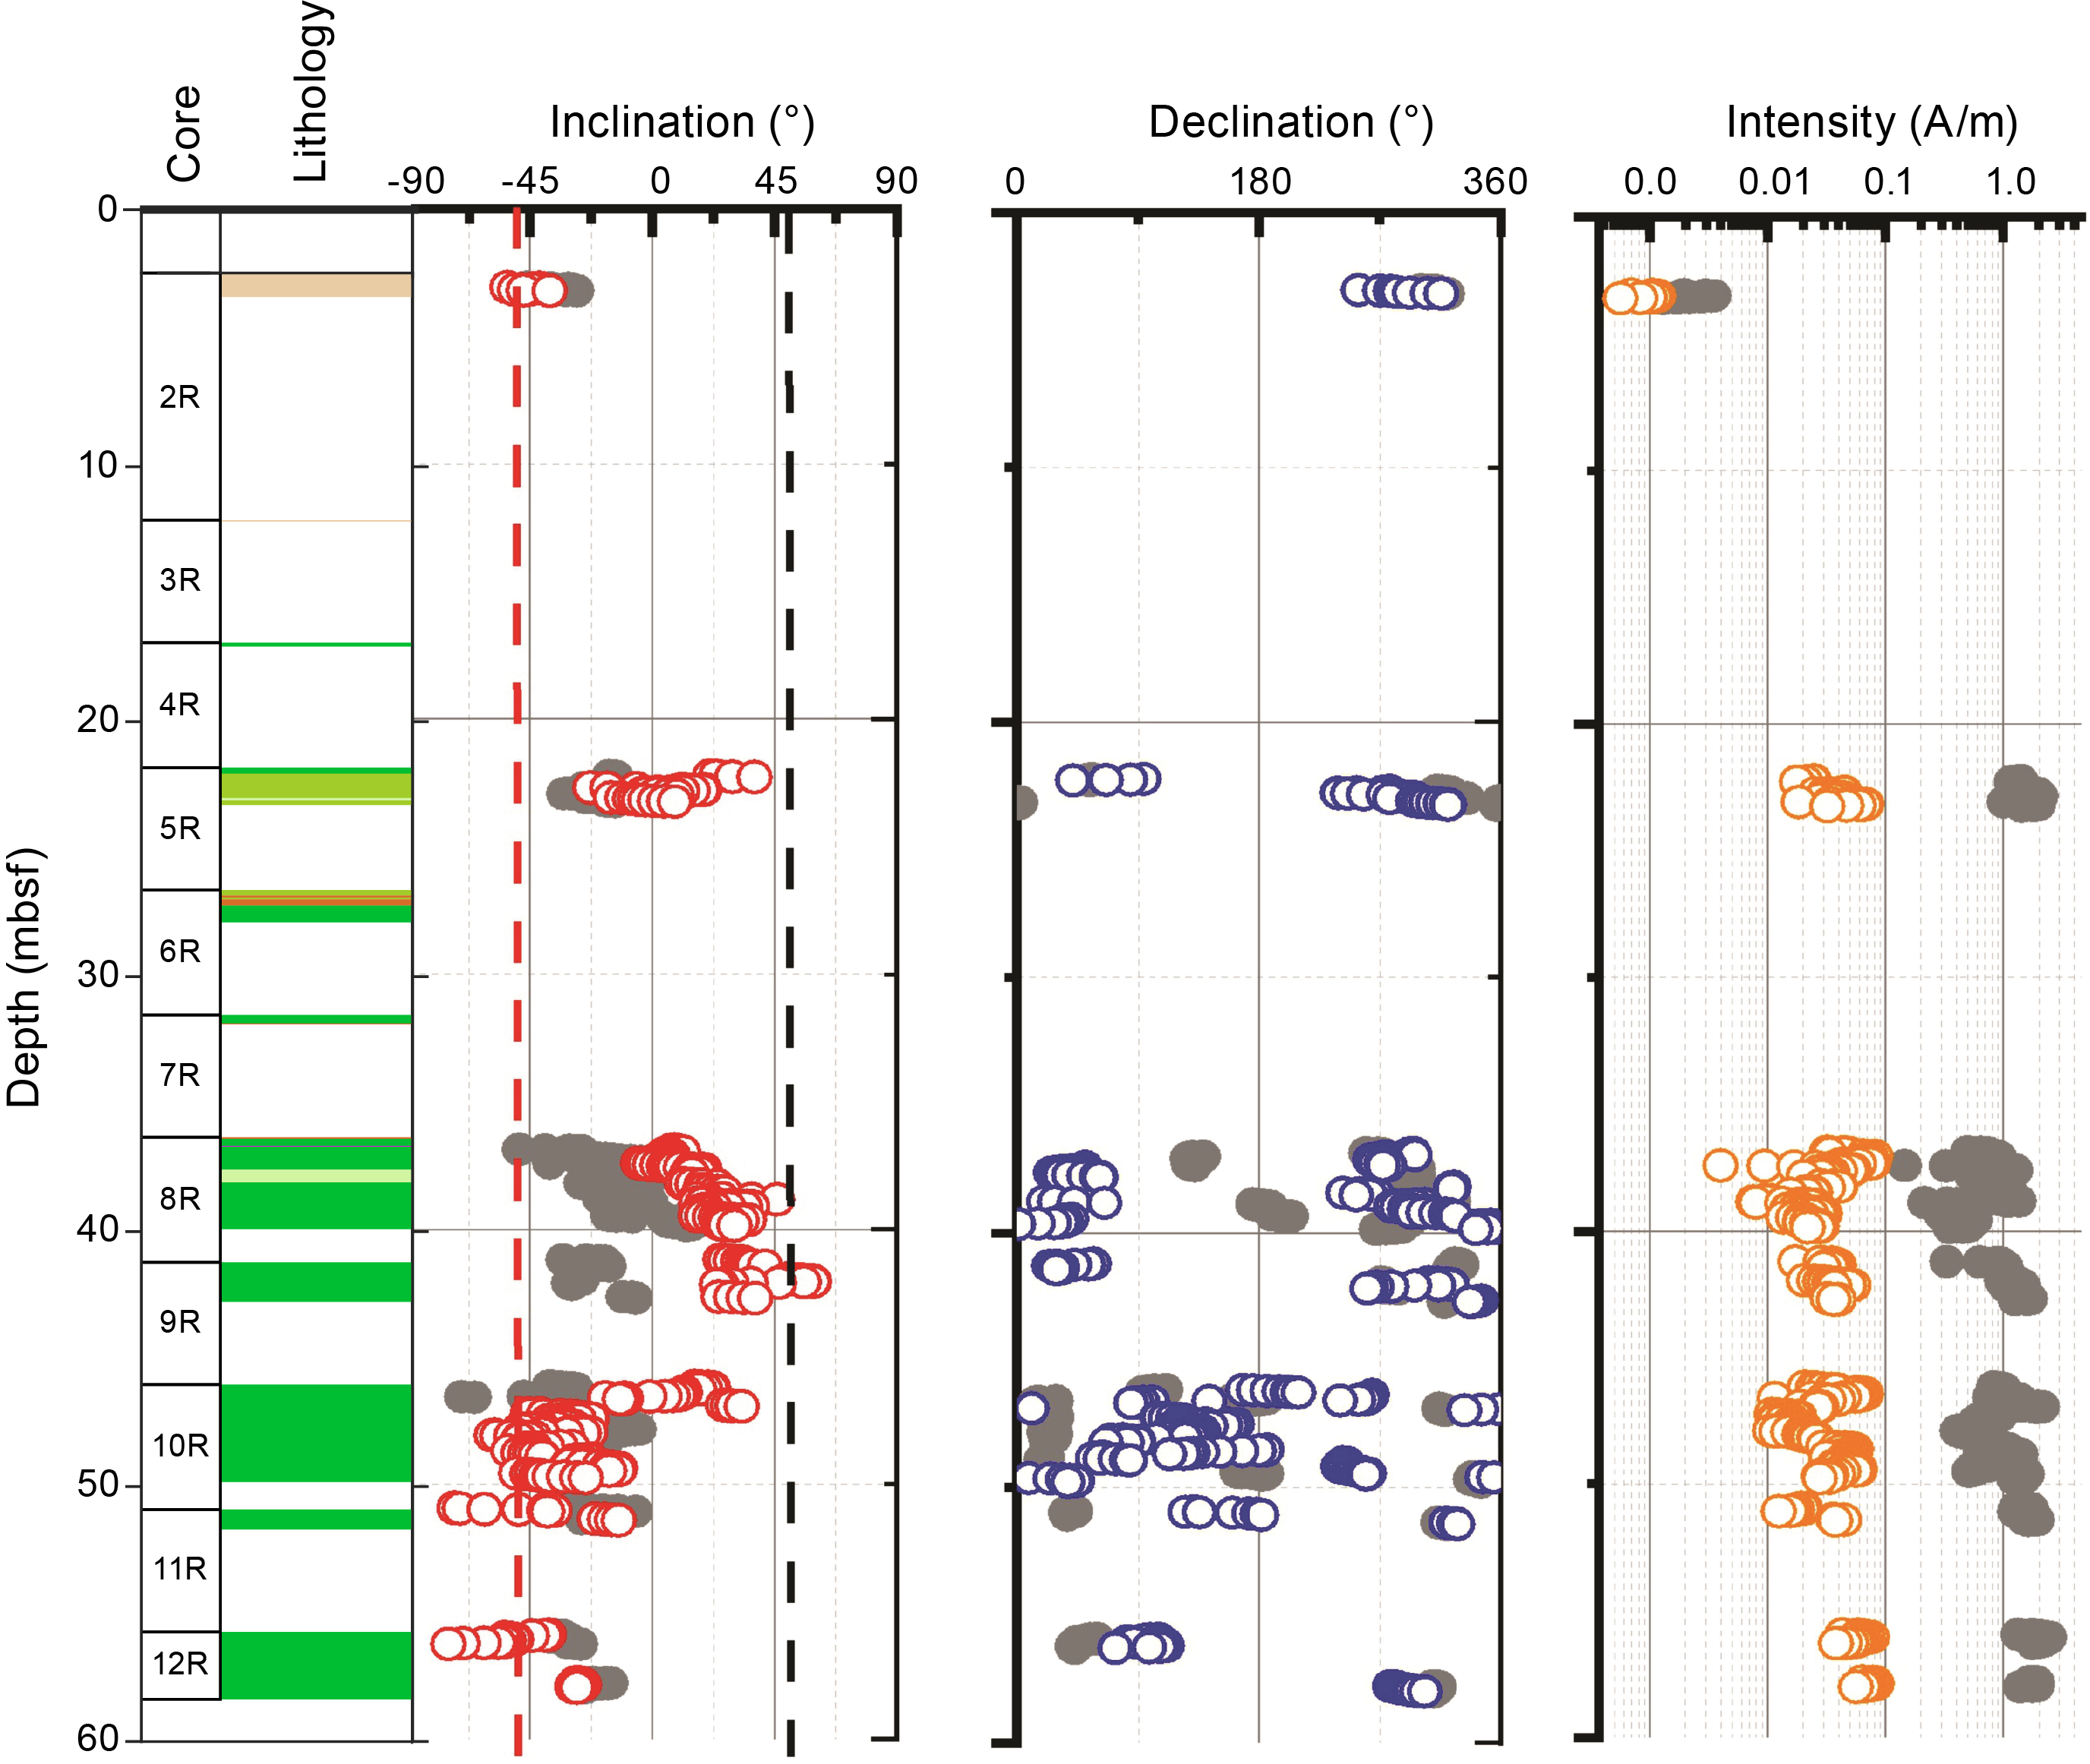
Figure F162. NRM, inclination, declination, and intensity, Hole U1601A.
For smaller demagnetization steps, inclination clustering became narrower and more pronounced (Figure F163). By 10 mT, 95% of the inclination values clustered within 5° of the mean Fisher inclination value, which is −50.6°. This strong correlation is highlighted by α95 and kappa values of 0.689 and 90.99, respectively.
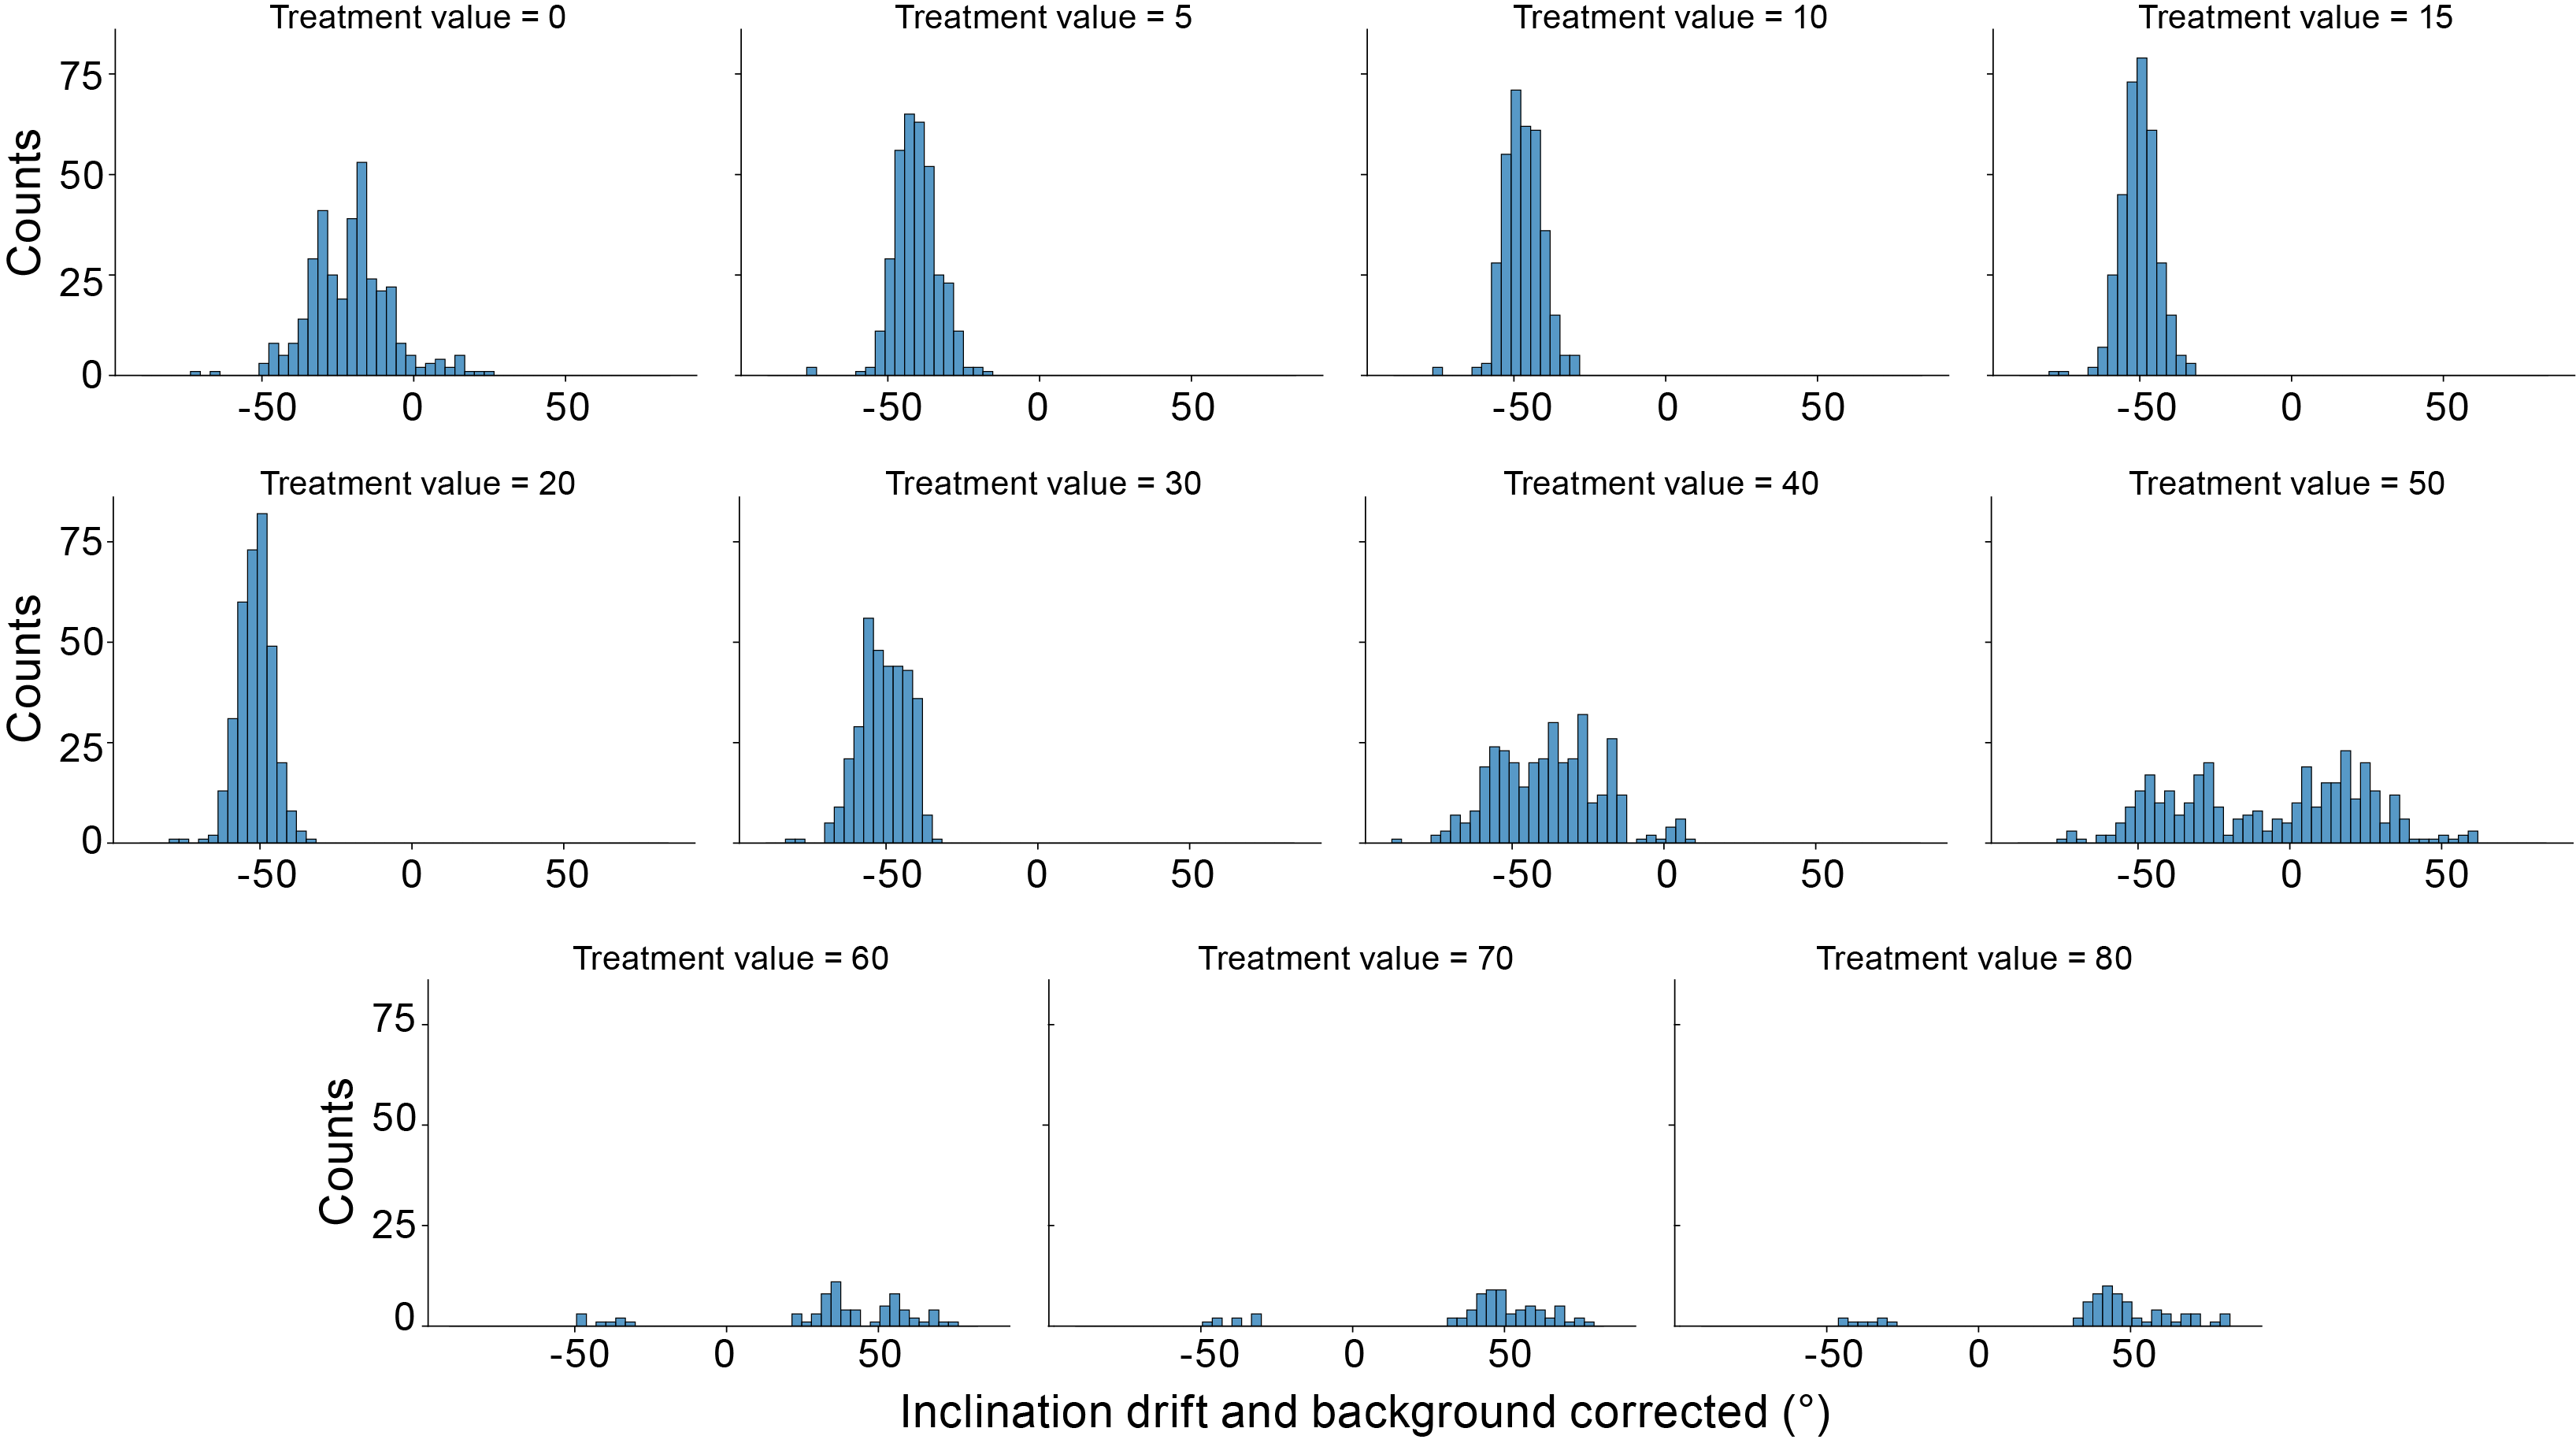
Figure F163. Inclination distributions, Hole U1601A.
The steepening of inclination values at smaller demagnetization steps suggests that drilling overprints were generally more positive than the mean inclination value, consistent with the positive polarity of the present-day magnetic field. However, the directional behavior becomes more complicated with stronger fields (>30 mT). Some of the samples displayed a rebounding effect, where they steepened at first with increasing AF fields but then began to shallow once more for increasing fields. It is possible that this behavior could be attributed to very low coercive magnetic components, multiple remanence directions, and/or a significant presence of gyroremanent magnetic minerals within the samples.
9.1.2. Hole U1601C remanence results
The NRM inclinations from Hole U1601C loosely clustered around a mean of −26.7° (±32.8°). Similar to Hole U1601A, this mean inclination value is shallower than the expected inclination value of −49° (Figures F161, F164). The data from Hole U1601C is somewhat more skewed toward positive values than that observed in Hole U1601A because of isothermal remanent drilling overprints and misoriented pieces (Figure F165). Although some misoriented pieces have been filtered out of the paleomagnetic analysis, it is likely that not all of the misoriented pieces were identified within shipboard analysis. Thorough filtering for high-fidelity values will occur postcruise to obtain a more accurate view of the real behavior of the NRM inclinations.
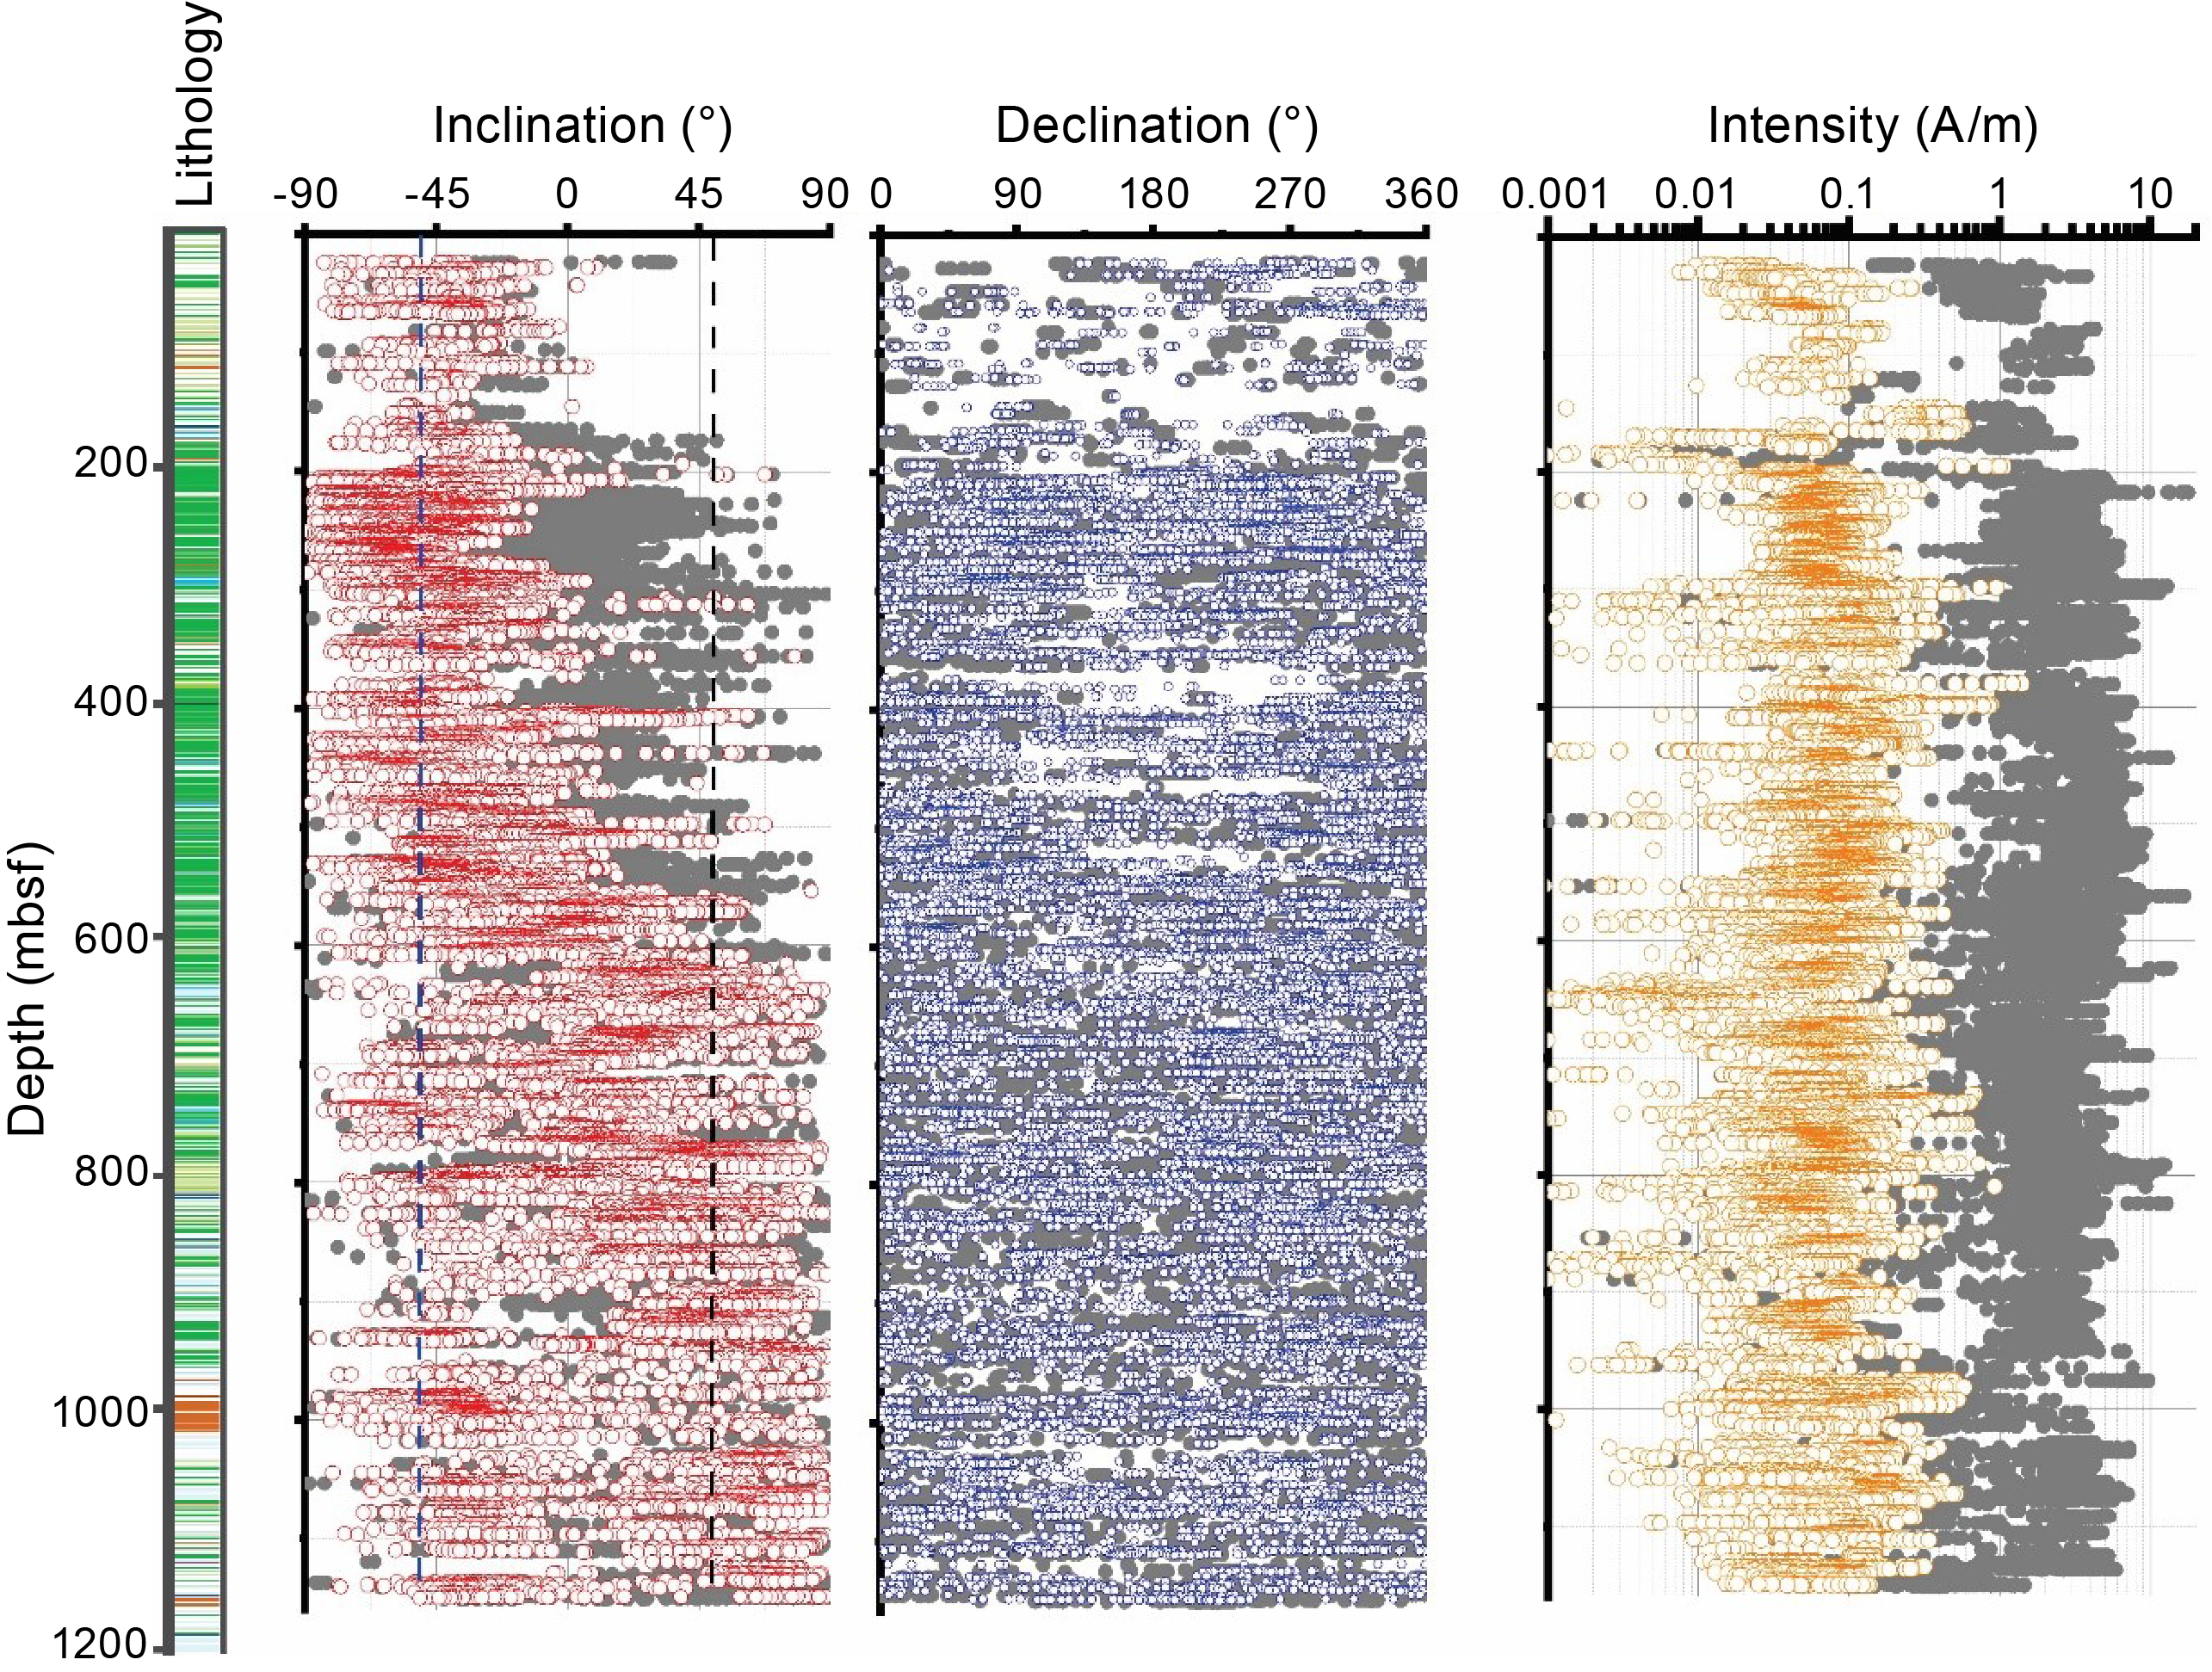
Figure F164. NRM, inclination, declination, and intensity, Hole U1601C.
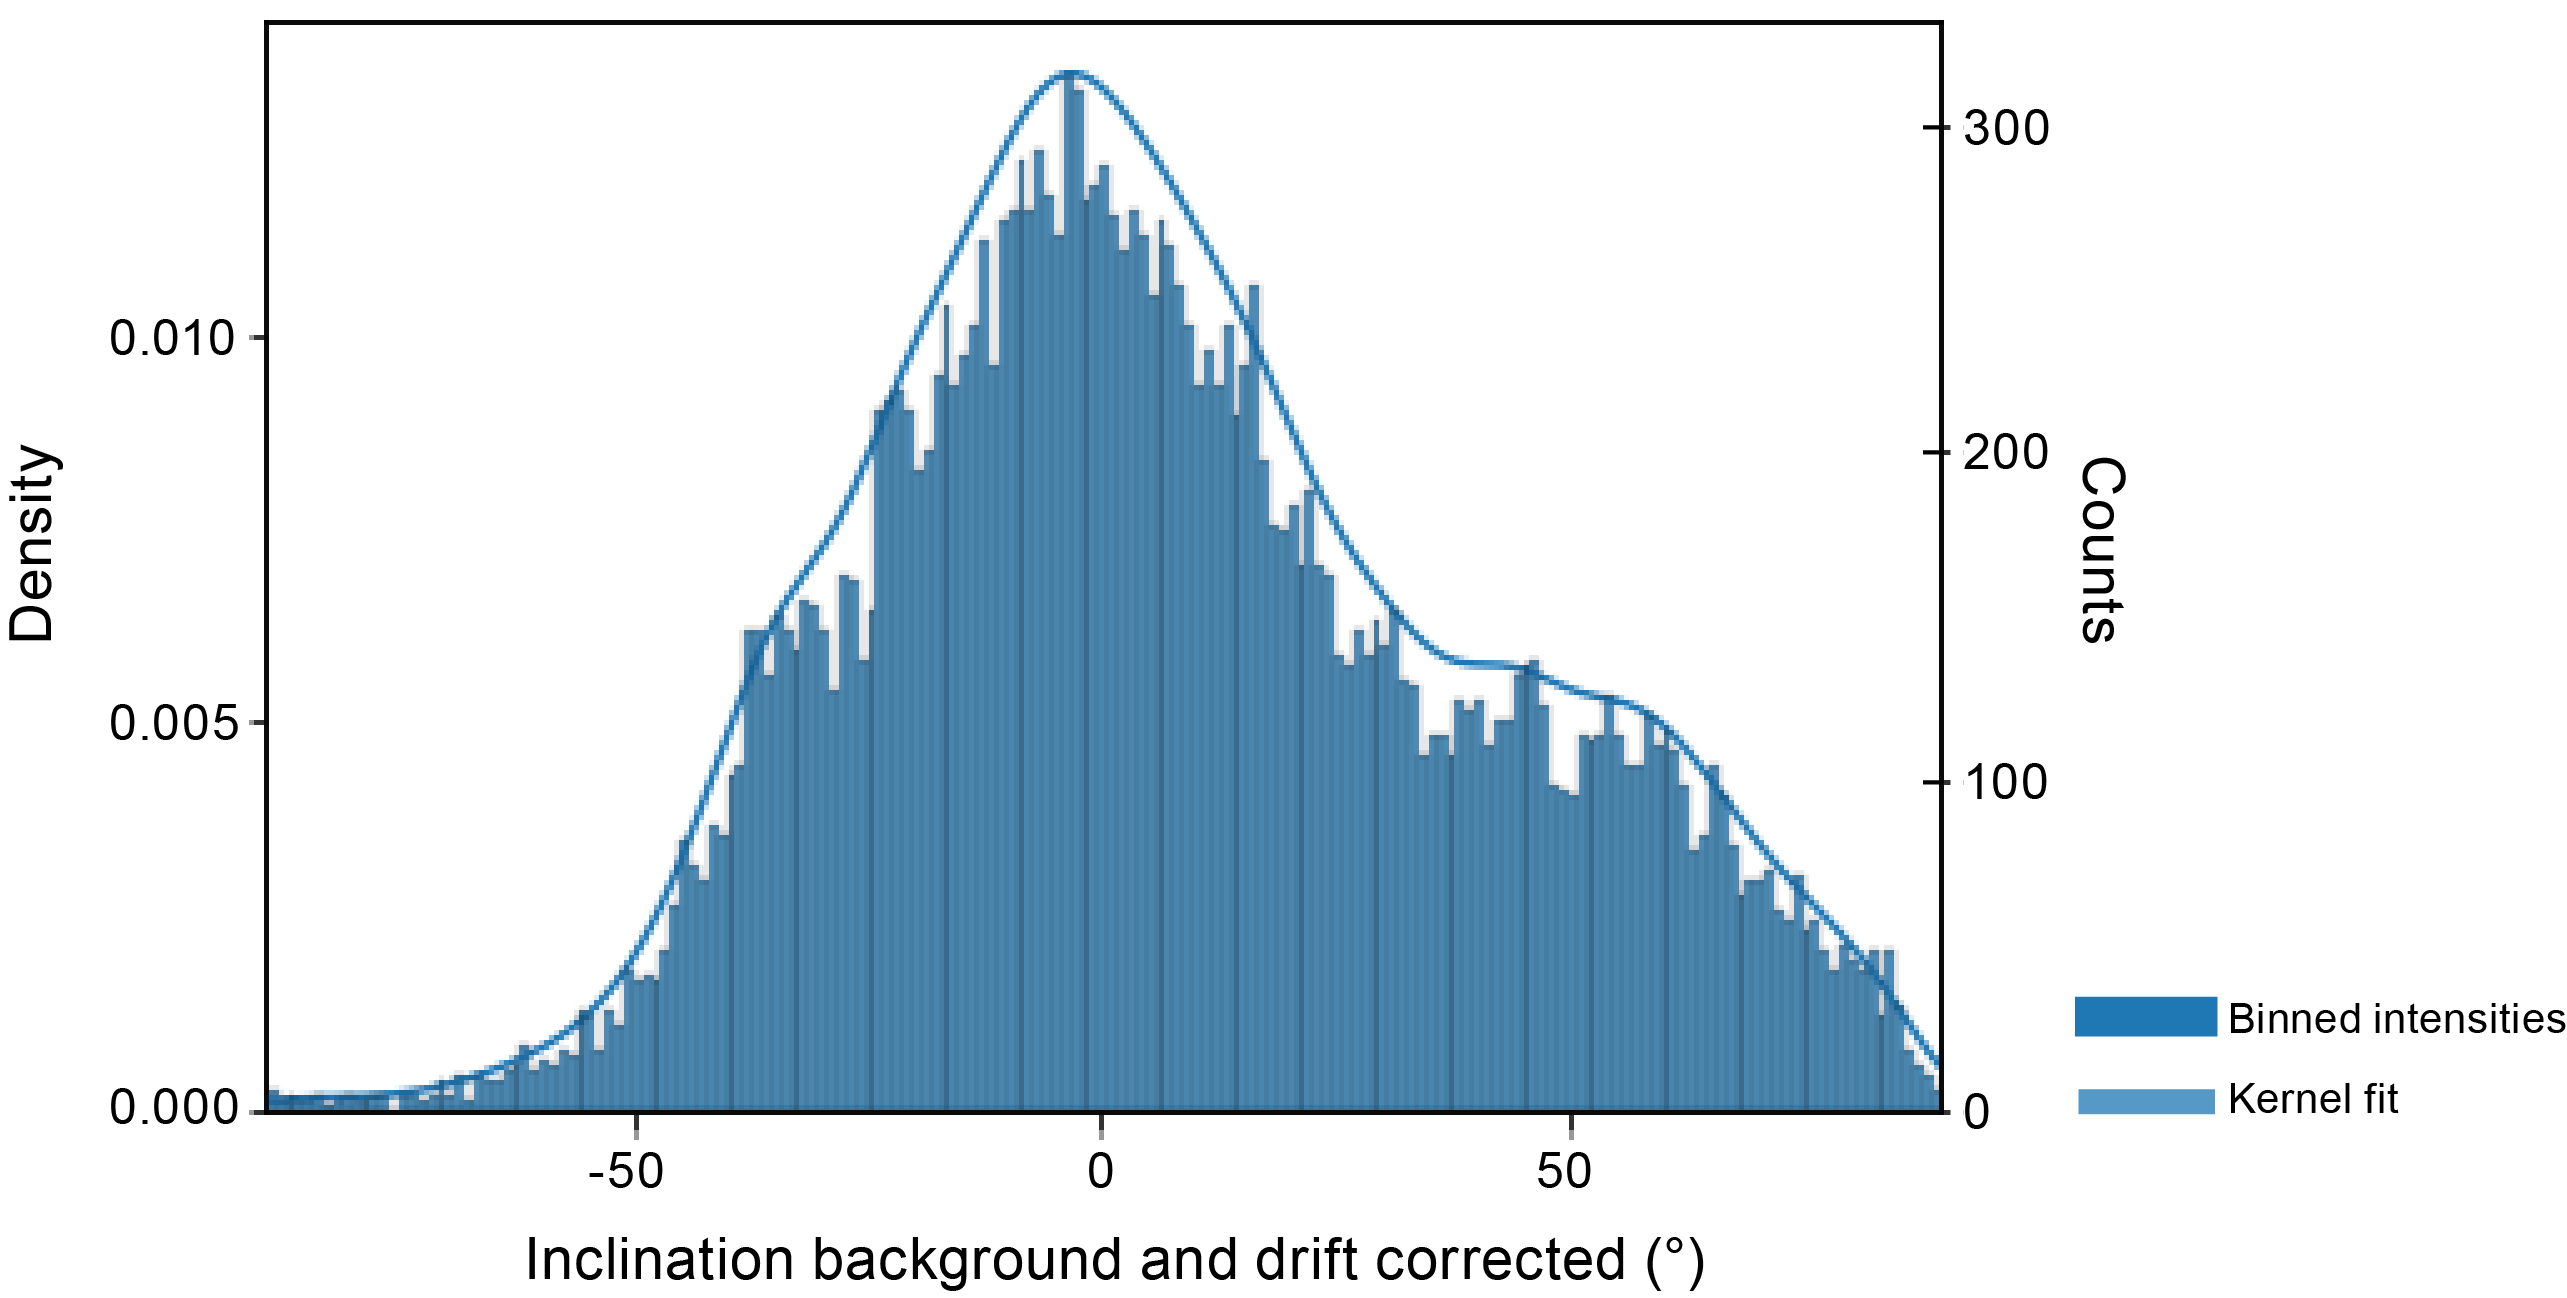
Figure F165. NRM inclination, Hole U1601C.
Inclination clustering became narrower and more pronounced with increasing demagnetization (Figure F166). By 15 mT, inclination values clustered around a mean inclination value of −43.5° (±24.7°), though with a significant degree of scatter. The minimum standard cutoff value for determining if kappa distribution values are precise is 15. The calculated kappa value of 18 for this hole is just above this threshold. It is likely that the rocks recovered from Hole U1601C exhibit more complicated magnetic behavior, with different populations of magnetic minerals creating a mixture of magnetic signals not observed in Holes U1601A or U1309D (Expedition 304/305 Scientists, 2006).
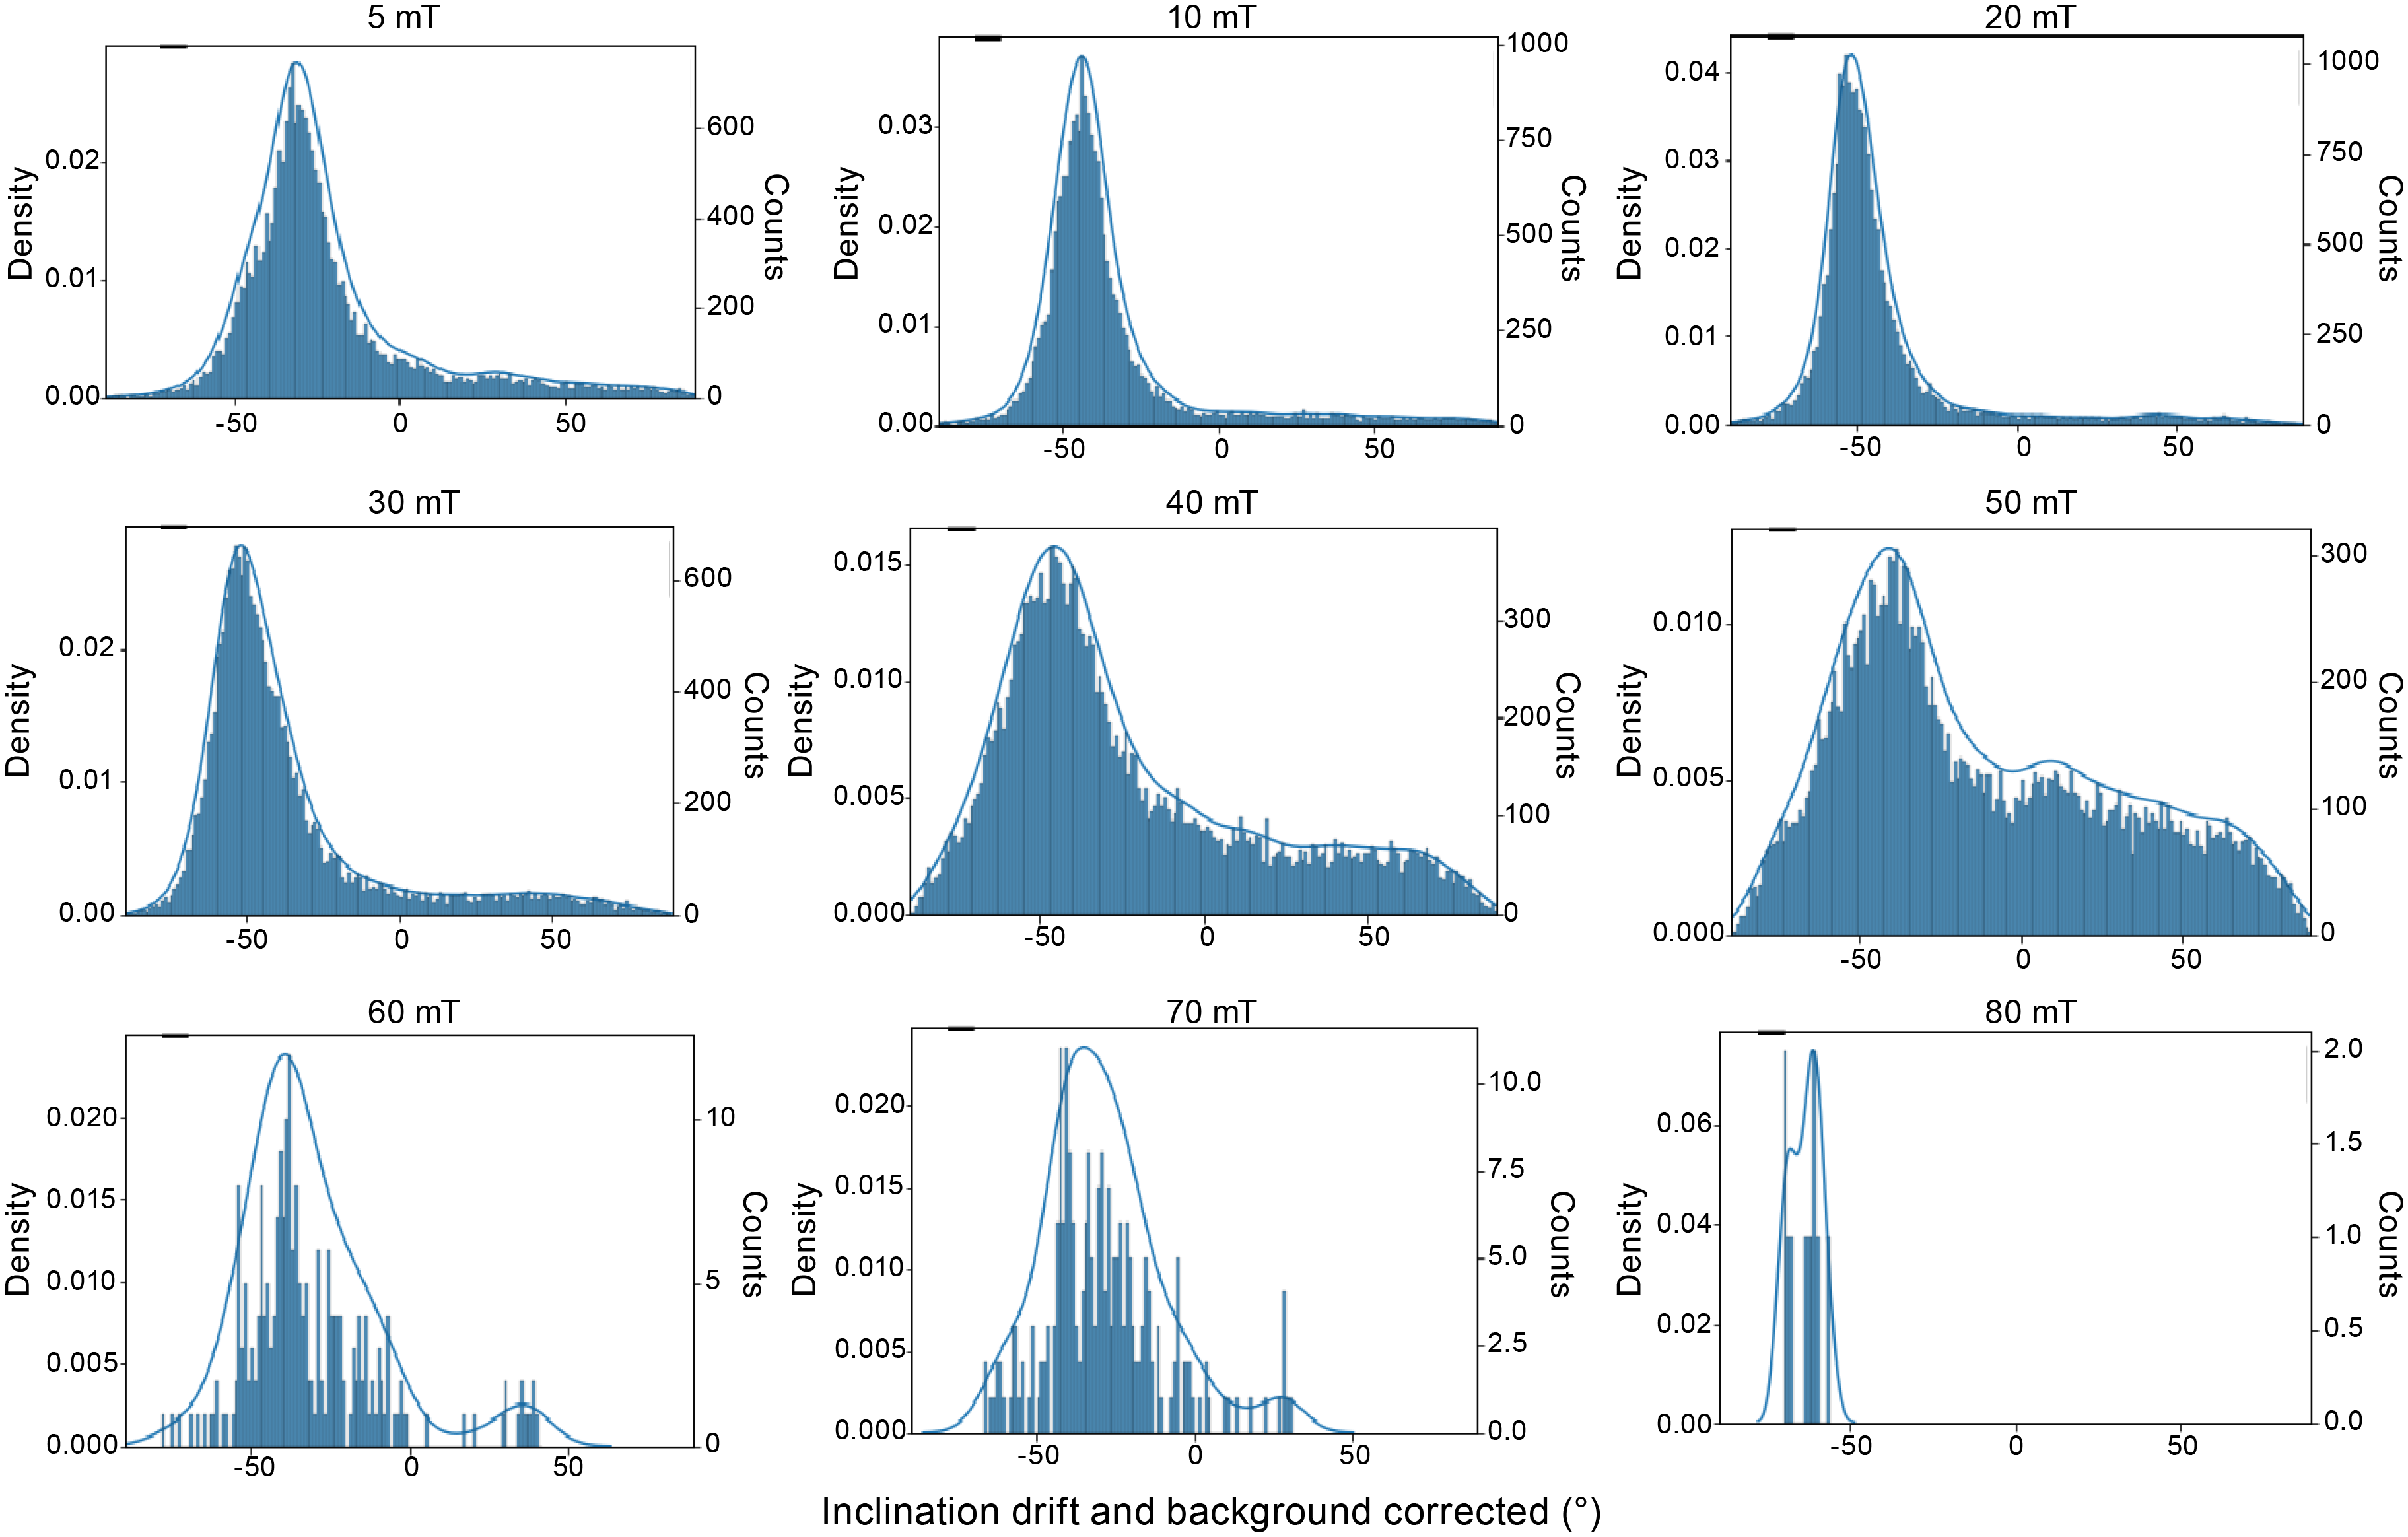
Figure F166. Inclination distributions, Hole U1601C.
When comparing downhole SRM data of Hole U1601C from Figure F164 with Hole U1309D from figure F237B in Expedition 304/305 Scientists (2006b), several patterns emerge. Although this comparison involves different AF demagnetization levels—30 mT for Hole U1309D and 50 mT for Hole U1601C—that are not directly equivalent, both levels effectively remove the drilling overprint and give a sense of the stable characteristic remanent magnetization (ChRM) directions, allowing for a valid comparison.
Both holes exhibit widely varying NRM inclinations downhole, which tend to decrease during initial demagnetization steps, suggesting the presence of low-coercivity components that significantly influence the NRM. These similarities extend to the relationship between NRM and lithology; gabbros generally show higher NRM intensities, as do serpentinized peridotites.
However, the magnetization behavior of Hole U1601C and Hole U1309D reveals significant differences between the two sites. Hole U1601C exhibits overall higher NRM magnetization intensities than Hole U1309D, likely due to a higher relative recovery of magnetite-rich ultramafic to mafic compositions. Additionally, Hole U1309D displays distinct intervals of positive polarity in AF inclinations, whereas Hole U1601C demonstrates a more ambiguous polarity trend with a larger scatter of inclinations, potentially indicating a mixture of positive and negative polarity remanence being recorded within the rocks. Notably, normal polarity in Hole U1309D is primarily associated with diabase, but no clear lithologic correlation is observed with the positive AF inclinations in Hole U1601C. Another important difference is that positive polarity in Hole U1309D is concentrated in the upper 400 mbsf, whereas Hole U1601C shows significant scatter in AF inclination directions from 400 mbsf downward. These distinctions suggest that the two holes record distinct magnetization histories. Future principal component analysis (PCA) of filtered archive half data from Hole U1601C will provide a more robust basis for comparison between the two holes.
9.2. Discrete samples
In total, 103 discrete cubes taken from the working halves of Site U1601 were analyzed. Their NRM and demagnetization behaviors were assessed using an AGICO JR-6A spinner magnetometer. All samples shared with petrophysics scientists were solely subjected to AF demagnetization. All other samples underwent low-temperature pretreatments (see the Expedition 399 methods chapter [Lang et al., 2025]). It is worth noting that the petrophysics samples were measured after the samples were dried for 24 h in an oven at 105°C, likely acquiring a thermoviscous overprint in the process.
Low-temperature pretreatment proved effective in reducing the drilling overprint and enhancing what is likely the true NRM strength. Samples were measured after each liquid nitrogen bath and compared with their initial strength and direction. The effects on the first step were typically the most dramatic, often changing the original magnetic remanence by approximately 15% (Figures F167, F168). However, for two samples, the intensity of magnetic remanence decreased by more than 75% from the initial NRM. This abnormal behavior only occurred for oxide gabbro samples, suggesting that this lithology contains the weakest coercive magnetic minerals of any studied lithology. For all of the samples, the intensity changed by ~5% relative to the original magnetic intensity after the second dunk.
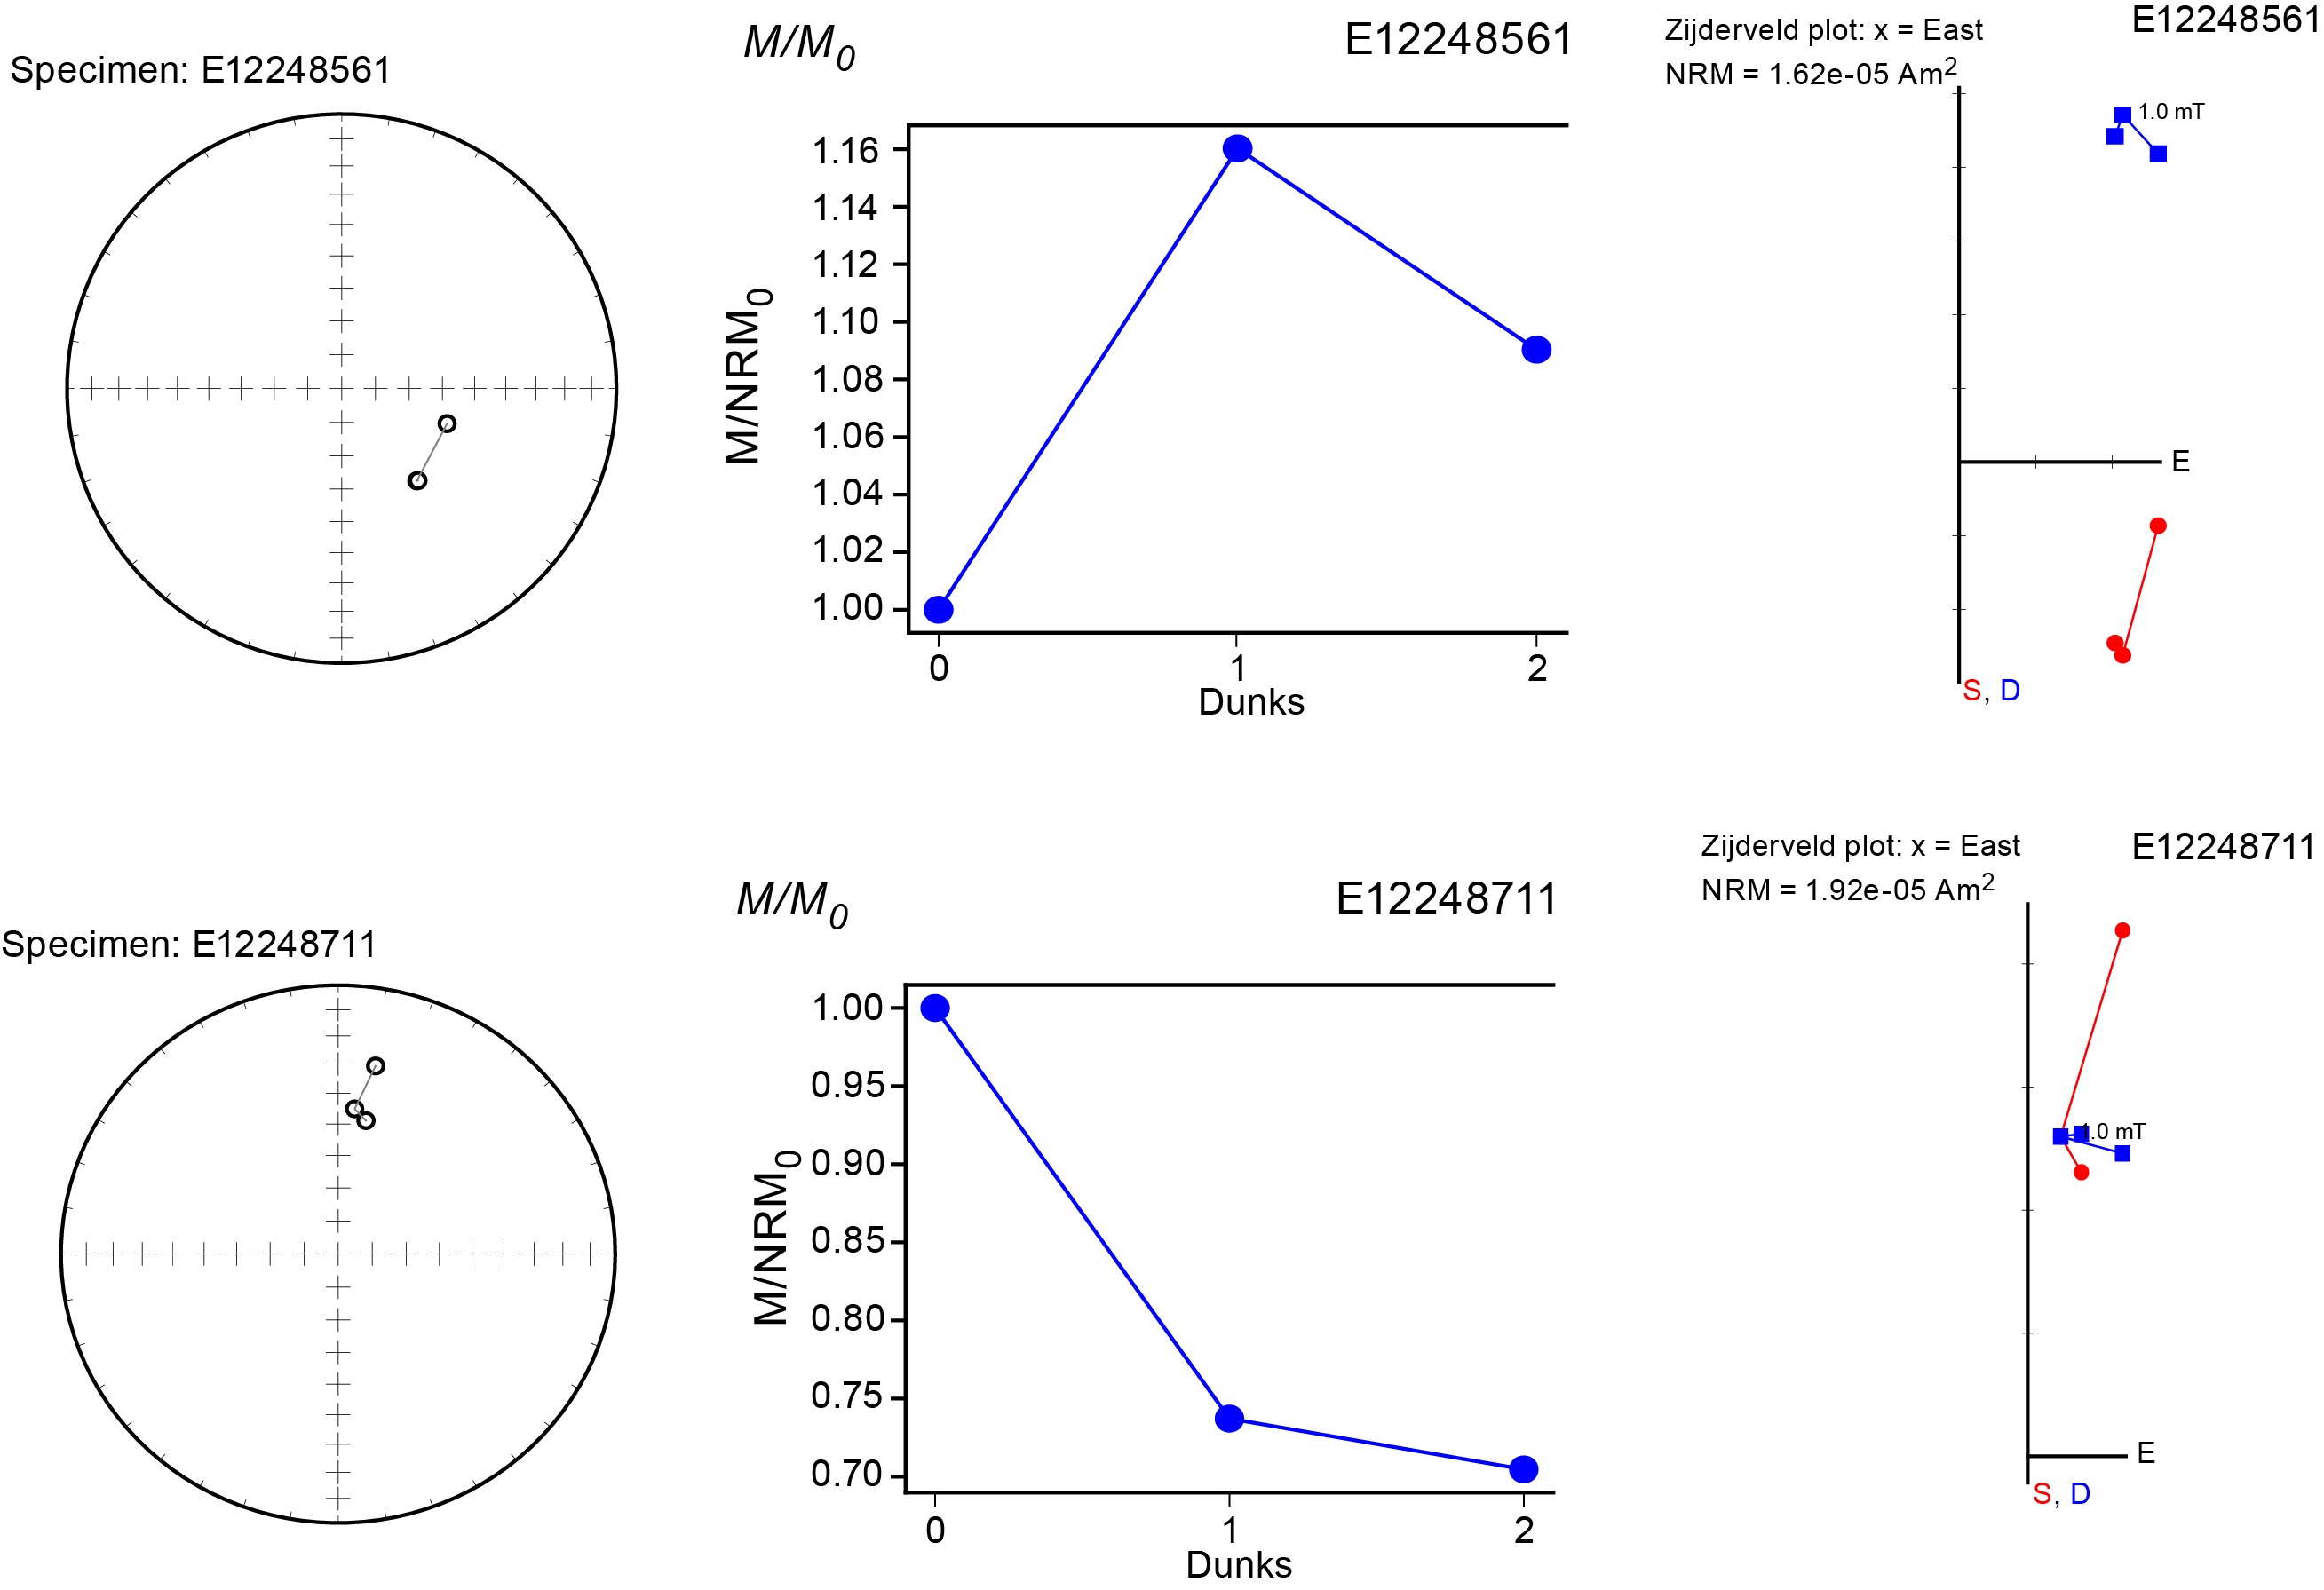
Figure F167. Low-temperature dunks, Hole U1601A.
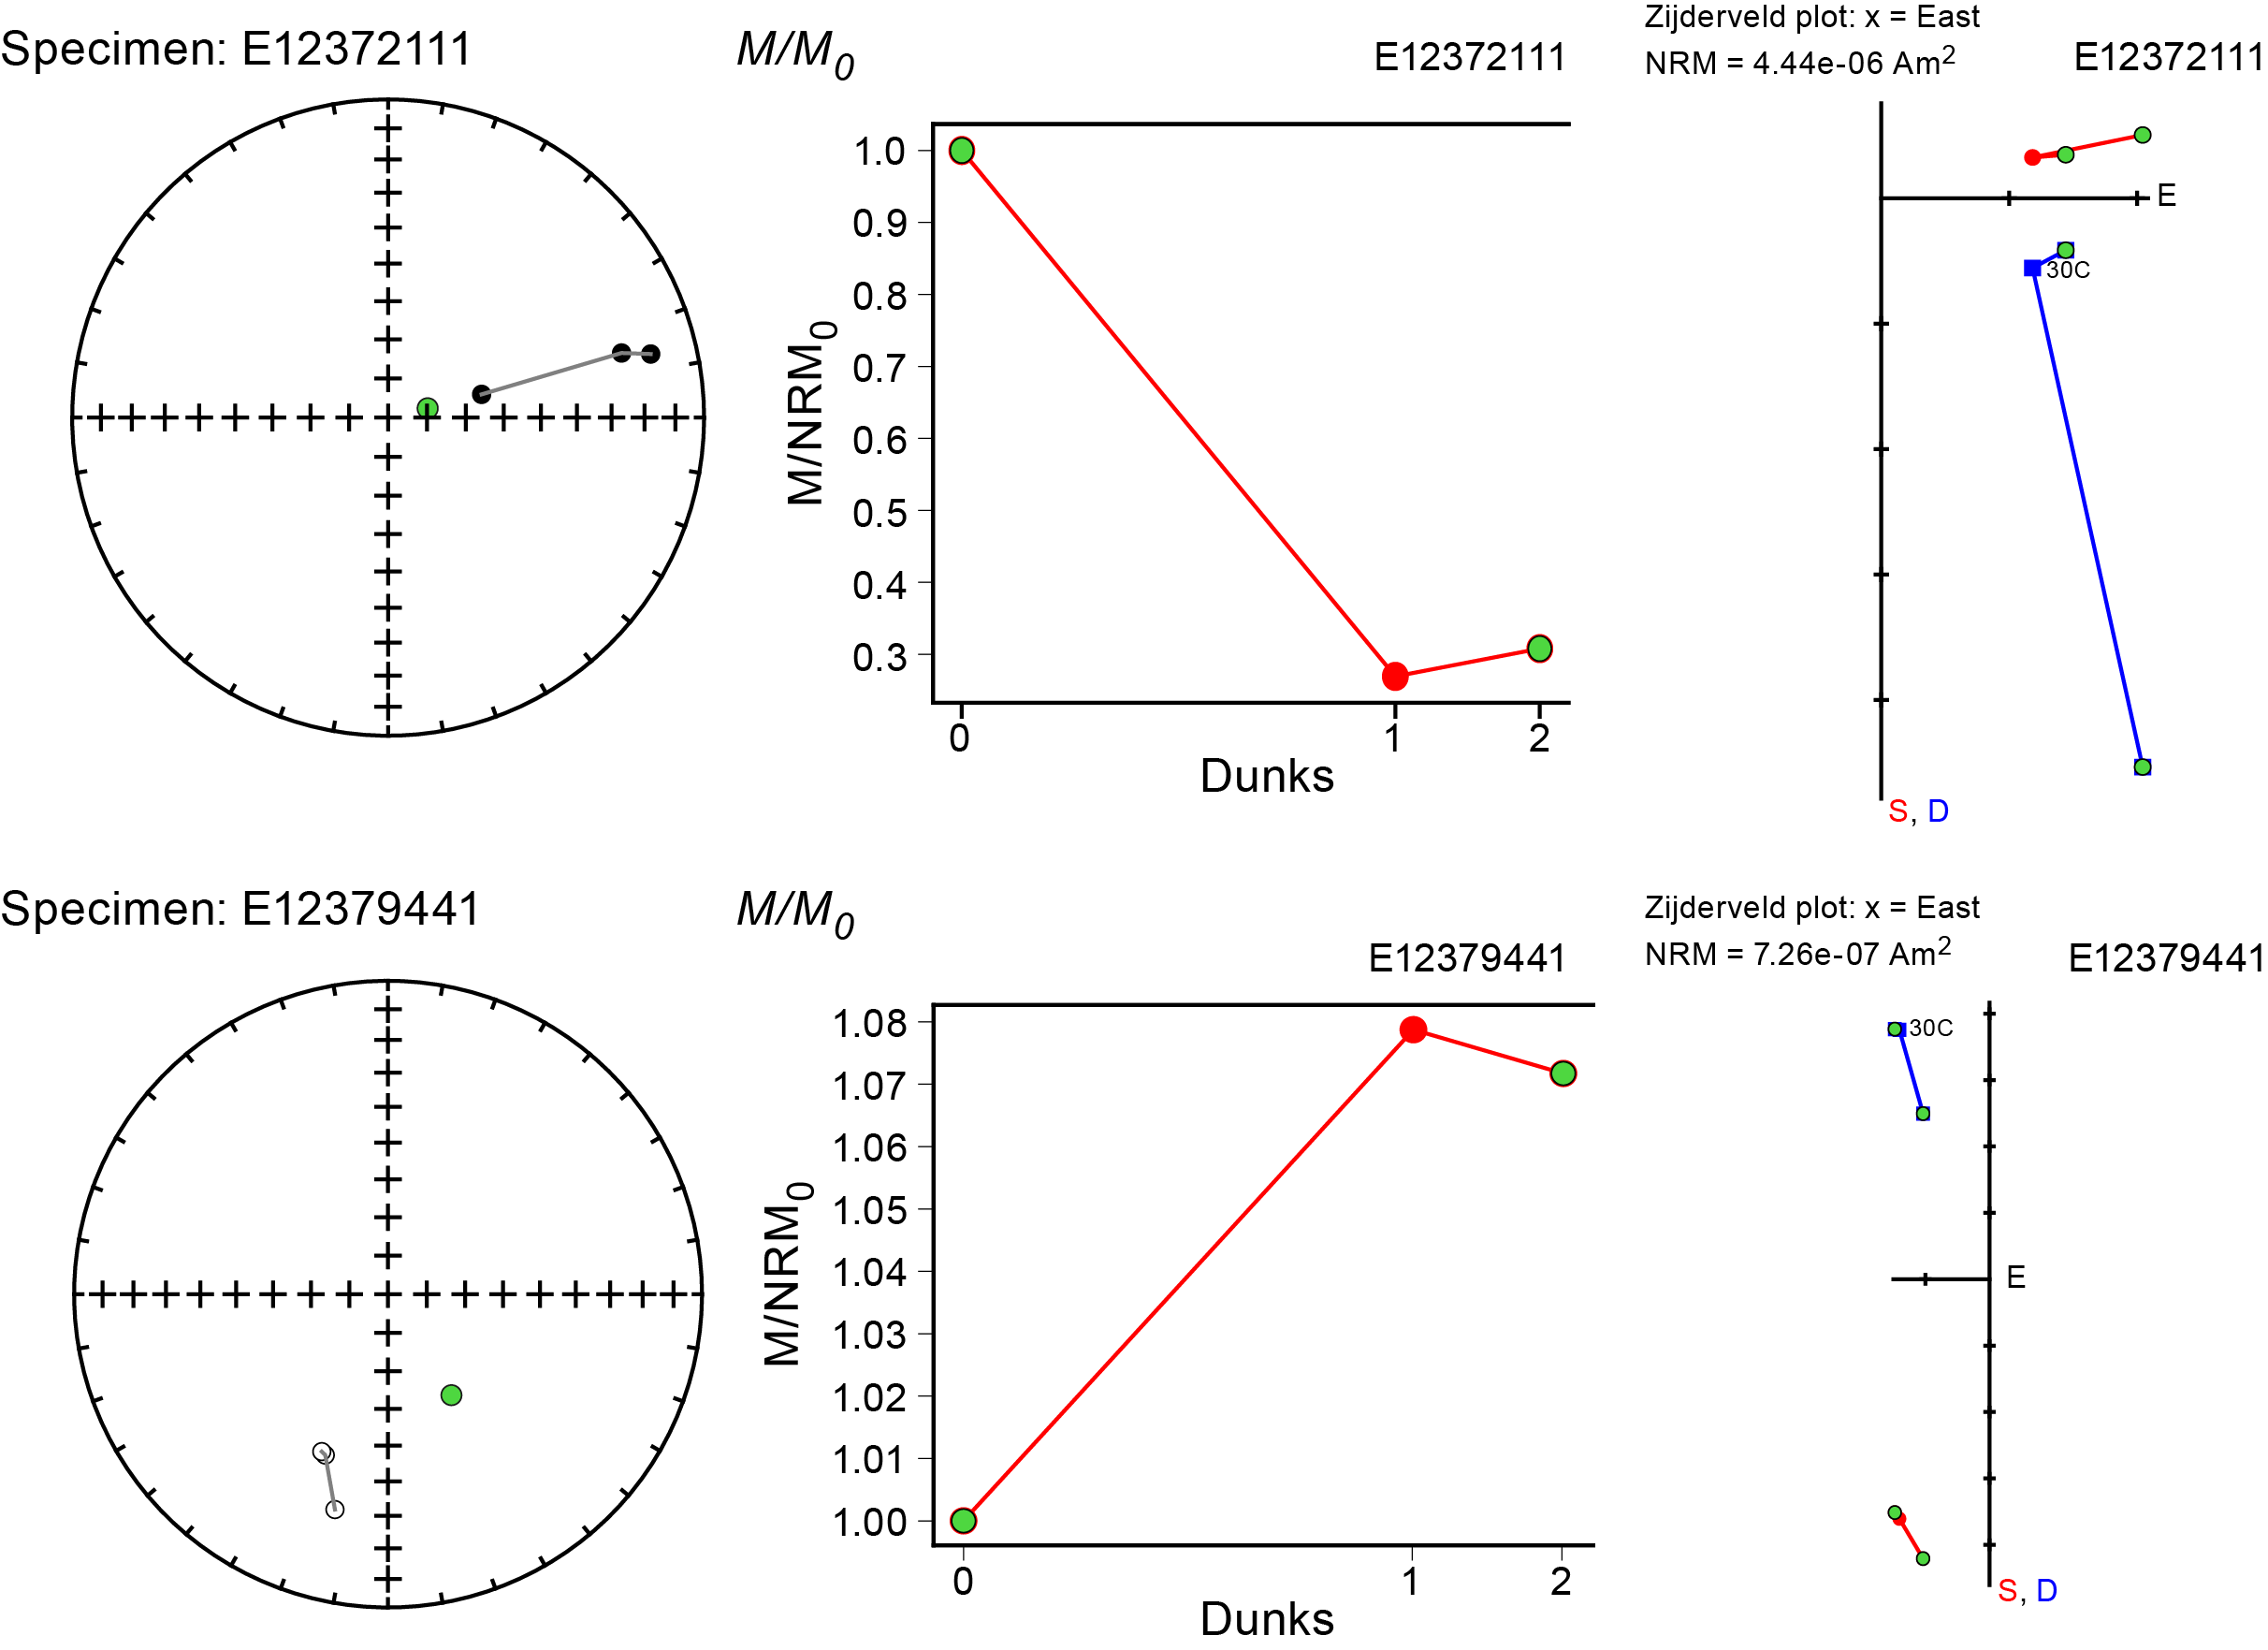
Figure F168. Low-temperature dunks, Hole U1601C.
Samples subjected to stepwise AF demagnetizations of up to 200 mT revealed 1–3 components within the samples (Figures F169, F170). After selecting for maximum angular deviation values <15°, a preliminary PCA show that the inflection point between the least coercive component and the second least coercive component usually occurred between 20 and 50 mT for Hole U1601A and between 40 and 70 mT for Hole U1601C (Tables T17, T18, T19, T20, T21, T22, T23). This difference in inflection point between the two holes could be a result of sampling bias, since a larger number of samples were analyzed from Hole U1601C than from Hole U1601A. Additionally, there were a few samples found in both holes that displayed significant gyroremanent behavior. This behavior, where the intensity increases for increasing AF fields, was only observed in the mafic rocks (diabase + gabbro) and not the ultramafic rocks. It is likely that iron sulfides, likely pyrrhotite, are responsible for this observed behavior.
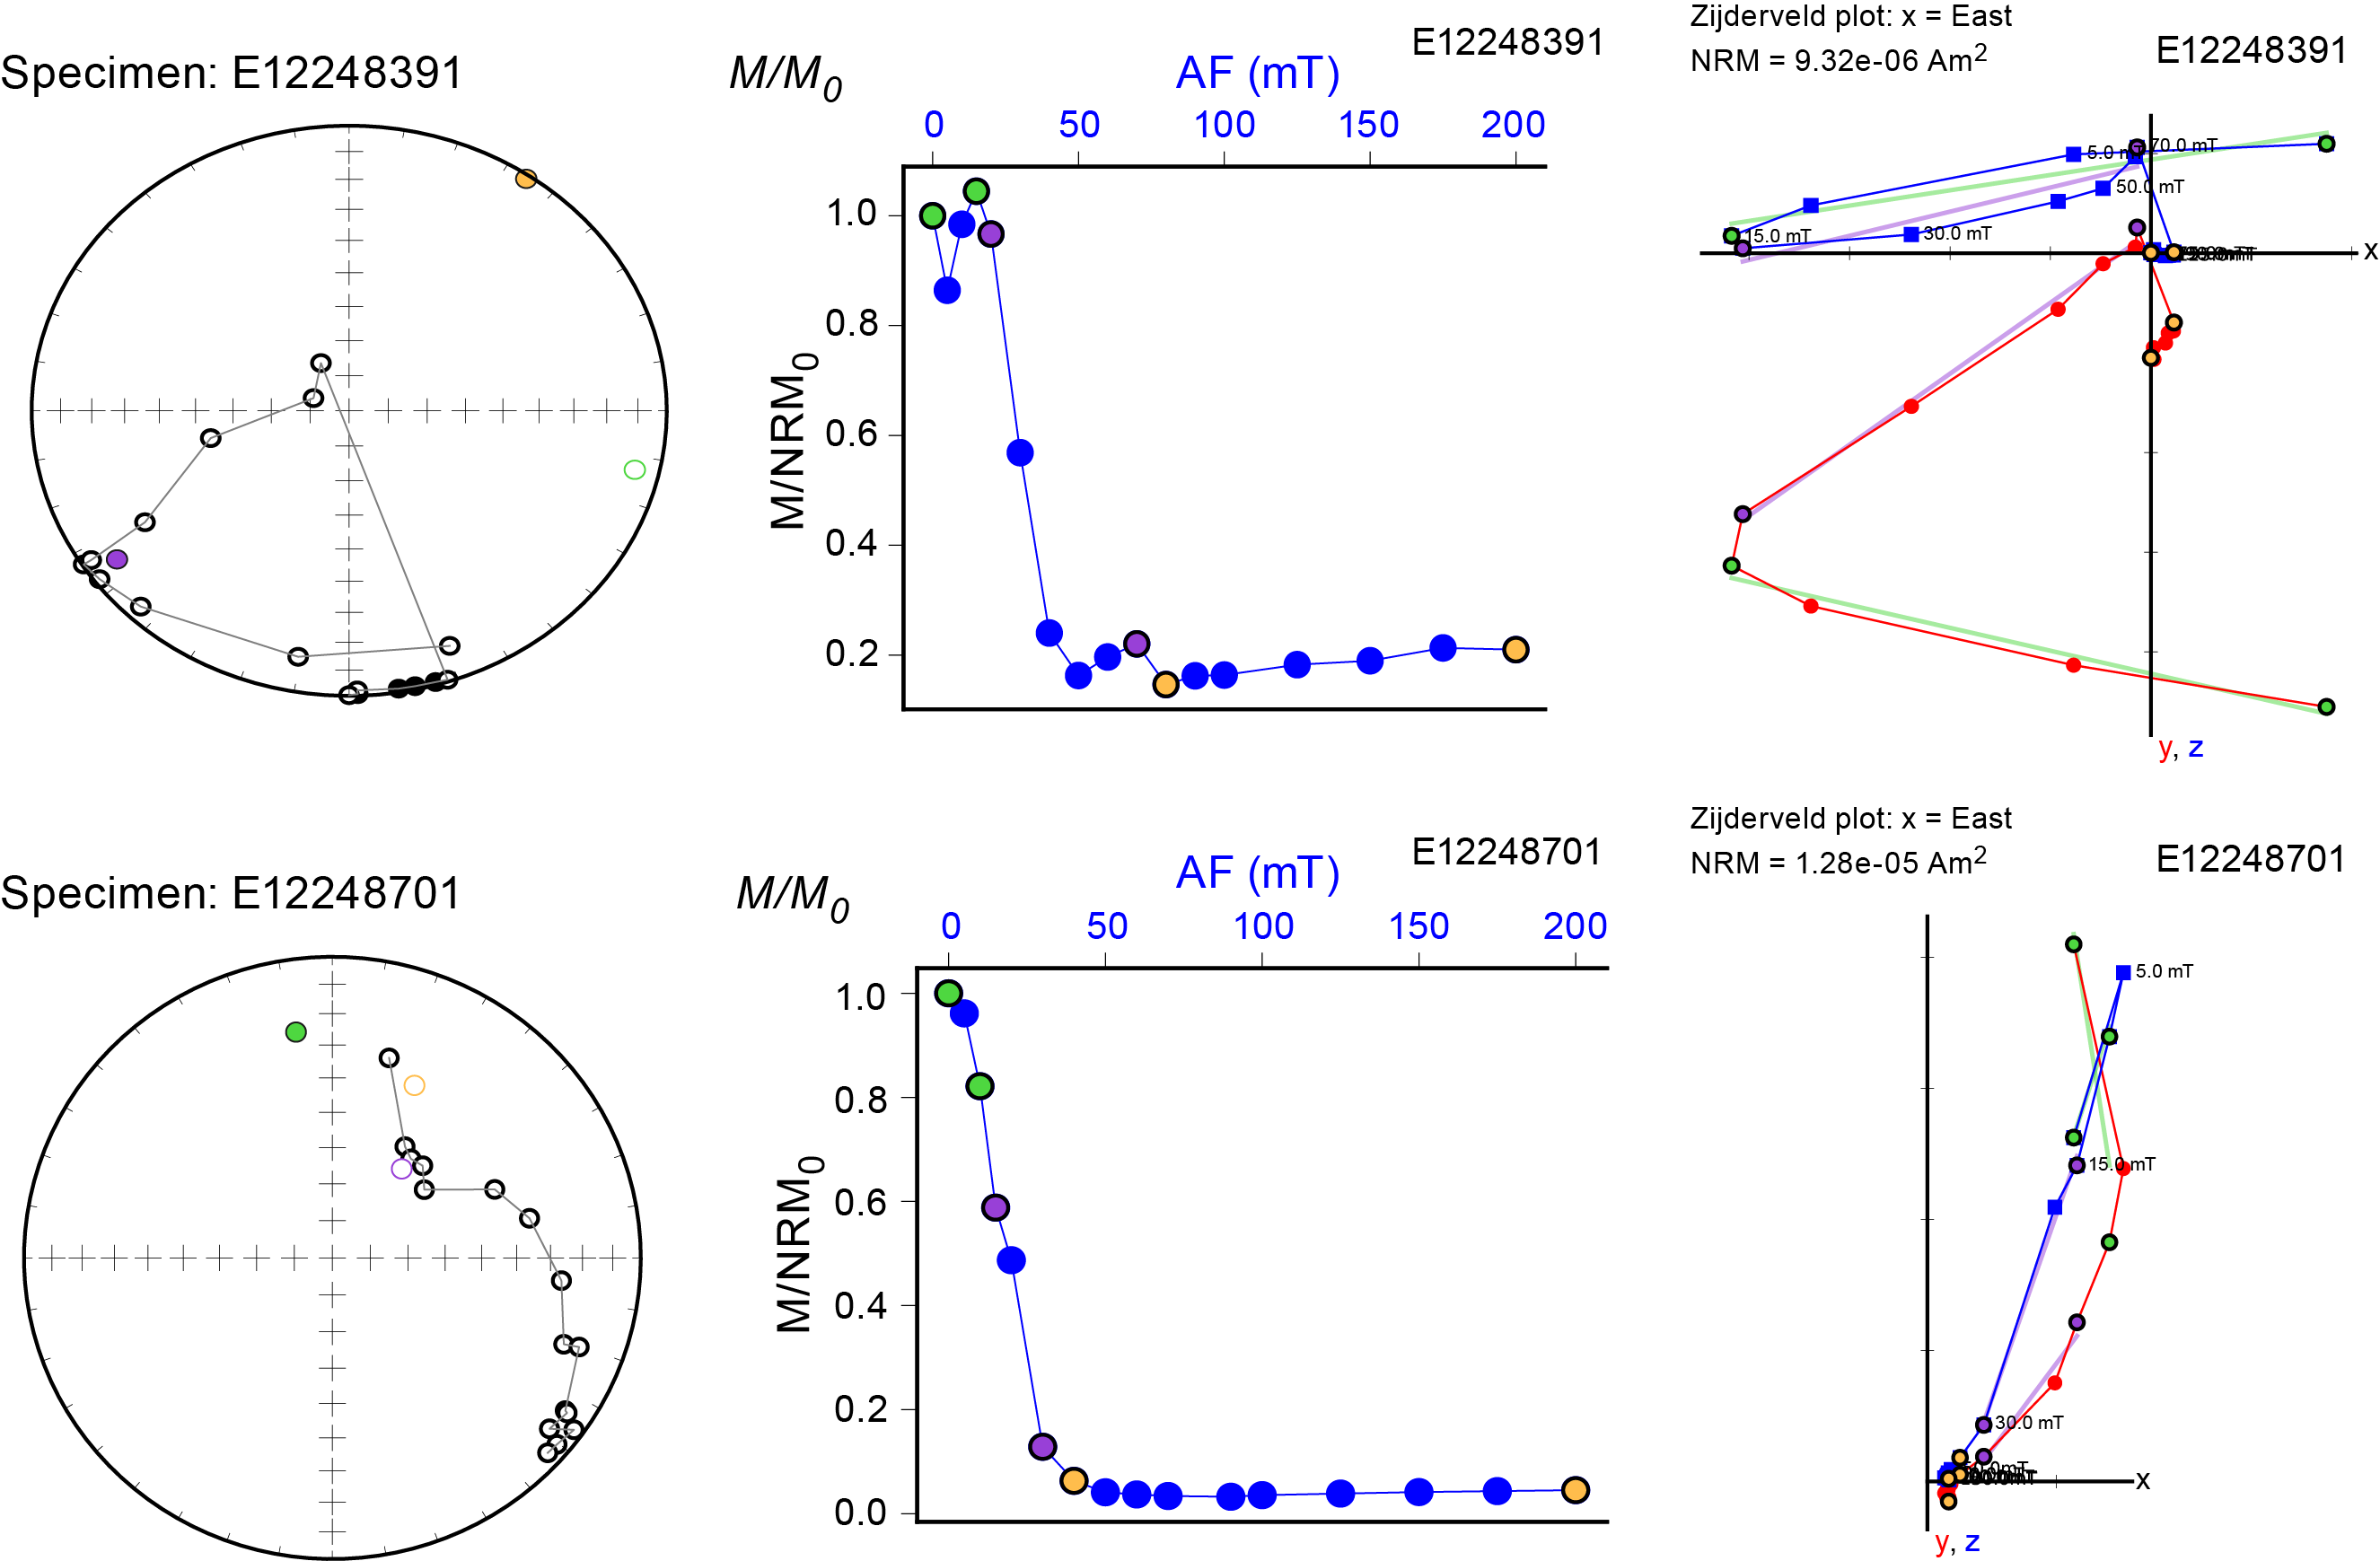
Figure F169. AF demagnetization, Hole U1601A.
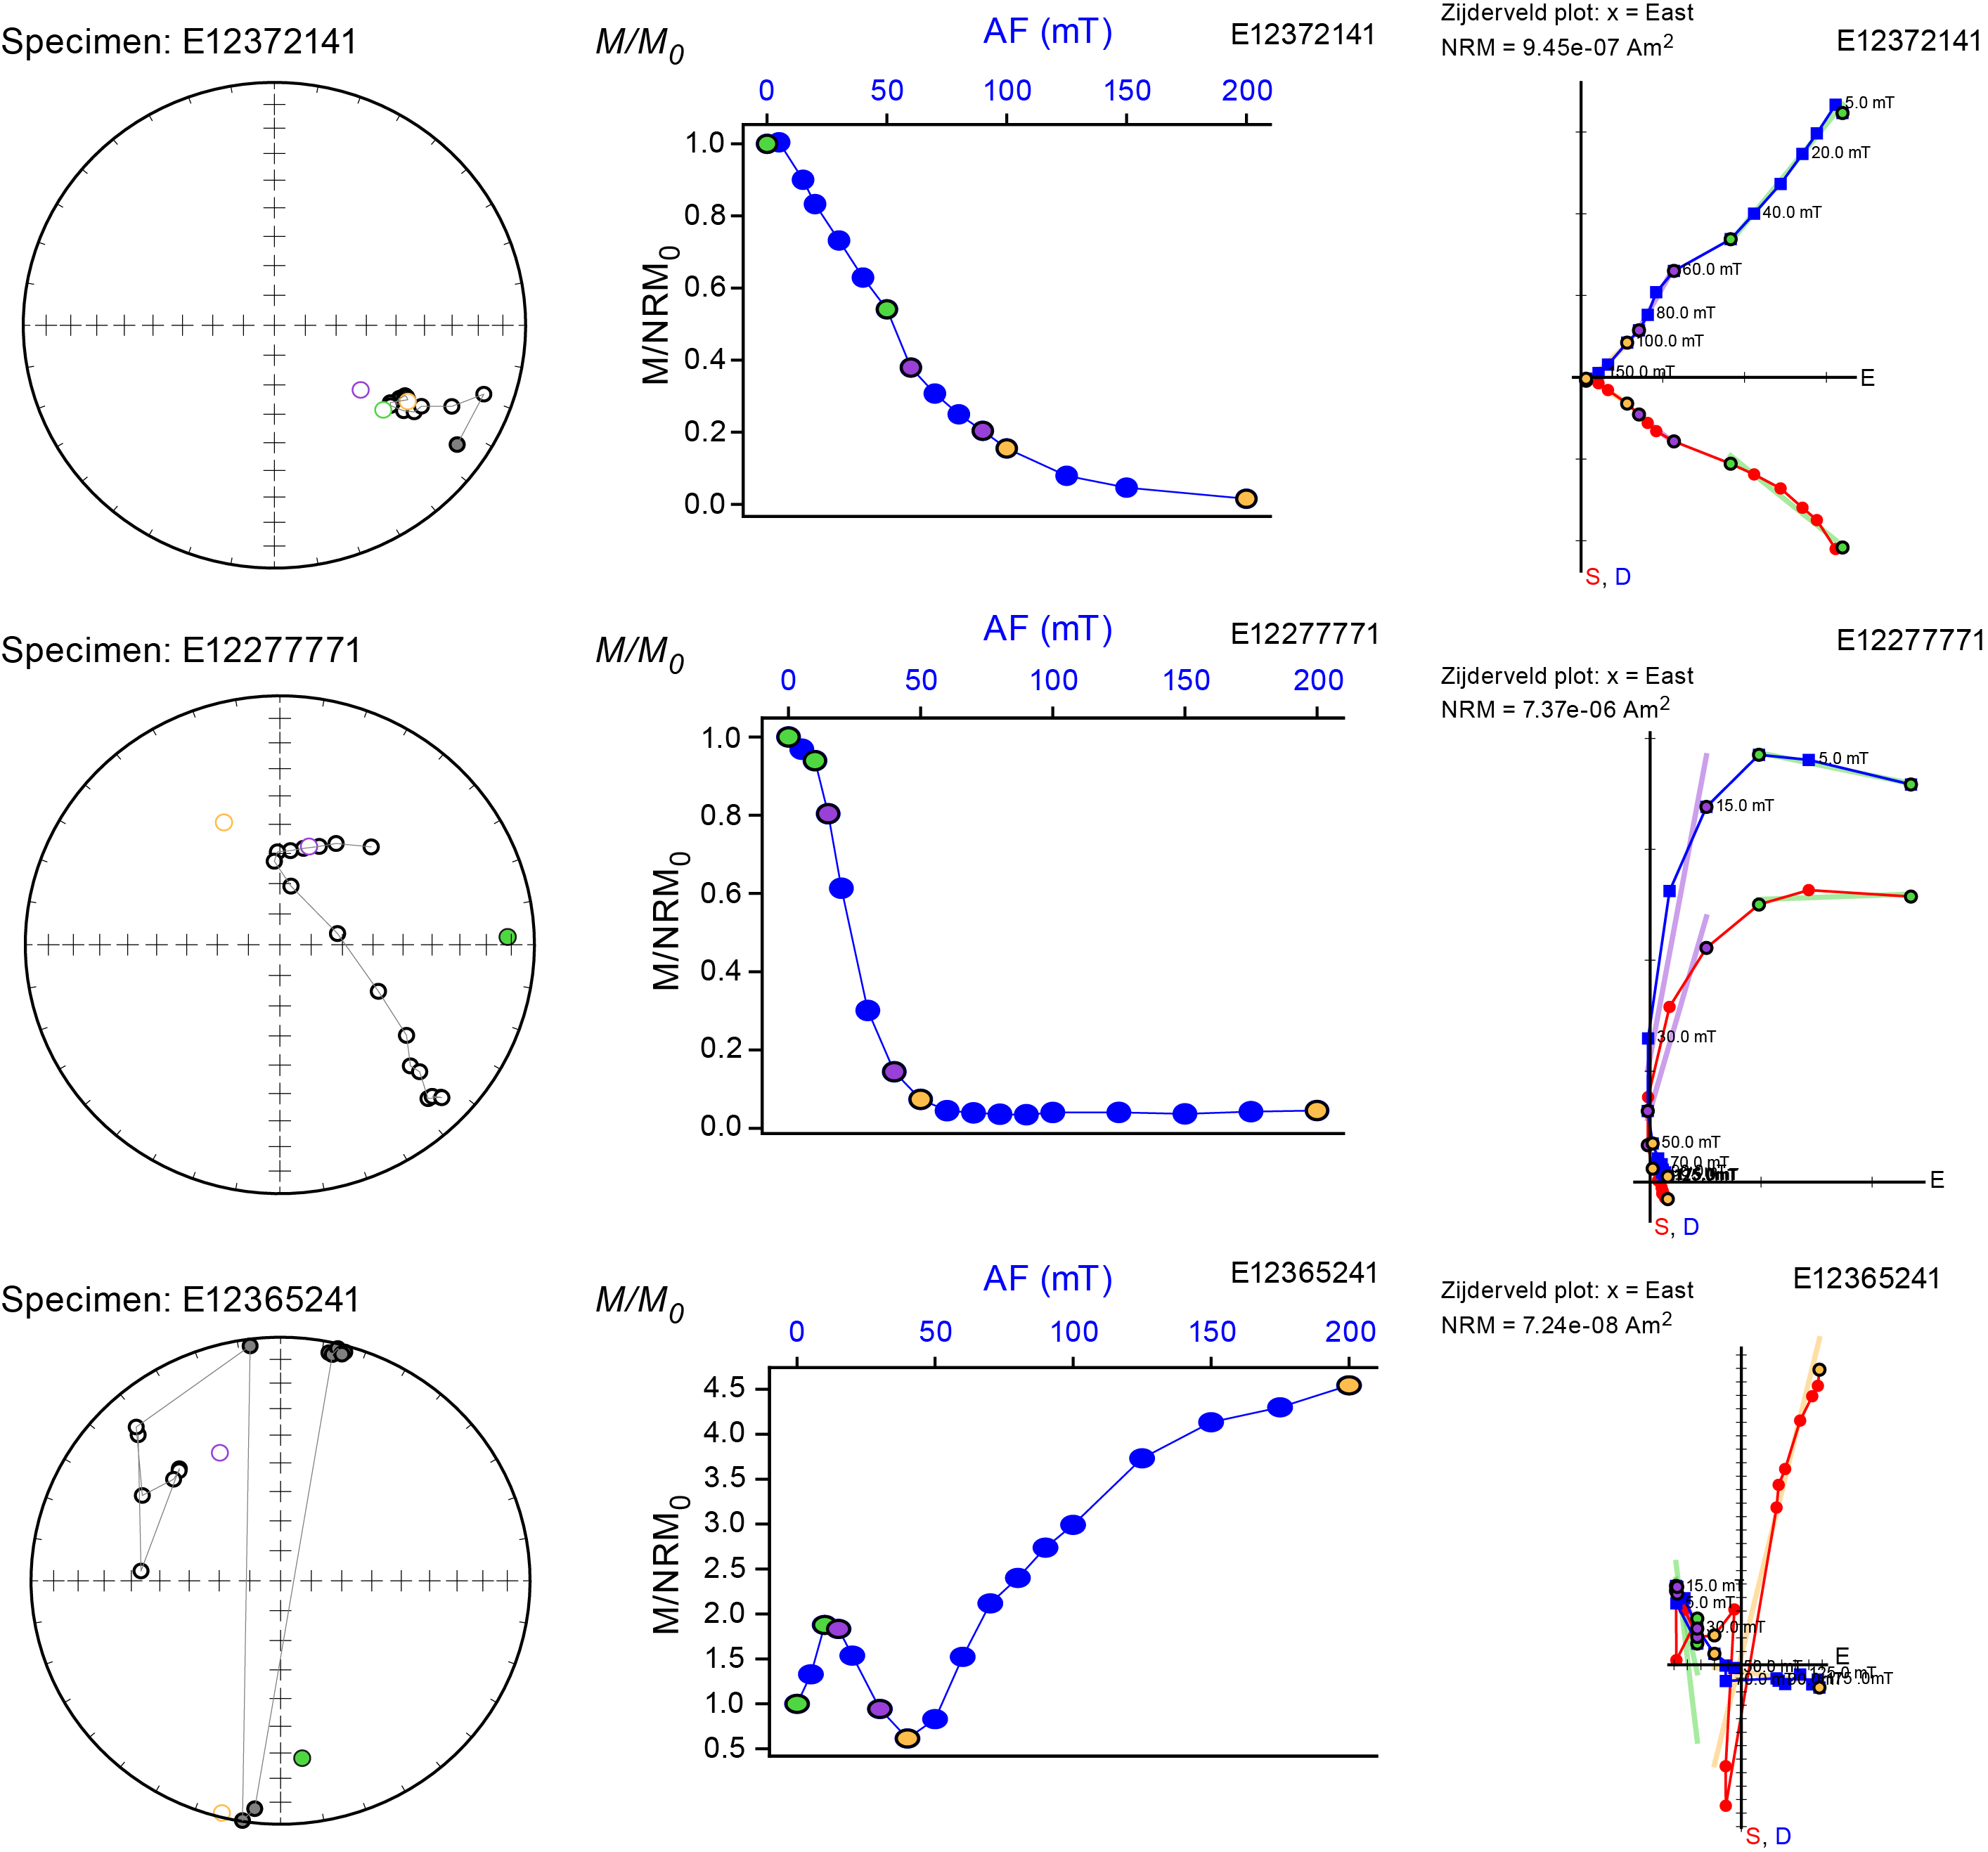
Figure F170. AF demagnetization, Hole U1601C.
Although a low-stability, presumably drilling related, component was evident in nearly all samples, this component represented a relatively small fraction of the remanence for the gabbroic samples (<20% of the NRM magnetic intensity). For most samples with representative demagnetization behaviors, the overprint was easily removed around an AF intensity of 10 mT or an unblocking temperature of 150°C. Although samples were not fully demagnetized, the demagnetization data eventually show a smooth decay toward the origin, indicating that the characteristic remanent magnetization (ChRM) directions were captured. Comparisons between the petrophysics samples taken adjacent to the paleomagnetism samples were in reasonable agreement, indicating that the viscous overprint of the petrophysics samples did not change the characteristic remanence direction.
For a subset of intervals, ChRM directions were calculated by PCA (Kirschvink, 1980) using the PmagPy GUI (Tauxe et al., 2016) (see Paleomagnetism in the Expedition 399 methods chapter [Lang et al., 2025]). All measurement points along the core pieces where stable vector components could be identified on Zijderveld plots underwent PCA analysis (Zijderveld, 1967). These directions provide preliminary constraints on identifying magnetizing mechanisms (Tables T17, T18, T19, T20, T21, T22, T23).
9.3. Hole U1601A discrete results
Samples subjected to stepwise thermal demagnetizations of up to 700°C showed characteristic remanence directions calculated using the inclination only method of McFadden and Reid (1982) that were in good agreement with their AF counterparts, albeit less constrained (Figure F171). Sample remanence directions were typically isolated just below the Curie temperature, around 500°–550°C. Three samples dropped <5% in intensity after 300°C, indicating a notable contribution from iron sulfides to the bulk magnetic remanence. Most samples exhibited a distinct drop in magnetization at the Curie temperature, as evidenced by sharp drops in magnetization intensity around 570°–580°C, indicating that the bulk remanence was carried by magnetite and/or titanomagnetite. However, a few samples showed a gradual decrease in magnetization with temperature from their NRM. Bulk susceptibility measurements taken after each temperature increment revealed that oxidation varied significantly, changing up to two orders of magnitude in either direction (Table T24). This suggests the production, destruction, or alteration of magnetic carriers throughout the heating experiment.
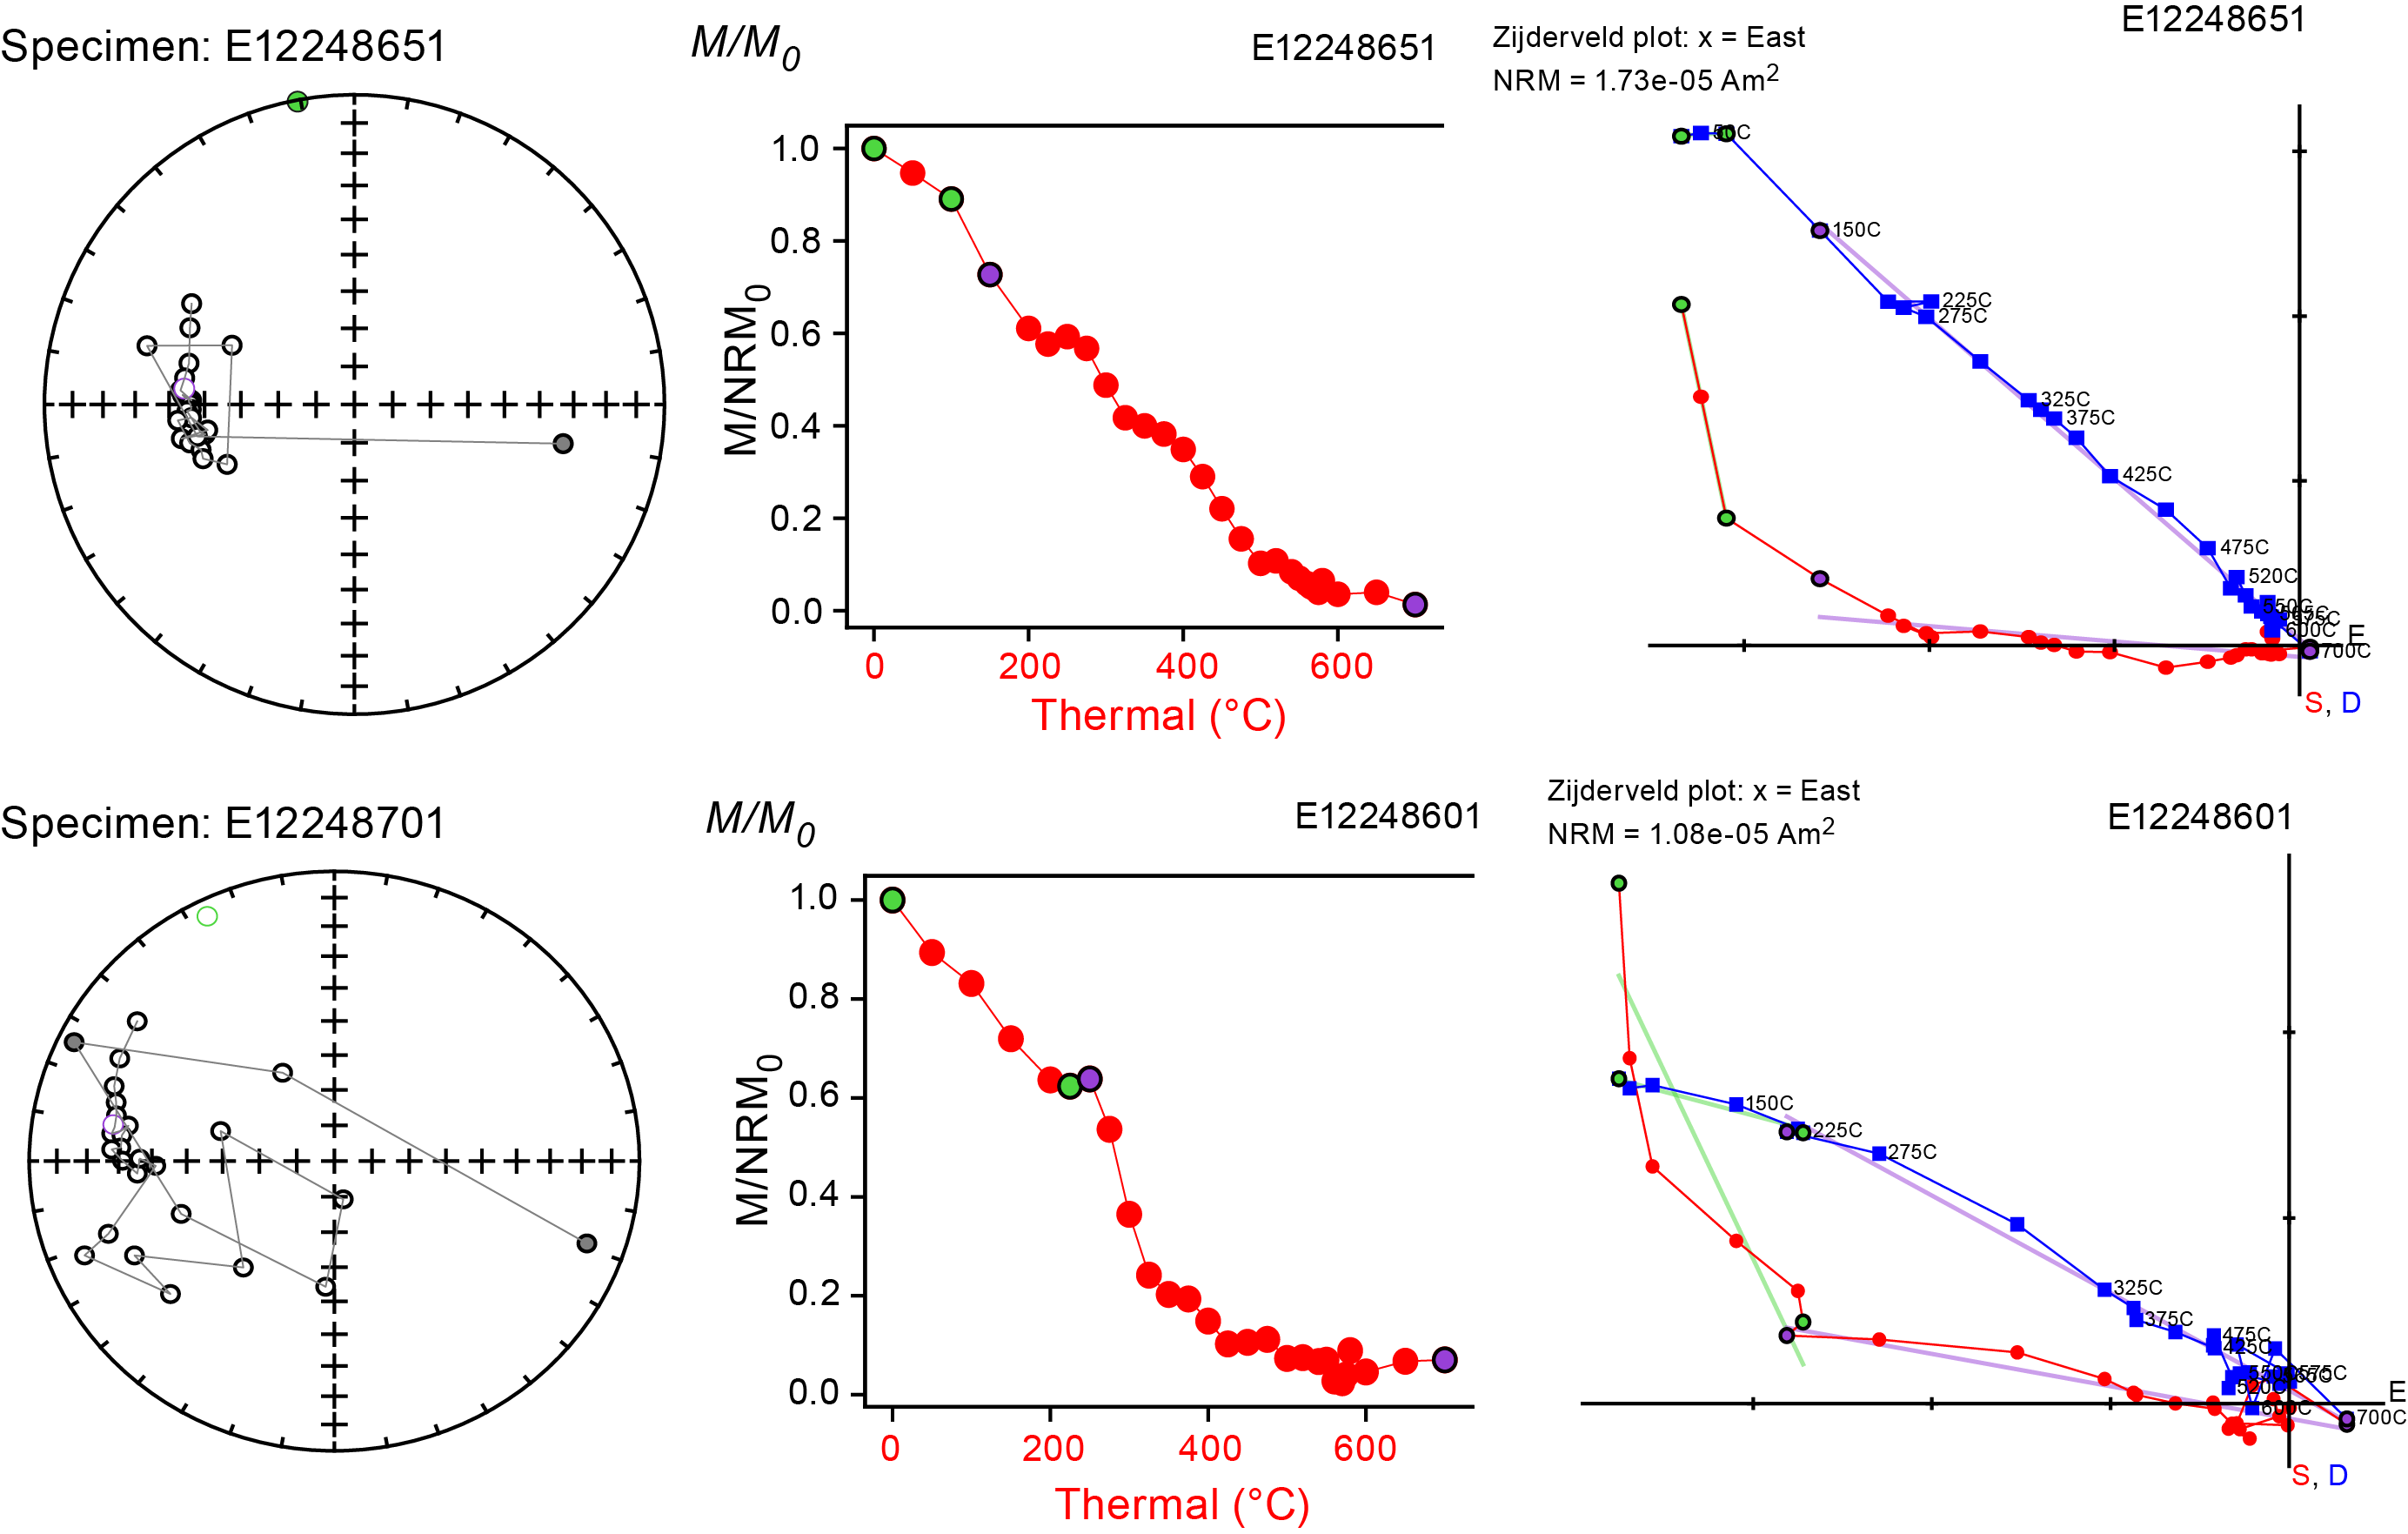
Figure F171. Thermal demagnetization, Hole U1601A.
Results from the hybrid AF and thermal demagnetization suite were inconclusive (Figure F172). All paleomagnetism samples underwent thermal demagnetizations, regardless of their prior treatment for AF demagnetization. Samples that were AF treated beforehand failed to exhibit clear Curie temperatures during thermal heating. For higher temperatures, these samples exhibited strongly variable intensity and directions. This strong variability motivated the reexamination of the background magnetic field of the shielded oven. Fluxgate magnetometer measurements revealed that the innermost shielding zone where the samples were loaded was imperfectly shielded (refer to Figure F25 in the Expedition 399 methods chapter [Lang et al., 2025]). Although this region was supposed to have a lower background magnetic field, the higher than expected measured field (~20 nT) could mean that sample magnetization values were contaminated and unrepresentative of true remanence. It is likely that the samples that were the most demagnetized before thermal treatment acquired the strongest viscous remanent components during this procedure. For this reason, it is recommended to avoid interpreting the hybrid results for this hole.
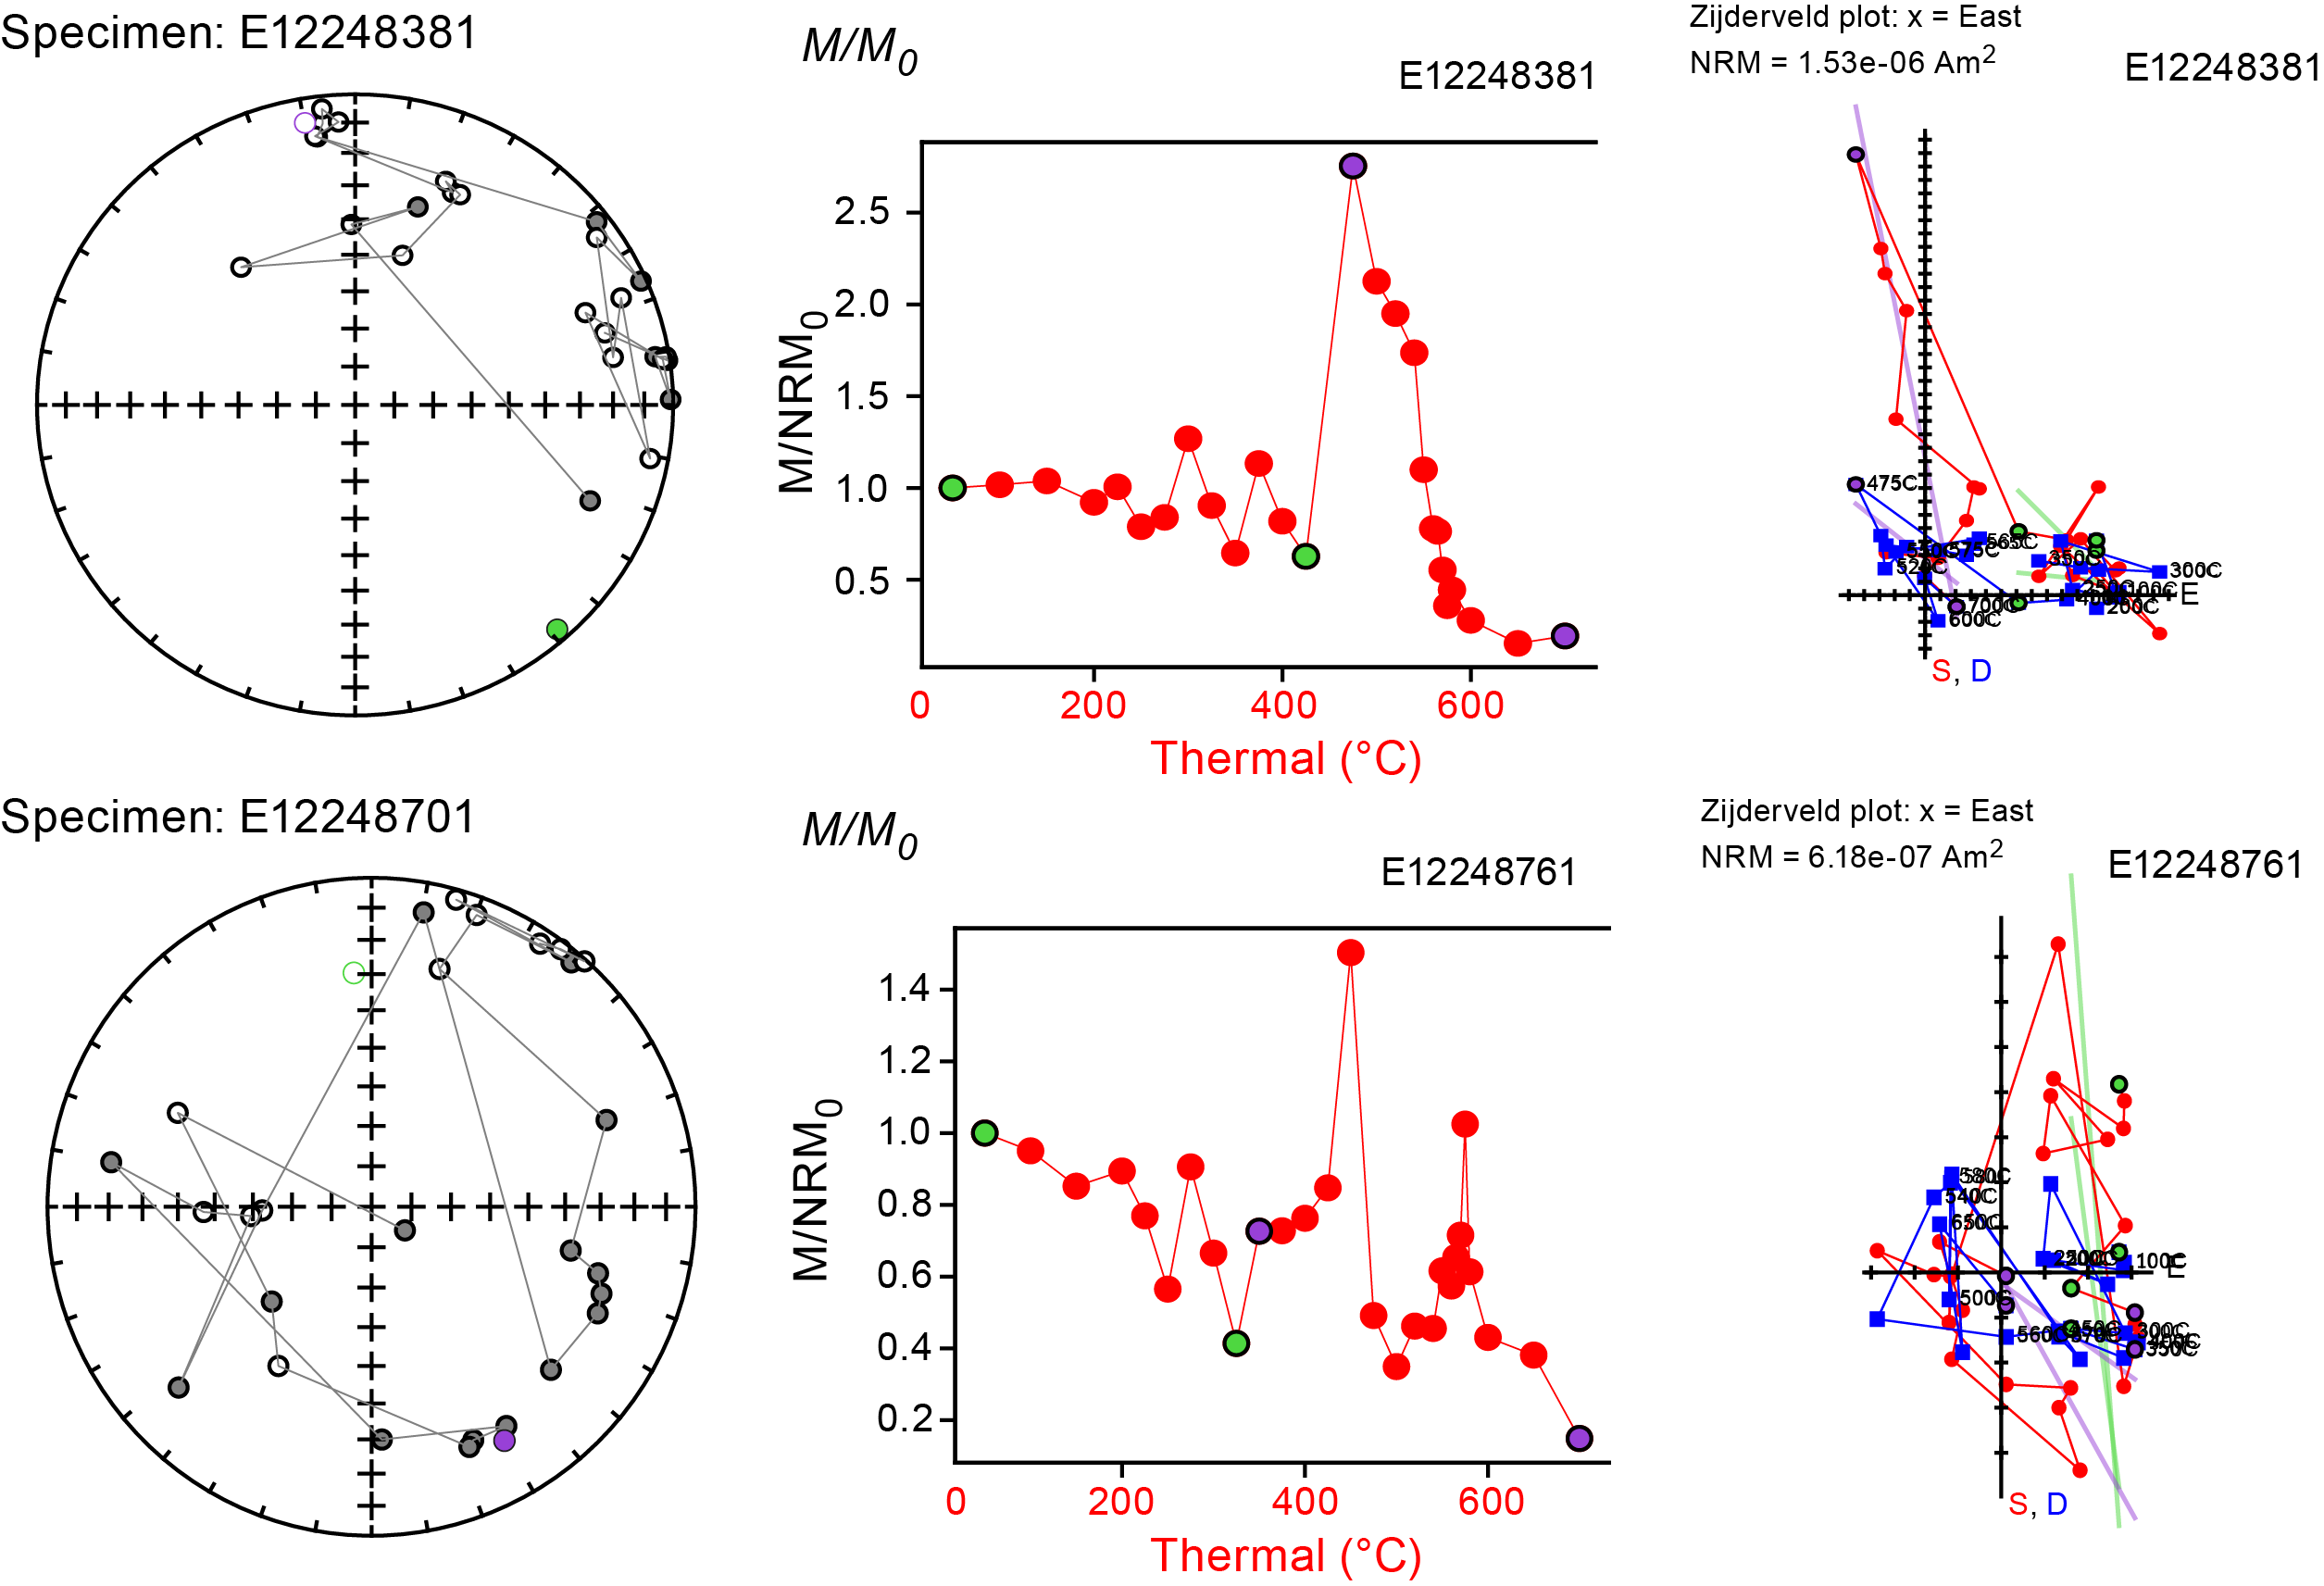
Figure F172. Thermal demagnetization after 200 mT AF, Hole U1601A.
9.4. Hole U1601C discrete results
Gabbroic samples were subjected to stepwise thermal demagnetizations of up to 700°C and showed ChRM directions that were in good agreement with their AF counterparts calculated using the using the inclination only method of McFadden and Reid (1982) (Figure F173). Ultramafic samples were excluded from the thermal experiments to comply with onboard safety protocols. Sample remanence directions were typically isolated just below the Curie temperature of magnetite, around 500°–550°C. Most samples showed a characteristic drop in magnetization intensity at the Curie temperature, but a few samples had a gradual decrease in magnetization intensity relative to the NRM. Bulk susceptibility varied significantly by sample (Table T25). Oxide gabbros displayed the largest change in susceptibility with given temperature, noticeably oxidizing after 150°C.
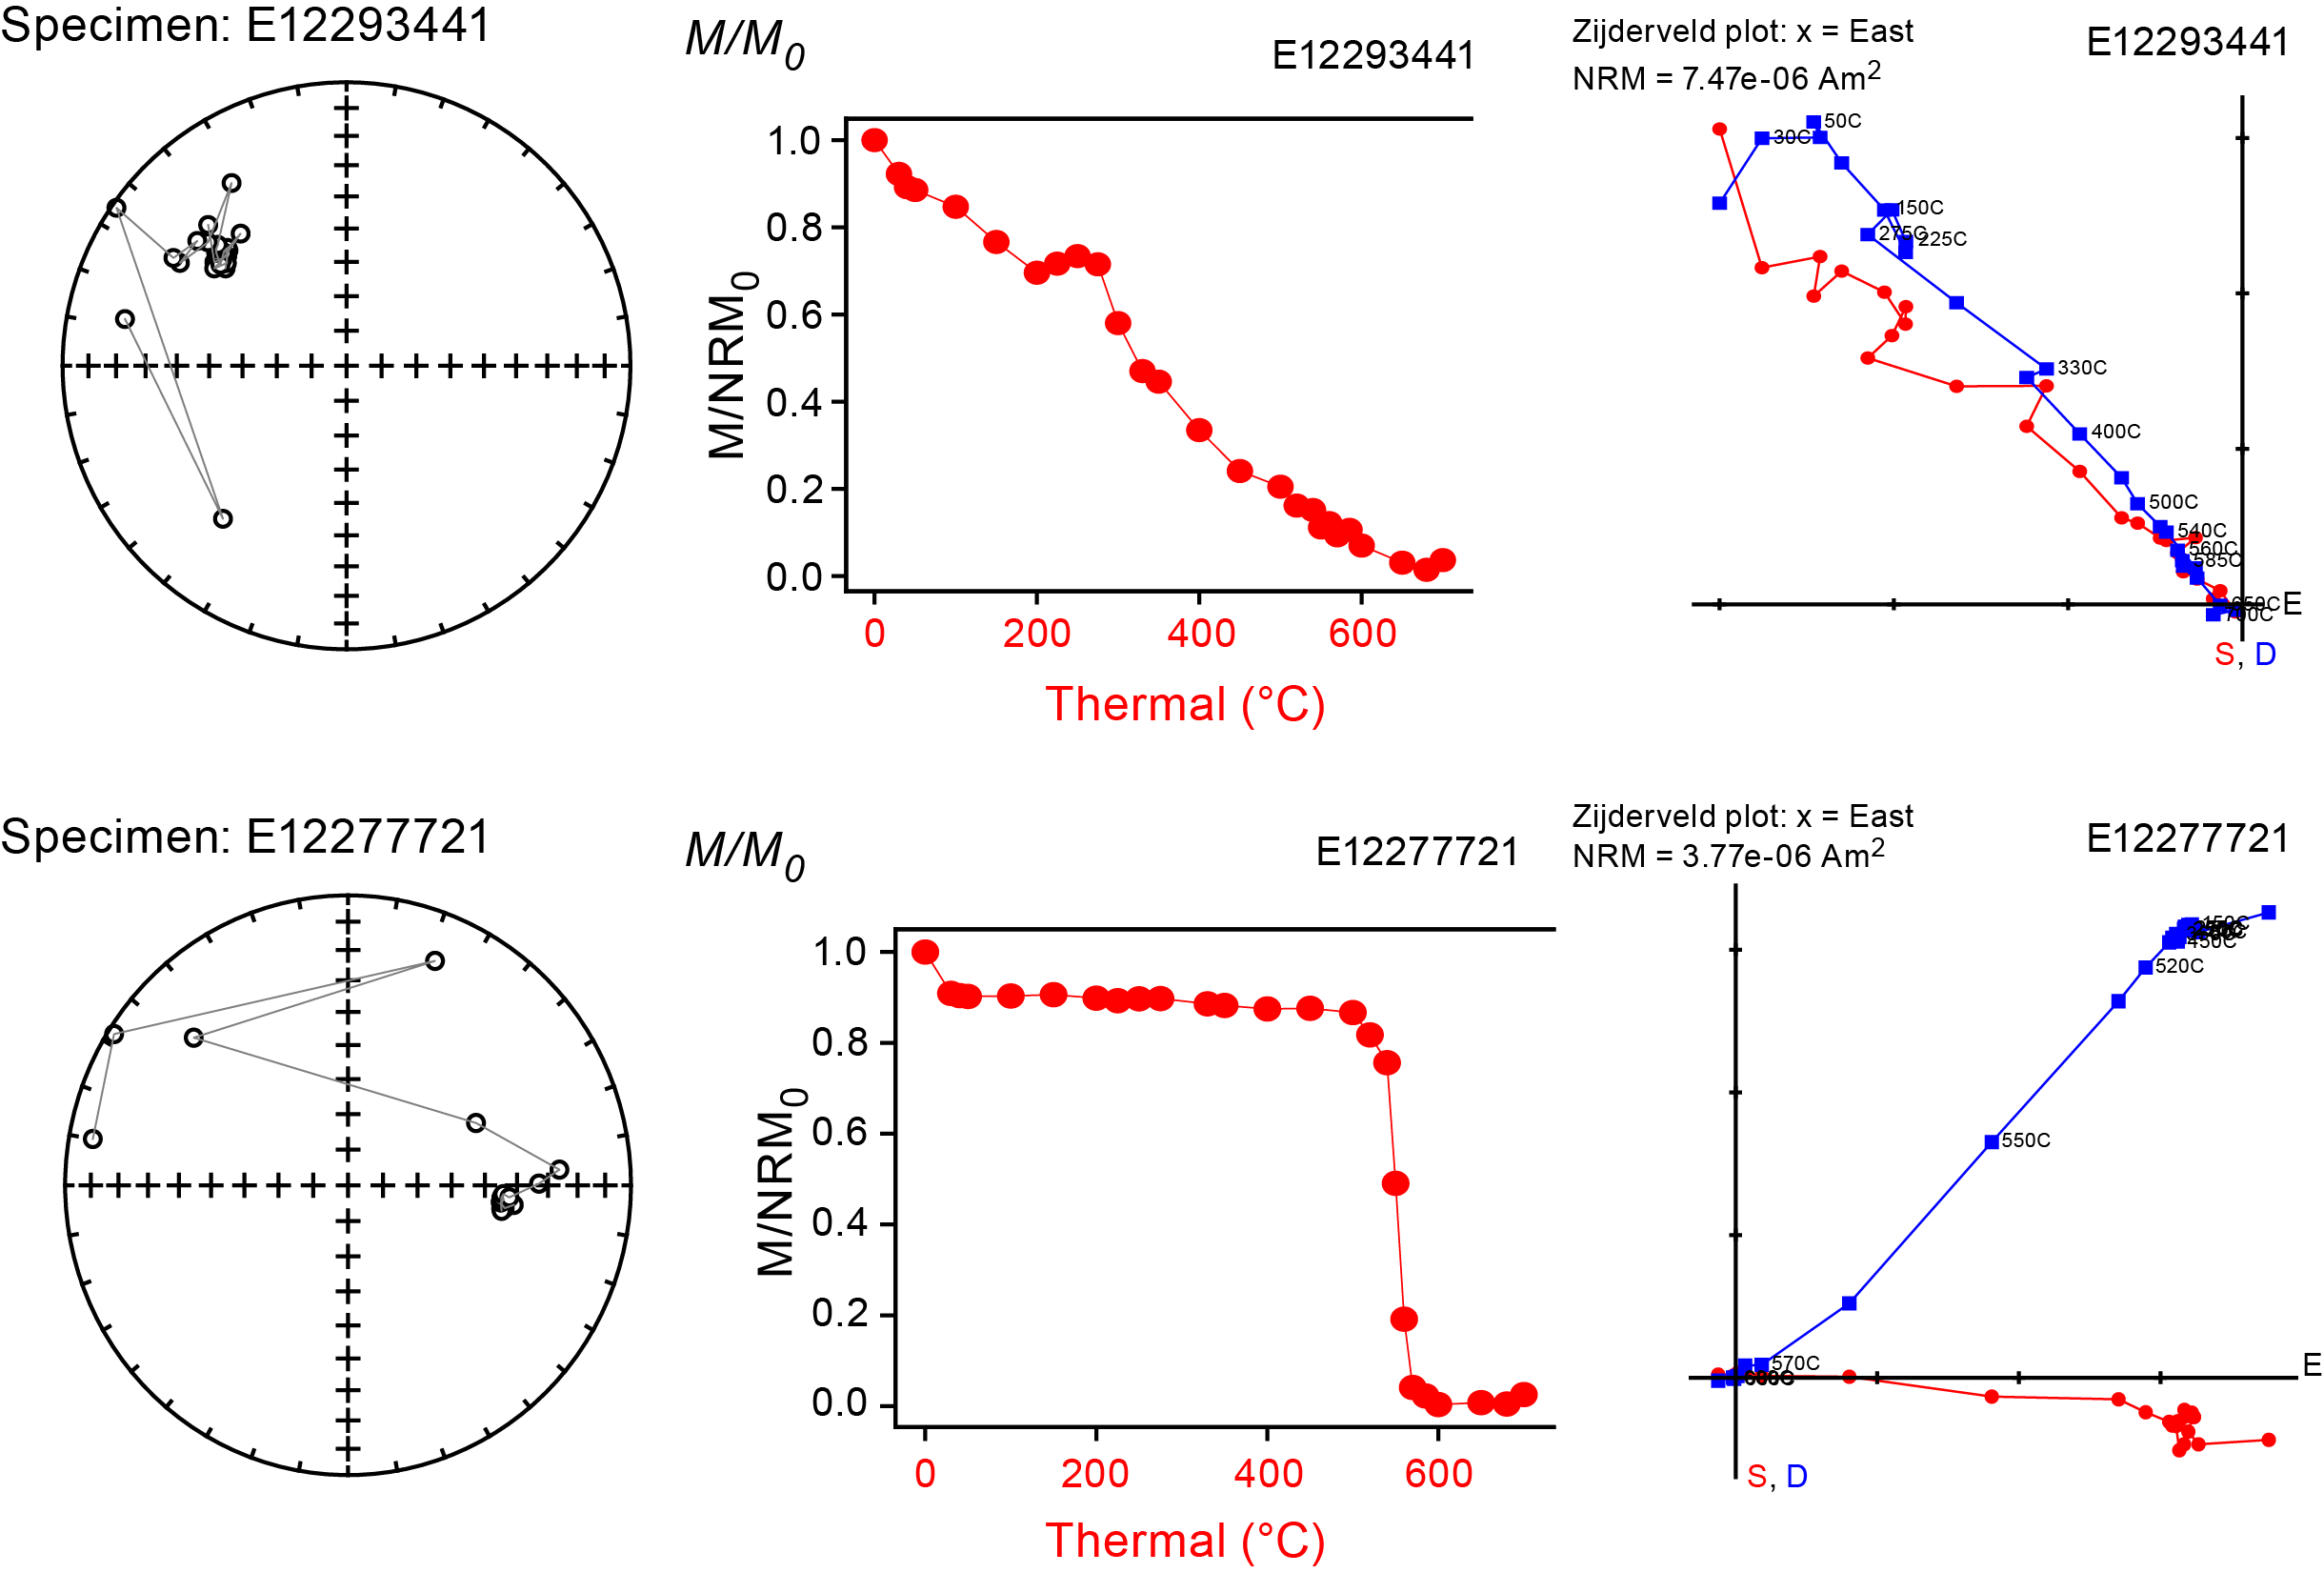
Figure F173. Thermal demagnetization, Hole U1601C.
Even after ensuring the correct placement of samples in the oven, some samples continued to display anomalous magnetization behaviors throughout thermal demagnetization. This behavior was further investigated with Sample 399-U1601C-211R-1, 128–130 cm (Cube 12382201). After observing rapid changes in intensity with repeated measurements, we investigated whether it could be attributed to the thermoviscous relaxation of the magnetization or to the relaxation of intensity as a function of time in the ambient field. The ambient magnetic field in the laboratory was determined to be ~2 μT with a portable triaxial fluxgate magnetometer (Applied Physics Model 534D). The sample was first heated to 650°C, removed from the oven, and measured immediately for magnetization. It was then kept in the shielded spinner magnetometer and measured again. Afterward, the sample was removed from the shielding for set amounts of time and remeasured over increasing time intervals (Table T26). After each analysis, the sample was immediately analyzed a second time without reopening the shield. Over the course of 24 h unshielded, the magnetization intensity increased by an order of magnitude and inclination and declination values became more variable. Interestingly, each second measurement of the spinner magnetometer resulted in an intensity drop of about 20 × 10−3 A/M. A possible explanation is that magnetic minerals began to anneal with increasing temperatures, increasing their effective grain size and susceptibility to low magnetic fields. If true, samples displaying extreme thermoviscous remanence may be less reliable for paleomagnetic records. Increased spinning intervals could provide an alternate method for demagnetizing shipboard samples.
9.5. Rock magnetic characterizations
9.5.1. Königsberger ratio
The Königsberger ratio (Q) is a proxy of magnetic stability used to determine a rock's stable remanence (Koenigsberger, 1938). A Q value of ≥1 indicates that a rock is capable of maintaining a stable remanence. The ratio is calculated by taking the NRM intensity over the product of the magnetic susceptibility with the local H field, which for Site U1601 is predicted to be about 32.56 A/m (Expedition 304/305 Scientists, 2006b). In general, the Königsberger ratios for samples collected from the two holes were >1.0 (Figure F174) indicating that the remanent magnetization was greater than the induced magnetization. However, it is worth noting that there are relatively more samples below a ratio of 1 than there were for Hole U1309D (Expedition 304/305 Scientists, 2006b).
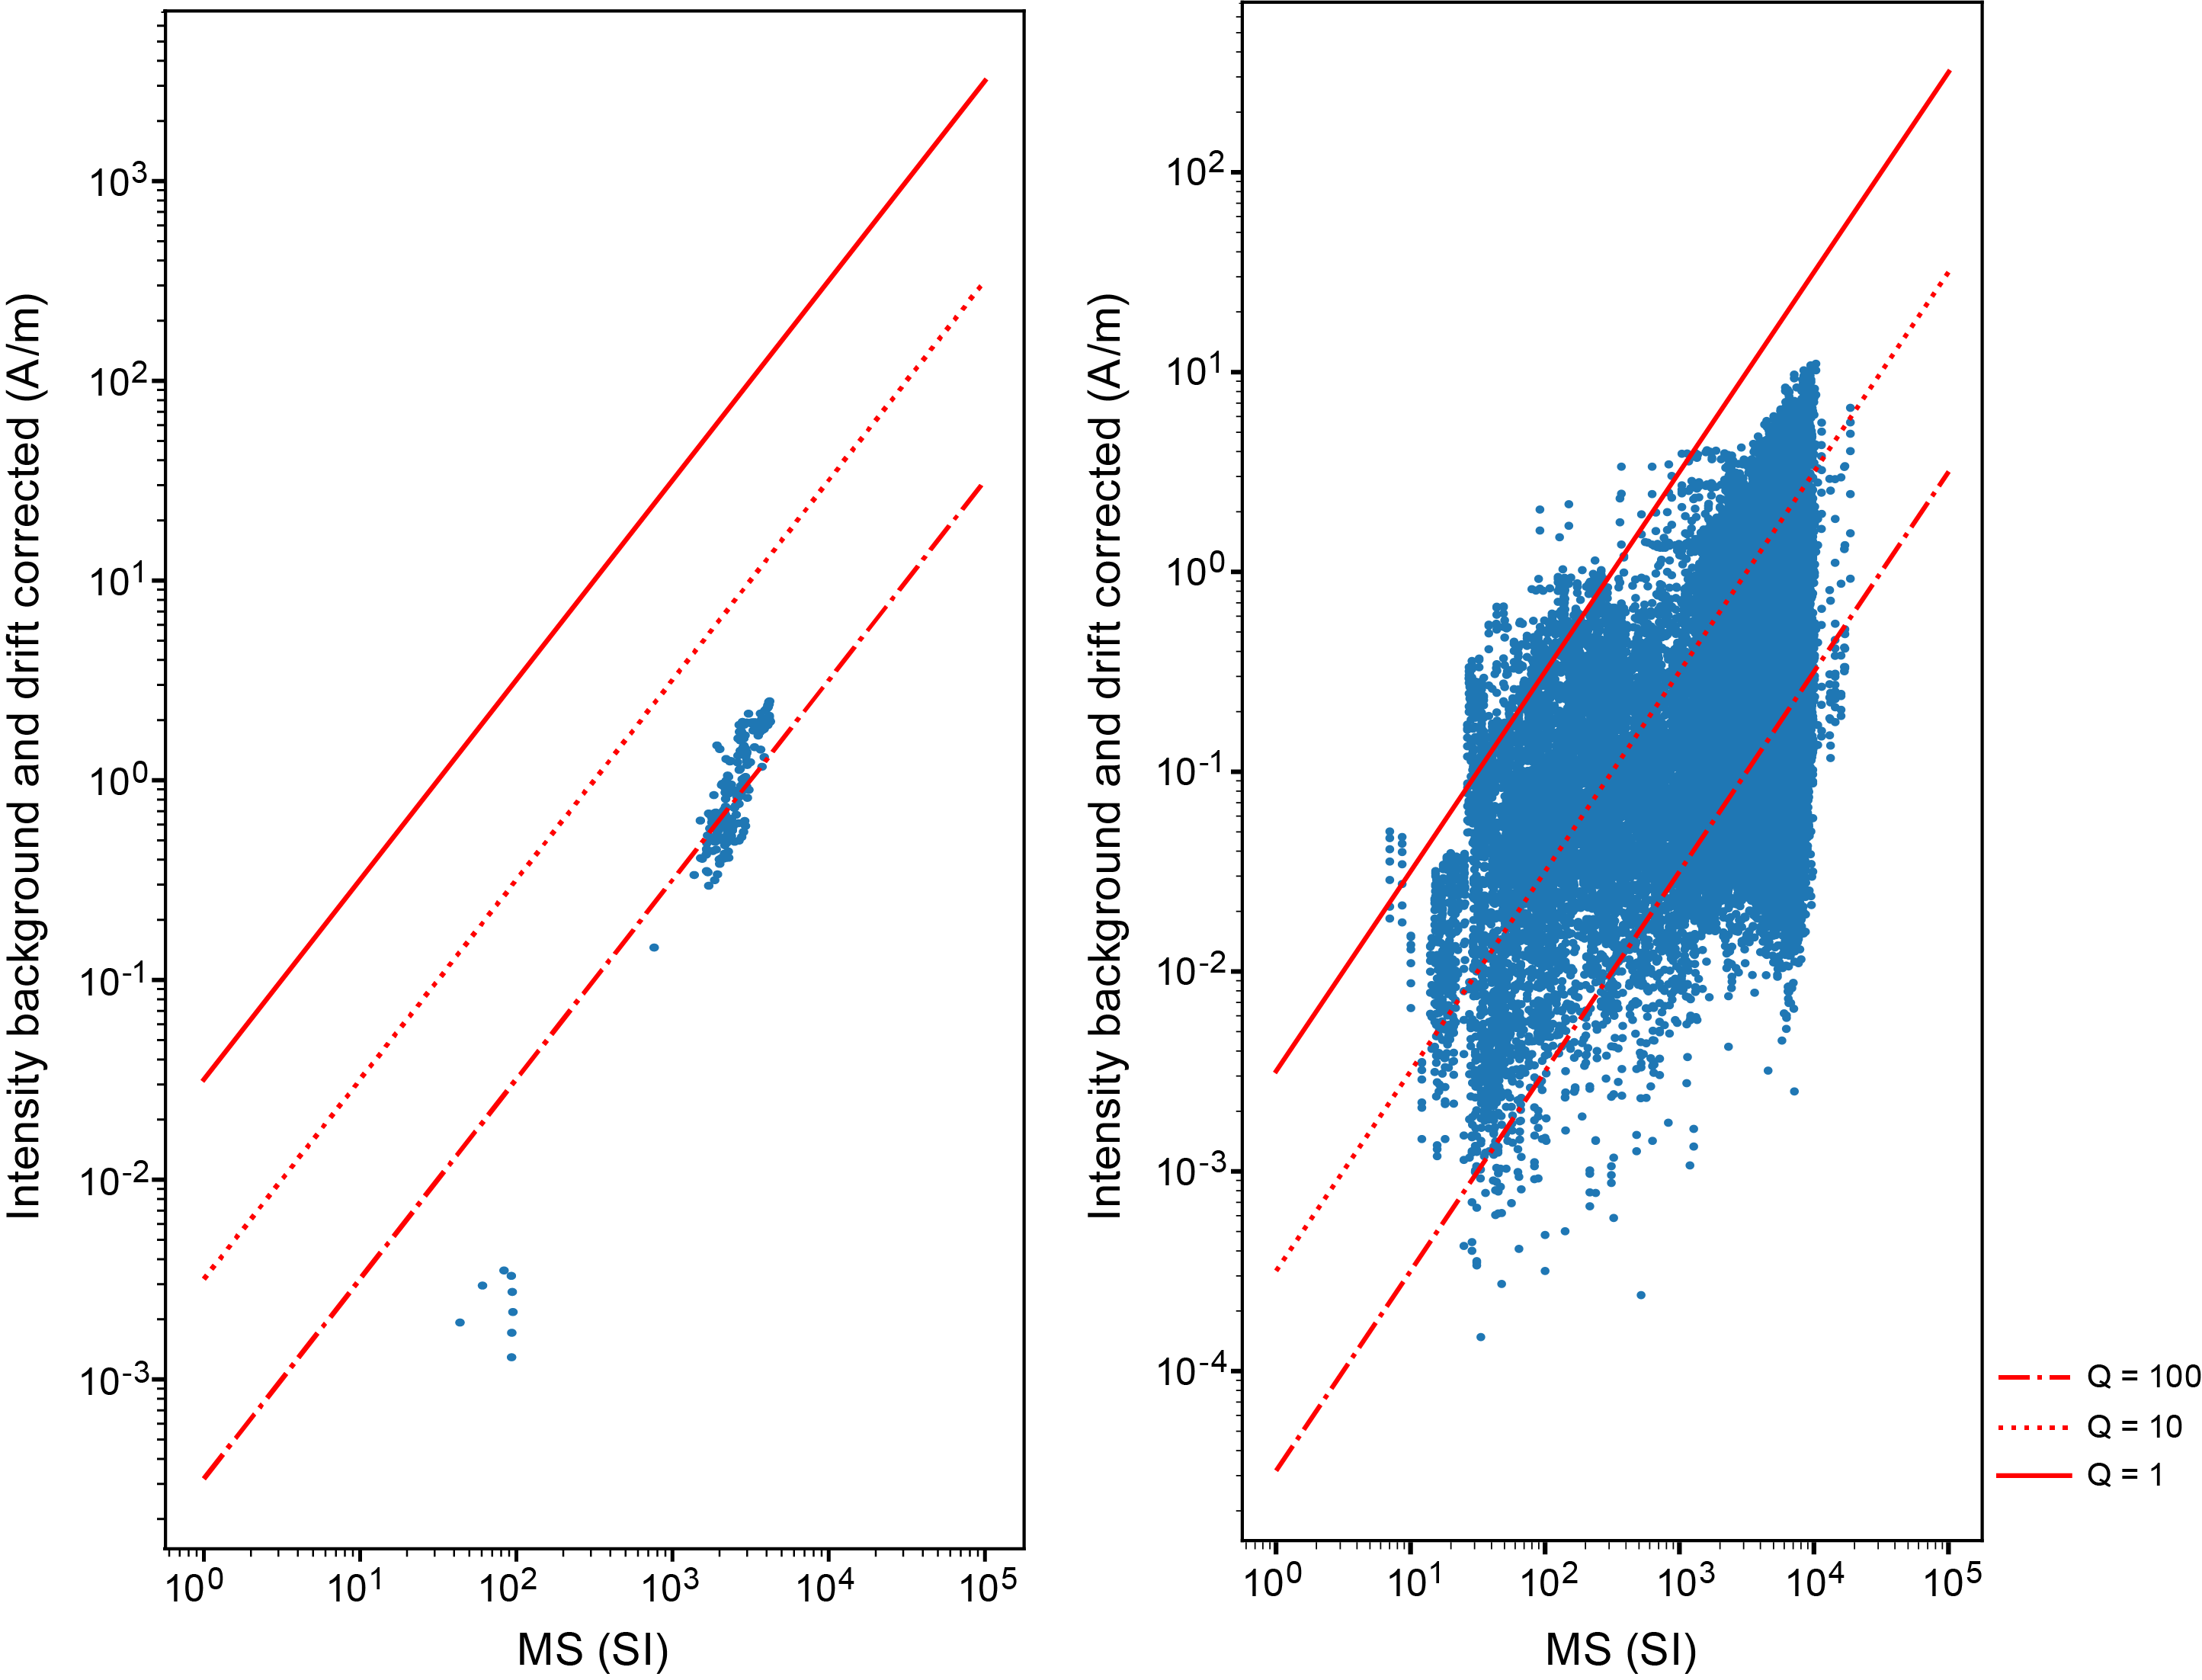
Figure F174. NRM vs. magnetic susceptibility.
9.5.2. IRMs
Isothermal remanent magnetization (IRM) experiments, both acquisition and backfield, were carried out after demagnetization experiments. Because of time constraints, only 23 of the 61 samples were analyzed for IRM (Tables T27, T28). Samples that appeared to be the most demagnetized were prioritized for IRM analysis. Samples were subjected to an impulse field along the +z-axis using an ASC impulse magnetizer (ASC Scientific Model IM-10), with a progressively increasing field from 5 mT to 1.2 T. Afterward, coercivity spectra were unmixed using the MAX UnMix program (Maxbauer et al., 2016), which is based off of a Cumulative Log Gaussian Function of magnetic carriers (Robertson and France, 1994):
- B = given field value,
- Bh = mean coercivity of an individual grain population,
- DP= dispersion parameter, and
- Mr = component saturation magnetic remanence.
Models for the components of the coercivity spectra assumed two primary magnetic mineral populations composed the bulk of the magnetization populations (Figure F175). The relative strengths and overlap between the assumed two dominant magnetization components are quite variable, indicating that there are multiple processes controlling the size and distribution of the magnetic populations. The distributions of the peaks consistently peak from 1.5 to 1.7 Log[Back Field (mT)], indicating that in situ magnetite carriers primarily characterize the bulk magnetization of the system (Egli, 2004). The variance in peak coercivity values for the different samples could be attributed to varying degrees of magnetite oxidation or grain sizes.
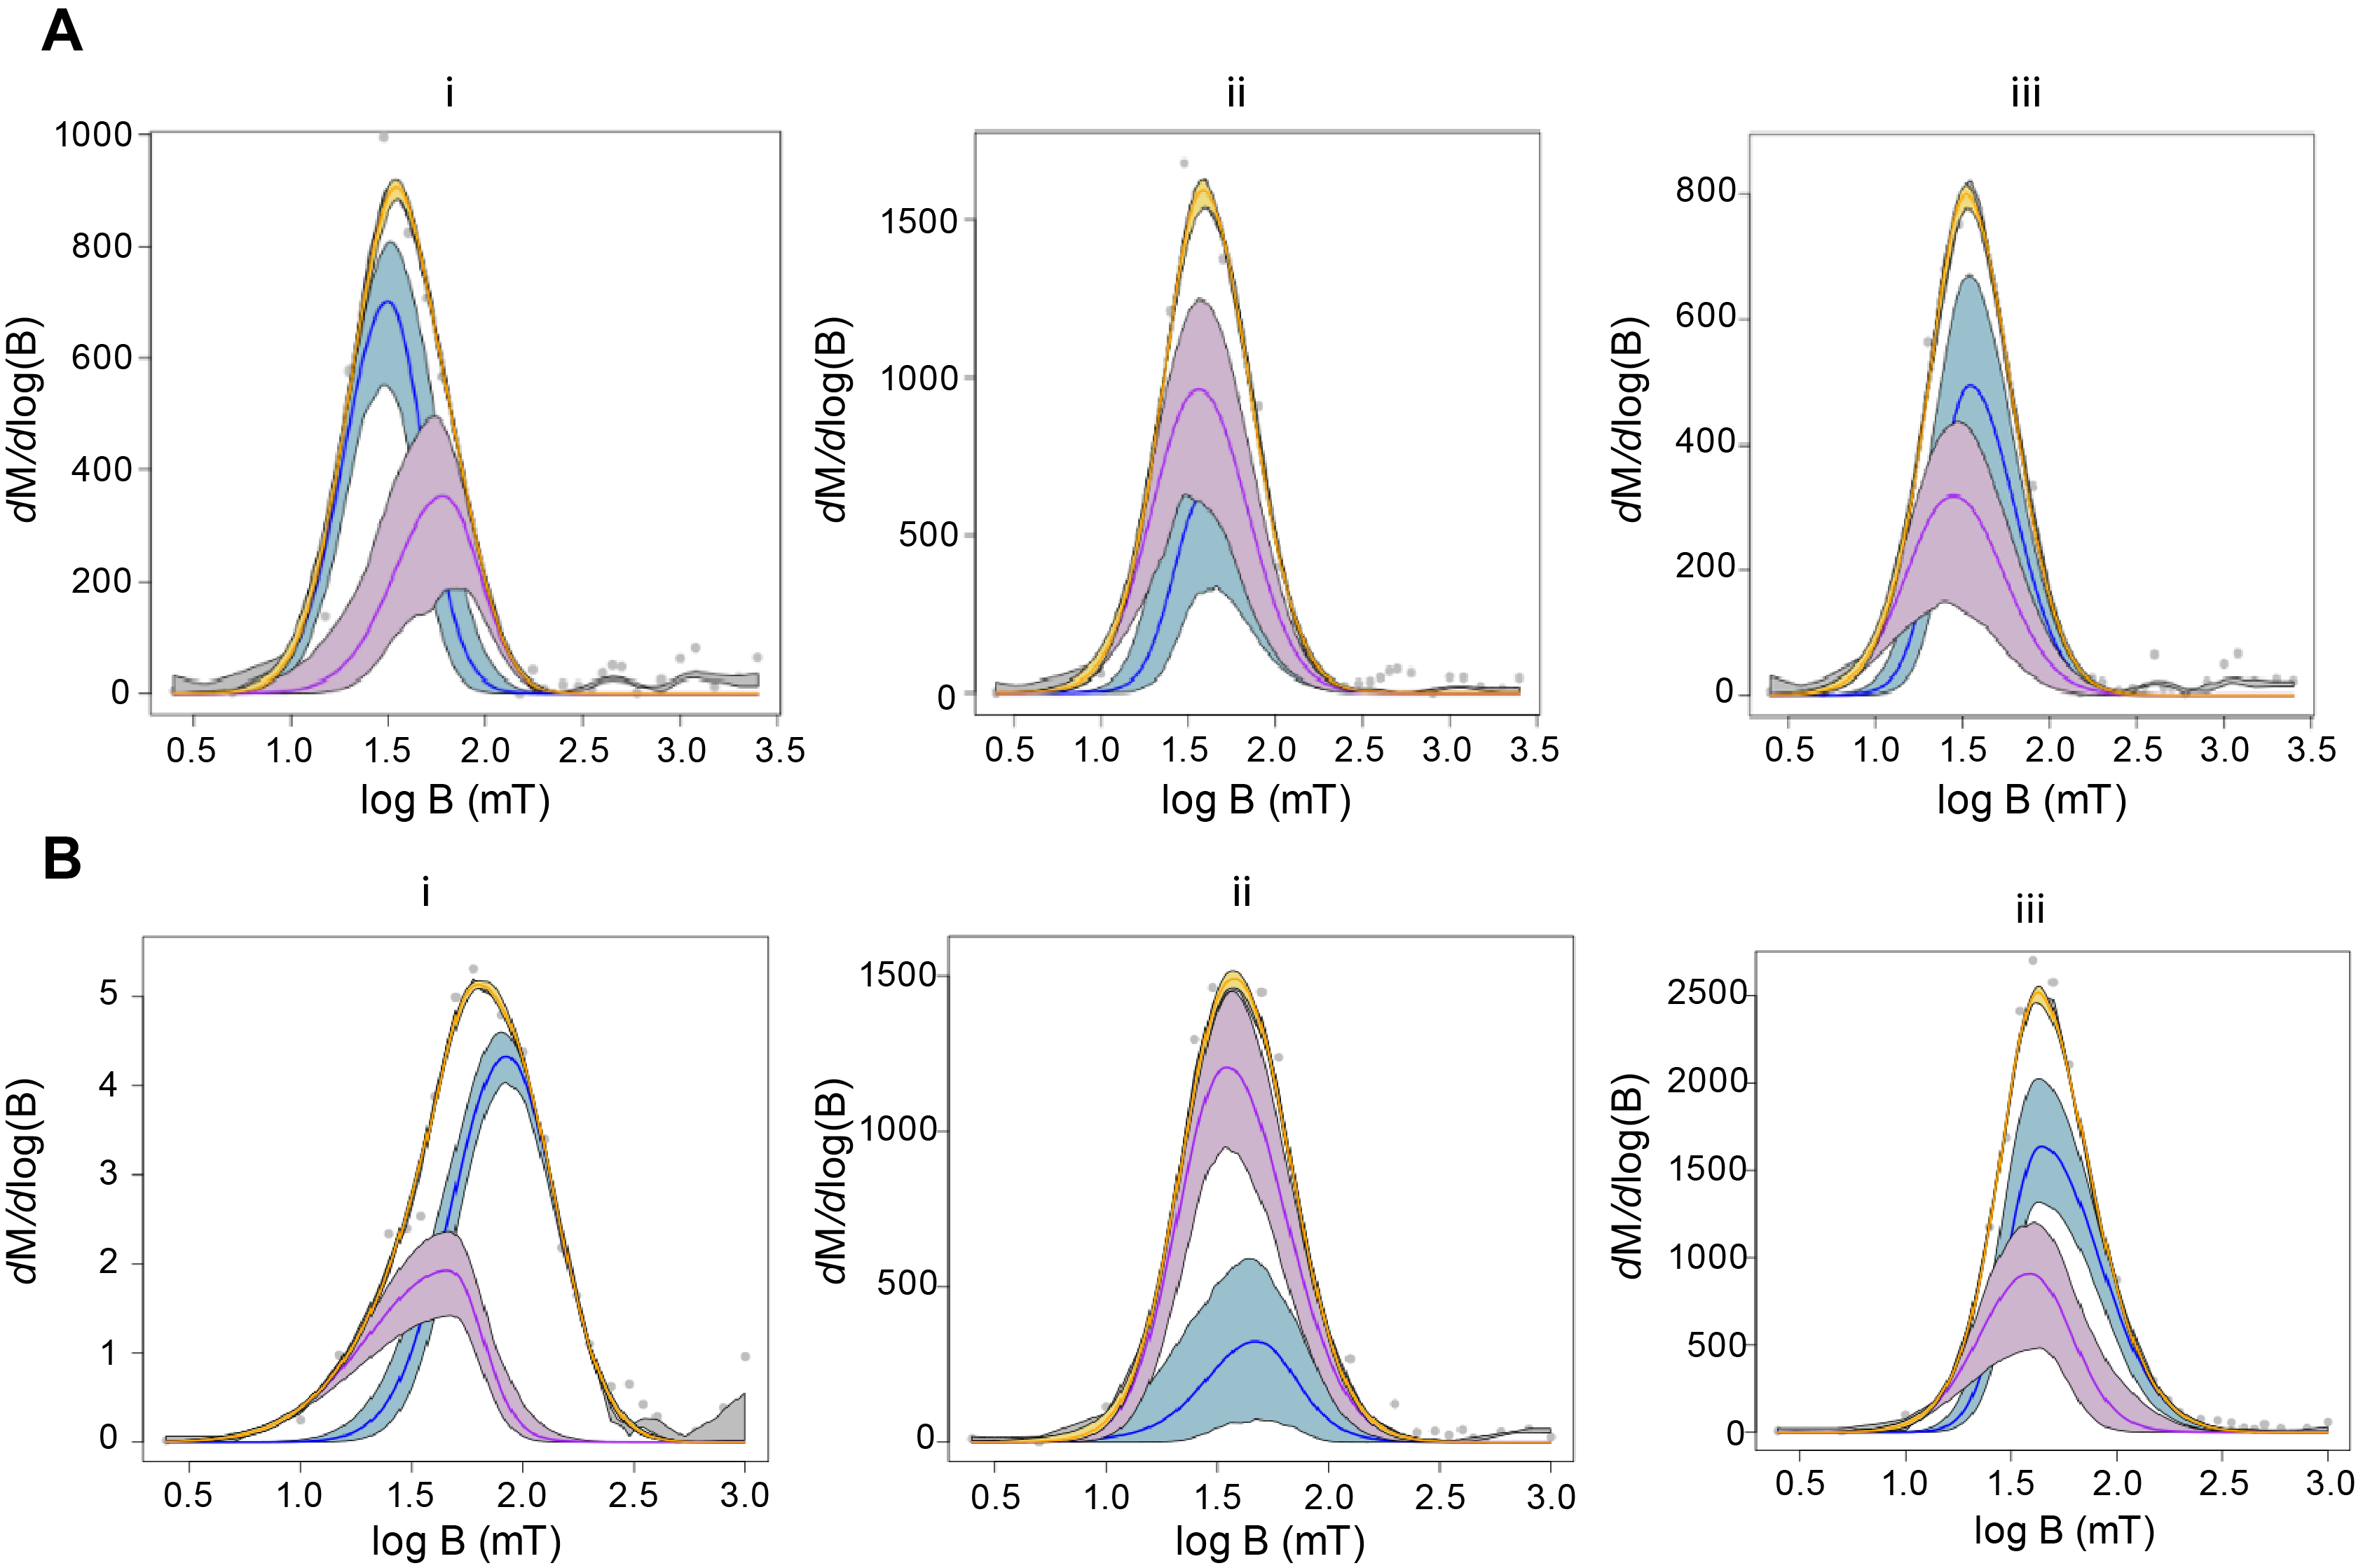
Figure F175. Representative coercivity spectra.
IRM backfield measurements place further constraints on the most coercive magnetic populations (Tables T29, T30). Samples for both holes have characteristic H values that range 20–60 mT, with the distribution skewing more toward lower values (Tables T31, T32). These results provide evidence for predominantly pseudosingle domain-like to multidomain grain populations, with minimal single domain contributions (Egli, 2004).
9.6. Anisotropy of magnetic susceptibility measurements
In total, magnetic anisotropic fabric measurements were carried out on 79 discrete cubes from Hole U1601C, and 24 samples from Hole U1601A were analyzed in the CRF (see Operations) as sample position described for 2D holder rotation. The summary of both scalar and directional data of both sites are presented in Tables T33 and T34, respectively. Rock fabric through magnetic anisotropy is described by the triaxial ellipsoid with principal axes (K1) ≥ (K2) ≥ (K3) referring to maximum (Kmax), intermediate (Kint), and minimum (Kmin) susceptibility axes, respectively (Borradaile, 1991; Tarling and Hrouda, 1993). The different anisotropy of magnetic susceptibility (AMS) parameters were considered to understand the depth-wise magnetic petrofabric behavior. The main parameters used in present study are mean magnetic susceptibility (Km) = (Kmax + Kint + Kmin)/3, and the ratio of Kmax/Kint and Kint/Kmin, inferring the degrees of linear and planar magnetic fabric, respectively. The proportionate components of Kmax/Kint and Kint/Kmin are popularly referred to as degree of magnetic lineation (L) and foliation (F), respectively. Additional parameters that were considered include the corrected anisotropy degree (Pj) and shape parameter (T), which were derived from the different relationship of the Km, Kmax, Kint, and Kmin (Hrouda, 1982; Jelinek, 1981). The parameter Pj is useful in identifying ellipsoidal eccentricity for directional alignments while the parameter T reflects the shape of the anisotropy ellipsoids ranging from −1 to +1, or prolate to oblate shapes, respectively. The site-wise observations of this analysis are discussed below.
9.6.1. Hole U1601A results
A total of 24 standard size cube samples were measured from Hole U1601A covering the depth range 12–94 mbsf (Table T33). Equal-area projection of susceptibility axes and subsequent contour plots indicated that the Kmin axes are grouped subvertically at a high angle (>65°), whereas Kmax and Kint axes are mostly scattered around the girdle (Figure F176A–F176C). The average magnetic susceptibility value of measured samples (n = 24) is 2.96 × 10⁻² SI, maximum susceptibility is noted as 5.69 × 10⁻¹ SI, and the minimum Km value is 2.03 × 10⁻⁴ SI. The majority of samples (n = 18) show consistent Km values between 2 and 4 × 10⁻¹ SI (Figure F176D). Only two samples (Cubes 12248381 and 12248711) have shape parameter (T) values with negative T < 0 (Table T33), and the rest of the samples have T > 1, falling into the oblate field. The shape parameter values T > 1 (n = 22) clearly indicates the predominance of planar fabrics; the same is evident when the ratios Kmax/Kint and Kint/Kmin are plotted in a Flinn-type diagram (Figure F177A, F177B). A similar downhole pattern was observed for magnetic foliation and lineation (Figure F178B, F178C). Throughout the hole, only planar ellipsoid fabrics were observed (Figure F178E). Most susceptibility tensors displayed minimal anisotropy, with the corrected degree of anisotropy (Pj) reaching a maximum value of 1.29. The Pj value decreases slightly downhole, and Km remains consistent (Figure F178A, F178D).
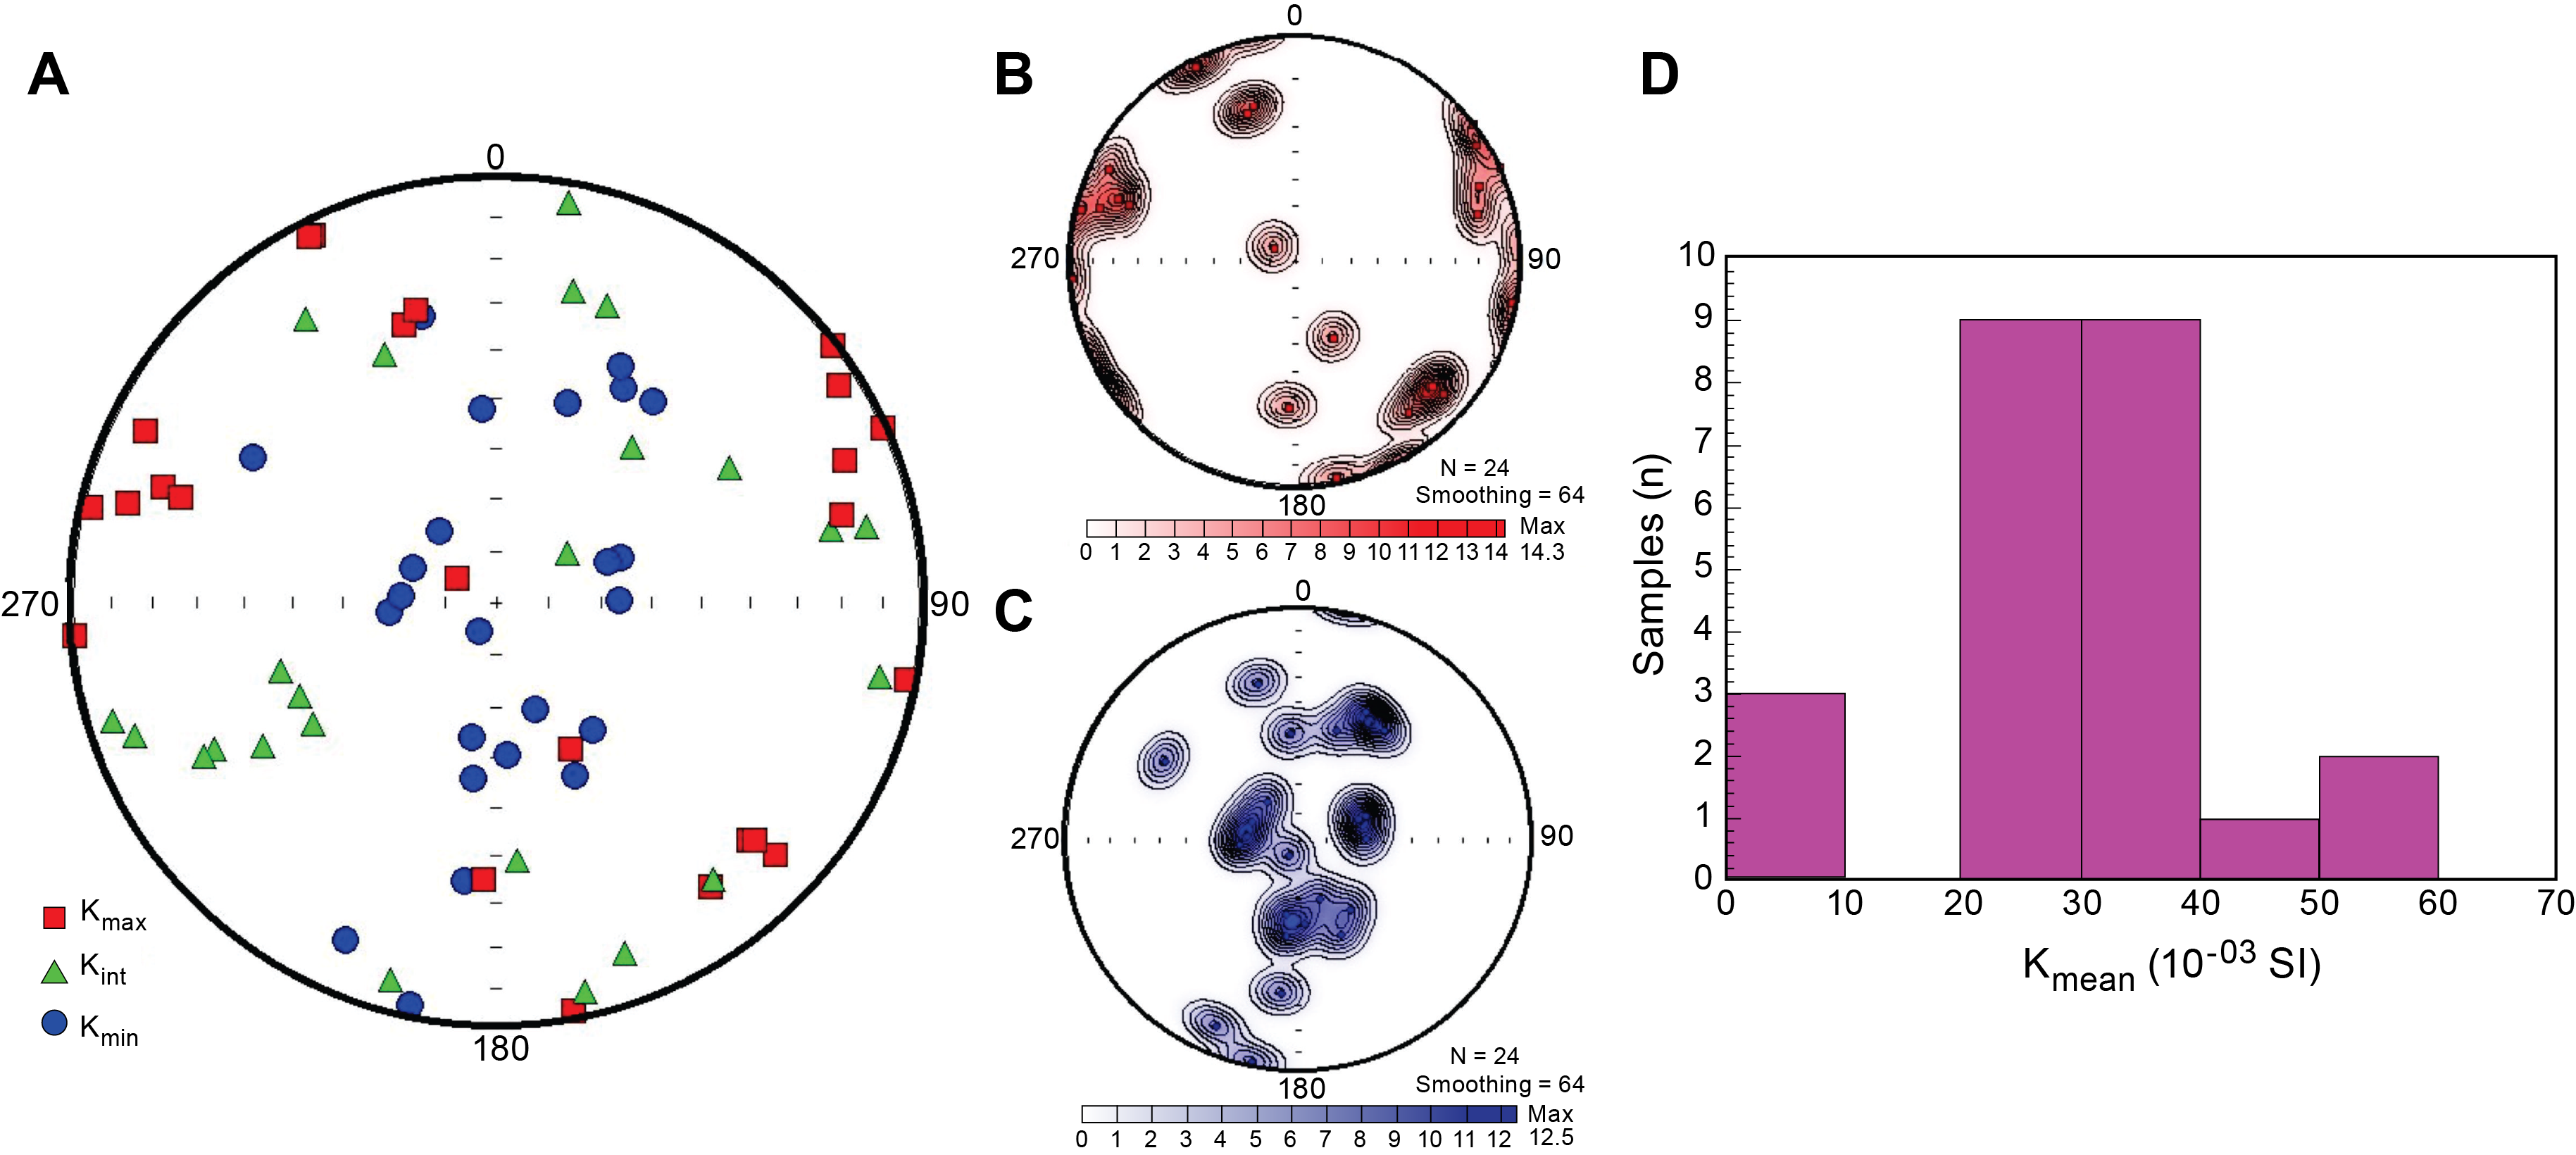
Figure F176. Susceptibility axes, Hole U1601A.
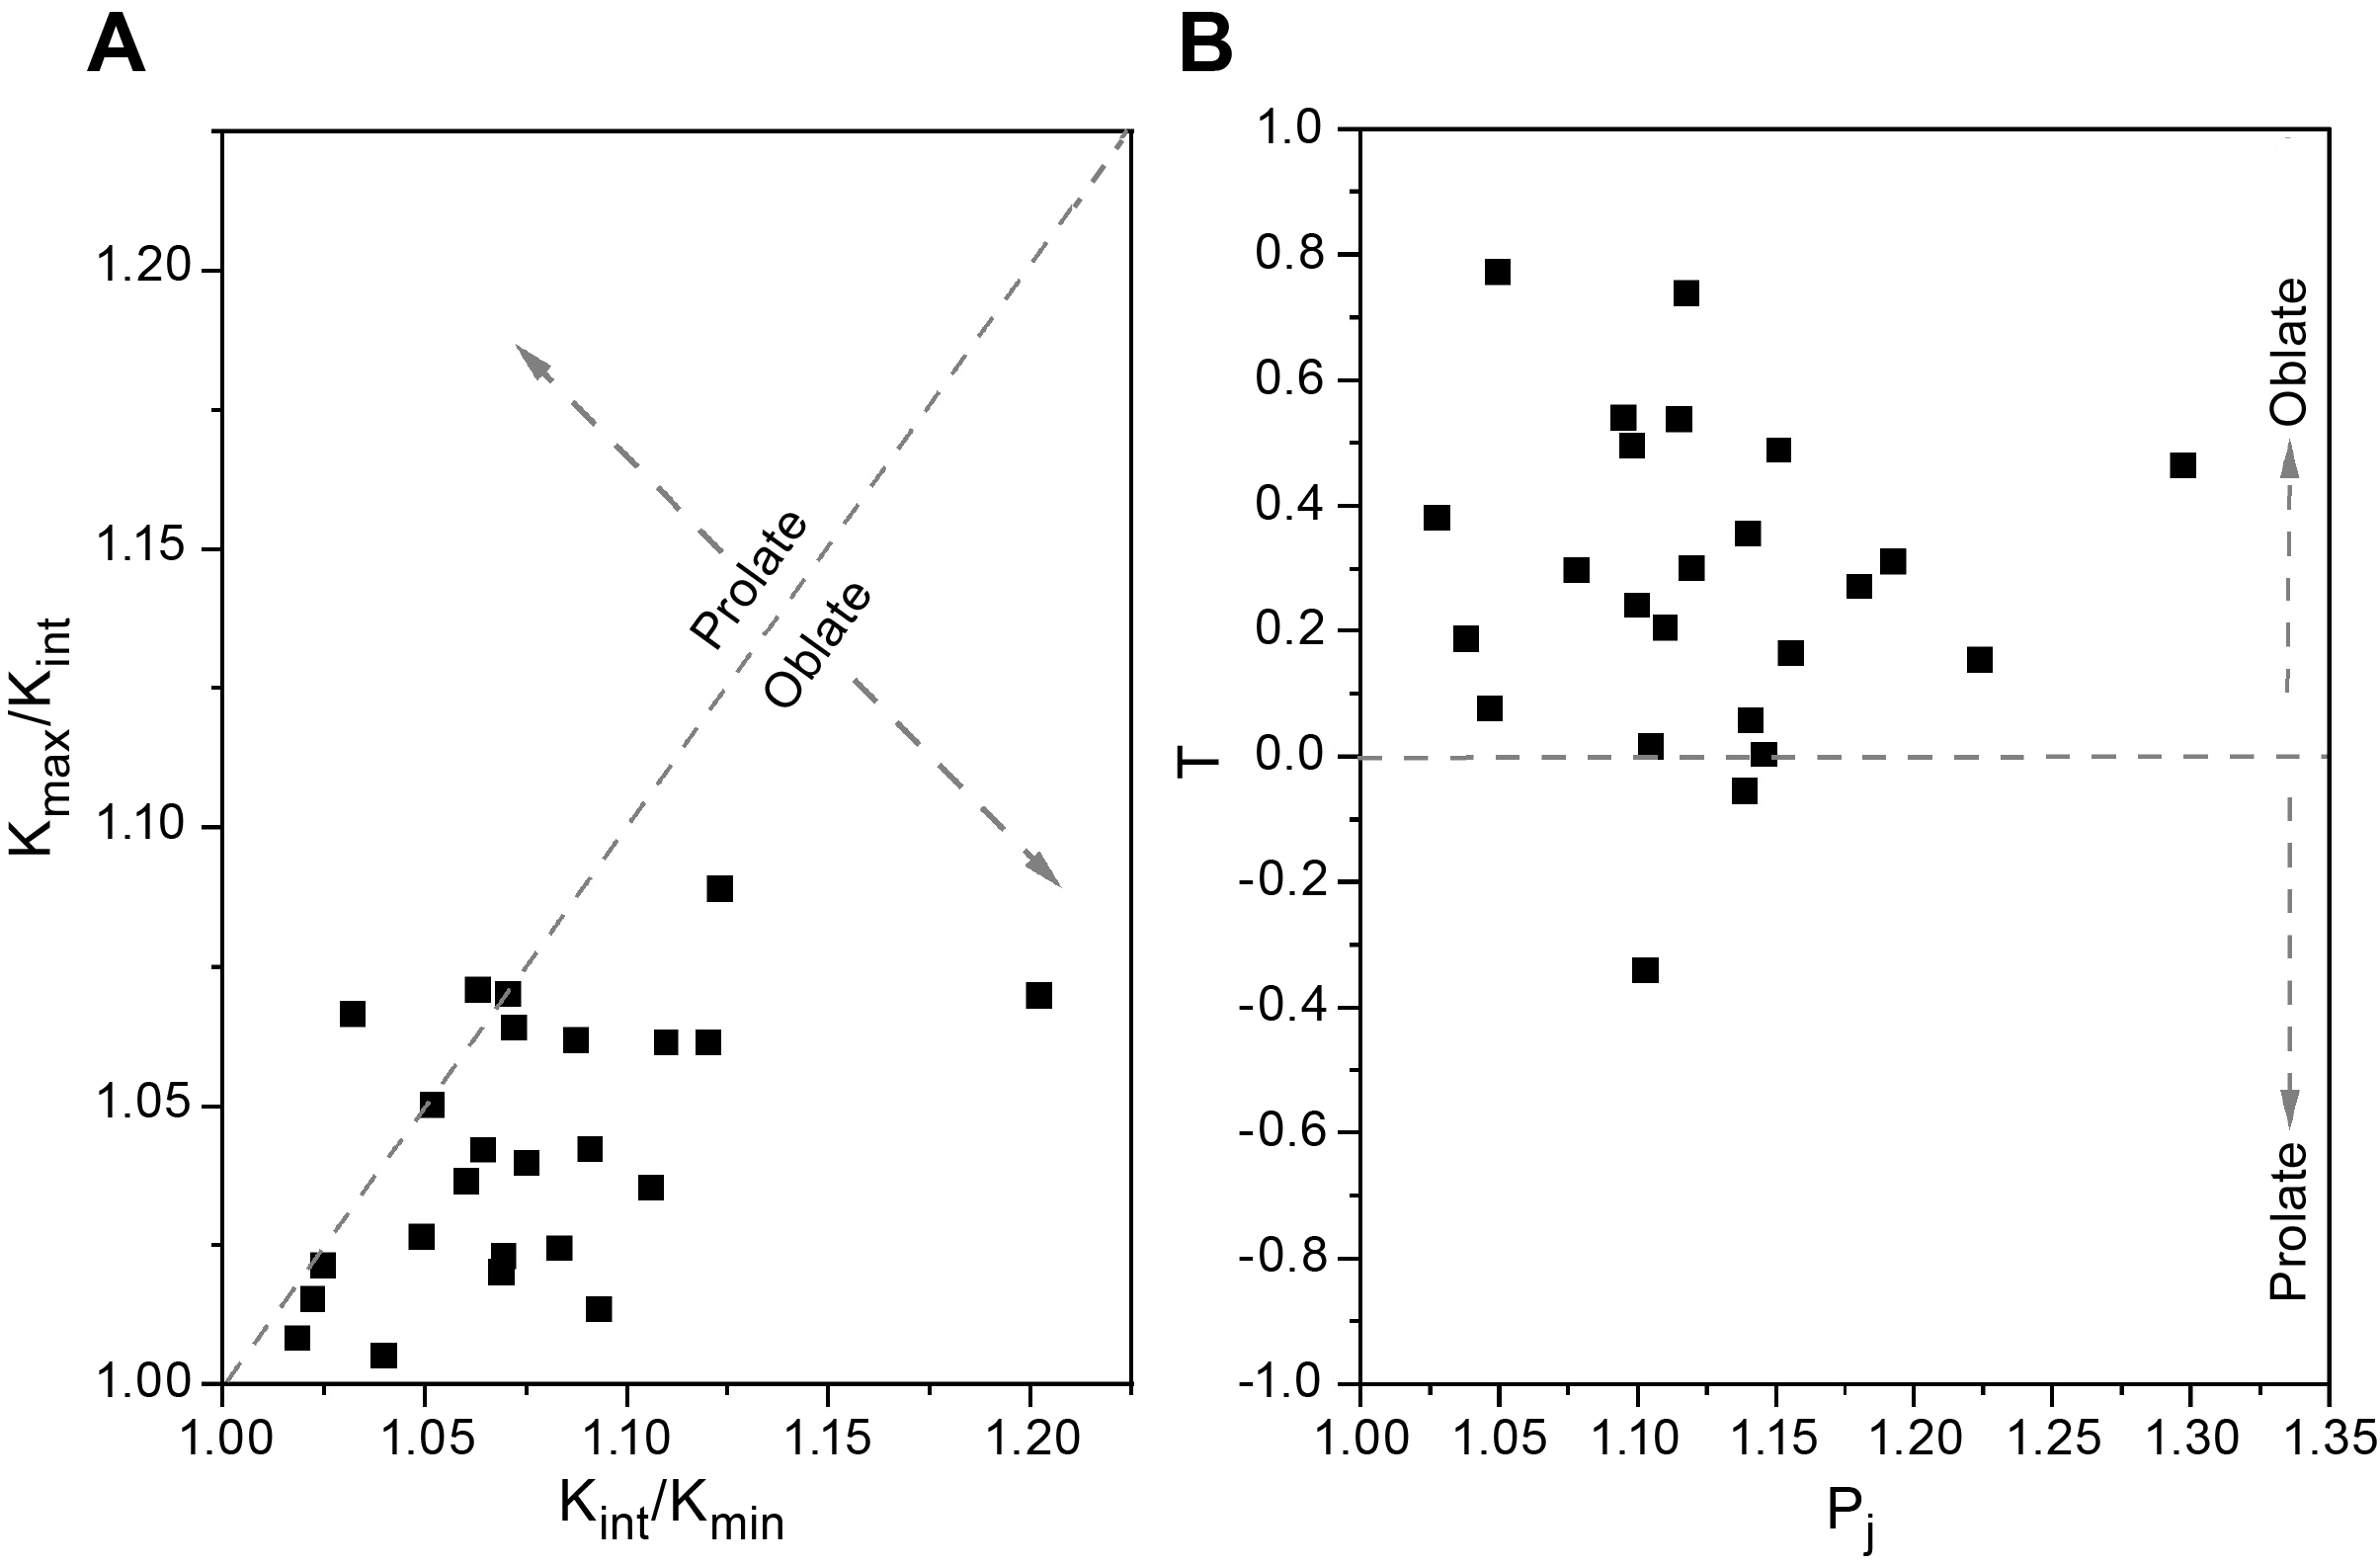
Figure F177. Kmax/Kint vs. Kint/Kmin, Hole U1601A.
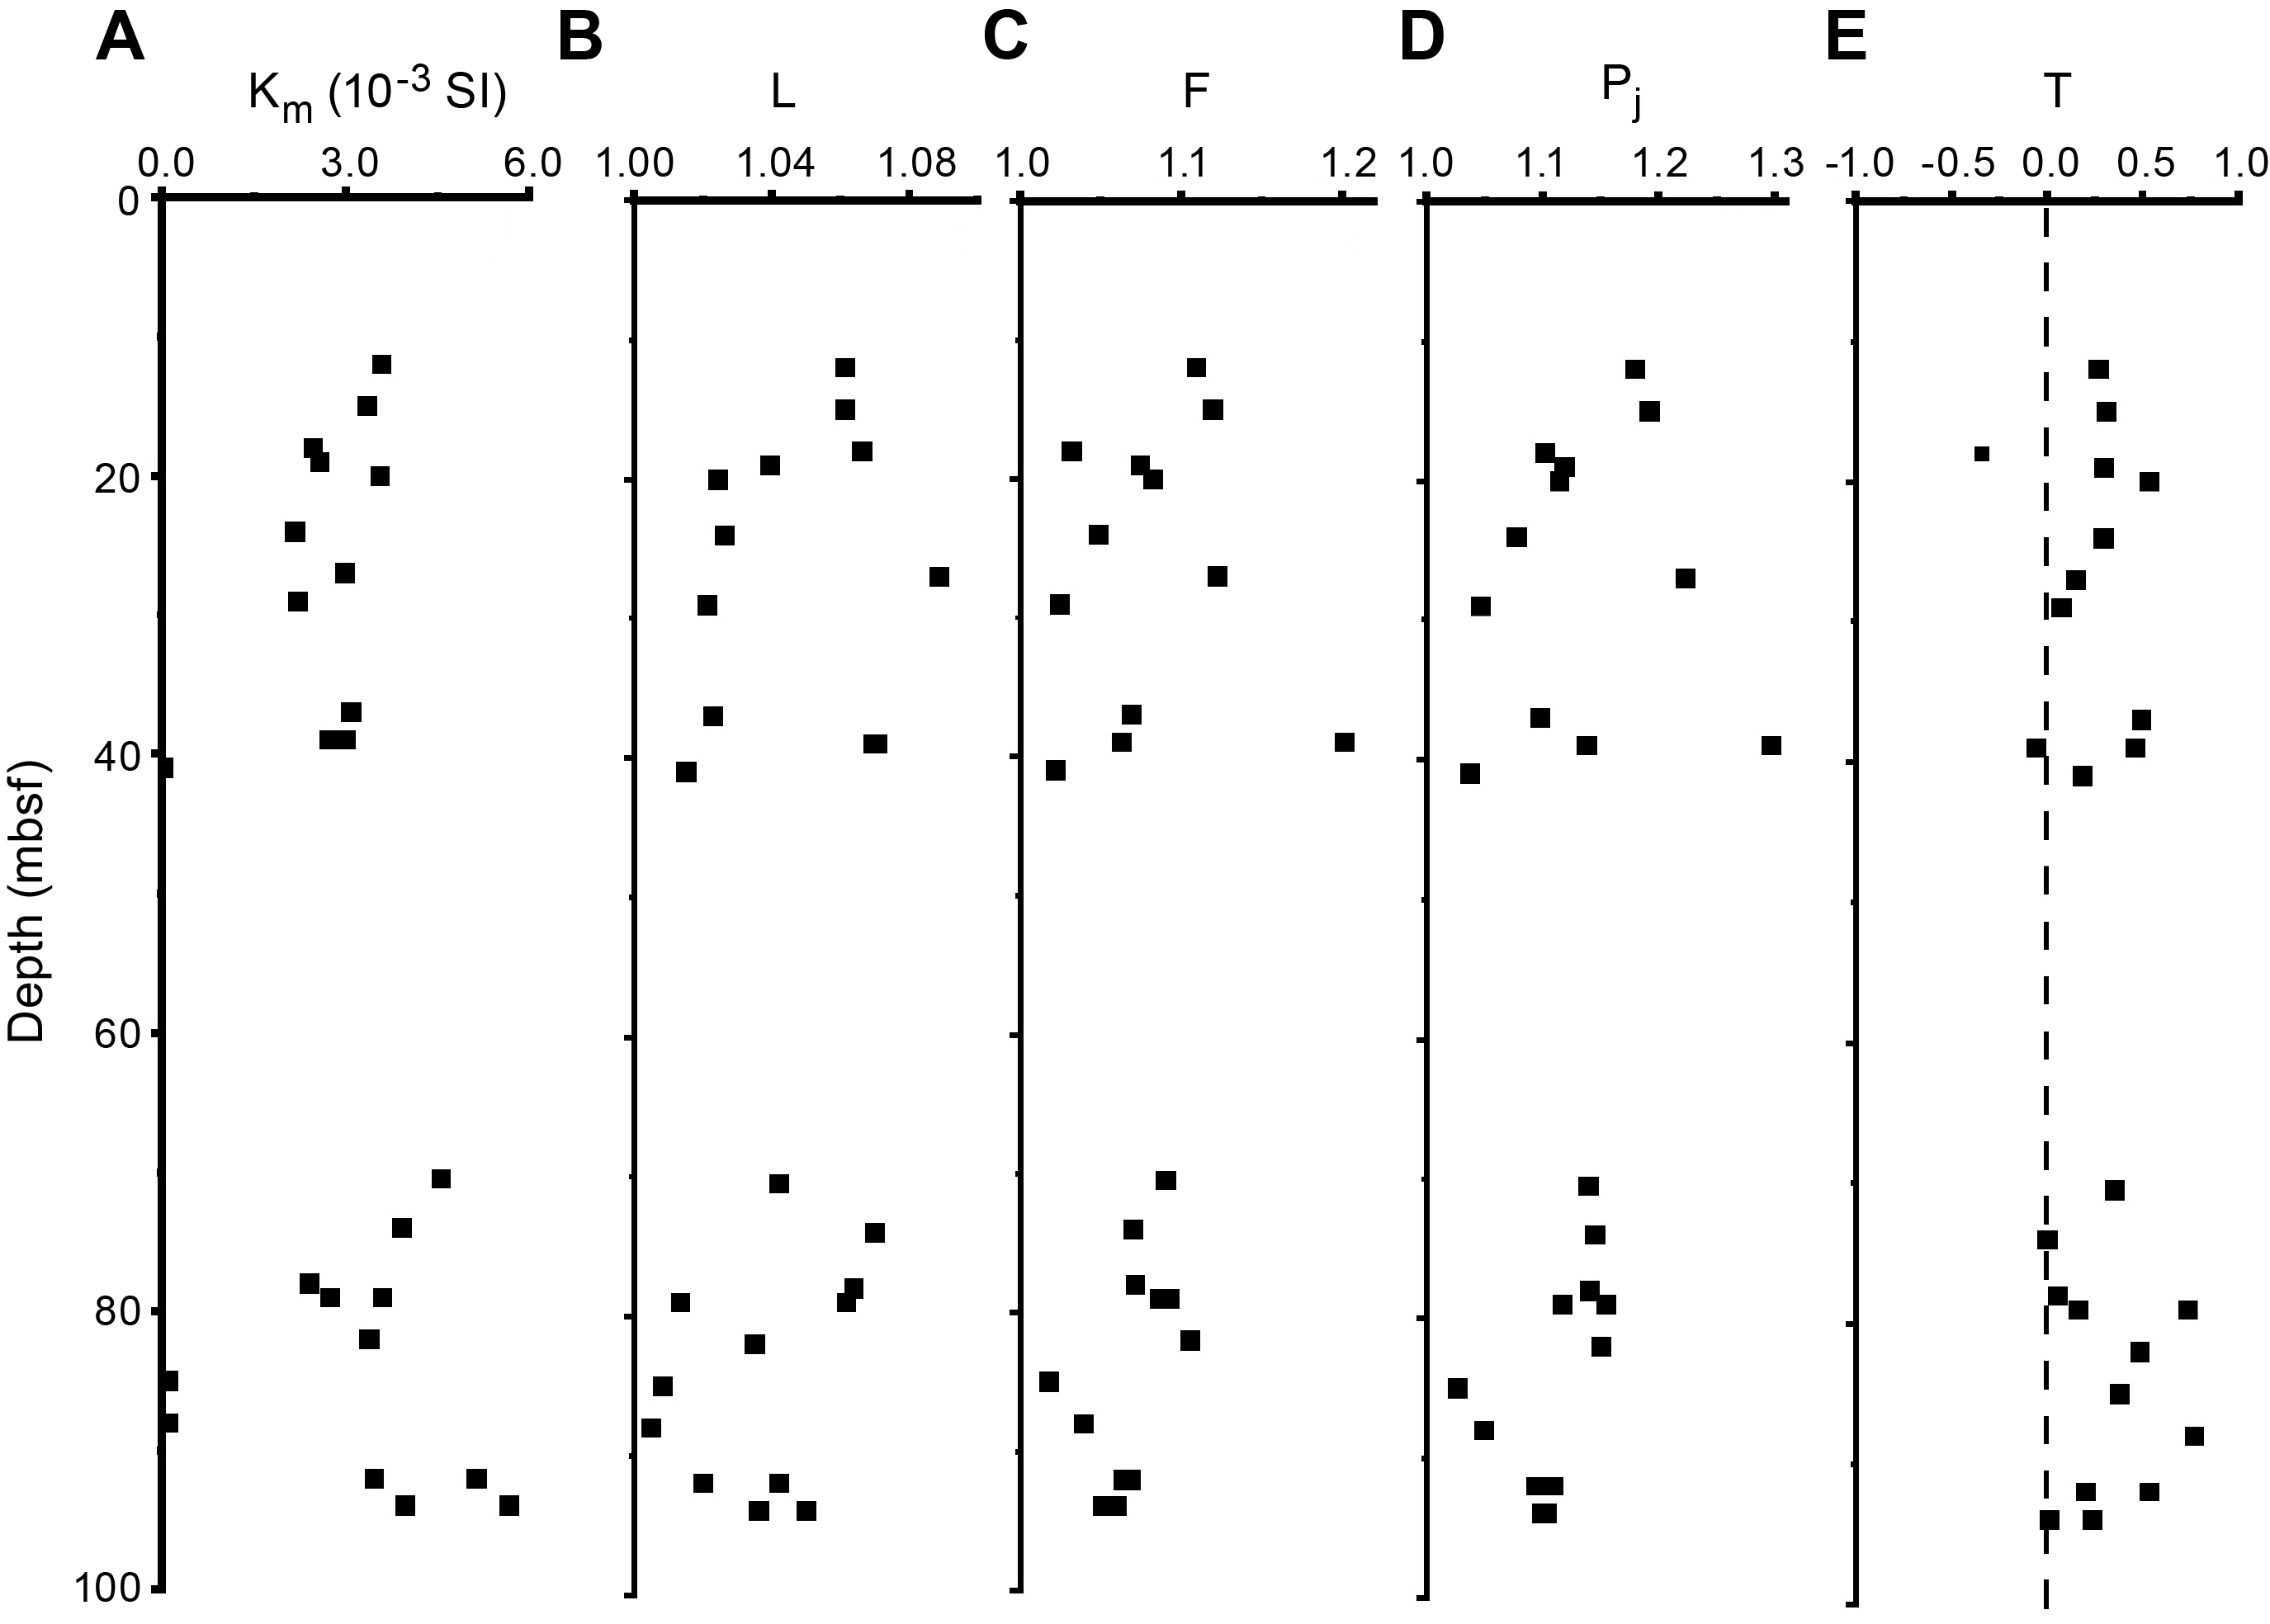
Figure F178. Downhole AMS parameters, Hole U1601A.
9.6.2. Hole U1601C results
The average magnetic susceptibility value of measured samples from Hole U1601C is 4.49 × 10⁻² SI (maximum = 3.67 × 10⁻¹ SI; minimum = 2.48 × 10⁻⁴ SI) (Table T34). The average Km value is almost 170% higher than the average value obtained from Hole U1309D (i.e., 3.378 × 10⁻³ SI versus 4.49 × 10⁻² SI). Because of paucity of discrete sampling, AMS measurements were not conducted at regular intervals for the depth range of 190–640 mbsf (Figure F179A–F179E). However, the available data indicate that throughout the hole, the majority of the samples (~n = 46) have a consistent magnetic susceptibility range close to average values of 3.67 × 10⁻¹ to 1.26 × 10⁻² SI. The AMS data from 23 to 190 mbsf (n = 21) and from 648 to 1059 mbsf (n = 52) do not exhibit much variability, excluding two anisotropic samples (Figure F179A–F179E). The magnetic foliation (F) values are higher than the magnetic lineation (L) values. The average F value is 1.128 ± 0.119 (n = 78), and the average L value is 1.05 ± 0.046 (n = 78). The slight dominance of foliation is clearly evident by the shape parameter (T) of the AMS ellipsoids which is predominately oblate type within the measured depth range (Figures F179E, F180). The development of the planar fabric down the hole between ~650 and 1000 mbsf could suggest increasing compaction downhole. Overall, AMS ellipsoids are mostly of the oblate/planar type with 54 samples possessing a T value greater than 0 (range = 0.906–0.061), whereas a moderate prolate (linear) ellipsoid shape is recorded in approximately one-third of samples (−0.669 to −0.001; n = 24). The Flinn (Figure F180A) and Jelinek (Figure F180B) plots show a fair number of specimens clustered near the neutral line, indicating an equal development of triaxial shape ellipsoid. The dominance of the planar fabric was observed in the shallow depth to 189 mbsf. Further down, however, linear data measurements indicate a potential region of deformation (Figure F179E). Most susceptibility tensors are moderately anisotropic, as the corrected degree of anisotropy (Pj) is 1.46. However, it is worth noting that some samples displayed higher Pj values of up to 2.219 (Figure F180B). The high values of L, F, T, and Pj were noted in a narrow zone of 654–658 mbsf (Figure F179E). A larger, comprehensive sampling size could highlight the downhole variation of magnetic fabric and their deformational signature.
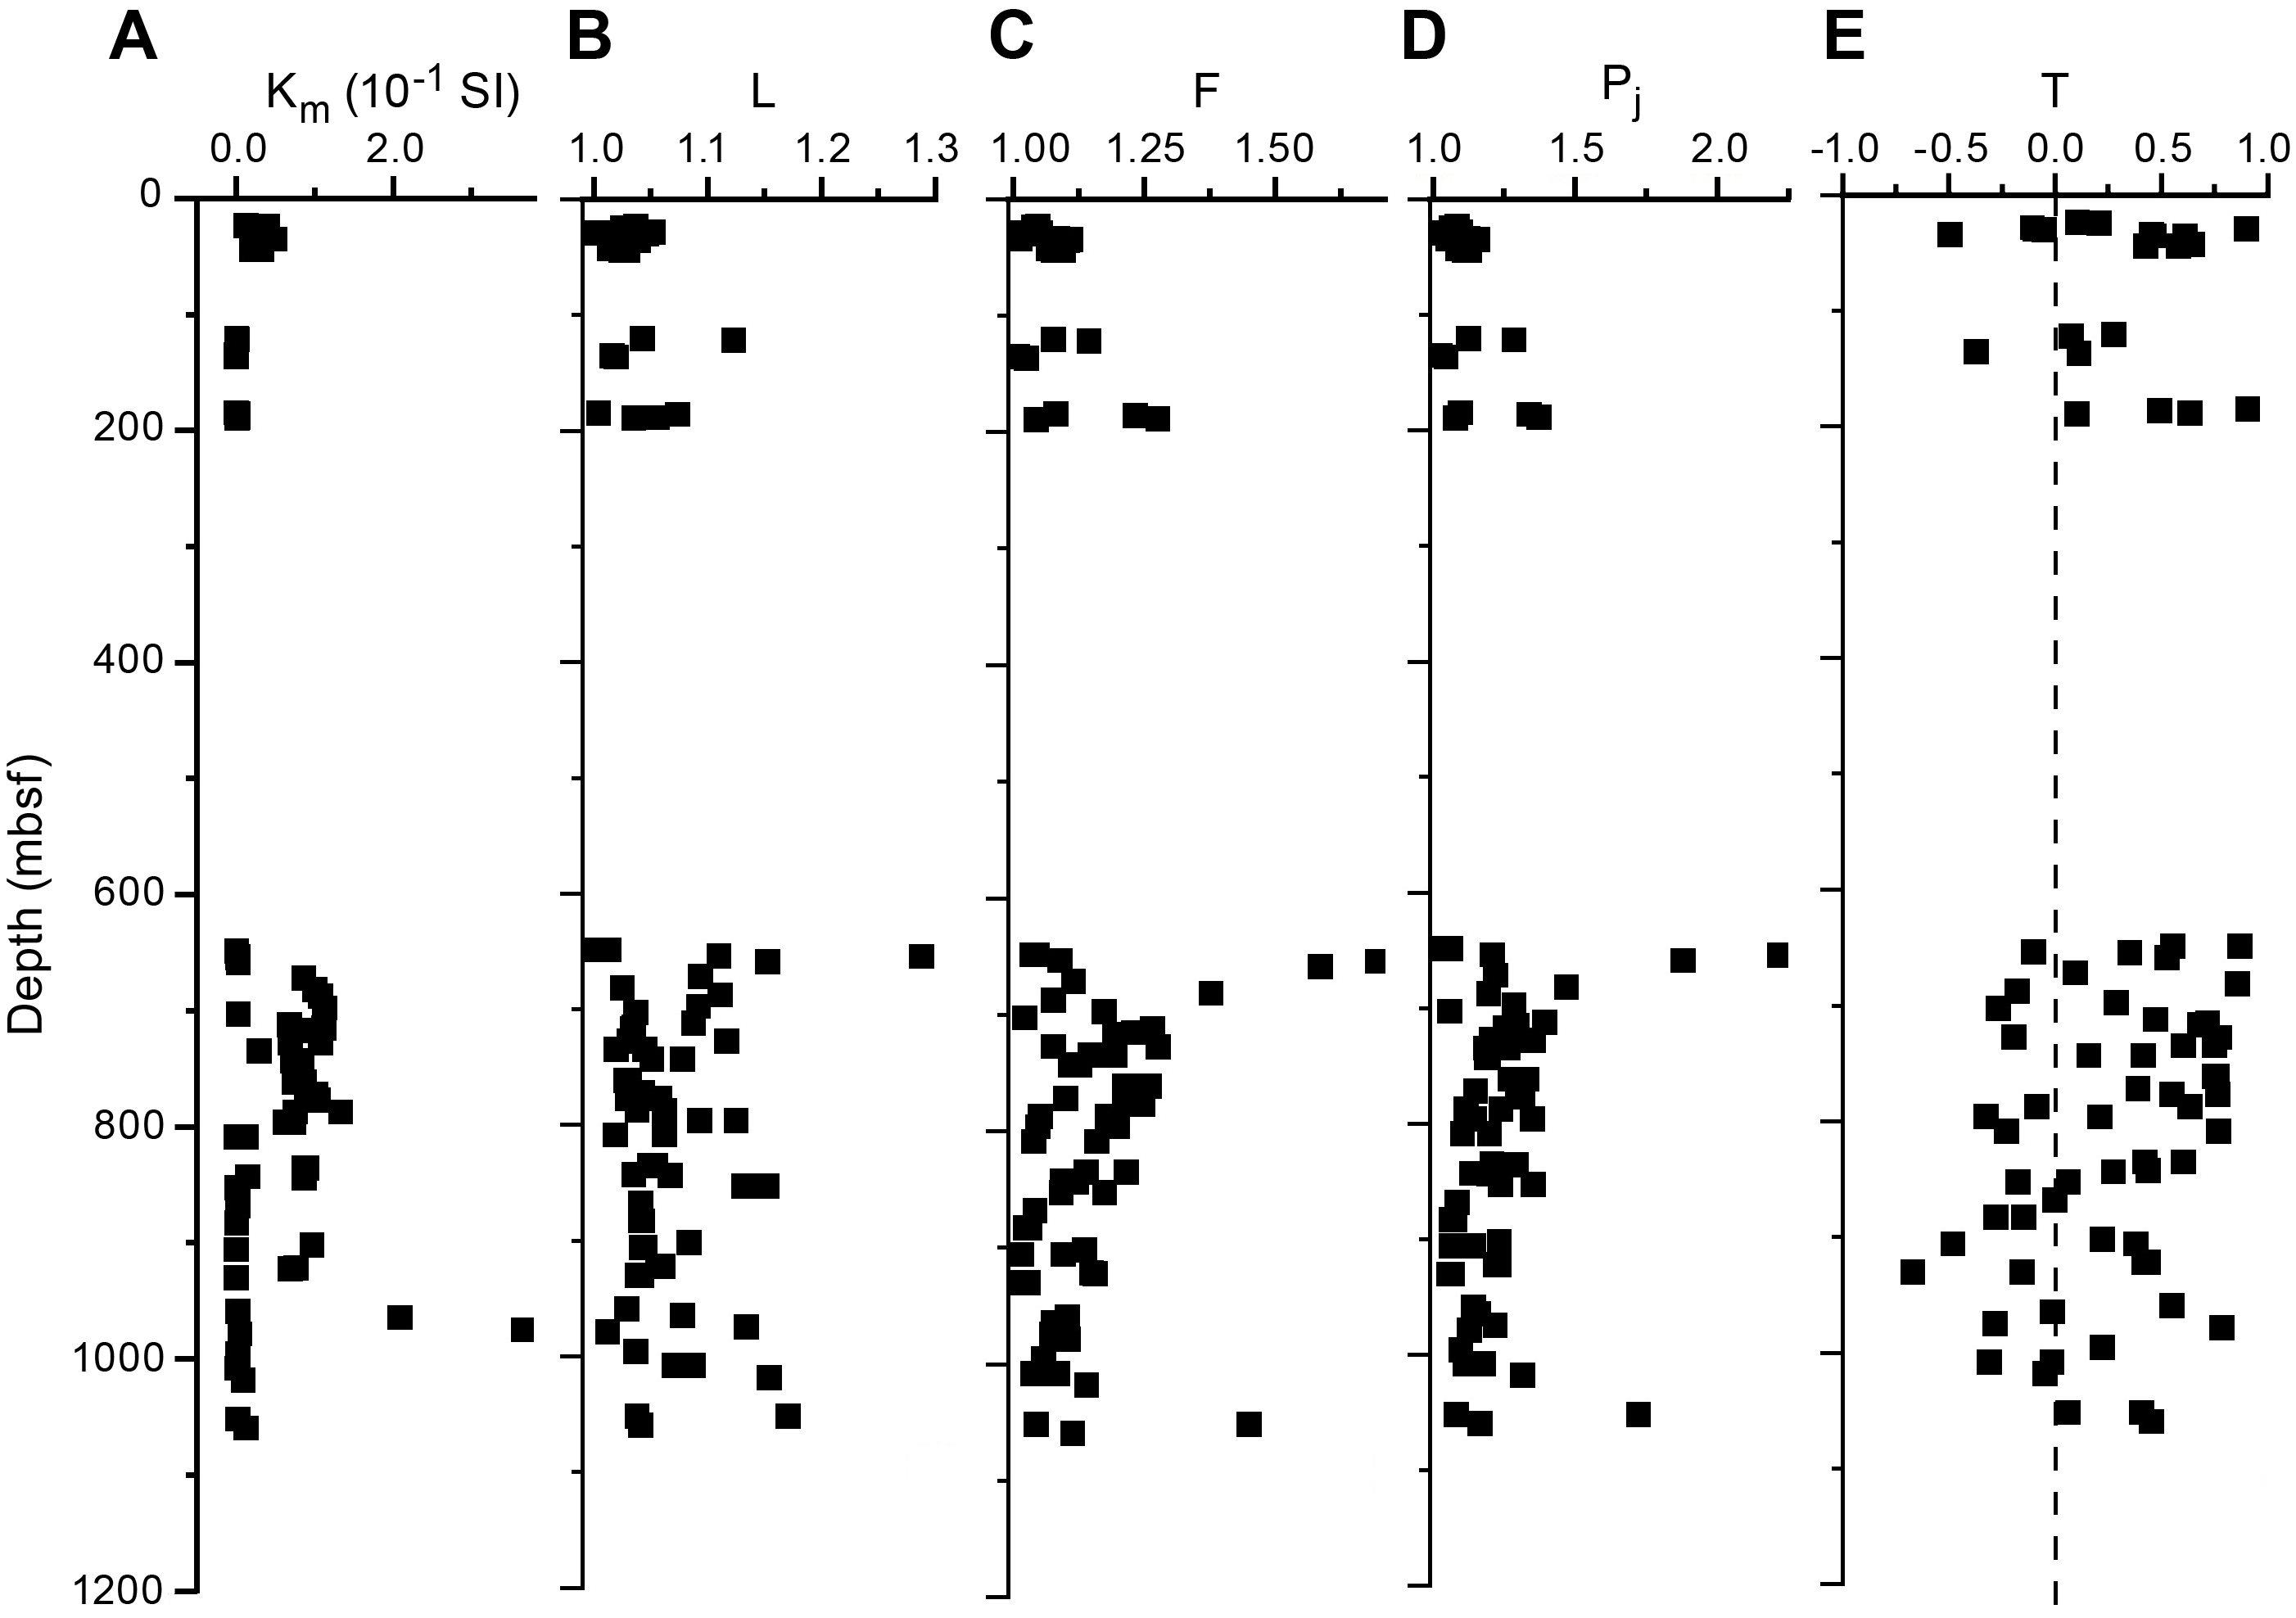
Figure F179. Downhole AMS parameters, Hole U1601C.
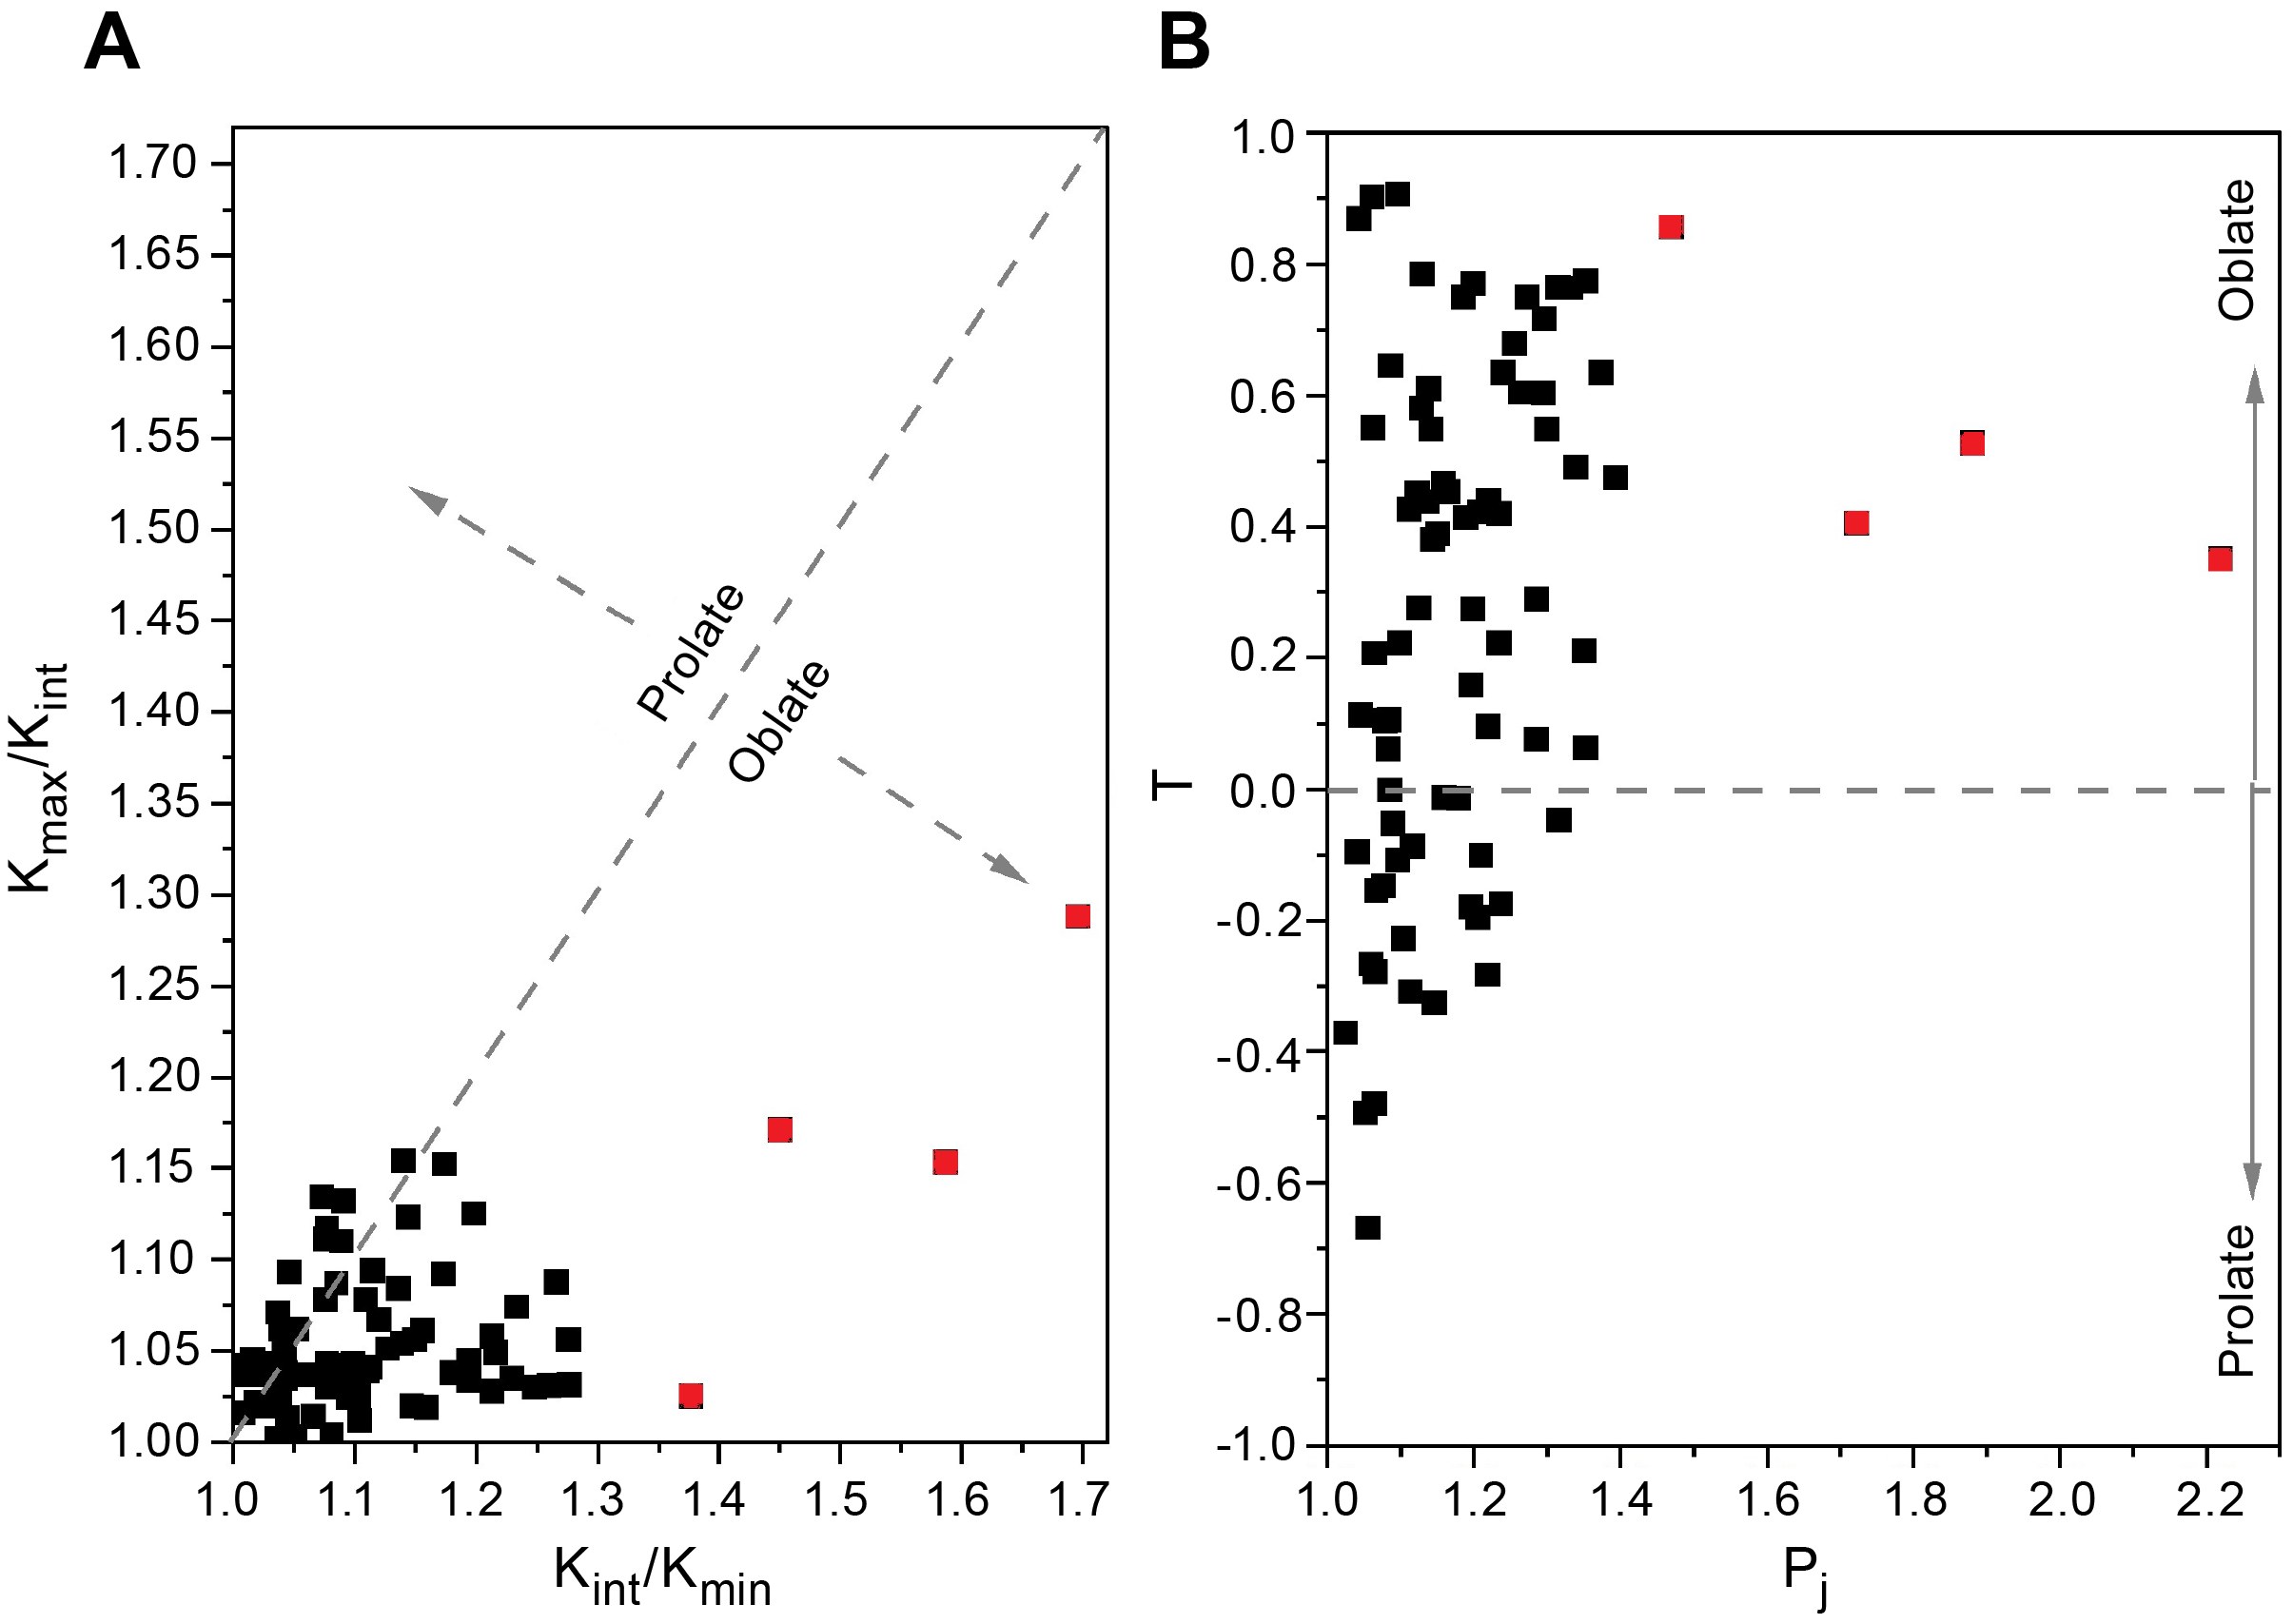
Figure F180. Kmax/Kint vs. Kint/Kmin, Hole U1601C.
The principal AMS axes were plotted on a lower hemisphere equal-area projection (Figure F181). The Kmax axis is broadly girdle distributed in a horizontal plane, and the Kint axes are randomly scattered. In contrast, the Kmin axes were grouped subvertically (Figure F181A). Contour plots for Kmax and Kint susceptibility axes were plotted with the Anisoft 5.2.02 software (Figure F181B, F181C). These plots suggest that the Kmin lies vertically and the Kmax is randomly distributed on the horizontal plane. This principal susceptibility axis distribution pattern is consistent with Holes U1309D and U1601A.
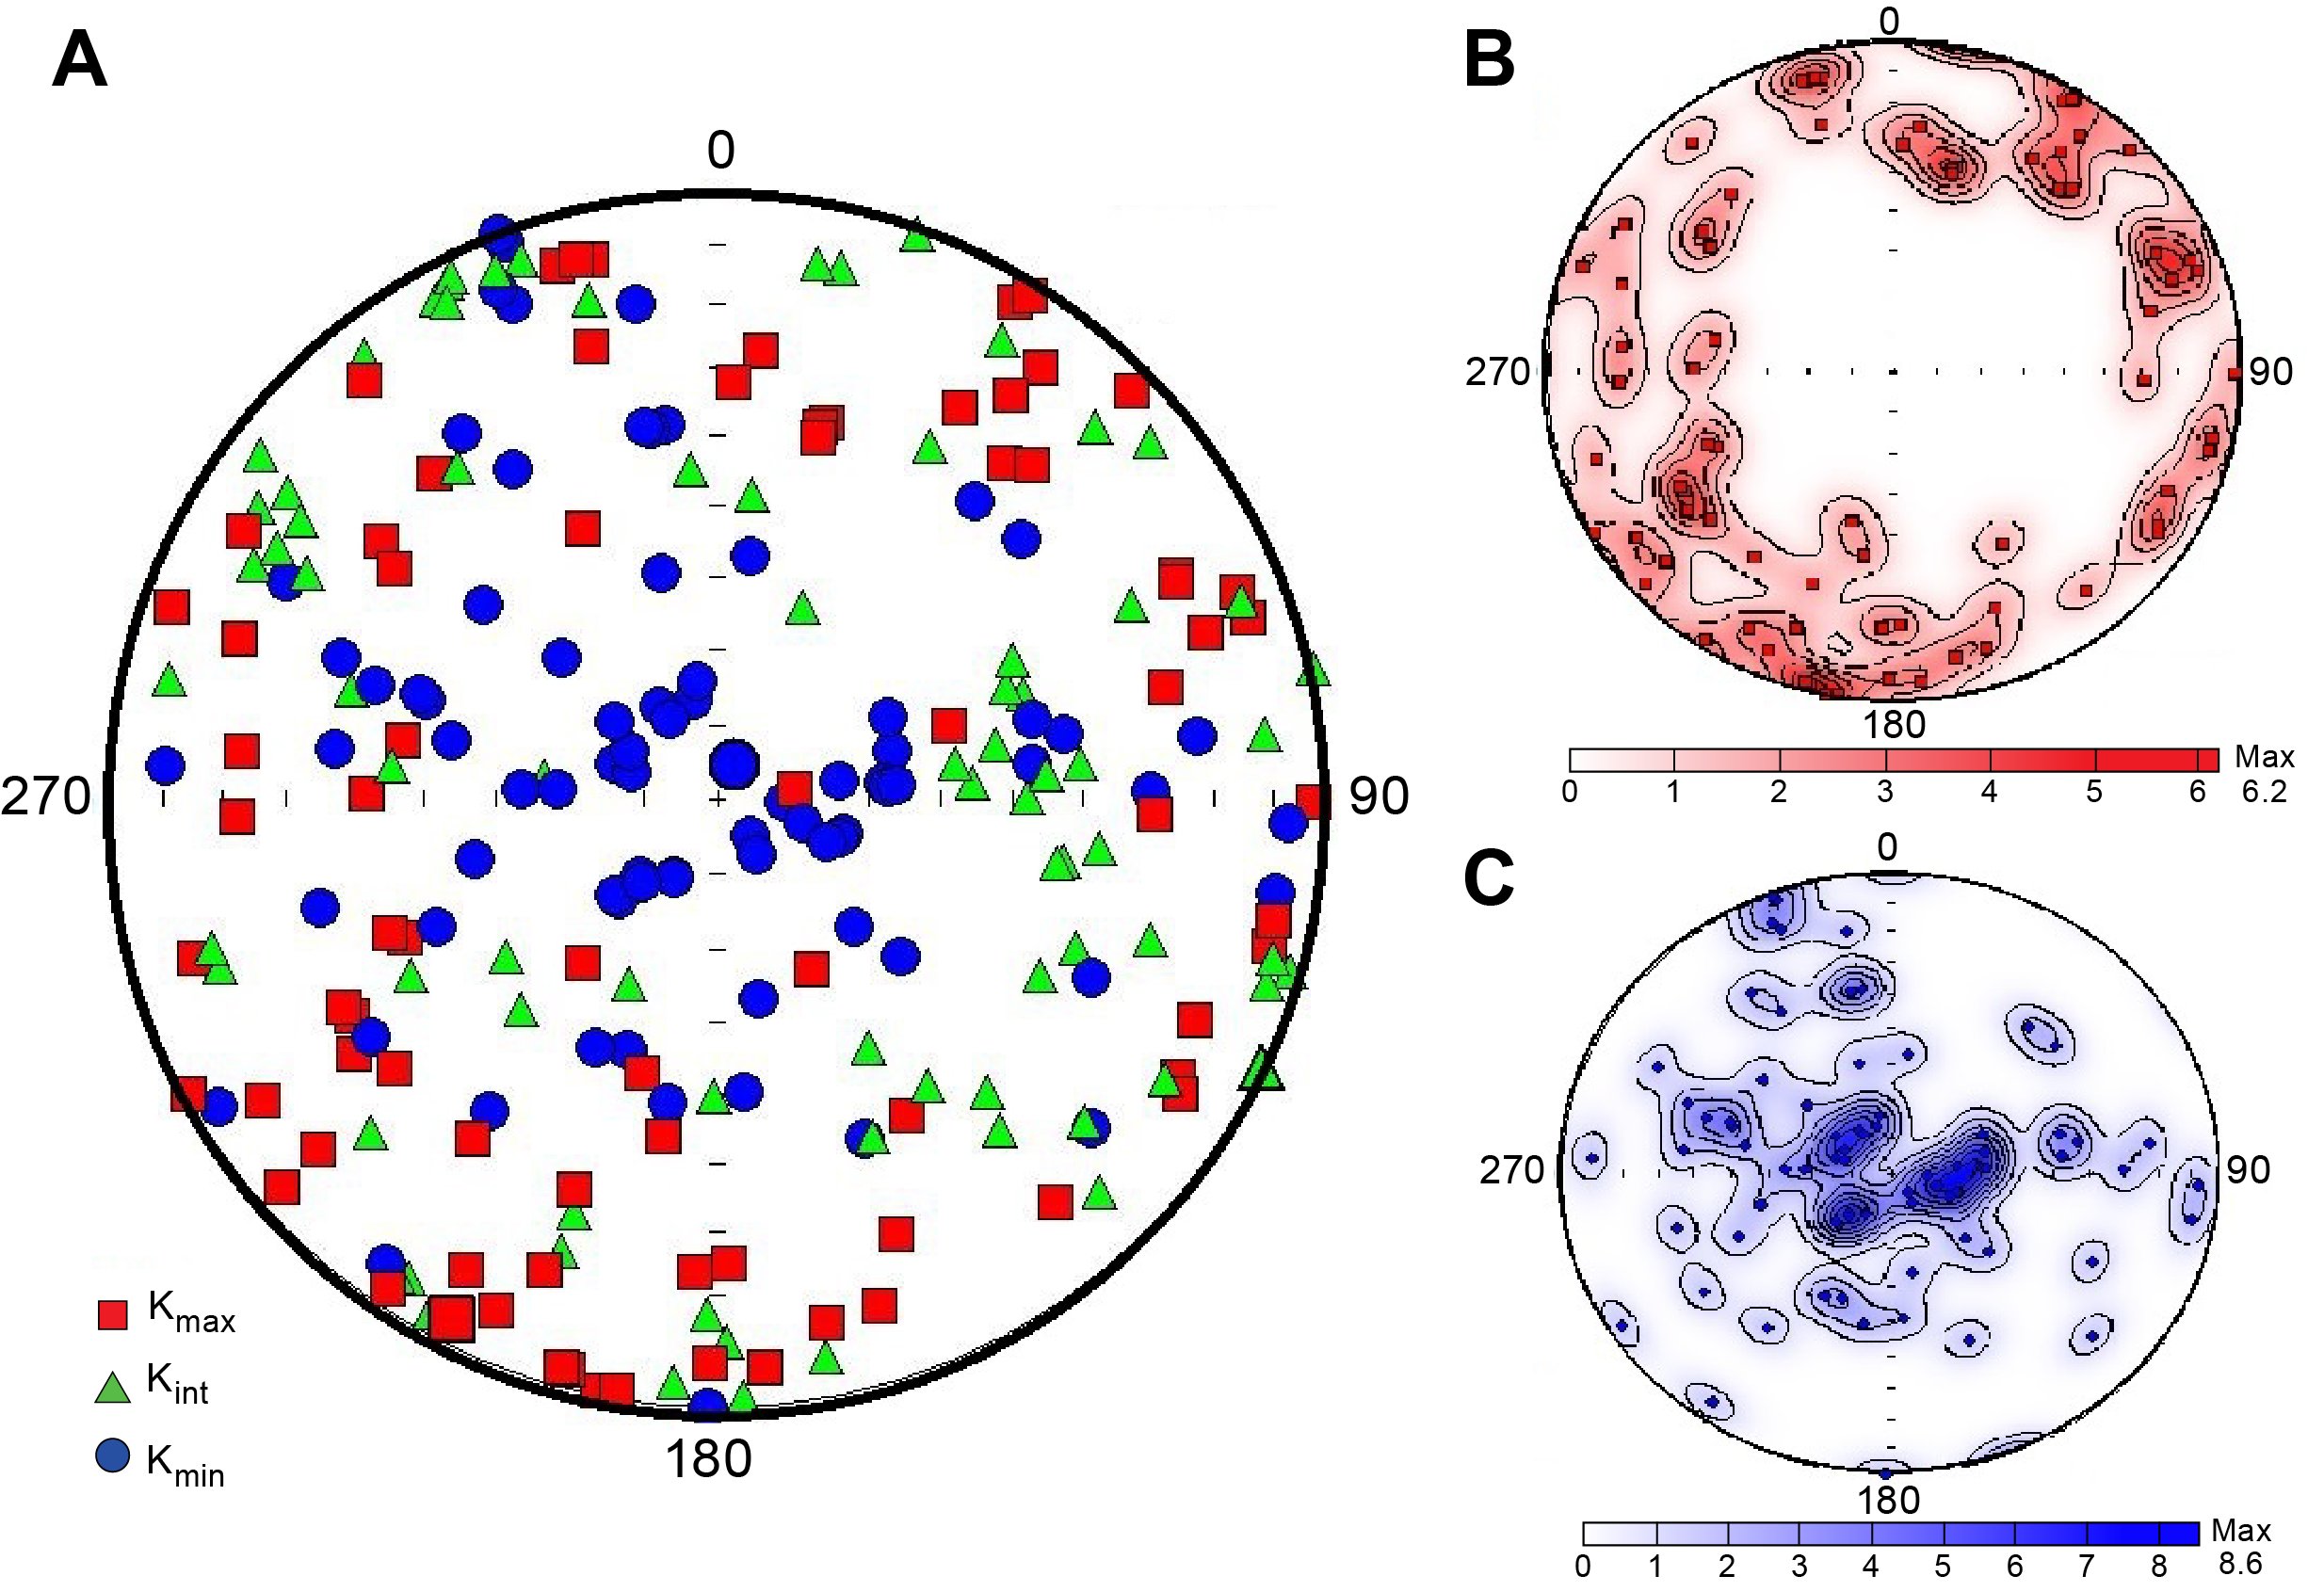
Figure F181. Susceptibility axes, Hole U1601C.
References
Abe, N., 2011. Petrology of podiform chromitite from the ocean floor at the 15°20'N FZ in the MAR, Site 1271, ODP Leg 209. Journal of Mineralogical and Petrological Sciences, 106(2):97–102. https://doi.org/10.2465/jmps.101022
Allen, D.E., and Seyfried, W.E., 2003. Compositional controls on vent fluids from ultramafic-hosted hydrothermal systems at mid-ocean ridges: an experimental study at 400°C, 500 bars. Geochimica et Cosmochimica Acta, 67(8):1531–1542. https://doi.org/10.1016/S0016-7037(02)01173-0
Alt, J.C., Schwarzenbach, E.M., Früh-Green, G.L., Shanks, W.C., Bernasconi, S.M., Garrido, C.J., Crispini, L., Gaggero, L., Padrón-Navarta, J.A., and Marchesi, C., 2013. The role of serpentinites in cycling of carbon and sulfur: seafloor serpentinization and subduction metamorphism. Lithos, 178:40–54. https://doi.org/10.1016/j.lithos.2012.12.006
Alt, J.C., and Shanks, W.C., III, 1998. Sulfur in serpentinized oceanic peridotites: serpentinization processes and microbial sulfate reduction. Journal of Geophysical Research: Solid Earth, 103:9917–9929. https://doi.org/10.1029/98JB00576
Alt, J.C., and Shanks, W.C., III, 2003. Serpentinization of abyssal peridotites from the MARK area, Mid-Atlantic Ridge: sulfur geochemistry and reaction modeling. Geochimica et Cosmochimica Acta, 67(4):641–653. https://doi.org/10.1016/S0016-7037(02)01142-0
Andreani, M., Mével, C., Boullier, A.M., and Escartín, J., 2007. Dynamic control on serpentine crystallization in veins; constraints on hydration processes in oceanic peridotites. Geochemistry, Geophysics, Geosystems, 8(2):Q02012. https://doi.org/10.1029/2006GC001373
Andreani, M., Montagnac, G., Fellah, C., Hao, J., Vandier, F., Daniel, I., Pisapia, C., Galipaud, J., Lilley, M.D., Früh Green, G.L., Borensztajn, S., and Ménez, B., 2023. The rocky road to organics needs drying. Nature Communications, 14(1):347. https://doi.org/10.1038/s41467-023-36038-6
Aquino, K.A., Früh-Green, G.L., Rickli, J., Bernasconi, S.M., Lang, S.Q., Lilley, M.D., and Butterfield, D.A., 2022. Multi-stage evolution of the Lost City hydrothermal vent fluids. Geochimica et Cosmochimica Acta, 332:239–262. https://doi.org/10.1016/j.gca.2022.06.027
Arai, S., and Matsukage, K., 1996. Petrology of the gabbro-troctolite-peridotite complex from Hess Deep, equatorial Pacific: implications for mantle-melt interaction within the oceanic lithosphere. Proceedings of the Ocean Drilling Program, Scientific Results, 147:135–155. https://doi.org/10.2973/odp.proc.sr.147.008.1996
Arai, S., and Miura, M., 2016. Formation and modification of chromitites in the mantle. Lithos, 264:277–295. https://doi.org/10.1016/j.lithos.2016.08.039
Bach, W., Garrido, C.J., Paulick, H., Harvey, J., and Rosner, M., 2004. Seawater-peridotite interactions: first insights from ODP Leg 209, MAR 15°N. Geochemistry, Geophysics, Geosystems, 5(9):Q09F26. https://doi.org/10.1029/2004GC000744
Bach, W., Jöns, N., and Klein, F., 2013. Metasomatism within the ocean crust. In Harlov, D.E., and Austrheim, H. (Eds.), Metasomatism and the Chemical Transformation of Rock. Berlin, Heidelberg (Springer Berlin Heidelberg), 253–288. https://doi.org/10.1007/978-3-642-28394-9_8
Bach, W., and Klein, F., 2009. The petrology of seafloor rodingites: insights from geochemical reaction path modeling. Lithos, 112(1):103–117. https://doi.org/10.1016/j.lithos.2008.10.022
Bach, W., Paulick, H., Garrido, C.J., Ildefonse, B., Meurer, W.P., and Humphris, S.E., 2006. Unraveling the sequence of serpentinization reactions: petrography, mineral chemistry, and petrophysics of serpentinites from MAR 15°N (ODP Leg 209, Site 1274). Geophysical Research Letters, 33(13). https://doi.org/10.1029/2006GL025681
Bach, W., Rosner, M., Jöns, N., Rausch, S., Robinson, L.F., Paulick, H., and Erzinger, J., 2011. Carbonate veins trace seawater circulation during exhumation and uplift of mantle rock: results from ODP Leg 209. Earth and Planetary Science Letters, 311(3):242–252. https://doi.org/10.1016/j.epsl.2011.09.021
Beard, J.S., Frost, B.R., Fryer, P., McCaig, A., Searle, R., Ildefonse, B., Zinin, P., and Sharma, S.K., 2009. Onset and progression of serpentinization and magnetite formation in olivine-rich troctolite from IODP Hole U1309D. Journal of Petrology, 50(3):387–403. https://doi.org/10.1093/petrology/egp004
Beinlich, A., Mavromatis, V., Austrheim, H., and Oelkers, E.H., 2014. Inter-mineral Mg isotope fractionation during hydrothermal ultramafic rock alteration – implications for the global Mg-cycle. Earth and Planetary Science Letters, 392:166–176. https://doi.org/10.1016/j.epsl.2014.02.028
Blackman, D.K., Ildefonse, B., John, B.E., Ohara, Y., Miller, D.J., Abe, N., Abratis, M., Andal, E.S., Andreani, M., Awaji, S., Beard, J.S., Brunelli, D., Charney, A.B., Christie, D.M., Collins, J., Delacour, A.G., Delius, H., Drouin, M., Einaudi, F., Escartin, J., Frost, B.R., Früh-Green, G., Fryer, P.B., Gee, J.S., Godard, M., Grimes, C.B., Halfpenny, A., Hansen, H.E., Harris, A.C., Tamura, A., Hayman, N.W., Hellebrand, E., Hirose, T., Hirth, J.G., Ishimaru, S., Johnson, K.T.M., Karner, G.D., Linek, M., MacLeod, C.J., Maeda, J., Mason, O.U., McCaig, A.M., Michibayashi, K., Morris, A., Nakagawa, T., Nozaka, T., Rosner, M., Searle, R.C., Suhr, G., Tominaga, M., von der Handt, A., Yamasaki, T., and Zhao, X., 2011. Drilling constraints on lithospheric accretion and evolution at Atlantis Massif, Mid-Atlantic Ridge 30°N. Journal of Geophysical Research: Solid Earth, 116(B7):B07103. https://doi.org/10.1029/2010JB007931
Blackman, D.K., Karson, J.A., Kelley, D.S., Cann, J.R., Früh-Green, G.L., Gee, J.S., Hurst, S.D., John, B.E., Morgan, J., Nooner, S.L., Ross, D.K., Schroeder, T.J., and Williams, E.A., 2002. Geology of the Atlantis Massif (Mid-Atlantic Ridge, 30° N): Implications for the evolution of an ultramafic oceanic core complex. Marine Geophysical Research, 23(5):443–469. https://doi.org/10.1023/B:MARI.0000018232.14085.75
Bodinier, J.L., and Godard, M., 2014. Orogenic, Ophiolitic, and Abyssal Peridotites. In Holland, H.D. and Turekian, K.K., Treatise on Geochemistry (Second Edition). Oxford (Elsevier), 103–167. https://doi.org/10.1016/B978-0-08-095975-7.00204-7
Borradaile, G.J., 1991. Correlation of strain with anisotropy of magnetic susceptibility (AMS). pure and applied geophysics, 135(1):15–29. https://doi.org/10.1007/BF00877006
Boschi, C., Früh-Green, G.L., Delacour, A., Karson, J.A., and Kelley, D.S., 2006. Mass transfer and fluid flow during detachment faulting and development of an oceanic core complex, Atlantis Massif (MAR 30°N). Geochemistry, Geophysics, Geosystems, 7(1):Q01004. https://doi.org/10.1029/2005GC001074
Casey, J.F., 1997. Comparison of major- and trace-element geochemistry of abyssal peridotites and mafic plutonic rocks with basalts from the MARK region of the Mid-Atlantic Ridge. In Karson, J.A., Cannat, M, Miller, D.J., and Elthon, D. (Eds.), Proceedings of the Ocean Drilling Program, Scientific Results. 153: College Station, TX (Ocean Drilling Program), 181–241. https://doi.org/10.2973/odp.proc.sr.153.012.1997
Coogan, L.A., Wilson, R.N., Gillis, K.M., and MacLeod, C.J., 2001. Near-solidus evolution of oceanic gabbros; insights from amphibole geochemistry. Geochimica et Cosmochimica Acta, 65(23):4339–4357. https://doi.org/10.1016/S0016-7037(01)00714-1
Delacour, A., Früh-Green, G.L., Bernasconi, S.M., and Kelley, D.S., 2008a. Sulfur in peridotites and gabbros at Lost City (30°N, MAR): implications for hydrothermal alteration and microbial activity during serpentinization. Geochimica et Cosmochimica Acta, 72(20):5090–5110. https://doi.org/10.1016/j.gca.2008.07.017
Delacour, A.G., Früh-Green, G.L., and Bernasconi, S.M., 2008b. Sulfur mineralogy and geochemistry of serpentinites and gabbros of the Atlantis Massif (IODP Site U1309). Geochimica et Cosmochimica Acta, 72(20):5111–5127. https://doi.org/10.1016/j.gca.2008.07.018
Dick, H.J.B., MacLeod, C.J., Blum, P., and the Expedition 360 Scientists, 2016. Expedition 360 Preliminary Report: Southwest Indian Ridge Lower Crust and Moho. International Ocean Discovery Program. https://doi.org/10.14379/iodp.pr.360.2016
Dick, H.J.B., MacLeod, C.J., Blum, P., Abe, N., Blackman, D.K., Bowles, J.A., Cheadle, M.J., Cho, K., Ciazela, J., Deans, J.R., Edgcomb, V.P., Ferrando, C., France, L., Ghosh, B., Ildefonse, B.M., Kendrick, M.A., Koepke, J.H., Leong, J.A.M., Chuanzhou, L., Qiang, M., Morishita, T., Morris, A., Natland, J.H., Nozaka, T., Pluemper, O., Sanfilippo, A., Sylvan, J.B., Tivey, M.A., Tribuzio, R., and Viegas, L.G.F., 2017. Expedition 360 summary. In MacLeod, C.J., Dick, H.J.B., Blum, P., and the Expedition 360 Scientists, Southwest Indian Ridge Lower Crust and Moho. Proceedings of the International Ocean Discovery Program, 360: College Station, TX (International Ocean Discovery Program). https://doi.org/10.14379/iodp.proc.360.101.2017
Dick, H.J.B., Natland, J.H., Alt, J.C., Bach, W., Bideau, D., Gee, J.S., Haggas, S., Hertogen, J.G.H., Hirth, G., Holm, P.M., Ildefonse, B., Iturrino, G.J., John, B.E., Kelley, D.S., Kikawa, E., Kingdon, A., LeRoux, P.J., Maeda, J., Meyer, P.S., Miller, D.J., Naslund, H.R., Niu, Y.-L., Robinson, P.T., Snow, J., Stephen, R.A., Trimby, P.W., Worm, H.-U., and Yoshinobu, A., 2000. A long in situ section of the lower ocean crust; results of ODP Leg 176 drilling at the Southwest Indian Ridge. Earth and Planetary Science Letters, 179(1):31–51. https://doi.org/10.1016/S0012-821X(00)00102-3
Dilek, Y., Coulton, A., and Hurst, S.D., 1997. Serpentinization and hydrothermal veining in peridotites at Site 920 in the MARK area. In Karson, J.A., Cannat, M., Miller, D.J., and Elthon, D. (Eds.), Proceedings of the Ocean Drilling Program, Scientific Results. 153: College Station, TX (Ocean Drilling Program), 35–59. https://doi.org/10.2973/odp.proc.sr.153.004.1997
Egli, R., 2004. Characterization of individual rock magnetic components by analysis of remanence curves: 2. Fundamental properties of coercivity distributions. Physics and Chemistry of the Earth, Parts A/B/C, 29(13):851–867. https://doi.org/10.1016/j.pce.2004.04.001
Escartín, J., Hirth, G., and Evans, B., 2001. Strength of slightly serpentinized peridotites: implications for the tectonics of oceanic lithosphere. Geology, 29(11):1023–1026. https://doi.org/10.1130/0091-7613(2001)029<1023:SOSSPI>2.0.CO;2
Escartín, J., John, B., Cannat, M., Olive, J.-A., Cheadle, M., Früh-Green, G., and Cotterill, C., 2022. Tectonic termination of oceanic detachment faults, with constraints on tectonic uplift and mass wasting related erosion rates. Earth and Planetary Science Letters, 584:117449. https://doi.org/10.1016/j.epsl.2022.117449
Evans, B.W., 2004. The serpentinite multisystem revisited: chrysotile is metastable. International Geology Review, 46(6):479–506. https://doi.org/10.2747/0020-6814.46.6.479
Expedition 304/305 Scientists, 2006a. Expedition 304/305 summary. In Blackman, D.K., Ildefonse, B., John, B.E., Ohara, Y., Miller, D.J., MacLeod, C.J., and the Expedition 304/305 Scientist, Proceedings of the Integrated Ocean Drilling Program. 304/305: College Station, TX (Integrated Ocean Drilling Program Management International, Inc.). https://doi.org/10.2204/iodp.proc.304305.101.2006
Expedition 304/305 Scientists, 2006b. Site U1309. In Blackman, D.K., Ildefonse, B., John, B.E., Ohara, Y., Miller, D.J., MacLeod, C.J., and the Expedition 304/305 Scientists, Proceedings of the Integrated Ocean Drilling Program. 304/305: College Station, TX (Integrated Ocean Drilling Program Management International, Inc.). https://doi.org/10.2204/iodp.proc.304305.103.2006
Expedition 340T Scientists, 2012. Atlantis Massif Oceanic Core Complex: velocity, porosity, and impedance contrasts within the domal core of Atlantis Massif: faults and hydration of lithosphere during core complex evolution. Integrated Ocean Drilling Program Preliminary Report, 340T. https://doi.org/10.2204/iodp.pr.340T.2012
Ferrando, C., Tribuzio, R., Lissenberg, C.J., France, L., MacLeod, C.J., Basch, V., Villeneuve, J., Deloule, E., and Sanfilippo, A., 2022. Brown amphibole as tracer of tectono-magmatic evolution of the Atlantis Bank Oceanic Core Complex (IODP Hole U1473A). Journal of Petrology. https://doi.org/10.1093/petrology/egac089
Fouquet, Y., Cambon, P., Etoubleau, J., Charlou, J.L., OndréAs, H., Barriga, F.J.A.S., Cherkashov, G., Semkova, T., Poroshina, I., Bohn, M., Donval, J.P., Henry, K., Murphy, P., and Rouxel, O., 2010. Geodiversity of hydrothermal processes along the Mid-Atlantic Ridge and ultramafic-hosted mineralization: a new type of oceanic Cu-Zn-Co-Au volcanogenic massive sulfide deposit. In Rona, P.A., Devey, C.W., Dyment, J., and Murton, B.J. (Eds.), Diversity of Hydrothermal Systems on Slow Spreading Ocean Ridges. Geophysical Monograph, 188: 321–367. https://doi.org/10.1029/2008GM000746
Frost, B.R., and Beard, J.S., 2007. On silica activity and serpentinization. Journal of Petrology, 48(7):1351–1368. https://doi.org/10.1093/petrology/egm021
Frost, B.R., Beard, J.S., McCaig, A., and Condliffe, E., 2008. The formation of micro-rodingites from IODP Hole U1309D: key to understanding the process of serpentinization. Journal of Petrology, 49(9):1579–1588. https://doi.org/10.1093/petrology/egn038
Früh-Green, G.L., Orcutt, B.N., Green, S.L., Cotterill, C., Morgan, S., Akizawa, N., Bayrakci, G., Behrmann, J.-H., Boschi, C., Brazelton, W.J., Cannat, M., Dunkel, K.G., Escartin, J., Harris, M., Herrero-Bervera, E., Hesse, K., John, B.E., Lang, S.Q., Lilley, M.D., Liu, H.-Q., Mayhew, L.E., McCaig, A.M., Menez, B., Morono, Y., Quéméneur, M., Rouméjon, S., Sandaruwan Ratnayake, A., Schrenk, M.O., Schwarzenbach, E.M., Twing, K.I., Weis, D., Whattam, S.A., Williams, M., and Zhao, R., 2017. Expedition 357 summary. In Früh-Green, G.L., Orcutt, B.N., Green, S.L., Cotterill, C., and the Expedition 357 Scientists, Atlantis Massif Serpentinization and Life. Proceedings of the International Ocean Discovery Program, 357: College Station, TX (International Ocean Discovery Program). https://doi.org/10.14379/iodp.proc.357.101.2017
Früh-Green, G.L., Kelley, D.S., Bernasconi, S.M., Karson, J.A., Ludwig, K.A., Butterfield, D.A., Boschi, C., and Proskurowski, G., 2003. 30,000 years of hydrothermal activity at the Lost City vent field. Science, 301(5632):495–498. https://doi.org/10.1126/science.1085582
Früh-Green, G.L., Orcutt, B.N., Green, S., Cotterill, C., and the Expedition 357 Scientists, 2016. Expedition 357 Preliminary Report: Atlantis Massif Serpentinization and Life. International Ocean Discovery Program. https://doi.org/10.14379/iodp.pr.357.2016
Früh-Green, G.L., Orcutt, B.N., Rouméjon, S., Lilley, M.D., Morono, Y., Cotterill, C., Green, S., Escartin, J., John, B.E., McCaig, A.M., Cannat, M., Ménez, B., Schwarzenbach, E.M., Williams, M.J., Morgan, S., Lang, S.Q., Schrenk, M.O., Brazelton, W.J., Akizawa, N., Boschi, C., Dunkel, K.G., Quéméneur, M., Whattam, S.A., Mayhew, L., Harris, M., Bayrakci, G., Behrmann, J.-H., Herrero-Bervera, E., Hesse, K., Liu, H.-Q., Ratnayake, A.S., Twing, K., Weis, D., Zhao, R., and Bilenker, L., 2018. Magmatism, serpentinization and life: insights through drilling the Atlantis Massif (IODP Expedition 357). Lithos, 323:137–155. https://doi.org/10.1016/j.lithos.2018.09.012
Gillis, K.M., Snow, J.E., Klaus, A., Guerin, G., Abe, N., Akizawa, N., Ceuleneer, G., Cheadle, M.J., Adrião, Á., Faak, K., Falloon, T.J., Friedman, S.A., Godard, M.M., Harigane, Y., Horst, A.J., Hoshide, T., Ildefonse, B., Jean, M.M., John, B.E., Koepke, J.H., Machi, S., Maeda, J., Marks, N.E., McCaig, A.M., Meyer, R., Morris, A., Nozaka, T., Python, M., Saha, A., and Wintsch, R.P., 2014. Expedition 345 summary. In Gillis, K.M., Snow, J.E., Klaus, A., and the Expedition 345 Scientists, Proceedings of the Integrated Ocean Drilling Program. 345: College Station, TX (Integrated Ocean Drilling Program). https://doi.org/10.2204/iodp.proc.345.101.2014
Gillis, K.M., and Meyer, P.S., 2001. Metasomatism of oceanic gabbros by late stage melts and hydrothermal fluids: evidence from the rare earth element composition of amphiboles. Geochemistry, Geophysics, Geosystems, 2(3):2000GC000087. https://doi.org/10.1029/2000GC000087
Glein, C.R., and Zolotov, M.Y., 2020. Hydrogen, hydrocarbons, and habitability across the solar system. Elements, 16(1):47–52. https://doi.org/10.2138/gselements.16.1.47
Godard, M., Awaji, S., Hansen, H., Hellebrand, E., Brunelli, D., Johnson, K., Yamasaki, T., Maeda, J., Abratis, M., Christie, D., Kato, Y., Mariet, C., and Rosner, M., 2009. Geochemistry of a long in-situ section of intrusive slow-spread oceanic lithosphere: results from IODP Site U1309 (Atlantis Massif, 30°N Mid-Atlantic-Ridge). Earth and Planetary Science Letters, 279(1–2):110–122. https://doi.org/10.1016/j.epsl.2008.12.034
Godard, M., Lagabrielle, Y., Alard, O., and Harvey, J., 2008. Geochemistry of the highly depleted peridotites drilled at ODP Sites 1272 and 1274 (Fifteen-Twenty Fracture Zone, Mid-Atlantic Ridge): implications for mantle dynamics beneath a slow spreading ridge. Earth and Planetary Science Letters, 267(3):410–425. https://doi.org/10.1016/j.epsl.2007.11.058
Goordial, J., D'Angelo, T., Labonté, J.M., Poulton, N.J., Brown, J.M., Stepanauskas, R., Früh-Green, G.L., Orcutt, B.N., and Dubilier, N., 2021. Microbial diversity and function in shallow subsurface sediment and oceanic lithosphere of the Atlantis Massif. MBio, 12(4):e00490-00421. https://journals.asm.org/doi/abs/10.1128/mBio.00490-21
Grimes, C.B., John, B.E., Cheadle, M.J., and Wooden, J.L., 2008. Protracted construction of gabbroic crust at a slow spreading ridge; constraints from 206Pb/238U zircon ages from Atlantis Massif and IODP Hole U1309D (30°N, MAR). Geochemistry, Geophysics, Geosystems, 9(8):Q08012. https://doi.org/10.1029/2008GC002063
Grozeva, N.G., Klein, F., Seewald, J.S., and Sylva, S.P., 2020. Chemical and isotopic analyses of hydrocarbon-bearing fluid inclusions in olivine-rich rocks. Philosophical Transactions of the Royal Society A: Mathematical, Physical and Engineering Sciences, 378(2165):20180431. https://doi.org/10.1098/rsta.2018.0431
Harding, A.J., Arnulf, A.F., and Blackman, D.K., 2016. Velocity structure near IODP Hole U1309D, Atlantis Massif, from waveform inversion of streamer data and borehole measurements. Geochemistry, Geophysics, Geosystems, 17(6):1990–2014. https://doi.org/10.1002/2016GC006312
Harper, G.D., 1985. Tectonics of slow spreading mid-ocean ridges and consequences of a variable depth to the brittle/ductile transition. Tectonics, 4(4):395–409. https://doi.org/10.1029/TC004i004p00395
Henig, A.S., Blackman, D.K., Harding, A.J., Canales, J.-P., and Kent, G.M., 2012. Downward continued multichannel seismic refraction analysis of Atlantis Massif oceanic core complex, 30°N, Mid-Atlantic Ridge. Geochemistry, Geophysics, Geosystems, 13(5):Q0AG07. https://doi.org/10.1029/2012GC004059
Hirth, G., and Guillot, S., 2013. Rheology and tectonic significance of serpentinite. Elements, 9(2):107–113. https://doi.org/10.2113/gselements.9.2.107
Hrouda, F., 1982. Magnetic anisotropy of rocks and its application in geology and geophysics. Geophysical surveys, 5(1):37–82. https://doi.org/10.1007/BF01450244
Jelinek, V., 1981. Characterization of the magnetic fabric of rocks. Tectonophysics, 79(3–4):T63–T67. https://doi.org/10.1016/0040-1951(81)90110-4
John, B.E., Cheadle, M.J., Gee, J.S., Grimes, C.B., Morris, A., and Pressling, N., 2009. Data report: spatial and temporal evolution of slow spread oceanic crust; graphic sections of core recovered from IODP Hole U1309D, Atlantis Massif, 30°N, MAR (including Pb/U zircon geochronology and magnetic remanence data). In Blackman, D.K., Ildefonse, B., John, B.E., Ohara, Y., Miller, D.J., MacLeod, C.J., and the Expedition 304/305 Scientists, Proceedings of the Integrated Ocean Drilling Program 304/305: College Station, TX (Integrated Ocean Drilling Program Management International, Inc.). https://doi.org/10.2204/iodp.proc.304305.205.2009
Jöns, N., Bach, W., and Klein, F., 2010. Magmatic influence on reaction paths and element transport during serpentinization. Chemical Geology, 274(3):196–211. https://doi.org/10.1016/j.chemgeo.2010.04.009
Karson, J.A., Früh-Green, G.L., Kelley, D.S., Williams, E.A., Yoerger, D.R., and Jakuba, M., 2006. Detachment shear zone of the Atlantis Massif core complex, Mid-Atlantic Ridge, 30°N. Geochemistry, Geophysics, Geosystems, 7(6):Q06016. https://doi.org/10.1029/2005GC001109
Kelemen, P.B., Shimizu, N., and Salters, V.J.M., 1995. Extraction of mid-ocean-ridge basalt from the upwelling mantle by focused flow of melt in dunite channels. Nature, 375(6534):747–753. https://doi.org/10.1038/375747a0
Kelley, D.S., Karson, J.A., Blackman, D.K., Früh-Green, G.L., Butterfield, D.A., Lilley, M.D., Olson, E.J., Schrenk, M.O., Roe, K.K., Lebon, G.T., Rivizzigno, P., and the AT3-60 Shipboard Party, 2001. An off-axis hydrothermal vent field near the Mid-Atlantic Ridge at 30°N. Nature, 412(6843):145–149. https://doi.org/10.1038/35084000
Kirschvink, J.L., 1980. The least-squares line and plane and the analysis of palaeomagnetic data. Geophysical Journal International, 62(3):699–718. https://doi.org/10.1111/j.1365-246X.1980.tb02601.x
Klein, F., and Bach, W., 2009. Fe–Ni–Co–O–S phase relations in peridotite–seawater interactions. Journal of Petrology, 50(1):37–59. https://doi.org/10.1093/petrology/egn071
Klein, F., Bach, W., Humphris, S.E., Kahl, W.-A., Jöns, N., Moskowitz, B., and Berquó, T.S., 2014. Magnetite in seafloor serpentinite—Some like it hot. Geology, 42(2):135–138. https://doi.org/10.1130/G35068.1
Klein, F., Bach, W., and McCollom, T.M., 2013. Compositional controls on hydrogen generation during serpentinization of ultramafic rocks. Lithos, 178:55–69. https://doi.org/10.1016/j.lithos.2013.03.008
Klein, F., Grozeva, N.G., and Seewald, J.S., 2019. Abiotic methane synthesis and serpentinization in olivine-hosted fluid inclusions. Proceedings of the National Academy of Sciences of the United States of America, 116(36):17666–17672. https://doi.org/10.1073/pnas.1907871116
Klein, F., Grozeva, N.G., Seewald, J.S., McCollom, T.M., Humphris, S.E., Moskowitz, B., Berquó, T.S., and Kahl, W.-A., 2015a. Fluids in the crust. Experimental constraints on fluid-rock reactions during incipient serpentinization of harzburgite. American Mineralogist, 100(4):991–1002. https://doi.org/10.2138/am-2015-5112
Klein, F., Humphris, S.E., Guo, W., Schubotz, F., Schwarzenbach, E.M., and Orsi, W.D., 2015b. Fluid mixing and the deep biosphere of a fossil Lost City-type hydrothermal system at the Iberia Margin. Proceedings of the National Academy of Sciences of the United States of America, 112(39):12036–12041. https://doi.org/10.1073/pnas.1504674112
Klein, F., and Le Roux, V., 2020. Quantifying the volume increase and chemical exchange during serpentinization. Geology, 48(6):552–556. https://doi.org/10.1130/G47289.1
Klein, F., Marschall, H.R., Bowring, S.A., Humphris, S.E., and Horning, G., 2017. Mid-ocean ridge serpentinite in the Puerto Rico Trench: from seafloor spreading to subduction. Journal of Petrology, 58(9):1729–1754. https://doi.org/10.1093/petrology/egx071
Koenigsberger, J.G., 1938. Natural residual magnetism of eruptive rocks. Terrestrial Magnetism and Atmospheric Electricity, 43(3):299–320. https://doi.org/10.1029/TE043i003p00299
Lambart, S., Laporte, D., and Schiano, P., 2009. An experimental study of focused magma transport and basalt–peridotite interactions beneath mid-ocean ridges: implications for the generation of primitive MORB compositions. Contributions to Mineralogy and Petrology, 157(4):429–451. https://doi.org/10.1007/s00410-008-0344-7
Lang, S.Q., and Brazelton, W.J., 2020. Habitability of the marine serpentinite subsurface: a case study of the Lost City hydrothermal field. Philosophical Transactions of the Royal Society A: Mathematical, Physical and Engineering Sciences, 378(2165):20180429. https://doi.org/10.1098/rsta.2018.0429
Lang, S.Q., McCaig, A.M, Blum, P., Abe, N., Brazelton, W., Coltat, R., Deans, J.R., Dickerson, K.L., Godard, M., John, B.E., Klein, F., Kuehn, R., Lin, K.-Y., Lissenberg, C.J., Liu, H., Lopes, E.L., Nozaka, T., Parsons, A.J., Pathak, V., Reagan, M.K., Robare, J.A., Savov, I.P., Schwarzenbach, E., Sissmann, O.J., Southam, G., Wang, F., and Wheat, C.G., 2025. Expedition 399 methods. In McCaig, A.M., Lang, S.Q., Blum, P., and the Expedition 399 Scientists, Building Blocks of Life, Atlantis Massif. Proceedings of the International Ocean Discovery Program, 399: College Station, TX (International Ocean Discovery Program). https://doi.org/10.14379/iodp.proc.399.102.2025
Lang, S.Q., Lilley, M.D., Baumberger, T., Früh-Green, G.L., Walker, S.L., Brazelton, W.J., Kelley, D.S., Elend, M., Butterfield, D.A., and Mau, A.J., 2021. Extensive decentralized hydrogen export from the Atlantis Massif. Geology, 49(7):851–856. https://doi.org/10.1130/G48322.1
Leong, J.A.M., Ely, T., and Shock, E.L., 2021. Decreasing extents of Archean serpentinization contributed to the rise of an oxidized atmosphere. Nature Communications, 12(1):7341. https://doi.org/10.1038/s41467-021-27589-7
Liebmann, J., Schwarzenbach, E.M., Früh-Green, G.L., Boschi, C., Rouméjon, S., Strauss, H., Wiechert, U., and John, T., 2018. Tracking water-rock interaction at the Atlantis Massif (MAR, 30°N) using sulfur geochemistry. Geochemistry, Geophysics, Geosystems, 19(11):4561–4583. https://doi.org/10.1029/2018GC007813
Lissenberg, C.J., McCaig, A.M., Lang, S.Q., Blum, P., Abe, N., Brazelton, W.J., Coltat, R., Deans, J.R., Dickerson, K.L., Godard, M., John, B.E., Klein, F., Kuehn, R., Lin, K.-Y., Liu, H., Lopes, E.L., Nozaka, T., Parsons, A.J., Pathak, V., Reagan, M.K., Robare, J.A., Savov, I.P., Schwarzenbach, E.M., Sissmann, O.J., Southam, G., Wang, F., Wheat, C.G., Anderson, L., and Treadwell, S., 2024. A long section of serpentinized depleted mantle peridotite. Science, 385(6709):623–629. https://doi.org/10.1126/science.adp1058
Ludwig, K.A., Kelley, D.S., Butterfield, D.A., Nelson, B.K., and Früh-Green, G., 2006. Formation and evolution of carbonate chimneys at the Lost City hydrothermal field. Geochimica et Cosmochimica Acta, 70(14):3625–3645. https://doi.org/10.1016/j.gca.2006.04.016
MacLeod, C.J., Dick, H.J.B., Blum, P., Abe, N., Blackman, D.K., Bowles, J.A., Cheadle, M.J., Cho, K., Ciazela, J., Deans, J.R., Edgcomb, V.P., Ferrando, C., France, L., Ghosh, B., Ildefonse, B.M., Kendrick, M.A., Koepke, J.H., Leong, J.A.M., Chuanzhou, L., Qiang, M., Morishita, T., Morris, A., Natland, J.H., Nozaka, T., Pluemper, O., Sanfilippo, A., Sylvan, J.B., Tivey, M.A., Tribuzio, R., and Viegas, L.G.F., 2017. Site U1473. In MacLeod, C.J., Dick, H.J.B., Blum, P., and the Expedition 360 Scientists, Southwest Indian Ridge Lower Crust and Moho. Proceedings of the International Ocean Discovery Program, 360: College Station, TX (International Ocean Discovery Program). https://doi.org/10.14379/iodp.proc.360.103.2017
MacLeod, C.J., Searle, R.C., Murton, B.J., Casey, J.F., Mallows, C., Unsworth, S.C., Achenbach, K.L., and Harris, M., 2009. Life cycle of oceanic core complexes. Earth and Planetary Science Letters, 287(3):333–344. https://doi.org/10.1016/j.epsl.2009.08.016
Malvoisin, B., Zhang, C., Müntener, O., Baumgartner, L.P., Kelemen, P.B., and the Oman Drilling Project Science Party, 2020. Measurement of volume change and mass transfer during serpentinization: insights from the Oman Drilling Project. Journal of Geophysical Research: Solid Earth, 125(5):e2019JB018877. https://doi.org/10.1029/2019JB018877
Maxbauer, D.P., Feinberg, J.M., and Fox, D.L., 2016. MAX UnMix: a web application for unmixing magnetic coercivity distributions. Computers & Geosciences, 95:140–145. https://doi.org/10.1016/j.cageo.2016.07.009
McCaig, A.M., Delacour, A., Fallick, A.E., Castelain, T., and Früh-Green, G.L., 2010. Detachment fault control on hydrothermal circulation systems: interpreting the subsurface beneath the TAG hydrothermal field using the isotopic and geological evolution of oceanic core complexes in the Atlantic. In Rona, P., Devey, C.W., Dyment, J., and Murton, B.J. (Eds.), Diversity of Hydrothermal Systems on Slow Spreading Ocean Ridges. Geophysical Monograph, 188: 207–239. https://doi.org/10.1029/2008GM000729
McCaig, A.M., and Harris, M., 2012. Hydrothermal circulation and the dike-gabbro transition in the detachment mode of slow seafloor spreading. Geology, 40(4):367–370. https://doi.org/10.1130/G32789.1
McCaig, A.M., Lang, S.Q., Blum, P., Abe, N., Brazelton, W., Coltat, R., Deans, J.R., Dickerson, K.L., Godard, M., John, B.E., Klein, F., Kuehn, R., Lin, K.-Y., Lissenberg, C.J., Liu, H., Lopes, E.L., Nozaka, T., Parsons, A.J., Pathak, V., Reagan, M.K., Robare, J.A., Savov, I.P., Schwarzenbach, E., Sissmann, O.J., Southam, G., Wang, F., and Wheat, C.G., 2025. Site U1309. In McCaig, A.M., Lang, S.Q., Blum, P., and the Expedition 399 Scientists, Building Blocks of Life, Atlantis Massif. Proceedings of the International Ocean Discovery Program, 399: College Station, TX (International Ocean Discovery Program). https://doi.org/10.14379/iodp.proc.399.103.2025
McCaig, A.M., Lang, S.Q., Blum, P., and the Expedition 399 Scientists, 2025. Supplementary material, https://doi.org/10.14379/iodp.proc.399supp.2025. In McCaig, A.M., Lang, S.Q., Blum, P., and the Expedition 399 Scientists, Building Blocks of Life, Atlantis Massif. Proceedings of the International Ocean Discovery Program, 399: College Station, TX (International Ocean Discovery Program).
McCollom, T.M., Klein, F., Moskowitz, B., Berquó, T.S., Bach, W., and Templeton, A.S., 2020. Hydrogen generation and iron partitioning during experimental serpentinization of an olivine–pyroxene mixture. Geochimica et Cosmochimica Acta, 282:55–75. https://doi.org/10.1016/j.gca.2020.05.016
McDermott, J.M., Seewald, J.S., German, C.R., and Sylva, S.P., 2015. Pathways for abiotic organic synthesis at submarine hydrothermal fields. Proceedings of the National Academy of Sciences of the United States of America, 112(25):7668–7672. https://doi.org/10.1073/pnas.1506295112
McFadden, P.L., and Reid, A.B., 1982. Analysis of palaeomagnetic inclination data. Geophysical Journal International, 69(2):307–319. https://doi.org/10.1111/j.1365-246X.1982.tb04950.x
Miller, D.J., and Christensen, N.I., 1997. Seismic velocities of lower crustal and upper mantle rocks from the slow-spreading Mid-Atlantic Ridge, south of the Kane transform zone (MARK). In Karson, J.A., Cannat, M, Miller, D.J., and Elthon, D. (Eds.), Proceedings of the Ocean Drilling Program, Scientific Results. 153: College Station, TX (Ocean Drilling Program), 437–454. https://doi.org/10.2973/odp.proc.sr.153.043.1997
Milliken, K.L., Lynch, F.L., and Seifert, K.E., 1996. Marine weathering of serpentinites and serpentinite breccias, Sites 897 and 899, Iberia abyssal plain. In Whitmarsh, R.B., Sawyer, D.S., Klaus, A., and Masson, D.G. (Eds.), Proceedings of the Ocean Drilling Program, Scientific Results. 149: College Station, TX (Ocean Drilling Program). https://doi.org/10.2973/odp.proc.sr.149.222.1996
Motamedi, S., Orcutt, B.N., Früh-Green, G.L., Twing, K.I., Pendleton, H.L., and Brazelton, W.J., 2020. Microbial residents of the Atlantis Massif's shallow serpentinite subsurface. Applied and Environmental Microbiology, 86(11):e00356-00320. https://doi.org/10.1128/AEM.00356-20
Nozaka, T., Akitou, T., Abe, N., and Tribuzio, R., 2019. Biotite in olivine gabbros from Atlantis Bank: evidence for amphibolite-facies metasomatic alteration of the lower oceanic crust. Lithos, 348–349:105176. https://doi.org/10.1016/j.lithos.2019.105176
Nozaka, T., and Fryer, P., 2011. Alteration of the oceanic lower crust at a slow-spreading axis: insight from vein-related zoned halos in olivine gabbro from Atlantis Massif, Mid-Atlantic Ridge. Journal of Petrology, 52(4):643–664. https://doi.org/10.1093/petrology/egq098
Nozaka, T., Fryer, P., and Andreani, M., 2008. Formation of clay minerals and exhumation of lower-crustal rocks at Atlantis Massif, Mid-Atlantic Ridge. Geochemistry, Geophysics, Geosystems, 9(11):Q11005. https://doi.org/10.1029/2008GC002207
Nozaka, T., Meyer, R., Wintsch, R.P., and Wathen, B., 2016. Hydrothermal spinel, corundum and diaspore in lower oceanic crustal troctolites from the Hess Deep rift. Contributions to Mineralogy and Petrology, 171(6):53. https://doi.org/10.1007/s00410-016-1266-4
Nozaka, T., Wintsch, R.P., and Meyer, R., 2017. Serpentinization of olivine in troctolites and olivine gabbros from the Hess Deep rift. Lithos, 282–283:201–214. https://doi.org/10.1016/j.lithos.2016.12.032
O'Hanley, D.S., 1996. Serpentinites: Records of Tectonic and Petrological History: Oxford, UK (Oxford University Press).
Paulick, H., Bach, W., Godard, M., De Hoog, J.C.M., Suhr, G., and Harvey, J., 2006. Geochemistry of abyssal peridotites (Mid-Atlantic Ridge, 15°20′N, ODP Leg 209): implications for fluid/rock interaction in slow spreading environments. Chemical Geology, 234(3):179–210. https://doi.org/10.1016/j.chemgeo.2006.04.011
Payot, B.D., Arai, S., Dick, H.J.B., Abe, N., and Ichiyama, Y., 2014. Podiform chromitite formation in a low-Cr/high-Al system: an example from the Southwest Indian Ridge (SWIR). Mineralogy and Petrology, 108(4):533–549. https://doi.org/10.1007/s00710-013-0317-z
Proskurowski, G., Lilley, M.D., Seewald, J.S., Früh-Green, G.L., Olson, E.J., Lupton, J.E., Sylva, S.P., and Kelley, D.S., 2008. Abiogenic hydrocarbon production at Lost City hydrothermal field. Science, 319(5863):604–607. https://doi.org/10.1126/science.1151194
Reed, M.H., and Palandri, J., 2006. Sulfide mineral precipitation from hydrothermal fluids. Reviews in Mineralogy and Geochemistry, 61(1):609–631. https://doi.org/10.2138/rmg.2006.61.11
Reed, M.H., and Palandri, J., 2009. Geochemical models of reactions of seawater and meteoric water with basalt and peridotite. Presented at the Workshop on Modeling Martian Hydrous Environments, Houston, TX, 1–3 June 2009. https://www.lpi.usra.edu/meetings/hydrous2009/pdf/4019.pdf
Robertson, D.J., and France, D.E., 1994. Discrimination of remanence-carrying minerals in mixtures, using isothermal remanent magnetisation acquisition curves. Physics of the Earth and Planetary Interiors, 82(3–4):223–234. https://doi.org/10.1016/0031-9201(94)90074-4
Roedder, E., 1984. Fluid inclusions. In Swainson, I. (Ed.), Reviews in Mineralogy and Geochemistry. P.H. Ribbe (Series Ed.), 12. https://doi.org/10.1515/9781501508271
Rouméjon, S., Früh-Green, G.L., Orcutt, B.N., and the IODP Expedition 357 Science Party, 2018. Alteration heterogeneities in peridotites exhumed on the southern wall of the Atlantis Massif (IODP Expedition 357). Journal of Petrology, 59(7):1329–1358. https://doi.org/10.1093/petrology/egy065
Rouméjon, S., Andreani, M., and Früh-Green, G.L., 2019. Antigorite crystallization during oceanic retrograde serpentinization of abyssal peridotites. Contributions to Mineralogy and Petrology, 174(7):60. https://doi.org/10.1007/s00410-019-1595-1
Schroeder, T., and John, B.E., 2004. Strain localization on an oceanic detachment fault system, Atlantis Massif, 30°N, Mid-Atlantic Ridge. Geochemistry, Geophysics, Geosystems, 5(11):Q11007. https://doi.org/10.1029/2004GC000728
Schwarzenbach, E.M., Caddick, M.J., Beard, J.S., and Bodnar, R.J., 2016. Serpentinization, element transfer, and the progressive development of zoning in veins: evidence from a partially serpentinized harzburgite. Contributions to Mineralogy and Petrology, 171:5. https://doi.org/10.1007/s00410-015-1219-3
Schwarzenbach, E.M., Früh-Green, G.L., Bernasconi, S.M., Alt, J.C., and Plas, A., 2013. Serpentinization and carbon sequestration: a study of two ancient peridotite-hosted hydrothermal systems. Chemical Geology, 351:115–133. https://doi.org/10.1016/j.chemgeo.2013.05.016
Schwarzenbach, E.M., Früh-Green, G.L., Bernasconi, S.M., Alt, J.C., Shanks Iii, W.C., Gaggero, L., and Crispini, L., 2012. Sulfur geochemistry of peridotite-hosted hydrothermal systems: comparing the Ligurian ophiolites with oceanic serpentinites. Geochimica et Cosmochimica Acta, 91:283–305. https://doi.org/10.1016/j.gca.2012.05.021
Schwarzenbach, E.M., Gazel, E., and Caddick, M.J., 2014. Hydrothermal processes in partially serpentinized peridotites from Costa Rica: evidence from native copper and complex sulfide assemblages. Contributions to Mineralogy and Petrology, 168:1079. https://doi.org/10.1007/s00410-014-1079-2
Schwarzenbach, E.M., Gill, B.C., and Johnston, D.T., 2018. Unraveling multiple phases of sulfur cycling during the alteration of ancient ultramafic oceanic lithosphere. Geochimica et Cosmochimica Acta, 223:279–299. https://doi.org/10.1016/j.gca.2017.12.006
Schwarzenbach, E.M., Vrijmoed, J.C., Engelmann, J.M., Liesegang, M., Wiechert, U., Rohne, R., and Plümper, O., 2021. Sulfide dissolution and awaruite formation in continental serpentinization environments and its implications to supporting life. Journal of Geophysical Research: Solid Earth, 126(5):e2021JB021758. https://doi.org/10.1029/2021JB021758
Seyfried, W.E., Foustoukos, D.I., and Fu, Q., 2007. Redox evolution and mass transfer during serpentinization: an experimental and theoretical study at 200°C, 500bar with implications for ultramafic-hosted hydrothermal systems at Mid-Ocean Ridges. Geochimica et Cosmochimica Acta, 71(15):3872–3886. https://doi.org/10.1016/j.gca.2007.05.015
Seyfried, W.E., Pester, N.J., Tutolo, B.M., and Ding, K., 2015. The Lost City hydrothermal system: constraints imposed by vent fluid chemistry and reaction path models on subseafloor heat and mass transfer processes. Geochimica et Cosmochimica Acta, 163:59–79. https://doi.org/10.1016/j.gca.2015.04.040
Shipboard Scientific Party, 1989. Site 735. In Robinson, P.T., Von Herzen, R. P., et al., Proceedings of the Ocean Drilling Program, Initial Reports. 118: College Station, TX (Ocean Drilling Program), 89–222. https://doi.org/10.2973/odp.proc.ir.118.107.1989
Shipboard Scientific Party, 1999. Leg 176 summary. In Dick, H.J.B., Natland, J.H., Miller, D.J., et al., Proceedings of the Ocean Drilling Program, Initial Reports, 176. College Station, TX (Ocean Drilling Program), 1–70. https://doi.org/10.2973/odp.proc.ir.176.101.1999
Shipboard Scientific Party, 2004. Leg 209 summary. In Kelemen, P.B., Kikawa, E., Miller, D.J., et al., Proceedings of the Ocean Drilling Program, Initial Reports. 209: College Station, TX (Ocean Drilling Program). https://doi.org/10.2973/odp.proc.ir.209.101.2004
Tamura, A., Arai, S., Ishimaru, S., and Andal, E.S., 2008. Petrology and geochemistry of peridotites from IODP Site U1309 at Atlantis Massif, MAR 30°N: micro- and macro-scale melt penetrations into peridotites. Contributions to Mineralogy and Petrology, 155(4):491–509. https://doi.org/10.1007/s00410-007-0254-0
Tarling, D.H., and Hrouda, F., 1993. The Magnetic Anisotropy of Rocks: London (Chapman and Hall).
Tauxe, L., Shaar, R., Jonestrask, L., Swanson-Hysell, N.L., Minnett, R., Koppers, A.A.P., Constable, C.G., Jarboe, N., Gaastra, K., and Fairchild, L., 2016. PmagPy: software package for paleomagnetic data analysis and a bridge to the Magnetics Information Consortium (MagIC) Database. Geochemistry, Geophysics, Geosystems, 17(6):2450–2463. https://doi.org/10.1002/2016GC006307
Warren, J.M., 2016. Global variations in abyssal peridotite compositions. Lithos, 248-251:193–219. https://doi.org/10.1016/j.lithos.2015.12.023
Whattam, S.A., Früh-Green, G.L., Cannat, M., De Hoog, J.C.M., Schwarzenbach, E.M., Escartin, J., John, B.E., Leybourne, M.I., Williams, M.J., Rouméjon, S., Akizawa, N., Boschi, C., Harris, M., Wenzel, K., McCaig, A., Weis, D., and Bilenker, L., 2022. Geochemistry of serpentinized and multiphase altered Atlantis Massif peridotites (IODP Expedition 357): petrogenesis and discrimination of melt-rock vs. fluid-rock processes. Chemical Geology, 594:120681. https://doi.org/10.1016/j.chemgeo.2021.120681
Workman, R.K., and Hart, S.R., 2005. Major and trace element composition of the depleted MORB mantle (DMM). Earth and Planetary Science Letters, 231(1–2):53–72. https://doi.org/10.1016/j.epsl.2004.12.005
Zijderveld, J.D.A., 1967. AC demagnetization of rocks: analysis of results. In Runcorn, S.K.C., Creer, K.M., and Collinson, D.W. (Eds.), Methods in Palaeomagnetism. Developments in Solid Earth Geophysics. J.R. Balsley (Series Ed.), 3: 254–286. https://doi.org/10.1016/B978-1-4832-2894-5.50049-5