Zitellini, N., Malinverno, A., Estes, E.R., and the Expedition 402 Scientists
Proceedings of the International Ocean Discovery Program Volume 402
publications.iodp.org
https://doi.org/10.14379/iodp.proc.402.107.2025
Site U16161
![]() N. Zitellini,
N. Zitellini,
![]() A. Malinverno,
A. Malinverno,
![]() E.R. Estes,
E.R. Estes,
![]() N. Abe,
N. Abe,
![]() N. Akizawa,
N. Akizawa,
![]() M. Bickert,
M. Bickert,
![]() E.H. Cunningham,
E.H. Cunningham,
![]() A. Di Stefano,
A. Di Stefano,
![]() I.Y. Filina,
I.Y. Filina,
![]() Q. Fu,
Q. Fu,
![]() S. Gontharet,
S. Gontharet,
![]() L.E. Kearns,
L.E. Kearns,
![]() R.K. Koorapati,
R.K. Koorapati,
![]() C. Lei,
C. Lei,
![]() M.F. Loreto,
M.F. Loreto,
![]() L. Magri,
L. Magri,
![]() W. Menapace,
W. Menapace,
![]() T. Morishita,
T. Morishita,
![]() A. Pandey,
A. Pandey,
![]() V.L. Pavlovics,
V.L. Pavlovics,
![]() P.A. Pezard,
P.A. Pezard,
![]() E.M. Poulaki,
E.M. Poulaki,
![]() M.A. Rodriguez-Pilco,
M.A. Rodriguez-Pilco,
![]() A. Sanfilippo,
A. Sanfilippo,
![]() B.D. Shuck,
B.D. Shuck,
![]() P. Vannucchi, and
P. Vannucchi, and
![]() X. Zhao2
X. Zhao2
1 Zitellini, N., Malinverno, A., Estes, E.R., Abe, N., Akizawa, N., Bickert, M., Cunningham, E.H., Di Stefano, A., Filina, I.Y., Fu, Q., Gontharet, S., Kearns, L.E., Koorapati, R.K., Lei, C., Loreto, M.F., Magri, L., Menapace, W., Morishita, T., Pandey, A., Pavlovics, V.L., Pezard, P.A., Poulaki, E.M., Rodriguez-Pilco, M.A., Sanfilippo, A., Shuck, B.D., Vannucchi, P., and Zhao, X., 2025. Site U1616. In Zitellini, N., Malinverno, A., Estes, E.R., and the Expedition 402 Scientists, Tyrrhenian Continent–Ocean Transition. Proceedings of the International Ocean Discovery Program, 402: College Station, TX (International Ocean Discovery Program). https://doi.org/10.14379/iodp.proc.402.107.2025
2 Expedition 402 Scientists' affiliations.
1. Background and objectives
Site U1616 is located in the Vavilov Basin, which is near the center of the Tyrrhenian Sea and contains its deepest waters at about 3600 m water depth (Figure F1). The basin is named after the prominent Vavilov Volcano, which is composed of intraplate basalts (Peccerillo, 2017). Mid-ocean-ridge basalts (MORBs) were cored at Ocean Drilling Program (ODP) Leg 107 Site 656 on the Gortani Ridge (Kastens and Mascle, 1990) and Deep Sea Drilling Project (DSDP) Leg 42 Site 373 (Shipboard Scientific Party, 1978), and island arc basalts were recovered at ODP Site 651 above 30 m of serpentinized peridotite (Beccaluva et al., 1990; Bonatti et al., 1990). In addition, continental basement outcrops are found in several locations within the Vavilov Basin; dredging the steep escarpments of the Central fault and the De Marchi, Flavio Gioia, and Farfalla Seamounts returned a variety of continental rocks, including granites, gneisses, quartzites, schists, phyllites, and shallow-water carbonates (Heezen et al., 1971; Colantoni et al., 1981).
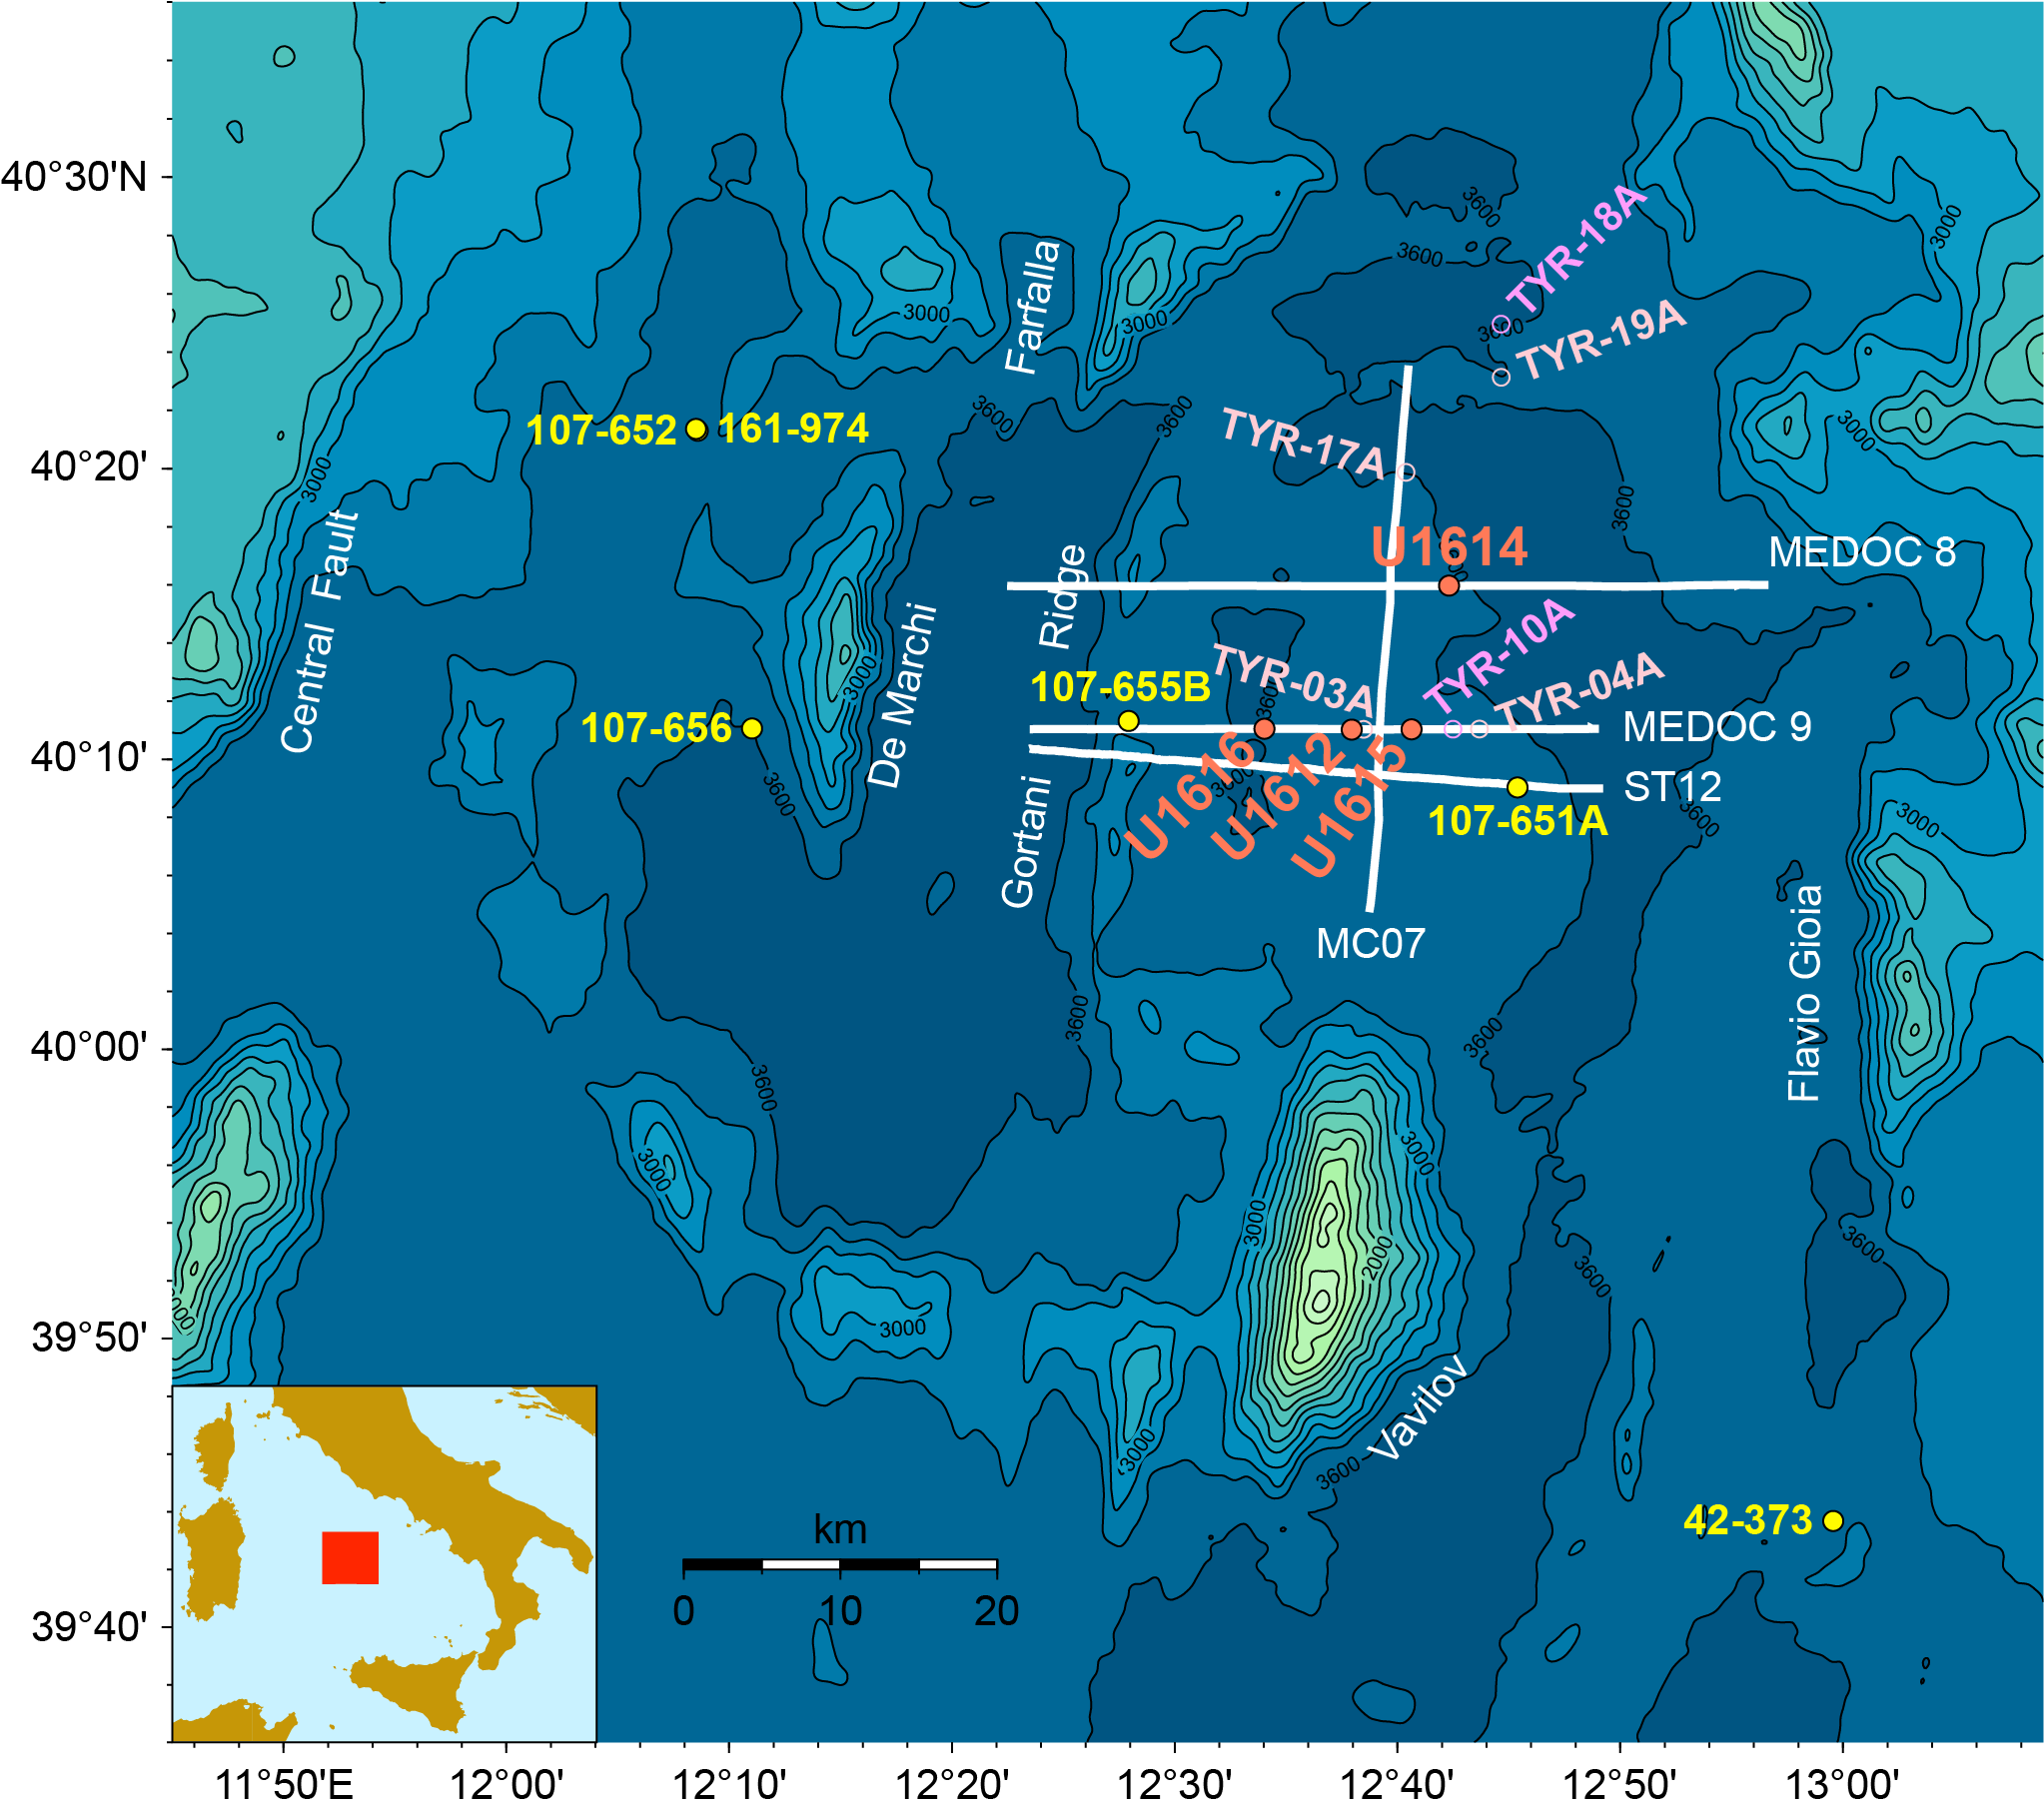
Figure F1. Location map.
Recent analyses of high-quality seismic data show a seismic velocity structure in the Vavilov Basin similar to that of continent–ocean transitions (COTs) where peridotitic mantle has been exhumed by low-angle normal faults and serpentinized by interaction with seawater (Prada et al., 2014). This finding led to the suggestion that most of the basement in the deep Vavilov Basin is composed of mantle peridotite (Prada et al., 2015), whereas previous interpretations considered it to be basaltic oceanic crust (e.g., Kastens and Mascle, 1990). A major goal of Expedition 402 was to test these alternative hypotheses by directly sampling the geologic basement of the Vavilov Basin and advance our still incomplete understanding of COT evolution.
The overall plan for Expedition 402 was to drill a total of six sites forming two transects: an east–west transect targeting the progression from continental crust to magmatic basaltic crust and exhumed mantle and a north–south transect mapping the area of inferred mantle basement. Site U1616 is one of four proposed sites targeting mantle peridotites and is located at the western end of the east–west transect in the Vavilov Basin, which also includes Sites U1612 and U1615 (Figures F1, F2). Site U1616 is located on the flank of an irregular basement high, interpreted to be the uplifted footwall of a long-offset low-angle detachment fault that exhumed the mantle. Similar low-angle normal faults have been proposed to expose deep-seated continental crustal rocks in metamorphic core complexes (Lister and Davis, 1989) and mantle peridotites at the Galicia Atlantic margin (Boillot and Winterer, 1988) and at the axis of the Mid-Atlantic Ridge (Tucholke et al., 1998). Drilling the east–west transect sites aims to clarify the nature and variation of the geologic basement exposed along the inferred detachment fault.
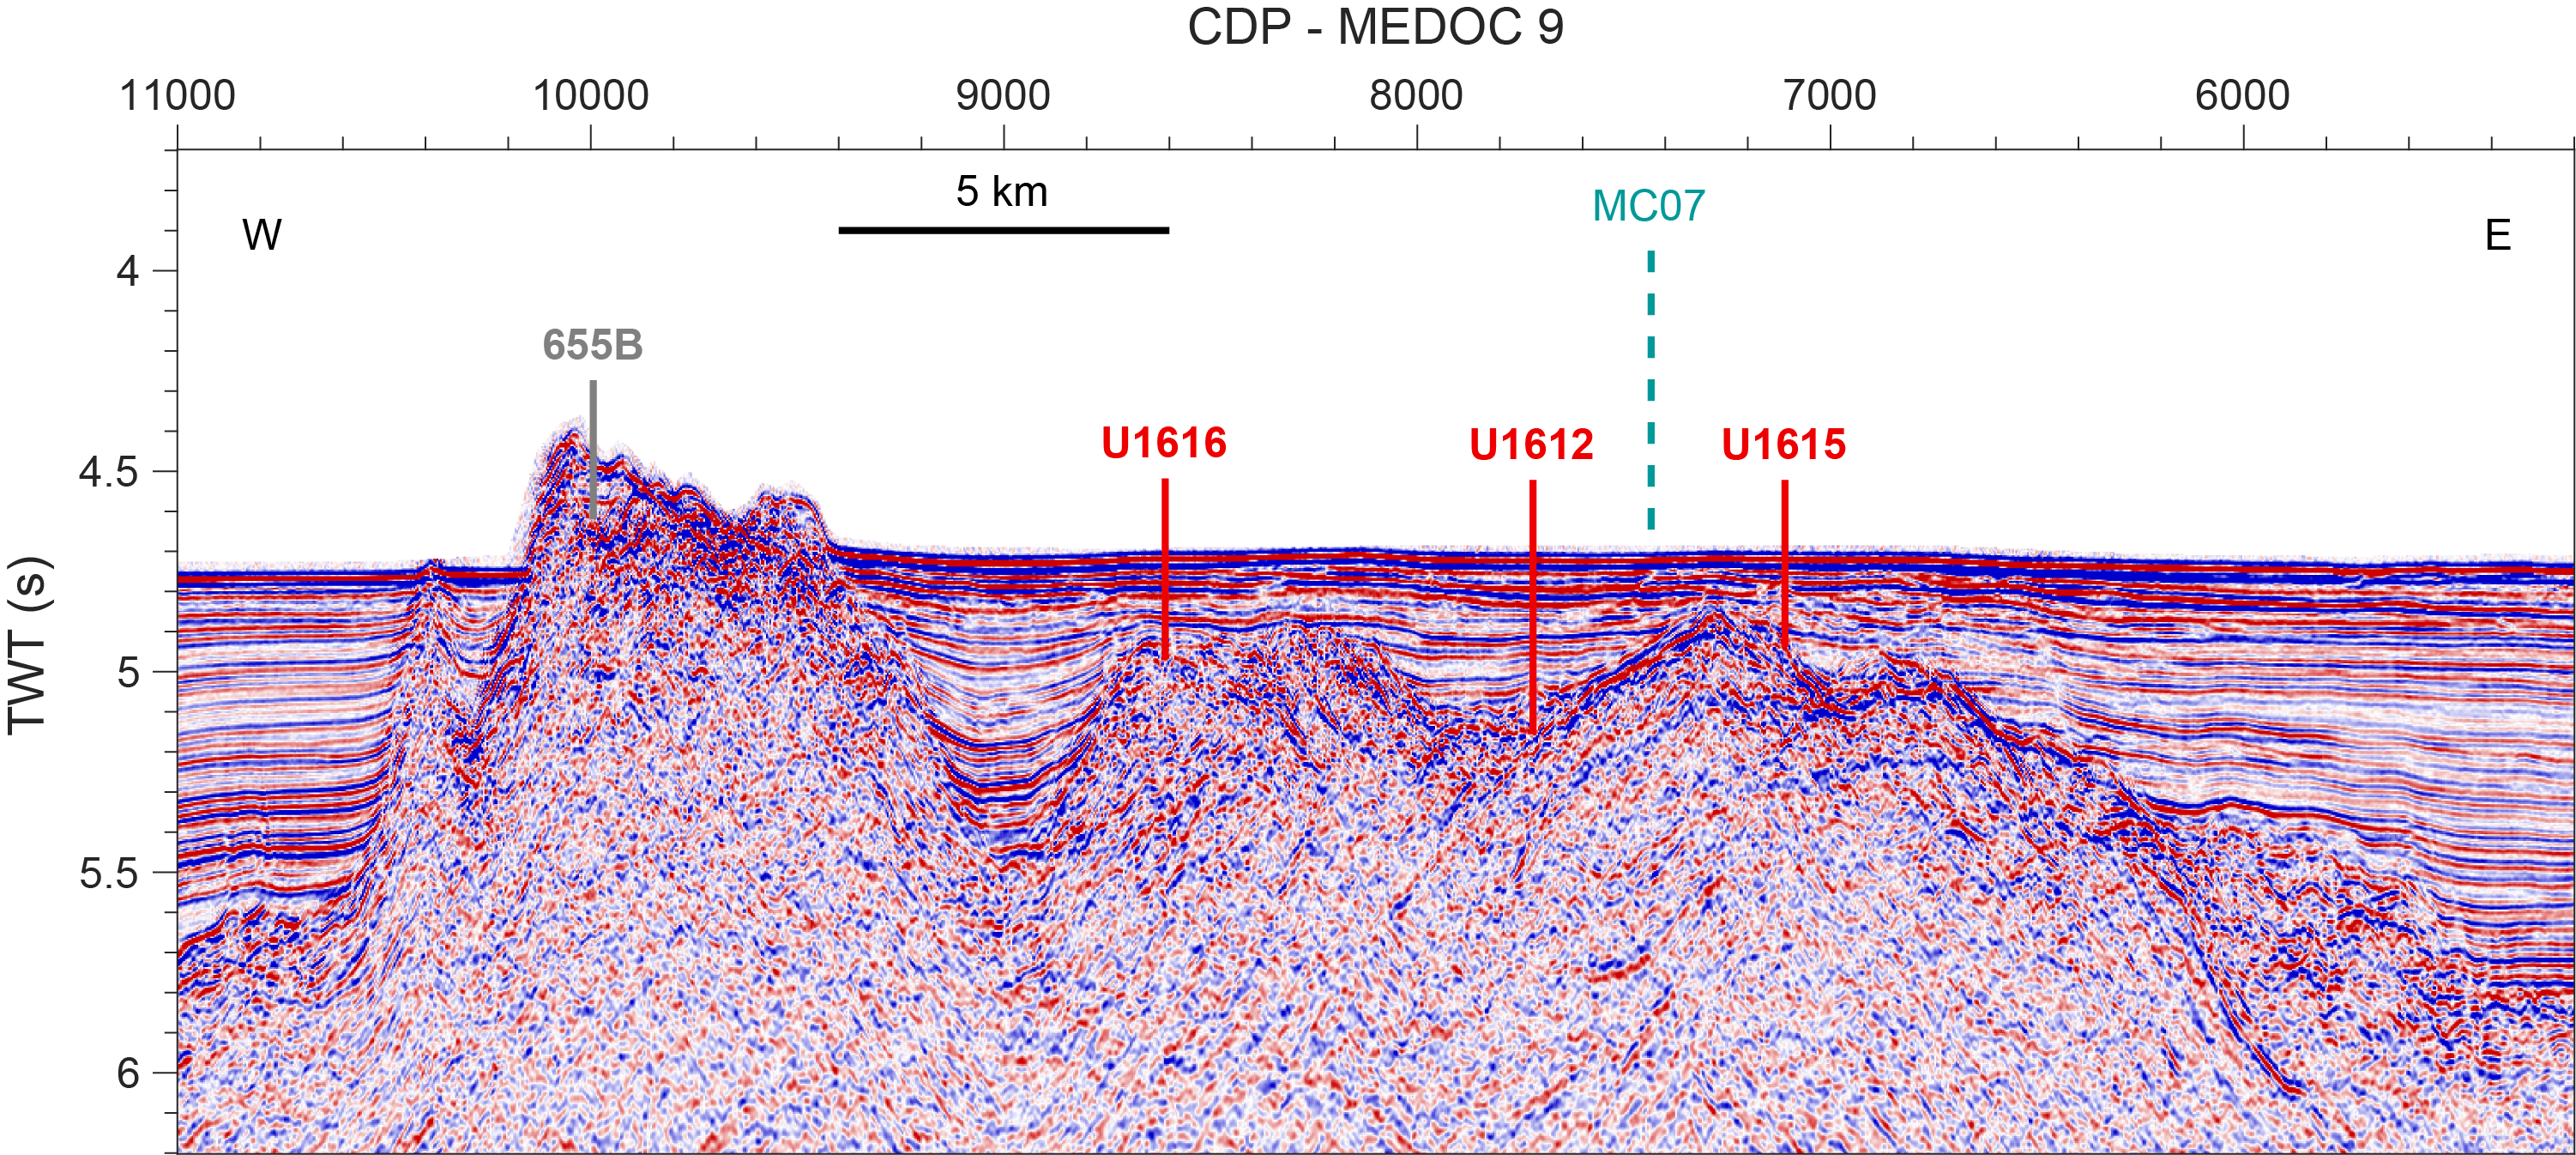
Figure F2. Seismic Line MEDOC 9.
The structural trends in the Vavilov Basin seem to suggest that the basement high drilled along the east–west transect at Sites U1612, U1615, and U1616 may be connected to a similar high about 10 km north sampled at Site U1614, forming an extended north–south trending basement ridge. However, north–south Seismic Line MC07 shows that these two basement highs are separated by a trough where sediment is at least 800 m thick (Figure F3). Emphasizing the lateral variability of the basement topography in this area, east–west Seismic Line ST12, which approximately parallels Seismic Line MEDOC 9 only 2–4 km south (Figure F1), shows a substantially different structure; the basement high of Site U1616 is much more subdued and is buried under a sediment cover about twice as thick (compare Figures F2 and F4).
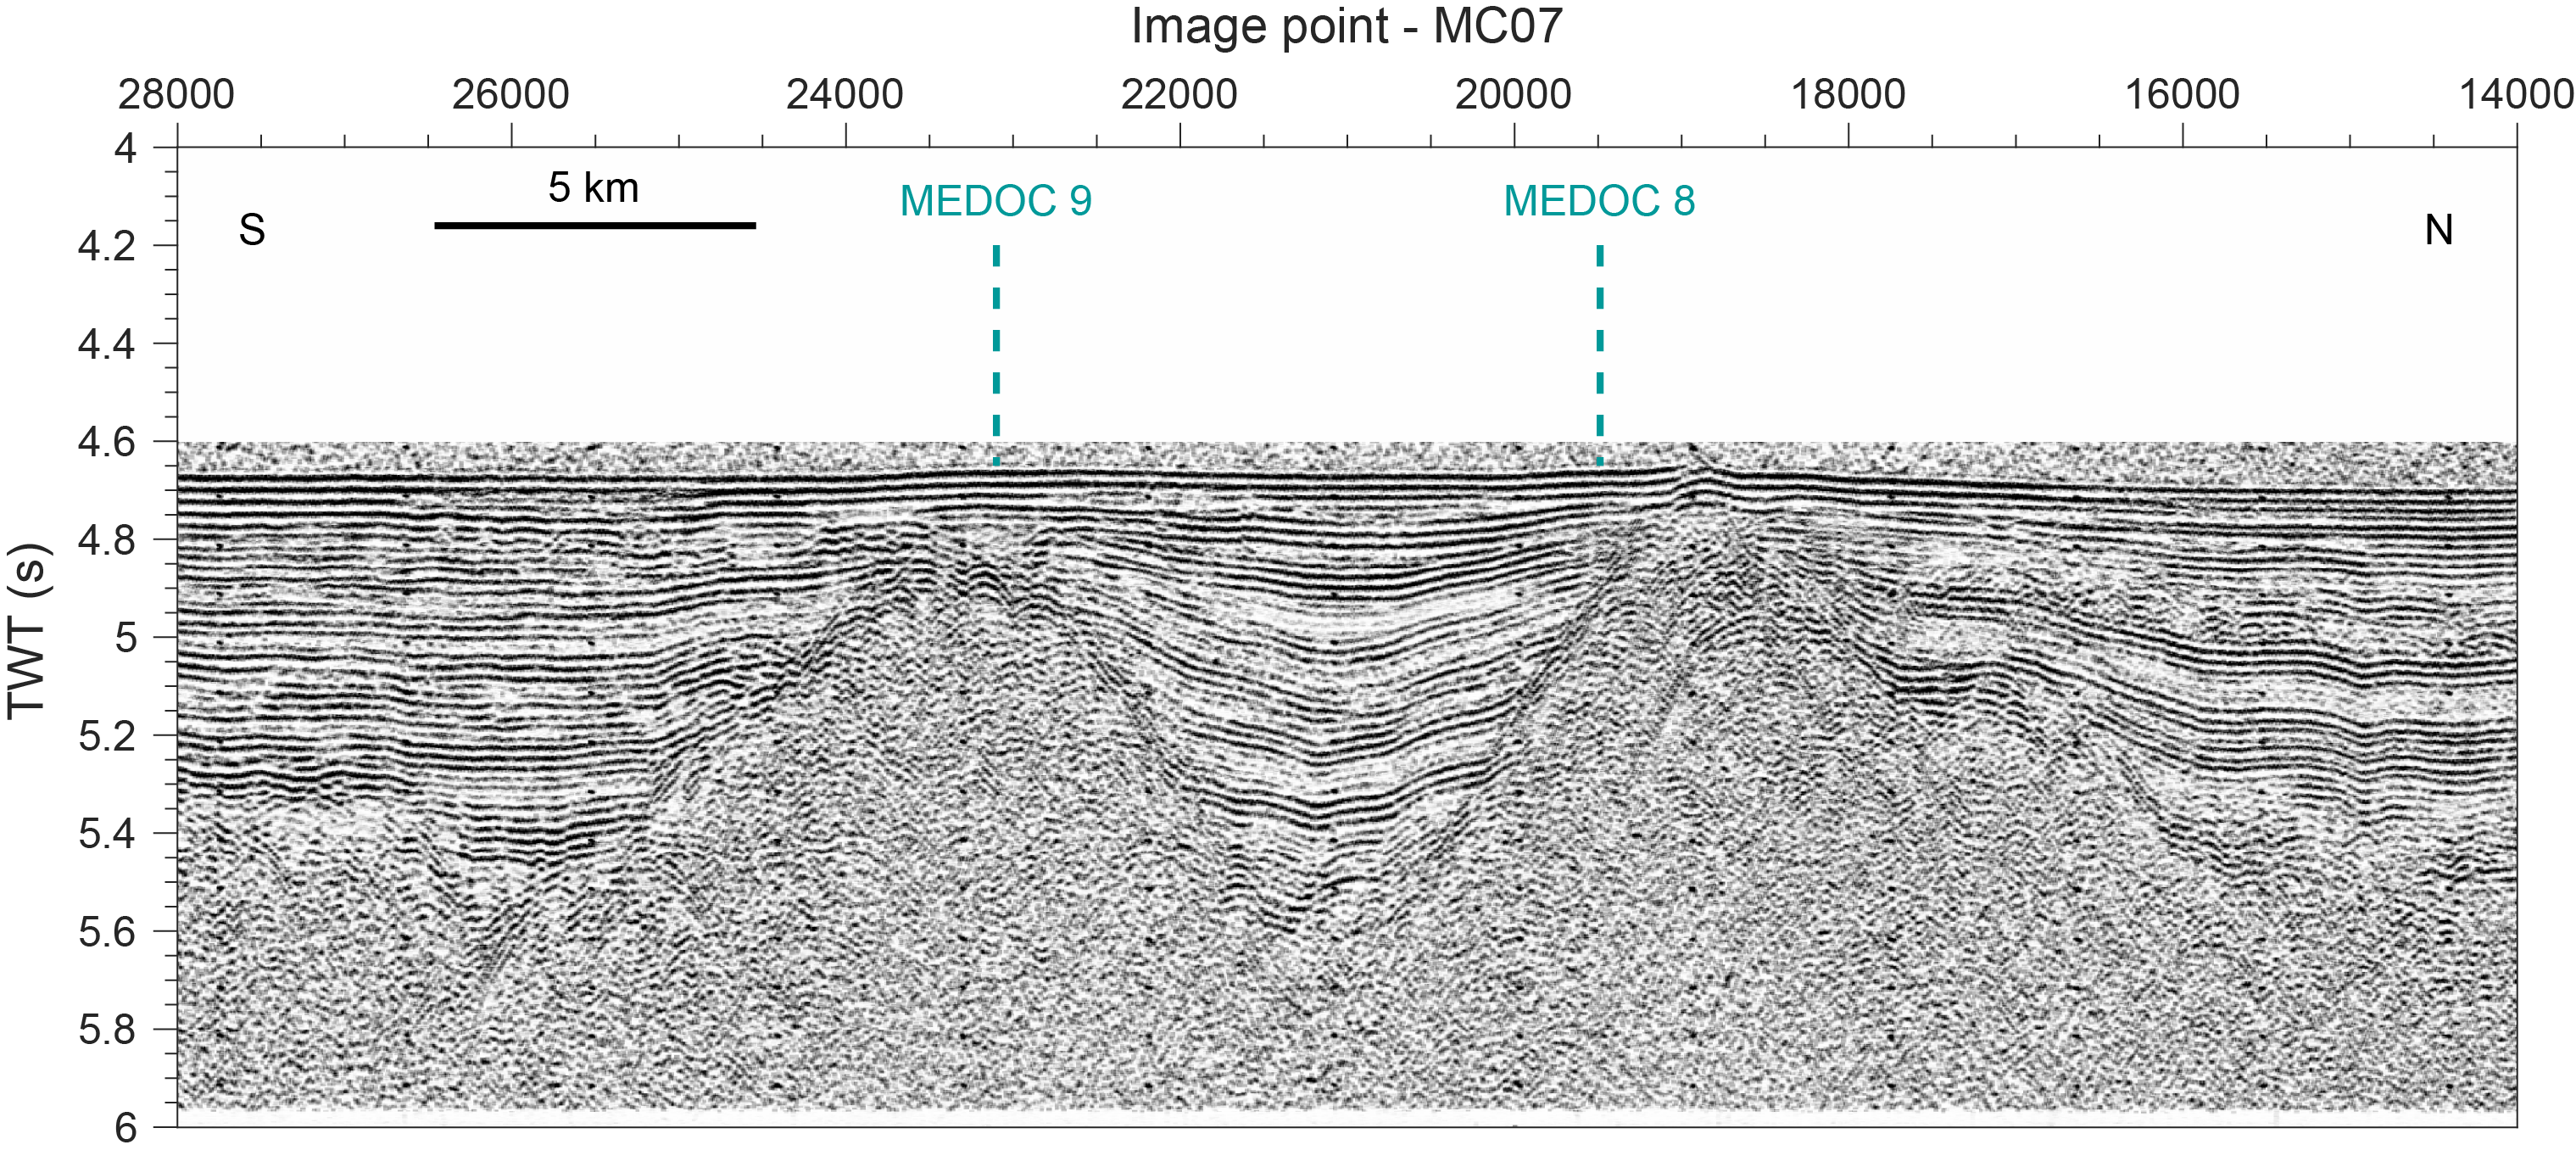
Figure F3. Seismic Line MC07.
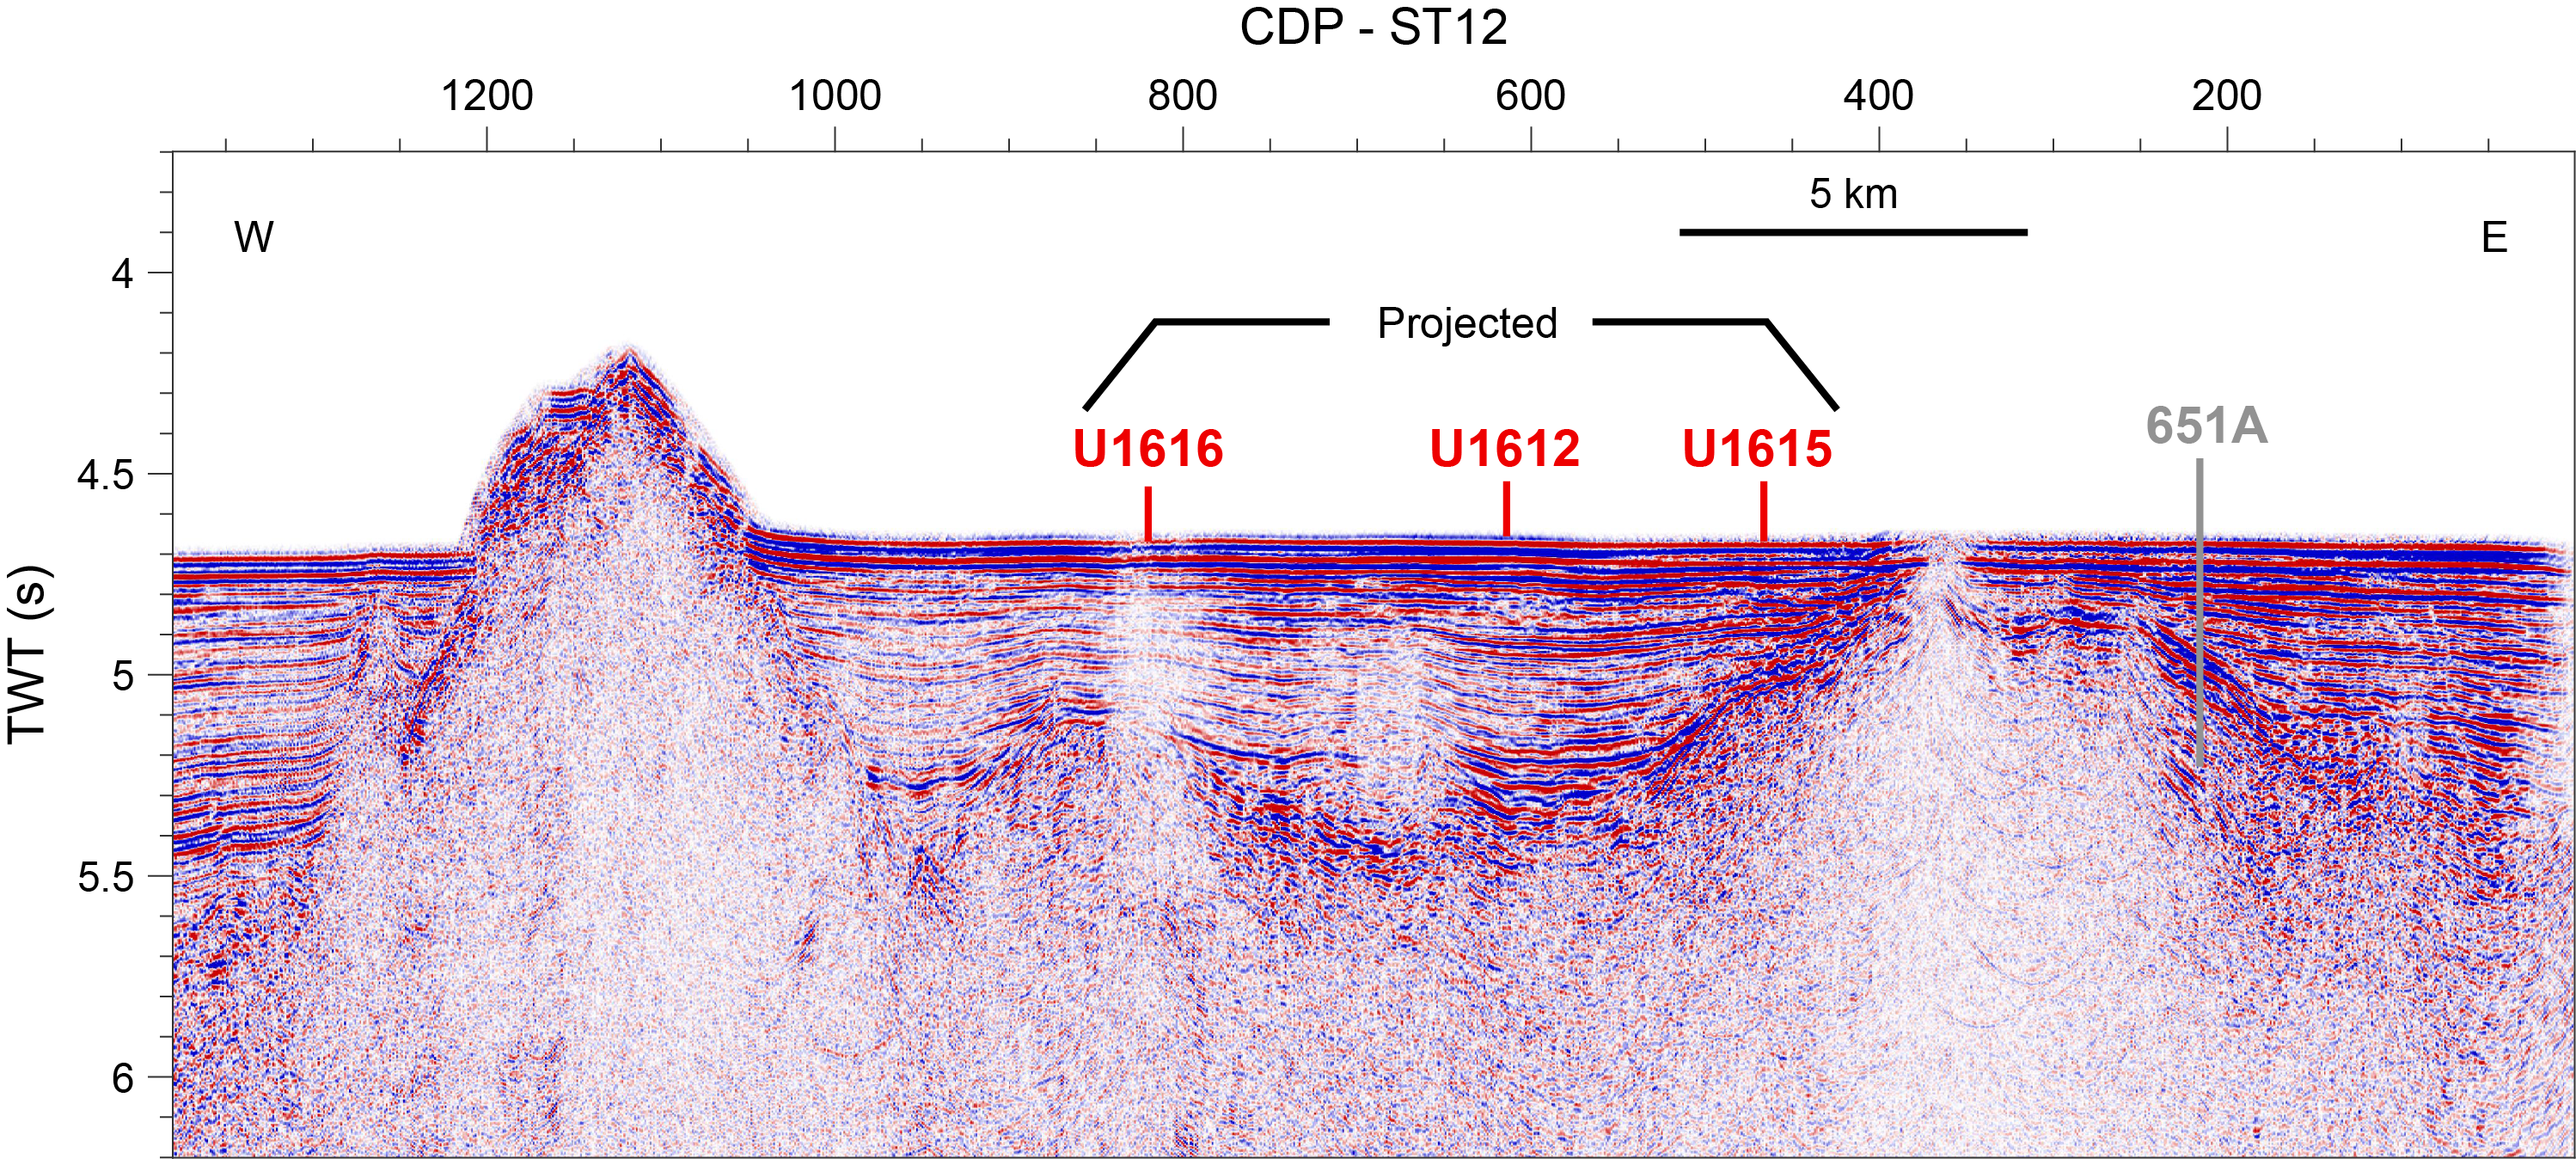
Figure F4. Seismic Line ST12.
As for the other sites in the Vavilov Basin, the scientific objectives of Site U1616 were to date with biostratigraphy and magnetostratigraphy the oldest sediment above the basement contact to constrain the timing of mantle exhumation; to sample sediments and pore fluids above the basement contact to investigate fluid-rock interactions; and to collect basement samples to determine the heterogeneous composition of the exhumed mantle, its degree of serpentinization and alteration, and its pattern of structural deformation. As a result, the initial plan for Site U1616 was to first drill a hole using the rotary core barrel (RCB) system to a total penetration of 320 meters below seafloor (mbsf), including an estimated 180 m of sediment and 140 m of basement to ensure intersection of the exhumation fault zone, which was estimated to be about 100 m thick. Recovery would be particularly important in the few tens of meters above the basement to determine the age of the oldest sediment (and hence the timing of basaltic magmatism or mantle exhumation) from biostratigraphy and magnetostratigraphy and to collect biogeochemical evidence of rock-fluid interactions due to serpentinization at depth. Depending on the sediment recovery in the RCB hole, the plan also allowed for drilling a second hole using the advanced piston corer (APC)/extended core barrel (XCB) system to ensure adequate sampling of the lowermost sediment interval and the sediment/basement interface.
After the loss of two RCB bottom-hole assemblies (BHAs) that became irremediably stuck in Holes U1612A and U1614C in the Vavilov Basin, we were forced to reevaluate the drilling plan. We decided not to drill any sites at the northern end of north–south Vavilov Basin transect (proposed Sites TYR-17A, TYR-18A, and TYR-19A) because their thick sediment cover (~500–1000 m) was likely to contain unstable volcaniclastics. Instead, we focused on Sites U1615 and U1616, located on basement highs in the east–west transect where the estimated sediment cover was much thinner (~200 m). The original order of drilling operations was reversed to first core a hole using the APC/XCB system. The expected high recovery of the sediment interval in this hole would provide a high-quality record above the sediment/basement interface and identify the extent and depth distribution of unconsolidated volcaniclastics. We would then compare the results with those obtained from a similar APC/XCB hole previously drilled at Site U1615, located approximately 10 km east of Site U1616. Based on the observations in the two APC/XCB holes, we would then select either Site U1615 or U1616 to drill a second hole and install a reentry system and casing string that would reach below the base of the problematic volcaniclastics. The second cased hole would then be RCB cored starting above the sediment/basement interface, with the goal of recovering the target 140 m thick basement interval. After coring, downhole geophysical logging was planned in the RCB hole with a focus on obtaining electrical and ultrasonic borehole wall images to complement core recovery and provide key input to the interpretation of the drilled basement interval.
2. Operations
Hole locations, water depths, and coring statistics for Site U1616 are listed in Table T1. All times are provided in local ship time (UTC + 1 h).
2.1. Hole U1616A
The vessel arrived at Site U1616 on 10 March 2024 at 0315 h, following a 5 nmi transit from Site U1615 that was completed in dynamic positioning (DP) mode. The top drive was picked up, and the drill pipe was spaced out for spudding with the drill string filled with the perfluorodecalin (PFD) microbial contamination tracer prior to coring. Hole U1616A was spudded at 0530 h with a 163.5 m long APC/XCB system BHA and a 9⅞ inch polycrystalline diamond compact (PDC) drill bit. The first core recovered the mudline and penetrated 2.7 m into the formation (101% recovery), placing the water depth at 3567.0 m. APC coring continued through Core 6H, reaching 50.2 mbsf and recovering 47.72 m of sediment (95%) overall. Formation temperature was measured with the third-generation advanced piston corer temperature (APCT-3) tool while coring Core 4H. Ship heave increased throughout the morning, and after the recovery of Core 6H the decision was made to pull out of the hole and wait on weather, thereby ending Hole U1616A.
2.2. Hole U1616B
Hole U1616B was spudded at 1500 h on 10 March 2024 after 2 h waiting on weather. This hole began with a drilled interval (drilled interval 11) from the seafloor to 31.2 mbsf, where APC/XCB coring was resumed with Core 2H. Cores 2H–6H advanced 47.5 m and recovered 34.25 m of sediment (72%). An APCT-3 measurement was made during the collection of Core 4H. After Core 6H, a half-length APC (HLAPC) attempt failed, resulting in a dropped core barrel. Two wireline runs were required to retrieve the empty barrel. Cores 7X–29X, drilled with the XCB system, advanced the hole to a final depth of 302.6 mbsf. Recovery was poor in Cores 7X–10X (3%) but improved in Cores 11X–27X (72%). A hard contact was reached during XCB coring of Core 28X, and the rate of penetration slowed. The core advanced 8.3 m after 1 h of drilling and was retrieved with only 6% recovery but containing clasts identified as peridotite breccia. A final core (29X) was collected to verify the basement contact. Coring was terminated, and we began tripping the pipe back to surface. The bit cleared the rig floor at 1700 h on 12 March, ending Hole U1616B. In total, a 271.4 m interval was cored in Hole U1616B with 156.58 m of core recovered (58%). Nonmagnetic core barrels were used for all APC cores, and all APC cores were oriented. The PFD microbial contamination tracer was pumped with the drilling fluid throughout coring.
2.3. Hole U1616C
Site U1616 was selected for the installation of a reentry system and casing because of the relatively high recovery in the sediment column compared to Site U1615 (58% in Hole U1616B compared to 38% in Hole U1615A). In addition, the basement contact is deeper than expected in Hole U1615A and was not reached after 300 m of penetration. Finally, Site U1616 contains less volcaniclastic gravel than Site U1615, which can contribute to hole instability. Before proceeding with the casing installation at Site U1616, operations were conducted in Hole U1617A between 12 and 16 March 2024.
The vessel returned to Site U1616 after coring Hole U1617A. The 40.1 nmi transit was completed at 0112 h on 17 March. After arriving on site, the vessel transitioned to DP mode and preparations began for a jet-in test to verify that the full 64.64 m of 16 inch casing could be washed in. The upper guide horn was removed, and a BHA with a 18½ inch tricone bit was made up. We tripped pipe toward the seafloor and spudded Hole U1616C at 1115 h on 17 March. The jet-in test was successful, penetrating 76.9 m into the sediment in ~3 h. The pipe was tripped back to the surface, and the bit was recovered to the rig floor at 2215 h, ending Hole U1616C. Preparations then began for the reentry system and casing installation planned for Hole U1616D.
2.4. Hole U1616D
With the reentry cone positioned on the moonpool doors, the 64.64 m of 16 inch casing that comprised the first casing string was run through the moonpool and hung in the reentry cone. The string consisted of five joints of 16 inch casing in addition to several 16 inch pup joints that would extend the length of the string past a layer of volcaniclastic gravel at ~60 mbsf that could cause hole instability. The stinger was assembled with the running tool and BHA and latched into the reentry cone with the DrilQuip running tool. The moonpool doors were opened, and the reentry system was lowered toward the seafloor. The vibration isolated television (VIT) camera system was launched to monitor the installation of the reentry cone on the seafloor and the release of the running tool from the reentry cone.
Hole U1616D was spudded at 2000 h on 18 March 2024, and the casing was successfully jetted in to 64.64 m, such that the reentry cone was sitting on the seafloor. From 0430 to 0545 h on 19 March, we attempted to unlatch the running tool from the DrilQuip reentry cone and casing but were unable to rotate. We consequently made the decision to recover and inspect the reentry system and redeploy in Hole U1616E. The casing was pulled out of the hole with a strong overpull experienced when the base of the casing was at ~10 mbsf. The VIT camera system was recovered, and the pipe was tripped back toward the surface. At 1400 h on 19 March, the reentry cone was brought back up through the moonpool and landed on the moonpool doors. We observed that all of the 16 inch casing string below the 20–16 inch crossover was lost. It is likely that the overpull experienced while pulling out of Hole U1616D was due to the casing detachment. The bit was recovered onto the rig floor at 1800 h, ending the hole. Two bent drill collars were removed from the BHA before a new BHA was assembled and latched back into the reentry cone.
2.5. Hole U1616E
The reentry cone with the remaining ~5 m of 20 inch casing was lowered through the moonpool, and we began tripping the pipe toward seafloor to install the reentry cone in Hole U1616E. The VIT with the Conductivity-Temperature-Depth (CTD) sensor and Niskin bottle water sampler attached to the frame was launched at 2330 h and lowered to observe casing installation and release. Hole U1616E was relocated 40 m west of Hole U1616D to avoid encountering any of the lost casing string that might be lying on the seafloor.
Hole U1616E was spudded at 0445 h on 20 March 2024, with the 20 inch casing set at 5.5 mbsf. At 0545 h, the running tool successfully unlatched from the casing. We then pulled out of the hole, recovered the VIT, and tripped pipe back to surface. A drilling BHA with a 14¾ inch tricone bit was used to drill ahead for the installation of 13⅜ inch casing (Figure F5). We began tripping the pipe toward the seafloor and launched the VIT to guide reentry at 2130 h. The hole was reentered at 0120 h on 21 March, and the VIT camera system was recovered. The hole was drilled to 250 mbsf, including a 30 m rathole to allow for fall-in from unstable layers within the sediment column. The drill ahead finished at 1130 h, and the hole was swept with sepiolite mud and then displaced with 170 bbl of barite mud to keep the hole open during casing installation. We then pulled out of the hole and began tripping back to the surface. The VIT was deployed to monitor the bit clearing the reentry cone and the position of the cone on the seafloor because of the shallow depth of the first casing string.
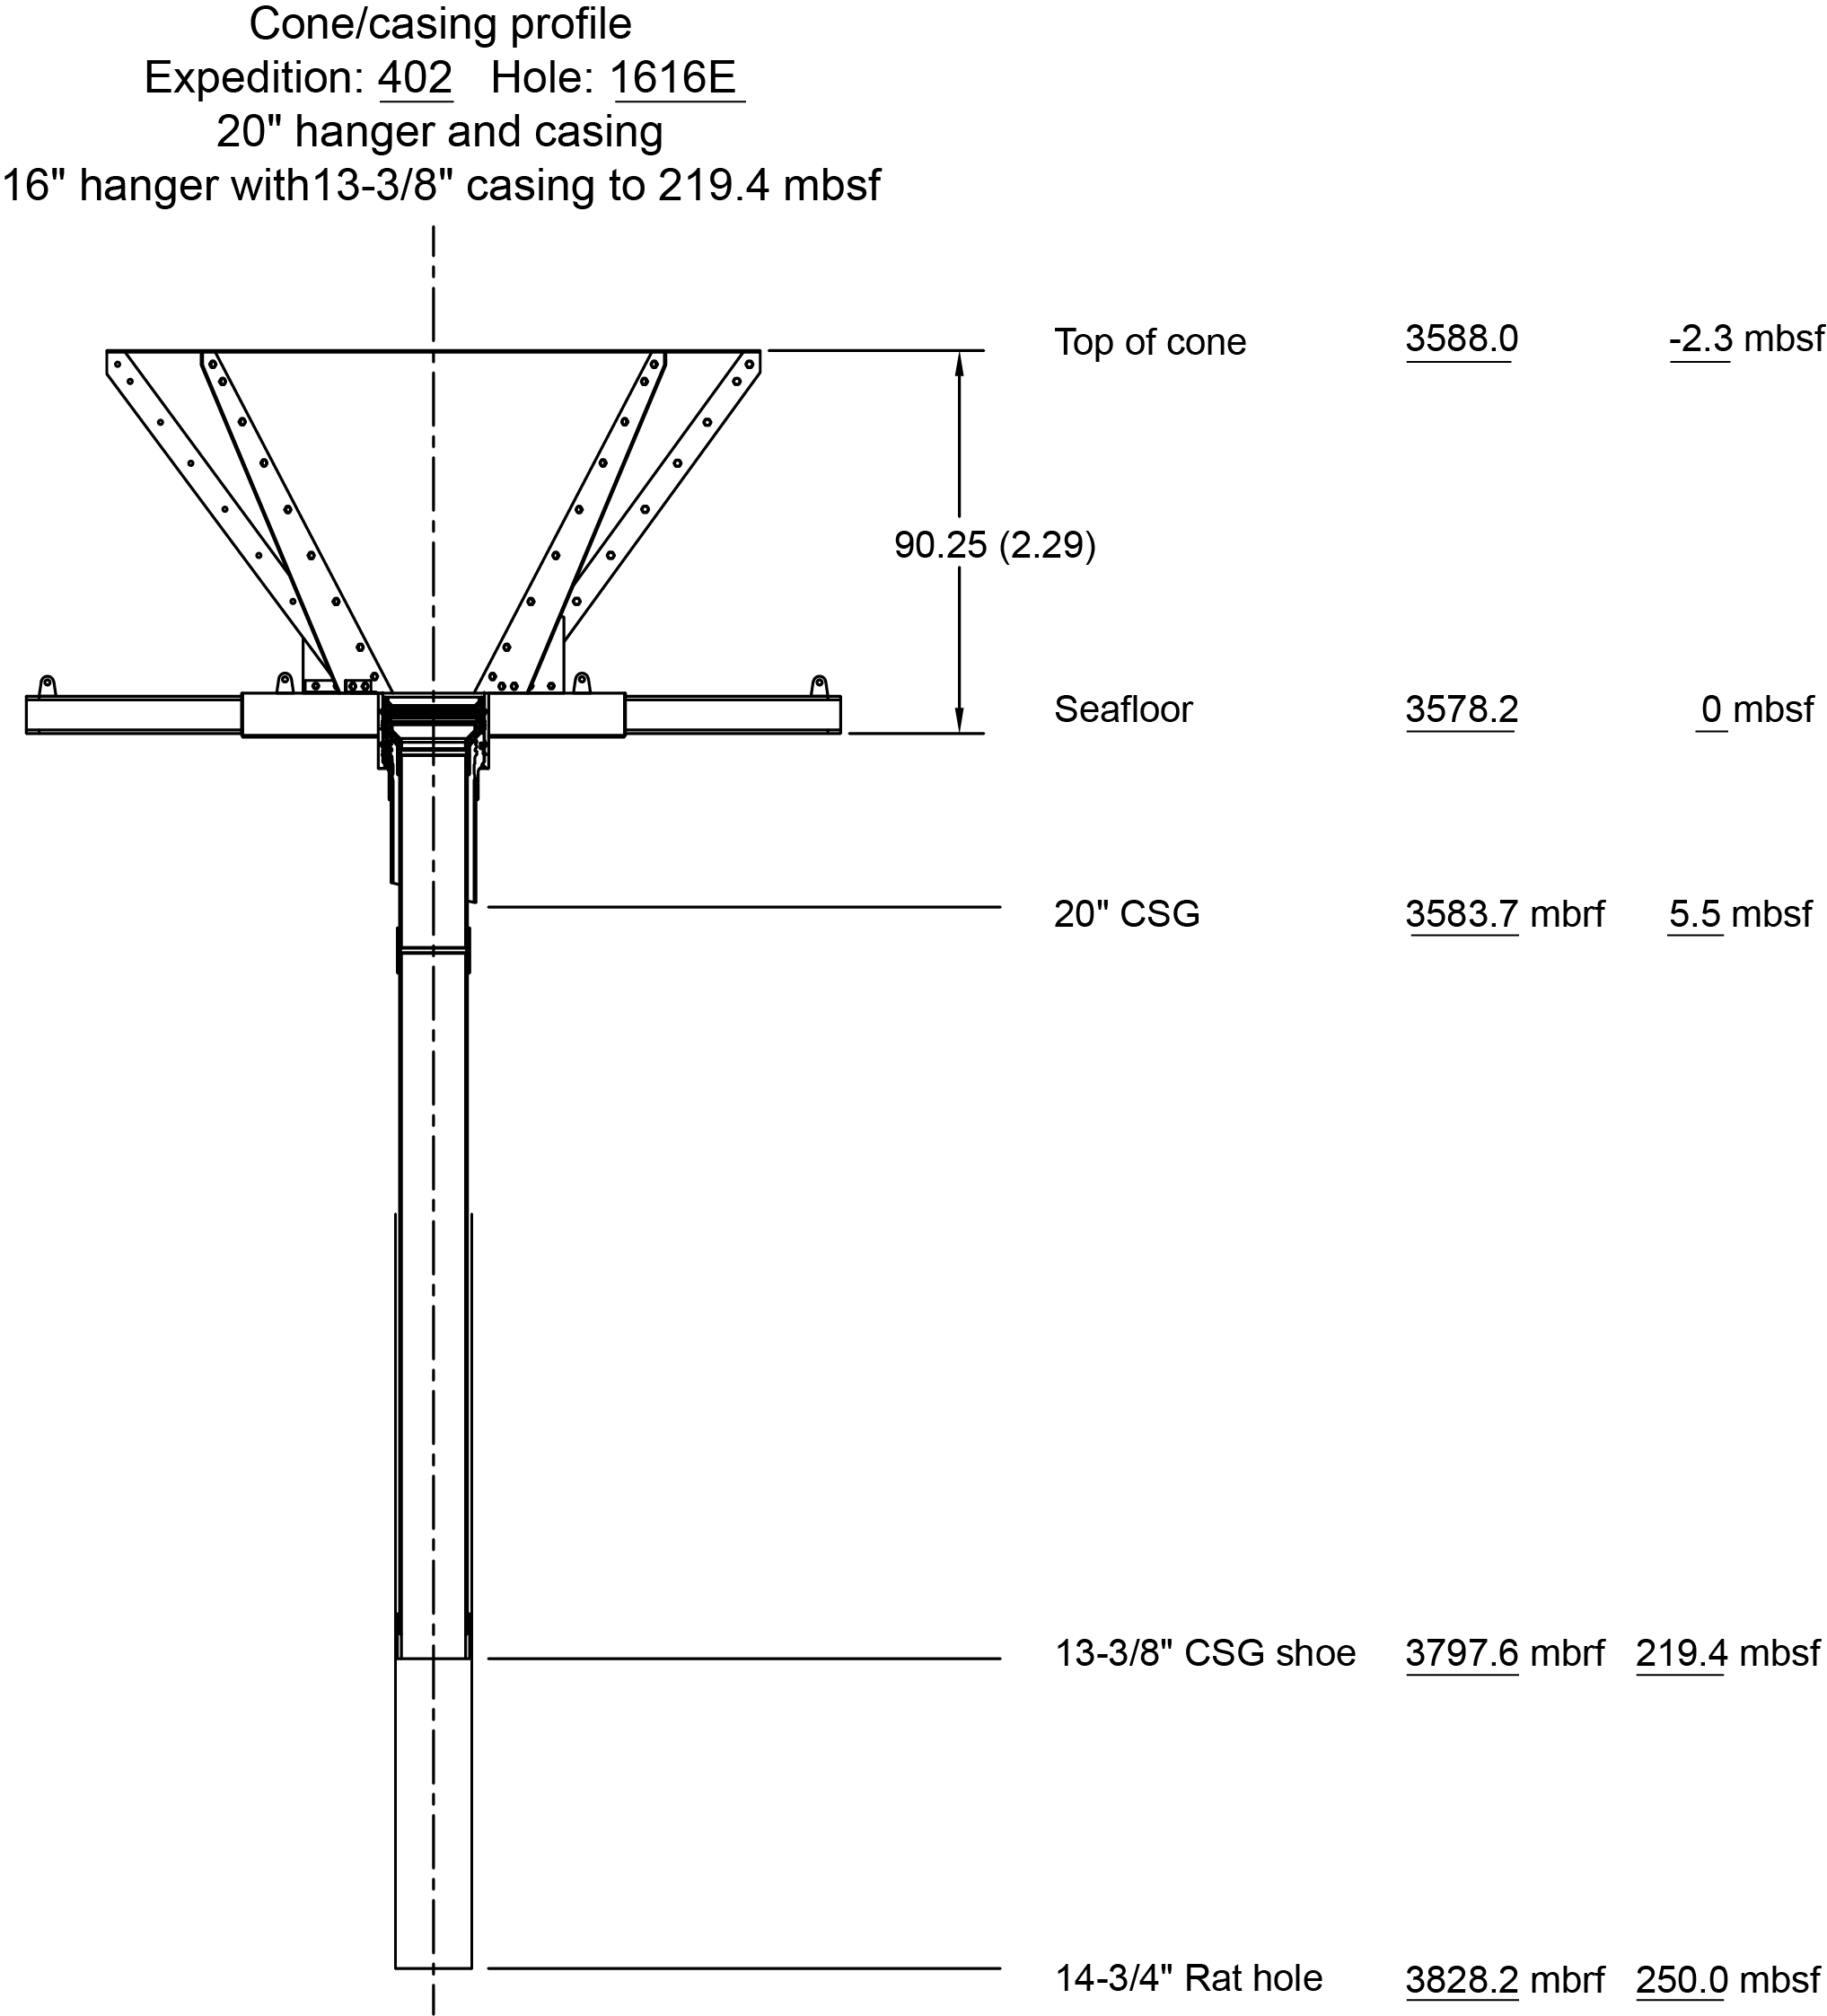
Figure F5. Reentry cone and casing installation.
The 13⅜ inch casing was rigged up and run, and the casing landed on the moonpool doors. The stinger and BHA were made up and run through the casing, and the stinger was latched into the casing hanger. We began tripping the pipe toward seafloor and launched the VIT camera system to facilitate the second reentry in Hole U1616E. We finished tripping pipe to the seafloor and reentered Hole U1616E at 1658 h on 22 March. The casing was washed down to 219.4 mbsf and landed in the reentry cone, and it was released at 2045 h. This casing depth successfully sealed off the volcaniclastic gravel (~60 mbsf) and tuff (~196–206 mbsf) layers that were predicted to pose a threat to the stability of the hole.
Following the recovery of the drill string, a 207.6 m long BHA with a RCB bit and mechanical bit release was assembled and tripped toward the seafloor. Reentry occurred at 1628 h on 23 March with the VIT camera system deployed to facilitate the process. The VIT was then recovered prior to drilling. We washed from the end of the casing (219.4 mbsf) to the bottom of the drilled interval (250 mbsf), encountering fill just below the casing shoe. A center bit was deployed to aid in washing down through the fill, and a 40 bbl sweep of sepiolite mud was pumped at the bottom of the hole to further clear the hole.
RCB coring in Hole U1616E started at 2200 h on 23 March. Cores 2R–23R penetrated from 250.0 to 371.0 mbsf. Cores 2R and 3R recovered 5.08 m of sediment from a 19.6 m advance (26%). A hard contact between sediment and a peridotite breccia was encountered in Core 4R, and recovery in Cores 4R–9R was very low (10%). All cores after Core 4R were drilled as half advances to improve recovery. Drilling parameters and formation lithology became more consistent beginning with Core 10R (303.5 mbsf), which was designated as the top of the basement and marks a transition from breccia into peridotite. Cores 10R–23R advanced 67.5 m into the basement and recovered 17.5 m of hard rocks (26%). While drilling Core 23R, the drill string experienced high torque and overpull at the bottom of the hole. Attempts to clean the hole bottom of any debris were unsuccessful, and coring was terminated in favor of logging after about 3 h of effort. Core 23R ultimately recovered 0.15 m of rock out of a 2.8 m advance (5%). Overall, this top interval of Hole U1616E consisted of a 121.0 m cored interval with 25.87 m (21%) recovered. All cores were taken with nonmagnetic core barrels.
The hole was conditioned for logging with a 40 bbl sweep of sepiolite mud and reamed to flush out cuttings and debris. The VIT was deployed, and we pulled the drill string out of the hole, clearing the seafloor at 0545 h on 26 March. The vessel was moved away from the reentry cone, and the bit was released on the seafloor. After successfully completing this operation, we reentered Hole U1616E for the fourth time at 0815 h and recovered the VIT. The triple combination (triple combo) tool string was rigged up and deployed at 1230 h on 26 March with the end of the drill pipe set at 266.6 mbsf, ~10 m above the sediment/breccia contact. The tool encountered an obstruction at 311.7 mbsf just below the breccia/basement contact at 303.5 mbsf. We made the decision to recover the triple combo tool string, lower the drill pipe past this interface, and attempt a second logging run. The tool string was deployed for this second logging run at 1900 h, reaching 251.8 mbsf, where it encountered an obstruction inside the drill pipe. Attempts to clear the obstruction using circulation were not successful because the pipe maintained ~500 psi of pressure. Consequently, we ended logging operations and began pulling the triple combo string out of the hole. After recovery of the tool string, the circulating head was rigged up and 1000 psi was applied to the drill pipe to clear the obstruction. The drill pipe was then recovered, and the end of the pipe cleared the seafloor at 0245 h on 27 March. The end of the pipe cleared the rotary, and the rig floor was secured for transit at 0925 h, ending the initial phase of operations in Hole U1616E.
A plan was formulated to continue drilling through this high-torque interval using a tricone bit, but we decided to first drill a second hole at Site U1617 using the RCB system to attempt to recover the complete Messinian succession and reach the underlying basement. After completing operations at Site U1617, the vessel returned to Site U1616. The transit from Site U1617 included surveying with the 3.5 and 12.0 kHz sonar systems over a region of geologic interest. The addition of the survey resulted in a 43 nmi transit that was completed at 0324 h on 1 April at an average speed of 11.3 kt.
Once positioned over Hole U1616E with the vessel in DP mode, a drilling BHA was set up with a 9⅞ inch tricone bit and the pipe was tripped toward the seafloor. The VIT camera system was launched to observe the reentry. The fifth reentry of Hole U1616E occurred at 1400 h on 1 April, the VIT was recovered, and the drill pipe was tripped toward the hole depth of 371.0 mbsf. Ledges or obstructions in the hole were encountered starting at 254.8 mbsf; the top drive was picked up, and drilling fluid was circulated to clear out the hole. The hole was reamed and washed to 371.0 mbsf and then drilled from 371.0 to 400.0 mbsf (drilled interval 241). We tripped the pipe out of the hole, recovered the tricone bit, and set the RCB BHA with a C-7 bit. We began tripping the pipe back toward the seafloor and launched the VIT camera system to facilitate the sixth reentry into Hole U1616E. Reentry occurred at 2208 h on 2 April, and the VIT was recovered.
Cores 402-U1616E-25R through 30R were all drilled as half advances, penetrating 27.2 m deeper into the basement and recovering 5.24 m of mantle rocks (19%). The final hole depth was 427.2 mbsf, including 123.7 m of basement penetration below the peridotite breccia. The rate of penetration during this second phase of operations in Hole U1616E was 12.1 m/h, but the frequent wiper trips and mud sweeps required to keep the hole stable took considerable time. During the recovery of Core 30R, the drill pipe was pulled up above the bottom of the hole to circulate drilling fluid. For the next ~9 h, we reamed and cleaned the hole in an effort to remove cuttings and/or fill but were unable to reach the bottom of the hole. At 1000 h on 4 April, the decision was made to stop coring in Hole U1616E and begin logging operations. A ghost core (31G) was recovered; it contains 0.78 m of rubble from an unknown depth within the hole. Coring in Hole U1616E had an overall recovery of 21%.
Because of the challenging hole conditions, we decided to fully trip the pipe back to the surface and reenter Hole U1616E with a logging bit that would give us a greater ability to work through obstructions. The BHA with the logging bit was deployed, and while the pipe was being tripped toward seafloor the VIT camera system was launched to facilitate the reentry. The seventh reentry into Hole U1616E occurred at 0538 h on 5 April, and the VIT was recovered. We picked up the top drive and used it to lower the drill string with the logging bit to 317.1 mbsf before the top drive was retracted.
We deployed the standard triple combo tool string without the radioactive source in the Hostile Environment Litho-Density Sonde (HLDS) because of concerns about hole stability. The bottom of the triple combo tool string passed ~25 m out of the logging bit, reaching 342.0 mbsf in the open hole before an obstruction was encountered and the entire tool string was recovered. The hole was reamed from 317.1 to 417.0 mbsf, where we encountered significant fill ~10 m above the total hole depth. We then pumped a mud sweep to condition the hole before pulling the pipe back up for the second logging attempt; however, we lost rotation and got stuck at ~353 mbsf. We were able to work the stuck pipe and eventually ream back to the casing shoe. These unsafe hole conditions deep within the hole precluded further logging efforts. The pipe was tripped back to the surface, and the drill bit was recovered onto the rig floor at 0630 h on 6 April, ending operations at Site U1616. Total operational time at Site U1616 was 18.0 days over the three visits to the site.
3. Lithostratigraphy
Holes U1616A and U1616B cored a total of 321.6 m of sediment and basement rocks with overall recoveries of 95% and 58%, respectively (Figure F6). The cored sediment is divided into three major lithostratigraphic units ranging in age from Holocene to Early Pliocene based on shipboard nannofossil and planktic foraminifera biostratigraphy (Figure F7). In addition, Hole U1616E cored through ~20 m of sediments above the basement (contact with breccia at 270 m core depth below seafloor, Method A [CSF-A]), which have been described as foraminifera-rich nannofossil ooze (Unit II) and dolomitic-rich nannofossil ooze with foraminifera (Unit III). The boundary between Units III and IV is the primary contact between the sedimentary cover and the breccia and mantle peridotites underneath.
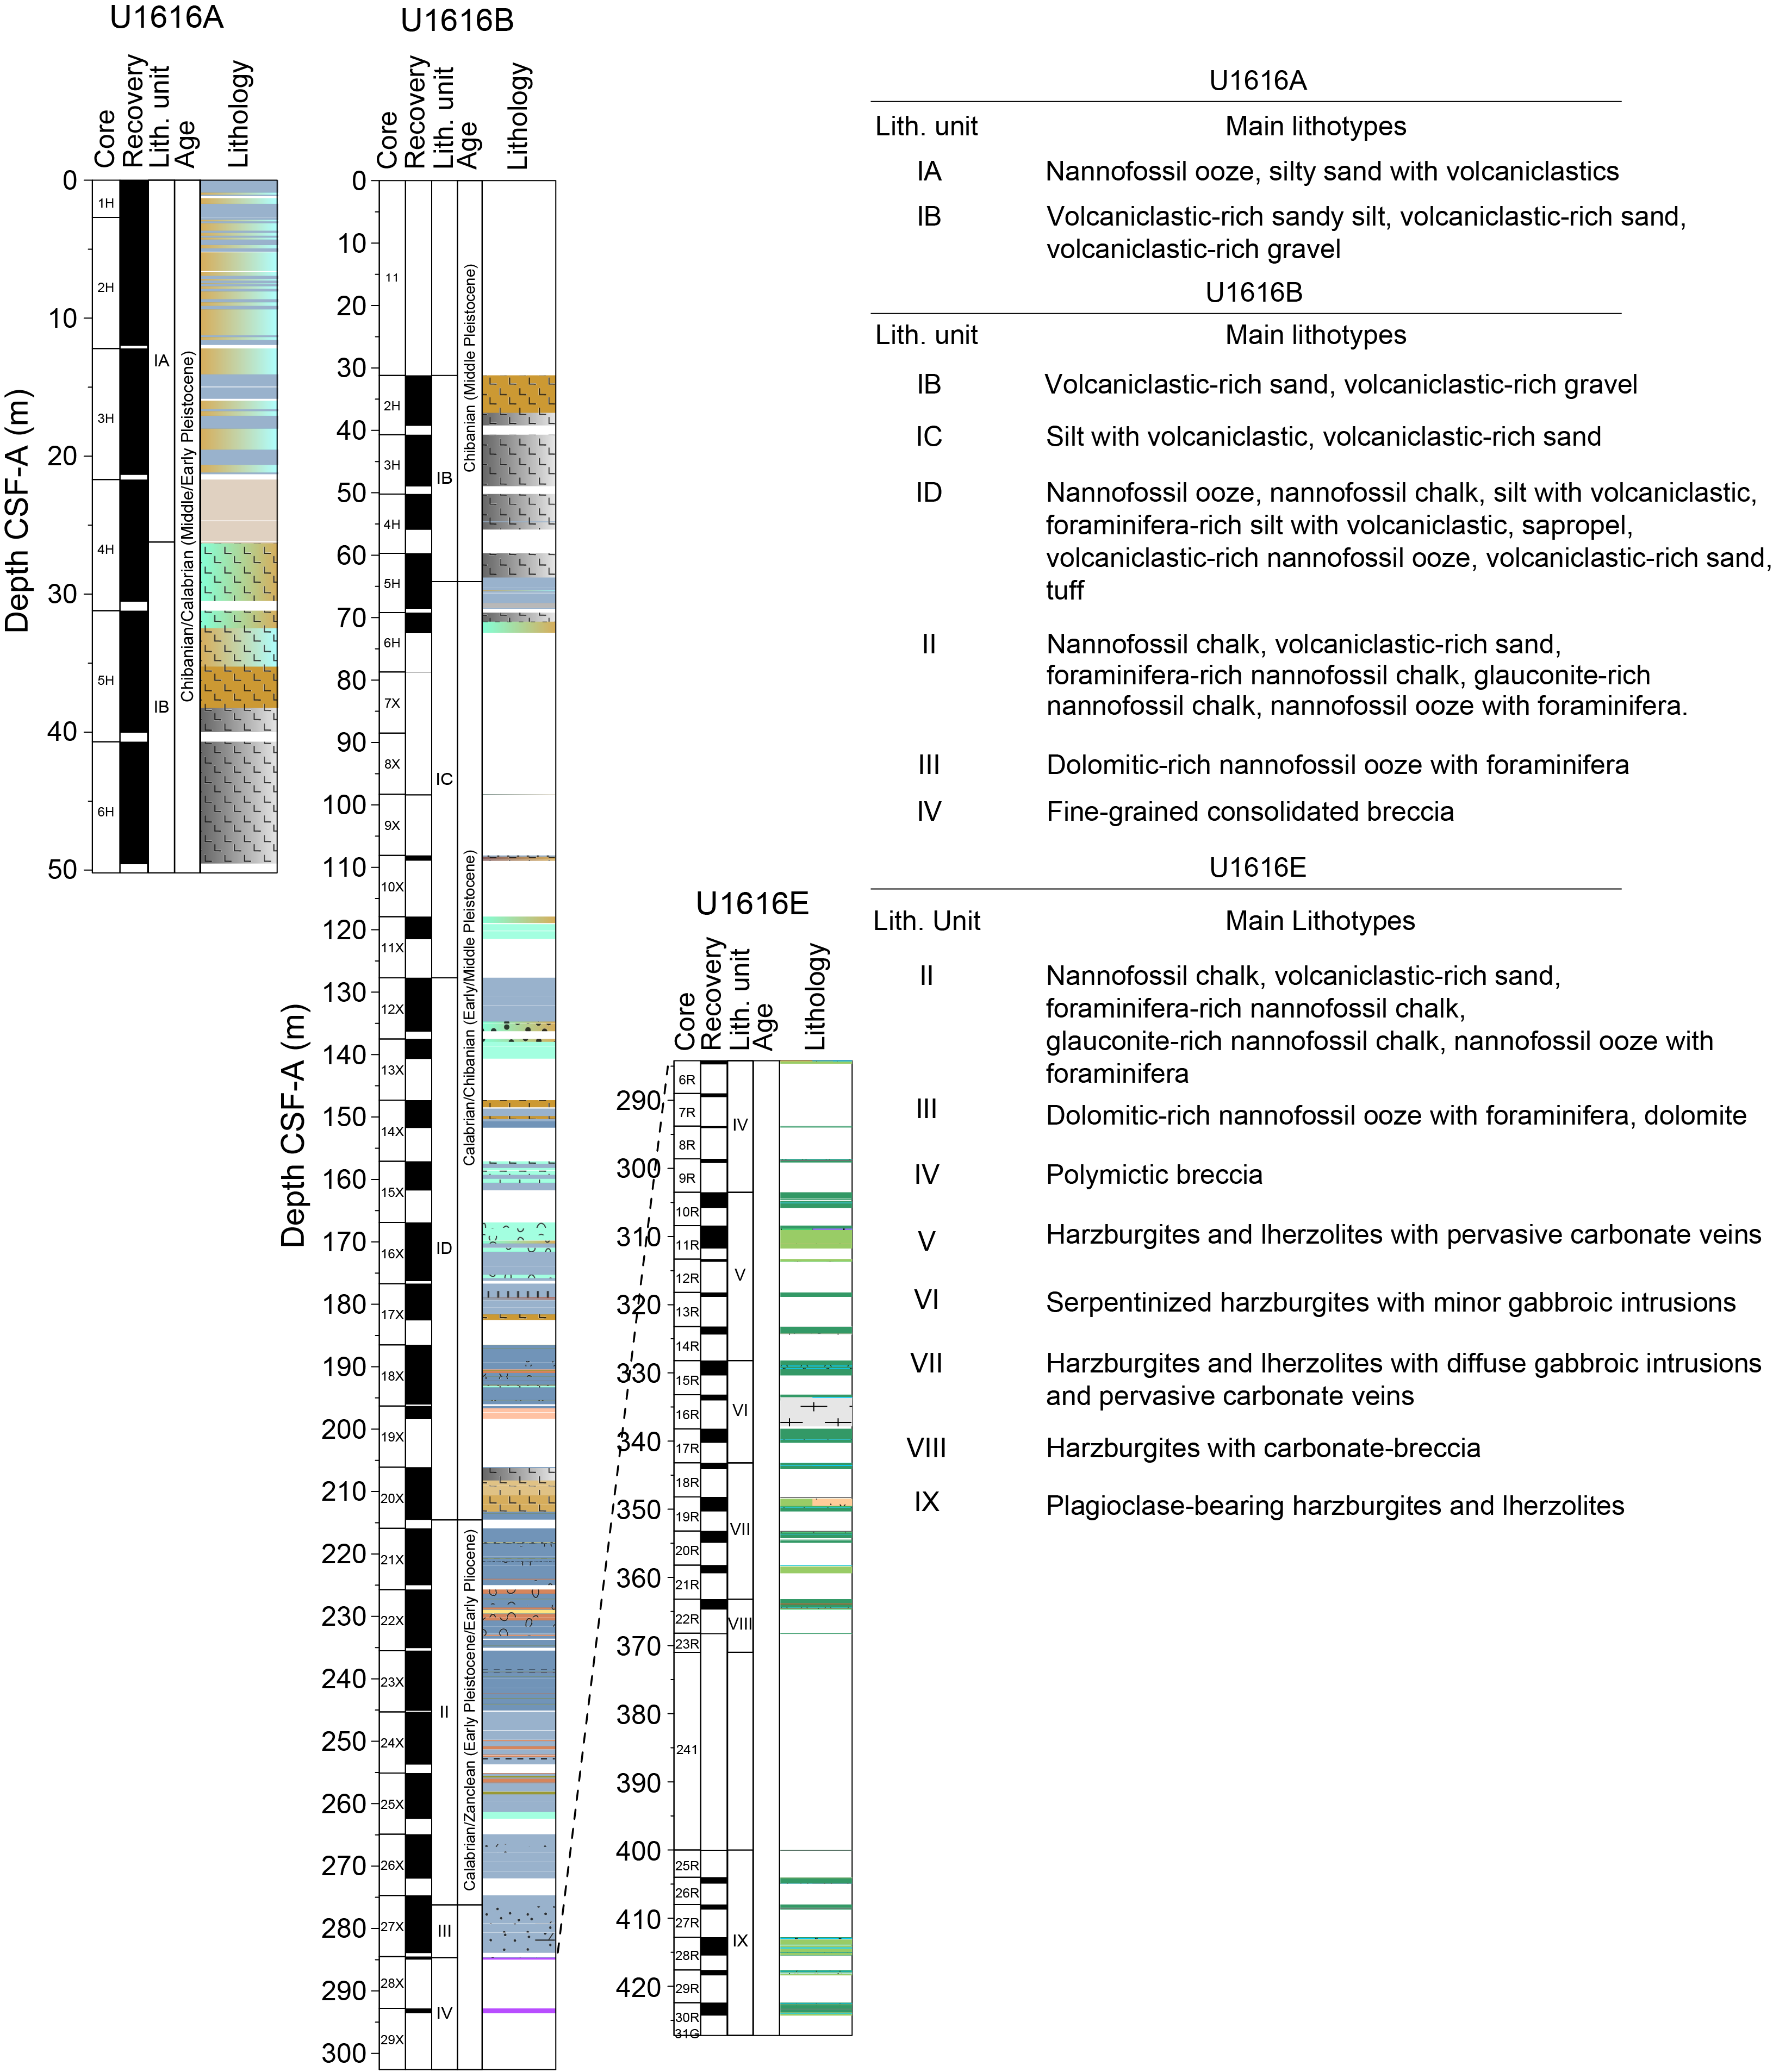
Figure F6. Lithostratigraphic summary.
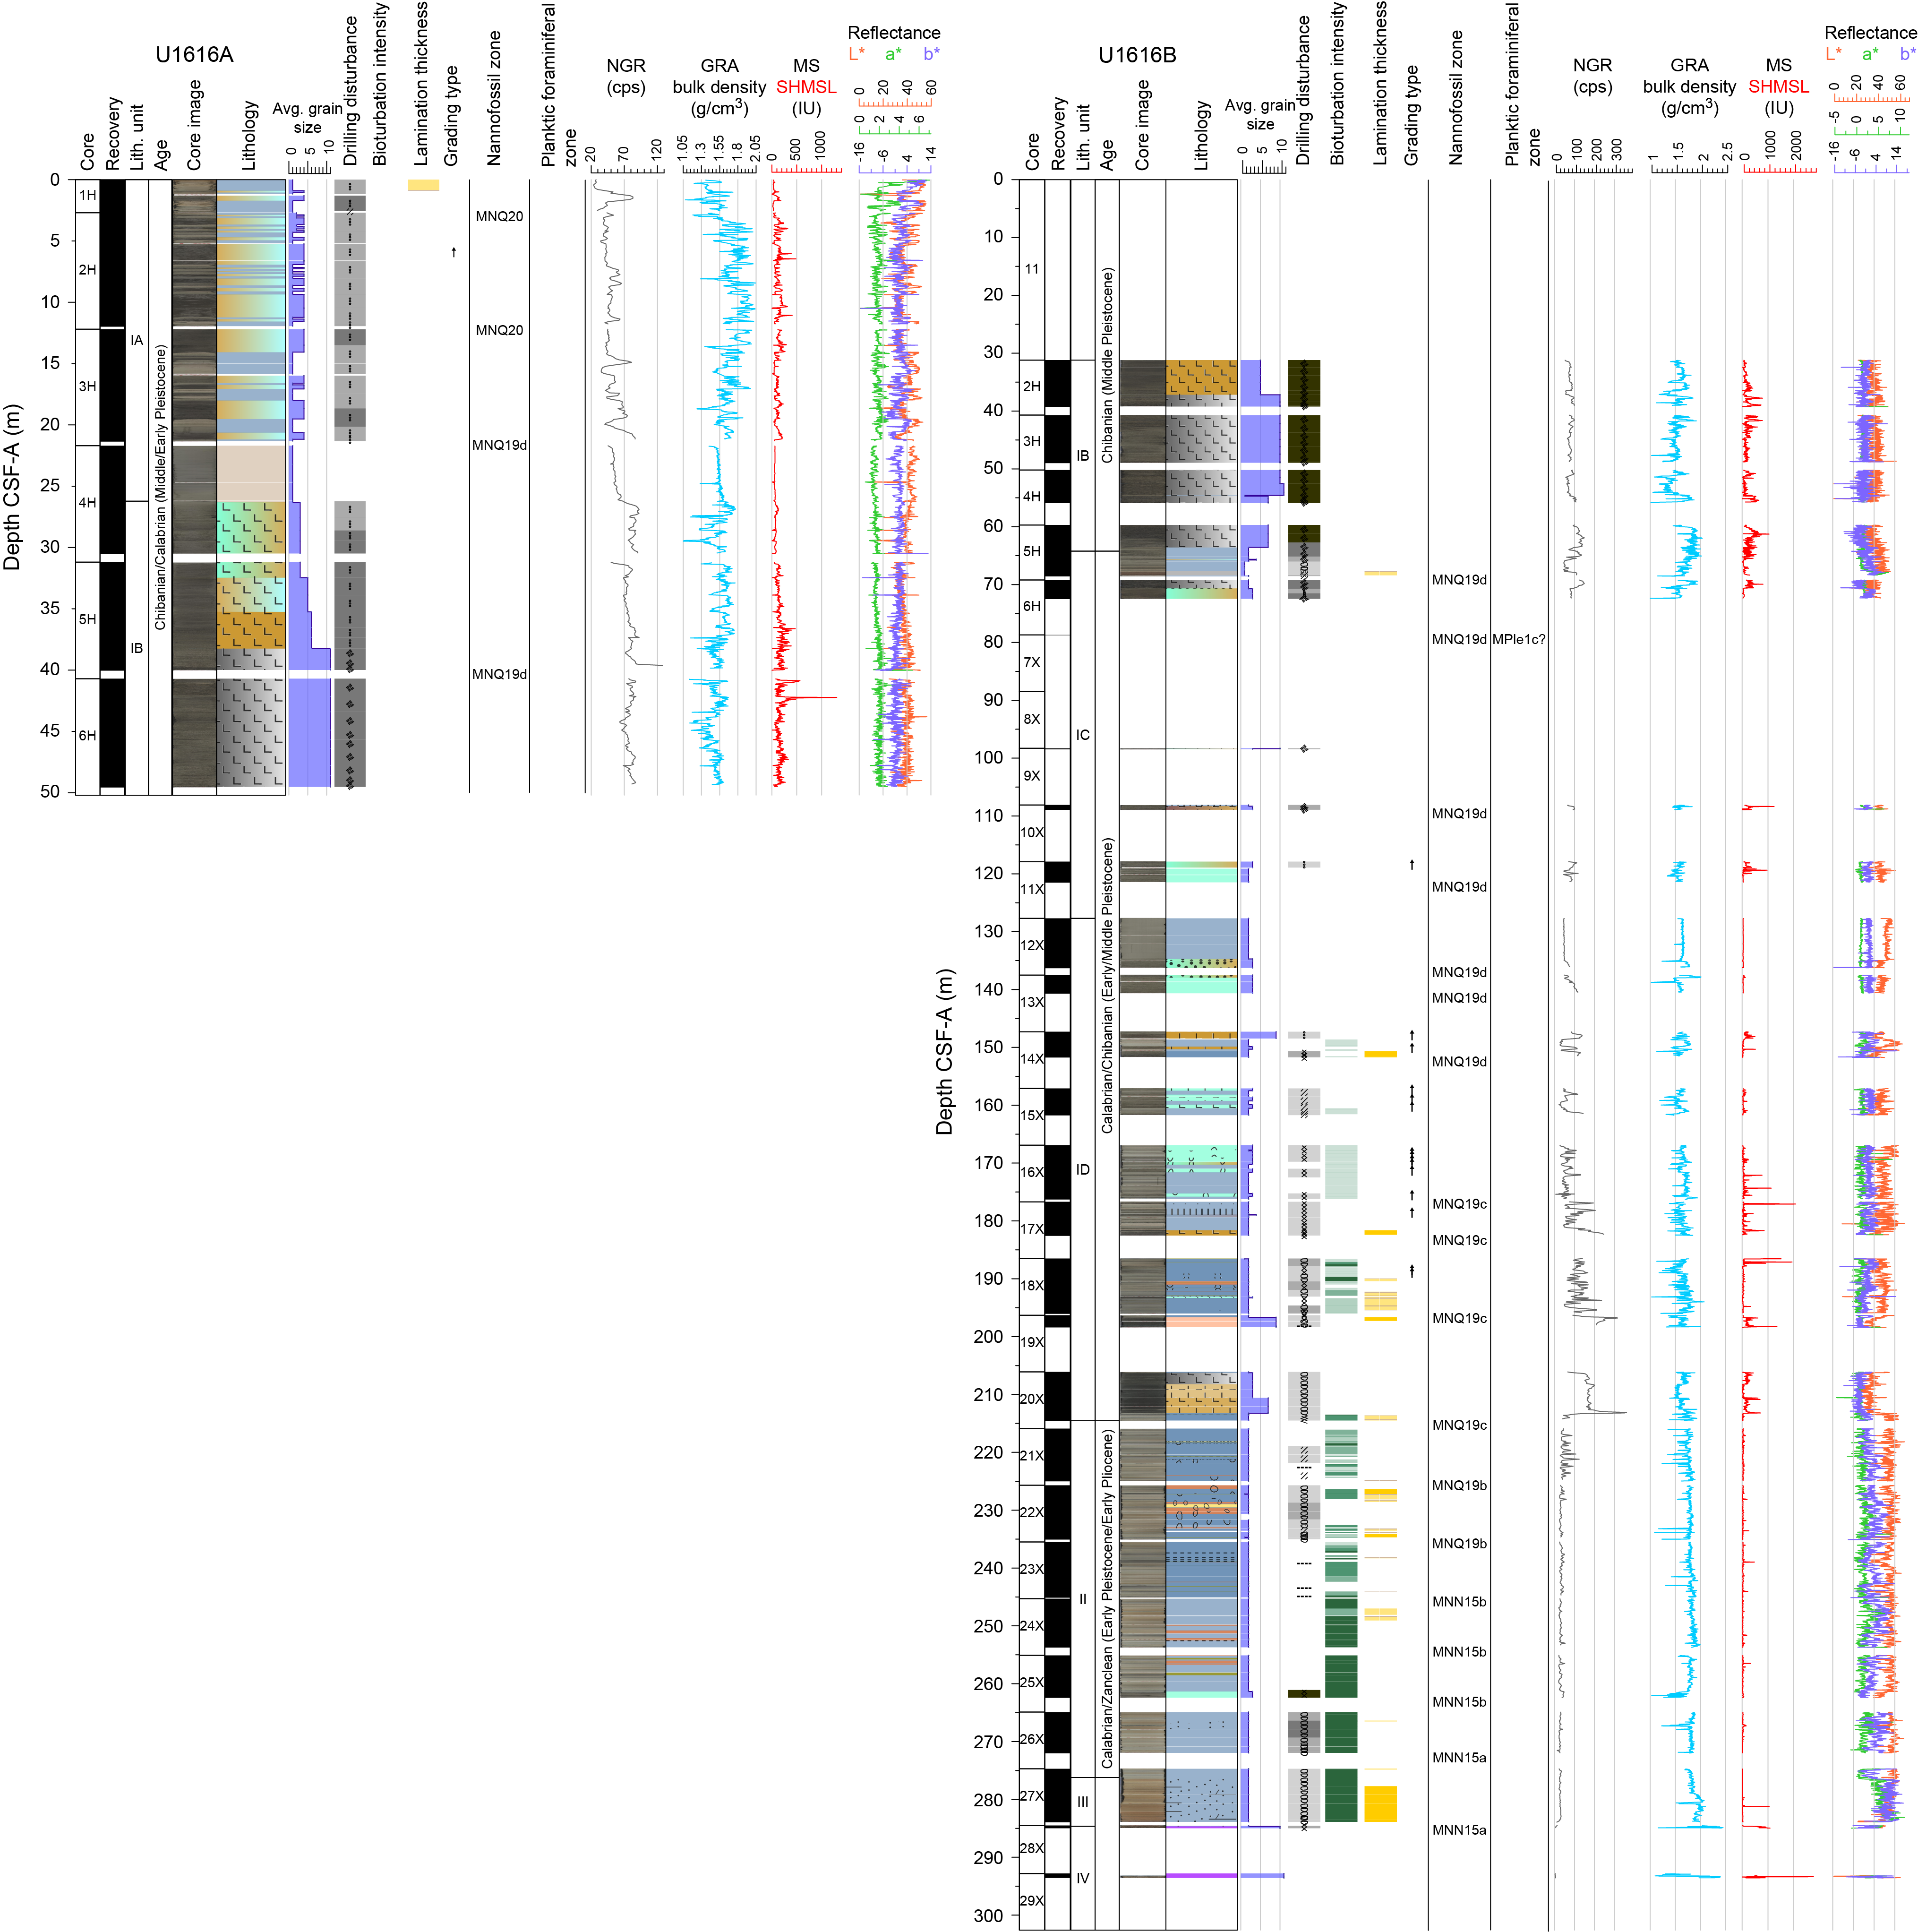
Figure F7. VCD.
Unit I is divided into four subunits based on the abundance of volcaniclastic material and sapropel- and/or organic-rich layers, with Subunits IA and ID consisting mainly of pelagic deposits with minor volcaniclastics (Figure F8). Unit I ranges in age from Holocene to Middle Pleistocene. Unit II consists of Early Pleistocene to Early Pliocene age nannofossil ooze containing numerous intervals of foraminifera-rich nannofossil ooze and chalk. Unit III is a dolomitic-rich nannofossil ooze; Unit IV is part of the basement and is a fine-grained consolidated breccia (Figure F8).
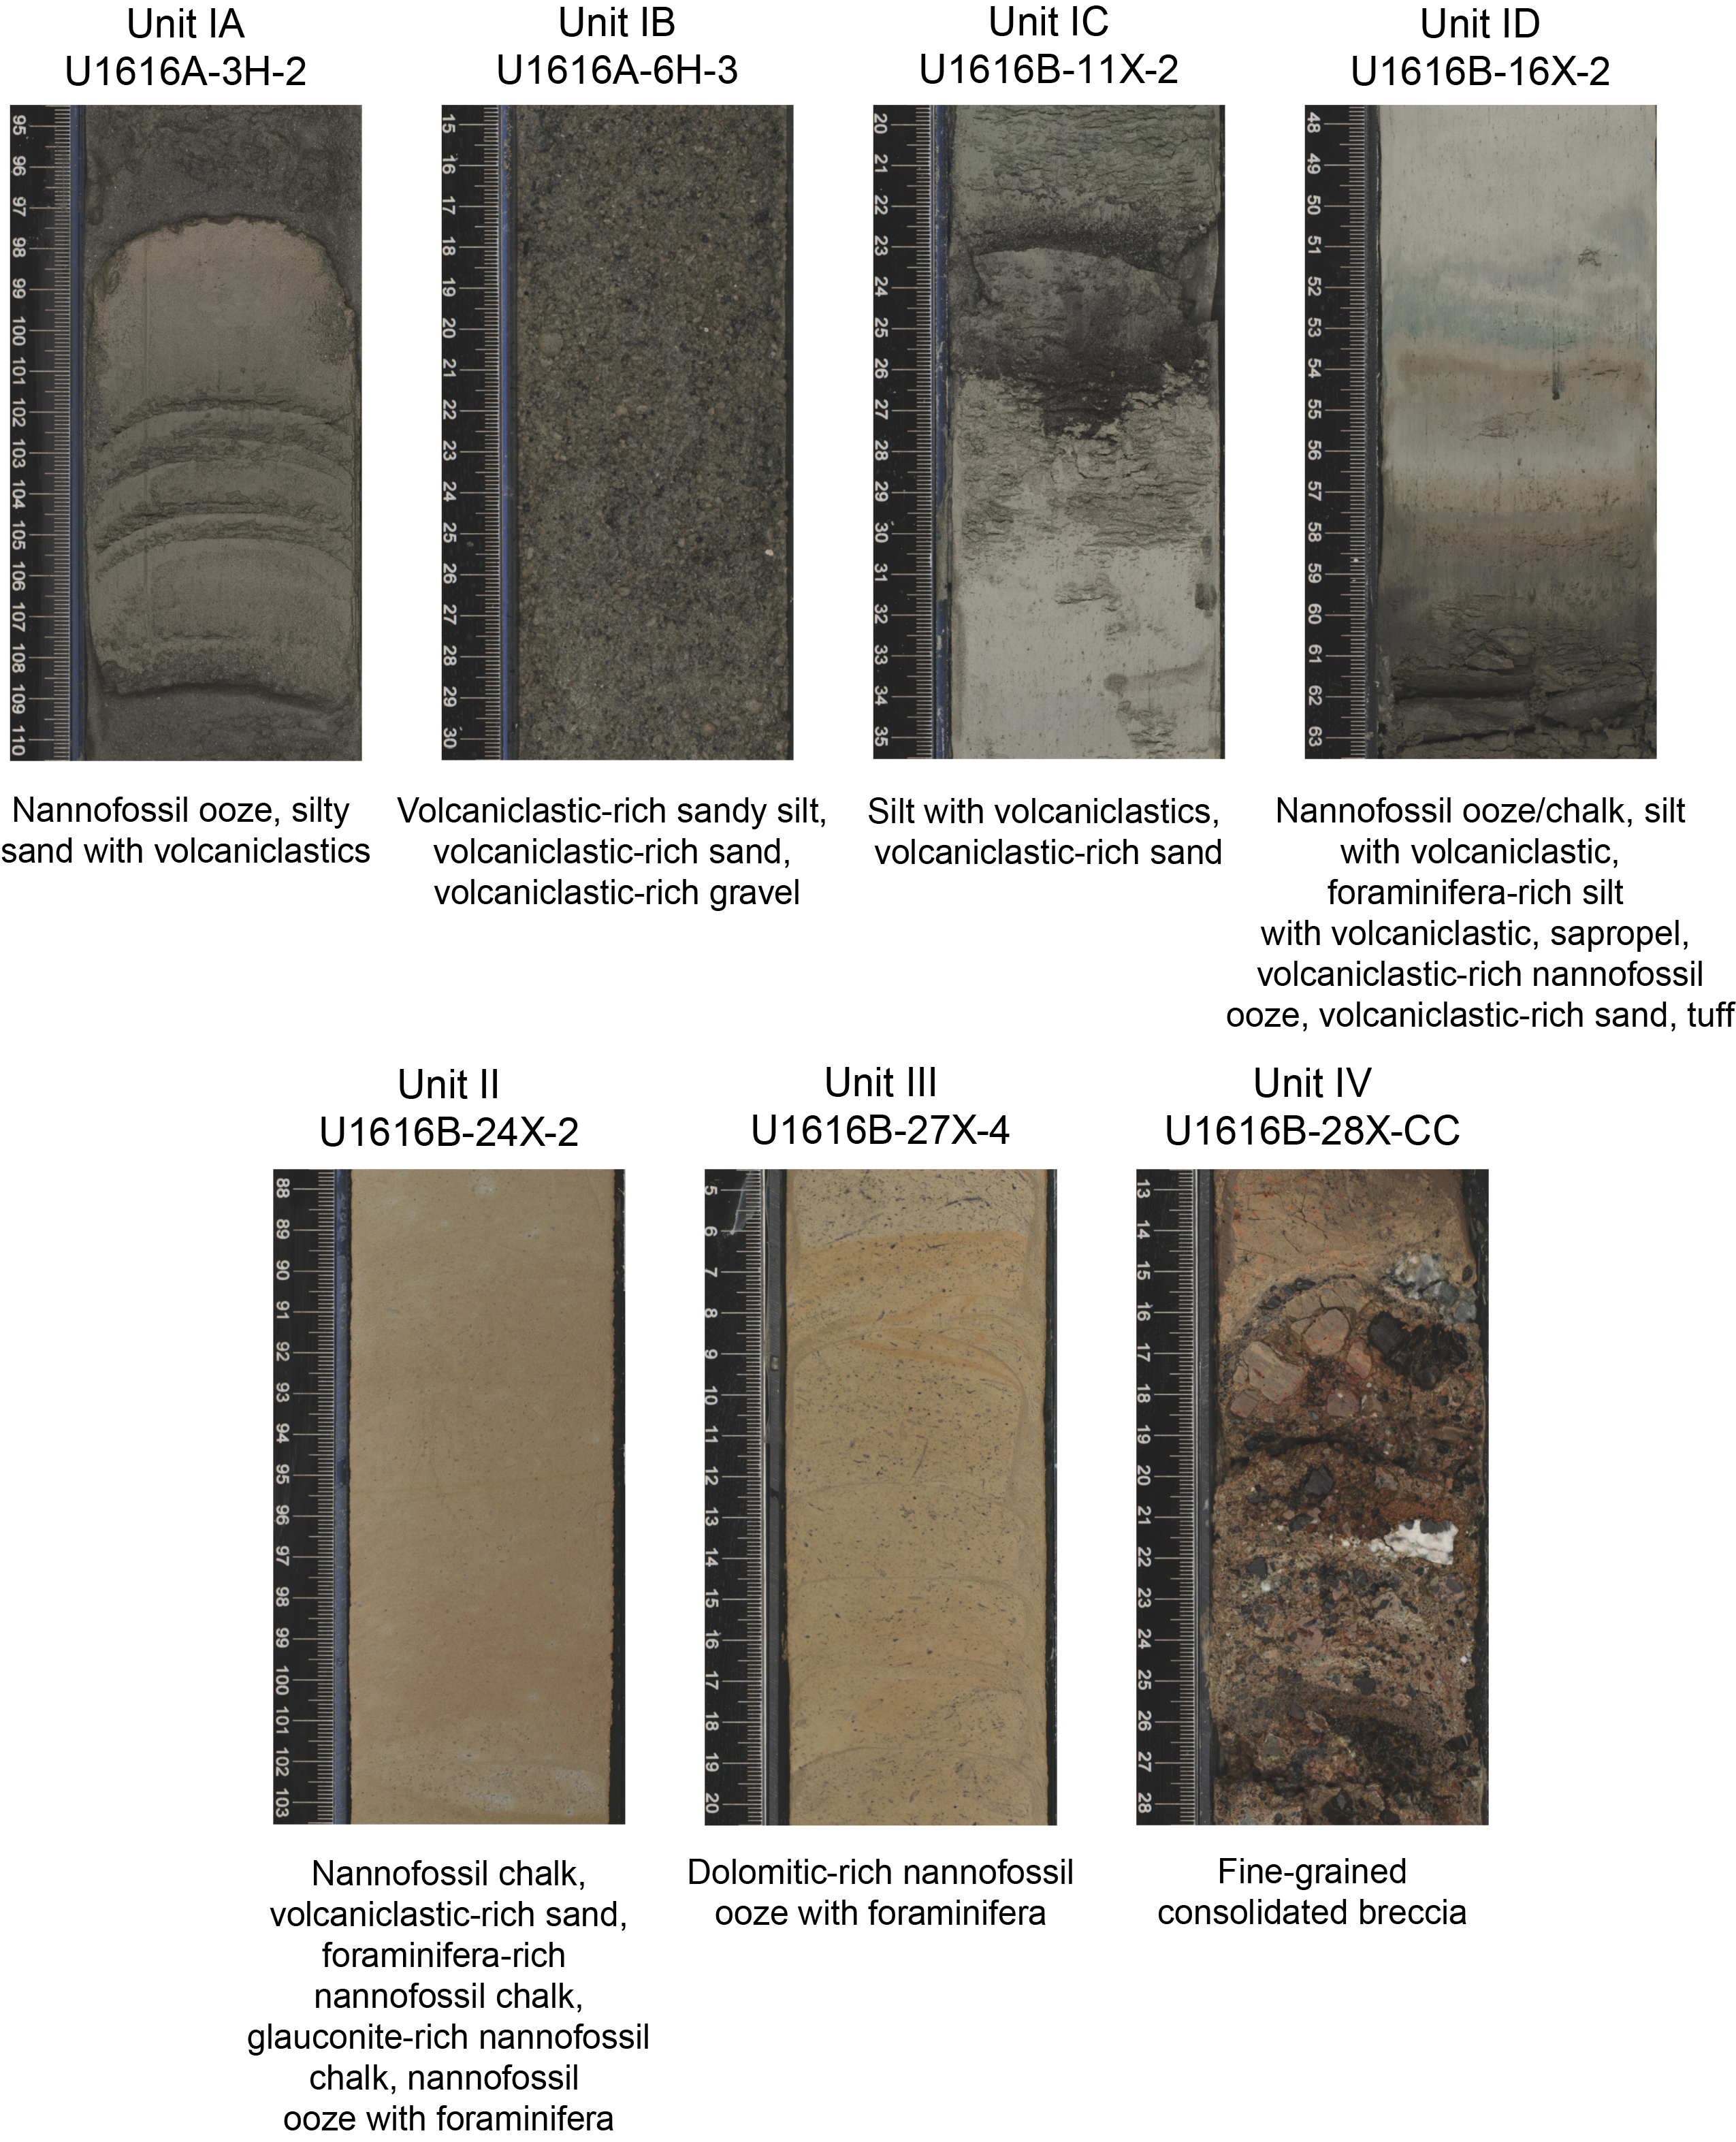
Figure F8. Examples of main lithologies.
Lithostratigraphic units are identified based on lithologic changes described in visual core description (VCD) forms (Figure F7), smear slide observations (Figure F9), physical properties, carbonate analysis, and mineralogy as measured by X-ray diffraction (XRD). The observed color changes (identified using the Munsell color chart) reflect major changes in mineralogical and/or biogenic components and thus lithology. Biostratigraphy, core observations, and structural measurements revealed the presence of soft-sediment deformation and possible repeating strata in the upper part of the sedimentary column; onshore studies will identify whether these structures are associated with the depositional hiatuses (Units I and II; see Biostratigraphy and Structural geology). Therefore, the age intervals of the different units are given as minimum and maximum brackets. For age repetitions possibly due to the presence of mass transport deposits, see Biostratigraphy.
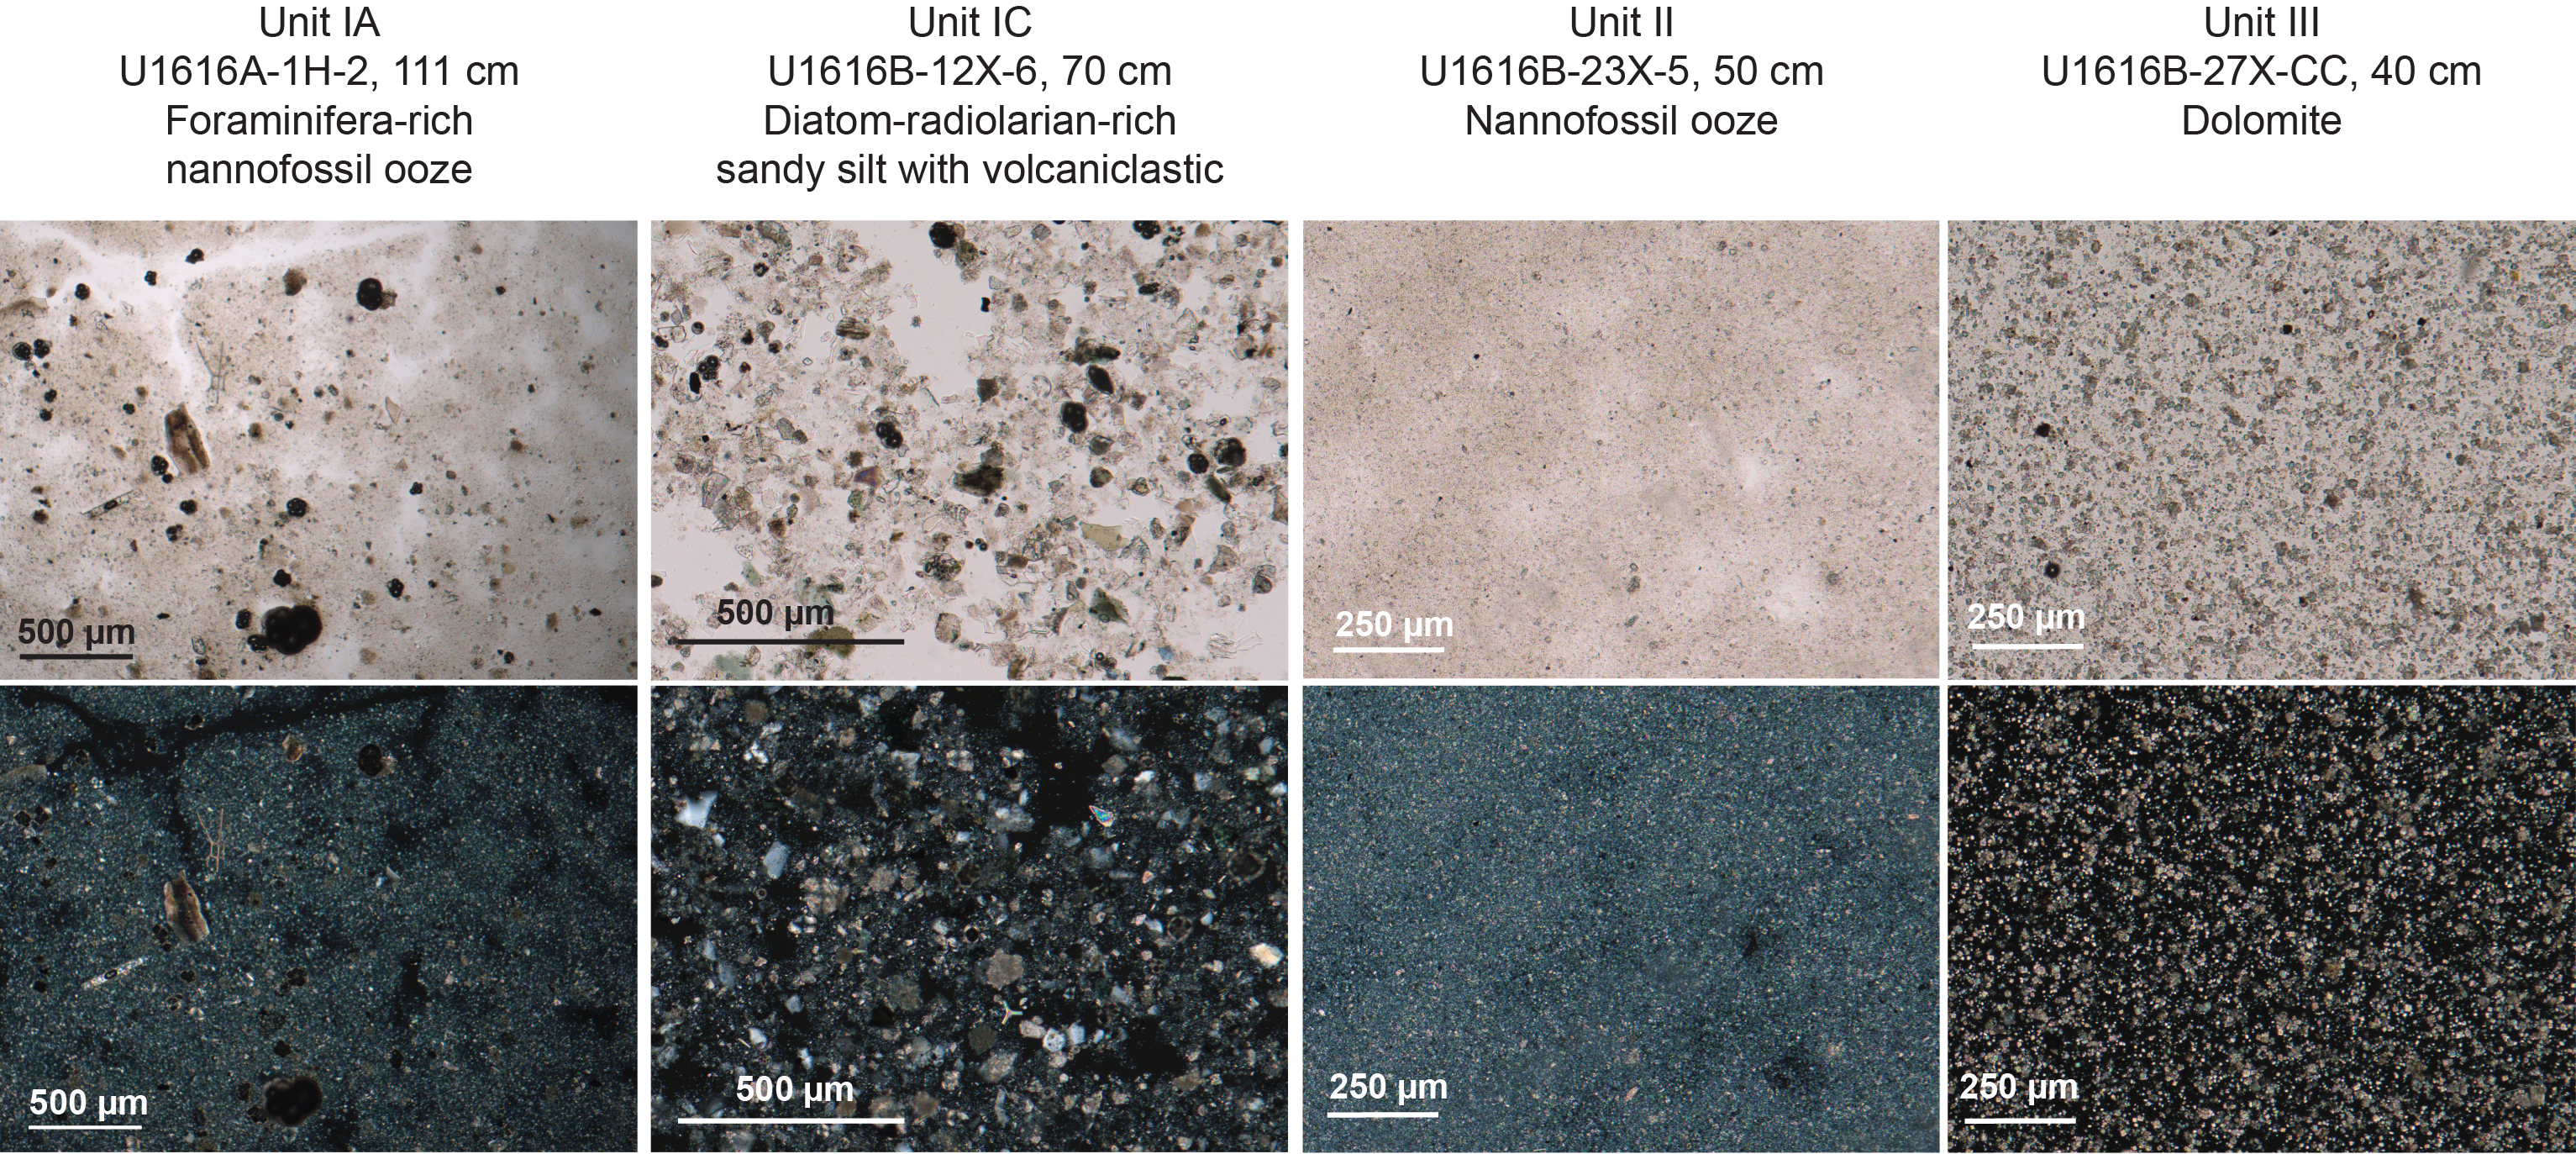
Figure F9. Main lithologies.
Hole U1616B was drilled ahead 31.2 m, and recovery started at Subunit IB after Hole U1616A was ended because of high ship heave. The lithostratigraphic classification is described here consistently, and where relevant, the distinction between the two holes is highlighted at the beginning of each unit description.
3.1. Lithostratigraphic unit descriptions
3.1.1. Lithostratigraphic Unit I
3.1.1.1. Lithostratigraphic Subunit IA
- Interval: 402-U1616A-1H-1 through 4H-3
- Depth: 0–26.22 m CSF-A
- Age: Holocene to Middle Pleistocene (present to Chibanian)
- Major lithologies: nannofossil ooze and silty sand with volcaniclastics
Subunit IA consists of alternating layers of olive-brown nannofossil ooze and dark gray silty sand layers with volcaniclastic material (Figures F8, F9). The amount of volcaniclastic material increases toward the base of the section where volcaniclastic-rich sand occurs. Much of the upper part of this subunit is soupy, and the cores contain material redistributed by drilling disturbance; in particular, wood fragments and sand are redistributed throughout. Occasional horizons contain shell fragments, including pteropods, especially in the uppermost few meters below the seafloor. Pelagic sediments alternate with turbidite deposits rich in both volcaniclastics (darker color) and bioclasts (shells and foraminifera; lighter color). Few ash layers and pumice clasts are present. Grading in the coarser turbidites is overprinted by drilling disturbances, but laminated tops and erosive bases are still preserved in some of the identified events.
3.1.1.2. Lithostratigraphic Subunit IB
- Intervals: 402-U1616A-4H-4 through 6H-CC; 402-U1616B-2H-1 through 5H-3
- Depths: Hole U1616A = 26.22–50.2 m CSF-A; Hole U1616B = 31.2–64.25 m CSF-A
- Age: Middle Pleistocene (Chibanian)
- Major lithologies: volcaniclastic-rich sandy silt, volcaniclastic-rich sand, and volcaniclastic-rich gravel
Subunit IB is composed entirely of volcaniclastic sand gradually transitioning to gravel at the bottom of the subunit and includes a high abundance of quartz, pumice, and lithics (Figures F8, F9). There is an apparent normal grading throughout the subunit, but it is difficult to interpret how much of the grading is real as opposed to being induced by core disturbance and the high volume of intruded water and drilling fluid that may have remobilized and redistributed sediment. Light-colored, pumice-rich layers are common and apparently randomly distributed throughout the subunit. Several fossils are observed throughout.
3.1.1.3. Lithostratigraphic Subunit IC
- Interval: 402-U1616B-5H-4 through 11X-CC
- Depth: 64.25–127.7 m CSF-A
- Age: Middle/Early Pleistocene (Chibanian/Calabrian)
- Major lithologies: silt with volcaniclastics and volcaniclastic-rich sand
Subunit IC is characterized by very poor recovery and is instead defined by a steep change in borehole magnetic susceptibility (MS) measured during downhole logging with the triple combo tool string (see Downhole measurements). The subunit also shows changes in elemental concentrations (i.e., Ca, Mg, B, and Sr) in the interstitial water (IW) samples from its base (see Sediment and interstitial water geochemistry). The small amount of sediment recovered consists of silt with volcaniclastics, volcaniclastic-rich sand, and few tephra intervals.
3.1.1.4. Lithostratigraphic Subunit ID
- Interval: 402-U1616B-12X-1 through 20X-CC
- Depth: 127.7–214.54 m CSF-A
- Age: Middle/Early Pleistocene (Chibanian/Calabrian)
- Major lithologies: nannofossil ooze/chalk, silt with volcaniclastics, foraminifera-rich silt with volcaniclastics, sapropel, volcaniclastic-rich nannofossil ooze, volcaniclastic-rich sand, and tuff
A homogeneous layer of olive-brown nannofossil ooze characterizes the upper part of Subunit ID, which seems to be in lateral continuity with similar layers of the same depth at Sites U1612 and U1615. In most of this subunit, pelagic sedimentation is intercalated by siltier and/or sandier intervals of volcaniclastic turbidites with a notable biogenic component. Tephra layers are also present throughout. Foraminifera are scattered throughout most of this subunit, and glauconite is present in some horizons. Locally, clast-supported polymictic conglomerate intervals characterize debris flow deposits (e.g., Section 402-U1616B-18X-4). Tuff intervals (Cores 19X and 20X) are present in the lower part of this subunit. Bioturbation is minor and mostly observed in the nannofossil chalk intervals. Several layers were observed to be organic rich based on color and smear slide analysis.
3.1.2. Lithostratigraphic Unit II
- Intervals: 402-U1616B-21X-1 through 27X-1; 402-U1616E-2R-1 through 3R-1
- Depths: Hole U1616B = 214.54–276.21 m CSF-A; Hole U1616E = 250–261.2 m CSF-A
- Age: Early Pleistocene/Early Pliocene (Calabrian/Zanclean)
- Major lithologies: nannofossil chalk, volcaniclastic-rich sand, foraminifera-rich nannofossil chalk, glauconite-rich nannofossil chalk, and nannofossil ooze with foraminifera
Nannofossil chalk is the prevalent lithology in Unit II, with color changes that result from varying degrees of bioturbation and foraminifera abundances. Soft-sediment deformation is more prevalent than in the overlying units, with nearly the entire unit affected by mass transport deposits (Figure F10). Bioturbation is common throughout, with intervals of heavy bioturbation and large Zoophycos ichnotraces. Drilling disturbance is limited to cracking, although an intense biscuiting effect, which is clearly visible in the X-ray images, is present in the more consolidated lower part of the unit. Some layers are rich in glauconite, and other layers are rich in foraminifera.
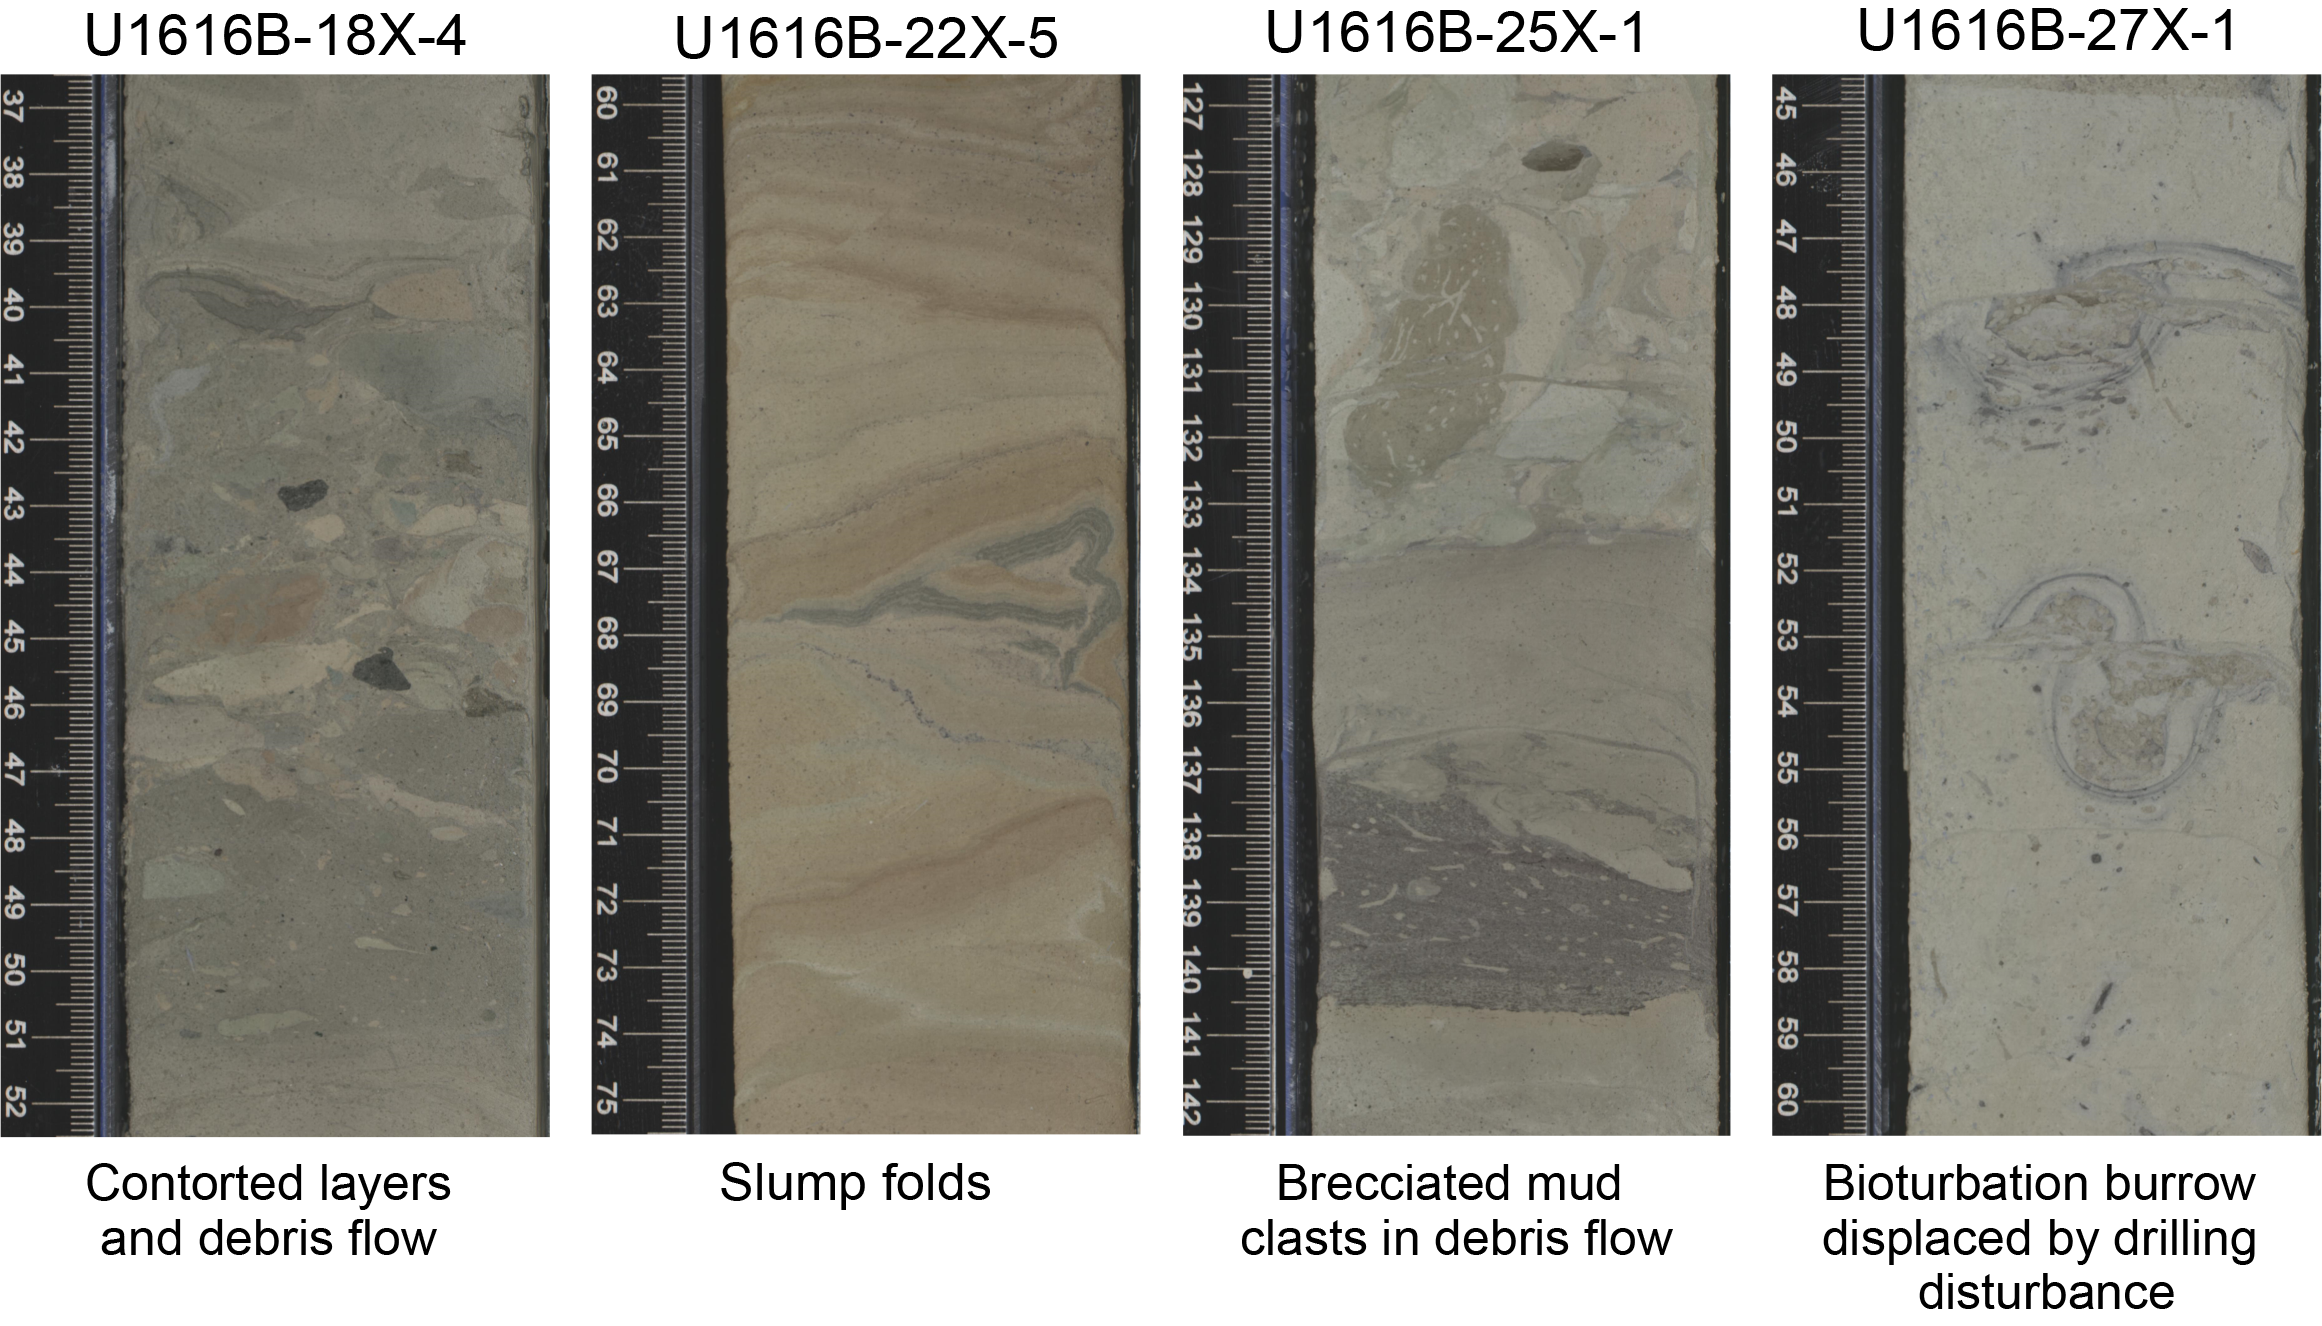
Figure F10. Soft-sediment deformation features.
Cyclic sapropel events characterize Core 402-U1616B-25X, and they are overall more abundant in this unit. Several organic-rich layers were selected for shipboard analysis and were found to have high total organic carbon (TOC) content, with three classified as true sapropels (TOC > 2%).
3.1.3. Lithostratigraphic Unit III
- Intervals: 402-U1616B-27X-2 through 28X-CC; 402-U1616E-3R-2 through 4R-2
- Depths: Hole U1616B = 276.21–284.65 m CSF-A; Hole U1616E = 261.2–270 m CSF-A
- Age: Late/Early Pliocene (Piacenzian/Zanclean)
- Major lithologies: dolomitic-rich nannofossil ooze with foraminifera and dolomite
Unit III consists of reddish dolomitic muds, locally laminated (Figures F8, F9), which are microscopically (high presence of rhombohedral dolomite crystals) and macroscopically (distinctive reddish colors) similar to those seen in Hole U1612A and at Site U1614. Unit III muds have a carbonate content of 84%, which XRD analysis confirms is primarily dolomite (Figure F11). The dolomite may have formed within the basal carbonate sediments in association with low-temperature hydrothermal alteration of the igneous basement. Dendritic precipitation of oxides is present throughout the whole unit. We also report the occurrence of small clasts of peridotite disseminated in the dolomitic mud and surrounded by red alteration rims. The primary contact between the dolomitic mud and a fine-grained consolidated breccia composed of various clasts of peridotite was recovered in Section 402-U1616B-28X-CC.
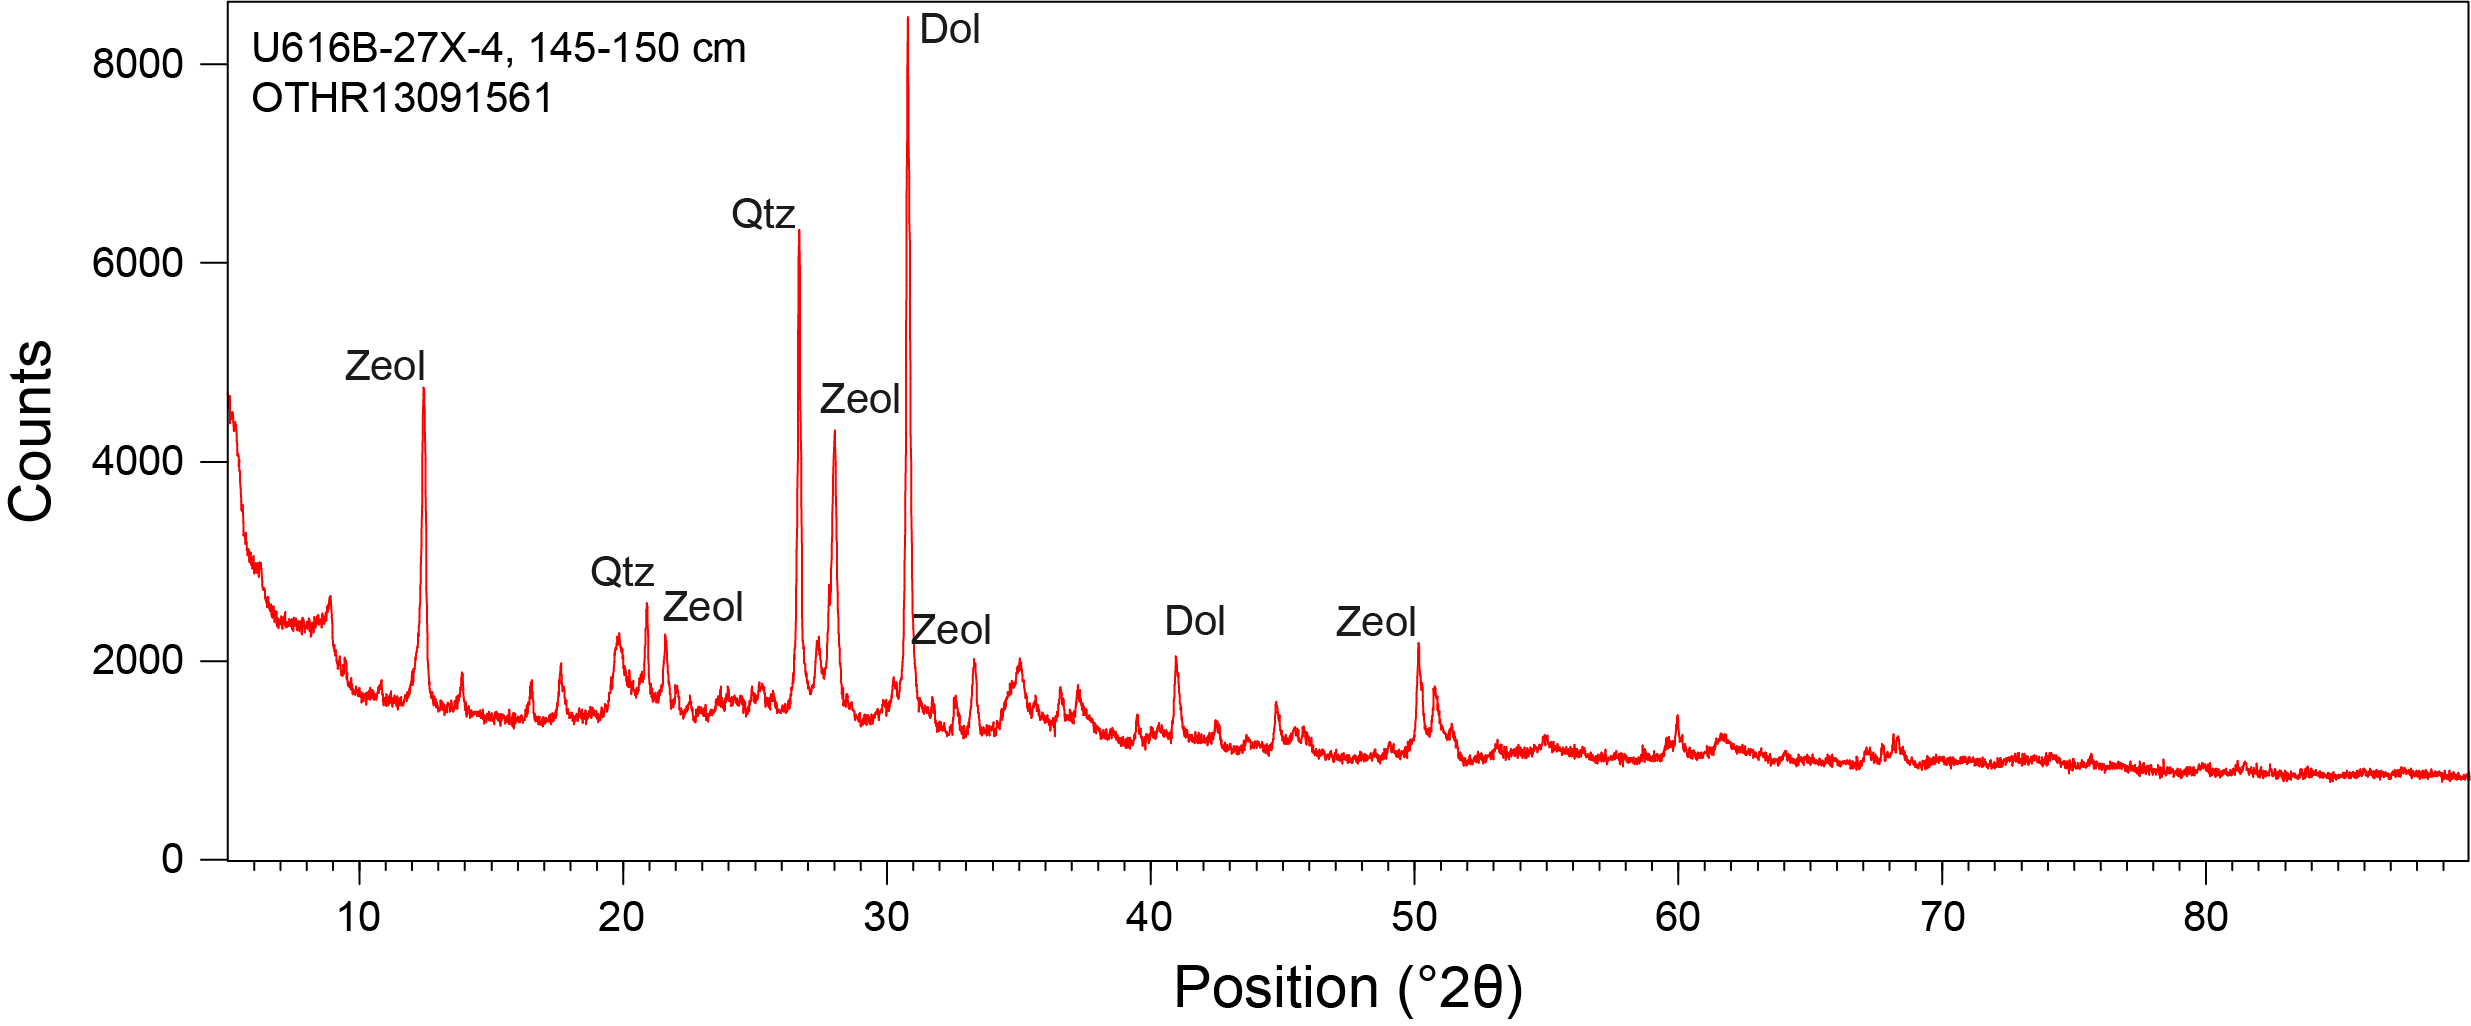
Figure F11. XRD diffractogram.
3.1.4. Lithostratigraphic Unit IV
The details of Units IV–VIII are discussed in Igneous and metamorphic petrology.
4. Biostratigraphy
Calcareous nannofossil and planktic foraminifera specimens extracted from core catcher samples and from core sections when needed were analyzed to develop a biostratigraphic framework for Site U1616. Three holes, U1616A, U1616B, and U1616E, were cored at this site with sediment recoveries of 95%, 58%, and 26%, respectively. The age constraints and biozonal boundaries across the sedimentary successions were established by analyzing semiquantitative data from well-preserved calcareous nannofossil and planktic foraminiferal assemblages. The Mediterranean biozonation schemes of Di Stefano et al. (2023) and Lirer et al. (2019) were used for this purpose.
4.1. Planktic foraminifera
4.1.1. Hole U1616A
4.1.1.1. Sedimentary compositions of collected samples
Sediment samples were collected from Sections 402-U1616A-1H-CC (2.67–2.72 mbsf) through 6H-CC (49.52–49.57 mbsf). All samples were washed using a 63 µm sieve to remove clay and/or silt particles. The residues were dried, sieved through a 125 µm sieve to remove any juvenile microfossil species, and analyzed under a microscope. The extracted residues (>125 µm) from the samples contain volcaniclastic sedimentary particles and/or planktic foraminiferal assemblages. Volcaniclastic sedimentary layers with a median grain size greater than 2 mm were more prominent in the lowermost sections and were devoid of foraminifera. The top few nannofossil ooze layers contain well-preserved planktic foraminifera. Foraminiferal abundances in the nannofossil ooze layers were high. Benthic foraminifera, sponge spicules, and broken molluscan shell fragments were also observed. Although the taxonomy and abundance of these species were not recorded because of time constraints, their presence provides valuable information for future analysis.
Sedimentary intervals were dated from Middle Pleistocene to Holocene based on biohorizons of planktic foraminiferal events. Of the six samples collected, four yielded residues containing mostly volcanogenic sediments dominated by particles such as pumice and volcanic glass, which reduced the microfossil content to a minimum level (Figure F12). Planktic foraminifera species are completely absent from these samples. The remaining two samples from the uppermost intervals of the nannofossil ooze zones contain moderately to well-preserved planktic foraminifera species that were helpful in identifying the biostratigraphic zonations at this site.
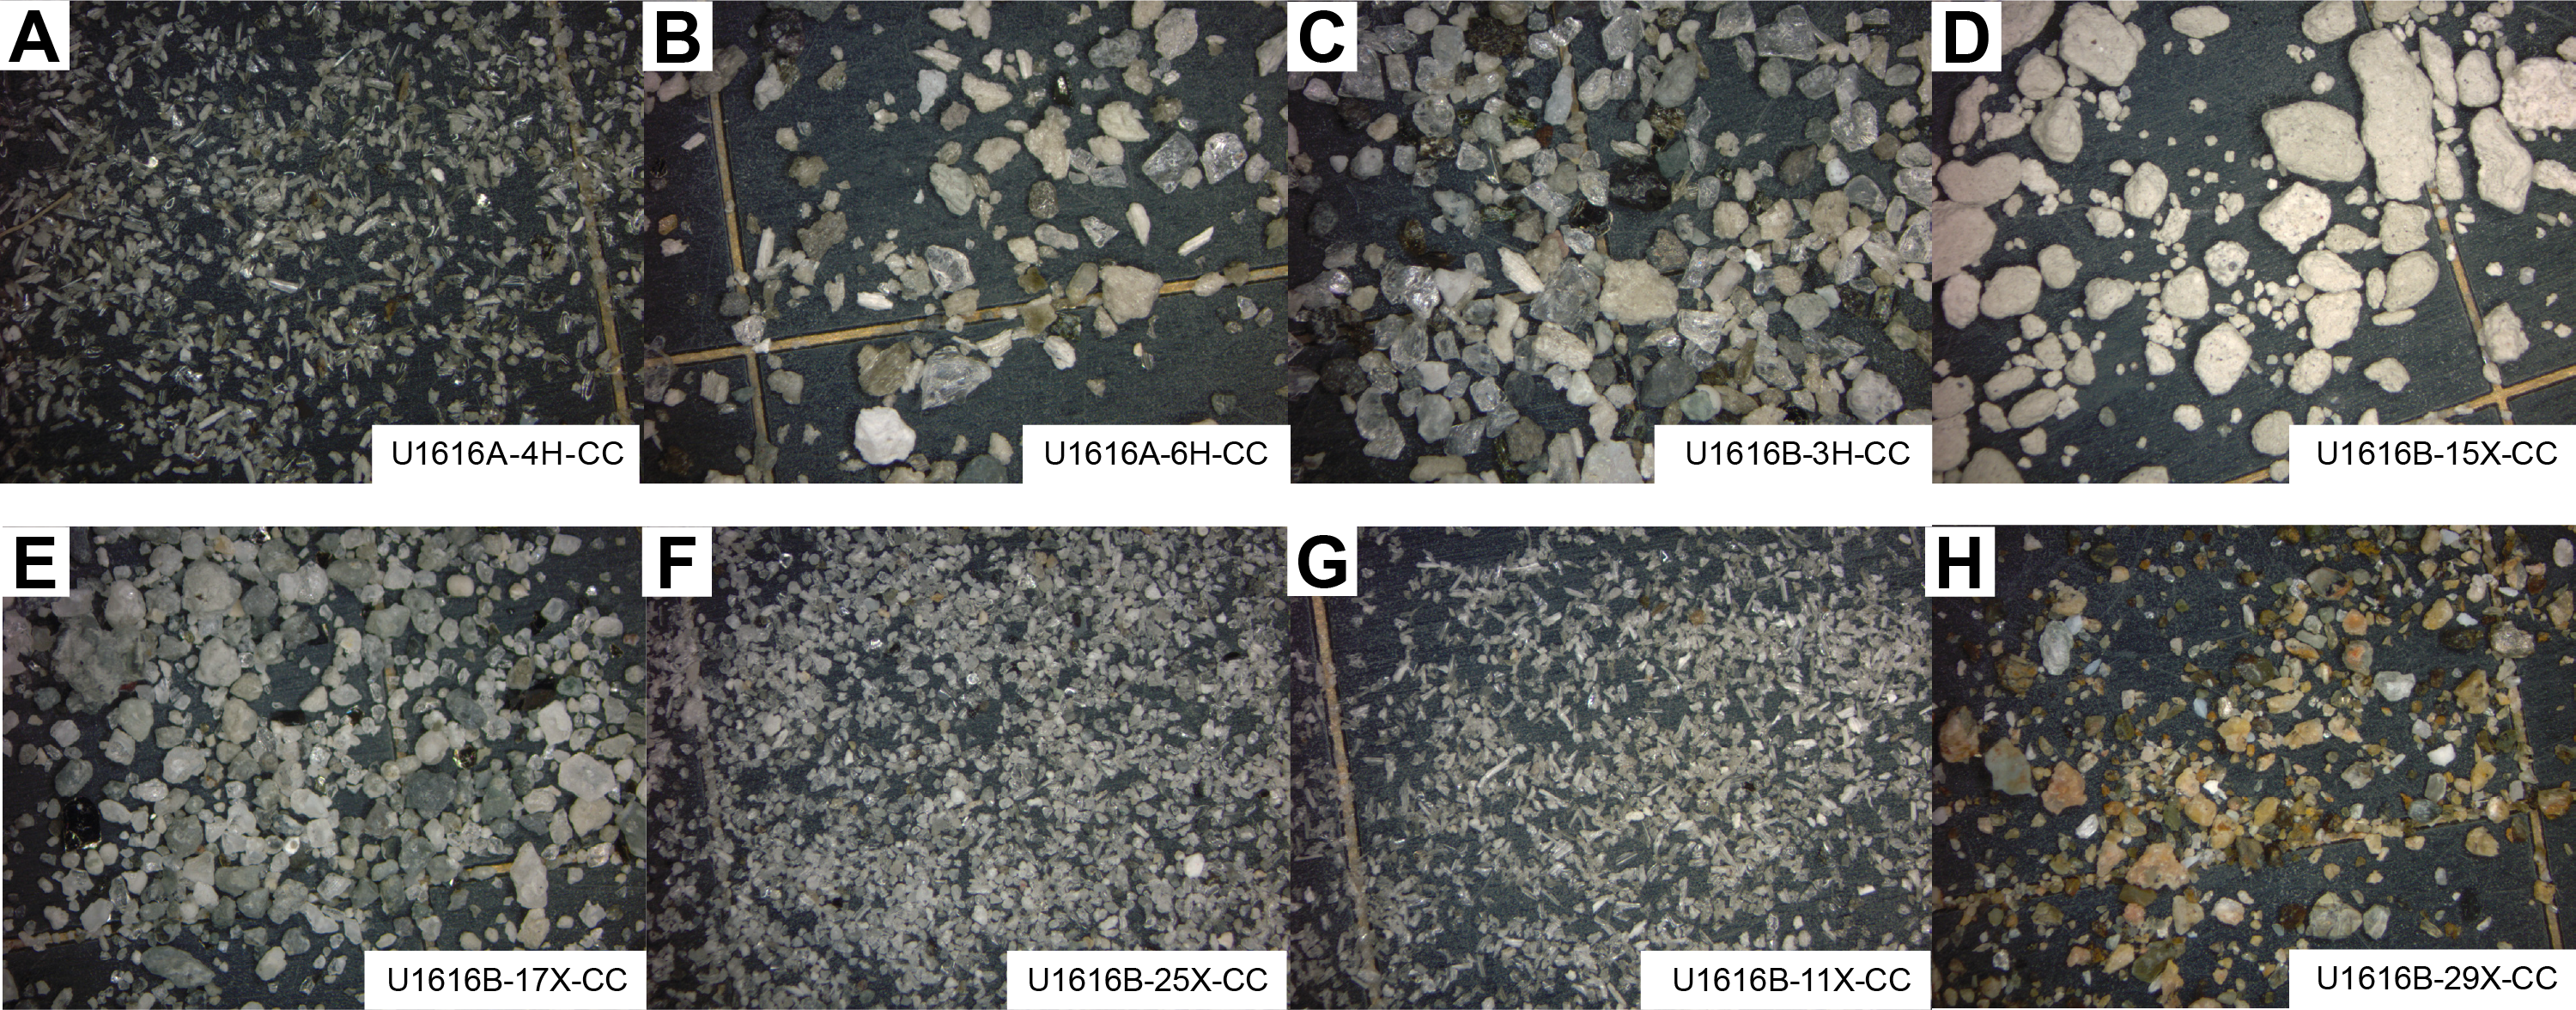
Figure F12. Sediments.
4.1.1.2. Planktic foraminifera biozonation
The biostratigraphic zonation scheme used in Hole U1616A is presented in Table T2.
The planktic foraminifera fauna between Sections 1H-CC and 6H-CC is typical of the Mediterranean biostratigraphic MPle2b zone, which is primarily composed of Globigerina bulloides, Orbulina universa, Globigerinella calida, Globoconella inflata, Globigerinoides ruber var. white, G. ruber var. pink, Globorotalia scitula, Globorotalia crassaformis, Neogloboquadrina spp. (sin), Neogloboquadrina incompta, and Globorotalia excelsa (Figures F13, F14, F15, F16).
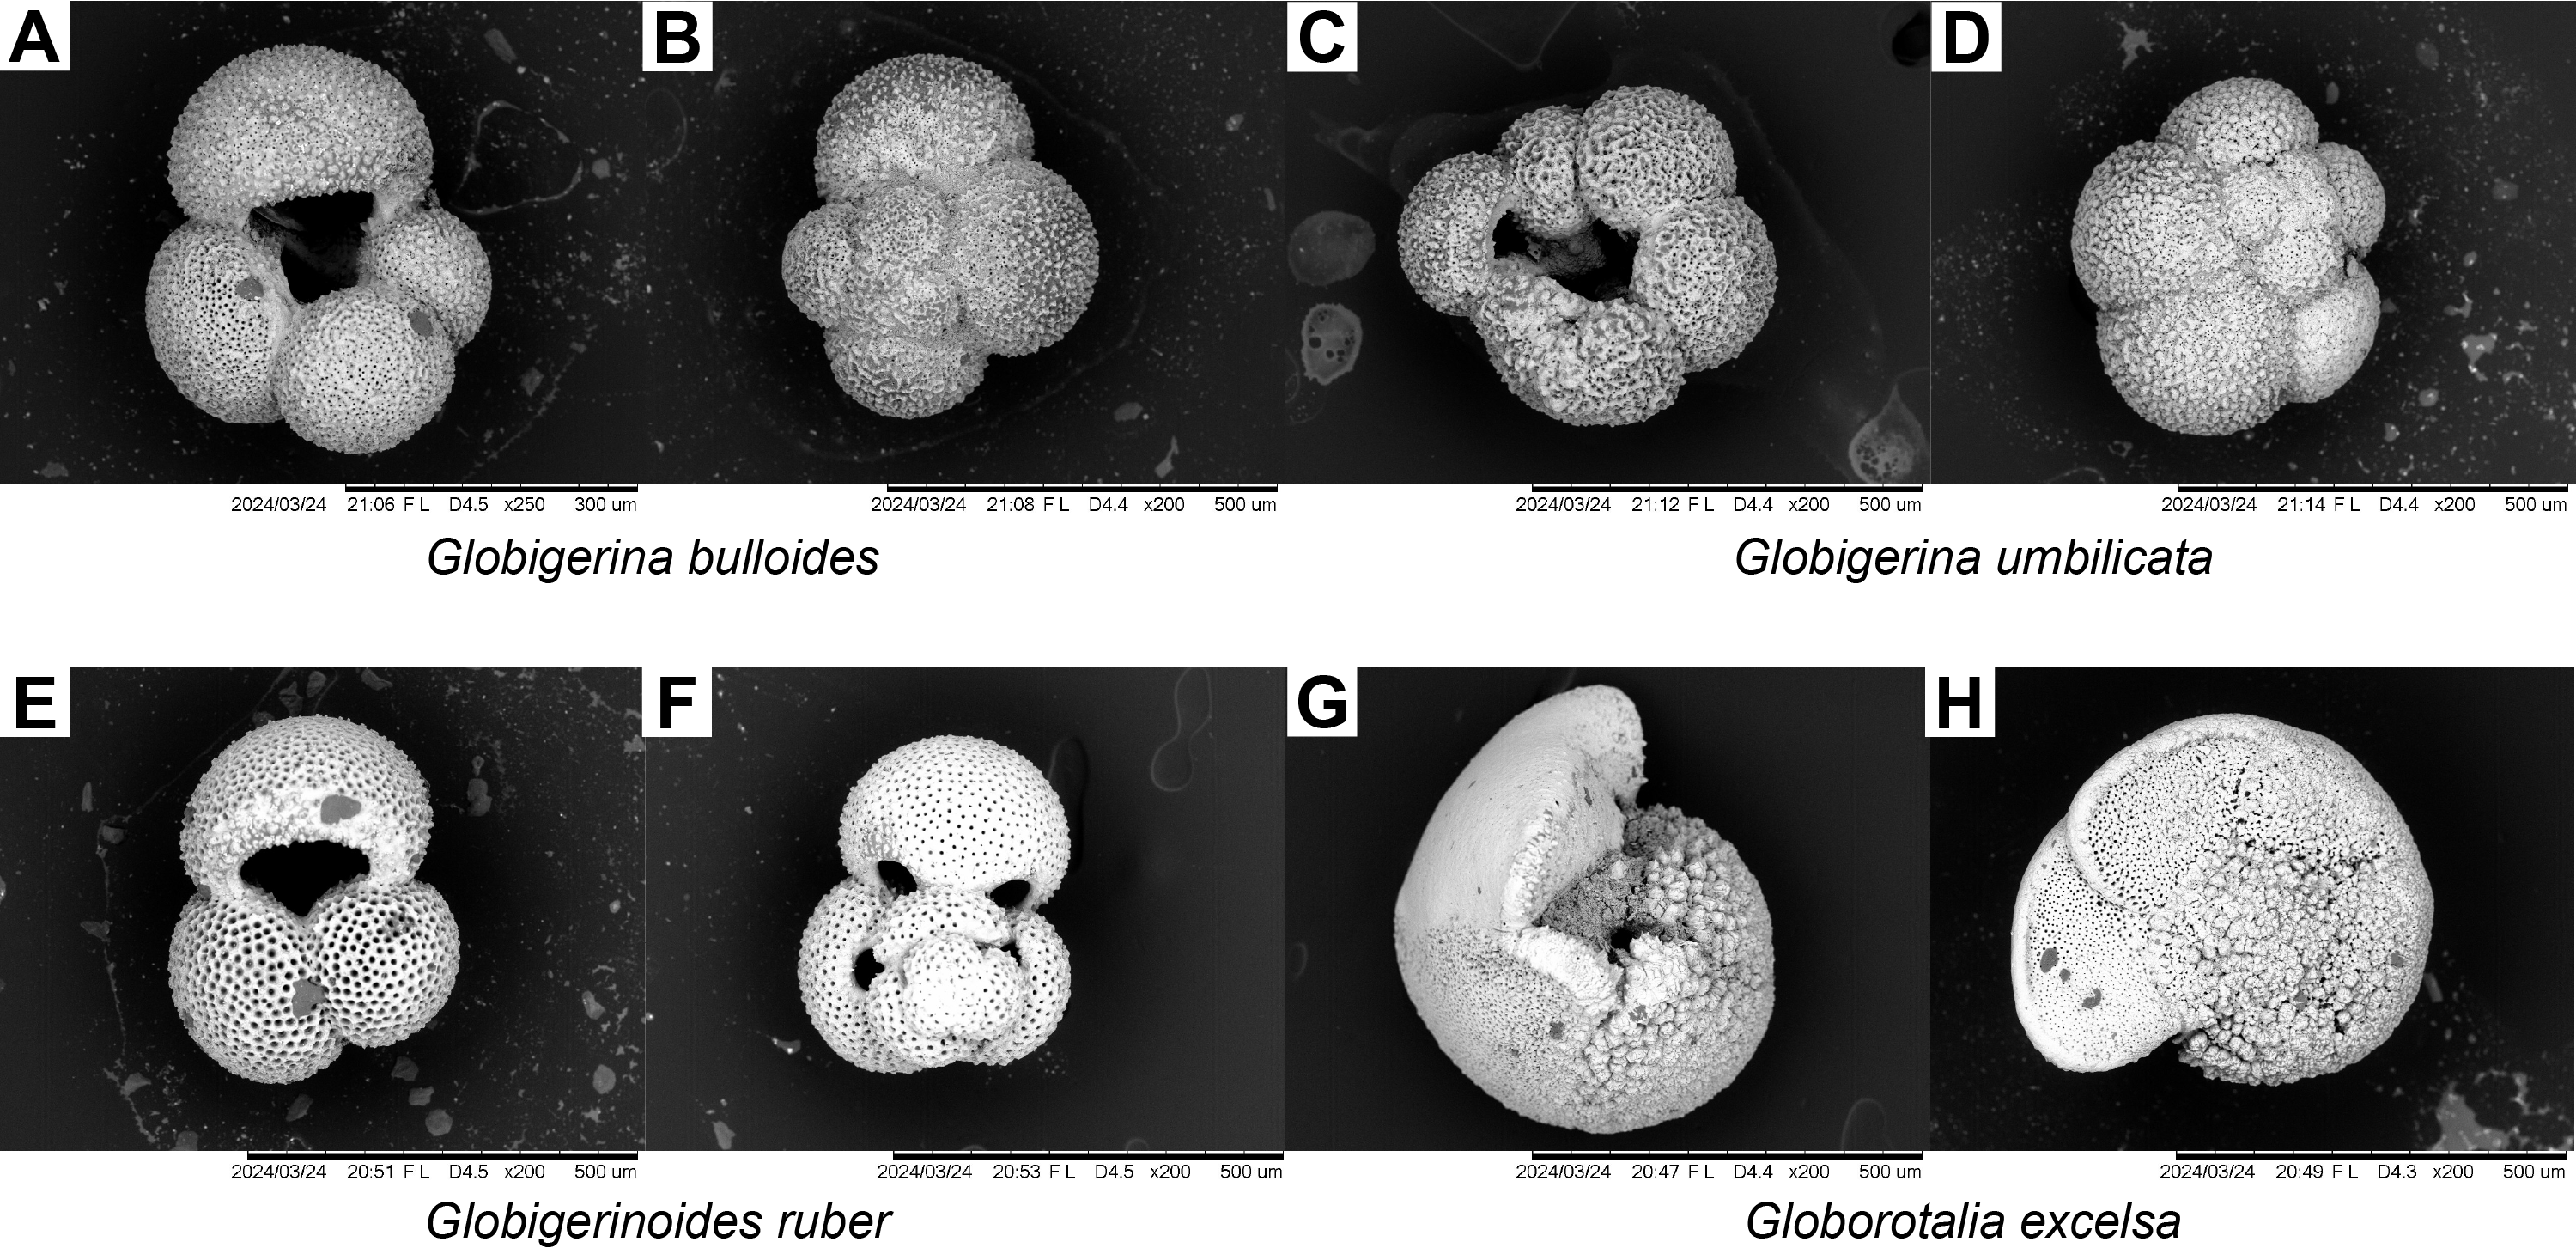
Figure F13. Globigerina, Globigerinoides, and Globorotalia.
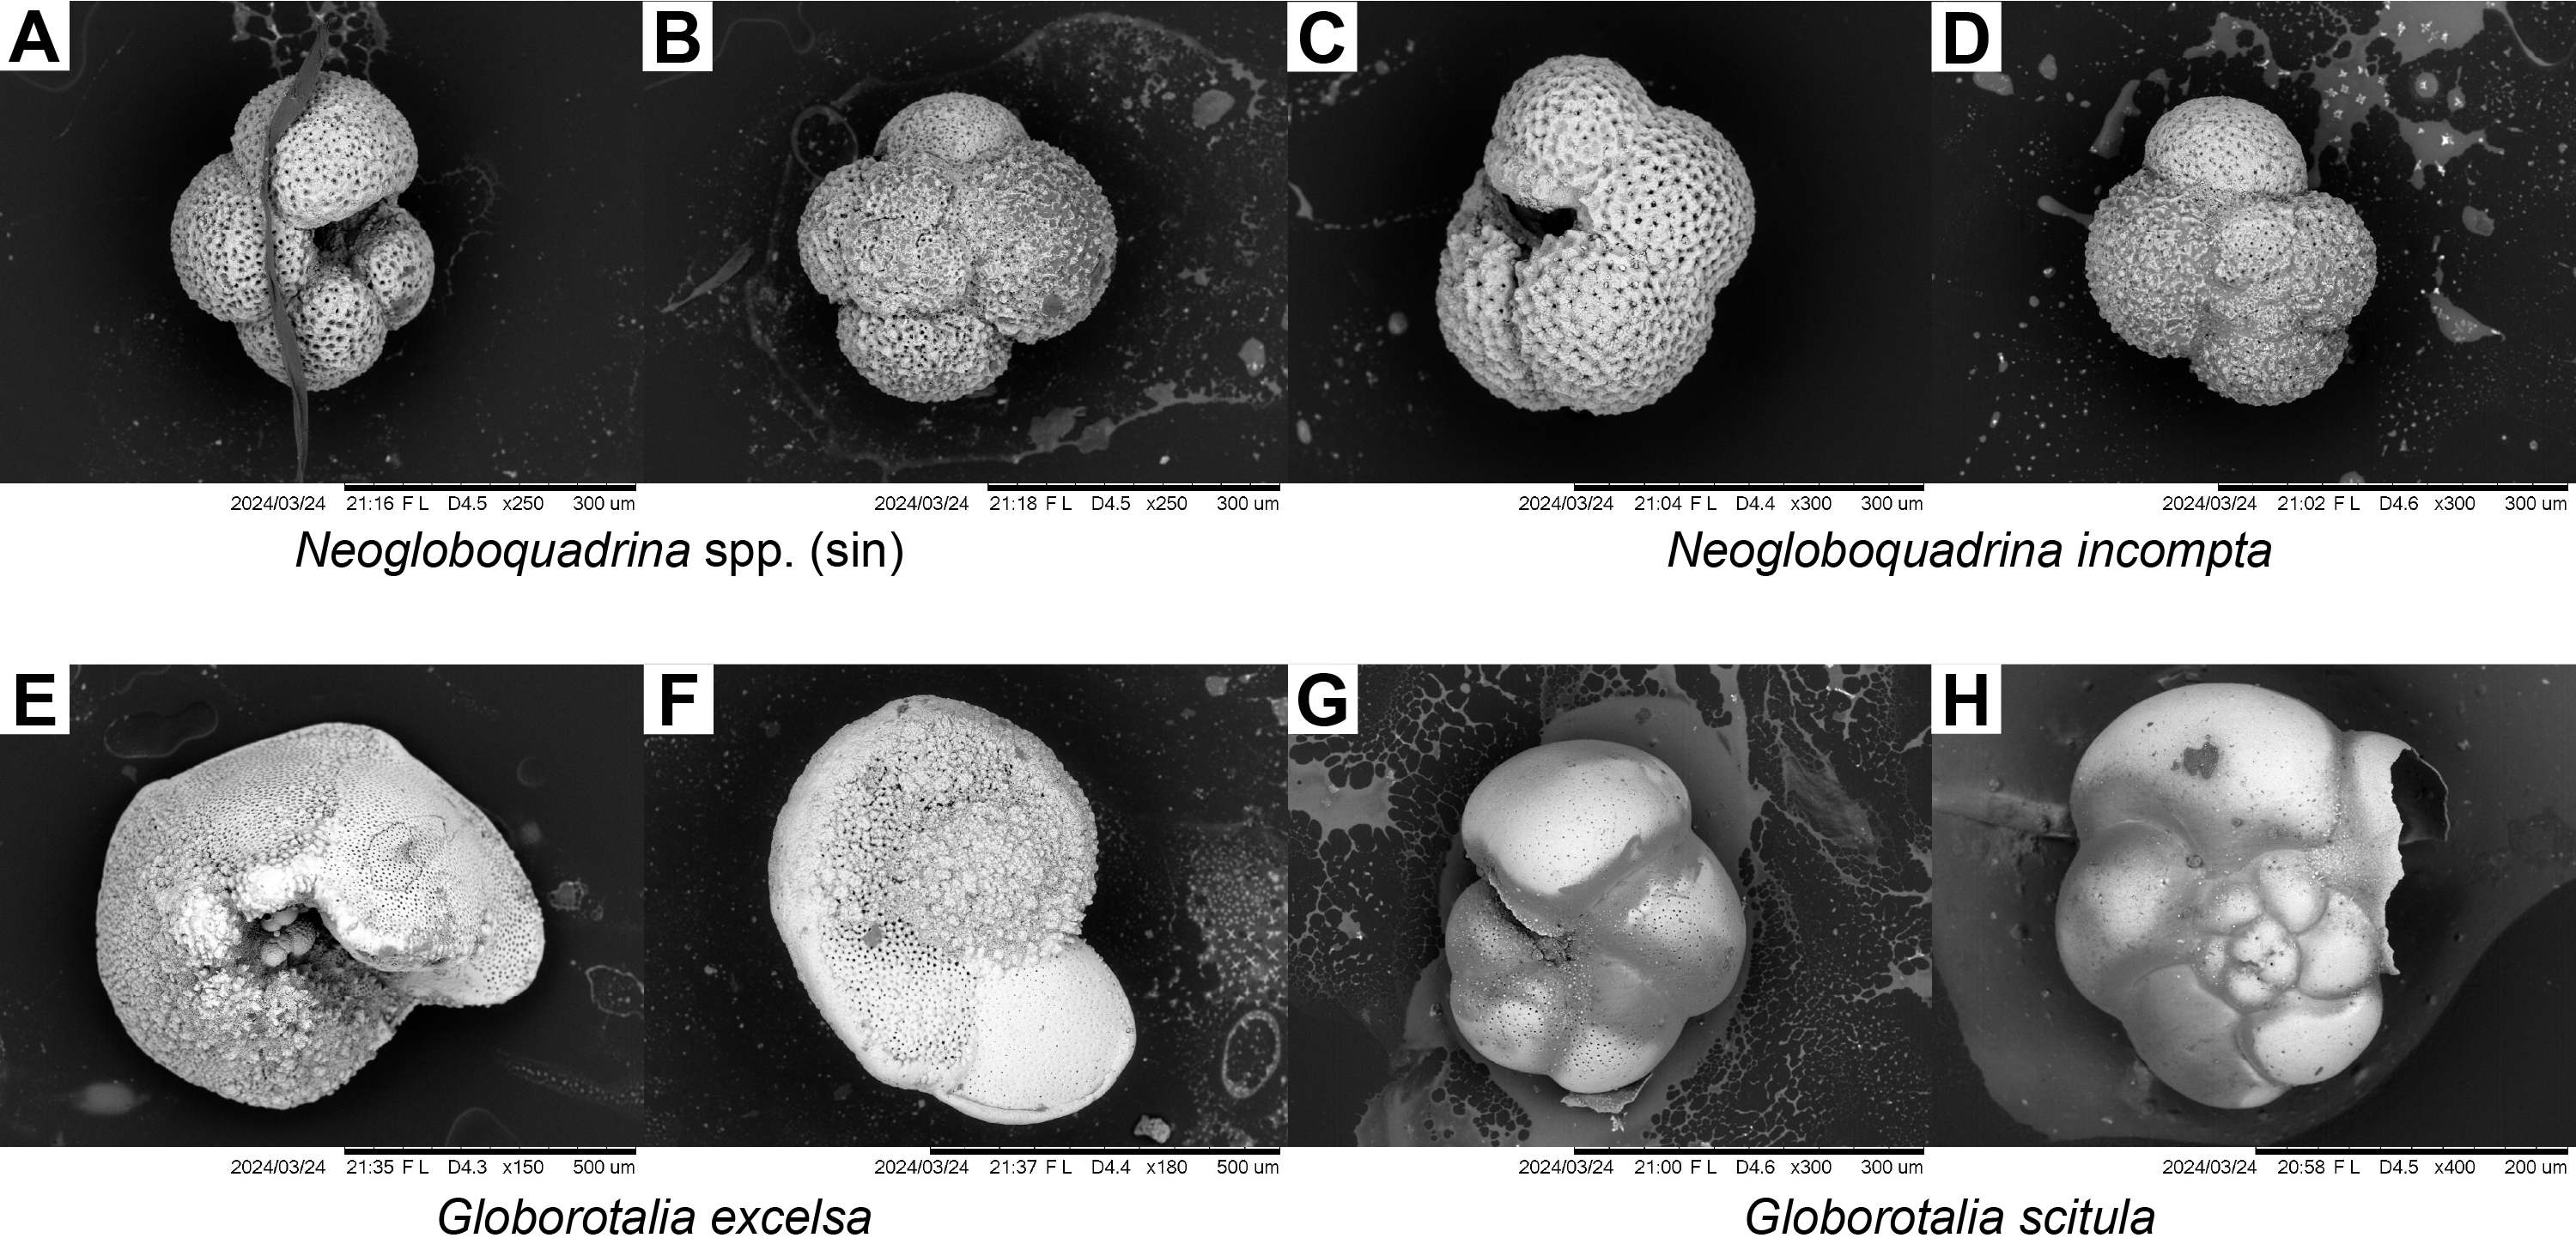
Figure F14. Neogloboquadrina and Globorotalia.
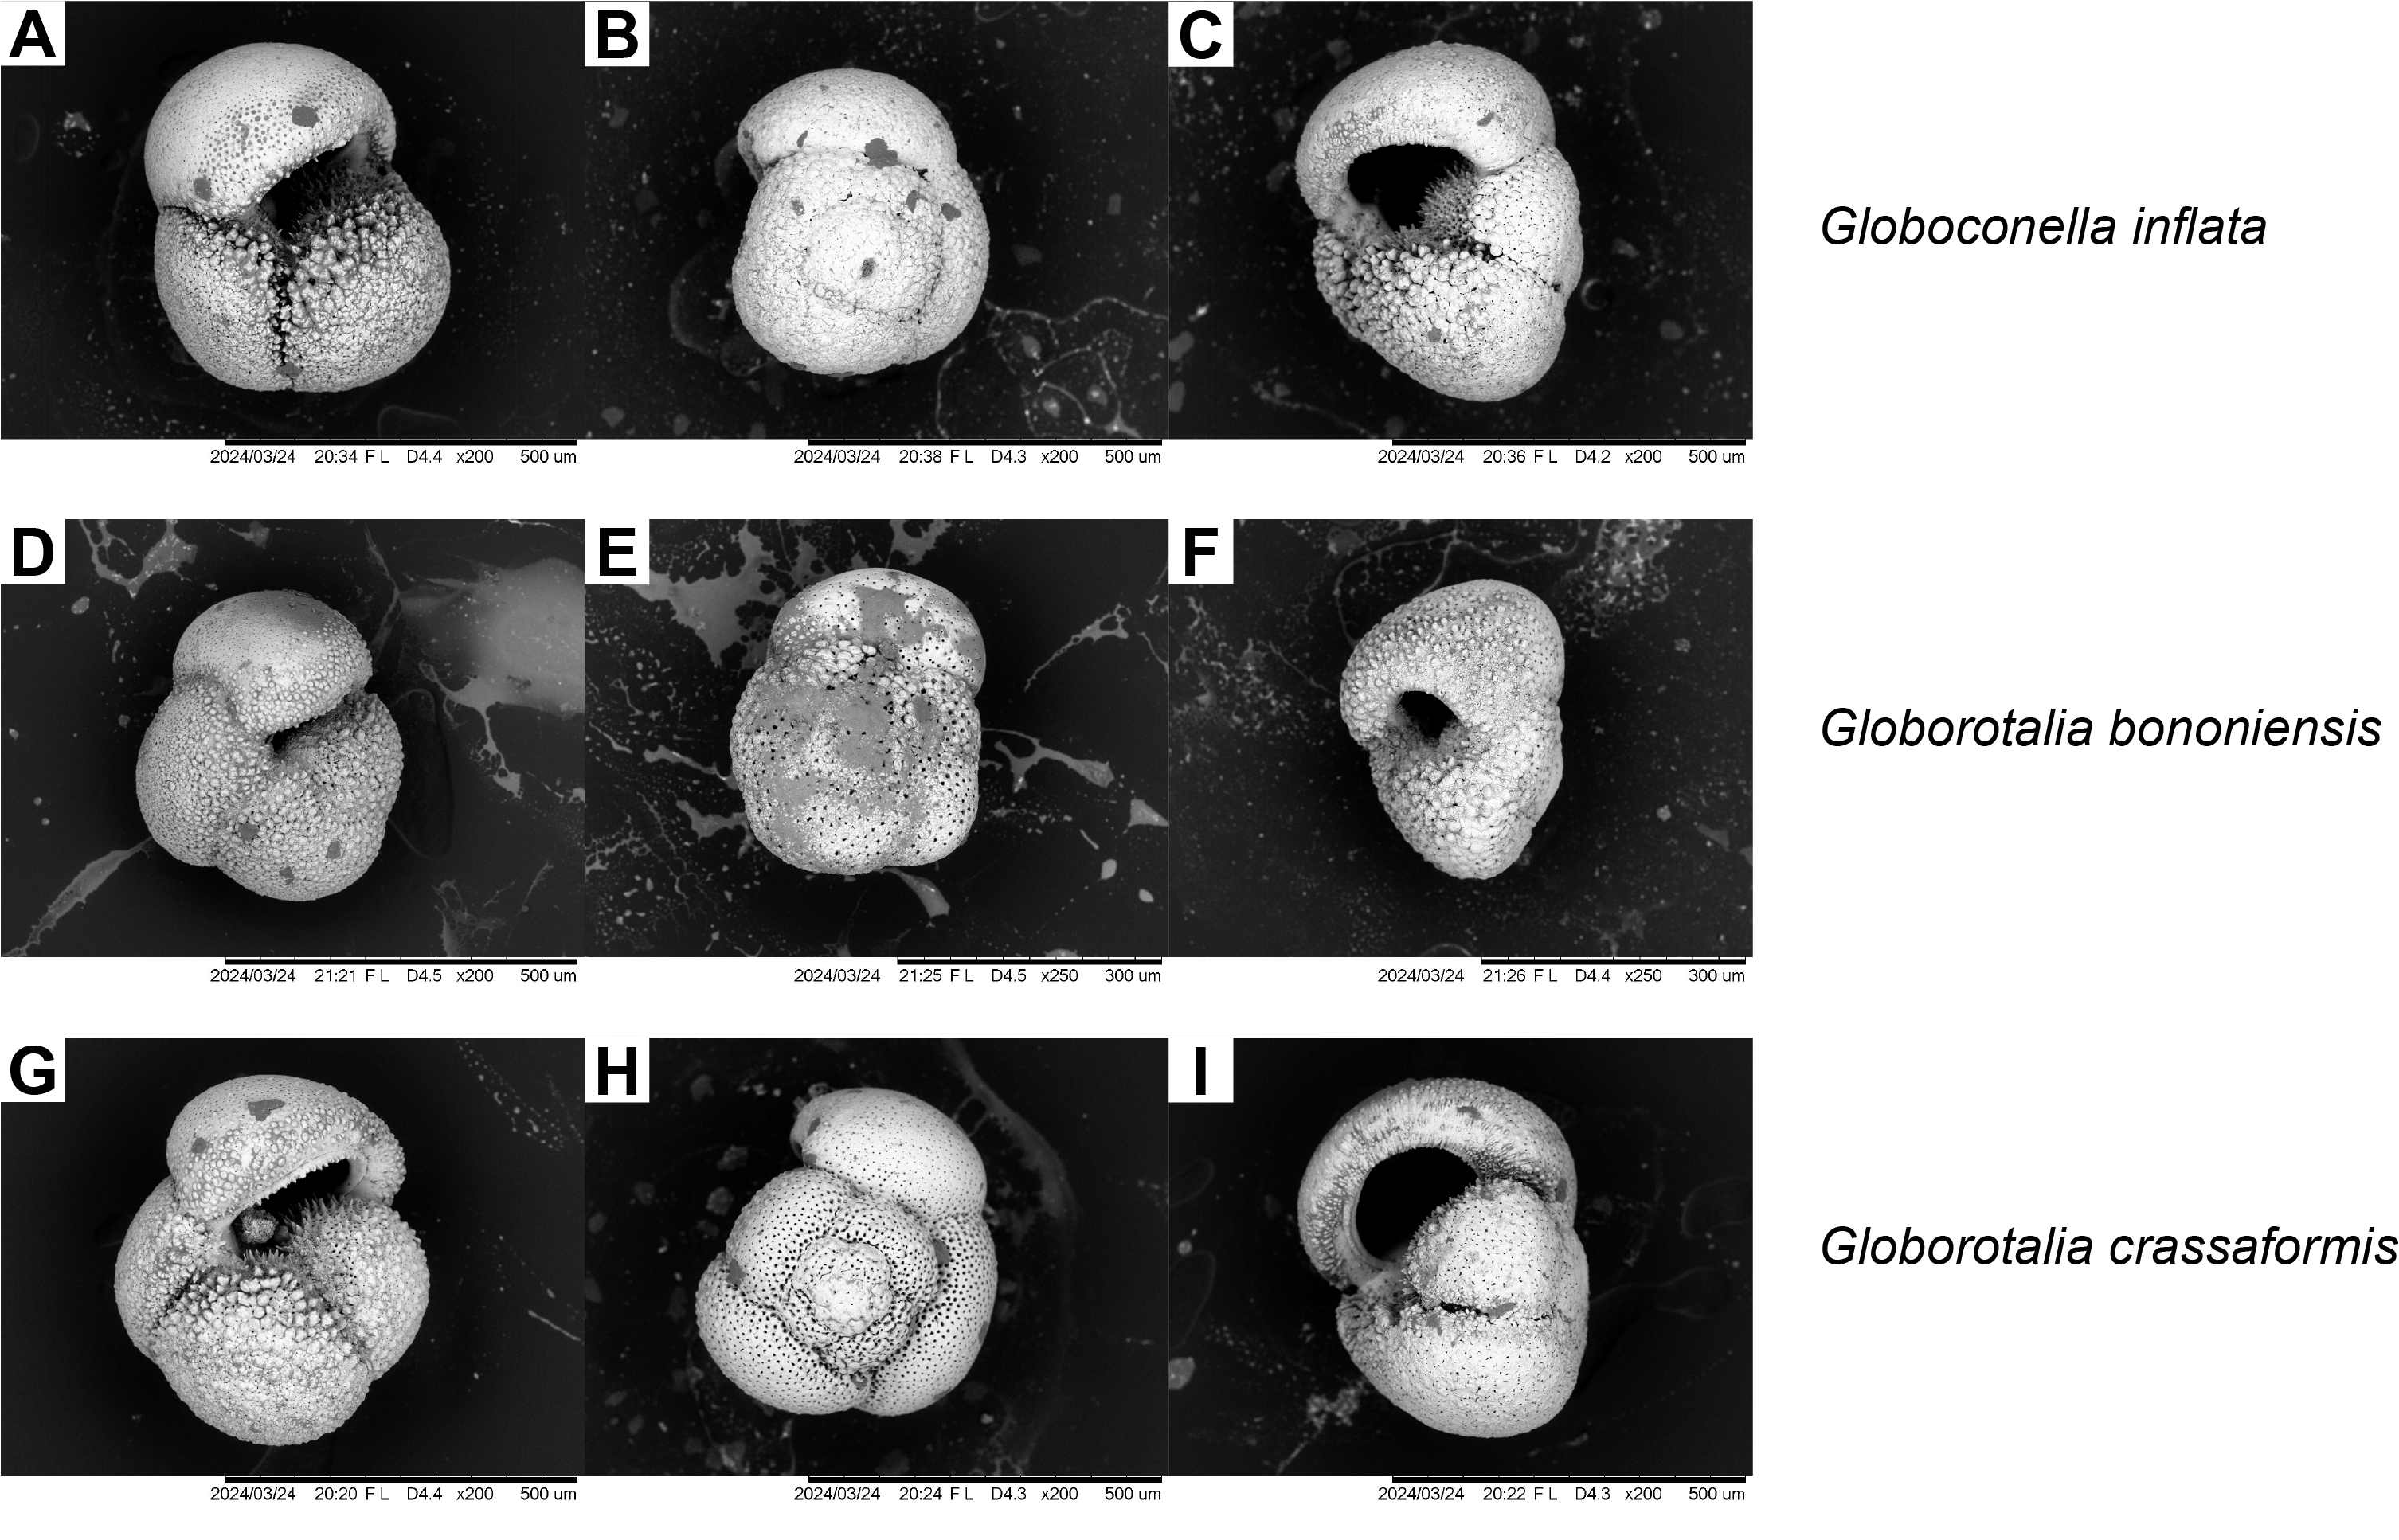
Figure F15. Globoconella and Globorotalia.
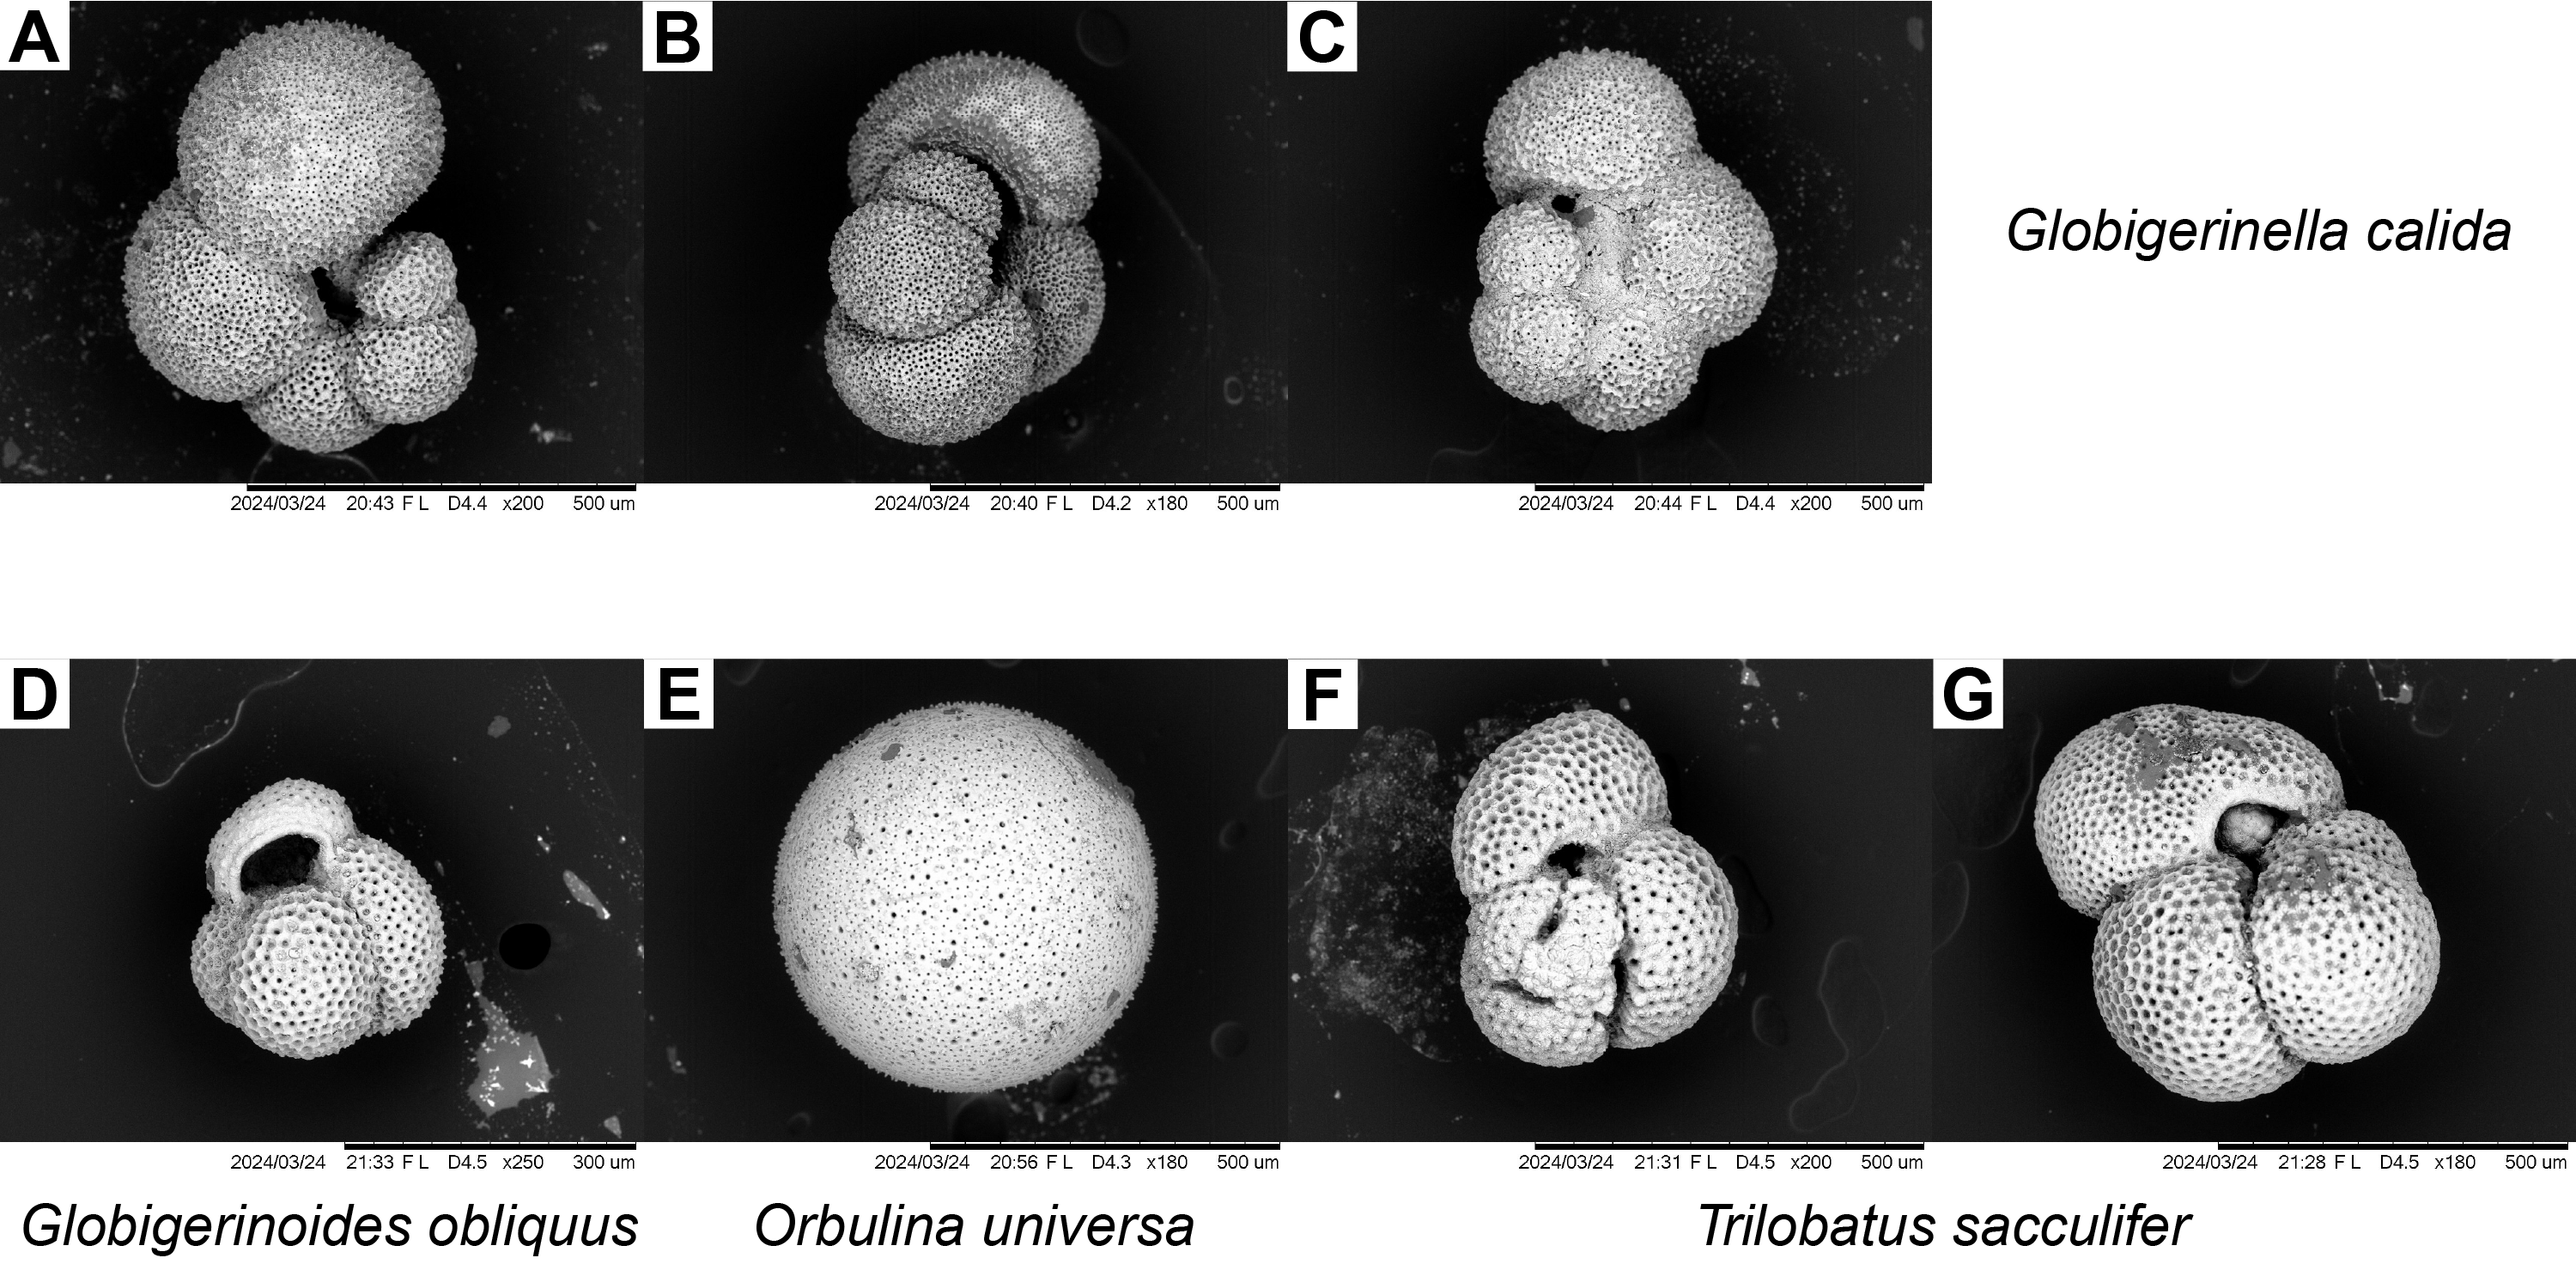
Figure F16. Globigerinella, Globigerinoides, Orbulina, and Trilobatus.
Biozones were delineated based on the faunal succession of marker species as defined below.
4.1.1.2.1. Zone MPle2b
Samples 1H-CC (2.67–2.72 mbsf) and 2H-CC (11.94–11.99 mbsf) were assigned to the MPle2b zone based on the occurrence of G. ruber var. pink (younger than 0.33 Ma) and the common occurrences of G. excelsa (first occurrence at younger than 1 Ma; Figure F14), Neogloboquadrina spp. (sin) (Figure F14), and G. calida (Figure F16) species.
Samples 3H-CC (21.31–21.36 mbsf) to 6H-CC (49.52–49.57 mbsf) exclusively contain volcaniclastic sediments and were devoid of any planktic foraminifera species. Therefore, these layers were not assigned to any biozone.
4.1.2. Hole U1616B
4.1.2.1. Sedimentary composition of collected samples
Hole U1616B drilled through the upper ~30 m of sediments to the base of the interval cored in Hole U1616A. The samples collected primarily from the core catchers were used to date the underlying sedimentary intervals. Some additional samples were selected to refine ages, particularly in cores where the core catcher sample was unlikely to contain abundant foraminifera. Holocene–Lower Pliocene (Zanclean stage) sediments were recognized in Hole U1616B by analyzing planktic foraminifera marker species events. Samples from the upper half of the cored interval, Samples 2H-CC (39.21–39.26 mbsf) to 19X-CC (198.36–198.41 mbsf), contain mostly volcaniclastic sediments (Figure F12) except for four nannofossil ooze samples (5X-CC, 7X-CC, 12X-CC, and 16X-CC) in between. Below this, sedimentary Samples 20X-CC to 29X-CC are more continuous with more prevalent nannofossil ooze sediments.
4.1.2.2. Planktic foraminifera biozonation
Planktic foraminifera marker species were examined from samples collected in Hole U1616B. The biostratigraphic zonation scheme used in Hole U1616B is presented in Table T3.
The planktic foraminifera fauna between Sections 402-U1616B-2H-CC (39.21–39.26 mbsf) and 29X-CC (293.4–293.45 mbsf) is typical of the Mediterranean biostratigraphic MPle2a–MPl4a zones and consists mainly of G. bulloides, Globigerina umbilicata, O. universa, G. calida, G. inflata, Globorotalia bononiensis, Globoconella puncticulata, G. ruber var. white, G. ruber var. pink, Globigerinoides obliquus, G. scitula, G. crassaformis, Neogloboquadrina spp. (sin), Trilobatus sacculifer, N. incompta, and G. excelsa (Figures F13, F14, F15, F16).
Biozones were delineated based on the faunal succession of marker species.
Samples 2H-CC (39.21–39.26 mbsf) to 4H-CC (55.88–55.93 mbsf) contain volcaniclastic sediments devoid of any planktic foraminifera and were therefore not assigned to any biozone.
4.1.2.2.1. Zone MPle2a
Samples 5H-CC (68.52–68.57 mbsf), 7X-CC (78.7–78.75 mbsf), and 12X-CC (136.21–136.26 mbsf) were assigned to the MPle2a zone coincident with the paracme top (~0.51 Ma; Sample 5H-CC) and paracme bottom (~0.91 Ma; Sample 12X-CC) occurrences of Neogloboquadrina spp. (sin) (Figure F14) along with the common species G. ruber var. white (Figure F13), G. inflata, (Figure F15), G. bulloides (Figure F13), and G. crassaformis (Figure F15) species.
All other samples from Sections 6H-CC (72.45–72.5 mbsf) through 15X-CC (161.71–161.76 mbsf) contain volcaniclastic sediments devoid of planktic foraminifera and were not assigned to any biozone.
4.1.2.2.2. Zone MPle1c
Sample 402-U1616B-16X-CC (176.23–176.28 mbsf) was assigned to the MPle1c biozone concurrent with the reappearance of G. crassaformis and the first common occurrence of G. excelsa (Figure F13) species.
Samples 17X-CC (182.52–182.57 mbsf) to 19X-CC (198.36–198.41 mbsf) were full of volcaniclastic sedimentary particles and were not assigned to any biozones.
4.1.2.2.3. Zone MPle1b
Sample 20X-CC (214.49–214.54 mbsf) was assigned to MPle1b zone based on the last occurrence of G. obliquus (Figure F16) and the commonly occurring G. inflata and Neogloboquadrina spp. (sin) species.
4.1.2.2.4. Zone MPle1a
Samples 21X-CC (224.97–225 mbsf) and 22X-CC (235.02–235.07 mbsf) were assigned to the MPle1a zone coincident with the dominant (>100 individuals) occurrence of Neogloboquadrina spp. (sin) and first occurrence of G. inflata species.
A ~1–1.2 Ma hiatus was interpreted to be present beneath these layers because planktic foraminiferal marker events corresponding to the MPl6 and MPl5b biozones ware not observed in the sedimentary succession below.
4.1.2.2.5. Zone MPl5a
G. bononiensis (Figure F15; Pforams database current identification is G. puncticulata) species was found to have its common and first occurrences in Samples 402-U1616B-23X-CC (245.07–245.095 mbsf) and 24X-CC (253.69–253.73 mbsf), respectively. These sedimentary layers were therefore assigned to the MPl5a biozone.
4.1.2.2.6. Zone MPl4b
Sample 26X-CC (271.96–272.01 mbsf) was assigned to the MPl4b zone corresponding to the acme and first occurrence of G. crassaformis along with commonly occurring G. obliquus and Neogloboquadrina spp. (sin) species.
4.1.2.2.7. Zone MPl4a
Sample 402-U1616B-28X-CC (284.5–285.55 mbsf) was assigned to the MPl4a zone corresponding to the first common occurrence of G. puncticulata (Figure F15) species.
Samples 25X-CC (262.39–262.44 mbsf), 27X-CC (283.88–283.93 mbsf), and 29X-CC (293.4–293.45 mbsf) contain silt, dolomitic mud, and fine-grained consolidated breccia material without any planktic foraminifera species, making it difficult to assign these layers to any biozones.
4.1.3. Hole U1616E
Samples 402-U1616E-2R-CC (252.44–252.49 mbsf) and 3R-CC (262.34–262.39 mbsf) were collected at the sediment/basement interface sampled in Hole U1616E, which was drilled with the objective of using the RCB system to core into the basement rocks. Based on the first occurrence of G. bononiensis and common occurrence of Globigerinoides species, these sedimentary layers were assigned to the MPl5a biozone (younger than 3 Ma). The biostratigraphic zonation scheme recognized in Hole U1616E is presented in Table T4 and is consistent with the nannofossil biostratigraphy observed in this hole.
4.2. Calcareous nannofossils
4.2.1. Hole U1616A
Calcareous nannofossils were analyzed in three core catcher samples from the six cores in Hole U1616A and in the mudline sample from Core 1H. The biozones were assigned according to the Mediterranean biozonation scheme described in Di Stefano et al. (2023).
Figure F17 shows the biozonal assignment for each examined sample at Site U1616.
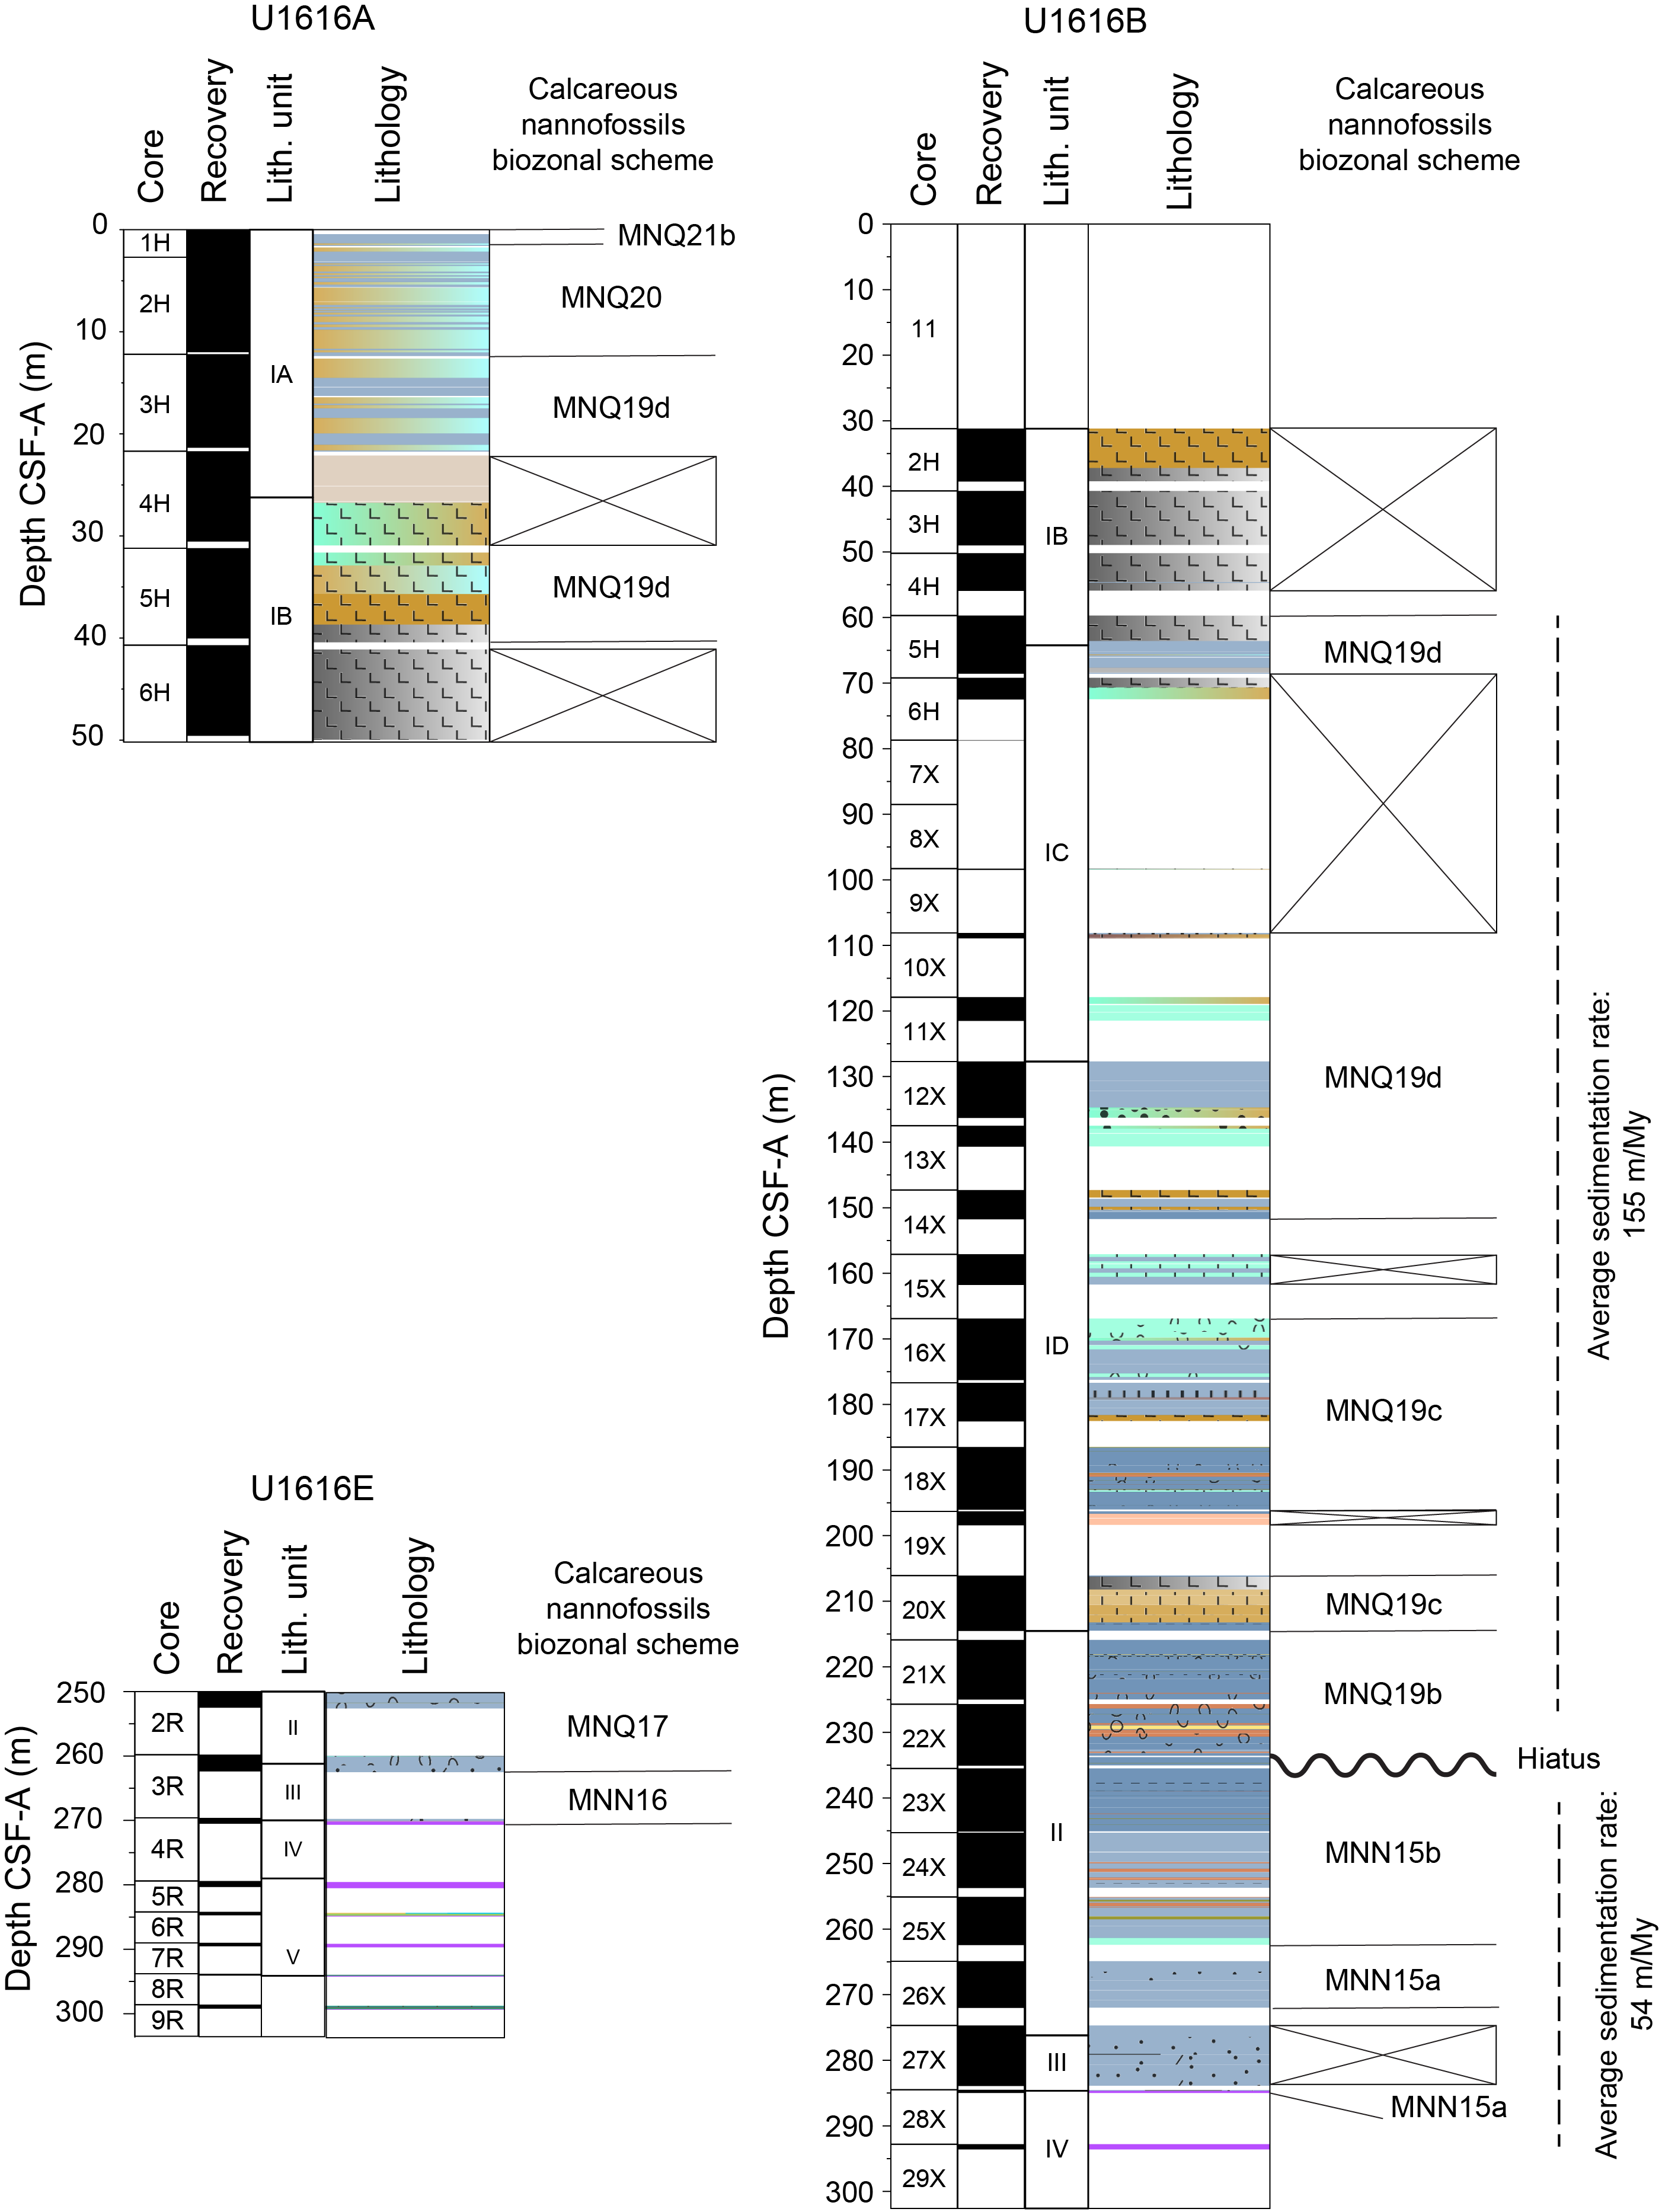
Figure F17. Calcareous nannofossil biozones.
The Hole U1616A mudline sample contains a well-preserved nannofossil assemblage characterized by the presence of Emiliania huxleyi and was assigned to the MNQ21 biozone (Middle Pleistocene–Holocene; younger than 0.25 Ma). Samples 1H-CC and 2H-CC were assigned to the Middle–Upper Pleistocene MNQ20 biozone (0.26–0.46 Ma) because of the presence of abundant and well-preserved nannofossil assemblages predominantly composed of small-sized Gephyrocapsa, middle-sized Gephyrocapsa, Helicosphaera carteri, Helicosphaera inversa, Calcidiscus leptoporus, Coccolithus pelagicus, Coronosphaera spp., and Syracosphaera pulchra.
Samples 402-U1616A-3H-CC and 5H-CC were assigned to the lower Middle Pleistocene MNQ19d biozone (0.46–0.96 Ma) because of the presence of Gephyrocapsa omega, Pseudoemiliania lacunosa, small-sized Gephyrocapsa, middle-sized Gephyrocapsa, H. carteri, H. inversa, C. leptoporus, C. pelagicus, Coronosphaera spp., and S. pulchra.
Samples 4H-CC and 6H-CC exclusively contain lithic fragments of volcanic origin and were devoid of any calcareous nannofossils.
4.2.2. Hole U1616B
In the upper part of Hole U1616B (Samples 2H-CC to 9X-CC), only Sample 5H-CC provided useful biostratigraphic information and was assigned to the lower Middle Pleistocene MNQ19d biozone (0.46–0.96 Ma). The other samples in this interval consist of volcaniclastic sediments and are devoid of any calcareous nannofossils.
Samples 402-U1616B-10X-CC to 14X-CC were assigned to the MNQ19d biozone. Sample 15X-CC did not provide reliable biostratigraphic information because of the scarce abundance of nannofossils.
Samples 16X-CC to 20X-CC were assigned to the upper Calabrian (Lower Pleistocene) MNQ19c subzone (0.96–1.24 Ma), characterized by the presence of dominant small-sized Gephyrocapsa, H. carteri, Helicosphaera sellii, C. leptoporus, Calcidiscus macintyrei, P. lacunosa, and Geminilithella (Umbilicosphaera) rotula.
In Sample 19X-CC, nannofossils were not observed but microclasts of volcanic origin were identified.
Samples 402-U1616B-21X-CC and 22X-CC were assigned to the lower Calabrian (Lower Pleistocene) MNQ19b subzone (1.24–1.61 Ma), characterized by the presence of large-sized Gephyrocapsa, H. carteri, H. sellii, C. leptoporus, C. macintyrei, P. lacunosa, and G. (U.) rotula.
The sedimentation rate in the interval between the top of Hole U1616B and Core 22X is estimated to be about 155 m/My.
None of the samples were assigned to the MNQ19a, MNQ18, MNQ17, or MNN16 biozones (1.61–2.81 Ma) in the geochronological intervals between the late Piacenzian (late Pliocene) and early Calabrian (Early Pleistocene).
Samples from 402-U1616B-23X-CC to 402-U1617A-25X-CC were found to belong to the Upper Pliocene (Piacenzian) MNN15b biozone (2.82–3.56 Ma) because they contain well-preserved nannofossil assemblages that include H. carteri, H. sellii, P. lacunosa, Discoaster asymmetricus, Discoaster brouweri, Discoaster surculus, and Discoaster tamalis among the other Discoaster species also occurring in the samples above, and exclude Discoaster pentaradiatus (D. pentaradiatus paracme event).
Samples 402-U1616B-26X-CC to 28X-CC were assigned to the Upper Pliocene (Zanclean–Piacenzian transition) MNN15a biozone (3.56–3.85 Ma) because of the presence of abundant D. pentaradiatus in the nannofossil assemblages.
In Sample 402-U1616B-29X-CC, nannofossils were not observed but oxides and dolomite granules were identified.
The average sedimentation rate calculated in Cores 402-U1616B-23X through 28X is about 54 m/My.
4.2.3. Hole U1616E
Calcareous nannofossils were analyzed in Samples 402-U1616E-2R-CC; 3R-CC; 4R-1, 7 cm; 4R-1, 20 cm; and 4R-1, 29 cm, to better define the age of the oldest sediment deposited above the basement. Samples 2R-CC and 3R-CC contain nannofossil assemblages characterized by the presence of D. brouweri and Discoaster triradiatus and are assigned to the Gelasian (Lower Pleistocene) MNQ17 biozone (1.95–2.51 Ma).
All samples collected from Core 402-U1616E-4R contain calcareous nannofossil assemblages characterized by H. carteri, H. sellii, P. lacunosa, D. brouweri, D. pentaradiatus, D. surculus, and D. triradiatus and are assigned to the MNN16 biozone (Upper Pliocene–Lower Pleistocene; Piacenzian–Gelasian transition; 2.51–2.82 Ma).
4.3. Synthesis from microfossil data
The biostratigraphic data show that the succession in the upper part of Site U1616A is of Middle Pleistocene–Holocene age. The upper part of the succession recovered in Hole U1616B, consisting of mainly volcaniclastic sediments, was determined to be of Calabrian–Chibanian age (early Middle Pleistocene). This interval is characterized by a high sedimentation rate (~155 m/My) probably because of the presence of mass transport deposits and/or slumps, as also highlighted by sedimentologic evidence.
Hole U1616B is characterized by the presence of a ~1.2 My long hiatus between Samples 402-U1616B-22X-CC and 23X-CC at about 235 mbsf. The lower part of Hole U1616B (~235–290 mbsf) is a continuous succession of Piacenzian–Zanclean age (2.82–3.56 Ma), characterized by an average sedimentation rate of ~54 m/My.
In Hole U1616E, the sediments overlying the basement were determined to be Piacenzian–Zanclean (2.51–2.82 Ma), suggesting a difference of about ~1 My with respect to the age of sediments deposited immediately above the basement in Hole U1616B.
5. Paleomagnetism
5.1. Sediment
5.1.1. Paleomagnetic results
Paleomagnetic analysis was conducted on a total of 36 sediment cores recovered from Holes U1616A, U1616B, and U1616E. A total of 34 cores were drilled using the APC/XCB system in Holes U1616A and U1616B (6 and 28 cores, respectively), and 2 sediment cores were drilled using the RCB system in Hole U1616E. Natural remanent magnetization (NRM) was measured at 2 cm intervals on section halves before and after demagnetization at 5, 10, 15, and 20 mT peak alternating field (AF). The NRM shows dominant normal polarity (Figure F18), and the peak of the inclination histogram is as expected for the geocentric axial dipole (GAD) field value (Ic_GAD = 59.37°) for the latitude at these three holes (40°11.0637′N, 40°11.0628′N, and 40°11.0506′N, respectively). Demagnetization of NRM at 20 mT peak AF (NRM@20mT) yields inclination values distributed around the expected GAD value (Figure F19), similar to NRM. A minor fraction of transitional and reverse inclination values is observed in NRM@20mT (Figure F19).
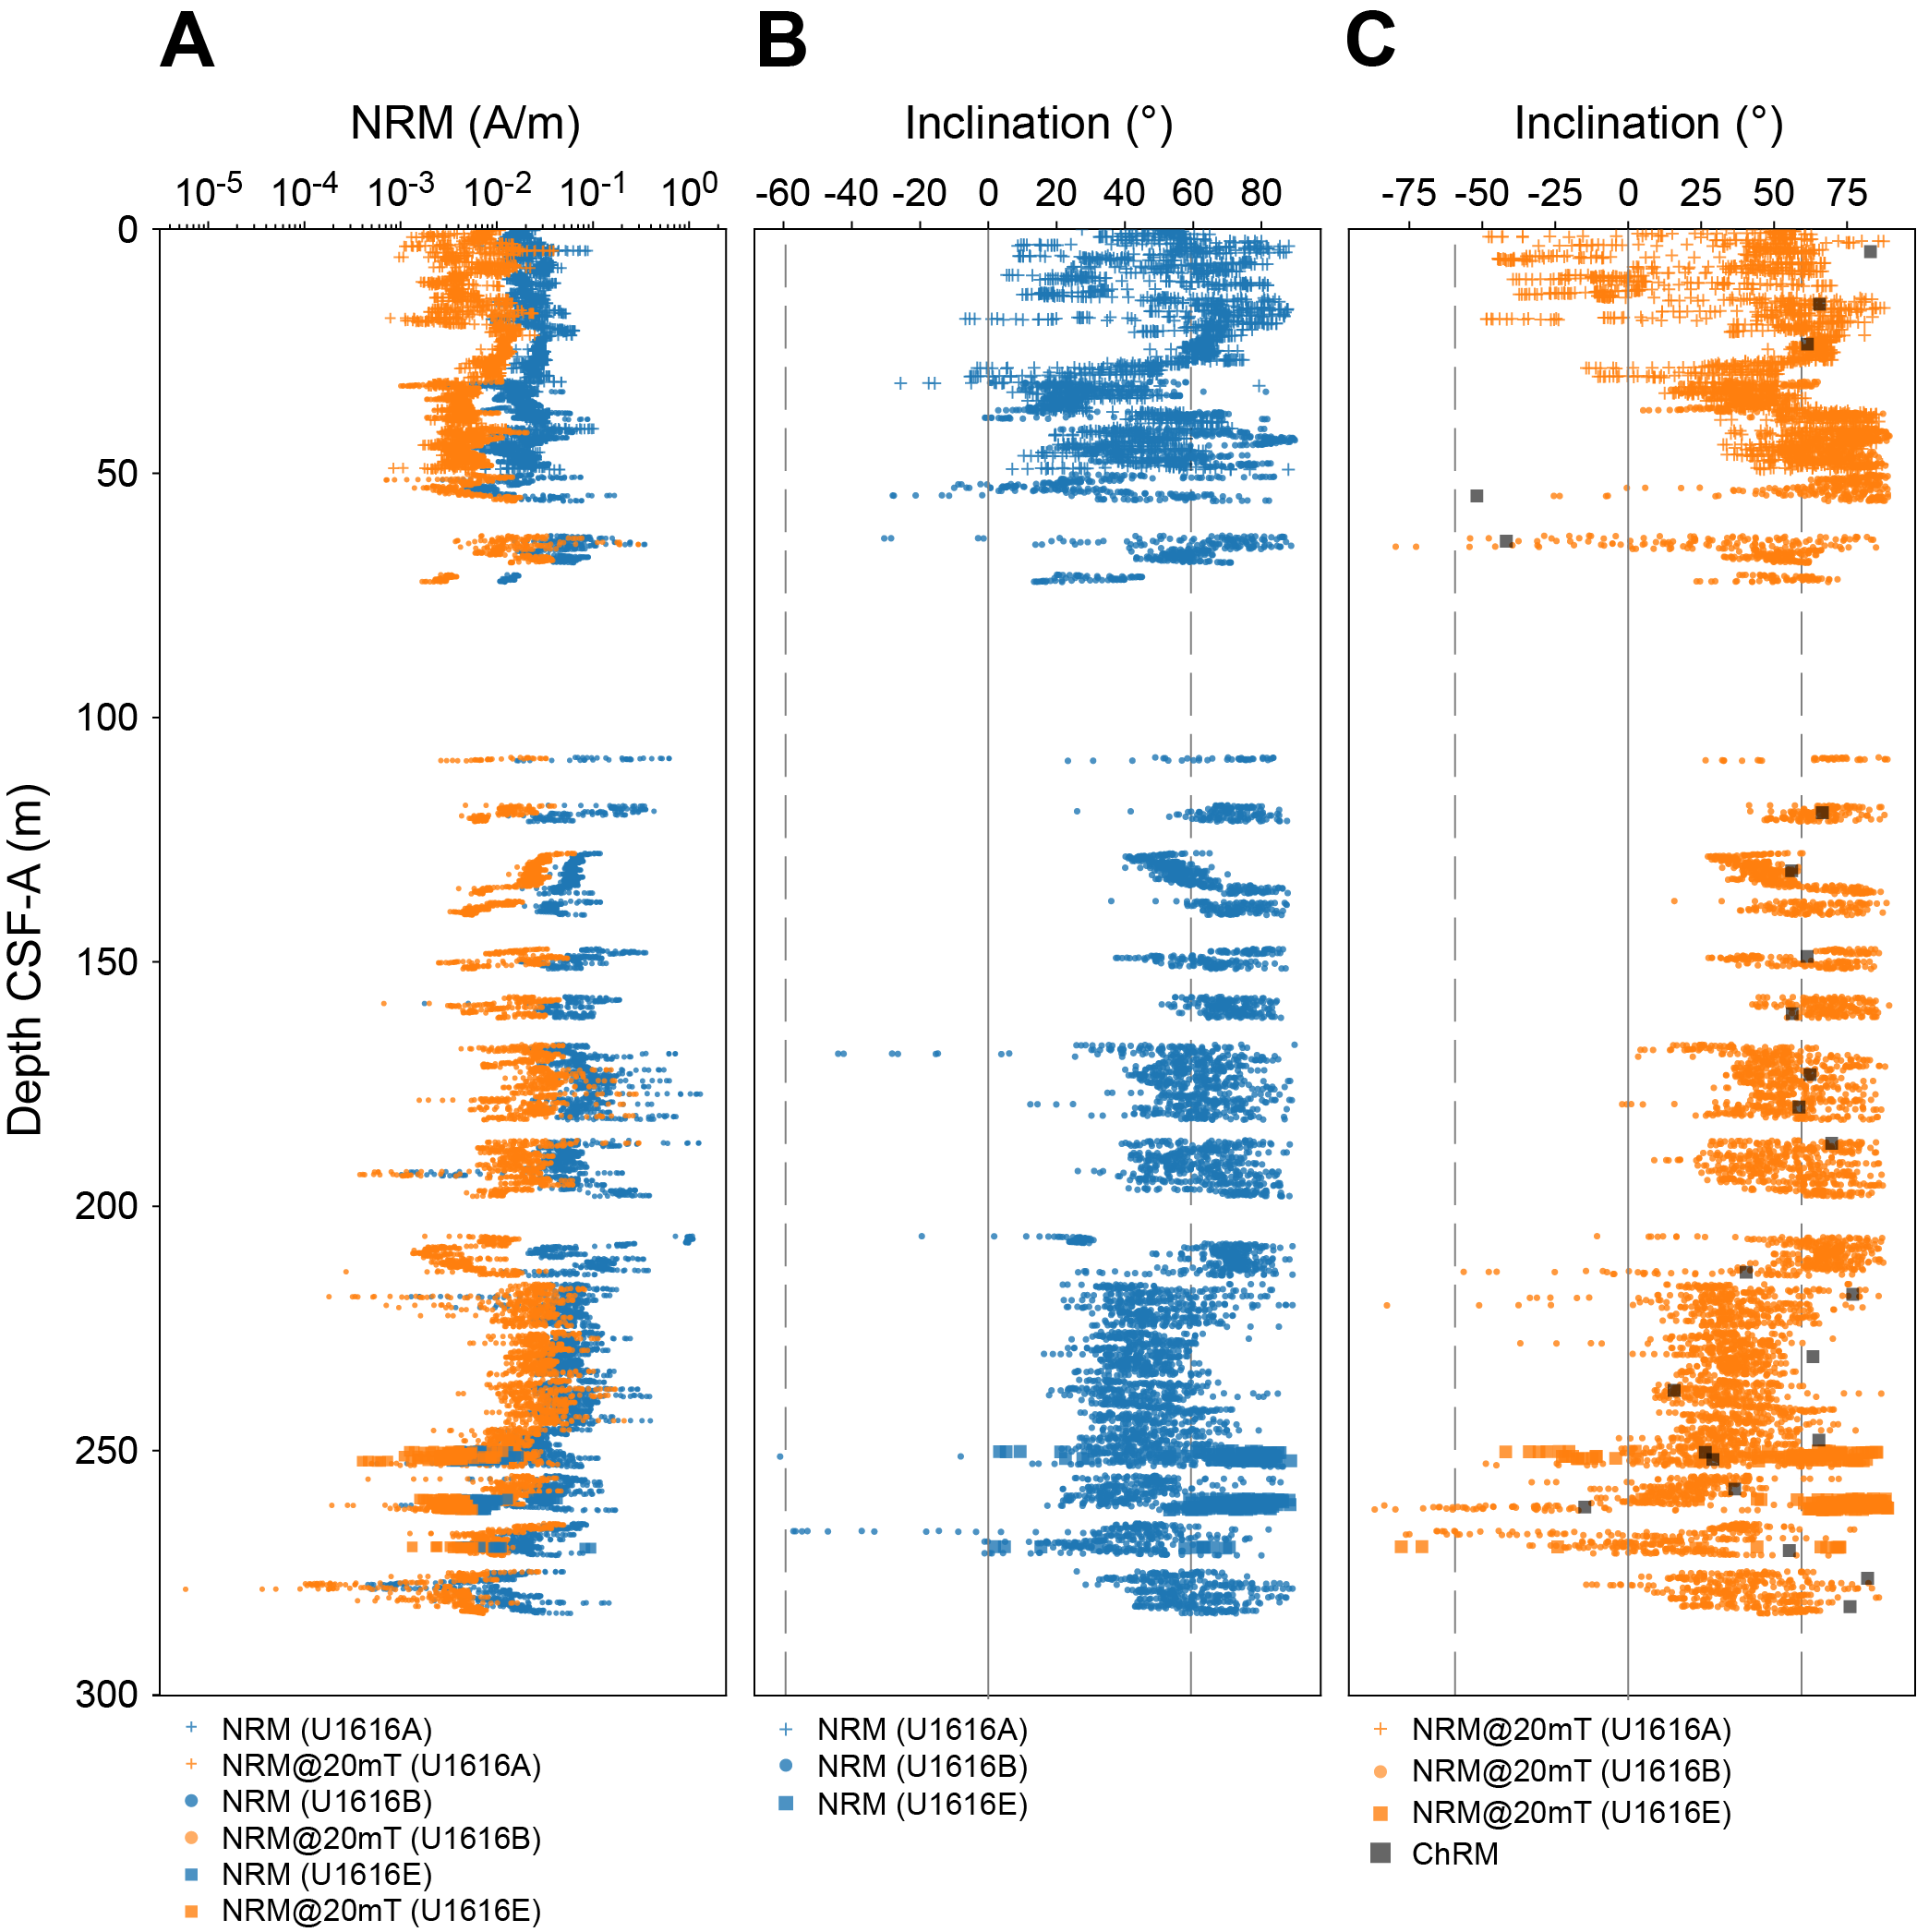
Figure F18. NRM variation, sediment.
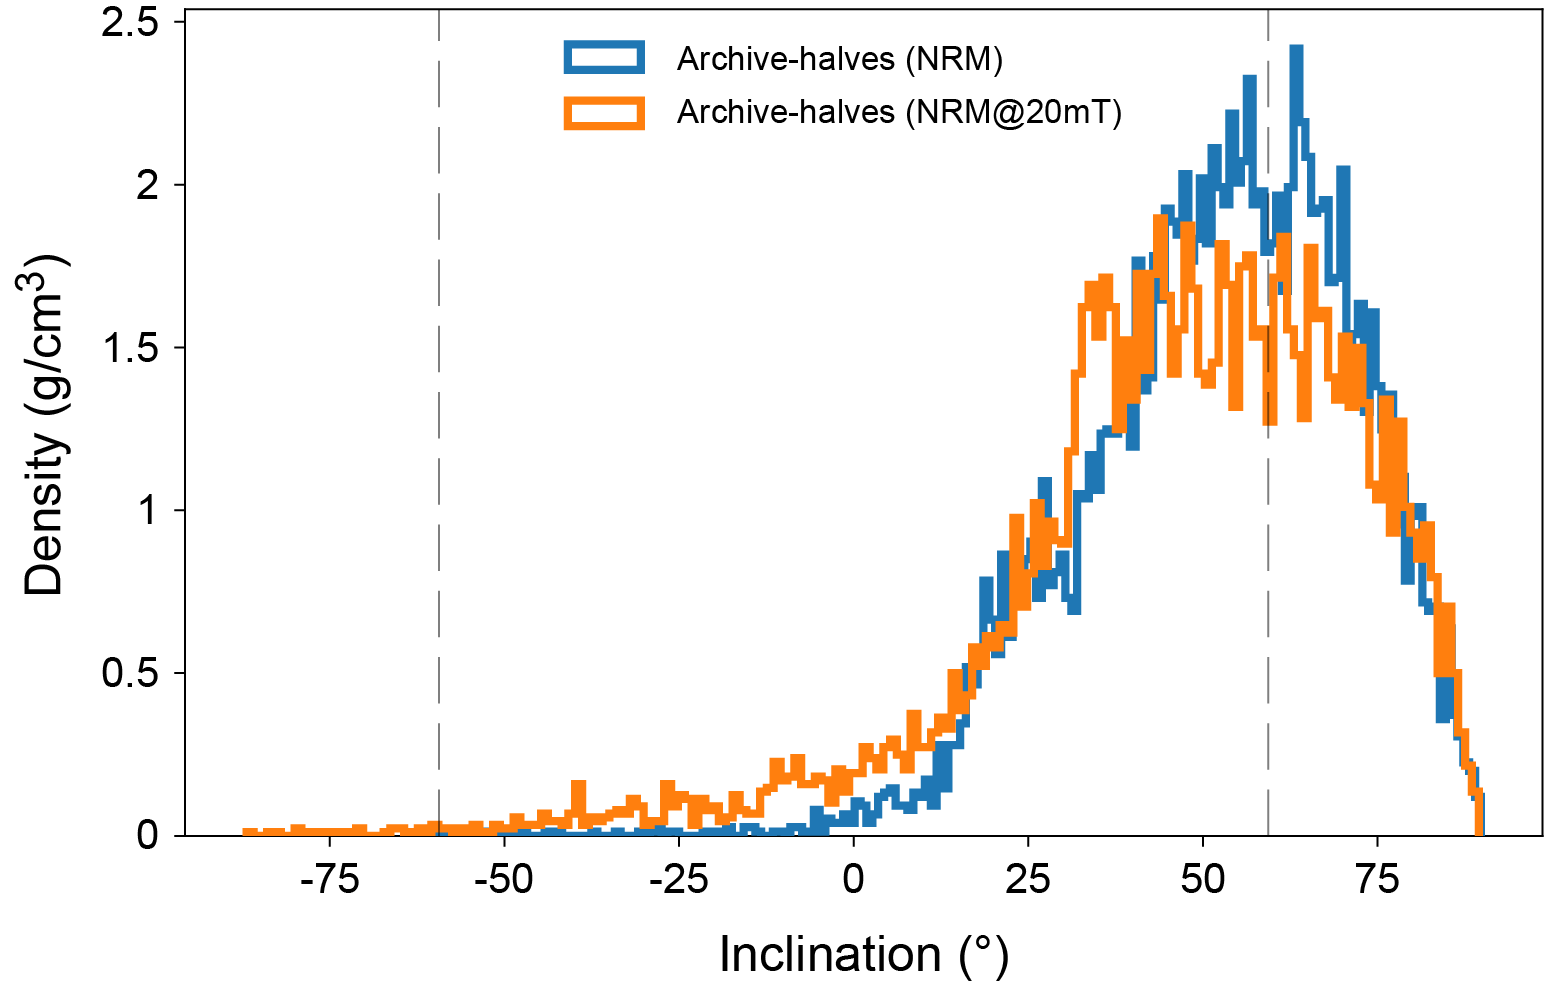
Figure F19. NRM and NRM after demagnetization at 20 mT, sediment.
Sporadic, thin reverse intervals recorded in Hole U1616A and at the top of Hole U1616B (occasional intervals across Cores 402-U1616A-1H through 6H and 402-U1616B-2H through 5H) are attributed to high volcaniclastic input into the sediments (see Lithostratigraphy). More apparent reversals are seen toward the bottom of Hole U1616B (Cores 24X–27X; 245.3–283.93 m CSF-A), but these are attributed to severe drilling disturbance and/or large cracks seen in the mud. As a result, the changes in polarity inclination data may not reflect geomagnetic reversals.
The anisotropy of magnetic susceptibility (AMS) in discrete samples shows that the minimum principal axes (K3) of AMS ellipsoids are well clustered without a preferred orientation, with a few exceptions (Figure F20A). K3 is distinct from the maximum (K1) and intermediate (K2) axes, which is characteristic of an oblate sedimentary fabric (Tauxe, 2010) and indicates that the cores are undeformed by drilling (Rosenbaum et al., 2000).
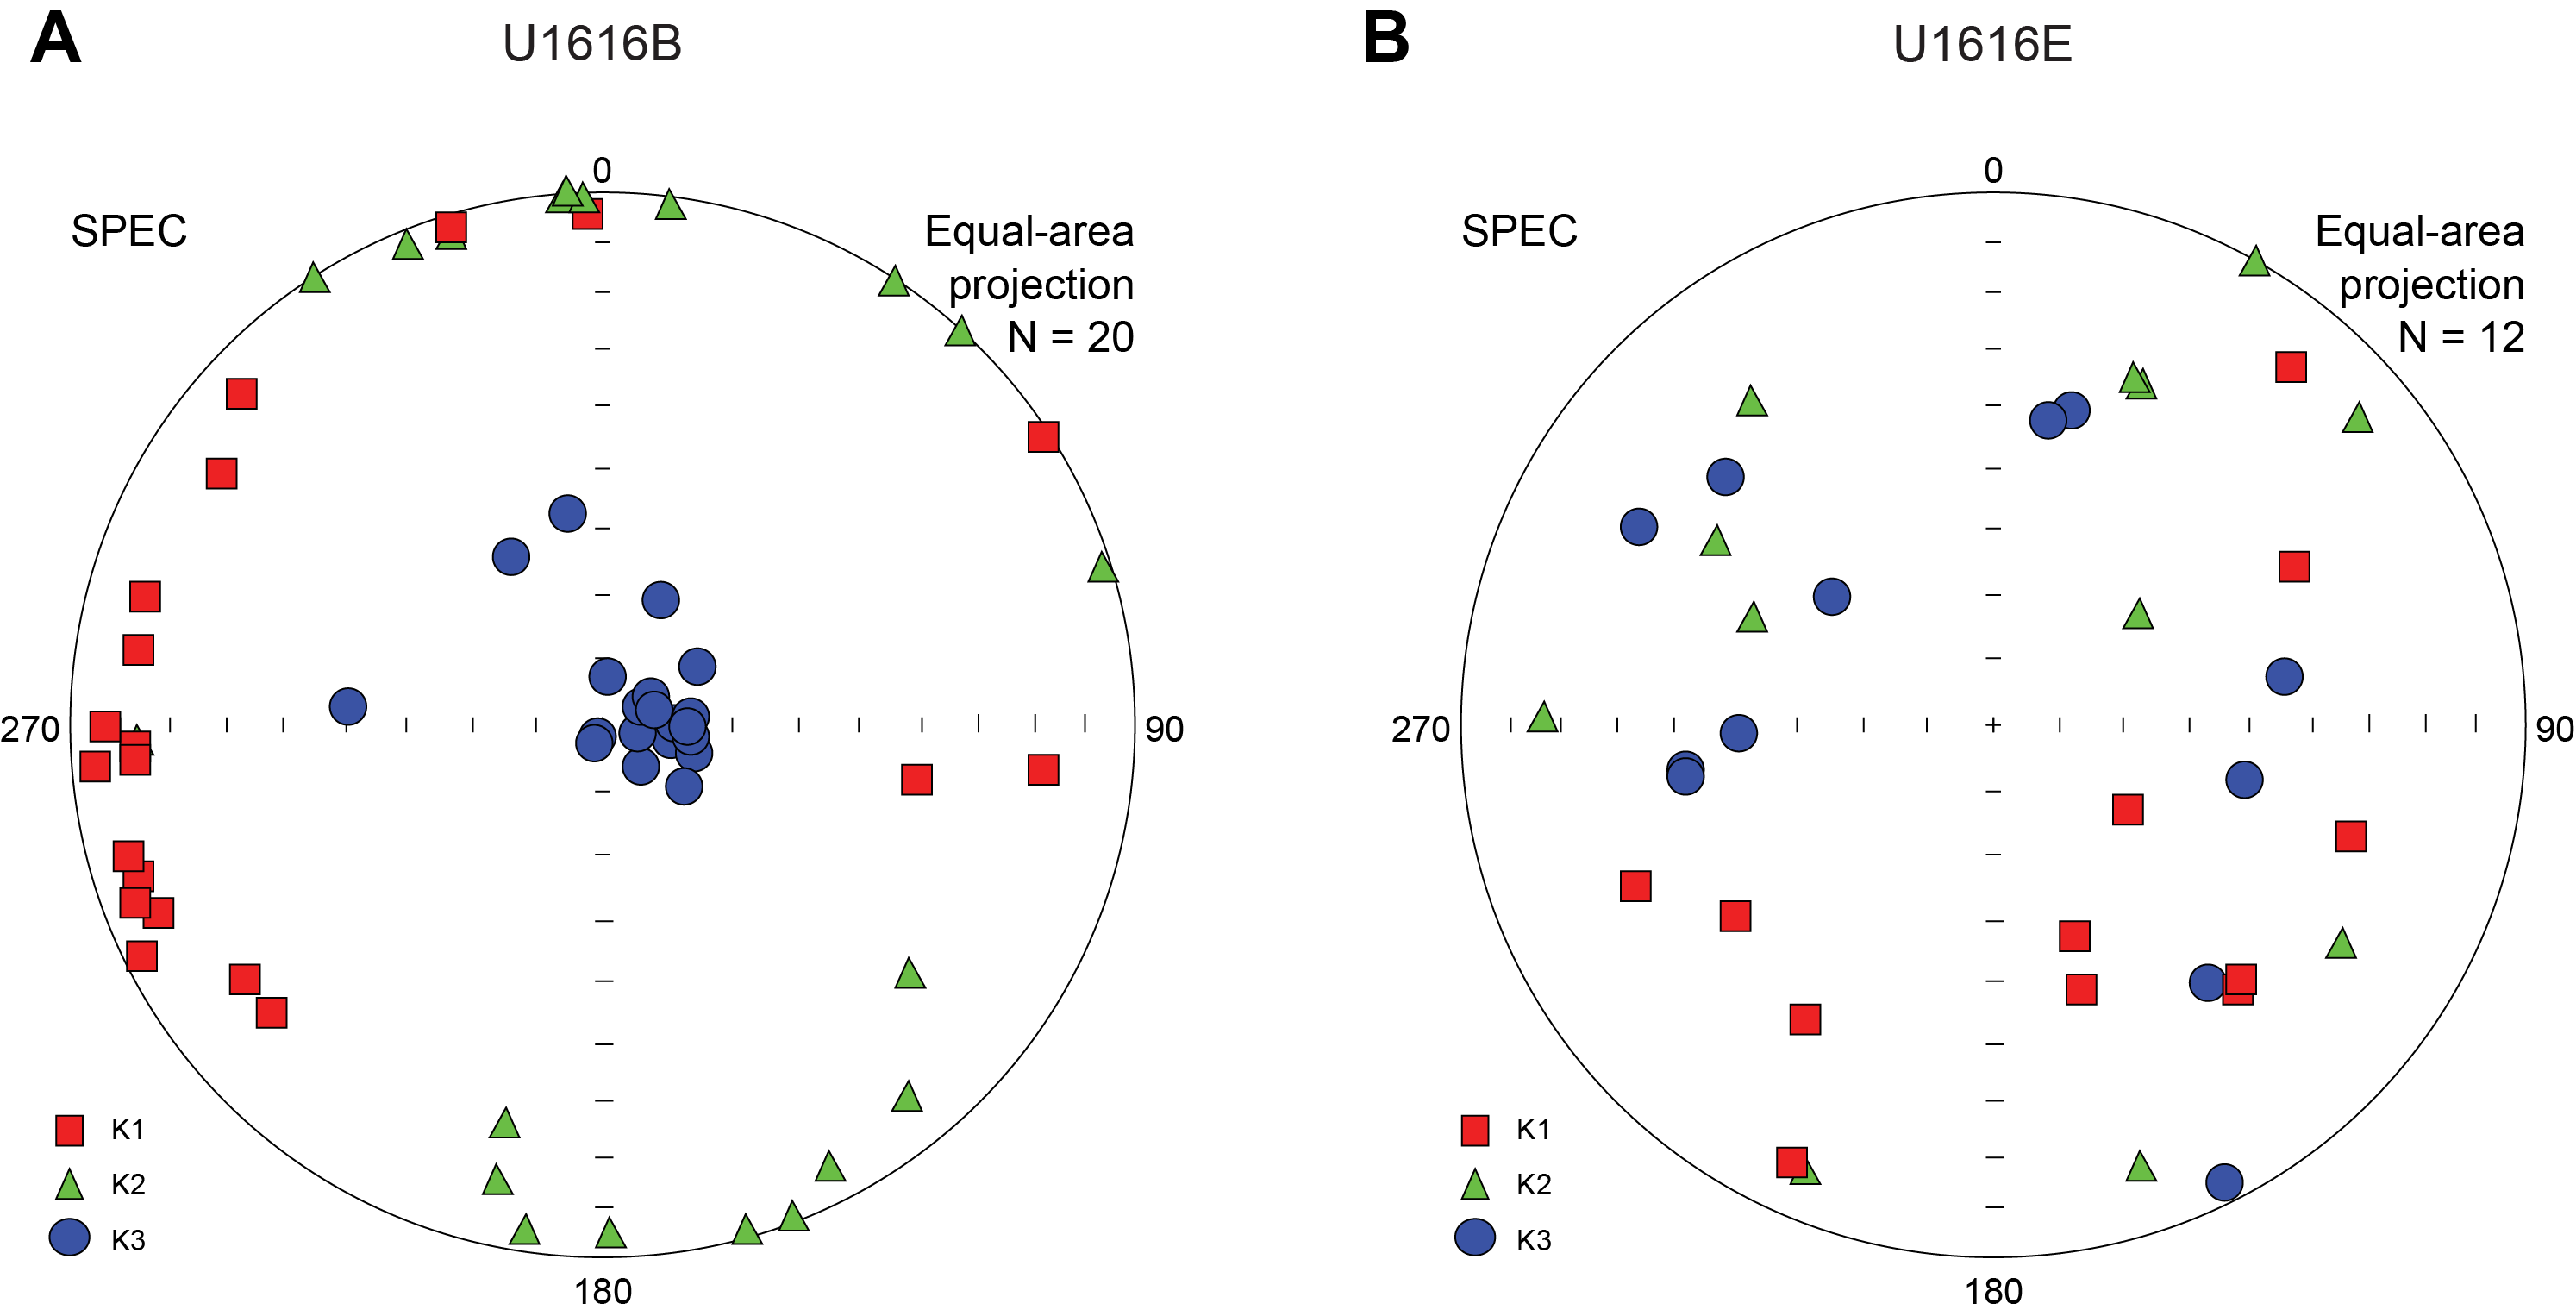
Figure F20. AMS ellipsoids.
5.1.2. Rock magnetism
The dominance of normal polarity recorded in this area is somewhat expected due to the inclinations recorded at nearby Sites U1612, U1614, and U1615. Discrete cube samples were subjected to AF demagnetization up to 120 mT peak AF to assess the quality of NRM data retrieved from archive-half sections. Principal component analysis (PCA) is used to define the characteristic remanent magnetization (ChRM) (Kirschvink, 1980). Data in the intervals between 20 and 80 mT were used to determine ChRM and the associated maximum angular deviation that indicates the quality of ChRM. The ChRM inclination of discrete samples is similar to those of the archive halves and what is expected at this latitude (average ChRM = 60.2°; average maximum angular deviation = 7.85°). The reversals seen in the upper part of Hole U1616B that are related to volcaniclastics are evident in discrete samples from Section 4H-4 (54.04–55.13 m CSF-A). Lithology-related reverse intervals were also found at previous sites of Expedition 402. The reversals found in the bottom few cores (Cores 24X–27X; 245.3–283.93 m CSF-A) are often associated with drilling disturbance such as cracking and biscuiting. In comparison, the more consolidated and less disturbed parts of the core show normal polarity, suggesting that the short reversals seen in the archive halves are due to drilling disturbance.
To gain insight into the magnetic properties of NRM carriers, anhysteretic remanent magnetization (ARM) was applied with a 70 mT peak AF and 50 µT direct field to the discrete samples and demagnetized up to 80 mT peak AF in 20 steps. The results are similar for samples with a median destructive field (MDF) of ranging 20–28 mT (Figure F21), indicating that magnetic properties of NRM carriers between samples are not significantly different.
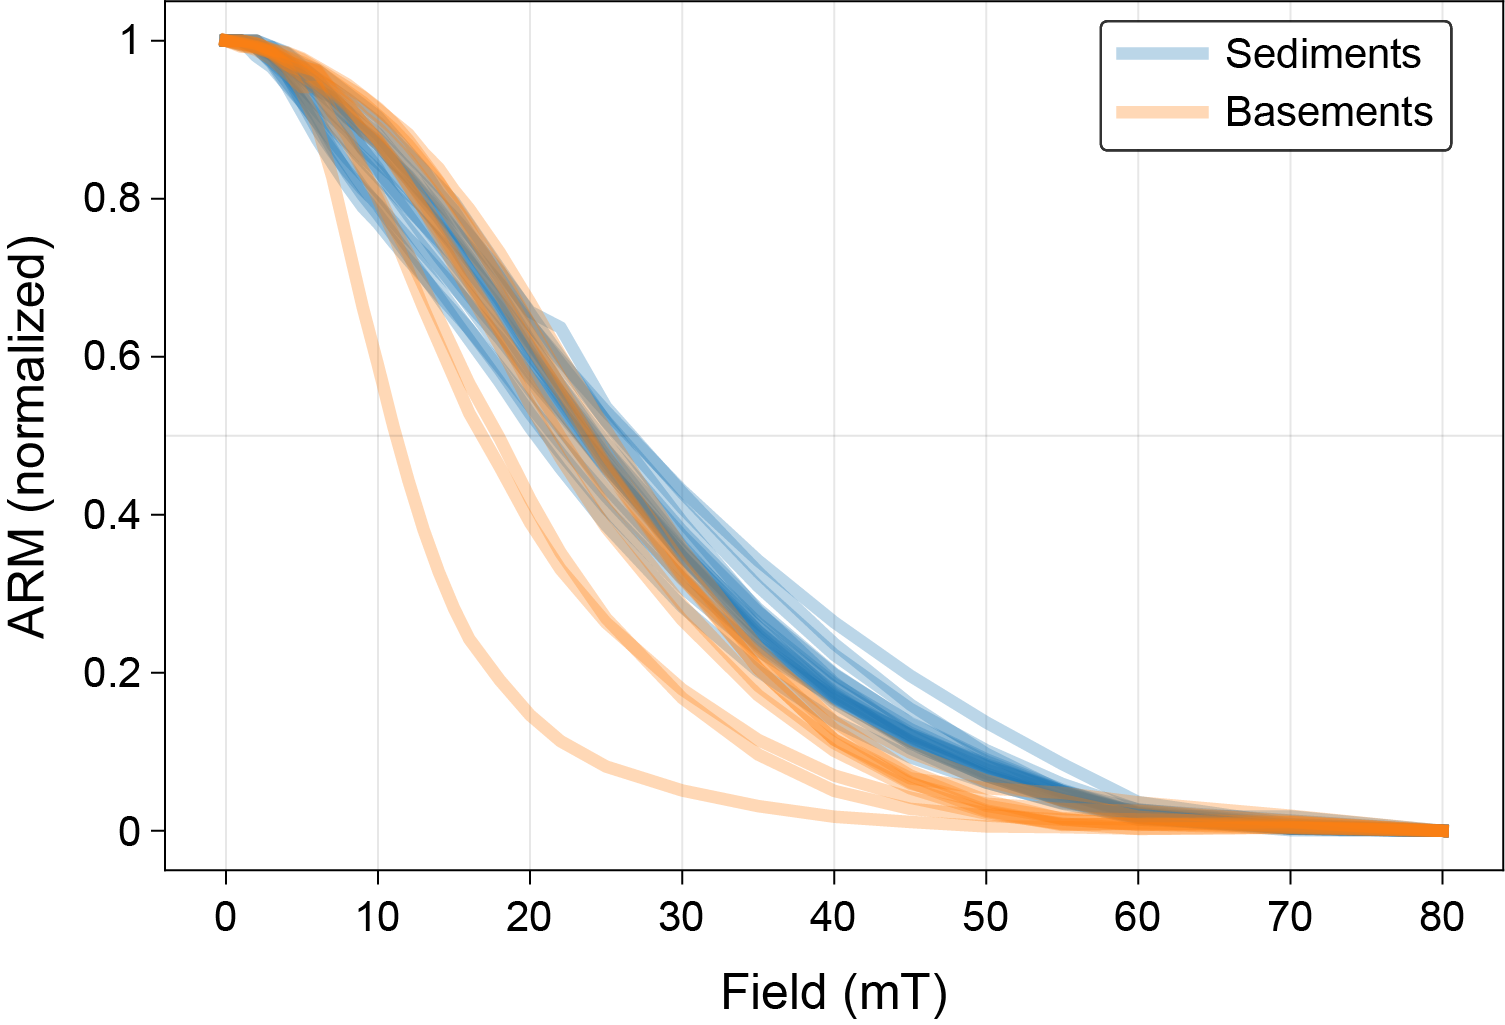
Figure F21. Demagnetization of ARM.
5.2. Basement
5.2.1. Paleomagnetic results
Hole U1616E retrieved 28 cores using the RCB system to 427.2 mbsf with 21% recovery. Paleomagnetic measurements were performed on whole-rock samples from archive-half sections that were >8 cm long because fragmented pieces cannot be properly oriented with respect to the downcore direction. NRM was measured at 2 cm intervals before and after demagnetization at 5, 10, 15, and 20 mT peak AF. NRM shows dominant normal polarity (Figure F22), and the peak of the inclination histogram is shallower than the expected GAD value for the latitude of Hole U1616E (40°11.0506′N). Demagnetization of NRM at 20 mT peak AF (NRM@20mT) yields an inclination distribution that is left-shifted compared to that of NRM (Figure F23). For NRM@20mT, inclination greater than the GAD value of normal polarity is much reduced compared to NRM, indicating the removal of the normal field overprint up to 20 mT peak AF.
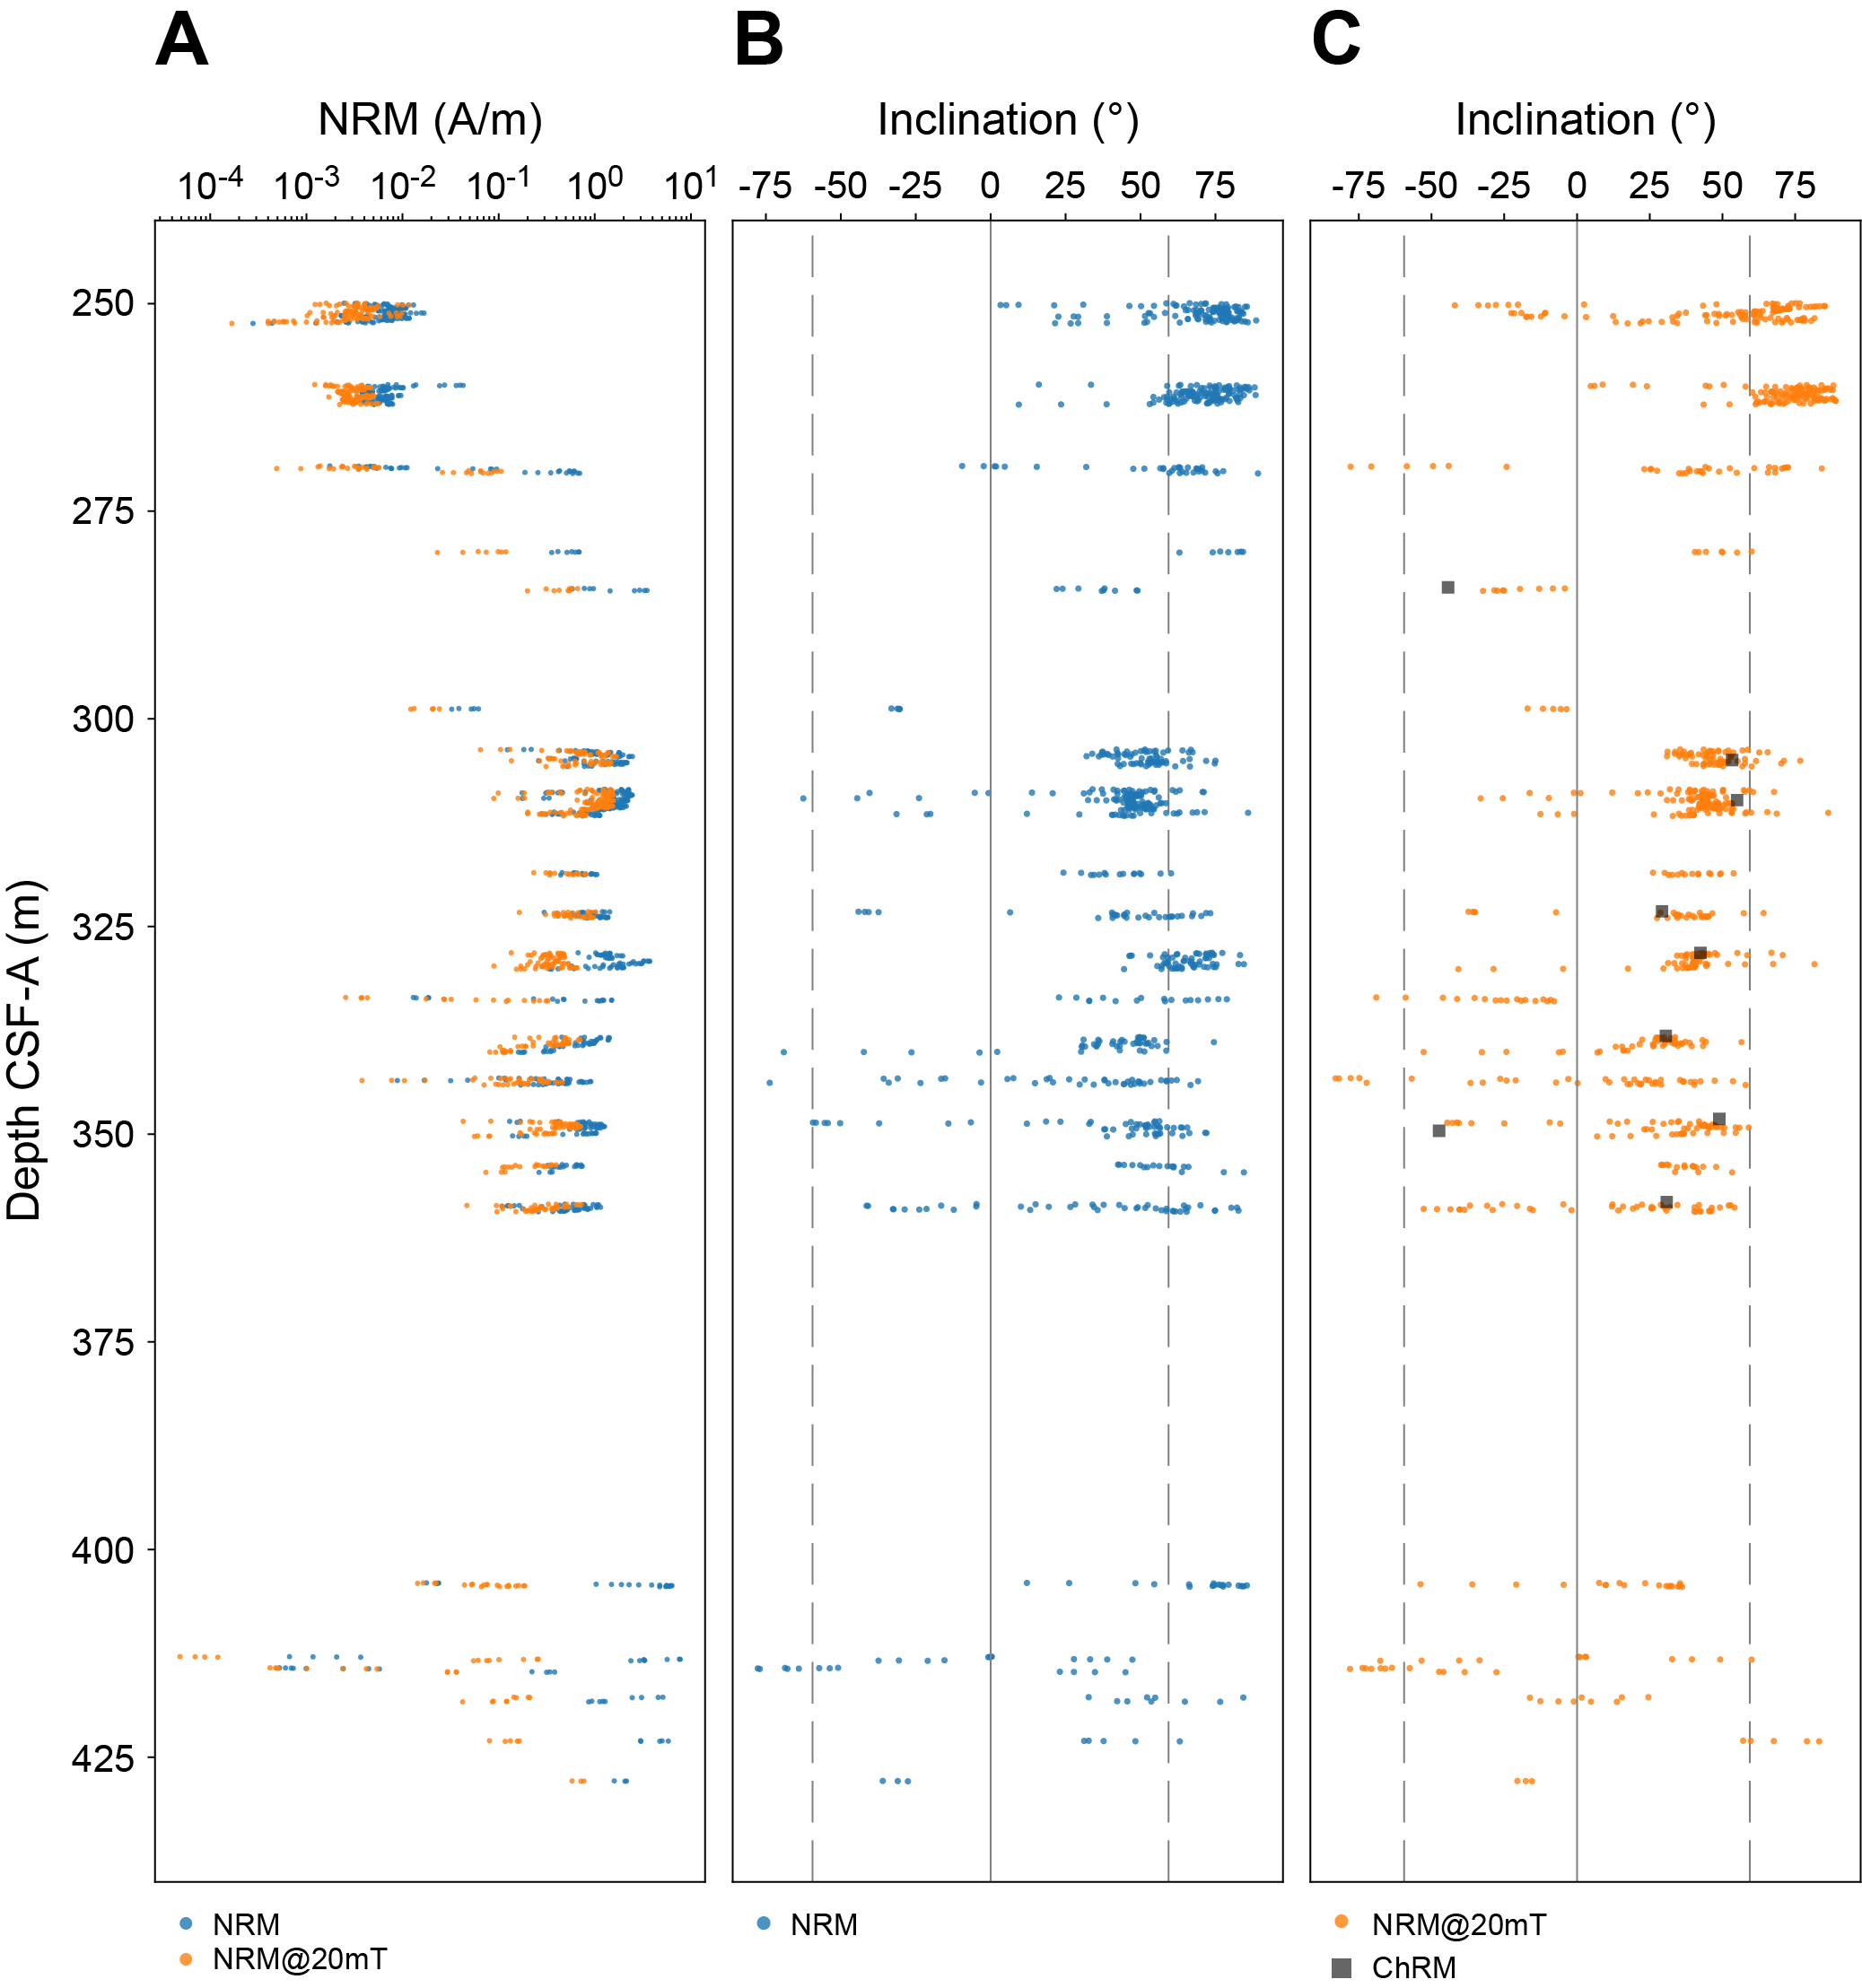
Figure F22. NRM basement rock variation.
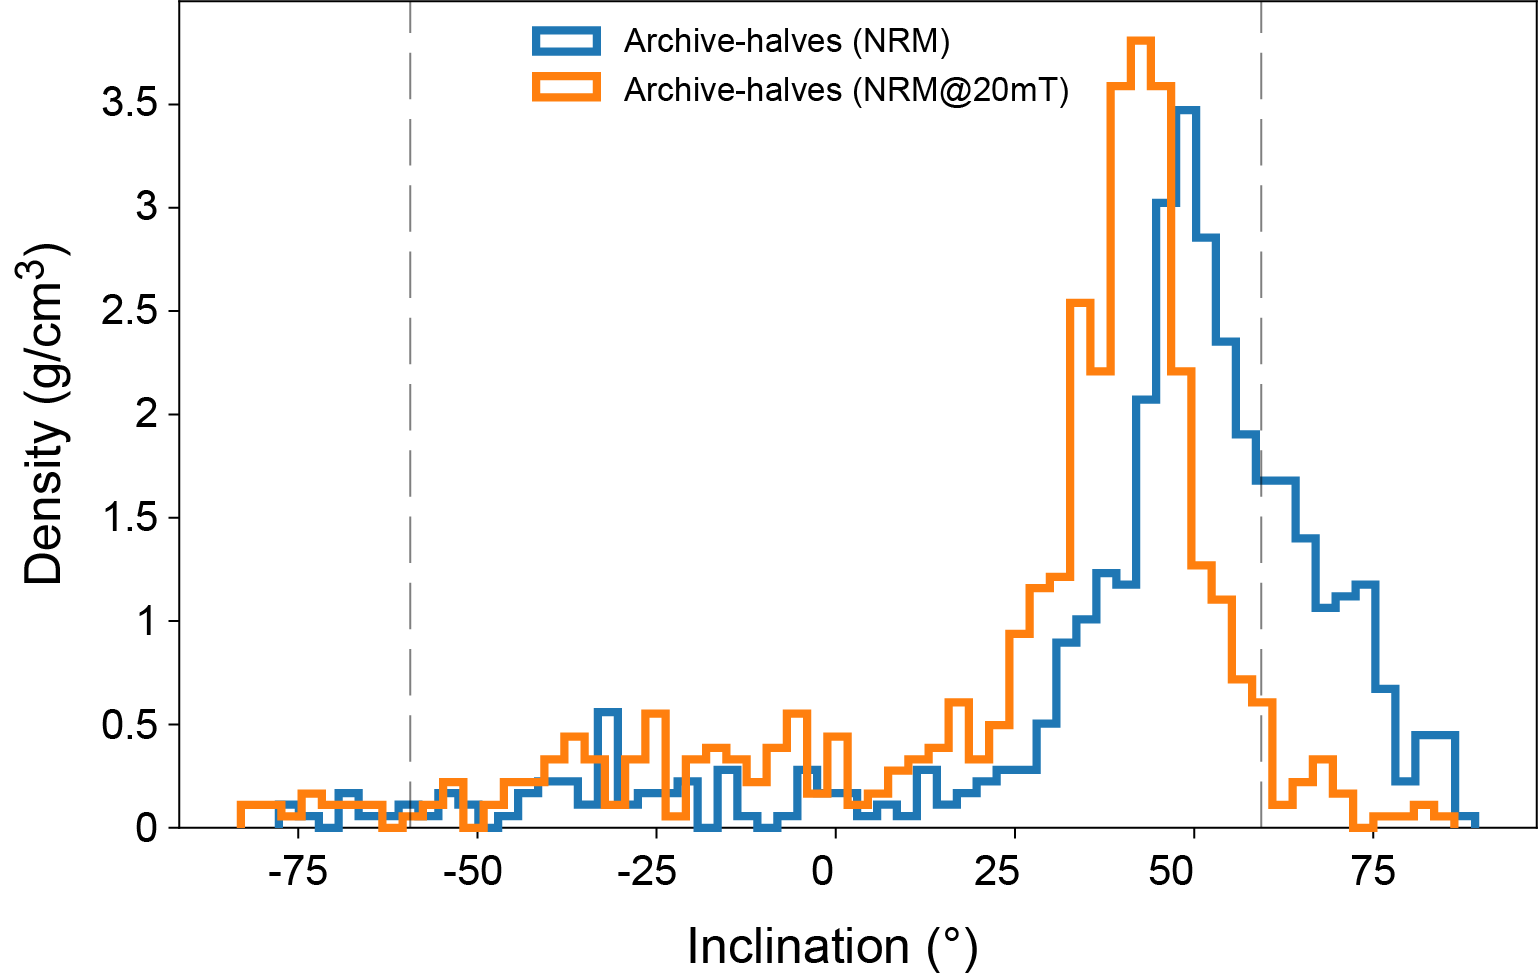
Figure F23. NRM and NRM after demagnetization at 20 mT peak AF, basement.
AMS of discrete samples shows that all three principal axes are scattered in the geographic coordinate (Figure F20B). The scatter may arise, at least in part, from the fact that the cores were not oriented in declination. Discrete cube samples were subjected to AF demagnetization up to 120 mT peak AF to assess the quality of NRM data obtained from the archive-half sections. PCA was used to define the ChRM inclination (Kirschvink, 1980) between the 20 and 60 mT intervals and the associated maximum angular deviation (average ChRM = 37.85°; maximum angular deviation = 5.5°). The ChRM inclination of discrete samples is similar to those of the archive halves (Figure F22).
5.2.2. Rock magnetism
ARM was conducted on discrete samples using the same parameters as the sediment samples. The MDF of rock samples is in the range of ~10–25 mT, similar to that of the sediments except for three samples (Figure F21). However, the ARM demagnetization curves of the basement samples differ from those of the sediments in the coercivity range above 30 mT, indicating that the remanence carriers of the basement rocks are generally coarser than those of sediments.
Isothermal remanent magnetization (IRM) curves were measured to determine the major magnetic carriers in the serpentinized peridotites (Figure F24). Although the samples appear to be highly magnetic, all but one of the IRM curves are noisy for an unknown reason. Regardless, it appears that different lithostratigraphic units (see Igneous and metamorphic petrology) show different saturation remanence (Mrs). When normalized to Mrs, the IRM curves are different below 100 mT but become comparable in higher magnetizing fields as the basement samples essentially saturate at ~300 mT, indicating multidomain magnetite as the dominant magnetic component for these peridotites. Although multidomain magnetite is seen in both Hole U1616E and U1614C peridotites, the ones in Hole U1616E are much more homogeneous.
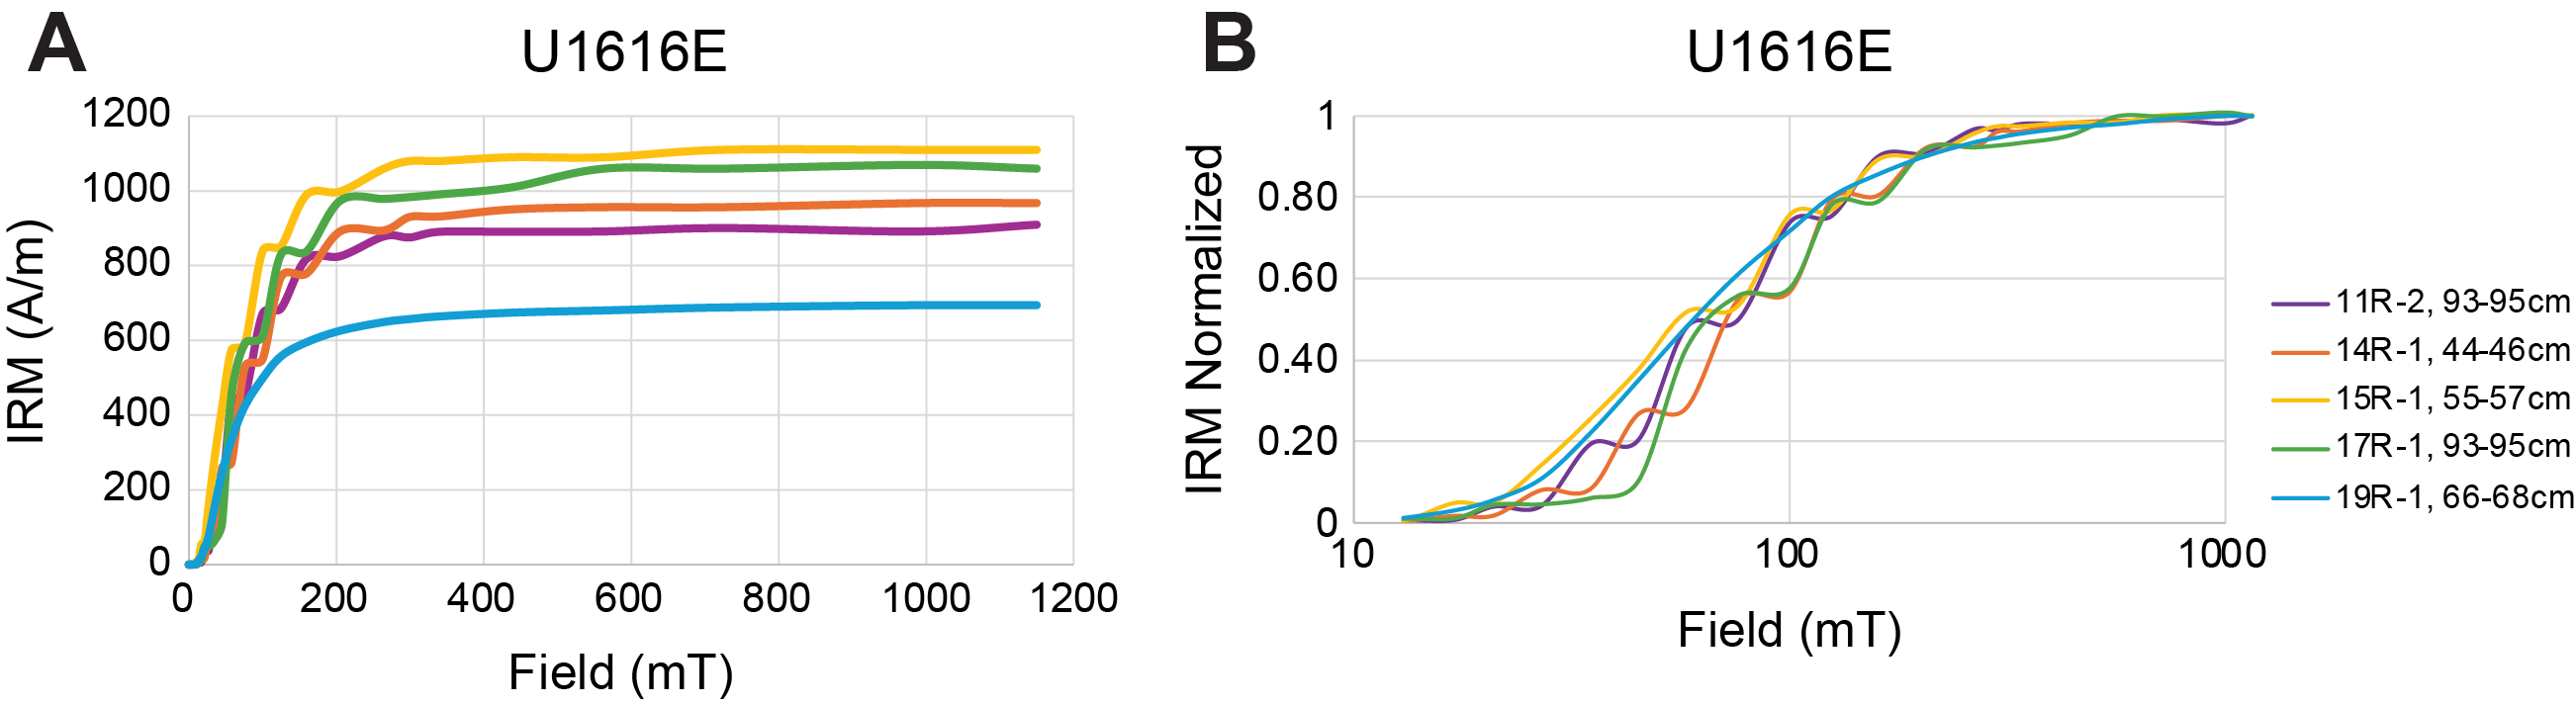
Figure F24. IRM curves.
6. Igneous and metamorphic petrology
Site U1616 targeted the Tyrrhenian basement beneath a ~280 m thick sedimentary section. As observed at Site U1614, mantle peridotites were recovered in contact with the sediments except that the sediment/peridotite interface at Site U1616 is marked by a basal breccia. The lithology proportion of the igneous rocks differs significantly between the upper and lower intervals cored in Hole U1616E (Figures F25, F26, F27). Between the upper and the lower cored interval, an interval from 371 to 400 mbsf was drilled without coring. Therefore, when necessary we will describe separately the lithology of the upper and lower intervals of Hole U1616E.
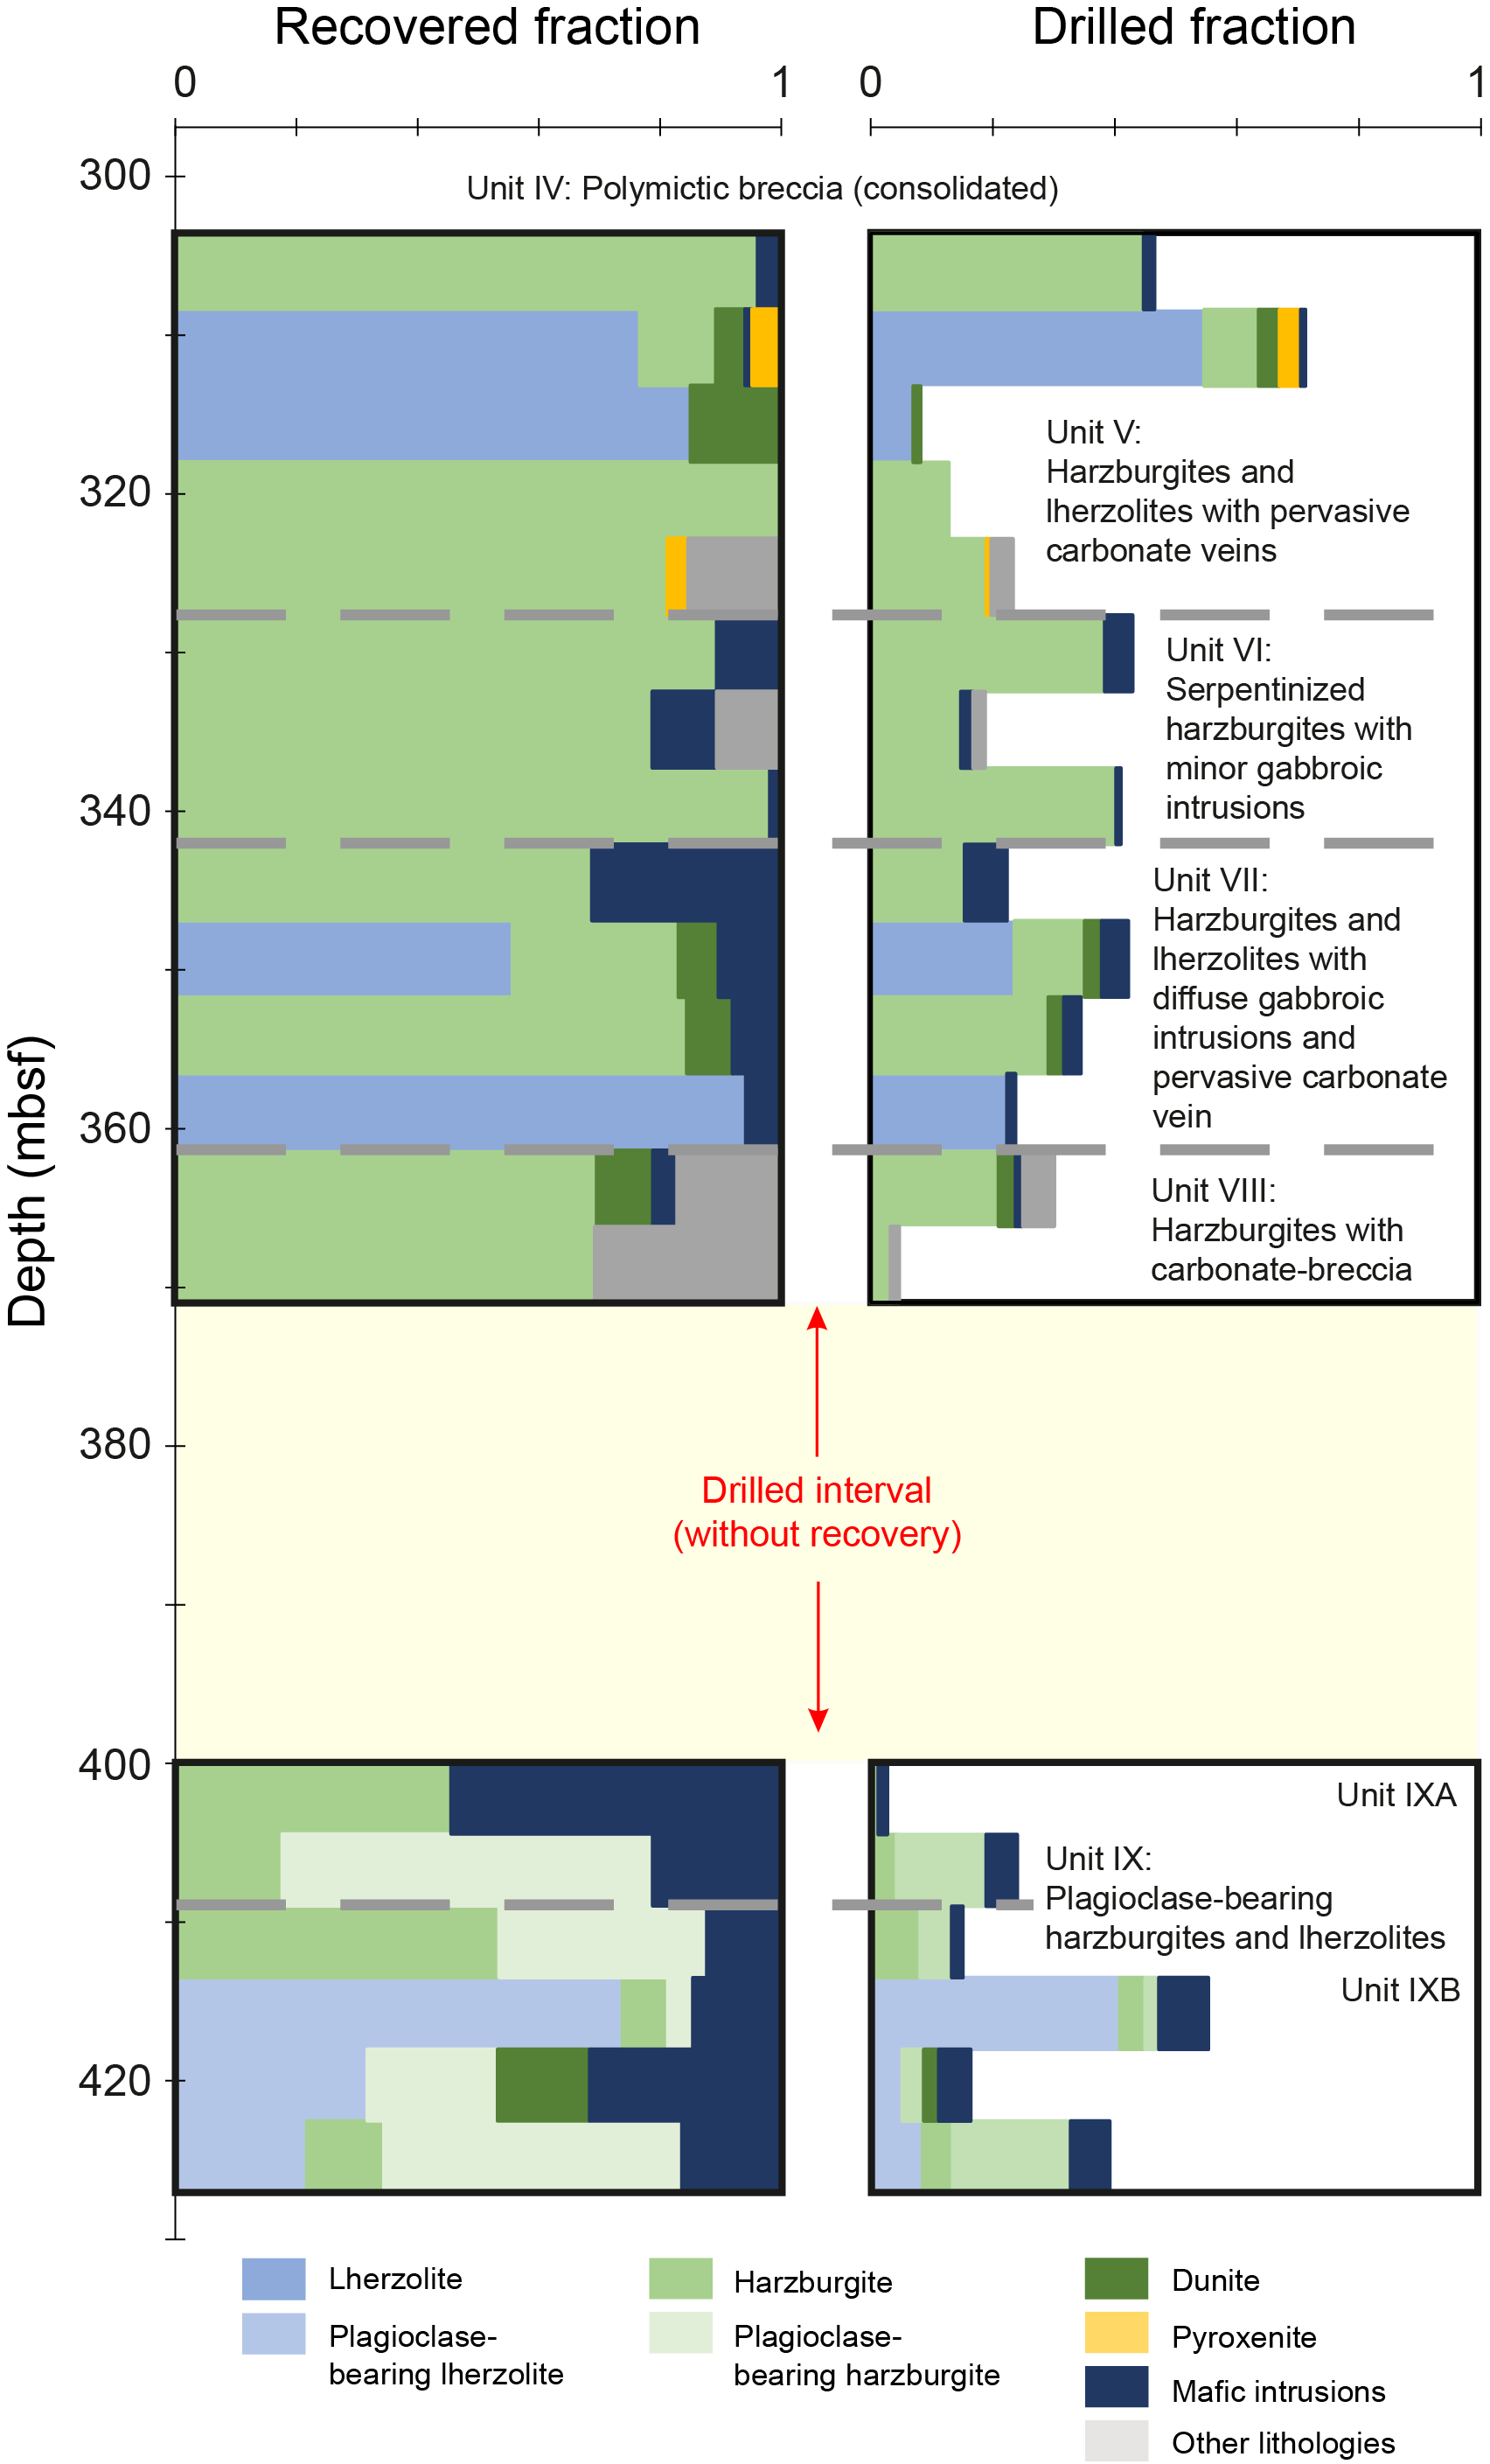
Figure F25. Lithostratigraphic variations, basement.
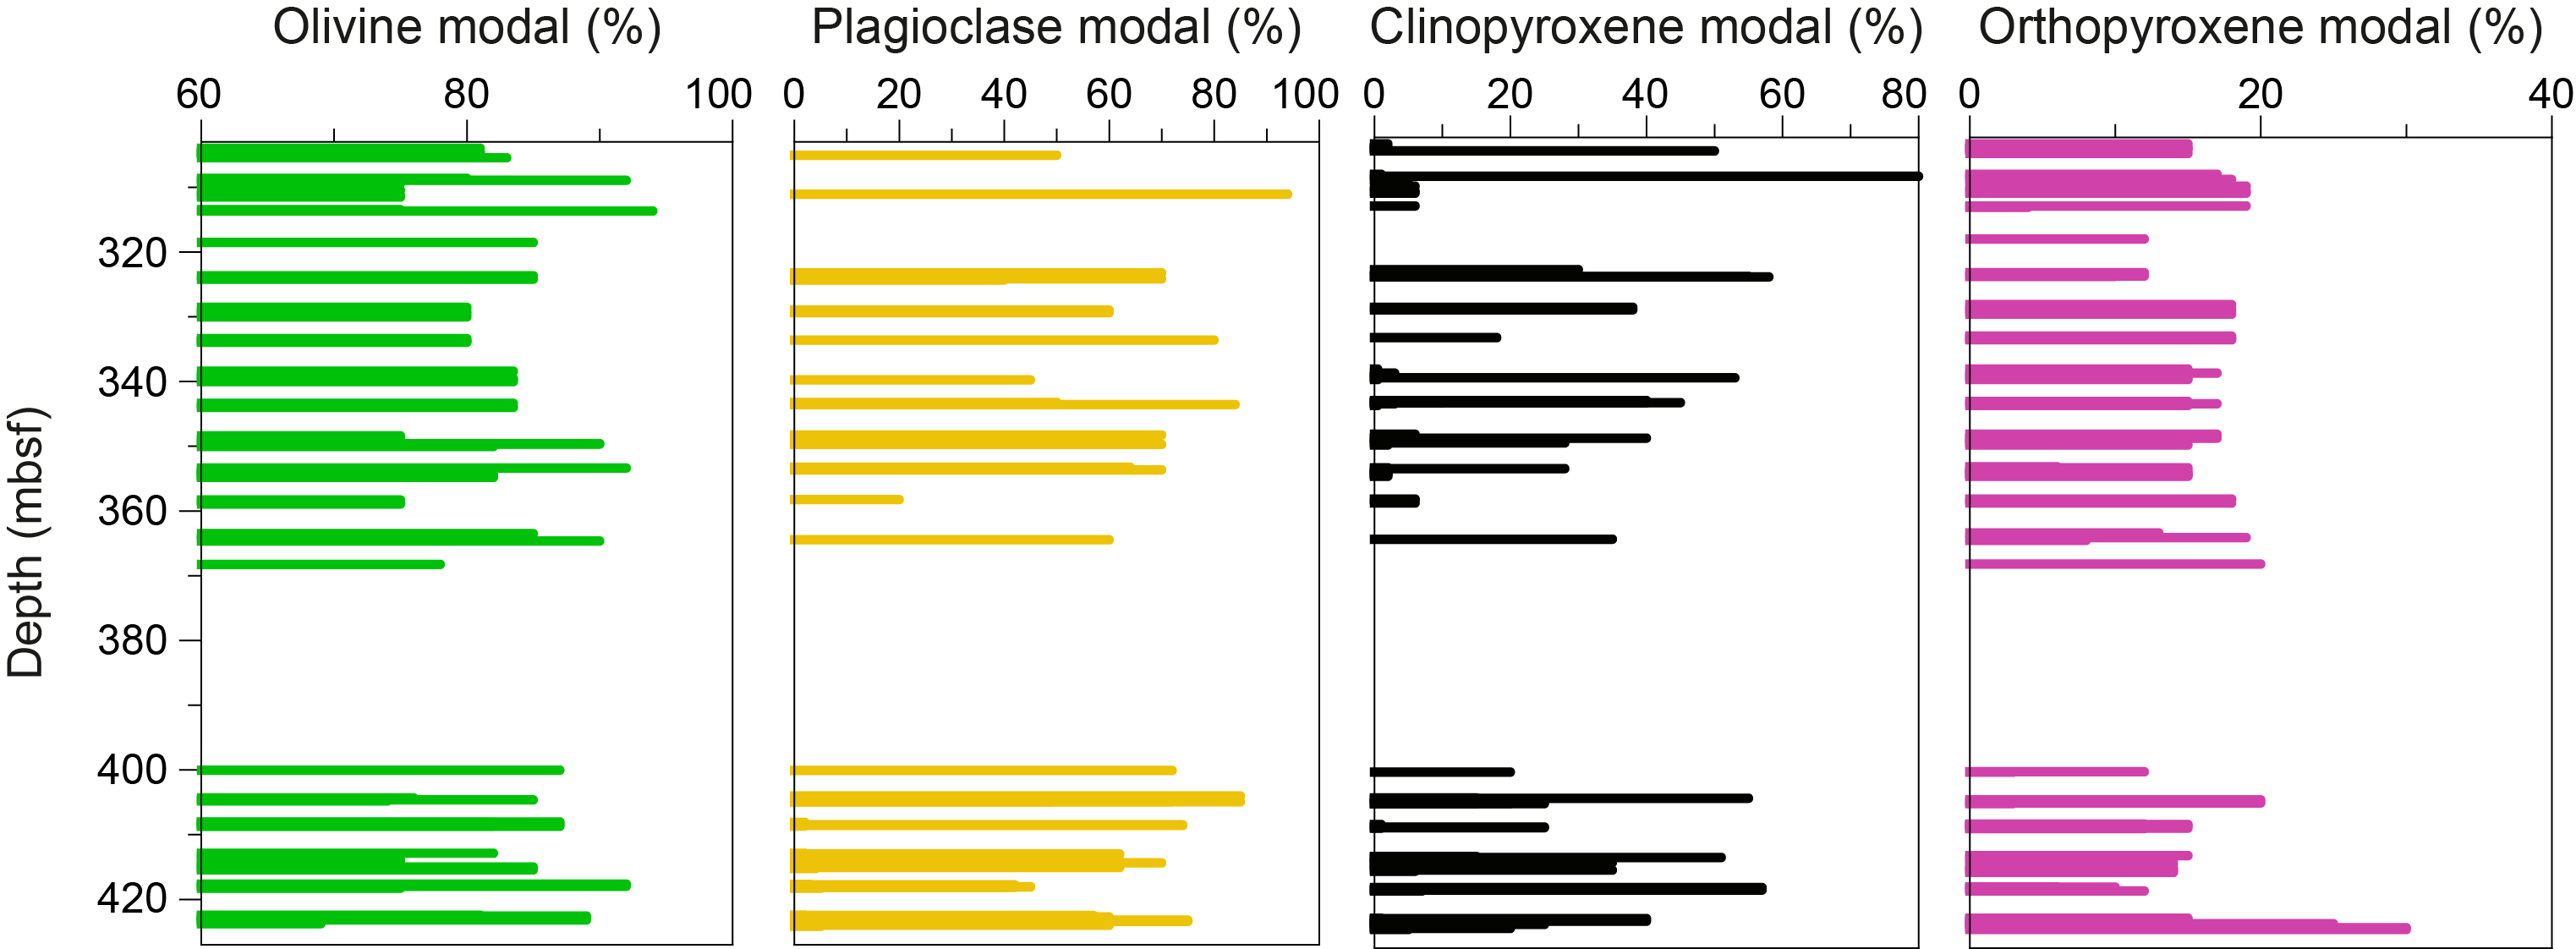
Figure F26. Major mineral abundance, mafic–ultramafic rocks.
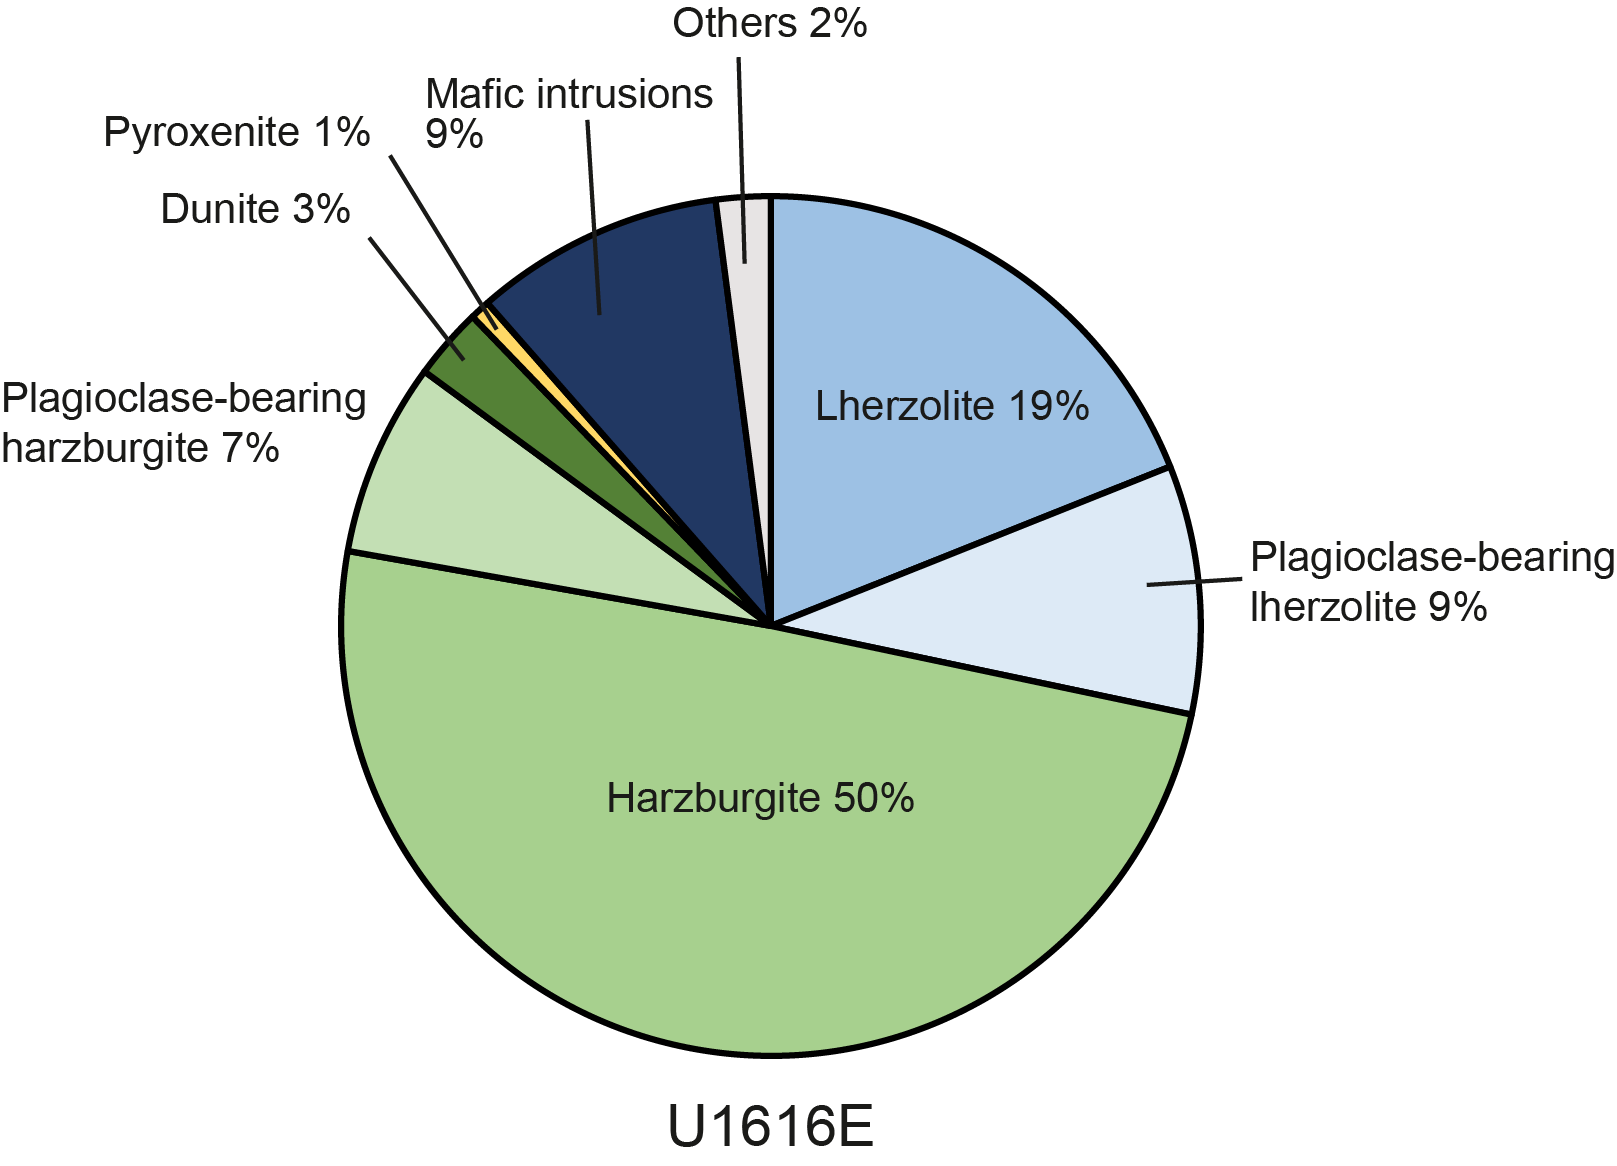
Figure F27. Abundance of lithologies, basement.
Hole U1616B recovered an intact primary contact between lithified dolomitized sediments and a ~20 m thick basal breccia composed of angular clasts of basalts and mantle peridotites (from 284.5 mbsf; Sections 28X-CC, 29X-1, and 29X-CC). The peridotite clasts recovered in the basal breccia in Hole U1616E are classified as lherzolites and harzburgites with the presence of minor plagioclase and are embedded in a cemented carbonate-rich matrix. A similar contact between sediments and highly serpentinized peridotites was recovered previously at Site U1614, where the basal polymictic breccia was found to be in direct contact with the dolomitic nannofossil ooze and a thin layer of lithified dolomite at 270 mbsf (Section 402-U1614C-4R-1, 12 cm). In Hole U1616E, the breccia was recovered in Cores 402-U1616E-3R through 9R. The clast size increases downhole, and the clasts consist mostly of harzburgite, exceptionally fresh diabase, and olivine-bearing gabbro. The top of the mantle peridotite is at 303.5 mbsf.
Unlike in Hole U1614C, the mantle peridotites sampled from the upper interval of Hole U1616E are relatively more homogeneous in composition and are dominated by harzburgites, with thin layers of lherzolites and dunites (Figures F25, F28). Plagioclase-bearing peridotites were not observed in the mantle peridotites sampled from the upper interval of Hole U1616E. Contrary to Hole U1614C, Hole U1616E comprises diabase and gabbroic intrusions (ranging in composition from gabbro to norite and diorite) that for the most part have been altered to rodingites. This recovery underscores a remarkable lack of gabbroic intrusions in Hole U1614C. Thin mica-bearing mafic intrusions are also rare in Hole U1616E peridotites compared to Hole U1614C. In addition, Hole U1616E differs from Hole U1614C in terms of style of alteration, with the former having an overall lower degree of serpentinization but more intense oxidation. The intervals of oxidized mantle peridotites in the upper section of Hole U1616E are often rich in carbonate veins, ranging from submillimeters to a few centimeters in thickness. The peridotite alteration in the upper section of Hole U1616E is significantly different compared to Hole U1614C, with alteration being mostly static serpentinization with pervasive carbonate veins lacking any significant ductile shearing in the former. The bottom part of the upper section of Hole U1616E is characterized by two layers of tectonic breccia, which show millimeter- to centimeter-scale clasts of angular peridotite in a carbonate matrix. Brittle deformation is observed in several locations throughout the section, mostly in between magmatic intrusions and peridotites. Ductile deformation is nearly absent in the upper peridotite interval, whereas ductile deformed peridotites are present in the lower interval.
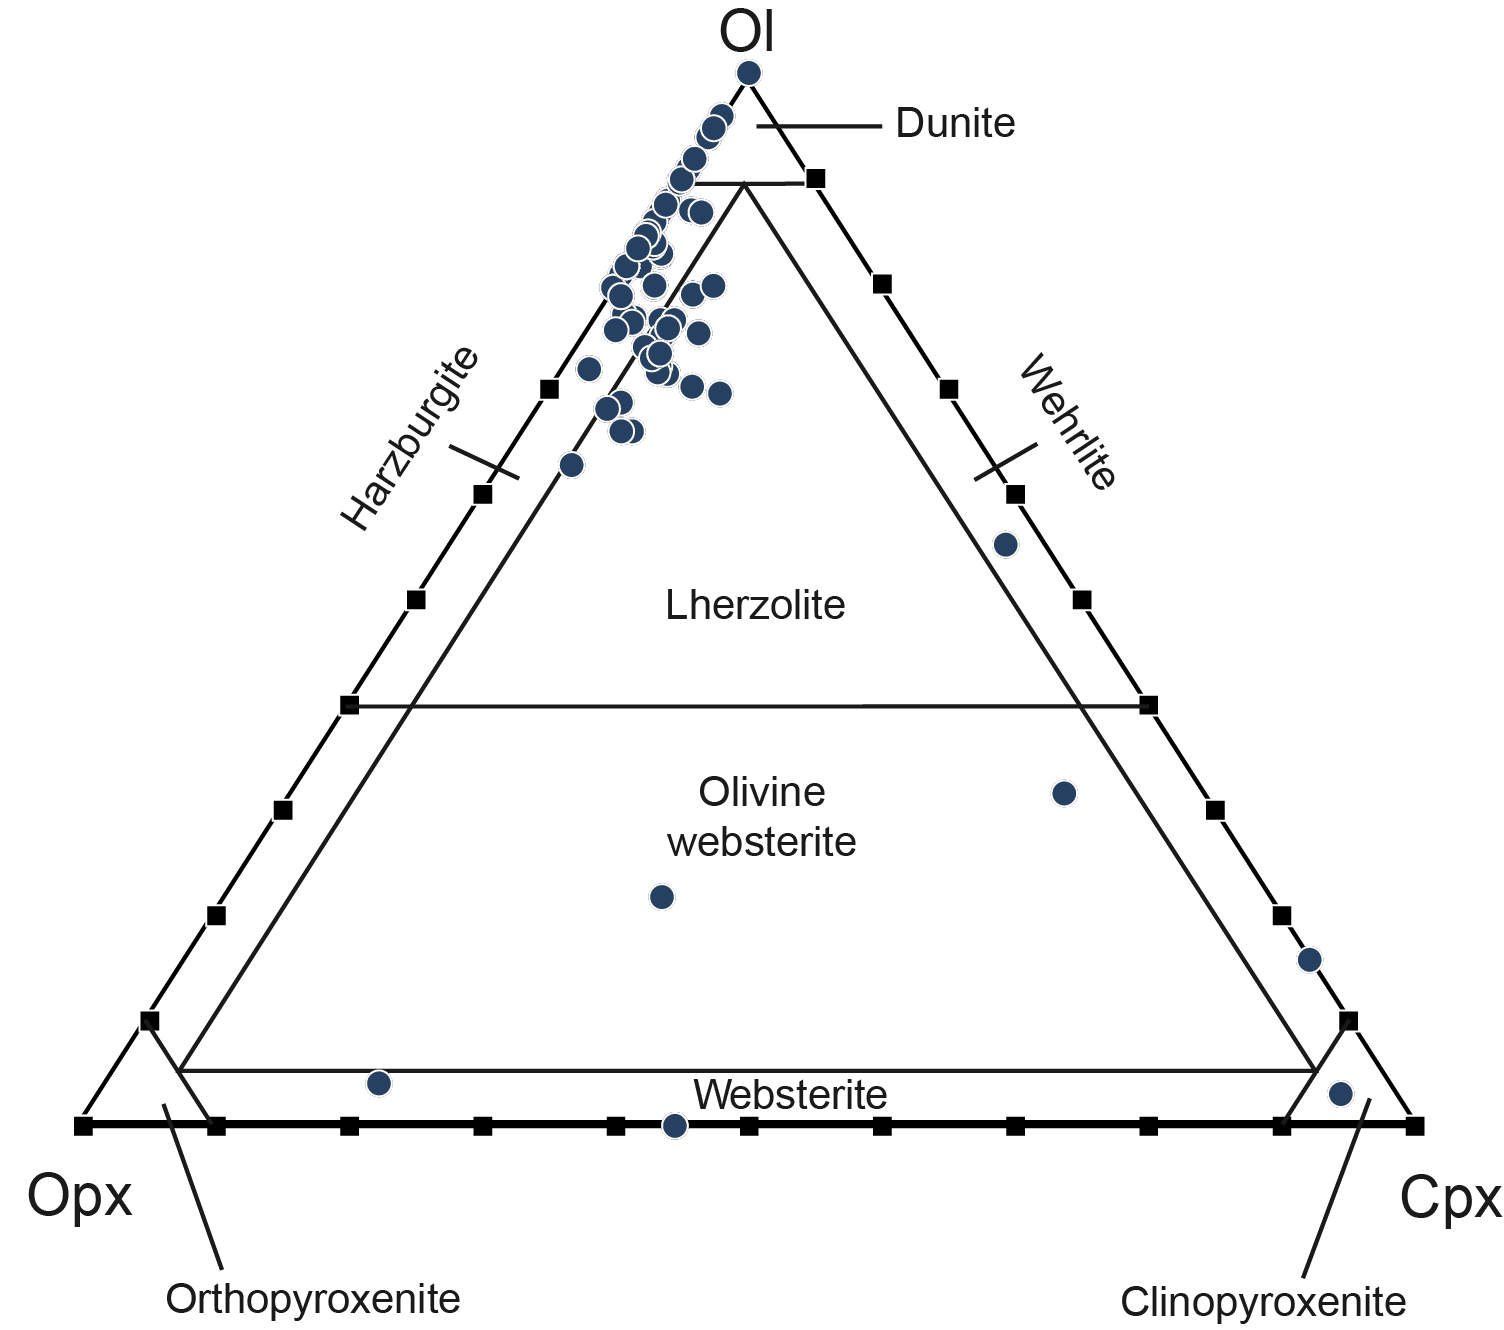
Figure F28. Ternary classification, ultramafic lithologies.
The lower part of Hole U1616E (400–427 mbsf) was cored beneath the drilled interval (371–400 mbsf). This interval consists mostly of plagioclase-bearing harzburgites and lherzolites. Notably, these plagioclase-bearing lithologies are absent in the upper interval cored in Hole U1616E (303.5–371 mbsf). A significant portion of the peridotites in the lower interval are intruded by mafic lithologies such as olivine gabbro, gabbro, norite, and diabase/dolerite.
6.1. Lithostratigraphic units
Holes U1616B and U1616E recovered basement rocks beneath a ~270 m thick sedimentary succession. The contact with the sediments is marked by a ~15 m thick layer of dolomite above a ~33 m thick basal breccia. Based on the variations in the lithology and alteration features and on the presence of intrusions and breccia, the recovered basement is classified into six units (Figure F25).
6.1.1. Lithostratigraphic Unit IV
- Interval: 402-U1616E-4R-2, 12 cm, through 9R; 402-U1616B-28X-CC through 29X-CC
- Depth: 270–303.5 mbsf (CSF-A)
Unit IV is the uppermost basement unit, consisting of a polymictic breccia with clasts of serpentinized peridotite, olivine gabbro, and diabase and is the thickest of all basement lithostratigraphic units. The breccia is well consolidated and compact with angular clasts ranging in size from a few millimeters to as large as 4 cm. Clast size increases downward through Core 402-U1616E-9R, where the recovery consists of 10 pieces of hard rock interpreted as individual clasts and one piece of carbonate breccia.
6.1.2. Lithostratigraphic Unit V
This unit consists of moderately serpentinized harzburgites, lherzolites, and rare dunites, locally cut by mica-bearing mafic intrusions and gabbros/norites altered to rodingites. The variety of lithologies recovered and the abundance of carbonate microveins are the notable features of this unit.
6.1.3. Lithostratigraphic Unit VI
Unit VI consists of highly serpentinized harzburgites with a few magmatic intrusions of gabbroic to noritic composition, locally altered to rodingites.
6.1.4. Lithostratigraphic Unit VII
This unit consists of moderately serpentinized harzburgites, lherzolites, and dunites, frequently cut by rodingitized gabbros up to 15 cm thick and centimeter-scale mica-bearing intrusions. Pervasive carbonate veins cut the rocks of this unit, and large serpentinized veins with secondary carbonates are common.
6.1.5. Lithostratigraphic Unit VIII
This unit is characterized by two carbonate breccia layers intercalated within highly serpentinized peridotites, mainly composed of harzburgites and dunites. The breccia is composed of angular clasts of variably serpentinized and weathered peridotite cemented with a fine-grained carbonate cement. Rodingitized gabbros occur within the peridotites with no intrusive contacts. Interestingly, the base of the unit contains a fresh aphyric diabase.
6.1.6. Lithostratigraphic Unit IX
The unit in the lower cored interval of Hole U1616E consists of plagioclase-bearing lherzolites and harzburgites with mafic intrusions composed of olivine gabbro, gabbro, norite, and diabase or dolerite. Mafic intrusions are recovered in all the cores of this unit. The unit is divided into Subunits IXA (Cores 25R and 26R) and IXB (Cores 27R–30R) based on the occurrence of harzburgite displaying high crystal-plastic deformation intensity, up to a mylonitic fabric.
6.2. Main rock types
6.2.1. Harzburgite and plagioclase-bearing harzburgite
Harzburgite is the dominant rock type of the upper section of the basement recovered in Hole U1616E and accounts for ~57% of the recovered core material overall. Harzburgites are encountered throughout the upper cored interval with higher proportions in the central part (Cores 402-U1616E-13R through 23R; ~320–371 mbsf). Harzburgites consist of millimeter-size grains of olivine associated with deformed orthopyroxene porphyroclasts that are as large as 5 mm. Scattered clinopyroxene porphyroclasts are also present. Porphyroclastic orthopyroxene commonly shows clinopyroxene exsolution lamellae, undulating extinction, and kink bands.
Harzburgite is relatively less abundant in the lower cored interval of Hole U1616E (Unit IX), and harzburgite and plagioclase-bearing harzburgite comprise ~43% of the recovered core material in this unit. The harzburgites and plagioclase-bearing harzburgites in the lower interval of Hole U1616E are extensively serpentinized, but the primary mineralogy could be inferred from hand samples. Harzburgites consist of millimeter-scale grains of olivine associated with deformed orthopyroxene porphyroclasts and minor clinopyroxene (up to 5 mm long). Plagioclase-bearing harzburgites occupy 28% of the rocks in Unit IX (Figures F25, F26) and are especially abundant in Cores 402-U1616E-26R and 30R. The plagioclase in harzburgite occurs in the form of discrete interstitial minerals or millimeter-scale veinlets, ranging 0.5–2 mm in length (see Figure F28B in the Site U1614 chapter [Zitellini et al., 2025]).
6.2.2. Lherzolite and plagioclase-bearing lherzolite
Lherzolites are a relatively minor lithology of the upper cored interval of Hole U1616E (Units V–VIII), comprising 26% of the total recovered material (Figure F25). Lherzolites constitute the main rock type only in Units V and VII, where they are associated with harzburgites. Lherzolites have porphyroclastic texture and commonly show a foliation defined by the preferential elongation of pyroxenes. Spinel is elongated to subequant in shape and is aligned to form disoriented trails locally reaching up to 2 mm. Lherzolites are made up of subequant olivine grains and millimeter-size deformed orthopyroxene porphyroclasts, generally mantled by fine-grained pyroxene. Clinopyroxene also occurs as deformed porphyroclasts as large as 5 mm. Plagioclase-bearing lherzolites in the upper interval are very rare (Figure F29) and only observed as clasts in the carbonate-cemented breccias in Unit IV (Figure F25). There, plagioclase occurs as millimeter-scale microveins and/or patches crosscutting the rock.
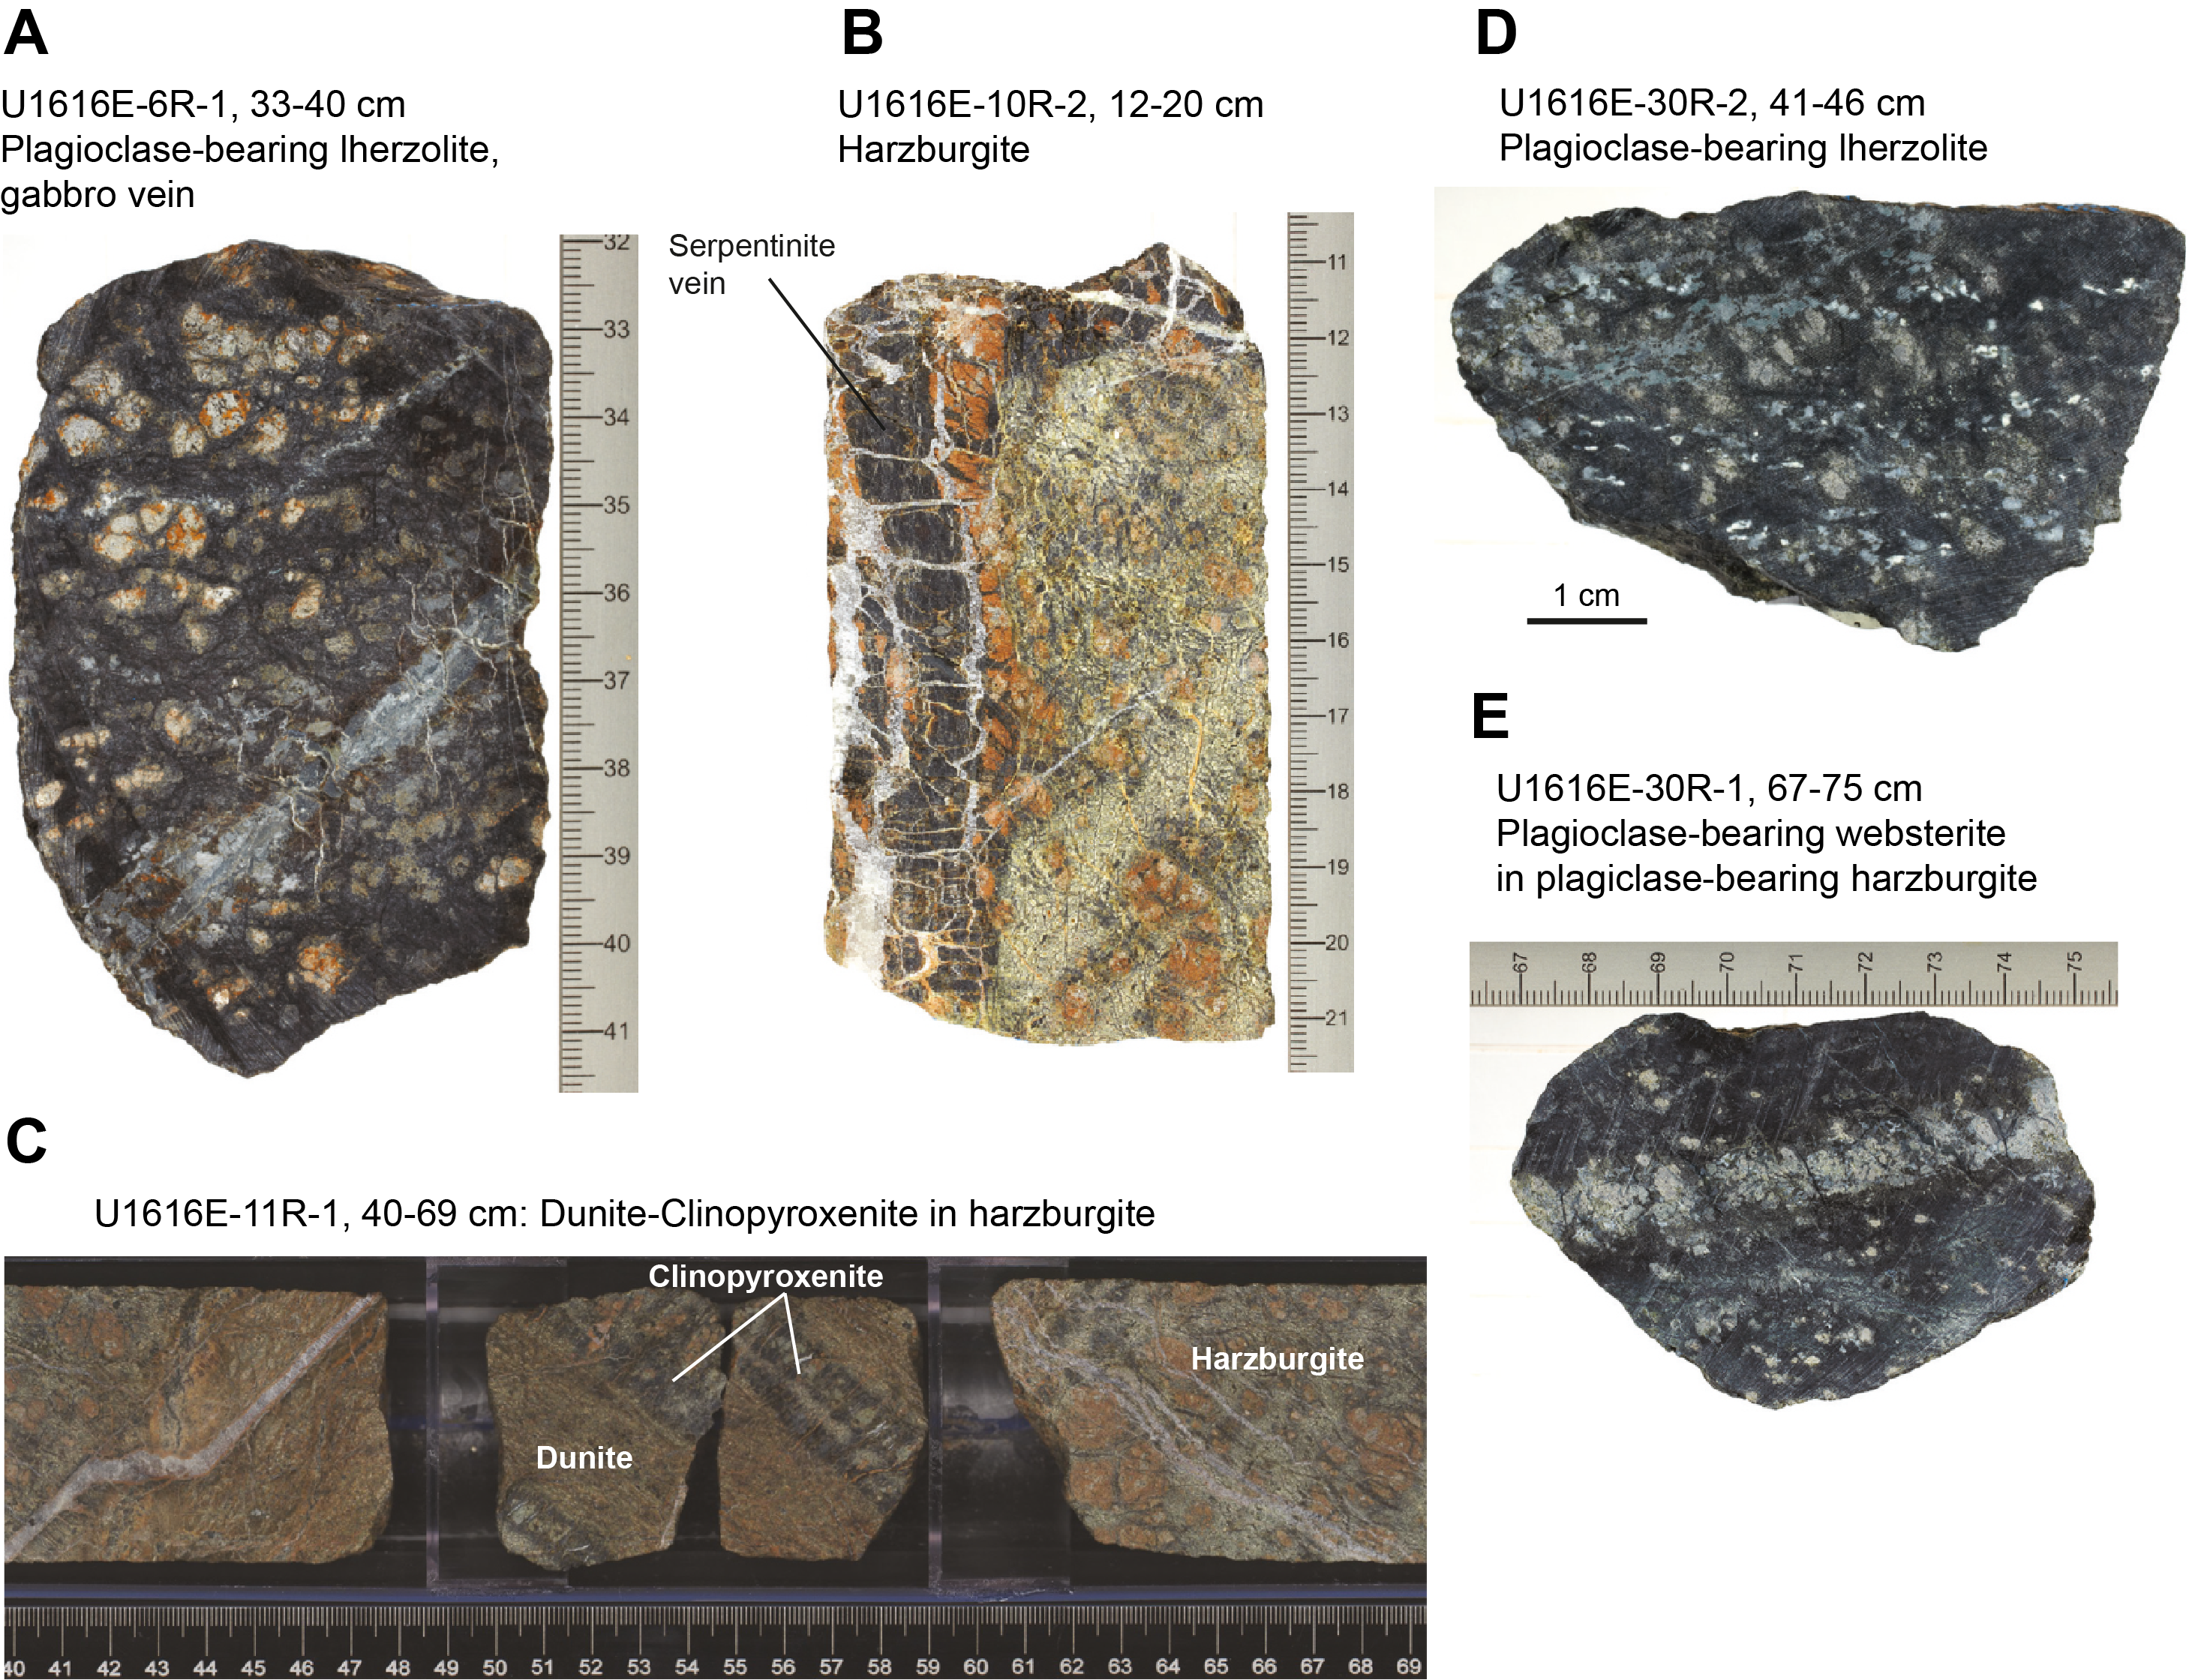
Figure F29. Main rock types.
All lherzolites in the lower cored interval are plagioclase-bearing, accounting for ~36% of the recovered core. These lithologies were encountered in Unit IX with higher proportions in Subunit IXB (Figure F25). Most of the plagioclase-bearing lherzolites have a porphyroclastic texture with weak foliation defined by the preferential elongation of plagioclase (Figure F29). Olivine appears to be almost completely serpentinized. Orthopyroxene is generally subequant with average grain sizes of 0.3–0.7 cm. Clinopyroxene in lherzolites is mostly subhedral to anhedral with grain sizes ranging 0.2–3 mm. Spinel is elongated to subequant and is locally interstitial. The plagioclase occurs as submillimetric patches sparsely distributed within the peridotite matrix or as elongated millimeter-size veinlets (Figure F29).
6.2.3. Dunite and pyroxenites
Dunites represent only 3% of the recovered rocks in the upper cored interval, where they mostly occur in Units V and VII, and 2% of the recovered rocks in the lower section (Figure F25). They range from pyroxene-free to orthopyroxene-bearing dunites. Olivine is completely replaced by serpentine and magnetite, whereas chromium-spinel is preserved and forms trails aligned to define the main foliation. Dunites in the upper interval preserve gradational contacts with harzburgites and are characterized by a decrease in pyroxene and an increase in modal proportions of spinel (Figure F29). Dunite between 308 and 318 mbsf contains three subparallel clinopyroxenite veins oriented parallel to the spinel trails and the contact with the host harzburgite Unit VII (Figure F29). In the lower cored interval, Unit IX, a 1 cm thick dunite layer is found in harzburgite (Section 402-U1616E-28R-2) with sharp contacts with the host harzburgite. Plagioclase-bearing wehrlite domains formed by large clinopyroxene and olivine are found within harzburgites in Unit VII (Figure F29), and plagioclase-bearing websterite layers occur within plagioclase-bearing harzburgite in Unit IX (Figure F29).
6.2.4. Gabbros, norites, and mica-bearing mafic intrusions
Magmatic veins and intrusions are widespread throughout the Hole U1616E cores. In contrast to the basement recovered in Hole U1614C, these intrusions are predominantly gabbroic to noritic in composition along with olivine-gabbro and rare fine-grained diorites. In the upper cored interval, fresh olivine, clinopyroxene, and plagioclase are preserved only in one coarse-grained olivine-gabbro occurring within the carbonated breccia in Section 402-U1616E-9R-1 (Figure F30). Olivine and plagioclase are subhedral and show sharp contacts with granular poikilitic clinopyroxene; subrounded chromian spinel is also locally present. Norites with fresh plagioclase and orthopyroxene and, locally, mica have been recovered in Sections 402-U1616E-19R-1 and 30R-2 (Figure F30). The rest of the recovered gabbroic samples in the upper interval were converted to rodingites, suggesting that the low-temperature alteration was concomitant with the serpentinization of the host peridotites. The intrusive rodingites rarely retain the original magmatic texture and are characterized by greenish amphibole pseudomorphs of pyroxene and, locally, interstitial mica in a white fine-grained matrix, likely representing the alteration products of plagioclase (Figure F30). A mica-bearing mafic intrusion occurs as a 2 cm vein in interval 10R-1, 134–136 cm. Based on hand specimen observations, the vein is inferred to be composed of >40% dark mica, including the chloritized portions and carbonates.
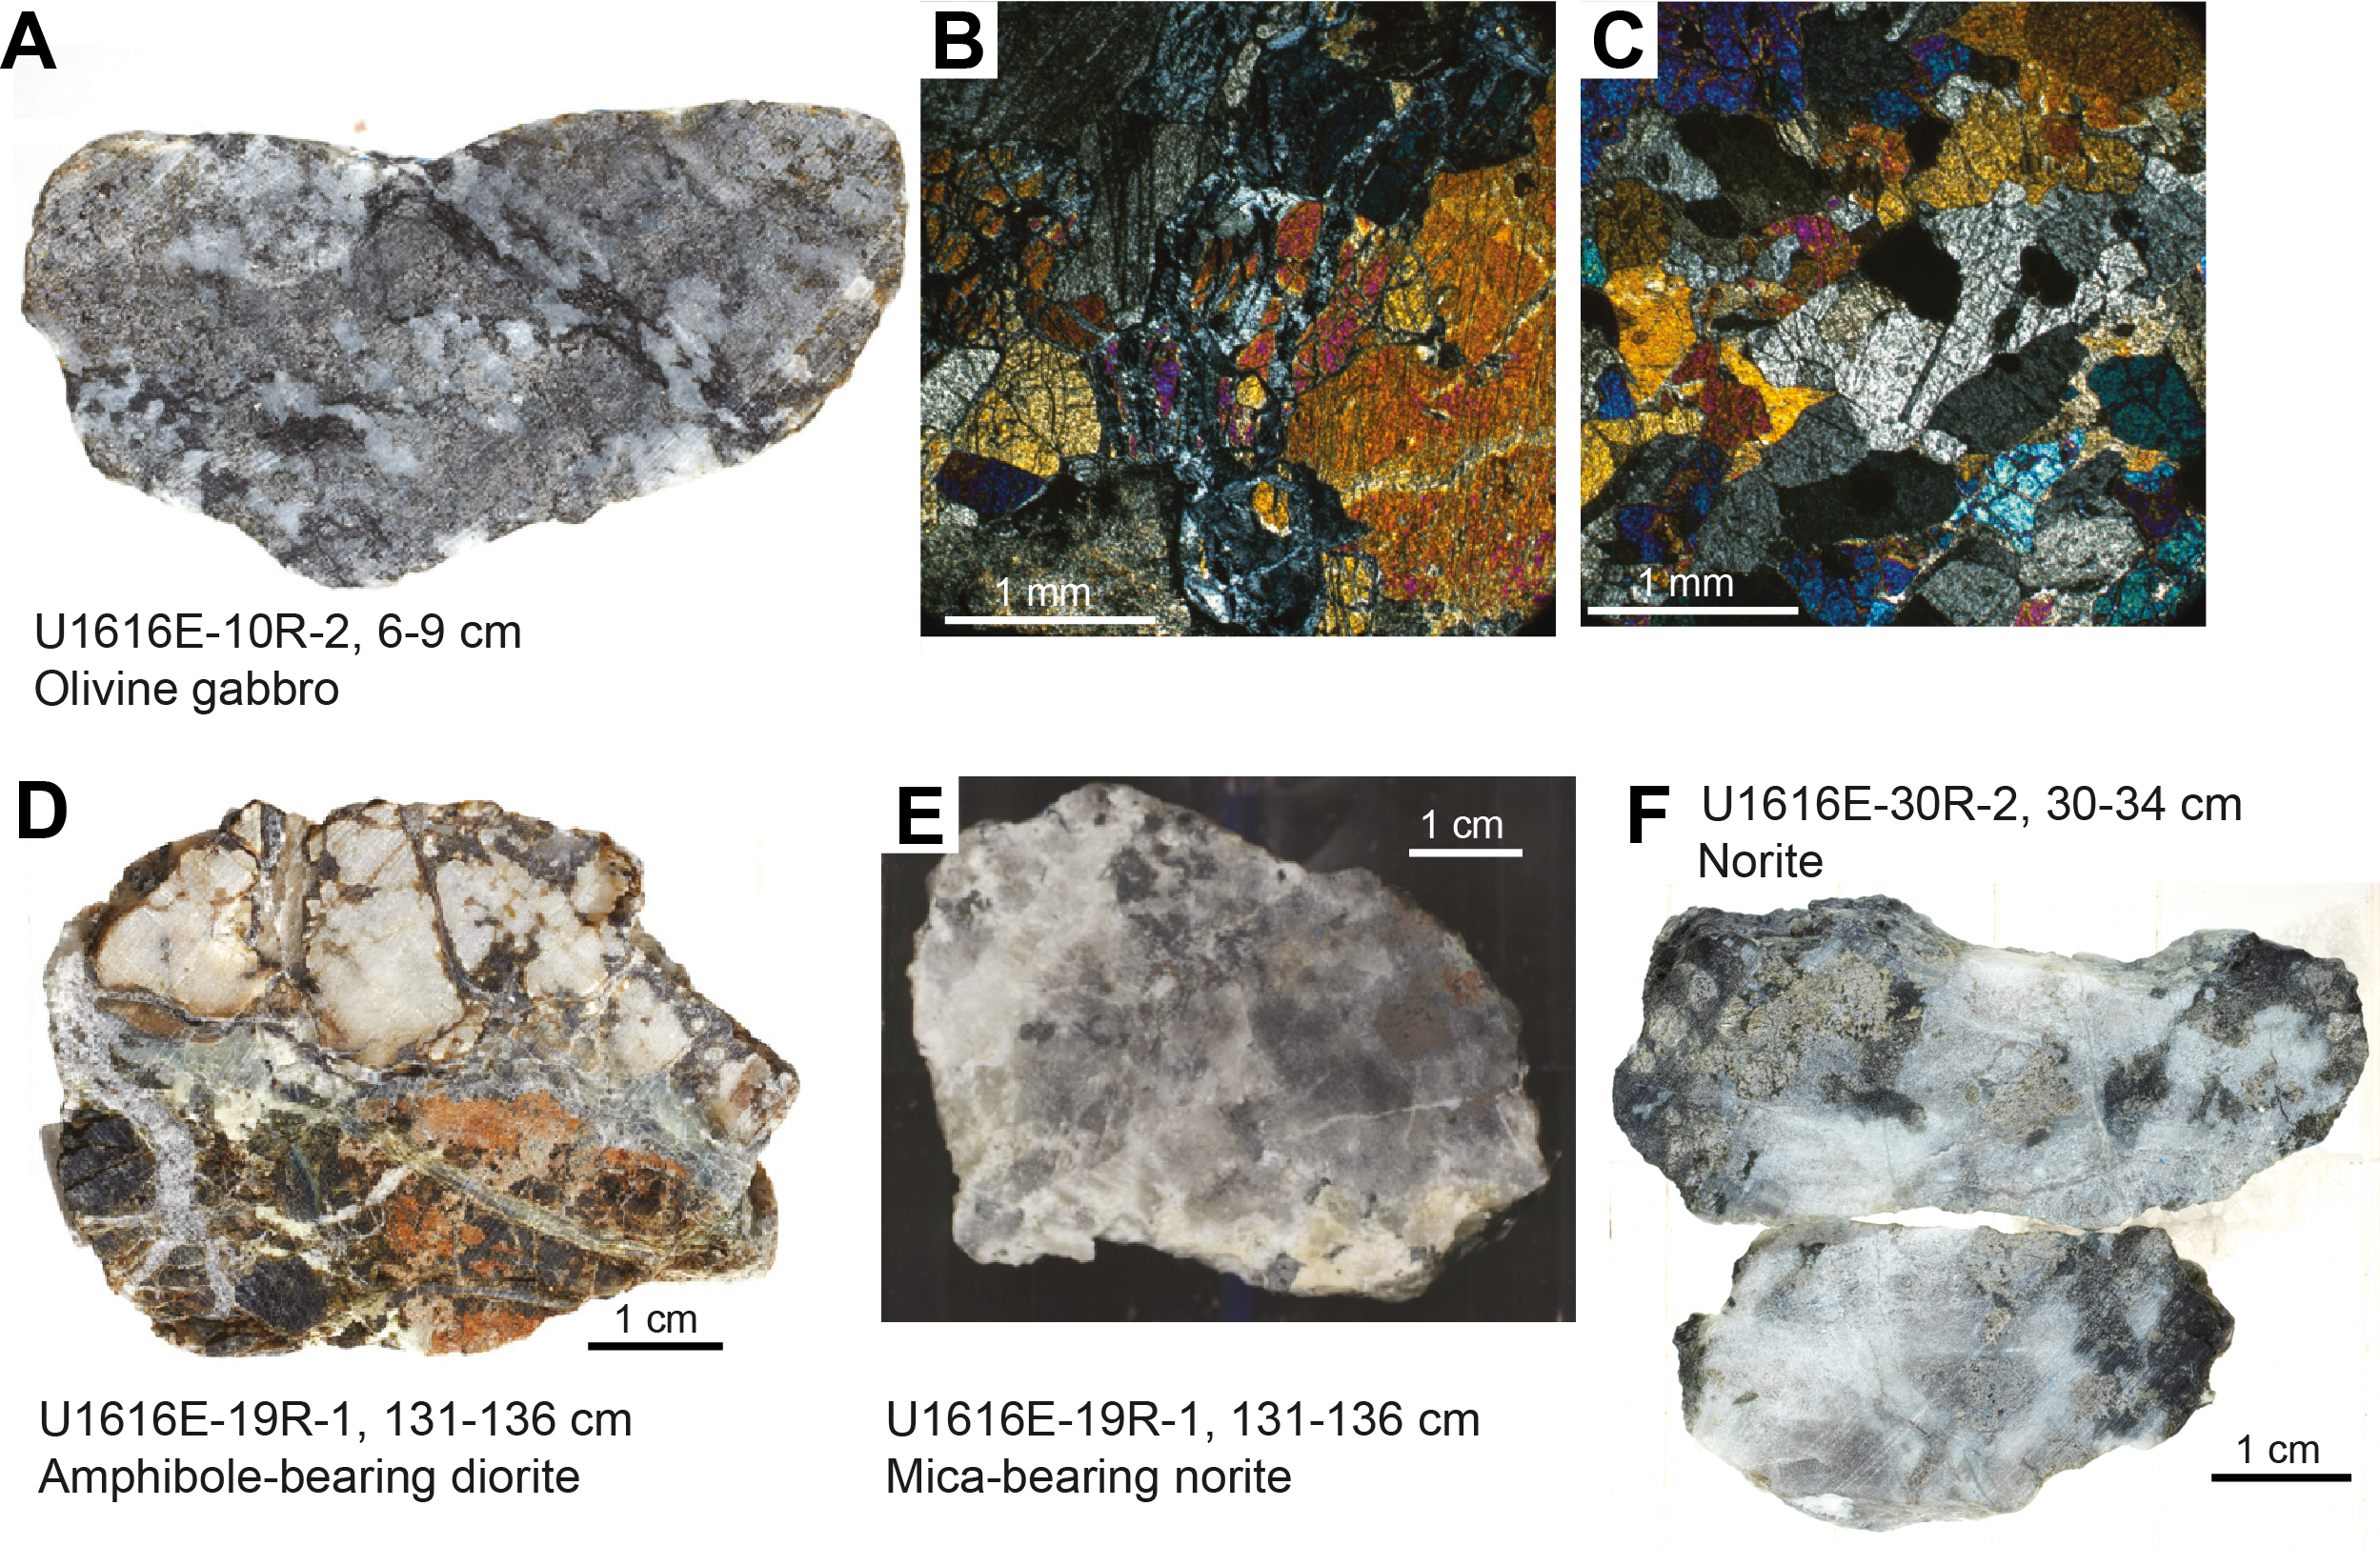
Figure F30. Mafic intrusive rocks.
6.2.5. Other lithologies
A minor fraction (<1%) of Units V–IX in Hole U1616E consists of breccia and diabase. Breccias in Unit VII contain highly angular clasts of peridotite cemented by carbonates and most likely mark a cataclastic fault zone. On the other hand, diabase was recovered in Cores 14R, 16R, 23R, 28R, and 29R (Figures F25, F30). They are locally composed of clinopyroxene phenocrysts. Based on hand examination, these rocks are identified as diabase; the contact of these rocks with the host peridotite is not recovered. One plagioclase-phyric basalt was recovered in the Unit IV breccia of Hole U1616B. Shipboard inductively coupled plasma–atomic emission spectrometry (ICP-AES) analyses reveal a basaltic composition (see Igneous geochemistry).
6.3. Main alteration features
Intense serpentinization and weathering are observed in peridotites and associated mafic rocks throughout the upper cored interval of Hole U1616E with multiple stages of serpentinization in a wide range of temperature conditions. In addition, carbonate minerals occur in veins of various sizes and replace primary minerals such as olivine and pyroxenes in Units V–VIII. The degree of alteration in the igneous lithology is the sum of serpentinization and weathering (Figure F31).
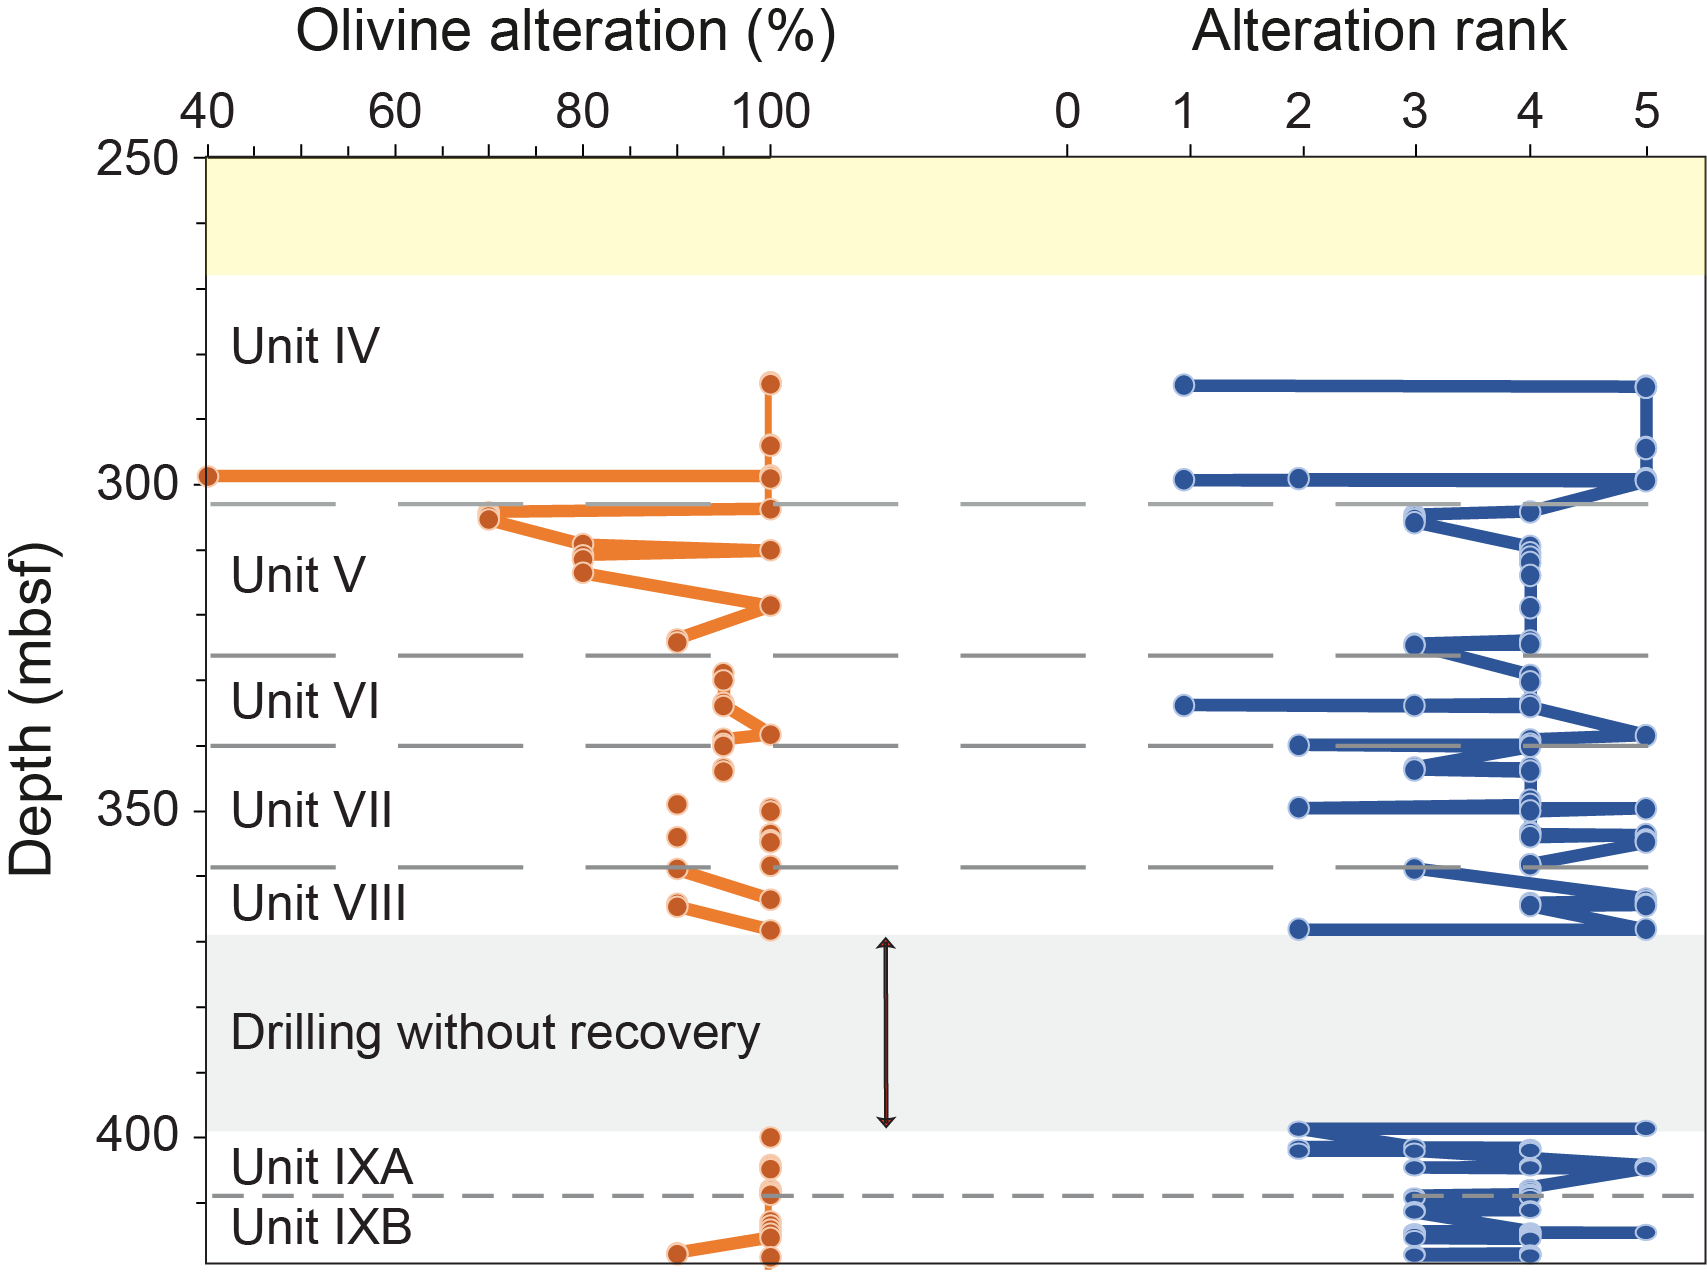
Figure F31. Alteration log, basement lithologies.
The serpentinized mantle peridotites exhibit either orange to brown or grayish black color. The orange-brown rocks are rich in carbonate veins and/or microveins and were recovered predominantly from the upper part of Unit V and the bottom of Unit VII (Figures F25, F29). The boundary between the orange-brown serpentinized peridotites and grayish black serpentinized peridotites is distinct and nearly coincides with the unit intervals or boundaries based on igneous features. The alteration degree ranges from moderate to complete alteration in the peridotites and slight to moderate alteration in the gabbroic intrusions.
Intense serpentinization is observed in the peridotite and mafic material throughout the lower cored interval (Unit IX), where weathering is less pronounced. In contrast to the upper cored interval of Hole U1616E, there are almost no carbonate veins in the lower interval. In addition, late serpentinite veins appear to be less common in this section than in the upper interval of the hole. The serpentinite cores in the lower section also exhibit two main distinctive colors: orange to brown and gray to blackish. The orange-colored patches on the orange-brown rocks consist mainly of weathered orthopyroxene and are dominant in the harzburgite cores. On the other hand, the darker gray/blackish rocks are mostly plagioclase-bearing serpentinite. The alteration degree, which is the sum of serpentinization and weathering, throughout the recovered core in the lower interval is high to complete (Figure F31). Static serpentinization is more intense in the lower interval than in the upper cored interval of the hole.
6.3.1. Static alteration
In the serpentinized peridotites of the upper cored interval, the mesh texture typical of serpentine and magnetite association is common (Figure F32). Most of the orthopyroxene is better preserved than at Site U1614 and is altered to bastite when altered. Clinopyroxene is generally fresh compared to the other minerals and locally shows rims of green amphibole. Plagioclase is not common in the upper part of Hole U1616E and when present it is completely saussuritized.
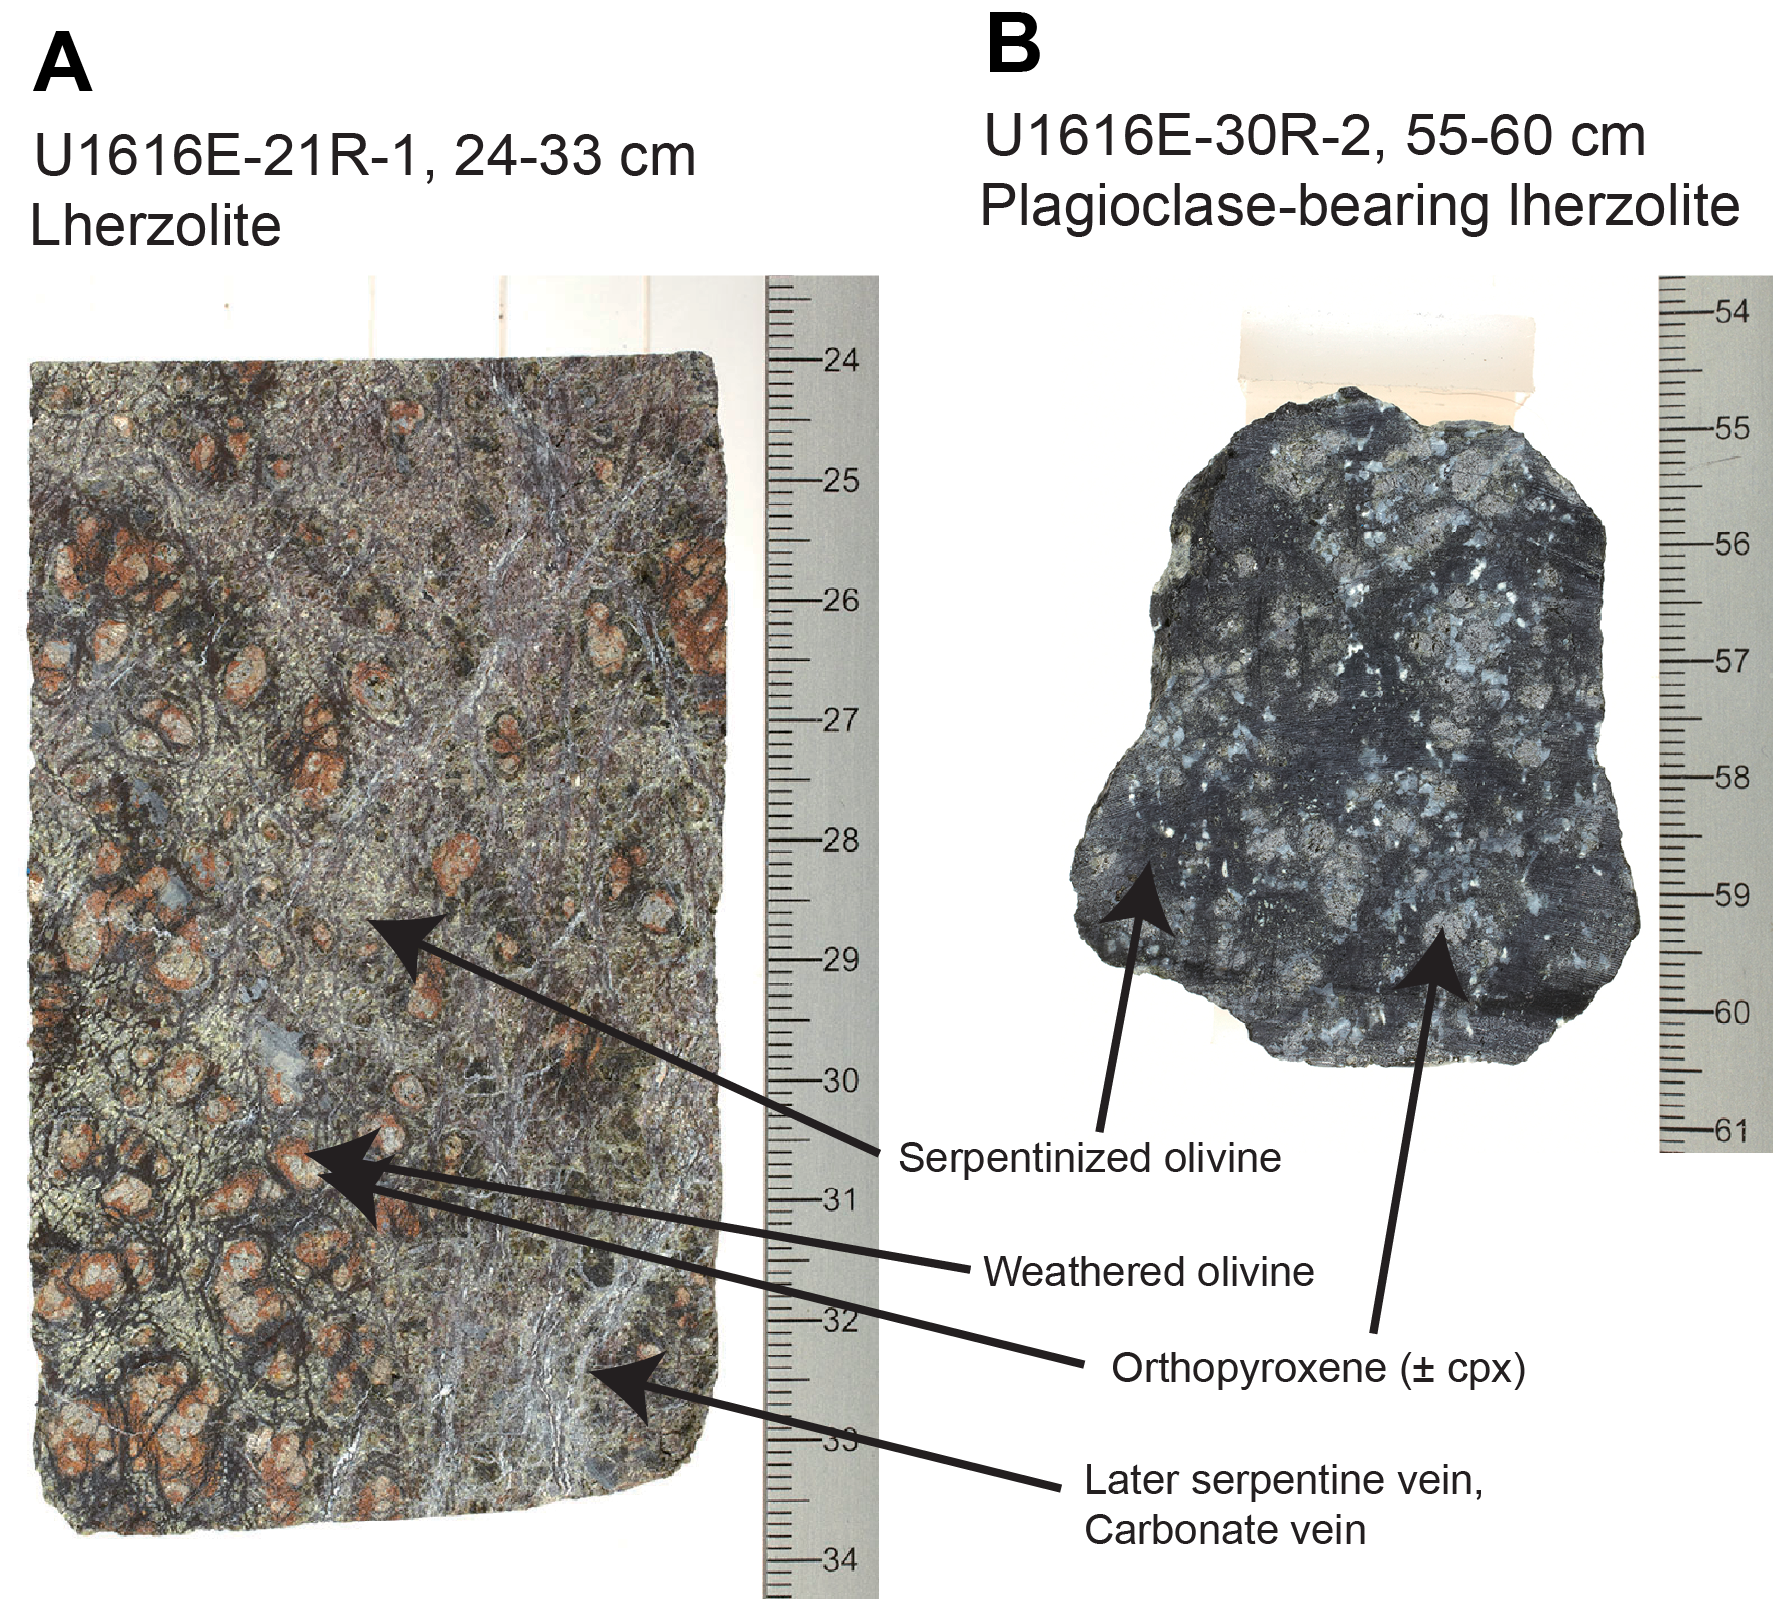
Figure F32. Weathering, serpentinization, and microveins.
Except for one olivine gabbro and two norites, most of the gabbroic intrusions in Hole U1616E are converted to rodingites. The magmatic clinopyroxene and plagioclase are almost completely converted into fine-grained chlorite, albitic plagioclase, actinolite, tremolite, and epidote associated with hydrogrossular garnet that, in at least one case, retains contact with the peridotite (Figure F30). This assemblage is predicted from thermodynamic models and suggests that the alteration of the gabbros was concomitant with the serpentinization of the host peridotite (Bach and Klein, 2009).
Peridotite carbonation (i.e., the formation of carbonate veins and carbonate minerals) is extensive in Units V and VII in Hole U1616E. Carbonate veins occur as thick veins (up to centimeter scale) or as networks on the millimeter scale surrounding and locally crosscutting primary minerals (Figures F29, F32). In addition, we note that carbonates can locally replace the serpentine-mesh texture. Here, the core of preserved primary olivine is converted into carbonates, mainly calcite with minor dolomite and Mg-calcite (Figure F29). Pores are sometimes preserved and are often observed in the center of the serpentine-mesh texture (Figure F29). The pore spaces are interpreted to be where primary olivine was mechanically or chemically removed due to weathering. Red oxide minerals, probably hematite and/or Fe hydroxides, occur along the boundary between the carbonate minerals in the core of the serpentine-mesh texture and the pore wall of the core of serpentine-mesh texture.
In the serpentinite areas of the lower cored interval, mesh textures consisting mainly of serpentinite and magnetite are also commonly visible in harzburgite without plagioclase (Figure F32). Most of the orthopyroxene is partially to completely serpentinized as bastite. Clinopyroxene appears less serpentinized and/or altered than other primary minerals. Plagioclase is completely saussuritized. The serpentinized olivine in the plagioclase-bearing rock is darker in color and has fewer areas of orange color (oxidized olivine), indicating a higher degree of serpentinization than in the upper cored interval.
6.3.2. Veins and halos
Several generations of serpentine and carbonate veins are present in the recovered rocks. Subvertical carbonate veins with sharp boundaries with the host peridotite are particularly abundant in Hole U1616E and range from centimeter-thick veins to microveins in the peridotites of Units V and VII. Unit IX contains large carbonate (possibly aragonite) crystals. Smaller carbonate veins to microveins are present within all the units. The carbonate veins locally show irregular boundaries and crosscut the mesh serpentinite texture, locally replacing preserved cores of olivine. Such pervasive carbonate veins were not observed at Site U1614. Interestingly, talc and amphibole-rich veins are often observed along the contact with the gabbroic veins but are not as common as at Site U1614.
6.3.3. Ductile deformation
The degree and style (static, brittle, and/or ductile) of alteration are observed to vary with depth. In contrast to Hole U1614C, ductile deformation is mostly absent and mylonites occur exclusively in some gabbroic intrusions. Peridotites show mainly a weak foliation fabric defined by the alignment of spinel, which is locally at a high angle with the fabric of the serpentinization. Mylonites and protomylonites are more pervasive in Subunit IXA. The ductile and brittle deformation are described in more detail in the section Structural geology.
7. Structural geology
Structural geology observations were made for the three holes cored at Site U1616. Holes U1616A and U1616B recovered the sedimentary sequence overlying the basement, and Hole U1616E recovered a carbonate breccia (Cores 4R–9R) overlying the basement with variably weathered and serpentinized peridotites and minor mafic lithologies.
The sedimentary sequence consists mainly of finely laminated sediments interlayered by mass transport deposits (MTDs). No significant faults intersect the sedimentary section in Hole U1616B. Synsedimentary faults were locally observed to offset the bedding by ~10 mm (Figures F33, F34). The sedimentary sequence is divided into two domains, based on the bedding dip: Domain I is characterized by subhorizontal bedding, and Domain II is characterized by moderately dipping beds and laminations.
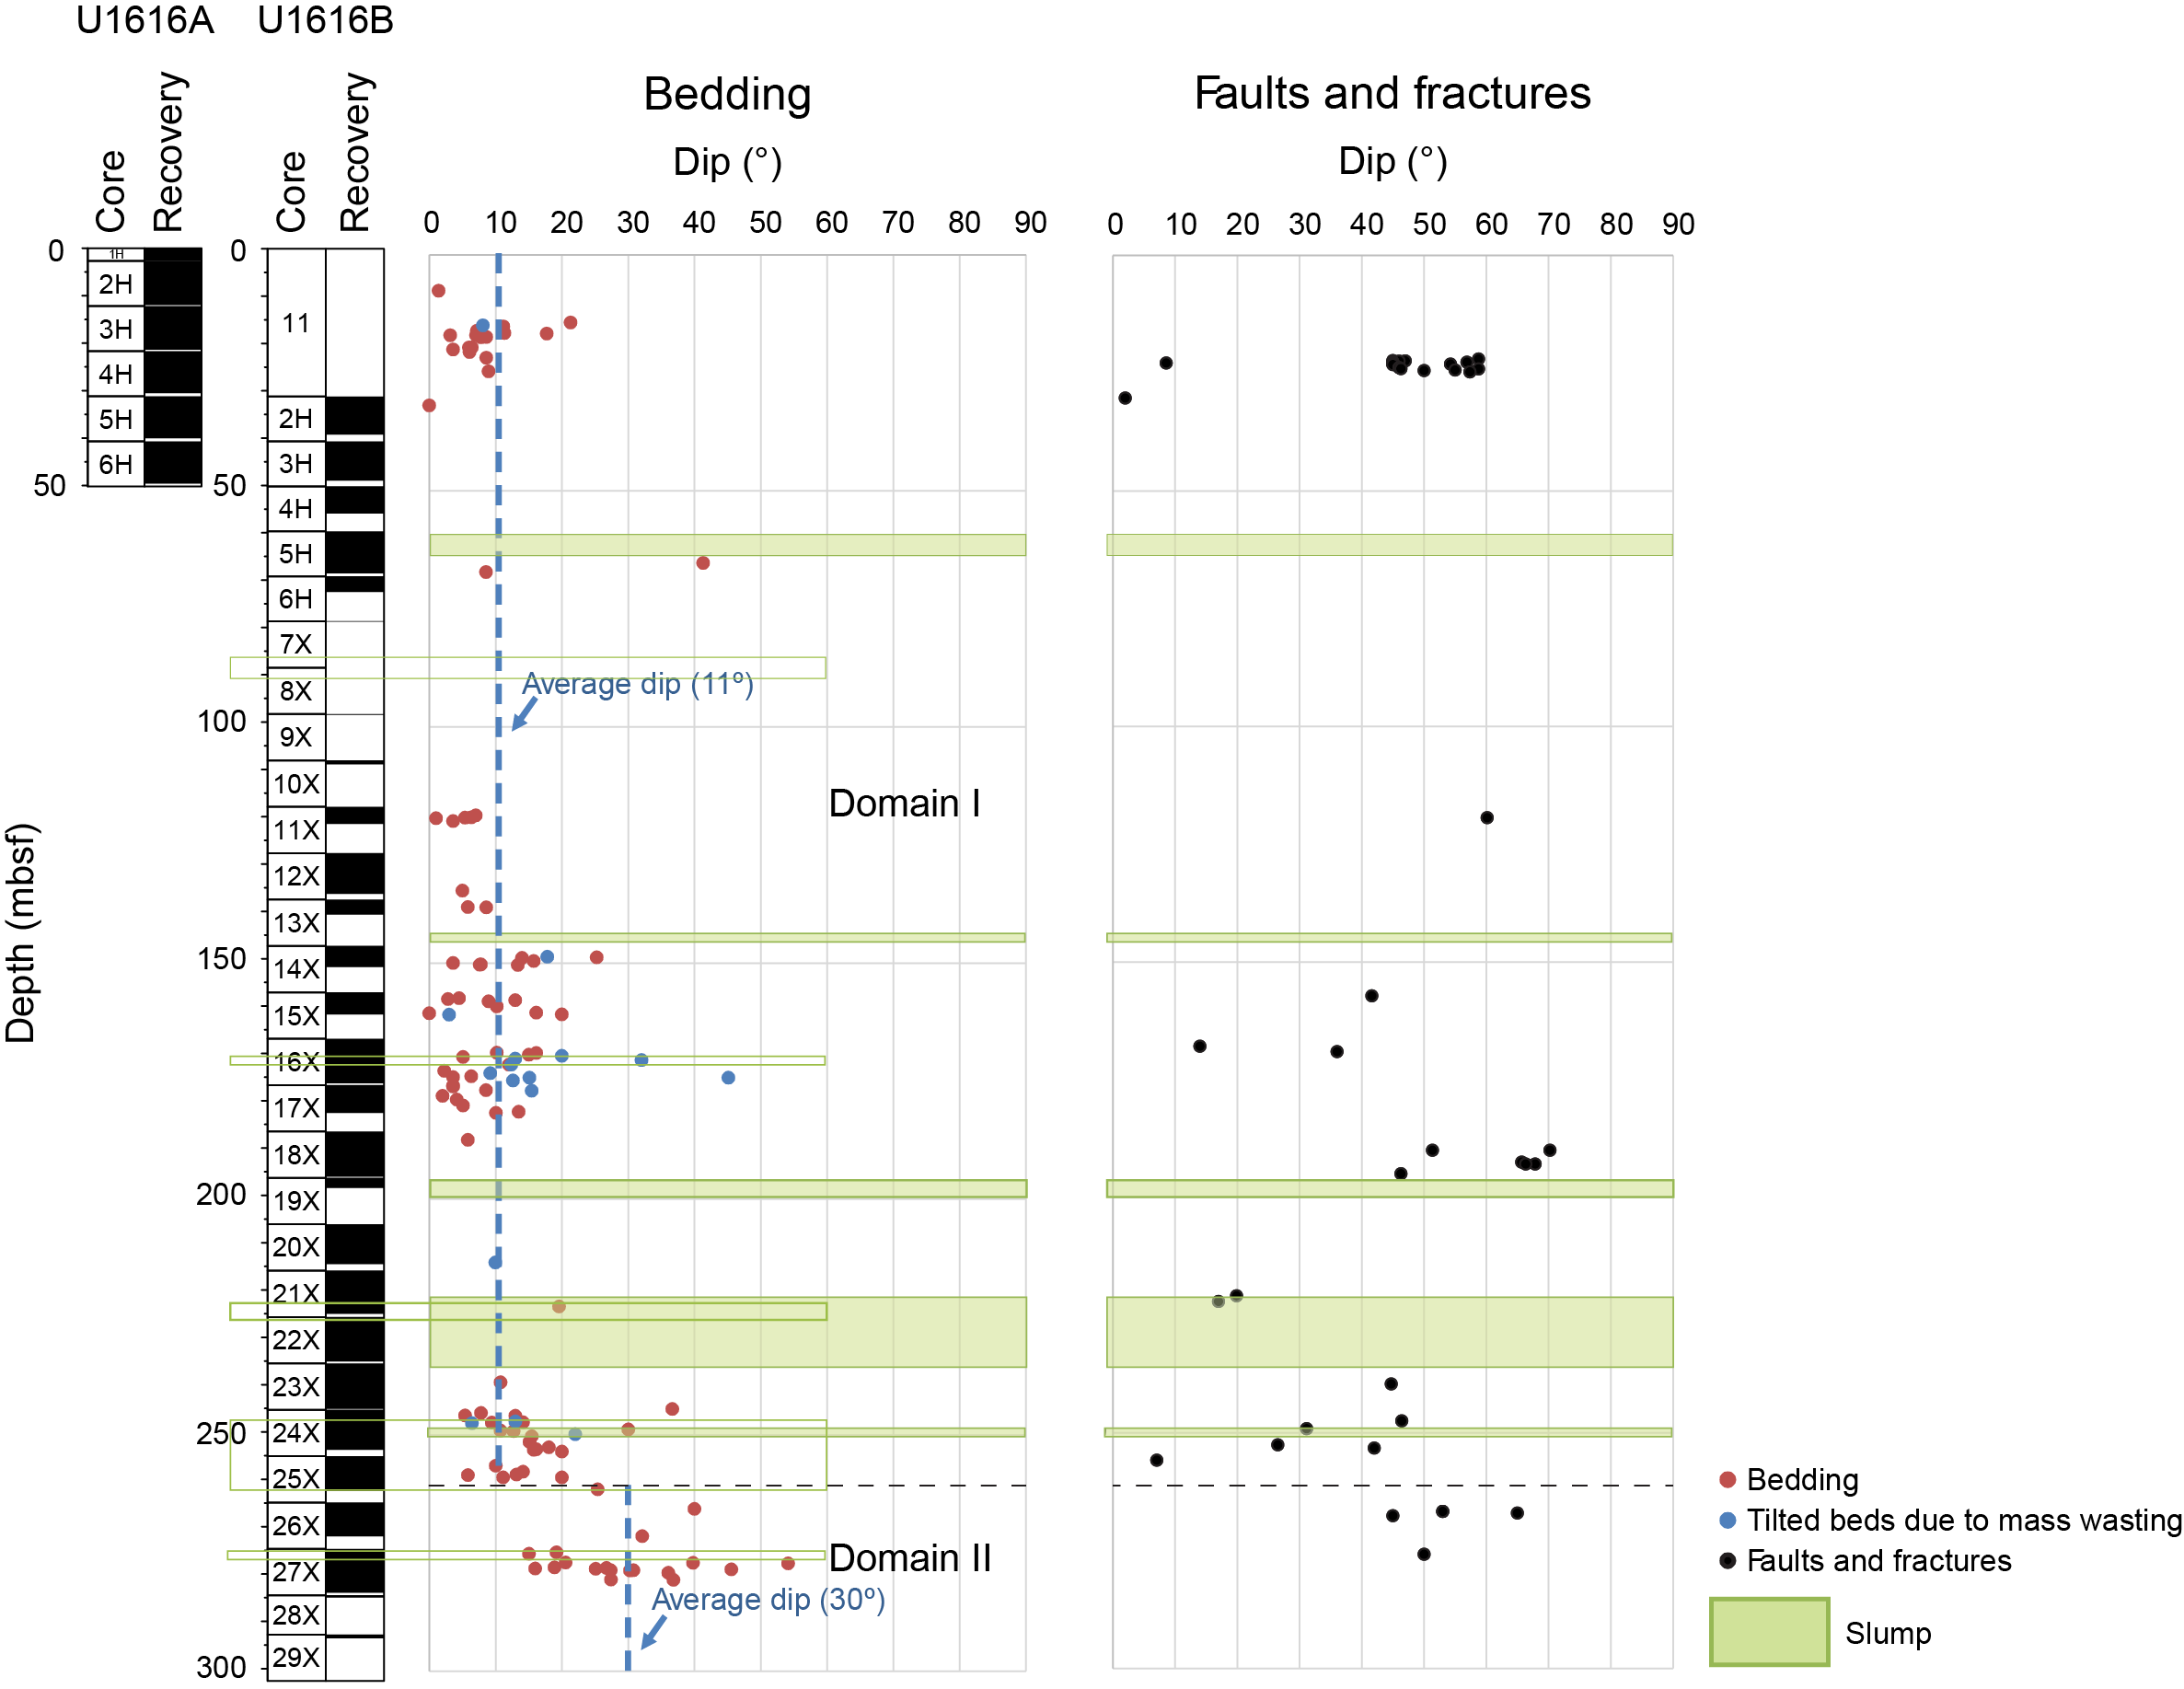
Figure F33. Bedding dip angles and fault, fracture, and fold frequency.
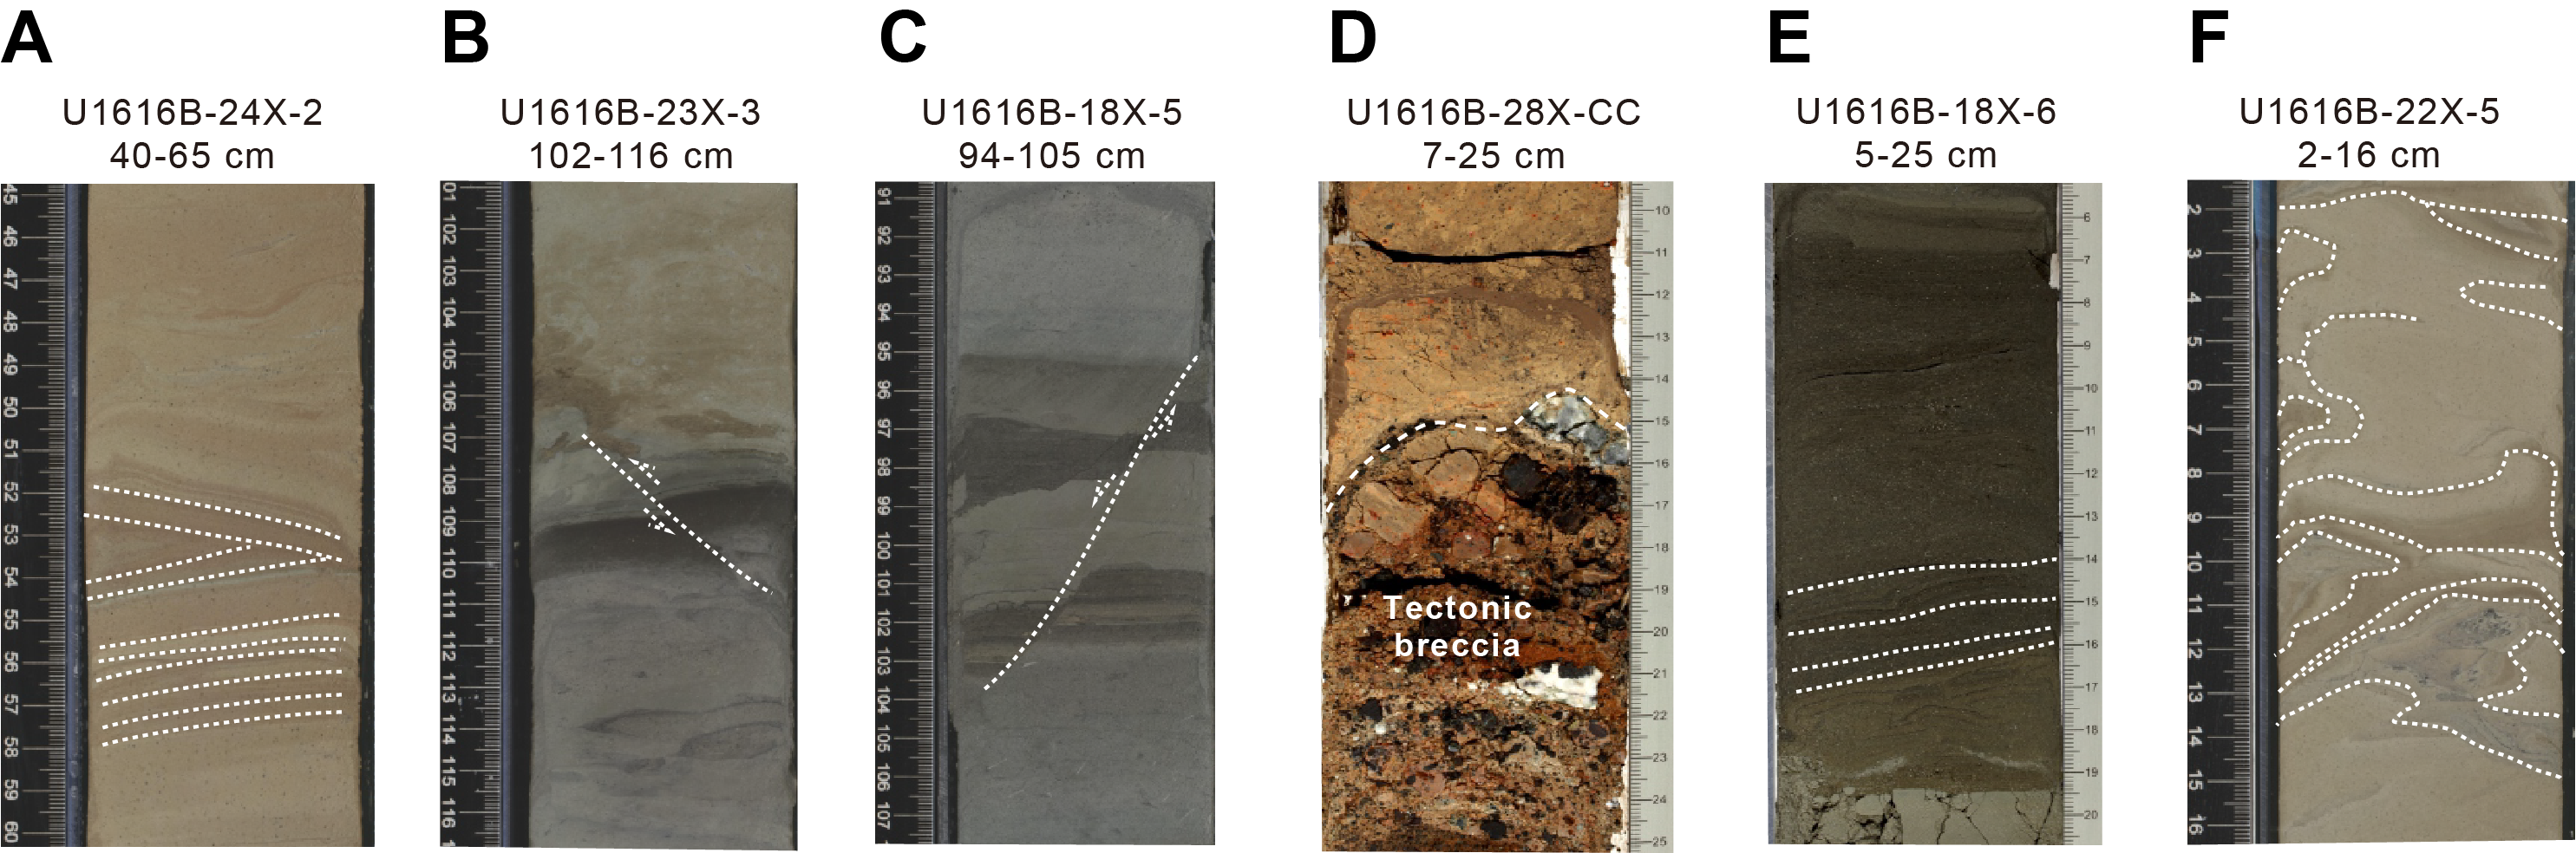
Figure F34. Deformation structures in sedimentary sequence.
The sedimentary sequence overlies ultramafic magmatic basement. The contact is marked by a breccia composed of carbonate cement and clasts of peridotite (Figure F35). The basement is characterized by weakly deformed peridotites locally intruded by mafic intrusions. The alteration pattern is mostly characterized by weathering and carbonate impregnation. In the following sections, we have divided the cores recovered at Site U1616 into three domains: sedimentary, transitional, and hard rocks.
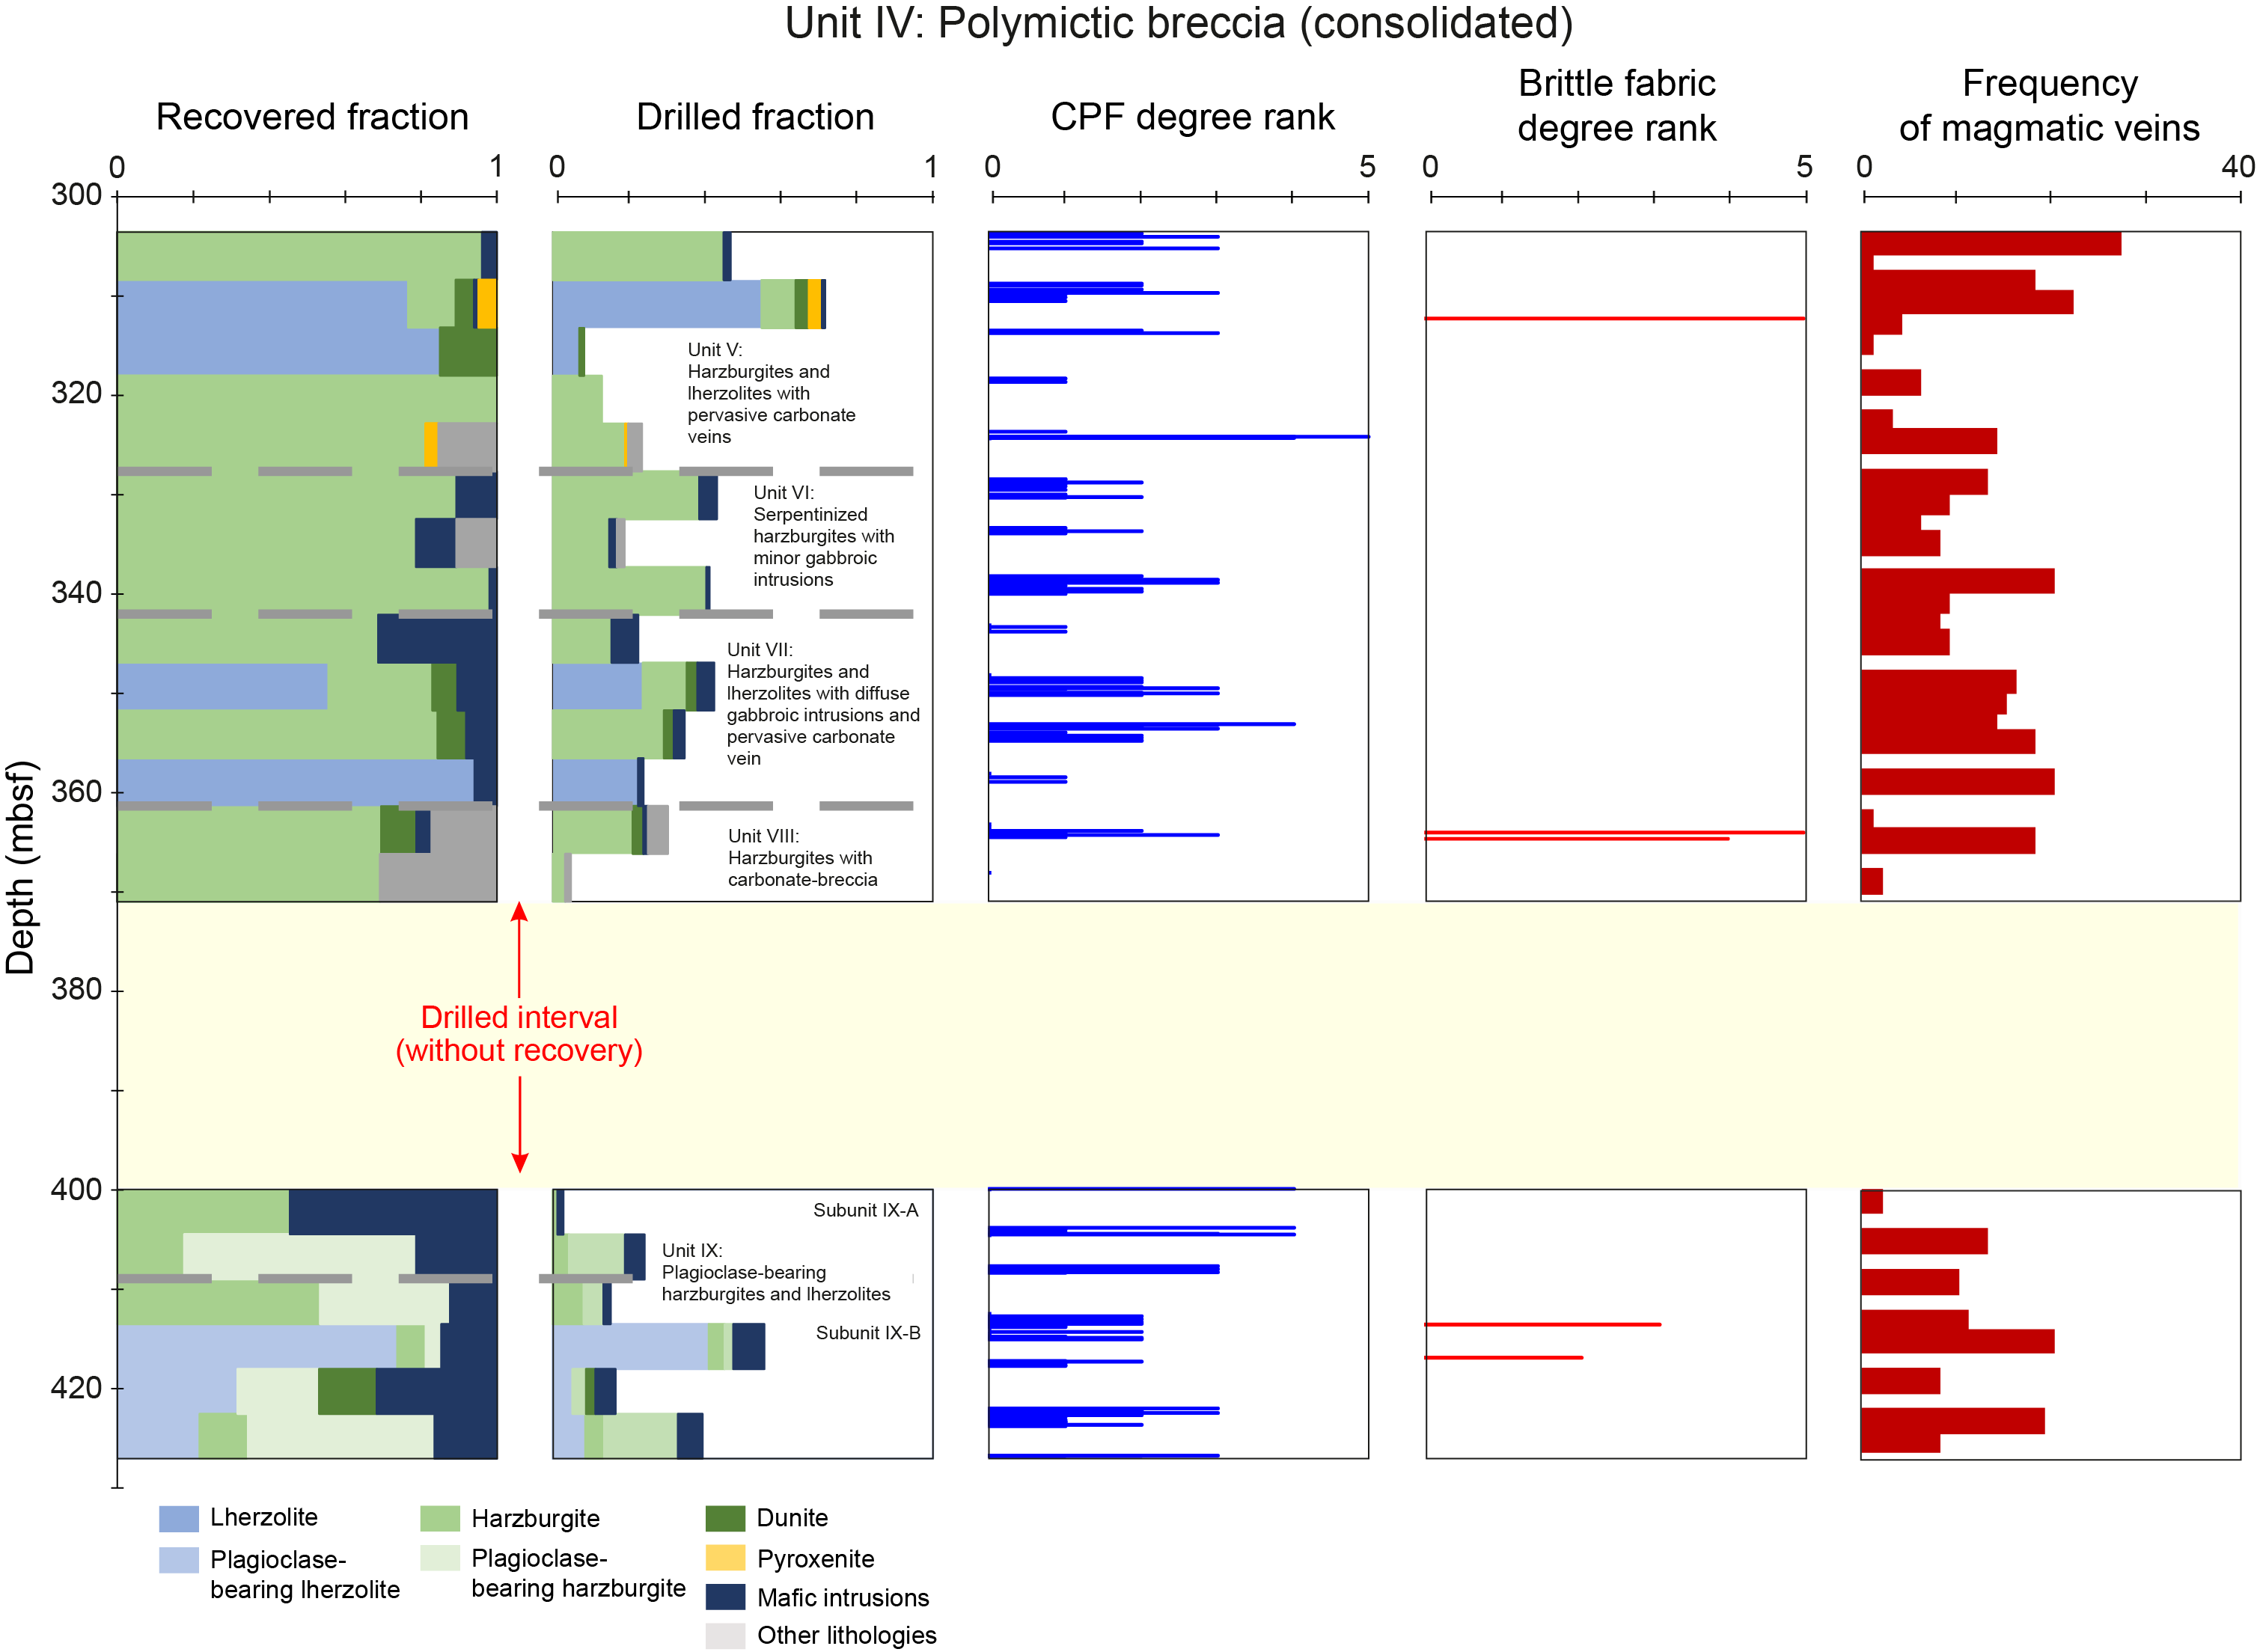
Figure F35. Structural characteristics.
7.1. Domain I: subhorizontal sediments and sedimentary rocks
Sediments from 0 to ~260 mbsf (Sections 402-U1616A-1H-1 through 402-U1616B-25X-4) consist of weakly deformed sediments intercalated with MTDs. Bedding orientations with respect to the core reference frame (see Structural geology in the Expedition 402 methods chapter [Malinverno et al., 2025]) are mostly subhorizontal (<20°) with an average dip of 11°. The dip locally increases within the MTDs and slumps, where it can reach dips of 45° (Figure F33).
A few soft-sediment faults, both normal and reverse, and fractures were measured within the sedimentary sequence (Figure F34). From 0 to 260 mbsf, the occurrence of faults and fractures in depth correlates with the distribution of MTDs (Figure F33).
7.2. Domain II: sediment–basement transition
From ~261 to 294 mbsf in Hole U1616B (Cores 25X–29X), the average dip increases from 11° to 30°. Domain II also contains an interval of dolomitic sediments (see Lithostratigraphy) overlying the polymictic breccia that marks the transition to the igneous basement (Figure F34D). The dolomitic sediments are reddish in color. A few steeply dipping faults, mostly normal, were observed in the cores of Domain II, but none were observed in the dolomitic unit.
7.3. Domain III: hard rock
Hard rocks were cored from Section 402-U1616E-4R-2, 12 cm, through Core 23R and again from Cores 25R–30R for a total advance with recovery of 128.2 m into breccia and basement rocks. The overall recovery is low (20% in this breccia and basement interval). The uppermost 29 m of hard rock (Section 4R-2, 12 cm, through Core 9R) consists of a carbonate-cemented breccia containing angular clasts of variably deformed serpentinized peridotite, diabase, and gabbro (Figures F35, F36A). Below the breccia, we recovered variably serpentinized and weathered peridotite and few gabbroic intrusions with several magmatic and metamorphic veins (Figures F35, F36B, F36C). We identified another layer of carbonate-cemented breccia in interval 22R-1, 60–140 cm (363.8–364.6 mbsf), in the upper cored interval of mantle peridotites (Figures F34, F35D), which correlates with the poor recovery.
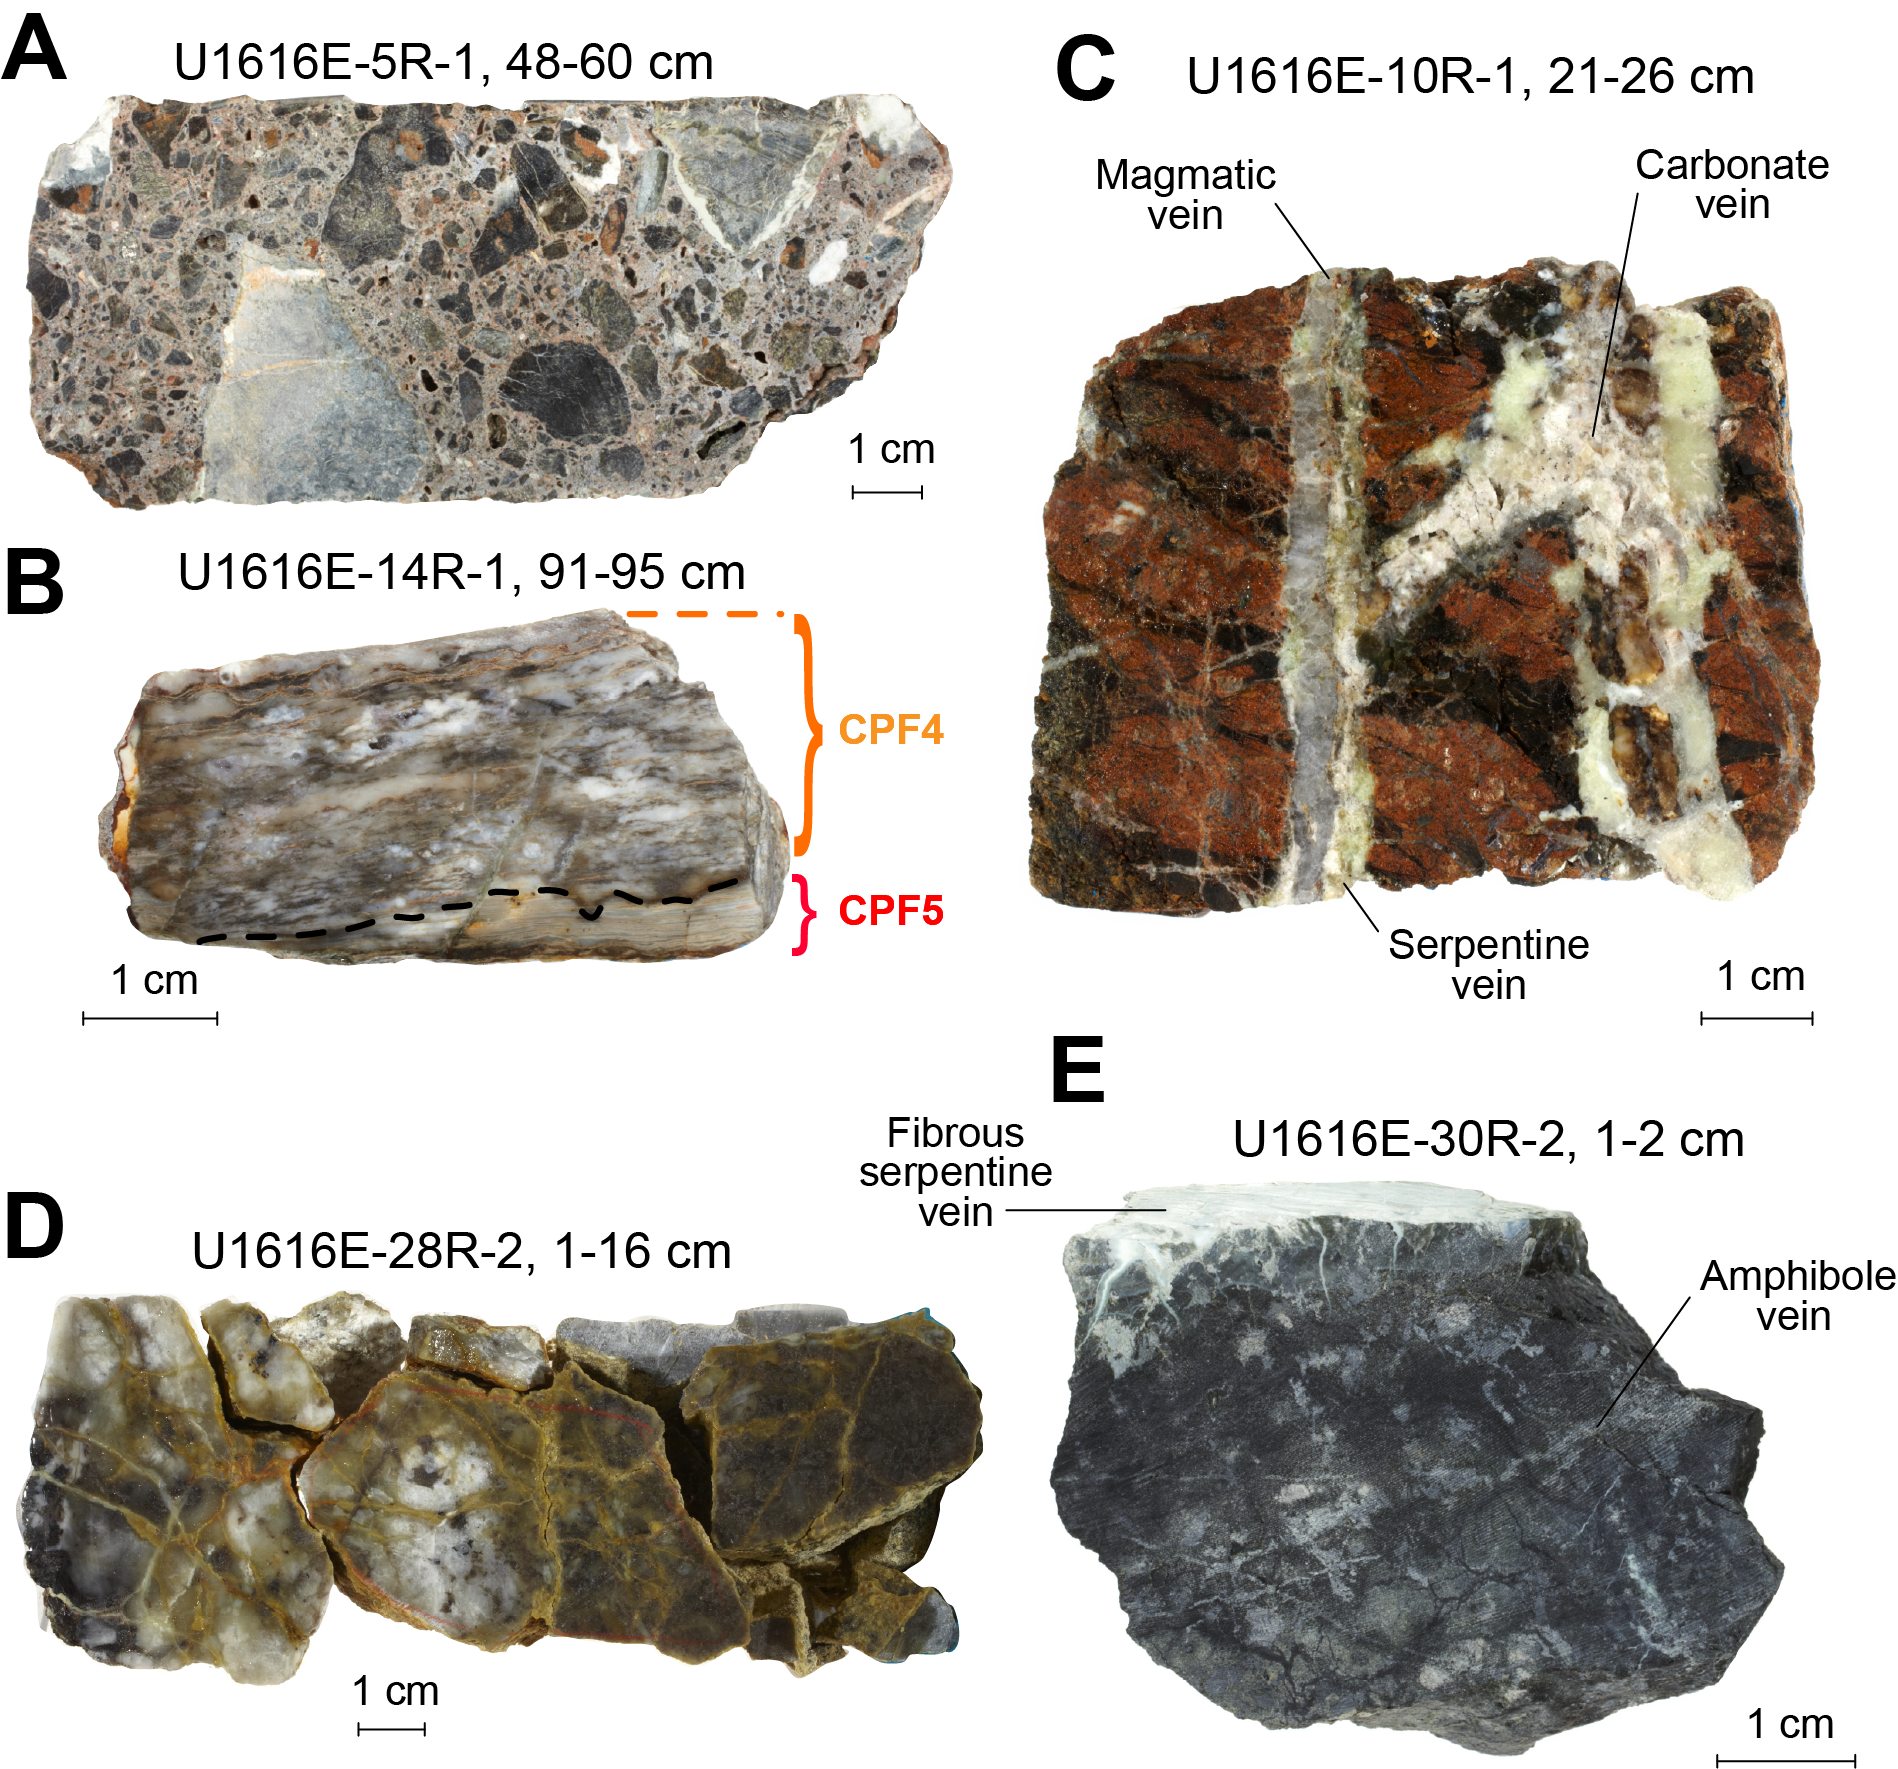
Figure F36. Characteristic rock samples.
In the peridotite interval, we measured several deformation structures, including crystal-plastic and brittle deformation (Figure F36A, F36B), fractures and microfaults (Figure F36D), magmatic intrusions (gabbroic and mica-bearing mafic), and metamorphic veins (mainly serpentine and carbonate; Figure F36C). The depth distribution of crystal-plastic fabrics (CPFs), brittle deformation, and magmatic and metamorphic veins is presented together with the lithologies and recovery in Figure F35. In contrast with Hole U1614C, the intensity of the CPF is weak, although it varies with depth and with the diversity of lithologies (Figure F35). The few highly deformed samples correlate with the presence of magmatic veins and intrusions such as gabbro and diabase (Figures F35, F37). However, it should be noted that the low recovery of highly deformed samples might also result in a biased sampling; lithologic heterogeneities, such as mylonites and ultramylonites or contacts between magmatic intrusions and peridotites, are preferential pathways for fluid, favoring fluid-rock interactions and associated alteration.
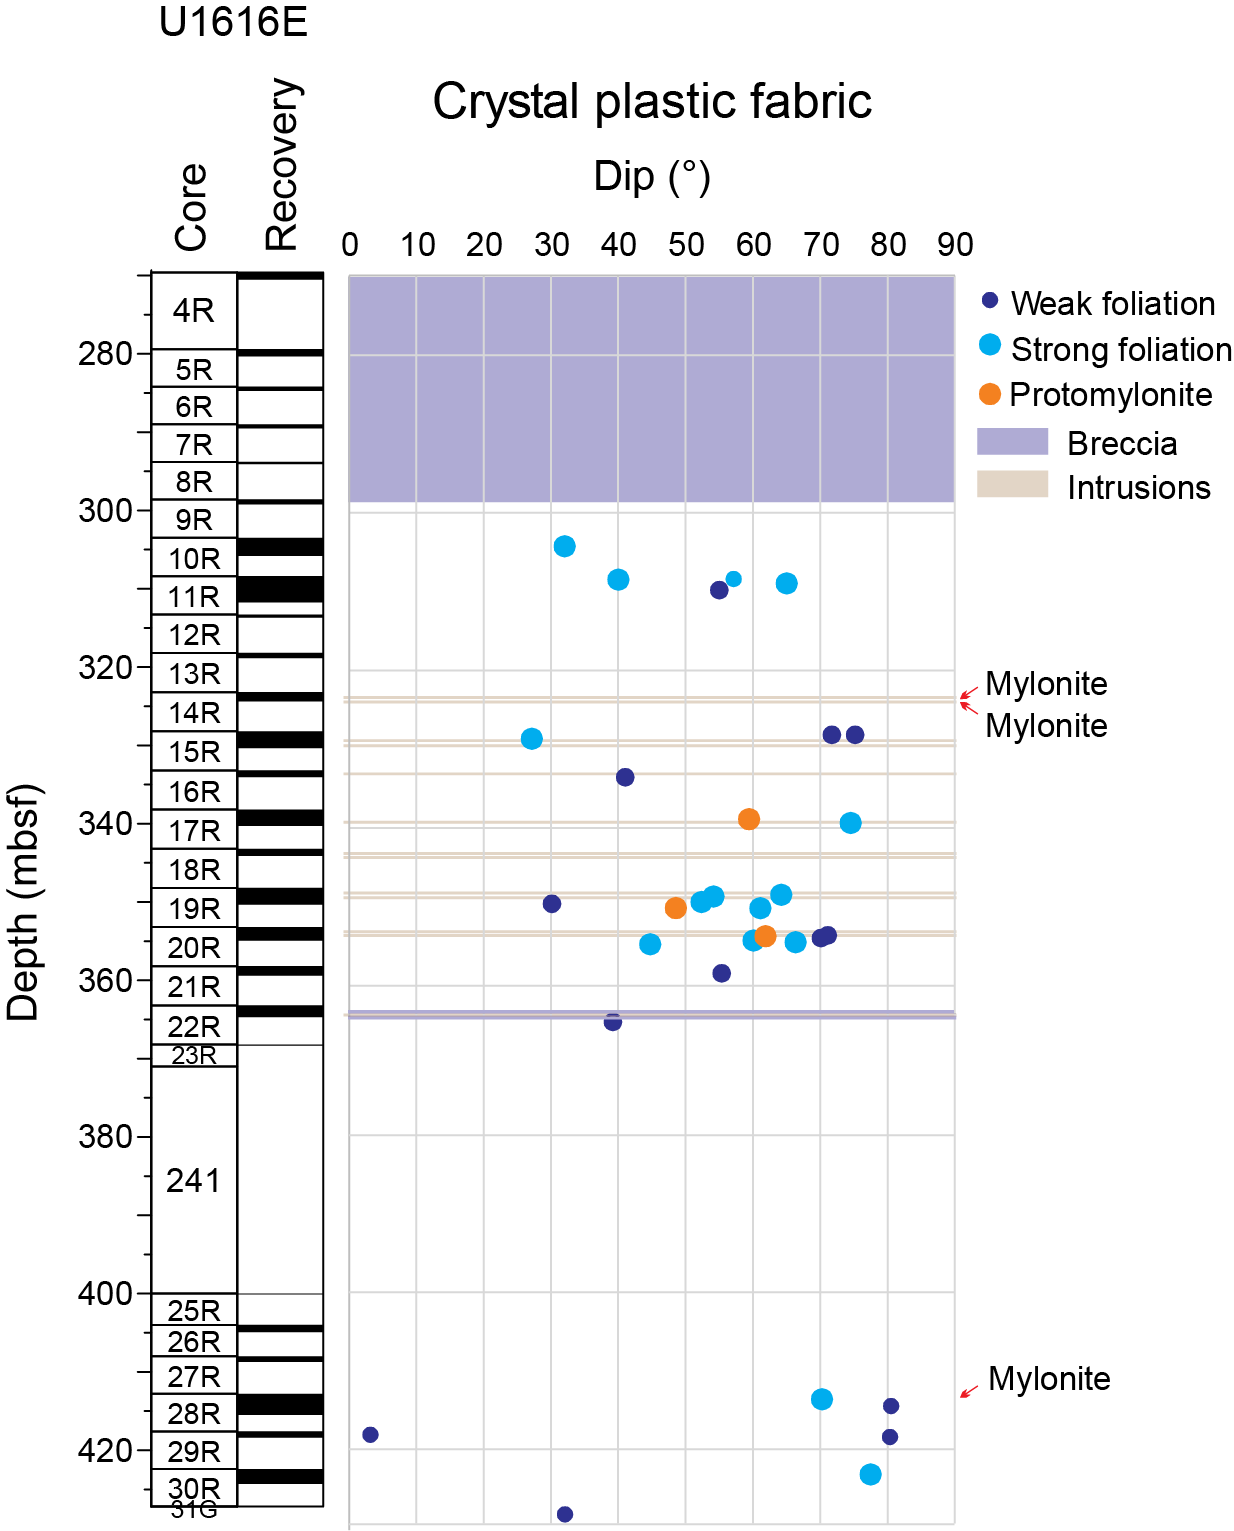
Figure F37. Dip of CPF.
Overall, the dip of CPF increases rapidly from 30° to 65° from 304 to 309 mbsf (Cores 402-U1616E-10R through 11R; Figure F37). From 328 to 364 mbsf, the orientation of CPF gradually flattens, switching from 75° to 39° (Figure F37). In contrast, there is no general trend in the dip of magmatic and metamorphic veins (Figure F38).
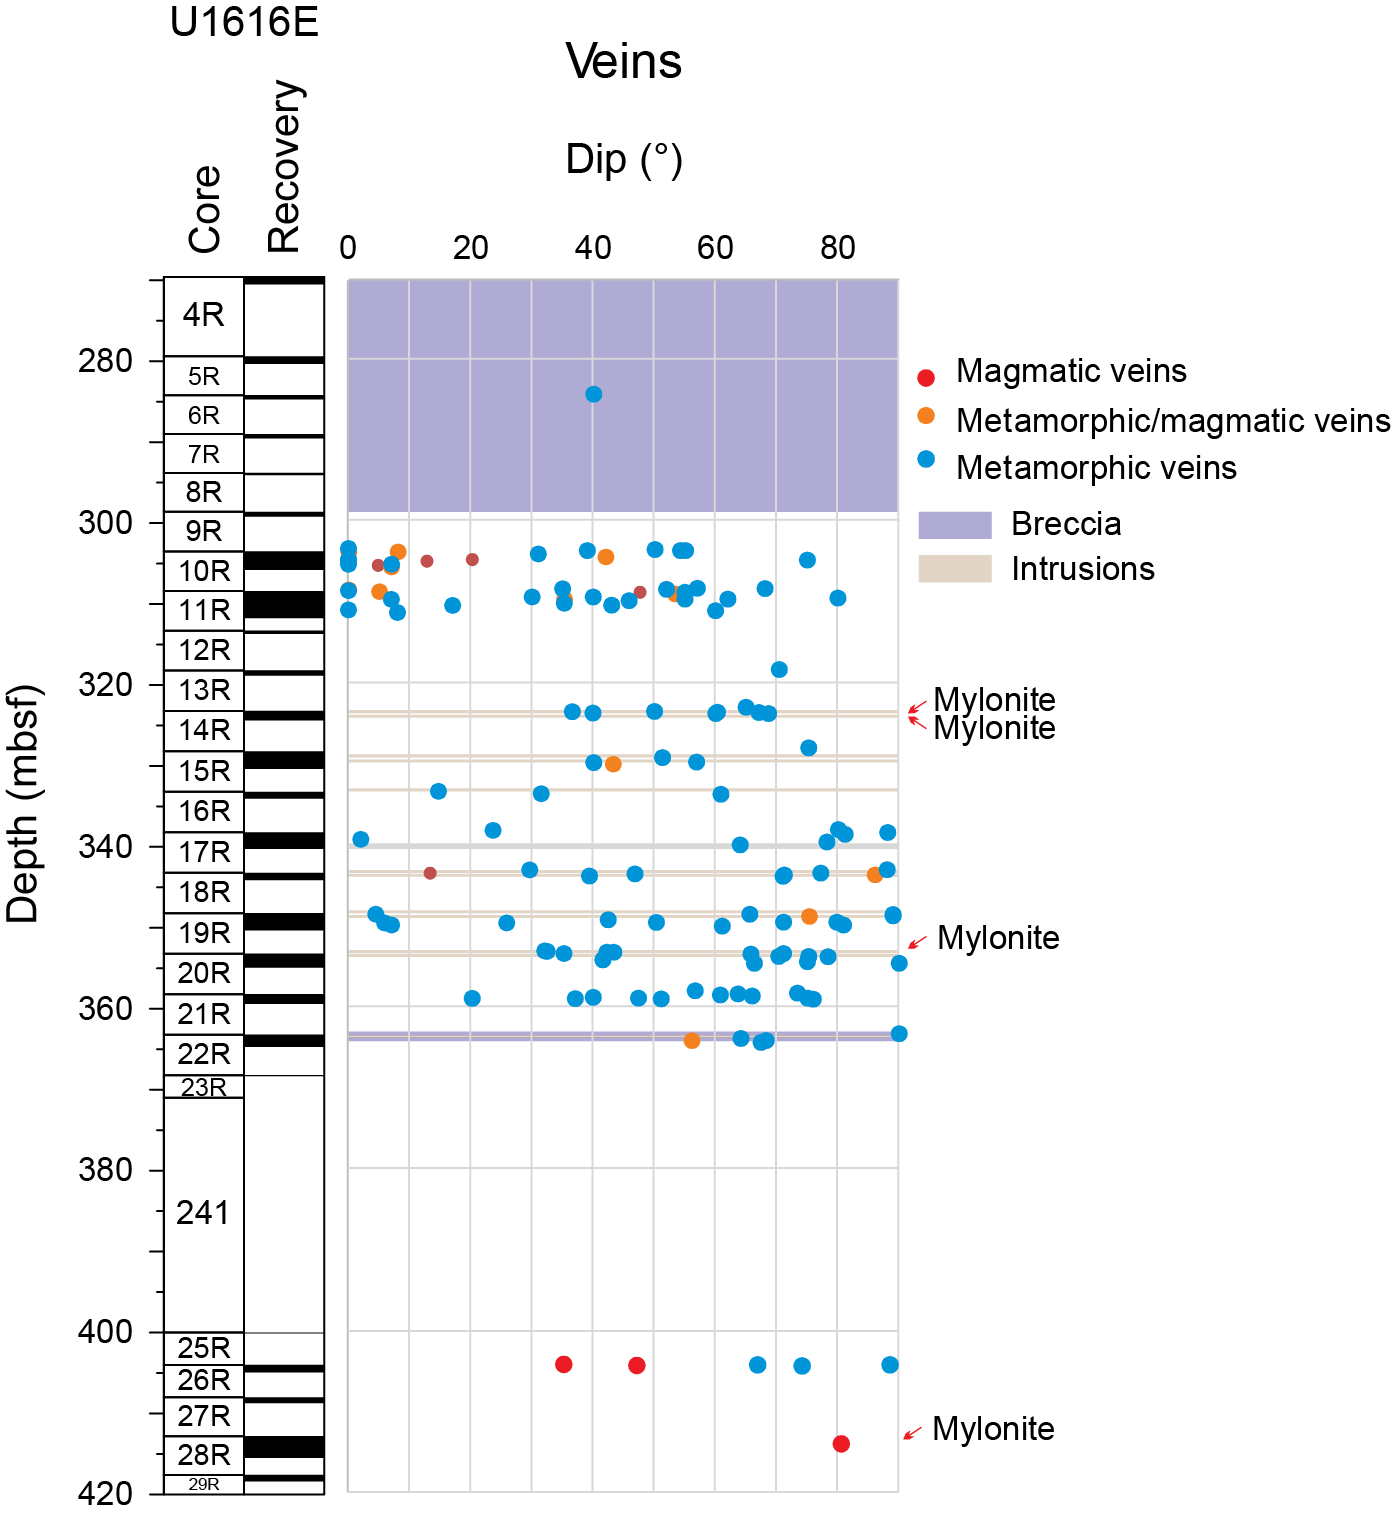
Figure F38. Dip of magmatic and metamorphic veins.
8. Sediment and interstitial water geochemistry
A total of 1 mudline and 22 whole-round core samples were collected at Site U1616, including 5 from Hole U1616A (0–26.2 mbsf) and 18 from Hole U1616B (65.2–280.7 mbsf). The samples were processed to obtain IW and for shipboard analyses. Headspace gas sampling was also performed at this site to measure the composition and abundance of C1–C6 hydrocarbon gases.
8.1. Interstitial water geochemistry
8.1.1. Alkalinity, pH, and salinity
IW alkalinity varies from 0.9 to 8.1 mM (Table T5). Alkalinity increases sharply in Lithostratigraphic Subunit IA from 3.2 mM near the seafloor to a maximum of 8.1 mM at 26.2 mbsf (Section 402-U1616A-4H-3). It then exhibits a decreasing trend toward the base of the cored interval, with values less than 2 mM below 138.7 mbsf (Figure F39).
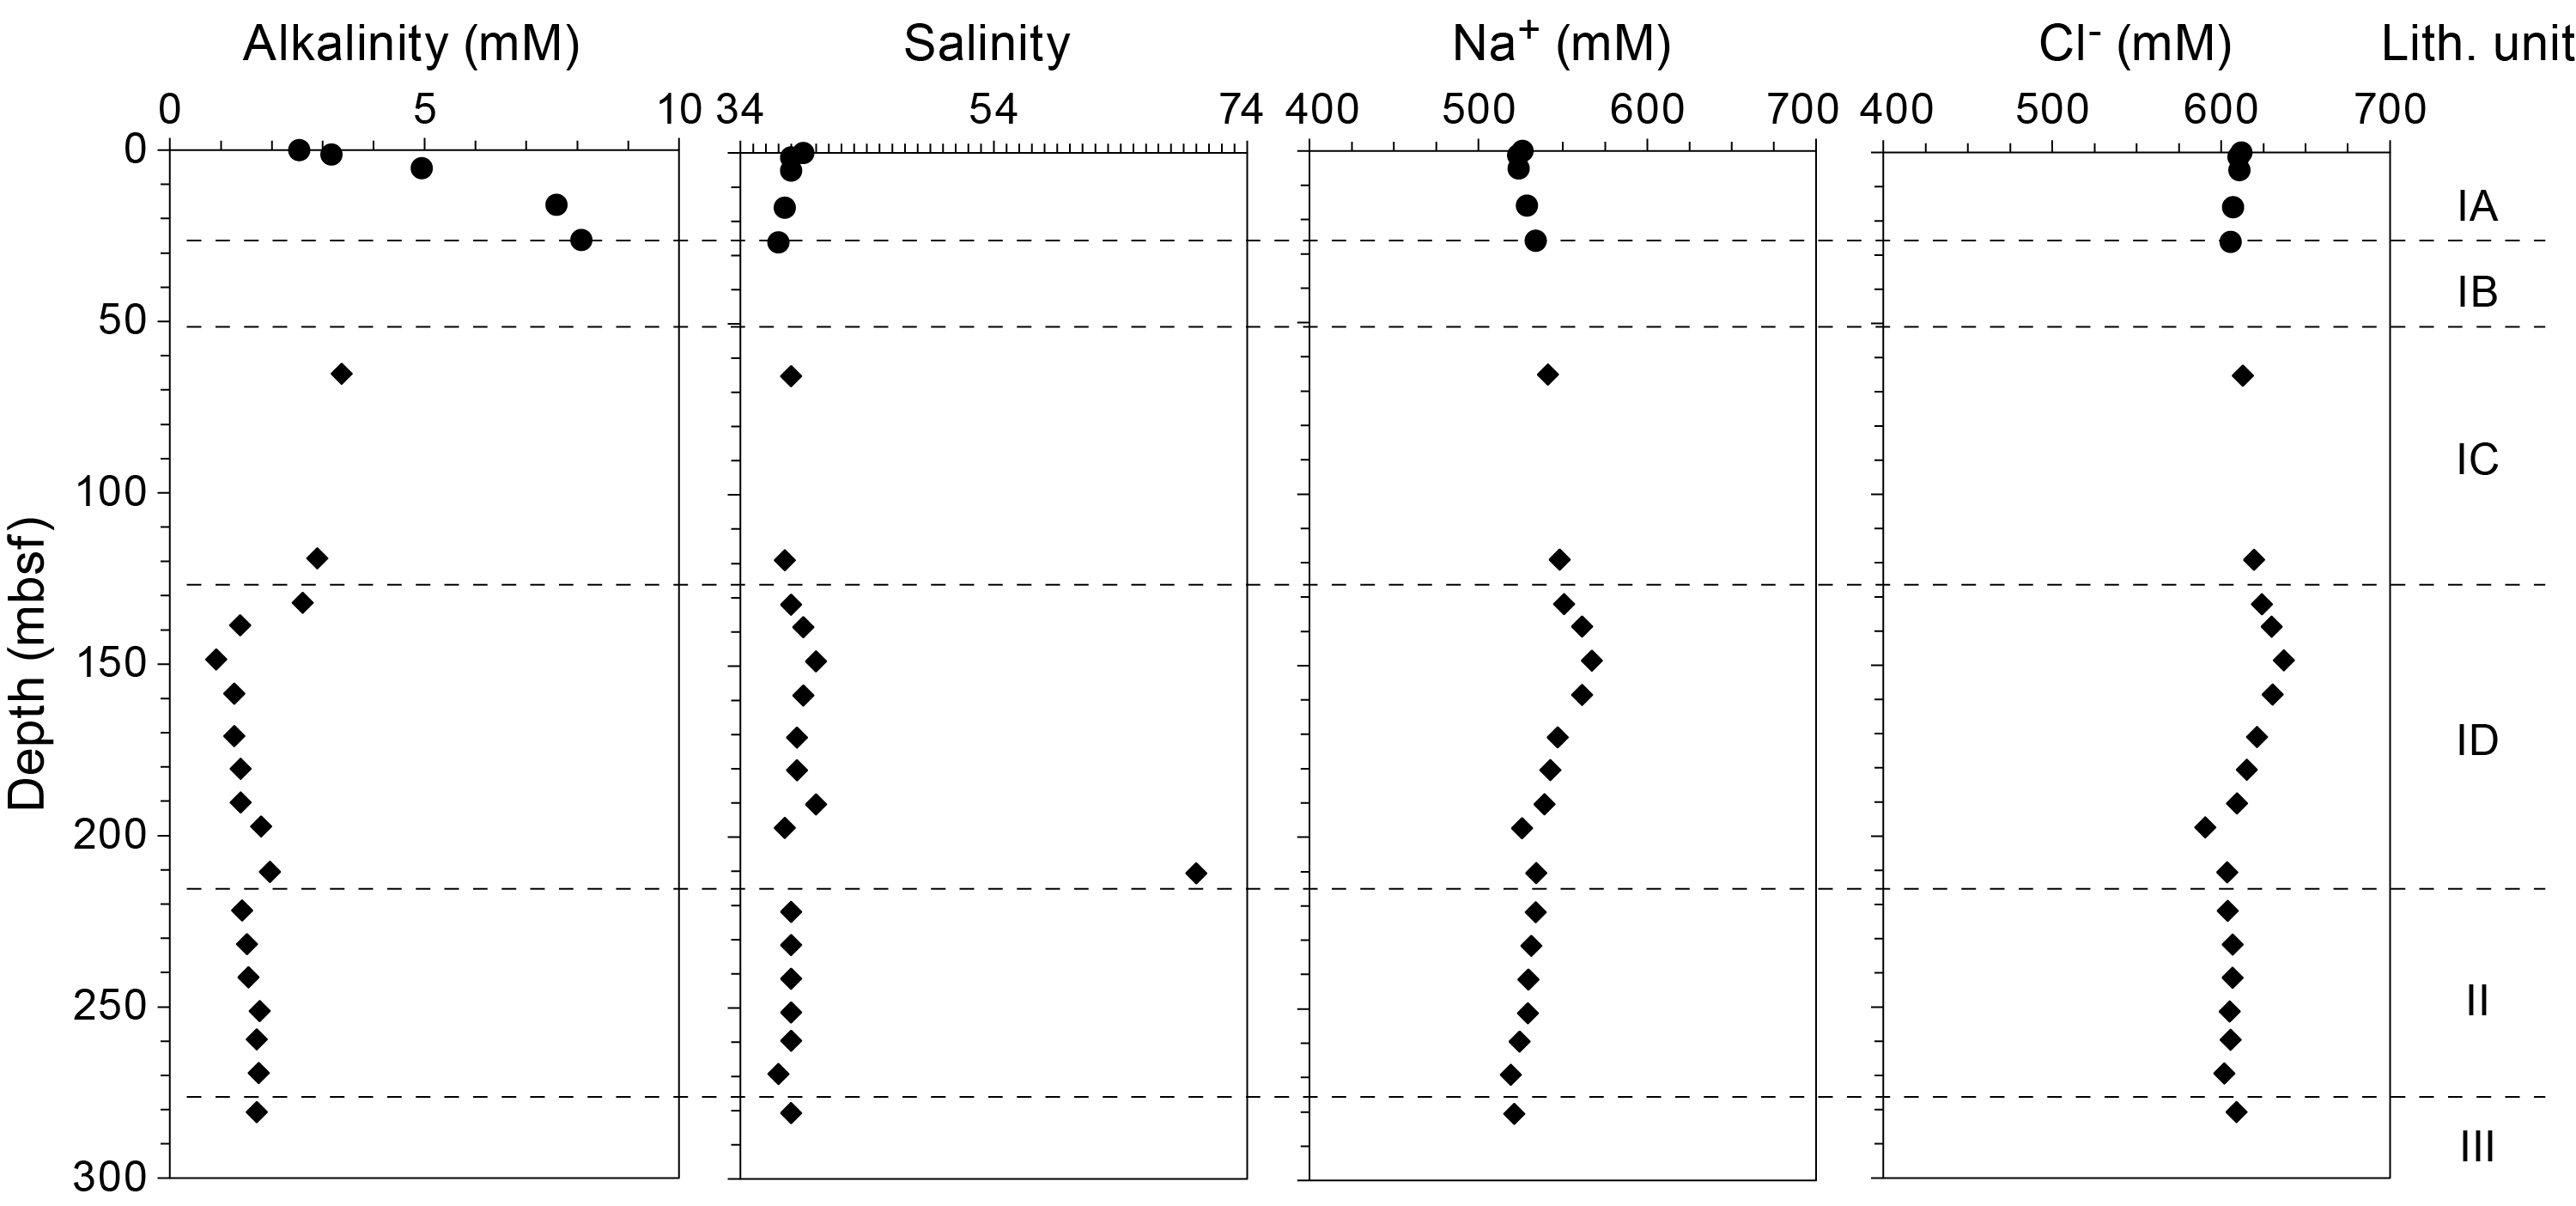
Figure F39. IW alkalinity, salinity, sodium, and chloride.
IW pH shows little variation, ranging 7.2–7.9, with maximum values of 7.9 and 7.8 at 197.4–210.6 mbsf (Table T5). The pH values suggest that the bicarbonate ion (HCO3−) is the predominant carbonate species.
IW salinity generally varies from 37 to 38.5 throughout the cored sediments except at 210.6 mbsf, where a maximum of 70 is reached (Table T5). In the lower part of Lithostratigraphic Subunit IC (Sections 402-U1616B-13X-1 through 20X-3), salinity becomes higher than 38.5, the value reported for the bottom seawater of the Mediterranean Sea (Figure F39) (Roether et al., 1996; Tsimplis and Baker, 2000; Tanhua et al., 2013). The salinity peak of 70 coincides with a small increase of alkalinity and pH.
8.1.2. Major elements
Concentrations of sodium (Na+) and chloride (Cl–) vary from 519.4 to 567.4 mM and 590.8 to 637.2 mM, respectively (Table T5). The variations of both elements with depth roughly follow salinity changes, with elevated concentrations in the middle to lower intervals of Lithostratigraphic Subunit IC (Figure F39). However, no important increase in the concentration of these two elements is observed at the depth of 210.6 mbsf, which is characterized by a salinity maximum of 70. The Na/Cl ratio is higher than the seawater ratio (0.86) between 15.9 and 259.5 mbsf. No linear correlation between these two elements is found at 0–26.2, 197.3, and 231.6–280.7 mbsf. At all other depths, a strong linear correlation between Na+ and Cl− occurs (R2 = 0.97). Because no halite deposits are known from this site, the increasing concentration of both elements could have derived from NaCl release from fluid inclusions by alteration of the volcanogenic minerals found in Lithostratigraphic Units I and II. The increase of Cl− could also be caused by removal of H2O from interstitial fluid during authigenesis of hydrous minerals (Martin, 1994) such as during clay formation.
The major cations magnesium (Mg2+) and calcium (Ca2+) show opposite concentration patterns with depth (Figure F40; Table T5) that are characterized by a strong negative linear correlation (R2 = 0.89). The Mg2+ concentration decreases downhole from 59.1 mM near the seafloor and reaches the minimum value of 15.2 mM at 148.6 mbsf. It increases below this depth, reaching 51.2 mM at the base of the hole. In contrast, the Ca2+ concentration increases with depth, reaching a maximum value of 36.7 mM at 148.6 mbsf. It then decreases to 17.1 mM at the base of the cored interval. The release of Ca2+ in parallel with the uptake of Mg2+ could result from diagenetic processes notably affecting carbonate minerals (substitution processes in calcite minerals and dolomitization) and volcaniclastic materials. The concentration of potassium (K+), varying from 9.8 to 16.2 mM, shows higher values at 26.2 (16.2 mM), 138.7 (13.5 mM), and 210.6 mbsf (13.7 mM) (Figure F40; Table T5). Higher concentrations than those measured in Mediterranean bottom seawater (11.00 mM; Michard et al., 1974) could result from the alteration of K-rich material such as K-feldspars generally present in volcaniclastic materials.
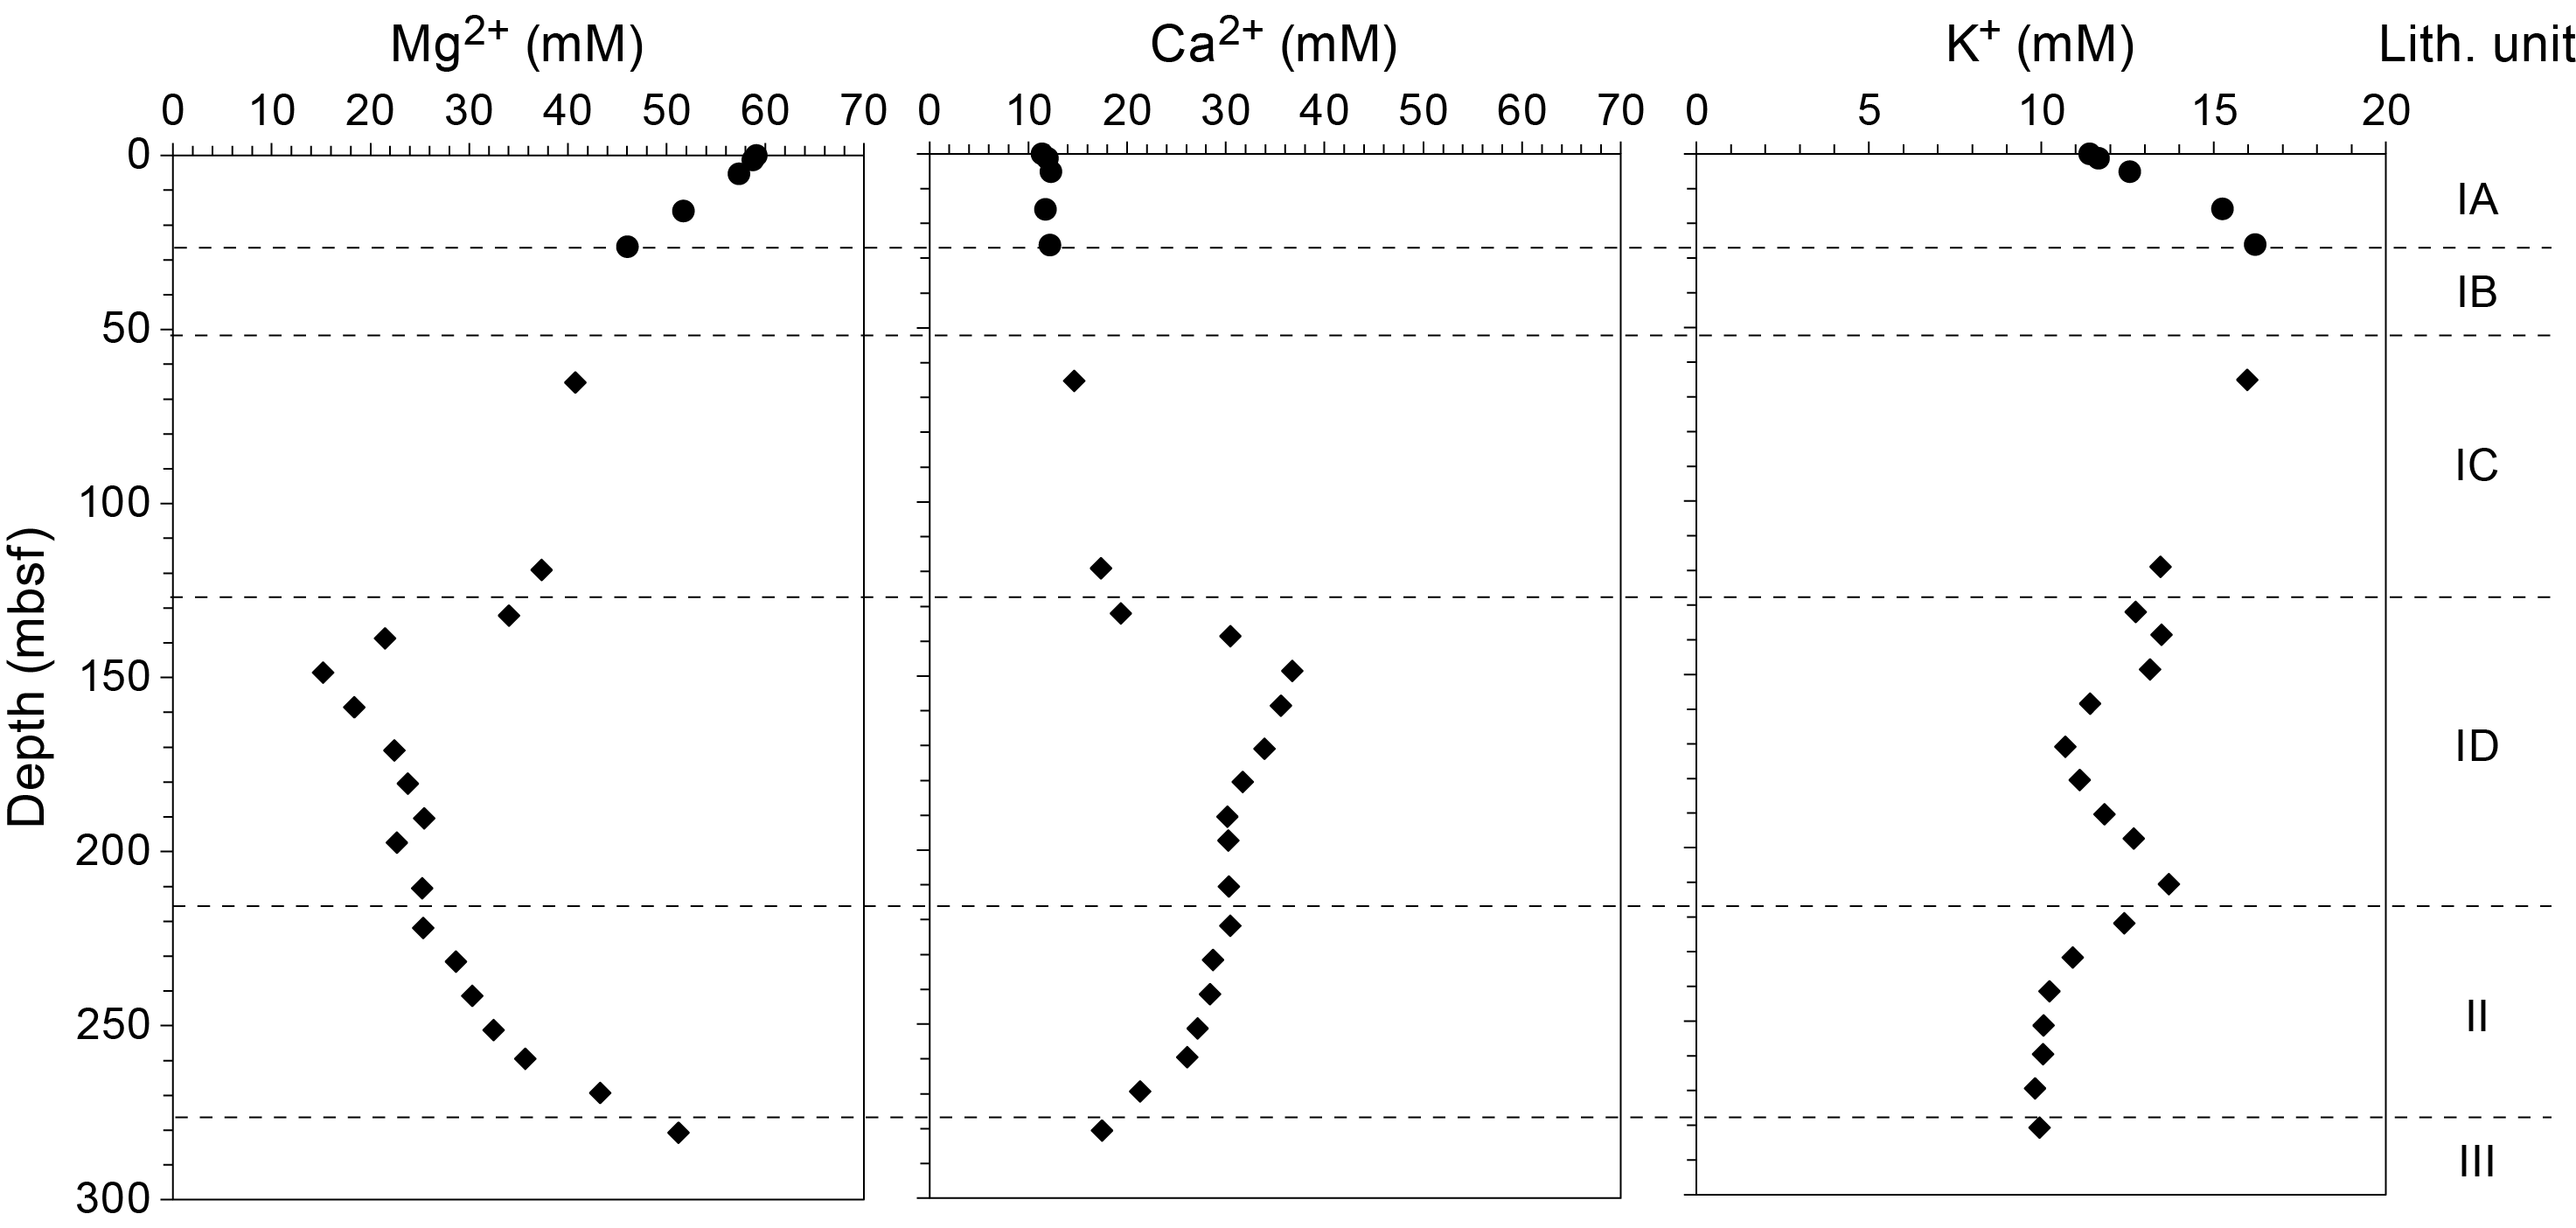
Figure F40. IW magnesium, calcium, and potassium.
As observed at other Expedition 402 sites, the concentration of bromide (Br−) is low with minor fluctuations. It varies between 0.9 and 1.0 mM throughout the entire cored interval (Table T5).
8.1.3. Minor elements
Cations, including lithium (Li), boron (B), and strontium (Sr), have elevated concentrations at intermediate depths, reaching maximum values between 138.7 and 197.3 mbsf (Figure F41; Table T6). These higher concentrations probably result from diagenetic processes and/or the influence of hydrothermal fluid circulation in IW composition. Concentrations of Ba are scattered across the cored interval and range 0.6–2.5 µM with maximum values of 2.5 µM at 231.6 mbsf and 2.4 µM at 280.7 mbsf (Table T6). Dissolved silica (Si) fluctuates in a wide range of 5.6–419 µM with no obvious pattern with depth and is probably influenced by silicate diagenesis (Figure F41; Table T6).
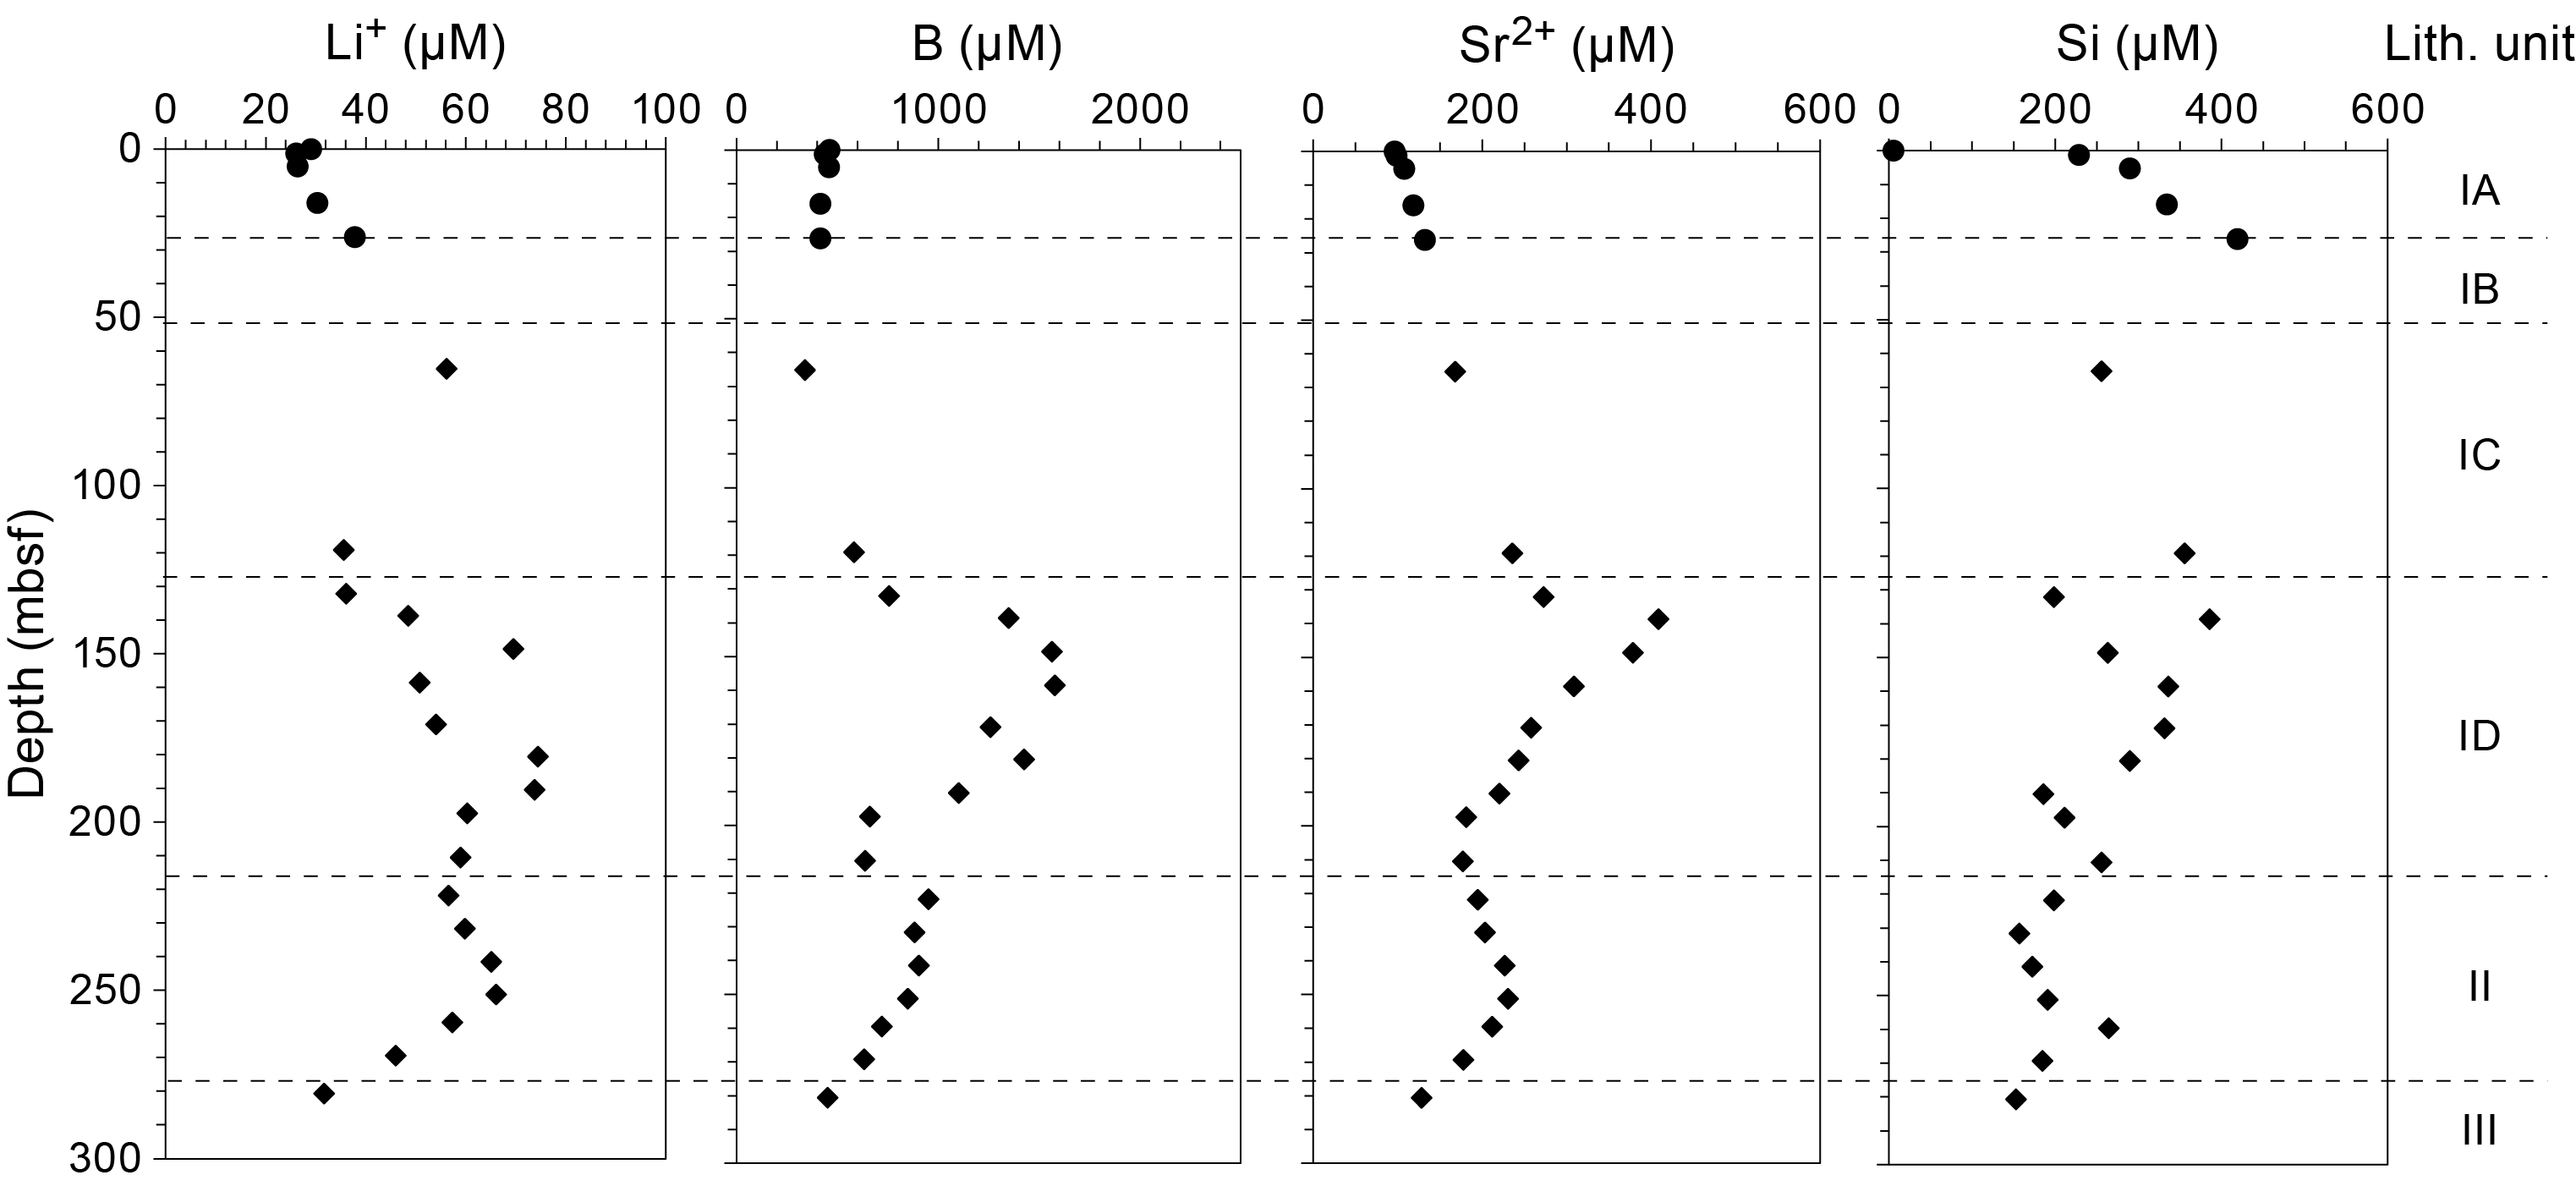
Figure F41. IW lithium, boron, strontium, and silica.
The concentration of iron (Fe = Fe2+ + Fe3+) mostly varies between undetectable and 58.5 µM with a mean value of 14.2 µM. Values higher than 14.2 µM occur at 15.9 (28.4 µM), 158.6 (16.4 µM), 180.5 (58.5 µM), and 221.8 mbsf (45.1 µM) (Table T6). Manganese (Mn = Mn2+ + Mn4+) exhibits higher concentrations near the seafloor (54.3 µM at 1.3 mbsf and 33.9 µM at 5.2 mbsf) and at 119.1 (27.1 µM) and 64.2–251.3 mbsf (32.2–110.7 µM). The vertical variations of Fe and Mn are most probably caused by biologically mediated reactions such as organic matter mineralization using (oxy)hydroxides (Jørgensen, 2000), oxidation, and solubilization of metal sulfides (Jørgensen et al., 2004).
8.1.4. Sulfate, nutrients, and sulfide
The depth profile of sulfate concentration (SO42−) is inversely correlated with that of alkalinity, decreasing sharply from a maximum of 31.7 mM (close to the reported value for the bottom seawater in the eastern Mediterranean Sea by Haese et al. [2003]) to a minimum of 21.3 mM above 26.2 mbsf (Section 402-U1616A-4H-3), which is the boundary between Lithostratigraphic Subunits IA and IB. This decrease mostly results from bacterially mediated sulfate reduction. Below this depth, sulfate increases gradually to 30.1 mM at the base of the cored interval (Figure F42), probably indicating a deeper source of this element. Sulfide concentrations are less than 6 µM with elevated values at shallower depths (Table T6).
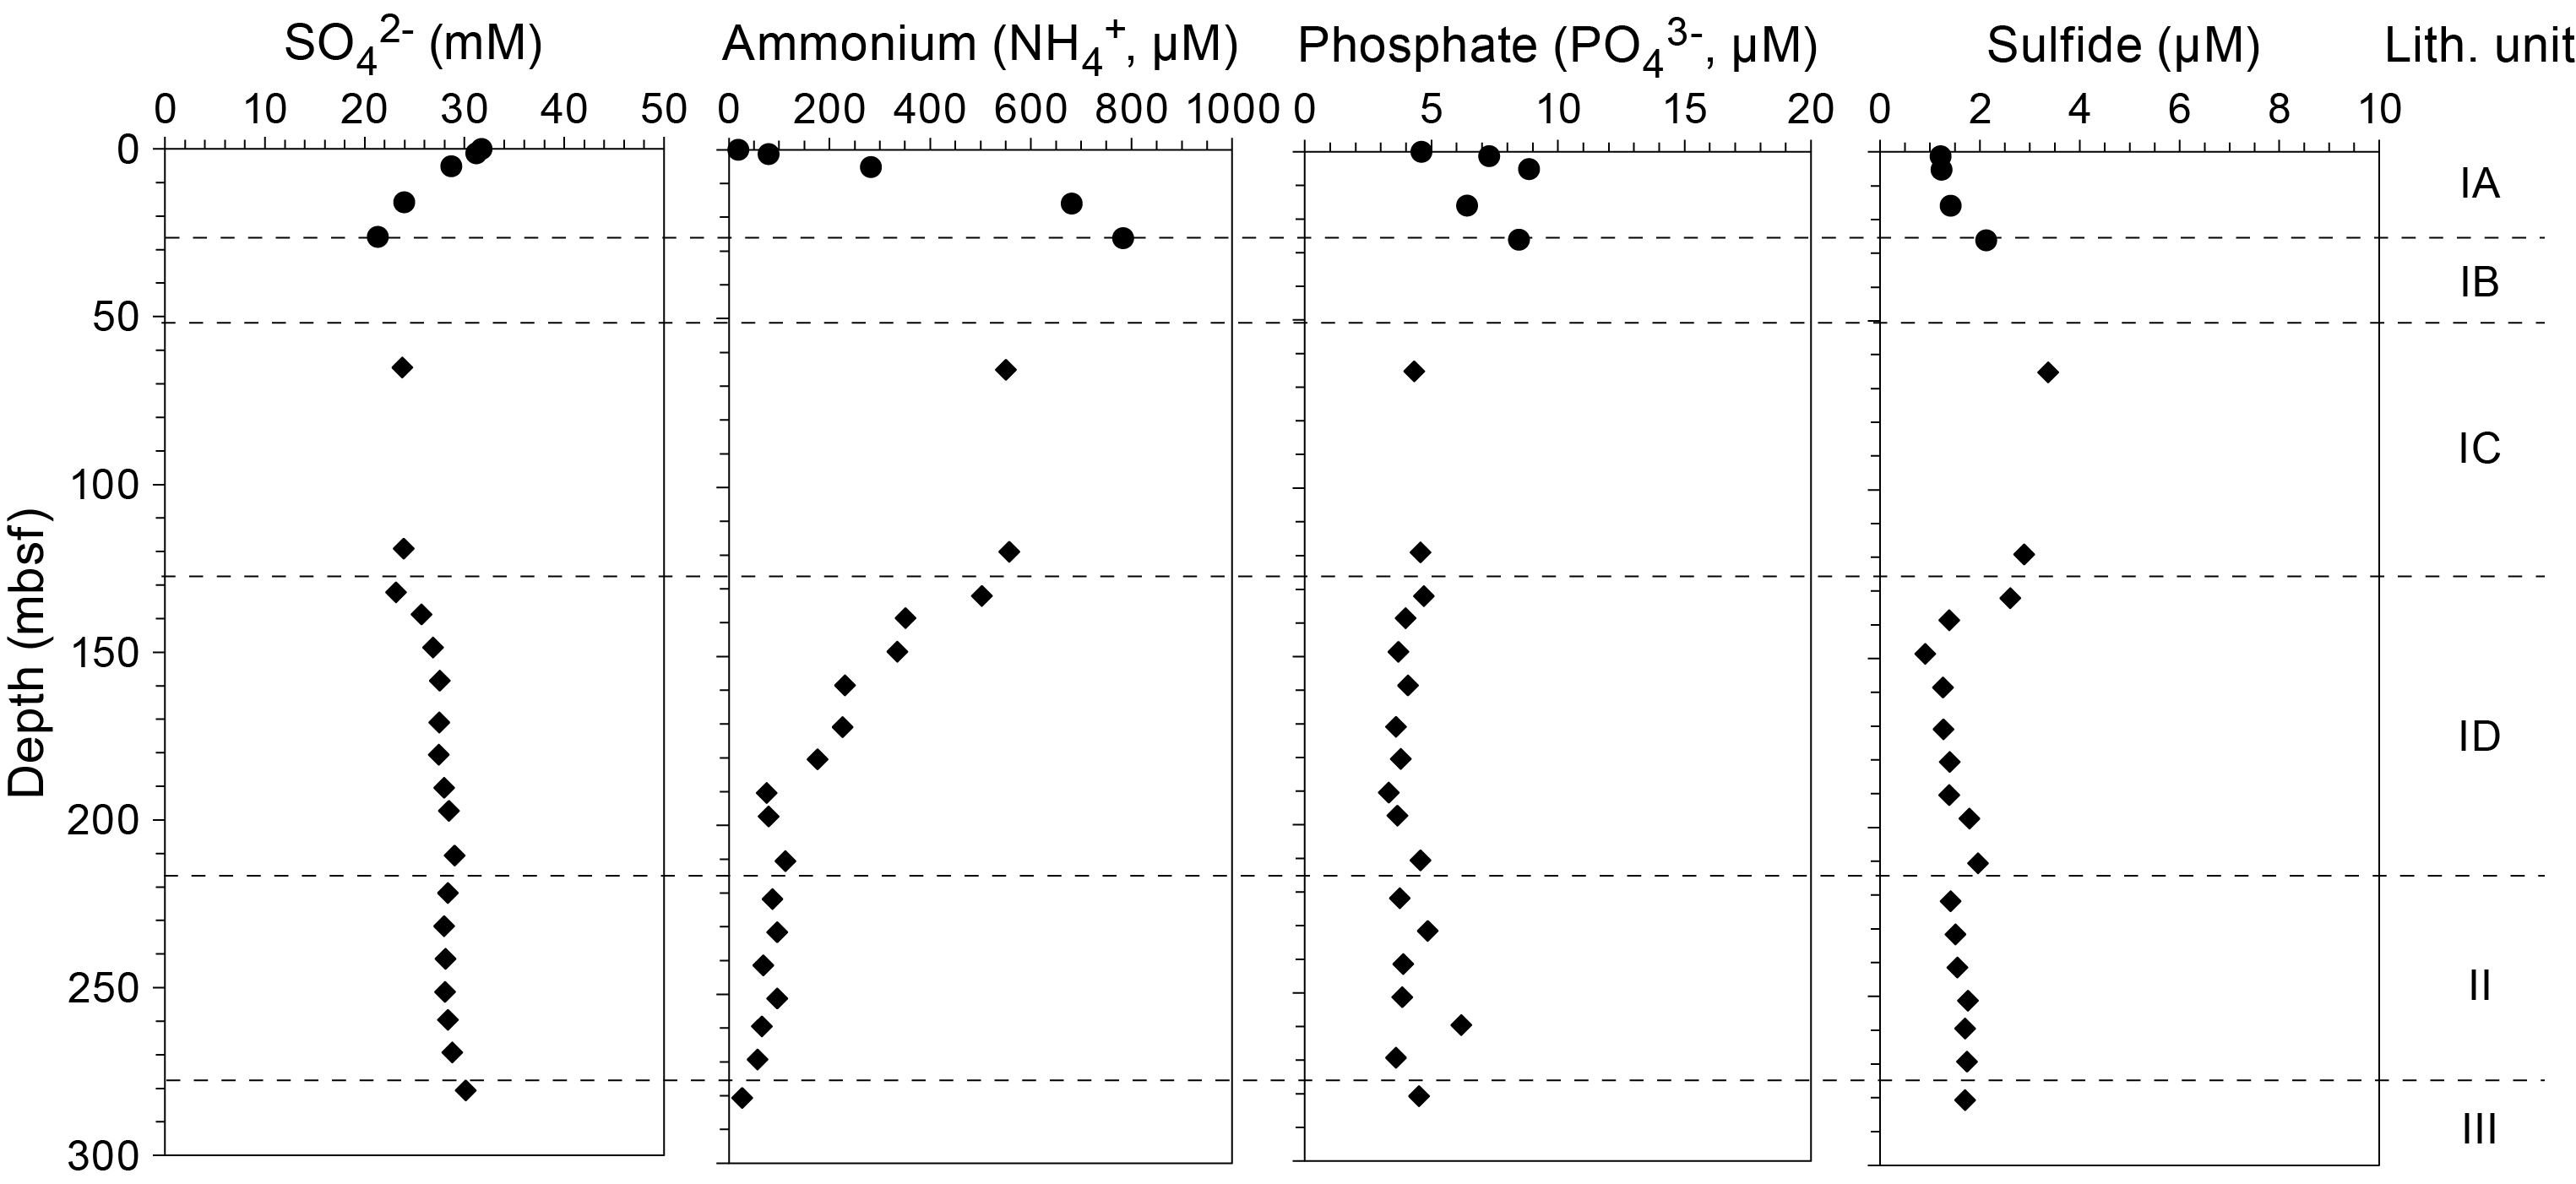
Figure F42. IW sulfate, ammonium, phosphate, and sulfide.
Concentration of ammonium (NH4+) ranges 26.6–783.3 µM. Its variations with depth follow changes in alkalinity, increasing sharply within the uppermost 26.2 m and then decreasing gradually to the minimum value at the base of the cored interval (Figure F42; Table T6). Phosphate (PO43−) has low abundances with a maximum of 8.9 µM at 5.2 mbsf (Section 402-U1616A-2H-2) and follows a weak decreasing trend toward the base of the cored interval (Figure F42; Table T6).
All these profiles reflect organic matter degradation, primarily through sulfate reduction, resulting in increased alkalinity and the accumulation of sulfide, ammonium, and phosphate in the IW above 132.1 mbsf.
8.2. Bulk sediment geochemistry
Solid-phase sediment samples were analyzed to determine (1) the weight percentage of calcium carbonates (CaCO3); (2) the percentage of total carbonate contents (including both calcium carbonates and other carbonate phases); (3) the percentage of total organic matter; and (4) TOC, total nitrogen (TN), and total sulfur (TS). At Site U1616, all analyses were performed on sediments from Holes U1616A and U1616B. Sediments from Hole U1616E were only used for the measurement of the weight percentage of calcium carbonates as well as the TOC, TN, and TS contents. In total, sediments analyzed included 22 squeeze cakes and an additional 37 samples selected by the core description team from sediment lithologies of interest as well as by igneous and metamorphic petrologists.
8.2.1. Carbonates
Table T7 and Figure F43 show the results obtained for calcium carbonate (CaCO3) contents. Bulk sediment CaCO3 contents vary from 16.3 to 28.4 wt% in Hole U1616A, from 1.7 to 84.5 wt% in Hole U1616B, and from 0.2 to 25.2 wt% in Hole U1616E. Because these contents are dependent on lithology (see Lithostratigraphy and Igneous and metamorphic petrology), the mean CaCO3 content is 19.4 ± 14.6 wt% in Unit I (22.4 ± 6.0 wt% for Subunit IA, 23.1 wt% for Subunit IB, and 18.6 ± 16.0 wt% for Subunit IC), 39.9 ± 18.1 wt% in Unit II, 39.4 ± 23.7 wt% in Unit III, and 5.8 ± 5.1 wt% in Unit IV. Higher CaCO3 contents than the overall mean value of 27.9 wt% are observed in microfossil- and/or nannofossil-rich layers (which include nannofossil ooze in Subunits IA and IC and foraminifera-rich nannofossil chalk, nannofossil chalk with mud, nannofossil chalk, and nannofossil ooze with foraminifera in Unit II), dolomitic layers (dolomitic-rich nannofossil ooze with foraminifera and dolomite in Unit III), and fine-grained consolidated breccia (Unit IV). The highest value of 85 wt% CaCO3 is measured at 284.6 mbsf in Section 402-U1616B-28X-CC in a sample of fine-grained consolidated breccia (Unit IV). Conversely, the lowest CaCO3 percentages occur in an interval of silt with volcaniclastic materials (169.0 mbsf; Subunit IC; 4.6 wt% CaCO3), in a volcaniclastic-rich sapropel (178.9 mbsf; Subunit IC; 1.4 wt% CaCO3), in a volcaniclastic-rich silt (193.4 mbsf; Subunit IC; 2.6 wt% CaCO3), in a tuff (197.3 mbsf; Subunit IC; 4.4 wt% CaCO3), and in volcaniclastic-rich medium to coarse sand (210.6 mbsf; Subunit IC; 3.4 wt% CaCO3), as well as in most of Unit IV.
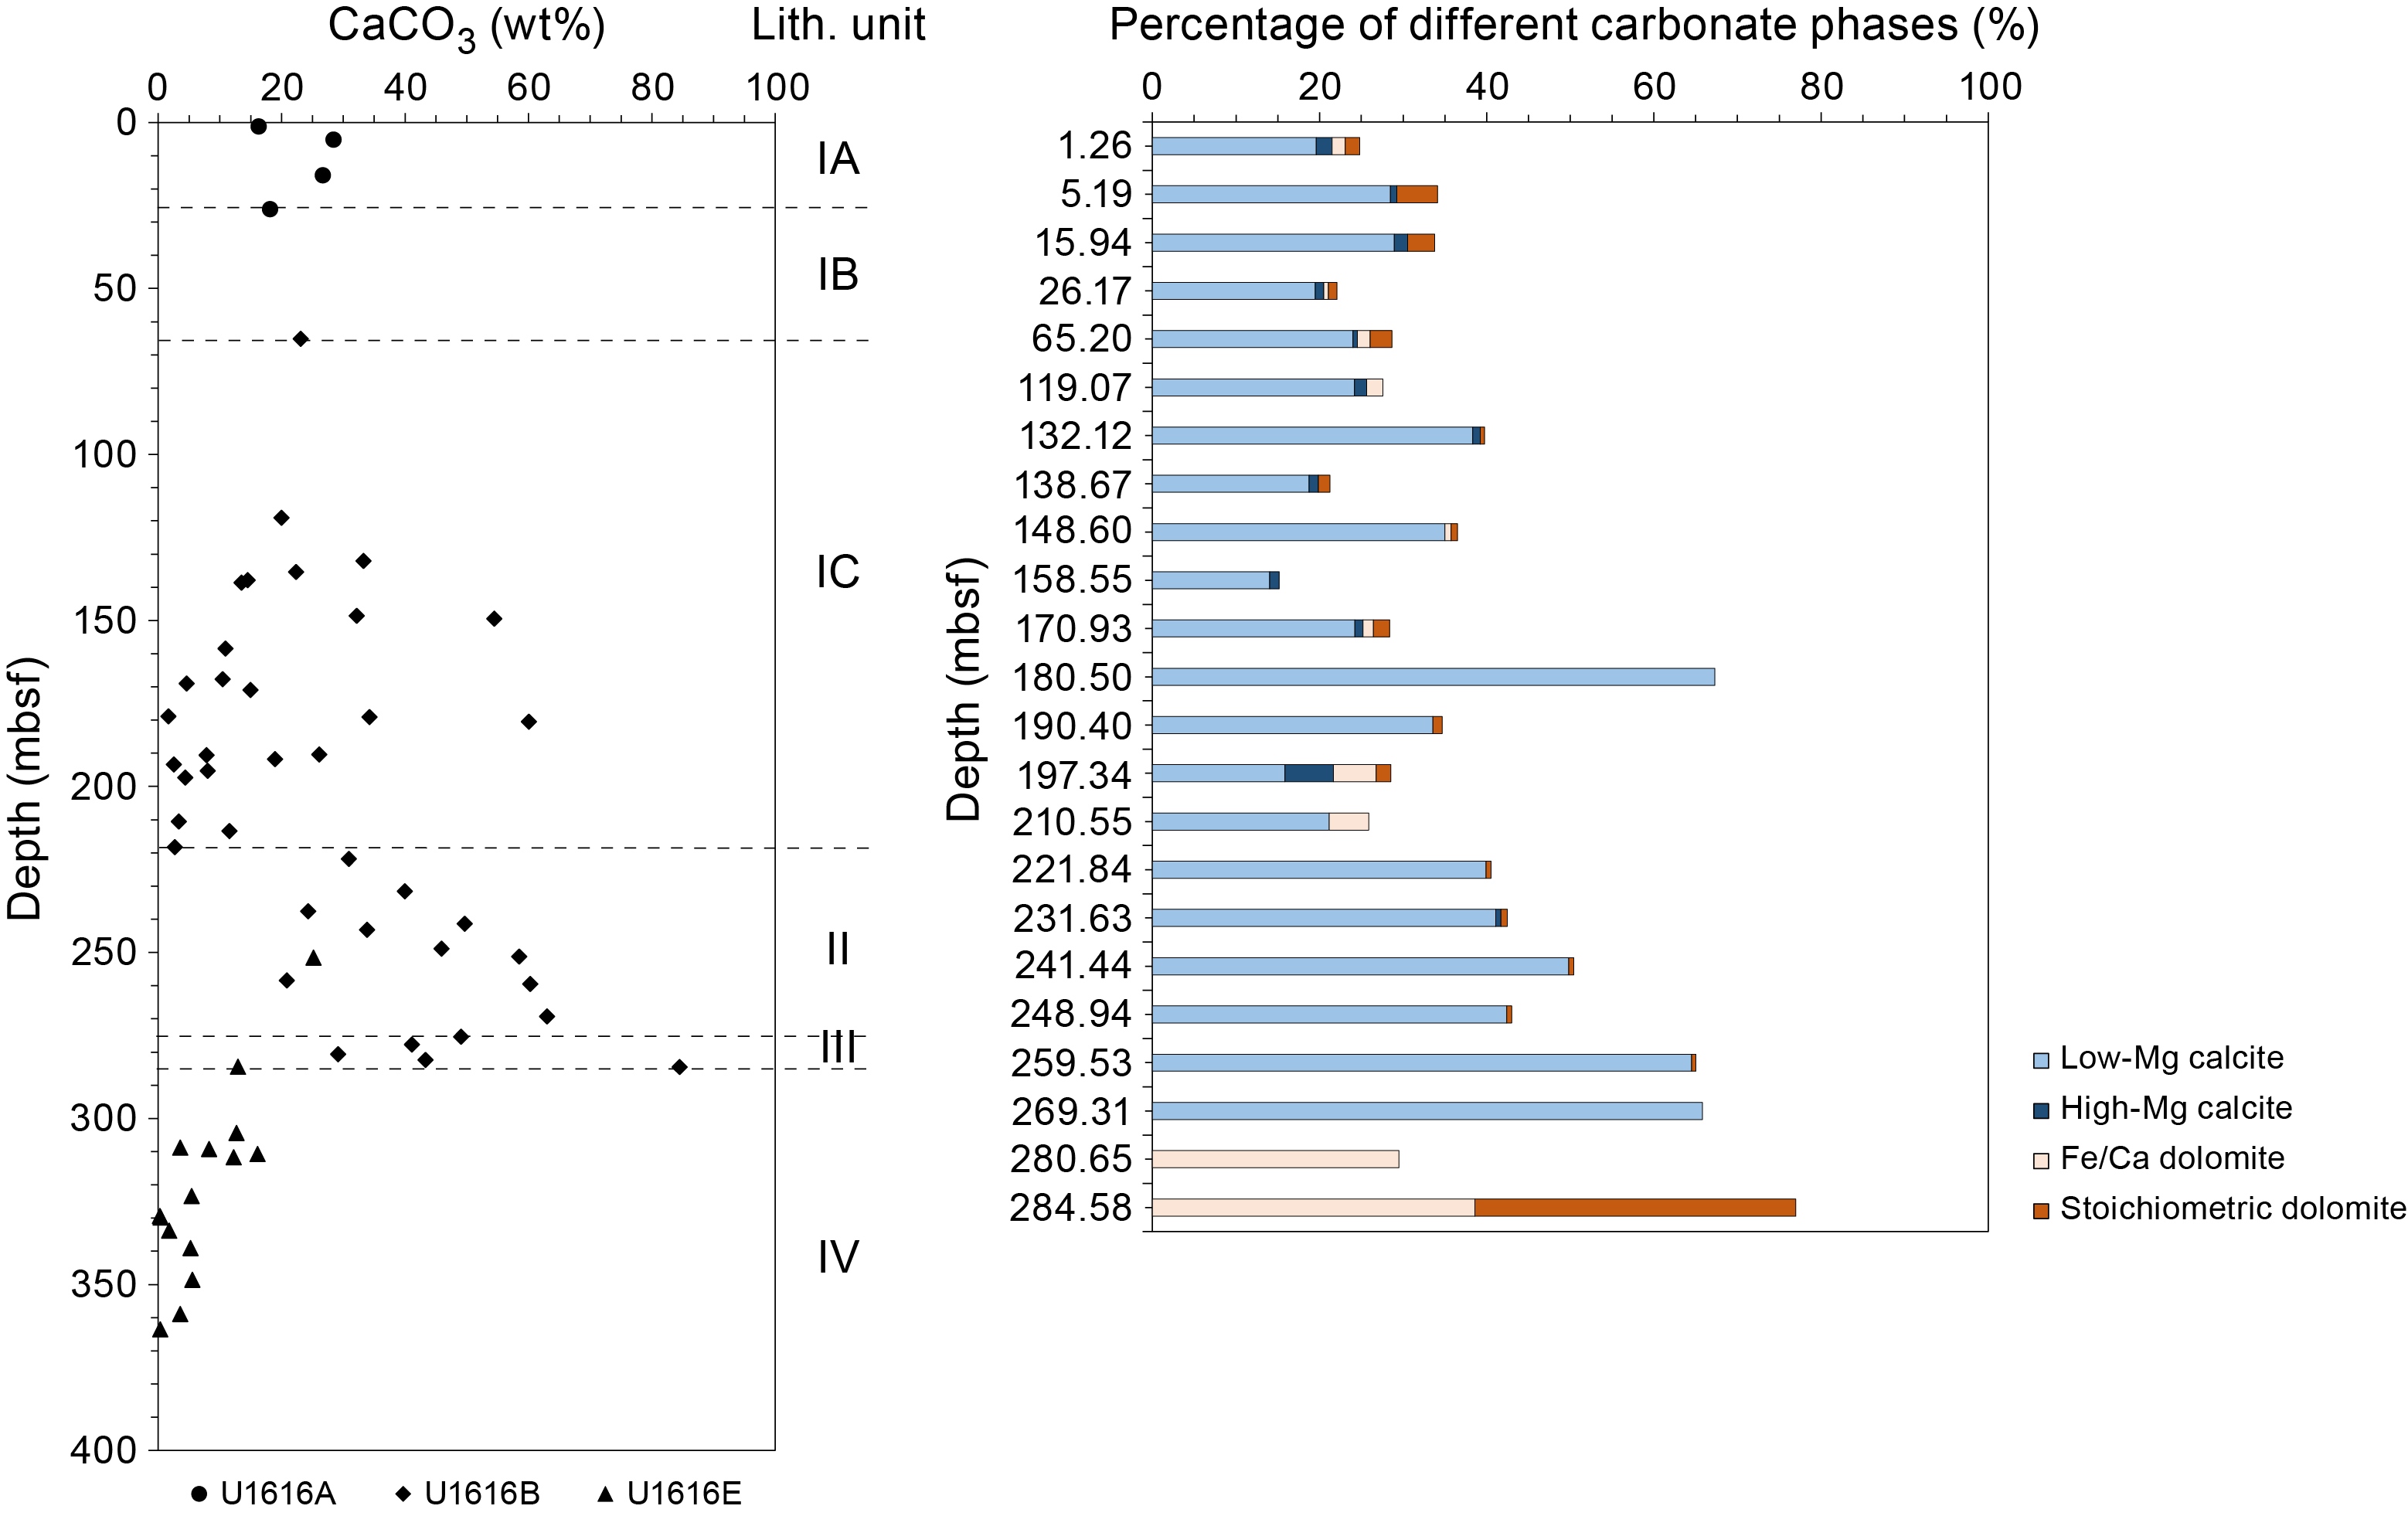
Figure F43. Carbonate and carbonate phases.
For samples collected from Holes U1616A and U1616B, XRD results show that the d(104) values of calcite vary in the range 3.037–2.992 Å; a low-Mg calcite group, mostly from calcite of pelagic or detrital sediment, is predominant between 3.037 and 3.034 Å and contains 0% to 0.2% moles MgCO3 (Goldsmith et al., 1958); a calcite enriched in magnesium, between 3.017 and 3.021 Å, contains 4.7% to 6.0% moles MgCO3 (Goldsmith et al., 1958); and a high-Mg calcite group, probably authigenic, predominates in the range 3.007–2.992 Å, containing 9.3%–14.5% moles MgCO3 (Goldsmith et al., 1958). Two groups of dolomites are identified: one group, characterized by d(104) values between 2.900 and 2.885 Å, is considered to be near stoichiometric dolomite; the second group, with d(104) values between 2.921 and 2.903 Å, corresponds to dolomites in which some Mg2+ cations are replaced by larger cations such as Fe2+ or Ca2+. Using both XRD data and percentage of total carbonate contents, low-Mg calcite is generally the dominant carbonate phase in the sediments from Holes U1616A and U1616B, most probably originating from biogenic precipitation (Table T7; Figure F43). This dominant carbonate phase is associated with variable amounts of high-Mg calcite (0.0%–5.8%), Fe- and/or Ca-rich dolomite (0.0%–38.6%), and stoichiometric dolomite (0.0%–38.4%). In Unit III, Fe- and/ Ca-rich dolomite and stoichiometric dolomite are the two main carbonate phases identified.
8.2.2. Total organic matter, organic carbon, nitrogen, and sulfur in the solid-phase samples
Data from total organic matter, TOC, TN, and TS in solid-phase samples are shown in Table T8 and Figure F44. The percentage of total organic matter in the sediments analyzed only from Holes U1616A and U1616B varies between 1.7% (193.4 mbsf) and 10.9% (221.8 mbsf) with a mean value of 7.2% ± 2.1%. TOC contents vary between 0.14 and 0.41 wt% in Hole U1616A, between undetectable and 4.30 wt% in Hole U1616B, and between undetectable and 1.28 wt% in Hole U1616E. The mean value of TOC content is 0.41 ± 0.53 wt% for Unit I (0.31 ± 0.12 wt% for Subunit IA, 0.24 wt% for Subunit IB, and 0.45 ± 0.61 wt% for Subunit IC), 0.97 ± 1.97 wt% for Unit II, 0.86 ± 0.56 wt% for Unit III, and 0.05 ± 0.04 wt% for Unit IV. TOC content shows little variation with depth, with a mean value of 0.22 ± 0.12 wt% between 1.3 and 284.6 mbsf. However, TOC contents higher than 1 wt% occur at 179.2 mbsf (2.19 wt%; Subunit IC), 213.5 mbsf (1.73 wt%; Subunit IC), 218.4 mbsf (4.30 wt%; Unit II), 237.7 mbsf (2.28 wt%; Unit II), 248.2 mbsf (2.10 wt%; Unit II), 258.5 mbsf (4.30 wt%; Unit II), 277.8 mbsf (1.08 wt%; Unit III), and 284.4 mbsf (1.28 wt%; Unit III). TN contents range from nondetectable to 0.3 wt% with an average value of 0.08 ± 0.05 wt%. Higher TN contents are found in TOC-rich sediments (nannofossil ooze at 179.2 mbsf; nannofossil chalk at 213.5, 237.7, and 243.2 mbsf; sapropel at 190.6 and 218.4 mbsf; sapropel with foraminifera at 259.5 mbsf), as confirmed by a strong positive correlation between these two parameters. Furthermore, Figure F45 shows that the intercept of the linear correlation between TOC and TN contents is a slightly positive value of 0.0502, revealing the presence of a nonnegligible amount of inorganic nitrogen in sediments (Goñi et al., 1998). Atomic TOC/TN ratios range 0.1–20.5 with a mean value of 8.1 ± 6.5. TOC/TN ratios greater than 13.1 are observed at 132.1 mbsf (Subunit IC; nannofossil ooze, diatom-radiolarian-rich sandy silt with volcaniclastics), 179.2 mbsf (Subunit IC; volcaniclastic-rich sapropel), 218.4 mbsf (Unit II; sapropel), 237.7 mbsf (Unit II; glauconite-rich nannofossil chalk), 243.2 mbsf (Unit II; sapropel), 258.5 mbsf (Unit II; sapropel with foraminifera), 277.8 mbsf, and 251.6 mbsf (Unit III; dolomitic-rich nannofossil ooze with foraminifera). The high value of these ratios might indicate higher inputs of terrestrial organic matter and/or the occurrence of organic matter diagenesis, which is consistent with the presence of more labile marine-derived compounds. Most of the sediments are characterized by atomic TOC/TN ratios lower than 9, indicating higher inputs of marine-derived organic matter (Meyers, 1994) and/or the presence of inorganic nitrogen bound to surface mineral particles, especially on the clay mineral species (Faganeli et al., 1991). The TS content varies from undetectable to 6.7 wt%. The highest values of TS content are observed at 179.2 mbsf (1.2 wt%), 190.6 mbsf (1.7 wt%), 193.4 mbsf (6.7 wt%), 218.4 mbsf (1.3 wt%), 237.7 mbsf (3.4 wt%), 243.2 mbsf (1.6 wt%), and 258.5 mbsf (1.26 wt%). Except for the highest value of TS observed in volcaniclastic-rich silt, the other high TS values occur in TOC-rich layers. The TOC/TS ratio is generally close to or lower than the mean value found in most fine-grained normal marine siliciclastic sediments (TOC/TS ratios of 2.8 ± 0.8; Goldhaber and Kaplan, 1974; Berner, 1982), except at 218.4 mbsf (TOC/TS = 3.3) and 277.9 mbsf (TOC/TS = 6.7), indicating an excess of total sulfur.
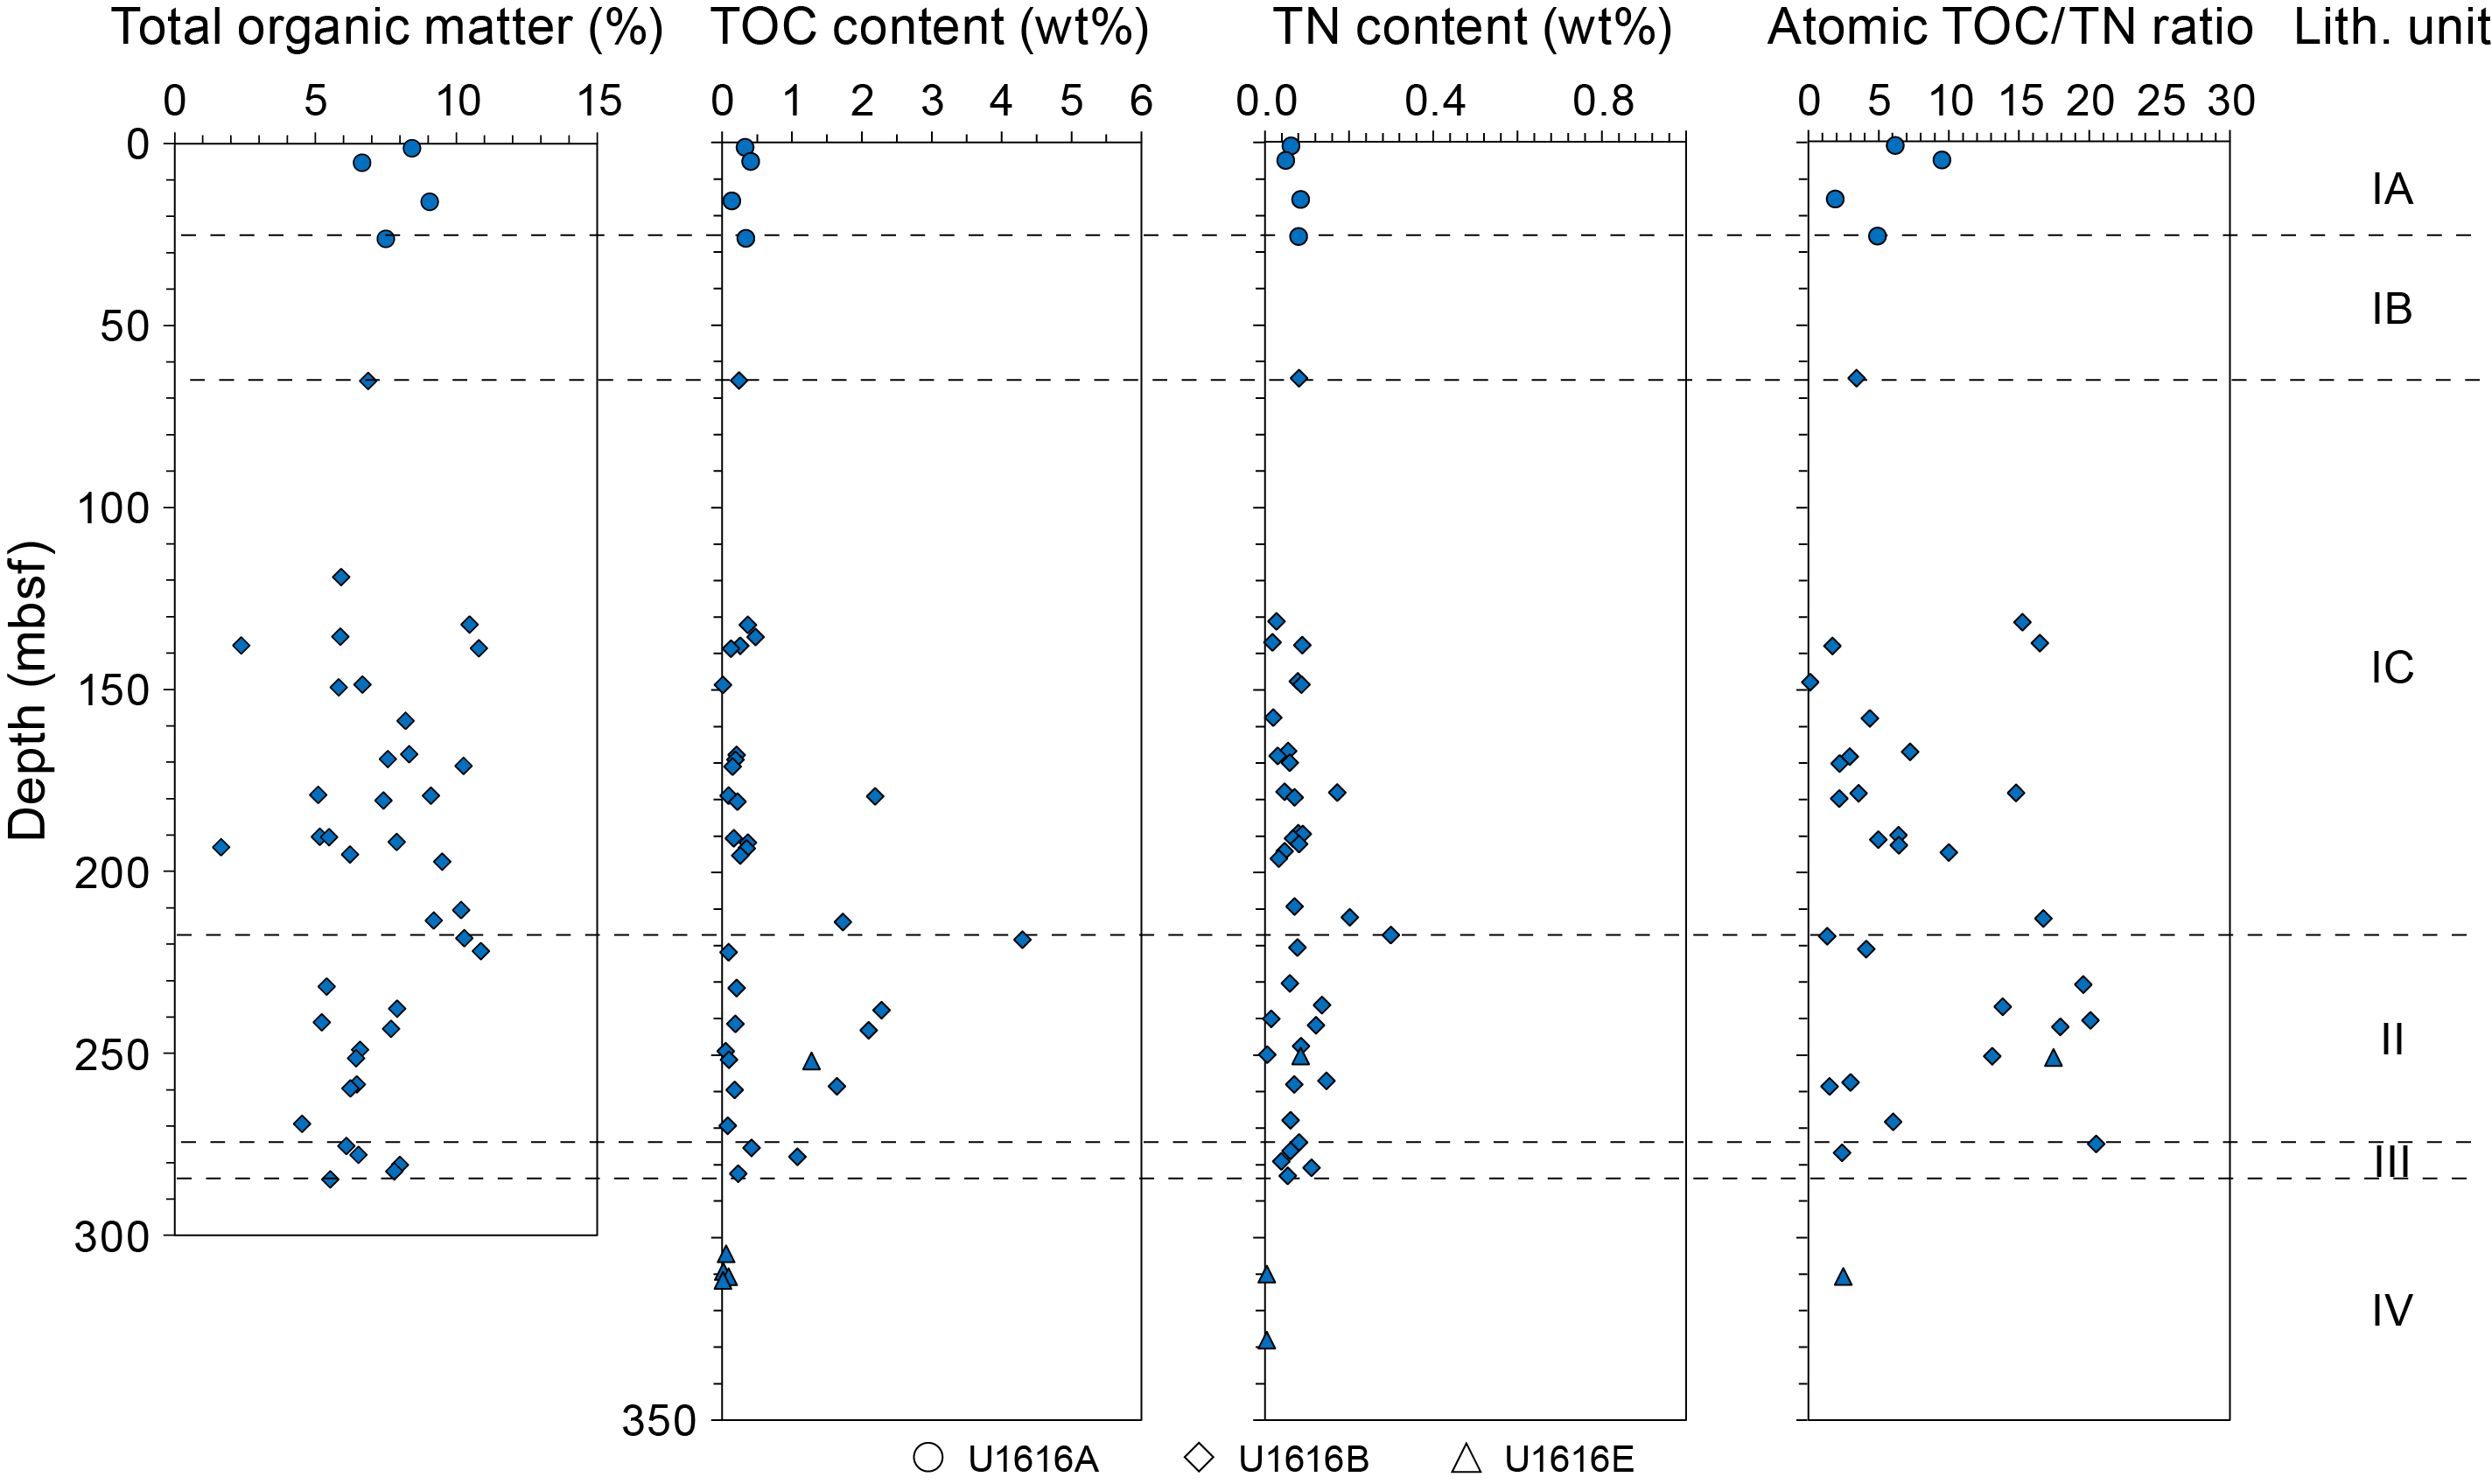
Figure F44. Total organic matter, TOC, TN, and atomic TOC/TN ratio.
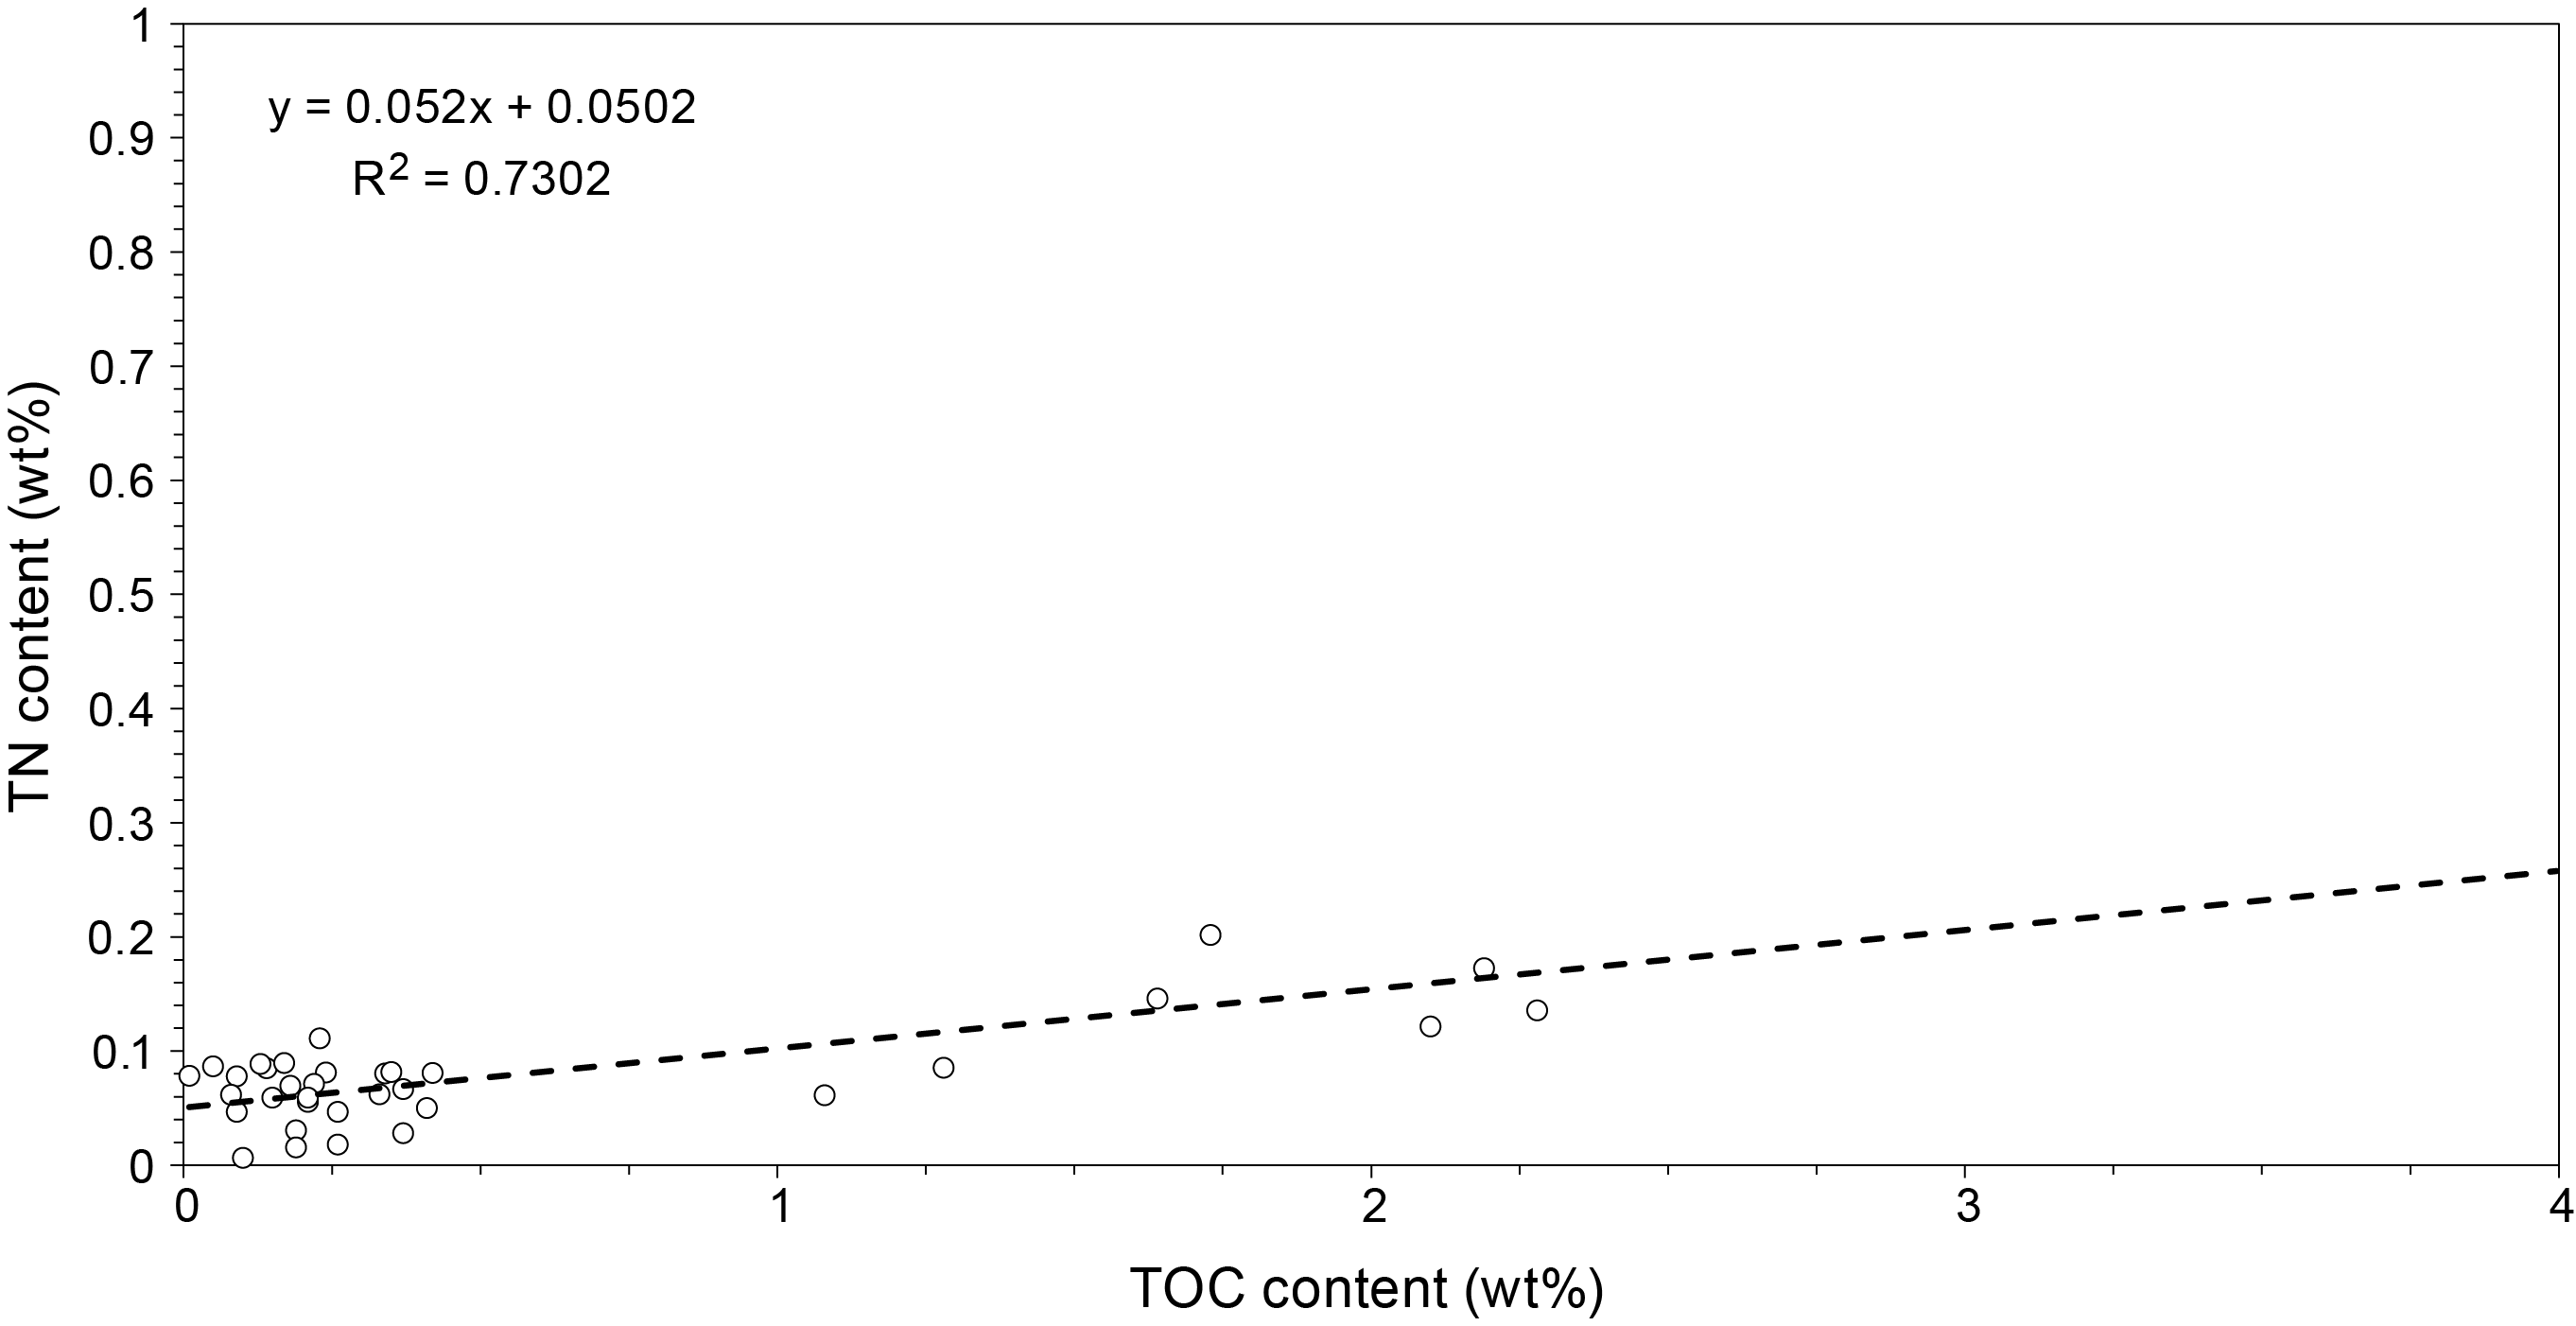
Figure F45. TOC and TN.
8.2.3. Major, minor, and trace element content of sediments
Sediments collected from Site U1616 in the form of IW squeeze cakes, along with their adjacent intervals in the same section halves, were analyzed using portable X-ray fluorescence spectrometry (pXRF) and ICP-AES. In total, four IW squeeze cakes and their adjacent section halves were analyzed from Hole U1616A, and 18 were analyzed from Hole U1616B. The results of pXRF analyses, in the form of corrected and raw data, are compiled in Tables T9 and T10 for Holes U1616A and U1616B, respectively. Variations with depth are plotted in Figure F46.
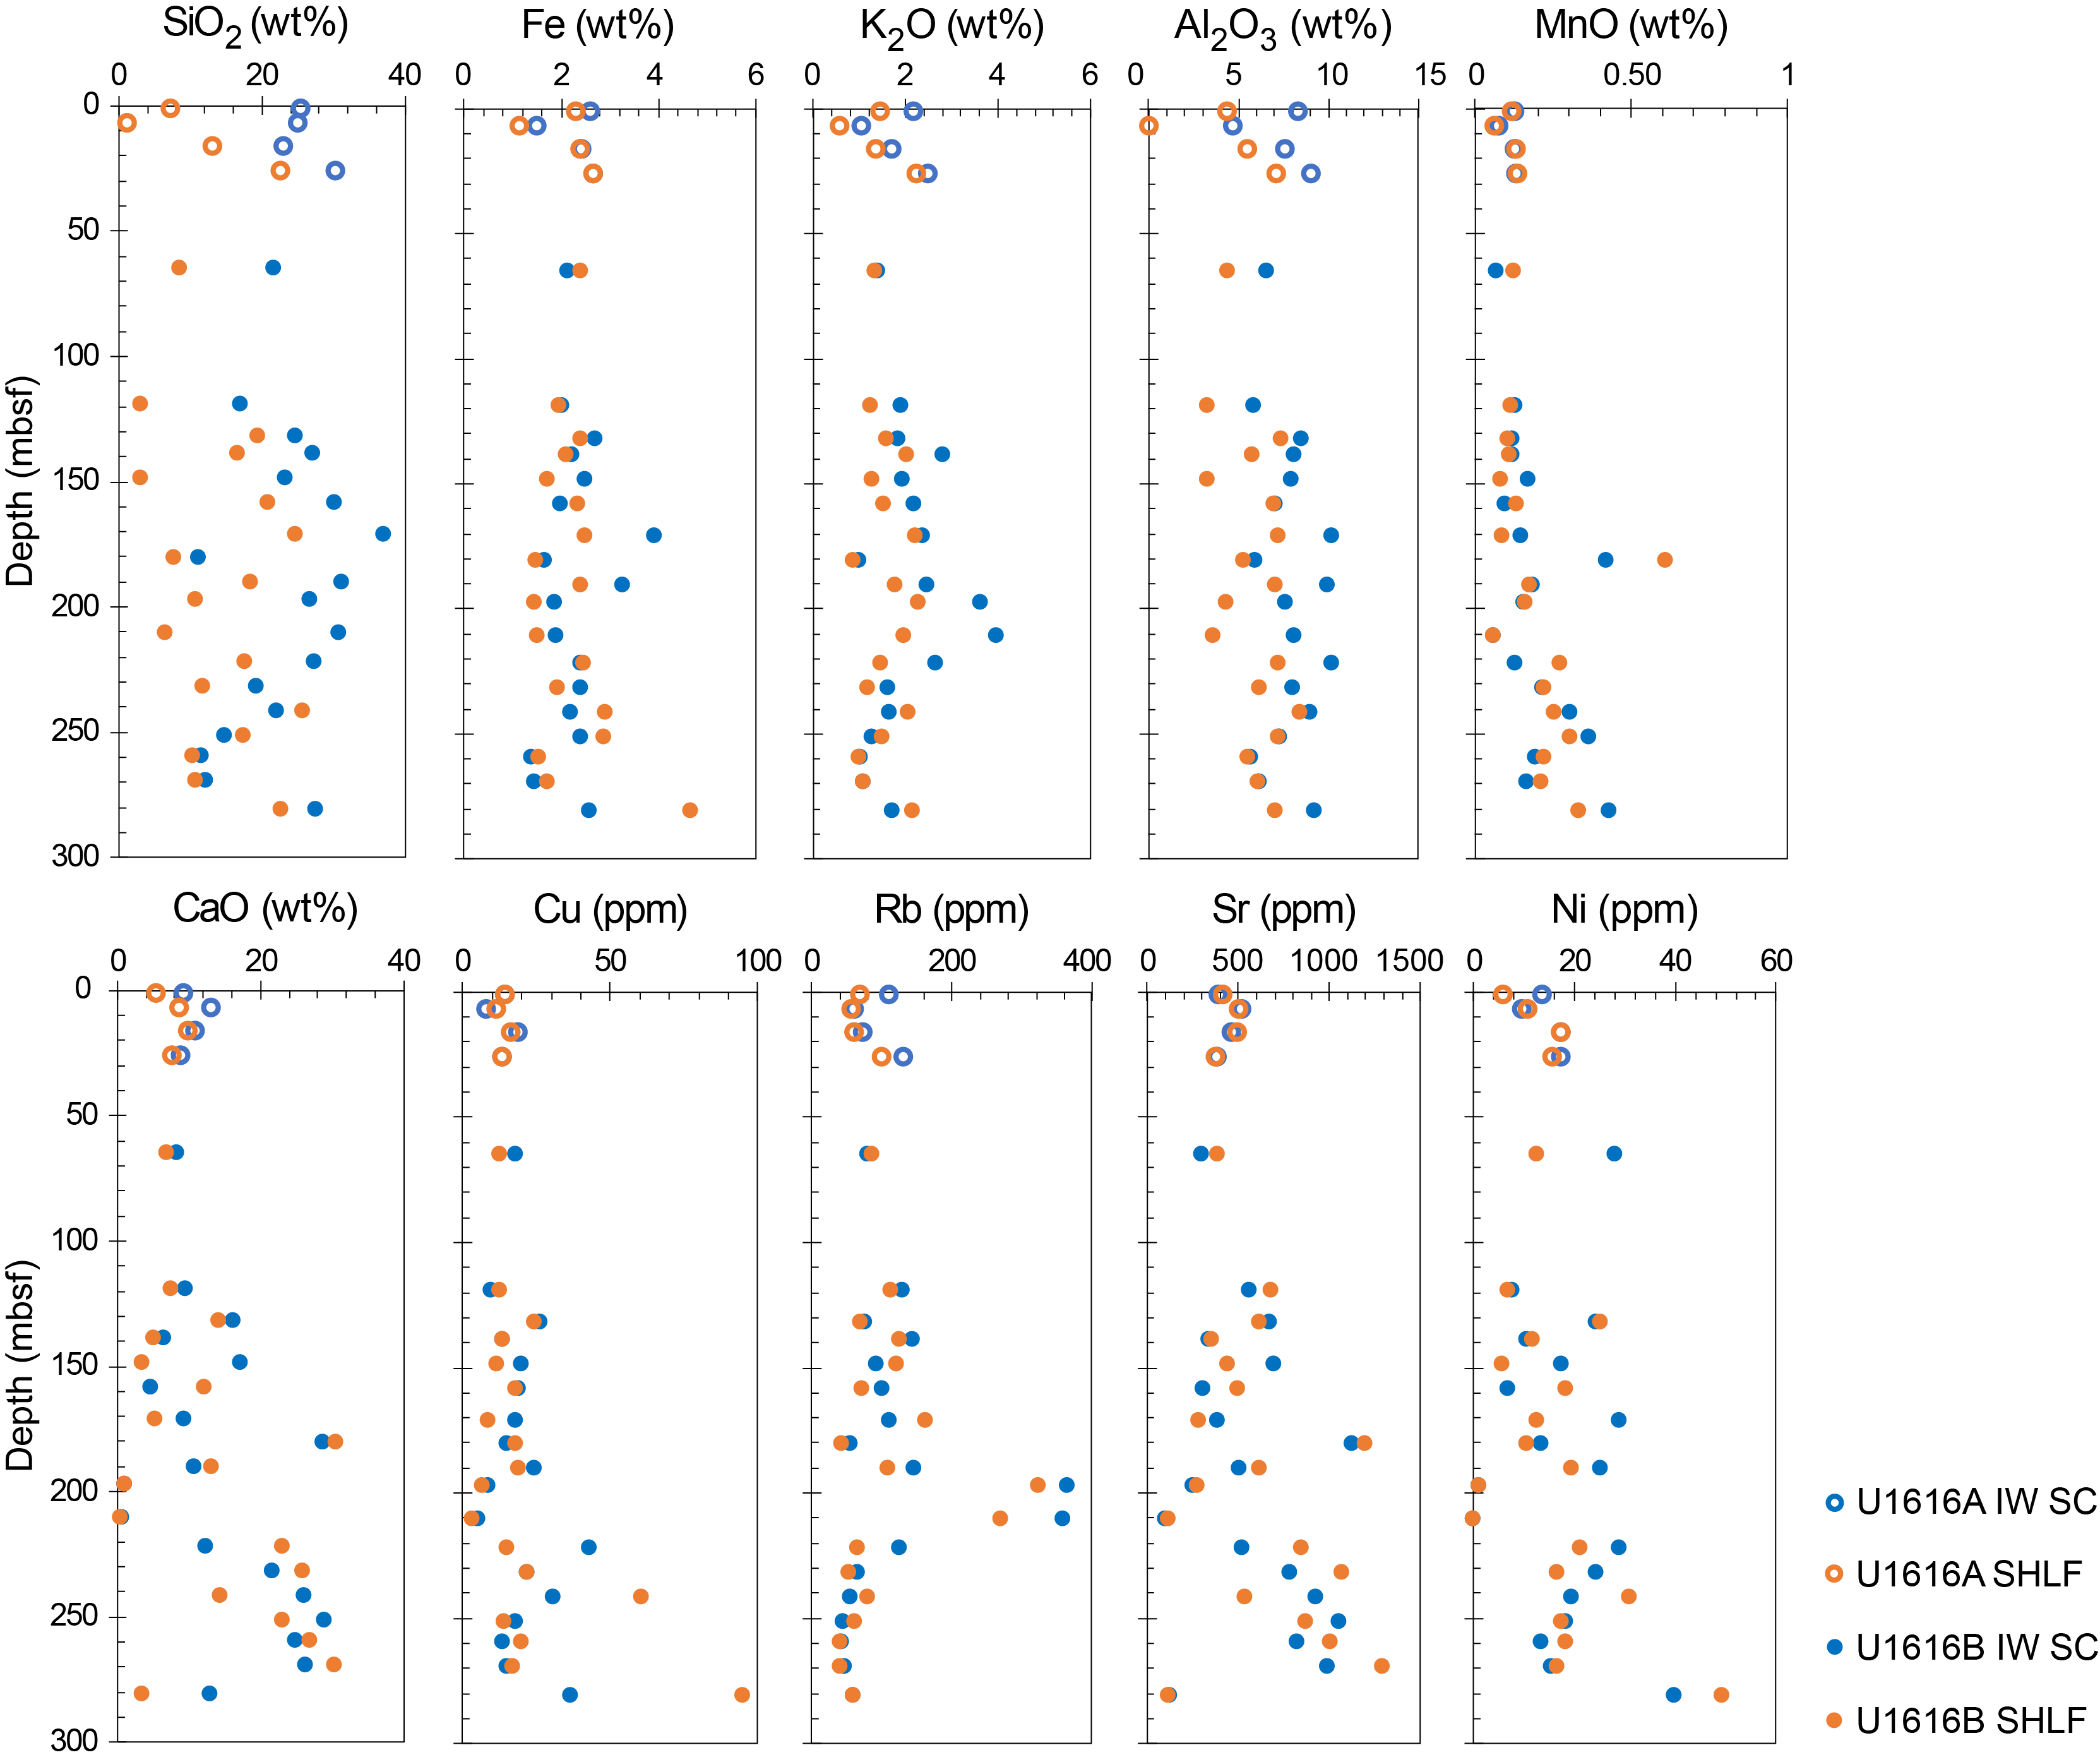
Figure F46. pXRF elemental concentrations.
From the top of the sediment section to ~30 mbsf, Fe, Al2O3, K2O, Rb, and Ni all increase gradually, whereas CaO and Sr contents decrease downhole, except for the topmost sediment core (Section 402-U1616A-1H-1). Volcaniclastic-rich layers in the interval 195–215 mbsf can be identified by the enrichments in K2O and Rb and depletions in CaO, Sr, and Ni (Figure F46). Downhole increases in CaO and Sr contents and decreases in K2O, Rb, and Ni contents are recognized down to the dolomite-rich nannofossil ooze layer (Section 402-U1616B-27X-4), where CaO and Sr contents are lower and Ni and Fe contents are higher than in the nannofossil ooze interval above (Figure F46).
One interval from Site U1616 was selected for ICP-AES analysis and is presented with loss on ignition (LOI) values in Table T11. The volcaniclastic-rich gravel sample (402-U1616A-5H-7, 35–37 cm) shows high alkali contents up to 11.6 wt% Na2O + K2O because of the higher contribution of volcaniclastic materials.
8.3. Headspace gas sample analysis
Sampling and gas analysis were performed at Site U1616 with one headspace gas sample per core for Hole U1616A (Sections 1H-2 through 6H-6, except for Core 5H) and Hole U1616B (Section 2H-5 through Core 28X, except for Cores 7X, 8X, and 11X). In Hole U1616E, the sampling resolution increased to one headspace sample per section for Sections 2R-1 through 4R-1 to identify an increase in gas concentration near the contact between sediments and hard rock. Gas samples were used to measure the concentration of C1–C6 hydrocarbons in parts per million by volume in accordance with the standard safety protocol during drilling (Pimmel and Claypool, 2001). A total of 38 headspace samples were analyzed (Table T12; Figure F47). Methane (CH4) is the only hydrocarbon gas detected between 1.3 and 269.6 mbsf. CH4 concentrations are consistently low, varying between undetectable (284.5 mbsf) and 2.0 ppmv (259.6 mbsf) with a mean value of 1.0 ± 0.5 ppmv. CH4 concentrations slightly greater than 1.0 ppmv occur at 15.0 mbsf (1.1 ppmv), 46.4–44.9 mbsf (1.1–1.5 ppmv), 132.2 mbsf (1.1 ppmv), 148.7–197.4 mbsf (1.1–1.9 ppmv), 220.4–241.5 mbsf (1.2–1.5 ppmv), 280.7 mbsf (1.6 ppmv) and 250.0–259.8 mbsf (1.1–1.6 ppmv). No significant difference is observed in CH4 concentration between holes and between different lithostratigraphic units. Because C2–C6 hydrocarbon gases were absent in this hole, C1/C2 and C1/C+ values were not calculated.
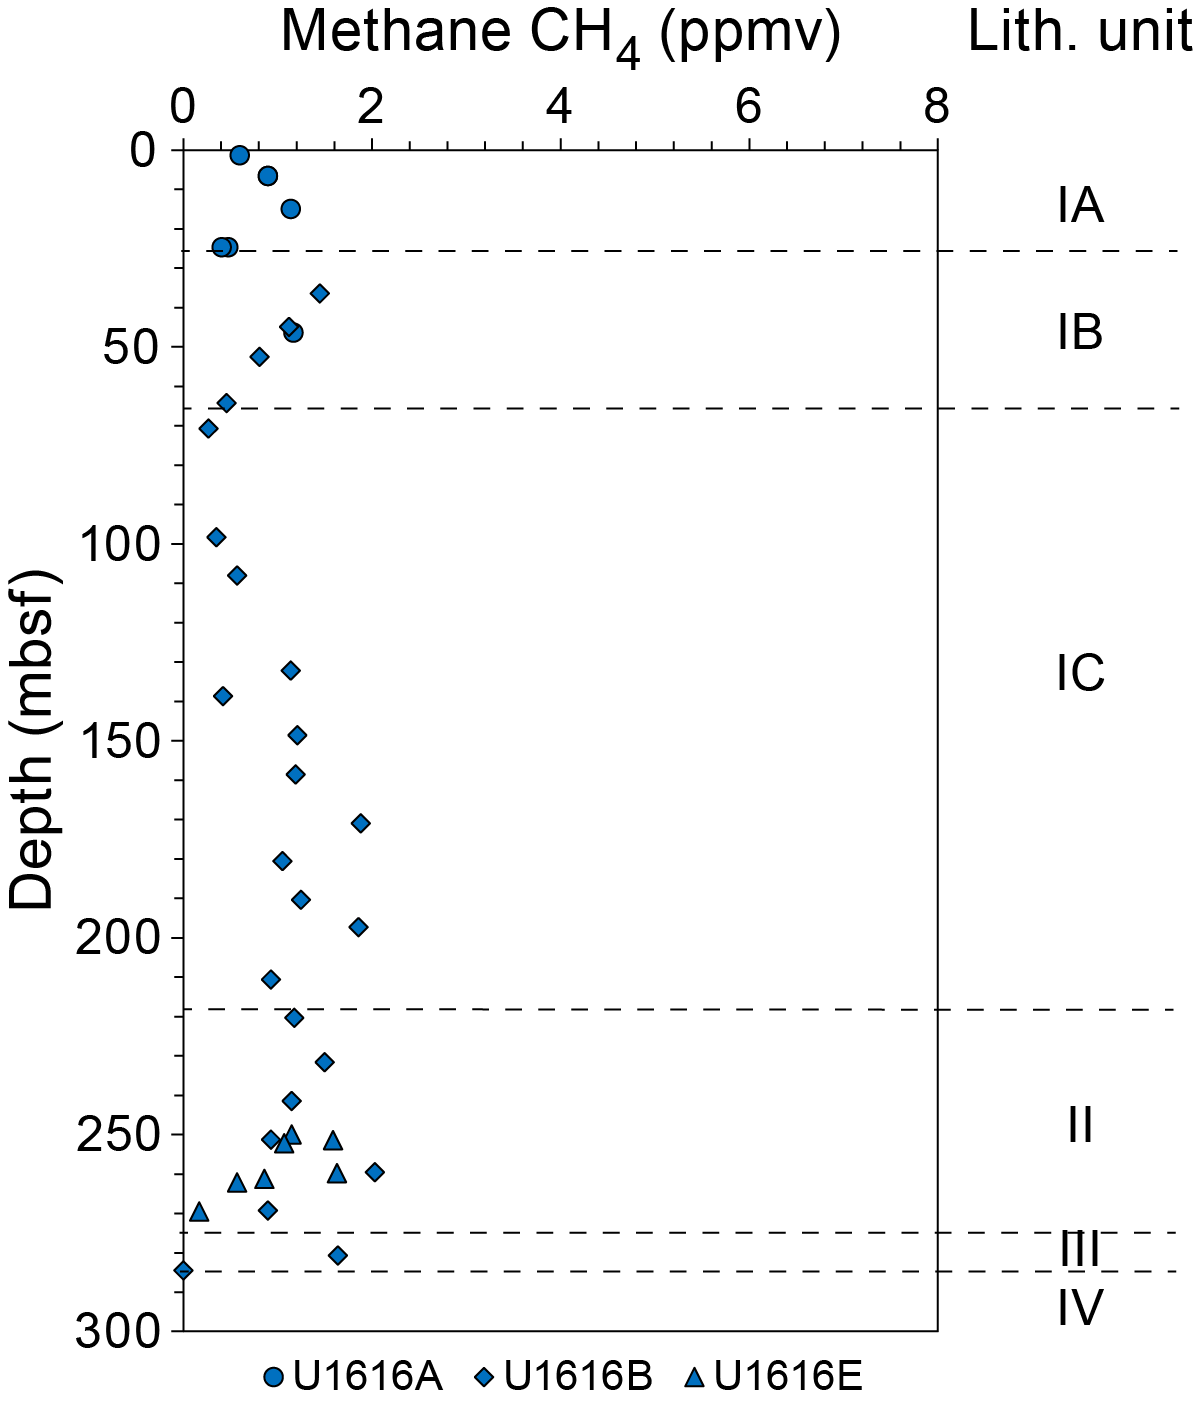
Figure F47. Dissolved methane concentrations.
9. Igneous geochemistry
Igneous materials were recovered in basal breccias in Hole U1616B, which became increasingly dominated by peridotite clasts downhole. Despite the abundance of peridotites in the breccias, no igneous geochemistry data were measured from Hole U1616B because the sample amount was limited. However, igneous rocks were recovered in place from 26 cores from Hole U1616E. Preliminary geochemical data were collected using pXRF, which was used to scan 50 intervals in 17 cores from Hole U1616E. These data were used only to aid in petrographic description or to determine the composition of minor lithologies. Corrected and raw pXRF values are compiled in Tables T13 and T14, respectively. Sampling intervals for pXRF analyses are displayed in Figure F48. A total of 20 igneous samples, thought to represent the range of recovered lithologies, were then measured for LOI and analyzed using ICP-AES. ICP-AES results are summarized in Table T15. Sampling intervals for ICP-AES analyses are displayed in Figure F49. Because of the presence of carbonate veins, 14 samples analyzed using ICP-AES were also selected for analyses of calcium carbonate, total carbon, and total sulfur contents (Table T16).
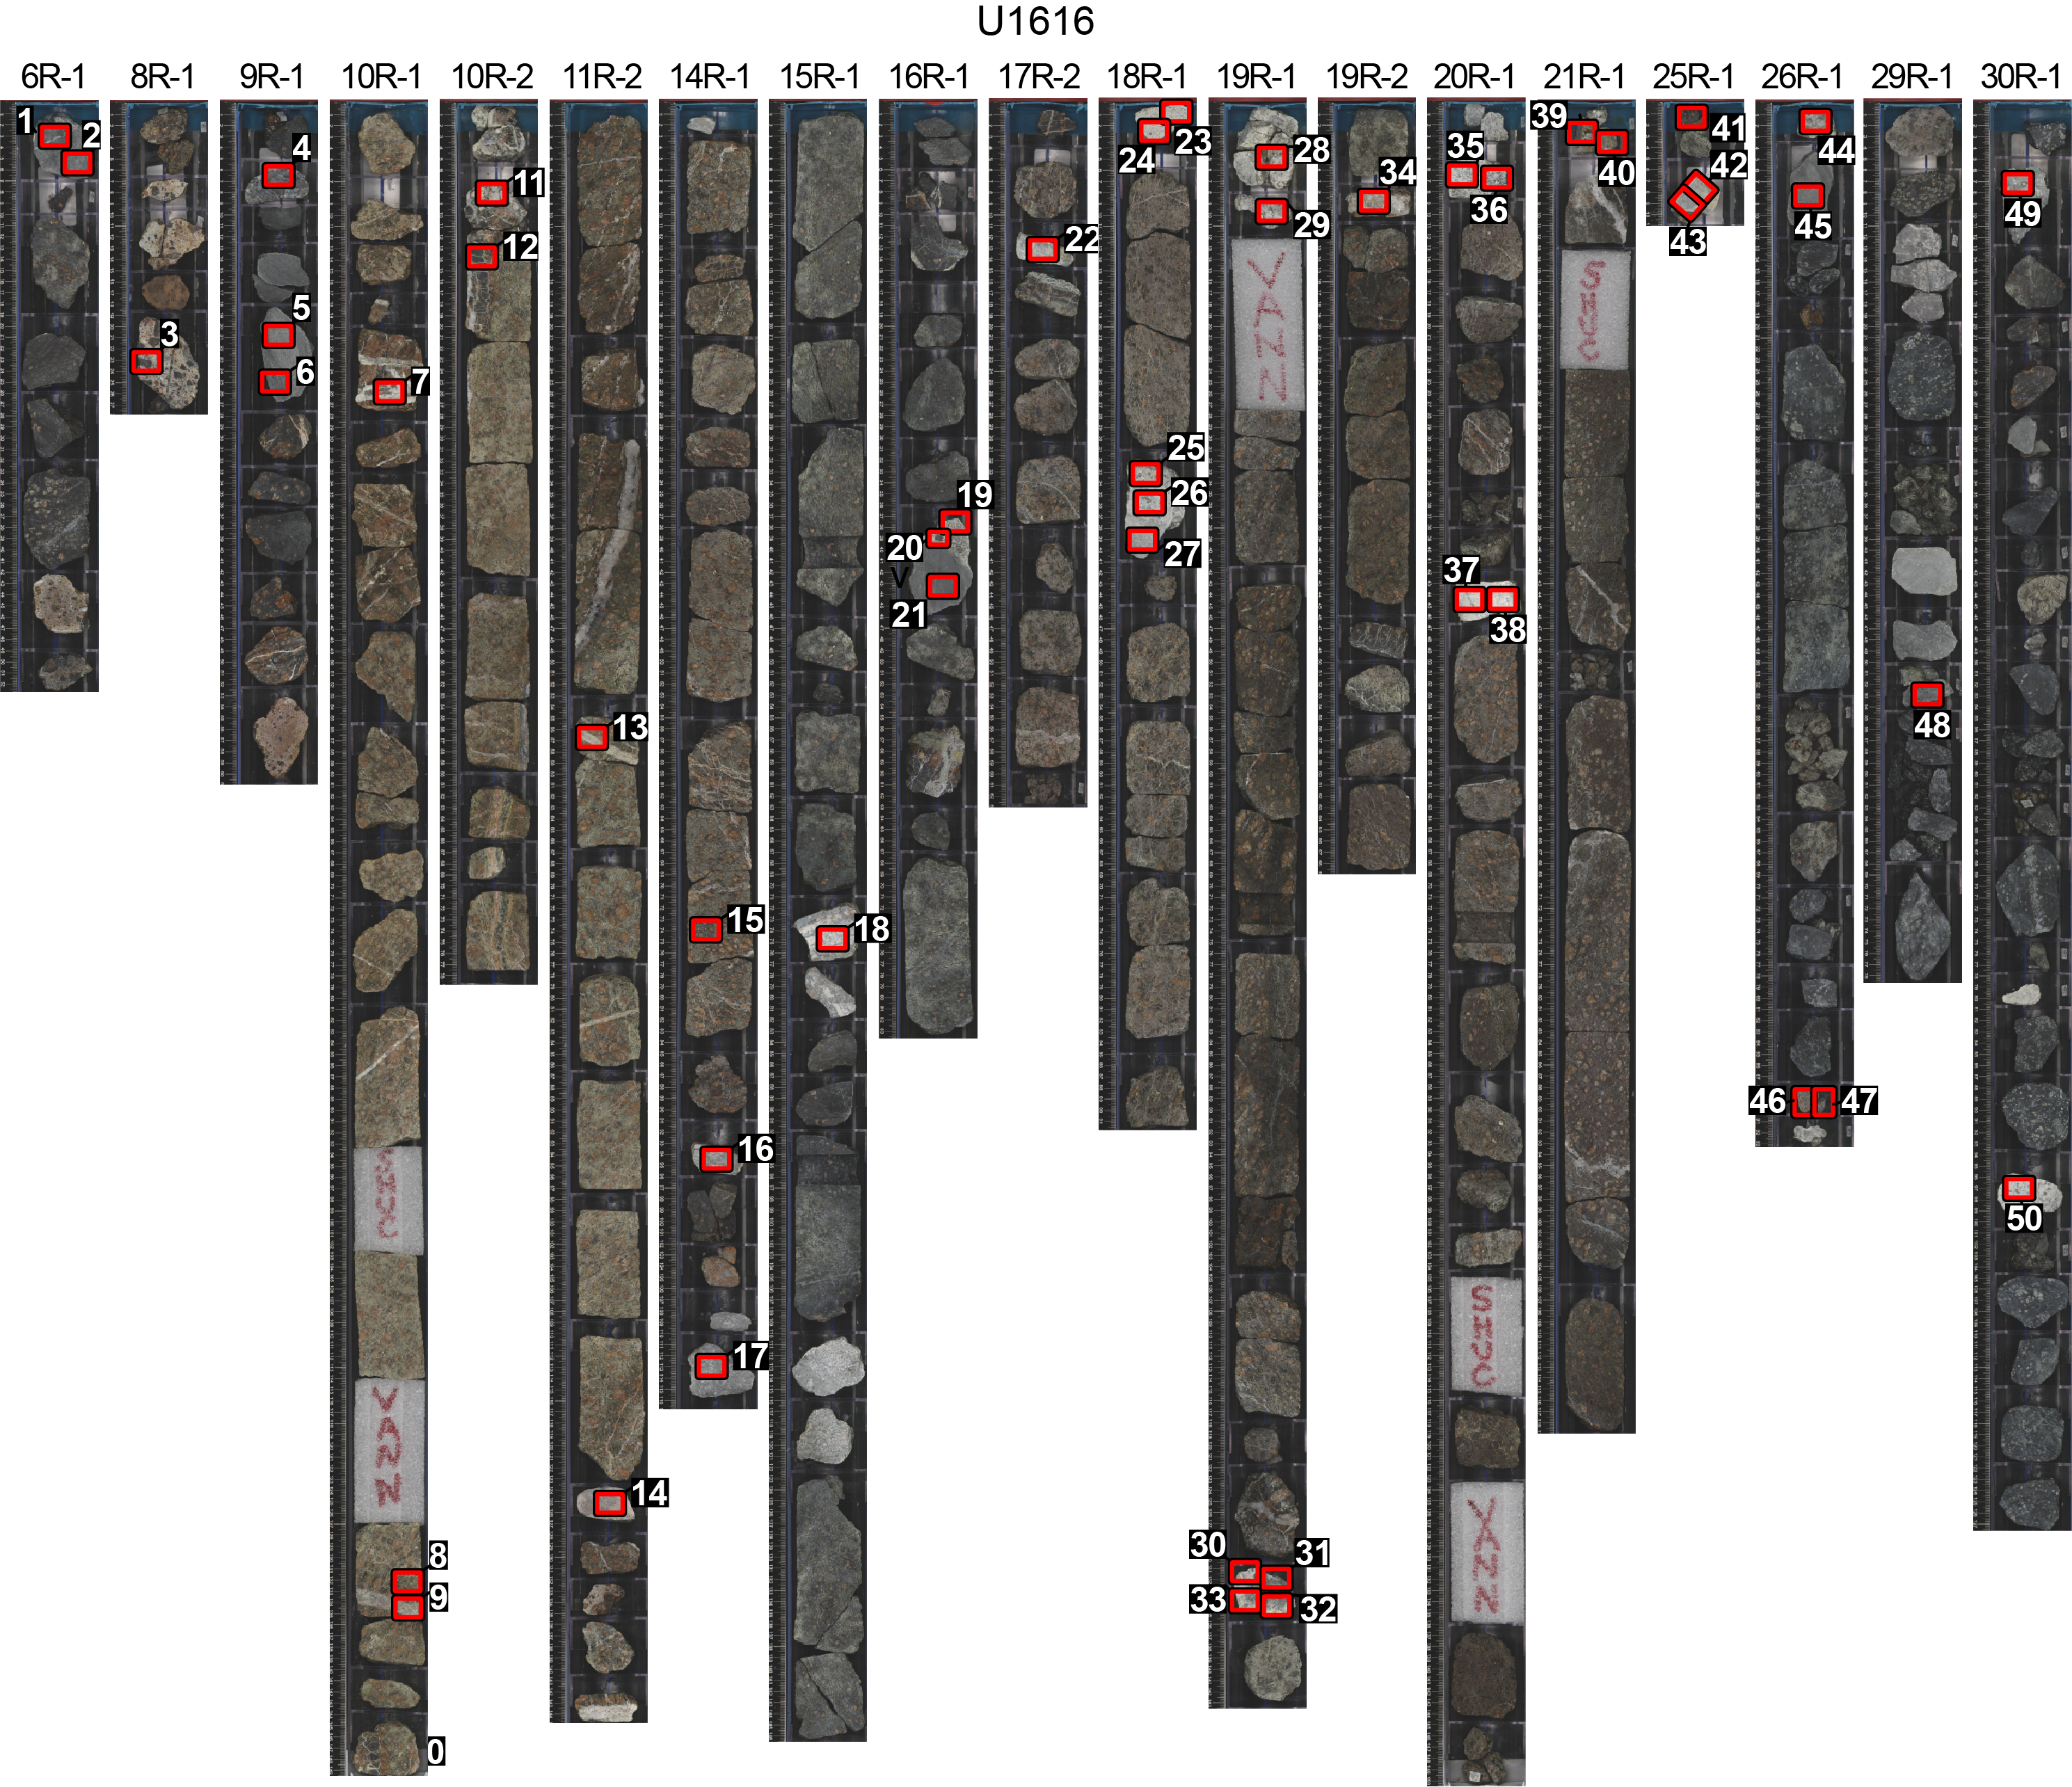
Figure F48. pXRF samples.
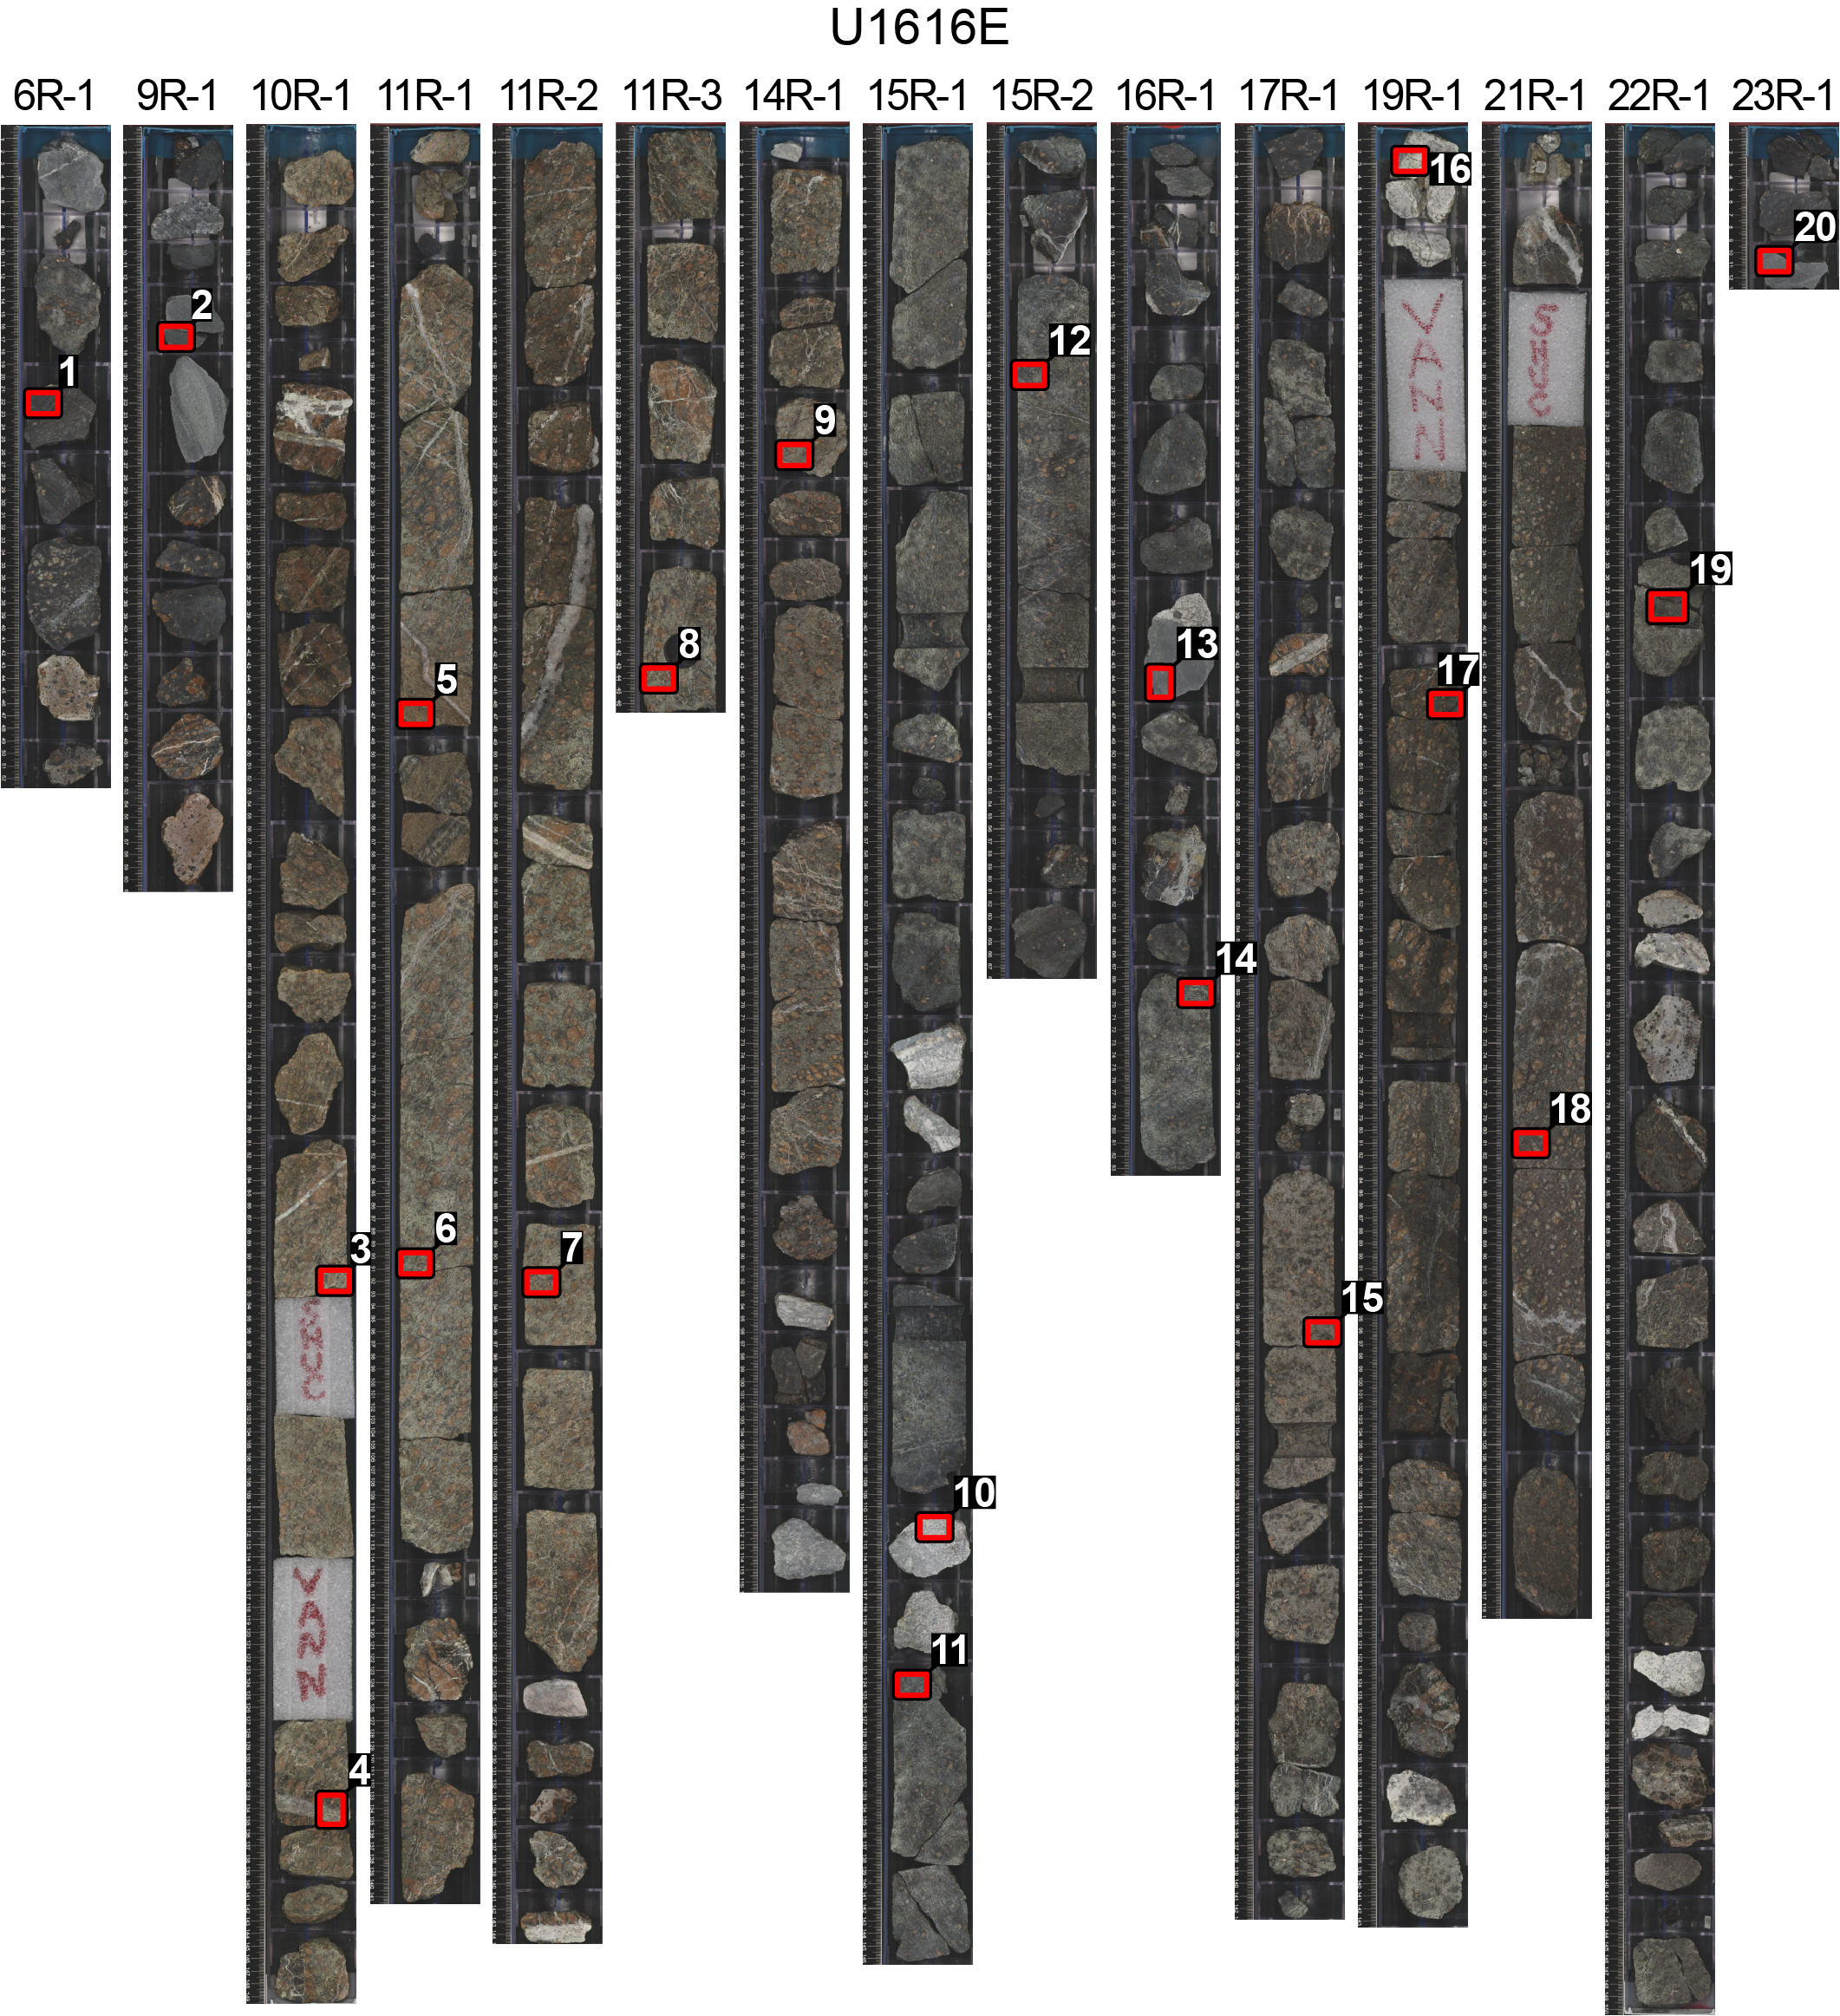
Figure F49. ICP-AES samples.
9.1. Loss on ignition
LOI values for samples collected in Hole U1616E vary between 0.2 and 17.2 wt% (Table T15). The lowest overall LOI value was recorded in a diorite (Sample 9R-1, 16–18 cm), and the highest LOI value was measured in a K-rich mica-bearing vein (Sample 10R-1, 132–135 cm). The LOI values for peridotites from Site U1616 vary between 12.2 and 17.1 wt%; similar LOI values were observed in peridotites from Site U1614. Hole U1616E peridotites show an approximately 5 wt% decrease in LOI downhole, particularly between Units V and VI (Figure F50L), suggesting a decrease in weathering and low-temperature alteration downhole over a scale of a few tens of meters.
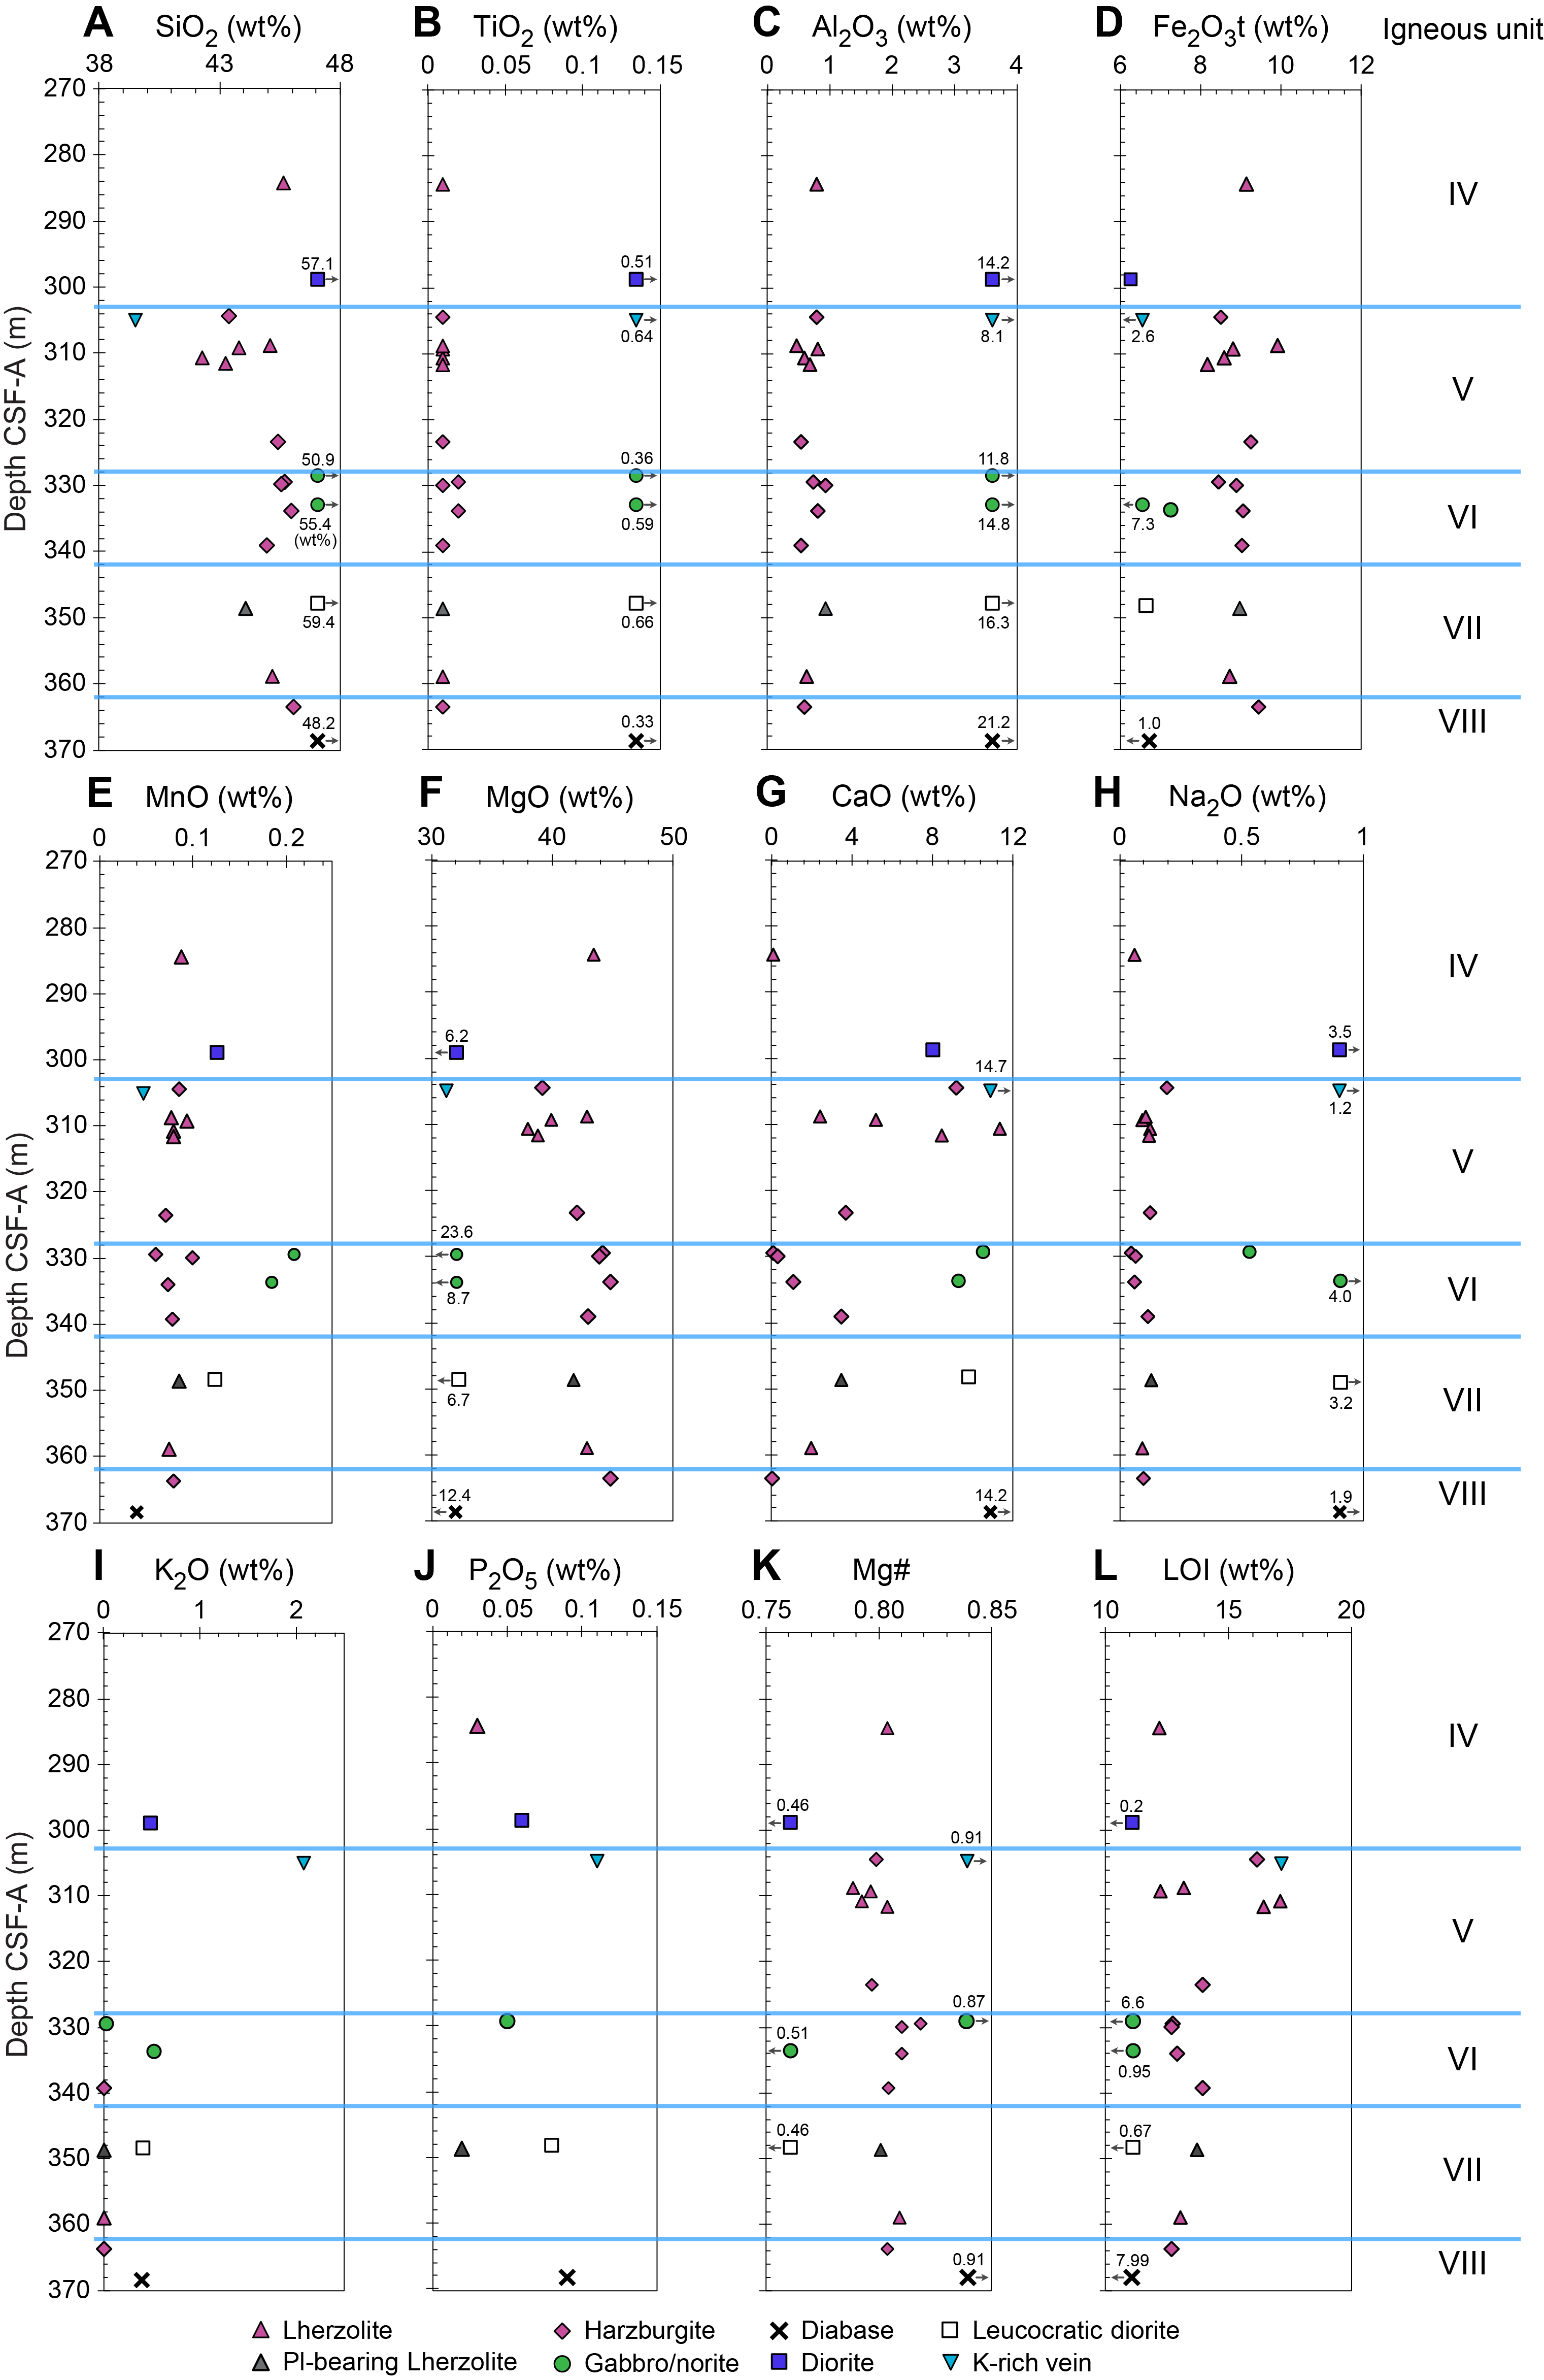
Figure F50. LOI and ICP-AES major and minor element geochemistry.
9.2. Major, minor, and trace element compositions using portable X-ray fluorescence spectrometry
pXRF analyses from Hole U1616E were used to identify lithologies recovered in thin intervals, such as gabbros, diorites, and granitoids and veins including mafic, carbonate, and serpentinite veins. The analytical totals for these pXRF analyses ranged 52.9–118.1 wt%. Unlike other intervals sampled during Expedition 402, 15 intervals from Hole U1616E analyzed using pXRF yielded analytical totals >100 wt% after applying the Expedition 402 data correction scheme (see Igneous geochemistry in the Expedition 402 methods chapter [Malinverno et al., 2025]). These intervals characteristically contain high proportions of SiO2 and/or MgO (Table T13). This overestimation of SiO2 and MgO stems from the pXRF's internal calibration and seems to be dependent on the relative abundance of these two oxides (see Igneous geochemistry in the Expedition 402 methods chapter [Malinverno et al., 2025]). Although we report these >100 wt% corrected data totals in Table T13, they were used only to aid the petrographic description and not for geological interpretation.
9.3. Inductively coupled plasma–atomic emission spectrometry
ICP-AES analyses were conducted on intervals thought to represent the range of lithologic compositions collected at Site U1616 (Figure F49). In total, seven lherzolites, one of which was plagioclase bearing, seven harzburgites, two gabbros, two diorites, one diabase, and one K-rich mica-bearing vein were analyzed using ICP-AES. Downhole variations in geochemistry are displayed in Figure F50 for major elements with LOI and Figure F51 for minor and trace elements. Concentrations of MgO and CaO show an inverse relationship, particularly in Unit V, where MgO steadily increases and CaO decreases downhole (Figure F50F, F50G). It is noteworthy that LOI values are extremely high in Unit V (up to 17.1 wt%) (Figure F50L), suggesting that these rocks were subjected to weathering and low-temperature alteration processes. Correspondingly, the peridotites in Unit V are enriched in Sr abundance up to 952 ppm (Figure F51G; Table T15). One interval of plagioclase-bearing lherzolite from Unit VII in Hole U1616E shows lower CaO content (~3.4 wt%) than nonplagioclase-bearing lherzolites in Unit V, further underscoring the high level of carbonation in the overlying Unit V.
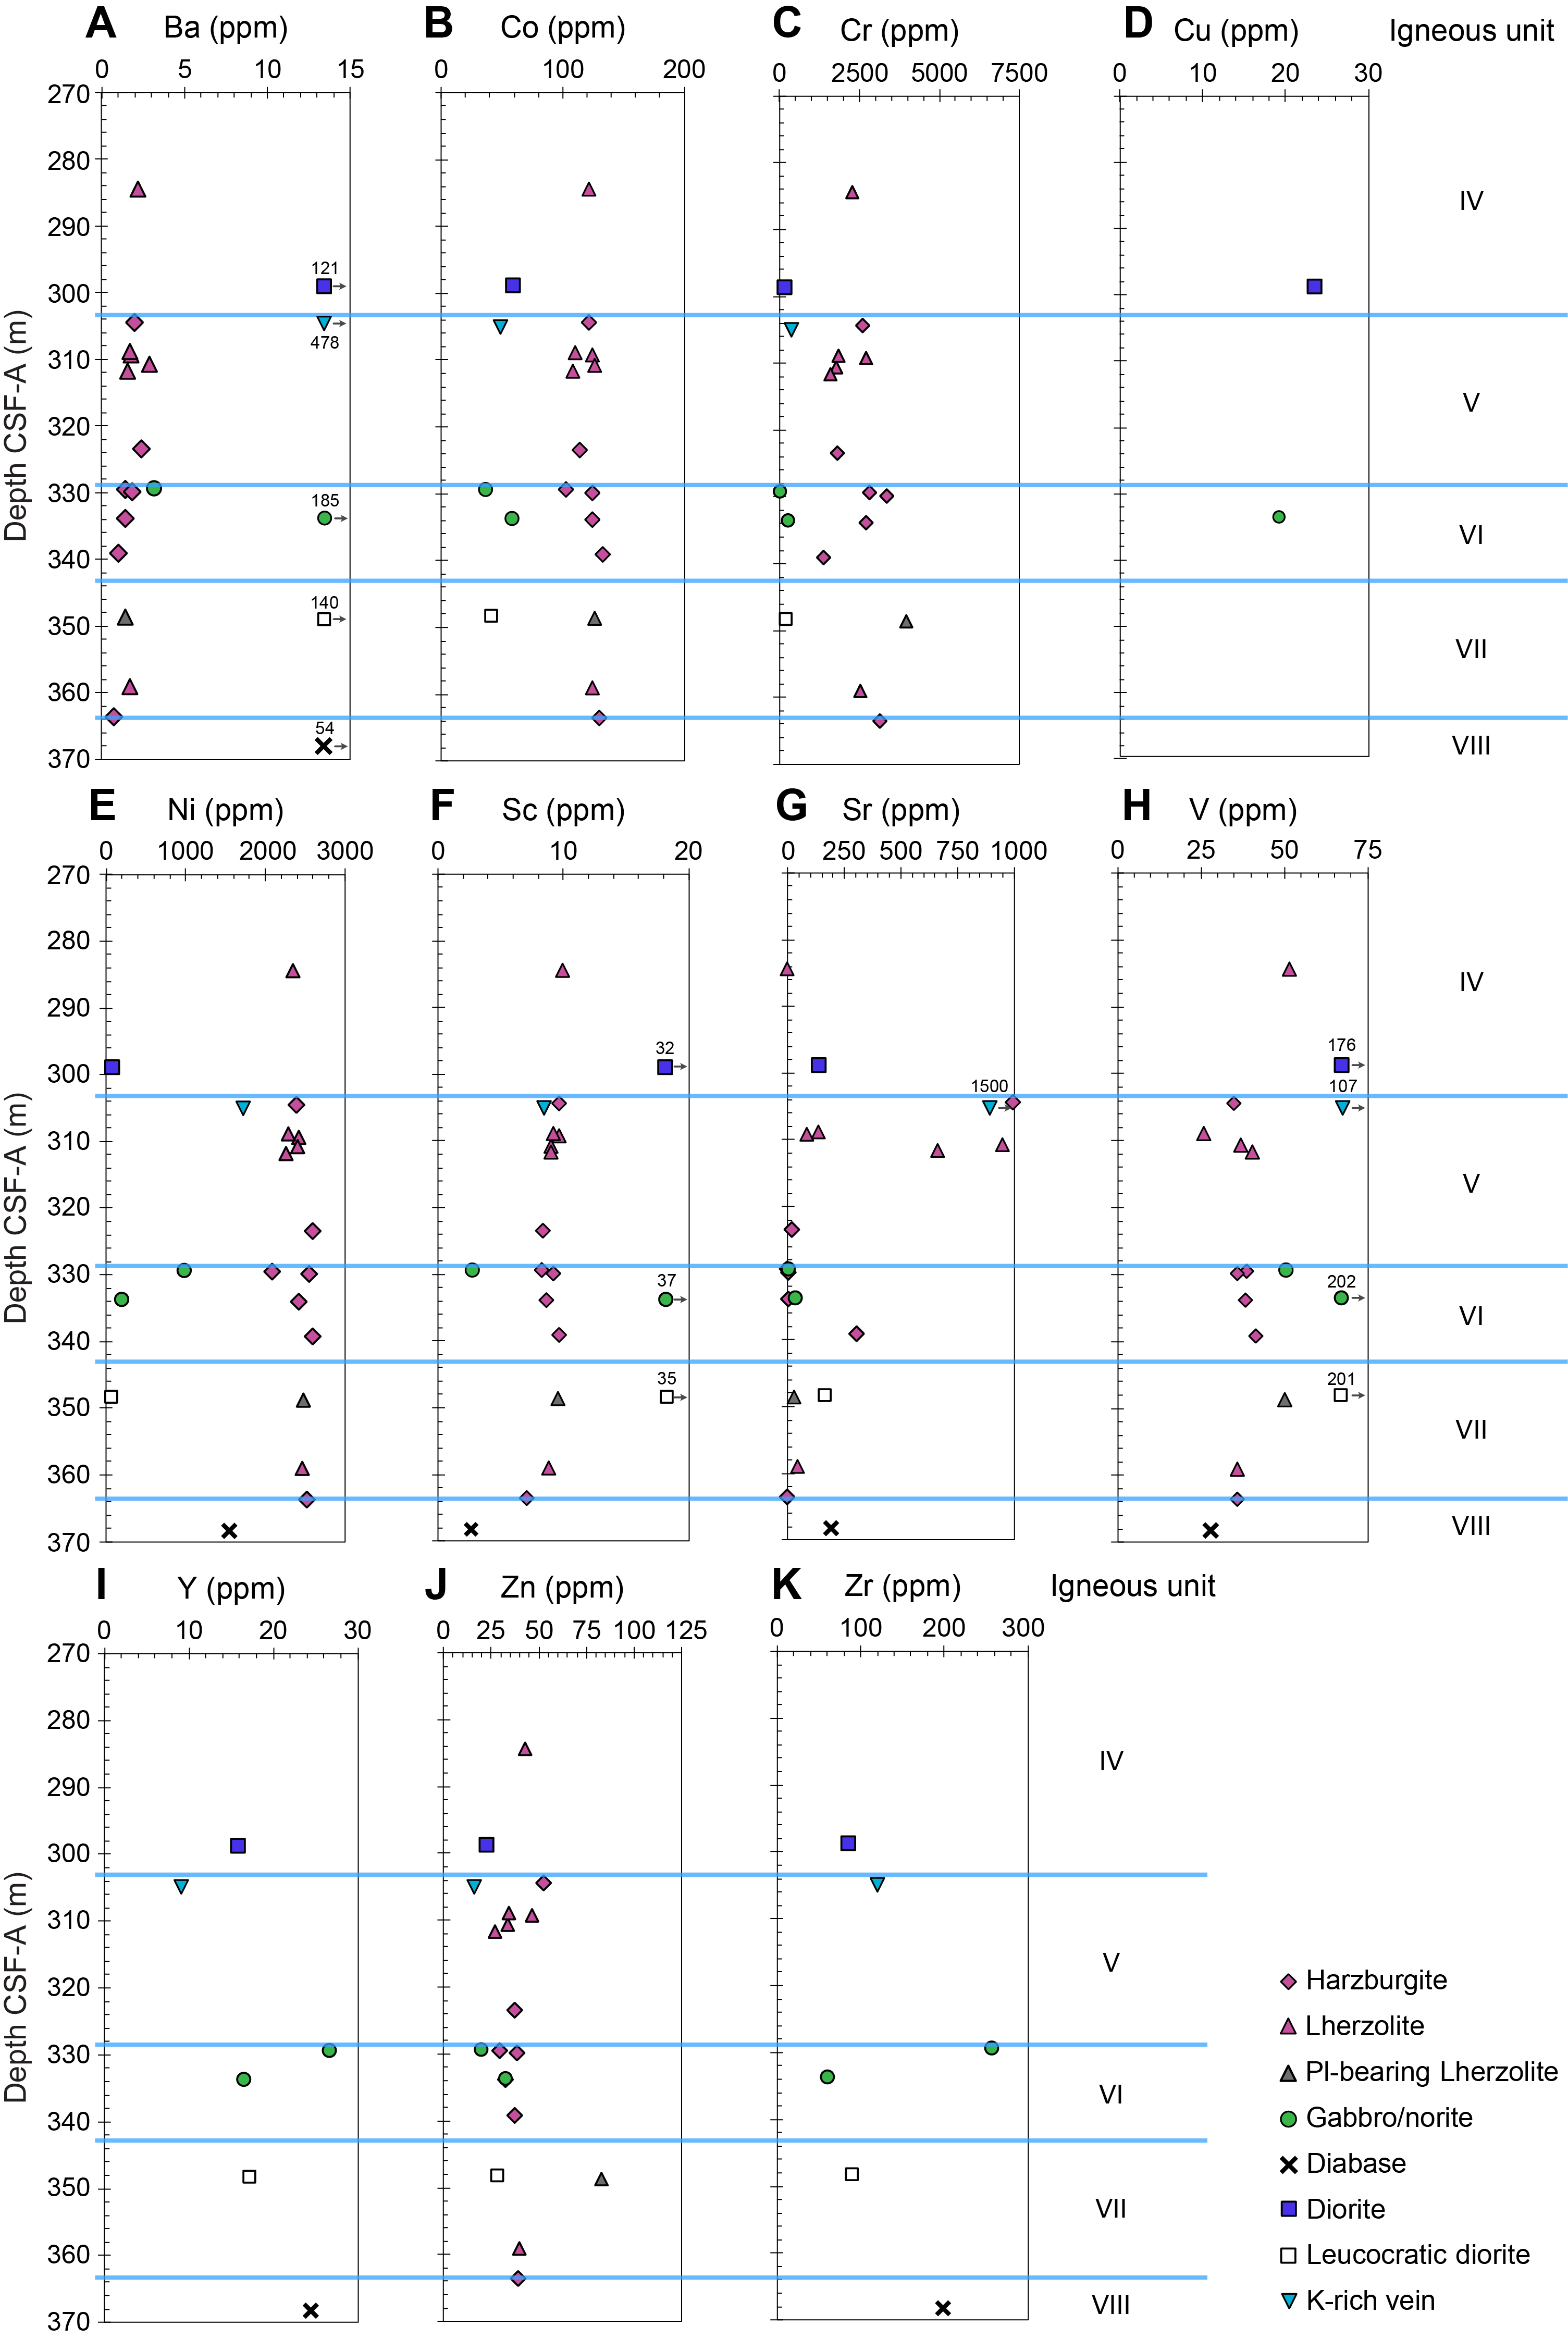
Figure F51. ICP-AES minor/trace element geochemistry.
Figure F52 compares the bulk chemistry of peridotites (harzburgite and lherzolite) collected at Site U1616 with that of peridotites collected at Site U1614 (dunite, harzburgite, and lherzolite), magma-poor Iberian margin peridotites (Hébert et al., 2001), back-arc basin peridotites (Akizawa et al., 2021), and mid-ocean ridge peridotites (Godard et al., 2009; Niu, 2004; Regelous et al., 2016). The peridotites from Site U1616 show less scatter than those from Site U1614 and global peridotites for K2O, TiO2, and Al2O3, all of which are less abundant (Figure F52B, F52D). In contrast, the peridotites from Site U1616 show overall higher CaO abundance (up to 11.3 wt%) (Figure F52C; Table T15). Hence, peridotites at Site U1616 are generally depleted in incompatible elements, with the exception of CaO, which in many cases is more abundant than in depleted MORB mantle (DMM) (a hypothetical upper mantle reservoir sourcing MORB; Workman and Hart, 2005) and primitive upper mantle (PUM) (a hypothetical undifferentiated fertile upper mantle reservoir; McDonough and Sun, 1995) (Figure F52C). The high CaO content is thereby due to the carbonation of the peridotite associated with weathering and low-temperature alteration processes, as noted below.
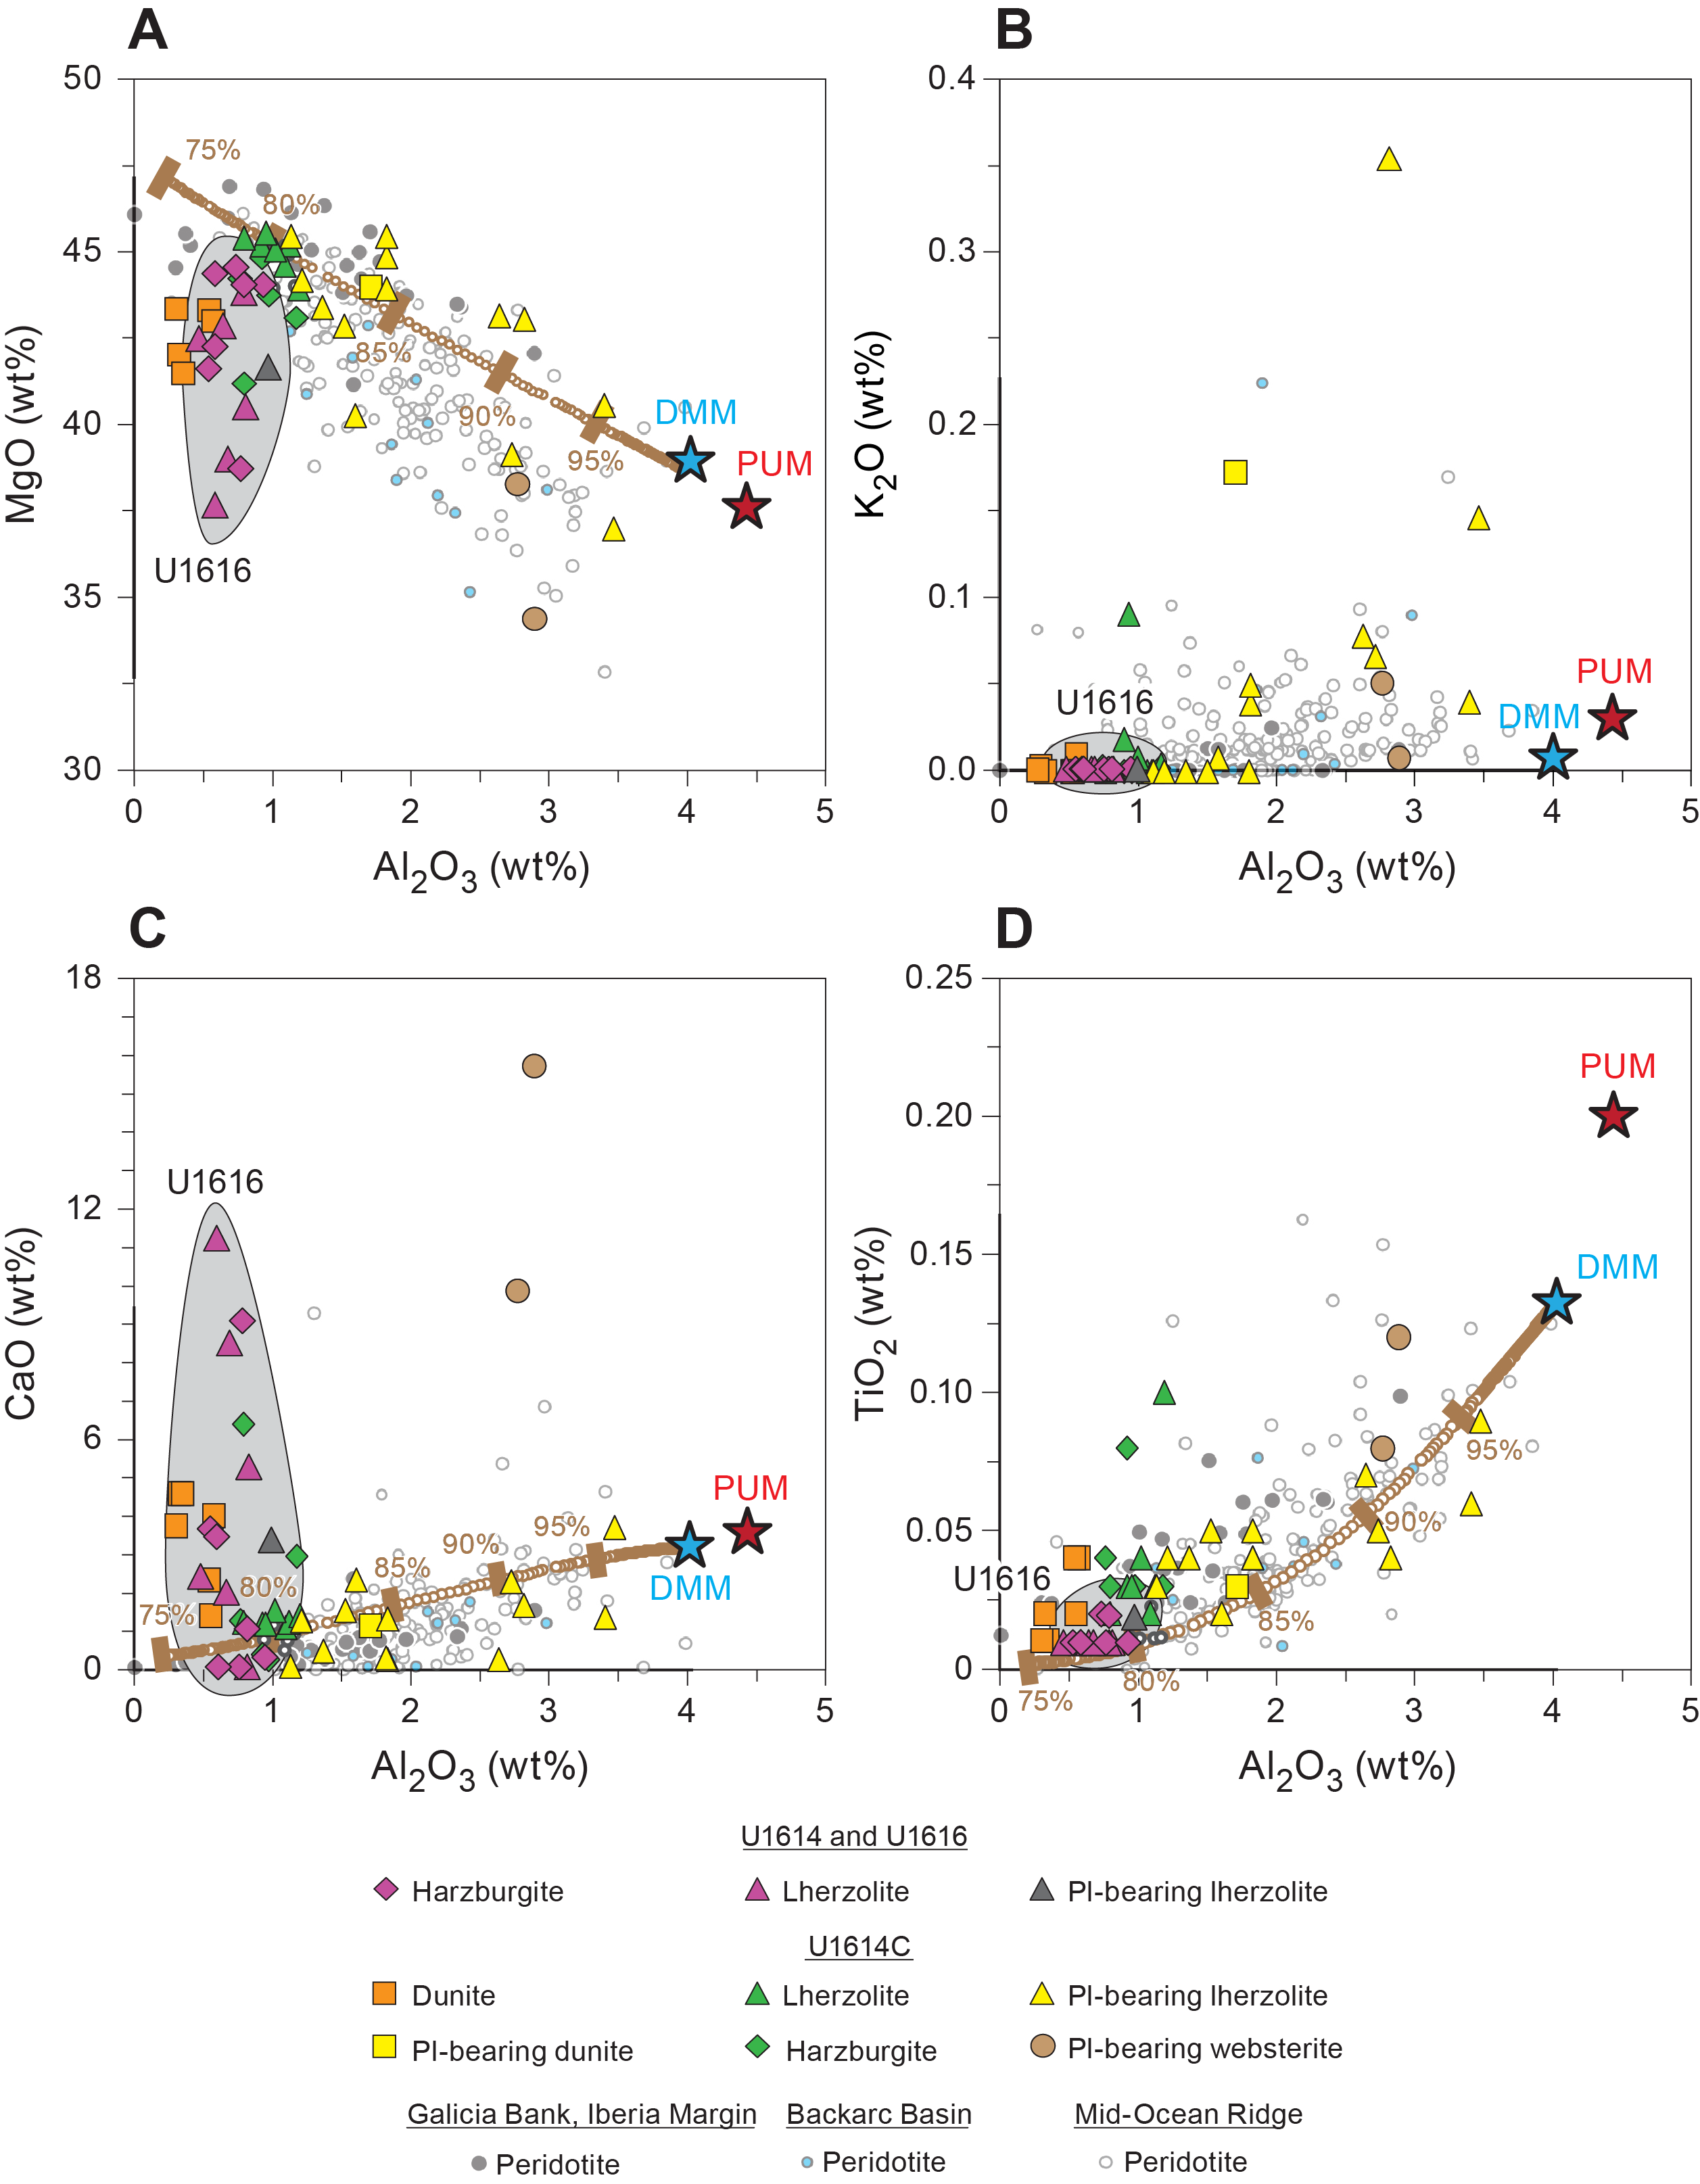
Figure F52. Bulk chemistry, mantle rock.
Figure F53 compares the composition of diabase from Site U1616 (Sample 402-U1616E-23R-1, 10–13 cm) to the basalt from Site U1612 (Sample 402-U1612A-35R-1, 79–80 cm) and basalts sampled from the Vavilov Basin during Leg 107 (Beccaluva et al., 1990) on an extrusive total alkali-silica (TAS) diagram. The diabase from Hole U1616E plots in the basalt field and has the lowest alkali content (2.3 wt%; Table T15) measured so far for samples from the Vavilov Basin.
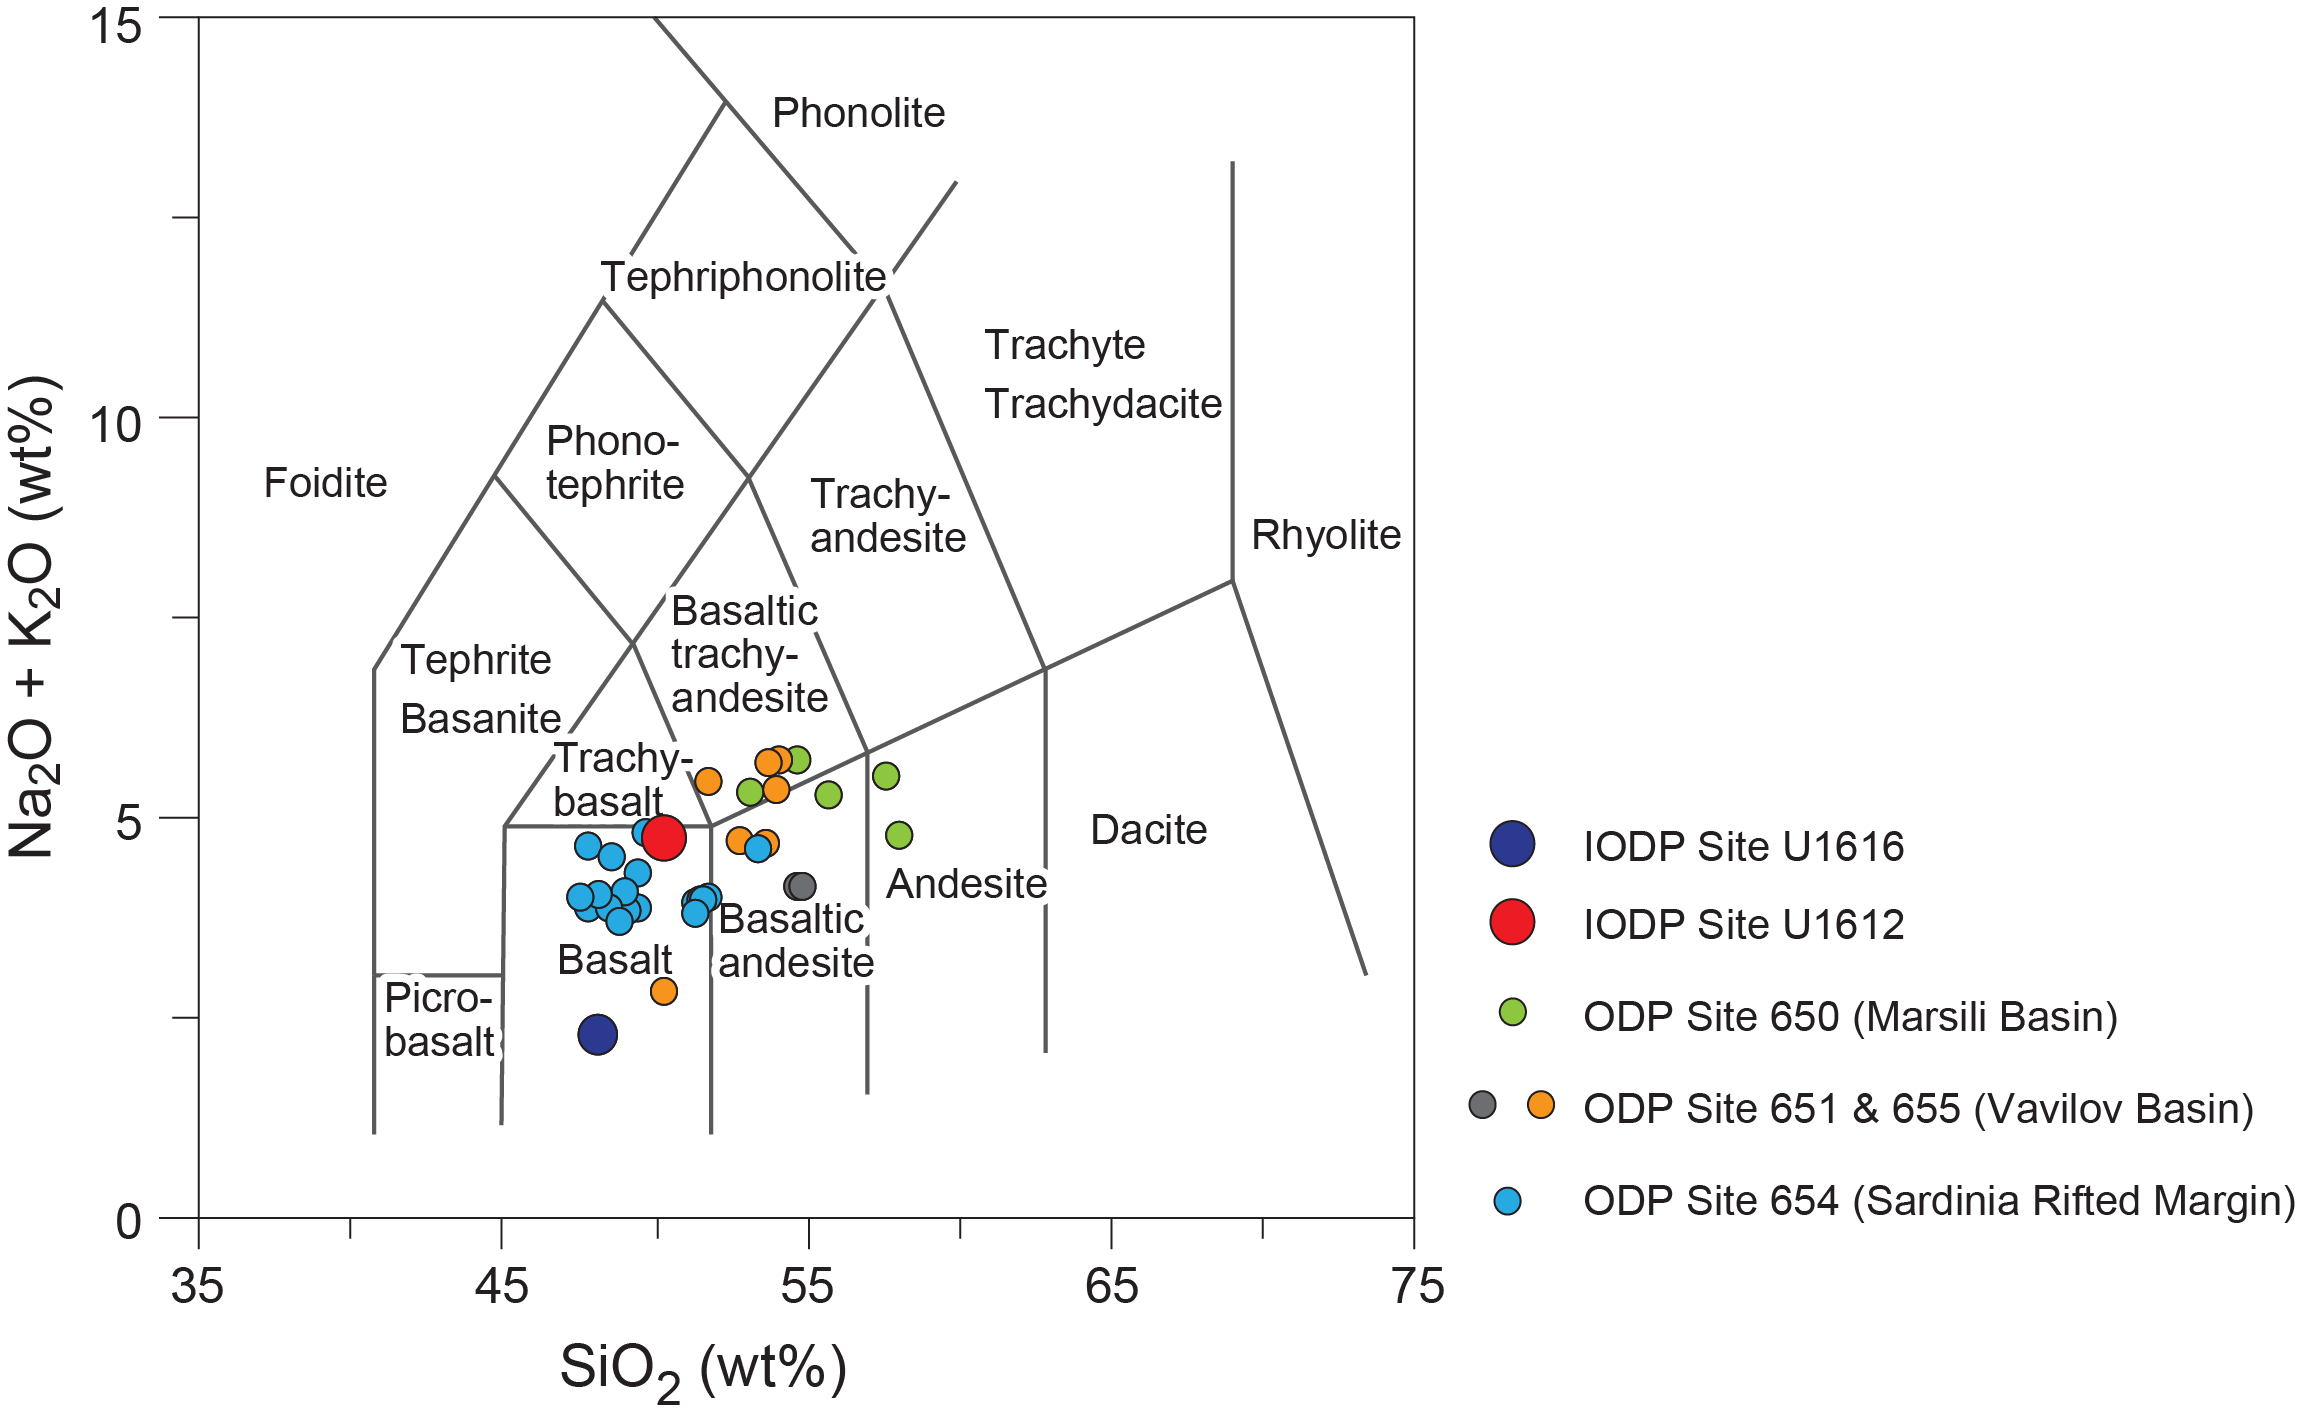
Figure F53. Basaltic rock compositions.
Plutonic rocks collected at Sites U1612 and U1614 are plotted and compared to those collected at Site U1616 on a plutonic TAS diagram (Figure F54). Although the plutonic rocks collected at Sites U1612 and U1614 are relatively similar in composition, those collected at Site U1616 show lower silica and alkali concentrations and generally plot in the gabbro/norite to diorite fields. The K-rich vein has the lowest SiO2 content (39.5 wt%), and the total alkali content is decidedly high, up to 3.3 wt% (Table T15).
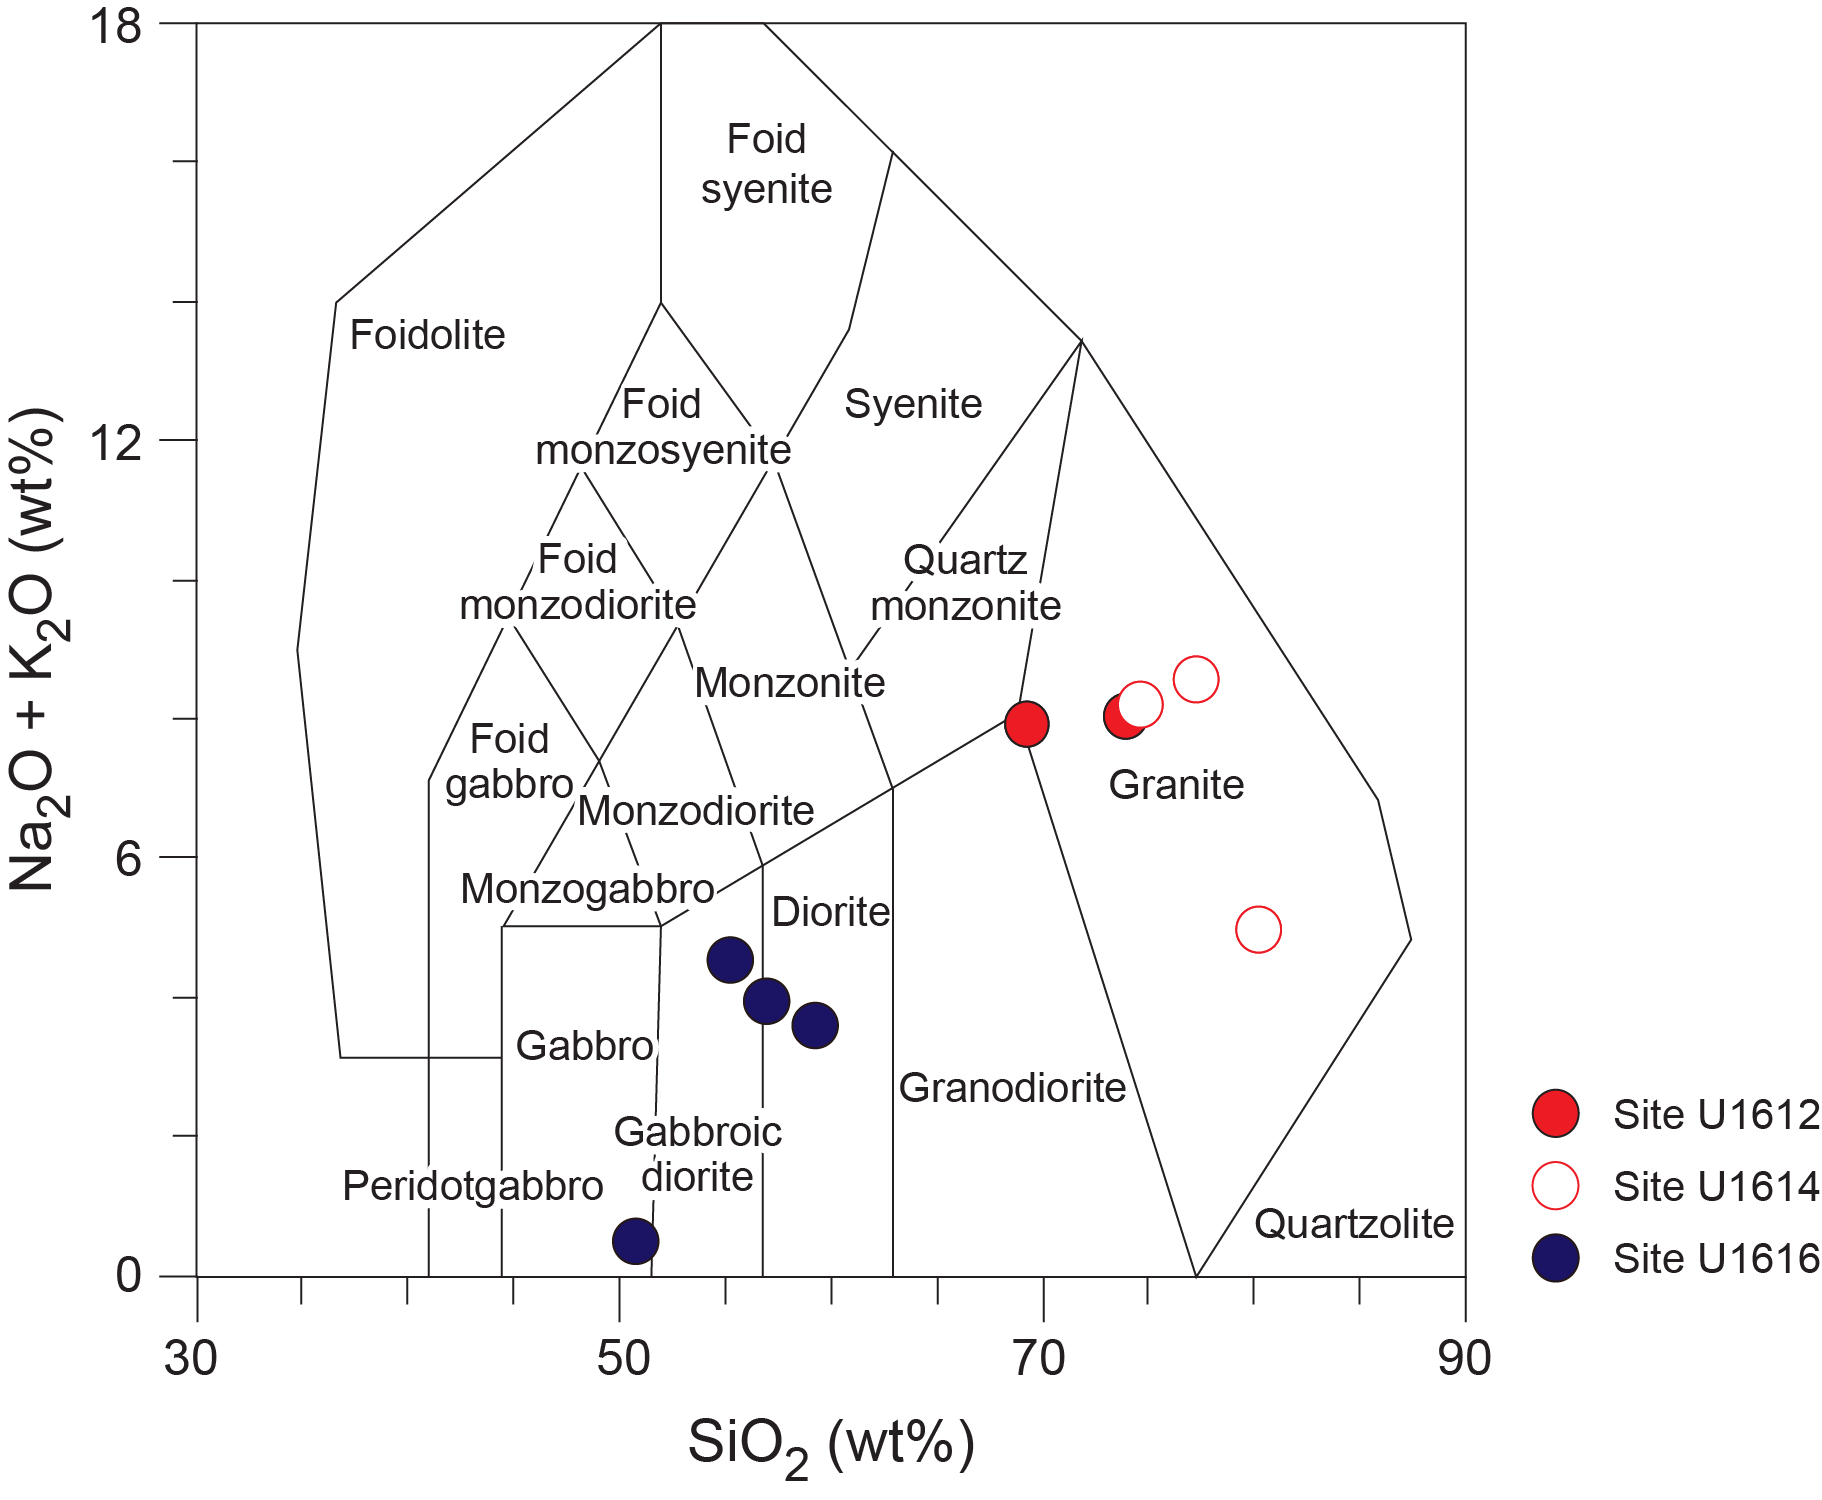
Figure F54. Plutonic rock compositions.
9.4. Calcium carbonate, total carbon, and total sulfur contents of rocks and veins
The peridotites collected at Site U1616 are carbonated with numerous network-like carbonate veins (see Igneous and metamorphic petrology), which is reflected by enrichments in bulk CaO content up to 11.3 wt% and calcium carbonate content up to 16.1 wt% (Figure F55; Tables T15, T16). The positive correlation between CaO and calcium carbonate contents indicates that the high CaO content of the peridotites is due to weathering and low-temperature alteration processes (e.g., Kelemen and Matter, 2008). The peridotite carbonation is more intense in Unit V of Hole U1616E (303.5–328.2 m CSF-A) (Figure F55). The presence of carbonates is supported by XRD analyses of the powders used for ICP-AES analyses, which identified low-Mg calcite, aragonite, and dolomite, along with lizardite and chrome spinel (Figure F56). The magnesium content of the carbonate was estimated semiquantitatively to be approximately 4.0 mol% Mg using the equation proposed by Goldsmith et al. (1958).
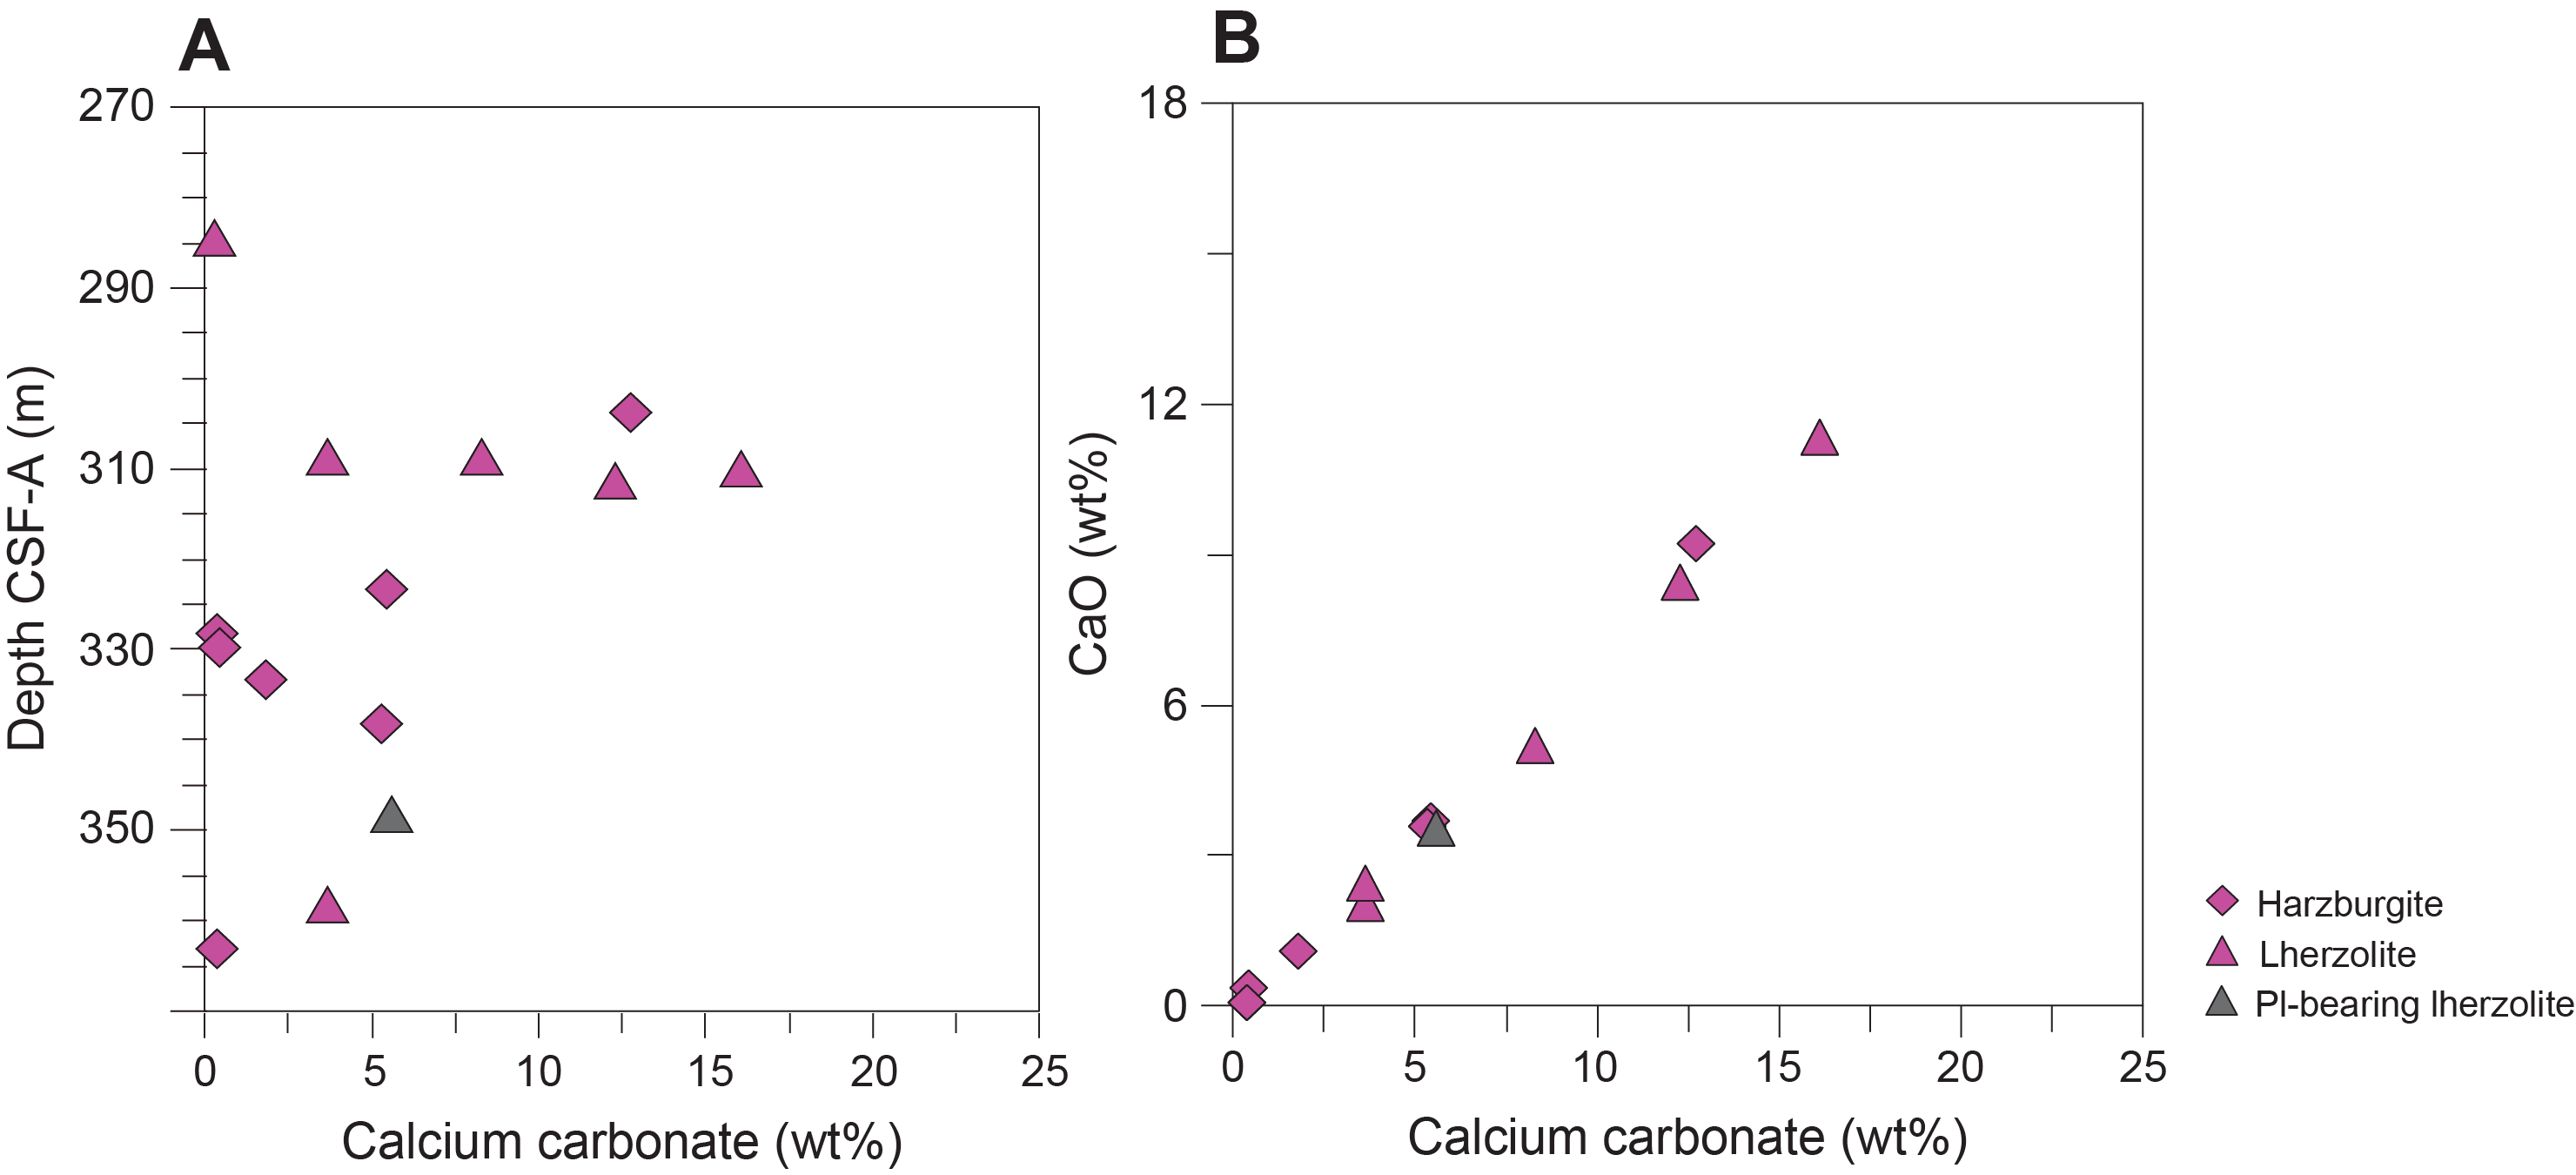
Figure F55. Bulk calcium carbonate content and correlation with bulk CaO content.
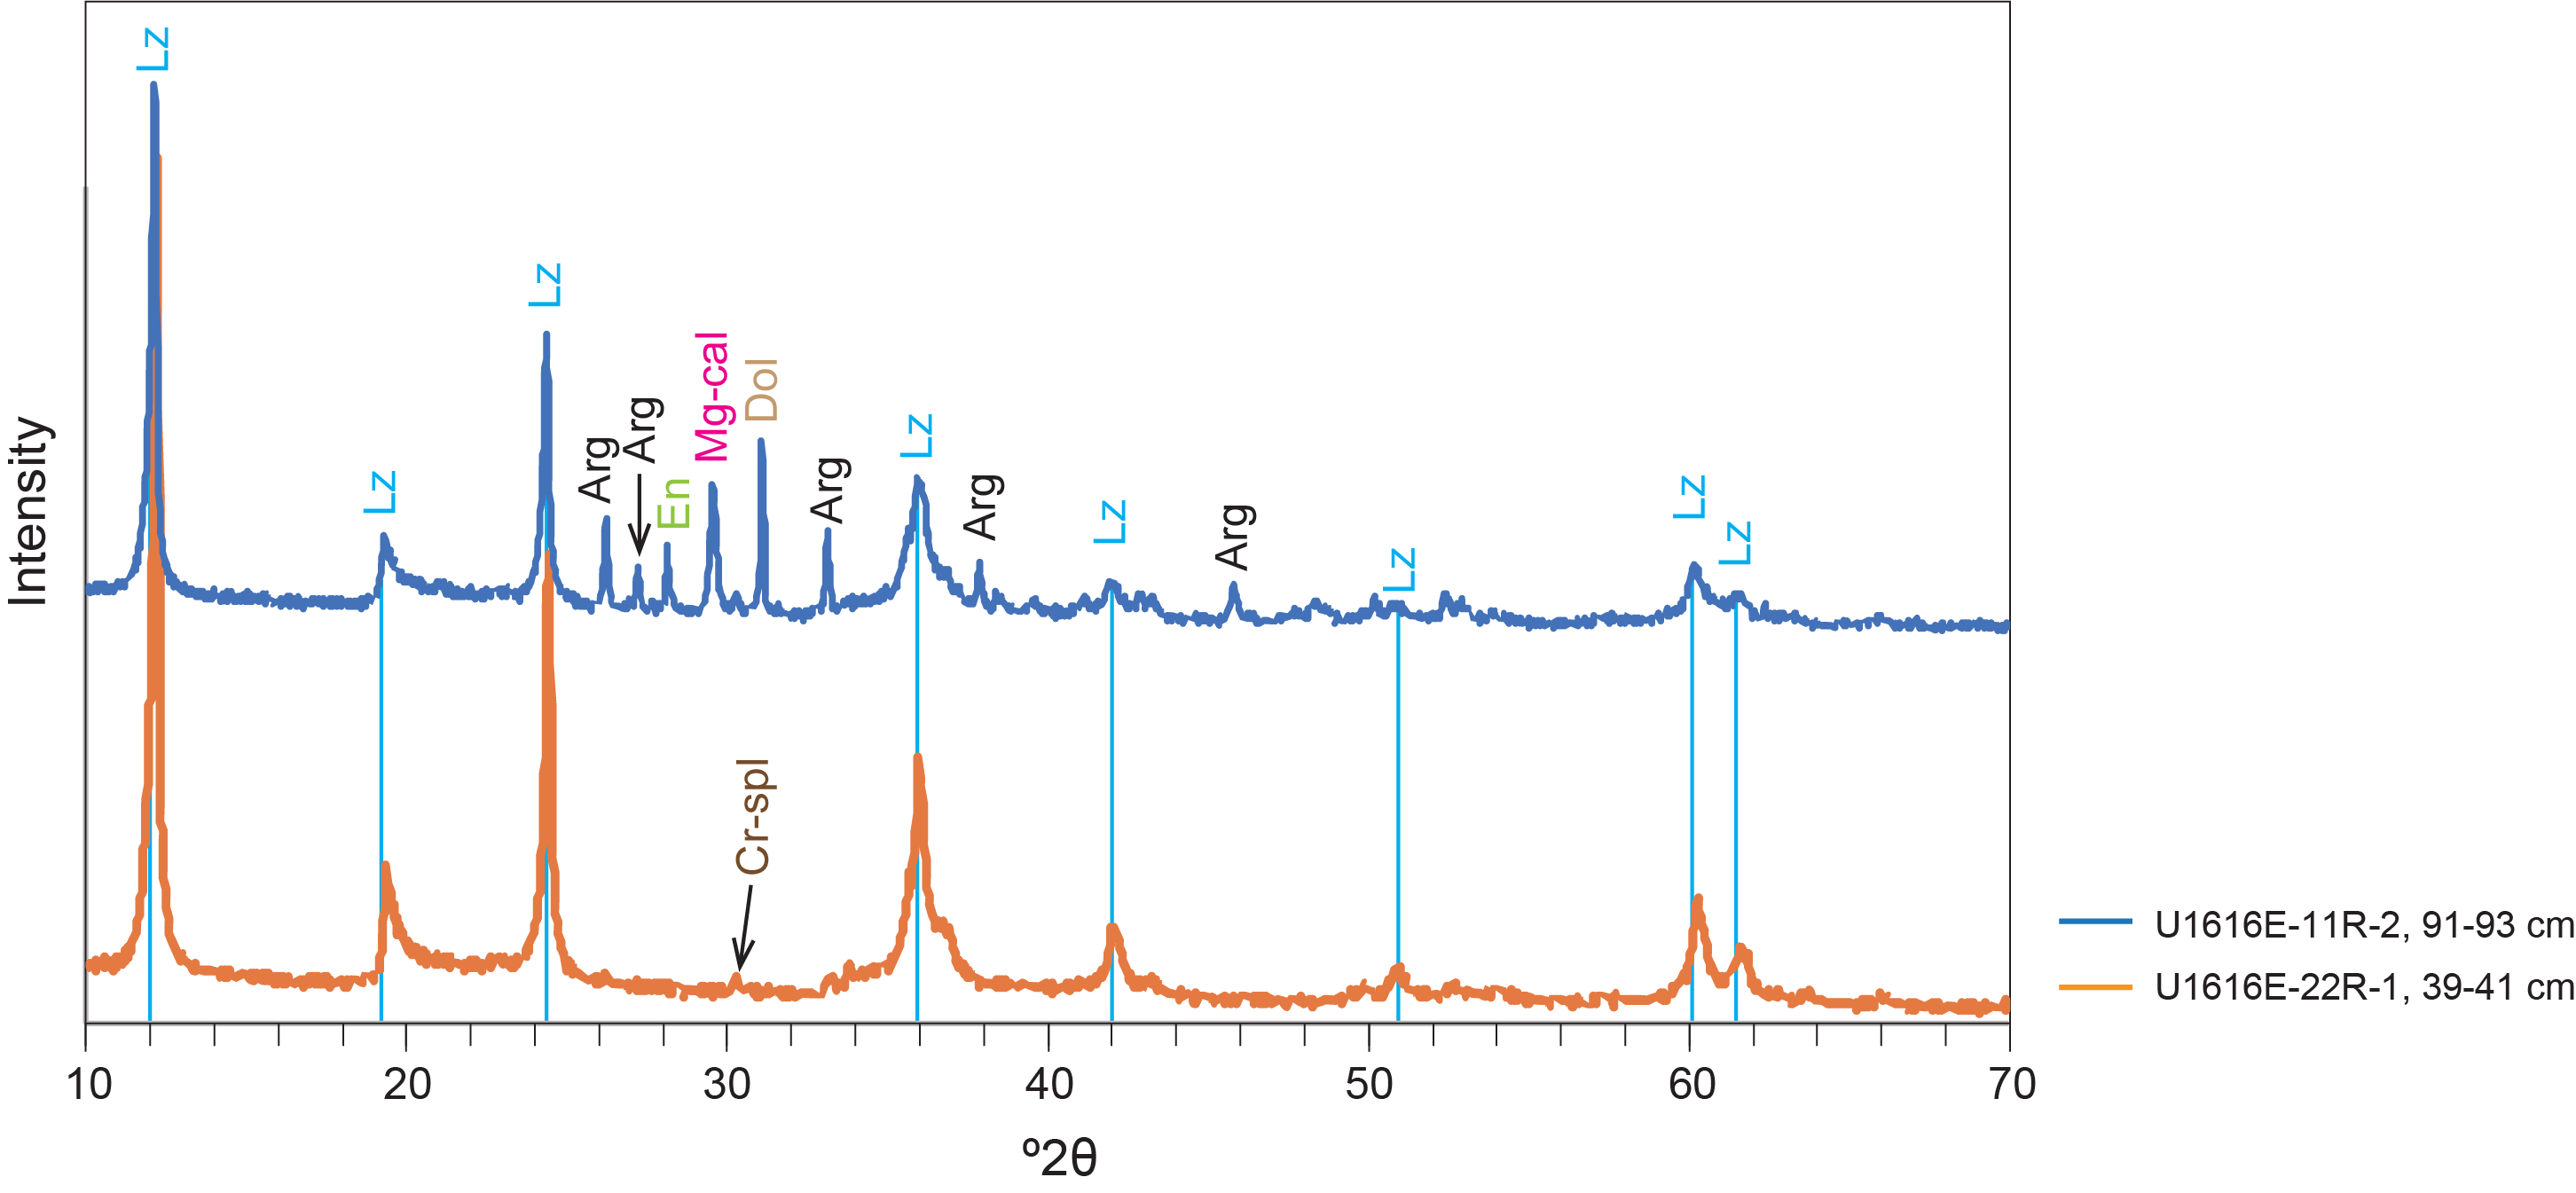
Figure F56. XRD spectra, phase characterizations of lherzolite and harzburgite.
10. Physical properties
Three holes were drilled at Site U1616. Hole U1616A cored through the uppermost 50 m of the sediment column and was abandoned because inclement weather prevented drilling operations. Hole U1616B was drilled without sampling for the uppermost 31.2 m and then cored to the base of the sediments and the top of a breccia at 284.65 mbsf. Hole U1616E was drilled without coring in the uppermost 250 m and then cored to a total depth of 427.2 mbsf. Physical properties on the whole-round cores measured with the Whole-Round Multisensor Logger (WRMSL) included gamma ray attenuation (GRA) bulk density, MS, and P-wave velocity (VP). Natural gamma radiation (NGR) was measured with the Natural Gamma Radiation Logger (NGRL). We also obtained X-Ray Linescan Logger (XSCAN) images for the split core sections of both sediment and hard rock. We used different settings on the XSCAN for sediments and rocks to image internal structures such as veins, fractures, or foliation. After the cores were split, we performed discrete VP measurements with the Gantry system in the X-direction (see Physical properties in the Expedition 402 methods chapter [Malinverno et al., 2025]), thermal conductivity measurements, and collected samples for moisture and density (MAD) analysis (Table T17).
The measured physical properties of the sediments recovered from Hole U1616A and U1616B show distinct variations that can be related to lithologic changes between and within Lithostratigraphic Units I–IV (Figure F57). In general, the recovered sediment varies from unconsolidated material that is highly porous (~74%) and low density (~1.456 g/cm3) to a denser (up to 2.618 g/cm3) consolidated breccia with porosity of 10%. Based on discrete measurements, VP ranges from 1466 m/s for unconsolidated material such as mud with calcareous nannofossils to 2330 m/s for tuff at the base of Subunit IC or up to 6025 m/s for a basaltic fragment from the breccia of Unit IV. Thermal conductivity ranges from 0.74 W/(m∙K) in coarse volcanic sand to 2.078 W/(m∙K) in the breccia. Notably, each lithostratigraphic unit has characteristic NGR values, with Subunit ID (Sections 402-U1616B-12X-1 through 20X-CC) showing the highest NGR values up to 361 counts/s. MS ranges 2.59–1235.99 instrument units (IU) with high values in Subunits IB, IC, and ID, whereas much lower values of ~20 IU are characteristic of Units II and III (Figure F57) and are associated with nannofossil ooze.
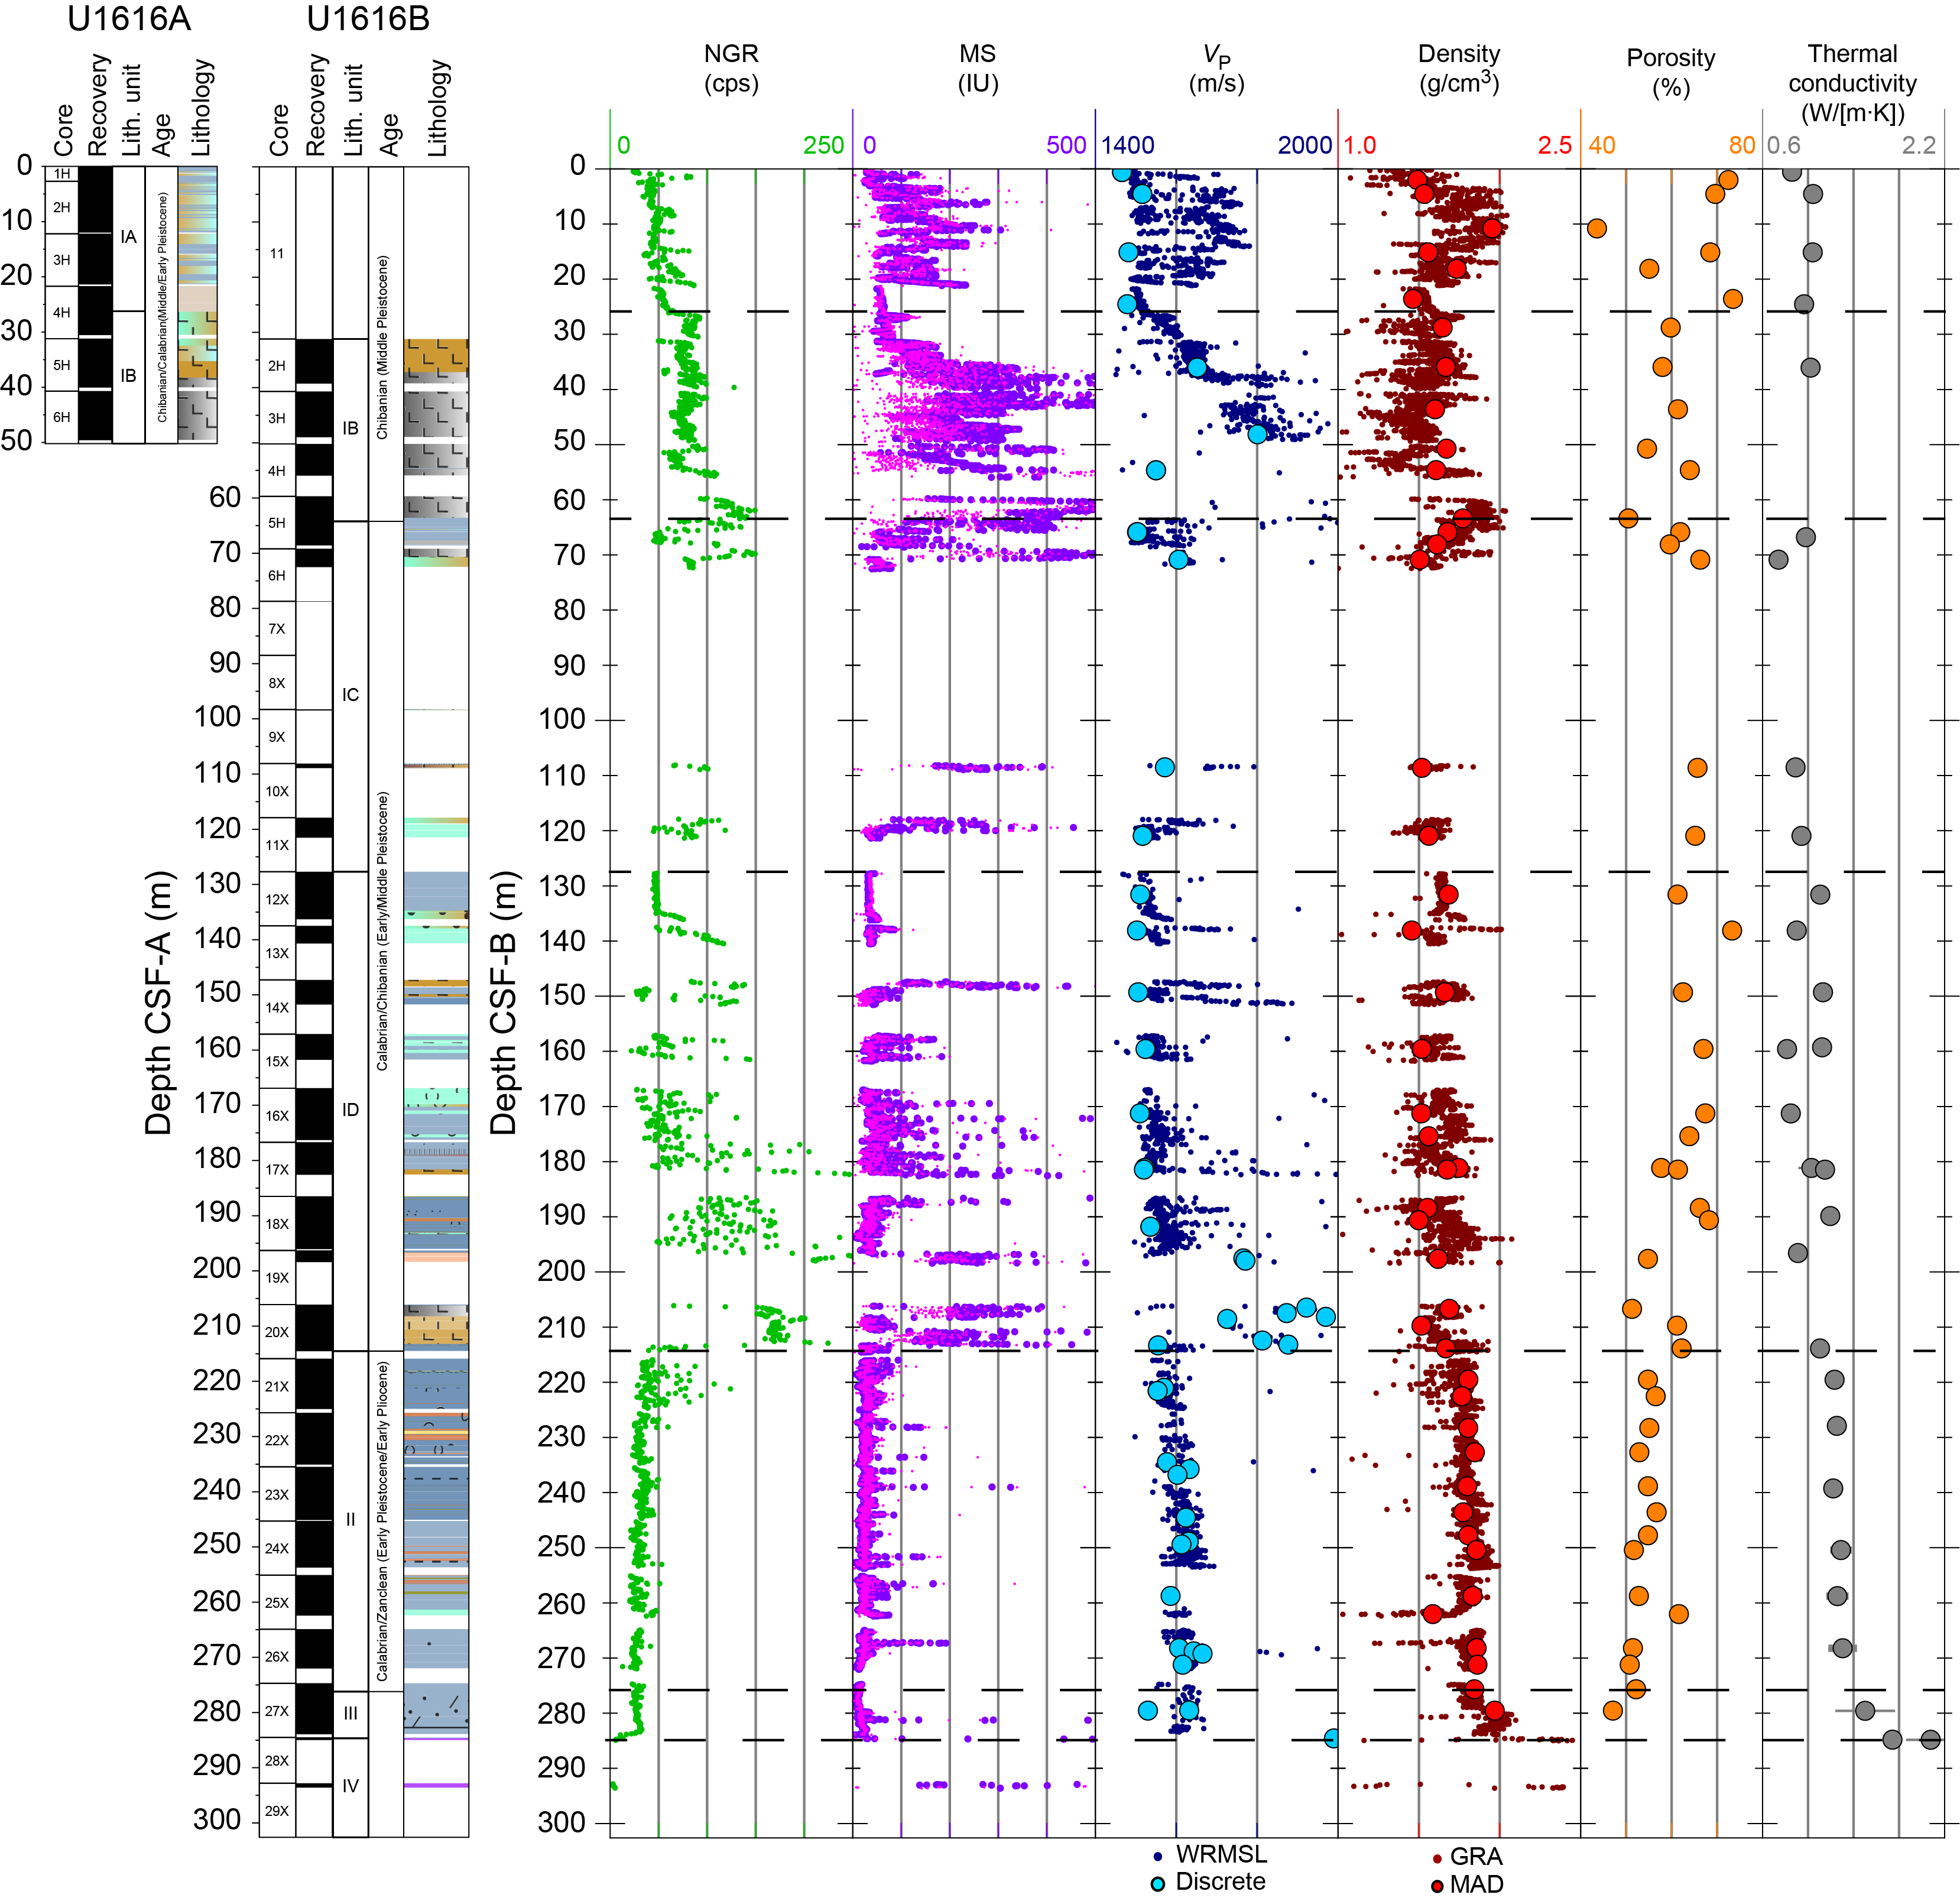
Figure F57. Physical properties, Holes U1616A and U1616B.
Drilling of basement rocks in Hole U1616E proceeded in two stages. The first one advanced to 371 mbsf (Core 23R) and recovered the polymictic breccia of Unit IV and the peridotites of Units V–VIII. At 371 mbsf, a hard layer was encountered that obstructed drilling. A 29 m thick interval was then drilled without recovery, followed by Cores 25R–30R (400–427.2 mbsf), which sampled the peridotites of Unit IX. Details of the physical properties measurements from Holes U1616A, U1616B, and U1616E are listed in Table T18.
10.1. Lithostratigraphic Unit I
10.1.1. Lithostratigraphic Subunit IA
Lithostratigraphic Subunit IA includes the interval from the seafloor to the base of Section 402-U1616A-4H-3 (0–26.22 mbsf). Sediment porosity in this interval varies from 74% to 44% based on six MAD samples, and bulk density ranges 1.46–1.95 g/cm3 (Table T18). The average VP in this interval is 1485 m/s based on four Gantry measurements. NGR shows a generally increasing trend with depth from 24 to 86 counts/s (Figure F57), and MS is highly variable, ranges 25–305 IU, and generally increases with depth in approximately the top half of this subunit and decreases in the bottom half. VP and GRA bulk density show similar trends to MS. The high variability of MS, VP, and NGR values is related to the presence of volcaniclastic layers alternating with nannofossil oozes. Four thermal conductivity measurements in Subunit IA give an average of 0.977 W/(m∙K).
10.1.2. Lithostratigraphic Subunit IB
Lithostratigraphic Subunit IB extends from Section 402-U1616A-4H-4 through Section 6H-CC (26.22–50.2 mbsf) and from Section 402-U1616B-2H-1 through Section 5H-3 (31.2–64.25 mbsf). Bulk density in this interval varies from 1.60 to 1.77 g/cm3 based on six MAD samples, and porosity ranges 51%–64% (Table T18). This interval is composed of volcaniclastic-rich gravel with an average VP of 1667 m/s (based on three Gantry measurements). VP generally increases from the top to the bottom of this subunit. Thermal conductivity was difficult to measure on these rocks, and the only measurement was 1.022 W/(m∙K). MS is highly variable with a peak of 835 IU, and NGR is more constant, ranging 50–149 counts/s (Figure F57).
10.1.3. Lithostratigraphic Subunit IC
Lithostratigraphic Subunit IC extends from the top of Section 402-U1616B-5H-4 to the base of Section 11X-CC (64.25–127.7 mbsf) and consists of nannofossil ooze layers that alternate with volcaniclastic-rich gravel and ash layers. This subunit has no recovery from 72.4 to 98.3 mbsf, and the subunit boundary was assigned based on downhole measurements. In the upper part of Subunit IC, where recovery was high, the GRA bulk density has a decreasing trend with depth, which is confirmed by five discrete MAD measurements (1.68–1.51 g/cm3) (Figure F57; Table T18), and the porosity increases from 60% to 66%. Based on two measurements, thermal conductivity increases slightly downhole from 0.74 to 0.981 W/(m∙K). In general, VP, MS, and NGR show a high variability without a clear trend (Figure F57).
10.1.4. Lithostratigraphic Subunit ID
Lithostratigraphic Subunit ID extends from the top of Section 402-U1616B-12X-1 to the base of Section 20X-CC (127.7–214.54 mbsf). Subunit ID is composed of alternating nannofossil ooze and volcaniclastic layers in the upper part, and near its base the subunit contains tuff and volcaniclastic gravel. VP collected with the Gantry system shows a general increase from 1503 to 1520 m/s from the top of the subunit to 181 mbsf. Below this depth, VP rapidly increases up to 2332 m/s (Table T18). VP measured using the WRMSL shows a similar trend (Figure F57). MAD bulk density varies from 1.46 to 1.75 g/cm3 based on 14 samples taken from this interval, and porosity shows a general decrease from 73% to 51% with some small oscillations from top to bottom. Thermal conductivity generally increases from 0.815 to 1.195 W/(m∙K) and shows an opposite trend to porosity. NGR increases rapidly from 150 mbsf to the end of the subunit within a wide range of 22–362 counts/s. MS remains constant around a value of 43 IU with local high peaks up to 1194 IU, correlating with high VP intervals.
10.2. Lithostratigraphic Unit II
Lithostratigraphic Unit II extends from Section 402-U1616B-21X-1 through Section 27X-1 (214.54–276.21 mbsf). Recovery in this unit was high, and physical properties measurements do not show large variations (Figure F57). A total of 13 MAD samples collected from this unit gave an average density of 1.80 g/cm3 and porosity of 54% (Table T18) with generally increasing and decreasing trends downhole, respectively (Figure F57). The VP has an average of 1609 m/s based on Gantry measurements and an average of 1639 m/s measured using the WRMSL, which is largely representative of the chalk intervals abundant in this unit. Thermal conductivity increases from 1.221 to 1.304 W/(m∙K) from the top to the bottom of Unit II. MS remains generally low at ~28 IU. The NGR data decrease downhole from 124 to 12.932 counts/s (Figure F57; Table T18).
10.3. Lithostratigraphic Unit III
Lithostratigraphic Unit III is a thin (about 8 m) sedimentary unit extending from Section 402-U1616B-27X-2 through Section 28X-CC (276.21–284.65 mbsf) and consists of dolomite-rich nannofossil ooze with foraminifera. One MAD sample collected from this interval (Section 28X-CC) shows a density of 1.97 g/cm3 and porosity of 47% (Figure F57; Table T18). VP is 1717 m/s, based on the average of three Gantry measurements above the breccia encountered in Section 28X-CC. NGR counts drop downhole from 33 to 10 counts/s in this unit, and MS remains relatively low around 25 IU with a few peaks up to 486 IU. The only thermal conductivity measurement made in Unit III gave a value of 1.502 W/(m∙K).
10.4. Lithostratigraphic Unit IV
Lithostratigraphic Unit IV extends from Section 402-U1616E-4R-2 through Core 9R (270–303.5 mbsf) and consists of consolidated polymictic breccia. Based on the measurement done with the Gantry system, Unit IV is characterized by high VP ranging 3560–5474 m/s with an average of 4247 m/s. Accordingly, bulk density (from WRMSL) and grain density (from MAD) are also high with average values of 2.011 and 2.689 g/cm3, respectively. Porosity shows an irregular trend ranging 14%–1% (Figure F58; Table T18). The lowest porosity, highest density, and fastest velocity values measured in this layer correspond to gabbroic and basalt fragments found in Section 402-U1616E-9R-1. NGR values are generally low, varying from 2 to 8 counts/s, and MS shows a very high variability between 54 and 3159 IU with an average of 632 IU. Thermal conductivity varies from 2.415 to 3.79 W/(m∙K) and shows a trend opposite to that of porosity.
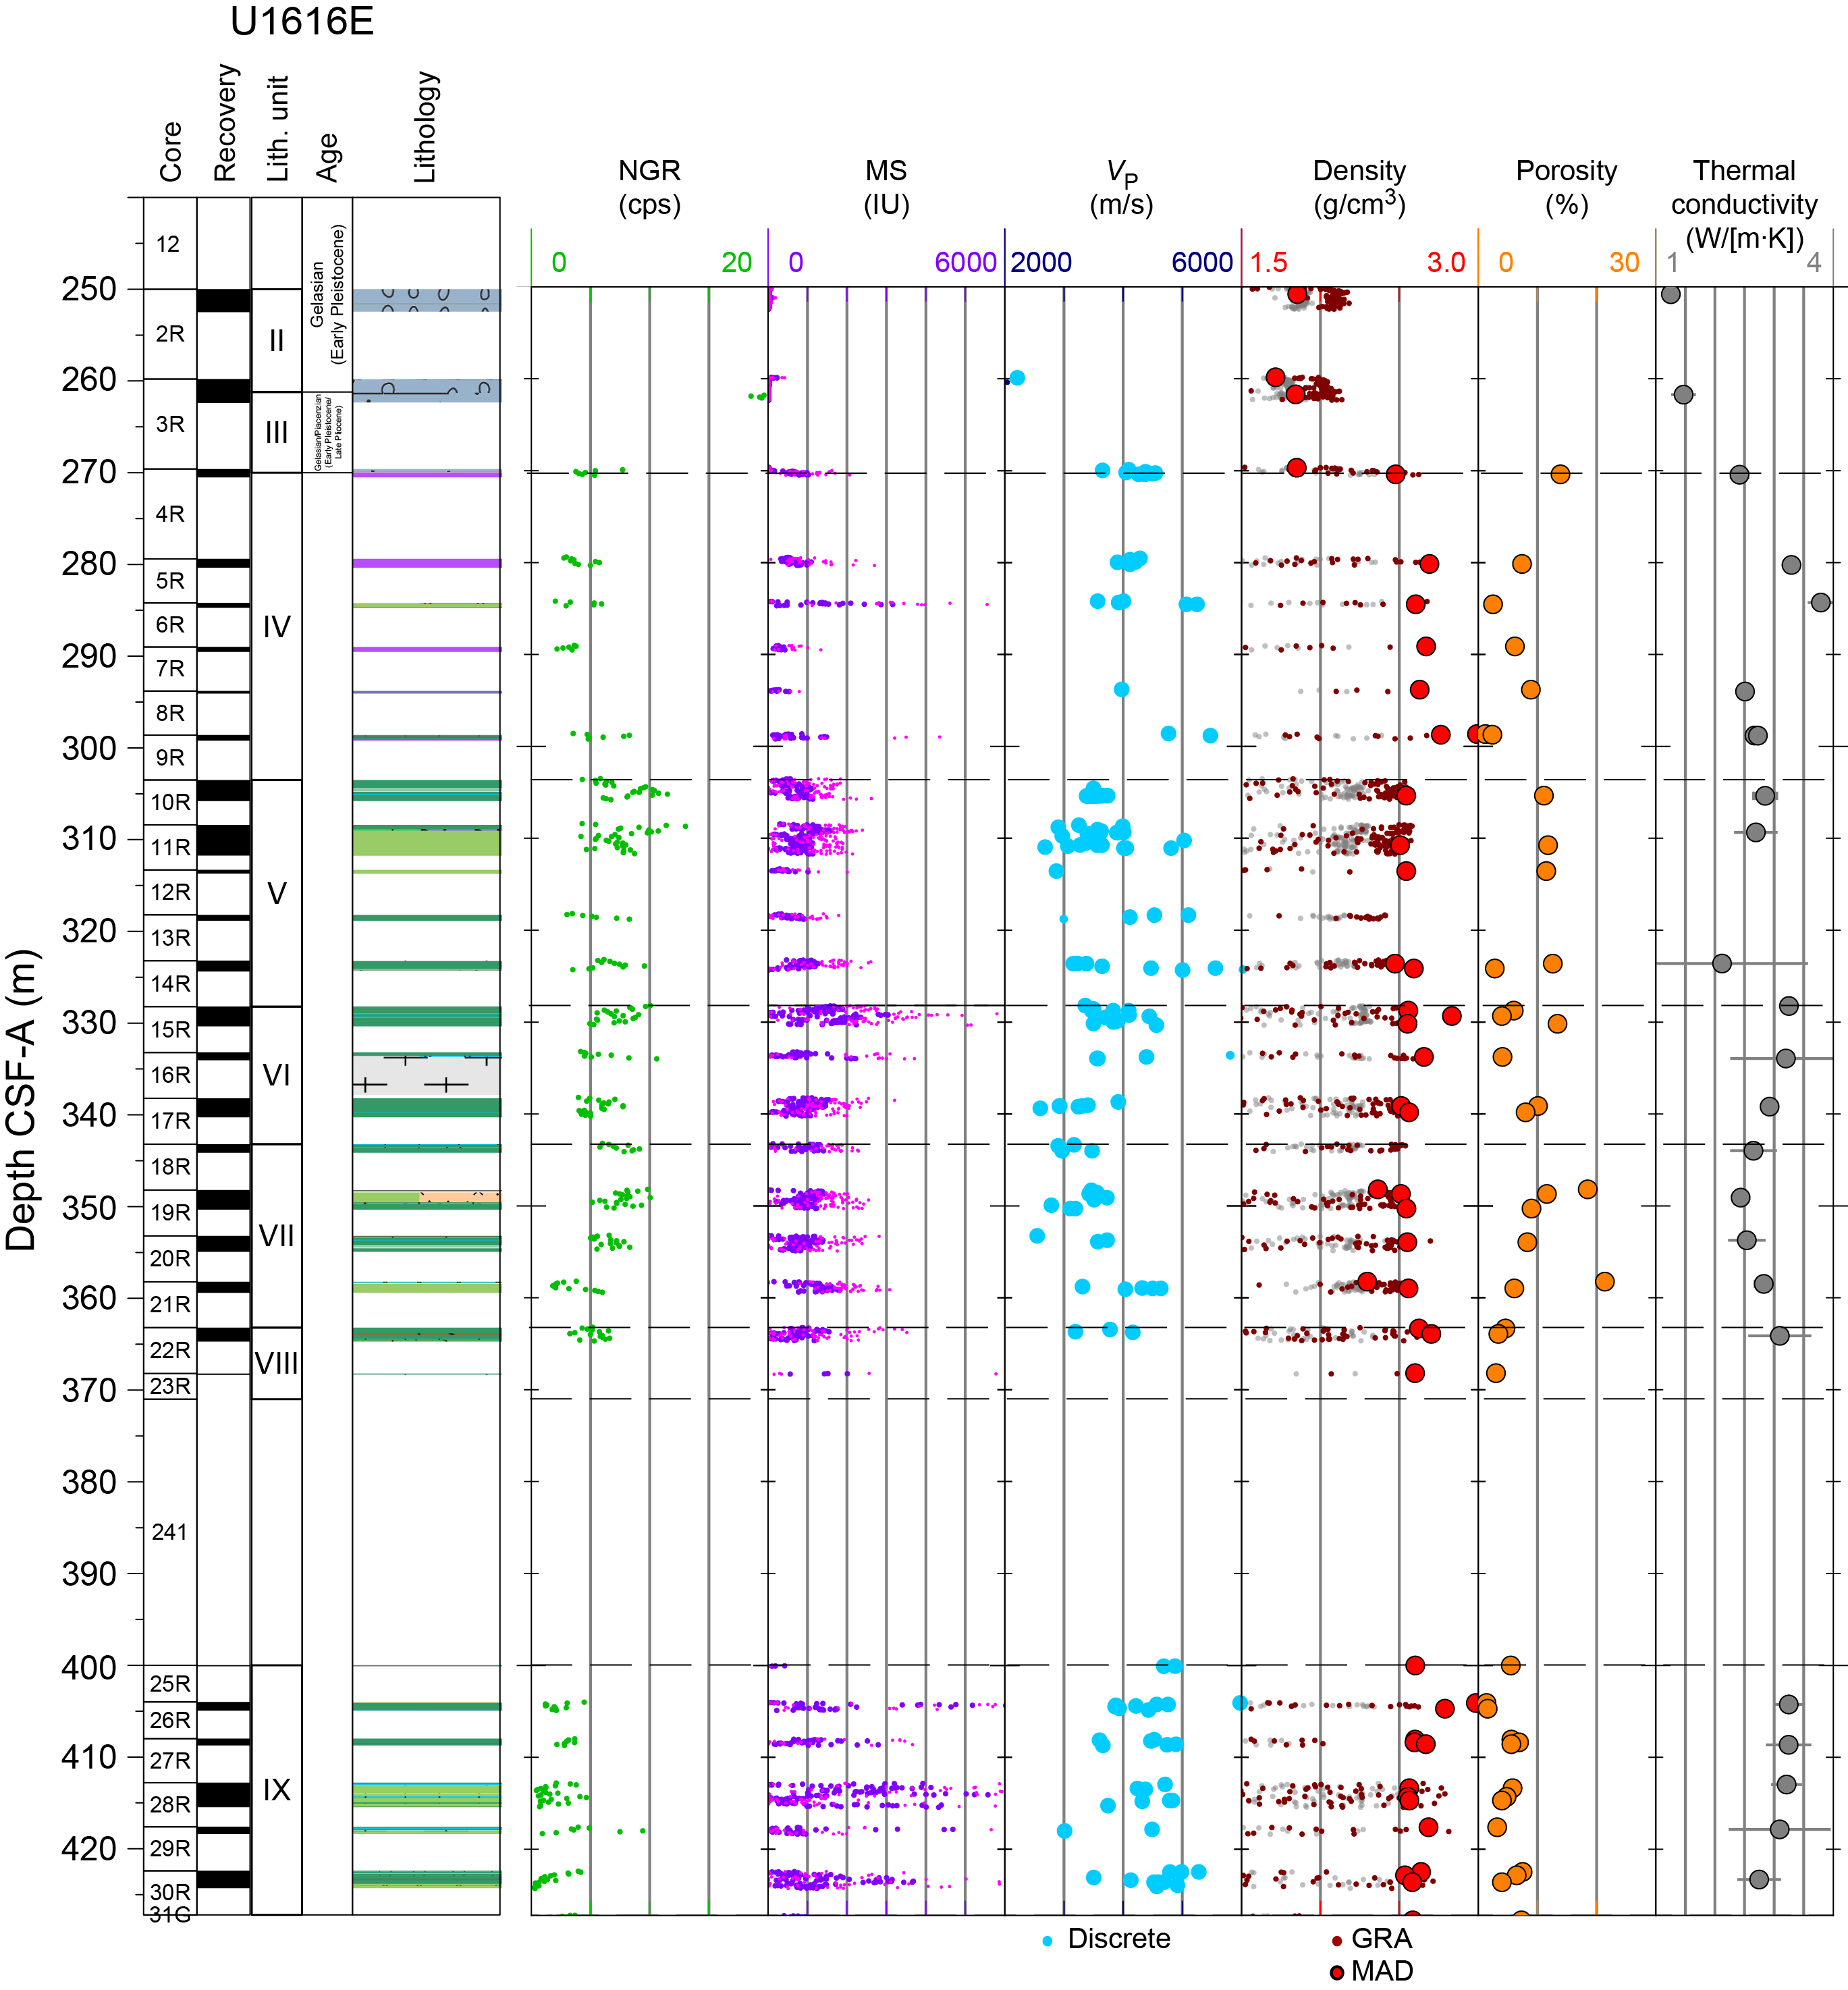
Figure F58. Physical properties, Hole U1616E.
10.5. Lithostratigraphic Unit V
The 25 m thick Lithostratigraphic Unit V extends from Core 402-U1616E-10R through Core 14R (303.5–328.2 mbsf) and is dominated by harzburgites and lherzolites with pervasive carbonate veins. Based on discrete measurements with the Gantry system, VP in Unit V has a large range of 2682–6024 m/s (Table T18). Bulk density (based on four MAD samples) is 2.528 g/cm3, and porosity ranges 13%–3% with an average of 10% (Figure F58; Table T18). NGR is generally stable and ranges 3–13 counts/s similarly to Unit IV, whereas MS shows a high variability between 5 and 1576 IU with an average of 752 IU. Thermal conductivity varies from 2.12 to 2.849 W/(m∙K) with an opposite trend to porosity.
10.6. Lithostratigraphic Unit VI
Lithostratigraphic Unit VI is 15 m thick and extends from Core 402-U1616E-15R through Core 17R (328.2–343.2 mbsf). This unit is composed of serpentinized harzburgites with minor gabbroic intrusions. VP measured using the Gantry system varies from 2600 to 5807 m/s with an average of 3764 m/s (Table T18); the highest velocities are associated with gabbroic intrusions. The average bulk density is 2.60 g/cm3, and the average porosity is 8% based on five MAD samples (Figure F58; Table T18). NGR and MS show trends similar to Unit V with generally low average values of 6 counts/s and 1115 IU, respectively. Thermal conductivity generally decreases downhole from 3.25 to 2.923 W/(m∙K).
10.7. Lithostratigraphic Unit VII
Lithostratigraphic Unit VII extends from Core 402-U1616E-18R through 21R (343.2–363.2 mbsf) and is dominated by harzburgites and lherzolites with diffuse gabbroic intrusions. VP varies from 2548 to 4321 m/s with an average of 3406 m/s (Table T18). The average bulk density is 2.47 g/cm3 based on six MAD samples, and porosity varies from 21% to 6% (Figure F58; Table T18). The minimum bulk density of 2.297 g/cm3 and the maximum porosity of 21% correspond to diorites from Section 402-U1616E-21R-1. NGR remains low and ranges 3–7 counts/s, and MS has a quite constant trend but a high variability and ranges 6–1822 IU. Thermal conductivity has an average of 2.612 W/(m∙K) based on four measurements.
10.8. Lithostratigraphic Unit VIII
Lithostratigraphic Unit VIII extends from Core 402-U1616E-22R through 23R (363.2–371.0 mbsf) This unit is composed of harzburgites with carbonate-rich breccia. Because Unit VIII is only ~5 m thick, the discrete measurements are limited, and it is not possible to define trends with depth. The three Gantry velocities measured provide an average value of 3711 m/s. The average bulk density is 2.66 g/cm3, and the average porosity is 4% based on two MAD samples (Table T18). NGR varies from 3 to 7 counts/s, and MS is highly variable and ranges 67–2010 IU. A single thermal conductivity measurement gave a value of 3.096 W/(m∙K).
10.9. Lithostratigraphic Unit IX
A total of 13 MAD samples were collected from Lithostratigraphic Unit IX (Cores 402-U1616E-25R through 30R; 400–427.2 mbsf; and ghost Core 31G). Bulk density ranges 2.536–2.985 g/cm3 (diabase sample from Section 26R-1), and porosity varies between 1% (diabase) and 8% (altered gabbro from Core 31G). MS is highly variable and ranges from 0 to greater than 5000 IU. NGR is generally low below 5 counts/s, except for a spike to 10 counts/s over the diabase interval in Section 29R-1. Five measurements of thermal conductivity are consistently high with an average of 3.109 W/(m∙K).
11. Downhole measurements
Downhole measurements at Site U1616 consisted of in situ sediment temperatures taken with the APCT-3 tool and limited downhole geophysical measurements in open hole with the triple combo tool string.
The downhole geophysical measurements operations began on 26 March 2024. Hole U1616E was swept with sepiolite to clear out debris (see Operations). The drill bit was dropped on the seafloor, and the base of the drill string was set at 266.6 mbsf.
The first downhole measurements pass in Hole U1616E was made with the triple combo tool string, which included the logging equipment head-tension and mud temperature (LEH-PT) for the temperature and electrical resistivity of the borehole fluid; the Enhanced Digital Telemetry Cartridge (EDTC) for total natural gamma ray; the Hostile Environment Natural Gamma Ray Sonde (HNGS) for total spectral gamma ray (HSGR) data in American Petroleum Institute gamma radiation units (gAPI); the HLDS for bulk density, photoelectric effect, and a one-arm caliper; the High-Resolution Laterolog Array (HRLA); and the Magnetic Susceptibility Sonde (MSS). During the down log, an obstruction was encountered at 311.7 mbsf (~60 m above the bottom of the hole) near the base of the breccia interval located between the sediments and the peridotite basement; the tool was unable to pass.
Downhole measurements were recorded during the down log from the seafloor to 265.8 mbsf, recording a short interval of natural gamma ray, electrical resistivity, bulk density, and MS data in the open hole. Natural gamma ray data were also recorded through the drill pipe and casing up to the seafloor (Figure F59). After lowering the base of the pipe to 309.8 mbsf, a second run of the same tool string was attempted. The tool string was stopped inside the pipe 50 m above the base of the BHA. The tool string was brought back to the surface, and logging operations were ended.
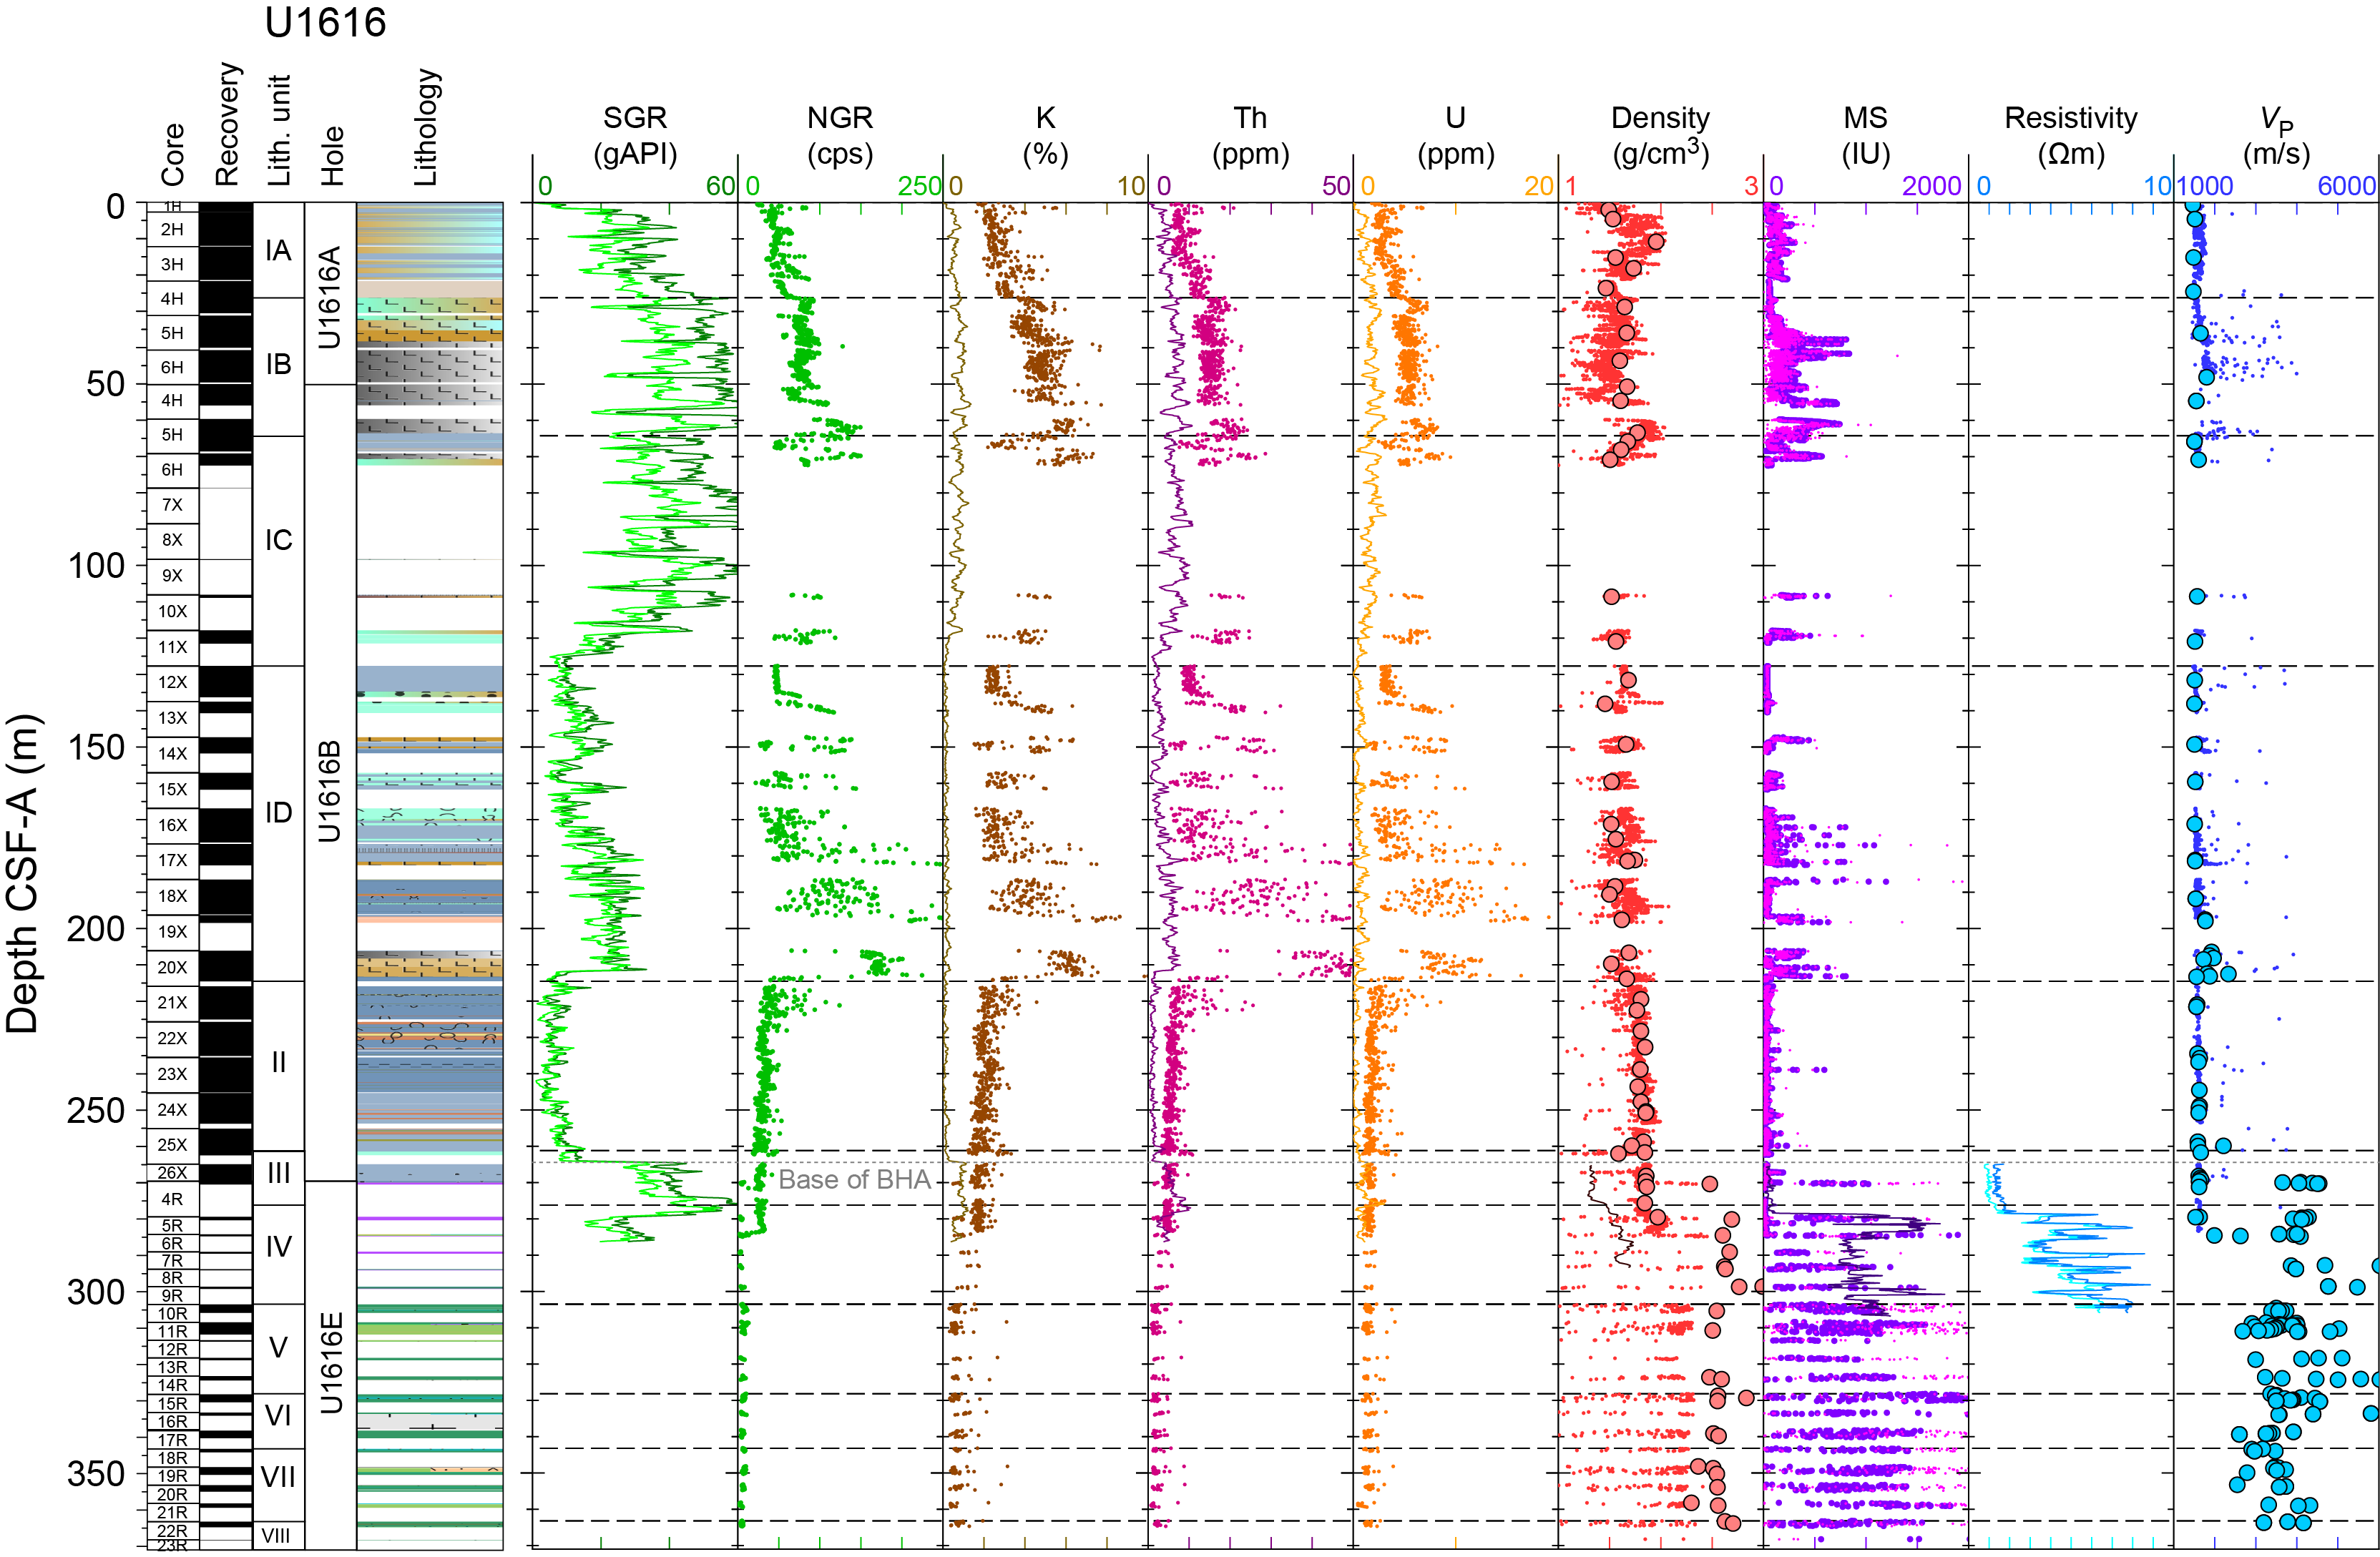
Figure F59. Physical properties data with downhole profiles, Run 1.
A third run of downhole measurements was also recorded in the lower portion of Hole U1616E on 5 April 2024 from the seafloor to 341.7 mbsf, where the triple combo tool string was stopped by a bridge. Electrical resistivity and MS data were only recorded in the open hole on the way out of the hole, from the bottom of the BHA at 317.1–341.7 mbsf. Natural gamma ray data were also recorded through the drill pipe and casing up to the seafloor, but less than a meter of data was recorded in the open hole because of the position of the tool on the tool string. While attempting to clean the hole and set the base of the pipe below the bridge for another set of measurements, the drill pipe became stuck for several hours (see Operations). When the drill pipe was freed, it was decided to end downhole measurement operations.
11.1. Downhole temperature measurements and heat flow
11.1.1. Downhole temperature measurements
The APCT-3 tool was deployed twice at Site U1616. First, it was deployed in the upper part of Hole U1616A with a successful measurement at 31.2 mbsf (Core 4H) and an equilibrium temperature of 14.98°C. After Hole U1616A was abandoned due to bad weather conditions, the APCT-3 tool was deployed again in Hole U1616B, with a successful measurement at 59.7 mbsf (Core 4H) and an equilibrium temperature of 17.91°C. These temperatures are consistent with an equilibrium seafloor temperature of 13.48°C recorded in Hole U1616B, yielding a thermal gradient of 7.38°C/100 m (Figure F60; Table T19). The correction factor determined from shipboard measurements was applied to the temperature measurements taken in sediments at Site U1616 (see Downhole measurements in the Expedition 402 methods chapter [Malinverno et al., 2025]).
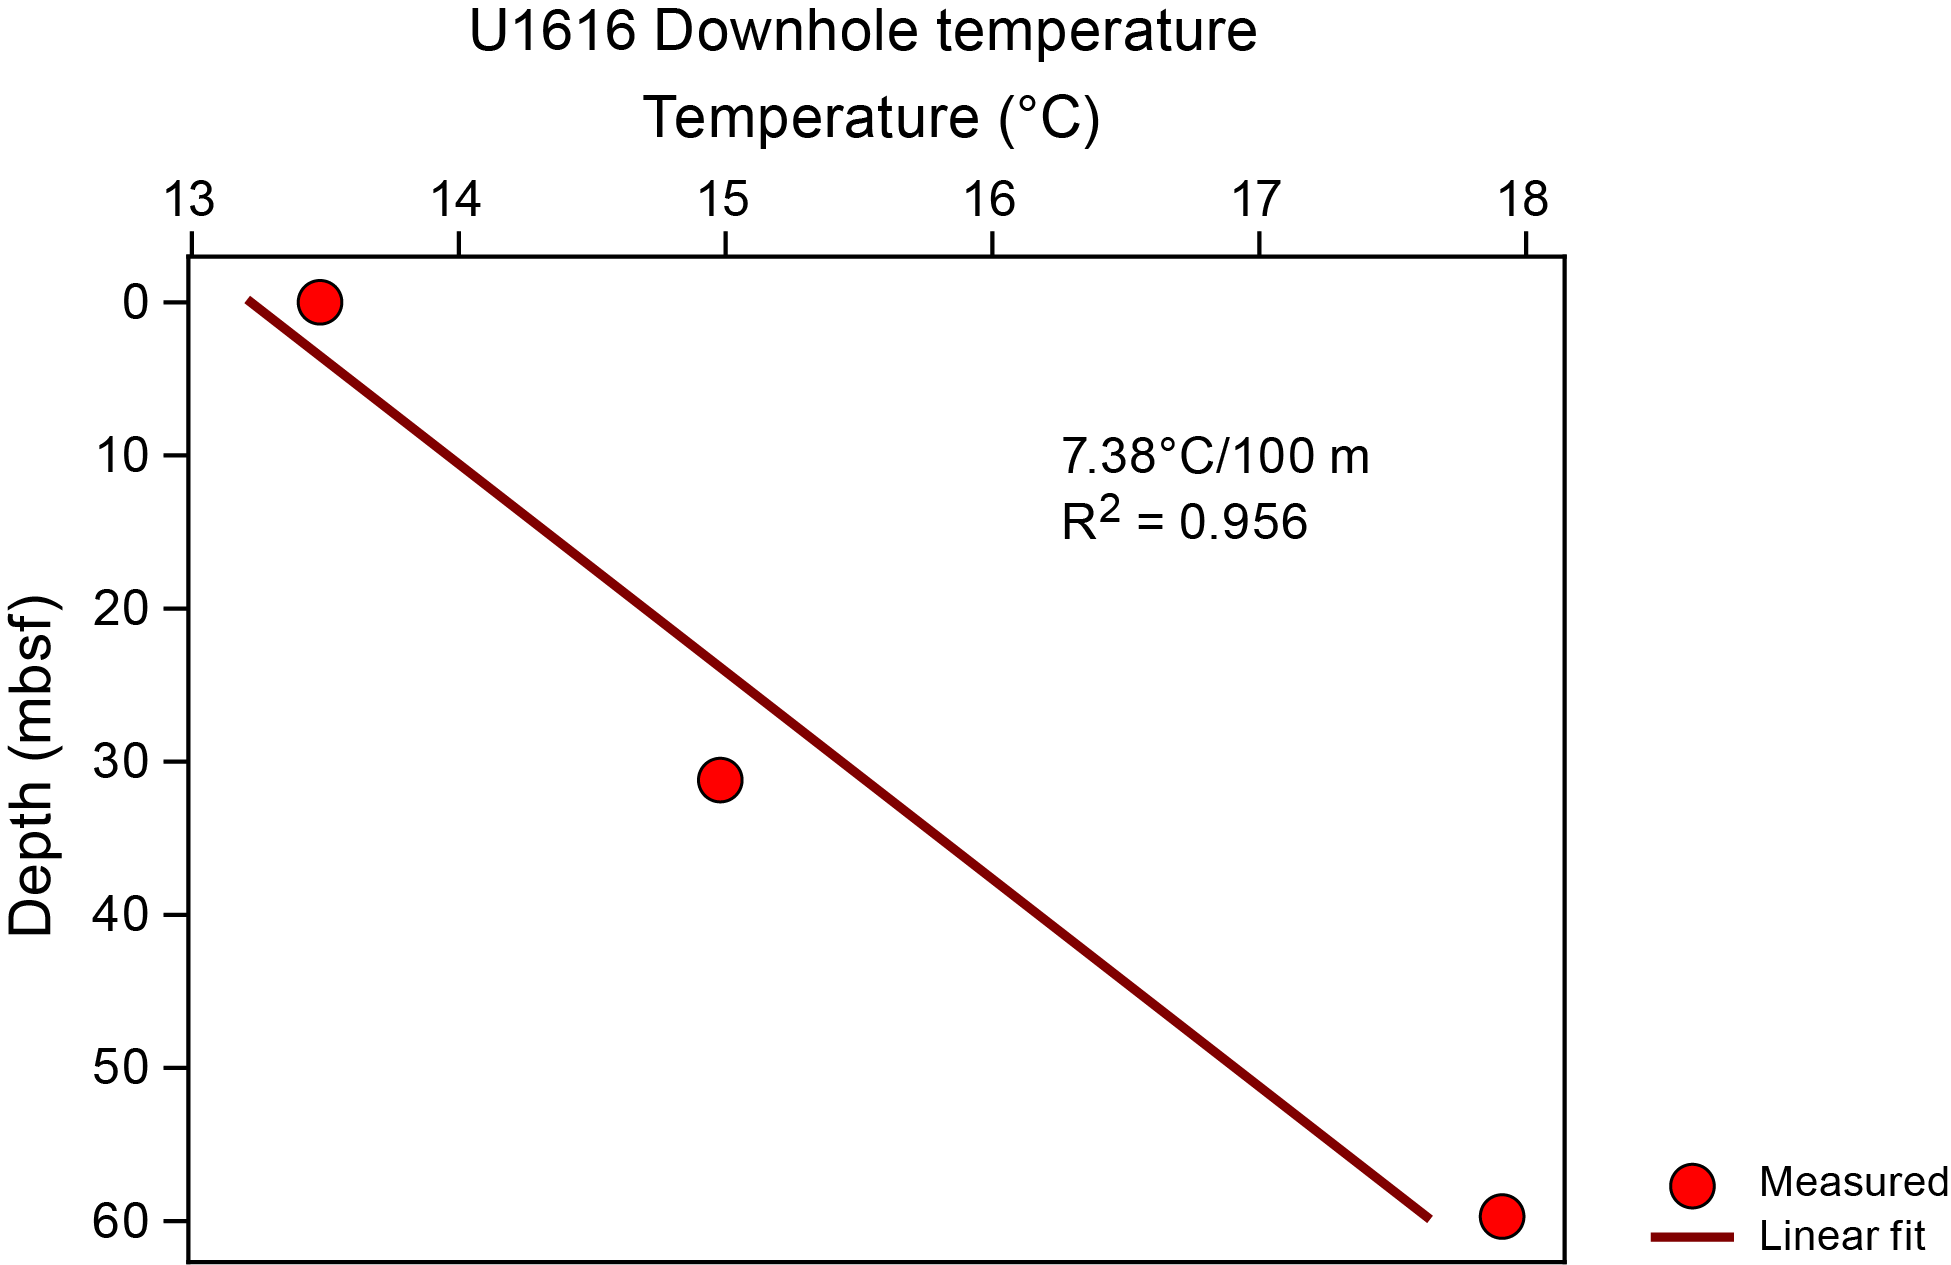
Figure F60. Temperatures in Vavilov Basin and local temperature gradient.
11.1.2. Heat flow
With a thermal gradient of 7.38°C/100 m, a heat flow value of 73 mW/m2 is obtained for Site U1616 using an average thermal conductivity of 0.986 W/(m∙K) measured on cores at Site U1616 for the uppermost 59.7 m (see Physical properties). This heat flow value is on the lower end compared to measurements from Expedition 402 Sites U1612 (184 mW/m2), U1614 (217 mW/m2) and U1615 (148 mW/m2), as well as at ODP Leg 107 Sites 650 (132 mW/m2), 651 (131 mW/m2), and 655 (63 mW/m2) (Shipboard Scientific Party, 1987a, 1987b, 1987c) and from near-seafloor measurements in the Vavilov Basin (Della Vedova et al., 2001).
11.2. Borehole geophysics
11.2.1. Borehole geophysics in the sediments and breccias of Hole U1616E
11.2.1.1. Natural gamma ray through pipe
Natural gamma ray data were recorded from the seafloor to 286.3 mbsf, mostly through the drill pipe except for a ~20 m interval acquired in the open hole (Figure F59). The cased section went from the seafloor to 220 mbsf, and the bottom of the pipe was set at 266.6 mbsf for downhole measurement operations. The recorded profile within drill pipe is mostly qualitative. However, the strong gamma signal related to clays and ash layers (see Lithostratigraphy and Physical properties) is recorded through the drill pipe. The downhole changes are analyzed below in terms of lithostratigraphy.
11.2.1.2. Open hole geophysical data
The MSS was located at the base of the triple combo tool string deployed in Hole U1616E. Consequently, this tool recorded the deepest data in Hole U1616E (to 308.2 mbsf; Figure F59). MS values show a sharp increase at the base of the dolomitized Lithostratigraphic Unit III (279.3 mbsf) and into the brecciated basement top (Lithostratigraphic Unit IV). During the first logging run, electrical resistivity data were recorded in the open hole over a 40.1 m interval, providing data from the base of Lithostratigraphic Unit III and through the more resistive breccia of Lithostratigraphic Unit IV (Figures F59, F61). The density tool caliper, which ensures contact between the measuring pad on the tool and the borehole wall, was not opened on either the down or up pass. Increasing bulk density values were recorded on the down log from 1.3 g/cm3 in the sedimentary Lithostratigraphic Unit III to 1.7 g/cm3 in Lithostratigraphic Unit IV, with a notable increase at the Lithostratigraphic Unit III/IV boundary. When compared to bulk density data measured on recovered core (Figures F59, F61), the in situ data are found to be 0.5 g/cm3 lower, probably due to a lack of contact between the measuring pad and the borehole wall. In the open hole, a 20.6 m long section of natural gamma ray data were obtained, recording a sharp decrease into the breccia of Lithostratigraphic Unit IV. Although the thorium and uranium in situ data in open hole agree with those measured on cores, a clear difference is obtained for potassium, with in situ values approximately half of that obtained from cores. The misfit between core and downhole potassium data is probably related to the large hole diameter because gamma rays produced from potassium decay are less energetic than those produced by thorium and uranium (Ellis and Singer, 2007). However, the downhole data in the short open hole interval show more variability than those obtained from the core (Figures F59, F61).
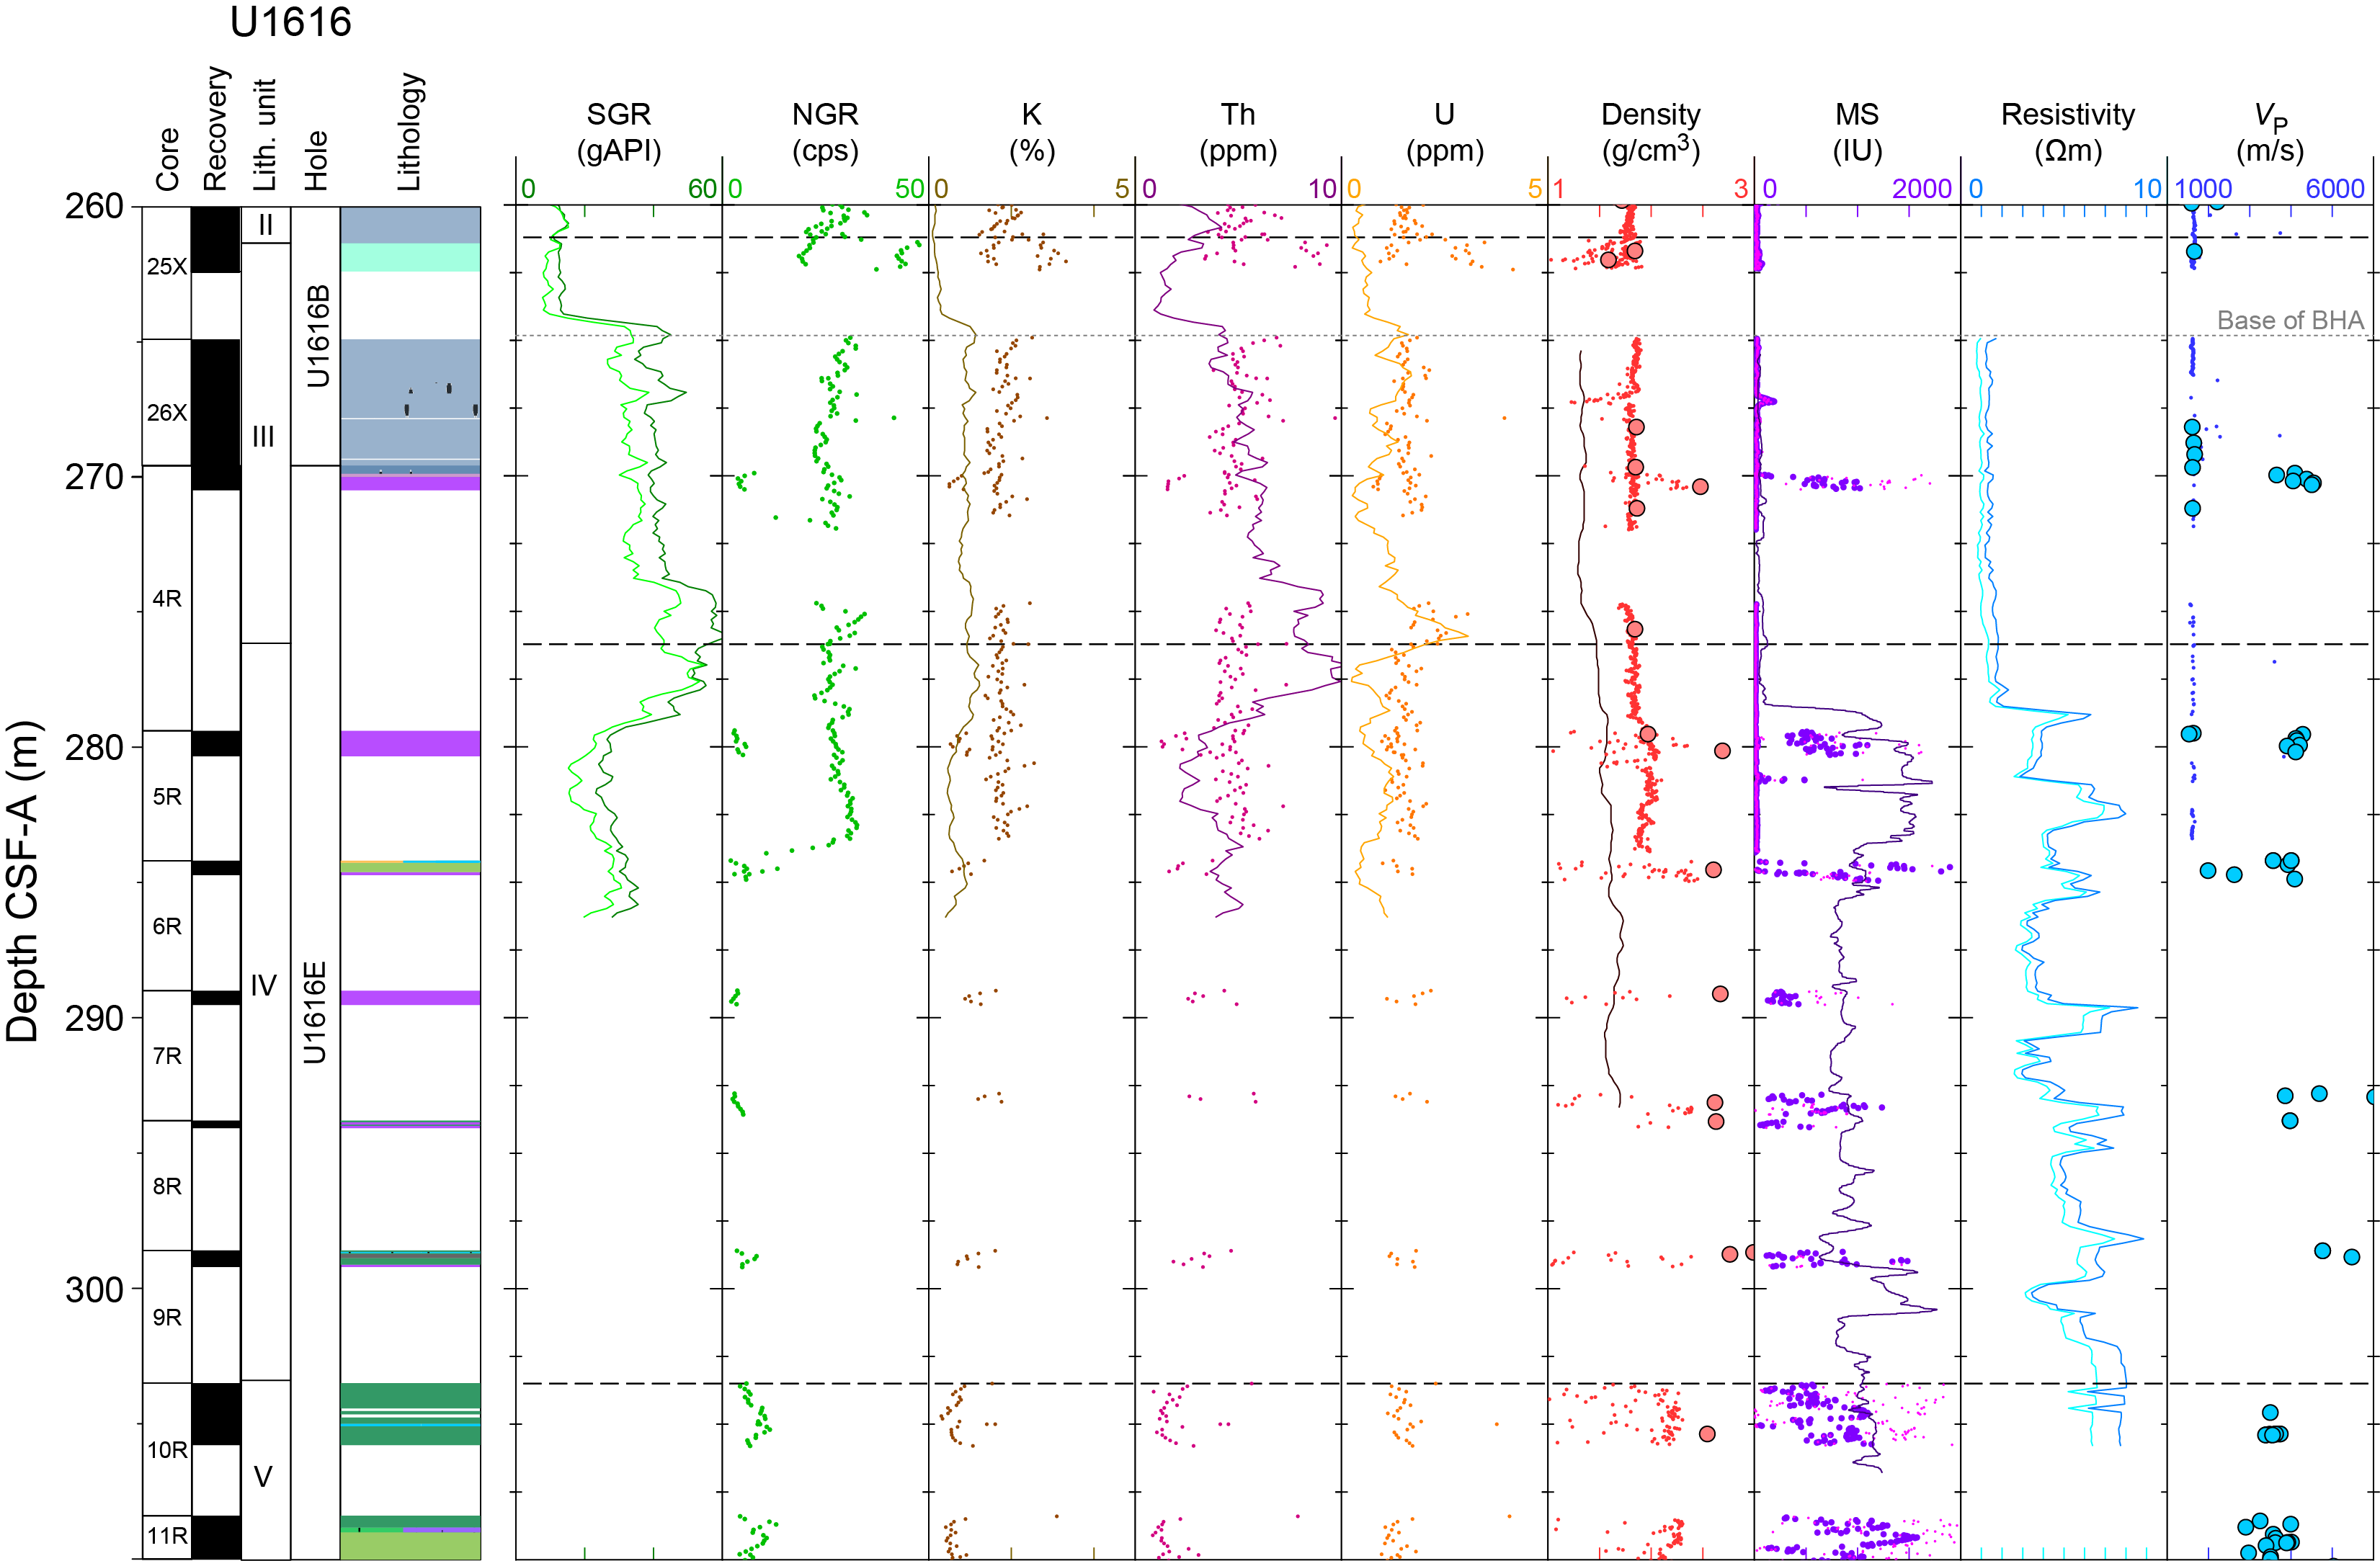
Figure F61. Physical properties data with downhole profiles, Run 1 close up.
Overall, a total of 42.4 m of open hole geophysical data were recorded in the sediments and basement breccia of Hole U1616E during the first set of logging operations at Site U1616. The bulk density data can be considered as only qualitative in the absence of hole size data. No measurements were recorded during the second run into the hole because the tool became stuck inside the drill pipe.
11.2.1.3. Lithostratigraphy
Throughout Lithostratigraphic Unit I (0–214.5 mbsf), the boundaries between Subunits IA, IB, IC, and ID are located close to sharp changes in the natural gamma ray data (Figure F59). The Subunit IA/IB and IB/IC boundaries display sharp changes in total gamma signal, but the Subunit IC/ID boundary could be moved 1 m up, where a sharp change in total natural gamma ray signal is recorded. Although the Lithostratigraphic Unit II/III boundary cannot be precisely defined from downhole measurements because it roughly coincides with the base of the drill pipe, the Lithostratigraphic Unit III/IV boundary at the base of the dolomitized interval could be moved 2 m down, where sharp changes in electrical resistivity, MS, and natural gamma signals are recorded, corresponding to the top of the breccia interval (Figures F59, F61).
11.2.2. Borehole geophysics in the basement of Hole U1616E
A third run recorded downhole geophysical measurements with the triple combo tool string in Hole U1616E on 5 April 2024 over a very short depth interval before the tool string encountered an obstruction.
The MSS was located at the base of the tool string deployed in Hole U1616E. Consequently, this tool recorded 25 m of data to 341.7 mbsf (Figure F62) through serpentinized peridotites, gabbros, and diabase layers. Three gabbroic layers identified in Cores 14R–16R (see Igneous and metamorphic petrology) coincide with low MS values at 328, 334, and 337 mbsf. Electrical resistivity data were recorded over an even shorter interval (21 m) from the base of the BHA (317.1 mbsf) to 338 mbsf. Whereas low values of electrical resistivity (4–10 Ωm) are measured in serpentinized peridotites sampled in Cores 12R–16R, higher values (15–34 Ωm) are measured in a diabase layer located at 325 mbsf and identified in Core 14R. Even higher electrical resistivities are measured at 319–320 mbsf, but this material does not appear to have been recovered in Cores 12R and 13R.
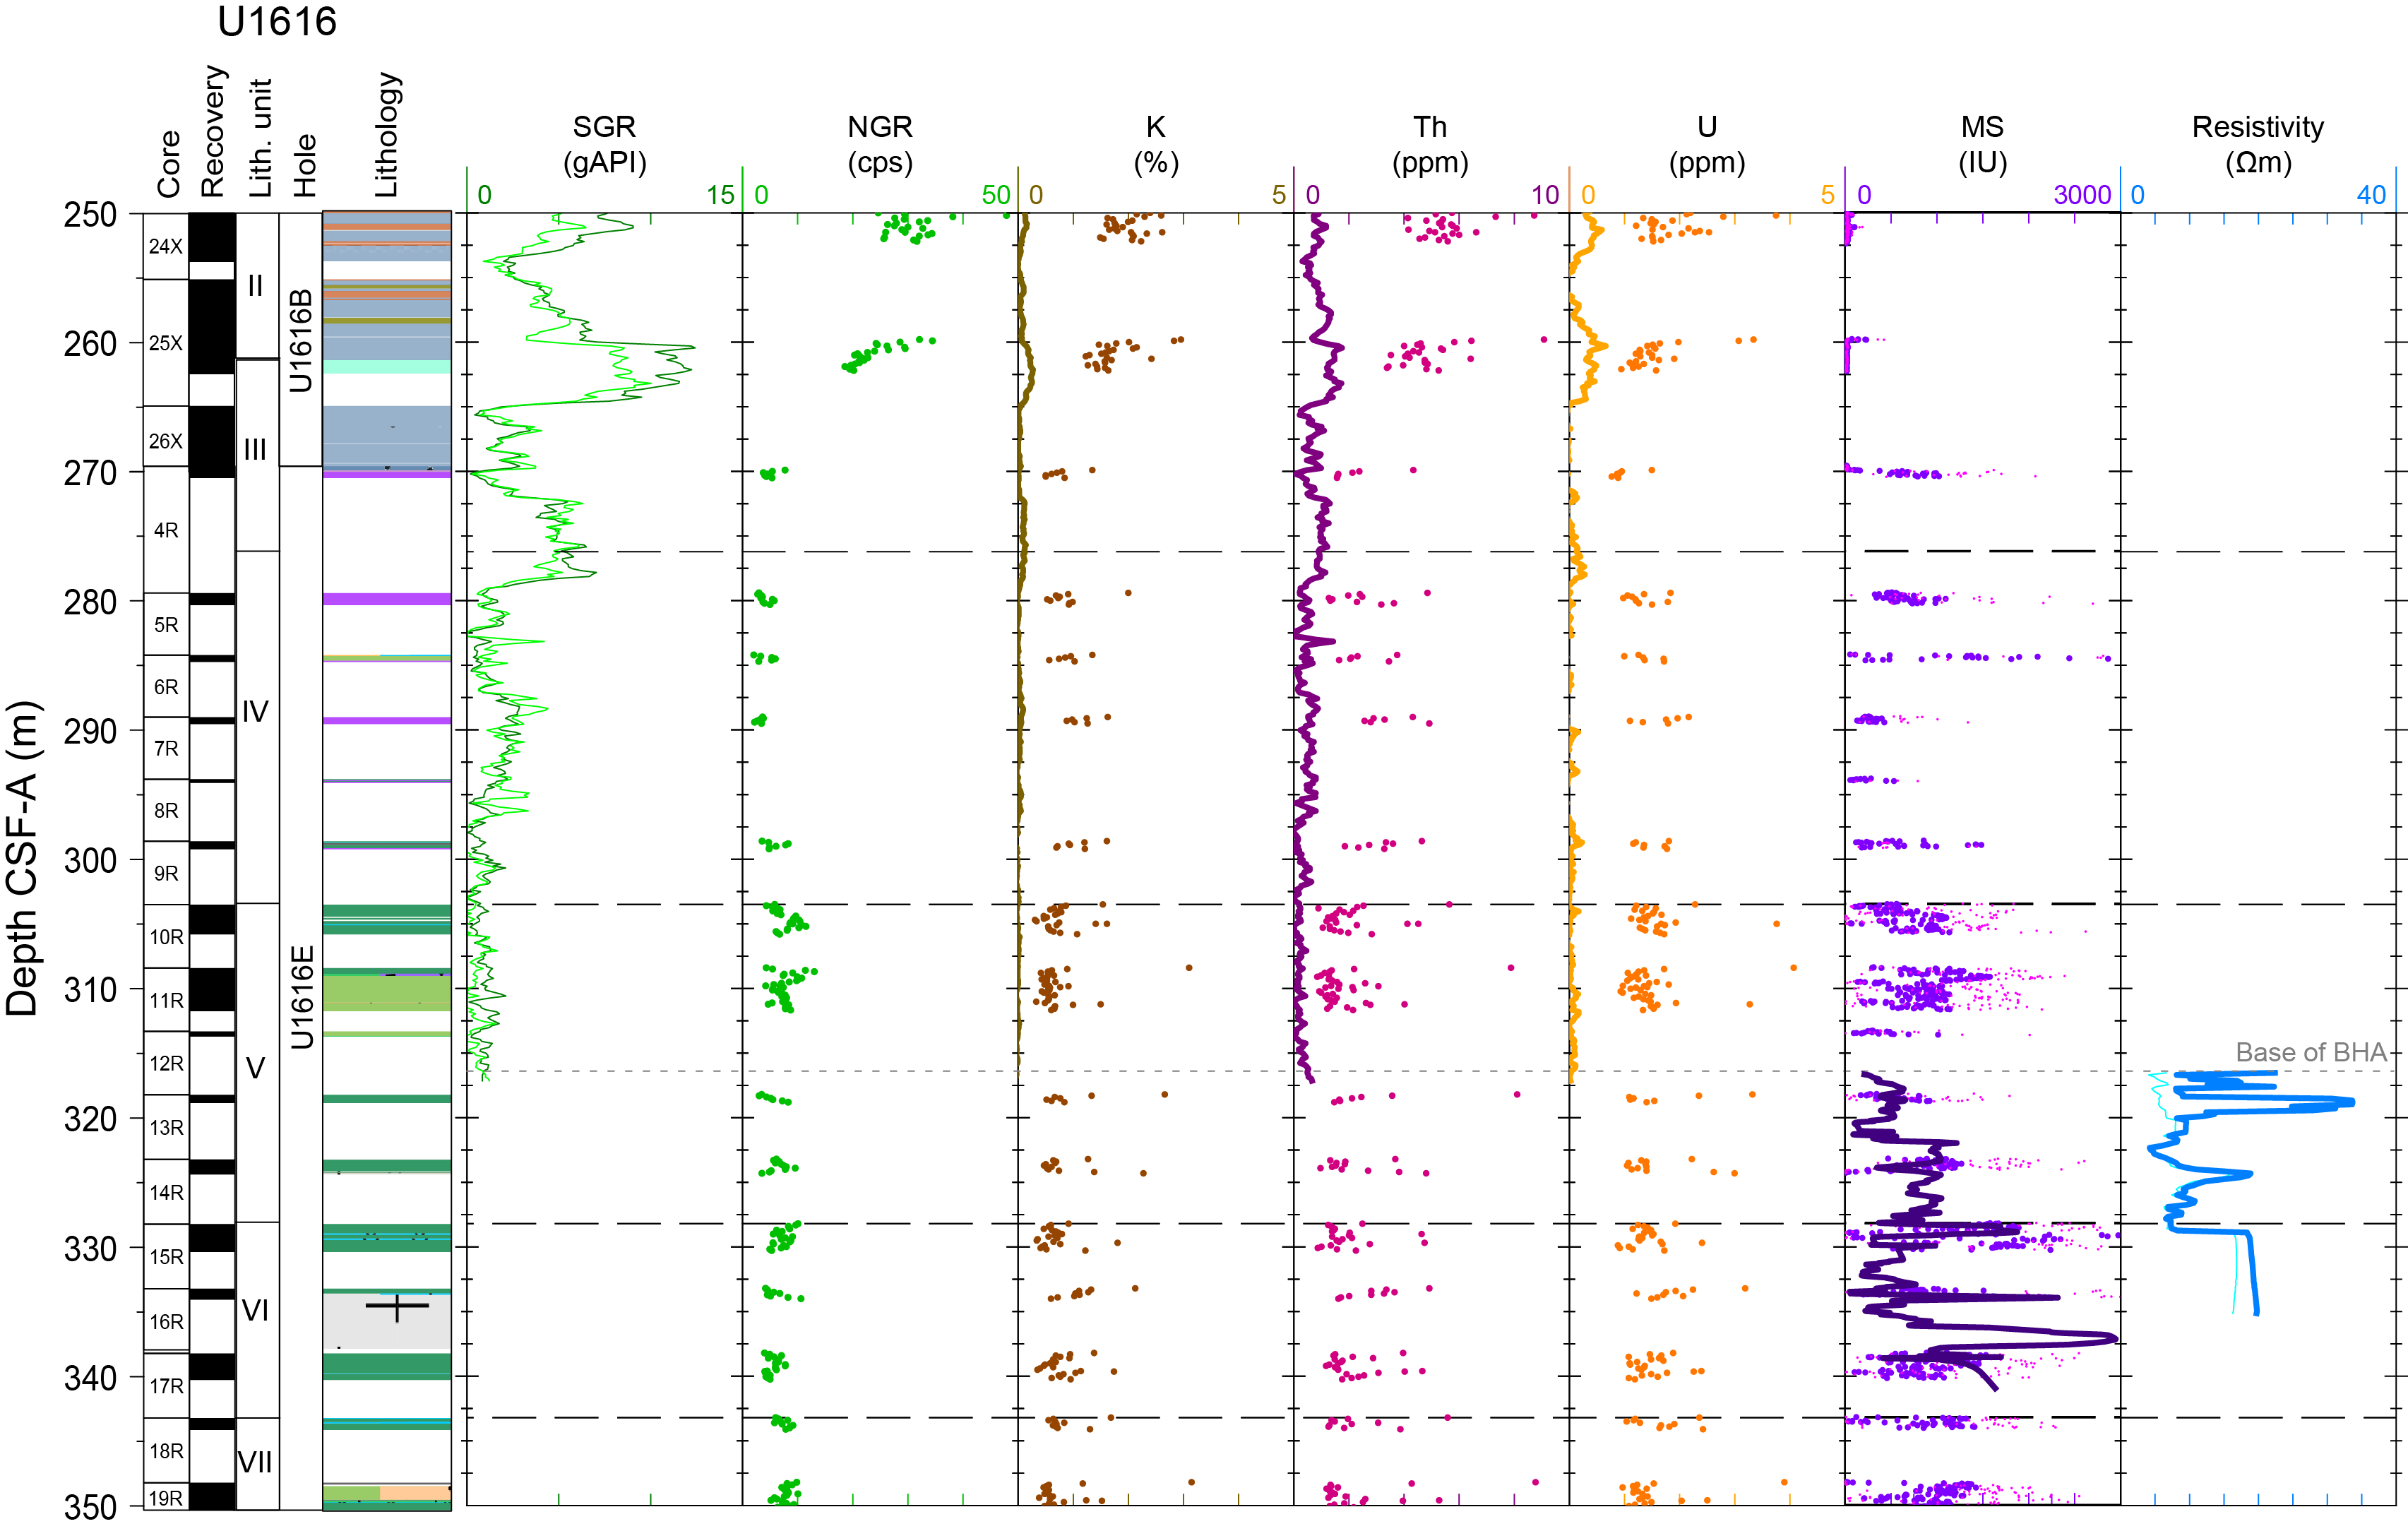
Figure F62. Physical properties data with downhole profiles, Run 3.
12. Microbiology
12.1. Sediment
At Site U1616, we drilled Holes U1616A and U1616B using the APC/XCB system to 302.6 mbsf. We carried out microbiological analyses to search for life in the sediments at various depths, including measurements of dissolved oxygen in the sediment pore waters, contamination tests using the PFD tracer for microbiological sample selection, deep seawater sampling using the Niskin bottle attached to the VIT camera frame, and the collection of samples for shore-based molecular biology and culture studies.
12.1.1. Oxygen profiles
Oxygen is the first molecule to be reduced during microbial degradation of organic matter and is therefore an important indicator of microbial activity in subsurface sediments. Oxygen concentrations in Holes U1616A (Subunits Unit IA and IB) and U1616B (Subunits IB and IC) were measured immediately after core recovery, beginning with Core 402-U1616A-1H. Measurements were taken only on core sections that were at least 80 cm long so that both the oxygen and temperature probes could be inserted and separated by a minimum distance of 20–30 cm. Core 1H was measured at several points and showed significant oxygen concentrations and a clear decrease with depth. Low concentrations were detected downcore, reaching a minimum value of 0.85 µmol/L at 0.6 mbsf (Figure F63; Table T20). Thereafter, the sediments were relatively anoxic to 180 mbsf in Core 402-U1616B-17X (Subunit IC), where oxygen increased to 22.69 µmol/L. Another measurement, taken a few meters downcore (Core 18X), continued to show nonzero oxygen concentrations. In deeper cores, it was not possible to insert the probe because the sediment had become more compacted.
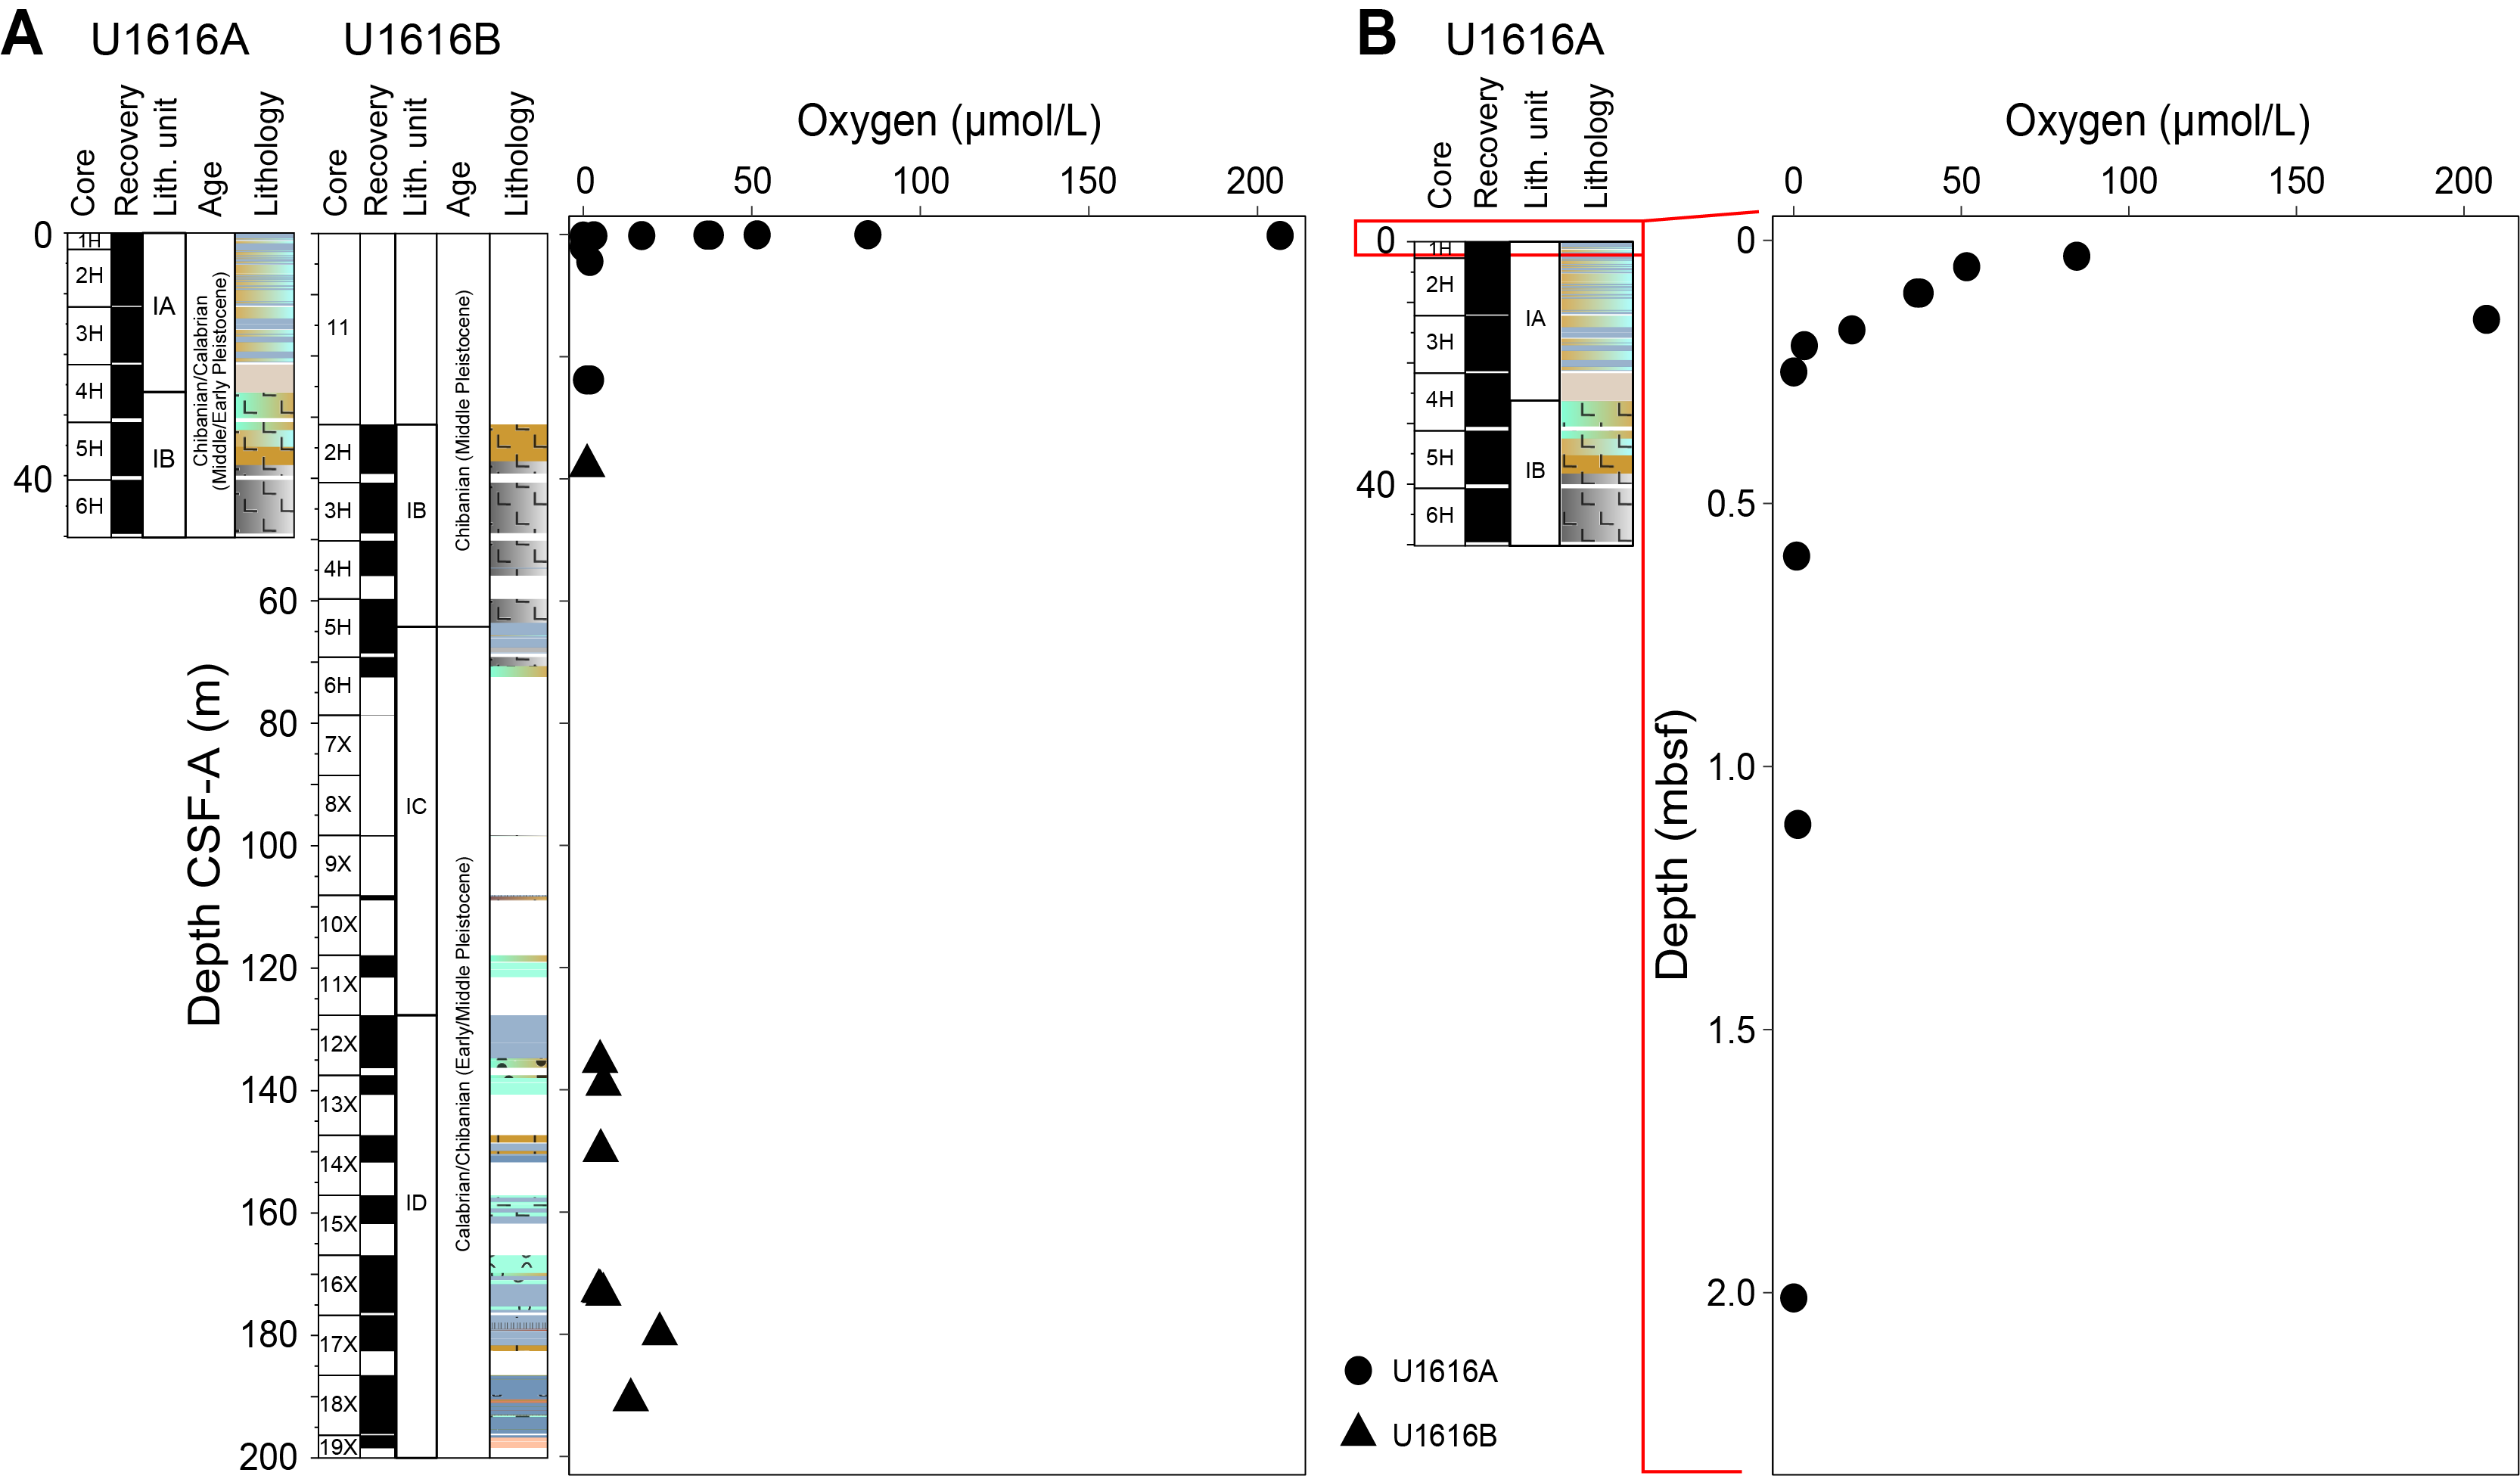
Figure F63. Oxygen concentration profile.
12.1.2. Microbiological contamination testing
Sediment samples can be easily contaminated by the intrusion of drilling fluid (Sylvan et al., 2021). PFD, an inert chemical substance, was used as a tracer to determine the extent of contamination in microbiological samples. It was injected into the drilling fluid at a concentration of 0.4 mL/L during circulation in Holes U1616A and U1616B. Drilling fluid was collected in glass vials directly from the core liner, and samples of the core exterior and interior were collected with syringe plugs alongside the microbiological samples.
A total of 20 sample sets of drilling fluid, core exterior, and core interior were collected on the catwalk. PFD was detected in drilling fluid and the exterior samples, indicating successful delivery of the tracer. The detection in interior samples was low with a median of 0.28 ng/g, and only one interior sample (402-U1616B-21X-5) showed significant tracer detection (Figure F64; Table T21). Samples collected with the APC/XCB coring system are known to have lower risk of contamination (Coggon et al., 2024; Sylvan et al., 2021).
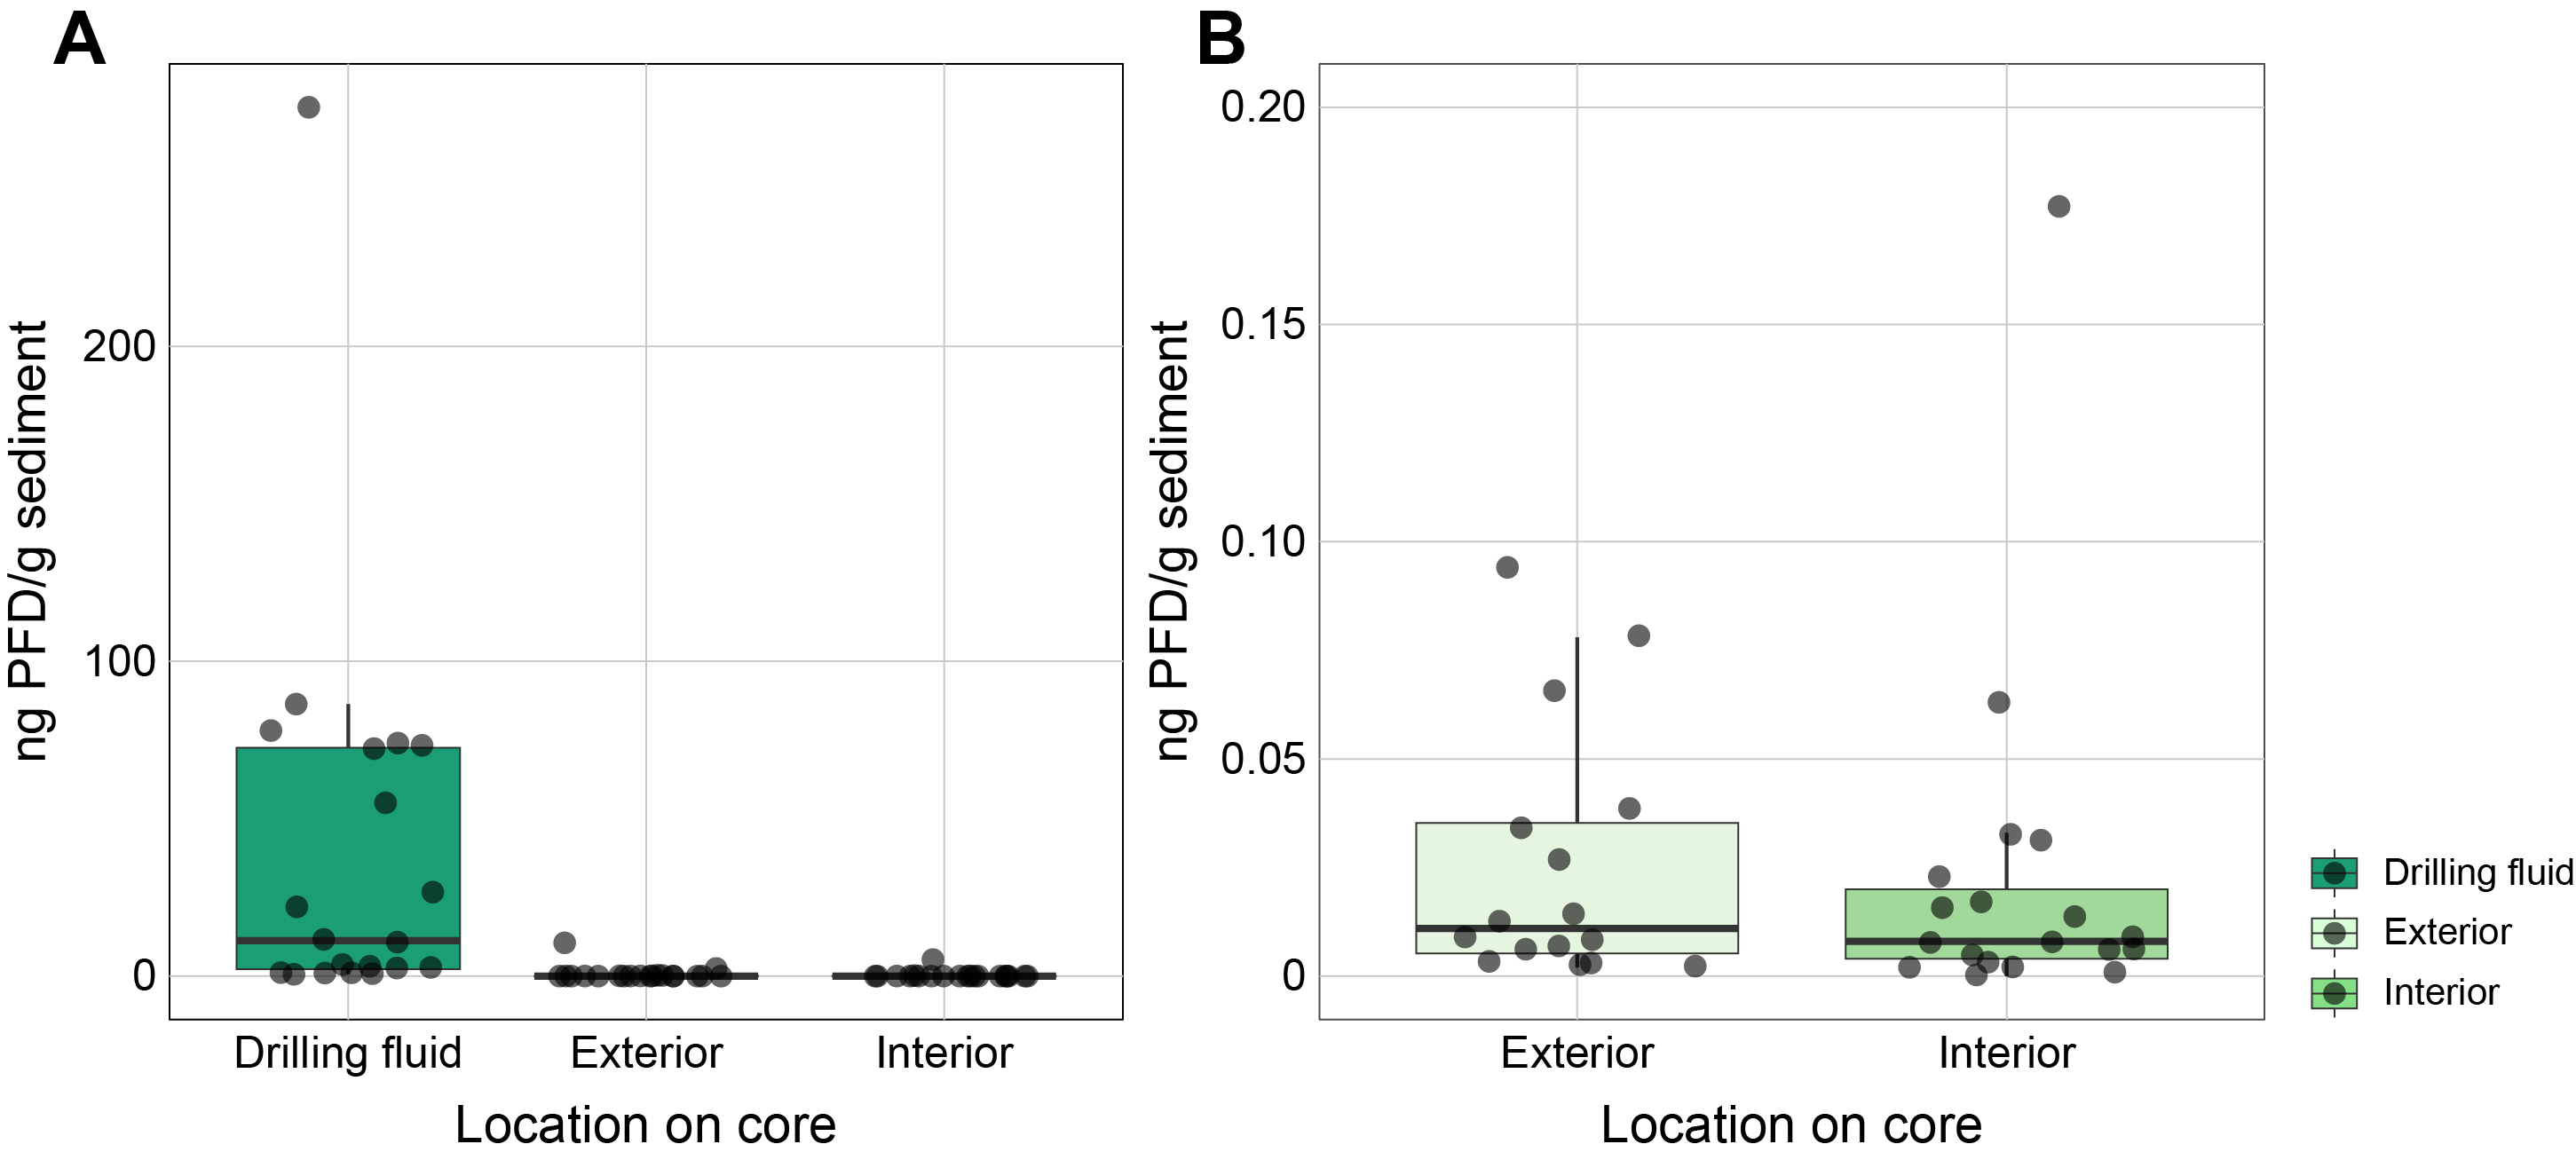
Figure F64. PFD tracer concentrations.
12.1.3. Deep seawater sampling
During reentry operations in Hole U1616E, the VIT camera system was lowered to the ocean floor with a Niskin bottle attached to the camera frame that sampled 2 L of deep water (water depth of 3554 m), which was brought to the surface and placed in a sterile glass bottle. Sample aliquots were taken for cell counting and molecular biology analyses of bacteria in the water. A total of 5 mL was divided into 1 mL cryotubes and fixed with 4% formaldehyde for the cell counts. The remaining water was filtered onto a 0.2 µm polycarbonate membrane filter, retaining the cells by wrapping the entire filter in an aluminum envelope. The cell count samples and filter were frozen at −86°C for onshore analysis.
12.2. Microbiological sampling
12.2.1. Microbial community
Sediment samples were collected in Holes U1616A and U1616B for analysis of the resident microbial communities. For this analysis, 5 cm long whole rounds were collected every 20 m for metagenomic analysis and a 10 mL plug was extracted from the center of each core for 16S rRNA gene amplification and sequencing. These were bagged and frozen at −86°C immediately after collection for onshore analysis.
12.2.2. Microbial experiments
An additional whole-round sample was collected on the catwalk from Sections 402-U1616B-11X-2 and 402-U1616E-2R-2 to perform microbial experiments on samples from possible geochemical transition zones. This is where there may be important changes in sediment and pore water composition affecting the distribution and availability of nutrients and elements essential for life. One whole-round sample was selected for processing in the anaerobic chamber under 0% oxygen conditions and kept at 11°C.
A sample from Section 402-U1616E-2R-2 was used to perform viral production experiments using an enrichment medium. To detect viral activity, the sample was incubated in a 100 mL serum vial under dark conditions while maintaining an anaerobic headspace. Incubations were subsampled at 0, 4, 8, 12, and 24 h. For each subsample, 1 mL of sample was collected in triplicate, fixed with 54 µL of 37% formaldehyde to a concentration of 4% formaldehyde, and stored at −86°C. The incubations were performed in the anaerobic chamber, and the subsampling was performed in the biosafety cabinet (clean air) without opening the incubation bottles.
In addition, a sample from Section 402-U1616B-11X-2 was used to prepare enrichment cultures using two anaerobic culture media (MMJHS and MJYPGS) (see Microbiology in the Expedition 402 methods chapter [Malinverno et al., 2025]), which were then stored in the dark at room temperature. The sediment was diluted in synthetic anaerobic seawater to facilitate transfer of the sediment to the vials.
12.2.3. Viral counts
Plug samples (1 cm3) were taken from each 9.5 m advance and then fixed with 4 mL of a solution of formaldehyde with phosphate-buffered saline (PBS) (100 mM) and stored at 4°C for onshore analysis.
References
Akizawa, N., Ohara, Y., Okino, K., Ishizuka, O., Yamashita, H., Machida, S., Sanfilippo, A., Basch, V., Snow, J.E., Sen, A., Hirauchi, K.-i., Michibayashi, K., Harigane, Y., Fujii, M., Asanuma, H., and Hirata, T., 2021. Geochemical characteristics of back-arc basin lower crust and upper mantle at final spreading stage of Shikoku Basin: an example of Mado Megamullion. Progress in Earth and Planetary Science, 8(1):65. https://doi.org/10.1186/s40645-021-00454-3
Bach, W., and Klein, F., 2009. The petrology of seafloor rodingites: insights from geochemical reaction path modeling. Lithos, 112(1):103–117. https://doi.org/10.1016/j.lithos.2008.10.022
Beccaluva, L., Bonatti, E., Dupuy, C., Ferrara, G., Innocenti, F., Lucchini, F., Macera, P., Petrini, R., Rossi, P.L., Serri, G., Seyler, M., and Siena, F., 1990. Geochemistry and mineralogy of volcanic rocks from ODP Sites 650, 651, 655, and 654 in the Tyrrhenian Sea. In Kastens, K.A., Mascle, J., et al., Proceedings of the Ocean Drilling Program, Scientific Results. 107: College Station, TX (Ocean Drilling Program), 49–47. https://doi.org/10.2973/odp.proc.sr.107.140.1990
Berner, R.A., 1982. Burial of organic carbon and pyrite sulfur in the modern ocean: its geochemical and environmental significance. American Journal of Science, 282(4):451–473. https://doi.org/10.2475/ajs.282.4.451
Boillot, G., and Winterer, E.L., 1988. Drilling on the Galicia margin: retrospect and prospect. In Boillot, G., Winterer, E. L., et al., Proceedings of the Ocean Drilling Program, Scientific Results. 103: College Station, TX (Ocean Drilling Program), 809–828. https://doi.org/10.2973/odp.proc.sr.103.180.1988
Bonatti, E., Seyler, M., Channell, J.E.T., Giraudeau, J., and Mascle, G., 1990. Peridotites drilled from the Tyrrhenian Sea, ODP Leg 107. In Kastens, K.A., Mascle, J., et al., Proceedings of the Ocean Drilling Program, Scientific Results. 107: College Station, TX (Ocean Drilling Program), 37–47. https://doi.org/10.2973/odp.proc.sr.107.141.1990
Coggon, R.M., Teagle, D.A.H., Sylvan, J.B., Reece, J., Estes, E.R., Williams, T.J., Christeson, G.L., Aizawa, M., Albers, E., Amadori, C., Belgrano, T.M., Borrelli, C., Bridges, J.D., Carter, E.J., D'Angelo, T., Dinarès-Turell, J., Doi, N., Estep, J.D., Evans, A., Gilhooly, W.P., III, Grant, L.C.J., Guérin, G.M., Harris, M., Hojnacki, V.M., Hong, G., Jin, X., Jonnalagadda, M., Kaplan, M.R., Kempton, P.D., Kuwano, D., Labonte, J.M., Lam, A.R., Latas, M., Lowery, C.M., Lu, W., McIntyre, A., Moal-Darrigade, P., Pekar, S.F., Robustelli Test, C., Routledge, C.M., Ryan, J.G., Santiago Ramos, D., Shchepetkina, A., Slagle, A.L., Takada, M., Tamborrino, L., Villa, A., Wang, Y., Wee, S.Y., Widlansky, S.J., Yang, K., Kurz, W., Prakasam, M., Tian, L., Yu, T., and Zhang, G., 2024. Site U1559. In Coggon, R.M., Teagle, D.A.H., Sylvan, J.B., Reece, J., Estes, E.R., Williams, T.J., Christeson, G.L., and the Expedition 390/393 Scientists, South Atlantic Transect. Proceedings of the International Ocean Discovery Program, 390/393: College Station, TX (International Ocean Discovery Program). https://doi.org/10.14379/iodp.proc.390393.109.2024
Colantoni, P., Fabbri, A., Gallignani, P., Sartori, R., and Rehault, J.P., 1981. Carta Litologica e Stratigrafica dei Mari Italiani, scala 1/1.500.000. Italy: Litografia Artistica Cartografica.
Della Vedova, B., Bellani, S., Pellis, G., and Squarci, P., 2001. Deep temperatures and surface heat flow distribution. In Vai, G.B. and Martini, I.P., Anatomy of an Orogen: the Apennines and Adjacent Mediterranean Basins. (Springer), 65–76. https://doi.org/10.1007/978-94-015-9829-3_7
Di Stefano, A., Baldassini, N., Raffi, I., Fornaciari, E., Incarbona, A., Negri, A., Negri, A., Bonomo, S., Villa, G., Di Stefano, E., and Rio, D., 2023. Neogene-Quaternary Mediterranean calcareous nannofossil biozonation and biochronology: a review. Stratigraphy, 20(4):259–302. https://www.micropress.org/microaccess/check/2342
Ellis, D.V., and Singer, J.M., 2007. Well Logging for Earth Scientists (2nd edition): New York (Elsevier). https://doi.org/10.1007/978-1-4020-4602-5
Faganeli, J., Planinc, R., Pezdič, Smodiš, B., Stegnar, P., and Ogorelec, B., 1991. Marine geology of the Gulf of Trieste (northern Adriatic): geochemical aspects. Marine Geology, 99(1):93–108. https://doi.org/10.1016/0025-3227(91)90085-I
Ghiorso, M.S., Hirschmann, M.M., Reiners, P.W., and Kress, V.C., III, 2002. The pMELTS: a revision of MELTS for improved calculation of phase relations and major element partitioning related to partial melting of the mantle to 3 GPa. Geochemistry, Geophysics, Geosystems, 3(5):1–35. https://doi.org/10.1029/2001GC000217
Godard, M., Awaji, S., Hansen, H., Hellebrand, E., Brunelli, D., Johnson, K., Yamasaki, T., Maeda, J., Abratis, M., Christie, D., Kato, Y., Mariet, C., and Rosner, M., 2009. Geochemistry of a long in-situ section of intrusive slow-spread oceanic lithosphere: results from IODP Site U1309 (Atlantis Massif, 30°N Mid-Atlantic-Ridge). Earth and Planetary Science Letters, 279(1–2):110–122. https://doi.org/10.1016/j.epsl.2008.12.034
Goldhaber, M.B., and Kaplan, I.R., 1974. The sulfur cycle. In Goldberg, E.D., The Sea (Volume 5): Marine Chemistry. New York (Wiley), 569–655.
Goldsmith, J.R., Graf, D.L., Chodos, A.A., Joensuu, O.I., and Mcvicker, L.D., 1958. Relation between lattice constants and composition of Ca-Mg carbonates. American Mineralogist, 43(1–2):84–101.
Goñi, M.A., Ruttenberg, K.C., and Eglinton, T.I., 1998. A reassessment of the sources and importance of land-derived organic matter in surface sediments from the Gulf of Mexico. Geochimica et Cosmochimica Acta, 62(18):3055-3075. https://doi.org/10.1016/S0016-7037(98)00217-8
Haese, R.R., Meile, C., Van Cappellen, P., and De Lange, G.J., 2003. Carbon geochemistry of cold seeps: methane fluxes and transformation in sediments from Kazan mud volcano, eastern Mediterranean Sea. Earth and Planetary Science Letters, 212(3):361–375. https://doi.org/10.1016/S0012-821X(03)00226-7
Hébert, R., Gueddari, K., Laflèche, M.R., Beslier, M.-O., and Gardien, V., 2001. Petrology and geochemistry of exhumed peridotites and gabbros at non-volcanic margins: ODP Leg 173 West Iberia ocean-continent transition zone. In Wilson, R.C.L., Whitmarsh, R.B., and Taylor, B., and Froitzheim, N. (Eds.), Non-Volcanic Rifting of Continental Margins: A Comparison of Evidence from Land and Sea. Geological Society, London, Special Publications, 187. https://doi.org/10.1144/GSL.SP.2001.187.01.09
Heezen, B.C., Gray, C., Segre, A.G., and Zarudski, E.F.K., 1971. Evidence of foundered continental crust beneath the central Tyrrhenian Sea. Nature, 229(5283):327–329. https://doi.org/10.1038/229327a0
Jørgensen, B.B., 2000. Pathways of organic matter degradation. In Schulz, H.D., and Zabel, M. (Eds.), Marine Geochemistry (2nd edition). Berlin (Springer-Verlag).
Jørgensen, B.B., Nelson, D.C., Amend, J.P., Edwards, K.J., and Lyons, T.W., 2004. Sulfide oxidation in marine sediments: geochemistry meets microbiology. In Amend, J.P., Edwards, K.J., and Lyons, T.W. (Eds.), Sulfur Biogeochemistry - Past and Present. 379: Special Paper - Geological Society of America. https://doi.org/10.1130/0-8137-2379-5.63
Kastens, K.A., and Mascle, J., 1990. The geological evolution of the Tyrrhenian Sea; an introduction to the scientific results of ODP Leg 107. In Kastens, K.A., Mascle, J., et al., Proceedings of the Ocean Drilling Program, Scientific Results. 107: College Station, TX (Ocean Drilling Program), 3–26. https://doi.org/10.2973/odp.proc.sr.107.187.1990
Kelemen, P.B., and Matter, J., 2008. In situ carbonation of peridotite for CO2 storage. Proceedings of the National Academy of Sciences of the United States of America, 105(45):17295–17300. https://doi.org/10.1073/pnas.0805794105
Kirschvink, J.L., 1980. The least-squares line and plane and the analysis of palaeomagnetic data. Geophysical Journal International, 62(3):699–718. https://doi.org/10.1111/j.1365-246X.1980.tb02601.x
Le Bas, M.J., Le Maitre, R.W., Streickeisen, A., Zanettin, B., the IUGS Subcommission on the Systematics of Igneous Rocks, 1986. A chemical classification of volcanic rocks based on the total alkali-silica diagram. Journal of Petrology, 27(3):745–750. https://doi.org/10.1093/petrology/27.3.745
Lirer, F., Foresi, L.M., Iaccarino, S.M., Salvatorini, G., Turco, E., Cosentino, C., Sierro, F.J., and Caruso, A., 2019. Mediterranean Neogene planktonic foraminifer biozonation and biochronology. Earth-Science Reviews, 196:102869. https://doi.org/10.1016/j.earscirev.2019.05.013
Lister, G.S., and Davis, G.A., 1989. The origin of metamorphic core complexes and detachment faults formed during Tertiary continental extension in the northern Colorado River region, U.S.A. Journal of Structural Geology, 11(1):65–94. https://doi.org/10.1016/0191-8141(89)90036-9
Malinverno, A., Zitellini, N., Estes, E.R., Abe, N., Akizawa, N., Bickert, M., Cunningham, E.H., Di Stefano, A., Filina, I.Y., Fu, Q., Gontharet, S., Kearns, L.E., Koorapati, R.K., Lei, C., Loreto, M.F., Magri, L., Menapace, W., Morishita, T., Pandey, A., Pavlovics, V.L., Pezard, P.A., Poulaki, E.M., Rodriguez-Pilco, M.A., Sanfilippo, A., Shuck, B.D., Vannucchi, P., and Zhao, X., 2025. Expedition 402 methods. In Zitellini, N., Malinverno, A., Estes, E.R., and the Expedition 402 Scientists, Tyrrhenian Continent–Ocean Transition. Proceedings of the International Ocean Discovery Program, 402: College Station, TX (International Ocean Discovery Program). https://doi.org/10.14379/iodp.proc.402.102.2025
Martin, J.B., 1994. Diagenesis and hydrology at the New Hebrides forearc and intra-arc Aoba Basin. In Greene, H.G., Collot, J.-Y., Stokking, L.B., et al., Proceedings of the Ocean Drilling Program, Scientific Results. 134: College Station, TX (Ocean Drilling Program), 109–130. https://doi.org/10.2973/odp.proc.sr.134.008.1994
McDonough, W.F., and Sun, S., 1995. The composition of the Earth. Chemical Geology, 120(3):223–253. https://doi.org/10.1016/0009-2541(94)00140-4
Meyers, P.A., 1994. Preservation of elemental and isotopic source identification of sedimentary organic matter. Chemical Geology, 114(3–4):289–302. https://doi.org/10.1016/0009-2541(94)90059-0
Michard, G., Church, T.M., and Bernat, M., 1974. The pore water chemistry of recent sediments in the western Mediterranean basin. Journal of Geophysical Research (1896-1977), 79(6):817–824. https://doi.org/10.1029/JC079i006p00817
Middlemost, E.A.K., 1994. Naming materials in the magma/igneous rock system. Earth-Science Reviews, 37(3–4):215–224. https://doi.org/10.1016/0012-8252(94)90029-9
Niu, Y., 2004. Bulk-rock major and trace element compositions of abyssal peridotites: implications for mantle melting, melt extraction and post-melting processes beneath mid-ocean ridges. Journal of Petrology, 45(12):2423–2458. https://doi.org/10.1093/petrology/egh068
Peccerillo, A., 2017. Cenozoic Volcanism in the Tyrrhenian Sea Region: (Springer). https://doi.org/10.1007/978-3-319-42491-0
Pimmel, A., and Claypool, G., 2001. Introduction to shipboard organic geochemistry on the JOIDES Resolution. Ocean Drilling Program Technical Note, 30. https://doi.org/10.2973/odp.tn.30.2001
Prada, M., Sallares, V., Ranero, C.R., Vendrell, M.G., Grevemeyer, I., Zitellini, N., and de Franco, R., 2014. Seismic structure of the Central Tyrrhenian basin: Geophysical constraints on the nature of the main crustal domains. Journal of Geophysical Research: Solid Earth, 119(1):52–70. https://doi.org/10.1002/2013JB010527
Prada, M., Sallares, V., Ranero, C.R., Vendrell, M.G., Grevemeyer, I., Zitellini, N., and de Franco, R., 2015. The complex 3-D transition from continental crust to backarc magmatism and exhumed mantle in the Central Tyrrhenian basin. Geophysical Journal International, 203(1):63–78. https://doi.org/10.1093/gji/ggv271
Regelous, M., Weinzierl, C.G., and Haase, K.M., 2016. Controls on melting at spreading ridges from correlated abyssal peridotite – mid-ocean ridge basalt compositions. Earth and Planetary Science Letters, 449:1–11. https://doi.org/10.1016/j.epsl.2016.05.017
Roether, W., Manca, B.B., Klein, B., Bregant, D., Georgopoulos, D., Beitzel, V., Kovačević, V., and Luchetta, A., 1996. Recent changes in eastern Mediterranean deep waters. Science, 271(5247):333–335. https://doi.org/10.1126/science.271.5247.333
Rosenbaum, J., Reynolds, R., Smoot, J., and Meyer, R., 2000. Anisotropy of magnetic susceptibility as a tool for recognizing core deformation: reevaluation of the paleomagnetic record of Pleistocene sediments from drill hole OL-92, Owens Lake, California. Earth and Planetary Science Letters, 178(3–4):415–424. https://doi.org/10.1016/S0012-821X(00)00077-7
Shipboard Scientific Party, 1978. Site 373: Tyrrhenian Basin. In Hsü, K., Montadert, L., et al., Initial Reports of the Deep Sea Drilling Project. 42(1): Washington, DC (US Government Printing Office), 151–174. https://doi.org/10.2973/dsdp.proc.42-1.104.1978
Shipboard Scientific Party, 1987a. Site 650: Marsili Basin. In Kastens, K.A., Mascle, J., Auroux, C., et al., Proceedings of the Ocean Drilling Program, Initial Reports. 107: College Station, TX (Ocean Drilling Program). https://doi.org/10.2973/odp.proc.ir.107.106.1987
Shipboard Scientific Party, 1987b. Site 651: Tyrrhenian Sea. In Kastens, K.A., Mascle, J., Auroux, C., et al., Proceedings of the Ocean Drilling Program, Initial Reports. 107: College Station, TX (Ocean Drilling Program). https://doi.org/10.2973/odp.proc.ir.107.107.1987
Shipboard Scientific Party, 1987c. Site 655: Gortani Ridge, Western Vavilov Basin. In Kastens, K.A., Mascle, J., Auroux, C., et al., Proceedings of the Ocean Drilling Program, Initial Reports. 107: College Station, TX (Ocean Drilling Program). https://doi.org/10.2973/odp.proc.ir.107.111.1987
Smith, P.M., and Asimow, P.D., 2005. Adiabat_1ph: a new public front-end to the MELTS, pMELTS, and pHMELTS models. Geochemistry, Geophysics, Geosystems, 6(2). https://doi.org/10.1029/2004GC000816
Sylvan, J.B., Estes, E.R., Bogus, K., Colwell, F.S., Orcutt, B.N., and Smith, D.C, 2021. Technical Note 4: Recommendations for microbiological sampling and contamination tracer use aboard the JOIDES Resolution following 20 years of IODP deep biosphere research. International Ocean Discovery Program Technical Note. https://doi.org/10.14379/iodp.tn.4.2021
Tanhua, T., Hainbucher, D., Schroeder, K., Cardin, V., Álvarez, M., and Civitarese, G., 2013. The Mediterranean Sea system: a review and an introduction to the special issue. Ocean Science, 9(5):789–803. https://doi.org/10.5194/os-9-789-2013
Tauxe, L., 2010. Essentials of Paleomagnetism: Oakland, CA (University of California Press).
Tsimplis, M.N., and Baker, T.F., 2000. Sea level drop in the Mediterranean Sea: an indicator of deep water salinity and temperature changes? Geophysical Research Letters, 27(12):1731–1734. https://doi.org/10.1029/1999GL007004
Tucholke, B.E., Lin, J., and Kleinrock, M.C., 1998. Megamullions and mullion structure defining oceanic metamorphic core complexes on the Mid-Atlantic Ridge. Journal of Geophysical Research: Solid Earth, 103(B5):9857-9866. https://doi.org/10.1029/98JB00167
Workman, R.K., and Hart, S.R., 2005. Major and trace element composition of the depleted MORB mantle (DMM). Earth and Planetary Science Letters, 231(1–2):53–72. https://doi.org/10.1016/j.epsl.2004.12.005
Zitellini, N., Malinverno, A., Estes, E.R., Abe, N., Akizawa, N., Bickert, M., Cunningham, E.H., Di Stefano, A., Filina, I.Y., Fu, Q., Gontharet, S., Kearns, L.E., Koorapati, R.K., Lei, C., Loreto, M.F., Magri, L., Menapace, W., Morishita, T., Pandey, A., Pavlovics, V.L., Pezard, P.A., Poulaki, E.M., Rodriguez-Pilco, M.A., Sanfilippo, A., Shuck, B.D., Vannucchi, P., and Zhao, X., 2025. Site U1614. In Zitellini, N., Malinverno, A., Estes, E.R., and the Expedition 402 Scientists, Tyrrhenian Continent–Ocean Transition. Proceedings of the International Ocean Discovery Program, 402: College Station, TX (International Ocean Discovery Program). https://doi.org/10.14379/iodp.proc.402.105.2025