Lucchi, R.G., St. John, K.E.K., Ronge, T.A., and the Expedition 403 Scientists
Proceedings of the International Ocean Discovery Program Volume 403
publications.iodp.org
https://doi.org/10.14379/iodp.proc.403.105.2026
Site U16201
![]() K.E.K. St. John,
K.E.K. St. John,
![]() R.G. Lucchi,
R.G. Lucchi,
![]() T.A. Ronge,
T.A. Ronge,
![]() M.A. Barcena,
M.A. Barcena,
![]() S. De Schepper,
S. De Schepper,
![]() L.C. Duxbury,
L.C. Duxbury,
![]() A.C. Gebhardt,
A.C. Gebhardt,
![]() A. Gonzalez-Lanchas,
A. Gonzalez-Lanchas,
![]() G. Goss,
G. Goss,
![]() N.M. Greco,
N.M. Greco,
![]() J. Gruetzner,
J. Gruetzner,
![]() L. Haygood,
L. Haygood,
![]() K. Husum,
K. Husum,
![]() M. Iizuka,
M. Iizuka,
![]() A.K.I.U. Kapuge,
A.K.I.U. Kapuge,
![]() A.R. Lam,
A.R. Lam,
![]() O. Libman-Roshal,
O. Libman-Roshal,
![]() Y. Liu,
Y. Liu,
![]() L.R. Monito,
L.R. Monito,
![]() B.T. Reilly,
B.T. Reilly,
![]() Y. Rosenthal,
Y. Rosenthal,
![]() Y. Sakai,
Y. Sakai,
![]() A.V. Sijinkumar,
A.V. Sijinkumar,
![]() Y. Suganuma, and
Y. Suganuma, and
![]() Y. Zhong2
Y. Zhong2
1 St. John, K.E.K., Lucchi, R.G., Ronge, T.A., Barcena, M.A., De Schepper, S., Duxbury, L.C., Gebhardt, A.C., Gonzalez-Lanchas, A., Goss, G., Greco, N.M., Gruetzner, J., Haygood, L., Husum, K., Iizuka, M., Kapuge, A.K.I.U., Lam, A.R., Libman-Roshal, O., Liu, Y., Monito, L.R., Reilly, B.T., Rosenthal, Y., Sakai, Y., Sijinkumar, A.V., Suganuma, Y., and Zhong, Y., 2026. Site U1620. In Lucchi, R.G., St. John, K.E.K., Ronge, T.A., and the Expedition 403 Scientists, Eastern Fram Strait Paleo-Archive. Proceedings of the International Ocean Discovery Program, 403: College Station, TX (International Ocean Discovery Program). https://doi.org/10.14379/iodp.proc.403.105.2026
2 Expedition 403 Scientists’ affiliations.
1. Background and objectives
The Svyatogor Ridge is a northwest–southeast elongated contouritic sediment drift lying on a young (<10 Ma) oceanic crust. This sediment drift is 46 km long and 5 km wide (Johnson et al., 2015; Waghorn et al., 2018) and is located ~130 km from the western margin of Svalbard on the northwestern flank of the ultraslow spreading Knipovich Ridge, south of the Molloy Transform Fault (MTF) (Figure F1). The sediment record at Svyatogor has been influenced by multiple factors: the locally complex tectonic history, the evolution of the West Spitsbergen Current (WSC), the regional ice sheet history, and the presence and migration of methane gas with likely biotic and abiotic sources (Waghorn et al., 2020).
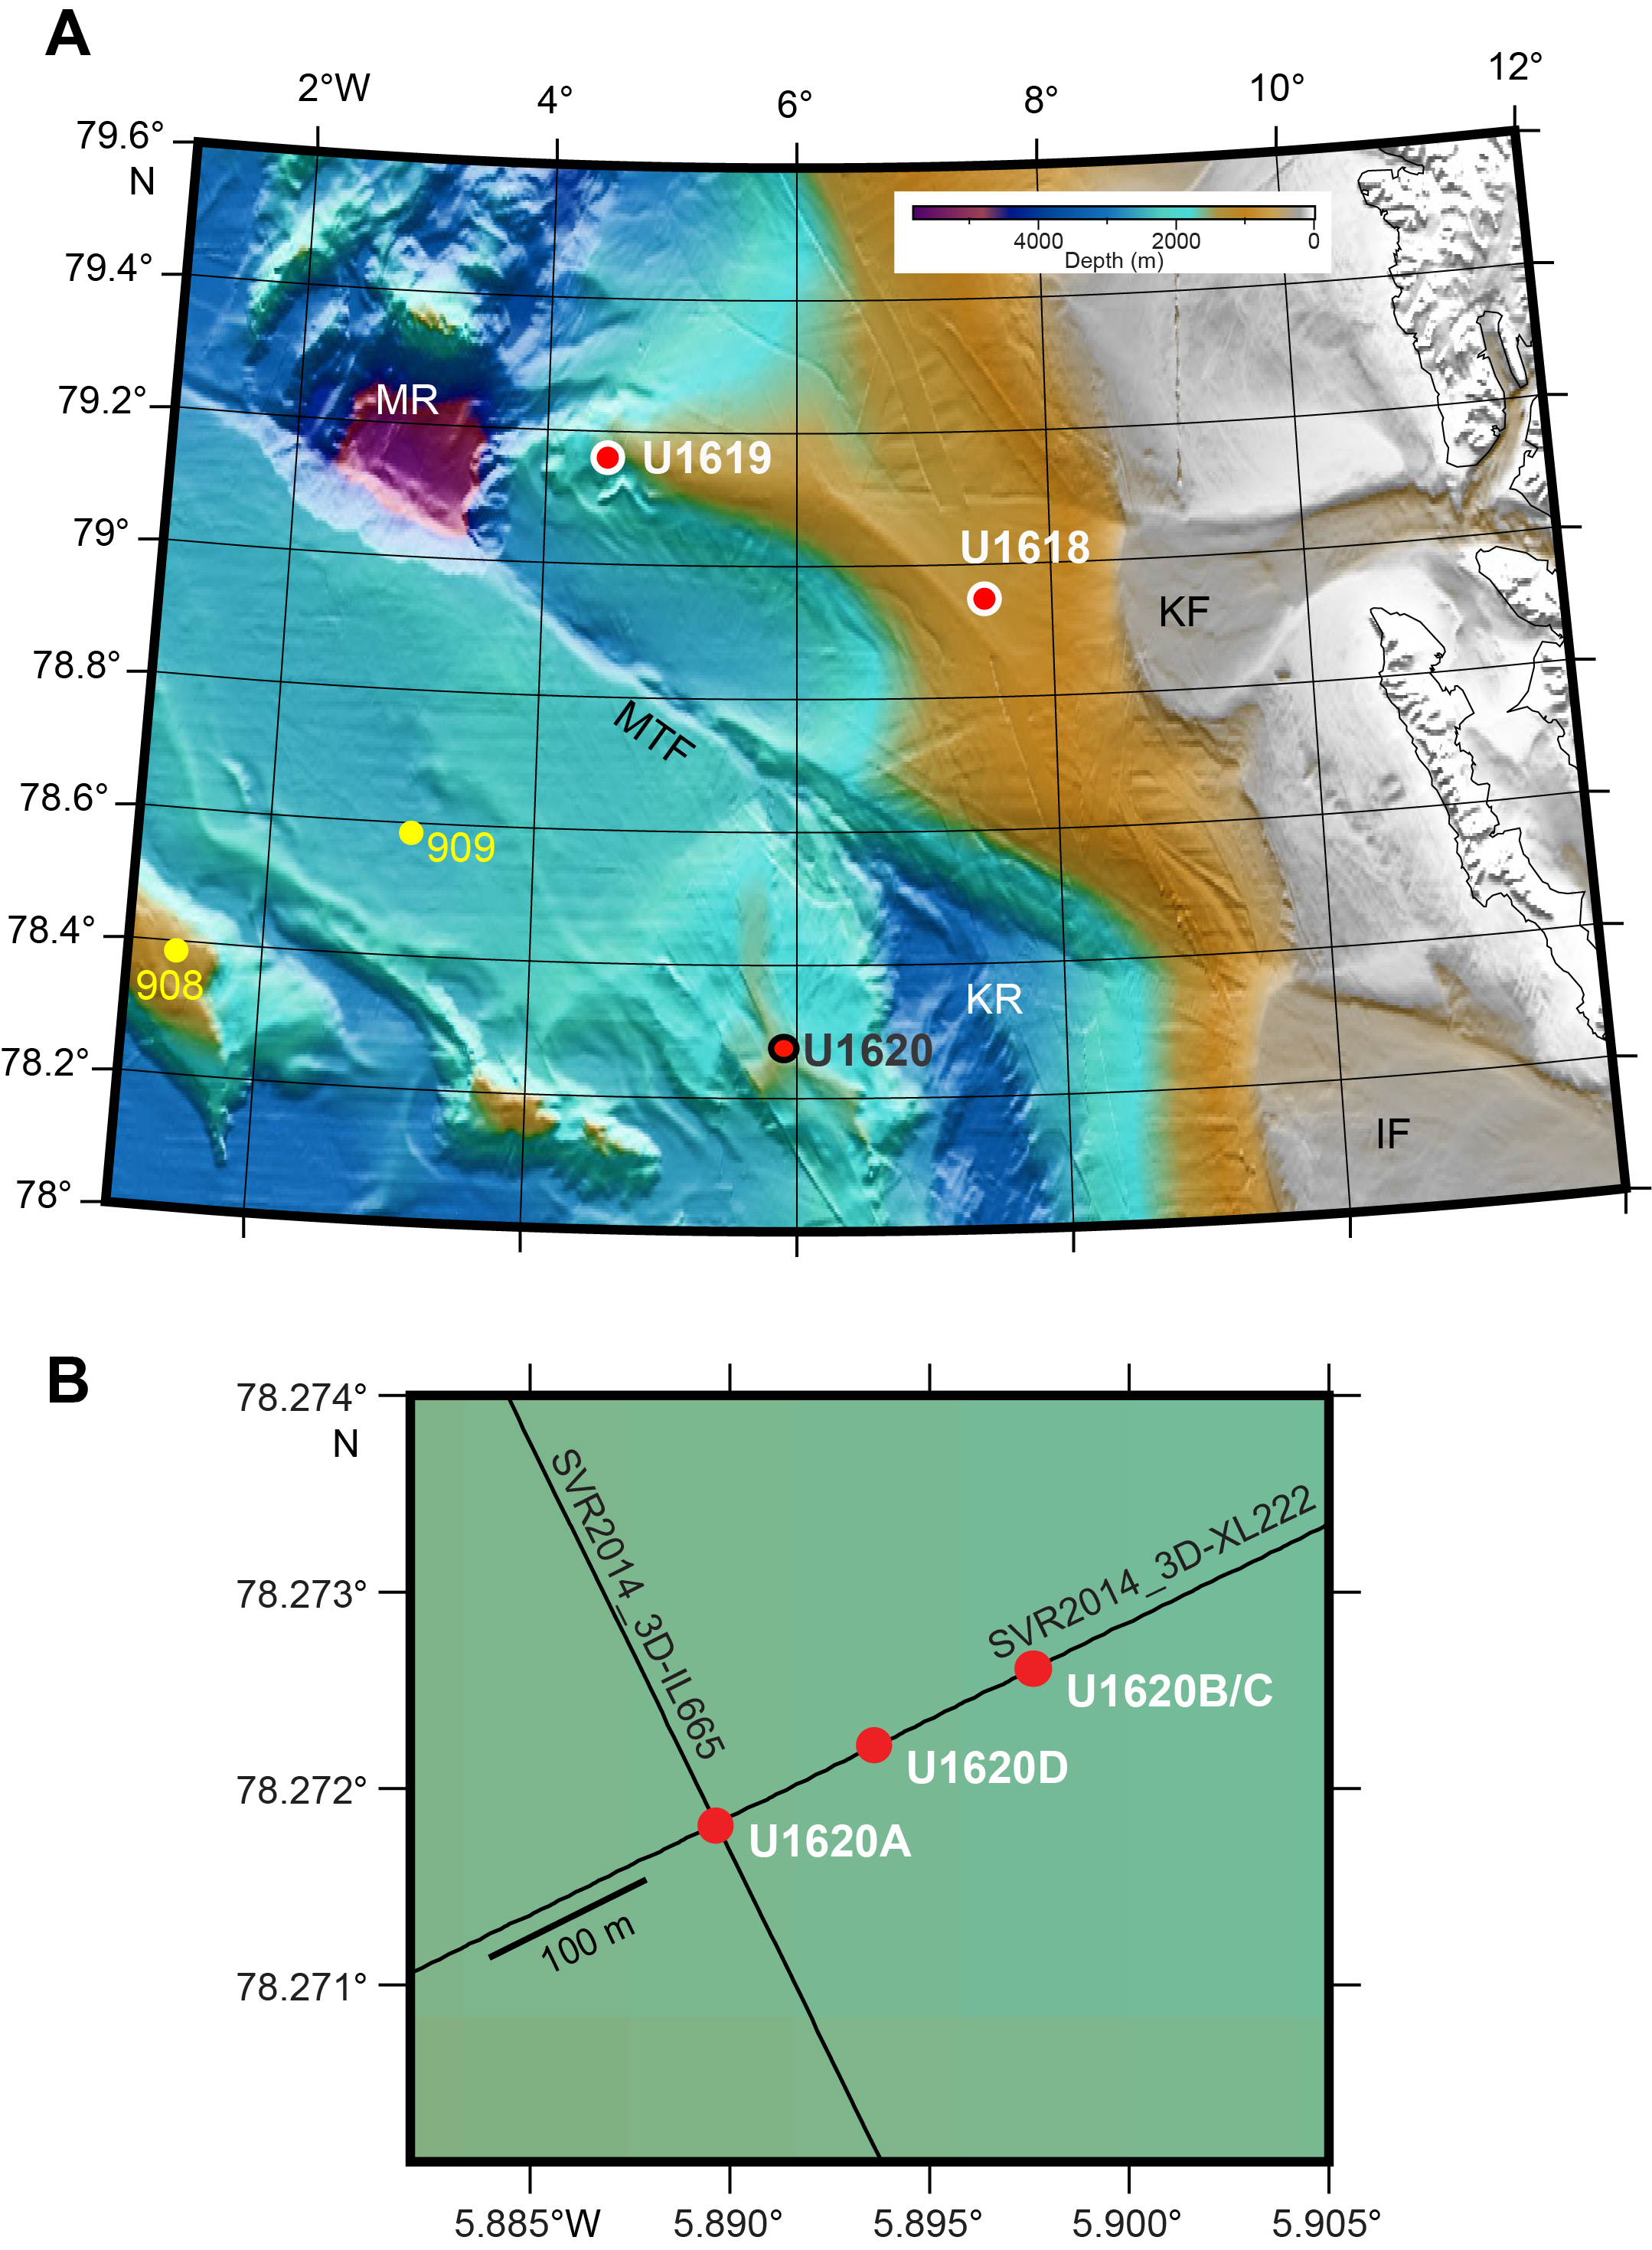
Figure F1. Bathymetric map.
It has been hypothesized that the Svyatogor and Vestnesa Ridge sediment drifts had once been contiguous and similarly northwest–southeast oriented, with sedimentation controlled by the main branch of the WSC and additionally controlled by tectonic-related (MTF) bathymetry (Johnson et al., 2015). As posited by Johnson et al. (2015), sediment drift buildup at the Svyatogor Ridge south of the MTF was delayed compared to the Vestnesa Ridge and only started when sediment delivery increased with the intensification of the Northern Hemisphere glaciation and shelf-edge glaciation of the paleo-Svalbard–Barents Sea Ice Sheet (SBSIS). Over the past 2 My, tectonic offset along the MTF separated the Svyatogor and Vestnesa sediment drifts (Johnson et al., 2015). It was believed that the sediment cover across the Svyatogor Ridge once again became limited compared to Vestnesa because displacement along the MTF has moved the ridge farther away from the main north/northwestern path of the WSC (Johnson et al., 2015), which is controlling the sedimentation today. The MTF right-lateral offset also impacted the geometry of the Vestnesa Ridge by turning its main axes westward.
According to Eiken and Hinz (1993), three main stratigraphic units provide the chronological constraints on the northwestern margin of Svalbard. Unit YP-1 is the oldest, and it is composed of syn- and postrift sediments lying directly on the oceanic crust after the opening of the Fram Strait occurred, at the earliest, during the Early Miocene (~17 Ma; Jakobsson et al., 2007; Ehlers and Jokat, 2013) or Late Miocene, at the latest (~10 Ma; Engen et al., 2008), creating an environment favorable for the onset of contour currents (Eiken and Hinz, 1993; Gebhardt et al., 2014). Unit YP-2 contains the sedimentation associated with contour current deposition having a basal age between ~7 and 10 Ma (Eiken and Hinz 1993; Gebhardt et al, 2014), whereas Unit YP-3 comprises the deposition associated with the onset of glacially transported sediments like glaciomarine deposits and debris flows. Correlation with the cores drilled during Ocean Drilling Program (ODP) Leg 151 indicate a boundary age between Units YP-2 and YP-3 of ~2.7 Ma, corresponding to the intensification of the North Hemisphere glaciation (Geissler et al., 2011, Mattingsdal et al., 2014). Based on the supposition that the Svyatogor Ridge experienced its initial growth as a southern extension of the Vestnesa Ridge across the MTF at ~2.7 Ma (Johnson et al., 2015), Seismic Stratigraphic Unit YP-3, and potentially the upper portion of Unit YP-2, should also be present on the Svyatogor Ridge.
Other than this general stratigraphic information for the area, the chronostratigraphy at the Svyatogor site is largely unknown because exploration was mostly limited to the geophysical survey focused to characterize the unique fluid flow system of this ridge. Because of the underlying young crust and the proximity to the ultraslow spreading Knipovich Ridge, the Svyatogor sediment drift likely contains a unique combination of biogenic-derived methane and abiotically derived gas generated from the serpentinization of exhumed mantle rocks; this complex system contributes to an extensive occurrence of free gas, gas hydrate, and fluid flow systems in the region with gas chimney and transform faults acting as a major pathway for fluid migration (Johnson et al., 2015; Waghorn et al., 2020).
Site U1620 on the Svyatogor Ridge was chosen for its distal location from the western margin of Svalbard, therefore having a reduced (yet discernible) continental impact on the sedimentation and an enhanced paleoceanographic signal that is mainly driven by the oceanic current. The relationship among sediment drift development, bathymetry, and tectonic motion are additional factors unique to this location that can be examined. Furthermore, as this is an almost unexplored area, the documented presence of a young oceanic crust and active seepage system can drive unexpected new findings in relation to fluid flow, diagenesis, and the microbial community.
Site U1620 comprises four holes drilled between 1589 and 1609 m water depth. Hole U1620A is positioned at the cross point of two seismic lines from a 3D survey (Waghorn et al., 2018): Svyatogor2014_3D-XL222 (crossline) and SVR2014_3D-IL665 (inline) (Figures F1B, F2). Holes U1620B–U1620D are located within 200 m northwest of Hole U1620A along Seismic Line Svyatogor2014_3D-XL222. The maximum subseafloor penetration was at Hole U1620D (616 mbsf).
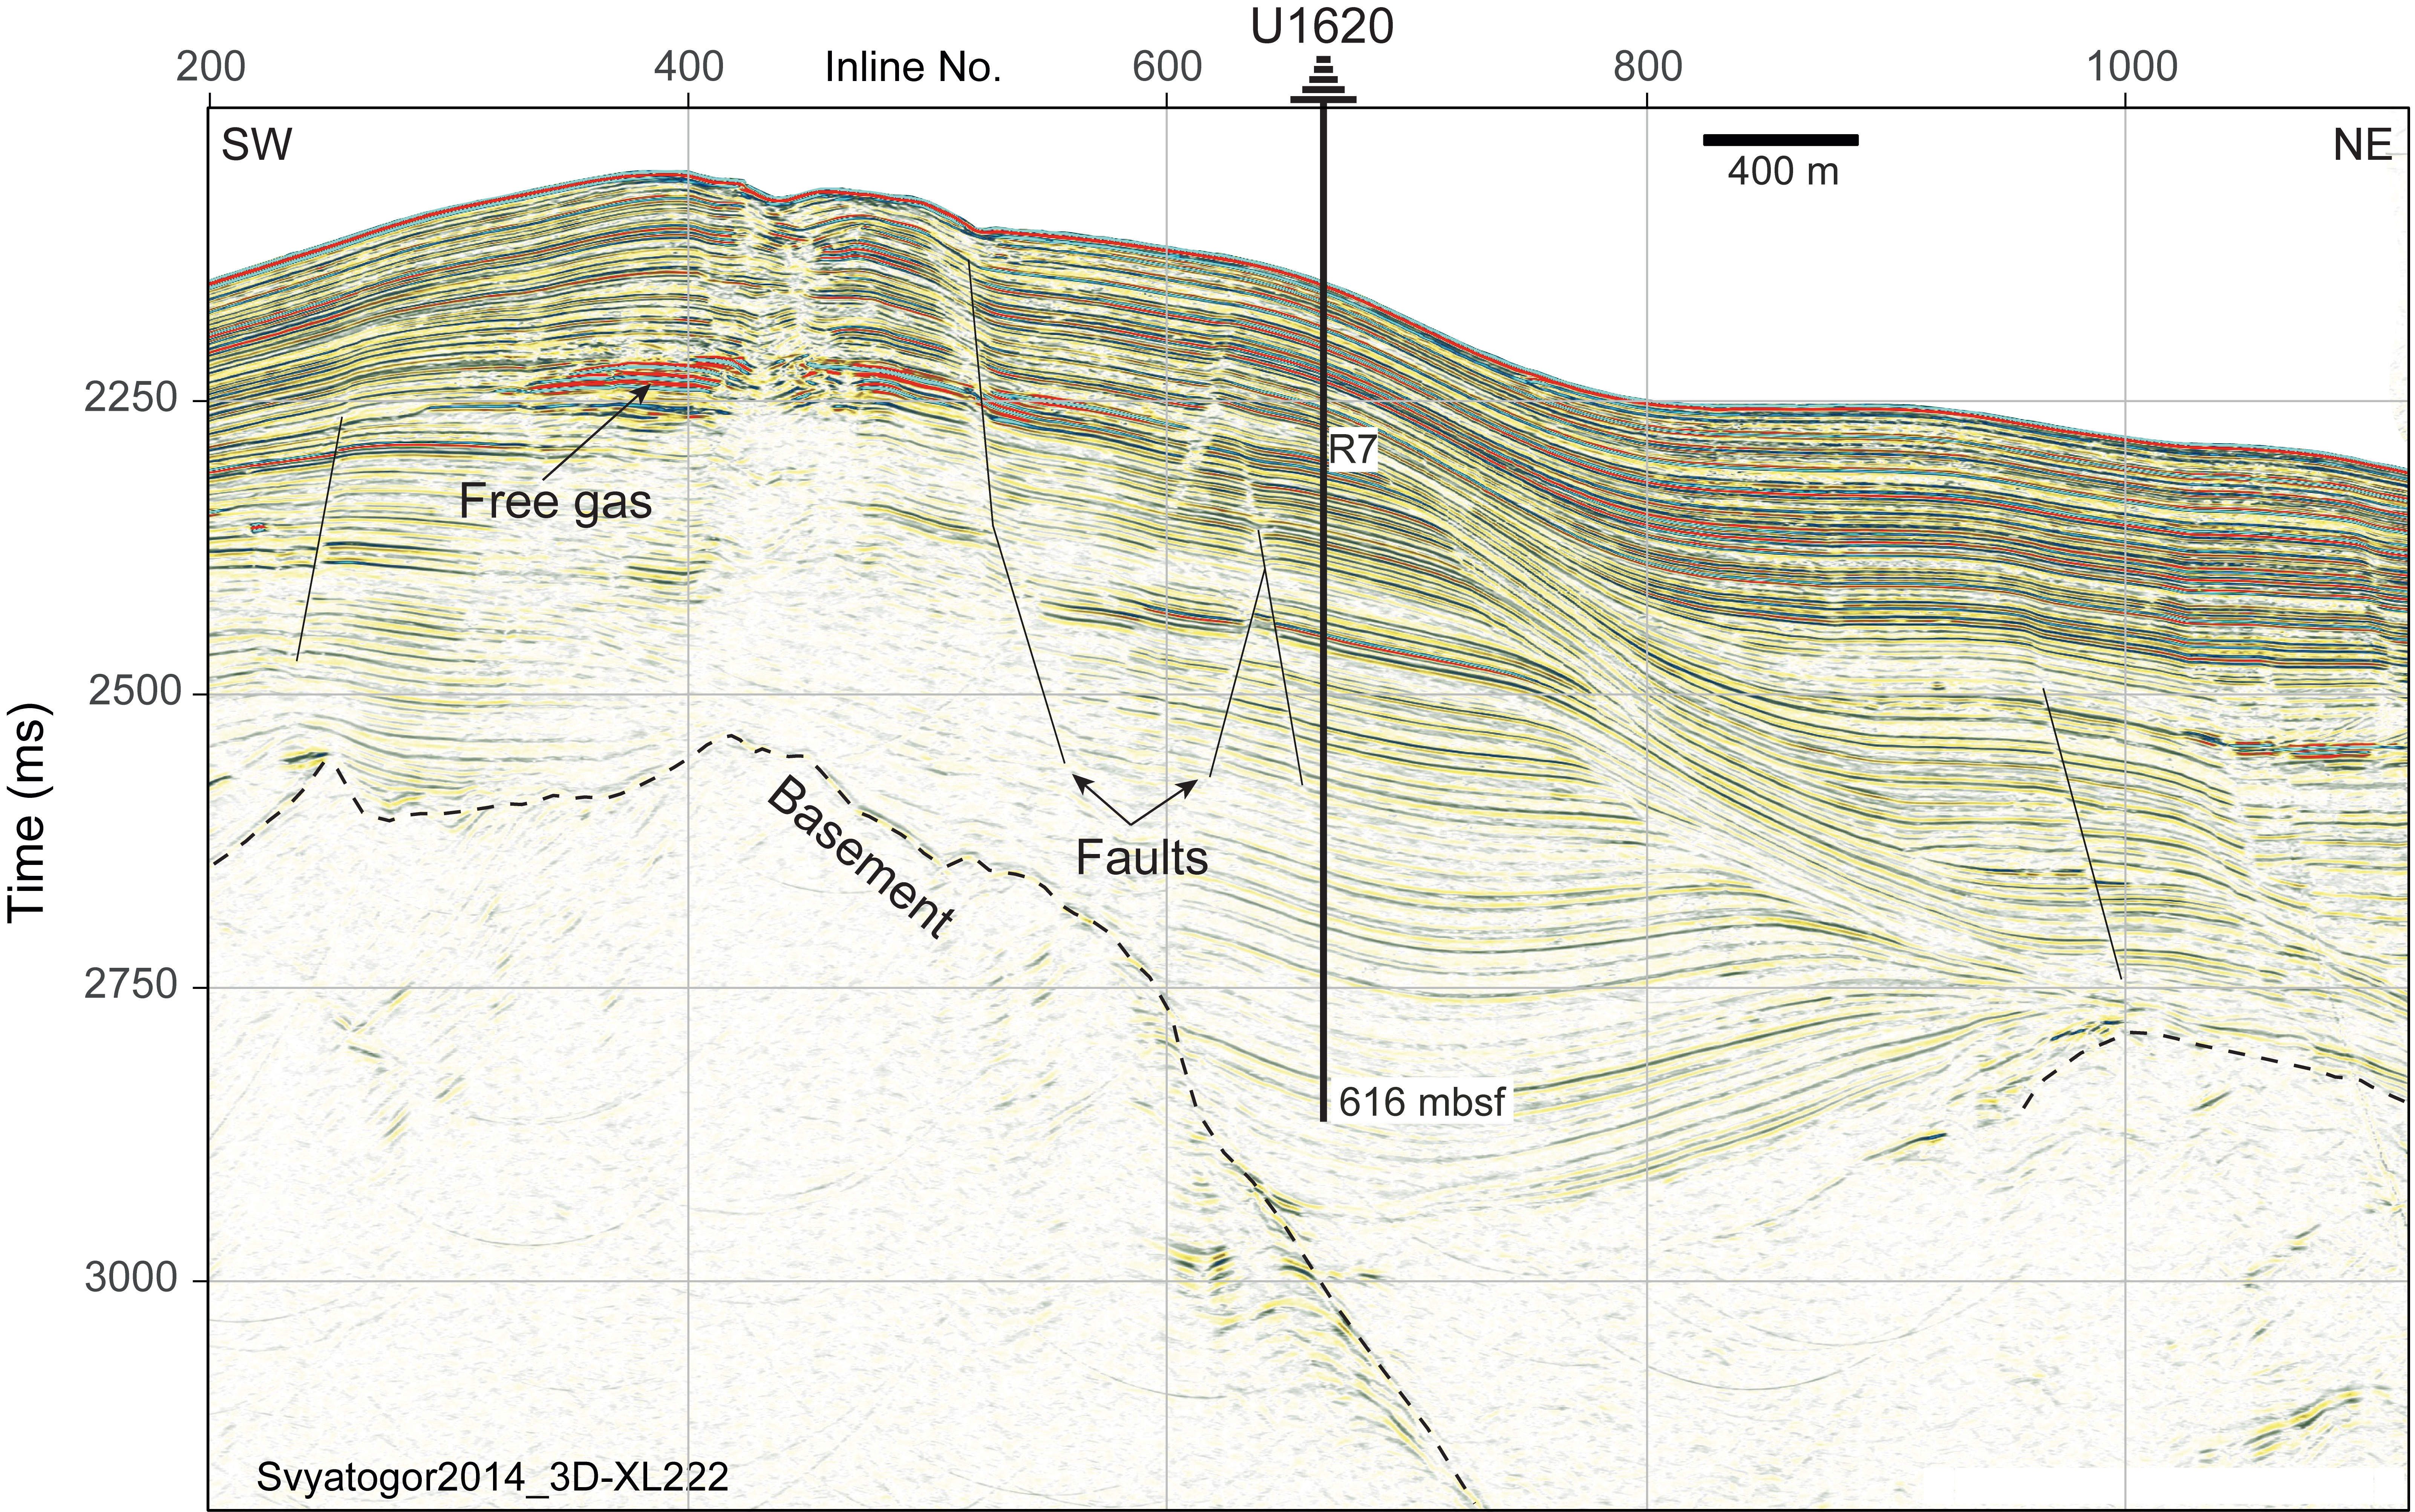
Figure F2. Seismic profile.
The main research objectives for this site include the following:
- Definition of a high-resolution sediment stratigraphy since the Late Pliocene intensification of the North Hemisphere glaciation;
- Reconstruction of the variability of the WSC transporting warm Atlantic Water to the Arctic;
- Definition of the effect of glacial and tectonic stresses on subseafloor sediment deformation and carbon transport; and
- Investigation of the influence of the WSC variability, ice coverage, climate, and the active seepage system on the microbial populations through time and to what extent this is still affecting contemporary geochemical fluxes.
2. Operations
In total, we spent 7.68 days at Site U1620 and penetrated to a maximum depth of 616 meters below seafloor (mbsf) in Hole U1620D, with a combined penetration of 1026.2 m. The cored interval of 1026.2 m resulted in a recovered length of 1132.2 m. Site U1620 consists of four holes that stretch 200 m (Hole U1620D was located halfway between Holes U1620A and U1620B/U1620C, with Hole U1620C spudded at the same location as the unsuccessful Hole U1620B) along Seismic Line Svyatogor2014_3D-XL222. We took 126 cores in total: 30% with the advanced piston corer (APC) system (38 cores) and 70% with the extended core barrel (XCB) system (88 cores). To minimize magnetic overprinting on the cored sediment, nonmagnetic collars and core barrels were used for all APC coring. Holes U1620A, U1620C, and U1620D had intervals where the sediments significantly expanded due to the presence of gas, resulting in recoveries often exceeding 100% (Table T1). To mitigate the impact of expansion and the potential for core disturbance and to release the pressure, holes were drilled into the liner by the drill crew on the rig floor and the technical staff on the core receiving platform (i.e., catwalk). In addition, most XCB cores were advanced by 6–8 m to allow for gas expansion.
To more easily communicate shipboard results, core depth below seafloor, Method A (CSF-A), depths in this chapter are reported using the mbsf depth scale unless otherwise noted.
2.1. Hole U1620A
The vessel made the 62.8 nmi transit to Site U1620 in 6.2 h at an average speed of 10.1 kt. The thrusters were down and secure, and the vessel switched from cruise mode to dynamic positioning (DP) mode at 0256 h on 29 June 2024, starting Site U1620 and Hole U1620A. A depth reading with the precision depth recorder (PDR) was taken as the vessel arrived, indicating that the seafloor was 1574.4 meters below sea level (mbsl). The crew assembled and deployed the APC/XCB bottom-hole assembly (BHA). Hole U1620A was spudded at 0820 h (UTC + 2 h) on 29 June. The seafloor was estimated to be 1577.1 mbsl based on recovery from Core 1H. APC coring continued to 112.6 mbsf (Cores 1H–14H). Partial strokes were recorded on Cores 3H, 8H, 11H, 12H, and 14H. Following Core 14H, the XCB system was deployed with 4.8–5.5 m advances to allow the cores room to expand without putting pressure on the liners. The headspace gas C1/C2 ratio was monitored closely while coring. Measurements of the C1/C2 ratio were in the anomalous zone, but additional void space gas analyses indicated that the gas content was biogenically produced, so it was deemed safe to proceed. As of 0000 h on 30 June, Hole U1620A had been advanced to 133.9 mbsf (through Core 16X). XCB coring continued with Cores 17X–31X from 133.9 to 239.9 mbsf. The cores were advanced 6.0–8.0 m to allow for gas expansion. Because of a low C1/C2 ratio that consistently plotted outside of our safety envelope, coring was terminated after Core 31X. The bit was pulled out of the hole, clearing the seafloor at 2025 h on 30 June and ending Hole U1620A.
A total of 31 cores were taken over a 239.9 m interval with 277.10 m of recovery (116%). The APC system was used for 14 cores over 123.6 m, recovering 128.42 m (104%), and the XCB system was used over a 116.3 m interval, recovering 148.68 m (128%). Formation temperature measurements using the advanced piston corer temperature (APCT-3) tool were taken on Cores 4H, 7H, 10H, and 13H. The Sediment Temperature 2 (SET2) tool was deployed following Cores 18X and 31X. Nonmagnetic core barrels were used on all APC cores.
2.2. Hole U1620B
The vessel was offset 200 m from Hole U1620A along Seismic Line Svyatogor2014_3D-XL222 at a bearing of 63.9°, arriving over the hole coordinates at 2050 h on 30 June 2024. A PDR reading was taken during the move, and it was decided to set the bit at 1582.5 mbsl for the spud attempt. An APC core barrel was deployed and fired but did not retrieve any sediment. The bit was lowered to 1588.5 mbsl, and another barrel was deployed. Hole U1621B was spudded at 2327 h on 30 June. Seafloor was calculated to be 1597.1 mbsl based on the 0.34 m recovered in Core 1H. It was decided to terminate coring in Hole U1620B to obtain a better mudline core, and the hole ended at 0000 h on 1 July. A total of one core was taken over a 0.4 m interval with 0.34 m of recovery (85%) (Table T1).
2.3. Hole U1620C
The vessel remained in the same location as Hole U1620B, and the bit was lowered to 1595.3 mbsl. An APC core barrel was deployed, and Hole U1620C was spudded at 0033 h on 1 July 2024. Seafloor was calculated to be 1597.1 mbsl based on recovery from Core 1H. APC coring continued to 109.4 mbsf. The XCB system was then deployed, and coring continued to 169.9 mbsf. With the C1/C2 ratio continuing to drop, it was decided to terminate coring in Hole U1620C. The bit was pulled out of the hole, clearing the seafloor at 2345 h on 1 July and ending Hole U1620C.
A total of 21 cores were taken over a 169.9 m interval, recovering 186.89 m of sediment (110%). The APC system was deployed for 13 cores over a 109.4 m interval with 116.35 m of recovery (106%), and the XCB system was deployed for 8 cores over a 60.5 m interval, recovering 70.54 m of sediment (117%) (Table T1). The APCT-3 tool was deployed on Cores 4H, 7H, 10H, and 13H. Nonmagnetic core barrels were used on all APC cores.
2.4. Hole U1620D
The vessel was offset approximately 100 m at 244° along the same seismic line (Svyatogor2014_3D-XL222) to a position halfway between the locations of Holes U1620A and U1620B/U1620C. Hole U1620D was spudded at 0214 h on 2 July 2024. The seafloor depth was calculated to be 1586 mbsl. APC coring continued to 91.5 mbsf (Core 10H). The XCB system was then deployed for Cores 11X–73X to a total depth of 616 mbsf. The C1/C2 ratio was monitored throughout coring and improved with depth. However, lower C1/C2 ratios and heavier hydrocarbon gases began to consistently appear in the last few cores approaching the target depth. Upon completion of coring, Hole U1620D was prepared for downhole wireline logging and the bit was pulled up to 71.5 mbsf.
A total of 73 cores were taken over a 616 m interval, recovering 667.91 m of sediment (109%). The APC system was deployed for 10 cores over a 91.5 m interval with 99.1 m of recovery (108%), and the XCB system was deployed for 63 cores over a 524.5 m interval, recovering 568.81 m of sediment (108%) (Table T1). Nonmagnetic core barrels were used on all APC cores. Short advances of 7.0–8.0 m were used for Cores 11X–53X to allow for core expansion due to gas. Full advances were used on Cores 64X–73X.
2.5. Downhole logging
The Schlumberger logging line was rigged up, and the triple combo tool string was assembled and deployed at 0700 h on 6 July 2024. The tool string encountered an obstruction at 579.5 mbsf, and the main uplog began from that point. The tools were recovered and rigged down at 1415 h. During logging, 10 sections of Hole U1620D between 127.5 and 347.5 mbsf were noted to be 2–3 inches under gauge, indicating that the hole closed in at a speed of about 1 inch/h. Because of poor hole stability, the second planned logging run with the Formation MicroScanner (FMS)-sonic tool was canceled and operations were terminated. The bit was pulled out of the hole, clearing the seafloor at 1423 h and the rig floor at 1800 h. The rig floor was secured for transit, and the vessel switched to cruise mode at 1909 h, ending Hole U1620D. All thrusters were up and secure at 1920 h, and the vessel began its sea passage to Site U1621 at 1930 h on 6 July.
3. Lithostratigraphy
The recovered sequence at Site U1620 consists of 126 cores: 1026.1 m of cored and 1132.2 m of recovered sediment due to core expansion. Hole U1620B consists of 0.34 m of sediments, recovered in the core catcher, and will not be discussed in this summary. The sediments throughout all cores from Holes U1620A–U1620D are primarily siliciclastic, mainly composed of dark gray (5Y 4/1) to dark greenish gray (10Y 4/1) silty clay, with coarser intervals containing clayey silt, sandy clay, and sandy mud (Figure F3). These lithologies contain varying amounts of authigenic mineral precipitants (Figure F4) and/or detrital clasts. Small (<2 cm) to large (>2 cm) clast occurrences are counted throughout the cores from visual descriptions and X-radiograph observations, when available (Figure F5). When present, clast abundance ranges from dispersed (observed on <1% of the split core surface) to common (1%–5%) to abundant (5%–30%). When the sediment is poorly sorted, with clast abundance between 1% and 30% and with large clasts (>2 cm), the lithology is designated as a diamicton (Figure F5C). Authigenic mineral precipitants range in size from micrometer-scale to 2–3 cm diameter in many forms, such as concretions, laminations, and loose layers (Figure F4). Although sedimentary structures are sometimes not visible on the split core surfaces (i.e., described as structureless), primary sedimentary structures (e.g., laminations; Figure F6), bioturbation (Figure F7), and diagenetic features (e.g., authigenic carbonate and iron sulfide minerals) are more commonly visible in the X-radiographs available dominantly from Hole U1620D. The sedimentological characteristics of Holes U1620A, U1620C, and U1620D are summarized in Figures F8, F9, and F10, respectively.
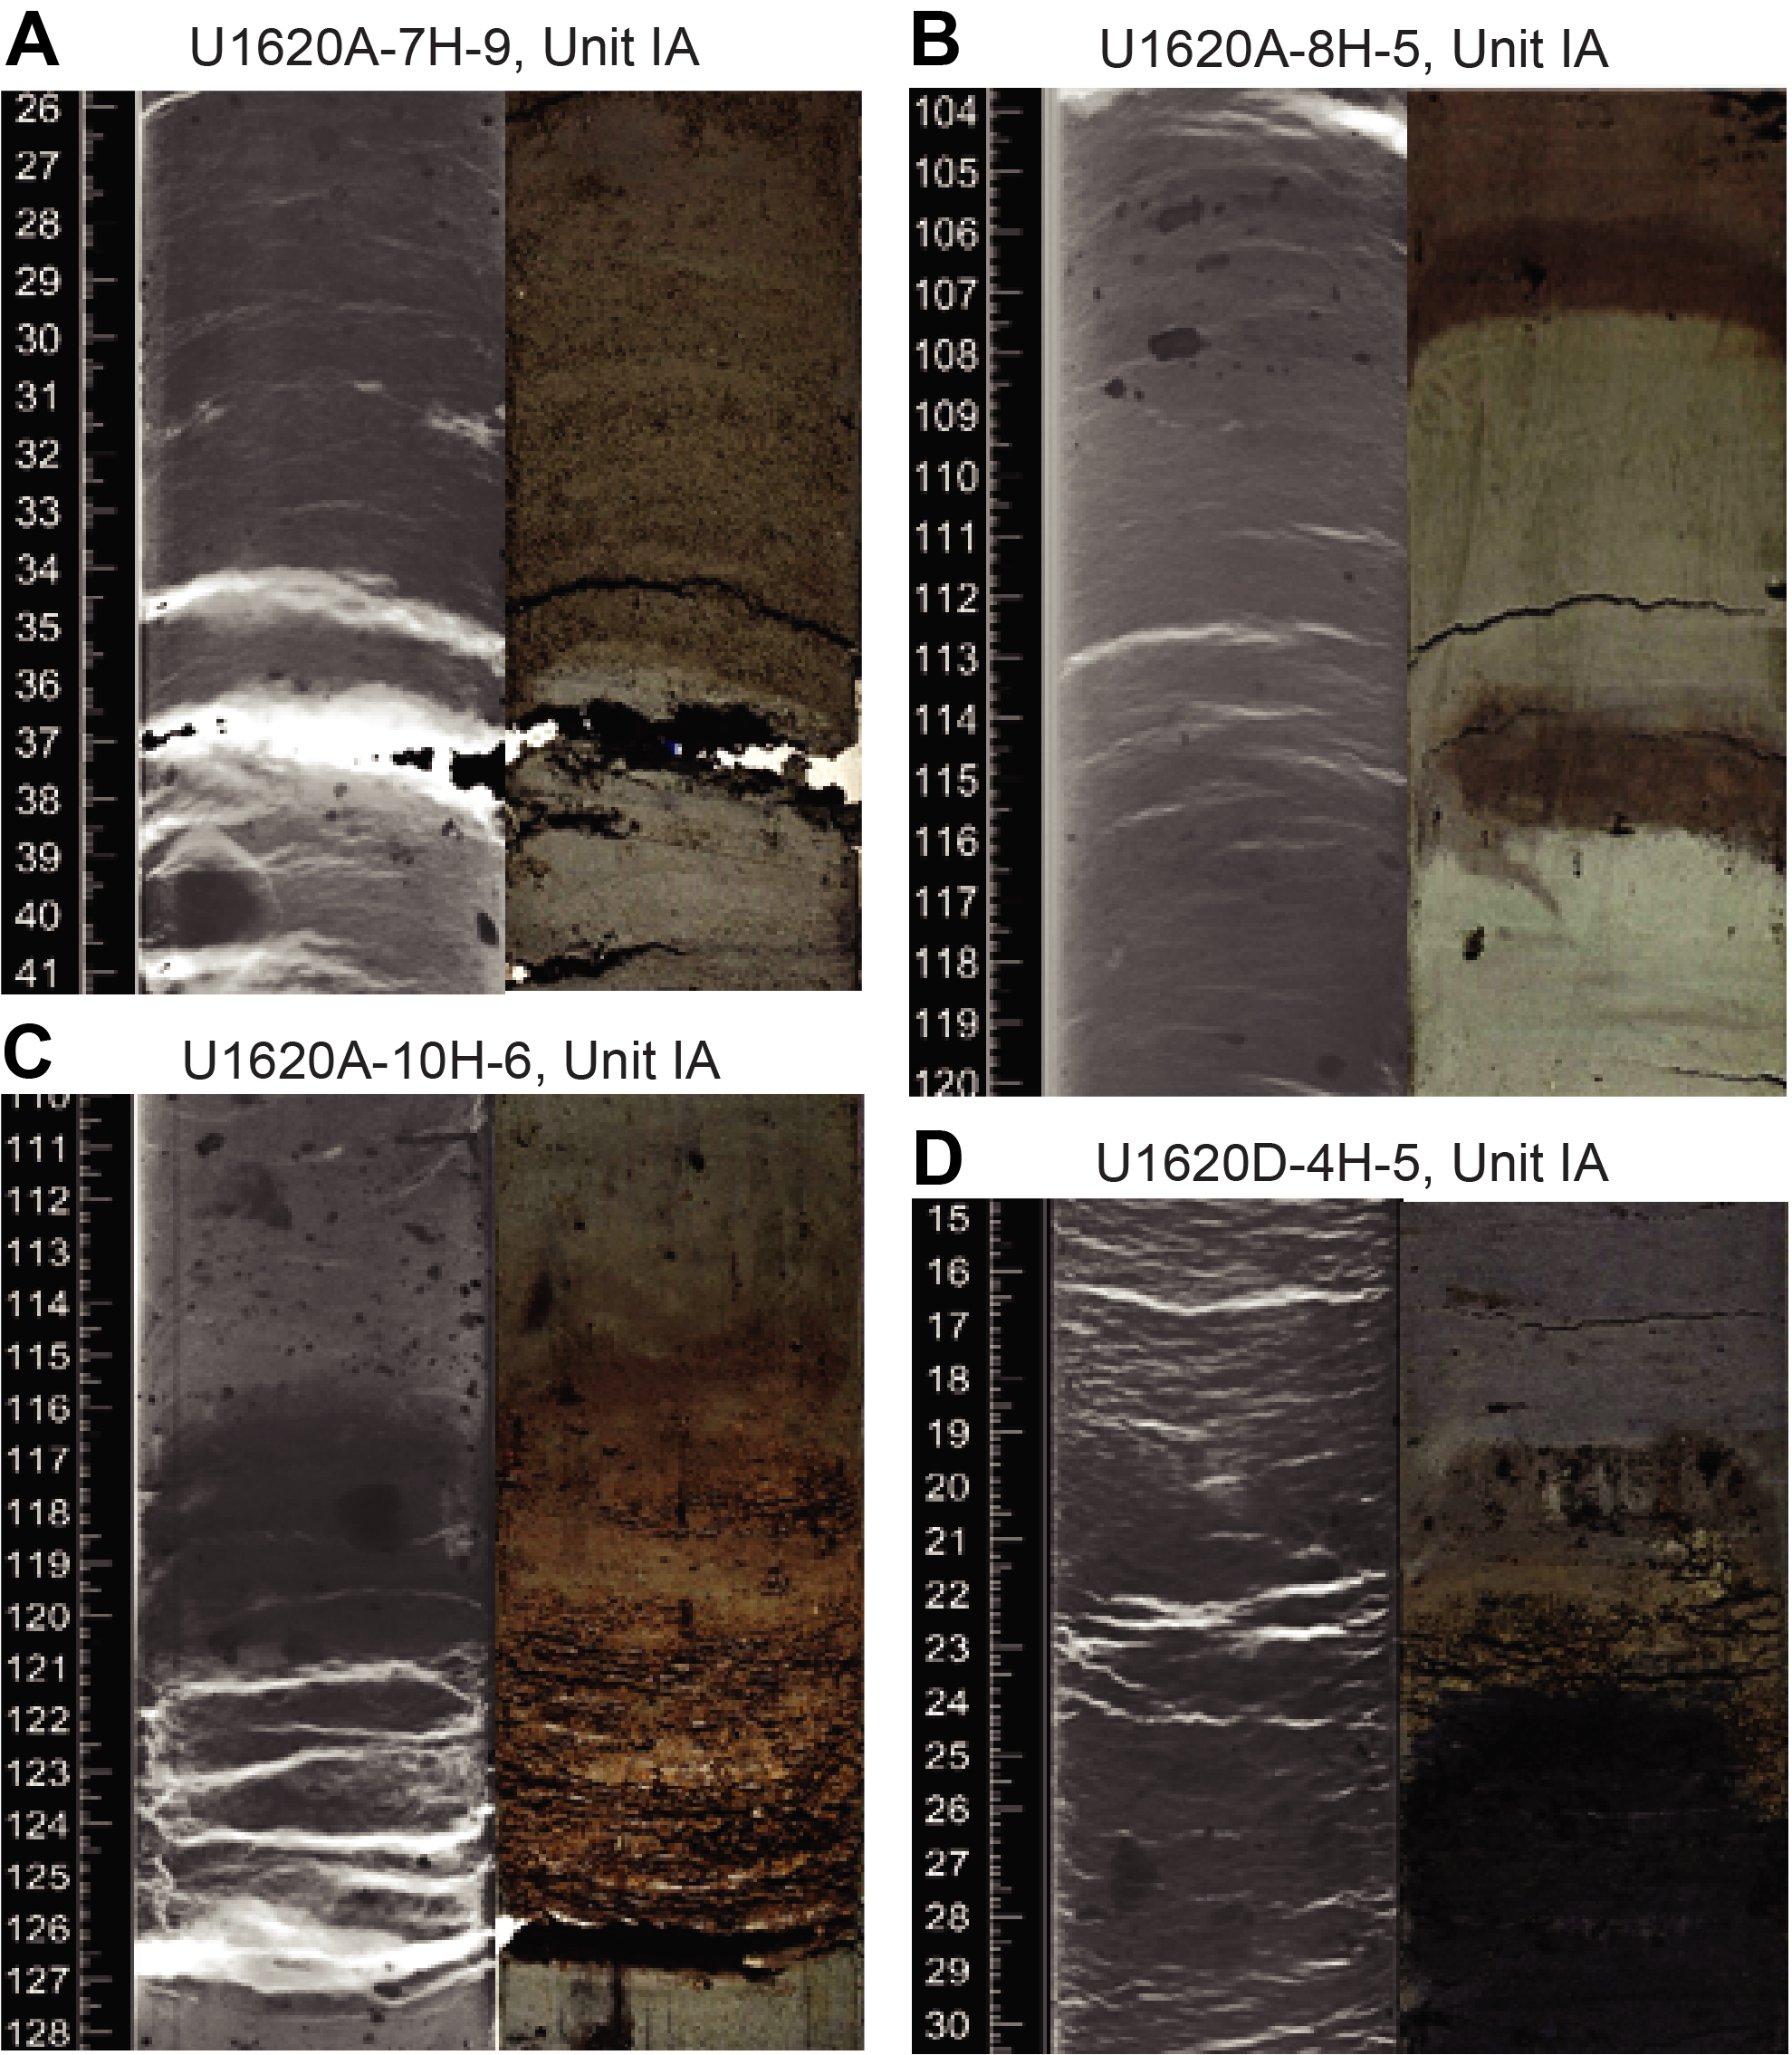
Figure F3. Lithologic boundaries.
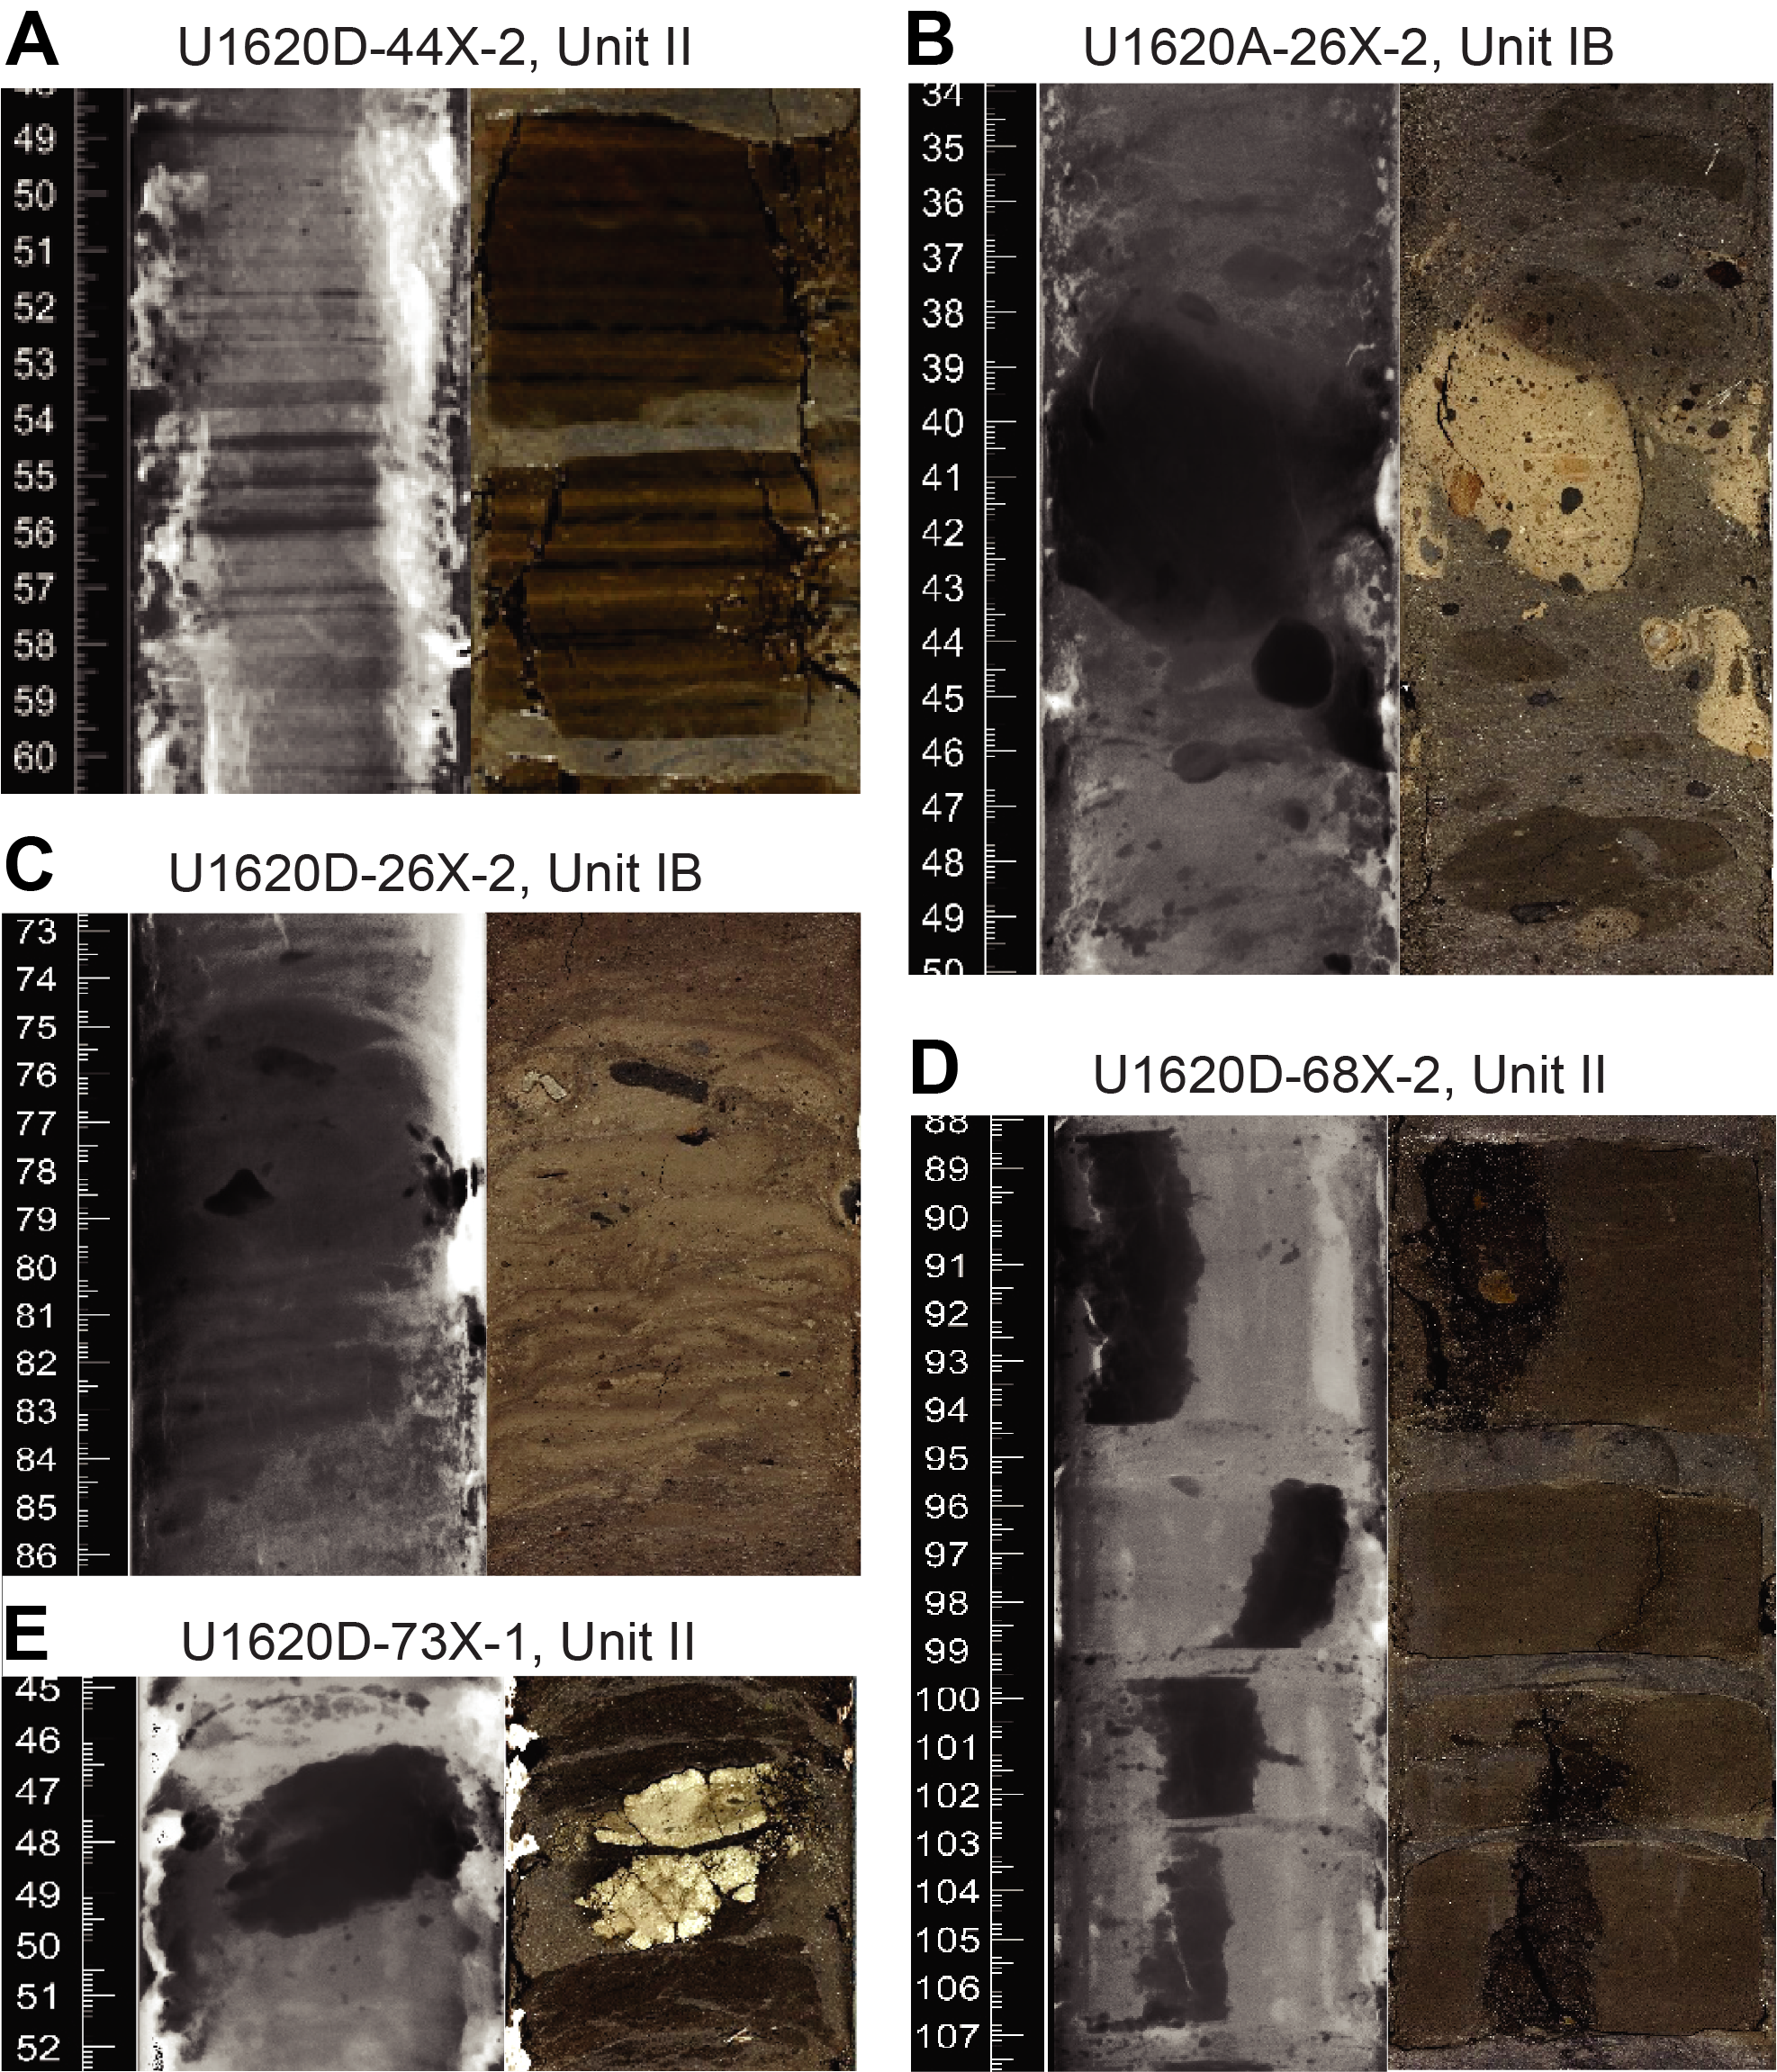
Figure F4. Authigenic features.
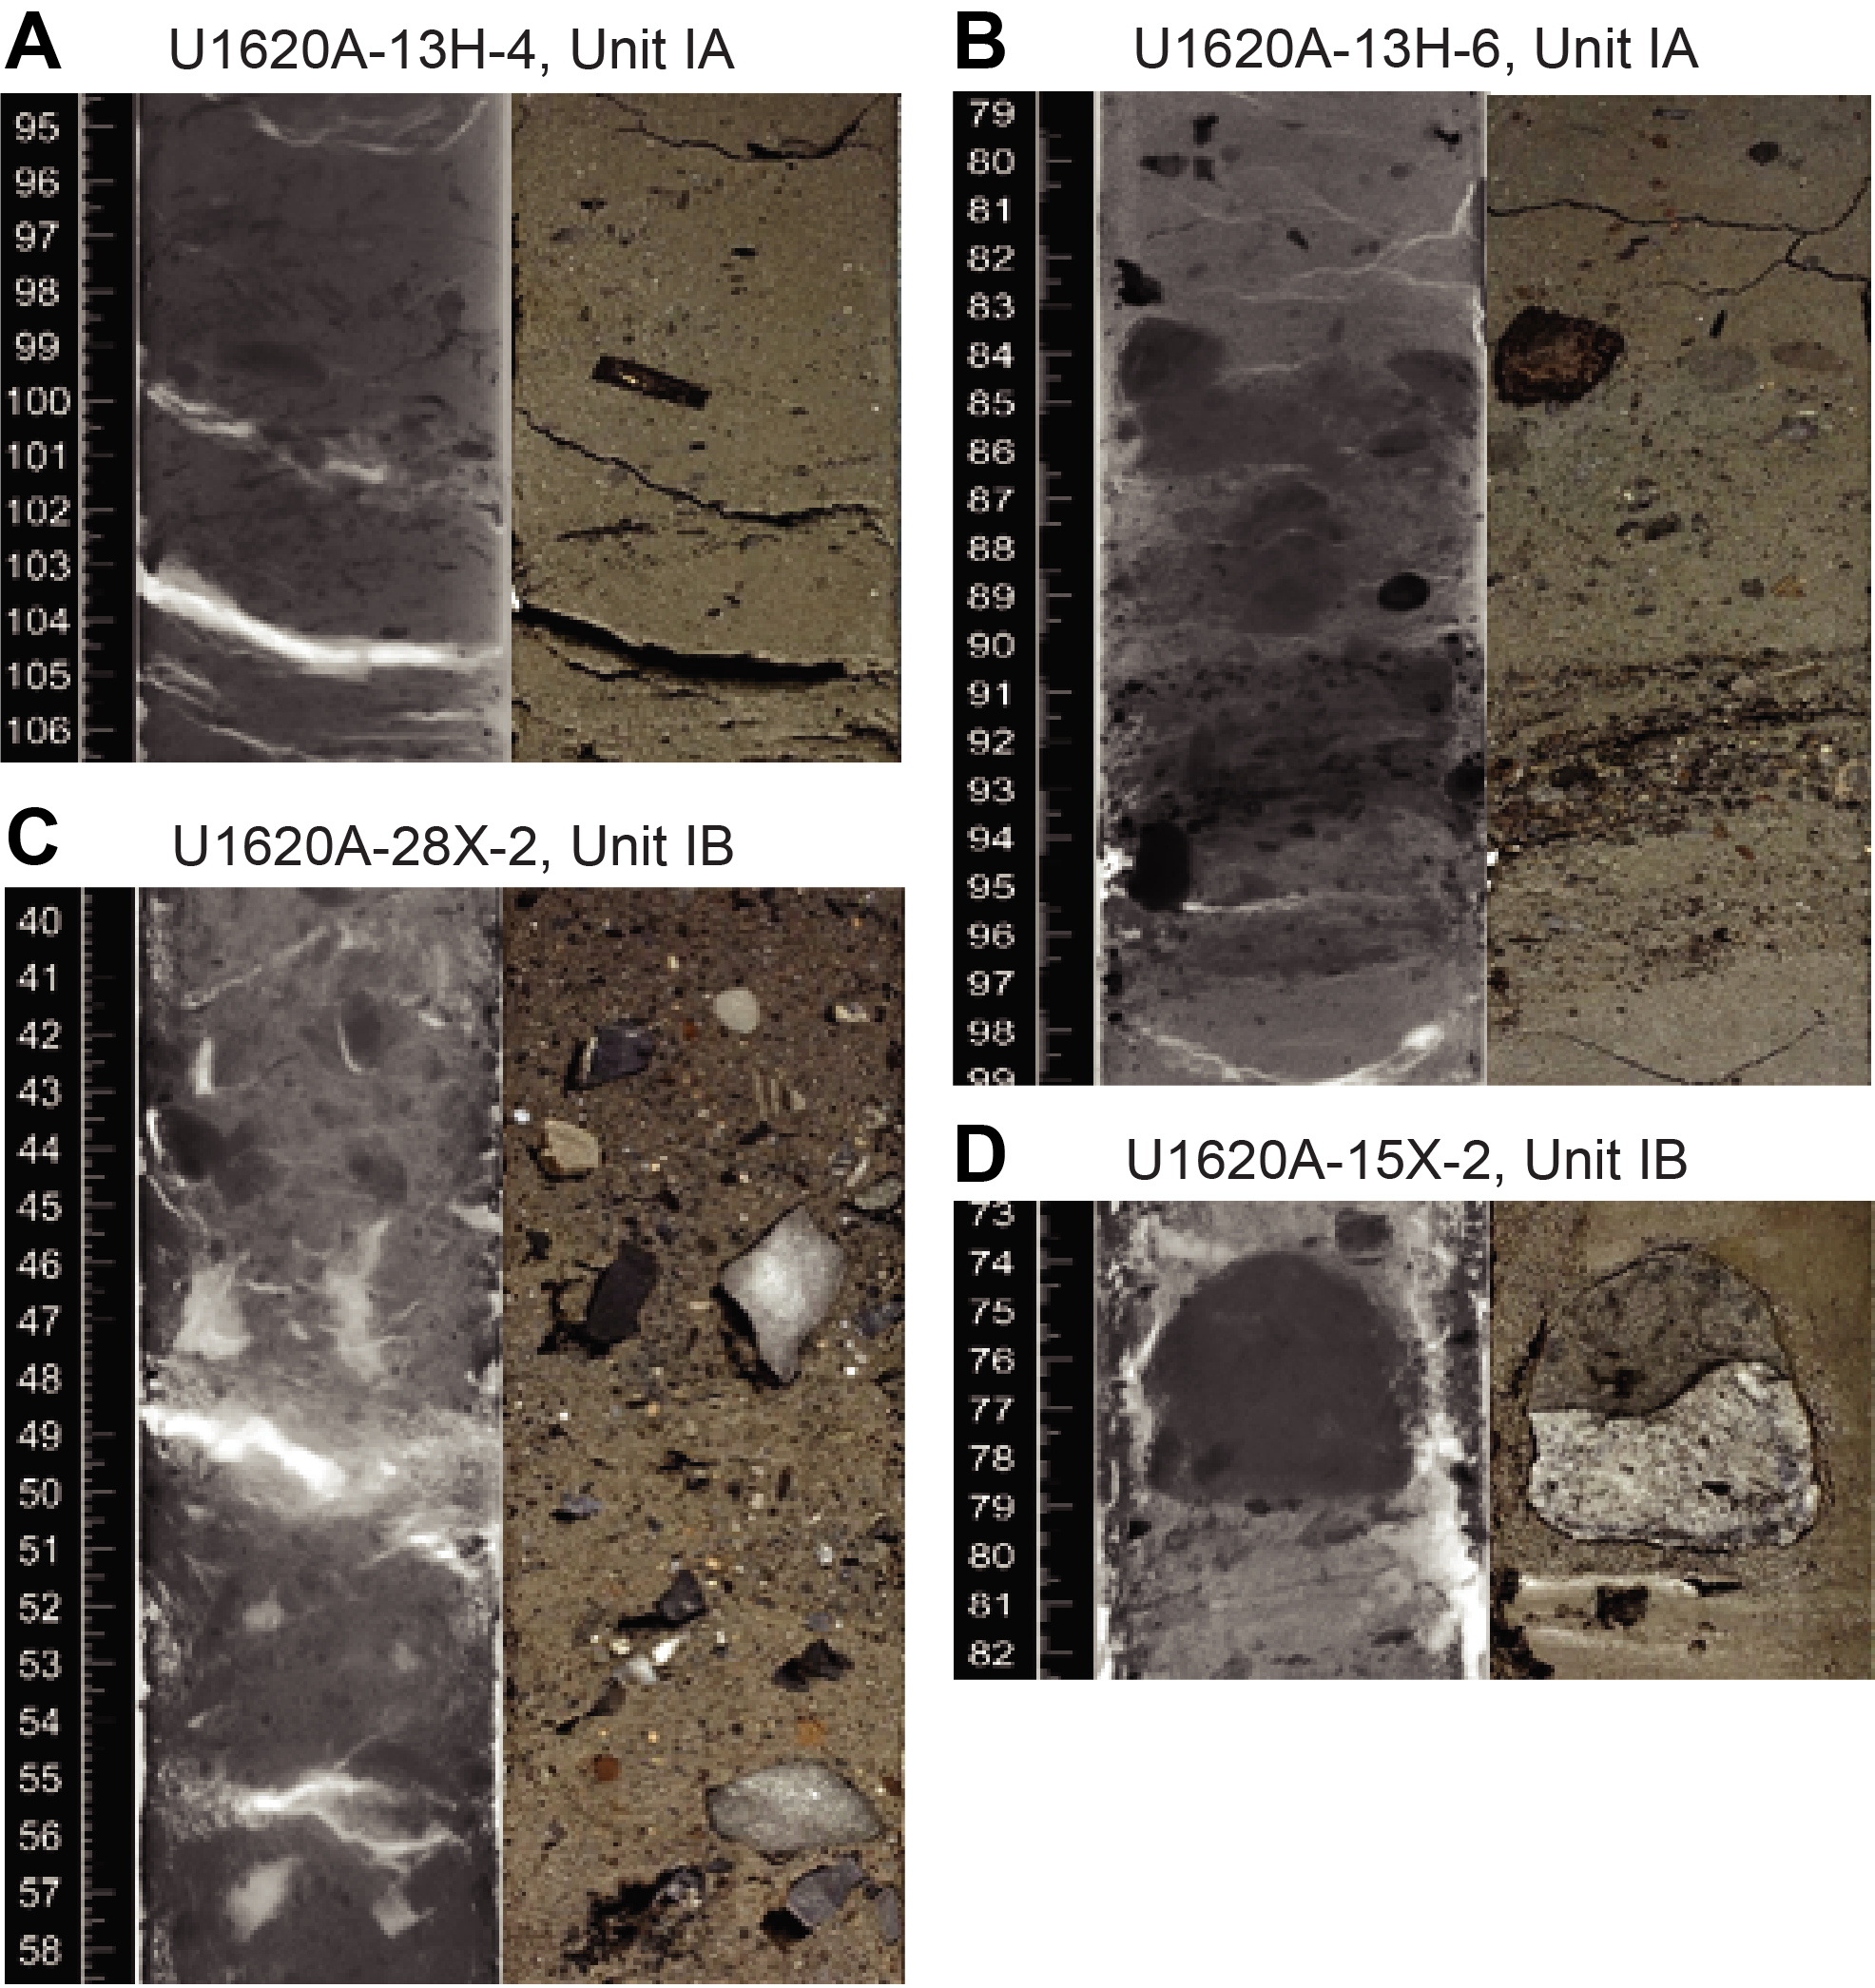
Figure F5. Clasts.
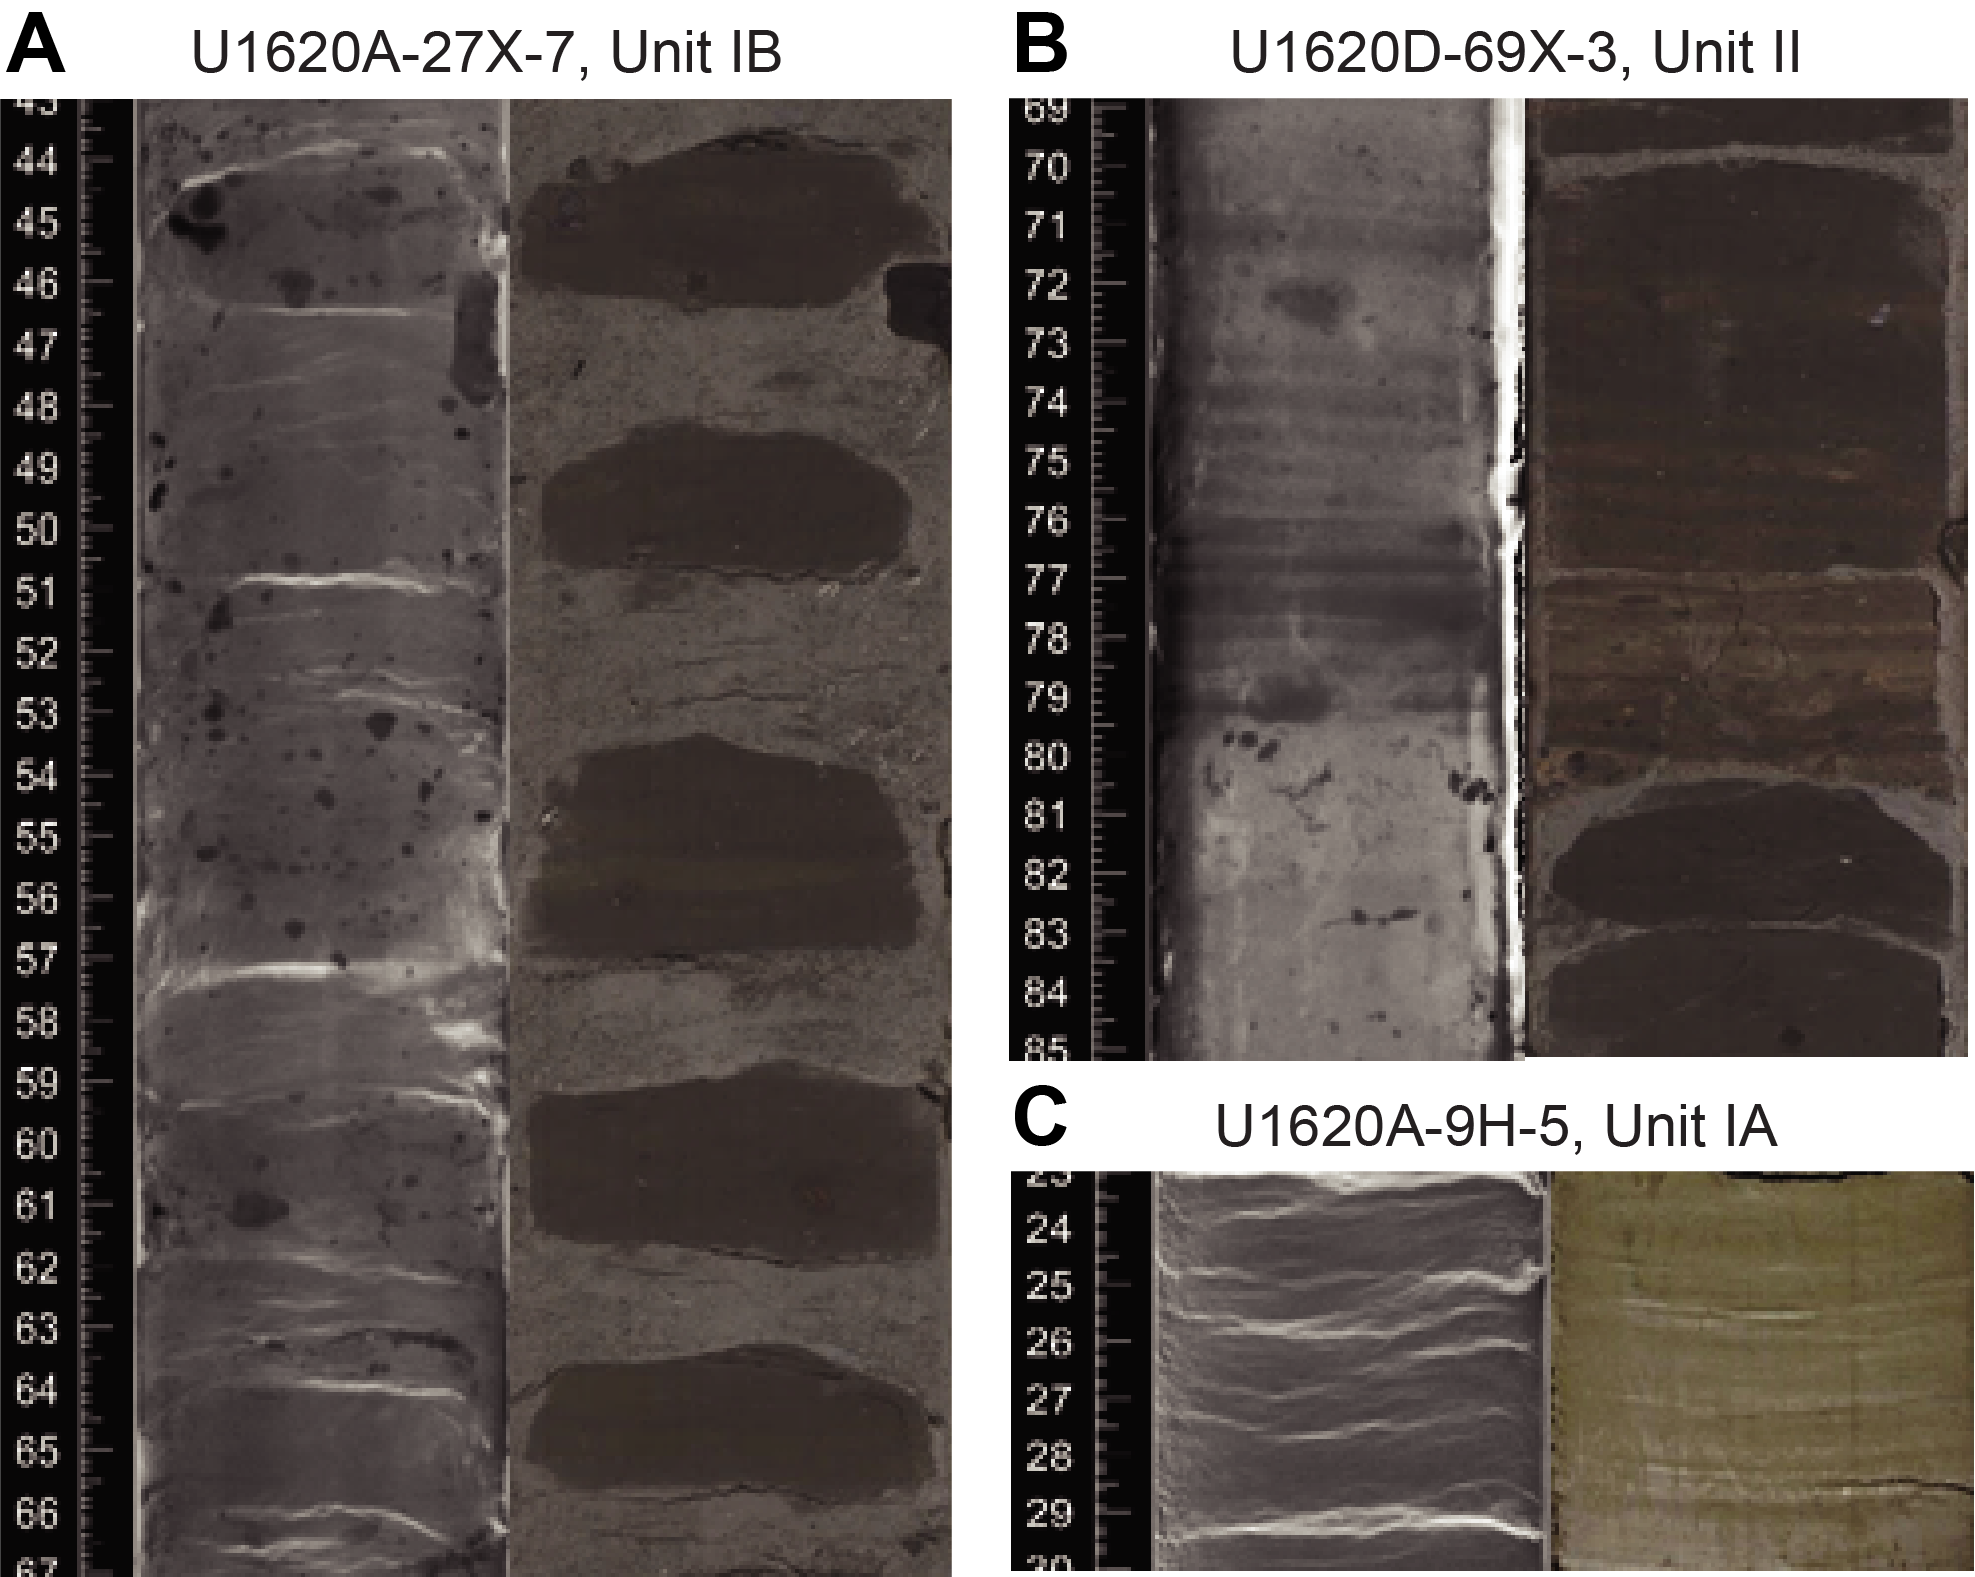
Figure F6. Laminations.
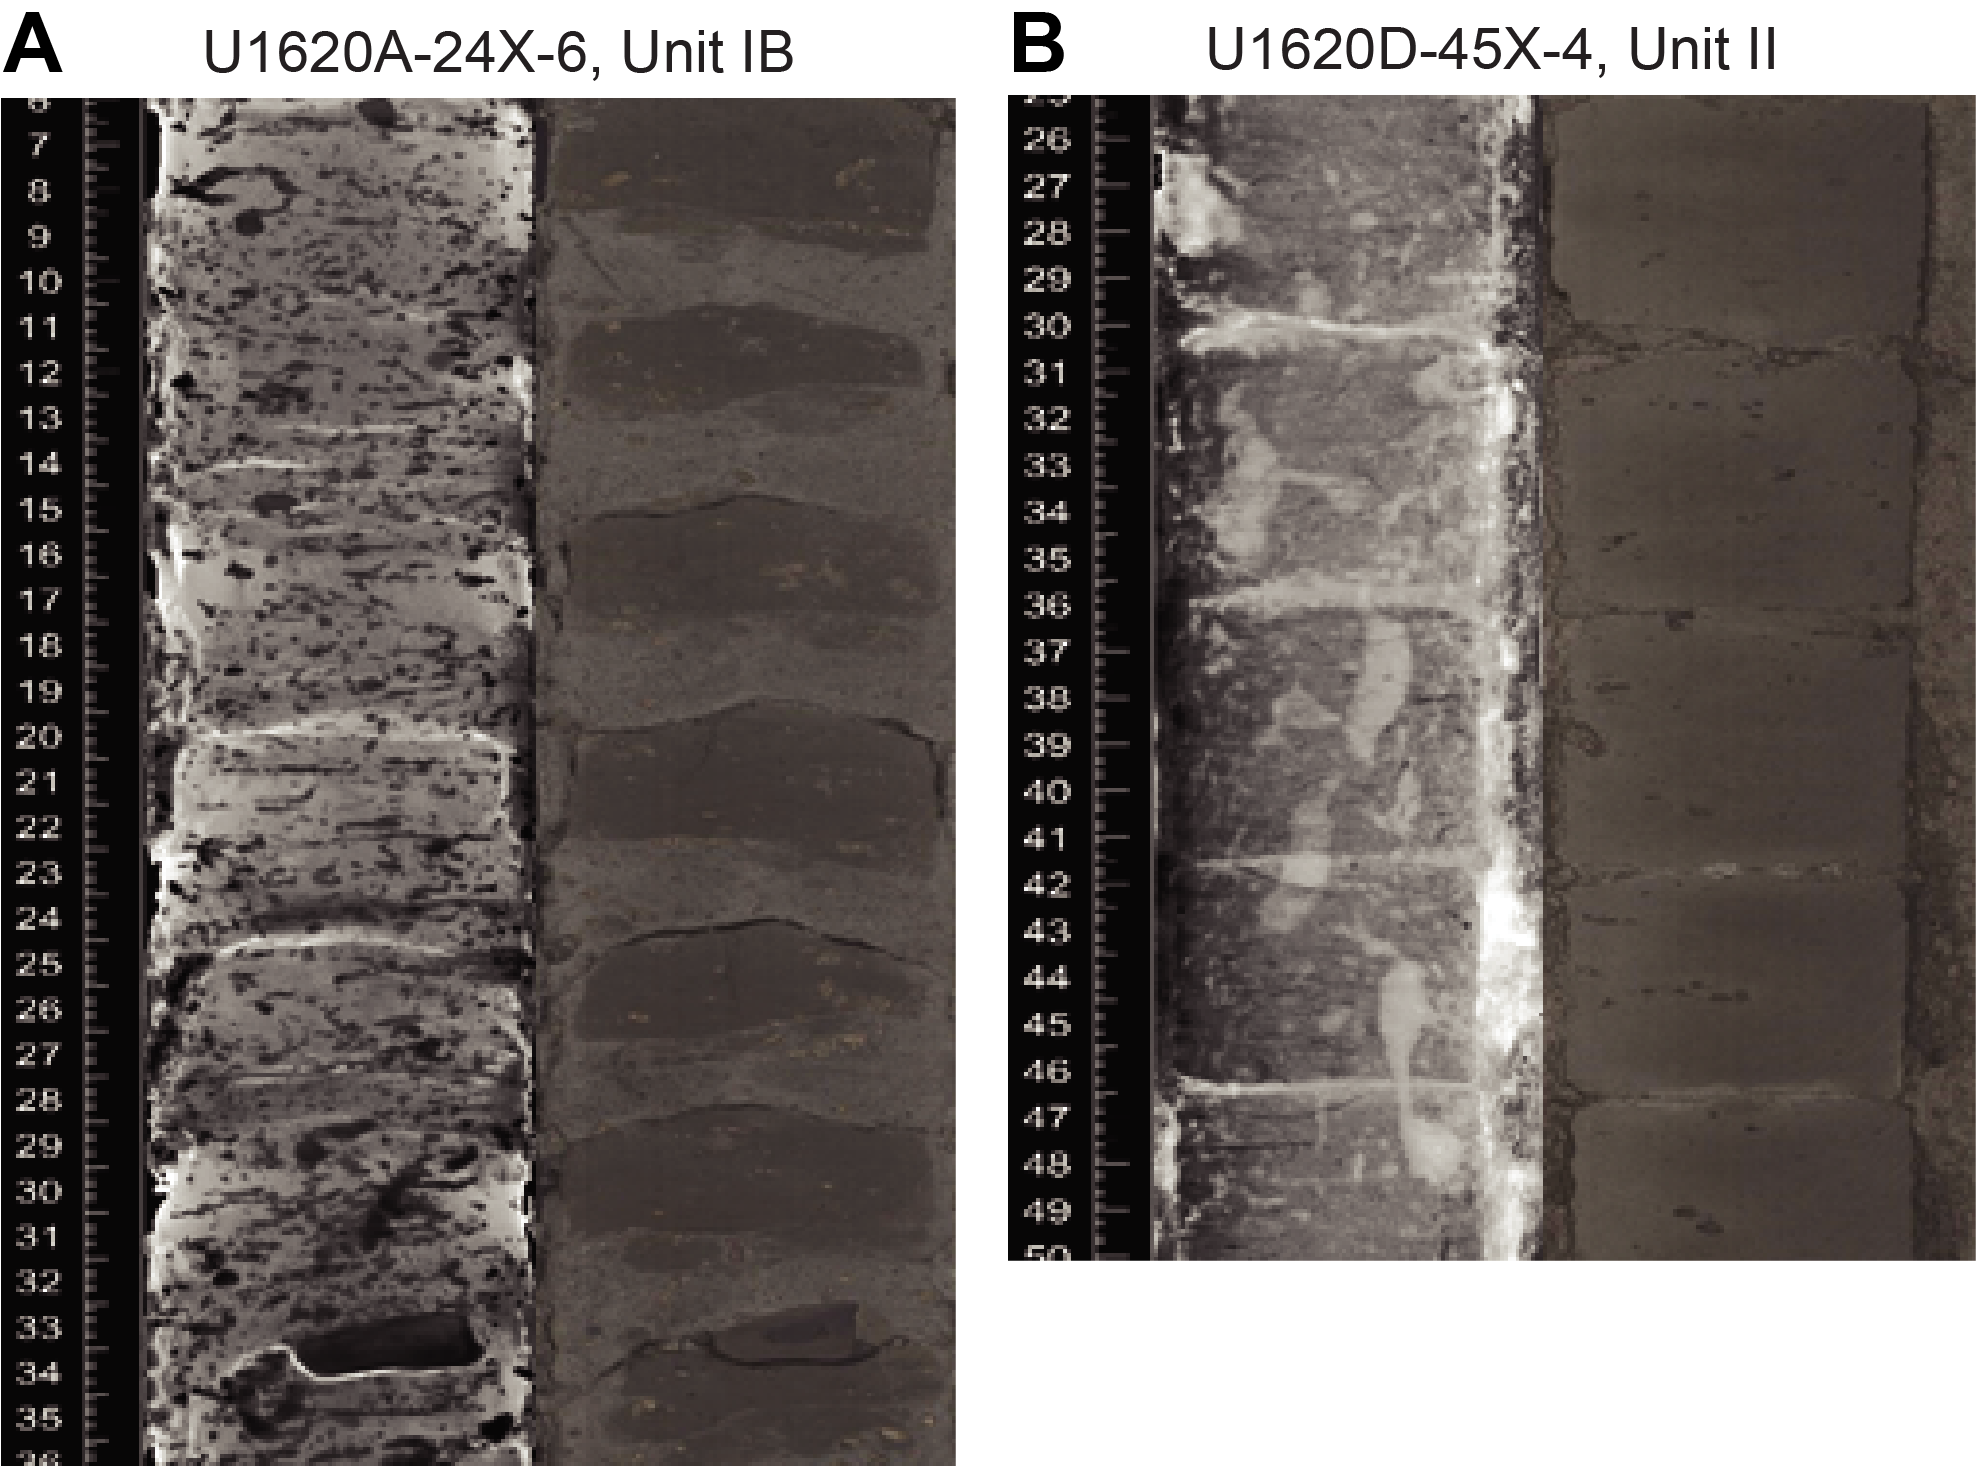
Figure F7. Bioturbation.
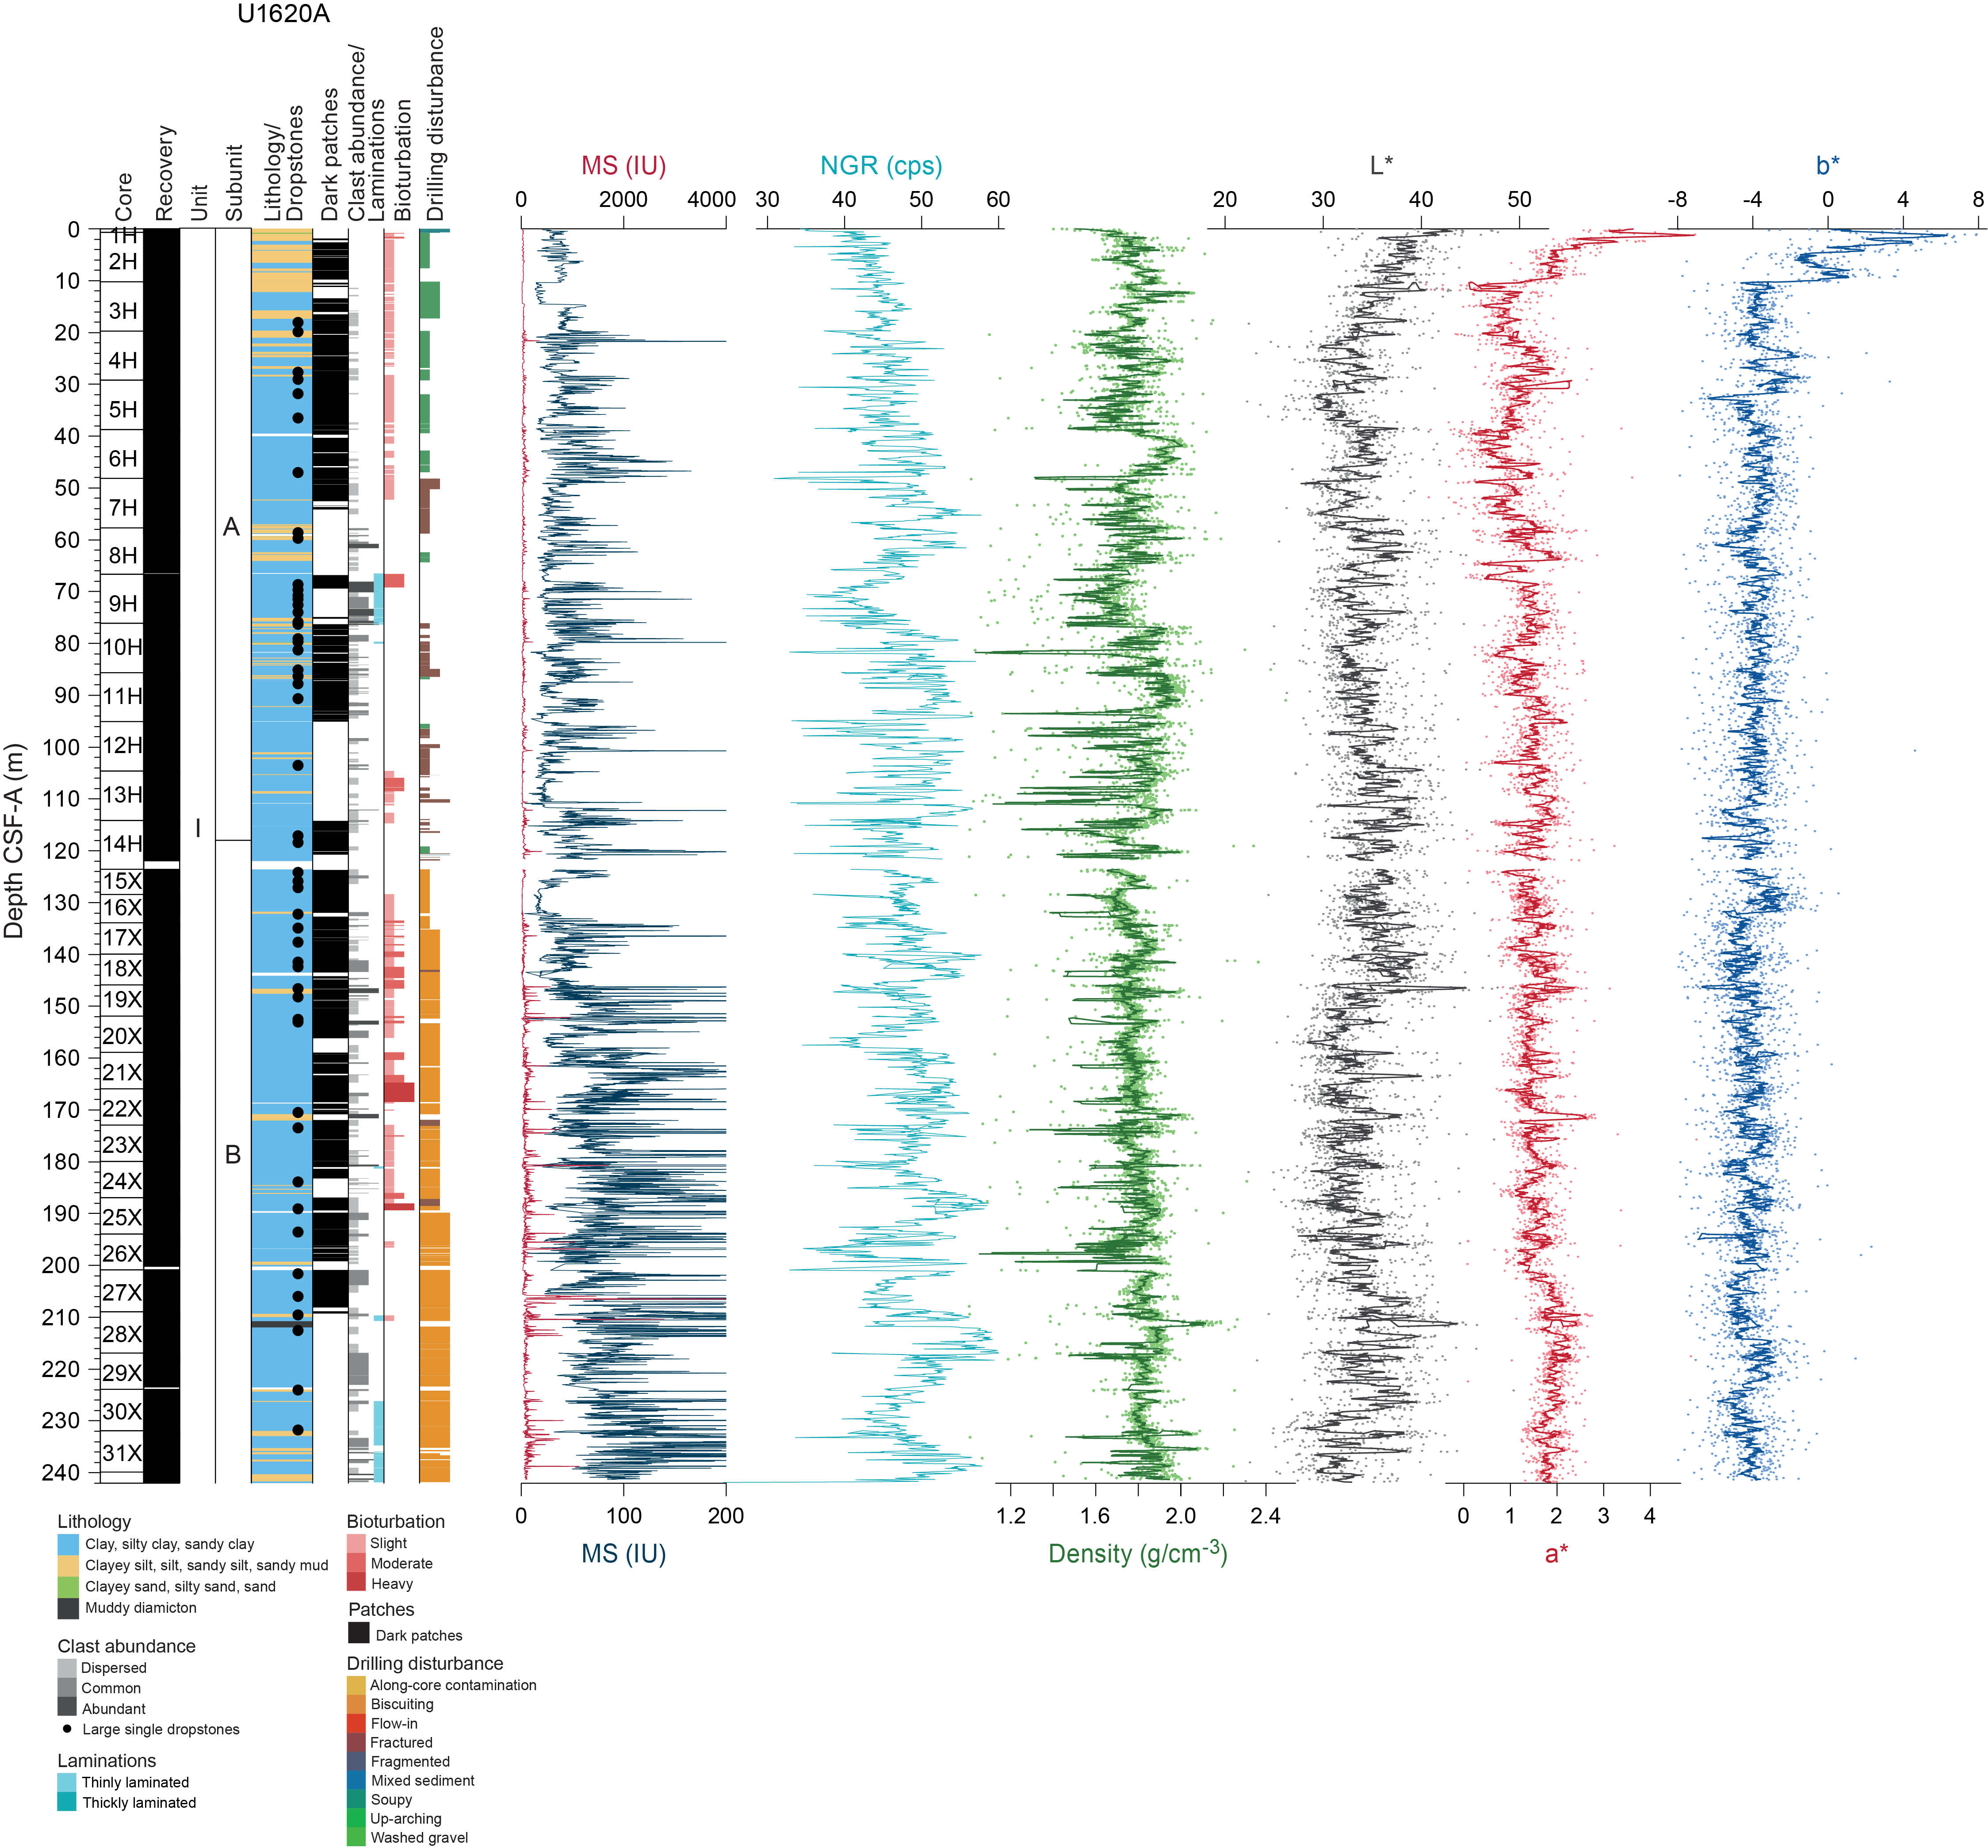
Figure F8. Physical properties, Hole U1620A.
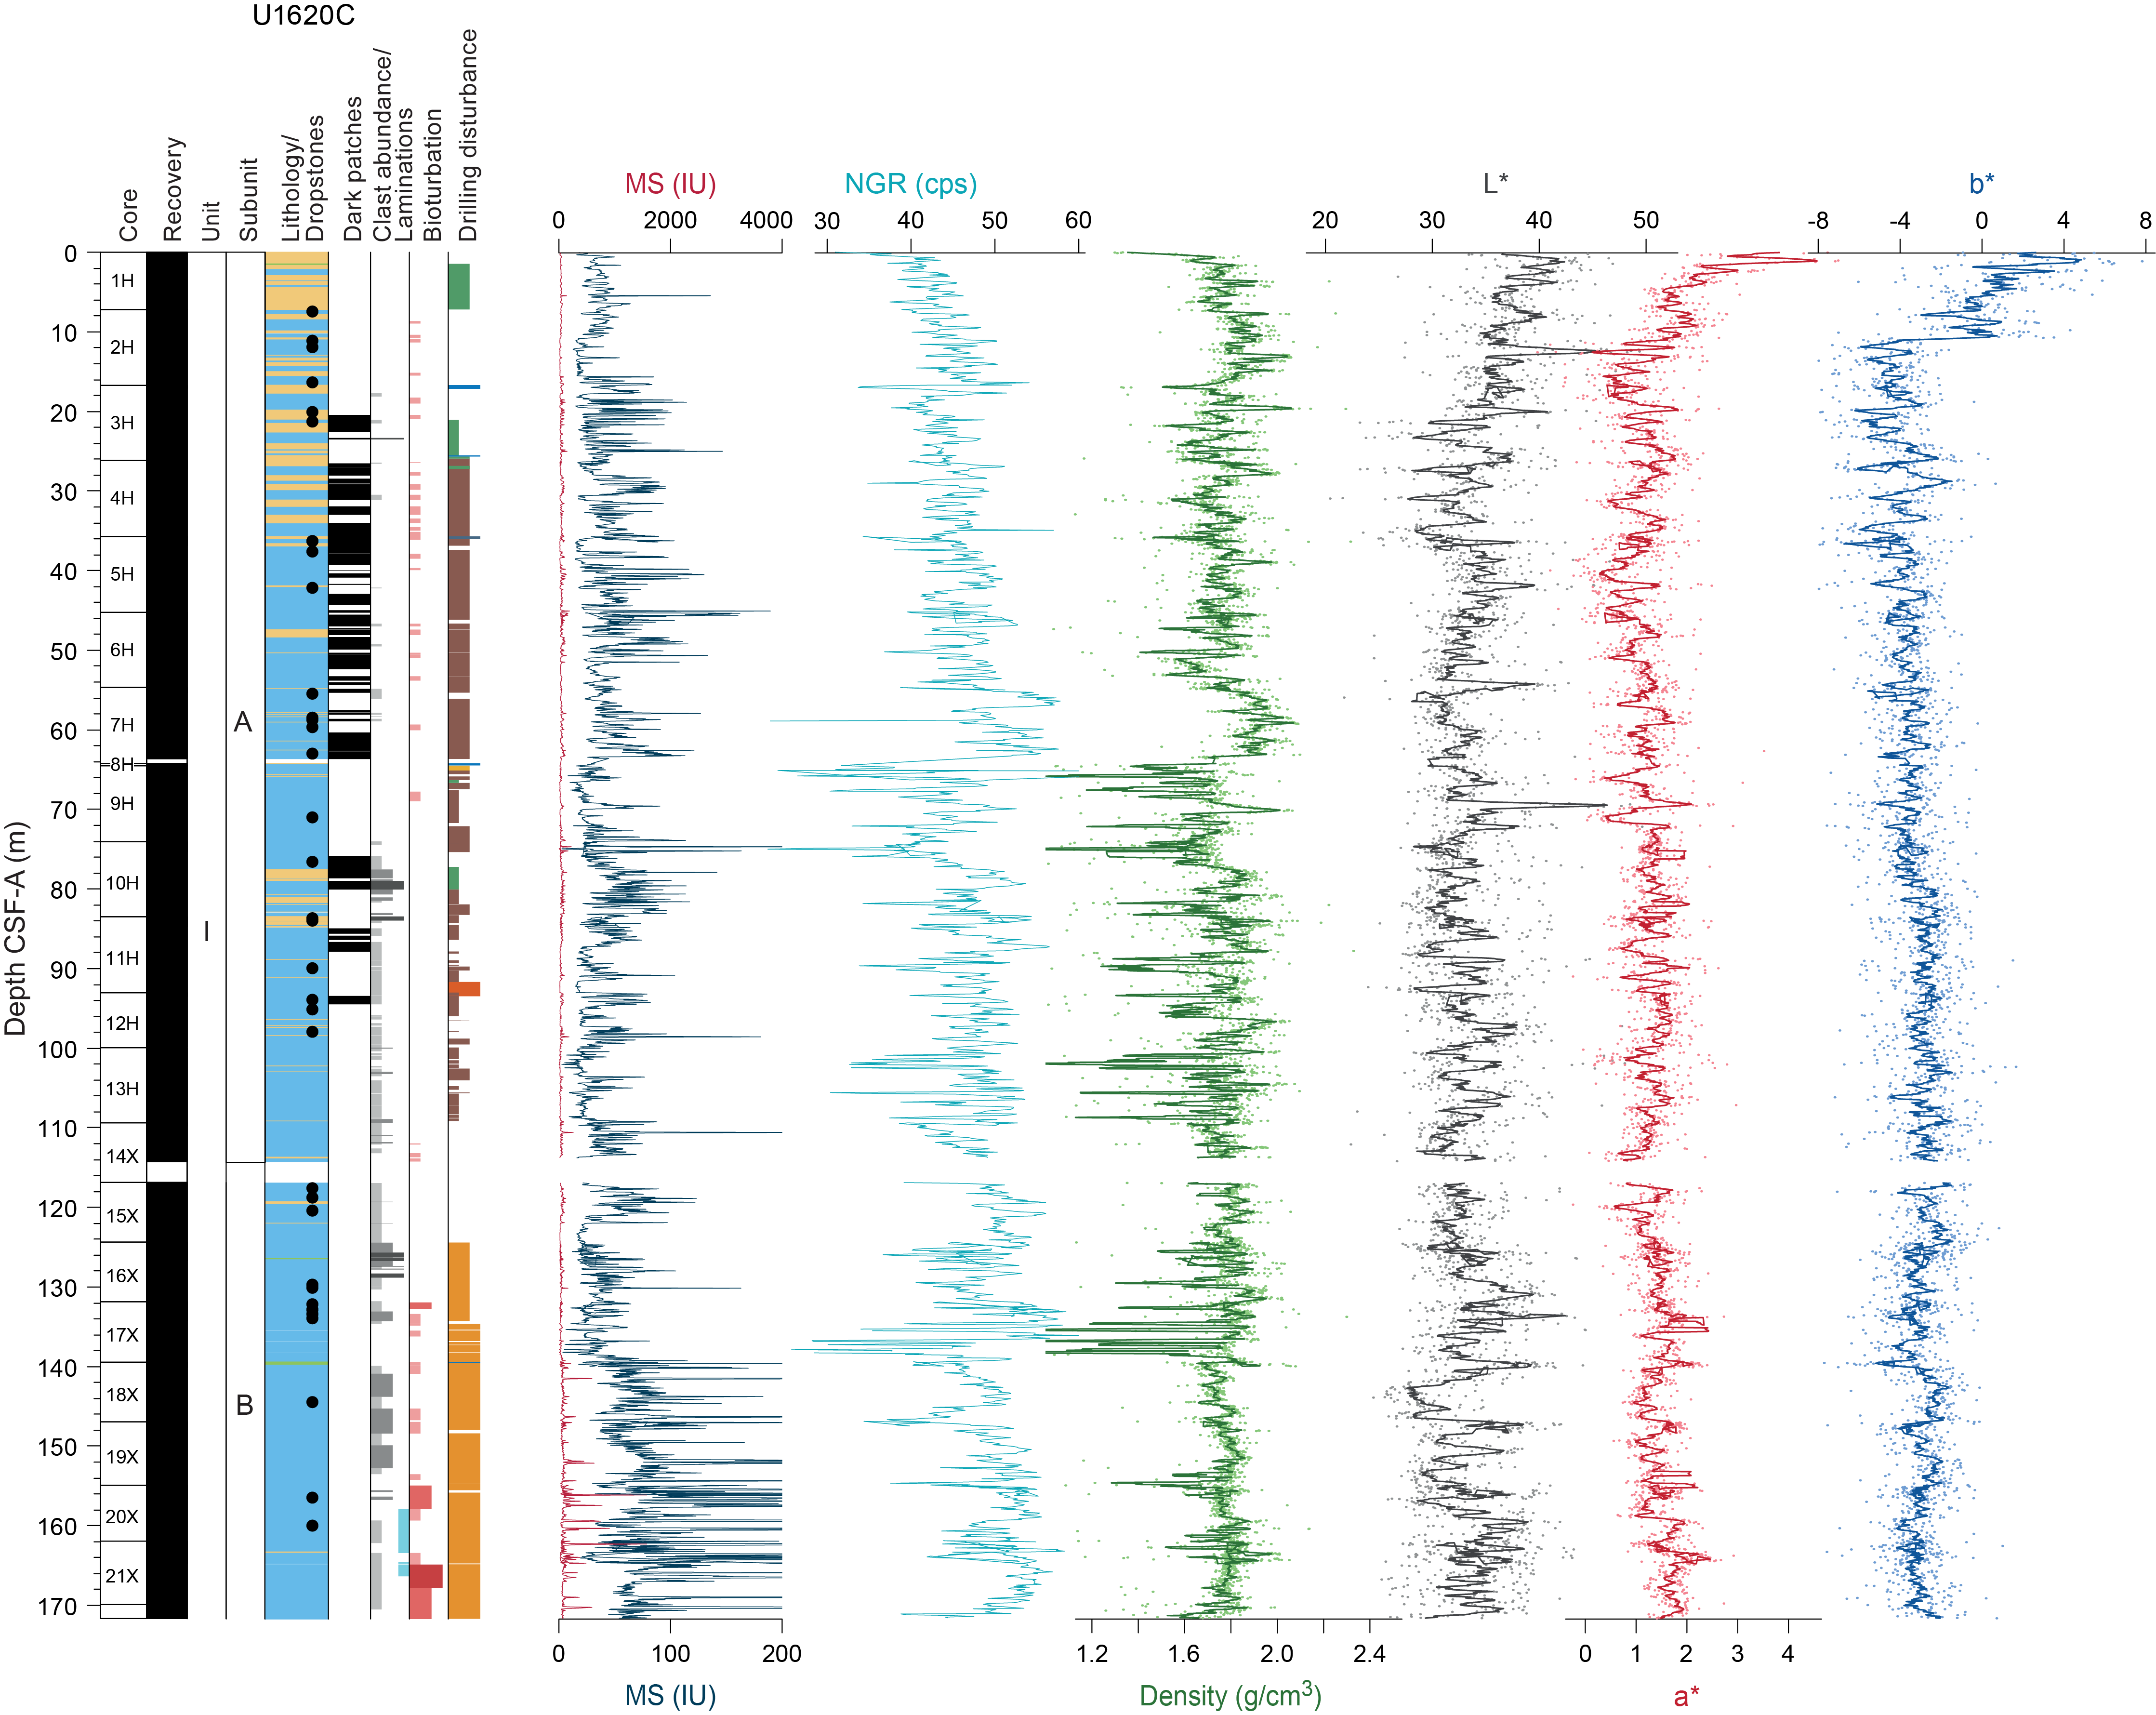
Figure F9. Physical properties, Hole U1620C.
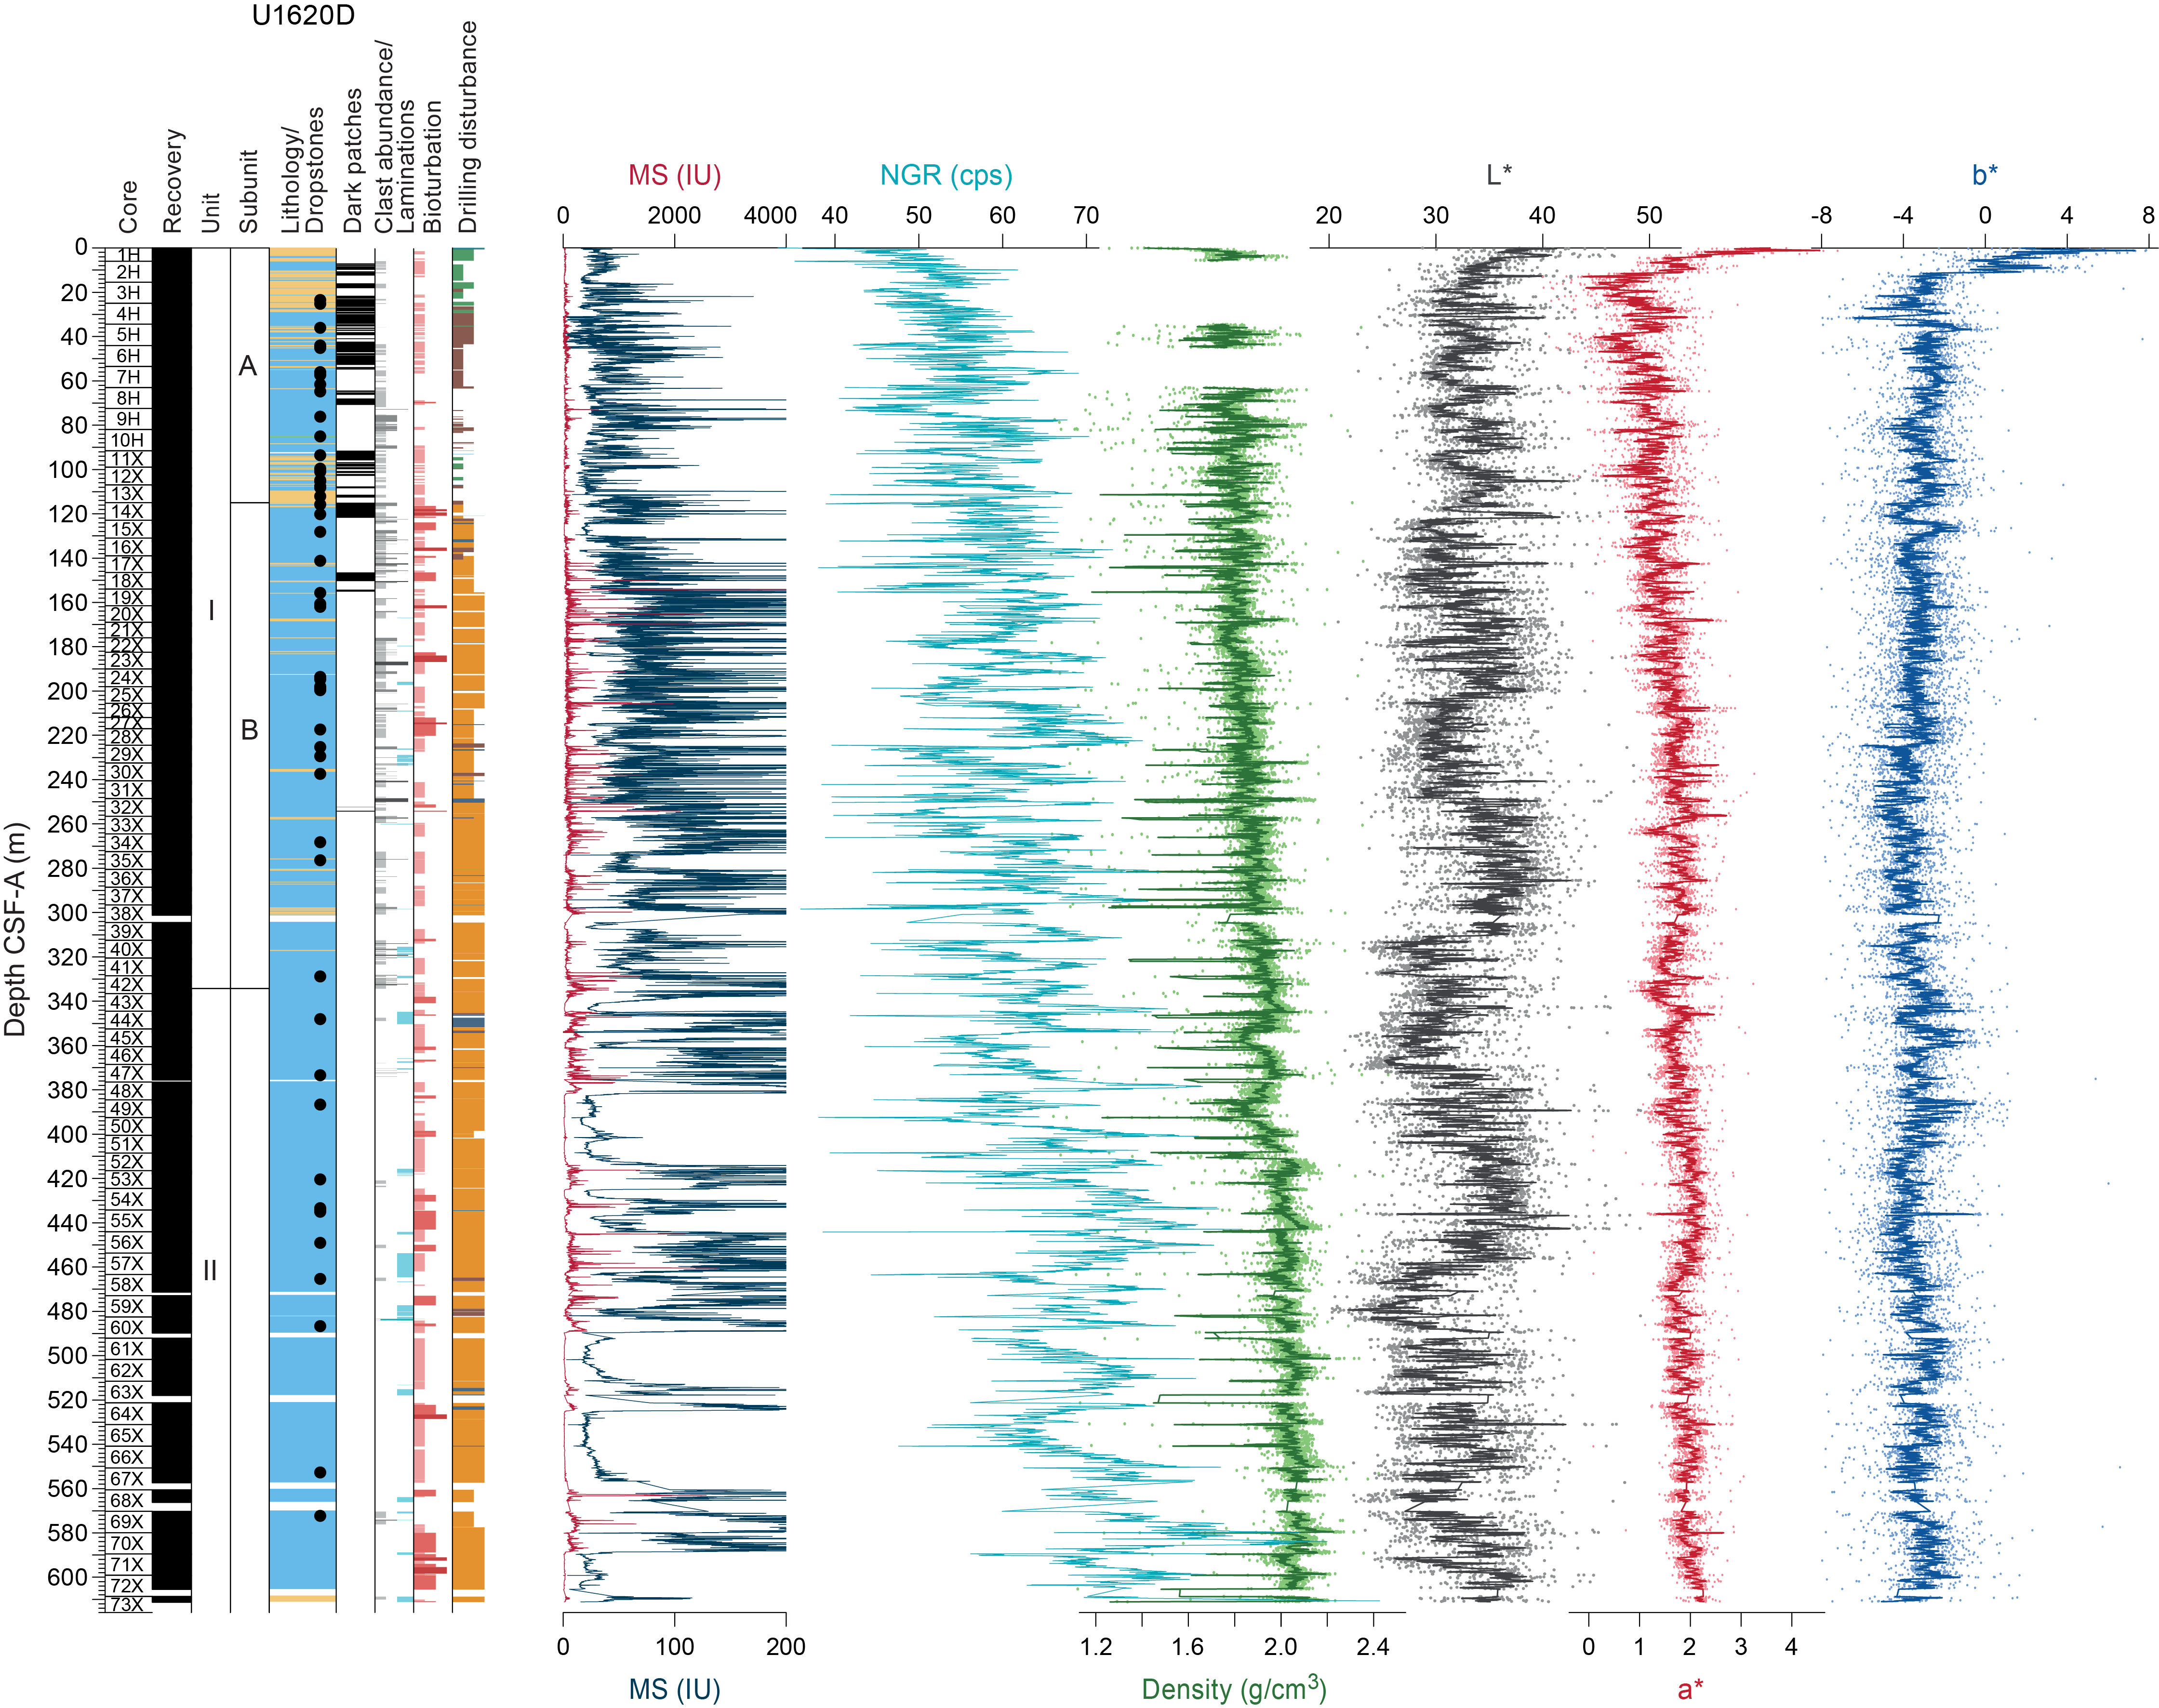
Figure F10. Physical properties, Hole U1620D.
The sediments from Site U1620 exhibit similarities to those from northern Sites U1618 and U1619, namely their siliciclastic (dominantly silty clay) composition with varying abundances of clasts, accompanied by the presence of diagenetic features deeper in the holes. X-radiographs, coupled with physical property and geochemical data, reveal notable changes in sediment characteristics throughout Holes U1620A–U1620D (Figures F8, F9, F10; Table T2). In summary, the uppermost ~334 m are composed of soft to firm silty clay with some coarser grained intervals of clayey silt and sandy mud. Dark patches and dispersed clasts are common, and bioturbation is absent (0%–10%) to slight (10%–30%). Below ~334 mbsf, the sediments become more clay-rich and contain fewer clasts, with an increase in grayish brown (2.5Y 5/2) to pale brown (2.5Y 7/4) authigenic carbonate.
Magnetic susceptibility (MS) in the uppermost ~140–150 m generally exhibits low values (0 to ~100 IU). The MS values below this depth are generally higher with significant spikes exceeding 200 IU, likely correlating to an increased presence of iron sulfide minerals, although several intervals of low MS values also exist at depth, including between ~380 and 410 mbsf and below 490 mbsf (Figure F10). Color reflectance also shows downhole changes; in the upper ~150 m, except for the uppermost interval, a* values oscillate around a common mean (~1.15) but exhibit a shift to higher values at ~150 mbsf (mean = 1.48) and at ~200 mbsf (mean = 1.73). L* values exhibit a pattern of cyclicity changes that are most apparent in Hole U1620D, which is the longest record. In the uppermost ~116 m of sediments, high-frequency oscillations are present. Below this depth, the high-frequency oscillation pattern is underlain by low-frequency oscillations, which dominate the signals. This pattern of high- and low-frequency oscillations in L* values is not clear in Holes U1620A or U1620C. Natural gamma radiation (NGR) values exhibit a similar oscillating trend in Hole U1620D, but this pattern is not as evident as in the L* data.
Diagenesis is apparent in the cores from Site U1620 in the form of authigenic iron sulfide minerals and authigenic carbonate minerals (Figure F4). Iron sulfide minerals at the micrometer to centimeter scale are observed on the split core surface from 110 to 114 mbsf in Hole U1620A and beginning at ~155 mbsf in Holes U1620C and U1620D. Authigenic carbonate layers (some in the form of laminations) and nodules are present in the upper part of Hole U1620D and become more frequent downhole, starting in Core 33X. One of the nodules (Sample 403-U1620D-53X-2, 97–99 cm) was thin sectioned and stained to aid in the identification of authigenic dolomite and/or siderite (Dickson, 1978; Hitzman, 1999). X-ray diffraction (XRD) on Sample 33X-2, 27–28 cm, collected from a light brownish gray mud layer, revealed the presence of siderite as a mineralogic component of the authigenic carbonate layer. Energy dispersive spectrometry (EDS) analyses on scanning electron microscope (SEM) performed on light brown to light orange, millimeter-sized minerals collected from a cavity of the sediment split surface (Sample 50X-4, 2 cm) revealed the presence of siderite (Fe = 0.99%, Mg = 0.55%, Ca = 60.00%, O = 30.10%). Another stained thin section collected from black-yellow-brown laminations (Sample 44X-2; TS09; Figure F4A) and analyzed with EDS, revealed a selective enrichment of iron sulfide minerals (black laminae) and (authigenic) carbonates (yellow laminae) in an overall quartz and clay mineral-rich bulk sedimentation (brown sediments).
Based on the primary (i.e., detrital siliciclastics) and secondary (i.e., diagenetic) sediment characteristics, two primary lithostratigraphic units and additional subunits are defined for Site U1620 (Table T2). Holes U1620A, U1620C, and U1620D were used to define the lithostratigraphic characteristics of Unit I and Subunits IA and IB, whereas the deeper Unit II was recovered in Hole U1620D only. The stratigraphic boundary between Subunits IA and IB was first placed in Hole U1620D, and the boundary was subsequently identified in Holes U1620A and U1620C in good agreement with the stratigraphic correlation (see Stratigraphic correlation) on the CSF-A scale (Figure F11).
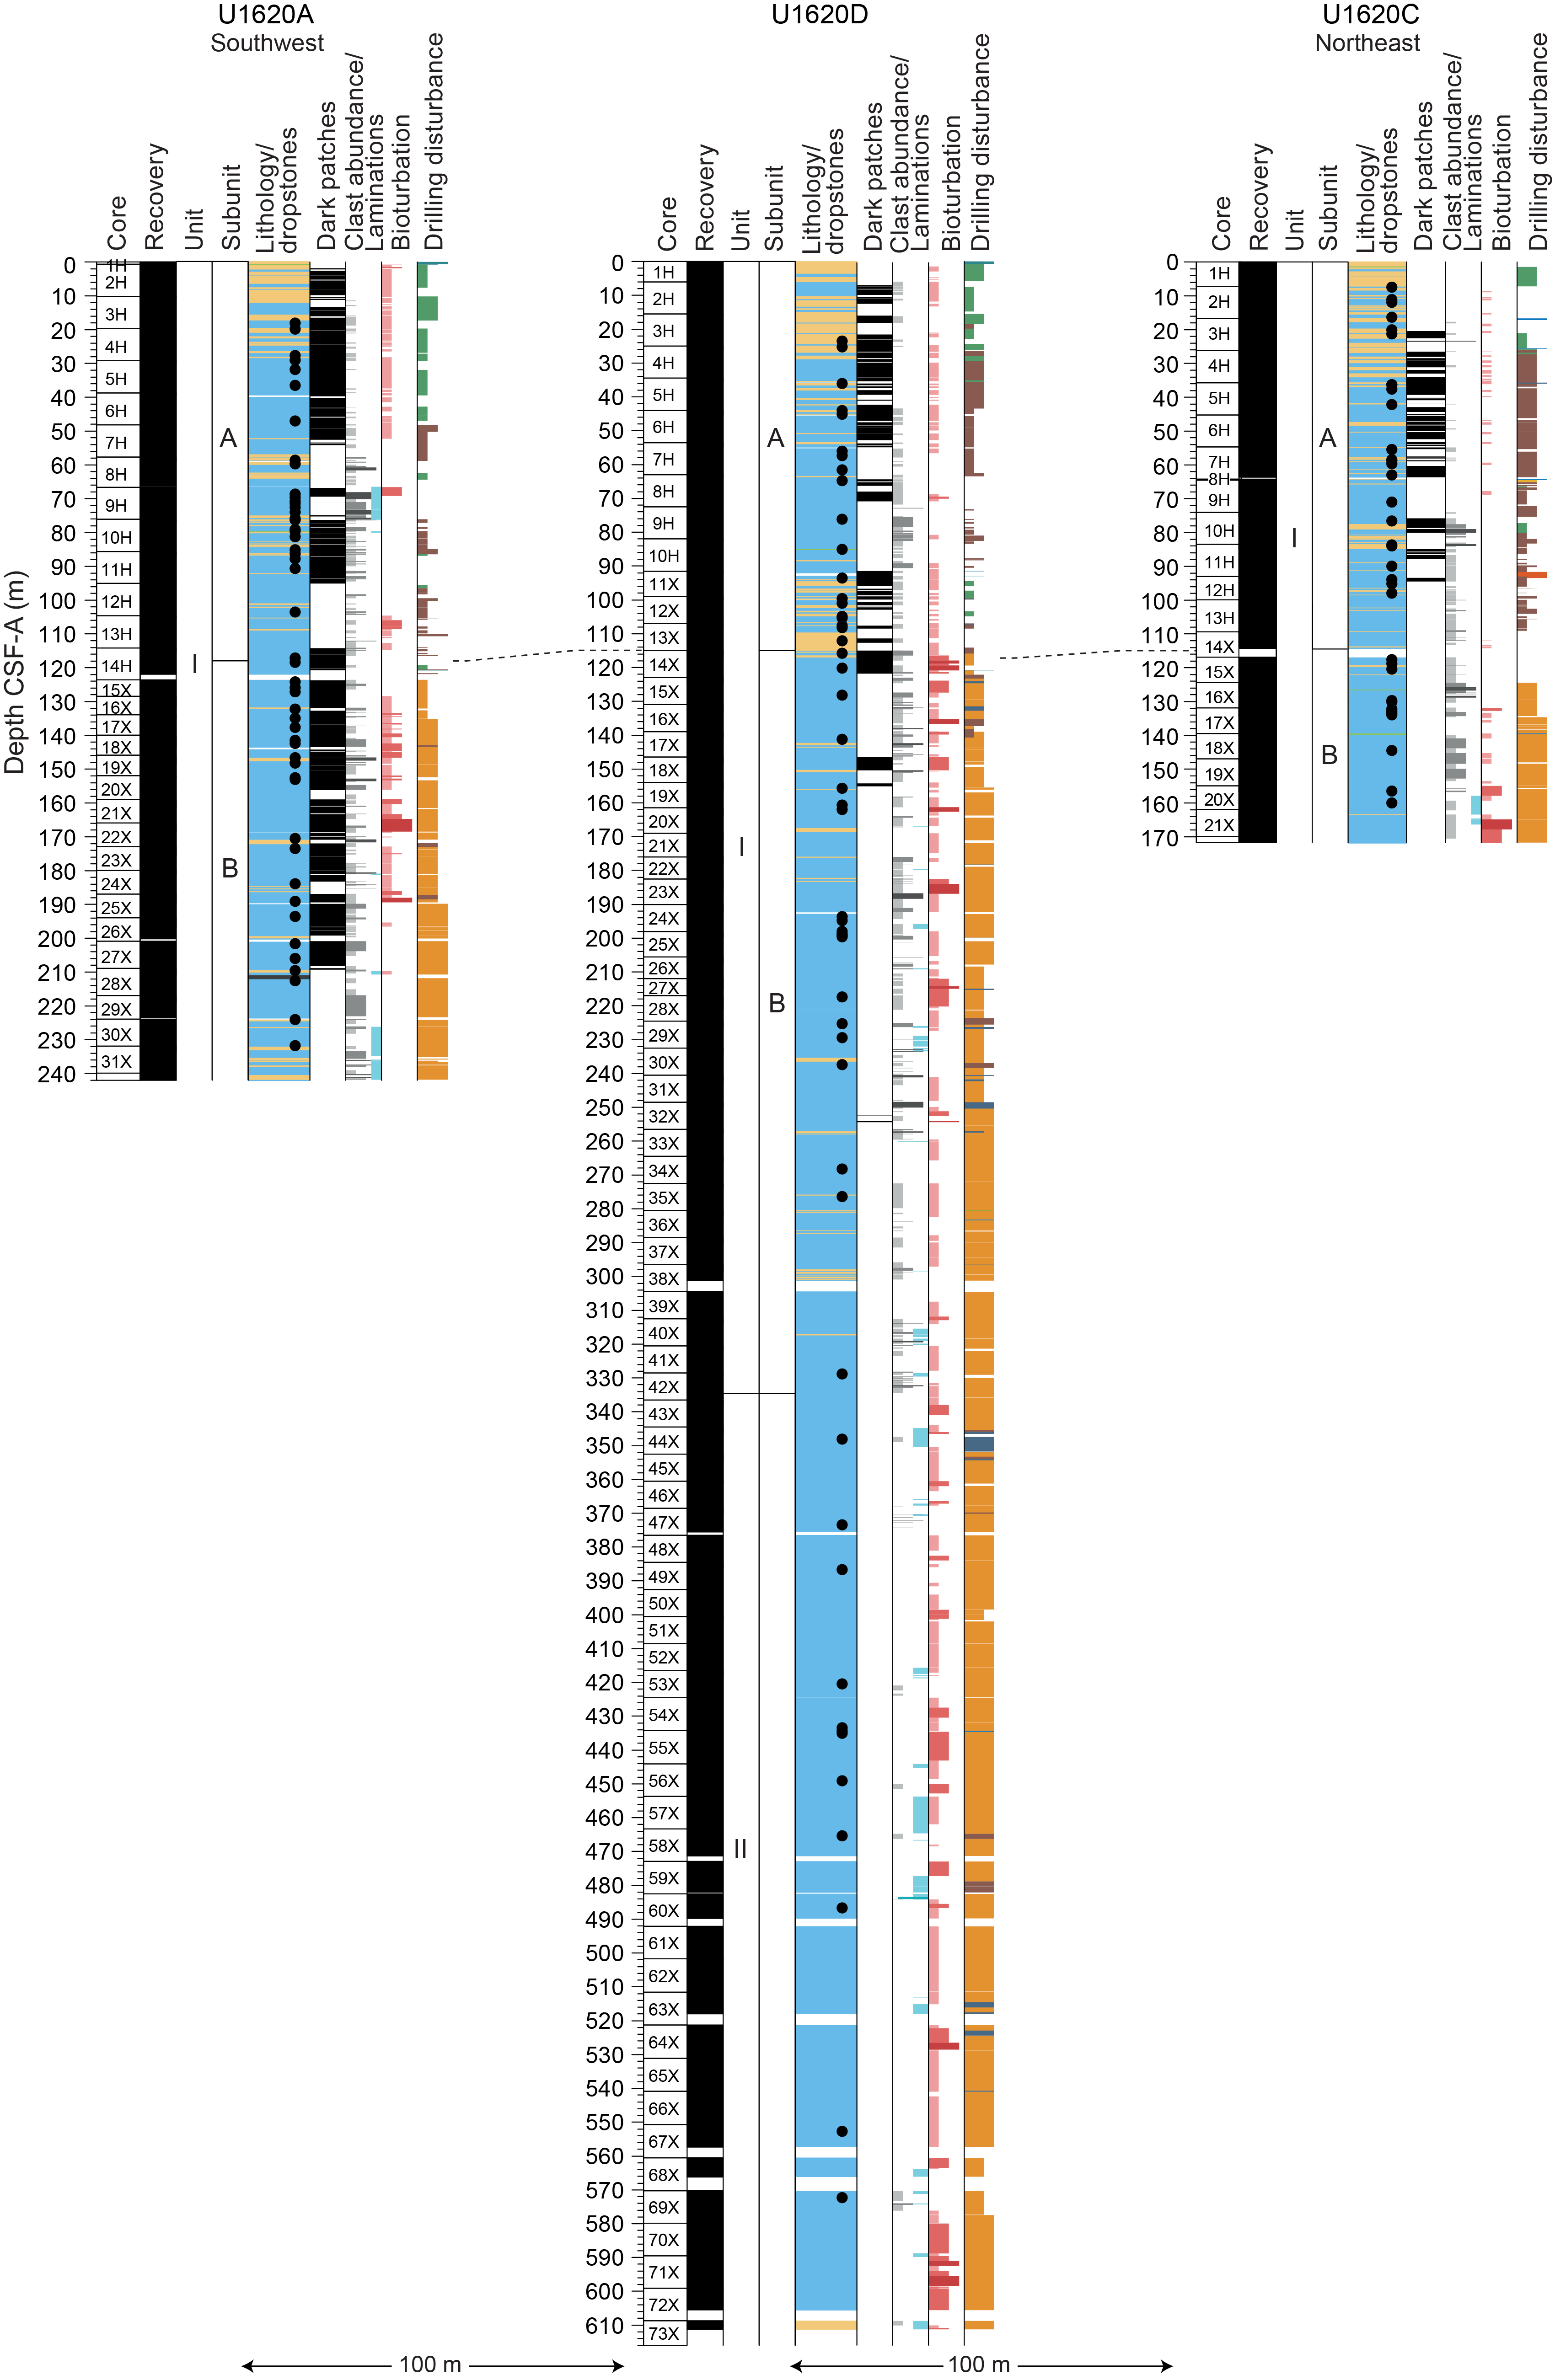
Figure F11. Lithostratigraphic correlation.
The degree of core recovery, coring disturbance, and gas expansion varies with the depth of the cores and the type of coring method employed. Advanced piston cores from Holes U1620A–U1620D exhibit slight to moderate coring disturbances and gaps related to gas expansion, but there was good sediment recovery overall (average recovery = ~110%). Most shallow XCB cores from all holes are slightly to moderately disturbed, with strong disturbances (dominantly biscuiting, with biscuiting alongside fracturing also common) occurring from ~125 mbsf in Holes U1620A and U1620C and ~155 mbsf in Hole U1620D, with a generally higher sediment recovery (often largely >110%) indicative of gas expansion. Similar to Sites U1618 and U1619, the coarser grained intervals seem to stabilize the sediments against biscuiting.
3.1. Lithostratigraphic unit descriptions
3.1.1. Unit I
- Intervals: 403-U1620A-1H-1 to the bottom of the hole; 403-U1620B-1H-1; 403-U1620C-1H-1 to the bottom of the hole; 403-U1620D-1H-1 through 42X-4
- Depths: Hole U1620A = 0–241.90 mbsf; Hole U1620B = 0–0.34 mbsf; Hole U1620C = 0–171.66 mbsf; Hole U1620D = 0–334.34 mbsf
- Age: Holocene to Pleistocene
The sediment in Lithostratigraphic Unit I is predominantly dark gray (5Y 4/1) to dark greenish gray (10Y 3/1) silty clay with clay, including occurrence of coarser grained intervals of clayey silt, sandy clay, and sandy mud (Figure F12). Clast content generally ranges from common to abundant, although some intervals are devoid of clasts. Clasts, interpreted to be ice-rafted debris, are mostly angular to subangular and smaller than 1–2 cm in size. Visual inspection of the split core surface reveals that most of the clasts consist of siltstones, mudstones, and igneous rocks, but metamorphic rocks are also evident. Based on visual observations of the split core surface and examination of X-radiographs, the unit has absent to moderate bioturbation, which appears heavier when clast abundance is lower. Thin laminations (<0.3 mm) occasionally appear in Unit I, and some laminated intervals in Unit I also contain clasts.
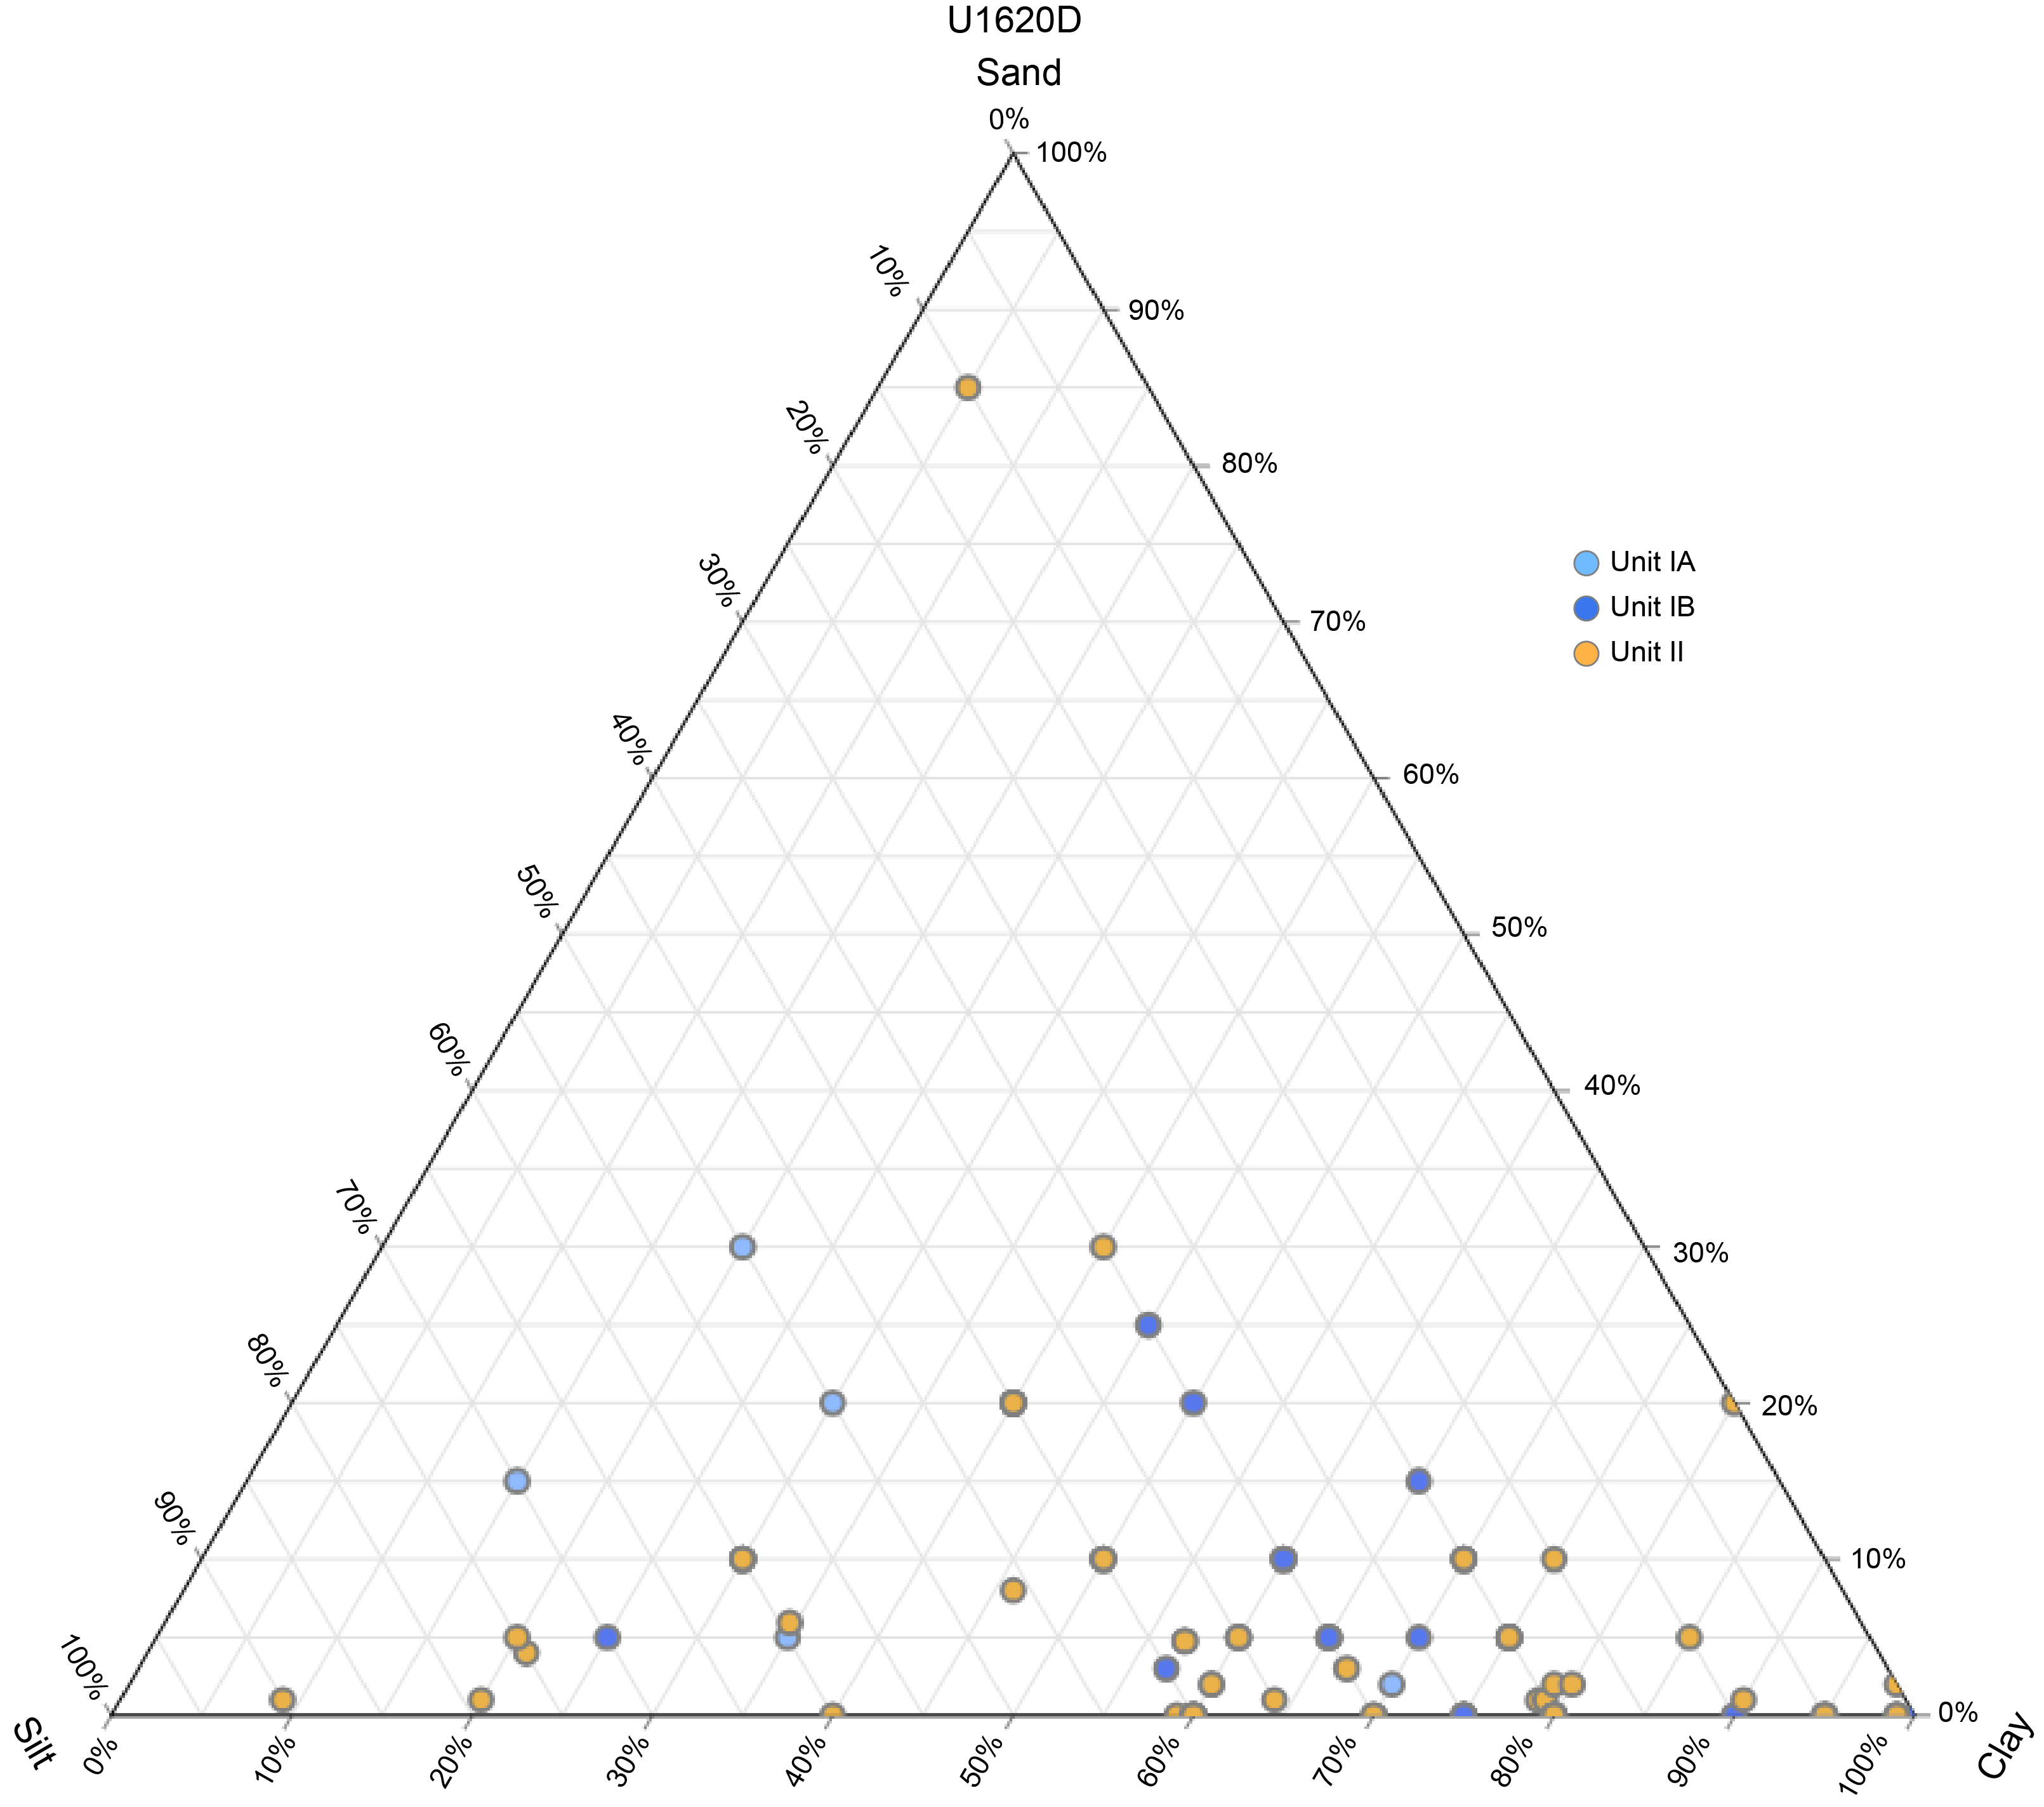
Figure F12. Sand, silt, and clay percentages.
The most common minerals observed in smear slides are clay minerals, quartz, and nonbiogenic carbonate. Rock fragments, micas, and dense minerals occur in varying amounts throughout (Figure F13). Glauconite is observed in low percentages (1%–4%) discontinuously downhole. Opaque minerals, including iron sulfide minerals, occur discontinuously in abundances of 1%–10% and are also sporadically observed on the surface of the split core. Their occurrences correspond to the higher MS values observed toward the lower part of Unit I. The biogenic component of the sediments within Unit I is low, with only 5 of the 53 smear slides taken from the unit containing biogenic components in amounts of 2%–7%.
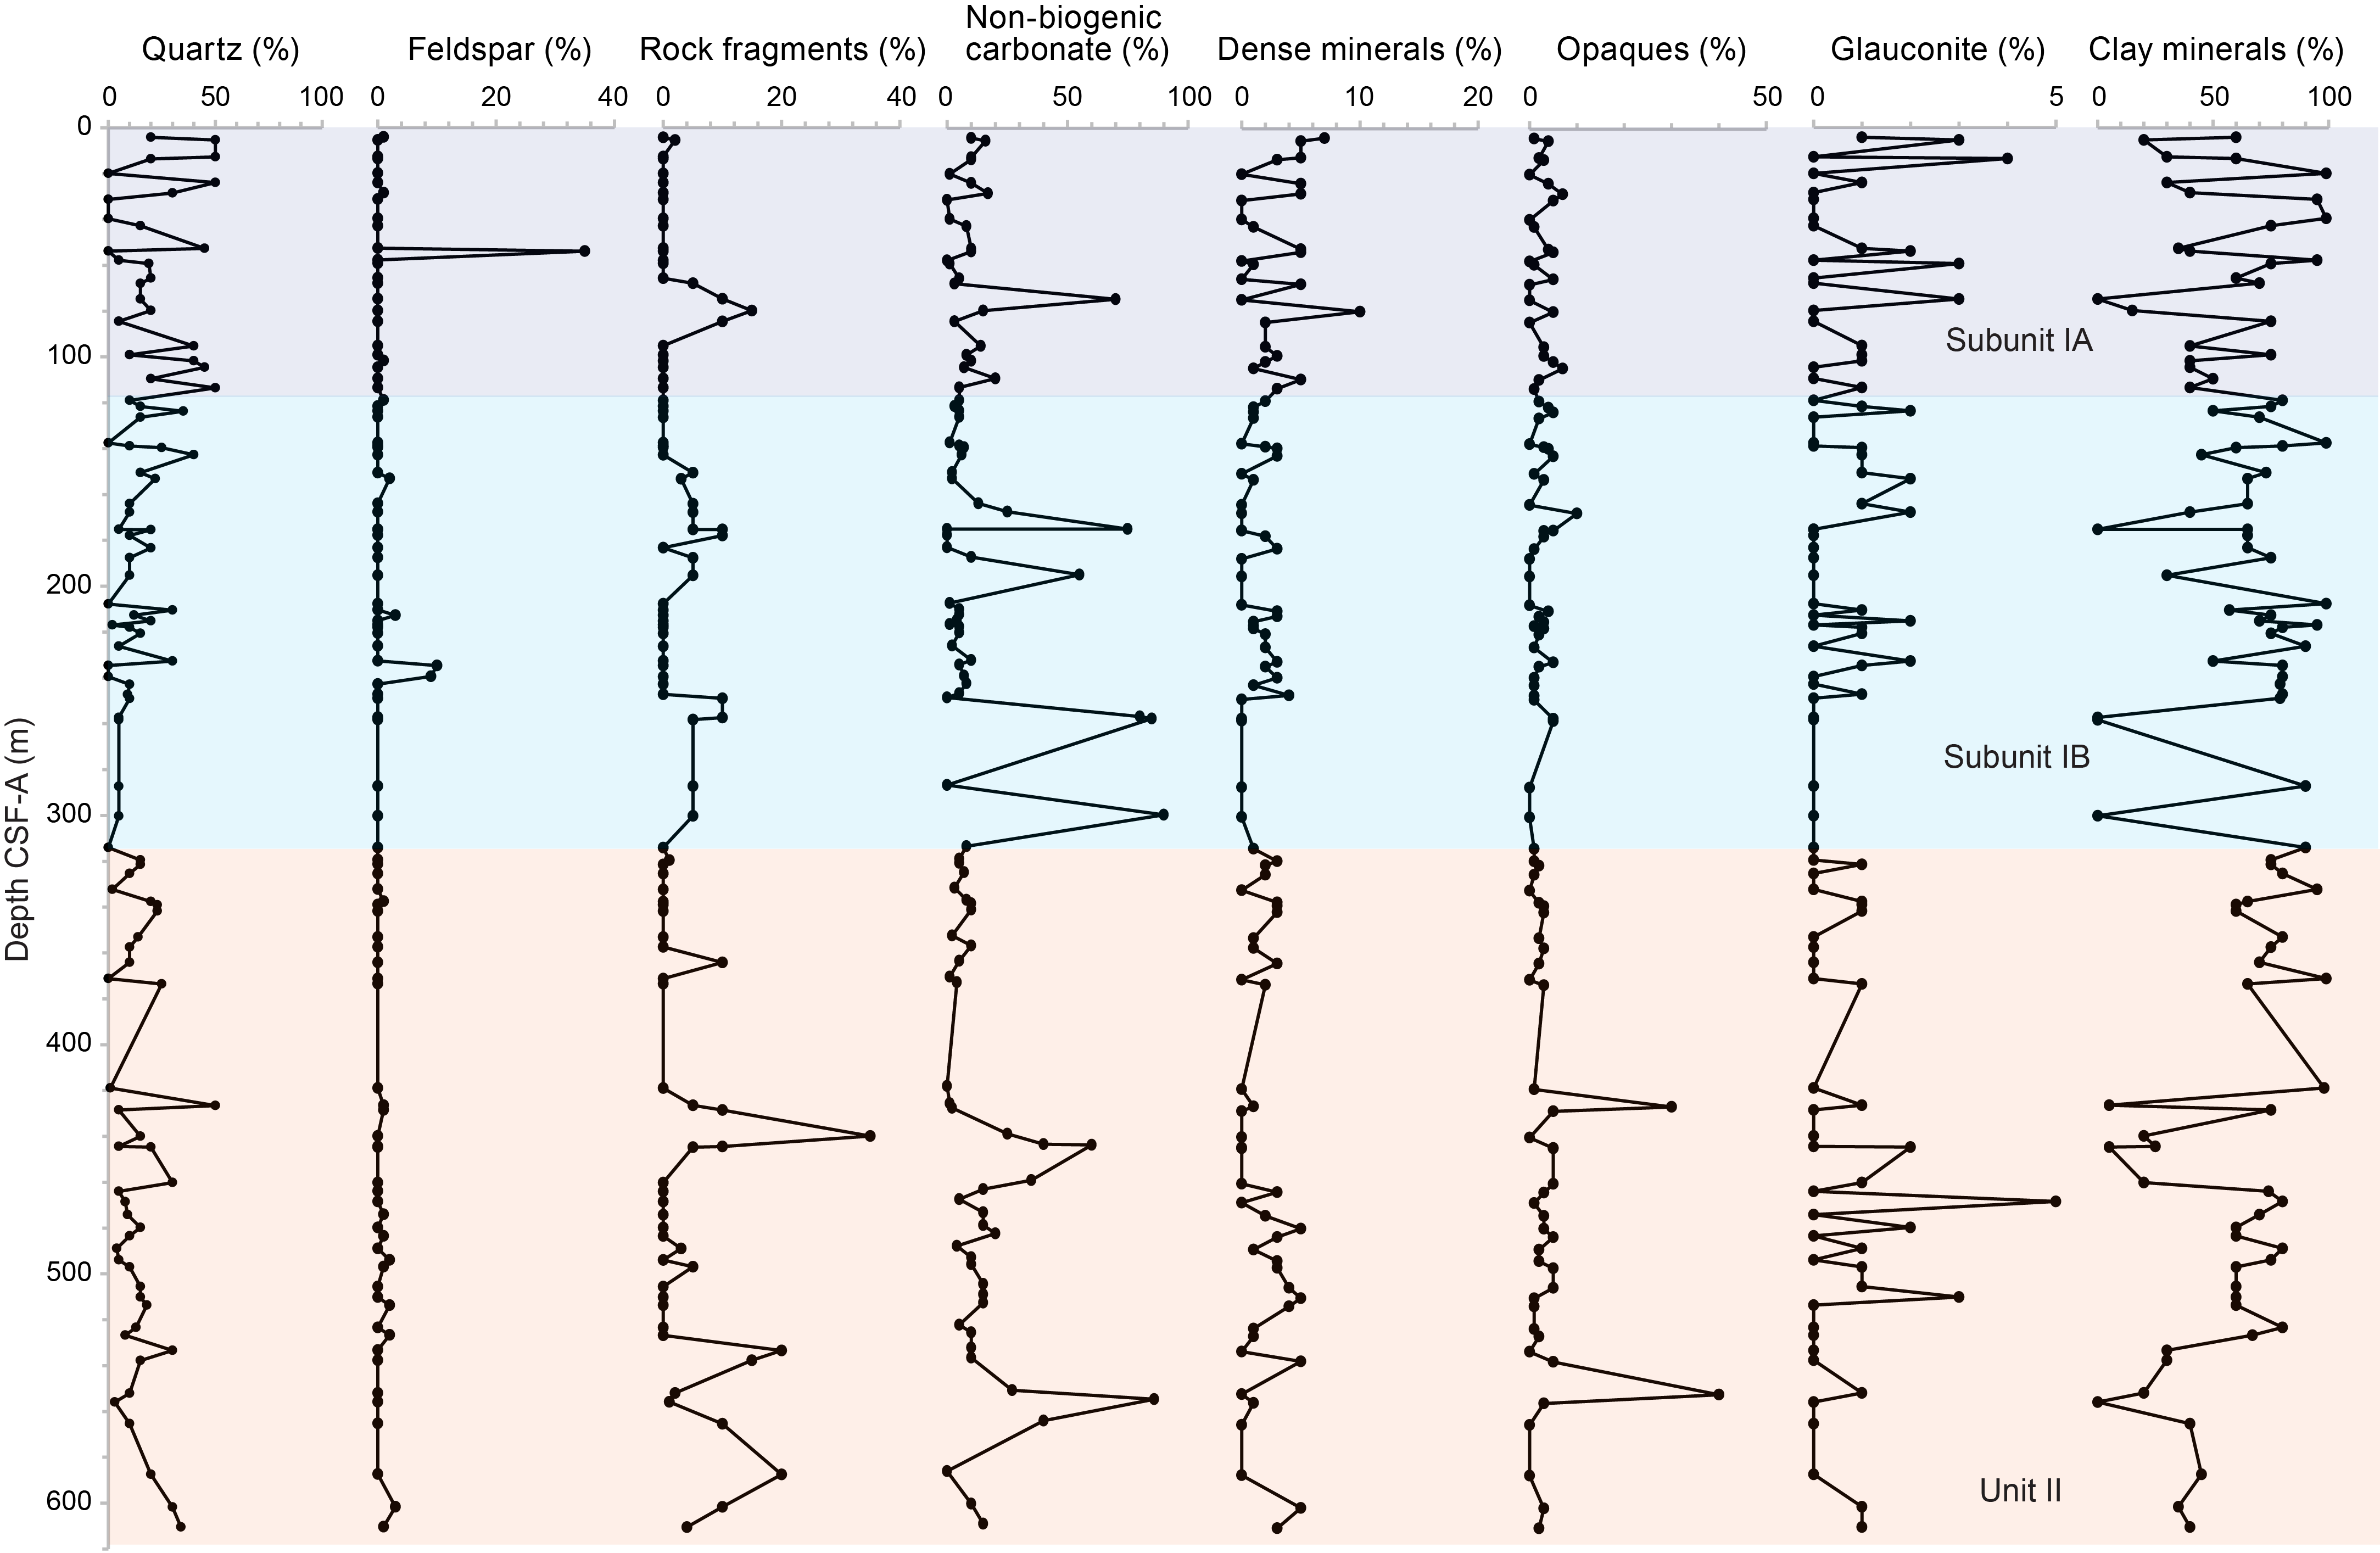
Figure F13. Downhole mineralogy.
Unit I is divided into two subunits (IA and IB) based on the generally higher degree of bioturbation downhole, a stepwise decrease in silt and sand, and the transition to firmer sediments. Additionally, physical property changes in L* and MS, as well as related changes in authigenic mineral presence, mark this subunit boundary.
3.1.1.1. Subunit IA
- Intervals: 403-U1620A-1H-1 through 14H-4, 25 cm; 403-U1620B-1H-1; 403-U1620C-1H-1 through 14X; 403-U1620D-1H-1 through 13X
- Depths: Hole U1620A = 0–117.72 mbsf; Hole U1620B = 0–0.34 mbsf; Hole U1620C = 0–114.18 mbsf; Hole U1620D = 0–116.94 mbsf
Lithostratigraphic Subunit IA is the youngest in the stratigraphic sequence, characterized by soft sediments and less bioturbation than Subunit IB. Subunit IA has a greater percentage of sand (e.g., sandy mud) and silt (e.g., clayey silt). Clast abundance is variable, ranging from absent to dispersed to common. Clast abundance appears to vary between holes in this uppermost subunit. MS values in this subunit are much lower compared to Subunit IB, with an average value of 42.40 IU.
3.1.1.2. Subunit IB
- Intervals: 403-U1620A-14H-4, 25 cm, to the bottom of the hole; 403-U1620C-15X-1 to the bottom of the hole; 403-U1620D-14X-1 through 42X-4 (bottom)
- Depths: Hole U1620A = 117.72–241.90 mbsf; Hole U1620C = 114.18–171.66 mbsf; Hole U1620D = 116.94–334.34 mbsf
The Lithostratigraphic Subunit IA/IB boundary occurs at the transition from soft to firm sediments (Hole U1620A = 117.72 m; Hole U1620C = 114.18 m; and Hole U1620D = 116.94 m), with a relative increase in the amount of clay and decrease in the amount of silt. Bioturbation becomes more frequent in Lithostratigraphic Subunit IB, with many slightly to heavily bioturbated intervals. The presence of clasts continues through this subunit. Subunit IB contains a shift to higher MS values, with spikes reaching more than 1000 IU, corresponding to increased abundances of iron sulfide minerals, as observed in smear slides. Additionally, the shift to a dominant lower frequency L* pattern emerges at the top of Subunit IB, continuing to the base of the Site U1620 sedimentary record. The presence of authigenic carbonate increases downhole within Subunit IB.
3.1.2. Unit II
- Interval: 403-U1620D-42X-4 to the bottom of the hole
- Depth: Hole U1620D = 334.34–611.21 mbsf
- Age: Pleistocene to Pliocene
Lithostratigraphic Unit II is predominantly dark gray (5Y 4/1) to dark gray (N 4/) silty clay to clay (Figure F12). Coarser intervals are infrequent (Figures F8, F9, F10). Based on visual core observations and X-radiographs, the presence of small to large clasts is evident, but their occurrence is much less frequent than in Unit I. Where clasts do occur in Unit II, they are dominantly dispersed to common, with few intervals where they become abundant. The unit contains occasional thinly (<0.3 cm) laminated intervals, sometimes alternating between very dark gray (5Y 3/1) and gray (2.5Y 5/1) in color. Laminations often include an increase in grayish brown (2.5Y 5/2) to pale brown (2.5Y 7/4) authigenic carbonate.
The most common minerals observed in smear slides are clay minerals and quartz, with additional rock fragments, micas, and dense minerals (Figure F13). Glauconite occurs occasionally but at low abundances (up to 5%) throughout. Opaque minerals are prevalent throughout the interval, and iron sulfide micrometer- to centimeter-scale individual or clustered nodules are observed on the split surface of the core (Figure F4). The biogenic components are missing from much of Unit II, except from the interval 488.94–587.46 mbsf in Hole U1620D, as inferred from smear slides (Figure F13), where there is an increase in the content of nannofossils. The sediments have variable degrees of bioturbation, including some intervals where no bioturbation is apparent.
The low-frequency oscillations in L* color reflectance that began at the Subunit IA/IB boundary continue throughout Unit II (Figure F10). Another feature of Unit II is the alternating, irregular occurrence of very high and low MS intervals in association with iron sulfide minerals (high MS) and authigenic carbonate (low MS) distribution. In the X-radiograph images, the authigenic carbonate nodules and layers are characterized by higher density with respect to the surrounding sediments.
3.2. X-ray diffraction
The bulk XRD analysis of selected powdered samples is consistent with smear slide observations that quartz is the primary component of the silt fraction in the silty clay lithologies (Table T3). Bulk XRD also confirms the compositions of the authigenic mineralogic components such as iron sulfide (e.g., greigite in Sample 403-U1620D-68X-2, 117–118 cm), iron carbonate (e.g., siderite in Sample 33X-2, 27–28 cm) and authigenic calcium carbonate (CaCO3; e.g., Sample 51X-6, 11–12 cm) minerals.
3.3. Preliminary interpretation
The lithostratigraphy of Site U1620 demonstrates that this location is well suited for reconstructing the Pliocene–Pleistocene evolution of the warm WSC and tracking the initial establishment and history of the paleo-SBSIS. The uphole stepwise transition from clay-rich, clast-poor lithologies in Lithostratigraphic Unit II to an increased occurrence of coarser intervals (e.g., including silts and sandy muds) and more dispersed clasts in Unit I hints at a major climate reorganization; the timing of such a reorganization may coincide with the expansion of Northern Hemisphere glaciation. An uphole increase in the presence of large clasts (i.e., dropstones) within Subunit IB, may point to specific changes in the ice margin of the paleo-SBSIS, perhaps marking the establishment of shelf-edge glaciation. Additionally, the cyclicities observed in the color reflectance and physical properties such as NGR (see Physical properties) suggest orbital pacing throughout the record, with a reorganization of the dominant signal at the Subunit IA/IB boundary. The increase in silts near the top of the record may further indicate either changes in the WSC and/or changes in ice sheet dynamics.
Diagenetic overprinting in the form of authigenic carbonates and iron sulfide minerals is an interesting window into fluid flow in the sediment drift. At the Svyatogor Ridge, such fluid flow is likely influenced by the presence of gas hydrates, gas chimneys, and a fault system within the sediment drift that may be connected to the relatively young basement rock (see Geochemistry).
Given that Site U1620 is more distal from the Svalbard margin than Sites U1618, U1621, U1623, and U1624, there is a lack of shelf edge glaciation–style deposition, such as recurring diamicton intervals and other coarser grained lithologies. However, clast-rich intervals and dropstones are present at Site U1620 and can be used to reconstruct the regional ice-rafting (iceberg) history.
The relatively low abundance of clasts in Lithostratigraphic Unit II (compared to Unit I), the bioturbation, and the greater abundance of calcareous nannofossils observed in smear slides suggest warm, likely ice-free conditions for much of the older part of the Site U1620 record. Planar laminations occurring in Unit II can be associated with bottom currents rather than deposition from meltwater plumes given the distal location of the Svyatogor Ridge with respect to continental margins.
4. Biostratigraphy and paleoenvironment
Site U1620 sediments were analyzed for calcareous nannofossils, dinoflagellate cysts (dinocysts), diatoms, and planktonic foraminifers. All holes were analyzed for calcareous nannofossils and diatoms, but only Holes U1620A and U1620D were analyzed for dinocysts and planktonic foraminifers. Diatoms and planktonic foraminifers are consistently present to abundant but only in the uppermost ~40 m of the site. Below this depth, rare diatoms are recorded between 100 and 120 mbsf in Holes U1620A and U1620D, whereas rare planktonic foraminifers reappear only below ~600 mbsf in Hole U1620D. In all holes, calcareous nannofossils appear intermittently with a variable abundance, and dinocysts are present throughout.
Several biostratigraphic events of Pleistocene age are recorded by calcareous nannofossils in Holes U1620A, U1620C, and U1620D and by dinocysts in Hole U1620A (Table T4). Planktonic foraminifers, calcareous nannofossils, and dinocysts converge on a Late Pliocene age for the lower part of Hole U1620D (Figure F14). Overall, biostratigraphic data show that Site U1620 ranges from Late Pliocene to Pleistocene and, together with paleomagnetic data, enables the development of an age-depth model for Site U1620 (Figure F15). Planktonic foraminifers, diatoms, and dinocysts show a paleoenvironment dominated by Arctic–polar surface waters with seasonal sea ice during the Pleistocene. During the Late Pliocene, sea ice was reduced and surface waters were temperate.
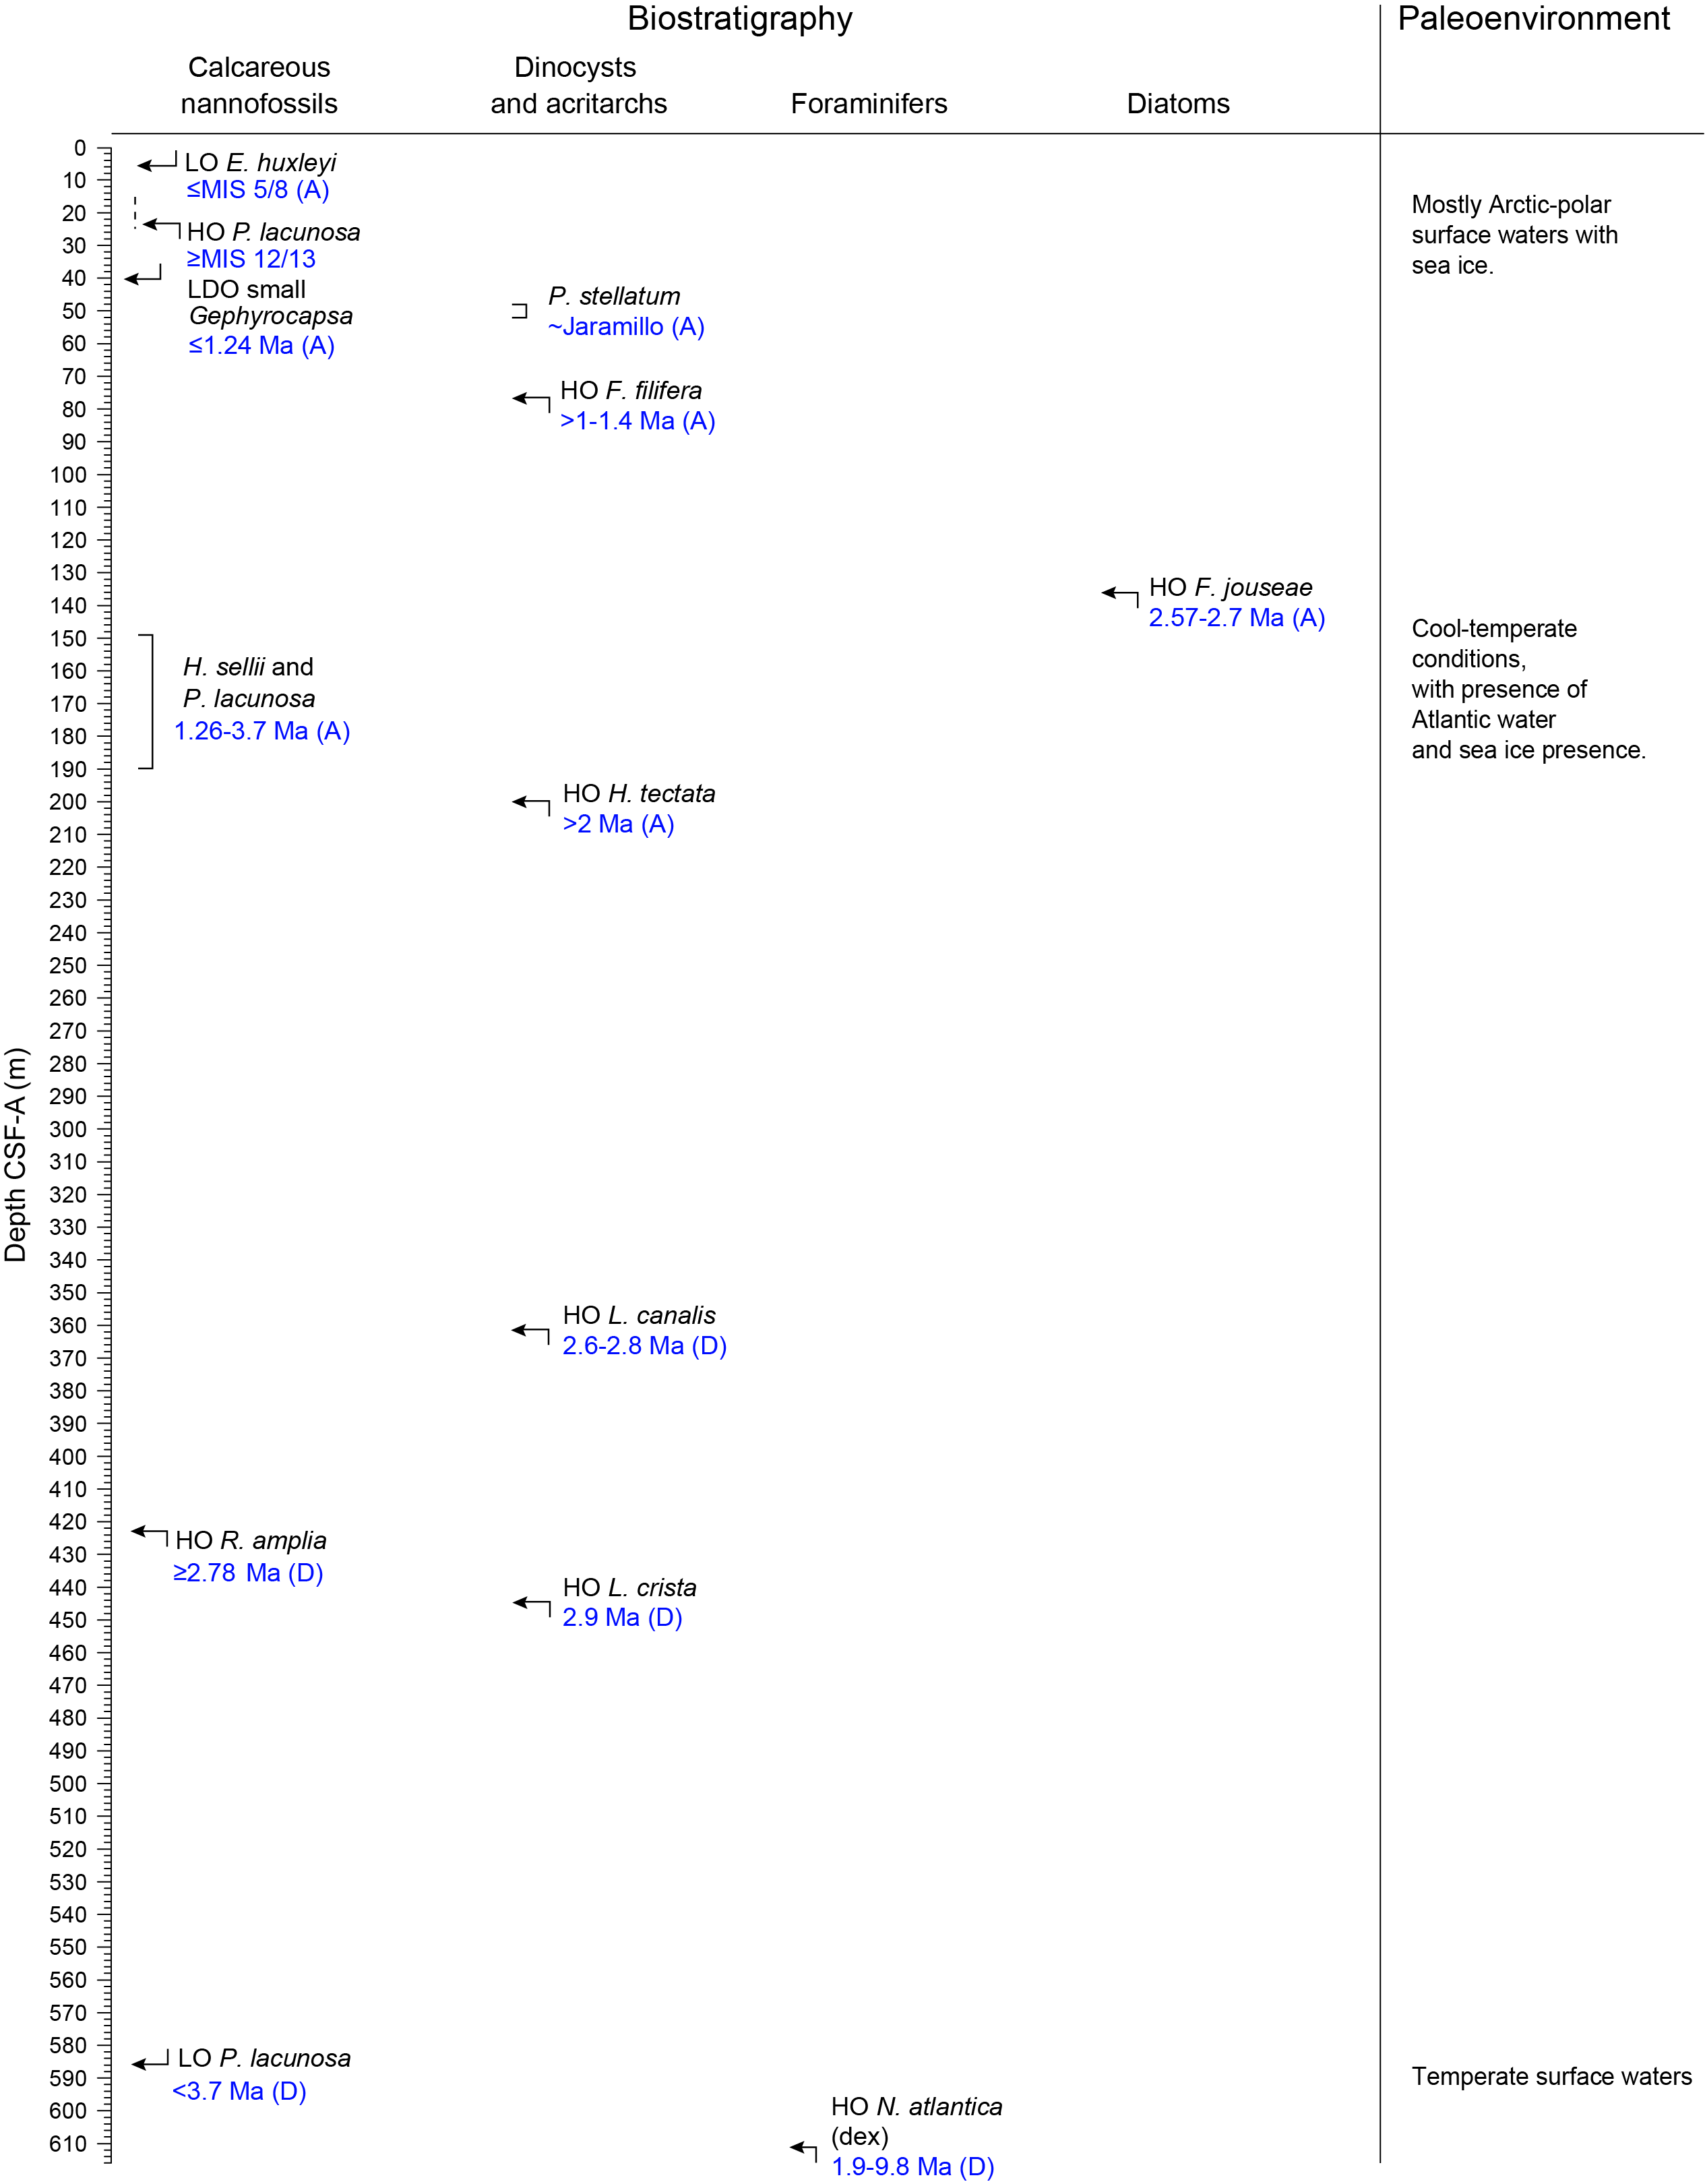
Figure F14. Biostratigraphic summary.
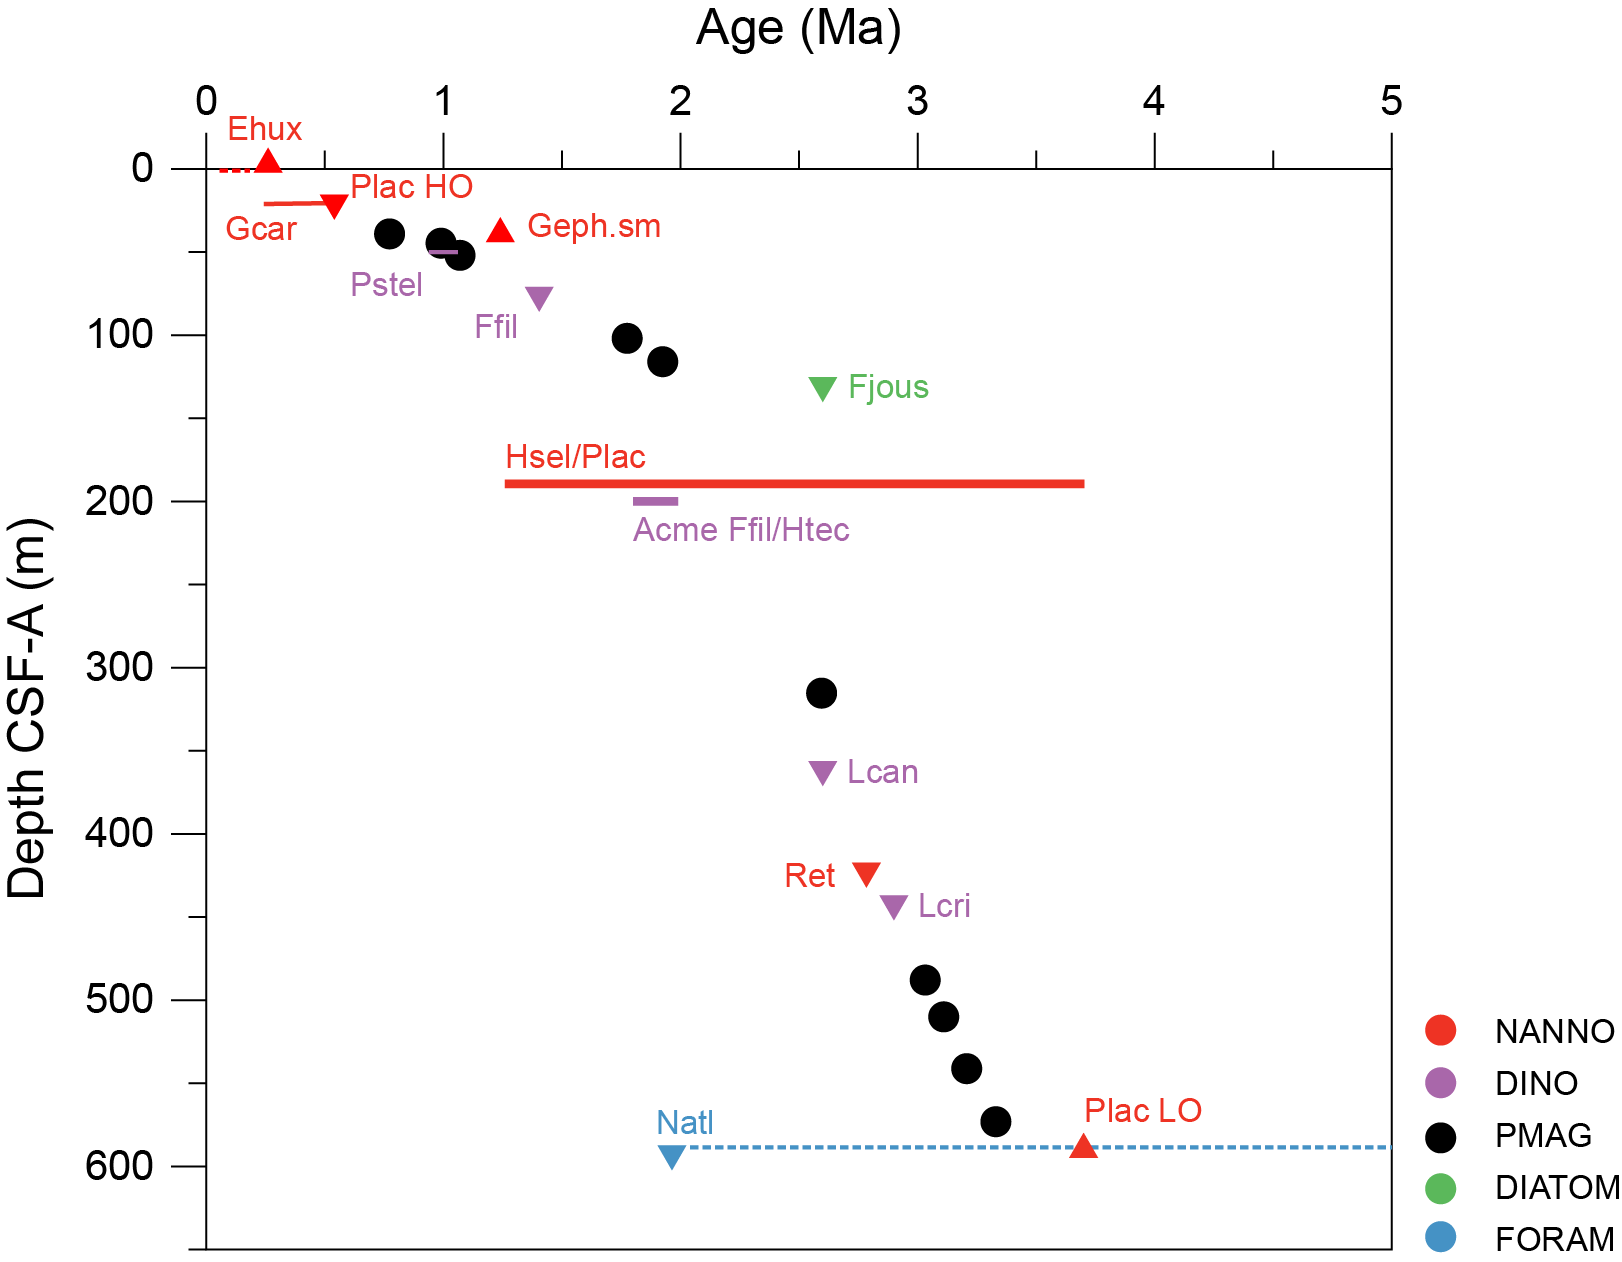
Figure F15. Age-depth model.
4.1. Calcareous nannofossils
Calcareous nannofossil biostratigraphy at Site U1620 is based on the study of 74 core catchers and 181 split core samples taken from Holes U1620A–U1620D (Figures F16, F17, F18). All core catchers from Hole U1620A were examined for calcareous nannofossils (Figure F16). Core catchers from Hole U1620D were analyzed just for those depths extending beyond the maximum depth in Hole U1620A (Figure F18). Split core samples (working halves) were routinary selected in all cores from Holes U1620A–U1620D based on the visual examination of sediments and physical properties (i.e., changes in MS).
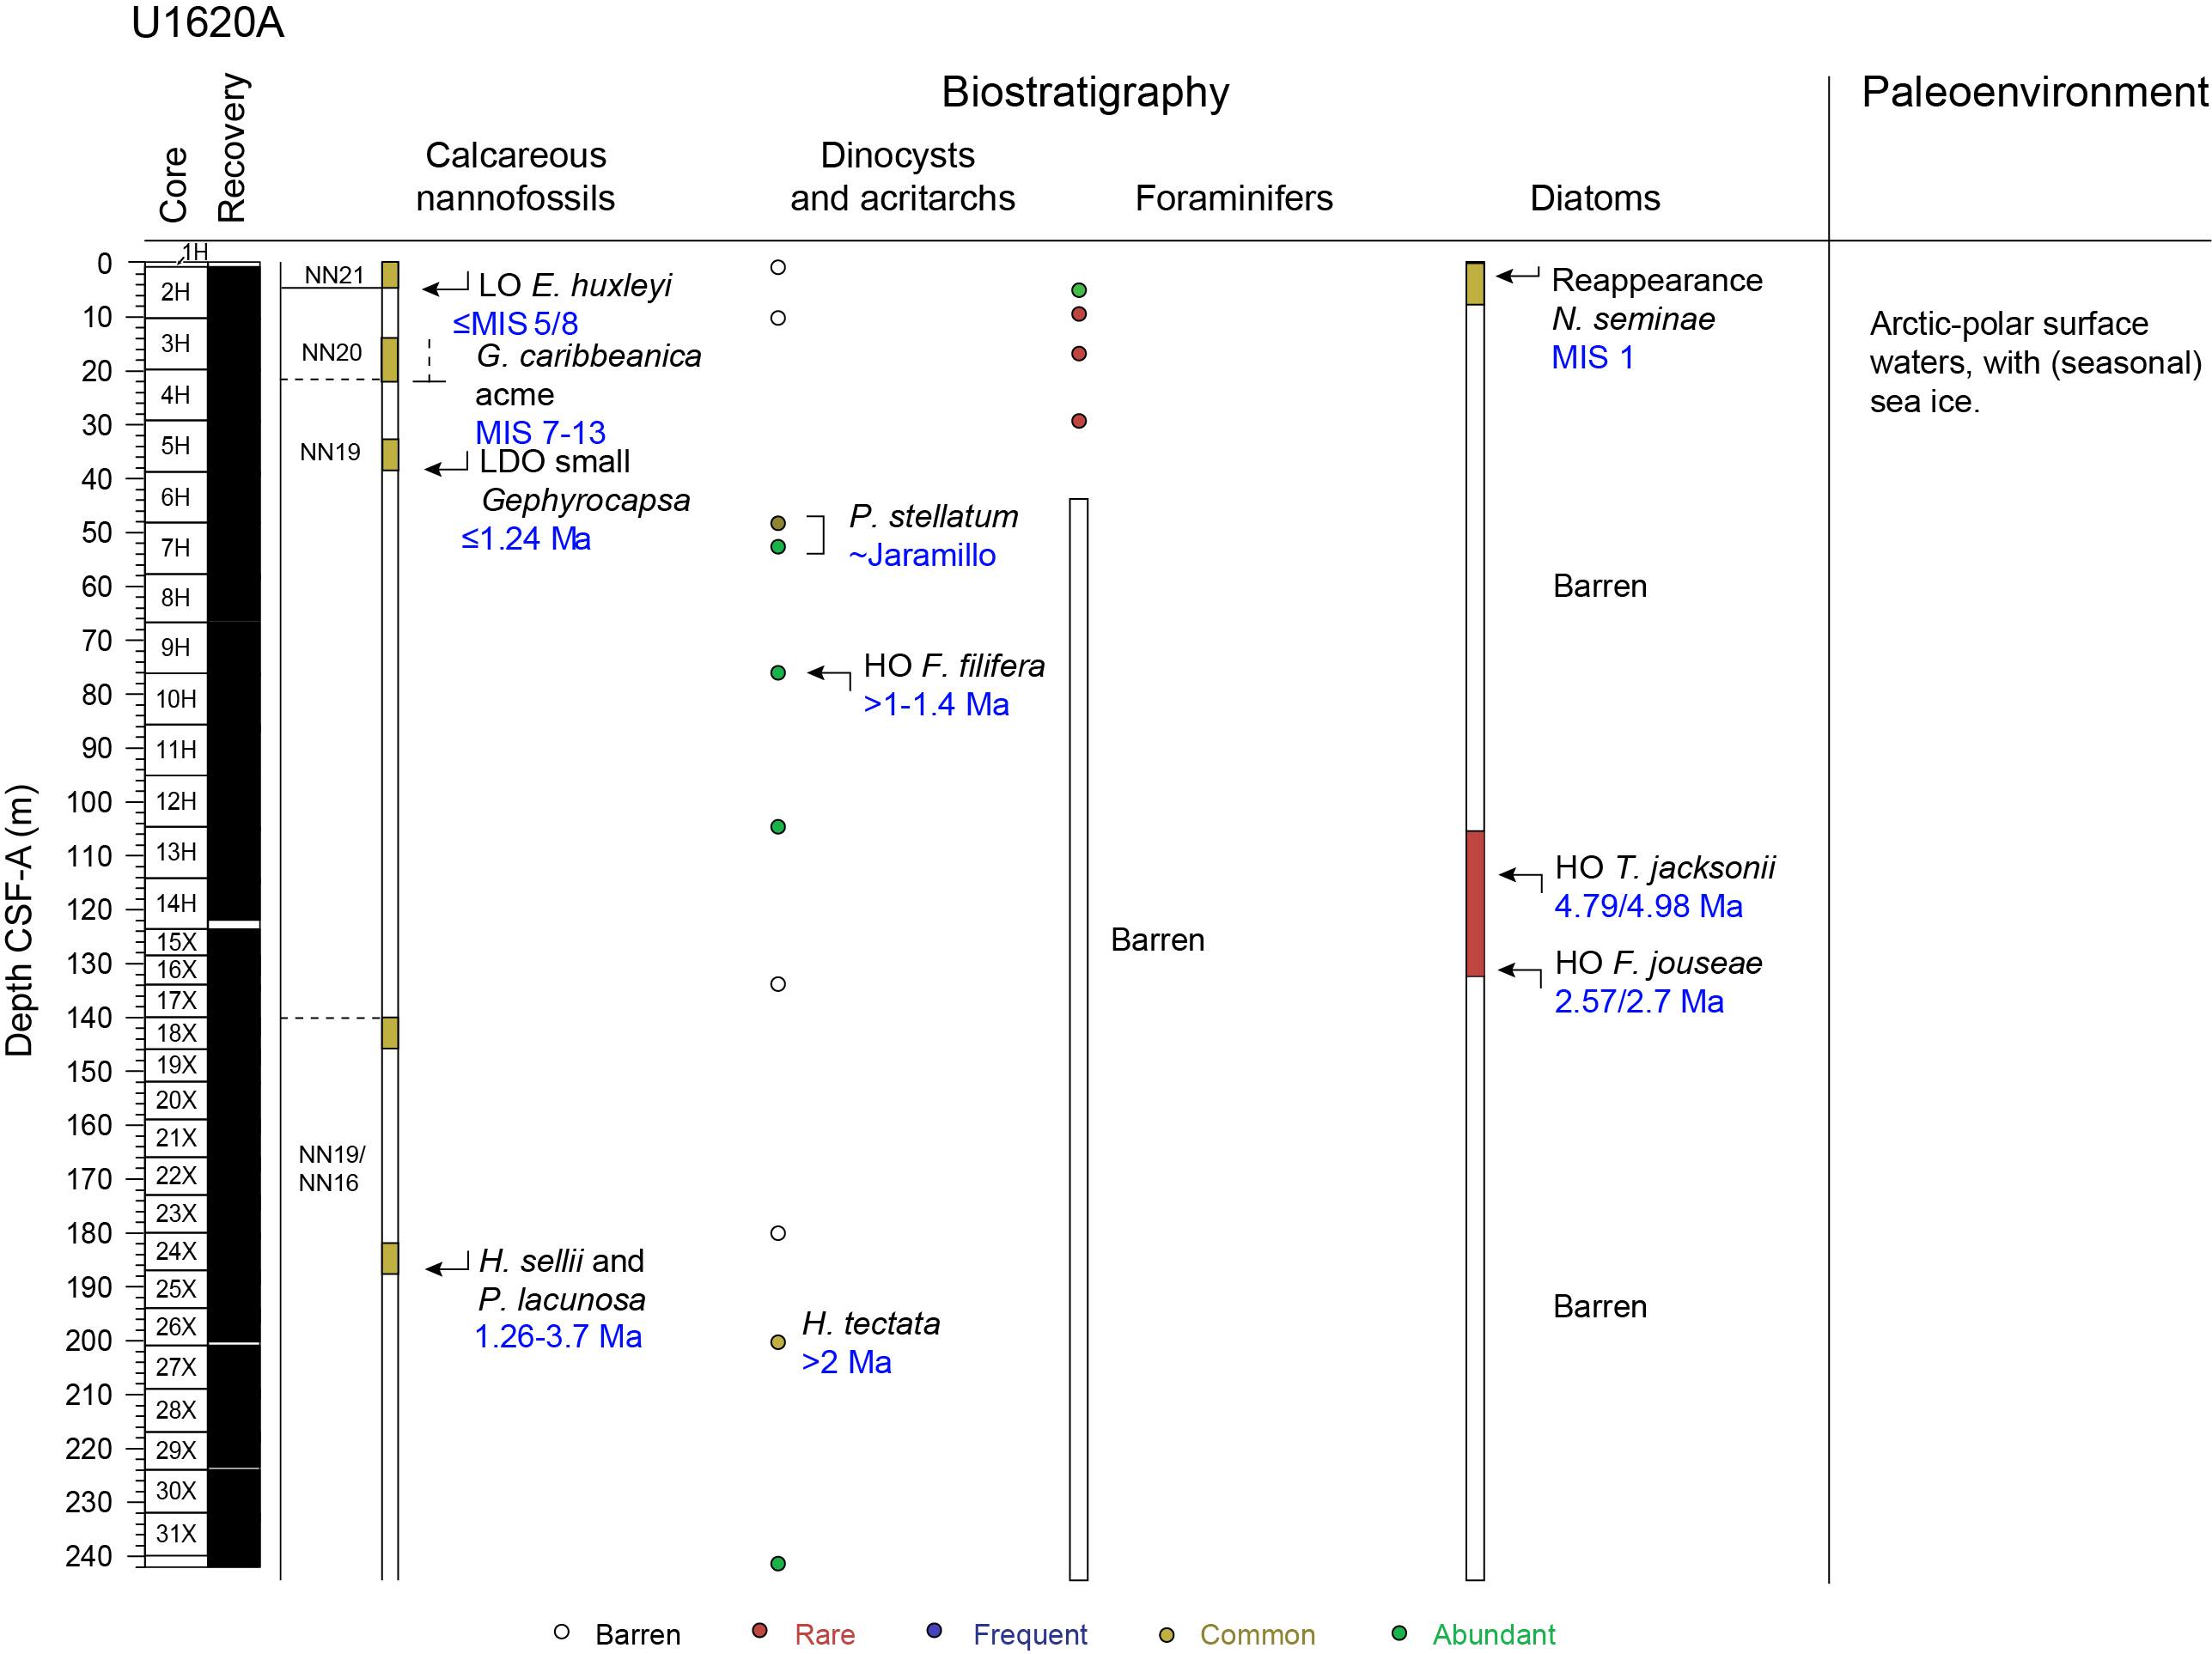
Figure F16. Biostratigraphy and paleoenvironment, Hole U1620A.
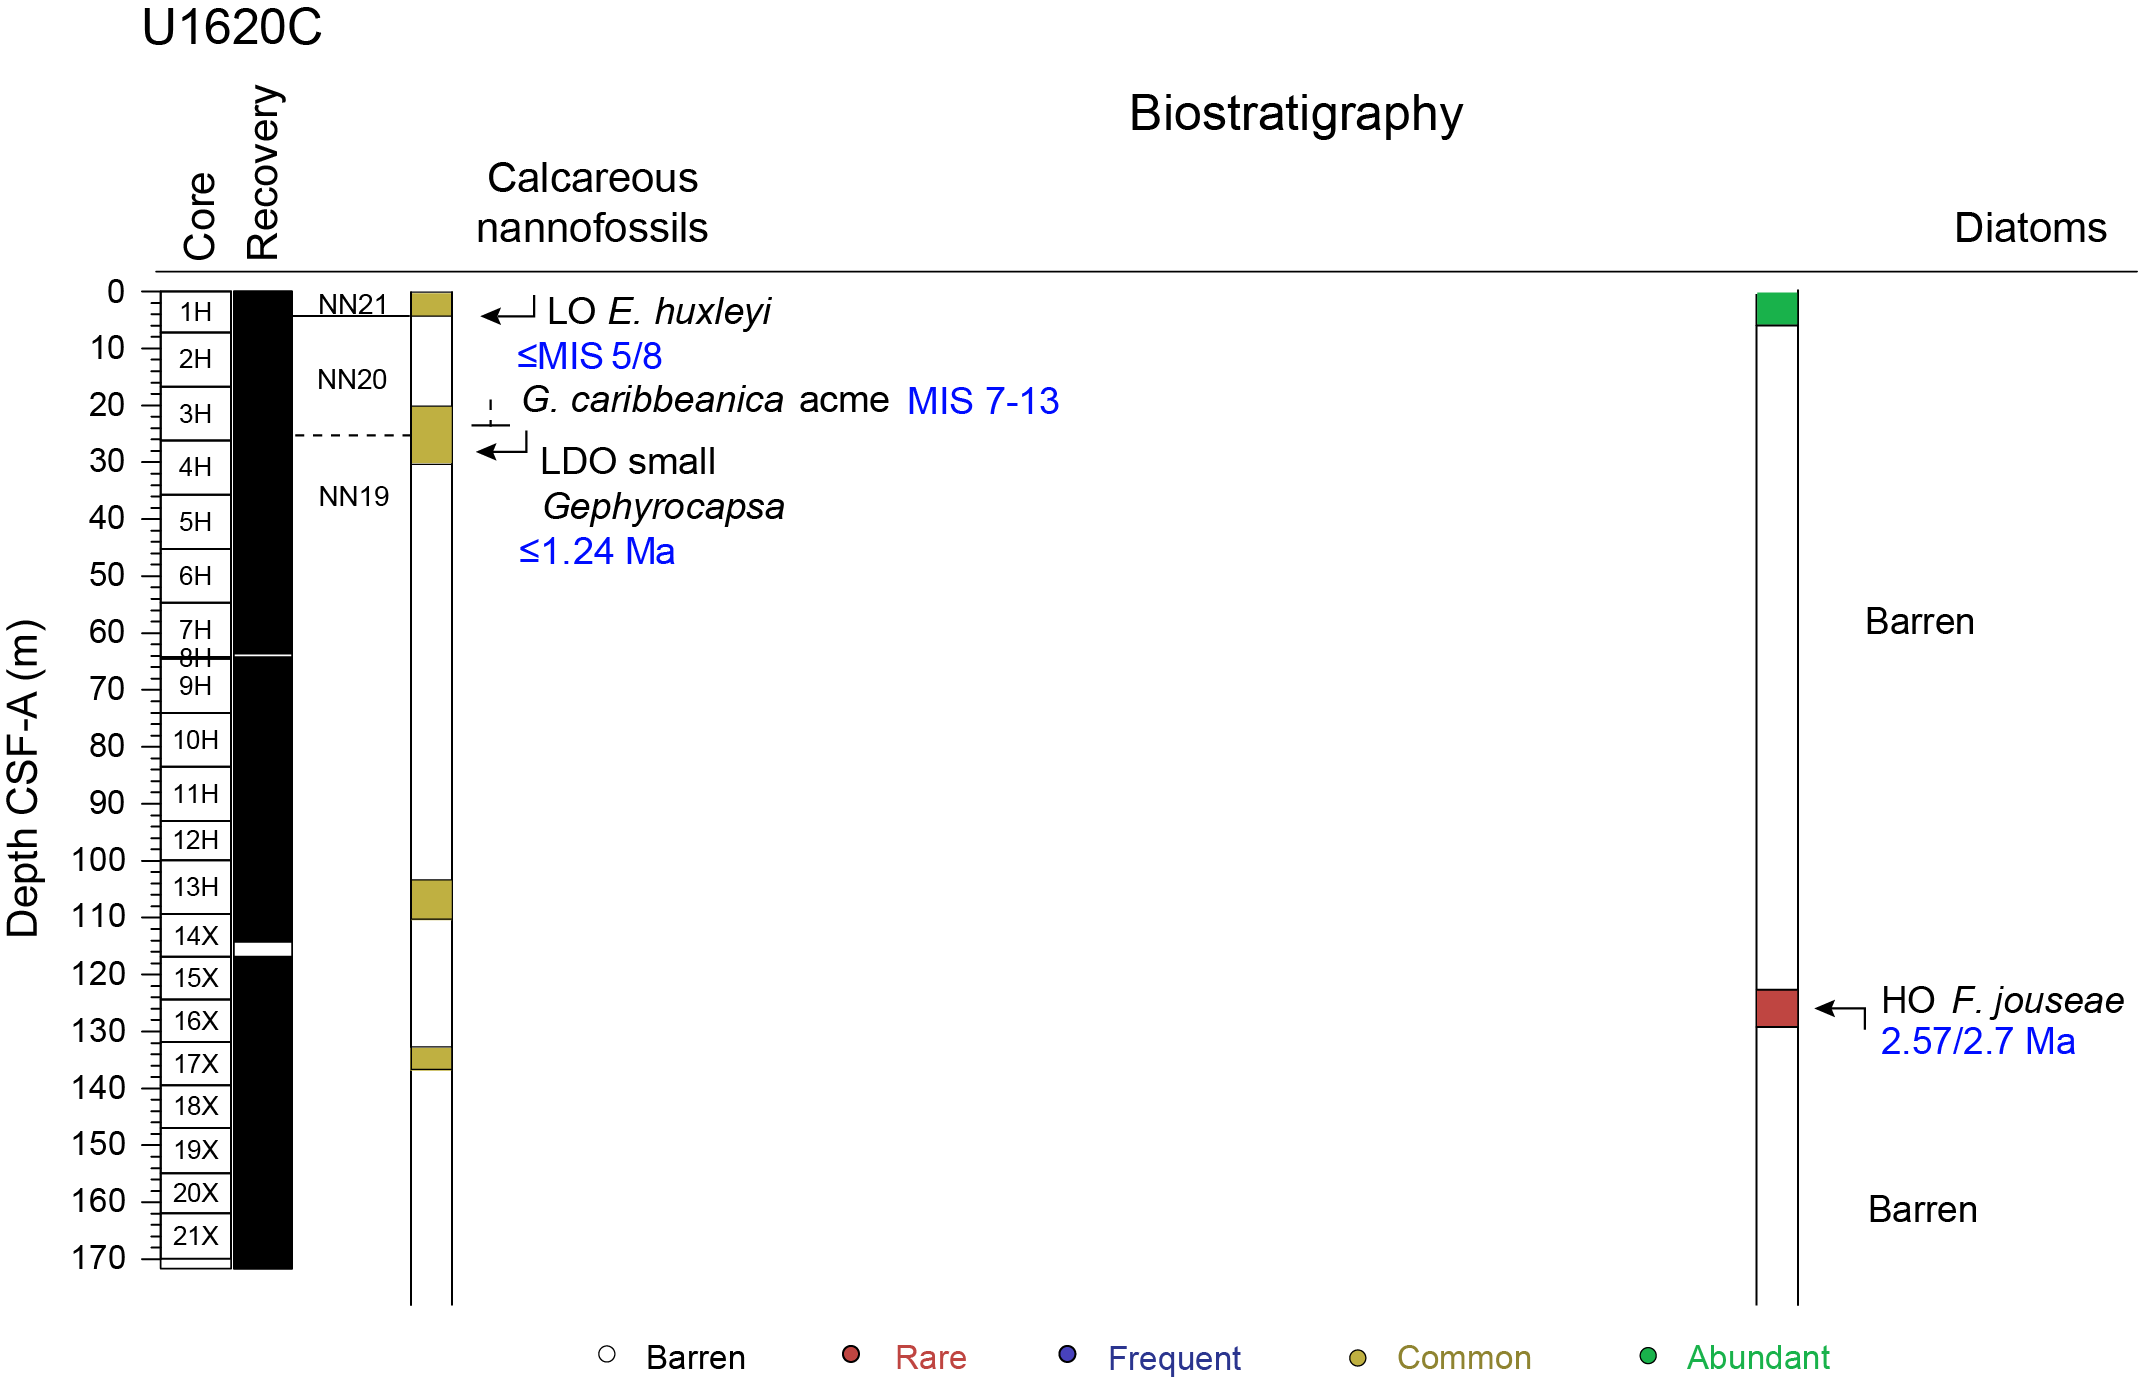
Figure F17. Biostratigraphy and paleoenvironment, Hole U1620C.
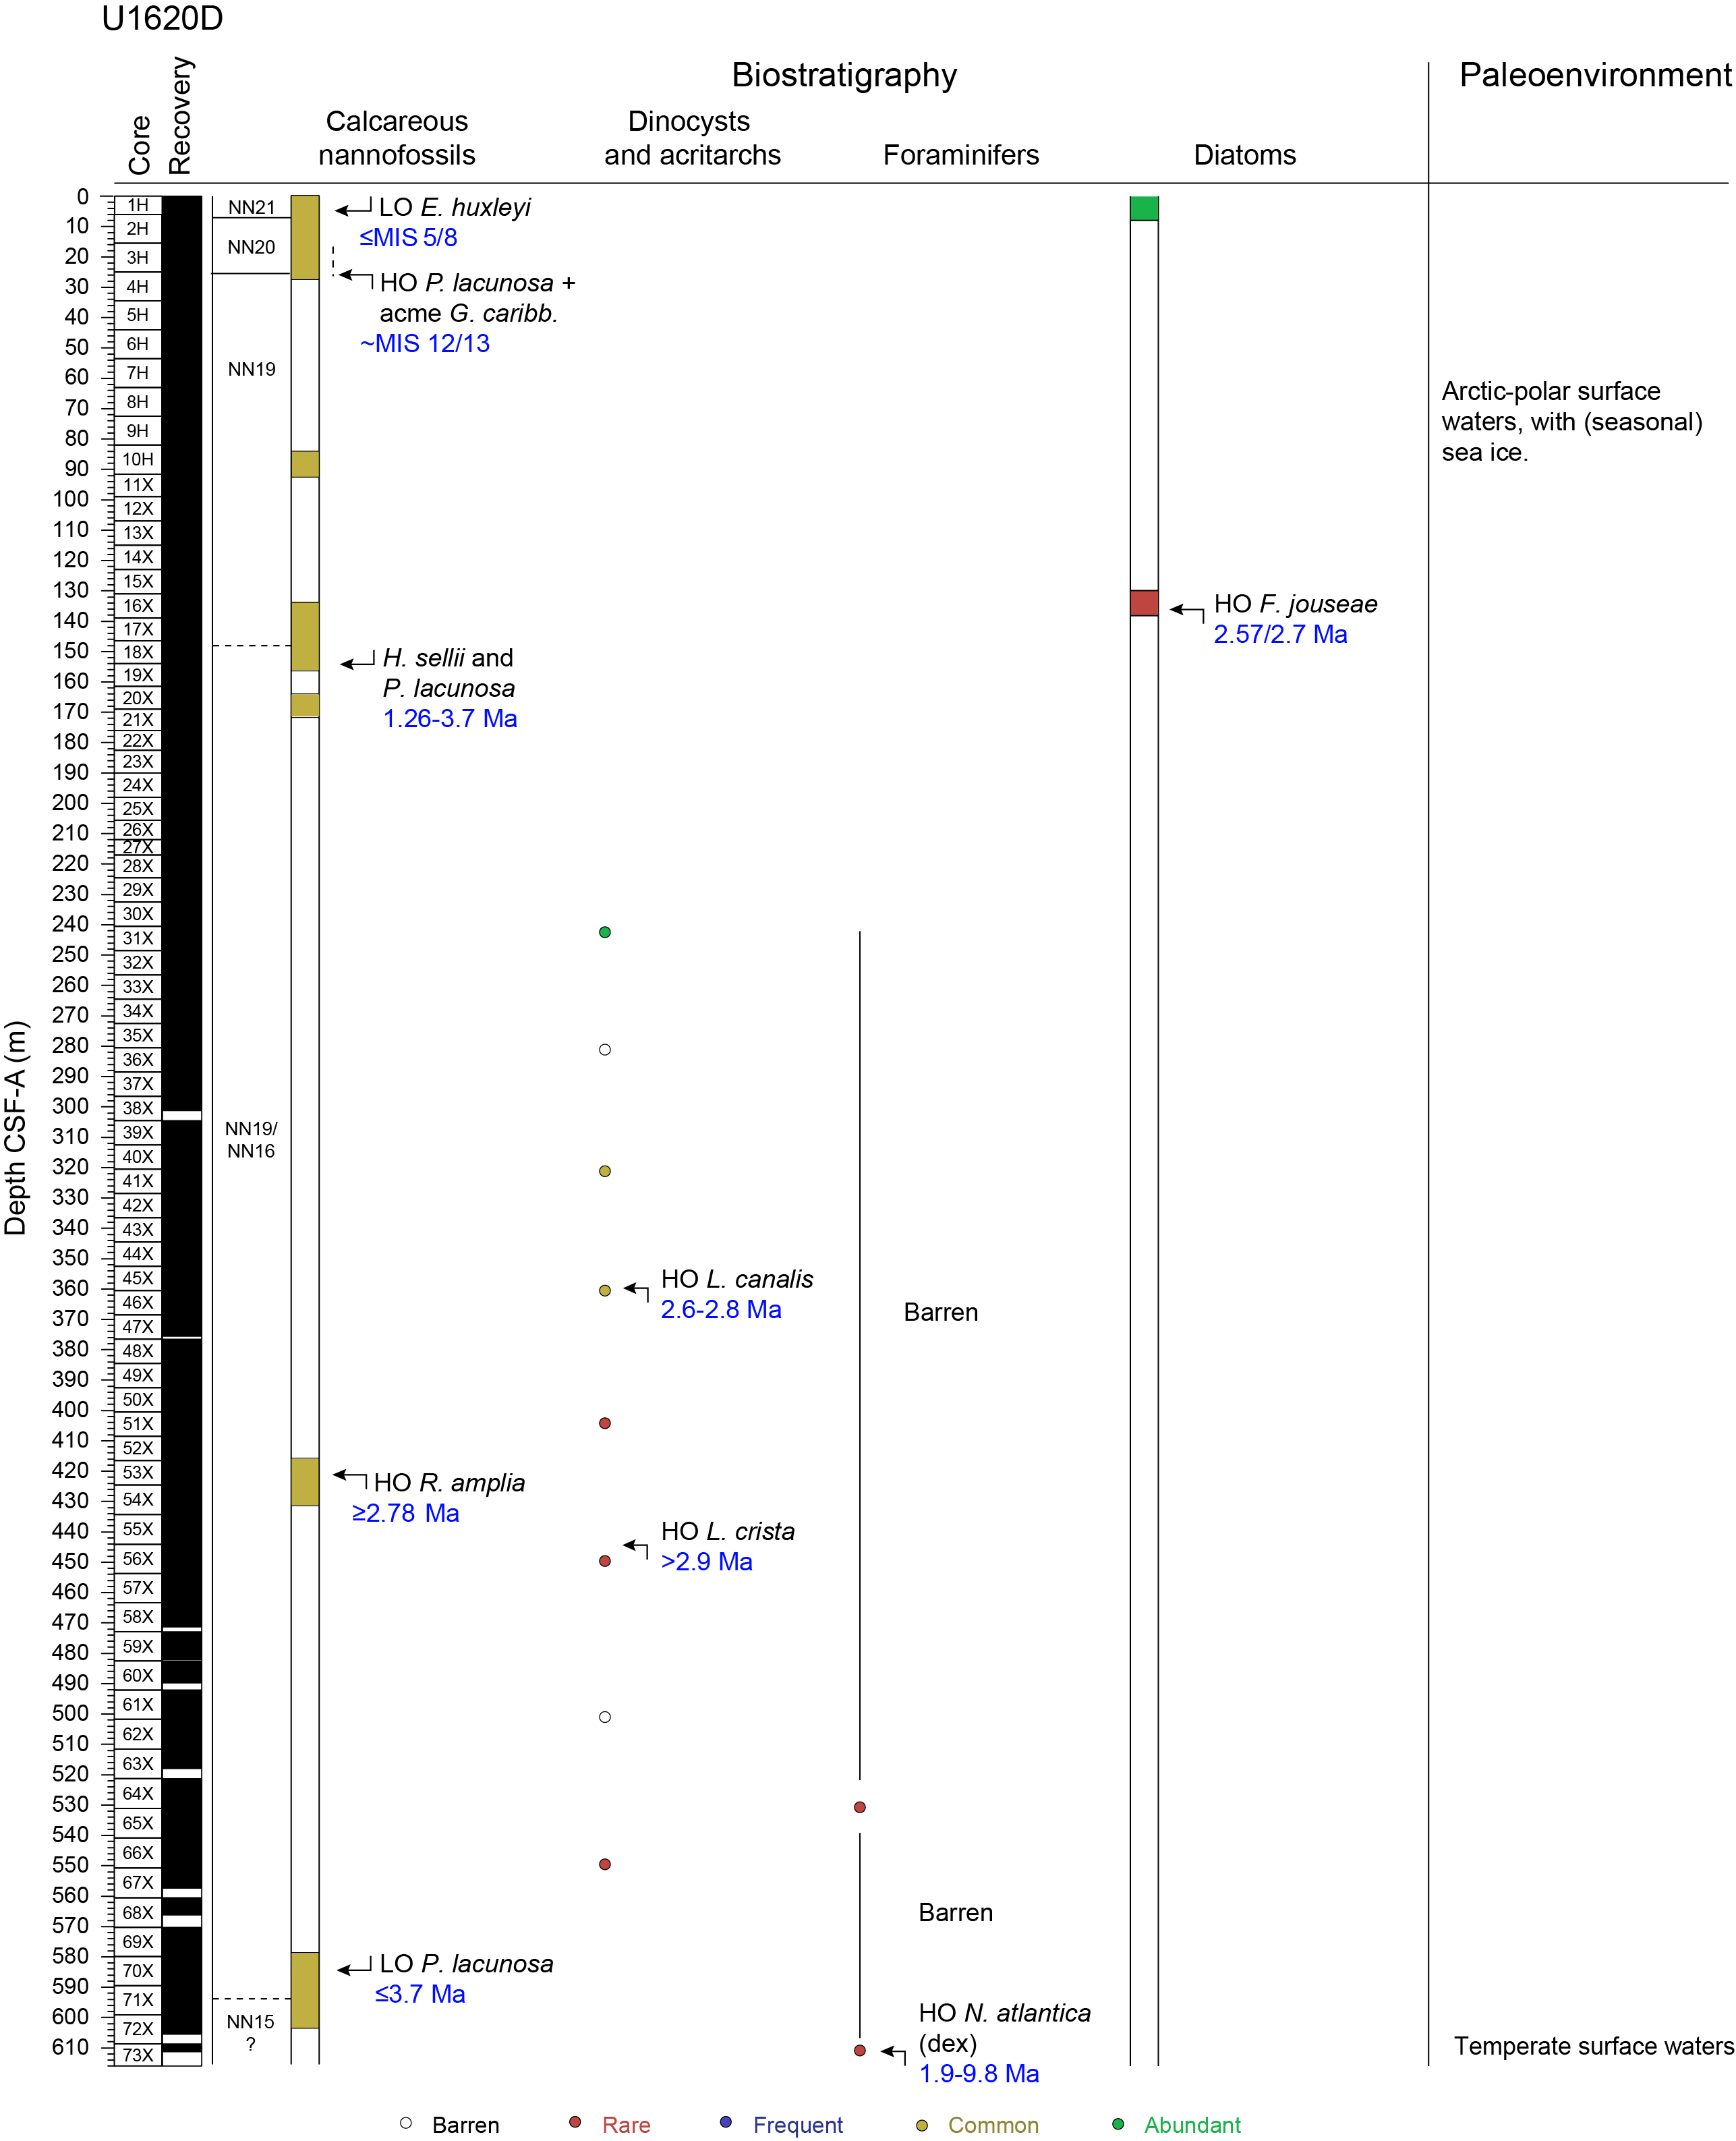
Figure F18. Biostratigraphy and paleoenvironment, Hole U1620D.
Calcareous nannofossils at Site U1620 are generally present in the uppermost part of Holes U1620A, U1620C, and U1620D and decrease to barren toward the lowermost sections. Samples with calcareous nannofossil content evidence an abundance of specimens that ranges between few and abundant, with low diversity. The assemblages comprise 12 groups/taxa, including Emiliania huxleyi, small Gephyrocapsa, Gephyrocapsa caribbeanica, medium Gephyrocapsa, Pseudoemiliania lacunosa, small Reticulofenestra, medium Reticulofenestra, Reticulofenestra pseudoumbilicus, Coccolithus pelagicus, Calcidiscus leptoporus, Helicosphaera carteri, and Helicosphaera sellii. The state of preservation ranges between moderate and good. Reworked nannofossils from older stratigraphic levels are consistently present in samples with a common abundance.
Five calibrated calcareous nannofossil events were identified across the three holes, allowing Site U1620 to be assigned an age range following the global zonation by Martini (1971) (Figures F16, F17, F18). Adaptation of calibrations and zonations for the North Atlantic, Fram Strait, and/or Arctic basin were considered when available (e.g., Razmjooei et al., 2023). Complementary biostratigraphic information based on acme events and age ranges of some species in the assemblages were also included, placing Site U1620 within the Late Pliocene to Pleistocene (Figure F14).
The lowest occurrence (LO) of E. huxleyi is observed in the three holes (Samples 403-U1620A-2H-3, 3 cm, 403-U1620C-1H-3, 100 cm, and 403-U1620D-1H-3, 87 cm) (Figures F16, F17, F18). The LO of E. huxleyi is an indicator of Zone NN21 of Martini (1971), with a global calibration of 291 ka, during Marine Isotope Stage (MIS) 8. For the central Arctic sediments, this event has been revised to be displaced up to MIS 5 (130 ka) (Razmjooei et al., 2023). According to these determinations, a lowermost age ranging between MISs 8 and 5 could be identified at these levels at Site U1620 and the correspondence of the uppermost part of the sequence to the Zone NN21 of Martini (1971) (Figure F14).
The acme of G. caribbeanica was identified between 15.17 and 22.05 mbsf in the three holes (Figure F14). The identification of this acme suggests an age range spanning between MISs 7 and 13 (191–524 ka) for the indicated depth interval (Flores et al., 2012; Marino et al., 2014; González-Lanchas et al., 2023). In Hole U1620D, the highest occurrence (HO) of P. lacunosa is identified within this range in Sample 3H-5, 70 cm (Figure F18). The HO of P. lacunosa is an indicator for the transition between Zones NN20 and NN19 of Martini (1971), with a global calibration for low latitudes of 430 ka during MIS 12 (Thierstein et al., 1977; Backman et al., 2012). Within the NN19 biozone, the HO of P. lacunosa at Arctic latitudes has been recently revised and assigned to correspond to MIS 13 (524 ka; Razmjooei et al., 2023). Following this determination, the identification of the HO of P. lacunosa allows the identification of the 430/524 ka boundary, within MISs 12 and 13, and the transition between Zones NN20 and NN19 (Martini, 1971) at Site U1620 (Figure F14).
The lowest dominant occurrence (LDO) of small Gephyrocapsa is observed for Hole U1620A in Sample 5H-CC; for Hole U1620C in Sample 4H-2, 112 cm; and for Hole U1620D in Sample 4H-2, 21 cm (Figure F14). According to the global calibration for this event (Lourens et al., 2004), these sediments are placed with an age younger than 1.24 Ma (Figure F15). The identification of this boundary characterizes this part of the sequence at Site U1620 to belong to Zone NN19 of Martini (1971).
The species H. sellii is present in Miocene to Pleistocene global calcareous nannofossil assemblages (Young et al., 2024). This species is observed as a common part of nannofossil assemblages from Holes U1620A and U1620D between 148.57 and 156.19 mbsf (Figures F16, F18). The co-occurrence of P. lacunosa in these samples indicates a maximum age of 3.7 Ma, according to the LO of P. lacunosa (Young, 1998). The HO of H. sellii ranges 1.19–1.27 Ma within different regional calibrations (Raffi et al., 2006; Sato and Kameo, 1996; Sato et al., 1991, 1999). For the Fram Strait region, 1.26 Ma is considered to be the age of the HO of H. sellii (Sato and Kameo, 1996), placing the interval between 148.57 and 156.19 mbsf between 1.26 and 3.7 Ma (Figure F14).
In the deepest hole (U1620D), small- and medium-sized specimens belonging to the genus Reticulofenestra spp. are commonly present in Sample 53X-CC (Figure F18). According to the determination by Sato and Kameo (1996), the consistent dominance of specimens belonging to this genus could be considered an indicator of the Pliocene. In particular, the HO of the species Reticulofenestra amplia, observed in Hole U1620D and included in the medium Reticulofenestra group, is indicative of this boundary, with a calibrated age of 2.78 Ma (Sato et al., 1999). This determination allows the identification of the Pliocene/2.78 Ma boundary and the Zone NN16 of Martini (1971) for this part of the sequence (Figures F14, F18).
Toward the lowermost part of the sequence in Hole U1620D, the LO of P. lacunosa is identified in Sample 70X-CC, indicating the assignation of a maximum age of 3.7 Ma to this part of the record, in Zone NN16 (Martini, 1971).
4.2. Diatoms and silicoflagellates
The study of diatoms at Site U1620 is based on the examination of 274 samples, including core catcher samples and additional samples from split core sections (working halves). The analyses revealed that Site U1620 is almost barren of diatoms, except in the uppermost sections in the four holes and in some intermittent intervals between 104 and 148 mbsf.
The uppermost part of all holes displays a diverse and complete diatom assemblage. Abundance varies from common to abundant, and preservation is moderate to good. The assemblage includes species related to sea ice, such as Bacterosira bathyomphala, Fragilariopsis oceanica, Fragilariopsis cylindrus, Fragilariopsis regina-jahniae, or Thalassiosira nordenskioeldii. The assemblage also includes species related to Arctic–subpolar waters, such as Thalassiosira antarctica var. borealis, Actinocyclus curvatulus, Coscinodiscus radiatus, Rhizosolenia hebetata f. hebetata, and Shionodiscus trifultus. Moreover, Neodenticula seminae is also present in the uppermost part of Hole U1620A, documenting the reentrance of the species in the region during MIS 1 (Reid et al., 2007; Miettinen et al., 2013; Matul and Kazarina, 2020) (Figures F16, F17, F18).
In Holes U1620A, U1620C, and U1620D, some intervals contain fragments of diatoms that are not useful for biostratigraphy. Nevertheless, the species Thalassiosira jacksonii was recorded in Hole U1620A (Sample 13H-6, 17 cm; 111.43 mbsf). Koç and Scherer (1996) defined the T. jacksonii interval in nearby ODP Site 907 by the LO and HO of T. jacksonii from Late Miocene to Early Pliocene (5.6–4.9 Ma). However, paleomagnetic and biostratigraphic events (calcareous nannofossils and dinocysts) from Site U1620 show a younger age, indicating that the content of T. jacksonii is due to reworking (Figures F15, F16).
The species Fragilariopsis jouseae was recorded consistently in all three holes between 119 and 132 mbsf. In Hole U1620A, it appears in Samples 15X-CC and 15X-CC, 18 cm; in Hole U1620C, in Sample 15X-5, 121 cm; and in Hole U1620D, in Samples 15X-3, 37 cm, and 15X-3, 74 cm, as well as 15X-4, 70 cm. The North Atlantic biozonation proposed by Baldauf (1987) defined the HO of F. jouseae at around 2.6 Ma, at the top of the F. jouseae Zone. None of the co-occurrent species within this zone (i.e., Azpeitia nodulifera, Azpeitia tabularis, Hemidiscus cuneiformis, Shionodiscus oestrupii, Paralia sulcata, C. radiatus, or R. hebetata var. hebetata) were observed at Site U1620. Therefore, these results suggest a possible reworked origin for the F. jouseae content (Figures F15, F16, F17, F18).
No silicoflagellates were observed at Site U1620.
4.3. Dinoflagellate cysts and acritarchs
Dinocysts were analyzed in a total of 19 samples from Holes U1620A (11) and U1620D (8). The samples analyzed from Holes U1620A and U1620D are dominated by round brown cysts (RBCs) and Brigantedinium spp. Specimens belonging to Protoceratium reticulatum, Bitectatodinium tepikiense, Filisphaera filifera, and Habibacysta tectata were frequently recorded. The acritarchs Cymatiosphaera? invaginata and Lavradosphaera crista were also identified. Assemblages are characterized by low diversity. Preservation is excellent in the upper part of the record (Hole U1620A) and medium to good in the lower part (Hole U1620D). The low cyst content in several samples may be a result of the nonacid preparation method, especially in Hole U1620D where lithologies are denser and more compacted deeper in the hole. All samples contain a considerable reworked terrestrial component, reworked dinocysts and acritarchs, and often a large amount of plant material in different stages of degradation.
Samples 403-U1620A-1H-CC, 2H-CC, 16X-CC, and 23X-CC and Samples 403-U1620D-40X-CC and 50X-CC are barren (Figures F16, F18). The dinocyst assemblage of Samples 403-U1620A-6H-CC and 7H-4, 104–105 cm, is dominated by RBCs and specimens belonging to Brigantedinium spp. In both samples, the species Protoperidinium stellatum is recorded. It is present in higher abundance in Sample 6H-CC than in Sample 7H-4, 104–105 cm. This species occurs around the Jaramillo Subchron, comparable to Site U1618 and nearby ODP Hole 911A (Matthiessen and Brenner, 1996). All these observations indicate P. stellatum may be a robust regional biostratigraphic marker of the Jaramillo Subchron. The HO of F. filifera was found in Sample 9H-CC and is recorded in several samples below (12H-CC, 26X-CC, and 403-U1620D-60X-CC), indicating that sediments below Sample 403-U1620A-9H-CC are older than 1–1.4 Ma (Matthiessen et al., 2018). It is difficult to identify the better age-constrained F. filifera acme (Matthiessen et al., 2018) due to limited sampling resolution and counts per samples. The highest number of F. filifera is recorded in Sample 26X-CC. This, together with the occurrence of H. tectata in this same sample, suggests this sample could correspond to the Olduvai Subchron (Matthiessen et al., 2018). H. tectata is in fact recorded in three consecutive samples (26X-CC, 31X-CC, and 403-U1620D-35X-CC). However, it is uncertain whether the occurrence of H. tectata in Sample 403-U1620A-26X-CC should be considered the HO or the highest persistent occurrence (HPO). The HO is difficult to identify in the high-latitude North Atlantic region, but an HPO occurs around the Olduvai Subchron, estimated around ~2 Ma (Matthiessen et al., 2018). The acritarch Lavradosphaera canalis occurs in Sample 403-U1620D-45X-CC. The presence of acritarch puts this sample firmly in the latest Late Pliocene. The species, which was originally described from the North Atlantic Integrated Ocean Drilling Program Site U1308 and reported from Deep Sea Drilling Project (DSDP) Hole 610A and Integrated Ocean Drilling Program Site U1307, occurs in a narrow time window between 2.6 and 2.8 Ma (De Schepper and Head, 2014; Aubry et al., 2020). The species Barssidinium pliocenicum also occurs in Sample 45X-CC, whereas Barssidinium graminosum appears in Samples 60X-CC and 70X-CC. Both species can range into the Early Pleistocene, but they often occur in the Pliocene sediments of the North Atlantic and Nordic Seas (De Schepper and Head, 2009; De Schepper et al., 2017). Another acritarch, L. crista, is recorded in Samples 55X-CC to 70X-CC. The highest common occurrence of this species in the North Atlantic is around 2.9 Ma (De Schepper and Head, 2014; Aubry et al., 2020), with the HPO occurring as late as 2.75 Ma in the Labrador Sea (Aubry et al., 2020). Its range base is in the uppermost Messinian (De Schepper and Head, 2014). The interval below Sample 55X-CC is, thus, constrained within a Late Pliocene age likely older than 2.9 Ma. No clear indications for an Early Pliocene age were found, which makes it likely that the base of Site U1620 is within the earliest Late Pliocene to, possibly, latest Early Pliocene.
Reworking of terrestrial and marine (pre-Neogene) palynomorphs is high, likely reflecting input of pre-Neogene sediments to the site. Fresh water algae (Pediastrum and Gelasinicysta vangeelii) are present between Samples 403-U1620A-6H-CC and 26X-CC. Dinocyst assemblages are mainly low in diversity and dominated by the heterotrophic species Brigantedinium and RBCs. RBCs are present throughout upper parts of the site and become less abundant in the lowermost samples, where autotrophic taxa increase (i.e., Samples 403-U1620D-45X-CC and 70X-CC). RBCs and Brigantedinium reflect nutrient-rich environments, which in this area are usually associated with Arctic–polar water masses with sea ice (de Vernal et al., 2020). We have recorded Islandinium species in two samples (403-U1620A-7H-4, 104–105 cm, and 31X-CC) and have interpreted these to indicate sea ice (de Vernal et al., 2020). B. tepikiense, a subpolar–temperate species that occurs mostly at mid-latitudes in the modern North Atlantic (de Vernal et al., 2020), is dominant in Sample 9H-CC, indicating that the site was not always underlying Arctic–polar water masses. The presence of P. reticulatum in several samples also indicates the influence of Atlantic water and cold–temperate conditions (e.g., Matthiessen and Knies, 2001). Around the Jaramillo Subchron (Samples 6H-CC and 7H-4, 104–105 cm), we again encountered a diverse dinocyst assemblage characterized by P. stellatum. The extinct H. tectata (from Samples 26X-CC to 403-U1620D-35X-CC) and F. filifera (from Samples 403-U1620A-9H-CC to 403-U1620D-60X-CC) are cold-tolerant taxa in the North Atlantic and Iceland Sea (e.g., Head, 1996; Hennissen et al., 2017; Schreck et al., 2017). However, in a cold, Arctic/polar setting, their paleoecological preferences suggest relatively warmer surface waters, which are associated with a reduction of sea ice cover (Matthiessen et al., 2018).
4.4. Foraminifers
Planktonic foraminifers were investigated in every core catcher in Hole U1620A down to 241.5 mbsf (Figure F16). In Hole U1620D, every core catcher sample from 242 to 338 mbsf was analyzed. From 338 to 434 mbsf, every other (and from 434 mbsf, every fifth) core catcher sample was investigated (Figure F18). Additional samples from levels determined to be constrained around MIS 5 in Hole U1620D (based on other microfossil groups [i.e., calcareous nannofossils and lithology]) were also investigated. In Hole U1620A, planktonic foraminifers are abundant in the very top (0.7 mbsf) and rare down to 39 mbsf. Below this depth, they disappear and all samples are barren (Figure F16). Overall, the tests are moderately well preserved; however, it does deteriorate at 39 mbsf before they disappear. There are very little to moderate amounts of fragments. The fauna is dominated by Neogloboquadrina pachyderma, indicating Arctic–polar surface water masses and possibly seasonal sea ice (e.g., Husum and Hald, 2012; Schiebel and Hemleben, 2017).
In Hole U1620D, all samples from 242 to 434 mbsf are barren of foraminifers. Below 434 mbsf, most samples are barren except Samples 64X-CC and 73X-CC, where some rare planktonic foraminifers are encountered (Figure F18). Foraminifers show a high degree of encrustation and/or dissolution and very low degree of fragments. Sample 64X-CC at 531 mbsf shows a few specimens that can only be identified as a Neogloboquadrina species. The lowermost sample at 611 mbsf (73X-CC) contains a rare amount of Neogloboquadrina atlantica (dex), which ranges from Late Miocene to Pliocene (e.g., Berggren, 1972) (Figure F14). The sample also contains one specimen of Trilobatus sacculifer that ranges from Early Miocene to recent. T. sacculifer might also indicate temperate surface waters (e.g., Lam and Leckie, 2020).
5. Paleomagnetism
Paleomagnetic investigation of Site U1620 focused on measurements of the natural remanent magnetization (NRM) before and after alternating field (AF) demagnetization of archive-half sections and vertically oriented discrete cube samples. All archive-half sections were measured except some that had significant visible coring disturbance and the core catchers. APC archive-half sections were measured before and after 10 and 15 mT peak AF demagnetization. Because XCB cores do not use nonmagnetic core barrels and are more susceptible to the viscous isothermal remanent magnetization (VIRM) drill string overprint (Richter et al., 2007), XCB archive-half sections required higher AF demagnetization steps to remove this overprint and were measured before and after 15 and 30 mT peak AF demagnetization. Some archive-half sections with high MS (above ~750 IU) had NRM intensities that were too strong to be measured on the superconducting rock magnetometer (SRM) and caused flux jumps even when track speed was slowed by 10×. This compromised our ability to collect quality data in these intervals. However, the intensity often was reduced after AF demagnetization, and measurements could sometimes, but not always, be made after demagnetization.
Following insight gained from work at Sites U1618 and U1619 (see Paleomagnetism in the Site U1618 chapter [Lucchi et al., 2026b] and Paleomagnetism in the Site U1619 chapter [St. John et al., 2026]) and consistent with observations made in the region during ODP Leg 151 (e.g., see Figures 16 and 17 in Shipboard Scientific Party, 1995), discrete cube samples were preferentially sampled from low-MS intervals when possible in an effort to avoid sampling greigite rich layers, with the approach varying based on the specific core and who was sampling. Although still capturing a range of variability in magnetic properties, this strategy likely imposes a bias toward the magnetic properties of these lower MS sediments. The NRMs of the oriented discrete cube samples were stepwise demagnetized before and after 0, 5, 10, 15, 20, 25, 30, 35, 40, 45, and 50 mT peak AF using the SRM and in-line AF demagnetization system. These measurements were supplemented by measurements of MS and anhysteretic remanent magnetization (ARM) before and after 30 mT peak AF demagnetization.
5.1. Sediment magnetic properties
Site U1620 sediments have similar magnetic properties to those observed at Sites U1618 and U1619 and likely reflect contribution from detrital and authigenic sources (see Paleomagnetism in the Site U1618 chapter [Lucchi et al., 2026b] and Paleomagnetism in the Site U1619 chapter [St. John et al., 2026]). Based on MS and ARM data, Site U1620 can broadly be classified into three magnetic zones (Figure F19). From 0 to around 49 mbsf (Magnetic Zone 1), MS is relatively low, ARM coercivity is relatively low (tracked by the ratio of the ARM after 30 mT peak AF demagnetization to the initial ARM [ARM30mT/ARM]), and ARM normalized by MS is variable. From around 49 to 140 mbsf (Magnetic Zone 2), ARM coercivity increases, with variability between values around 0.5 and 0.8, and MS increases slightly but remains relatively low. This transition likely reflects changes to the magnetic mineral assemblage during early diagenesis, located below the depths of sulfate depletion and peak in alkalinity that characterize the sulfate–methane transition zone (SMTZ) observed in the interstitial water (IW) samples (Figure F40). Below 140 mbsf (Magnetic Zone 3), intervals of very high MS become frequent whereas ARM coercivity values are similar to the values observed from 49 to 140 mbsf. Some intervals with low MS (<30 IU) are present below 140 mbsf and include thick intervals centered around 400, 500, 540, and 600 mbsf. Similar to Sites U1618 and U1619, below about 140 mbsf authigenic iron sulfides are visible on the split core surface, sometimes occurring as nodules up to a few centimeters in diameter and sometimes associated with high MS (>1000 IU). Examples of high MS intervals from Hole U1620D are presented in Figure F20 along with core photos and X-rays, showing that these high-susceptibility intervals are associated with high-density objects (darker objects in X-ray images). Although we did not sample any of these intervals at Site U1620 for XRD, they are consistent in character with the greigite nodules we described at Sites U1618 and U1619 (see Paleomagnetism in the Site U1618 chapter [Lucchi et al., 2026b] and Paleomagnetism in the Site U1619 chapter [St. John et al., 2026]). Further work, including using thermal magnetic, in-field magnetic, SEM/EDS, and XRD analyses, will provide additional insight to Site U1620 magnetic mineralogy and its implications for the fidelity of the paleomagnetic signal.
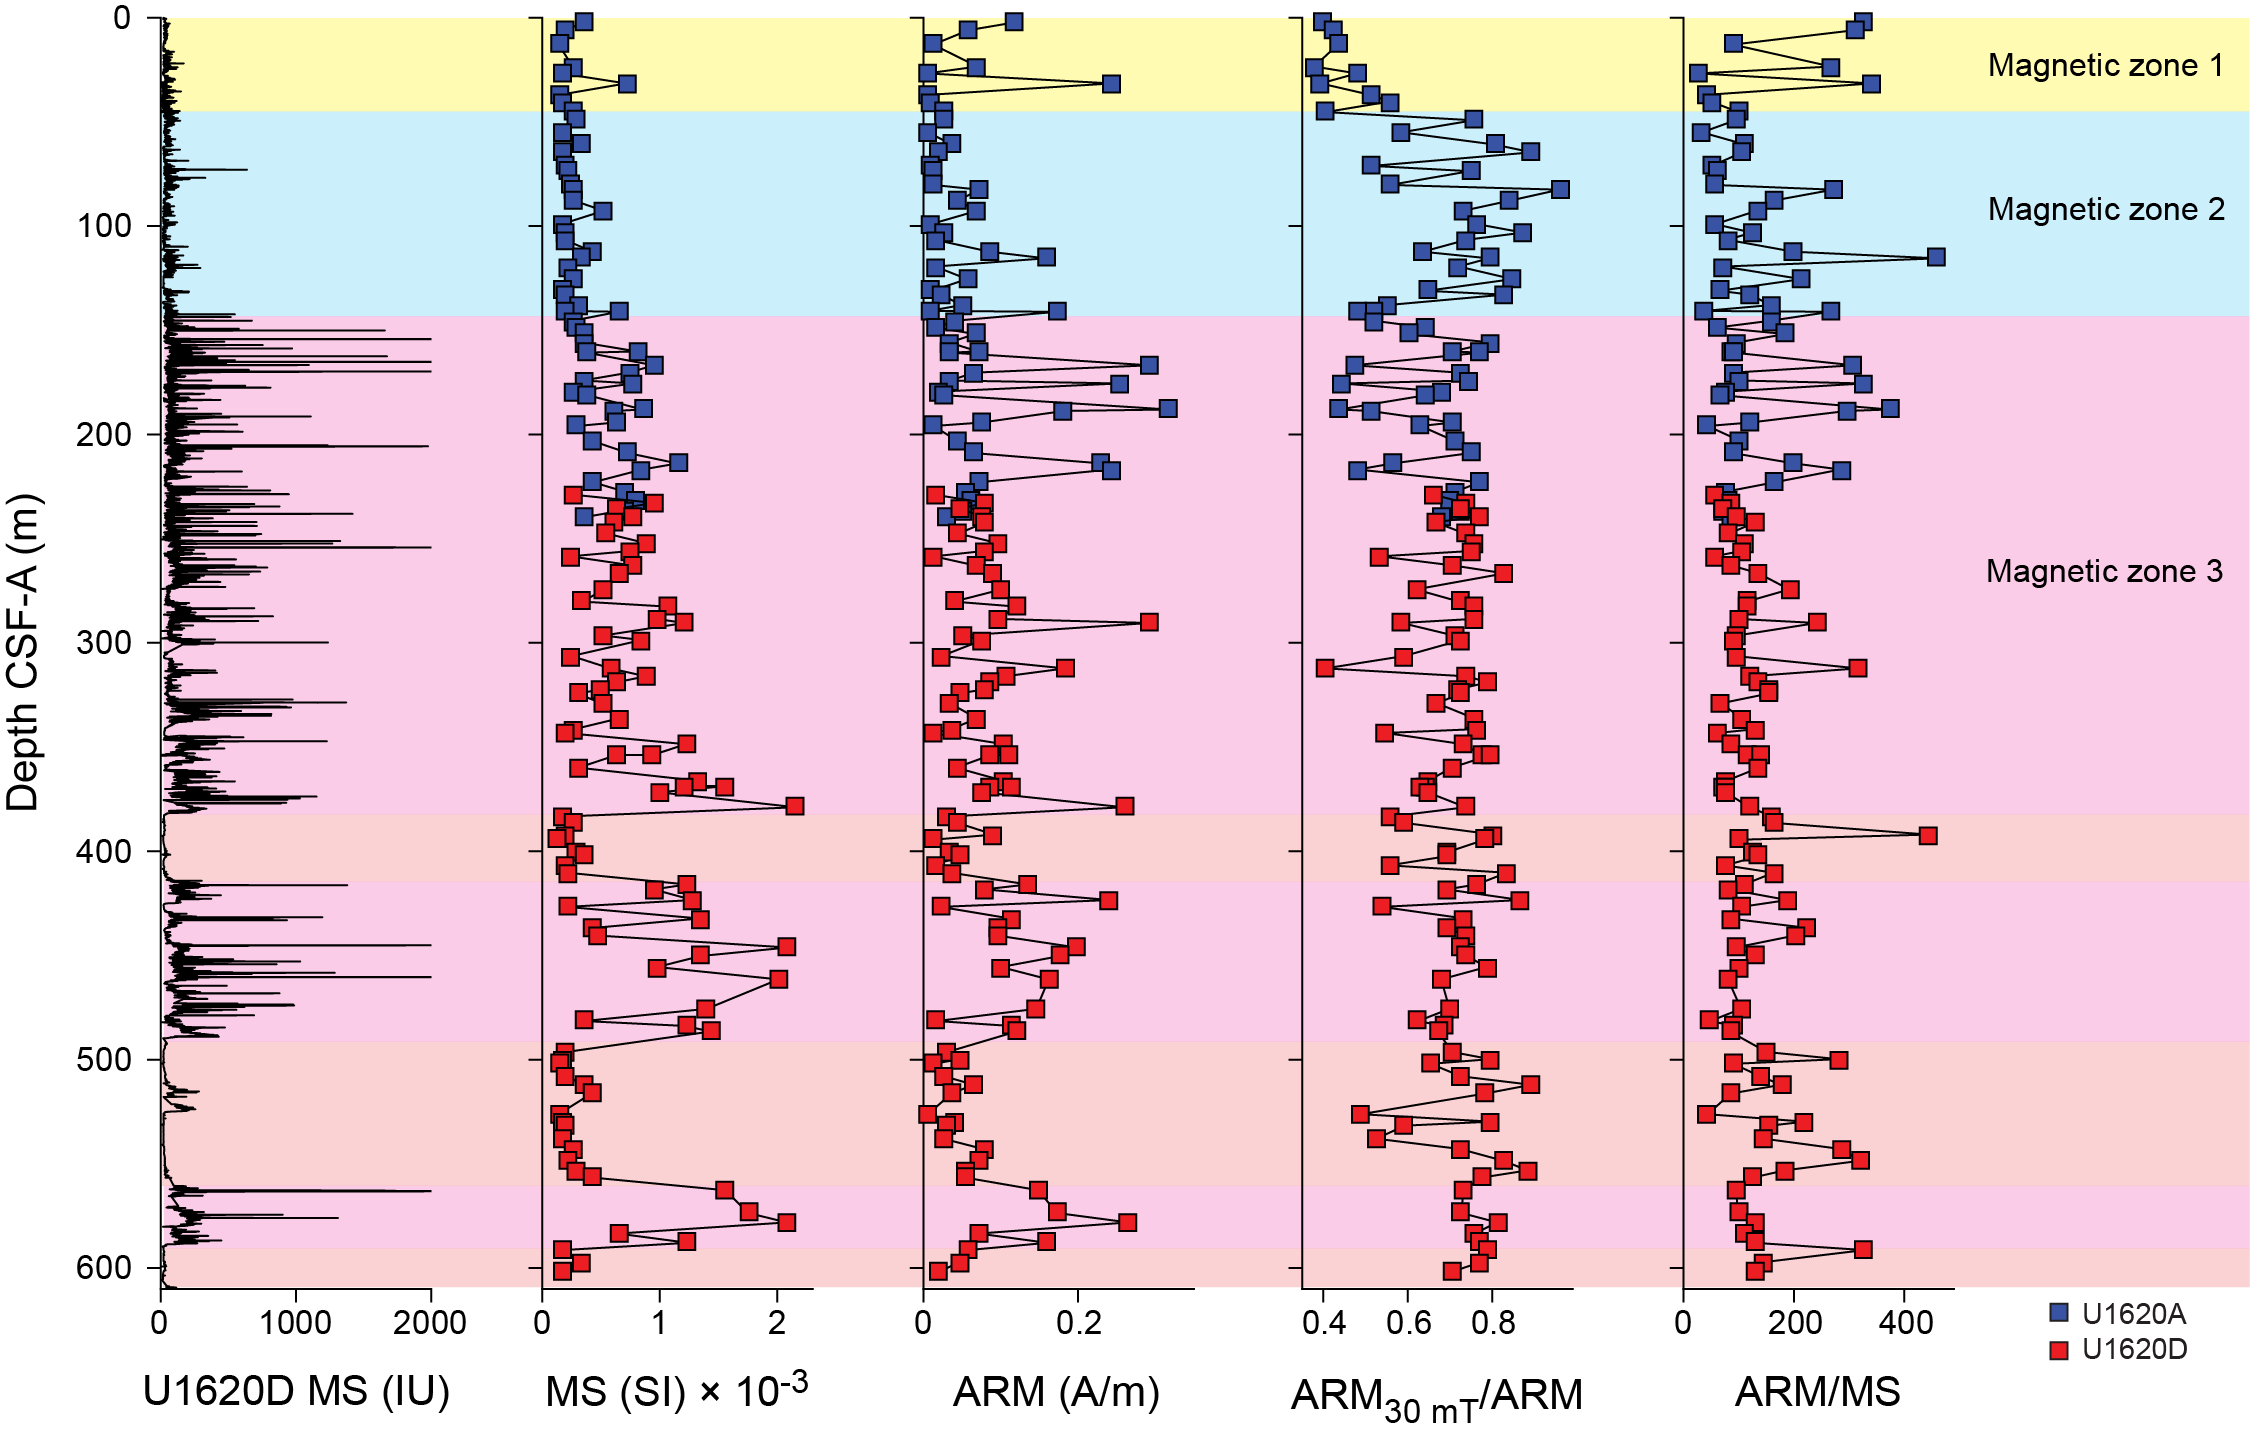
Figure F19. Cube measurements and WRMSL MS.
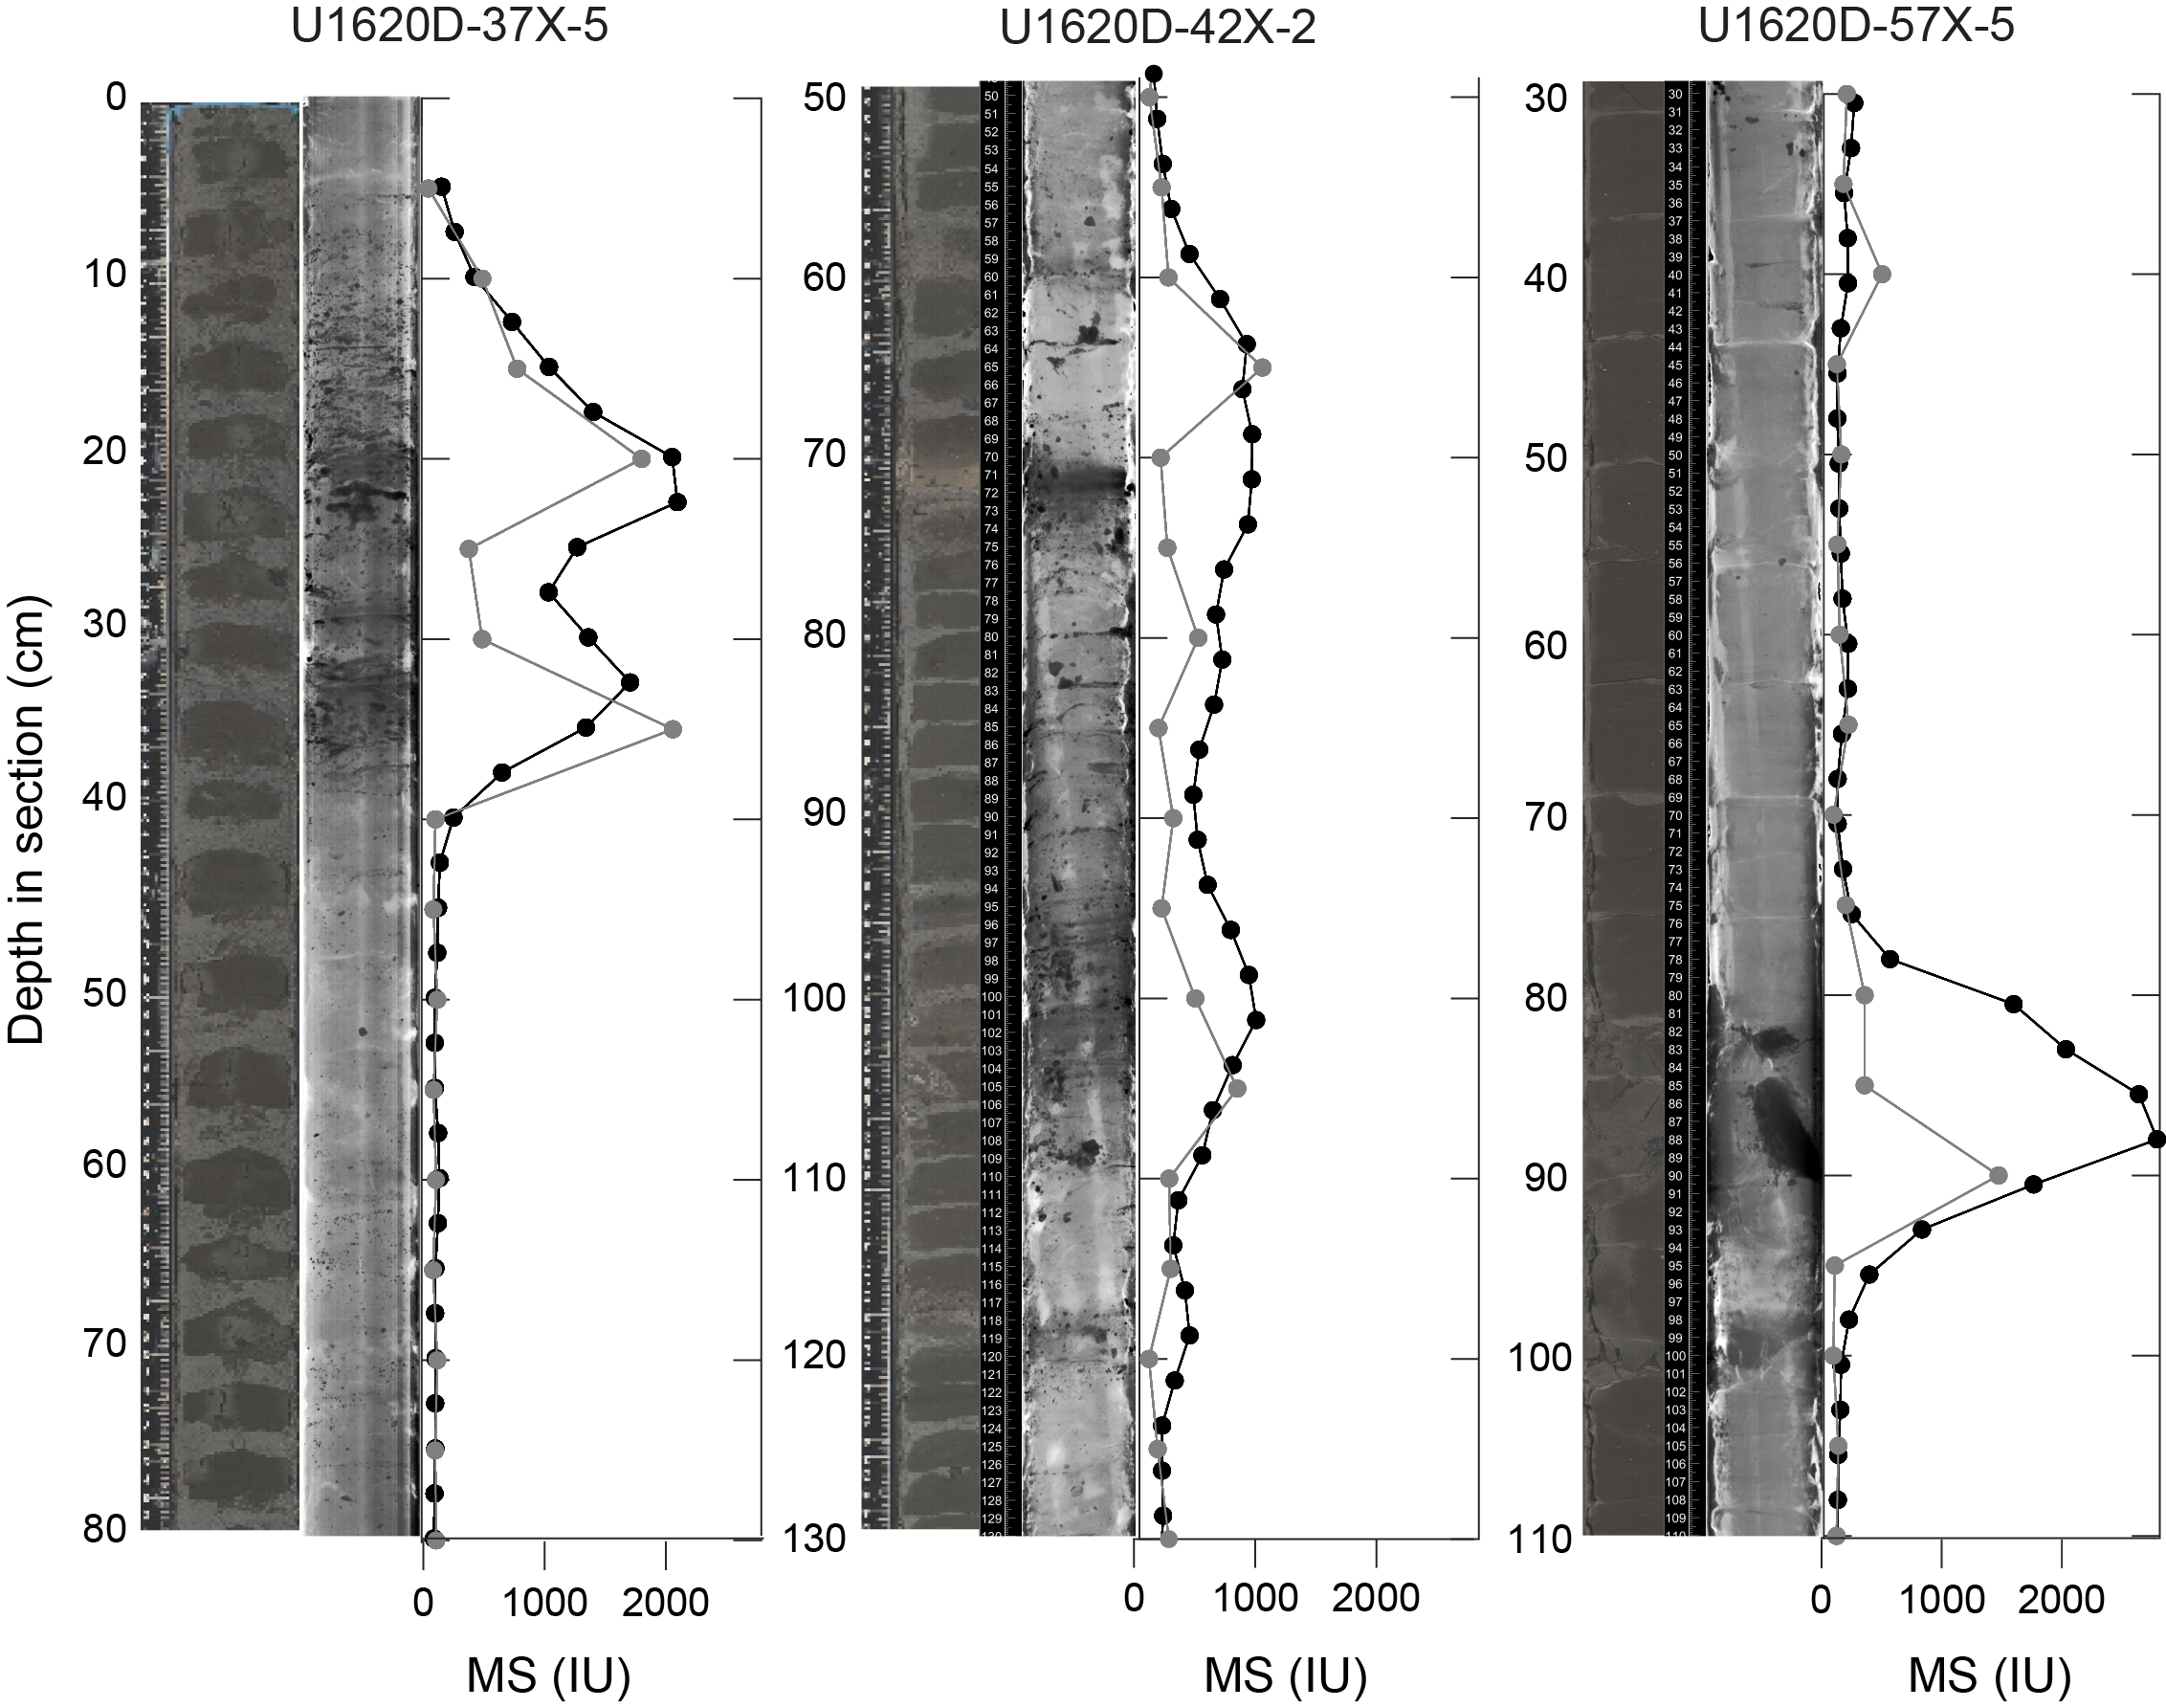
Figure F20. High-MS intervals.
5.2. Natural remanent magnetization
Of NRM intensities at Site U1620, 95% were between 2.4 × 10⁻³ and 9.3 × 10⁻¹ A/m, with APC sections between 4.0 × 10⁻⁴ and 5.7 × 10⁻² A/m after 15 mT peak AF demagnetization and XCB sections between 7.0 × 10⁻⁴ and 1.5 × 10⁻¹ A/m after 30 mT peak AF demagnetization. After 15 mT peak AF demagnetization, APC-cored sections show strong bimodal distribution in inclination with peaks between ±65° and 80° in the three holes, just shallow of the expected ±84.1° geocentric axial dipole value for this latitude (Figure F21). This bimodal distribution is not well expressed in data collected after 30 mT peak AF demagnetization in XCB cores, with data collected from Hole U1620A having a near-uniform distribution; Hole U1620C having a broad peak centered at 40°; and Hole U1620D having a significant negative skew with a mode similar to that in the APC cores, around 72°. However, below 300 mbsf, Hole U1620D inclinations have a single steep positive inclination mode that more closely approximates the positive half of the distribution observed in the APC cores. The difference between the APC and XCB distributions is most likely the result of switching from the APC coring method to XCB coring at shallow depths (~124, 110, and 92 mbsf in Holes U1620A, U1620C, and U1620D, respectively). Comparison of sediments recovered in the uppermost 122 m at each site clearly shows the difference in data quality, with archive-half data only interpretable in the APC-cored intervals in the 92–124 mbsf interval (Figure F22). This indicates significant disturbance of the primary sediment fabric in the XCB cores. Discrete cube samples taken from XCB-cored sediments were selected only from intervals with large intact pieces and recovered inclinations consistent with expected values, indicating that discrete samples may be more appropriate than pass-through section-half measurements for XCB-cored intervals in the transition zone between the base of APC coring and the deeper and firmer sediments that are more suitable for XCB coring (Figures F22, F23).
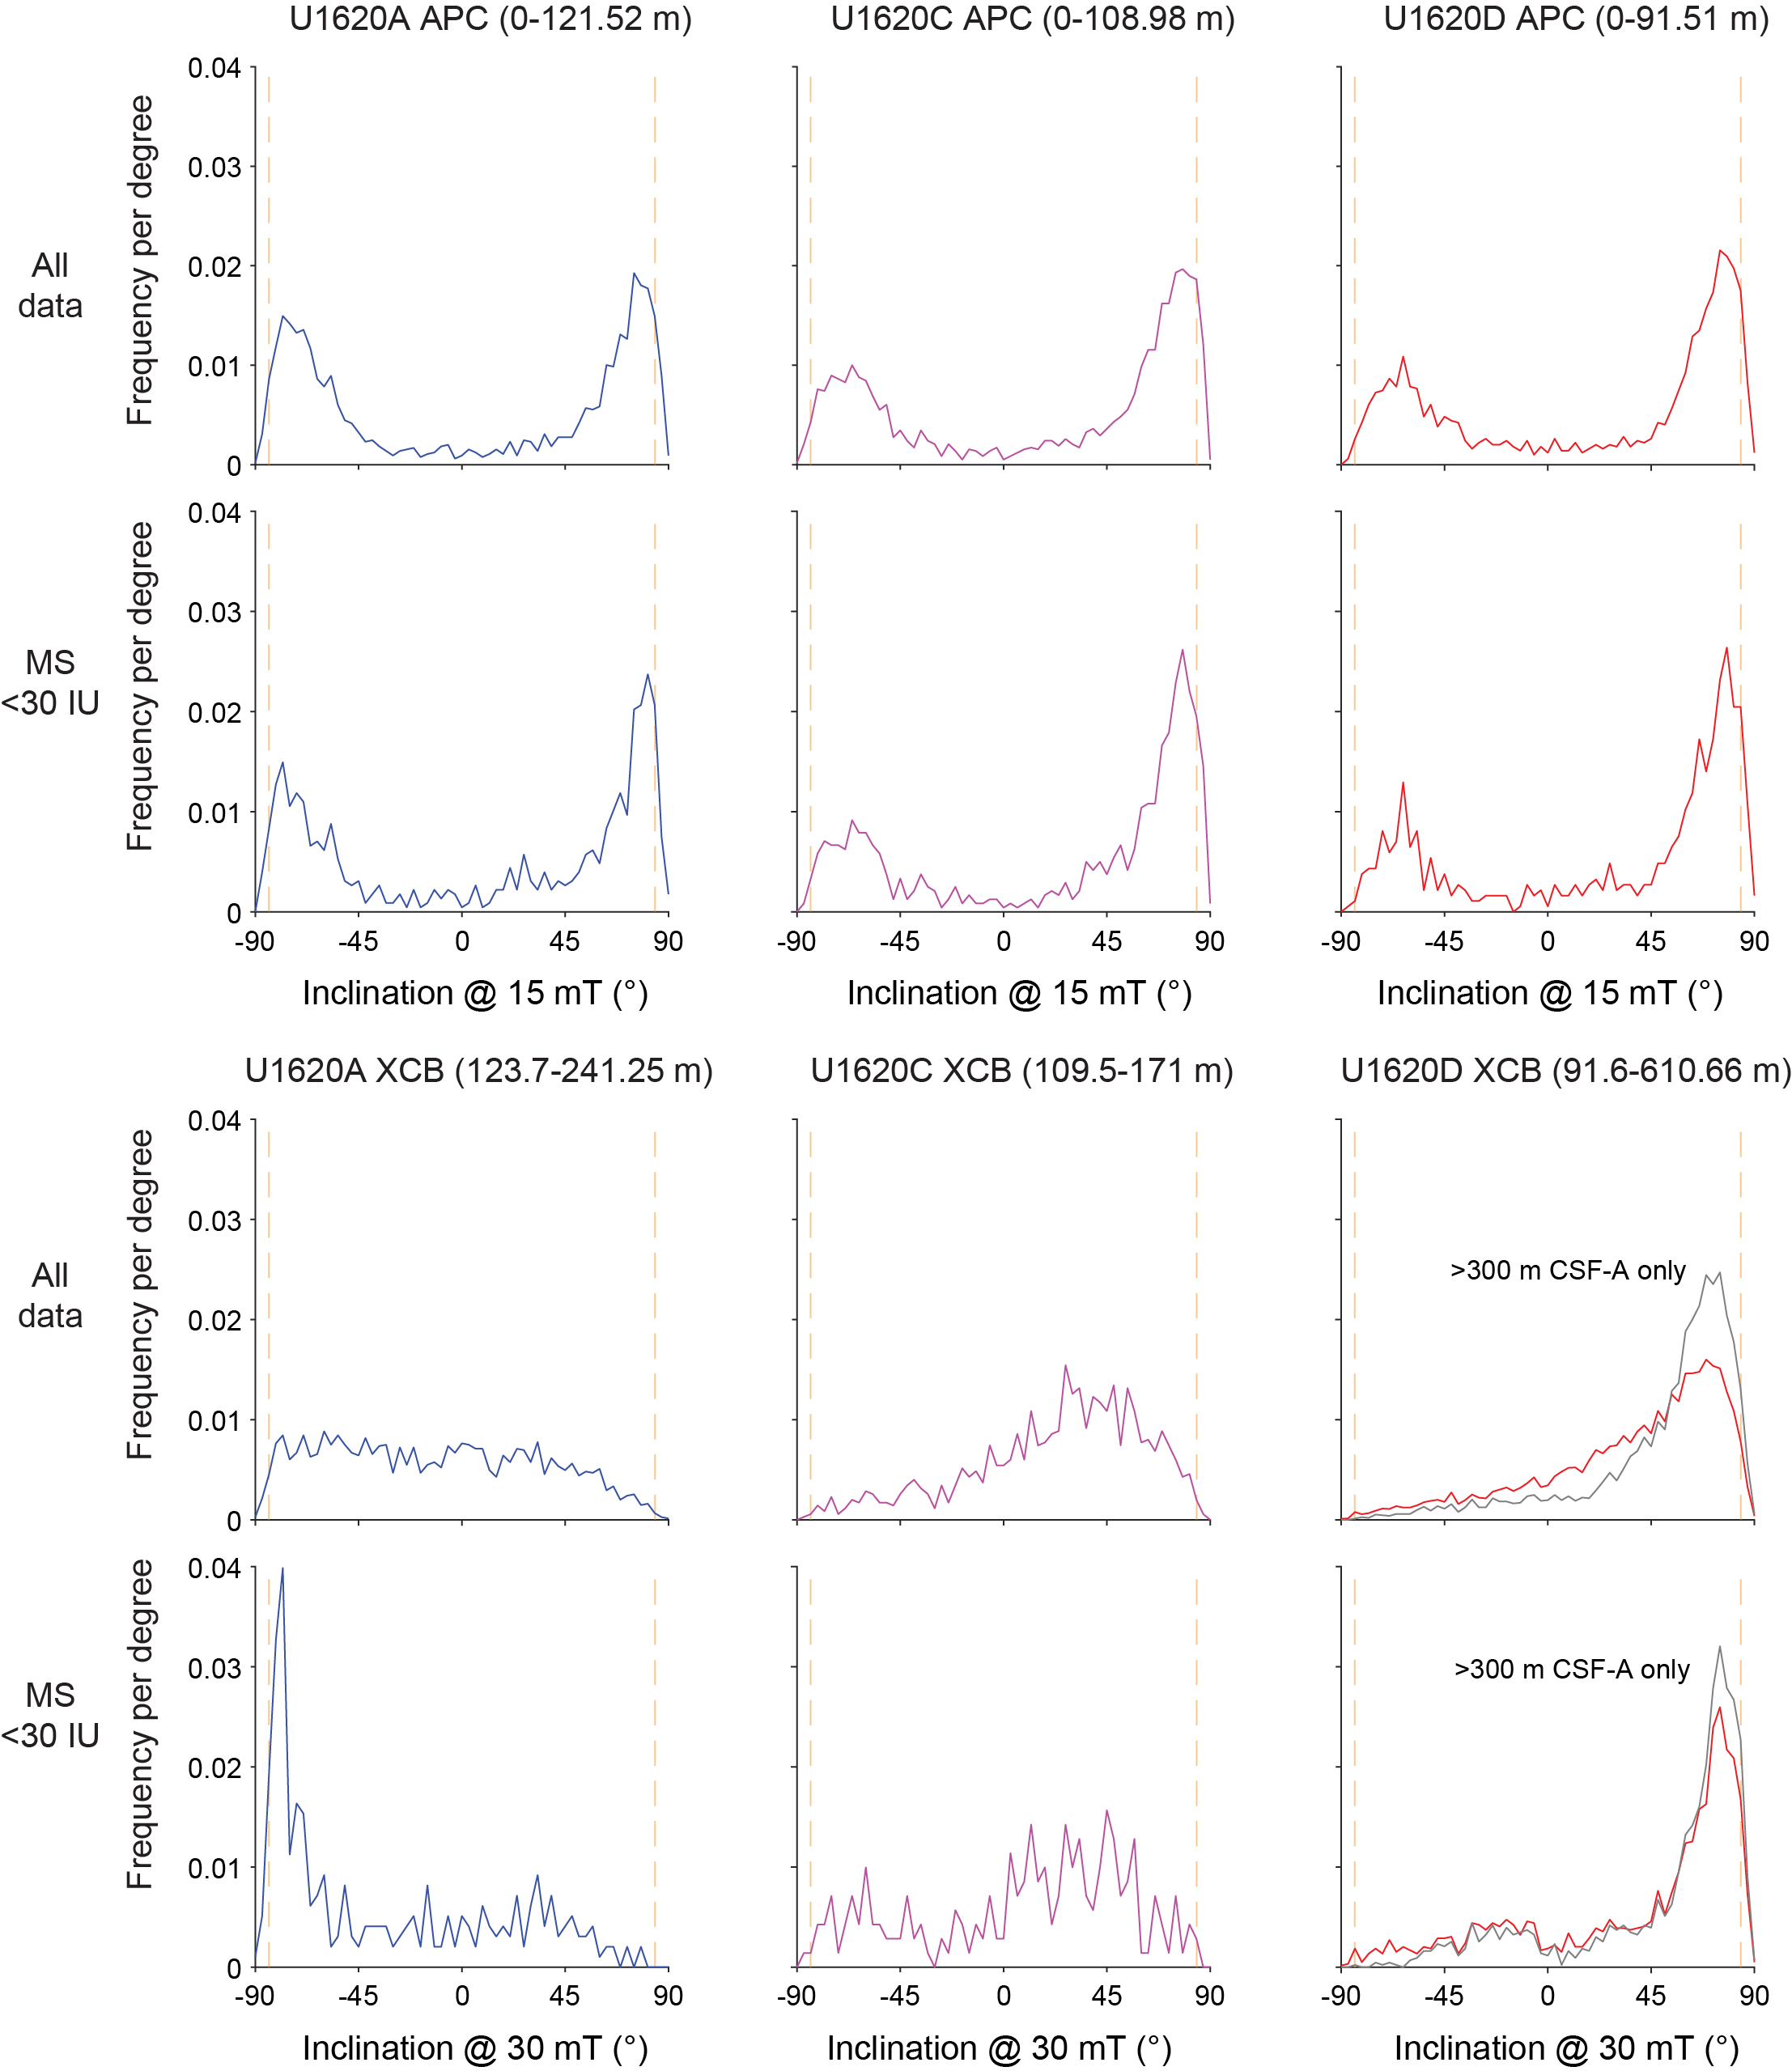
Figure F21. Inclination.
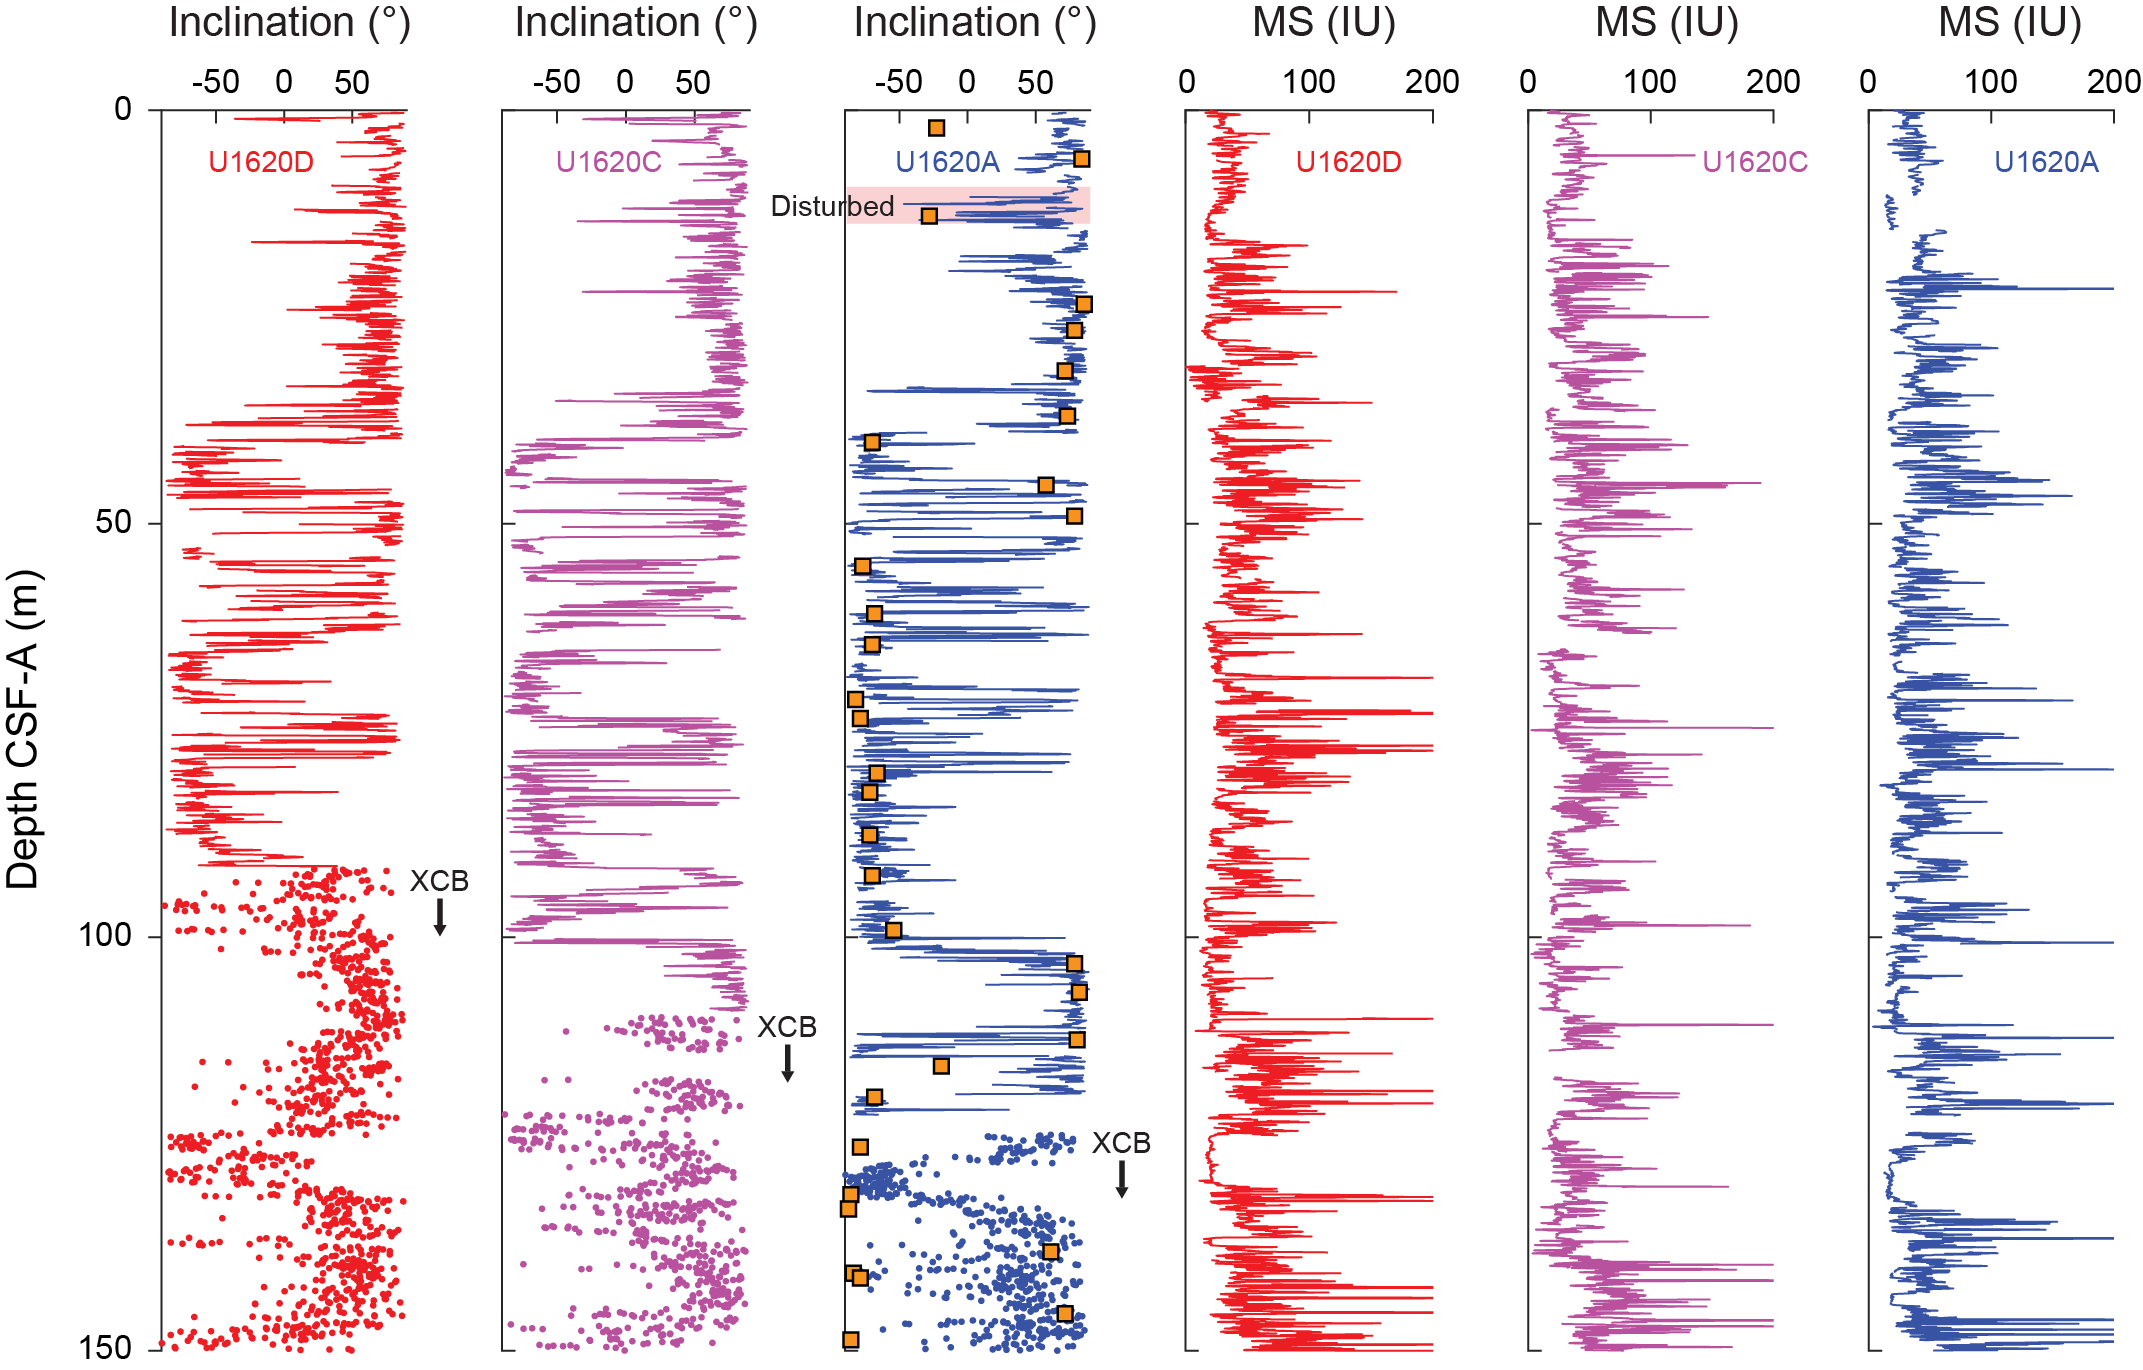
Figure F22. MS and archive section half inclination.
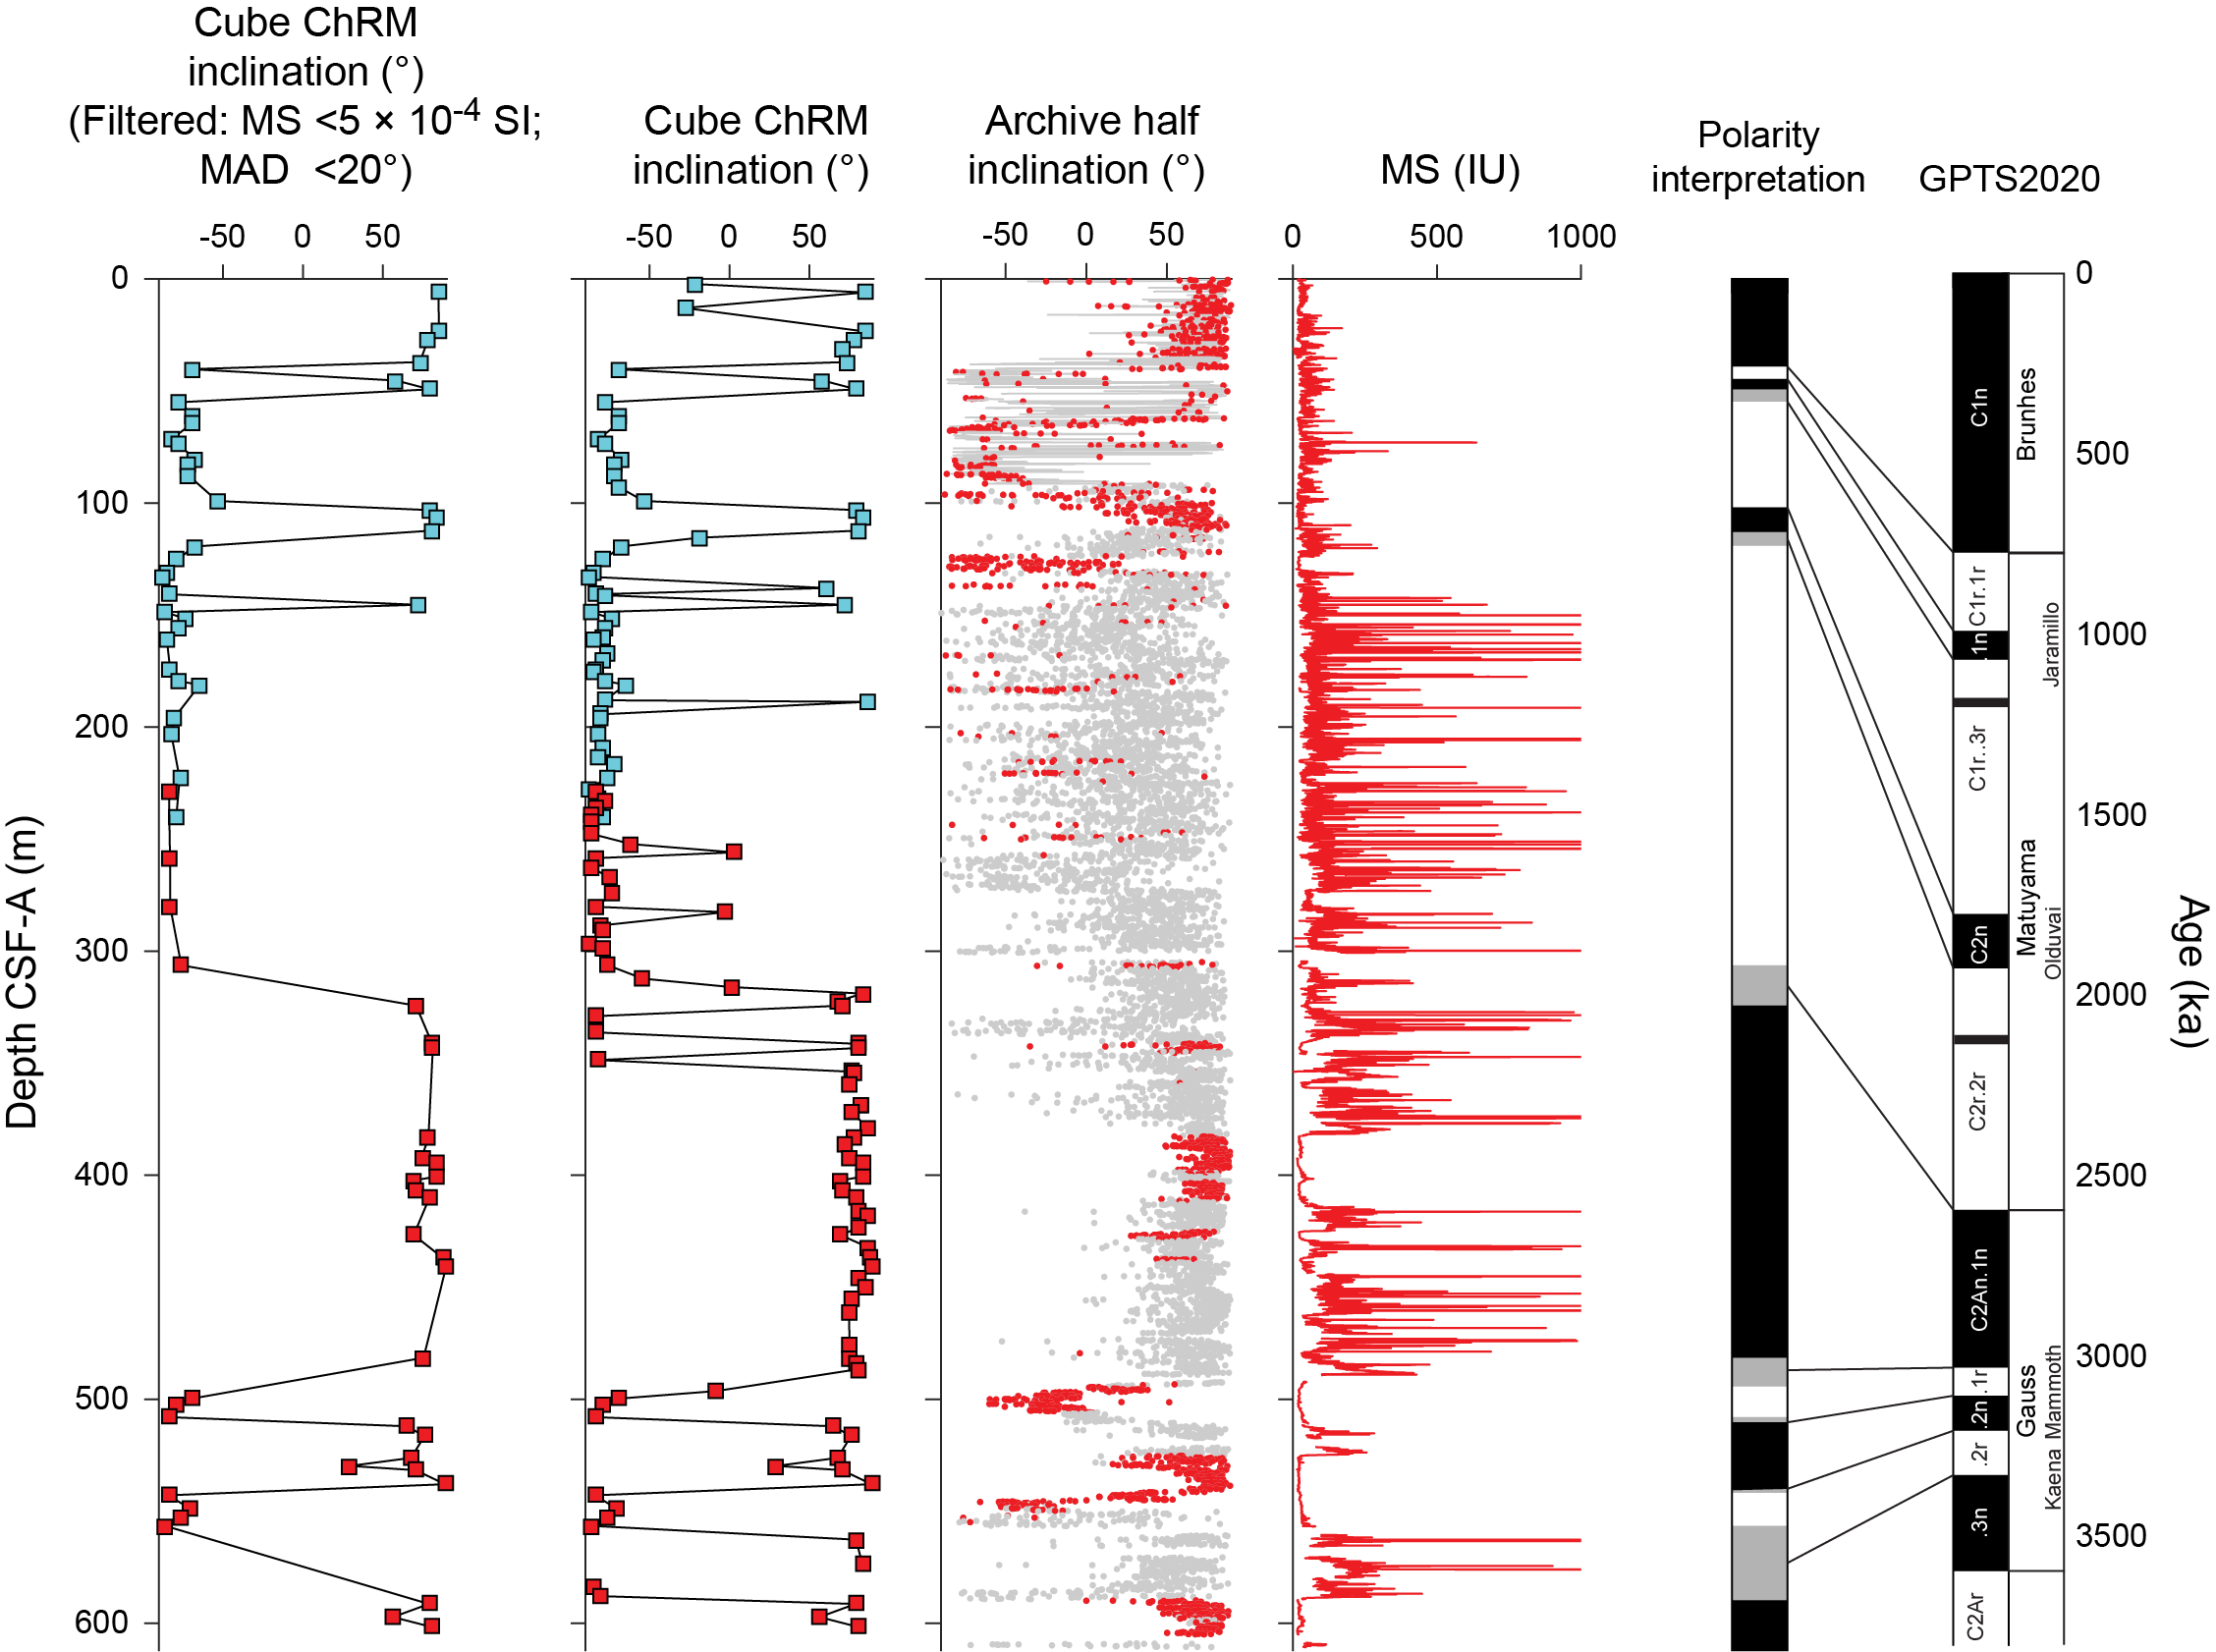
Figure F23. MS and paleomagnetic data.
Detailed AF demagnetization of the 138 discrete cube samples indicates a range of demagnetization behavior (Figure F24). Characteristic remanent magnetizations (ChRMs) were isolated using principal component analysis, and the maximum angular deviation parameter (Kirschvink, 1980) was used to assess how well the magnetization was defined. We could determine a ChRM inclination in all but two samples; however, seven of these samples had near-horizontal directions that were likely a result of coring disturbance, sampling issues, or multicomponent magnetization and could not be used to determine polarity. Of the samples with ChRM inclinations greater than ±45°, 124 samples had maximum angular deviation values less than 20°, which we consider sufficiently defined to resolve polarity. Examples of AF demagnetization behavior are presented in Figure F24. They include well-defined normal magnetizations, reverse magnetizations with strong VIRM drill string overprints that can typically be removed by 25 mT in XCB cores, noisy data for weakly magnetized samples, and acquisition of remanence at higher AF steps that may be the result of a gyroremanent magnetization or spurious remanence acquisition related to a nonzero field in the AF chamber.
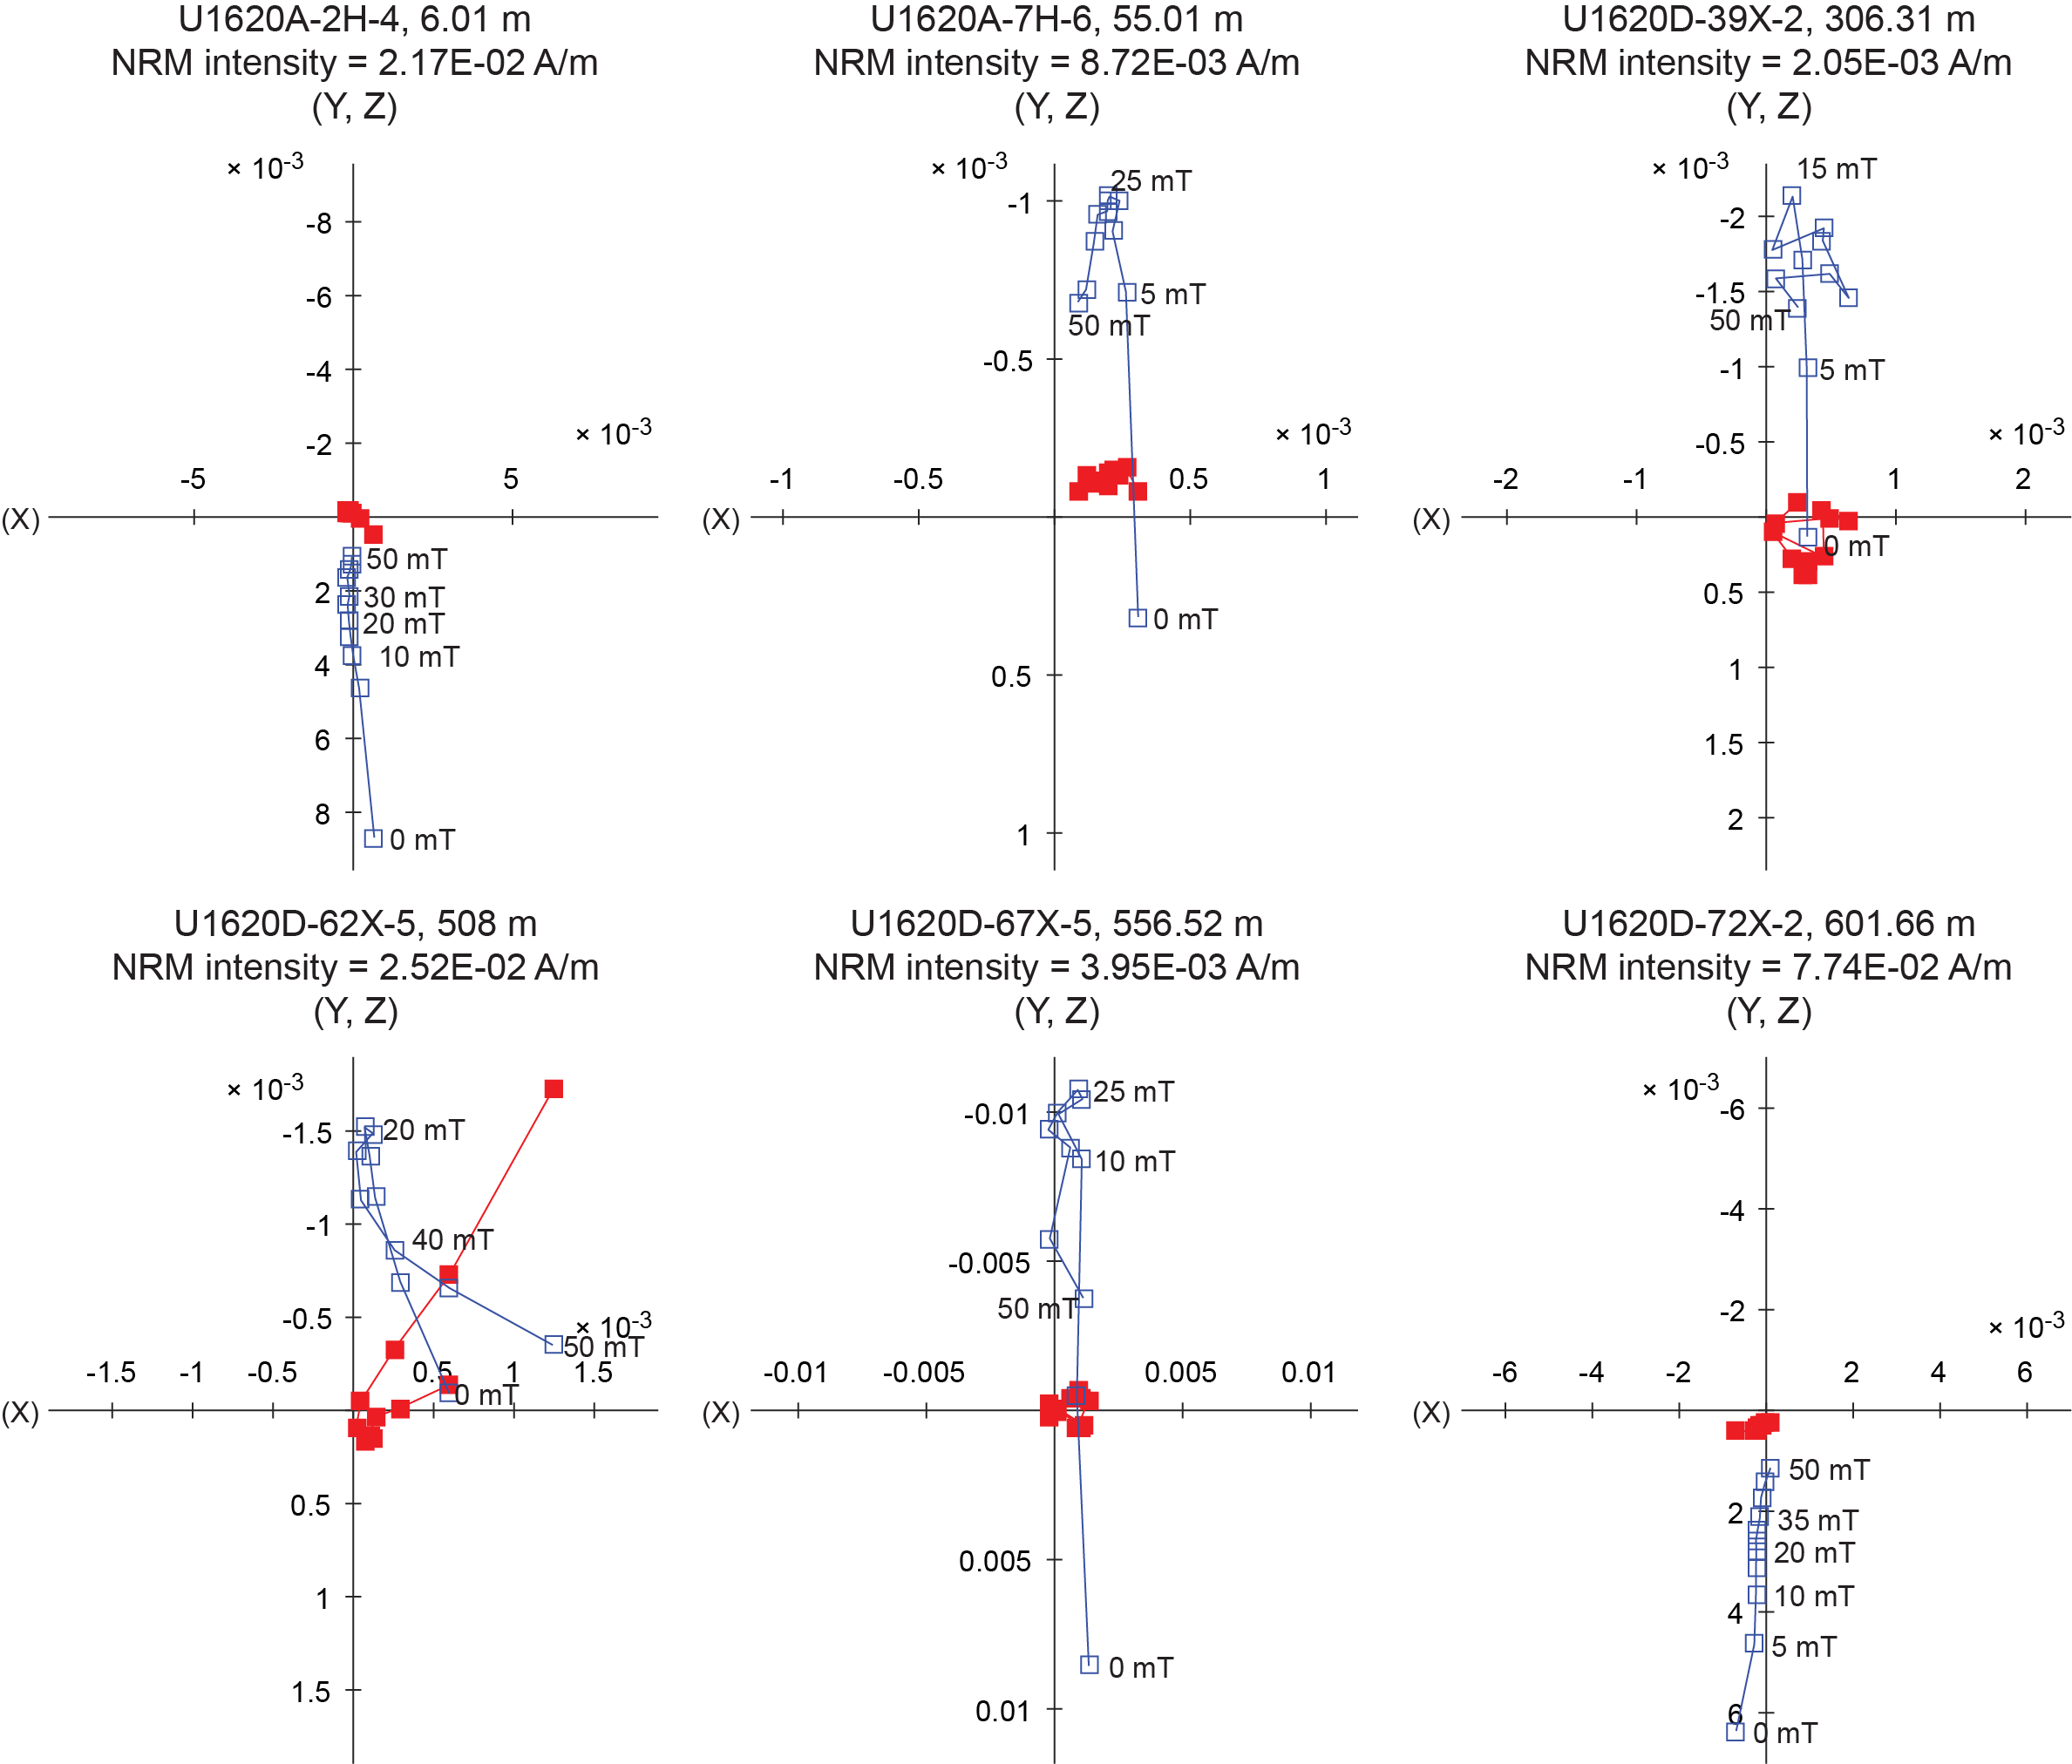
Figure F24. Variability of demagnetization.
5.3. Magnetic stratigraphy
Because of the similarity of magnetic properties between Site U1620 and Sites U1618 and U1619 and clear evidence for authigenic greigite at all three sites (see Paleomagnetism in the Site U1618 chapter [Lucchi et al., 2026b] and Paleomagnetism in the Site U1619 chapter [St. John et al., 2026]), we recognize the potential for late-forming chemical remanent magnetizations (CRMs) and thus interpret Site U1620 paleomagnetic data cautiously. However, also like Sites U1618 and U1619, shipboard analysis indicates great potential for future assessment and refinement of the magnetic stratigraphy with additional sampling and detailed study of Site U1620 remanence carriers. To guide our magnetostratigraphic interpretation, we began by locating polarity boundaries between our discrete cube samples and then further refining the top and bottom depth range using archive-half data if possible (Figure F23; Table T5).
The base of Chron C1n (Matuyama–Brunhes reversal; 773 ka) is well defined in APC-cored archive-half data at Site U1620. It was directly observed in Cores 403-U1620C-5H (39.87 mbsf) and 403-U1620D-5H (40.12 mbsf), and it is likely in a nonrecovered interval between Cores 403-U1620A-5H and 6H. The top of Chron C1r.1n (Upper Jaramillo; 990 ka) is also well defined in APC-cored archive-half data and found in Cores 6H (44.67 mbsf), 403-U1620C-5H (44.53 mbsf), and 403-U1620D-6H (45.49 mbsf), with depth uncertainty on the order of 0.4 m between steep negative (reverse) and steep positive (normal) inclinations (Figure F22). The base of Chron C1r.1n (Lower Jaramillo; 1070 ka) is less well defined, as the data are fairly noisy at all three sites; however, two discrete samples bracket the transition in Core 403-U1620A-7H (49.23 and 55.01 mbsf), and archive-half data could be used to refine the position to between 49.26 and 54.7 mbsf in Core 7H, around 51.63 mbsf in Core 403-U1620C-6H, and around 52.86 mbsf in Core 403-U1620D-6H (Table T5).
The top of Chron C2n (Upper Olduvai; 1775 ka) is well captured in Core 403-U1620A-12H between 100.7 and 103.1 mbsf and is likely in a nonrecovered interval between Cores 403-U1620C-12H and 13H (between 99.35 and 100.23 mbsf). The transition is not clear in equivalent XCB-cored intervals in Hole U1620D, and we recommend using the boundary where it is best constrained in Hole U1620A. Similarly, the base of Chron C2n (Lower Olduvai; 1925 ka) is best constrained in Hole U1620A in an APC-cored interval by cube samples, supplemented by archive-half data, in Cores 13H and 14H between 112.9 and 119.0 mbsf. The boundary is not well constrained in equivalent XCB-cored intervals in Holes U1620C and U1620D, and we recommend using the constraint from Hole U1620A (Figure F22; Table T5).
In our magnetic polarity stratigraphy interpretation below 140 mbsf, where greigite nodules become more frequent and MS peaks often are higher than 500 IU, we avoid data from high-MS intervals, assuming that these intervals have the potential to contain a significant amount of authigenic greigite that likely holds a late-forming CRM. Based on observations at Site U1619 (see Paleomagnetism in the Site U1619 chapter [St. John et al., 2026]), we filter the archive-half data for intervals with MS less than 30 IU and cube samples for MS less than 5 × 10⁻⁴ SI (Figure F23). This provides a clear polarity pattern in which the Hole U1620D cube samples are reverse between 228.9 and 306.3 mbsf and largely normal below this depth with two brief intervals of reverse polarity around 500 and 550 mbsf. We interpret the polarity stratigraphy based on this pattern but recommend future work to provide additional assessment of the magnetic remanence carriers, evaluation of the fidelity of the paleomagnetic signal, and refinement of the polarity boundaries.
The top of Subchron C2An.1n (Gauss/Matuyama boundary; 2595 ka) is best defined by cube samples in Cores 403-U1620D-39X and 41X between 306.31 and 315.315 mbsf, with archive section data showing a general transition to more stable normal polarity but with too much noise to provide any additional constraint. Subchron C2An.1r (Kaena; 3032–3110 ka) is bound by polarity boundaries at 481.48–487.89 mbsf (between Cores 59X and 61X) and 508.00–510.03 mbsf (between Cores 62X and 63X). This interval of reverse polarity is also clearly defined in archive section half data from an interval with MS less than 30 IU, allowing for refinement of the depth ranges beyond the cube samples (Table T5). Subchron C2An.2r (Mammoth; 3207–3330 ka) is bound by polarity boundaries at 540.6–541.8 mbsf (between Cores 65X and 66X) and 556.52–589.7 mbsf (between Cores 67X and 71X). The upper boundary appears to be well captured in a low-MS interval, allowing for refinement of the boundary using archive section half data. The lower boundary had much greater uncertainty due to a high-MS interval between around 556.52 and 589.7 mbsf that has the potential to contain a significant amount of greigite nodules (Figure F23). The lowest interpretable data around 605 mbsf near the base of recovery at Hole U1620D is normal and likely constrains the Site U1620 record as younger than the base of Subchron C2An.3n (Gauss/Gilbert boundary; 3596 ka).
The magnetic stratigraphy interpretation implies a nonlinear long-term sedimentation rate pattern for Site U1620 with an expanded Piacenzian and Gelasian sequence (Figure F25). For the last 1 My, long-term sedimentation rates are on the order of ~5 cm/ky with slightly higher sedimentation rates ~7 cm/ky between 1 and 2 Ma. Older than ~2 Ma, sedimentation rates are 5–7 times higher, on the order of ~36 cm/ky. This age model places Seismic Reflector R7 (Figure F2) around or above this change in accumulation rate, around the depth of Subchron C2n (Olduvai; 1775–1925 ka).
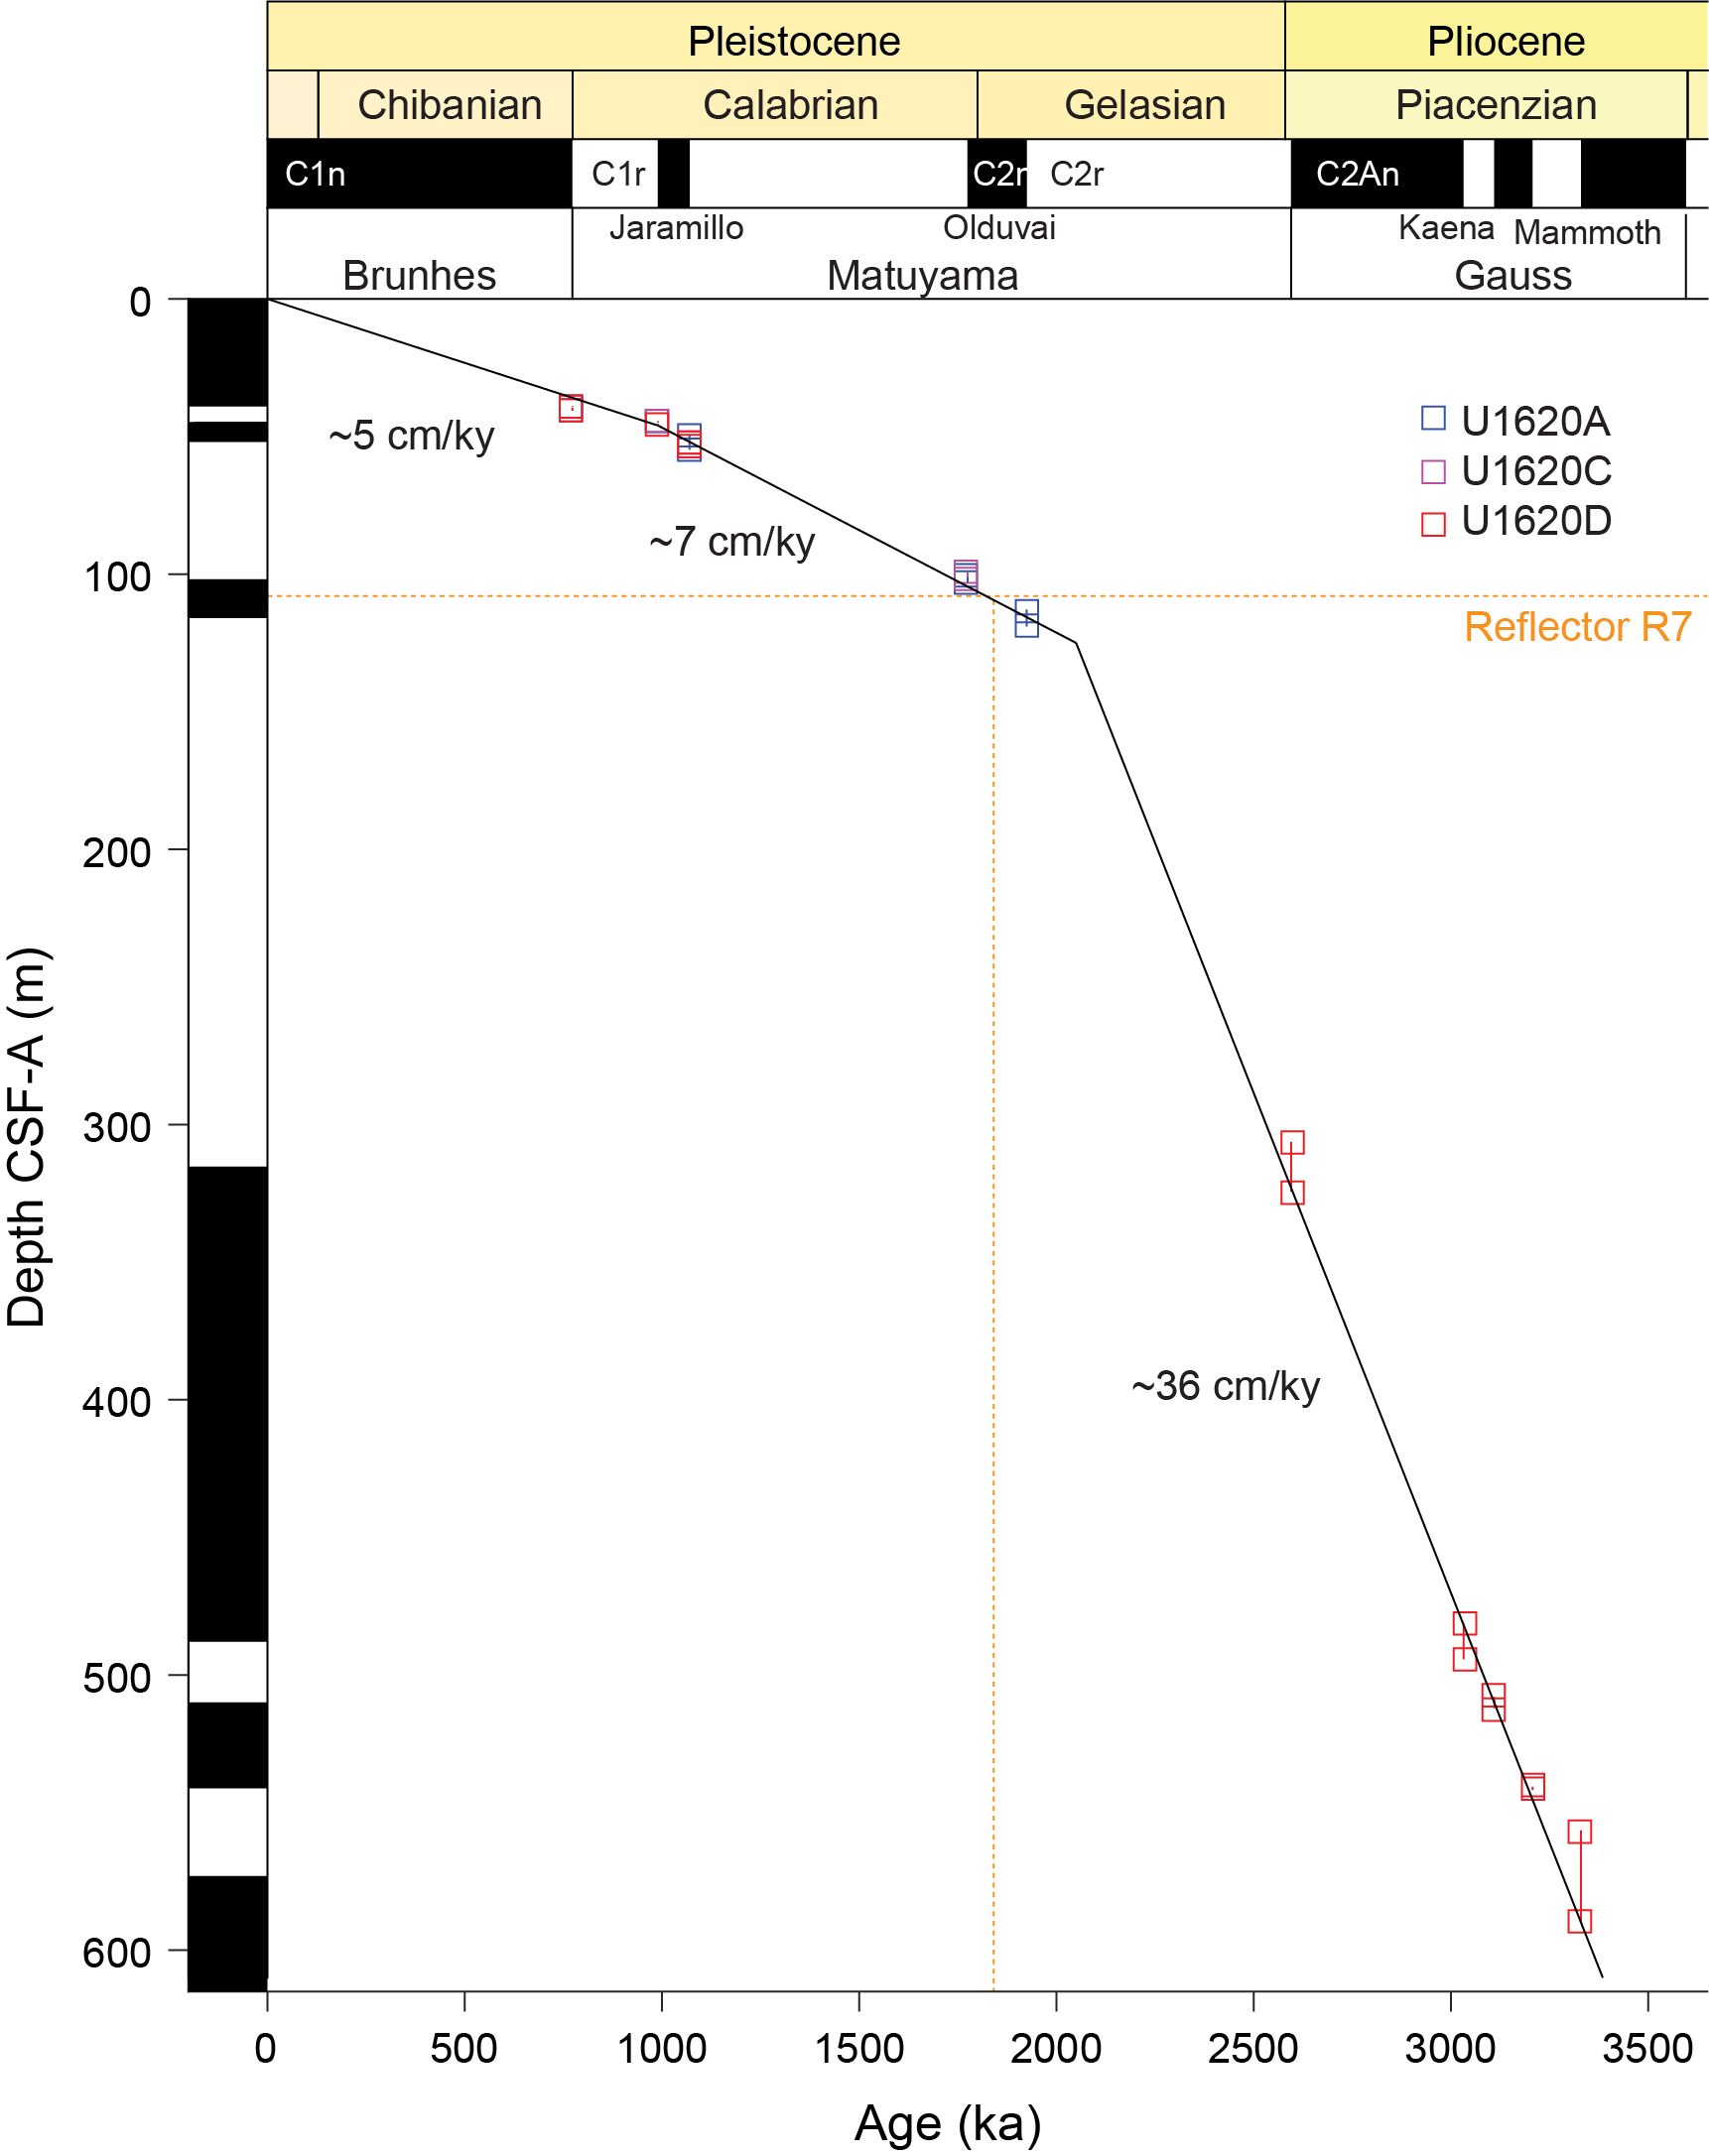
Figure F25. Age-depth relationship of interpreted polarity zones.
6. Physical properties
The physical properties measured shipboard for Site U1620 included nondestructive whole-round measurements using the Special Task Multisensor Logger (STMSL), Whole-Round Multisensor Logger (WRMSL), and Natural Gamma Radiation Logger (NGRL), as well as thermal conductivity and discrete P-wave velocity measurements on working-half sections after cores were split. Gamma ray attenuation (GRA) bulk density and MS were measured on the STMSL immediately after recovery and then on the WRMSL after thermally equilibrating for a minimum of 4 h. Cores 403-U1620D-2H through 4H and 6H–8H were excluded from GRA density measurements due to their selection for sedimentary ancient DNA (sedaDNA) sampling and the need to avoid exposure to the radioactive cesium source. Physical property data from the STMSL were used for initial hole-to-hole stratigraphic correlation (see Stratigraphic correlation) to aid in near-real-time drilling and sampling (e.g., sedaDNA and biostratigraphic smear slide sampling) decisions, but they are not further evaluated and reported here. Further use of STMSL data is discouraged because WRMSL and Section Half Multisensor Logger (SHMSL) data, collected after allowing for thermal equilibration, are available in the Laboratory Information Management System (LIMS) database. P-wave velocity was measured on the WRMSL for all core sections, aside from the three discrete 10 cm interval whole-round samples taken from the bottom of Sections 37X-4, 52X-CC, and 68X-CC for anelastic strain recovery (ASR) analysis. Results from whole-round scans are compiled in Figure F26. Discrete P-wave measurements were made with the Section Half Measurement Gantry (SHMG) on the uppermost cores from Hole U1620A (Sections 1H-1 and 2H-7). However, below these cores (~10 mbsf), SHMG measurements ceased due to poor data quality, likely related to higher gas content and coarser material. Thermal conductivity measurements were made for all the cores recovered from Hole U1620A and from Hole U1620D cores below the maximum depth in Hole U1620A using a puck probe on the split face of working-half sections. Whole-round physical property data were used for hole-to-hole stratigraphic correlation and splicing (see Stratigraphic correlation).
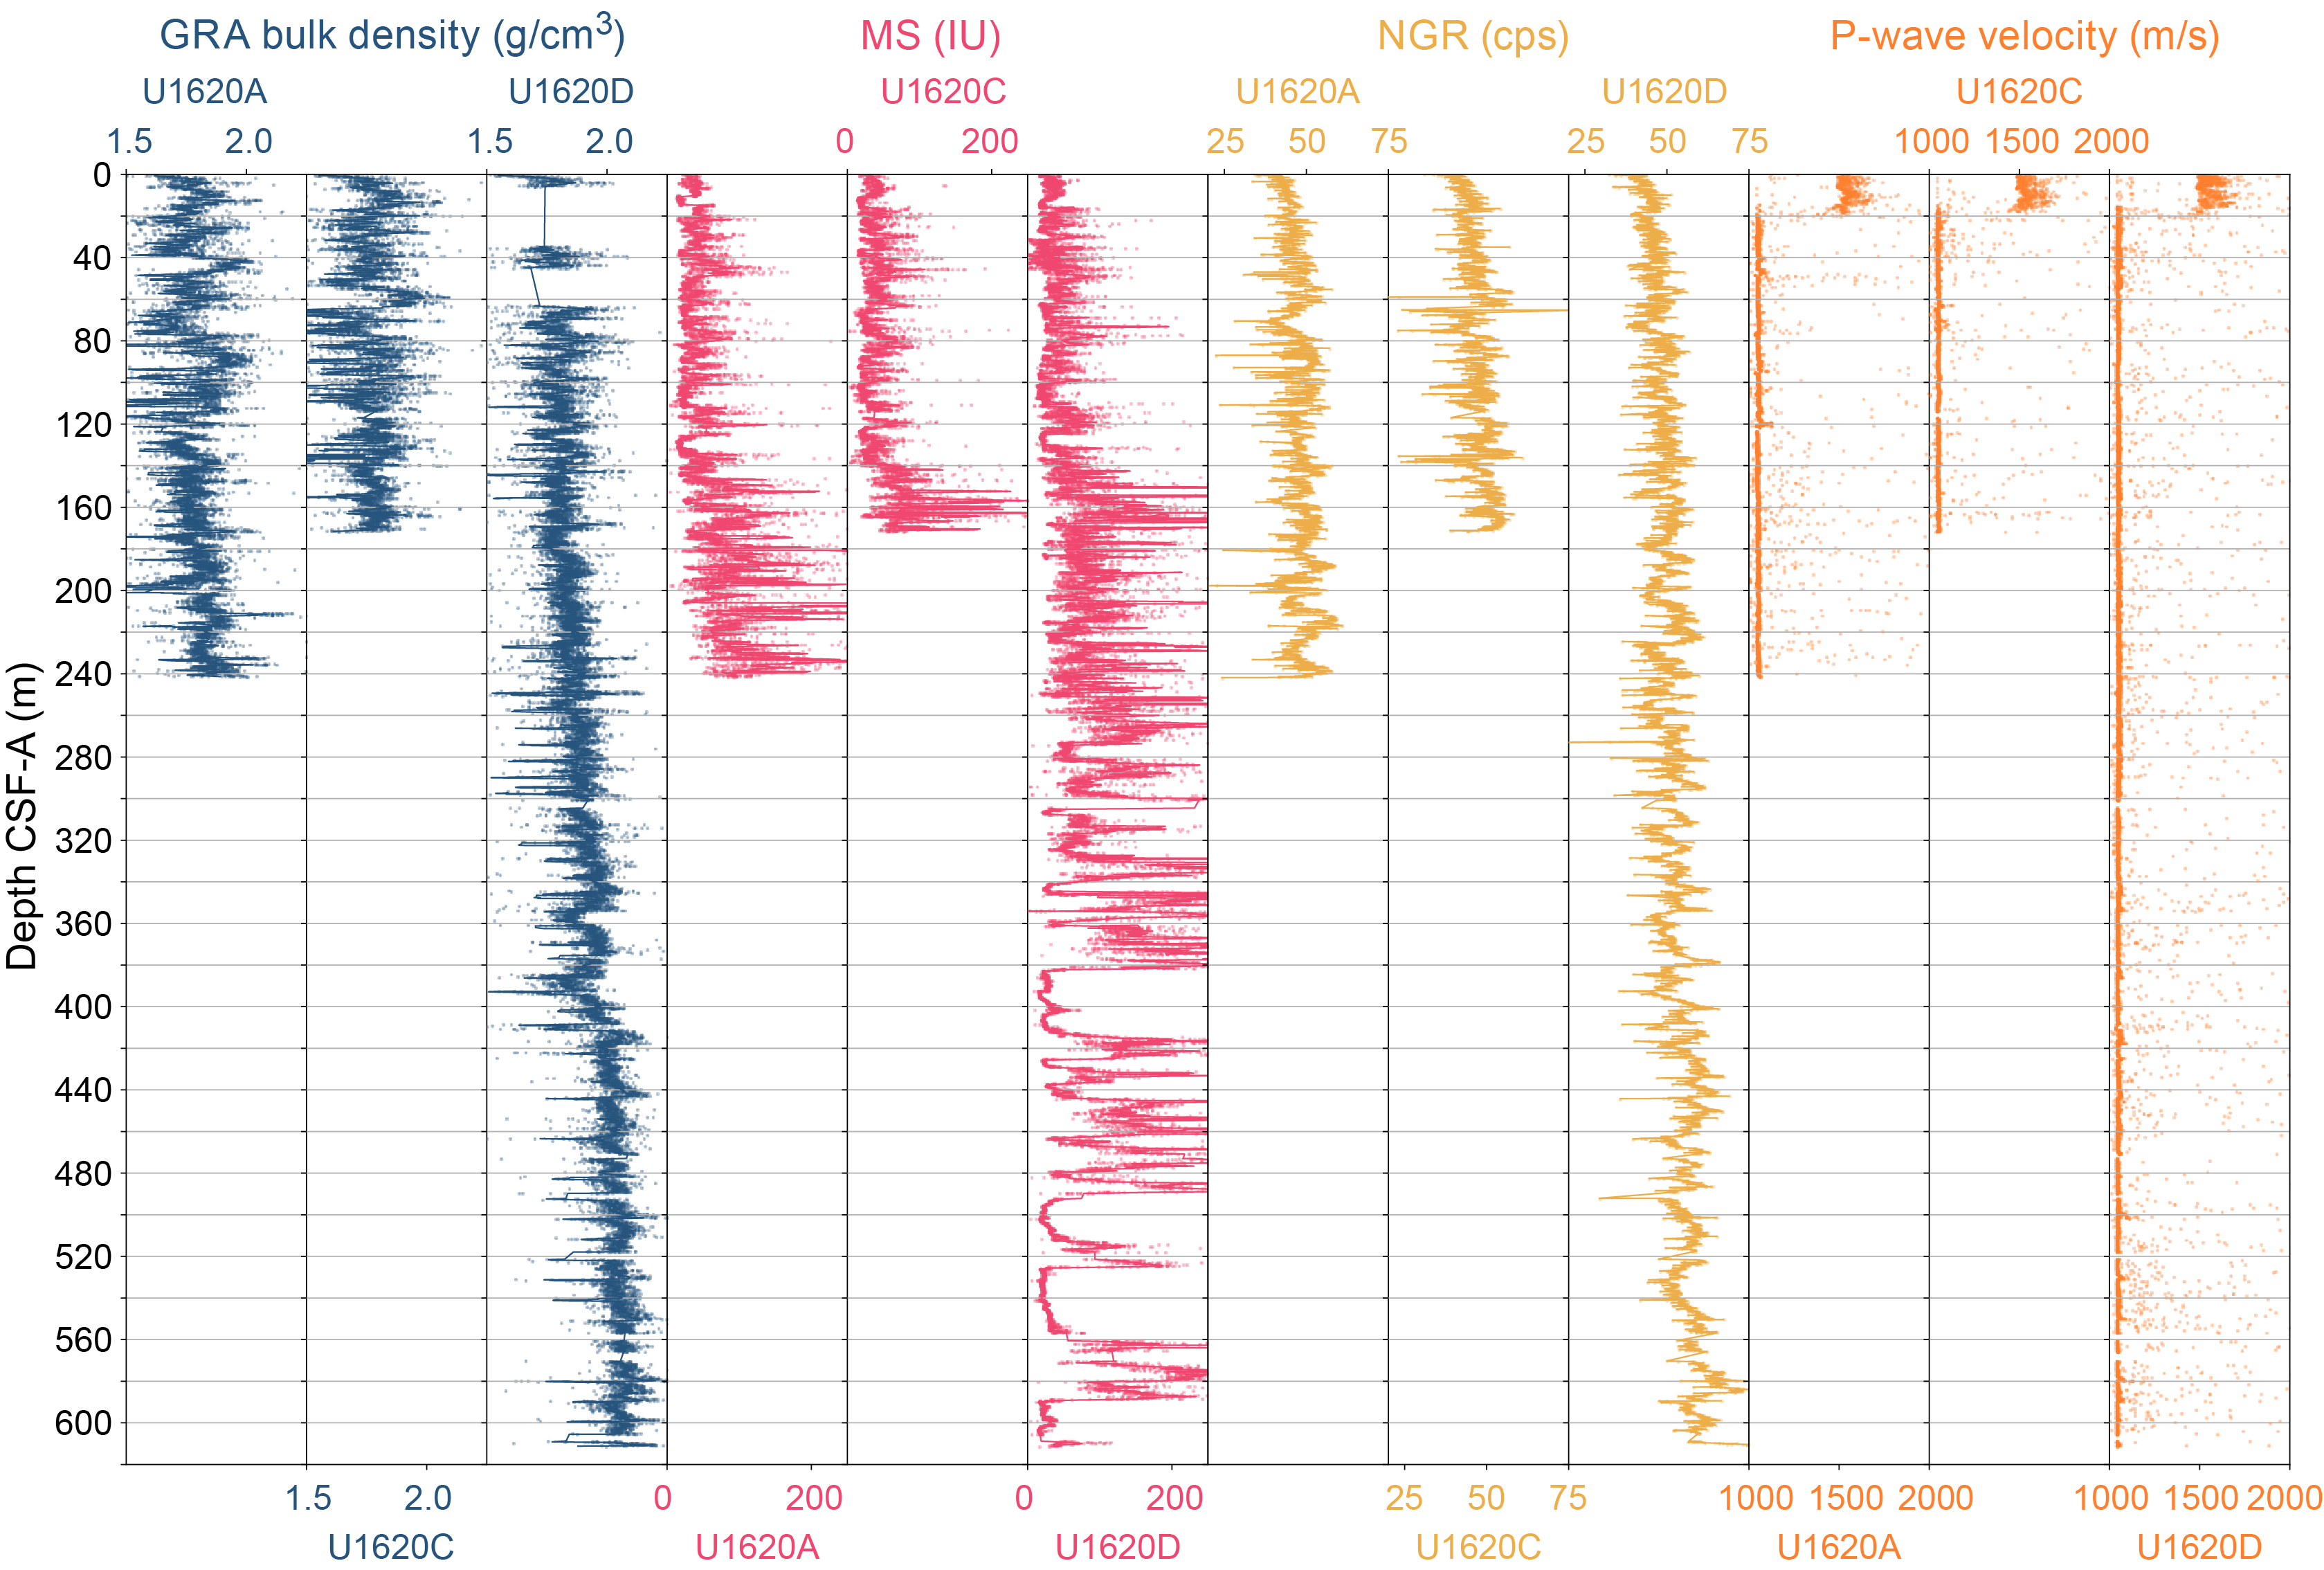
Figure F26. Physical properties, Holes U1620A, U1620C, and U1620D.
Working-half sections of all cores from Hole U1620A and deeper cores from Hole U1620D were sampled for moisture and density (MAD) analyses. Intervals with minimal coring disturbances were targeted. Archive halves were measured with the SHMSL for MSP and color reflectance and X-ray scanned using the X-Ray Linescan Logger (XSCAN) (see Lithostratigraphy). Hole U1620B recovered only a single core catcher; it is excluded from most of the discussion.
6.1. Magnetic susceptibility
MS was measured both on whole-round sections using a pass-through loop sensor on the WRMSL track and on split archive-half sections using a point-source sensor on the SHMSL track. WRMSL measurements were made at 2.5 cm increments, and SHMSL resolution was 5 cm. WRMSL and SHMSL MS measurements yielded similar values and downhole variability (Figure F27). MS values range 0.71 to 7,521.26 IU for whole-round sections and 0 to 11,311.53 IU for archive-half sections. Overall, the average MS values are 90.78 IU for the WRMSL data and 100.84 IU for the SHMSL data (see Physical properties in the Expedition 403 methods chapter [Lucchi et al., 2026a] for details on instrument units).
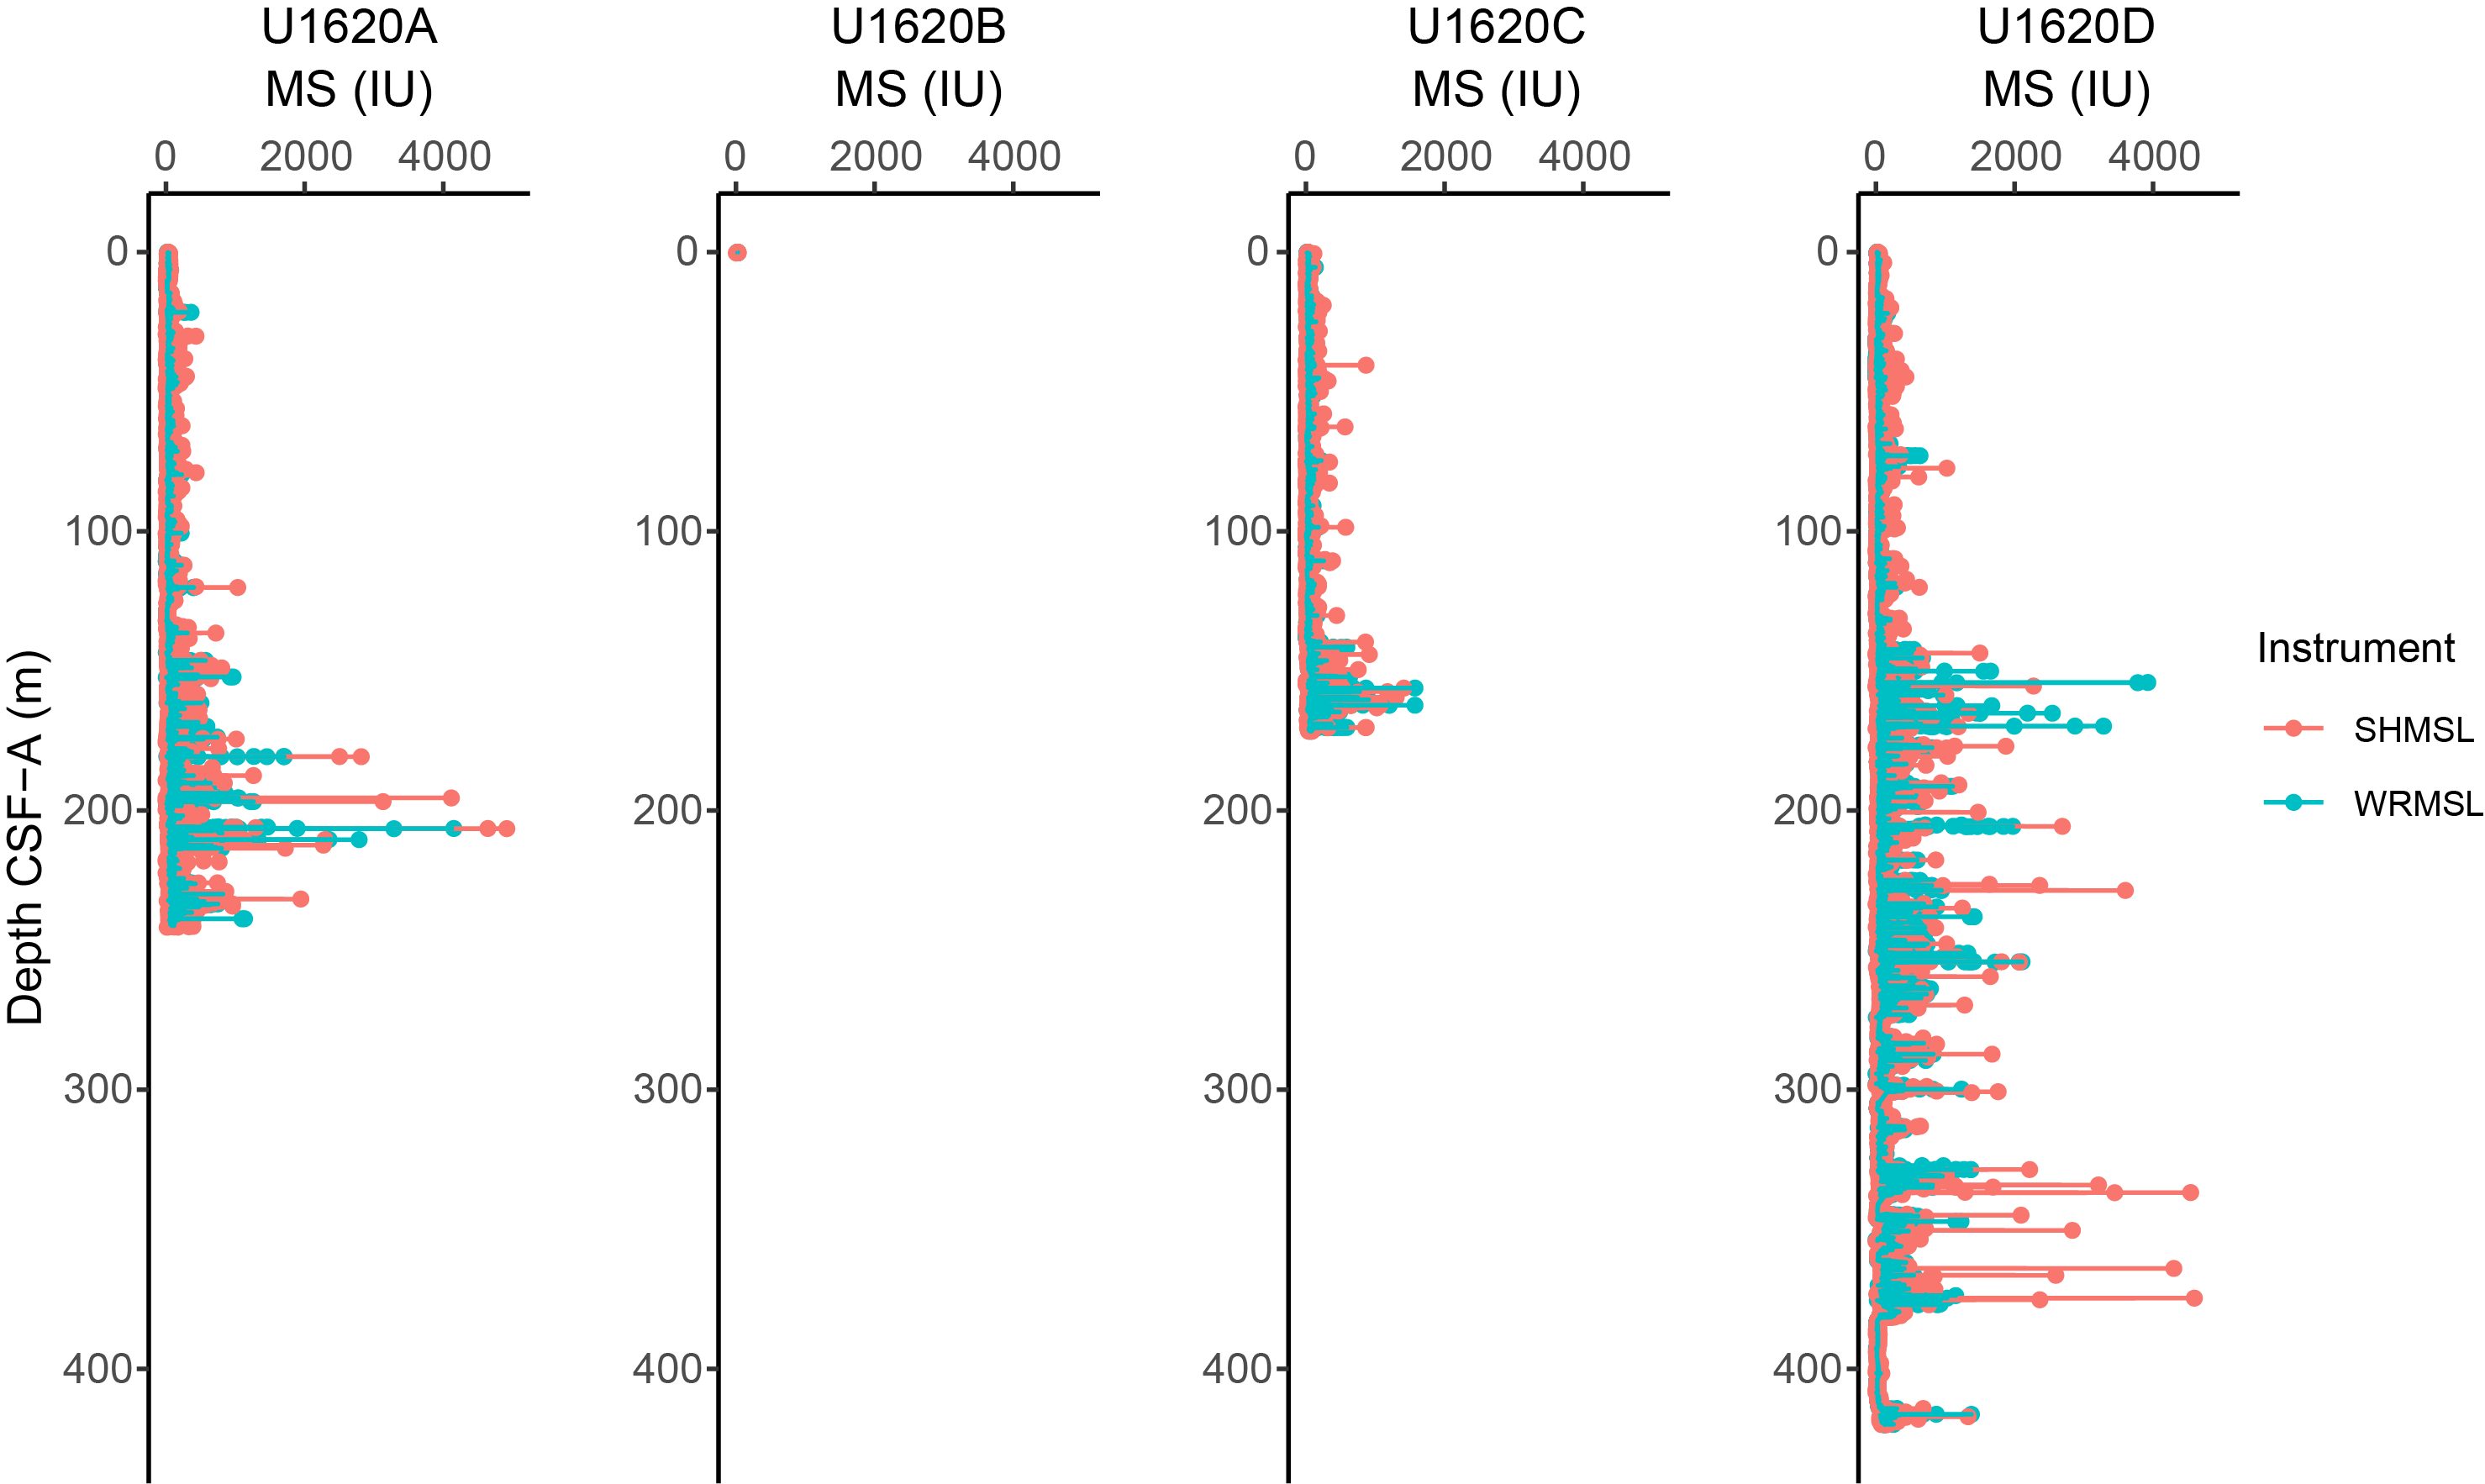
Figure F27. WRMSL and SHMSL MS.
From the seafloor to ~50 mbsf, MS values vary between ~2 and ~150 IU. Irregularly spaced peaks of higher magnitude MS start to appear in the record at ~50 mbsf and become more prevalent below ~150 mbsf to the base. The WRMSL-derived maxima reach 7521.26 IU, whereas the background is represented by MS modes of 23.64, 21.47, and 23.54 IU for Holes U1620A, U1620C, and U1620D, respectively. The large MS peaks are often associated with the occurrence of authigenic iron sulfide minerals (e.g., greigite identified in rock magnetic and XRD analyses) (see Lithostratigraphy, Geochemistry, and Paleomagnetism). MS co-varies with NGR and GRA bulk density from 0 to ~50 mbsf but not in deeper cores (Figure F28). The change in MS correlation with other physical properties occurs within Lithostratigraphic Subunit IB (see Lithostratigraphy).
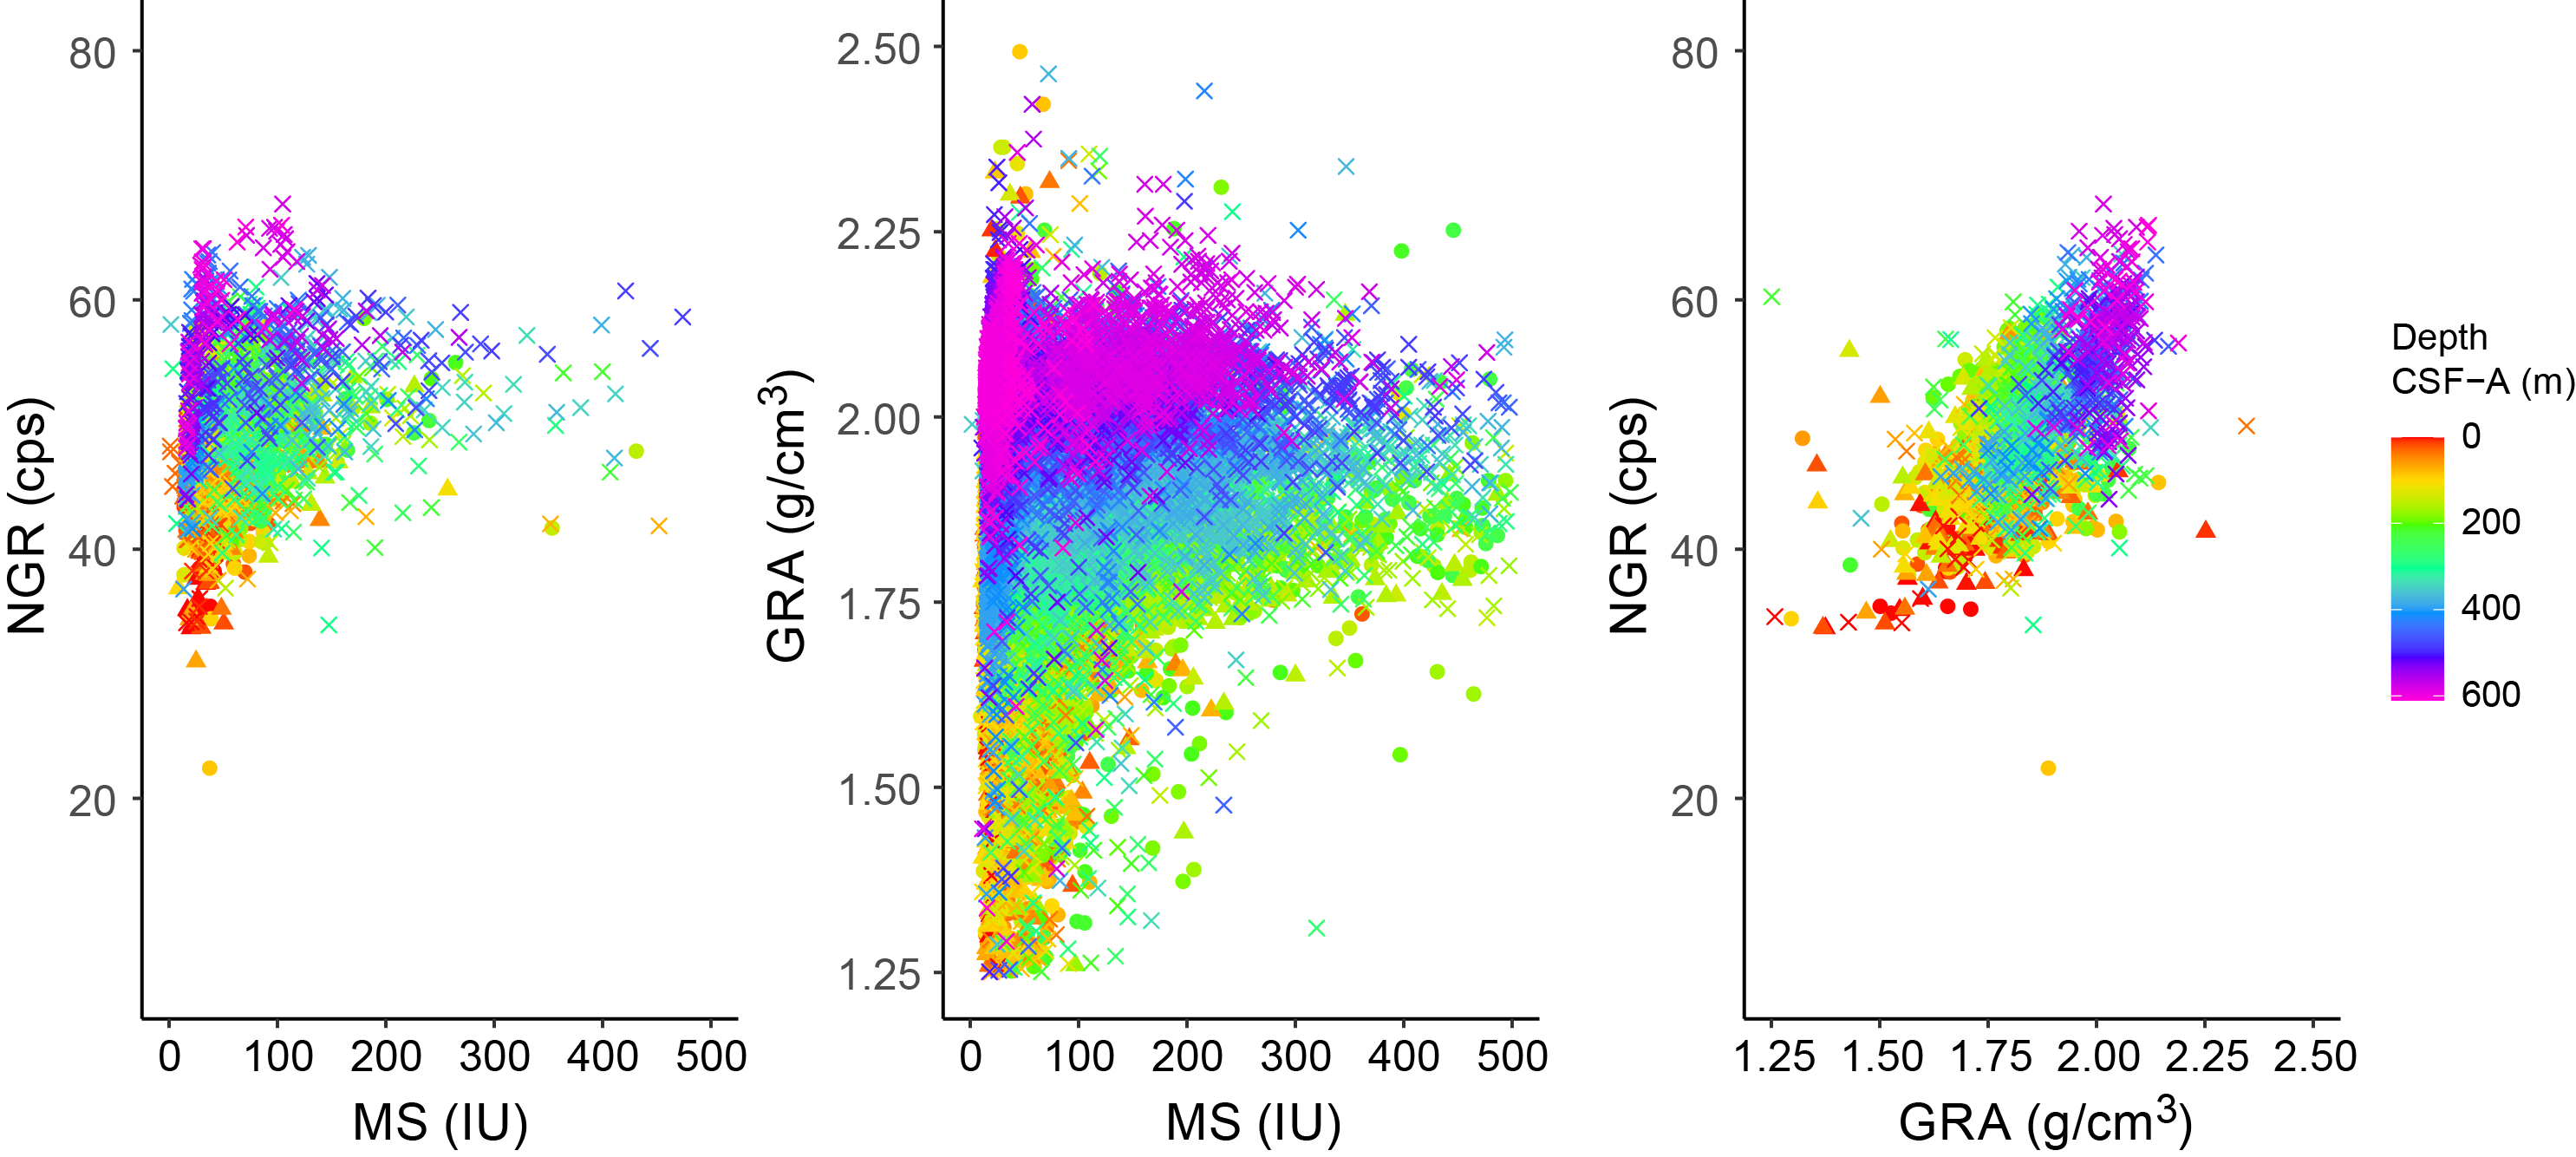
Figure F28. NGR, GRA bulk density, and MS.
6.2. Gamma ray attenuation bulk density
Except for the cores that were sampled for sedaDNA, every whole-round section was measured at 2.5 cm intervals using the GRA densitometer on the WRMSL. Excluding outliers related to voids or coring disturbances, measured GRA bulk density values range ~1.5 to ~2.25 g/cm3. A rapid GRA density increase from ~1.5 to ~1.8–1.9 g/cm3 occurs in the uppermost ~10 mbsf of the record. The overall GRA bulk density trend is toward higher values with increasing depth below seafloor, which is consistent with sediment compaction at depth. The bulk density record shows the most variability in the uppermost ~80 m, where it has the strongest positive linear correlation with MS. The positive linear GRA to MS relationship weakens from ~80 to ~200 mbsf and disappears at lower depths, likely due to authigenic minerals influencing MS (Figure F28). GRA density values demonstrate a positive linear correlation with NGR, although in the uppermost ~10 m GRA density values increase more rapidly compared to NGR values. Lowest densities occur in Cores 403-U1620D-8H to 10H, 44X, 45X, and 49X–51X between relative GRA density highs in layers above and below. GRA density highs occur in deeper sections of Hole U1620D with some regularity (Cores 52X, 55X, 62X, 66X, and 70X) and appear to be associated with cyclical changes observed in Lithostratigraphic Unit II (see Lithostratigraphy).
6.3. Natural gamma radiation
NGR was measured on all whole-round core sections at 10 cm intervals. Measured NGR values range ~12–80 counts/s at Site U1620 and average 47 counts/s for Holes U1620A and U1620C and 52 counts/s for Hole U1620D. The overall NGR trend is toward higher values with increasing depth below seafloor. Generally, NGR mirrors GRA bulk density trends downcore, except in the uppermost 10 m where the GRA bulk density experiences a more rapid change compared to NGR (Figure F28). NGR variability appears cyclical and is associated with lithologic changes. NGR lows of ~30 counts/s are found in Core 403-U1620A-9H (Lithostratigraphic Subunit IA) and Core 30X (Subunit IB). The highest NGR values of ~75 counts/s are found in Core 403-U1620D-70X (Unit II) (see Lithostratigraphy).
6.4. P-wave velocity
Whole-round sections were measured for compressional P-wave velocity on the WRMSL at a resolution of 2.5 cm for all core sections at Site U1620. Values range from ~1250 m/s at the seafloor to ~1750 m/s at 15 mbsf. Below ~15 mbsf, the signal becomes dominated by noise. Persistent issues with void spaces and gas expansion, which required reinforcing the core liners, along with the switch to XCB cores led to variability in liner thickness and core diameter. This compromised P-wave velocity calculations from WRMSL measurements (see Physical properties in the Expedition 403 methods chapter [Lucchi et al., 2026a]), and P-wave velocity data below ~15 mbsf should not be used.
Discrete P-wave velocity measurements were made using the SHMG (see Physical properties in the Expedition 403 methods chapter [Lucchi et al., 2026a]) in intervals that excluded excessive coring disturbances, voids, cracks, or large clasts. Measurements were made for Sections 403-U1620A-1H-1 and 2H-7 using the x-caliper. Because of noise in the signal, P-wave velocity waveforms were manually selected. Values range from ~1450 m/s at the seafloor to ~1520 m/s at ~15 mbsf. Below ~15 mbsf, however, P-wave measurements on the SHMG were abandoned due to increasing noise and eventual lack of a detectable signal. We suspect the abundance of large clasts and authigenic mineral formations (e.g., greigite nodules and authigenic carbonates) as well as free gas trapped in isolated pore spaces of the deeper, more consolidated sediments contribute to signal depletion below ~15 mbsf.
6.5. Moisture and density
MAD analyses were conducted using 132 discrete samples collected from the working section halves of Cores 403-U1620A-1H-31X and 403-U1620D-29X-73X (see Physical properties in the Expedition 403 methods chapter [Lucchi et al., 2026a]). Several parameters, including porosity, water content, and bulk density, were calculated using the measurements of wet mass, dry mass, and volume from the samples. MAD bulk density increases downcore from ~1.6 g/cm3 at the sediment surface to ~1.9 g/cm3 at ~25 mbsf, in parallel with decreasing porosity and water content, from 63% to 45% and from 39% to 31%, respectively. As such, this trend of bulk density increase is likely related to sediment compaction. From 60 mbsf to the termination of Hole U1620A, MAD bulk density ranges ~1.7 to ~2 g/cm3 (average = ~1.9 g/cm3). From 230 mbsf to the termination of Hole U1620D, MAD bulk density ranges ~1.9 to ~2.2 g/cm3. Overall, MAD bulk density values correspond well to GRA bulk density trends downcore (Figure F29). The highest MAD bulk density values of ~2.2 g/cm3 are found in Cores 403-U1620D-72X and 73X in Lithostratigraphic Unit II (see Lithostratigraphy). Water content, porosity, and void ratio co-vary downcore and are anti-correlated with MAD bulk density (Figure F30). Below ~25 mbsf, water content generally decreases downcore from ~24% to 23%, and porosity decreases from ~55% to ~45%. A greater change in porosity, compared to water content, may indicate the pore space was filled with gas rather than water.
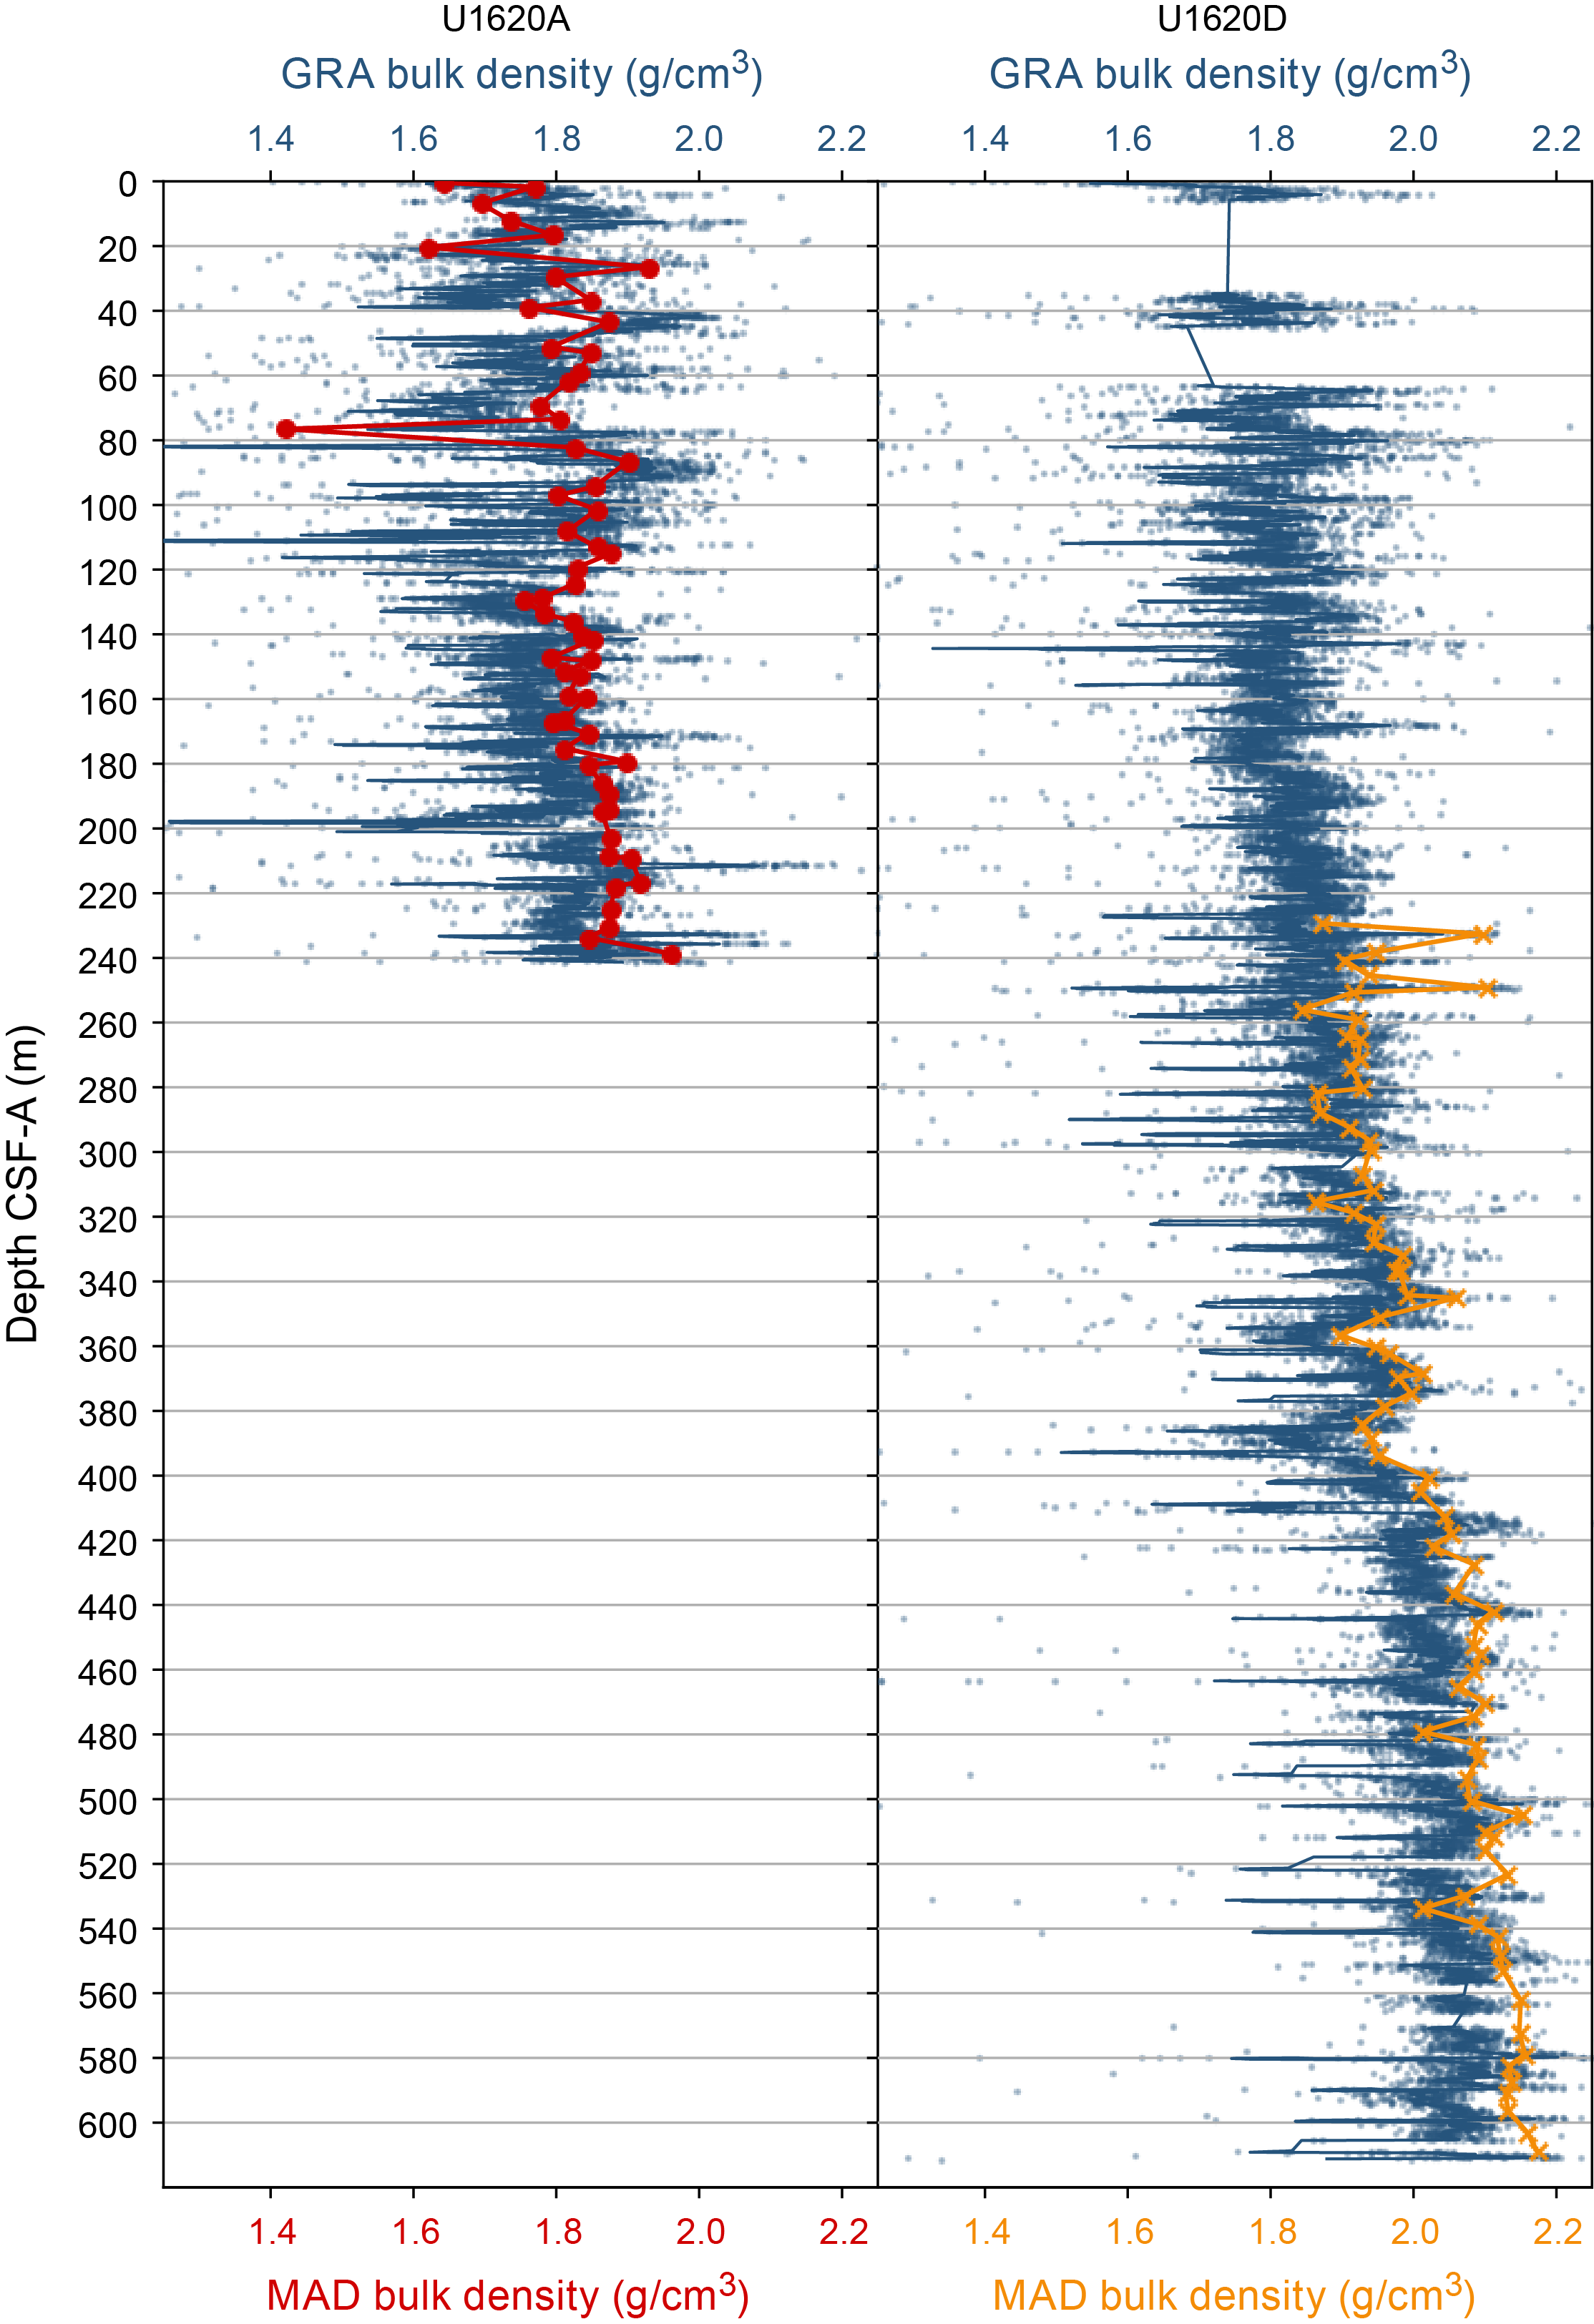
Figure F29. GRA bulk density and MAD.
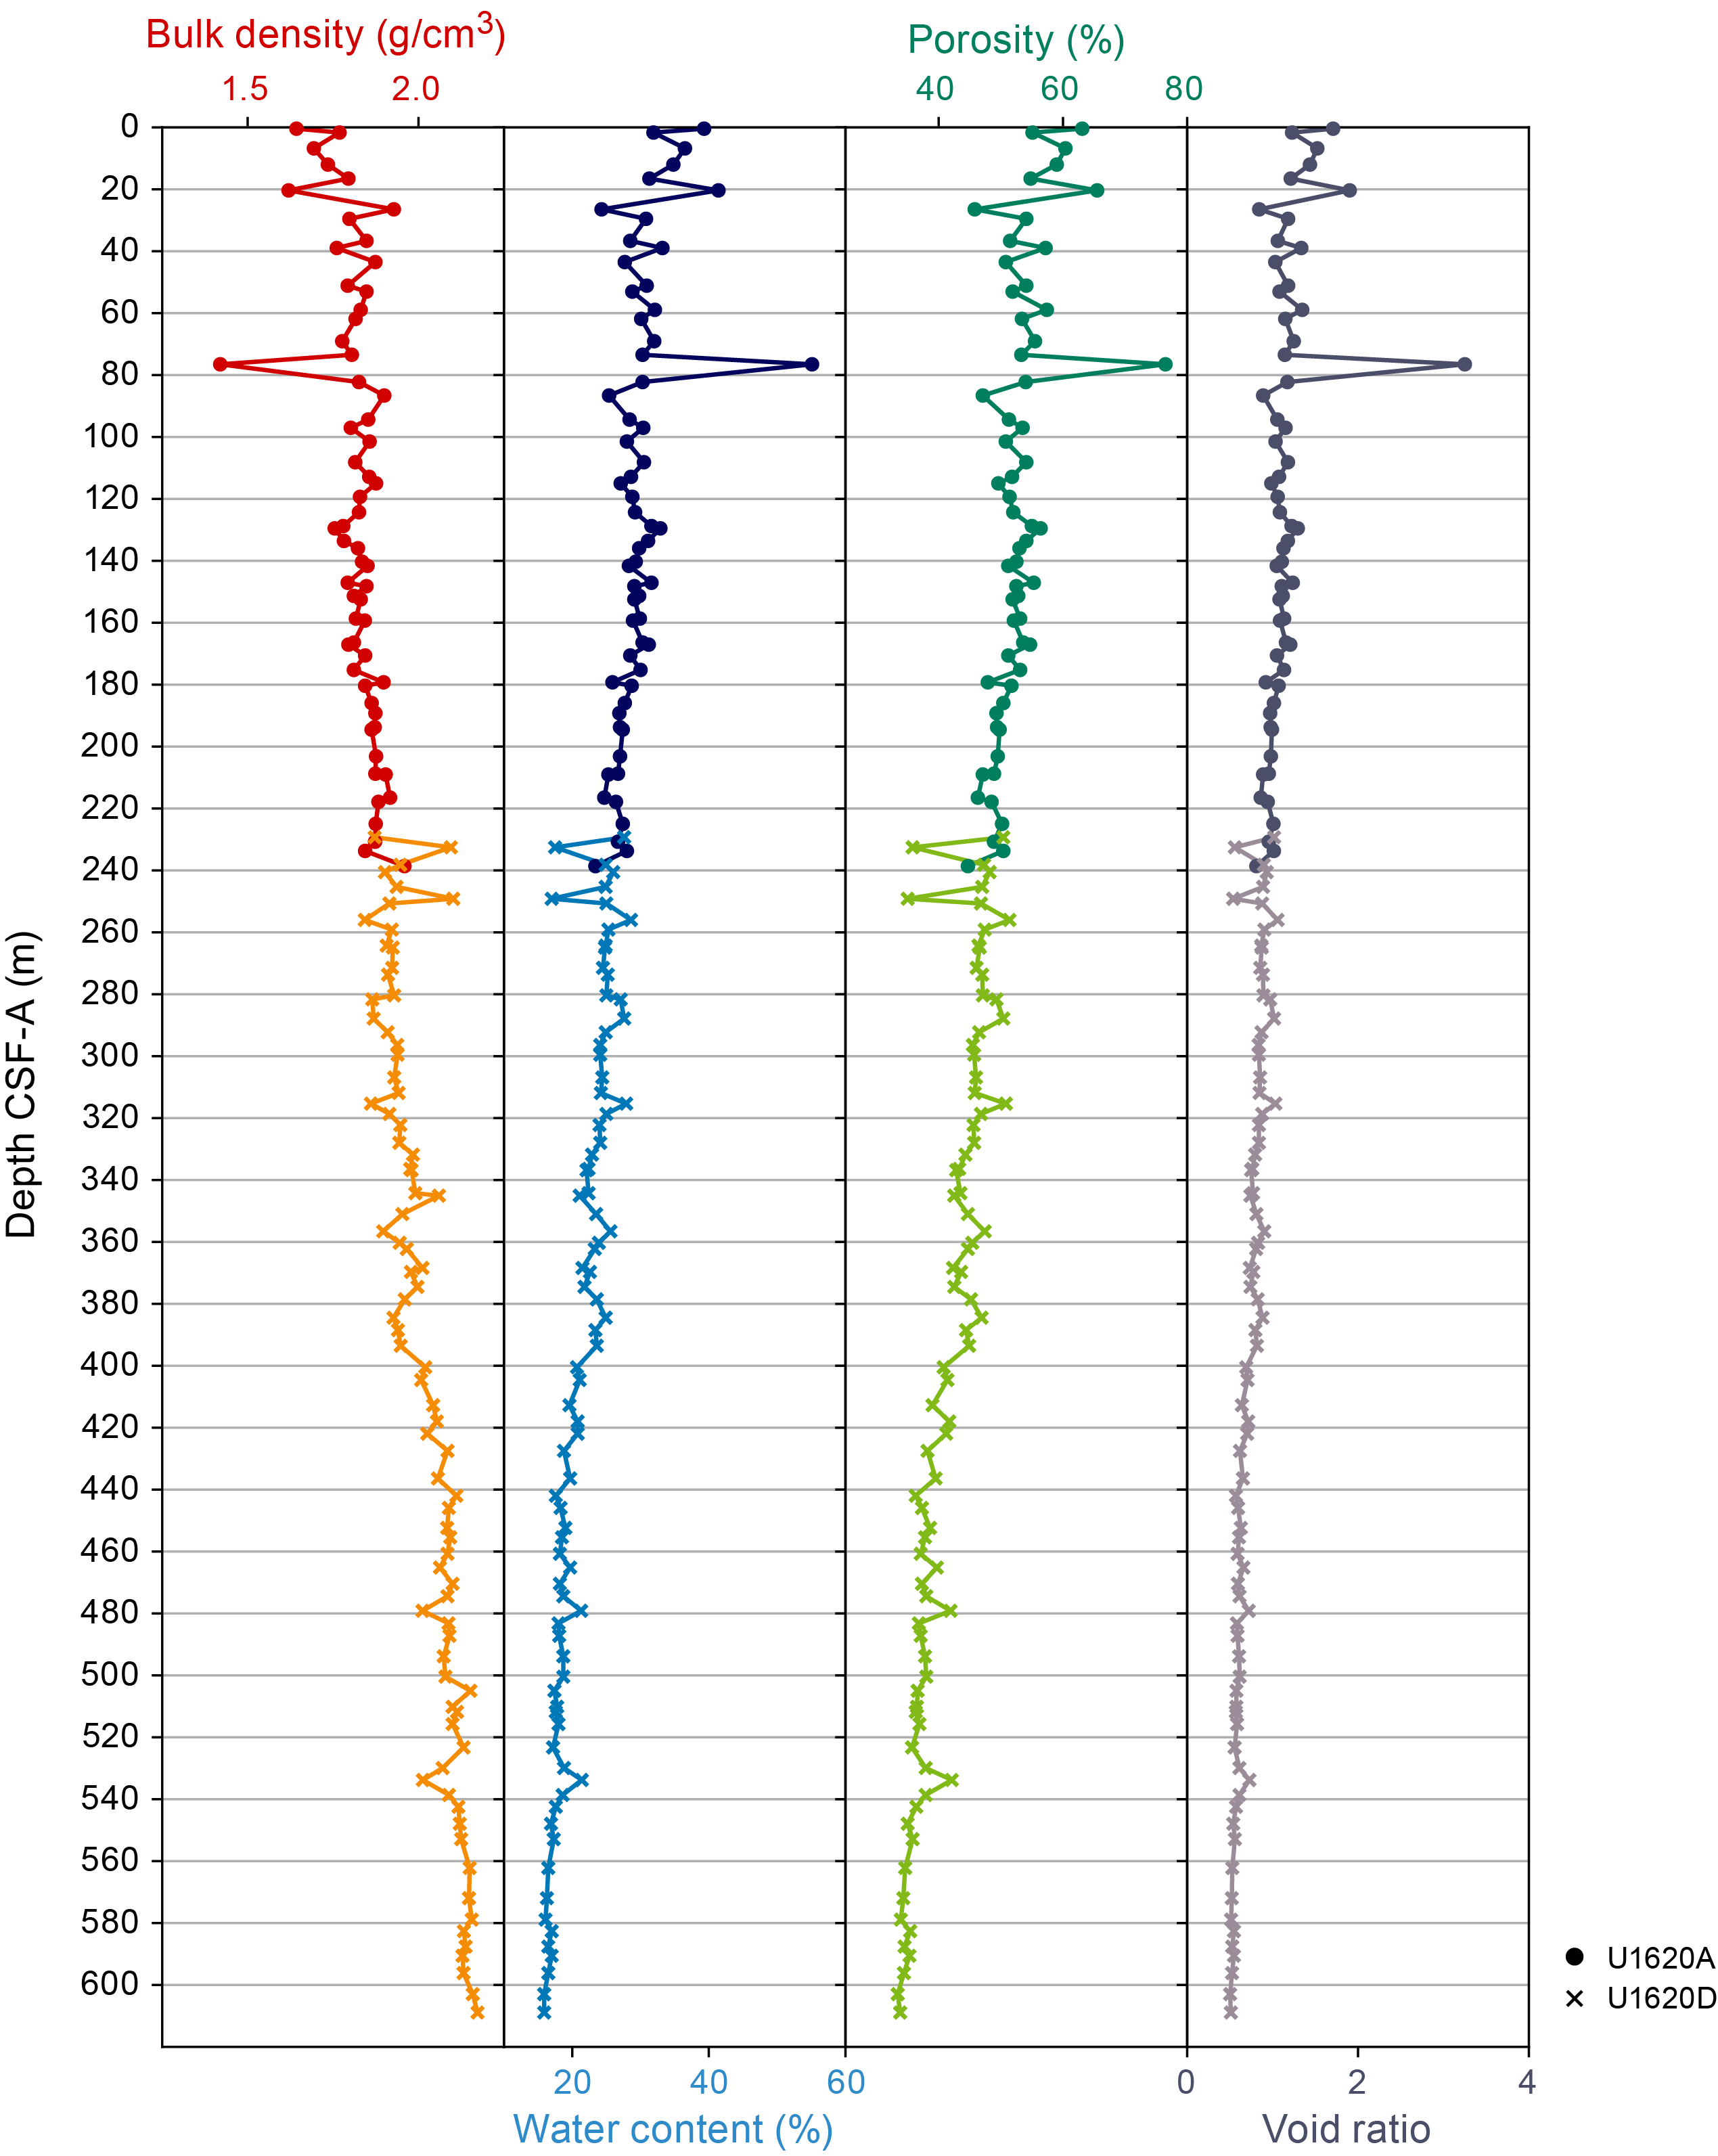
Figure F30. MAD parameters.
6.6. Thermal conductivity
To calculate heat flow and interpolate temperature data, thermal conductivity measurements were made using the TK04 system for one working section half per core for Cores 403-U1620A-1H through 31X and 403-U1620D-29X through 73X. A puck contact probe was placed on the split face of working section halves. To ensure good contact with the probe, a small amount of deionized water was added and/or the face was swept with a spatula. Homogeneous intervals lacking large clasts, voids, cracks, and sediment disturbances were targeted. Three measurements were made on the same interval, but we encountered a few failed measurements from the TK04 meter. Some cores did not have suitable intervals for thermal conductivity, especially in XCB cores, which often had biscuiting, large clasts, and cracks on the surface of split core halves. Therefore, thermal conductivity results were not possible for all cores and may be responsible for some of the scatter in measurements downcore. Overall, thermal conductivity values at Site U1620 increase with depth from ~1.2 W/(m·K) at the seafloor to ~1.5–1.6 W/(m·K) at ~600 mbsf, which likely corresponds to a downcore increase in dry bulk density and a decrease in porosity from compaction (Figure F31). Thermal conductivity increase is gradual to ~280 mbsf and then more rapid from ~300 mbsf to the base of Hole U1620C. Results from thermal conductivity taken from split cores agree with the downhole temperature gradient (see Downhole logging).
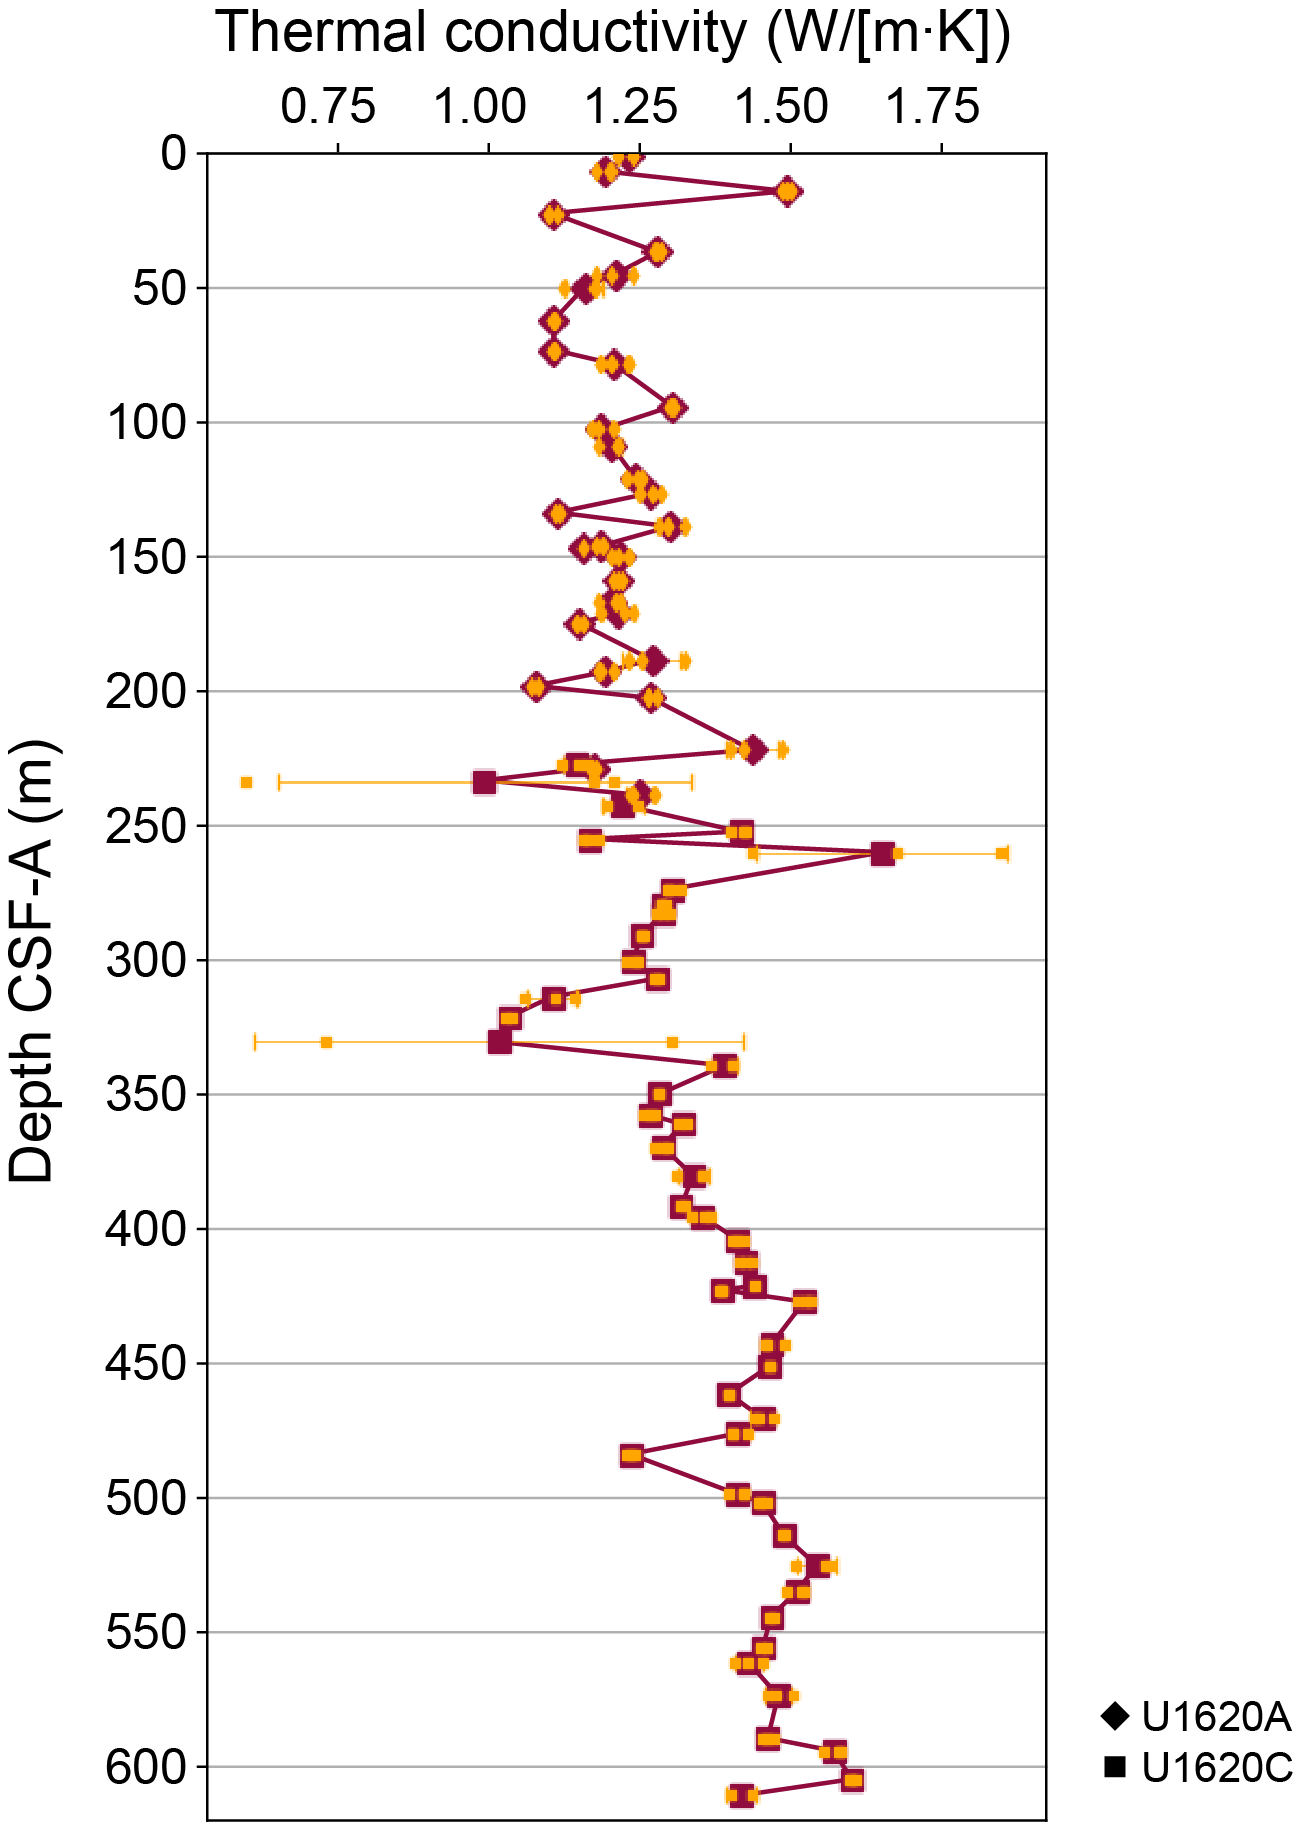
Figure F31. Thermal conductivity.
6.7. Anelastic strain recovery
ASR experiments were conducted using three whole-round samples, each up to 10 cm long, selected from the bottom of Sections 403-U1620D-37X-4, 52X-CC, and 68X-CC. After the whole-round core liners were cut on the core receiving platform, the whole rounds were scanned on the STMSL (Sections 37X-4, 52X-CC, and 68X-CC) and NGR (Section 37X-4) and the ASR samples were removed from the core liners. To attach 16 strain gauges, soft materials (i.e., drilling mud) surrounding the core samples were removed and the surfaces were flattened with a spatula and/or sandpaper. Gauges were glued onto the surfaces, and the samples were wrapped with plastic bags and put into a thermostatic water bath. All strain gauges were then electrically connected to a data logger to collect three-dimensional strain recovery. All sample preparation procedures were completed within ~3 h after core recovery. Average strain values of 11 ASR measurements were collected every 10 min from each of the 18 strain gauges. Temperatures and dummy channel data were also measured to ensure that the water temperature was stable and that the data logger was operating correctly. Gauges remained connected to the samples to monitor strain value for ~14 days to fully record the recovery. Preliminary results show that after temperature equilibrium, strain released logarithmically but some strain gauges showed shrinking (Figures F32, F33, F34). Shrinkage amount might have a positive correlation with semiquantitative methane amount (see Geochemistry). Postexpedition, inversion analysis will be conducted to convert the raw strain data set to three-dimensional strain that will be combined with azimuths of core samples by paleomagnetism to determine actual principal stress azimuths.
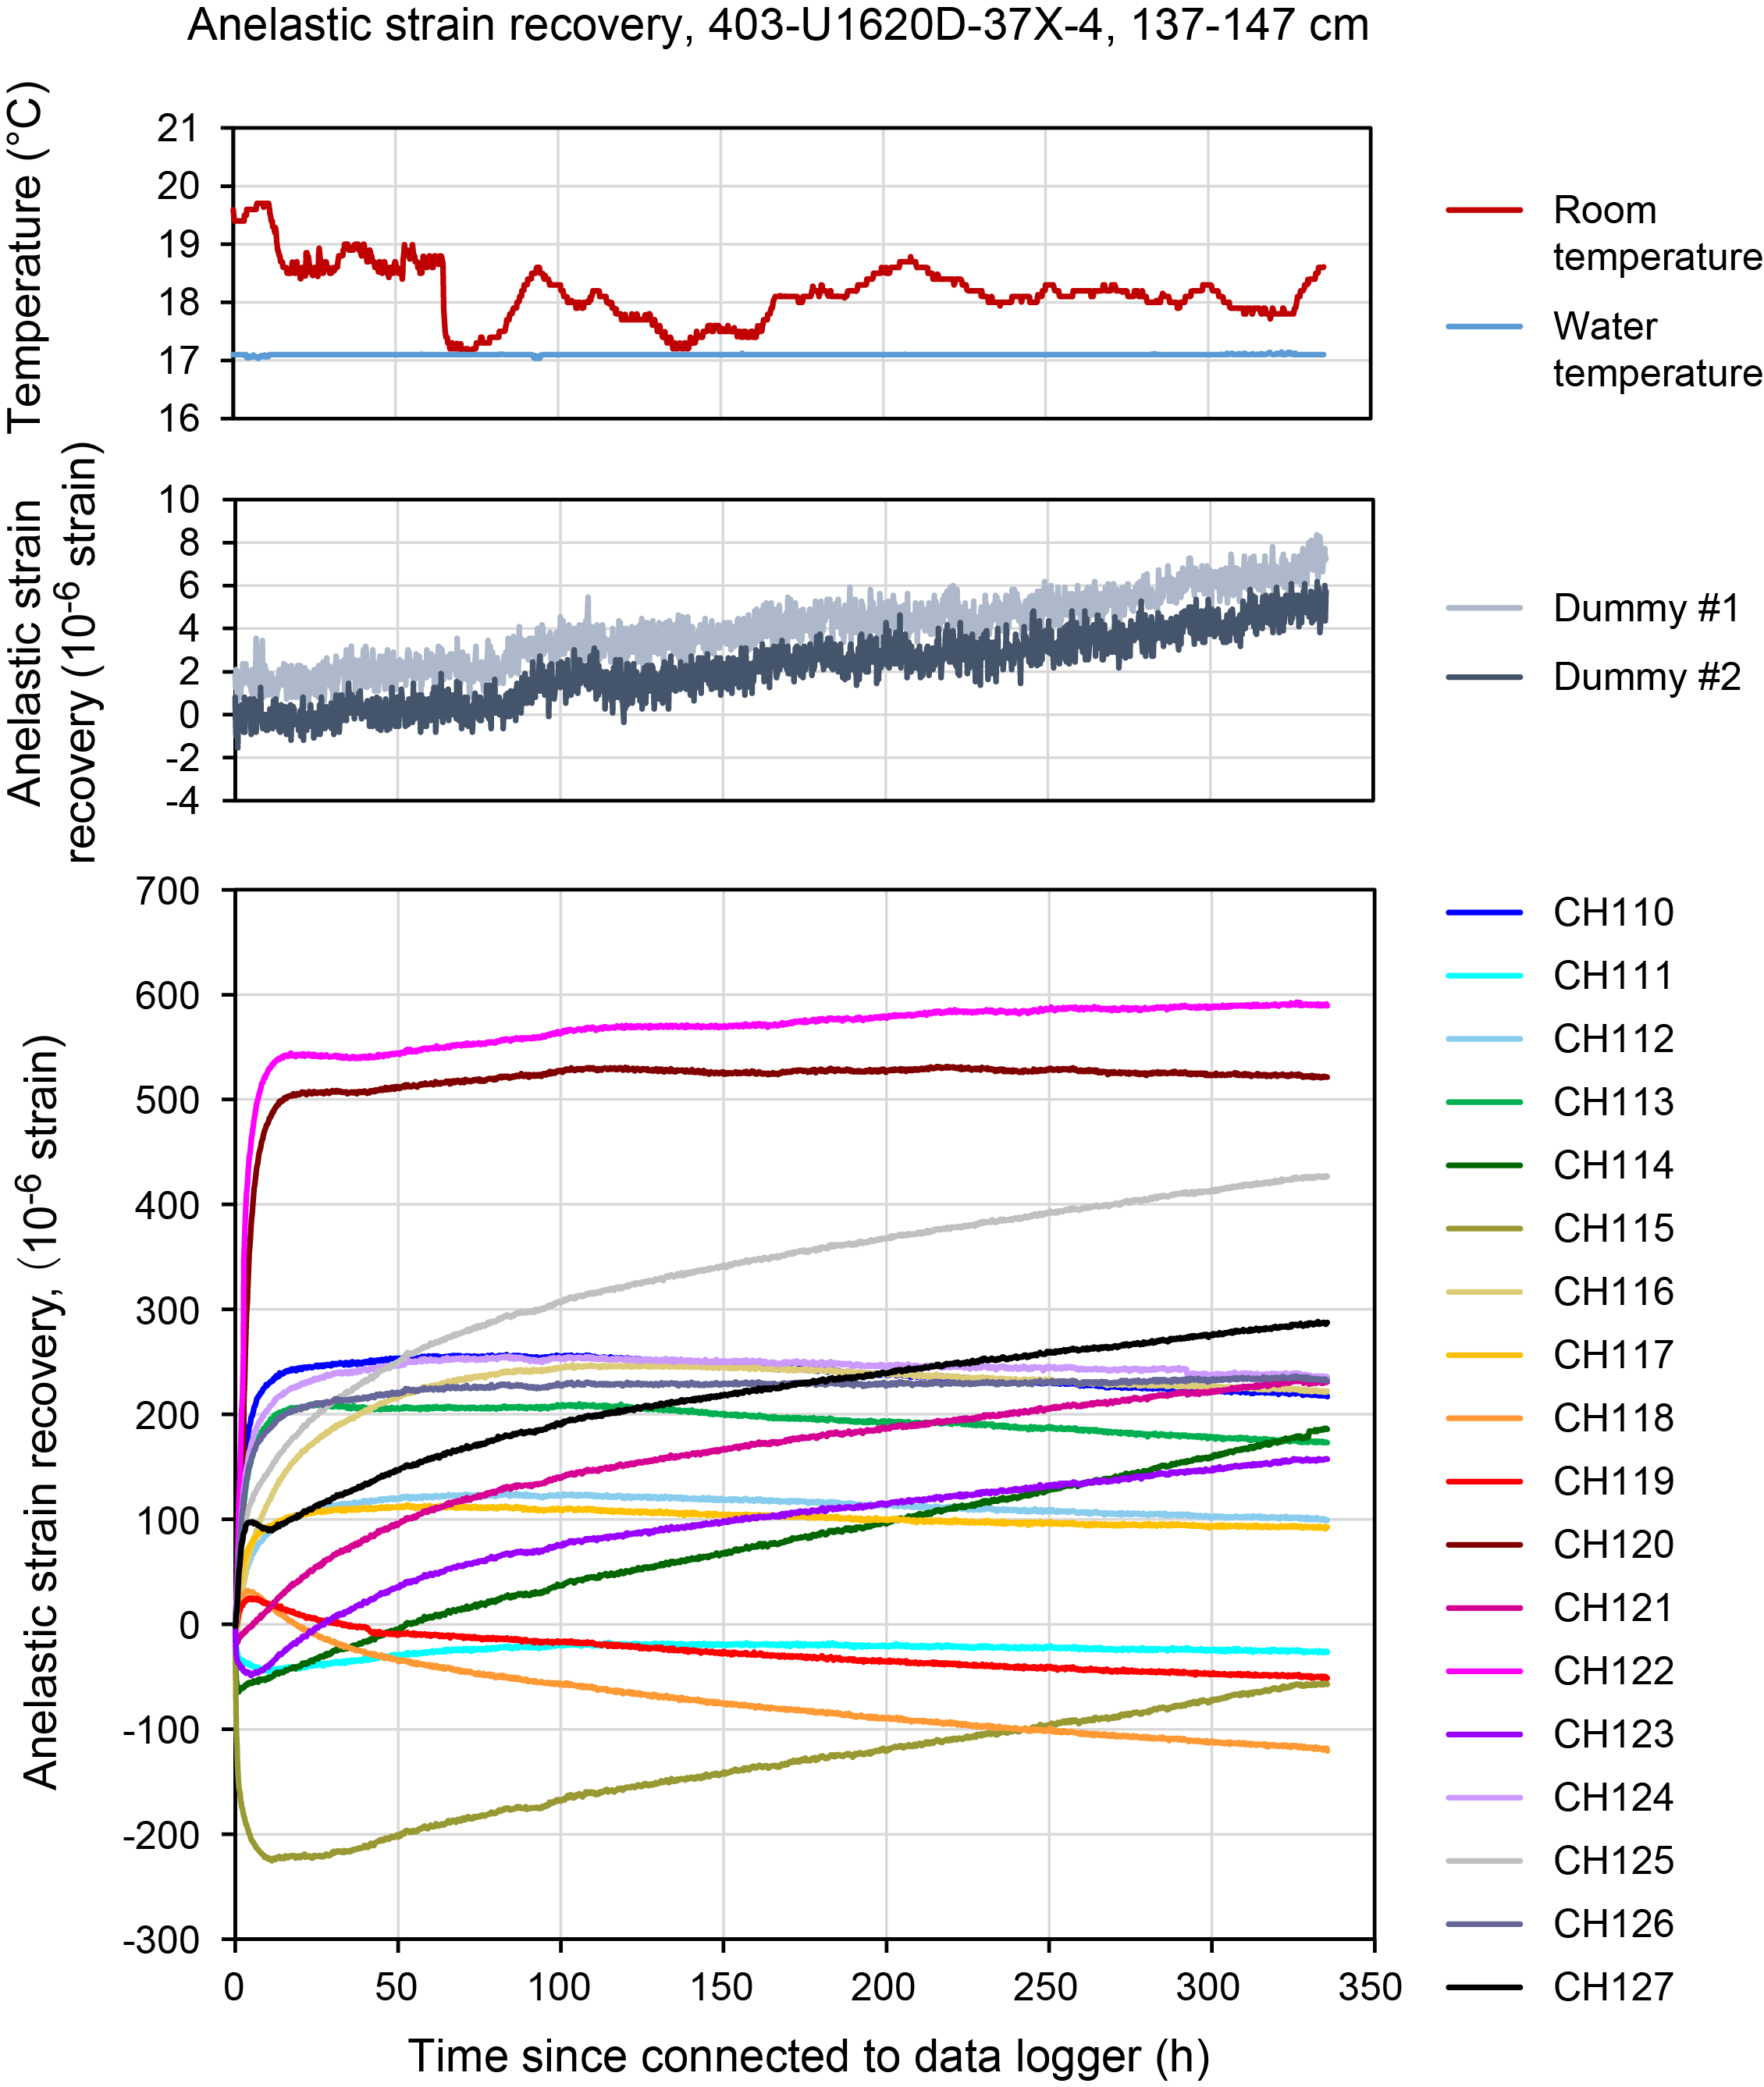
Figure F32. ASR initial results (403-U1620D-37X-4).
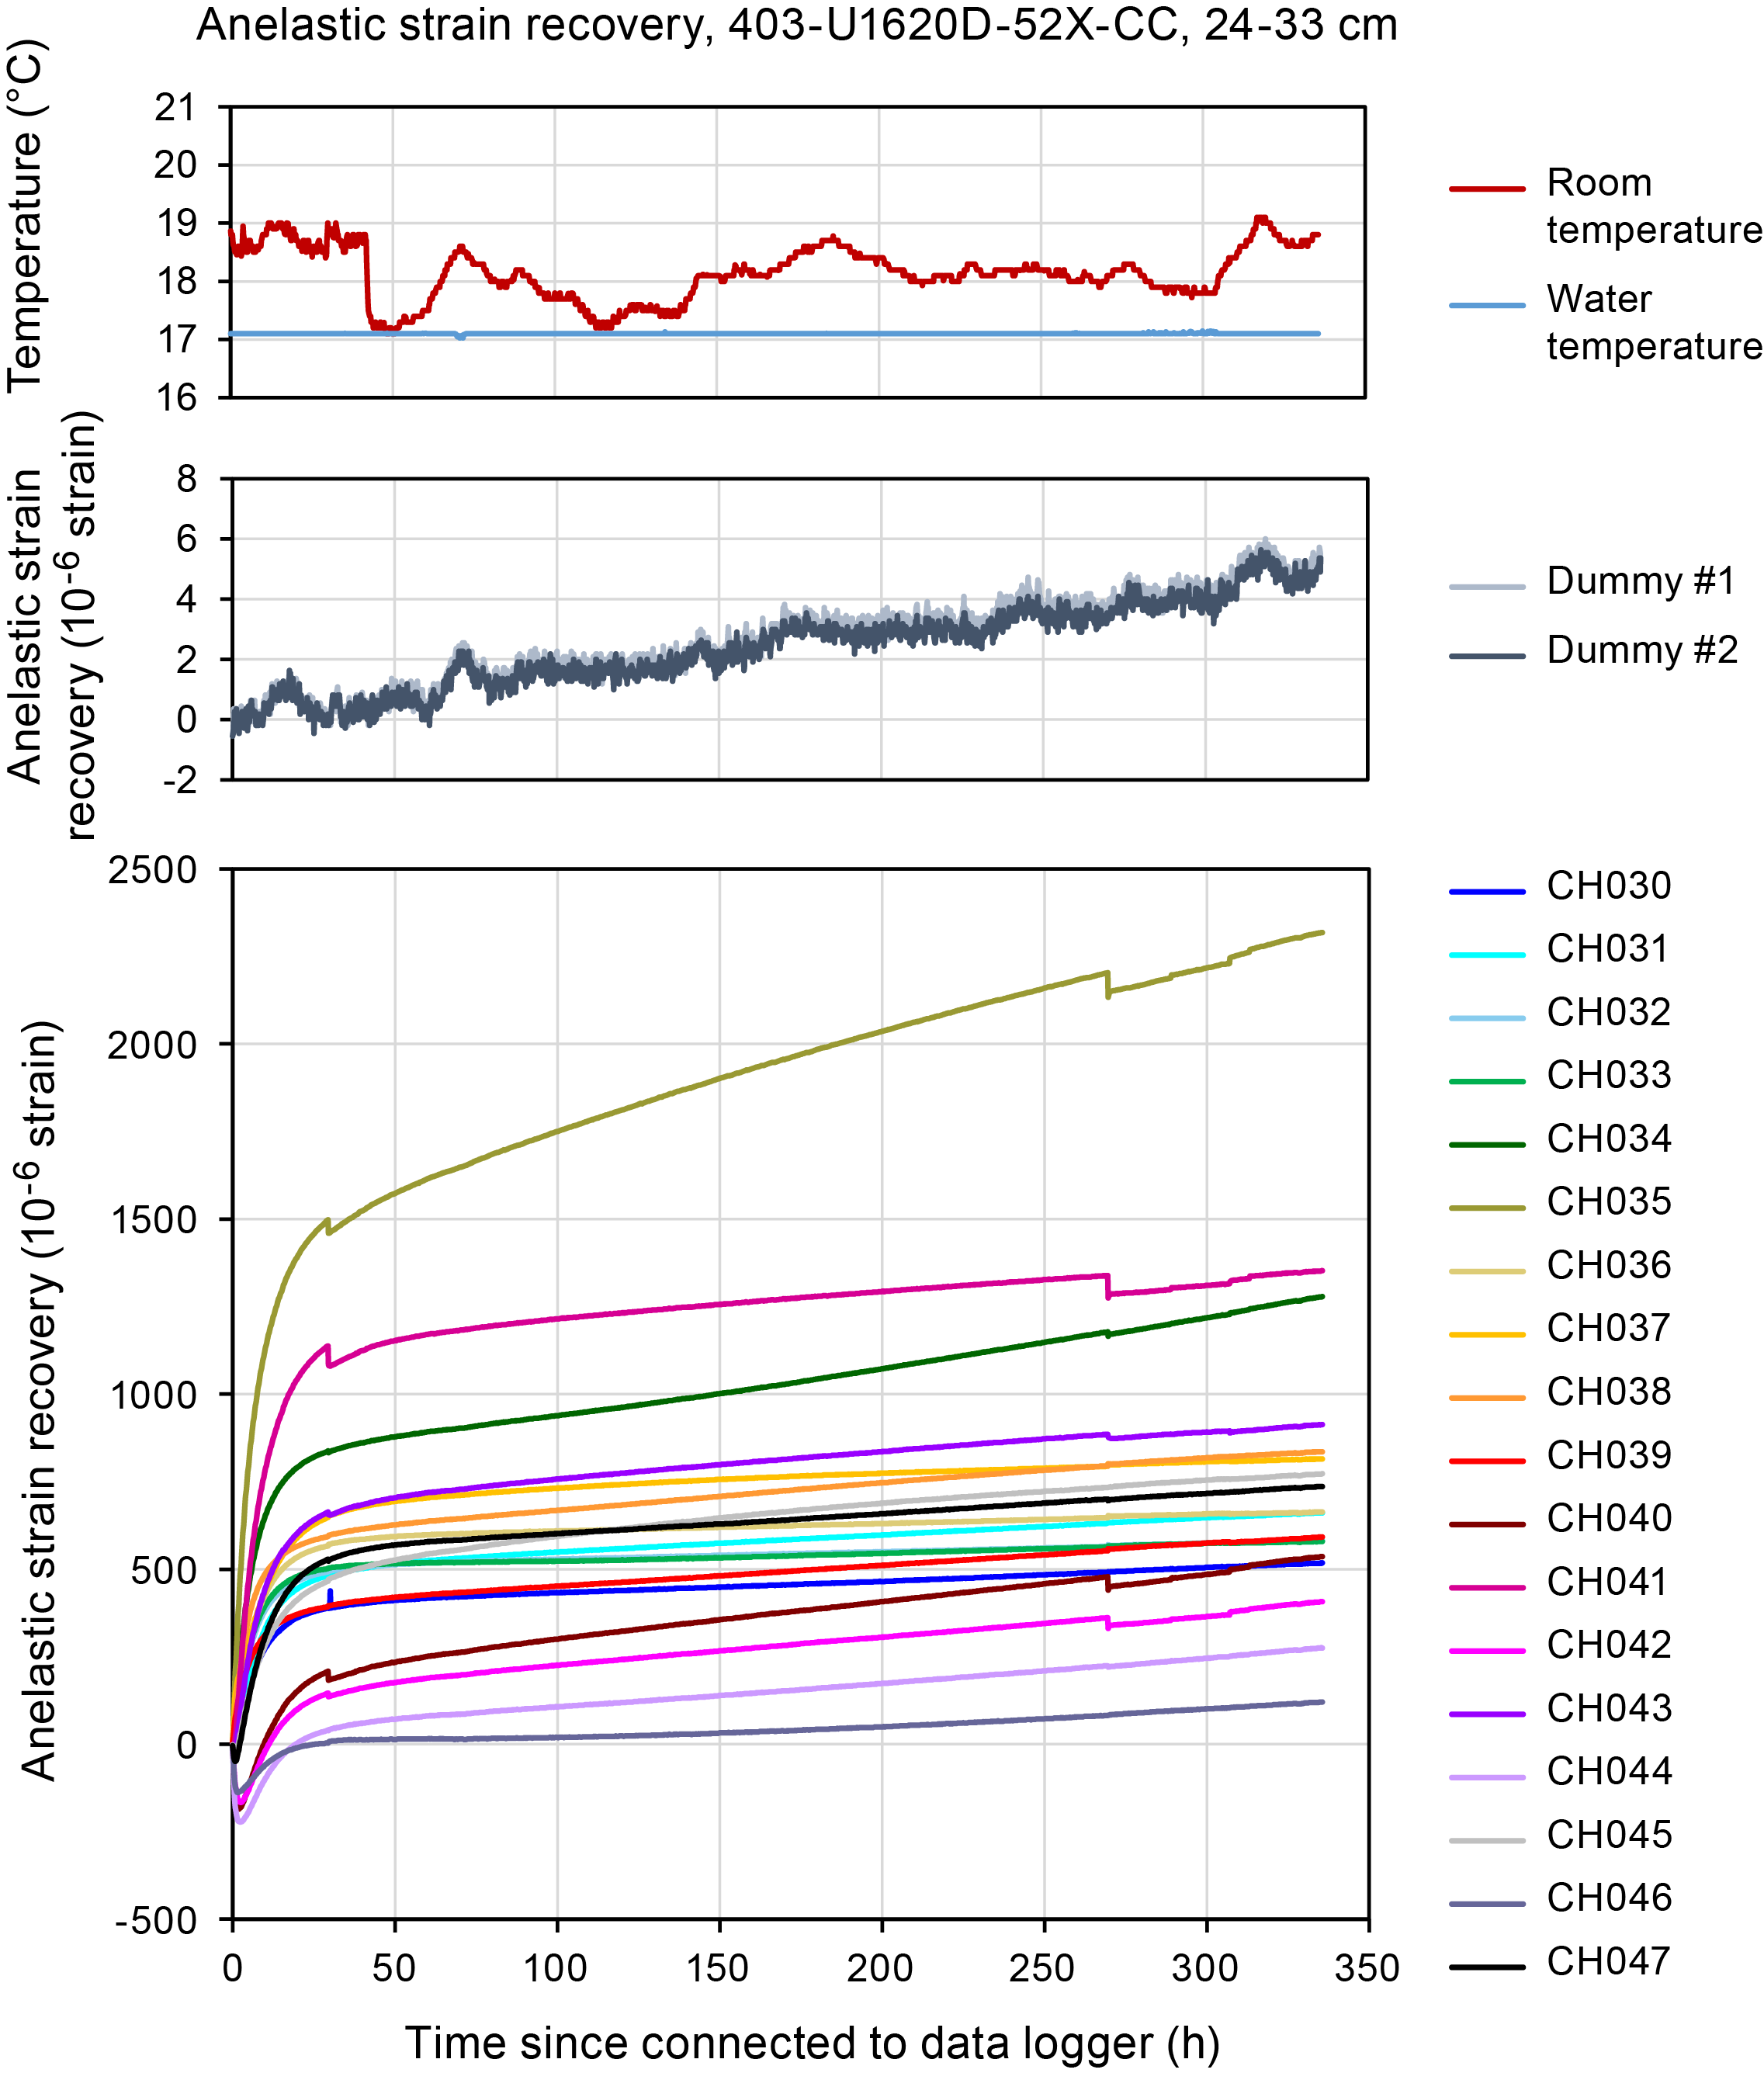
Figure F33. ASR initial results (403-U1620D-52X-CC).
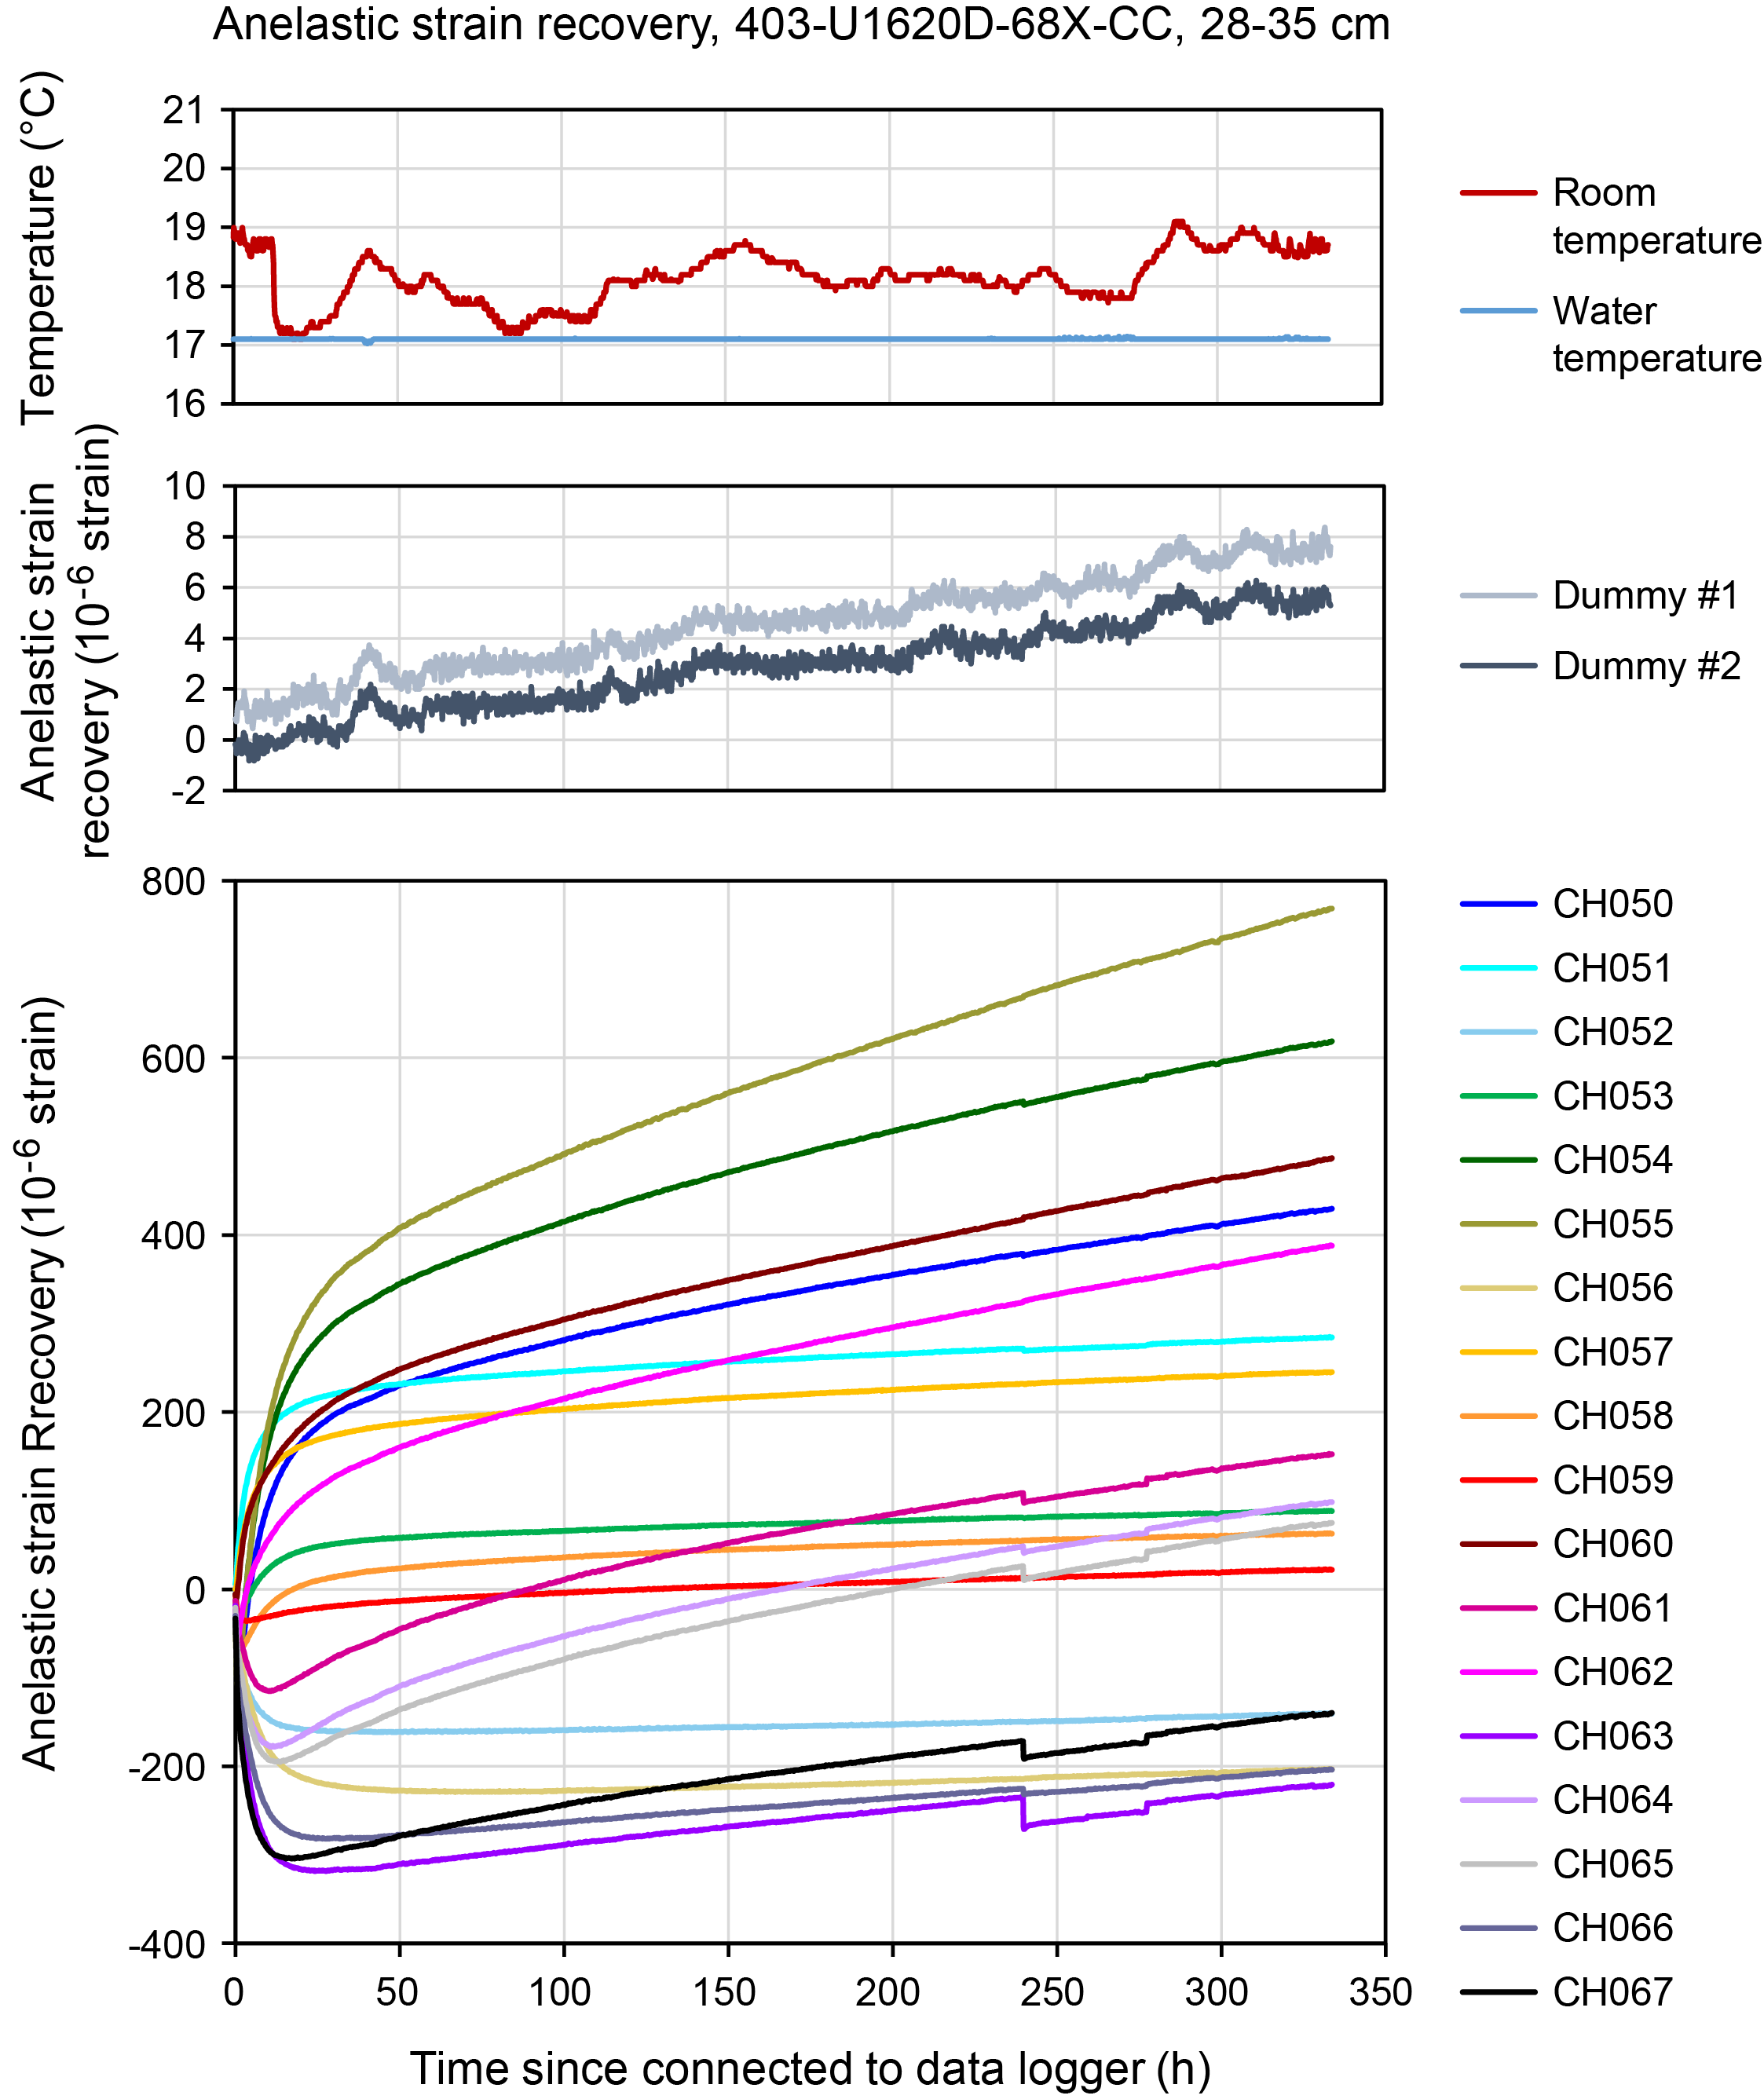
Figure F34. ASR initial results (403-U1620D-68X-CC).
6.8. Physical properties summary
There is generally good correspondence between data collected at higher resolution on the MS loop sensor and data collected at lower resolution on the MSP sensor. The MSP measurements pick up additional peaks in MS that were missed during averaging in WRMSL measurements. There is also good correspondence between GRA bulk density and discrete MAD sample measurements. Because of issues with gas, as discussed above, P-wave velocity data are not considered reliable, and there is no detectable signal in discrete nor logger data below ~15 mbsf. Thermal conductivity values generally increase with depth (see Downhole logging).
MS, NGR, and GRA bulk density generally display a positive linear correlation to ~150 mbsf, associated with Lithostratigraphic Subunits IA and partially IB. Below ~150 mbsf, MS correlation with other physical properties ceases due to presence of authigenic iron sulfide clasts (see Paleomagnetism) and diagenetic alteration. Unit II has a bimodal distribution in MS. The mode below ~100 IU likely tracks depositional processes, and the mode above represents units affected by authigenic processes (Figure F35).
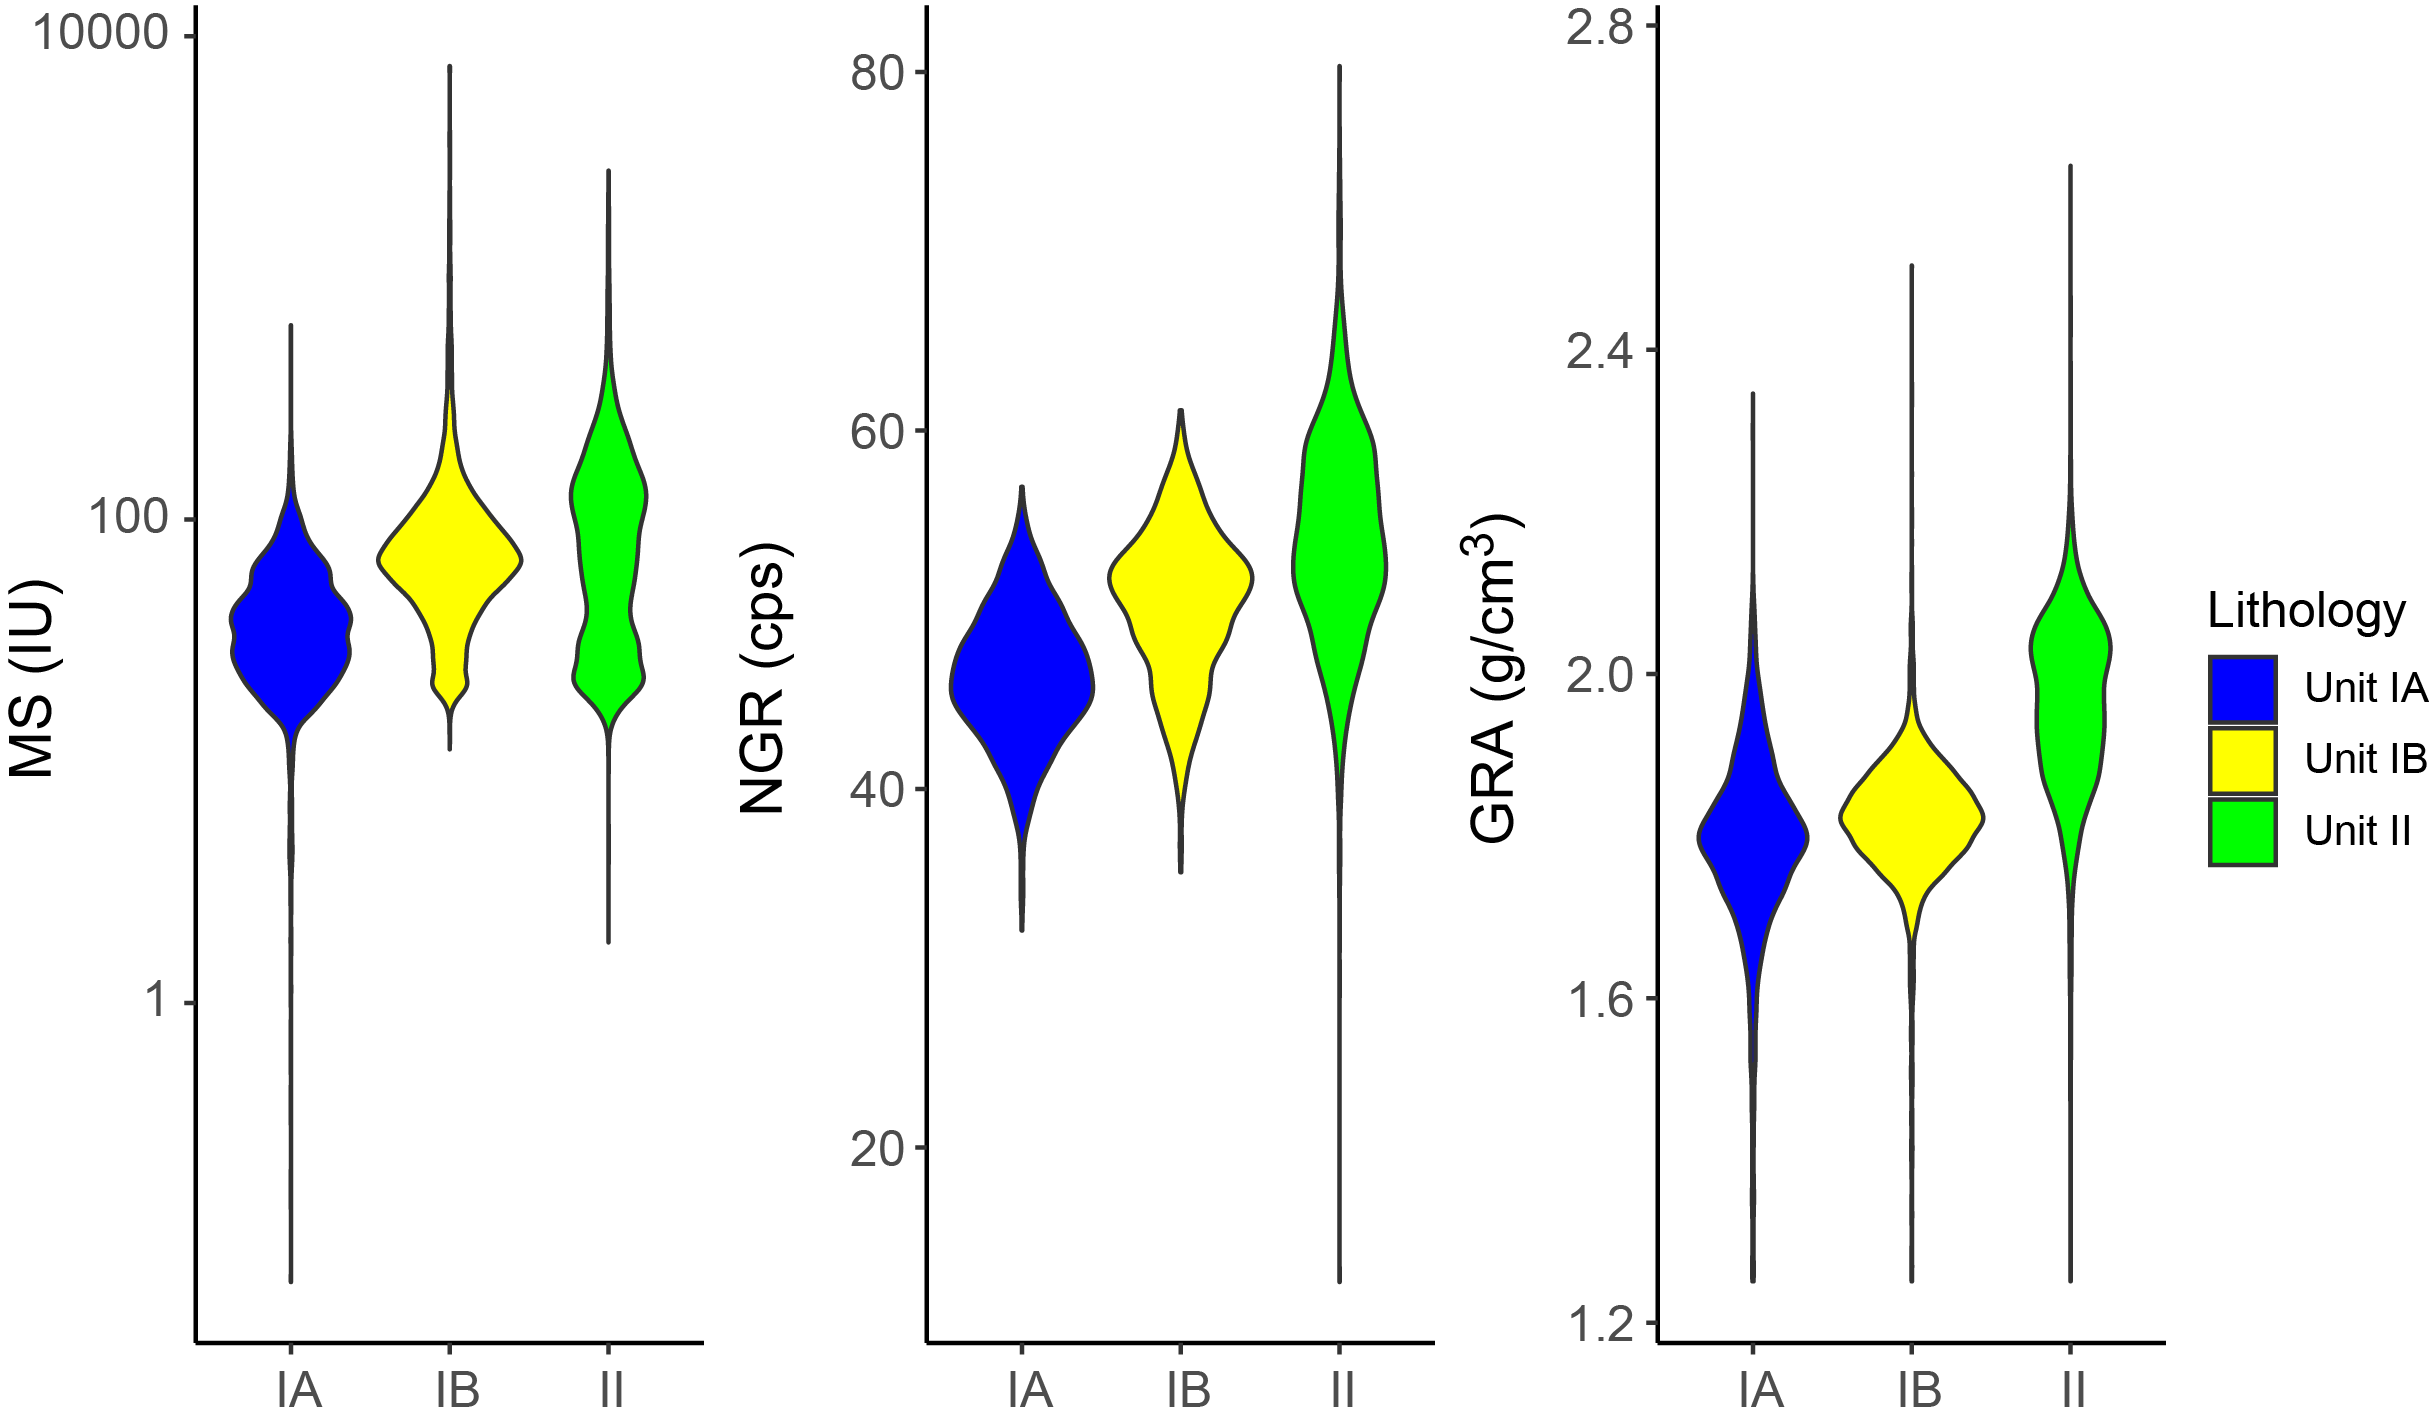
Figure F35. Physical property associations with preliminary lithostratigraphic units/subunits.
NGR and GRA bulk density are well correlated at depth and capture some cyclicity, especially in Lithostratigraphic Unit II (see Lithostratigraphy). This variability is relayed in Unit II bimodal distribution of GRA bulk density (Figure F35) and may indicate climate-driven changes in sediment delivery and depositional processes across glacial–interglacial cycles. GRA bulk density and NGR increase with depth but not with MS peaks (Figure F28), indicating that magnetically strong constituents are not limited to a specific material or degree of compaction. NGR is important for identifying relationships between physical properties and lithostratigraphy, especially because the MS signal below ~150 mbsf was partially overprinted by postdepositional alteration and GRA measurements were omitted in cores sampled for sedaDNA analyses.
Overall, physical properties at Site U1620 are influenced by changes in depositional conditions possibly associated with changing climate states, as well as postdepositional processes evidenced by MS peaks and observations of greigite nodules. Further studies onshore are necessary to interpret the relationship between physical properties measured on board, depositional lithofacies, and postdepositional alteration.
7. Stratigraphic correlation
Correlations between holes at Site U1620 were accomplished using Correlator software (version 4.5.4). For the splice, tie points were established based on WRMSL MS. Although the holes were located relatively far from each other (Holes U1620A–U1620C = 200 m apart; Holes U1620A–U1620D and U1620C and U1620D = 100 m apart) and the records were often overprinted with high MS spikes due to abundant authigenic greigite below ~100 mbsf, we could identify the common features to correlate among the holes. Below ~100 mbsf, expansion of the sediments caused many gaps in the cores that resulted in relatively high growth factors and voids, which likely affected the physical properties (e.g., density) and led to some stratigraphic inconsistencies among holes.
We constructed two spliced intervals. The upper one, from 0 to 190.135 m core composite depth below seafloor (CCSF), is based on correlations among the three holes (U1620A, U1620C, and U1620D), and the lower one, from 190.937 to 271.135 m CCSF, is based on a correlation between Holes U1620A and U1620D (Figure F36; Table T6). Only Hole U1620D extends below 271.233 m CCSF. In that interval, we appended the cores in Hole U1620D according to their individual expansion/growth factor of ~1.16–1.3 of the previous cores (Table T7). Although we relied on MS data in building this splice, we note that the NGR data are less noisy than other data sets and may be more useful for comparison with climate records (Figure F37).
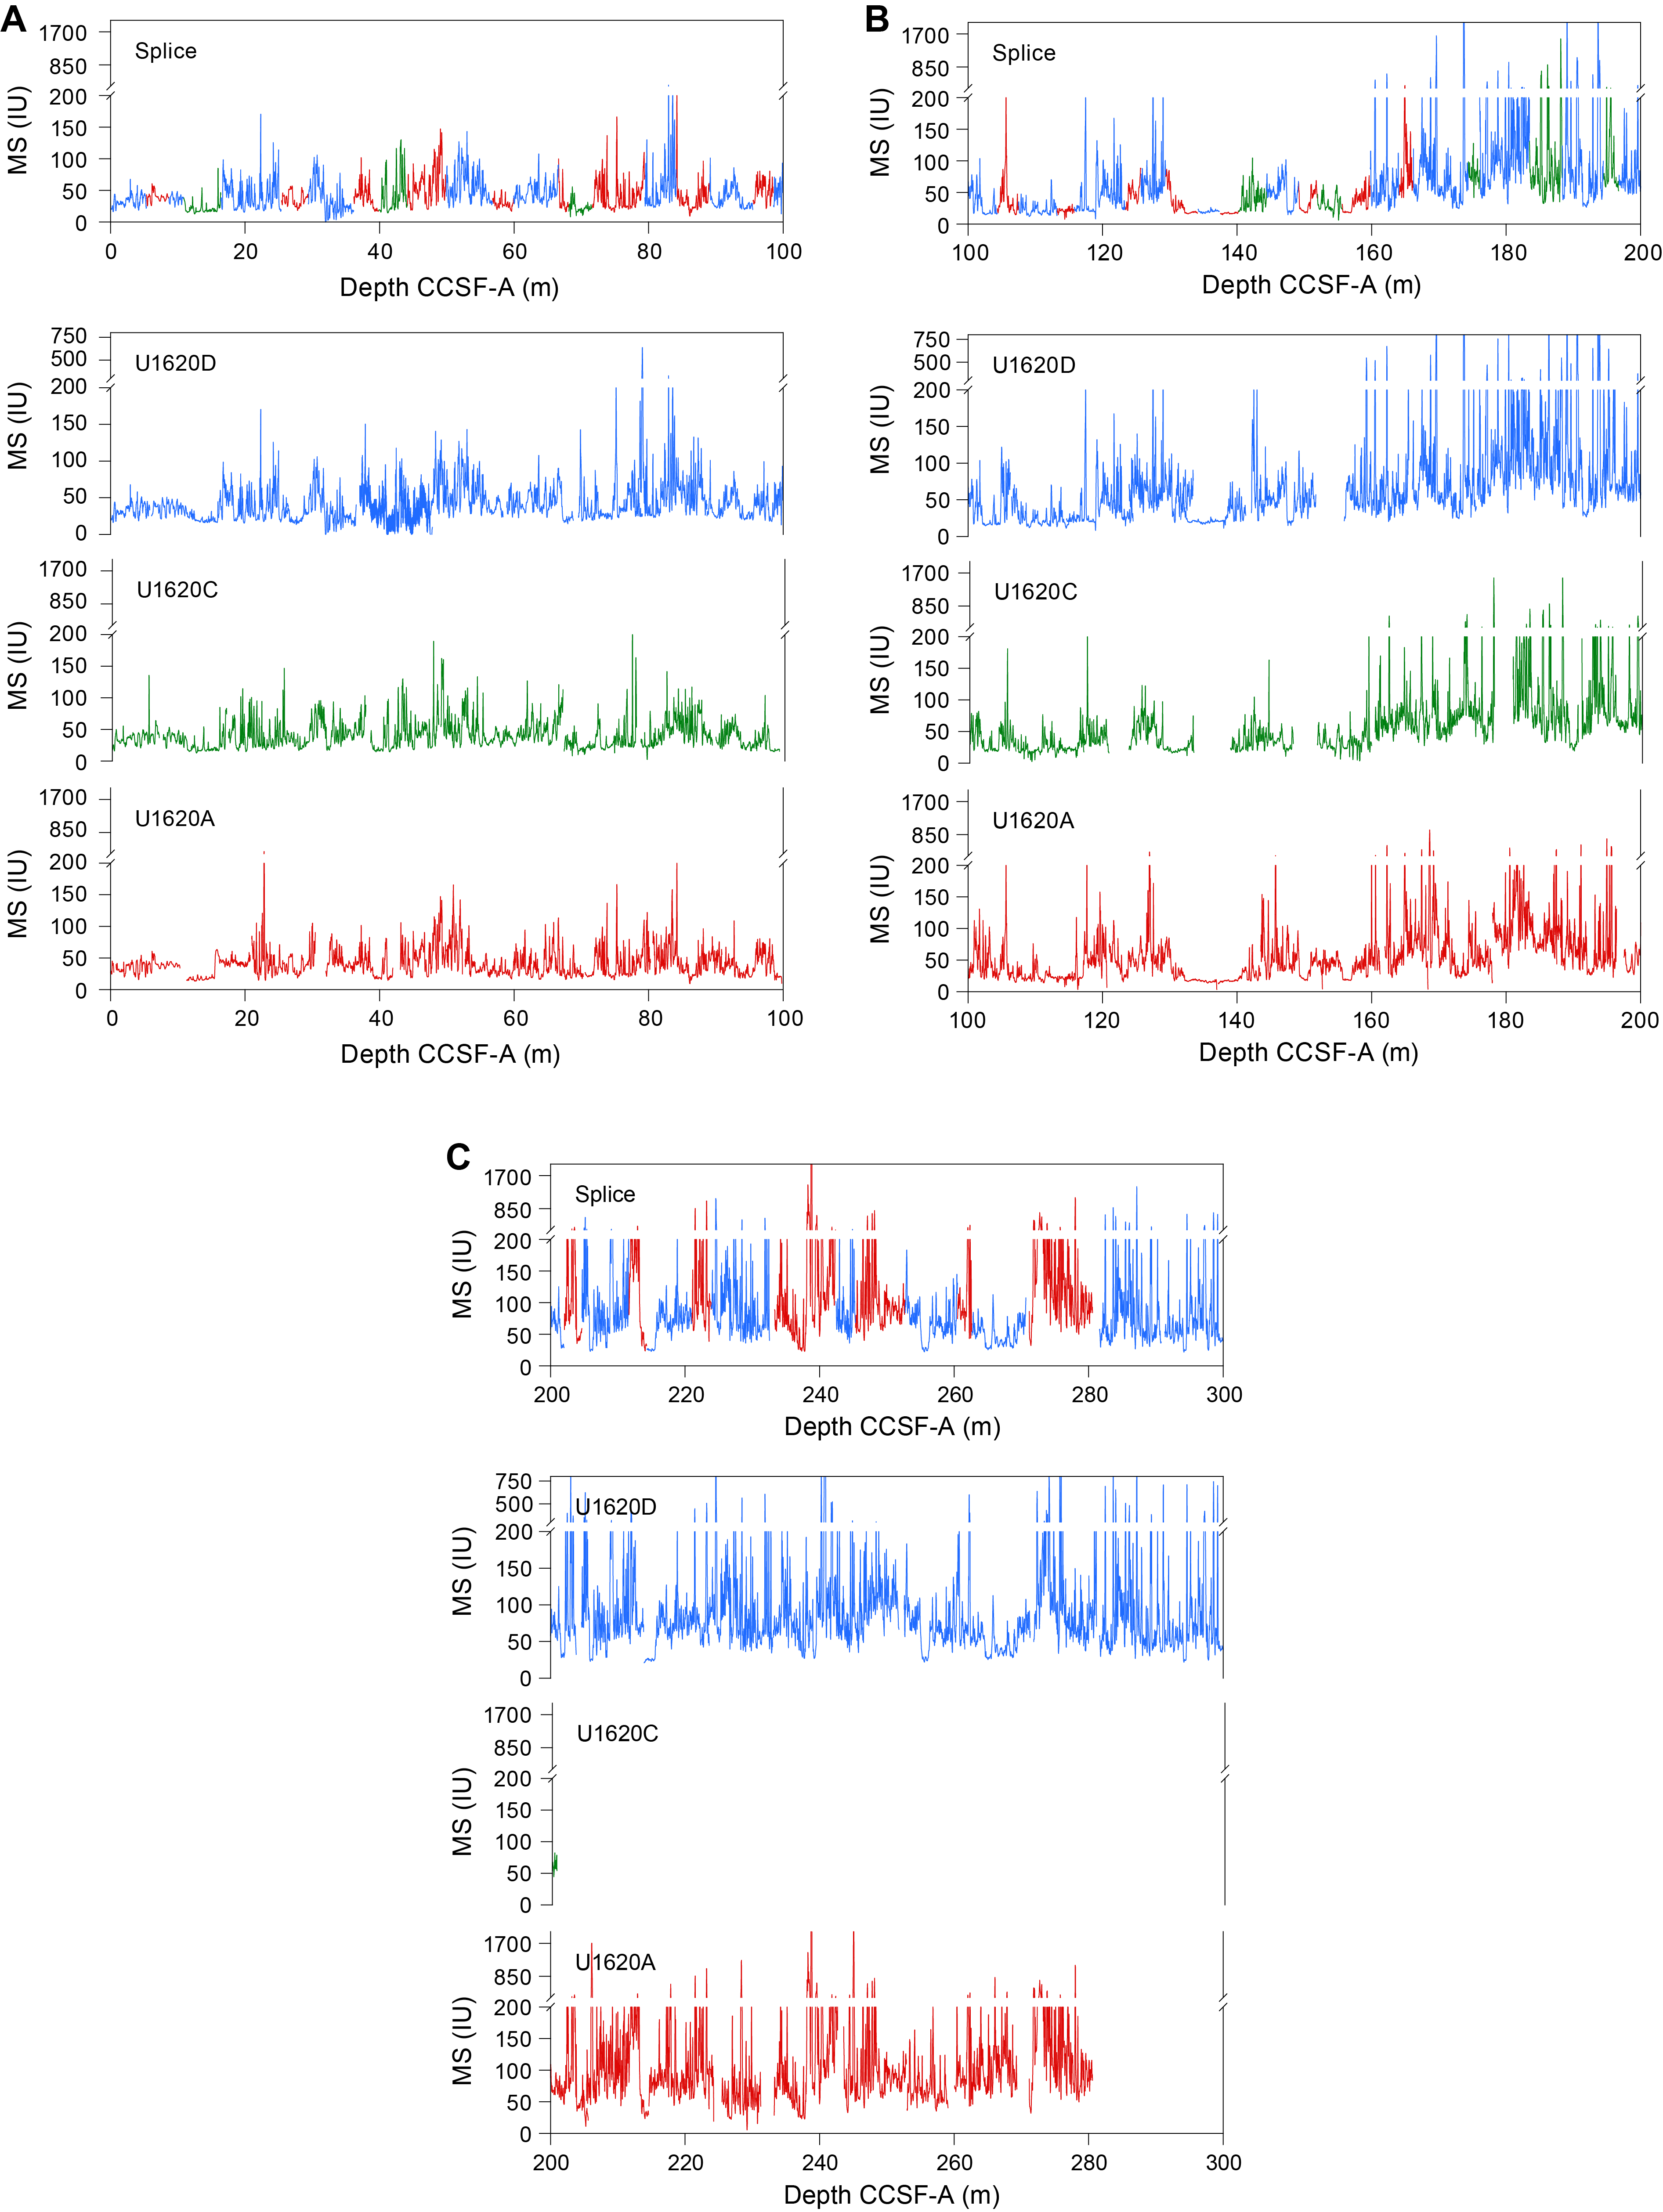
Figure F36. WRMSL MS.
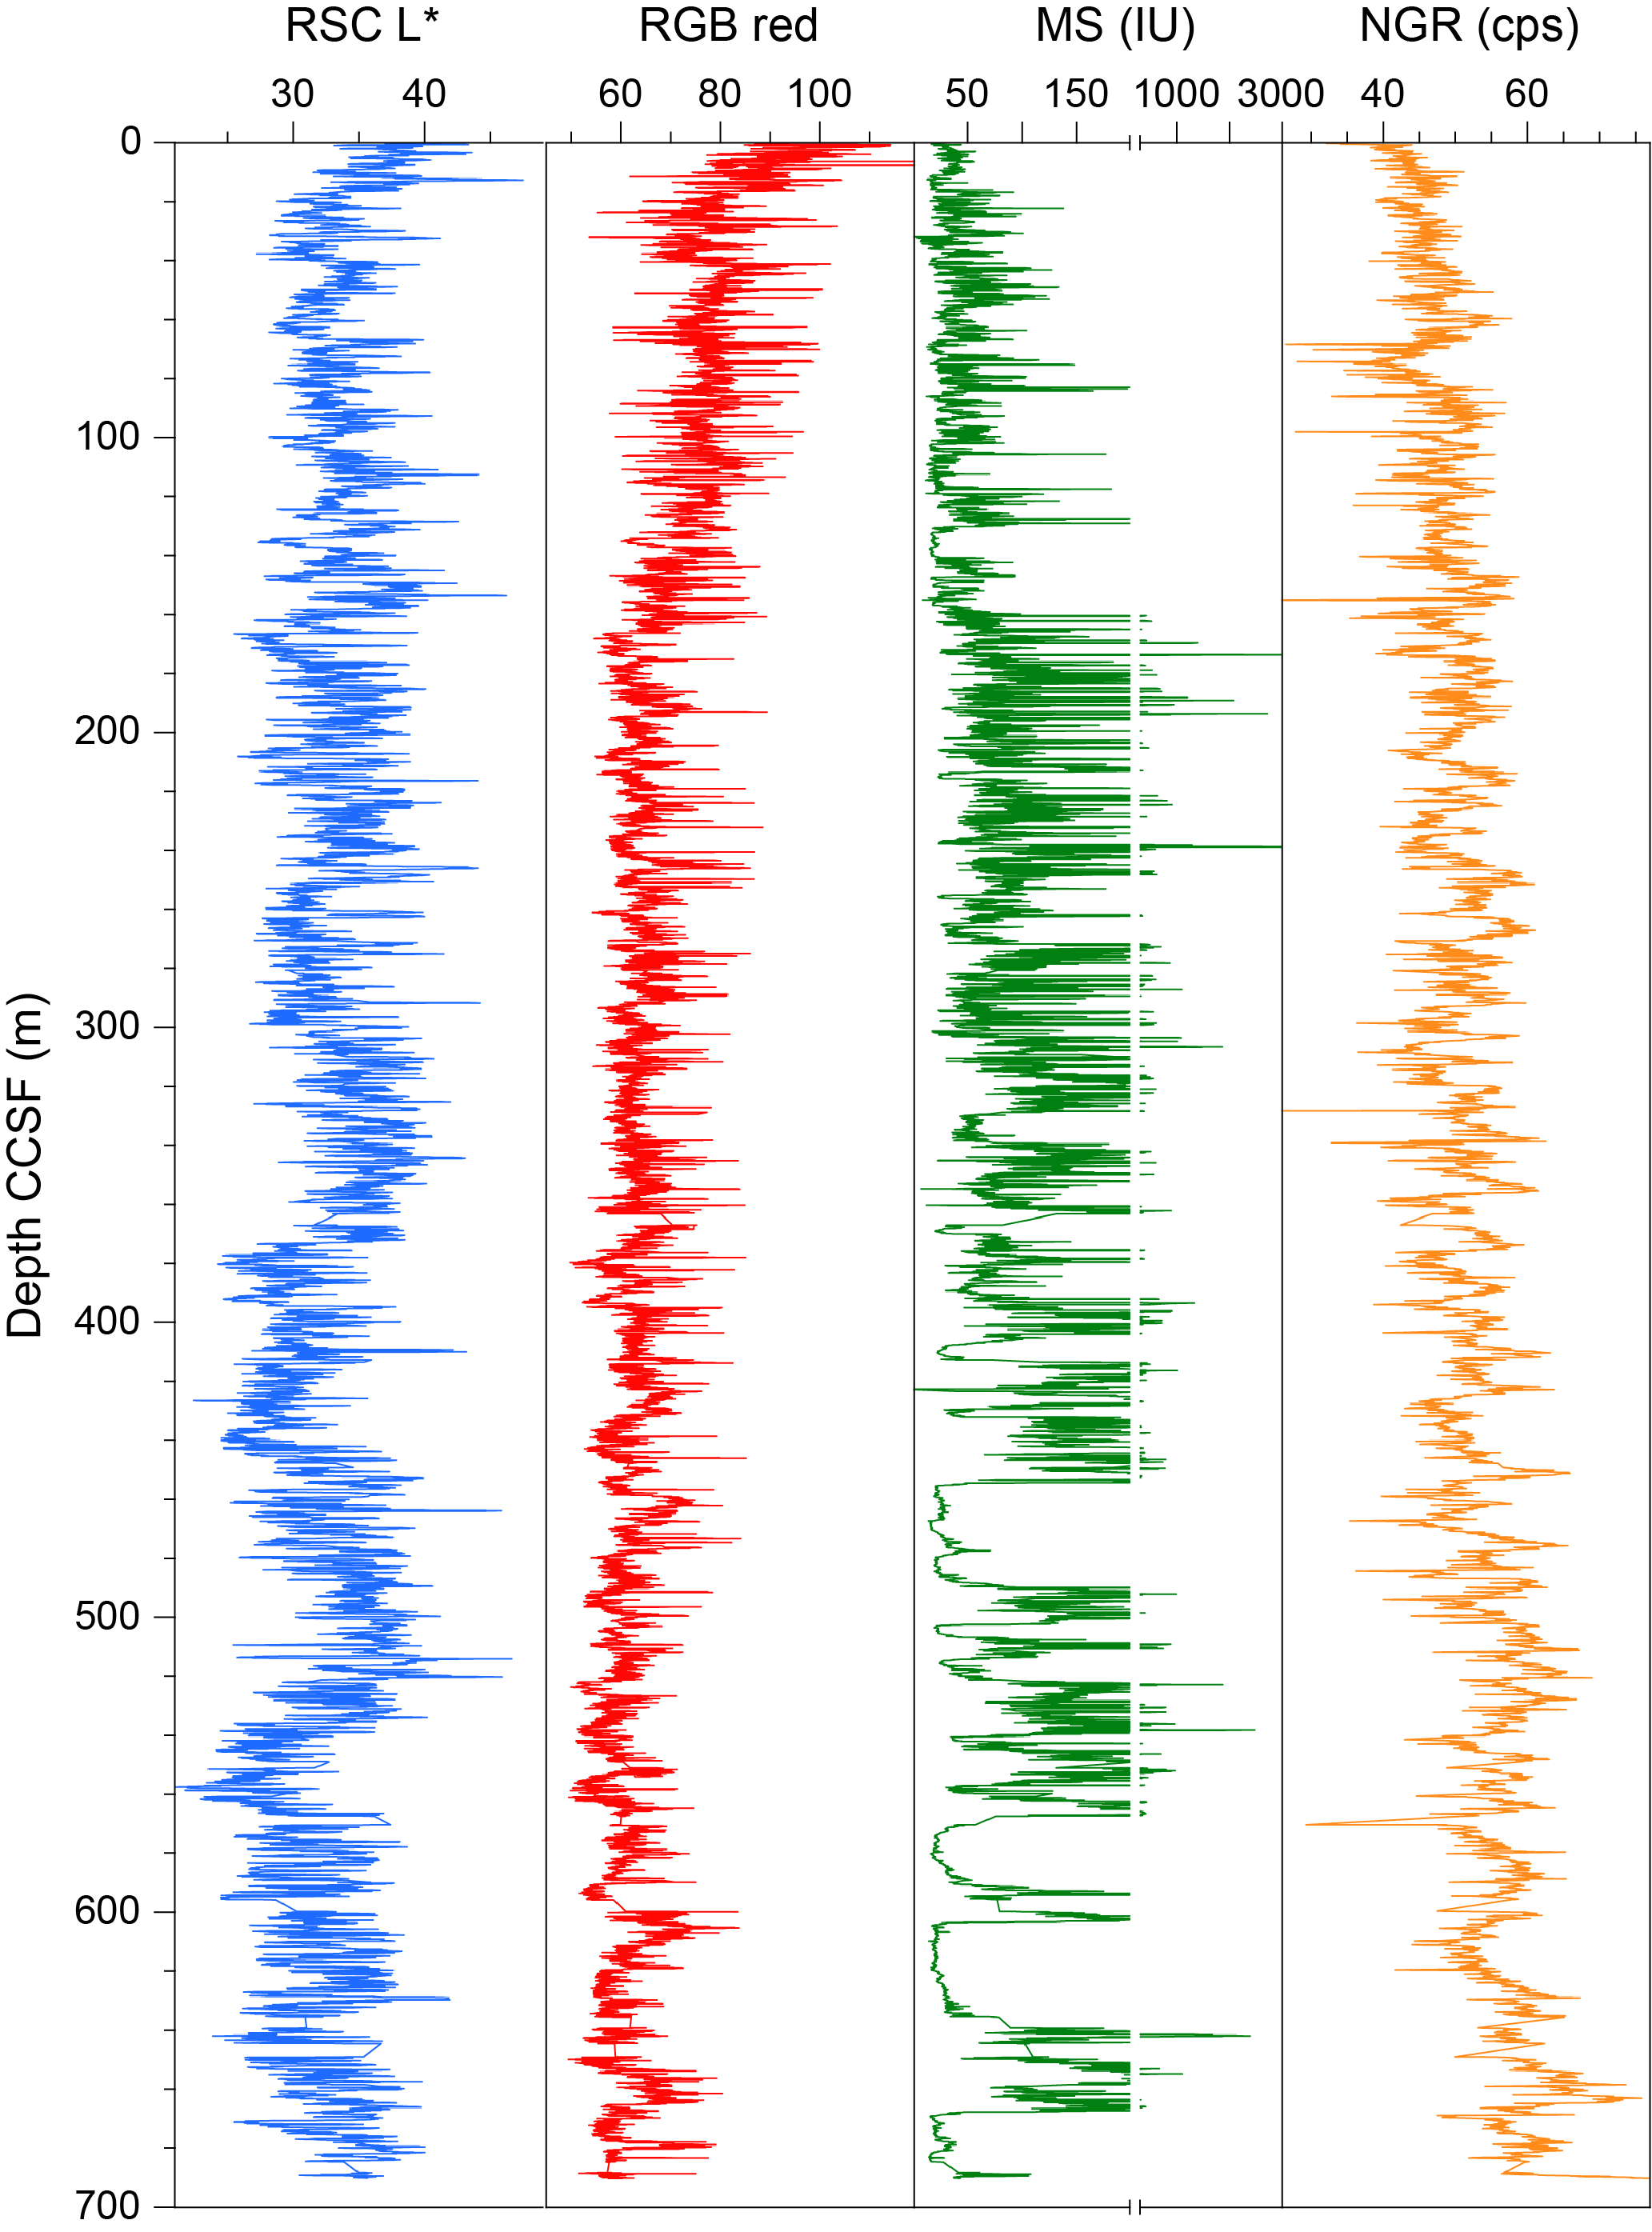
Figure F37. Reflectance spectroscopy and colorimetry L*, RGB red, WRMSL MS, and NGR.
The CCSF scale is anchored to the mudline of Core 403-U1620D-1H, which is assigned the depth of 0 m CCSF. From this anchor, we worked downhole using Correlator to establish a composite stratigraphy on a core-by-core basis. The match between holes is relatively well constrained within the spliced intervals, although there are gaps throughout the splice. Between 0 and ~200 m CCSF, the splice is secured except for a few tentative tie points (Figure F36).
We approached the construction of the splice by mainly using the best recovered stratigraphy of Hole U1620D as the backbone, where possible, and using Hole U1620C to fill the core gaps down to 190.937 m CCSF, where coring in Hole U1620C was terminated, and then using Hole U1620A down to 271.135 m CCSF, where coring in Hole U1620A was terminated. There are three appended gaps in the interval from 190.937 to 271.135 m CCSF of the sedimentary sequence: Cores 403-U1620A-15X to 403-U1620D-15X, 403-U1620D-24X to 403-U1620A-27X, and 403-U1620D-28X to 403-U1620A-31X and 403-U1620D-30X. In addition, there are several possible gaps that were difficult to correlate between holes, and postcruise work will be required to verify some of the tentative tie points used to construct the splice. These include Cores 403-U1620A-10H to 403-U1620D-10H, 403-U1620A-11H to 403-U1620D-11X, 403-U1620D-13X to 403-U1620A-14H, 403-U1620D-15X to 403-U1620A-16X, 403-U1620A-17X to 403-U1620D-17X, 403-U1620A-19X to 403-U1620D-18X, 403-U1620C-19X to 403-U1620D-19X, 403-U1620D-20X to 403-U1620C-21X, 403-U1620A-23X to 403-U1620D-22X, 403-U1620A-24X to 403-U1620D-23X, 403-U1620A-25X to 403-U1620D-24X, 403-U1620A-27X to 403-U1620D-26X, 403-U1620A-28X to 403-U1620D-27X, and 403-U1620D-27X to 403-U1620C-30X. Only Hole U1620D extends below 271.135 m CCSF, so gaps between cores were adjusted using the expansion rate. However, the recovery was mostly good, and the gaps between cores should be minimal.
The offset between the CSF and CCSF depth scales is nearly linear (Figure F38A). Close inspection of the cumulative offset as a function of depth (mbsf) (Figure F38B) shows, however, that in the upper section (0 to ~134 mbsf) cores from all three holes consistently show minimal growth factor. This is because of low expansion associated with the release of overburden combined with methane gas expansion. The growth factors below ~134 mbsf are strongly affected by gas expansion, leading to growth rates of 15%–30% that are consistent among the three holes. Below ~232 mbsf, we appended subsequent cores by their expansion, assuming minimal coring gaps (CSF scale) between cores, except for several cores with <100% recovery.
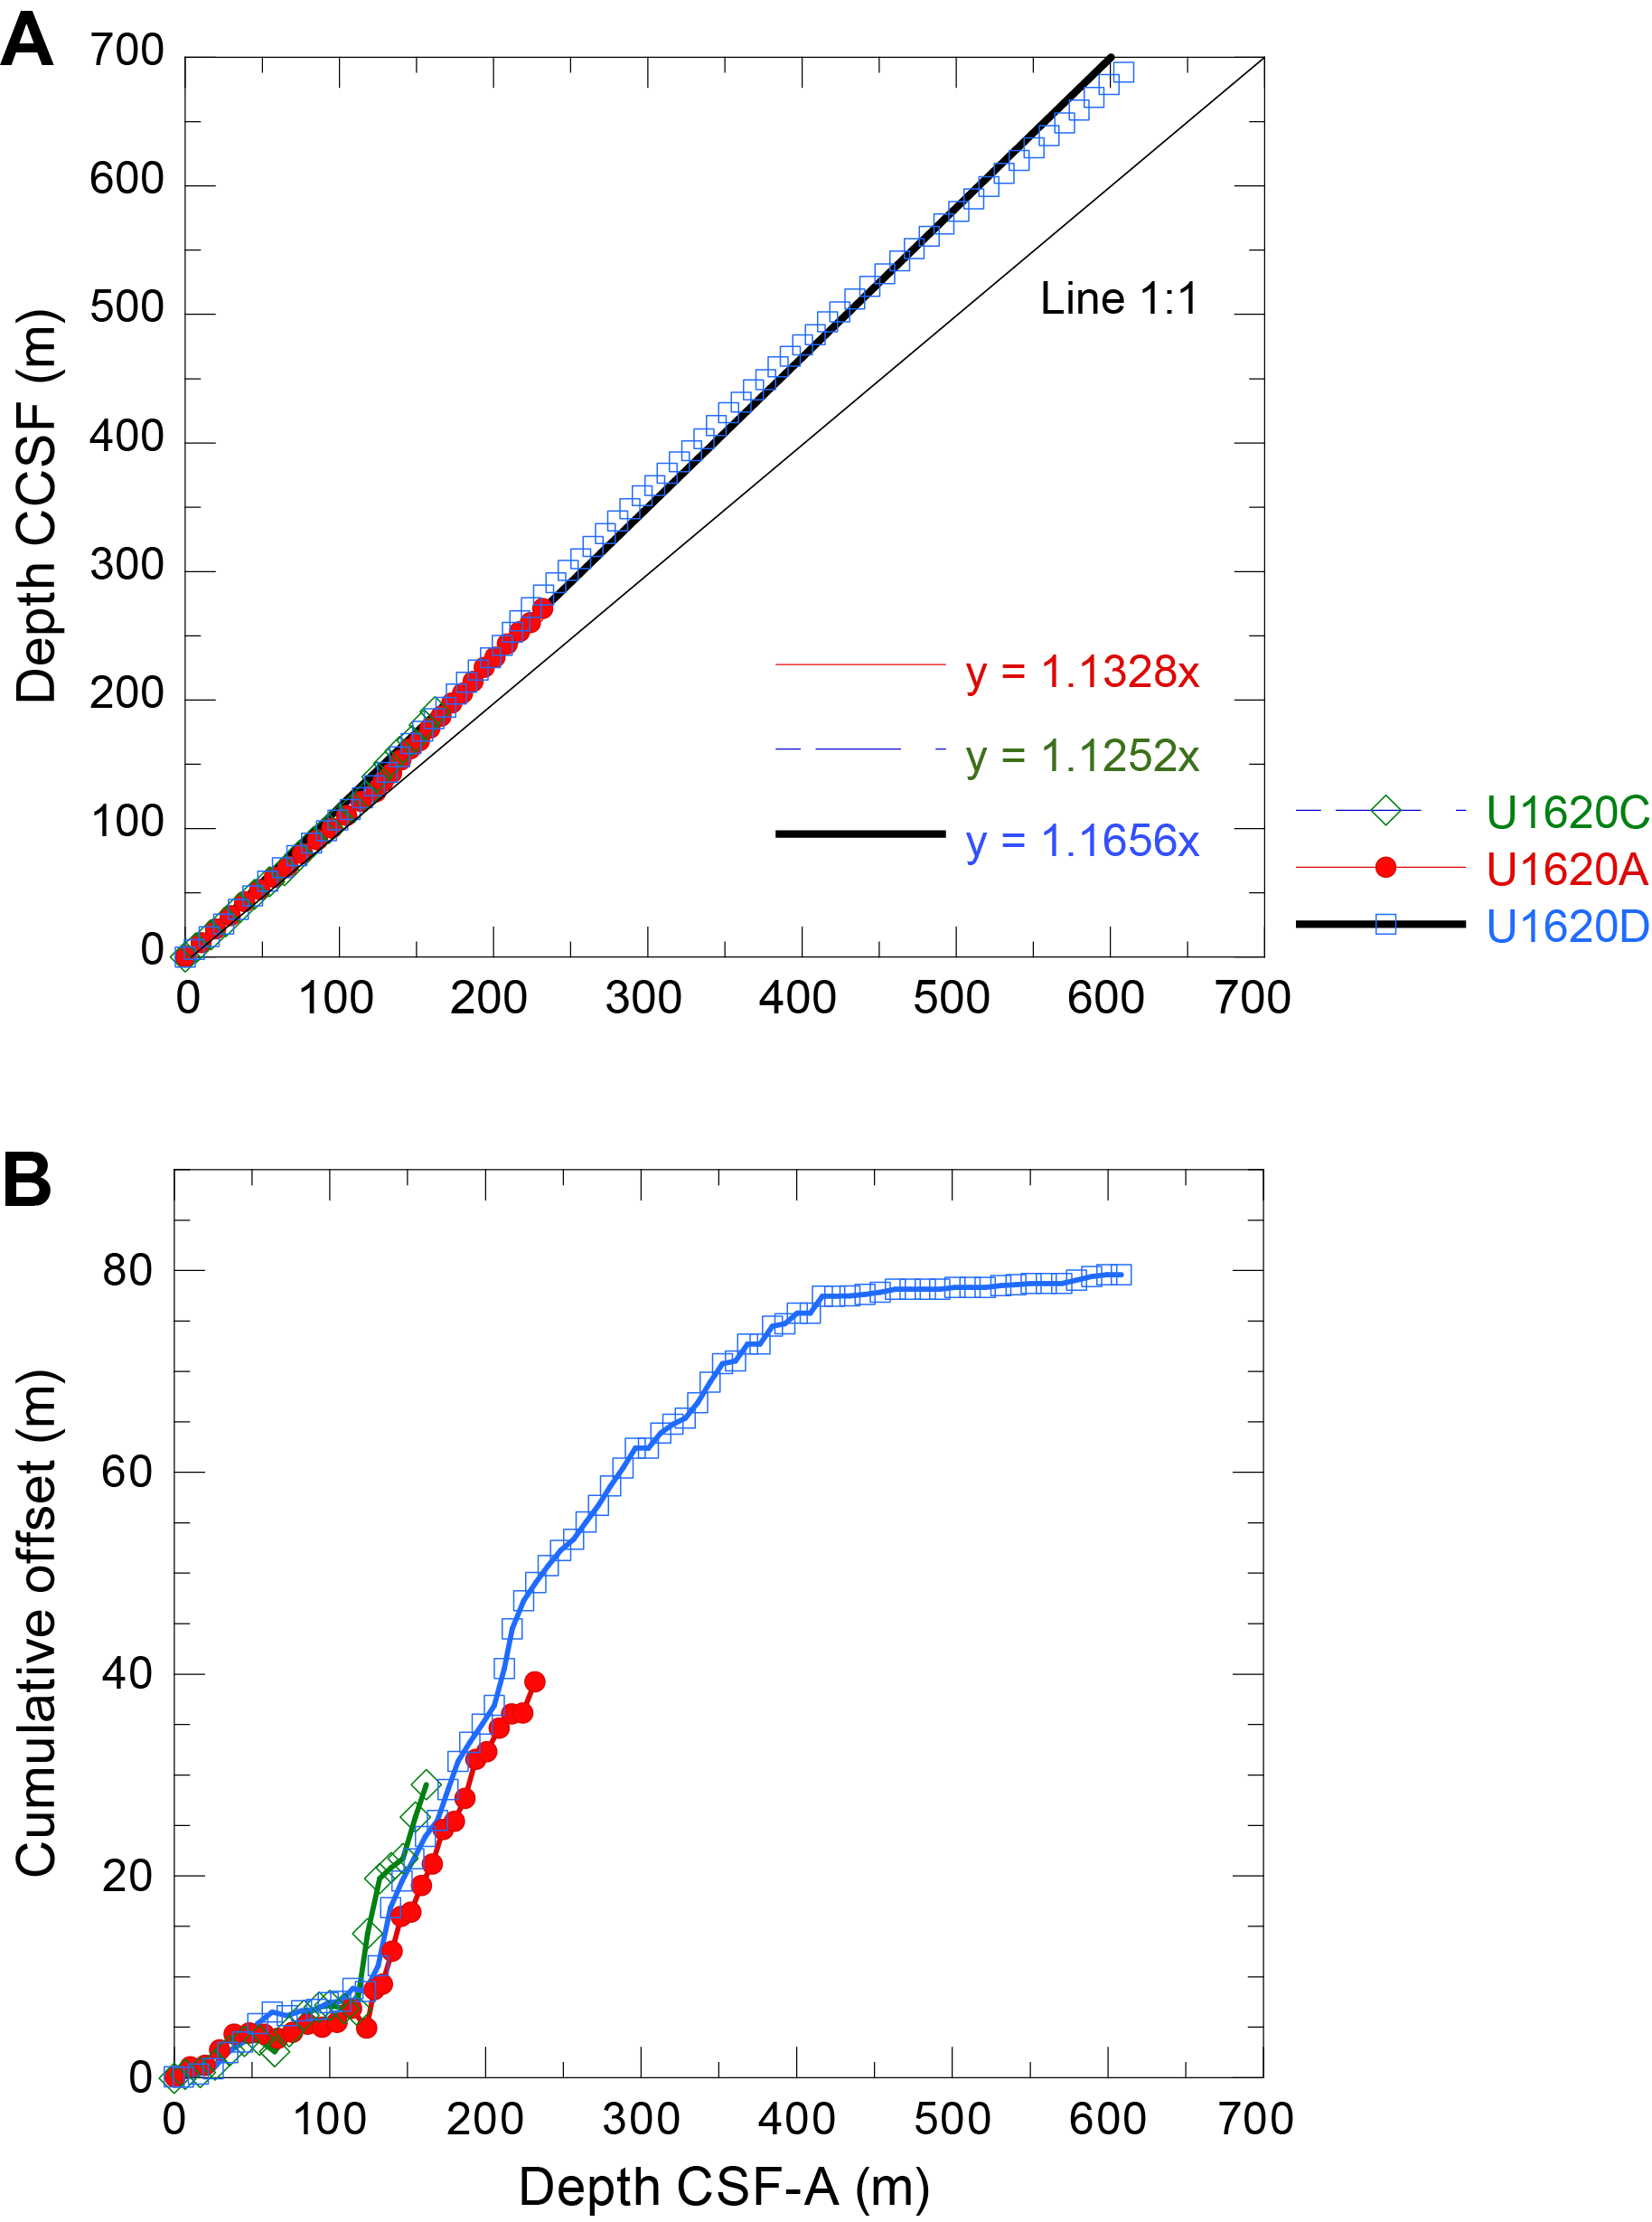
Figure F38. Depth scale offset.
In summary, we are confident about the splice for the interval 0–271.135 m CCSF. Only Hole U1620D extends below this depth, but for the most part the gaps should be small and the record is almost complete. Calculation of mass accumulation rates, based on the CCSF scale, should account for the expansion by dividing apparent depth intervals by the appropriate growth factor.
8. Geochemistry
Samples for IW chemistry, bulk sediment geochemistry, and headspace gas were analyzed at Site U1620. The main findings from IW analysis suggest organic matter diagenesis, as well as diagenetic alteration of mineral phases. The bulk sediment geochemistry trends appear to correlate with the lithostratigraphic units, and they are typical of the Arctic region (Stein and Stax, 1996).
Seismic surveys of Svyatogor Ridge have shown the presence of a gas hydrate system (Waghorn et al., 2018) that is heavily influenced by a tectonic regime, consisting of detachment faults that allow fluid migration from basement rock upward toward the sediment/water interface (Waghorn et al., 2018, 2020, 2022). The IW geochemistry, bulk sediment geochemistry, and headspace gas reflect the influence of deep fluid flow migration.
8.1. Interstitial water chemistry
A total of 45 IW samples were squeezed from 5 or 10 cm whole-round samples. Typical samples yielded 10 cm3 of water for subsequent analysis. Major and trace elements (Table T8) were measured following the analytical procedures described in Geochemistry in the Expedition 403 methods chapter (Lucchi et al., 2026a). In general, the geochemical profiles at Site U1620 show evidence of IW freshening and diagenetic reactions.
8.1.1. pH, chloride, sodium, and salinity
The pH of Hole U1620A varies between 7.2 and 8.1, whereas Hole U1620D varies between 7.5 and 7.8; overall, the pH trends of both Holes U1620A and U1620D are typical for IWs. The geochemical profiles of chloride (Cl), sodium (Na), and salinity can be used to investigate gas hydrate dissociation versus formation within sediments (e.g., Ussler and Paull, 2001; Kastner et al., 2008). Freshening of pore water occurs when gas hydrates dissociate and release freshwater into the sediment, whereas brine rejection from the formation of gas hydrates leads to the salinization of pore water. Although Cl and Na concentrations and salinity show fluctuation with depth, the general trends of Cl and salinity decrease with depth, whereas Na concentrations remain relatively close to average seawater values of 468 mM (Bruland and Lohan, 2006). Although the Cl concentrations at Site U1620 exhibit an overall decreasing trend downcore (as observed at Site U1618), there is more variation at this site than at Site U1618. Notably, there are pronounced minima in Cl concentrations at 231.08, 255.27, and 367.69 mbsf and an increase in Cl below ~440 mbsf. The Cl minima at 231.08 and 255.27 mbsf are only ~10 mM lower than average seawater value (Bruland and Lohan, 2006), whereas the minimum at 367.69 mbsf is ~20 mM lower than average seawater value, and all three decreases in Cl concentration correlate to slight decreases in salinity and increased methane (described below). There are additional correlations with other data (see Physical properties); specifically, at ~233 and ~249 mbsf, the physical properties data indicate sediments at these depths contain low water content, relatively higher density, and lower porosity (see Physical properties), and the overall geothermal gradient (see Downhole measurements) does not support hydrate formation in the modern day. The overall correlations with multiple data sets may suggest different phenomena, such as the destabilization of paleo–gas hydrates (possibly due to isostatic adjustments related to glaciation–deglaciation; e.g., Wallmann et al., 2018), disintegration of gas hydrates upon core surfacing, and/or the effect of free gas movement to pore water composition. Further postcruise geochemical studies are required to narrow down the main mechanism behind these trends. The slight increase in Cl below ~440 mbsf is likely attributed to the change of phase by hydration of the methane derived from serpentinization of nearby ultramafic rocks (i.e., Waghorn et al., 2020).
Sodium (Na) concentrations are consistently close to average seawater values (e.g., Bruland and Lohan, 2006) throughout the recovered sediment profile. Due to variability of Na from inductively coupled plasma–atomic emission spectroscopy (ICP-AES) measurements, we used ion chromatography (IC)-measured Na to describe Na trends. Sodium slightly increases below approximately 440 mbsf to 577.27 mbsf, which correlates well with the slight increase of Cl at this same depth interval.
The geochemical profile of salinity varies with depth from 35 at 7.61 mbsf to ~31 at 577.27 mbsf, which indicates a slight decrease downcore. The geochemical profiles of Cl, Na, and salinity (Figure F39) are likely reflective of the (bio)geochemical impact that the gas hydrate system has on pore water chemistry at Svyatogor Ridge.
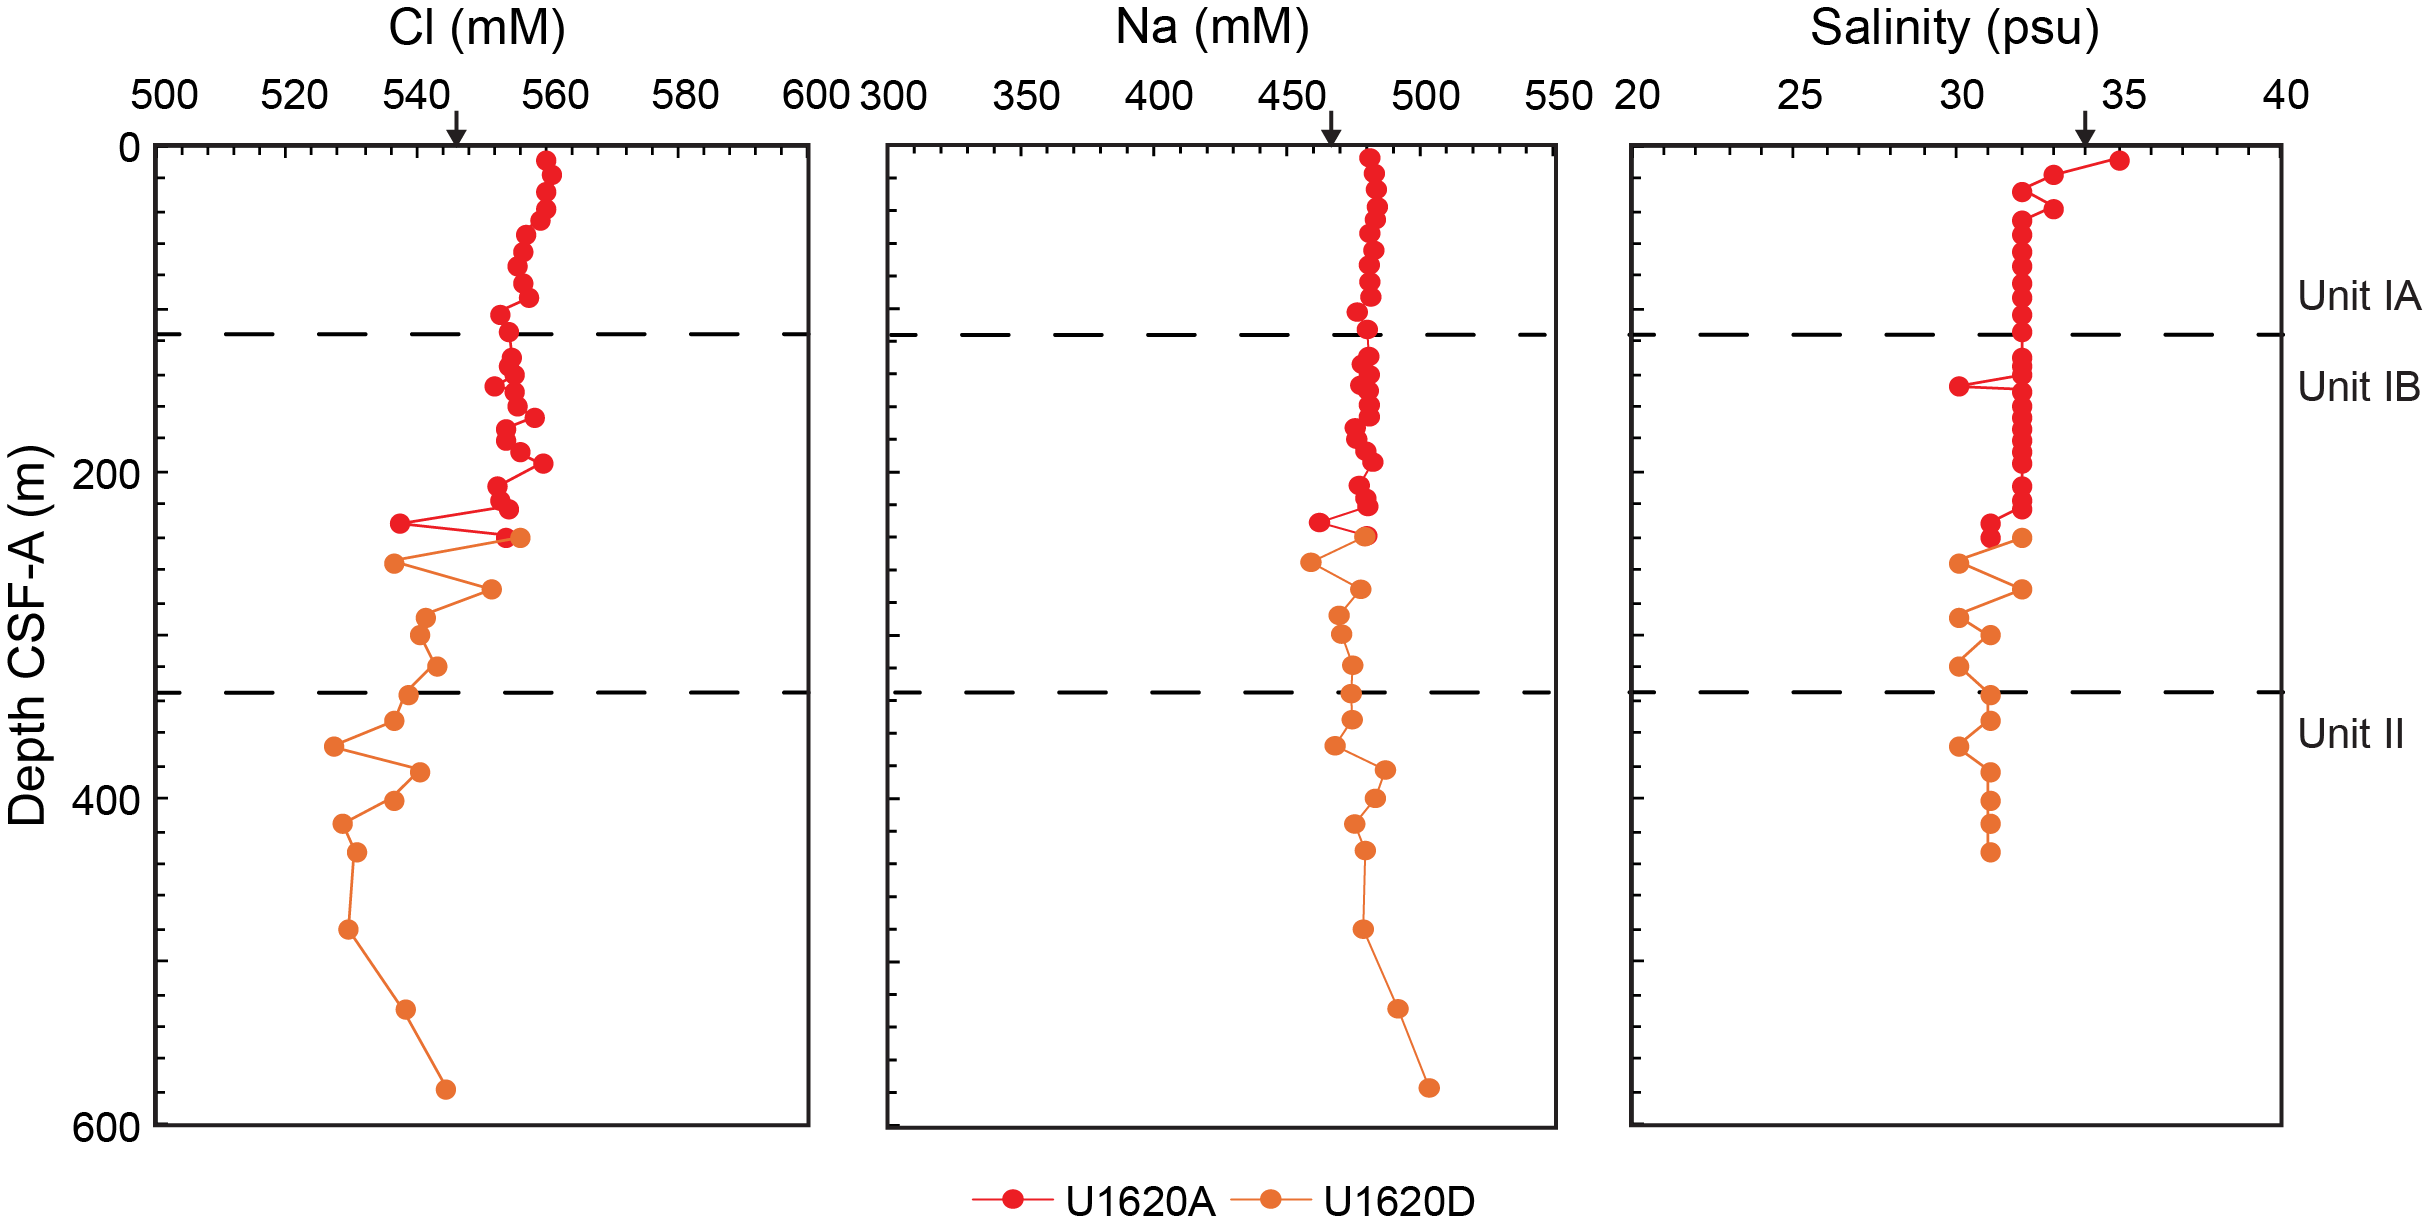
Figure F39. IW chloride, sodium, and salinity.
8.1.2. Sulfate, alkalinity, iron, and manganese
Sulfate at Site U1620 decreases from 13 mM at 7.61 mbsf to ~1 mM at 17.3 mbsf, below which sulfate is severely depleted (concentrations remain at values ≤ 1 mM). The rapid decrease in sulfate concentrations between 7.61 and 17.3 mbsf marks the SMTZ. The location of the SMTZ is also supported by the presence of methane in the headspace samples (described below) where sulfate is depleted. The SMTZ at Site U1620 is shallow and near the sediment/water interface, which is expected given the high methane supply (Borowski et al., 1996; Graves et al., 2017). The shallow SMTZ is additionally supported by the alkalinity data; the alkalinity concentration increases from ~9 to ~12 mM within the SMTZ, which is consistent with the production of bicarbonate that occurs due to the anaerobic oxidation of methane (AOM). Broader trends in the record show alkalinity concentrations decrease within Lithostratigraphic Subunits IA and IB and then increase around the transition into Unit II and continue to increase throughout Unit II, which is well correlated with the preservation of nannofossils (see Biostratigraphy and paleoenvironment). The alkalinity trend is inversely correlated with total organic carbon (TOC; described below).
In general, sulfate in marine sediments reaches near-zero concentrations once the sulfate from seawater is depleted by microbial processes in the upper sediment layers. However, we find low but traceable amounts of sulfate in the lower depths of the record, increasing from ~1 mM at 239.75 mbsf to a maximum of ~2 mM at 480.08 mbsf, which may represent slight seawater contamination from trace amounts of drill fluid present in the sediment “gravy” created during XCB coring.
Iron concentrations decrease from ~10 to ~1 µM from 7.61 to 17.3 mbsf, which is indicative of Fe reduction above the SMTZ. Although Fe concentrations remain at values ≤ 1 µM, there are few depths where Fe concentrations reach values ≥ 1 µM, with a maximum concentration of ~24 µM at 239.75 mbsf. Manganese (Mn) decreases from ~40 to ~3 µM from 7.61 to 17.3 mbsf, indicative of Mn reduction above the SMTZ. The Mn concentrations fluctuate between ~0 and ~6 µM in the IWs below the SMTZ. The reduction of Fe and Mn above the SMTZ is associated with organic matter remineralization (discussed below), and the concentrations of Fe and Mn with depth are attributed to lithology changes and consumption within diagenetic mineral phases. The maxima of Fe and Mn coincide with increases of heavy hydrocarbons (described below); these may be related because Fe can act as an adsorbent of hydrocarbons as well as be involved in hydrocarbon degradation reactions. Sulfate, alkalinity, Fe, and Mn concentration-depth profiles are shown in Figure F40.
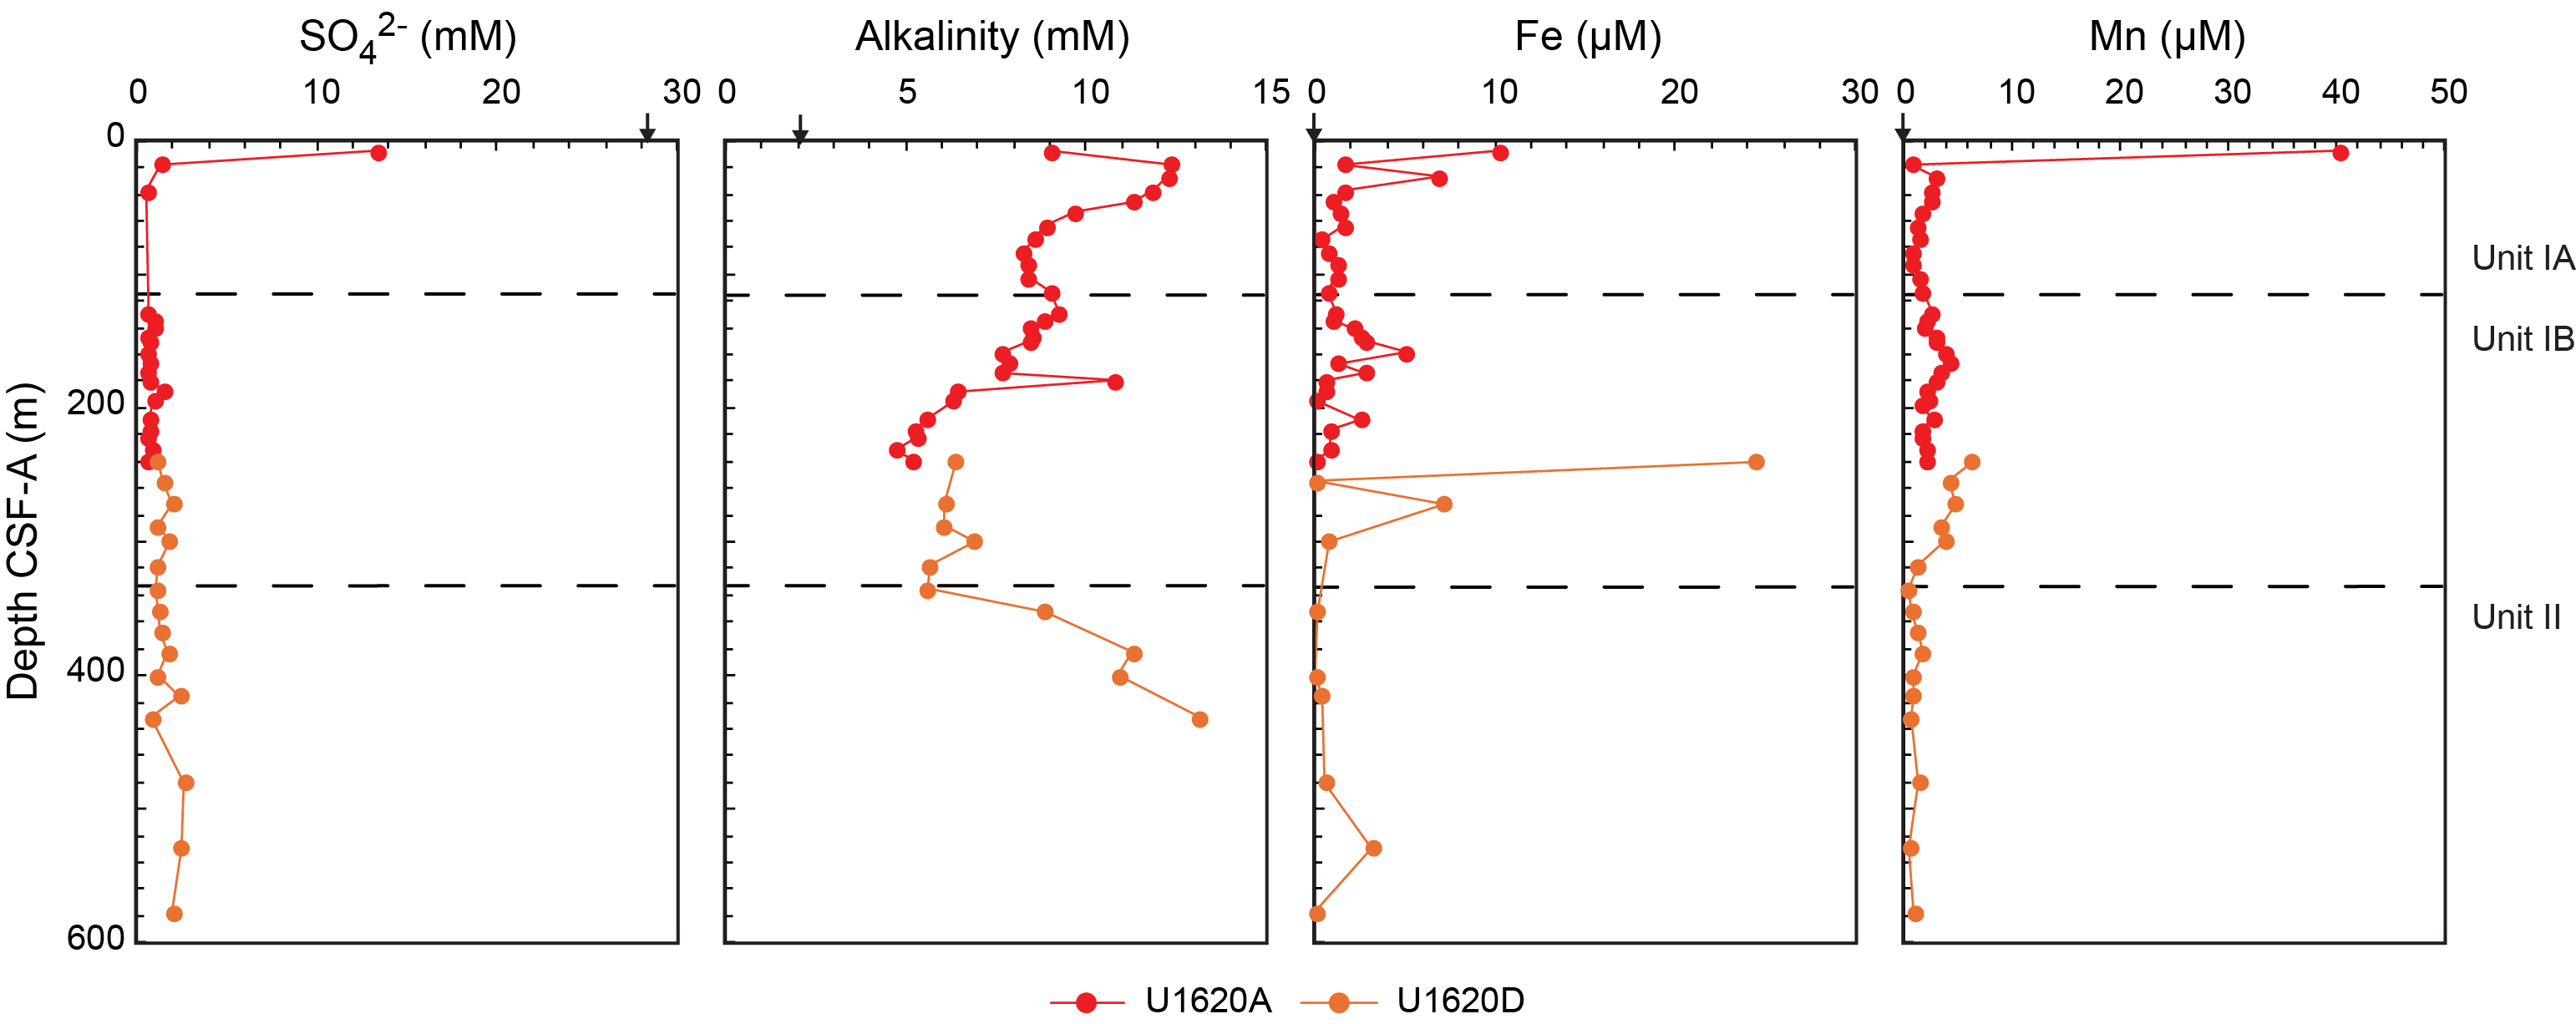
Figure F40. IW sulfate, alkalinity, iron, and manganese.
8.1.3. Calcium, magnesium, strontium, silica, barium, lithium, boron, bromide, and potassium
The IW geochemical profiles of calcium (Ca), magnesium (Mg), and strontium (Sr) are consistent with what is expected within the SMTZ and methanogenic sediments. Calcium decreases within the SMTZ, consistent with the formation of authigenic carbonates during AOM (Graves et al., 2017). Below the SMTZ, Ca concentrations increase with depth to ~350 mbsf, suggesting Ca release in the IWs. The continuous release of Ca with depth to ~350 mbsf is most likely due to calcite dissolution, given the Sr concentrations also increase with depth. In contrast, Mg decreases with depth from ~44 mM at 7.61 mbsf to ~9 mM at 577.27 mbsf, which suggests Mg may be consumed in authigenic carbonate mineral formation and possibly replacing Ca in the solid phase. Dolomite formation at Site U1620 cannot be excluded because the geochemical profile of Mg indicates removal from the IWs.
The geochemical profile of silica (Si) fluctuates with depth, indicative of a combination of sediment gravy created due to XCB coring and silicate alteration within methanogenic sediments (see alkalinity discussion above). The dissolved barium (Ba) is indicative of barite formation above the SMTZ at 7.61 mbsf, followed by Ba dissolution within Lithostratigraphic Subunits IA and IB due to sulfate depletion (e.g., Torres et al., 1996; Dickens, 2001). In Unit II, dissolved Ba significantly increases but is variable, ranging between ~80 and ~30 µM. The variability of Ba in Unit II may be related to the burial of sediments with more barite than dissolution, resulting in a variable Ba IW profile. Potassium is nearly consumed with depth, reaching concentrations of ~2 mM at depth, whereas bromide (Br) increases to 1.3 mM at 221.21 mbsf followed by a slight decrease with depth. Lithium (Li) in the IW increases with depth to ~615 µM, below which Li concentration decreases with depth to ~342 µM. The concentrations of ~615 to ~342 µM are significantly higher than average seawater (~25.9 µM; Bruland and Lohan, 2006). Additionally, the gradual transition in concentration from increasing with depth to decreasing with depth corresponds to the change of Subunit IB to Unit II. The geochemical profile of Li is most likely attributed to diffusion from a Li-rich fluid within core recovery intervals and may potentially be sourced to reactions within oceanic crust and hydrothermal fluids (Zhang et al., 1998). Furthermore, reactions with oceanic crust and hydrothermal fluids can mobilize boron (B) within sediments. The B profile increases with depth, suggesting B is mobilized within the sediment column of Site U1620. Large detachment faults within Svyatogor Ridge act as conduits for deep fluid flow migration through sediments (Waghorn et al., 2018, 2022), and these faults may have provided the pathway for the Li-rich fluid observed. The Ca, Mg, Sr, Si, Ba, and Li concentration-depth profiles are shown in Figure F41, and the K and B profiles are shown in Figure F42.
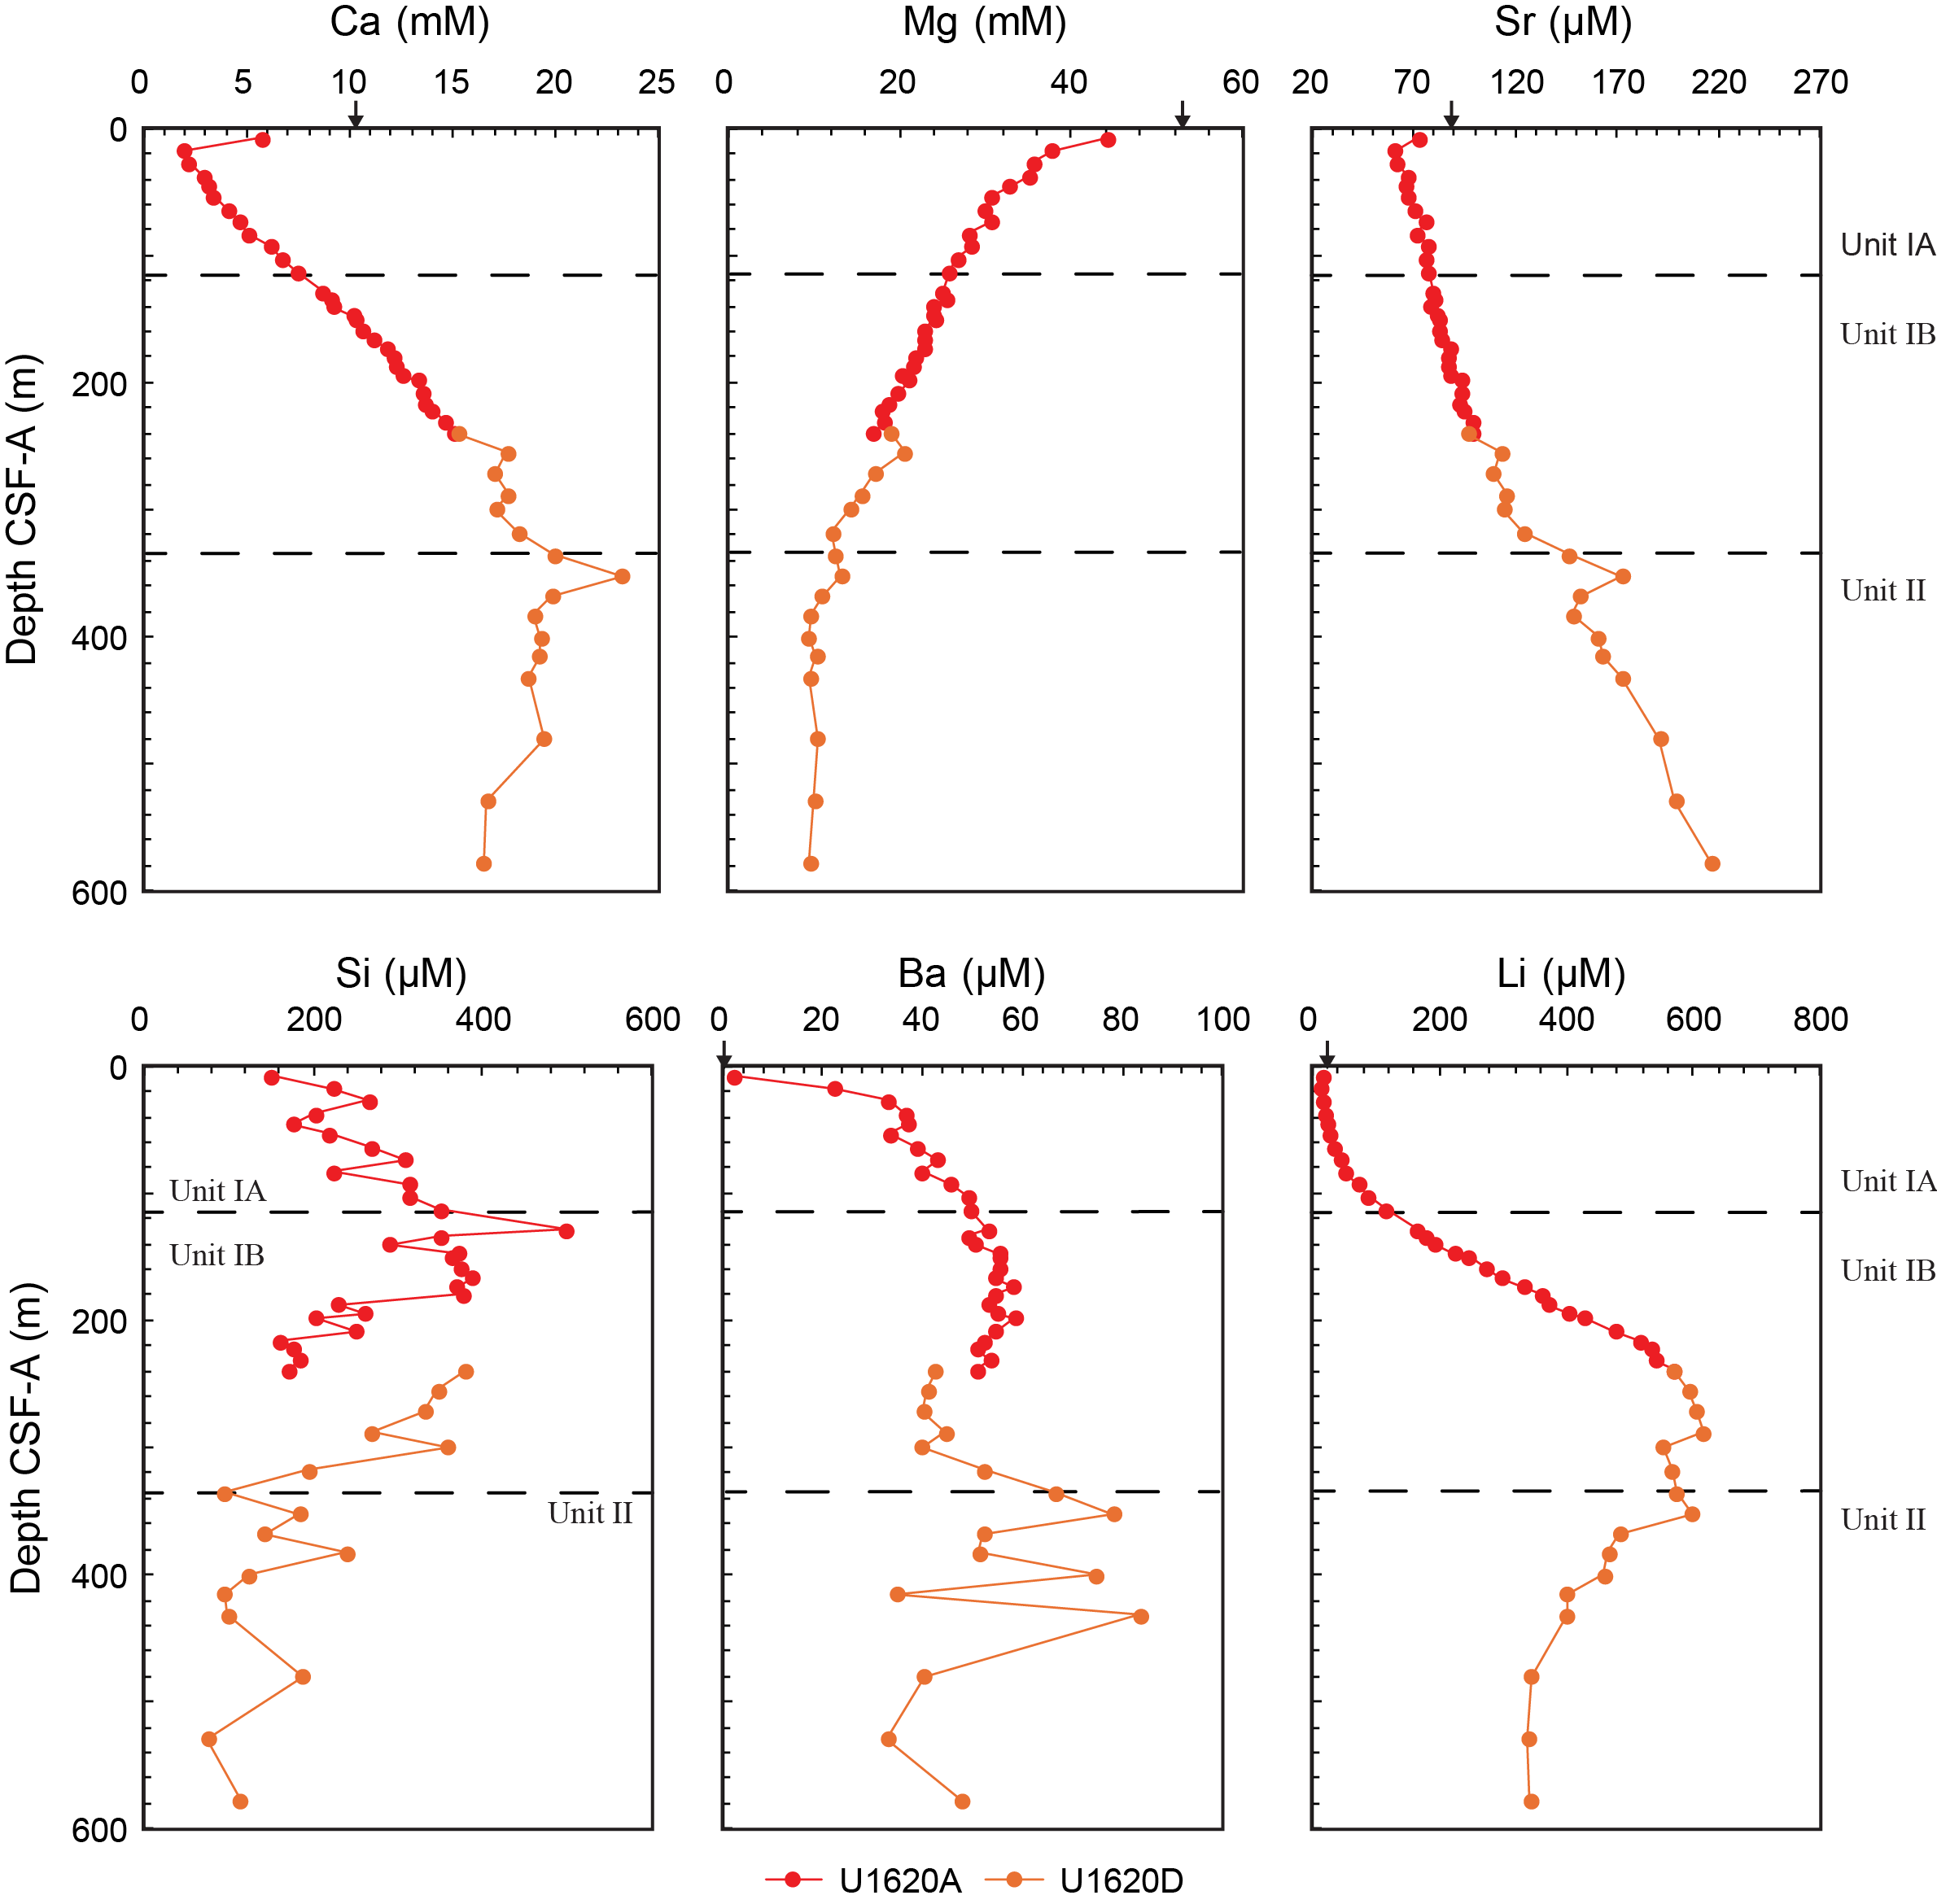
Figure F41. IW calcium, magnesium, strontium, silica, barium, and lithium.
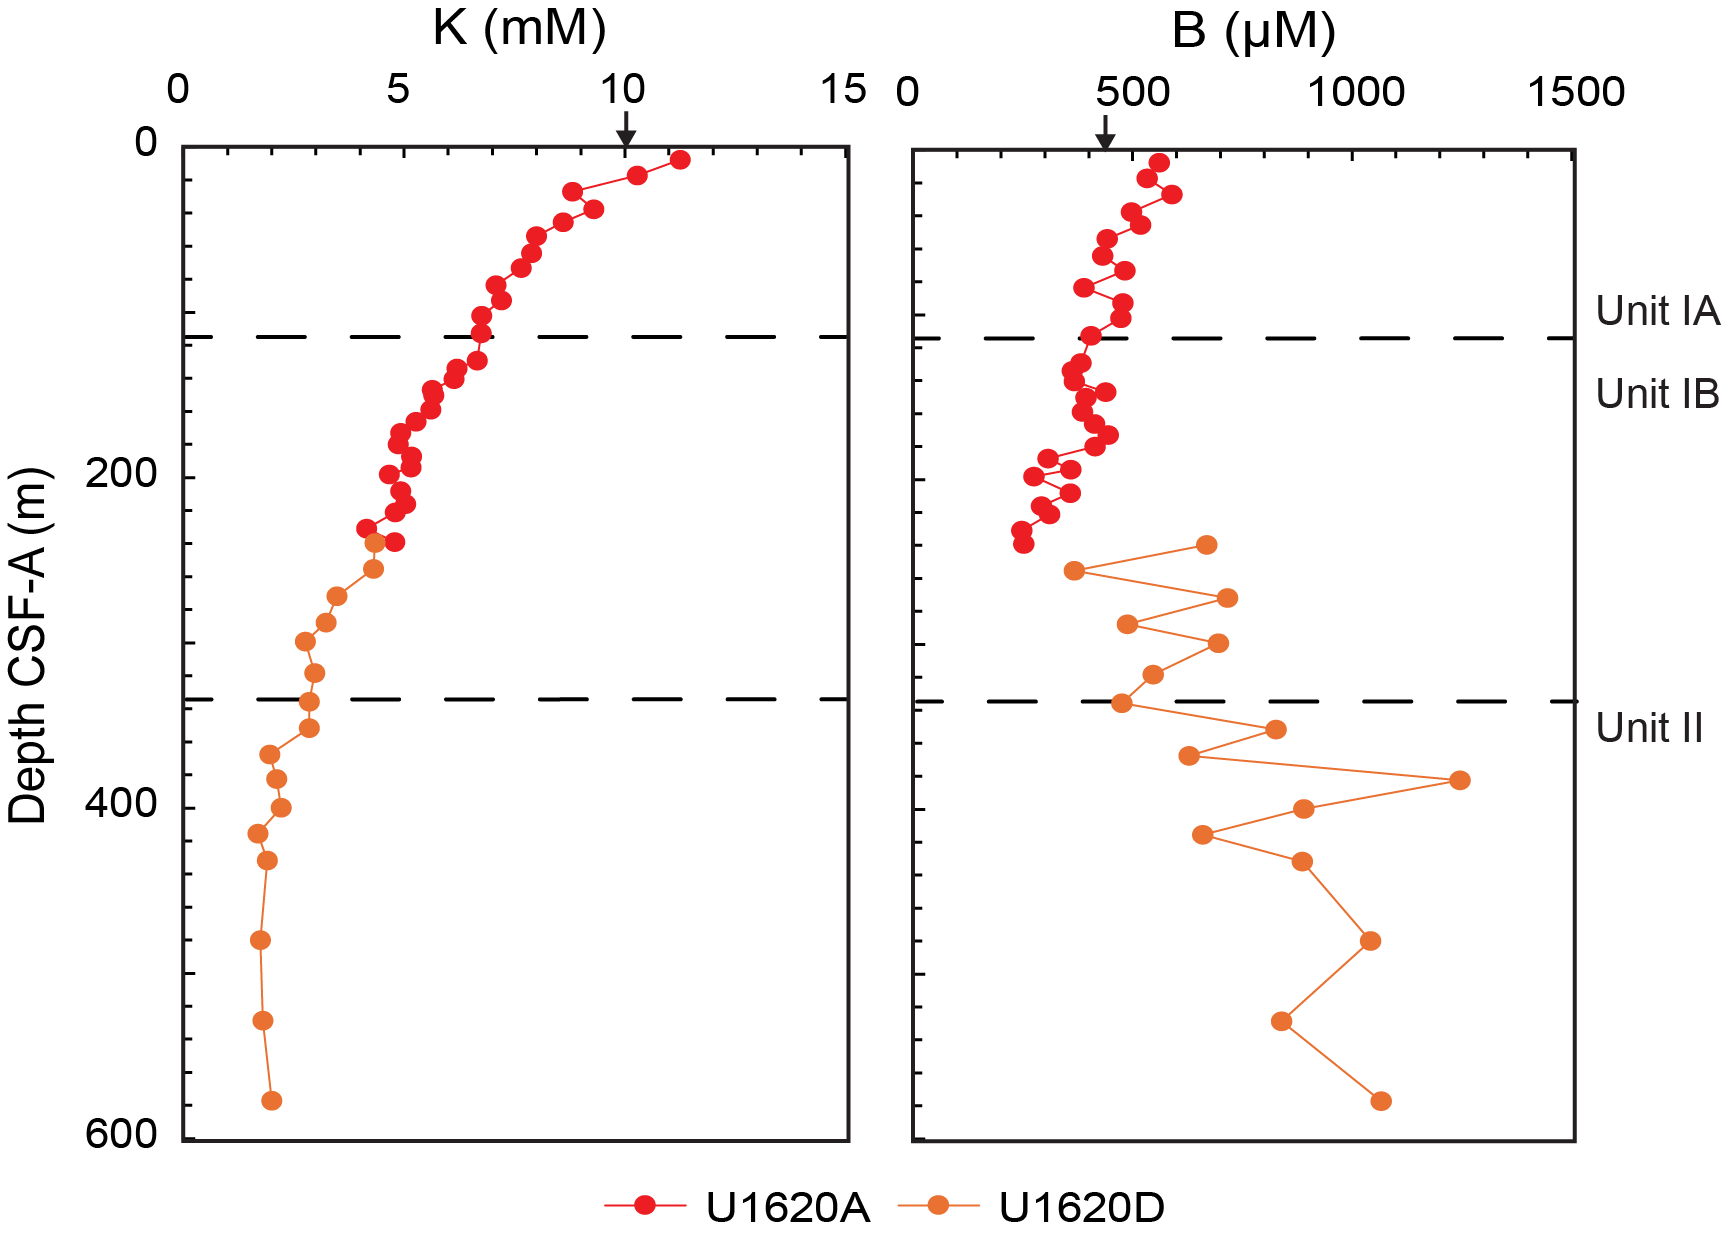
Figure F42. IW potassium and boron.
8.1.4. Phosphate and ammonium
The geochemical profile of phosphate increases from ~27 µM at ~7 mbsf to ~99 µM at ~17 mbsf, followed by a consistent decrease with increasing depth ranging between 6 and 7 µM down to ~577 mbsf. The increase in phosphate concentrations at the sediment/water interface is most likely due to organic matter remineralization resulting from Fe and Mn reduction. Ammonium concentrations within the IWs increase from ~1 mM at ~7 mbsf to ~6 mM at ~92 mbsf, followed by a progressive decrease in concentration to ~3 mM down to ~577 mbsf. The ammonium geochemical profile is most likely a result of organic matter diagenesis, supporting the interpretation of the phosphate IW data. The ammonium near-zero value at ~180 mbsf is possibly analytical-related or seawater contamination. Ammonia profiles follow the total nitrogen (TN) trend (discussed below). The phosphate and ammonium concentration-depth profiles are shown in Figure F43.
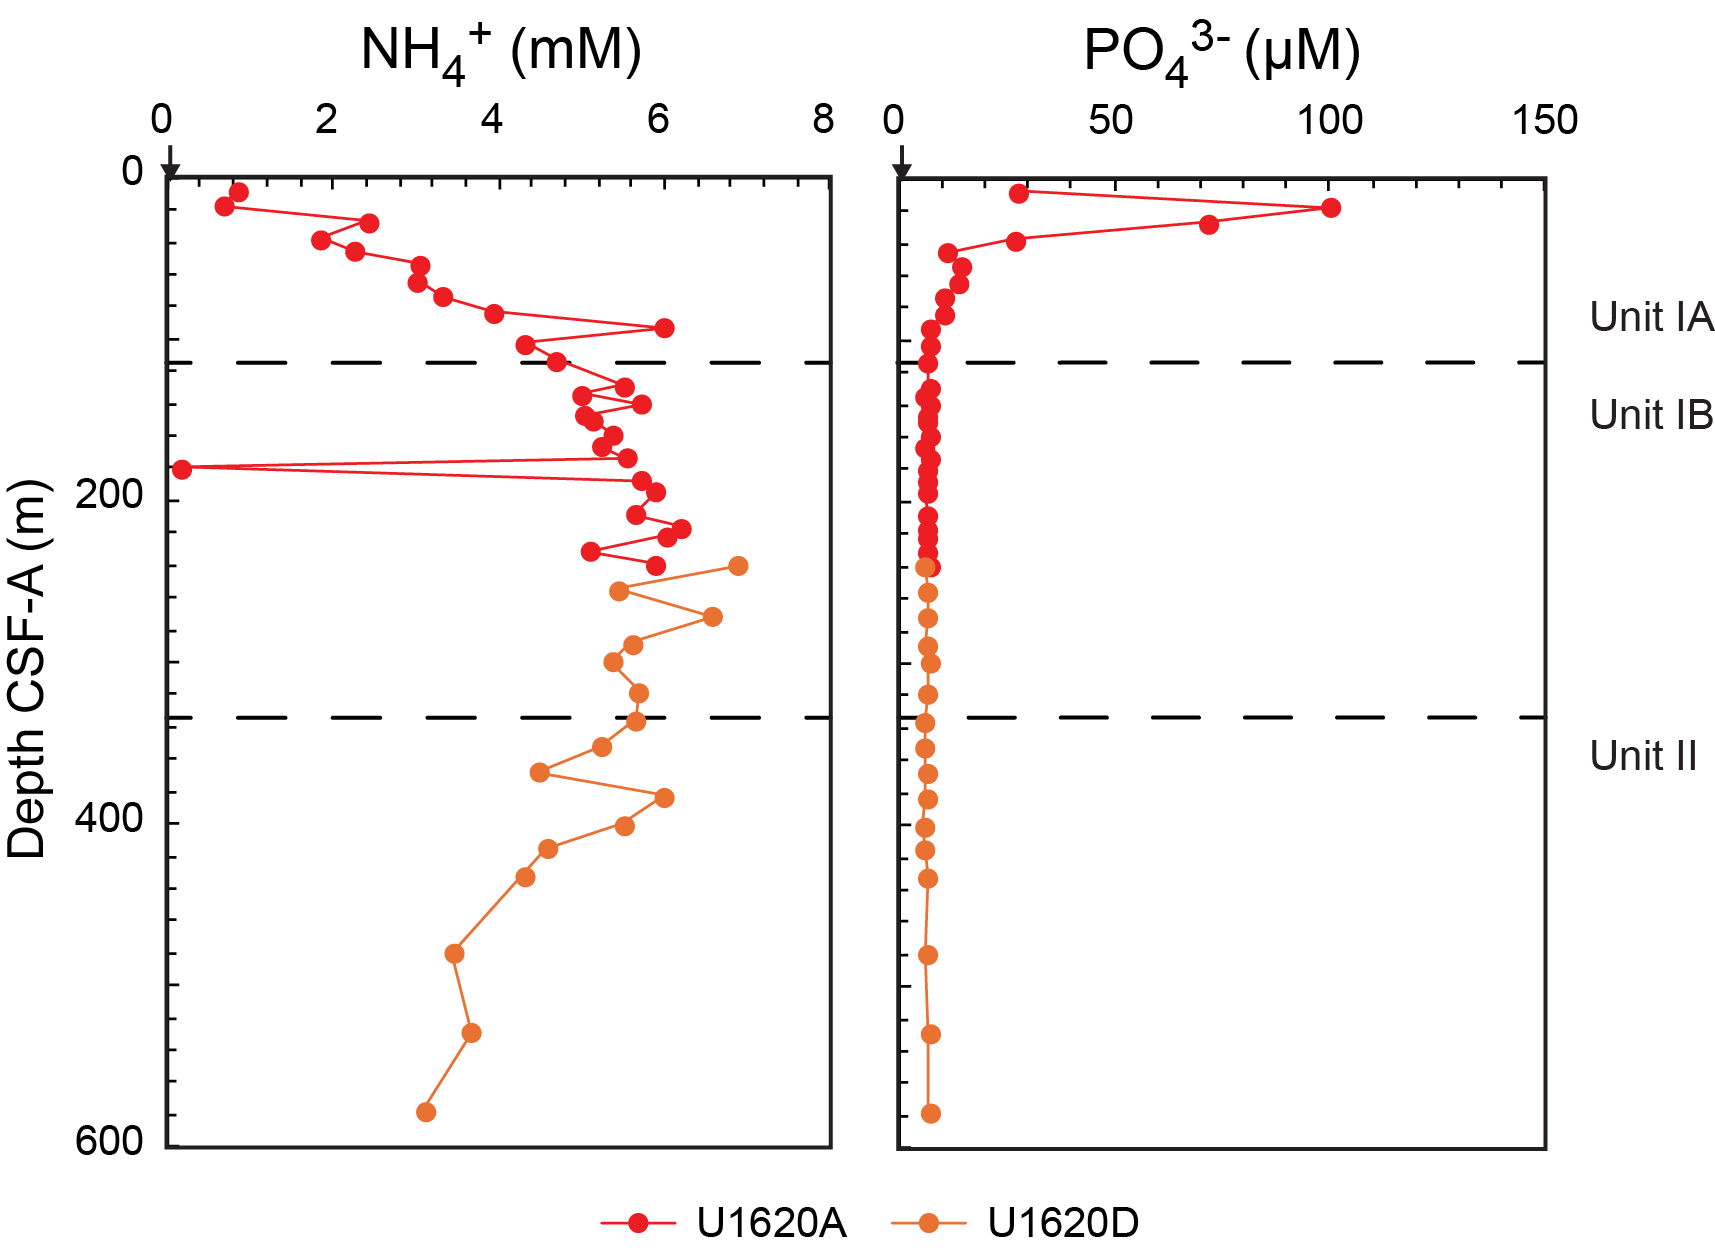
Figure F43. IW ammonium and phosphate.
8.2. Sedimentary organic geochemistry
The shipboard solid-phase analysis at Site U1620 involved measurements of total inorganic carbon (TIC; i.e., calcium carbonate [CaCO3]), TN, total carbon (TC), TOC (calculated as TC − TIC), and total sulfur (TS) (Table T9) using shipboard plastic cylinder sampling (sample type CARB). The sedimentology team identified intervals for CARB samples at Holes U1620A and U1620D, resulting in a total of 77 samples taken. These samples are not systematically spaced and include representation of both major and minor lithologies.
Figure F44 illustrates the downcore profiles of TC, CaCO3, TOC, TN, and TOC/TN (C/N) at Site U1620. The TC content in the sedimentary sequences of Holes U1620A and U1620D mostly exceeds values of 1 wt%, with the highest content observed at 300.22 and 372.18 mbsf. The CaCO3 content varies, ranging 0–22 wt%, with increases closely corresponding to those of TC. The TC and CaCO3 peaks are possibly derived from authigenic carbonate minerals formation primarily, as biogenic carbonates (e.g., foraminifers and nannofossils) are generally in low abundance (see Biostratigraphy and paleoenvironment) and authigenic minerals were observed at Site U1620 (see Lithostratigraphy).
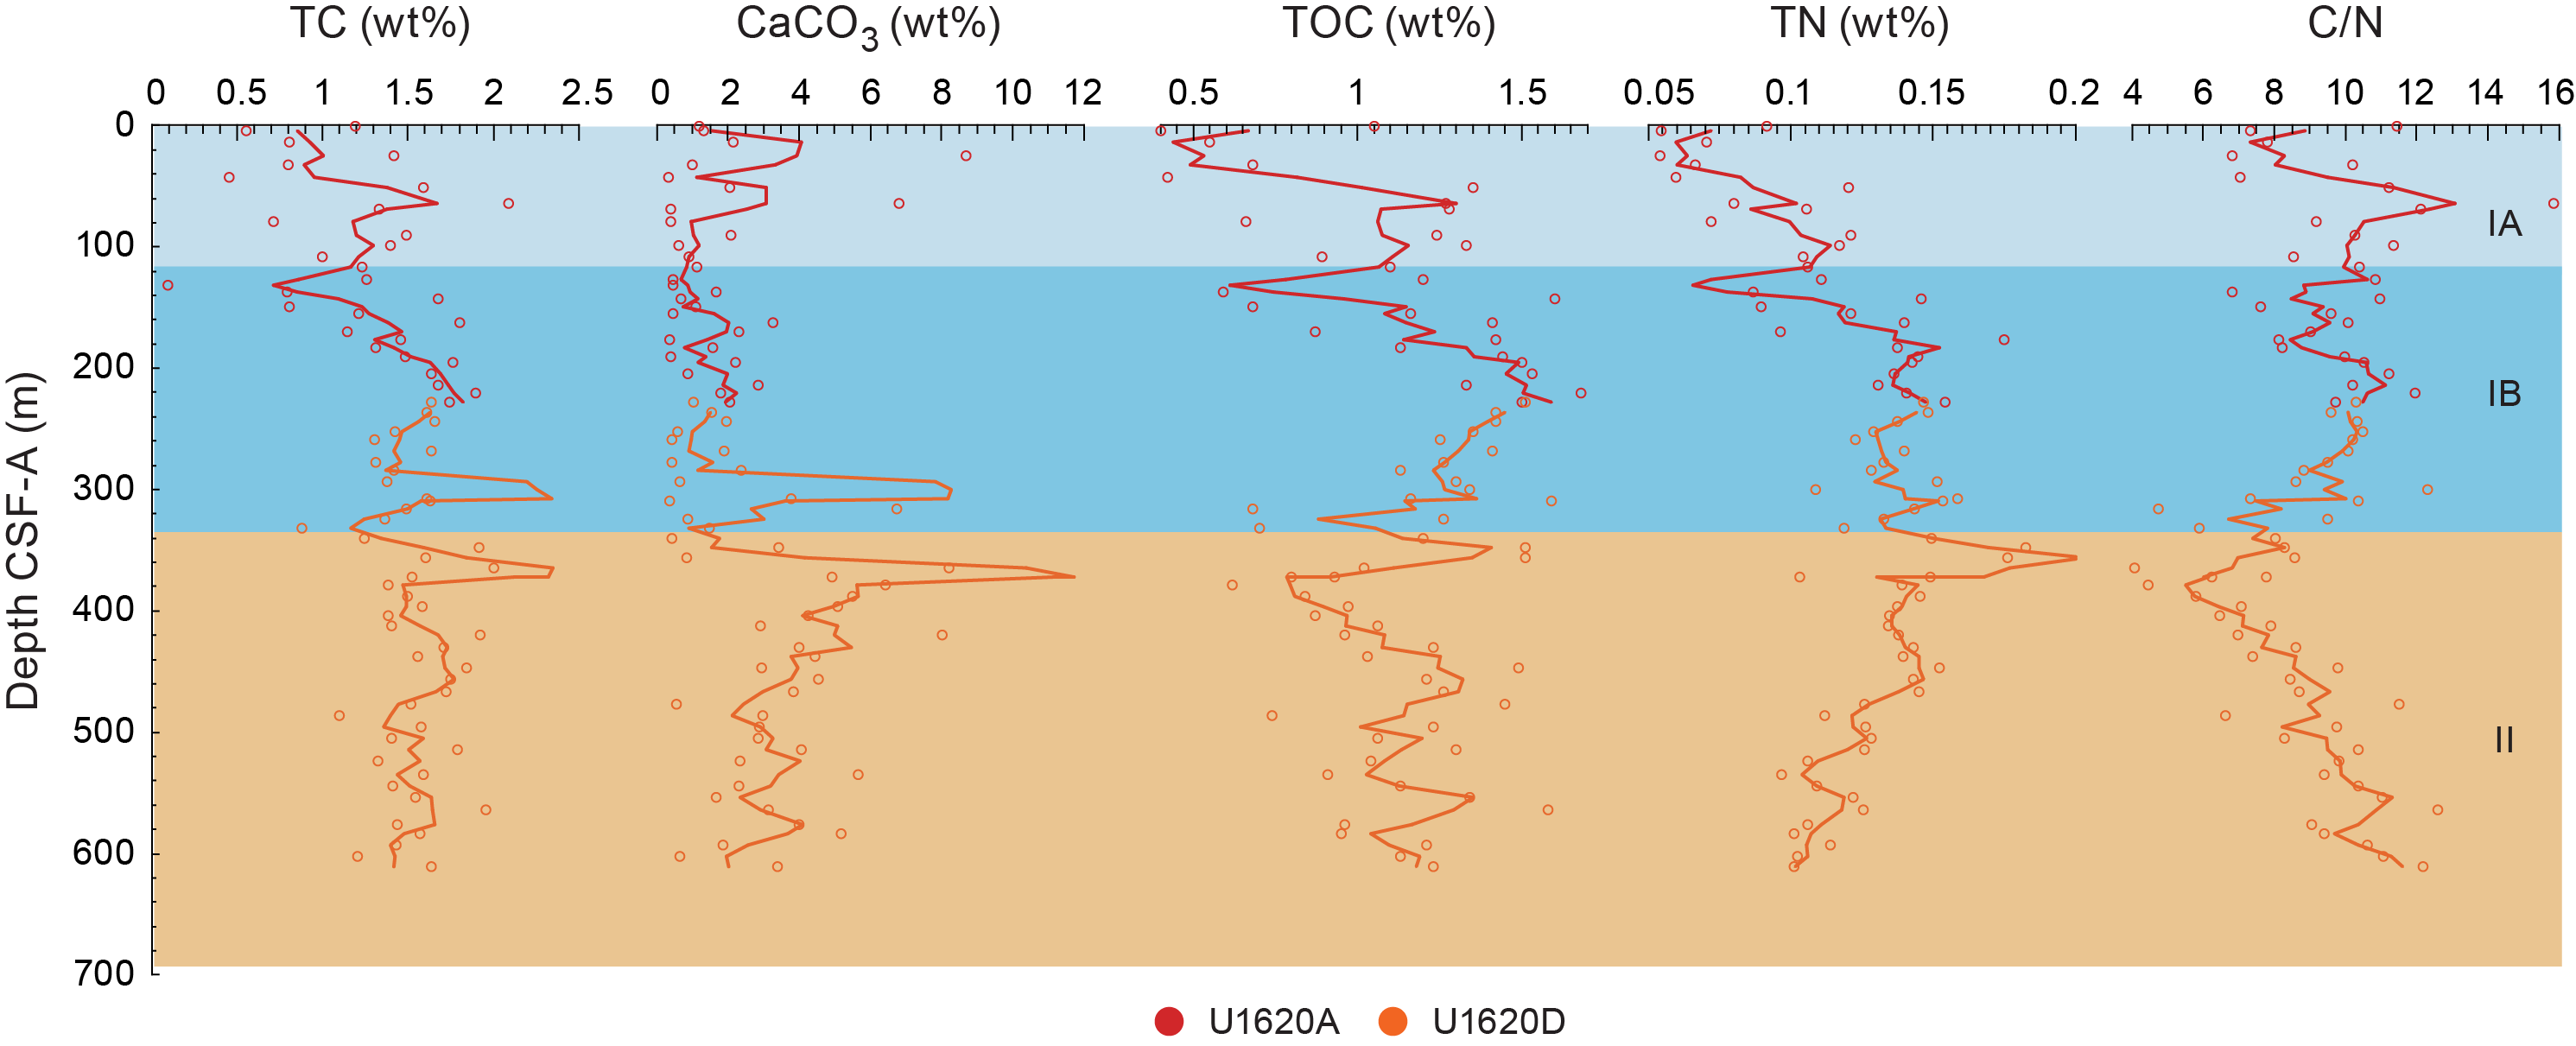
Figure F44. Bulk sediment contents of TC, CaCO3, TOC, TN, and C/N ratio.
In the upper layers of Lithostratigraphic Subunit IA, the TOC content is relatively low at approximately 0.5 wt%, increasing to above 1 wt% at around 42 mbsf followed by a decrease to the base of Subunit IA. From the upper layers of Subunit IB (around 115 mbsf), the TOC content increases to 1.6 wt% at 227.64 mbsf and then decreases to the base of Subunit IB. In Unit II, there is large variability, with mean values at around 1 wt%. The overall trend of TOC variations is well correlated with an inverse relationship to the alkalinity of IW, suggesting that the changes in TOC may be closely related to methanogenesis accompanied by the decomposition of organic matter. The TN content ranges between 0.05–0.2 wt%. The TN content shows an overall increasing trend in Subunits IA and IB, with a prominent minimum at the Subunit IA/IB boundary, and a general decreasing trend in Unit II, except for a prominent peak of 0.3 wt% at 364.45 mbsf. This trend is well correlated with the ammonium pattern, further suggesting that the degradation of organic matter is active at Site U1620. TS is variable (Figure F45), ranging between 0 and 2.5 wt%, with higher TS contents observed within Unit II.
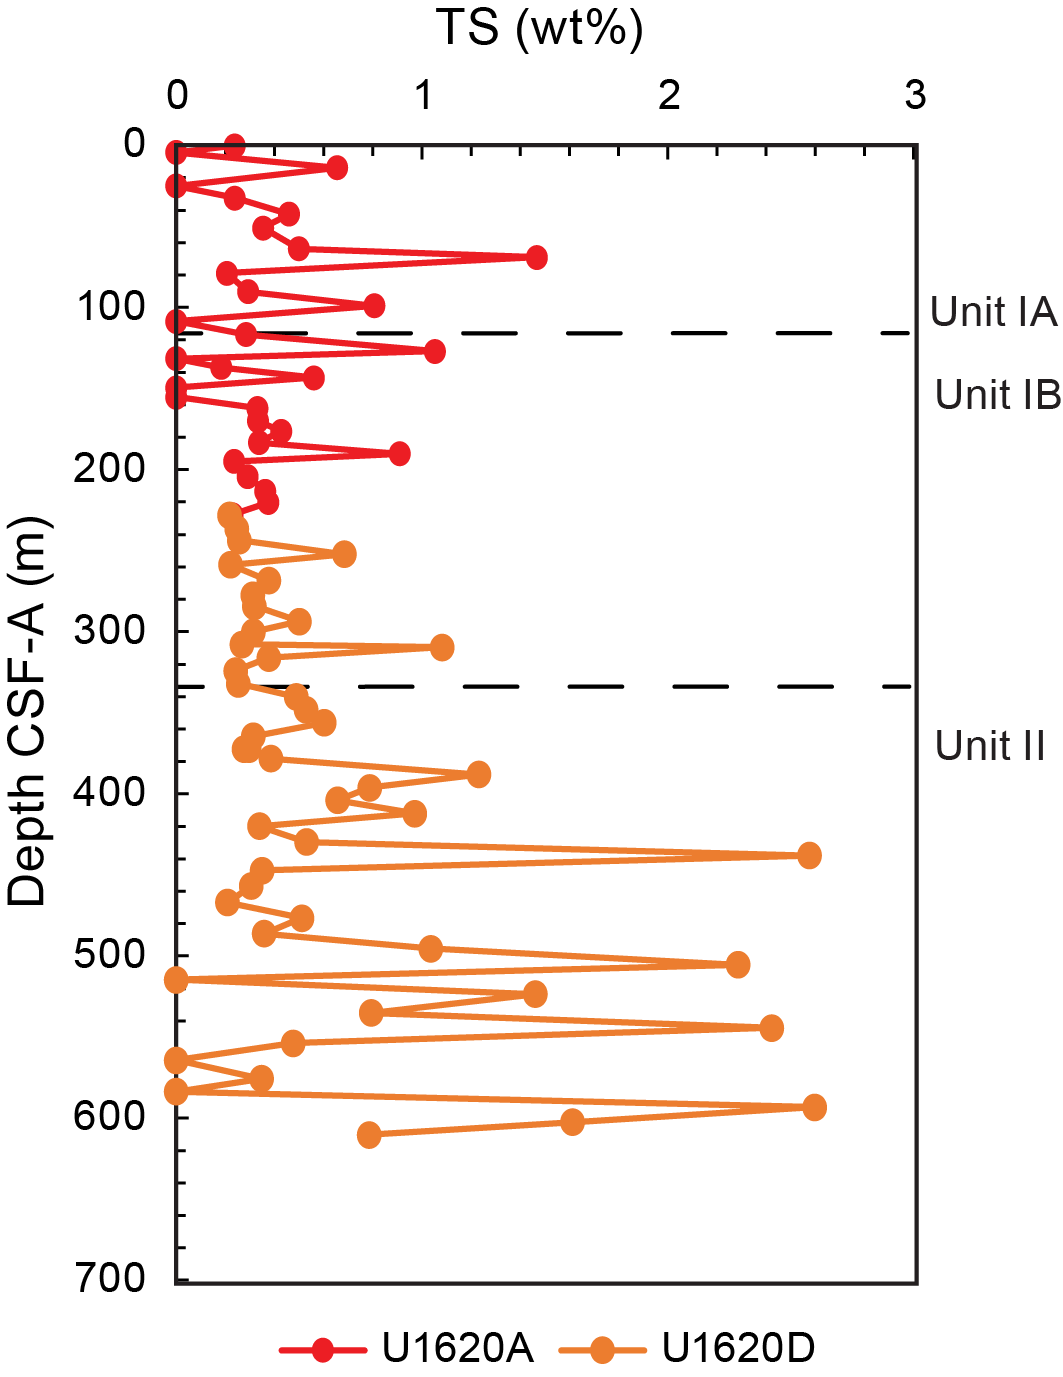
Figure F45. Bulk sediment contents of TS.
The C/N ratio is commonly used to identify the origin of sedimentary organic matter (e.g., Meyers, 1997). Generally, C/N ratios between 4 and 10 indicate a marine origin, primarily from marine algae, whereas values of 20 or greater tend to suggest the input of terrestrial organic matter (e.g., Meyers, 1994; Meyers, 1997). At Site U1620, the C/N ratio fluctuates, ranging 4–16. Values > 10 were observed at approximately 40–120, 200–280, and 520–610 mbsf, possibly indicating input of terrestrial organic matter at these depths. Conversely, the low values (<10) observed at approximately 300–380 mbsf may indicate a relationship with high marine productivity.
8.3. Headspace gas geochemistry
As part of standard safety and environmental monitoring procedures, headspace hydrocarbons (Table T10) were measured at Site U1620 with a resolution of one sample per core. Considering the high gas anomalies observed while coring at this site, we decided to take headspace samples from all holes except U1620B to ensure safe drilling (Figure F46). A total of 126 samples were analyzed from Holes U1620A, U1620C, and U1620D. Additionally, void gas samples (VACs) were analyzed from 10 samples in Holes U1620A and U1620C where voids were observed through the core liner on the core receiving platform.
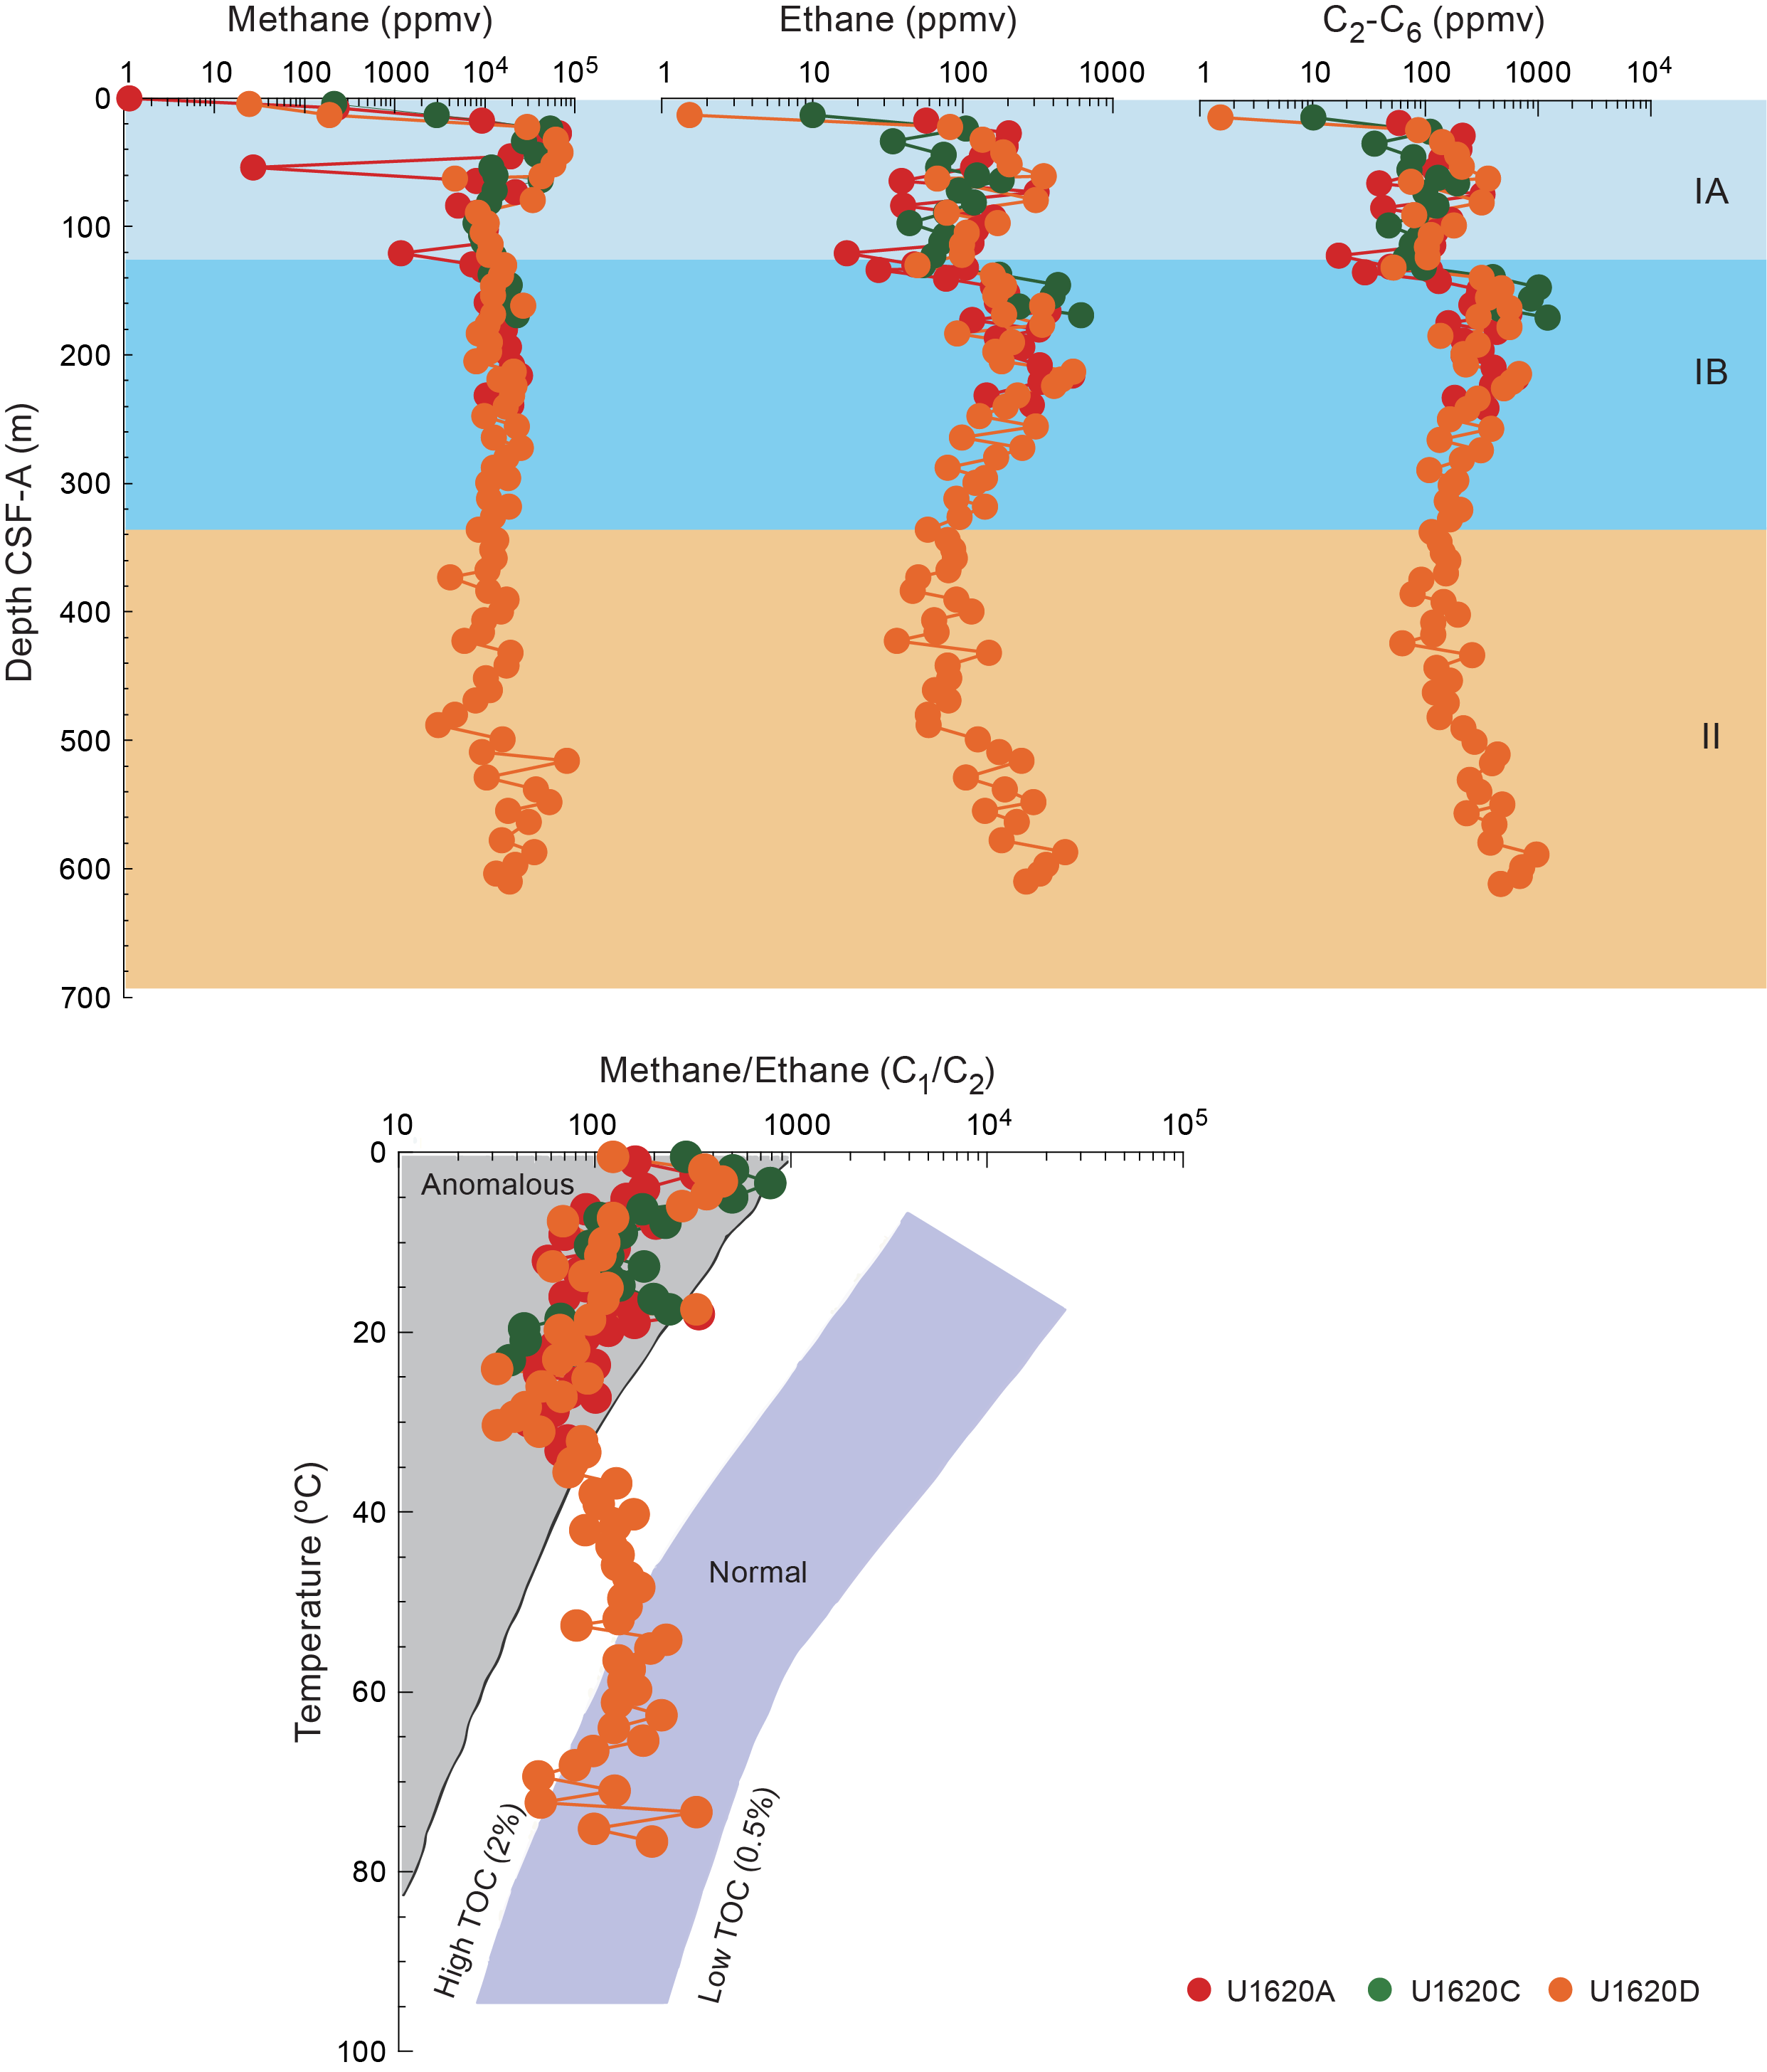
Figure F46. Methane, ethane, and heavier hydrocarbon concentrations and methane/ethane ratios.
Methane concentrations were generally high in all holes (generally above 5000 ppmv). Methane peaks were observed at the top of Holes U1620A, U1620C, and U1620D once the sulfate supply is exhausted at the SMTZ. This is characteristic of the increase of biogenic methane resulting from an increase in microbial methanogenesis, which is inhibited by sulfate. The methane profile remains relatively stable for most of Lithostratigraphic Subunit IB and Unit II before increasing again from 516 mbsf to the bottom of the record. The extrapolated high temperature of the sediment at this depth (75°C) (see Downhole measurements for the Site U1620 geothermal gradient) implies that the elevated methane levels at depth are not from an active biological process of methanogenesis, given the thermal limitations of methanogenic microbes (Katayama, 2021).
Ethane (C2) concentrations followed a similar trend to methane in Lithostratigraphic Subunit IA before diverging from the trend and sharply rising at the start of Subunit IB. The increase in ethane concentration from approximately 516 mbsf to the bottom of the core again coincides with elevated methane concentrations. Propene (C3), iso-butane (C4), n-butane (C4), iso-pentane (C5), n-pentane (C5), and iso-hexane (C6) also trended with ethane.
VAC samples contained methane and ethane concentrations two to three orders of magnitude higher than the headspace samples, and heavier hydrocarbons were also observed. The high concentrations of C2–C6 hydrocarbons from VACs were observed where C2–C6 hydrocarbons peaked in the sediment samples.
C1/C2+ ratios can suggest the origin of hydrocarbons. Generally, low C1/C2+ ratios indicate a nonbiogenic source (i.e., thermogenic or abiotic source of hydrocarbon gas; McCollom and Seewald, 2007). This implies that the high C2–C6 hydrocarbon intervals in Lithostratigraphic Subunit IB and Unit II are a result of the early low-temperature diagenesis of organic matter (a thermogenic source) or originate from abiotic processes, one candidate for which may be the serpentinization of ultramafic rocks that originated at the nearby ultraslow-spreading mid-ocean ridge (Johnson et al., 2015). In the latter case, hydrocarbons may have been advected to these layers in fluids sourced from depth.
9. Microbiology
9.1. Site U1620
At Site U1620, sedaDNA samples were taken at the mudline (Hole U1620A), at lower resolution on the core receiving platform (Hole U1620C), and at higher resolution for selected intervals on split cores (Hole U1620D), totaling 204 sedaDNA samples. In addition to this, two 10 cm long whole-round samples were taken in Hole U1620D (Table T11). To evaluate possible drill fluid contamination in the sedaDNA samples, 146 perfluorodecalin (PFD) tracer controls were analyzed shipboard. Positive controls of the drill fluid were taken from the top of the core to determine whether the tracer had been correctly dispensed, and negative controls of the sediment were taken directly adjacent to the sedaDNA samples to assess whether drill fluid had penetrated the interior of the core (see Microbiology in the Expedition 403 methods chapter [Lucchi et al., 2026a]).
9.1.1. Hole U1620C
Hole U1620C was sampled continuously at low resolution for the complete ~187 m recovered length (Figure F47). Preliminary age estimates from the shipboard chronology suggest the record will span the Holocene to Early Pleistocene (see Biostratigraphy and paleoenvironment and Paleomagnetism).
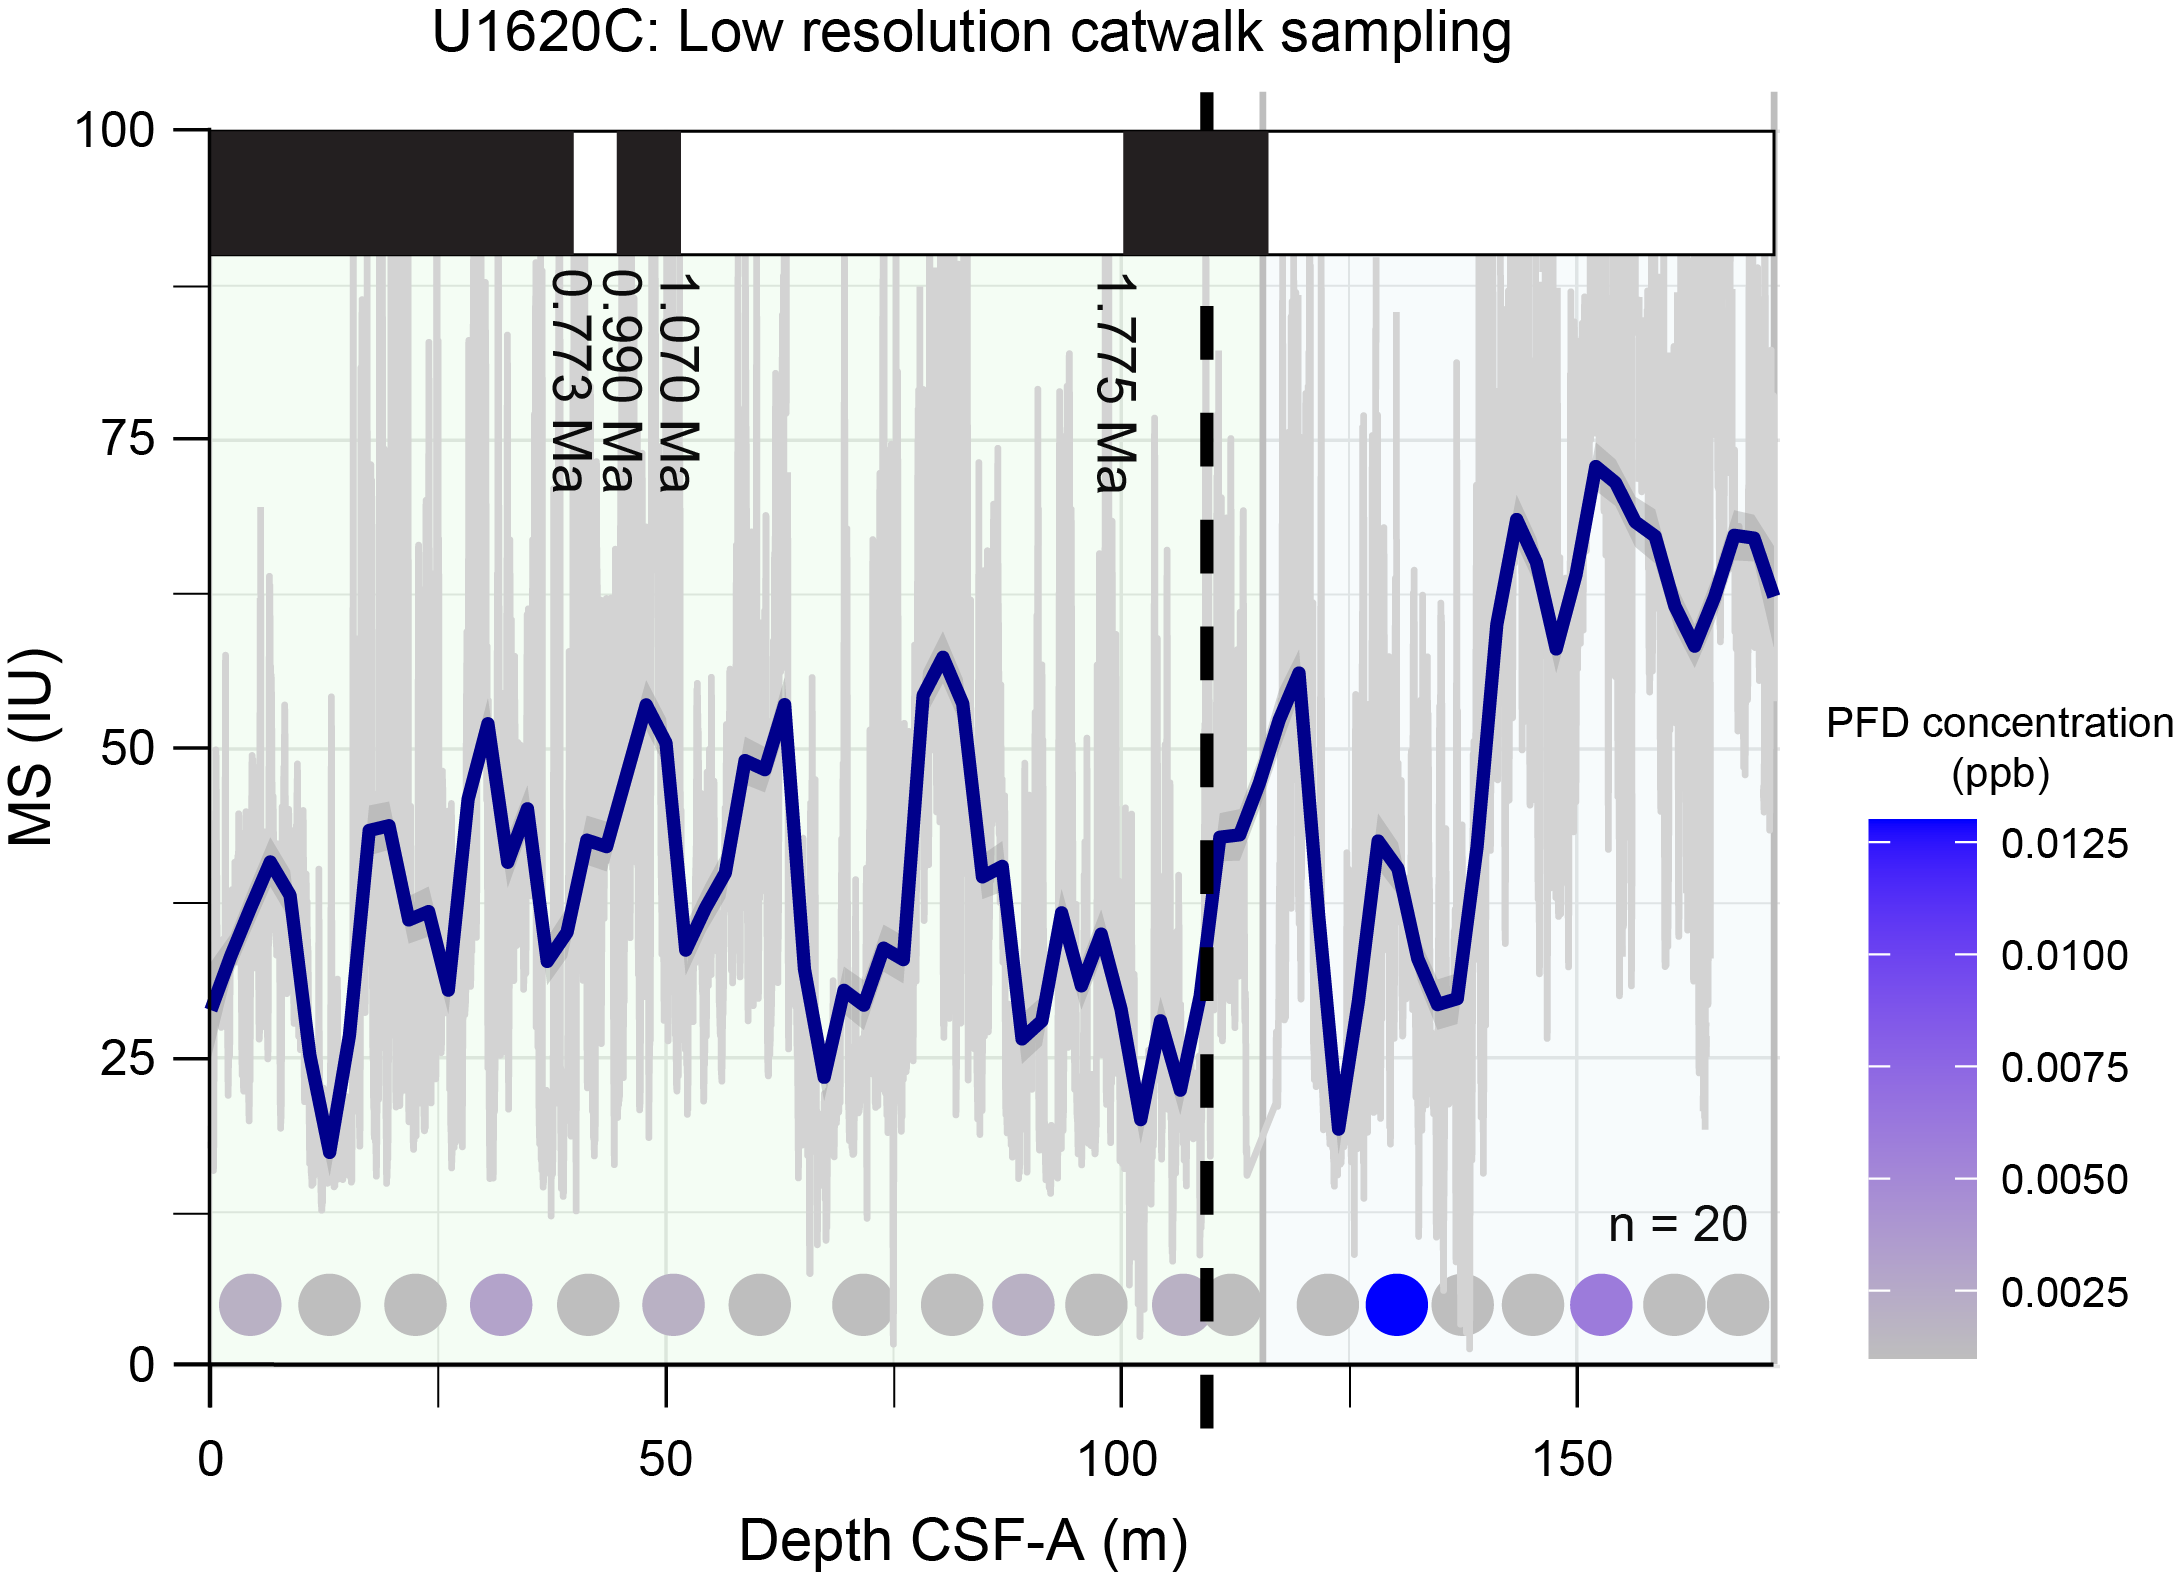
Figure F47. Low-resolution sedaDNA sampling.
Although all negative tracer control samples except one indicated drill fluid contamination (403-U1620C-16X-4; Table T12), positive drill fluid control samples were below background blank levels in four cores (9H, 15X, 17X, and 20X; Table T13). This suggests that the corresponding negative controls may be false negatives and should therefore be interpreted with caution. The low PFD concentration in the positive control sample from Core 9H may be explained by drilling disturbance because this core needed to be extruded from the core barrel and may not have represented the sediment surface in contact with the drill fluid at the top of the core. In general, XCB cores yielded lower positive PFD values, possibly because the sediment was firmer and it was harder to get a pure sample of the drill fluid from the top of the core.
9.1.2. Hole U1620D
9.1.2.1. High-resolution records of warmer interglacials
In Hole U1620D, we targeted warm interglacial cycles over two continuous sampling intervals: MIS 5e–MIS 11 (~9–31 mbsf; Cores 403-U1620D-2H through 4H; n = 50 sampled horizons) and MIS 31 (~44–62 mbsf; Cores 6H and 7H; n = 42 sampled horizons) (Figure F48). The intervals were constrained from the preliminary shipboard chronology (see Biostratigraphy and paleoenvironment, Paleomagnetism, Stratigraphic correlation, and Physical properties).
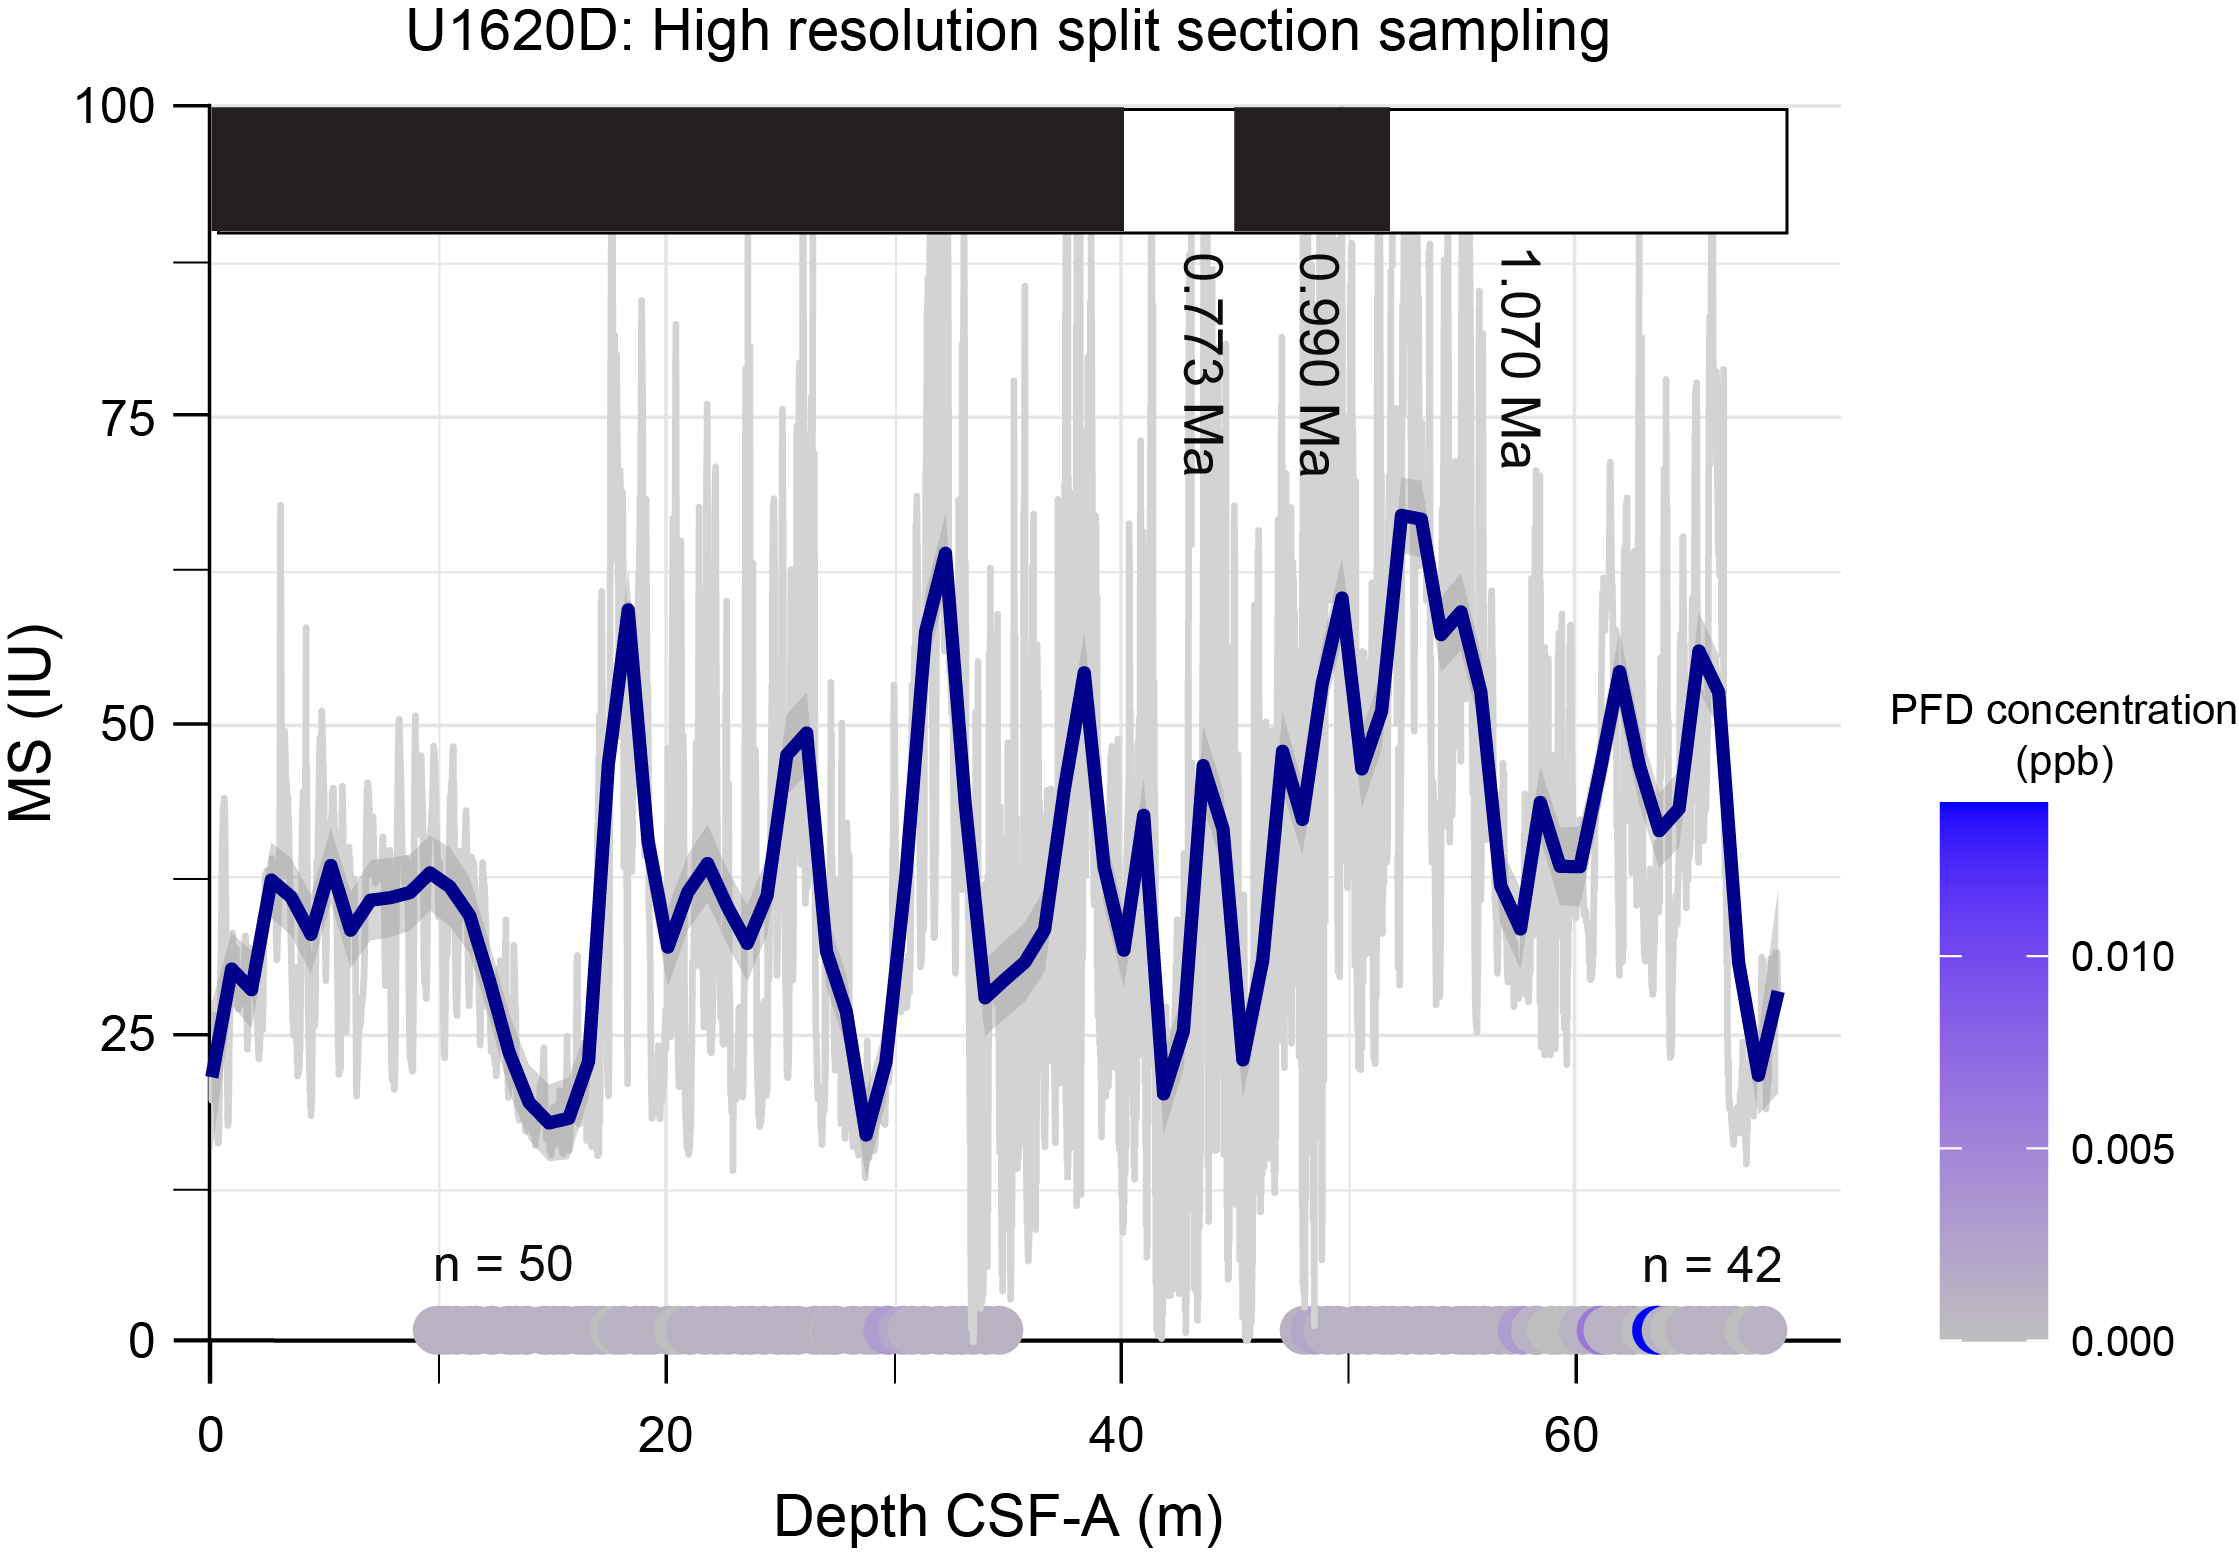
Figure F48. High-resolution sedaDNA sampling.
Positive controls confirmed the tracer was present in the drill fluid of all sampled cores (Table T13). Negative controls showed PFD concentrations below background levels in all but one sample (403-U1620D-7H-5, 105–106 cm; Table T12), suggesting drill fluid contamination in these sedaDNA samples is very low.
9.1.2.2. Oldest preservation of sedaDNA
Two whole rounds of 10 cm each were taken at ~300 mbsf (Section 403-U1620D-38X-1) and ~400 mbsf (Section 50X-4) to test the preservation limits of sedaDNA at Site U1620. The whole rounds were vacuum sealed in nitrogen-flushed plastic bags and stored at 4°C to be opened on shore. This method of sampling was adopted for the oldest DNA test to allow more material to be sampled, increasing the likelihood of capturing the highly degraded DNA signal at this age. Preliminary shipboard age estimates based on paleomagnetism suggest these samples fall in the range of Early Pleistocene (2.14–2.59 Ma) to Late Pliocene (2.59–3.05 Ma).
Positive drill fluid controls confirmed the PFD tracer was dispensed correctly into the drill fluid for both cores (Table T13). No negative drill fluid controls were taken aboard ship because the whole rounds will be split and sampled on shore.
10. Downhole measurements
10.1. Formation temperature
During APC coring in Holes U1620A and U1620C, in situ formation temperature was measured for every third core (403-U1620A-4H, 7H, 10H, 13H, 403-U1620C-4H, 7H, 10H, and 13H) using the APCT-3 tool. After switching to XCB coring in Holes U1620A and U1620D, in situ formation temperature was measured before Cores 403-U1620A-19X, 31X, 403-U1620D-38X, and 44X using the SET2 probe. The temperature increased almost linearly with depth, and the slope of linear regression provides a much higher geothermal gradient (145.3°C/km) than typical oceanic sediments compared with the statistical data set (Kolawole and Evenick, 2023) (Figure F49). The heat flow in the sediments and the temperature at the seafloor were calculated from the measured thermal conductivity in Cores 403-U1620A-1H through 31X and 403-U1620D-31X through 37X and the formation temperature measurements. Assuming a linear relationship between thermal conductivity and depth, the heat flow in the sediments and the temperature at the seafloor are approximately 182.0 mW/m2 and −1.960°C, respectively. The heat flow follows the trends measured by Crane et al. (1991) using temperature at shallow depth (as deep as ~12 mbsf).
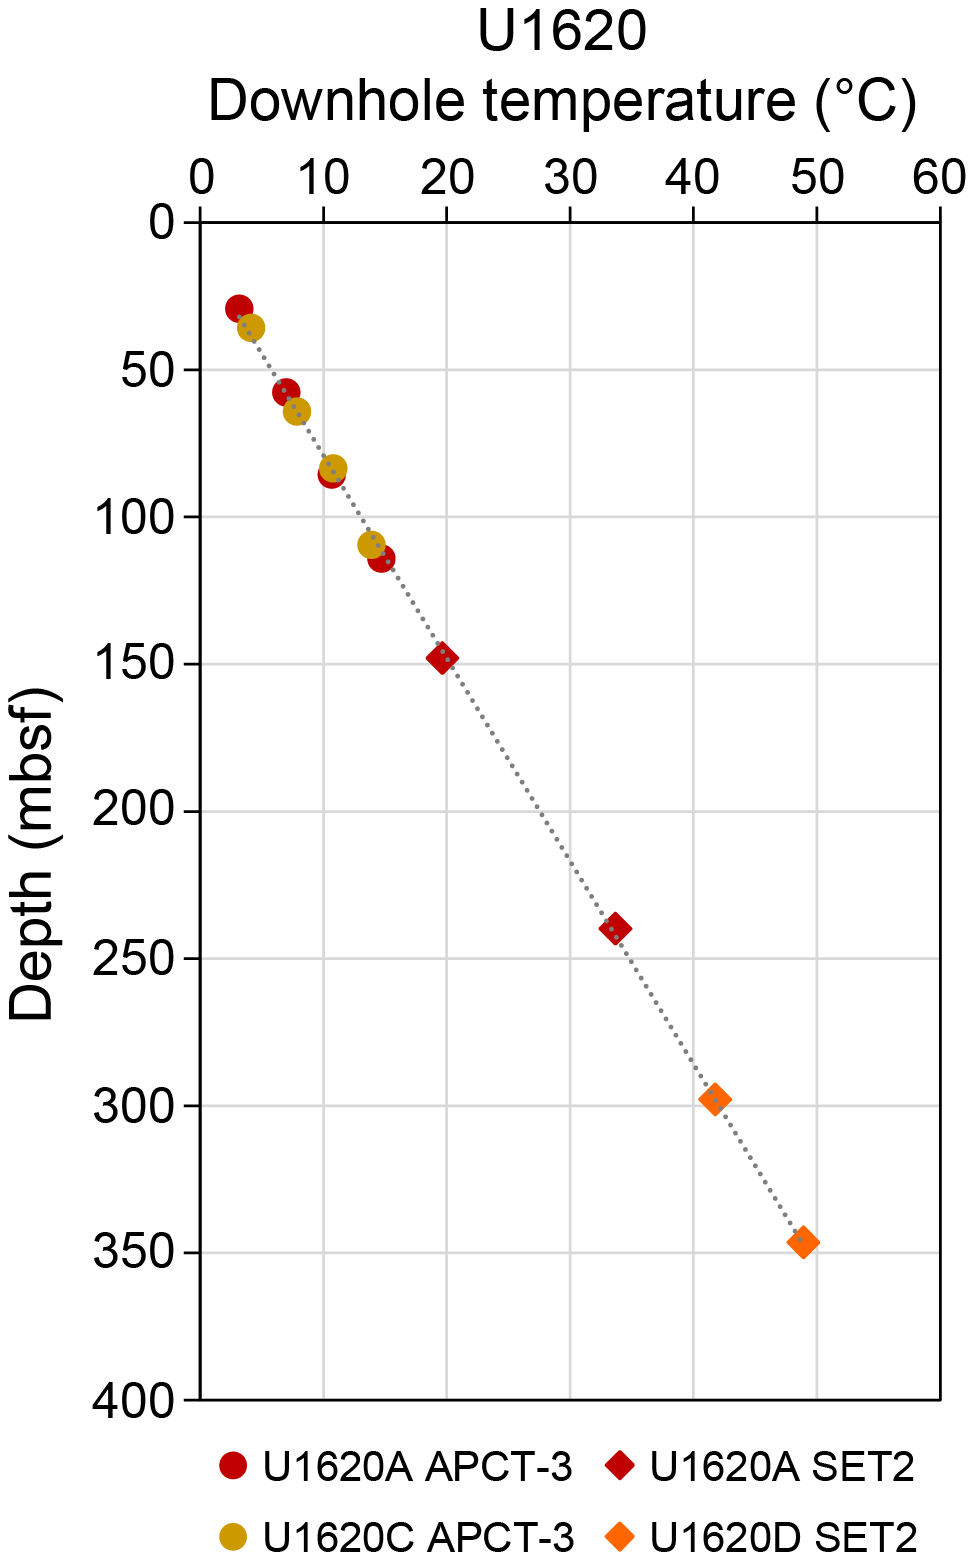
Figure F49. Formation temperature.
10.2. Downhole logging
In Hole U1620D, downhole logging was conducted using the triple combo tool string to obtain multiple in situ property measurements (Figure F50). The logging run using the FMS-sonic was canceled after observing gradually swelling formations with a closing rate of about 1 inch/h that were likely to block the hole and/or trap the logging string during operations. After the BHA was set at 71.5 m wireline log matched depth below seafloor (WMSF), the string was first lowered to 580.0 m WMSF for the downlog with the caliper closed. A downlog of the Hostile Environment Litho-Density Sonde (HLDS) was not obtained. Subsequently, the tool string was pulled up for the first uplog from 584.3 to 483.3 m WMSF. To increase data recovery, the strings were lowered again to 579.0 m WMSF and pulled up to 0 m WMSF for the second uplog. The average peak-to-peak heave was estimated at 0.3 m. The heave compensator was utilized during the logging operation.
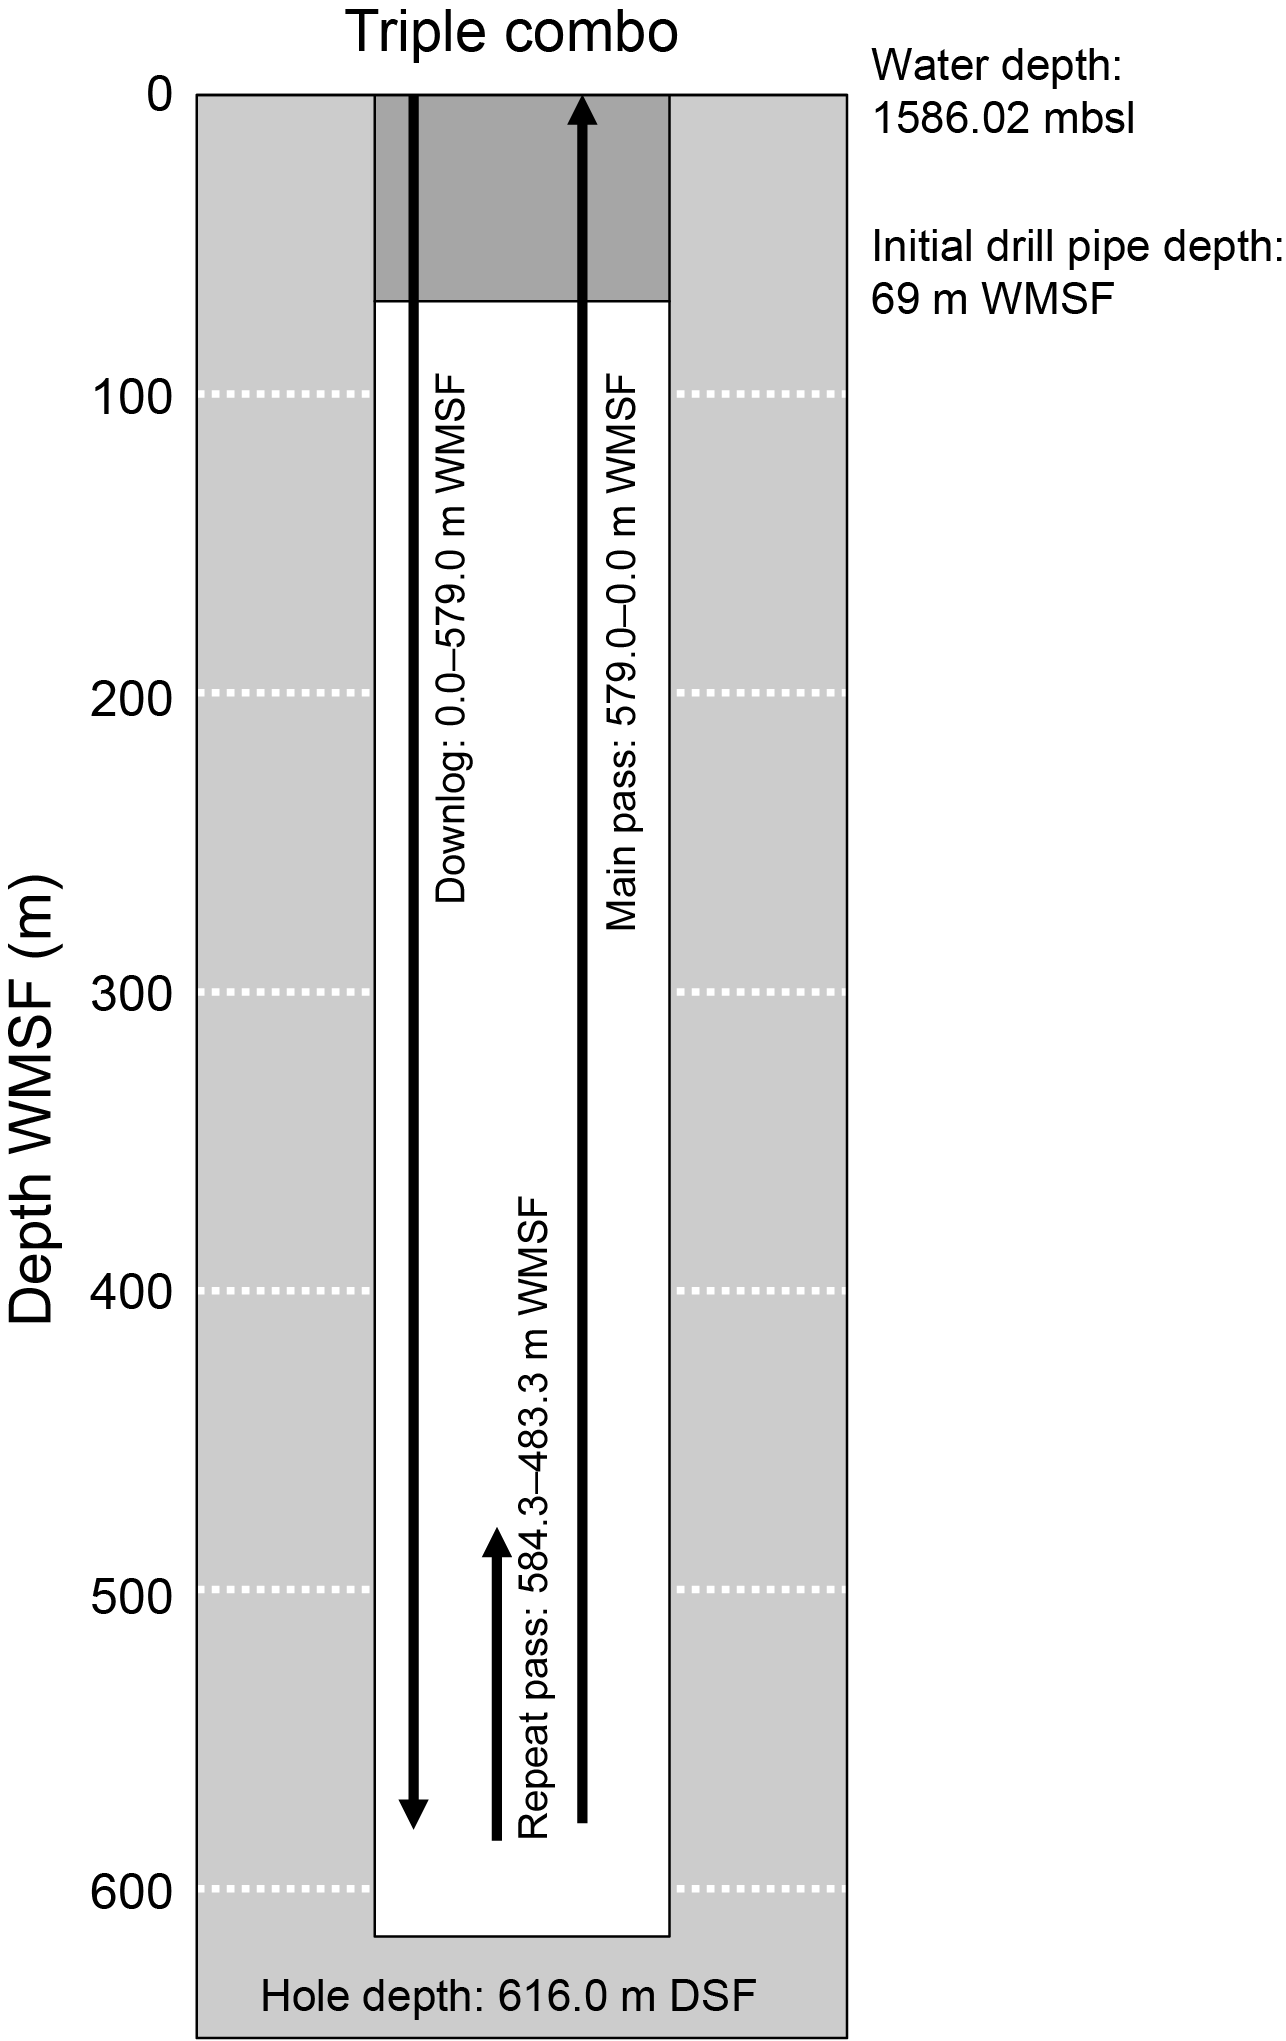
Figure F50. Downhole operations.
Logging data were sent for processing to the Lamont-Doherty Earth Observatory (LDEO; Columbia University, USA) (Figure F51; Table T14). The data provide important information for core-log integration to understand the actual depth and thickness of each lithostratigraphic unit because most cores at this site suffered from gas expansion.
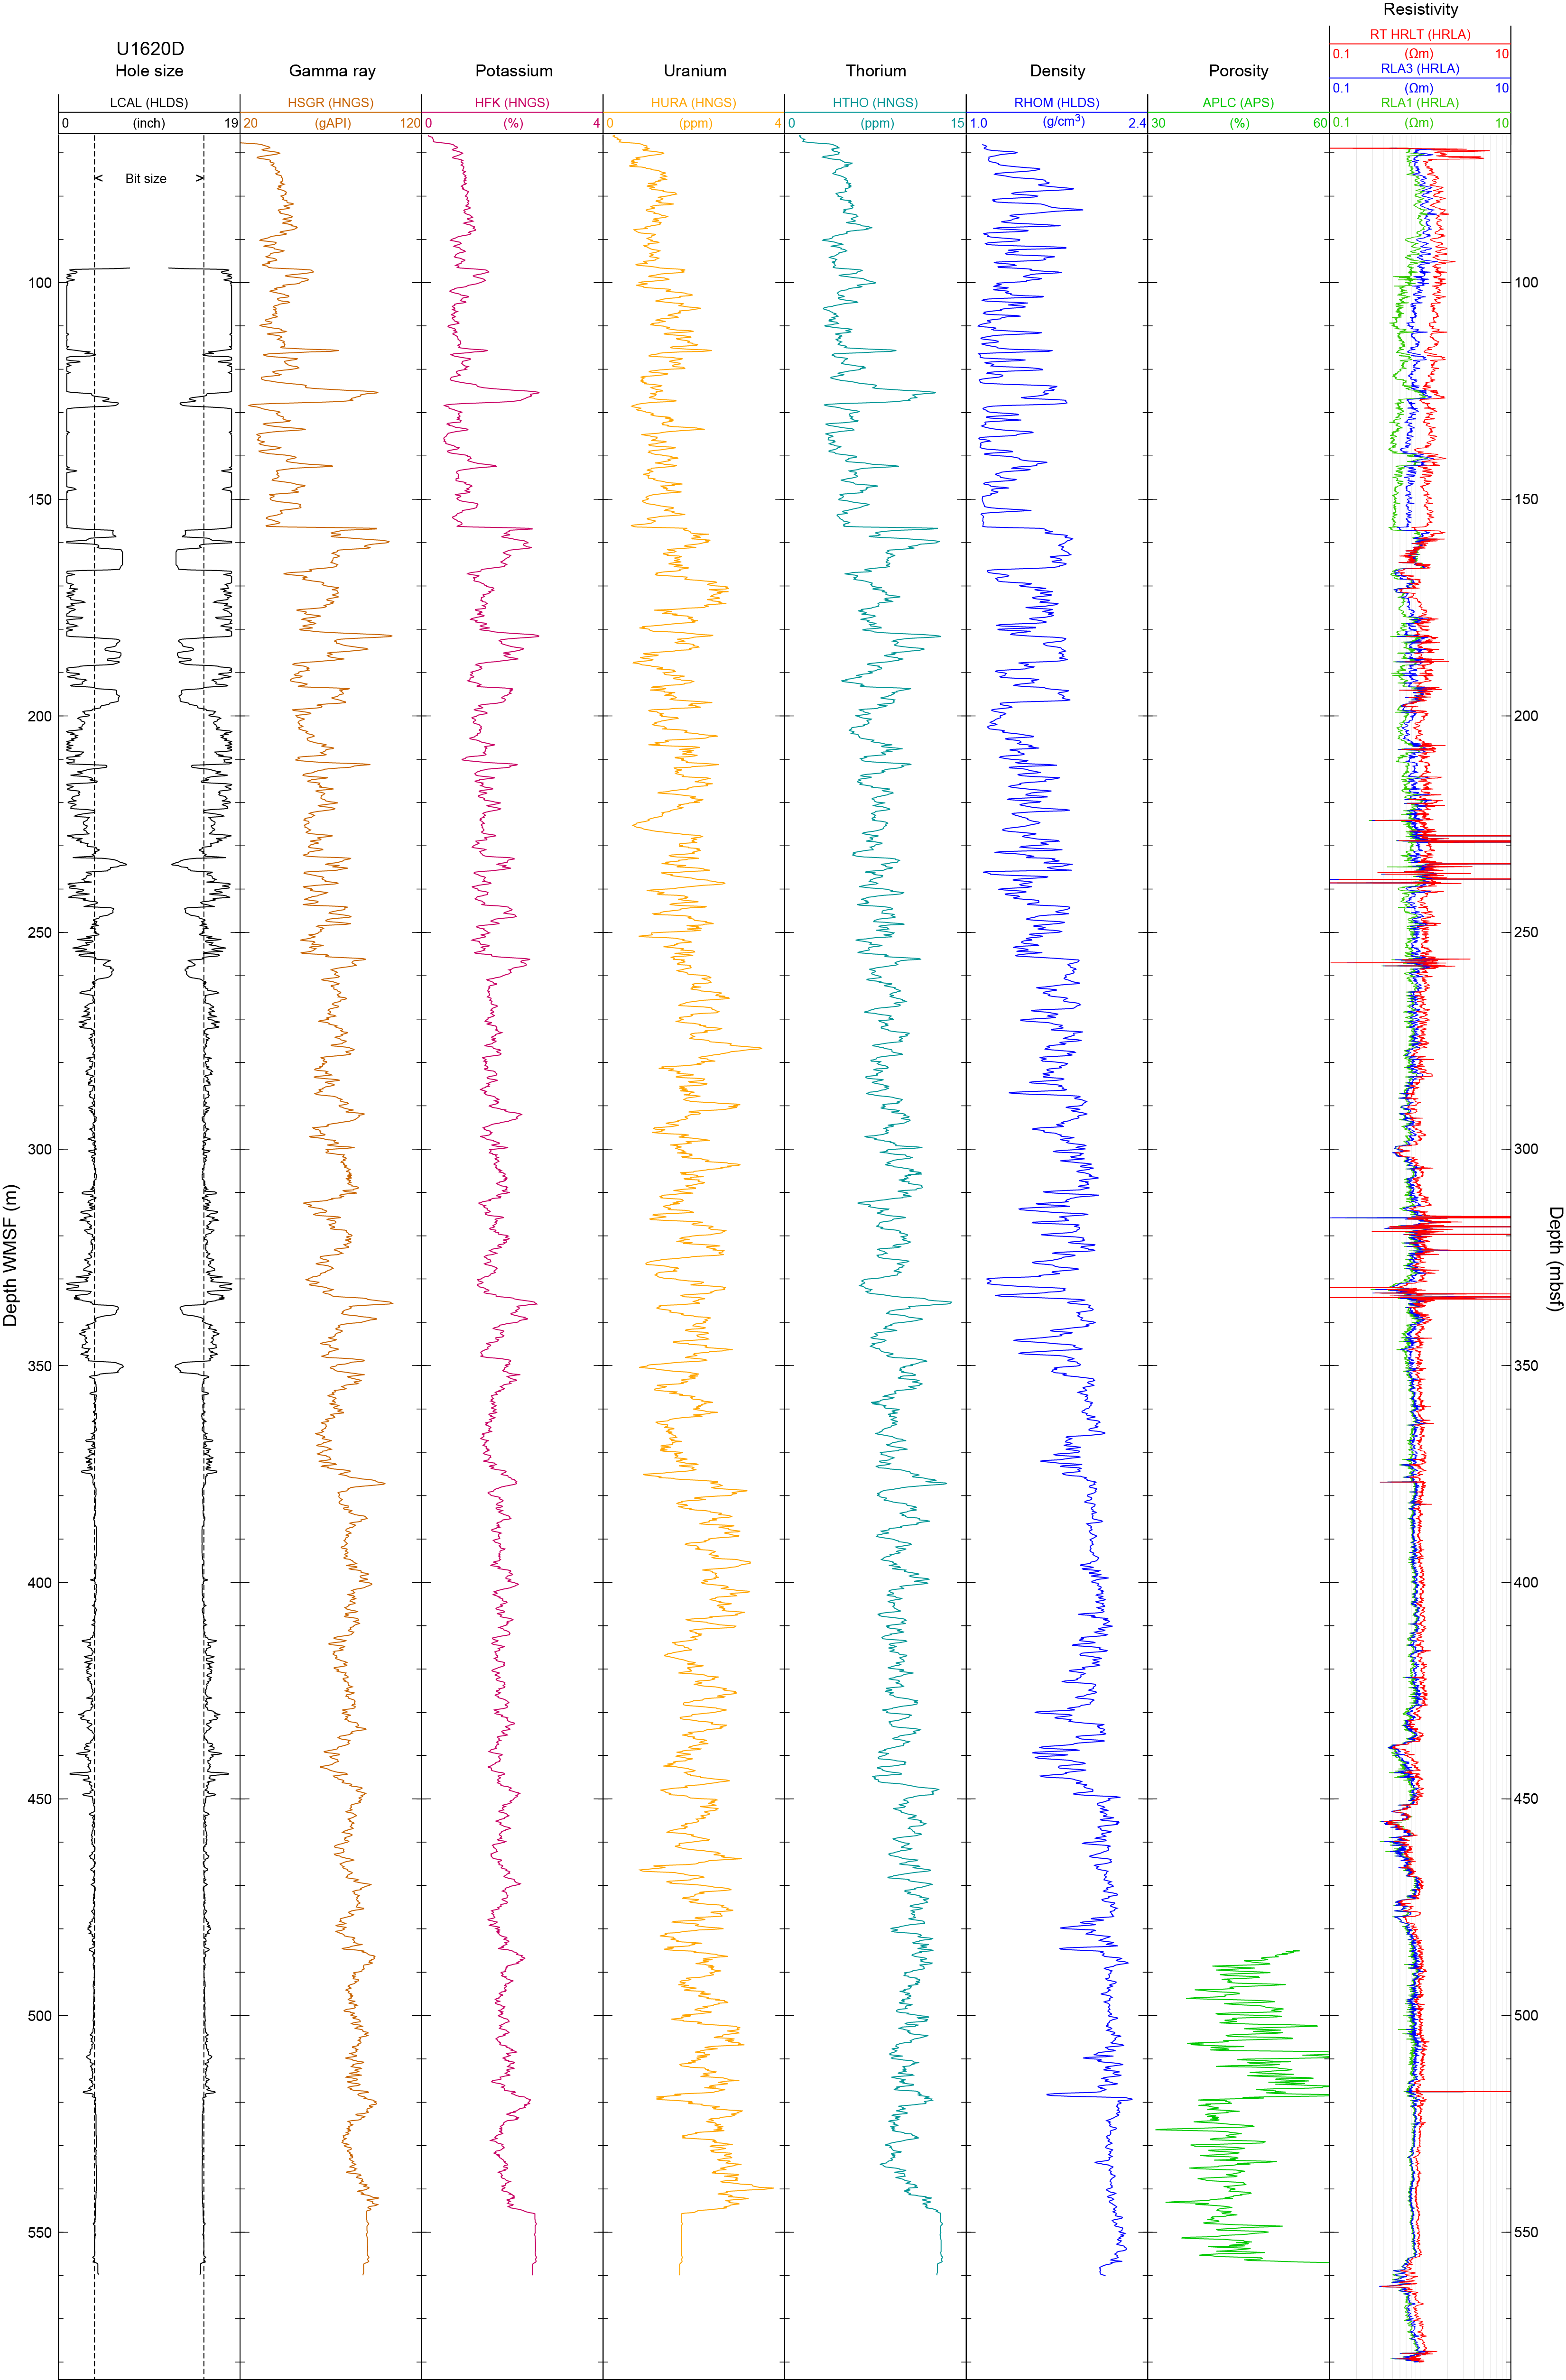
Figure F51. Downhole logging data.
10.2.1. Triple combo tool string
The triple combo tool string acquired borehole diameter, natural gamma ray, density, and electrical resistivity, although most of the data suffered from noise caused alternately by swelling and washed-out formations. Because of some technical issues, the Accelerator Porosity Sonde (APS) and Magnetic Susceptibility Sonde (MSS) could not obtain porosity except in intervals deeper than ~484.9 m WMSF of the repeat log and entire MS logs, respectively (Figure F51).
Logging data were collected for variations in the borehole diameter, which were measured using a hydraulic caliper on the HLDS during each uplog. Based on these caliper measurements at the interval shallower than ~272 m WMSF, the borehole diameter was enlarged and diminished alternately, indicating that washouts and formation swelling occurred while drilling and preparing for logging in Hole U1620D. Given the characteristics of sondes and methodologies, borehole diameter variation may affect logging of physical properties.
Downhole natural gamma ray was reported as total spectral gamma ray (HSGR) data. For the measurements not influenced by the drill pipe (>71.5 m WMSF), the average value is 70.0 American Petroleum Institute gamma radiation units (gAPI). The anomalies around 90–100 gAPI occurred in swelling formations where more gamma rays might reach the detector. On the other hand, probably due to fewer gamma rays that reached the detector, lower natural gamma ray values were observed in washout intervals. The amplitude of natural gamma ray changes is much higher in the upper part (>~260 m WMSF) of the measurements because more gamma rays reach the detector in a swelling formation and less reach it in washout intervals. Except for the swelling/washout formations, the HSGR data show great similarity to natural gamma ray measured on cores with the natural gamma ray logger, indicating that core (CSF) and log (WMSF) depth scales can be readily correlated (Figure F52). The differences of the depth scales can be assumed to be less than 1 m but should be considered with caution, especially in the upper part (>~260 m WMSF). Absolute values of the HSGR in the upper 71.5 m are much lower because measurements were made through the drill pipe.
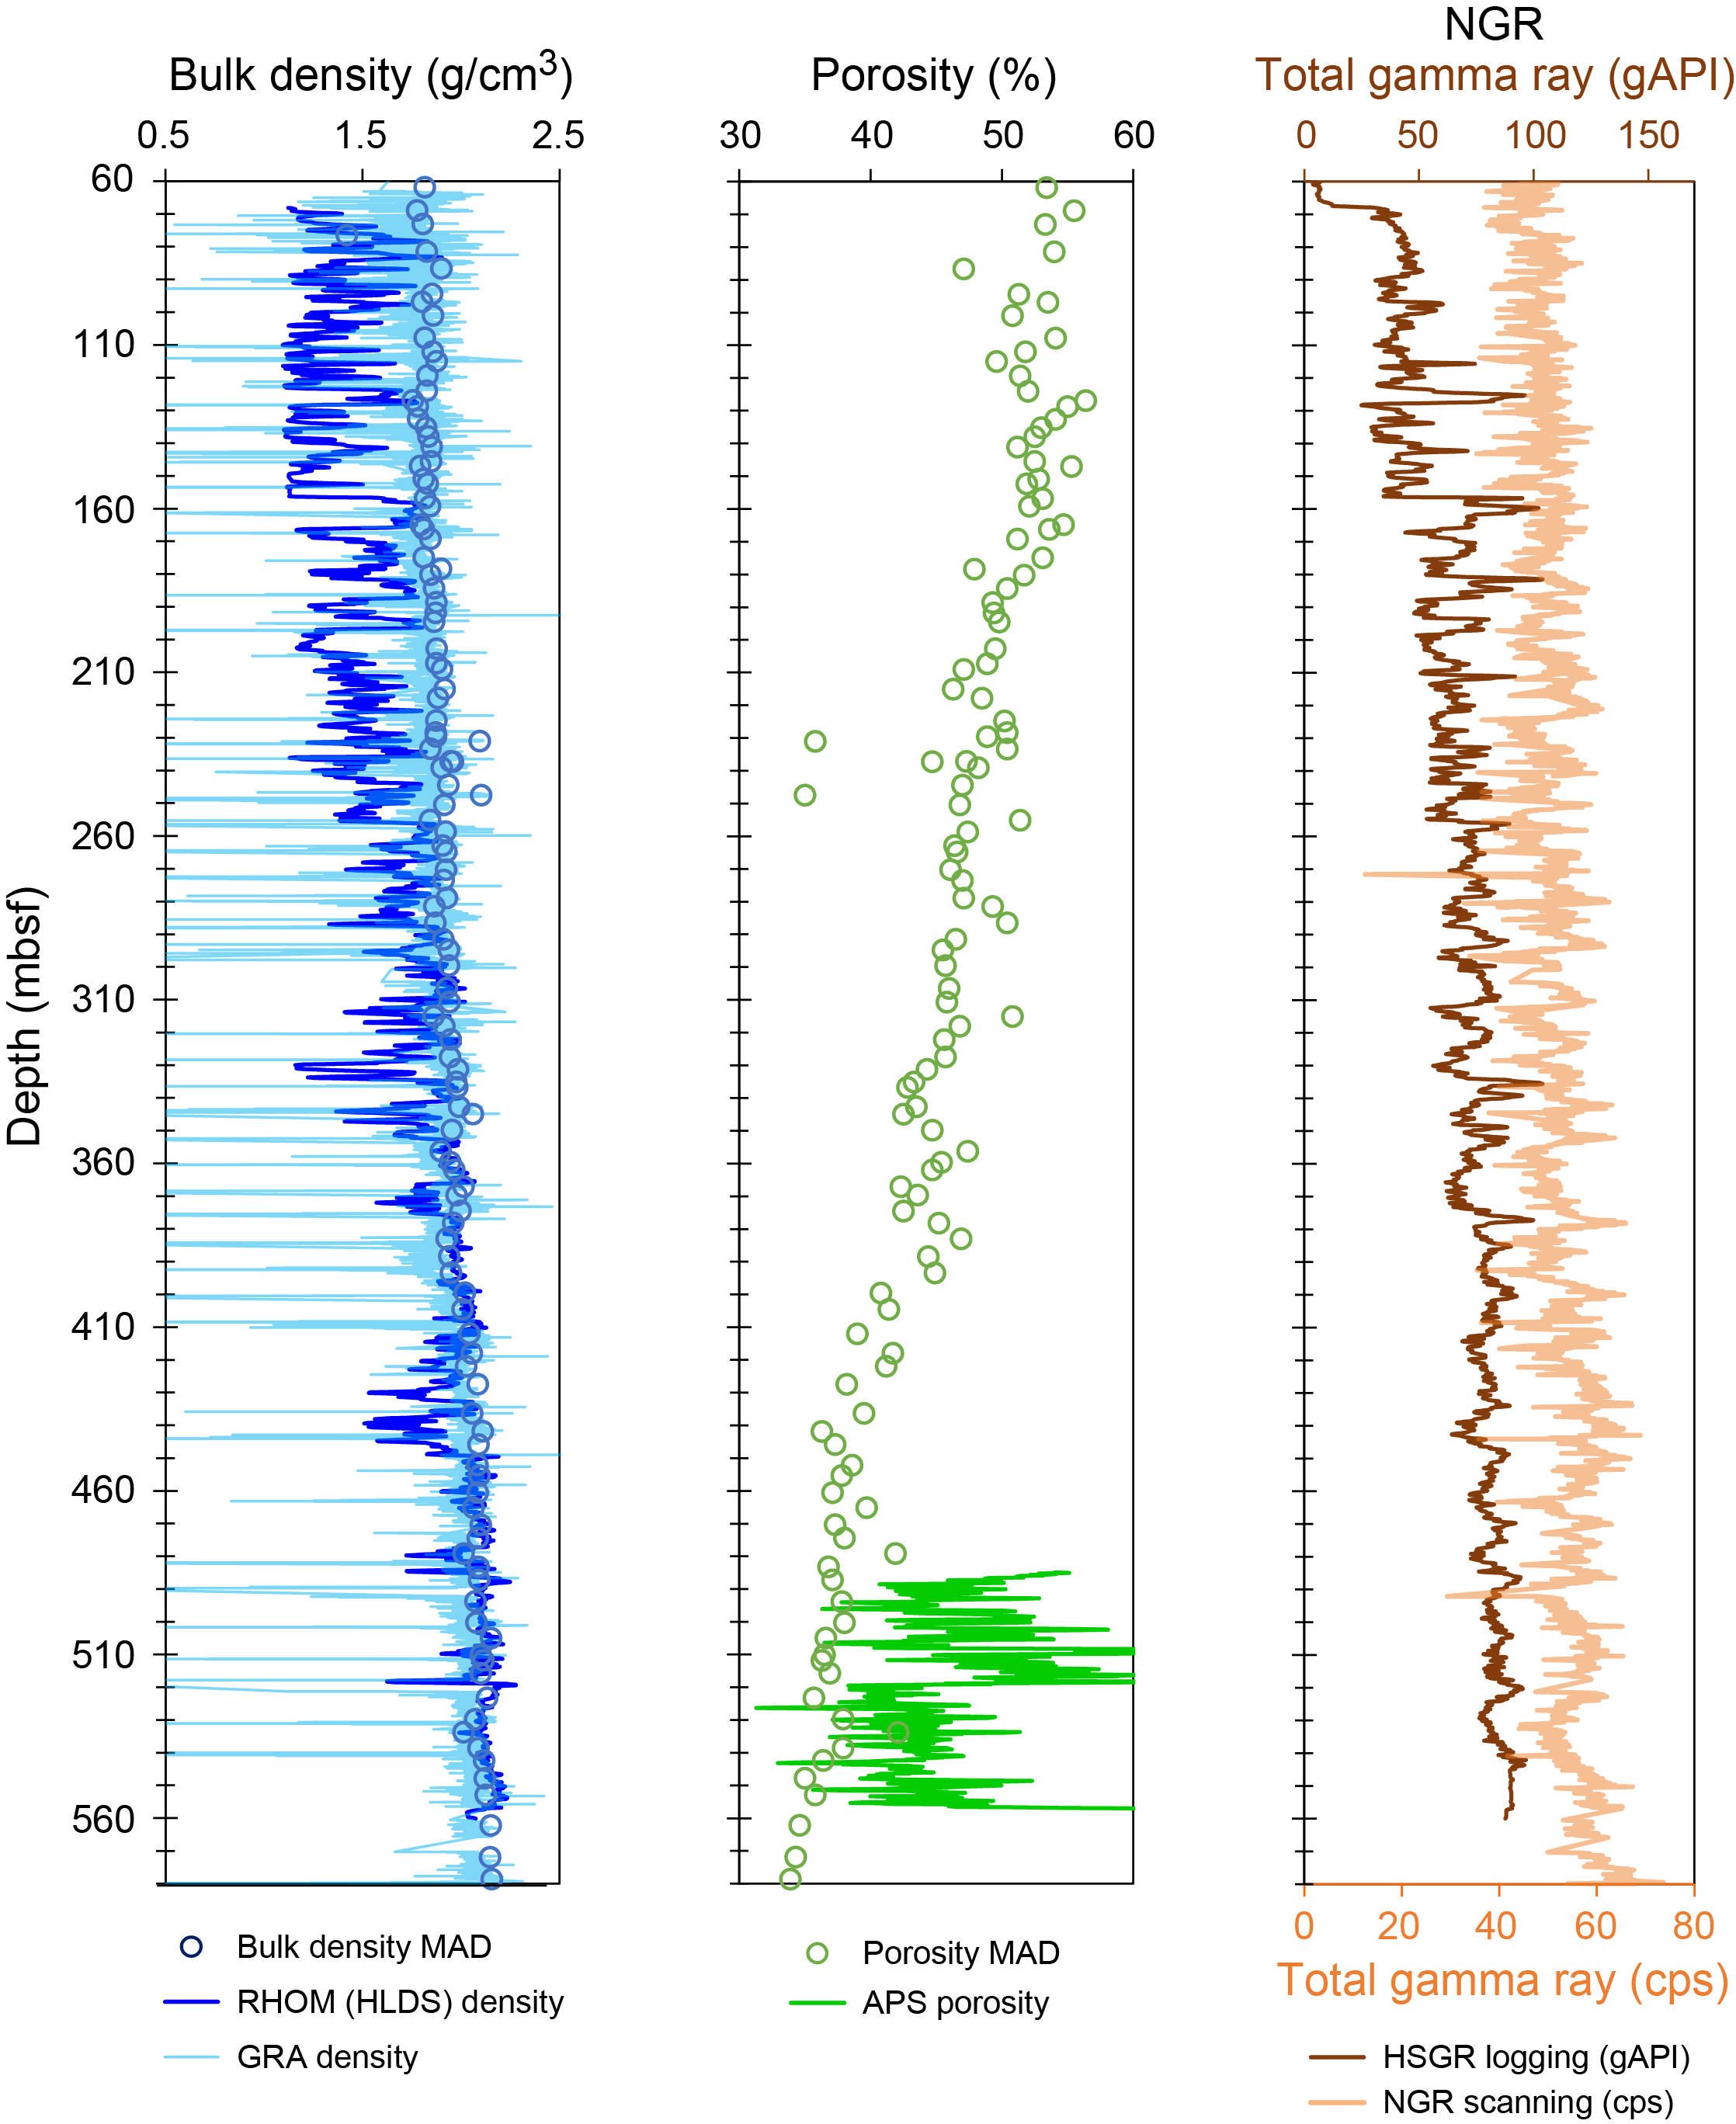
Figure F52. Core-log comparison.
HLDS density log measurements from 68 to 560 m WMSF (below the drill pipe) are on average 1.74 g/cm3 and show a downhole trend but seem to suffer from bad contact of the probe with the borehole walls in the upper part (below ~260 m WMSF) and at several depths. Absolute values of the HLDS density measurements are very similar to densities derived from GRA bulk density core logging and discrete MAD measurements (Figure F52) within the intervals with good borehole condition. APS porosity showed unclear and unstable trends within the available data (~484.9 to ~584.3 m WMSF).
For electrical resistivity, laterologging using the High-Resolution Laterolog Array (HRLA) tool recorded multiple logs depending on the travel paths of the electrical current: apparent resistivity from shallow to deep, as well as true resistivity. Resistivity ranged 0.5–2 Ω·m along the most depth. No significant downcore trend was observed. Because electrical resistivity of formation is highly dependent on water content, unless lithology changes, rapid decrease of resistivity suggests the existence of fluids at several depths (~300, ~440, ~460, ~475, and ~560 m WMSF).
References
Aubry, A.M.R., De Schepper, S., and de Vernal, A., 2020. Dinocyst and acritarch biostratigraphy of the Late Pliocene to Early Pleistocene at Integrated Ocean Drilling Program Site U1307 in the Labrador Sea. Journal of Micropalaeontology, 39(1):41–60. https://doi.org/10.5194/jm-39-41-2020
Backman, J., Raffi, I., Rio, D., Fornaciari, E., and Pälike, H., 2012. Biozonation and biochronology of Miocene through Pleistocene calcareous nannofossils from low and middle latitudes. Newsletters on Stratigraphy, 45(3):221–244. https://doi.org/10.1127/0078-0421/2012/0022
Baldauf, J.G., 1987. Diatom biostratigraphy of the middle- and high-latitude North Atlantic Ocean, Deep Sea Drilling Project Leg 94. In Ruddiman, W.E., Kidd, R. B., Thomas, E., et al., Initial Reports of the Deep Sea Drilling Project, 94: Washington, DC (U.S. Government Printing Office), 729–762. http://doi.org/10.2973/dsdp.proc.94.115.1987
Berggren, W.A., 1972. Cenozoic biostratigraphy and paleobiogeography of the North Atlantic. In Laughton, A.S., Berggren, W.A., et al., Initial Reports of the Deep Sea Drilling Project, 12: Washington, DC (U.S. Government Printing Office), 965–1001. https://doi.org/10.2973/dsdp.proc.12.114.1972
Borowski, W.S., Paull, C.K., and Ussler, W., III, 1996. Marine pore-water sulfate profiles indicate in situ methane flux from underlying gas hydrate. Geology, 24(7):655–658. https://doi.org/10.1130/0091-7613(1996)024<0655:MPWSPI>2.3.CO;2
Bruland, K.W., and Lohan, M.C., 2006. Controls of trace metals in seawater. In Elderfield, H., Treatise on Geochemistry (Volume 6): the Oceans and Marine Geochemistry. Amsterdam (Elsevier), 23–47. https://doi.org/10.1016/B0-08-043751-6/06105-3
Crane, K., Sundvor, E., Buck, R., and Martinez, F., 1991. Rifting in the northern Norwegian-Greenland Sea: Thermal tests of asymmetric spreading. Journal of Geophysical Research: Solid Earth, 96(B9):14529–14550. https://doi.org/10.1029/91JB01231
De Schepper, S., Beck, K.M., and Mangerud, G., 2017. Late Neogene dinoflagellate cyst and acritarch biostratigraphy for Ocean Drilling Program Hole 642B, Norwegian Sea. Review of Palaeobotany and Palynology, 236:12–32. https://doi.org/10.1016/j.revpalbo.2016.08.005
De Schepper, S., and Head, M.J., 2009. Pliocene and Pleistocene dinoflagellate cyst and acritarch zonation of DSDP Hole 610A, eastern North Atlantic. Palynology, 33(1):179–218. https://doi.org/10.2113/gspalynol.33.1.179
De Schepper, S., and Head, M.J., 2014. New late Cenozoic acritarchs: evolution, palaeoecology and correlation potential in high latitude oceans. Journal of Systematic Palaeontology, 12(4):493–519. https://doi.org/10.1080/14772019.2013.783883
de Vernal, A., Radi, T., Zaragosi, S., Van Nieuwenhove, N., Rochon, A., Allan, E., De Schepper, S., Eynaud, F., Head, M.J., Limoges, A., Londeix, L., Marret, F., Matthiessen, J., Penaud, A., Pospelova, V., Price, A., and Richerol, T., 2020. Distribution of common modern dinoflagellate cyst taxa in surface sediments of the Northern Hemisphere in relation to environmental parameters: The new n=1968 database. Marine Micropaleontology, 159:101796. https://doi.org/10.1016/j.marmicro.2019.101796
Dickens, G.R., 2001. Sulfate profiles and barium fronts in sediment on the Blake Ridge: present and past methane fluxes through a large gas hydrate reservoir. Geochimica et Cosmochimica Acta, 65(4):529–543. https://doi.org/10.1016/S0016-7037(00)00556-1
Dickson, J.A.D., 1978. Stains for carbonate minerals. In Middleton, G.V., Church, M.J., Coniglio, M., Hardie, L.A. and Longstaffe, F.J., Encyclopedia of Sediments and Sedimentary Rocks. Encyclopedia of Earth Sciences Series. Dordrecht (Springer), 683–684. https://doi.org/10.1007/978-1-4020-3609-5_220
Ehlers, B.-M., and Jokat, W., 2013. Paleo-bathymetry of the northern North Atlantic and consequences for the opening of the Fram Strait. Marine Geophysical Research, 34(1):25–43. https://doi.org/10.1007/s11001-013-9165-9
Eiken, O., and Hinz, K., 1993. Contourites in the Fram Strait. Sedimentary Geology, 82(1–4):15–32. https://doi.org/10.1016/0037-0738(93)90110-Q
Engen, Ø., Faleide, J.I., and Dyreng, T.K., 2008. Opening of the Fram Strait gateway: a review of plate tectonic constraints. Tectonophysics, 450(1–4):51–69. https://doi.org/10.1016/j.tecto.2008.01.002
Flores, J.A., Filippelli, G.M., Sierro, F.J., and Latimer, J.C., 2012. The “White Ocean” Hypothesis: A Late Pleistocene Southern Ocean Governed by Coccolithophores and Driven by Phosphorus. Frontiers in Microbiology, 3. https://doi.org/10.3389/fmicb.2012.00233
Gebhardt, A.C., Geissler, W.H., Matthiessen, J., and Jokat, W., 2014. Changes in current patterns in the Fram Strait at the Pliocene/Pleistocene boundary. Quaternary Science Reviews, 92:179–189. https://doi.org/10.1016/j.quascirev.2013.07.015
Geissler, W.H., Jokat, W., and Brekke, H., 2011. The Yermak Plateau in the Arctic Ocean in the light of reflection seismic data-implication for its tectonic and sedimentary evolution. Geophysical Journal International, 187(3):1334–1362. https://doi.org/10.1111/j.1365-246X.2011.05197.x
González-Lanchas, A., Rickaby, R.E.M., Sierro, F.J., Rigual-Hernández, A.S., Alonso-García, M., and Flores, J.A., 2023. Globally enhanced calcification across the coccolithophore Gephyrocapsa complex during the mid-Brunhes interval. Quaternary Science Reviews, 321:108375. https://doi.org/10.1016/j.quascirev.2023.108375
Gradstein, F.M., Ogg, J.G., Schmitz, M.D., and Ogg, G.M. (Eds.), 2020. Geologic Time Scale 2020: Amsterdam (Elsevier BV). https://doi.org/10.1016/C2020-1-02369-3
Graves, C.A., James, R.H., Sapart, C.J., Stott, A.W., Wright, I.C., Berndt, C., Westbrook, G.K., and Connelly, D.P., 2017. Methane in shallow subsurface sediments at the landward limit of the gas hydrate stability zone offshore western Svalbard. Geochimica et Cosmochimica Acta, 198:419–438. https://doi.org/10.1016/j.gca.2016.11.015
Head, M.J., 1996. Late Cenozoic Dinoflagellates from the Royal Society Borehole at Ludham, Norfolk, Eastern England. Journal of Paleontology, 70(4):543–570. https://doi.org/10.1017/S0022336000023532
Hennissen, J.A.I., Head, M.J., De Schepper, S., and Groeneveld, J., 2017. Dinoflagellate cyst paleoecology during the Pliocene–Pleistocene climatic transition in the North Atlantic. Palaeogeography, Palaeoclimatology, Palaeoecology, 470:81–108. https://doi.org/10.1016/j.palaeo.2016.12.023
Hitzman, M.W., 1999. Routine staining of drill core to determine carbonate mineralogy and distinguish carbonate alteration textures. Mineralium Deposita, 34(8):794–798. https://doi.org/10.1007/s001260050240
Husum, K., and Hald, M., 2012. Arctic planktic foraminiferal assemblages: Implications for subsurface temperature reconstructions. Marine Micropaleontology, 96-97:38–47. https://doi.org/10.1016/j.marmicro.2012.07.001
Jakobsson, M., Backman, J., Rudels, B., Nycander, J., Frank, M., Mayer, L., Jokat, W., Sangiorgi, F., O'Regan, M., Brinkhuis, H., King, J., and Moran, K., 2007. The Early Miocene onset of ventilated circulation regime in the Arctic Ocean. Nature, 447(7147):986–990. https://doi.org/10.1038/nature05924
Johnson, J.E., Mienert, J., Plaza-Faverola, A., Vadakkepuliyambatta, S., Knies, J., Bünz, S., Andreassen, K., and Ferré, B., 2015. Abiotic methane from ultraslow-spreading ridges can charge Arctic gas hydrates. Geology, 43(5):371–374. https://doi.org/10.1130/G36440.1
Kastner, M., Claypool, G., and Robertson, G., 2008. Geochemical constraints on the origin of the pore fluids and gas hydrate distribution at Atwater Valley and Keathley Canyon, northern Gulf of Mexico. Marine and Petroleum Geology, 25(9):860–872. https://doi.org/10.1016/j.marpetgeo.2008.01.022
Katayama, I., 2021. Strength models of the terrestrial planets and implications for their lithospheric structure and evolution. Progress in Earth and Planetary Science, 8(1). https://doi.org/10.1186/s40645-020-00388-2
Kirschvink, J.L., 1980. The least-squares line and plane and the analysis of palaeomagnetic data. Geophysical Journal International, 62(3):699–718. https://doi.org/10.1111/j.1365-246X.1980.tb02601.x
Koç, N., and Scherer, R.P., 1996. Neogene diatom biostratigraphy of the Iceland Sea Site 907. In Thiede, J., Myhre, A.M., Firth, J.V., Johnson, G.L., and Ruddiman, W.F. (Eds.), Proceedings of the Ocean Drilling Program, Scientific Results, 151: College Station, TX (Ocean Drilling Program), 61–74. https://doi.org/10.2973/odp.proc.sr.151.108.1996
Kolawole, F., and Evenick, J.C., 2023. Global distribution of geothermal gradients in sedimentary basins. Geoscience Frontiers, 14(6):101685. https://doi.org/10.1016/j.gsf.2023.101685
Lam, A.R., and Leckie, R.M., 2020. Late Neogene and Quaternary diversity and taxonomy of subtropical to temperate planktic foraminifera across the Kuroshio Current Extension, northwest Pacific Ocean. Micropaleontology, 66(3):177–268. https://doi.org/10.47894/mpal.66.3.01
Lourens, L., Hilgen, F., Shackleton, N.J., Laskar, J., and Wilson, D., 2004. The Neogene period. In Smith, A.G., Gradstein, F.M. and Ogg, J.G., A Geologic Time Scale 2004. Cambridge, UK (Cambridge University Press), 409–440. https://doi.org/10.1017/CBO9780511536045.022
Lucchi, R.G., St. John, K.E.K., Ronge, T.A., Barcena, M.A., De Schepper, S., Duxbury, L.C., Gebhardt, A.C., Gonzalez-Lanchas, A., Goss, G., Greco, N.M., Gruetzner, J., Haygood, L., Husum, K., Iizuka, M., Kapuge, A.K.I.U., Lam, A.R., Libman-Roshal, O., Liu, Y., Monito, L.R., Reilly, B.T., Rosenthal, Y., Sakai, Y., Sijinkumar, A.V., Suganuma, Y., and Zhong, Y., 2026a. Expedition 403 methods. In Lucchi, R.G., St. John, K.E.K., Ronge, T.A., and the Expedition 403 Scientists, Eastern Fram Strait Paleo-Archive. Proceedings of the International Ocean Discovery Program, 403: College Station, TX (International Ocean Discovery Program). https://doi.org/10.14379/iodp.proc.403.102.2026
Lucchi, R.G., St. John, K.E.K., Ronge, T.A., Barcena, M.A., De Schepper, S., Duxbury, L.C., Gebhardt, A.C., Gonzalez-Lanchas, A., Goss, G., Greco, N.M., Gruetzner, J., Haygood, L., Husum, K., Iizuka, M., Kapuge, A.K.I.U., Lam, A.R., Libman-Roshal, O., Liu, Y., Monito, L.R., Reilly, B.T., Rosenthal, Y., Sakai, Y., Sijinkumar, A.V., Suganuma, Y., and Zhong, Y., 2026b Site U1618. In Lucchi, R.G., St. John, K.E.K., Ronge, T.A., and the Expedition 403 Scientists, Eastern Fram Strait Paleo-Archive. Proceedings of the International Ocean Discovery Program, 403: College Station, TX (International Ocean Discovery Program). https://doi.org/10.14379/iodp.proc.403.103.2026
Marino, M., Maiorano, P., Tarantino, F., Voelker, A., Capotondi, L., Girone, A., Lirer, F., Flores, J.-A., and Naafs, B.D.A., 2014. Coccolithophores as proxy of seawater changes at orbital-to-millennial scale during middle Pleistocene Marine Isotope Stages 14–9 in North Atlantic core MD01-2446. Paleoceanography, 29(6):518–532. https://doi.org/10.1002/2013PA002574
Martini, E., 1971. Standard Tertiary and Quaternary calcareous nannoplankton zonation. Proceedings of the Second Planktonic Conference, Roma, 1970:739–785.
Matthiessen, J., and Brenner, W., 1996. Dinoflagellate cyst ecostratigraphy of Pliocene-Pleistocene sediments from the Yermak Plateau (Arctic Ocean, Hole 911A). In Thiede, J., Myhre, A.M., Firth, J.V., Johnson, G.L., and Ruddiman, W.F. (Eds.), Proceedings of the Ocean Drilling Program, Scientific Results, 151: 243–253. https://doi.org/10.2973/odp.proc.sr.151.109.1996
Matthiessen, J., and Knies, J., 2001. Dinoflagellate cyst evidence for warm interglacial conditions at the northern Barents Sea margin during marine oxygen isotope stage 5. Journal of Quaternary Science, 16(7):727–737. https://doi.org/10.1002/jqs.656
Matthiessen, J., Schreck, M., De Schepper, S., Zorzi, C., and de Vernal, A., 2018. Quaternary dinoflagellate cysts in the Arctic Ocean: potential and limitations for stratigraphy and paleoenvironmental reconstructions. Quaternary Science Reviews, 192:1–26. https://doi.org/10.1016/j.quascirev.2017.12.020
Mattingsdal, R., Knies, J., Andreassen, K., Fabian, K., Husum, K., Grøsfjeld, K., and De Schepper, S., 2014. A new 6 Myr stratigraphic framework for the Atlantic–Arctic gateway. Quaternary Science Reviews, 92:170–178. https://doi.org/10.1016/j.quascirev.2013.08.022
Matul, A., and Kazarina, G.K., 2020. The North Pacific Diatom Species Neodenticula seminae in the Modern and Holocene Sediments of the North Atlantic and Arctic. Geosciences, 10(5).
https://doi.org/10.3390/geosciences10050173
McCollom, T.M., and Seewald, J.S., 2007. Abiotic synthesis of organic compounds in deep-sea hydrothermal environments. Chemical Reviews, 107(2):382–401. https://doi.org/10.1021/cr0503660
Meyers, P.A., 1994. Preservation of elemental and isotopic source identification of sedimentary organic matter. Chemical Geology, 114(3–4):289–302. https://doi.org/10.1016/0009-2541(94)90059-0
Meyers, P.A., 1997. Organic geochemical proxies of paleoceanographic, paleolimnologic, and paleoclimatic processes. Organic Geochemistry, 27(5–6):213–250. https://doi.org/10.1016/S0146-6380(97)00049-1
Miettinen, A., Koç, N., and Husum, K., 2013. Appearance of the Pacific diatom Neodenticula seminae in the northern Nordic Seas — An indication of changes in Arctic sea ice and ocean circulation. Marine Micropaleontology, 99:2–7. https://doi.org/10.1016/j.marmicro.2012.06.002
Raffi, I., Backman, J., Fornaciari, E., Pälike, H., Rio, D., Lourens, L., and Hilgen, F., 2006. A review of calcareous nannofossil astrobiochronology encompassing the past 25 million years. Quaternary Science Reviews, 25(23):3113–3137. https://doi.org/10.1016/j.quascirev.2006.07.007
Razmjooei, M.J., Henderiks, J., Coxall, H.K., Baumann, K.-H., Vermassen, F., Jakobsson, M., Niessen, F., and O’Regan, M., 2023. Revision of the Quaternary calcareous nannofossil biochronology of Arctic Ocean sediments. Quaternary Science Reviews, 321:108382. https://doi.org/10.1016/j.quascirev.2023.108382
Reid, P.C., Johns, D.G., Edwards, M., Starr, M., Poulin, M., and Snoeijs, P., 2007. A biological consequence of reducing Arctic ice cover: arrival of the Pacific diatom Neodenticula seminae in the North Atlantic for the first time in 800,000 years. Global Change Biology, 13(9):1910–1921. https://doi.org/10.1111/j.1365-2486.2007.01413.x
Richter, C., Acton, G., Endris, C., and Radsted, M., 2007. Technical Note 34: Handbook for shipboard paleomagnetists. Ocean Drilling Program. https://doi.org/10.2973/odp.tn.34.2007
Sato, T., and Kameo, K., 1996. Pliocene to Quaternary calcareous nannofossil biostratigraphy of the Arctic Ocean, with reference to late Pliocene glaciation. In Thiede, J., Myhre, A.M., Firth, J.V., Johnson, G.L., and Ruddiman, W.F. (Eds.), Proceedings of the Ocean Drilling Program, Scientific Results, 151: College Station, TX (Ocean Drilling Program), 39–59. https://doi.org/10.2973/odp.proc.sr.151.112.1996
Sato, T., Kameo, K., and Mita, I., 1999. Validity of the latest Cenozoic calcareous nannofossil datums and its application to the tephrochronology. Earth Science (Chikyu Kagaku), 53(4):265–274. https://doi.org/10.15080/agcjchikyukagaku.53.4_265
Sato, T., Kameo, K., and Takayama, T., 1991. Coccolith biostratigraphy of the Arabian Sea. In Prell, W.L., Niitsuma, N., et al., Proceedings of the Ocean Drilling Program, Scientific Results, 117: College Station, TX (Ocean Drilling Program), 37–54. https://doi.org/10.2973/odp.proc.sr.117.133.1991
Schiebel, R., and Hemleben, C., 2017. Planktic Foraminifers in the Modern Ocean: Berlin (Springer). https://doi.org/10.1007/978-3-662-50297-6
Schreck, M., Nam, S.-I., Clotten, C., Fahl, K., De Schepper, S., Forwick, M., and Matthiessen, J., 2017. Neogene dinoflagellate cysts and acritarchs from the high northern latitudes and their relation to sea surface temperature. Marine Micropaleontology, 136:51–65. https://doi.org/10.1016/j.marmicro.2017.09.003
Shipboard Scientific Party, 1995. Site 910. In Myhre, A.M., Thiede, J., Firth, J.V., et al., Proceedings of the Ocean Drilling Program, Initial Reports, 151: College Station, TX (Ocean Drilling Program), 221–270. https://doi.org/10.2973/odp.proc.ir.151.108.1995
St. John, K.E.K., Lucchi, R.G., Ronge, T.A., Barcena, M.A., De Schepper, S., Duxbury, L.C., Gebhardt, A.C., Gonzalez-Lanchas, A., Goss, G., Greco, N.M., Gruetzner, J., Haygood, L., Husum, K., Iizuka, M., Kapuge, A.K.I.U., Lam, A.R., Libman-Roshal, O., Liu, Y., Monito, L.R., Reilly, B.T., Rosenthal, Y., Sakai, Y., Sijinkumar, A.V., Suganuma, Y., and Zhong, Y., 2026. Site U1619. In Lucchi, R.G., St. John, K.E.K., Ronge, T.A., and the Expedition 403 Scientists, Eastern Fram Strait Paleo-Archive. Proceedings of the International Ocean Discovery Program, 403: College Station, TX (International Ocean Discovery Program). https://doi.org/10.14379/iodp.proc.403.104.2026
Stein, R., and Stax, R., 1996. Organic carbon and n-alkane distribution in late Cenozoic sediments of Arctic gateways Sites 909 and 911 and their paleoenvironmental implications: preliminary results. In Thiede, J., Myhre, A.M., Firth, J.V., Johnson, G.L., and Ruddiman, W.F. (Eds.), Proceedings of the Ocean Drilling Program, Scientific Results, 151: College Station, TX (Ocean Drilling Program), 391–405. https://doi.org/10.2973/odp.proc.sr.151.143.1996
Thierstein, H.R., Geitzenauer, K.R., Molfino, B., and Shackleton, N.J., 1977. Global synchroneity of late Quaternary coccolith datum levels validation by oxygen isotopes. Geology, 5(7):400–404. https://doi.org/10.1130/0091-7613(1977)5<400:GSOLQC>2.0.CO;2
Torres, M.E., Brumsack, H.J., Bohrmann, G., and Emeis, K.C., 1996. Barite fronts in continental margin sediments: a new look at barium remobilization in the zone of sulfate reduction and formation of heavy barites in diagenetic fronts. Chemical Geology, 127(1):125–139. https://doi.org/10.1016/0009-2541(95)00090-9
Ussler, W., III, and Paull, C.K., 2001. Ion Exclusion Associated with Marine Gas Hydrate Deposits. In Natural Gas Hydrates: Occurrence, Distribution, and Detection. 41–51. https://doi.org/10.1029/GM124p0041
Waghorn, K.A., Bünz, S., Plaza-Faverola, A., and Johnson, J.E., 2018. 3-D seismic investigation of a gas hydrate and fluid flow system on an active mid-ocean ridge; Svyatogor Ridge, Fram Strait. Geochemistry, Geophysics, Geosystems, 19(8):2325–2341. https://doi.org/10.1029/2018GC007482
Waghorn, K.A., Johnson, J.E., Bünz, S., Plaza-Faverola, A., Vadakkepuliyambatta, S., and Waage, M., 2022. Svyatogor Ridge—A Gas Hydrate System Driven by Crustal Scale Processes. In Mienert, J., Berndt, C., Tréhu, A.M., Camerlenghi, A. and Liu, C.-S., World Atlas of Submarine Gas Hydrates in Continental Margins. Cham (Springer International Publishing), 247–254. https://doi.org/10.1007/978-3-030-81186-0_20
Waghorn, K.A., Vadakkepuliyambatta, S., Plaza-Faverola, A., Johnson, J.E., Bünz, S., and Waage, M., 2020. Crustal processes sustain Arctic abiotic gas hydrate and fluid flow systems. Scientific Reports, 10(1):10679. https://doi.org/10.1038/s41598-020-67426-3
Wallmann, K., Riedel, M., Hong, W.L., Patton, H., Hubbard, A., Pape, T., Hsu, C.W., Schmidt, C., Johnson, J.E., Torres, M.E., Andreassen, K., Berndt, C., and Bohrmann, G., 2018. Gas hydrate dissociation off Svalbard induced by isostatic rebound rather than global warming. Nature Communications, 9(1):83.
https://doi.org/10.1038/s41467-017-02550-9
Young, J.R., 1998. Neogene. In Bown, P.R., Calcareous Nannofossil Biostratigraphy. Dordrecht, Netherlands (Kluwer Academic Publishing), 225–265.
Young, J.R., Bown, P.R., and Lees, J.A., 2024. Nannotax3 website. International Nannoplankton Association. https://www.mikrotax.org/Nannotax3
Zhang, L., Chan, L.-H., and Gieskes, J.M., 1998. Lithium isotope geochemistry of pore waters from Ocean Drilling Program Sites 918 and 919, Irminger Basin. Geochimica et Cosmochimica Acta, 62(14):2437–2450. https://doi.org/10.1016/S0016-7037(98)00178-1