Betzler, C., Eberli, G.P., Alvarez Zarikian, C.A., and the Expedition 359 Scientists
Proceedings of the International Ocean Discovery Program Volume 359
publications.iodp.org
doi:10.14379/iodp.proc.359.109.2017

Site U14711
C. Betzler, G.P. Eberli, C.A. Alvarez Zarikian, M. Alonso-García, O.M. Bialik, C.L. Blättler, J.A. Guo, S. Haffen, S. Horozal, M. Inoue, L. Jovane, D. Kroon, L. Lanci, J.C. Laya, A. Ling Hui Mee, T. Lüdmann, M. Nakakuni, B.N. Nath, K. Niino, L.M. Petruny, S.D. Pratiwi, J.J.G. Reijmer, J. Reolid, A.L. Slagle, C.R. Sloss, X. Su, P.K. Swart, J.D. Wright, Z. Yao, and J.R. Young2
Keywords: International Ocean Discovery Program, IODP, JOIDES Resolution, Expedition 359, Site U1471, Maldives, Kardiva Channel, Goidhoo atoll, Indian Ocean paleoceanography, Oligocene, Miocene, Pliocene, Pleistocene, carbonate platform, carbonate platform drowning, celestine, dolomite, drift deposits, large benthic foraminifers, monsoon, sea level, sequence stratigraphy
MS 359-109: Published 4 May 2017
Background and objectives
At 4°45.9828′N, 073°08.1146′E, Site U1471 (proposed Site MAL-07A) is the easternmost site of the southern transect (Figure F1). Located 16.8 km east of Site U1470 and 16.4 km southwest of Site U1467 at a water depth of 419.3 m, it is well within the Inner Sea portion of the Kardiva Channel, where the seafloor is essentially a flat surface (Figure F2). Sediments of the Inner Sea are hemipelagic carbonates consisting of a mixture of components exported from the atolls and pelagic components (periplatform ooze). Therefore, Site U1471 cores were expected to provide a complete and uninterrupted record of the sedimentary and paleoceanographic changes in the Maldives from the Miocene through the Pleistocene.
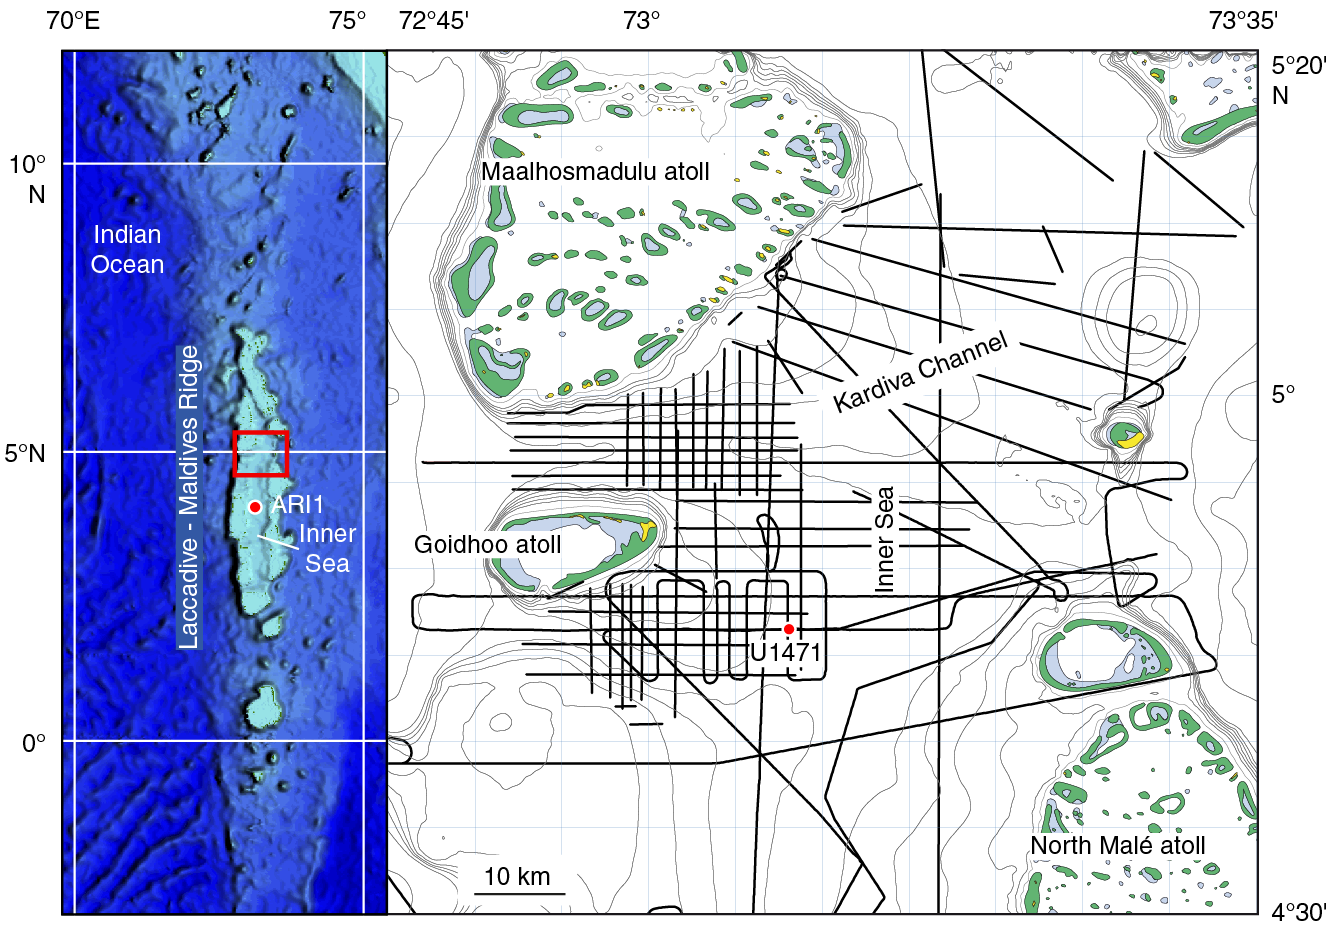
Figure F1. Location map, Site U1471.
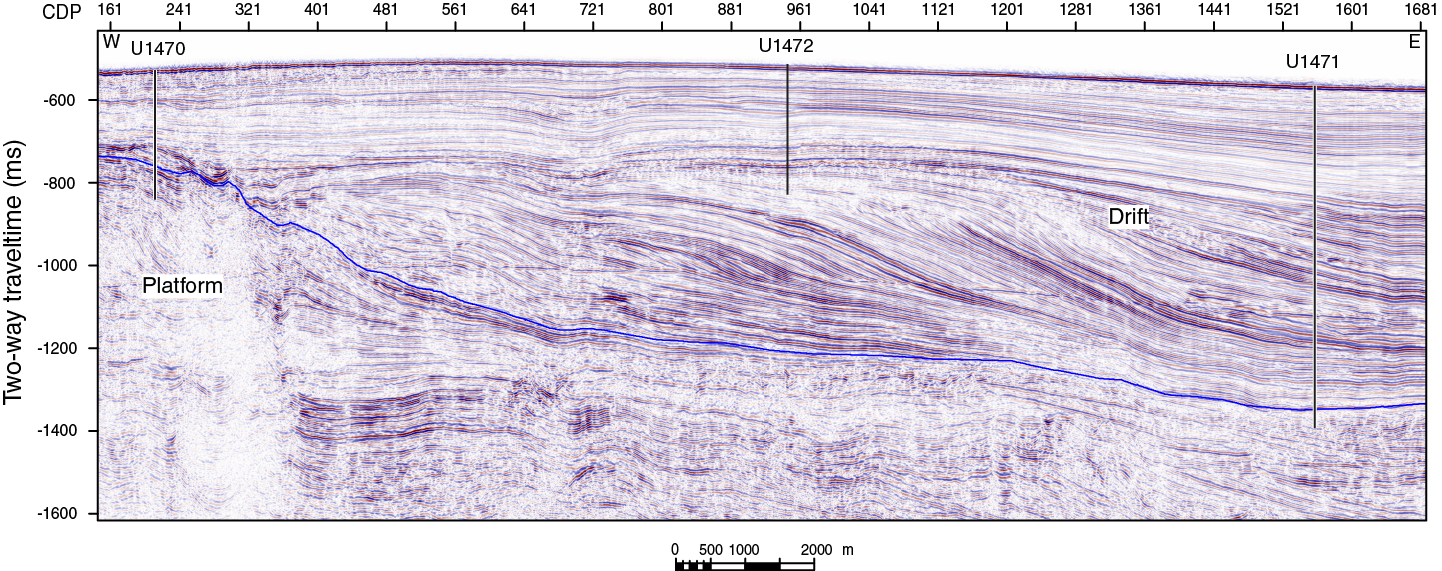
Figure F2. Seismic section along the southern transect.
The site location was chosen based on an interpretation of seismic lines showing the series of Miocene–Pliocene shingled drift bodies prograding toward the east. The proximal part of these drifts was cored at Sites U1466, U1468, and U1470, where it overlies the drowned carbonate platform, the oldest drift sequence (DS) DS1 and part of DS2. These drift sequences are of considerable thickness at these sites. At Site U1471, DS1 and DS2 are reduced in thickness, but the younger drift sequences DS3 and DS4 are expanded. Therefore, this location, with respect to depocenter evolution, has an intermediate position between the proximal drift sites of the northern transect and distal Site U1467. The drift sequence here does not contain any unconformities, and with its >800 m of thickness, it provides an expanded record from the middle Miocene to recent. The target depth was in the distal bottomsets of the sea level–controlled platform sequences underneath the drift.
The objectives for this site were (1) to constrain the age of onset of current-dominated sedimentation; (2) to analyze the cyclostratigraphy of drift deposits, therefore reconstructing changes in the current regime and monsoon cyclicity; and (3) to constrain the timing of sequence boundaries within the drift and the youngest platform sequence.
Operations
Transit to Site U1471
At 1448 h on 17 November 2015, we started the transit to Site U1471. We covered the short 9.1 nmi distance in 1 h, arriving over the site coordinates at 1548 h. Thrusters were lowered, and heading control was switched over to dynamic positioning at 1636 h. This process took a little longer than usual because the captain had to turn the ship around and change heading prior to getting back on the location coordinates. The advanced piston corer (APC)/extended core barrel (XCB) bottom-hole assembly (BHA) was built, and at 1707 h we deployed the same positioning beacon recovered from Site U1470. We lowered the drill string to the seafloor, picked up the top drive, and spaced out the bit at 414.6 meters below sea level (mbsl).
Hole U1471A
We started Hole U1471A at 2050 h on 17 November 2015 by cutting Core 1H and recovering 4.62 m of sediment, thus establishing a seafloor depth of 419.5 mbsl. Uninterrupted oriented APC coring continued through Core 32H to 295.1 meters below seafloor (mbsf), where high overpull and an incomplete stroke with the APC system led us to switch to the half-length APC (HLAPC) coring system. We continued to core with the HLAPC system through Core 37F to 318.6 mbsf. All HLAPC cores were incomplete strokes, and penetration continually decreased. The high content of sand in the formation caused the flapper valve in the core barrel to lock up, leading to occasional misfires of the APC and HLAPC coring systems. We therefore switched to XCB coring and continued through Core 44X to 384.0 mbsf, but because of poor recovery, we attempted another HLAPC core (see Figure F1 in the Expedition 359 summary chapter [Betzler et al., 2017b]). Core 45F recovered only 0.51 m, indicating the formation had become more lithified and therefore too hard for piston coring. In addition, the driller noticed that the wash pipe assembly on top of the top drive was seriously leaking, leading to an impromptu wiper trip to condition the hole and position the tapered drill collar above the seafloor. The standpipe assembly was replaced, and the bit was washed back to bottom. At 0030 h on 19 November, we resumed XCB coring and continued through Core 59X to 515.1 mbsf. Recovery was extremely poor, averaging just 9% (2%–27%). Only 2 of 14 cores were recovered with more than 1 m of sediment. Cores 60F and 61F were HLAPC cores in an attempt to improve recovery. These cores recovered 1.91 and 1.16 m, respectively. It was deemed too risky to drill out the rathole with the pipe open ended and no core barrel in place. Core 63F was the final HLAPC core attempted, and it recovered 1.74 m. Continuous XCB coring began with Core 64X at 531.5 mbsf and continued through Core 82X to 685.1 mbsf. XCB coring the interbedded hard/soft material was difficult, and recovery was marginal because the lithified limestone jammed in the XCB cutting shoe and the softer material was washed away. Although hole conditions remained good throughout and core recovery improved significantly over the last 100 m interval (averaging 44.5% and ranging between 19% and 88%), we decided to stop coring before reaching our depth and age objectives because of the slow rate of penetration (<8 m/h) and in favor of reaching our target depth in a rotary core barrel (RCB) hole to be drilled after completing two more APC holes (see Figure F1 in the Expedition 359 summary chapter [Betzler et al., 2017b]). Therefore, at 2300 h on 20 November, we stopped coring Hole U1471A and pulled the drill string back, clearing the seafloor. Total core recovered in Hole U1471A was 366.08 m (53%). Of the 82 cores recovered, 32 were APC cores, 9 were HLAPC cores, and 41 were XCB cores (Table T1).
Table T1. Site U1471 core summary. Download table in .csv format. View PDF table.
Holes U1471B and U1471C
After offsetting the ship 20 m west, we started coring Hole U1471B at 0440 h on 21 November 2015. The mudline core recovered 6.62 m, but the core liner shattered and much of the material was lost. Therefore, we started Hole U1471C another 20 m west at 0555 h. Core 1H recovered 7.85 m and established a seafloor depth of 419.3 mbsl. APC coring continued through Core 19H to a total depth of 178.8 mbsf. Successful temperature measurements were made using the advanced piston corer temperature tool (APCT-3) at 26.8, 45.8, 64.8, 83.8, and 169.3 mbsf and were 11.4°C, 11.6°C, 12°C, 12.2°C, and 13.5°C, respectively. The downhole temperature trend defined a very low temperature gradient of 15.3°C/km. In addition, as a result of one APCT-3 cutting shoe arriving late to the rig floor, the shoe was inadvertently installed without a core catcher, resulting in Core 5H (36.3–45.8 mbsf) being recovered empty. The drill string was pulled clear of the seafloor at 2000 h, ending Hole U1471C. Total core recovered in Hole U1471C was 170.19 m (95%). Nineteen APC cores were recovered (Table T1).
Hole U1471D
The ship was moved another 20 m west, and we initiated Hole U1471D at 2105 h on 21 November 2015. For this hole, the bit was advanced to 1 mbsf before taking the first core to optimally position the core breaks for reliable stratigraphic correlation. Cores 2H–7H were recovered to 59.0 mbsf. The last two cores were not oriented. Total core recovered in six APC cores in Hole U1471D was 56.76 m (100%) (Table T1).
Testing the Motion Decoupled Hydraulic Delivery System
After completing coring operations in Hole U1471D, the planned test of the Motion Decoupled Hydraulic Delivery System (MDHDS) took place with mixed results. Handling of the tool at the rig floor was vastly improved, reducing deployment time from the 1.5 h required during the first test at Site U1467 to 30 min. The Electronic RS (ERS; overshot system) was opened and closed numerous times and worked flawlessly each time. The Sediment Temperature Tool (SET2) functioned as designed and successfully recorded data, although it was not inserted into the formation because the MDHDS became stuck in the lockable float valve (LFV). A round trip of the drill string was completed, and the bit cleared the rig floor at 0545 h on 22 November 2015, ending Hole U1471D.
The MDHDS tool was removed without incident at the rig floor, and the LFV was packed with sand. It appeared that entrained sand was restricting removal of the MDHDS tool downhole and was flushed from the system during the pipe trip, which also explained several unusual piston core sequences where the pressure profile was atypical.
Hole U1471E
After making up a new RCB coring bit with a mechanical bit release and a four-stand BHA, the drill string was once again lowered to the seafloor. The ship was offset another 20 m west, and at 1110 h on 22 November 2015, we started drilling Hole U1471E. Our initial goal was to drill this hole to ~610 mbsf and then continuously RCB core to ~950 mbsf. Once coring operations were completed, downhole logging would follow with the three suites of wireline tools: the triple combo, Formation MicroScanner (FMS)-sonic, and Versatile Seismic Imager (VSI) tool strings. By midnight on Sunday, 22 November, Hole U1471E was drilled to 421.4 mbsf. Drilling ahead continued to 596.3 mbsf. Several deployments of the RCB bit deplugger were required to clear debris from the float valve flapper, resulting in drill string backflow. Drilling was halted because of the slow penetration rate and a concern for possible damage to the RCB center bit in the hard formation. The center bit was recovered via wireline, and an RCB core barrel was deployed. At 1045 h on 23 November, RCB coring was initiated. Coring continued through Core 44R to 1003.7 mbsf. The original Environmental Protection and Safety Panel (EPSP)-approved depth was 950 mbsf, but because of concerns about the reliability of the velocity depth model used, we requested to deepen the hole and received a depth extension approval from the EPSP to 1050 mbsf to ensure penetration to the target seismic reflector. This also provided a small amount of rathole below the target depth, which allowed for logging across the target facies. Additional depth would also accommodate any cuttings that might settle out of the hole annulus or cave-in during subsequent logging runs. Core recovery was adequate for most of the hole but continually improved with depth. Overall recovery for the hole was 42%; however, this increased to an average of 57% over the last 100 m (37%–89%). Toward the end of the cored interval, multiple deployments of the bit deplugger were made because of excessive backflow during drill string connections. Although these were unsuccessful, the coring process was not impacted. This suggested that the spring in the float valve was either broken or weakened and no longer able to fully seal the end of the pipe. There were no indications of hole stability issues through the course of drilling/coring in the hole. There was no filling identified on bottom between connections, no elevated drilling torque noted, and no wiper trips required during the course of the drilling/coring effort. As a result, the hole was not displaced with heavy mud and there was no prelogging wiper trip conducted in preparation for wireline logging. Forty-three RCB cores were recovered in Hole U1471E with a total core recovery of 171.54 m (42%) (Table T1).
Downhole logging
The RCB bit was released at the bottom of the hole, and the pipe was pulled up to a logging depth of 99.7 mbsf. The triple combo tool string was rigged up and deployed in the hole at 0545 h on 26 November 2015. A downlog was completed to 1003.7 mbsf (the total drilled depth), a short repeat pass was logged, and the main pass of the tool string was recorded from the bottom of the hole up past the seafloor. The borehole diameter in the upper section of the hole was at the maximum reach of the caliper arm (~17 inches), but much of the lower section was in gauge. The VSI tool string was rigged up next and run into the hole at 1245 h for a vertical seismic profile (VSP) experiment. The tool string reached an unpassable obstruction at ~615 mbsf, where the borehole had been observed to be very narrow during the triple combo run. Therefore, only shallow VSP stations could be reached; clear waveforms were recorded at three depth stations between 233 and 606 mbsf. The VSI tool string was run one more time into the hole to attempt one deeper station, but on this second attempt an obstruction was encountered at 454 mbsf, another narrow section observed during the triple combo run. A third logging run was made with a sonic tool string, measuring gamma ray and sonic velocity, with the aim of recording velocity data in the available open hole interval. The FMS tool that is usually combined with the sonic tool has a maximum caliper reach of ~15 inches and would not have made contact with the borehole walls in sections where the diameter exceeded 17 inches; thus, it was not included in the third logging tool string. The sonic tool string was run into the hole at 1620 h, and a downlog was recorded down to 454 mbsf, the same location where an obstruction blocked passage of the VSI tool string. After several unsuccessful attempts to pass the blocked section, the sonic tool string was pulled up from 454 mbsf to record a main pass through the shallow section of open hole up to the seafloor. The sonic tool string was rigged down, and logging operations for Hole U1471E and Expedition 359 were completed by 1940 h. The drill string was pulled on board and the seafloor-positioning beacon was recovered as the ship began to move using the dynamic positioning system to the next site (U1472) at 2120 h on 26 November.
Lithostratigraphy
Site U1471 is situated at the western (distal) position of a transect south of the Goidhoo atoll, drilled in a basinal to outer slope position through a succession of drift and hemipelagic deposits (see Background and objectives). It is comparable to the succession drilled at Sites U1466 and U1468 situated to the north of Goidhoo atoll. This site, however, is in a more distal position of the drift, providing a link to Site U1467.
The sequence from Holes U1471A–U1471E was divided into eight lithostratigraphic units based on changes in texture, components, degree of lithification, and color (Figure F3):
- Unit I: unlithified planktonic foraminifer–rich packstone to wackestone.
- Unit II: unlithified to partially lithified foraminifer-rich packstone.
- Unit III: unlithified to partially lithified planktonic foraminifer–rich wackestone.
- Unit IV: unlithified to lithified planktonic foraminifer–rich packstone.
- Unit V: dominantly lithified planktonic foraminifer–rich packstone.
- Unit VI: alternations of planktonic foraminifer–rich packstone and wackestone.
- Unit VII: alternations of planktonic foraminifer–rich and bioclastic-rich grainstone.
- Unit VIII: alternations of foraminifer-rich packstone to wackestone and wackestone to mudstone.
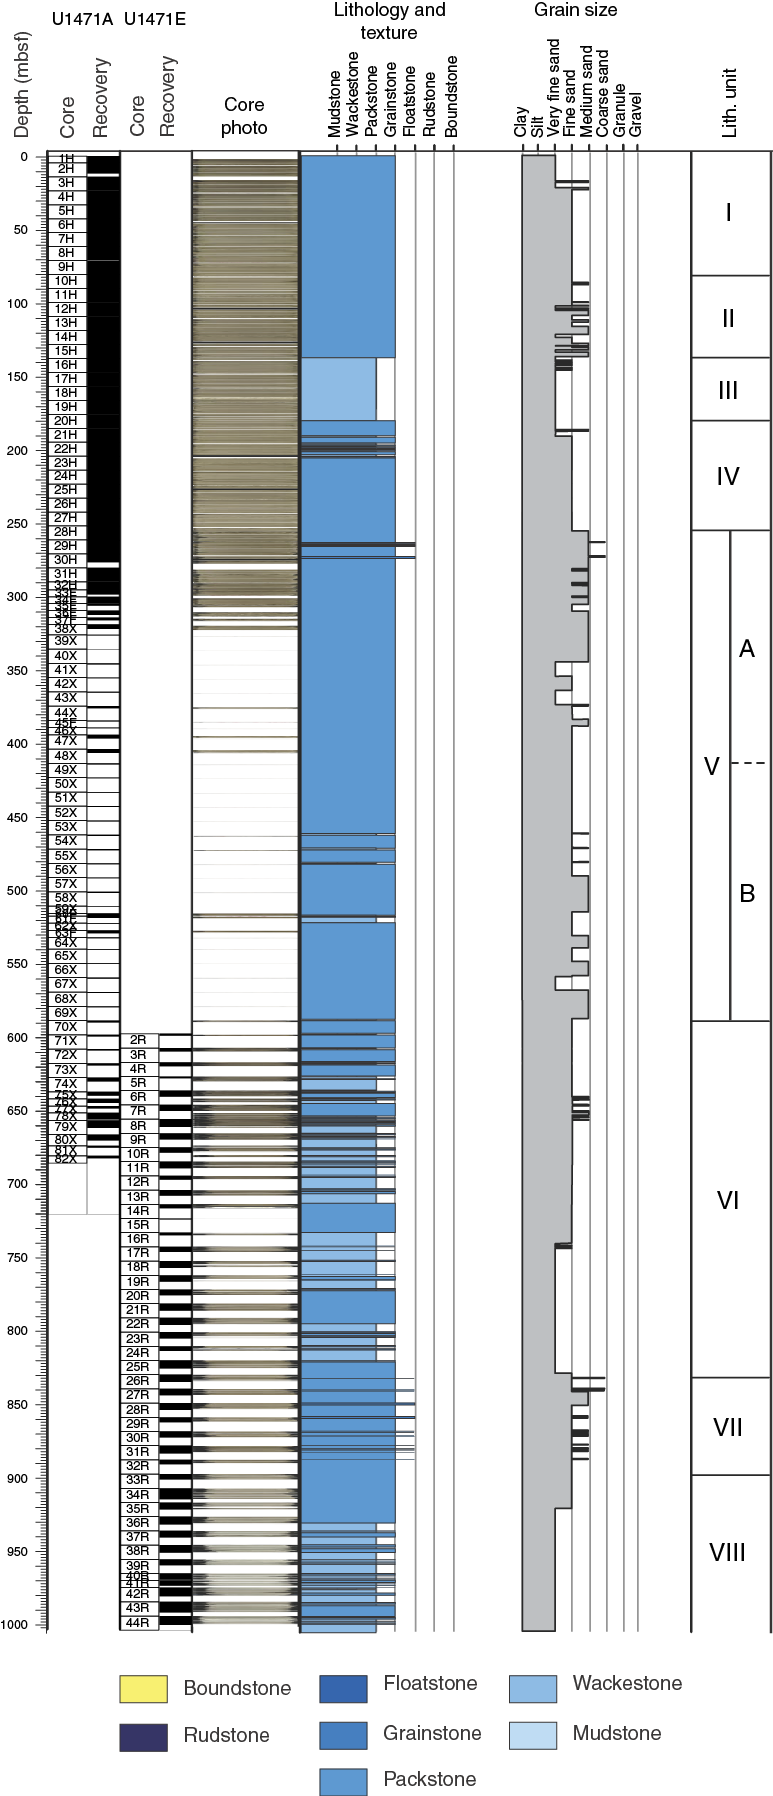
Figure F3. Lithostratigraphic overview, Site U1471.
Lithostratigraphic units
Unit I
- Intervals: 359-U1471A-1H-1, 0 cm, to 9H-CC, 12 cm; 359-U1471B-1H-1, 0 cm to 2H-CC, 16 cm; 359-U1471C-1H-1, 0 cm, to 9H-CC, 23 cm
- Depth: 0–80.69 mbsf
Unit I consists of unlithified brownish gray to white planktonic foraminifer–rich, fine- to medium-grained packstone to wackestone. Components include abundant planktonic foraminifers and well-preserved benthic foraminifers, echinoderm spines, pteropods, sponge spicules (Figure F4), calcareous nannofossils, and mollusk fragments. Plant remains are also present. Bioturbation is complete in this unit, often producing mottling. Components range in size from medium-grained (0.0–24.36 mbsf) to very fine grained (24.36–80.69 mbsf). Benthic foraminifers decrease in abundance downhole from common (0–39.33 mbsf) to rare (39.33–80.69 mbsf). The upper portion of the unit (0–23.26 mbsf) has darker colors and becomes lighter in color downhole (Figure F5). The transition is gradual with irregular alternations between lighter and darker colors throughout the unit. Dark-light colored couplets range from 0.25 to 8.05 m in thickness, averaging 2.94 ± 2.26 m per couplet.
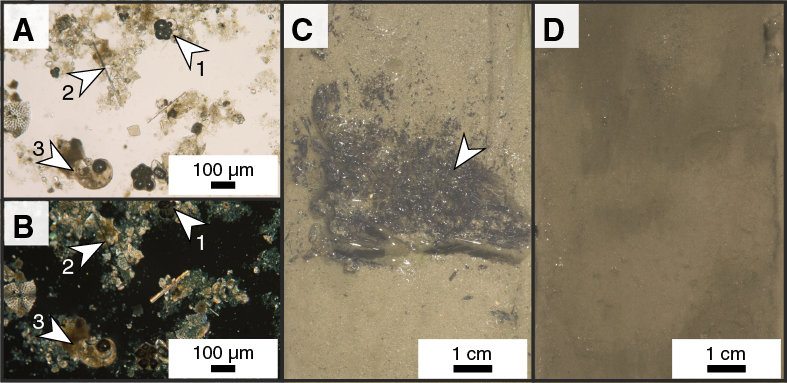
Figure F4. Common components in Unit I.
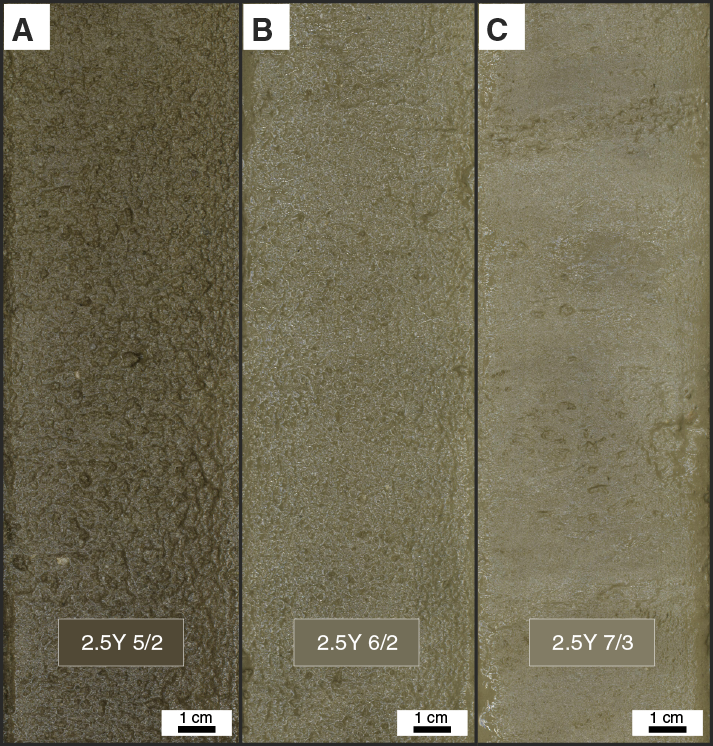
Figure F5. Color change across Unit I.
Unit II
- Intervals: 359-U1471A-10H-1, 0 cm, to 15H-CC, 12 cm; 359-U1471C-10H-1, 0 cm, to 19H-CC, 20 cm
- Depth: 80.69–137.60 mbsf
The Unit I/II boundary (Figure F6) is defined by the first occurrence of partially lithified intervals (Figure F3). Unit II consists of grayish brown to gray interlayered unlithified and partially lithified fine- to medium-grained planktonic foraminifer-rich packstone. Other components include benthic foraminifers, calcareous nannofossils, spicules (sponge and tunicate), echinoderm spines, mollusk fragments, and aggregates (Figure F7).
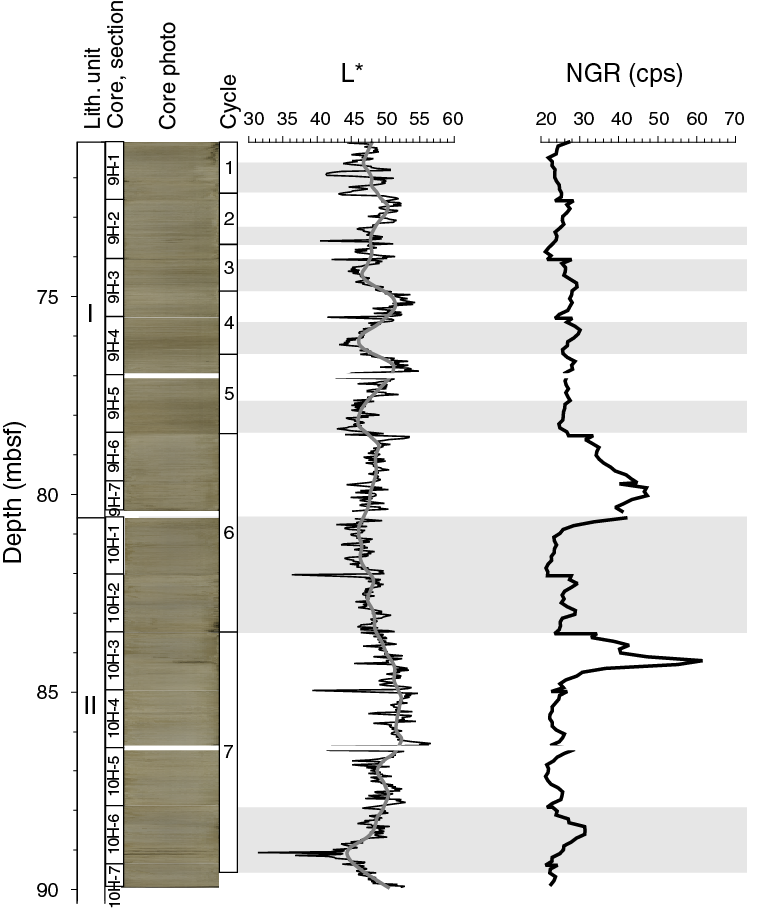
Figure F6. Unit I/II transition.
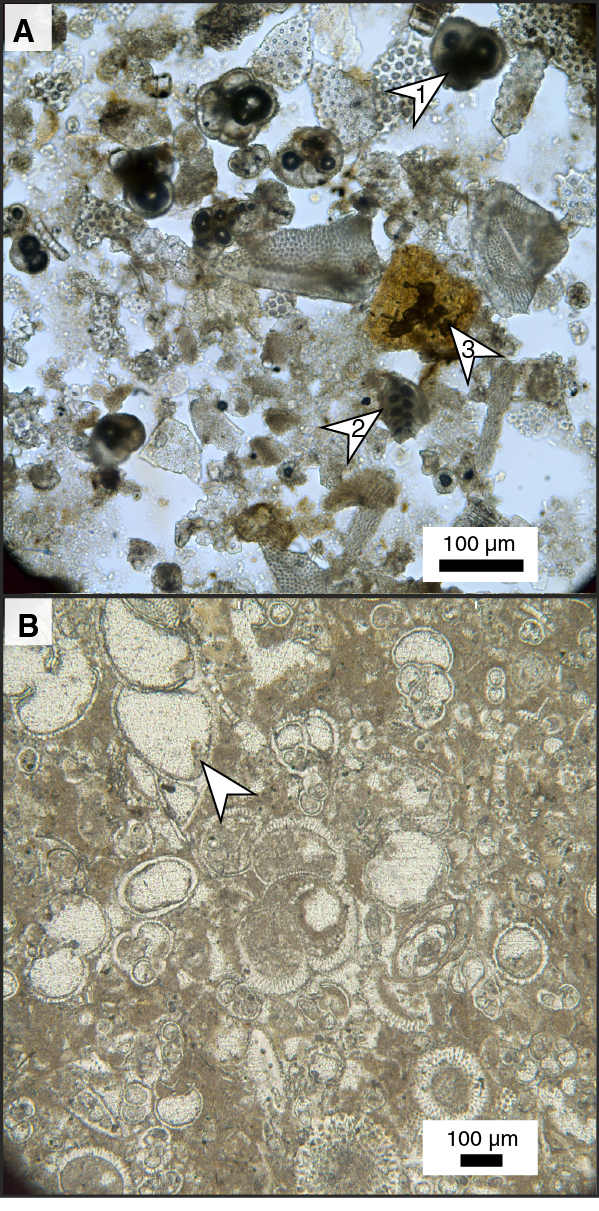
Figure F7. Components of Unit II.
Color in Unit II oscillates between grayish brown (2.5Y 5/2) and light gray (2.5Y 7/2) end-members and is at times slightly yellower. These alternations occur at a scale of approximately 10 m with lighter intervals that are 6.6 m thick on average and dark intervals that average 0.6 m. This wavelength is noticeably longer than that observed at the base of Unit I (Figure F6). Dark intervals are at times mottled because of bioturbation. Smear slide analysis indicates slight differences, with a notably higher abundance of organic matter and tunicates and fewer benthic foraminifers in the darker intervals.
The unit contains partially lithified intervals that are 0.41 m thick on average and unlithified intervals that are 0.48 m on average (Figure F8A). The thickness of the partially lithified intervals decreases downhole from a mean of 0.44 m in the upper half of the unit to 0.30 m in the lower half (Figure F9). The transition from unlithified to partially lithified is for the most part gradational, although in some cases the top of the partially lithified horizon is marked by a sharp or shorter gradient than the transition downhole to unlithified intervals. Unlithified horizons have a higher abundance of benthic foraminifers, and partially lithified horizons have a higher abundance of organic matter (Figure F7A) and tunicates. No clear correlation exists between color and lithification. Thin sections show good textural preservation of the components, no secondary porosity, and fill of intraparticle porosity by microcrystalline cement. Further examination using a scanning electron microscope (SEM) (Figure F8B–F8C) shows minor dissolution and textural degradation of individual calcareous nannofossils and higher abundance of very fine aragonite needles in the unlithified intervals that are absent in the partially lithified intervals.

Figure F8. Lithification.
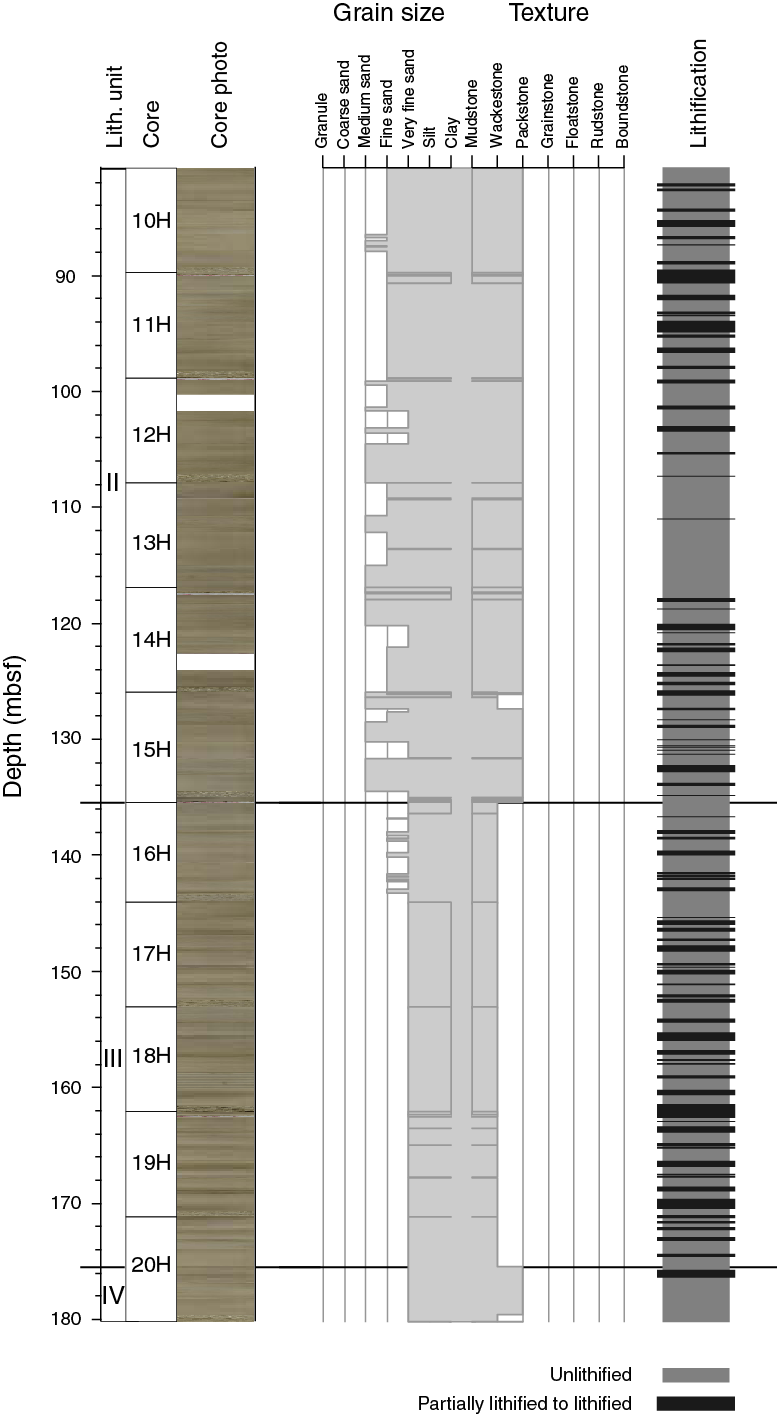
Figure F9. Distribution of lithified horizons, grain sizes, and textures, Hole U1471A.
Grain size fluctuates across the unit (Figures F3, F9), with the top of the unit dominated by fine sand–sized material. Decimeter-thick medium-grained intervals occur in Cores 359-U1471A-10H and 11H. From Core 12H to the base of the unit, grain size varies on a meter scale between very fine grained and medium-grained, a trend that continues into the upper part of Unit III.
Unit III
The Unit II/III boundary is defined by the change from packstone to wackestone as the dominant texture (Figures F3, F9). Unit III consists of light brownish gray to gray unlithified to partially lithified very fine to fine-grained planktonic foraminifer–rich wackestone. The uppermost core in this unit (16H) contains decimeter-thick fine-grained intervals, which are absent below this core in this unit. This core marks the end of a grain size decrease from Unit II that continues past the textural change that marks the unit boundary and continues as fine-grained wackestone to the base of Unit III. Bioturbation in this unit is complete and often represented by mottling. Color variability is relatively minor between light brownish gray, light gray, and gray. A downhole increase in lithification occurs within this unit, marked by an increase in thickness of the partially lithified horizons.
Benthic foraminifers and other calcareous bioclasts are present, as well as calcareous nannofossils and organic matter. Preservation of bioclastic grains varies from pristine to components with calcite overgrowth (Figure F10). The transition between these modes of preservation becomes most noticeable at ~175.6 mbsf, where specific identifiable components are no longer the principal component.

Figure F10. Lithification transition and effects on preservation.
Unit IV
The Unit III/IV boundary is defined by the transition in dominant texture from wackestone to packstone (Figure F9) and an increase in organic remains. Unit IV is completely bioturbated and consists of light brownish gray to light gray unlithified to lithified very fine to fine-grained planktonic foraminifer–rich packstone with a minor lithology of unlithified wackestone. The dominant components are recrystallized and abundant overgrown calcareous bioclasts, and cemented grains are also present. At times, benthic foraminifers were identified within the recrystallized grains (Figure F10). Benthic foraminifers (Amphistegina spp. and Uvigerina spp.), fish debris, echinoid spines, calcareous nannofossils, mollusk fragments, and organic matter are present. Dark grains and patches of friable organic material were observed throughout this unit.
Lithification is not uniform, and in some cases it is preferential to burrows and their surroundings. A textural preference is also observed, with packstones exhibiting a higher affinity to lithification. Approximately 63% of packstone is partially lithified to lithified and 37% is unlithified, whereas only 6% of the wackestone thickness is partially lithified and 94% is unlithified.
Preservation of bioclasts is notably better in unlithified intervals than in partially lithified intervals that do not present infill and retain very delicate structures (Figure F10). In partially lithified intervals, overgrowth completely masks the original shape of bioclastic grains, with the original texture only generally visible.
Unit V
The Unit IV/V boundary is defined by the first occurrence of fully lithified intervals. Unit V consists of light brownish gray to light gray unlithified to lithified fine- to medium-grained packstone as the dominant lithology and very fine to coarse-grained planktonic foraminifer–rich wackestone to grainstone. Bioturbation is complete, and organic matter is occasionally concentrated in burrows.
Although the first occurrence of fully lithified intervals occurs at 254.6 mbsf, alternating unlithified, partially lithified, and fully lithified horizons are present, and a transition to dominantly lithified material occurs farther downhole within this unit (Figure F11). However, poor recovery limited the ability to clearly define this transition and eliminate possible effects related to the change from HLAPC to XCB coring (see Operations). Although a clear unit boundary cannot be drawn for this transition, two subunits were identified for the upper and lower portions of this unit based on the difference in lithification level.
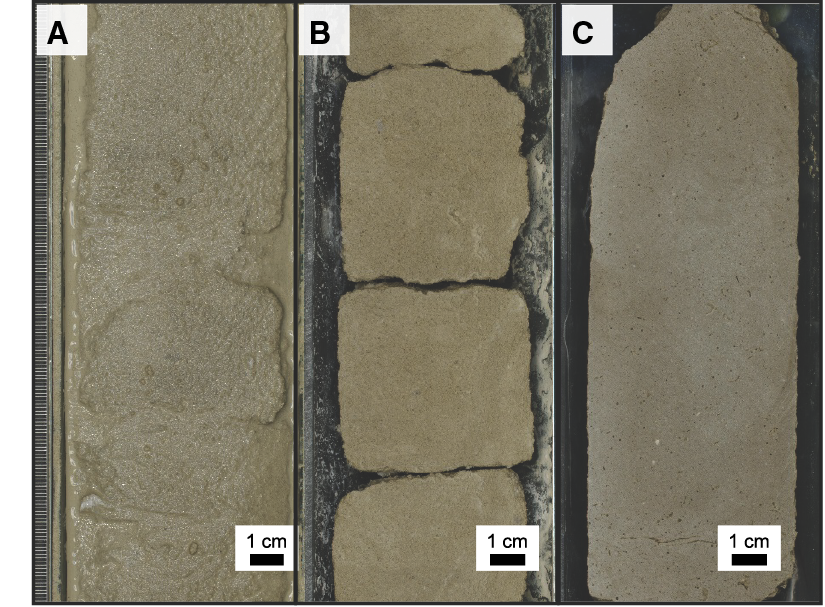
Figure F11. Variation in appearance of lithified intervals of Unit V.
Several intervals exhibit porosity, which is visible in core and thin section and includes intraparticle, moldic, and vuggy porosity. Celestine is present at times, forming large crystals spanning adjacent pores (Figure F12).
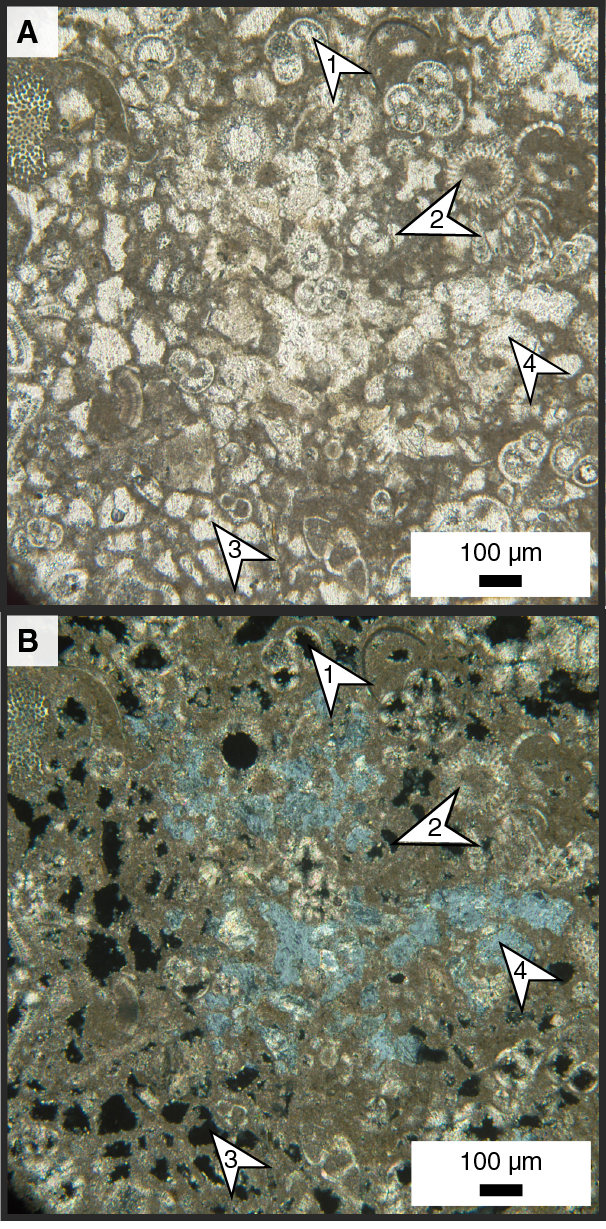
Figure F12. Components, porosity, and cementation of packstone in Unit V.
Subunit VA
Subunit VA is defined by alternating unlithified, partially lithified, and fully lithified horizons (Figure F11). It comprises very fine to coarse-grained planktonic foraminifer–rich packstone to grainstone. Benthic foraminifers, calcareous bioclasts, and chert are present; moldic porosity first appears in this subunit. Recovery decreases from ~100% at the top of the subunit to 4%–5% at the base; total recovery was 42%.
The lower portion of this subunit, from 309.2 mbsf to the bottom (36X-1, 0 cm, to 48X-CC, 41 cm) is marked by multiple occurrences of unlithified material, notably in Cores 36X, 43X, and 47X, all of which are nearly entirely unlithified.
Subunit VB
Subunit VB is defined by dominantly to fully lithified very fine to coarse-grained planktonic foraminifer–rich packstone to grainstone (Figure F11C). Calcareous bioclasts, benthic foraminifers, and mollusk fragments are present. Occasionally, components are identifiable only by molds. Recovery in this subunit was around 8%, often limited to the core catcher. Recovered material was highly modified by drilling disturbance, limiting description.
Unit VI
- Intervals: 359-U1471A-70X-1, 0 cm, to 82X-CC, 38 cm; 359-U1471E-2R-1, 0 cm, to 26R-3, 0 cm
- Depth: 588.1–832.06 mbsf
The Unit V/VI boundary is defined by a rapid transition from very fine to fine-grained planktonic foraminifer–rich dark brownish gray to brownish gray packstone and dark brownish gray to light gray wackestone to packstone (Figure F13). The latter are the more dominant lithologies in the unit. Lithologic transitions are gradational. In addition to planktonic foraminifers, sponge spicules, radiolarians, and calcareous nannofossils were identified in smear slides, as well as rare dolomite crystals. A single solitary coral was identified in interval 359-U1471E-6R-2, 73–76 cm. Moldic porosity is prevalent. In Cores 359-U1471A-70X and 359-U1471E-13R, packstone intervals are thinner than wackestone intervals (average: 18 cm σ = 21 cm and 28 cm σ = 28 cm, respectively). In Core 359-U1471E-14R, packstone intervals become less compacted, as evidenced by a decrease in the degree of vertical reduction of burrows. Packstone intervals also become thicker (average: 30 cm σ = 31 cm) and more prevalent from this position until the base of the unit.
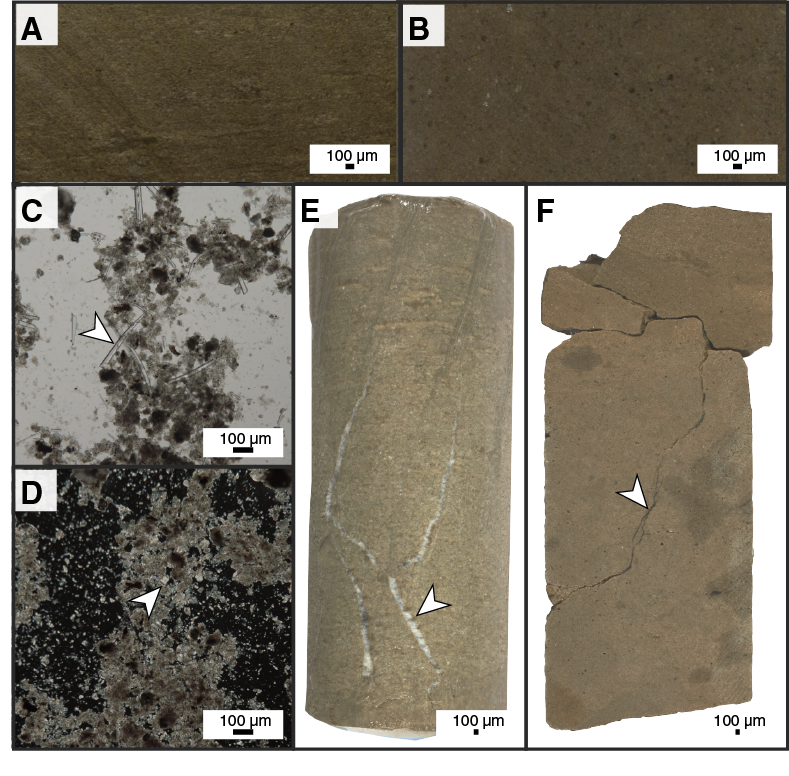
Figure F13. Components and composition of Unit VI.
Bioturbation is complete in wackestones, but it is common in packstones. Individual burrows are discernable, and in some cases completely flattened and discontinuous lamination-like structures are present and may be highly compacted burrows, possibly with organic matter. Planolites, Chondrites, Palaeophycus, Phycosiphon, Thalassinoides, Teichichnus, and Zoophycos ichnofossils were identified, in that order of abundance. Bioturbation completely homogenizes the wackestone, with individual burrows rarely identifiable.
Both vertical and subhorizontal fractures are present in this unit. Although some parallel fractures may be related to drilling operations, vertical to subvertical fractures are cemented (cement composition unclear), indicating that fracturing predated drilling.
Unit VII
The Unit VI/VII boundary is defined by the first occurrence of grainstone layers. Unit VII consists of fine-grained light gray to grayish brown planktonic foraminifer–rich grayish brown to light brownish gray packstone alternating with light brownish gray to light gray coarse-grained bioclastic-rich grainstone (Figure F14A). Planktonic foraminifers, calcareous bioclasts, and calcareous nannofossils are abundant, and benthic foraminifers are a minor component. Organic matter is present, mostly concentrated in darker intervals. Chert and convoluted bedding are also present in this unit. Components are often identifiable only by molds, which are commonly infilled with silica.
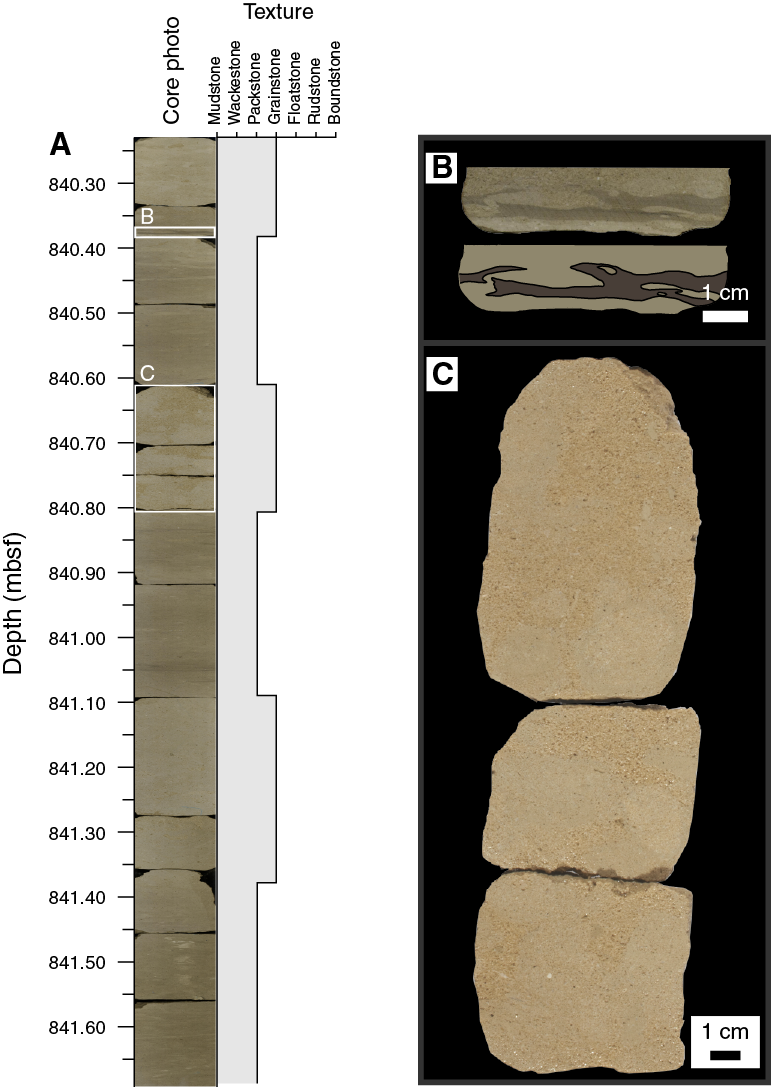
Figure F14. Packstone and grainstone alternations in Unit VIII.
Packstone intervals are darker in color, and their thickness ranges between 2 and 35 cm (average = 10.7 cm). These intervals have higher organic content and exhibit wavy and/or poorly laminated bedding. Bioturbation is common and characterized by the presence of smaller burrowing communities dominated by Phycosiphon and Chondrites.
Grainstone layers are lighter in color, and their thickness ranges between 2 and 78 cm (average = 14.0 cm) (Figure F14A). Grainstone interbeds often have a sharp basal contact with the underlying packstone, and at times flame structures (Figure F14B) can be identified as the basal contacts. Gradational contacts are also present. Large burrow communities (Planolites and Thalassinoides) are the dominant ichnofauna, and burrows are infilled with packstone (Figure F14C).
Unit VIII
The Unit VII/VIII boundary is defined by the last occurrence of grainstone and a color change from grayish brown to dark gray and white alternations.
Unit VII consists of alternations between very fine to fine-grained white to light gray foraminifer-rich packstone to wackestone and very fine grained and very fine grained dark gray wackestone to mudstone (Figure F15A). Calcareous nannofossils are abundant in both end-members, and planktonic foraminifers are abundant in the lighter colored packstone to wackestone and rare in dark wackestone to mudstone. Benthic foraminifers and glauconite are present only in the lighter colored packstone to wackestone, and a few chert nodules are present, mostly occurring in the brighter packstone to wackestone.
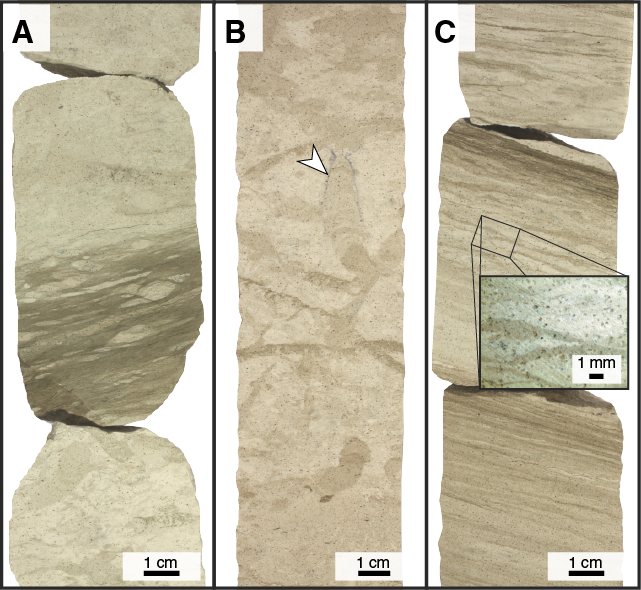
Figure F15. Sedimentary features in Unit VIII.
Bioturbation is common to complete in the lighter colored packstone to wackestone intervals. Burrows often host pyrite and glauconite concentrated principally in the outer rim of the burrow and presented as a slight pale blue and green mottle (Figure F15B). Large burrowing communities dominate these intervals, and common ichnofossils include Planolites, Thalassinoides, Zoophycos, and Chondrites.
The thickness of the dark wackestone to mudstone ranges between 2 and 50 cm (average = 11 cm). These intervals are poorly laminated and compacted, hosting organic matter, horsetail structures, and abundant dissolution seams. Bioturbation in these intervals ranges from absent to common and is characterized by small burrowing communities and dominated by Phycosiphon. Some tapering and flattening of burrows is observed; an extreme example in Section 359-U1471E-36R-2 (Figure F15C) resulted in lamination-like structures.
Discussion
The lithostratigraphy of Site U1471 reflects a nearly complete record of the sedimentary evolution of the Maldives drift package as identified in seismic sections (see Seismic stratigraphy). This succession is, age wise, comparable to the record recovered at Site U1467 (see Biostratigraphy) but differs sedimentologically because of its more proximal position.
The unlithified series defined as Unit I represents the youngest drift sequences (Lüdmann et al., 2013). The composition of this unit is dominated by pelagic components with possible neritic and terrestrial contribution. The pelagic contribution is mostly represented by planktonic foraminifers, calcareous nannofossils, and pteropods, whereas the neritic component is represented by spicules and some benthic foraminifers (see Biostratigraphy). Plant remains represent the terrestrial contribution; however, the full extent and mode of terrestrial contribution is unclear.
The transition to Unit II is marked by the occurrence of partially lithified horizons. The occurrence of these horizons does not correspond to changes in the pore water chemistry (see Geochemistry) and thus is unlikely to relate to the current diagenetic process, but it likely reflects an older diagenetic state. This change in state may be related to the change in color pattern (Figure F6) and the increasing grain size downhole in this unit (Figure F3). It is still unclear what governs the color changes. If the change marks loss of organic matter to past degradation, such process would provide a mechanism to initiate lithification. This change is made by modifying alkalinity and pH, leading to dissolution/reprecipitation (Bathurst, 1970), which may explain the observed loss of some of the very fine texture. Alternatively, given the asymmetry of lithification gradients around some of the partially lithified horizons, the possibility that these horizons represent firmgrounds (sensu Goldring, 1995) cannot be fully negated at this time.
Unit III shows a general grain size decrease in comparison to Units I–III and is represented by the transition from packstone in Unit II to wackestone. Lüdmann et al. (2013), combining new results with previously published data by Vincent and Toumarkine (1990) and Droxler et al. (1990), note an inverse trend in the fine fraction (<63 µm) distribution at Ocean Drilling Program Site 716 in the comparable interval. Through comparison to younger records, Betzler et al. (2013b) propose that these changes are the combined effect of seafloor sediment winnowing, which removes platform-derived material shedding and the fine fraction, transporting it further into the receiving basin. The sediment characteristics and trends observed in Units II and III indicate that similar processes associated with current intensification and abating were also recorded at Site U1471. In addition, the transition from Unit II to Unit III coincides with an increase in sedimentation rate (see Biostratigraphy). Therefore, it is also possible that a component of pelagic productivity plays a role in supply of the fine fraction.
Unit IV marks the return to packstone, an increase in grain size, and darker colors. Similar to Unit I, a mixture of pelagic and neritic components is observed; most notable for the latter is the presence of larger benthic foraminifers such as Amphistegina spp. This unit could represent an environment comparable to the more recent one encountered in Unit I. Unlike Unit I, Unit IV expresses fewer color variations and hosts partially lithified horizons at higher abundance and thickness than those encountered in Unit II. These differences may be due to a difference in initial water body productivity and organic matter supply or the result of more advance diagenesis.
The occurrence of nonselective dissolution in Unit V may have two possible sources. The first is spatial reorganization during aragonite/calcite recrystallization. Although this explanation has some support from the infill of porosity by celestine, it is not conducive with the volume increase involved in the transition to the calcite larger cell unit (Lippmann, 1973; Moore, 1989). The alternative is circulation of either unsaturated or corrosive fluids through the unit following at least the early stage of lithification (Melim et al., 2004). No other evidence supports circulation of unsaturated fluids, whereas the occurrence of a sulfate reduction zone in the sedimentary column currently above this unit (see Geochemistry) poses a possible source for corrosive fluids.
Differential compaction and fracturing observed in Unit VI varies in the rheological properties of the different intervals, possibly related to their diagenetic histories (e.g., cementation or dolomitization). The occurrence of silicates/tunicates/siliceous?? sponge spicules, and radiolarians (see Biostratigraphy) implies a high nutrient supply conducive to the preservation of biogenic silica (Tréguer and De La Rocha, 2013) and by extension high productivity.
The occurrence of grainstone intervals in Unit VII may be the result of two possible mechanisms: downslope gravity-induced mass transport or current-driven winnowing. Supporting evidence for downslope processes includes the presence of convoluted bedding within this unit and the soft-sediment deformation at the base of grainstone intervals. Both features are the product of sediment remobilization (Phillips, 2006). However, such remobilization can also be current related. Given the established understanding of the Maldives drift package (Betzler et al., 2013a) and given that no clear grading was identified in these beds and that some contacts were gradational at both the base and top of the grainstone layers, it is more likely these intervals represent high-current events from the migration of a shifting bottom current.
The occurrence of the punctuated dark laminated horizons in Unit VII along with the change in trace fossil density accompanied in the transition to smaller ichnofossils, notably the dominance of Phycosiphon, suggest oscillating oxygen conditions possibly related to changes in pelagic productivity (Savrda and Bottjer, 1986; Uchman et al., 2008).
In conclusion, the overall evolution of the sedimentary succession tracks a series of changes in sedimentary regimes notably related to changes in productivity distribution and current-derived winnowing overprinted by diagenesis. The relation between these two mechanisms may relate to temporal changes in type and abundance of organic matter in each interval, as proposed by Reuning et al. (2006).
Biostratigraphy
A ~1003 m thick succession recovered at Site U1471 was studied for biostratigraphic and paleoenvironmental analyses combining Holes U1471A, U1471C, and U1471E. In Hole U1471A, the top (~685 m) of the sequence was recovered. The sequence in Hole U1471C overlaps with the uppermost ~180 m of Hole U1471A. Recovery in Hole U1471E starts at ~596 mbsf and reaches ~1003 mbsf, overlapping with the bottom 180 m of the interval cored in Hole U1471A. Samples from Hole U1471A (Cores 1H–82X; 0–685 mbsf) and Hole U1471E (Cores 5R–44R; 625–1003 mbsf) were examined for calcareous nannofossils, planktonic and benthic foraminifers, radiolarians, and ostracods, whereas samples from Hole U1471C (Cores 1H–19H; 0–179 mbsf) were studied only for planktonic foraminifers. The succession was divided into two intervals (A and B).
Interval A was recovered in Cores 359-U1471A-1H through 16H (0 to ~147 mbsf) and 359-U1471C-1H through 16H (0 to ~150 mbsf) and comprises the Pleistocene and late Pliocene. Preservation of planktonic and benthic foraminifers and calcareous nannofossils is very good to good from the top to approximately 55 mbsf (from the top of the sequence to Samples 359-U1471A-6H-CC and 359-U1471C-6H-CC).
Interval B was recovered in Cores 359-U1471A-17H through 82X and 359-U1471E-5R through 44R. This interval comprises early Pliocene to middle Miocene sediments. Preservation of planktonic foraminifers is generally moderate to very poor in this interval, with mostly poor to very poor preservation in the samples from Hole U1471E. Benthic foraminifers are moderately preserved throughout this interval and decrease downhole. Nannofossil preservation is also poor to moderate through most of this interval but improves in the lower part (Cores 37R–44R).
Age model
Site U1471 was considered of special interest for biostratigraphy because it had an expanded Pleistocene to late Miocene sequence and offered the opportunity to correlate nannofossil and planktonic foraminiferal events and to calibrate them against cyclostratigraphy. For this reason, a special effort was made to locate all key events as closely as possible.
The sequence of events recognized at this site is summarized in Table T2. Identified biozones and paleoenvironmental interpretations are shown in Figure F16. An age-depth plot is given in Figure F17; ages inferred from planktonic foraminifers and calcareous nannofossils substantially correspond with each other throughout the sequence.
Table T2. Biostratigraphic events, Site U1471. Download table in .csv format.
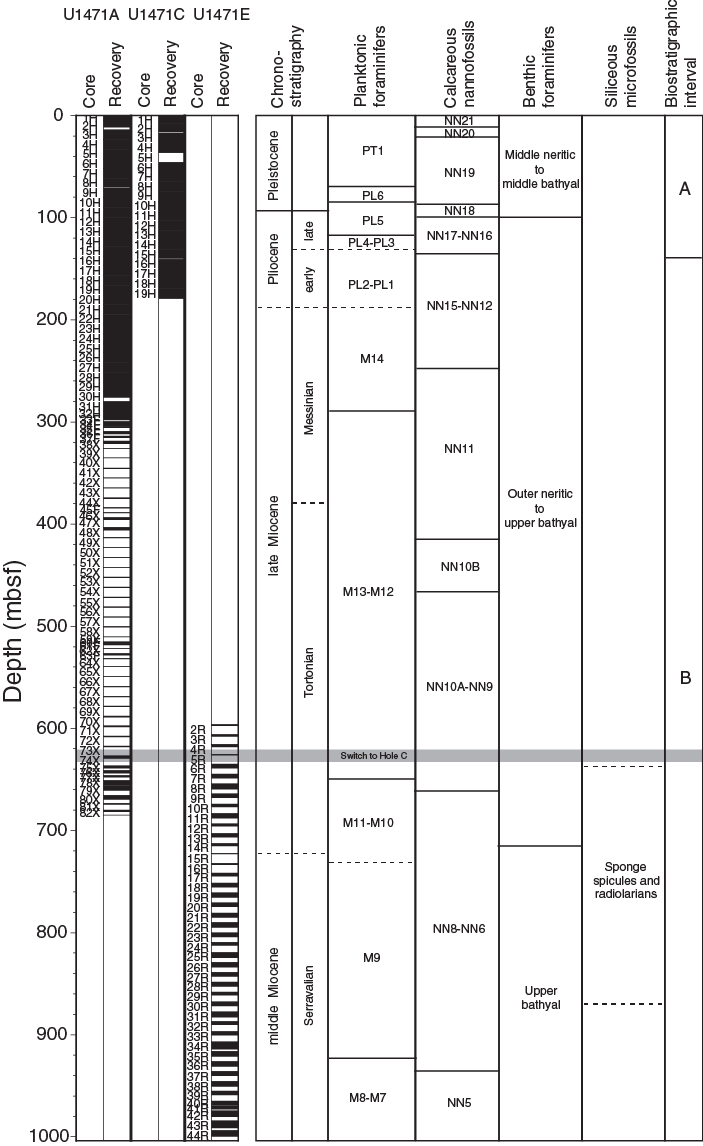
Figure F16. Biostratigraphic and paleoenvironmental summary, Site U1471.
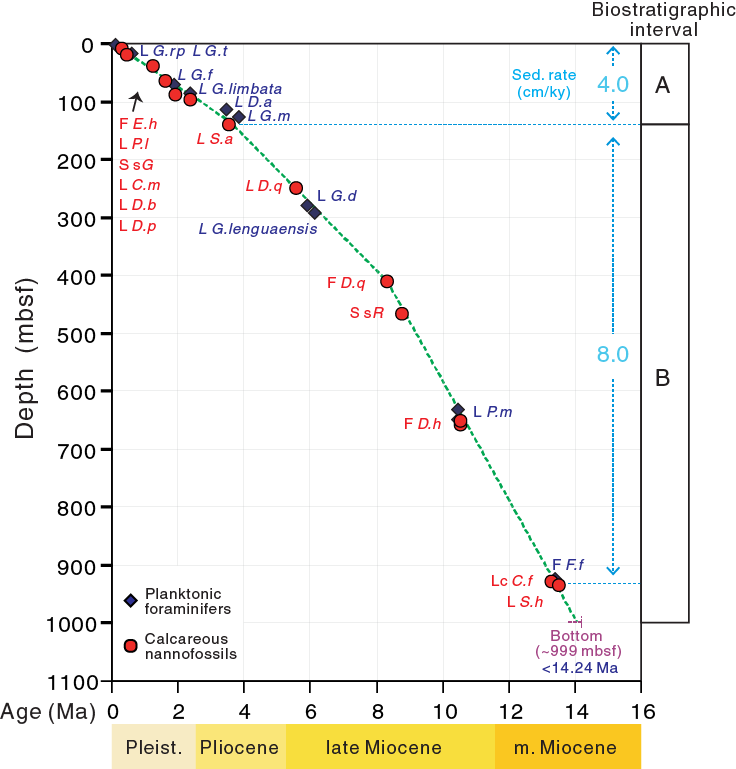
Figure F17. Age-depth plot, Site U1471.
Interval A contains a succession of well-constrained events that indicate an average sedimentation rate of 4.0 cm/ky. In the Pliocene–Pleistocene interval, however, a consistent offset occurs between ages inferred from calcareous nannofossil events and those inferred from planktonic foraminifers, with the planktonic foraminifers suggesting ages about 0.5 My older than the calcareous nannofossils. This pattern was also observed in the Pliocene–Pleistocene sequence of Sites U1465–U1467, which points to a possible problem with the age calibrations of these events for this region. In Intervals B and C, sufficient planktonic foraminiferal and nannofossil events were recognized, and their ages reasonably agree with each other. The inferred average sedimentation rate for this interval is 8.0 cm/ky.
Calcareous nannofossils
Samples were taken from almost every core section from the uppermost 16 cores of Hole U1471A (Table T3). Additional samples were taken from many sections and from different depths in the core catcher when it showed variable lithology, especially in the lower part of the hole.
Table T3. Nannofossil range chart, Holes U1471A and U1471E. Download table in .csv format.
Interval A: Quaternary to early Pliocene (Cores 359-U1471A-1H through 16H)
Nannofossil preservation is good in the Late Pleistocene (from the top of the sequence to Core 6H) and then declines as a result of increasing overgrowth, which particularly affects the larger coccolith species (e.g., Helicosphaera carteri) and discoasters. Despite this overgrowth, all major events could be recognized, as outlined below.
The first occurrence (FO) of Emiliania huxleyi was initially placed between Samples 359-U1471A-2H-CC and 3H-CC based on light microscopy. Samples from the intervening sections were examined using the shipboard SEM, enabling the FO to be placed between Samples 2H-3, 75 cm, and 2H-4, 75 cm. Gephyrocapsa protohuxleyi specimens also occur in this interval but are mostly smaller and do not significantly complicate identification of the event. The LO of Pseudoemiliania lacunosa occurs within Core 3H, with very rare specimens in Samples 3H-3, 75 cm, and 3H-4, 75 cm, and common specimens in Sample 3H-5, 75 cm. Assemblages in the succeeding interval are distinctive because of high abundances of small Gephyrocapsa (<3 µm). By examining section samples, it was possible to precisely locate this event within Core 5H (Table T2).
Although Calcidiscus macintyrei is rare at this site, this species is consistently present until its last occurrence (LO) in Sample 8H-1, 75 cm. Discoaster brouweri is common in the basal Pleistocene (sensu Hilgen et al., 2012) and has a well-marked LO in the lower part of Core 4H (Table T2). However, the Discoaster triradiatus acme event that normally occurs at the top of the D. brouweri range (Backman et al., 2012) was not observed, possibly due to the calcite overgrowth. The LO of Discoaster pentaradiatus occurs as an abrupt event at the base of Core 5H. Below this core, the abundance of discoasters rapidly decreases, and it was not possible to identify the last occurrences of Discoaster variabilis, Discoaster surculus, or Discoaster tamalis. The LO of Sphenolithus abies was clearly marked, occurring at the top of Core 16H, with only very few specimens occurring in the basal samples of Core 15H.
Interval B: early Pliocene to middle Miocene (Cores 359-U1471A-17H-82X and 359-U1471E-5R-44R)
During Interval B nannofossil preservation was poor to moderate. As a result, only the most reliable events identified were used to constrain the age model. In the lower part of the site (Cores 359-U1471E-37R through 44R), nannofossils are generally more abundant and better preserved.
The LO of Discoaster quinqueramus marks the end of the D. quinqueramus lineage and is straightforward taxonomically because this species is the last nonbirefringent symmetrical five-rayed discoaster, so even very poorly preserved specimens can be identified. The last specimens of D. quinqueramus were observed in Sample 359-U1471A-29H-CC. However, other species of discoasters are completely absent in many samples from this part of the sequence; therefore, there is a large uncertainty in the placement of this event. The species Discoaster berggrenii and D. quinqueramus intergrade, and we did not separate them at Site U1471. The FO of the lineage occurs in an interval of poor recovery and variable discoaster preservation, so it could not be entirely reliably placed, even though it appears in several samples from each core catcher. The lowest sample with D. quinqueramus is 48X-CC; below this sample, Sample 49X-CC contains frequent discoasters but no D. quinqueramus. There is an interval with no discoasters until Sample 54X-CC. Therefore, the LO was placed between Samples 48X-CC and 49X-CC but with low confidence.
The small Reticulofenestra event is relatively easy to identify because it involves the most abundant element of the assemblage, the reticulofenestrids. This event falls in an interval of very poor recovery but was readily placed between Samples 54X-CC and 55X-CC. The LO of Discoaster hamatus is usually a reliable event, but here, as at Site U1467, it occurs within an interval of very poor preservation and low abundance and could not be placed with sufficient precision to include it in the age model.
The FO of D. hamatus is somewhat problematic to place because this species is difficult to identify in poorly preserved samples. The species is defined by the presence of clockwise-deflected (in distal view) proximal ray extensions, and both ray breakage and overgrowth can prevent definitive identification. We placed its FO within the interval overlapping Holes U1467A and U1471E at very nearly the same level in both holes (Hole U1471A = 651–655 mbsf; Hole U1471E = 655–661 mbsf). Catinaster coalitus continued below D. hamatus in both holes but did not have a clear first occurrence.
The LO of Coronocyclus nitescens was well marked in Sample 359-U1471E-33R-2, 70 cm. However, this is anomalously low relative to all other data, so it was not used in the age model. Cyclicargolithus floridanus is an abundant and distinctive component of nannofossil assemblages from the Oligocene to middle Miocene. However, its LO is generally regarded as diachronous. For tropical sites, the last common occurrence (LCO) of C. floridanus has been calibrated at 13.3 Ma. This LCO was an abrupt event at Sites U1467 and U1468. At Site U1471, it occurred between Samples 359-U1471E-36R-2, 77 cm (no specimens found), and 36R-2, 132 cm (several specimens per field of view). This event occurs slightly above the FO of Fohsella fohsi and the LO of Sphenolithus heteromorphus. Combined, these three events constitute a very useful set of events. S. heteromorphus occurs during a relatively short time interval (17.7–13.5 Ma). At Site U1471, its FO is well marked within Core 37R.
Planktonic foraminifers
Planktonic foraminifers were studied in Holes U1471A (78 samples), U1471C (18 samples), and U1471E (44 samples). We examined core catcher samples plus some supplementary core samples when planktonic foraminifers were badly preserved. Additionally, we investigated mudline samples recovered in Holes U1471A and U1471C. Planktonic foraminifers are present in most of the samples, allowing a reasonably reliable biostratigraphic zonation (Figure F16), although the preservation and number of foraminifers are variable. Preservation is very good to good from the top of the sequence to approximately 55 mbsf (i.e., from the top to Samples 359-U1471A-6H-CC and 359-U1471C-6H-CC). Below this depth, preservation is generally moderate to very poor in Hole U1471A, with intervals of very poor preservation (e.g., Sample 39X-CC to 42X-CC) and some barren samples (e.g., Sample 52X-CC). However, we found a few sparse well-preserved samples (e.g., 32H-5, 86–87 cm, and 44X-CC). Samples from Hole U1471E generally have very poor preservation with a few barren samples. The preservation status of foraminifers in all studied samples is given in Table T4.
Table T4. Planktonic foraminifer range chart, Hole U1471E. Download table in .csv format.
We used core catcher samples from Holes U1471A and U1471C to locate bioevents to 180 mbsf (Tables T2, T5, T6). Samples studied from Hole U1471E only cover the bottom part of the sequence and slightly overlap with the bottom part of Hole U1471A.
Table T5. Planktonic foraminifer range chart, Hole U1471A. Download table in .csv format.
Table T6. Planktonic foraminifer range chart, Hole U1471C. Download table in .csv format.
Interval A (Cores 359-U1471A-1H through16H and 359-U1471C-1H through 16H)
Interval A comprises the top of the sequence, where the sedimentation rate was lower. This interval was investigated in Holes U1471A and U1471C, and the events are coherent between both holes (Table T2). Four Pleistocene bioevents were identified within this interval: the LO of Globigerinoides ruber pink (0.12 Ma) between the Hole U1471A mudline sample and Sample 359-U1471A-1H-CC (~2.34 mbsf) and between the Hole U1471C mudline sample and Sample 1H-CC (~3.95 mbsf), the LO of Globorotalia tosaensis (0.61 Ma) between Samples 359-U1471A-2H-CC and 3H-CC (~17.59 mbsf) and between Samples 359-U1471C-2H-CC and 3H-CC (~21.63 mbsf), the LO of Globigerinoides fistulosus (1.88 Ma) between Samples 359-U1471A-7H-CC and 9H-CC (~71.19 mbsf) and between Samples 359-U1471C-7H-CC and 9H-CC (~74.59 mbsf), and the LO of Globorotalia limbata (~2.39 Ma) between Samples 359-U1471A-9H-CC and 10H-CC (~85.52 mbsf) and between Samples 359-U1471C-9H-CC and 10H-CC (~88.64 mbsf). Within the Pliocene, we identified the LO of Dentoglobigerina altispira (3.47 Ma) between Samples 359-U1471A-12H-CC and 13H-CC (~114.13 mbsf).
Interval B (Cores 359-U1471A-17H through 82X and 359-U1471E-5R through 44R)
This interval was investigated in Holes U1471A and U1471E. Three late Miocene events were identified: the LO of Globoquadrina dehiscens (5.92 Ma) between Samples 359-U1471A-29H-CC and 31H-CC (~280.17 mbsf), the LO of Globorotalia lenguaensis (6.13 Ma) between Samples 31H-CC and 32H-5, 86–87 cm (~292.79 mbsf), and the LO of Paragloborotalia mayeri (10.46 Ma) between Samples 76X-CC and 78X-3, 42–43 cm (~649.08 mbsf) and between Samples 359-U1471E-5R-1, 37–41 cm, and 6R-3, 49–51 cm (~631.98 mbsf). Constraints on the LOs of G. dehiscens and G. lenguaensis are limited because only a few specimens of these species were identified at the top ends of their ranges. Unfortunately, the samples above yield very low abundances of the planktonic foraminifers and have poor preservation. The small offset observed in the LO of P. mayeri between Holes U1471A and U1471E may be due to the poor preservation of the foraminifers in this part of the record. Within the middle Miocene, we identified the FO of F. fohsi between Samples 359-U1471E-35R-CC and 36R-1, 1–3 cm (~923.67 mbsf). Sample 44R-5, 69–71 cm, at the bottom of the hole yields few specimens of Fohsella peripheroacuta. The presence of this species implies that the bottom of the borehole is younger than 14.24 Ma.
Benthic foraminifers
Core catcher and section samples from Holes U1471A (25 samples) and U1471C (15 samples) were examined for benthic foraminifers, which are abundant throughout Intervals A and B (Figure F16). Preservation at the top of Interval A (spanning the early Pliocene to Pleistocene) ranges from very good to good with diverse benthic foraminiferal fauna present. The presence of benthic species Planulina subtenuissima and Siphonina pozonensis at the base of Hole U1471A (Samples 55X-CC to 80X-CC) during the early part of the late Miocene indicates an upper bathyal depositional environment. The base of Hole U1471C (middle Miocene section) contains benthic foraminifer S. pozonensis and Pleurostomella alternans, also indicating an upper bathyal depositional environment during this interval (Table T7).
Table T7. Benthic foraminifer range chart, Holes U1471A and U1471E. Download table in .csv format.
Interval A (Cores 359-U1471A-1H through 16H)
The top of this sequence ranges from very good to good in preservation, and benthic foraminifers are abundant in these samples. Species present in this interval include Uvigerina sp., Textularia sp., Hoeglundina elegans, Stilostomella lepidula, Plectofrondicularia vaughni, and unidentified agglutinated benthic foraminifers, all indicating a middle neritic to middle bathyal depositional environment (Figure F18).
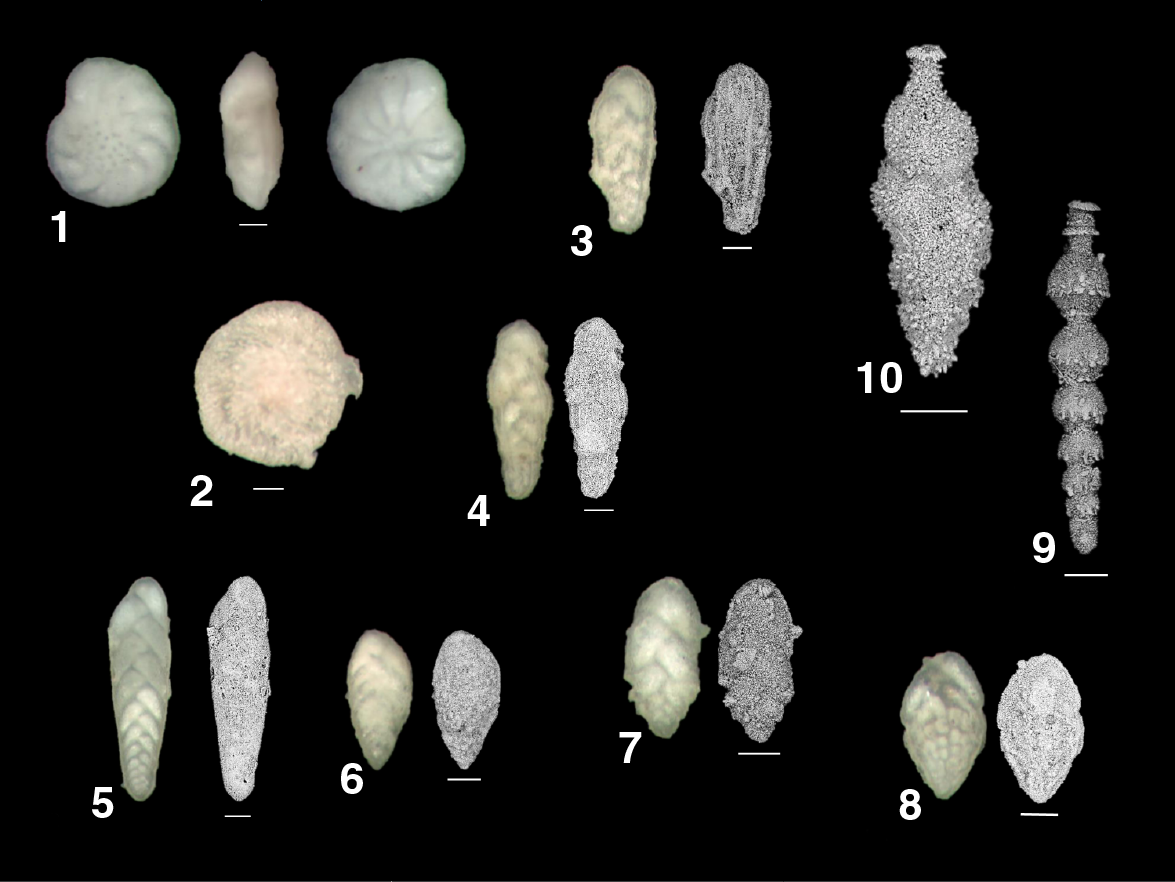
Figure F18. Benthic foraminifers.
Interval B (Cores 359-U1471A-7H through 82X and 359-U1471E-5R through 44R)
Interval B spans the middle to late Miocene. Benthic foraminifers are abundant throughout this interval, with good preservation at the top of the sequence and decreasing preservation downhole observed in Samples 359-U1471A-39X-CC to 53X-CC. The top of Hole U1471E ranges from very poor to poor preservation with some barren intervals also present (Table T7). The abundance of the benthic foraminifer genus Bolivina (both smooth and crenulate species are present) increases in Hole U1471A beginning in Sample 20H-CC and increases downhole throughout this interval in Holes U1471A and U1471C. Sample 359-U1471A-51X-CC is dominated by the overwhelming presence of both Bolivina and Uvigerina species. Overall, preservation in Hole U1471E is poor to very poor, and few benthic foraminifers were identified in this interval.
Radiolarians
Twenty-four core catcher samples from Hole U1471A and four core catcher samples and four core section samples from Hole U1471E were prepared for radiolarian analysis (Table T8). Radiolarians are present between Samples 359-U1471A-76X-CC and 82X-CC (~644–681 mbsf) with moderate amounts of radiolarians in Samples 79X-CC and 80X-CC. Most radiolarian specimens, however, could not be identified because of their poor preservation. In Hole U1471A, sponge spicules are present from Sample 75X-CC (641.3 mbsf) to the bottom of the hole (82X-CC; 685.1 mbsf). In Hole U1471E, radiolarians were found in Samples 7R-3, 104–105 cm (648.65 mbsf), 20R-CC (774.65 mbsf), and 28R-4, 0–5 cm (853.09 mbsf). Sponge spicules are also common in the interval between Samples 359-U1471E-7R3, 104–105 cm, and 28R-4, 0–5 cm, except for Sample 24R-CC (819.4 mbsf).
Table T8. Radiolarian and sponge spicule range chart, Holes U1471A and U1471E. Download table in .csv format.
Geochemistry
Interstitial water chemistry
Interstitial water (IW) samples were taken by whole-round squeezing from Hole U1471A at a rate of one per core (recovery permitting) and from Hole U1471E at just two intervals. A total of 40 IW samples were obtained from Hole U1471A, including a bottom water (mudline) sample, with the majority occurring above 320 mbsf and only a few occurring between 320 and 528 mbsf. Lithification prevented IW sampling at greater depths, in contrast to Sites U1467 and U1468, where IW samples were recovered throughout almost the entire cored interval. The two IW samples from Hole U1471E yielded only ~8 and ~15 mL of fluid and were not subjected to the entire suite of shipboard analyses.
Major cations (Na+, K+, Ca2+, and Mg2+) were measured using ion chromatography (IC) rather than by inductively coupled plasma–atomic emission spectroscopy (ICP-AES). The correlation between Cl– measured with IC and that measured by titration is quite poor, so the remaining IC data are normalized using the IC Cl– data in all subsequent figures and discussion. Concentrations of all species measured are presented in Table T9.
Table T9. Interstitial water chemistry, Site U1471. Download table in .csv format.
Chloride, bromide, and salinity
Concentrations of Cl– range between 558 and 563 mM in the upper 40 mbsf and then increase slightly to ~568 mM (Figure F19; Table T9). Chloride remains between 562 and 568 mM, slightly elevated relative to the mean seawater concentration, throughout the rest of the sampled interval. Bromide has a pattern similar to chloride, increasing by 1%–2% below ~40 mbsf, which is consistent with conservative behavior. Salinity remains constant with a value of 35 throughout Site U1471.
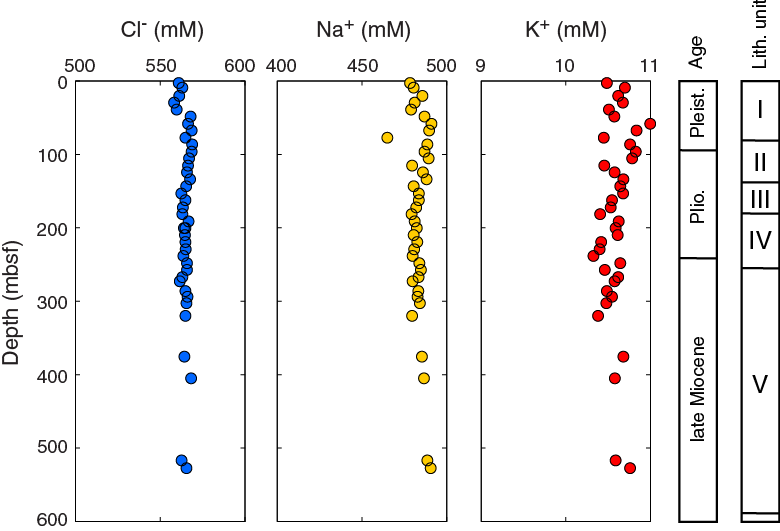
Figure F19. IW Cl–, Na+, and K+, Site U1471.
Major cations
Concentrations of Na+ range between 465 and 491 mM and slightly increase with depth below ~40 mbsf, similar to the increase in Cl– (Figure F19; Table T9). Potassium is generally stable between 10.3 and 11.0 mM.
Calcium and magnesium vary in opposite directions (Figure F20). Concentrations of Ca2+ are stable at ~11 mM in the upper 30 mbsf, rise steadily to ~17 mM at 160 mbsf, and remain at ~17 mM through the rest of the sampled interval. Concentrations of Mg2+ decrease during the interval where Ca2+ increases, starting at a value of ~54 mM and decreasing to ~48 mM at 160 mbsf. Below this depth, Mg2+ remains at 48 mM. Calcium and magnesium exhibit a strong negative correlation (R2 = 0.82), and as a result, the Mg/Ca ratios decrease strongly from 5.1 to 2.8 mol/mol (Figure F21). Excess Ca and Mg, calculated using Equation 1, also show opposing behavior between these two cations relative to bottom water concentrations (Figure F22).
Excess sulfate (in mM) =
SO42–sample – SO42–seawater × [Cl–sample/Cl–seawater].
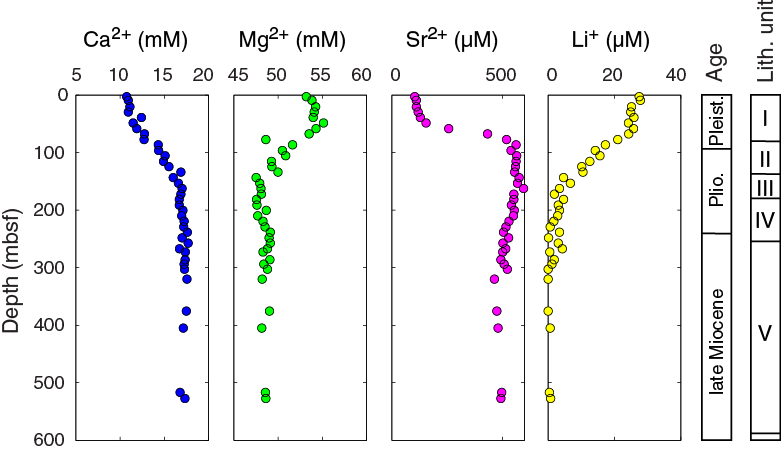
Figure F20. IW Ca2+, Mg2+, Sr2+, and Li+, Site U1471.
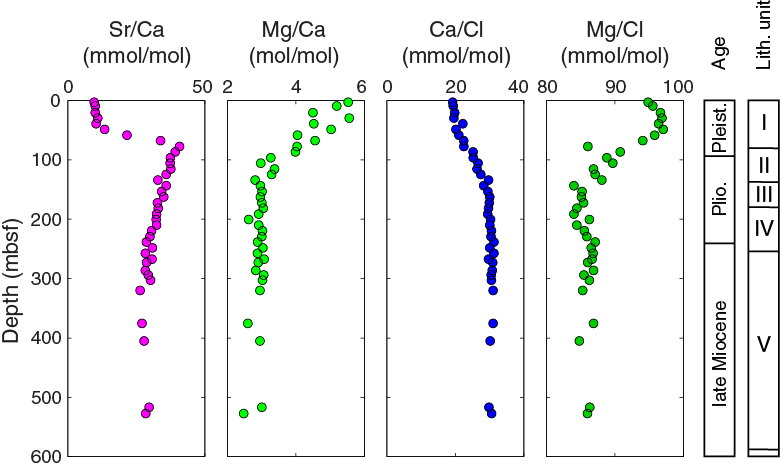
Figure F21. Sr2+/Ca2+, Mg2+/Ca2+, Ca2+/Cl–, and Mg2+/Cl–, Site U1471.
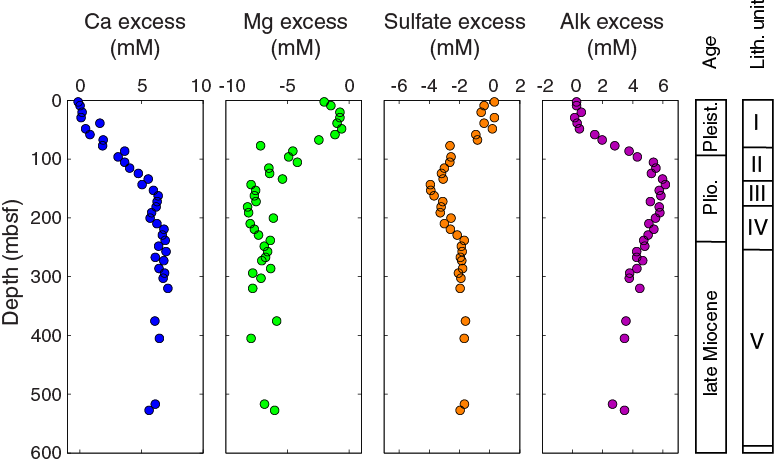
Figure F22. Excess Ca2+, Mg2+, SO42–, and alkalinity, Site U1471.
Alkalinity, pH, and dissolved sulfate
Alkalinity is constant at ~2.7 mM in the upper ~40 mbsf and then rises smoothly to a maximum of 8.5 mM at 143.5 mbsf (Figure F23; Table T9). From 143.5 to 527.7 mbsf, alkalinity steadily decreases to ~5 mM. The measured pH of interstitial waters decreases from ~7.6 to ~7.3, with scatter in the data on the order of ±0.1.
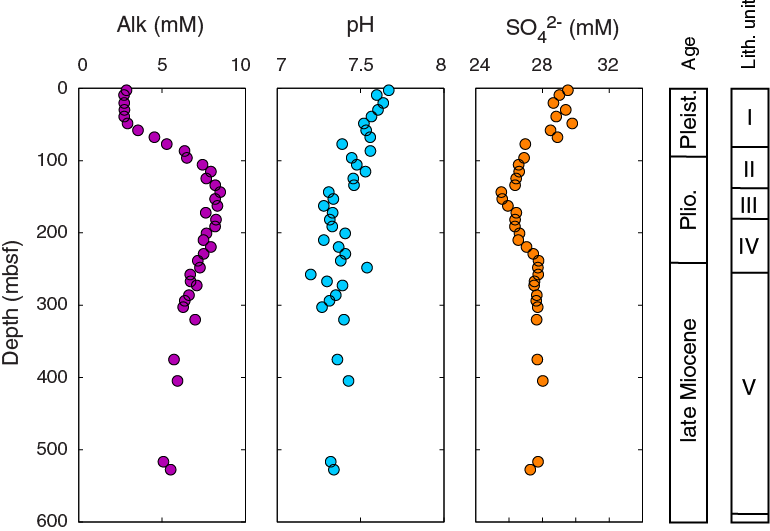
Figure F23. IW alkalinity, hydrogen, and SO42–, Site U1471.
Sulfate concentrations are ~29 mM throughout the upper ~70 mbsf at Site U1471 before decreasing to a minimum of 25.4 mM at 143.5 mbsf. Between 143.5 and 229 mbsf, sulfate increases again by 2 mM and remains stable at 27.6 mM below 229 mbsf. The sulfate excess (Figure F22) clearly demonstrates the magnitude of change relative to bottom water SO42– concentrations.
Minor ions
Concentrations of Sr2+ and Sr2+/Ca2+ ratios show a similar pattern to those at Site U1467. In the upper ~40 mbsf, Sr2+ rises gradually from 90 to 120 µM and then rises sharply to ~560 µM by 87 mbsf (Figure F20; Table T9). Concentrations of Sr2+ remain stable at this elevated level to approximately 200 mbsf and then decline slightly to between 480 and 500 µM. Ratios of Sr2+/Ca2+ rise sharply from 8–10 mmol/mol to a maximum of 40.8 mmol/mol between 40 and 77 mbsf and then gradually decline to approximately 28 mmol/mol at greater depths (Figure F21).
The behavior of Li+ at Site U1471 is distinctly different than at any other Expedition 359 site. In the upper 70 mbsf, Li+ is between 20 and 24 µM, but it drops to essentially zero by 162.5 mbsf. Lithium remains at zero (below detection limit) throughout the rest of the sampled interval.
Silicon also exhibits different behavior than that observed at other sites. The bottom water concentration is 43 µM at Site U1471, and Si concentrations increase linearly with depth to 320 mbsf, reaching a value of 423 µM (Figure F24). In contrast to Sites U1467 and U1468, where Si concentrations reach a plateau at ~750 µM, the few IW samples recovered at greater depths at Site U1471 suggest a continued increase in Si, and at an even greater rate, below 320 mbsf. The maximum measured Si concentration is 932 µM at 527.71 mbsf (Sample 359-U1471A-63F-1, 91–101 cm).
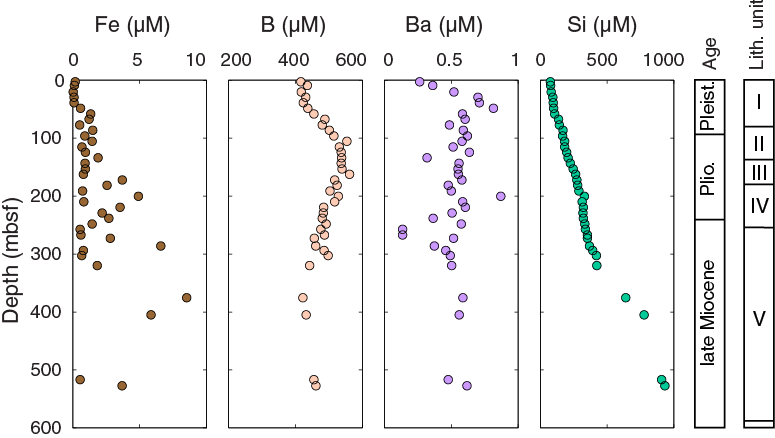
Figure F24. IW Fe, B, Ba2+, and Si, Site U1471.
Concentrations of Mn are below detection limits, with the exception of two higher values at 200.5 mbsf (Sample 22H-4, 140–150 cm) and 219.5 mbsf (Sample 24H-4, 140–150 cm). No distinct trends are observed in Ba, which varies between 0.1 and 0.9 µM.
Concentrations of Fe are very low (~0.1 µM) in the upper ~40 mbsf but are somewhat higher and more varied at greater depths. The baseline for Fe below 40 mbsf is around 0.5–1.0 µM, with higher values (>2 µM) occurring frequently below 170 mbsf. The maximum measured Fe concentration is 8.5 µM at 375.11 mbsf (Sample 44X-1, 91–96 cm).
Concentrations of B(OH)4– range between 395 and 563 µM. The upper ~40 mbsf have B(OH)4– concentrations similar to the bottom water value, and then B(OH)4– rises to a maximum of ~540 µM between 105.55 and 162.50 mbsf. Below this interval of elevated B(OH)4–, values decrease again to ~450 µM.
Bulk sediment geochemistry
Calcium carbonate and organic matter
Calcium carbonate content was determined in 234 samples. Because dolomite concentrations are low (<5%) at this site, no correction was applied to the calculated percent carbonate. The range of carbonate content is largely between 80 and 95 wt%, with a few samples containing lower amounts between 60 and 80 wt% (Figure F25; Table T10). A single sample at 861.09 mbsf yielded only 36.6 wt% carbonate (Sample 359-U1471E-29R-3, 11–13 cm).
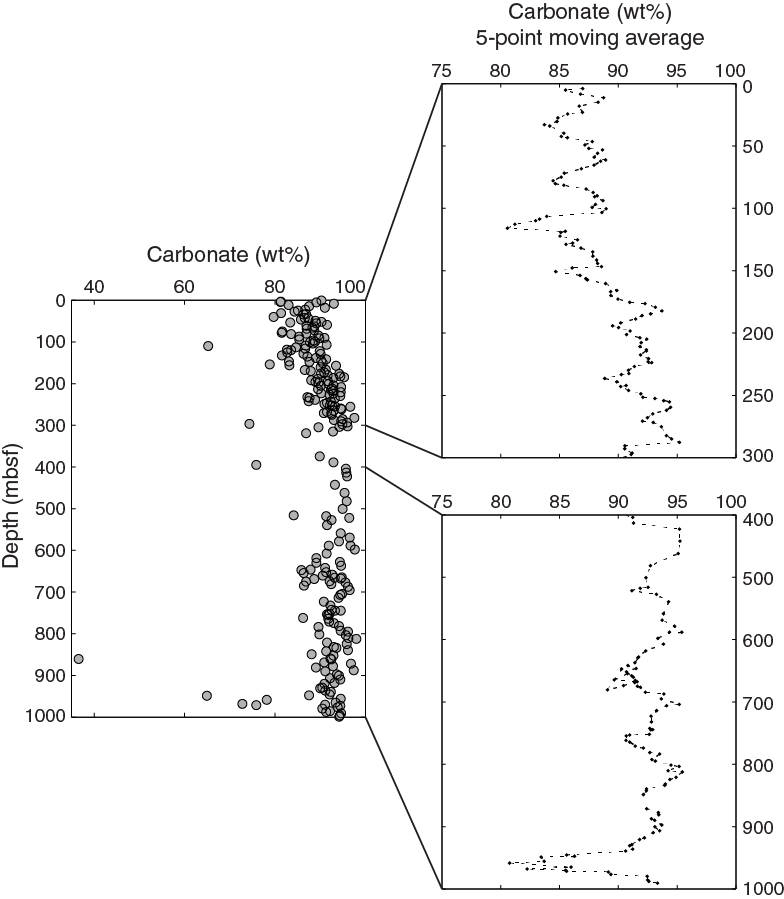
Figure F25. Carbonate content, Site U1471.
Table T10. Carbon and nitrogen, Site U1471. Download table in .csv format.
A cyclic pattern in carbonate content, with alternations of ~5 wt% between higher and lower values, is visible when the data are smoothed with a five-point moving average. The upper 300 mbsf has a period of approximately 40 m, with seven or eight maxima within this depth interval. Where recovery is poor from 300 to 400 mbsf, the smoothing is not effective, but cycles with an amplitude of ~5 wt% carbonate are again apparent between 400 and 1000 mbsf. These cycles range between roughly 85 and 90 wt% in the upper 150 mbsf and between 90 and 95 wt% at greater depths.
Total organic carbon (TOC) and total nitrogen (TN) were measured on 103 samples at Site U1471. TOC varies between 0.14 and 2.7 wt%, excluding two negative outliers (Figure F26). Maximum TOC values were found between 460 and 525 mbsf. The concentration of TN has a baseline range between 0.05 and 0.1 wt% but is elevated between 440 and 520 mbsf, with two samples having TN of >0.2 wt%. Slightly elevated values (0.10–0.13 wt%) were also found between 645 and 685 mbsf.

Figure F26. Organic carbon and nitrogen, Site U1471.
X-ray diffraction
Sedimentary mineralogy was determined by X-ray diffraction (XRD) at a rate of approximately one sample per core, yielding 113 total samples. The sediments consist mainly of aragonite and low-Mg calcite (LMC), with very small amounts (<1%) of quartz occurring throughout Site U1471 (Figure F27; Table T11). Celestine (SrSO4) is identifiable in 11 XRD spectra between 238.5 and 706.78 mbsf.

Figure F27. Relative concentrations of aragonite, HMC, LMC, dolomite, and quartz, Site U1471.
Table T11. XRD results, Site U1471. Download table in .csv format.
High-Mg calcite (HMC) is present in the uppermost two samples at 2.66 and 9.05 mbsf but disappears lower in the core. Aragonite initially comprises 30%–40% of the sediment in the upper ~90 mbsf, but its contribution decreases to <5% by ~300 mbsf. Aragonite content is higher but variable from ~470 to ~700 mbsf, with peaks up to 44%. Below 700 mbsf, aragonite content drops again to <8%, and the sediments are dominated by LMC.
Dolomite is present in small amounts (<5%) during particular intervals at Site U1471. Dolomite is absent from the upper ~90 mbsf but occasionally constitutes >1% of the sediment from 96.05 to 181.5 mbsf and has an abundance of up to 4.6% at 105.55 mbsf (Sample 359-U1471A-12H-4, 145–150 cm). Less than 1% dolomite is present below 181.5 mbsf, with the exception of two samples at 471.5 and 527.71 mbsf with 4.2% and 2.6% dolomite, respectively.
Major, minor, and trace element composition
Major, minor, and trace element composition was determined by inductively coupled plasma spectroscopy on squeeze cakes or headspace residues. The most important elements relevant to carbonate diagenesis (Sr, Mg, Fe, and Mn) are presented in Figure F28 as molar ratios relative to calcium. All data are presented in Table T12.
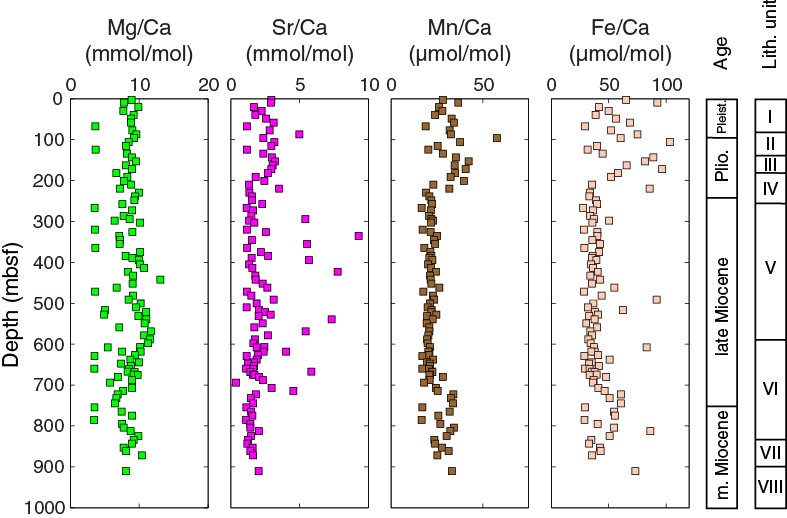
Figure F28. Mg/Ca, Sr/Ca, Mn/Ca, and Fe/Ca in sediments, Site U1471.
Table T12. Solids geochemistry, Site U1471. Download table in .csv format.
The Mg/Ca ratios are relatively constant around 9 mmol/mol. The Sr/Ca ratios are generally between 1 and 3 mmol/mol, with a higher baseline (frequently >2 mmol/mol) in the upper ~200 mbsf and a lower one (between 1 and 2 mmol/mol) at greater depths. Higher values (up to 10 mmol/mol) occur between ~300 and ~700 mbsf, overlapping the depth interval where celestine is observed in the XRD spectra.
Manganese and iron are both higher in the Pliocene–Pleistocene portions of Site U1471, with Mn/Ca ranging from 25–45 µmol/mol and Fe/Ca ranging from 30–104 µmol/mol. At greater depths, Mn/Ca and Fe/Ca remain more stable at ~30 µmol/mol and ~40 µmol/mol, respectively, with some scattered higher values. A small increase in both Mn and Fe is observed below ~700 mbsf.
Volatile hydrocarbons
Samples for the analysis of methane, ethene, ethane, propene, and propane (headspace gases) were taken from Holes U1471A and U1471E. These samples were generally taken from the top of Section 5 in each core when an IW sample was taken or from fragments of lithified material from the core catcher where lithification or poor recovery prevented IW sampling. The concentration of methane is low (1–2 ppmv) in the upper 50 mbsf and then rises slightly to between 5 and 11 ppmv between 80 and 300 mbsf (Figure F29; Table T13). At greater depths in Hole U1471A, the methane baseline drops again to ~4 ppmv, with several spikes to higher concentrations. The highest methane levels (75 ppmv) are present at 490.0 mbsf in Sample 359-U1471A-57X-CC, 0–1 cm. In Hole U1471E, methane concentrations remain between 2 and 13 ppmv. Ethene, ethane, and propene were detected in small amounts in several samples, usually coinciding with peaks in methane. The highest ethane levels (16 ppmv) are also present in Sample 359-U1471E-57X-CC, 0–1 cm.
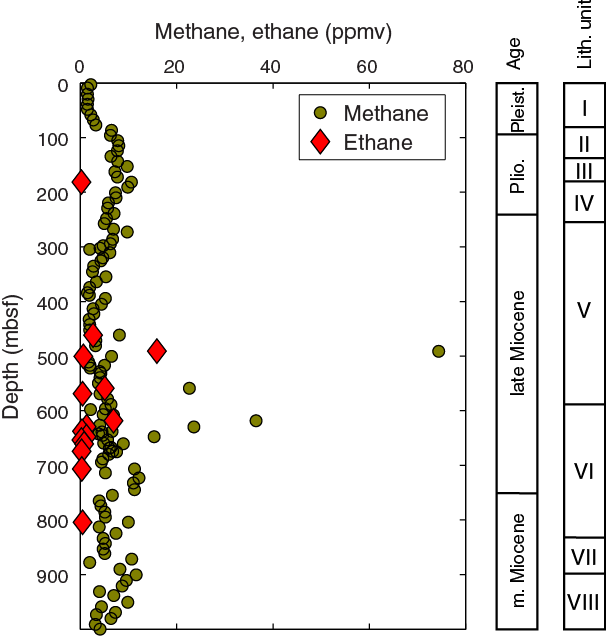
Figure F29. Headspace methane and ethane, Site U1471.
Table T13. Headspace hydrocarbons, Site U1471. Download table in .csv format.
Discussion
Interstitial water chemistry
The upper 40 mbsf exhibits negligible changes in IW chemistry, reflecting either low rates of organic matter remineralization or fast rates of advection by seawater. Below this interval, pore water profiles of many elements start to vary, indicating numerous diagenetic processes occurring in the sediment column. The inflection points of these profiles, however, do not usually coincide with boundaries between lithostratigraphic units. This suggests that the modern diagenetic regime is not responsible for the diagenetic differences observed in the sediments, but that the sediments record a greater history of alteration.
The decrease in sulfate coincides well with the increase in alkalinity (Figure F22), indicating that bacterial sulfate reduction is occurring in the sediment column. However, a greater increase in alkalinity is expected from the ~4 mM decrease in sulfate than is observed; the difference of ~2 mM in alkalinity is therefore likely being consumed by the authigenic precipitation of calcite. The decrease in Mg2+ and concurrent increase in Ca2+ reflect dolomitization by replacement of calcium carbonate, which would result in a stoichiometric exchange of 1 mol Mg2+ for 1 mol Ca2+. The slightly greater magnitude of the Mg2+ decrease is again consistent with a small amount of authigenic calcite precipitation.
The rapid increase in the Sr2+/Ca2+ ratio of the pore water below 40 mbsf reflects the neomorphism of aragonite sediments to LMC, which is evident in the changes in carbonate mineralogy based on the XRD data. The large increase in Sr2+ causes the pore fluids to attain saturation with respect to celestine (SrSO4), using the calculated saturation from Baker and Bloomer (1988). The interval of celestine saturation at Site U1471, based on the IW chemistry, extends from ~50 to at least 500 mbsf (Figure F30). The presence of celestine based on XRD spectra and high sedimentary Sr/Ca ratios extends deeper, to approximately 700 mbsf, and may indicate either the depth of modern celestine saturation in the pore waters or fossil celestine from when SrSO4 was saturated at those depths.
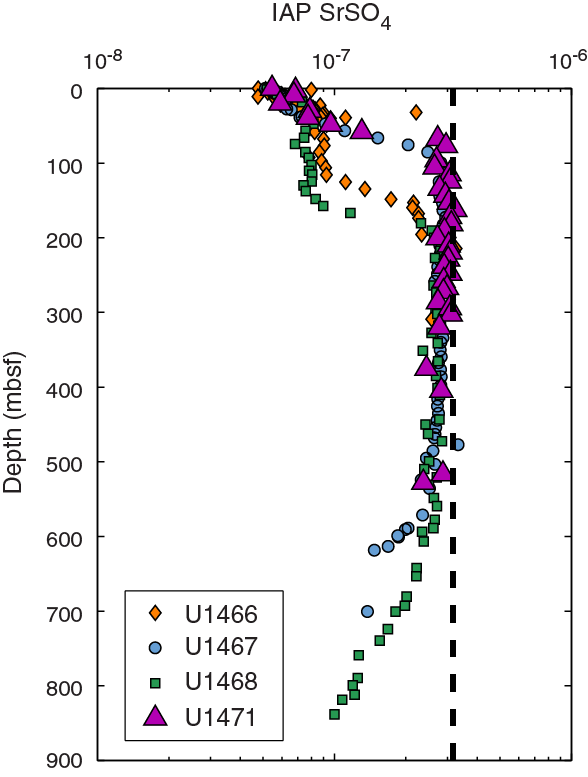
Figure F30. Ion activity product of SrSO4, Sites U1471 and U1466–U1468.
The markedly different character of the Li+ and Si IW profiles relative to other Expedition 359 sites suggests that clay diagenesis is occurring at Site U1471. Lithium is present in very low concentrations in carbonates but is more abundant in silicate minerals; therefore, its concentration in pore fluids is essentially sensitive to reactions with silicates only. The removal of Li+ within lithostratigraphic Units II and III may be the result of clay diagenesis acting as a Li+ sink. Clay mineral formation would be promoted by the rising concentration of Si with depth, probably driven by the dissolution of skeletal components. It is unclear why these distinct trends are observed only at this site, when sedimentary and major element IW compositions are not markedly different than at other nearby drilling locations.
Sedimentary composition
Only minor dolomitization is found at this site, with the dolomite peak at 105.55 mbsf occurring close to the maximum decrease in Mg2+ concentrations. This depth interval indicates a zone of modern dolomite formation, whereas the deeper dolomite peaks within lithostratigraphic Unit V are the result of older diagenetic episodes and are no longer actively forming dolomite. The near absence of dolomite between 250 and 470 mbsf coincides well with a single drift sequence package between DS4 and DS5 (see Seismic stratigraphy) and suggests that past episodes of dolomitization were associated with changes in sea level at this site. Each drift sequence, however, appears to have a different diagenetic history that is now partly reflected in mineralogical changes between individual drift packages.
Variations in the Sr/Ca ratios of the sediments reflect leaching of celestine during dissolution of the sample. Changes in Mn concentrations of pore waters and sediments are related to the redox state (see Geochemistry in the Site U1466 chapter [Betzler et al., 2017c]). The higher Pliocene–Pleistocene Mn/Ca and Fe/Ca ratios may reflect a more reducing environment during this time interval relative to the late Miocene. The small increase in Mn/Ca and Fe/Ca in the middle Miocene may be coincident with the development of the oxygen minimum zone as proposed by Dickens and Owen (1994).
The apparent cycles in carbonate content may be related to changes in climate or currents which influence sediment supply at Site U1471. It is unclear whether changes in the production/deposition of carbonate or dilution by noncarbonate minerals (or both) are responsible for these changes. Variations in color and in lithification occur on shorter length scales, but no other lithologic characteristics are observed with the same frequency as the cycles in carbonate content (see Lithostratigraphy). If these cycles are periodic, they have a much longer period than Milankovitch cycles (order of 106 y). It is notable that the baseline change in carbonate content between ~120 and 180 mbsf (from 85–90 to 90–95 wt%) does not seem to affect the character of the cycles in carbonate content, which retain a similar amplitude and period both above and below this interval. This observation suggests that the external forcing mechanism for these cycles operated independently of longer term changes in the depositional regime at this site.
Paleomagnetism
Pass-through magnetometer measurements were performed on the entire set of archive-half cores at 5, 10, and 15 cm intervals, depending on core flow, and subjected to stepwise alternating field (AF) demagnetization up to 30 mT. The natural remanent magnetization (NRM) of discrete samples from Holes U1471A and U1471E were measured with the AGICO JR-6A spinner magnetometer.
Natural remanent magnetization of sedimentary cores
NRM intensity, inclination, and declination in Holes U1471A, U1471C, U1471D, and U1471E are compared with intensity and inclination results obtained from demagnetization at 15 and 30 mT in Figures F31, F32, F33, and F34. The magnetization of these sediments in cores drilled with the APC or HLAPC systems shows very large variations that were maintained even after demagnetization at 30 mT, with high values related to drilling contamination located at the top of each core. As noted at previous sites, XCB and RCB cores do not seem to be affected by this problem. For that reason, we have not interpreted measurements made on APC and HLAPC cores with intensities (after demagnetization at 30 mT) larger than 1 × 10⁻⁴ A/m. Discrete samples from Holes U1471A and Hole U1471E have NRM intensities between 1.03 × 10⁻⁵ and 5.89 × 10⁻³ A/m with a mean of 4.41 × 10⁻⁴ A/m. In these data, which should not be affected by contamination, some intervals from the consolidated sediments below 600 mbsf have much stronger NRM intensities than the upper unconsolidated sediments (Figure F35).
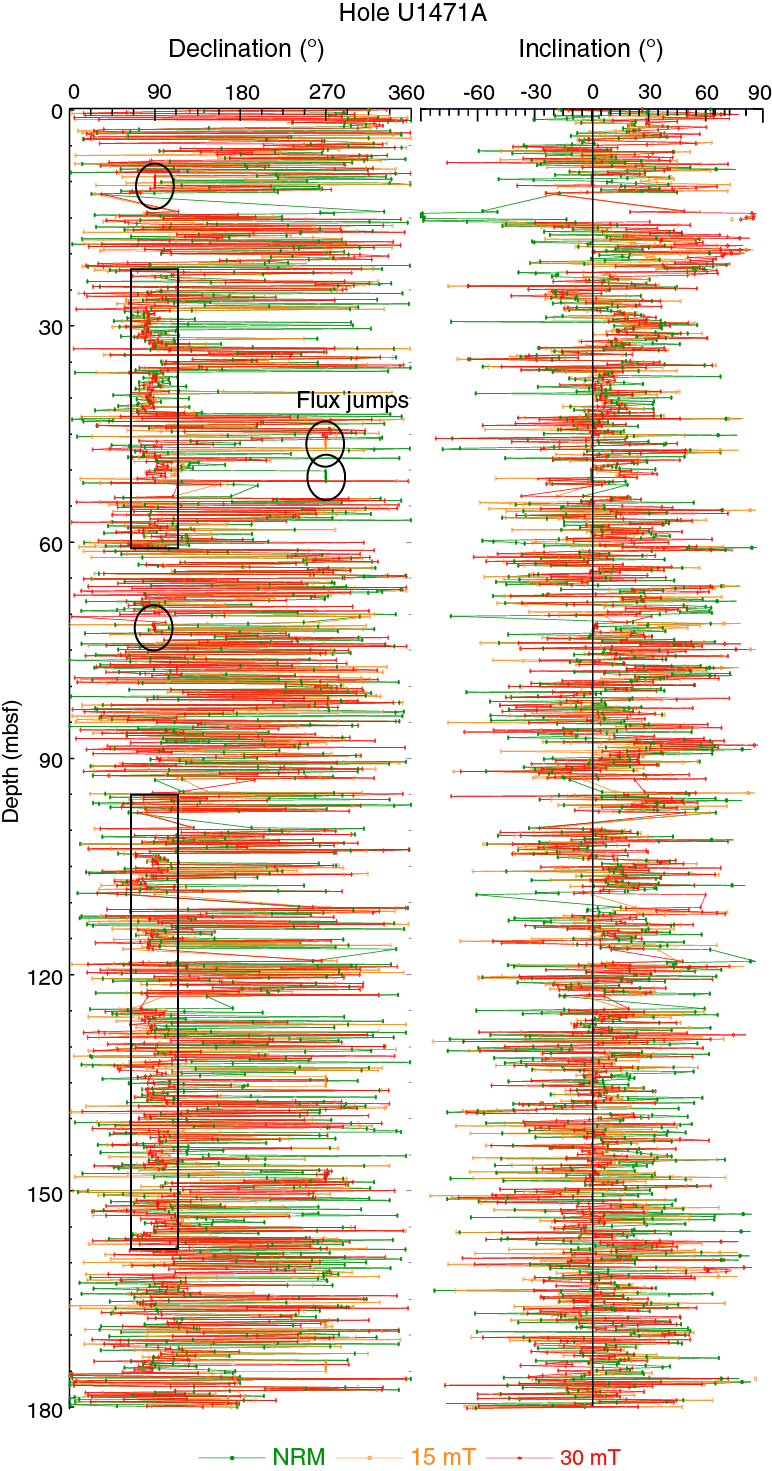
Figure F31. NRM declination and inclination from the upper 180 mbsf, Hole U1471A.
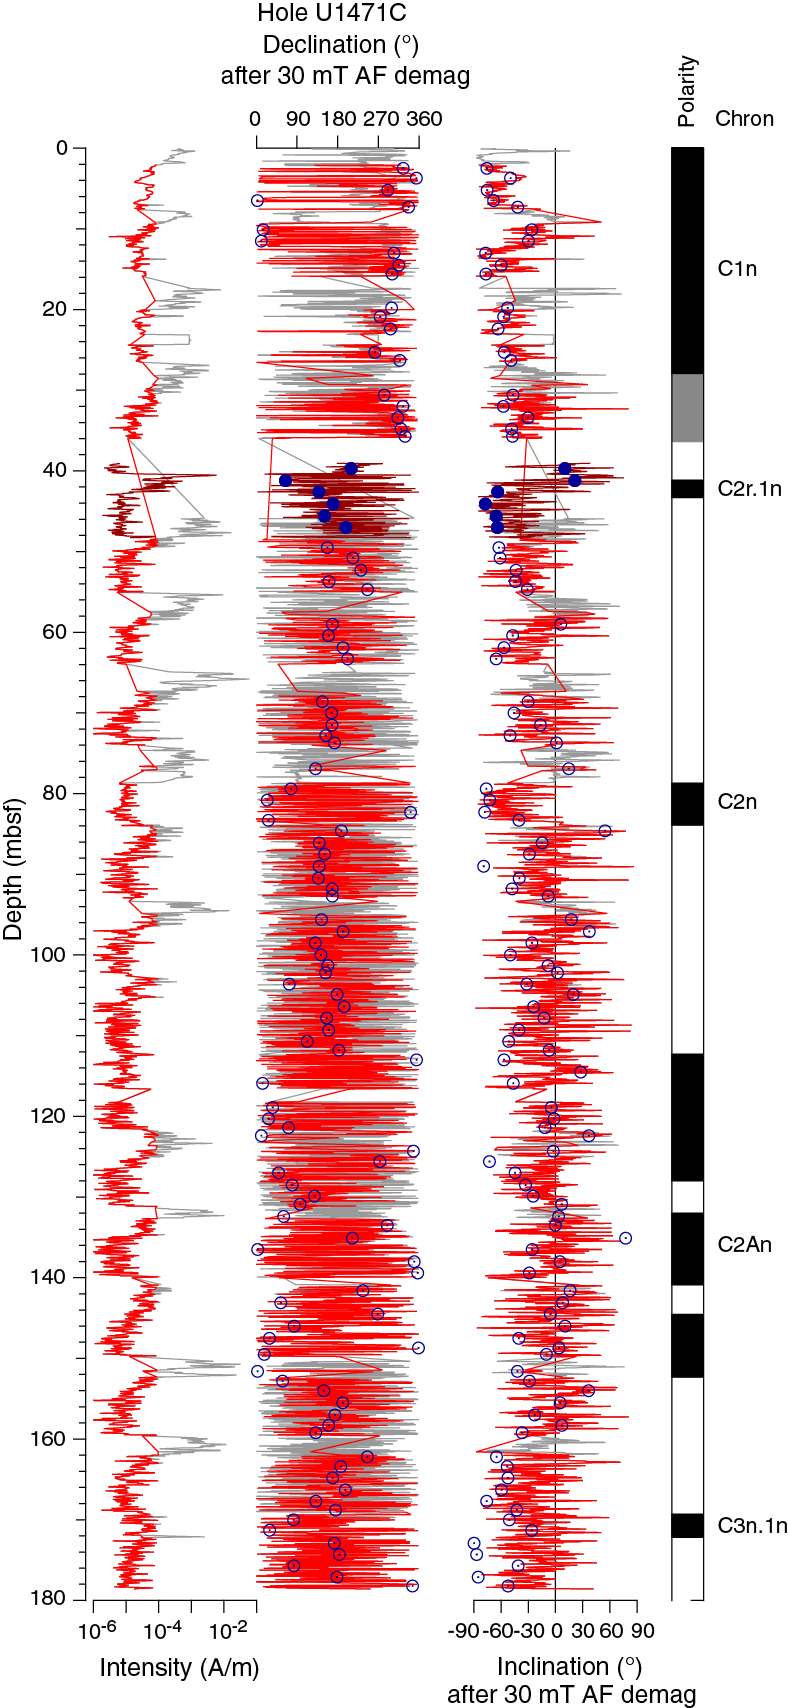
Figure F32. NRM intensity, declination, and inclination with magnetostratigraphy, Hole U1471C.
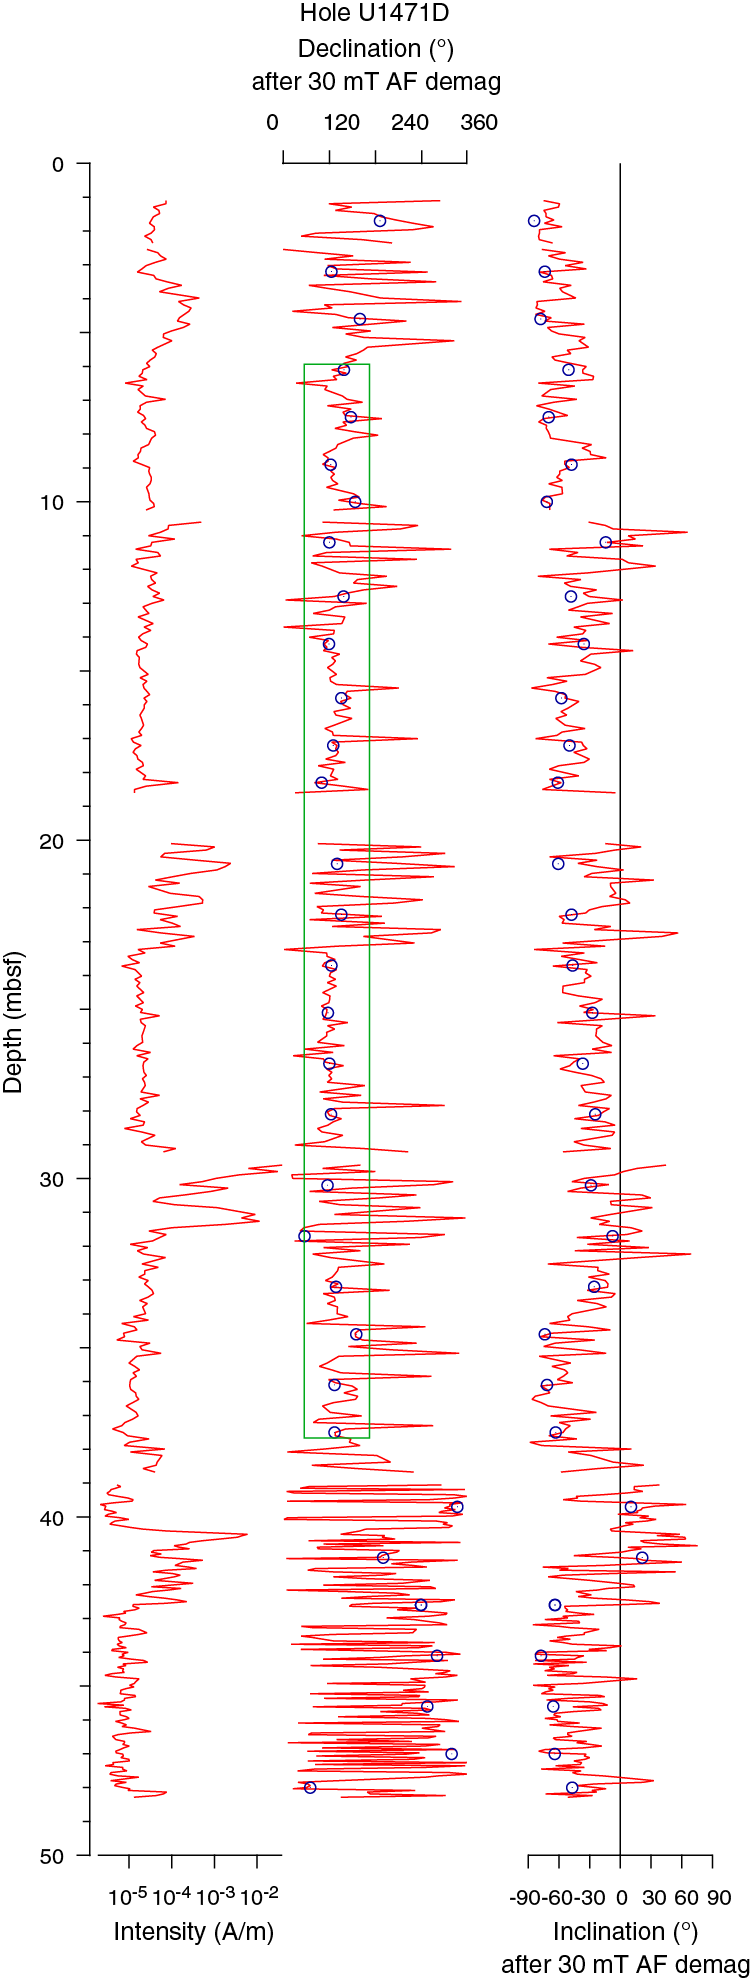
Figure F33. NRM intensity, declination, and inclination, Hole U1471D.
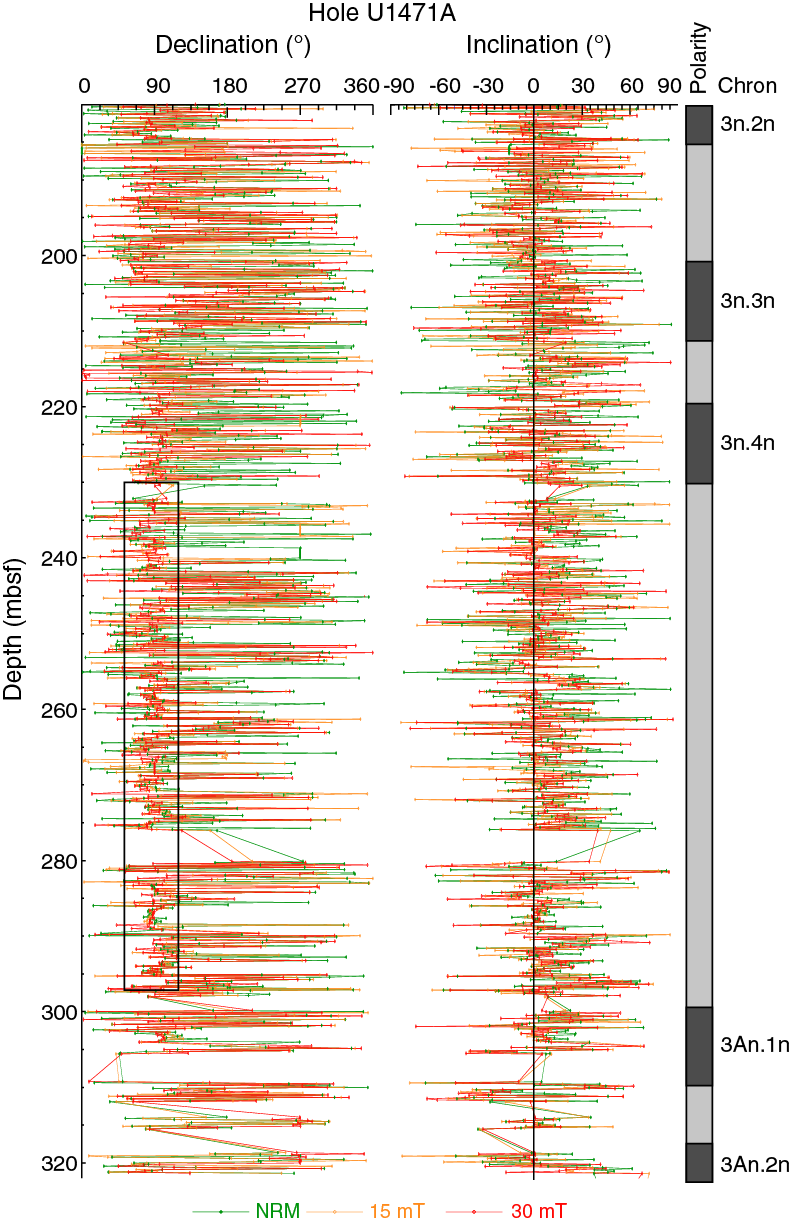
Figure F34. NRM declination and inclination with magnetostratigraphy from 180 to 320 mbsf, Hole U1471A.
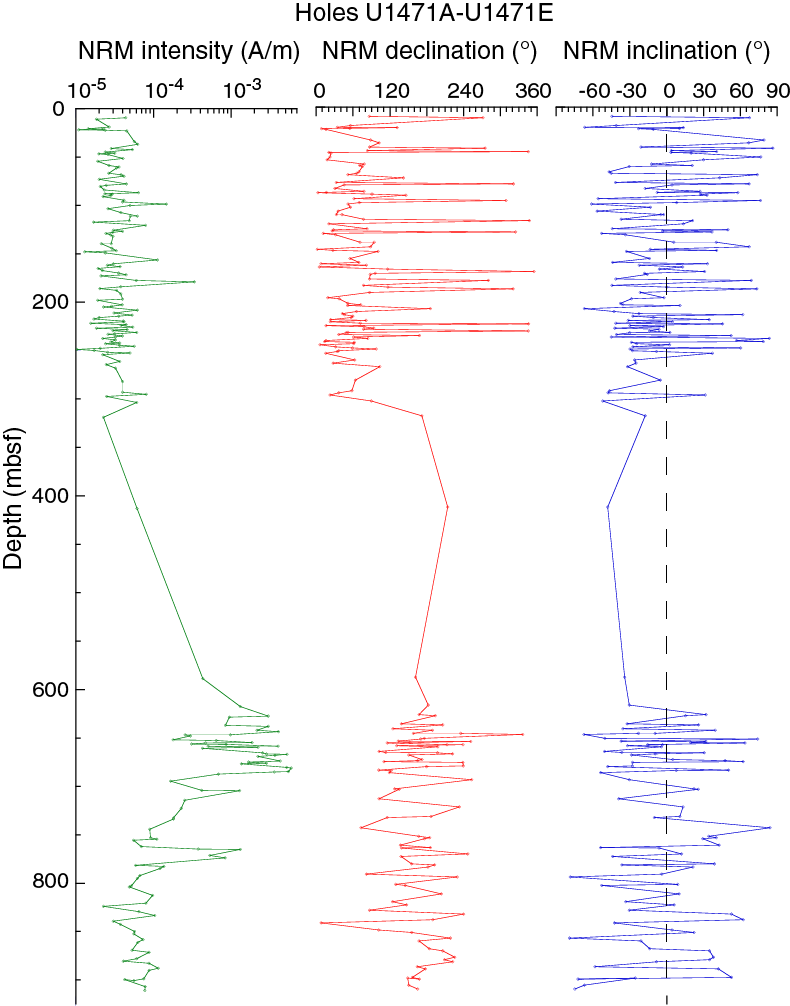
Figure F35. NRM intensity, declination, and inclination from discrete samples without demagnetization, Holes U1471A and U1471E.
Magnetic measurements
Occasional “flux jumps” occurred in the magnetometer, mostly in the y-axis superconducting quantum interference device (SQUID) sensor. In addition, two other problems affected magnetic measurements at Site U1471: (1) the above-mentioned contamination in the upper part of each core, normally influencing the first and partially the second sections; and (2) the eastward bias of the magnetic declination previously noticed in Site U1470. The latter is clearly visible as a constant declination direction at about 90°E and is independent from core orientation in Hole U1471D between 5 and 40 mbsf and at various depths in Hole U1471A (Figures F31, F33, F34). Both problems contributed to significantly degrading the paleomagnetic results; however, a relatively robust magnetostratigraphy was obtained for the upper 180 mbsf using Hole U1471C and Core 359-U1471D-6H (Figure F32), and a tentative magnetostratigraphy based on analysis of inclination only was obtained in Hole U1471A below 180 mbsf (Figures F34, F36).
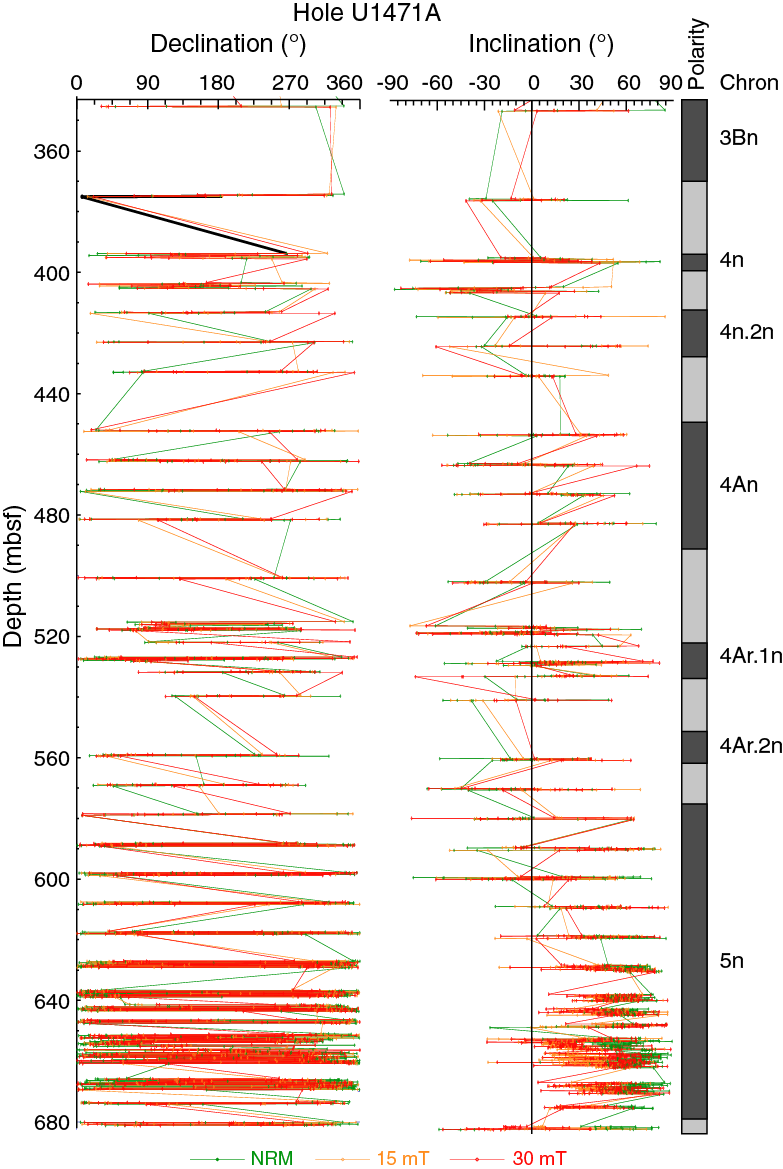
Figure F36. NRM declination and inclination with magnetostratigraphy below 320 mbsf, Hole U1471A.
An increase in magnetization intensity from ~2 × 10⁻⁵ A/m to ~2 × 10⁻³ A/m and an inversion of average values of declination from 0°–40° to 160°–200° were observed between ~600 and ~700 mbsf in Holes U1471A and U1471E (Figure F35). In this interval, no changes in magnetic susceptibility were recognized with the Bartington and contact magnetic susceptibility meter.
Magnetostratigraphy
The Icefield MI-5 core-orienting device was used in the uppermost 19 cores from Hole U1471C and in Cores 359-U1471D-6H and 7H. The rest of the APC cores were not oriented.
Magnetostratigraphy of Hole U1471C (Figure F32) is based on interpretation of declinations from oriented APC cores that show relatively consistent directions within each core with most of the reversal occurring within a single core. Because of the imprecision of the orienting tool, however, several cores were reoriented following the methodology of Guidry et al. (2013). The resulting magnetostratigraphy might have some degree of arbitrariness, but we think that given the paleontological constraint (Biozones NN21 to NN15–NN12 and PT1 to PL2-1; see Biostratigraphy) this arbitrariness is reduced.
The Brunhes/Matuyama boundary was not found directly, but we tentatively placed it between Cores 359-U1471C-4H and 359-U1471D-6H (36–39 mbsf) based on the short reversal found in Core 359-U1471D-5H that was interpreted as the Jaramillo Chron. However, because Core 359-U1471C-4H was arbitrary reoriented, the boundary could also lie at about 27 mbsf between Cores 359-U1471C-3H and 4H. Reversals at 112, 152, 169, and 172 mbsf were identified within Cores 12H, 16H, and 19H. Reversals at 79 and 84 mbsf were identified in Cores 9H and 10H, both of which are oriented according to the orientation tool data. The interpretation is reported in Figure F32.
We also considered a smoothing moving average (six points) in the inclinations of unoriented samples from Hole U1471A. The paleomagnetic inclinations of the sediments were tentatively interpreted in Holes U1471A and U1471E, where we recognized a series of magnetozones defined as intervals with multiple consecutive sections with the same polarity (defined by inclination or declination) and/or smoothing of the inclinations (Figures F31, F32, F33, F34). The magnetostratigraphy based on inclination alone has a high degree of uncertainty because of the subequatorial paleolatitude of this site.
Physical properties
Natural gamma radiation (NGR), magnetic susceptibility (MS), gamma ray attenuation (GRA) bulk density, and P-wave velocity were measured on whole-round cores from Holes U1471A (0–685 mbsf), U1471C (0–179 mbsf), U1471D (0–58 mbsf), and U1471E (0–1003 mbsf). Magnetic susceptibility point (MSP or Section Half Multisensor Logger [SHMSL] MS) and color reflectance were measured on archive-half sections. P-wave velocity was measured on working-half sections (with liner) and discrete paleomagnetic samples (without liner) from Holes U1471A and U1471E. One sample from every other section from Holes U1471A and U1471E was measured for moisture and density (MAD). In addition, thermal conductivity was measured mostly on the third section of soft-sediment cores from Hole U1471A. No shear strength measurements were conducted on cores from this site.
Site U1471 is divided into six petrophysical (PP) units based on variations of physical properties, especially density, porosity, and P-wave velocity: Unit 1 (0–68 mbsf), Unit 2 (68–138 mbsf), Unit 3 (138–180 mbsf), Unit 4 (180–320 mbsf), Unit 5 (320–700 mbsf), and Unit 6 (700–1003 mbsf).
Natural gamma radiation
In Unit 1, NGR increases from about 10 to 40 counts/s at 0–45 mbsf (Figure F37) with a spike in values (about 50 counts/s) at 21 mbsf. Below 45 mbsf, NGR decreases sharply and fluctuates around 25 counts/s to the bottom of Unit 1 (68 mbsf). NGR generally decreases with depth in Unit 2 from 25 to 20 counts/s. Sharp increases of >30 counts/s occur at 72, 79, 84, 100, and 132 mbsf. In Unit 3, the general decreasing trend in NGR continues. A sharp increase in NGR occurs at the bottom of this unit, reaching 50 counts/s. Unit 4 is characterized by five NGR cycles with a length of ~25 m that increase in amplitude with depth. The lower values in these cycles are around 15 counts/s (202, 222, 246, 284, and 320 mbsf) and the higher values are around 60 counts/s (190, 219, 242, 254, and 300 mbsf).
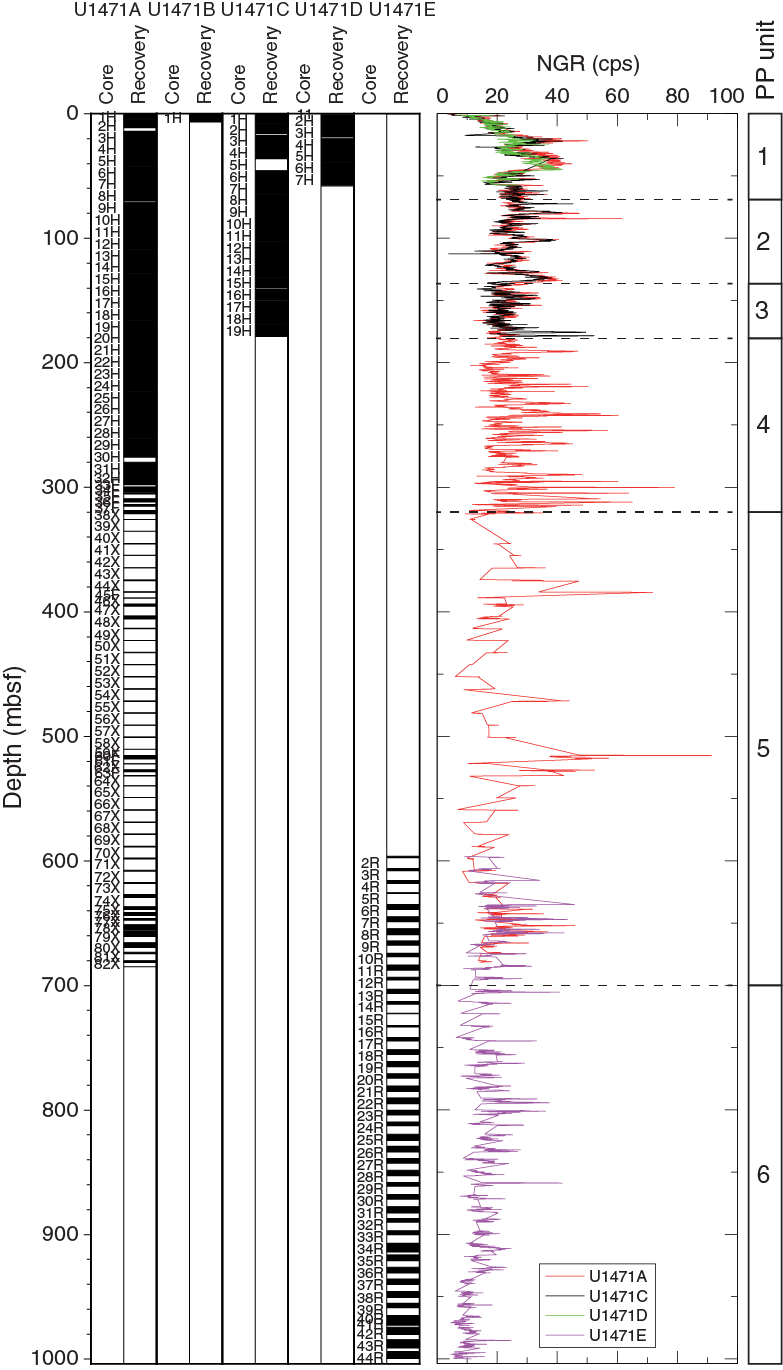
Figure F37. NGR, Site U1471.
Core recovery is lower in Units 5 and 6, allowing only broad trends to be identified. In Unit 5, three main cycles in NGR are recorded with an average cycle length of 125 m. The upper cycle is defined by minimum values of 10 and 6 counts/s at 325 and 452 mbsf, respectively, with a maximum value of 91 counts/s at 384 mbsf. The second cycle has minimum values at 452 and ~580 mbsf (560–600 mbsf; recovery is too low to precisely place this minimum) with a maximum value at 515 mbsf. The lowermost cycle occurs between ~580 and 690 mbsf with a maximum at 652 mbsf. In Unit 6, one NGR cycle appears between 757 and 843 mbsf with a maximum value at 794 mbsf. The range in NGR is generally too low to discern whether other cycles are present. Below 930 mbsf, NGR decreases and averages 9 counts/s.
Density and porosity
In Unit 1, bulk and dry density increase regularly with depth from 1.51 to 1.77 g/cm3 and from 0.78 to 1.08 g/cm3, respectively (Figure F38). Grain density is constant with depth within a narrow range of 2.74 to 2.76 g/cm3 (close to calcite density). MAD porosity decreases from ~70% in the upper 40 m to 61% at the bottom of Unit 1 (68 mbsf). The increase in density and decrease in porosity reflects early diagenetic processes occurring at 40 mbsf (see Geochemistry).
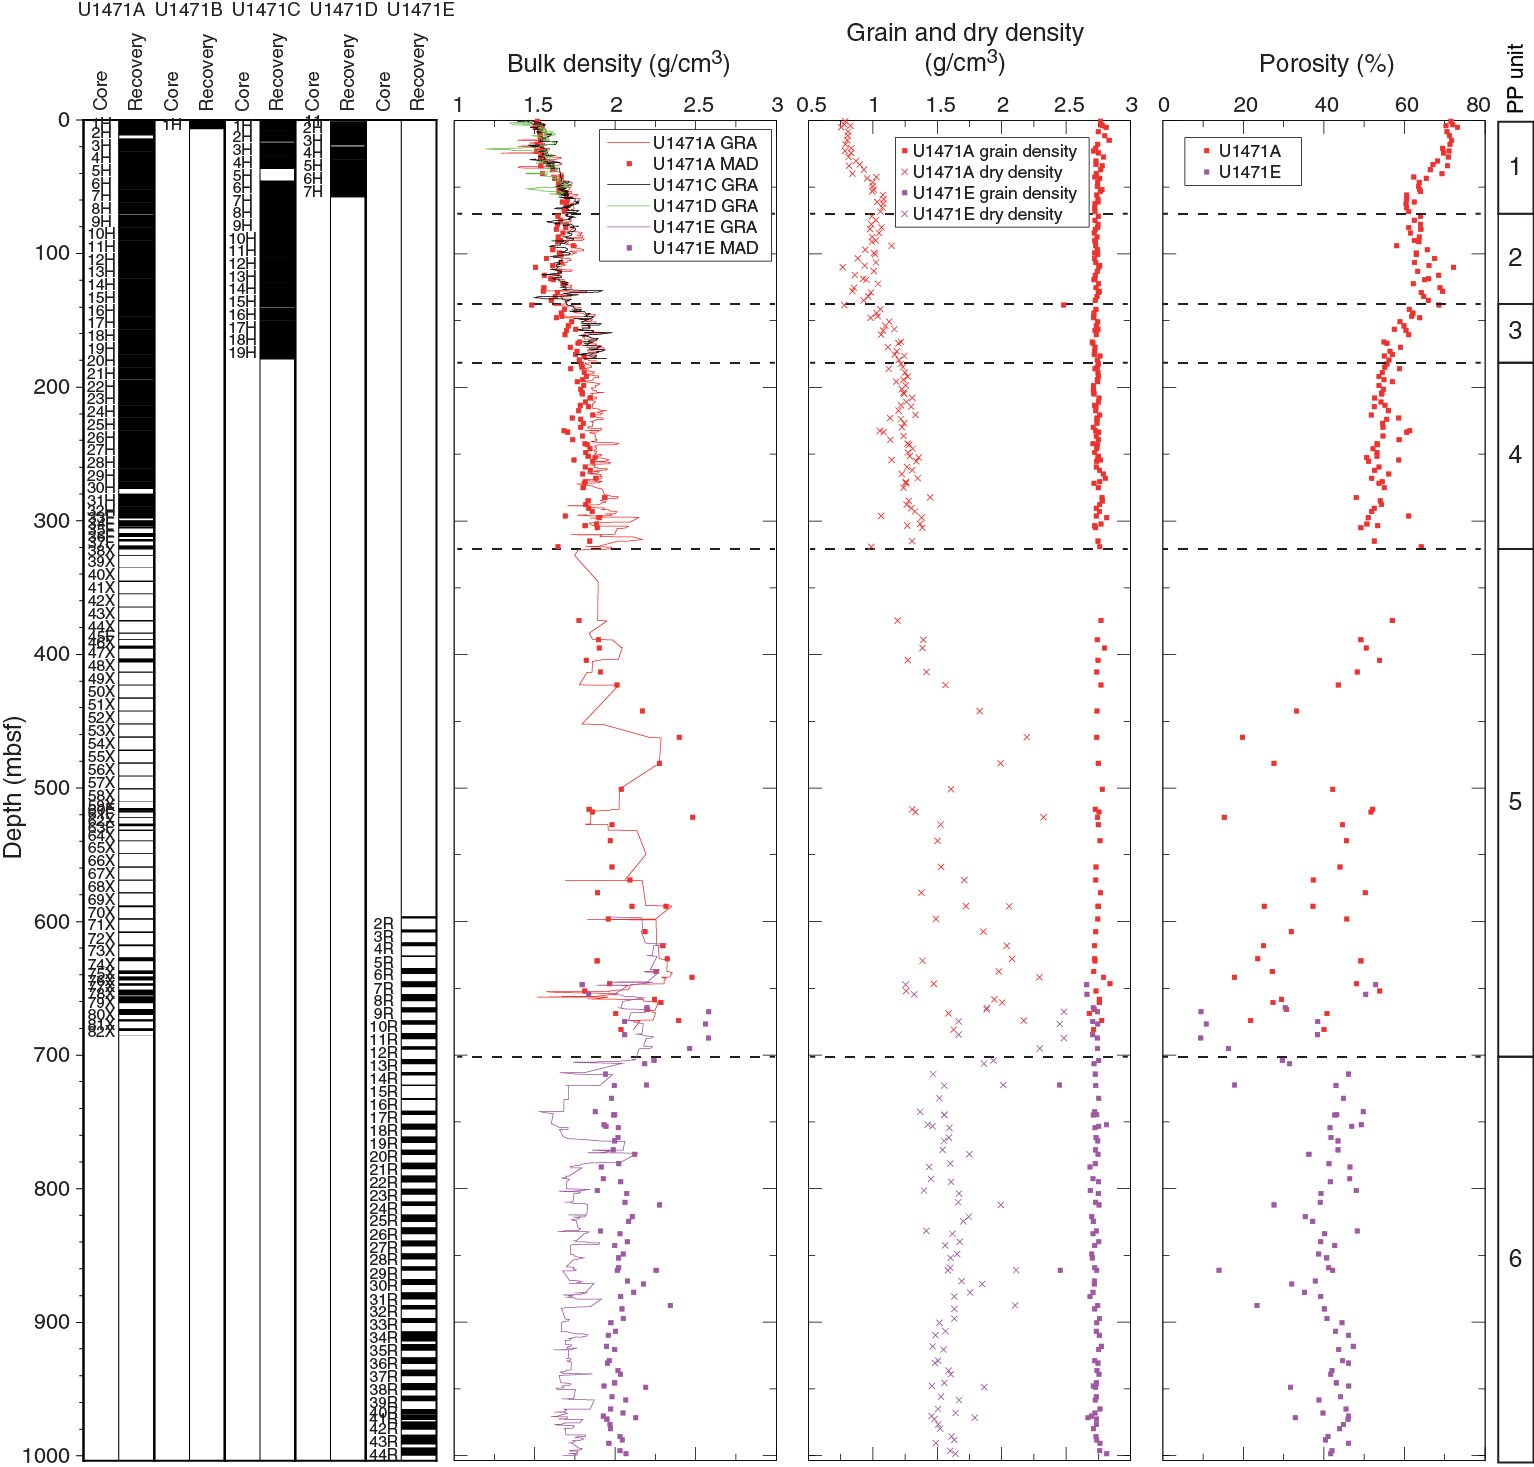
Figure F38. Bulk density, grain and dry density, and porosity, Site U1471.
In Unit 2, bulk and dry density decrease with depth from 1.77 to 1.48 g/cm3 and from 1.08 to 0.78 g/cm3, respectively. Grain density remains constant around 2.74 g/cm3. Porosity increases with depth from 61% to 70%.
In Unit 3, bulk and dry density increase from 1.48 to 1.79 g/cm3 and from 0.78 to 1.22 g/cm3, respectively. Grain density is around 2.72–2.73 g/cm3. Porosity decreases with depth from 70% to 55%. The increase in density and decrease in porosity are likely associated with a decrease in grain size and sorting as well as cementation in this wackestone unit (see Lithostratigraphy).
In Unit 4, bulk and dry density increase with depth from 1.70 to 1.90 g/cm3 and from 1.22 to 1.44 g/cm3, respectively. As density increases, porosity decreases generally with depth from 55% to 50%. Both density and porosity display increasing variability toward the bottom of this unit. Grain density exhibits minor variability toward the base of this unit between 2.72 and 2.75 g/cm3.
In Unit 5, all properties measured with MAD display high and increasing variability with depth. Bulk and dry density range from 1.64 to 2.48 g/cm3 and 0.98 to 2.32 g/cm3, respectively. Density and porosity are inversely related and are associated with diagenetic processes occurring in this unit (see Lithostratigraphy and Geochemistry). Grain density is more variable in this unit than other with a range of 2.67 to 2.84 g/cm3.
In Unit 6, GRA bulk density measurements are uniformly lower than MAD bulk density measurements (from 1.52 to 2.12 g/cm3 and from 1.87 to 2.34 g/cm3, respectively) and are attributed to the thinner RCB cores that do not fill the entire core liner, producing erroneously low bulk density values. Dry density has a similar trend and ranges from 1.85 to 2.11 g/cm3; grain density is nearly constant and ranges from 2.67 to 2.81 g/cm3. Porosity varies between 40% and 45%, but some lower porosity layers are present in Unit 6. The highest bulk and dry density and lowest porosity in this unit correspond to cherts (silica-rich) and/or strongly lithified intervals (see Lithostratigraphy).
P-wave velocity
From the seafloor to 300 mbsf (Units 1–4), many of the P-wave velocity measurements on whole rounds are close to 1450 m/s, which is approximately the velocity of seawater. Thus the velocity of the sediments in this interval rely on the split-core section P-wave velocities (Figure F39). In Units 1 and 2, split-core section P-wave velocities are about 1650 m/s and are consistent with the maximum Whole-Round Multisensor Logger (WRMSL) measurements. In Unit 3, only three split-core measurements were made, and they are similar to those taken in Units 1 and 2. In contrast, P-wave velocities from whole-round cores are notably high in Hole U1471C, displaying a highly variable pattern that reaches a maximum of about 2210 m/s. The high P-wave values in Unit 3 correspond to increased density and decreased porosity. In Unit 4, P-wave velocities on split cores slightly increase with depth and average about 1750 m/s.
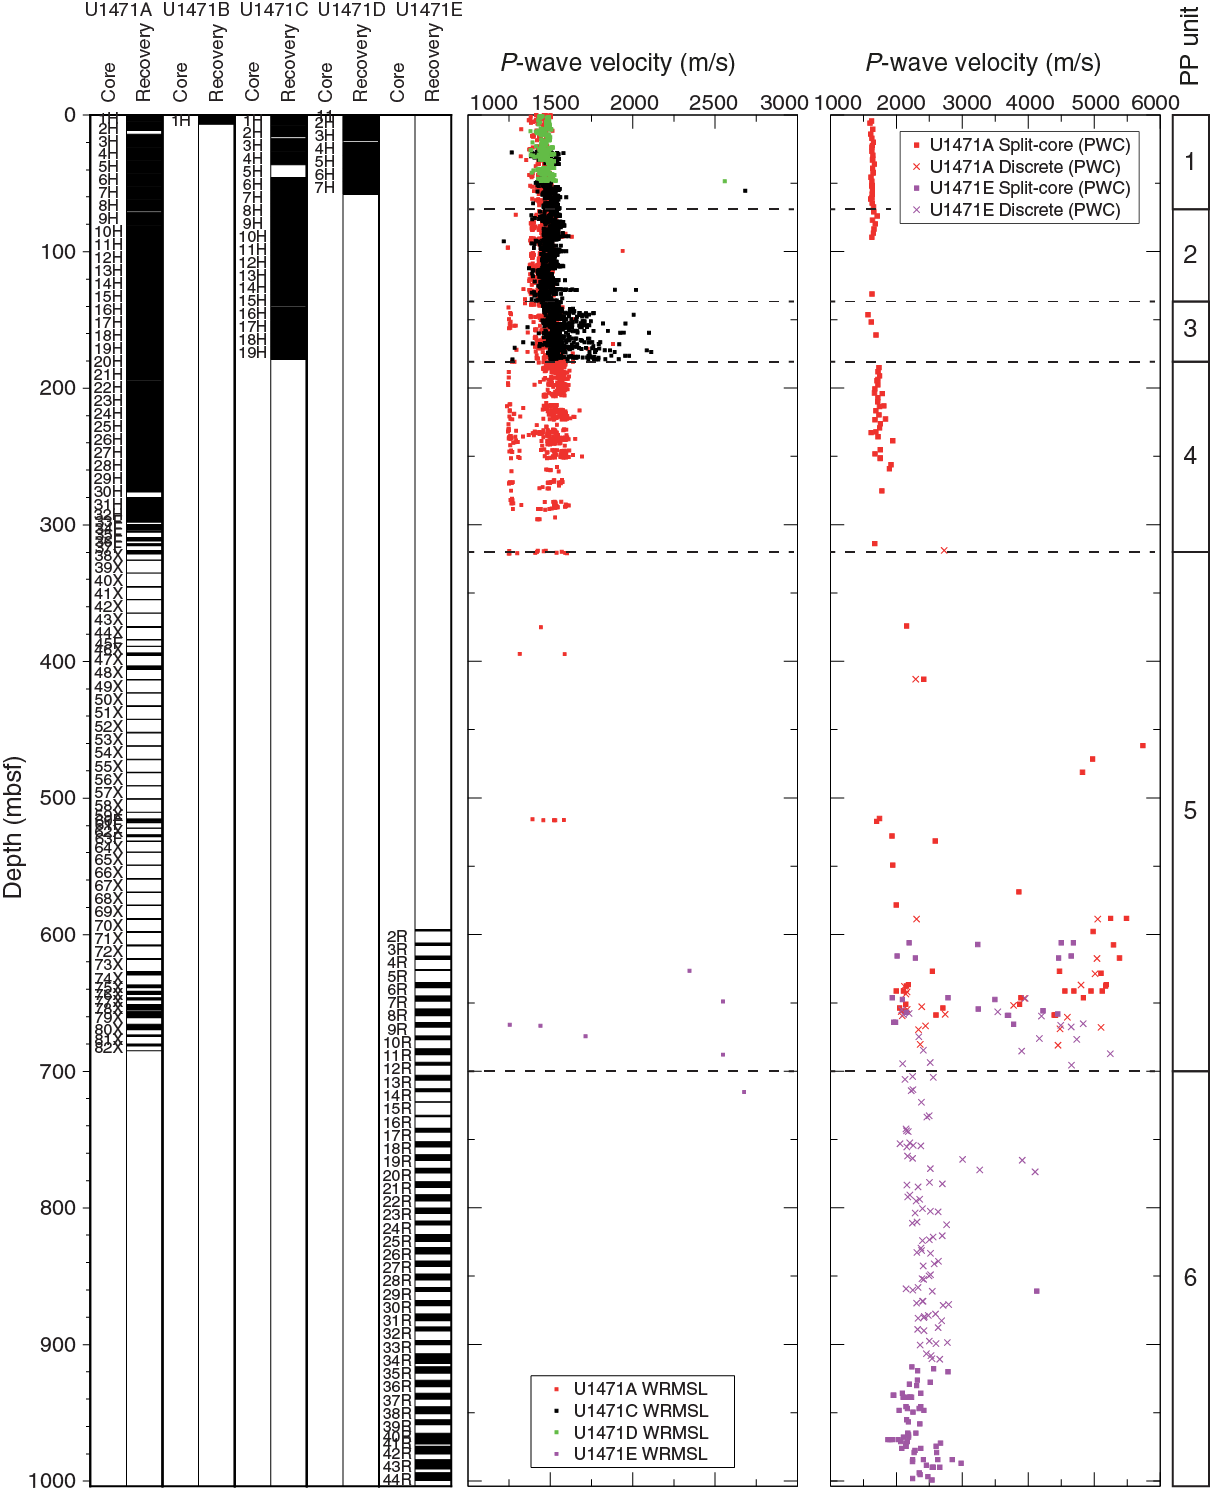
Figure F39. P-wave velocity from the WRMSL and from split cores and discrete samples, Site U1471.
P-wave velocity in Unit 5 increases significantly, with some discrete measurements reaching 5700 m/s in the lithified layers. Lower P-wave velocity values (~2000 m/s) reflect intercalated relatively soft and/or porous sediment layers. A velocity inversion to lower values defines the Unit 5/6 boundary. In Unit 6, P-wave velocity is generally constant around 2500 m/s. Five velocity measurements on cherts and more lithified carbonate samples yield velocities between 3000 and 4130 m/s.
Color reflectance
In Units 1–4 where recovery was high, L* ranges from 35 to 55 (Figure F40). L* generally increases with depth in Units 1 and 3, whereas in Units 2 and 4, it generally decreases with depth. In Units 1–4, a* is around 1.8 and gradually increases with depth and b* ranges between 0 and 10. b* increases in Unit 1 and generally decreases in Units 2–4.
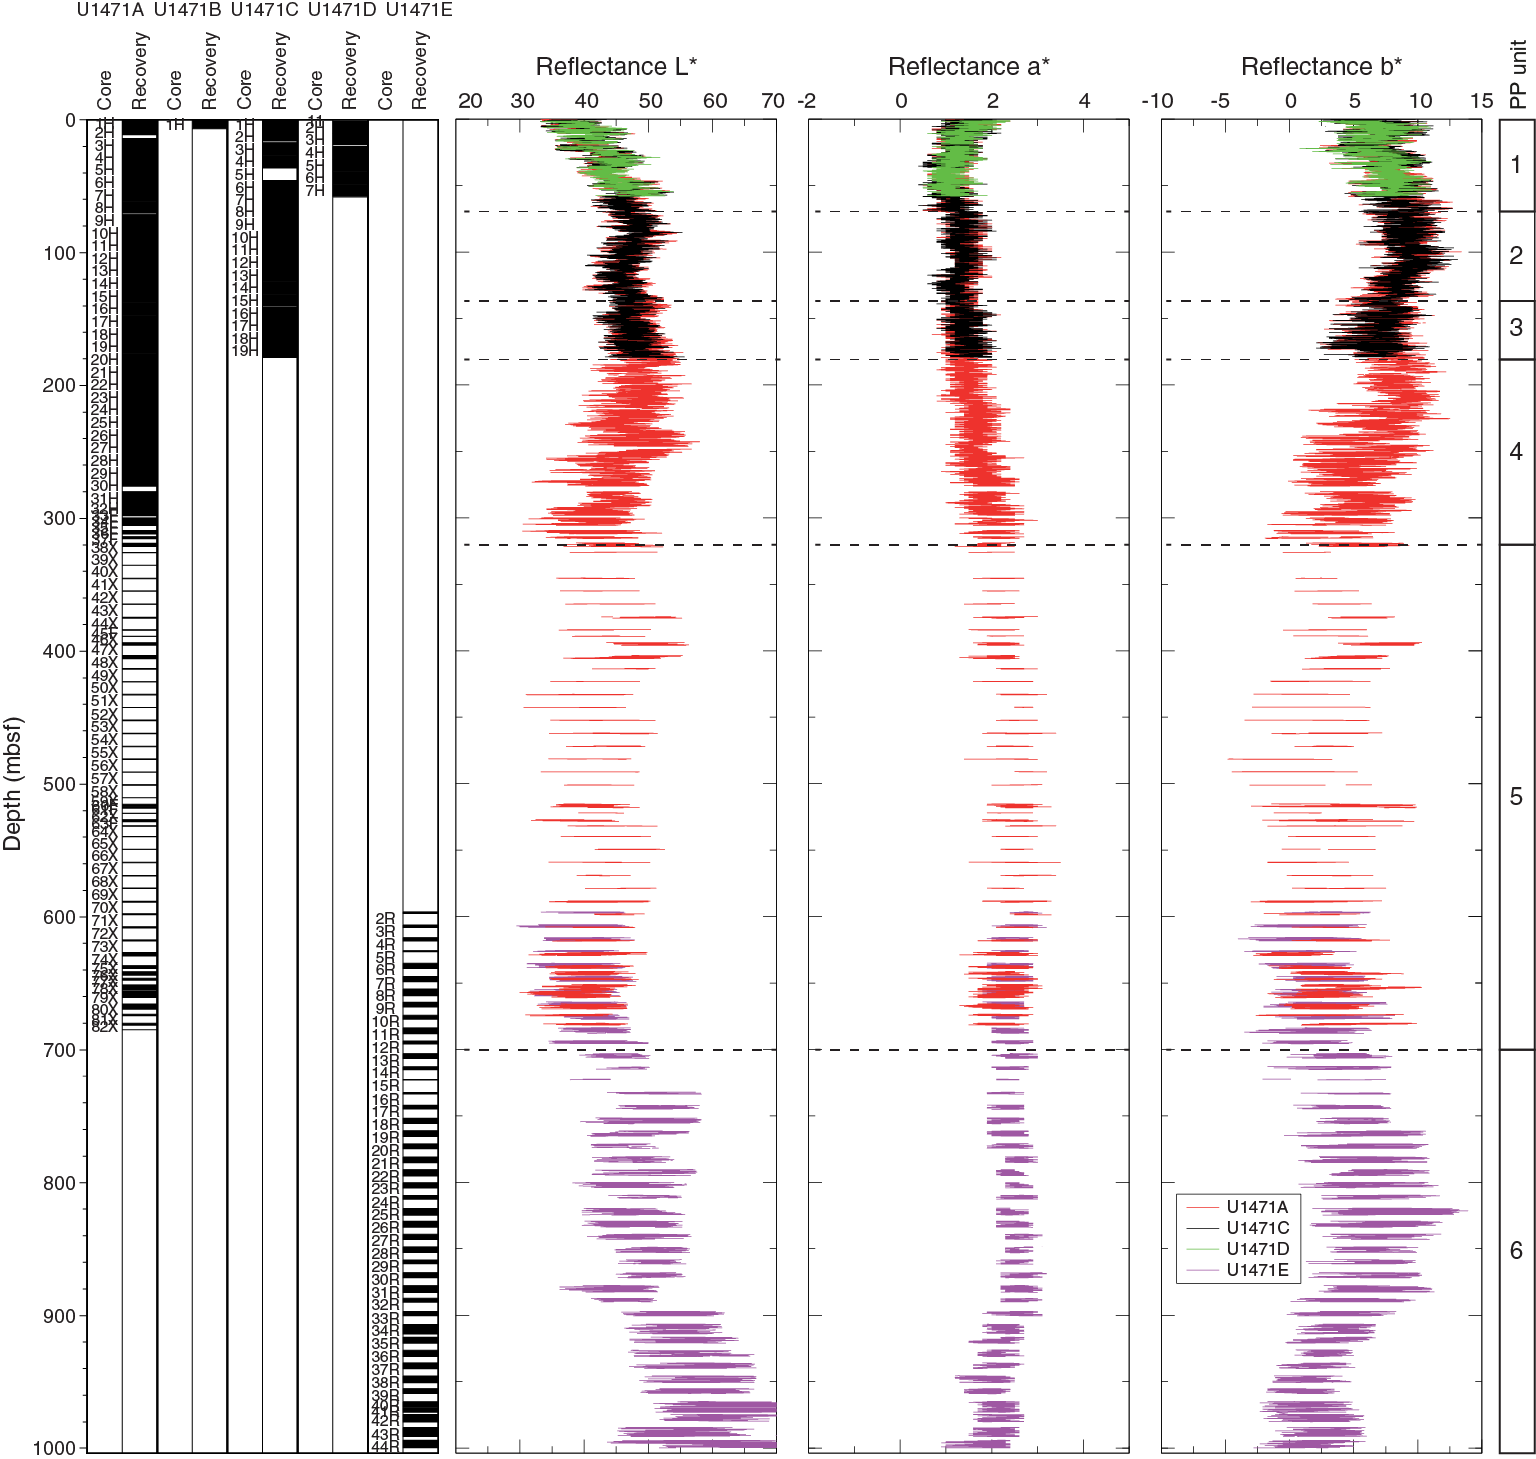
Figure F40. Color reflectance, Site U1471.
In Unit 5, the low recovery of cores prevents a detailed description of L*, a*, and b* behavior. Nevertheless, L* and b* seem to be characterized by cycles of more or less 100 m, whereas a* generally increases to the bottom of this unit.
In Unit 6, variability in L* within each core is on the order of 20; L* averages about 50 from the top of the unit to about 900 mbsf. A sharp increase occurs at 900 mbsf, and below this depth, the average in core L* is about 58. b* generally has an opposite trend to L*: above 900 mbsf, average b* values are about 4.8, and they decrease rapidly (about 10) below 900 mbsf. This variation in average L*, a*, and b* could be related to the transition between the upper drift and the lower basinal (carbonate platform) deposits (see Biostratigraphy and Lithostratigraphy).
Magnetic susceptibility
Magnetic susceptibility measured on whole-round and split cores indicates that the upper portion of every core was contaminated with rust from the drill string (see Paleomagnetism). This magnetic overprint was manually filtered from the data used in this report. An offset appears between the two data sets: MSL and MSP values range from about –2.5 to 0 IU and –12 to –5 IU, respectively. In general, magnetic susceptibility is very low and associated with the diamagnetic component of carbonates in the measured cores (Figure F41).
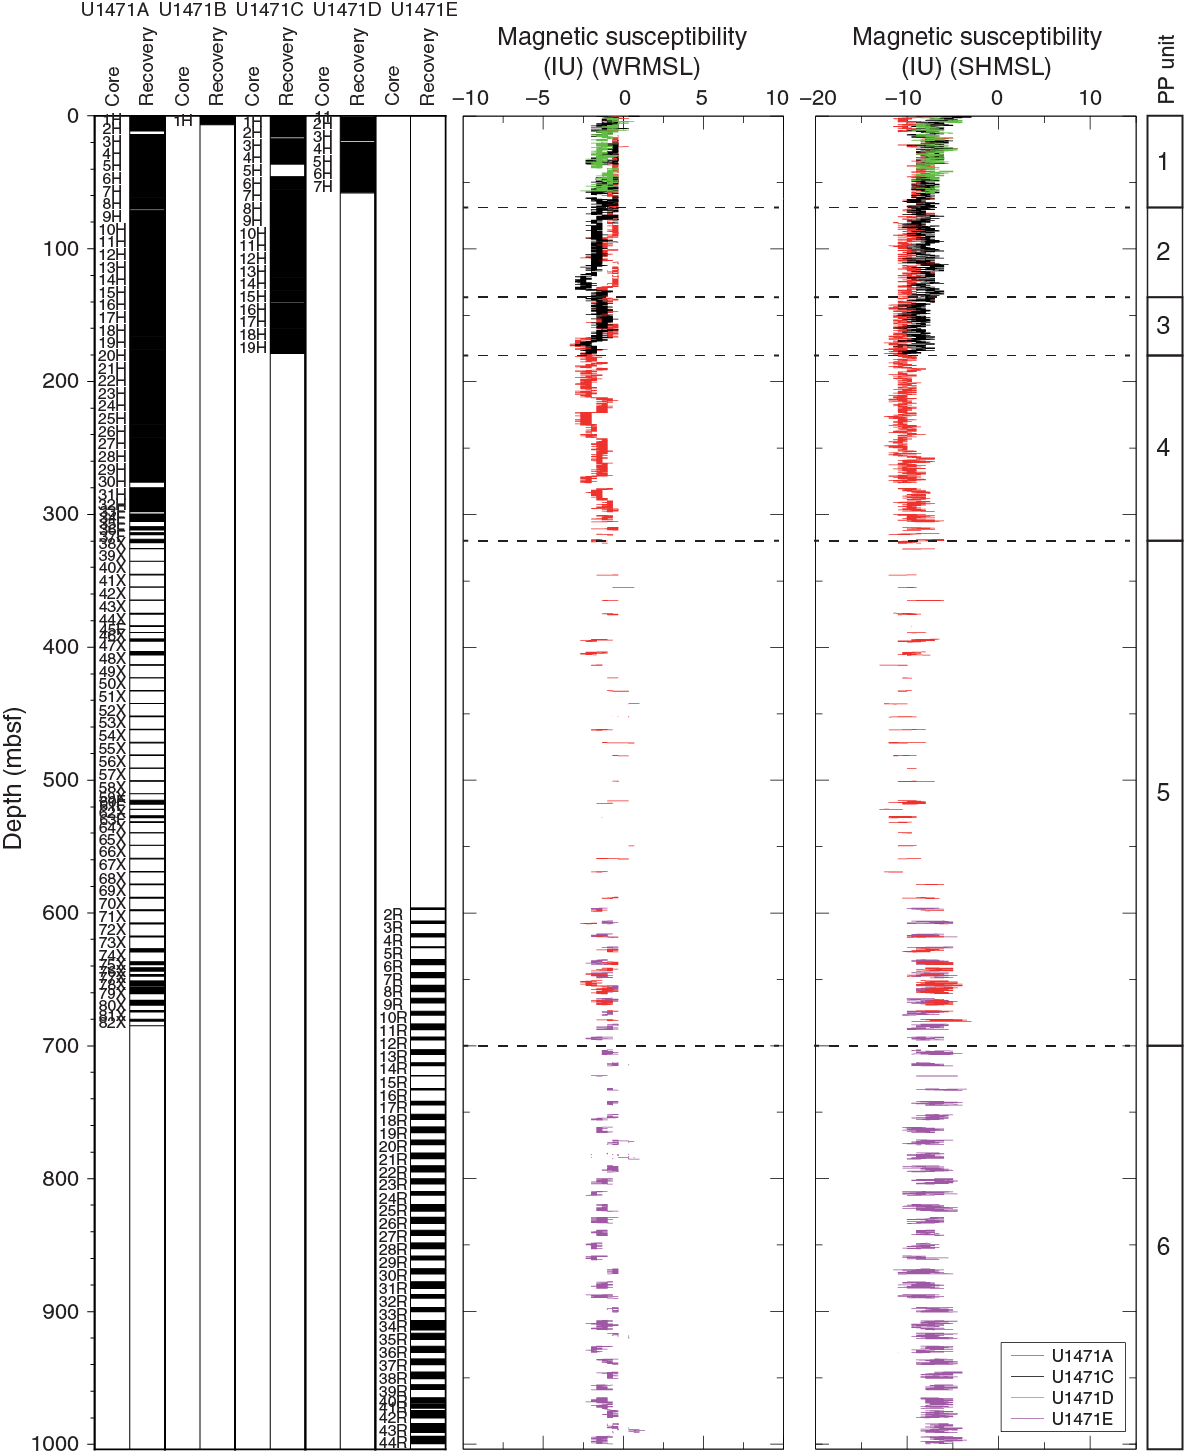
Figure F41. Magnetic susceptibility for WRMSL and SHMSL, Site U1471.
Thermal conductivity
Thermal conductivity measured on 31 samples in Hole U1471A ranges from 0.928 to 1.457 W/(m·K) with a mean value of 1.207 W/(m·K) (standard deviation = 0.118 W/[m·K]) (Figure F42; Table T14). Values obtained from this interval display a general increase with depth but with considerable scatter.
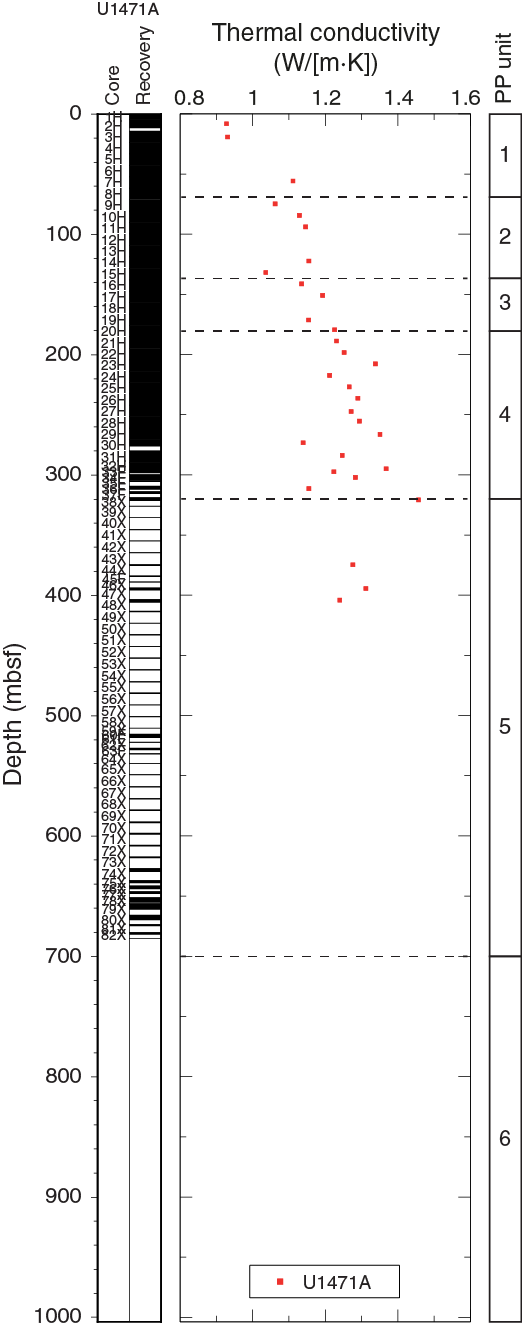
Figure F42. Thermal conductivity, Hole U1471A.
Table T14. Thermal conductivity, Site U1471. Download table in .csv format.
Discussion
At Site U1471, the influence of diagenetic processes can be observed in physical properties beginning at 40 mbsf with notable decreases in porosity and increases in density. This trend continues to the bottom of the site. Discrete samples in Unit 5 record significant increases in density and P-wave velocity with a concomitant decrease in porosity. These extremes are associated with cherts and highly lithified carbonates. In Unit 6, density, P-wave velocity, and porosity are less scattered, with increased porosity values and decreased velocity values. The velocity inversion between Units 5 and 6 is observed in carbonates and is caused by changes in lithology and diagenesis rather than overpressure horizon as in siliciclastics (Eberli et al., 2003).
As a measurement of sedimentary reflectance, high L* values are associated with aragonite/calcite-rich intervals, whereas low L* values are well correlated to darker intervals with more organic matter (see Geochemistry and Lithostratigraphy). In the upper 30 m, the L* pattern appears to correlate with the Late Pleistocene glacial–interglacial cycles (see Stratigraphic correlation and sediment rates), showing a direct link between sea level and sedimentation
Downhole measurements
Logging operations
Logging operations for Site U1471 began after the completion of drilling and coring in Hole U1471E to a total depth of 1003.7 m drilling depth below seafloor (DSF) on 25 November 2015. In preparation for logging, a 30 bbl mud sweep was pumped, the RCB bit was released near the bottom of the hole, and the pipe was pulled up to a logging depth of 100.4 m DSF. The drilling process was relatively smooth, and a normal amount of drag was encountered as the pipe was raised to logging depth, so logging operations were carried out with seawater as the logging fluid. The sea state was calm throughout logging operations, and the wireline heave compensator was not used.
The full triple combo tool string, measuring total and natural gamma ray, porosity, density, electrical resistivity, and magnetic susceptibility, was rigged up and run into the hole at 0545 h on 26 November 2015 (Figure F43). A downlog was recorded from just above the seafloor to the total drilled depth (1003.7 m wireline depth below seafloor, WSF), where the tool string tagged bottom. A short repeat pass was logged near the bottom of the hole to establish repeatability of tool measurements. The tool string was run back to total depth, and the main pass was run from the bottom of the hole up past the seafloor at a speed of 365 m/h.
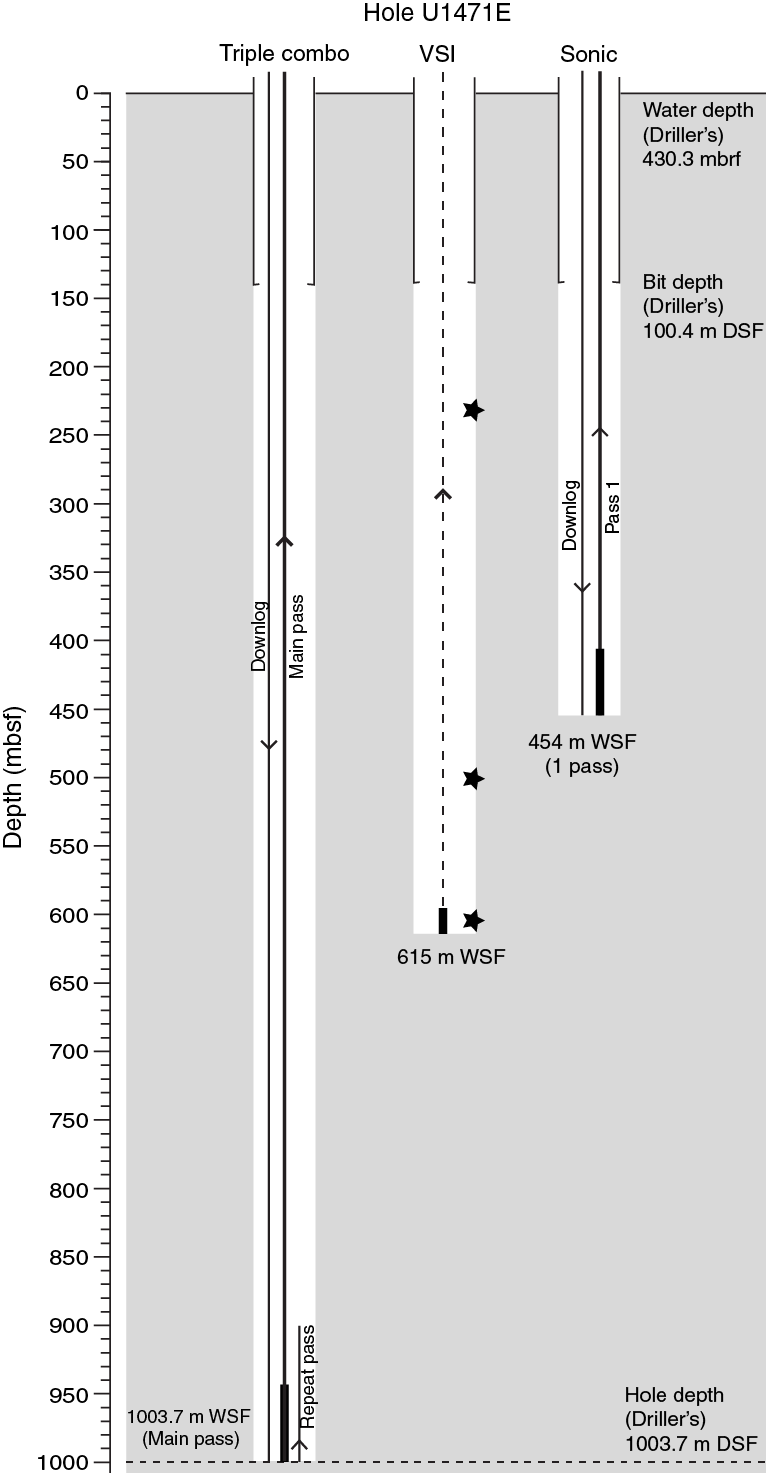
Figure F43. Logging operations, Hole U1471E.
Borehole diameter in the upper section of the hole was at the maximum reach of the Hostile Environment Litho-Density Sonde (HLDS) caliper arm (~17 inches); in the lower section of the hole below 430 m WSF, diameter ranged from ~7 to 17 inches (Figure F44). Based on hole diameter, it was determined that the lower section of the hole could provide sufficient in-gauge intervals suitable for a VSP experiment. The VSI tool string was rigged up and run into the hole at 1245 h. The tool string reached an unpassable obstruction at ~615 m WSF where the borehole had been undergauge during the triple combo run. Only shallow VSP stations could be reached, and clear waveforms were recorded at three depth stations between 232 and 605 m WSF. The VSI tool string was run into the hole to attempt one deeper station, but on this attempt, an obstruction was encountered at 454 m WSF, also a location where the hole had been undergauge during the triple combo run. The VSP experiment ended at 1510 h, and the tool string was returned to the rig floor and rigged down.
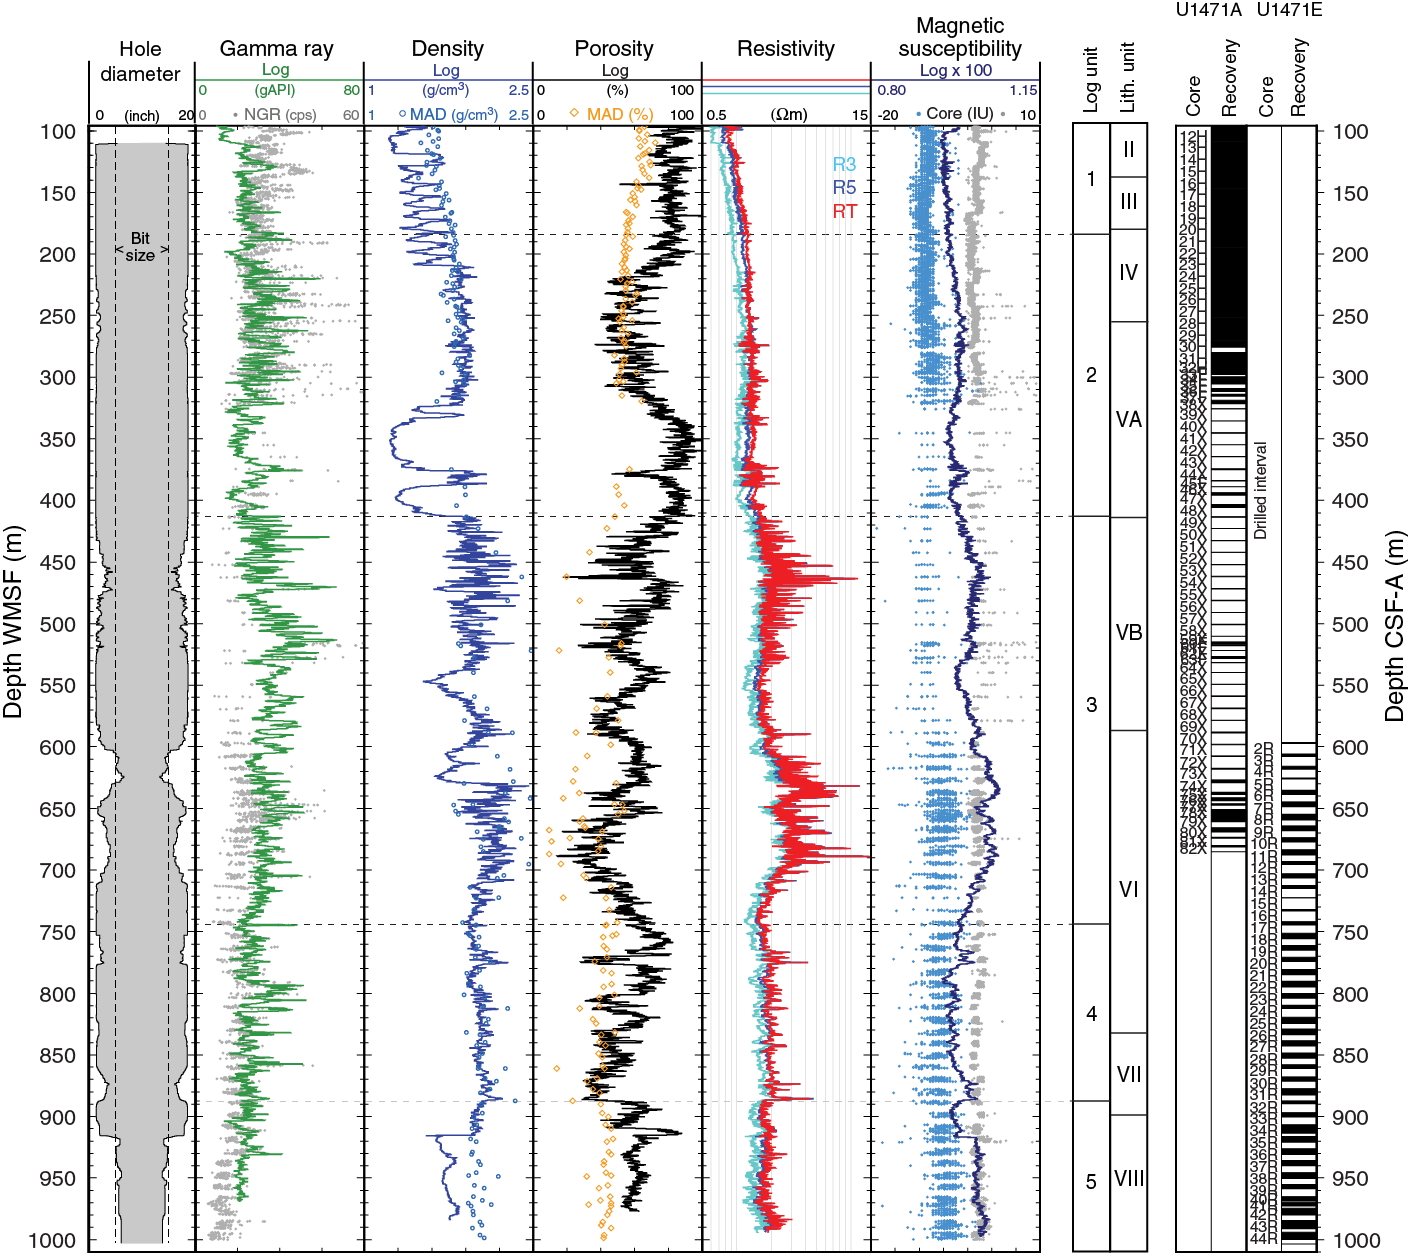
Figure F44. Triple combo logs, Hole U1471E.
A third logging run was made with a sonic tool string measuring gamma ray and sonic velocity (see Figure F13 in the Expedition 359 methods chapter [Betzler et al., 2017a]) with the aim of recording velocity data in the available open-hole interval. The FMS tool that is usually combined with the sonic tool has a maximum caliper reach of ~15 inches, and so would not have made contact with the borehole walls in this section where borehole diameters were ≥17 inches. The sonic tool string was run into the hole at 1620 h, and a downlog was recorded to 454 m WSF, the same depth where an obstruction blocked passage of the VSI tool string. After several unsuccessful attempts to pass the blocked section, the sonic tool string was pulled up at a speed of 610 m/h from 454 m WSF to record a main pass through the shallow section of open hole up to the seafloor. The sonic tool string was pulled up to the rig floor and rigged down, and logging operations for Hole U1471E and Expedition 359 were completed by 1940 h on 26 November 2015.
Downhole log data quality
During shore-based processing, all logging curves were depth-matched using the total gamma ray log from the main pass of the triple combo run as a reference log and shifted to a seafloor depth reference, allowing a unified depth scale to be produced (wireline log matched depth below seafloor [WMSF]). Features in gamma ray logs from the main pass were aligned to the reference log to produce a complete depth-matched data set. The data were shifted to WMSF based on the depth of the step increase in gamma ray that indicated the seafloor during the downlog, measured at 430.5 m WRF.
As a result of varying borehole conditions in Hole U1471E, logging data vary in quality. Borehole diameter ranged from ~7 to ≥17 inches (Figure F44), as measured by the HLDS caliper during the triple combo logging run. In general, borehole logging data should be interpreted cautiously in intervals where the borehole diameter is unknown or highly variable. Gamma ray and electrical resistivity logs are relatively robust to wide borehole conditions; density and porosity logs can be compromised in wide boreholes because those tools require good contact with the borehole walls during measurement.
There is good agreement between the NGR from physical properties measurements on cores and the gamma ray log (Figure F44). The same general trends and features are observed in both data sets where core recovery permitted NGR measurements to be made, and a relatively small depth offset is apparent on the order of 1–2 m. There are intervals of good agreement between the density and porosity logs and density and porosity data from MAD measurements on cores. Throughout these intervals, the logs are considered reliable. Particularly in the enlarged or washed out intervals where the caliper measures a maximum diameter (~17 inches), density log values are erroneously low (~1.2 g/cm3) and porosity log values are erroneously high (≥80%). Although values are suspect in these intervals, their locations are likely partly controlled by lithology or sediment character; lithology controls log responses, and some formation types are more easily washed out than others.
Logging units
Five logging units were identified on the basis of characteristic features and trends, primarily in electrical resistivity and magnetic susceptibility data. These units are identified in Figures F44, F45, and F46.
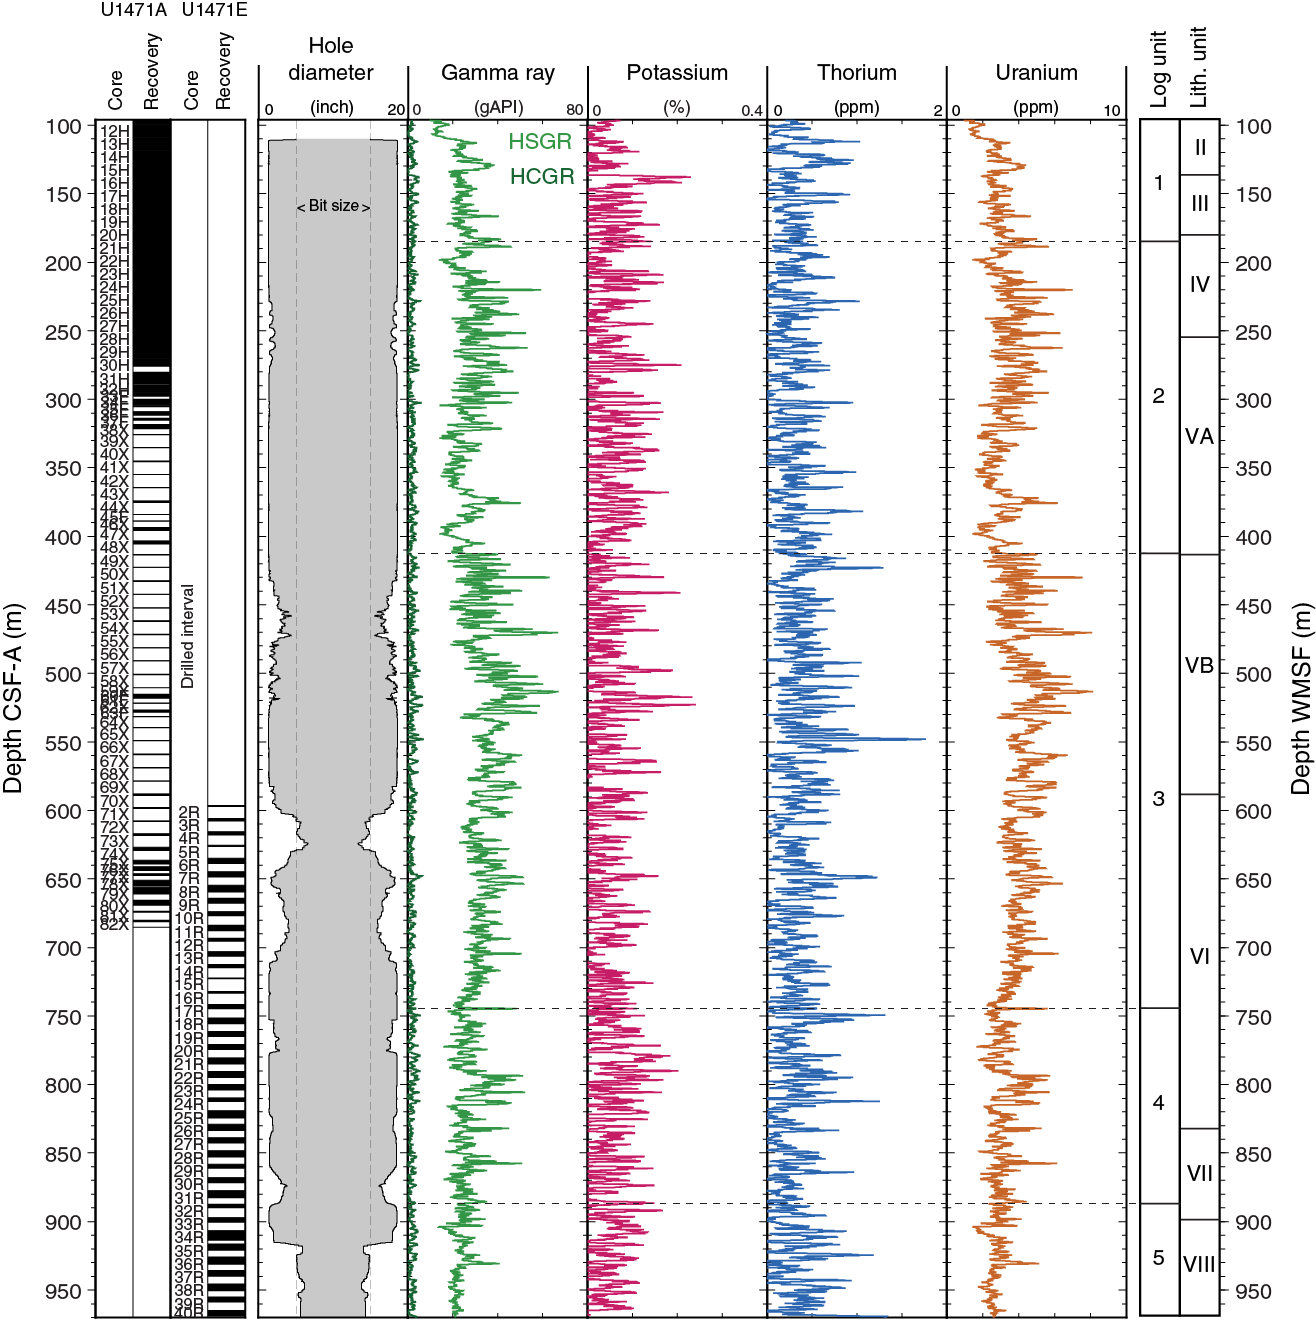
Figure F45. NGR logs, Hole U1471E.
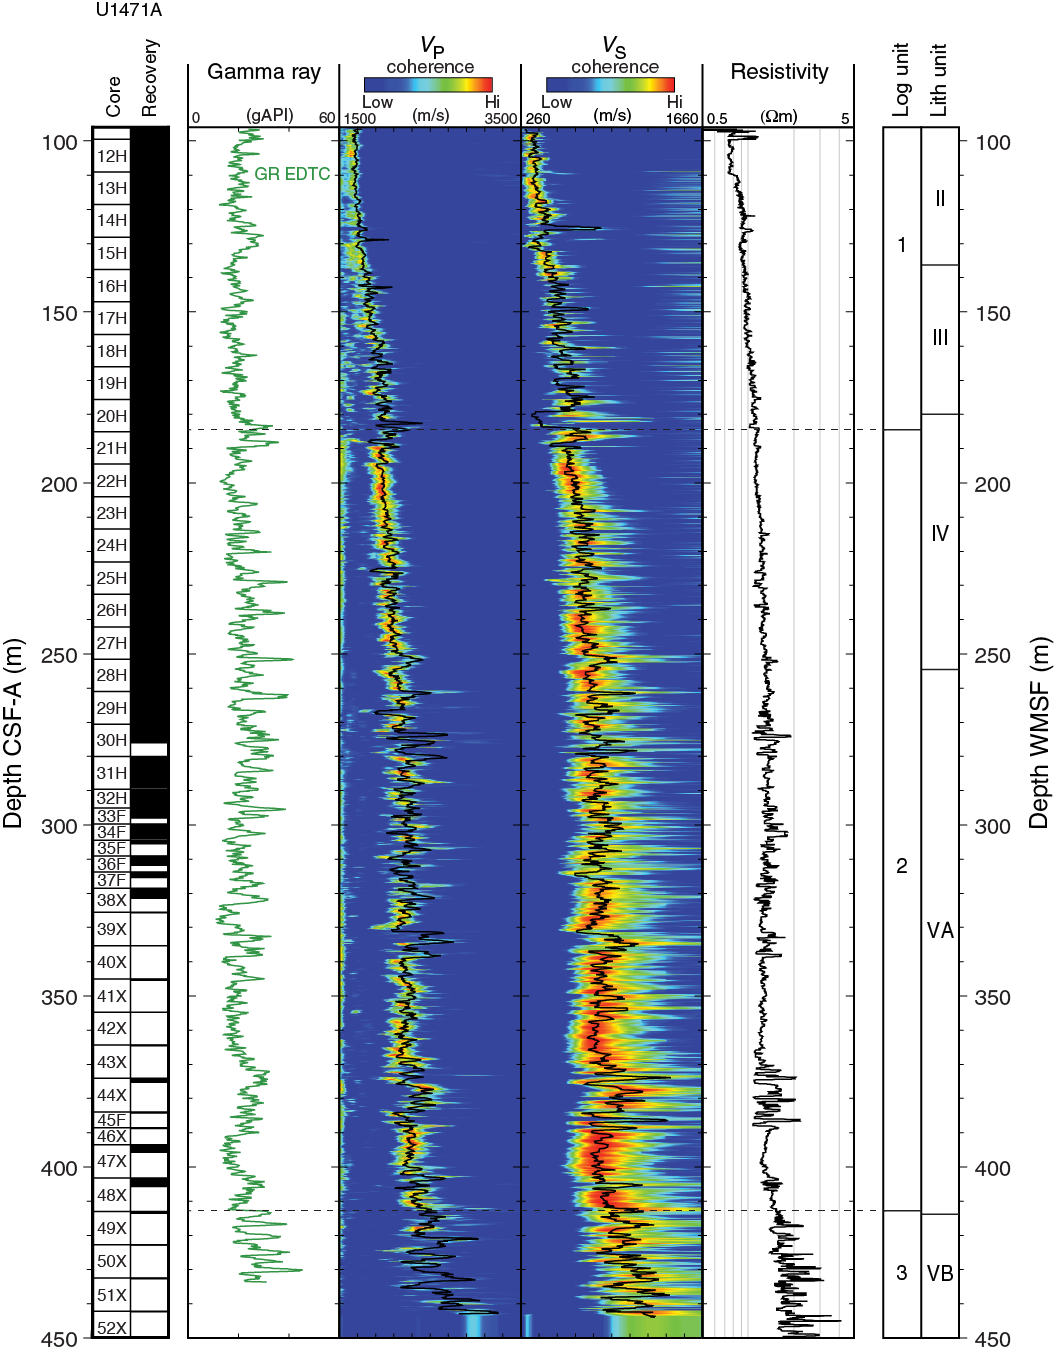
Figure F46. Downhole logs recorded in the main pass of the sonic tool string, Hole U1471E.
Logging Unit 1 (base of drill pipe to 184 m WMSF)
Logging Unit 1 is characterized by relatively low resistivity, magnetic susceptibility, and sonic velocity, all of which increase slightly with depth in the unit and exhibit low-amplitude variability. Gamma ray values are relatively low with low- to moderate-amplitude variability.
Logging Unit 2 (184–412 m WMSF)
The logging Unit 1/2 boundary is distinguished by an interval of increased sonic velocity (Figure F46). There is a series of distinctive multimeter-scale features within Unit 2, characterized by higher amplitudes in resistivity data and locally elevated velocity values. The most prominent of these packages (centered at 380 m WMSF) is distinctive in most of the logged properties, with locally elevated gamma ray, density, and magnetic susceptibility. Higher coherence appears in the sonic waveforms in this unit, which is consistent with a change in physical properties relative to the overlying unit.
Logging Unit 3 (412–745 m WMSF)
Logging Unit 3 is distinguished from the overlying units primarily on the basis of a change in character in the resistivity log, which exhibits more variability and higher amplitudes in this unit. Resistivity values are highest and exhibit the greatest range (1.4–14.7 Ωm) in Unit 3, compared to overlying and underlying units. Increasing and decreasing trends in resistivity are also observed in the magnetic susceptibility data. Sonic velocity data were only recorded in the upper ~30 m of Unit 3 but suggest an increasing trend in velocity as resistivity within the unit also increases.
Logging Unit 4 (745–888 m WMSF)
Logging Unit 4 is distinguished by a change to moderate amplitude variability in resistivity, with only minor fluctuations around a mean value of 2.0 Ωm. Intervals with locally elevated magnetic susceptibility values and peaks in resistivity are near the top of the unit (~770 m WMSF) and at the bottom of the unit (~880 m WMSF).
Logging Unit 5 (888–1000 m WMSF; total depth in hole)
The logging Unit 4/5 boundary is characterized by a subtle but distinct change across nearly all logged measurements. Density, resistivity, and magnetic susceptibility decrease across the unit boundary. Resistivity logs exhibit a decrease in the range of values in Unit 5, relative to overlying units.
Downhole logs and lithology
Gamma ray profiles in Hole U1471E change gradually downhole, with no major steps in base levels. The gamma ray data are characterized by variability but no distinct trend with depth. As at all previous logged sites (Sites U1466–U1468), spectral gamma ray data indicate that uranium is the dominating contributor to the total gamma radiation of these sediments (Figure F45). The signal shows moderately high amplitude variability on a several-meter to submeter scale, and given the sedimentological context (see Lithostratigraphy), it most likely tracks organic matter content. Only minor variations in K and Th are measured on the order of 0.2% and <1 ppm, respectively.
Intervals of high-frequency variability and moderate to high amplitude in resistivity logs and sonic logs correlate well with increased magnetic susceptibility in the upper 412 m of the borehole in logging Units 1 and 2. The logged interval between 420 and 530 m WMSF (within Unit 3) may correlate in depth with seismic stratigraphic boundary DS4, which is a package of strong reflections between DS4 and DS3 (see Seismic stratigraphy). Below this interval, the resistivity profile is characterized by low amplitudes that may correspond to a relatively acoustically transparent section in the interior of DS3. Between ~600 and 700 m WMSF, logging profiles reveal another package characterized by high-amplitude variability in resistivity and increased magnetic susceptibility that may correlate in depth to DS3.
Between 700 and 900 m WMSF, logging profiles within Unit 4 reveal two features with locally elevated density, resistivity, and magnetic susceptibility (centered at 770 and 880 m WMSF) that may correspond to DS2 and DS1.
It is difficult to interpret formation properties below the oldest drift sequence boundary (DS1) because there are no major changes in logging data character within Unit 5 at the base of the hole. However, borehole diameter changes significantly below ~920 m WMSF, going from enlarged to undergauge within meters (Figure F44). Although not direct evidence of petrophysical or lithologic change, this change in borehole condition may reflect an abrupt change in sediment character at this depth.
Vertical seismic profile and sonic velocity
The VSI tool string was deployed in Hole U1471E to conduct a VSP experiment with the aim of focusing on in-gauge intervals of the borehole identified by the triple combo caliper. However, the tool string was obstructed by a blocked zone at ~615 m WMSF, so the VSP was limited to the washed out, shallow section of the hole. Data provided by the VSP experiment and the sonic velocity log in Hole U1471E help establish the conversion between depth and two-way traveltime (TWT) for the shallow section of the borehole above 610 m WMSF (Figures F47, F48).

Figure F47. P-wave velocity from the sonic velocity log in Hole U1471E and cores from Holes U1471A and U1471E.
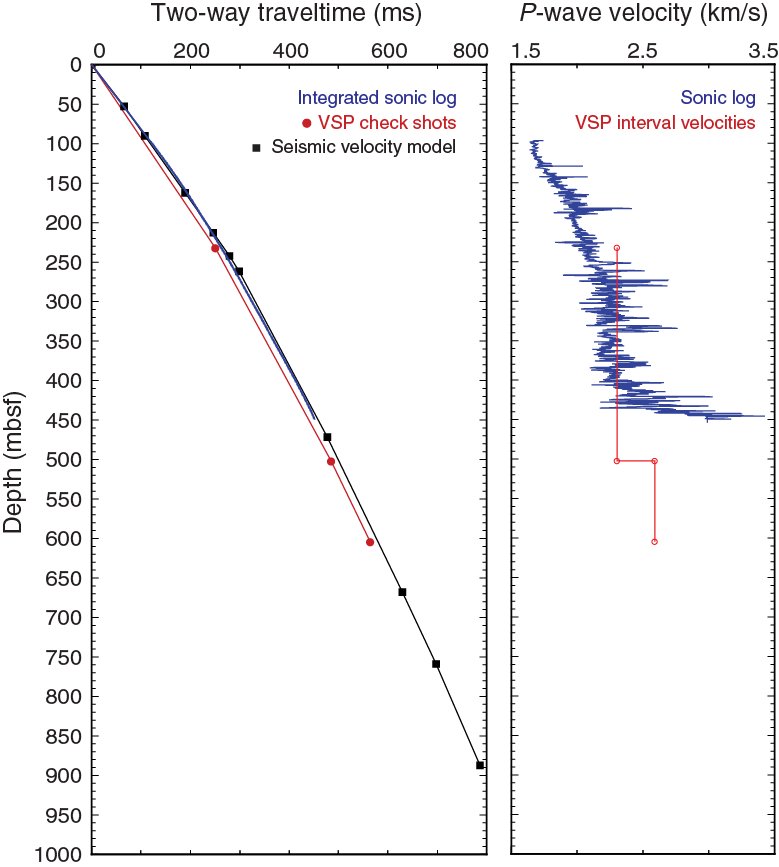
Figure F48. Time-depth curves and P-wave velocity, Site U1467.
Sonic waveforms were recorded during the VSP experiment at three stations. All three stations yielded good check shot traveltimes, ranging from 0.8251 s TWT at 232.5 m WMSF to 1.1384 s TWT at the deepest station at 604.7 m WMSF (Figure F43; Table T15). It was difficult for the VSI caliper arm to achieve sufficient clamping force against the borehole wall in this enlarged section of the borehole. Multiple shots were stacked at the two shallower stations, but only one good shot was recorded at the deepest station. Measured traveltimes were corrected to the sea level datum and are based on the first break of the sonic waveform.
Table T15. VSP experiment direct arrival times, Site U1471. Download table in .csv format.
Sonic traveltimes were also calculated from sonic log velocities in the upper 450 m WMSF of the borehole and give two-way traveltimes very close to those from the seismic velocity model from expedition site survey data (Figure F48). Traveltimes from the VSP in Hole U1471 suggest that formation velocities are somewhat faster than those recorded with sonic velocity logs, which are limited in depth.
P-wave velocities from downhole logging differ from physical properties measurements on cores, both discrete sample and whole-round measurements (Figure F47) (see Physical properties). However, this comparison is limited by a relatively short interval of overlapping data because sonic log data only cover the borehole section between ~100 and 450 m WMSF and core-based velocity data are limited by core recovery. There is an indication of higher measured velocities in the sonic log approaching 450 m WMSF. An interval of higher velocity below this depth would be consistent with the interval of increased resistivity and magnetic susceptibility between 420 and 530 m WMSF that likely corresponds to DS4. Although there is no velocity from downhole logs at this depth, core-based velocity data indicate another interval of increased velocity between ~600 and 700 m WMSF at the same depth as the interval of increased resistivity and magnetic susceptibility that likely corresponds to DS3.
Downhole temperature
Five downhole temperature measurements were made using the APCT-3 in Hole U1471C between 26.8 and 169.3 mbsf (Table T16).
Table T16. APCT-3 temperature measurements, Site U1471. Download table in .csv format.
All measurements were made in a good sea state (<1 m swell). The APCT-3 was stopped at the mudline for at least 5 min prior to each penetration. Mudline temperatures ranged from 12.0°C to 14.6°C (Table T16). Frictional heating was observed on all penetrations with the APCT-3 in Hole U1471C, with temperature-time records exhibiting characteristic probe penetration and subsequent decay. Tool movement while the probe was in the sediment was minimal during three deployments at the bottoms of Cores 3H, 5H, and 18H, and the measurements from these deployments appear to be reliable. There was evidence of tool motion during the deployments at the base of Cores 7H and 9H, but equilibrium temperatures could still be determined from the temperature-time series recording during those deployments.
Mudline temperatures were not consistent during the five APCT-3 deployments, but they suggest that water column temperatures are higher than sediment temperatures at shallowest depths below seafloor. The subsurface temperature gradient based on our five formation temperature measurements is 15.3°C/km (Figure F49).

Figure F49. APCT-3 temperature measurements, Hole U1471C.
Stratigraphic correlation and sedimentation rates
Determining the relative positions of core gaps among the various holes at Site U1471 during drilling was accomplished using GRA data collected at 5 cm resolution on the Whole-Round Multisensor Logger (WRMSL). NGR was also used to evaluate sedimentary completeness among Holes U1471A, U1471C, and U1471D. Particular emphasis was placed on the interval represented by Core 359-U1471C-5H, which recovered no sediments (see Operations). Hole U1471D was started at 1 mbsf (by drilling down) and when combined with Hole U1471A filled in sedimentary gap left by Core 359-U1471C-5H. Core 359-U1471B-1H, the only core from Hole U1471B, was recovered with a shattered liner and was not used in stratigraphic correlation.
Correlations were accomplished using IODP Correlator software (version 2.0.1). High-resolution compositing (decimeter scale; see Stratigraphic correlation and sedimentation rates in the Expedition 359 methods chapter [Betzler et al., 2017a]) was based on reflectance L* from the Section Half Imaging Logger (SHIL) at 2.5 cm resolution for all but one interval where reflectance lacked distinct patterns. NGR was used at that level (Table T17). Holes U1471A, U1471C, and U1471D were composited to ~61.2 m core composite depth below seafloor (CCSF-A). Only Holes U1471A and U1471C were cored below this level. For detailed discussion of the GRA, NGR, and L* data sets, see Physical properties in the Expedition 359 methods chapter (Betzler et al., 2017a).
Table T17. Splice tie points, Site U1471. Download table in .csv format.
The composite depth scale and splice at Site U1471 are constructed from 0.0 to 195.71 m CCSF-D (from the mudline in Hole U1471C to the bottom of Core 359-U1471A-20H) (Figure F50). Below the splice, Hole U1471A cores (with unknown gaps in each) are appended with a constant affine value (Tables T17, T18). Uncertainty in moving between cores within the splice (CCSF-D) based on *L tie points is estimated to be 10 cm but may be as high as 30 cm for some ties. Uncertainty in the only tie point in the splice based on NGR may be on the order of 30 cm (~109 m CCSF-D).
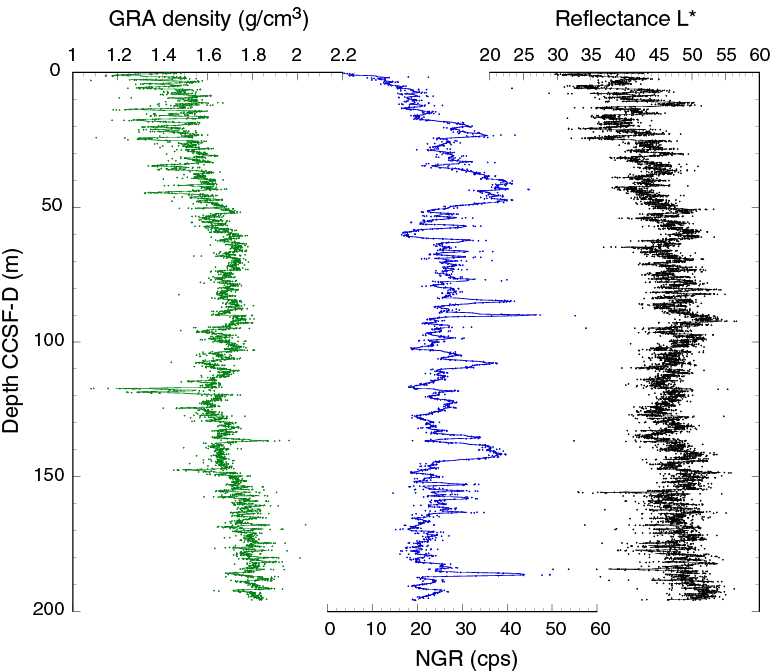
Figure F50. Spliced L*, NGR, and GRA records, Site U1471.
Table T18. Splice intervals, Site U1471. Download table in .csv format.
The growth rate is 6% for Hole U1471A–U1471C composited sections (0–195.71 m CCSF-A) (Table T17). This rate is similar to the growth for Site U1467 (see Stratigraphic correlation and sedimentation rates in the Site U1467 chapter [Betzler et al., 2017d]). Lower growth rates at Sites U1471 and U1467 reflect low clay content in the cores, good weather with calm sea state, and low tidal range (~0.5 m).
Comparison of Sites U1471 and U1467
The top 30 m CCSF-D of the L* records from Sites U1467 and U1471 were compared to assess Late Pleistocene sections at each site (Figure F51). This interval was correlated to 0–800 ka at Site U1467 (see Figure F55 in the Site U1467 chapter [Betzler et al., 2017d]). Broad L* highs are interpreted as marine isotope stage interglacials, which is consistent with sedimentation patterns on carbonate platforms showing increased sedimentation rates during interglacial highstands (Betzler et al., 2013b; Eberli, Swart, Malone, et al., 1997; Isern et al., 2002). Based on the L* records, the latest Pleistocene section at Site U1467 is slightly more expanded than the one at Site U1471 (18 vs. 16 m CCSF-D, respectively) over the interval correlated to marine isotope Stages 1–11. Below this level, L* highs are more expanded at Site U1471 than at Site U1467. The change in relative thickness of reflectivity highs between Site U1467 and U1471 is likely related to subtle changes in the location of current-controlled sedimentation at ~450 ka.
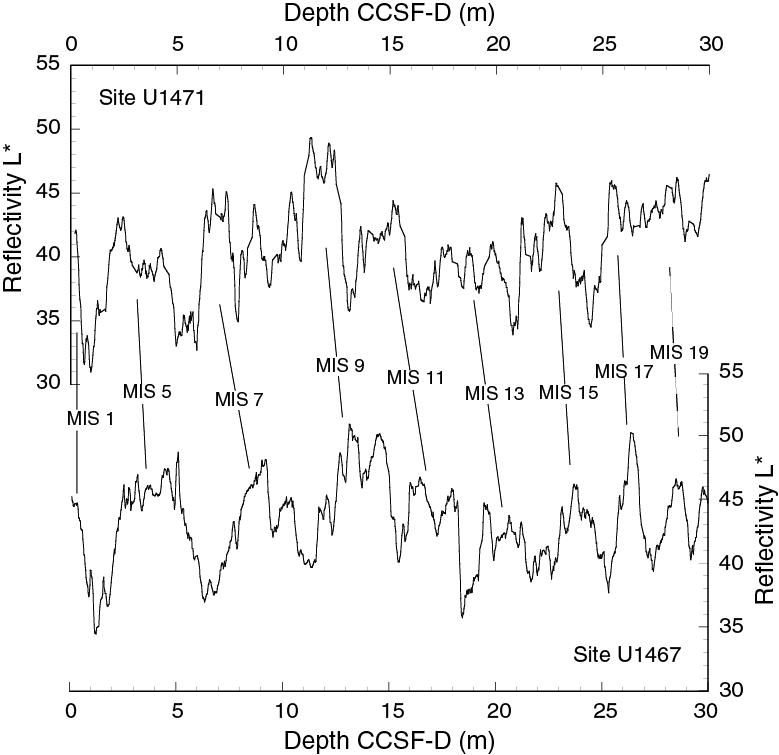
Figure F51. Spliced L* record, Sites U1471 and U1467.
Comparison of Sites U1471 and U1467 was continued downsection using the spliced NGR records from each site, which indicate that ~115 m CCSF-D at Site U1471 correlates to 100 m CCSF-D at Site U1467 (Figure F52). This correlation is consistent with the biostratigraphic age model that shows higher sedimentation rates over the Pliocene–Pleistocene section at Site U1471 than at Site U1467 (5 vs. 3.5 cm/ky, respectively) (see Biostratigraphy).
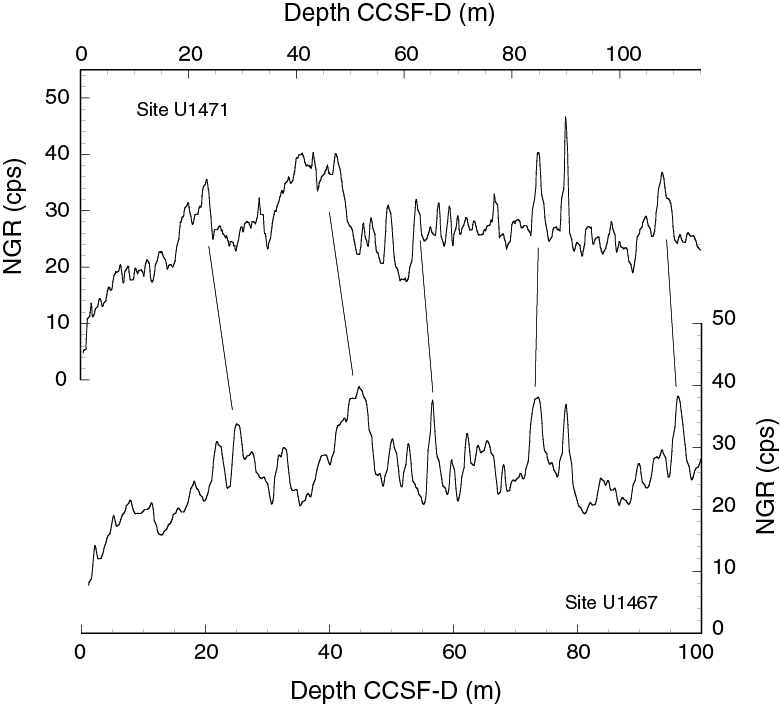
Figure F52. Spliced NGR record, Sites U1471 and U1467.
Seismic stratigraphy
Site U1471 is in the distal portion of the prograding drift southwest of the Goidhoo atoll in the Inner Sea. This site is positioned to penetrate all drift sequences (DS1–DS10) (Figure F53). The drift sequences are thicker here than at basinal Site U1467 (Lüdmann et al., 2013). This expanded section and the continuity of seismic reflections in the younger sequences (DS6–DS10) make the site favorable for cyclostratigraphic and paleoceanographic reconstructions for the drift interval. In addition, the drift conformably overlies the distal bottomsets of the platform deposits, which is ideal for determining the biostratigraphic age of the onset of drift deposition at the base of DS1 (Figure F53).
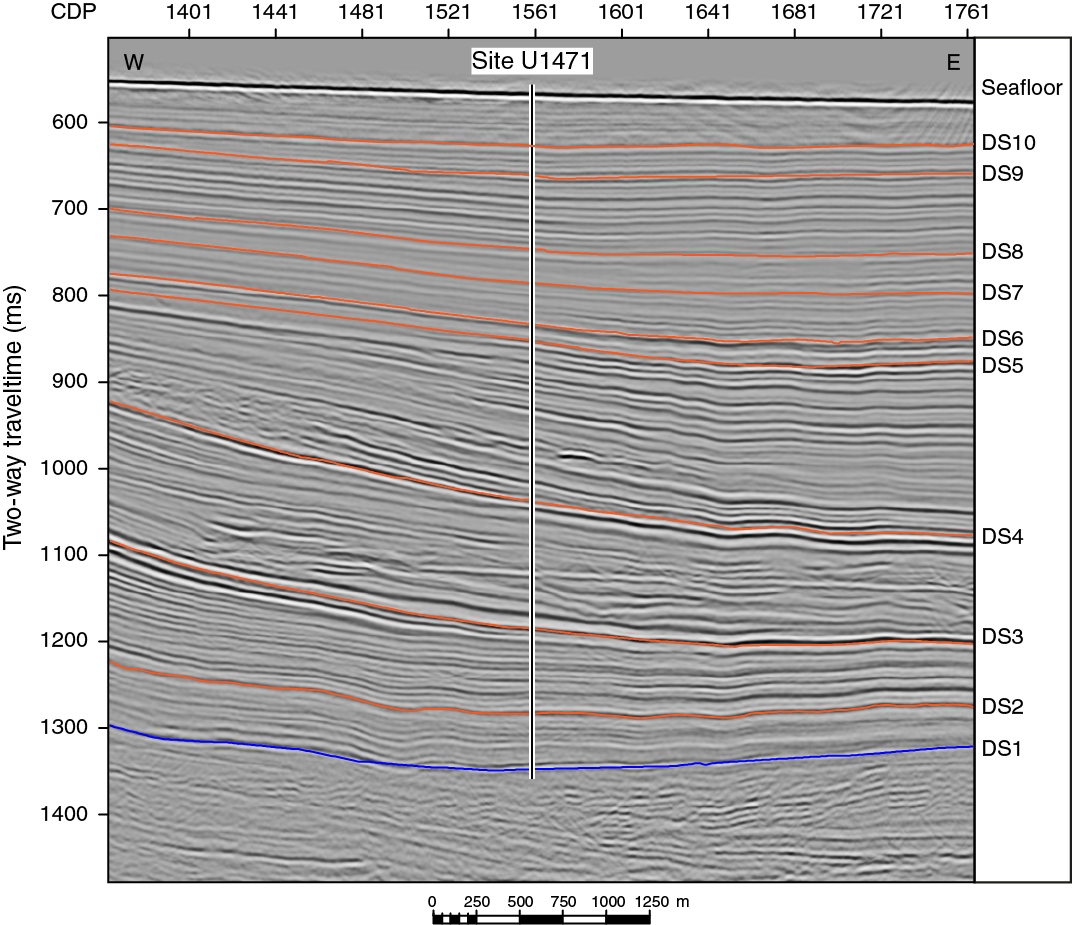
Figure F53. West–east seismic section across Site U1471.
Time-depth conversion
A short check shot survey was performed in the upper part of Hole U1471E. At 604.6 mbsf, collapsed sediments blocked the tool’s passage to the lower portion. In the section above the blockage, the hole diameter was wide, and thus only three stations had good coupling between the formation and the VSI (see Downhole measurements). However, the measurements were of high quality. To anchor the velocity model below 604.6 mbsf, we used the lithostratigraphic Unit VII/VIII boundary (Core 359-U1471E-33R), which marks the change from drift to platform sequences at 898 mbsf as a tie point (see Lithostratigraphy). Figure F54 shows the interval velocities used, and Figure F55 shows the resulting time-depth conversion. The depths of the mapped drift sequences (DS1–DS10) are shown in Table T19.
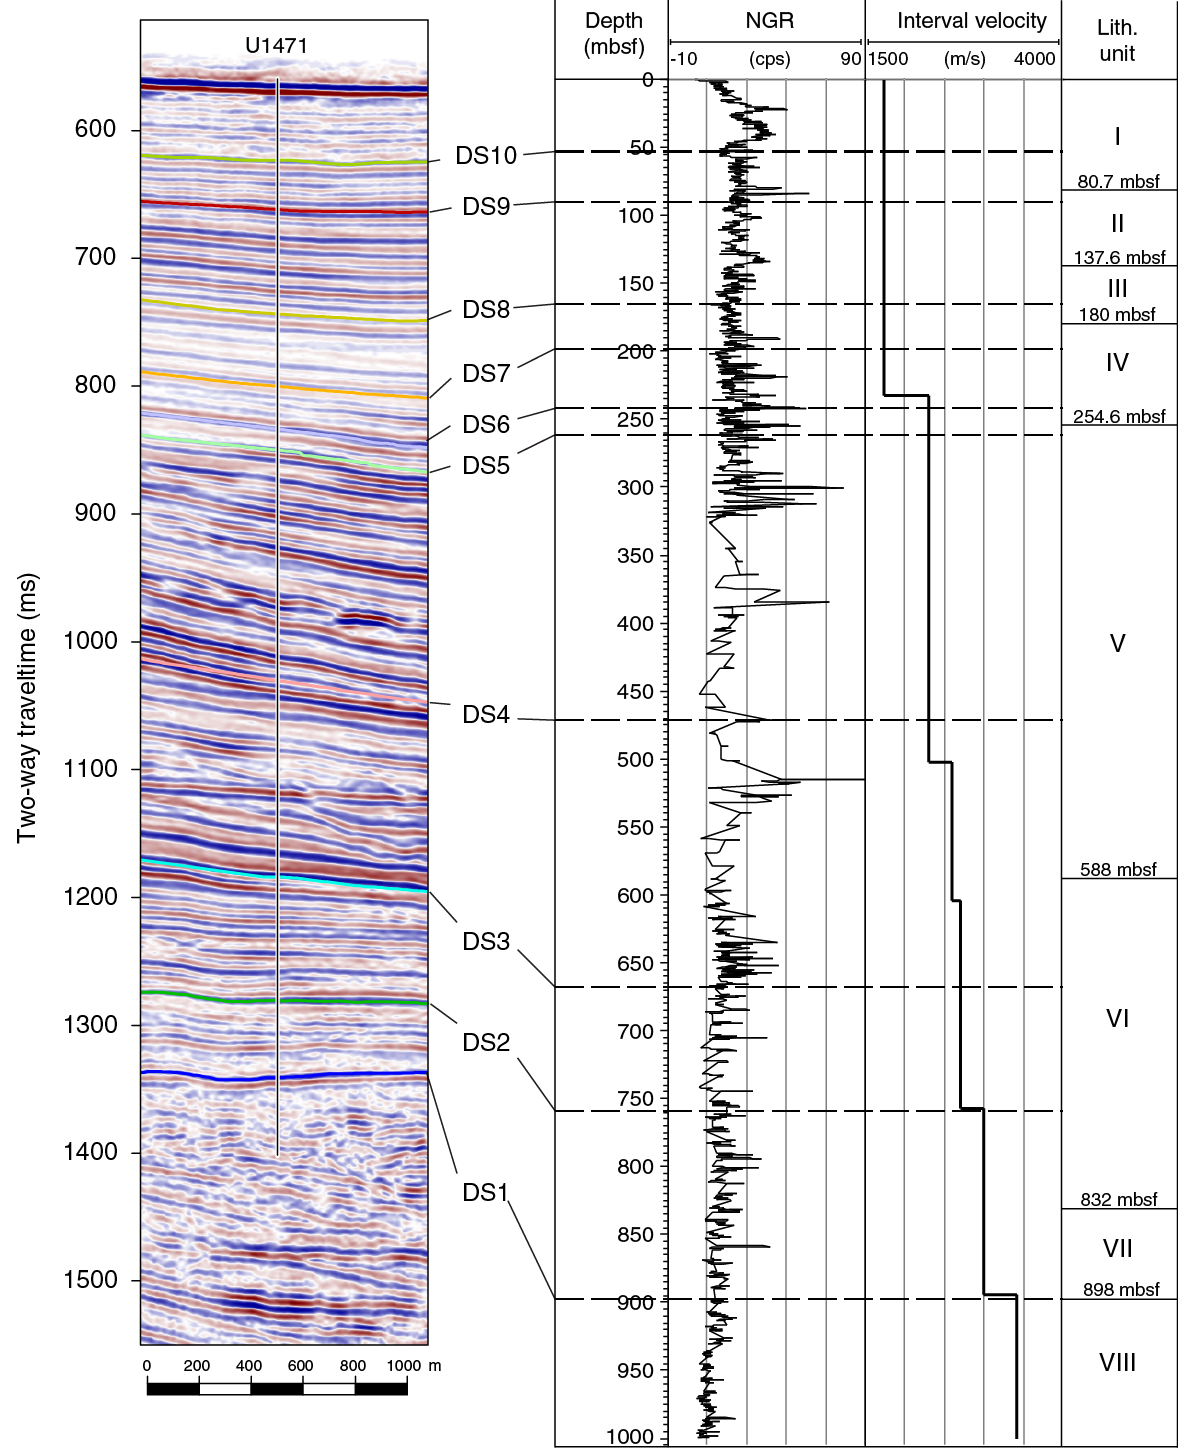
Figure F54. Correlation of seismic and core data, Site U1471.
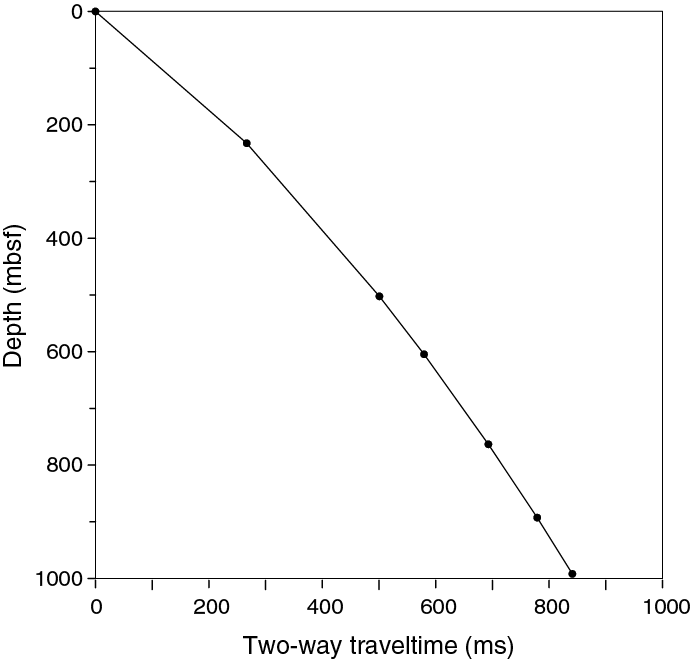
Figure F55. Time-depth conversion, Site U1471.
Table T19. DS boundaries, Site U1471. Download table in .csv format.
Seismic facies and geometries
The three oldest drift sequences (DS1–DS3) show a pronounced prograding clinoform reflection pattern (Figure F1). However, in comparison to the platform sequences, which often have a convex shape, the external geometry of this drift sequence is concave. These sediment packages are nestled against the drowned platform south of the Goidhoo atoll and are interpreted as contourite fans (Lüdmann et al., 2013). DS5–DS10 are classified as elongated, mounded separate drifts (Lüdmann et al., 2013). Site U1471 penetrated the bottomsets of the prograding drift bodies, which are generally composed of high-amplitude reflections, especially in DS3. The amplitudes are related to strong impedance contrasts that were, as coring confirmed, produced by the alternation of high- and low-density beds. Likewise, DS4 has strong parallel reflections that downlap onto the sequence boundary. In DS3 and DS4, small-scale wave patterns occur that can be interpreted as cyclic steps or bottom-current–related features. The younger drift sequences are well stratified and display low- to medium-amplitude reflections.
Core-seismic correlation
Correlation between lithostratigraphic units and seismic sequences is shown in Figure F54. As at Site U1467, correlation between lithostratigraphic unit boundaries and sequence stratigraphic limits is rather poor, with the exception of the bases of DS6 and DS9, which correspond to unit boundaries. DS6–DS10 (upper Miocene–Pleistocene) have low- to medium-amplitude reflections and are composed of medium- to coarse-grained planktonic foraminifer–rich packstone to wackestone with different degrees of lithification. The pronounced change in lithology between lithostratigraphic Units IV and V at 254.6 mbsf occurs within the thin DS5 (19 m), followed by a distinct change in seismic facies starting with DS4. The bottom of DS1 at 887 mbsf matches a color change from grayish brown to dark gray and white alternations and the last occurrence of grainstone layers (898 mbsf; Core 359-U1471E-33R) in the succession.
References
Backman, J., Raffi, I., Rio, D., Fornaciari, E., and Pälike, H., 2012. Biozonation and biochronology of Miocene through Pleistocene calcareous nannofossils from low and middle latitudes. Newsletters on Stratigraphy, 45(3):221–244. http://dx.doi.org/10.1127/0078-0421/2012/0022
Baker, P.A., and Bloomer, S.H., 1988. The origin of celestite in deep-sea carbonate sediments. Geochimica et Cosmochimica Acta, 52(2):335–339. http://dx.doi.org/10.1016/0016-7037(88)90088-9
Bathurst, R.G.C., 1970. Problems of lithification in carbonate muds. Proceedings of the Geologists’ Association, 81(3):429–440. http://dx.doi.org/10.1016/S0016-7878(70)80005-0
Betzler, C., Eberli, G.P., Alvarez Zarikian, C.A., Alonso-García, M., Bialik, O.M., Blättler, C.L., Guo, J.A., Haffen, S., Horozal, S., Inoue, M., Jovane, L., Kroon, D., Lanci, L., Laya, J.C., Ling Hui Mee, A., Lüdmann, T., Nakakuni, M., Nath, B.N., Niino, K., Petruny, L.M., Pratiwi, S.D., Reijmer, J., Reolid, J., Slagle, A.L., Sloss, C.R., Su, X., Swart, P.K., Wright, J.D., Yao, Z., and Young, J.R., 2017a. Expedition 359 methods. In Betzler, C., Eberli, G.P., Alvarez Zarikian, C.A., and the Expedition 359 Scientists, Maldives Monsoon and Sea Level. Proceedings of the International Ocean Discovery Program, 359: College Station, TX (International Ocean Discovery Program). http://dx.doi.org/10.14379/iodp.proc.359.102.2017
Betzler, C., Eberli, G.P., Alvarez Zarikian, C.A., Alonso-García, M., Bialik, O.M., Blättler, C.L., Guo, J.A., Haffen, S., Horozal, S., Inoue, M., Jovane, L., Kroon, D., Lanci, L., Laya, J.C., Ling Hui Mee, A., Lüdmann, T., Nakakuni, M., Nath, B.N., Niino, K., Petruny, L.M., Pratiwi, S.D., Reijmer, J., Reolid, J., Slagle, A.L., Sloss, C.R., Su, X., Swart, P.K., Wright, J.D., Yao, Z., and Young, J.R., 2017b. Expedition 359 summary. In Betzler, C., Eberli, G.P., Alvarez Zarikian, C.A., and the Expedition 359 Scientists, Maldives Monsoon and Sea Level. Proceedings of the International Ocean Discovery Program, 359: College Station, TX (International Ocean Discovery Program). http://dx.doi.org/10.14379/iodp.proc.359.101.2017
Betzler, C., Eberli, G.P., Alvarez Zarikian, C.A., Alonso-García, M., Bialik, O.M., Blättler, C.L., Guo, J.A., Haffen, S., Horozal, S., Inoue, M., Jovane, L., Kroon, D., Lanci, L., Laya, J.C., Ling Hui Mee, A., Lüdmann, T., Nakakuni, M., Nath, B.N., Niino, K., Petruny, L.M., Pratiwi, S.D., Reijmer, J., Reolid, J., Slagle, A.L., Sloss, C.R., Su, X., Swart, P.K., Wright, J.D., Yao, Z., and Young, J.R., 2017c. Site U1466. In Betzler, C., Eberli, G.P., Alvarez Zarikian, C.A., and the Expedition 359 Scientists, Maldives Monsoon and Sea Level. Proceedings of the International Ocean Discovery Program, 359: College Station, TX (International Ocean Discovery Program). http://dx.doi.org/10.14379/iodp.proc.359.104.2017
Betzler, C., Eberli, G.P., Alvarez Zarikian, C.A., Alonso-García, M., Bialik, O.M., Blättler, C.L., Guo, J.A., Haffen, S., Horozal, S., Inoue, M., Jovane, L., Kroon, D., Lanci, L., Laya, J.C., Ling Hui Mee, A., Lüdmann, T., Nakakuni, M., Nath, B.N., Niino, K., Petruny, L.M., Pratiwi, S.D., Reijmer, J.J.G., Reolid, J., Slagle, A.L., Sloss, C.R., Su, X., Swart, P.K., Wright, J.D., Yao, Z., and Young, J.R., 2017d. Site U1467. In Betzler, C., Eberli, G.P., Alvarez Zarikian, C.A., and the Expedition 359 Scientists, Maldives Monsoon and Sea Level. Proceedings of the International Ocean Discovery Program, 359: College Station, TX (International Ocean Discovery Program). http://dx.doi.org/10.14379/iodp.proc.359.105.2017
Betzler, C., Fürstenau, J., Lüdmann, T., Hübscher, C., Lindhorst, S., Paul, A., Reijmer, J.J.G., and Droxler, A.W., 2013a. Sea-level and ocean-current control on carbonate-platform growth, Maldives, Indian Ocean. Basin Research, 25(2):172–196. http://dx.doi.org/10.1111/j.1365-2117.2012.00554.x
Betzler, C., Lüdmann, T., Hübscher, C., and Fürstenau, J., 2013b. Current and sea-level signals in periplatform ooze (Neogene, Maldives, Indian Ocean). Sedimentary Geology, 290:126–137. http://dx.doi.org/10.1016/j.sedgeo.2013.03.011
Dickens, G.R., and Owen, R.M., 1994. Late Miocene–early Pliocene manganese redirection in the central Indian Ocean: expansion of the intermediate water oxygen minimum zone. Paleoceanography, 9(1):169–181. http://dx.doi.org/10.1029/93PA02699
Droxler, A.W., Haddad, G.A., Mucciarone, D.A., and Cullen, J.L., 1990. Pliocene–Pleistocene aragonite cyclic variations in Holes 714A and 716B (the Maldives) compared with Hole 633A (the Bahamas): records of climate-induced CaCO3 preservation at intermediate water depths. In Duncan, R.A., Backman, J., Peterson, L.C., et al., Proceedings of the Ocean Drilling Program, Scientific Results, 115: College Station, TX (Ocean Drilling Program), 539–577. http://dx.doi.org/10.2973/odp.proc.sr.115.179.1990
Eberli, G.P., Baechle, G.T., Anselmetti, F.S., and Incze, M.L., 2003. Factors controlling elastic properties in carbonate sediments and rocks. The Leading Edge, 22(7):654–660. http://dx.doi.org/10.1190/1.1599691
Eberli, G.P., Swart, P.K., Malone, M.J., et al., 1997. Proceedings of the Ocean Drilling Program, Initial Reports, 166: College Station, TX (Ocean Drilling Program). http://dx.doi.org/10.2973/odp.proc.ir.166.1997
Fisher, R.A., 1953. Dispersion on a sphere. Proceedings of the Royal Society of London, Series A, 217:295–305.
Goldring, R., 1995. Organisms and the substrate: response and effect. In Bosence, D.W.J., and Allison, P.A. (Eds.), Marine Palaeoenvironmental Analysis from Fossils. Geological Society Special Publication, 83(1):151–180. http://dx.doi.org/10.1144/GSL.SP.1995.083.01.09
Gradstein, F.M., Ogg, J.G., Schmitz, M.D., and Ogg, G.M. (Eds.), 2012. The Geological Time Scale 2012: Amsterdam (Elsevier).
Guidry, E.P., Richter, C., Acton, G.D., Channell, J.E.T., Evans, H.F., Ohneiser, C., Yamamoto, Y., and Yamazaki, T., 2013. Oligocene–Miocene magnetostratigraphy of deep-sea sediments from the equatorial Pacific (IODP Site U1333). In Jovane, L., Herrero-Bervera, E., Hinnov, L.A., and Housen, B. (Eds.), Magnetic Methods and the Timing of Geological Processes. Geological Society Special Publication, 373(1):13–27. http://dx.doi.org/10.1144/SP373.7
Hilgen, F.J., Lourens, L.J., and Van Dam, J.A., 2012. The Neogene period. With contributions by A.G. Beu, A.F. Boyes, R.A. Cooper, W. Krijgsman, J.G. Ogg, W.E. Piller, and D.S. Wilson. In Gradstein, F.M., Ogg, J.G., Schmitz, M.D., and Ogg, G.M. (Eds.), The Geologic Time Scale: Oxford, United Kingdom (Elsevier), 923–978. http://dx.doi.org/10.1016/B978-0-444-59425-9.00029-9
Isern, A.R., Anselmetti, F.S., Blum, P., et al., 2002. Proceedings of the Ocean Drilling Program, Initial Reports, 194: College Station, TX (Ocean Drilling Program). http://dx.doi.org/10.2973/odp.proc.ir.194.2002
Laskar, J., Robutel, P., Joutel, F., Gastineau, M., Correia, A.C.M., and Levrard, B., 2004. A long-term numerical solution for the insolation quantities of the Earth. Astronomy & Astrophysics, 428(1):261–285. http://dx.doi.org/10.1051/0004-6361:20041335
Lippmann, F., 1973. Minerals, Rocks and Inorganic Materials (Volume 6): Sedimentary Carbonate Minerals. Wyllie, P.J., El Goresy, A., von Engelhardt, W., and Hahn, T. (Series Eds.): Berlin (Springer-Verlag). http://dx.doi.org/10.1007/978-3-642-65474-9
Lourens, L., Hilgen, F., Shackleton, N.J., Laskar, J., and Wilson, D., 2004. The Neogene period. In Gradstein, F.M., Ogg, J.G., and Smith, A. (Eds.), A Geologic Time Scale 2004: Cambridge, United Kingdom (Cambridge University Press), 409–440. http://dx.doi.org/10.1017/CBO9780511536045.022
Lüdmann, T., Kalvelage, C., Betzler, C., Fürstenau, J., and Hübscher, C., 2013. The Maldives, a giant isolated carbonate platform dominated by bottom currents. Marine and Petroleum Geology, 43:326–340. http://dx.doi.org/10.1016/j.marpetgeo.2013.01.004
Melim, L.A., Swart, P.K., and Eberli, G.P., 2004. Mixing-zone diagenesis in the subsurface of Florida and the Bahamas. Journal of Sedimentary Research, 74(6):904–913. http://dx.doi.org/10.1306/042904740904
Moore, C.H. (Ed.), 1989. Developments in Sedimentology (Volume 46): Carbonate Diagenesis and Porosity: Amsterdam (Elsevier). http://www.sciencedirect.com/science/bookseries/00704571/46/supp/C
Phillips, E., 2006. Micromorphology of a debris flow deposit: evidence of basal shearing, hydrofracturing, liquefaction and rotational deformation during emplacement. Quaternary Science Reviews, 25(7–8):720–738. http://dx.doi.org/10.1016/j.quascirev.2005.07.004
Raffi, I., Backman, J., Fornaciari, E., Pälike, H., Rio, D., Lourens, L., and Hilgen, F., 2006. A review of calcareous nannofossil astrobiochronology encompassing the past 25 million years. Quaternary Science Reviews, 25(23–24):3113–3137. http://dx.doi.org/10.1016/j.quascirev.2006.07.007
Reuning, L., Reijmer, J.J.G., and Mattioli, E., 2006. Aragonite cycles: diagenesis caught in the act. Sedimentology, 53(4):849–866. http://dx.doi.org/10.1111/j.1365-3091.2006.00799.x
Savrda, C.E., and Bottjer, D.J., 1986. Trace-fossil model for reconstruction of paleo-oxygenation in bottom waters. Geology, 14(1):3–6. http://dx.doi.org/10.1130/0091-7613(1986)14<3:TMFROP>2.0.CO;2
Thompson, P.R., Bé, A.W.H., Duplessy, J.-C., and Shackleton, N.J., 1979. Disappearance of pink-pigmented Globigerinoides ruber at 120,000 yr BP in the Indian and Pacific Oceans. Nature, 280(5723):554–558. http://dx.doi.org/10.1038/280554a0
Tréguer, P.J., and De La Rocha, C.L., 2013. The world ocean silica cycle. Annual Review of Marine Science, 5(1):477–501. http://dx.doi.org/10.1146/annurev-marine-121211-172346
Uchman, A., Bąk, K., and Rodríguez-Tovar, F.J., 2008. Ichnological record of deep-sea palaeoenvironmental changes around the oceanic anoxic Event 2 (Cenomanian–Turonian boundary): an example from the Barnasiówka section, Polish Outer Carpathians. Palaeogeography, Palaeoclimatology, Palaeoecology, 262(1–2):61–71. http://dx.doi.org/10.1016/j.palaeo.2008.02.002
Vincent, E., and Toumarkine, M., 1990. Neogene planktonic foraminifers from the western tropical Indian Ocean, Leg 115. In Duncan, R.A., Backman, J., Peterson, L.C., et al., Proceedings of the Ocean Drilling Program, Scientific Results, 115: College Station, TX (Ocean Drilling Program), 795–836. http://dx.doi.org/10.2973/odp.proc.sr.115.143.1990
Wade, B.S., Pearson, P.N., Berggren, W.A., and Pälike, H., 2011. Review and revision of Cenozoic tropical planktonic foraminiferal biostratigraphy and calibration to the geomagnetic polarity and astronomical time scale. Earth-Science Reviews, 104(1–3):111–142. http://dx.doi.org/10.1016/j.earscirev.2010.09.003
1 Betzler, C., Eberli, G.P., Alvarez Zarikian, C.A., Alonso-García, M., Bialik, O.M., Blättler, C.L., Guo, J.A., Haffen, S., Horozal, S., Inoue, M., Jovane, L., Kroon, D., Lanci, L., Laya, J.C., Ling Hui Mee, A., Lüdmann, T., Nakakuni, M., Nath, B.N., Niino, K., Petruny, L.M., Pratiwi, S.D., Reijmer, J.J.G., Reolid, J., Slagle, A.L., Sloss, C.R., Su, X., Swart, P.K., Wright, J.D., Yao, Z., and Young, J.R., 2017. Site U1471. In Betzler, C., Eberli, G.P., Alvarez Zarikian, C.A., and the Expedition 359 Scientists, Maldives Monsoon and Sea Level. Proceedings of the International Ocean Discovery Program, 359: College Station, TX (International Ocean Discovery Program). http://dx.doi.org/10.14379/iodp.proc.359.109.2017
2 Expedition 359 Scientists’ addresses.
This work is distributed under the Creative Commons Attribution 4.0 International (CC BY 4.0) license. 
- F1. Location map, Site U1471.
- F2. Seismic section along the southern transect.
- F3. Lithostratigraphic overview, Site U1471.
- F4. Common components in Unit I.
- F5. Color change across Unit I.
- F6. Unit I/II transition.
- F7. Components of Unit II.
- F8. Lithification.
- F9. Distribution of lithified horizons, grain sizes, and textures, Hole U1471A.
- F10. Lithification transition and effects on preservation.
- F11. Variation in appearance of lithified intervals of Unit V.
- F12. Components, porosity, and cementation of packstone in Unit V.
- F13. Components and composition of Unit VI.
- F14. Packstone and grainstone alternations in Unit VIII.
- F15. Sedimentary features in Unit VIII.
- F16. Biostratigraphic and paleoenvironmental summary, Site U1471.
- F17. Age-depth plot, Site U1471.
- F18. Benthic foraminifers.
- F19. IW Cl–, Na+, and K+, Site U1471.
- F20. IW Ca2+, Mg2+, Sr2+, and Li+, Site U1471.
- F21. Sr2+/Ca2+, Mg2+/Ca2+, Ca2+/Cl–, and Mg2+/Cl–, Site U1471.
- F22. Excess Ca2+, Mg2+, SO42–, and alkalinity, Site U1471.
- F23. IW alkalinity, hydrogen, and SO42–, Site U1471.
- F24. IW Fe, B, Ba2+, and Si, Site U1471.
- F25. Carbonate content, Site U1471.
- F26. Organic carbon and nitrogen, Site U1471.
- F27. Relative concentrations of aragonite, HMC, LMC, dolomite, and quartz, Site U1471.
- F28. Mg/Ca, Sr/Ca, Mn/Ca, and Fe/Ca in sediments, Site U1471.
- F29. Headspace methane and ethane, Site U1471.
- F30. Ion activity product of SrSO4, Sites U1471 and U1466–U1468.
- F31. NRM declination and inclination from the upper 180 mbsf, Hole U1471A.
- F32. NRM intensity, declination, and inclination with magnetostratigraphy, Hole U1471C.
- F33. NRM intensity, declination, and inclination, Hole U1471D.
- F34. NRM declination and inclination with magnetostratigraphy from 180 to 320 mbsf, Hole U1471A.
- F35. NRM intensity, declination, and inclination from discrete samples without demagnetization, Holes U1471A and U1471E.
- F36. NRM declination and inclination with magnetostratigraphy below 320 mbsf, Hole U1471A.
- F37. NGR, Site U1471.
- F38. Bulk density, grain and dry density, and porosity, Site U1471.
- F39. P-wave velocity from the WRMSL and from split cores and discrete samples, Site U1471.
- F40. Color reflectance, Site U1471.
- F41. Magnetic susceptibility for WRMSL and SHMSL, Site U1471.
- F42. Thermal conductivity, Hole U1471A.
- F43. Logging operations, Hole U1471E.
- F44. Triple combo logs, Hole U1471E.
- F45. NGR logs, Hole U1471E.
- F46. Downhole logs recorded in the main pass of the sonic tool string, Hole U1471E.
- F47. P-wave velocity from the sonic velocity log in Hole U1471E and cores from Holes U1471A and U1471E.
- F48. Time-depth curves and P-wave velocity, Site U1467.
- F49. APCT-3 temperature measurements, Hole U1471C.
- F50. Spliced L*, NGR, and GRA records, Site U1471.
- F51. Spliced L* record, Sites U1471 and U1467.
- F52. Spliced NGR record, Sites U1471 and U1467.
- F53. West–east seismic section across Site U1471.
- F54. Correlation of seismic and core data, Site U1471.
- F55. Time-depth conversion, Site U1471.
- T1. Site U1471 core summary.
- T2. Biostratigraphic events, Site U1471.
- T3. Nannofossil range chart, Holes U1471A and U1471E.
- T4. Planktonic foraminifer range chart, Hole U1471E.
- T5. Planktonic foraminifer range chart, Hole U1471A.
- T6. Planktonic foraminifer range chart, Hole U1471C.
- T7. Benthic foraminifer range chart, Holes U1471A and U1471E.
- T8. Radiolarian and sponge spicule range chart, Holes U1471A and U1471E.
- T9. Interstitial water chemistry, Site U1471.
- T10. Carbon and nitrogen, Site U1471.
- T11. XRD results, Site U1471.
- T12. Solids geochemistry, Site U1471.
- T13. Headspace hydrocarbons, Site U1471.
- T14. Thermal conductivity, Site U1471.
- T15. VSP experiment direct arrival times, Site U1471.
- T16. APCT-3 temperature measurements, Site U1471.
- T17. Splice tie points, Site U1471.
- T18. Splice intervals, Site U1471.
- T19. DS boundaries, Site U1471.