Strasser, M., Ikehara, K., Everest, J., and the Expedition 386 Scientists
Proceedings of the International Ocean Discovery Program Volume 386
publications.iodp.org
https://doi.org/10.14379/iodp.proc.386.105.2023
Site M0091 (Basin S3)1
![]() M. Strasser,
M. Strasser,
![]() K. Ikehara,
K. Ikehara,
![]() J. Everest,
J. Everest,
![]() L. Maeda,
L. Maeda,
![]() K. Hochmuth,
K. Hochmuth,
![]() H. Grant,
H. Grant,
![]() M. Stewart,
M. Stewart,
![]() N. Okutsu,
N. Okutsu,
![]() N. Sakurai,
N. Sakurai,
![]() T. Yokoyama,
T. Yokoyama,
![]() R. Bao,
R. Bao,
![]() P. Bellanova,
P. Bellanova,
![]() M. Brunet,
M. Brunet,
![]() Z. Cai,
Z. Cai,
![]() A. Cattaneo,
A. Cattaneo,
![]() K.-H. Hsiung,
K.-H. Hsiung,
![]() J.-J. Huang,
J.-J. Huang,
![]() T. Ishizawa,
T. Ishizawa,
![]() T. Itaki,
T. Itaki,
![]() K. Jitsuno,
K. Jitsuno,
![]() J.E. Johnson,
J.E. Johnson,
![]() T. Kanamatsu,
T. Kanamatsu,
![]() M. Keep,
M. Keep,
![]() A. Kioka,
M. Kölling,
A. Kioka,
M. Kölling,
![]() M. Luo,
M. Luo,
![]() C. März,
C. März,
![]() C. McHugh,
C. McHugh,
![]() A. Micallef,
A. Micallef,
![]() Y. Nagahashi,
Y. Nagahashi,
![]() D.K. Pandey,
D.K. Pandey,
![]() J.-N. Proust,
J.-N. Proust,
![]() E.T. Rasbury,
E.T. Rasbury,
![]() N. Riedinger,
N. Riedinger,
![]() Y. Satoguchi,
Y. Satoguchi,
![]() D.E. Sawyer,
D.E. Sawyer,
![]() C. Seibert,
C. Seibert,
![]() M. Silver,
M. Silver,
![]() S.M. Straub,
S.M. Straub,
![]() J. Virtasolo,
J. Virtasolo,
![]() Y. Wang,
Y. Wang,
![]() T.-W. Wu, and
T.-W. Wu, and
![]() S.D. Zellers2
S.D. Zellers2
1 Strasser, M., Ikehara, K., Everest, J., Maeda, L., Hochmuth, K., Grant, H., Stewart, M., Okutsu, N., Sakurai, N., Yokoyama, T., Bao, R., Bellanova, P., Brunet, M., Cai, Z., Cattaneo, A., Hsiung, K.-H., Huang, J.-J., Ishizawa, T., Itaki, T., Jitsuno, K., Johnson, J.E., Kanamatsu, T., Keep, M., Kioka, A., Kölling, M., Luo, M., März, C., McHugh, C., Micallef, A., Nagahashi, Y., Pandey, D.K., Proust, J.-N., Rasbury, E.T., Riedinger, N., Satoguchi, Y., Sawyer, D.E., Seibert, C., Silver, M., Straub, S.M., Virtasalo, J., Wang, Y., Wu, T.-W., and Zellers, S.D., 2023. Site M0091 (Basin S3). In Strasser, M., Ikehara, K., Everest, J., and the Expedition 386 Scientists, Japan Trench Paleoseismology. Proceedings of the International Ocean Discovery Program, 386: College Station, TX (International Ocean Discovery Program). https://doi.org/10.14379/iodp.proc.386.105.2023
2 Expedition 386 Scientists’ affiliations.
1. Operations
During Expedition 386, two Giant Piston Corer (GPC) system deployments in the northern study area (Basin S3) of the southern Japan Trench (Figure F1) resulted in the recovery of cores from four holes at Site M0091 (Figure F2). The water depth was between 7802 and 7812 meters below sea level (mbsl). A breakdown of operational time is reported weekly instead of daily (see OPS in Supplementary material) due to decisions to move between sites based on weather and current conditions. Holes at Site M0091 were cored during Week 6 of the offshore phase. In total, 51.94 m of cores (Table T1) and 53.5 km of hydroacoustic profiles (see Hydroacoustics) were recovered and acquired, respectively, in the focus area. Further operations details, including winch log and inclinometer information, are found for all sites in Coring methodology in the Expedition 386 methods chapter (Strasser et al., 2023a) and associated files (see PALEOMAG and WINCHLOGS in Supplementary material).

Figure F1. Site map.
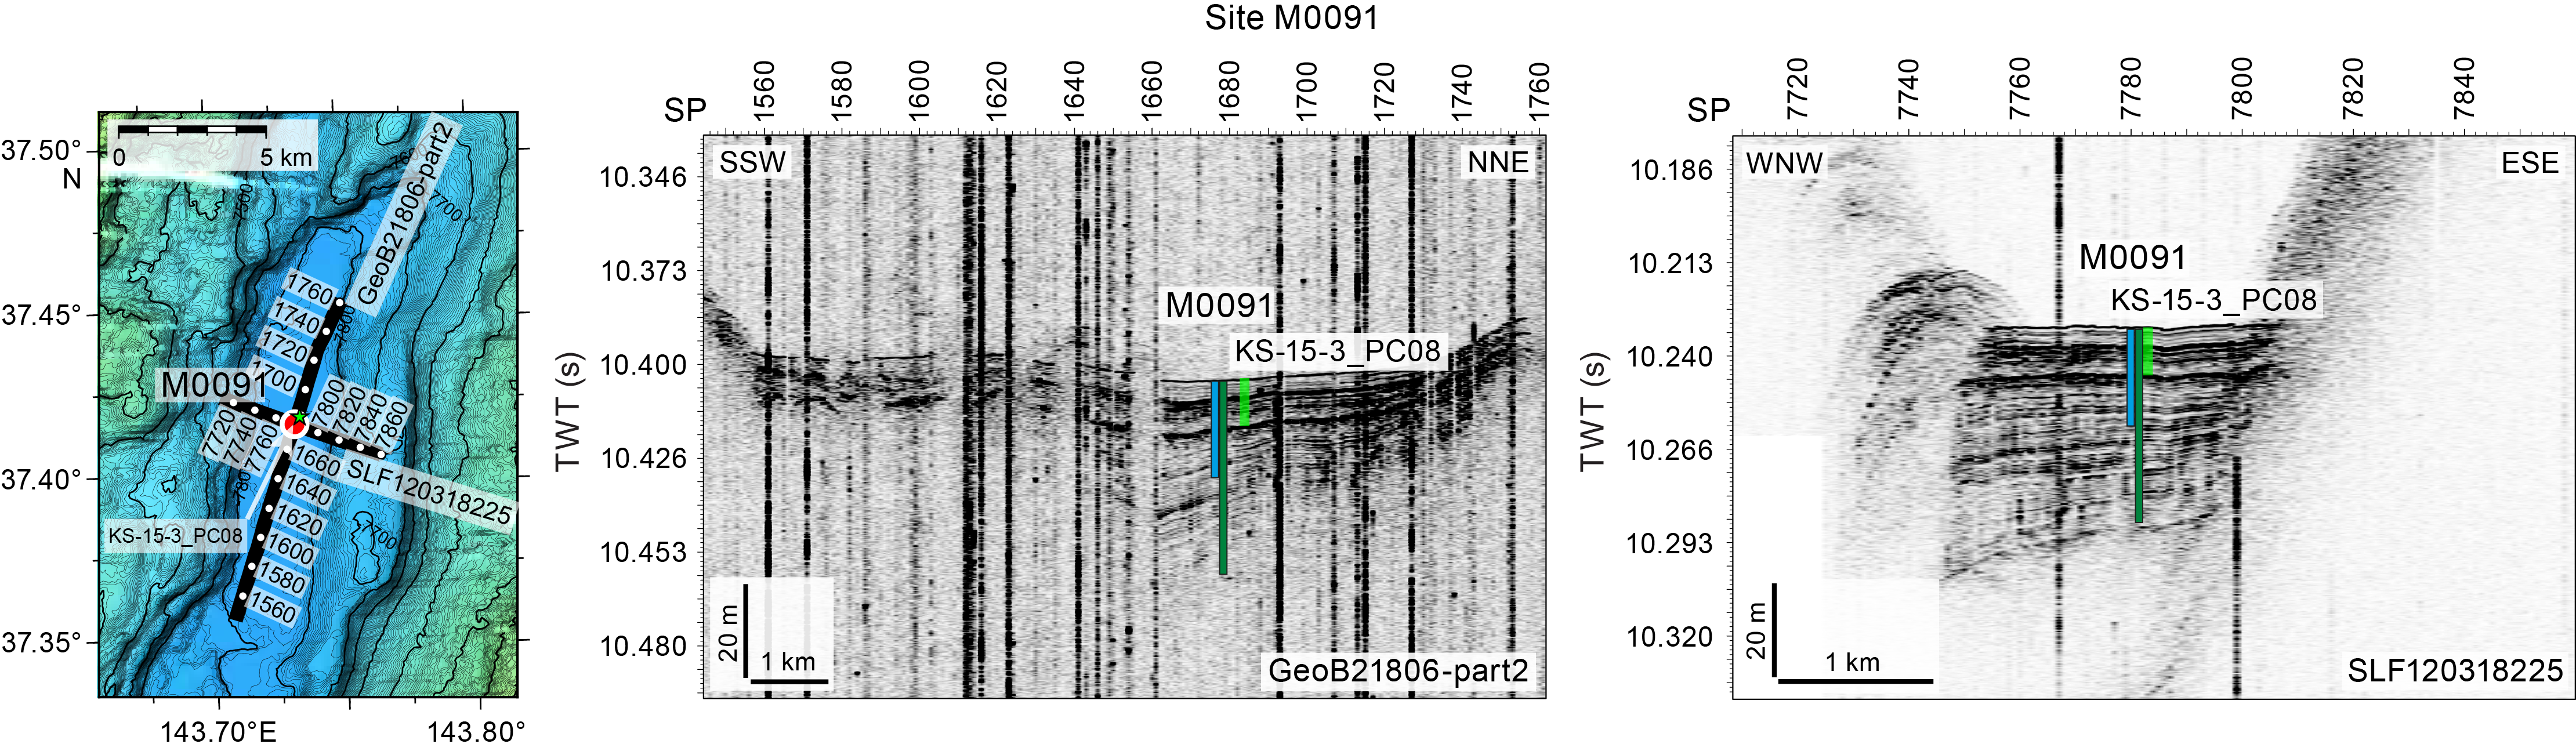
Figure F2. Site M0091.
The main site-specific scientific objectives for Site M0091 were as follows:
- Recover a continuous stratigraphic succession comprising event deposits from an isolated trench basin in the north-central part of the southern Japan Trench.
- Analyze the stratigraphic pattern and event deposit characteristics and integrate results from other sites to establish robust stratigraphic pattern recognition of proxy-evidence for earthquakes.
- Generate results for comparison with those from all other Expedition 386 sites to explore spatiotemporal distribution of event deposits to eventually develop a long-term record for giant earthquakes.
1.1. Site M0091
The R/V Kaimei arrived at Site M0091 at 0045 h on 19 May 2021 and undertook a single multibeam echo sounder/subbottom profiler (MBES/SBP) survey, which was completed at 0215 h. Conditions were overcast with moderate wind (7 m/s), relatively large wave heights (2 m), and a 2.2 kt current. Monitoring conditions was ongoing from 0800 h, and it was determined that operations could begin at 0915 h. GPC operations started in Holes M0091A and M0091B with a 20 m GPC barrel string at 0915 h and were completed when the GPC system was recovered on deck at 1515 h. The deck crew and GPC operation team withdrew the core from the GPC assembly and cut it into 5 m segments. The Science Party cut the core into 1 m sections from 1545 to 1645 h. The 40 m GPC assembly was prepared for the next run by 2015 h, and MBES/SBP surveys were started around Site M0091 at the same time.
MBES/SBE surveying continued around Site M0091 until 0300 h on 20 May, when the ship stood by for GPC deployment dependent on conditions. Conditions were overcast with a steady wind (<7 m/s), relatively large wave heights (2 m), and a 2 kt current. At 0900, the 40 m GPC was prepared for operation in Holes M0091C and M0091D, and operations were completed when the GPC was recovered on deck at 1515 h. The deck crew and GPC operation team withdrew the core from the GPC assembly and cut it into 5 m segments. The Science Party cut cores into 1 m sections from 1545 to 1900 h. Preparation of the 40 m GPC was suspended at 1900 h when the ship set sail for Miyako Bay to wait on weather due to a poor forecast.
1.1.1. Holes M0091A and M0091B
Holes M0091A and M0091B were cored on 19 May 2021. Preparations for running the 20 m GPC began at 0915 h, and the GPC was run into the water at 1005 h with an inclinometer and transponder attached to the winch cable 20 m above the GPC trigger arm and on the GPC assembly (see Figure F4 in the Expedition 386 methods chapter [Strasser et al., 2023a]). Winch speed was set at 1 m/s. At 1215 h, running the GPC down was paused at a cable length of 7900 m for stabilization and monitoring the GPC position and resumed after 5 min at a winch speed of 0.3 m/s. Spud-in commenced at 12:38:24 h and ended at 12:38:28 h at a cable length of 8162 m. Recovery commenced, and the cable tension rose to 3056 kgf at 12:38:31 h before dropping to 1865 kgf and then rising again to a maximum of 7097 kgf at 12:39:39 h. It dropped to 5365 kgf at 12:39:46 h, indicating the corer was clear of the seabed (see WINCHLOGS in Supplementary material). Inclinometer data for Hole M0091B show the piston corer barrel was rotated clockwise by 138.9° at the estimated seabed, with an east–west dip of 0.41° and a north–south dip of −1.55° (see Figure F5 in the Expedition 386 methods chapter [Strasser et al., 2023a]). The GPC was run back to the surface at a winch speed of 1.1 m/s. The trigger corer and GPC were recovered to deck at 1440 and 1515 h, respectively. The trigger core and GPC core from Holes M0091A and M0091B have a total length of 0.835 m (2 sections) and 19.22 m (20 sections), respectively.
1.1.2. Holes M0091C and M0091D
Holes M0091C and M0091D were cored on 20 May 2021. Preparations for running the 40 m GPC began at 0900 h, and the GPC was run into the water at 0945 h with an inclinometer attached to the winch cable 20 m above the GPC trigger arm and on the GPC assembly (see Figure F4 in the Expedition 386 methods chapter [Strasser et al., 2023a]). Winch speed was set at 1 m/s. At 1200 h, running the GPC down was paused at a cable length of 7900 m for stabilization and monitoring the GPC position and resumed after 3 min at a winch speed of 0.3 m/s. Spud-in commenced at 12:12:30 h and ended at 12:12:31 h at a cable length of 8162 m. Inclinometer data for Hole M0091D show the piston corer barrel was rotated clockwise by 120.9° at the estimated seabed, with an east–west dip of 0.07° and a north–south dip of 3.74° (see Figure F5 in the Expedition 386 methods chapter [Strasser et al., 2023a]). The GPC was run back to the surface at a winch speed of 1.0 m/s. The trigger corer and GPC were recovered on deck at 1435 and 1515 h, respectively. The trigger core and GPC core from Holes M0091A and M0091B have a total length of 0.765 m (2 sections) and 31.12 m (32 sections), respectively.
2. Hydroacoustics
Site M0091 lies within Basin S3 in the southern Japan Trench survey area. The grid of acquired subbottom profile data, restricted to the flat basin floor, comprises four lines. Three lines are approximately parallel to the trench axis, and one is oblique to the trench axis (Figure F3). In total, 53.5 km of profiles were obtained. The acquisition parameters for all lines in Basin S3 are documented in Table T2. The area surveyed for bathymetry includes the basin floor and surrounding area, covering an area of approximately 570 km2. All depth estimates in this section are approximate and are based on a seismic velocity of 1500 m/s.
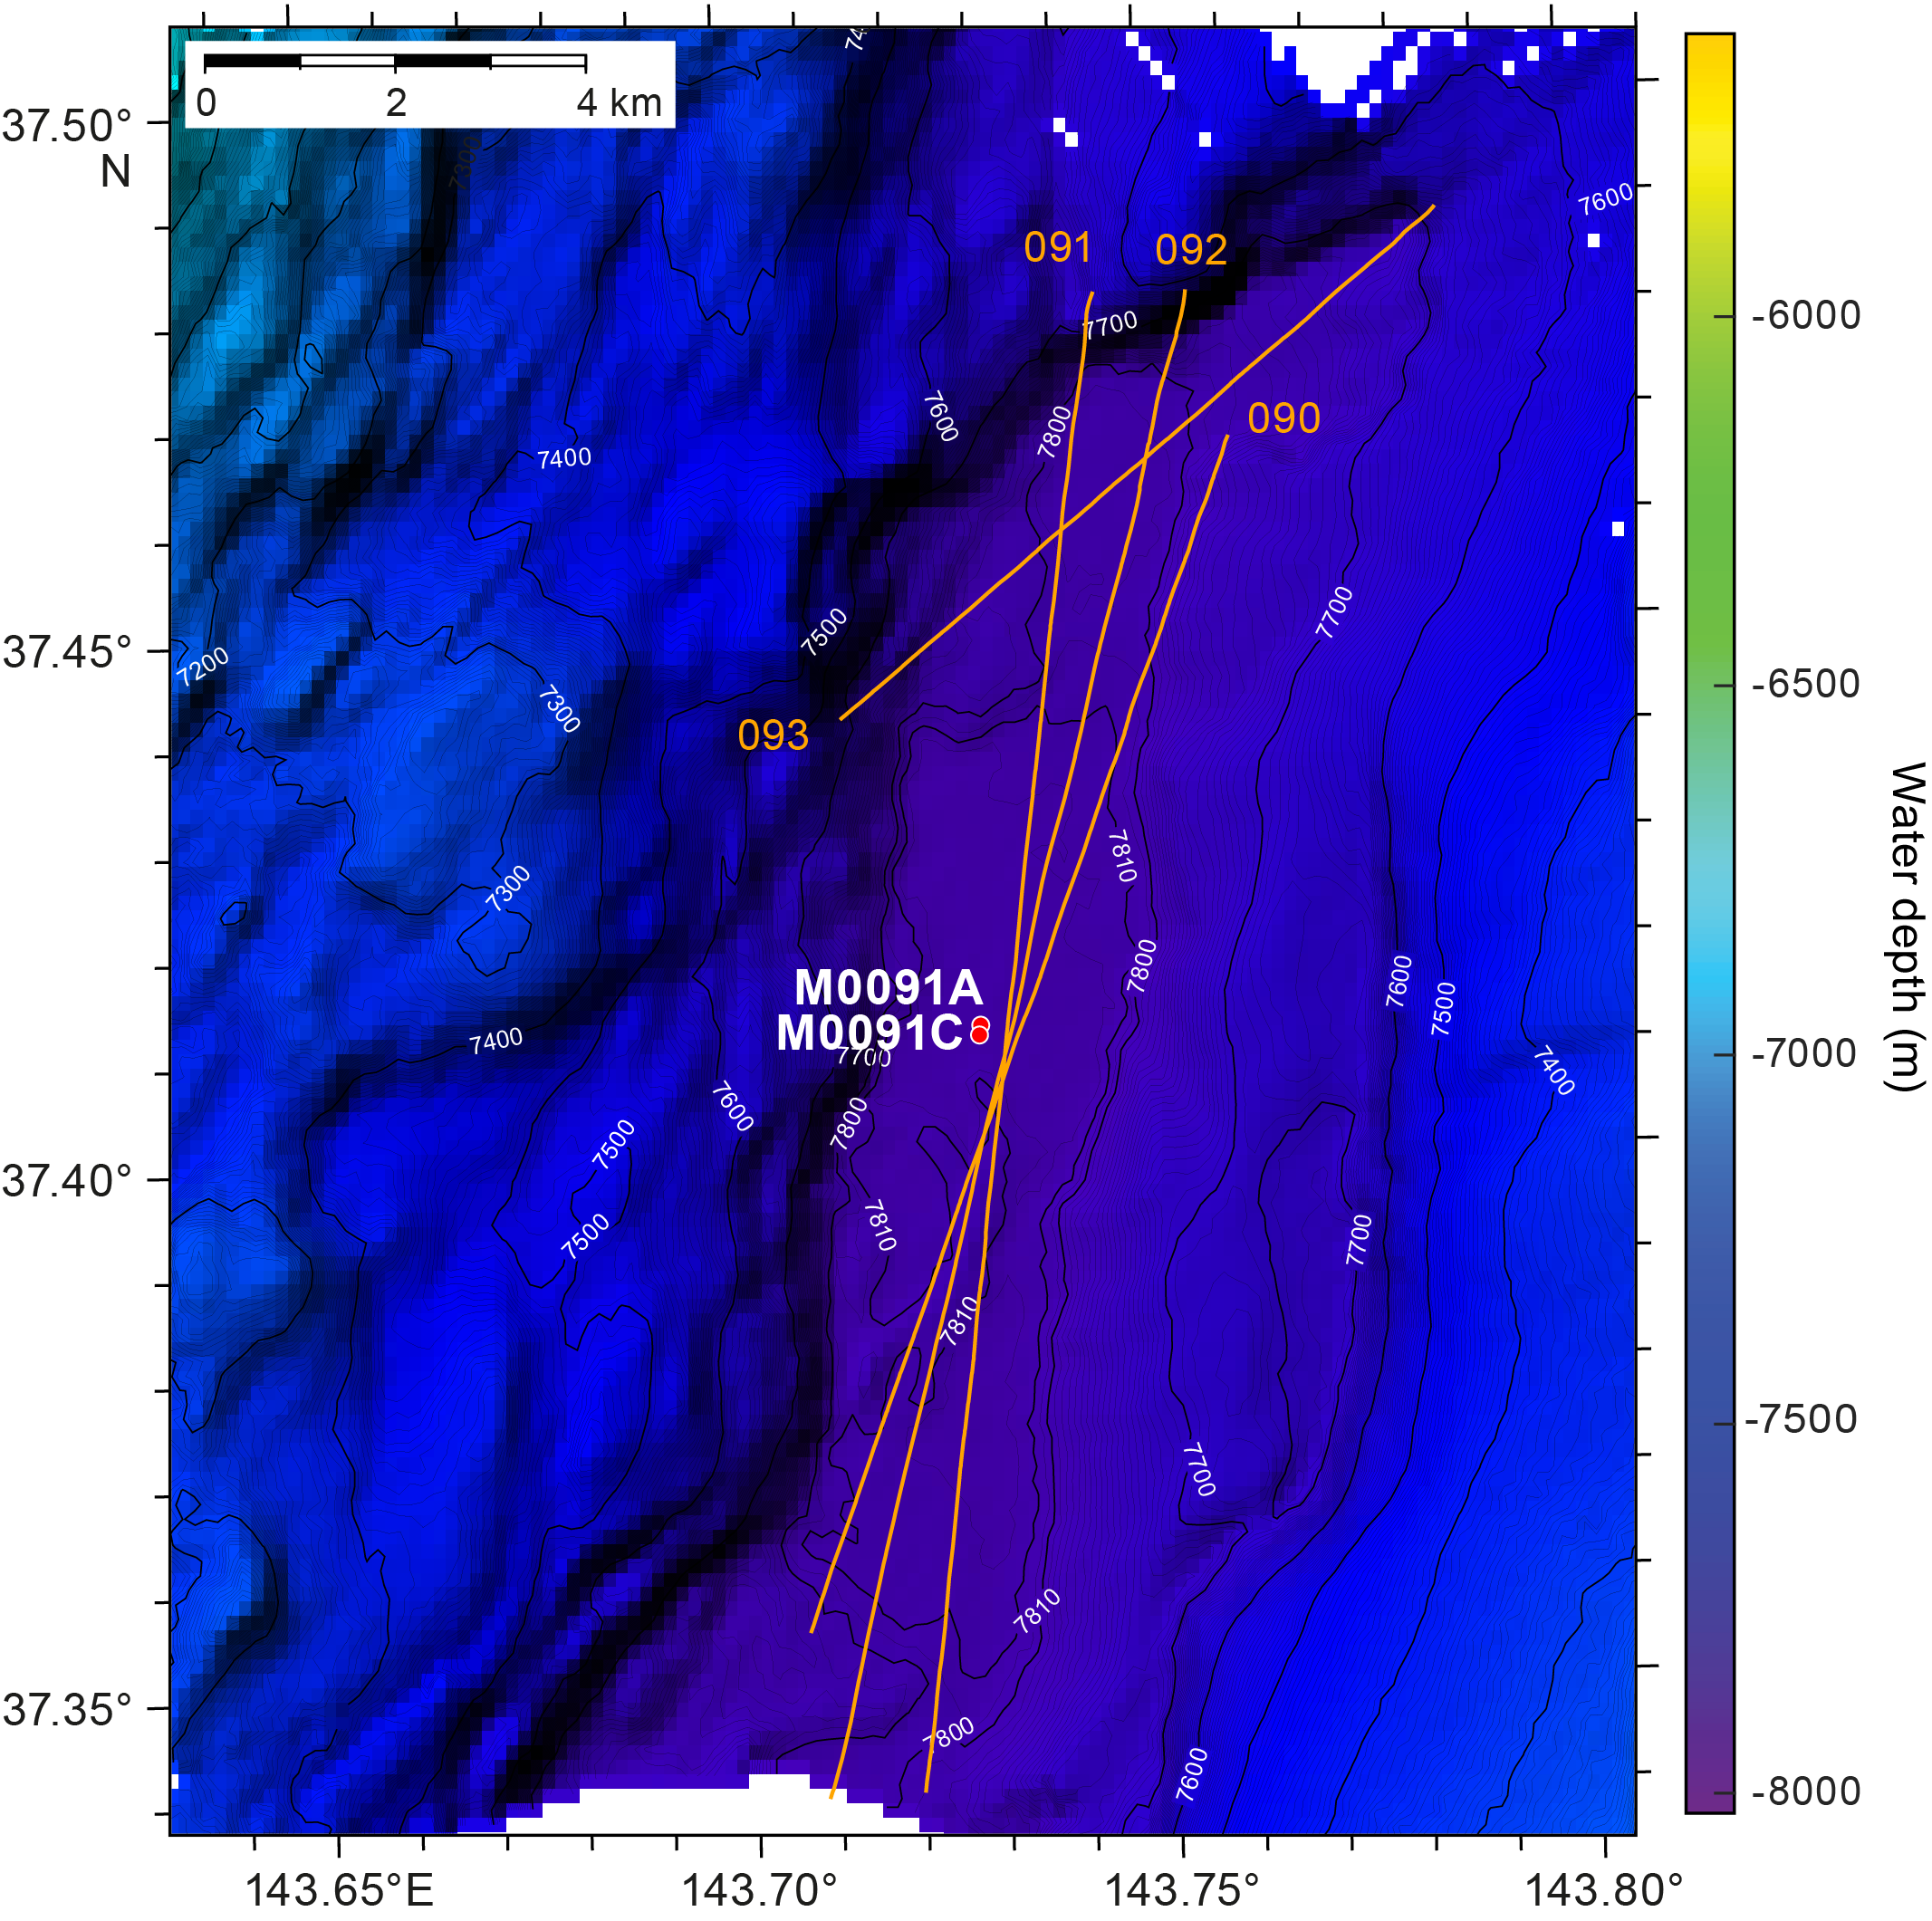
Figure F3. Bathymetry and subbottom profile lines.
2.1. Bathymetry
Seafloor depths in Basin S3 range up to 7815 mbsl; Holes M0091A and M0091B are at 7802 mbsl, and Holes M0091C and M0091D are at 7812 mbsl. The width of the basin, defined as the change from the flat basin floor to the first point of rapidly changing bathymetry on either side, varies from approximately 5500 to 6200 m in the vicinity of Site M0091.
Bathymetry is steeper on the western side of the basin, where the seabed shallows by 100 m vertically over a horizontal distance of 500 m (~20% slope gradient) west of Site M0091 and by 100 m over 3000 m (3% slope gradient) to the east. A sharp, northeast-trending topographic ridge bounds the northern basin margin and has a slope gradient of ~20% (Figure F3).
2.2. Basin characterization
Line 386_Underway_093 strikes northeast–southwest (Figure F4), oblique to the long axis of the basin but parallel to the sharp topographic boundary at the northern basin margin. Much of the basin floor is disrupted, especially to the southwest from Shotpoint 1910 to Shotpoint 2000, and a basal high underlies much of the northeast end of the line.
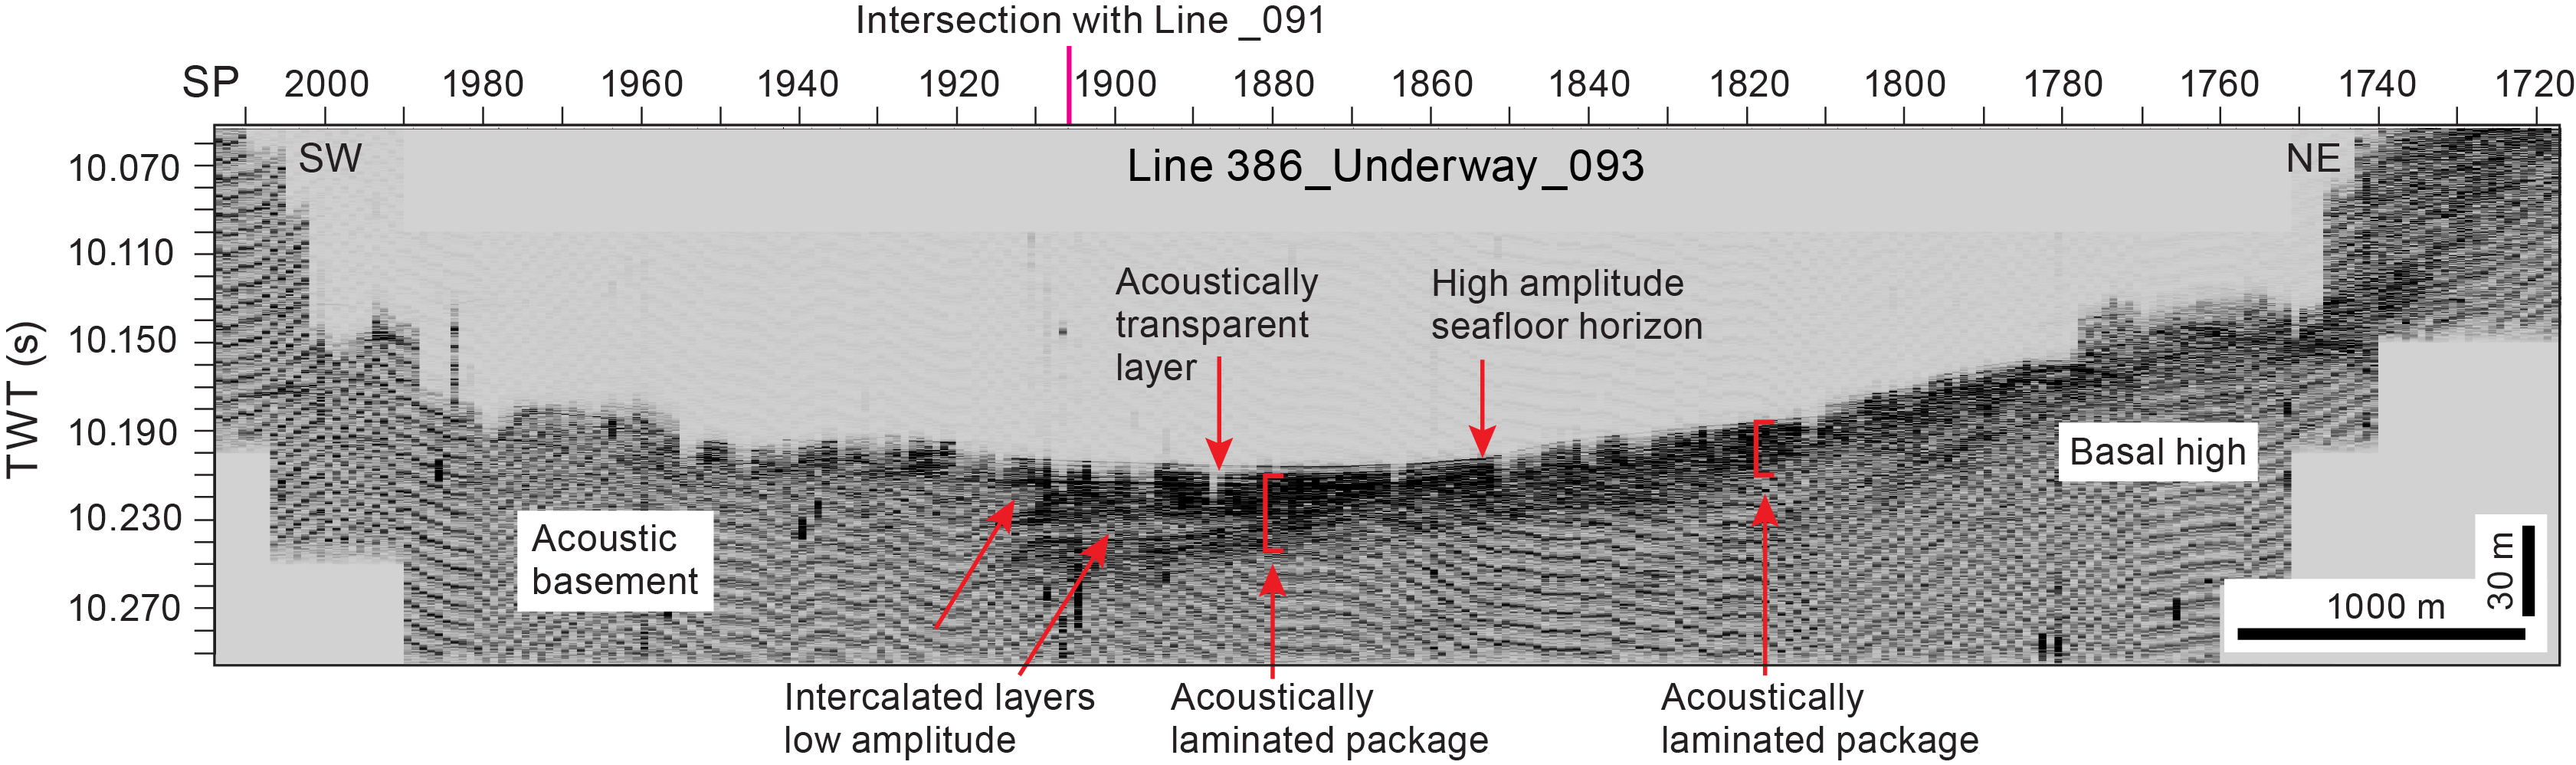
Figure F4. Line 386_Underway_093.
In the main part of the basin, a high-amplitude, discontinuous reflector at the seabed from around Shotpoint 1920 to Shotpoint 1820 in Line 386_Underway_093 overlies a thin (1–2 m) acoustically transparent layer. A package of acoustically laminated materials lies immediately beneath the thinner transparent layer, varying in thickness from 10 m on the margins of the northeast basal high to approximately 25 m in the central part of the basin. The contact between the laminated package and underlying basal layers is not always clear. Beneath Shotpoints 1880–1910, some lower amplitude, semitransparent acoustic layers are intercalated within the higher amplitude laminated package. The boundary between these layers and the basal high to the southwest is unclear, but the acoustically laminated package is clearly disrupted by these more transparent sections.
Trench-parallel Line 386_Underway_091 intersects Line 386_Underway_093 (Figure F5) and captures changes in acoustic character from north to south in the basin, showing three individual depocenters separated by basal highs. All three depocenters have a high-amplitude seafloor reflector overlying an acoustically transparent layer, which varies in thickness from approximately 2–4 m in the flat parts of the basin floor and thins on the basal highs. At the northernmost end of the line, the transparent layer thins to approximately 1 m. Beneath the acoustically transparent layer in all depocenters is an acoustically laminated package that varies in thickness from 30 to 40 m. The northernmost package of this laminated material is disrupted, with laminations not as clear as in the depocenters farther south on the line. In the central (Shotpoints 460–570) and southern (Shotpoints 660–720) depocenters, the laminated package contains intercalated transparent sections, as seen in Line 386_Underway_093.

Figure F5. Line 386_Underway_091.
Lines 386_Underway_092 and 386_Underway_090 are also generally parallel to the trench but have slightly different azimuths, which allows for slight variations in acoustic character to be captured from north to south in the basin (Figures F6, F7). Line 386_Underway_092 shows a high-amplitude seafloor reflector overlying an acoustically transparent layer up to 3 m thick in places that varies in thickness over topographic changes. The transparent layer overlies a wedge-shaped acoustically laminated package that is up to 50 m thick at the northern end of the line (Shotpoint 1180) but is only 10–12 m thick at the southern end of the line (Shotpoint 1000). Between the two packages, a topographic high disrupts the seafloor (beneath Shotpoints 1040–1180). Line 386_Underway_090 captures the same variation in thickness and geometry, with a thicker package of laminated materials to the northeast (up to 45 m at Shotpoint 550) and a thinner package of the same fill to the southwest (approximately 10 m at Shotpoint 720).

Figure F6. Line 386_Underway_092.

Figure F7. Line 386_Underway_090.
2.3. Site M0091
Holes M0091A–M0091D lie west of Line 386_Underway_091 at distances of 284 and 310 m, respectively (measured perpendicular to the line) (Figure F8). On Line 386_Underway_091 (Figure F9), the locations of both holes can be seen north of a central basal high that disrupts the seafloor. There is an acoustically transparent layer beneath the seabed reflector that is up to 4 m thick but thins to approximately 2 m onto the basal high to the north. South of Site M0091 (Shotpoint 570), a sharp subvertical boundary separates the basin fill from the acoustic basement, which abruptly terminates the laminated package. It is unclear whether this feature is a fault because it dips into the high (to the south), not away from it. A similar abrupt truncation is also seen on the margin of the basal high to the south at Shotpoint 720. If these truncations represent structural features, they may be oriented out of plane to this line. This interpretation is tentatively supported by Line 386_Underway_092 (Figure F10), which has a different azimuth. Here, the sharp boundary at the same location, adjacent to Site M0091, dips away from the high (Shotpoint 1180 on Line 386_Underway_092). The feature resembles a fault, an interpretation supported by the appearance of drag on some of the horizons, starting at 10.236 s two-way traveltime (TWT) at Shotpoint 1180. Horizons above this level have incurred drag, whereas the underlying package of laminated materials is not affected, giving an indication as to the timing of movement on the potential fault. Elsewhere on Line 386_Underway_092, the acoustic character is similar to that of Line 386_Underway_091. The high-amplitude seafloor layer occurs throughout the basin, overlying an acoustically transparent package that varies in thickness from 1–2 m above the basal highs in the north to approximately 4 m closer at Site M0091, with the layer thickening to the south. The acoustically laminated package also varies in thickness, extending up to 50 m at its thickest part against the basal high at Shotpoint 1180.
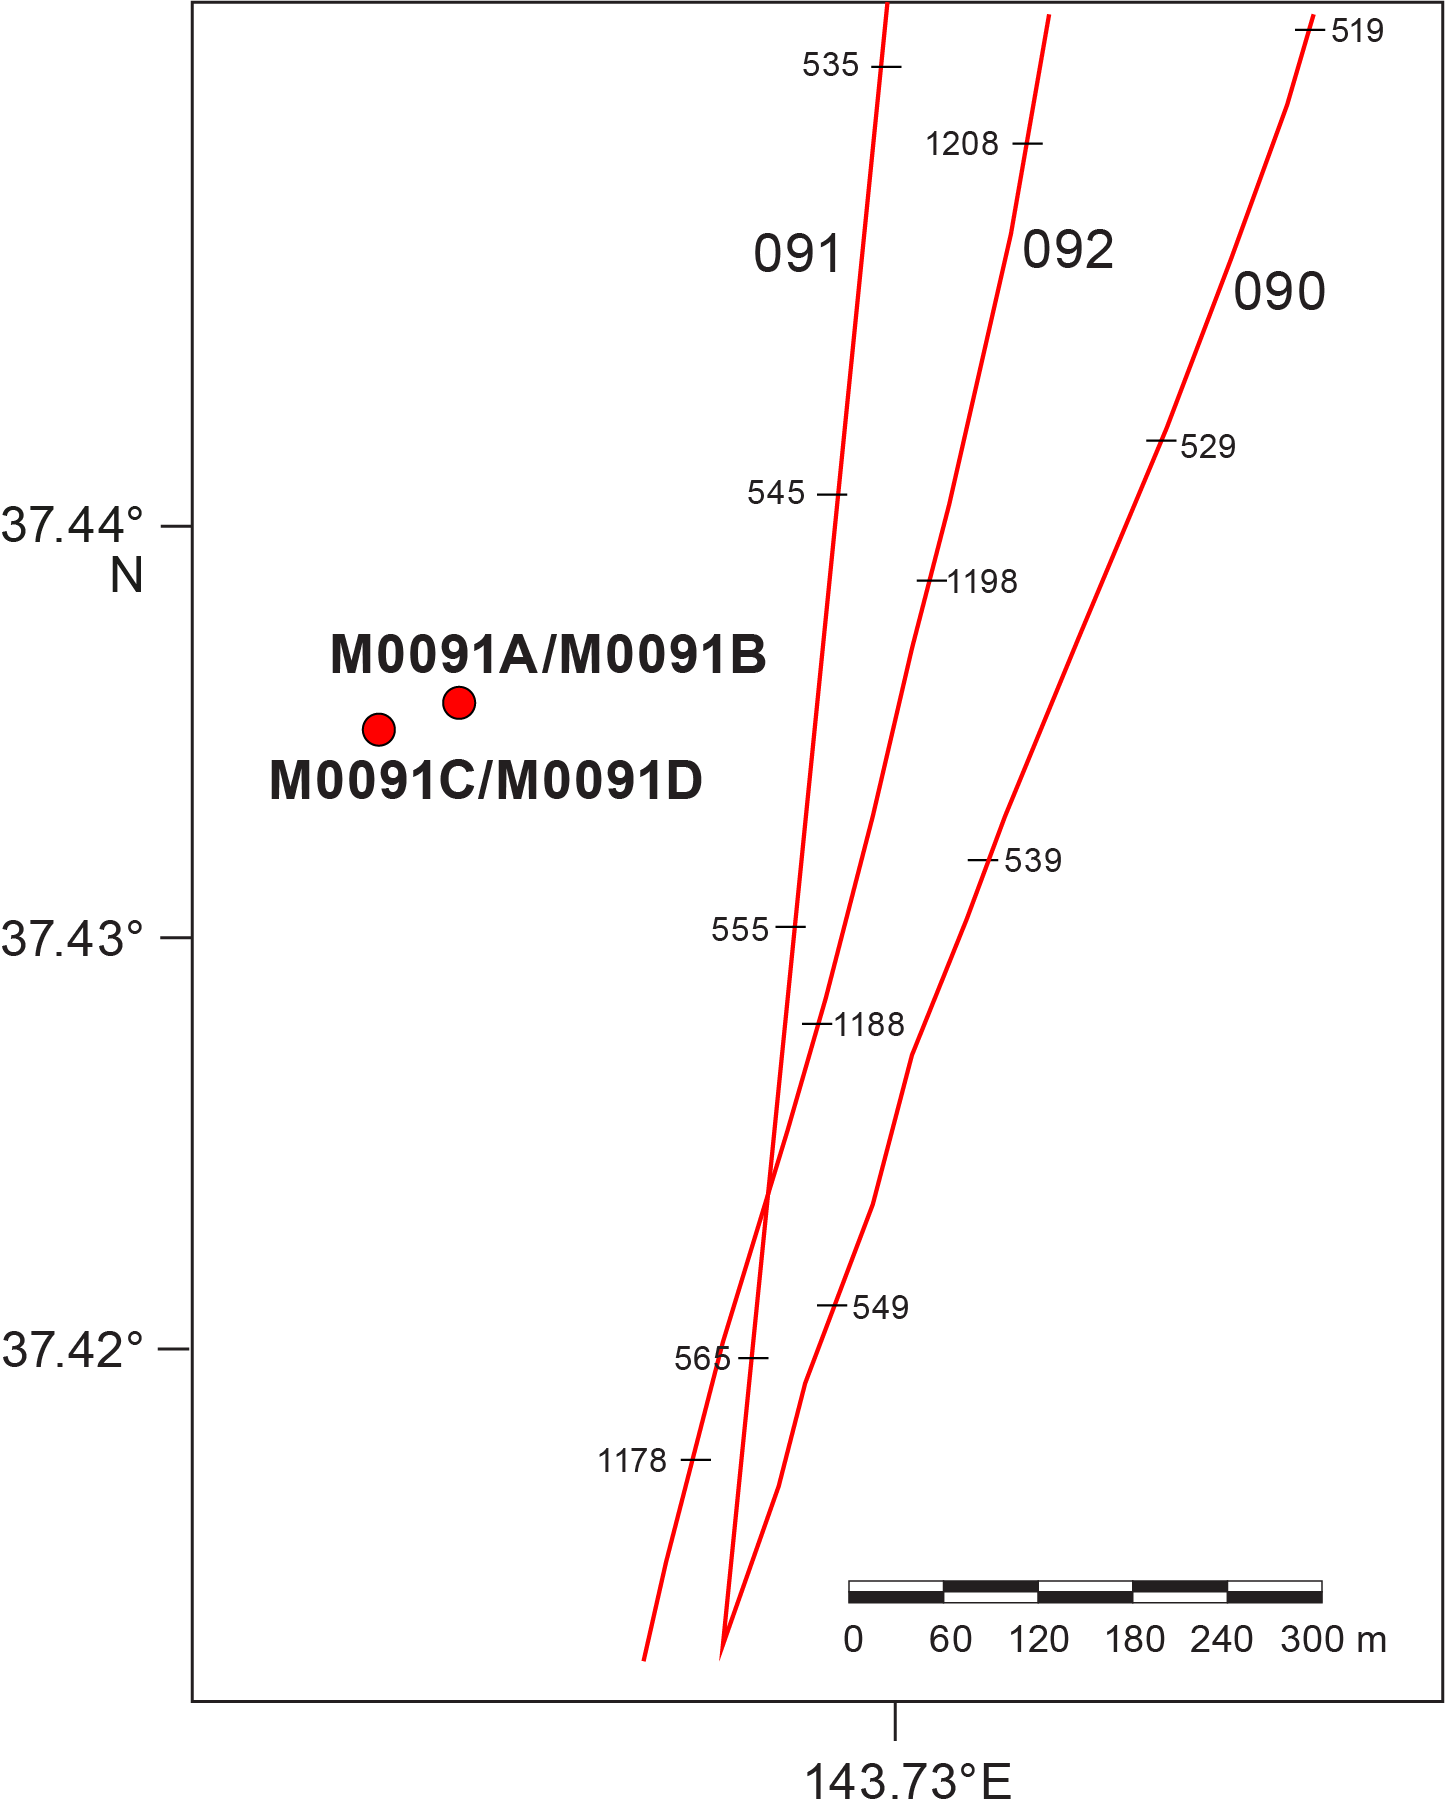
Figure F8. Subbottom profile lines.
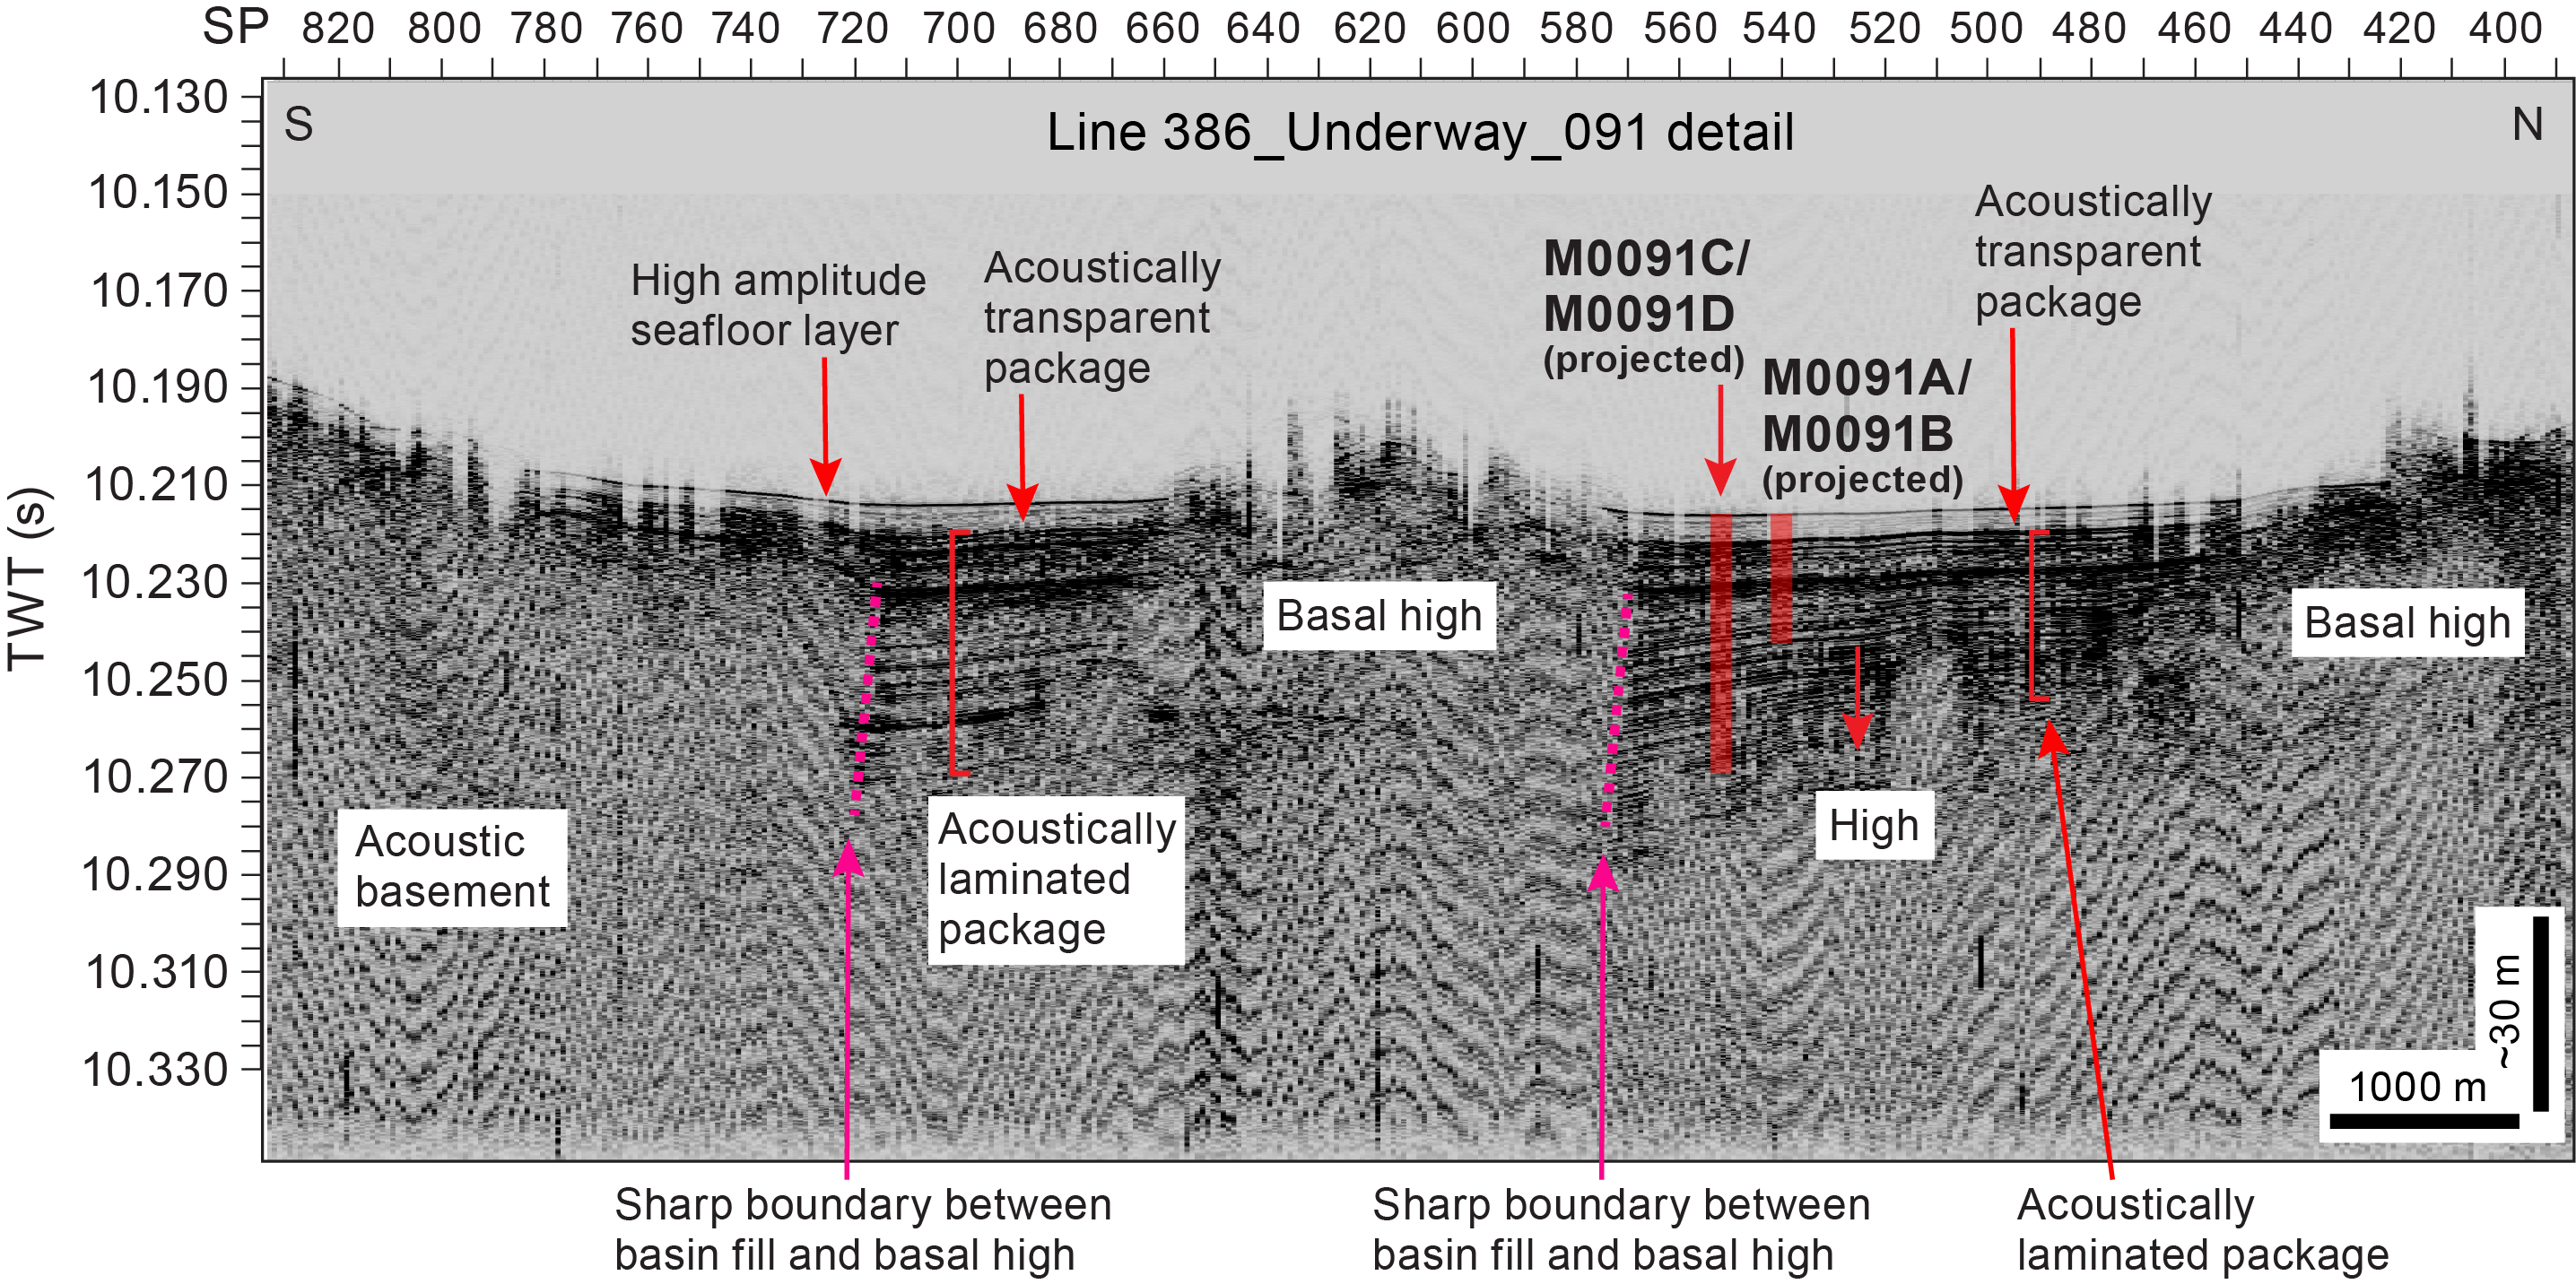
Figure F9. Enlarged portion of Line 386_Underway_091.
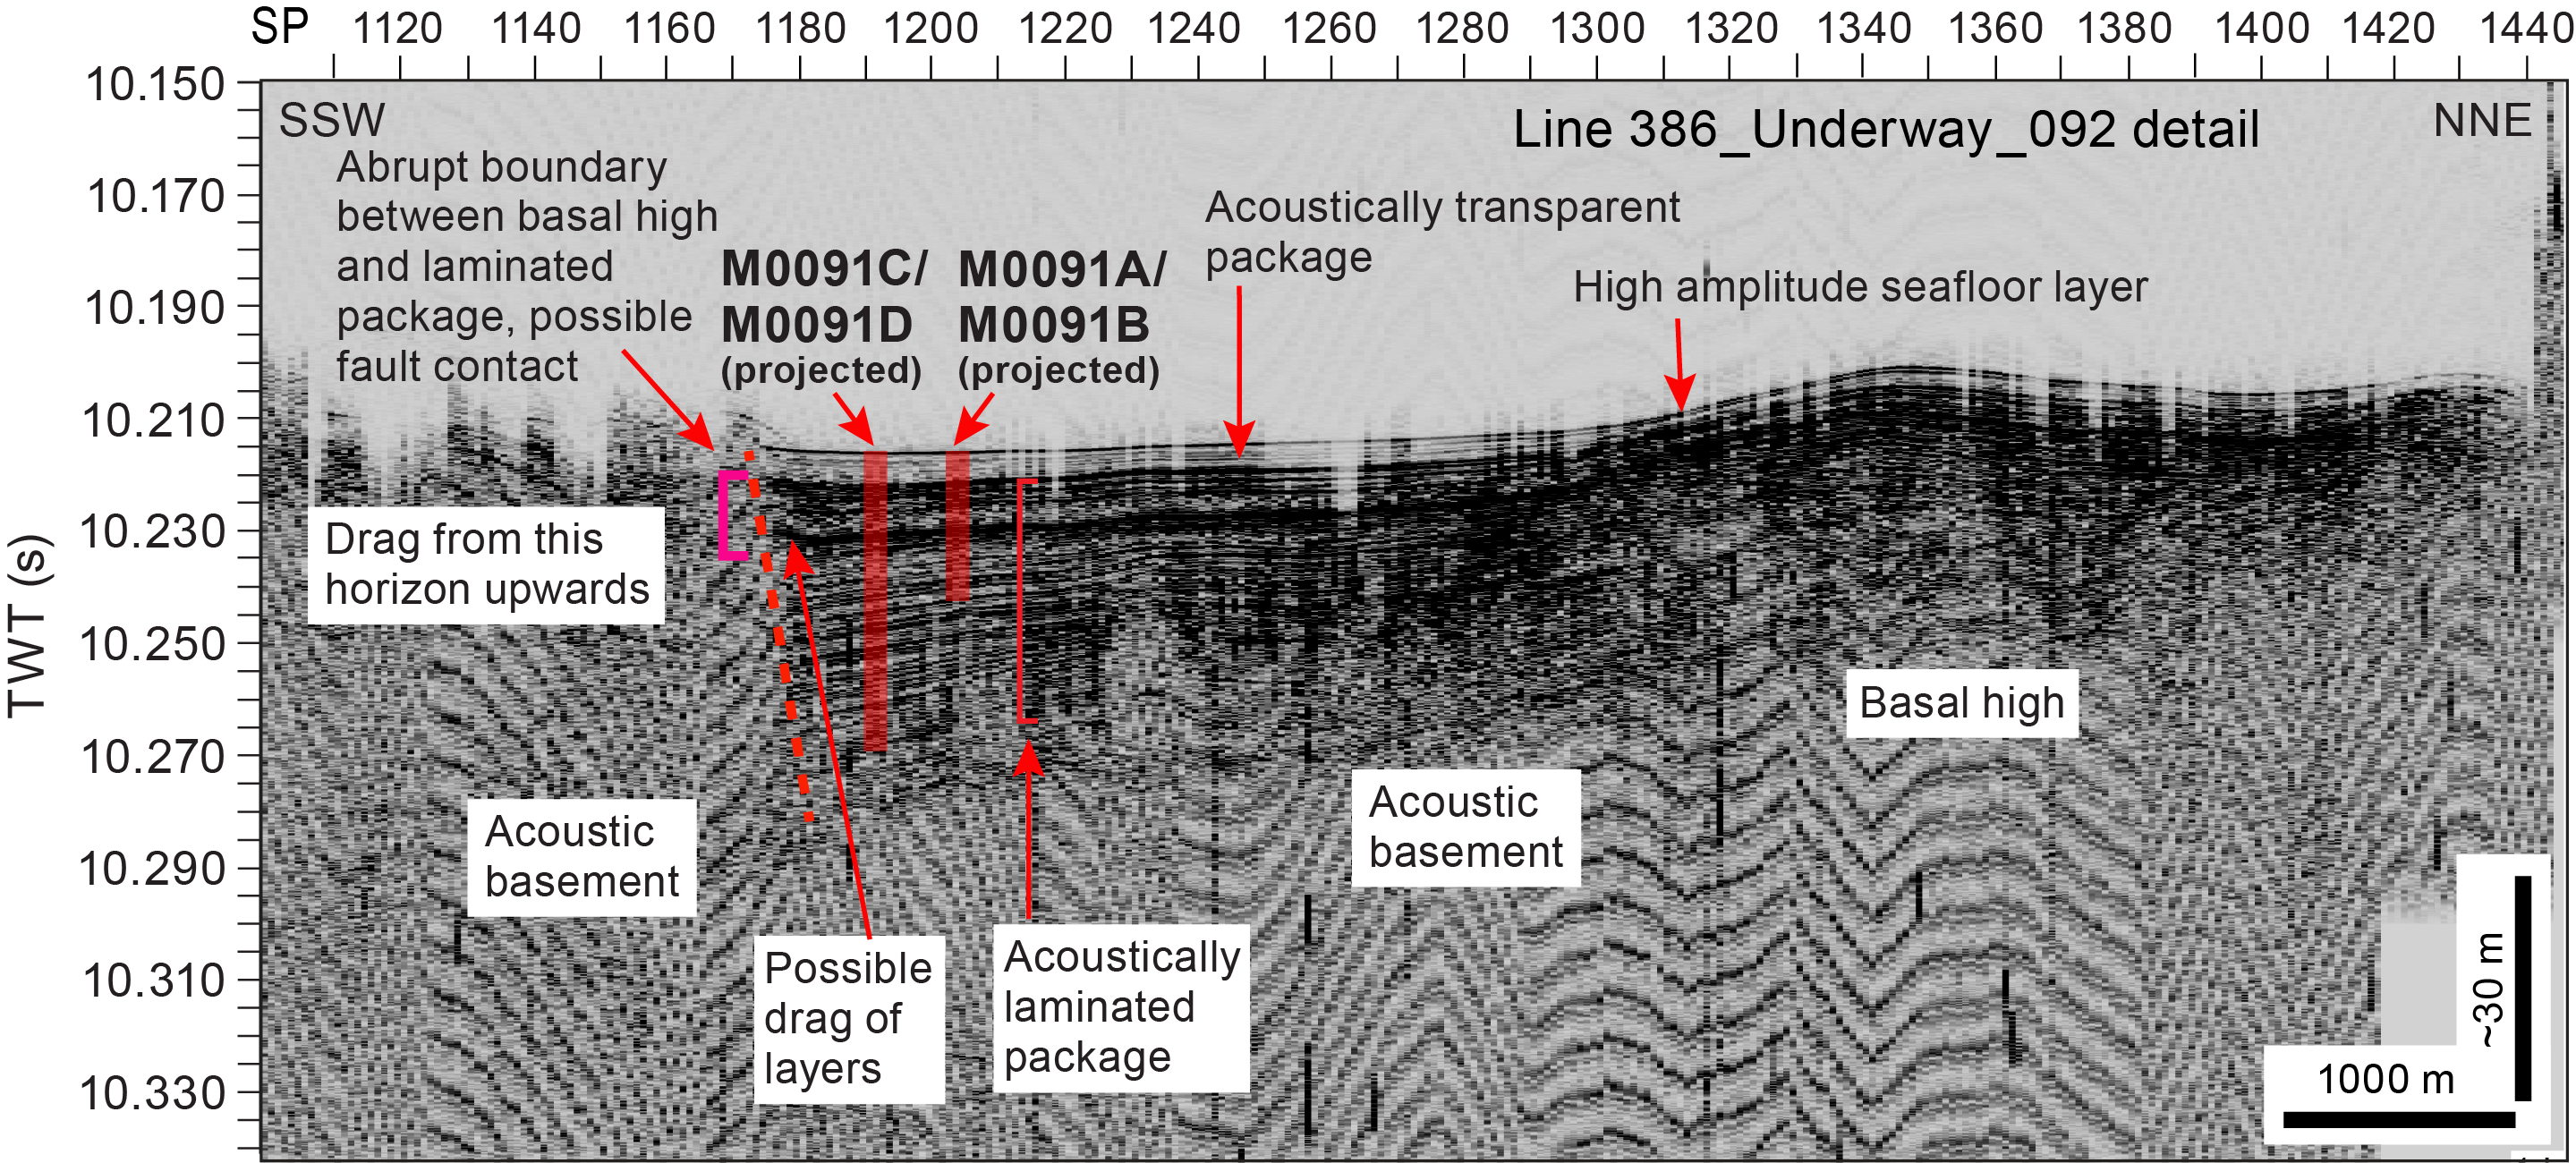
Figure F10. Enlarged portion of Line 386_Underway_092.
3. Lithostratigraphy
Site M0091 was cored in Basin S3 in the northern region of the southern Japan Trench. It includes four holes (Holes M0091A–M0091D), including those of the accompanying trigger cores, which were cored in the basin floor where the greatest sediment recovery was anticipated based on the subbottom profiles.
Visual core description reveals that the lithology is dominated by clay and silty clay, with discrete laminae and beds of clayey silt, silt, and very fine to medium sand (Figures F11, F16). Sand, silt, and clay percentage estimates from smear slides in the dominant lithologies confirm these grain size–based lithologies (Figure F12). Total lithogenic, vitric, and biogenic components in smear slides document a bulk composition dominated by variable mixtures of lithogenic and biogenic grains (80%–100%) with some vitric components (0%–20%), including a single tephra, described below, with 84% glass shards (Figure F12). The relative percentage of major components in the sediments observed in smear slides are shown with depth for each hole in Figures F13 and F17. In general, coarser grained sediment beds contain more lithogenic components (clay minerals, quartz, feldspar, and vitrics) than biogenic grains (diatoms, sponge, spicules, radiolaria, and calcareous microfossils); the specific downcore trends are described below for each hole. Smear slides reveal the full range of compositional variability (Figure F15). The main lithology names derived from smear slide observations suggest a dominance of silty siliceous ooze. The most common sedimentary structures observed are structureless sediments and laminae, sometimes with parallel laminated intervals that contain fine sand, very fine sand, silt, and clay. These deposits tend to have basal sharp, gradational, or bioturbated contacts and fine upward (Figure F14). The sediments have undergone extensive organoclastic sulfate reduction and/or anaerobic oxidation of methane, which manifests as iron monosulfides of variable intensity downcore (Figure F18) and a sulfate–methane transition at ~13 mbsf (Hole M0091D; see Geochemistry). Bioturbation is common and ranges from slight to heavy. Core deformation is minor and characterized by minor voids, bowing, and post–core recovery oxidation prior to and after splitting. Core photos close-ups can be found in CORECLOSEUP in Supplementary material.
3.1. Holes M0091A and M0091B
3.1.1. Hole M0091A
The sediments recovered in Hole M0091A (interval 1P-1, 0–84 cm) are composed of thick, grayish olive (7.5Y 4/2) clay (Figure F11). A dark olive brown (2.5Y 3/3), 1 cm thick interval at the top of the hole is interpreted as oxygenated, indicating that the surface of the seafloor was recovered. The lithology in this section is structureless and not bioturbated. Color changes in the clay (7.5Y 5/2 grayish olive) are seen in Section 1P-1 at 1 and 15 cm, and a lighter colored band (7.5Y 6/2 grayish olive) is located in interval 1P, 21–22 cm. Physical properties such as magnetic susceptibility, density, and natural gamma radiation (NGR) increase toward the bottom of the hole (see Physical properties).
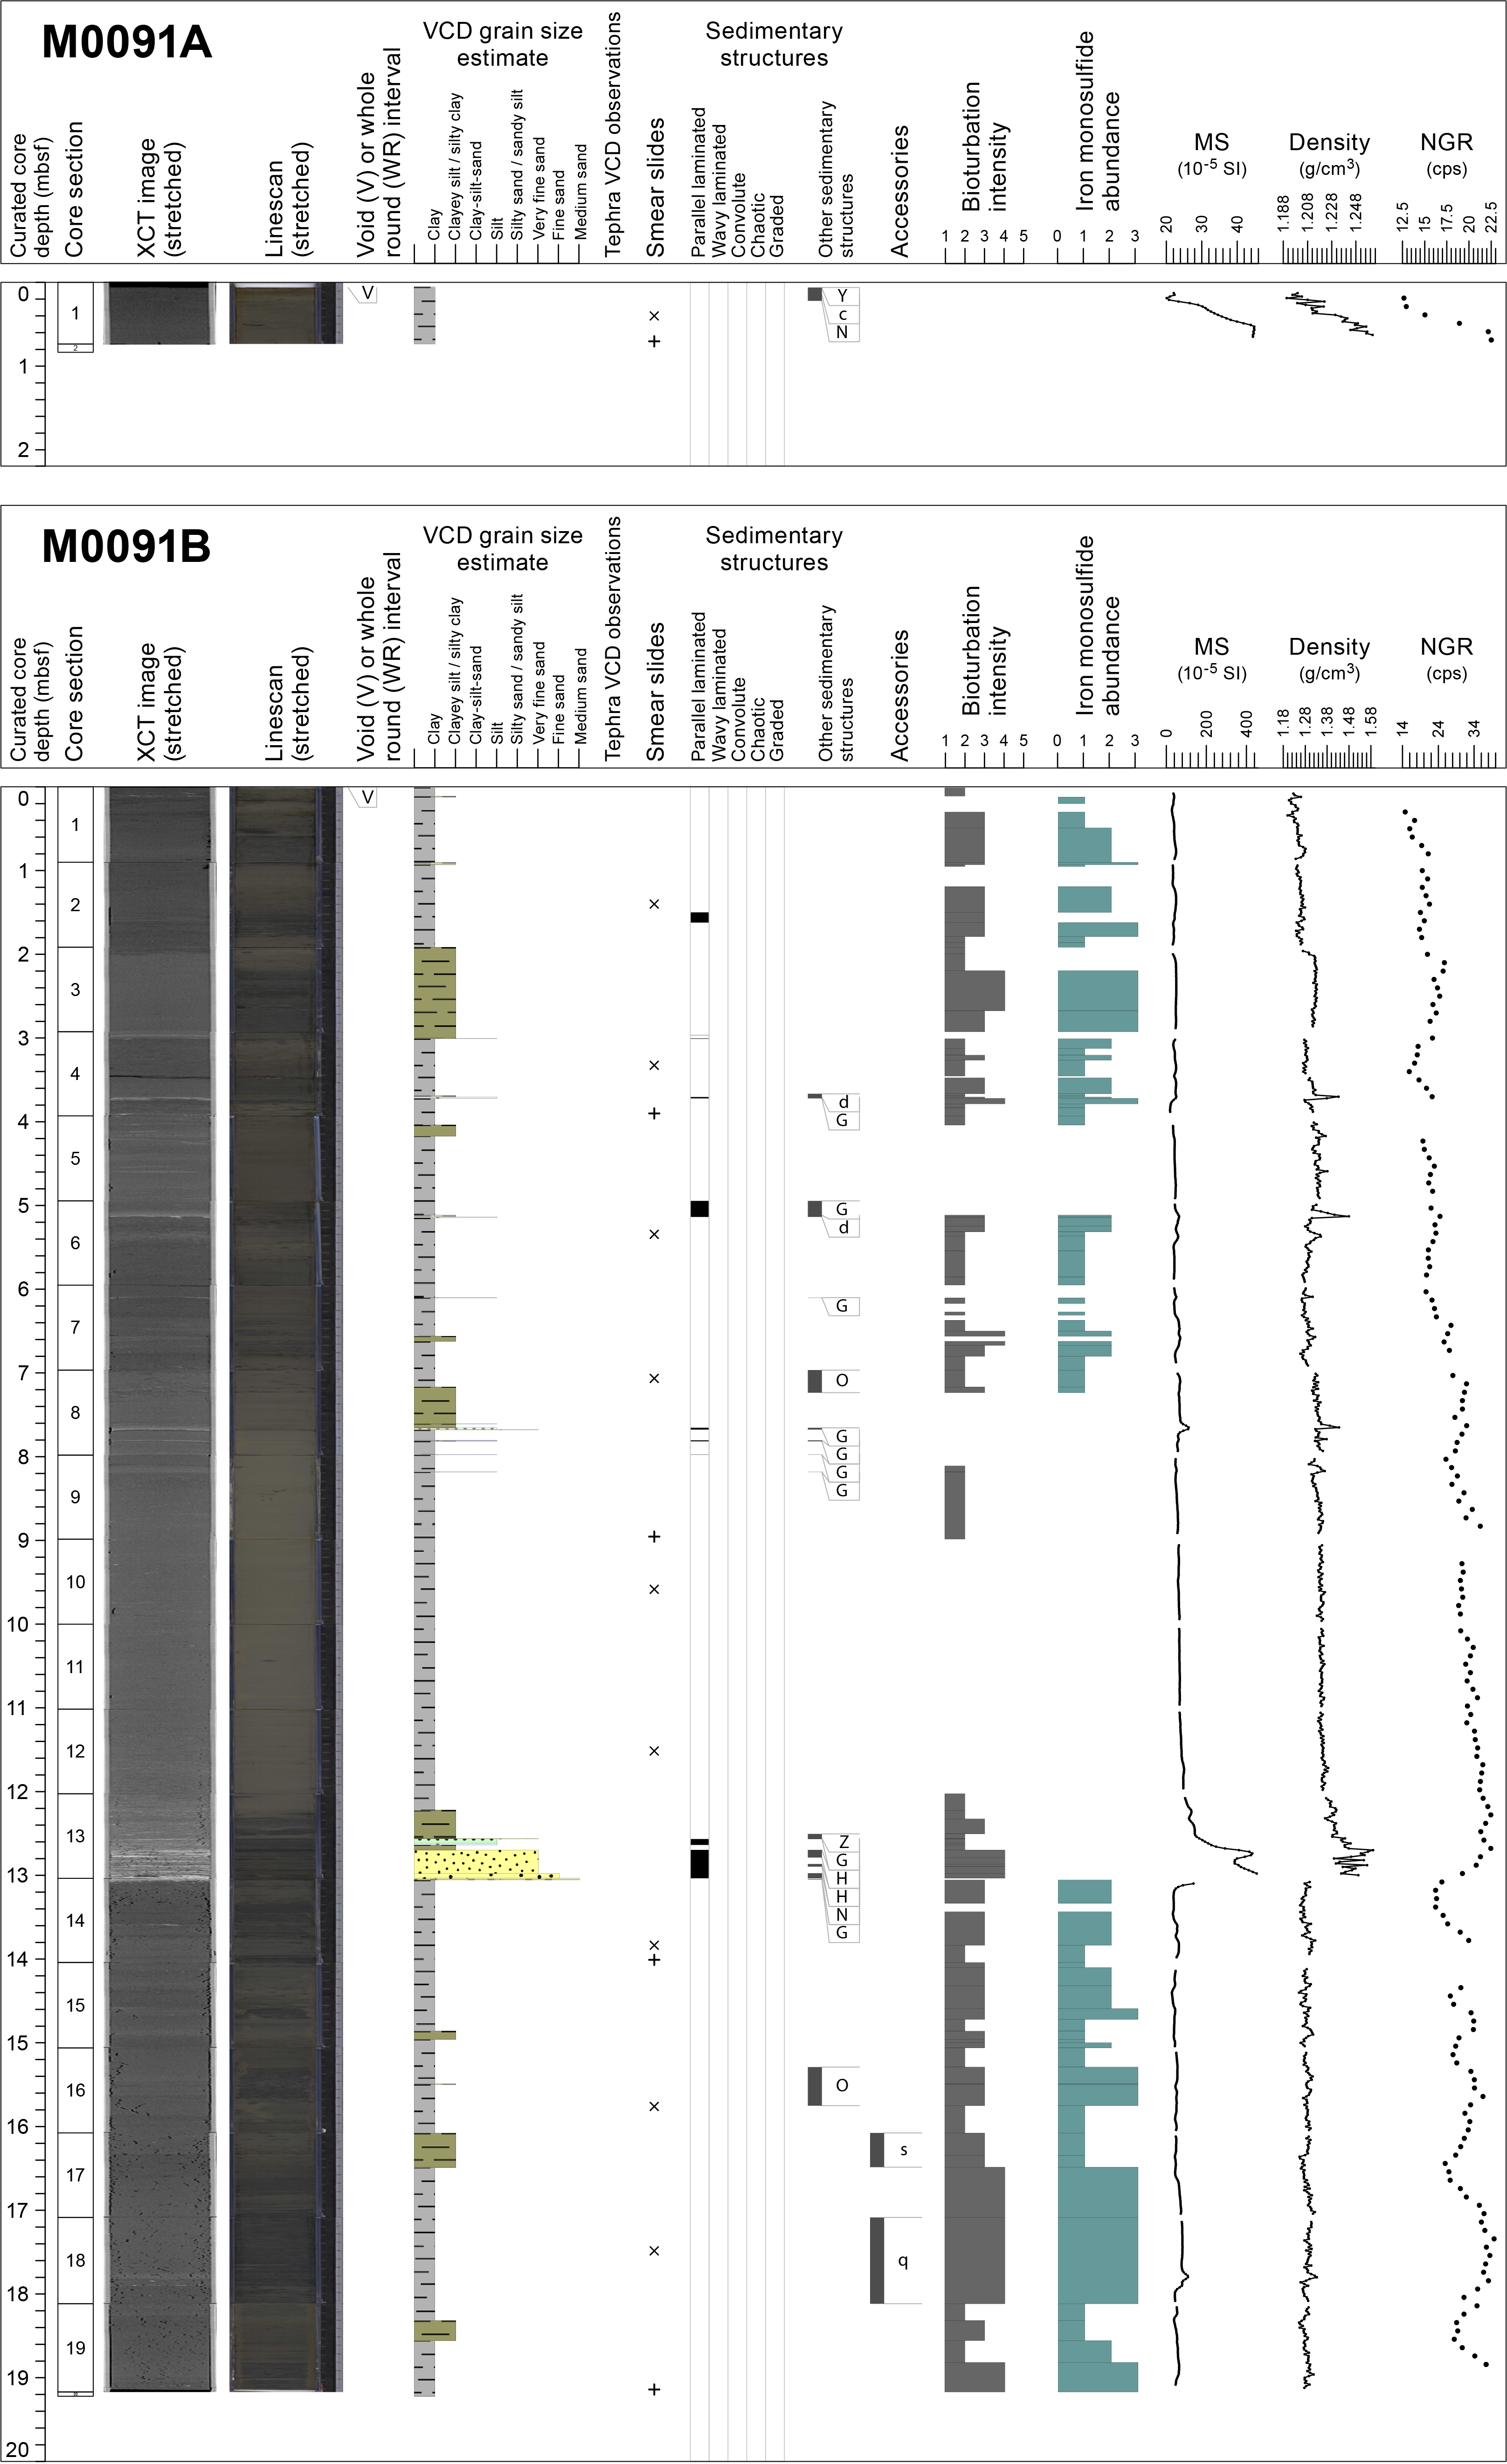
Figure F11. Lithostratigraphic summary, Holes M0091A and M0091B.
One smear slide was collected in Hole M0091A (Table T3). The grain size is clayey silt (Figure F12). Clay is the most abundant mineral component (38.5%), with additional quartz (7.7%) and vitric shards (3.8%); diatoms (38.5%) and sponge spicules (11.5%) dominate the biogenic fraction (Figure F13).

Figure F12. Ternary diagram of major components.
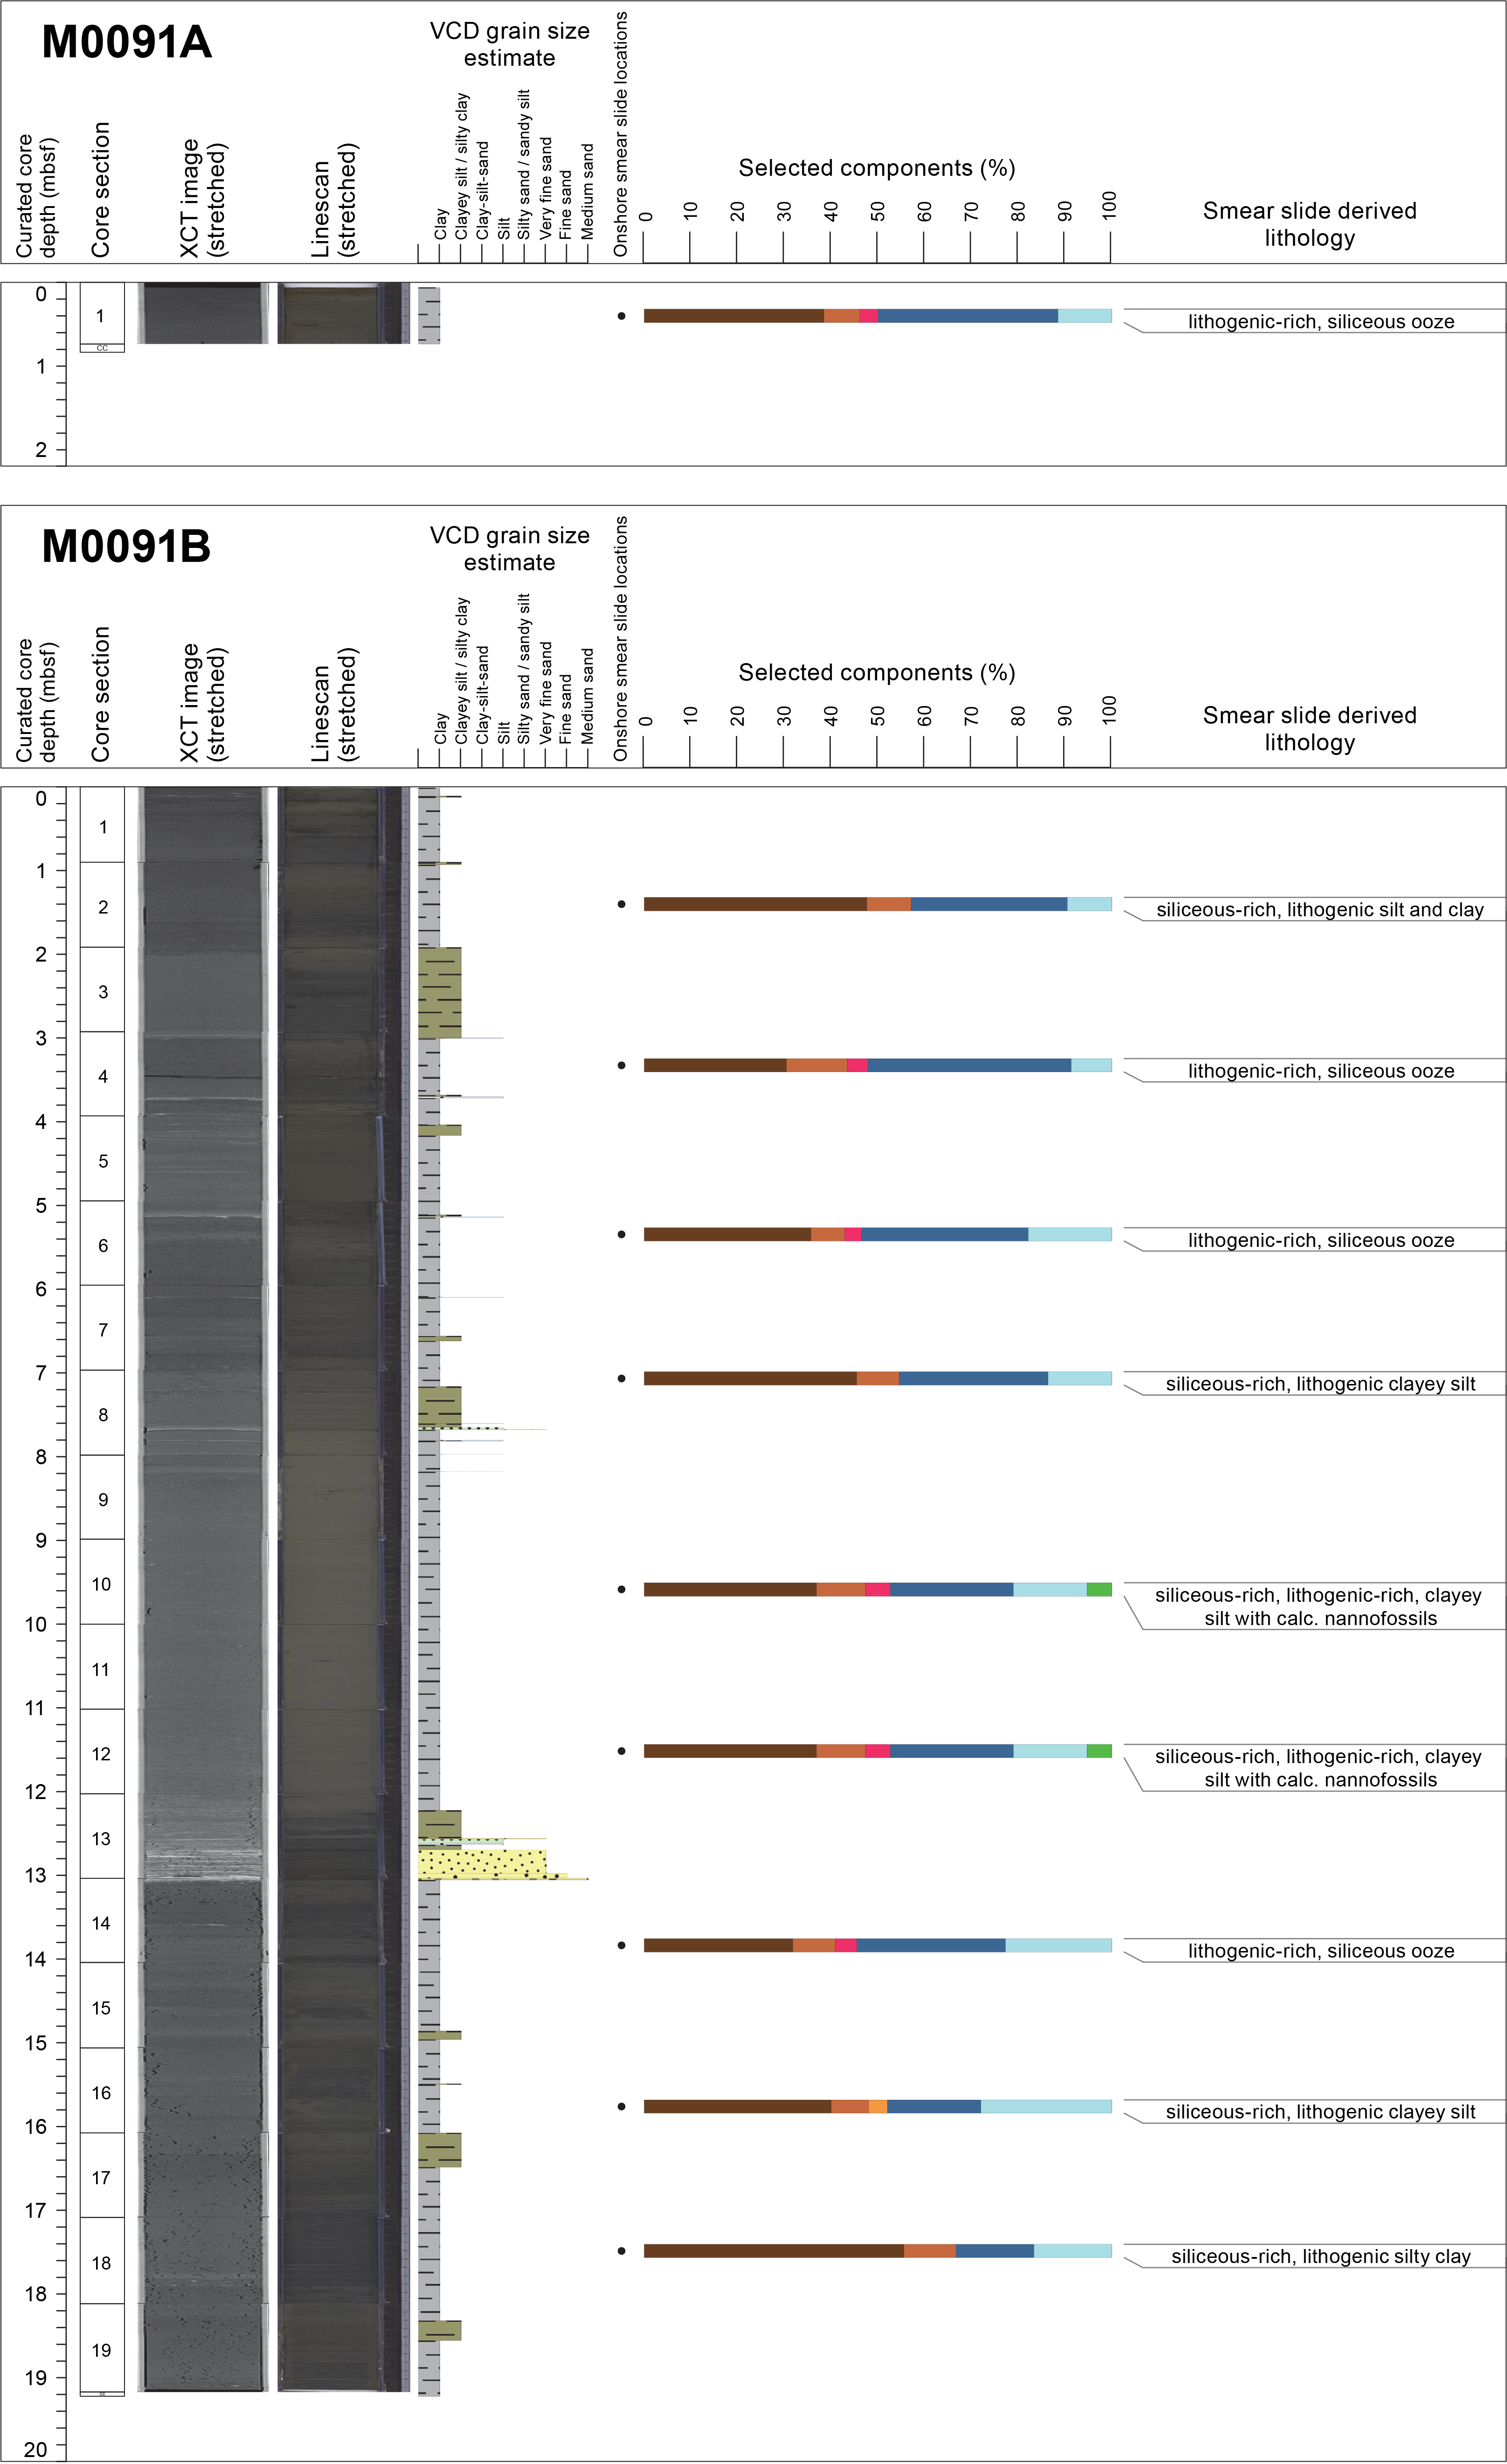
Figure F13. Smear slide summary plots, Holes M0091A and M0091B.
3.1.2. Hole M0091B
Hole M001B is divided into three intervals.
Interval 1 (0–7.68 mbsf; Sections 386-M0091B-1H-1, 0 cm, to 1H-8, 71 cm) is dominated by clay to silty clay with coarser grained laminae and beds of variable thickness, ranging from silty clay to fine sand (Figure F11). Sedimentary structures within the coarse beds include planar laminations and fining-upward grading. The degree of bioturbation varies from slight to heavy throughout the interval but is also absent in some locations. Generally, bioturbation is most easily observed when it is amplified by iron monosulfides. Magnetic susceptibility is uniformly low, but bulk density and NGR show more variation in concert with the occurrence of coarse laminae and beds.
Interval 2 (7.68–13.06 mbsf; Sections 386-M0091B-1H-8, 71 cm, to 1H-14, 3 cm) is composed of a single, large event deposit. At the base of the event is a 36 cm thick very fine sand to medium sand, laminated, fining-upward bed that grades into a thick, structureless clay that extends upward to Section 1H-8, 71 cm (7.68 mbsf) (Figures F11, F14). Three additional coarse-grained laminae and beds between Sections 1H-8, 71 cm, and 1H-9, 20 cm, are observed within the structureless clay. Iron monosulfides are absent throughout the interval; bioturbation is mainly absent. The laminae and other coarse-grained beds are more frequent in Interval 1 than in Interval 2. Magnetic susceptibility and density show a strong broad peak corresponding to the thick sand at the base of Interval 2 and then abruptly decrease and remain largely uniform to the top. Aside from the upward decreasing trend in the structureless clay, NGR is smooth with minor variations (see Physical properties).
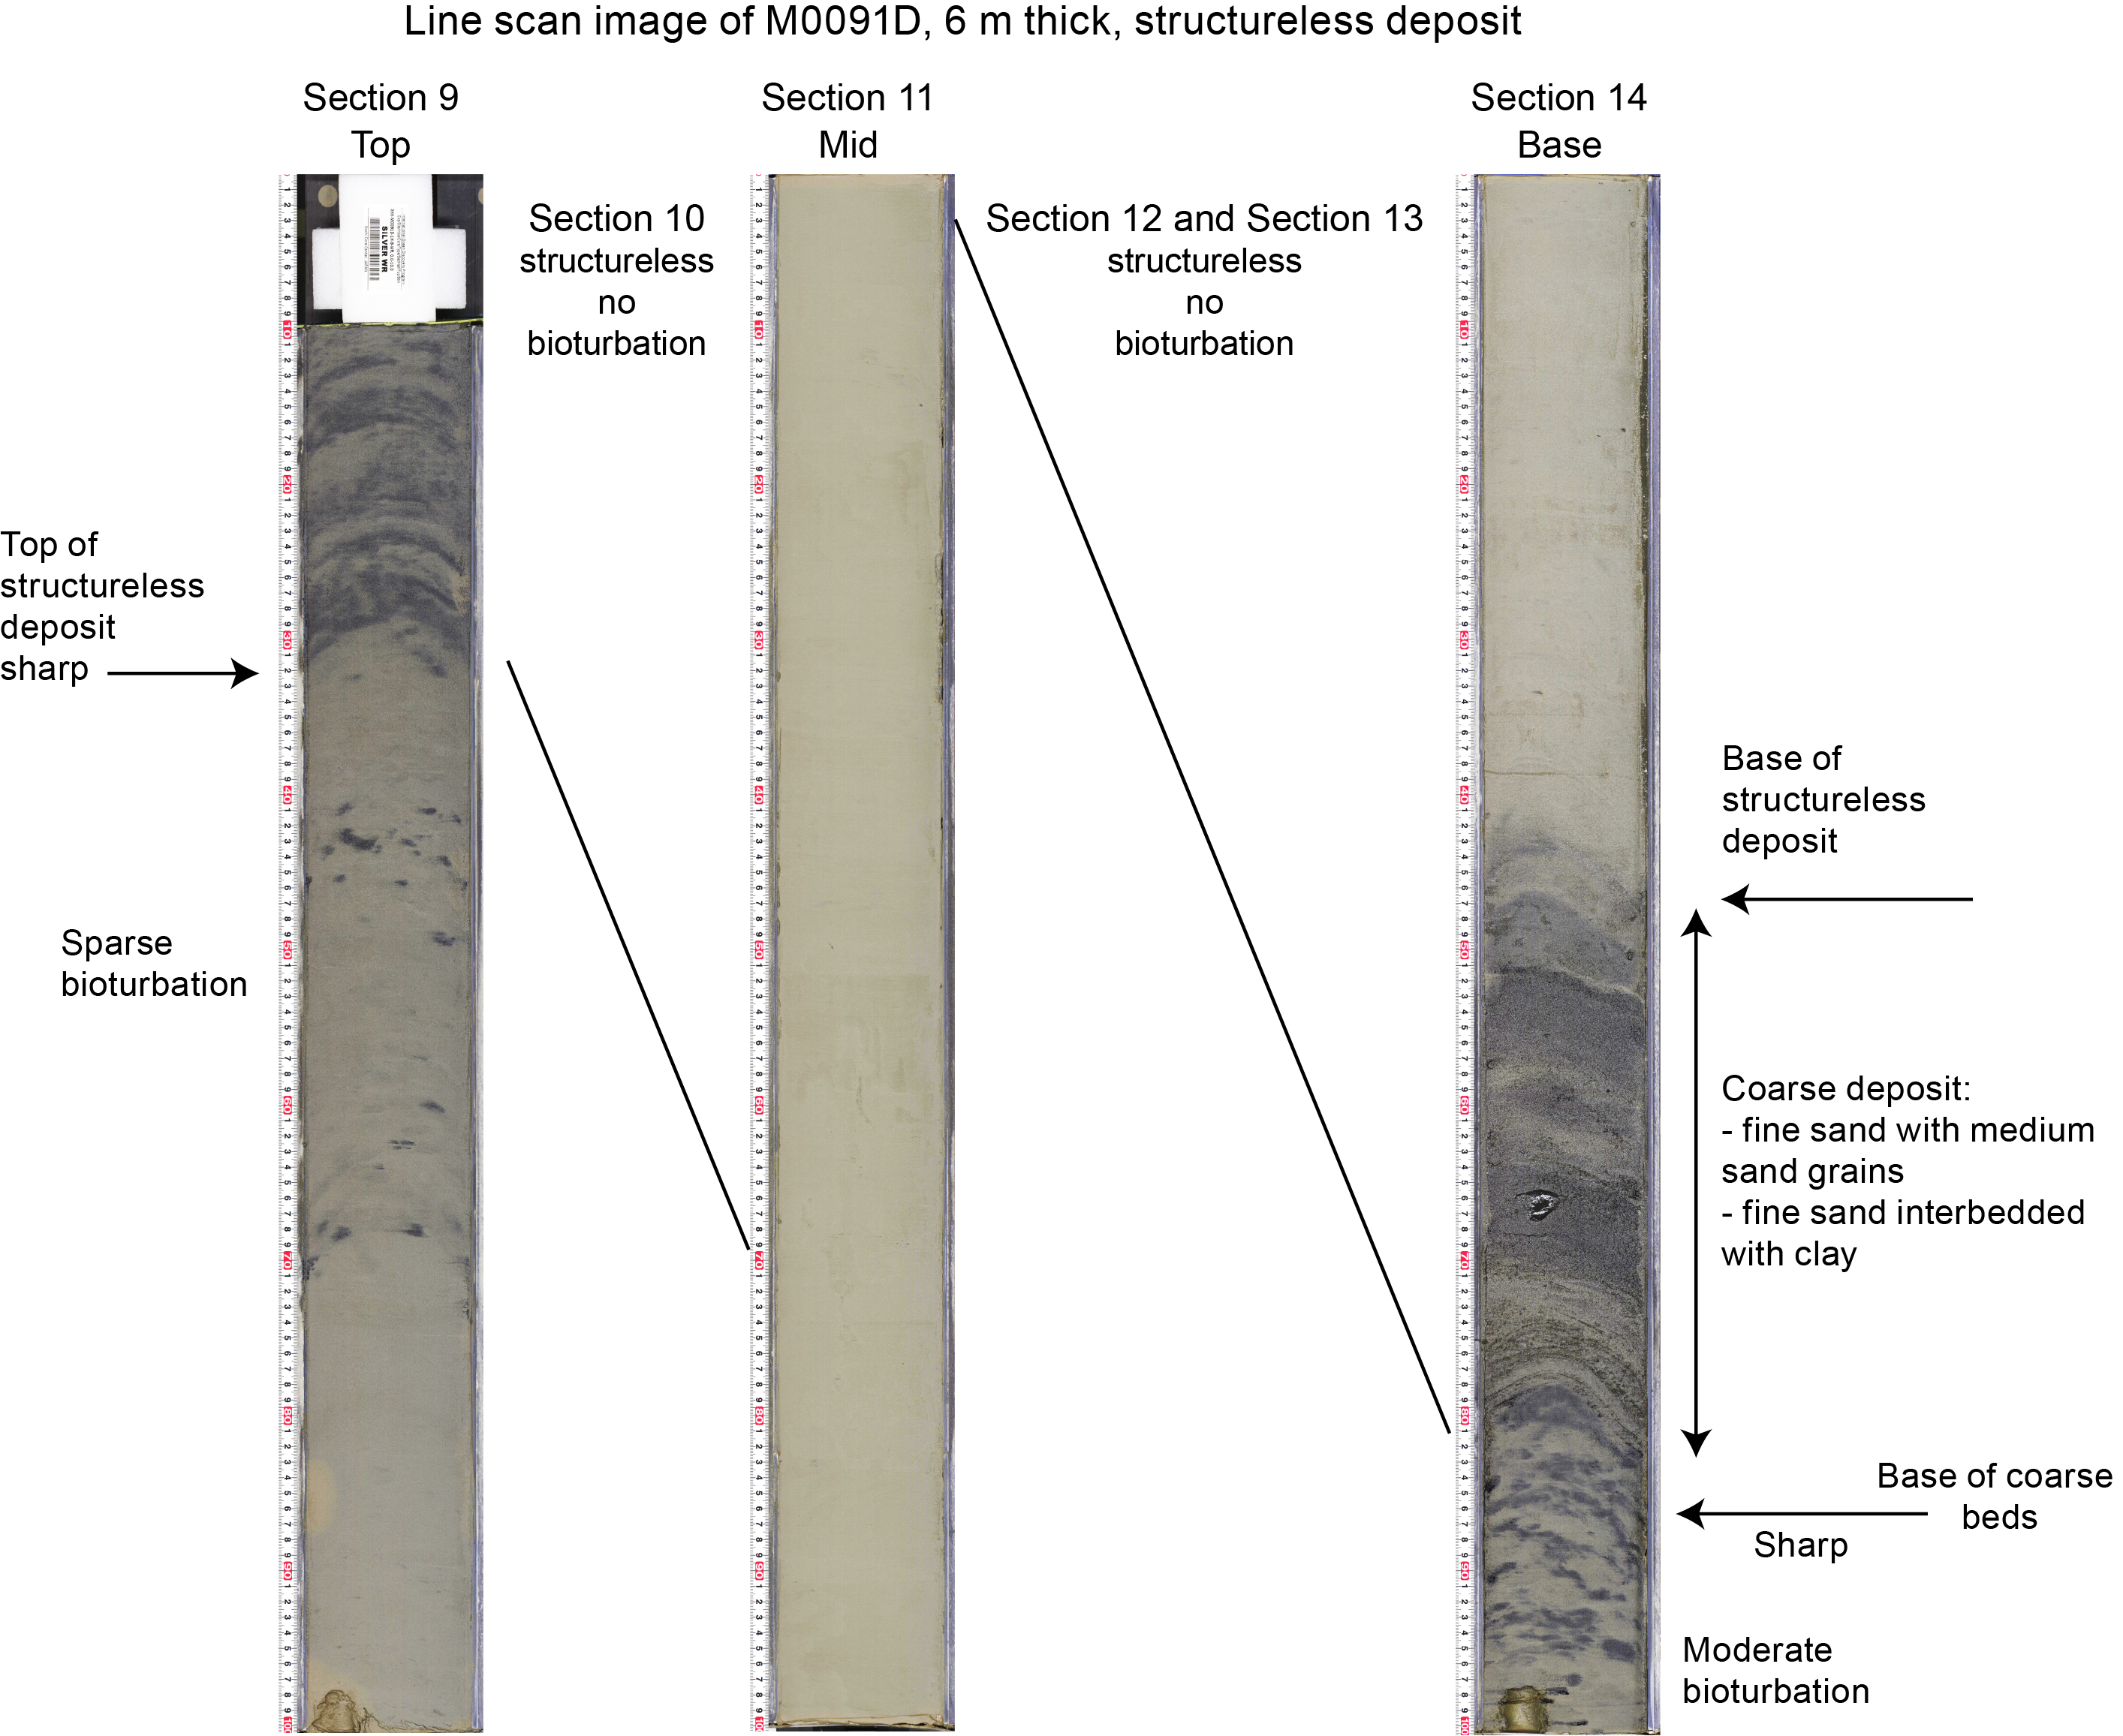
Figure F14. Event bed.
Interval 3 (13.06–19.15 mbsf; Sections 386-M0091B-1H-14, 3 cm, to 1H-19, 103 cm) is composed of clay with minor silty clay occurrences. Bioturbation intensity and iron monosulfide intensity are variable but co-vary throughout the interval. Magnetic susceptibility and density are uniform and low, lower in magnitude than in Intervals 1 and 2. NGR is high but variable and shows larger variations than Intervals 1 and 2 and lower values in the coarser grained intervals.
Nine smear slides were studied in Hole M0091B (Table T3; Figure F13). The grain size, as determined from smear slides, ranges from clayey silt to silty clay (Figure F12). In terms of the major components in the sediment throughout the core, the composition is generally a near equal mixture of biogenic and lithogenic grains with less vitric grains (Figures F12, F13). Clay is the most abundant mineral component (30%–55%), with additional quartz (0%–12%) and vitric shards (<5%); diatoms and sponge spicules dominate the biogenic fraction, with more diatoms (15%–45%) than sponge spicules (10%–30%) in all samples. Calcareous nannofossils occurred in only two smear slides collected in the thick, structureless clay interval mentioned above (Samples 1H-10, 60 cm, and 1H-12, 50 cm) (Figure F15). These nannofossils were also observed in the equivalent sediment from Hole M0091D and may be diagnostic of this sediment deposit.
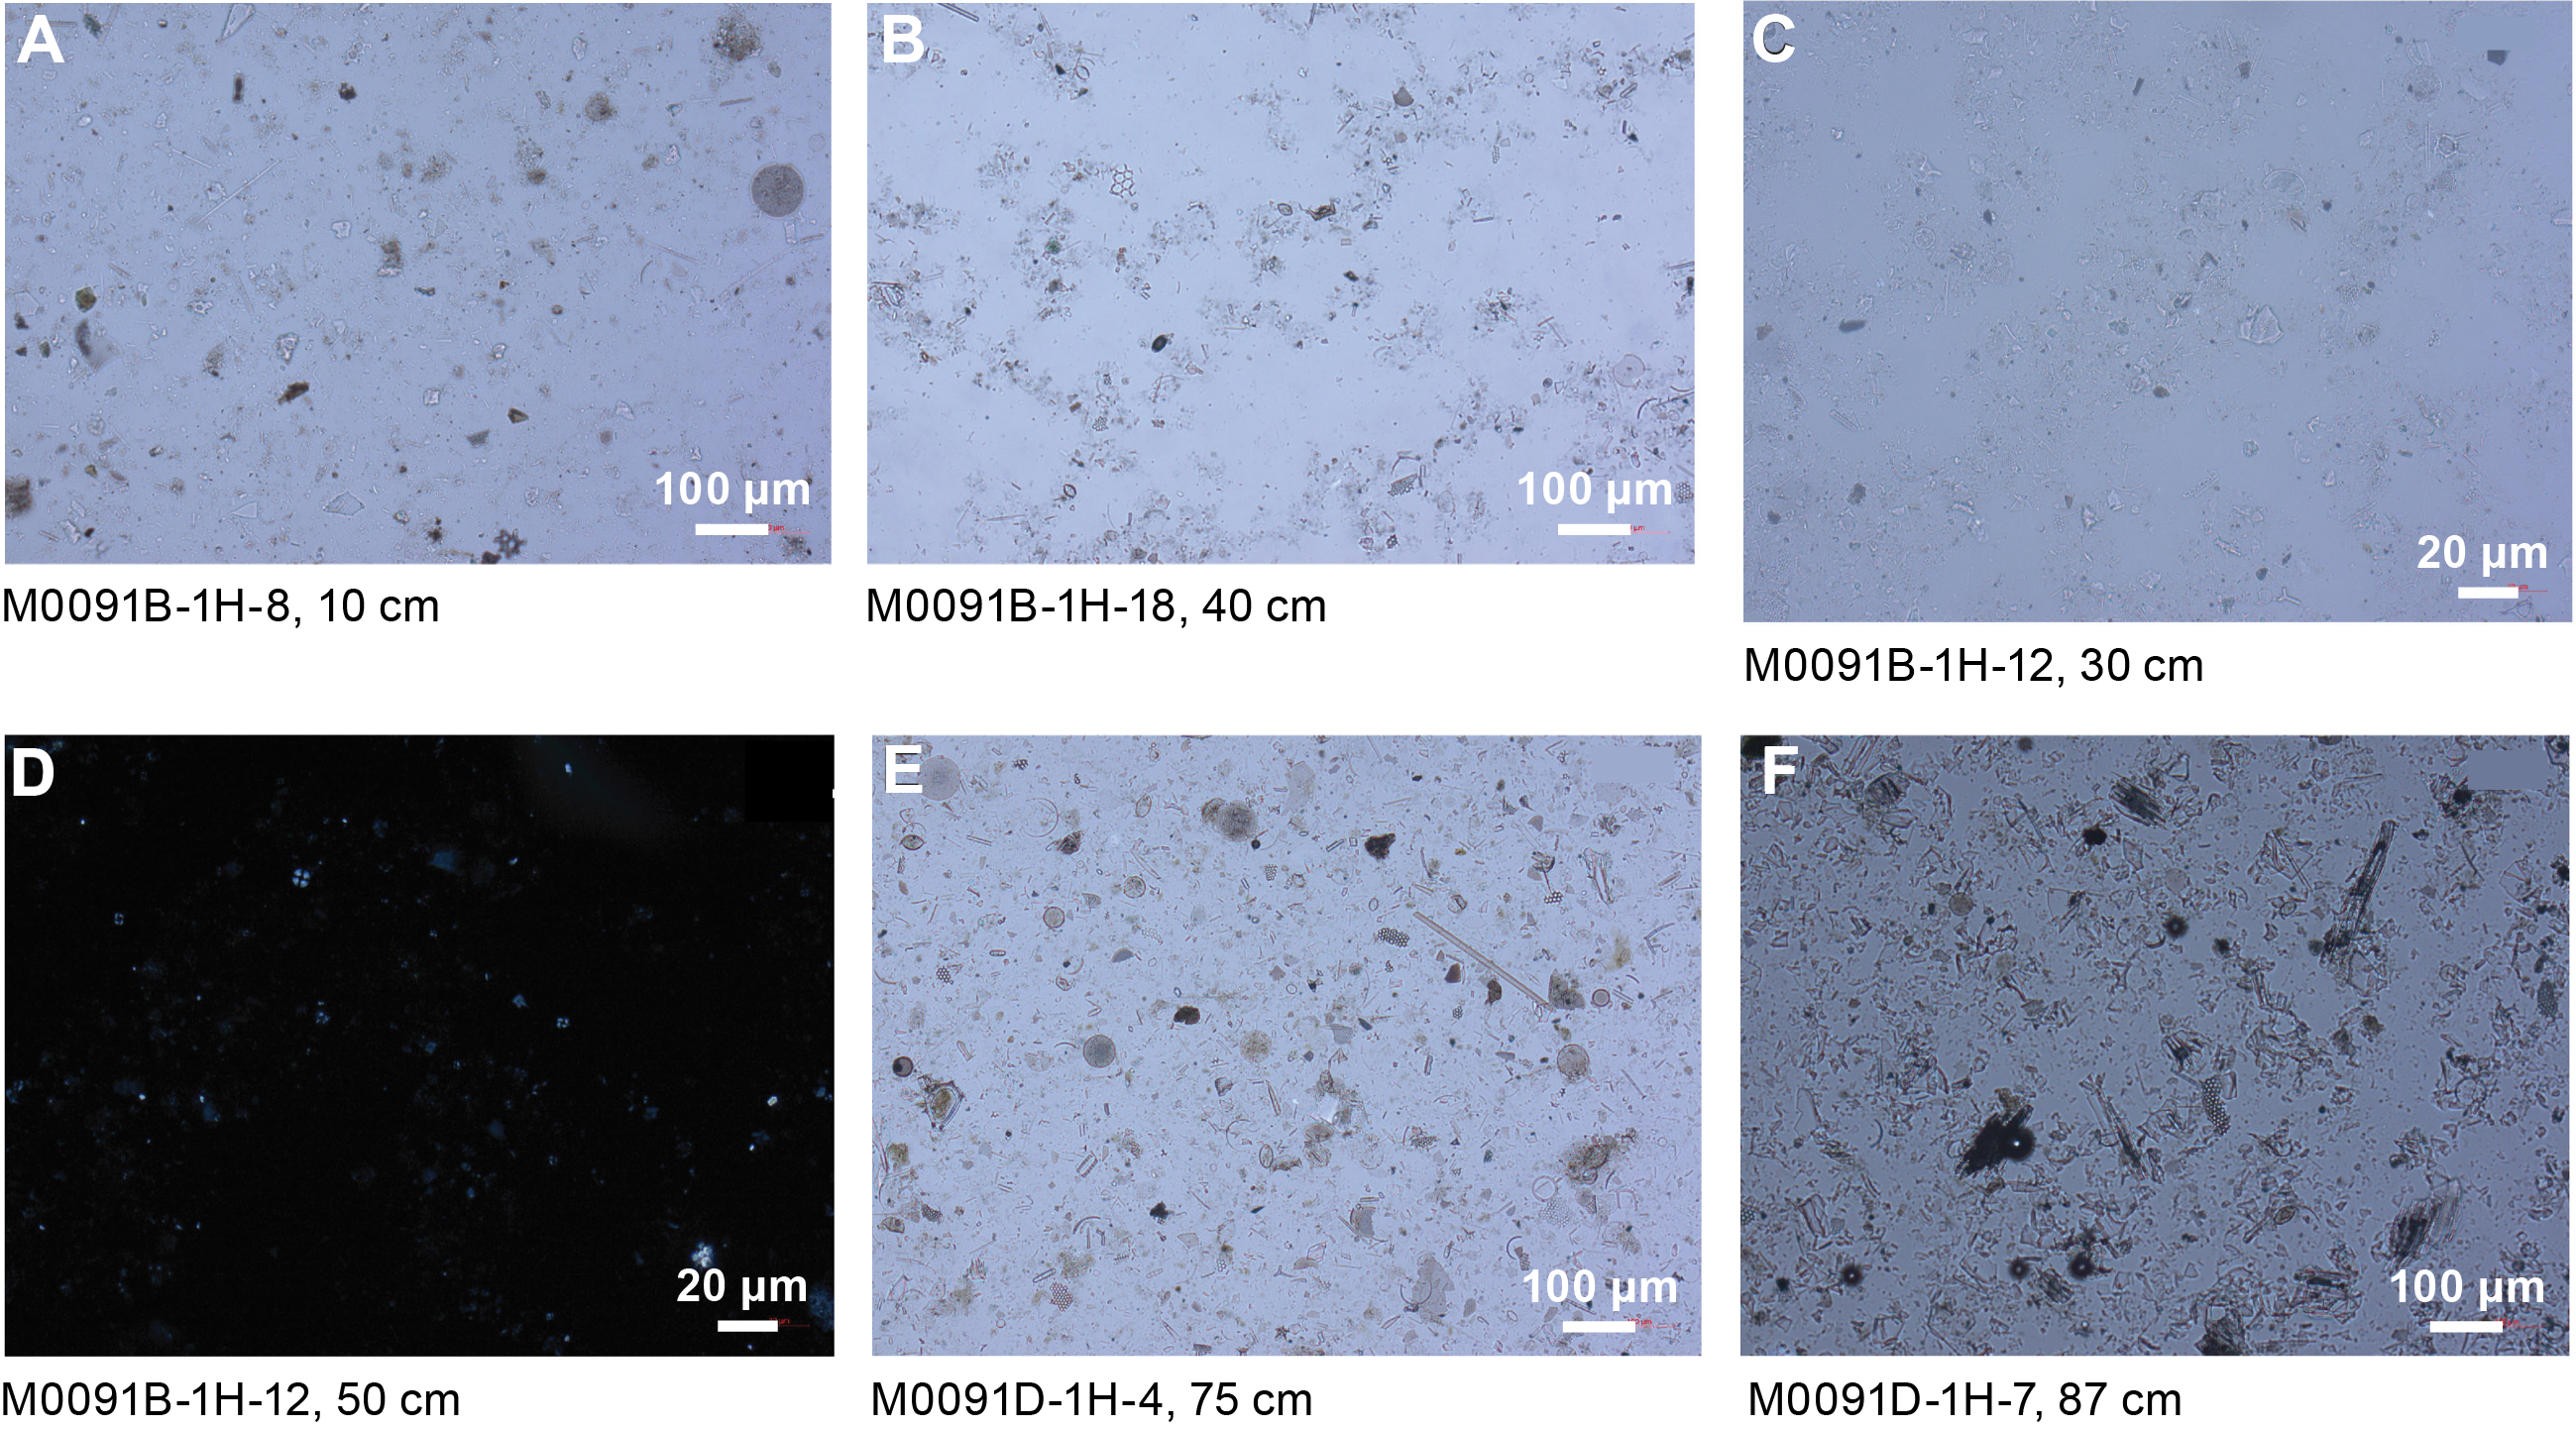
Figure F15. Lithologic components.
3.2. Holes M0091C and M0091D
3.2.1. C.2.1. Hole M0091C
The sediments recovered in Hole M0091C (interval 1H-1P, 0–66 cm) are composed of thick, grayish olive (7.5Y 4/2) clay (Figure F16). There is a void at the section top (interval 1H-1P, 0–7 cm), but the uppermost 1 cm of sediment in the core (interval 1H-1P, 7–8 cm) is oxidized, indicating that the surface of the seafloor was recovered. The lithology in this section appears structureless with only slight bioturbation. Another subtle color change occurs in Section 1H-1P, 19 cm, and both are underlain by very slight bioturbation. Magnetic susceptibility, bulk density, and NGR increase toward the base of the hole, and the bulk density shows two distinct peaks with no obvious lithologic change (see Physical properties).
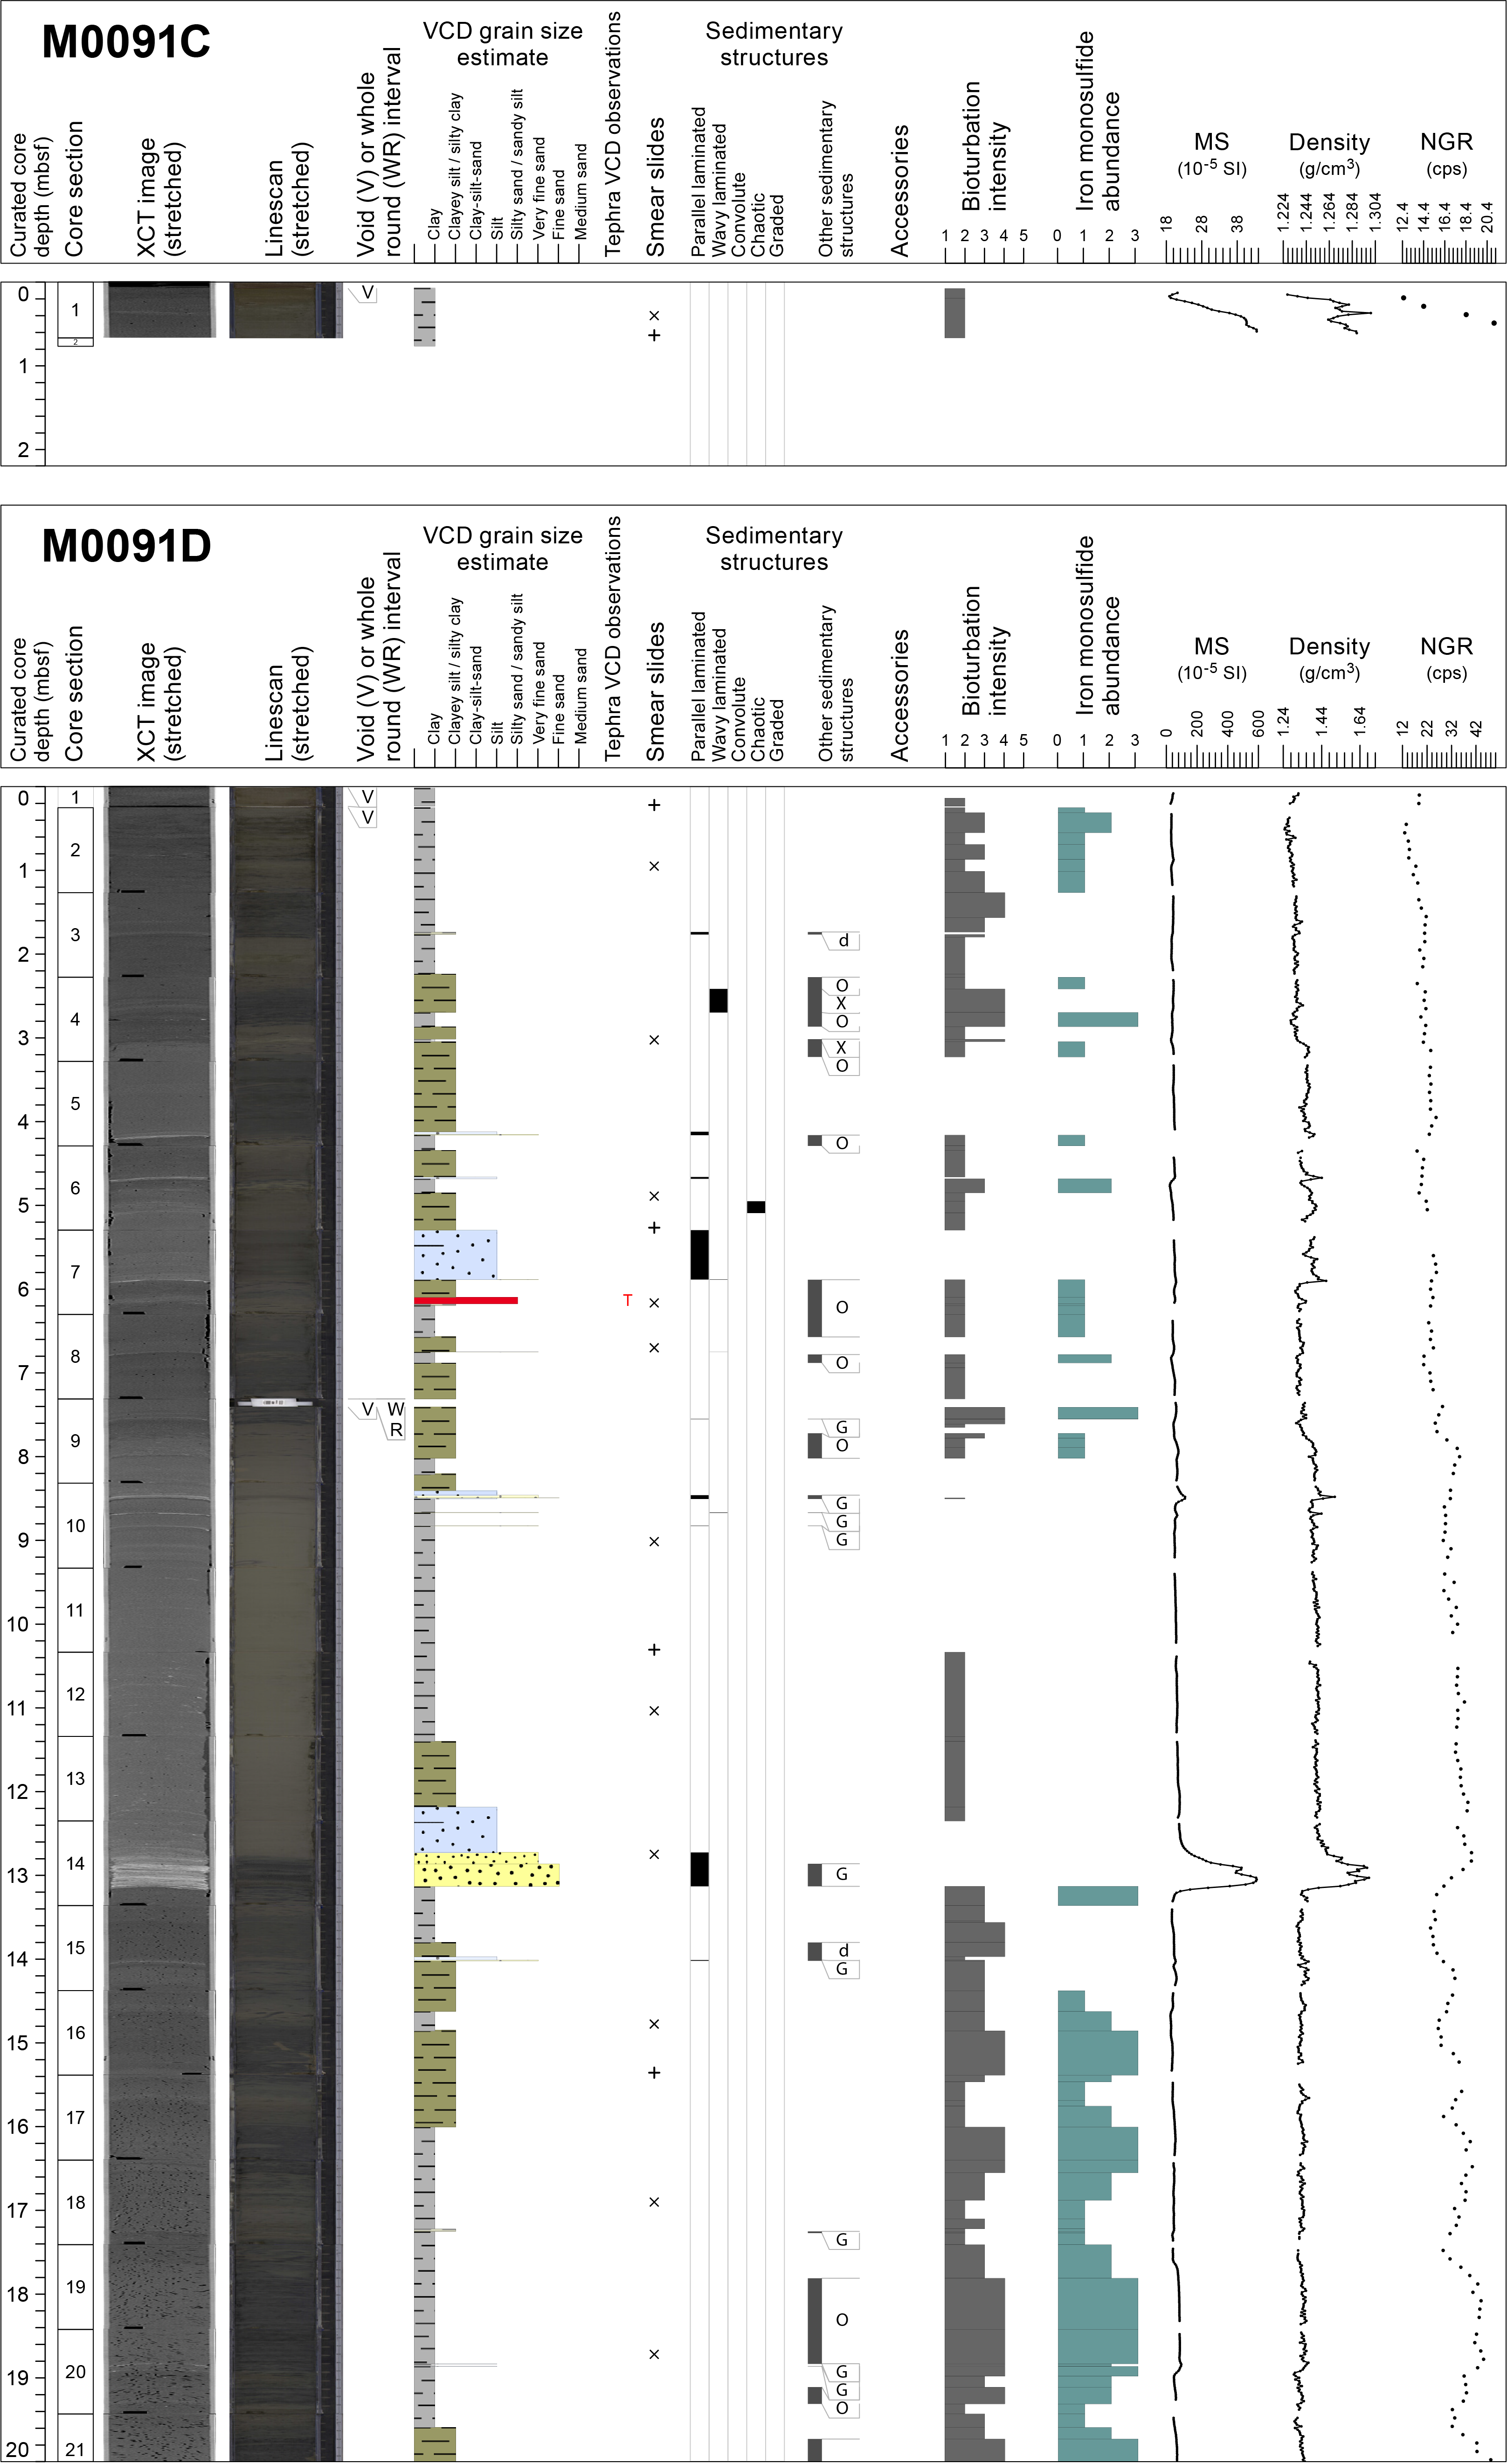
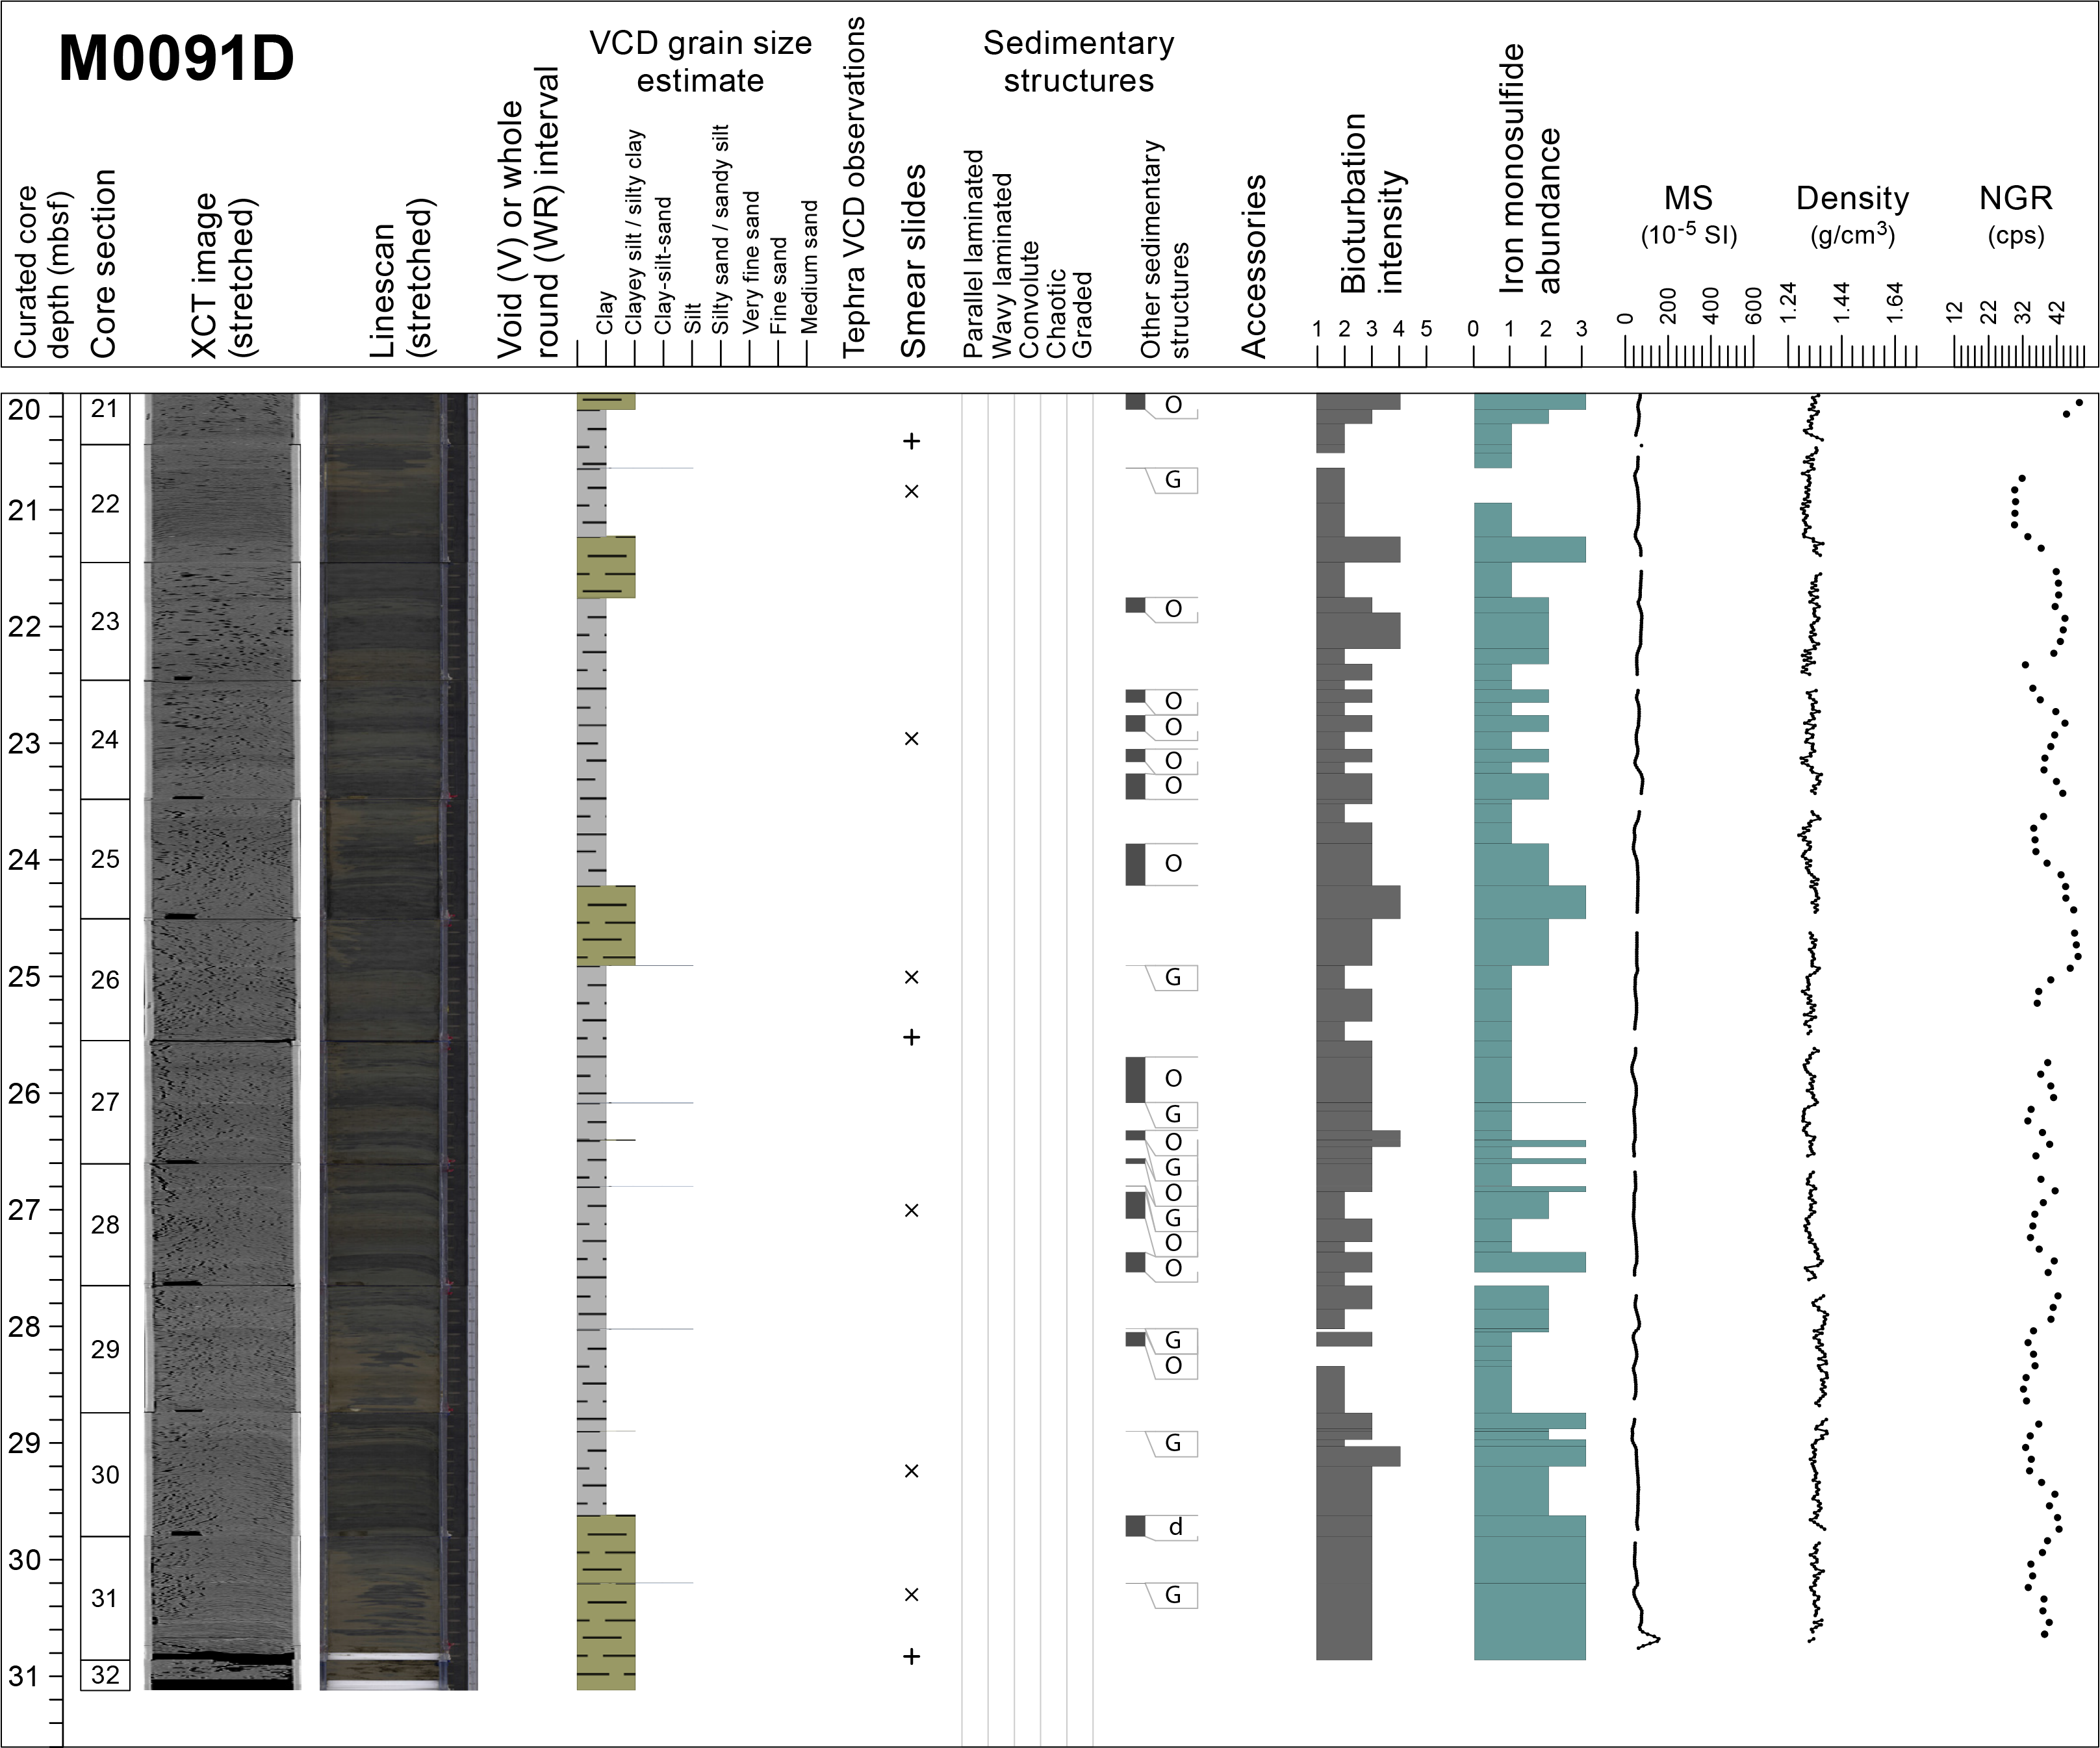
Figure F16. Lithostratigraphic summary, Holes M0091C and M0091D.
One smear slide was collected in Hole M0091C (Table T3). The grain size is silt (Figure F12). Clay minerals are the most abundant component of the lithogenic fraction (12.8%), with additional quartz (7.7%), vitric shards (12.8%), and pyrite (5.1%); diatoms (51.3%), sponge spicules (7.7%), and radiolaria (2.6%) dominate the biogenic fraction (Figure F17).
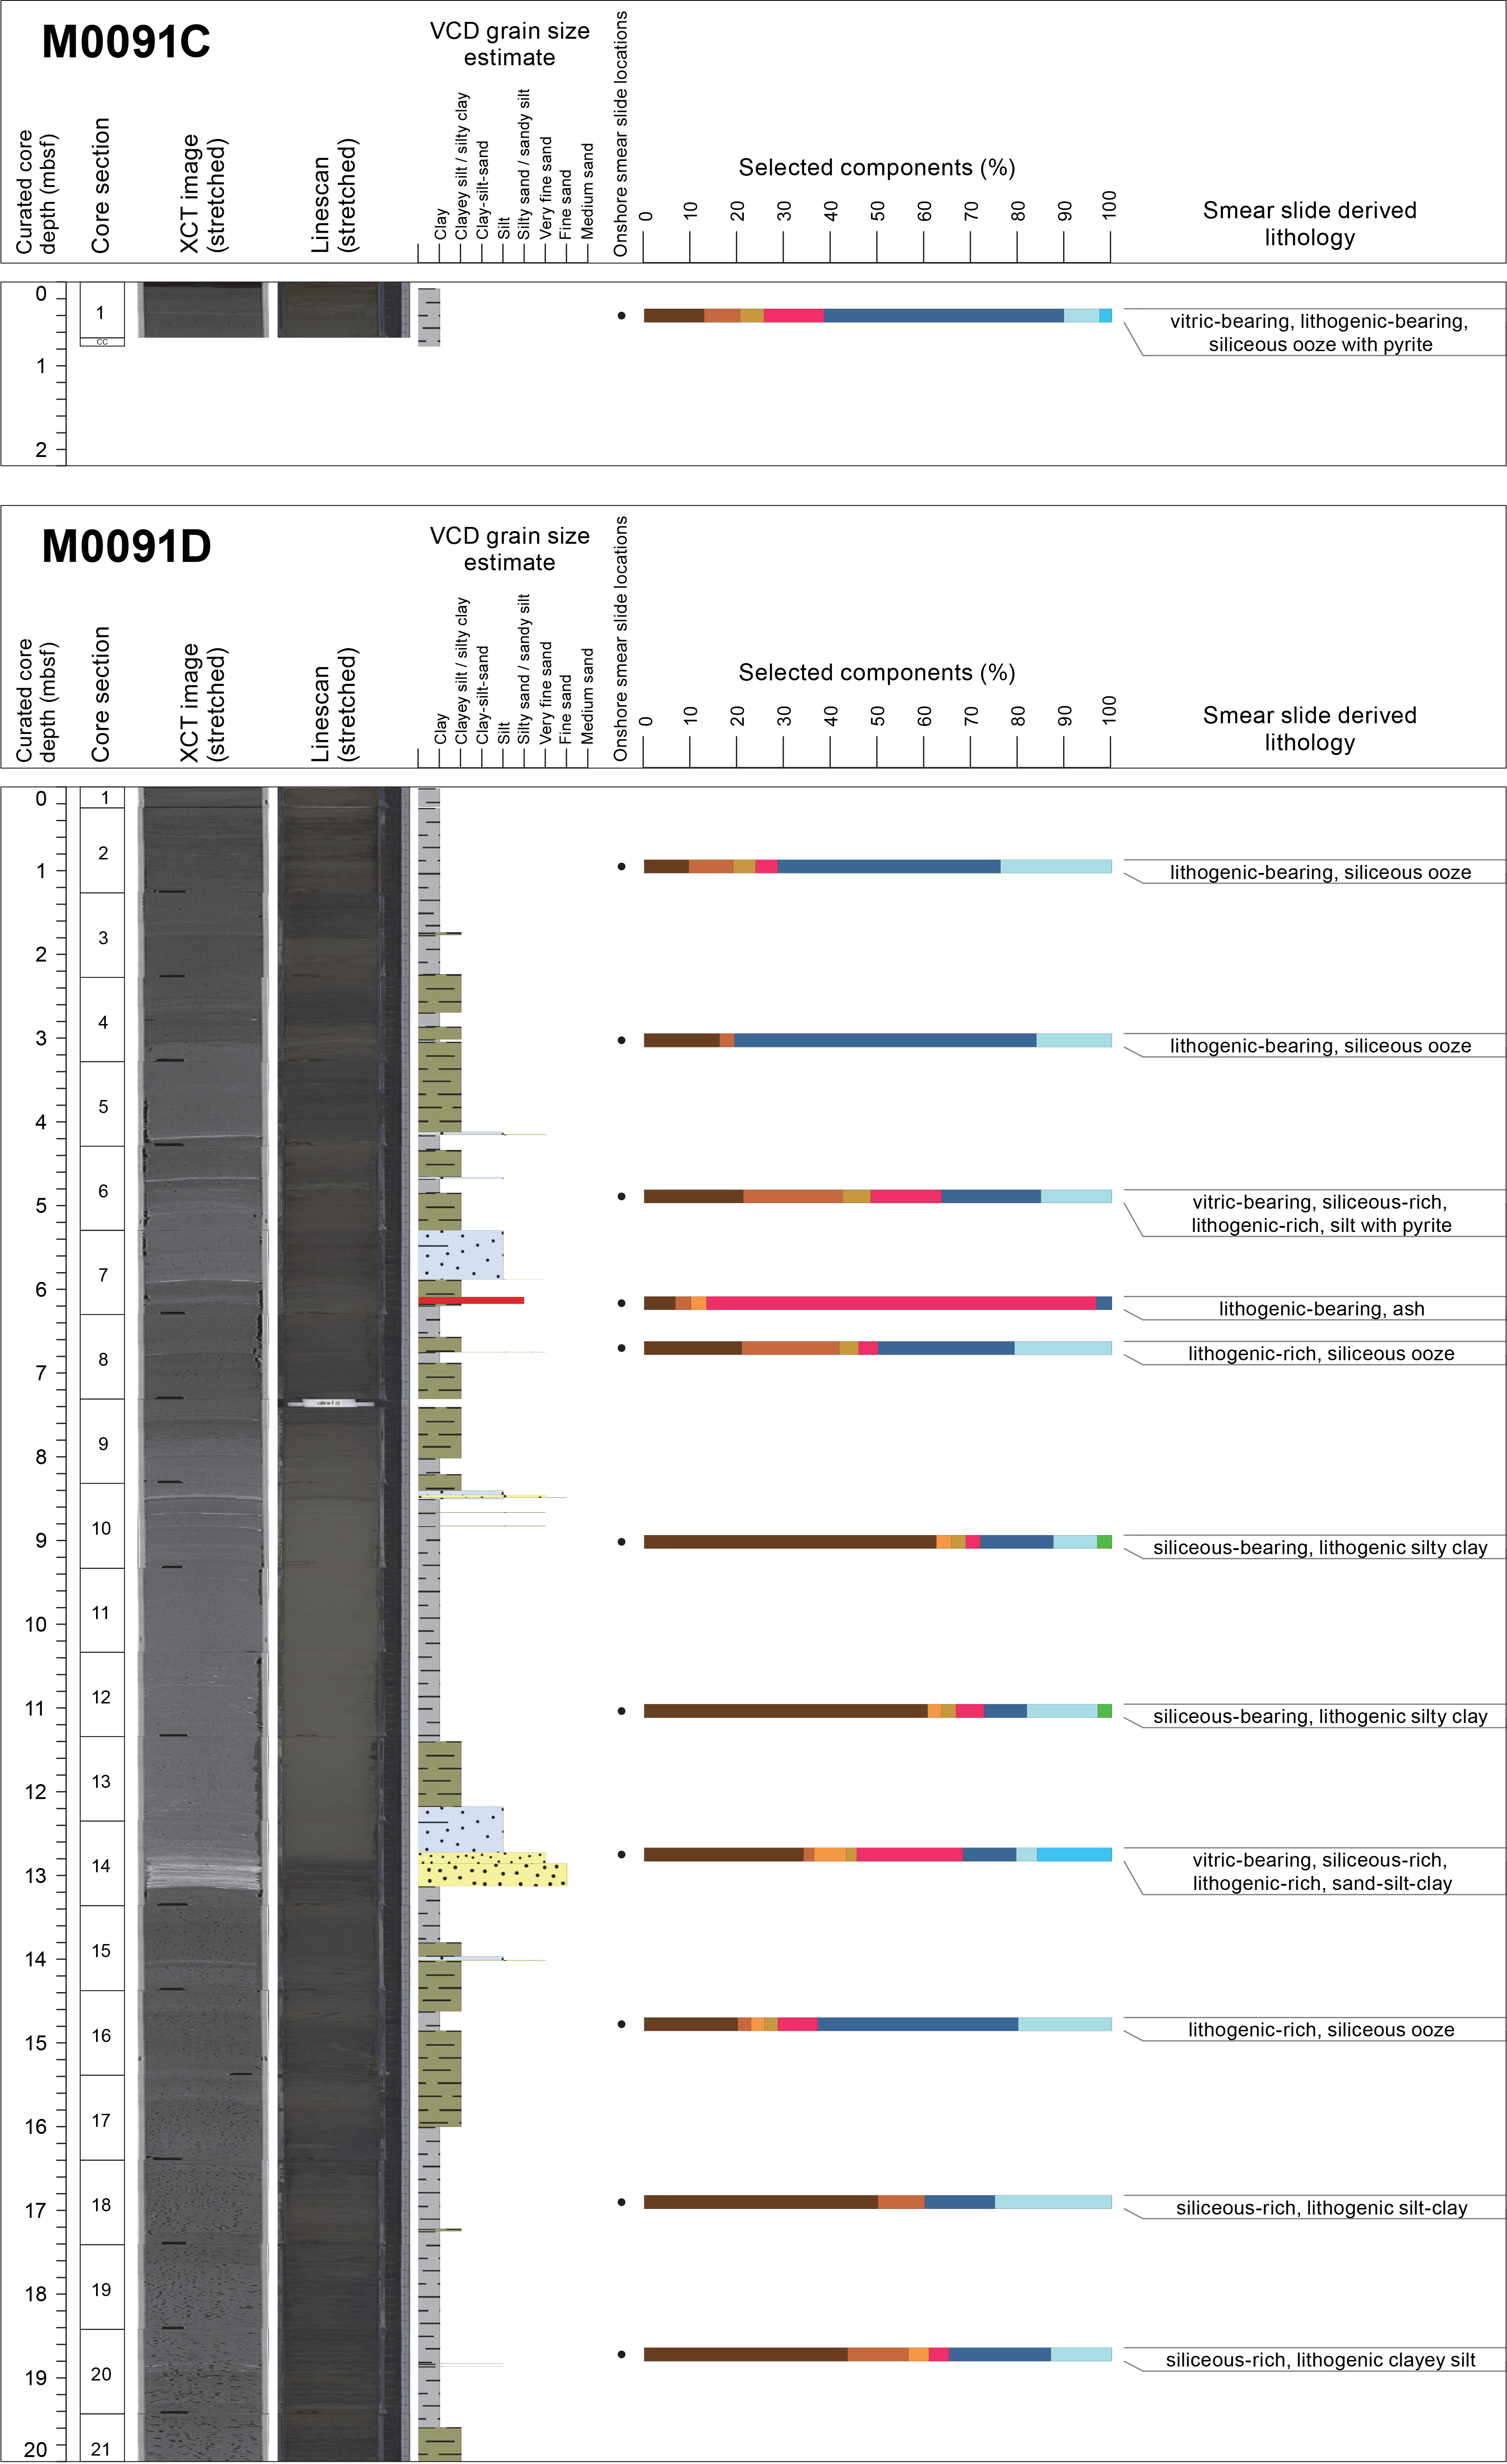
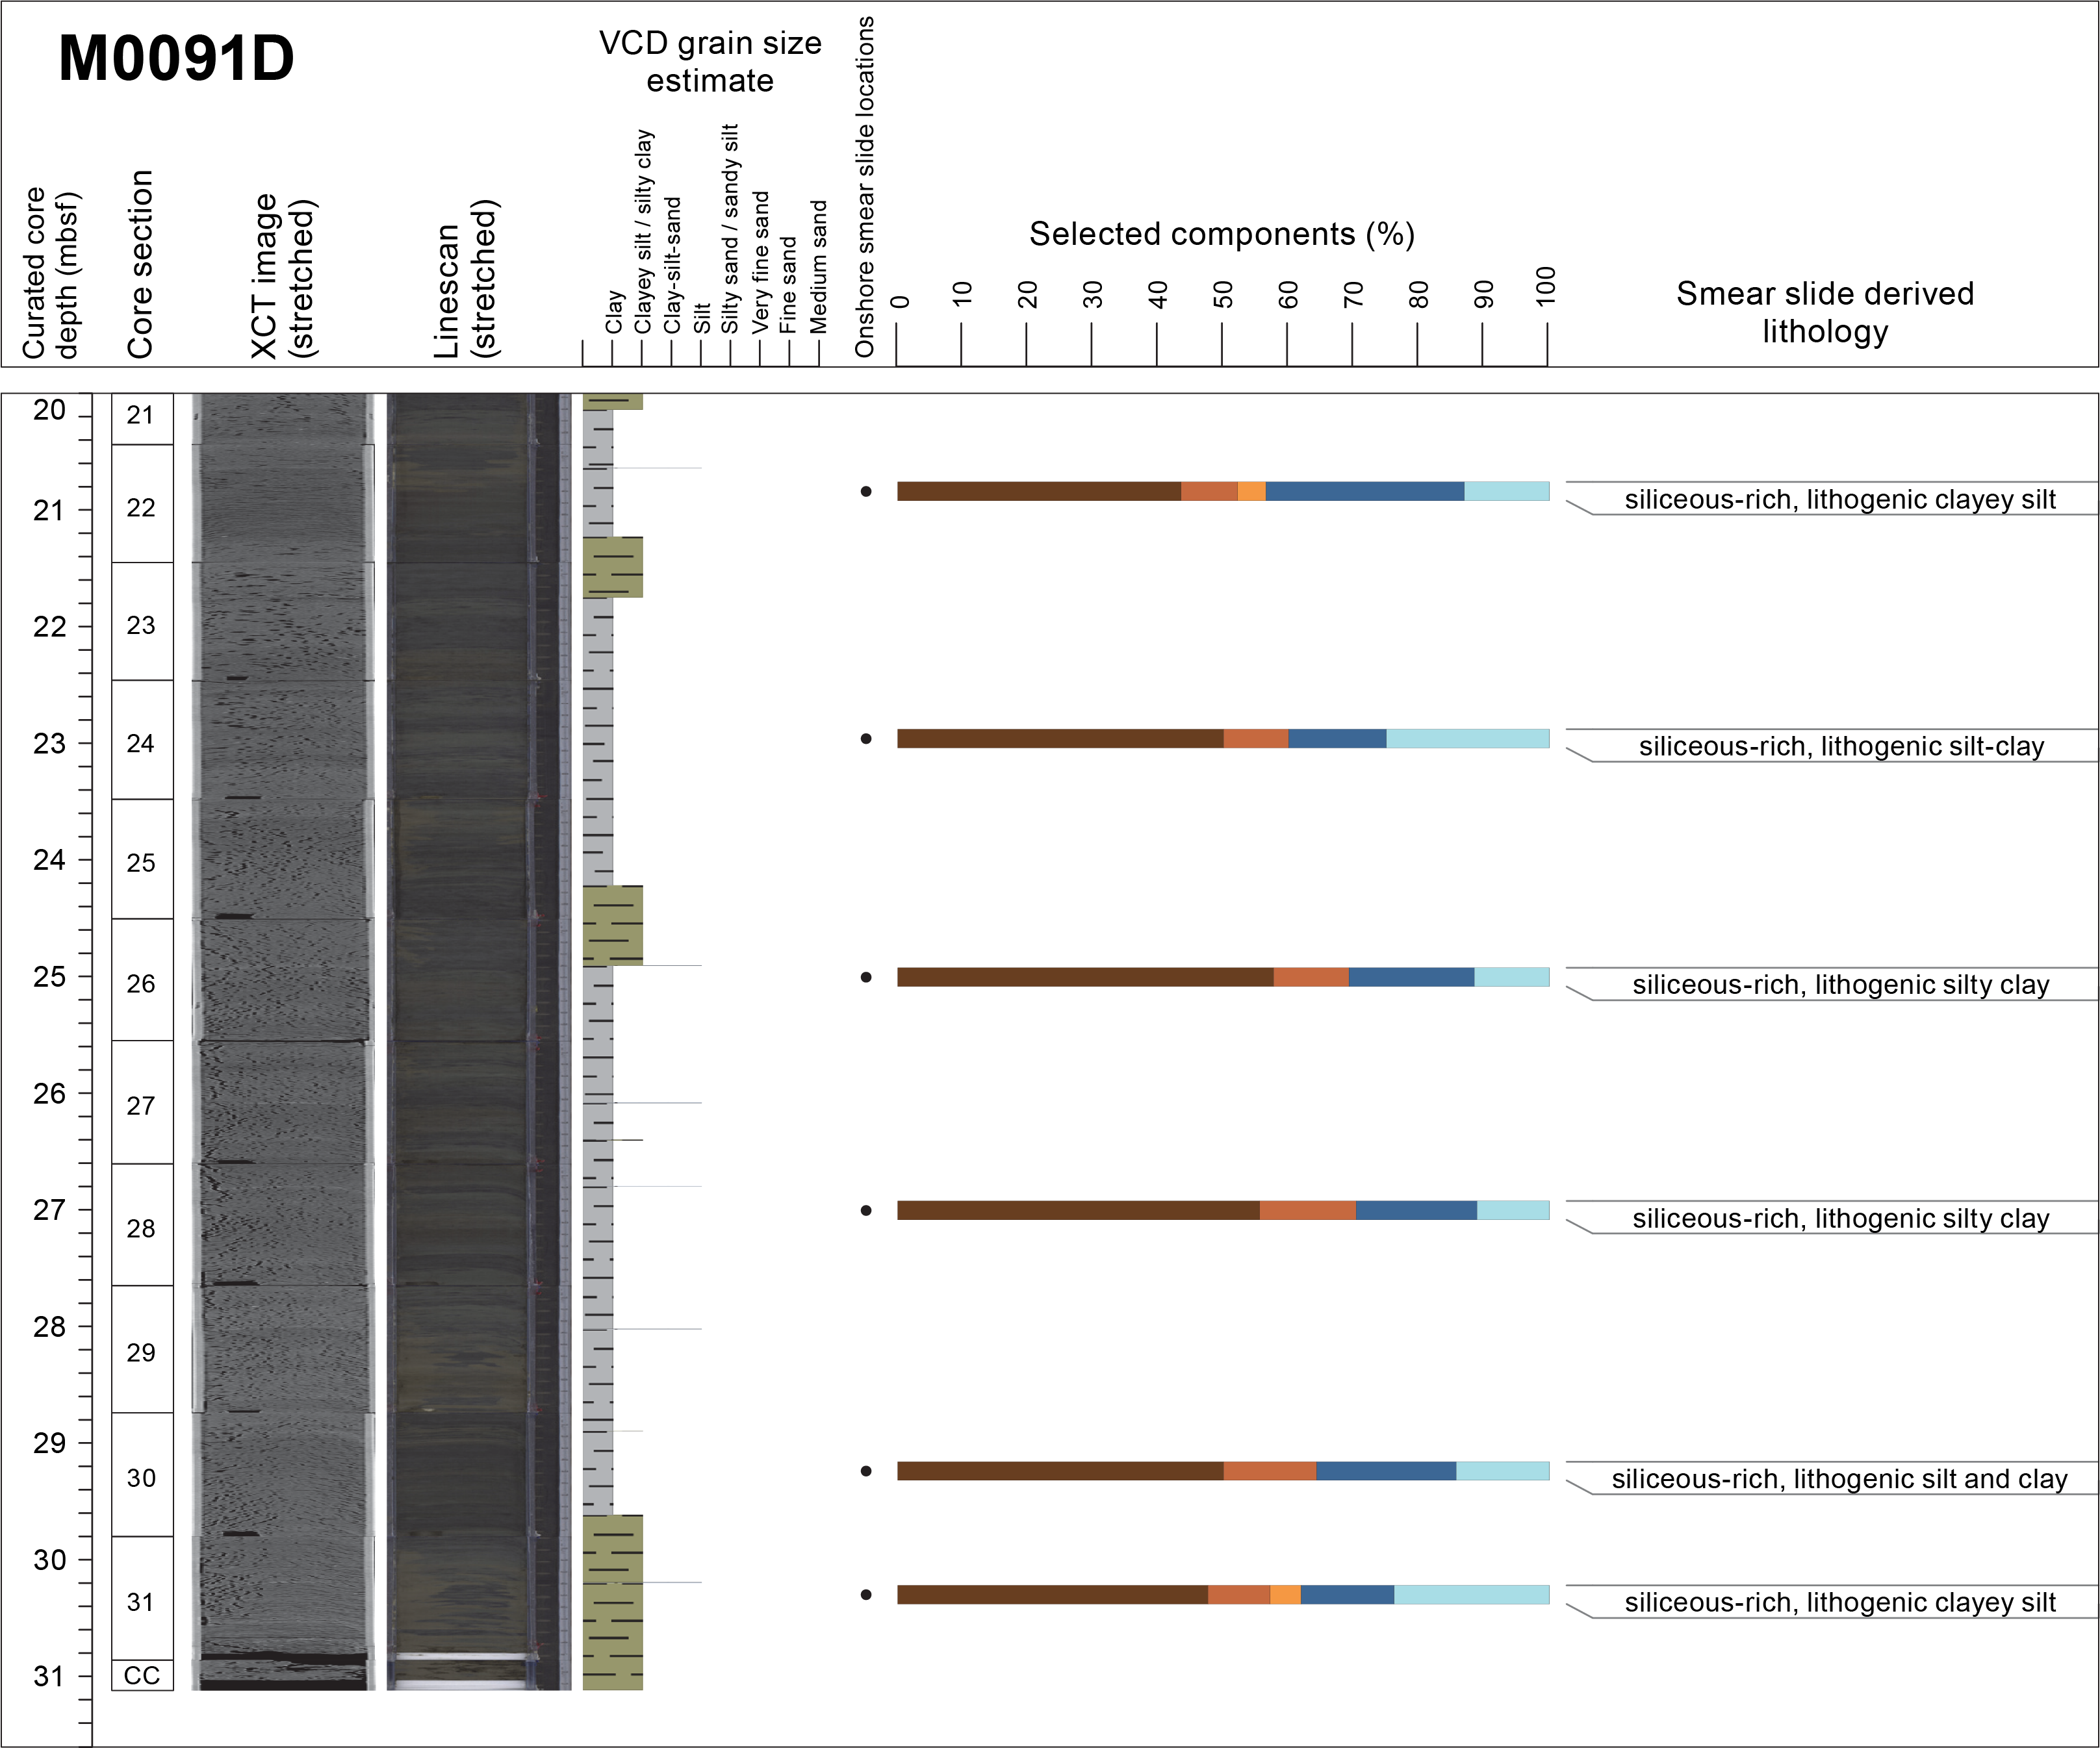
Figure F17. Smear slide summary plots, Holes M0091C and M0091D.
3.2.2. Hole M0091D
Hole M0091D is divided into three intervals.
Interval 1 (0–8.51 mbsf; Sections 386-M0091D-1H-1, 0 cm, to 1H-10, 19 cm) is similar to Interval 1 in Hole M0091B and is dominated by clay to silty clay with coarser grained laminae and beds of variable thickness, ranging from silty clay to fine sand (Figure F16). Sedimentary structures within the coarse beds include planar laminations and fining-upward grading. The degree of bioturbation varies from slight to heavy throughout the interval but is also absent in places. Generally, bioturbation is most easily observed when it is amplified by iron monosulfides. A bioturbated tephra (not observed in Hole M0091B) is distributed in patches in interval 386-M0091D-1H-7, 82–87.6 cm (6.12–6.17 mbsf) (see Tephra). Magnetic susceptibility is uniformly low, but bulk density and NGR show more variation in concert with the occurrence of coarse laminae and beds.
Interval 2 (8.51–13.14 mbsf; Sections 386-M0091D-1H-10, 19 cm, to 1H-14, 78 cm) is composed of a single, large event deposit. At the base of the event (Section 1H-14, 78 cm; 13.14 mbsf) a 27 cm thick very fine sand to fine sand, laminated, fining-upward bed grades into a thick, structureless clay that extends upward to Section 1H-10, 19 cm (8.51 mbsf). The structureless clay is present in Sections 1H-14 through 1H-9, and its lithostratigraphic characteristics are shown in detail in Figures F14 and F16. Two additional coarse-grained laminae and beds occur in Sections 1H-10, 36 cm, and 1H-10, 51 cm, within the structureless clay. Bioturbation and iron monosulfides are absent throughout the interval. The laminae and other coarse-grained beds are more frequent in Interval 1 than they are in Interval 2. Magnetic susceptibility and density show a strong broad peak corresponding to the thick sand at the base of the interval and then abruptly decrease and remain largely uniform to the top. Aside from the upward decreasing trend in the structureless clay, NGR is smooth with minor variations.
Interval 3 (13.14–31.12 mbsf; Sections 386-M0091D-1H-14, 78 cm, to 1H-31, 126 cm) is composed of clay with minor silty clay occurrences. Below 20 mbsf, the patterns and characteristics of the lithostratigraphy are remarkably consistent with those observed below 13 mbsf in Hole M0091B. In contrast to Hole M0091B, the laminae and other coarse-grained thin beds are of equal frequency throughout the recovered length of Hole M0091D. The degree of bioturbation varies from slight to heavy throughout the sections, except where absent. Generally, bioturbation coincides with iron monosulfide occurrence, and both are more prevalent and consistent in Holes M0091B and M0091D below 13 mbsf. Magnetic susceptibility and bulk density remain low and nearly constant in this interval, not apparently tracking with the coarser silt and sand laminae and thin beds that are present throughout this interval. NGR maintains its apparent cyclic variations, as observed in Hole M0091B at 13–20 mbsf and below 20 mbsf in Hole M0091D (see Physical properties).
A total of 17 smear slides were described for Hole M0091D (Table T3; Figure F17). The grain size, as determined from smear slides, includes silt, clayey silt, silty clay, and sand-silt-clay (Figure F12). In terms of the major components in the sediment, the composition is similar to Hole M0091B, but the relative percentage of the grain size of sedimentary components is slightly more variable in Hole M0091D (Figures F13, F17). In particular, vitric components are slightly more abundant in Hole M0091D in several smear slides from 0 to 19 mbsf. The tephra occurrence in the smear slide from Hole M0091D (Sample 1H-7, 87 cm) contains 83% vitric components (see Tephra). Clay is the most abundant mineral component (30%–55%), with some quartz (0%–12%) and vitric shards (<5%); diatoms and sponge spicules dominate the biogenic fraction, with more diatoms (15%–45%) than sponge spicules (10%–30%) in all samples. Pyrite was observed in smear slides collected between 0 and 15 mbsf in Hole M0091D. This component was not observed in smear slides from Hole M0091B. Calcareous nannofossils occurred in only two smear slides from Hole M0091D (Samples 1H-10, 70 cm, and 1H-12, 70 cm) from the thick, structureless clay interval above the coarse laminated bed (~13 mbsf). Calcareous nannofossils were also observed in the equivalent sediment of Hole M0091B (Samples 1H-10, 60 cm, and 1H-12, 50 cm) and may be diagnostic for this sediment deposit. In addition, radiolaria were documented in a smear slide (Sample 386-M0091D-1H-14, 40 cm) collected within the coarse-grained deposit at ~13 mbsf; this occurrence may potentially be diagnostic of this deposit. Example smear slides are shown in Figure F15.
3.3. Diagenesis
Sediments at Site M0091 have variations in the intensity of iron monosulfides throughout the cores. Relative to the host lithostratigraphy, there are three main patterns of iron monosulfide occurrence: (1) mottled as small dots (1–10 mm in diameter) or patches (>1 cm in diameter) in fine-grained sediment intervals, (2) mottled in bioturbated zones beneath coarse-grained sediments, and (3) nearly uniform in stratabound layers in both fine- and coarse-grained beds (Figure F18). This variation ranges from absent in some intervals to ~10–15 cm thick intervals of variable intensity iron monosulfides in the cores to a nearly uniform presence in the sediments. Iron monosulfides are most easily observed during split core description and subsequent examination of the linescan images for each section. Although bioturbation intensity is also variable throughout the cores, some bioturbated zones are most easily seen when amplified by iron monosulfide precipitates, particularly in lighter portions of the cores. In the lithostratigraphic summaries (Figures F11, F16), there is a strong coincidence of bioturbation and iron monosulfide occurrence. Core storage after acquisition (20–21 May 2021) and before core splitting (February 2022) resulted in variable oxidation of the sediments, which is particularly visible in some sections along fractures, at core section ends, and as encroachment fronts from the core liner edges. More pronounced oxidation occurs in Sections 386-M0091B-1H-3, 1H-15, and 1H-16 and 386-M0091D-1H-16, 1H-22, 1H-25, 1H-26, 1H-29, and 1H-31.
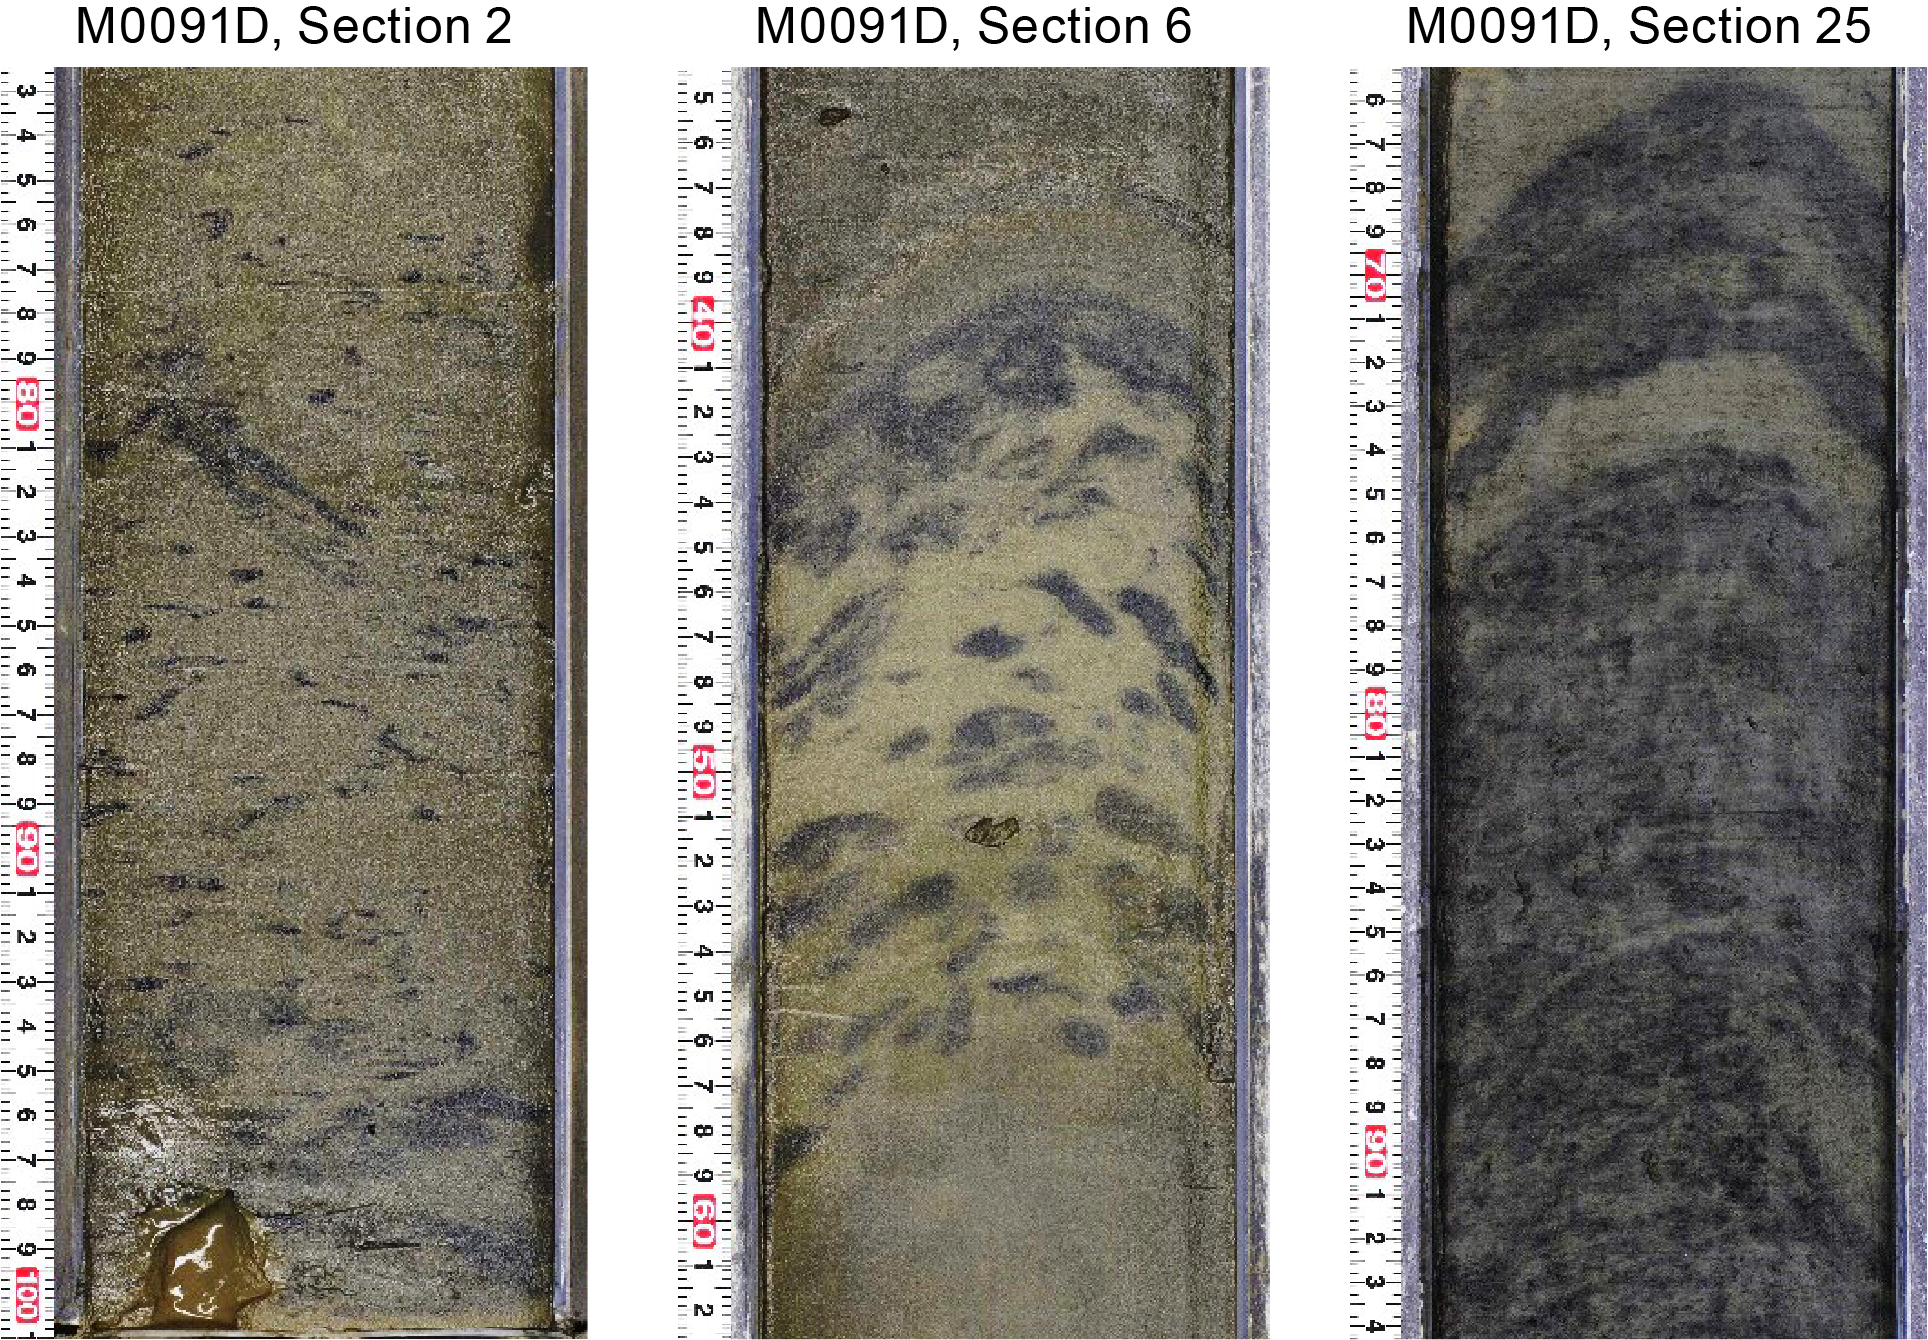
Figure F18. Iron monosulfide modes of occurrence.
3.4. X-ray diffraction mineralogy
X-ray diffraction (XRD) mineralogy was conducted for one sample in every other section, and the most abundant mineral and/or mineral groups are summed and shown as a downcore cumulative abundance plot with depth for the longest hole in each basin, in this case Hole M0091D (Figure F19; see XRD in Supplementary materials). Some of these mineral groupings will require additional processing to extract a signal for each mineral. For example, clays, carbonates, amphiboles, pyroxenes, and heavy minerals are composed of several minerals in each grouping (see Lithostratigraphy in the Expedition 386 methods chapter [Strasser et al., 2023a]). The interpretation of the mineralogy is preliminary at this stage; however, some interpretations can be made when the data are compared with the smear slides and lithostratigraphic summaries. For Hole M0091D, the most abundant minerals are quartz, feldspar, and clays, followed by micas (muscovite and biotite). The data show correspondence between quartz, feldspar, clays, and micas, and the smear slide data, which also show they are the most abundant minerals (Table T3). Palygorskite, a clay associated with the weathering of glasses, occurs at 6–12 and 26 mbsf, and in most instances it occurs where there are vitric grains or tephra. The amphibole group minerals, the heavy minerals, and pyroxene are rarely present throughout the core, but where present, they seem to correlate with silty clay and clayey silt intervals. Pyrite was detected between 2 and 6 mbsf. Carbonate is rare in most of the Expedition 386 cores; however, the XRD data indicate it is present at 20 mbsf. Future studies will be required to fully extract the bulk mineralogy of the sediments in these two holes.
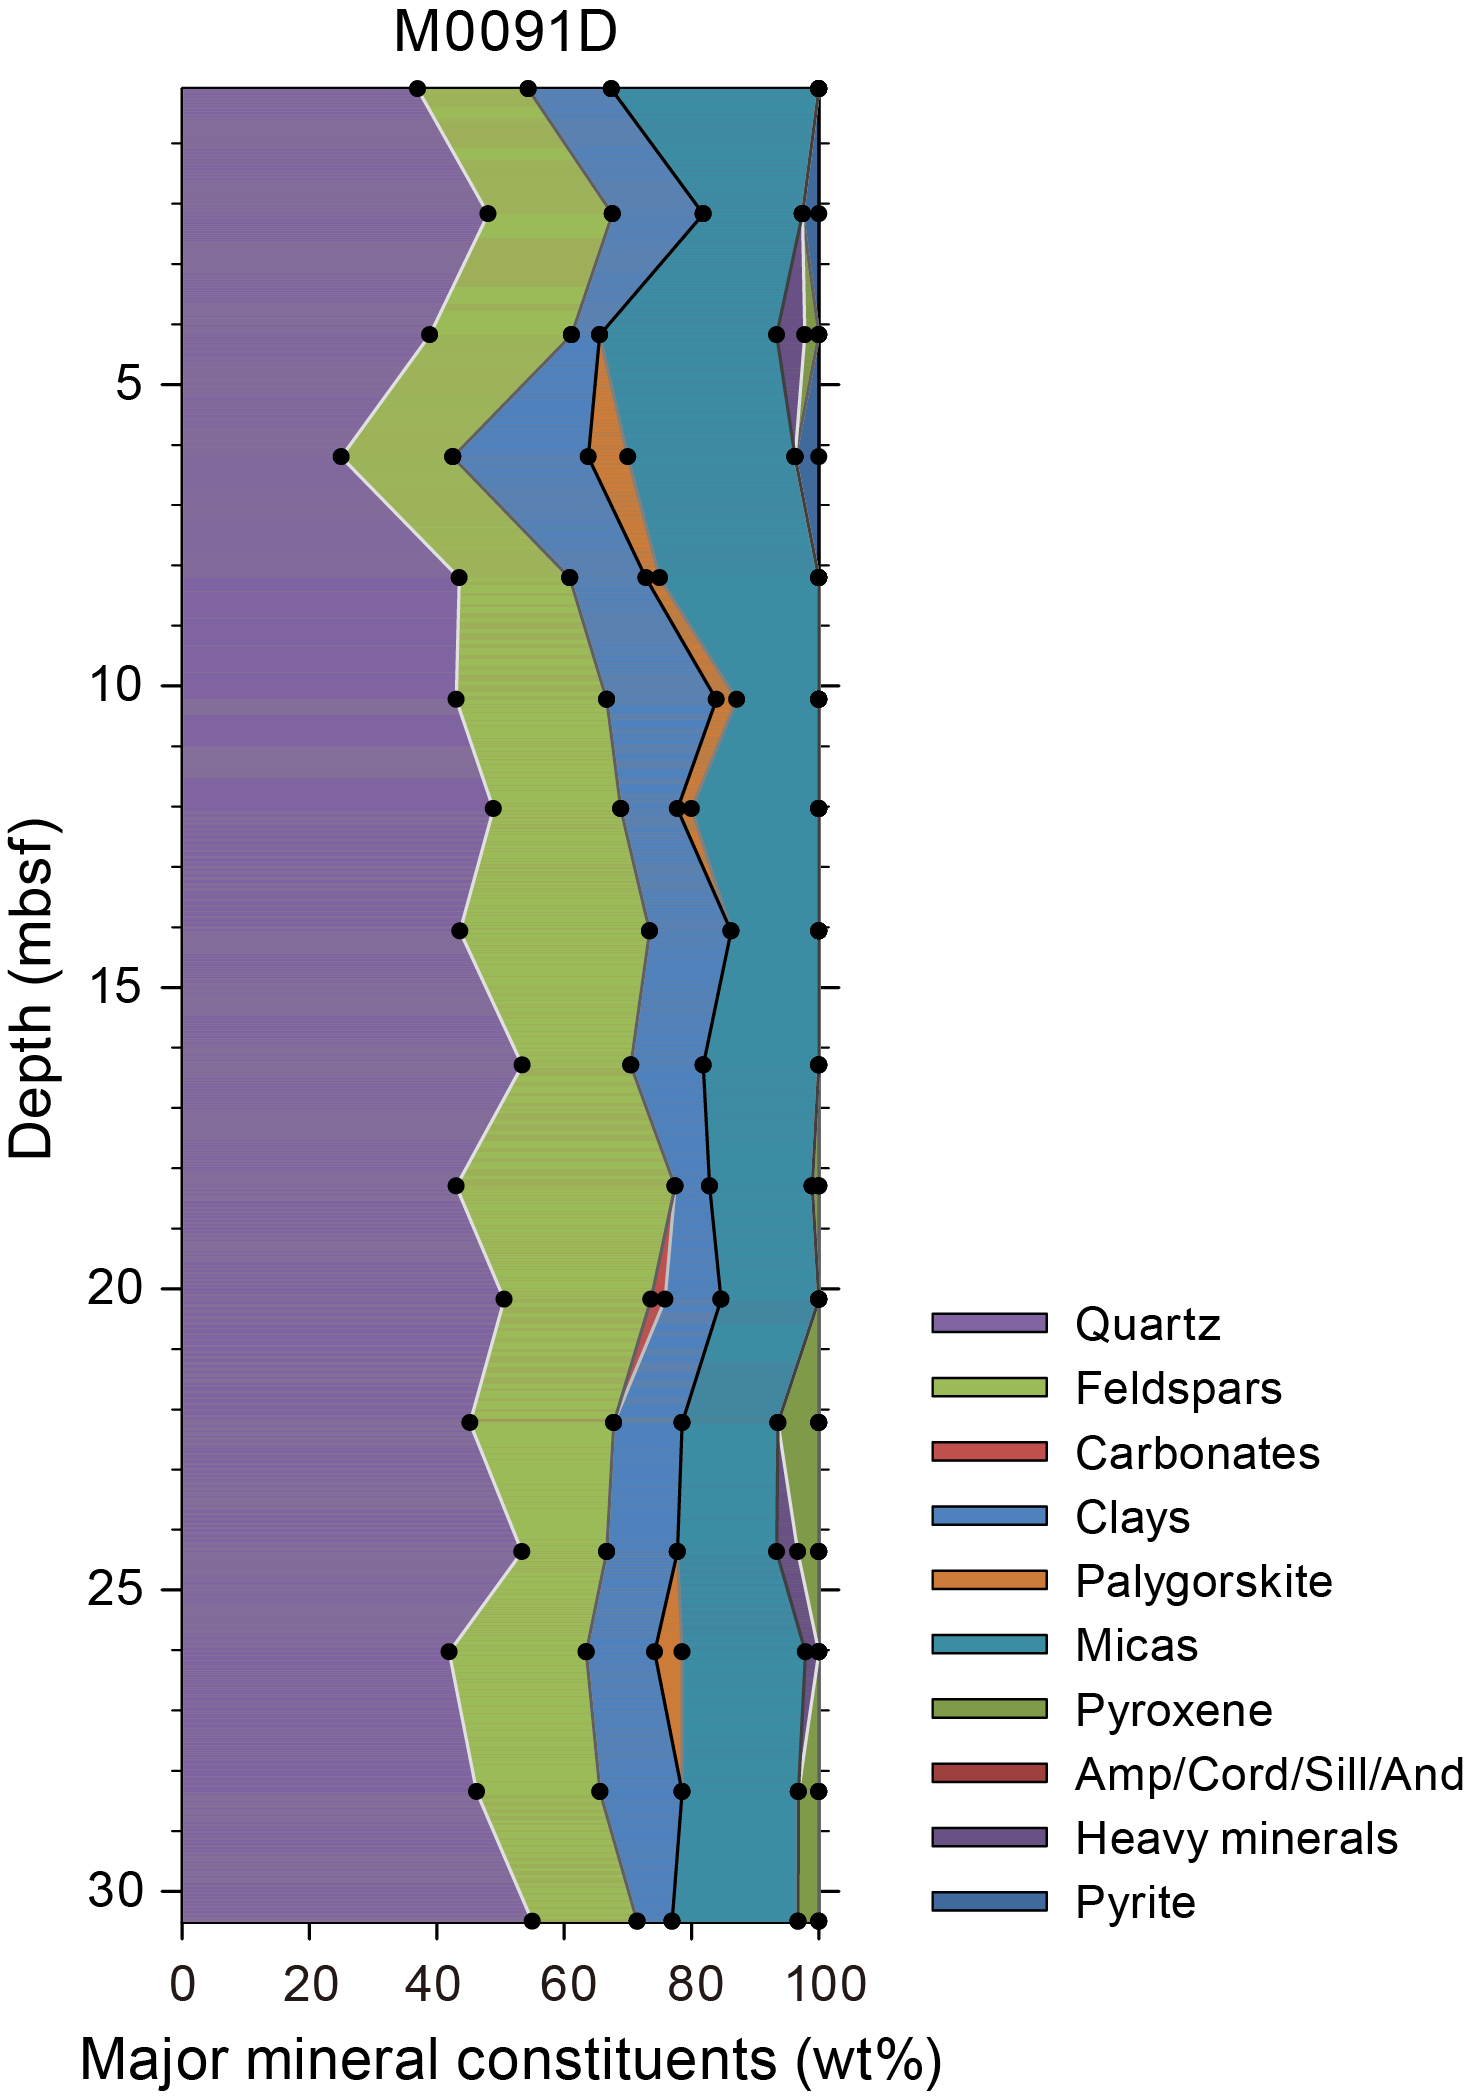
Figure F19. XRD mineralogy.
4. Tephra
One tephra layer was described in Basin S3 (Figure F20). This reddish brown silt-sized tephra (M0091D-1H-7, 87.6 cm) is intercalated as patches in silty sediment interval 386-M0091D-1H-7, 82–87.6 cm. It is composed of abundant fibrous type volcanic glass shards, with other types, such as pumiceous and moderate vesicularity volcanic glass shards, also present (Table T4; Figure F21). Heavy minerals are rare, although hornblende was observed.
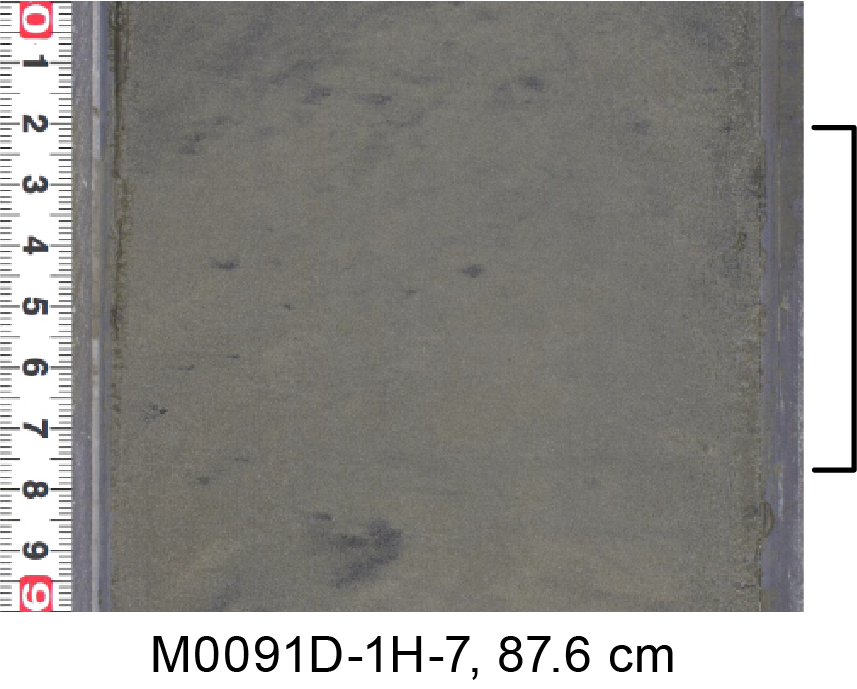
Figure F20. Tephra core photo.
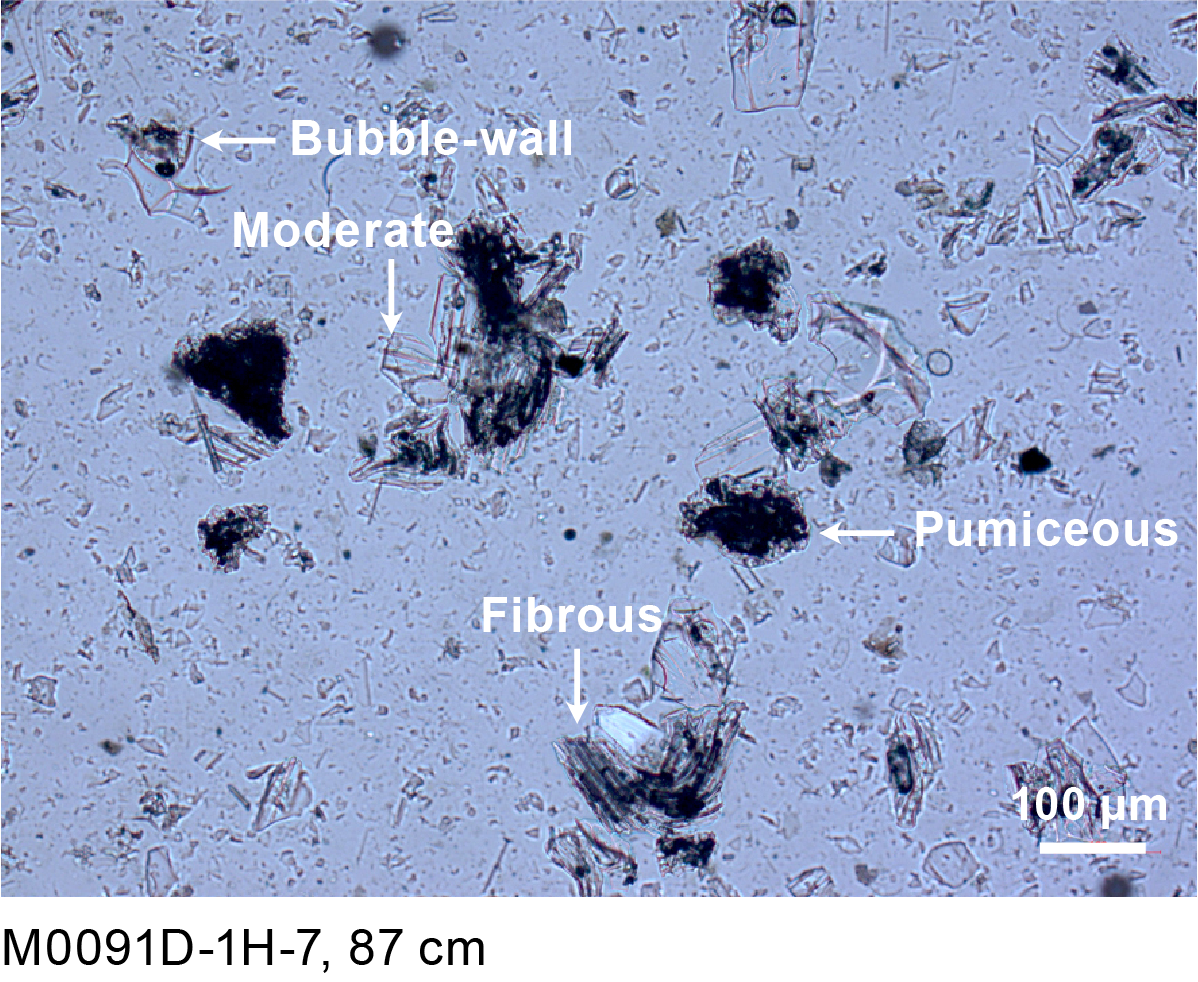
Figure F21. Volcanic glass shards.
5. Micropaleontology
Four holes were cored at Site M0091 in Basin S3 in the northern part of the southern Japan Trench. The biostratigraphy determined for Hole M0091D was based on an examination of radiolaria collected during the offshore phase of Expedition 386. Foraminifera in samples collected during the offshore phase were examined to determine provenance of mass transport deposits.
5.1. Radiolaria
Relative abundance changes of Cycladophora davisiana, the Tetrapyle circularis/fruticosa group (hereafter Tetrapyle group), and Lithomelissa setosa in Hole M0091D are shown in Figure F22. Results of radiolarian analysis for this hole are described below.
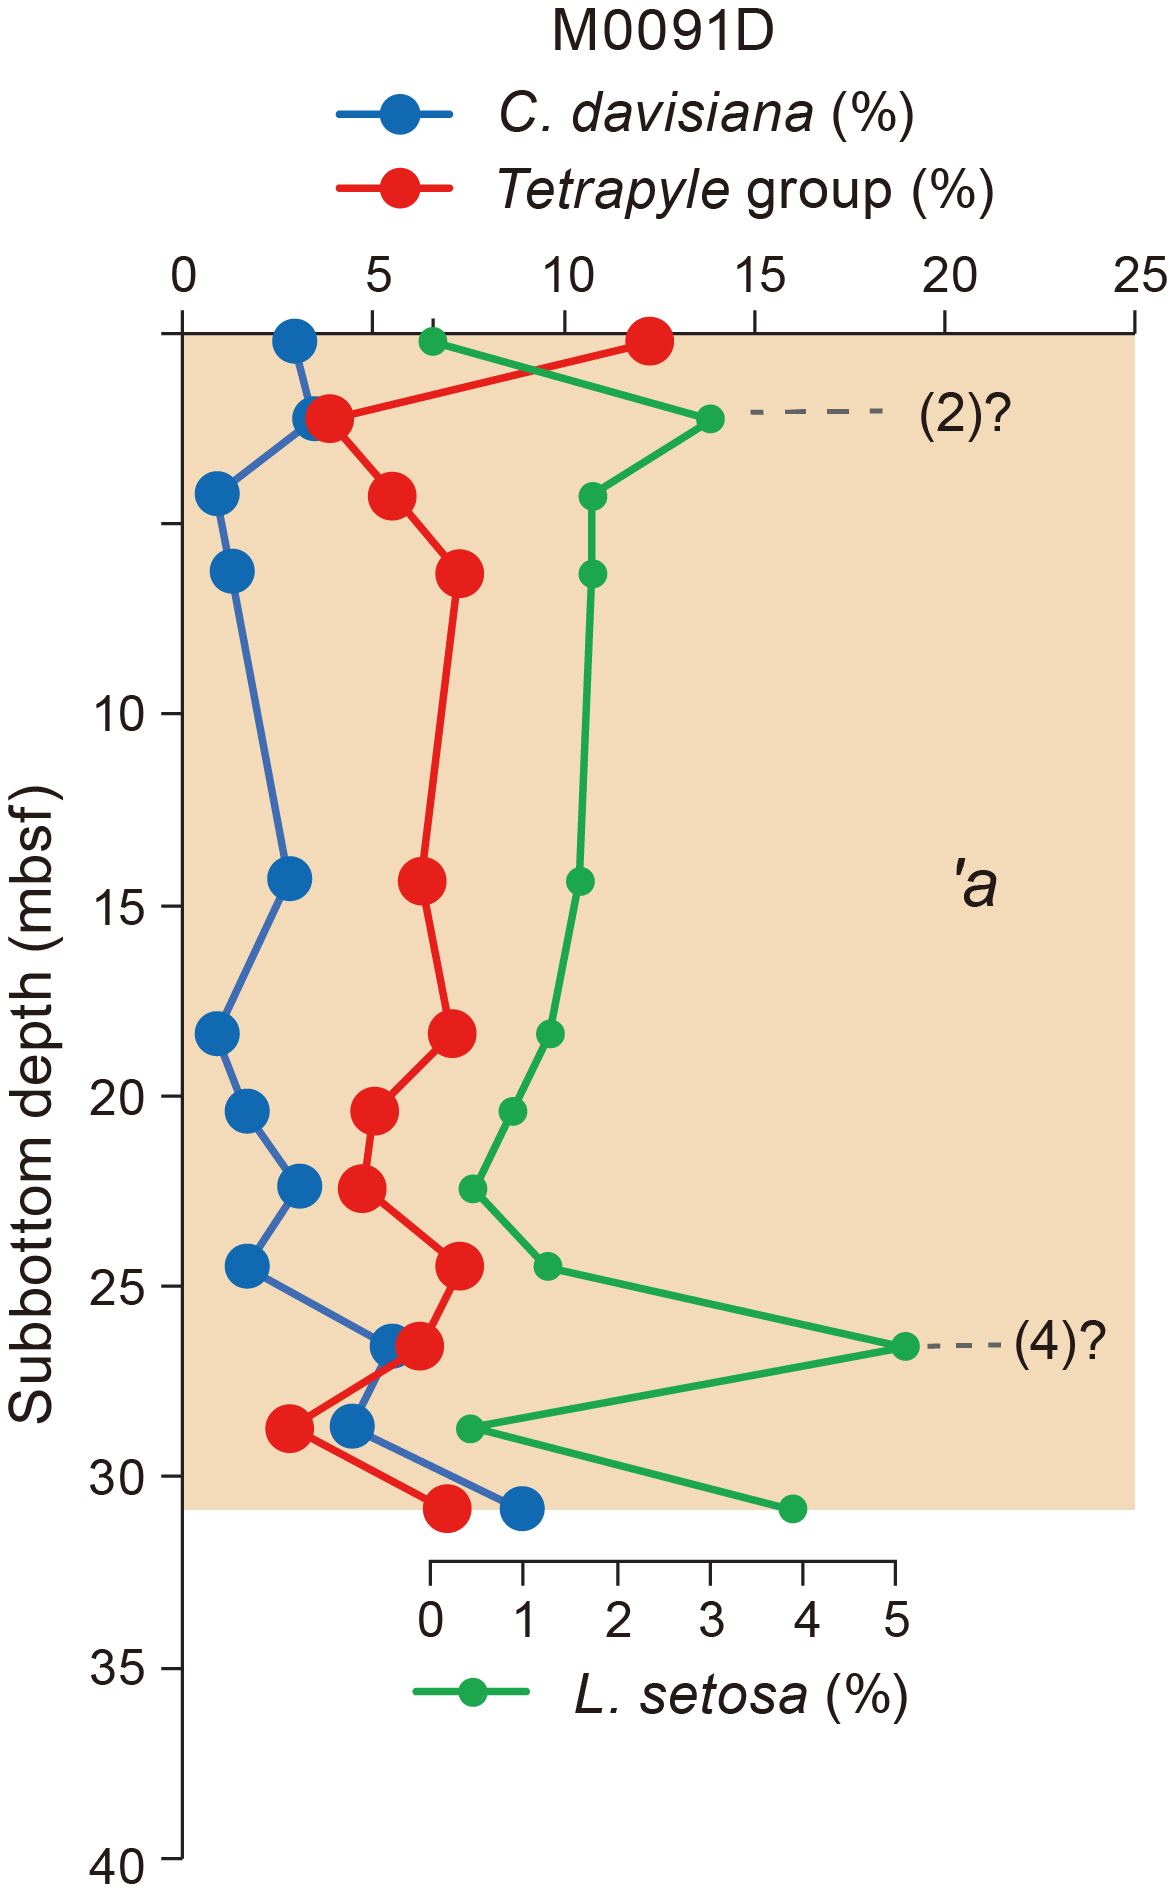
Figure F22. Radiolarian species abundance.
A total of 16 radiolarian samples were collected from Hole M0091D, and 12 were processed for analysis (Table T5). Four additional samples were recovered from possible event layers and were not processed. Radiolarian fossils were abundant in all examined samples, with good preservation. The relative abundance of C. davisiana ranges 1%–9% and tends to be high (>5%) below 26.6 mbsf. Therefore, it is likely that the entire section of this core is included in C. davisiana Zone ‘a, corresponding to the Holocene (Morley et al., 1982; see Micropaleontology in the Expedition 386 methods chapter [Strasser et al., 2023a]), and it is possible that the lower part of the core correlates with the earliest Holocene, near the boundary of C. davisiana Zones ‘a and ‘b. Relative abundance of the Tetrapyle group ranges 3%–12%; however, it is difficult to define the interval between Events 1 and 3. It may be possible to correlate the two peaks in the relative abundance of L. setosa at 2.3 and 26.6 mbsf with Events 2 and 4, corresponding to approximately 7 and 11 ka, respectively (see Micropaleontology in the Expedition 386 methods chapter [Strasser et al., 2023a]).
5.2. Foraminifera
Samples were taken at 5 m intervals offshore, as described in Micropaleontology in the Expedition 386 methods chapter (Strasser et al., 2023a). With the exception of the agglutinated foraminifera, which may be either in situ or reworked, all foraminifera at Site M0091 are considered to be allochthonous.
5.2.1. Hole M0091A
One sample taken from the base of Hole M0091A was examined for foraminifera (Table T6). Only one benthic specimen with good preservation is present. The sample contains abundant diatoms, radiolaria, sponge spicules, and glass shards.
No provenance interpretation can be made for this sample due to low foraminifera abundance.
5.2.2. Hole M0091B
Four samples from Hole M0091B were examined for foraminifera (Table T6). Benthic foraminifera with moderate preservation are present in two of the samples; two samples are barren. Planktonic foraminifera with moderate preservation are present in only one sample. All samples examined for foraminifera contain abundant diatoms, radiolaria, and sponge spicules.
No provenance interpretation can be made for these samples due to low foraminifera abundance.
5.2.3. Hole M0091C
One sample from the base of Hole M0091C was examined for foraminifera (Table T6). Benthic foraminifera are present with very good preservation. One planktonic specimen with good preservation occurs in this sample, along with abundant diatoms, radiolaria, sponge spicules, and glass shards.
No provenance interpretation can be made for this sample due to low foraminifera abundance.
5.2.4. Hole M0091D
Seven samples from Hole M0091D were examined for foraminifera (Table T6). Benthic foraminifera with moderate to good preservation are present to rare in all samples, except for one. Planktonic foraminifera with poor to moderate preservation are present in two samples. All samples examined for foraminifera contain abundant diatoms, radiolaria, and sponge spicules.
One sample of note, 386-M0091D-1H-1, 22–25 cm (0.22 mbsf), contains very delicate agglutinated specimens of Reophax spp., which incorporate sponge spicules in their tests, and Bathysiphon spp., which incorporate sponge spicules and volcanic glass shards; these taxa are likely to be in situ. This sample also contains very abundant iron monosulfides, either infilling diatoms or radiolaria or as irregular masses.
No provenance interpretation can be made for these samples due to low foraminifera abundance.
6. Geochemistry
6.1. Interstitial water
At Site M0091, a total of 47 interstitial water (IW) samples were collected using Rhizon samplers from two trigger cores (Holes M0091A and M0091C) and two GPC cores (Holes M0091B and M0091D). In addition, one bottom water (BW) sample was taken from each of the two trigger cores. See Geochemistry in the Expedition 386 methods chapter (Strasser et al., 2023a) for details on the sampling, analytical methods, and data quality. Overall, IW geochemical results from all Site M0091 holes closely match for all analytes and are discussed together except where noted. In general, IW composition at Site M0091 is influenced by organic matter degradation, including the release of metabolic products and consumption of electron acceptors, as well as dissolution/precipitation reactions with sediment.
6.1.1. Shipboard analyses: salinity, alkalinity, and ammonium
Salinity generally varies between 33.5 and 35.9 (Table T7; Figure F23). Values of ~34.4 to 33.7 are found in the BW samples. In Hole M0091A, the two samples at 0.1 and 0.5 mbsf have a similar salinity (~34.5) to the BW sample from this core. However, an extreme salinity value of 34.9 occurs in Hole M0091C at ~0.5 mbsf. In both GPC cores, salinity fluctuates between 34.0 and 34.5 in the uppermost ~11 m. Below 11 mbsf, salinity increases gradually to 35.6–35.8 at 17–19 mbsf, except for one outlying low value of 33.5 at 17 mbsf in Hole M0091D.
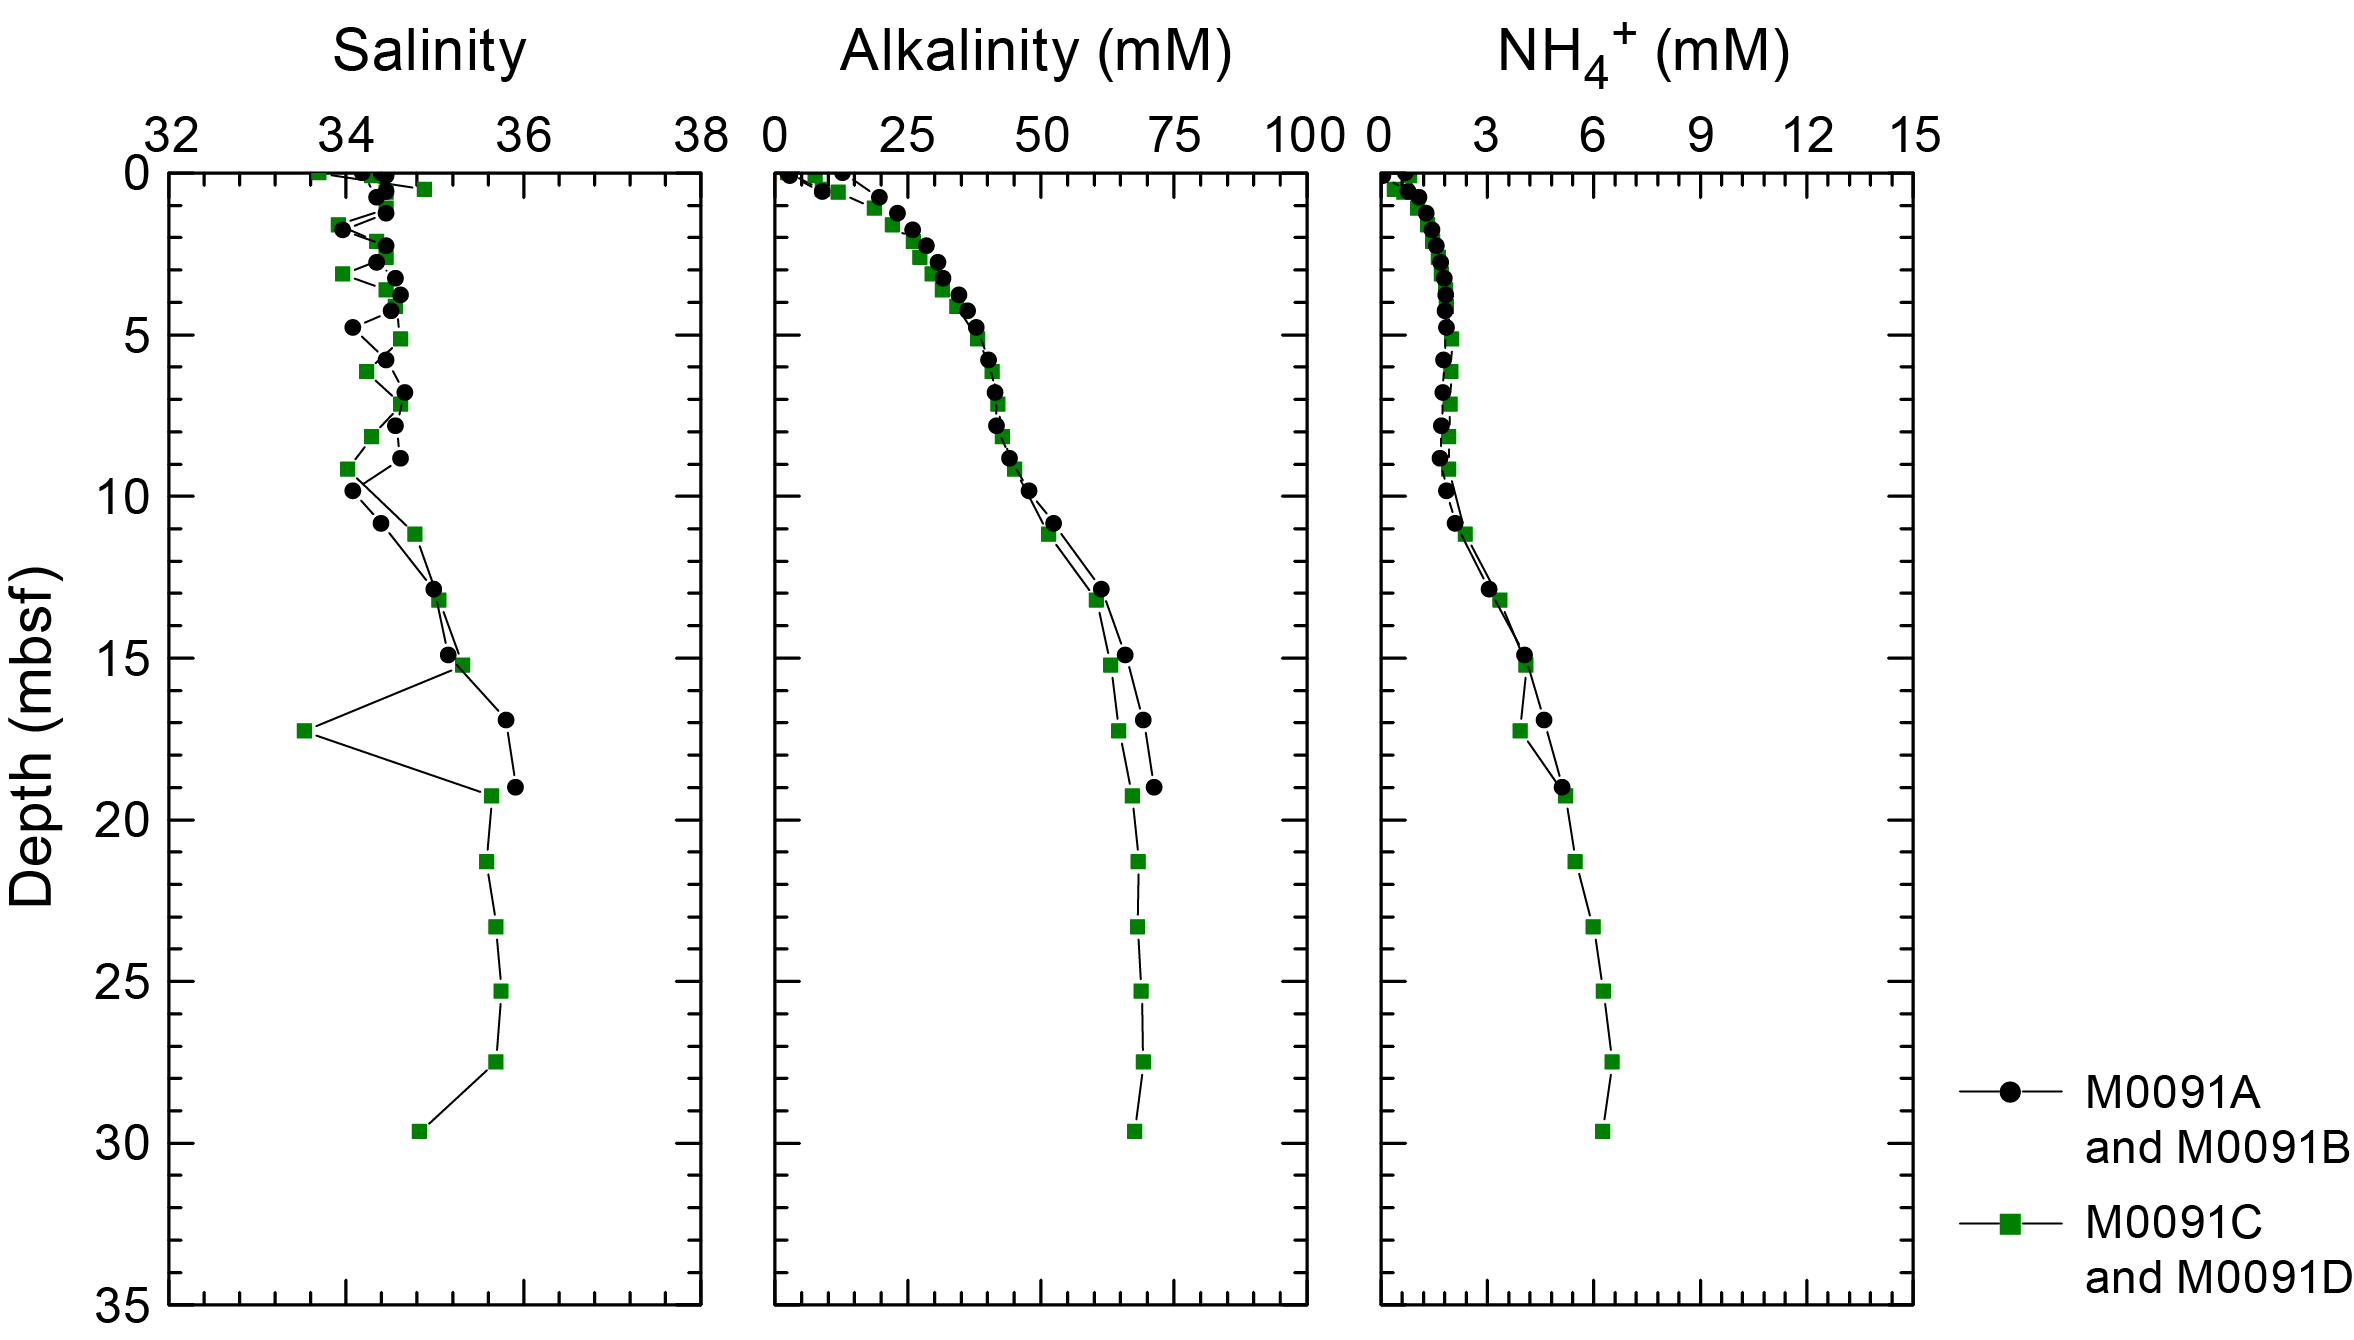
Figure F23. IW salinity, total alkalinity, and ammonium.
Alkalinity in the BW samples is similar to seawater values (2.5 mM; Bruland et al., 2014). In the trigger cores, alkalinity increases with depth from 3 to 9 mM between 0.1 and 0.6 mbsf. In the GPC cores, alkalinity increases with depth, starting at around 10 mM at <1 mbsf and rapidly increasing from ~10 to ~40 mM at ~7 mbsf. Below this depth, the increase slows to ~9 mbsf (~45 mM) and then accelerates again before the values stabilize at ~70 mM from ~19 mbsf to the bottom of Hole M0091D (Figure F23).
Ammonium (NH4+) is low (<0.06 mM) in the BW. Ammonium increases downcore in the trigger cores to a maximum of ~0.77 mM at 0.6 mbsf. This value is comparable to the values at the top of the GPC cores at <1 mbsf. In the GPC cores, ammonium increases rapidly to ~1.8 mM at ~4 mbsf and then decreases slightly to ~10 mbsf. Below 10 mbsf, ammonium increases more or less linearly with depth, reaching maximum values of ~6–6.5 mM below ~25 mbsf (Figure F23).
6.1.2. Shore-based analysis
6.1.2.1. Dissolved vanadium, molybdenum, and uranium
A suite of trace metals was analyzed using inductively coupled plasma–mass spectroscopy (ICP-MS), including vanadium (V), molybdenum (Mo), and uranium (U), briefly described below, as well as Copper (Cu) and rubidium (Rb). Data are listed in Table T7, and downcore variations are shown in Figure F24. Dissolved V concentrations in the BW and trigger cores from Holes M0091A and M0091C overlap, although the average value of ~50 nM in Hole M0091A is slightly higher than the value of ~40 nM in Hole M0091C. Similar V concentrations are observed within 1 m of comparable depth ranges in Holes M0091B and M0091D, except for one single outlying value of 189 nM at ~0.1 mbsf in Hole M0091D. Below 1 mbsf, dissolved V concentrations increase within the uppermost 2 m to about ~50 and ~70 nM in Holes M0091B and M0091D, respectively, before remaining more or less constant to ~8–9 mbsf. Below this depth, dissolved V concentrations increase to maximum values of ~190 nM between ~23 and 25 mbsf in Hole M0091D before slightly decreasing to ~155 nM at the bottom of the hole (~30 mbsf).
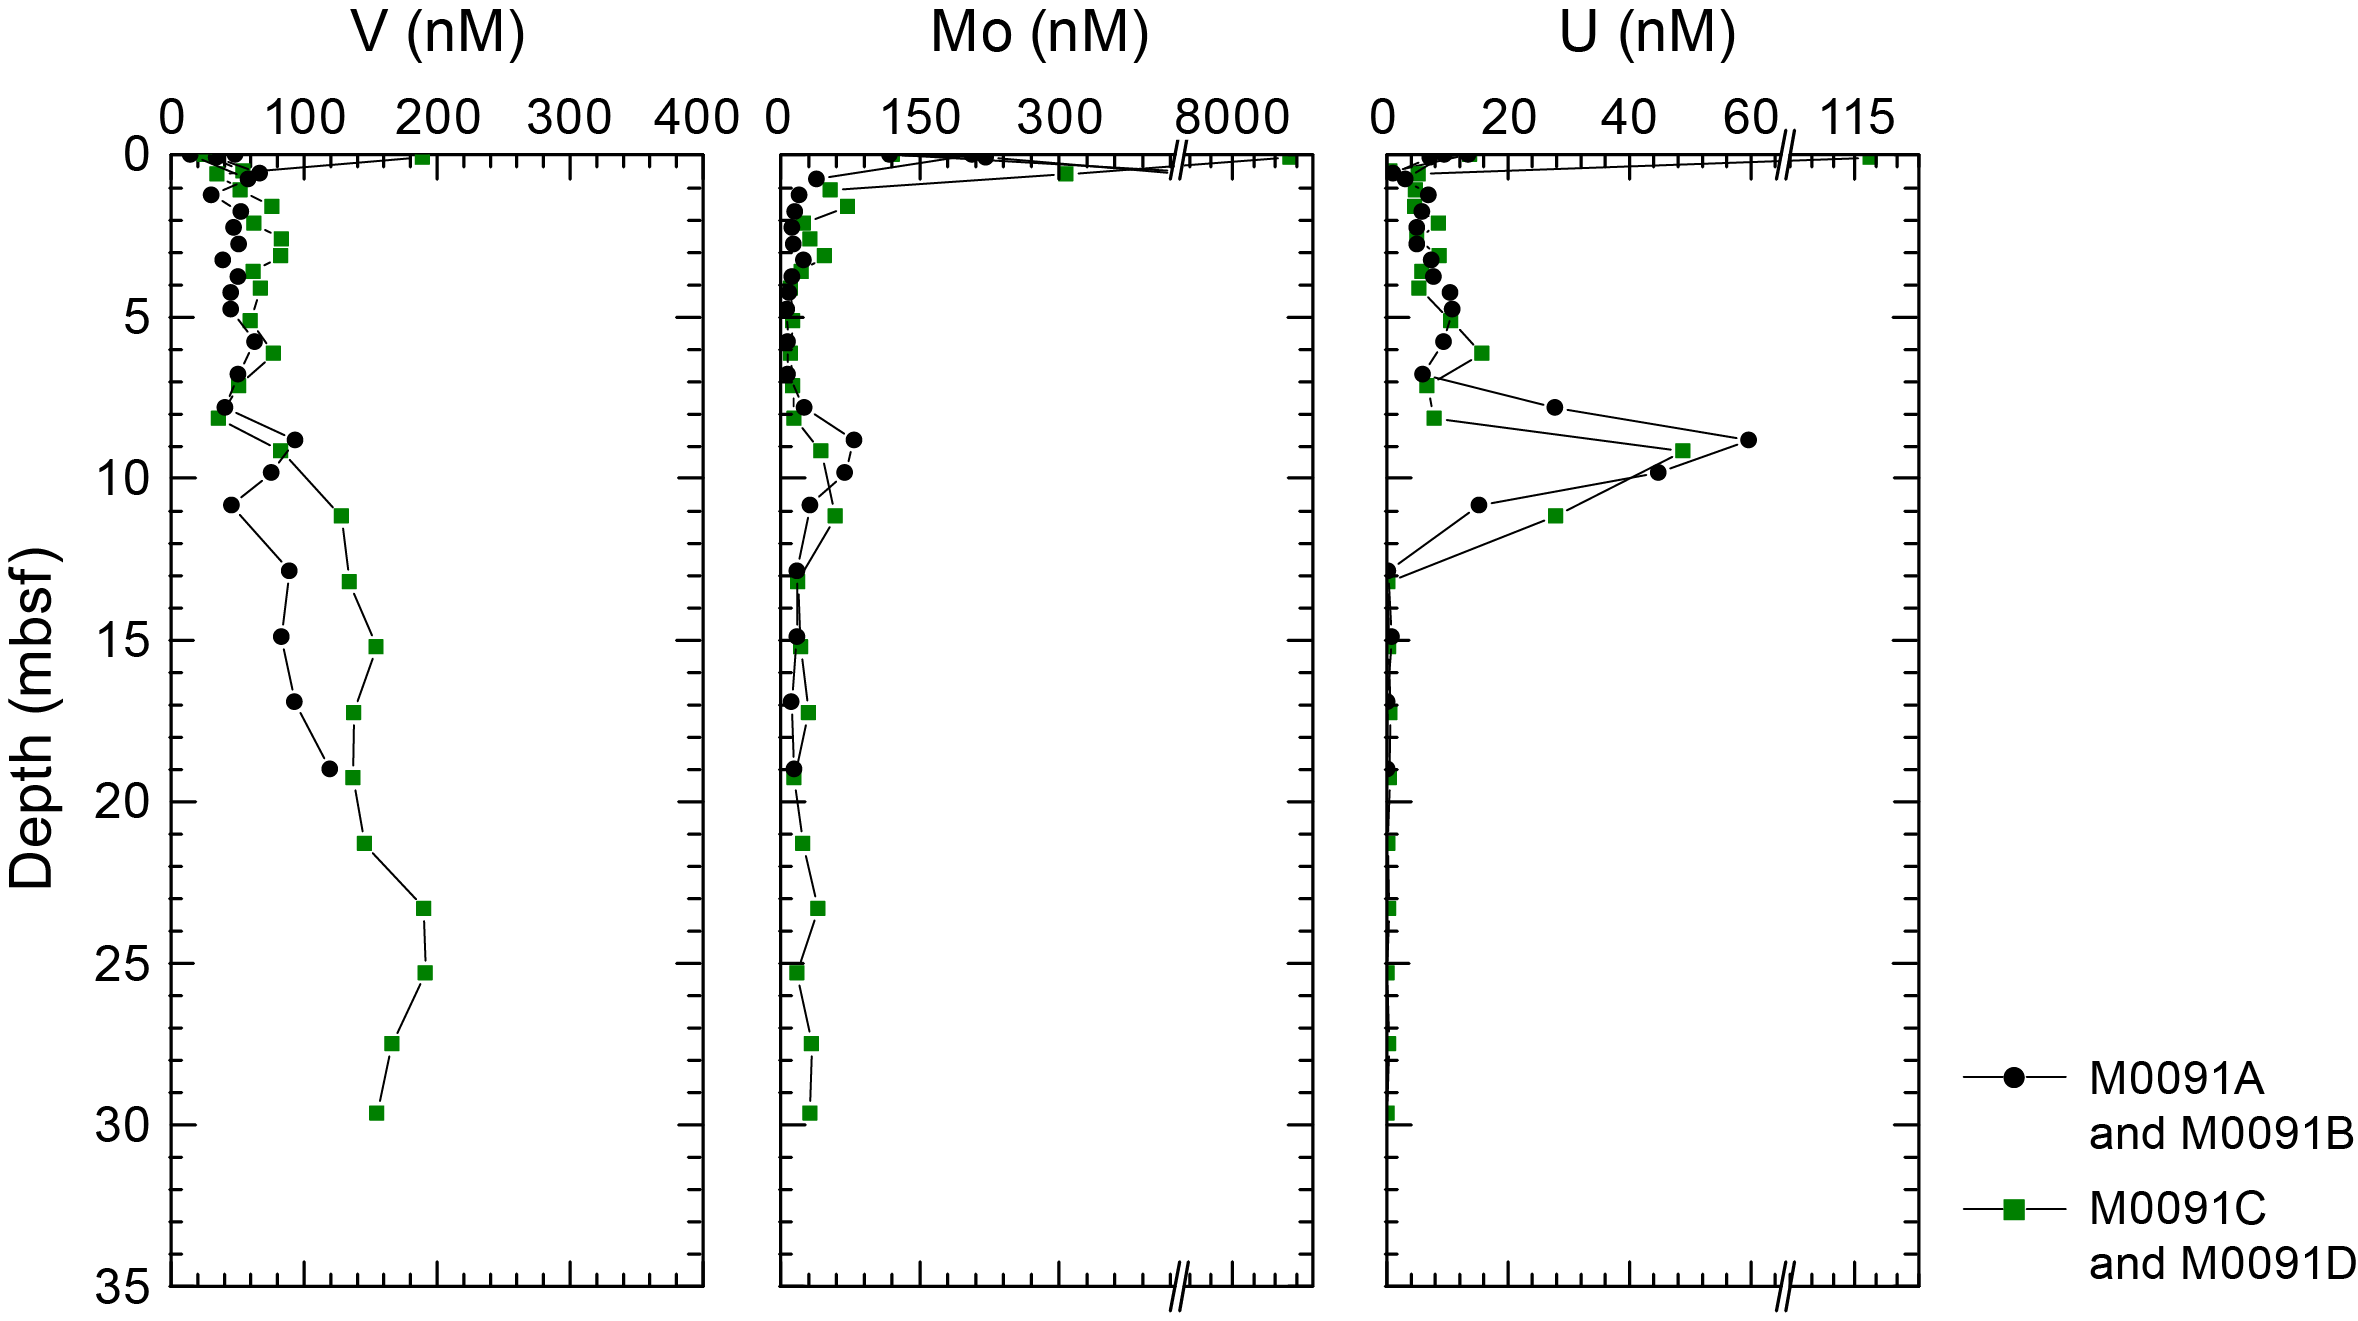
Figure F24. IW V, Mo, and U.
Dissolved Mo concentrations are low in the BW (118–120 nM) with values similar to seawater (Bruland et al., 2014), but they reach outlying maximum values of 3568, 1580, and 9086 nM in Holes M0091A and M0091C at ~0.6 and ~0.5 mbsf, respectively, and at the top of Hole M0091B at ~0.35 mbsf. In the GPC cores, the maximum values are at the top (Hole M0091B = 206 nM; Hole M0091D = 9086 nM), but below 1 mbsf, concentrations abruptly drop to <100 nM. Compared to Hole M0091B, dissolved Mo fluctuates more in Hole M0091D but follows a similar pattern downcore. In both holes between ~2 and ~8 mbsf, dissolved Mo is below 50 nM and fluctuates mostly between 10 and 30 nM. Between ~9 and ~11 mbsf, dissolved Mo increases to ~30 to ~80 nM before decreasing again, fluctuating between ~10 and ~40 nM for the remainder of the cores.
Dissolved U values in BW are relatively high (~13 nM) compared to the trigger cores (0.6–8 nM), but a maximum of ~116 nM occurs at 0.35 mbsf in Hole M0091D. The maximum value in Hole M0091B is only ~9 nM at ~0.85 mbsf. In the GPC cores, like the Mo profiles, U concentrations fall immediately within <1.5 mbsf and remain initially low at values that fluctuate between 5 and 10 nM. Between 6 and 11 mbsf, concentrations increase abruptly to a maximum value of 60 nM. After an abrupt drop in concentrations below 11 mbsf, U concentrations remain very low (<1 nM) for the remainder of the cores.
6.1.2.2. Dissolved lithium, boron, silica, manganese, iron, strontium, and barium
All minor elements analyzed using inductively coupled plasma–atomic emission spectroscopy (ICP-AES) are listed in Table T7, and downcore variations for the elements described below are shown in Figure F25. Dissolved lithium (Li) concentrations are highest (~26 μM) in the BW of Site M0091. In the trigger cores, Li concentrations decrease from ~26 to 22 µM between 0.1 and 0.6 mbsf. In the GPC cores, Li concentrations at the top (~22 µM) are similar to those in the lower parts of the trigger cores, which are also the maximum values for all GPC cores at this site. Holes M0091B and M0091D show nearly identical variations downcore. Dissolved Li drops rapidly to around ~19–20 µM between ~1 and 5 mbsf before increasing slightly to ~21 µM between ~5 and ~8 mbsf. Below ~8 mbsf, dissolved Li decreases nearly linearly to a minimum of ~13 μM at ~17 mbsf. Farther downcore, Li slowly increases to ~16 μM at the bottom of Hole M0091D (~30 mbsf).

Figure F25. IW Li, B, Si, Mn, Fe, Sr, and Ba.
Dissolved boron (B) is lowest in the BW (~431–436 µM). In the trigger cores, dissolved B increases from 474 to 520 μM between 0.1 and 0.6 mbsf. In the GPC cores, dissolved B gradually increases to ~660 μM at ~6 mbsf, where the B concentrations first level out and then slightly decrease to ~630 μM at ~10 mbsf. Below this depth, concentrations increase linearly to reach ~930 μM below 29 mbsf in the lowest part of Hole M0091D.
Dissolved silica (Si) concentrations are lowest in the BW (~144 μM). In the trigger cores, dissolved Si is much higher (~700–900 µM between ~0.1 and 0.6 mbsf). At the top of the GPC cores, Si concentrations are also ~700–900 µM. They increase slightly below ~0.3 to ~0.8 mbsf to ~700 to ~900 μM and remain at this level to ~7 mbsf. Below ~8 mbsf, dissolved Si decreases to 700 μM before increasing again at ~13 mbsf to fluctuate between ~700 and ~800 μM to the base of the cores.
Dissolved manganese (Mn) concentrations are at or near zero in the BW at this site. In the trigger cores, dissolved Mn increases downcore from ~114 to ~1915 μM between ~0.1 and 0.6 mbsf. In the GPC cores, a single maximum value of ~1738 μM occurs at ~0.35 mbsf in Hole M0091D. Otherwise, dissolved Mn is 400–440 µM at the top of the GPC cores, and then it decreases steadily and asymptotically downcore and eventually falls below ~20 μM at the bottom of Hole M0091D (30 mbsf).
Dissolved iron (Fe) mainly follows the downcore pattern of Mn. Concentrations are below the detection limit in the BW. In the trigger cores, dissolved Fe increases from ~60 to ~440 μM between ~0.1 and 0.6 mbsf. In the GPC cores, dissolved Fe ranges ~27–42 μM in the uppermost ~1 m. Below ~1 and 7 mbsf, dissolved Fe is consistently higher (up to ~86 μM) in Hole M0091B than in Hole M0091D, where maximum Fe values do not exceed ~27 μM. Downcore, dissolved Fe decreases to minima of ~10–12 μM at ~7 mbsf before increasing irregularly again downcore. In Hole M0091B, Fe concentrations reach a maximum of ~185 μM at ~13 mbsf, but otherwise dissolved Fe fluctuates between ~2 and 112 μM to the base of the cores.
Dissolved strontium (Sr) concentrations are around ~88–93 µM in the BW and the trigger cores (Holes M0091A and M0091C) without a systematic change with depth. In the GPC cores, there is a single higher value of dissolved Sr (~99 µM) at ~0.1 mbsf at the top of Hole M0091D. Dissolved Sr first decreases slightly downcore in the GPC cores and then levels out at ~85 μM at ~5 mbsf. Below this depth, dissolved Sr concentrations increase linearly to ~100 µM at ~13 mbsf. Below this depth, dissolved Sr remains more or less stable to the base of the cores at concentrations around ~100–105 µM.
Dissolved barium (Ba) values are lowest (~0.15 μM) in the BW. In the trigger cores, dissolved Ba increases from ~0.6 to ~1.5 μM between ~0.1 and 0.6 mbsf. Dissolved Ba is also low (~1 μM) in the uppermost 11 m of the GPC cores except for a single elevated value of ~3.7 μM at 0.1 mbsf in Hole M0091D. At ~8 mbsf, dissolved Ba concentrations increase steeply and rapidly to ~30 µM at ~11 mbsf. Ba concentrations in Hole M0091B continue to increase to a maximum of ~44 μM at ~19 mbsf. Below ~15 mbsf in Hole M0091D, dissolved Ba fluctuates around 30 μM prior to reaching a maximum value of ~45 μM at the bottom of the hole (~29.6 mbsf).
6.1.2.3. Chloride, bromide, and sulfate
Dissolved chloride (Cl−), bromide (Br−) and sulfate (SO42−) concentrations analyzed using ion chromatography (IC) are listed in Table T7, and downcore variations are shown in Figure F26. Dissolved Cl− concentrations are similar to seawater (546 mM) and range ~537 to ~548 mM. A single outlying low Cl− concentration of ~531 mM is found in Hole M0091B at ~15 mbsf. No systematic downcore variations of dissolved Cl− concentrations are observed.
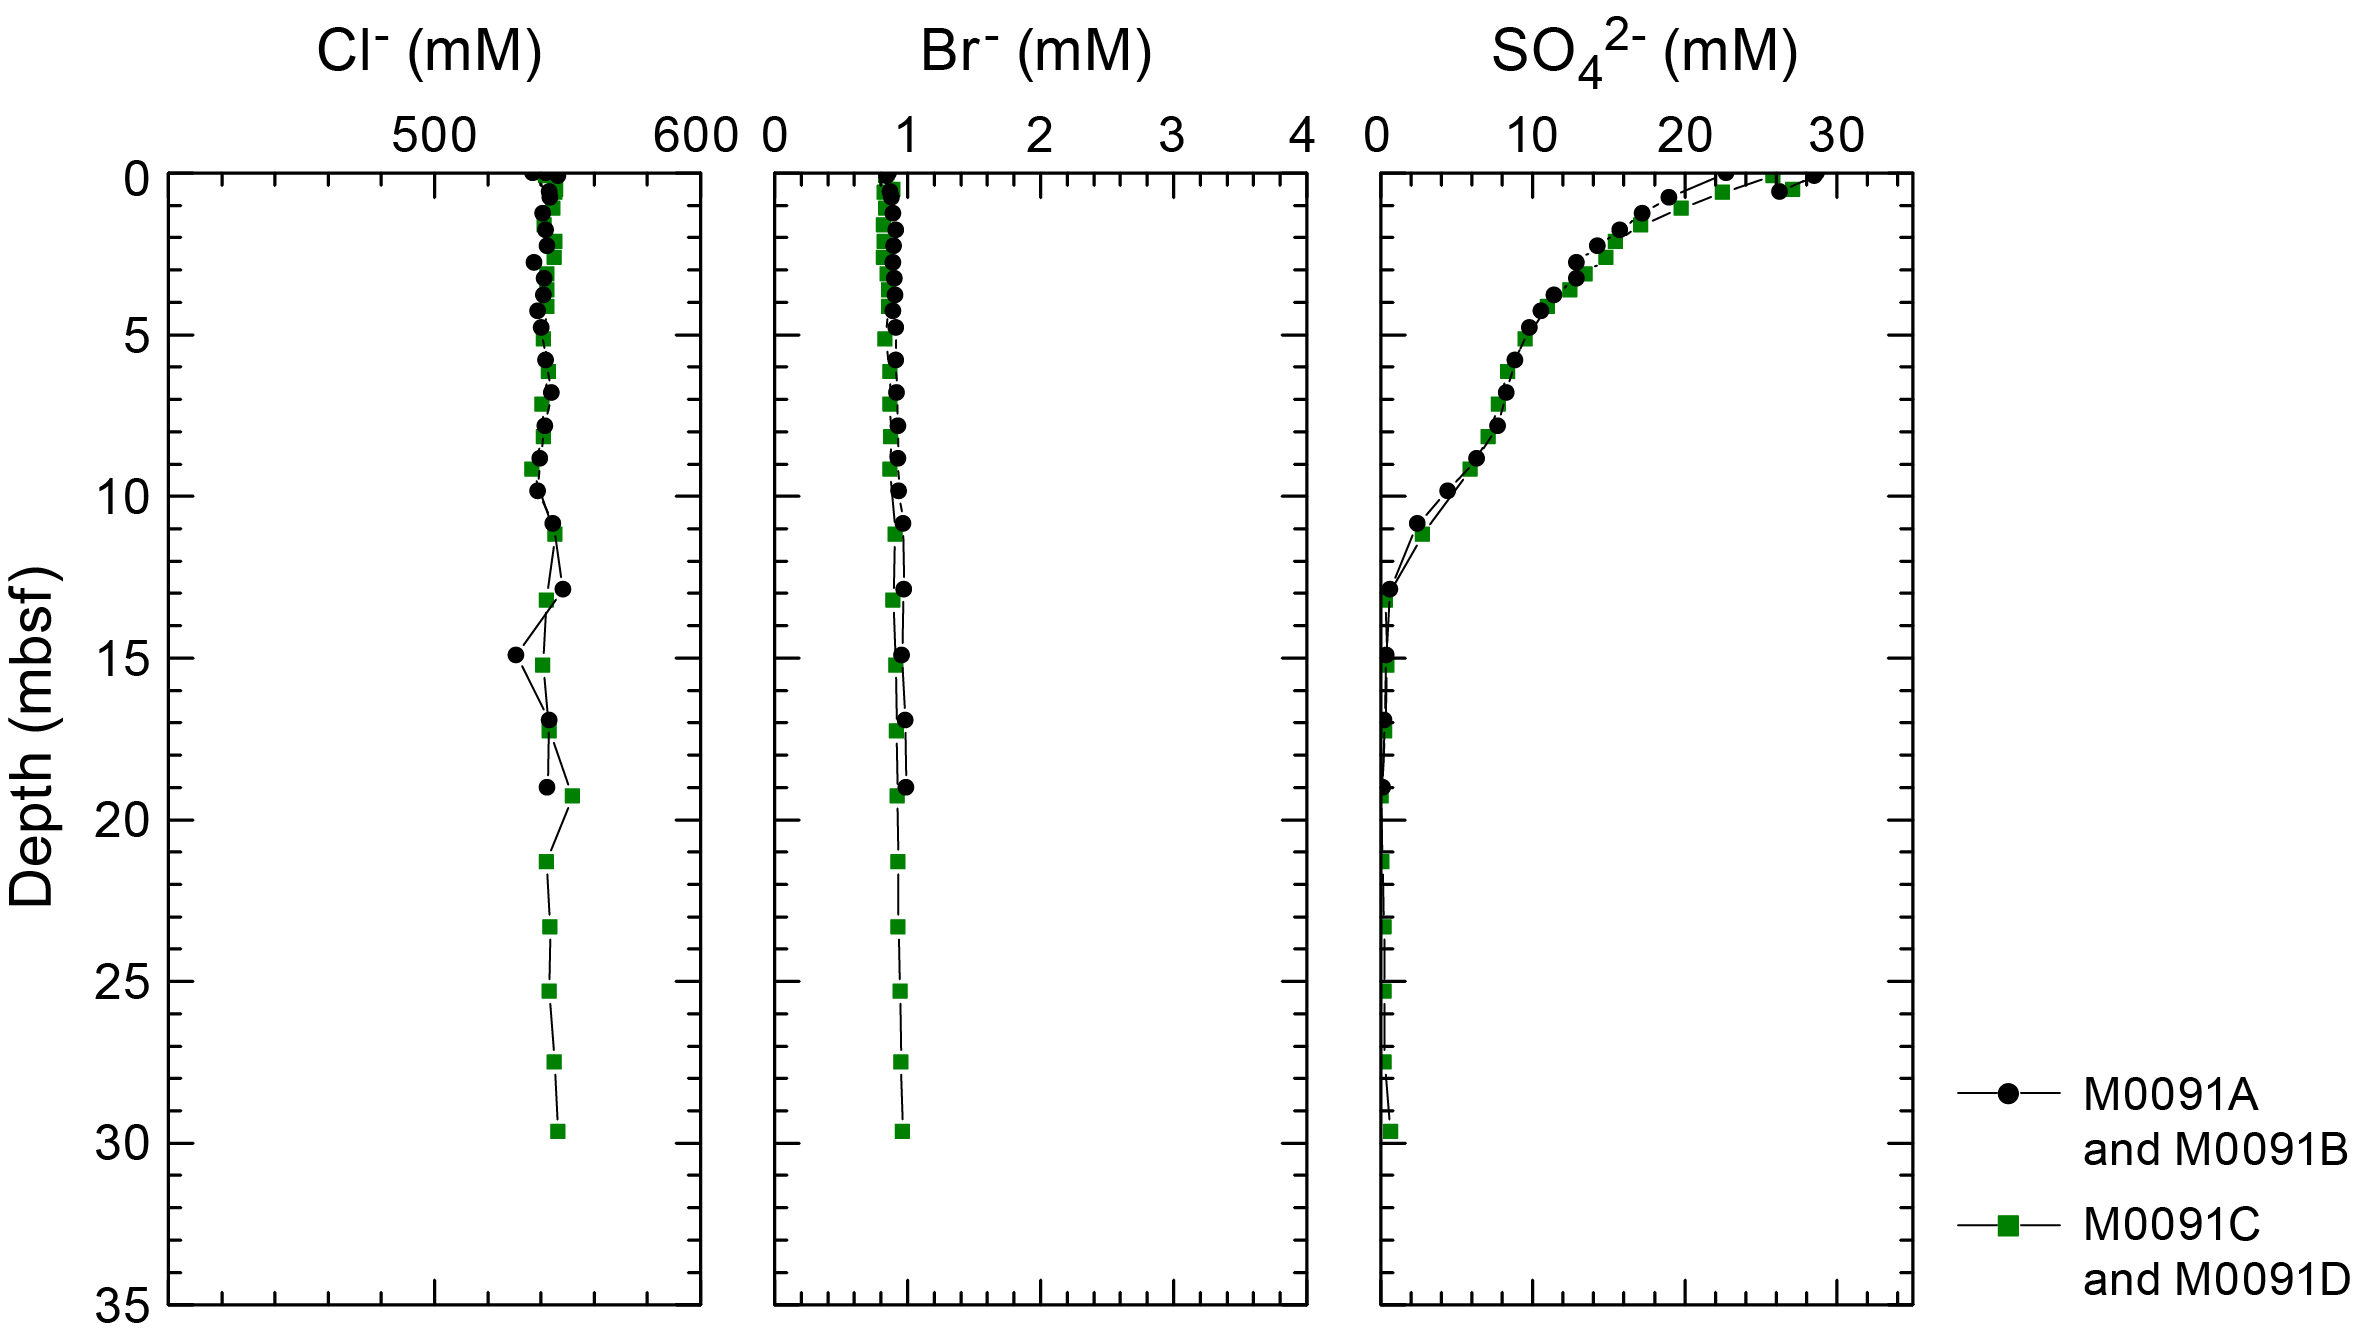
Figure F26. IW Cl−, Br−, and SO42−.
Dissolved Br− concentrations show an overall asymptotic increase with depth in all holes, starting from ~0.84 mM in the BW at the top of the trigger cores and reaching ~0.99 mM at ~19 mbsf at the bottom of Hole M0091B. In GPC Hole M0091D, the asymptotic increase of dissolved Br− is shallower, and maximum values of ~0.96 mM are reached at the maximum depth of ~30 mbsf.
Dissolved SO42− concentrations are highest in the BW, with values that are close to seawater (~28–29 mM; Bruland et al., 2014). Dissolved SO42− exponentially decreases from ~26 to 28 mM in the trigger cores between 0.1 and 0.6 mbsf. Dissolved SO42− concentrations also decrease exponentially in GPC Holes M0091B and M0091D. Dissolved SO42− reaches values near the detection limit at ~13 mbsf in both GPC cores and remains at these low levels to the bottom of the holes.
6.1.2.4. Sodium, magnesium, potassium, and calcium
Downcore profiles of dissolved concentrations of sodium (Na+), potassium (K+), calcium (Ca2+), and magnesium (Mg2+) show overall very similar patterns and little variations. Dissolved Na+ concentrations fluctuate unsystematically and are mostly above average seawater values (~470 mM; Bruland et al., 2014) in all holes, ranging ~465–582 mM. Dissolved K+ concentrations are mostly above seawater values (~10 mM) in all holes, ranging ~9.8–12.8 mM. Dissolved K+ fluctuates unsystematically downcore but appears on average to be slightly lower in GPC Hole M0091B (10.7 ± 0.6 mM) than GPC Hole M0091D (11.6 ± 0.6 mM). Dissolved Ca2+ concentrations fluctuate unsystematically and are mostly around or slightly above seawater values (~10 mM) in all holes, ranging ~8.6–12.2 mM. Dissolved Mg2+ concentrations fluctuate unsystematically and are mostly around or slightly above seawater values (~53 mM; Bruland et al., 2014) in all holes, ranging ~50.9–73.1 mM. Dissolved Mg2+ appears to have a very slight increase below ~12 mbsf in both GPC cores.
The IC cation data is only presented in GEOCHEM in Supplementary material because the samples require postexpedition analysis for validation of absolute values (analytical accuracy).
6.2. Shore-based H2S analysis
At Site M0091, H2S concentrations were below the detection limit in all samples (see GEOCHEM in Supplementary material).
6.3. Headspace gas analysis: methane, ethane, and C1/C2 ratio
A total of 32 headspace samples from Holes M0091C (trigger core) and M0091D (GPC core) were measured for hydrocarbon compositions. Data are listed in Table T8, and downcore variations of selected variables are shown in Figure F27. The offshore-based headspace gas analysis was mainly performed on the longest GPC core. Methane, ethylene, ethane, propylene, and butane were identified at each hole, and methane (CH4 and C1) is the major component of the headspace samples. From 0 to ~30 mbsf, methane concentrations increase from ~117 to 17,219 ppmv. Concentrations reach a maximum of 17,219 ppmv at ~30 mbsf. Below ~30 mbsf, methane concentrations decrease to 9,689 ppmv. Ethane (C2H4 and C2) was detected in relatively constant but low concentrations (~0.3–0.7 ppmv) in all headspace samples. The methane/ethane (C1/C2) ratios follow the methane profile pattern and are consistently >10,000 below ~22 mbsf.

Figure F27. Methane, ethane, and C1/C2 ratios.
Alongside C1 and C2, other hydrocarbon gases such as ethylene (C2=), ethane (C2), propene/propylene (C3=), propane (C3), and n-butane (n-C4) were detected and measured, but their concentrations are very low, generally less than 1 ppmv at all sites (see GEOCHEM in Supplementary material).
6.4. Shore-based solid-phase analysis
6.4.1. Aluminum, calcium, silica, iron, and manganese
Energy dispersive X-ray fluorescence (ED-XRF) was used to quantify elements from 10 ground solid sediment samples from Hole M0091B, 16 from Hole M0091D, and 1 from each of the trigger cores (Holes M0091A and M0091C). The solid-phase elements (including Al, Ca, Si, Fe, and Mn, briefly described below, plus Ba, Br, Cr, Cu, K, Mg, Ni, P, Sr, Ti, V, Zn, and Zr) are listed together in Table T9. Selected elements plotted in Figure F28 highlight the compositional differences in the sediments (see Lithostratigraphy).
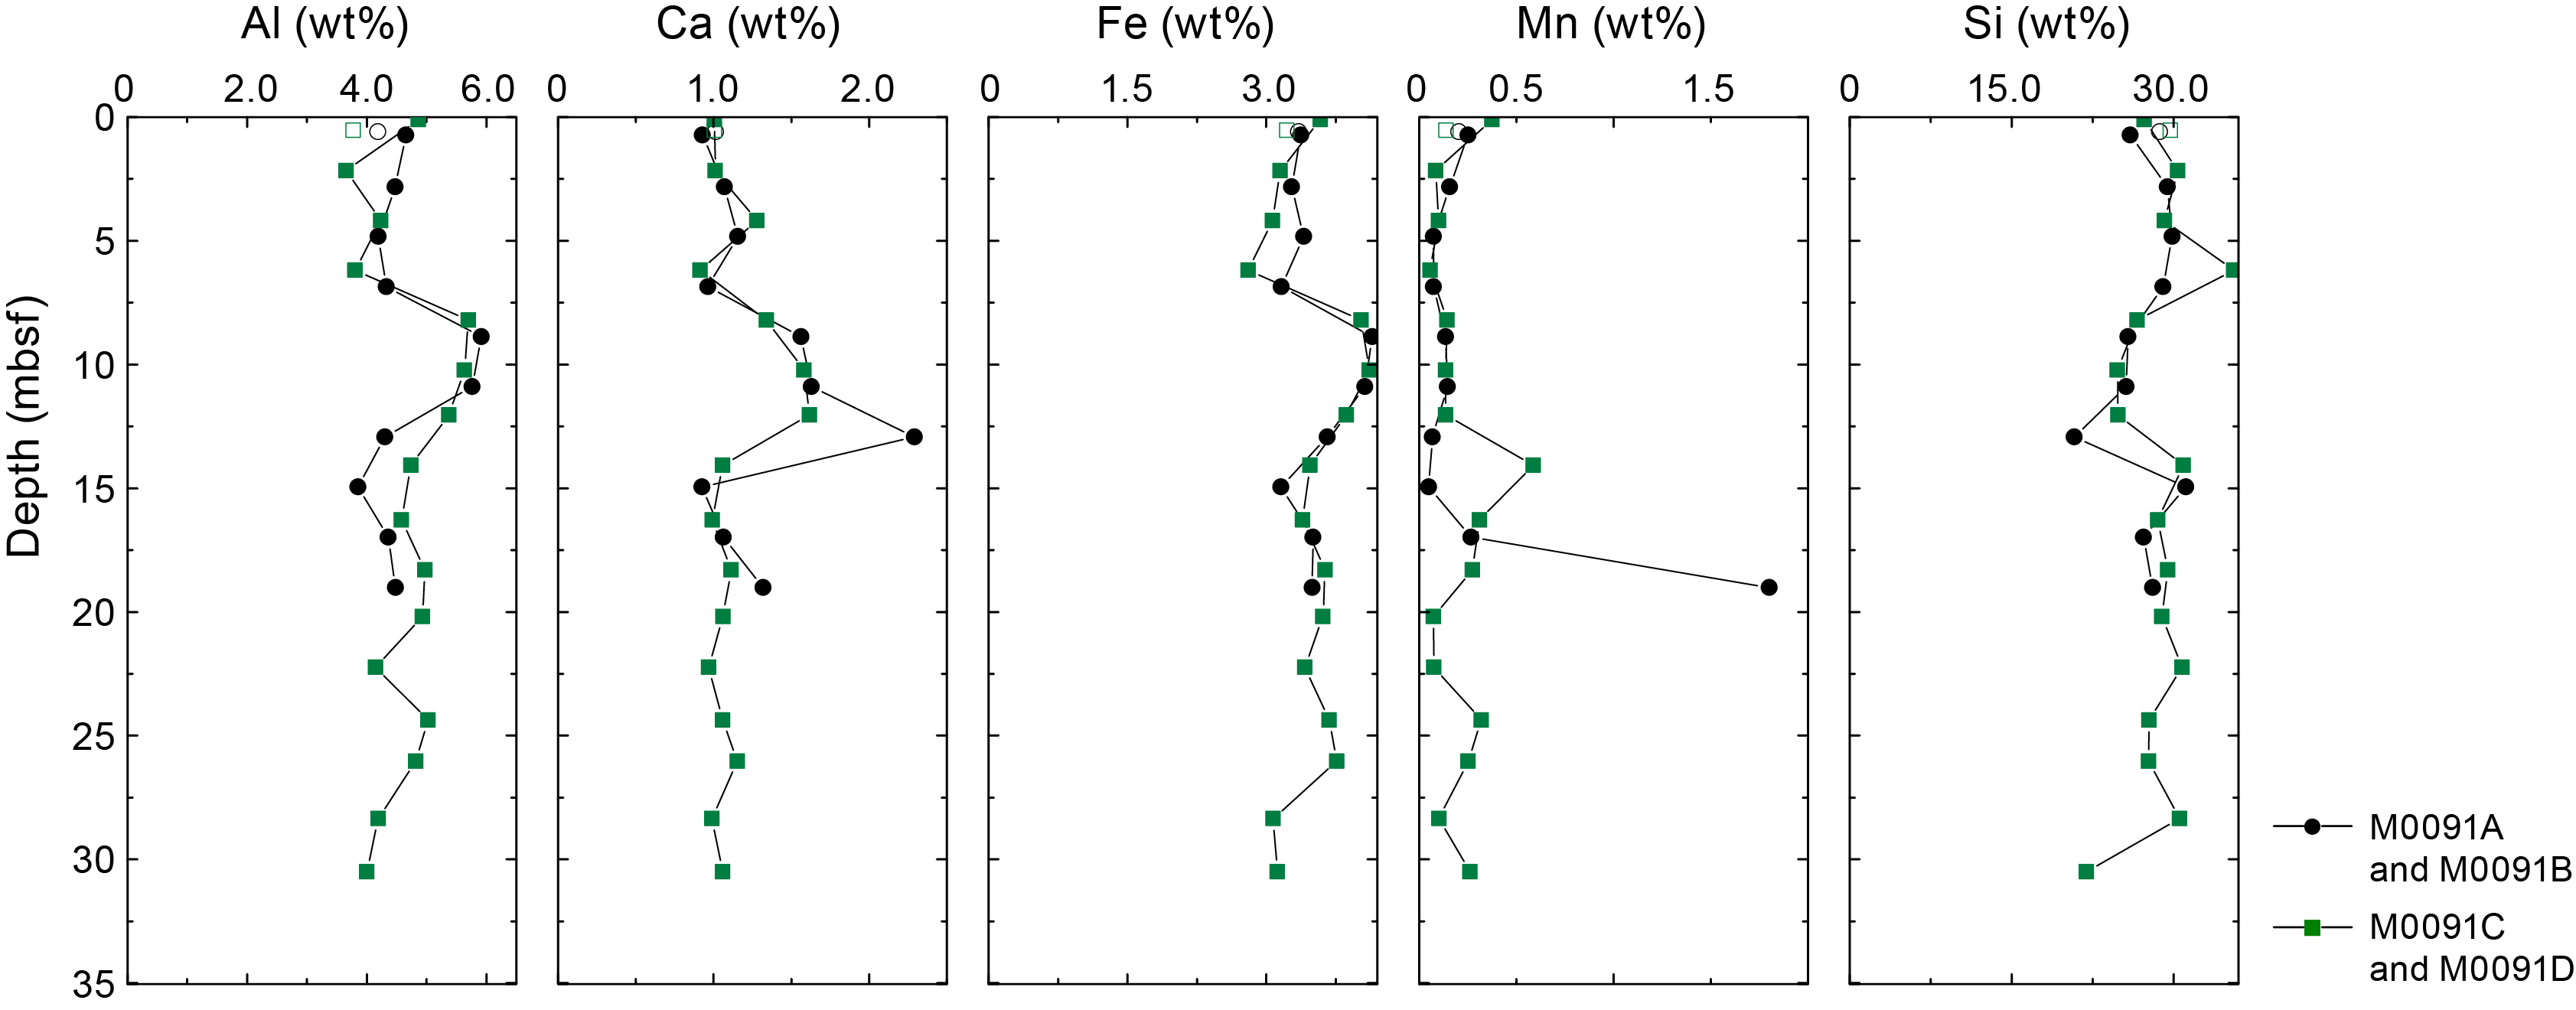
Figure F28. Solid-phase major elements.
Aluminum (Al) contents range ~3.8–6 wt% (37,747–59,158 mg/kg). In all holes, a common downcore pattern is observed: relatively low Al contents (~3–5 wt%) in the uppermost 0–8 m are followed by an interval of higher contents (~5.4–5.9 wt% in GPC Holes M0091B and M0091D) between ~8 and 12 mbsf. Below ~12 mbsf, Al drops to previous levels and fluctuates between ~4 and 5 wt% to the bottom of Hole M0091D.
Calcium (Ca) contents range ~0.9–2.3 wt% (9,144–22,916 mg/kg). Lower Ca contents (~0.9–1.3 wt%) are found in the uppermost 0–7 m and are followed by an interval of higher Ca contents (~1.3–2.3 wt% in GPC Holes M0091B and M0091D) between ~7 and 14 mbsf. Below ~14 mbsf, Ca returns to low levels and fluctuates between ~0.98 and 1.10 wt% to the bottom of Hole M0091D, except for one higher Ca value (~1.3 wt%) at the bottom of Hole M0091B (~19 mbsf).
Silica (Si) contents range ~21–36 wt% (207,894–355,505 mg/kg). They do not show a trend with depth but exhibit fluctuations. The most pronounced change is a drop to ~21–25 wt% in both GPC holes between ~7 and 14 mbsf, including the minimum value of ~21 wt% at ~13 mbsf in GPC Hole M0091B. The maximum Si value of ~36 wt% is found at ~6 mbsf in Hole M0091B.
Iron (Fe) contents range ~2.8–4.1 wt% (28,043–41,452 mg/kg). In all holes, a common downcore pattern is observed, resembling that of Al and Ca: relatively low Fe contents (~2.8–3.6 wt%) in the uppermost 0–7 m are followed by an interval of high Fe contents (~3.8–4.2 wt% in GPC Holes M0091B and M0091D) between ~8 and 12 mbsf. Below ~12 mbsf, Fe drops to previous levels and fluctuates between ~3.1 and 3.8 wt% to the bottom of Hole M0091D.
Manganese (Mn) contents are low overall and range ~0.05–0.6 wt% (486–5873 mg/kg), except for a single outlying value of ~1.8 wt% (18,613 mg/kg) at ~19 mbsf at the bottom of GPC Hole M0091B. Mn values slightly decrease to ~4 mbsf, remain low and stable to ~12 mbsf, and fluctuate from there to the base of the core. In Hole M0091B, Mn increases from ~0.3 to 0.6 wt% at ~14–18 and ~24–26 mbsf.
6.4.2. Carbon and sulfur
Total carbon (TC), total organic carbon (TOC), and total inorganic carbon (TIC = TC − TOC) are listed in Table T9. Downcore variations are shown in Figure F29.
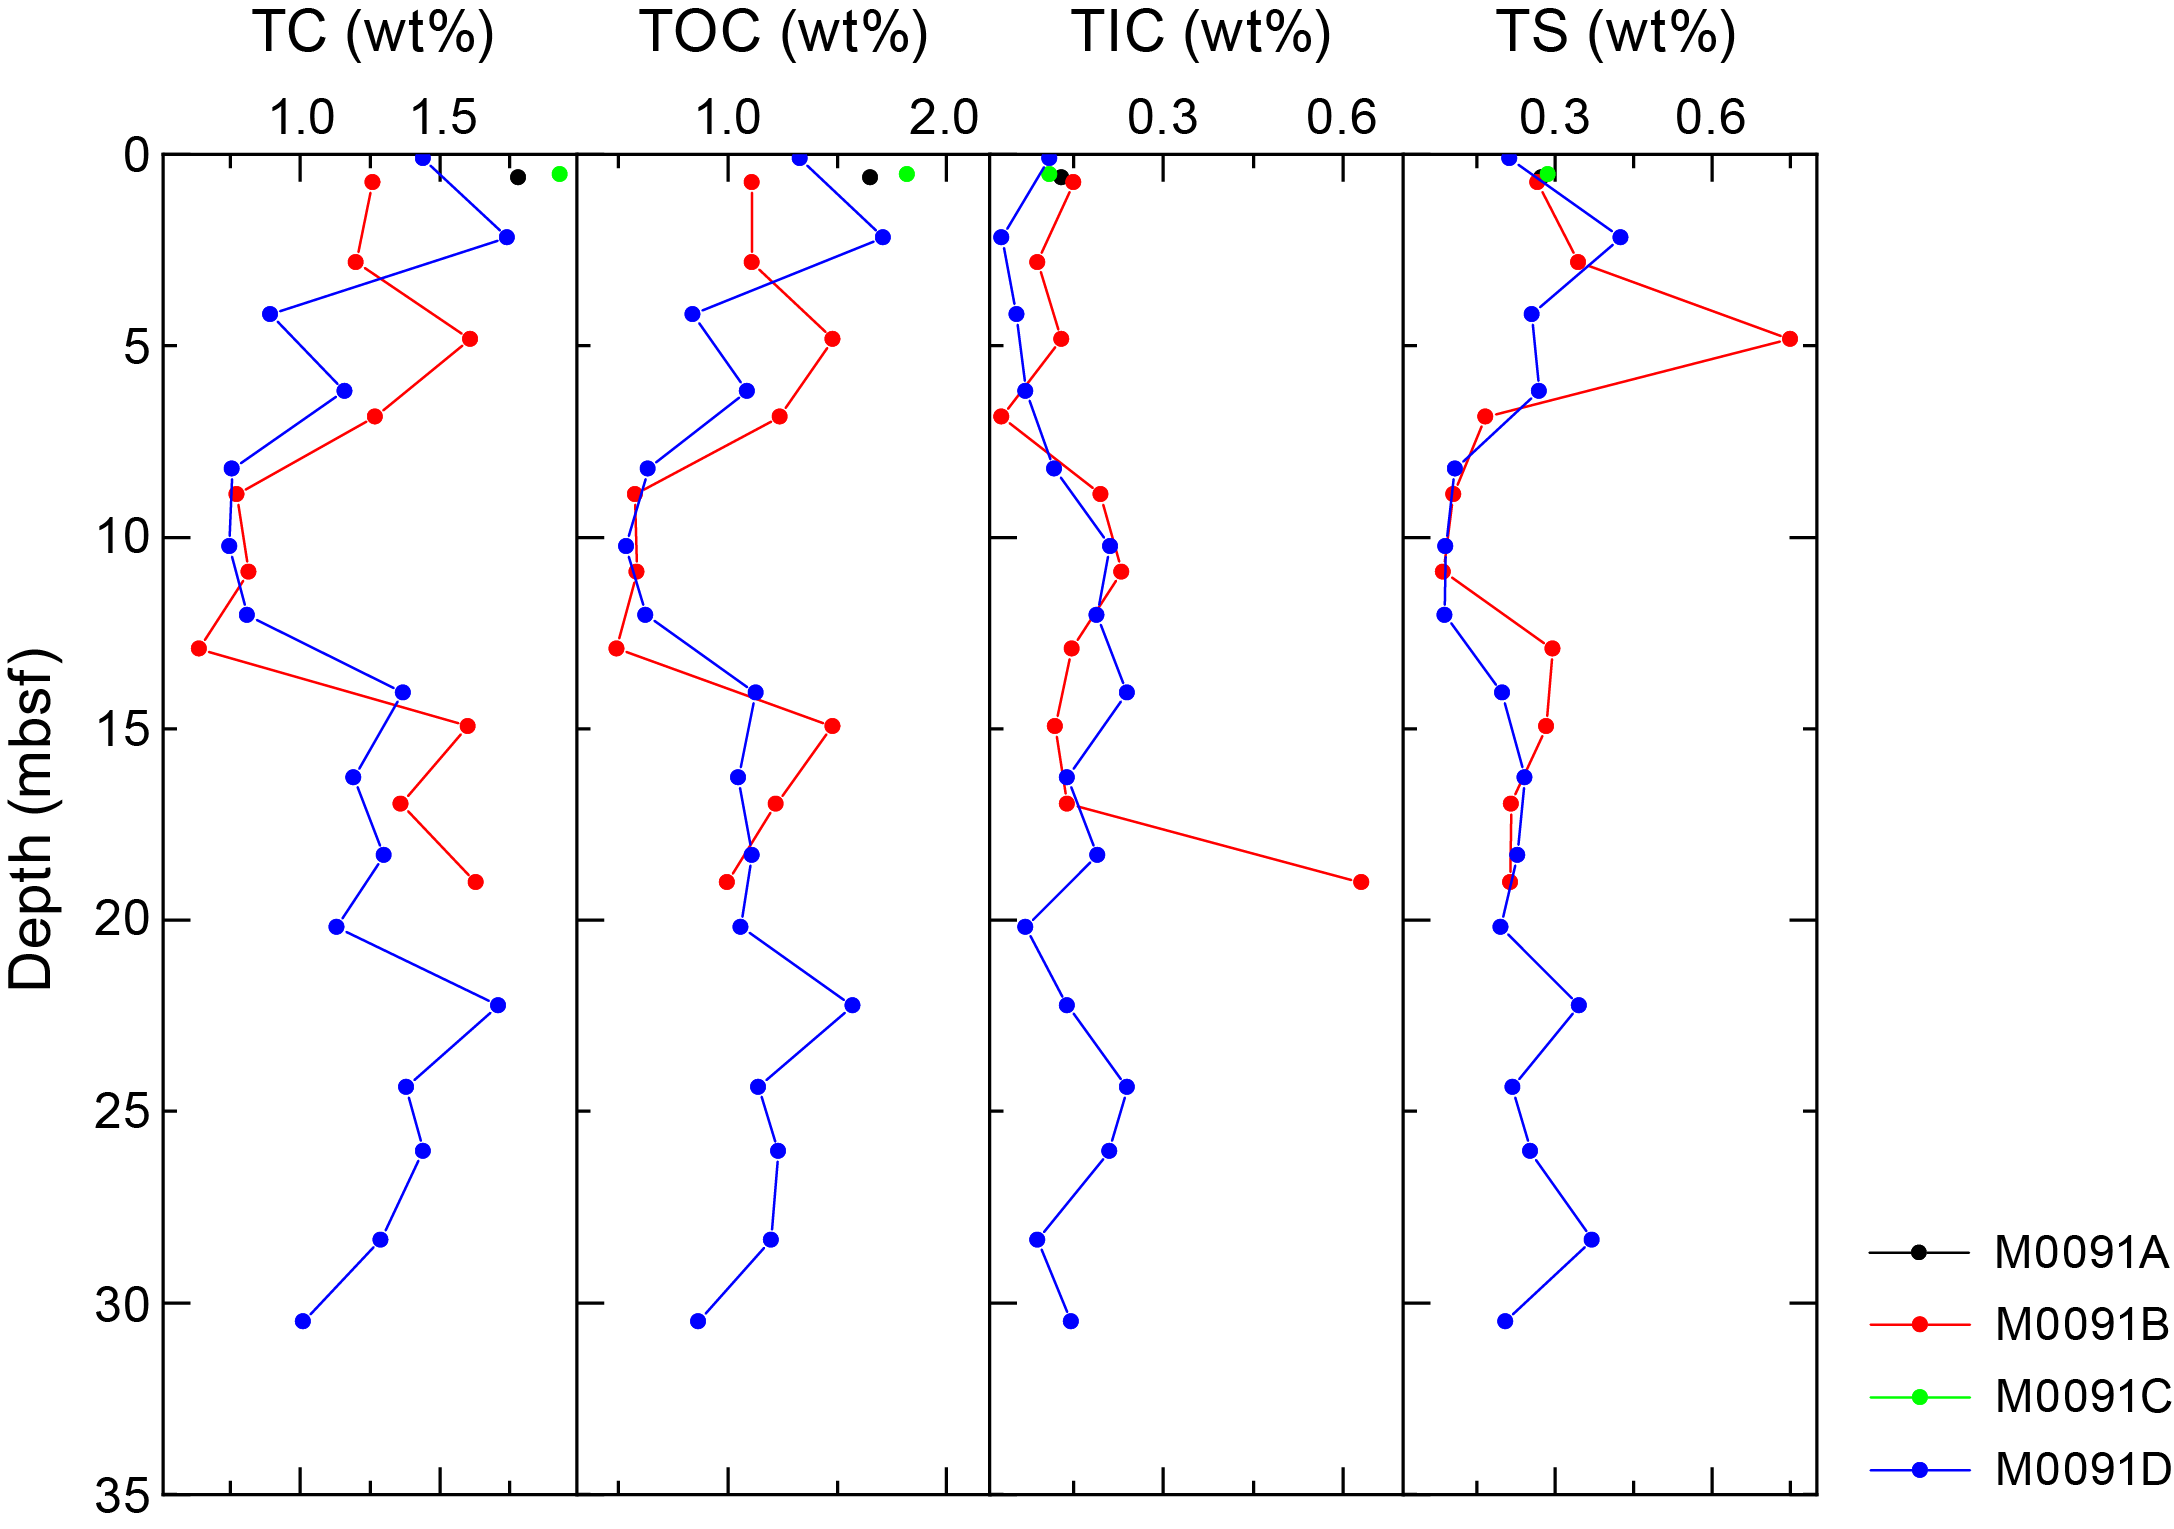
Figure F29. TC, TOC, TIC, and TS.
A TC content of ~1.78–1.93 wt% and a TOC content of ~1.65–1.82 wt% were measured for one sample from each trigger core (Holes M0091A and M0091C, respectively).
TC and TOC range ~0.64–1.93 and ~0.49–1.71 wt% in GPC Holes M0091B and M0091D, respectively. Downcore, TC and TOC decrease from ~1.7 to ~8 mbsf and then reach minimum values of ~0.64–0.78 wt% TC and ~0.49–0.63 wt% TOC between ~8 and ~13 mbsf. Farther downcore, TC and TOC increase abruptly to levels comparable to those in the upper meters of the holes.
TIC contents are near zero (<0.11 wt%) in the upper sediments of Holes M0091A and M0091B. Downcore, TIC contents fluctuate but remain generally low at concentrations of <0.24 wt% in Holes M0091B and M0091D, except for one sample at ~19 mbsf in which TIC reaches maxima of ~0.6 wt%.
Total sulfur (TS) contents in the two trigger cores are very similar (~0.27–0.28 wt%). Downcore, TS values fluctuate to ~7 mbsf, where they decline to minimum values of ~0.09 wt% between ~8 and ~13 mbsf. Farther downcore, TS increases abruptly to the same levels found in the upper meters of GPC Holes M0091B and M0091D.
6.5. Discussion
Intensive organic matter remineralization occurs at Site M0091, as indicated by the ammonium, alkalinity, bromide, and methane concentrations, with the highest degradation rates in the uppermost 3–5 m. Additionally, dissolved Fe and Mn concentrations are very high in the top meter of the sediment column, indicating organic matter remineralization by intensive dissimilatory Mn and Fe reduction (Froehlich et al., 1979). Below this uppermost sediment interval, organoclastic sulfate reduction becomes the dominant electron acceptor for organic matter remineralization, followed by methanogenesis onset at about 12 mbsf and marking the sulfate–methane transition (SMT).
Around about 9 mbsf, the alkalinity and ammonium profiles show an inflection in their generally increasing concentration trend. This suggests nonsteady-state processes. The observation is supported by the sulfate profile, which shows a slight elevation at the same depth (around 9 mbsf) in an otherwise exponential concentration decrease with depth. Sulfate is depleted at around 13 mbsf, marking the SMT.
Similarly, a strong increase in U concentrations between 8 and 12 mbsf that corresponds with an increase in Fe indicates sources of reactive iron that are subject to reductive processes. All these signals are strong indicators of nonsteady-state conditions and are most likely related to a mass transport deposit (~8.5–13.1 mbsf) observed in the lithology (see Lithostratigraphy).
The very high dissolved Si concentrations reflect the dissolution of amorphous silica, which can be explained by the abundance of biogenic opal in diatom frustules and sponge spicules, and of tephra layers (see Lithostratigraphy). Additionally, the solid-phase data show that the overall sediment composition is dominated by siliceous material. Carbonate phases are unimportant, as indicated by the overall low amounts of TIC and Ca, suggesting no significant authigenic carbonate formation.
Similar to the IW profiles, all solid-phase profiles analyzed using XRF show a strong change in their overall concentration trends around 9 mbsf. This supports the notion of a mass transport deposit between about 8.5 and 13.1 mbsf. The depositional impact is also observed in the sulfur and carbon profiles.
The organic carbon content in the sediments at Site M0091 is relatively high (up to 1.82 wt%), leading to the high mineralization rates observed in the IW profiles (Glud et al., 2013). The coupled but marked variation in TC, TOC, and TIC may imply alien material input into the Japan Trench. In addition, although intensive remineralization occurs in the top part of sediments, high TOC and TC contents were found in the deeper sediments, suggesting significant organic matter preservation in the trench sediments. The high methane concentrations and C1/C2 values observed in the deeper sediments suggest microbial processes impact the fate of sedimentary organic carbon in the hadal sediments.
7. Physical properties
This section summarizes the physical properties results from cores acquired at Site M0091 at a water depth of 7995 mbsl in Basin S3 of the Southern Japan Trench. Two trigger cores (Holes M0091A and M0091C) and corresponding GPC cores (Holes M0091B and M0091D) were collected (see Operations). The physical properties data sets were collected using the techniques and sampling rates defined in Physical properties in the Expedition 386 methods chapter (Strasser et al., 2023a). During the offshore phase, whole cores were scanned through the Multi-Sensor Core Logger (MSCL). During the onshore phase, cores were split, scanned through the Tri-Sensor Core Logger (TSCL), and sampled for moisture and density (MAD), undrained shear strength, and P-wave velocity. Overall, the physical properties data sets are high quality and correlate well with lithology and hydroacoustics.
7.1. Bulk density
Offshore, density data (bulk density) were obtained using the gamma ray attenuation (GRA) technique on the MSCL. Onshore, bulk density, porosity, water content, void ratio, and grain density were obtained using the MAD technique on discrete samples. Overall, the bulk density from both techniques are in good agreement. Bulk density values trend around 1.35 g/cm3, increasing from 0 to ~13 mbsf (Figures F30, F31). In both GPC cores, a pronounced peak in bulk density occurs at ~12–13 mbsf. Below this peak, bulk density decreases and remains relatively consistent at ~1.3 g/cm3 throughout the remaining core depths.

Figure F30. Physical properties summary, Holes M0091A and M0091B.
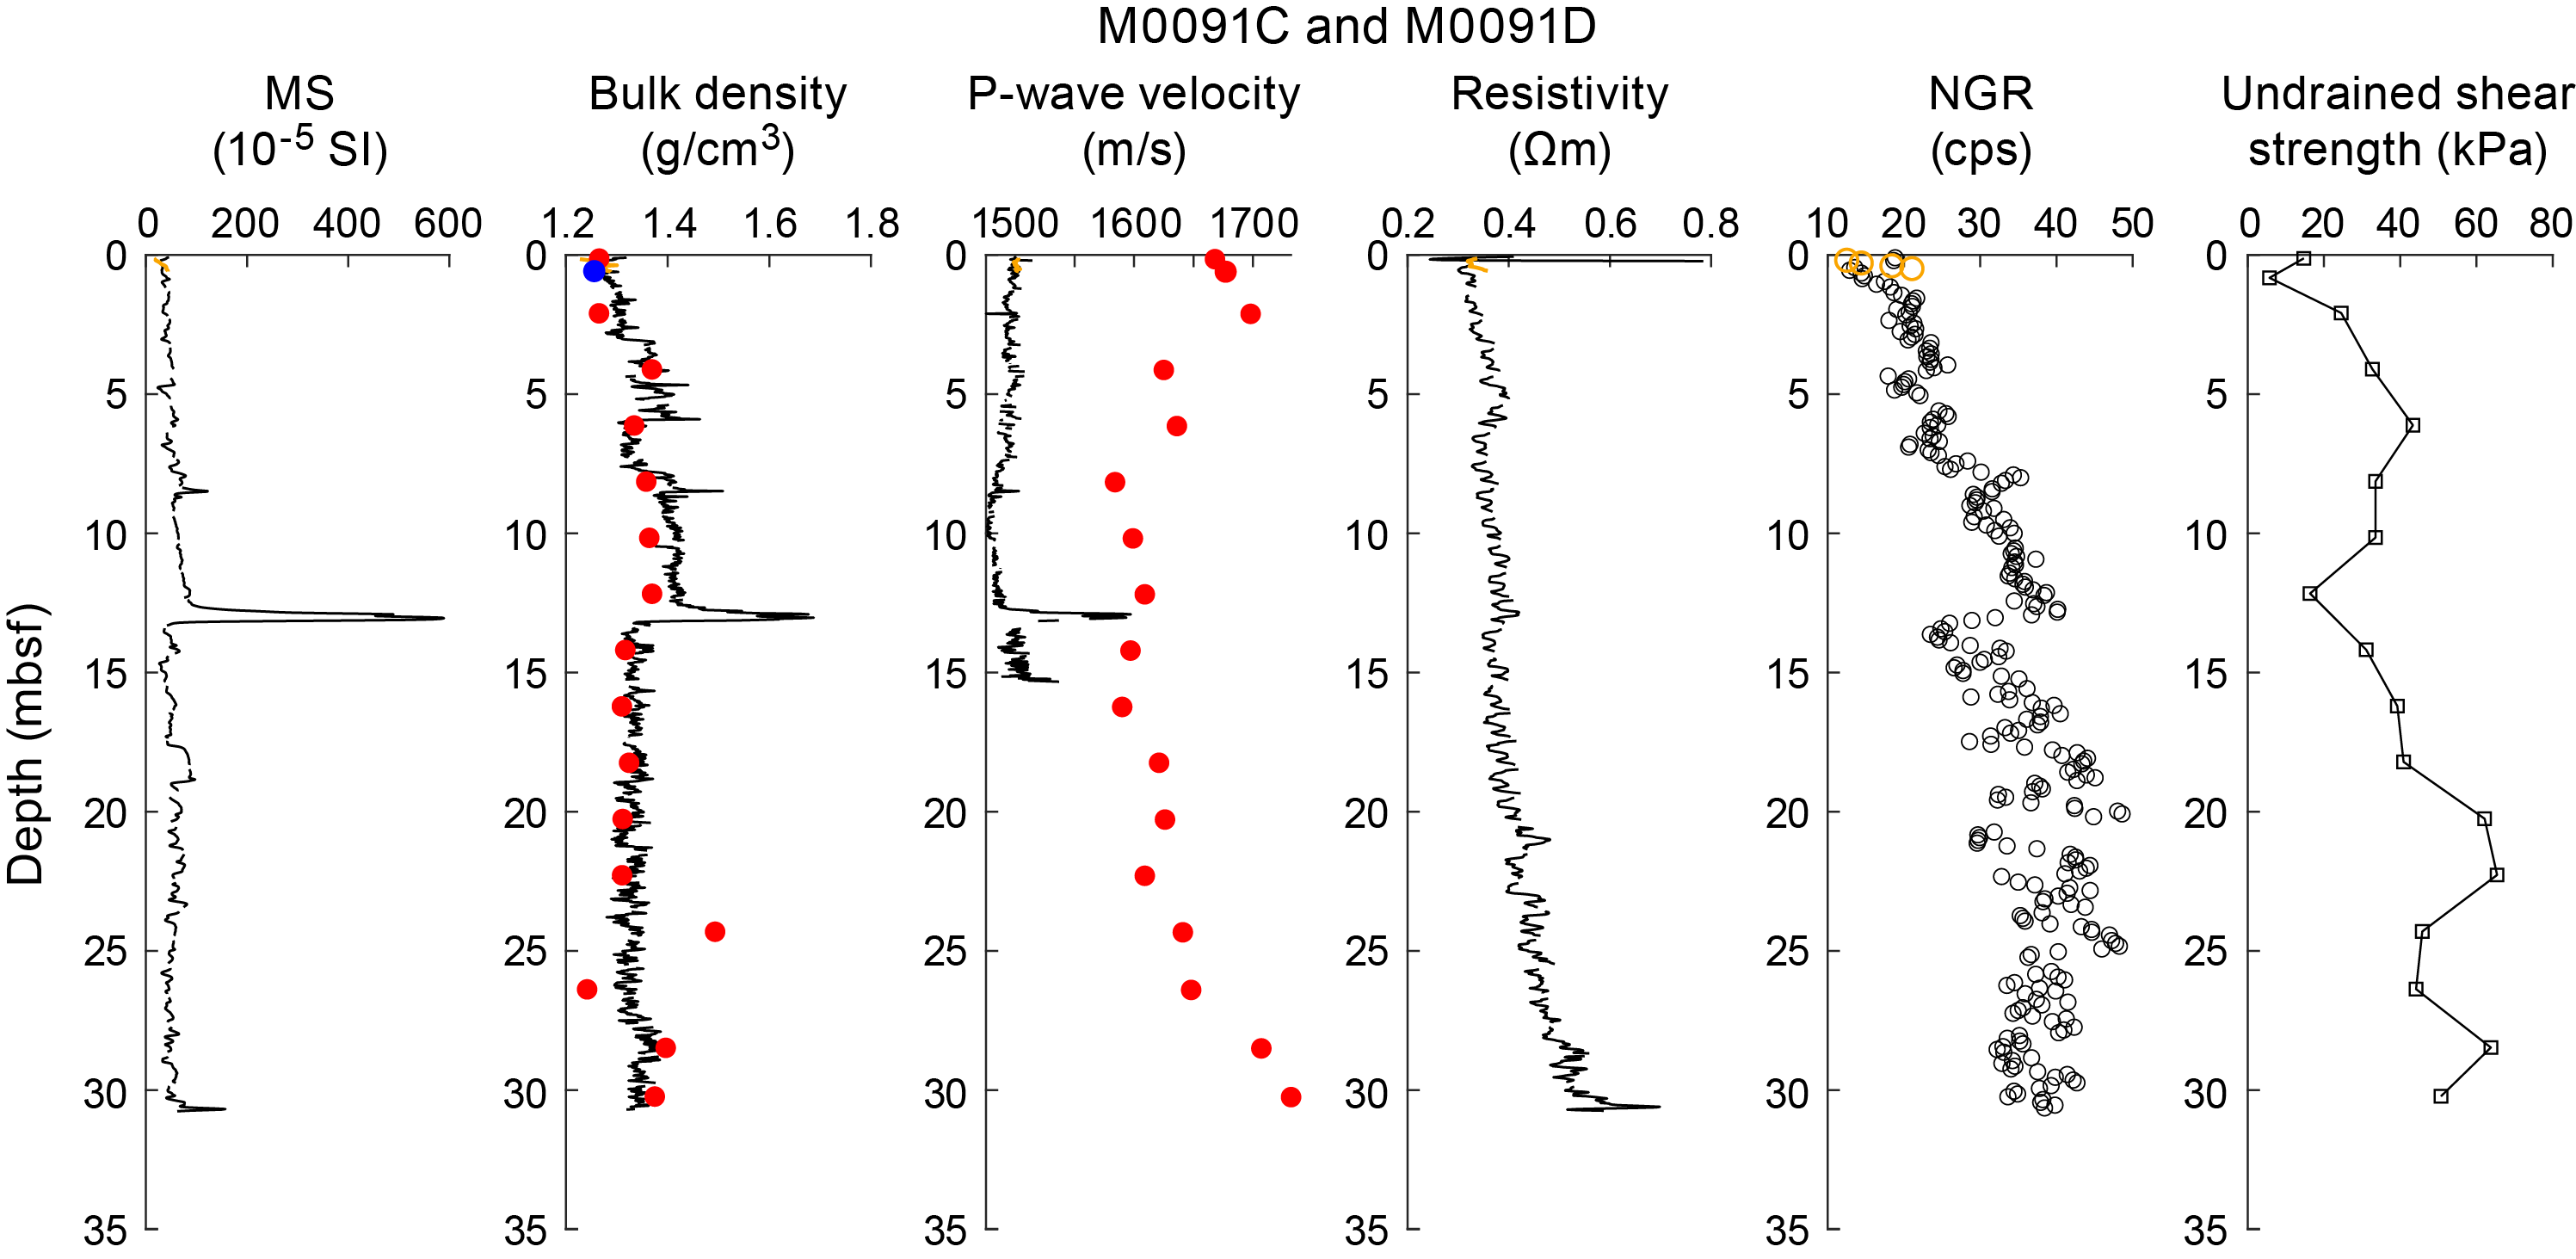
Figure F31. Physical properties summary, Holes M0091C) and M0091D).
Bulk densities of trigger core Holes M0091A and M0091C average 1.23 g/cm3 ± 0.02 g/cm3 and 1.27 g/cm3 ± 0.02 g/cm3, respectively. Bulk densities range 1.19–1.26 g/cm3 and 1.23–1.30 g/cm3 in Holes M0091A and M0091C, respectively.
Bulk densities in Holes M0091B and M0091D average 1.31 g/cm3 ± 0.05 g/cm3 and 1.35 g/cm3 ± 0.05 g/cm3, respectively. Values range 1.20–1.59 g/cm3 and 1.25–1.69 g/cm3 in Holes M0091B and M0091D, respectively.
Bulk density was also measured onshore at a single depth in each trigger core and every odd-numbered GPC core section. Onshore measurements of trigger core Holes M0091A and M0091C show bulk densities of 1.25 and 1.26 g/cm3, respectively.
Onshore measurements of GPC Holes M0091B and M0091D show average bulk densities of 1.34 g/cm3 ± 0.05 g/cm3 and 1.34 g/cm3 ± 0.6 g/cm3, respectively. Values range 1.25–1.47 g/cm3 and 1.24–1.49 g/cm3 in Holes M0091B and M0091D, respectively.
7.2. Magnetic susceptibility
Magnetic susceptibility data were obtained during the offshore phase using the MSCL. Magnetic susceptibilities in GPC Holes M0091B and M0091D average 59.9 ± 40.6 × 10⁻⁵ and 60.6 ± 49.9 × 10⁻⁵ SI, respectively (Figures F30, F31). A distinct peak occurs in both GPC holes around 13 mbsf: approximately 400 × 10−5 SI and 600 × 10−5 SI, respectively. This peak also corresponds with peaks in bulk density (up to ~1.7 g/cm3) and MSCL-measured P-wave velocity (~1600 m/s).
Magnetic susceptibilities in trigger core Holes M0091A and M0091C average 34.4 ± 8.7 × 10⁻⁵ and 32.6 ± 8.7 × 10⁻⁵ SI, respectively. Values range 20.1 × 10⁻⁵ to 44.8 × 10⁻⁵ SI and 18.9 × 10⁻⁵ to 43.5 × 10⁻⁵ SI in Holes M0091A and M0091C, respectively.
7.3. P-wave velocity
P-wave velocity was measured on whole cores using the MSCL during the offshore phase. During the onshore phase, P-wave velocity was measured on discrete samples approximately every 2 m. Many of the MSCL velocity data were of insufficient quality below ~5 mbsf and have been omitted.
MSCL and laboratory-measured P-wave data are plotted in Figures F30 and F31 for Site M0091. MSCL P-wave velocities consistently trend around 1500 m/s (the velocity of water) for the entire length of the measured cores but are higher (closer to 1700 m/s) in on-shore discrete measurements. P-wave velocities in trigger core Holes M0091A and M0091C average 1498.4 ± 1.3 and 1501.2 ± 1.4 m/s, respectively. Values range 1495.9–1501.6 m/s in Hole M0091A and 1498.6–1504.2 m/s in Hole M0091C. P-wave velocities in GPC Holes M0091B and M0091D average 1490.5 ± 8.6 and 1493.9 ± 14.7 m/s, respectively. Values range 1474.8–1522.8 m/s in Hole M0091B and 1475.5–1597.3 m/s in Hole M0091D. As with magnetic susceptibility and bulk density measurements, P-wave velocity measurements show a distinct peak at ~13 mbsf. The difference in velocity exceeds the uncertainty associated with the discrete velocity measurements (±50 m/s). The difference between the two data sets may be attributed to continued compaction or degassing of the sediments between offshore and onshore phase of the expedition. Further investigation during postcruise research will be required to fully understand the discrepancy, and the data should thus be used with a degree of caution.
7.4. Noncontact resistivity
Noncontact electrical resistivity measurements at Site M0091 increase from ~0.3 to ~0.65 Ωm at ~30 mbsf (Figures F30, F31).
Electrical resistivities for trigger core Holes M0091A and M0091C average 0.34 ± 0.02 and 0.33 ± 0.01 Ωm, respectively. Values range 0.32–0.37 Ωm in Hole M0091A and 0.32–0.36 Ωm in Hole M0091C.
Electrical resistivities for GPC Holes M0091B and M0091D average 0.39 ± 0.03 and 0.40 ± 0.06 Ωm, respectively. Values range 0.33–0.50 Ωm in Hole M0091B and 0.24–0.78 Ωm in Hole M0091D.
7.5. Natural gamma radiation
NGR measurements at Site M0091 increase from 0 to ~13 mbsf, at which depth they decrease (~20 counts/s) and then recover to ~35 counts/s at ~17 mbsf. Below this depth, NGR values trend around 35 counts/s (Figures F30, F31).
NGR measurements for trigger core Holes M0091A and M0091C were limited: n = 6 and n = 4, respectively. NGR averages 17.4 ± 4.1 counts/s in Hole M0091A and 16.6 ± 3.3 counts/s in Hole M0091C. Values range 12.7–22.5 and 12.5–21.1 counts/s, respectively.
NGR measurements for GPC Holes M0091B and M0091D were more robust. These values average 28.5 ± 6.1 and 32.6 ± 8.0 counts/s in M0091B and M0091D, respectively. NGR ranges 14.7–39.6 counts/s in Hole M0091B and 12.9–48.6 counts/s in Hole M0091D.
7.6. Undrained shear strength
Undrained shear strength (Su) was measured with the handheld penetrometer, automated vane shear (AVS) device, and fall cone penetrometer on split cores. The handheld penetrometer was used during the Onshore Science Party (OSP) phase, and the AVS and fall cone were used during the personal sampling phase. Su increases with depth in all holes at Site M0091.
The Su of sediments measured using the handheld penetrometer during the onshore phase averages 43.6 ± 27.2 kPa in Holes M0091A and M0091B and 49.3 ± 84.9 kPa in Holes M0091C and M0091D, respectively (Figures F30, F31). Values range 0–93.2 kPa for Holes M0091A and M0091B and approximately 5–150 kPa for Holes M0091C and M0091D.
Su measured during the Personal Sampling Party (PSP) using a fall cone was recorded once in each section for all holes at Site M0091 (Figure F32). Su measured across all holes using the fall cone at Site M0091 generally increases with depth, ranging 3.0–75.6 kPa and averaging 24.1 ± 18.4 kPa. Fall cone Su measurements in Holes M0091B and M0091D range 5.0–75.6 and 4.0–63.6 kPa, respectively. Fall cone Su measurements in Holes M0091B and M0091D average 28.3 ± 21.5 and 22.9 ± 15.8 kPa, respectively.
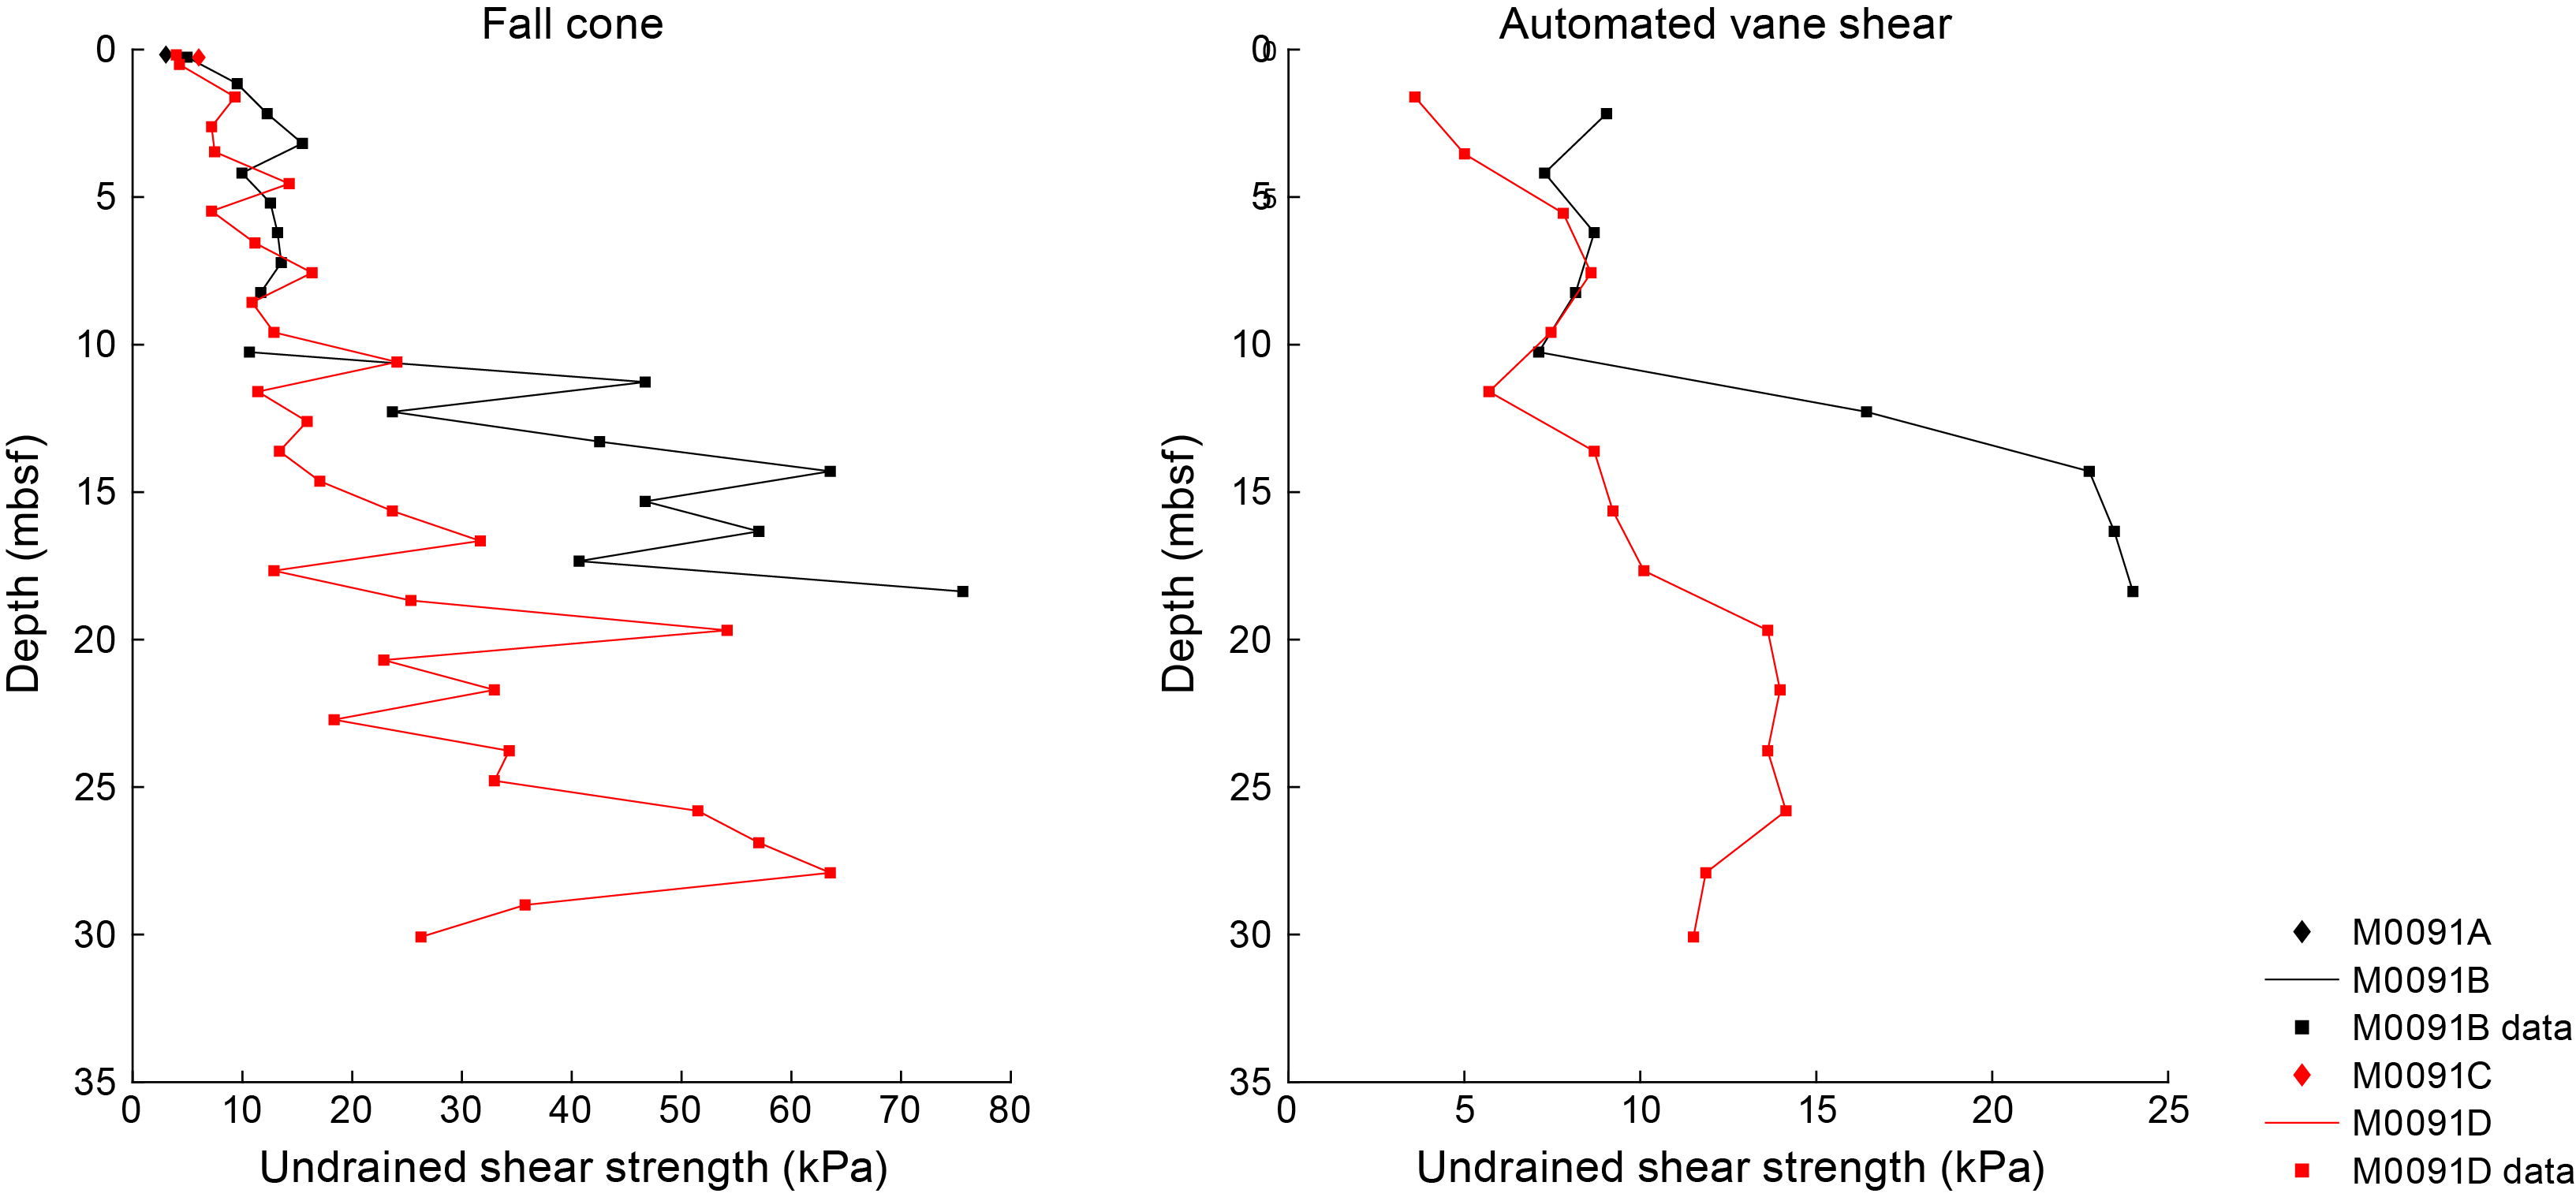
Figure F32. Undrained shear strength.
Su measured during the PSP using an AVS was measured in alternating sections in Holes M0091B and M0091D (Figure F32). Su measured across these holes using the AVS were generally lower than Su values measured using the fall cone penetrometer. AVS Su values generally increase with depth, ranging 3.6–24.0 kPa and averaging 11.3 ± 5.5 kPa. AVS Su for Holes M0091B and M0091D ranges 7.1–24.0 and 3.6–14.1 kPa, respectively. AVS Su in Holes M0091B and M0091D averages 14.1 ± 7.1 and 9.7–3.3 kPa, respectively.
It should be noted that values of Su vary according to the device used to obtain them (Figures F30, F31, F32). For example, fall cone strengths are higher than those obtained with the AVS and handheld penetrometer. The influence of the U-channel along the center of the core could result in lower strengths than those obtained with the fall cone. The fall cone only impacts a small region of the core (~2–5 mm), whereas the AVS impacts a larger region of the core (~20–50 mm). Both measurements ideally should be obtained from the center of the core away from the core sidewall. However, samples could not be taken at the center because of the U-channel recovered during the OSP. As a result, strength sampling points had to be placed halfway between the central U-channel and the sidewall of the core (see Physical properties in the Expedition 386 methods chapter [Strasser et al., 2023a]). During AVS measurements, the fractures that opened often propagated toward both the central U-channel and the sidewall, perhaps resulting in lower strength values. Fall cone measurements were not seen to be affected by the U-channel or the sidewall. Postcruise analysis will more closely examine the strength data to try to reconcile the differences.
7.7. Moisture and density
Water content, porosity, void ratio, and density of sediments were recorded at a single depth in each trigger core and once for every odd-numbered GPC core section (Figures F33, F34). Water content, porosity, and void ratio decrease with depth in Holes M0091A and M0091B, with minima at ~13 mbsf and coinciding with trends observed in MSCL data. Bulk and dry densities showed inverse trends compared to water content, porosity, and void ratio, as expected. However, trends in Holes M0091C and M0091D were different, remaining consistent between ~4 and ~22 mbsf. At ~24 mbsf, water content, porosity, and void ratio attain minimum values and density peaks in Holes M0091C and M0091D. An accompanying peak or dip (water content, porosity, and void ratio or density, respectively) immediately follows to the base of the core.
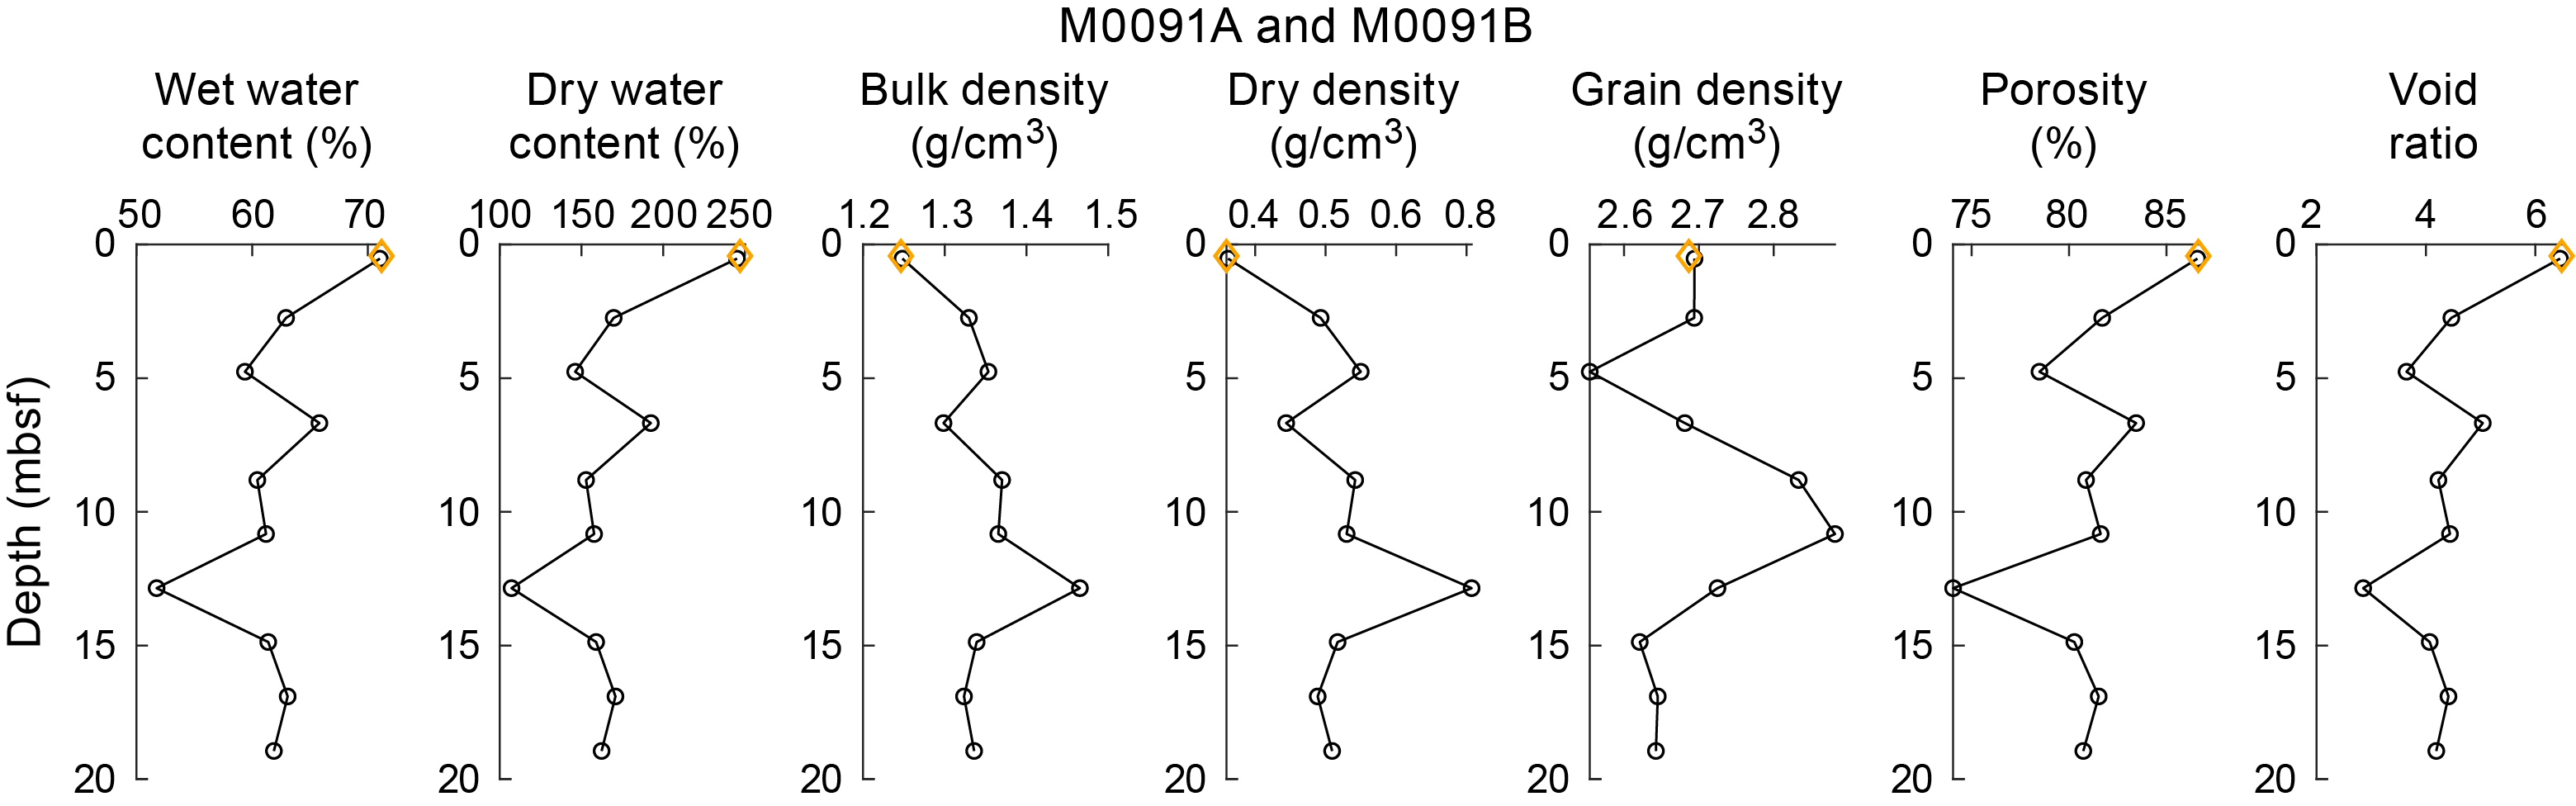
Figure F33. MAD data, Holes M0091A and M0091B.
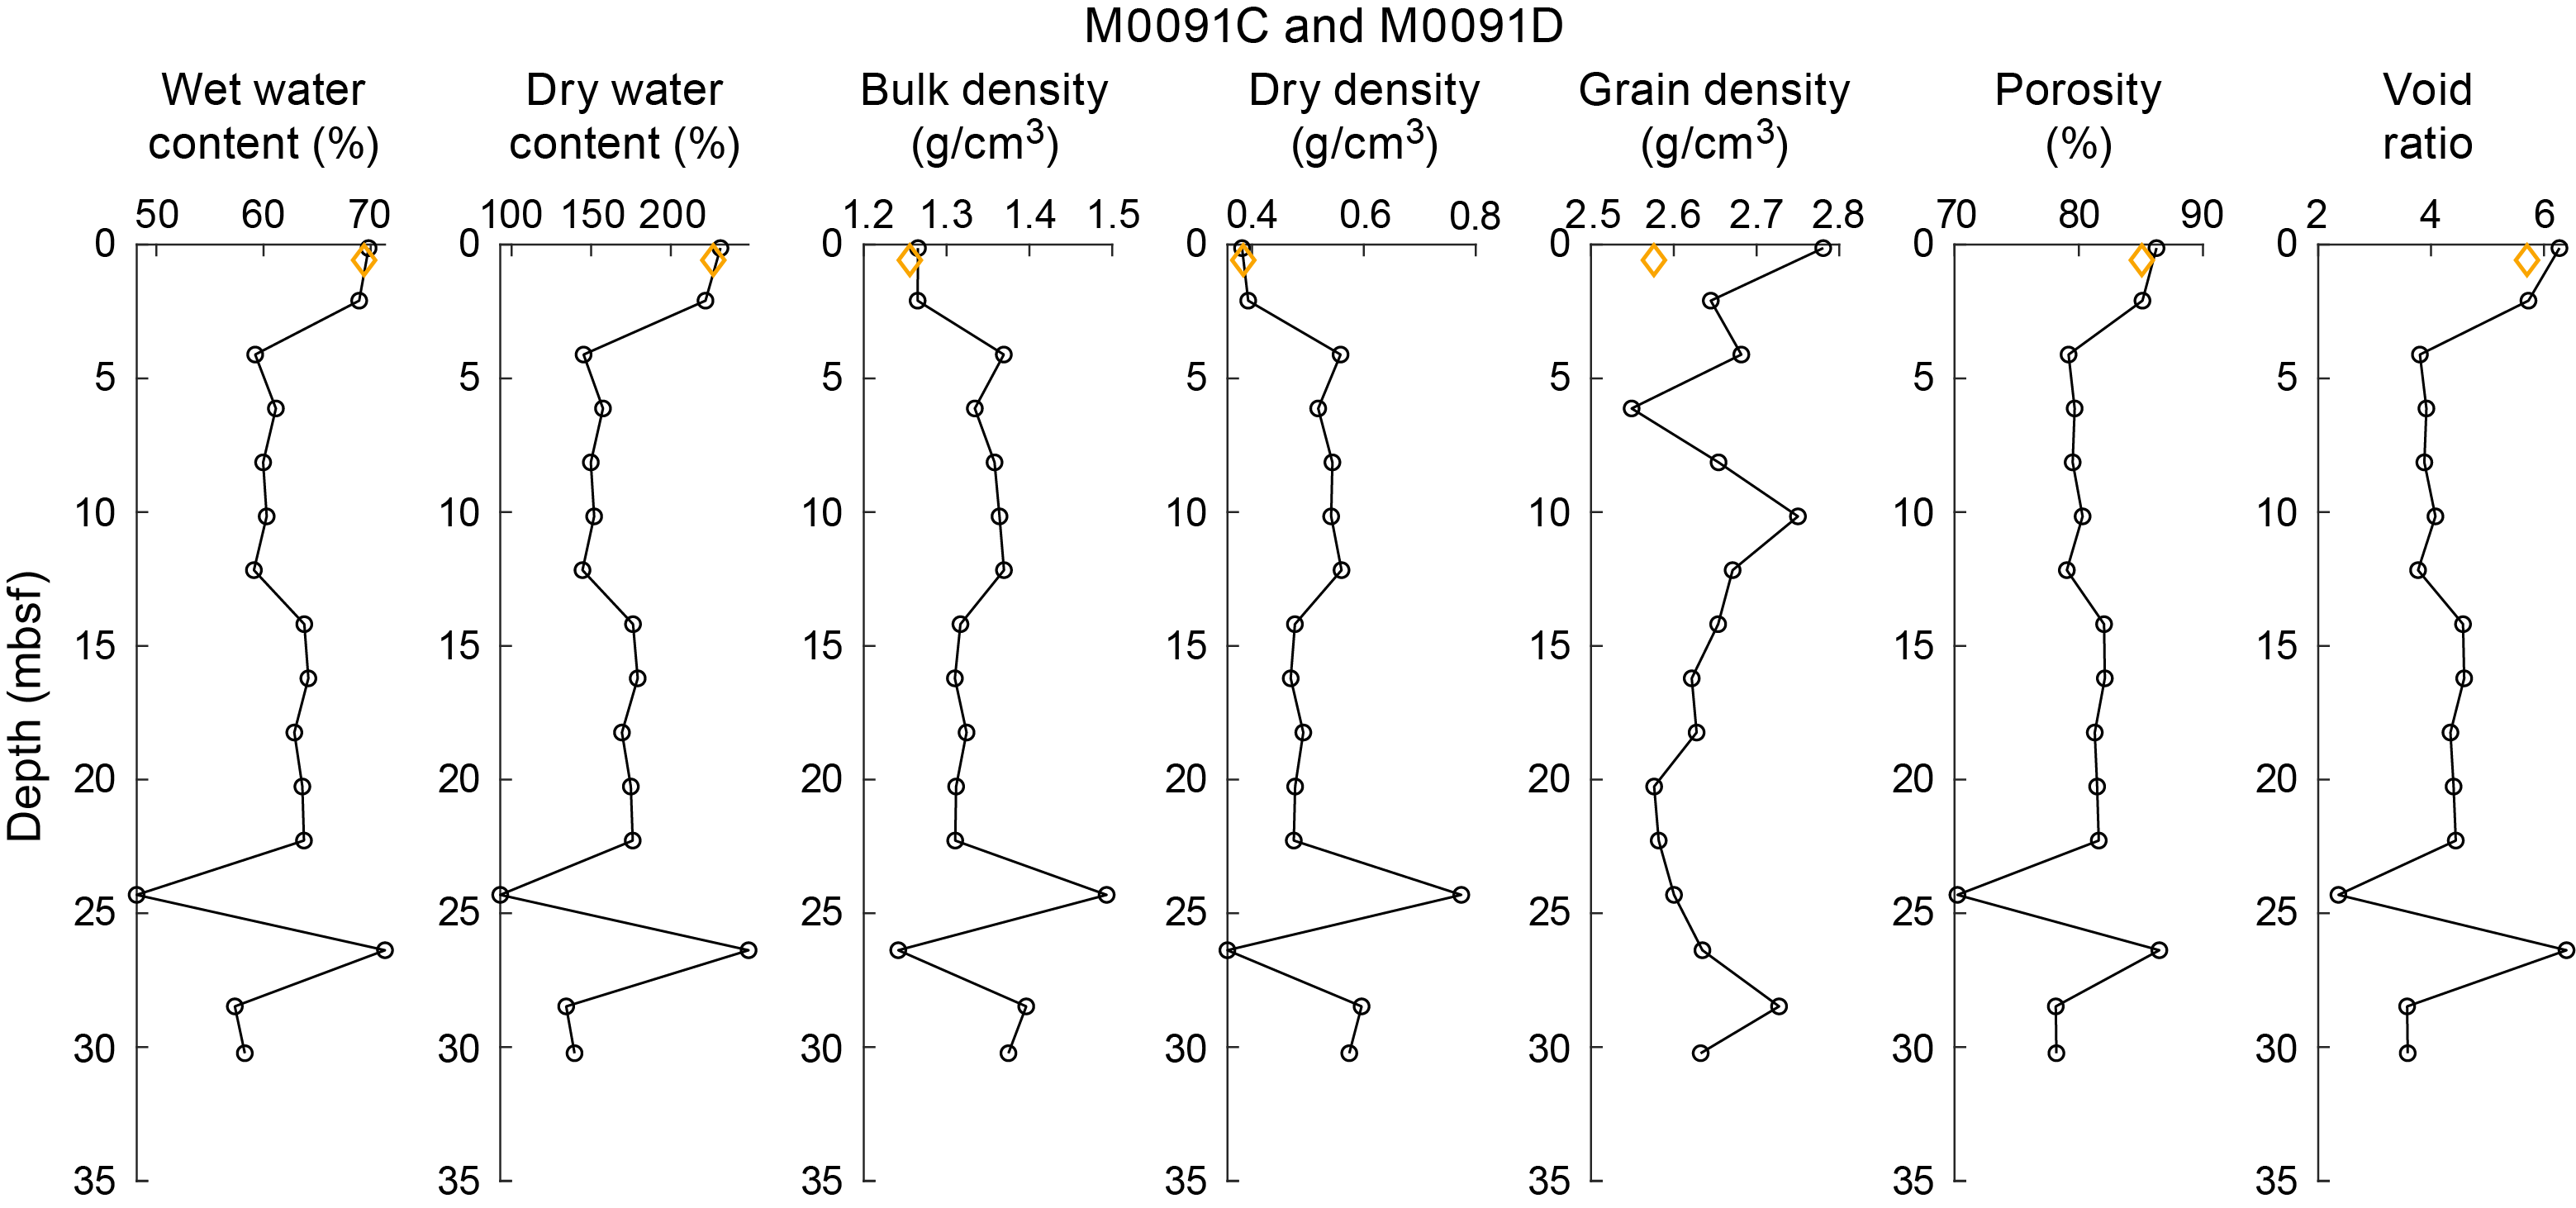
Figure F34. MAD data, Holes M0091C and M0091D.
Trigger core Holes M0091A and M0091C have wet water contents of 71% and 69%, respectively. GPC Holes M0091B and M0091D have average wet water contents of 62 ± 5% and 62 ± 5%, respectively. In Holes M0091B and M0091D, values range 52%–71% and 48%–71%, respectively.
Trigger core Holes M0091A and M0091C have porosities of 87 and 85%, respectively. GPC Holes M0091B and M0091D have average porosities of 81% ± 3 and 81% ± 4, respectively. Porosities in Holes M0091B and M0091D range 74%–87% and 70%–86%, respectively.
Trigger core Holes M0091A and M0091C have void ratios of 6.48 and 5.70, respectively. GPC Holes M0091B and M0091D have average void ratios of 4.4 ± 0.9 and 4.4 ± 1.0, respectively. Values range 2.9–6.5 and 2.4–6.4 for Holes M0091B and M0091D, respectively.
Trigger core Holes M0091A and M0091C have grain densities of 2.69 and 2.58 g/cm3, respectively. GPC Holes M0091B and M0091D have average grain densities of 2.70 ± 0.09 g/cm3 and 2.65 ± 0.06 g/cm3, respectively. Values range 2.55–2.88 g/cm3 and 2.55–2.78 g/cm3 for Holes M0091B and M0091D, respectively.
7.8. Color reflectance and RGB values
Color spectrometry was measured onshore and reported as L*a*b* values for each core (Figures F35, F36). In Hole M0091A, L*a*b* values average 28.78 ± 1.70, −0.41 ± 0.85, and 10.34 ± 1.38, respectively. In Hole M0091B, L*a*b* values average 28.78 ± 6.18, −0.93 ± 0.39, and 6.08 ± 2.65, respectively. In Hole M0091C, L*a*b* values average 28.75 ± 2.72, −0.47 ± 0.39, and 10.66 ± 0.86, respectively. In Hole M0091D, L*a*b* values average 27.97 ± 5.35, −1.06 ± 0.40, and 5.36 ± 2.64, respectively.

Figure F35. Color data, Holes M0091A and M0091B.
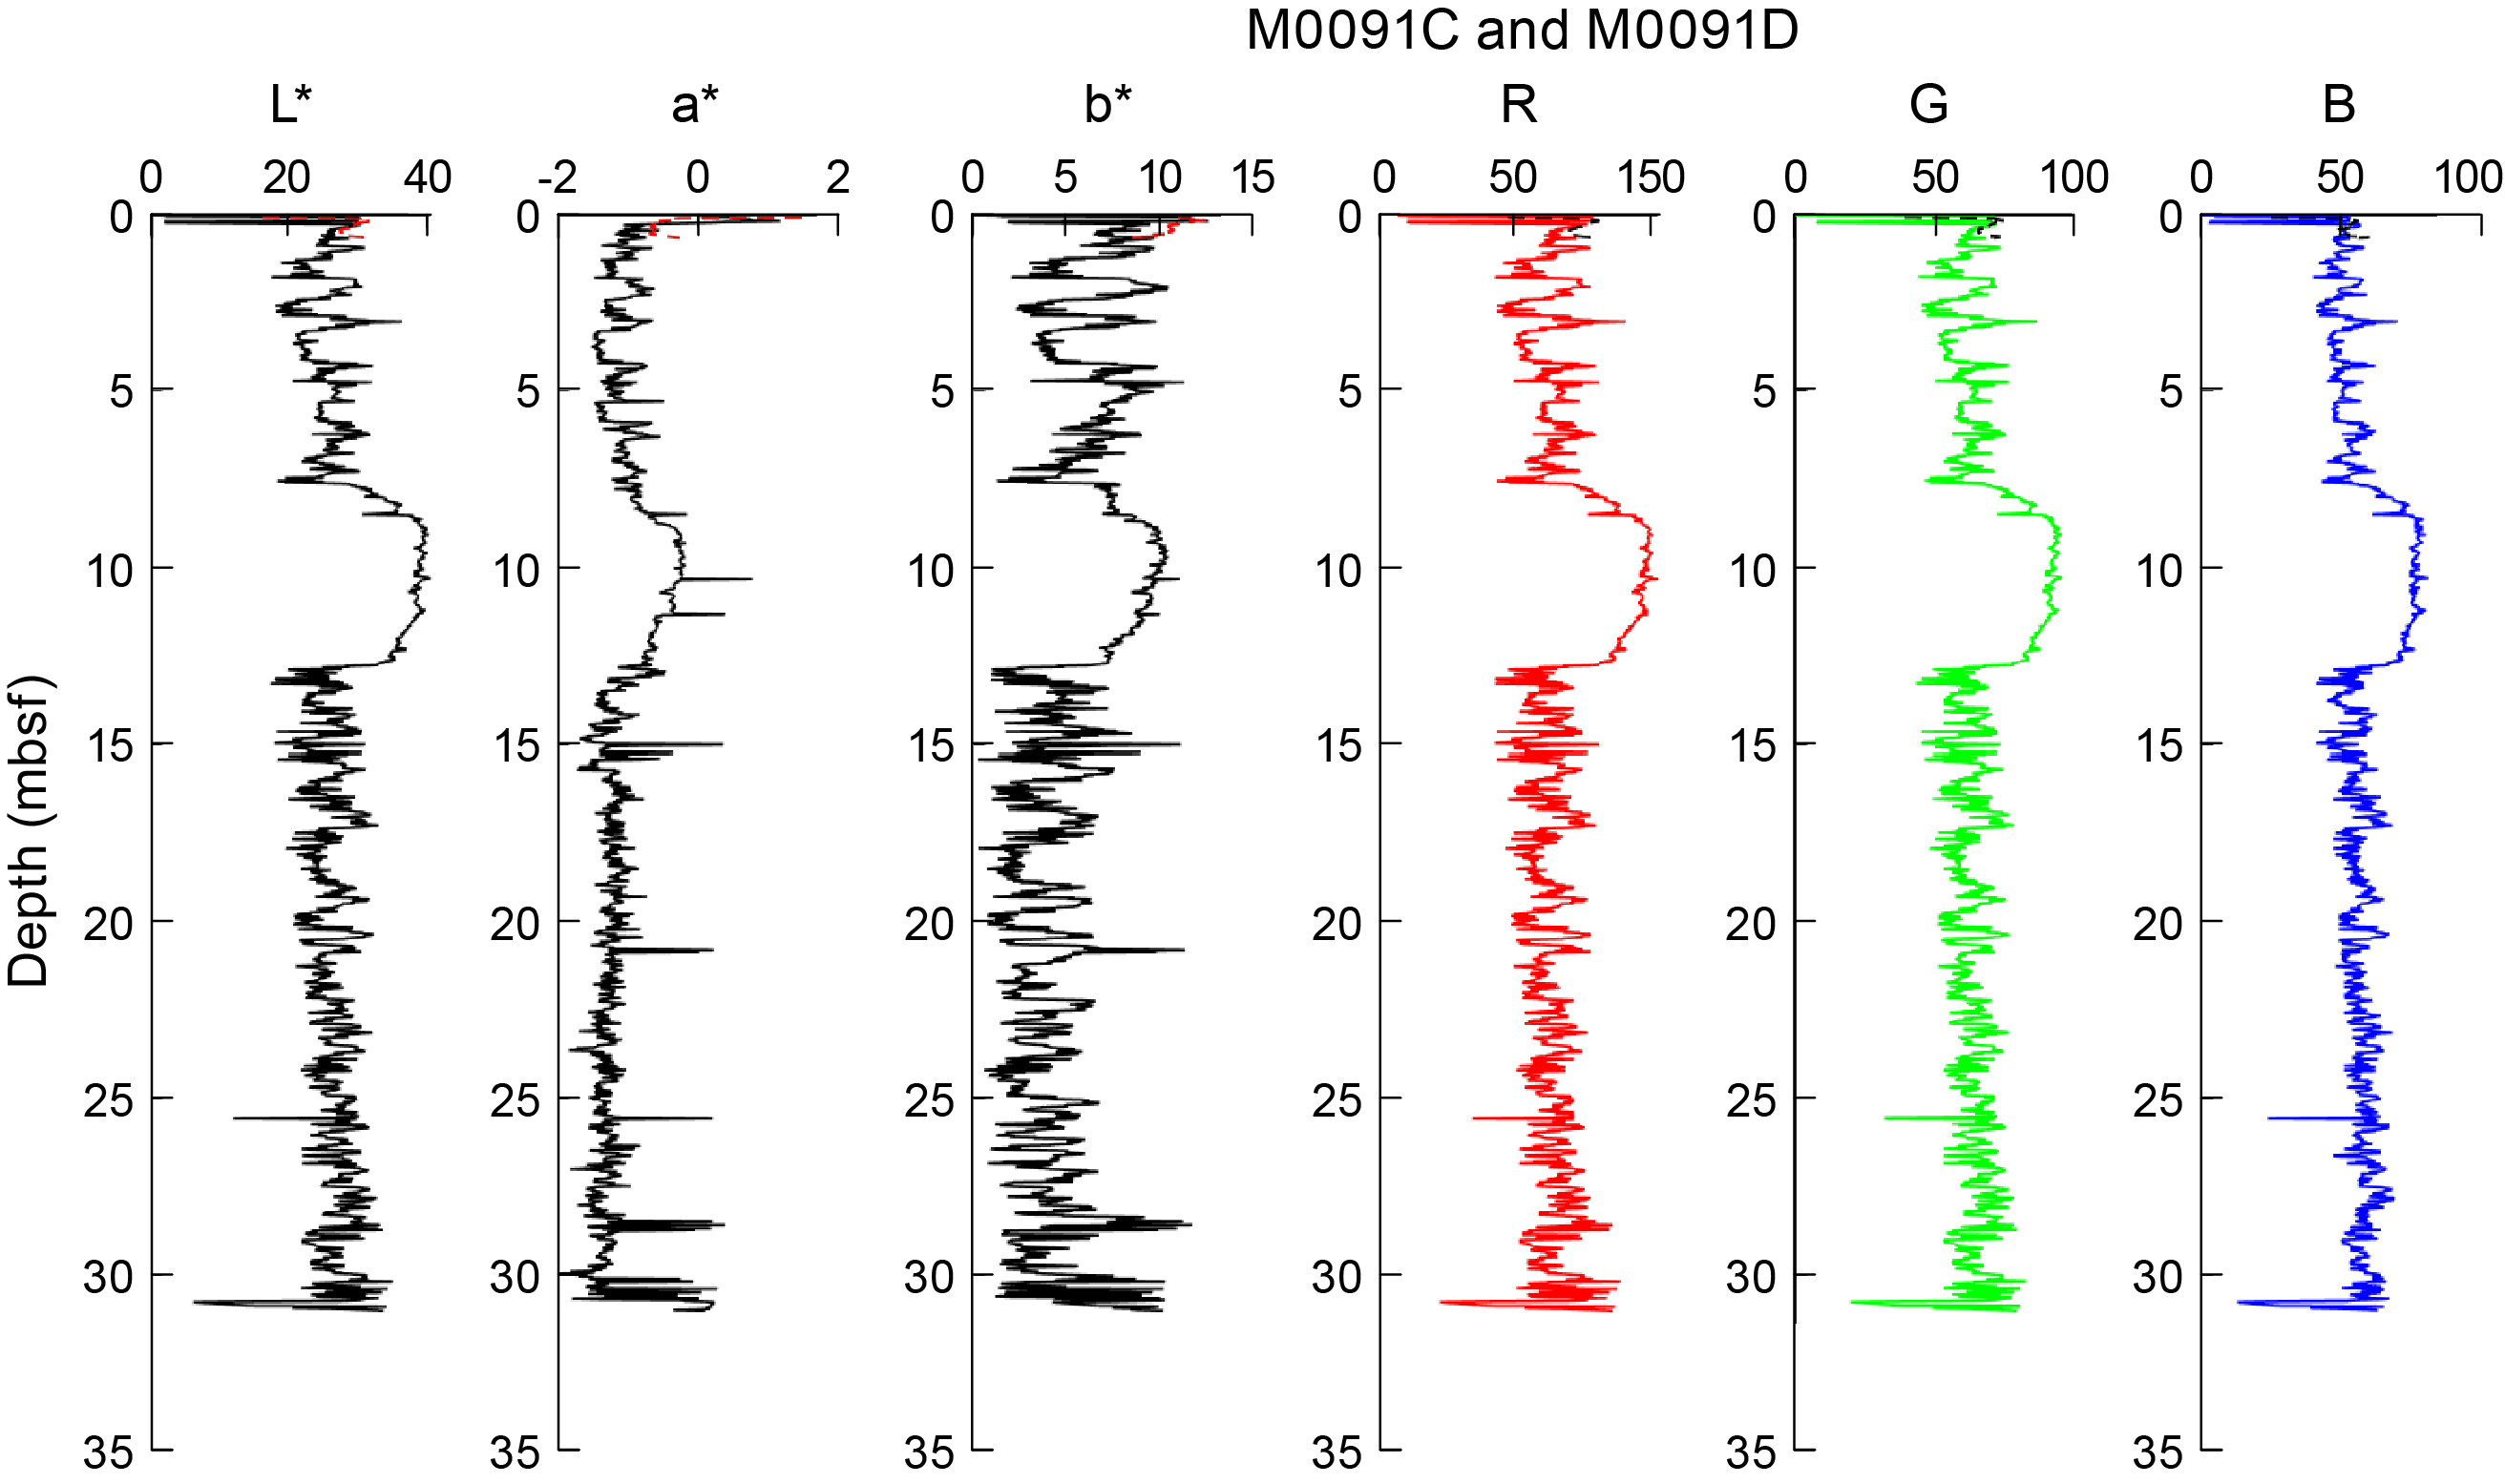
Figure F36. Color data, Holes M0091C and M0091D.
8. Paleomagnetism
This section reports the measurement of remanent magnetization in Holes M0091A–M0091D, which are located in Basin S3 near the border between the central and southern Japan Trench focus areas (Sites M0083 and M0089 and Sites M0081 and M0082, respectively).
Remanent magnetization of U-channel samples was measured on sections of the working halves at 2 cm intervals. Natural remanent magnetization (NRM) measurements were only conducted at 0 and 5 mT peak fields due to the time constraints of the hybrid OSP.
Profiles of intensity, inclination, and declination after demagnetization at 5 mT are displayed in the figures in this section. The profiles of Holes M0091A and M0091C are shown separately from their GPC counterparts due to the short length of the trigger cores (Figure F37). Intensities are higher (around 0.2 mbsf) in Holes M0091A (~5 × 10⁻⁵ A/m) and M0091C (~10 × 10−5 A/m) and then decrease downward. Inclinations in Holes M0091A and M0091C are about 60° in the core tops and become constant at about 45° below 0.2 mbsf. Declinations in Holes M0091A and M0091C remain constant at about 270° and 30°, respectively.
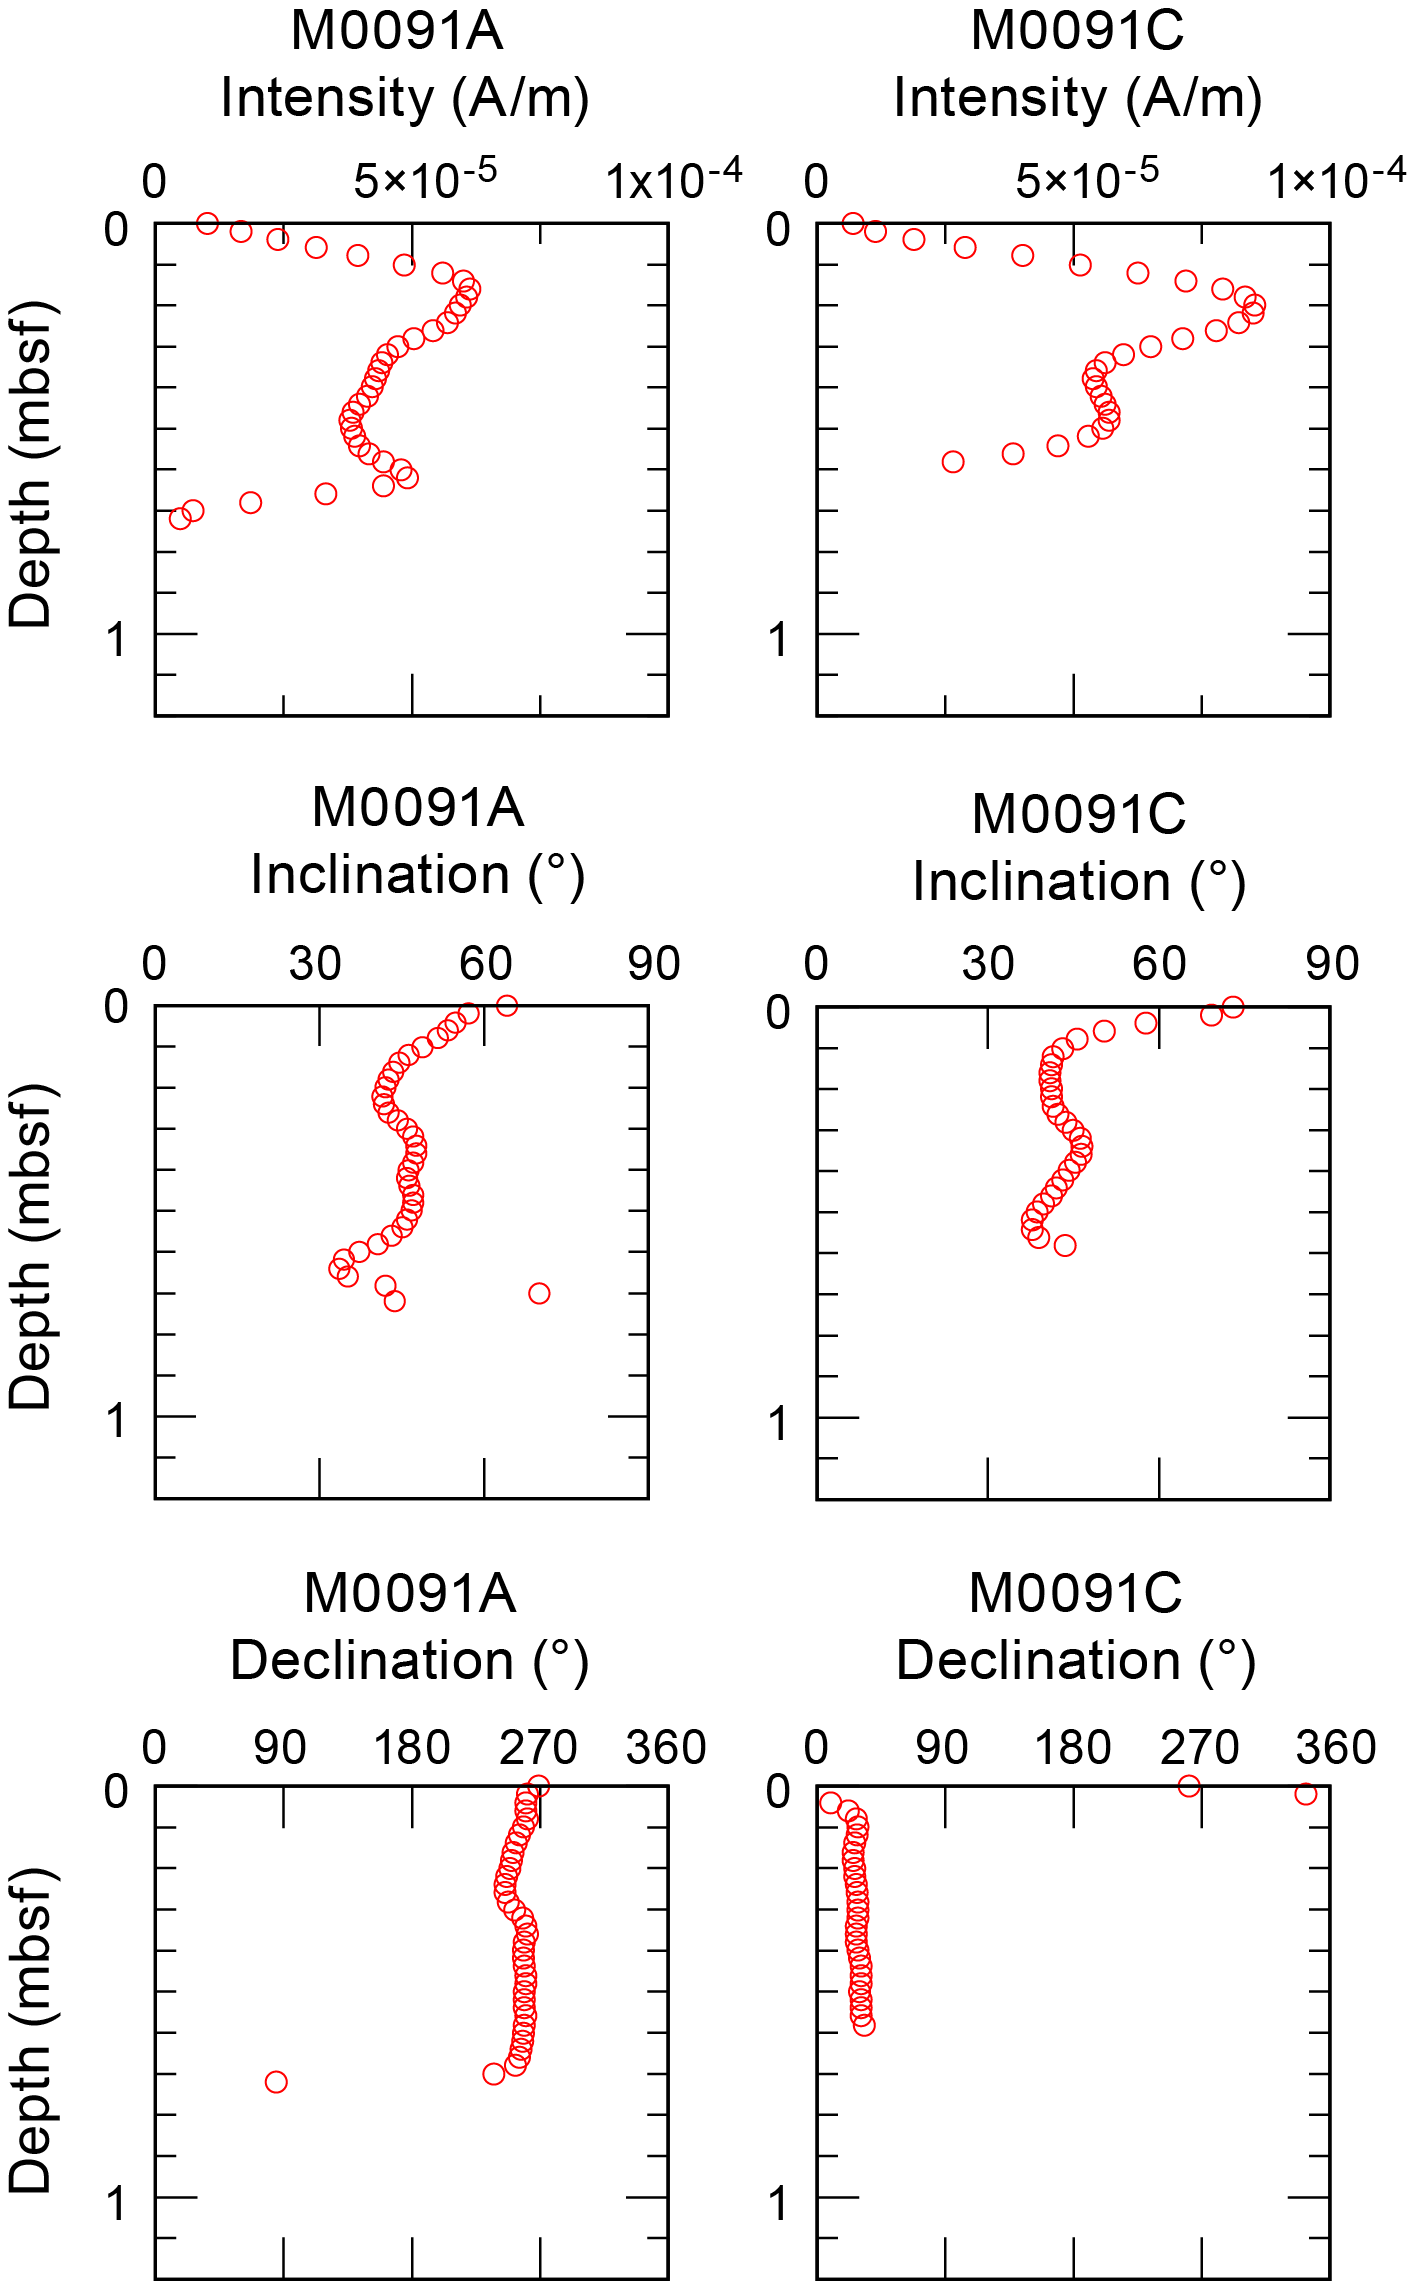
Figure F37. Intensity, inclination, and declination.
Intensities are characterized by large fluctuations in Holes M0091B and M0091D (10 × 10−5 A/m) (Figure F38). Both holes show a similar pattern in their intensity profiles, characterized by a linear downward increase to a pronounced peak of about 6 × 10⁻⁵ A/m at ~3 mbsf, a relative low between ~4 and 5 mbsf, and another roughly linear downcore increase to higher values between around 6 and 8 mbsf. Between 9 and 16 mbsf, lower values are comparable, followed by 4–5 high intensity peaks between 16 and 24 mbsf. In Hole M0091D, values decrease between about 24 and 29 mbsf, and there is one peak of 6 × 10⁻⁵ A/m at 31 mbsf. However, intensity in Hole M0091D is weaker (about 60%) than in Hole M0091B.
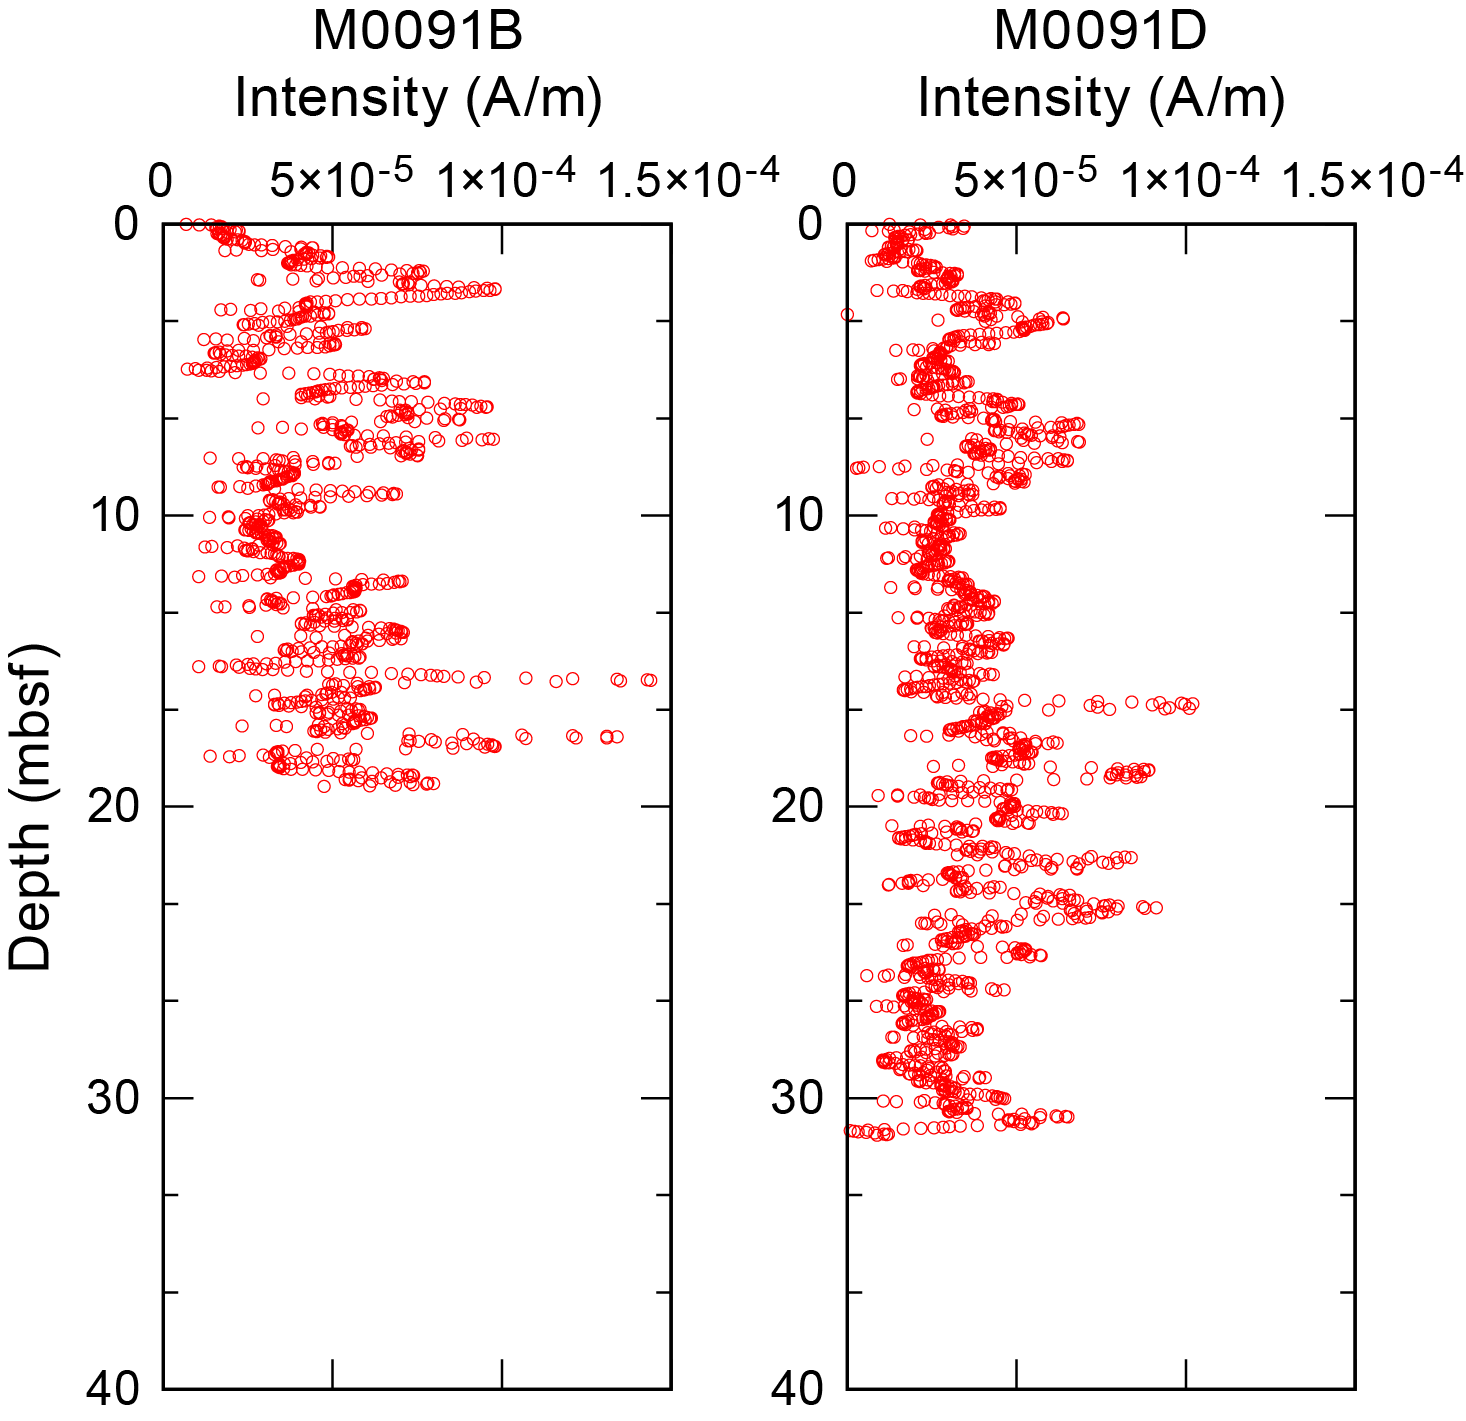
Figure F38. Intensity.
Declination trends are shown in Figure F39. Relatively low fluctuations between 180° to 270° are observed throughout Hole M0091B. In contrast, a clockwise gradual shift downward is seen in Hole M0091D. A simple linear correction with depth function was applied to reconstruct the original declination trend of Hole M0091D. Discontinuities of the declination trend observed at 10 mbsf were corrected by shifting to compensate for directional gaps. It is likely that the corrected declination profile of Hole M0091D has not been properly corrected because the declination variation between 0 and 12 mbsf does not match the declination profile of Hole M0091B (Figure F40). The declination trends between 14 and 19 mbsf in both holes show good agreement and are interpreted as paleomagnetic secular variation.
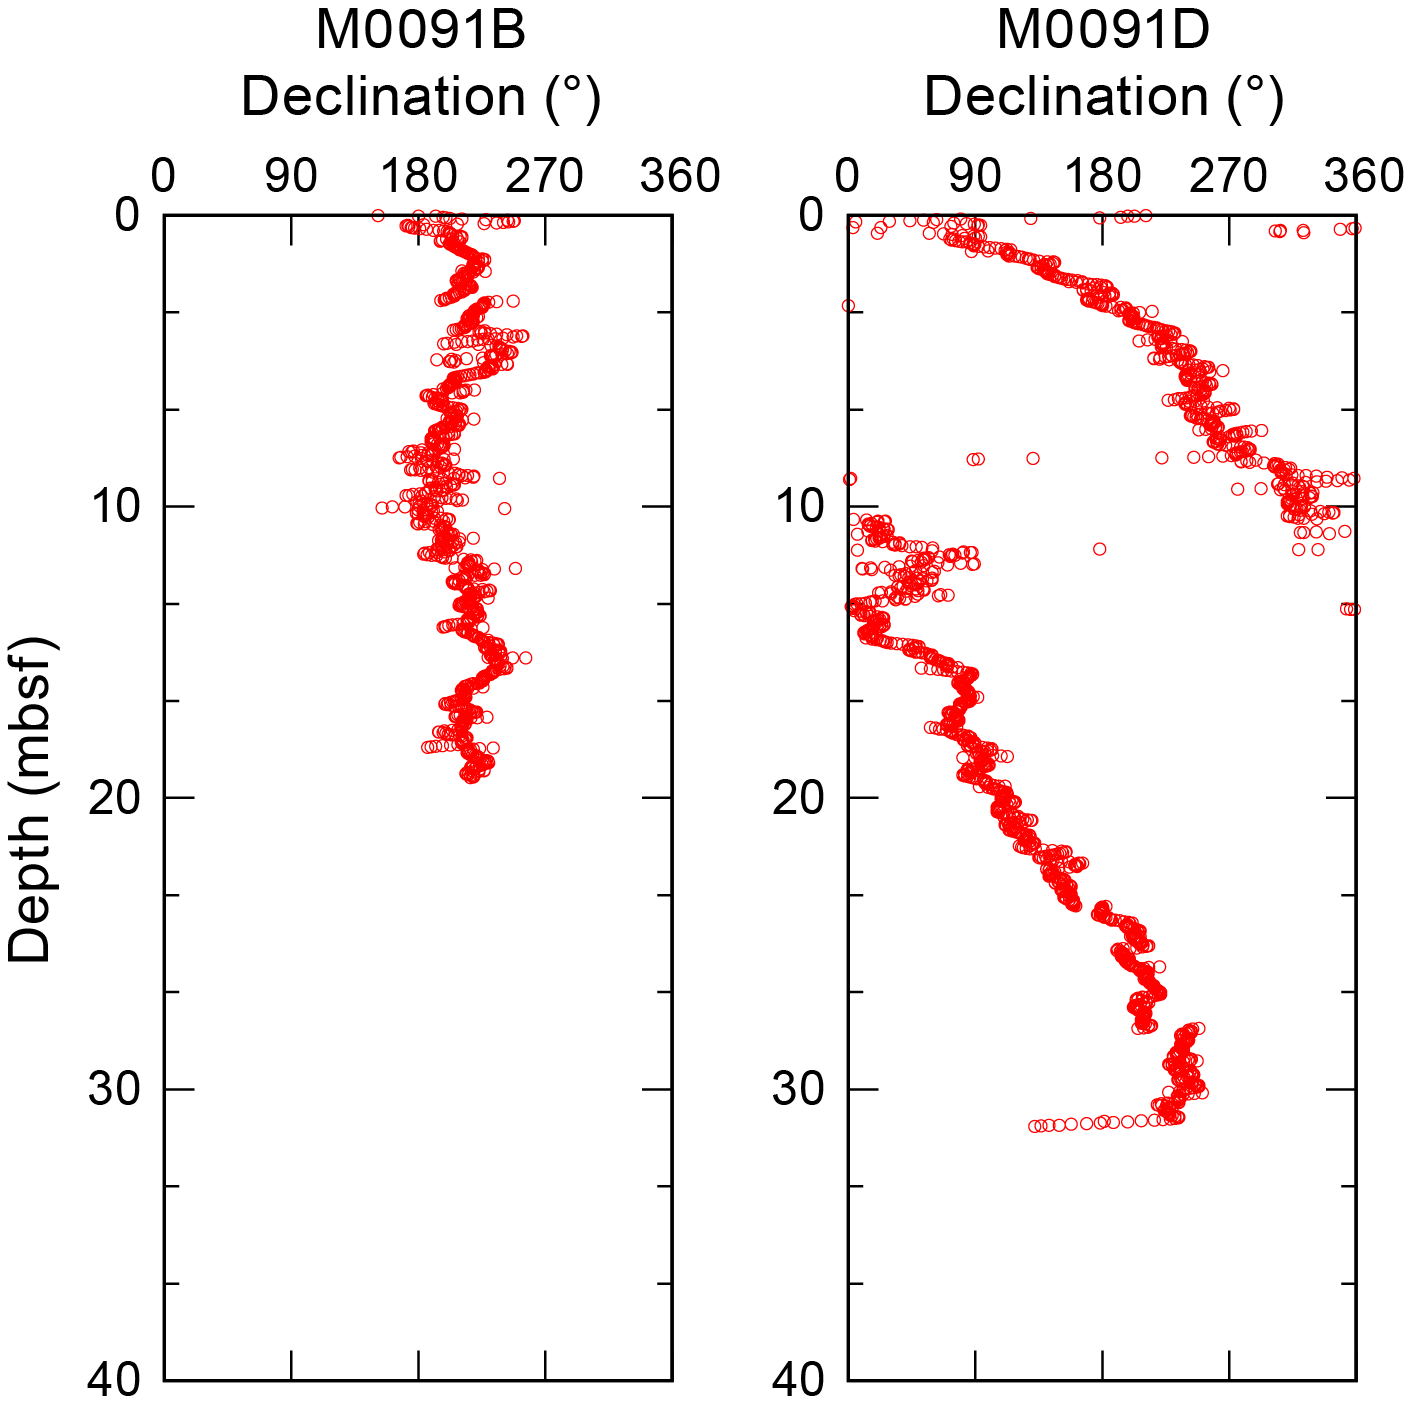
Figure F39. Declination.
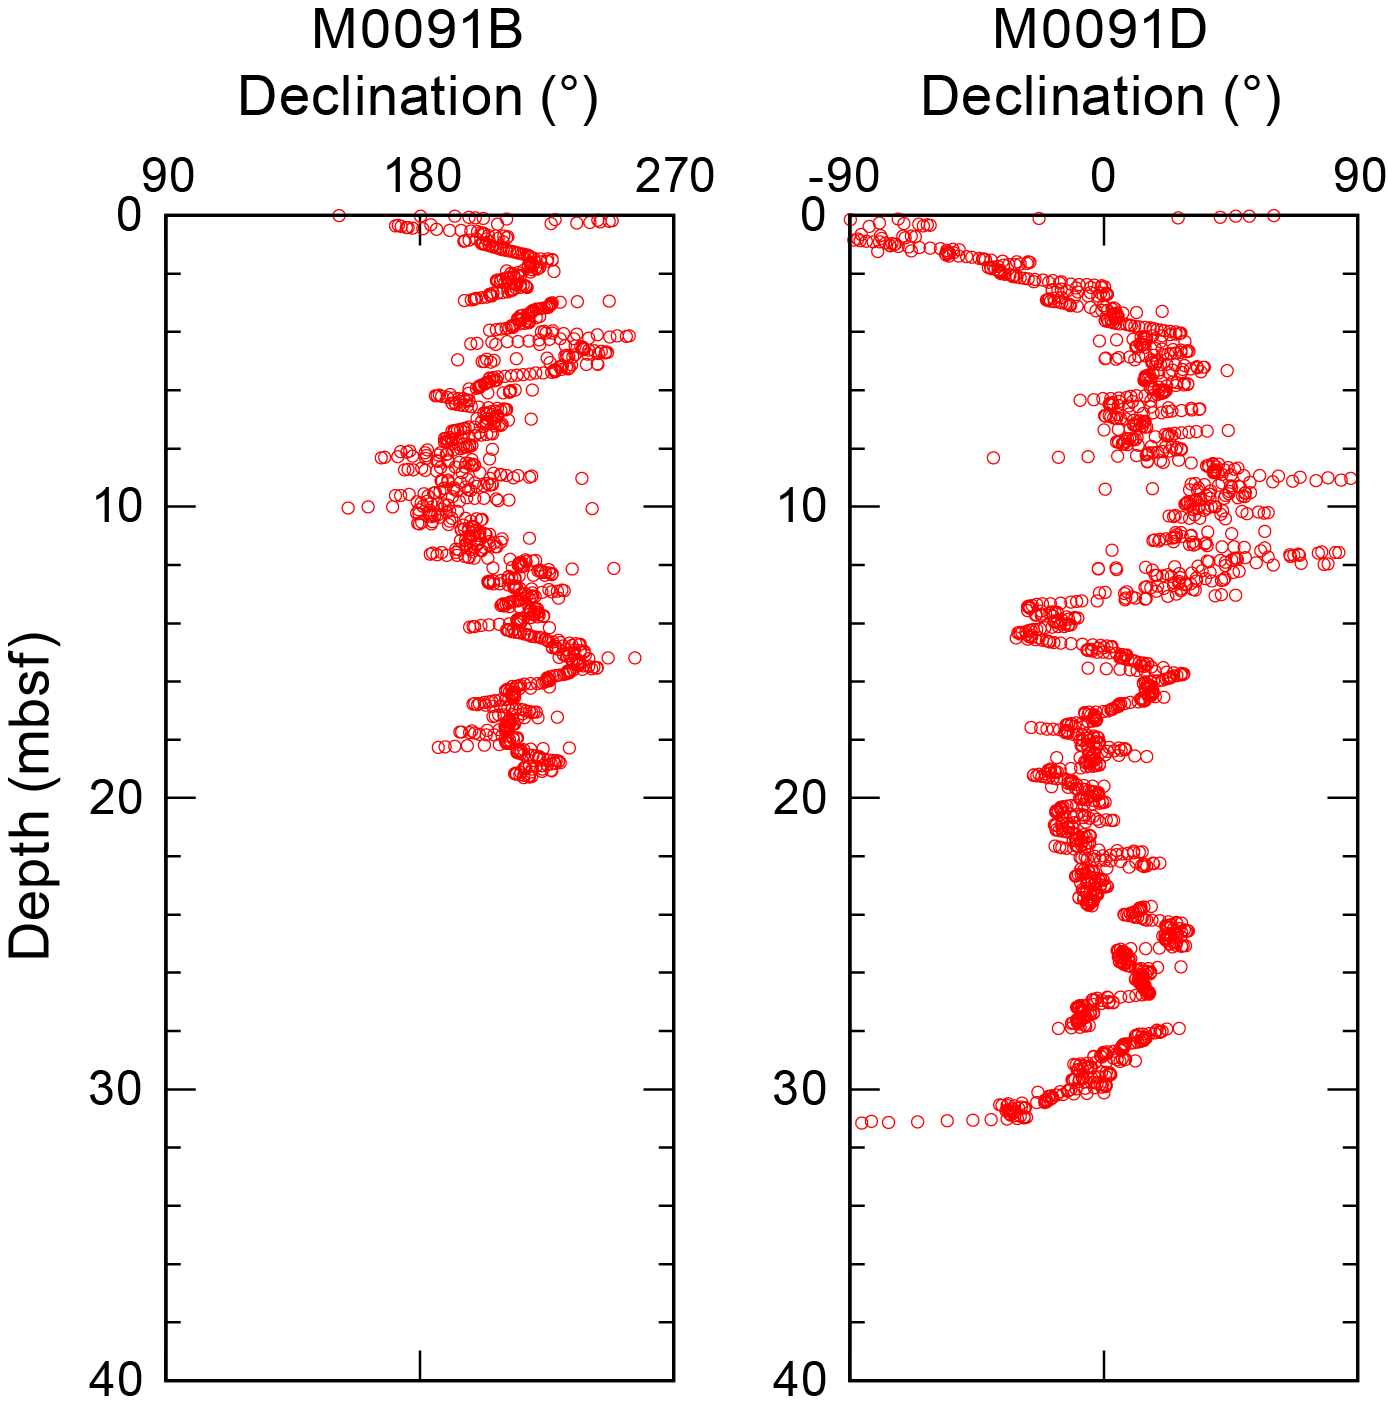
Figure F40. Rescaled declination and corrected declination.
The inclination profiles of Holes M0091B and M0091D generally fluctuate between 30° and 60° and show similar trends (Figure F41); however, the distribution of inclination in Hole M0091D is more scattered than in Hole M0091B. At around 16 mbsf, an inclination low is identified in both profiles, which is likely to correspond with similar signatures observed in other sites, such as Sites M0083 and M0085 (e.g., Figure F69 in the Sites M0083 and M0089 (Basin C2) chapter [Strasser et al., 2023b] and Figure F68 in the Sites M0084 and M0085 (Basin N3) chapter [Strasser et al., 2023c]).
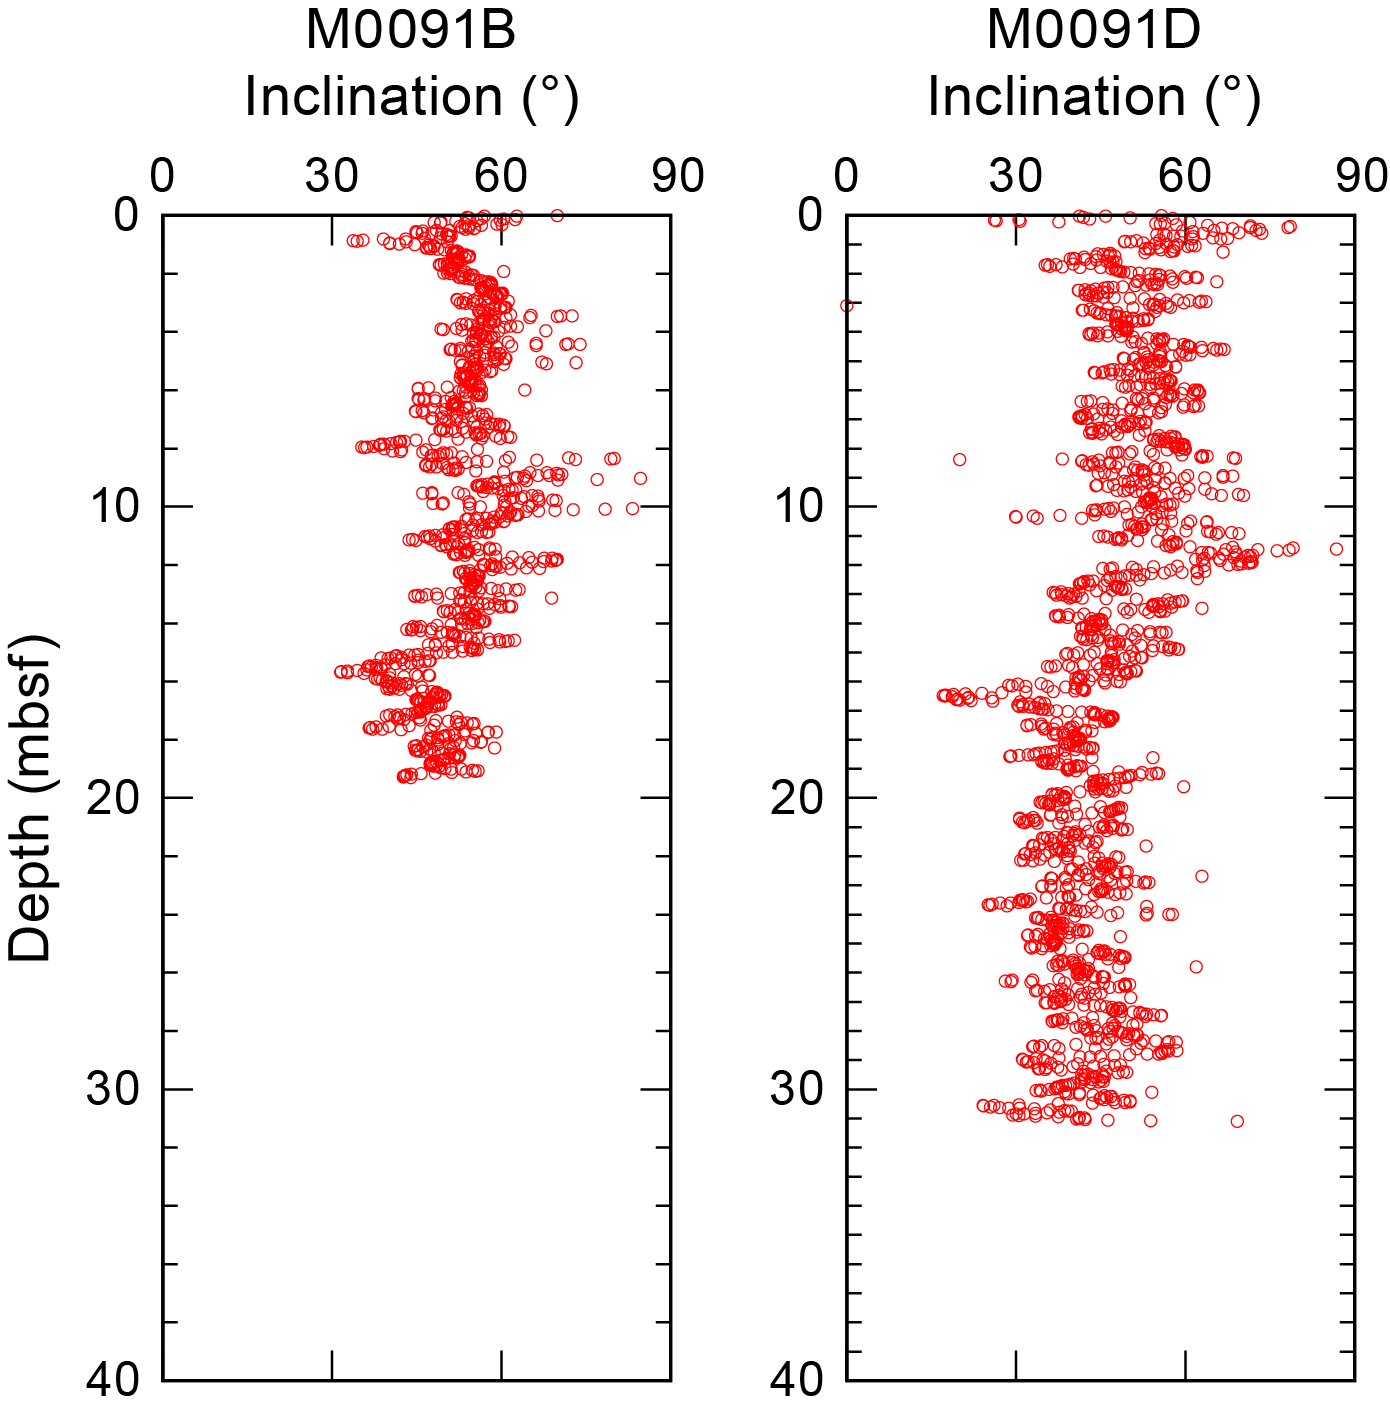
Figure F41. Inclination.
Preliminary paleomagnetic data for Holes M0091B and M0091D display similar trends in intensity and inclination, but Hole M0091D has a smaller magnitude of intensity and a wider distribution in inclination. The corrected declination of Hole M0091D reveals the same pattern seen between 14 and 19 mbsf in Hole M0091B. Variation in other intervals of Hole M0091D reveals a distorted record, which is interpreted here as a likely to result from an erroneous correction of declination.
9. Stratigraphic correlation
A core composite depth scale and first-order splice (see Stratigraphic correlation in the Expedition 386 methods chapter [Strasser et al., 2023a]) were constructed for Basin S3 (Site M0091) to establish a first-order continuous sediment succession. Four cores were recovered from four holes during two GPC deployments (Holes M0091A–M0091D).
First-order splicing between the four holes at Site M0091 enabled construction of a continuous stratigraphic succession from the seafloor to the bottom of Hole M0091D (31.47 meters composite depth in splice [mcd-splice]), with the exception of one currently unresolved gap between the base of Trigger Core 386-M0091A-1P and the top of GPC Core 386-M0091D-1H. Therefore, the Site M0091 composite depth below seafloor scale for depths >0.665 mcd is currently referred to as a floating depth, assuming the coring gap to be zero.
9.1. Construction of core composite depth scale
9.1.1. Definition of top and selection of seafloor anchor core
The hand drawn visual core descriptions (VCDs) show a thin oxidized top of the trigger cores (Holes M0091A and M0091C), demonstrating that an undisturbed mudline was recovered in both holes (Sections 386-M0091A-1P-1, 7 cm, and 386-M0091C-1P-1, 6.5 cm). Hence, the top (0 mcd) is defined as the mudline and a vertical shift of −0.07 m to Core 386-M0091A-1P and −0.065 m to Core 386-M0091C-1P is applied (Tables T10, T11, T12).
A correlative planar stratigraphic horizon at ~20 cm in both trigger cores, characterized by a subtle color change and a slight downward increase in radiodensity, suggests nearly constant thickness of the stratigraphic succession recovered in Holes M0091A and M0091C. Thus, the longer trigger core (386-M0091A-1P) was selected as the anchor core and Section 386-M0091A-1P-1, 7 cm, is designated as 0 mcd.
9.1.2. Compositing cores
Before compositing holes, artificial and/or natural voids were measured at the ends of sections (see Stratigraphic correlation in the Expedition 386 methods chapter [Strasser et al., 2023a]) and the void length was subtracted from the curated section length to obtain the sediment length for each section (neglecting core catchers that were sampled in bags). Corrected section lengths and section top and bottom depths for Site M0091 are listed in Table T10.
The first-order core composite scale for Site M0091 is based on the visual correlation of marker horizons on X-ray computed tomography (CT) images and VCDs generated during the OSP, guided by visual inspection of trends and spikes in magnetic susceptibility and density data from the MSCL, linescan images and color reflectance data, and, where present, visible tephra layers (see Stratigraphic correlation in the Expedition 386 methods chapter [Strasser et al., 2023a]). At this stage, thin but clear marker beds visible on X-ray CT and/or linescan images are used, in places verified by the hand drawn VCDs, instead of large (coarse and thick) event beds that may have eroded the underlying sediments. Primary air fall tephra beds, which were generated by a single volcanic eruption and fell through the water column, represent some of the best tie points between holes. Only one such potential tephra occurrence was observed during visual core description, and it appears as bioturbated patches in interval 386-M0091D-1H-7, 82–87.6 cm (see Tephra), but was not observed in the neighboring hole.
First-order correlation does not allow for correlation between either of the trigger cores (386-M0091A-1P and 386-M0091C-1P) and the upper part of the GPC cores (386-M0091B-1H and 386-M0091D-1H) because no correlation tie points could be identified to tie the GPC cores to the mudline-anchored trigger core. This suggests that the coring gap at the top of the GPC core is larger than the total length of the trigger cores, and the composite depth scale of the GPC cores remains floating. Following the methodology in Stratigraphic correlation in the Expedition 386 methods chapter (Strasser et al., 2023a), the base of the longest trigger core (Section 386-M0091A-1P-1, 73.5 cm; 0.665 mbsf [corrected core depth scale; Table T10]; 0.665 mcd-splice; Tables T11, T12) and the top of GPC Core 386-M0091D-1H (which has more recovery at the core top than Core 386-M0091B-1H) are aligned, assuming the gap to be zero (Append Point AP1). With an artificial void (1.5 cm) at the top of Section 386-M0091D-1H-1 (Table T10), a vertical depth shift of 0.65 m is calculated for the top of Core 1H (Table T11).
Several different types of tie points can be determined, and as a result, the general stratigraphic succession and several distinct marker horizons can be correlated across GPC cores. Horizontal alignment of a first stratigraphic tie point likely allows Core 386-M0091B-1H to be tied to Core 386-M0091D-1H using TP2 at 2.415 mcd-splice (Table T12). This is defined at the base of a correlative 2 cm thick silty clay bed with slightly higher radiodensity at the boundary between the underlying structureless clay and the overlying bioturbated clay with a slightly darker color hue. This results in a vertical offset for Core 386-M0091B-1H of 1.51 m. The vertical offsets of the top depth of each core used to create the first-order core composite depth scales at Site M0091 are given in the affine table (Table T11). Note that these linear bulk shifts are only correct for the uppermost few meters shallower than the first occurrence of artificial voids added to the bottom or tops of section during core cutting due to sediment expansion during core recovery (Table T10).
Overall, the general stratigraphic succession and several distinct marker horizons, as observed in X-ray CT images and verified on the hand drawn VCDs, can be correlated across GPC cores. However, sequential horizontal alignment of marker beds from the top to bottom of the cores reveals that the stratigraphic succession covered by both holes is more expanded in the upper part of Hole M0091B than in the stratigraphically equivalent succession in Hole M0088D, whereas the lower part (below ~12 mbsf) shows opposite trends. This might reflect spatial differences in the original depositional succession or might be due to differences in gas expansion and elastic rebound during core recovery or a combination of both.
9.1.3. Construction of splice
All tie points were evaluated for robustness of correlation and suitability for composing the splice. From these, three were selected to construct the splice (Table T12). Most of these are described as thin laminae that are slightly coarser than the surrounding fine-grained sediments or as a correlative color band within the overall succession of superpositioned facies associations (see Figure F29 in the Expedition 386 methods chapter [Strasser et al., 2023a]). The accuracy of correlation depends on how clearly the tie point can be recognized in X-ray CT and linescan images. The depth of each tie point was determined during visual core description or based on X-ray CT and linescan images when a description is lacking.
With the exception of the unknown coring gap between the base of the longest trigger core (Section 386-M0091A-1P, 73.5 cm; 0.665 mcd-splice) and the top of the GPC core with highest recovery at the core top (386-M0091D-1H), a combination of Cores 386-M0091A-1P (mudline anchor core), 386-M0091B-1H, and 386-M0091D-1H reveals the longest, most complete, and least disturbed stratigraphy interval at Site M0091.
At 0.665 mcd-splice, the top of the sedimentary succession recovered in Core 386-M0091D-1H is appended to the base of the anchor core (386-M0091A-1P; AP1; Table T12). Below, the top interval from Hole M0091B to TP2 was selected to include in the splice. Below this splice depth (2.415 mcd-splice), the respective interval in Hole M0091B was selected for the splice because cores recovered from the 20 m long GPC barrel deployment are generally less disturbed. The splice stays in Hole M0091B to TP3 near the bottom of the hole. This splice interval includes the tephra layer in interval 386-M0091D-1H-7, 82–87.6 cm, which has, based on similar facies pattern superposition, a likely correlative horizon in Section 386-M0091B-1H-6, 39–44 cm, for which no tephra was observed during visual core description. At TP3 (19.415 mcd-splice), the lower of two thin silt lamina within moderately bioturbated clay is used to tie the lowermost splice interval from the longer GPC core (from Section 386-M0091D-1H-20, 49 cm [19.415 mcd-splice], to the bottom of the hole [31.47 mcd-splice = bottom of splice]). All splice tie points used to construct a complete first-order splice along with the calculated core composite depth within the splice are given in Table T12.
References
Bruland, K.W., Middag, R., and Lohan, M.C., 2014. Controls of trace metals in seawater. In Holland, H.D., and Turekian, K.K. (Eds.), Treatise on Geochemistry (Second Edition). Oxford (Elsevier), 19–51. https://doi.org/
Froelich, P.N., Klinkhammer, G.P., Bender, M.L., Luedtke, N.A., Heath, G.R., Cullen, D., Dauphin, P., Hammond, D., Hartman, B., and Maynard, V., 1979. Early oxidation of organic matter in pelagic sediments of the eastern equatorial Atlantic: suboxic diagenesis. Geochimica et Cosmochimica Acta, 43(7):1075–1090. https://doi.org/
Glud, R.N., Wenzhöfer, F., Middelboe, M., Oguri, K., Turnewitsch, R., Canfield, D.E., and Kitazato, H., 2013. High rates of microbial carbon turnover in sediments in the deepest oceanic trench on Earth. Nature Geoscience, 6(4):284–288. https://doi.org/
Kioka, A., Schwestermann, T., Moernaut, J., Ikehara, K., Kanamatsu, T., Eglinton, T.I., and Strasser, M., 2019. Event stratigraphy in a hadal oceanic trench: the Japan Trench as sedimentary archive recording recurrent giant subduction zone earthquakes and their role in organic carbon export to the deep sea. Frontiers in Earth Science, 7:319. https://doi.org/
Morley, J.J., Hays, J.D., and Robertson, J.H., 1982. Stratigraphic framework for the late Pleistocene in the northwest Pacific Ocean. Deep Sea Research, Part A: Oceanographic Research Papers, 29(12):1485–1499. https://doi.org/
Strasser, M., Ikehara, K., and Cotterill, C., 2019. Expedition 386 Scientific Prospectus: Japan Trench Paleoseismology. International Ocean Discovery Program. https://doi.org/
Strasser, M., Ikehara, K., Everest, J., Maeda, L., Hochmuth, K., Grant, H., Stewart, M., Okutsu, N., Sakurai, N., Yokoyama, T., Bao, R., Bellanova, P., Brunet, M., Cai, Z., Cattaneo, A., Hsiung, K.-H., Huang, J.-J., Ishizawa, T., Itaki, T., Jitsuno, K., Johnson, J.E., Kanamatsu, T., Keep, M., Kioka, A., Kölling, M., Luo, M., März, C., McHugh, C., Micallef, A., Nagahashi, Y., Pandey, D.K., Proust, J.-N., Rasbury, E.T., Riedinger, N., Satoguchi, Y., Sawyer, D.E., Seibert, C., Silver, M., Straub, S.M., Virtasalo, J., Wang, Y., Wu, T.-W., and Zellers, S.D., 2023a. Expedition 386 methods. In Strasser, M., Ikehara, K., Everest, J., and the Expedition 386 Scientists, Japan Trench Paleoseismology. Proceedings of the International Ocean Discovery Program, 386: College Station, TX (International Ocean Discovery Program). https://doi.org/
Strasser, M., Ikehara, K., Everest, J., Maeda, L., Hochmuth, K., Grant, H., Stewart, M., Okutsu, N., Sakurai, N., Yokoyama, T., Bao, R., Bellanova, P., Brunet, M., Cai, Z., Cattaneo, A., Hsiung, K.-H., Huang, J.-J., Ishizawa, T., Itaki, T., Jitsuno, K., Johnson, J.E., Kanamatsu, T., Keep, M., Kioka, A., Kölling, M., Luo, M., März, C., McHugh, C., Micallef, A., Nagahashi, Y., Pandey, D.K., Proust, J.-N., Rasbury, E.T., Riedinger, N., Satoguchi, Y., Sawyer, D.E., Seibert, C., Silver, M., Straub, S.M., Virtasalo, J., Wang, Y., Wu, T.-W., and Zellers, S.D., 2023b. Sites M0083 and M0089 (Basin C2). In Strasser, M., Ikehara, K., Everest, J., and the Expedition 386 Scientists, Japan Trench Paleoseismology. Proceedings of the International Ocean Discovery Program, 386: College Station, TX (International Ocean Discovery Program). https://doi.org/
Strasser, M., Ikehara, K., Everest, J., Maeda, L., Hochmuth, K., Grant, H., Stewart, M., Okutsu, N., Sakurai, N., Yokoyama, T., Bao, R., Bellanova, P., Brunet, M., Cai, Z., Cattaneo, A., Hsiung, K.-H., Huang, J.-J., Ishizawa, T., Itaki, T., Jitsuno, K., Johnson, J.E., Kanamatsu, T., Keep, M., Kioka, A., Kölling, M., Luo, M., März, C., McHugh, C., Micallef, A., Nagahashi, Y., Pandey, D.K., Proust, J.-N., Rasbury, E.T., Riedinger, N., Satoguchi, Y., Sawyer, D.E., Seibert, C., Silver, M., Straub, S.M., Virtasalo, J., Wang, Y., Wu, T.-W., and Zellers, S.D., 2023c. Sites M0084 and M0085 (Basin N3). In Strasser, M., Ikehara, K., Everest, J., and the Expedition 386 Scientists, Japan Trench Paleoseismology. Proceedings of the International Ocean Discovery Program, 386: College Station, TX (International Ocean Discovery Program). https://doi.org/
Strasser, M., Ikehara, K., Everest, J., and the Expedition 386 Scientists, 2023d. Supplementary material, https://doi.org/10.14379/iodp.proc.386supp.2023. In Strasser, M., Ikehara, K., Everest, J., and the Expedition 386 Scientists, Japan Trench Paleoseismology. Proceedings of the International Ocean Discovery Program, 386: College Station, TX (International Ocean Discovery Program).