Sager, W., Hoernle, K., Höfig, T.W., Blum, P., and the Expedition 391 Scientists
Proceedings of the International Ocean Discovery Program Volume 391
publications.iodp.org
https://doi.org/10.14379/iodp.proc.391.105.2023
Site U15771
![]() W. Sager,
W. Sager,
![]() K. Hoernle,
K. Hoernle,
![]() T.W. Höfig,
T.W. Höfig,
![]() A.J. Avery,
A.J. Avery,
![]() R. Bhutani,
R. Bhutani,
![]() D.M. Buchs,
D.M. Buchs,
![]() C.A. Carvallo,
C.A. Carvallo,
![]() C. Class,
C. Class,
![]() Y. Dai,
Y. Dai,
![]() G. Dalla Valle,
G. Dalla Valle,
![]() A.V. Del Gaudio,
S. Fielding,
A.V. Del Gaudio,
S. Fielding,
![]() K.M. Gaastra,
K.M. Gaastra,
![]() S. Han,
S. Han,
![]() S. Homrighausen,
S. Homrighausen,
![]() Y. Kubota,
Y. Kubota,
![]() C.-F. Li,
C.-F. Li,
![]() W.R. Nelson,
W.R. Nelson,
![]() E. Petrou,
E. Petrou,
![]() K.E. Potter,
K.E. Potter,
![]() S. Pujatti,
S. Pujatti,
![]() J. Scholpp,
J. Scholpp,
![]() J.W. Shervais,
J.W. Shervais,
![]() S. Thoram,
S. Thoram,
![]() S.M. Tikoo-Schantz,
S.M. Tikoo-Schantz,
![]() M. Tshiningayamwe,
X.-J. Wang, and
M. Tshiningayamwe,
X.-J. Wang, and
![]() M. Widdowson2
M. Widdowson2
1 Sager, W., Hoernle, K., Höfig, T.W., Avery, A.J., Bhutani, R., Buchs, D.M., Carvallo, C.A., Class, C., Dai, Y., Dalla Valle, G., Del Gaudio, A.V., Fielding, S., Gaastra, K.M., Han, S., Homrighausen, S., Kubota, Y., Li, C.-F., Nelson, W.R., Petrou, E., Potter, K.E., Pujatti, S., Scholpp, J., Shervais, J.W., Thoram, S., Tikoo-Schantz, S.M., Tshiningayamwe, M., Wang, X.-J., and Widdowson, M., 2023. Site U1577. In Sager, W., Hoernle, K., Höfig, T.W., Blum, P., and the Expedition 391 Scientists, Walvis Ridge Hotspot. Proceedings of the International Ocean Discovery Program, 391: College Station, TX (International Ocean Discovery Program). https://doi.org/10.14379/iodp.proc.391.105.2023
2 Expedition 391 Scientists' affiliations.
1. Background and objectives
The strategy for International Ocean Discovery Program (IODP) Expedition 391 was to drill at three distributed locations on Walvis Ridge and one in Guyot Province, providing an age transect along the Tristan-Gough-Walvis (TGW) hotspot track. Site U1577 (proposed Site VB-13A) is located on the eastern flank of Valdivia Bank (Figure F1). The purpose of this site and Site U1576 (on the west side of Valdivia Bank) is to investigate the type of volcanism, possible plume-ridge interaction, geochemical heterogeneity, and the age progression of the hotspot track. Both hotspot models and the age progression of Homrighausen et al. (2019) predict an age of ~80–85 Ma (Figures F2, F3). A magnetic anomaly map indicates that Site U1577 is located on a prominent positive anomaly (Figure F4) that is thought to be the young end of Chron 34n (83.7 Ma; Ogg, 2020).
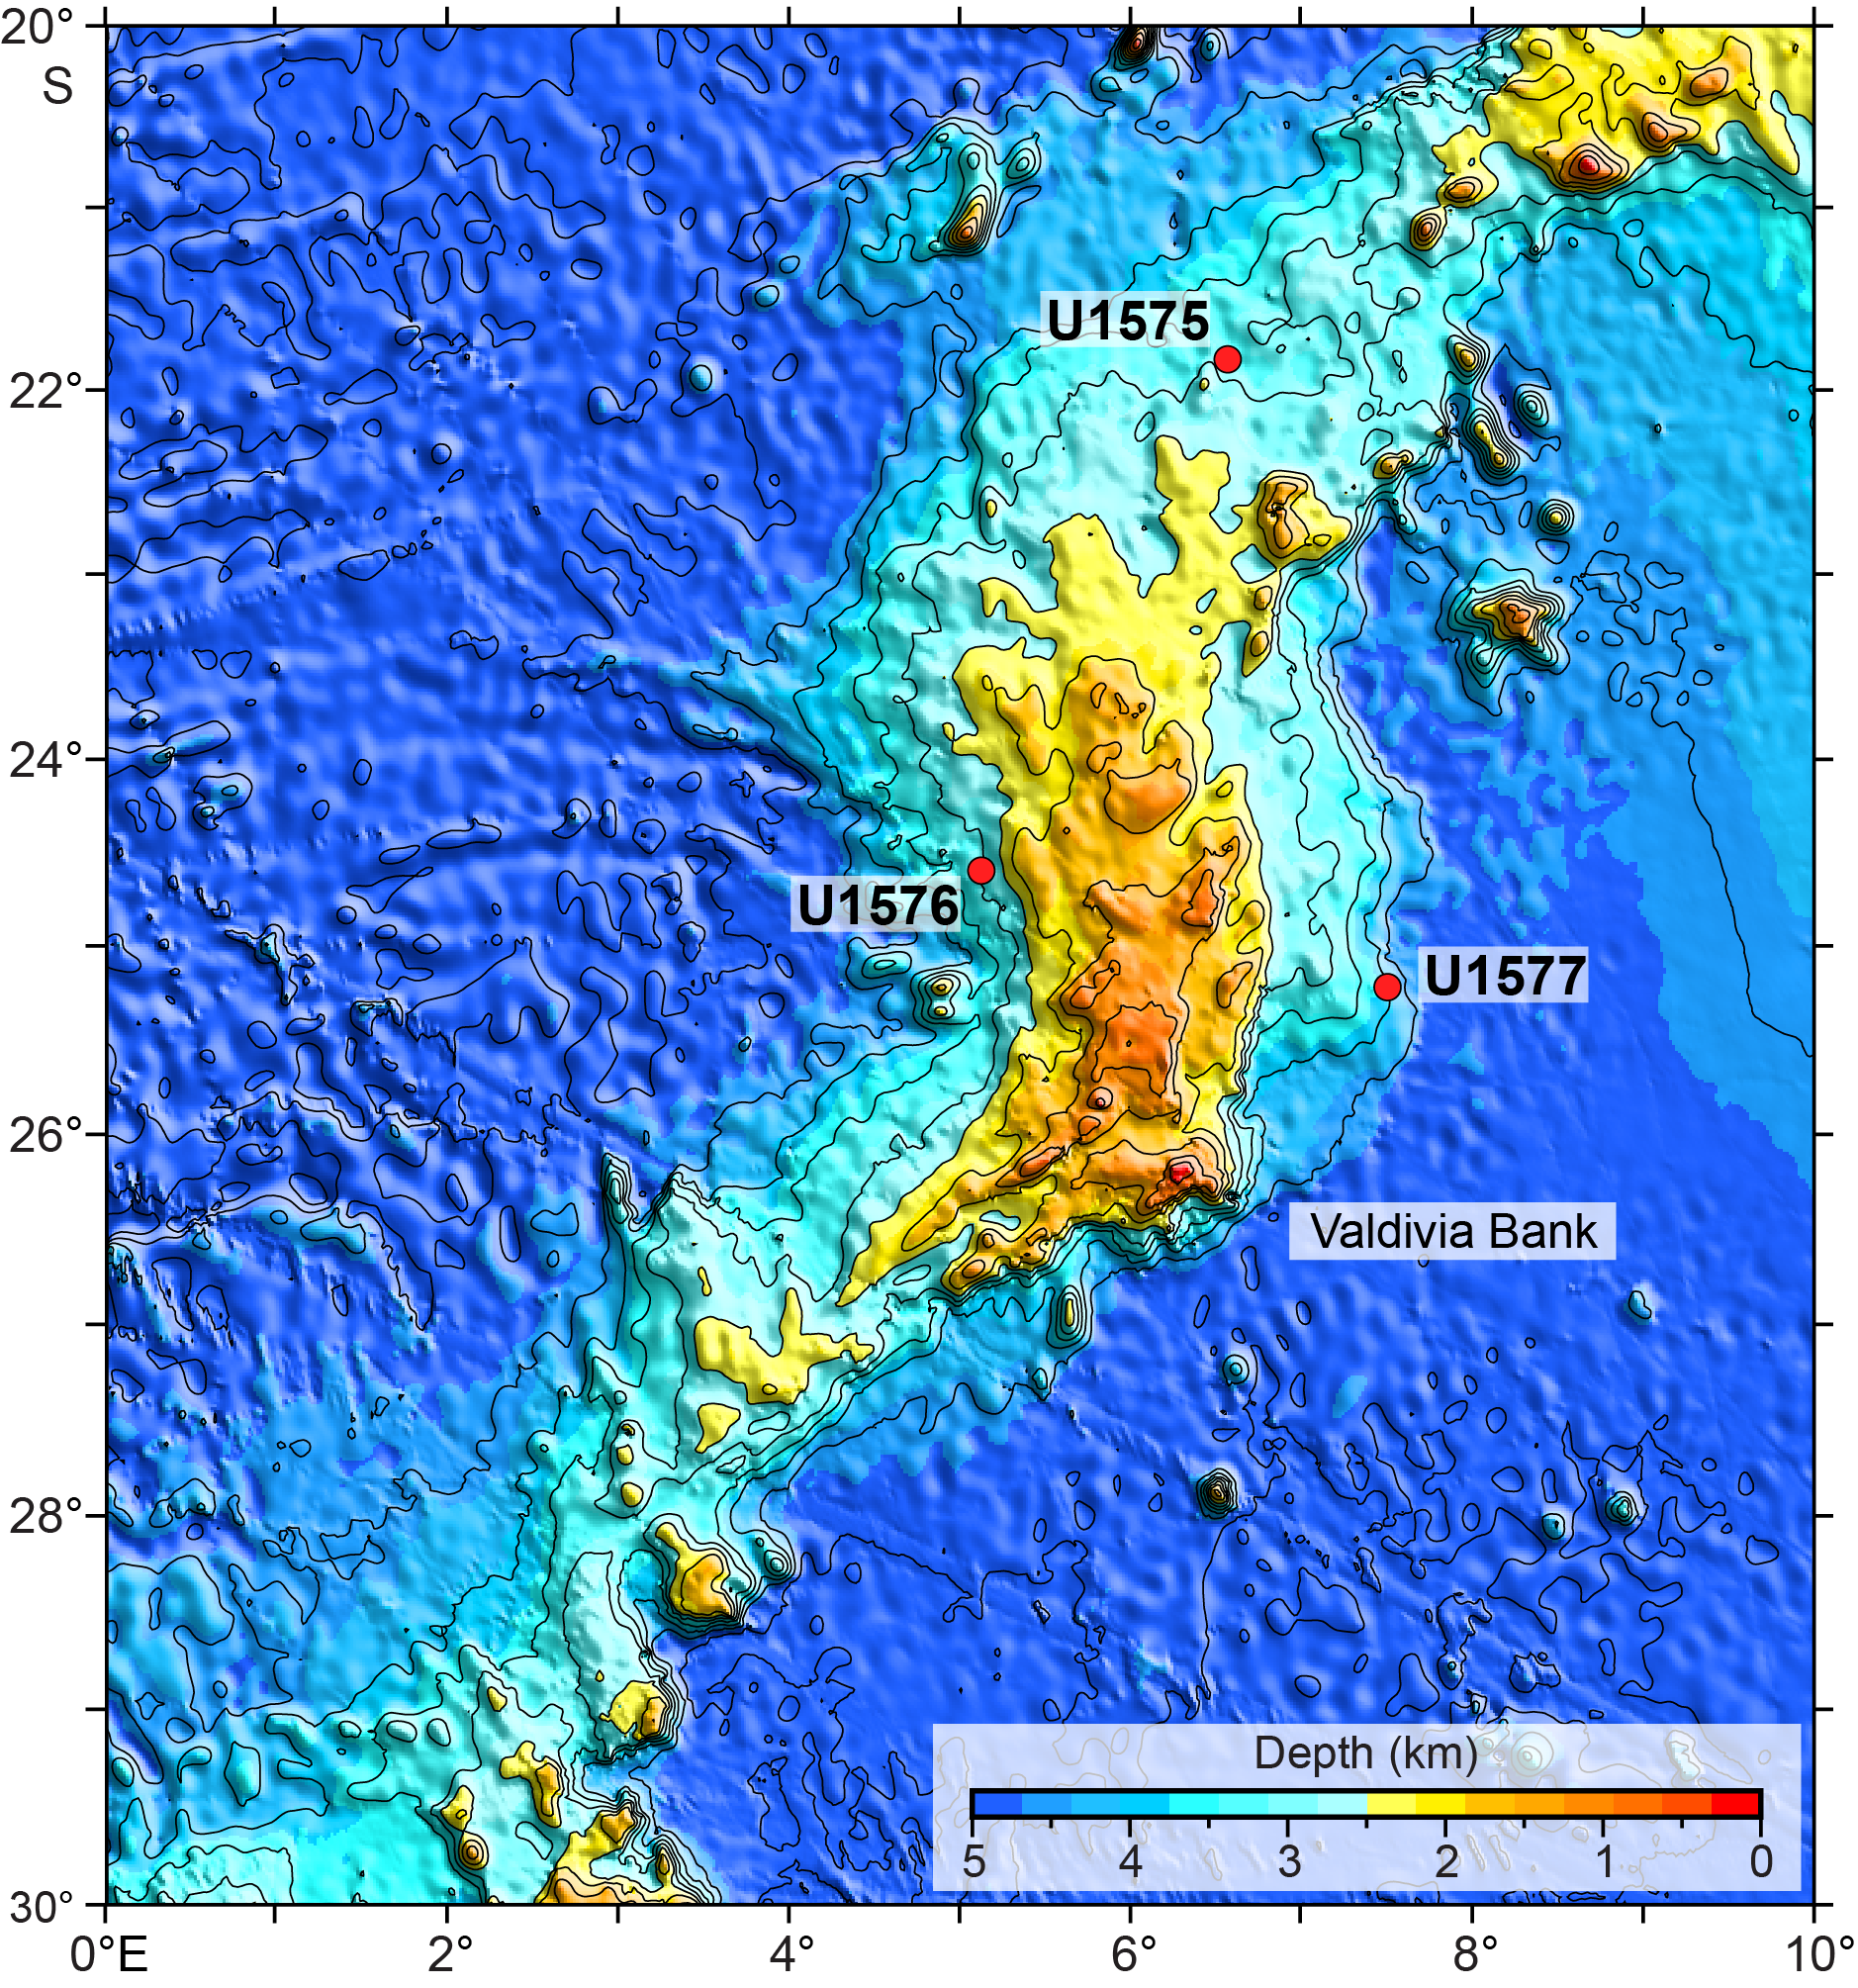
Figure F1. Bathymetry map, Valdivia Bank.
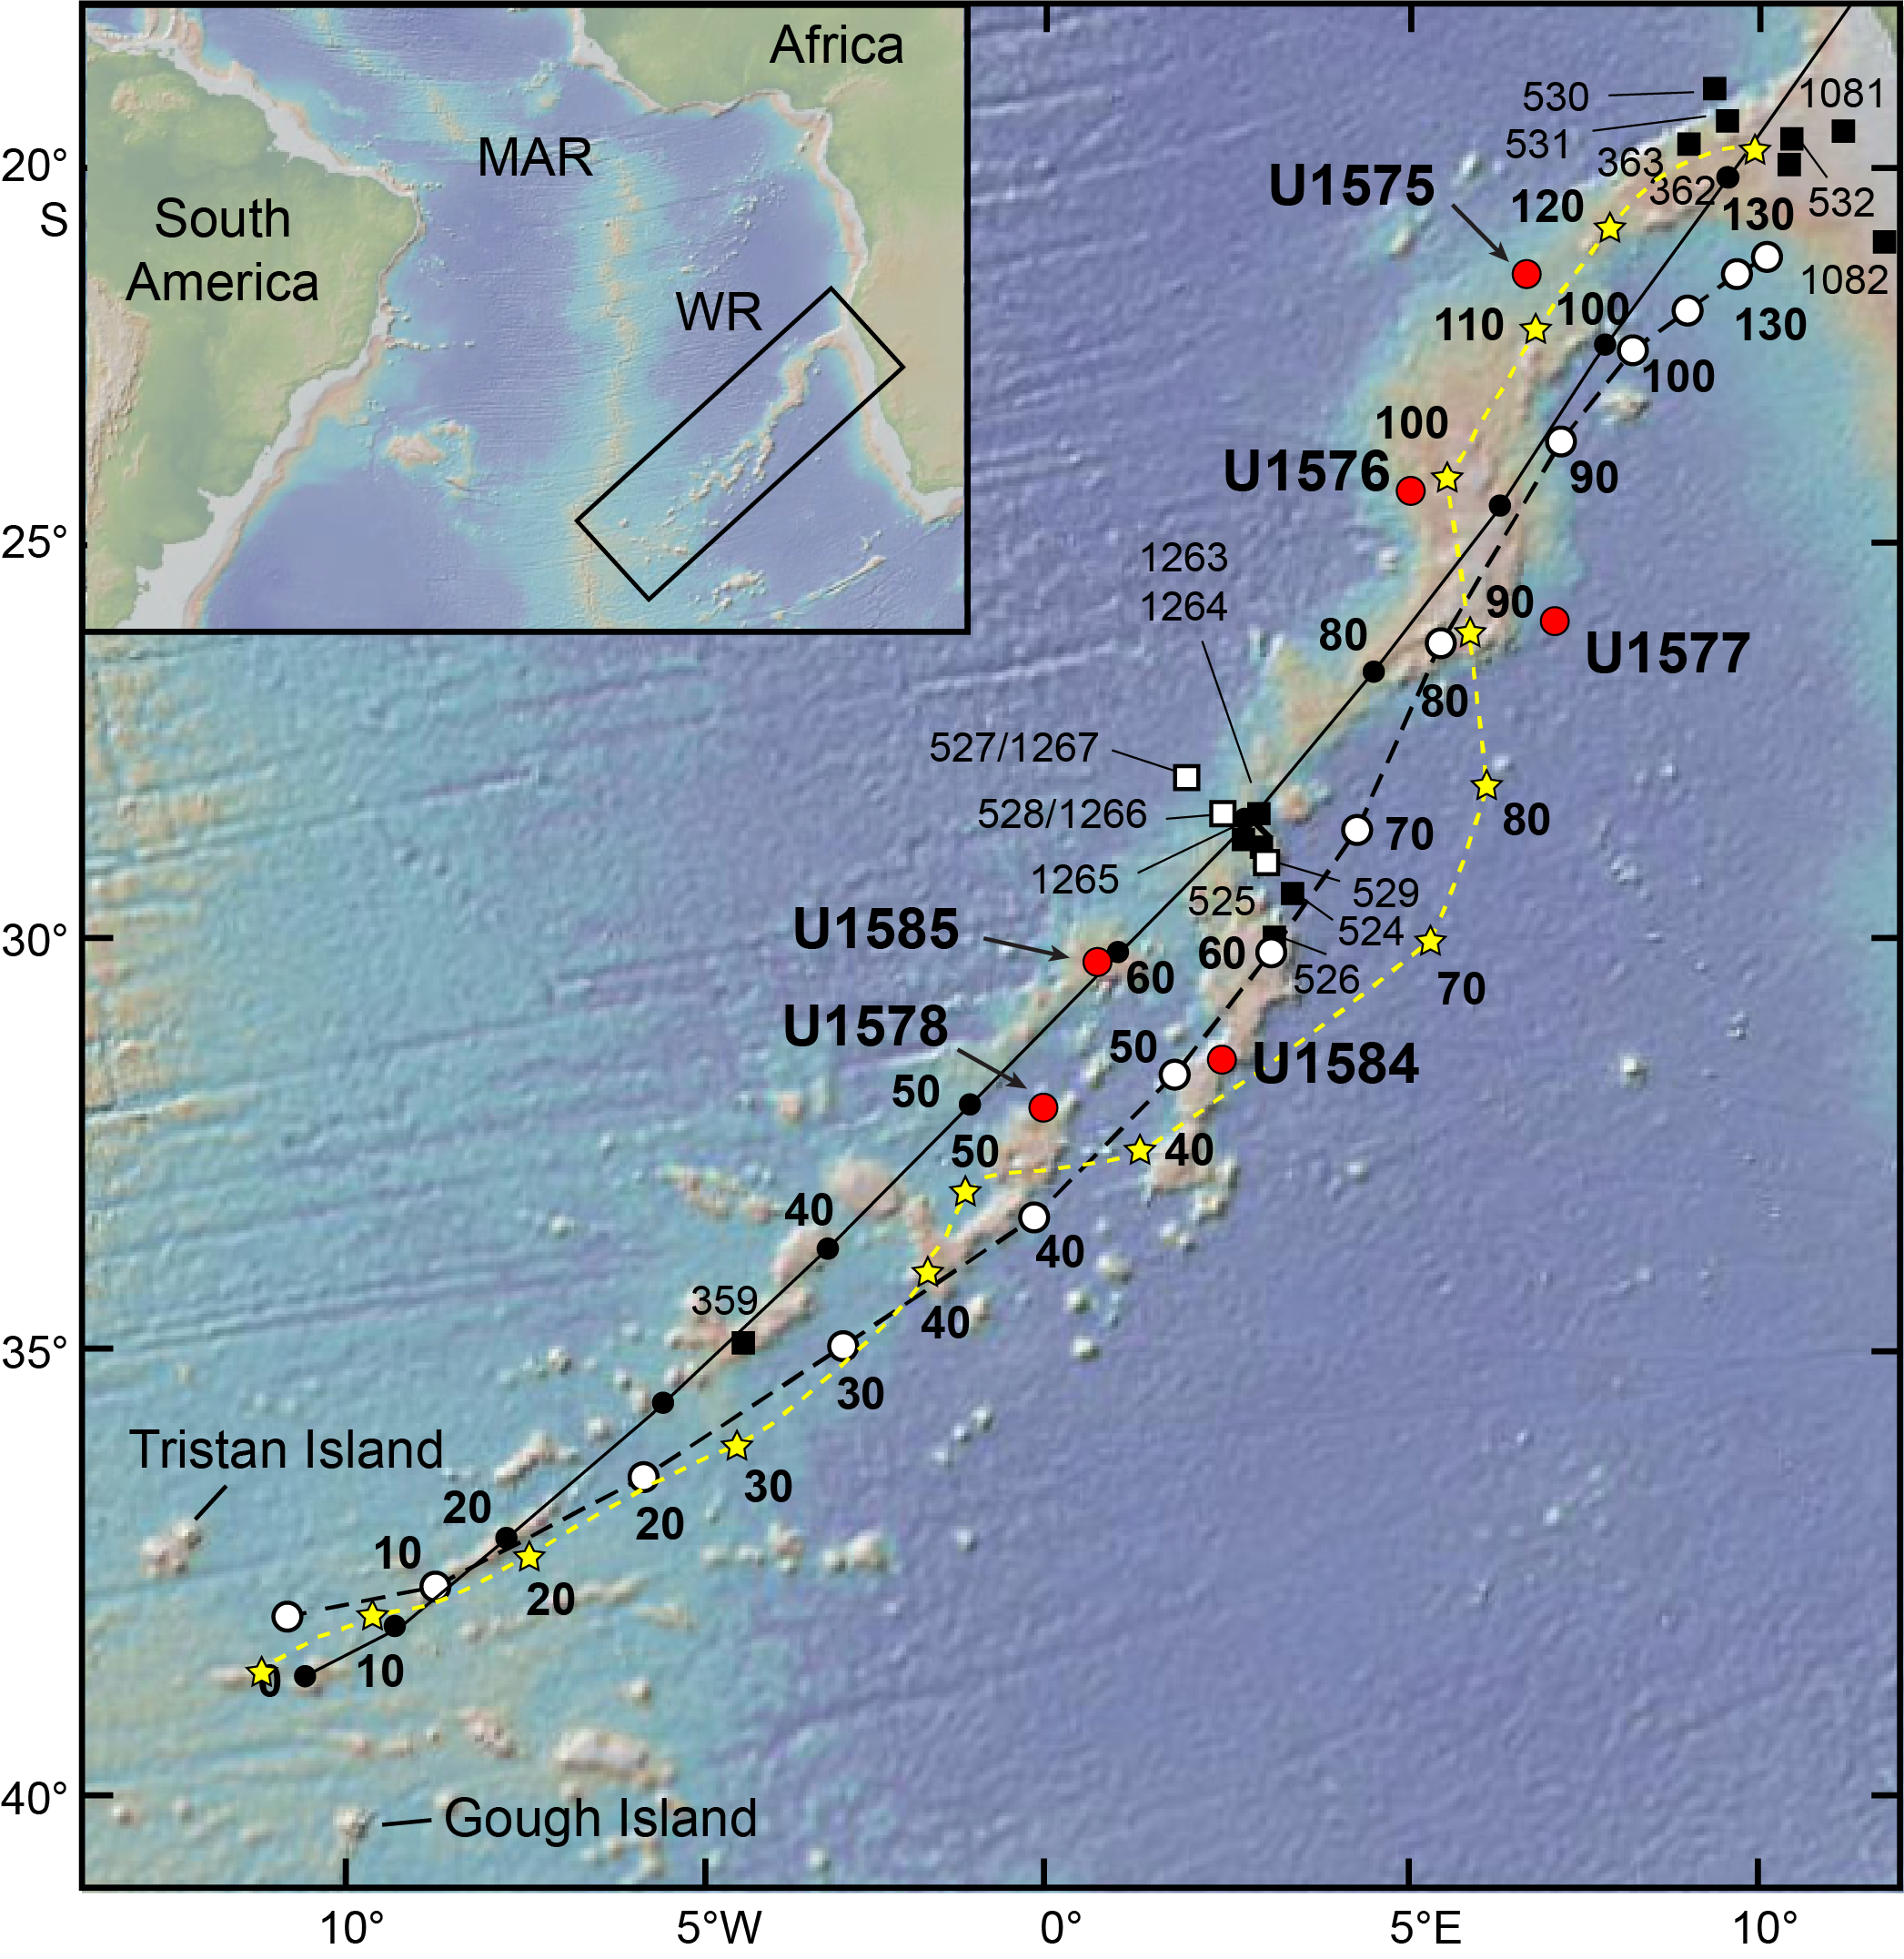
Figure F2. Walvis Ridge bathymetry and hotspot age models.
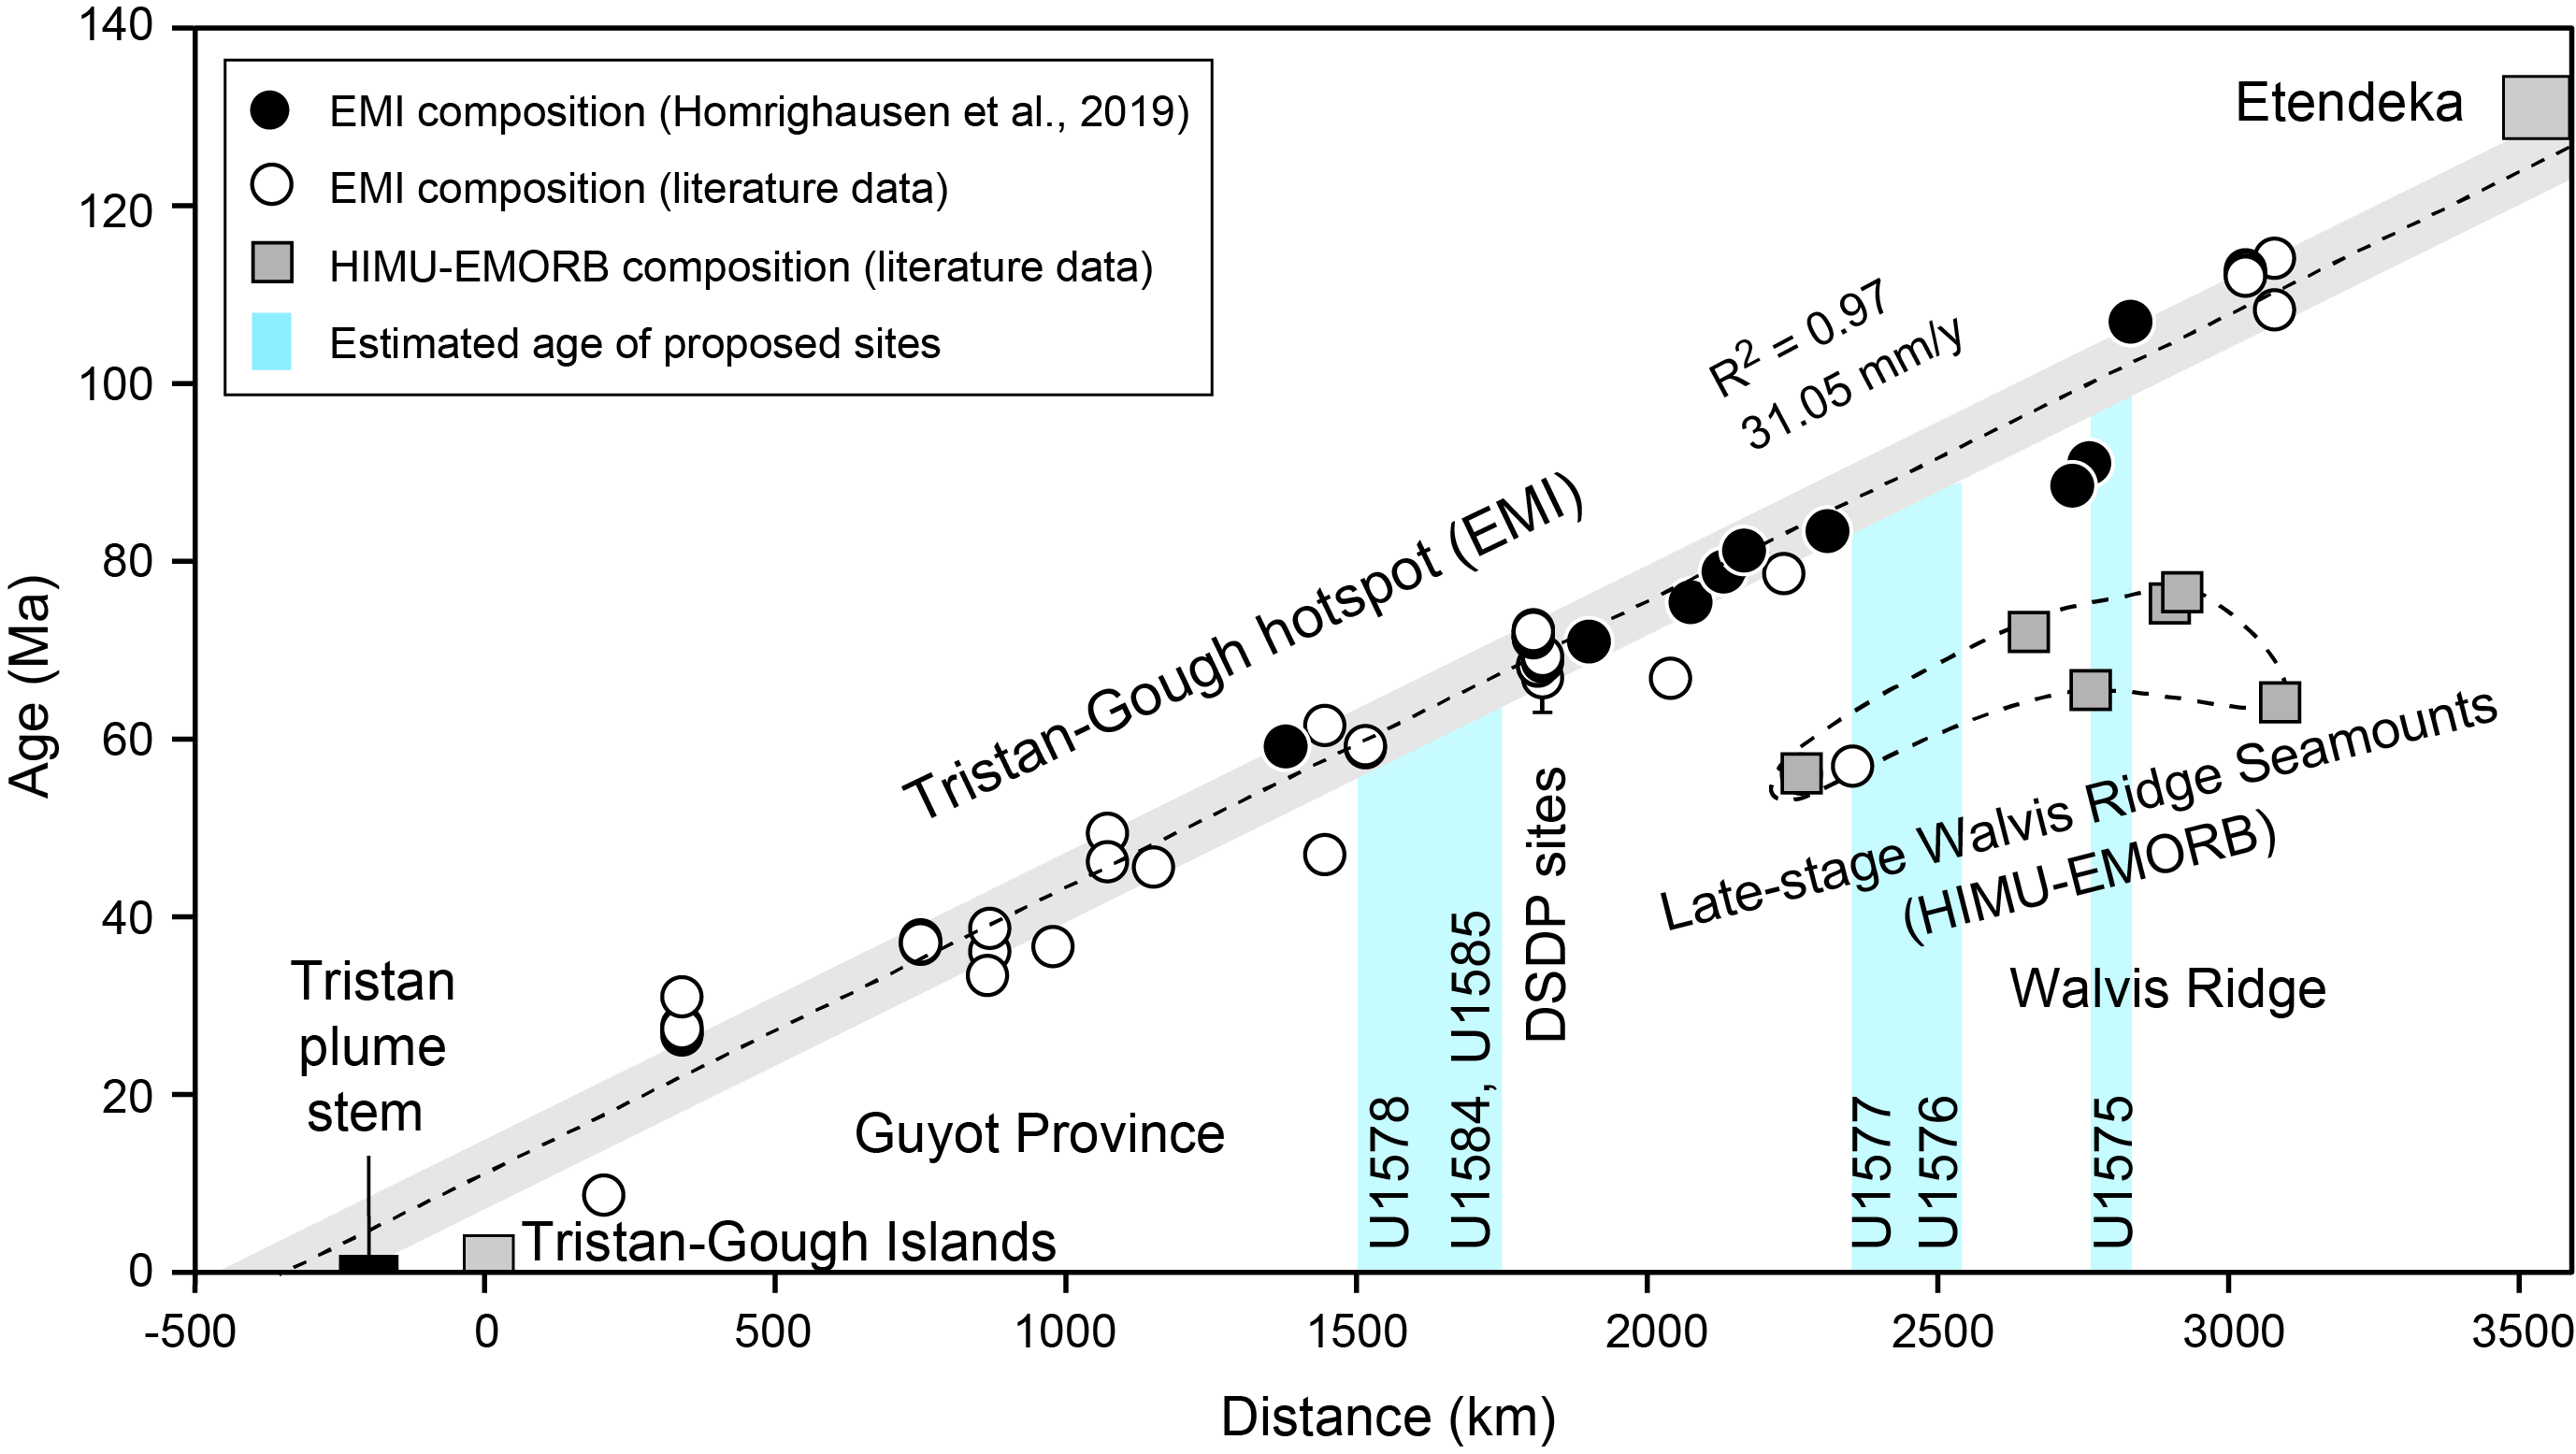
Figure F3. Age progression.
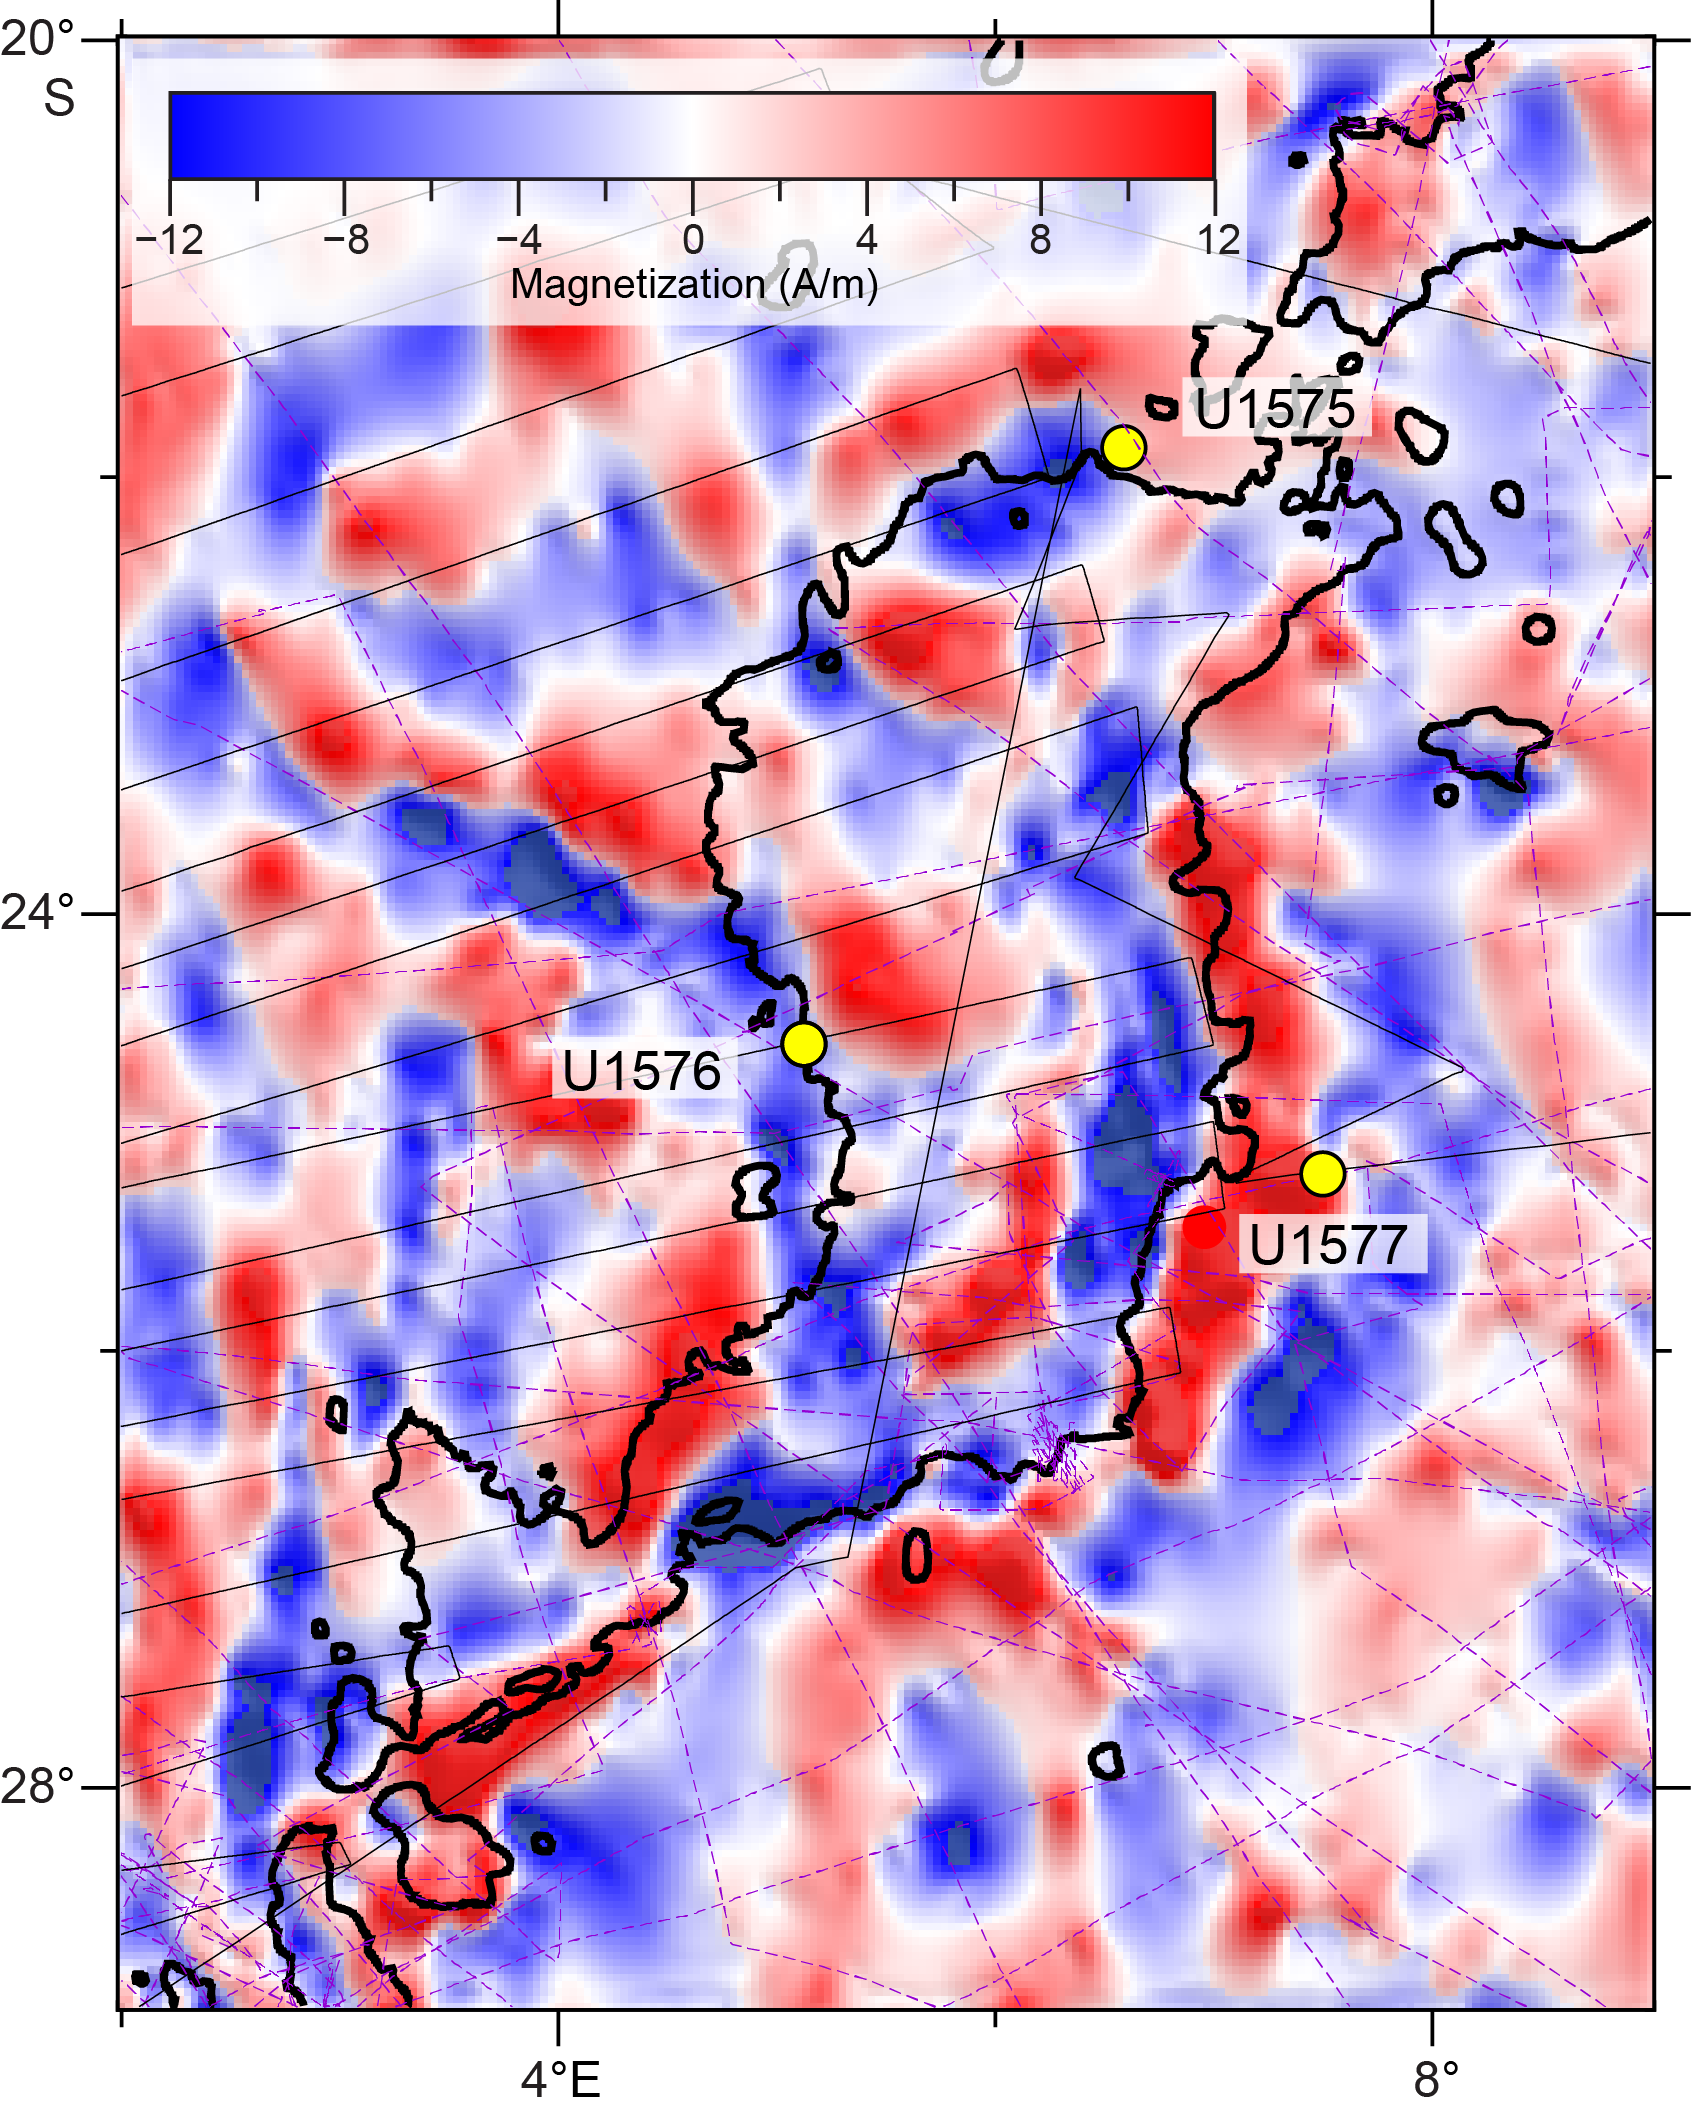
Figure F4. Magnetization of Valdivia Bank.
1.1. Operational strategy
Planning for Expedition 391 included using only the rotary core barrel (RCB) bit for all holes to save time. Unfortunately, this choice meant that soft-sediment cores underwent significant drilling disturbance. Site U1577 was planned as a single-bit hole, meaning that only one bit was deployed and the hole was drilled until it was decided to move to the next site due to bad weather that did not allow continued drilling at Site U1577. Originally, a site closer to the eastern escarpments of Valdivia Bank was the target (proposed Site VB-12A), but drilling was shifted to Site U1577 because the latter has about half the sediment cover, which saved time.
1.2. Objectives
1.2.1. Geochemical objectives
Site U1577 has the potential to provide important constraints on the geochemical evolution of TGW track volcanism. Dredge samples from Walvis Ridge north of the Deep Sea Drilling Project (DSDP) Leg 74 sites are dominated by the Gough-type geochemical composition, with rare exceptions (Hoernle et al., 2015; Homrighausen et al., 2019). Because there are no exposed portions of the basement on the extreme eastern side of Valdivia Bank, it has not been possible to sample this area to date. Therefore, the composition of this portion of Walvis Ridge is completely unknown.
Another important question concerns the presence of two distinct flavors of the Gough type in the Etendeka flood basalts in northwest Namibia, which are believed to represent lavas from the starting plume head of the TGW hotspot (Zhou et al., 2020). The Gough-type basalts sampled thus far on Walvis Ridge are characterized by high-Ti contents. At Site U1575, low-Ti Gough-type basalts were found for the first time, but none were found at Site U1576. Therefore, an important question was whether they continued to Site U1577.
1.2.2. Geochronologic objectives
Site U1577 is located on the east flank of Valdivia Bank on a positive magnetic anomaly interpreted as Chron 34. Site U1575 was drilled on the north flank of this plateau and Site U1576 on the west side. This distribution of sites will help determine the age progression along and across Valdivia Bank. Hotspot models predict a north–south age progression, which has been observed in the sparse sampling thus far (Homrighausen et al., 2019), but plume-ridge interaction models imply a local east–west age progression (Thoram et al., 2019; Sager et al., 2021). Thus, it is important to determine the age of basement sites to understand how the edifice formed through time in relation to the Mid-Atlantic Ridge and the TGW hotspot. Sites on Valdivia Bank will also help us understand the development of this large volcanic edifice. These sites were chosen on the lower, more distal flanks because on a typical volcano, such sites may have lower volcanic emplacement rates. Therefore, only more voluminous units will reach these sites. Given this inference, it is expected that drill holes on the lower flanks may sample a longer time span than more central areas, which receive more frequent eruptive products. In the absence of volcanic centers on the volcano flanks, temporal variations downhole may be sufficiently large to discern them with geochronologic studies.
1.2.3. Paleomagnetic objectives
According to global paleomagnetic data, the Late Cretaceous was a period of rapid paleolatitude change for the African plate, during which the paleolatitudes shifted from ~15° farther north than at present around the time of Etendeka emplacement (Ernesto et al., 1990, 1999) to ~5° south of present around 50–60 Ma (Figure F5). Site U1577 samples the TGW track at a time when the paleolatitude was nearly the same as the present hotspot latitude band (Figure F5). Thus, samples from Site U1577 can provide important constraints on hotspot latitude changes with time. Paleomagnetic studies of basal sedimentary rock and igneous rock basement will be used to determine paleolatitudes that will help define the contributions of hotspot drift, plate motion, and true polar wander.

Figure F5. Predicted paleolatitude drift.
1.2.4. Volcanologic objectives
Site U1577 is located on Valdivia Bank, an oceanic plateau incorporated into Walvis Ridge. It represents a period of high hotspot volcanic output. This has been explained as interaction of the TGW plume and the Mid-Atlantic Ridge (O'Connor and Duncan, 1990; O'Connor and Jokat, 2015). Was volcanism during formation of this plateau fundamentally different than elsewhere on the ridge? Site U1577 cores have the potential to illustrate the style of volcanism for this oceanic plateau to see whether it is similar to other plateaus such as Ontong Java Plateau (Neal et al., 1997), Kerguelen Plateau (Coffin et al., 2002), and Shatsky Rise (Sager et al., 2016). Studies of igneous rock types will seek to understand the volcanic development of this large edifice on Walvis Ridge.
1.2.5. Sedimentologic objectives
Site U1577 is located at the outer edge of Valdivia Bank (Figure F6), so it should record sedimentation far from the summit. Layering in the seismic section (Figure F7) implies that the sediment column has two main layers that imply two sedimentation phases: a lower transparent layer that was deposited shortly after Valdivia Bank formation and an upper layer with many reflectors that implies active reworking. The summit of this volcanic edifice was most likely in shallow water for much of its history, probably starting subaerially and then eroding to sea level before subsiding well below the wave base (Homrighausen et al., 2019). Moreover, it experienced a late-stage volcanic episode ~30–40 My after the main volcanic stage (Homrighausen et al., 2018, 2020) that probably caused additional faulting and uplifted the summit near or above sea level again. Thus, the sediments on the flank at Site U1577 may have recorded a complex history. Biostratigraphic and sedimentologic studies will focus on reconstructing the history of Valdivia Bank, providing clues as to how the edifice formed and evolved.
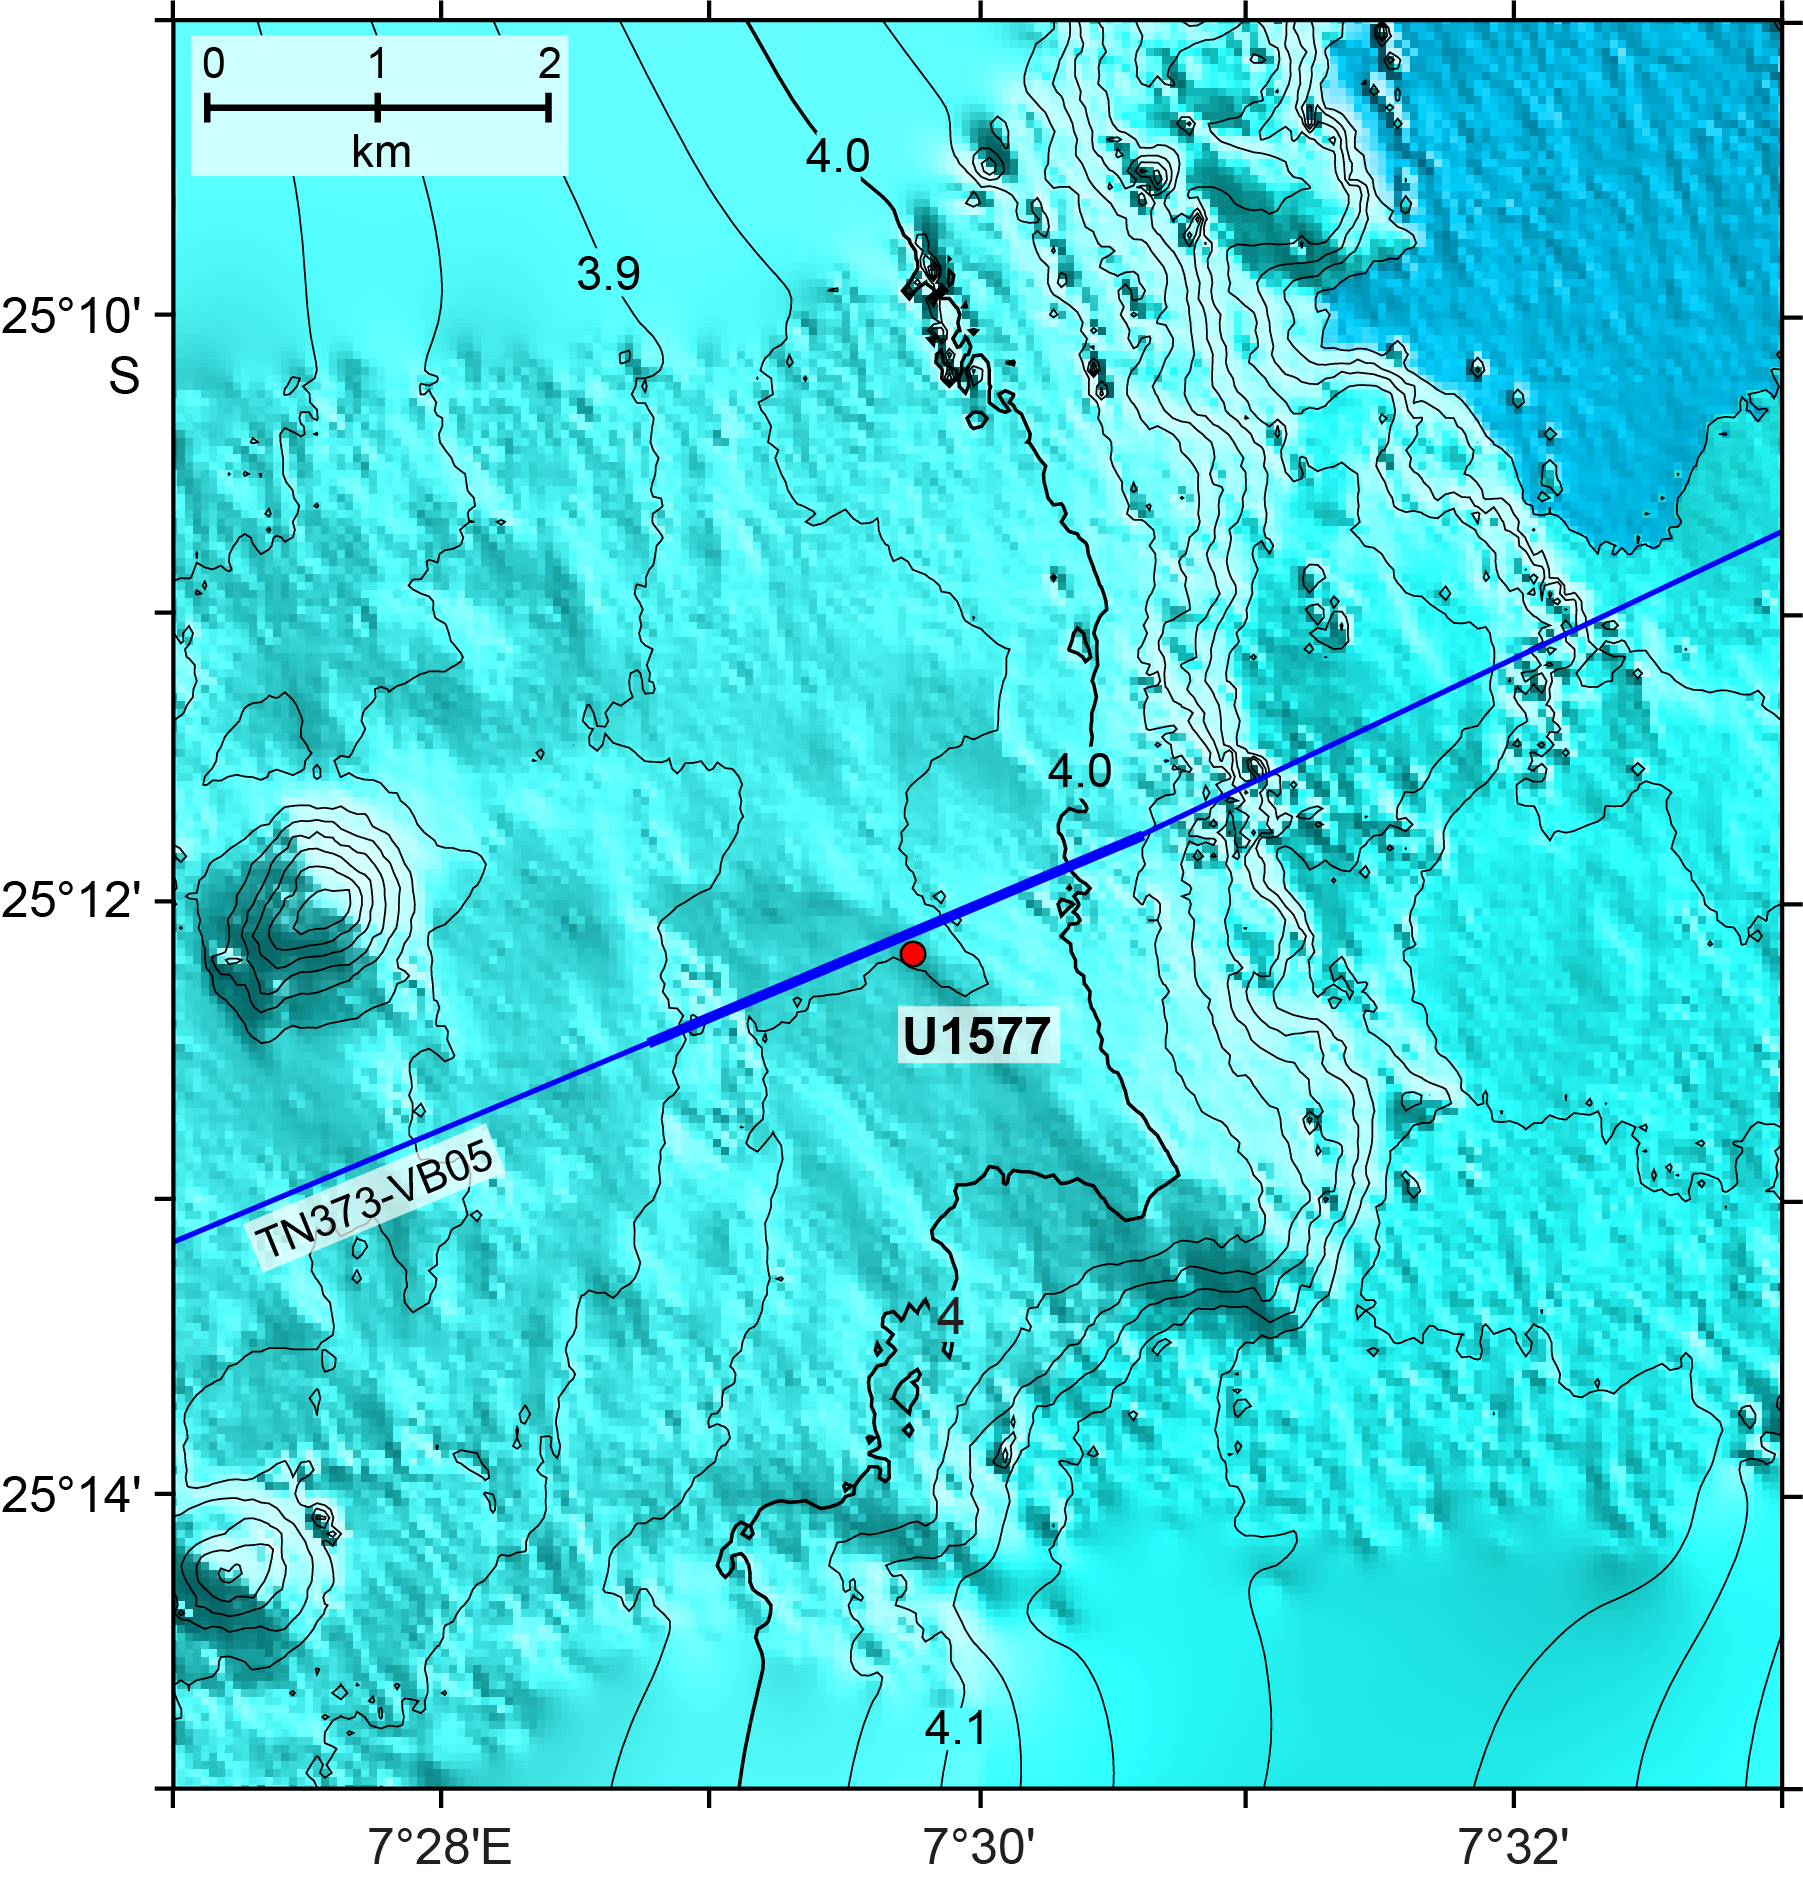
Figure F6. Bathymetry map, Site U1577.
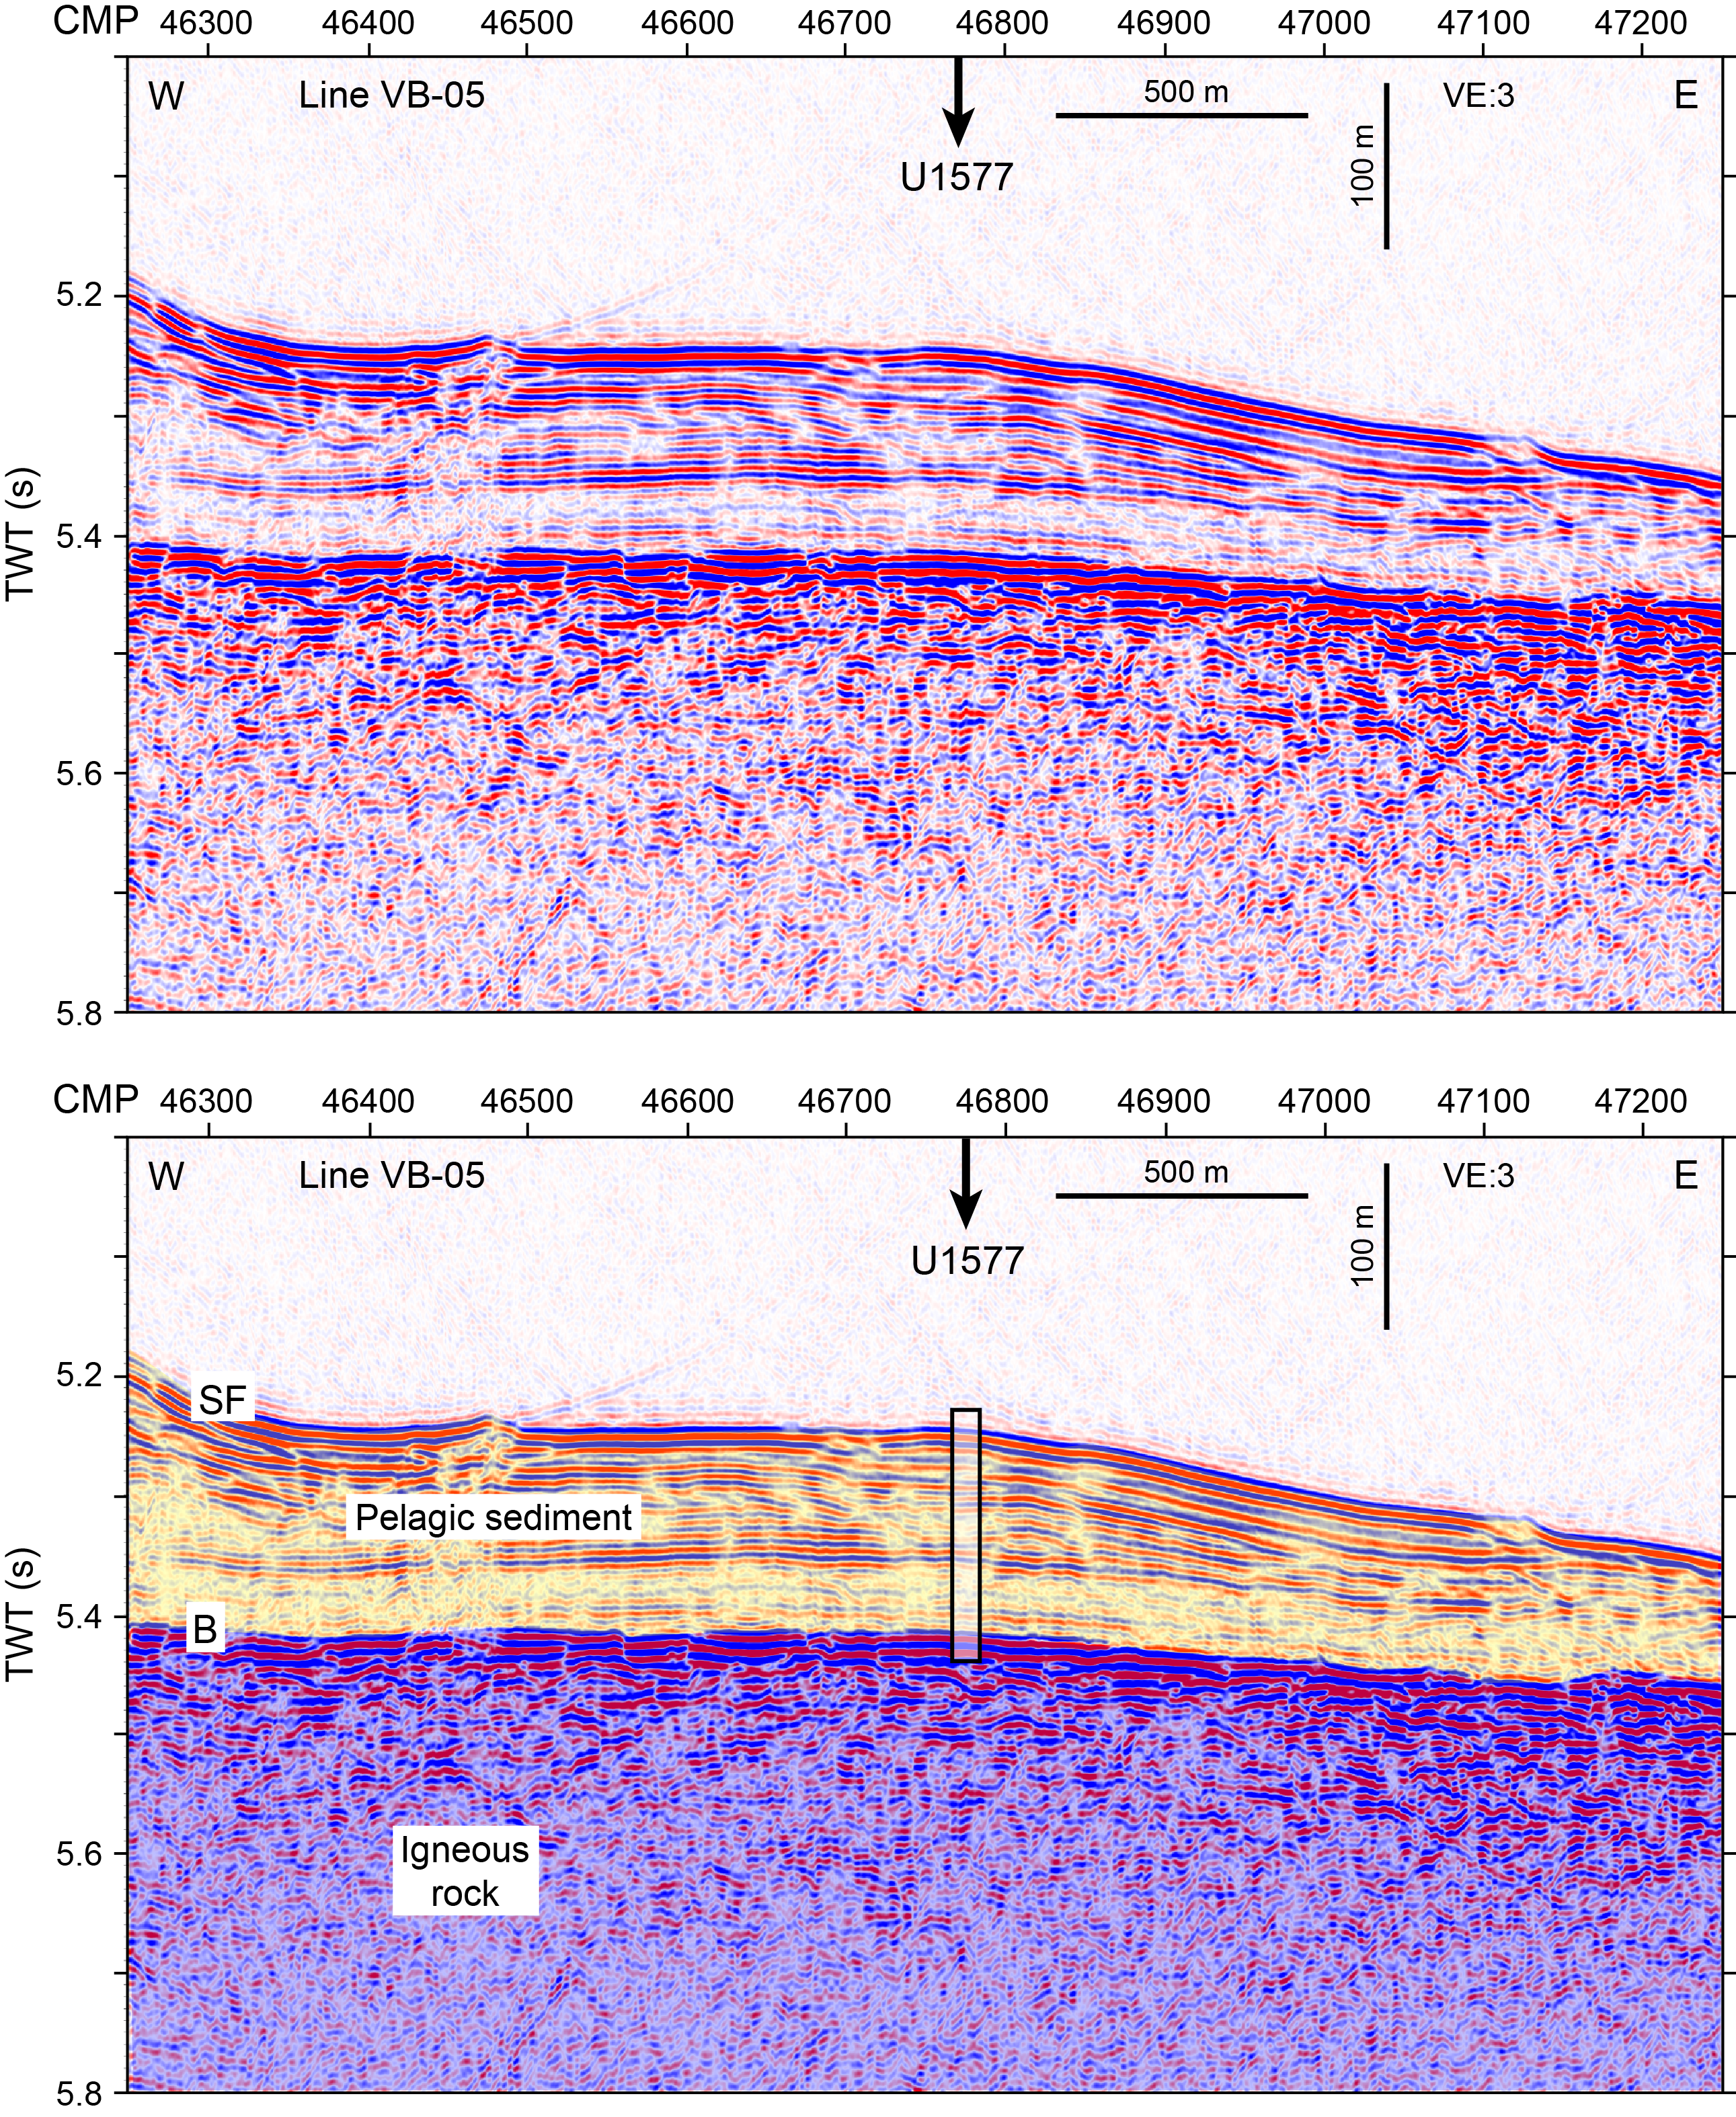
Figure F7. Seismic Line TN373-VB05.
1.3. Site geophysics
Site U1577 is located on the eastern flank of Valdivia Bank at a water depth of ~3950 m (Figures F1, F6). The drill site was picked on Seismic Line TN373-VB05, collected in 2019 by the R/V Thomas G. Thompson. Bathymetric data show that the site is near the top of an escarpment, several hundred meters tall, bounding the eastern edge of Walvis Ridge. Topography shows that the site is atop a low ridge. Given its shape and the flat acoustic basement at the site (Figure F7), the ridge probably results from deposition of sediments eroded from higher portions of Valdivia Bank.
The TN373-VB05 profile shows a ~140 m thick sediment layer overlying a strong, undulating basement horizon (Figure F7). Sediment thickness varies along the profile, mainly reflecting variations in the upper sediment package. The seismic line shows spots where the layering becomes unclear, attributed to the interference of seismic wavelets in a section with many reflectors. Nevertheless, these dropouts form an inclined feature west of the site. To avoid this feature, the site was moved ~90 m east from its originally proposed location. Based on recovery at Sites U1575 and U1576 and other drill sites in the region (e.g., Bartels et al., 2007), the pre-drilling expectation was that the uppermost layer is Cenozoic pelagic carbonates, and the lower section is Cretaceous.
Basement on the TN373 profile (Figure F7) is interpreted to be igneous rock at the top of Valdivia Bank. This surface is undulatory, as is expected for a lava flow surface. The seismic source for the TN373-VB05 profile was small and does not penetrate deeply into basement, but it shows several semicontinuous reflectors in the upper ~50 ms (~100 m assuming velocity = 4000 m/s). These reflections likely indicate lava flow packages (Inoue et al., 2008; Sager et al., 2013).
2. Operations
2.1. Transit to Site U1577
After securing the rig floor for transit at 1942 h (UTC + 2 h) on 14 January 2022, the thrusters were raised and the vessel was switched from dynamic positioning (DP) to cruise mode. We then secured the vessel for transit to Site U1577. The sea passage began at 1942 h. Upon completing the 134 nmi transit at an average speed of 11.0 kt, the vessel arrived at Site U1577 at 0754 h on 15 January. After lowering the thrusters and switching from cruise mode to DP mode, the rig floor was released for operations at 0817 h, beginning Hole U1577A.
2.2. Site U1577
Site U1577 comprises one hole. The original plan for Site U1577 was for a single hole. Hole U1577A would be cored with the RCB system to a volcanic basement penetration of ~100 m, amounting to a total depth of 233 meters below seafloor (mbsf) that included a 133 m thick sediment cover as interpreted based on preexpedition seismic surveys. Actual operations differed slightly from the plan because the sediments were slightly thicker and the igneous section was shorter (Table T1). Hole U1577A was RCB cored to 193.9 mbsf and intersected the sediment/volcanic basement contact at 154.8 mbsf. The time spent on Hole U1577A was 109.5 h, or 4.6 days.
2.2.1. Hole U1577A
Upon being cleared for operations, the rig floor crew picked up the outer core barrel and started assembling the RCB bottom-hole assembly (BHA). Once the BHA was made up, we began lowering it to the seafloor while offsetting the ship 90 m east from the proposed site coordinates to a new location for Hole U1577A. This shift, which made no significant difference in the sediment thickness or basement character, was made to avoid a seismic anomaly at the proposed location that is probably an interference artifact. After installing the crossover at the top of the BHA, 70 stands of pipe were deployed. Then the circulating head was hooked up to fill the drill pipe with surface seawater. After filling the drill pipe, we continued lowering the drill string until the bit reached 3910.0 meters below sea level (mbsl) at 1630 h on 15 January 2022. The top drive was picked up, and the drill bit was positioned just above the seafloor depth of 3940.2 mbsl obtained from the precision depth recorder (PDR). After a nonmagnetic core barrel was deployed, we spudded Hole U1577A at 1710 h on 15 January and began RCB coring. Cores 1R–26R advanced from the seafloor to a final depth of 193.9 mbsf and recovered 152.9 m (79%) of sediment and igneous rock. The first recorded advance amounted to 8.0 m into the seafloor. The PDR water depth appeared to match the driller's tag depth and was used as the official water depth for Hole U1577A. Coring continued from the seafloor with full core advances through Core 17R at 154.2 mbsf. The sediment/basement contact was intersected while cutting the following half-length (~4.8 m) Core 18R at 154.8 mbsf on 16 January. When we attempted to recover Core 19R at 0400 h on 17 January, we retrieved only the latch assembly for the upper section of the inner core barrel that was still in place at the end of the drill string. It was discovered that the inner core barrel parted in the upper section at the swivel assembly, which is a single coherent piece that broke at the base of its bearing shaft. We then deployed a second RCB core barrel and attempted to catch the remaining lower section of the inner core barrel to no avail. A new fishing catcher insert was built and deployed successfully. After the inner core barrel was recovered at 0800 h, Core 19R was retrieved, and the inner core barrel was repaired. RCB coring resumed with Core 20R at 1030 h on 17 January. Coring continued with half-length (~4.8 m) advances through Core 25R. While cutting Core 26R on 19 January, we were unable to keep the bit on the bottom of the hole due to inclement weather and up to 5 m of ship heave. Thus, at 0215 h on 19 January, the cutting of Core 26R was terminated early. We then raised the drill string to 148.6 mbsf, inserted an extra knobby drilling joint on top of the drill string, and waited for the weather to improve enough to resume operations. After we spent 10.25 h waiting on the weather to improve, it was decided to terminate operations at Site U1577, given the persistent ship heave and the remaining scientific priorities of the expedition. At 1330 h on 19 January, we started pulling the drill string out of Hole U1577A. When the drill string reached 104.6 mbsf at 1400 h, we set back the top drive and continued raising the drill string. The bit cleared the seafloor at 1450 h and arrived at the rig floor at 2125 h. The rig floor was secured at 2150 h on 19 January, ending Hole U1577A and Site U1577. The time spent on Hole U1577A (and Site U1577) was 109.5 h, or 4.6 days. The final depth of Hole U1577A was 193.9 mbsf, and a total volume of 160 bbl (25,438 L) of high-viscosity mud was pumped in 20 bbl (3,180 L) sweeps for hole cleaning over the course of coring.
3. Lithostratigraphy
At Site U1577, a ~155 m thick succession of pelagic sediment interbedded with tephra layers was recovered lying on top of igneous basement. Three lithostratigraphic units (the third divided into three subunits) were recognized based on macroscopic and microscopic (smear slide, thin section, and scanning electron microscopy) lithologic observations together with significant changes in natural gamma radiation (NGR) and biostratigraphic data (Figure F8). This sedimentary cover overlies the igneous succession, which consists of three massive flow units that are devoid of sedimentary intercalations or infillings.

Figure F8. Lithostratigraphic synthesis.
The bulk of the sedimentary cover at Site U1577 is composed of two recurring key lithofacies that are referred to in all unit descriptions below. Lithofacies 1 consists of nannofossil ooze to chalk, typically clayey, that is moderately to strongly bioturbated and commonly shows subtle, cyclical changes of color at a 10–60 cm scale (Figure F9). Lithofacies 2 consists of tephra layers (ash to tuff) with a median thickness of 4 cm (n = 71; minimum = 0.5 cm; maximum = 30 cm) that are typically normally graded and can be slightly to strongly bioturbated (Figure F10). Because these layers are typically bioturbated and often appear as diffuse bands within the background sedimentation, it was not possible to determine whether they are primary tephra fallout (locally partly reworked by bioturbation) or secondary deposits reworked by turbidity and/or bottom currents. Unlike Sites U1576 and U1578, unequivocal sedimentary evidence of turbidites was not found at Site U1577. Overall, the sediment succession shows only minor deformation features and is primarily expressed by tilted sharp lithologic contacts in very small apparent dip angles of less than 15° (Figure F11). Other structures are basically absent.
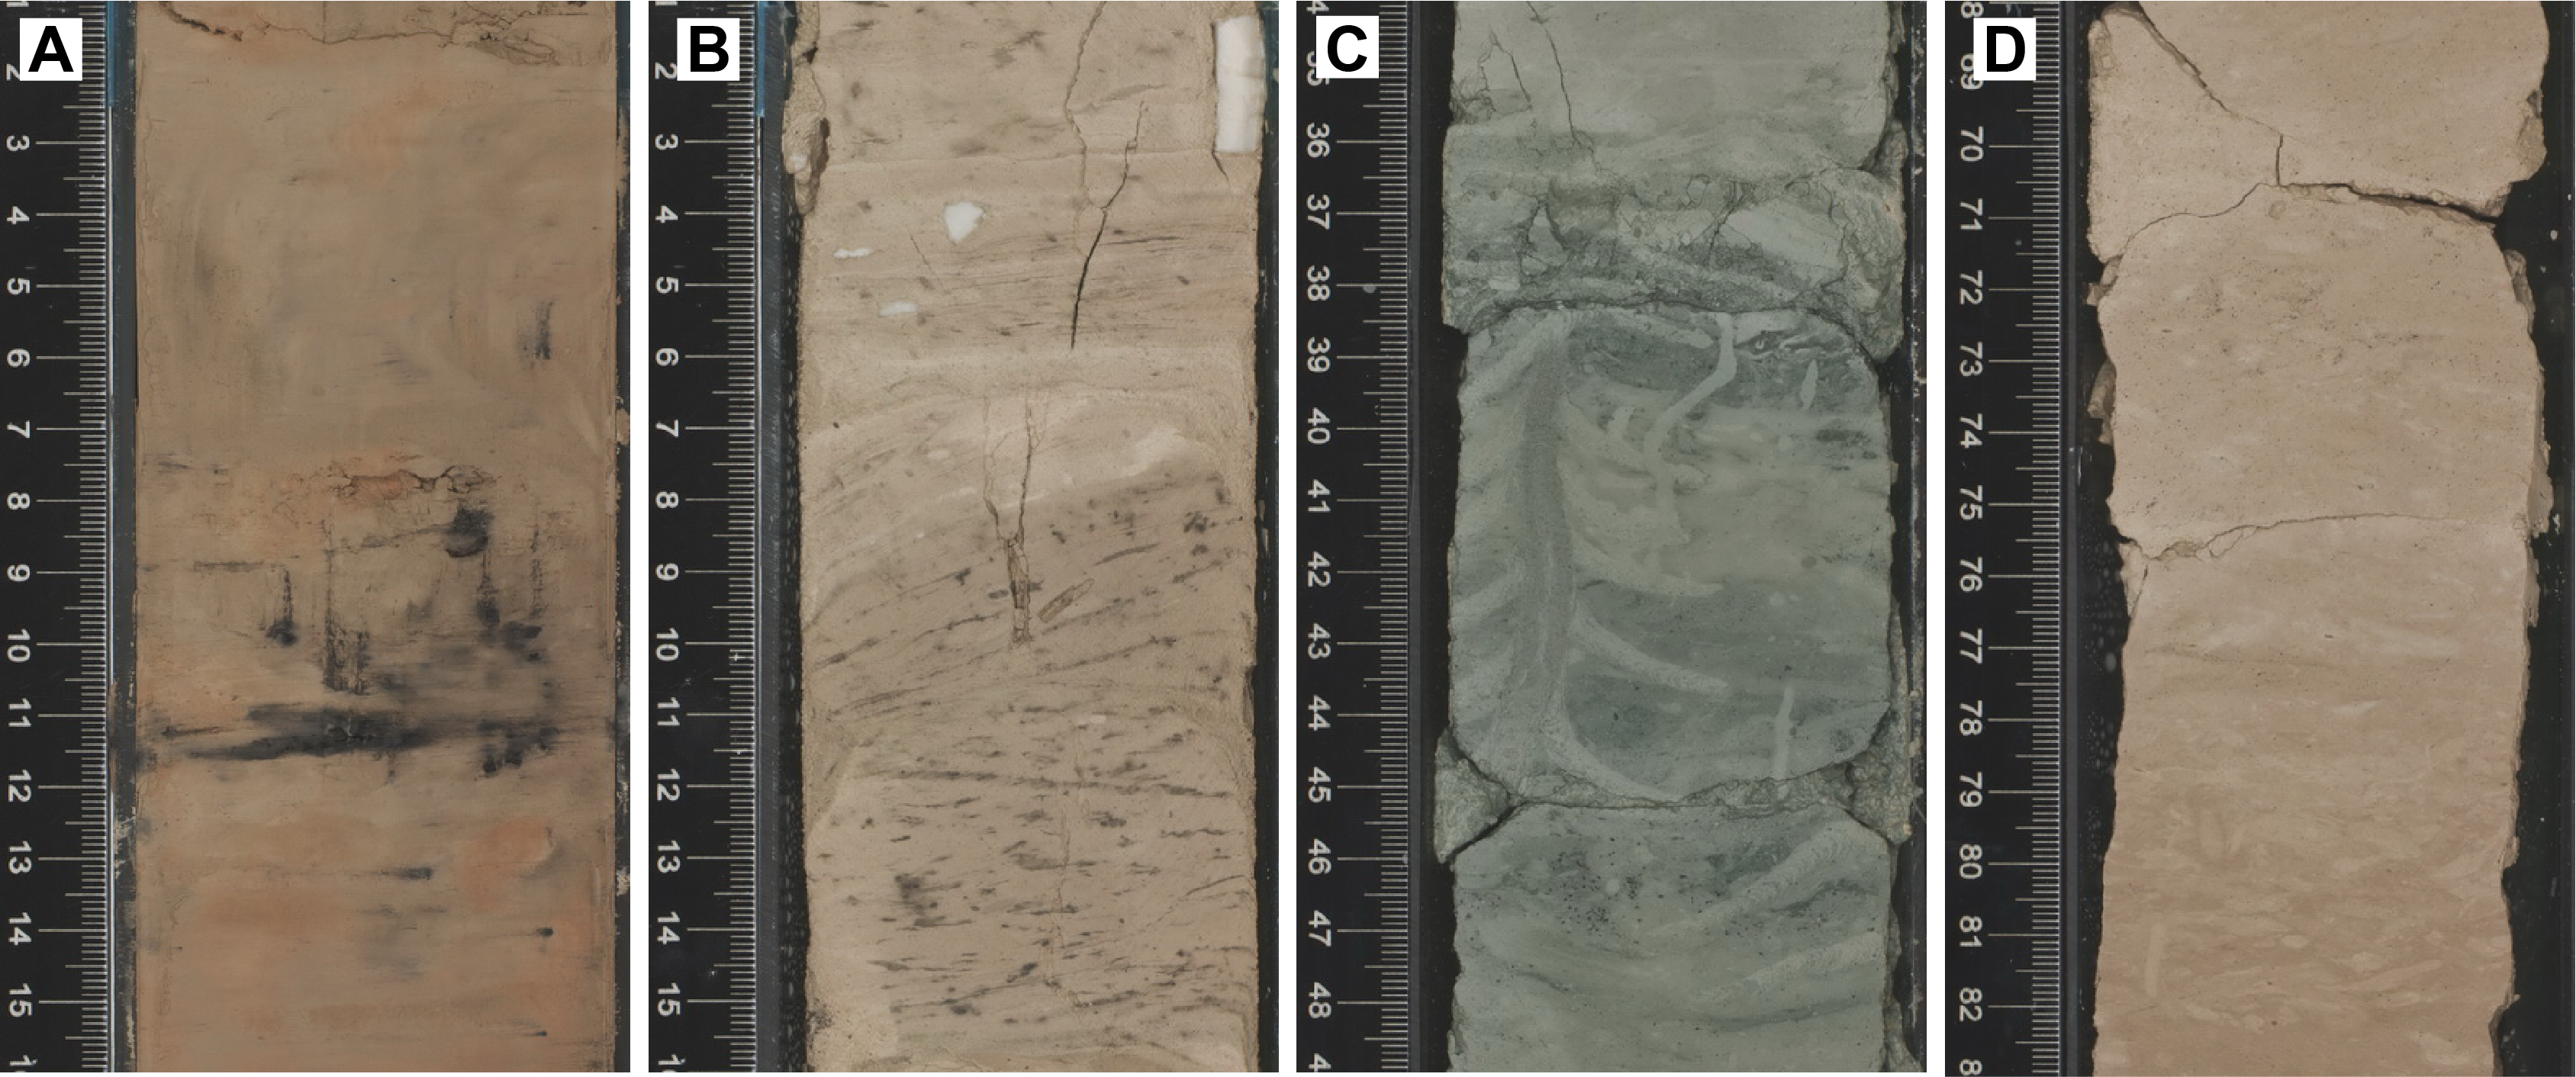
Figure F9. Clayey nannofossil chalk.

Figure F10. Tephra layers and primary volcaniclastic deposits.
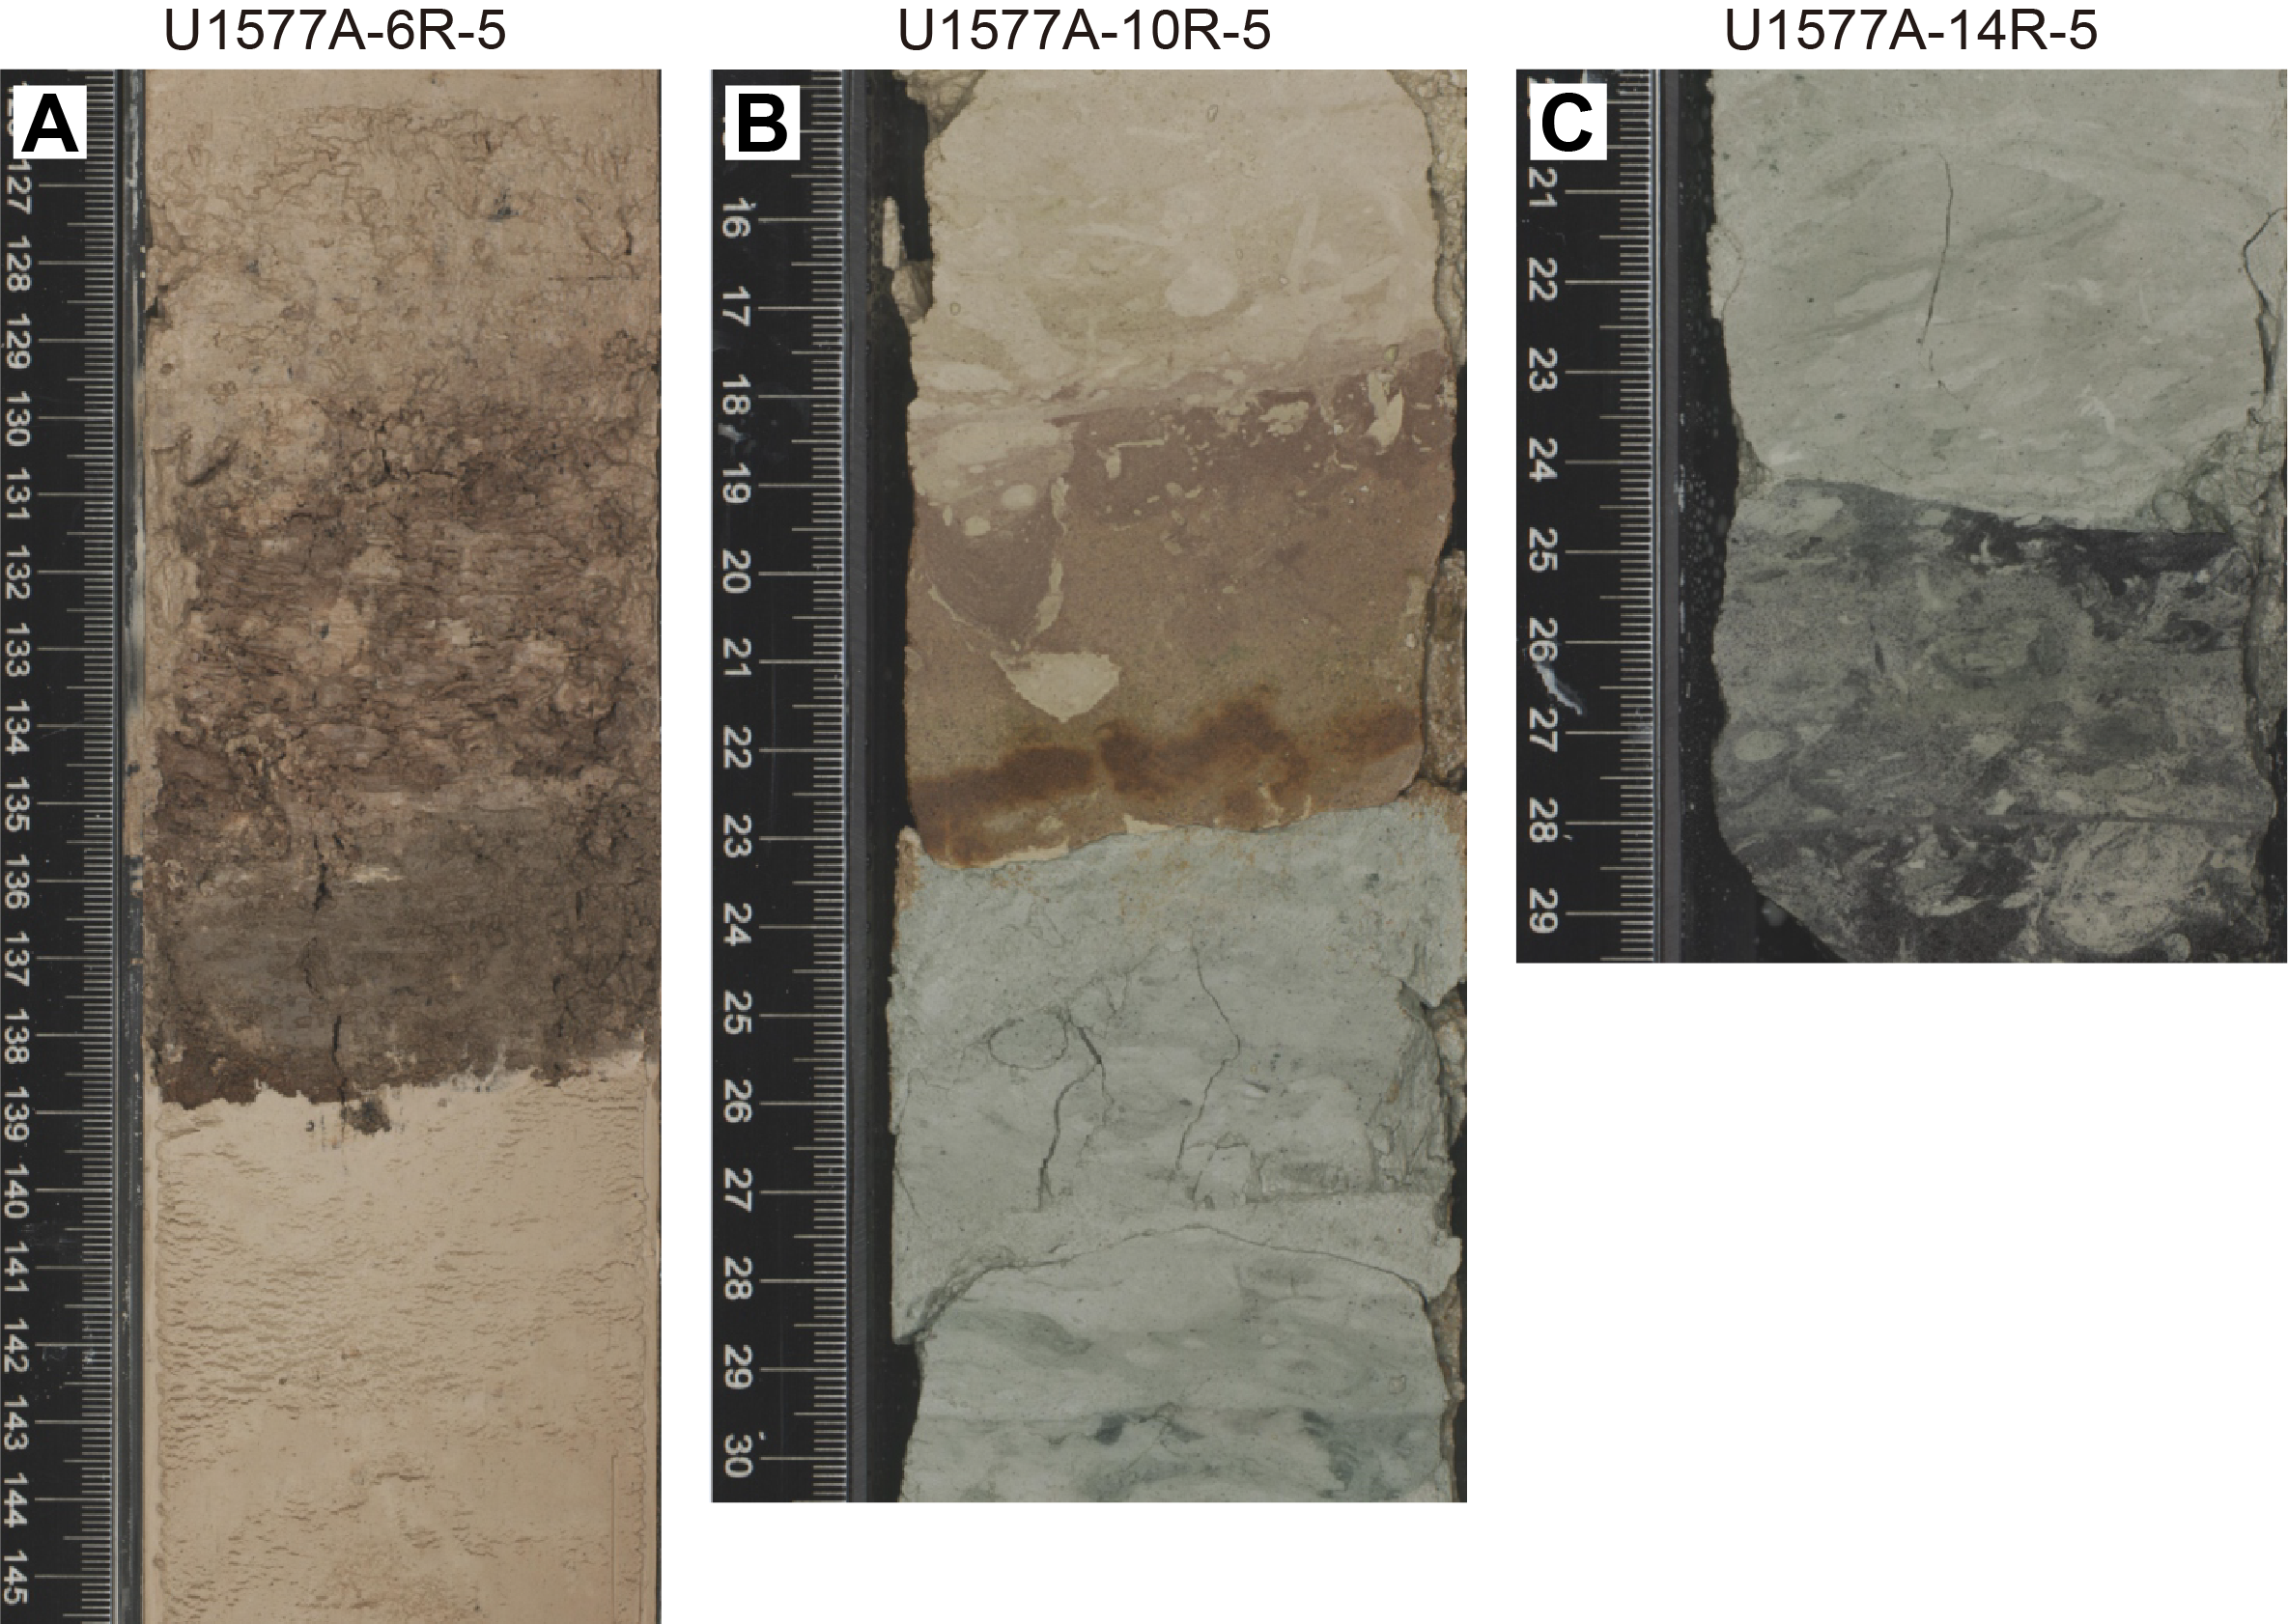
Figure F11. Tilted sharp sedimentary contacts.
3.1. Lithostratigraphic unit descriptions
3.1.1. Unit I
Unit I is a ~47 m thick succession predominantly composed of pale brown to white bioturbated nannofossil ooze with clay (Lithofacies 1) interbedded with tephra layers (Lithofacies 2) (Figure F12A). Pervasive slight to strong drilling disturbance occurred due to poor sediment consolidation. The upper and lower parts of this unit contain increased proportions of clay and tephra. A marked decrease in clay content and tephra abundances occurs between Sections 391-U1577A-2R-2 and 3R-5, producing an interval (~11–24 mbsf) where the sediment is distinctively lighter in color and resulting in a broad three-fold zonation observable in the NGR data (see Physical properties). The more clayey ooze intervals at the top and bottom of the unit display light brown to brown 10–50 cm thick cycles, and the lowest 3–4 m have an increasingly pink hue. The CaCO3 content in the ooze is typically ~60–80 wt% (see Sediment geochemistry); this is consistent with macroscopic and microscopic lithologic assessment of the clay content. Foraminifera are uncommon in the unit, but a distinctive foraminifera sand occurs at the top of Section 1R-1, which might reflect local winnowing of the ooze by bottom currents. Similar sedimentological features in the lower part of the unit could have been lost due to drilling disturbance.
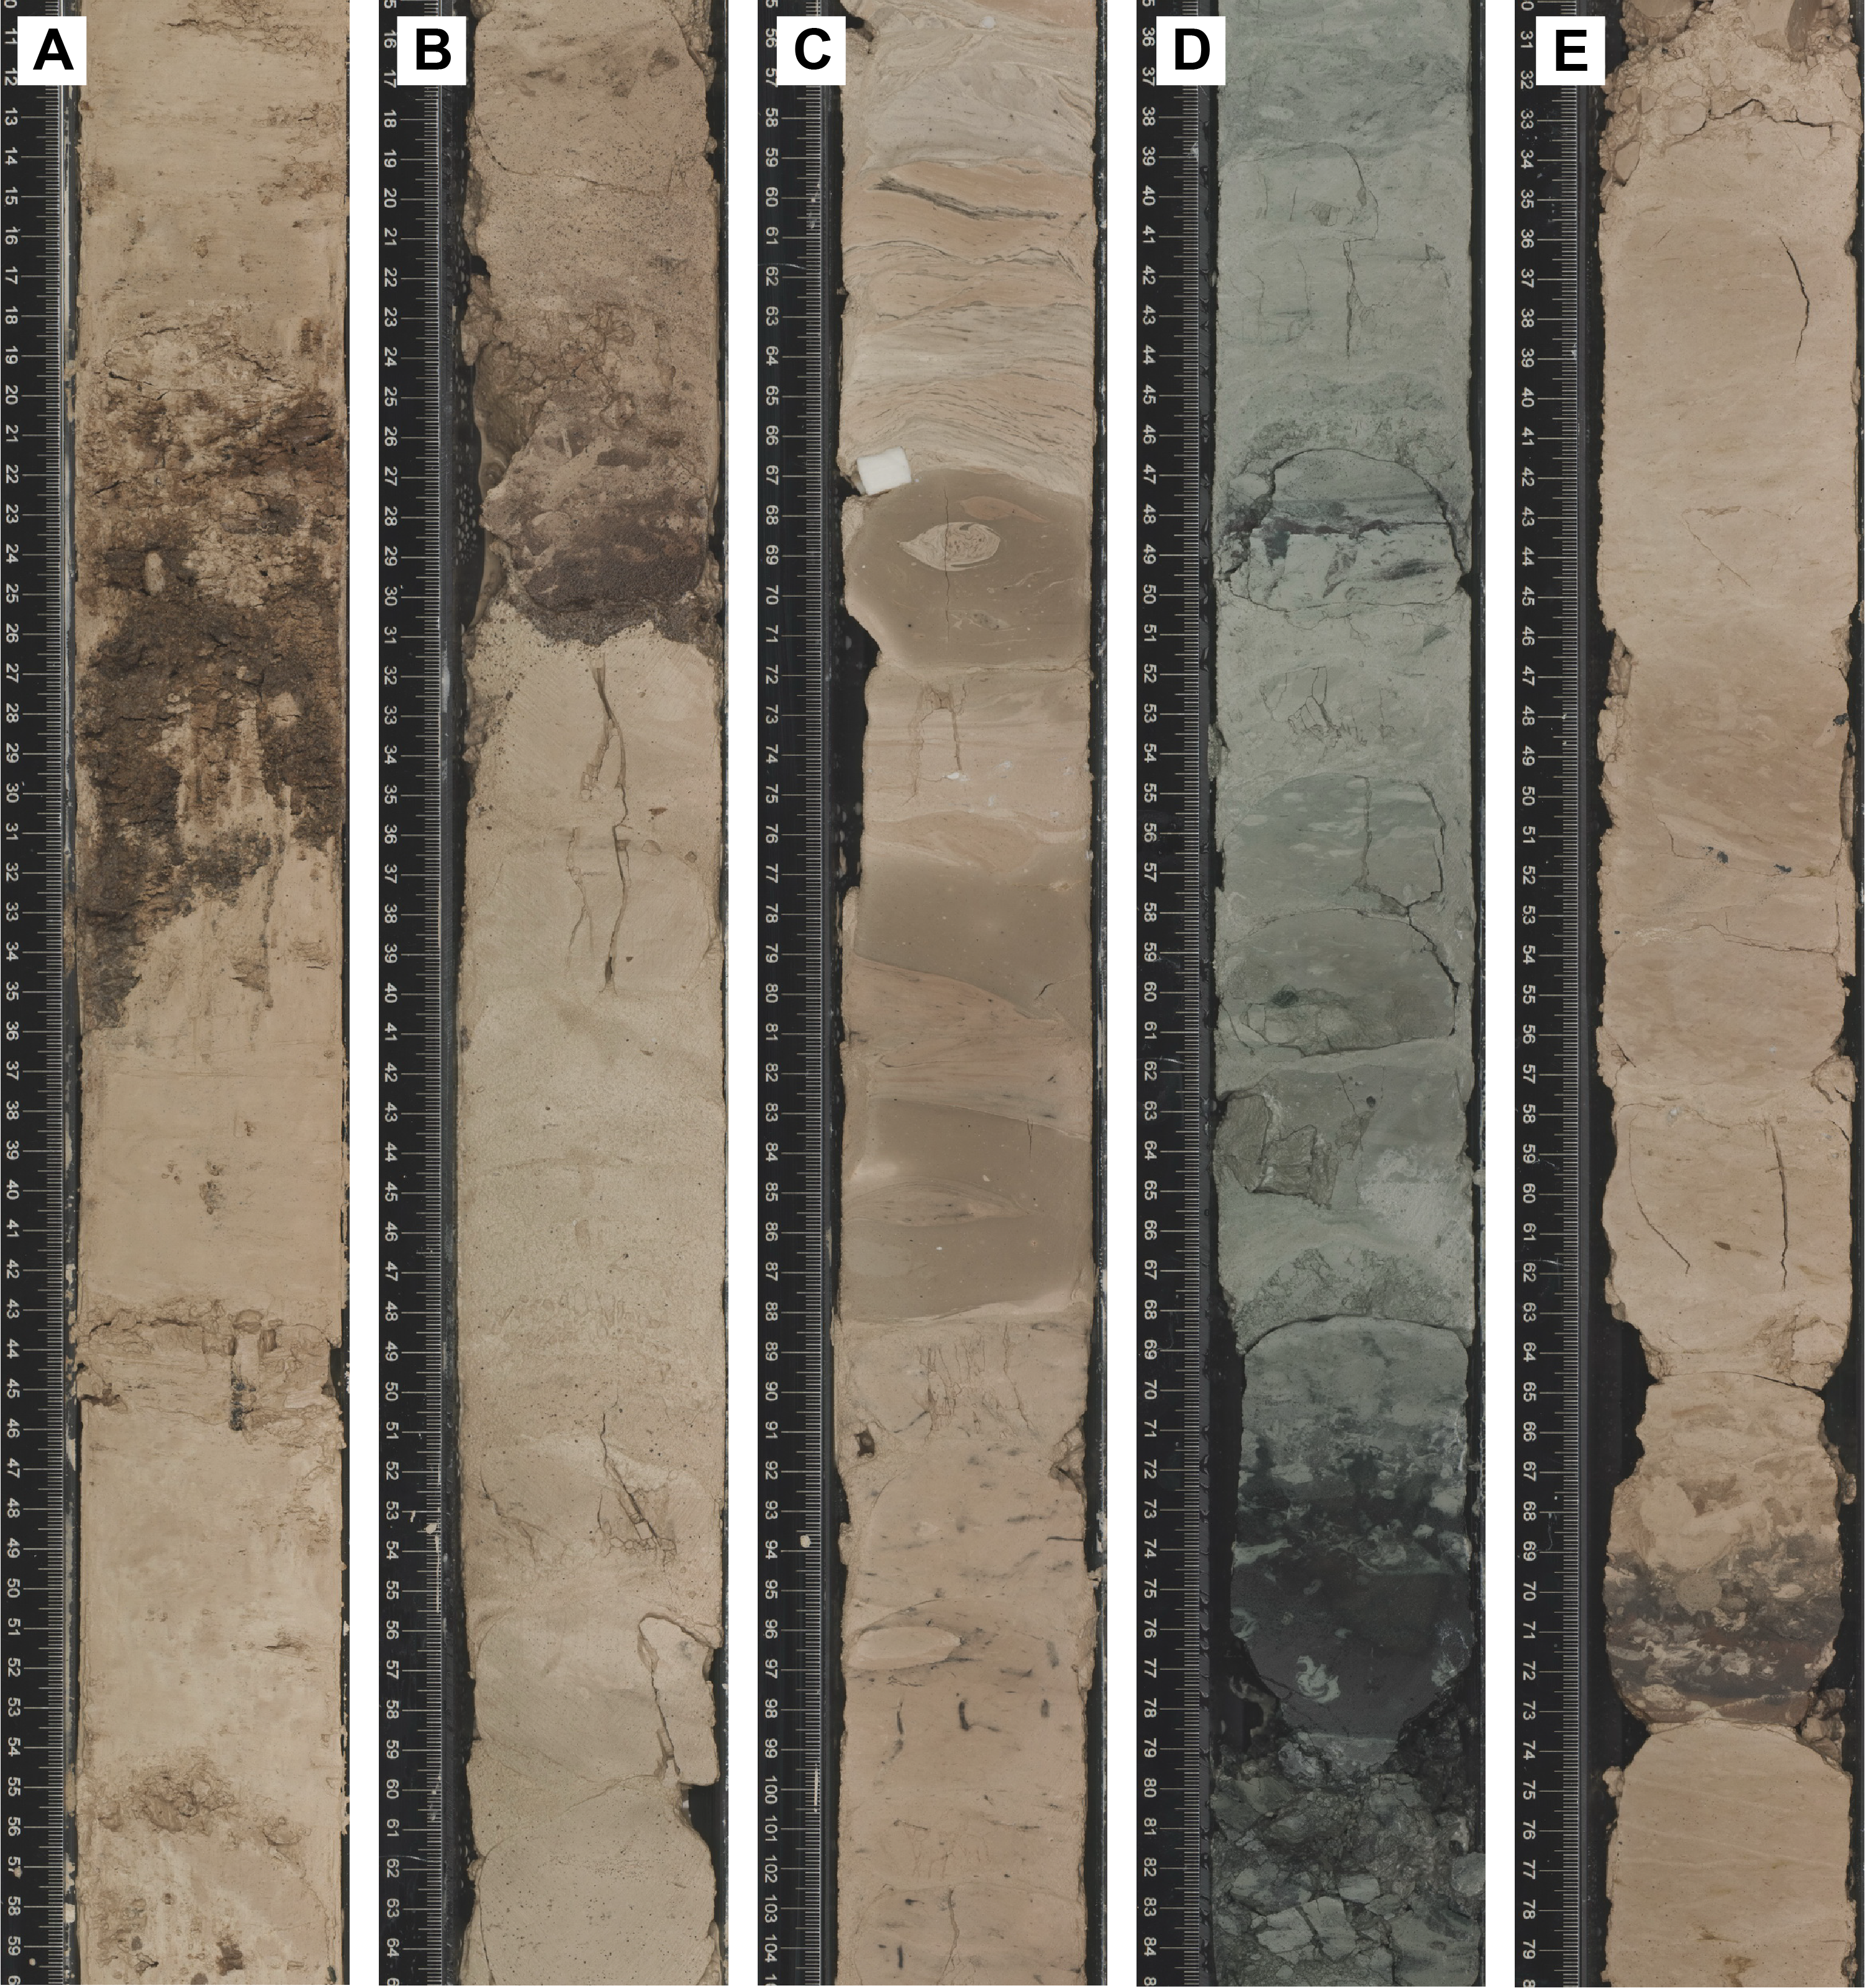
Figure F12. Representative intervals of units.
Tephra (Lithofacies 2) occurs in 1–30 cm thick dark brown layers that are commonly disturbed by drilling. These layers are often normally graded from sand to silt and clay (Figures F9B, F10B). Alteration of volcanic glass to clay appears pervasive, but very fine sand–sized crystals of unaltered feldspar, biotite, and amphibole are commonly observed in smear slides. NGR values are consistent with changes in the clay content of the ooze and variable abundance of tephra layers in the unit (see Physical properties).
Biostratigraphic observations indicate a lower Danian age for Core 391-U1577A-5R and a Maastrichtian age for Core 6R, with potentially poor recovery at or near the Cretaceous/Paleogene (K/Pg) boundary (see Biostratigraphy). Poor recovery at the boundary between Lithostratigraphic Units I and II is also supported by paleomagnetic data that indicate missing magnetic polarity chrons near the K/Pg boundary (see Paleomagnetism). Black centimeter-sized ferromanganese layers and patches occur toward the base of Unit I in the more pinkish sediments of Sections 5R-2 and 5R-3 (down to 40.31 mbsf) (Figure F9A). These do not occur in Core 6R, which may further indicate an unrecovered interval and nonretrieval of the boundary between Cores 5R and 6R. Such an interpretation is consistent with the particularly low recovery (40%) in Core 5R. Accordingly, in the absence of clear K/Pg boundary data, the base of Unit I has been placed at the top of Core 6R, which marks the first appearance of Cretaceous sediments (see Biostratigraphy).
In summary, Unit I is predominantly composed of pelagic sediments with sporadic tephra fallout deposits and ferromanganese patches and layers toward the base. This lithologic assemblage closely resembles that observed previously in Paleocene deposits in Unit II at Site U1576, albeit with a higher volcaniclastic component that may indicate occurrence of nearby subaerial(?) explosive volcanism. Biotite, higher NGR values, and portable X-ray fluorescence (pXRF) data in tephra-rich intervals suggest a more evolved magmatic composition than that of the known basaltic basement (see Physical properties; Table T6); the composition and origin of these tephra layers await further detailed investigation. The occurrence of possible winnowed foraminifera sand at the top of the unit may indicate that the absence of Eocene and younger sediment at Site U1577 is related to a phase of erosion (or nondeposition), perhaps in response to the impingement of bottom currents. Interestingly, the same mechanism could account for the possible early Miocene and Oligocene–Maastrichtian hiatuses at Site U1575, which occur above similar foraminifera sand deposits (see Lithostratigraphy in the Site U1575 chapter [Sager et al., 2023b]).
3.1.2. Unit II
- Interval: 391-U1577A-6R-1, 0 cm, to 8R-3, 131 cm
- Depth: 46.90–70.72 mbsf
- Age: Maastrichtian (~66–74 Ma)
Unit II is a ~24 m thick succession of slightly to heavily burrowed pinkish brown to pale brown clayey nannofossil ooze to chalk (Lithofacies 1) with minor interbeds of brown to gray volcanic ash to tuff (Lithofacies 2) (Figure F12B). Consolidation of the sediment and tephra gradually increases downhole. CaCO3 content in two whole-round samples of chalk is 72–77 wt%, similar to that of Lithofacies 1 in Unit I (see Sediment geochemistry). Biostratigraphic and paleomagnetic data indicate a Maastrichtian age of deposition (see Biostratigraphy and Paleomagnetism).
The lithologic assemblage of Unit II is broadly comparable to that of Unit I, but it lacks black ferromanganese crusts and patches and the clay content (i.e., brown color) of the chalk remains high throughout (i.e., there is no clay-poor interval). Regular color changes in Unit II indicate background cyclical sedimentation every 10–60 cm, although these are poorly developed and largely masked by the addition of tephra and bioturbation. Cyclical changes in color most likely correspond to fluctuation in the relative abundance of clays and Fe minerals relative to carbonates. Ichnofossils are generally outlined by infills of lighter brown nannofossil ooze/chalk; rarely, volcanic to foraminifera sand can also be locally preserved in the burrows. At least 20 layers of graded to bioturbated tephra occur in this unit (Figure F10B). The lower boundary of Unit II corresponds to the base of a 5 cm thick graded tephra in Section 391-U1577A-8R-3, 131 cm (Figure F13A). It is also indicated by the appearance of fragments of inoceramid shells together with the disappearance of brown tephra in Unit III. Biostratigraphic and paleomagnetic data indicate an apparent stratigraphic gap or period of reduced sedimentation of ~3 My between Units II and III (see Biostratigraphy and Paleomagnetism). The occurrence of a gap is likely but impossible to establish unequivocally due to significant drilling disturbance and possibly minor sediment loss during recovery below the unit boundary (Figure F13A).
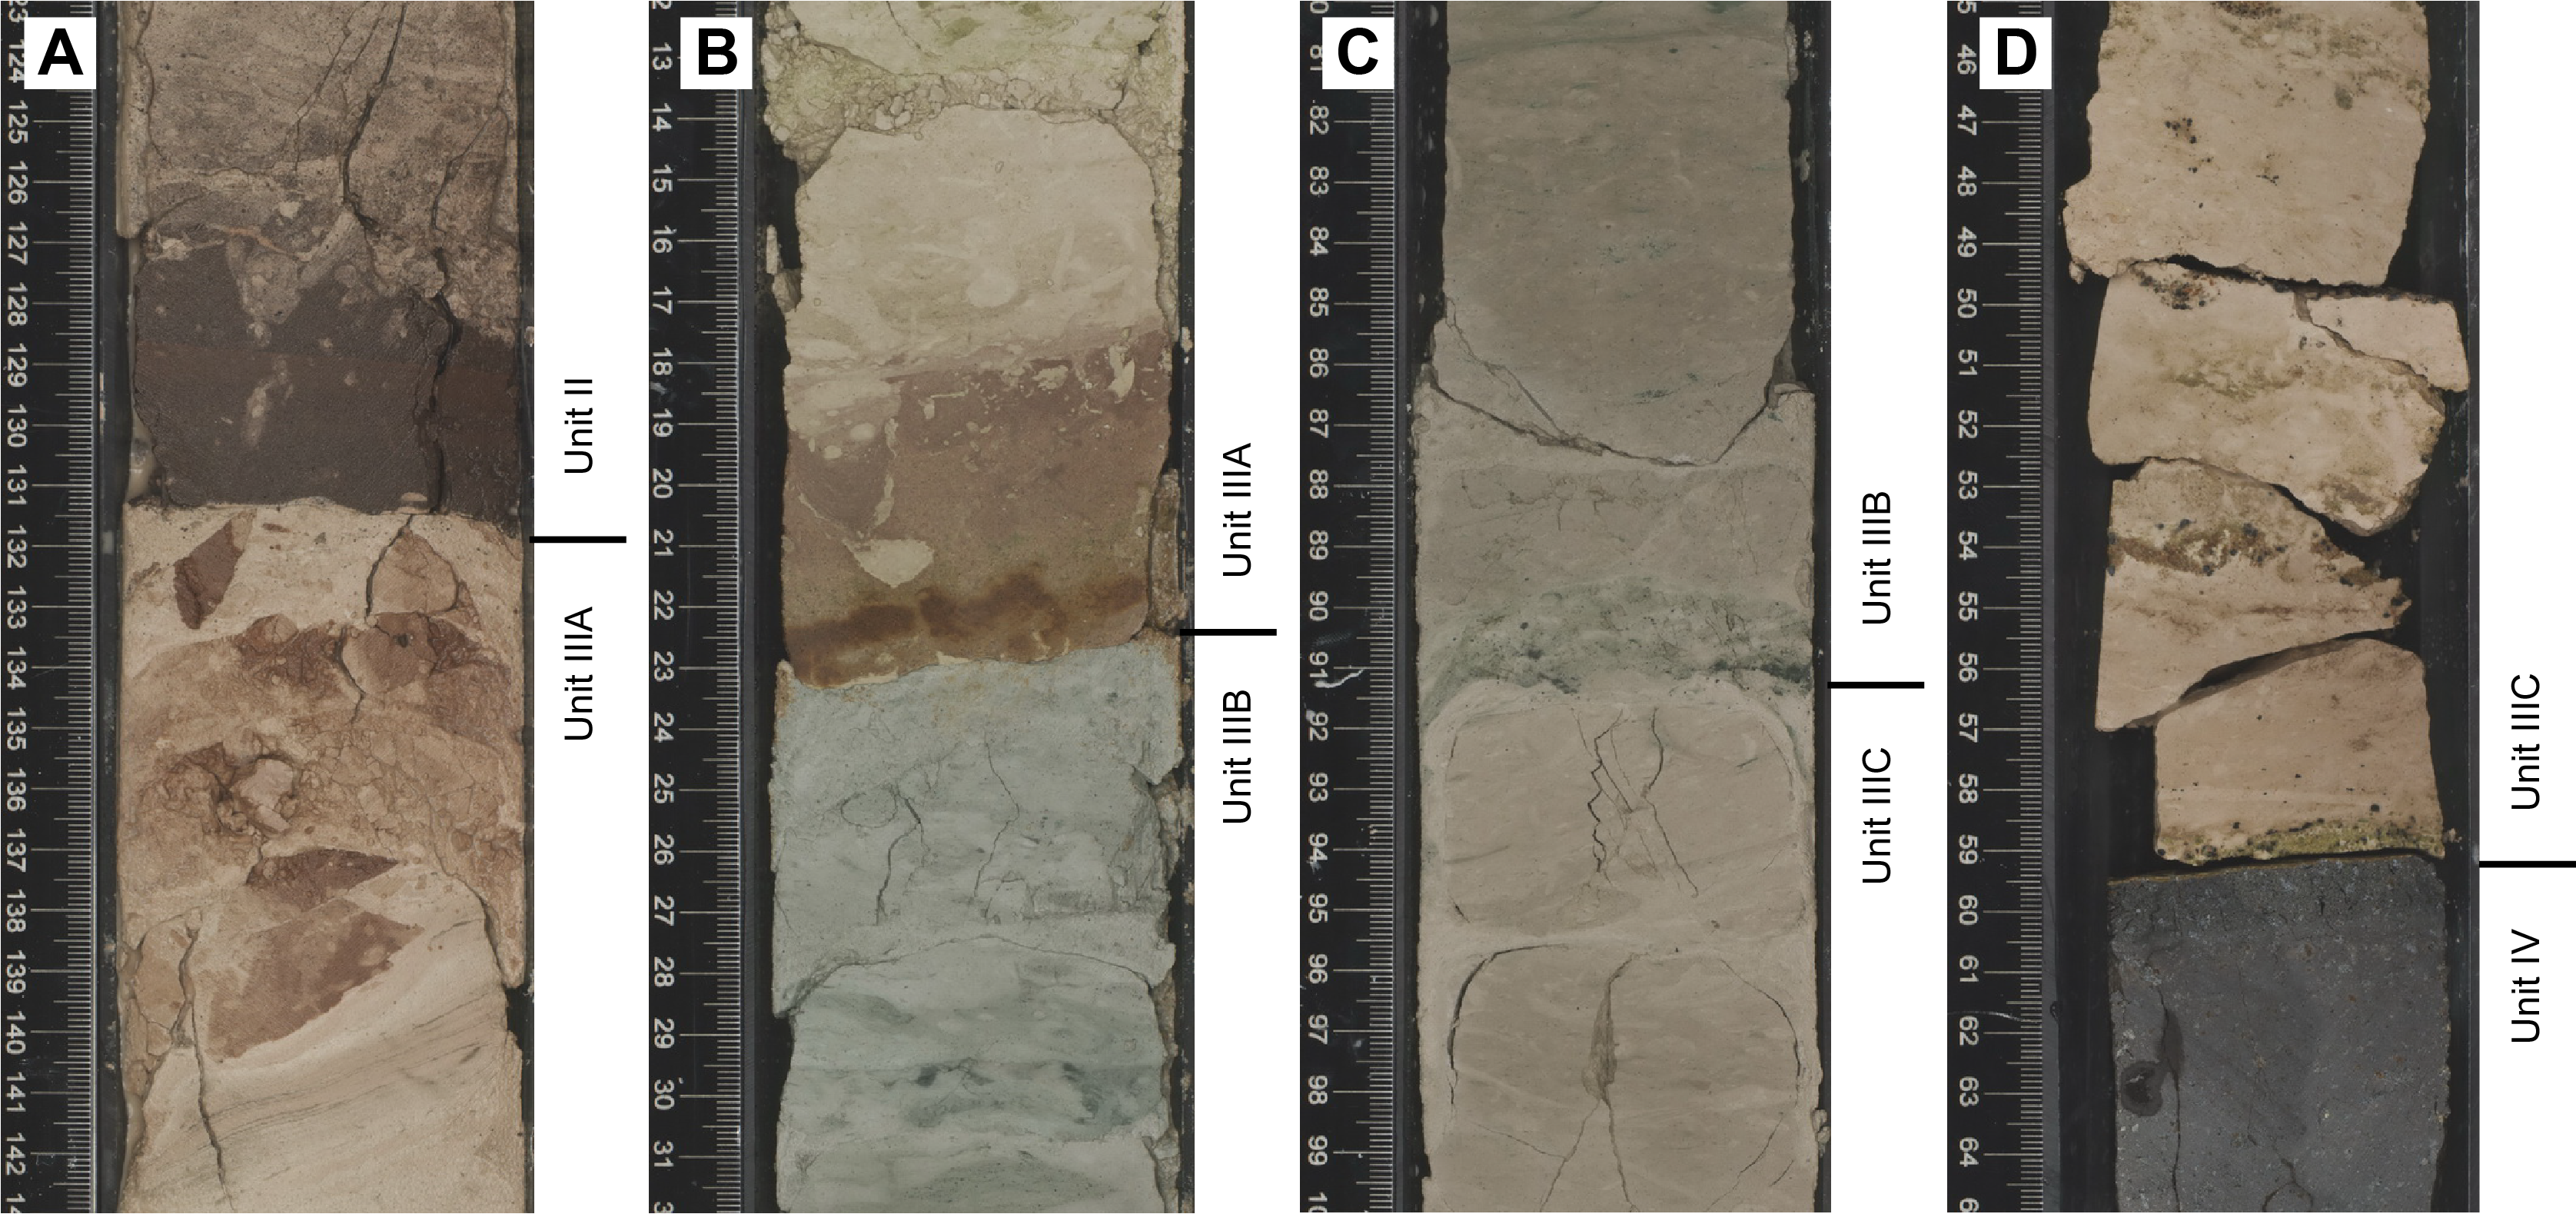
Figure F13. Unit and subunit boundaries.
Like Unit I, Unit II records sedimentation in a pelagic environment that is punctuated by volcanic events leading to sporadic deposition of tephra on the seafloor. Subtle color cyclicity in the chalk (Lithofacies 1) is observed throughout the unit and may relate to sedimentary cycles such as those observed in Unit III at Site U1576. These cycles likely reflect fluctuating paleoenvironmental conditions in the Walvis Ridge area (and/or South Atlantic) during the uppermost Cretaceous.
3.1.3. Unit III
- Interval: 391-U1577A-8R-3, 131 cm, to 18R-1, 60 cm
- Depth: 70.72–154.80 mbsf
- Age: late Campanian to Santonian (~75–84 Ma)
Unit III is an ~84 m thick succession of bioturbated clayey nannofossil chalk (Lithofacies 1) with minor tephra interbeds (Lithofacies 2) (Figure F12C). These deposits record the first appearance of inoceramid shell fragments and the disappearance of brown tephra. In addition, the change from Unit II to Unit III is marked by a rapid fall in NGR values from ~12–32 counts/s (average = 21) to 8–16 counts/s (average = 13) in Section 391-U1577A-8R-3 (see Physical properties). This correlates with the disappearance of tephra in the upper part of Unit III and a discontinuity in the paleomagnetic reversal record at this level. Thereafter, average NGR values gradually increase downhole from Section 9R-4 throughout Unit III from ~10 to >15 counts/s immediately above the igneous basement. This increase appears to be broadly correlated with an increase in tephra abundance and a concomitant increase in the clay content of the clayey nannofossil chalk. The lower boundary of Unit III is the contact of this chalk with glass on top of a massive lava at the top of the igneous basement. Unit III is divided into three subunits based on significant color changes in the clayey nannofossil chalk (i.e., rapid change from pink to green at the base of a tephra band in Section 10R-5, 23 cm, and a gradual return from green to pink in Section 14R-6), as well as corroborative variations in the relative abundance of Lithofacies 1 and 2 and changes in the nature of tephra deposits.
3.1.3.1. Subunit IIIA
- Interval: 391-U1577A-8R-3, 131 cm, to 10R-5, 23 cm
- Depth: 70.72–92.23 mbsf
- Age: late Campanian (~75–79 Ma)
Subunit IIIA is a ~22 m thick succession of bioturbated pinkish brown to pale brown clayey nannofossil chalk (Lithofacies 1) with minor gray to greenish tephra layers (Lithofacies 2) (Figure F12C). Biostratigraphic data indicate a Campanian (~75–79 Ma) age of deposition. The clayey nannofossil chalk has a CaCO3 content of 60–76 wt% (n = 2, excluding an outlying analysis of 46 wt% in Section 391-U1577A-10R-3), which is comparable with the carbonate content of the overlying units (see Sediment geochemistry). The lower boundary of the subunit is defined based on a change in the color of the bioturbated clayey nannofossil chalk (Lithofacies 1) from reddish brown to greenish gray; however, the precise contact between Subunits IIIA and IIIB may have been lost due to drilling disturbance and biscuiting (Figure F13B).
Although the lithologic assemblage of Subunit IIIA is broadly similar to that of the rest of the sedimentary cover at Site U1577, this subunit can be readily distinguished from the overlying units based on the occurrence of fragments of inoceramid shells throughout. In addition, tephra interbeds in Subunit IIIA are rare and consist almost exclusively of <30 cm thick greenish to gray layers altered to clay with locally abundant silt-sized feldspars (e.g., Sample 391-U1577A-10R-4, 42 cm), whereas the other units at Site U1577 include more abundant brown to black tephra layers. The clearest tephra layers in Subunit IIIA are restricted to Core 10R, where they occur as light green bands and oxidized graded beds at the boundary with Subunit IIIB (Figure F13B). Gray beds, ~5–30 cm thick, occur downhole from Section 9R-3 in the clayey nannofossil chalk, which could reflect a minor addition of ash in the pelagic sediments (Figures F10C, F12C). A similar process could account for the occurrence of thin (<1 cm) layers of lamination in the bioturbated clayey nannofossil chalk associated with gray infills and the coating of some of the burrows above Section 9R-3; these are two other distinguishing features of Subunit IIIA (Figure F9B).
As observed in Unit II (and the partially contemporaneous Unit III at Site U1576), the chalk (Lithofacies 1) in Subunit IIIA displays ~10–60 cm thick reddish brown to pale brown cycles correlated to changes in the relative abundance of clay and carbonate components. Here, the degree and intensity of this cyclicity is less well developed; nevertheless, the cycles are apparent in Sections 391-U1577A-8R-5, 8R-6, and 9R-3 through 9R-7, where lower degrees of bioturbation and drilling disturbance occur (see Core descriptions). The cycles are locally punctuated by centimeter-sized black ferromanganese patches in Sections 10R-2 and 10R-3.
Subunit IIIA is interpreted as recording sedimentation in a pelagic environment with sporadic tephra fall. Reworking of this volcaniclastic component largely results from varying degrees of bioturbation of the substrate. Laminae in the upper part of the unit could possibly represent the effect of bottom or low-density turbidity currents, but drilling disturbance prevents definitive confirmation. Patches and possible dismembered layers of dark ferromanganese material in Lithofacies 1 may indicate several periods of slow sedimentation on the seafloor and reworking by the aforementioned processes. As earlier described, the color cyclicity observed in Subunit IIIB likely represents fluctuation in clay and biogenic components in the pelagic sediment.
3.1.3.2. Subunit IIIB
- Interval: 391-U1577A-10R-5, 23 cm, to 14R-6, 92 cm
- Depth: 92.23–133.53 mbsf
- Age: early Campanian (~79–81 Ma)
Subunit IIIB is a ~41 m thick succession of greenish gray bioturbated clayey nannofossil chalk (Lithofacies 1) with gray to black tephra layers (Lithofacies 2) (Figure F12D). Biostratigraphic data indicate a Campanian (~79–81 Ma) age of deposition. The clayey nannofossil chalk has a CaCO3 content of 37–54 wt% (n = 5) (see Sediment geochemistry), which suggests a ~20 wt% reduction in the carbonate (i.e., biogenic) component of Lithofacies 1 compared to the overlying units. The lower boundary of Subunit IIIB is defined based on the disappearance downhole of the greenish gray color of Lithofacies 1 and the gradual return of reddish brown clayey nannofossil chalk in Subunit IIIC (Figure F13C). In addition to the green color of the chalk, Subunit IIIB is distinguished from the overlying sediment by the first occurrence downhole of thick black vitric tephra (Lithofacies 2), which commonly occurs in 3–20 cm layers graded from sand to silt with minor bioturbation (Figures F10A, F12D). The tephra can locally be extensively bioturbated, apparently leading to pervasive dispersal of the volcaniclasts in the chalk (Figure F9C). Although the tephra is commonly palagonized, the coarser fragments of volcanic glass are locally fresh with minor vesicles. A pXRF measurement of the (altered) black vitric tuff suggests a more mafic composition than that of (altered) brown biotite-bearing tephra in overlying units (Table T6). Common dispersion of tephra in the clayey nannofossil chalk limits recognition of pelagic sedimentary cyclicity. However, 10–60 cm thick cycles similar to those observed in the overlying units may locally be preserved (Figure F12D).
Subunit IIIB is interpreted as recording sedimentation in a pelagic environment with sporadic tephra fallouts. Submeter sedimentary cycles in this subunit are likely controlled by relative changes in the abundance of biogenic carbonates, detrital clays, and altered tephra mixed within the chalk by bioturbation; the associated compositional changes are probably due to biogenic, detrital, or volcanic controls. This cyclical character of the sediment is analogous to cycles observed in the overlying units and in Unit III at Site U1576. If so, this would indicate widespread cyclical paleoenvironmental changes in the Walvis Ridge area during the Late Cretaceous, with differing subenvironments operating on either side of this submarine barrier. The origin of the green coloration of the sediment in Subunit IIIB is enigmatic; it may record a period of oceanic anoxia (or more reduced conditions on the seafloor), which appears at least partly correlative to that recorded by Subunits IIIB and IIIC at Site U1576. Alternatively, because trace fossil content appears to be undiminished when crossing from oxidized (pink) to reduced (green), these sedimentary intervals may represent a hitherto unrecognized diagenetic alteration (reduction) of part of this Campanian succession. Determination of the origins of reduction in both of these Cretaceous stratigraphies awaits additional (postexpedition) analytical and stratigraphic investigation.
3.1.3.3. Subunit IIIC
- Interval: 391-U1577A-14R-6, 92 cm, to 18R-1, 60 cm
- Depth: 133.53–154.80 mbsf
- Age: early Campanian to Santonian (~81–84 Ma)
Subunit IIIC is lithologically very similar to Subunit IIIA. It is a ~21 m thick succession of pinkish brown to pale brown bioturbated clayey nannofossil chalk (Lithofacies 1) that is interbedded with gray to brown and black vitric tuff layers (Lithofacies 2) (Figures F9D, F12E). As in Subunit IIIA, fragments of inoceramid shells occur locally. The CaCO3 content of the chalk is 50–61 wt% (n = 2), which is broadly consistent with that of clayey nannofossil chalk in Subunits IIIA and IIIB (see Sediment geochemistry). Biostratigraphic data indicate an early Campanian to Santonian age of deposition (~81 to 83–84 Ma). Recovery of the uppermost Santonian (~84 Ma) in Subunit IIIC is also attested by a magnetic reversal from Chron 33r to Chron 34n in Core 391-U1577A-17R (see Paleomagnetism). The lower boundary of Subunit IIIB marks the contact between the sedimentary cover and volcanic basement at Site U1577. It consists of the top of a massive lava overlain by a 0.5 cm thick layer of altered hyaloclastite and bioturbated clayey nannofossil chalk (Lithofacies 1) (Figure F13D).
The clayey nannofossil chalk of Subunit IIIC includes ~10–60 cm thick reddish brown to pale brown cycles that correlate with changes in the relative abundance of clay and carbonate components (very similar to those observed in Subunit IIIA). However, in contrast to Subunit IIIA, Subunit IIIC includes black layers of graded to bioturbated vitric tuff and likely represents continuation downhole of the input of black tephra first observed in Subunit IIIB. In addition to tephra layers (Lithofacies 2) that are sporadically interbedded with the chalk (Lithofacies 1), volcaniclastic deposits of Subunit IIIC also include rare <15 cm thick layered hyaloclastites, which appear approximately 6 m above the contact with the volcanic basement from Section 391-U1577A-17R-3 downhole (Figure F10D). Although volcanic glass is commonly altered in Subunit IIIC (and the sedimentary cover overall), a thin section of hyaloclastite in Sample 17R-3, 29–32 cm, reveals angular fragments of nonvesicular fresh glass with abundant feldspar microlites that experienced only minor palagonization.
As with the immediately overlying units at Site U1577, Subunit IIIC is interpreted as recording sedimentation in a pelagic environment with sporadic tephra fallouts. Cyclical sedimentation in the subunit resembles that observed in the overlying units and in Units II–IV at Site U1576, and it likely represents similar cyclical changes in environmental conditions in the Late Cretaceous. The return to reddish brown chalk deposition (i.e., oxic conditions on the seafloor) in Subunit IIIC at Site U1577, following a possible period of anoxia in overlying Subunit IIIB, was not observed at Site U1576 (see Lithostratigraphy in the Site U1576 chapter [Sager et al., 2023c]). This might reflect preservation of slightly older sediments at Site U1577 (i.e., not observed at Site U1576) or spatial variability in oxic versus anoxic ocean bottom (?) conditions around Valdivia Bank during the early Campanian.
3.1.4. Unit IV (igneous basement)
The igneous basement at Site U1577 comprises a succession of massive basalt flows ranging >4.1–19.1 m in thickness, with no sediment intercalations between flows, implying relatively rapid emplacement over short timescales (see Igneous petrology and volcanology). These are similar in dimension and internal structure to those observed at Frio Ridge (Site U1575) and western Valdivia Bank (Site U1576).
4. Igneous petrology and volcanology
Igneous rocks were recovered in Hole U1577A, which penetrated 39.1 m of igneous basement (Section 391-U1577A-18R-1, 60 cm, through the bottom of the hole at 193.9 mbsf) and recovered 28.04 m (64.0%). The igneous basement at Site U1577 represents Lithostratigraphic Unit IV in the overall subseafloor succession (see Lithostratigraphy). Hole U1577A terminates in a massive basalt flow with a minimum thickness of 19.07 m.
4.1. Igneous unit descriptions
One igneous unit was identified in Hole U1577A (Figure F14). The unit comprises three massive basalt flow subunits separated by thin chilled margins. The similar eruptive style (i.e., as massive flows), the consistent chemistry (all high TiO2), and the lack of any sediment or significant alteration at the contacts suggest that these flows erupted in relatively quick succession and are closely related geochemically.
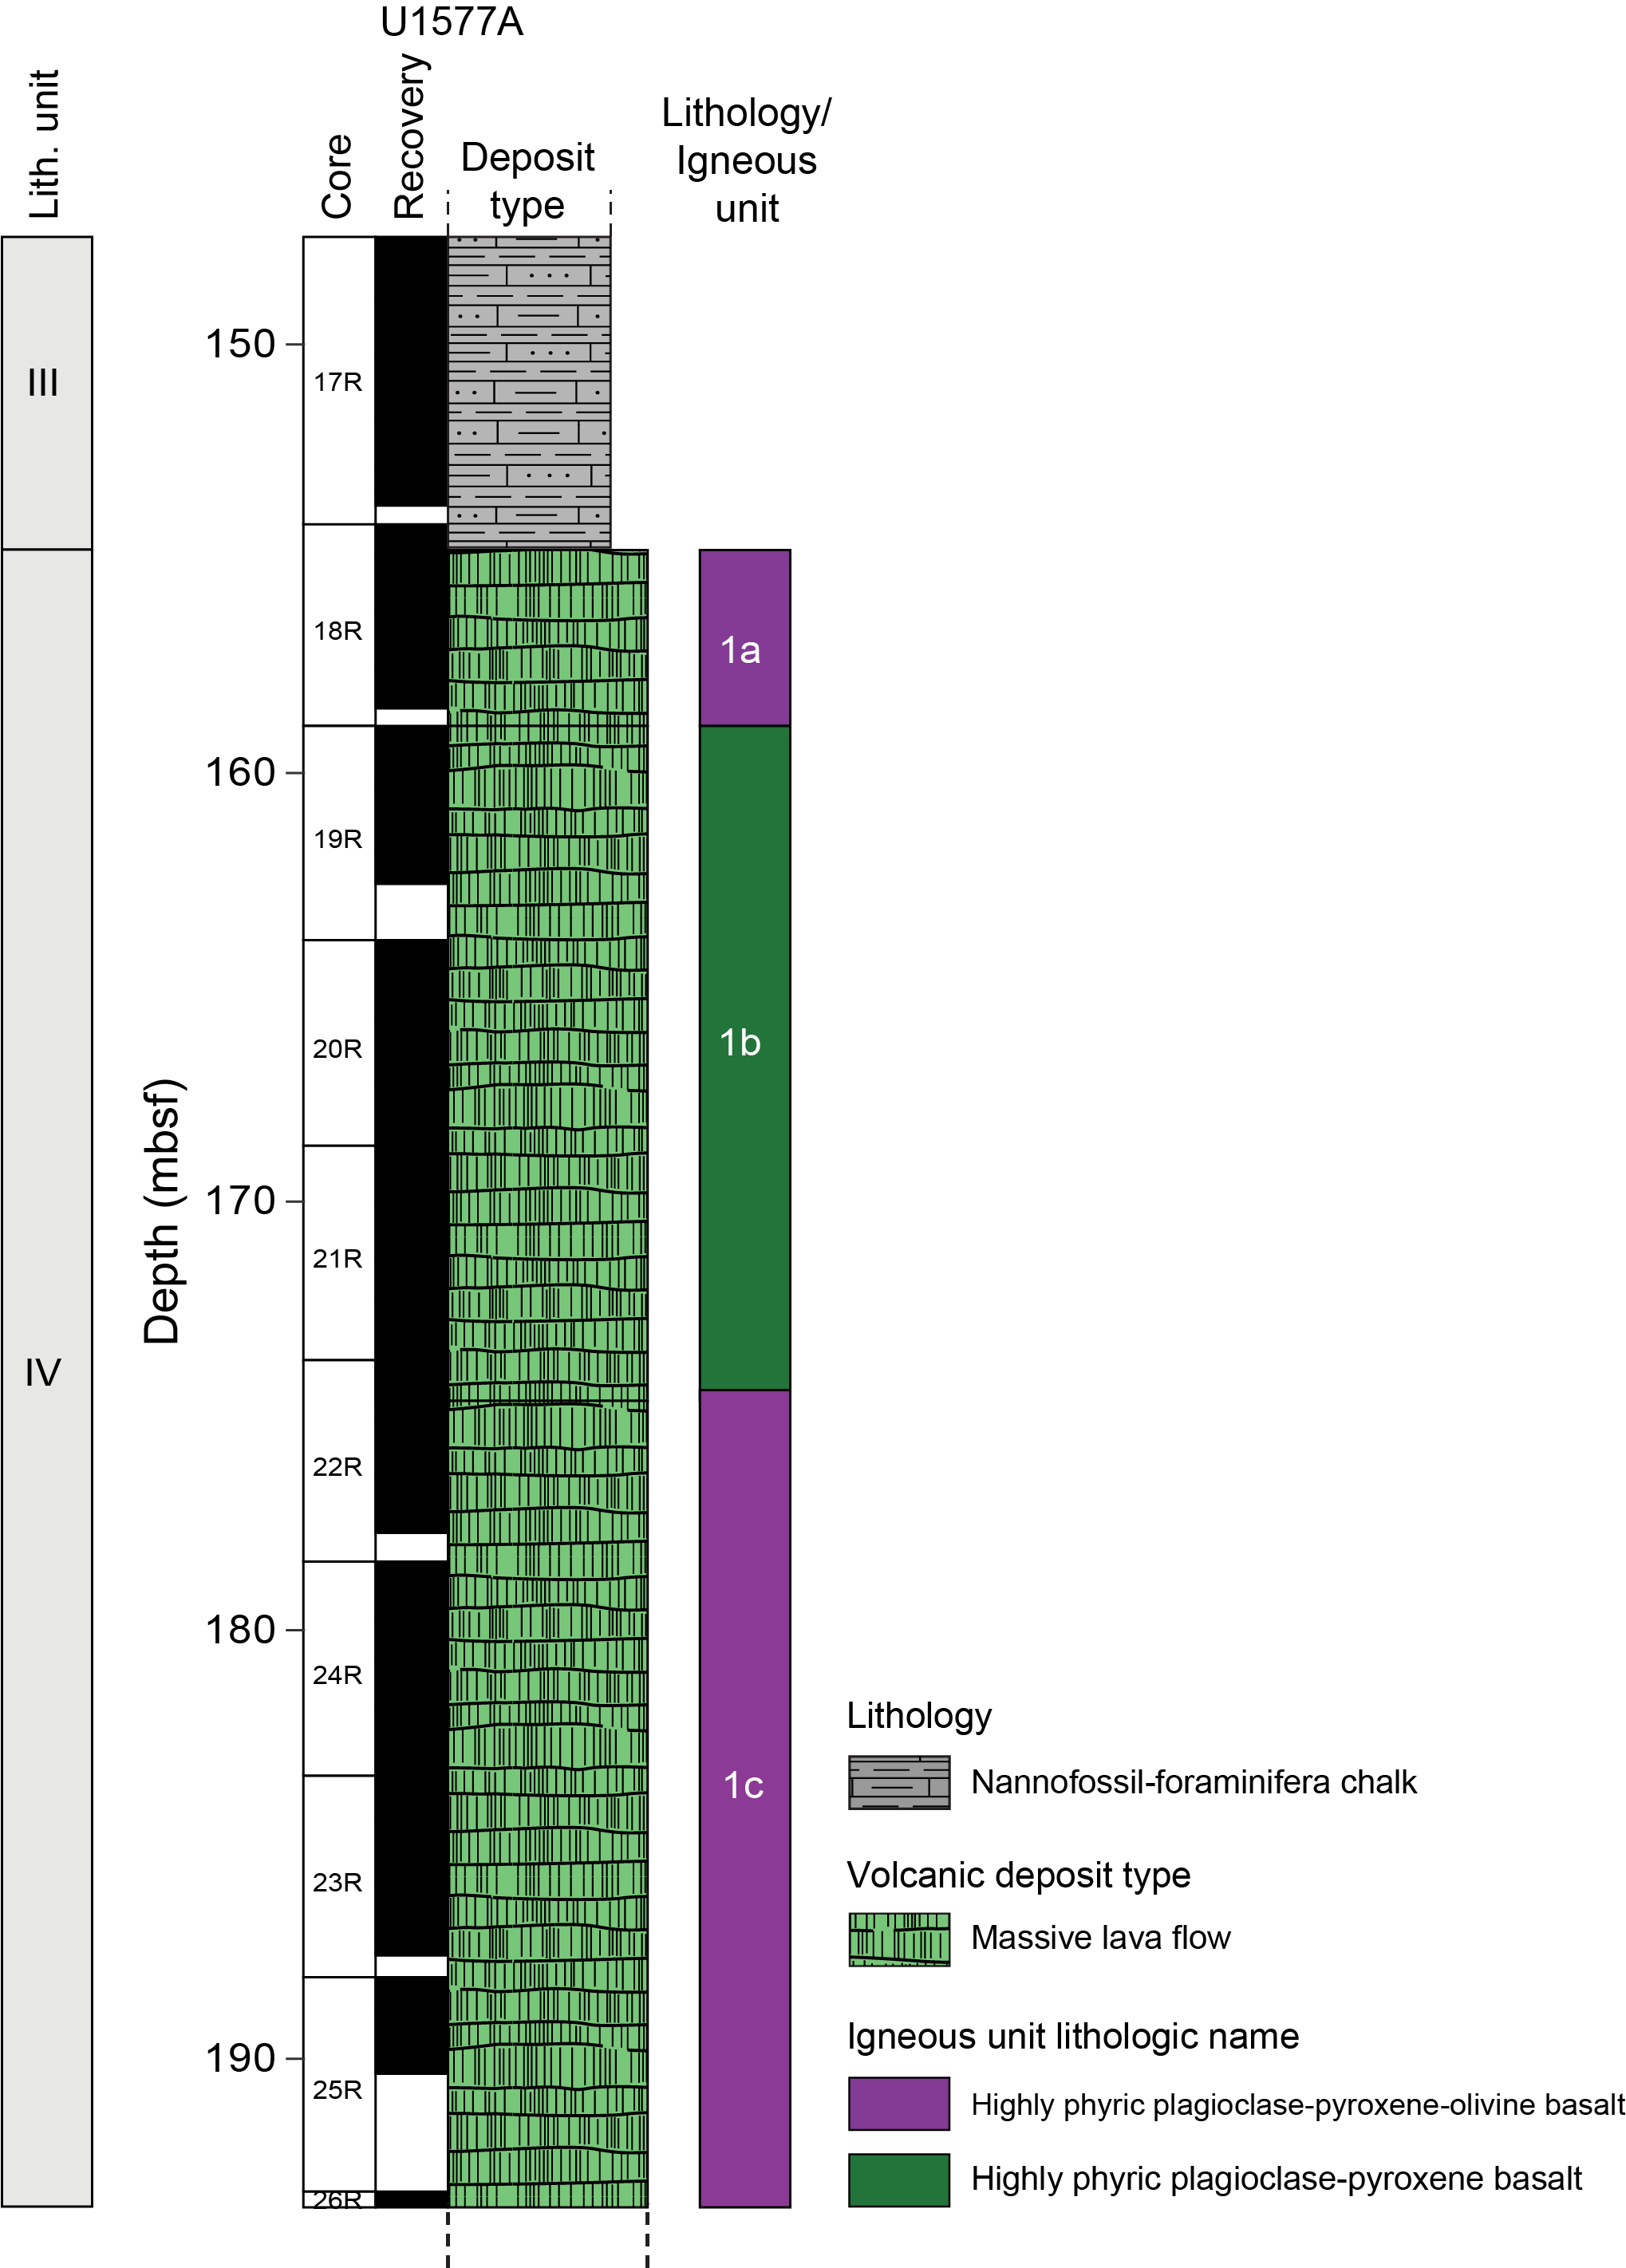
Figure F14. Stratigraphic column.
4.1.1. Unit 1
- Interval: 391-U1577A-18R-1, 60 cm, to 26R-1, 37 cm
- Depth: 154.80–193.90 mbsf
- Drilled thickness: 39.10 m
Unit 1 consists of three highly phyric (plagioclase-pyroxene-olivine) massive basalt flows. Glass was observed only at the top of Subunit 1a at the contact with overlying pelagic sediments. Slight alteration and significant fining of groundmass mineral grains mark the chilled margins between flow subunits. Subunit 1c terminates in a massive flow with a minimum thickness of 19.07 m. Alteration intensity is typically slight and only occasionally moderate, and the thick flow interiors present negligible changes in primary mineralogy with the exception of olivine in Subunit 1a and at the top of Subunit 1b, where it is commonly replaced by iddingsite; olivine is largely preserved in Subunit 1c. Other primary igneous minerals are typically unaltered, with only very minor replacement observed in feldspar (kaolinite) and occasional oxidative Fe oxyhydroxide films around pyroxenes in the uppermost chilled margins or else in diffuse halos adjacent to fractures.
4.1.1.1. Subunit 1a
- Interval: 391-U1577A-18R-1, 60 cm, to 18R-4, 96 cm
- Depth: 154.80–158.49 mbsf
- Drilled thickness: 4.10 m
- Recovered thickness: 3.69 m
- Rock type: highly phyric plagioclase-pyroxene-olivine basalt
- Deposit: massive lava flow
- Chemistry type: high TiO2
Subunit 1a is a massive basalt flow (4.1 m thick; 90% recovery) with the primary flow contacts preserved. Fresh glass occurs as a thin selvage at the top of the aphanitic chilled margin of this subunit. This has been altered to a thin (<3 mm) zone of palagonite where it has been in contact with the overlying sediment, and hyaloclastite fragments are intermixed with the basal pelagic sediments (Figure F15). The bottom 0.5 m shows gradual groundmass crystal size–fining toward the basal contact. The flow interior has porphyritic textures in a fine-grained holocrystalline groundmass. The total phenocryst cargo in this unit is ~20%. It is dominated by plagioclase (~15%) with minor pyroxene (5%) and olivine (2%). Plagioclase occurs as phenocrysts and glomerocrysts 5–8 mm in size. Pyroxene is present in glomerocrysts with plagioclase and more rarely as individual phenocrysts. Olivine is present but completely altered to iddingsite. Sparse round vesicles (~1–2 mm in diameter) are filled with secondary mineralization, dominantly clay.
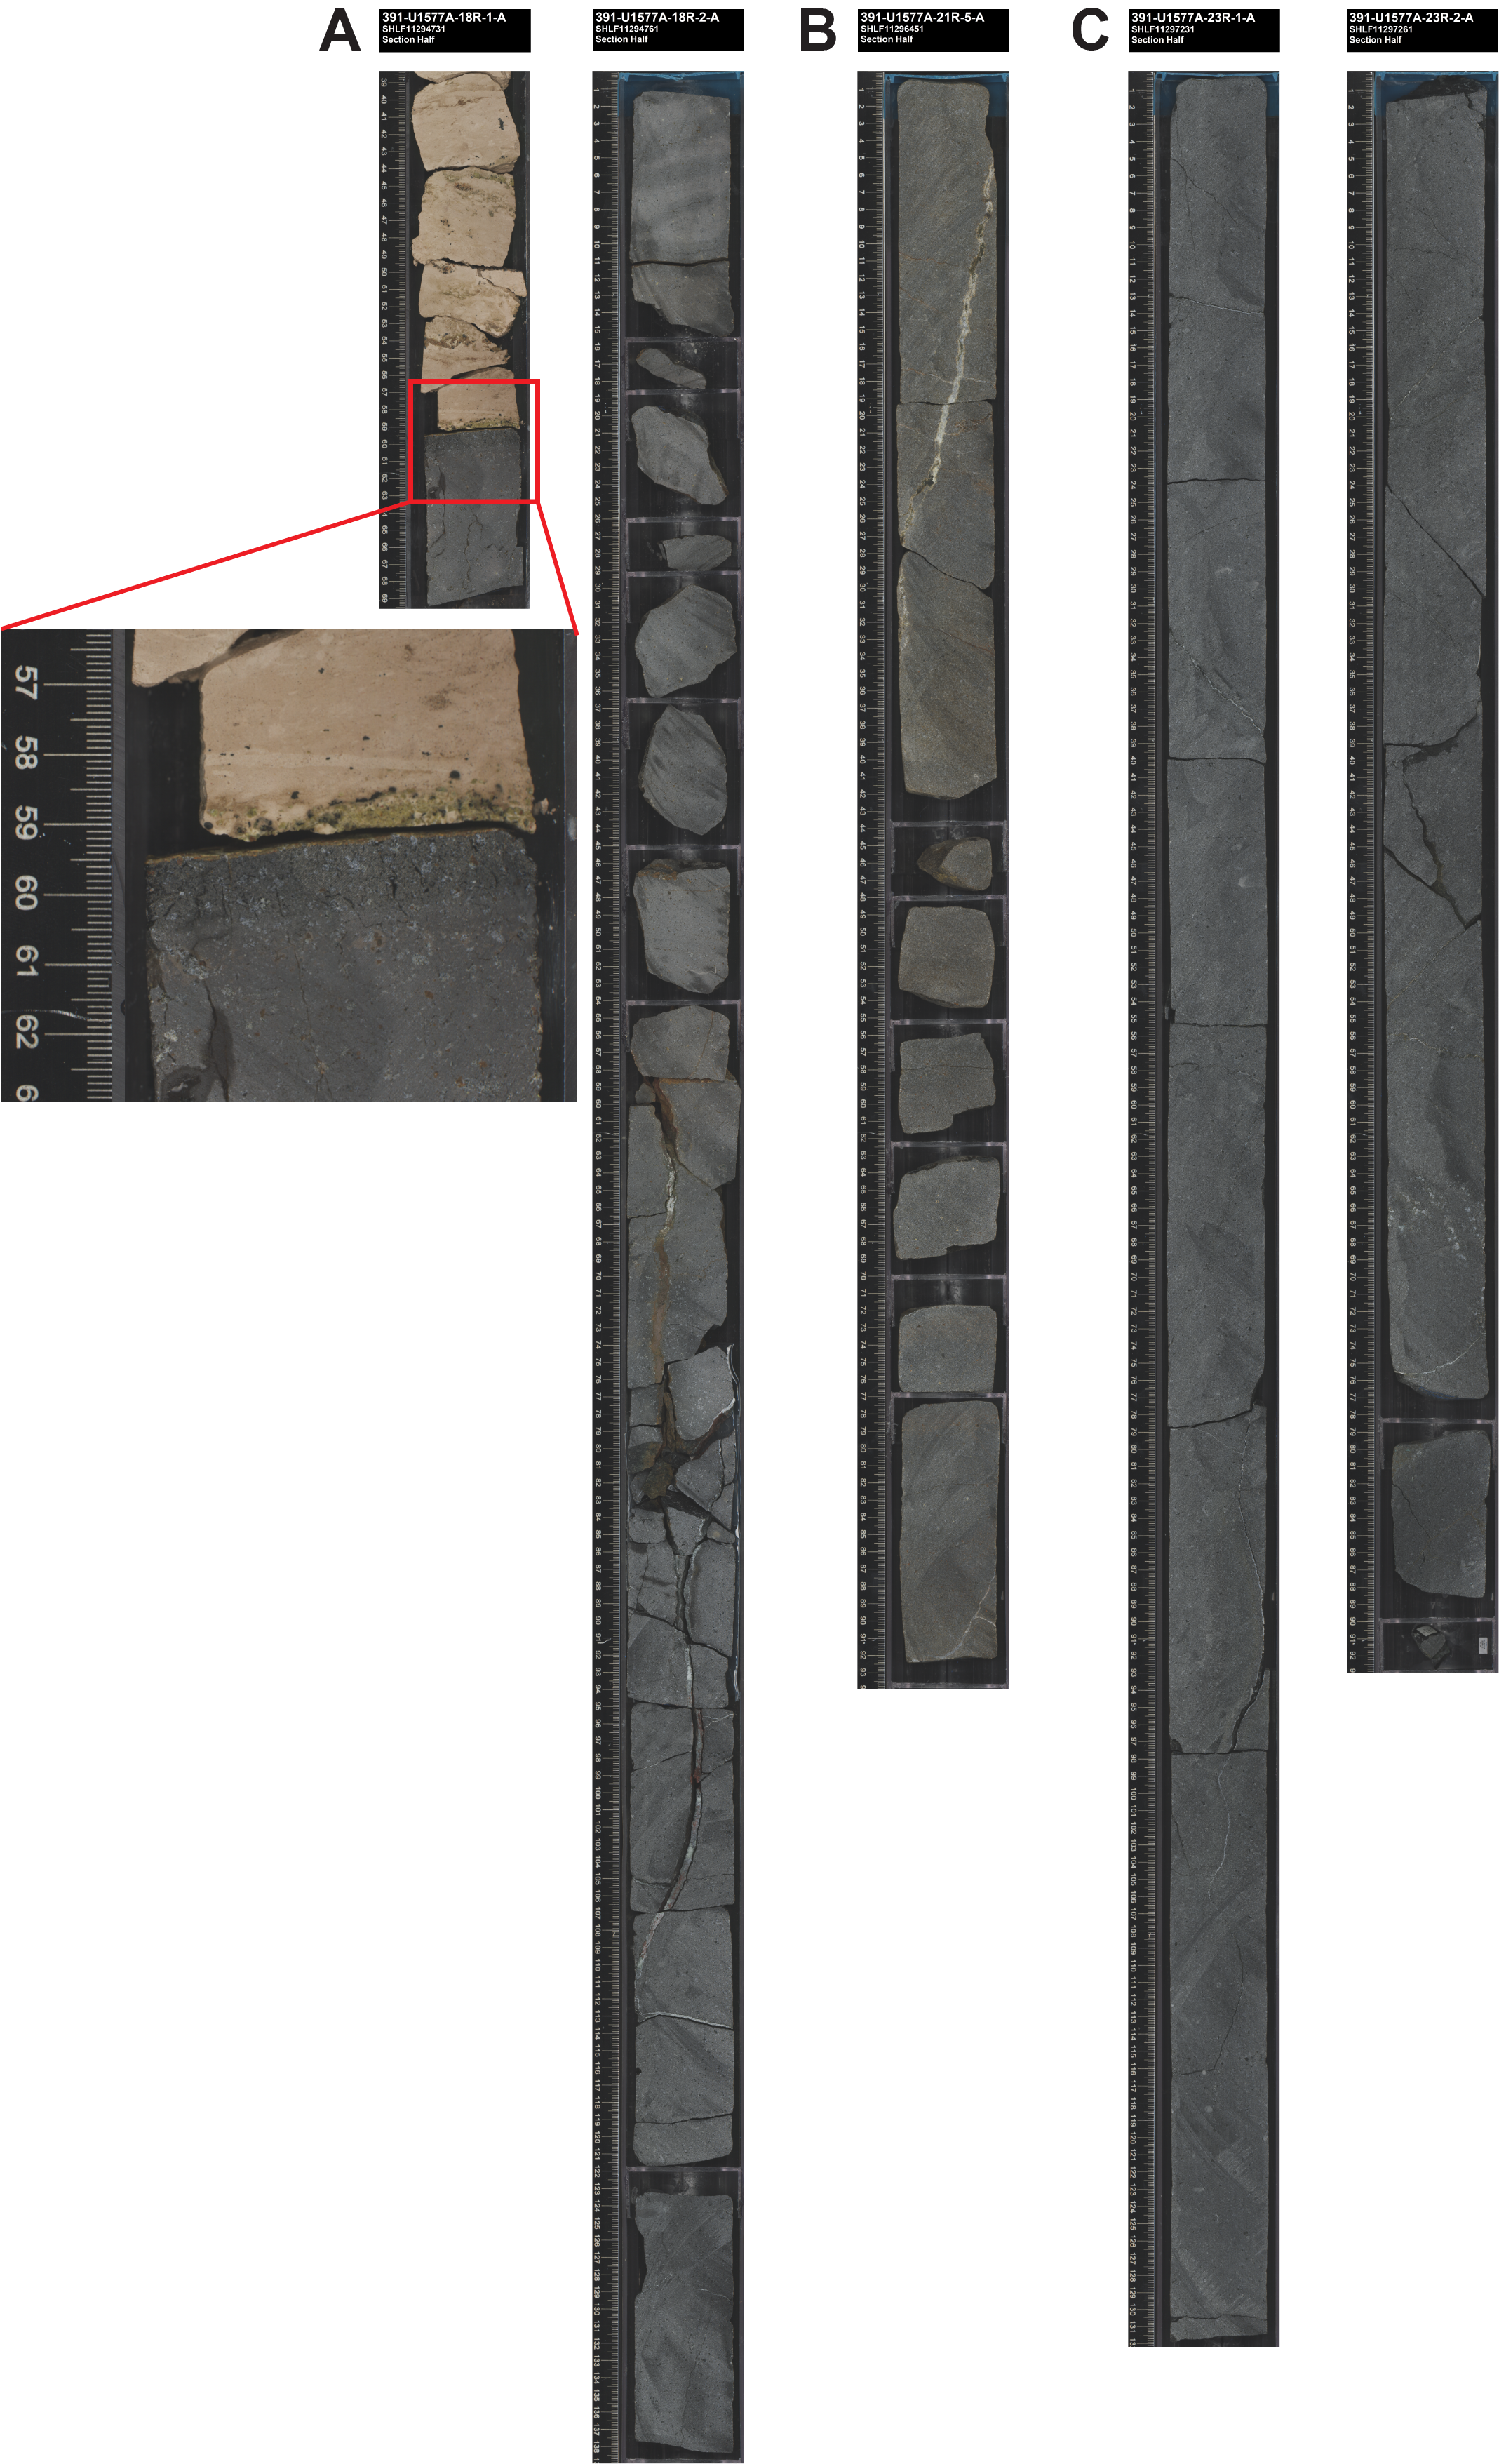
Figure F15. Basalt.
4.1.1.2. Subunit 1b
- Interval: 391-U1577A-19R-1, 0 cm, to 22R-1, 70 cm
- Depth: 158.90–174.4 mbsf
- Drilled thickness: 15.50 m
- Recovered thickness: 15.16 m
- Rock type: highly phyric plagioclase-pyroxene basalt
- Deposit: massive lava flow
- Chemistry type: high TiO2
Subunit 1b is a massive basalt flow (15.5 m thick; 98% recovery) with the primary flow contacts preserved as gradational aphanitic zones in the upper and lower chilled margin. This subunit has porphyritic textures in a fine-grained holocrystalline groundmass (Figure F15). Total phenocryst load in this unit is 10%–22%, dominated by plagioclase (~7%–22%) with minor pyroxene (2%–5%) and rare olivine ( ≪1%). Plagioclase occurs as phenocrysts and glomerocrysts 3–5 mm in size. Pyroxene is present in glomerocrysts with plagioclase and more rarely as individual phenocrysts. Olivine (altered to iddingsite) is observed in the upper 2 m, but it is absent thereafter. Sparse round vesicles (~1–2 mm in diameter) are filled with secondary mineralization, dominantly clay. Alteration is minimal, consisting largely of oxidative discoloration from dark gray-green to reddish tan. This alteration is most common near flow boundaries or fractures and veins.
4.1.1.3. Subunit 1c
- Interval: 391-U1577A-22R-1, 70 cm, to 26R-1, 37 cm
- Depth: 174.40–193.90 mbsf
- Drilled thickness: 19.50 m
- Recovered thickness: 15.31 m
- Rock type: highly phyric plagioclase-pyroxene-olivine basalt
- Deposit: massive lava flow
- Chemistry type: high TiO2
Subunit 1c is a massive flow (>19.1 m thick; does not intersect lower contact; 79% recovery of drilled thickness) with a primary flow contact preserved as an aphanitic zone in the upper chilled margin. This subunit has porphyritic textures in a fine-grained holocrystalline groundmass. Long, continuous pieces of rock were recovered from several cores (Figure F15). The total phenocryst load in this unit is 15%–18%, and it is dominated by plagioclase (~12%–15%) with minor pyroxene (1%–3%) and olivine (1%–3%). Plagioclase occurs as phenocrysts and glomerocrysts 3–5 mm in size. Pyroxene is present in glomerocrysts with plagioclase and more rarely as individual phenocrysts. Olivine, much of which is fresh, is observed throughout in varying proportions. Sparse round vesicles (~1–2 mm in diameter) are filled with secondary mineralization, dominantly clay.
4.2. Petrography
All of the basalts in Hole U1577A are massive flows, and there are only two confirmed interflow contacts. Samples from flow interiors are highly phyric plagioclase-clinopyroxene-olivine basalt. Plagioclase is the dominant phenocryst (up to 22%) and ranges ~0.5–2.5 mm. The largest (>1 cm) are more blocky and are commonly found in glomerocrysts (Figure F16). These large phenocrysts display complex zoning and many have sieved interiors with melt inclusions aligned along zoning boundaries. Smaller plagioclase phenocrysts are more tabular and typically lack zoning. Clinopyroxene (0.2–0.4 mm) is subdominant as a phenocryst phase (up to 10%) and commonly occurs in glomerocrysts with plagioclase. Most olivine phenocrysts have been replaced by serpentine/saponite, which commonly occurs in glomerocrysts or very large clusters with other minerals; it occurs rarely by itself in the groundmass or mesostasis. Olivine clusters have 120° triple-junction grain boundaries, suggesting magma chamber cumulate origins (Figure F16). Both blocky and skeletal Fe-Ti oxides are large enough to be considered phenocrystic (Figure F16).
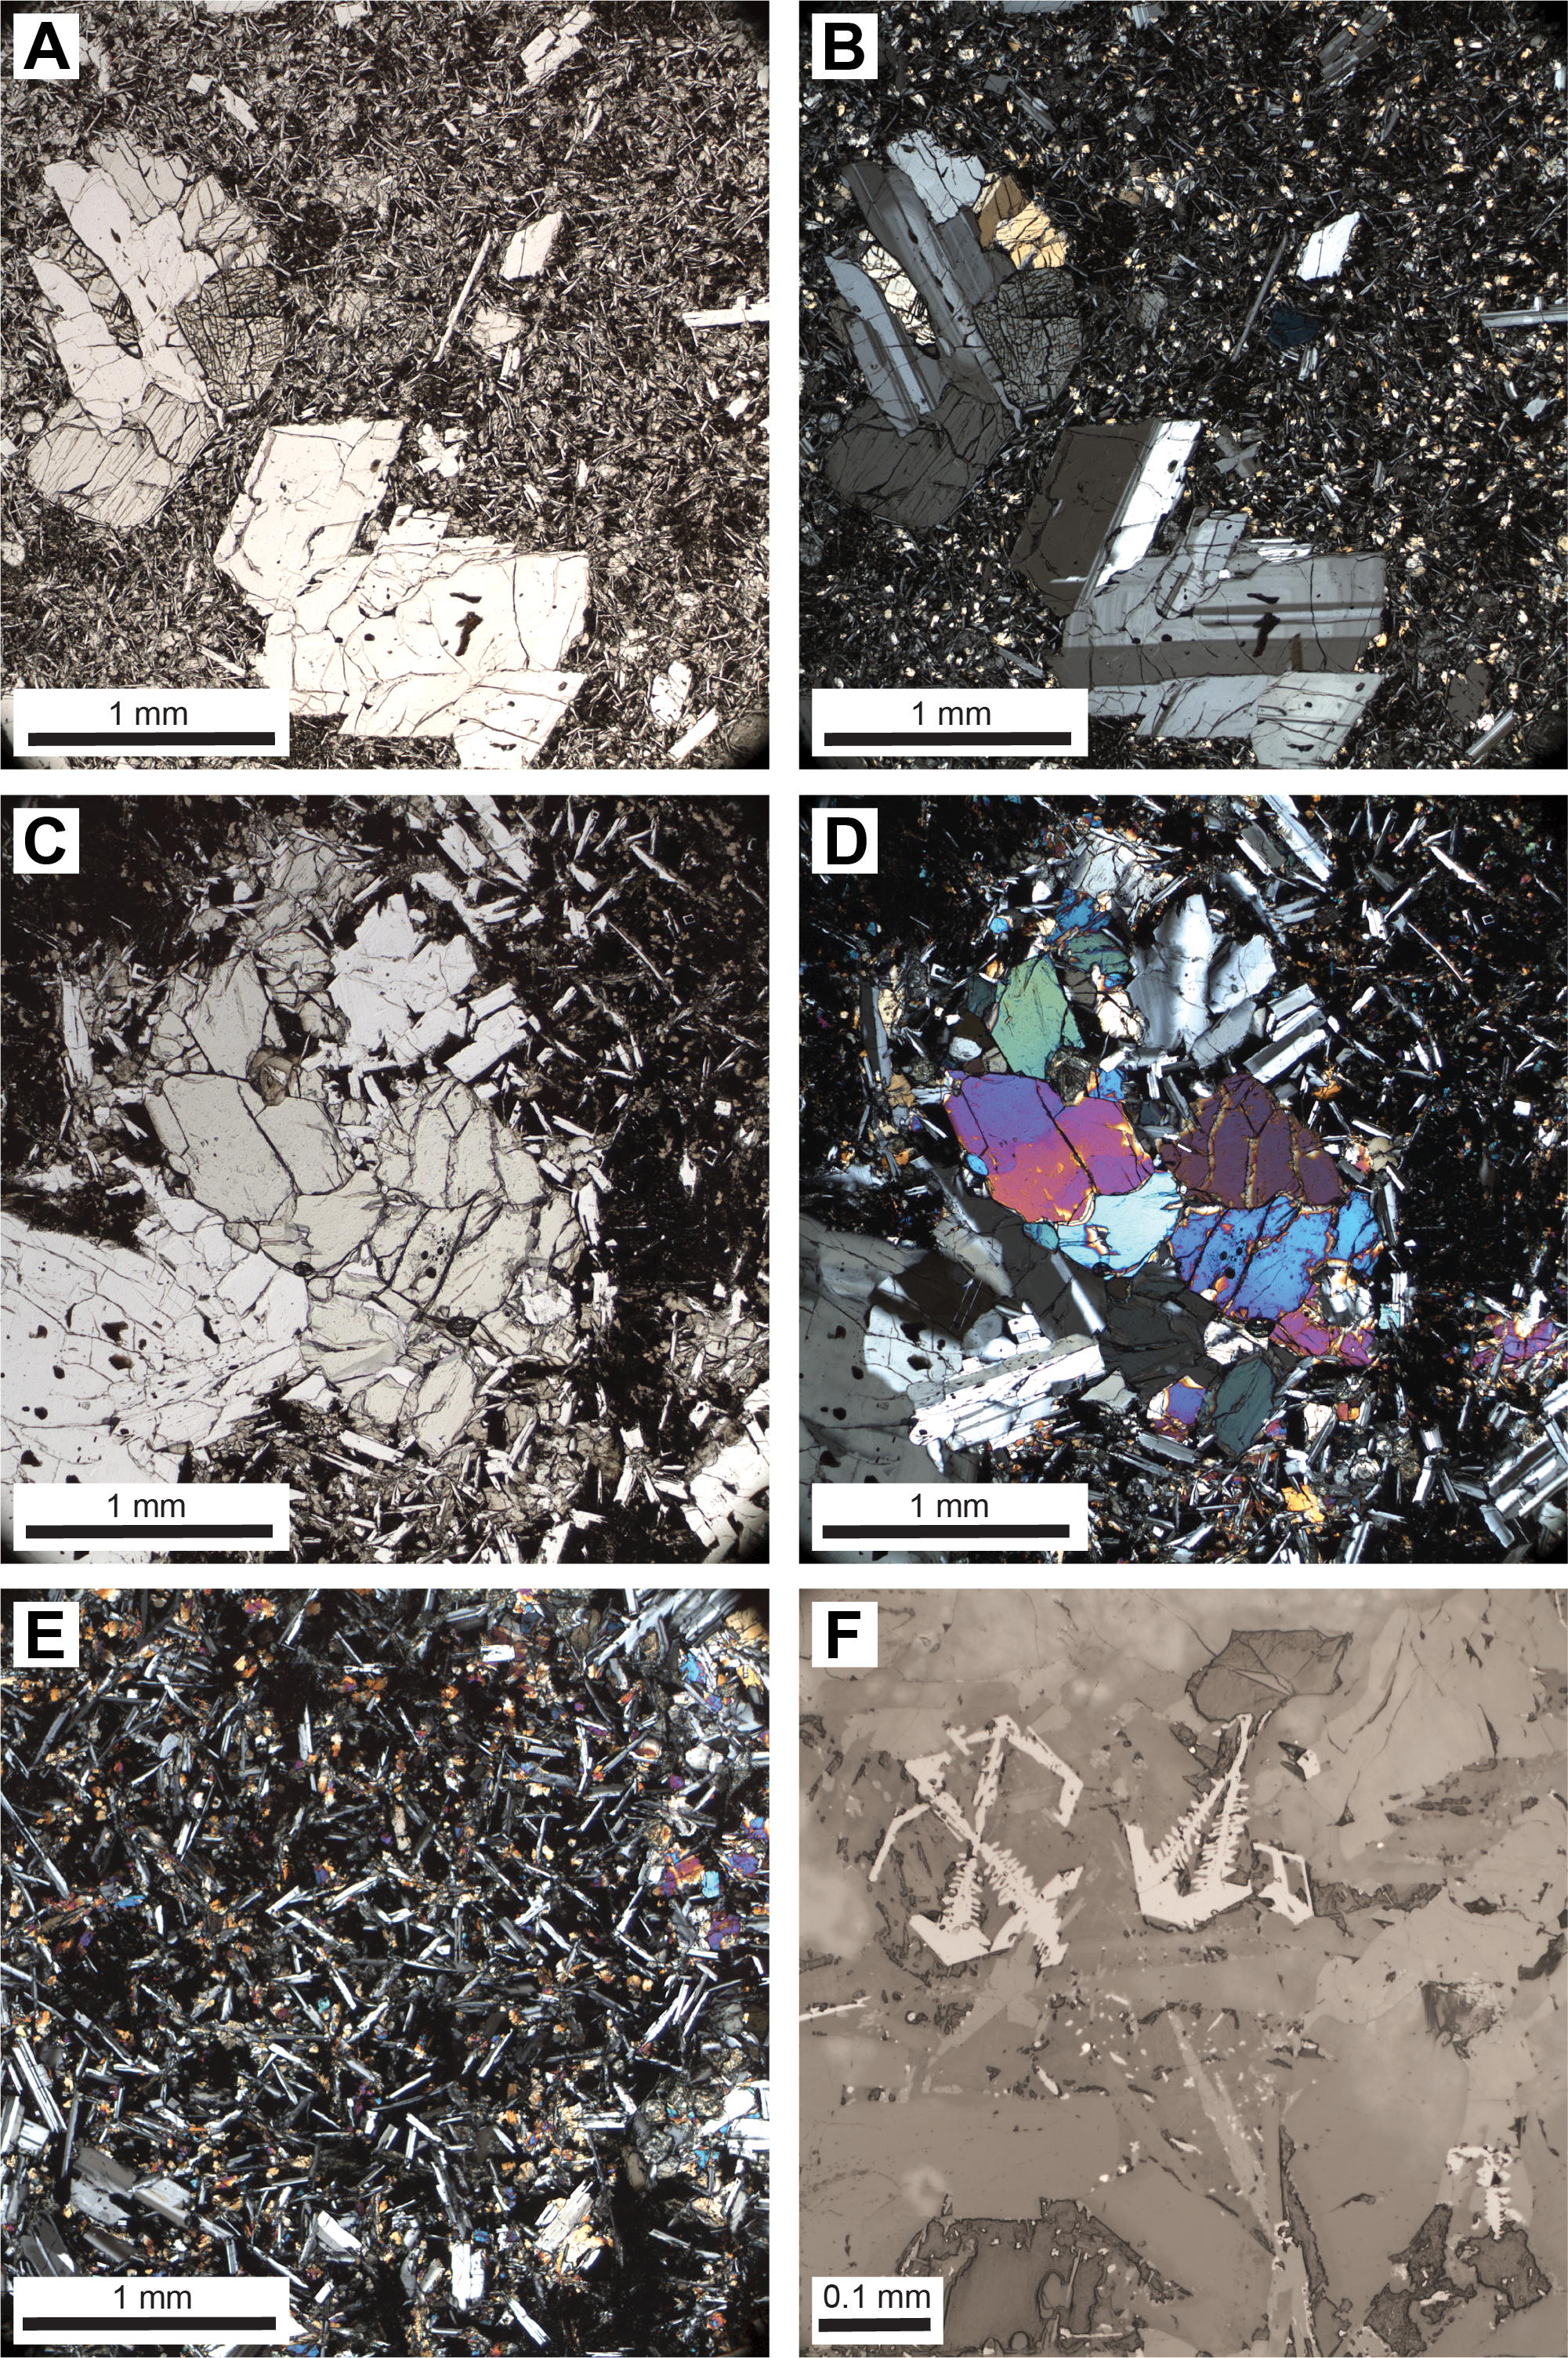
Figure F16. Representative textures in Igneous Unit 1.
Within flow interiors, the groundmass consists of fine- to medium-grained clinopyroxene and plagioclase in subophitic textures, often showing late-stage crystallization after olivine and plagioclase (Figure F16). In addition, this groundmass has a seriate texture and coarse crystal size distribution that approaches that of the phenocrysts, and mesostasis (quenched melt) forms irregular rounded blobs that consist of microcrystalline plagioclase, clinopyroxene, and Fe-Ti oxides.
Samples from flow margins consist of plagioclase, clinopyroxene, and olivine phenocrysts. Plagioclase is the dominant phenocryst phase but in much lower abundance than in flow interiors (~5%), albeit with similar large blocky or tabular glomerocrysts (up to 2.4 mm). Olivine and clinopyroxene are less common and form smaller anhedral grains (up to 0.6 mm), although olivine is typically altered to saponite and other phases. The groundmass in samples from flow margins is markedly distinct from flow interiors; plagioclase, clinopyroxene, and Fe-Ti oxides are very fine grained with intergranular textures. Plagioclase forms small needle-like skeletal crystals (<0.4 mm), whereas clinopyroxene (<0.08 mm) forms small blocky crystals. There is no seriate gradation in size as is seen in the flow interiors. Mesostasis forms distinct regions with microcrystalline textures.
4.3. Alteration
Because of the rapid successive emplacement of flows, there was little opportunity for seafloor alteration to occur. Accordingly, there are negligible quantities of secondary minerals throughout the three subunits, but those that do occur are disseminated as limited peripheral alteration (e.g., plagioclase) or oxidative films around crystals (e.g., pyroxene), and these changes impart minor color changes from unaltered blue-gray flow interiors to light brown margins. Additionally, these types of oxidative changes also occur as discolored halos extending 2–4 cm away from fractures and veins.
It is probable that the greater part of this very limited oxidative alteration occurred during or very shortly after eruption and only where the cooling lava unit interacted with seawater; this was further enhanced through the development of cooling fractures in the brittle outer flow crust. In the flow interiors, where these cooling fractures are absent, discoloration, and hence alteration, is minimal.
In major massive flows, cooling fractures often form subvertical joints of various widths that narrow downward to a narrower tip and diminish in the uppermost third of the unit. This is a major structural characteristic that is documented to reach up to ~50 cm in length in Hole U1577A (Figure F17). In some instances, these incorporate rare pipe vesicles, which then represent zones of mechanical weakness for propagation of later brittle fractures. Calcite infilling is typical in the upper parts of these networks, whereas Fe oxyhydroxide fillings are associated with the lowermost part of the fracture networks (Figure F17). Spot pXRF analysis of veins in the interior of Igneous Subunit 1b revealed high Cu and Ni content in greenish veins (showing Cu-bearing hydroxides and clays) and, in one instance, native copper (interval 391-U1576A-20R-4, 110–114 cm; Figure F18). A second set of low-angle, calcite-filled conjugate veins occasionally crosscut the primary cooling fracture vein set (Figures F19, F20). These veins can exceed 1 cm in width; they represent a later stage of fracturing and may be a result of loading by the ensuing flow and/or by the overlying sediment pile.
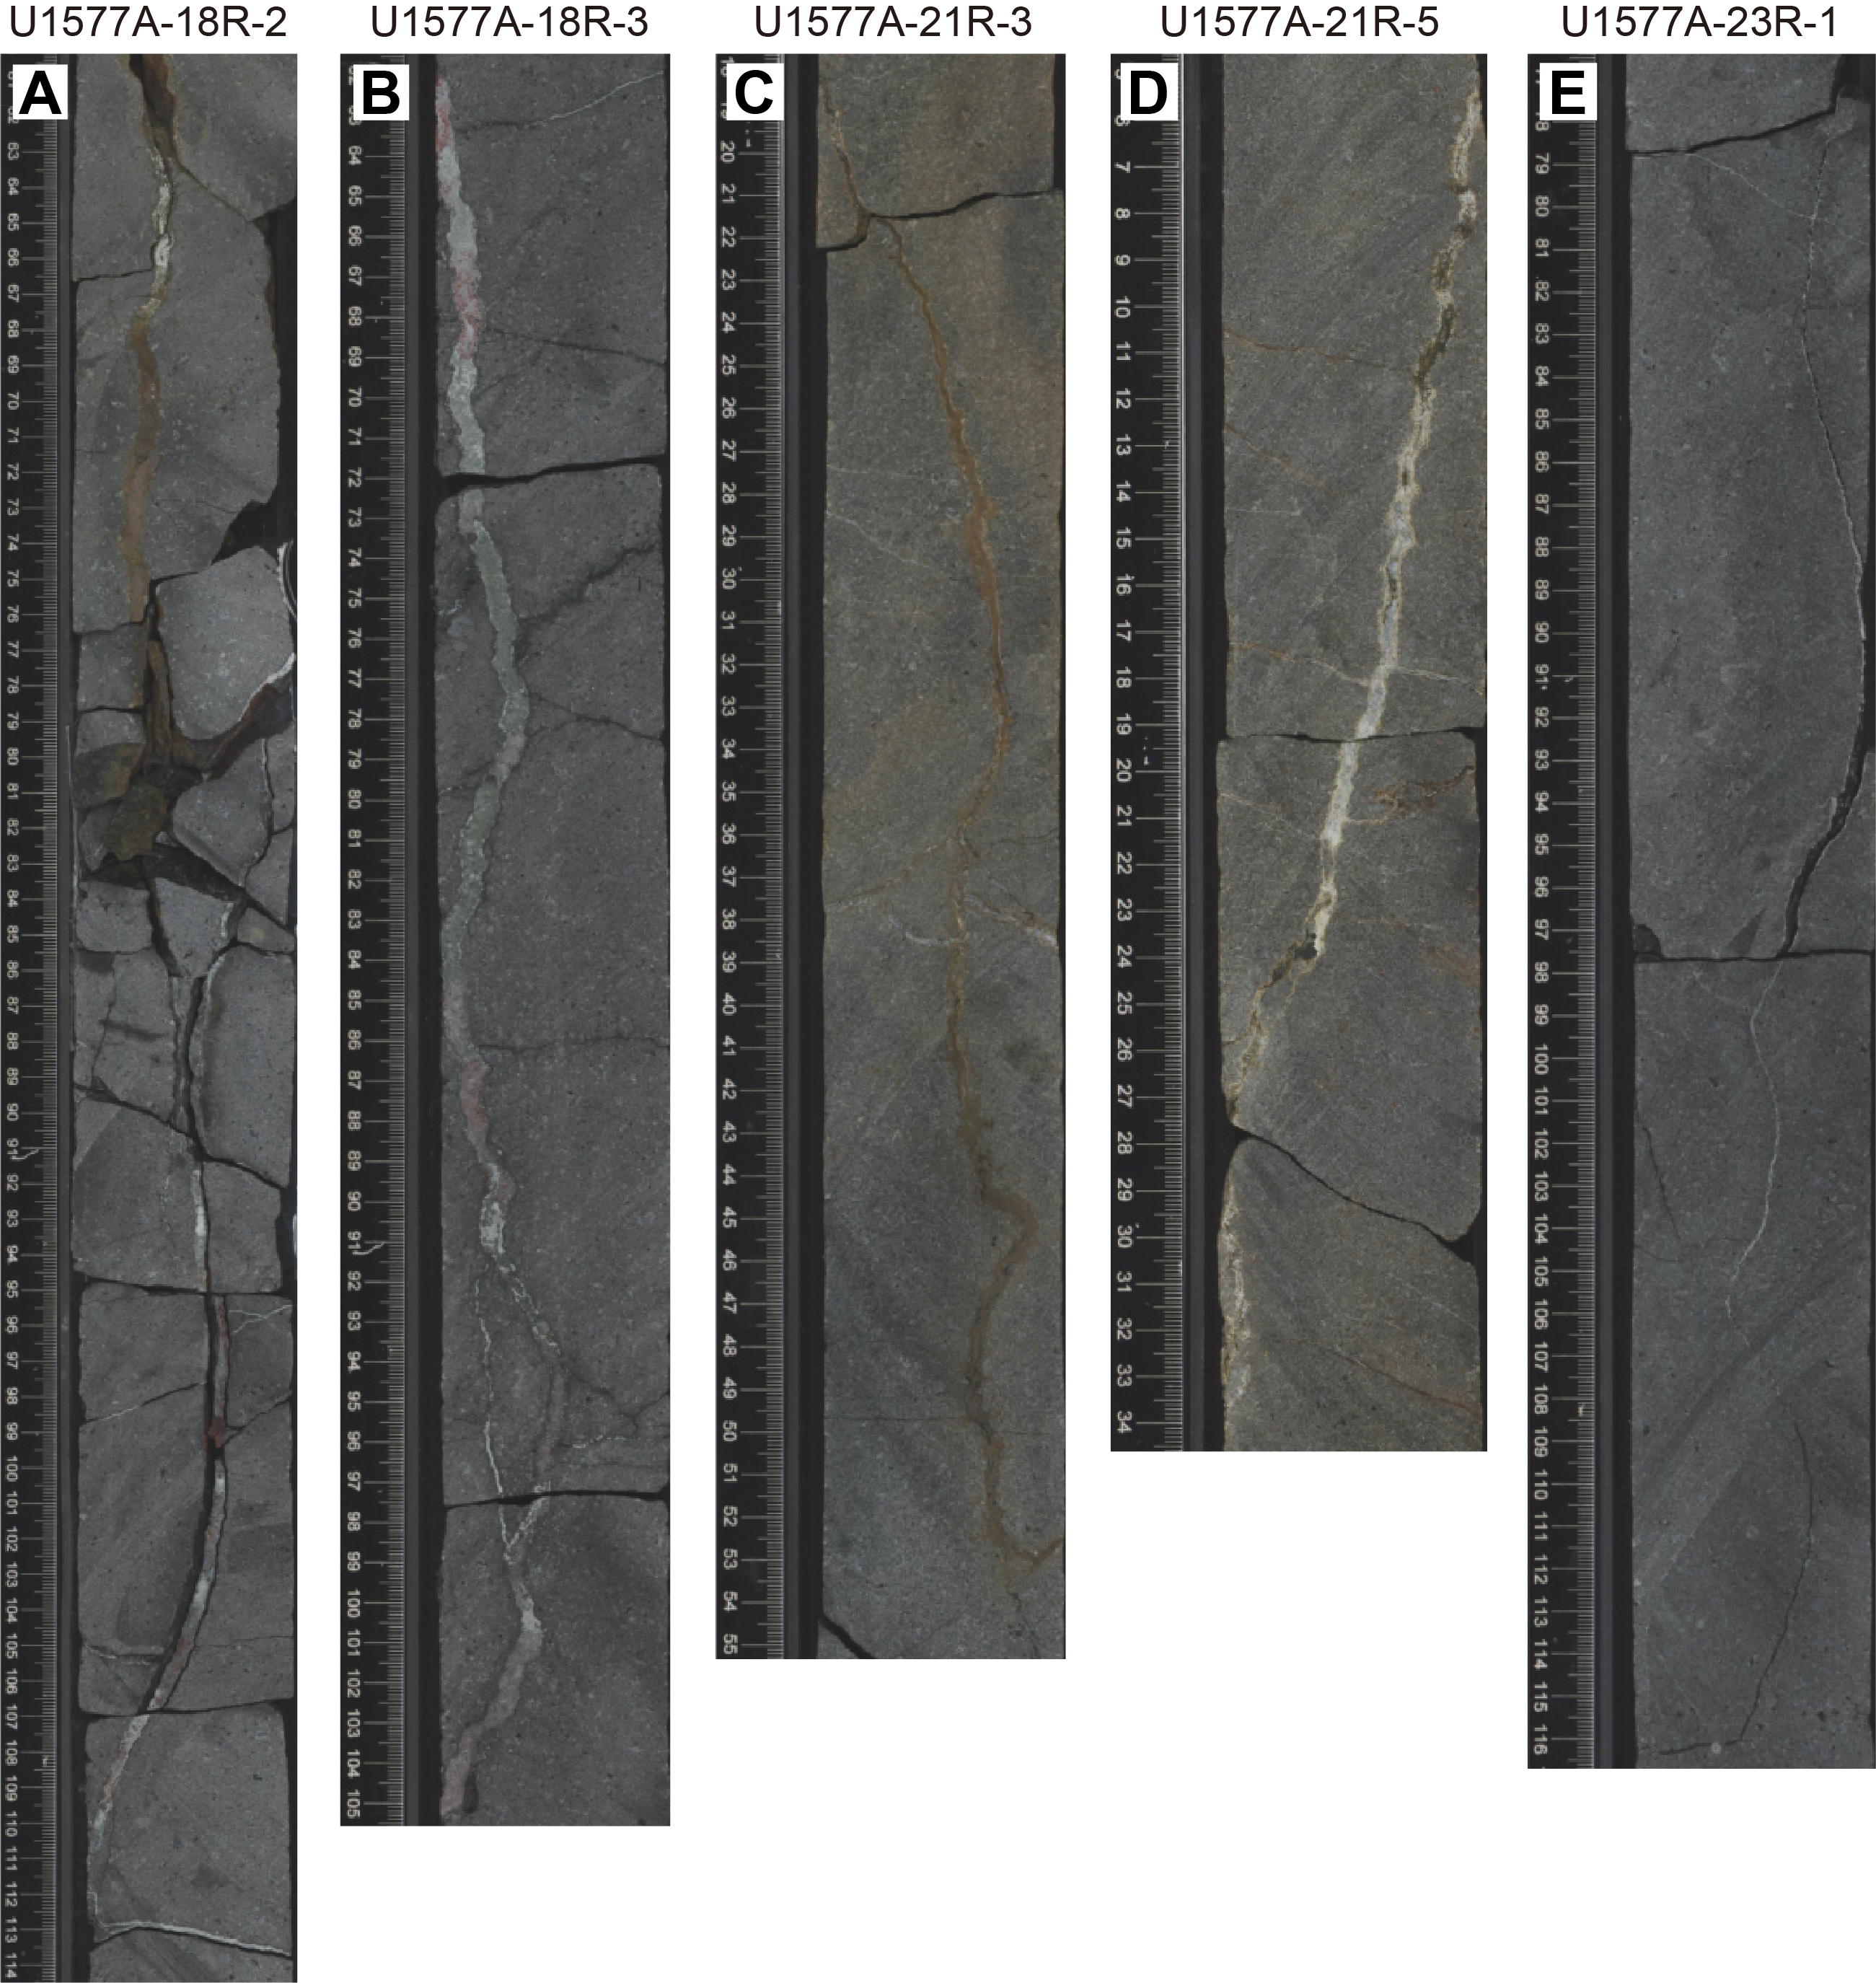
Figure F17. Basalt filled with calcite and iron oxide.

Figure F18. Copper-bearing mineral vein.

Figure F19. Inclined veins.
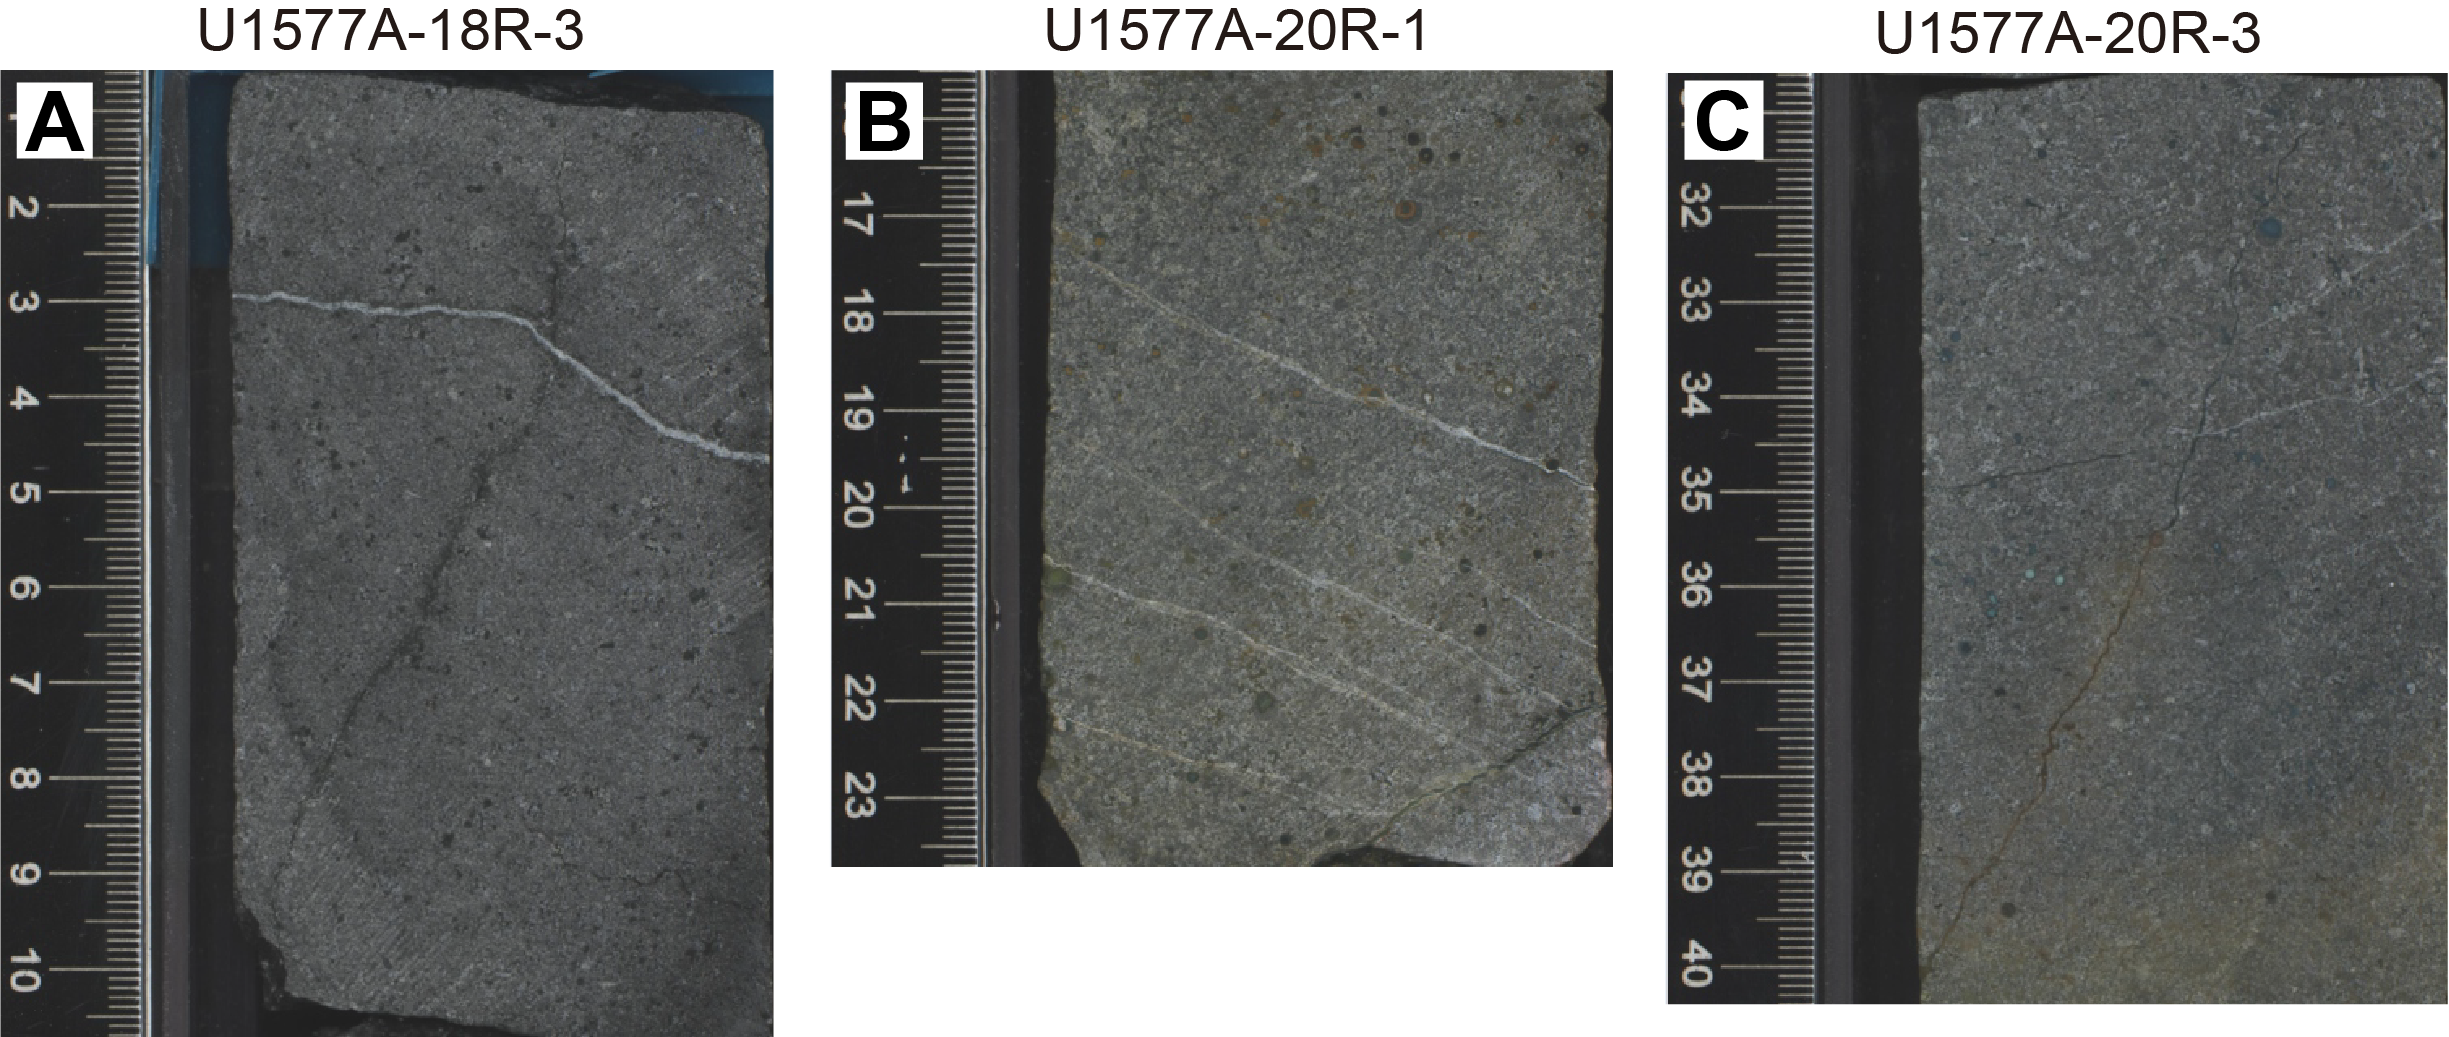
Figure F20. Vein formation.
Vesicles are scarce, typically occurring as isolated round voids (<1 mm) or as rare sections through pipe vesicle zones in the upper regions of the flow interior (Figure F21). Vesicle infill is typically calcite or zeolite (white) or clay minerals (dark green).

Figure F21. Inclined pipe vesicles.
4.4. Discussion
The igneous basement at Site U1577 comprises a sequence of massive basalt flows ranging 4.1–19.1 m thick with no sediment intercalations between flows, implying relatively rapid emplacement. Site U1577 basalt flows are similar to those at Sites U1575 and U1576, with flows 5.1–8.0 m thick at Site U1576 and 3.7–21.1 m thick at Site U1575.
The scale of these massive flows is similar to continental flood basalt (CFB) provinces, such as the Etendeka–Parana, Deccan, and Columbia River CFBs (e.g., Thordarson and Self, 1998; Jerram and Widdowson, 2005; Self et al., 2021). These lavas are thought to be emplaced as giant inflationary pahoehoe lobes with the early formed crust acting as an insulator that inhibits rapid cooling of the flow interior (e.g., Hon et al., 1994; Self et al., 1997). This allows prolonged emplacement of the lava flow and its advancement across greater horizontal distances than would otherwise be possible. Nonetheless, massive flows >10 m thick still require prodigious eruption rates of ~4 km3/s (Self et al., 1997).
The occurrence of massive submarine lava flows with thicknesses similar to those cored from Walvis Ridge has been documented at oceanic plateaus (e.g., Shatsky Rise and Ontong Java) (Sager et al., 2013; Koppers et al., 2010; Neal et al., 1997), which are thought to reflect high effusion rates often associated with mantle plume head settings, but to a lesser extent on hotspot tracks, in particular in areas where the plume is interacting with a mid-ocean ridge. In areas of plume-ridge interaction, magma production rates are especially high due to the presence of a hot mantle plume beneath very thin lithosphere, which yields a maximum melting column length and high degrees of decompression melting. We suggest that the massive flows of Walvis Ridge (Frio Ridge: Site U1575; Valdivia Bank: Sites U1576 and U1577) likely result from a similar inflationary process in which initial emplacement of thin sheet flows evolves into massive flows by endogenous inflation in response to ongoing high effusion rates. Although water has a specific heat capacity that exceeds that of air by a factor of 4 (1.005 vs. 4.18 J/[g·K]), when heated to steam the heat capacity drops to 1.996 J/(g·K). Supercritical water has a heat capacity that approaches that of air (1.23 J/[g·K]); this may be attained by seawater depth of 3 km (Cas and Giordano, 2014). Thus, a thin layer of steam or supercritical vapor may be sufficient to insulate the underlying flow from rapid heat loss and allow its continued inflation during a prolonged eruption.
Magmas erupted in deepwater environments (>500 m) are subject to physical constraints very different from those for subaerial eruptions, including hydrostatic pressure, bulk modulus, thermal conductivity, heat capacity, and the density of water mass, which are generally orders of magnitude greater than for air (Cas and Simmons, 2018). Generally, the exsolved volatile content of the erupting magma will be lower because magmas decompress to hydrostatic pressures orders of magnitude greater than atmospheric pressure. A higher retention of volatiles makes subaqueously erupted magmas less viscous and further aids their lateral propagation as a single flow entity. However, the high heat capacity and thermal conductivity of (ambient) water makes for smaller volume or slower eruption rate effusion (i.e., pillow and lobate lava more prone to rapid cooling and quench fragmentation, producing nonexplosive hyaloclastite breccia). By contrast, the thicker crust on high–effusion rate massive subaqueous flows allows a greater degree of endogenous inflation. In effect, more efficient cooling in water generates a thicker chilled layer at the flow surface, which has greater yield strength, thus limiting breakout and propagation at the flow tip (Deschamps et al., 2014). Accordingly, assuming no local topographic constraints or ponding effects, submarine massive inflation lava units should be thicker and less laterally extensive than their CFB counterparts. Furthermore, the thicker and more resistant crust of the units may explain the observation of little or no disturbance of the upper parts of cored units.
The pattern typically includes a thin (few centimeters) glassy selvage and an aphanitic chill zone (several centimeters) passing into a very gradual increase in crystal size away from the cooling surface and reaching a maximum into the flow interior. The thinner crusts on CFBs are more susceptible to disruption and surface breakout (e.g., features such as tumuli and parasitic flows) on the newly formed surface. Additionally, the hydrostatic overpressure experienced by deep submarine eruptions inhibits vesiculation (Cas and Simmons, 2018) and hence the typical vesicle bands that collect beneath the upper surface cooling front, which is a typical component of the architecture within CFB units. During surface or shallow-water emplacement, these vesicularity bands offer an additional mechanical weakness that further promotes disruption and reentrainment of the chilled or lava crust components during eruption; these are a contributing factor to development of inflated rubbly pahoehoe lavas (Marshall et al., 2016). The internal architecture of massive flows erupted in deepwater environments thus differs from their CFB counterparts in the manner of crust development and lack of vesicle sheets, and they develop simple surface morphologies that pass directly down into uniform flow interiors; all of these characteristics are seen in Site U1577 massive flows. This overpressure may also prevent the development of pipe vesicles within flow interiors in massive flows erupted at significant depths.
Deschamps et al. (2014) documented numerous occurrences of inflated subaqueous basalt flows and showed through thermal modeling that subaqueous basalt flows are about 25% more efficient than subaerial flows at inflation because of the increased thickness of the initial crust that insulates the inner lava. Taken together, these data suggest that the massive flows of Walvis Ridge may represent far-traveled inflationary lobes that formed in response to prolonged, high volume, high effusion rate eruptions.
5. Biostratigraphy
Thanetian (upper Paleocene) to lower Campanian sediments were recovered at Site U1577. Preliminary zonal and stage assignments were obtained from calcareous nannofossils and planktonic foraminifera (Figure F22).
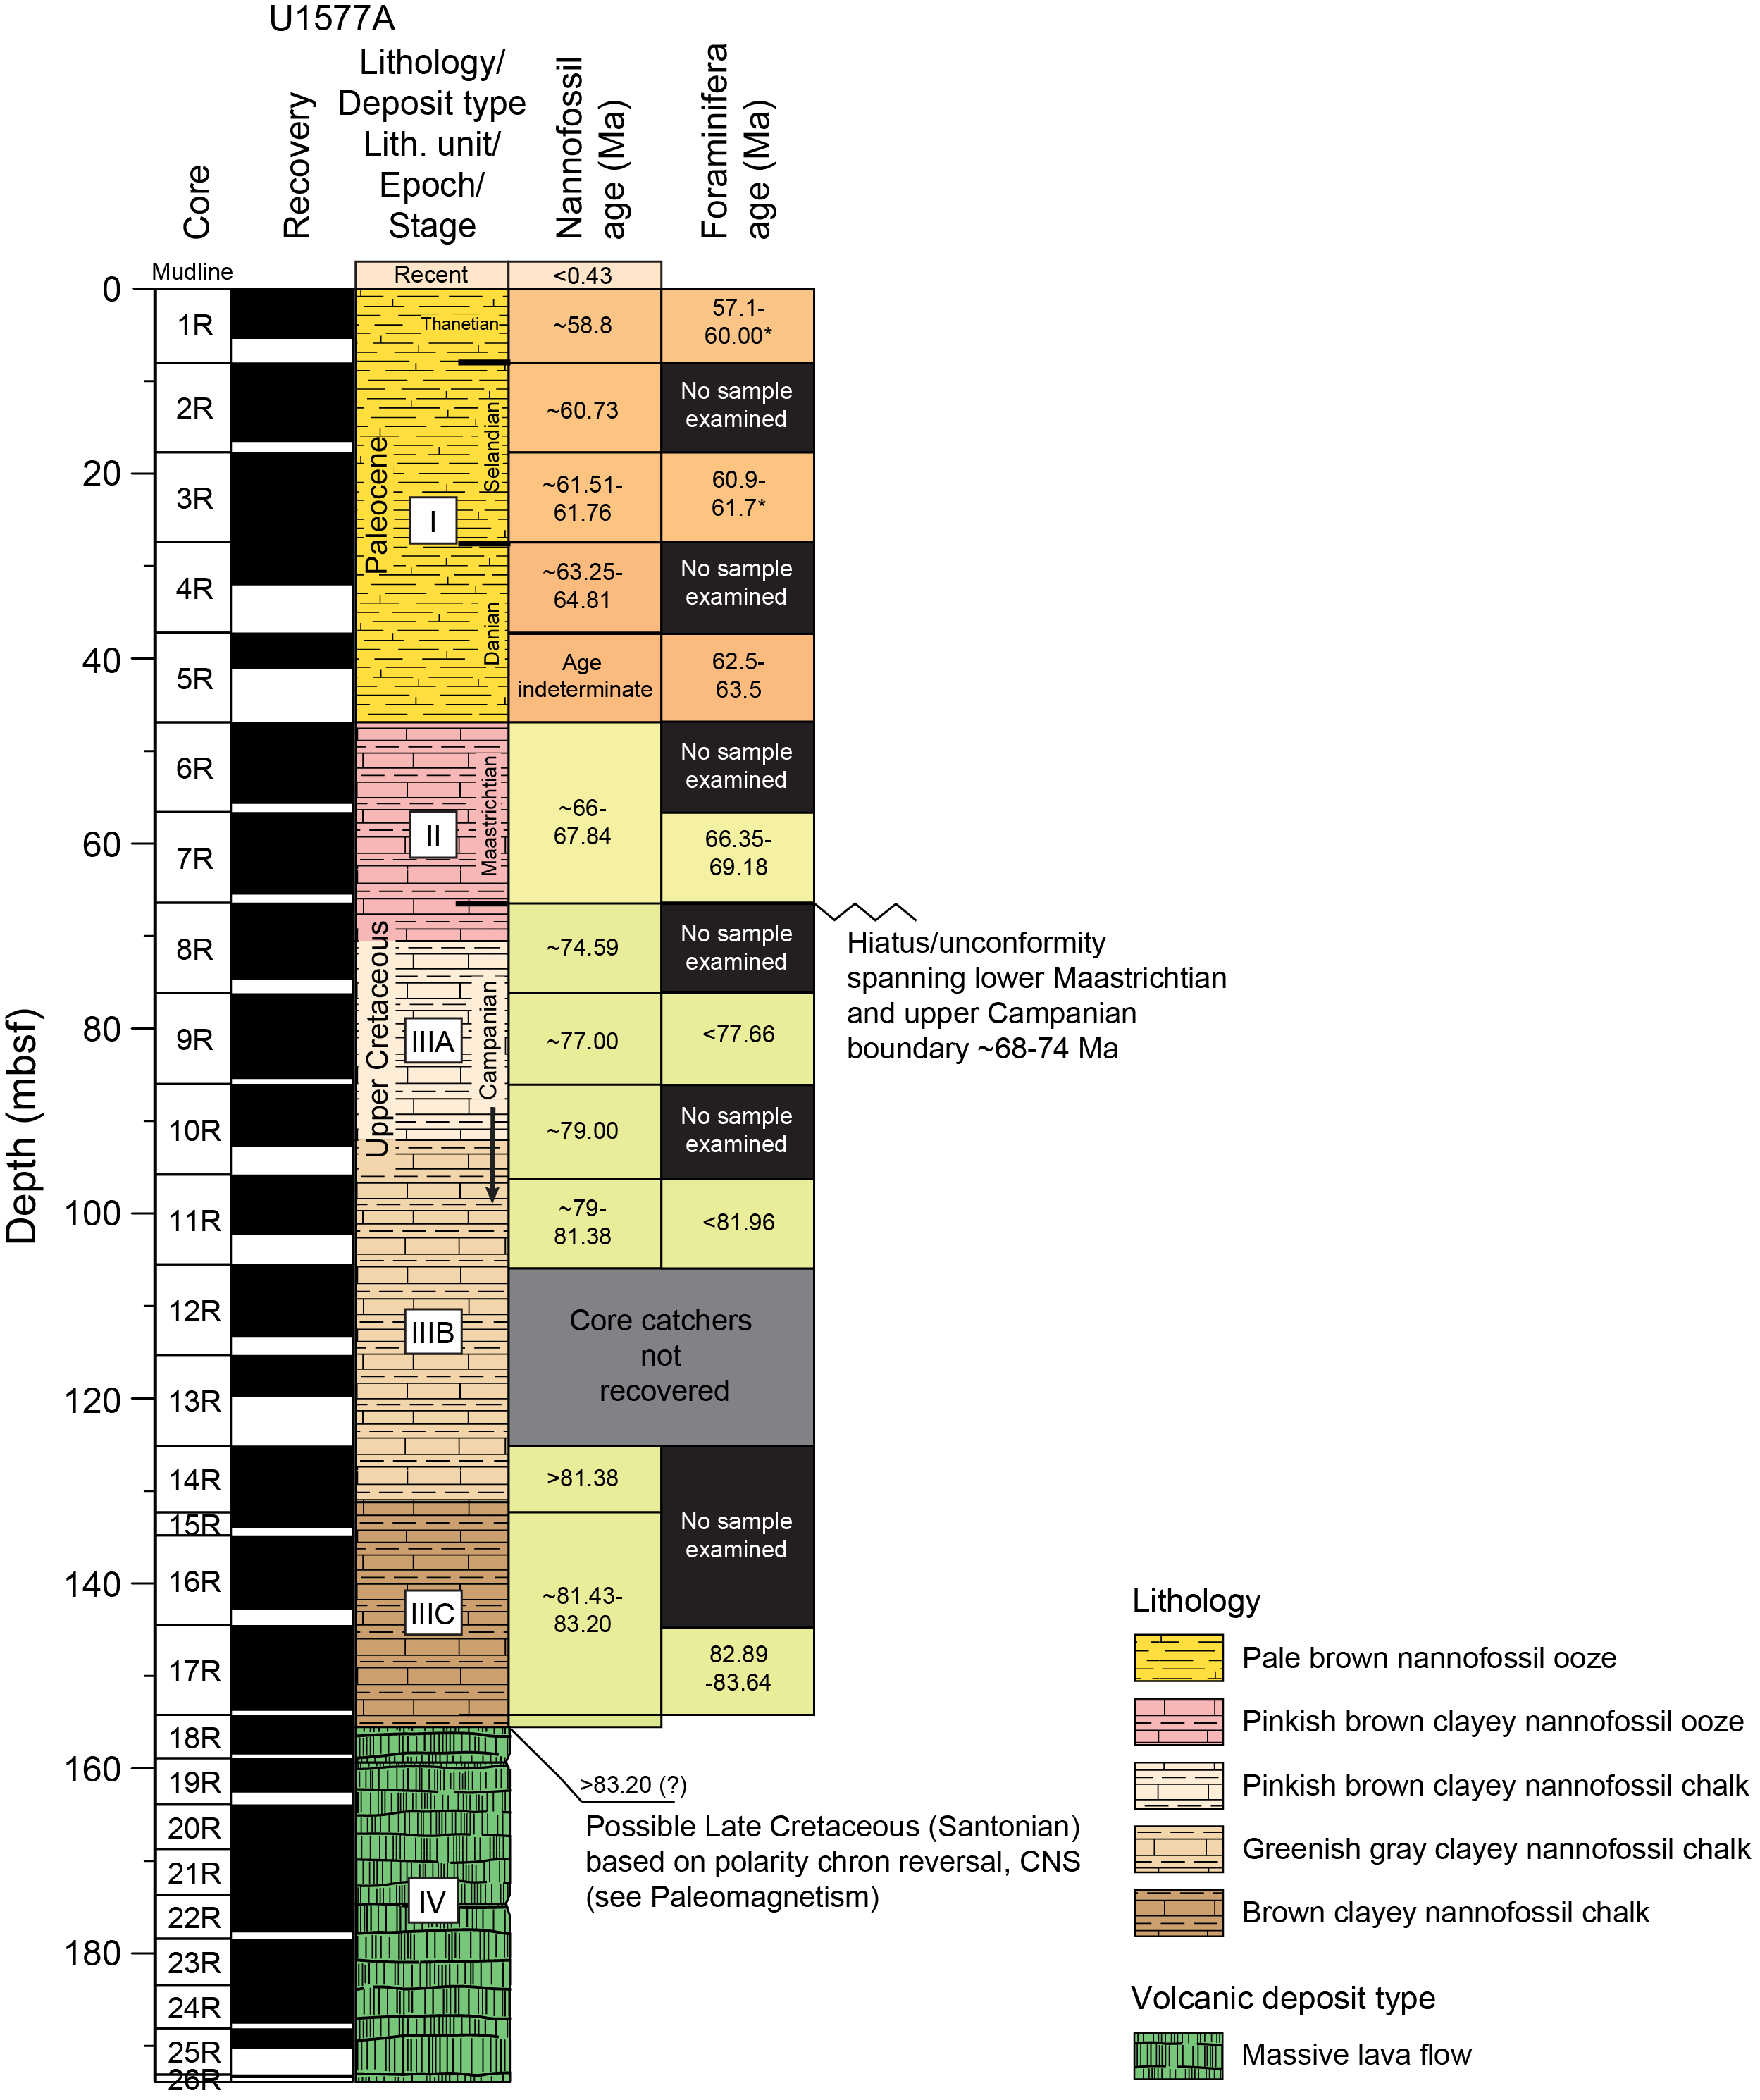
Figure F22. Correlated lithostratigraphy and biostratigraphy.
First occurrence (FO) and last occurrence (LO) events of the microfossil groups were used to provide a biostratigraphic framework for Hole U1577A. Biostratigraphic datums are summarized in Tables T2 and T3.
The age-depth model (Figure F23) was obtained by plotting biostratigraphic control points against depth value (in meters below seafloor). Polarity chrons were obtained from the 2020 geologic timescale (Gradstein et al., 2012, 2020) (see Paleomagnetism).
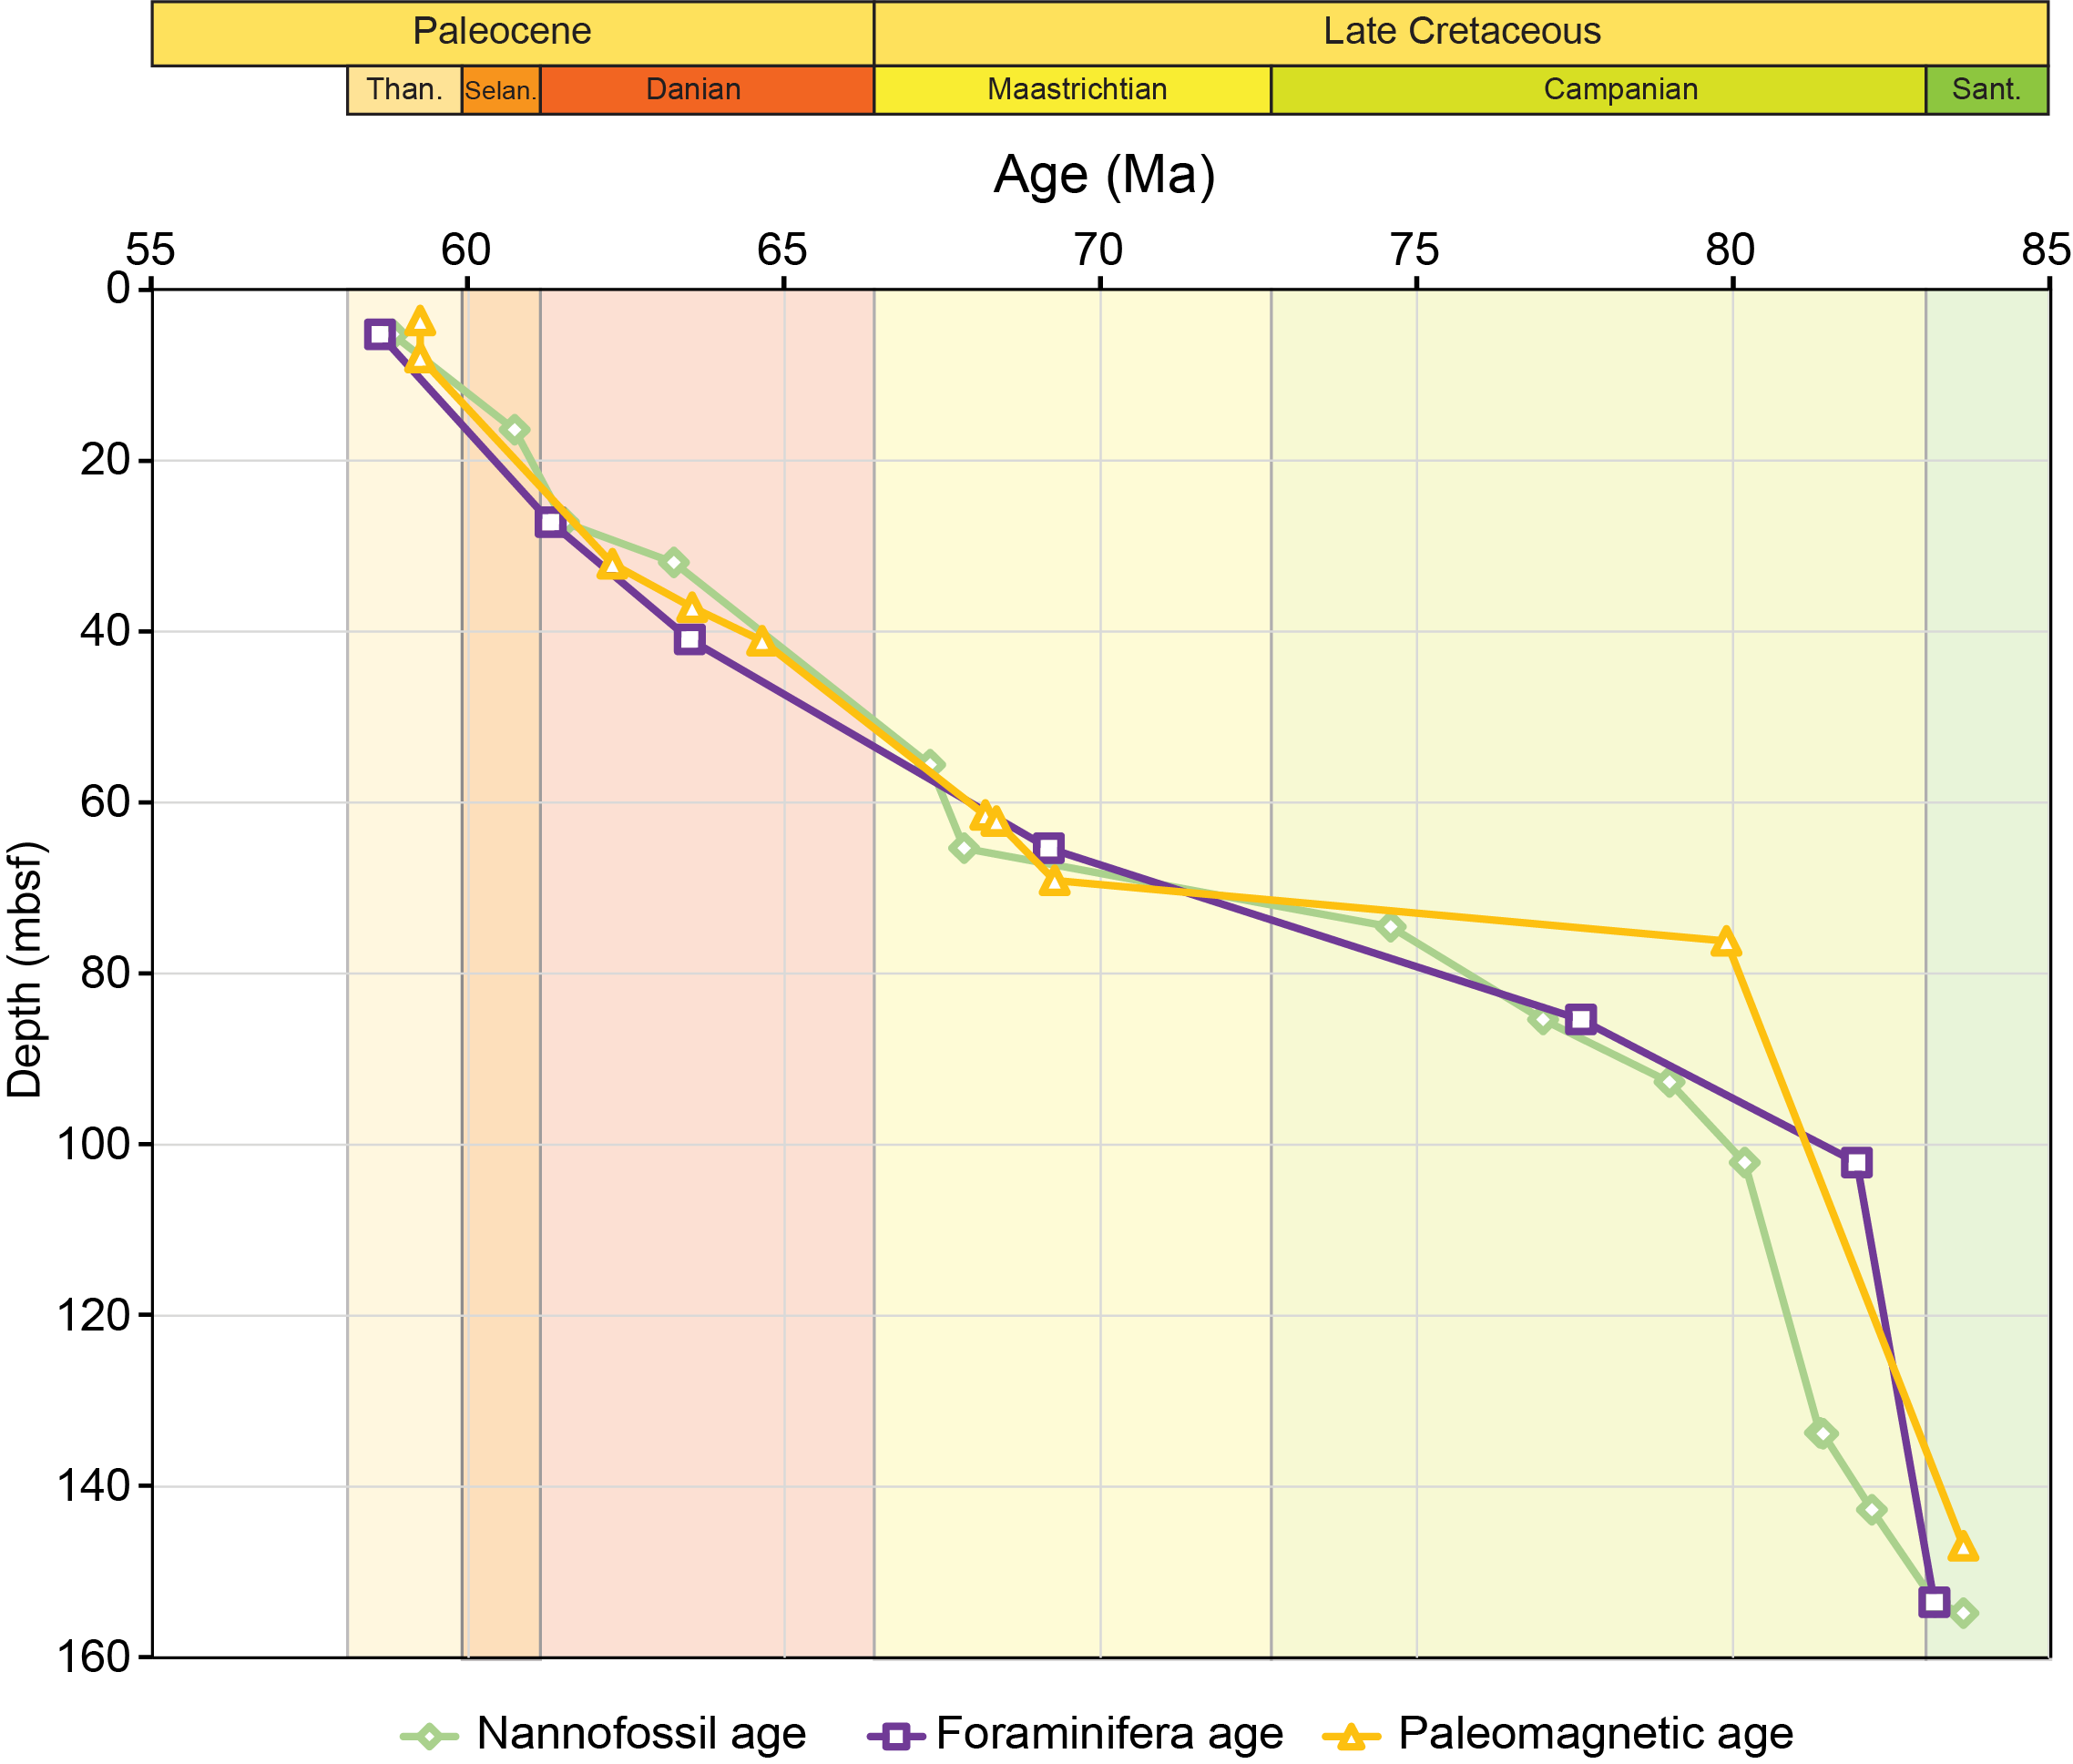
Figure F23. Age-depth model.
5.1. Calcareous nannofossils
Calcareous nannofossil assemblages were examined from 15 core catcher samples from Hole U1577A. Two toothpick samples, one from the mudline (Core 1R) and one from Sample 18R-1, 58 cm, just above the sediment/basement contact, were also examined. Calcareous nannofossil biozonation is summarized in Table T2. Calcareous nannofossil examination revealed nearly continuous sedimentation ranging from upper Paleocene (Thanetian) to Upper Cretaceous (Campanian).
After Sample 391-U1577A-1R-CC revealed a Paleocene age, a sample from the top of that core (the mudline) was examined to determine whether current water depths are below the carbonate compensation depth (CCD). Mudline sediments showed calcareous nannofossils of recent age, indicating deposition is not below the CCD at present. Therefore, the lack of younger sediments at the top of the sediment column is potentially indicative of an erosional boundary rather than long-term CCD fluctuation. This observation is supported by the seismic profile for this site, which shows the borehole was drilled close to an escarpment in the east extending to a greater depth, which may cause sediment erosion by concentrating bottom water currents.
5.1.1. Cenozoic (Paleogene)
Sections 391-U1577A-1R-CC through 5R-CC contain an apparently continuous succession of Paleogene sediments ranging from the lower Thanetian through the Danian stage of the Paleocene. Abundances were floods with good preservation in every sample except Sample 5R-CC, revealing common to abundant coccoliths with poor preservation. Almost no specimens were able to be identified at the species level. This may be CCD related or may have to do with this sample's stratigraphic proximity to the K/Pg boundary. We could not assign a confident age to this sample. Shipboard sample examination of calcareous nannofossils reveals the K/Pg boundary likely was not recovered in Hole U1577A.
5.1.2. Mesozoic (Upper Cretaceous)
Sections 391-U1577A-6R-CC through 17R-CC contain Upper Cretaceous nannofossil assemblages from the upper Maastrichtian to lower Campanian. A possible hiatus/unconformity exists between Sections 7R-CC and 8R-CC, where the age changes from ~66.04–67.84 Ma in Section 7R-CC based on the presence of Micula prinsii to ~74.59 Ma in Section 8R-CC based on the highest observed Broinsonia parca parca. This indicates that the lower Maastrichtian, the Maastrichtian/Campanian boundary, and the uppermost Campanian are missing, all of which were recovered at all previous Expedition 391 sites where Upper Cretaceous sediment was cored except for Site U1575, where Maastrichtian sediments were not recovered. It is possible that the missing time exists within unsampled core sections containing a relatively condensed succession of upper to lower Maastrichtian sediments. However, a clear change in NGR intensity is observed at this boundary (see Physical properties) and may indicate that this section has not been recovered.
Sections 391-U1577A-8R-CC through 17R-CC apparently contain a continuous Campanian succession. The highest observed Eiffellithus eximius (77.00 Ma) occurs in Section 9R-CC, the highest observed Lithastrinus grillii (79.00 Ma) is in Section 10R-CC, the lowest observed Broinsonia parca constricta (81.38 Ma) is in Section 14R-CC, and the lowest observed B. parca parca (81.43 Ma) is in Section 15R-CC. Toothpick Sample 18R-1, 58 cm, was examined for the oldest possible age above the basement. This sample may be Santonian in age based on magnetostratigraphic data (see Paleomagnetism). The nannofossil assemblage in the uppermost Santonian does not contain any reliable Santonian markers, but there is a distinct change in the forms of Arkhangelskiella spp. that should have evolved in the Campanian yet seem to appear slightly earlier in the sedimentary sequence at Site U1577. This is possibly an issue with taxonomic identification of this species lineage or perhaps with new data that make it unreliable to define the base of the Campanian by this species, at least for this study area. Additionally, Calculites obscurus, which has a base in the uppermost Santonian (~84.08 Ma), is not observed. This species, however, was only noted sporadically in Hole U1577A, and it seems to be an unreliable marker for this hole.
5.2. Planktonic foraminifera
Planktonic foraminifera were analyzed in seven core catcher samples. Generally, planktonic foraminifera were found to be the major component of the assemblage, whereas only very rare benthic individuals were recorded.
The total abundance of planktonic foraminifera varies in Hole U1577A. Samples at the top of the stratigraphic sequence (1R-CC and 3R-CC) contain a low number of planktonic foraminifera, with a high amount of pyrite, biotite, and feldspar grains observed. Conversely, the abundance of the microfossil group increases downhole.
Preservation of planktonic foraminifera is moderate to poor in the upper Paleocene and well preserved in the lower Paleocene. Maastrichtian fauna show moderate preservation, whereas the Campanian assemblages are moderately to poorly preserved.
A hydrogen peroxide solution (30%) was used to disaggregate the material in all the analyzed samples. This added step reduced the time available for shipboard analyses.
5.2.1. Cenozoic (Paleogene)
Sample 391-U1577A-1R-CC contains a low number of planktonic foraminifera. Detailed postexpedition analysis is needed to provide a better evaluation of the foraminifera assemblages. Shipboard analyses indicate the presence of a high amount of minerals such as pyrite, biotite, and feldspar grains. Planktonic foraminifera are very small and fragile, and the assemblage was not diversified enough to obtain a confident biostratigraphic age. However, some individuals of Igorina albeari, Acarinina acarinata, and Globanomalina pseudomenardii were observed, indicating a tentative age between 57.1 and 60.0 Ma (Wade et al., 2011), referring to the Thanetian to Selandian stages of the Paleocene. This age agrees with the calcareous nannofossil analysis of this sample.
Sample 391-U1577A-3R-CC exhibits, again, poor species richness and diversity. For this reason, it was difficult to assess the age of the sample based on rapid shipboard analysis. Specimens belonging to Igorina pusilla, G. pseudomenardii, and Globanomalina cf. ehrenbergi were observed. We assign a tentative age of younger than 61.7 Ma (Selandian/Danian boundary or lower Selandian).
Sample 391-U1577A-5R-CC contains an abundant lower Paleocene (Danian) assemblage, including Praemurica inconstans (FO 62.9 Ma; Wade et al., 2011), Praemurica pseudoinconstans (FO 65.8 Ma and LO 62.5 Ma; Olsson et al., 1999), and Globanomalina compressa (FO 63.5 Ma; Wade et al., 2011). The core catcher material was dated between 62.5 and 63.5 Ma and assigned to Zone P1c (Wade et al., 2011).
5.2.2. Mesozoic (Cretaceous, Upper Cretaceous)
Planktonic foraminifera in Sample 391-U1577A-7R-CC are highly fragmented. The sample also includes feldspars and volcanic glass. The planktonic fauna includes Abathomphalus mayaroensis, Contusotruncana contusa, Globotruncana spp., Planoglobulina acervulinoides, and Planoglobulina multicamerata. The FO (69.18 Ma; Gradstein et al., 2012) and LO (66.35 Ma; Gradstein et al., 2012) of A. mayaroensis were used to provide a biostratigraphic framework for the sample.
An upper Campanian assemblage was found in Sample 391-U1577A-9R-CC. Planktonic foraminifera species include Contusotruncana plummerae, common Globotruncana ventricosa, and Pseudoguembelina costellifera. The core catcher material was tentatively dated at younger than 77.66 Ma using the datum G. ventricosa (consistent) based on the common occurrence of the species G. ventricosa (Gradstein et al., 2012).
Sample 391-U1577A-11R-CC contains no abundant planktonic foraminifera. Most species are encrusted and filled with sediment. Specimens of G. ventricosa, Pseudoguembelina costulata, and P. costellifera are recorded. The presence of P. costulata possibly suggests an age younger than 81.96 Ma (Gradstein et al., 2012) (i.e., lower Campanian).
Planktonic foraminifera in Sample 391-U1577A-17R-CC are poorly preserved, and most specimens are encrusted, filled with sediment, and partially dissolved. The principal features are rarely recognizable. The assemblage contains several specimens of Marginotruncana coronata and rare individuals of Whiteinella baltica. Specimens of Globotruncanita elevata were also observed. The presence of M. coronata and G. elevata indicate a possible age between 82.89 and 83.64 Ma (Gradstein et al., 2012) (i.e., lowermost Campanian or Campanian/Santonian boundary).
5.3. Lithobiostratigraphy
Calcareous nannofossil and foraminifera biozonation ages are compared with lithostratigraphic units in Figure F22. This figure demonstrates that both fossil groups generally agree well throughout the sedimentary succession. One apparent hiatus is noted near the base of Lithostratigraphic Unit II. Most sediments recovered from Hole U1577A are late Cretaceous (Campanian) in age.
5.4. Age-depth model
Calcareous nannofossil and foraminifera ages are plotted with magnetostratigraphic data (see Paleomagnetism) obtained from sediment cores (Figure F23). Above the unconformity, the three age datums are in good agreement. The unconformity appears to span the Maastrichtian/Campanian boundary. Below the unconformity in Lithostratigraphic Subunit IIIA at 76.20 mbsf, the magnetostratigraphy demonstrates an older age for the sediment package nannofossils, indicating the sediment age is already in the lower Campanian (~79.00 Ma), whereas nannofossil assemblages indicate a considerably younger age (~75 Ma) at a similar depth. At ~85.0 mbsf, nannofossils and foraminifera agree on a (still) younger age of ~77.0 Ma. It is unclear, based on shipboard analysis, why magnetostratigraphy and microfossil ages disagree on the boundary of reversed polarity Chron 33r.
It is possible that older fossil markers that would agree with the magnetostratigraphy ages in this depth range are present in very low numbers and therefore were not observed. Asynchronies of global fossil events may also play a role; perhaps the fossil tops/LOs occur higher in the stratigraphic record than what is typically found, but this is unlikely based on other sites drilled during Expedition 391. Additionally, calcareous nannofossil data have the highest resolution across this horizon, and they seem to be reliable with no obvious presence of reworking or mixing.
6. Paleomagnetism
6.1. Sedimentary rocks
6.1.1. Archive-half measurements
Paleomagnetic measurements of the archive halves of sediment RCB cores recovered from Hole U1577A (Cores 1R–17R) were conducted using the pass-through superconducting rock magnetometer (SRM) on board the ship. All sediment cores were treated with the same alternating field (AF) demagnetization steps of 10 and 20 mT after measurement of natural remanent magnetization (NRM). All recovered sediment cores consisted of partially to fully consolidated clay and chalk, which had measurable NRMs of 10−3 to 10−1 A/m. In all, 88 sediment archive-half sections totaling 121.7 m of core were demagnetized and measured (Figure F24).
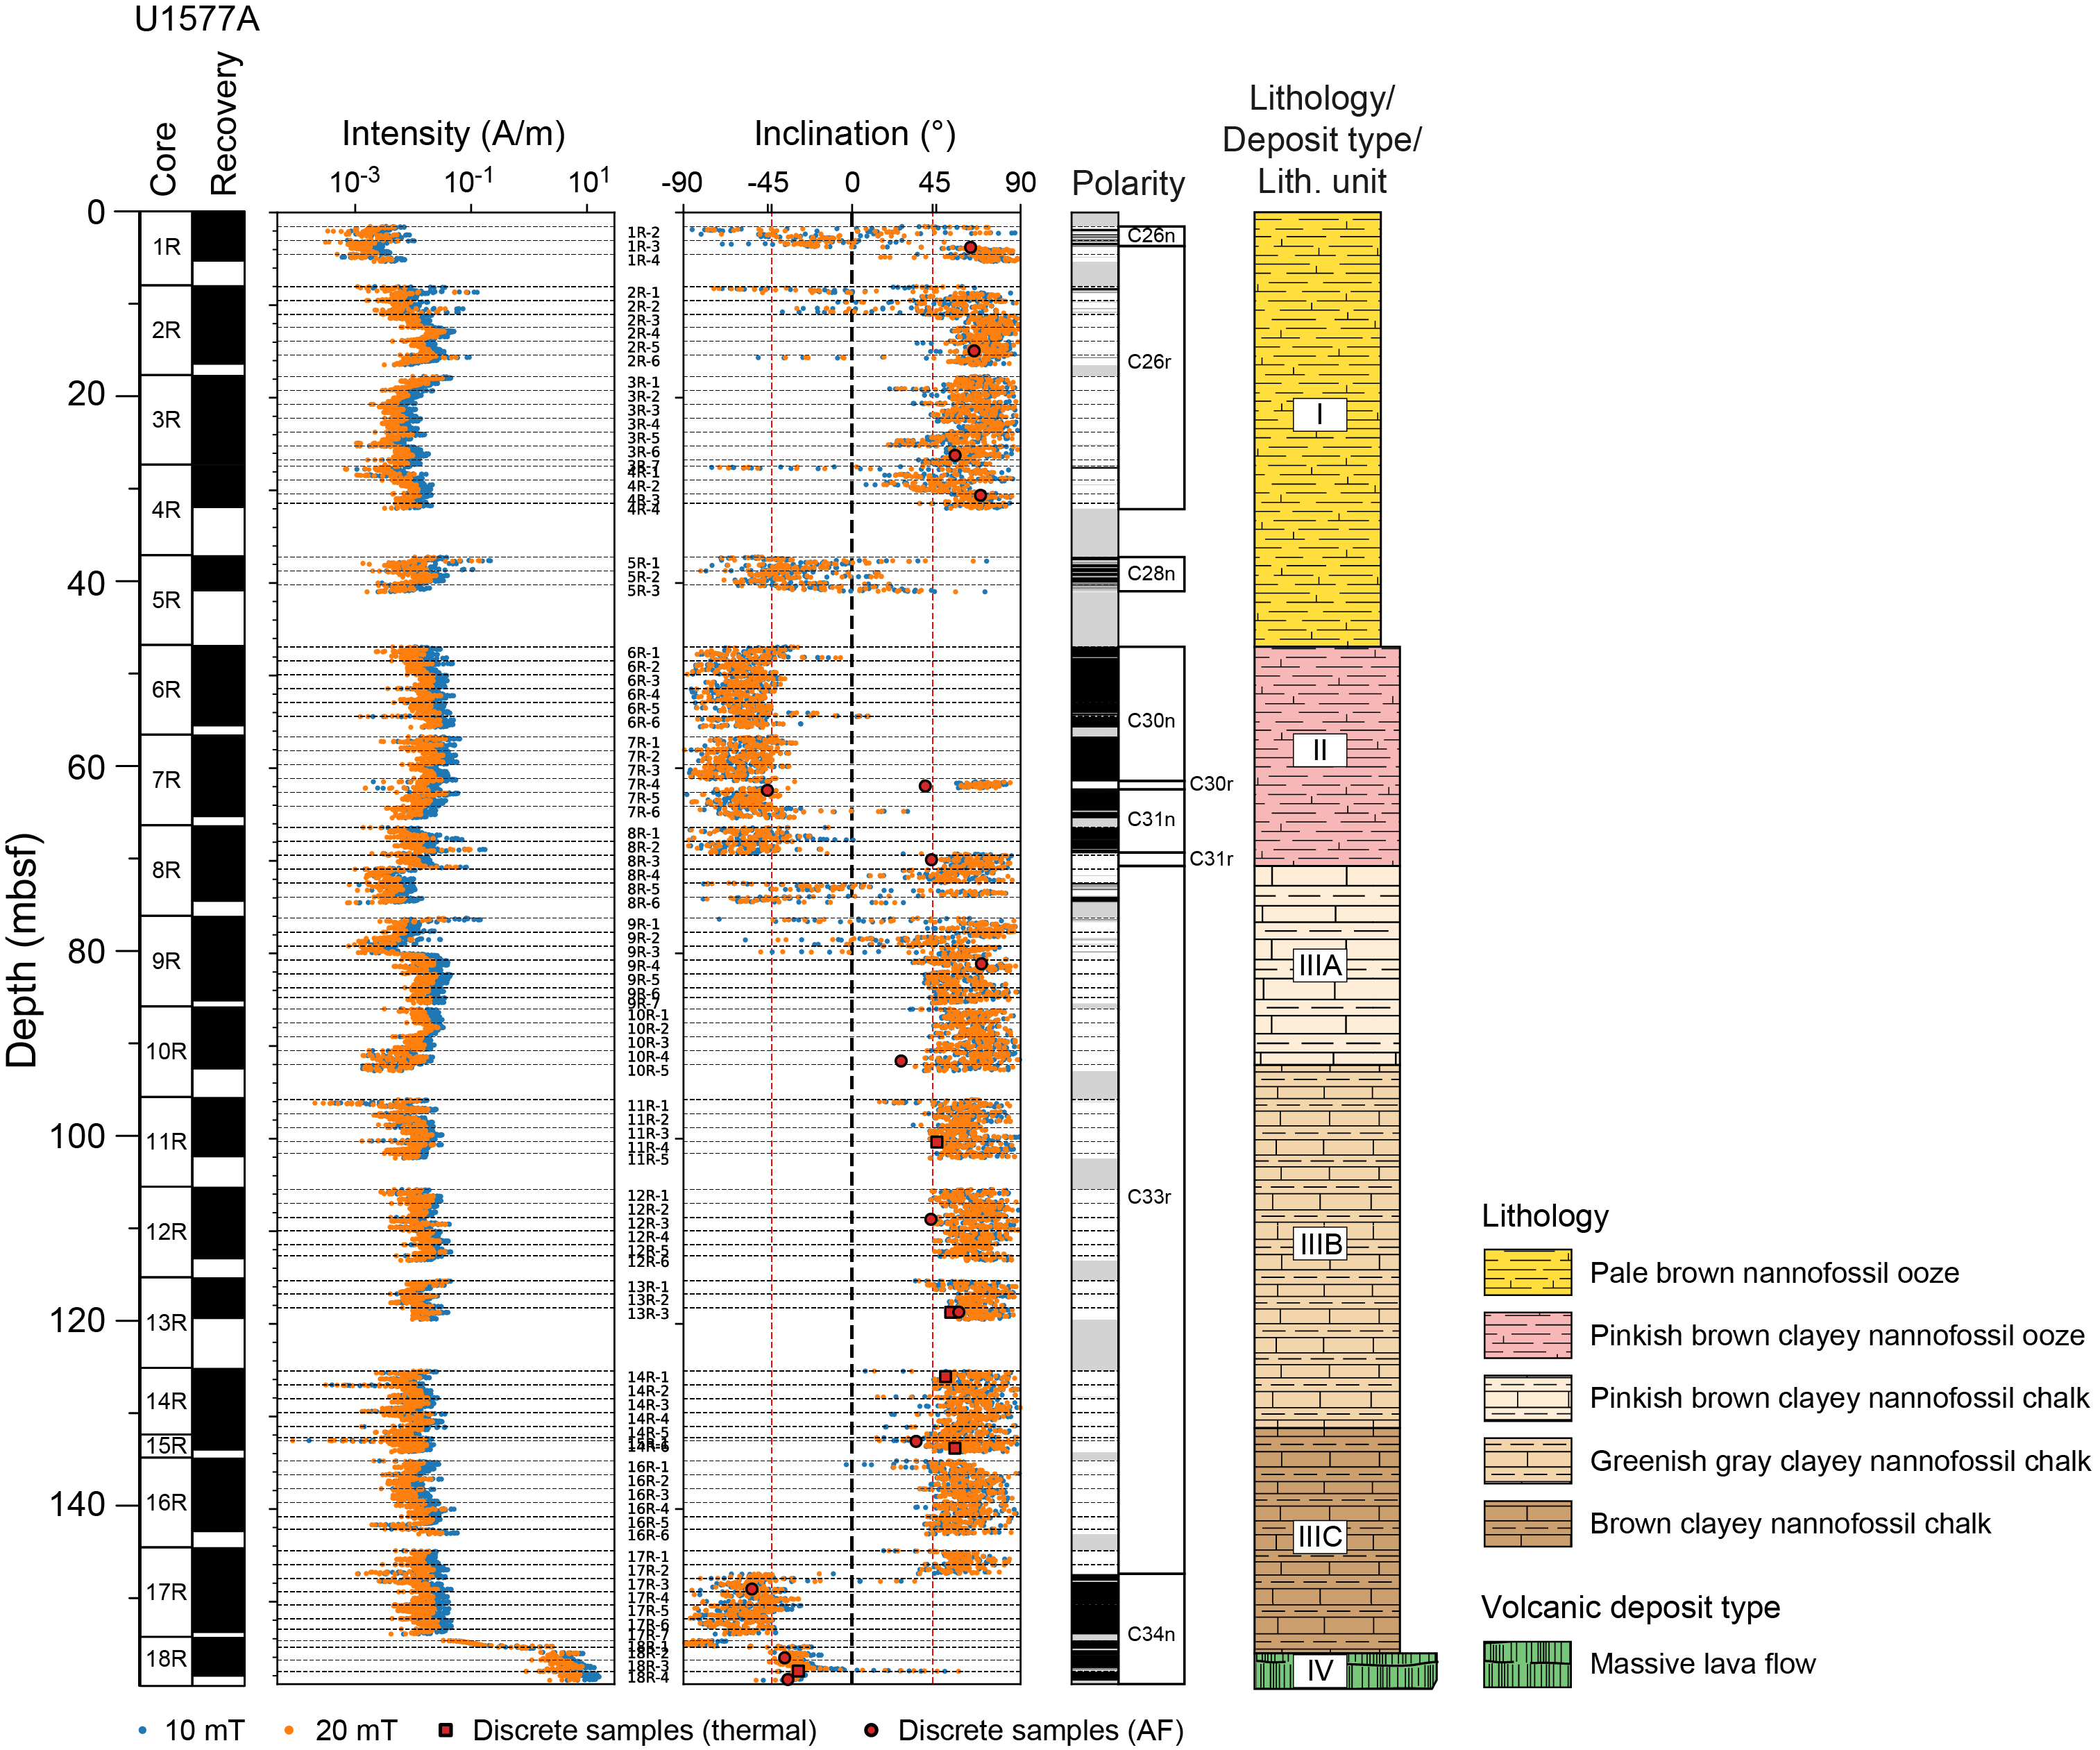
Figure F24. SRM and discrete sample magnetic results from sediment sections.
The average of the 20 mT step inclinations for the consolidated sediments from Hole U1577A was calculated using the method of McFadden and Reed (1982) and gave average inclinations of 65.3° and −54.3° for the positive and negative inclinations, respectively (Figure F25). The slightly steeper positive inclination is consistent with a persistent drill string overprint in some of the sections after the 20 mT demagnetization, although the inclinations are sufficiently steep that this likely does not affect our polarity assignments (Acton et al., 2002). Both of these inclination values are nominally steeper than the expected geocentric axial dipole (GAD) inclination of −43.3°. We did not assign an uncertainty to the average inclinations of the SRM data because the degree of independence of the 2 cm SRM measurements from each other is questionable such that any uncertainty we could estimate would be of dubious reliability.
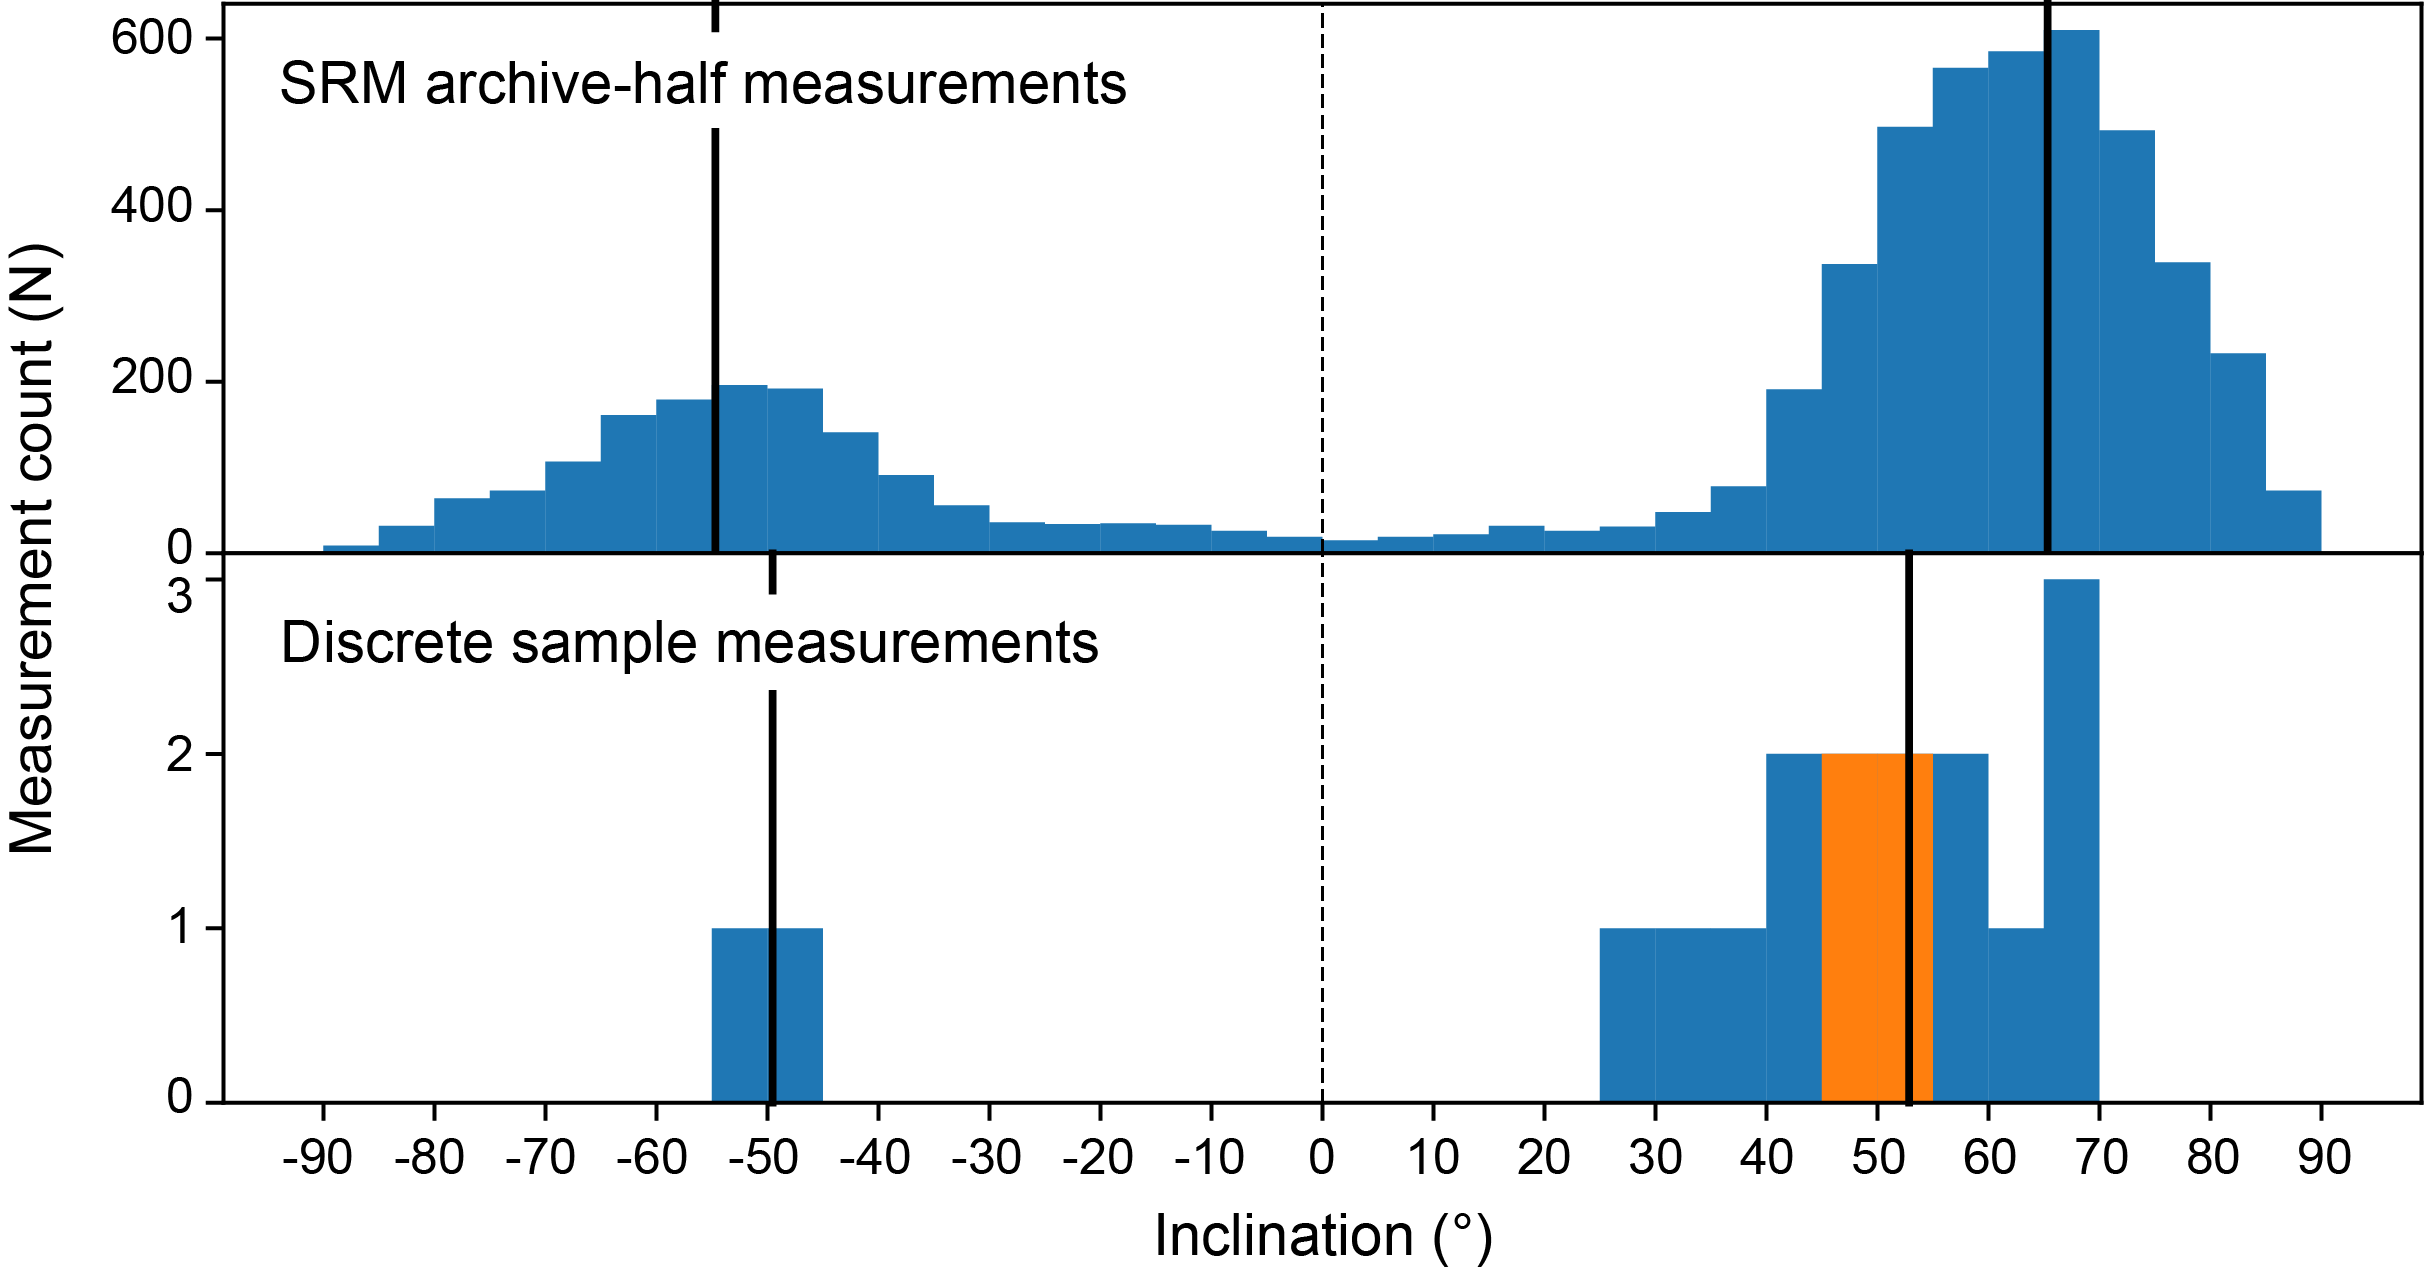
Figure F25. Distributions of inclination values from sediments.
6.1.2. Discrete sample measurements
Discrete samples were collected from unconsolidated sediments using plastic 7 cm3 Japanese-style sediment cubes, whereas cubic discrete samples from more lithified sediments were prepared using a dual-bladed circular saw. We collected a total of 19 discrete samples from Hole U1577A sediments. The samples in plastic cubes were all used for AF demagnetization. In total, 4 samples were subjected to thermal demagnetization and 15 to AF demagnetization.
Most samples used for AF demagnetization had a sufficiently strong magnetization to obtain a direction fitted with principal component analysis (PCA) (Figure F26). Demagnetization spectra are consistent throughout the sediment cores. Median destructive fields range ~10–30 mT. Unlike sediments from Sites U1575 and U1576, we did not observe any unusually high coercivities. Thermal demagnetization spectra showed a slow drop of magnetization at unblocking temperatures in the 200°–400°C range followed by a sharper drop of magnetization close to the 580°C Curie temperature of magnetite (Figure F27). This suggests the presence of a mixture of titanomagnetite with various Ti contents and magnetite as magnetization carriers.
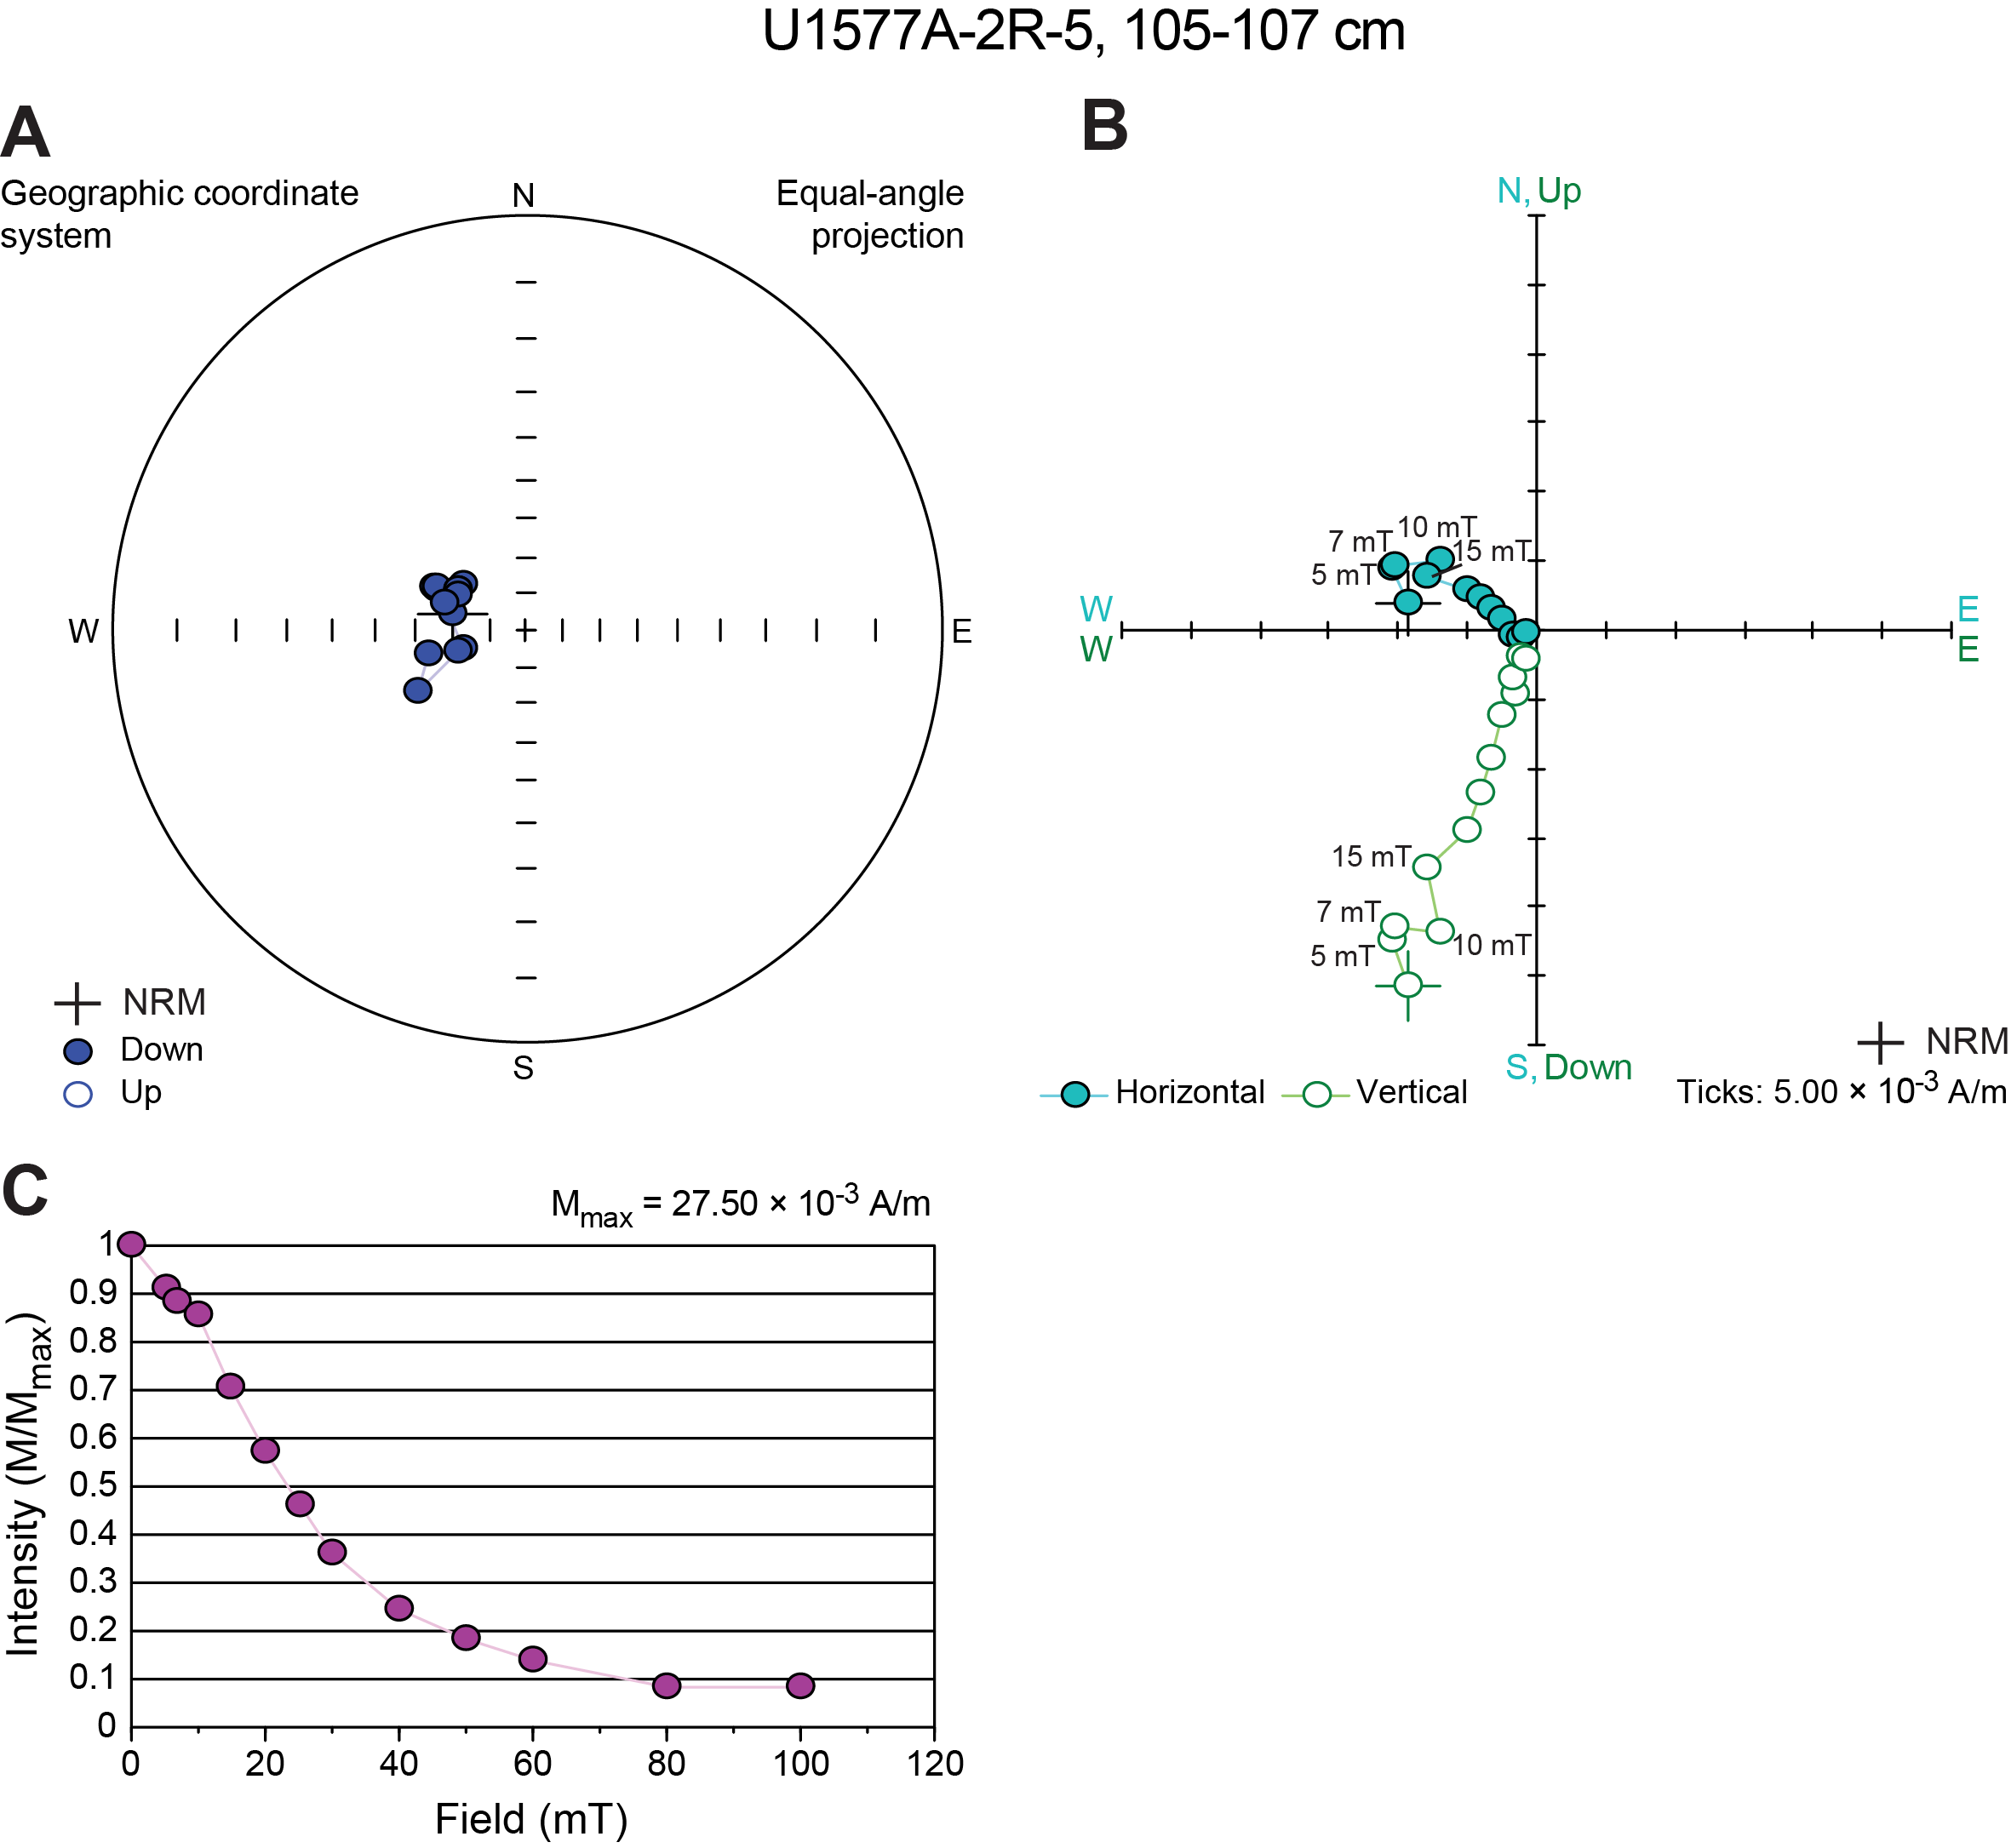
Figure F26. AF demagnetization result for a sediment sample.
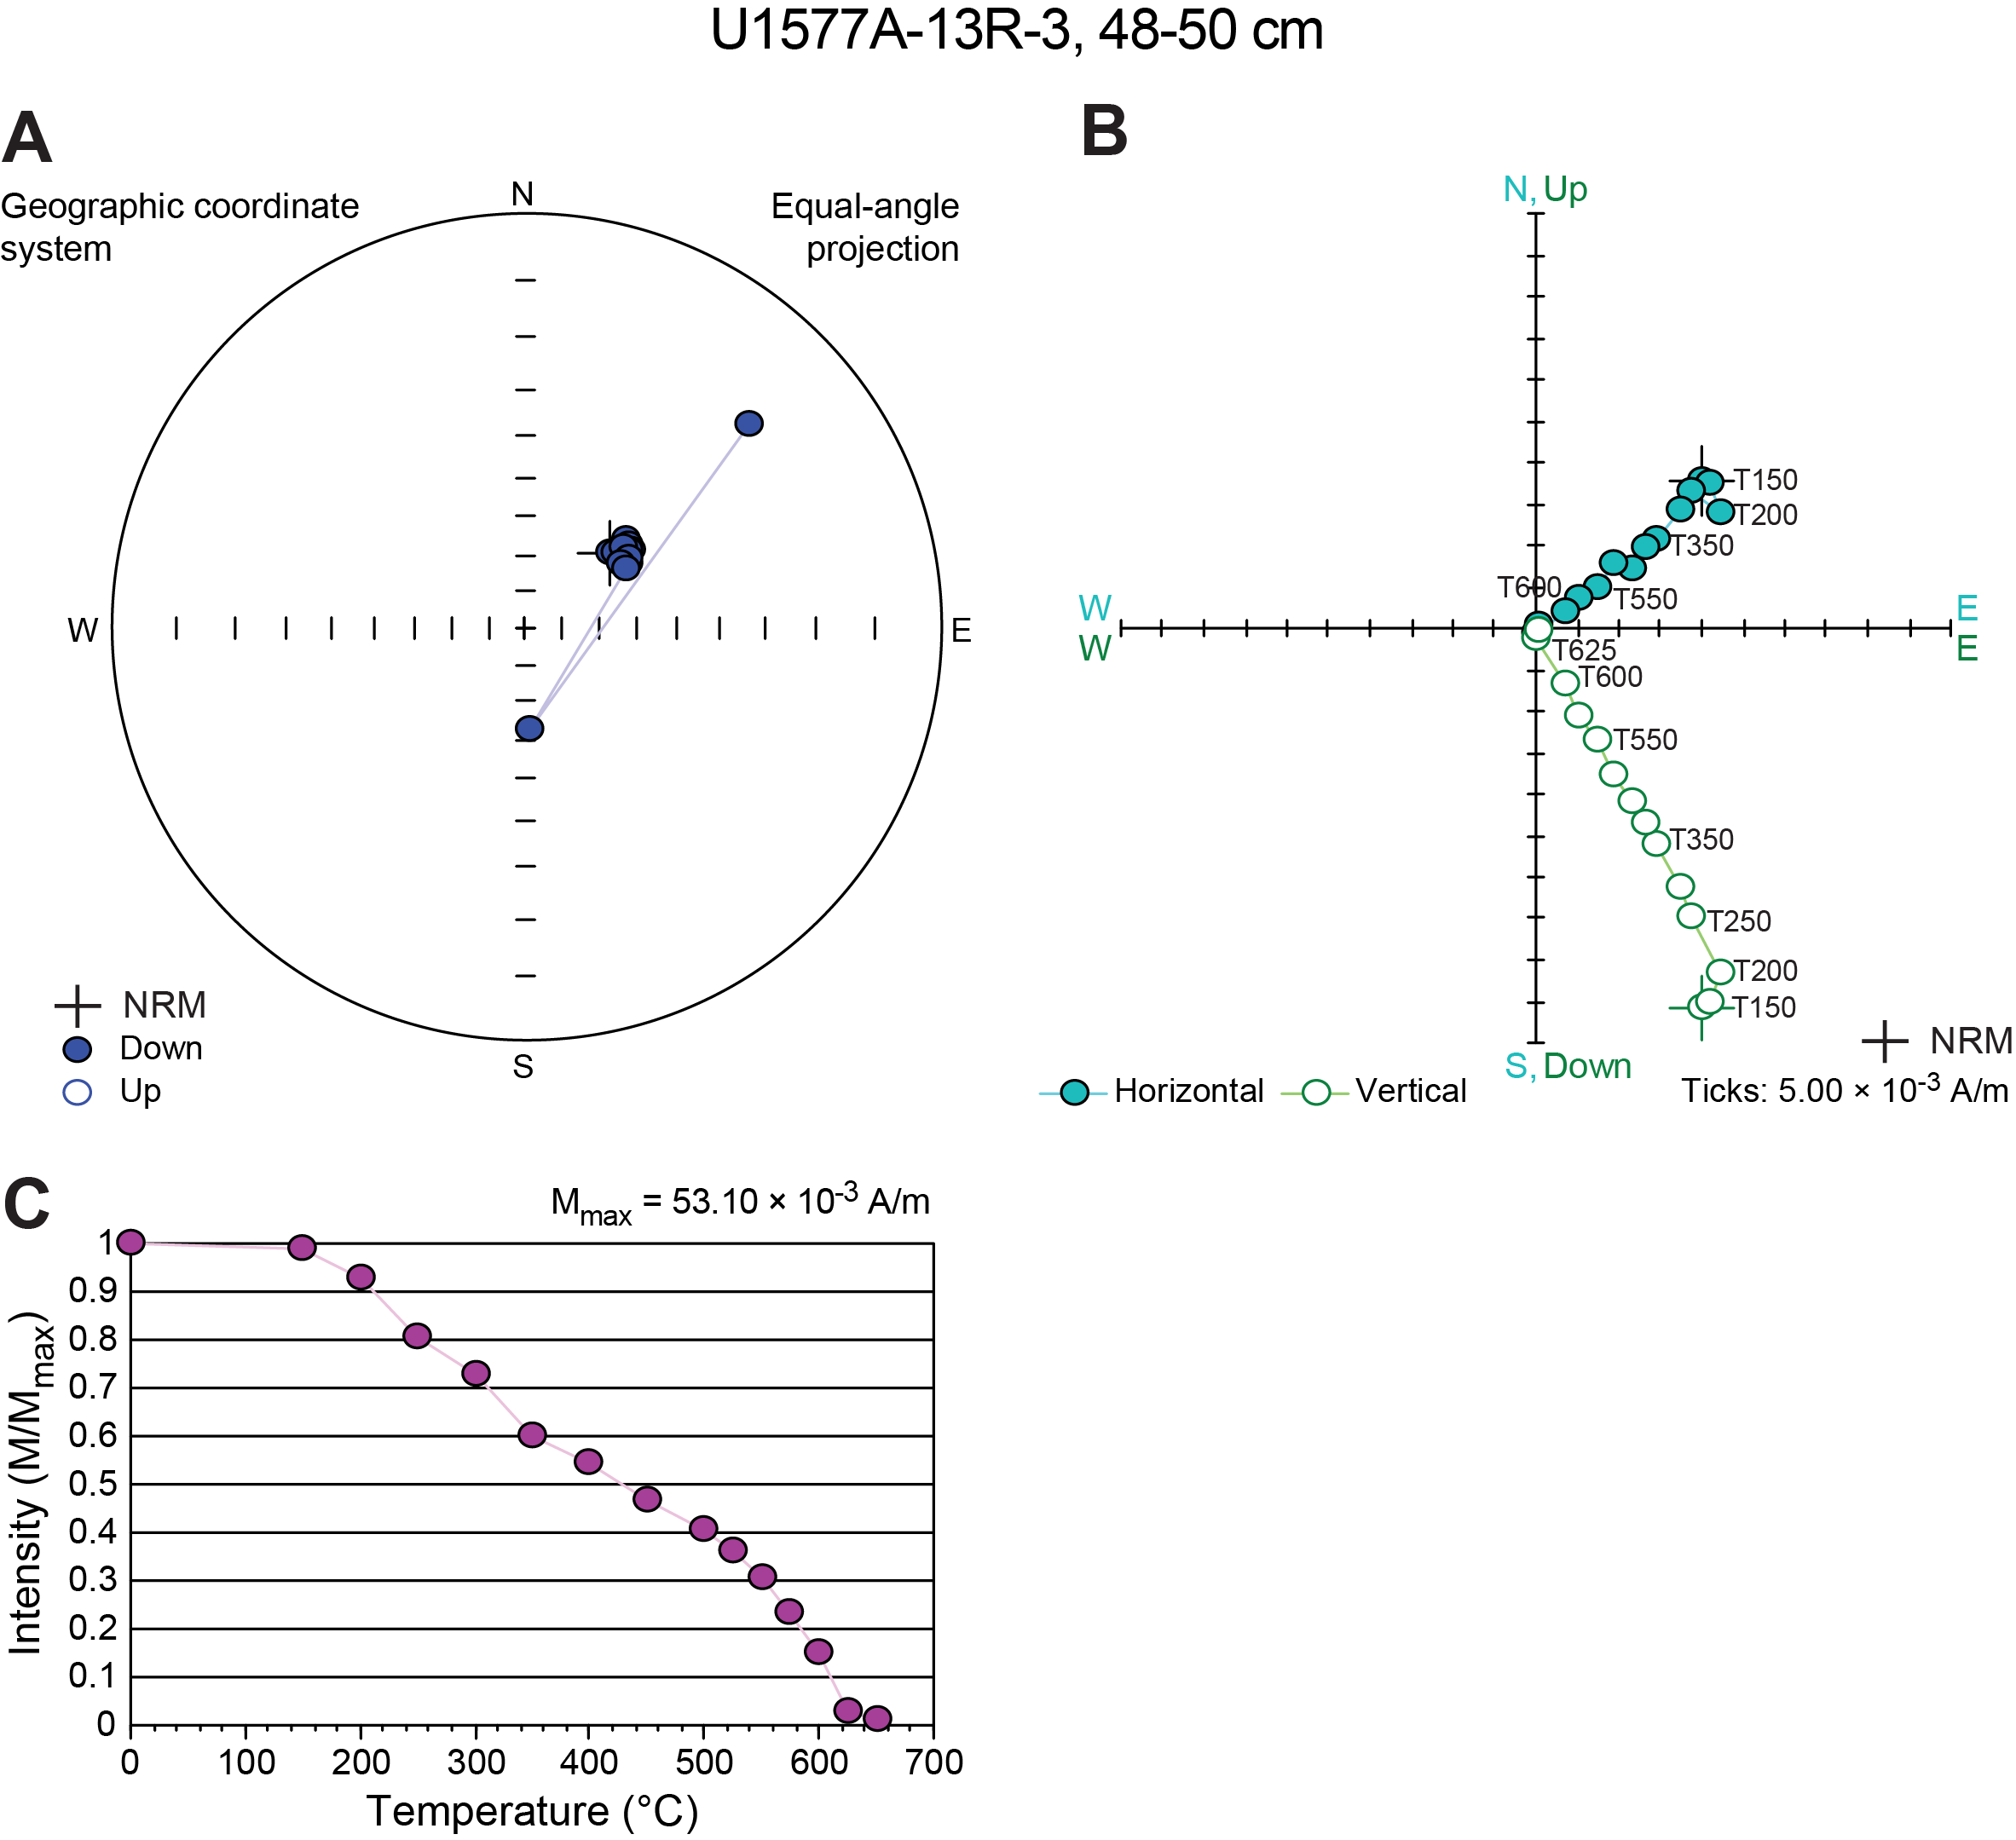
Figure F27. Thermal demagnetization result for a sediment sample.
In total, 13 AF demagnetized samples and the 4 thermally demagnetized samples revealed reliable inclination values (N > 4 data points included in the PCA fit; maximum angular deviation <15°) with strikingly linear Zijderveld diagrams, whereas 3 AF demagnetized samples yielded poor quality inclination values (maximum angular deviation >15°) or did not demagnetize to the origin. The AF demagnetized samples generally contained low-coercivity overprints that were removed by AF cleaning at 10 mT and are consistent with being drilling induced (e.g., Acton et al., 2002).
We identified 11 positive and 2 negative inclination characteristic remanent magnetizations (ChRMs) that may be indicative of magnetic polarities if these magnetizations represent primary detrital remanence. The most reliable inclination values calculated with PCA agree well with the SRM inclinations after 20 mT AF demagnetization, although inclinations obtained from PCA are regularly shallower than those from the SRM 20 mT step (Figure F24). The average inclination of the reversed polarity discrete sediment samples is 52.8° ± 6.8°, and the average inclination of the normal polarity discrete sediment samples is −49.5° ± 61.7° (95% confidence).
6.1.3. Magnetostratigraphy
For most consolidated sediments, magnetic polarity was interpreted from paleomagnetic inclinations measured from archive halves after the 20 mT AF demagnetization step. PCA fit directions obtained from ChRM components for discrete samples were checked against the SRM inclination values and the interpreted magnetic polarity, where available.
We assigned polarity zones for sediment in Cores 391-U1577A-1R through 18R (Figure F24). Chron boundary ages were assigned following Ogg (2020). In total, we observed eight polarity chrons from the base of Chron C26n (59.236 Ma) in Core 1R to the top of Chron C34n (83.650 Ma) near the contact with the basement. This sequence of polarity chrons is consistent with a Thanetian to Santonian stage assignment. There are three apparent gaps in the magnetostratigraphy caused by poor core recovery or unconformities. The first gap occurs between Cores 4R and 5R, which changes from reversed polarity Chron C26r (62.278–59.237 Ma) to a normal polarity chron interpreted to be Chron C28n (64.645–63.537 Ma) based on the biostratigraphic markers available from that core (see Biostratigraphy). The next gap occurs between Cores 5R and 6R. This continues to a normal polarity chron, C30n (68.178–66.380 Ma), based on the size of the next two polarity chrons and the available biostratigraphic markers. This suggests the K/Pg boundary was not recovered but occurs somewhere between Cores 5R and 6R. Cores 6R–8R record the remainder of Chrons 30n and 31n and the start of Chron C31r (71.451 Ma) before a large unconformity in Section 8R-3, which crosses the lower Campanian reversed polarity Chron C33r (83.650–79.900 Ma). This unconformity was observed visually in the core as a color change in the sediment, marking a significant change in biostratigraphic markers, and magnetically because the reversed polarity Chron C31r is too short to explain the large reversed interval observed following Chron C31n without a large change in sedimentation rate (see Lithostratigraphy and Biostratigraphy). Chron C33r continues in Sections 8R-3 through 17R-2, where a sharp reversal occurs in the SRM data marking the Campanian/Santonian boundary at the end of the Cretaceous Normal Superchron (CNS), C34n (83.650 Ma).
6.1.4. Magnetic properties
Bulk susceptibility measurements were conducted for a total of 14 discrete samples collected from Cores 391-U1577A-2R through 13R (including sediments that were interbedded between basalt layers, as described in the next section) using an AGICO Kappabridge KLY 4 magnetic susceptibility (MS) meter. Measured susceptibility values range from 3.7 × 10⁻⁴ to 2.5 × 10⁻³ SI.
Stepwise isothermal remanent magnetization (IRM) curves were acquired for six discrete samples (Figure F28). Magnetization increased sharply with the applied field up to 300 mT and then increased more slowly until the peak field level of 1.2 T was applied. This suggests the presence of principally titanomagnetite-like magnetic carriers as well as a second higher coercivity magnetic mineral that is likely hematite because the thermal demagnetization experiments all show high unblocking temperatures. Because the magnetization was very close to saturation at 1.2 T, we were able to calculate the S-ratio as the ratio of IRM1.2/IRM−0.3, which is often used as a proxy for quantifying the fraction of hard-coercivity minerals. The three uppermost samples (from Cores 391-U1577A-5R, 7R, and 13R) have high S-ratios ranging 0.950–0.966, whereas the three lowermost samples (from Cores 15R–17R) have lower S-ratios ranging 0.861–0.909. This indicates that the high-coercivity hematite content is higher downhole.
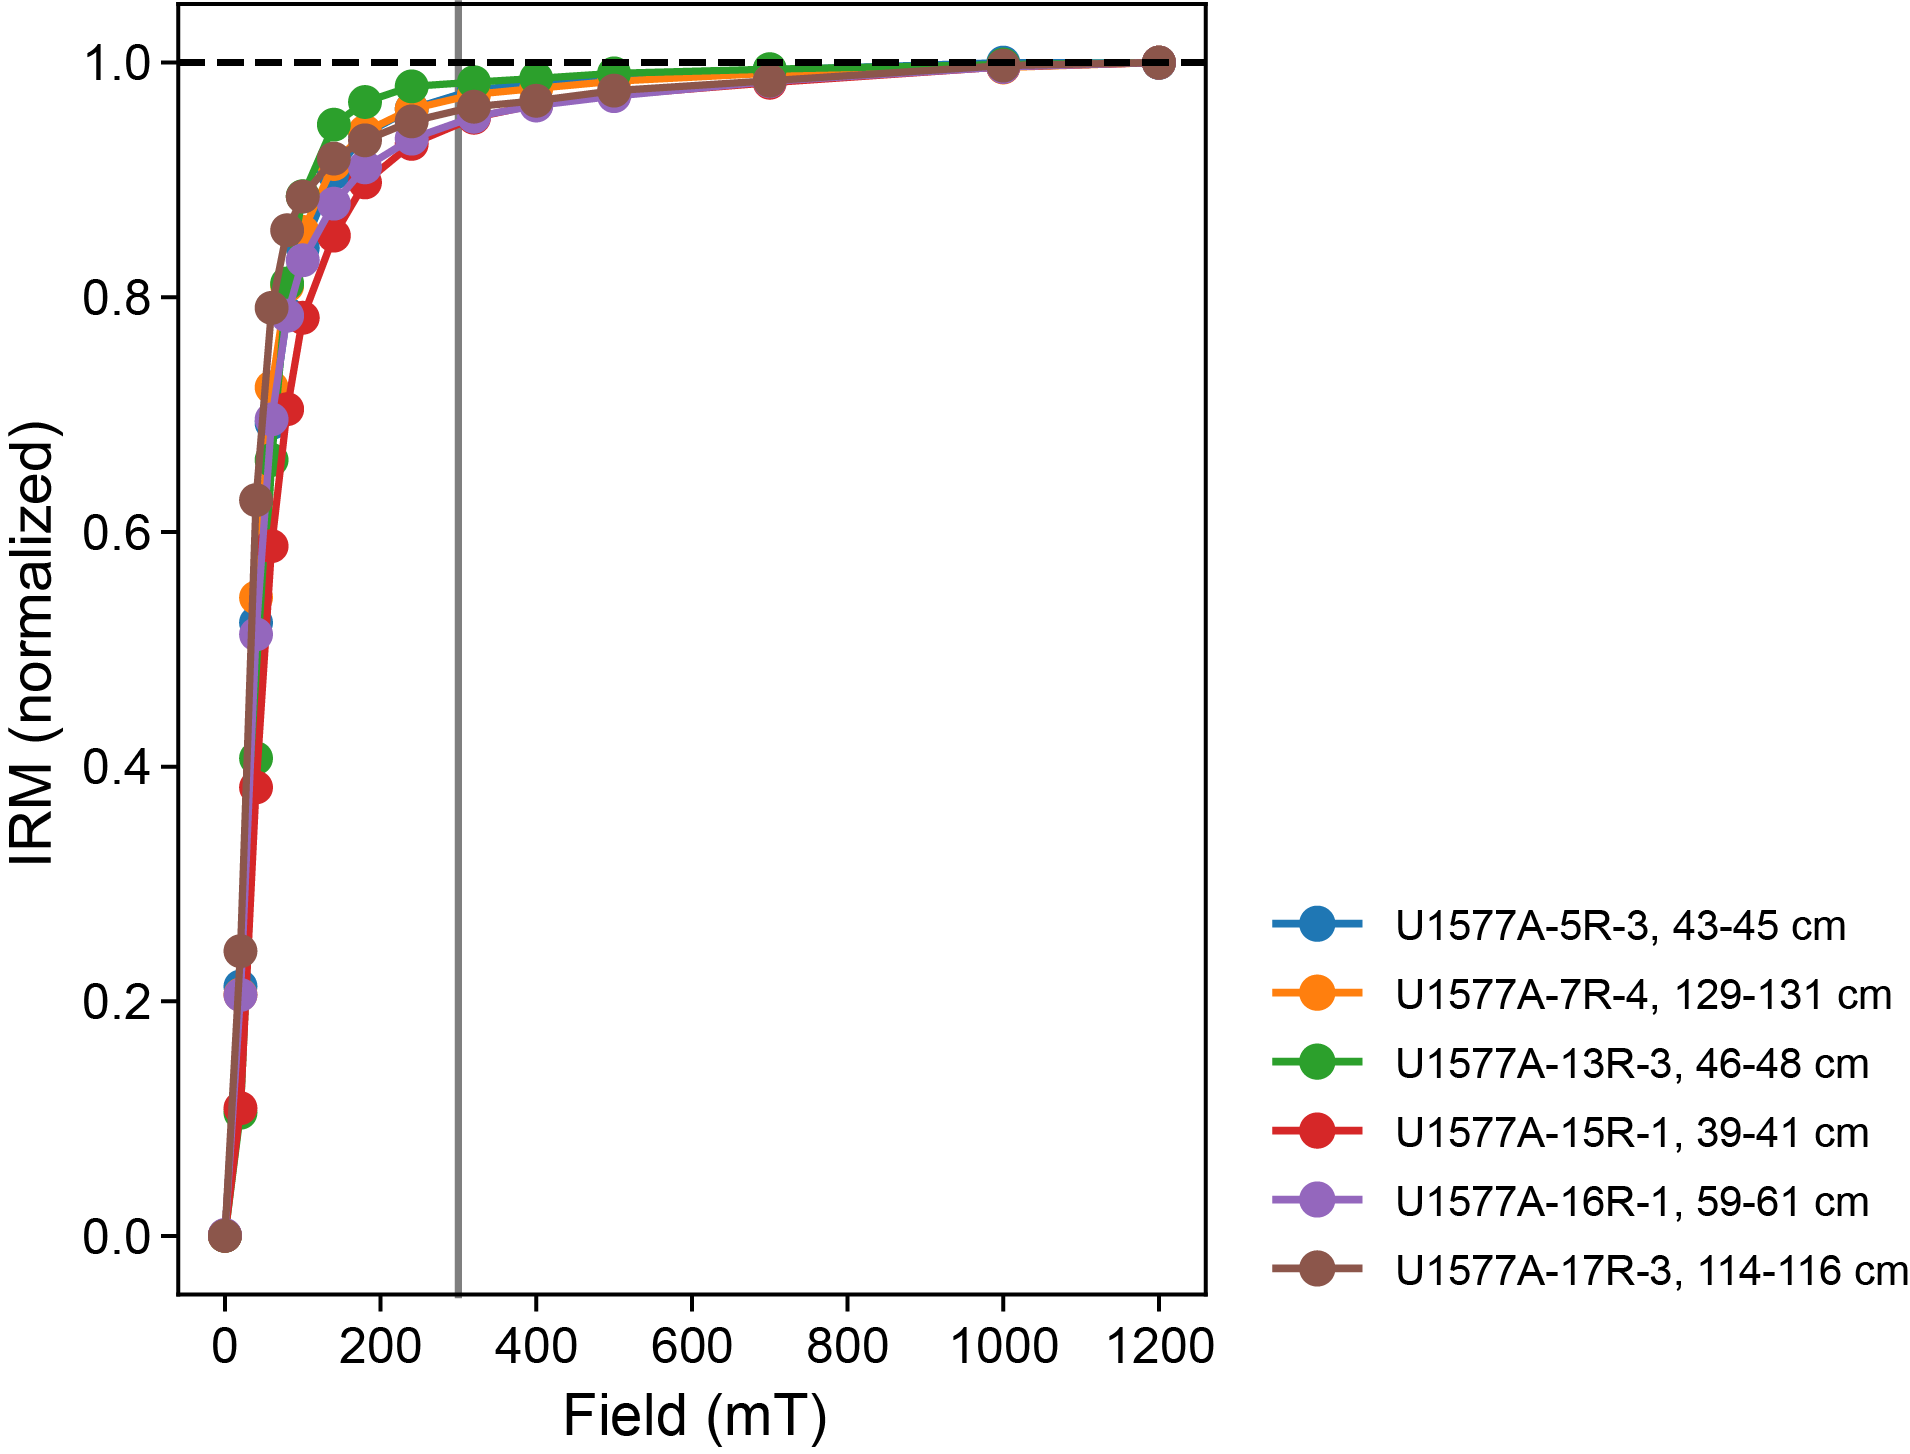
Figure F28. IRM acquisition curves for sediment samples.
6.2. Igneous rocks
6.2.1. Archive-half measurements
Paleomagnetic measurements of the archive halves of igneous RCB cores (391-U1577A-18R through 26R) were conducted using the pass-through SRM on board the vessel and demagnetized at AF levels of 5, 10, 15, and 20 mT after the initial NRM measurements. In all, 29 igneous archive-half sections totaling 31.2 m of core were demagnetized and measured (Figure F29).
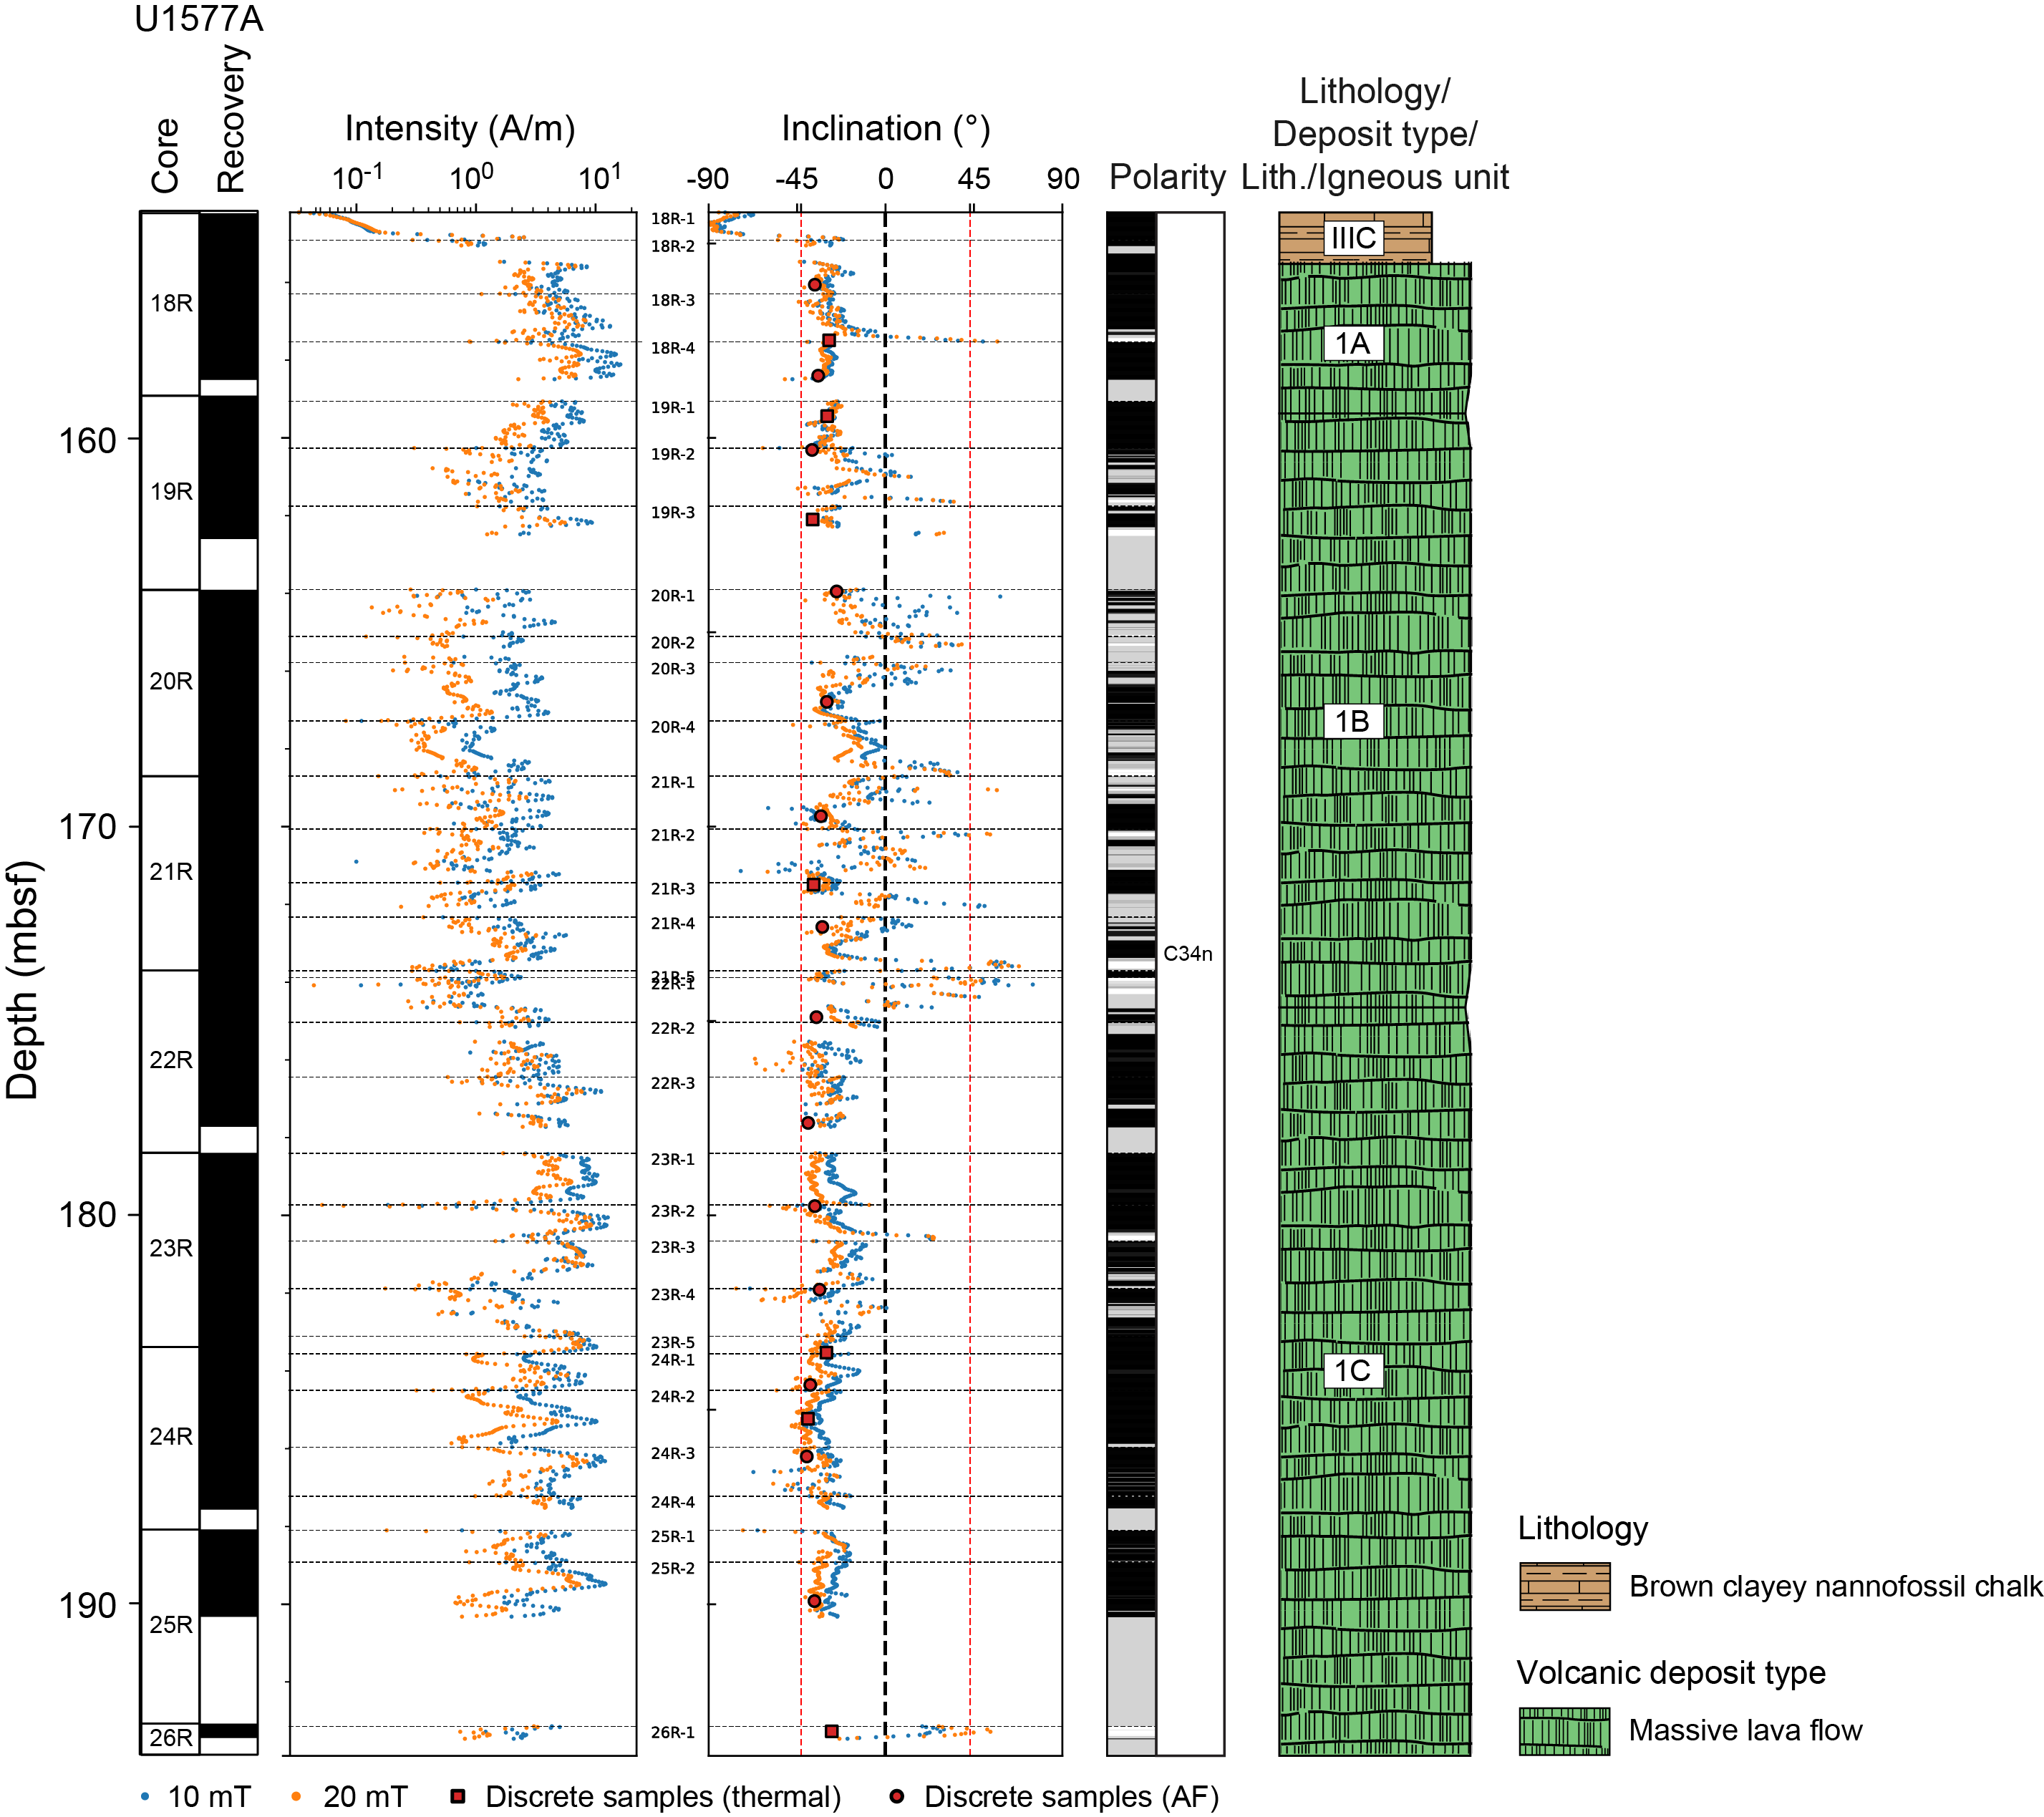
Figure F29. SRM and discrete sample data from igneous units.
Most of the igneous RCB cores contained low-coercivity overprints that may be drilling induced (e.g., Acton et al., 2002). After AF cleaning to 20 mT, igneous cores typically exhibit a normal polarity magnetization consistent with the polarity chron assignment of C34n (120.964–83.650 Ma) observed in the basement contacting sediment. The average inclination, calculated using the method of McFadden and Reed (1982) after cleaning the igneous cores to 20 mT, is −31.5° (Figure F30). This average inclination is nominally shallower than the expected GAD inclination of −43.3°. However, this shallower average inclination may be due in part to a partially remaining drill string overprint, which would bias the samples toward positive inclinations.
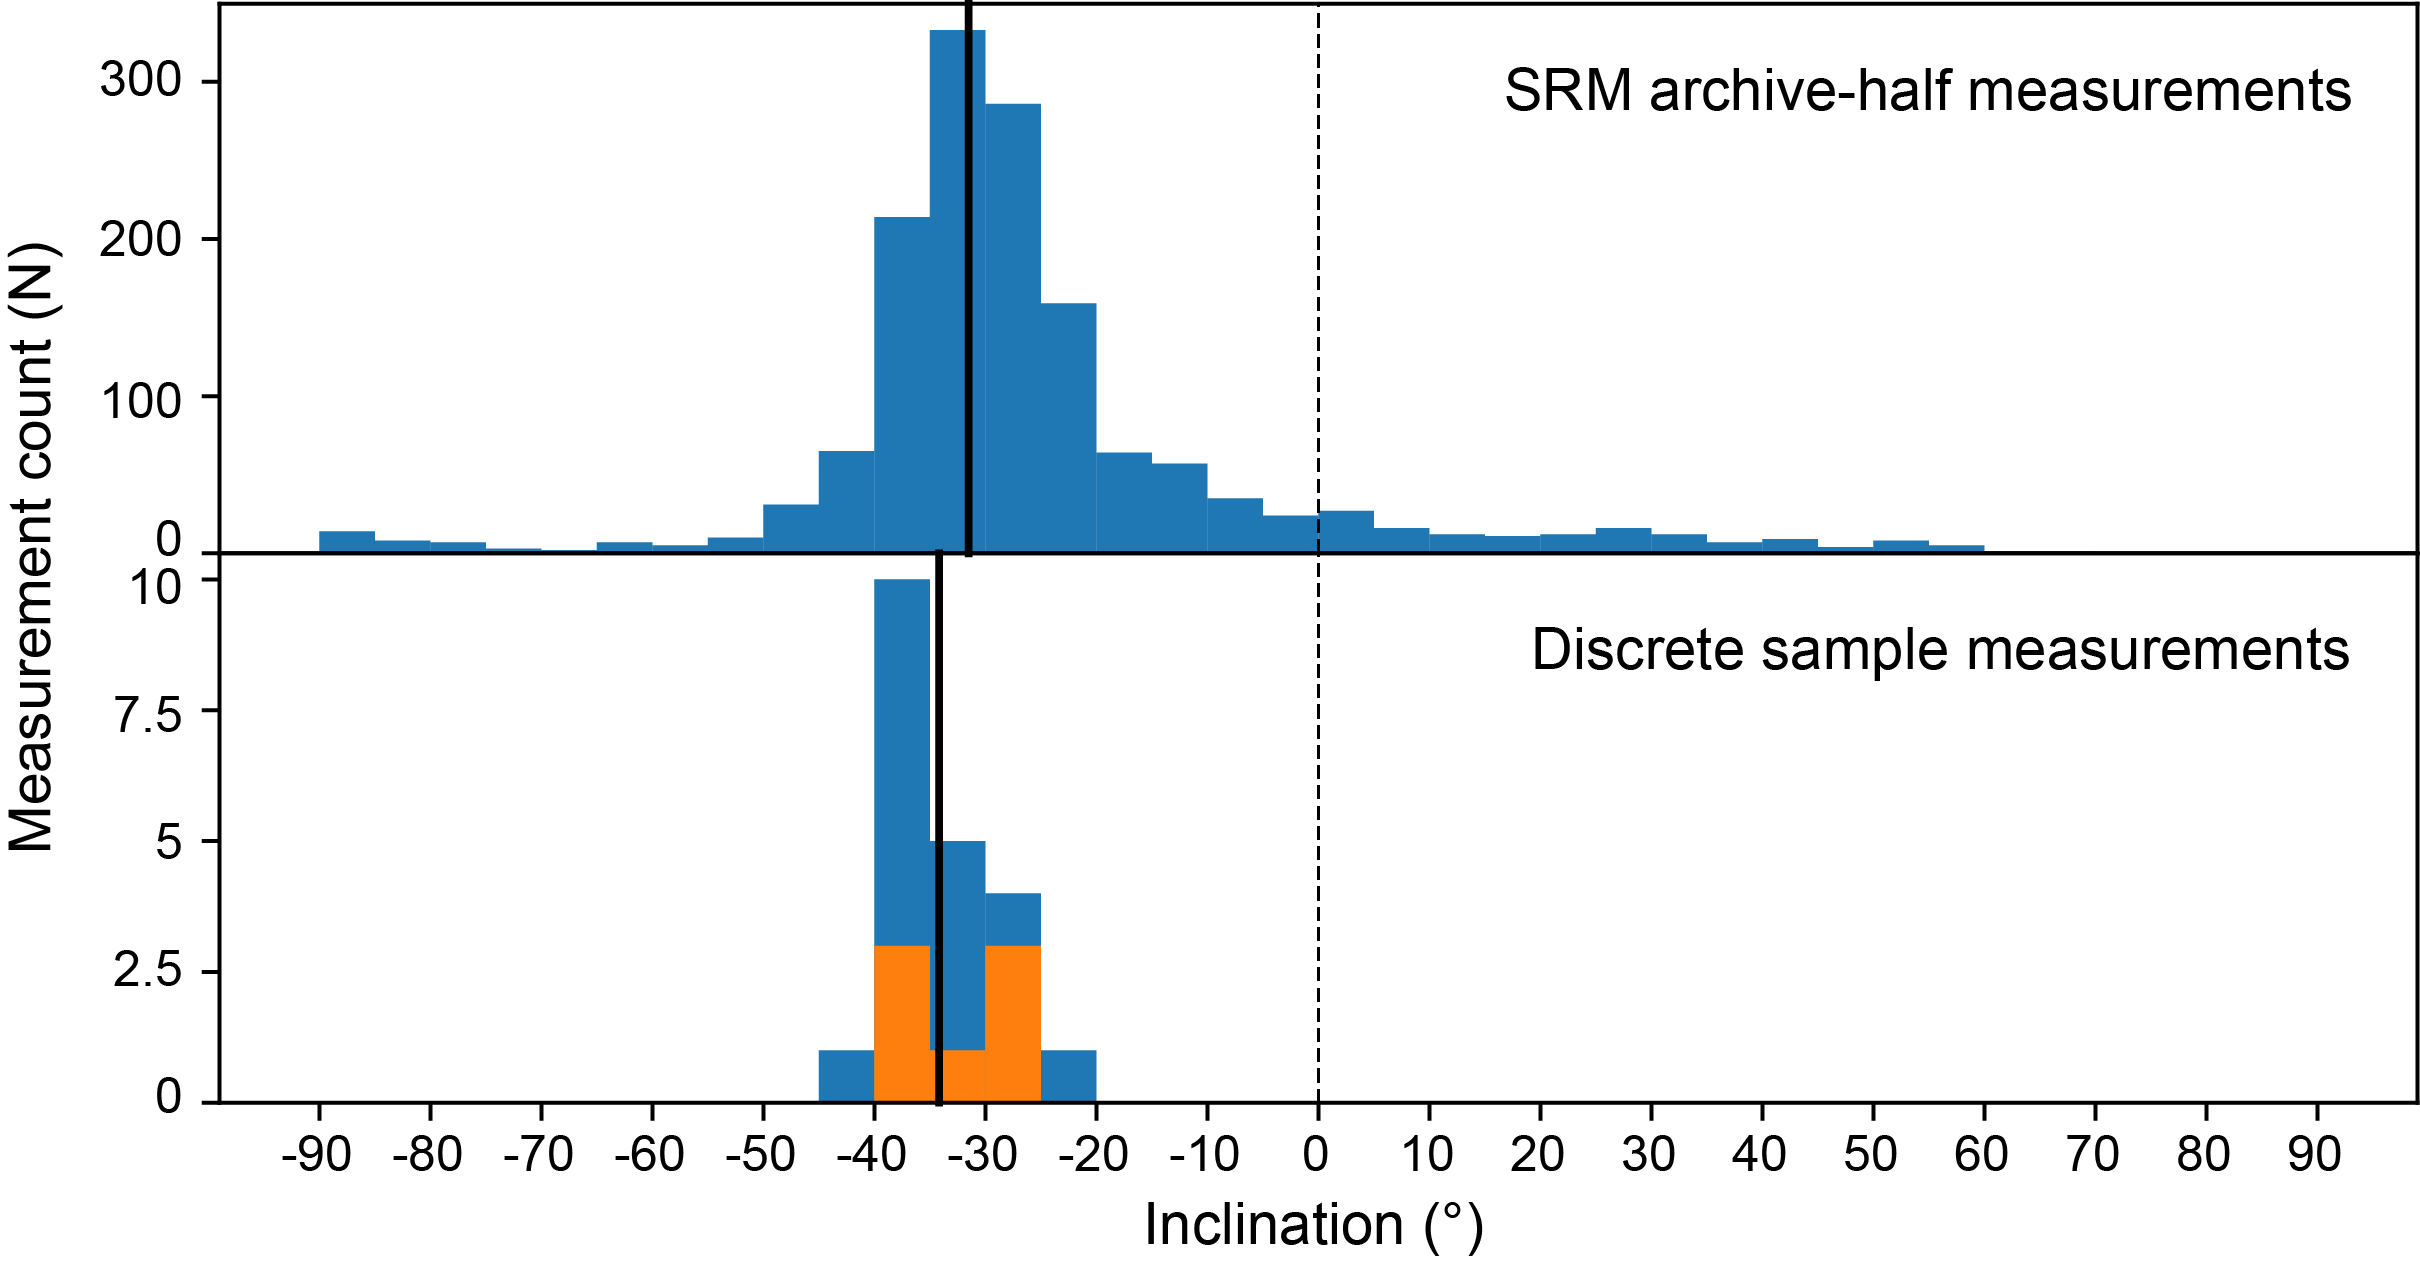
Figure F30. Distributions of inclination values from igneous rocks.
6.2.2. Discrete sample measurements
A total of 29 discrete sample cubes (8 cm3) were taken from the basalts at a frequency of approximately one sample per core section using a dual-bladed circular saw. A total of 15 cubes were subjected to AF demagnetization, and the remaining 14 cubes were subjected to thermal demagnetization. Most of the AF demagnetizations led to reliable inclination values; they are characterized by unidirectional Zijderveld diagrams after the removal of a small overprint by 15–20 mT, with median destructive fields between about 5 and 25 mT (Figure F31). Thermal demagnetizations showed a range of demagnetization behaviors. Some samples had a range of magnetization unblocking temperatures ranging from as low as 200°C to as high as 580°C, the Curie temperature of magnetite (Figure F32). Other samples showed a progressive diminution of magnetization over a range of temperatures from 100° to 350°C or more, implying the coexistence of magnetic phases with various contents of Ti within a single sample (Figure F33). According to these results, the magnetization carriers seem to be titanomagnetite with various Ti contents. Only one AF demagnetization failed to lead to reliable inclination determinations. Thermal demagnetizations were less successful; half of the Zijderveld diagrams could not be fitted with PCA.
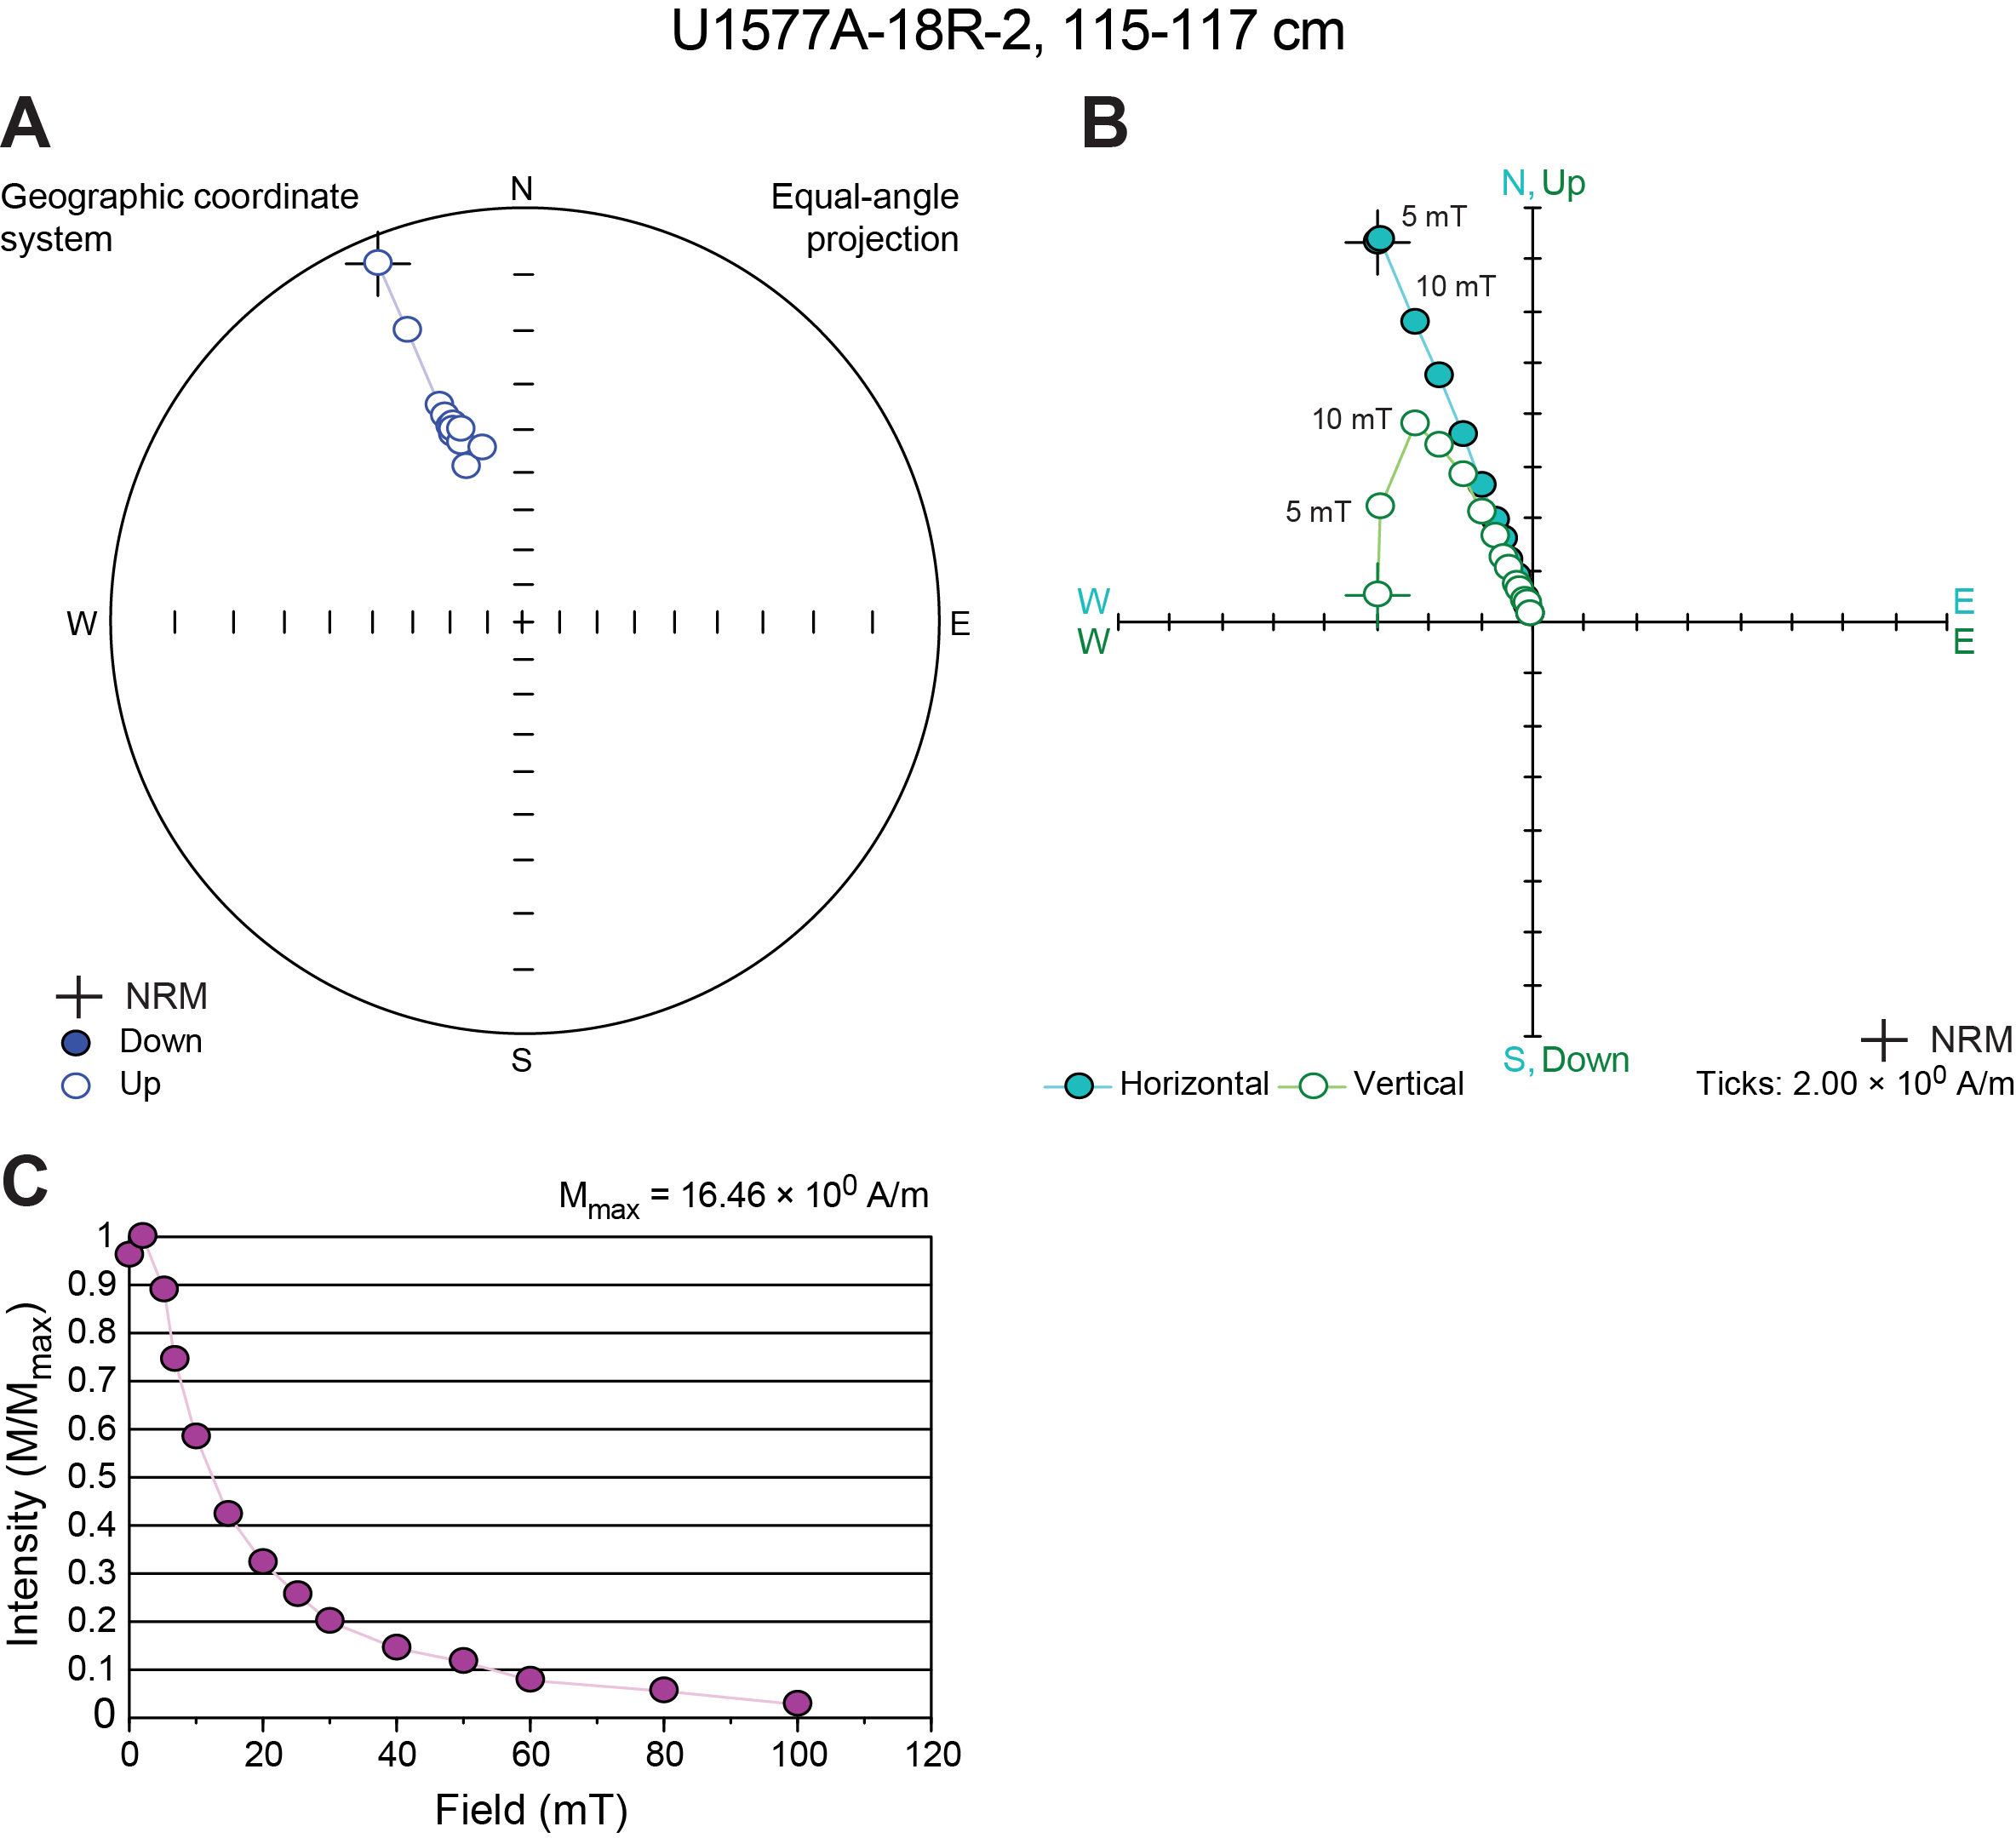
Figure F31. AF demagnetization result for a basalt sample.
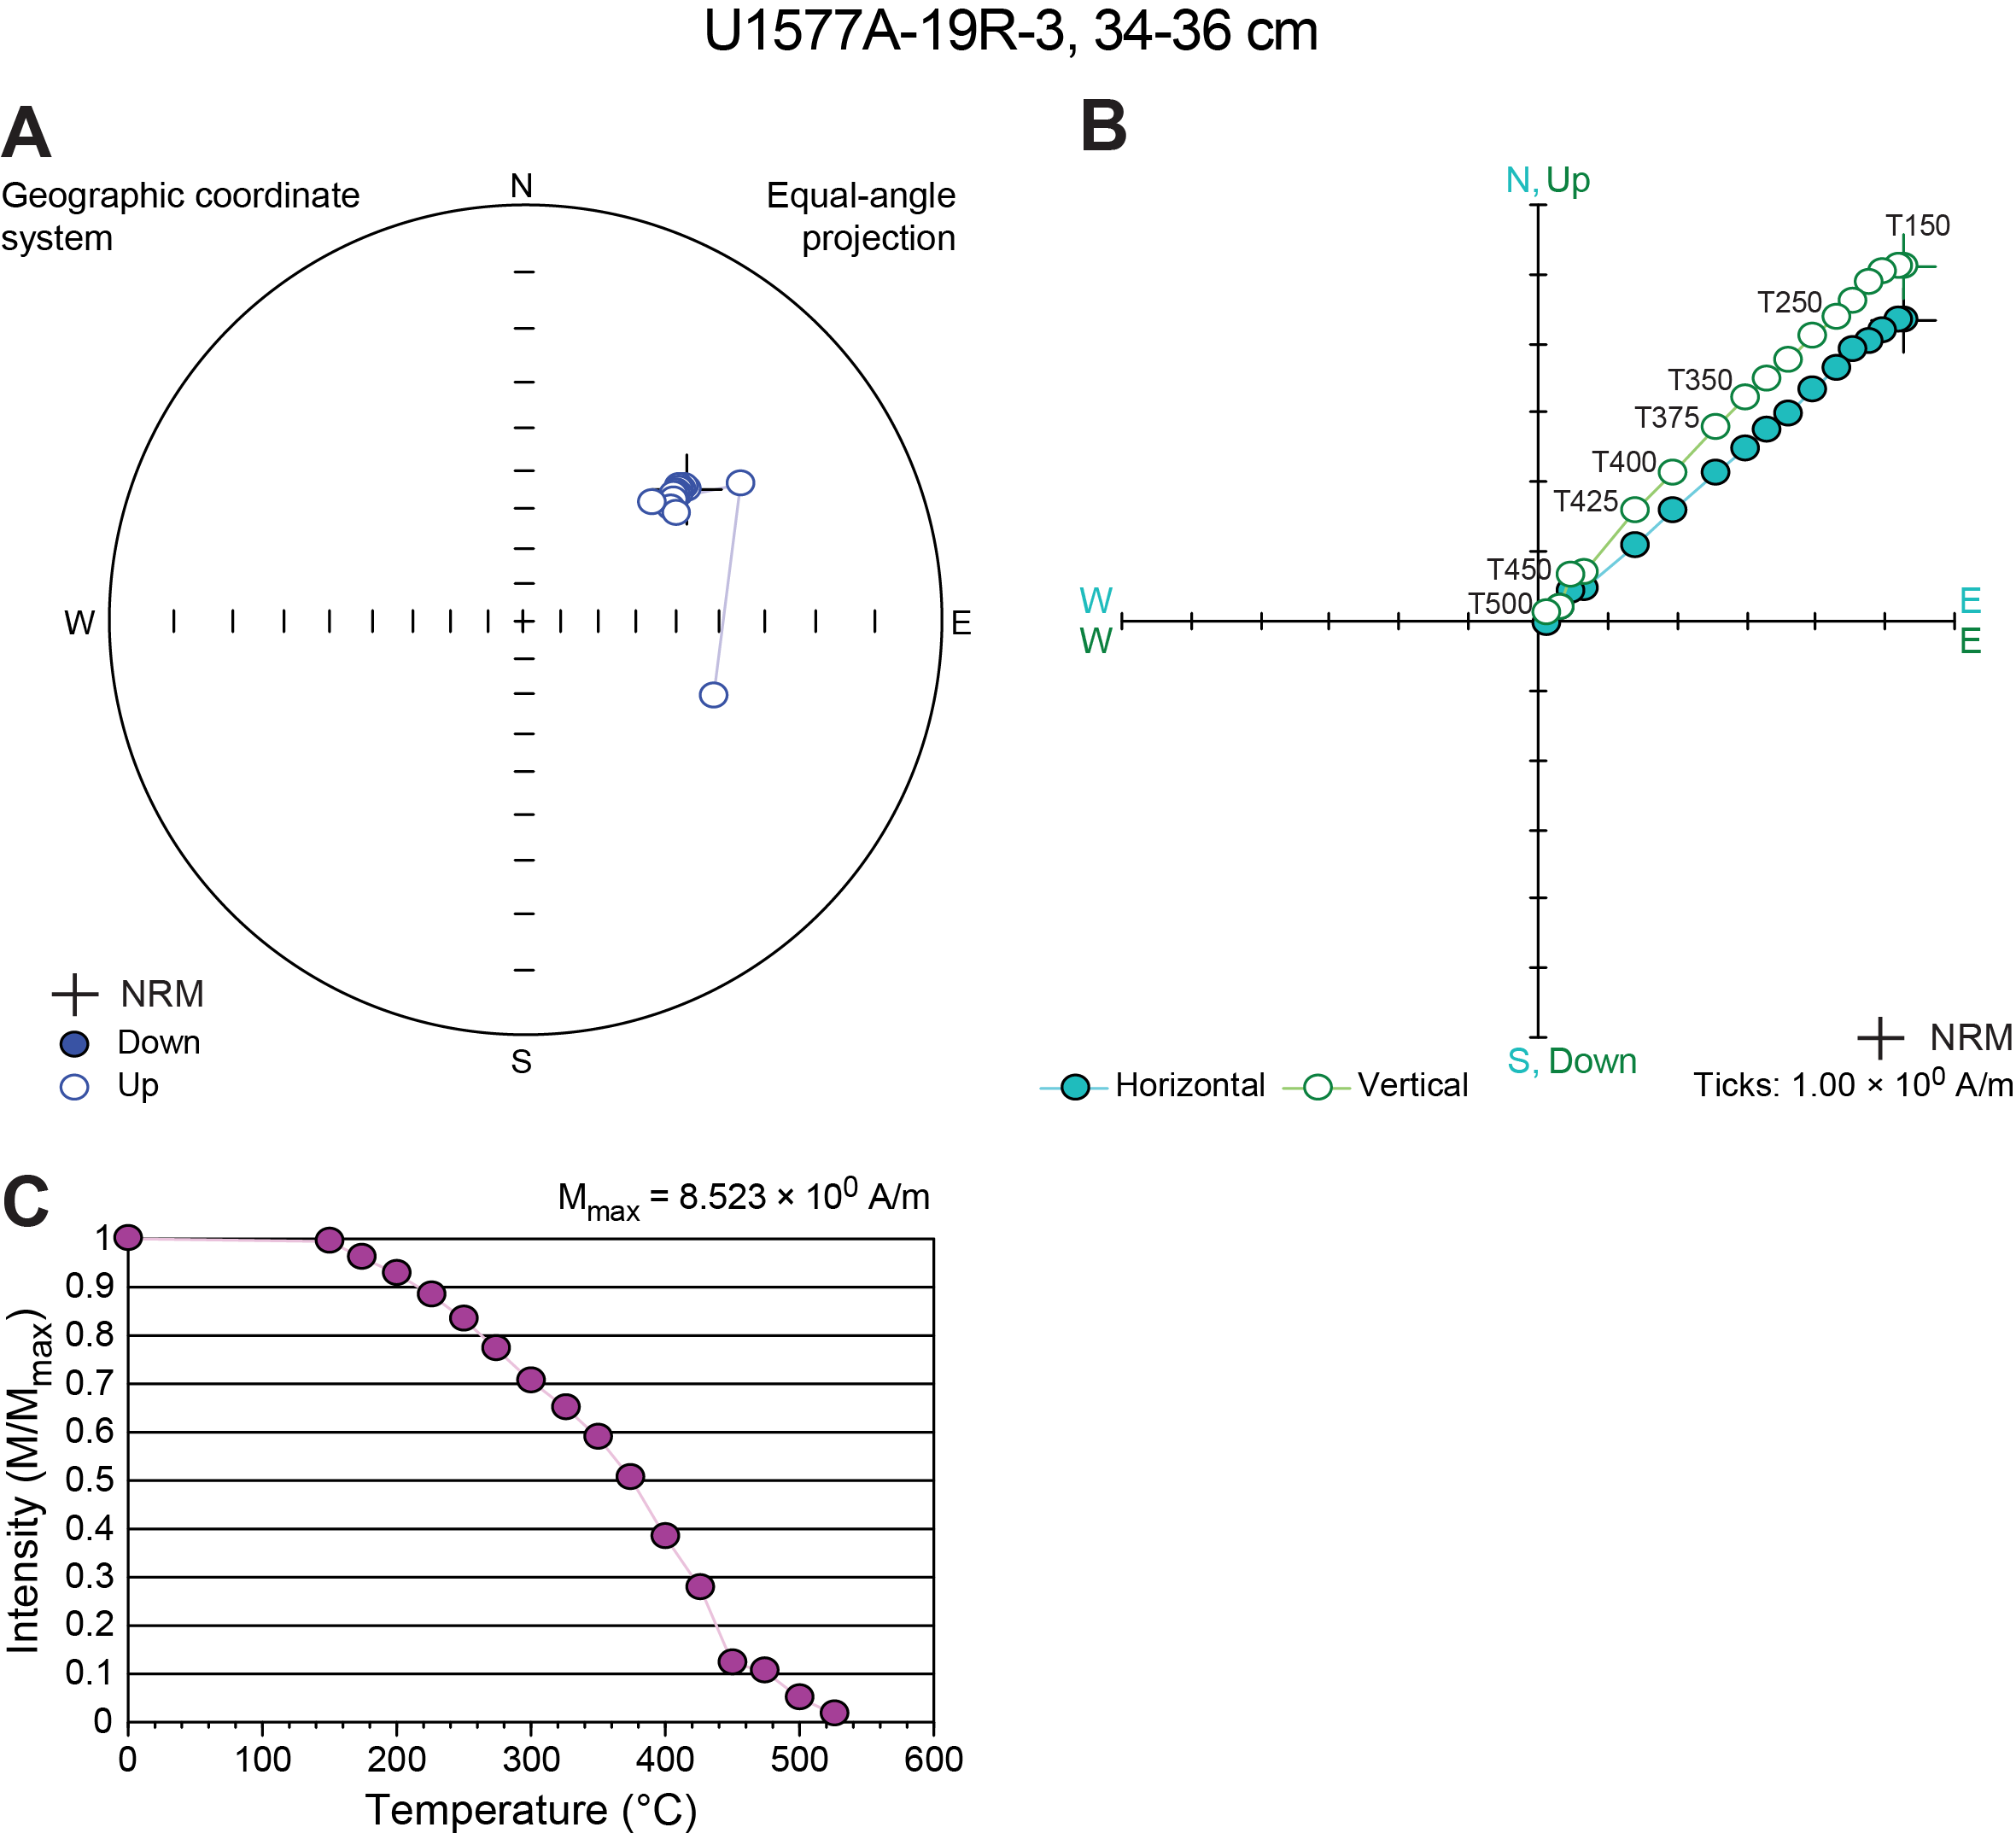
Figure F32. Thermal demagnetization result for a basalt sample.
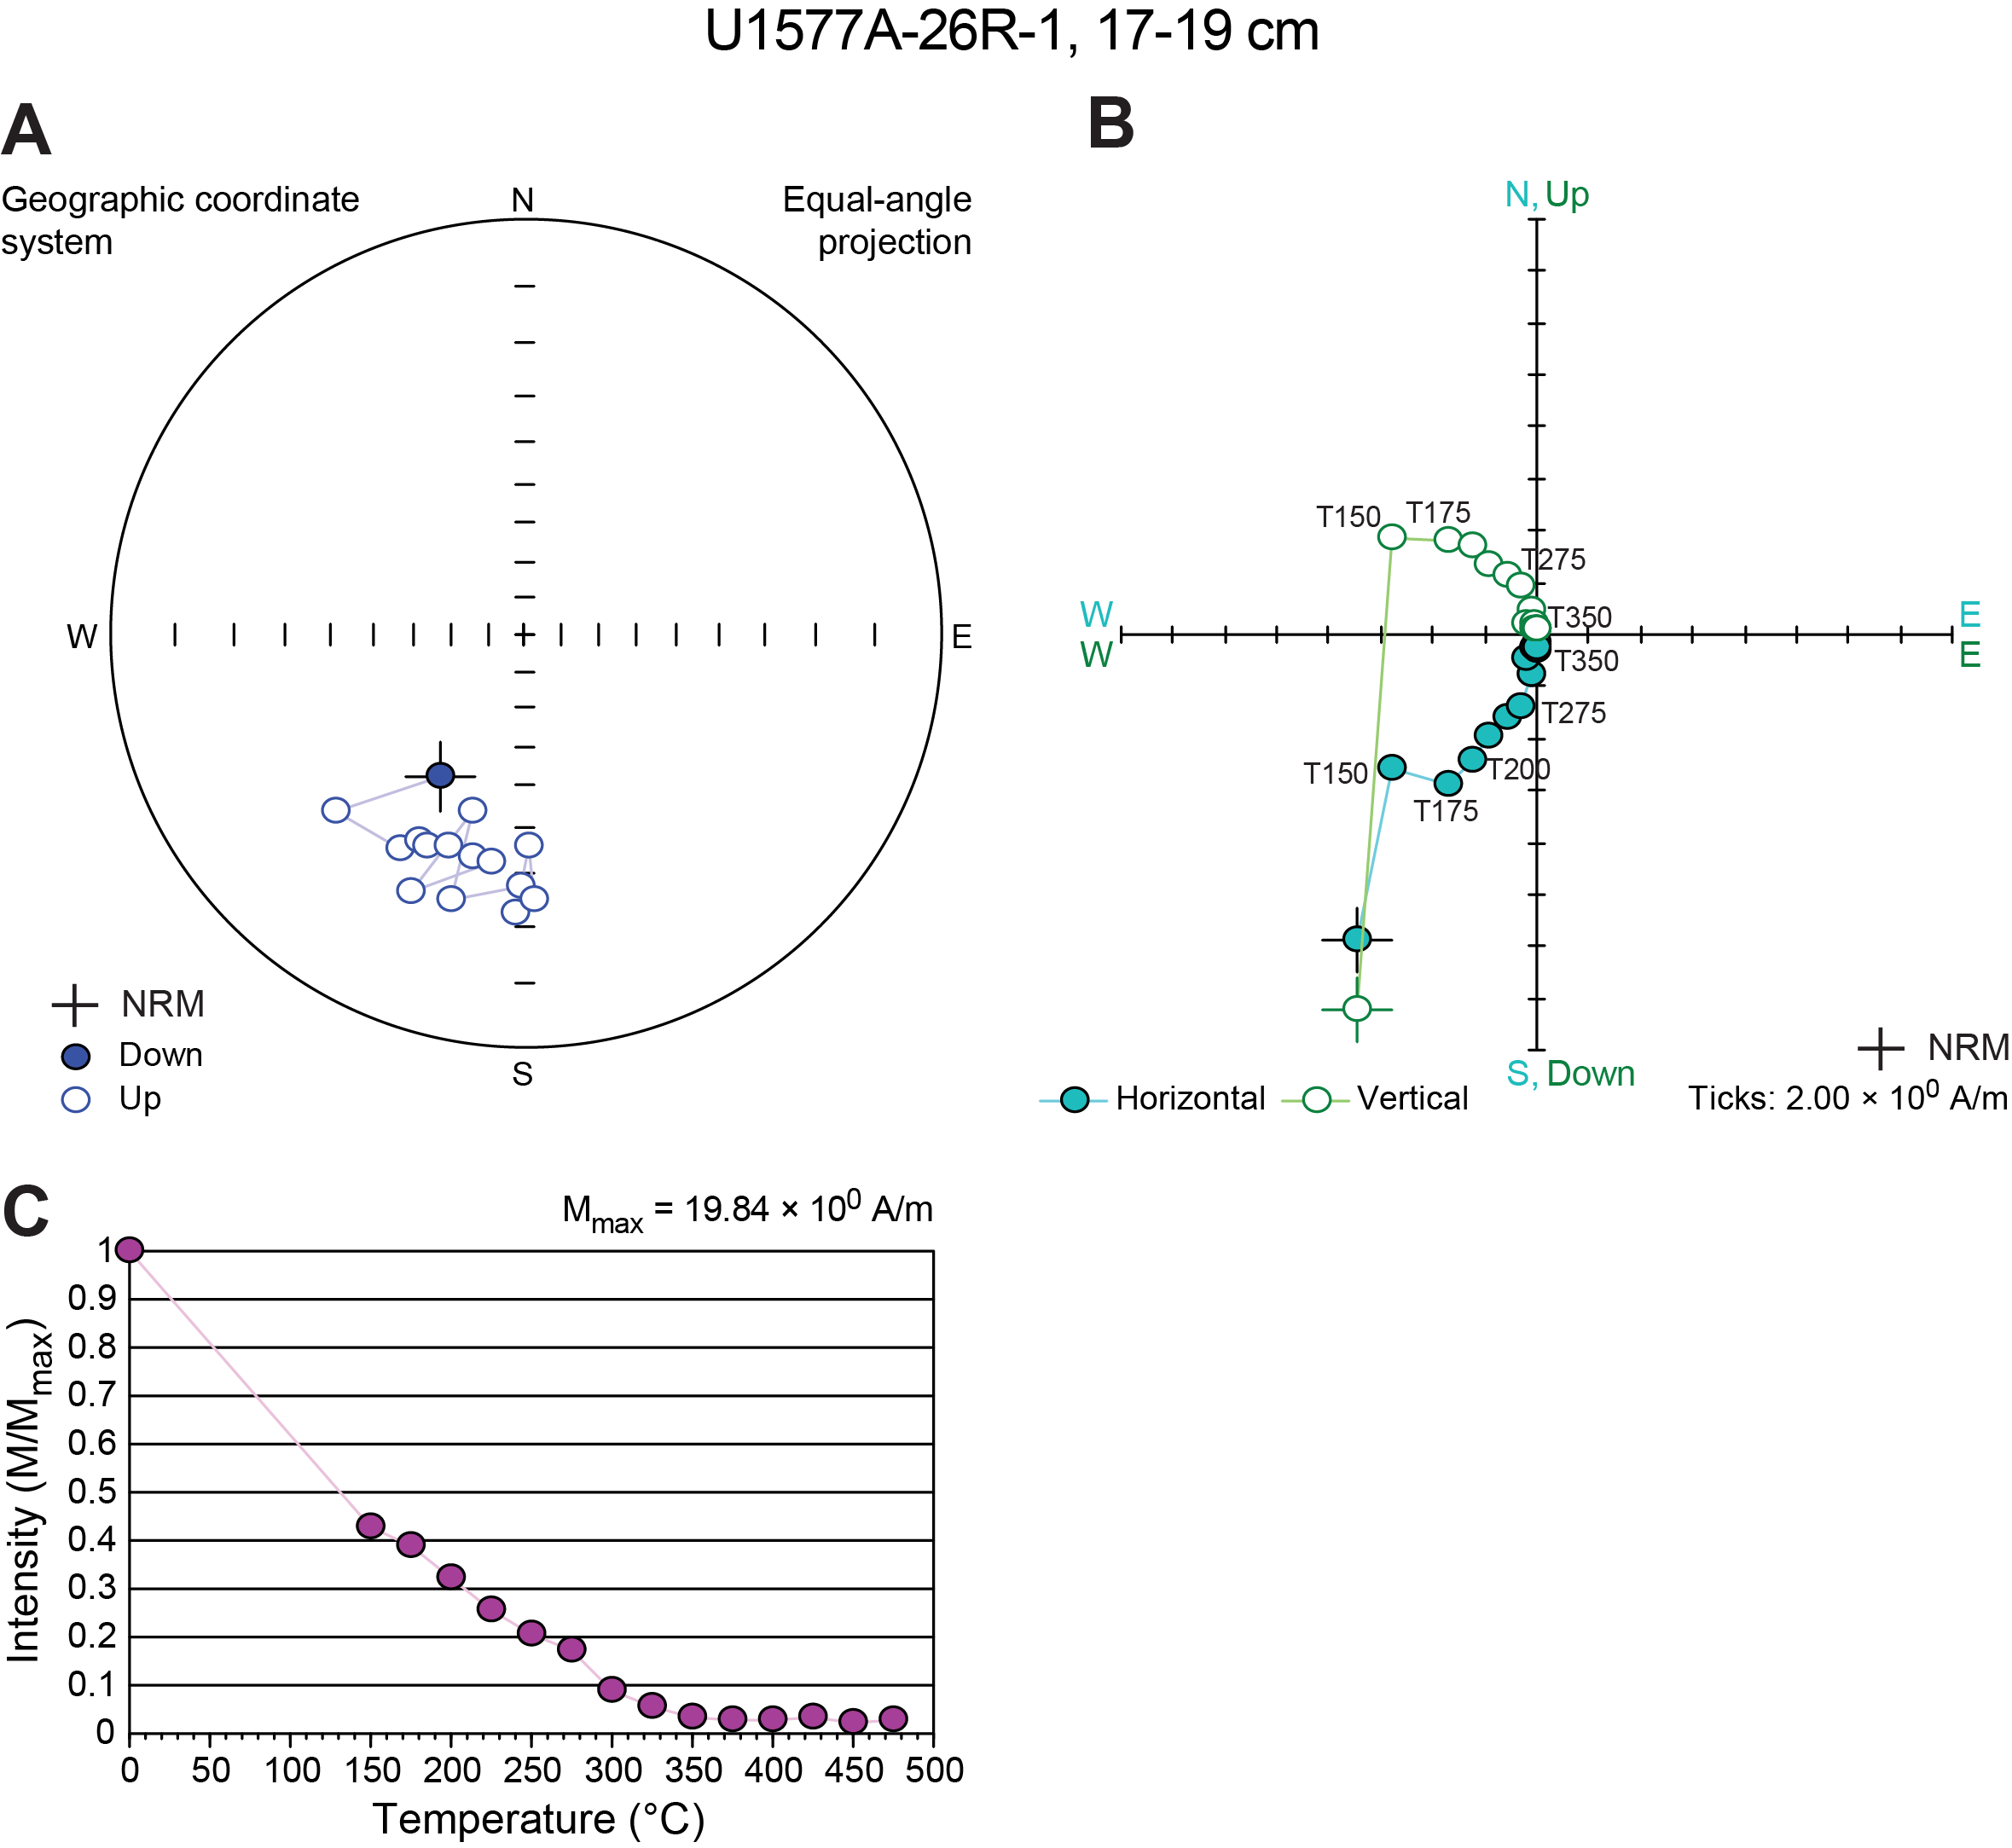
Figure F33. Thermal demagnetization result for a basalt sample.
In general, the discrete sample inclinations are in good agreement with the archive-half measurements of inclination after the 20 mT AF demagnetization step (Figure F29). The distribution of inclinations calculated from discrete AF and thermal demagnetizations are similar and comparable with the 20 mT AF step measured on archive halves (Figure F30). All average inclinations were calculated using the protocol of McFadden and Reid (1982). Inclination ChRM component directions with maximum angular deviation values <15° and N > 4 were used to calculate an overall site mean inclination of −34.2°. Because we did not estimate cooling units, we do not report an uncertainty on this number, calculate a paleolatitude, or estimate the degree to which secular variation is averaged downhole.
6.2.3. Magnetostratigraphy
All discrete igneous rock samples recovered from Site U1577 exhibit normal polarity consistent with a polarity chron assignment of C34n (120.964–83.650 Ma). The majority of the SRM 20 mT demagnetization data are also normal and agree with a CNS formation age. Although some reversed polarity sections were observed, they typically occur in sections with large hydrothermal veins which may have caused local remagnetization.
6.2.4. Magnetic properties
Bulk MS was measured on 17 discrete basalt AF demagnetization specimens. Bulk susceptibility values range 1.23 × 10⁻³ to 5.32 × 10⁻² SI.
Partial anhysteretic remanent magnetization (pARM) acquisition experiments were conducted on seven discrete igneous rock samples that had previously been used for AF demagnetization. pARM was acquired using 5 mT steps up to 45 mT (Figure F34). The pARM acquisition peaks are all between fields of 5 and 10 mT and are consistent with those of synthetic magnetite with grain sizes larger than about 4 µm (Jackson et al., 1988). IRM acquisition curves were also obtained for three samples, as were backfield curves, to measure the coercivity of remanence (Bcr), which is the field that must be applied to bring the saturation IRM to zero (Figure F35). All three samples saturated by 100 mT, which is much smaller than that of the sediments and indicates the absence of any high-coercivity magnetic minerals. Bcr values are between 10 and 20 mT, which are typical values for multidomain magnetite (e.g., Thompson and Oldfield, 1986). According to these results, the magnetization is most likely carried by pseudo–single domain to multidomain titanomagnetite with various Ti contents.

Figure F34. pARM acquisition curves.
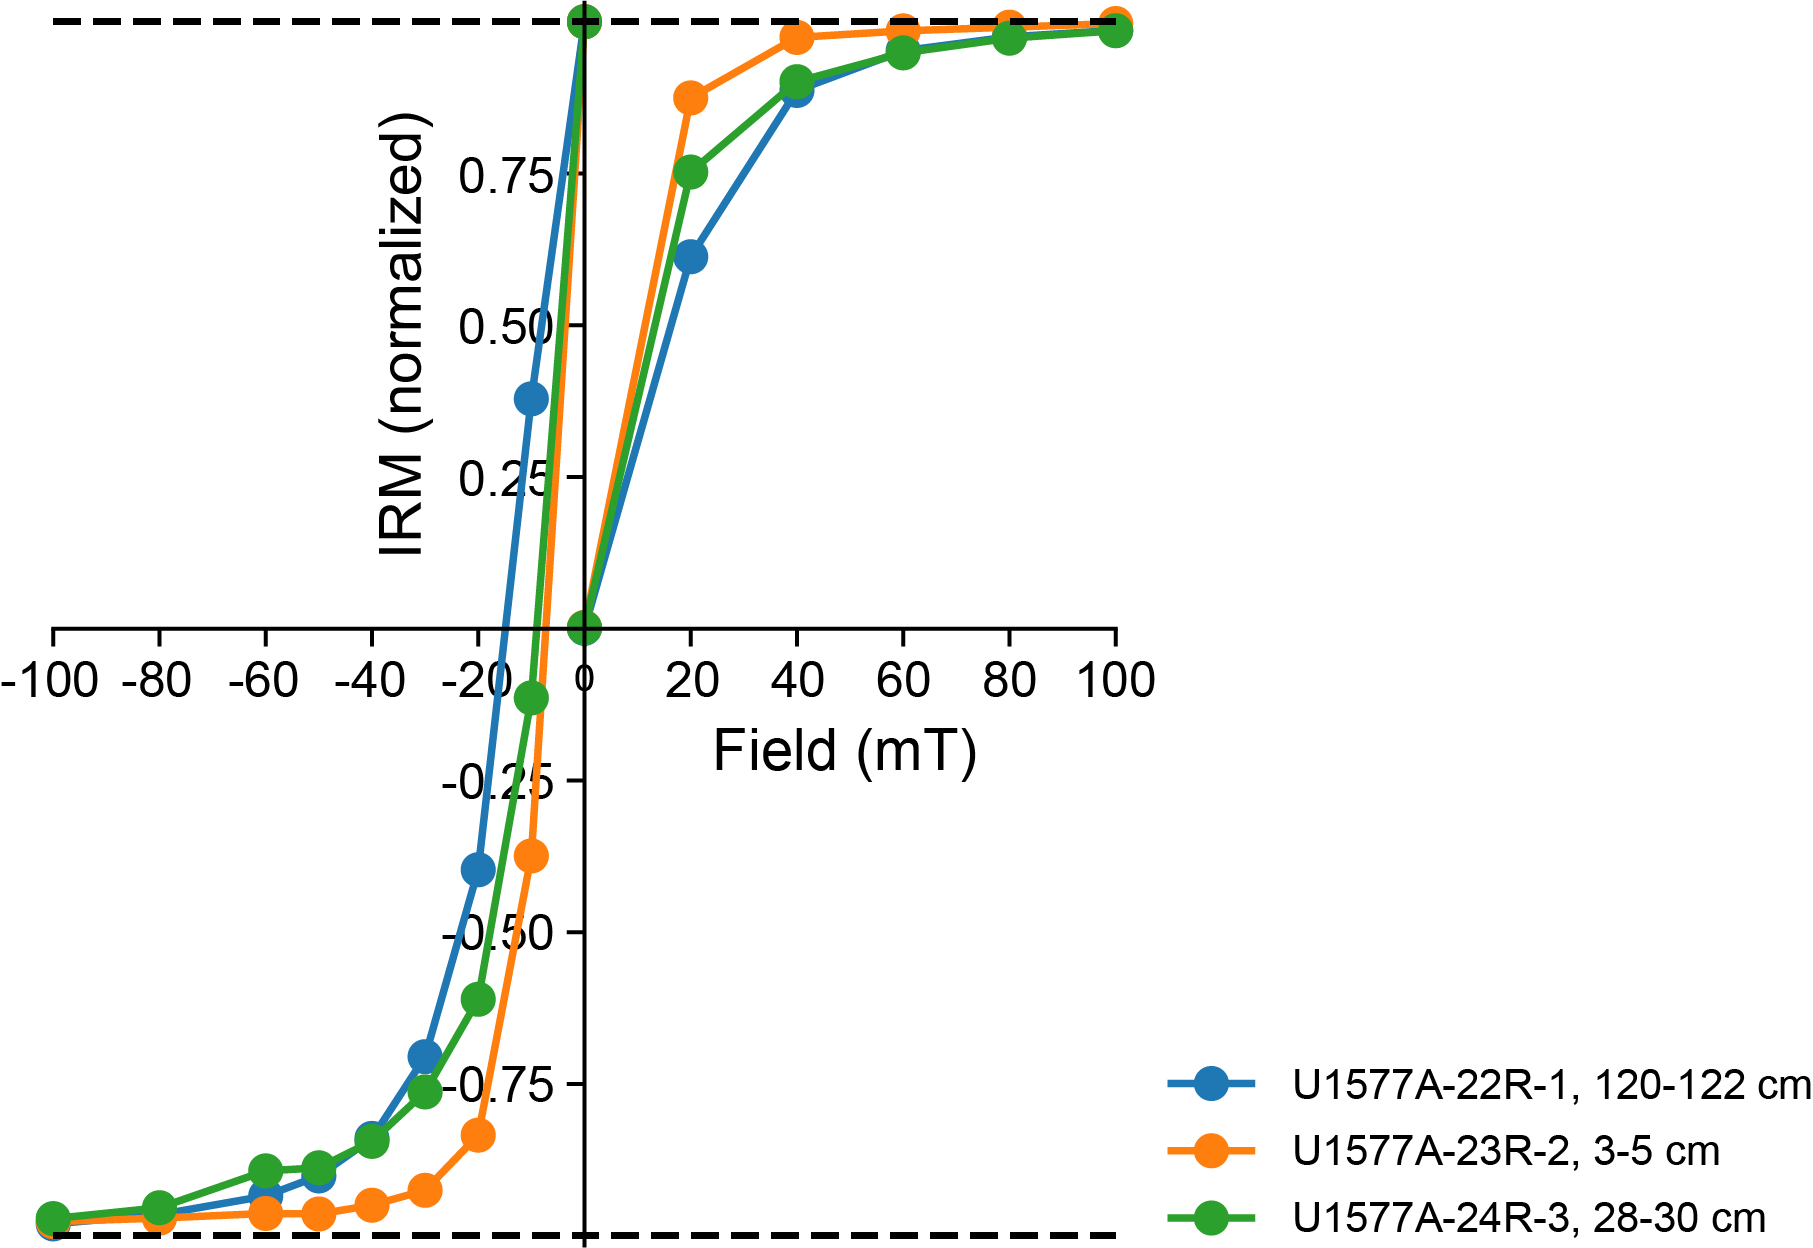
Figure F35. IRM acquisition curves for igneous rock samples.
7. Sediment and pore water geochemistry
7.1. Interstitial water chemistry
Interstitial water (IW) was collected from 16 samples from Hole U1577A (2.96–150 mbsf) for shipboard analyses. Chemical compositions of these samples were measured according to procedures outlined in Sediment and pore water geochemistry in the Expedition 391 methods chapter (Sager et al., 2023a). All results are presented in Table T4 and Figure F36.
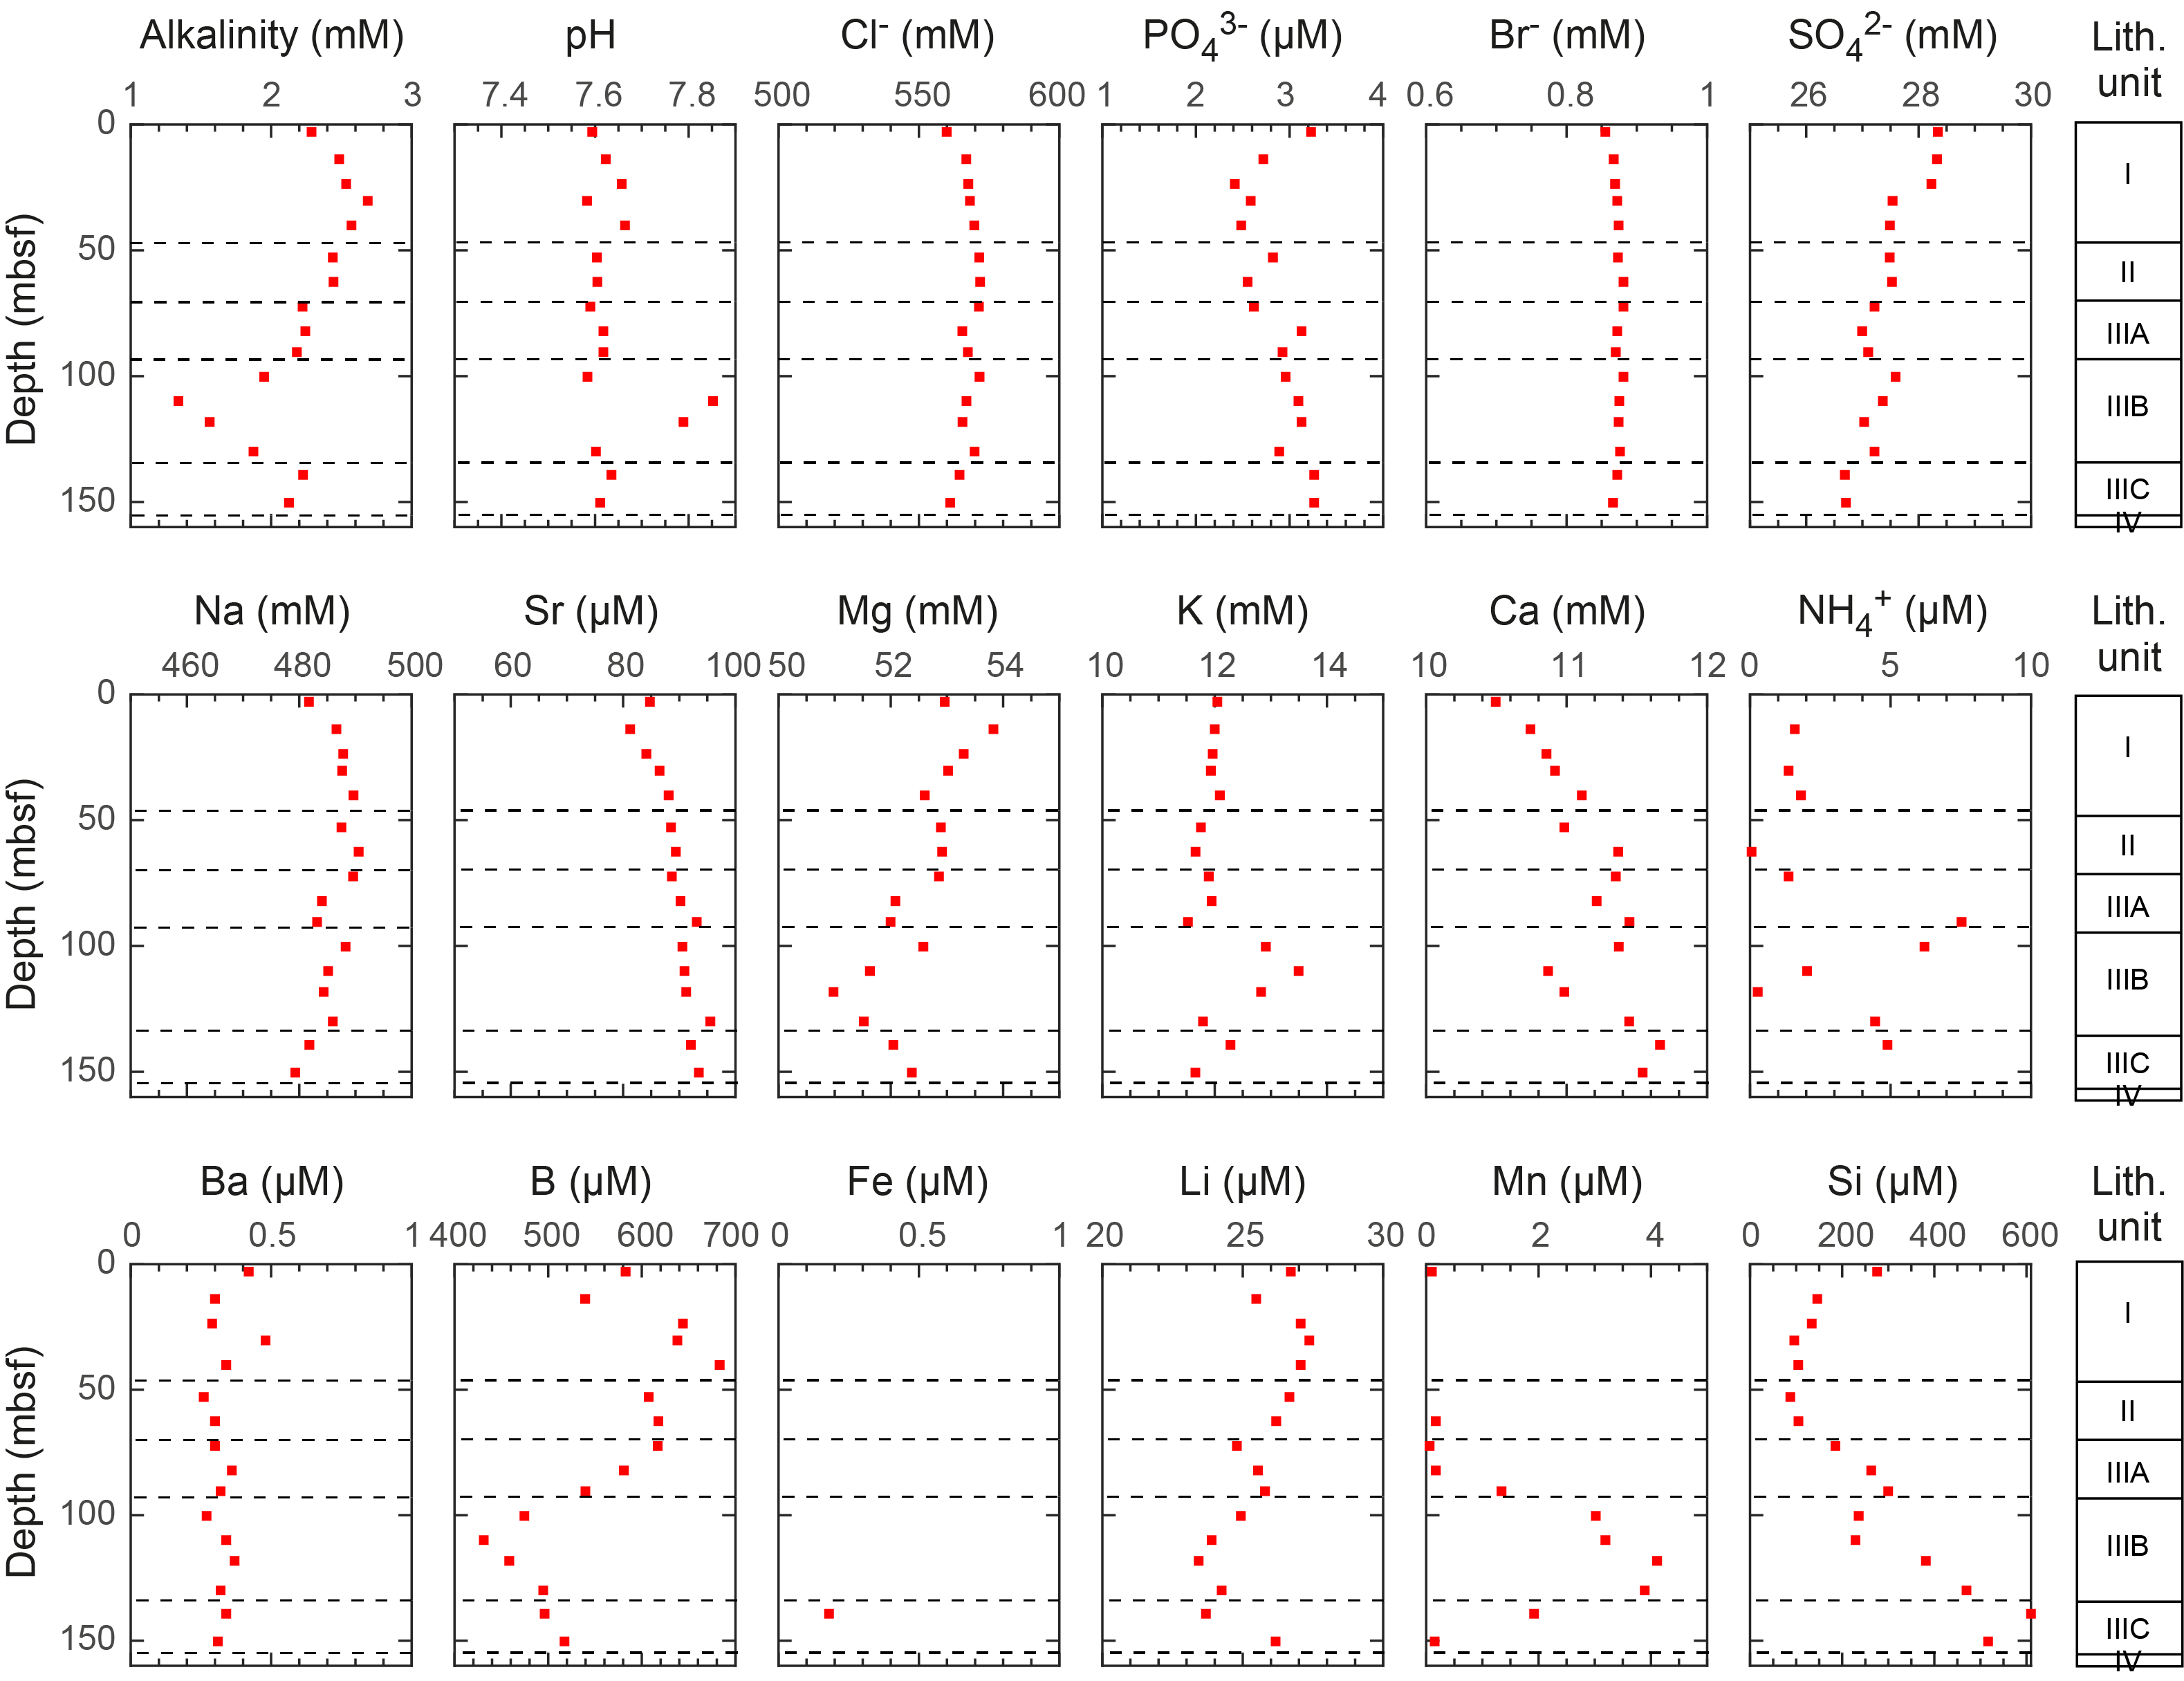
Figure F36. IW chemical compositions.
7.1.1. pH, alkalinity, chloride, and sodium
The pH value of IW at Site U1577 ranges 7.58–7.85 with a mean of 7.64 ± 0.08 (1σ standard deviation). pH is nearly constant except for the two highest values of 7.85 and 7.79 at 110 and 118 mbsf, respectively, in Lithostratigraphic Subunit IIIB. IW alkalinity varies between 1.3 and 2.7 mM and increases from 2.4 mM at 3.0 mbsf to a maximum of 2.7 mM at 30.3 mbsf, which may be attributed to dissolution of biogenic calcite. Below this depth, IW alkalinity generally shows a decreasing trend toward the bottom of the sediment succession, except for sharp minima at 110 and 118 mbsf. These alkalinity minima coincide with the pH maxima, showing that bicarbonate concentrations are tightly related to pH values.
IW chloride concentration narrowly varies between 560 and 572 mM with an average of 567 ± 4 mM. An increasing trend of chloride concentration is observed from the seafloor to 23.7 mbsf. IW chloride concentration is nearly constant below this depth. IW sodium concentration is also nearly uniform, ranging 482–490 mM (486 ± 3 mM). Like chloride, a weak increase was found from the seafloor to 23.7 mbsf. IW chloride and sodium concentrations found just below the seafloor are close to the average concentrations in the modern ocean (chloride = 559.5 mM; sodium = 480.7 mM) (Quinby-Hunt and Turekian, 1983).
7.1.2. Calcium, magnesium, lithium, and potassium
IW calcium concentration shows an overall increase throughout the depth profile from 10.5 mM at 2.96 mbsf to 11.1 mM at 40.1 mbsf at a rate of 0.016 mM/m. Below 40.1 mbsf, the rate of calcium increase with depth declines to 0.0031 mM/m. Two low-calcium anomalies are observed at 110 mbsf (10.8 mM) and 118 mbsf (11.0 mM) in Lithostratigraphic Subunit IIIB; they coincide with the pH maxima and alkalinity minima.
IW magnesium concentration is 53.0 mM at 2.96 mbsf (i.e., close to the average modern ocean value of 54.0 mM) (Quinby-Hunt and Turekian, 1983) and decreases thereafter from 53.8 mM at 13.8 mbsf to 52.6 mM at 40.1 mbsf. It is then nearly constant with a mean of 52.6 ± 0.4 mM between 53 and 100 mbsf. The lowest concentrations of magnesium were also observed at 110 mbsf (51.6 mM) and 118 mbsf (51.0 mM), where pH, alkalinity, and calcium anomalies were also found.
Site U1577 depth profiles of calcium and magnesium concentrations are distinct from those for Sites U1575 and U1576. At Site U1575, calcium and magnesium concentrations are generally constant except for the uppermost 30 m interval (see Igneous geochemistry in the Site U1575 chapter [Sager et al., 2023b]). At Site U1576, a nearly linear increase of 10 mM for calcium and decrease of 6 mM for magnesium was found between 0 and ~300 mbsf (see Igneous geochemistry in the Site U1576 chapter [Sager et al., 2023c]). At Site U1577, calcium increases by 1 mM and magnesium decreases by 2 mM from the seafloor to ~100 mbsf in a nonlinear pattern, indicating that calcite dissolution and reprecipitation might be more complex than at Sites U1575 and U1576 due to higher abundances of clay minerals related to more frequent occurrences of tephra layers (see Lithostratigraphy).
IW lithium concentration shows a gentle decrease from 27.4 µM at 30.4 mbsf to 23.4 µM at 118 mbsf. Lithium concentration then increases to 26.2 mM at the bottom of the sediment succession, perhaps due to the influence of the underlying basalt. IW potassium concentration remains relatively constant from the seafloor to 90.5 mbsf with an average of 11.9 ± 0.2 mM. In Subunit IIIB, the potassium concentration reaches a maxima with a ~2 mM increase at 110 mbsf. The surface potassium concentration is 12.0 mM, close to the modern seawater value (10.5 mM) (Quinby-Hunt and Turekian, 1983).
7.1.3. Strontium
IW strontium concentration slightly decreases from 84.8 µM just beneath the seafloor to 81.3 µM at 13.8 mbsf. Below this depth, strontium gently increases toward the bottom of the sediment succession. The maximum concentration at 131 mbsf is 95.5 µM. The overall lower IW strontium content at Site U1577 (89.3 ± 3.7 µM) compared to Sites U1575 (196.5 ± 62.4 µM) and U1576 (264.2 ± 51.1 µM) may be due to lower biogenic carbonate content at Site U1577.
7.1.4. Silicon, manganese, iron, sulfate, ammonium, and phosphate
IW silicon concentration at Site U1577 ranges 96.0–610 µM and decreases from 276 µM at the seafloor to 87.3 µM at 52.9 mbsf. Below this depth, silicon concentration increases to a maximum of 609 µM at 139 mbsf in Lithostratigraphic Subunit IIIC. The upper peak of silicon found in Unit I could be the result of biogenic silica dissolution. In contrast, the lower peak observed in Subunit IIIC could be caused by dissolution of volcanic sand and sandstone. Both processes are also evident from IW silicon concentration observed at Site U1576.
IW manganese concentration is lower than detection limits between 13.8 and 52.9 mbsf. It gently increases from 0.17 µM at 82.2 mbsf to the maximum value of 4.11 µM at 118 mbsf. The broad manganese anomaly at 90–150 mbsf in Subunits IIIB and IIIC indicates that it is mainly Mn(IV)-reducing bacteria that oxidize organic matter to produce ammonium and phosphate in the lower fraction of sediment. This is consistent with the greenish color of Subunit IIIC, which indicates a reducing environment. Ferric oxide might not be actively used as microbial electron acceptors over the entire sediment succession because most iron concentrations were lower than the instrumental detection limit. The only iron concentration above the detection limit is the IW sample at 139 mbsf, which has a concentration of 0.18 µM. On the other hand, overall sulfate concentration decreases from 28.3 mM at the seafloor to 26.7 mM at the bottom of the sediment succession, suggesting that approximately 1.6 mM of sulfate was reduced to sulfide in the entire sediment column.
IW ammonium concentration ranges 0–7.53 µM (2.87 ± 2.49 µM) at Site U1577, which is much lower than concentrations at Sites U1575 (36.3 ± 15.3 µM) and U1576 (25.5 ± 5.5 µM). In the case of IW phosphate, a surface peak of 3.23 µM at 2.96 mbsf is likely attributable to biogenic silica dissolution. Apart from the surface sample, the overall phosphate concentration increases from 2.42 to 3.26 µM between 23.7 and 150 mbsf, in line with the potential organic matter remineralization by manganese and sulfate reduction. Compared to previous sites, a molar ratio of ammonium to phosphate concentration is lower at Site U1577 with a ratio of nearly 1:1.
7.1.5. Bromide, boron, and barium
Concentrations of IW bromide and barium change little over the entire sediment depth range; bromide has a mean concentration of 0.87 ± 0.01 mM, and barium has a mean concentration of 0.33 ± 0.06 µM. Bromide concentration is similar to the concentrations observed at Sites U1575 and U1576, but barium concentration is lower than at the two previous sites (1.11 ± 0.24 µM at Site U1575; 2.74 ± 0.22 µM at Site U1576). IW boron concentration is relatively constant between the seafloor and 70 mbsf and averages 616 ± 43 µM. Below this depth, a large decrease in boron is found, with a minimum value of 431 µM at 110 mbsf. This is likely the consequence of strengthened boron absorption by clay minerals (Marschall, 2018), which have an elevated content in Lithostratigraphic Subunit IIIB.
7.2. Hydrocarbons in gas phase
Gas-phase samples were analyzed for C1–C6 (methane, ethane, propane, butane, pentene, and hexane) for routine safety monitoring in Hole U1577A at a frequency of one sample per 9.6 m core. The concentration of methane (C1) in 16 headspace samples analyzed from Site U1577 was lower than 2.0 µL/L (i.e., the atmospheric background level) in all samples. No hydrocarbon gases that have higher concentrations than C1 were detected.
7.3. Sediment geochemistry
7.3.1. Total carbon, inorganic carbon, and organic carbon
Sediment samples were analyzed to determine CaCO3, total carbon (TC), total organic carbon (TOC), total nitrogen (TN), and total sulfur (TS) contents. Solid phase analysis results are reported in Table T5 and Figure F37. In Hole U1577A, the sampling frequency was one per core for Cores 1R–17R (except Core 15R). CaCO3 content in sediment varies 37–80 wt% (mean = 60 ± 14 wt%). In Lithostratigraphic Unit I, sediment consists mainly of nannofossil-foraminifera ooze (see Lithostratigraphy). In the same unit, CaCO3 content shows a range of 49–80 wt% (mean = 69 ± 10 wt%). CaCO3 content shows a major decrease from 76 wt% at 72.4 mbsf to 37 wt% at 131 mbsf in Subunits IIIA and IIIB. The decreasing trend agrees with the lithology changes from foraminifera-nannofossil ooze to foraminifera-nannofossil chalk with clay that includes minor or rare layers of volcanic sand or sandstone. TC content in the sediment varies between 4.49 and 9.40 wt% (mean = 7.3 ± 1.6 wt%). The TC trend is approximately the same as that of CaCO3 and has a narrow range from 6.08 wt% at 2.96 mbsf to 9.40 wt% at 52.9 mbsf (mean = 8.4 ± 1.2 wt%) in Units I and II. In Subunits IIIA and IIIB, TC content decreases from 9.2 wt% at 72.4 mbsf to 4.5 wt% at 131 mbsf. TOC content in sediment varies between 0.05 and 0.23 wt% (mean = 0.14 ± 0.05 wt%) throughout the entire sediment succession. A gentle decrease of TOC is noted from 0.23 at 100 mbsf to 0.05 wt% at 139 mbsf in Subunit IIIB. TS and TN contents were below the instrumental detection limits for all samples.
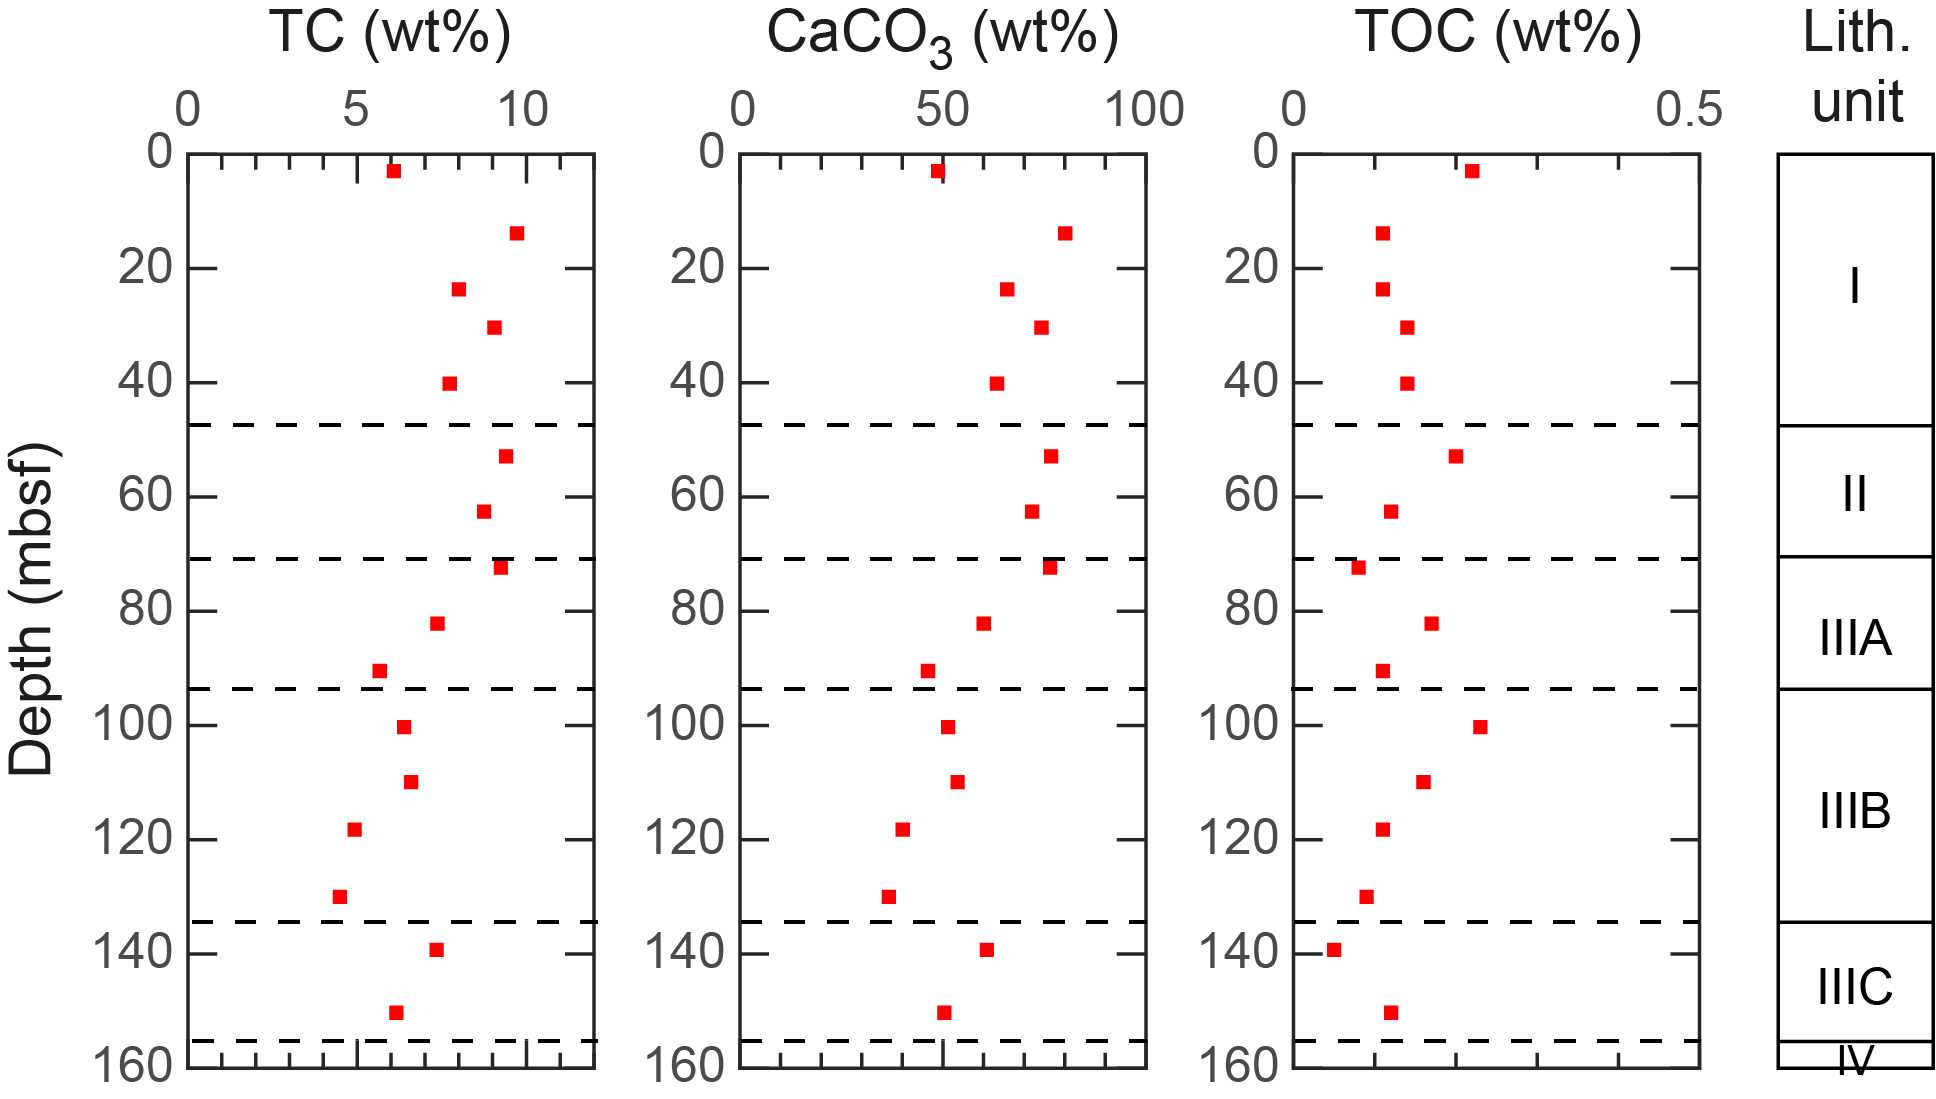
Figure F37. TC, CaCO3, and TO.
8. Igneous geochemistry
At Site U1577, one igneous unit (154.80–193.47 mbsf) consisting of highly phyric massive basalt flows separated by thin chilled margins is divided into three subunits. In total, seven samples, covering the depth range from 154.93 mbsf (Sample 391-U1577A-18R-2, 2–4 cm) to 189.92 mbsf (Sample 25R-2, 100–102 cm), were analyzed by inductively coupled plasma–atomic emission spectroscopy (ICP-AES) and pXRF spectrometry. The samples were selected based on the variations of lithology, pXRF measurement results on archive-half sections (Table T6), and alteration extent (see Igneous petrology and volcanology) and are representative of the recovered lithologies, which can be briefly summarized as follows:
- Igneous Subunit 1a: one sample from a 4.1 m thick highly phyric plagioclase-clinopyroxene-olivine basalt flow.
- Igneous Subunit 1b: three samples from a 15.5 m thick highly phyric plagioclase-clinopyroxene basalt flow.
- Igneous Subunit 1c: three samples from a > 19.1 m thick highly phyric plagioclase-clinopyroxene-olivine basalt flow.
Major and trace element compositions were analyzed using ICP-AES and pXRF on all seven samples (Tables T7, T8). Detailed sample preparation, analytical procedures, standard analyses, calibration, and drift corrections are reported for both methods in the Expedition 391 methods chapter (Sager et al., 2023a). The total sums of the major element oxides in weight percentages acquired using ICP-AES range 96.95–100.71 wt% (Table T8). Total iron was recalculated as Fe2O3t, and the major element oxide concentrations determined using ICP-AES were normalized to 100% on a volatile-free basis. Similar to Sites U1575 and U1576, the normalized values at Site U1577 are used for an improved comparison between the respective Expedition 391 sites and literature data from previous drill and dredge sites along the submarine Tristan-Gough hotspot track (e.g., Le Maitre, 1962; Richardson et al., 1984; Weaver et al., 1987; Le Roex et al., 1990; Cliff et al., 1991; Willbold and Stracke, 2006; Class and le Roex, 2008; Salters and Sachi-Kocher, 2010; Rohde et al., 2013; Hoernle et al., 2015; Homrighausen et al., 2018, 2019). For Hole U1577A, pXRF section half measurements (n = 50) were conducted on the archive-half sections of the recovered cores (Table T6). Drift was monitored by running the BHVO-2 standard intermittently throughout the analytical process; no instrumental drift was detected (see Table T10 in the Expedition 391 methods chapter [Sager et al., 2023a]). In general, each point was analyzed twice to account for analytical error.
8.1. Comparison of ICP-AES and pXRF results
The ICP-AES and pXRF results display good linear correlation coefficients between the two methods (Figure F38), with R2 ≥ 0.90 for K2O, MnO, and Ni, whereas V, Cu, Zn, Zr, and Y have weak correlation coefficients (R2 = 0.02–0.16), which is probably due to pXRF measurement error and the relatively restricted and homogeneous composition of Site U1577 samples compared to previous sites drilled during Expedition 391. The difference between the two methods is relatively minor, with less than ±10% for Sr and Zr. In contrast, the pXRF results are systematically higher for TiO2 and lower for Fe2O3t, MnO, CaO, and V than those determined by ICP-AES, probably due to the secondary fluorescence effect in pXRF caused by the iron atoms, which lowers, for example, the Fe2O3t value compared to the actual value and raises the value of elements with masses similar to iron. CaO also shows systematically lower pXRF results, with the discrepancy increasing with increasing CaO content up to ~40% compared to ICP-AES results. Cr values obtained using pXRF are not considered in the following because the Cr concentration of the samples is close to the detection limit of the pXRF. For elements lighter than potassium, absorption and scattering have a significant effect on pXRF measurements, so data for these elements are not discussed here.
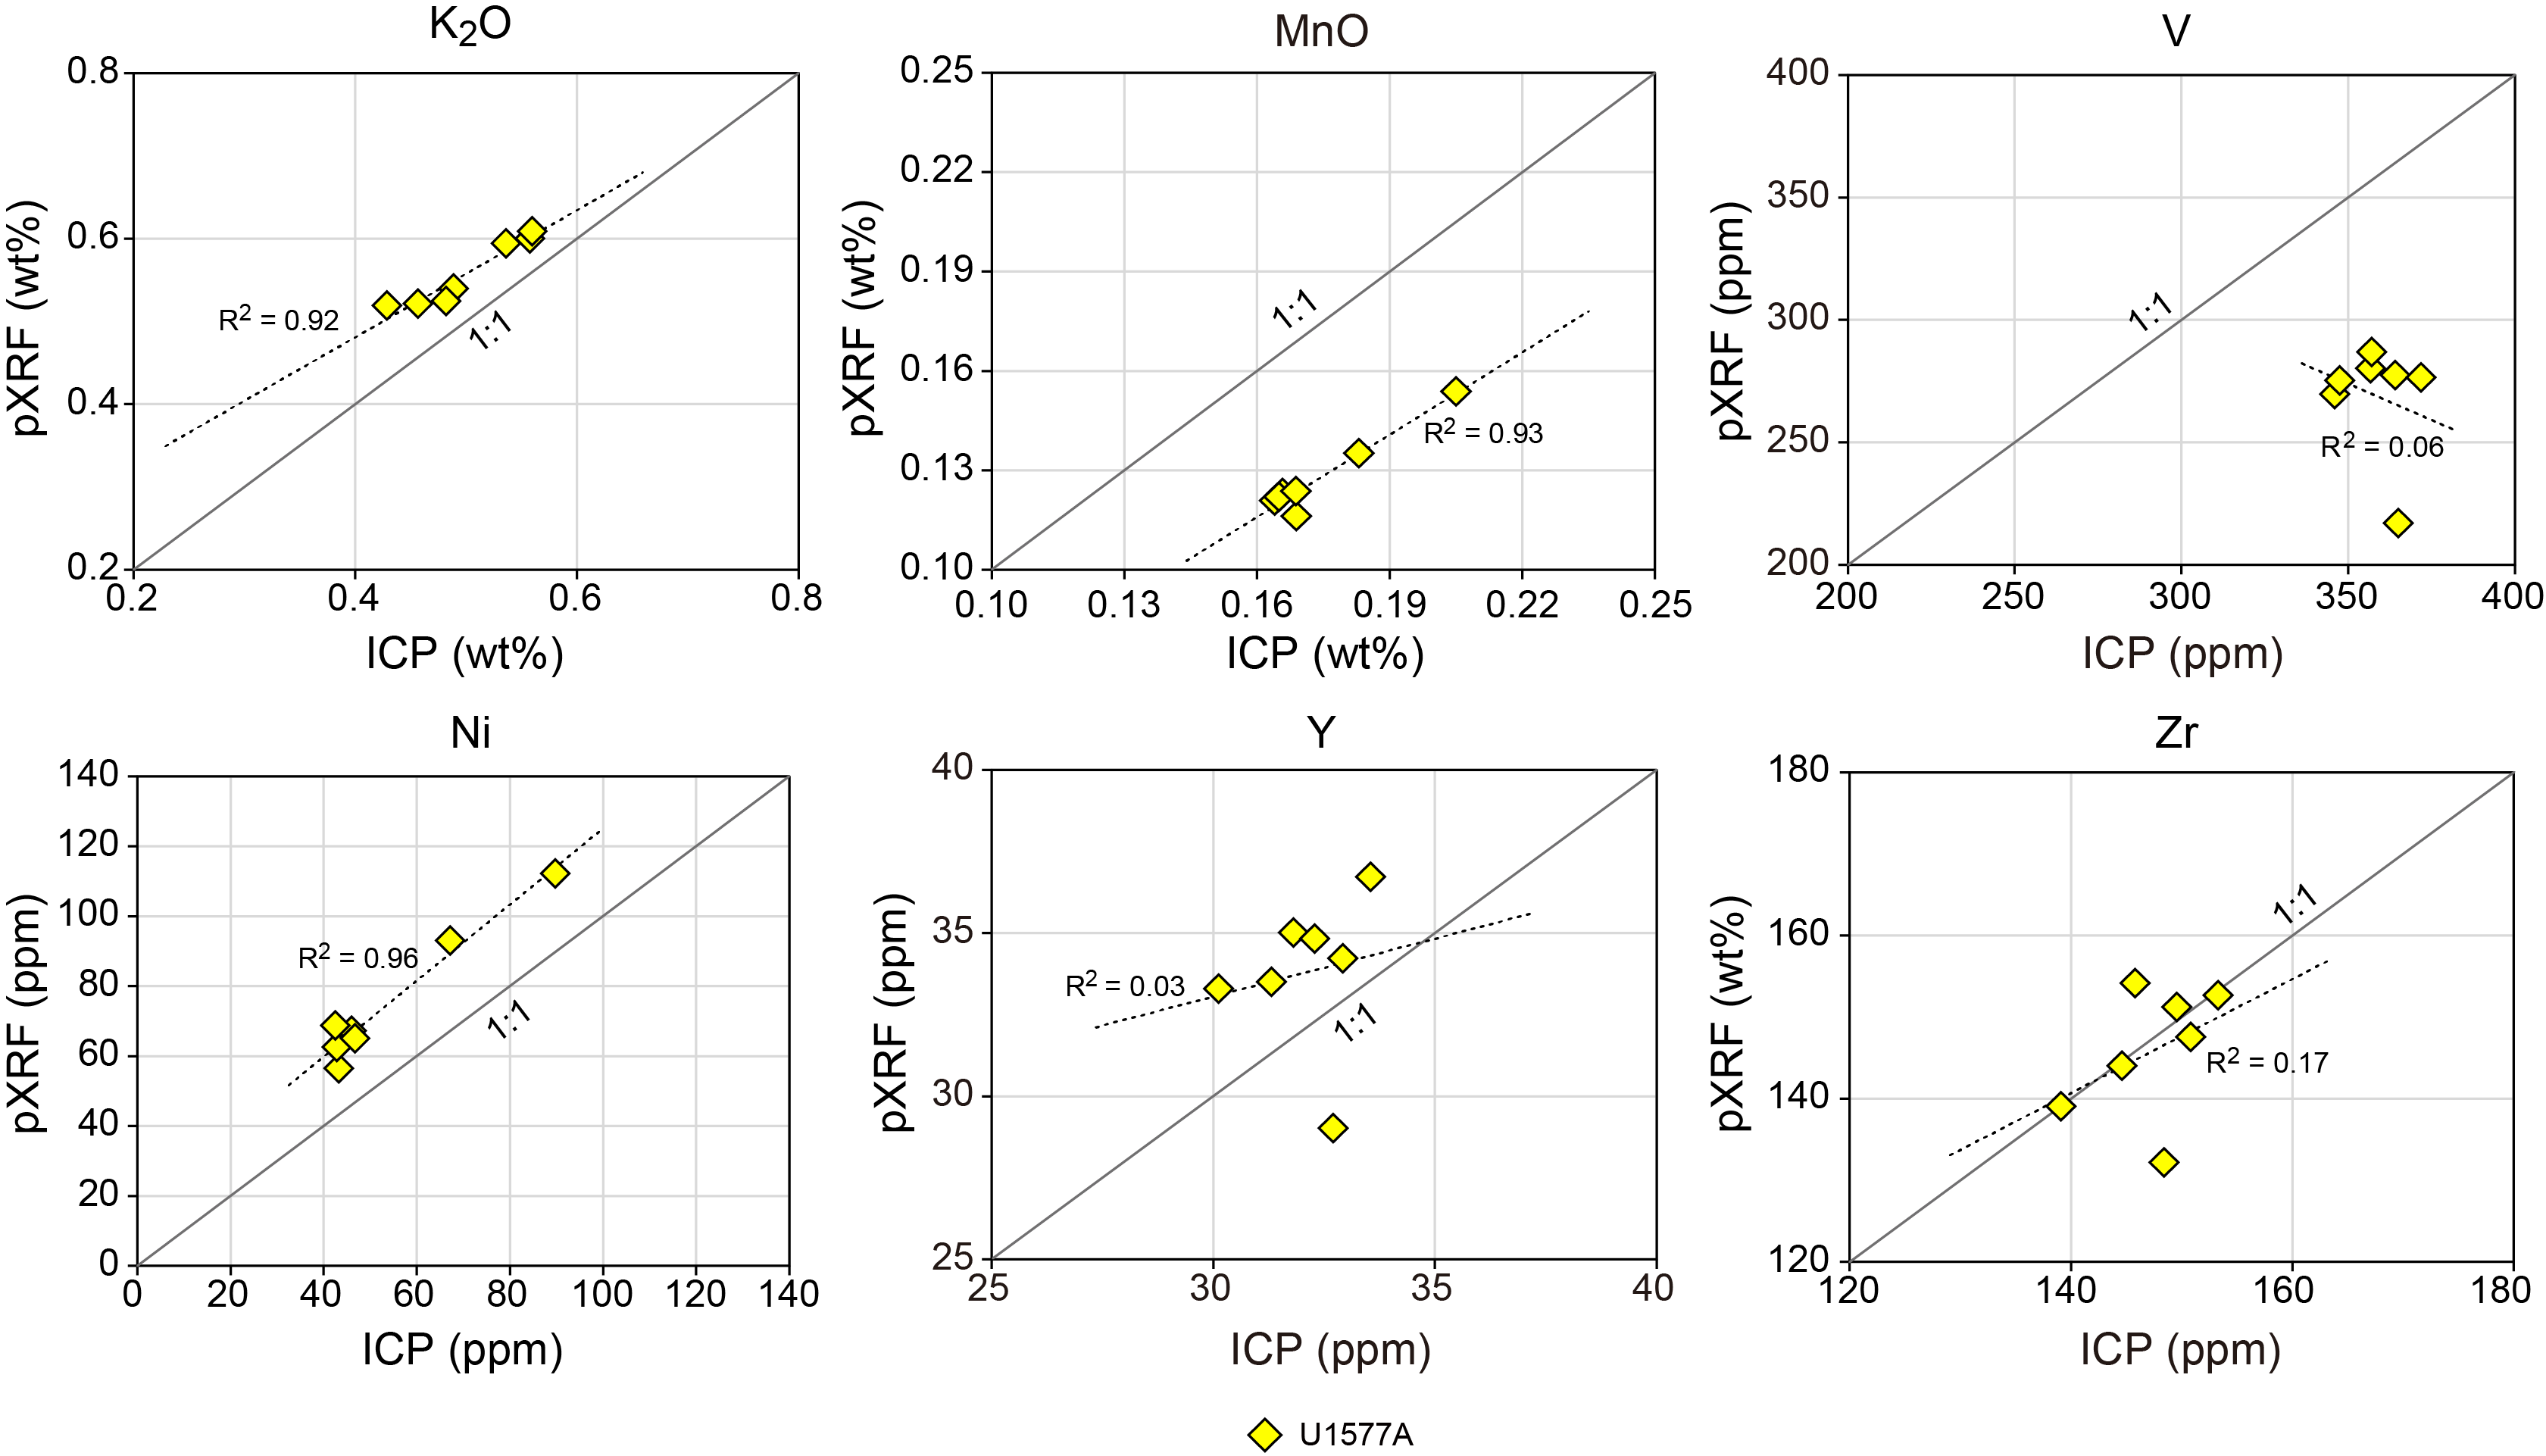
Figure F38. pXRF and ICP-AES results.
8.2. Alteration
The recovered igneous units at Site U1577 consist of massive basalt lava flows that show negligible quantities of secondary minerals throughout (see Igneous petrology and volcanology). Nevertheless, three samples (391-U1577A-18R-2, 2–4 cm; 20R-4, 13–14 cm; and 21R-1, 98–100 cm) are classified as slightly altered based on minor brownish discoloration. Overall, loss on ignition (LOI), which is an indicator for the degree of alteration, is low (<1.35 wt%) for all samples. Two of three slightly altered samples have LOI of 1.10 and 1.32 wt%, whereas all remaining samples have LOI <0.72 wt%. The three slightly altered samples have major and trace element compositions that are within the range of the fresh samples (Table T8), except K2O, which is slightly higher (0.56 wt%) compared to the remainder (0.43–0.54 wt%). In general, seawater alteration could lead to significant modifications of fluid-mobile elements, such as increased K2O and Sr (e.g., Hart et al., 1974; Jochum and Verma, 1996), but the low LOI, petrographic observations and overall extremely homogeneous composition of the slightly altered and fresh samples in the respective igneous units (Table T8) indicate that alteration did not significantly affect the pristine composition of the reported samples.
8.3. Total alkali versus silica classification and Ti/V
All samples from Site U1577 are basalts according to the total alkali versus silica classification after Le Bas et al. (1986), and they lie within the tholeiitic field of MacDonald and Katsura (1964) (Figure F39). Compared to the samples previously recovered during Expedition 391, the lavas from Site U1577 have an intermediate composition and cluster where the low- and high-Ti basalts from Site U1575 overlap. Site U1577 samples lie at the extension of the most mafic samples from Site U1576 (Figure F39A). Overall, Site U1577 samples are extremely homogeneous and of limited compositional range compared to Sites U1575 and U1576 (Figure F40).
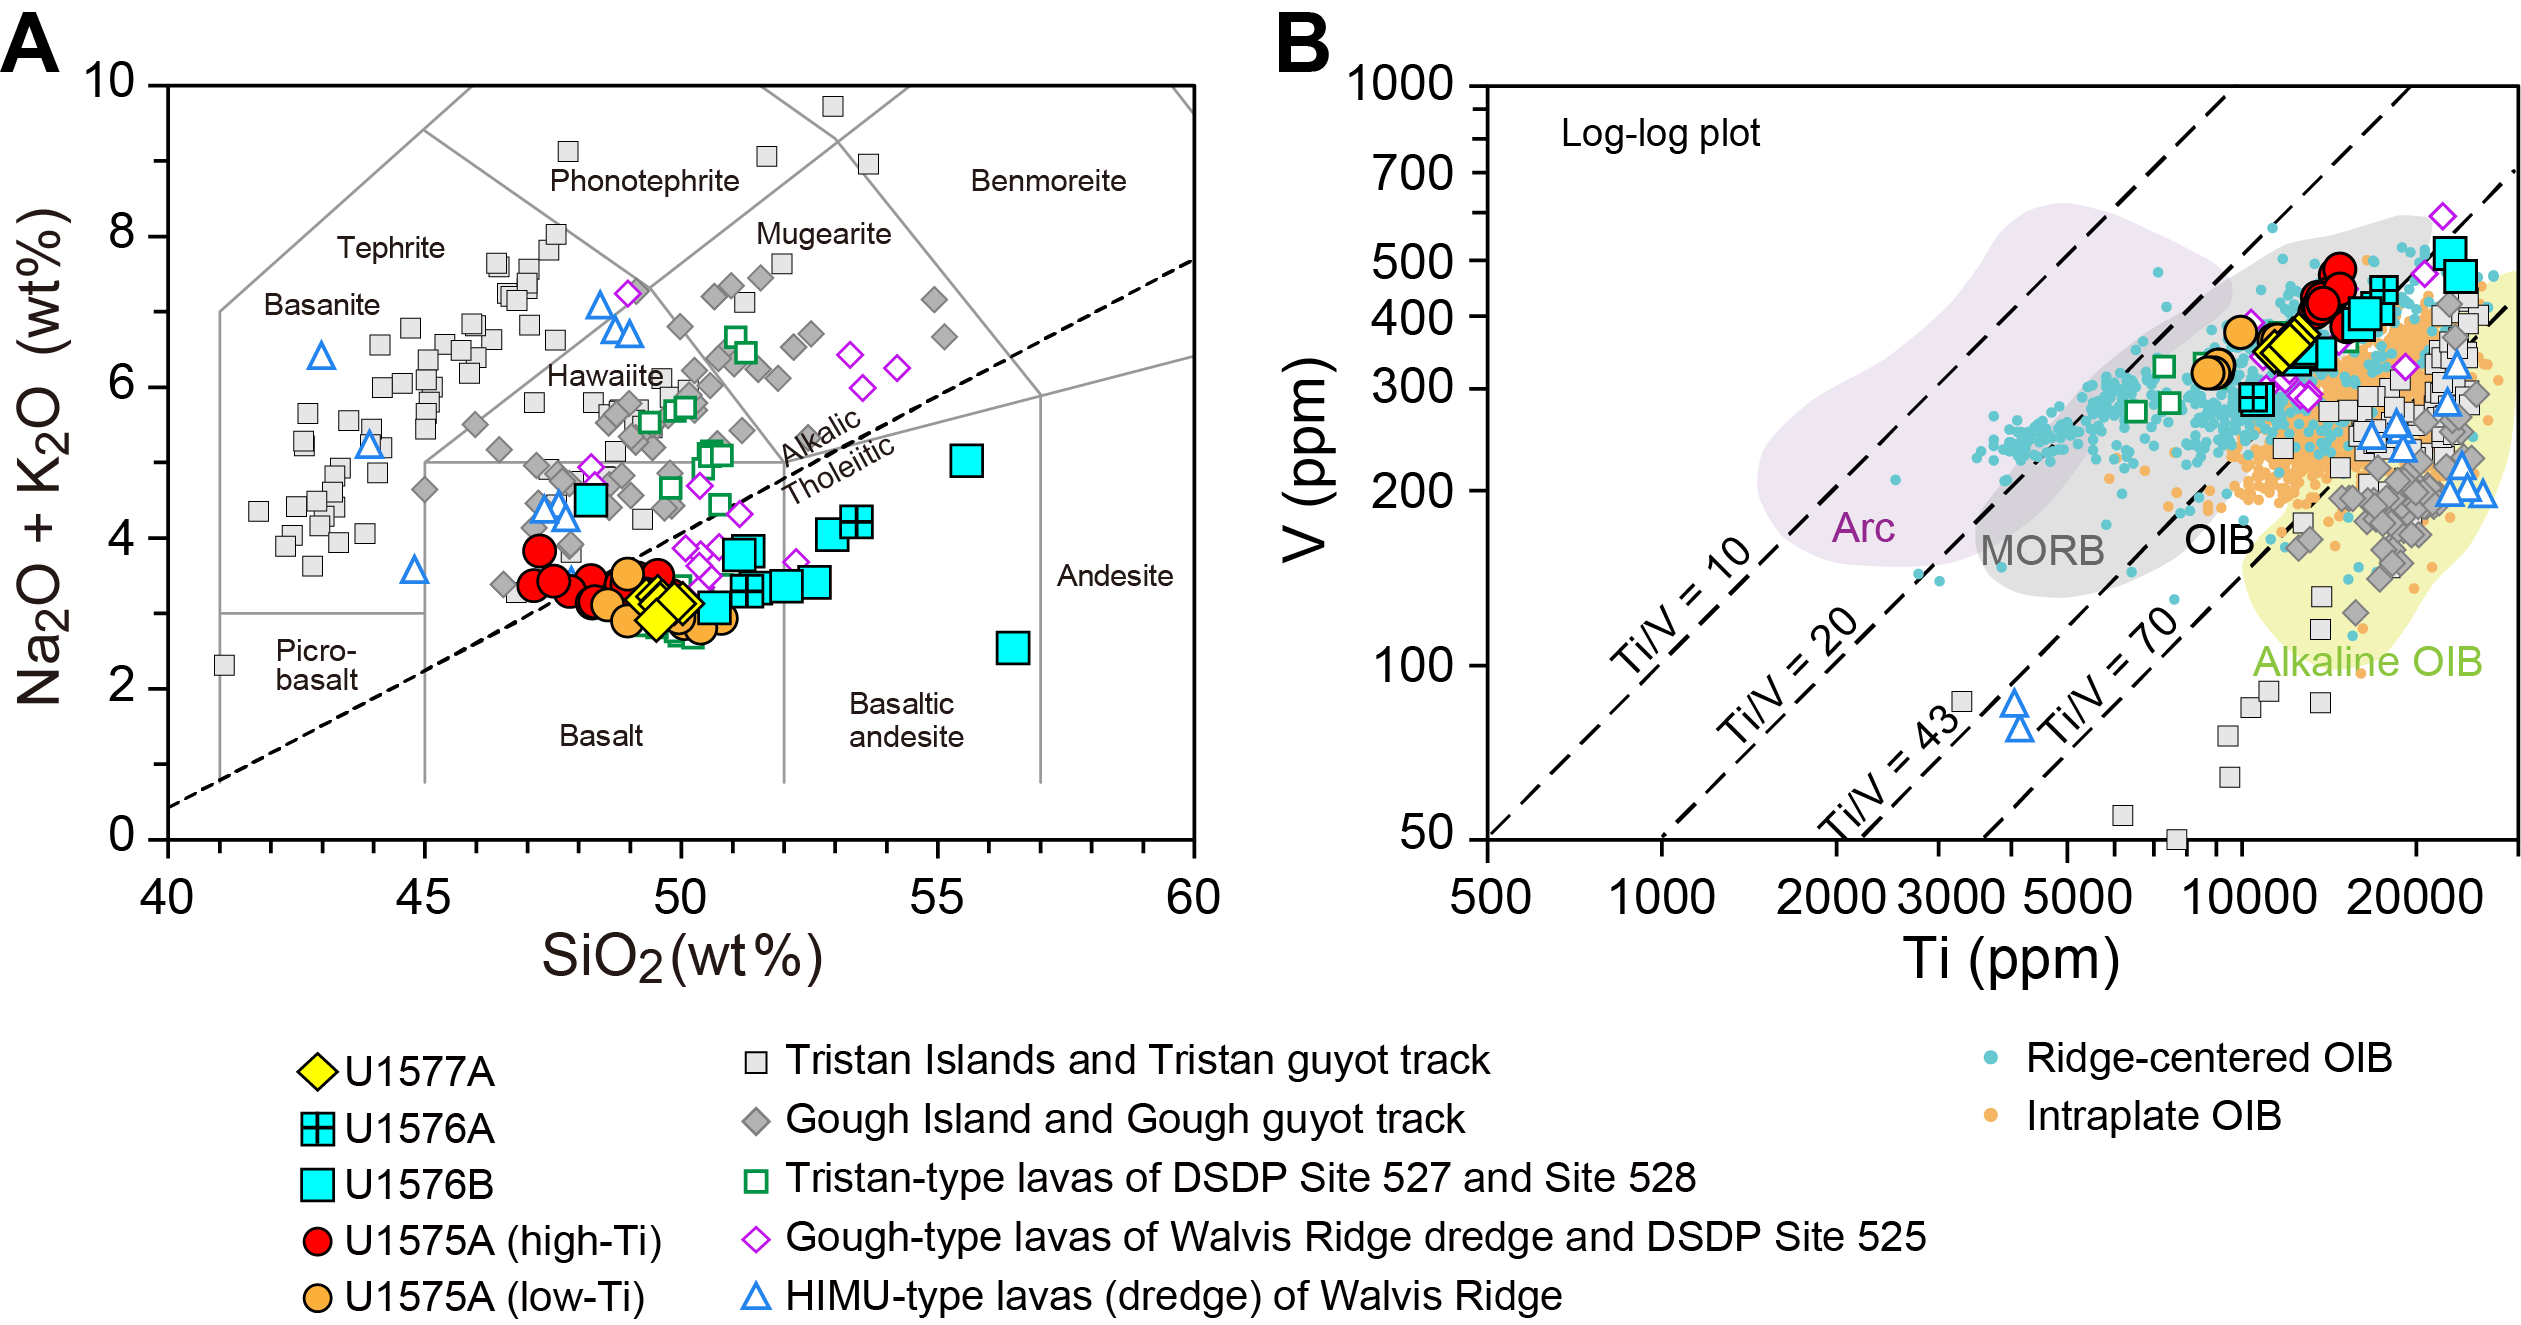
Figure F39. Alkali versus silica and Ti vs. V classifications.

Figure F40. Mg# vs. elemental data.
On the Ti-V diagram of Shervais (2022), the basalts from Site U1577 lie within the mid-ocean-ridge basalt (MORB) array and overlap with the field of ridge-centered ocean-island basalt (OIB), similar to Sites U1575 and U1576 (Figure F39B). The intermediate Ti/V values of 33 and 34 are comparable to the high-Ti rocks from Site U1575 and overlap with the previously reported tholeiitic enriched mantle one (EMI)-type (Zindler and Hart, 1986) lavas from Walvis Ridge dredge and DSDP drill sites (Figure F39B), which were interpreted to result from plume-ridge interaction (e.g., Richardson et al., 1984; Gibson et al., 2005; Hoernle et al., 2015; Homrighausen et al., 2019). In contrast, the late-stage or rejuvenated high µ (HIMU)–type or high-time-integrated 238U/204Pb mantle with radiogenic Pb isotope ratios samples from Walvis Ridge and EMI-type samples from the Guyot Province have overall higher Ti/V values and lie within the OIB array or intraplate setting.
8.4. Bivariate element plots
The basaltic rocks from Site U1577 have a very limited compositional range (e.g., SiO2 = 49.3–50.1 wt%; MgO = 5.8–7.3 wt%) that overlaps with the most primitive, MgO-rich part of the Site U1575 array. On bivariate diagrams of Mg# versus the other major and trace elements, the Site U1577 samples form tight clusters that overlap with previous dredge and DSDP drill site samples from Walvis Ridge (Figure F40). With such a tight cluster and very limited range in MgO and Mg#, no fractionation trends can be identified in Site U1577 rocks. Overall, Site U1577 samples have major and trace elements similar to the high-Ti rocks from Site U1575 (Figure F40), but they trend to slightly lower TiO2, V, Sc, and Zr concentrations at a given Mg# (52.2–57.7) (Figure F40), which could indicate differences in primary magma compositions.
8.5. Downhole variations
The three igneous subunits of Site U1577 show very limited geochemical variation downhole (Figure F41). Consistent with the absence of olivine, an early fractionation phase, the olivine-free Igneous Subunit 1b, relative to Subunits 1a and 1c, is slightly lower in MgO, Mg#, Ni, and Cr, with the latter possibly having been fractionated by Cr-spinel, present as inclusions in olivine (Figure F41). Incompatible minor and trace elements, such as TiO2, Zr, and Sr, show a very slight decrease downhole (Figure F41). Ba shows a more pronounced decrease downhole, with the uppermost sample in Subunit 1a having a significantly higher concentration, which might indicate some effect of alteration (Figure F41). If fractionation was the main process controlling the difference in the compatible and incompatible elements, we would have expected Subunit 1b to show the highest incompatible element abundances (corresponding to lowest MgO and Mg#) (Figure F41). Because this is not the case, other processes, such as different degrees of partial melting and/or source compositional differences, must have also been involved in generating the melts of the three flow units.
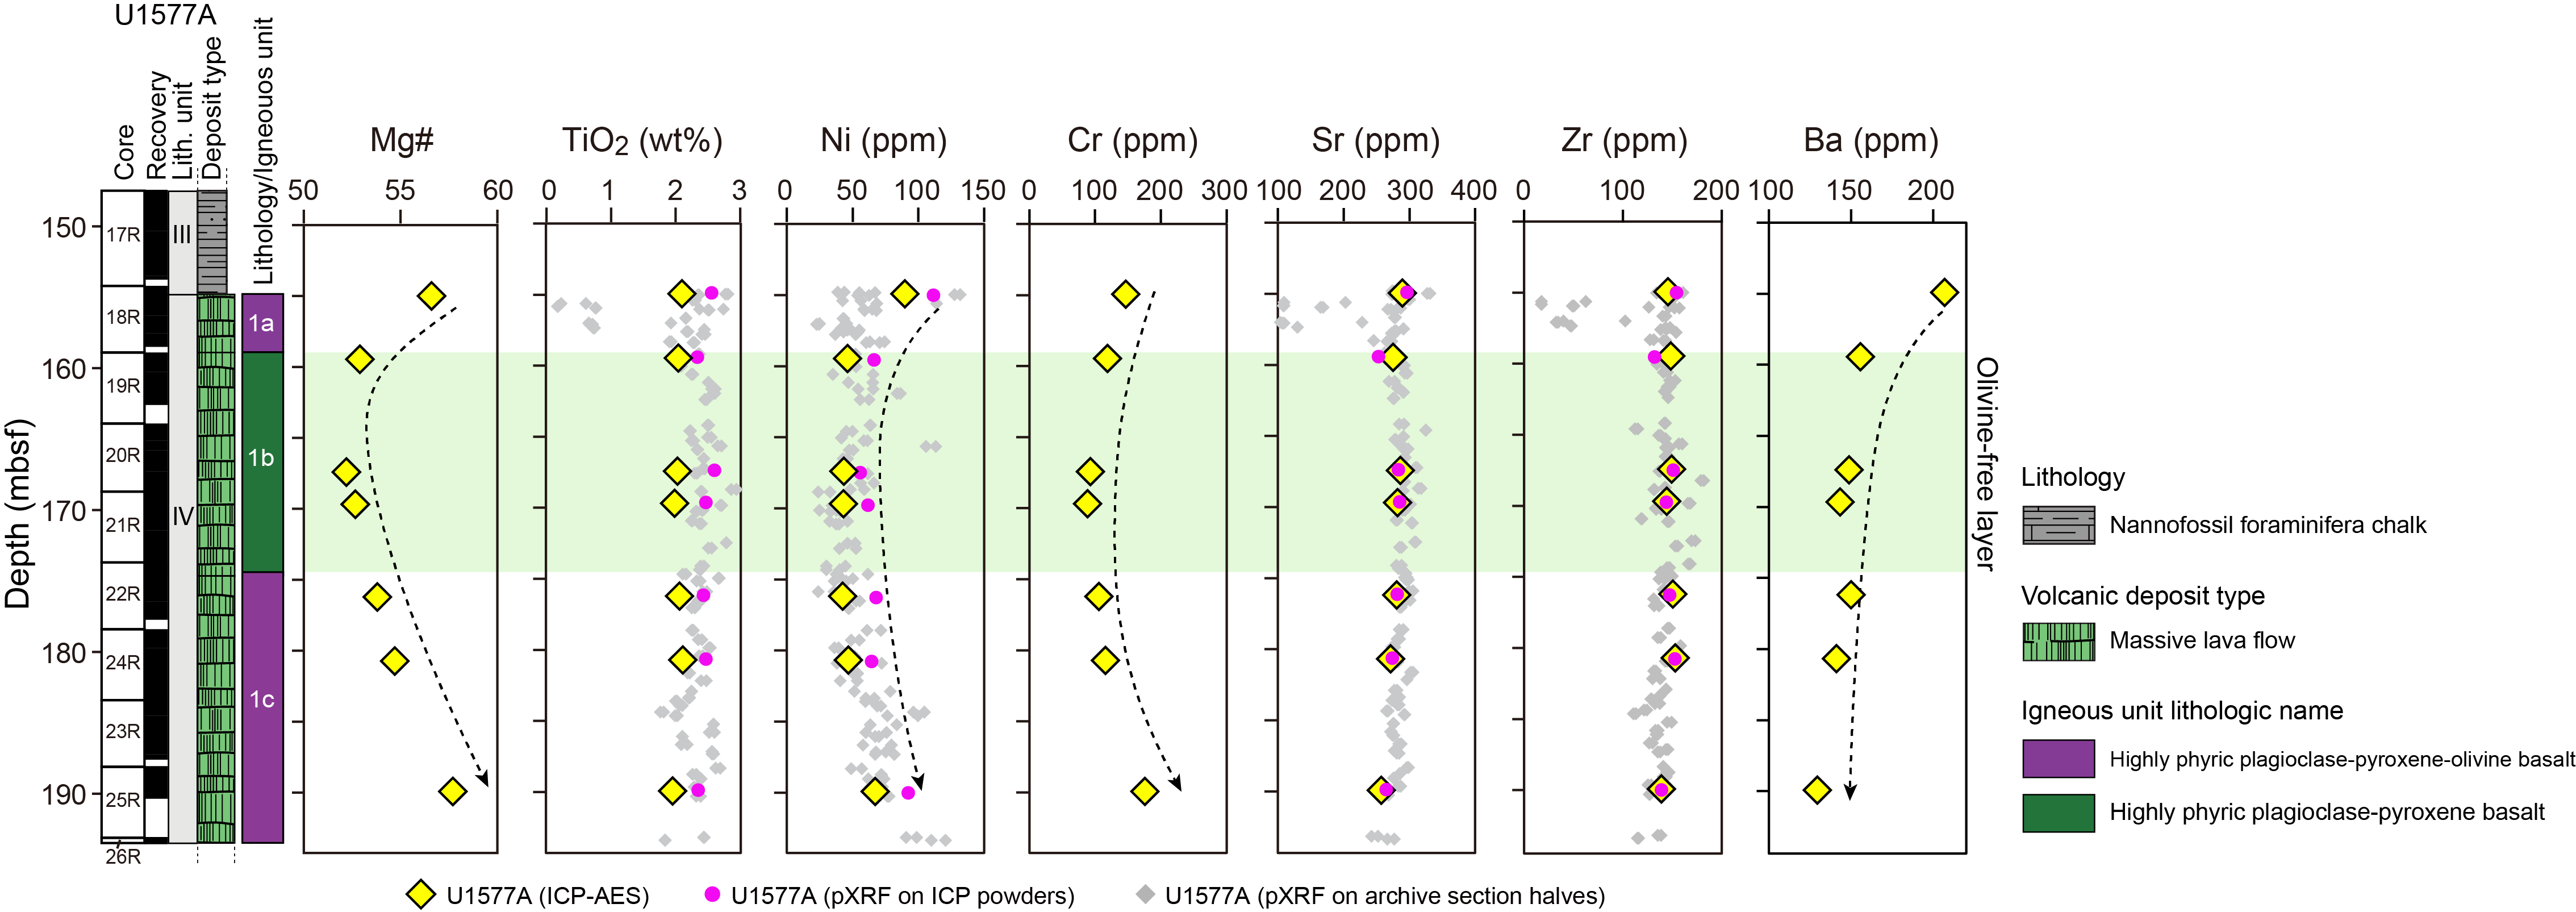
Figure F41. Downhole chemical variations.
9. Physical properties
Physical properties measurements were made on the cores from Hole U1577A, which was drilled on the eastern flank of Valdivia Bank to 193.9 mbsf. MS, NGR, gamma ray attenuation (GRA) bulk density, and P-wave velocity (x- and y-directions) were measured on whole-round cores. Thermal conductivity was measured on whole-round cores of unlithified sediment and ooze and on section halves in lithified units. P-wave velocity was measured in the y- and z-directions using the P-wave bayonet (PWB) on unlithified sediment section halves and in the x-, y-, and z-directions using the P-wave caliper (PWC) on discrete sample cubes. Point magnetic susceptibility (MSP) was measured on all section halves. Section-half and discrete sample measurements were obtained from representative units, at least one measurement per core.
Two general intervals are identified in Hole U1577A based on physical properties data shown in Figure F42: (1) moderately lithified to lithified ooze and chalk from the seafloor to ~155 mbsf and (2) relatively unaltered basalt flows from ~154 mbsf to the bottom of the hole. Three general lithostratigraphic boundaries exist in the sediment interval based on color, composition, and clay content (see Lithostratigraphy). However, physical properties measurements distinguish only the sediment/basalt contact and do not correlate with contacts between individual chalk units, with one exception. A shift in NGR values from a relatively wide range of ~13 to ~28 counts/s to more narrowly defined values of ~10–16 counts/s at ~70 mbsf defines the contact between Lithostratigraphic Unit II and Subunit IIIA chalk (see Lithostratigraphy). A transition from Chron 31n to Chron 33r, also at ~70 mbsf, suggests that this boundary may also represent an unconformity (see Paleomagnetism; Figure F43). The sediment/basalt contact is clearly imaged at ~155 mbsf as an increase in MS, MSP, and bulk density and an accompanying decrease in porosity and NGR values (Figure F42). Relatively uniform bulk density and NGR values indicate a continuous package of basalt with no interbedded sediments from ~155 mbsf to the bottom of the hole at 193.4 mbsf. As at Sites U1575 and U1576, abrupt decreases in GRA bulk density, NGR, MS, and MSP in the basalt interval may correlate to rubbly and fractured zones and/or low quality or missing data.

Figure F42. Physical properties.
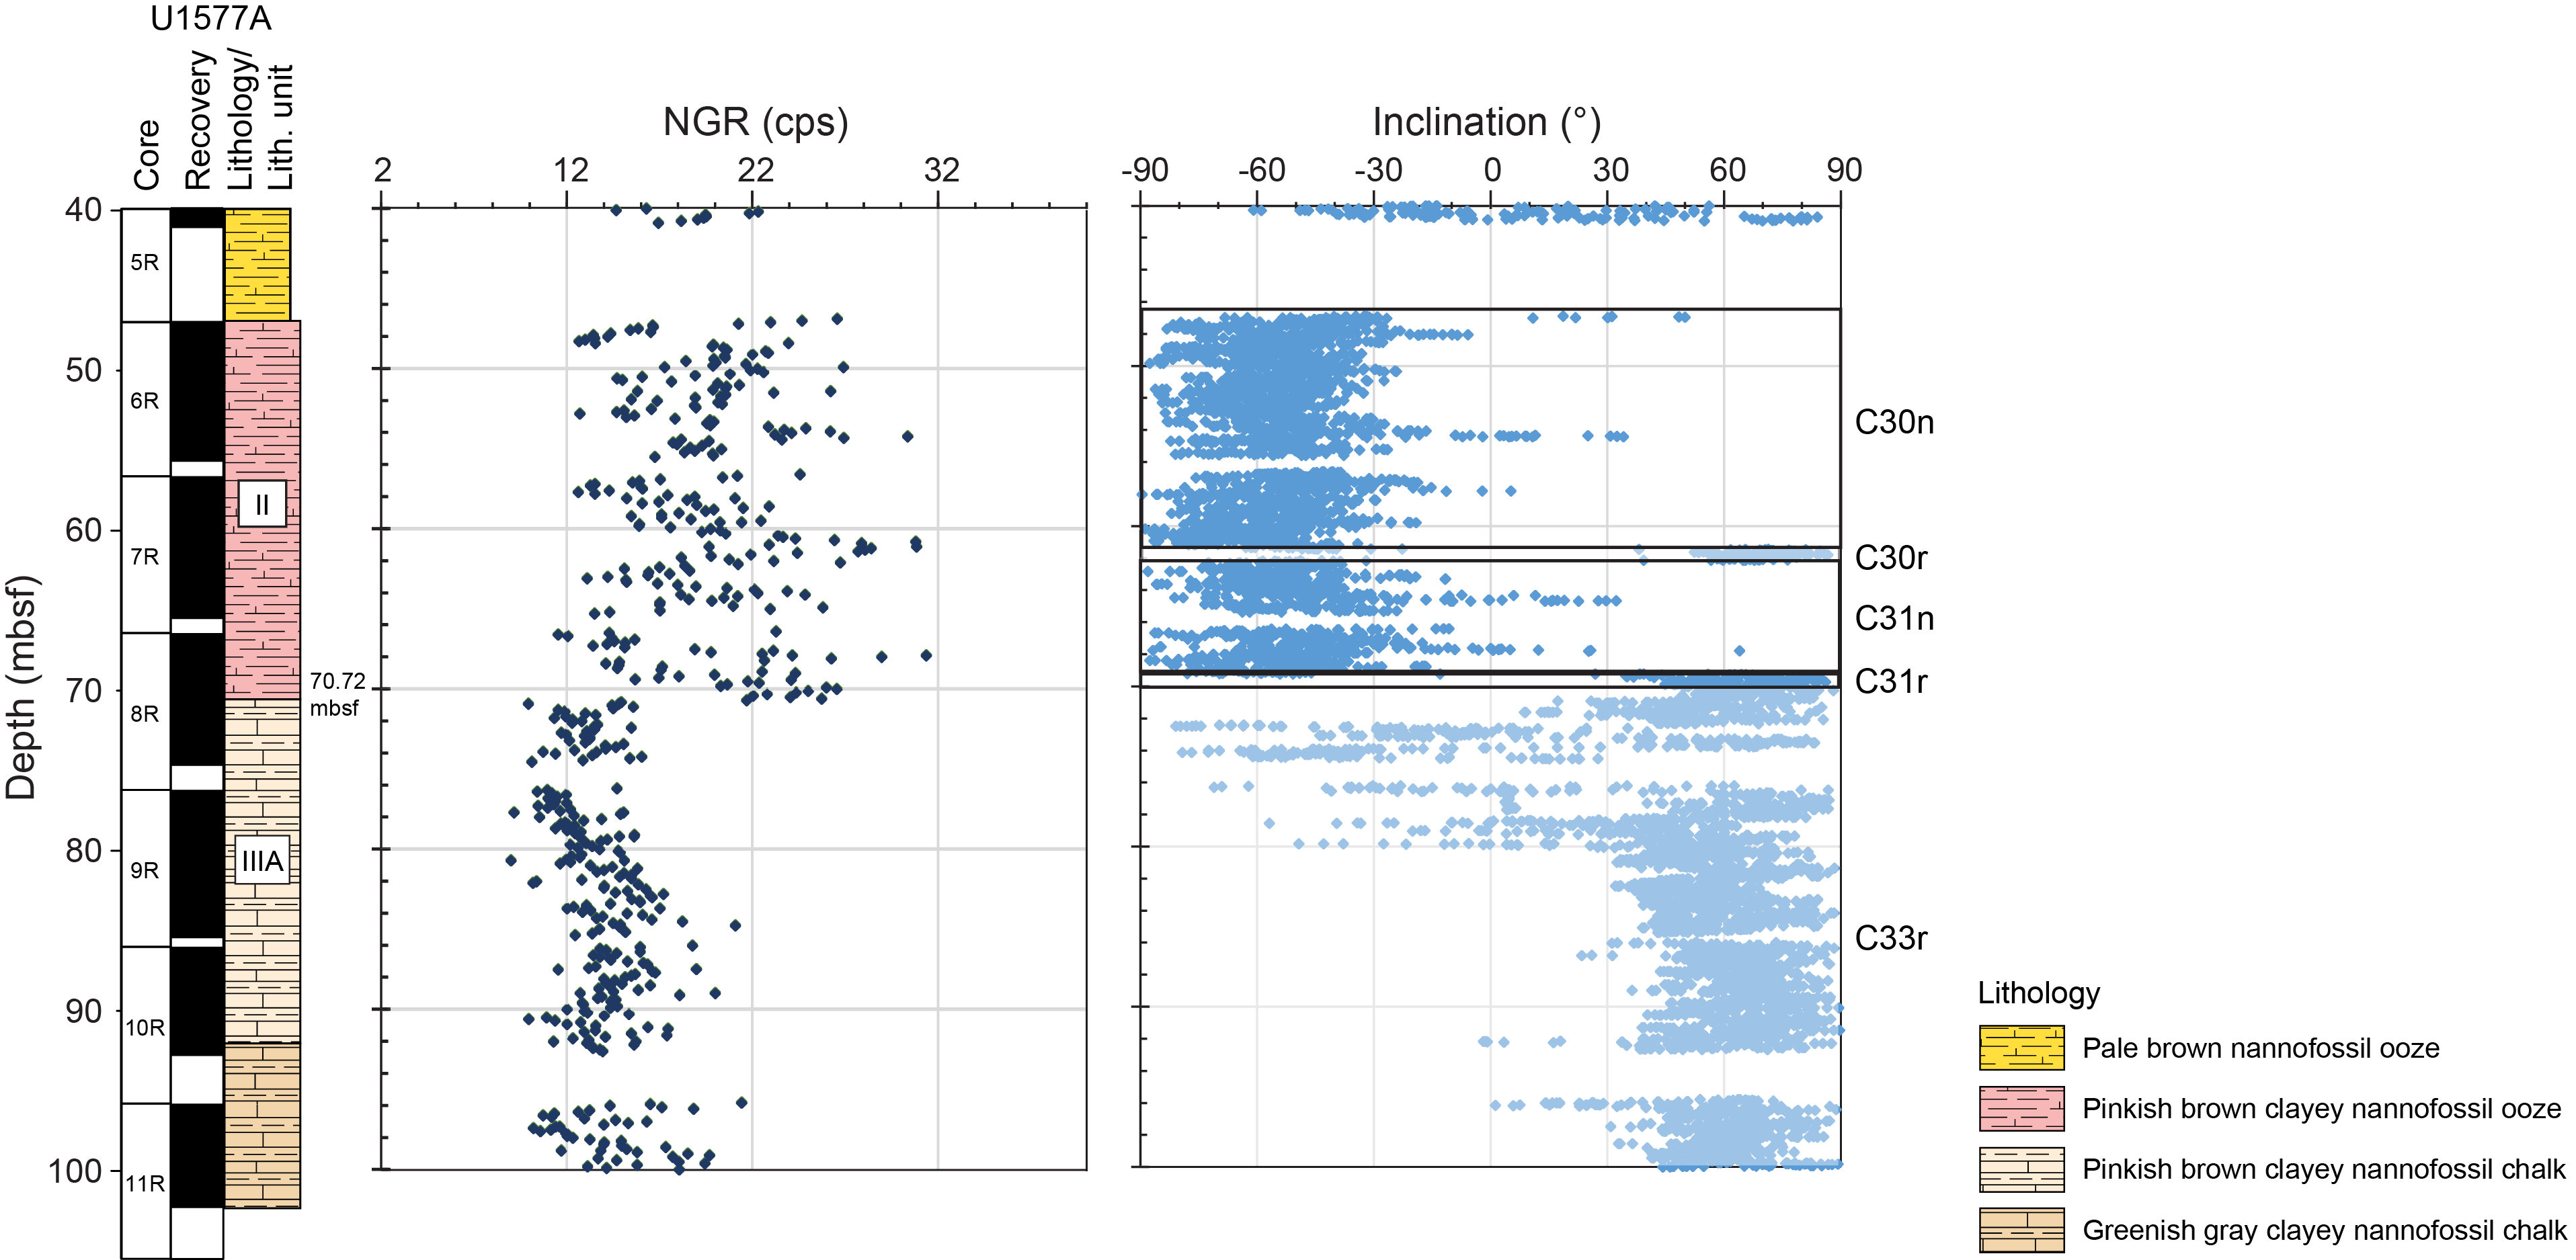
Figure F43. Lithostratigraphic, petrophysical, and paleomagnetic correlation.
9.1. Data acquisition
Each whole-round core recovered at Site U1577 was measured for GRA bulk density, P-wave velocity (x- and y-axis; PWL), and MS on the Whole-Round Multisensor Logger (WRMSL) and NGR on the Natural Gamma Radiation Logger (NGRL). Thermal conductivity measurements were obtained from representative whole-round cores of ooze and lithified sediment and basalt section halves. P-wave velocities in the y- and z-directions were measured on ooze and unlithified sediment section halves using the PWB and in the x-direction using the PWC. Discrete sample cubes from lithified intervals were measured using the PWC in the x-, y-, and z-directions. MSP measurements were obtained using the Section Half Multisensor Logger (SHMSL). As with previous Expedition 391 sites, a high-resolution sampling plan is critical for tracking physical properties variations with depth and correlating them with lithologic, geochemical, and paleomagnetic observations.
9.2. Thermal conductivity
Thermal conductivity measurements agree with other physical properties data sets and appear to correlate with lithologic observations (see Lithostratigraphy; Figure F42). Thermal conductivity values are relatively consistent throughout the sedimentary interval in Hole U1577A and range 1.06–1.49 W/(m·K). The sediment/basalt contact is distinguished by an increase in mean thermal conductivity from 1.26 ± 0.12 W/(m·K) (1σ standard deviation, used throughout) to 1.66 ± 0.12 W/(m·K) across the ~154 mbsf lithologic boundary. In basalt units below the contact, thermal conductivity increases to 1.39–1.81 W/(m·K).
9.3. Rheology
Sediment shear strength was measured with the automated vane shear (AVS) system on two cores recovered from Hole U1577A in ooze from the seafloor to 11.7 mbsf. AVS measurements were not taken below this depth because of the increasing lithification of sediments.
The shear strength of sediment in Section 391-U1577A-1R-2 was 26.1 kN/m2, and the shear strength of Section 2R-3 was 12.4 kN/m2. No rheologic trends were identified in Hole U1577A because of the limited number of measurements.
9.4. Magnetic susceptibility
MS pass-through (WRMSL) and MSP (performed on the SHMSL) data agree throughout Hole U1577A and show general uniformity. Sediments have MS values of 6.67–647 × 10−5 SI (mean = 89.0 ± 57.9 × 10⁻⁵ SI). Higher values (e.g., 647 × 10−5 SI in Section 8R-3; ~71 mbsf) are associated with volcaniclastic deposits within the sediment interval. MS and MSP values abruptly decrease below ~70 mbsf, which coincides with the location of the boundary between Lithostratigraphic Unit II and Subunit IIIA. Below the contact, MS and MSP values return to a range similar to the sediments above (7.04–530 × 10−5 SI; mean = 69.5 ± 43.4 × 10⁻⁵ SI) to the sediment/basalt contact at ~155 mbsf. MS and MSP values range 47.0–2709 × 10−5 SI from the contact to the bottom of the hole. As with other sites, low values in the basalt interval (<100 × 10−5 SI) appear to be associated with fractured and rubbly zones, whereas high values (>1000 × 10−5 SI) appear to be coincident with longer (>20 cm), more coherent basalt fragments (e.g., Section 23R-1).
9.5. Bulk density and porosity
GRA and moisture and density (MAD) bulk density measurements generally follow the same trend and vary little along the depth profile of Hole U1577A. Both data sets record the sediment/basalt contact at ~155 mbsf as a shift from relatively low bulk densities to higher values. GRA bulk density in the sediment interval is relatively uniform between 1.00 and 2.12 g/cm3 (mean = 1.65 ± 0.14 g/cm3). In the basalt interval below ~155 mbsf, GRA bulk densities are 1.00–2.84 (mean = 2.4 ± 0.30 g/cm3). Discrete MAD bulk density values are slightly higher in both intervals: 1.49–2.02 g/cm3 (mean = 1.75 ± 0.12 g/cm3) in the sediment interval and 2.70–2.95 g/cm3 (mean = 2.83 ± 0.079 g/cm3) in the basalt interval. Void spaces between the core and the core liner result in artificially low GRA bulk density values. MAD bulk density measurements therefore likely provide a more accurate representation of sediment and basalt bulk density in Hole U1577A. Neither data set records a significant difference in bulk densities across the ~70 mbsf boundary.
MAD measurements were also used to calculate porosity. In Hole U1577A, porosity is uniform (37.3–73.2 vol%; mean = 55.6 ± 7.55 vol%) from the seafloor to ~155 mbsf, and as with bulk density measurements, there is no significant change across the ~70 mbsf boundary. Below the ~155 mbsf sediment/basalt contact, porosity values decrease sharply to 2.73–11.7 vol% (mean = 5.11 ± 2.63 vol%), which is consistent with massive basalts (see Lithostratigraphy; Figure F42).
9.6. Sonic velocities
The PWL, PWB, and PWC were used to measure ooze in the sedimentary succession from the seafloor to ~65 mbsf. Below this depth, x-axis P-wave velocity measurements were obtained from representative locations in lithified section halves using the PWC. Discrete sample cubes of basalt were measured in the x-, y-, and z-directions, also using the PWC. In Hole U1577A, the transition from the PWL to PWC results in a shift from continuous measurements to a wider sampling interval with increased depth (Figure F42); however, P-wave velocity data sets agree and collectively image two distinct lithologic intervals in Hole U1577A.
In the sediment interval, P-wave velocities appear to be relatively uniform (1450–1731 m/s; mean = 1552 ± 54.3 m/s) from the seafloor to the sediment/basalt contact at ~155 mbsf. Higher P-wave velocities (e.g., 1763 m/s in Section 391-U1577A-6R-5) in the sediment interval are associated with volcaniclastic deposits (e.g., sediments and/or tephra; see Lithostratigraphy). P-wave velocities increase abruptly across the sediment/basalt interface from 1690 m/s at ~148 mbsf to 5844 m/s at ~156 mbsf. Below the contact, basalts have relatively uniform P-wave velocities of 4617–6189 m/s (mean = 5727 ± 375 m/s to the bottom of the hole) (Figure F42).
9.7. Natural gamma radiation
NGR in Hole U1577A broadly defines sedimentary and igneous intervals and identifies a boundary at ~70 mbsf (Figures F42, F43). Sediments above ~70 mbsf have NGR counts between 5.68 and 34.6 counts/s (mean = 16.6 ± 5.2 counts/s), whereas sediments below ~70 mbsf are defined by a slightly lower range in NGR counts (3.76–31.3 counts/s; mean = 15.4 ± 3.2 counts/s). Volcaniclastic deposits are common throughout the sediment interval and appear to be recorded as peaks in NGR between ~25 and ~35 counts/s as well as increases in MS and P-wave velocity values. The sedimentary interval (~80 to ~90 mbsf) also appears to display cyclic variations in NGR. Similar cycles were observed in sediments in Hole U1576A over a larger depth range. The sedimentary/basalt contact at 154.6 mbsf is defined by a decrease in NGR values. Basalts below the contact have relatively uniform NGR values between 4.98 and 15.8 counts/s (mean = 9.56 ± 1.77 counts/s). Lower NGR values (less than ~7 counts/s) appear to be associated with fractured or rubbly basalt intervals and/or poor data quality (e.g., Section 22R-2).
9.8. Data integration and lithology correlation
Physical properties data sets agree with measurements and observations from other shipboard scientific parties. Two general intervals were observed in Hole U1577A: sediments (including ooze and chalk) and igneous basement (basalt). MS, P-wave velocity, and GRA and MAD bulk density measurements indicate relatively coherent massive basalt flows (see Igneous petrology and volcanology), and NGR peaks (~25–35 counts/s) in the entire sedimentary sequence appear to correlate with the distribution of volcaniclastic deposits in ooze and chalk units (see Lithostratigraphy).
Lithologic features in the sedimentary interval also seem to correlate with physical properties data. Tephra-poor white sediments (~10–22 mbsf; e.g., Section 391-U1577A-3R-1) have NGR values between 5.68 and 17.4 counts/s (mean = 9.99 ± 2.00 counts/s), whereas tephra-rich pale brown sediments from the seafloor to ~10 mbsf (e.g., Section 1R-2) and ~22–31 mbsf have NGR values between 8.49 and 34.6 counts/s (mean = 17.8 ± 4.5 counts/s). Tephra layers also are imaged by MS, MSP, and P-wave velocity data sets. Abrupt increases in P-wave velocity (e.g., 1655 m/s in Section 4R-2; ~29 mbsf) and higher MS and MSP values (e.g., 647 × 10−5 SI in Section 8R-3; ~71 mbsf) appear to associate closely with volcaniclastic deposits in the sediment interval. NGR and, to a lesser degree, MS and MSP values abruptly shift at ~70 mbsf and indicate a lithologic contact at ~70 mbsf between Lithostratigraphic Unit II and Subunit IIIA (see Lithostratigraphy). The ~70 mbsf contact also aligns with paleomagnetic measurements, which suggests that Chron 32 (as well as part of the depositional record) is missing in Hole U1577A (see Paleomagnetism; Figure F43).
References
Acton, G.D., Okada, M., Clement, B.M., Lund, S.P., and Williams, T., 2002. Paleomagnetic overprints in ocean sediment cores and their relationship to shear deformation caused by piston coring. Journal of Geophysical Research: Solid Earth, 107:2067–2081. https://doi.org/10.1029/2001JB000518
Bartels, T., Krastel, S., and Spiess, V., 2007. Correlation of high-resolution seismic data with ODP Leg 208 borehole measurements. In Kroon, D., Zachos, J.C., and Richter, C. (Eds.), Proceedings of the Ocean Drilling Program, Scientific Results. 208: College Station, TX (Ocean Drilling Program). https://doi.org/10.2973/odp.proc.sr.208.204.2007
Cas, R.A.F., and Giordano, G., 2014. Submarine volcanism: a review of the constraints, processes and products, and relevance to the Cabo de Gata volcanic succession. Italian Journal of Geosciences, 133(3):362–377. https://doi.org/10.3301/IJG.2014.46
Cas, R.A.F., and Simmons, J.M., 2018. Why deep-water eruptions are so different from subaerial eruptions. Frontiers in Earth Science, 6:198. https://doi.org/10.3389/feart.2018.00198
Chave, A.D., 1984. Lower Paleocene-Upper Cretaceous magnetostratigraphy, Sites 525, 527, 528, and 529, Deep Sea Drilling Project Leg 74. In Moore, T.C., Jr., Rabinowitz, P.D., et al., Initial Reports of the Deep Sea Drilling Project. 74: Washington, DC (US Government Printing Office), 525–531. https://doi.org/10.2973/dsdp.proc.74.110.1984
Class, C., and Lehnert, K., 2012. PetDB Expert MORB (Mid-Ocean Ridge Basalt) Compilation, Version 1.0. Interdisciplinary Earth Data Alliance (IEDA). https://doi.org/10.1594/IEDA/100060
Class, C., and le Roex, A.P., 2008. Ce anomalies in Gough Island lavas — trace element characteristics of a recycled sediment component. Earth and Planetary Science Letters, 265(3–4):475–486. https://doi.org/10.1016/j.epsl.2007.10.030
Cliff, R.A., Baker, P.E., and Mateer, N.J., 1991. Geochemistry of inaccessible island volcanics. Chemical Geology, 92(4):251–260. https://doi.org/10.1016/0009-2541(91)90073-Z
Coffin, M.F., Pringle, M.S., Duncan, R.A., Gladczenko, T.P., Storey, M., Müller, R.D., and Gahagan, L.A., 2002. Kerguelen hotspot magma output since 130 Ma. Journal of Petrology, 43(7):1121–1137. https://doi.org/10.1093/petrology/43.7.1121
Deschamps, A., Grigné, C., Le Saout, M., Soule, S.A., Allemand, P., Van Vliet-Lanoe, B., and Floc'h, F., 2014. Morphology and dynamics of inflated subaqueous basaltic lava flows. Geochemistry, Geophysics, Geosystems, 15(6):2128–2150. https://doi.org/10.1002/2014GC005274
Doubrovine, P.V., Steinberger, B., and Torsvik, T.H., 2012. Absolute plate motions in a reference frame defined by moving hot spots in the Pacific, Atlantic, and Indian oceans. Journal of Geophysical Research: Solid Earth, 117(B9):B09101. https://doi.org/10.1029/2011JB009072
Ernesto, M., Pacca, I.G., Hiodo, F.Y., and Nardy, A.J.R., 1990. Palaeomagnetism of the Mesozoic Serra Geral Formation, southern Brazil. Physics of the Earth and Planetary Interiors, 64(2):153–175. https://doi.org/10.1016/0031-9201(90)90035-V
Ernesto, M., Raposo, M.I.B., Marques, L.S., Renne, P.R., Diogo, L.A., and de Min, A., 1999. Paleomagnetism, geochemistry and 40Ar/39Ar dating of the north-eastern Paraná Magmatic Province: tectonic implications. Journal of Geodynamics, 28(4):321–340. https://doi.org/10.1016/S0264-3707(99)00013-7
Gibson, S.A., Thompson, R.N., Day, J.A., Humphris, S.E., and Dickin, A.P., 2005. Melt-generation processes associated with the Tristan mantle plume: constraints on the origin of EM-1. Earth and Planetary Science Letters, 237(3–4):744–767. https://doi.org/10.1016/j.epsl.2005.06.015
Gradstein, F.M., Ogg, J.G., Schmitz, M.D., and Ogg, G.M. (Eds.), 2012. The Geologic Time Scale 2012: Amsterdam (Elsevier). https://doi.org/10.1016/C2011-1-08249-8
Gradstein, F.M., Ogg, J.G., Schmitz, M.D., and Ogg, G.M. (Eds.), 2020. The Geologic Time Scale 2020: Amsterdam (Elsevier BV). https://doi.org/10.1016/C2020-1-02369-3
Hart, S.R., Erlank, A.J., and Kable, E.J.D., 1974. Sea floor basalt alteration: some chemical and Sr isotopic effects. Contributions to Mineralogy and Petrology, 44(3):219–230. https://doi.org/10.1007/BF00413167
Hoernle, K., Rohde, J., Hauff, F., Garbe-Schönberg, D., Homrighausen, S., Werner, R., and Morgan, J.P., 2015. How and when plume zonation appeared during the 132 Myr evolution of the Tristan Hotspot. Nature Communications, 6(1):7799. https://doi.org/10.1038/ncomms8799
Homrighausen, S., Hoernle, K., Geldmacher, J., Wartho, J.A., Hauff, F., Portnyagin, M., Werner, R., van den Bogaard, P., and Garbe-Schönberg, D., 2018. Unexpected HIMU-type late-stage volcanism on the Walvis Ridge. Earth and Planetary Science Letters, 492:251–263. https://doi.org/10.1016/j.epsl.2018.03.049
Homrighausen, S., Hoernle, K., Hauff, F., Wartho, J.A., van den Bogaard, P., and Garbe-Schönberg, D., 2019. New age and geochemical data from the Walvis Ridge: the temporal and spatial diversity of South Atlantic intraplate volcanism and its possible origin. Geochimica et Cosmochimica Acta, 245:16–34. https://doi.org/10.1016/j.gca.2018.09.002
Homrighausen, S., Hoernle, K., Zhou, H., Geldmacher, J., Wartho, J.-A., Hauff, F., Werner, R., Jung, S., and Morgan, J.P., 2020. Paired EMI-HIMU hotspots in the South Atlantic—starting plume heads trigger compositionally distinct secondary plumes? Science Advances, 6(28):eaba0282. https://doi.org/10.1126/sciadv.aba0282
Hon, K., Kauahikaua, J., Denlinger, R., and Mackay, K., 1994. Emplacement and inflation of pahoehoe sheet flows: observations and measurements of active lava flows on Kilauea Volcano, Hawaii. Geological Society of America Bulletin, 106(3):351–370. https://doi.org/10.1130/0016-7606(1994)106<0351:EAIOPS>2.3.CO;2
Inoue, H., Coffin, M.F., Nakamura, Y., Mochizuki, K., and Kroenke, L.W., 2008. Intrabasement reflections of the Ontong Java Plateau: implications for plateau construction. Geochemistry, Geophysics, Geosystems, 9(4):Q0401. https://doi.org/10.1029/2007GC001780
Jackson, M., Gruber, W., Marvin, J., and Banerjee, S.K., 1988. Partial anhysteretic remanence and its anisotropy: applications and grainsize-dependence. Geophysical Research Letters, 15(5):440–443. https://doi.org/10.1029/GL015i005p00440
Jerram, D.A., and Widdowson, M., 2005. The anatomy of continental flood basalt provinces: geological constraints on the processes and products of flood volcanism. Lithos, 79(3–4):385–405. https://doi.org/10.1016/j.lithos.2004.09.009
Jochum, K.P., and Verma, S.P., 1996. Extreme enrichment of Sb, Tl and other trace elements in altered MORB. Chemical Geology, 130(3–4):289–299. https://doi.org/10.1016/0009-2541(96)00014-9
Koppers, A.A.P., Sano, T., Natland, J.H., Widdowson, M., Almeev, R., Greene, A.R., Murphy, D.T., Delacour, A., Miyoshi, M., Shimizu, K., Li, S., Hirano, N., Geldmacher, J., and the Expedition 324 Scientists, 2010. Massive basalt flows on the southern flank of Tamu Massif, Shatsky Rise: a reappraisal of ODP Site 1213 basement units. In Sager, W.W., Sano, T., Geldmacher, J., and the Expedition 324 Scientists, Proceedings of the Integrated Ocean Drilling Program, 324: Tokyo (Integrated Ocean Drilling Program Management International, Inc.). https://doi.org/10.2204/iodp.proc.324.109.2010
Le Bas, M.J., Le Maitre, R. W., Streickeisen, A., Zanettin, B., the IUGS Subcommission on the Systematics of Igneous Rocks, 1986. A chemical classification of volcanic rocks based on the total alkali-silica diagram. Journal of Petrology, 27(3):745–750. https://doi.org/10.1093/petrology/27.3.745
Le Maitre, R.W., 1962. Petrology of volcanic rocks, Gough Island, South Atlantic. Geological Society of America Bulletin, 73(11):1309–1340. https://doi.org/10.1130/0016-7606(1962)73[1309:POVRGI]2.0.CO;2
Le Roex, A.P., Cliff, R.A., and Adair, B.J.I., 1990. Tristan da Cunha, South Atlantic: geochemistry and petrogenesis of a basanite-phonolite lava series. Journal of Petrology, 31(4):779–812. https://doi.org/10.1093/petrology/31.4.779
MacDonald, G.A., and Katsura, T., 1964. Chemical composition of Hawaiian lavas. Journal of Petrology, 5(1):82–133. https://doi.org/10.1093/petrology/5.1.82
Marschall, H.R., 2018. Boron isotopes in the ocean floor realm and the mantle. In Marschall, H., and Foster, G. (Eds.), Boron Isotopes: The Fifth Element. Cham, Switzerland (Springer International Publishing), 189–215. https://doi.org/10.1007/978-3-319-64666-4_8
Marshall, P.E., Widdowson, M., and Murphy, D.T., 2016. The Giant Lavas of Kalkarindji: rubbly pāhoehoe lava in an ancient continental flood basalt province. Palaeogeography, Palaeoclimatology, Palaeoecology, 441(1):22–37. https://doi.org/10.1016/j.palaeo.2015.05.006
McFadden, P.L., and Reid, A.B., 1982. Analysis of palaeomagnetic inclination data. Geophysical Journal International, 69(2):307–319. https://doi.org/10.1111/j.1365-246X.1982.tb04950.x
Neal, C.R., Mahoney, J.J., Kroenke, L.W., Duncan, R.A., and Petterson, M.G., 1997. The Ontong Java Plateau. In Mahoney, J.J., and Coffin, M.F. (Eds.), Large Igneous Provinces: Continental, Oceanic, and Planetary Flood Volcanism. Geophysical Monograph, 100: 183–216. https://doi.org/10.1029/GM100p0183
O'Connor, J.M., and Duncan, R.A., 1990. Evolution of the Walvis Ridge-Rio Grande Rise hot spot system: implications for African and South American plate motions over plumes. Journal of Geophysical Research: Solid Earth, 95(B11):17475–17502. https://doi.org/10.1029/JB095iB11p17475
O'Connor, J.M., and Jokat, W., 2015. Age distribution of ocean drill sites across the Central Walvis Ridge indicates plate boundary control of plume volcanism in the South Atlantic. Earth and Planetary Science Letters, 424:179–190. https://doi.org/10.1016/j.epsl.2015.05.021
O'Connor, J.M., and le Roex, A.P., 1992. South Atlantic hot spot-plume systems: 1. Distribution of volcanism in time and space. Earth and Planetary Science Letters, 113(3):343–364. https://doi.org/10.1016/0012-821X(92)90138-L
Ogg, J.G., 2020. Geomagnetic Polarity Time Scale. In Gradstein, F.M., Ogg, J.G., Schmitz, M., and Ogg, G. (Eds.), Geologic Time Scale 2020. Amsterdam (Elsevier), 159–192.
Olsson, R.K., Berggren, W.A., Hemleben, C., and Huber, B.T., 1999. Atlas of Paleocene Planktonic Foraminifera: Washington, DC (Smithsonian Institution Press). https://doi.org/10.5479/si.00810266.85.1
Parker, R.L., and Huestis, S.P., 1974. The inversion of magnetic anomalies in the presence of topography. Journal of Geophysical Research, 79:1587–1593. https://doi.org/10.1029/JB079i011p01587
Quinby-Hunt, M.S., and Turekian, K.K., 1983. Distribution of elements in sea water. Eos, Transactions of the American Geophysical Union, 64(14):130. https://doi.org/10.1029/EO064i014p00130
Renne, P.R., Scott, G.R., Glen, J.M.G., and Feinberg, J.M., 2002. Oriented inclusions of magnetite in clinopyroxene: source of stable remanent magnetization in gabbros of the Messum Complex, Namibia. Geochemistry, Geophysics, Geosystems, 3(12):1–11. https://doi.org/10.1029/2002GC000319
Richardson, S.H., Erlank, A.J., Reid, D.L., and Duncan, A.R., 1984. Major and trace element and Nd and Sr isotope geochemistry of basalts from the Deep Sea Drilling Project Leg 74 Walvis Ridge transect. In Moore, T.C., Jr., Rabinowitz, P. D., et al., Initial Reports of the Deep Sea Drilling Project. 74: Washington, DC (US Government Printing Office), 739–754. https://doi.org/10.2973/dsdp.proc.74.125.1984
Rohde, J., Hoernle, K., Hauff, F., Werner, R., O'Connor, J., Class, C., Garbe-Schönberg, D., and Jokat, W., 2013. 70 Ma chemical zonation of the Tristan-Gough hotspot track. Geology, 41(3):335–338. https://doi.org/10.1130/G33790.1
Sager, W., Hoernle, K., Höfig, T.W., Avery, A.J., Bhutani, R., Buchs, D.M., Carvallo, C.A., Class, C., Dai, Y., Dalla Valle, G., Del Gaudio, A.V., Fielding, S., Gaastra, K.M., Han, S., Homrighausen, S., Kubota, Y., Li, C.-F., Nelson, W.R., Petrou, E., Potter, K.E., Pujatti, S., Scholpp, J., Shervais, J.W., Thoram, S., Tikoo-Schantz, S.M., Tshiningayamwe, M., Wang, X.-J., and Widdowson, M., 2023a. Expedition 391 methods. In Sager, W., Hoernle, K., Höfig, T.W., Blum, P., and the Expedition 391 Scientists, Walvis Ridge Hotspot. Proceedings of the International Ocean Discovery Program, 391: College Station, TX (International Ocean Discovery Program). https://doi.org/10.14379/iodp.proc.391.102.2023
Sager, W., Hoernle, K., Höfig, T.W., Avery, A.J., Bhutani, R., Buchs, D.M., Carvallo, C.A., Class, C., Dai, Y., Dalla Valle, G., Del Gaudio, A.V., Fielding, S., Gaastra, K.M., Han, S., Homrighausen, S., Kubota, Y., Li, C.-F., Nelson, W.R., Petrou, E., Potter, K.E., Pujatti, S., Scholpp, J., Shervais, J.W., Thoram, S., Tikoo-Schantz, S.M., Tshiningayamwe, M., Wang, X.-J., and Widdowson, M., 2023b. Site U1575. In Sager, W., Hoernle, K., Höfig, T.W., Blum, P., and the Expedition 391 Scientists, Walvis Ridge Hotspot. Proceedings of the International Ocean Discovery Program, 391: College Station, TX (International Ocean Discovery Program). https://doi.org/10.14379/iodp.proc.391.103.2023
Sager, W., Hoernle, K., Höfig, T.W., Avery, A.J., Bhutani, R., Buchs, D.M., Carvallo, C.A., Class, C., Dai, Y., Dalla Valle, G., Del Gaudio, A.V., Fielding, S., Gaastra, K.M., Han, S., Homrighausen, S., Kubota, Y., Li, C.-F., Nelson, W.R., Petrou, E., Potter, K.E., Pujatti, S., Scholpp, J., Shervais, J.W., Thoram, S., Tikoo-Schantz, S.M., Tshiningayamwe, M., Wang, X.-J., and Widdowson, M., 2023c. Site U1576. In Sager, W., Hoernle, K., Höfig, T.W., Blum, P., and the Expedition 391 Scientists, Walvis Ridge Hotspot. Proceedings of the International Ocean Discovery Program, 391: College Station, TX (International Ocean Discovery Program). https://doi.org/10.14379/iodp.proc.391.104.2023
Sager, W.W., Sano, T., and Geldmacher, J., 2016. Formation and evolution of Shatsky Rise oceanic plateau: insights from IODP Expedition 324 and recent geophysical cruises. Earth-Science Reviews, 159:306–336. https://doi.org/10.1016/j.earscirev.2016.05.011
Sager, W.W., Thoram, S., Engfer, D.W., Koppers, A.A.P., and Class, C., 2021. Late Cretaceous Ridge reorganization, microplate formation, and the evolution of the Rio Grande Rise – Walvis Ridge hot spot twins, South Atlantic Ocean. Geochemistry, Geophysics, Geosystems, 22(3):e2020GC009390. https://doi.org/10.1029/2020GC009390
Sager, W.W., Zhang, J., Korenaga, J., Sano, T., Koppers, A.A.P., Widdowson, M., and Mahoney, J.J., 2013. An immense shield volcano within the Shatsky Rise oceanic plateau, northwest Pacific Ocean. Nature Geoscience, 6(11):976–981. https://doi.org/10.1038/ngeo1934
Salters, V.J.M., and Sachi-Kocher, A., 2010. An ancient metasomatic source for the Walvis Ridge basalts. Chemical Geology, 273(3–4):151–167. https://doi.org/10.1016/j.chemgeo.2010.02.010
Self, S., Mittal, T., and Jay, A.E., 2021. Thickness characteristics of Pāhoehoe lavas in the Deccan Province, Western Ghats, India, and in continental flood basalt provinces elsewhere. Frontiers in Earth Science, 6:630604. https://doi.org/10.3389/feart.2020.630604
Self, S., Thordarson, T., and Keszthelyi, L., 1997. Emplacement of continental flood basalt lava flows. In Mahoney, J.J., and Coffin, M.F. (Eds.), Large Igneous Provinces: Continental, Oceanic, and Planetary Flood Volcanism. Geophysical Monograph, 100: 381–410. https://doi.org/10.1029/GM100p0381
Shervais, J.W., 2022. The petrogenesis of modern and ophiolitic lavas reconsidered: Ti-V and Nb-Th. Geoscience Frontiers, 13(2):101319. https://doi.org/10.1016/j.gsf.2021.101319
Smith, W.H.F., and Sandwell, D.T., 1997. Global sea floor topography from satellite altimetry and ship depth soundings. Science, 277(5334):1956–1962. https://doi.org/10.1126/science.277.5334.1956
Thompson, R., and Oldfield, F., 1986. Environmental Magnetism: Dordrecht (Springer). https://doi.org/10.1007/978-94-011-8036-8
Thoram, S., 2021. Tectonic evolution of oceanic plateaus and hotspot-ridge interactions: Walvis Ridge-Rio Grande Rise, South Atlantic, and Tamu Massif, Pacific Ocean [PhD dissertation]. University of Houston, Houston, TX.
Thoram, S., Sager, W.W., and Jokat, W., 2019. Implications of updated magnetic anomalies for the Late Cretaceous tectonic evolution of Walvis Ridge. Geophysical Research Letters, 46(16):9474–9482. https://doi.org/10.1029/2019GL083467
Thordarson, T., and Self, S., 1998. The Roza Member, Columbia River Basalt Group: a gigantic pahoehoe lava flow field formed by endogenous processes? Journal of Geophysical Research: Solid Earth, 103(B11):27411–27445. https://doi.org/10.1029/98JB01355
Torsvik, T.H., Müller, R.D., Van der Voo, R., Steinberger, B., and Gaina, C., 2008. Global plate motion frames: toward a unified model. Reviews of Geophysics, 46(3):RG3004. https://doi.org/10.1029/2007RG000227
Tozer, B., Sandwell, D.T., Smith, W.H.F., Olson, C., Beale, J.R., and Wessel, P., 2019. Global bathymetry and topography at 15 arc sec: SRTM15+. Earth and Space Science, 6(10):1847–1864. https://doi.org/10.1029/2019EA000658
Van Fossen, M.C., and Kent, D.V., 1992. Paleomagnetism of 122 Ma plutons in New England and the mid-Cretaceous paleomagnetic field in North America: true polar wander or large-scale differential mantle motion? Journal of Geophysical Research: Solid Earth, 97(B13):19651–19661. https://doi.org/10.1029/92JB01466
Verosub, K.L., 1977. Depositional and postdepositional processes in the magnetization of sediments. Reviews of Geophysics, 15(2):129–143. https://doi.org/10.1029/RG015i002p00129
Wade, B.S., Pearson, P.N., Berggren, W.A., and Pälike, H., 2011. Review and revision of Cenozoic tropical planktonic foraminiferal biostratigraphy and calibration to the geomagnetic polarity and astronomical time scale. Earth-Science Reviews, 104(1–3):111–142. https://doi.org/10.1016/j.earscirev.2010.09.003
Weaver, B.L., Wood, D.A., Tarney, J., and Joron, J.L., 1987. Geochemistry of ocean island basalts from the South Atlantic: Ascension, Bouvet, St. Helena, Gough and Tristan da Cunha. In Fitton, J.G., and Upton, B.G.J. (Eds.), Alkaline Igneous Rocks. Geological Society Special Publication, 30: 253–267. https://doi.org/10.1144/GSL.SP.1987.030.01.11
Willbold, M., and Stracke, A., 2006. Trace element composition of mantle end-members: implications for recycling of oceanic and upper and lower continental crust. Geochemistry, Geophysics, Geosystems, 7(4):Q04004. https://doi.org/10.1029/2005GC001005
Zhou, H., Hoernle, K., Geldmacher, J., Hauff, F., Homrighausen, S., Garbe-Schönberg, D., and Jung, S., 2020. Geochemistry of Etendeka magmatism: spatial heterogeneity in the Tristan-Gough plume head. Earth and Planetary Science Letters, 535:116123. https://doi.org/10.1016/j.epsl.2020.116123
Zindler, A., and Hart, S., 1986. Chemical geodynamics. Annual Review of Earth and Planetary Sciences, 14:493–570. https://doi.org/10.1146/annurev.ea.14.050186.002425