Sager, W., Hoernle, K., Höfig, T.W., Blum, P., and the Expedition 391 Scientists
Proceedings of the International Ocean Discovery Program Volume 391
publications.iodp.org
https://doi.org/10.14379/iodp.proc.391.108.2023
Site U15851
![]() W. Sager,
W. Sager,
![]() P. Blum,
P. Blum,
![]() R. Bhutani,
R. Bhutani,
![]() C.A. Carvallo,
C.A. Carvallo,
![]() D. Heaton,
D. Heaton,
![]() W.R. Nelson,
W.R. Nelson,
![]() M. Tshiningayamwe,
M. Tshiningayamwe,
![]() M. Widdowson, and the Expedition 391 Scientists2
M. Widdowson, and the Expedition 391 Scientists2
1 Sager, W., Blum, P., Bhutani, R., Carvallo, C.A., Heaton, D., Nelson, W.R., Tshiningayamwe, M., Widdowson, M., and the Expedition 391 Scientists, 2023. Site U1585. In Sager, W., Hoernle, K., Höfig, T.W., Blum, P., and the Expedition 391 Scientists, Walvis Ridge Hotspot. Proceedings of the International Ocean Discovery Program, 391: College Station, TX (International Ocean Discovery Program). https://doi.org/10.14379/iodp.proc.391.108.2023
2 Expedition 391 Scientists' affiliations.
1. Background and objectives
The strategy of Expedition 391 was to core at six distributed locations on the Tristan-Gough-Walvis (TGW) hotspot track, providing new insights into the temporal, volcanologic, petrologic, geochemical and paleomagnetic evolution of the hotspot track (see Scientific objectives in the Expedition 391 summary chapter [Sager et al., 2023c]). At the youngest and westernmost of these locations, three sites were proposed as a transect across the northern Guyot Province seamounts and ridges immediately southwest of the morphologic split that occurs at about 2°E (Figure F1). Because of severe cuts to operational time on that expedition caused by COVID-19 mitigation, two proposed sites (GT-4A and TT-4A) were omitted (see Introduction in the Expedition 391 summary chapter [Sager et al., 2023c]). Only the middle site (U1578) was cored (Figures F1, F2). This omission was a major deficiency for Expedition 391, because the three holes were positioned to sample the isotopic split that first occurs farther northeast, at the location of the DSDP Leg 74 transect (Hoernle et al., 2015). By omitting the ends of the transect, only dredge samples are available to characterize the isotopic end-members, which correspond to the Tristan track (northern seamounts that connect Walvis Ridge with the Tristan Island group) and the Gough track (southern seamounts that connect Walvis Ridge to the Gough Island group).
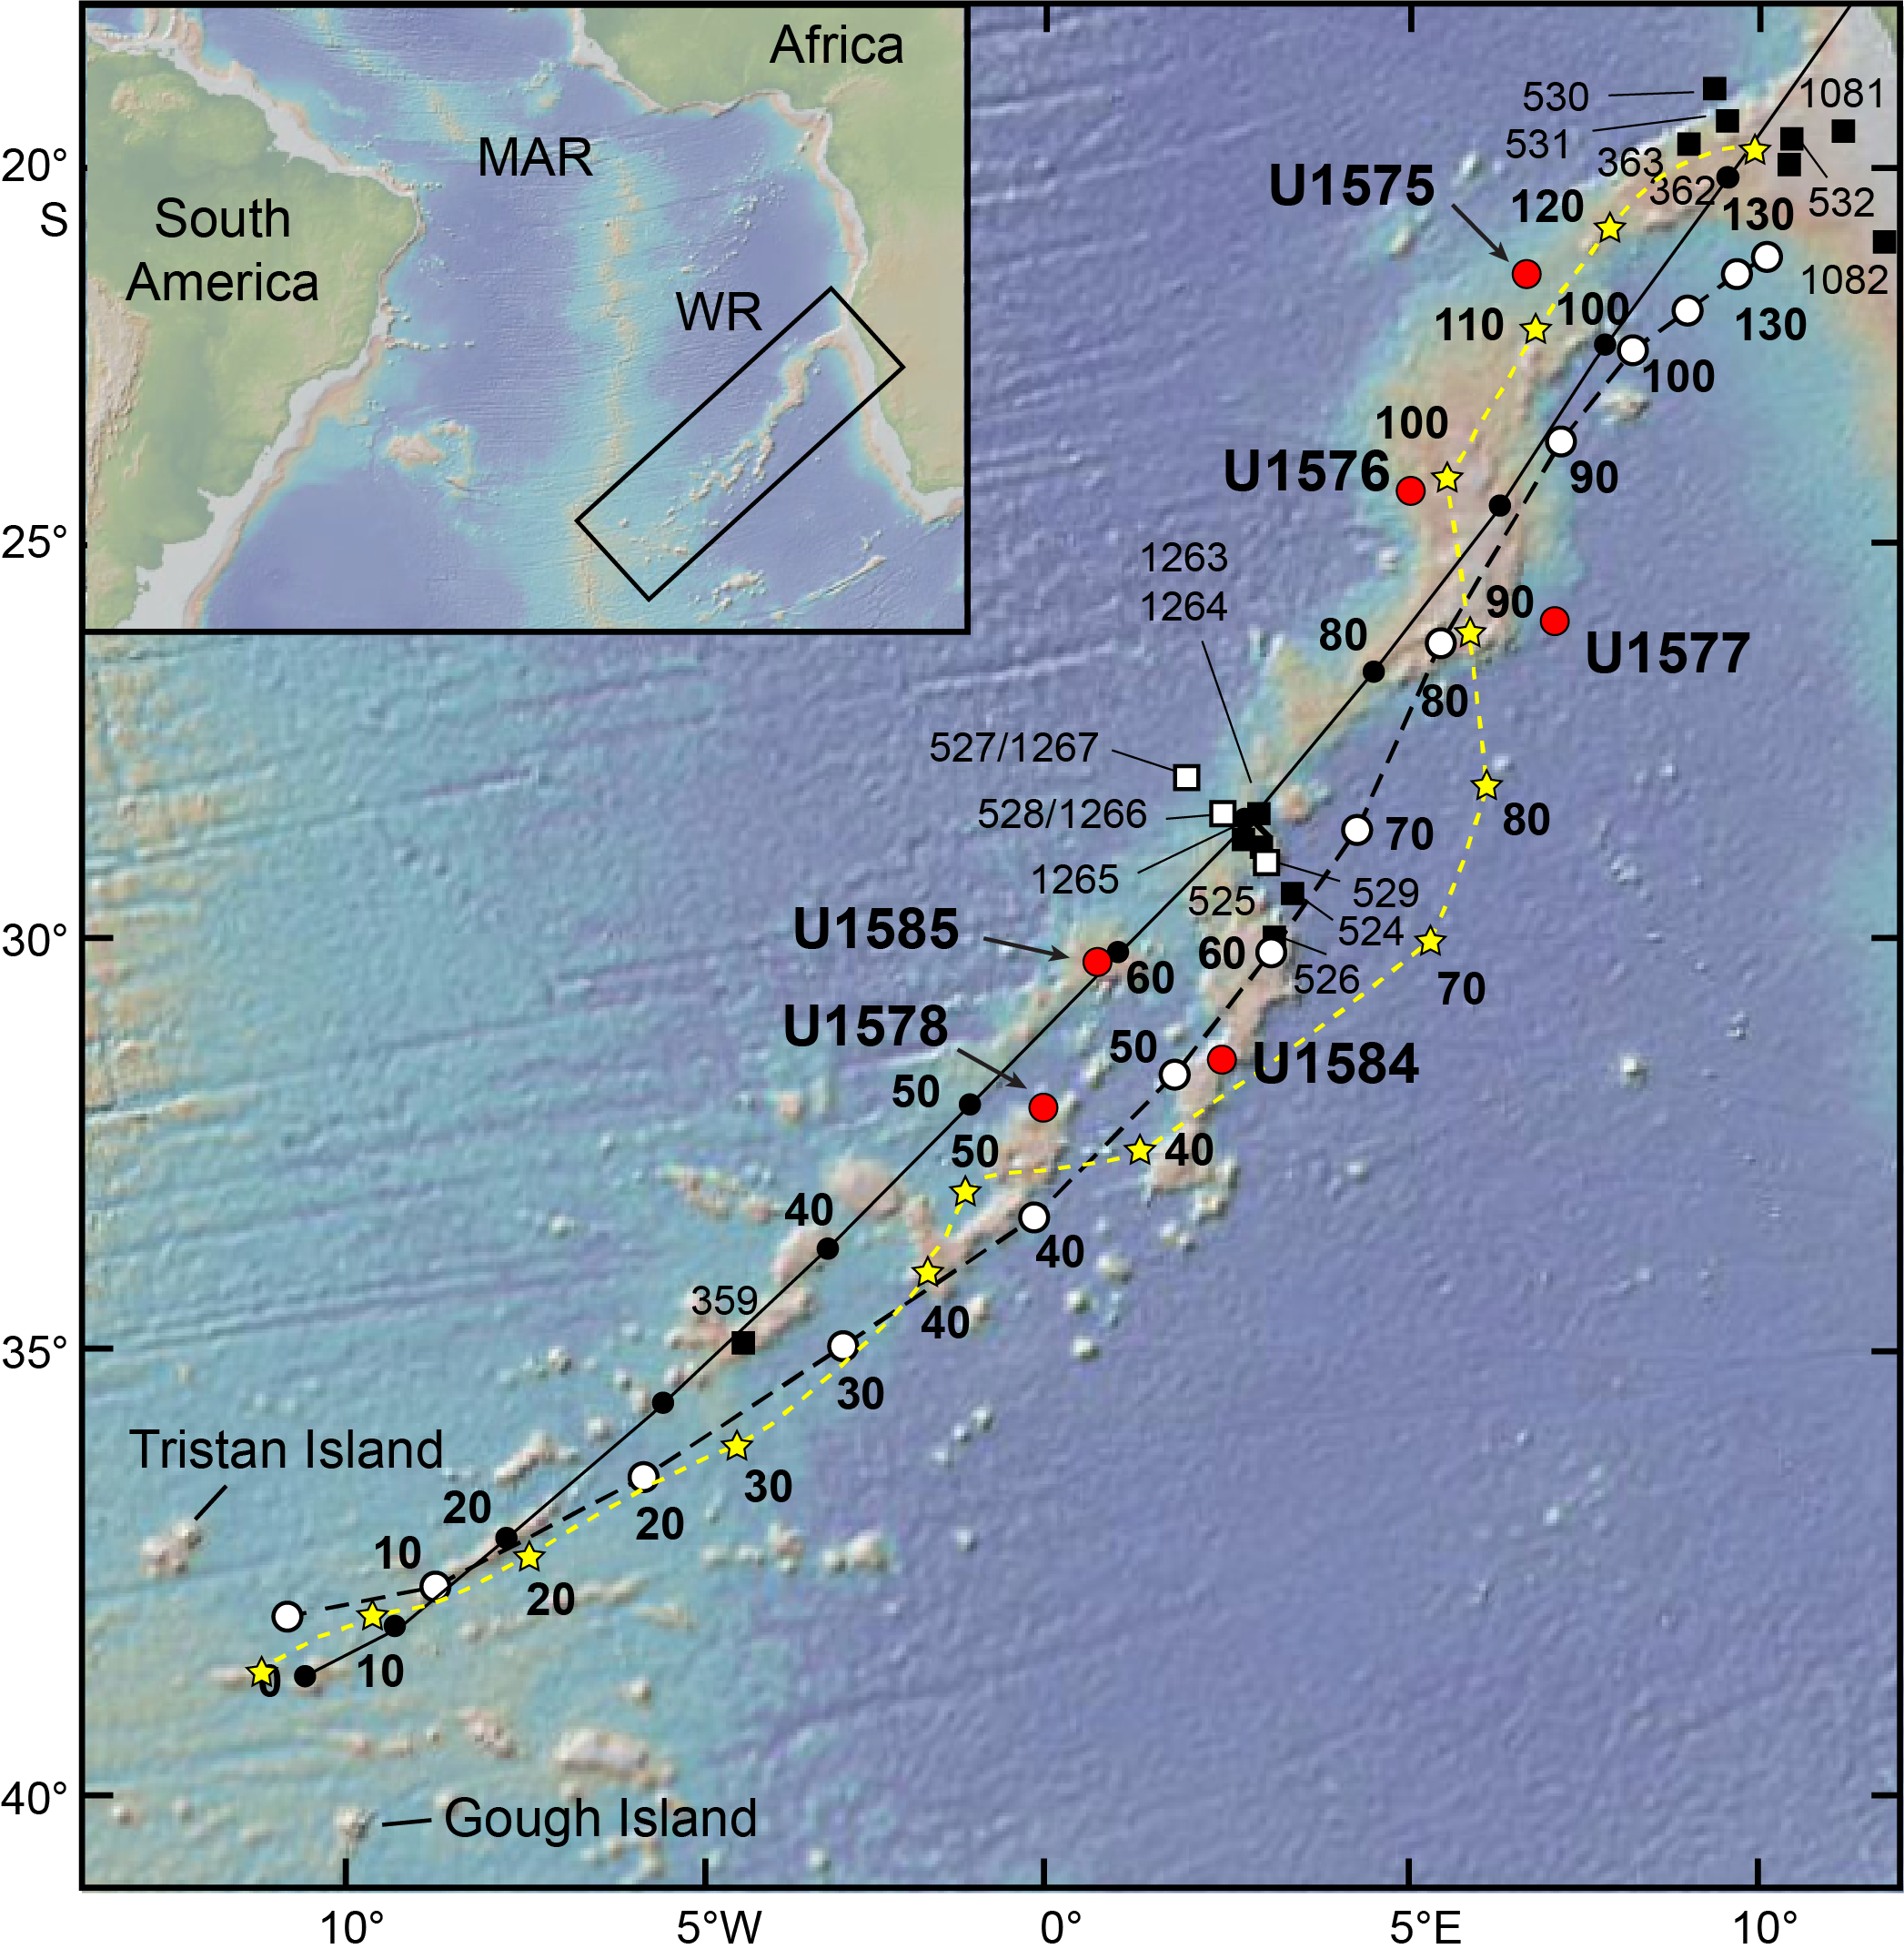
Figure F1. Walvis Ridge bathymetry hotspot age models, previous drill sites, and proposed drill sites.

Figure F2. Bathymetry map of the northern Guyot Province.
The objective of Expedition 397T was to core at the two omitted sites (or nearby alternates). The rationale was the same: core basaltic basement for geochemical, isotopic, geochronologic, paleomagnetic, and other studies. Site U1585 (proposed Site TT-4A) is located on the lower north flank of an unnamed guyot ridge that is part of the Tristan track (Figures F1, F2). The main operational purpose of coring at this site was to extend the Expedition 391 Guyot Province transect to the Tristan track, coring a seamount of probable Late Cretaceous or early Cenozoic age (Figures F1, F3). Site U1585 promised critical samples for two important scientific goals of the combined expeditions: (1) to establish whether differences in geochemical composition of edifices along the Tristan, Gough, and Center tracks are caused by mixing or distinct plume components and (2) to determine whether the latest Cretaceous–earliest Cenozoic paleolatitude of the TGW hotspot is consistent with moving mantle plumes or true polar wander.
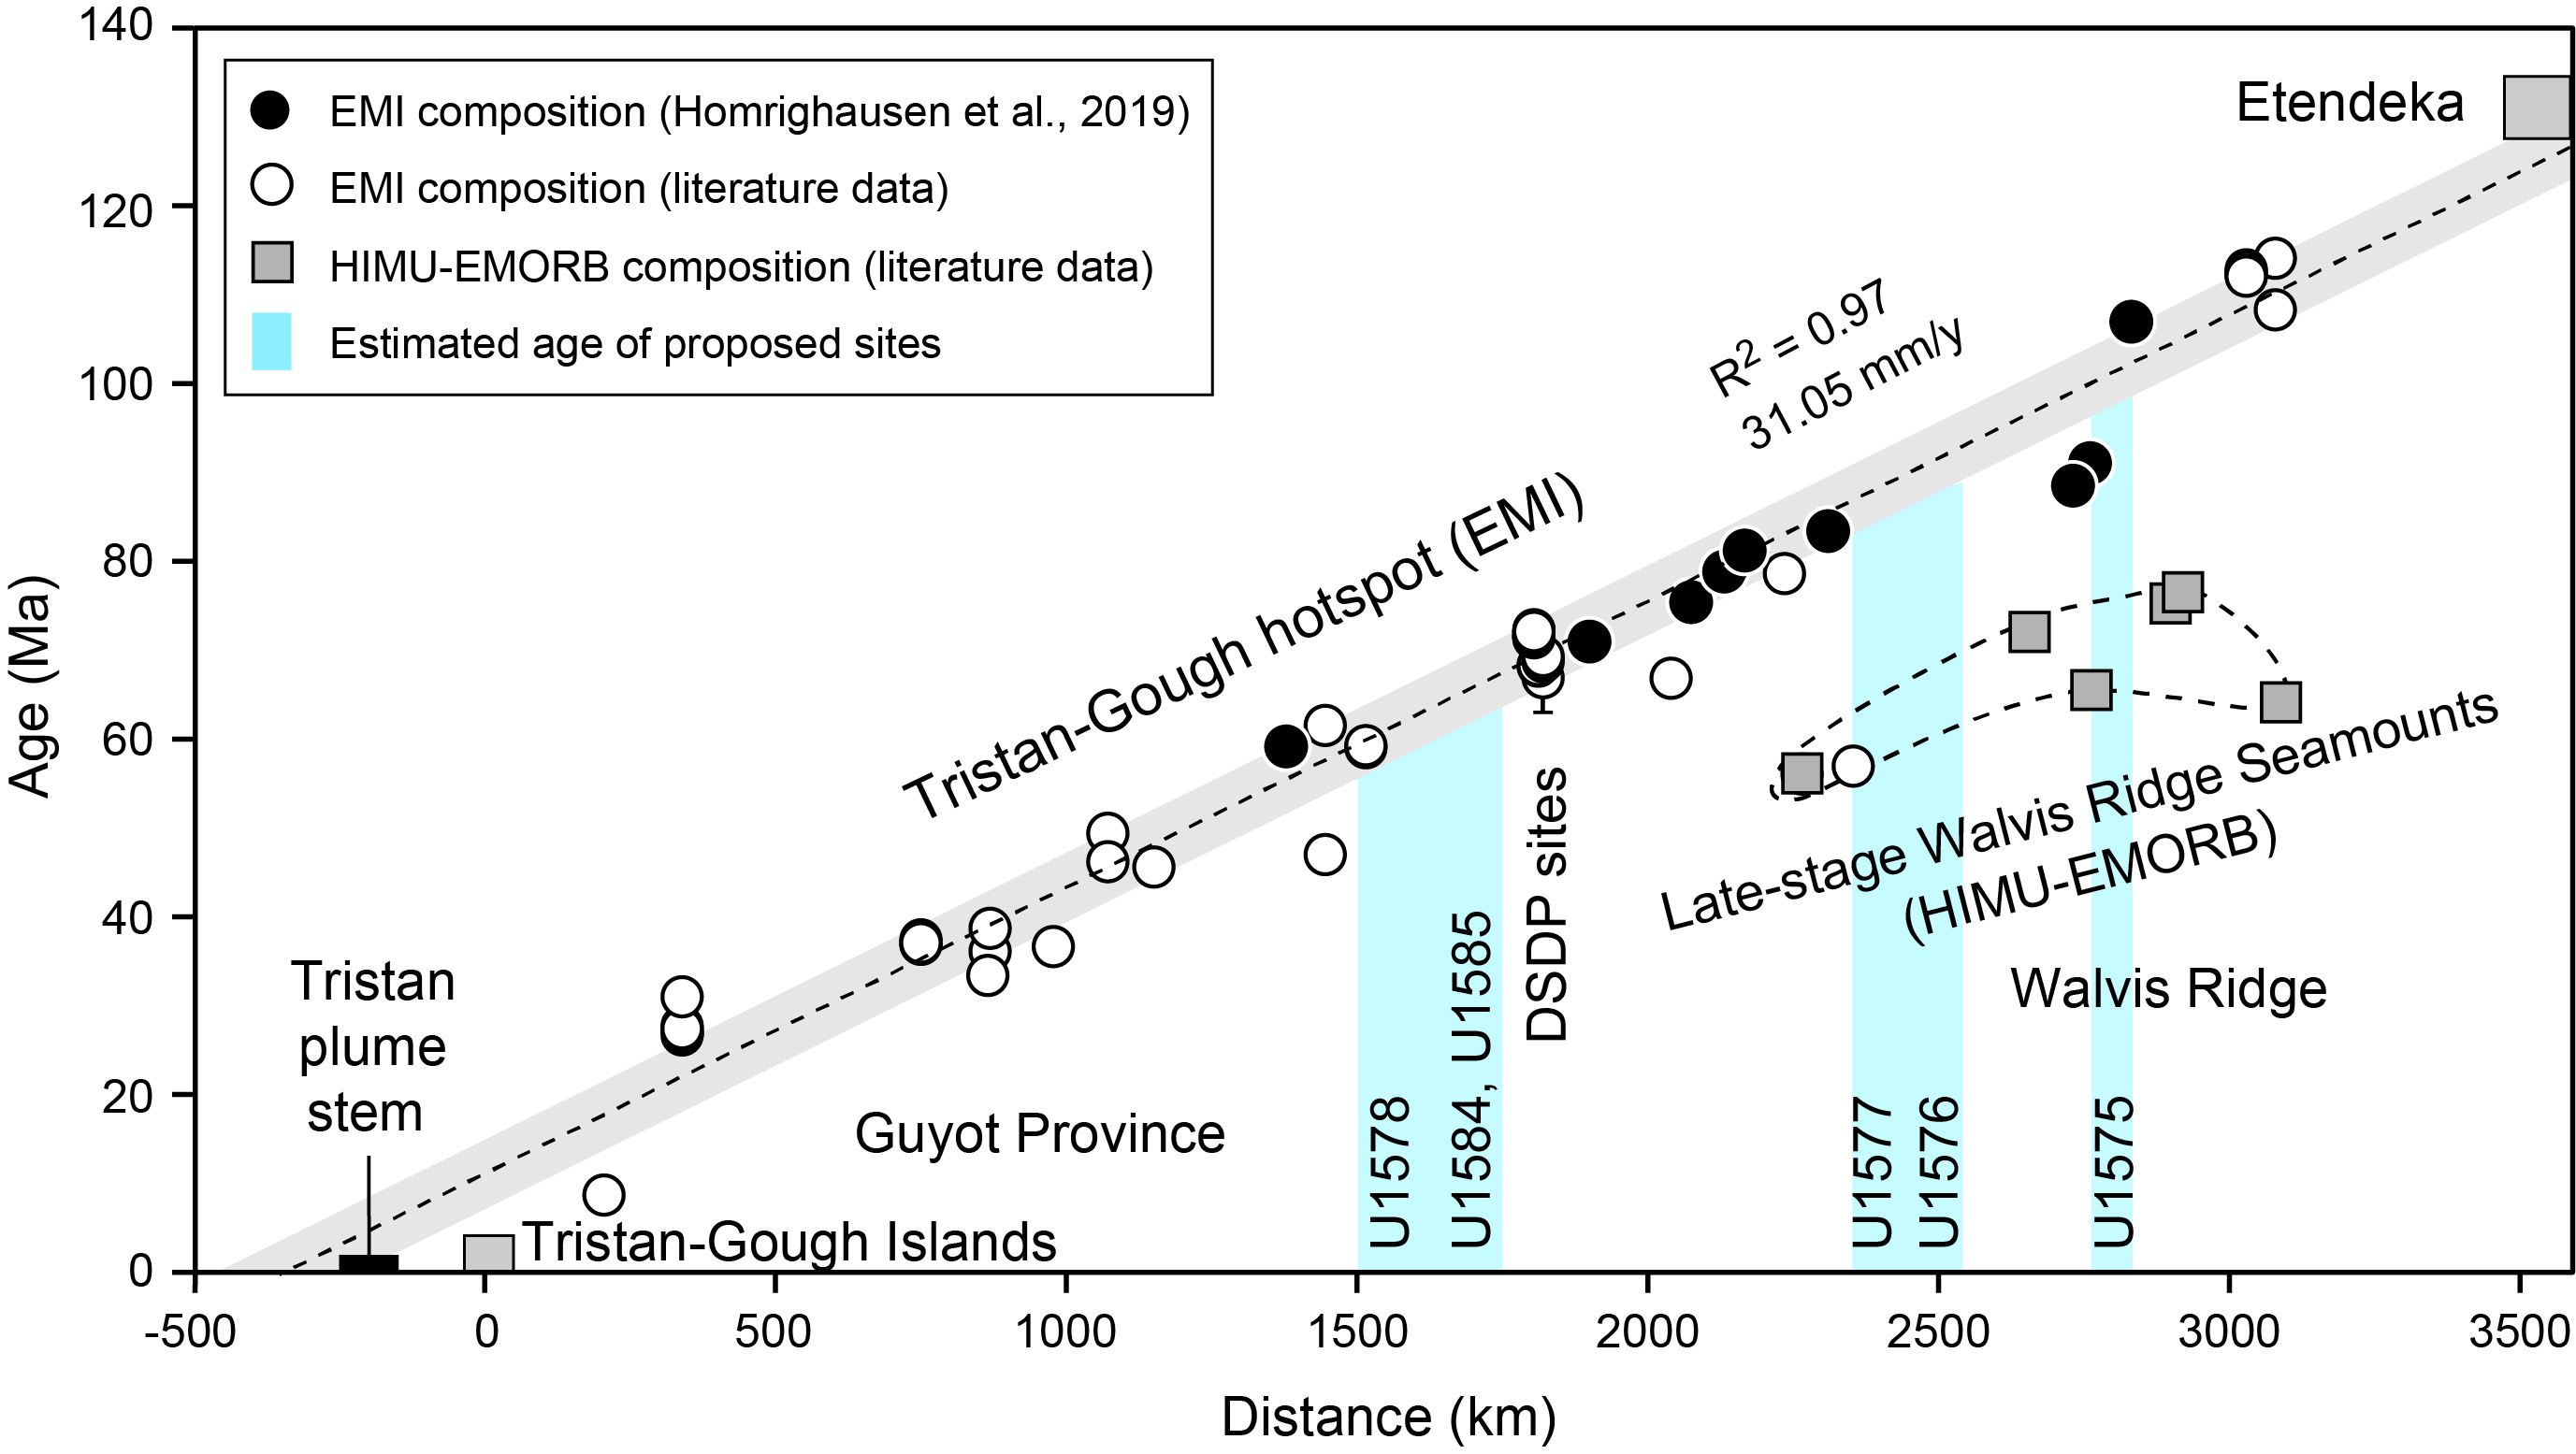
Figure F3. Walvis Ridge age progression.
The first hole drilled during Expedition 397T, U1584A, did not live up to expectations, encountering lithified volcanic breccias that were time consuming to core. As a result, coring was terminated early in that hole and the remaining time was saved for Site U1585. Recovery of basalt from Hole U1584A was limited to scattered altered basalt clasts, so it is unclear how well they will address some cruise objectives. Thus, drilling at Site U1585 became more important for fulfilling overall expedition goals.
1.1. Operational strategy
Expedition 397T was allotted ~7 days of drilling time during a long transit. Coring one hole at each of the two sites planned would normally take longer than that. Thus, the primary operational imperative was to minimize drilling time. A number of operational steps were taken to do so. Drilling was planned using the rotary core barrel (RCB) bit because it is best for coring igneous rocks. Unfortunately, this choice usually means that soft-sediment cores suffer significant drilling disturbance. Moreover, proponents requested to the Environmental Protection and Safety Panel to drill without coring to ~20 m above the igneous interface to save hours of wireline core retrieval time. The request was granted, so Expedition 397T coring first established the mudline position, and then cored with a center bit (which does not allow sediment to enter the core barrel) to ~20 m above estimated basement depth. In addition, the mudline was established by lowering the drill string to the depth indicated by the site survey bathymetry and the precision depth recorder (PDR). Then we started coring. When a core was retrieved that contained soft sediment, the mudline was established. This method saved time over lowering a camera to the seafloor to observe the bottom depth, which is a common operational approach.
An exception to the time-saving approach above was a switch in the targeted site. The initial plan for Expedition 397T Site U1585 was to core proposed Site TT-3A, which is near the center of the guyot summit (Figure F4). Instead, proposed Site TT-4A was cored. This site is on the lower flank of the seamount. This change was made because of concerns that a summit site might encounter volcaniclastic deposits or perhaps sample later volcanism, represented by a nearby summit dome (Figure F4). The extra depth of the seafloor (~1500 m) lengthened wireline core recovery trips by ~30 min each. This was nevertheless considered a good trade-off because site geology appeared simpler and extra time was available owing to the reduced drilling time at Site U1584. The plan for Site U1585 was to core to igneous basement and keep going until the bit failed or time expired.

Figure F4. Site U1585 and Tristan track guyot bathymetry map.
1.2. Geochemical objectives
Site U1585 has the potential to provide important constraints on the geochemical evolution of the TGW track volcanism. Dredge samples from the Walvis Ridge north of the DSDP Leg 74 sites (527, 528, and 525A, from northwest to southeast) are dominated by the Gough-type geochemical composition with rare exceptions (Hoernle et al., 2015; Homrighausen et al., 2019). Beginning at the DSDP Leg 74 sites and going to Tristan and Gough Islands, the volcanic track shows geochemical zonation with enriched mantle one (EMI)-type compositions that can be divided into Tristan (low 207Pb/204Pb) and Gough (high 207Pb/204Pb) type compositions. Site U1585 (together with Site U1584 on the Gough subtrack and Site U1578 on the Center subtrack) was chosen to test the zonation model for the northern part of the Guyot Province of the TGW track (Rohde et al., 2013; Hoernle et al., 2015; Homrighausen et al., 2019). The zonation model predicts that the lavas from U1585 will have a Tristan-type composition. More specifically, Site U1585 will serve as the northwest end-member for a possible mixing array formed by the three sites on the Guyot cross-hotspot-track profile, as is the case with the Leg 74 sites farther northeast.
1.3. Geochronologic objectives
Site U1585 is located on the Tristan track of the Guyot Province, at a location where the predicted age from hotspot models is uncertain, but ranges ~55–60 Ma (Figure F1). The age progression model of Homrighausen et al. (2019) predicts a slightly older age of 55–70 Ma (Figure F3). Although the age progression is fairly well constrained along the TGW hotspot track, one or more reliable radiometric dates from this site will help refine the age progression. Furthermore, the evolution of Guyot Province volcanic seamounts and their age span of activity is poorly known because most are represented by a single date. By providing samples from a deep borehole, Site U1585 has the potential to aid in understanding the temporal evolution of a Guyot Province seamount. The location of Site U1585, on the lower flank, was chosen with the expectation that this location would experience infrequent eruptions and therefore sample a large time span.
1.4. Paleomagnetic objectives
Site U1585 is an important location for examining the paleolatitude of the TGW hotspot and possible true polar wander because the expected guyot age is near that of the farthest south paleolatitudes implied by global paleomagnetic data (Figure F5). Analysis by Gordon and colleagues (Woodworth and Gordon, 2018; Zheng et al., 2018; Gordon et al., 2019) suggest that a true polar wander stillstand (i.e., no polar motion) occurred during the mid-Cenozoic, but prior to this time, there was a true polar wander shift of ~5°. True polar wander was an early explanation for the paleolatitude difference between Suiko Seamount, in the mid-Emperor chain, relative to the present latitude of the hotspot (Gordon and Cape, 1981). Although southward hotspot motion has largely replaced true polar wander as an explanation for that shift (Tarduno et al., 2009; Koppers et al., 2012), true polar wander has not been ruled out. The determination of a reliable paleolatitude from Sites U1578 and U1585, with a small uncertainty estimate, can be used to test these two models. In addition, models of hotspot motion caused by mantle flow suggest that the TGW hotspot has moved southward by ~7° since Cretaceous time (Doubrovine et al., 2012), but the paleolatitude inferred from the global paleomagnetic data implies northward motion (Figure F5). This northward post-Cretaceous motion of the TGW hotspot is the sense of motion that would be expected from true polar wander. The Hawaiian and TGW hotspots, being almost antipolar, would display different senses of motion (south in the Pacific and north in the Atlantic).
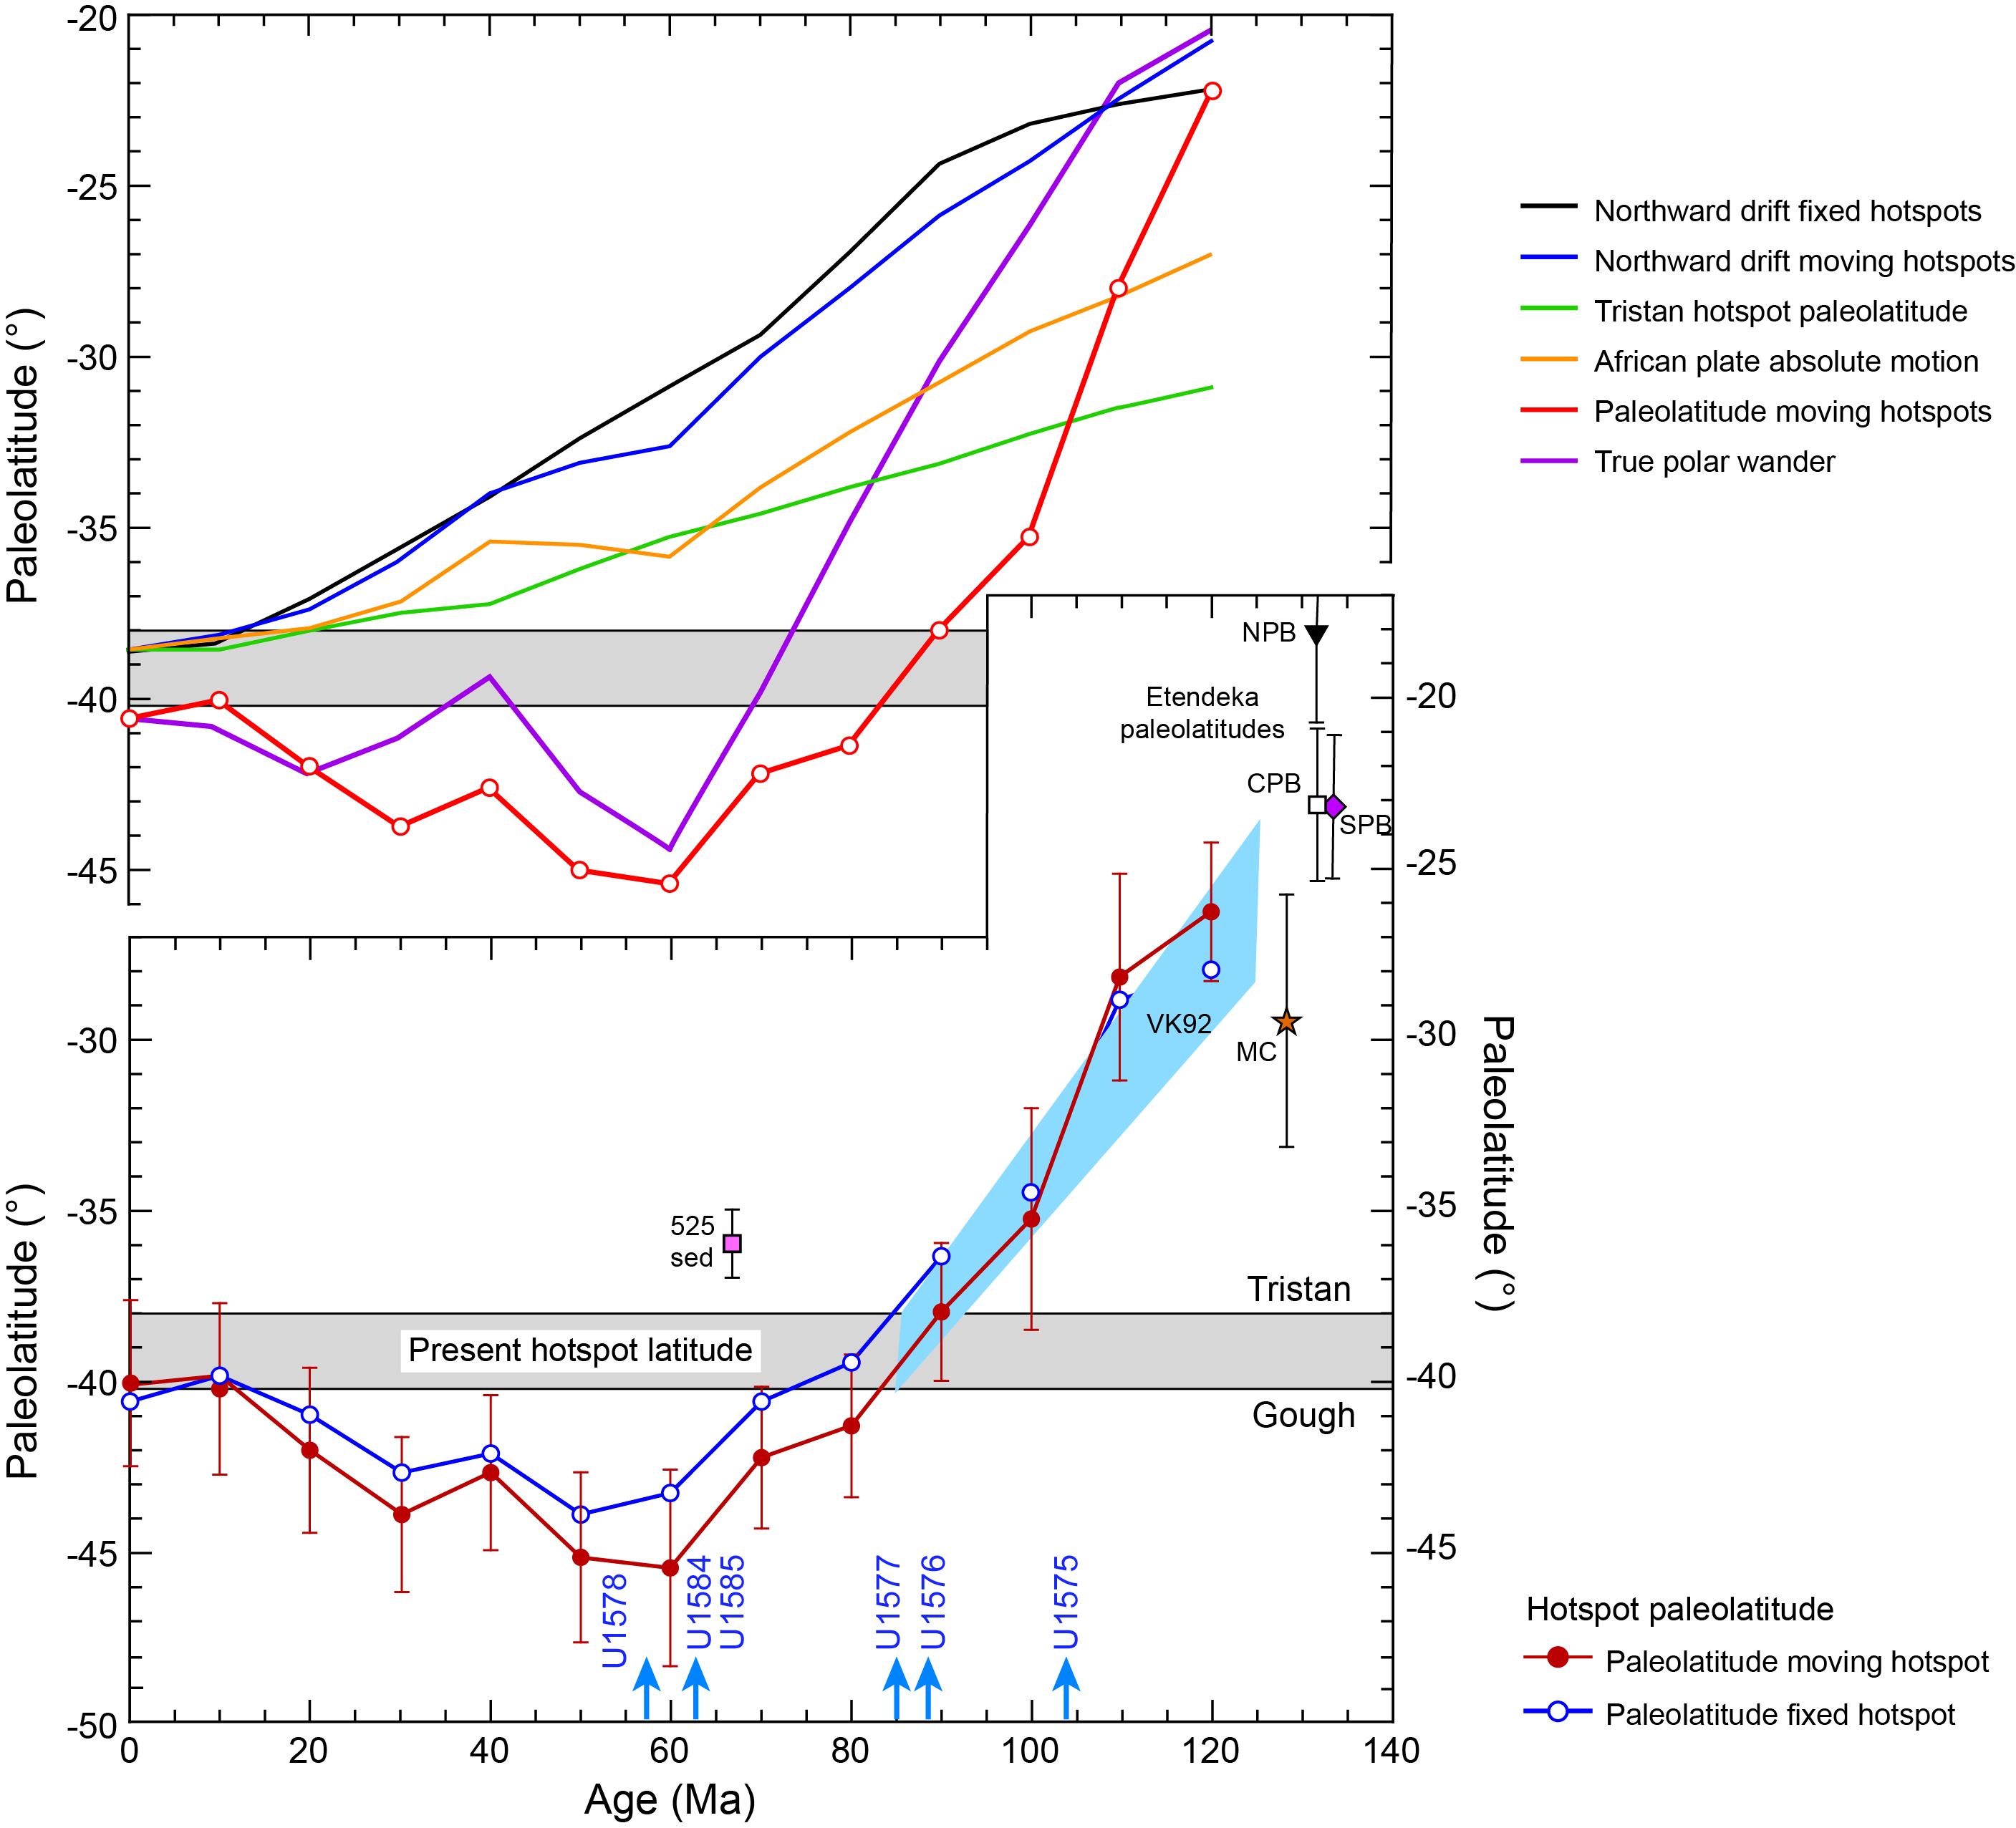
Figure F5. Predicted paleolatitude drift of the TGW hotspot, hotspot models, and true polar wander.
1.5. Volcanologic objectives
Site U1585 samples a guyot of the TGW hotspot track Guyot Province, where the form of the volcanic edifice is distinct from the older Walvis Ridge. This difference implies several important volcanologic questions. Was volcanism during formation of the guyots fundamentally different from the older ridge (e.g., compared to Sites U1575–U1577) for example because of higher rates of volcanism related to plume-ridge interaction during formation of the Walvis Ridge? Will massive flows, common at previously drilled Walvis Ridge sites, be less, overall thinner, or absent? Will volcaniclastics, which are rare at Walvis Ridge sites, make up a larger part of the section? Coring at Site U1578 recovered a ~300 m igneous section with many sedimentary interbeds (see the Site U1578 chapter [Sager et al., 2023d]), suggesting a long duration of volcanic activity. Is this typical of TGW hotspot guyots? Studies of igneous textures and petrology and geochemistry of the lavas will help us understand the volcanic development of large guyots in the Guyot Province. Such detailed studies of submarine volcanoes are few, so Site U1585 will provide important information about intraplate volcanism.
1.6. Sedimentologic objectives
Site U1585 is located ~1500 km from land in the middle South Atlantic Gyre. For this reason, sediments at this site may be different than those found on the older Walvis Ridge. Coring at other sites has shown cycles of sediment color and other properties that may be caused by paleoenvironmental changes. Moreover, Valdivia Bank sites showed thick carbonate sediment sections, even when the site was in deep water (e.g., Site U1577). Prior sites also demonstrated that the sediment sequence is often punctuated by lengthy hiatuses. The abbreviated nature of the Site U1585 sediment column shown by seismic data (Figure F6) implies a truncated sedimentary history, perhaps caused by mass wasting or erosion. Although sediment coring was limited to basal sediments only, Site U1585 sediment cores nevertheless offer the opportunity for a comparison with other Walvis Ridge sites closer to land and for improving our understanding of South Atlantic sedimentation.
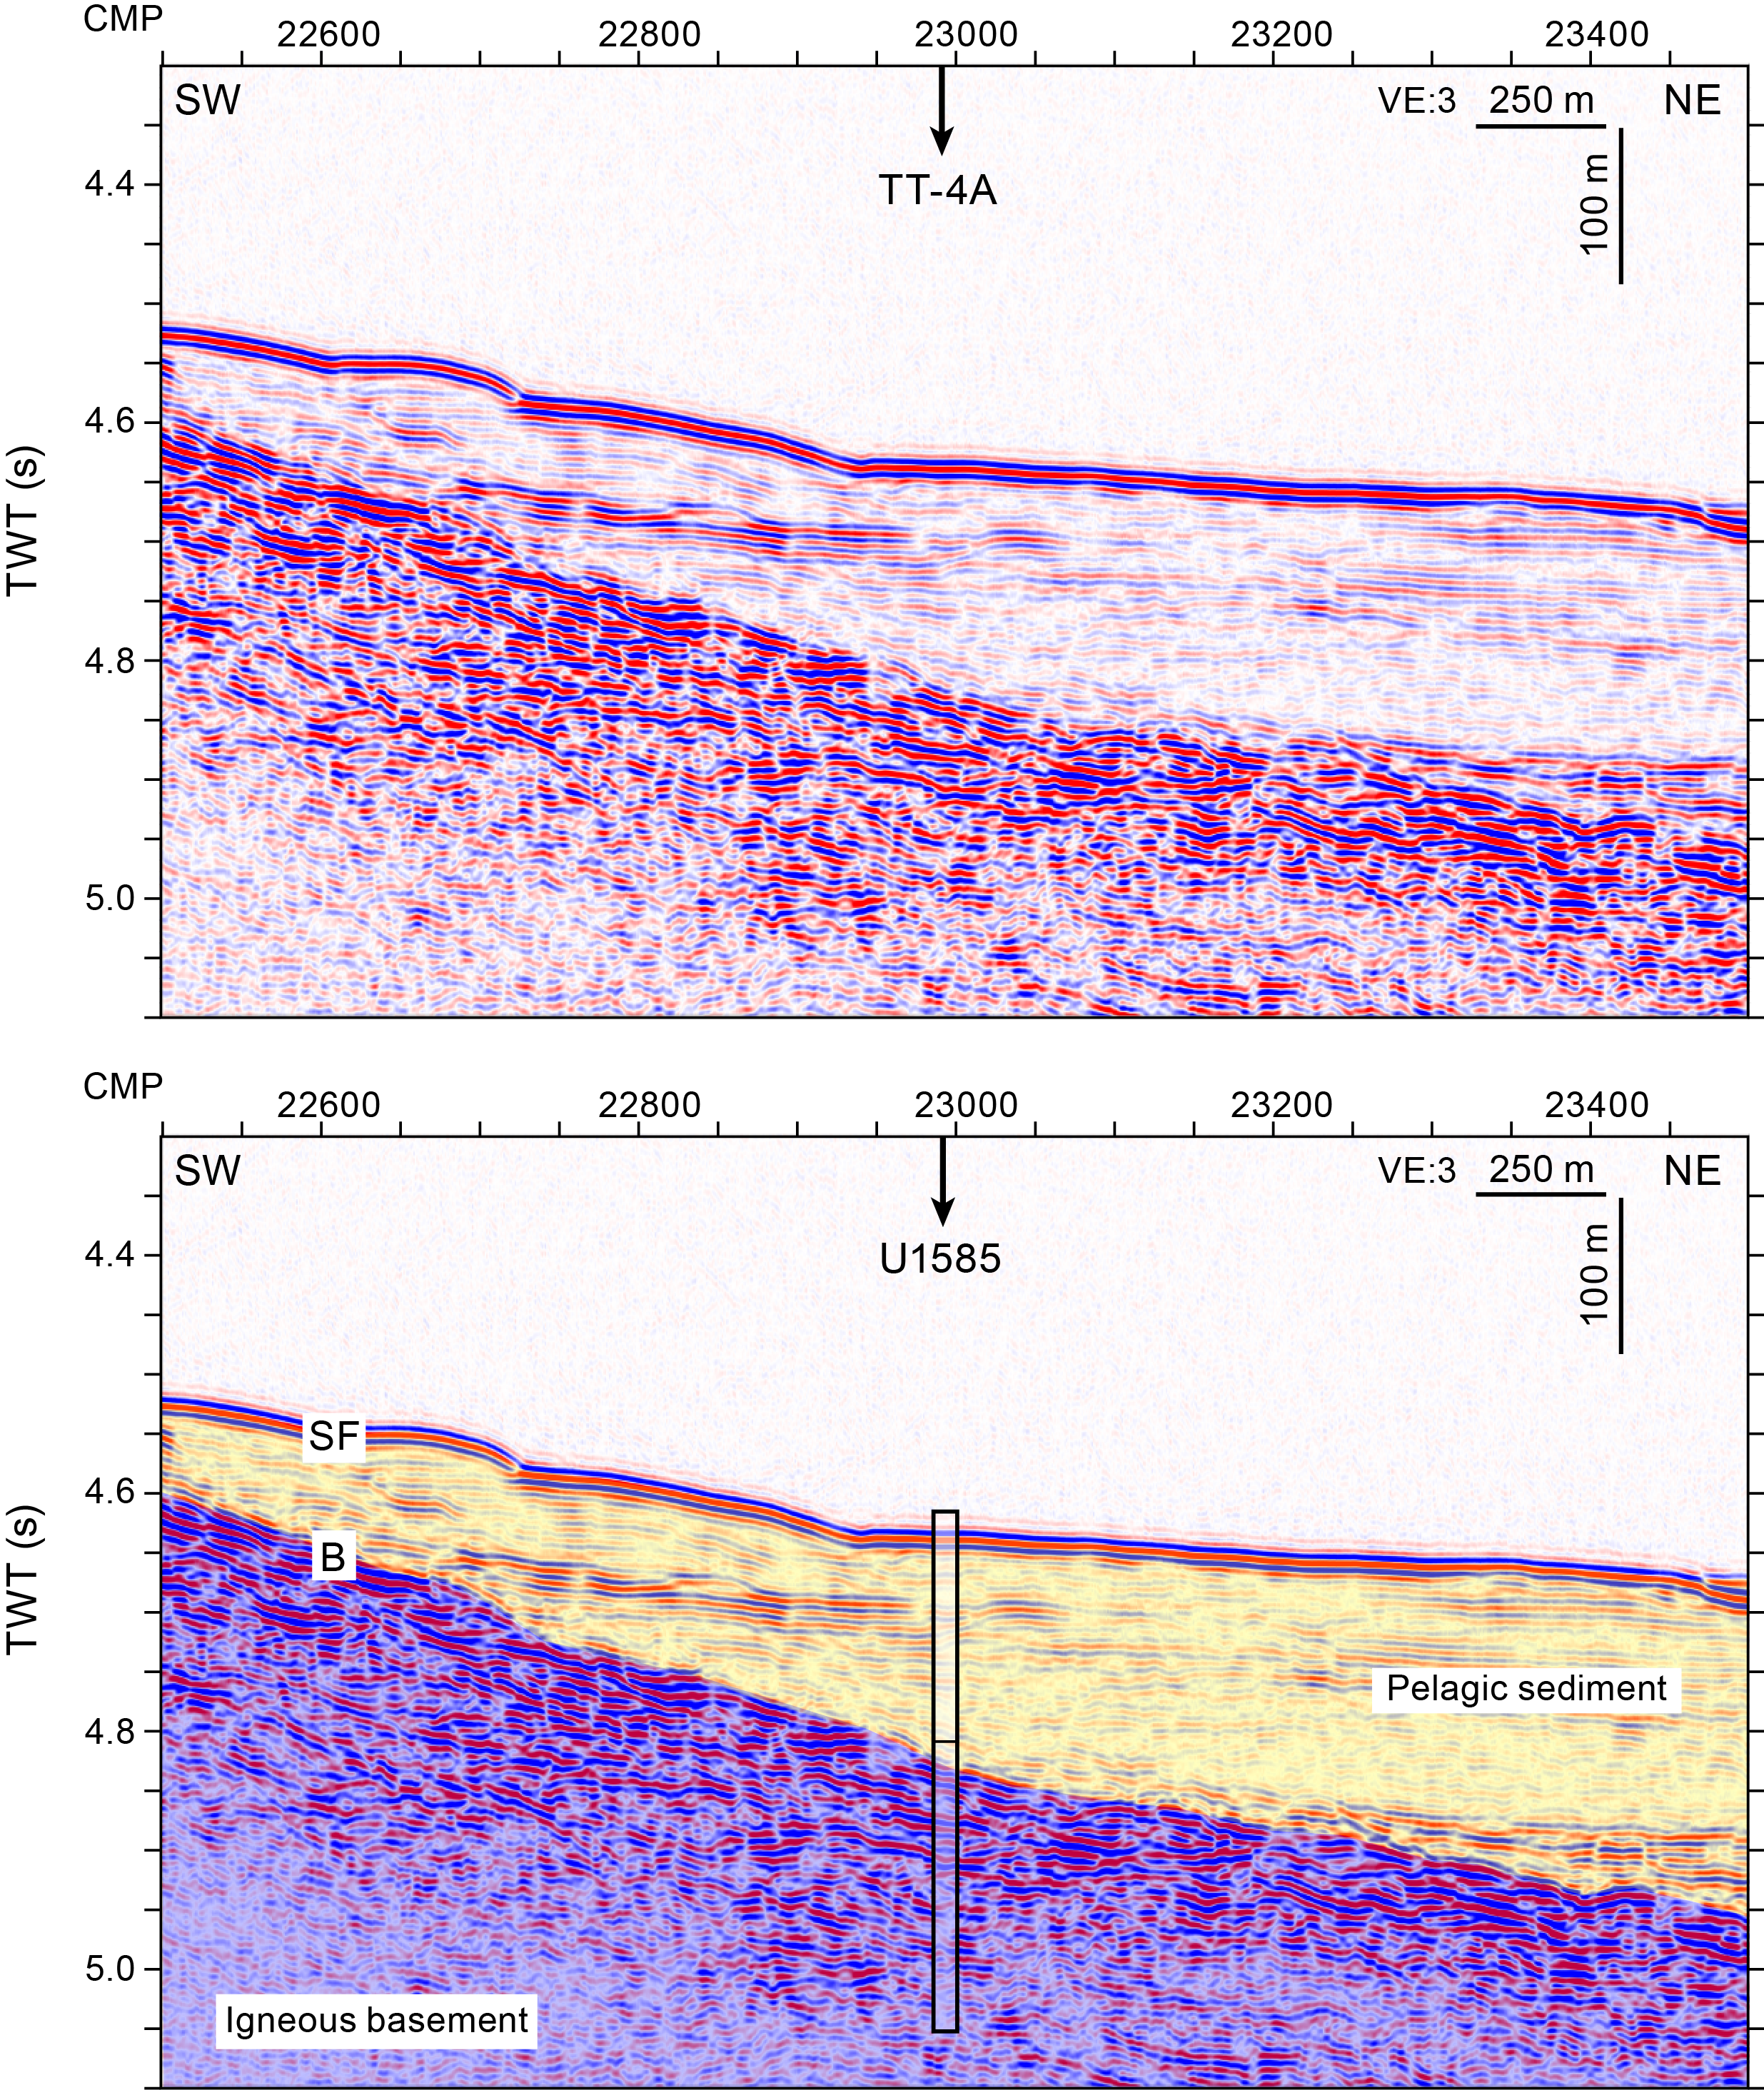
Figure F6. Seismic Line TT-01 over Site U1585.
1.7. Site geophysics
Site U1585 is located on the northern flank of an unnamed guyot ridge at the north end of the Tristan track. The site is situated at a water depth of ~3454 m (Figures F4, F7). The drill site was picked on Seismic Line TT-01, collected during 2019 by the R/V Thomas G. Thompson. Bathymetry data show that the site is located on the beginning of the abyssal plain where sediments onlap the guyot lower flank (Figures F6, F8).

Figure F7. Bathymetry map of the area around Site U1585.

Figure F8. Site U1585 regional seismic profile.
The Seismic Line TT-01 profile shows a wedge-shaped sediment layer that is ~170 m thick at the proposed drill site. Acoustic basement is a strong horizon (Figure F6) and is interpreted as the top of the igneous section. Sediment thickness varies greatly along the profile (Figure F8), implying that average sediment accumulation rate may be laterally variable. Onlap of one observed reflector in the seismic section on the seamount flank suggests lateral changes may result from basin fill. Based on recovery at Site U1578 and other drill sites in the region (e.g., Bartels et al., 2007; see the Site U1578 chapter [Sager et al., 2023d]), the topmost layer is probably Cenozoic pelagic ooze whereas the lower section is early Cenozoic or Late Cretaceous chalk. Upslope on the seismic profile, it appears that the lower layers onlap the basement horizon farther south, so the sediment package may consist mostly of late Cenozoic layers. Those layers are difficult to interpret on the seismic profile at the location of Site U1585 because of the abbreviation of the sediment package.
2. Operations
We completed the 111 nmi transit from Site U1584 to Site U1585 at a speed of 11.4 kt and arrived on 17 September 2022 at 1615 h. Dynamic positioning (DP) mode was established, and we were ready for operations at 1650 h. A bit and bit sub were made up to the RCB bottom-hole assembly (BHA), which was deployed to just above the seafloor based on the PDR signal. We picked up the top drive, pumped the pipe cleaning device (pig) to clear the newly installed pipe from potential rust and other obstructions, dropped the RCB, and began to spud Hole U1585A. The first attempt advanced from 3450.0 to 3459.7 meters below rig floor (mbrf). No tag was observed, and the barrel returned empty. On the second attempt from 3459.7 to 3469.4 mbrf the driller observed a tag at 3468.5 mbrf. The barrel again returned empty; however, it showed evidence of contact in the coring shoe. At 0340 h on 18 September, we declared the seafloor depth at 3468.5 mbrf (3457.3 meters below sea level [mbsl]). At 0430 h a wash barrel was dropped, followed by a center bit, and we drilled ahead to 144.1 meters below seafloor (mbsf). The wash barrel and center bit were retrieved and a 30 bbl (4769.6 L) sepiolite mud sweep was conducted. At 1815 h, the core barrel was dropped and coring began with Core 397T-U1585A-3R. The driller noted a hard tag at 250 mbsf, followed by a drilling break at 262 mbsf. This corresponded to the penetration of a massive basalt breccia layer. Hard rock drilling rates were encountered from Core 31R downhole, corresponding to penetration of massive basalt. Core 39R, the last core, was retrieved in the morning of 23 September, reaching a total penetration of 498.8 mbsf. In Hole U1585A, we recovered a total of 217.7 m of sediment and rock for a 354.7 m interval cored, with recovery ranging 11%–103% (average = 61%) (Table T1). The hole was swept with 30–40 bbl (4769.6–6359.5 L) of sepiolite mud after every 1–3 cores.
At 0615 h on 23 September, we began retrieving the drill string and the bit cleared the rig floor at 1555 h, ending Hole U1585A. The drill floor was secured, the thrusters raised, and the voyage to Lisbon, Portugal, began at 1715 h.
COVID-19 mitigation protocols were followed with mask wearing, social distancing, and antigen testing of all personnel for the 6 days that started after the last recorded positive case on board was isolated, as mandated by the COVID-19 mitigation protocol. As of midnight on 21 September, daily COVID-19 testing ended and wearing of masks was no longer mandatory. On 24 September the last of four infected personnel was released from isolation.
3. Lithostratigraphy
A >274 m thick succession consisting of a mixture of pelagic and detrital sediment and mixed fine (argillaceous) to coarse (blocky) volcaniclastic material lying on top of igneous basement was drilled at Site U1585. Four main sediment units and associated subunits were recognized based predominantly upon macroscopic lithologic (core) observation with supplementary microscopic (thin section) analysis, together with changes in physical properties: P-wave velocity taken using the P-wave caliper (PWC), natural gamma radiation (NGR), and gamma ray attenuation (GRA) bulk density (GRA bulk density measurements cited below). Additional physical properties data are summarized in Table T7. No biostratigraphic data were available at the time of writing.
The sedimentary succession consists of Lithostratigraphic Unit I pelagic chalk; Unit II volcaniclastic pumice lapillistone and chalk succession comprising Subunits IIA and IIB; Unit III, a cyclical pink to greenish gray pelagic tuffaceous chalk succession with multiple complex volcaniclastic horizons divided into Subunits IIIA–IIIH, and Unit IV, a stack of well-cemented basaltic lapilli-sized and block breccia (including juvenile ejects) and ash. This sedimentary succession overlies igneous basement (Unit V), which consists of three igneous lithologic units within massive flows. The four lithostratigraphic units recognized in the overlying sedimentary cover can be summarized as follows (Figure F9; Table T2):
- Unit I (base = 157.02 mbsf; lower boundary = Section 397T-U1585A-4R-3, 91 cm; recovery = ~40%): highly bioturbated nannofossil chalk with foraminifera alternating in color from whitish to pale green with chert horizon(s) and containing occasional thin volcanogenic silty sand (ash) intercalations. There is significant drilling disturbance throughout and at the boundary with underlying Unit IIA. P-wave velocity is ~1700 m/s; the base of Unit I is demarcated by a step increase in P-wave velocity downhole along with an increase in NGR.
- Unit II: a thick succession of massive and bedded pumice and scoria lapillistone units showing an increasing degree of reworking (bedding) downhole together with a concomitant increase in tuffaceous chalk component and thick pelagic chalk intercalations.
- Subunit IIA (157.02–194.85 mbsf; lower boundary = Section 397T-U1585A-8R-3, 32 cm; recovery = ~64%): pumice and scoria lapillistone with altered basaltic clasts arranged in massive beds and thinner, reworked bedded layers containing a minor chalk component in downhole sections. The boundary with underlying Subunit IIB is defined by the first occurrence of a thick chalk intercalation. This subunit suffered slight to moderate drilling disturbance. P-wave velocity is significantly higher (~3000 m/s) in this interval than in the overlying chalk, and NGR is elevated as well (~15–18 counts/s). The base of Subunit IIA corresponds to a slight decrease in P-wave velocity.
- Subunit IIB (base = 249.20 mbsf; lower boundary = Section 397T-U1585A-13R-CC; recovery = ~40%): pumice and scoria lapillistone with distinct red to green redox intervals and sedimentary reworking, including intervals containing larger altered (coarse) basaltic lapillistone and breccia with some biogenic clasts (shell and bryozoan fragments), and increasingly thick alternating chalk and tuffaceous chalk beds downhole. The extent of drilling disturbance is moderate. Compared with the overlying subunit, P-wave velocity is lower (~2000 m/s) in Subunit IIB, which also has slightly elevated magnetic susceptibility (MS).
- Unit III: a complex thick succession of alternating (cyclical?) pink to greenish gray tuffaceous chalk-rich to silty and sandy sediments containing multiple thin, graded ash and tuffaceous ash turbidites. This sedimentary succession is frequently intercalated with thick tuffaceous chalk slump intervals, together with several thick, lithologically diverse, coarse lapilli- and block-dominated volcaniclastic layers.
- Subunit IIIA (base = 259.29 mbsf; lower boundary = Section 397T-U1585A-15R-1, 49 cm; recovery = ~53%): massive, unsorted basaltic lapilli-sized breccia with occasional blocks, partially cemented with a mixture of gray-green tuffaceous chalk and basaltic ash. There is moderate to significant drilling disturbance with much of the material retrieved as short sections and fragments. Compared with the overlying subunit, Subunit IIIA has elevated MS and is characterized by a significant increase in P-wave velocity (to ~4000 m/s) and highly variable bulk density.
- Subunit IIIB (base = 281.50 mbsf; lower boundary = Section 397T-U1585A-17R-CC, 12 cm; recovery = ~46%): a highly bioturbated gray-green to pinkish gray tuffaceous chalk and silty clay succession with subtle alternating color bands and containing occasional distinct, occasionally graded pumiceous ash (silt- and sand-sized particles) layers and passing into pumice and chalk slump deposits. Drilling disturbance is slight to moderate. A significant and abrupt downhole decrease in P-wave velocity to <2000 m/s coincides with the top of Subunit IIIB. The subunit displays slightly higher NGR (~18–20 counts/s) and much more uniform bulk density (~1.5–1.7 g/cm3) than the overlying units.
- Subunit IIIC (base = 294.48 mbsf; lower boundary = Section 397T-U1585A-18R-6, 27 cm; recovery = ~75%): bioturbated tuffaceous chalky claystone, banded dark gray to greenish gray and passing downward into a chaotic basal interval of paler gray to buff tuffaceous chalk primarily composed of intervals of stacked chalk rip-up clasts interspersed with layers displaying soft-sediment deformation. This subunit shows negligible to slight drilling disturbance. It has similar P-wave velocity and bulk density characteristics to the overlying subunit but has a significantly higher NGR (~30–45 counts/s).
- Subunit IIID (base = 298.67 mbsf; lower boundary = Section 397T-U1585A-19R-2, 19 cm; recovery = 37%): massive, unsorted, densely packed scoria and microvesicular aphanitic basalt lapillistone with ash, containing a mixture of dark, subrounded tuffaceous chalk pebbles and isolated basaltic blocks toward the base, displaying moderate to high drilling disturbance. This volcaniclastic layer has reduced MS but high bulk density because of the basalt clasts, increased porosity, and elevated P-wave velocity >2600 m/s.
- Subunit IIIE (base = 331.76 mbsf; lower boundary = Section 397T-U1585A-22R-4, 137 cm; recovery = ~68%): bioturbated tuffaceous and clearly banded chalk, alternating from pale gray to pinkish brown and containing infrequent tuffaceous ash (sand-sized) layers, some with shell debris. The base of this unit contains frequent chaotic intervals displaying soft-sediment deformation and containing lozenge-shaped tuffaceous chalk rip-up clasts. These chaotic layers retain cyclical coloration. Physical properties are similar to the comparable tuffaceous chalk succession of Subunit IIIC.
- Subunit IIIF (base = 367.07 mbsf; lower boundary = Section 397T-U1585A-26R-2, 137 cm; recovery = ~59%): highly bioturbated tuffaceous, carbonate-rich silty sand, banded dark greenish gray to dark reddish brown. Occurrence of thicker (2–15 cm) graded ash (sand-sized) layers with shell debris including larger bivalve (inoceramid) and oyster (Liostrea?) and ammonite(?) fragments. Graded coarse ash (coarse sand- to gravel-sized) layers containing subrounded clasts become more frequent downhole. Drilling disturbance is variable from negligible or slight in finer grained sections to high in the poorly cemented ash layers. Downhole, this mixed sediment and volcaniclastic succession displays increasing MS but a broadly uniform bulk density of ~1.6 g/cm3.
- Subunit IIIG (base = 374.10 mbsf; lower boundary = Section 397T-U1585A-27R-1, 10 cm; recovery = 55%): polymict lapilli-sized dominantly volcanic breccia passing downward into blocky breccia. The ash fraction includes altered, rounded, zoned (accretionary?) lapilli. Clasts consist of angular, aphanitic nonvesicular basalt fragments often display chilled margins or partially preserved glassy/palagonitized rims or rinds. The deposit is patchily cemented by calcite and zeolite and altered ash. Bulk density is highly variable, MS higher, and NGR lower (~12–14 counts/s) than in the bracketing Subunits IIIF and IIIH. Importantly, paleomagnetic measurements give a consistent positive inclination that matches surrounding units (see Paleomagnetism; Figure F26). This observation likely indicates that the breccia was deposited at high temperature (>500°–600°C, the Curie temperature for titanomagnetite) and acquired its magnetization after deposition and cooling. This suggests a significant component of the breccia was ejected as juvenile pyroclasts that cooled as a unit after deposition.
- Subunit IIIH (base = 397.76 mbsf; lower boundary = Section 397T-U1585A-29R-4, 69.5 cm; recovery = ~66%): bioturbated tuffaceous, carbonate-rich silty sand with banded (cyclical?) alternations of dark greenish gray to dark reddish brown with thin (~1–2 cm) tuffaceous ash (sand-sized particles) layers. Toward its base the volcaniclastic layers become thick polymict conglomeratic intervals consisting of graded intervals containing tuffaceous chalk pebbles and volcaniclastic lapillistone with some block-sized clasts. Lapillistone contains a component of partially palagonitized quenched/glassy basaltic fragments. Lower lapilli-sized layers are reworked into inclined beds and mixed with fragmentary shell debris with low porosity (~15 vol%). MS is medium to high and variable. Porosity is elevated (<40–60 vol%); similar to Subunit IIIG, paleomagnetic measurements give a consistent positive inclination that matches surrounding units (see Paleomagnetism; Figure F26).
- Unit IV (base = 417.60 mbsf; lower boundary = Section 397T-U1585A-31R-5, 75 cm; recovery = ~70%): a stacked succession of clast- and/or grain-supported basaltic block, bomb, and lapillistone displaying crudely developed/incomplete fining-upward intervals terminating in medium-sized, sometimes zoned lapilli. The matrix is a distinctive light-colored cement of pale ash, calcite, and zeolite. This unit shows slight drilling disturbance. The top of Unit IV is marked by a significant downhole increase in MS and P-wave velocity and an elevation in bulk density to ~ 2.2 g/cm3. As with Subunit IIIG, this unit also gives a consistent paleomagnetic inclination (Figure F26), similarly implying deposition at high temperature.
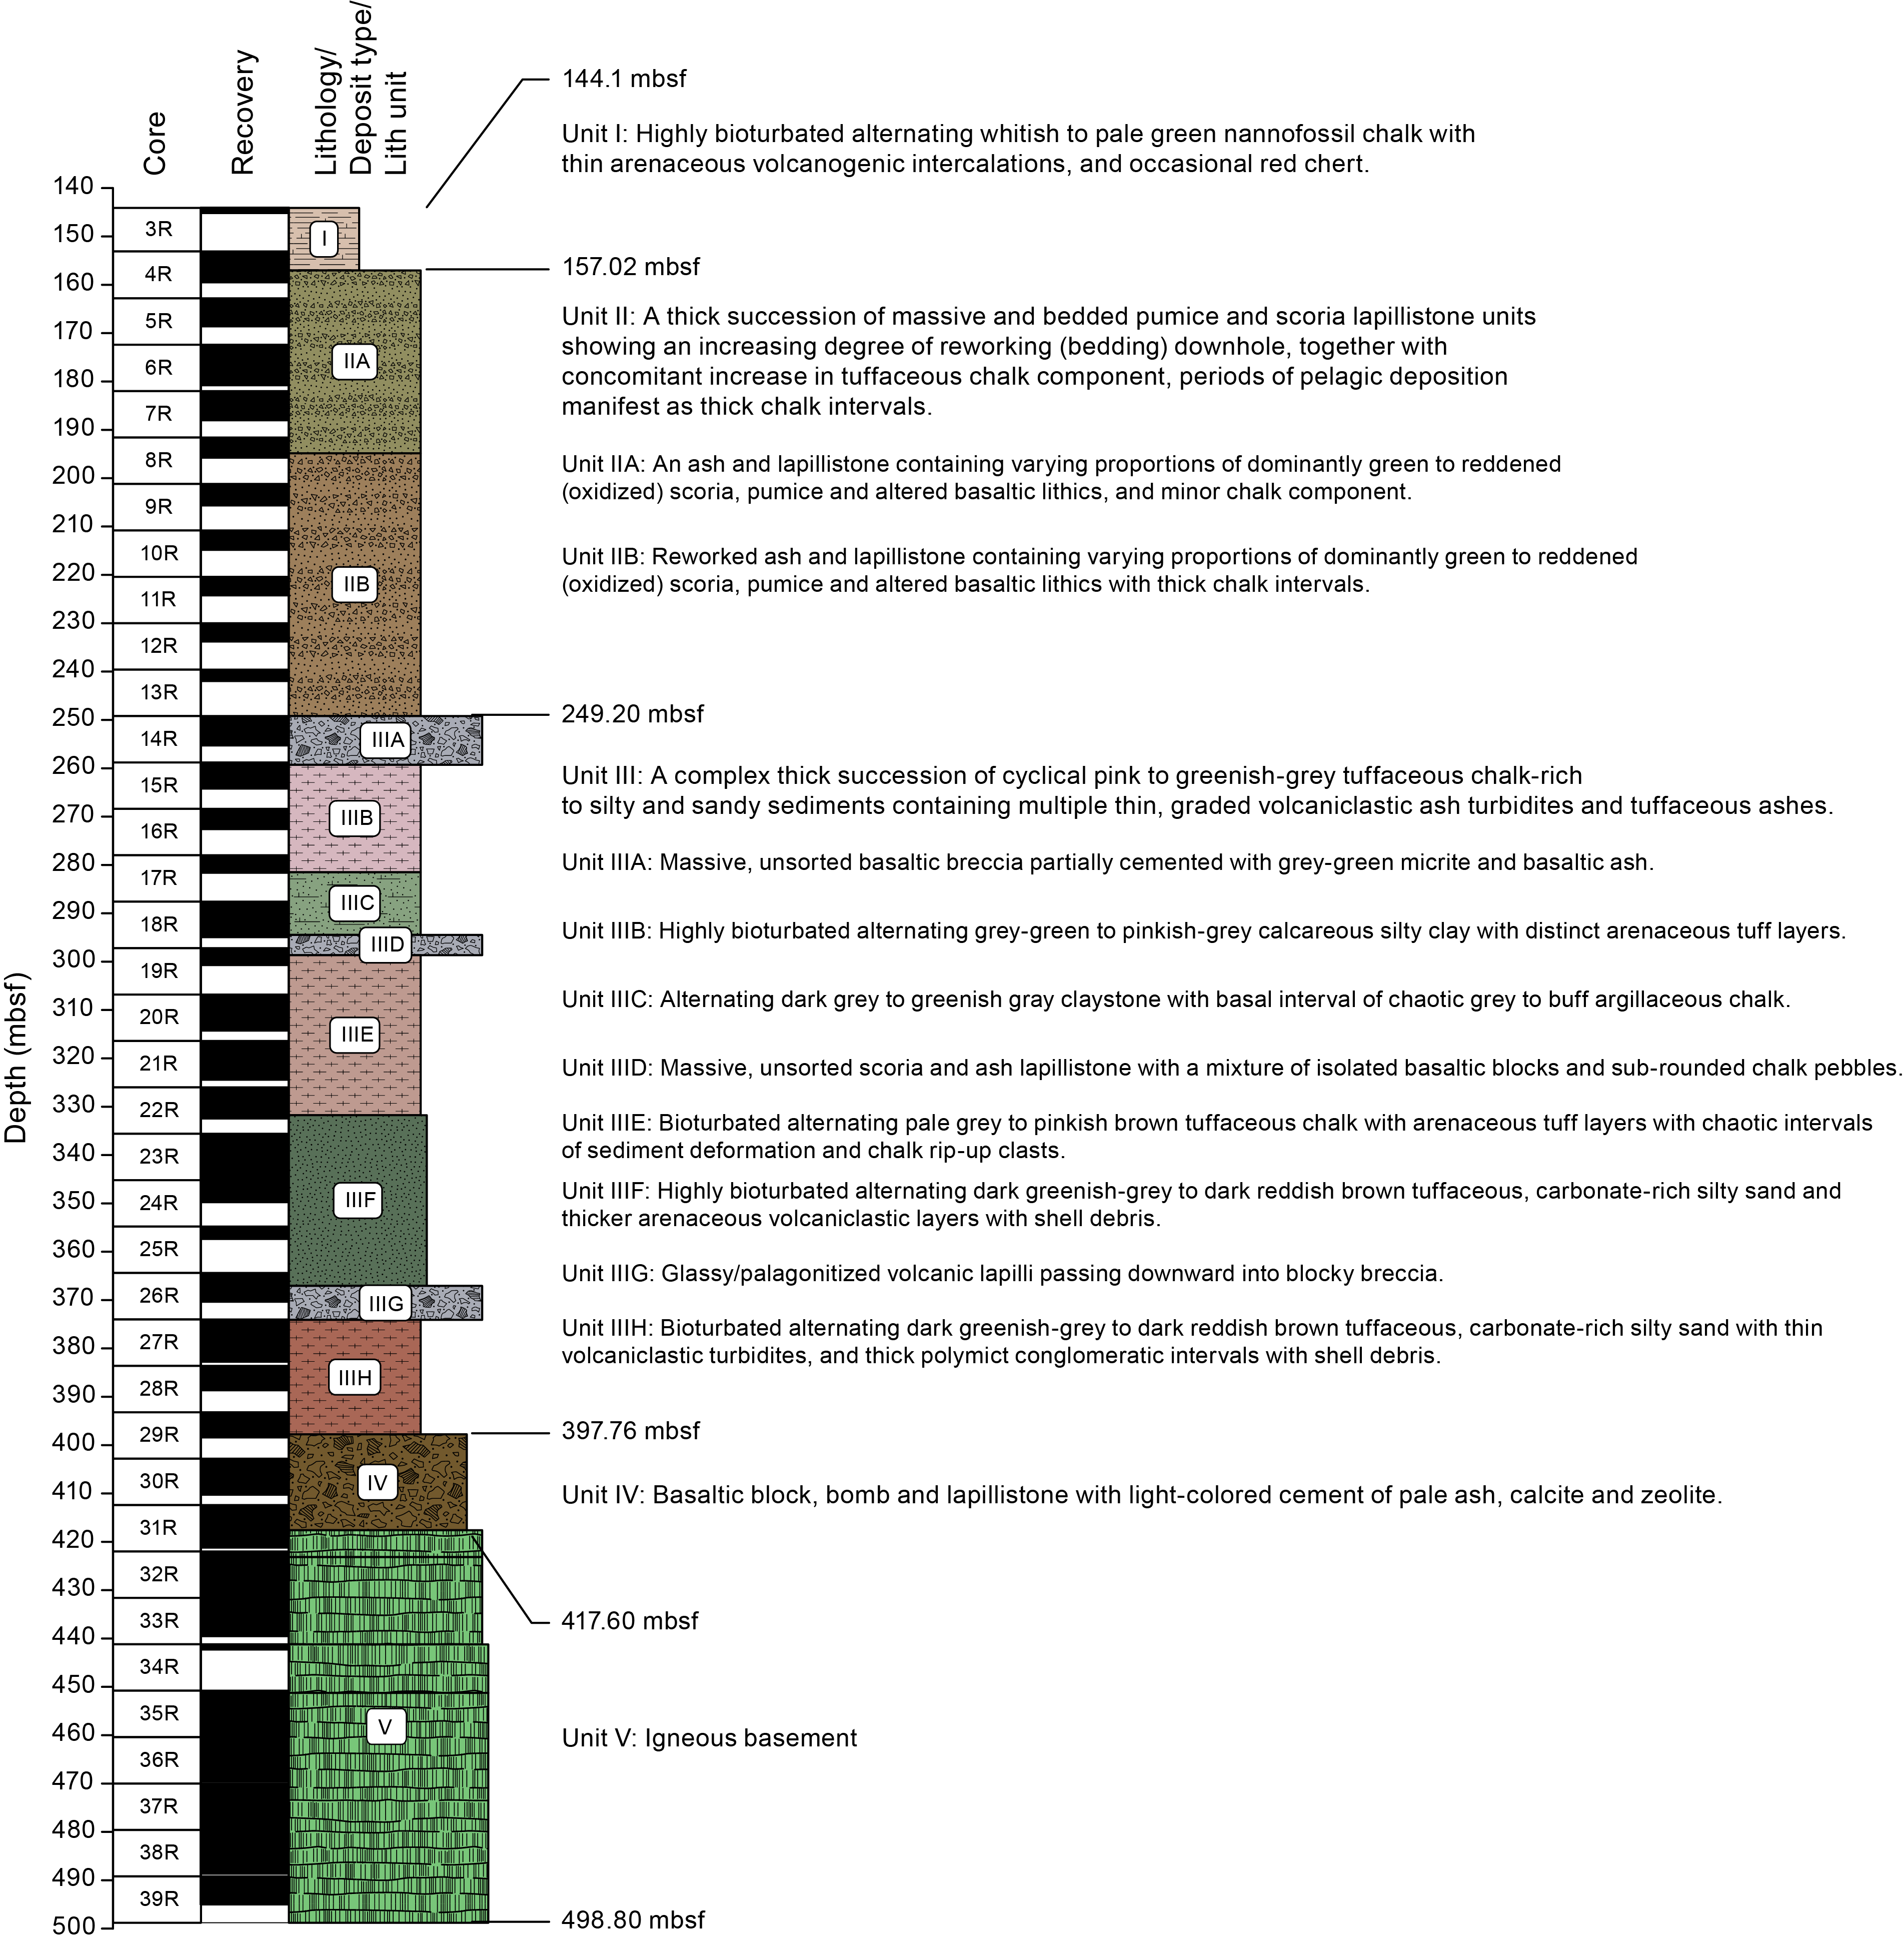
Figure F9. Lithostratigraphic summary.
Below Unit I, the bulk of the sedimentary cover at Site U1585 is complex and presented a challenge to divide, especially in the absence of biostratigraphic control. However, the adopted approach was to identify key intervals representing either a fundamental change in lithology or depositional process or horizons where a clear change in either composition or features associated with depositional hiatus occur. For instance, Unit II division is based upon the change from essentially pumice lapillistone only (one lithofacies) to pumice lapillistone intercalated with pelagic chalk (two lithofacies). However, Unit III consists of a broad continuum and interplay of different sedimentary components and juxtaposes different depositional processes and changing environment throughout. Accordingly, several lithofacies may be recognized in this unit. To aid further explanation, several recurring lithofacies are recognized and used throughout the following unit and subunit descriptions. For ease of description, these lithofacies are presented below as two groupings of broadly sedimentary and volcaniclastic deposits.
3.1. Lithofacies descriptions
3.1.1. Sedimentary deposits and associated processes
Lithofacies 1 consists of consolidated semilithified nannofossil chalk with a minimal clay component that is moderately to strongly bioturbated and commonly shows subtle cyclical changes of color at a 10–60 cm scale. This lithofacies represents deep marine, dominantly pelagic carbonate deposition (Figure F10A).

Figure F10. Lithofacies 1–6.
Lithofacies 2 is a typically gray or green or reddish brown to gray tuffaceous chalk varying to tuffaceous chalky siltstone with increasing degrees of volcaniclastic-derived clay or fine-grained (ash) indicating deep marine sedimentation but with increased clastic input/influence. This type of succession often displays cyclical redox color variation. (Figure F10B).
Lithofacies 3 consists of intervals of tuffaceous chalk and chalky silts affected through or redeposited by submarine mass transport processes, particularly slumping. These intervals are often underlain by zones of microfracturing and offset, have erosive bases, contain slump sheets with little internal deformation, and are separated by intervals with significant soft-sediment deformation including folded and contorted bedding and sediment mixing and incorporation of fragmentary sedimentary material including soft-sediment rip-up clasts (lozenge-shaped tuffaceous chalk and tuffaceous siltstone fragments) (Figure F10C). Such features indicate mixed brittle to plastic behavior during the mass transport process. These resulting submarine mass flow deposits (slumps or slides) typically rework earlier deposited low-energy, fine-grained, or chalky seafloor sediments. Such events arise from weakening of the sediment by seismic activity, localized stacking involving sudden vertical facies changes, or instability arising from nearer shore sediment accumulation, or a combination of all. In some instances, these chaotic tuffaceous chalky deposits are intimately associated with volcaniclastic breccias (Lithofacies 6a), and may represent density-driven separation of carbonate-rich and volcaniclastic components during the same mass movement event.
3.1.2. Volcaniclastic deposits and associated processes
Lithofacies 4 is a coarse, dominantly volcaniclastic succession consisting of relatively fresh to oxidized lapilli-sized pumice and scoria mixed with similar sized basalt (lithic) fragments and occasional basaltic blocks (Figure F10D). It is mostly present as thick (1–3 m), massive, unsorted intervals with some layers reworked into finer laminated beds by current action. Pumice and scoria are increasingly lithified downhole and cemented by a mixture interstitial altered ash and zeolite.
Lithofacies 5a consists of volcaniclastic layers (fine to coarse ash to vitric-lithic silt to sandstone tuffs) with a median thickness of 1–2 cm, but infrequently >5–10 cm, that are typically graded and occasionally cross-laminated to cross-bedded. These bioturbated tephra deposits often present as diffuse bands of particles in the background pelagic sedimentary deposits; they can be slightly to strongly bioturbated (Figure F10E). They represent either primary/pyroclastic fallout from nearby subaerial or submarine eruptions or as postvolcanic secondary/epiclastic material reworked by turbidity and/or bottom currents from older volcanic structures or their associated volcaniclastic deposits. Often, it is not possible to determine whether they are primary tephra fall or sedimented volcanic debris.
Lithofacies 5b consists of volcaniclastic layers as in Lithofacies 5a but in which clear evidence for shallower marine (neritic) or nearshore environments and processes may be inferred. These include subrounded, reworked volcaniclasts with varying quantities of shell debris and incorporation of large fragmentary bioclasts of bivalve shell (inoceramid and oyster), bryozoan and, rarely, ammonite. Intervals can include entire articulated inoceramid valves (preserved in situ in muddy horizons) and oysters (Liostrea?) in coarser sand intervals (Figure F10F). These are additionally often associated with evidence of shallow-marine processes winnowing (bioclast coquinas and sediment reworking) and wave/tidal action inferred from inclined bed contacts (cross-bedding) preserved in sandstone intervals.
Lithofacies 6 is volcaniclastic-dominated breccias or conglomerates including blocks (rarely bombs) and fine to coarse vitric and lithic lapilli (Figure F10G). These may be massive (unstratified) or else show crude layering with identifiable intervals grading upward from blocks through coarse to fine lapilli with ash-sized layers at the top. These may be wholly or partially cemented by altered interstitial ash together with varying degrees of calcite and zeolite cement. Layering can originate from redepositional processes of volcanic material mobilized from shallower to deeper marine environments such as episodes of submarine mass movement (slumps and slides) and may include bioclasts. Layering can also be primary and record the change of intensity of eruption along with associated tephra fall and its subsequent accumulation in relatively shallow marine environments. In these examples, the coarse angular and fragmentary lithic lapilli display quench textures and (palagonitized) glassy (tachylitic) rinds and inclusions together with zoned (armored and accretionary?) pelletal lapilli often with glassy or lithic nuclei. These types of fragmentary and pelletal lapilli likely represent juvenile pyroclasts. Fragments have often been oxidized prior to inclusion in the deposit.
3.2. Lithostratigraphic unit descriptions
3.2.1. Unit I
Unit I consists of a ~13 m thick succession of highly bioturbated nannofossil chalk with foraminifera, alternating in color from whitish to pale green (Lithofacies 1) and containing occasional thin volcanogenic silty sand intercalations. A single piece of red chert was recovered in interval 397T-U1585A-3R-1, 62–67 cm. There are infrequent thin and diffuse interbeds of gray volcanic ash tuff (Lithofacies 2). This deposit represents deep marine, dominantly pelagic carbonate deposition; the unit is strongly bioturbated throughout and displays subtle cyclical changes of color at a 10–60 cm scale. Frequent large (5–20 mm diameter) horizontal burrows are often lined with a thin layer of amorphous black (fecal?) material and filled with white chalk (Figure F10A).
3.2.2. Unit II
A thick (>90 m) succession of massive and bedded pumice and scoria lapillistone units (Subunit IIA), showing an increasing degree of lithics, reworking, and compaction in Subunit IIB (Lithofacies 4). Subunit IIB is further characterized by thick intercalations of chalk sedimentation indicative of substantial periods of between arrival of the packages of pumice and scoria lapilli during which conditions returned to deposition of nannofossil ooze (chalk).
3.2.2.1. Subunit IIA
A ~38 m thick, typically massive, unsorted basaltic lapillistone of dominantly pale-green pumice, darker scoria, and basaltic lithics with occasional larger (5–15 mm) lapilli-sized basalt fragments and rare vesicular blocks (Lithofacies 4) (Figure F11A, F11B). Petrographic inspection reveals significant interstitial green glassy shards, often with crystal fragments or lithic cores and/or black glass inclusions; they have blocky form but display irregular (cuspate) margins. Some intervals show reworking of the lapilli into laminations (bedded on the millimeter to centimeter scale), and some are inclined, indicative of cross-bedding and suggesting reworking of the tops of the more massive deposits by current action (Figure F12C, F12D). The lapilli components are well cemented by an intimate mixture of gray-green tuffaceous chalk, basaltic ash, and zeolite, especially in the reworked components where it appears as thin whitish laminae. The lower part of Subunit IIB shows an alternating color change from pale green to oxidized brown. These color changes coincide with an increase in the frequency of reworking and comminution of lapilli and may be a result of redox changes in ocean floor conditions during deposition and reworking of the lapillistone.
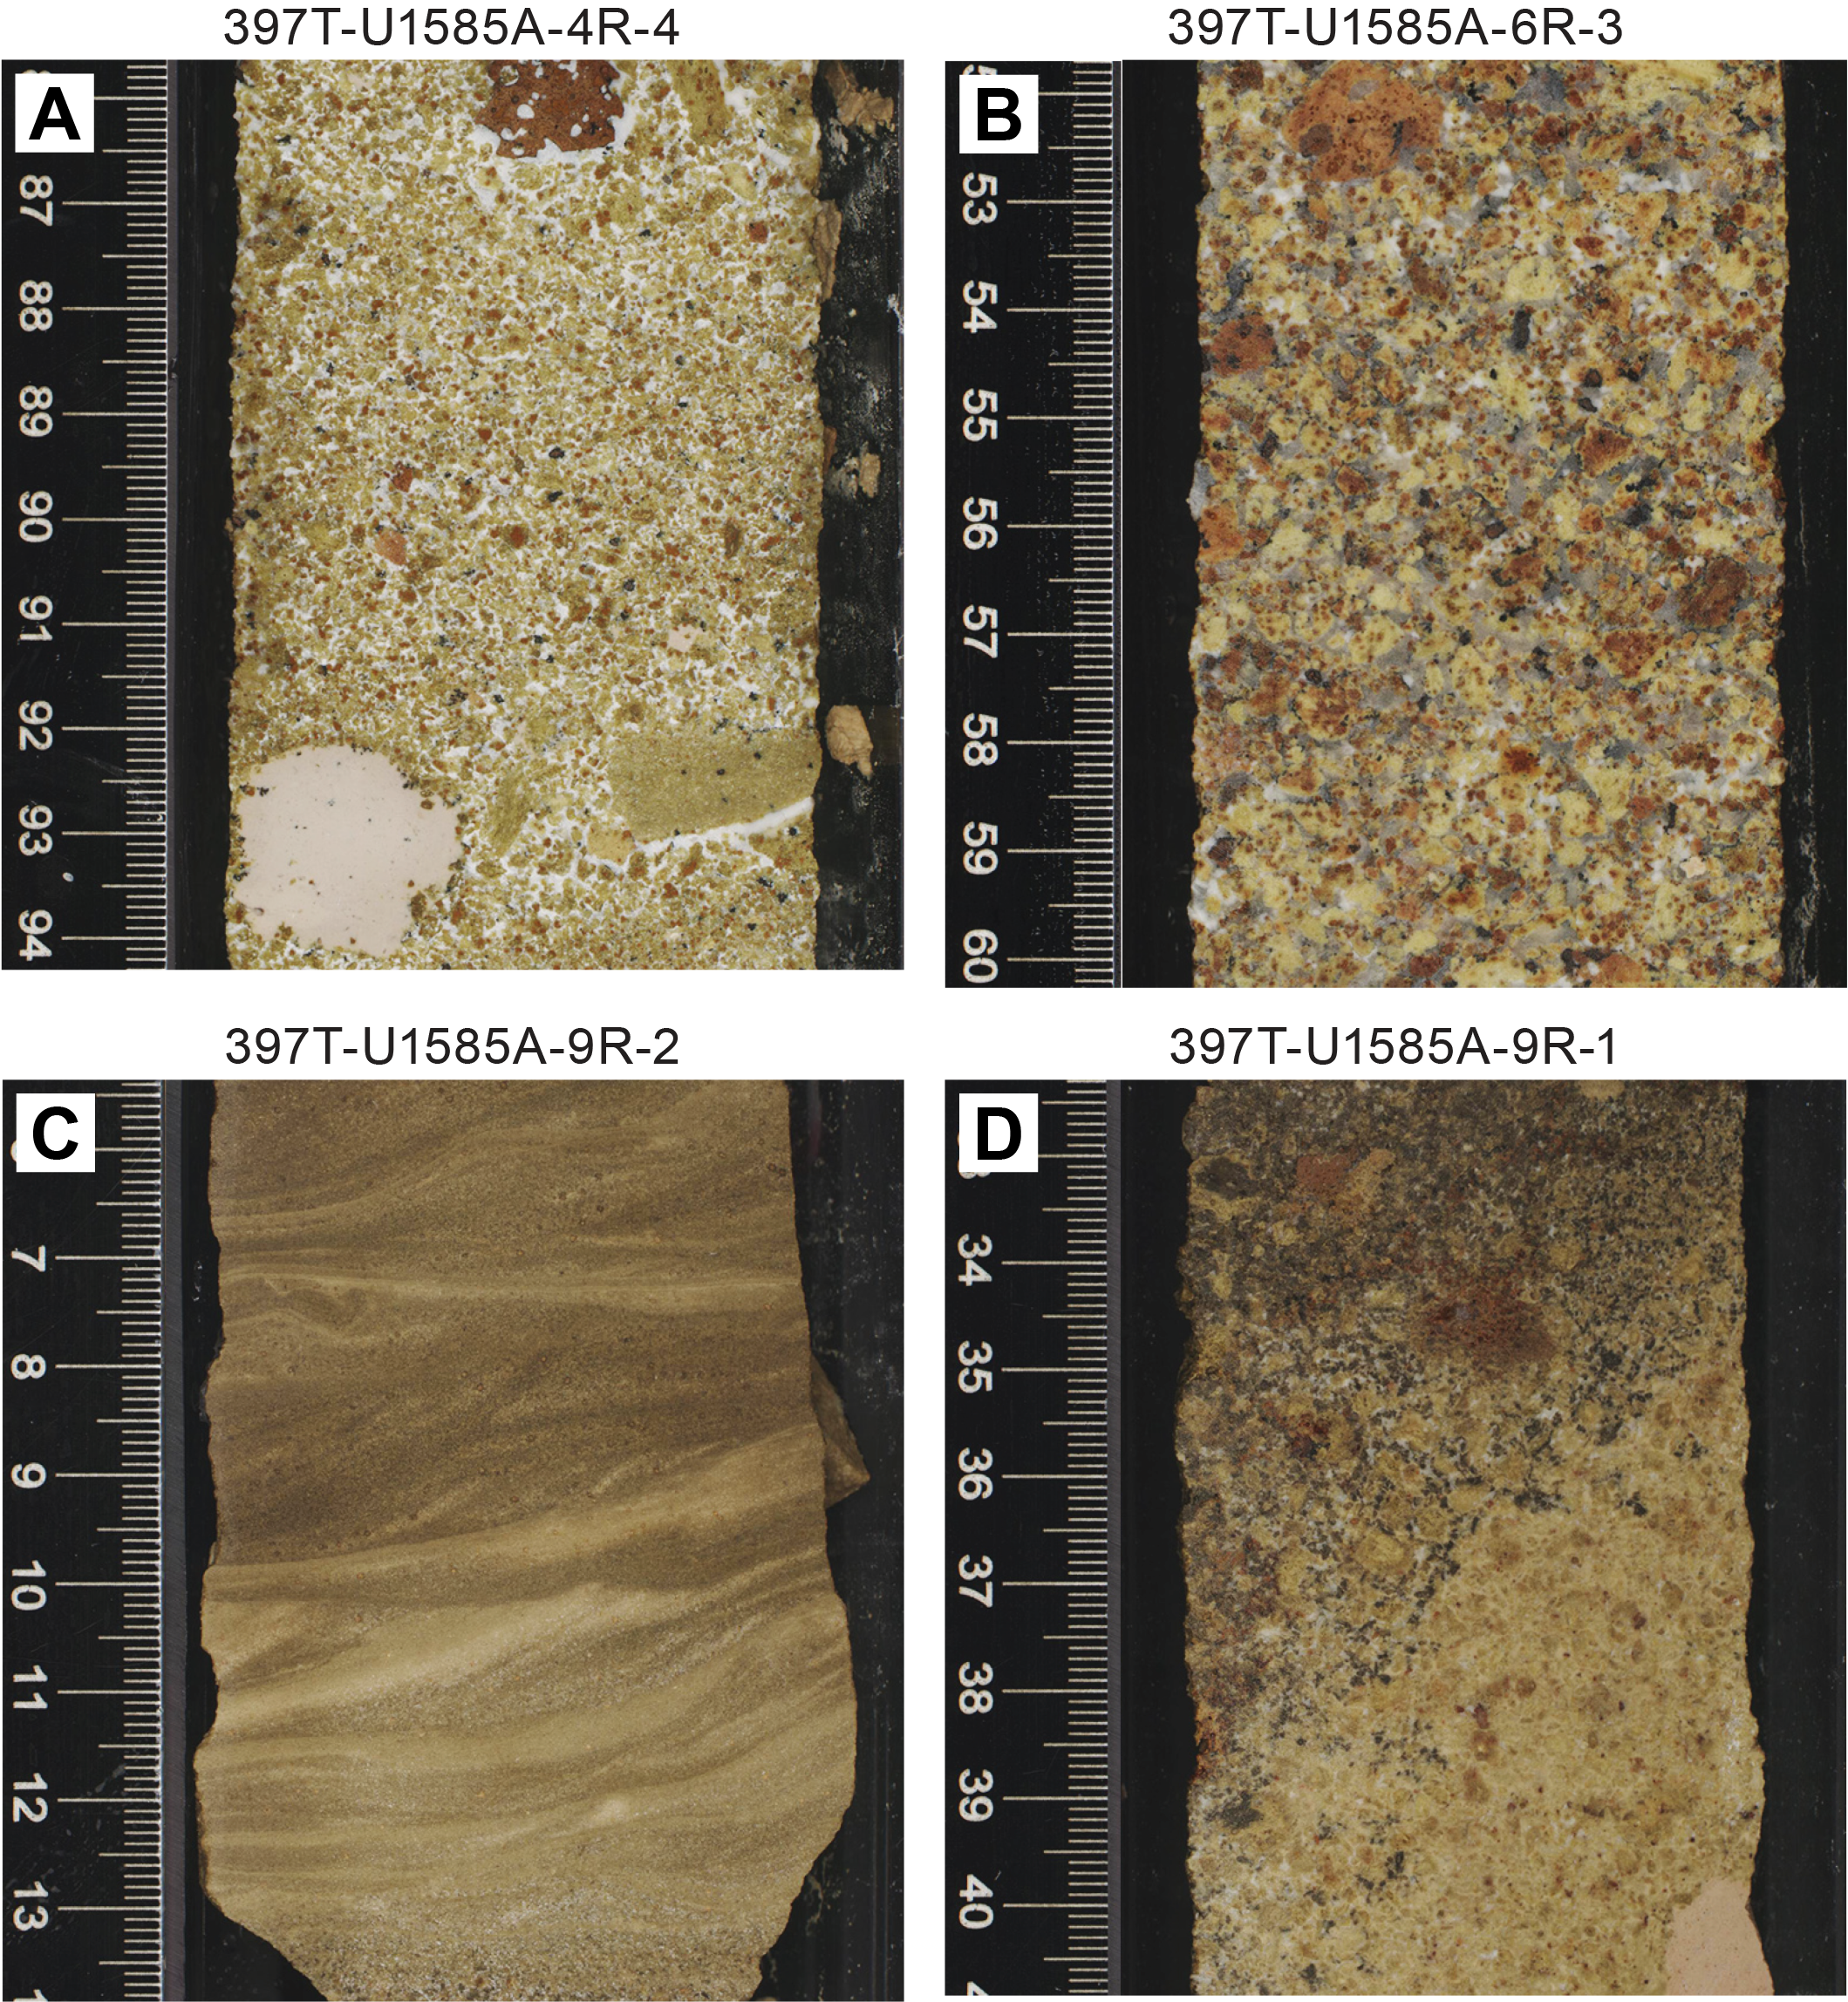
Figure F11. Key elements in Unit II.
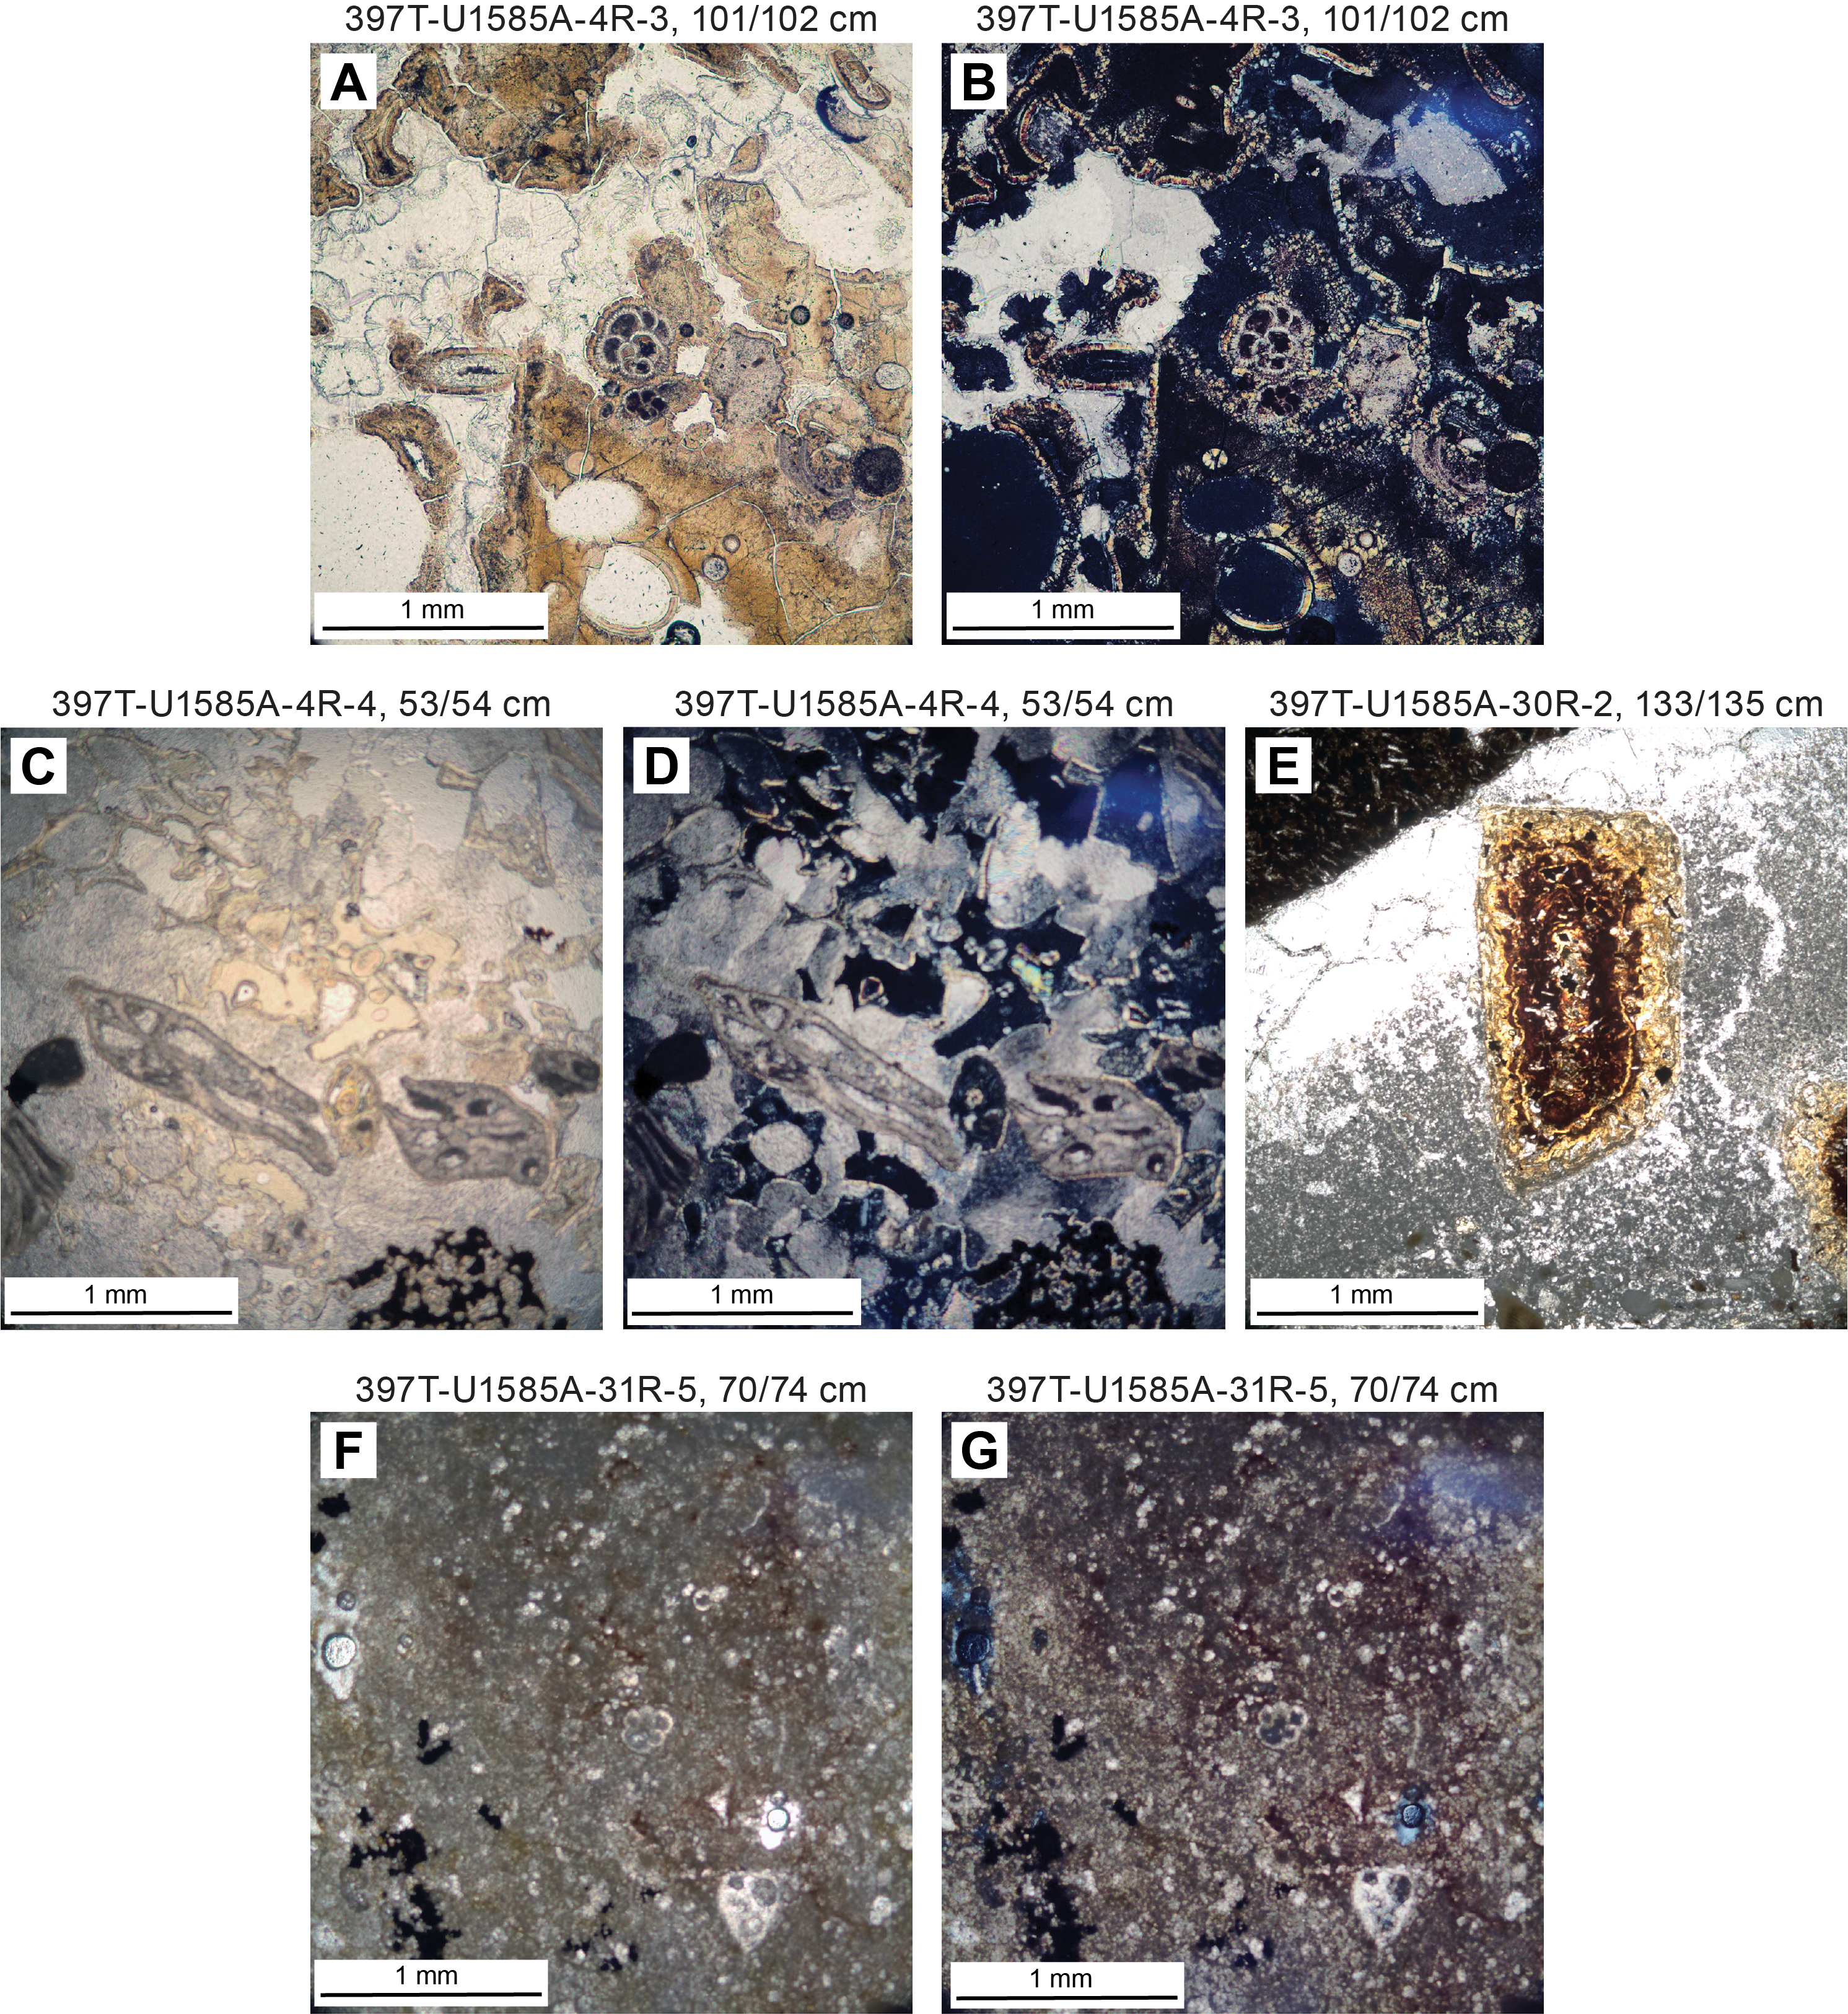
Figure F12. Selected sedimentary features.
3.2.2.2. Subunit IIB
Subunit IIB is a >54 m thick succession that is effectively a continuation of Lithofacies 4; however, the top of this subunit is based on the downhole reappearance of chalk (Lithofacies 1); increasingly thick chalk and tuffaceous chalk depositional cycles occur below (Sections 397T-U1585A-9R-2, 32 cm, through 9R-CC and 10R-1, 5 cm, through 10R-2, 57 cm) interspersed with thinner (several tens of centimeters) reworked, oxidized pumice horizons (Figure F11C, F11D). Similarly, the intensity of green to red-brown color alternations increases, as do the intervals of reworking; many of these latter show distinct graded bedding over several centimeters. The thick chalk intervals contain numerous thin layers of pumice and ash and much thicker graded beds of altered pumice and scoria lapilli (Lithofacies 4). The interfaces between chalk and these thicker layers often display loading or dewatering structures indicating that the overlying graded lapilli were likely introduced as turbidites. In thicker examples toward the base of this subunit, there is a greater influx of coarser graded volcaniclastic material as the succession passes from pumice and scoria-rich layers into lower layers containing a noticeable increase in lithic content together with occasional larger subrounded, cobble-sized basalt clasts (Lithofacies 5a). These can also contain chalk rip-up clasts that show evidence of being malleable or partially fluidal (nonlithified) when incorporated. These intervals are interpreted as slump deposits capped by turbidite layers resulting from settle-out immediately post-mass flow. Fragments of bryozoan and foraminifera-rich sands can occur in settle-out layers and chalk immediately above these slump units. Overall, there is a downhole increase in clastic influence with dominantly reworked pumice and pumiceous turbidites preceded by major slumping events that incorporate a significantly greater content of larger basaltic clasts and disturb the nonlithified (chalk) succession as they entered the deeper seafloor. This is consistent with progressive deepening of the depositional environment and/or increasing remoteness of the volcaniclastic source.
3.2.3. Unit III
- Interval: 397T-U1585A-14R-1, 0 cm, to 29R-4, 69.5 cm
- Depth: 249.2–397.76 mbsf
- Age: unknown–Upper Cretaceous
Unit III comprises a very thick (~150 m), complex succession combining cyclical pink to greenish gray tuffaceous chalk-rich to silty and sandy sediments containing multiple thin, graded volcaniclastic ash turbidites and tuffaceous ashes, intercalated thick tuffaceous chalk slump intervals, and several thick, lithologically diverse, coarse lapilli- and block-dominated volcaniclastic layers. Together, these represent a variety of sedimentary environments and sedimentary sources that are repeated as intercalated facies types. Division into subunits is based upon key a fundamental change in lithology or depositional process, such as particularly thick volcanic breccia intervals, or horizons where a clear change in either composition or features associated with depositional hiatus occur.
3.2.3.1. Subunit IIIA
This is the uppermost example of a thick basalt-dominated volcanic lapillistone breccia encountered in Hole U1585A. It is a massive >10 m thick interval of unsorted basaltic lapilli-sized breccia with occasional blocks, partially cemented with a mixture of gray-green tuffaceous chalk and basaltic ash (Lithofacies 6). The basalt clasts are altered and angular to subrounded, indicating transportation, and include both aphanitic and plagioclase phyric types with varying degrees of vesicularity, probably from a local source dominated by lava flows (Figure F13A).

Figure F13. Key elements of Unit III.
3.2.3.2. Subunit IIIB
Subunit IIIB is a >22 m thick uniform but highly bioturbated gray-green to pinkish gray tuffaceous chalk and silty clay succession with subtle alternating color cycles and containing occasional distinct, occasionally graded pumice and ash layers (Lithofacies 2). This subunit changes to dominantly pinkish gray in Core 16R with increasing frequency of thin, fine scoria-rich tuff horizons (Figure F13B).
3.2.3.3. Subunit IIIC
A distinct color change marks the top of Subunit IIC. However, the precise boundary is not recovered because of poor recovery in Core 397T-U1585A-17R and drilling disturbance in Section 17R-CC. It is a ~13 m thick bioturbated cyclical dark gray to greenish gray tuffaceous chalky claystone (Lithofacies 2). This subunit shows increased evidence of sedimentary disturbance downhole, where lighter buff and gray colors indicate a change redox conditions. In Sections 18R-4 and 18R-5 these include inclined bedding, dispersed, rounded chalk clasts, and brittle fracturing (Lithofacies 3) (Figure F13C); there are escape burrows in the basal intervals. This interval immediately overlies Subunit IIID below and is consistent with a significant disturbance of deep seafloor chalky tuffaceous sediments. Possible causes include submarine slumping, seismic activity, or tsunami.
3.2.3.4. Subunit IIID
This subunit is another example of a thick (~4 m) basalt-dominated volcanic lapillistone breccia encountered in Hole U1585A. It differs from Subunit IIIA in that it consists of densely packed scoria and microvesicular aphanitic basalt lapillistone and contains a mixture of dark, subrounded tuffaceous chalk pebbles and isolated basaltic blocks toward its base (Figure F13D). Core 19R has poor recovery, and the poorly cemented volcaniclastic material has been preferentially lost, making more detailed interpretation difficult. It is possible that this subunit could represent the base of a major submarine slump and mass flow deposit in which the denser volcaniclastic materials have preferentially settled, and entrained unlithified chalk sediments (oozes) then separated toward the top (see description of base on previous subunit).
3.2.3.5. Subunit IIIE
- Interval: 397T-U1585A-19R-2, 19 cm, to 22R-4, 137 cm
- Depth: 298.6–331.76 mbsf
- Age: unknown–Upper Cretaceous
A thick (~33 m) succession of bioturbated tuffaceous chalk (Lithofacies 2) clearly displaying regularly spaced (~0.5–1.0 m) cyclical alternations from pale gray to pinkish brown and containing infrequent tuffaceous ash (sand-sized) layers, some preserving unaltered plagioclase crystals (1–2 mm) and some with shell debris (bivalve and bryozoan fragments). The base of this unit contains frequent chaotic intervals displaying soft-sediment deformation and containing lozenge-shaped tuffaceous chalk rip-up clasts (Lithofacies 3) (Figure F14A–F14C). Three distinct intervals of Lithofacies 3 can be recognized, as follows:
- Interval 1 (Sections 397T-U1585A-20R-2, 108 cm, to 20R-3, 8 cm) has a contorted fluidal base displaying sediment mixing that passes upward into loosely packed, horizontally oriented, lozenge-shaped rip-up clast stacks with an interstitial matrix of volcaniclasts (crystal debris) and comminuted shell debris filling interstices (Lithofacies 5b). In some instances, sediment loading has pressed and deformed one clast into another, indicating these were unlithified prior to the mass movement event. The rip-up stack displays a crude upward reduction in lozenge size and is overlain by a 2 cm thick sand-sized settle-out layer of mixed shell and crystal debris and scoria.
- Interval 2 (Section 397T-U1585A-20R-3, 64–84 cm) is similar to Interval 1 and has a well-defined erosive base but lacks the lowermost layer(s) of soft-sediment deformation below the chalk rip-up stack.
- Interval 3 (Sections 397T-U1585A-20R-5, 96 cm, through 20R-CC) has similar component layering to Interval 1 and, additionally, displays well-developed fining-upward gradation terminating in very fine gray-red silt.

Figure F14. Key elements of Subunit IIIE.
These intervals are clearly major slumps involving the local semilithified seafloor tuffaceous chalk sediment. Subaqueous mass-transport processes, including gravity-induced slides, slumps, and debris flows, are one of the mechanisms for transport of sediment into the deep sea. They contain an exotic component derived from shallower marine environments that includes shell and bryozoan debris together with ash layers consisting of scoria and lithic and crystal lapilli (fine to medium sand-sized particles); these are typically graded and represent thin turbiditic influxes. Fragments of inoceramid shell (interval 397T-U1585A-22R-4, 55–60 cm) (Figure F14C) constrain the age to Late Cretaceous. Significantly, thicker volcaniclastic units are absent throughout. Therefore, because these predominantly chalk and tuffaceous chalk mass flow deposits of Subunit IIIE are entirely unassociated with any coarser volcaniclastic material, they would be consistent with having been seismically triggered mass flow events (seismites) rather than being associated with shallower water volcaniclastic sediment accumulation, instability, and slumping. Wider seismic mass flow triggering is common in regions affected by major volcanic eruptions.
Furthermore, the observed redox color changes have clearly been superimposed upon the succession irrespective of facies type (either pelagic or mass flow deposit), indicating that this redox pattern was effected by a postdepositional process. Such could be achieved by regular redox change in ocean waters and/or ocean floor conditions that could be climatically and/or productivity modulated.
3.2.3.6. Subunit IIIF
- Interval: 397T-U1585A-22R-4, 137 cm, to 26R-2, 137 cm
- Depth: 331.76–367.07 mbsf
- Age: Upper Cretaceous
This subunit is a >35 m succession of carbonate-rich silty clays displaying increasingly shallower water characteristics downhole, together with an increasing influence of volcaniclastic layers. For convenience, the top of this unit is placed at distinct dark horizontal sedimentary and/or redox layer, possibly an organic encrustation associated with a depositional hiatus (TBC) (Figure F15A) and, more importantly, below which there is an increase in grain size from tuffaceous chalk to a highly bioturbated cyclical, dominantly dark reddish brown (to dark greenish gray) tuffaceous carbonate-rich silty sand (Lithofacies 2). Sections 397T-U1585A-23R-1 through 23R-4 contain isolated individual orientated matrix-supported carbonate rip-up clasts (Lithofacies 3). Below these intervals, sections of paired (upper and lower valves) inoceramid shells are present in some of the finer sedimentary layers where the core has cut through large articulated in situ examples (Figure F15B). These place these sediments at a minimum Late Cretaceous (Maastrichtian) stratigraphic age.
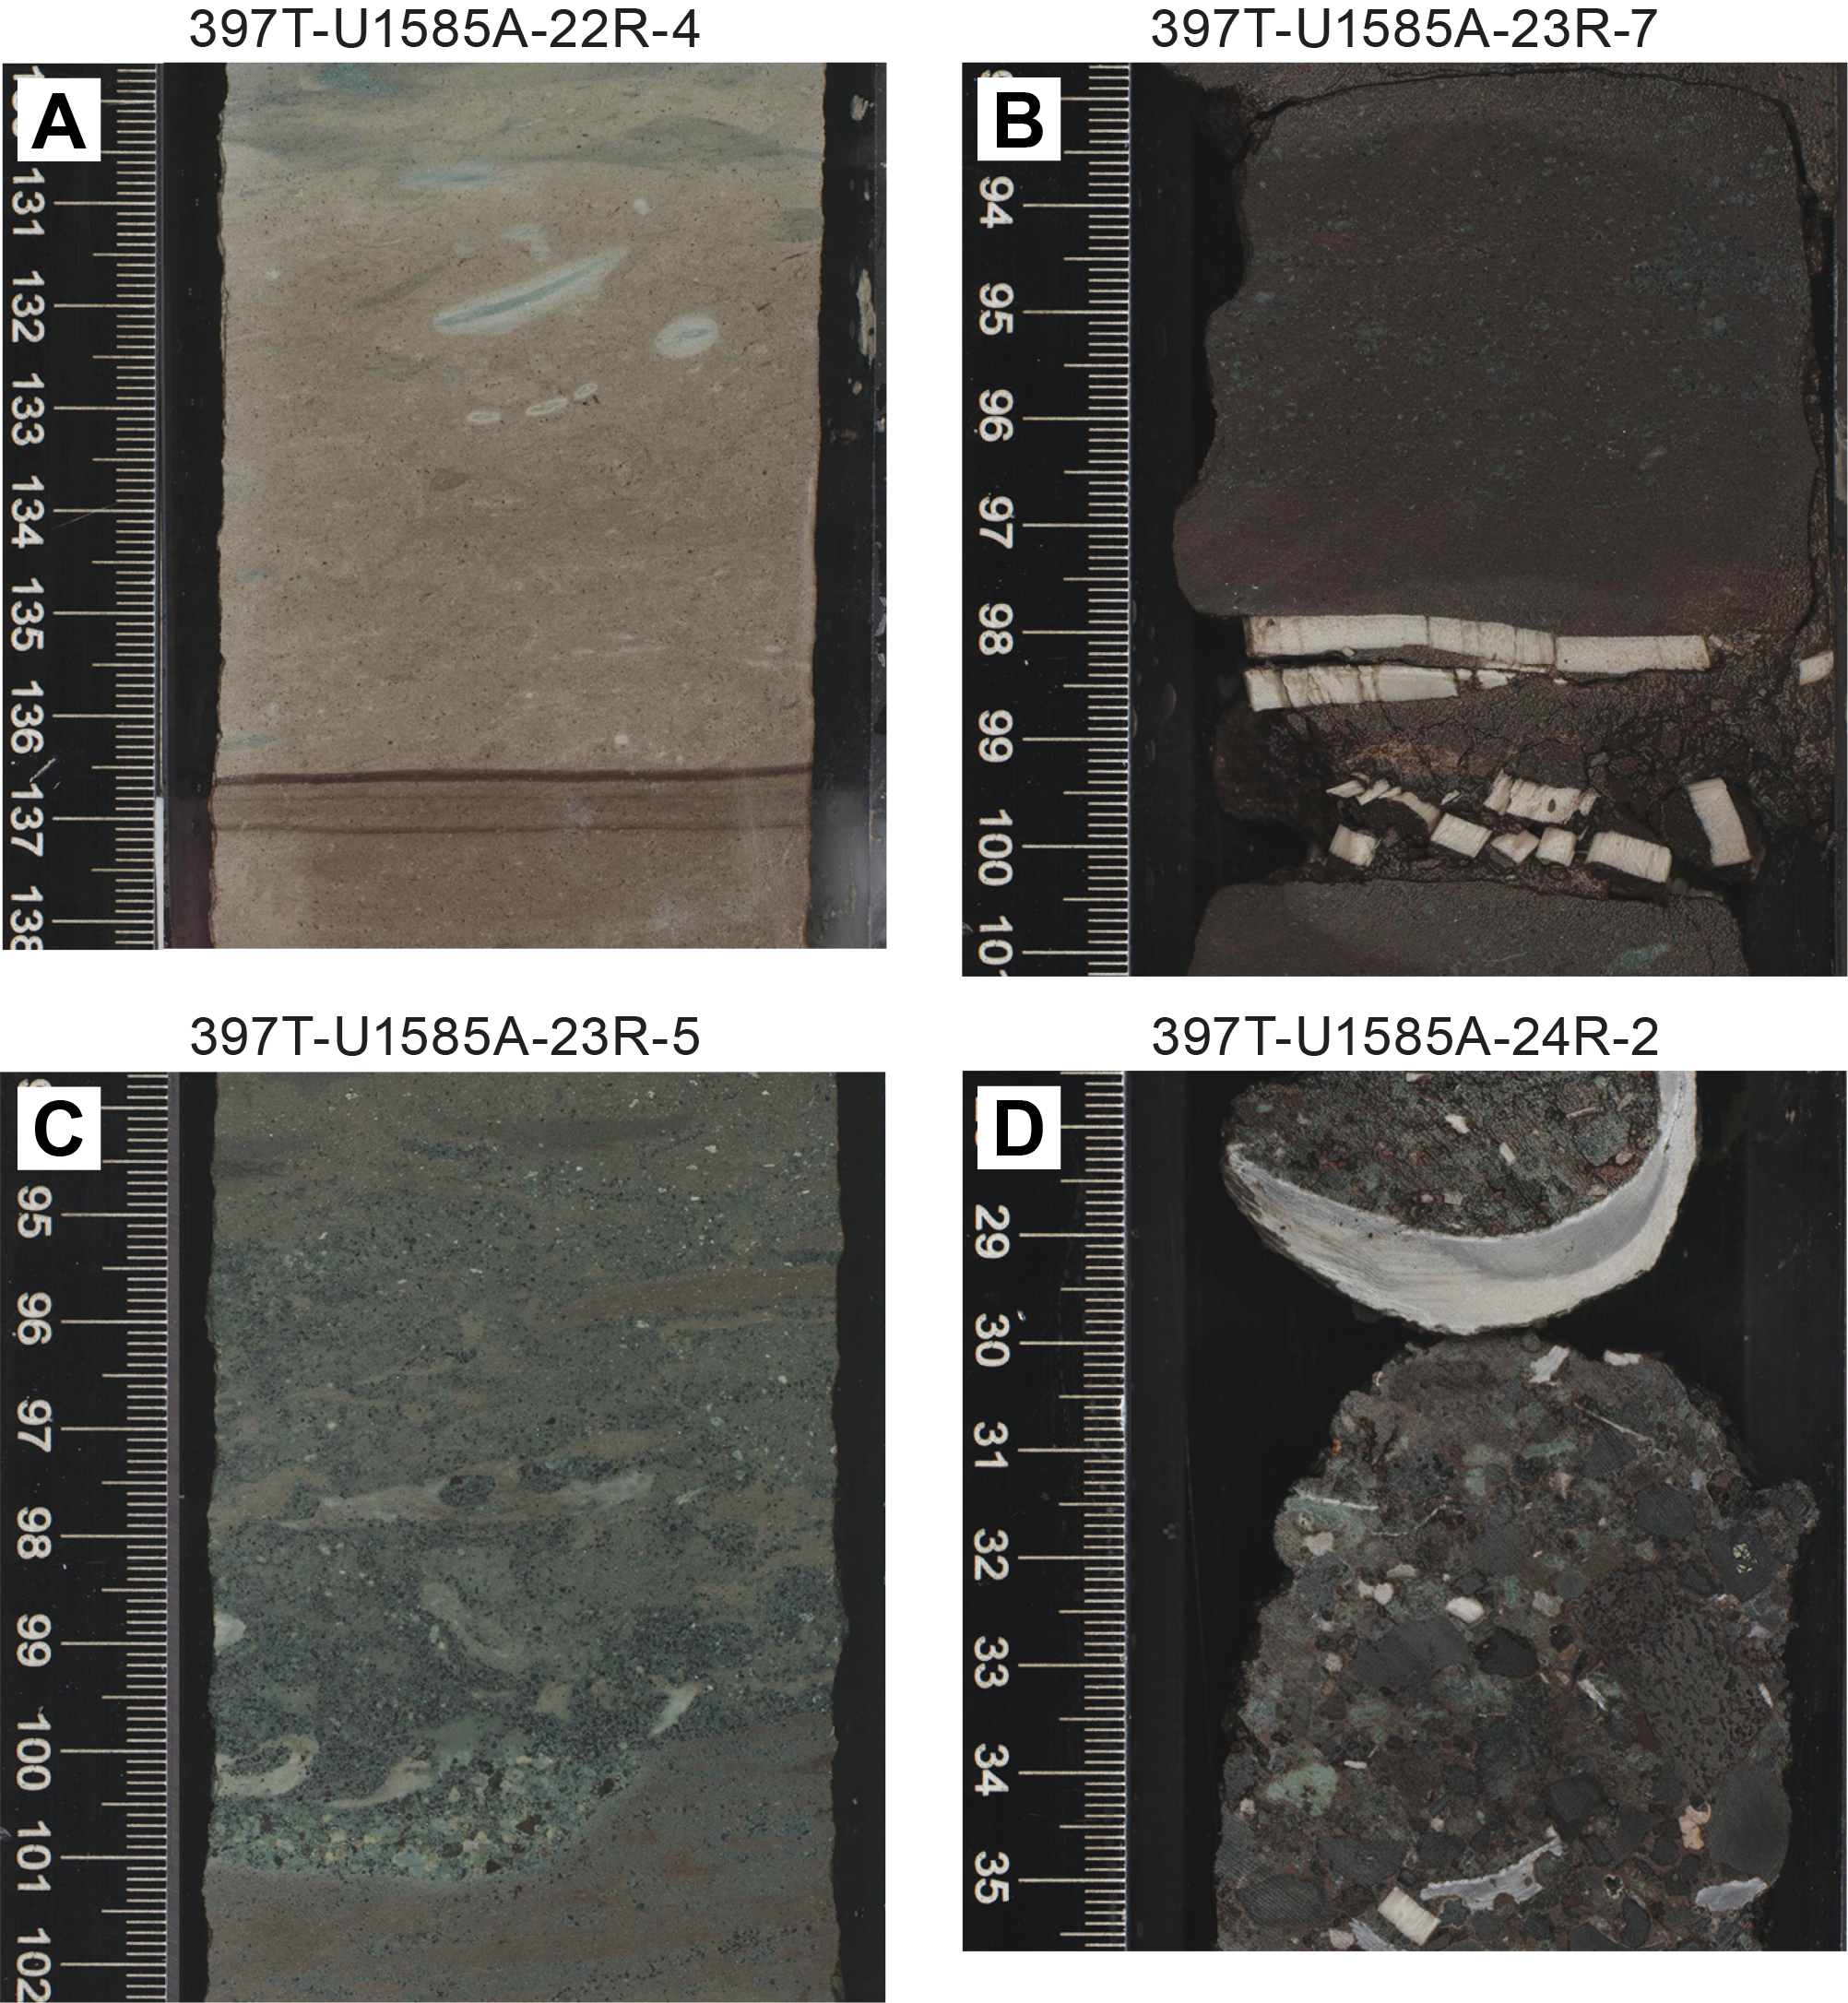
Figure F15. Key elements of Subunit IIIF.
The upper part of Subunit IIIF shows poorly developed color cycles because bioturbation and sedimentary disturbance have largely erased patterns that may have originally been present. The frequency of thin (1–4 cm) crystal-rich ash and shell debris turbidites also increases downhole, many displaying erosive bases (Figure F15C, F15D); in the lower sections these intercalations are present as thicker (2–15 cm) graded, coarse ash (coarse sand- to gravel-sized) layers containing subrounded, often altered clasts (Lithofacies 5a). These intervals frequently contain comminuted and larger shell debris including bivalve (Inoceramids) and oyster (Liostrea?) and ammonite(?) fragments (Section 397T-U1585A-23R-3, 108–11 cm) and, occasionally, entire bivalve shells (Lithofacies 5b). Inspection of shell fragments reveals numerous surface borings, whereas near entire shells do not. This is likely a result of prolonged seafloor exposure of the shell clasts. Together with the increased frequency of subangular to subrounded and typically weathered basaltic lapilli material (sand- to gravel-sized clasts), these shell fragments and borings suggest the material now incorporated into this deposit originally accumulated and was stored for some time on the seafloor in a shallow shelf environment.
In summary, Subunit IIIF contains indications of shallower water facies encountered downhole. The thicker shelly and basalt lapilli-dominated interval likely represent slumps or slurries of shelfal, sublittoral sediment accumulation into a deeper offshore setting; these become less frequent and thinner toward the middle and top of this succession interval. In effect, this subunit records progressive drowning of a nearshore environment; it culminates in a deeper marine sediment-starved, carbonate-dominated environment receiving predominantly tuffaceous pelagic ooze, carbonate-dominated slumps, and occasional volcaniclastic input from shallower water sources.
3.2.3.7. Subunit IIIG
This subunit is a ~>7 m thick polymict lapilli-sized, dominantly volcanic breccia passing downward into blocky breccia. The deposit is patchily cemented by calcite and zeolite and altered ash that has resulted in poor recovery. The upper, smaller ash and lapilli fraction includes partial and entire altered, rounded, zoned (accretionary?) lapilli (5–10 mm). Clasts consist of angular to subangular, aphanitic nonvesicular basalt fragments often displaying chilled margins or partially preserved glassy/palagonitized rims or tachylitic rinds (Figure F16). There are no shell fragments and, excepting the finer and polymict topmost layers, little evidence of reworking, so this deposit more probably represents a primary/pyroclastic fallout from nearby subaerial or near-surface submarine eruption (Lithofacies 5a and 6). Importantly, paleomagnetic measurements give a consistent positive inclination that matches surrounding units (see Paleomagnetism; Figure F26). This is not expected if breccias contain randomized clasts. Accordingly, this observation likely indicates that the breccia was deposited at high temperature (>500°–600°C, the Curie temperature for titanomagnetite) and the subunit then acquired its magnetization after deposition and cooling. This suggests a significant component of this breccia were ejected as juvenile pyroclasts that cooled as a unit after deposition.
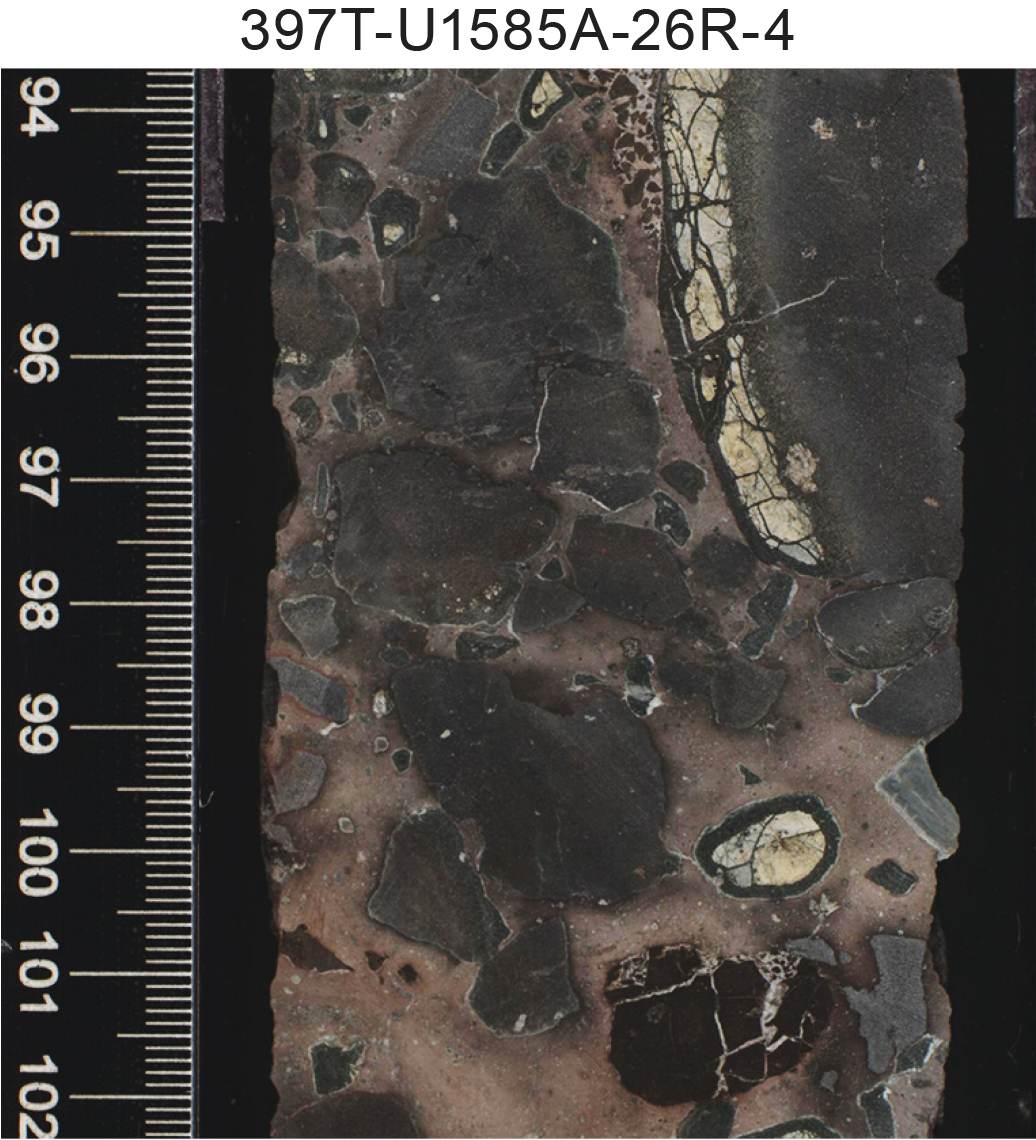
Figure F16. Key elements of Subunit IIIG.
3.2.3.8. Subunit IIIH
- Interval: 397T-U1585A-27R-1, 9.5 cm, to 29R-4, 69.5 cm
- Depth: 374.10–397.76 mbsf
- Age: Upper Cretaceous
This subunit is the lowermost of Unit III and the end of a succession in which, overall, progressively deeper to shallower water facies and processes are encountered downhole. It is >24 m thick, and the uppermost intervals are dominated by bioturbated cyclical dark greenish gray to dark reddish brown tuffaceous, carbonate-rich silty sand representing similar ocean floor conditions to those displayed in the upper part of Unit III, together with frequent (~2–5 cm) tuffaceous ash (sand-sized particles) layers (Lithofacies 2). A prominent redox front occurs in interval 397T-U1585A-28R-2, 77–79 cm, below which the remainder all of the components of the subunit display a dark to (orange) reddish brown (oxidized) coloration (Figure F17A). Many of the tuffaceous layers are disturbed by intense bioturbation but present erosive bases and/or sediment loading structures at the interface with underlying tuffaceous chalk. These are thin volcaniclastic turbidites (Figure F17B). Toward the lower half of the unit (Sections 29R-2 through 29R-4), thicker (~5–10 cm) polymict conglomeratic intervals become common, consisting of graded intervals containing tuffaceous chalk pebbles, fine shell debris, and volcaniclastic lapillistone with some block-sized clasts (Lithofacies 5a). Grading indicates they originated as volcaniclastic slurries and associated turbidites. The lapillistone contains a component of partially palagonitized quenched/glassy basaltic fragments, and some fragments retain altered tachylitic rinds (Figure F17C). In the lowermost interval, medium to coarse sand-sized lapilli layers are reworked into inclined beds (cross-bedding) and mixed with fragmentary shell debris (Lithofacies 5b) (Figure F17D). Together, these features indicate downhole shallowing and reworking by stronger bottom currents or wave action, together with increasing influence of near-source volcaniclastic or even juvenile volcanic material early in the deposition of Subunit IIIG. This is interpreted as an oxygen-rich, nearshore marine environment, affected by currents and/or wave action and frequently receiving debris from a nearby volcanic source; in the earliest stages, there may be an admixture of juvenile pyroclastic fall-out. The succession gradually deepens, giving way to tuffaceous chalk deposition but supporting significant seafloor biological activity (bioturbation); it is affected by smaller, graded erosive turbidite incursions bringing in finer volcaniclastics. This is likely the result of the shallower shoal (and shoreline) becoming more distant or waning or hiatus in volcanic activity.

Figure F17. Key elements of Subunit IIIH.
3.2.4. Unit IV
- Interval: 397T-U1585A-29R-4, 69.5 cm, to 31R-5, 75 cm
- Depth: 397.76–417.60 mbsf
- Age: Upper Cretaceous
The upper boundary of Unit IV is fixed at the first appearance of thick volcanic breccia containing dominantly juvenile volcaniclasts (Figure F18A). It is ~20 m thick volcanic breccia consisting of a stacked succession of clast- and/or grain-supported basaltic block, bomb, and lapillistone intervals displaying crudely developed/incomplete fining-upward intervals terminating in medium-sized (<5–10 mm), sometimes zoned lapilli (Lithofacies 6). This upper part of this subunit is a continuum of the base of Subunit IIIG, with intervals of reworked cross-bedded sand-sized lapillistone. Interval 397T-U1585A-30R-1, 60–35 cm (Figure F18B), is a moderately well sorted sand- to gravel-sized lapillistone containing comminuted bioclasts, recrystallized fragments of bryozoan, oyster, and other thinner bivalve shells, together with pellet-like clasts of pale, fine volcanic tuff. Below this interval, the bulk of the deposit is coarse, angular, and fragmentary lithic lapilli displaying quench textures and (palagonitized) glassy (tachylitic) rinds and inclusions together with zoned (armored and accretionary?) and often irregular-shaped or blocky pelletal lapilli, typically with glassy or lithic nuclei (Figures F12E, F18A, F18C). This succession lies upon the basaltic basement. The contact with the underlying basement is marked by a recrystallized chalk horizon (Figures F12F, F12G, F18D).
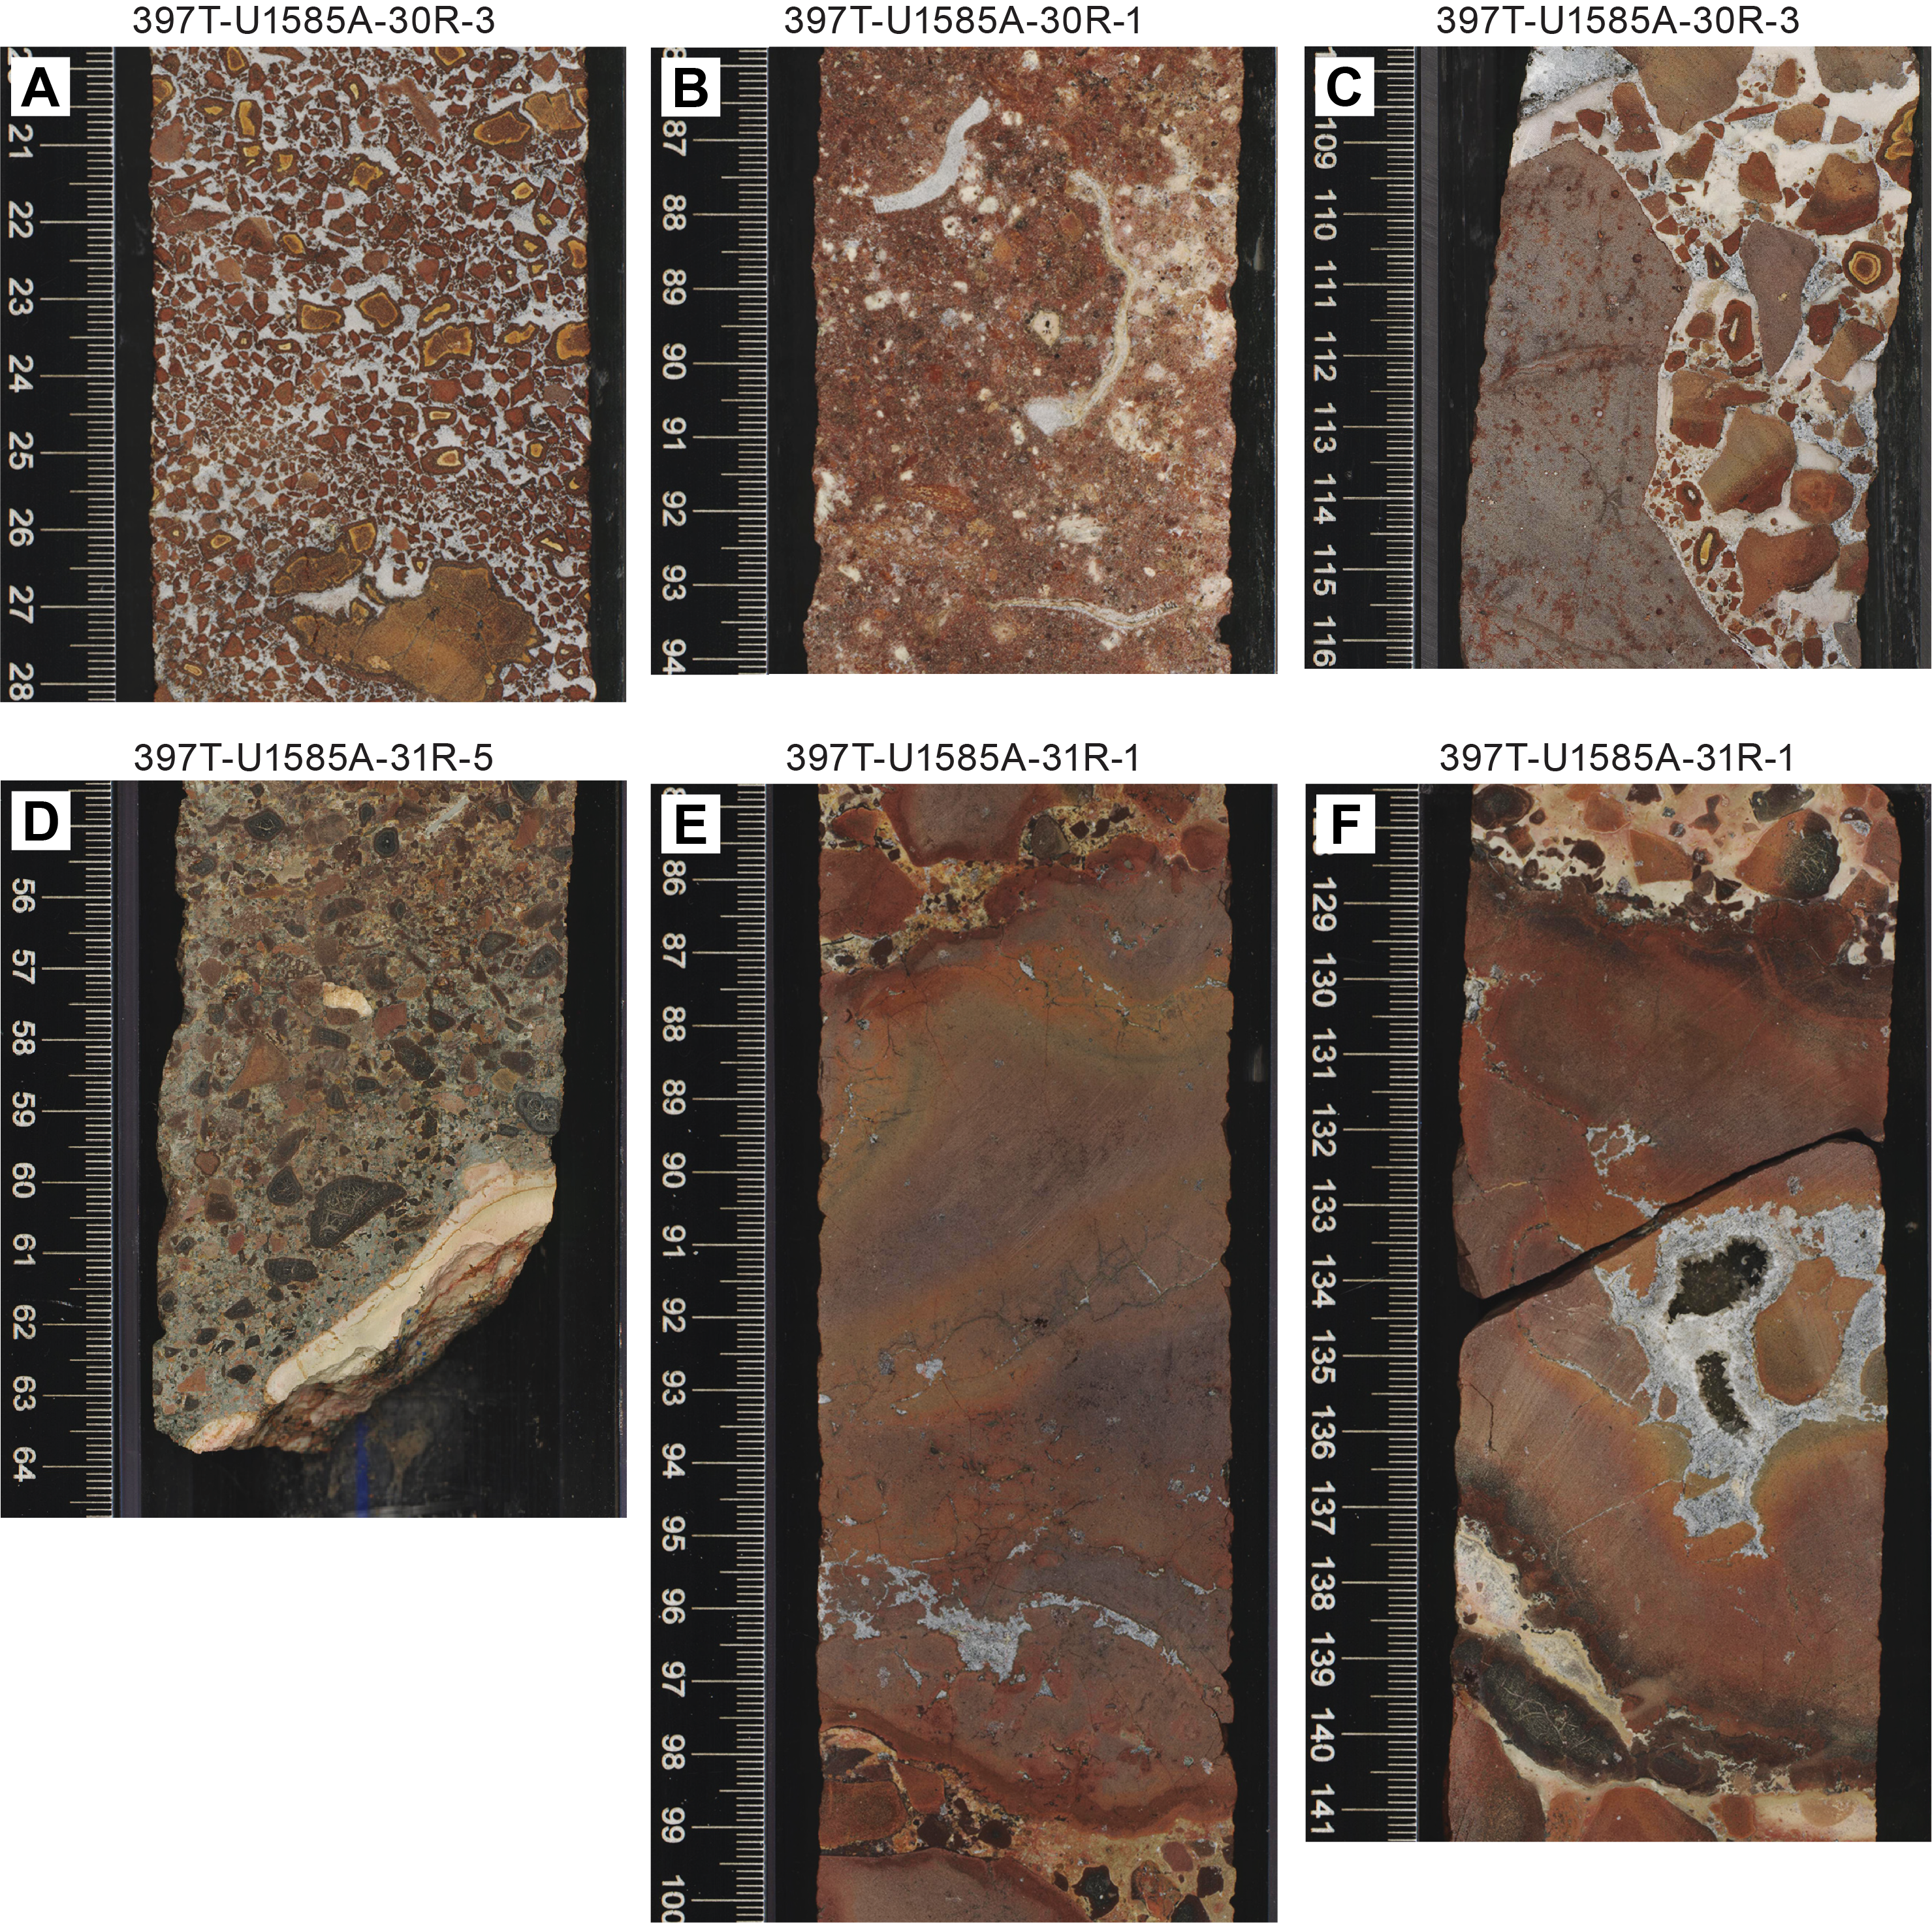
Figure F18. Key elements in Unit IV.
These types of fragmentary and pelletal lapilli likely represent juvenile pyroclasts. Fragments have often been oxidized prior to inclusion in the deposit and may be concentrated through sedimentary reworking. Shell (Liostrea bivalve) bioclasts are concentrated together with zoned lapilli in interval 397T-U1585A-30R-2, 58–126 cm. Larger block fragments have incomplete tachylitic rinds indicating fracture and break-up prior to incorporation in the deposit; rare, large examples retain a more entire glassy rind and show irregular curved margins, internal deformation, or folding and/or internal fracturing. These are interpreted as volcanic bombs (intervals 31R-1, 85–100 and 129–140 cm) (Figure F18E, F18F). Recovery in this unit is good because the unit is well cemented with a mixture of fine gray ash and secondary calcite and zeolite. Overall, the unit contains a wide range of size of juvenile and reworked volcaniclastic components together with marine bioclasts and recrystallized foraminifera in the cement, indicating a complex eruptive–sedimentary environment. As with Subunit IIIG, paleomagnetic measurements give a consistent positive inclination (see Paleomagnetism; Figure F26), indicating this unit acquired its magnetization after deposition and cooling and likely indicates that the breccia was deposited at high temperature (above the Curie temperature for titanomagnetite) and that, except for the topmost fossiliferous (reworked) portion, the bulk component of the breccia was ejected as juvenile pyroclasts that cooled as a single mass upon deposition.
The abundance of glassy shards and tachylitic rinds on the angular basaltic fragments suggests that this volcaniclastic succession formed through the explosive interaction of basaltic magma with water in hydroclastic eruptions. Tachylite is generally thought to form by rapid cooling of basaltic magma droplets in air or in littoral environments where subaerial lava flows quench and fragment as they enter the sea (Fisher and Schmincke, 1984). The presence of tachylite clasts and red (oxidized) lithic clasts in Unit V strongly suggests a subaerial setting for at least some of the eruptions (Simon and Schmincke, 1984; Thordarson, 2004). Angular blocks and bombs not only suggest volcanically induced fragmentation but also indicate that the material originated close to the eruptive center, and the fact that accretionary and armored pelletal lapilli are common and locally abundant suggests either deposition close to vent source or very short transport distances during reworking. Accretionary and armored lapilli cannot form underwater and therefore most likely indicate the presence of steam-rich subaerial eruption columns. Such eruption columns are typical of hydroclastic volcanic activity and generally originate from vents at water depths <300 m (e.g., Fisher and Schmincke, 1984). More probably, eruption may have occurred subaerially if the volcanic edifice had constructed sufficiently to become emergent, with ground or surface water providing the moisture necessary for formation of accretionary lapilli. In summary, Unit V is considered to be the product of repeated explosive hydroclastic eruptions in a shallow-marine to emergent environment with local shallow-water (sublittoral?) reworking at, or near, an active volcanic ocean island.
3.3. Summary
The wider setting of Site U1585 lies in the guyot province of the Walvis Ridge, in the older, more easterly part of the Tristan hotspot trail at a water depth of 3454 m. Specifically, it lies on the northeastern flank of a major seamount the nearest summit of which rises another ~2250 m above the drill site to a water depth of ~1200 m, ~22 km south of Site U1585 (Figure F4). Accordingly, Hole U1585A cored volcanic basement, passing upward into varied sedimentary facies on the flank of a major volcanic edifice of Late Cretaceous (~60–70 Ma) age.
In chronological order, the cored succession begins with a thick, enigmatic igneous basement consisting of unusually thick uniform basaltic units (Unit V), overlain by a varied package combining initially juvenile volcaniclastic material (Unit IV), and subsequent sedimentary lithofacies involving reworked volcaniclastics before eventually passing into offshore and eventually deep-marine chalk-dominated sedimentary settings (Units I–III). The lowermost basalt flow and primary volcanic deposits represent the end stages of the constructive phase of the evolution of the nearby volcanic edifice and constitute an effusive stage culminating at the top with a succession of particularly voluminous, rapidly erupted lavas, followed by an explosive hydromagmatically driven stage. This stage is dominated by explosive volcanism and pyroclasts of varying size (ash through lapilli to bombs) and contains accretionary and armored lapilli, tachylite glass pellets, and fragmentary rinds on juvenile basalt clasts, indicating a change from downflank lava encroachment to localized explosive volcanism and associated accumulation and minor reworked volcaniclastic debris in a shallow-marine environment. The latter is evidenced by clast rounding, sorting, and palagonitization (Zhou and Fyfe, 1989). At this stage, parts of the active volcano are likely to have been, at least briefly, emergent.
Overlying this effusive–explosive volcanic sequence is an essentially sedimentary succession (including volcaniclastic turbidites and mass flow deposits) indicating, at least locally, the onset of drowning of the volcanic edifice (Units IV and V) followed by progressive deepening, culminating in deep-marine carbonate ooze-dominated deposition. Initially, repeated influxes of coarse volcanic debris indicate a nearby offshore shelfal source where accumulated clastic detritus periodically slumped into a deeper water and an increasingly pelagic ocean floor depositional environment. Accordingly, a reduction in grain size through silt and sand-sized sediments to silt and clay then tuffaceous chalk-dominated sediments provides a narrative of subsidence from wave- and storm-influenced sedimentary deposits to conditions where ocean floor processes were largely affected only by bottom currents and frequent to sporadic influx of turbidites bringing material from local, and then increasingly distant, sources. Continued supply and erosion of local volcanic sources around the edifices allowed accumulation of sediment. Overthickening of these detrital sediments in shelfal areas around the edifice and their periodic destabilization through volcanically triggered seismic activity (possibly due to later eruptive phases) in more distant centers in the guyot province would then explain the intervals of thick volcaniclastic materials resulting as slumps or slides from submarine mass movement episodes. Where volcaniclastic material was unavailable or otherwise sediment-starved situations, the slumping is preserved as seismites forming deep-water carbonate slumps. Eventually, continued drowning and deepening of the guyots took even these sources to depths below which further accumulation or reactivation and slumping could occur.
Long periods of deepwater pelagic accumulation are demonstrated by the preservation of cyclical redox conditions within tuffaceous and increasingly purer nannofossil chalk sediments (Subunits IIIB and IIIE). Such deep-marine cycles in the South Atlantic are likely modulated by Milankovitch periodicities affecting regional (or global) climate and hence terrigenous (eolian dust) input to, or oceanic productivity in, the deep ocean during variation between warmer and colder climate (Park et al., 1993; de Winter et al., 2014). Cyclical tuffaceous carbonates eventually give way to more homogeneous carbonate ooze (chalk) with little or no volcanic input except thin ash tuff recording distant volcanic eruptions. Local volcanic sources having now been long been extinct and the supply of volcaniclastic material from nearby shallower marine or once emergent vents long exhausted.
Because the thick pumice and scoria-rich layers of Unit II are separated from the earlier volcanic succession (Subunit IIIG and Units IV and V) by significant thicknesses of deep-marine and/or pelagic deposition, it is very probable that these represent a much later and entirely separate phase of volcanism. The length of hiatus between this and the earlier lava and its ensuing hydrovolcanic eruptions remains to be determined. The source of the pumice is likely local and may represent reactivation of activity in the seamount chain and development of the elevated peaks upon the guyot that are evident from the bathymetry. This phase of volcanism appears to be iterative, but each event was short-lived and supplied pumice and scoria (and sporadic lithics) to the accumulating carbonate ooze to the base of the guyot flank. Finally, Site U1585 records deep-water pelagic nannofossil carbonate ooze now preserved as chalk (Unit I).
4. Igneous petrology and volcanology
Igneous rocks were recovered in Hole U1585A, which penetrated 81.21 m of igneous basement (interval 31R-5, 75 cm, through 39R-6, 43 cm; end of hole) and recovered 67.55 m (83% recovery). The igneous basement at Site U1585 represents Lithostratigraphic Unit V in the overall subseafloor succession (see Lithostratigraphy). Hole U1585A terminates in a massive lava flow with a minimum flow thickness of 44.85 m.
4.1. Lithostratigraphy of igneous rocks
Three igneous lithologic units were identified in Hole U1585A (Figure F19). Igneous Units 1 and 3 consist of massive lava flows with highly variable thickness. Units 1 and 3 each have two subunits marked by distinct textural and compositional changes. Unit 2 is an igneous unit that consists of a mineralogically and texturally distinct piece of quenched lava potentially related to a pillow sequence with very low recovery. To be consistent in reporting (see unit definition protocol in Igneous petrology and volcanology in the Expedition 391 methods chapter [Sager et al., 2023b]), the boundaries are set at the top of or within recovered increments, and unrecovered material is accounted for at the bottom of a recovered core. However, we suspect this norm underrepresents the thickness of Unit 2 and overrepresents the thickness of Subunit 3a. See discussion below.
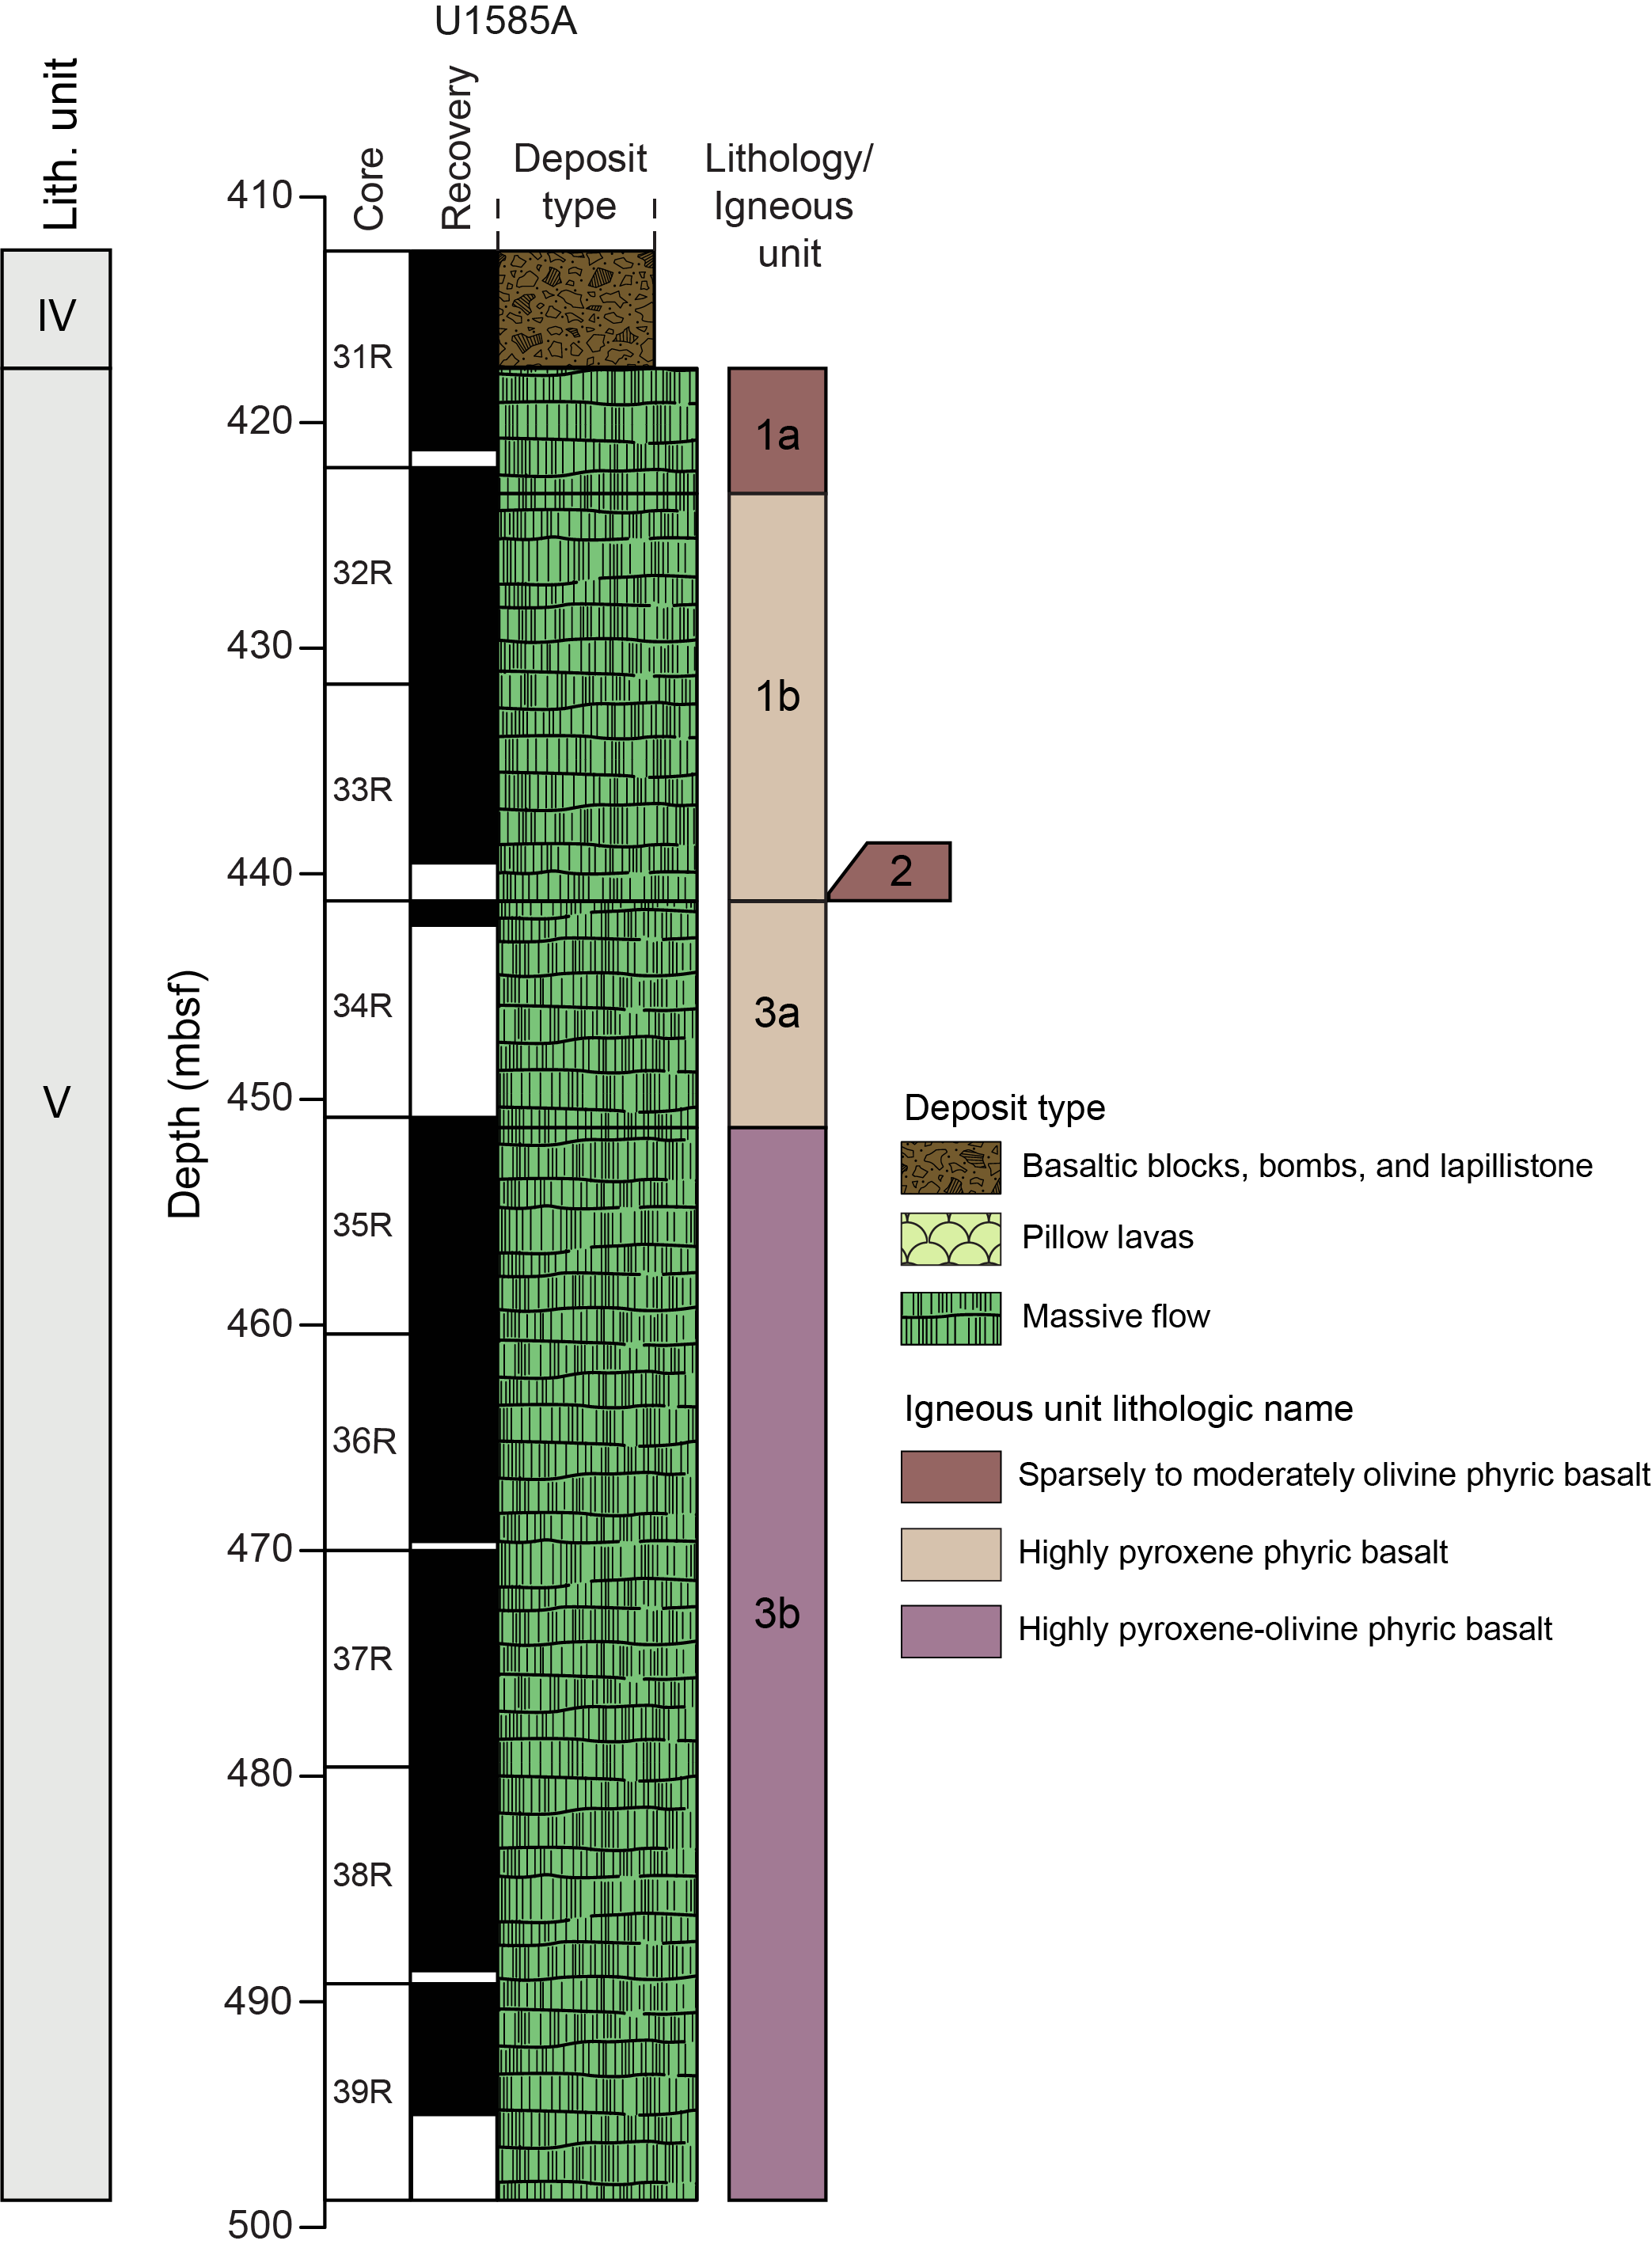
Figure F19. Stratigraphic column.
4.1.1. Unit 1: sparsely to highly phyric (pyroxene-olivine ± plagioclase) basalt
- Interval: 397T-U1585A-31R-5, 75 cm, to 34R-1, 0 cm
- Depth: 417.60–441.20 mbsf
- Drilled thickness: 23.61m
- Recovered thickness: 21.15 m
Unit 1 consists of two subunits (Figure F19; Table T3). Subunit 1a consists of sparsely to moderately phyric (olivine ± pyroxene) massive lava flow, whereas Subunit 1b is a moderately phyric (pyroxene-plagioclase) massive lava flow.
4.1.1.1. Subunit 1a: sparsely to moderately phyric (olivine ± pyroxene) basalt
- Interval: 397T-U1585A-31R-5, 75 cm, to 32R-1, 6.5 cm
- Depth: 417.60–422.07 mbsf
- Drilled thickness: 4.47 m
- Recovered thickness: 3.67 m
- Rock type: sparsely to moderately phyric olivine ± pyroxene basalt
- Deposit: massive lava flow
Subunit 1a consists of a single massive flow (4.47 m). A small quench rim appears at the top of the flow, but no glass is present. Small (~1 mm), sparse (1%) olivine phenocrysts are completely altered (Figure F20A, F20B). Groundmass microphenocrysts of elongate pyroxene and plagioclase are fine grained and visible with a hand lens. The groundmass has a seriate texture, and pyroxene crystals become large enough to be considered phenocrysts (>1 mm) toward the flow interior. Sparse, round vesicles of 2–5 mm are partially to completely filled with secondary minerals. The diktytaxitic texture of groundmass crystals creates small (<1 mm), irregular-shaped vesicles that are lined to completely filled with secondary mineralization.

Figure F20. Different textures observed in Lithostratigraphic Unit V.
4.1.1.2. Subunit 1b: moderately phyric (pyroxene ± plagioclase) basalt
- Interval: 397T-U1585A-32R-1, 6.5 cm, to 34R-1, 0 cm
- Depth: 422.07–441.20 mbsf
- Drilled thickness: 19.14 m
- Recovered thickness: 17.48 m
- Rock type: moderately phyric pyroxene ± plagioclase basalt
- Deposit: massive lava flow
Subunit 1b consists of one (potentially two) massive flows with similar mineralogy and texture. The potential flow boundary is equivocal: the sudden appearance of a horizontal band of elongate vesicles (Section 397T-U1585A-32R-6, 119–120 cm) (Figure F20C) usually indicates proximity to the bottom of a flow, but no evidence of quenched/chilled margins was apparent. Mineralogically, the small (1–2 mm) pyroxene and plagioclase phenocrysts and groundmass microphenocrysts have a seriate texture (Figure F20D). Both are elongate, and plagioclase becomes large enough to be considered a phenocryst (>1 mm) toward the flow interior. Groundmass crystals are fine grained and abundant, creating a diktytaxitic texture with irregularly shaped vesicles. Although Subunit 1a is also fine grained, Subunit 1b has a noticeably coarser groundmass. Subunit 1b also has larger (up to 3 mm) and more abundant (~8%) pyroxene phenocrysts. Small (1–3 mm) vesicles are round, and larger (4–10 mm), more sporadic vesicles are elongate and subrounded. Small vesicles are more abundant near the top of each flow and become progressively less abundant toward the flow interiors. Larger, elongate vesicles are generally found in patches in the flow interior. Small vesicles and some large vesicles are completely filled with secondary minerals except for patches where oxidizing fluids passed through the portion of the core. In these areas, the rock has a reddish brown hue and the vesicles are empty (see Alteration).
4.1.2. Unit 2: moderately phyric (olivine) basalt
- Interval: 397T-U1585A-34R-1, 0 cm, to 34R-1, 3 cm
- Depth: 441.20–441.23 mbsf
- Drilled thickness: 0.03 m
- Recovered thickness: 0.03 m
- Rock type: moderately phyric olivine basalt
- Deposit: pillow basalt flow
Unit 2 consists of a 3 cm piece of quenched basalt with olivine phenocrysts in a microcrystalline groundmass (Figure F20E). Olivine is completely replaced by iddingsite. No glass is observed, but the coloring is consistent with a quench rim near a flow boundary. This piece is at the top of Core 397T-U1585A-34R with very low recovery (11%), suggesting much of this unit was not recovered during drilling. It is also large enough that it is unlikely to be the result of fall-in between cores. We hypothesize that this was a pillow sequence, but it is difficult to determine with the low recovery. Because unrecovered intervals are, by convention, expressed at the end of a core, the thickness of Unit 2 is underrepresented and the thickness for Subunit 3a is overrepresented.
4.1.3. Unit 3: moderately to highly phyric (pyroxene-plagioclase ± olivine) basalt
- Interval: 397T-U1585A-34R-1, 3 cm, to 39R-6, 43 cm (end of core recovery)
- Depth: 441.23–495.0 mbsf
- Note: bottom of cored interval on the drilling depth below seafloor (DSF) scale is 498.8 m
- Drilled thickness: 57.57 m
- Recovered thickness: 46.36 m
Unit 3 consists of two potential massive lava flows without any clear flow boundary features (Figure F19; Table T3). However, changes in texture, mineralogy, and geochemistry (see Igneous geochemistry) suggest that there may be two flows with separate fractionation histories. Alternatively, it could also be a single massive flow but with a complex magma injection history. However, current spacing of thin section and geochemical sampling prevented a definitive determination. Subunit 3a is a highly pyroxene-plagioclase phyric massive basalt flow with a fine-grained groundmass, and Subunit 3b is a moderately to highly pyroxene-plagioclase ± olivine massive basalt flow with evidence for gradual crystal accumulation toward the bottom of the flow.
4.1.3.1. Subunit 3a: moderately to highly phyric (pyroxene-plagioclase) basalt
- Interval: 397T-U1585A-34R-1, 3 cm, to 35R-1, 46 cm
- Depth: 441.23–451.26 mbsf
- Drilled thickness: 10.03 m
- Recovered thickness: 1.51 m
- Rock type: highly phyric pyroxene-plagioclase basalt
- Deposit: massive lava flow
Subunit 3a is a massive lava flow with pyroxene (~8%), plagioclase (3%–5%) phenocrysts in a fine-grained groundmass. Seriate textures show a continuum of phenocrysts to microphenocryst sizes. Larger pyroxene and plagioclase phenocrysts are ~2 mm and appear minimally altered. Round vesicles are present but small (~1 mm) and sparse (up to 2%). Secondary minerals line the vesicles (see Alteration). As stated in the Unit 2 description, the thickness of Subunit 3a is likely overrepresented because of the low recovery in Core 397T-U1585A-34R.
4.1.3.2. Subunit 3b: moderately to highly phyric (pyroxene-olivine-plagioclase) basalt
- Interval: 397T-U1585A-35R-1, 46 cm, to 39R-6, 43 cm (end of core recovery)
- Depth: 451.26–495.0 mbsf
- Note: bottom of cored interval on the DSF scale is 498.8 m
- Drilled thickness: 47.54 m
- Recovered thickness: 44.85 m
- Rock type: moderately to highly phyric pyroxene-olivine-plagioclase basalt
- Deposit: massive lava flow
Subunit 3b had excellent core recovery, including two cores (397T-U1585A-35R and 37R) that had 103% recovery (Figure F21). Subunit 3b is a massive lava flow with pyroxene and olivine phenocrysts throughout, but plagioclase phenocrysts and olivine microphenocrysts vary significantly because of crystal fractionation and accumulation. Olivine phenocrysts (~1 mm) are relatively consistent throughout the flow. However, groundmass olivine microphenocrysts increase from ~10% near the top of the flow to ~35% near the base of the flow (see Petrography). Olivine varies from crystals containing fresh interiors with thin alteration rims to crystals completely replaced by chlorite or serpentine. Fresh olivine is visible in hand sample, but thin sections are required to identify the altered olivine and the extent of its presence. Plagioclase phenocrysts are visible in the top and middle of the flow; however as a consequence of the seriate nature, of all of the phases become progressively smaller toward the bottom of the flow and are no longer considered phenocrysts (<1 mm) where olivine microphenocrysts are the most abundant. Pyroxene phenocrysts are ~2–3 mm in length and are more abundant (15%–20%) in the top and middle of the flow but decrease to 2%–8% toward the bottom of the flow. The flow is fine grained, but because of the larger phenocryst sizes appears coarser grained than in Subunit 3a. The flow is largely nonvesicular with <1% vesicles throughout most of the flow. However, the bottom of the flow has 2%–5% filled round vesicles.
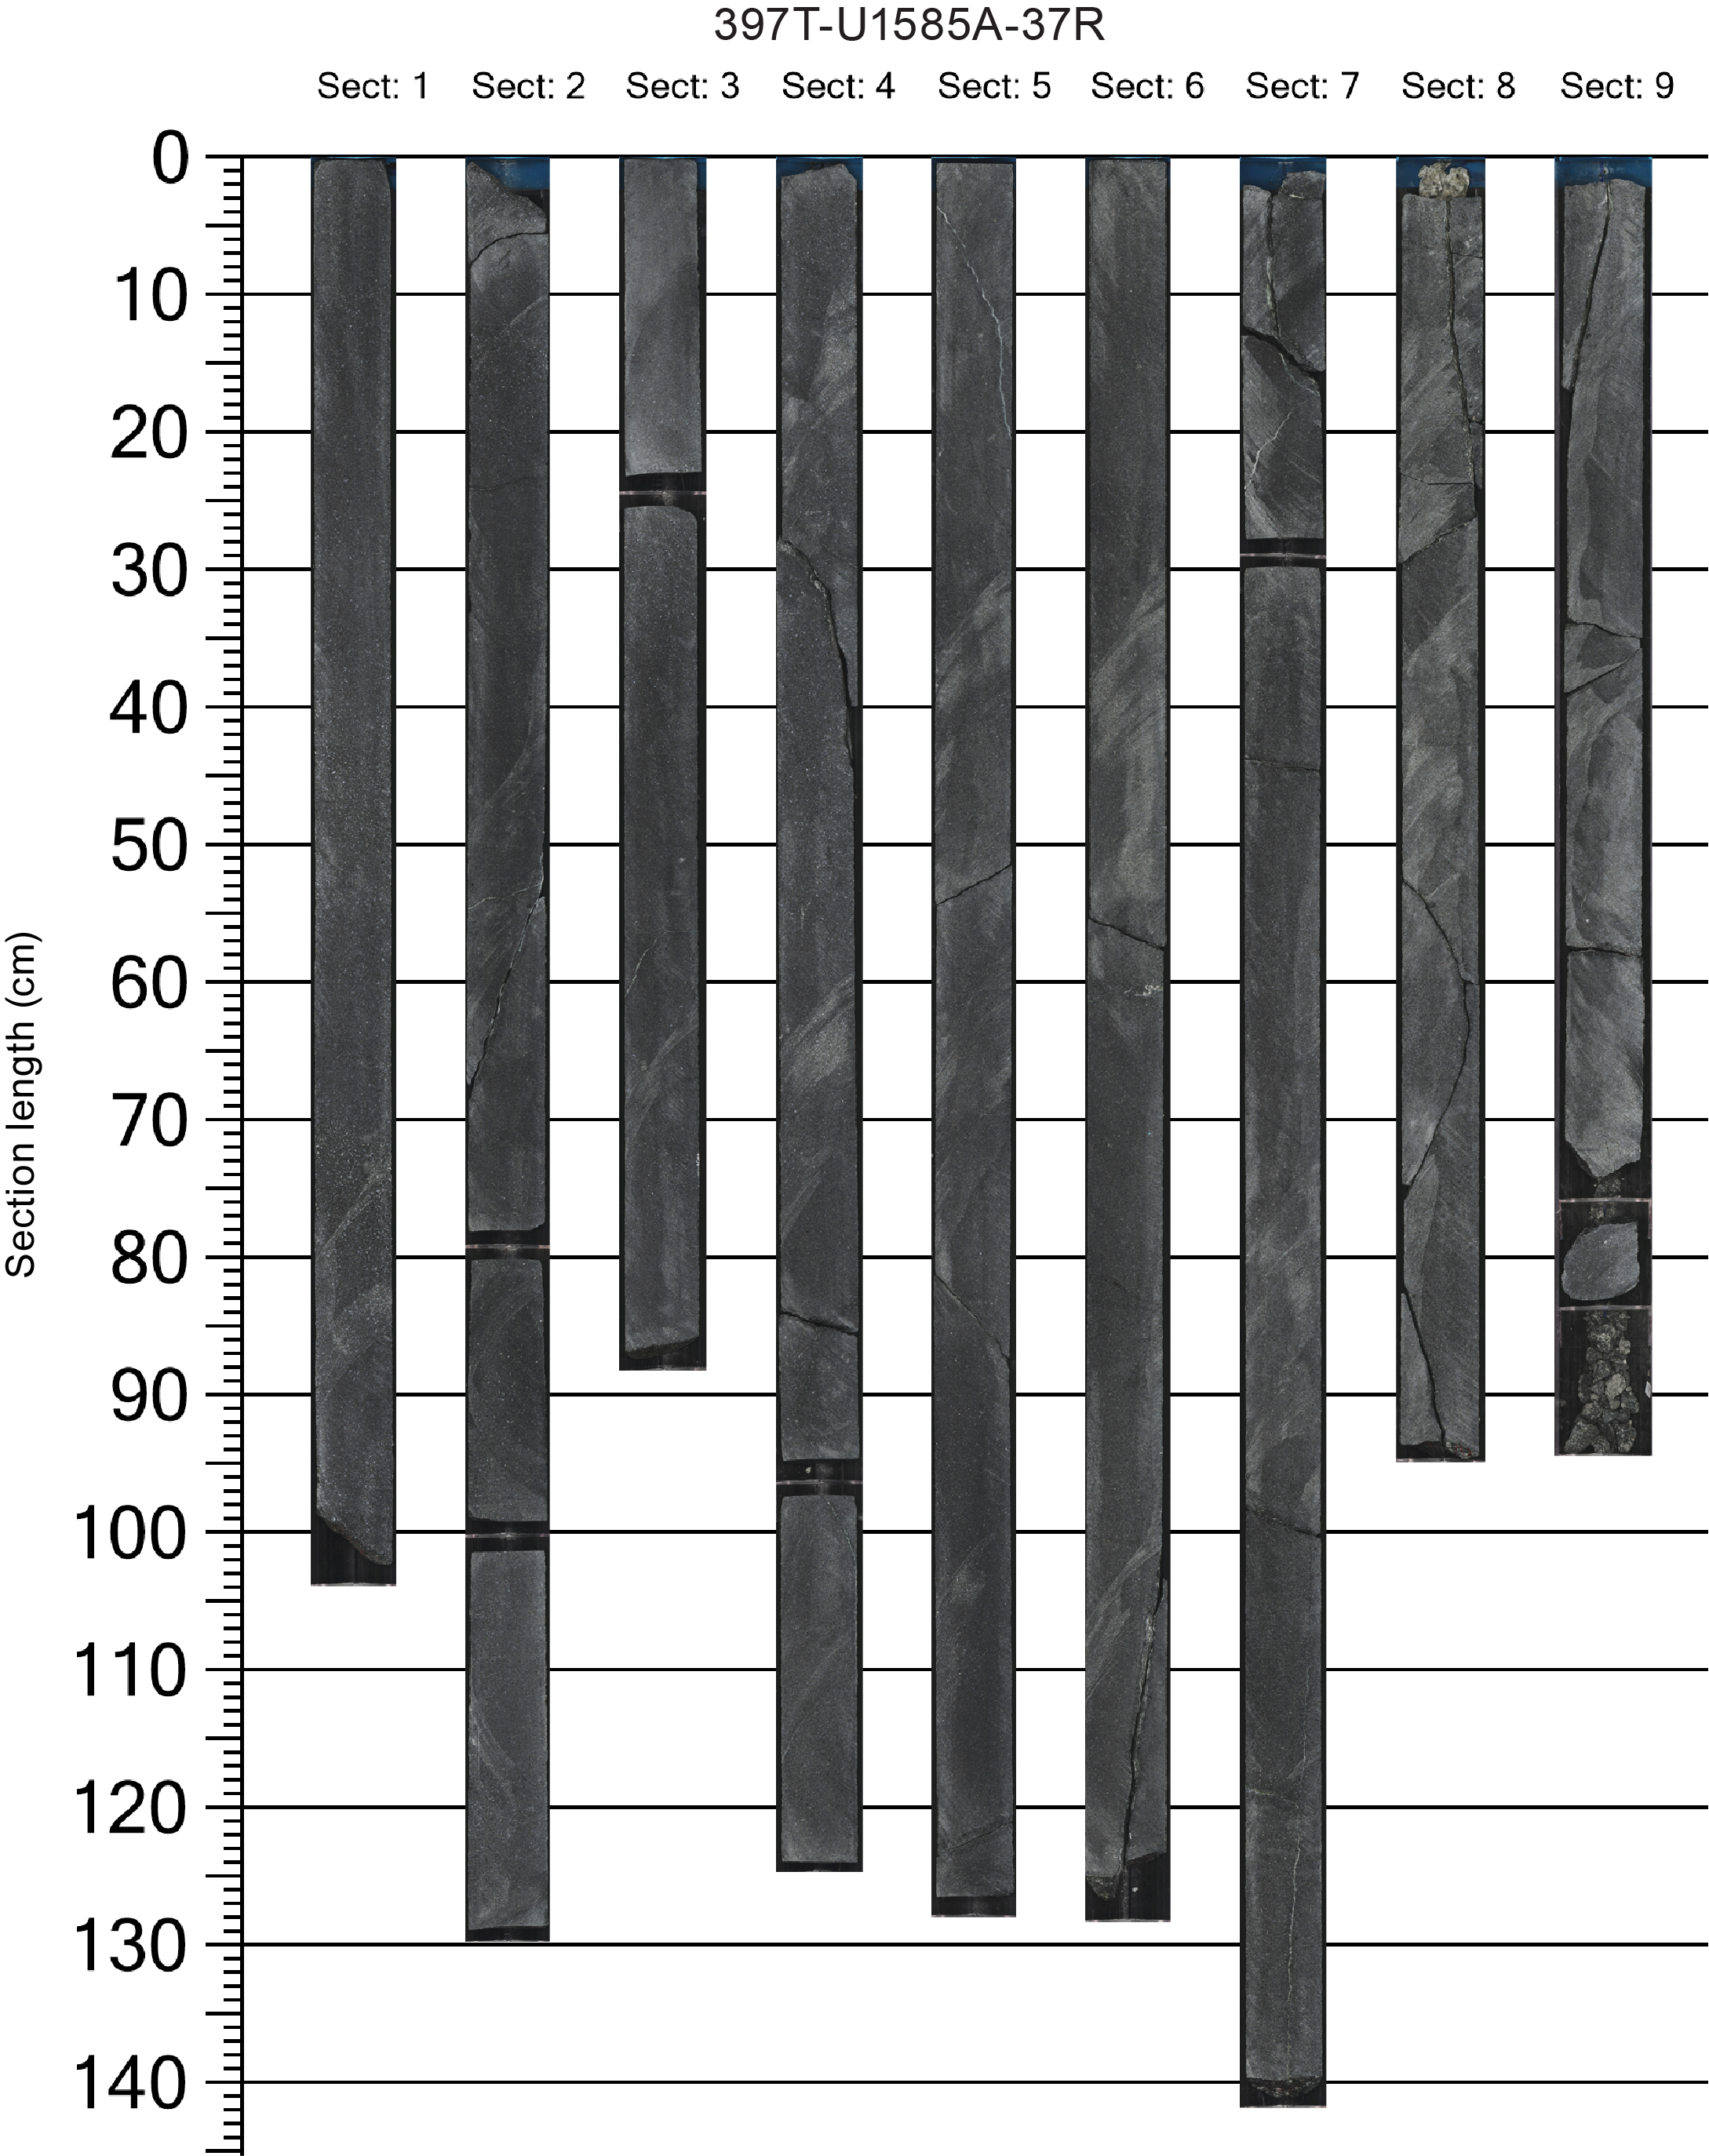
Figure F21. Massive basalt flow.
A finer grained magma intruded the massive basalt while both were partially crystallized, creating a distinctive change in grain size and mineralogy in Sections 397T-U1585A-35R-9, 35–45 cm, and 37R-5, 26–46 cm (Figure F22).
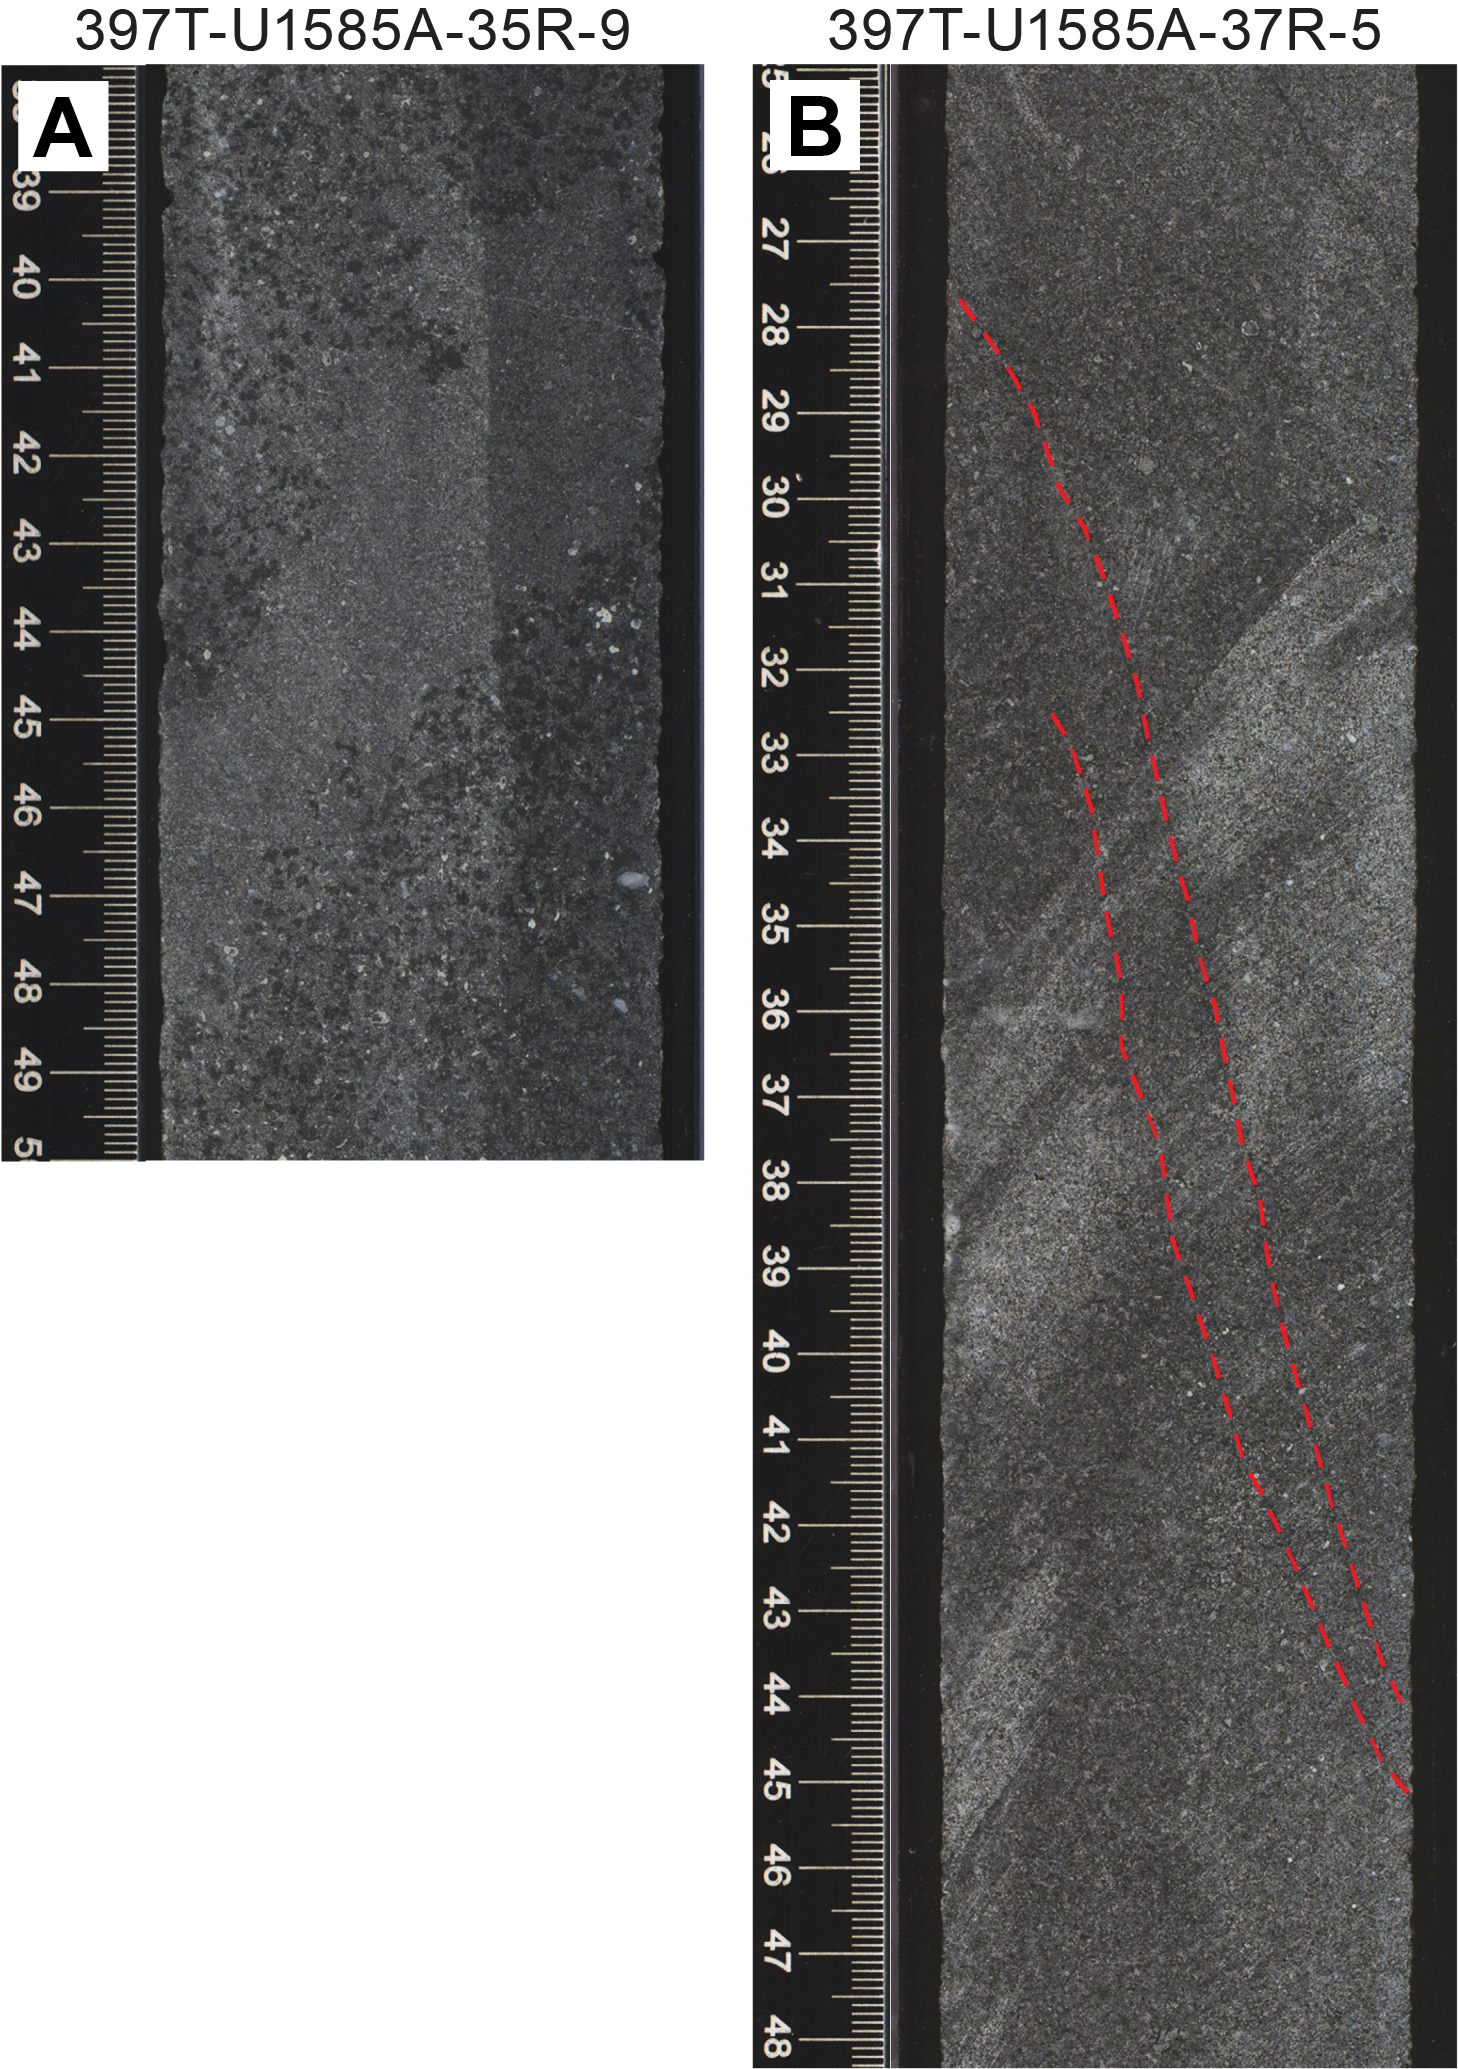
Figure F22. Small fine-grained mafic intrusions.
4.2. Petrography
The massive lava flows in Units 1 and 3 (Unit 2 was not sampled during the expedition) are sparsely to highly clinopyroxene phyric with varying amounts of plagioclase and olivine phenocrysts. All of the flows have a seriate texture between phenocrysts and microphenocrysts in the groundmass. The groundmass is consistently fine grained, but different flows vary as to the modal groundmass size within that defined grain size modal name (see Igneous petrology and volcanology in the Expedition 391 methods chapter [Sager et al., 2023b]). Both plagioclase and clinopyroxene have more elongate crystals in Unit 1 (Figure F23A), some showing skeletal textures. Clinopyroxene phenocrysts are dominantly fresh, range 1–3 mm in size, and vary in abundance (3%–20%) with decreasing clinopyroxene toward the bottom of Subunit 3b. Clinopyroxene is also strongly subophitic throughout most of the massive flows (Figure F23B), although the occurrence of that texture also decreases with decreasing clinopyroxene abundance and size in the bottom of Subunit 3b; more tabular to blocky clinopyroxene is also present in that subunit. Groundmass clinopyroxene is 0.6–0.8 mm except for microlites in mesostasis patches.
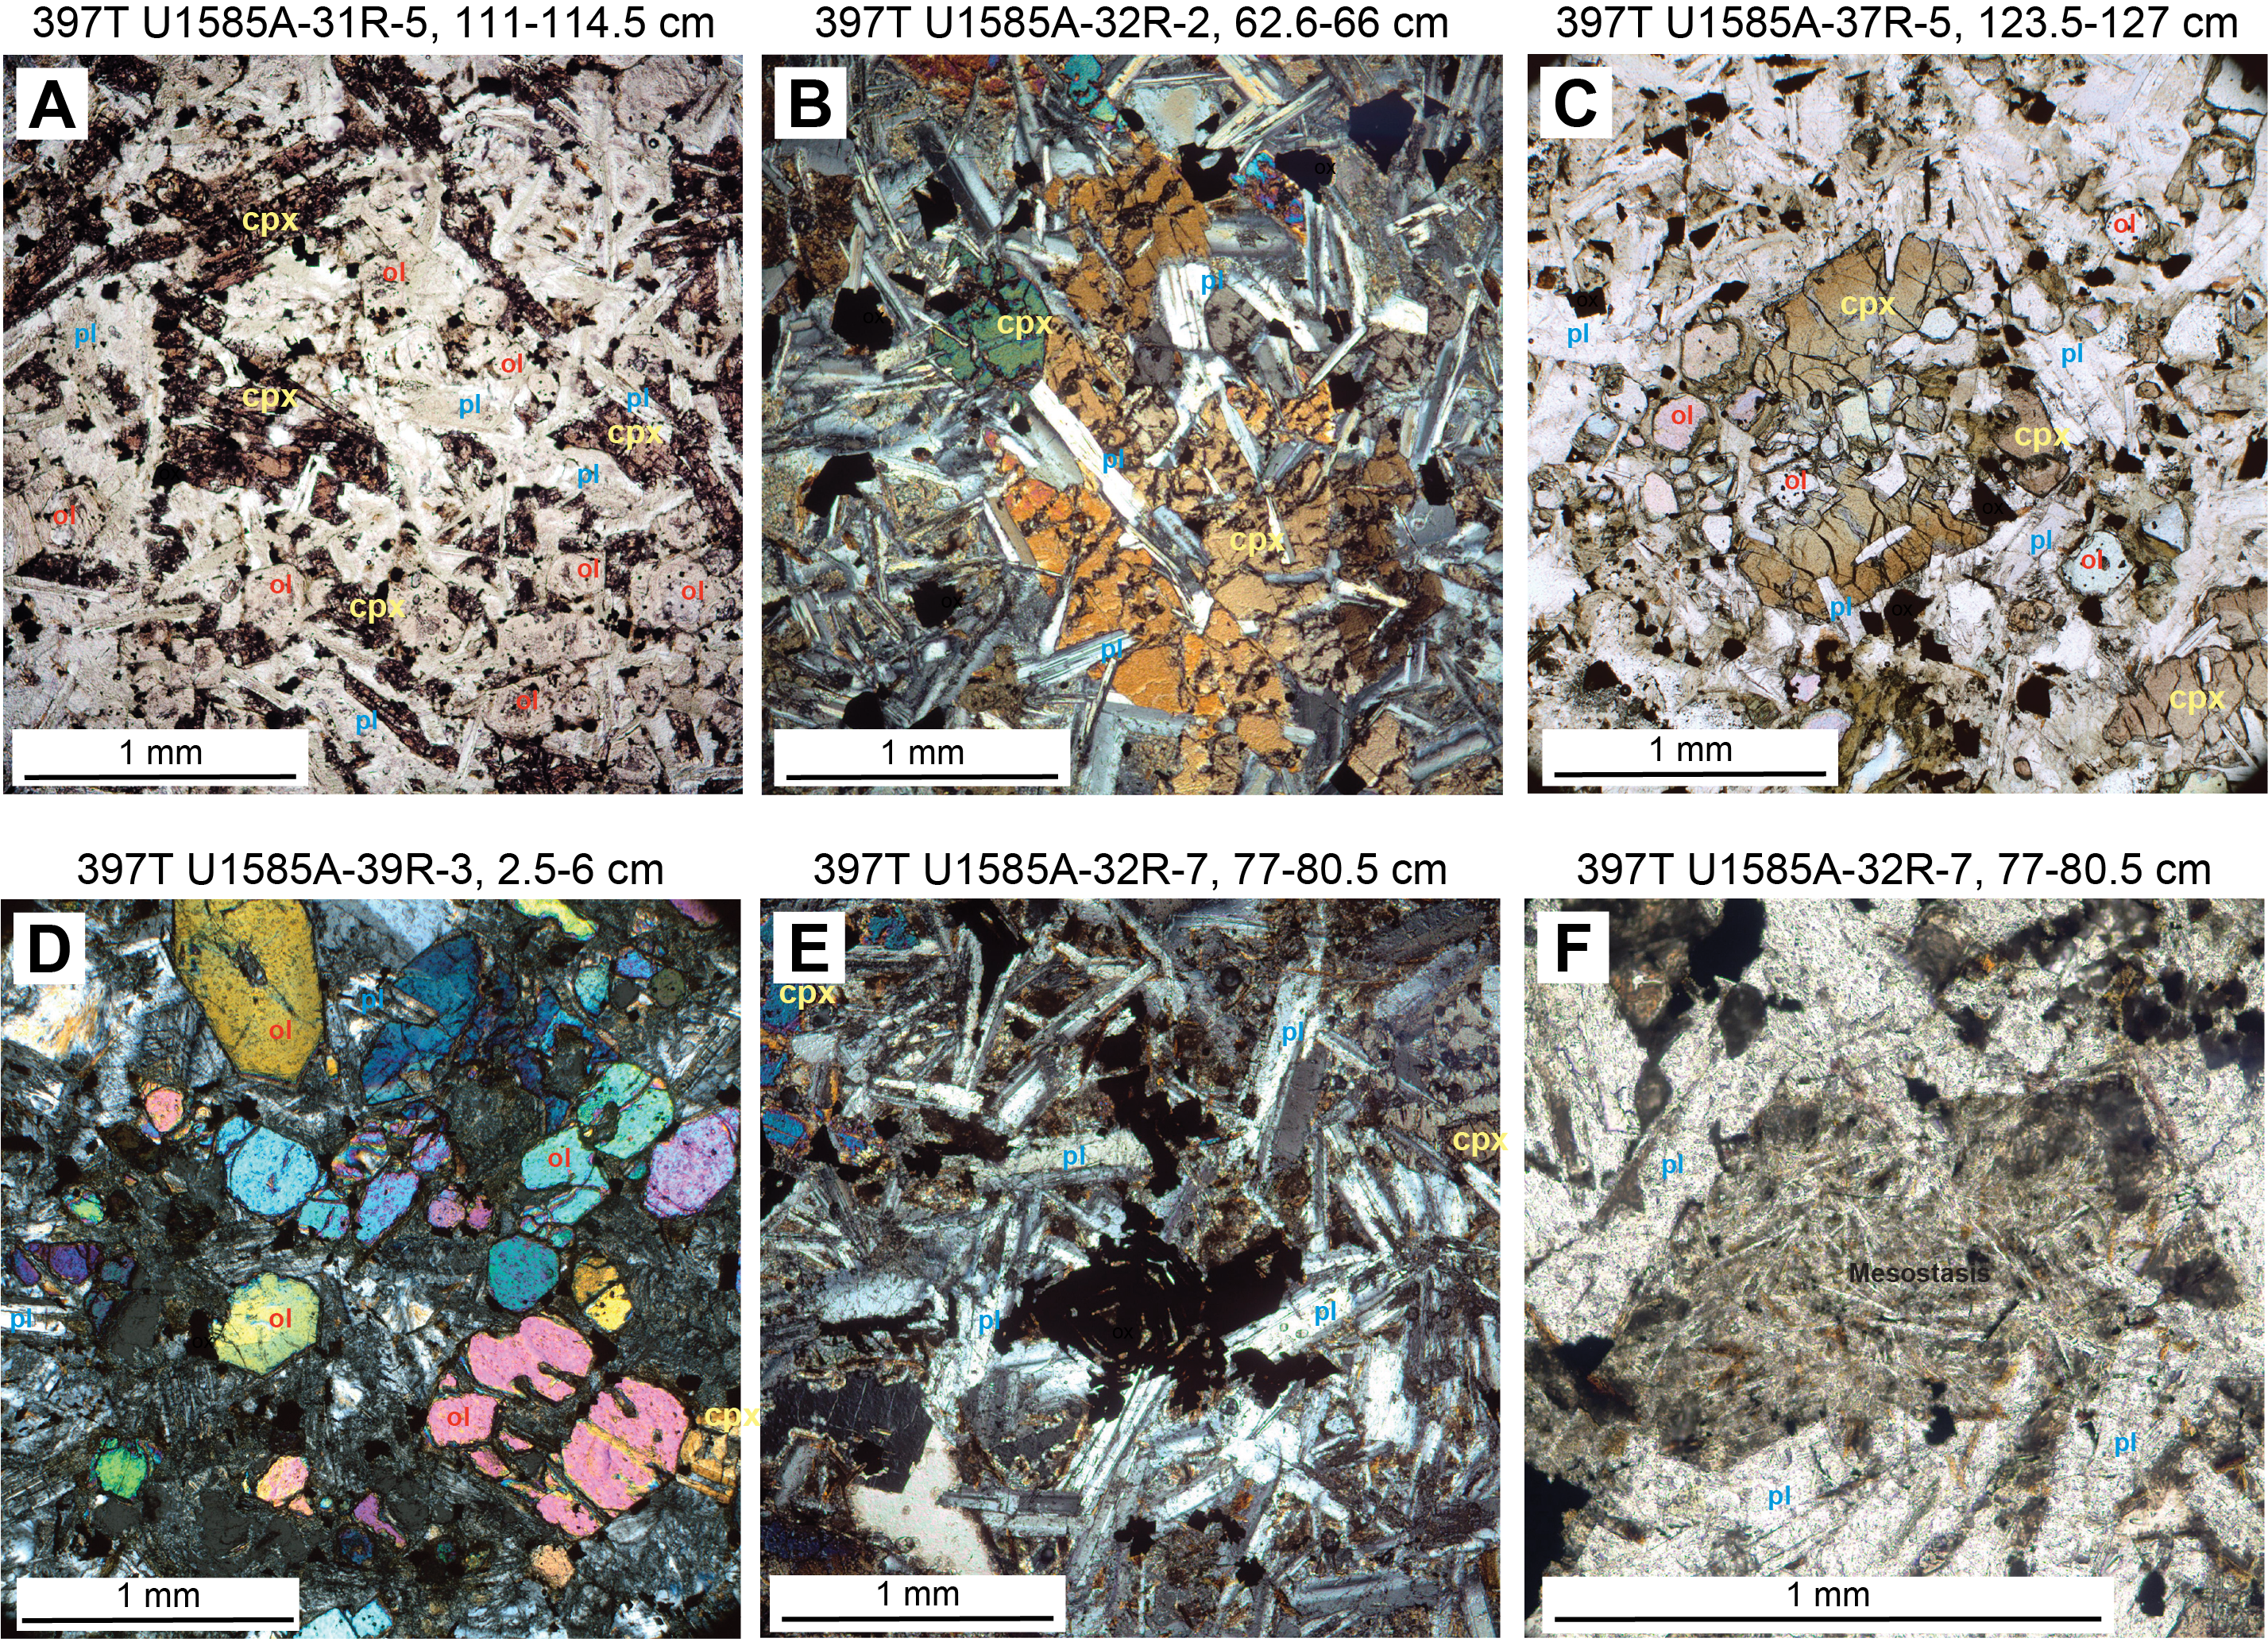
Figure F23. Massive lavas.
Plagioclase is a ubiquitous groundmass phase that, in some flows, is large enough to exceed 1 mm in length to be considered a phenocryst. Like clinopyroxene, it is more slender toward the top of the flows and becomes more tabular with depth, especially in Unit 3. Plagioclase phenocrysts show a modest range in size (1–2 mm) and abundance (0%–5%), and plagioclase constitutes 20%–40% of the groundmass with most groundmass crystals >0.5 mm. Compositional zoning is more common in the tabular crystals. All plagioclase crystals have sustained moderate to high levels of sericite alteration, and the crystal cores display the most intense alteration.
Although only occasionally large enough to be considered a phenocryst, olivine shows consistent size (0.5–0.8 mm) but a wide range of abundances in the groundmass (5%–35%). Phenocrystic olivine ranges 1%–3% in abundance with modest sizes of 1–2 mm. Groundmass olivine varies from ~13% in Subunit 1a, 2%–5% in Subunits 1b and 3a, and 10%–35% in Subunit 3b. All olivine crystals show some degree of chlorite alteration, ranging from a thin rim of alteration around a fresh core to complete replacement (Figure F23C, F23D). Even though there are alteration rims, the olivine crystals do not appear compositionally zoned.
Fe-Ti oxides are all <1 mm and therefore are confined to the groundmass. The size and morphology of the groundmass Fe-Ti oxides, however, varies widely. Subunit 1a contains small (~0.05 mm), moderately abundant (~7%), equant Fe-Ti oxides. In contrast, in Subunits 1b and 3a, the Fe-Ti oxides are, on average, 0.3–0.7 mm in size with rare grains as large as 1.1 mm. These large grains can display elaborate skeletal growth textures (Figure F23E). Subunit 3b contains more modest groundmass Fe-Ti oxide sizes (0.1–0.2 mm) that tend to be more blocky and equant. Large skeletal grains are less common.
Mesostasis groundmass material is common (20%–45%) in Subunits 1a, 1b, and 3a but is less easily identifiable in Subunit 3b. This could be because of increased crystallinity. However, the more tabular groundmass plagioclase and high degree of alteration of both the plagioclase and mesostasis made it, at times, difficult to distinguish one phase from the other. Where groundmass olivine is the most abundant, mesostasis is estimated to be ~10%. In the upper portions of Subunit 3a, mesostasis estimates range 25%–50% of the groundmass. Some mesostasis is relatively featureless, whereas other patches contain microlites of plagioclase, clinopyroxene, and Fe-Ti oxides (Figure F23F).
4.3. Alteration
Alteration of the igneous basement shows a variety of alteration products, secondary mineralization, veining, and vesicle fill. In general, throughout the cores the veins are filled with a composite of varying proportions of calcite and zeolite/chlorite/Fe oxyhydroxide minerals. The vesicles are lined with a blue-gray mineral and filled with carbonate and/or zeolite. Because the occurrence and style of alteration is not restricted to specific igneous units described above (see Lithostratigraphy of igneous rocks), a core-by-core description of alteration is provided based on macroscopic, microscopic, and X-ray diffraction (XRD) observations.
4.3.1. Alteration description
Alteration throughout Core 397T-U1585A-31R is patchy and caused by at least two episodes of alteration. In the first episode, microphenocrysts of plagioclase are sericitized and olivine phenocrysts are completely altered to iddingsite; large vesicles are filled with carbonates and, occasionally, with zeolites. This style of alteration caused an overall bluish gray color with a pale bluish gray mineral lining the vesicles; the latter persists downhole throughout several deeper cores (see description of Core 33R below). The bluish gray alteration turns greenish gray with depth (Section 31R-6). The greenish cast is characterized by partial or complete alteration of the phenocrysts to chlorite. A second stage of alteration is apparent in portions of the core by yellow to brown discoloration. Near the top of the igneous basement, a large patch (~30 cm) of core is discolored to pale yellow, likely due to fluid-sulfide (mainly pyrite) interaction partly altering and staining the primary igneous minerals and groundmass. Deeper in the core, Fe oxyhydroxide minerals and a second network of veins generated brownish patch in Section 31R-7. This second episode of alteration is also superimposed on previously formed veins (Figure F20A).
Core 397T-U1585A-32R exhibits primary and secondary alteration patches that alternate between bluish gray and yellowish brown, respectively. Similar to Core 31R, pyroxene, plagioclase, and mesostasis are altered to chlorite-sericite. Vesicles in general are lined, in relative temporal order, by chlorite (±pyrite) and subsequently filled with carbonates and/or zeolites. Veins are composite, isolated, sometimes networked, and filled with a mixture of carbonates and zeolite/chlorite/clay. The secondary yellowish brown patches are characterized by the presence of pyrite and Fe oxyhydroxides. Inspection reveals that the brownish patches generally have empty vesicles, most likely due to dissolution of the secondary minerals by the introduction of a later oxidizing fluid, thus indicating more than one stage of alteration.
Core 397T-U1585A-33R primarily records the light gray to bluish gray alteration episode without the secondary, oxidizing alteration observed in the previous two cores. Alteration of pyroxene, plagioclase, and mesostasis leads to fibrous growth of chlorite-sericite. Vein density decreases and, where present, veins are generally filled with carbonate and/or clay minerals. Consistent with the lava flows stratigraphically above this core, the vesicles are filled with carbonates and zeolite/clay and are mostly lined with the bluish green mineral (Figure F24A). An XRD powder aliquot of the bluish mineral lining a thin vein (Sample 33R-1, 122–124 cm) indicates the presence of chlorite, serpentine (chrysotile), and kaolinite. However, complex overlap in the diffraction peaks of these three minerals precludes definitive determination and likely represents the presence of one or more of these minerals (Figure F24C).

Figure F24. Materials on basalt.
The previously observed patches of light gray to bluish gray alteration continues in Cores 397T-U1585A-34R and 35R. Pyroxene phenocrysts and mesostasis are partially chloritized and serpentinized. Vesicles are lined with chlorite-serpentine-clay and filled with carbonate. Branching veins are filled with carbonate and zeolite and are occasionally lined with chlorite.
Alteration in Core 397T-U1585A-36R is initially continuous with the previous core, but with depth, alteration intensity decreases. Phenocrysts of olivine are partly altered to chlorite/serpentine, and the groundmass is partially chloritized. Composite veins are lined with serpentine/talc/chlorite and filled with carbonates. Some veins are wider (~1 cm) and filled with two generations of calcite. Vesicles are sparse and filled with zeolite.
Decreased alteration intensity continues in Core 397T-U1585A-37R, giving rise to lighter and darker shades of gray. Olivine microphenocrysts are partly altered along the fractures to chlorite or serpentine. Mesostasis is partly chloritized (Figure F25). However, increased veining and weakness along those veins has resulted in a more fractured, less continuous core (Figure F24B). The broken surfaces reveal a white greenish mineral; XRD investigation suggests it is a variable mixture of talc, zeolite, and serpentine (Figure F24D).
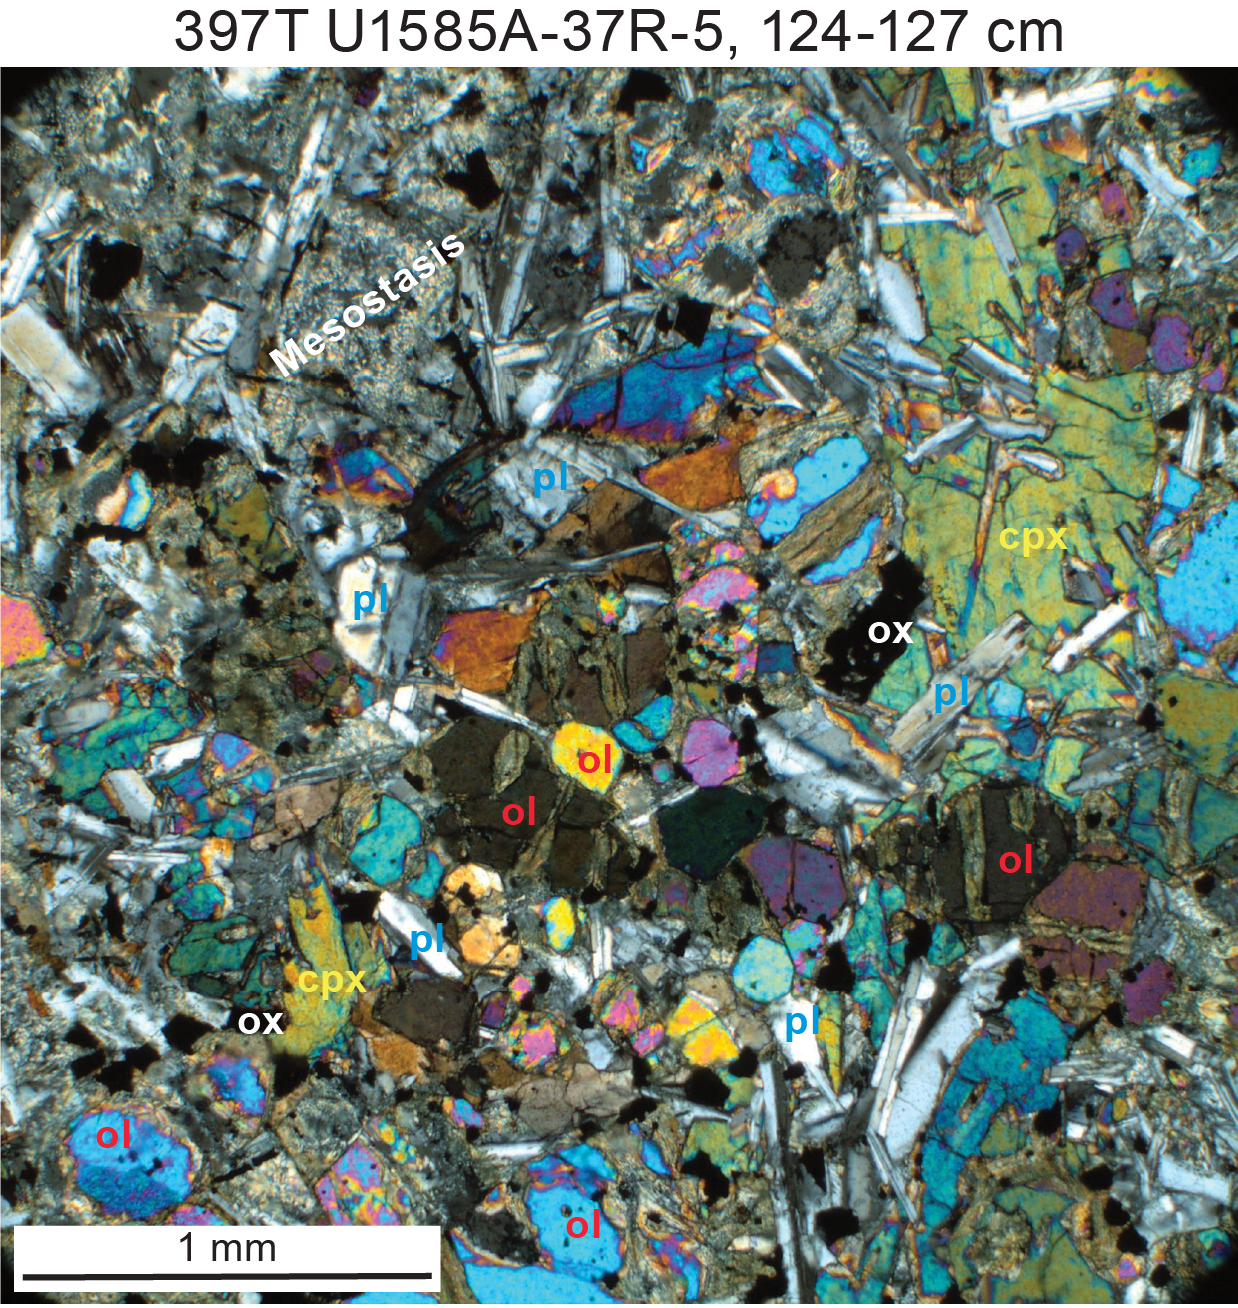
Figure F25. Fresh clinopyroxene and plagioclase but chloritized groundmass and mesostasis.
Similar to the previous two cores, alteration in Core 397T-U1585A-38R is largely limited to groundmass chloritization. A few-centimeter-wide portion of fine-grained basalt is lined with secondary sulfide and an unidentified black powdery mineral. Vesicles are few and filled with zeolites. Veins are isolated to branched and networked and filled with talc-zeolite-serpentine assemblage.
Core 397T-U1585A-39R has a finer crystal size, and thus the lighter and darker shades of alteration are more readily contrasted. The groundmass is chloritized, and phenocrysts are partially chloritized and serpentinized. Vesicles are few and filled with zeolite. Veins are isolated, branched, or networked, compositely filled with talc-zeolite-serpentine assemblage.
4.3.2. Alteration discussion
The macroscopic, limited microscopic, and XRD investigations give sufficient background to offer a tentative paragenesis of the observed alteration minerals. These are as follows: serpentine-talc-chlorite-sericite-pyrite-zeolite-calcite-iddingsite-Fe oxyhydroxide-clay.
Although most of the above minerals except for the serpentine and talc persist across the cores, there appear to be two broad categories of alteration: chlorite-sericite-zeolite facies and Fe oxyhydroxide alteration. Further evidence, such as calcite-filled vesicles and veins lined by chlorite, clay, and zeolite suggest that the calcite could be of two generations, the latter calcite dominating the shallower basalts. Fe oxyhydroxide alteration is also limited to the shallower depth (upper part of the igneous basement), overprinting the early-stage chlorite facies alteration (Figure F24).
Downhole, the deeper levels of the basalt unit(s) seem to have altered under rock-dominated (i.e., with lower water to rock ratio) conditions, and the alteration of mesostasis and groundmass could be part of deuteric alteration. The serpentinization along the fractures and rims of olivine and deposition of talc-serpentine-zeolite assemblage along the fractures could have followed the deuteric alteration stage at relatively higher temperature (>100°C). The serpentinization can lead to production of secondary magnetite by oxidizing the Fe in the rock. This occurrence of secondary magnetite could have been one of the reasons for poor retrieval of primary magnetization from the deeper cores (see Paleomagnetism). Following the serpentinization stage, the fluids in the basement evolved, causing reduction of primary glass and mafic minerals to form chlorite and, in some cases, plagioclase sericitization. The reductive alteration of the rock leads to oxidation of the fluid and, when mixed with the oxidizing seawater, likely then led to Fe oxyhydroxide alteration. The ubiquitous presence of disseminated pyrite grains likely represents an earlier stage of alteration, possibly even from late-stage postcrystallization magmatically derived fluids, and were then subsequently partly redissolved and reprecipitated as the redox conditions changed.
The proposed redox cycle of dissolution and precipitation is further supported by the two clearly different generations of vein fills in most of the fractures. The lining of vesicles with chlorite/serpentine/zeolite mixture preserved throughout the basalt lavas indicates that the first generation of products formed largely during a lower water to rock ratio stage of alteration and may have started with deuteric alteration. These first-generation veins were then later filled with chlorite/clay and further expanded by the fluid pressure depositing calcite.
4.4. Volcanology and discussion
The type of emplacement of this >80 m thick igneous basement succession (Lithostratigraphic Unit V) proves difficult to be interpreted, referring to either lava units or a hypabyssal body. Massive lava flows recorded in flood basalt provinces rarely exceed 30–40 m thickness and most commonly are 15–25 m (Single and Jerram, 2004; Jay et al., 2009). Exceptions do occur where compositional or topographical factors lead to ponding or otherwise affect rheology during eruption (Lyle, 2000; Marshall et al., 2016). Therefore, it is unlikely that the entire cored succession (417–498 mbsf) represents a single emplacement event. Recovery is excellent, with the exception of Igneous Unit 2 (Section 397T-U1585A-34R-1, 0–3 cm) in which only a single piece (biscuit) of a clearly different and distinct type of fine-grained olivine-phyric basalt was retrieved. Arguably, poor recovery in this interval could represent a different type of volcanic or volcaniclastic material that because of its mechanical properties or poor cementation could not be easily cored; for instance, a basalt breccia or a stack of pillow lavas. Following convention outlined in Igneous petrology and volcanology in the Expedition 391 methods chapter (Sager et al., 2023b), unit boundaries were placed above and below this fragment; arguably then, the thick igneous units above and below must represent massive lava flows. Similar relationships involving intercalated pillow stacks and massive flows were documented in Expedition 391 Holes U1575A and U1578A.
The only identifiable contact is the thin upper boundary of Igneous Unit 1, which preserves a reduction in crystal size in the uppermost 20–30 cm of the basalt (upper chilled margin), a 0.5 cm quench margin at the top of the flow, baked chalk sediment, and ferric staining, indicating limited interaction with seawater. For the remainder of the basement succession there are no similar physical features and little internal structure that might allow division of Lithostratigraphic Unit V into recognizable eruptive units using the criteria outlined in Igneous petrology and volcanology in the Expedition 391 methods chapter (Sager et al., 2023b). These might include concentration of fractures and joints that may suggest brittle contraction in the upper part of a flow or vesicle layers and accumulations that amass in the upper portion of a cooling flow as a consequence of the inward advance of the thickening viscoelastic crust of a lava flow. Detailed petrography indicates distinct variation in the size and texture of crystallinity, but such features can occur in larger lava units or sills through repeated injection of magma during the inflation and advance of the igneous unit (Thorpe and MacDonald, 1985; Lyle, 2000; Liss et al., 2004). In effect, there are none of the usual physical volcanology clues that might otherwise aid in dividing this succession into well-defined and distinct eruptive units.
As regards volcanological interpretation, a number of possibilities arise. One possibility is that the succession comprises a series of welded lows where successive massive units overstep an earlier massive lava flow while it yet had an uncooled (liquid?) core, and was thus in the early stages of cooling and solidification. In these instances, the actual physical interface between the two becomes a welded zone between the upper viscoelastic crust of the earlier flow and the basal contact of the overriding unit. In such examples, chilled margins are poorly developed and the boundary between the separate units difficult to discern. Such examples are observable in continental flood basalt provinces such as the Columbia River Basalt Province and the Deccan Flood Basalt Province. An alternative possibility is that the whole succession is a single, or possibly two, sills. Sills can achieve greater thickness than lava flows but tend to have coarser (doleritic) texture and distinct thermal baking effects on the host country rock (thermal aureole) for several tens of centimeters or, exceptionally, a few meters above and below the upper and lower contacts. It is not uncommon for host rock xenoliths to be incorporated and mixed into the margins of sills, especially where the host material is fragmentary or otherwise poorly consolidated. The top of the igneous basement preserved in Section 397T-U1585A-31R-5 immediately underlies a thick succession of blocky well-cemented volcanic breccia (Lithostratigraphic Unit IV), but there is no indication that this has been physically or thermally affected by sill emplacement. Accordingly, a sill interpretation can reasonably be rejected.
In summary, it is likely the succession represents at least two thick massive flows, both of which received multiple magma injections during their emplacement, thus explaining the observed complex variation in microtextures as well as magmatic veining and patches of crystal clots. Detailed geochemical logging through these two massive flows may further aid with division.
5. Biostratigraphy
There were no Expedition 397T shipboard paleontologists, and therefore no shipboard report can be provided.
6. Paleomagnetism
Drilling in Hole U1585A cored ~355 m of section, including fine-grained calcareous sediments, volcaniclastic sediments, and basalt. The sedimentary section is ~273 m thick, whereas the basalt section is ~81 m thick. A total of 52,829 superconducting rock magnetometer (SRM) measurements were made on 183 core sections. In addition, 125 discrete cube samples were demagnetized and measured.
6.1. Archive-half measurements
SRM measurements were made on all archive section halves longer than ~20 cm, at 2 cm intervals. Stepwise alternating field (AF) demagnetization was performed at field steps of 5, 10, 15, and 20 mT. For convenience, these measurements are discussed and plotted separately for the sedimentary and basaltic sections (Figures F26, F27).
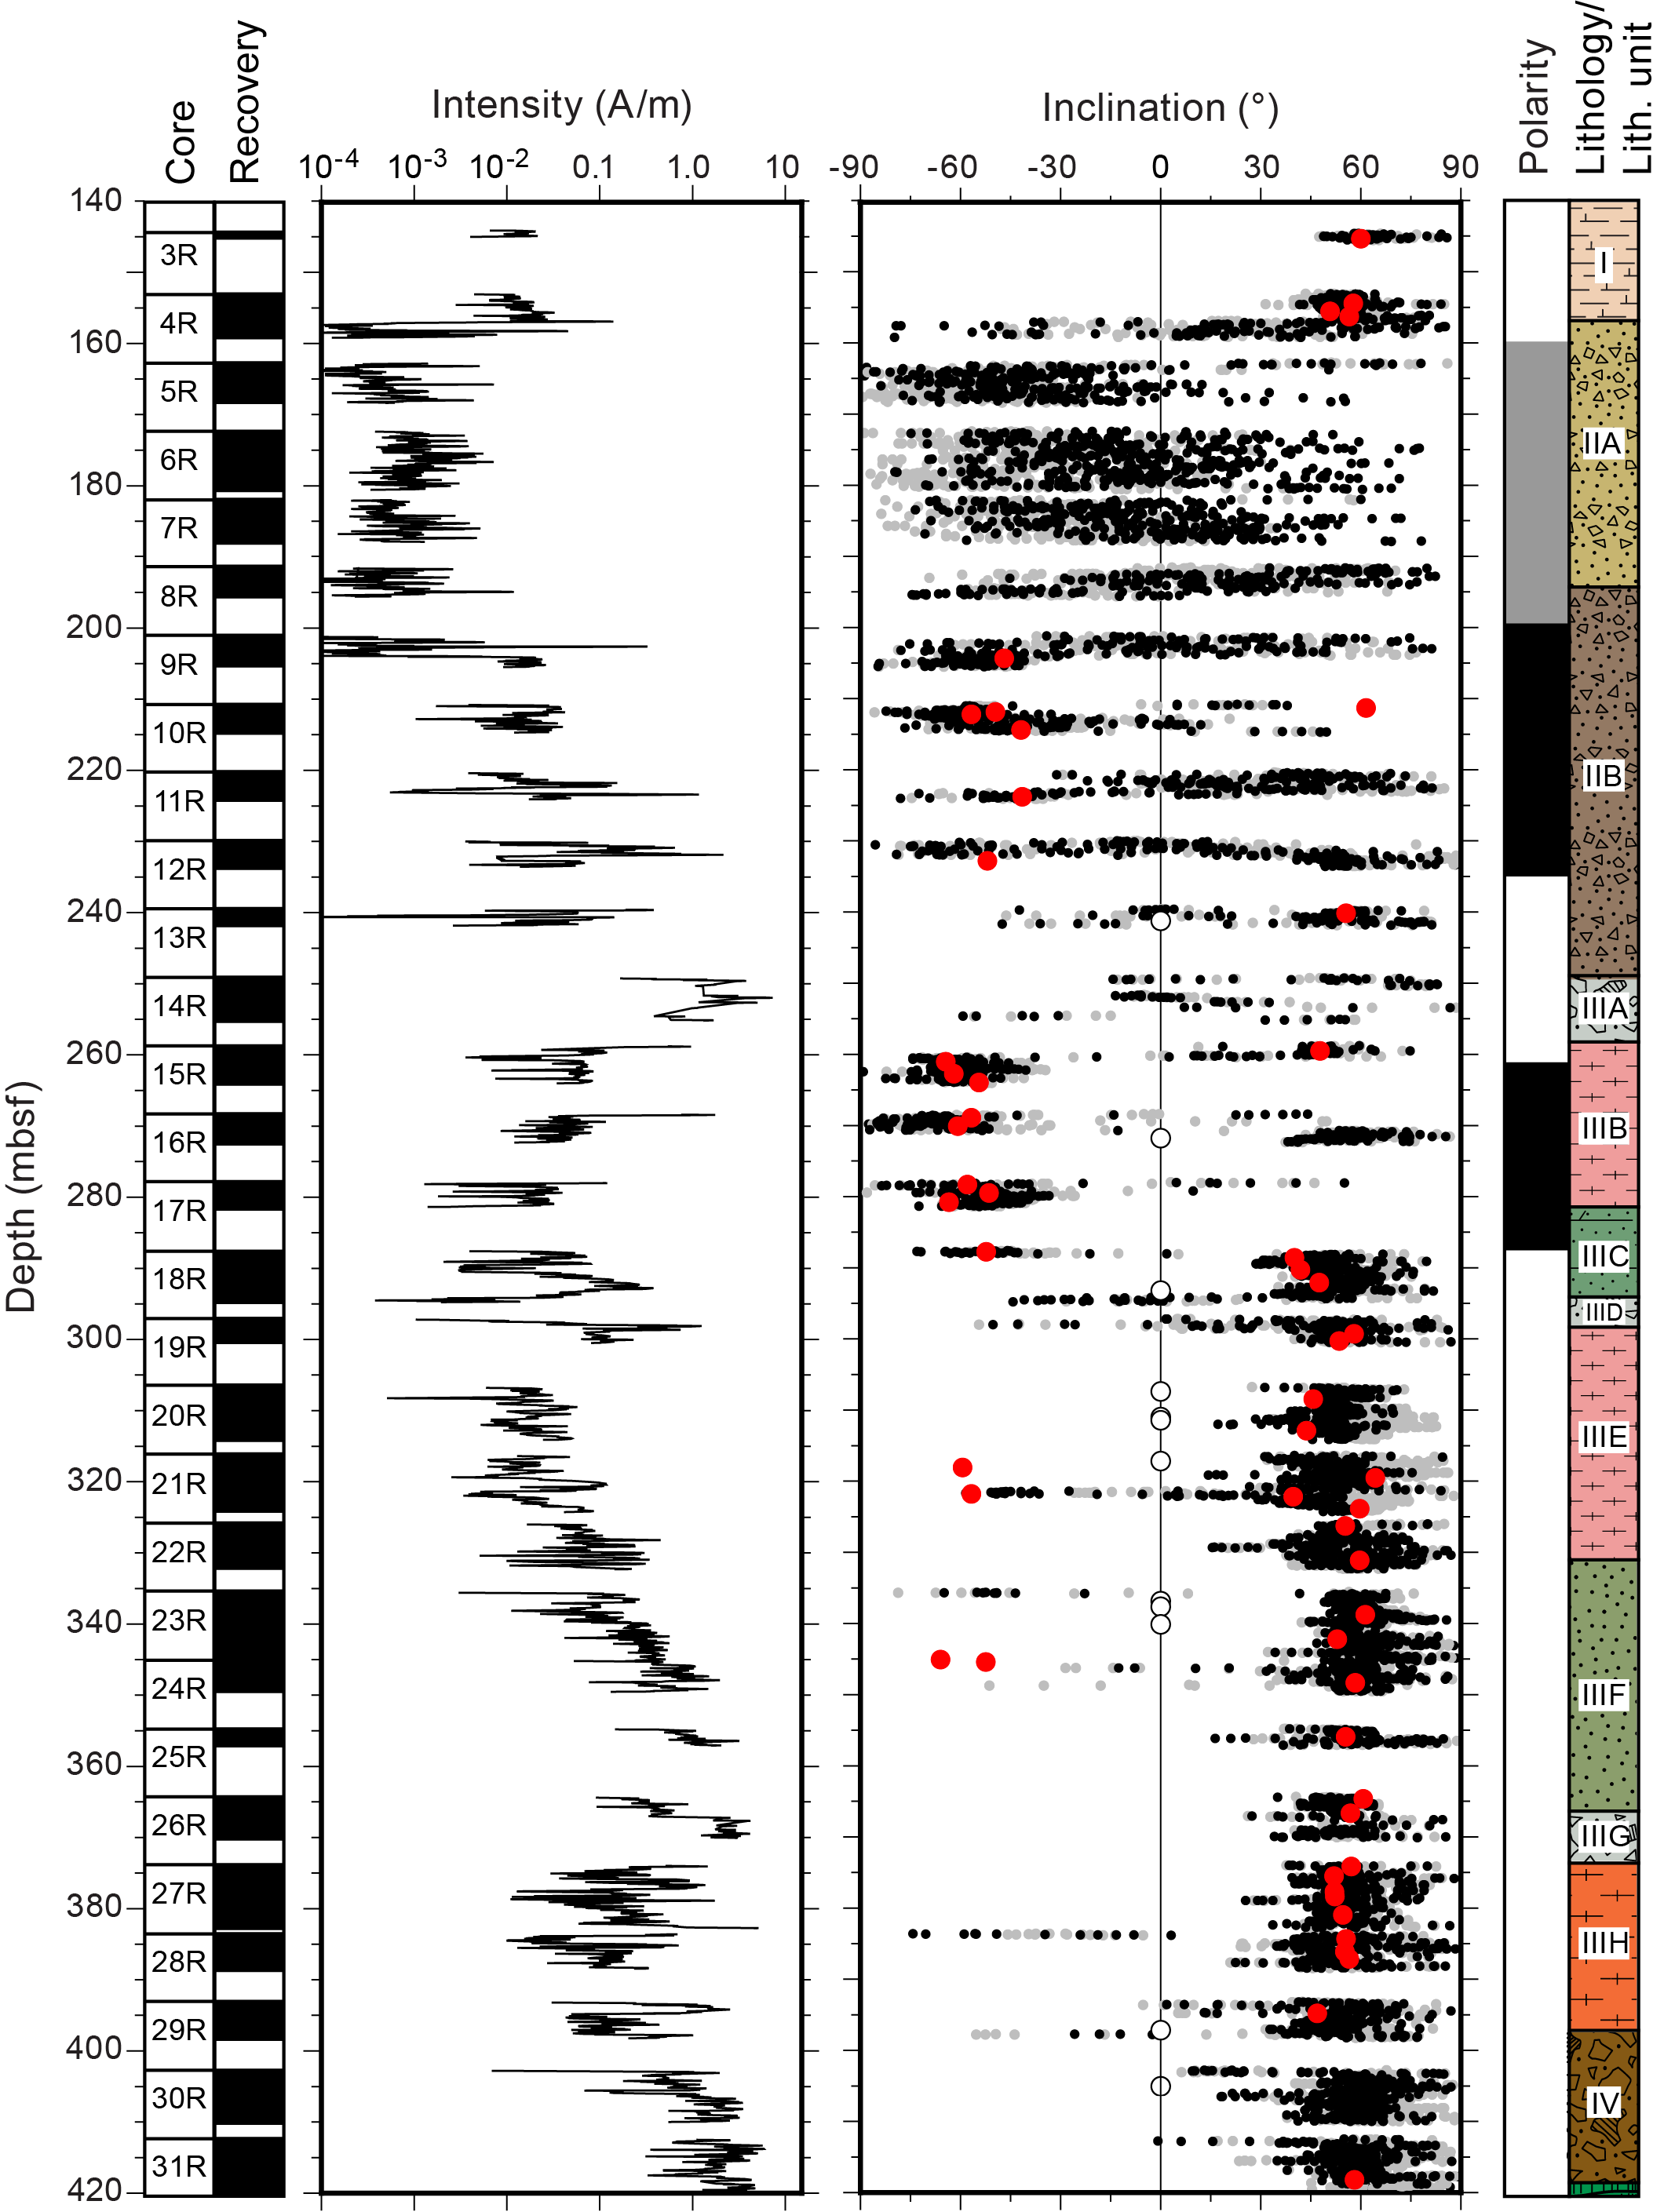
Figure F26. Sediment core NRM intensity and paleomagnetic inclination.
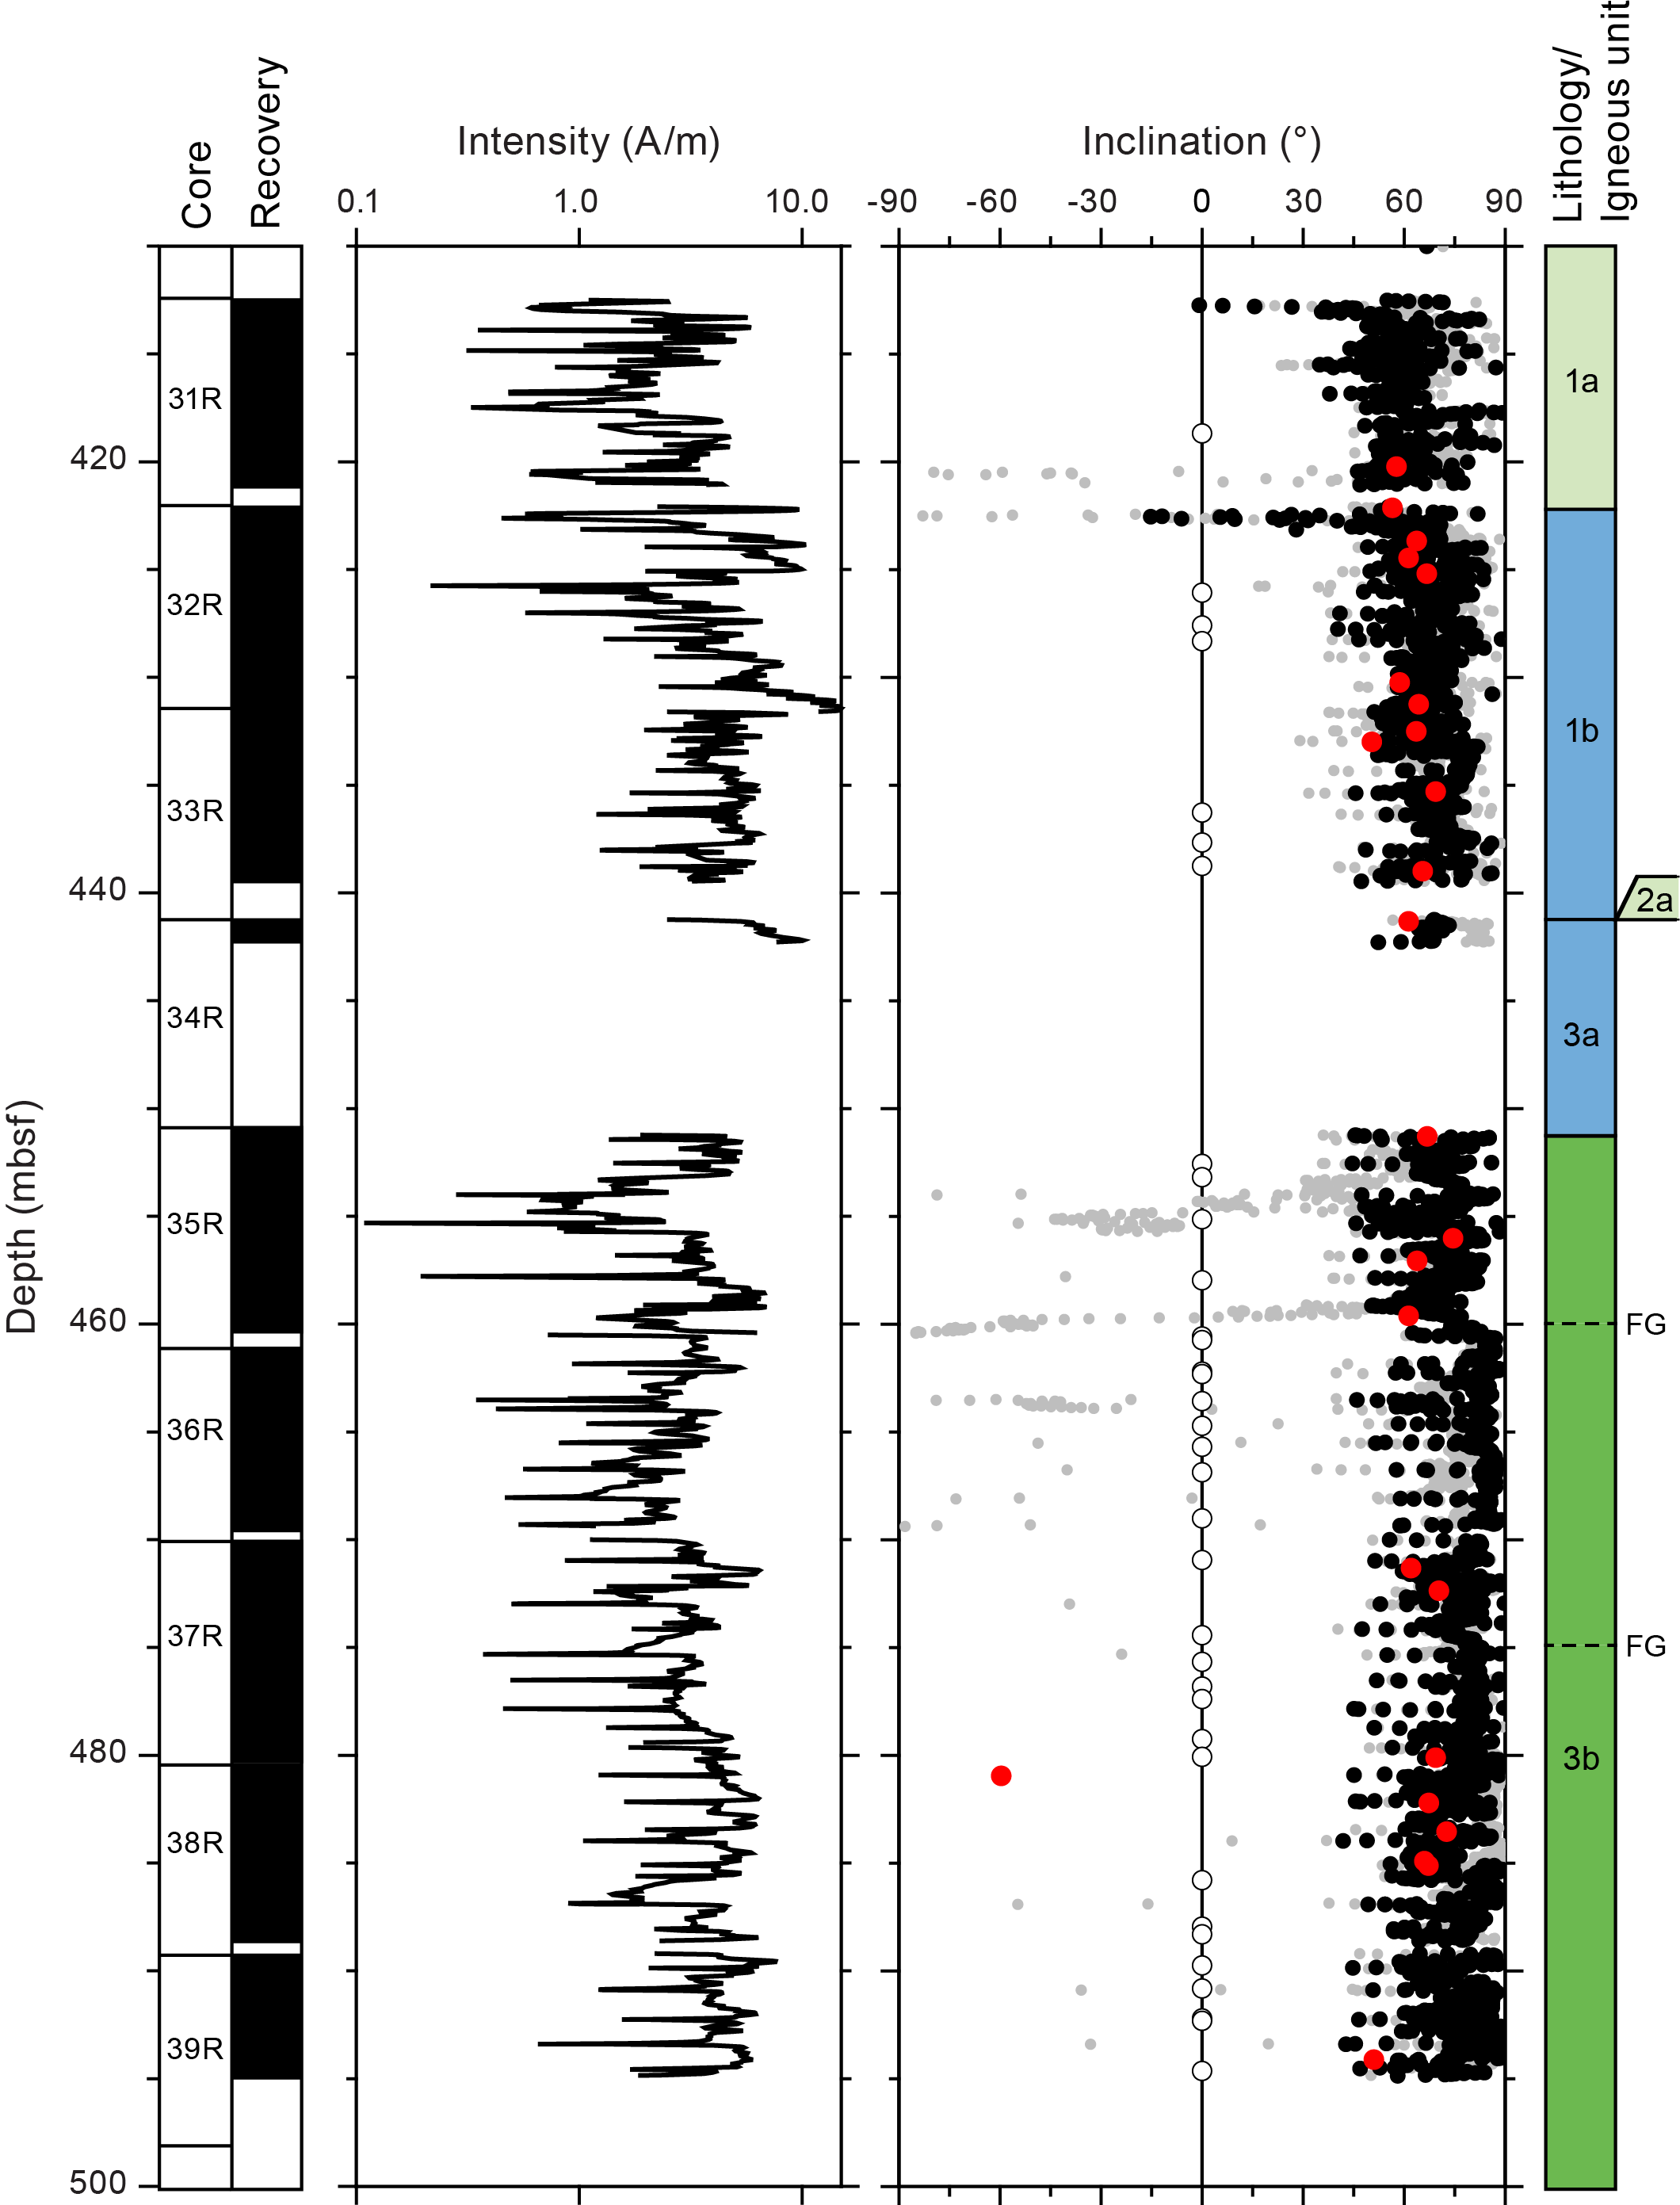
Figure F27. Basalt core NRM intensity and paleomagnetic inclination.
Natural remanent magnetization (NRM) intensities of the sediments show an extreme range (3.0 × 10⁻⁵ to 7.3 A/m) but are on average high (average = 3.1 × 10⁻¹ A/m) (Figure F26). This wide range reflects the extraordinary variability of the sediment types from calcareous clay to basalt clast breccia. Even calcareous sediments of Lithostratigraphic Unit I, which would normally be weakly magnetic, have higher than usual magnetization intensities (average = 1.68 × 10⁻² A/m) owing to the volcanic grain content. The strongest units, for example the basaltic breccias of Subunit IIIG (average = 2.63 A/m) and Unit IV (average = 1.66 A/m), are nearly indistinguishable from basalt.
Paleomagnetic inclinations in the sedimentary section generally cluster around ±45°–70°, indicating that most of the cores record magnetic polarity (Figure F26). Scattered values outside this range are likely a result of unoriented core pieces. NRM inclination values are often slightly steeper for positive values and shallower for negative values than the measurements after AF demagnetization at 20 mT. This observation suggests that the NRM has a small amount of downward directed drill string overprint. Paleomagnetic inclination values are most scattered in the upper two volcanic breccia subunits (IIA and IIIA), as might be expected for layers made up of jumbled rocks. In contrast, Subunit IIIG and the breccia of Unit IV have coherently positive inclinations that agree with adjacent units (Figure F26). This observation implies that both units were deposited at high temperature, acquiring a magnetization after deposition and cooling.
SRM measurements in the basalt flow section give high NRM intensity values, ranging 0.45–15.26 A/m (average = 3.75 A/m) (Figure F27). Such values are normal for relatively fresh lava flows. Almost all inclination measurements are positive (ranging ~45°–90°). Once again, scattered values outside this range probably indicate small unoriented bits of core. Inclination values after AF demagnetization to 20 mT do not change much. Inclinations in Cores 397T-U1585A-31R and 34R have slightly shallower inclinations than those below. Cores 36R–39R have steep inclinations that may reflect a softer magnetization that has experienced greater remagnetization by the magnetic field of the drill string.
6.2. Discrete sample measurements
A total of 125 cube samples, 2 cm × 2 cm × 2 cm, were cut from Hole U1585A cores. A total of 65 of these were cut from the sedimentary section and 60 from the basaltic lava flows (Table T4). Of these, 49 were measured using thermal demagnetization and 76 were treated by AF demagnetization. The larger number of samples treated to AF demagnetization was a result of the shorter time required for such treatments and the limited time available during Expedition 397T. A large number of samples (n = 46; 37%) produced poor results with inconsistent demagnetization steps that could not produce a principal component analysis (PCA) characteristic remanent magnetization (ChRM). This was especially true of the basalt samples (35 failed samples) (Figure F27). The distribution of failed samples is not random but concentrated in groups that may indicate grain size differences. Cores 397T-U1585A-35R through 39R were especially problematic.
Nevertheless, many samples, both in sediment and basalt, produced consistent demagnetization results (Table T4). Typical AF demagnetization results for sediments produced a series of vector endpoints that declined consistently toward the plot origin (Figure F28A, F28B). Some samples demonstrated high coercivity, requiring demagnetization up to the 0.2 T limit of the demagnetizer instrument (Figure F28B). Thermal demagnetization produced similar results, with a nearly linear decrease in sample intensity with increased temperature (Figure F28C, F28D). Despite the indication of high coercivity from the AF demagnetization, the samples were mostly demagnetized by 600°C, which is above the Curie temperature for titanomagnetite but below that for hematite (e.g., Butler, 1992). Where present, hematite must hold only a small amount of the magnetization. Basalt samples showed varying demagnetization character. A few displayed high Curie temperatures (Figure F28E), suggesting magnetic grains that are titanomagnetite with low titanium content. A number of samples were quickly demagnetized using the AF technique, with median destructive fields (MDF) <10 mT (Figure F28F). Although it was possible to solve for a PCA direction in some of these samples, others never revealed a consistent direction (Figure F28F).
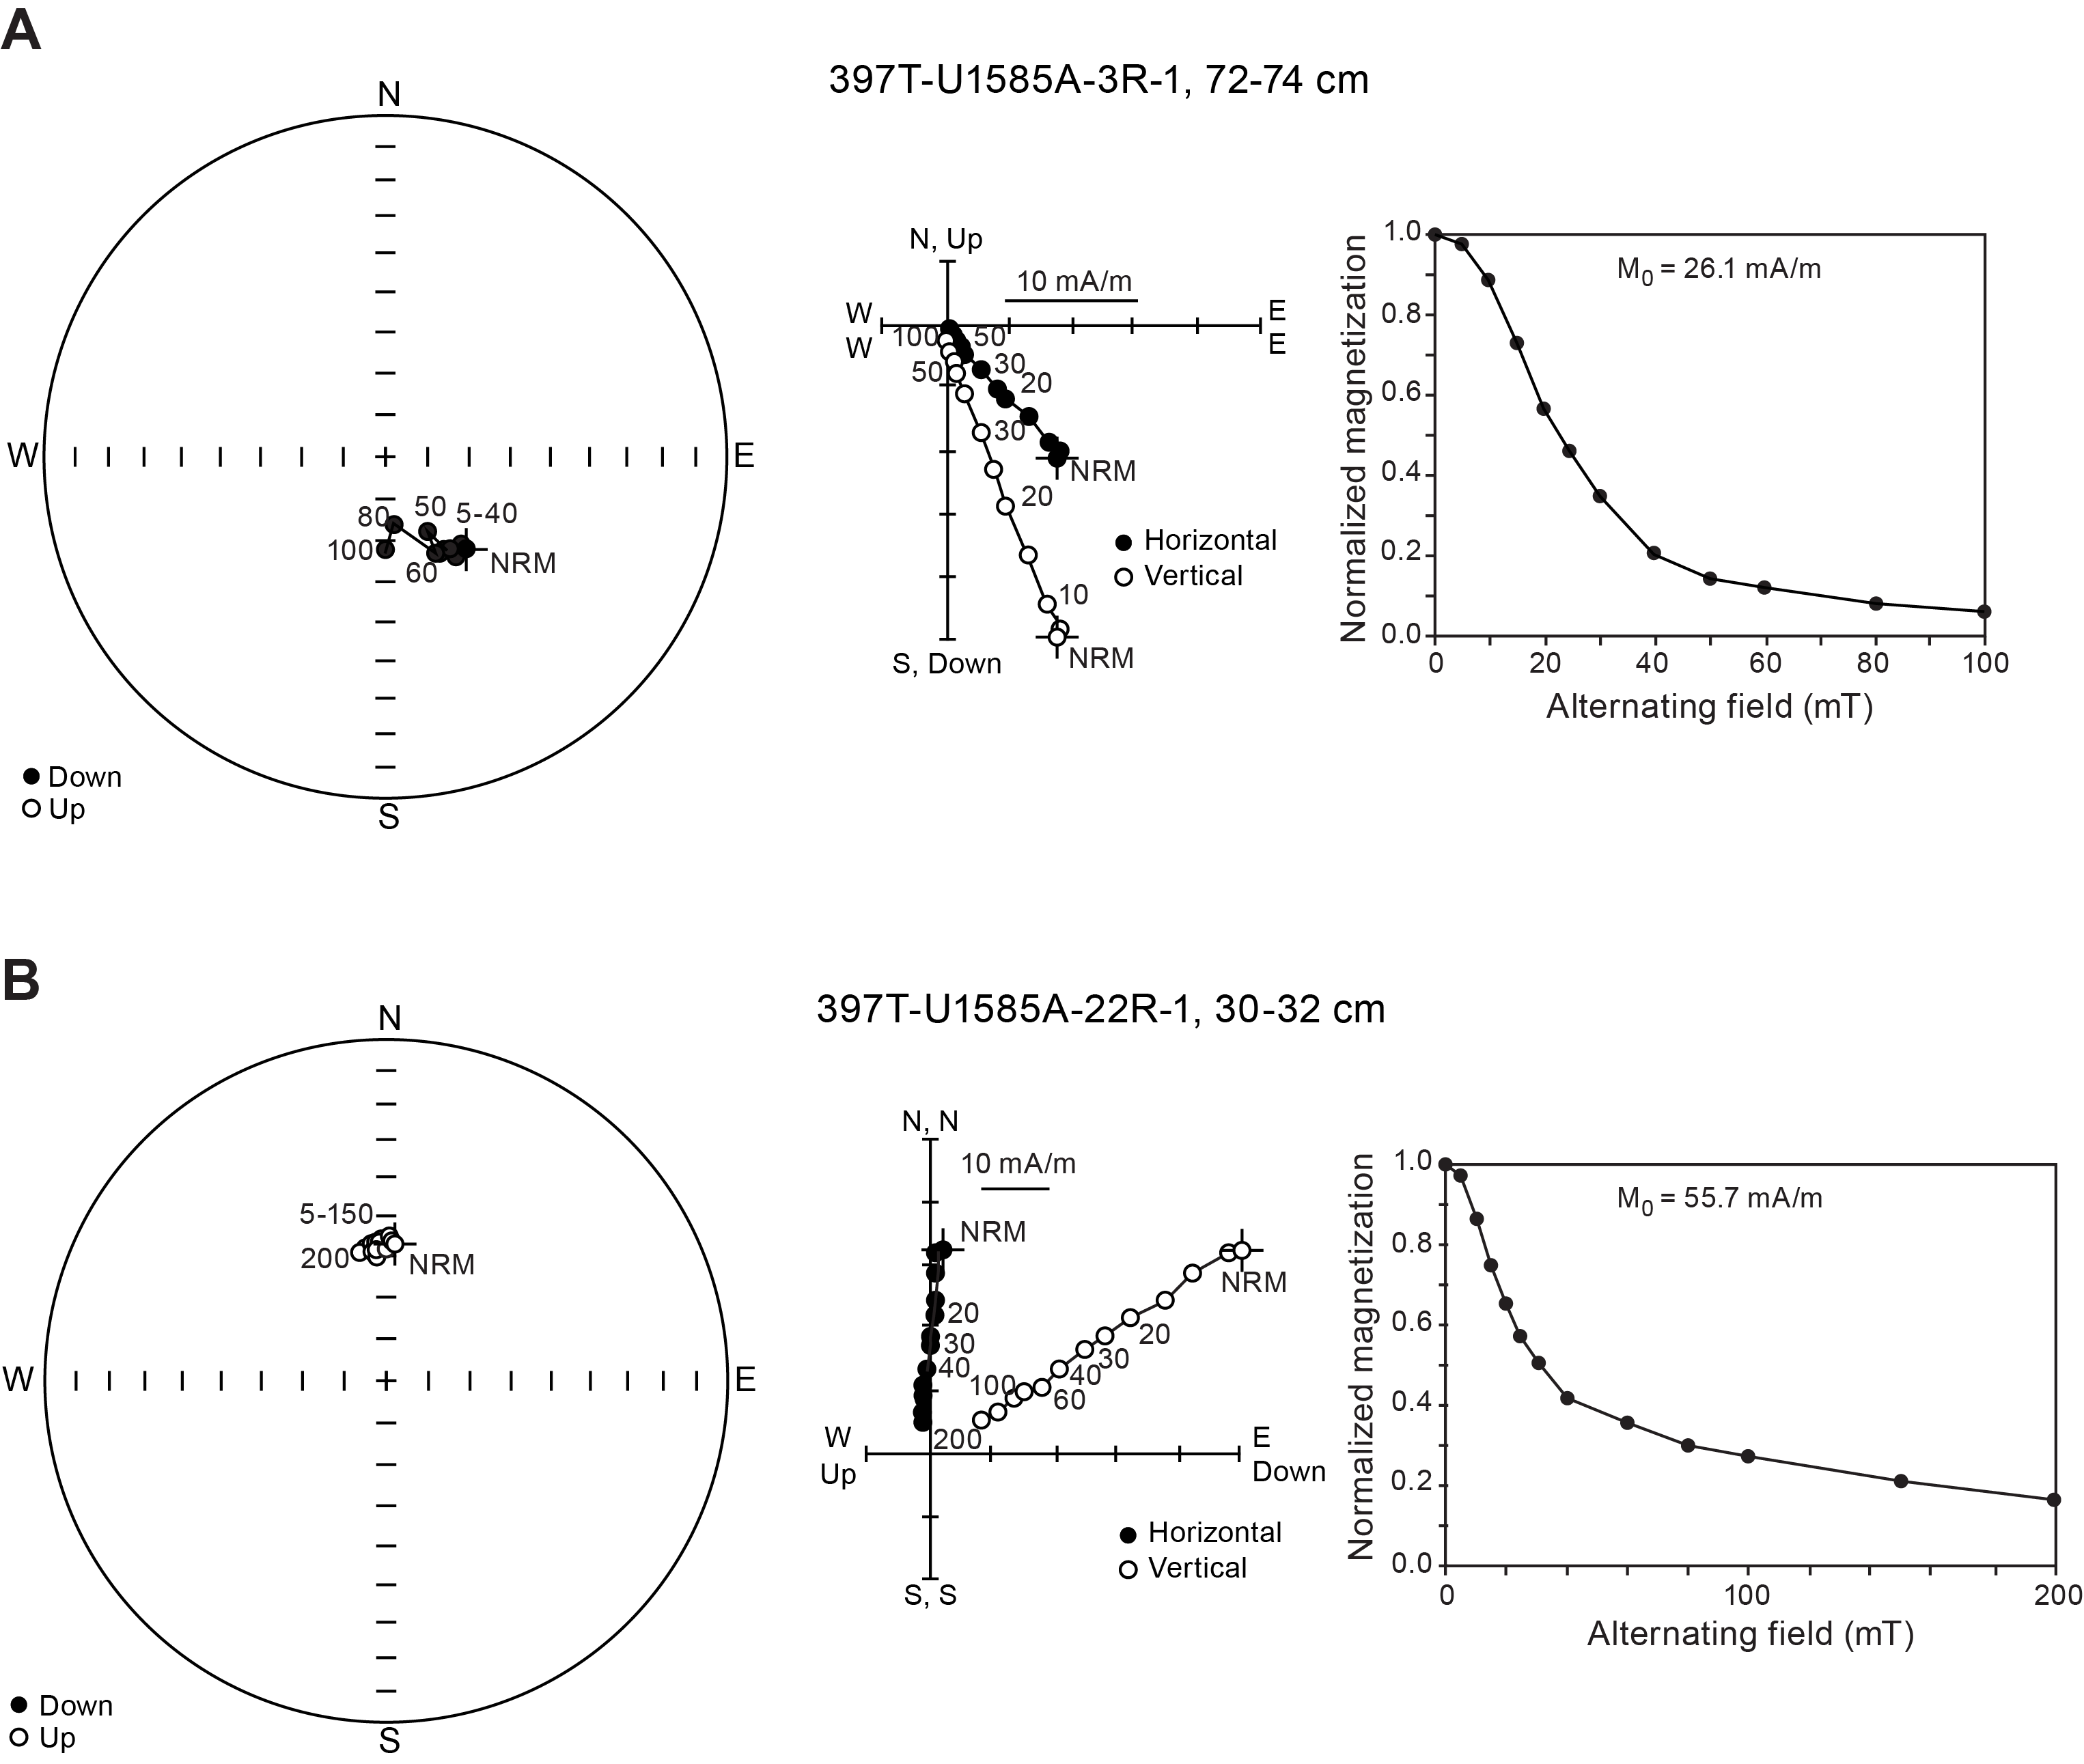

Figure F28. Demagnetization plots.
6.3. Isothermal remanent magnetization acquisition experiments
Isothermal remanent magnetization (IRM) acquisition curves and backfield curves were measured on a subset of samples previously AF demagnetized, and S-ratios were calculated:
The value of S-ratio provides a relative measure of the contributions of low- and high-coercivity material to a sample's saturation IRM (SIRM). Samples from the topmost part of the hole (Samples 397T-U1585A-4R-3, 16–18 cm, through 15R-5, 61–63 cm) saturate in field of 400 mT and their S-ratios are around 0.9, indicating a small contribution of high-coercivity magnetic minerals (Figure F29). The other samples from Hole U1585A saturate at higher fields and have lower S-ratios, especially those taken from the interval between Sections 18R-3 and 22R-1, as well as the sample from Section 29R-2 (Figure F29). Two of those samples did not saturate by 1200 mT and their S-ratio <0.5 indicates a significant contribution from high-coercivity minerals to the magnetic signal, a result that corroborates our observations of samples that required high AF fields to demagnetize completely. The reddish color of those two samples, a common tint for samples containing hematite, suggests that this mineral is responsible for this high coercivity. However, we could not find any correlation between the saturation field, the S-ratio, and the AF demagnetization behavior. Values of the coercivity of remanence are generally high, from 30 mT to >100 mT for the most magnetically hard samples.
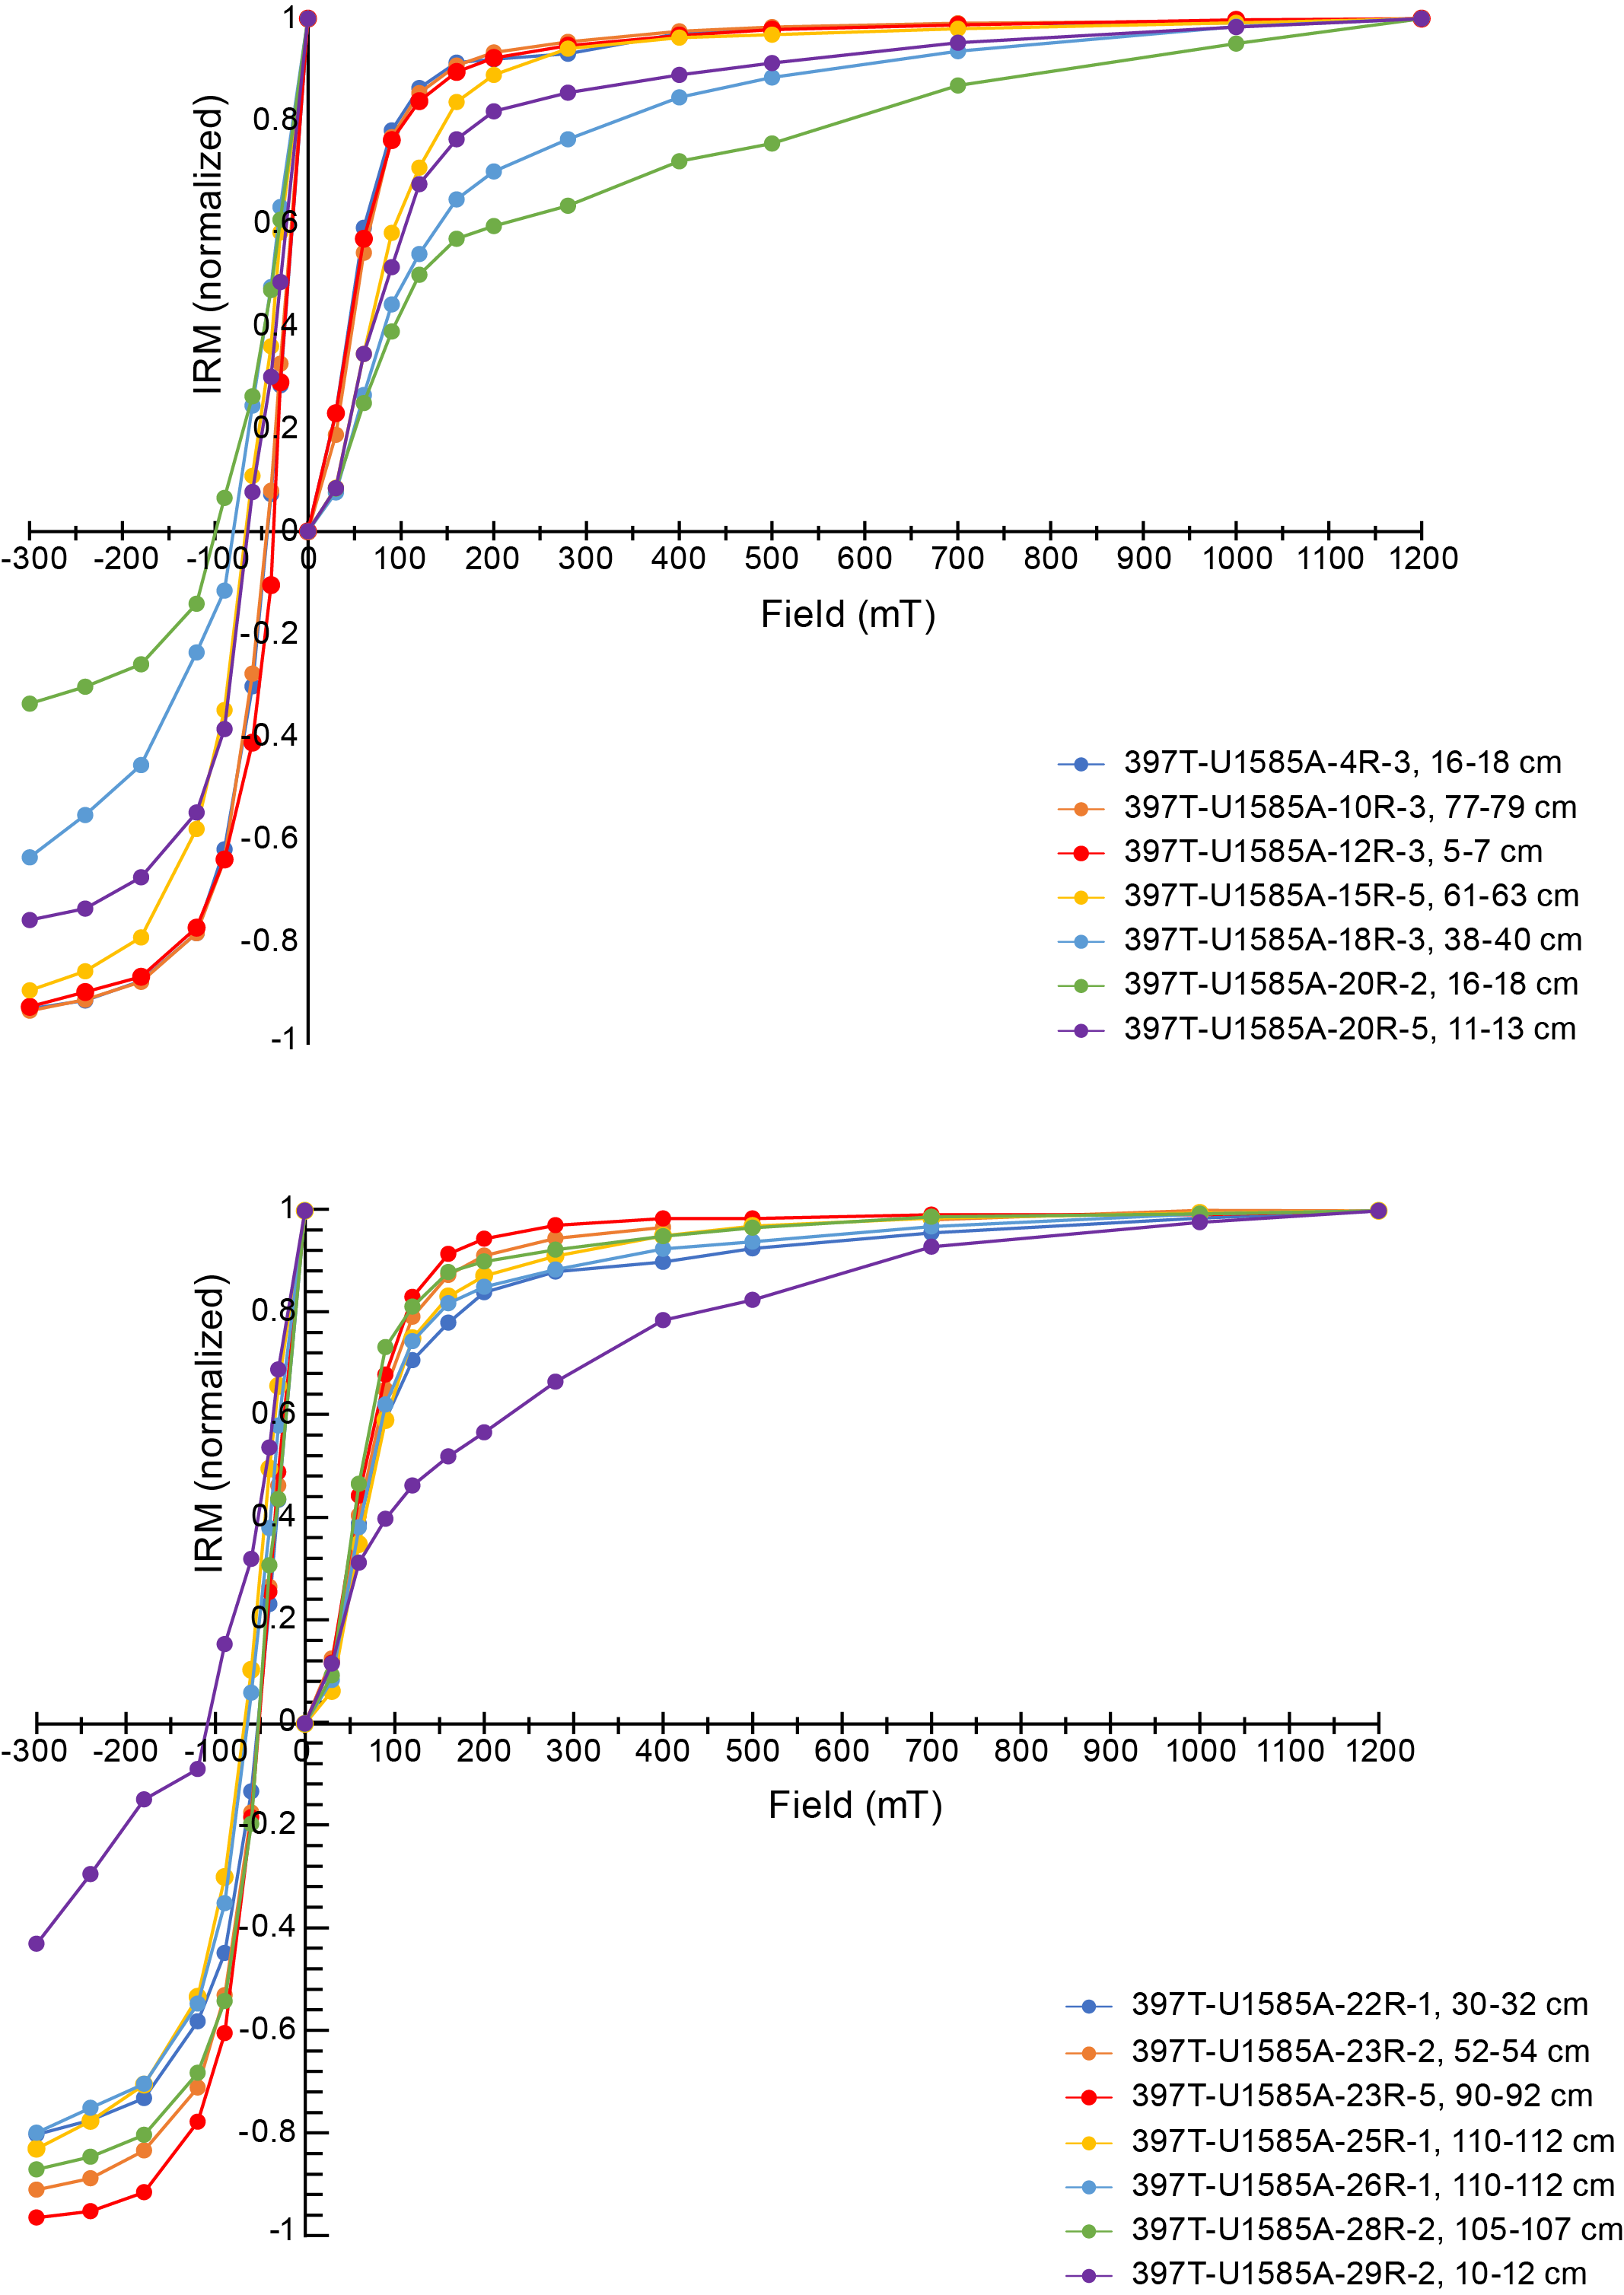
Figure F29. Discrete sediment sample IRM acquisition curves and backfield curves.
IRM acquisition curves and backfield curves were measured on three basalt samples previously AF demagnetized, and S-ratios were calculated. Unlike the sediment samples, the saturation of IRM is attained by 300 mT, indicating the presence of soft magnetic minerals such as titanomagnetite as the magnetization carriers (Figure F30). This is further confirmed by the high S-ratio values, >0.990. Two samples have a coercivity of remanence between 10 and 20 mT, which are typical values for multidomain magnetite (e.g., Thompson and Oldfield, 1986). For Sample 397T-U1585A-38R-2, 4–6 cm, this value is close to 30 mT, indicating the presence of smaller magnetic grains. This is consistent with the MDF values of the AF demagnetization spectra of this sample, which is significantly higher than that of most of the other basalt samples.
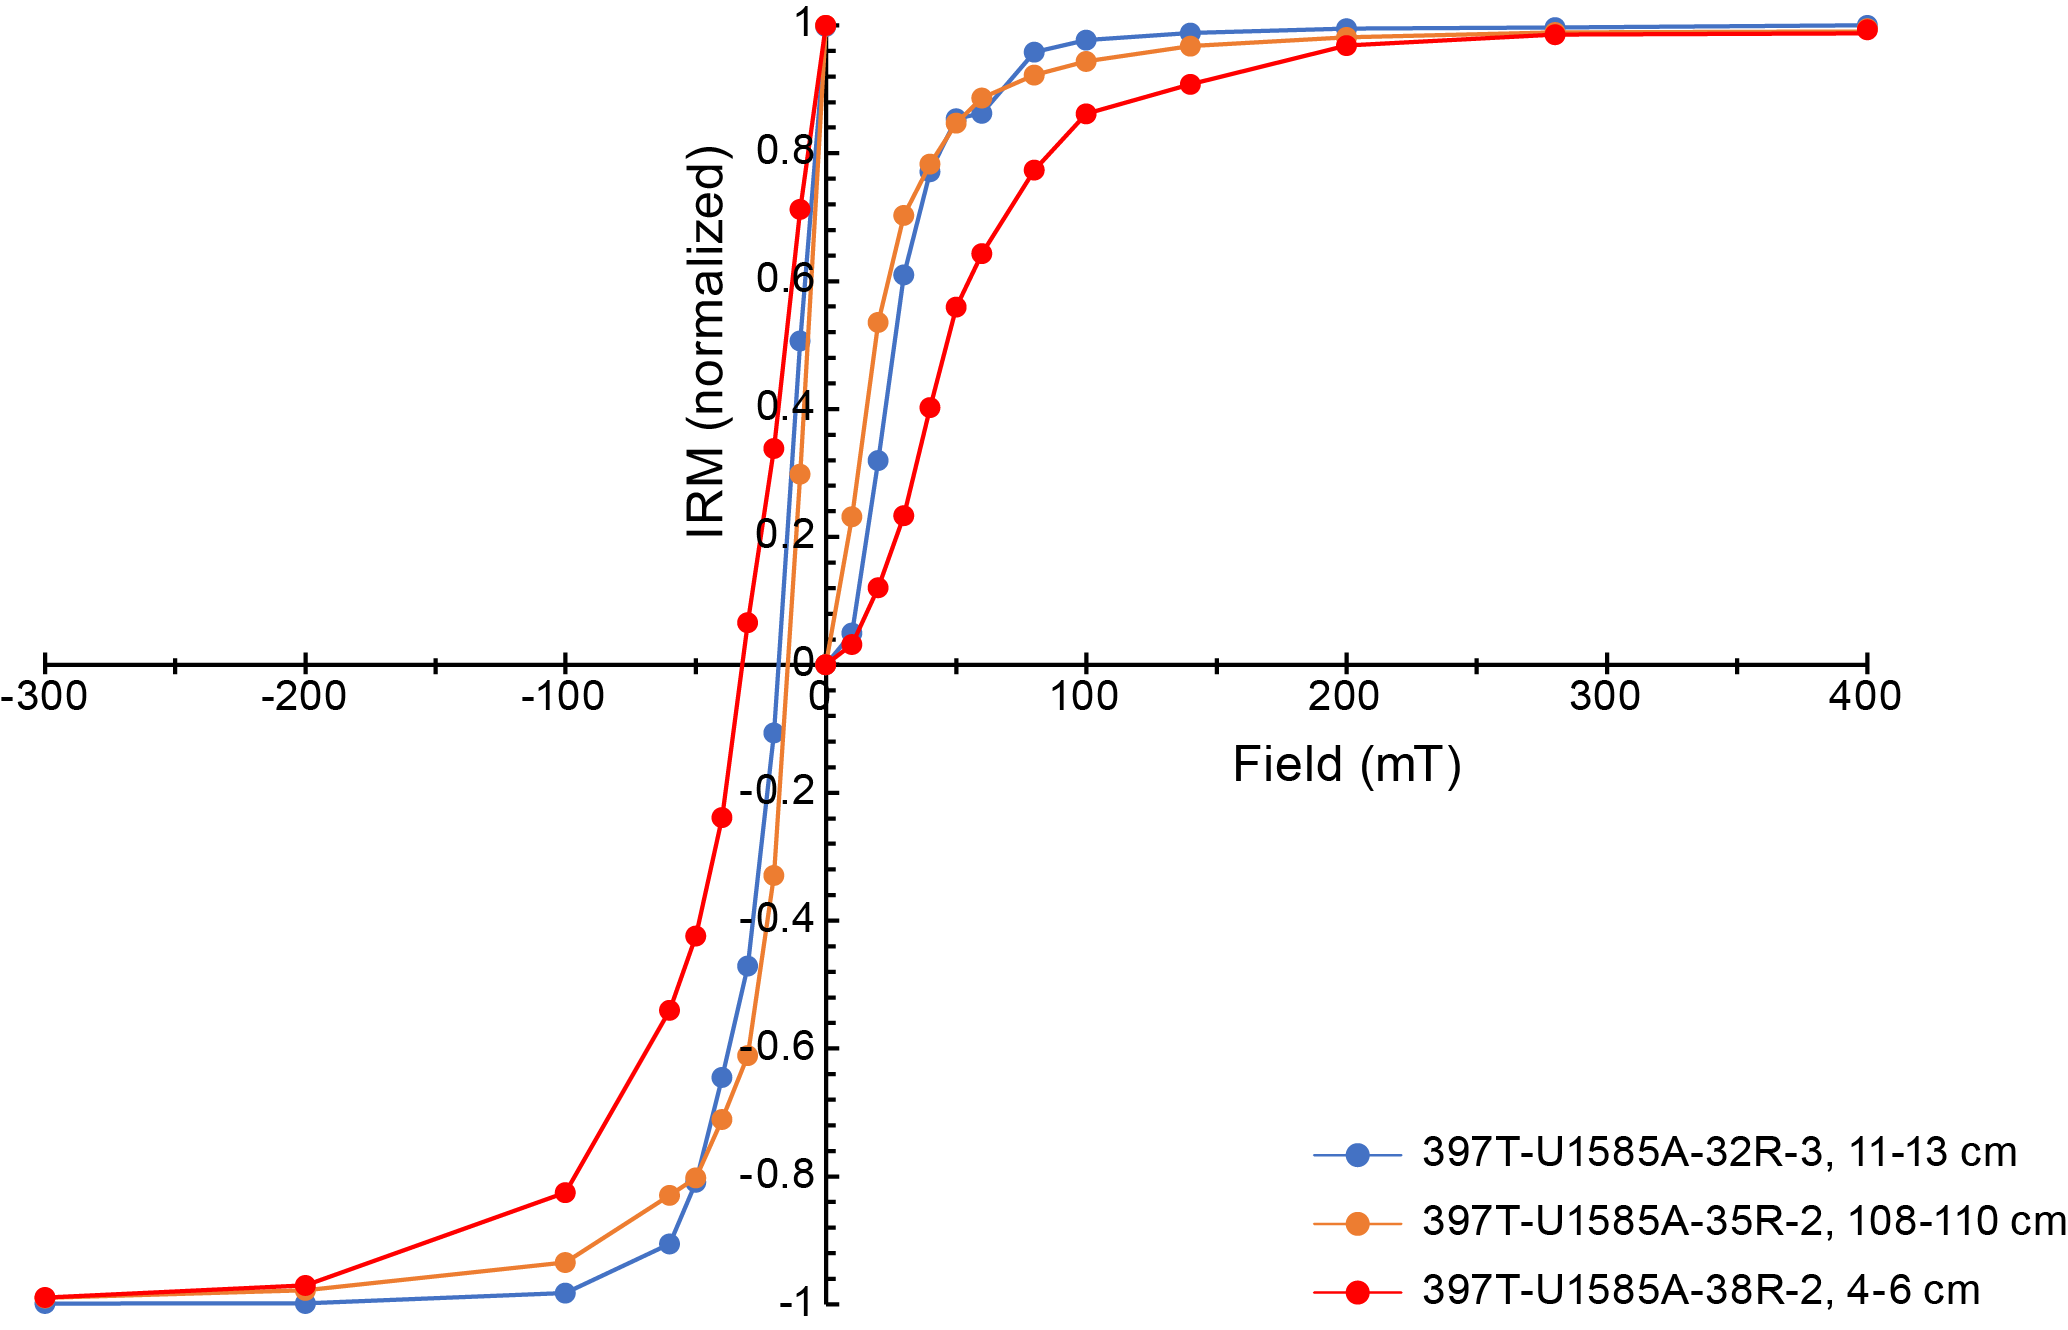
Figure F30. Discrete igneous rock sample IRM acquisition curves and backfield curves.
6.4. Magnetic polarity
Despite some samples not producing reliable results, the combination of SRM and discrete cube sample measurements allow a magnetic stratigraphy to be defined (Figures F26, F27). The sediment section appears to record two normal polarity zones surrounded by three reversed polarity zones. Cores 397-U1585A-3R and 4R in Lithostratigraphic Unit I give positive inclinations that define a reversed polarity zone at the top of the cored interval. Below that, volcaniclastics in Subunit IIA give scattered inclination values, so no polarity can be defined. In contrast, almost all cube samples from Cores 9R–12R yielded negative inclination values, interpreted as the upper normal polarity unit. This zone may continue downward through Subunits IIIB and IIIC (Cores 15R–18R), but the bottom of Subunits IIB and IIIA give scattered directions. Two cube samples from that interval produced positive inclination ChRM, so we interpret this zone as reversed polarity (Figure F26). Starting with Sample 18R-2, 14–16 cm, samples at deeper intervals consistently display positive inclinations, which are interpreted as reversed polarity. Thus, the lowermost ~120 m of sediment is reversed polarity. This matches the positive inclinations of the basaltic section (Figure F27), which also represent reversed polarity. The identity of the polarity zones in the cored section cannot be identified without biostratigraphic data, which are not yet available.
7. Sediment geochemistry
7.1. Inorganic carbon, total carbon, and organic carbon
Sediment samples were analyzed to determine the weight percent of CaCO3, total carbon (TC), total inorganic carbon, total organic carbon (TOC), and total nitrogen (TN) (Table T5). In Hole U1585A, 119 samples were taken from Cores 3R–29R. In Lithostratigraphic Unit I, CaCO3 content is high (mean = 77 ± 9.7 wt%). The mean CaCO3 content is more moderate in Subunits IIB, IIIA, IIIB and IIIE (40 ± 9.1 wt% to 62.9 wt%; numbers with ± values are averages with standard deviation given; those without are single measurements). Subunits IIA, IIIF, and IIIH all have low CaCO3 (26–31 wt%). TOC is low abundance across all units (<0.5 wt%) and shows no consistent trend between units. Therefore, TC contents are nearly identical (within error) to total inorganic carbon and do not show a clear pattern with depth. Likewise, given the complexity of each lithostratigraphic unit, it is difficult to draw clear connections between TC and lithostratigraphic unit. Subunits IA and IIA have relatively higher TC (7.9 and 9.3 ± 1.3 wt%, respectively) than other units. TC is moderate in Subunits IIB, IIIB, IIIC, IIIE, and IIIH (4.0–6.6 wt%) and low in Subunits IIA, IIID, and IIIF (2.8–3.1 wt%). TN contents are below the instrumental detection limits for all samples.
7.2. Basalt clast geochemistry
A variety of basalt clast size and lithologies were recovered from the volcaniclastic deposits in Hole U1585A and are described in Lithostratigraphy. Thirteen representative basalt clasts (as large as 6 cm) were analyzed for major and select trace element abundances using inductively coupled plasma–atomic emission spectroscopy (ICP-AES). Those data are reported and described in Igneous geochemistry along with the chemistry of the igneous units.
8. Igneous geochemistry
At Site U1585, three igneous units comprising massive flows and an equivocal pillow lava flow interbedded were recovered at 417.60–498.80 mbsf (see Igneous petrology and volcanology). In total, 16 samples from 417.60 to 490.93 mbsf (Samples 397T-U1585A-31R-5, 111–114.5 cm, through 39R-3, 2.5–6 cm) were analyzed using ICP-AES (Table T6). Additionally, 13 samples from large basalt clasts within various volcaniclastic lithostratigraphic units above the igneous basement were also analyzed. Sample selection in both the clasts (see Lithostratigraphy) and the lava flows (see Igneous petrology and volcanology) was based on variations of mineralogy and texture. The shipboard pXRF was not operational during Expedition 397T, and consequently, pXRF analyses were unavailable to guide sampling. The selected samples are representative of the clasts and lava flows recovered, which can be briefly summarized as follows:
- Sedimentary basaltic clasts: 13 samples ranging from aphyric to moderately phyric olivine to highly phyric plagioclase basalt.
- Igneous Subunit 1a: 1 sample from sparsely to moderately phyric olivine ± clinopyroxene massive basalt flow.
- Igneous Subunit 1b: 5 samples from moderately phyric pyroxene ± plagioclase massive basalt flow.
- Igneous Unit 2: no samples.
- Igneous Subunit 3a: 2 samples from highly phyric pyroxene ± plagioclase massive basalt flow.
- Igneous Subunit 3b: 8 samples from moderately to highly phyric pyroxene-olivine-plagioclase massive basalt.
Detailed sample preparation, analytical procedures, standard analyses, calibration, and drift corrections are reported in Igneous geochemistry in the Expedition 391 methods chapter (Sager et al., 2023b). The volatile-free total sums of the major element oxides in weight percentages acquired using ICP-AES range 96.9–99.52 wt% in the basalt clasts (mean = 98.65 wt%) and 97.9–99.76 wt% in the basalt lava flows (mean = 98.61 wt%) (Table T6). As at all other Expedition 391 sites, total iron was recalculated as Fe2O3t. Major element oxide concentrations determined using ICP-AES were normalized to 100% on a volatile-free basis to facilitate comparison with the respective Expedition 391 and 397T sites and literature data from previous drill and dredge sites along the submarine TGW hotspot track (e.g., Le Maitre, 1962; Richardson et al., 1984; Weaver et al., 1987; Le Roex et al., 1990; Class and le Roex, 2008; Salters and Sachi-Kocher, 2010; Rohde et al., 2013; Homrighausen et al., 2018, 2019).
8.1. Alteration
Alteration is highly variable throughout the sampled intervals of basalt clasts and basalt lava flows. Visually, the basalt clasts range from reddish brown to various shades of gray with hues of brown. The basalt lava flows show some brown discoloration in Igneous Subunits 1a and 1b and are otherwise various shades of gray to bluish gray (see Igneous petrology and volcanology). Geochemically, loss on ignition (LOI) is one indicator of degree of alteration. The clasts are minimally altered (LOI = 1.2 wt%) to more highly altered (LOI = 6.4%). One basalt clast (Sample 397T-U1585A-4R-CC, 2–4 cm) was processed from a thin section billet that was taken across the basalt clast/carbonate matrix boundary. It has elevated CaO and LOI (22.59 and 13.59 wt%, respectively), indicating the powder is a hybrid of the two materials and, therefore, the sample is omitted from further discussion. The basaltic lava flows show a small degree of alteration (LOI = 2.3–4.9 wt%). Seawater alteration can cause K2O mobility, manifested as scatter elemental plots. Site U1585 basalt clasts show significant scatter in K2O for a given Mg# (Figure F31) and, by extension, have experienced K2O associated with sweater alteration. In contrast, the basalt lava flows show minimal K2O scatter and, therefore minimal elemental mobility.

Figure F31. Mg# vs. SiO2, TiO2, K2O, Al2O3, Ni, V, Zr, and Sr.
8.2. Classification
According to the total alkali versus silica (TAS) classification after Le Bas et al. (1986), the majority of Site U1585 basalt clasts and lava flows lie within the basalt compositional field (Figure F32A). However, 5 lava flows and 3 clasts are compositionally trachybasalts, and 1 basalt clast is a basaltic trachyandesite. Apart from 3 basalt clasts (Samples 397T-U1585A-11R-3, 0–2.5 cm; 12R-1, 95–97 cm; and 12R-1, 115–118.5 cm) that lie near the alkalic-tholeiitic division of MacDonald and Katsura (1964), all Site U1585 samples lie within the alkaline compositional series.
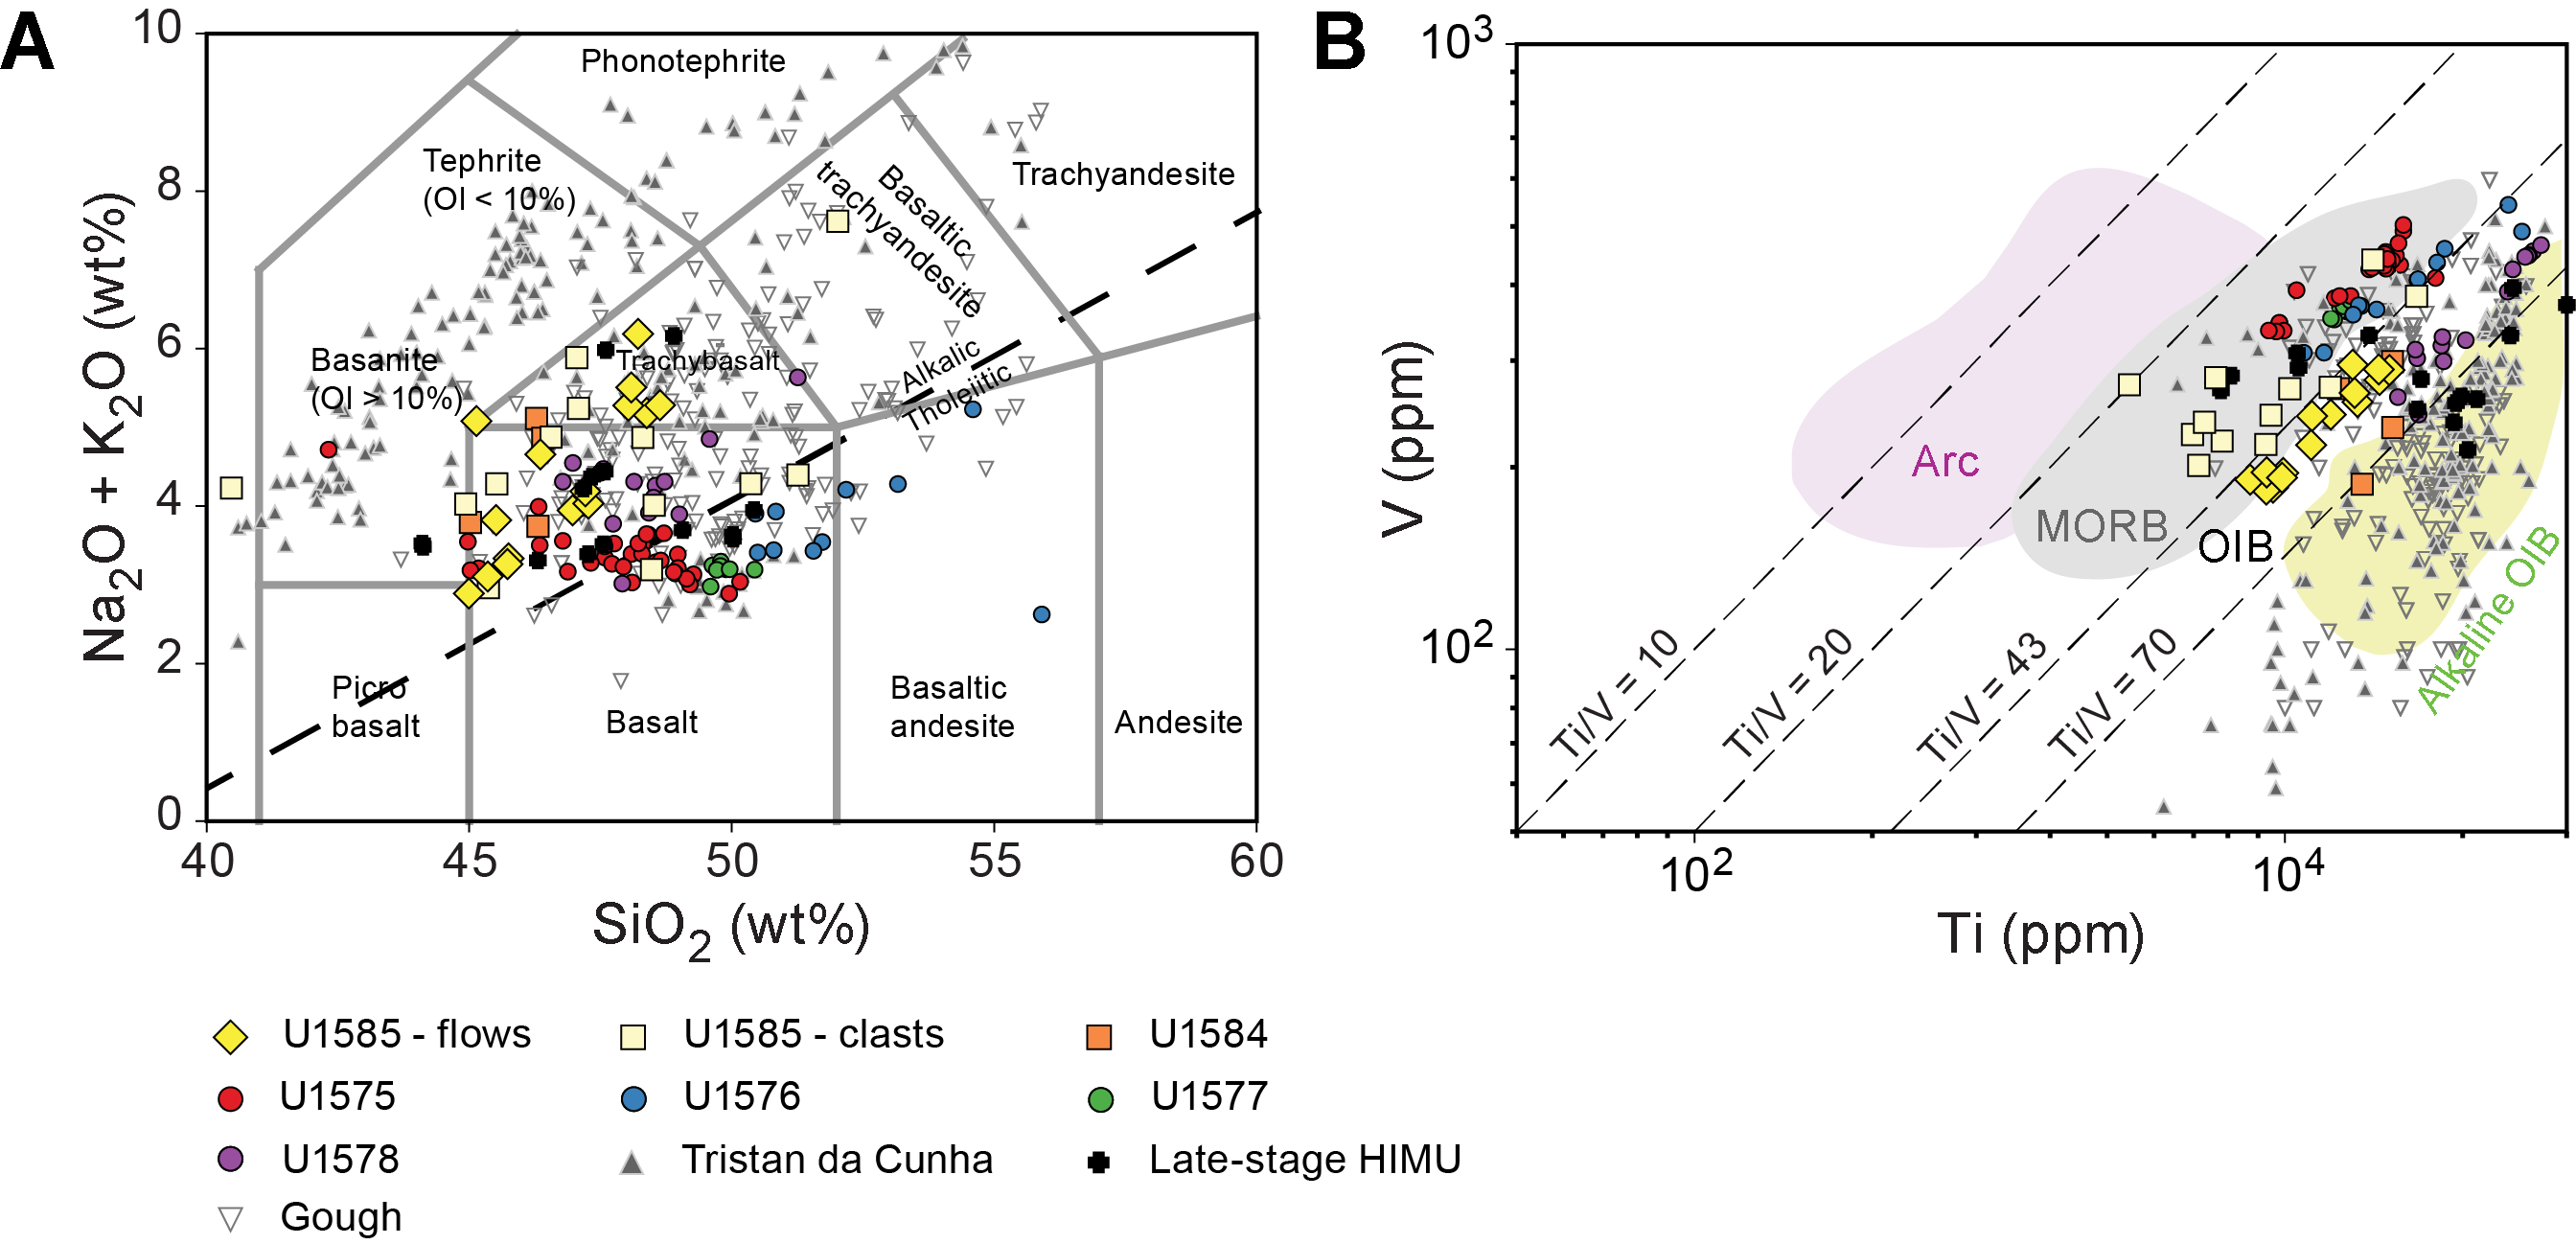
Figure F32. Total alkali vs. silica classification with alkalic-tholeiitic division and Ti vs. V.
On the Ti versus V classification diagram after Shervais (2022), the basalt clasts and basalt lava flows from Site U1585 are compositionally distinct. All of the lava flows fall within the intraplate ocean-island basalt (OIB) array, similar to Expedition 391 Site U1578 (Figure F32B). In contrast, the overlying basalt clasts fall within the mid-ocean-ridge basalt (MORB) array or straddle the line between MORB and intraplate OIB, similar to Expedition 391 Sites U1575, U1576, and U1577. The moderate to high Ti/V values (43–51) of the basalt flows fall between Ti/V ratios for Site U1578 (Ti/V < 51) and the majority of the other Expedition 391 sites (Ti/V ≤ 45). In contrast, the basalt clasts have ranges of Ti/V consistent with Expedition 391 Sites U1575, U1576, and U1577. Site U1585 basalt flow and clast samples overlap with the previously reported alkaline EMI-type (Zindler and Hart, 1986) lavas from Walvis Ridge, Guyot Province, and the Tristan da Cunha and Gough Island groups.
8.3. Bivariant element diagrams
The basalt clasts at Site U1585 show a wide range of Mg# (32.5–64.6), similar to basalt clasts at Site U1584 (Figure F31). However, unlike clasts from Site U1584, the more numerous basalt clasts at Site U1585 also show a wider range of other elemental abundances (e.g., SiO2 = 45–52 wt%; CaO = 5.0–16.6 wt%; TiO2 = 0.9–2.8 wt%). The range of compositions results in largely scattered elemental relationships on bivariant element diagrams (Figure F31). In contrast, the basalt lava flows show a range of compositions but usually form clear trends generated by fractional crystallization. The basalt lava flows show increasing SiO2, TiO2, CaO, K2O, Al2O3, Zr, V, and Sr with decreasing Mg# (Figure F31). The strong positive correlation between Mg# and Ni is indicative of modest olivine accumulation in the most MgO-rich samples (up to 18.3 wt% MgO and 565 ppm Ni). Overall, TiO2 contents are modest for both basalt clasts and basalt lavas flows; none are as TiO2-rich as Expedition 391 Site U1578 lavas. However, the TiO2 content of the basalt clasts is lower than the basalt lava flows with similar Mg# (Figure F31). The relational offset is also observed in Zr and Sr. Tristan da Cunha Island lavas have higher TiO2, Zr, and Sr than Gough Island lavas, suggesting the compositional difference between the younger basalt clasts and the older basalt lava flows may be due to a change in magmatic source.
8.4. Downhole variations
The two igneous units of Site U1585 for which we have geochemical data show notable geochemical variations downhole (Figure F33). The basalt clasts were not included in this discussion because, due to the nature of volcaniclastic deposits, there are few robust clues about their actual eruptive age other than they are younger than the basalt lava flows. Igneous Subunits 1a and 3b have higher MgO and Ni and lower TiO2, Al2O3, V, Zr, and Sr than Subunits 1b and 3a. Subunits 1b and 3a are more fractionated than the subunits above and below. Both Subunits 1a and 3b contain olivine (see Igneous petrology and volcanology), which is consistent with their more primitive compositions (MgO > 11 wt% and Ni > 230 ppm). In Subunit 3b, MgO and Ni mirror a cuspate increase then subtle decrease with depth, consistent with fractional crystallization and accumulation of olivine. The accumulation results in an identical but inverse relationship with more incompatible elements (e.g., TiO2, Al2O3, V, Sr, and so on).
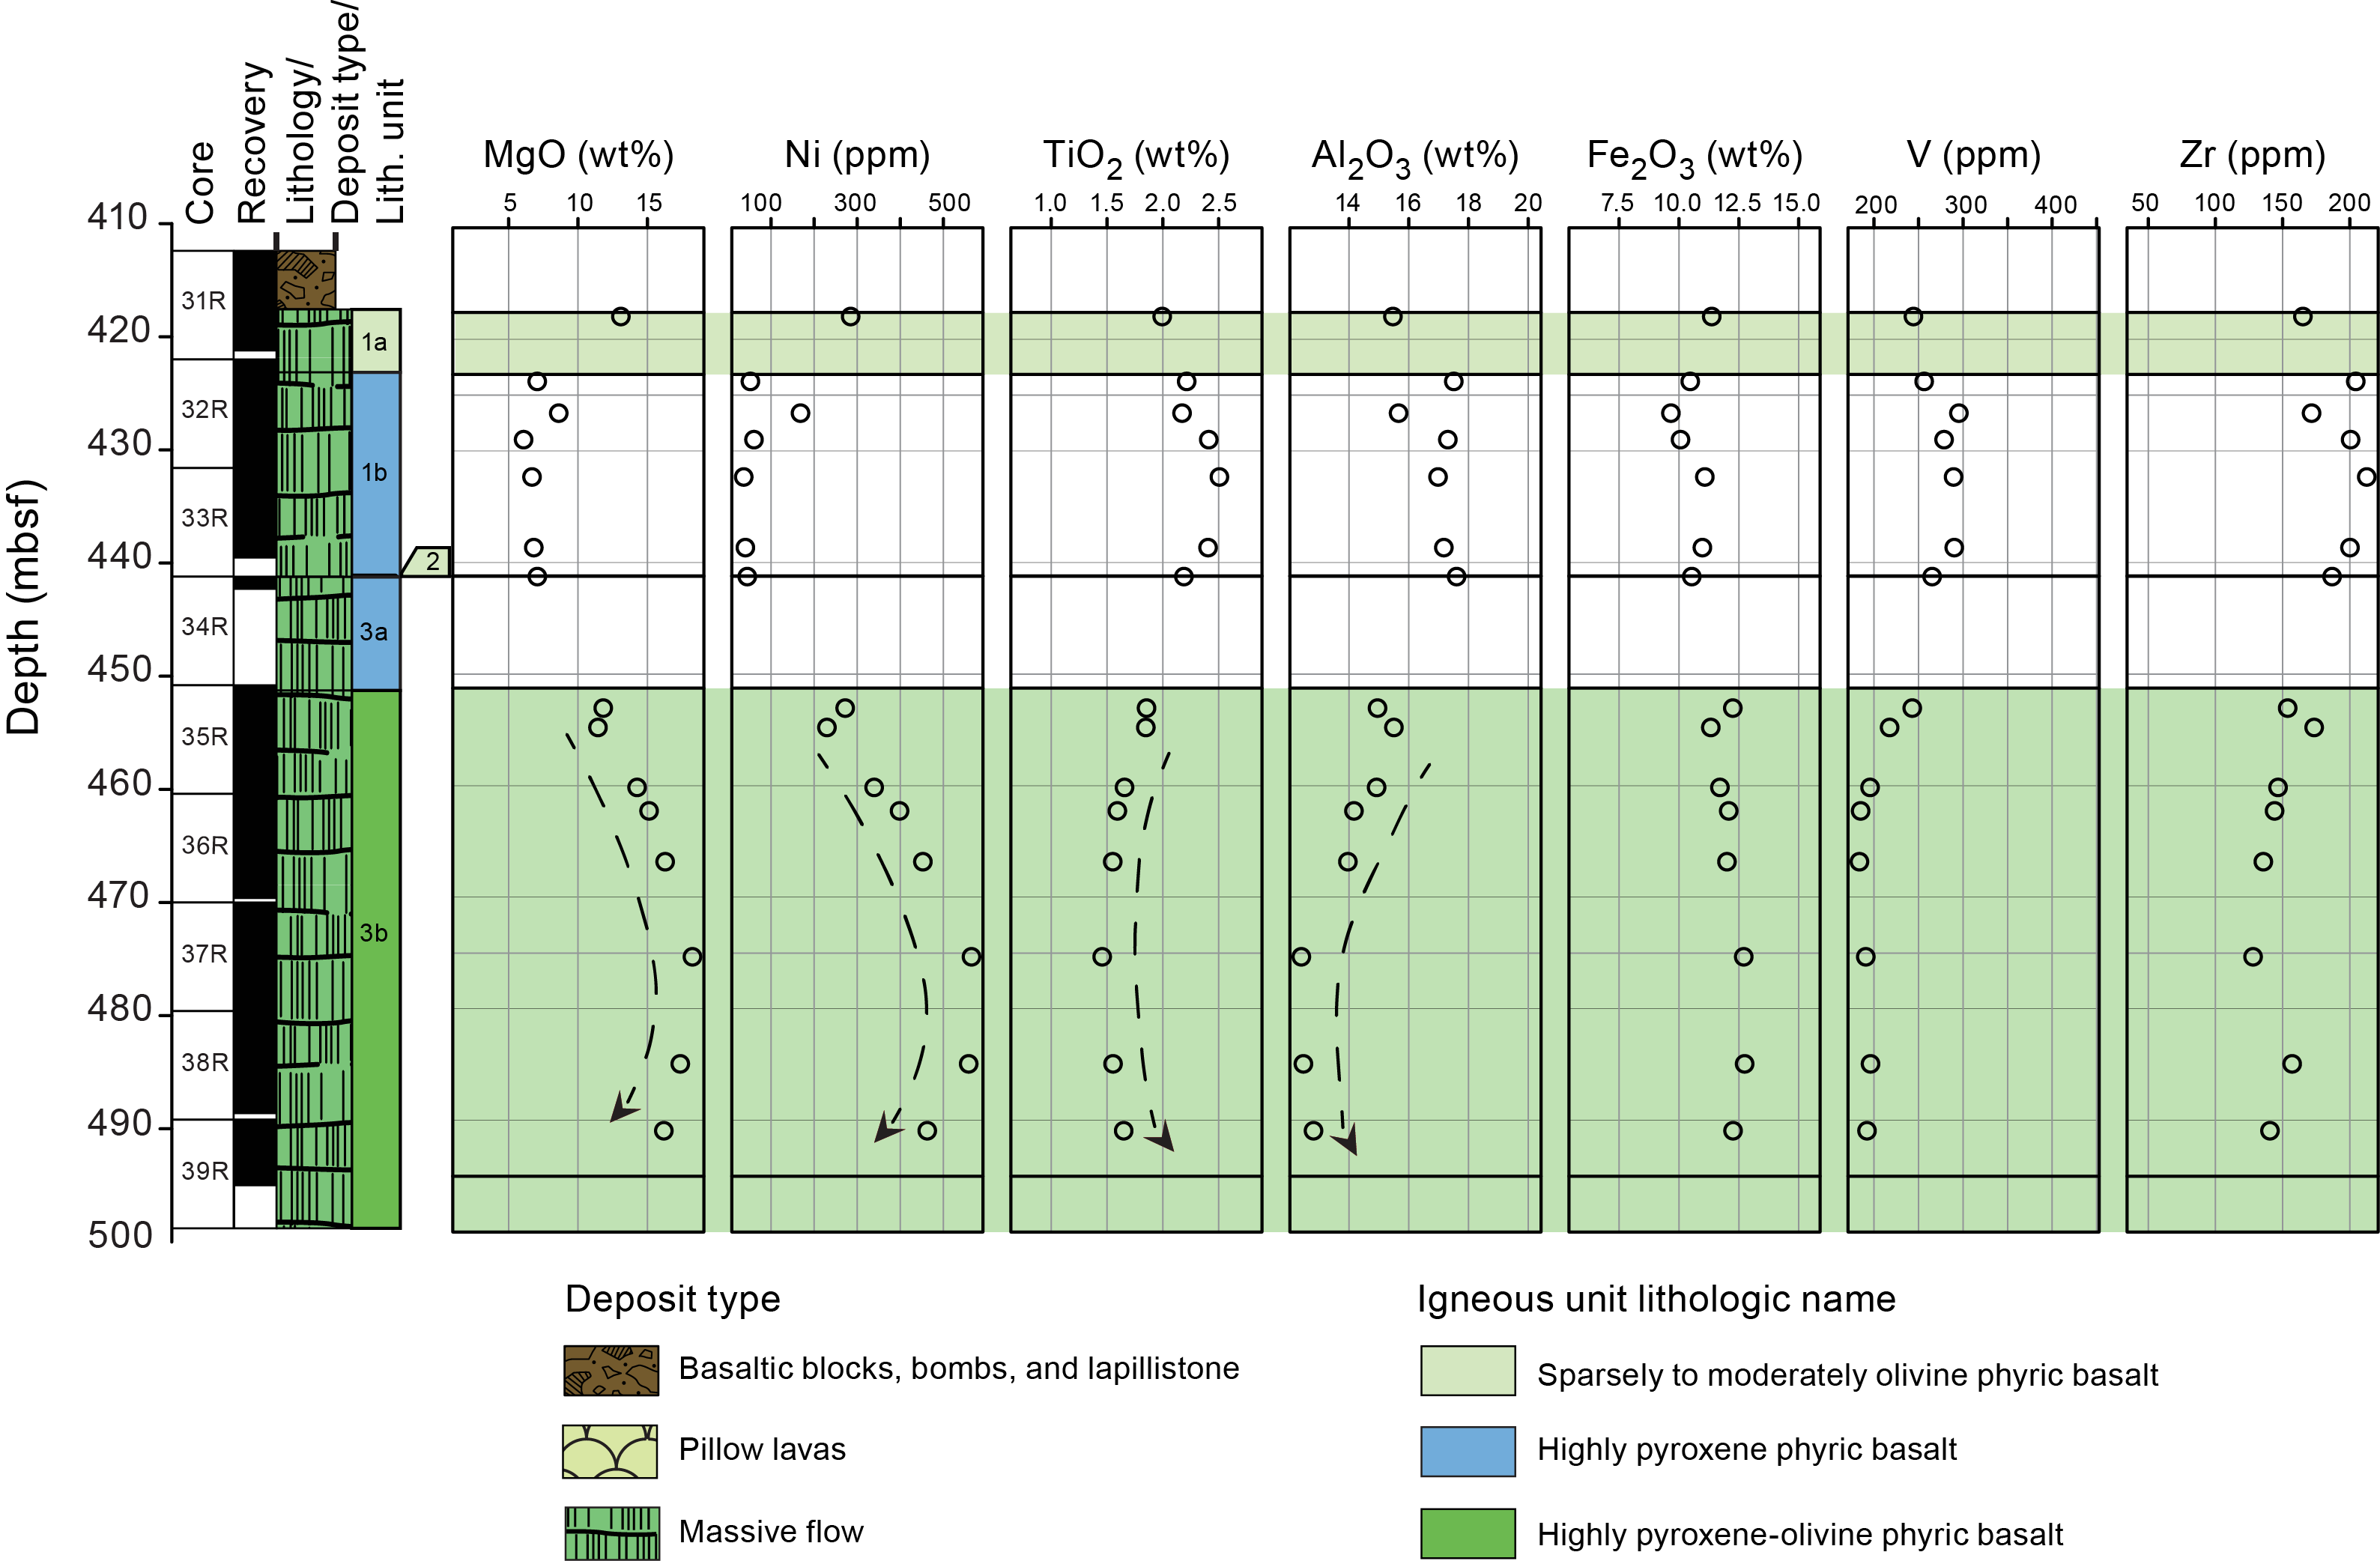
Figure F33. Downhole chemical variations.
9. Physical properties
The scope of the physical properties measurements taken on core samples from Site U1585 is summarized in Physical properties in the Site U1584 chapter (Sager et al., 2023a) and is slightly modified from the measurements taken during Expedition 391 (see Physical properties in the Expedition 391 methods chapter [Sager et al., 2023b]). Whole-round data were taken on each core for NGR, MS, and GRA bulk density. Section halves were measured for point MS (MSP) and reflectance spectrophotometry and colorimetry every 4–5 cm. P-wave velocity using the P-wave caliper in the x-direction was measured on section halves. Moisture and density (MAD) and porosity measurements were made on discrete sediment samples from Lithostratigraphic Units I through III, except for Subunits IIIA, IIID, and IIIG because they are dominated by basalt clasts.
In Hole U1585A, three primary sedimentary units were identified and defined by changes in sedimentary successions and major shifts in physical properties behavior. Three units were also identified in the igneous basement, but those units had minor changes in physical properties and were mainly distinguished using changes in petrography and geochemistry. The physical properties measurements are shown in Figure F34 and summarized in Table T7 with the mean and standard deviation (1σ) based on the units described in Lithostratigraphy and Igneous petrology and volcanology. The data were not processed to remove outliers or to correct for reduced core diameter.
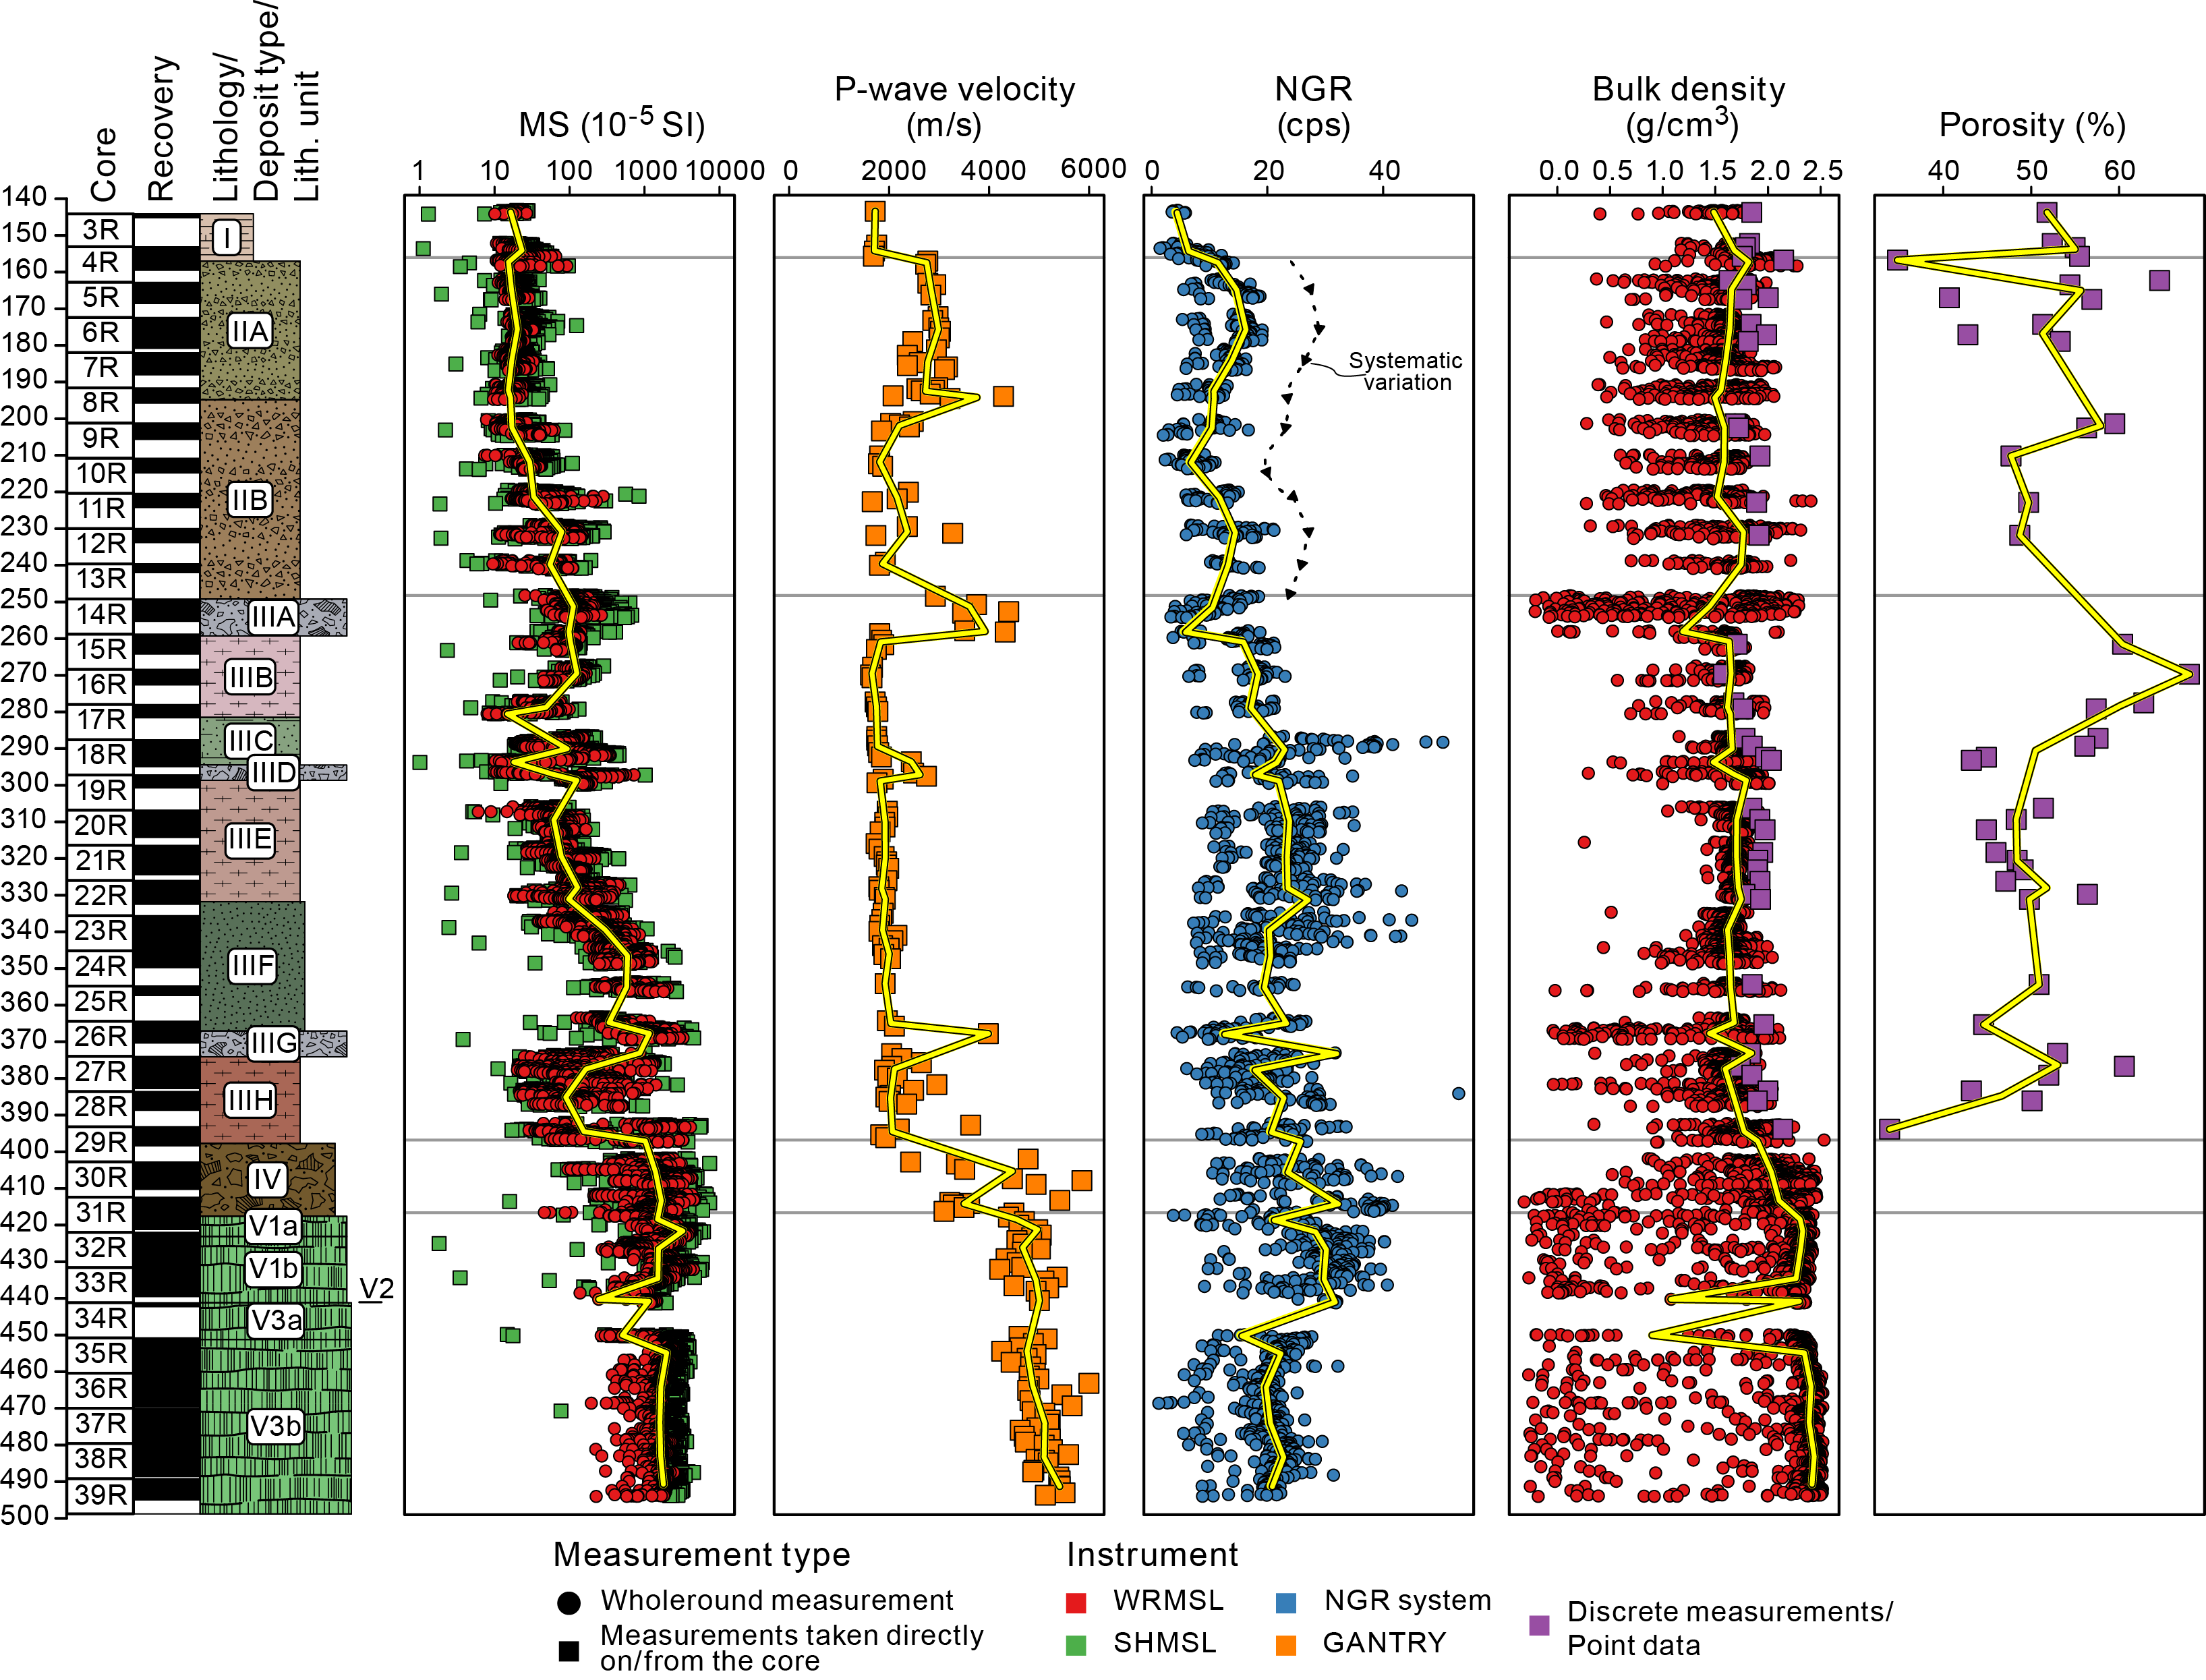
Figure F34. Physical properties.
The physical properties data are broken into two categories: (1) properties that mark major lithostratigraphic boundaries by following distinct measurable changes that are within 1σ of the previous unit and (2) properties that display intra-unit variation and small-scale variations (e.g., in a single core).
9.1. Properties that mark lithostratigraphic boundaries
GRA and MAD bulk density and P-wave velocity are nearly homogeneous through Lithostratigraphic Units I through III, excluding the basalt breccia units in Unit III (Subunits IIIA, IIID, and IIIG) where the latter displays higher peaks. P-wave velocity values are the lowest in the nannofossil chalk (Unit I; ~1700 m/s) but sharply increase when the lithology changes to lapillistone with basaltic clasts (Subunit IIa; ~2800 m/s). P-wave velocity decreases slightly in Subunit IIB (~2300 m/s) because the lapillistone contains fewer basaltic clasts and includes reworked sediment units and biogenic clasts. In Unit III, the P-wave velocity decreases to values just slightly higher than in calcareous Unit I. Subunit IIIB is a succession of highly bioturbated tuffaceous chalk and silty clay, whereas Subunit IIIC is a succession of tuffaceous chalky claystone and tuffaceous chalk having similar P-wave velocities (~1750 and ~1780 m/s, respectively). Progressing downhole, the basalt clast-rich Subunits IIID and IIIE show significant P-wave velocity increases as the lithology changes from the clay- and silt-dominant lithologies of Subunits IIIB and IIIC to units that are more sand dominant mixed with tuffaceous chalk. This change sees the P-wave velocity increase to ~1900 m/s in Subunit IIIE and slightly higher to ~1950 m/s in Subunit IIIF. Below the third basalt clast Subunit IIIG, the P-wave velocity increases to values similar to those in Unit II but also displays much more variability in Subunit IIIH as it transitions to a succession of carbonate-rich tuffaceous sand with intervals of lapillistone (2300 ± 460 m/s). The final sedimentary assemblage above igneous basement, Unit IV, marks another jump in P-wave velocity because the basaltic clast–dominant lapillistone provides a wide range of P-wave velocity values. Finally, the P-wave velocity increases again through the igneous basement Unit V to 4600 m/s and gradually increases toward the bottom of the hole (~5000 m/s; Subunit V3b).
GRA and MAD bulk density behave in a similar fashion to the P-wave velocity, although they lack the small variations from Unit I through Unit III and stay relatively consistent (~1.6 cm3 from GRA bulk density). However, MAD bulk density increases from ~1.8 g/cm3 in Unit I to 1.9 g/cm3 in Subunit IIIH. Between the bottom of Unit III and through Unit IV, GRA bulk density increases to 1.9 g/cm3, and from there it steadily climbs through the igneous basement to the bottom of the hole to 2.5 g/cm3.
9.2. Properties that display intra-unit variation
MS, MSP, NGR, and porosity have more inter-unit variation or cyclicity when compared to density and P-wave velocity. They display systematic changes within a single core. Core section (meter scale) variations are present, but careful processing of the data is needed to remove outliers introduced by gaps between sections and pieces. MS and MSP closely correlate on a core length and unit scale and will be discussed as one measurement type but MSP values are cited. Intensity does vary between MS and MSP measurements. At lower intensities (~<100 SI) and higher intensities (~>1000 SI), MS values are lower at a given intensity than MSP values based on section averages (Figure F35). This probably occurs because the MS determines susceptibility from the core volume within the sensor, which can include gaps and small core pieces, whereas the MSP determines susceptibility by placing a sensor in contact with the section half surface.

Figure F35. Comparison of averaged measurements using the MSP vs. MS susceptibility meters.
NGR has the lowest values in Lithostratigraphic Unit I at the top of Hole U1585A, fluctuates downhole, steadily increases to a maximum in the volcanic breccia in Unit IV (~27 counts/s), decreases in Igneous Subunit 1a in the igneous basement (~21 counts/s; Lithostratigraphic Unit V), and reaches the absolute maximum in Hole U1585A of ~29 counts/s in Igneous Subunit 1b. NGR values then decrease to ~20 counts/s at the bottom of Subunit 3b. Core to core variations of NGR do occur on a lithologic unit basis but also over different unit types and boundaries. For example, across sedimentary Subunits IIA and IIB, NGR varies in a sinusoidal pattern (black dashed line, Figure F34). Through Cores 4R–13R, NGR systematically varies between ~6.5 and ~16 counts/s. NGR begins at ~11 counts/s in Core 4R, reaches a high of 16 counts/s in Core 6R, descends to the lowest core average in Core 10R at 6.5 counts/s, increases once more to 14 counts/s in Core 12R, and in Core 13R decreases through the end of Subunit IIB.
MS behaves in a similar manner to NGR, generally increasing with depth but also displaying some core to core and intra-unit variation. Lithostratigraphic Unit I and the Igneous Unit 3 are end-members for MS, with Unit I having the lowest value of ~30 SI and bottom of the hole in Unit V (igneous basement) showing the highest value of ~2600 SI. This is expected because calcareous sediments have a far lower abundance of magnetic minerals than basalt. This pattern fits that observed in magnetization intensity measured by the SRM (see Paleomagnetism). The steady rise of MS between these end-member values is likely an indicator of the downhole increase in volcanic material in the sediments.
Porosity varies between 40 and 60 vol% across lithostratigraphic units and within cores. The variation on the unit scale is likely attributed to the way the units and subunits were grouped based on succession packages that included a range of sediment types and assemblages. Increased sampling would be needed to get a clearer picture of how the porosity changes throughout the site.
References
Bartels, T., Krastel, S., and Spiess, V., 2007. Correlation of high-resolution seismic data with ODP Leg 208 borehole measurements. In Kroon, D., Zachos, J.C., and Richter, C. (Eds.), Proceedings of the Ocean Drilling Program, Scientific Results. 208: College Station, TX (Ocean Drilling Program). https://doi.org/10.2973/odp.proc.sr.208.204.2007
Butler, R.F., 1992. Paleomagnetism: Magnetic Domains to Tectonic Terrains: Boston, MA (Blackwell Science Inc.).
Chave, A.D., 1984. Lower Paleocene-Upper Cretaceous magnetostratigraphy, Sites 525, 527, 528, and 529, Deep Sea Drilling Project Leg 74. In Moore, T.C., Jr., Rabinowitz, P.D., et al., Initial Reports of the Deep Sea Drilling Project. 74: Washington, DC (US Government Printing Office), 525–531. https://doi.org/10.2973/dsdp.proc.74.110.1984
Class, C., and le Roex, A.P., 2008. Ce anomalies in Gough Island lavas—trace element characteristics of a recycled sediment component. Earth and Planetary Science Letters, 265(3–4):475–486. https://doi.org/10.1016/j.epsl.2007.10.030
de Winter, N.J., Zeeden, C., and Hilgen, F.J., 2014. Low-latitude climate variability in the Heinrich frequency band of the Late Cretaceous greenhouse world. Climate of the Past, 10(3):1–19. https://doi.org/10.5194/cp-10-1001-2014
Doubrovine, P.V., Steinberger, B., and Torsvik, T.H., 2012. Absolute plate motions in a reference frame defined by moving hot spots in the Pacific, Atlantic, and Indian oceans. Journal of Geophysical Research: Solid Earth, 117(B9):B09101. https://doi.org/10.1029/2011JB009072
Ernesto, M., Pacca, I.G., Hiodo, F.Y., and Nardy, A.J.R., 1990. Palaeomagnetism of the Mesozoic Serra Geral Formation, southern Brazil. Physics of the Earth and Planetary Interiors, 64(2):153–175. https://doi.org/10.1016/0031-9201(90)90035-V
Ernesto, M., Raposo, M.I.B., Marques, L.S., Renne, P.R., Diogo, L.A., and de Min, A., 1999. Paleomagnetism, geochemistry and 40Ar/39Ar dating of the north-eastern Paraná Magmatic Province: tectonic implications. Journal of Geodynamics, 28(4):321–340. https://doi.org/10.1016/S0264-3707(99)00013-7
Fisher, R.V., and Schmincke, H.-U., 1984. Pyroclastic Rocks: Berlin (Springer). https://doi.org/10.1007/978-3-642-74864-6
Gibson, S.A., Thompson, R.N., Day, J.A., Humphris, S.E., and Dickin, A.P., 2005. Melt-generation processes associated with the Tristan mantle plume: constraints on the origin of EM-1. Earth and Planetary Science Letters, 237(3–4):744–767. https://doi.org/10.1016/j.epsl.2005.06.015
Gordon, R.G., and Cape, C.D., 1981. Cenozoic latitudinal shift of the Hawaiian hotspot and its implications for true polar wander. Earth and Planetary Science Letters, 55(1):37–47. https://doi.org/10.1016/0012-821X(81)90084-4
Gordon, R.G., Woodworth, D.T., Gaastra, K., and Seidman, L.E., 2019. Paleogene true polar wander, origin of the Hawaiian-Emperor Bend, paleolatitude of Ellesmere Island, and Cenozoic climate change. Geological Society of America Abstracts with Programs, 51(5):59. https://doi.org/10.1130/abs/2019AM-339253
Hoernle, K., Rohde, J., Hauff, F., Garbe-Schönberg, D., Homrighausen, S., Werner, R., and Morgan, J.P., 2015. How and when plume zonation appeared during the 132 Myr evolution of the Tristan Hotspot. Nature Communications, 6(1):7799. https://doi.org/10.1038/ncomms8799
Homrighausen, S., Hoernle, K., Geldmacher, J., Wartho, J.A., Hauff, F., Portnyagin, M., Werner, R., van den Bogaard, P., and Garbe-Schönberg, D., 2018. Unexpected HIMU-type late-stage volcanism on the Walvis Ridge. Earth and Planetary Science Letters, 492:251–263. https://doi.org/10.1016/j.epsl.2018.03.049
Homrighausen, S., Hoernle, K., Hauff, F., Wartho, J.A., van den Bogaard, P., and Garbe-Schönberg, D., 2019. New age and geochemical data from the Walvis Ridge: the temporal and spatial diversity of South Atlantic intraplate volcanism and its possible origin. Geochimica et Cosmochimica Acta, 245:16–34. https://doi.org/10.1016/j.gca.2018.09.002
Homrighausen, S., Hoernle, K., Zhou, H., Geldmacher, J., Wartho, J.-A., Hauff, F., Werner, R., Jung, S., and Morgan, J.P., 2020. Paired EMI-HIMU hotspots in the South Atlantic—starting plume heads trigger compositionally distinct secondary plumes? Science Advances, 6(28):eaba0282. https://doi.org/10.1126/sciadv.aba0282
Jay, A.E., Niocaill, C.M., Widdowson, M., Self, S., and Turner, W., 2009. New palaeomagnetic data from the Mahabaleshwar Plateau, Deccan Flood Basalt Province, India: implications for the volcanostratigraphic architecture of continental flood basalt provinces. Journal of the Geological Society, 166(1):13–24. https://doi.org/10.1144/0016-76492007-150
Kirschvink, J.L., 1980. The least-squares line and plane and the analysis of palaeomagnetic data. Geophysical Journal International, 62(3):699–718. https://doi.org/10.1111/j.1365-246X.1980.tb02601.x
Koppers, A.A.P., Yamazaki, T., Geldmacher, J., Gee, J.S., Pressling, N., Hoshi, H., Anderson, L., Beier, C., Buchs, D.M., Chen, L.H., Cohen, B.E., Deschamps, M., Dorais, J., Ebuna, D., Ehmann, S., Fitton, J.G., Fulton, P.M., Ganbat, E., Hamelin, C., Hanyu, T., Kalnins, L., Kell, J., Machida, S., Mahoney, J.J., Moriya, K., Nichols, A.R.L., Rausch, S., Sano, S., Sylvan, J.B., and Williams, R., 2012. Limited latitudinal mantle plume motion for the Louisville Hotspot. Nature Geoscience, 5(12):911–917. https://doi.org/10.1038/ngeo1638
Le Bas, M.J., Le Maitre, R.W., Streickeisen, A., Zanettin, B., the IUGS Subcommission on the Systematics of Igneous Rocks, 1986. A chemical classification of volcanic rocks based on the total alkali-silica diagram. Journal of Petrology, 27(3):745–750. https://doi.org/10.1093/petrology/27.3.745
Le Maitre, R.W., 1962. Petrology of volcanic rocks, Gough Island, South Atlantic. Geological Society of America Bulletin, 73(11):1309–1340. https://doi.org/10.1130/0016-7606(1962)73[1309:POVRGI]2.0.CO;2
Le Roex, A.P., Cliff, R.A., and Adair, B.J.I., 1990. Tristan da Cunha, South Atlantic: geochemistry and petrogenesis of a basanite-phonolite lava series. Journal of Petrology, 31(4):779–812. https://doi.org/10.1093/petrology/31.4.779
Liss, D., Owens, W.H., and Hutton, D.H.W., 2004. New palaeomagnetic results from the Whin Sill complex: evidence for a multiple intrusion event and revised virtual geomagnetic poles for the late Carboniferous for the British Isles. Journal of the Geological Society, 161(6):927–938. https://doi.org/10.1144/0016-764903-156
Lyle, P., 2000. The eruption environment of multi-tiered columnar basalt lava flows. Journal of the Geological Society, 157(4):715–722. https://doi.org/10.1144/jgs.157.4.715
MacDonald, G.A., and Katsura, T., 1964. Chemical composition of Hawaiian lavas. Journal of Petrology, 5(1):82–133. https://doi.org/10.1093/petrology/5.1.82
Marshall, P.E., Widdowson, M., and Murphy, D.T., 2016. The Giant Lavas of Kalkarindji: rubbly pāhoehoe lava in an ancient continental flood basalt province. Palaeogeography, Palaeoclimatology, Palaeoecology, 441(1):22–37. https://doi.org/10.1016/j.palaeo.2015.05.006
Moore, T.C., Jr., Rabinowitz, P.D., Borella, P.E., Boersma, A., and Shackleton, N.J., 1984. Introduction and explanatory notes. In Moore, T.C., Jr., Rabinowitz, P.D., et al., Initial Reports of the Deep Sea Drilling Project. 74: Washington, DC (US Government Printing Office), 3–39. https://doi.org/10.2973/dsdp.proc.74.101.1984
O'Connor, J.M., and le Roex, A.P., 1992. South Atlantic hot spot-plume systems: 1. Distribution of volcanism in time and space. Earth and Planetary Science Letters, 113(3):343–364. https://doi.org/10.1016/0012-821X(92)90138-L
Park, J., D'Hondt, S.L., King, J.W., and Gibson, C., 1993. Late Cretaceous precessional cycles in double time: a warm-Earth Milankovitch response. Science, 261(5127):1431–1434. https://doi.org/10.1126/science.261.5127.1431
Renne, P.R., Scott, G.R., Glen, J.M.G., and Feinberg, J.M., 2002. Oriented inclusions of magnetite in clinopyroxene: source of stable remanent magnetization in gabbros of the Messum Complex, Namibia. Geochemistry, Geophysics, Geosystems, 3(12):1–11. https://doi.org/10.1029/2002GC000319
Richardson, S.H., Erlank, A.J., Reid, D.L., and Duncan, A.R., 1984. Major and trace element and Nd and Sr isotope geochmistry of basalts from the Deep Sea Drilling Project Leg 74 Walvis Ridge Transect. In Moore, T.C. Jr., Rabinowitz, P.D., et al., Initial Reports of the Deep Sea Drilling Project, 74: Washington , DC (US Government Printing Office). https://doi.org/10.2973/dsdp.proc.74.125.1984
Rohde, J., Hoernle, K., Hauff, F., Werner, R., O'Connor, J., Class, C., Garbe-Schönberg, D., and Jokat, W., 2013. 70 Ma chemical zonation of the Tristan-Gough hotspot track. Geology, 41(3):335–338. https://doi.org/10.1130/G33790.1
Ryan, W.B.F., Carbotte, S.M., Coplan, J.O., O'Hara, S., Melkonian, A., Arko, R., Weissel, R.A., Ferrini, V., Goodwillie, A., Nitsche, F., Bonczkowski, J., and Zemsky, R., 2009. Global multi-resolution topography synthesis. Geochemistry, Geophysics, Geosystems, 10(3):Q03014. https://doi.org/10.1029/2008GC002332
Sager, W., Blum, P., Carvallo, C.A., Heaton, D., Nelson, W.R., Tshiningayamwe, M., Widdowson, M., and the Expedition 391 Scientists, 2023a. Site U1584. In Sager, W., Hoernle, K., Höfig, T.W., Blum, P., and the Expedition 391 Scientists, Walvis Ridge Hotspot. Proceedings of the International Ocean Discovery Program, 391: College Station, TX (International Ocean Discovery Program). https://doi.org/10.14379/iodp.proc.391.107.2023
Sager, W., Hoernle, K., Höfig, T.W., Avery, A.J., Bhutani, R., Buchs, D.M., Carvallo, C.A., Class, C., Dai, Y., Dalla Valle, G., Del Gaudio, A.V., Fielding, S., Gaastra, K.M., Han, S., Homrighausen, S., Kubota, Y., Li, C.-F., Nelson, W.R., Petrou, E., Potter, K.E., Pujatti, S., Scholpp, J., Shervais, J.W., Thoram, S., Tikoo-Schantz, S.M., Tshiningayamwe, M., Wang, X.-J., and Widdowson, M., 2023b. Expedition 391 methods. In Sager, W., Hoernle, K., Höfig, T.W., Blum, P., and the Expedition 391 Scientists, Walvis Ridge Hotspot. Proceedings of the International Ocean Discovery Program, 391: College Station, TX (International Ocean Discovery Program). https://doi.org/10.14379/iodp.proc.391.102.2023
Sager, W., Hoernle, K., Höfig, T.W., Avery, A.J., Bhutani, R., Buchs, D.M., Carvallo, C.A., Class, C., Dai, Y., Dalla Valle, G., Del Gaudio, A.V., Fielding, S., Gaastra, K.M., Han, S., Homrighausen, S., Kubota, Y., Li, C.-F., Nelson, W.R., Petrou, E., Potter, K.E., Pujatti, S., Scholpp, J., Shervais, J.W., Thoram, S., Tikoo-Schantz, S.M., Tshiningayamwe, M., Wang, X.-J., and Widdowson, M., 2023c. Expedition 391 summary. In Sager, W., Hoernle, K., Höfig, T.W., Blum, P., and the Expedition 391 Scientists, Walvis Ridge Hotspot. Proceedings of the International Ocean Discovery Program, 391: College Station, TX (International Ocean Discovery Program). https://doi.org/10.14379/iodp.proc.391.101.2023
Sager, W., Hoernle, K., Höfig, T.W., Avery, A.J., Bhutani, R., Buchs, D.M., Carvallo, C.A., Class, C., Dai, Y., Dalla Valle, G., Del Gaudio, A.V., Fielding, S., Gaastra, K.M., Han, S., Homrighausen, S., Kubota, Y., Li, C.-F., Nelson, W.R., Petrou, E., Potter, K.E., Pujatti, S., Scholpp, J., Shervais, J.W., Thoram, S., Tikoo-Schantz, S.M., Tshiningayamwe, M., Wang, X.-J., and Widdowson, M., 2023d. Site U1578. In Sager, W., Hoernle, K., Höfig, T.W., Blum, P., and the Expedition 391 Scientists, Walvis Ridge Hotspot. Proceedings of the International Ocean Discovery Program, 391: College Station, TX (International Ocean Discovery Program). https://doi.org/10.14379/iodp.proc.391.106.2023
Sager, W.W., 2022. Cruise Report, Research Vessel Thomas G. Thompson. Walvis Ridge Geophysical Surveys, TN-373, TN-374. Zenodo. https://doi.org/10.5281/zenodo.6981374
Salters, V.J.M., and Sachi-Kocher, A., 2010. An ancient metasomatic source for the Walvis Ridge basalts. Chemical Geology, 273(3–4):151–167. https://doi.org/10.1016/j.chemgeo.2010.02.010
Shervais, J.W., 2022. The petrogenesis of modern and ophiolitic lavas reconsidered: Ti-V and Nb-Th. Geoscience Frontiers, 13(2):101319. https://doi.org/10.1016/j.gsf.2021.101319
Simon, M., and Schmincke, H.U., 1984. Late Cretaceous volcaniclastic rocks from the Walvis Ridge, Southeast Atlantic, Leg 74. In Moore, T.C., Jr., Rabinowitz, P. D., et al., Initial Reports of the Deep Sea Drilling Project. 74: Washington, DC (US Government Printing Office), 765–791. https://doi.org/10.2973/dsdp.proc.74.127.1984
Single, R.T., and Jerram, D.A., 2004. The 3D facies architecture of flood basalt provinces and their internal heterogeneity: examples from the Palaeogene Skye Lava Field. Journal of the Geological Society, 161(6):911–926. https://doi.org/10.1144/0016-764903-136
Tarduno, J., Bunge, H.-P., Sleep, N., and Hansen, U., 2009. The bent Hawaiian-Emperor hotspot track: inheriting the mantle wind. Science, 324(5923):50–53. https://doi.org/10.1126/science.1161256
Thompson, R., and Oldfield, F., 1986. Environmental Magnetism: Dordrecht (Springer). https://doi.org/10.1007/978-94-011-8036-8
Thordarson, T., 2004. Accretionary-lapilli-bearing pyroclastic rocks at ODP Leg 192 Site 1184: a record of subaerial phreatomagmatic eruptions on the Ontong Java Plateau. Geological Society, London, Special Publications, 229(1):275–306. https://doi.org/10.1144/GSL.SP.2004.229.01.16
Thorpe, R.S., and Macdonald, R., 1985. Geochemical evidence for the emplacement of the Whin Sill complex of northern England. Geological Magazine, 122(4):389–396. https://doi.org/10.1017/S0016756800031836
Torsvik, T.H., Müller, R.D., Van der Voo, R., Steinberger, B., and Gaina, C., 2008. Global plate motion frames: toward a unified model. Reviews of Geophysics, 46(3):RG3004. https://doi.org/10.1029/2007RG000227
Tozer, B., Sandwell, D.T., Smith, W.H.F., Olson, C., Beale, J.R., and Wessel, P., 2019. Global bathymetry and topography at 15 arc sec: SRTM15+. Earth and Space Science, 6(10):1847–1864. https://doi.org/10.1029/2019EA000658
Van Fossen, M.C., and Kent, D.V., 1992. Paleomagnetism of 122 Ma plutons in New England and the mid-Cretaceous paleomagnetic field in North America: true polar wander or large-scale differential mantle motion? Journal of Geophysical Research: Solid Earth, 97(B13):19651–19661. https://doi.org/10.1029/92JB01466
Verosub, K.L., 1977. Depositional and postdepositional processes in the magnetization of sediments. Reviews of Geophysics, 15(2):129–143. https://doi.org/10.1029/RG015i002p00129
Weaver, B.L., Wood, D.A., Tarney, J., and Joron, J.L., 1987. Geochemistry of ocean island basalts from the South Atlantic: Ascension, Bouvet, St. Helena, Gough and Tristan da Cunha. In Fitton, J.G., and Upton, B.G.J. (Eds.), Alkaline Igneous Rocks. Geological Society Special Publication, 30: 253–267. https://doi.org/10.1144/GSL.SP.1987.030.01.11
Woodworth, D., and Gordon, R.G., 2018. Paleolatitude of the Hawaiian hot spot Since 48 Ma: evidence for a mid-Cenozoic true polar stillstand followed by late Cenozoic true polar wander coincident with Northern Hemisphere glaciation. Geophysical Research Letters, 45(21):11632–11640. https://doi.org/10.1029/2018GL080787
Zheng, L., Gordon, R.G., and Woodworth, D., 2018. Pacific plate apparent polar wander, hot spot fixity, and true polar wander during the formation of the Hawaiian Island and Seamount Chain from an analysis of the skewness of magnetic anomaly 20r (44 Ma). Tectonics, 37(7):2094–2105. https://doi.org/10.1029/2017TC004897
Zhou, Z., and Fyfe, W.S., 1989. Palagonitization of basaltic glass from DSDP Site 335, Leg 37; textures, chemical composition, and mechanism of formation. American Mineralogist, 74(9–10):1045–1053.
Zindler, A., and Hart, S.R., 1986. Chemical geodynamics. Annual Review of Earth and Planetary Sciences, 14:493–571.