Sager, W., Hoernle, K., Höfig, T.W., Blum, P., and the Expedition 391 Scientists
Proceedings of the International Ocean Discovery Program Volume 391
publications.iodp.org
https://doi.org/10.14379/iodp.proc.391.107.2023
Site U15841
![]() W. Sager,
W. Sager,
![]() P. Blum,
P. Blum,
![]() R. Bhutani,
R. Bhutani,
![]() C.A. Carvallo,
C.A. Carvallo,
![]() D. Heaton,
D. Heaton,
![]() W.R. Nelson,
W.R. Nelson,
![]() M. Tshiningayamwe,
M. Tshiningayamwe,
![]() M. Widdowson, and the Expedition 391 Scientists2
M. Widdowson, and the Expedition 391 Scientists2
1 Sager, W., Blum, P., Bhutani, R., Carvallo, C.A., Heaton, D., Nelson, W.R., Tshiningayamwe, M., Widdowson, M., and the Expedition 391 Scientists, 2023. Site U1584. In Sager, W., Hoernle, K., Höfig, T.W., Blum, P., and the Expedition 391 Scientists, Walvis Ridge Hotspot. Proceedings of the International Ocean Discovery Program, 391: College Station, TX (International Ocean Discovery Program). https://doi.org/10.14379/iodp.proc.391.107.2023
2 Expedition 391 Scientists' affiliations.
1. Background and objectives
The strategy of Expedition 391 was to core at six distributed locations on the Tristan-Gough-Walvis (TGW) hotspot track, providing new insights into its temporal, volcanological, petrologic, geochemical, and paleomagnetic evolution (Sager et al., 2023b). At the youngest and westernmost of these locations, three sites were proposed as a transect across the northern Guyot Province seamounts and ridges immediately southwest of the morphological split that occurs at about 2°E (Figure F1). Because of severe cuts to operational time during Expedition 391 caused by COVID-19 mitigation, two sites (proposed Sites GT-4A and TT-4A) were omitted (Sager et al., 2023b). Only the middle site (U1578) was cored (Figure F1). This omission was a major deficiency for Expedition 391 because the three sites were positioned to sample the isotopic split that first occurs farther northeast at the location of the Deep Sea Drilling Project (DSDP) Leg 74 transect (Hoernle et al., 2015). By omitting the ends of the transect, only dredge samples are available to characterize the isotopic end-members, which correspond to the Tristan track (northern seamounts) and the Gough track (southern seamounts).
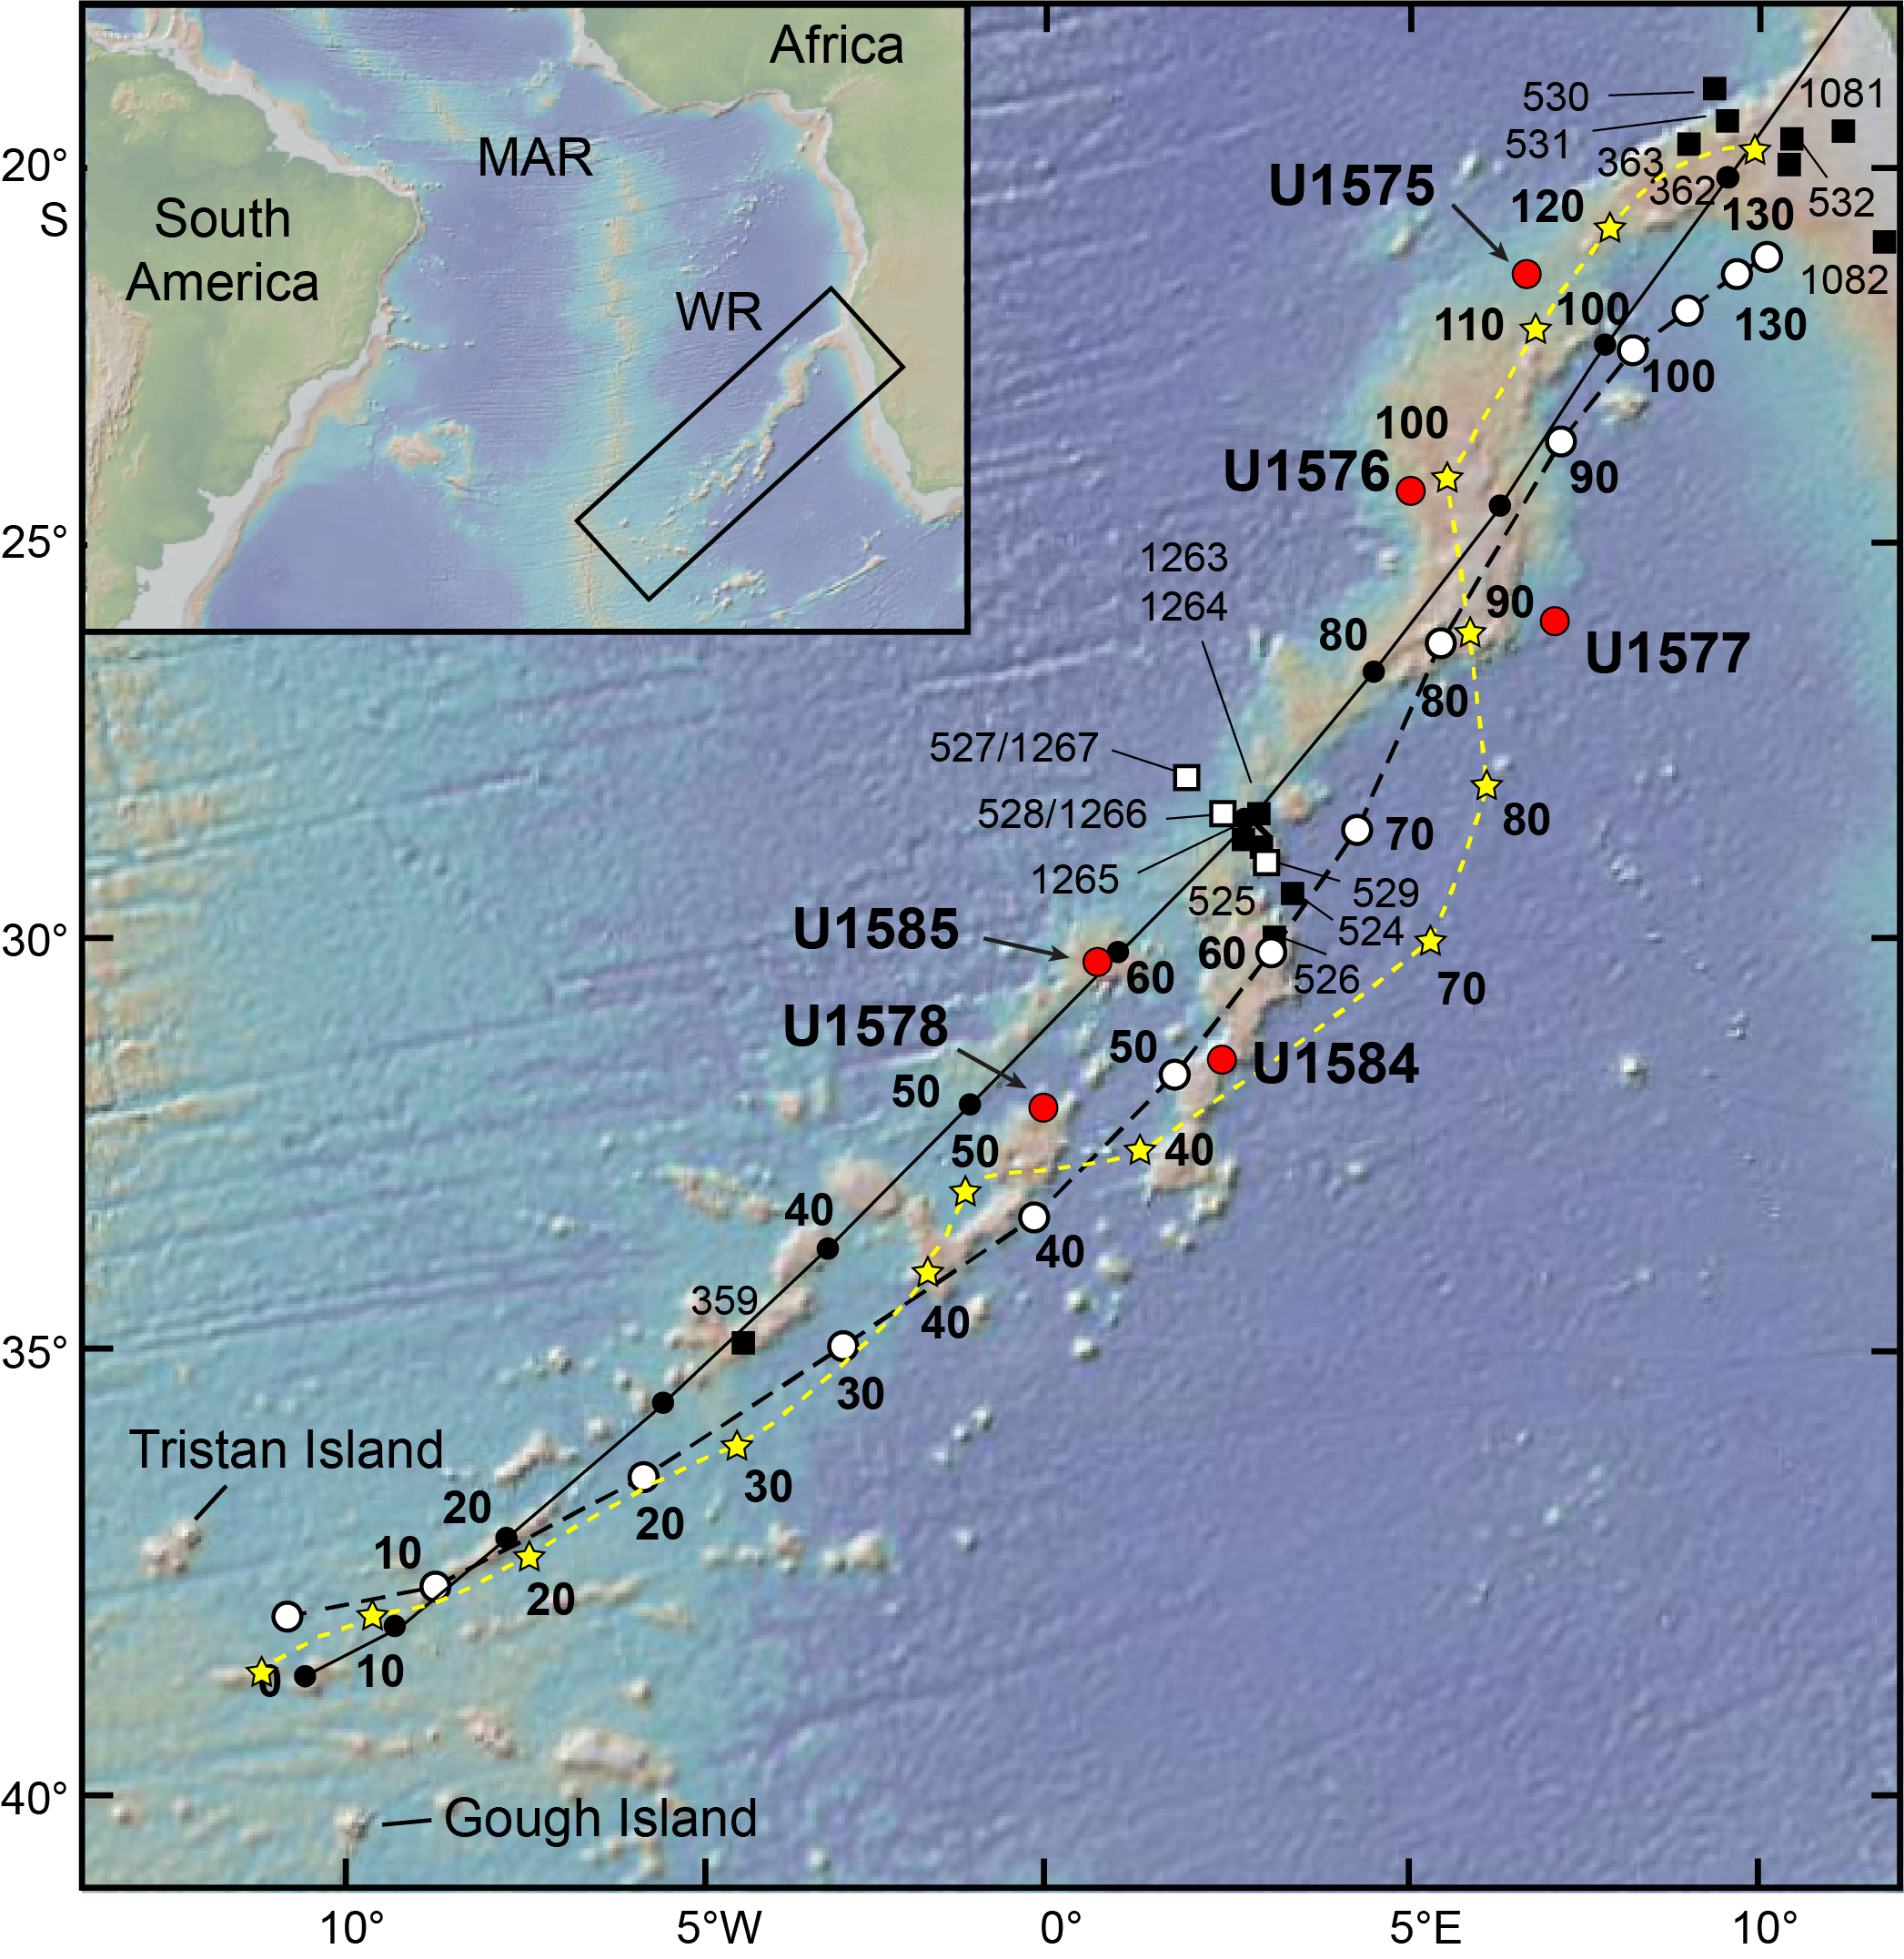
Figure F1. Walvis Ridge bathymetry.
The objective of Expedition 397T was to core at the two omitted sites (or nearby alternates) in the Guyot Province, one on the Gough track (Site U1584 for proposed Site GT-6A), and one on the Tristan track (Site U1585 for proposed Site TT-4A). The rationale was the same: core basaltic basement for geochemical, isotopic, geochronologic, paleomagnetic, and other studies. Site U1584 is located on the middle east flank of an unnamed guyot ridge that is part of the Gough track, a quasilinear chain of ridges and more conical-shaped seamounts that extends toward the active volcanoes of Gough Island group (Figures F1, F2). The main operational purpose of coring at this site was to extend the Expedition 391 Guyot Province transect to the Gough track, coring a seamount of probable Late Cretaceous or early Cenozoic age (Figures F1, F3). Site U1584 promised critical samples for two important scientific goals of the combined expeditions: (1) to establish whether differences in geochemical composition of edifices along the Tristan, Gough, and Center subtracks are caused by mixing or distinct plume components and (2) to determine whether the latest Cretaceous–earliest Cenozoic paleolatitude of the TGW hotspot is consistent with moving mantle plumes or true polar wander.
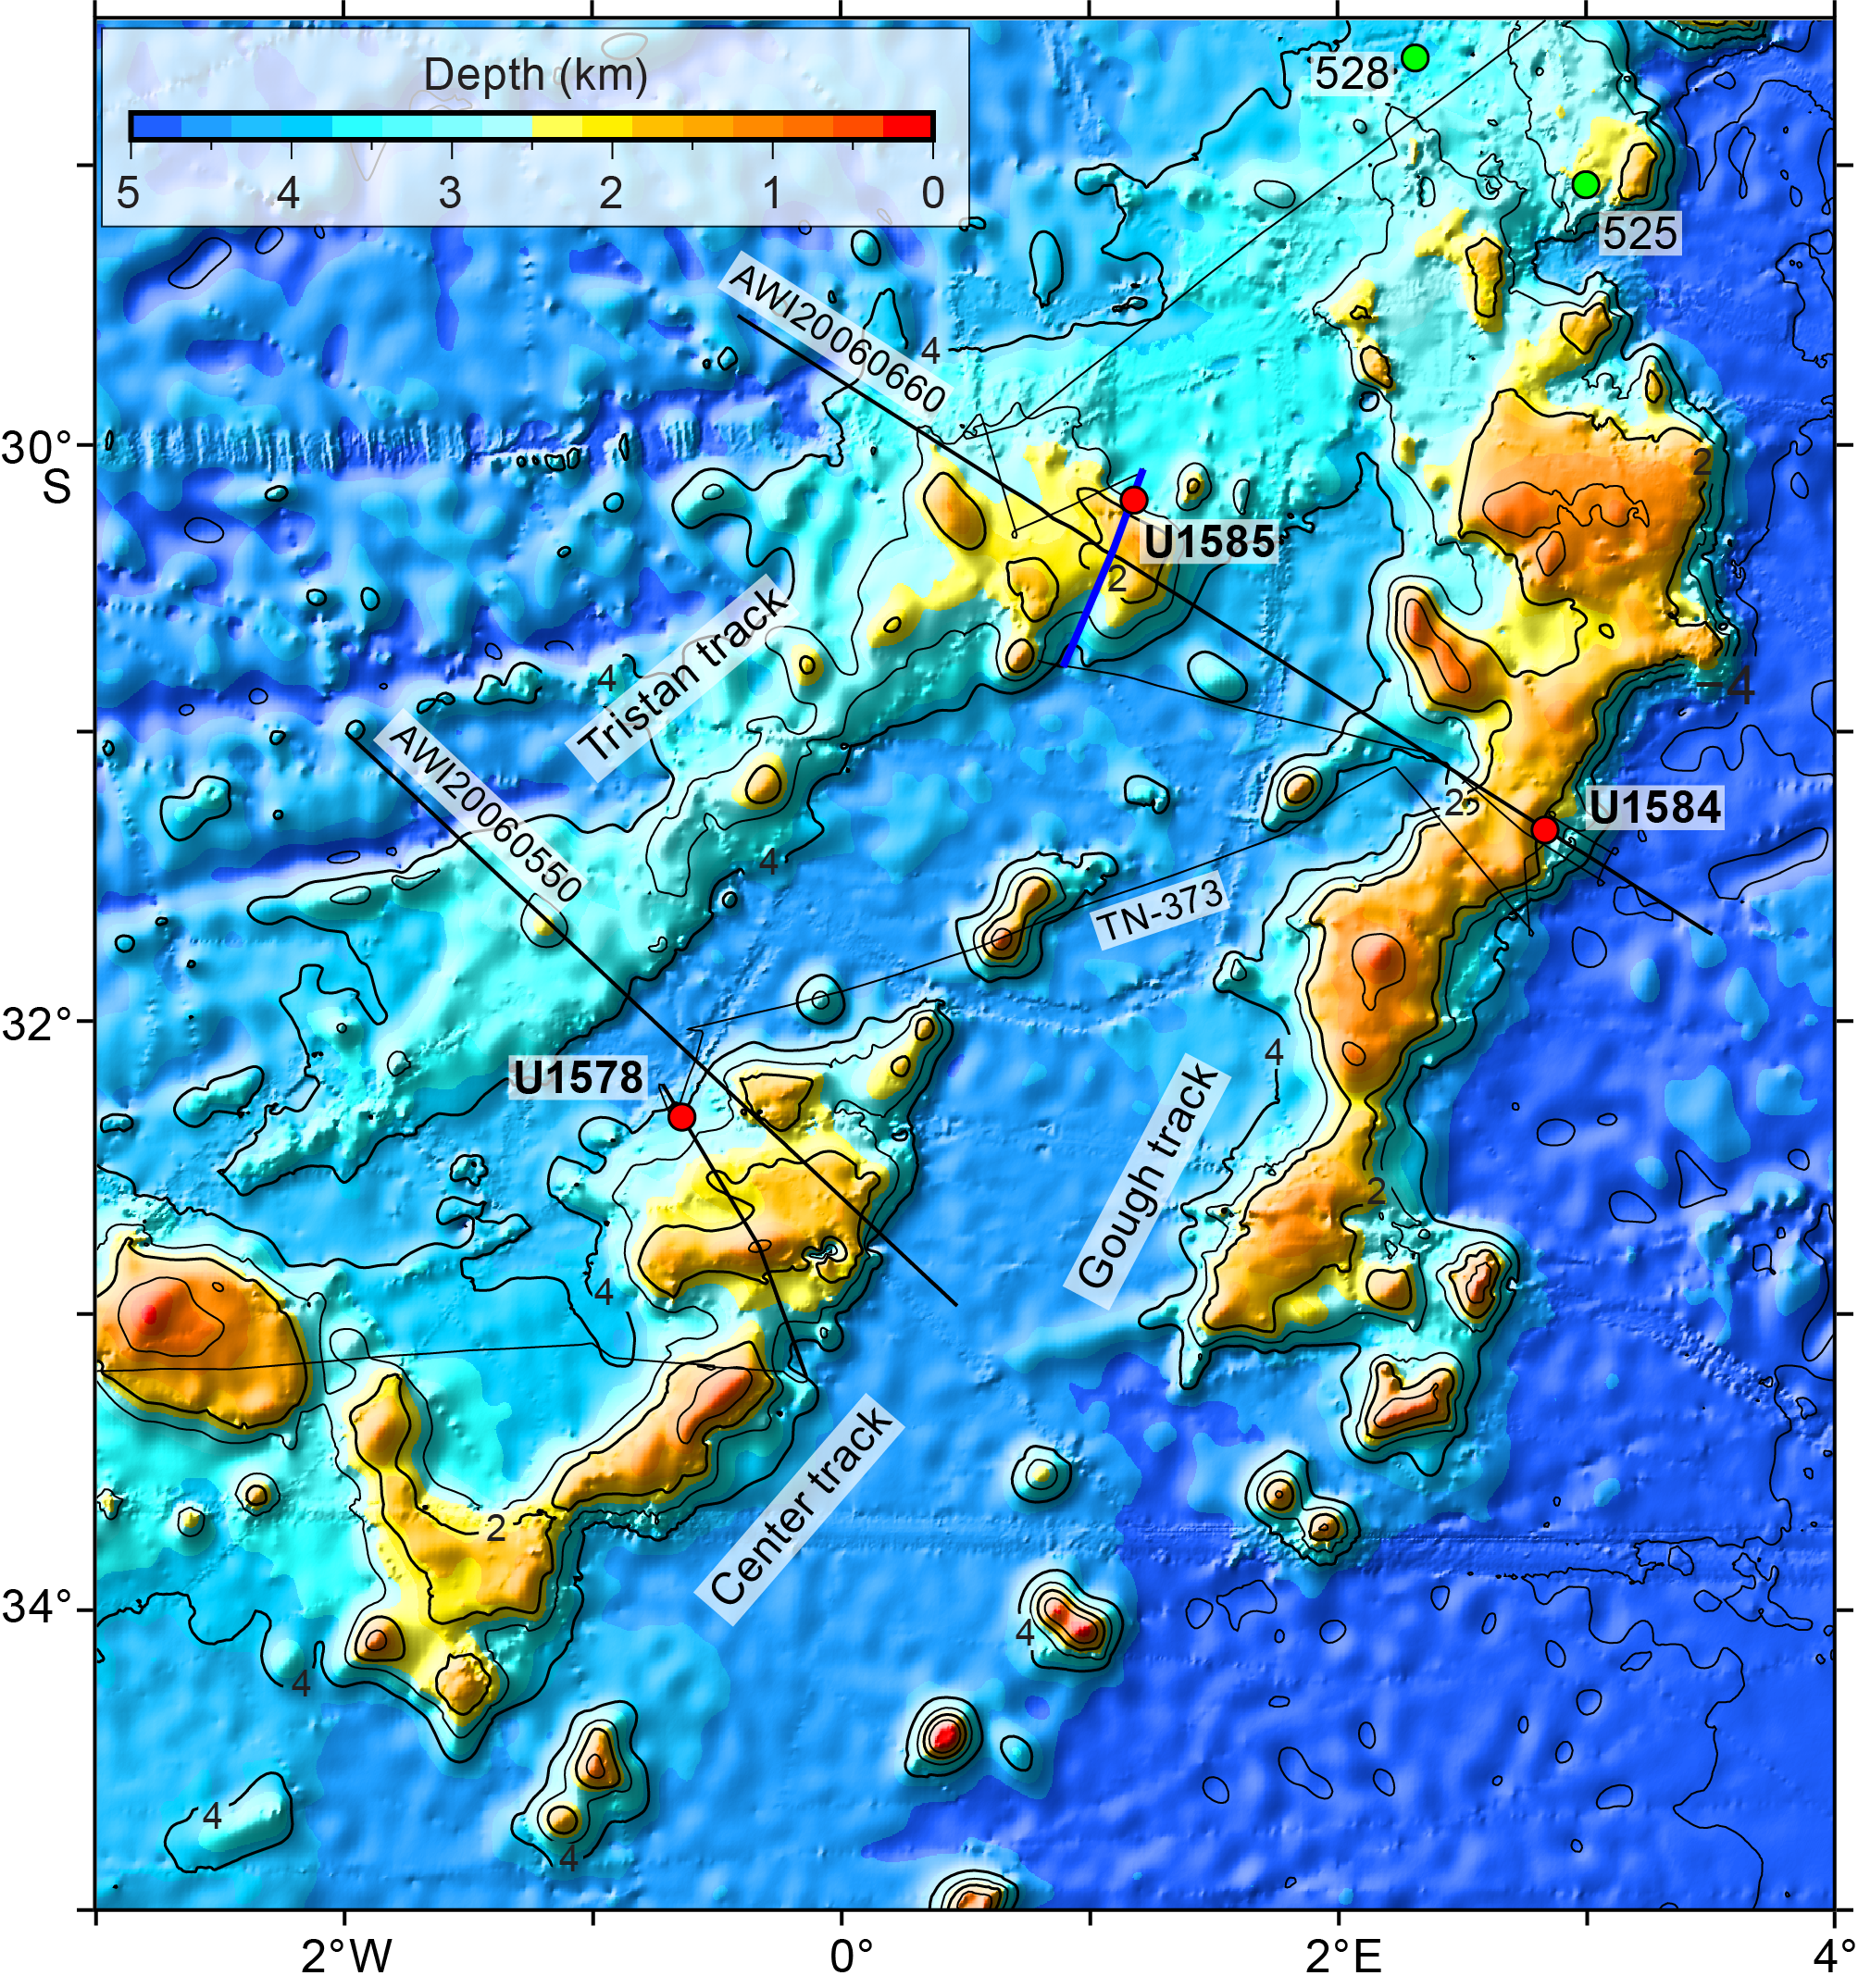
Figure F2. Northern Guyot Province.

Figure F3. Walvis Ridge age progression.
1.1. Operational strategy
Expedition 397T was allotted ~7 days of drilling time during a long transit. Coring the two sites would normally take longer than that. Therefore, the primary operational imperative was to minimize drilling time. A number of operational steps were taken to do so. Drilling with the rotary core barrel (RCB) bit was planned because it is the best for coring igneous rocks. Unfortunately, this choice usually means that soft-sediment cores suffer significant drilling disturbance. Originally, the plan was to core Site GT-4A, which is near the center of a midslope sediment package (Figure F4). The original estimate for sediment thickness was 302 m. Given Expedition 391 results, the velocity used to estimate the depth of the igneous interface was likely ~20% too low, so a better estimate was ~360 m. To reduce coring time through the sediment column, a new site was chosen upslope where the sediment package thins. This move cut the estimated sediment thickness to 164 m. Moreover, proponents requested the Environmental Protection and Safety Panel to approve drilling without coring to ~20 m above the igneous interface. This saved ~10 h of wireline core retrieval time. The request was granted, so Expedition 397T coring first established the mudline position and then cored with a center bit (which does not allow sediment to enter the core barrel) to ~20 m above estimated basement depth. In addition, the mudline was established by lowering the drill string to the depth indicated by the site survey bathymetry and the precision depth recorder (PDR). To save time, the team chose to establish the seafloor depth by retrieving a mudline core rather than using the alternative method, which involves lowering a camera to the seafloor to see the bottom depth.
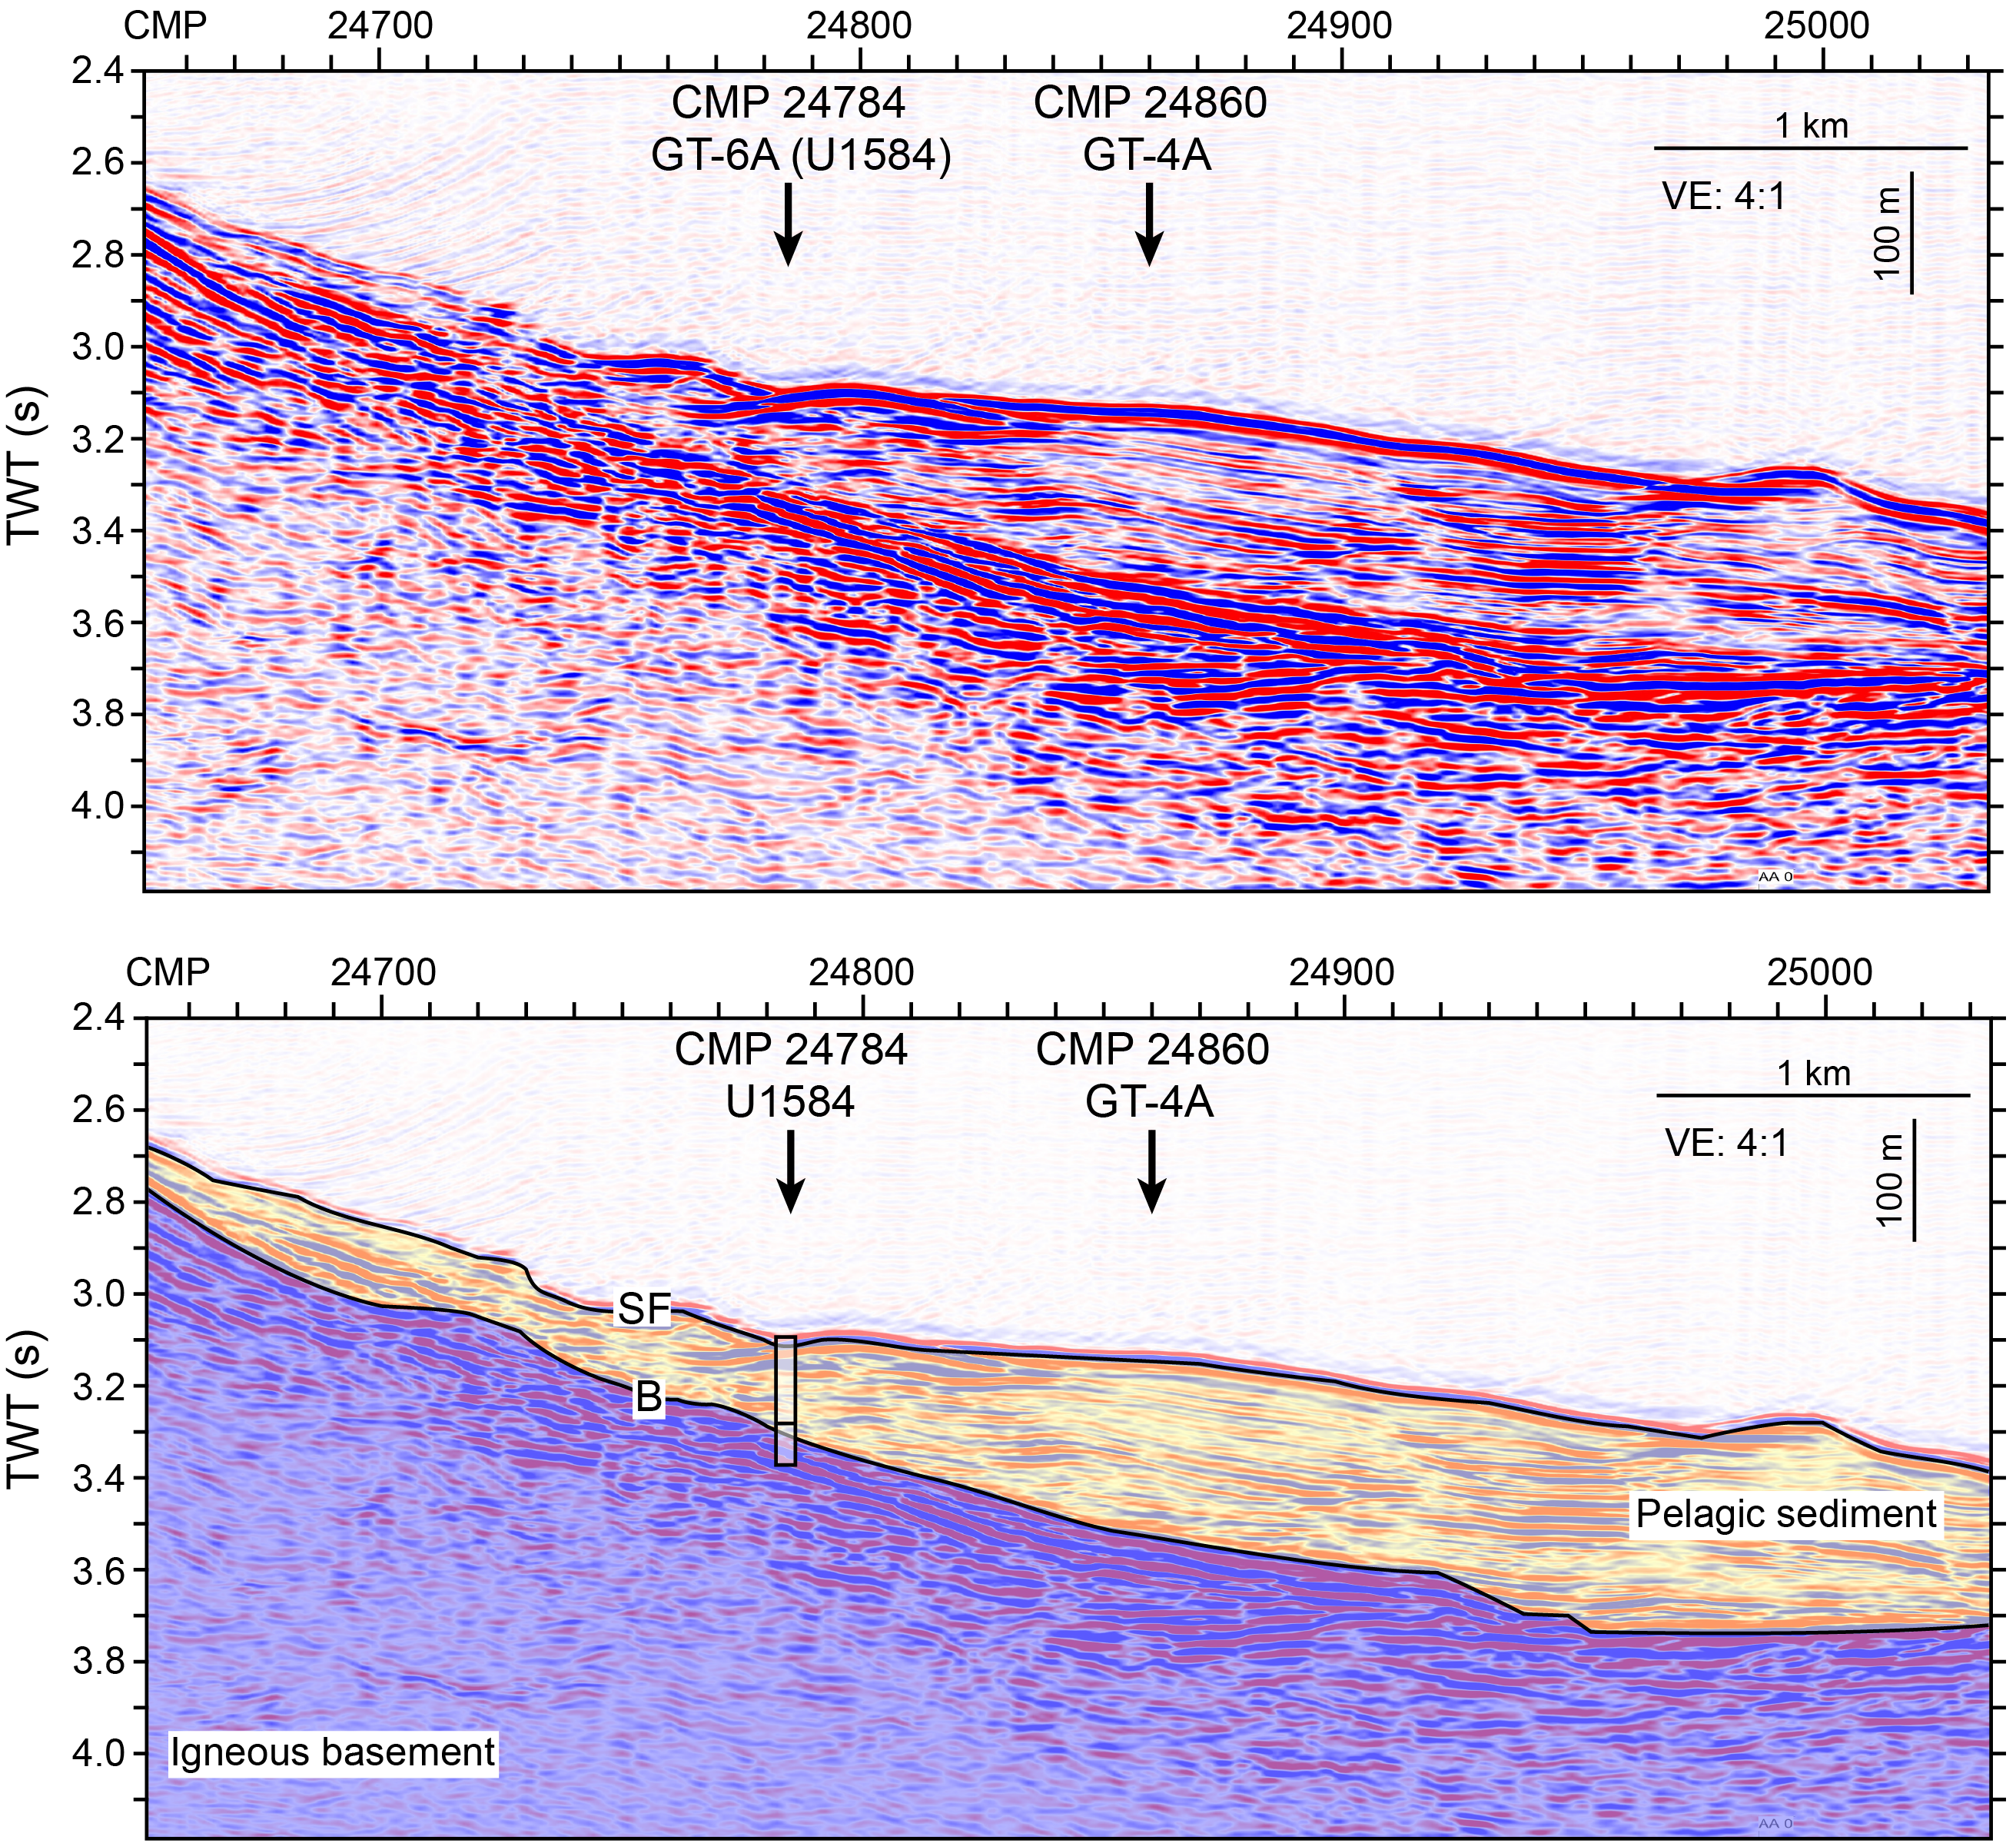
Figure F4. Seismic Line AWI-20060660.
1.2. Geochemical objectives
Site U1584 has the potential to provide important constraints on the geochemical evolution of the TGW track volcanism. Dredge samples from Walvis Ridge north of the DSDP Leg 74 sites (527, 528, and 525A, from northwest to southeast) are dominated by the Gough-type geochemical composition with rare exceptions (Hoernle et al., 2015; Homrighausen et al., 2019). Beginning at the DSDP Leg 74 sites and going to the Tristan and Gough Islands, the volcanic track shows geochemical zonation with enriched mantle one (EM1)-type compositions that can be divided into Tristan (low 207Pb/204Pb)- and Gough (high 207Pb/204Pb)-type compositions. Although Gough-type composition is predicted for the Gough track sites, this has yet to be established because dredging in this part of the Gough subtrack has been largely unsuccessful thus far. Therefore, Site U1584 (together with Site U1578 on the Center track and Site U1585 on the Tristan track) was chosen to test the zonation model for the northern part of the Guyot Province of the TGW track (Rohde et al., 2013; Hoernle et al., 2015; Homrighausen et al., 2019). More specifically, Site U1584 will serve as the southeast end-member for a possible mixing array formed by the three sites on the Guyot cross-hotspot-track profile, as is the case with the Leg 74 sites.
1.3. Geochronologic objectives
Site U1584 is located on a Gough subtrack Guyot Province ridge at a location where the predicted age from hotspot models is uncertain but ranges ~55–60 Ma (Figure F1). The age progression model of Homrighausen et al. (2019) predicts a slightly older age of 55–70 Ma (Figure F3). Although the age progression is fairly well constrained along the TGW hotspot track, one or more reliable radiometric dates from this site will help refine the age progression. Furthermore, the evolution of Walvis Ridge guyots and their age span of activity is poorly known because most are represented by a single date. By providing samples from a deep borehole, Site U1584 has the potential to aid in understanding the temporal evolution of a Guyot Province seamount. The location of Site U1584 on the middle flank was chosen with the expectation that this location would experience infrequent eruptions and therefore sample a large time span.
1.4. Paleomagnetic objectives
Site U1584 is an important location for examining the paleolatitude of the TGW hotspot and possible true polar wander because the expected guyot age is near that of the farthest south paleolatitudes implied by global paleomagnetic data (Figure F5). Analysis by Gordon and colleagues (Woodworth and Gordon, 2018; Zheng et al., 2018; Gordon et al., 2019) suggest that a true polar wander stillstand (i.e., no polar motion) occurred during the mid-Cenozoic, but prior to this time there was a true polar wander shift of ~5°. True polar wander was an early explanation for the paleolatitude difference between Suiko Seamount in the mid-Emperor chain relative to the present latitude of the hotspot (Gordon and Cape, 1981). Although southward hotspot motion has largely replaced true polar wander as an explanation for that shift (Tarduno et al., 2009; Koppers et al., 2012), true polar wander has not been ruled out. The determination of a reliable paleolatitude from Sites U1578, U1584, and U1585, with a small uncertainty estimate, can be used to test these two models. In addition, models of hotspot motion caused by mantle flow suggest that the TGW hotspot moved southward by ~7° since the Cretaceous (Doubrovine et al., 2012), but the paleolatitude inferred from the global paleomagnetic data implies northward motion (Figure F5). This northward post-Cretaceous motion of the TGW hotspot is the sense of motion that would be expected from true polar wander, with the spin axis moving away from the Pacific toward the Atlantic. The Hawaiian and TGW hotspots, being almost antipolar, would display different senses of motion (south in the Pacific; north in the Atlantic).
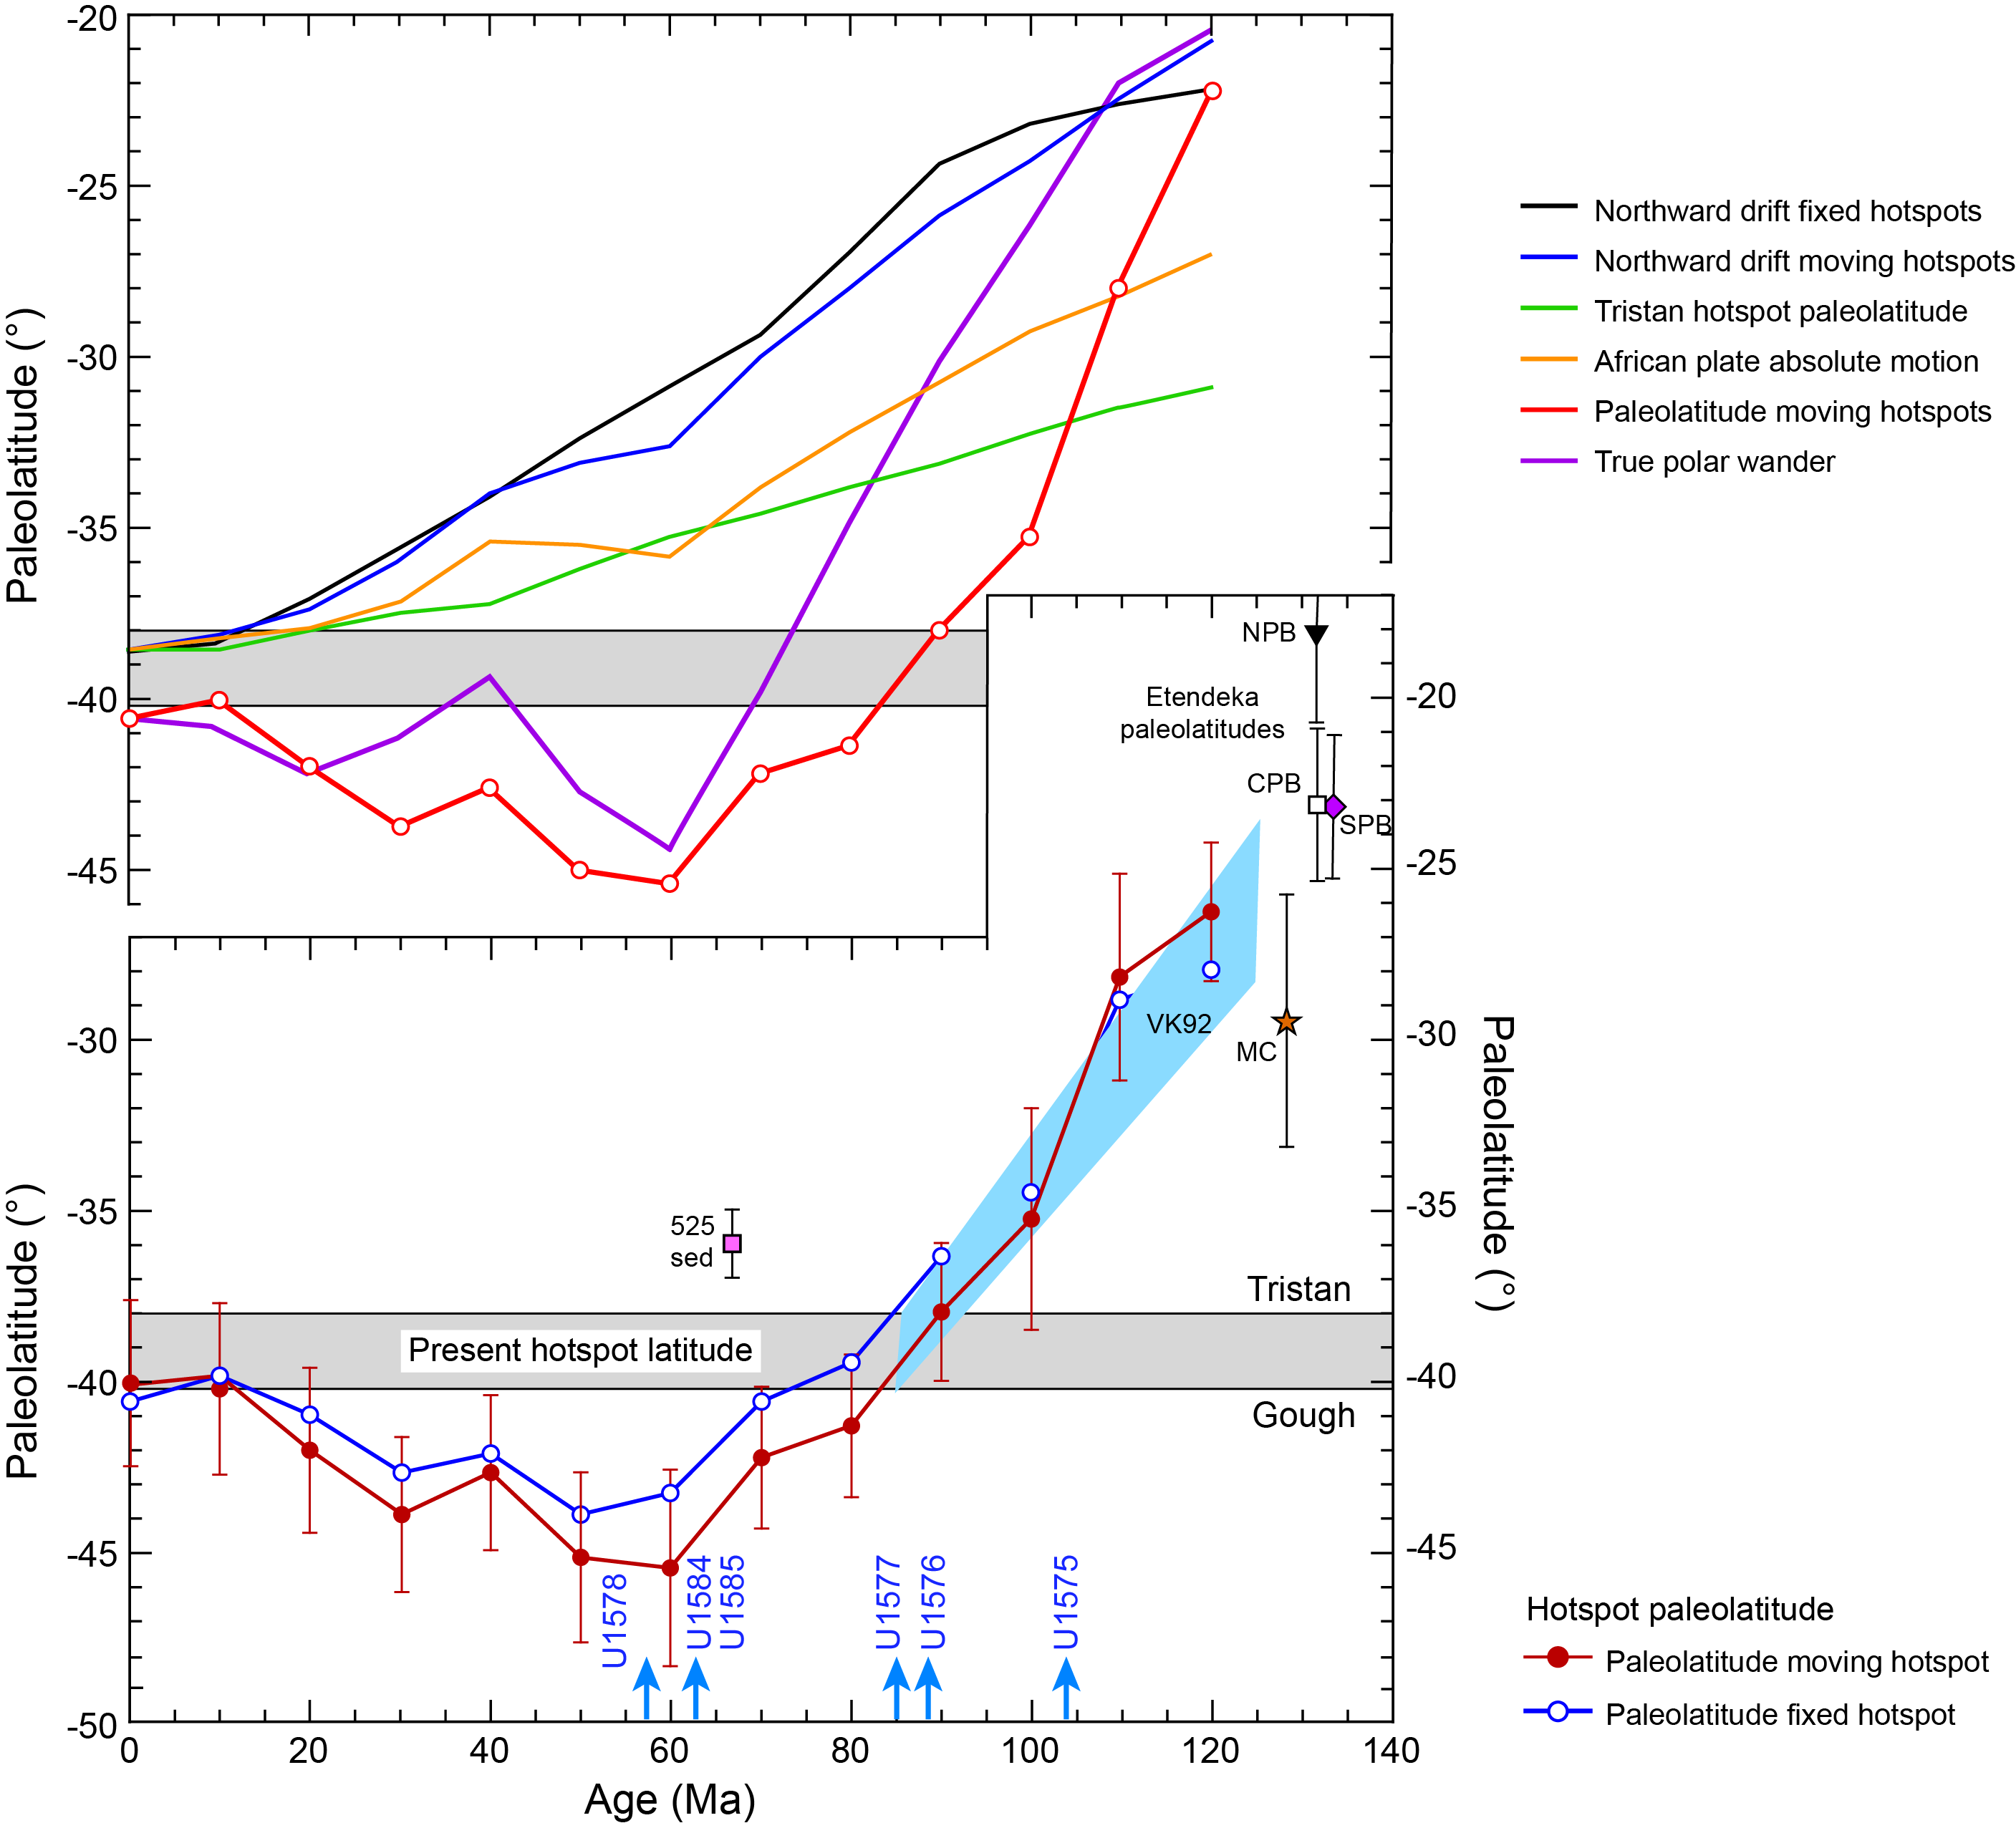
Figure F5. Predicted paleolatitude drift of the TGW hotspot, hotspot models, and true polar wander.
1.5. Volcanological objectives
Site U1584 samples a guyot on the southwestern end of the Walvis Ridge Guyot Province where the form of volcanic edifice appears much different than for the older Walvis Ridge. This difference implies several important volcanological questions. Was volcanism during formation of the guyots fundamentally different from the older ridge (e.g., compared to Sites U1575–U1577)? Will massive flows, common at previous sites, be fewer or absent? Will volcaniclastics, which are rare at Walvis Ridge sites, make up a larger part of the section? Coring at Site U1578 recovered a ~300 m igneous section with many sedimentary interbeds (Sager et al., 2023c), suggesting a long period of eruption. Is this typical of Walvis Ridge guyots? Studies of igneous rock types will seek to understand the volcanic development of this large guyot. Such studies are few, so Site U1584 will provide important information about midplate volcanism.
1.6. Sedimentologic objectives
Site U1584 is located ~1500 km from land in the middle South Atlantic Gyre. For this reason, sediments at this site may be different than those found on the older Walvis Ridge. Other sites showed cycles of sediment color and other properties that may be caused by paleoenvironmental changes. Moreover, Valdivia Bank sites showed thick carbonate sediment sections, even in deep water (e.g., Site U1577). Prior sites also demonstrated sediment sequences often punctuated by lengthy hiatuses. The abbreviated nature of the Site U1584 sediment column shown by seismic data (Figure F4) implies a truncated sedimentary history, perhaps caused by mass wasting or erosion. Although sediment coring was limited to basal sediments, Site U1584 sediment cores nevertheless offer the opportunity for comparison with other Walvis Ridge sites closer to land and for improving our understanding of South Atlantic sedimentation.
1.7. Site geophysics
Site U1584 is located on the eastern flank of an unnamed guyot ridge at the north end of the Gough track, at a water depth of ~2320 m (Figures F1, F6, F7). The drill site was picked on Seismic Line AWI-20060660, collected in 2006 by the R/V Polarstern. Bathymetry data show the site located on a midflank mound that appears to be an erosional sediment remnant (Figures F4, F7).
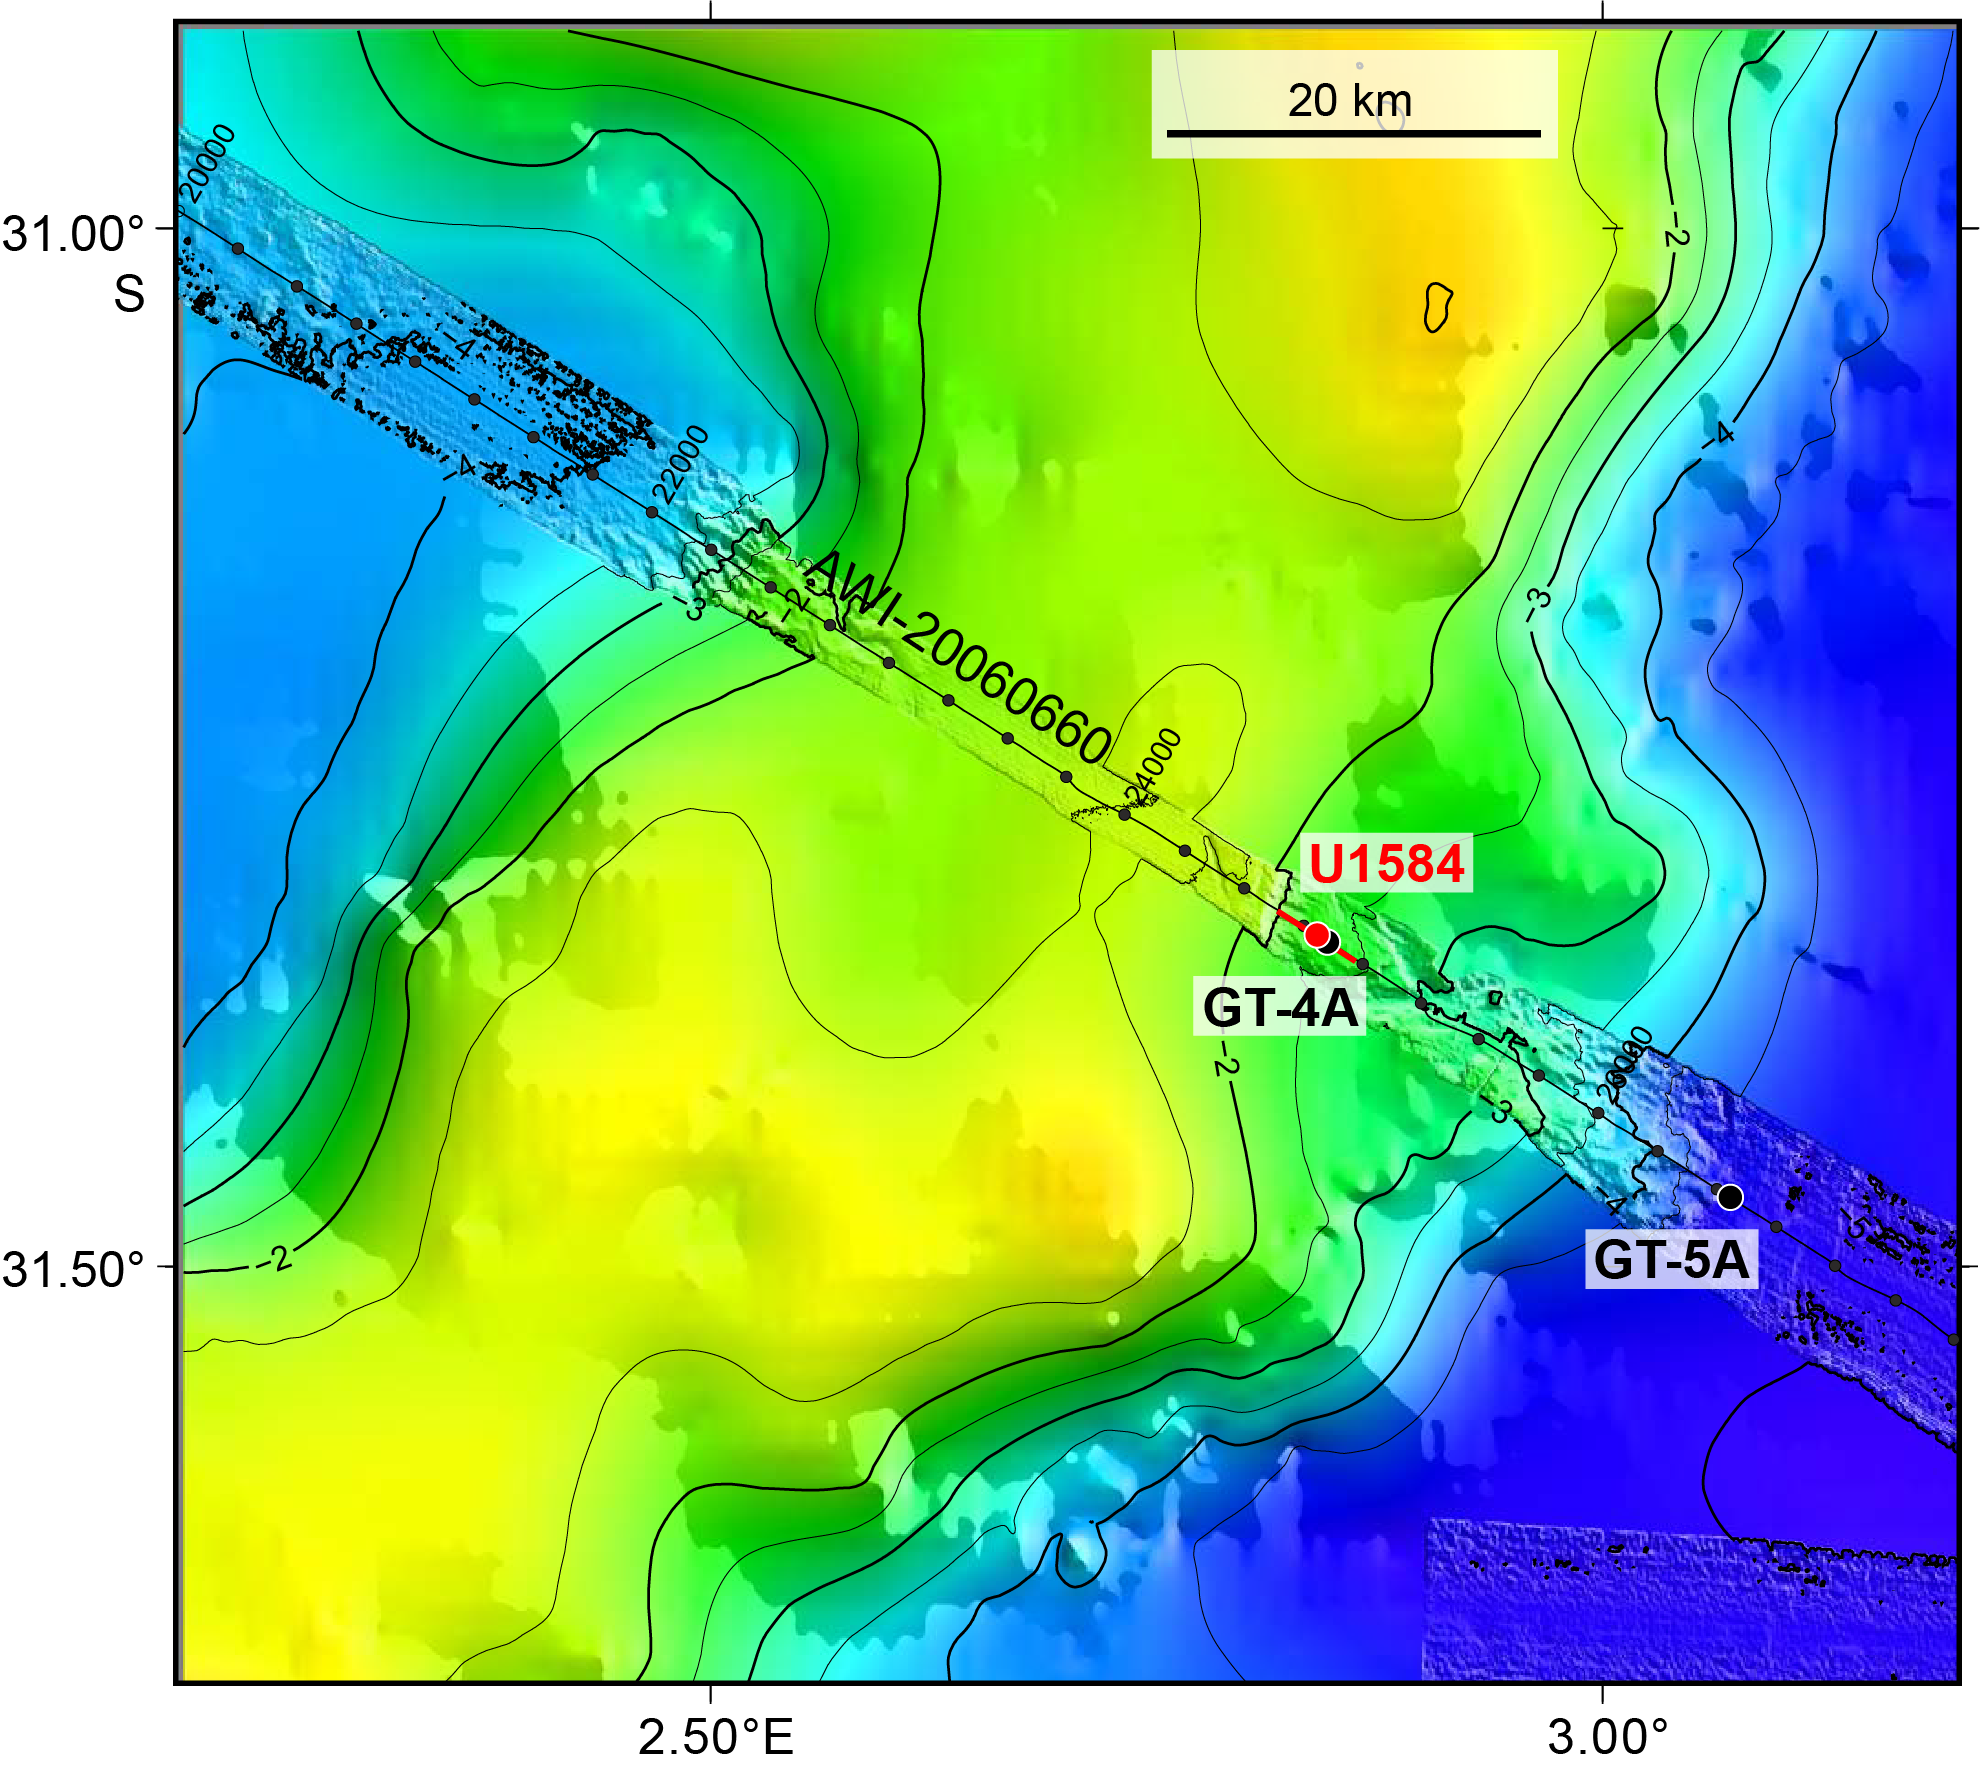
Figure F6. Gough track guyot ridge.

Figure F7. Multibeam bathymetry of Site U1584.
The AWI-20060660 profile shows a lens-shaped sediment layer ~360 m in maximum thickness (the thickness estimated on site forms, 302 m, is too low because the seismic velocity was underestimated; this revised thickness is based on Expedition 391 experience). Site GT-4A was picked near the point of maximum thickness. To save time, Site U1584 was chosen at the upslope end of the sediment package, where the estimated thickness is ~164 m. Acoustic basement is a strong horizon (Figure F4) interpreted as the top of the igneous section. Sediment thickness varies greatly along the profile (Figure F4), implying that overall sediment accumulation rate is highly variable laterally, probably because of erosion by bottom currents or downslope mass wasting. Based on recovery at Site U1578 and other drill sites in the region (e.g., Bartels et al., 2007; Sager et al., 2023c), the topmost layer is probably Cenozoic pelagic ooze, whereas the lower section is early Cenozoic or Late Cretaceous chalk. Upslope on the seismic profile, it appears that the lower layers onlap the basement horizon farther west, so the sediment package may mostly consist of late Cenozoic layers. Those layers are difficult to interpret on the seismic profile at the location of Site U1584 because of the abbreviation of the sediment package.
2. Operations
Expedition 397T began on 10 September 2022 at 0800 h (UTC + 2) with the ship tied up at Duncan Dock E in Cape Town, South Africa. All oncoming Expedition 397T personnel, including 22 JOIDES Resolution Science Operator (JRSO) staff and 8 scientists, moved onto the ship following a 4 day hotel quarantine. The quarantine included a polymerase chain reaction (PCR) test and an antigen test according to the COVID-19 mitigation protocol. All personnel tested negative. Once on board, all shipboard personnel received another COVID-19 PCR test, and all were negative. Port call activities continued, including the loading of 500 metric tons of fuel and fresh food. COVID-19 mitigation protocols continued to be followed. One more JRSO staff member came on board before the pilot boarded and the ship departed Cape Town on 12 September at 1018 h.
At 0200 h on 15 September, the ship's clock was set back 1 h to UTC + 1 h. We completed the 810 nmi voyage from Cape Town and arrived at Site U1584 at 0830 h. The thrusters were deployed, and a drill string with an RCB bottom-hole assembly (BHA) and a C-4 coring bit was assembled. At 1630 h, the top drive was engaged, and a pipe cleaning device (pig) was deployed to clear potential rust and other obstructions from the drill pipe. We estimated the seafloor at 2313 meters below rig floor (mbrf) based on the corrected PDR signal. At 1800 h, the first core barrel was dropped from 2310 mbrf, and the liner returned empty. The driller observed a tag at 2315.9 mbrf while lowering the core barrel. For the second attempt, the barrel was dropped from 2315.9 mbrf. The liner returned empty again except for sediment residue smeared all along its length, indicating that the barrel had penetrated the formation but could not hold the sediment. At 2005 h, we declared the seafloor depth at 2315.9 mbrf and deployed the core barrel. The barrel with center bit had to be deployed twice because no indication of landing was detected the first time. We started to drill Hole U1584A without coring, reaching the target at 141.8 meters below seafloor (mbsf) at 0515 h on 16 September. The wash barrel was retrieved, and the RCB core barrel was deployed. RCB coring proceeded with Cores 397T-U1584A-3R through 9R (141.8–208.2 mbsf), and core recovery ranged 0%–95% (average = 36%) (Table T1). The hole was swept with 30 bbl (4769.6 L) of sepiolite mud after Cores 5R (170 mbsf) and 9R (208.2 mbsf).
At 2215 h on 16 September, we decided to terminate operations at Site U1584 because the seismic basement reflector turned out to be the top of a potentially thick succession of volcaniclastic sediments rather than the desired basaltic lava flows. We retrieved the drill string from Hole U1584A, and the bit cleared the rig floor at 0605 h on 17 September. The rig floor was secured, the thrusters were raised, and we departed Site U1584 at 0700 h.
COVID-19 mitigation protocols continued to be followed with mask wearing, social distancing, and antigen testing of all personnel. Four individuals tested positive for COVID-19 after boarding the ship on 11, 13 (2), and 15 September. They were isolated until antigen tests on two successive days, starting on day five, were negative.
3. Lithostratigraphy
A ~65 m thick succession consisting of chalky pelagic sediment passing into highly bioturbated sandy silts with clays and foraminifera (Unit I), followed by a distinct lithologic change to a volcaniclastic-dominated succession composed of greenish pumice lapilli and fragmentary volcanic lapilli and blocks (Unit II) was cored in Hole U1584A. The hole ended at 207.75 mbsf. No igneous basement was encountered. The two main lithostratigraphic units and associated subunits can be recognized in the overlying sedimentary cover and summarized as follows (Figure F8; Table T2):
- Subunit IA (base = 150.80 mbsf; Section 397T-U1584A-3R-1; recovery = 3%): consolidated/lithified pale pinkish gray bioturbated clayey nannofossil chalk. Drilling disturbance is high, and the very limited recovery consists of three larger (5–8 cm) pieces with smaller gravel-sized fragments.
- Subunit IB (150.80–153.64 mbsf; lower boundary = Section 397T-U1584A-4R-CC, 16 cm; recovery = 29%): consolidated/lithified pale brown bioturbated silty sand with volcaniclastics, a clay component, and foraminifera. A homogeneous, heavily bioturbated succession preserves no obvious internal lamination or bedding except occasional layers of moderately well sorted medium sand. Recovery is relatively poor with moderate drilling disturbance throughout.
- Subunit IC (142.1–164.84 mbsf; lower boundary = Section 397T-U1584A-5R-4, 64 cm; recovery = 48%): lithified reddish brown silty sandstone with volcaniclastic and clay components and foraminifera. A homogeneous, heavily bioturbated succession preserves little internal lamination or bedding; infrequent layers of moderately well sorted medium sand and gravel and rare individual bioclasts (bivalve shell fragments?) are observed. There is moderate recovery with slight drilling disturbance in longer recovered sections.
- Subunit IIA (164.84–193.43 mbsf; lower boundary = Section 397T-U1584A-8R-3, 60 cm; recovery = ~26%; note Core 6R had no recovery): lithified greenish yellow pumiceous lapillistone containing a minor component of brownish volcaniclasts and irregular-shaped blocks. This is an unstratified succession of predominantly lapilli-sized green pumice fragments, with a downward increasing component of basaltic lithic fragments and blocks. The interstitial matrix is fine-grained gray ash-like material, calcite, and zeolite. Recovery improved downhole with increasing degrees of lithification and cementation (Core 4R = 29%; Core 5R = 48%). Core 7R showed moderate drilling disturbance; Core 8R showed slight or no drilling disturbance.
- Subunit IIB (193.43–207.75 mbsf; lower boundary not determined = Section 397T-U1584A-9R-CC, 29 cm, end of hole; recovery = ~95%): lithified olive-brown volcanic breccia consisting of oxidized pumiceous lapillistone and brown volcaniclastics with blocks. This is an unstratified succession of roughly equal content of oxidized (reddened) pumice and altered basaltic lithic fragments and blocks. The interstitial matrix is fine-grained gray ash-like material and zeolite. There was no drilling disturbance in Core 9R.

Figure F8. Lithostratigraphic summary.
The sedimentary cover at Site U1584 is composed of three lithofacies that correspond to the unit and/or subunit divisions. Unit I contains two lithofacies. Lithofacies 1 is bioturbated clayey nannofossil chalk; recovered fragments vary in color. Lithofacies 2 consists of near-homogeneous, highly bioturbated, pale brown to reddish silty sand combining varying degrees of pelagic carbonate sedimentation and volcaniclastic input. Lithofacies 3 is a dominantly volcaniclastic succession consisting of relatively fresh to oxidized lapilli-sized pumice fragments mixed with similarly sized basalt fragments and occasional basaltic blocks (see Basaltic clast summary below); these components are increasingly lithified downhole and cemented by a mixture of interstitial altered ash and zeolite.
3.1. Lithostratigraphic Unit I
Unit I is a ~23 m thick succession of bioturbated clayey nannofossil chalk (Lithofacies 1) passing down into highly bioturbated pale brown to reddish silty sand combining a varying degree of pelagic carbonate sedimentation and volcaniclastics with minor tephra interbeds (Lithofacies 2). The unit is highly bioturbated throughout, effectively erasing any original bedding or sedimentary structures with the exception of sparse coarser beds of sand or gravel volcaniclastics and lithics. Because these have also been affected by bioturbation, it is not possible to determine whether these represent tephra fall or material brought in by turbidite or bottom currents.
Unit I is divided into three subunits based on significant composition or color changes in the clayey silty sand unit (i.e., rapid change from pale brown to reddish brown at the base of a tephra band in Section 397T-U1584A-4R-CC, 16 cm), together with a change to a finer more silt- and carbonate-rich composition.
3.1.1. Lithostratigraphic Subunit IA
Subunit IA is of unknown thickness and consists of consolidated/lithified pale pinkish gray bioturbated clayey nannofossil chalk (Lithofacies 1) indicative of a deep-marine depositional environment (Figure F9A). The pale clayey nannofossil chalk has high CaCO3 (67 wt%; n = 1), with the increasingly pink fragments yielding progressively lower CaCO3 (45–21 wt%; n = 2) in Section 397T-U1584A-3R-1.
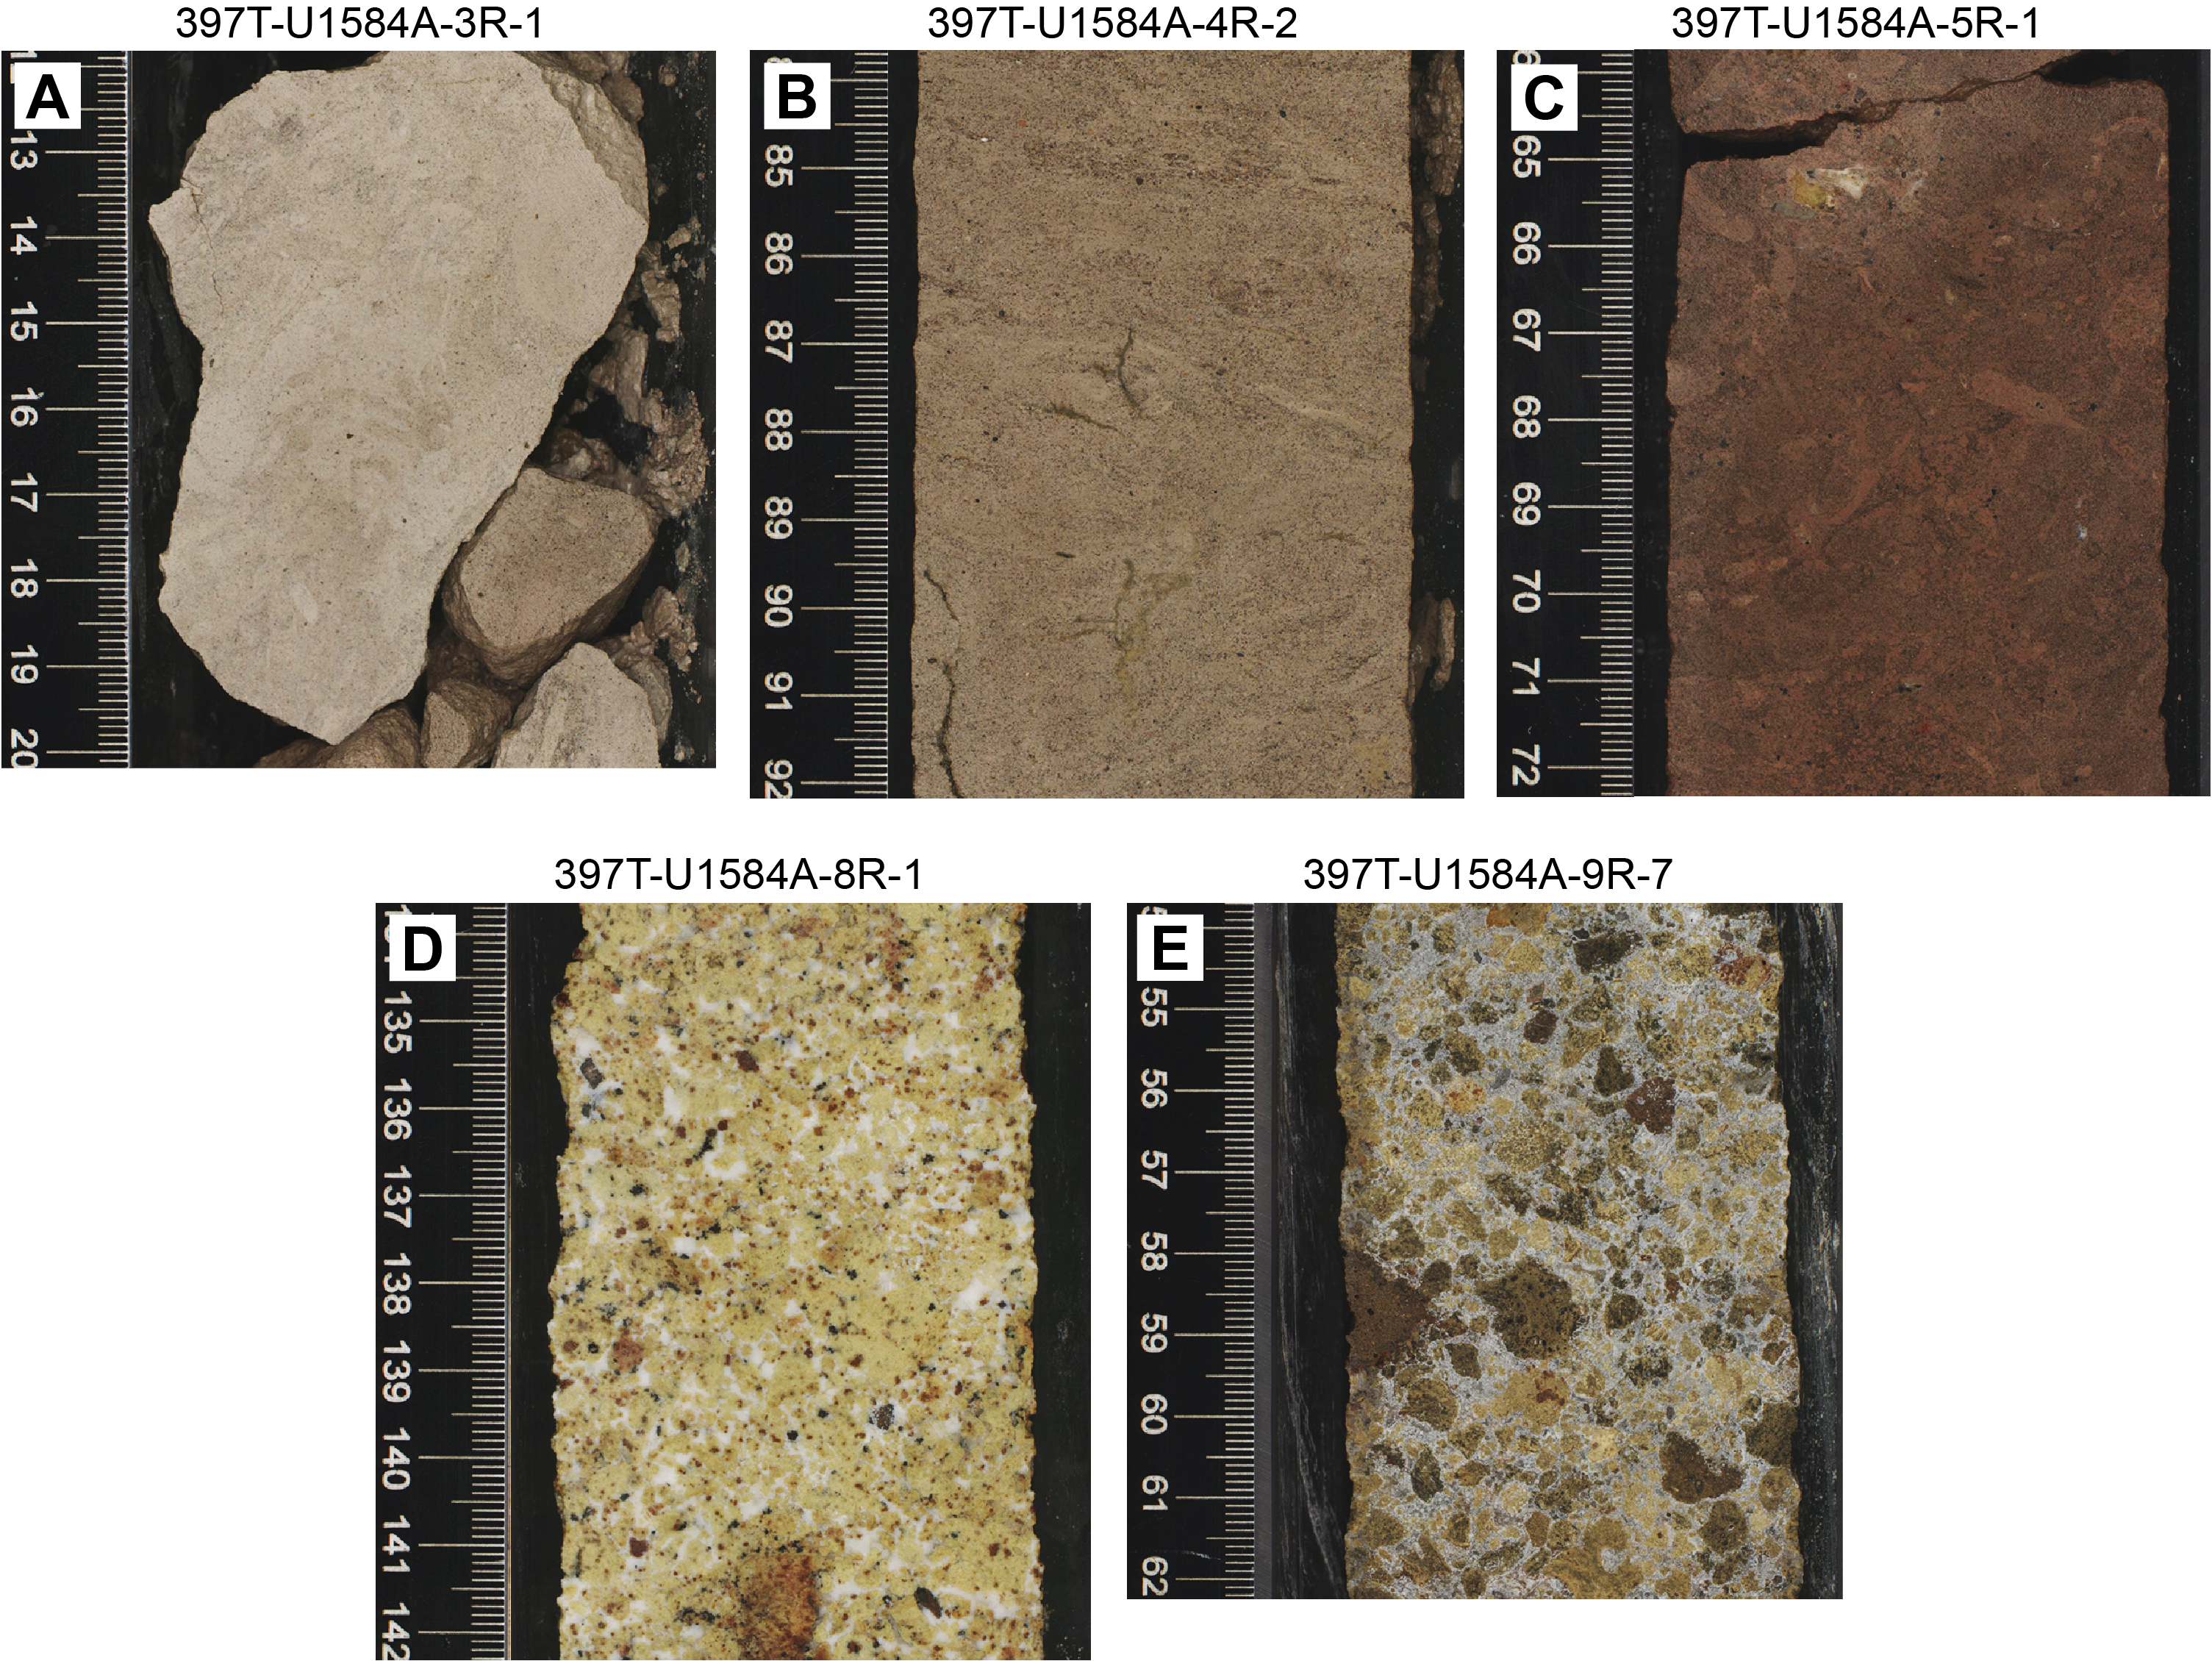
Figure F9. Representative intervals of units and subunits.
3.1.2. Lithostratigraphic Subunit IB
Subunit IB is an approximately <3 m thick succession of pale brown bioturbated silty sand with volcaniclastic and clay components and foraminifera. It is a homogeneous, heavily bioturbated succession preserving no obvious internal lamination or bedding except infrequent ungraded sandy or gravel-sized tephra layers (ash to tuff) with a thickness of ~2 cm (Figure F9B). Extensive bioturbation indicates a well-oxygenated seafloor environment at moderate to deeper marine depth. It was not possible to determine whether the layers are primary tephra fall, secondary deposits locally, or partly reworked by turbidity and/or bottom currents. This subunit has lower CaCO3 (25–28 wt%; n = 2).
3.1.3. Lithostratigraphic Subunit IC
Subunit IC is an ~11 m thick succession of heavily bioturbated silty sands forming the base of Lithofacies 2. An abrupt color change provides the upper boundary to Subunit IC, which consists of reddish brown silty sandstone with volcaniclastic and clay components and foraminifera (Figure F9C). This subunit is a heavily bioturbated succession that preserves little internal lamination or bedding and infrequent layers of moderately well sorted medium sand and gravel and rare individual bioclasts (bivalve shell fragments?) and represents moderate depth trending toward deeper marine deposition. The cores preserve infrequent development of Mn dendrites in some larger burrows. Increased clay and volcaniclastic components result in lower CaCO3 (~20 wt%; n = 2) that locally increases to 40 wt% (Section 5R-4 just above the boundary with Unit II).
3.2. Lithostratigraphic Unit II
An abrupt boundary near the base of Section 397T-U1584A-5R-4, 64 cm, marks the upper boundary of Unit II (Lithofacies 3). The precise boundary contact is not preserved due to drilling fracturing, but the overlying brown to reddish silty sands with variable nannofossil and microfossil carbonate content clearly overlie a coarse, dominantly volcaniclastic succession consisting of varying proportions of green to reddened (oxidized) pumice mixed with often significantly altered basaltic lithic fragments and blocks of varying type (Figure F10B). Two subunits are recognized in this unit (Lithofacies 3) based on a change in component proportions in the upper part of Core 5R.

Figure F10. Key elements in selected subunits.
3.2.1. Lithostratigraphic Subunit IIA
Subunit IIA is a ~30 m thick succession of predominantly lapilli-sized yellow-green pumice fragments consisting of highly (micro-)vesicular volcanic glass (Lithofacies 3). Fragments are typically angular to less commonly subrounded, indicating a fragmentation process and relatively little posteruptive transport. Pumice fragments are in 3-D contact with interstices partially filled with fine white ash-like material, together with, and partially replaced by, secondary carbonate (calcite) and zeolite cement (Figure F9D). Because pumice fragments are easily abraded and rounded, these materials suggest a primary tephra fall into and deposition in a marine environment. This is further supported by the fresh, unaltered pumice and lack of oxidation or weathering prior to deposition (Figure F10C). The succession contains little obvious internal structure; however, crude grading may be recognized from coarser lapilli with volcanic blocks to smaller pumice lapilli with infrequent lapilli-sized basaltic volcaniclasts. Accordingly, two very broad fining-upward cycles can be discerned in Sections 397T-U1584A-9R-5 through 7R-1; these could represent pulsing of the volcanic ejecta output during eruption. Volcanic blocks are all basaltic, typically angular, and vary from vesicular basalt fragments to aphanitic material and fine-grained olivine-phyric (oxidized and altered to iddingsite) basalt lava fragments. The variety of basaltic volcaniclasts likely represents country rock entrained from preexisting volcanic basement during the eruption event. Photomicrographs of key components are provided in Figure F11. The petrography and composition of these lithic blocks is described in Basaltic clast summary.

Figure F11. Photomicrographs.
3.2.2. Lithostratigraphic Subunit IIB
Subunit IIB is recognized because it is darker (olive-green to brown) due to a greater proportion of basaltic clasts (~50:50 pumice and basalt), a reduction in dominant clast size, and a greater frequency of subrounded pumice lapilli (Lithofacies 3) (recovery = approximately <15 m) (Figure F9E). This color and compositional change corresponds to a step increase in density from ~1.8 to 2.2 g/cm3 and reduction in porosity from 40–60 vol% in Subunit IIA to <25 vol% in Subunit IIB (see Physical properties). These changes, together with more obvious brown oxidation, may indicate a greater degree of transportation and alteration prior to deposition and/or compositional variation indicative of an earlier eruptive event. Also present are sparse, rounded, internally zoned lapilli; oxidative alteration reveals layers of accreted ash around an amorphous core, an armored accretionary lapilli typical of more ash-rich eruptions (Figure F10D).
In summary, deposition of the succession as a whole indicates a change from volcaniclastic-dominated, in which the main preserved eruptive products were highly vesicular pumices with basaltic lithic fragments and fine ash, to carbonate pelagic sedimentation. Basaltic fragments include occasional cobble or block-sized fragments. The degree of alteration and rounding of pumice clasts decreases upward from Unit II to Unit I, which could indicate derivation from temporally separated volcanic events. Lack of sedimentary sorting or depositional intercalation indicates these are tephra fall from a locally emergent eruptive source. Crude layering in Unit I may be caused by eruptive pulsing during the later event. The overlying sediments of Unit I are fine to medium clayey sands passing into deeper water clayey silts with a concomitant decrease in volcaniclastic component and finally into pelagic chalks with minimal clastic component. There are infrequent arenaceous volcaniclastics (likely turbiditic incursions) in Subunits IB and IC, most probably sourced from shallower shoals.
3.3. Basaltic clast summary
3.3.1. Macroscopic
In Lithostratigraphic Unit II, basalt clasts >1 cm in diameter, ranging up to 6 cm, show a range of mineralogy and porphyritic aphanitic textures (Figure F12). No volcanic glass was observed. Highly phyric clasts, as a whole, contain abundant olivine phenocrysts (8%–10%) with some pyroxene (1%–3%). All olivine is partly to completely altered to iddingsite, whereas pyroxene shows varying degrees of alteration. Plagioclase is present but almost entirely as a groundmass phase. A minor highly phyric clast population lacks olivine but contains abundant plagioclase (10%) with minor pyroxene phenocrysts (2%). Moderately and sparsely phyric basalt clasts have lower olivine (0%–7%) with more plagioclase phenocrysts (0%–5%). Pyroxene is often present in low amounts (0%–2%). Texturally, olivine is found as single crystals or small crystal clusters. Plagioclase phenocrysts range from blocky to elongate crystals with variable degrees of alteration to sericite. Pyroxene is present in thin, blocky crystals with only minor visible alteration. Aphyric clasts are also present but represent a minor component compared to other basaltic clasts. These clasts contain microphenocrysts of iddingsite after olivine in an otherwise microcrystalline groundmass. Vesicle abundance varies widely, with some vesicle-free clasts and others containing up to 30% vesicles. Vesicles commonly contain alteration minerals ranging from a thin zeolite lining to being completely filled with calcite.
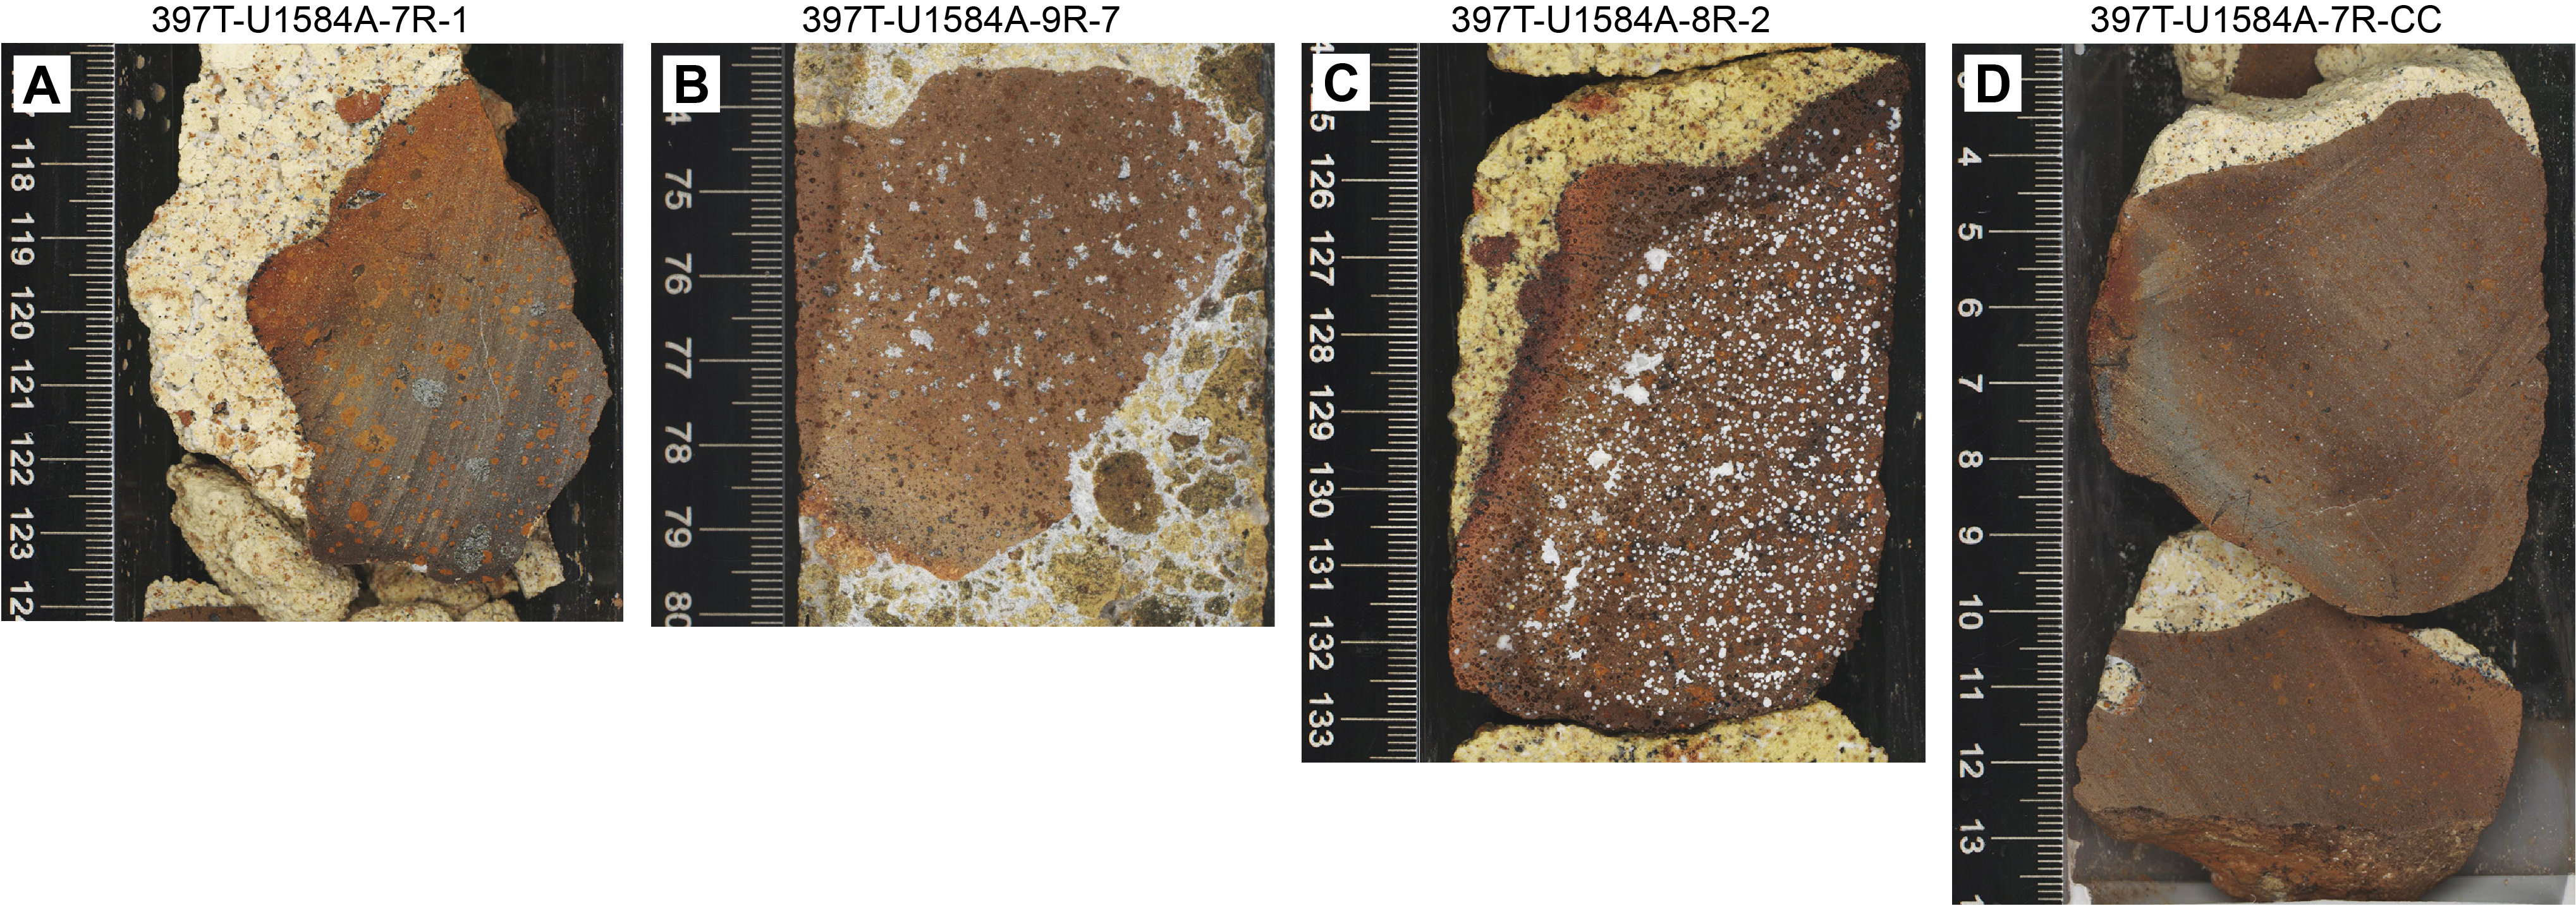
Figure F12. Basalt clasts.
3.3.2. Microscopic
Four representative basalt clasts were selected for thin sectioning. Most are moderately to highly olivine-phyric basalts with clinopyroxene and/or plagioclase phenocrysts. Olivine phenocrysts (8%–11%) are euhedral to subhedral and completely replaced by iddingsite and/or calcite (Figure F13). Clinopyroxene phenocrysts (1%–2%) are subhedral and show only minor alteration. Plagioclase phenocrysts are sparse (1%–2%) and elongate and show mild to moderate sericitization. Groundmass plagioclase is far more abundant (10%–40%) than plagioclase phenocrysts and exhibit pilotaxitic to trachytic textures. When present, groundmass olivine is also abundant (12%–13%) but completely altered to iddingsite. Groundmass clinopyroxene (4%–5%) is reasonably fresh. Oxides are restricted to a groundmass phase and range 0%–12%. Mesostasis ranges 40%–60% and is completely altered, but alteration minerals vary. Sparse vesicles are present in one of the thin sections. These vesicles are small (0.1–0.3 mm), round, and lined with a secondary mineral. One of the thin sections sampled an aphyric basalt clast. Groundmass olivine (3%) and plagioclase (30%) crystals are small (<0.5 mm). Olivine is altered, but plagioclase is mostly fresh.
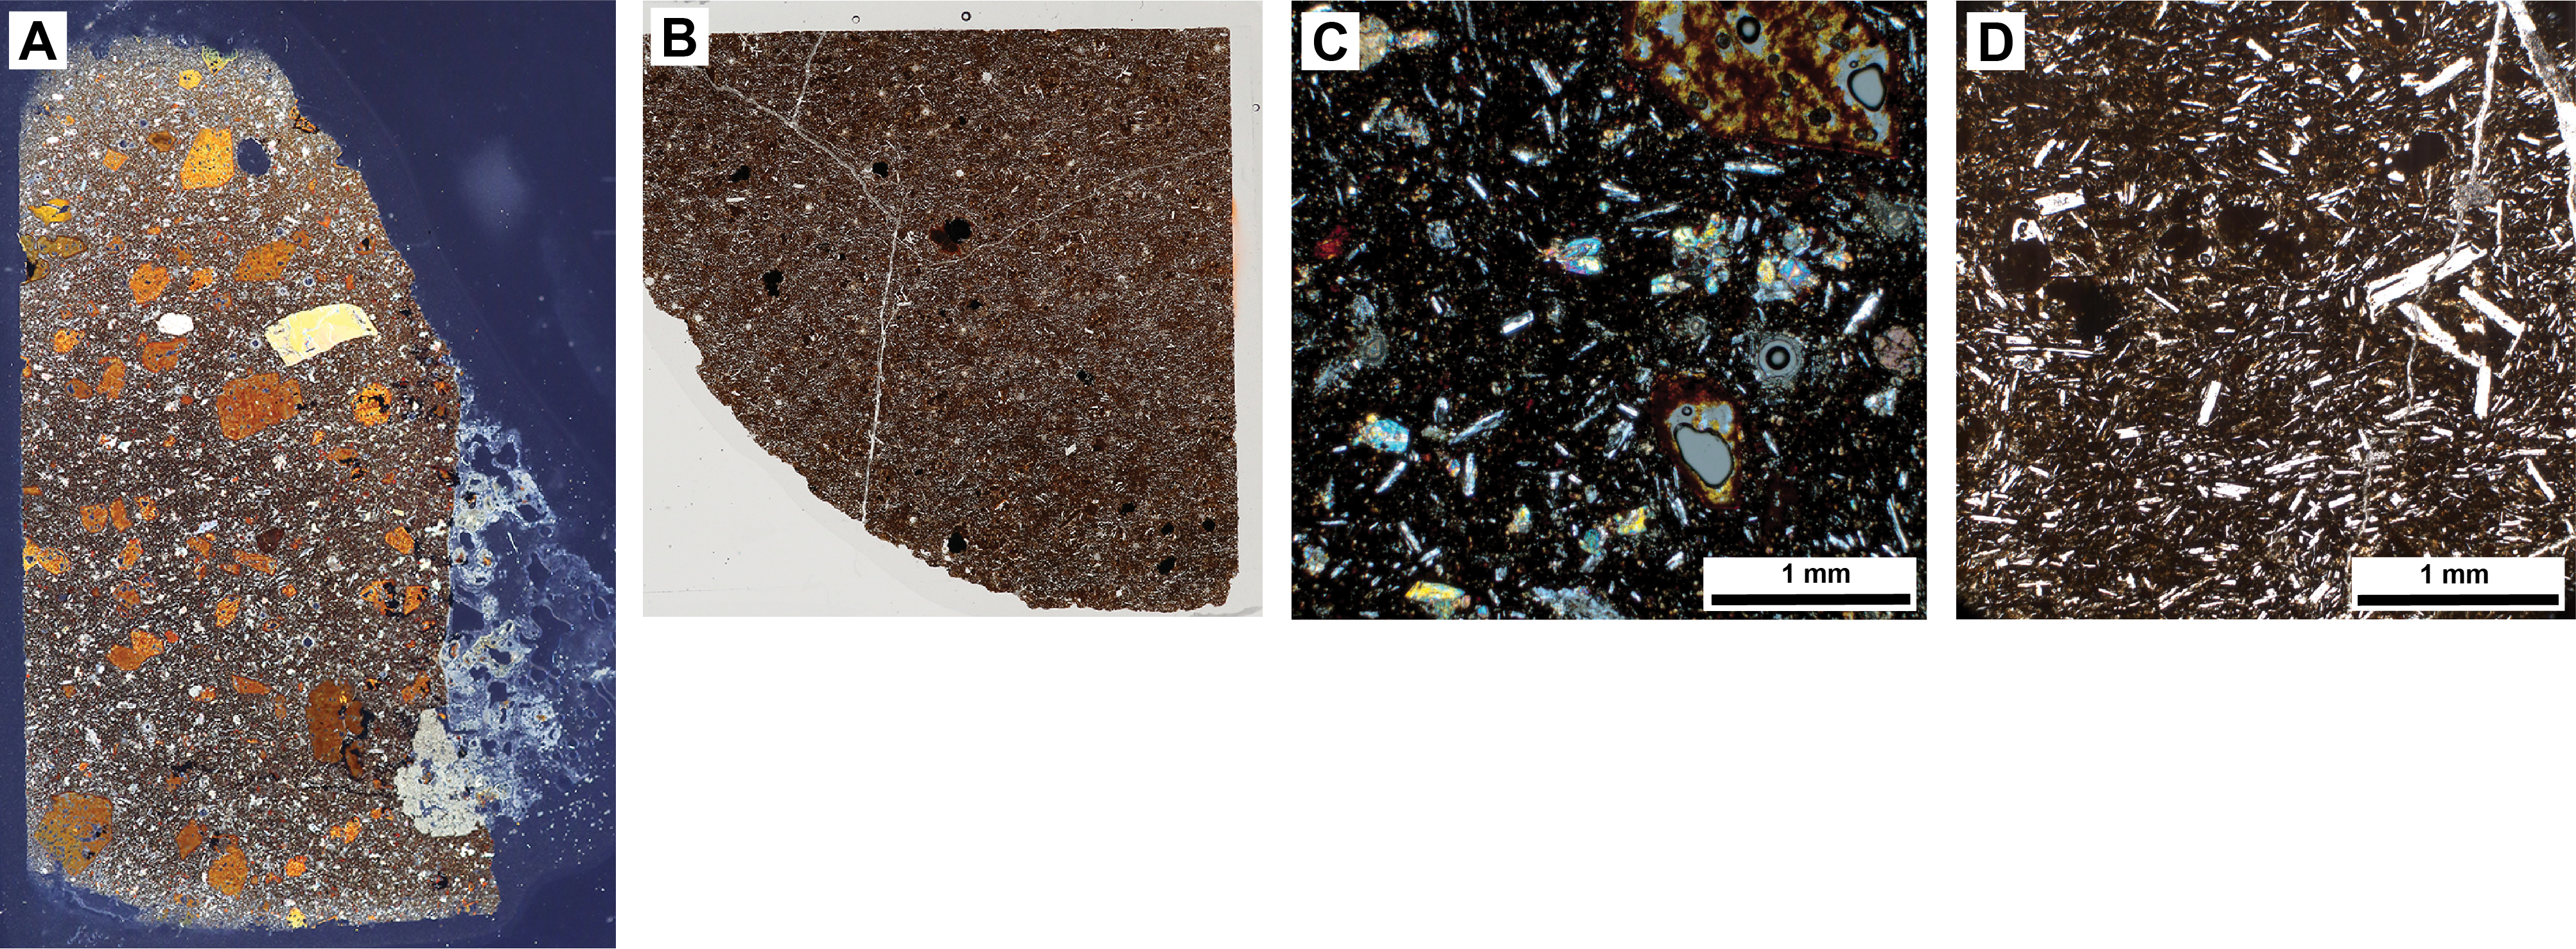
Figure F13. Basalt and olivine.
4. Igneous petrology and volcanology
Expedition 397T did not penetrate basalt flows at Site U1584. Information on some basalt clasts is incorporated in Sediment geochemistry.
5. Biostratigraphy
There were no Expedition 397T shipboard paleontologists, so there is no shipboard report.
6. Paleomagnetism
Hole U1584A was short, and samples were recovered only in Cores 3R, 4R, and 7R–9R. Core 6R was empty. Furthermore, Core 3R had only 30 cm of recovered sediments. Therefore, measurements were done only on Cores 3R, 4R, and 7R–9R.
6.1. Archive-half measurements
Although the volcaniclastics of Cores 397T-U1584A-7R through 9R were not expected to give coherent magnetic data, archive-half measurements were made on sections from Cores 3R–9R using the superconducting rock magnetometer (SRM) (see Paleomagnetism in the Expedition 391 methods chapter [Sager et al., 2023a]). Alternating field (AF) demagnetization was done at 5, 10, 15, and 20 mT steps. Natural remanent magnetization (NRM) intensities were moderate to strong for sediment Cores 3R and 4R (8.8 × 10⁻³ to 2.1 × 10⁻¹ A/m) (Figure F14). The strong magnetizations were likely caused by relatively high concentrations of volcanic grains. NRM intensities in Cores 7R–9R were highly variable, generally low intensities (10−5 to 10−4 A/m) interrupted by high-value spikes (10−1 A/m) (Figure F14). This pattern occurs because the volcaniclastic matrix of low magnetization contained basaltic clasts with high magnetizations. Because the SRM averages over a section of core that contains both basalt clasts and surrounding matrix, it is likely that the high NRM values underestimate the actual basalt clast magnetization.
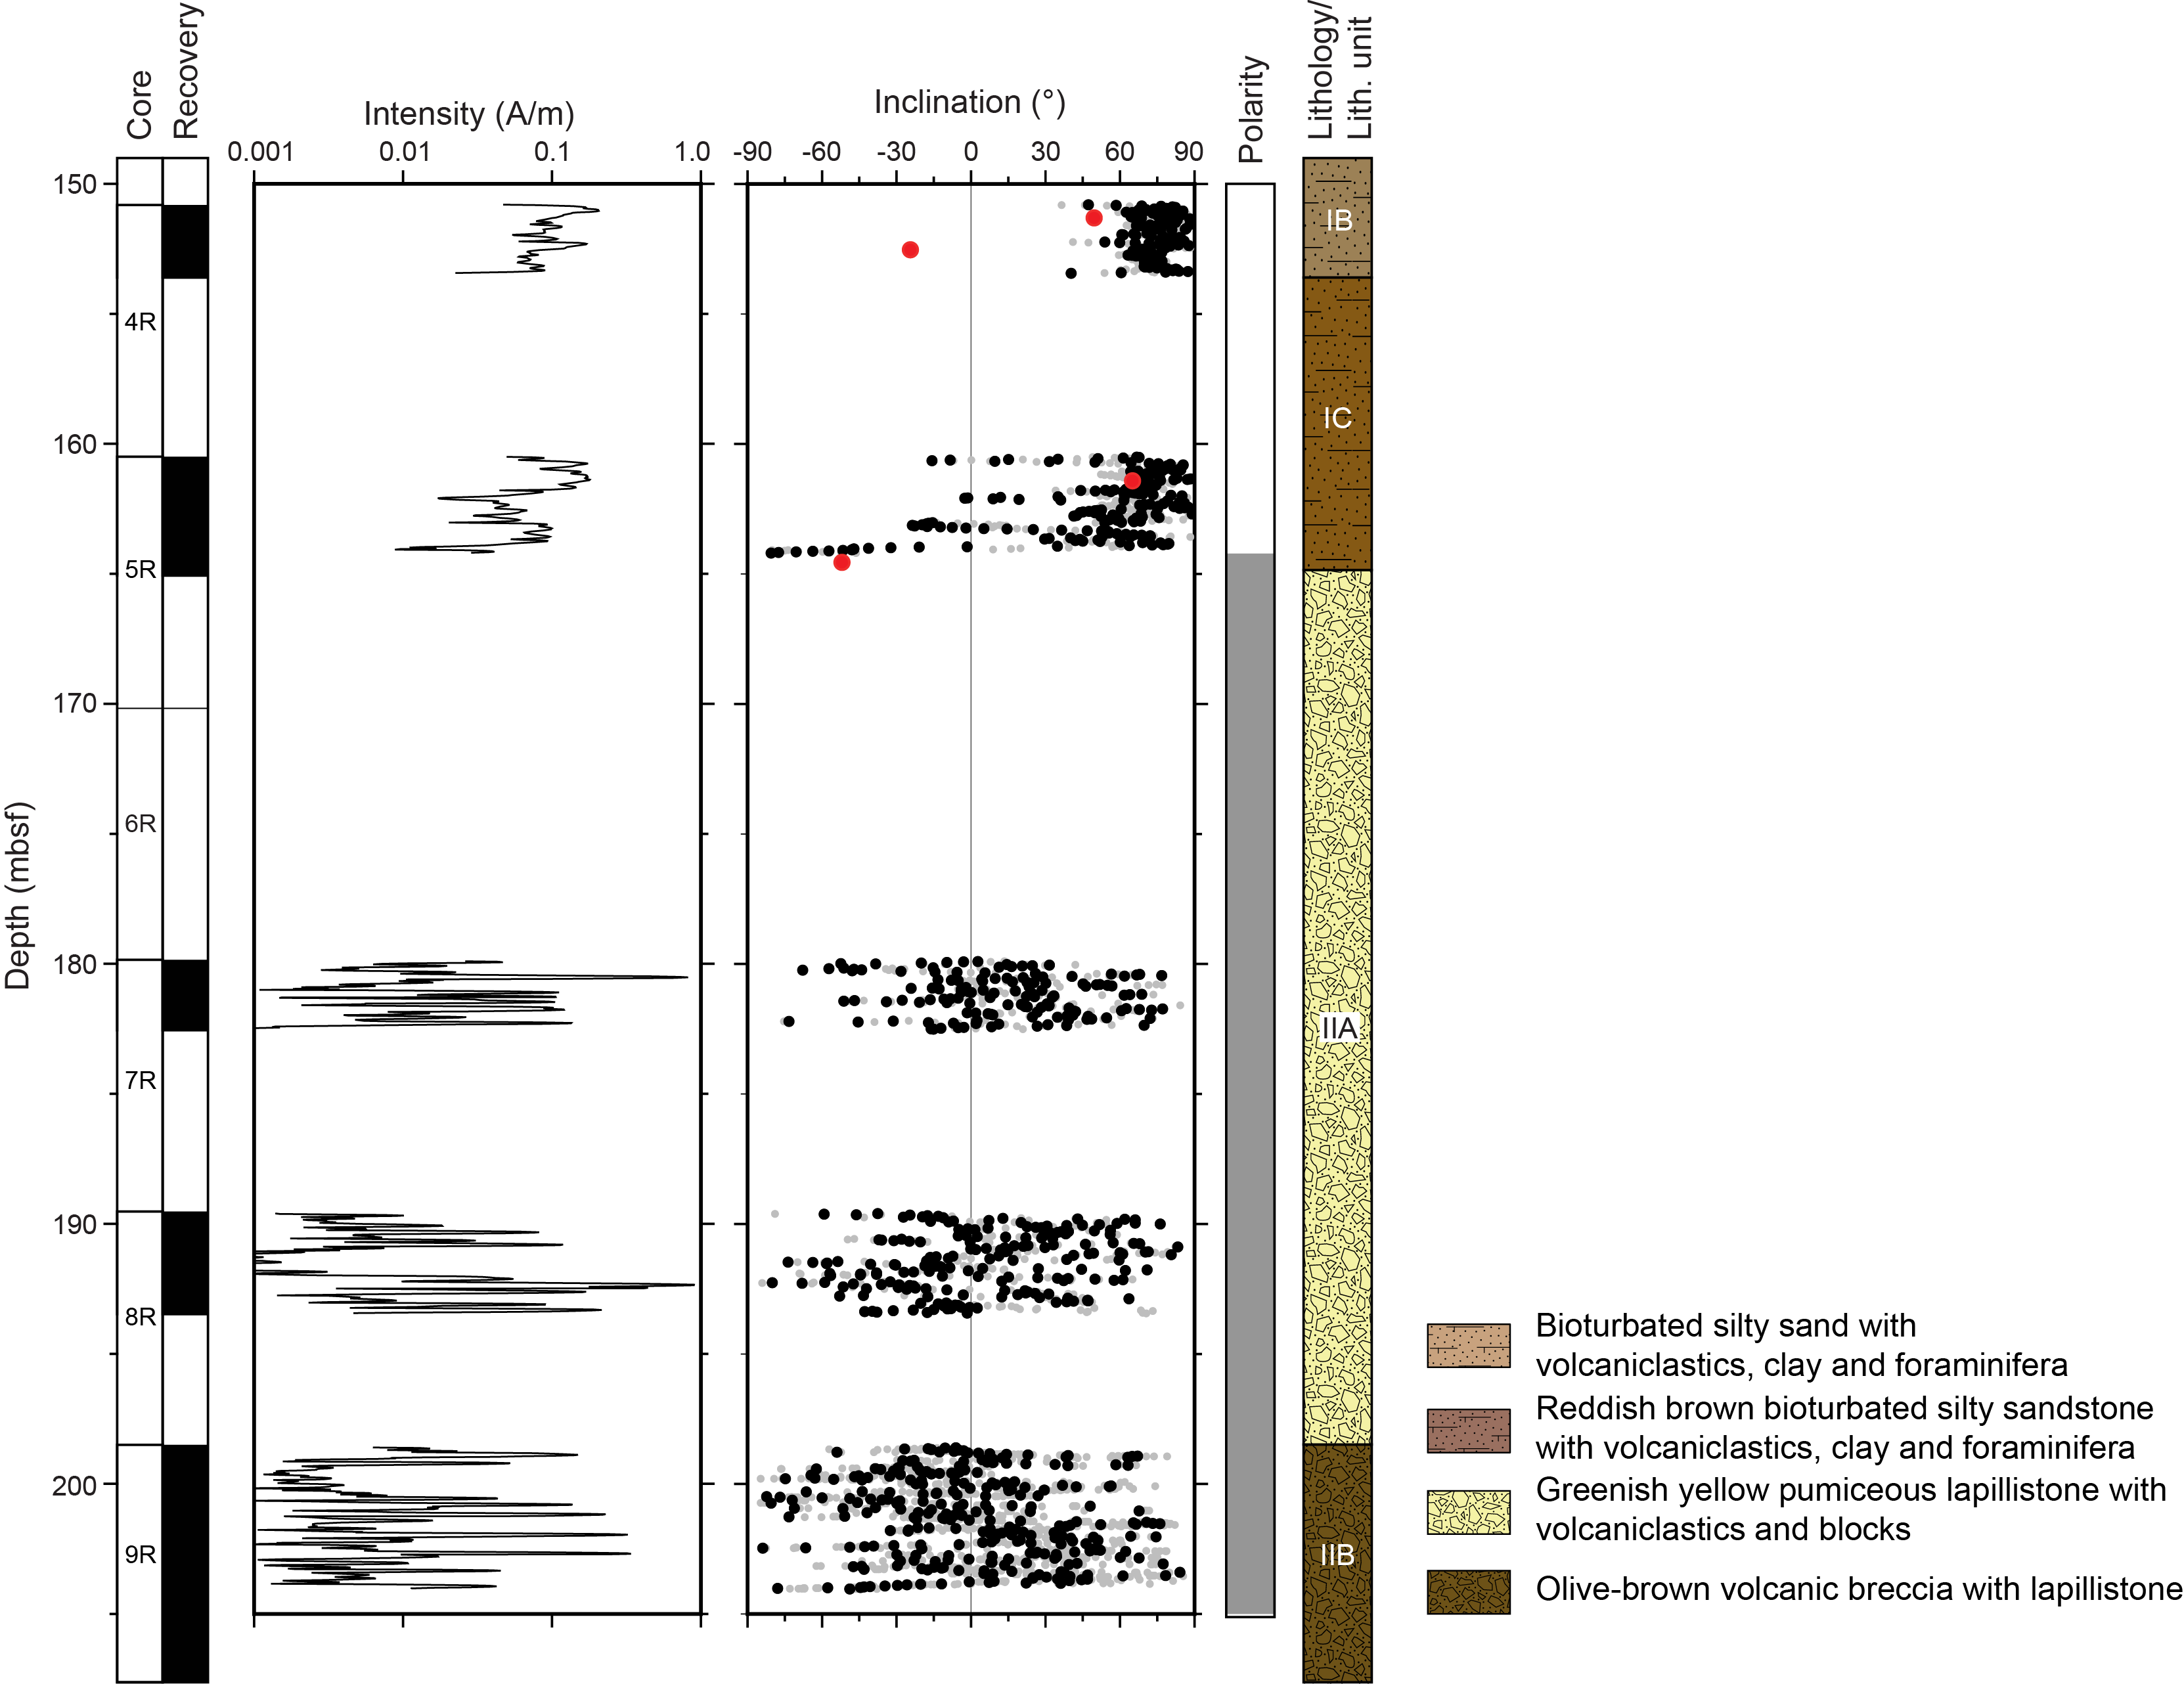
Figure F14. Paleomagnetic results.
As would be expected of pelagic sediments versus volcaniclastic breccia, the former produces relatively consistent paleomagnetic inclination values, whereas the latter does not. Cores 397T-U1584A-4R and 5R produced high positive inclinations with averages of 73.6° ± 8.0° and 48.8° ± 38.1° (both 1σ error), respectively (Figure F14). The larger standard deviation in Core 5R reflects numerous dips that produce outliers near or below 0°. If those were removed, the average inclination would be steeper and similar to that from Core 4R. These high average inclinations are steeper than expected for the geocentric axial dipole (49°), and this may indicate a downward-directed overprint from the drill string that was incompletely removed by demagnetization in a 20 mT field. Nevertheless, the consistent positive inclinations for these two cores indicate reversed polarity in the Southern Hemisphere.
6.2. Discrete sample measurements
Given the likelihood that data from the volcaniclastic breccias of Cores 397T-U1584A-7R through 9R would be poor and incoherent, discrete samples were not taken from these cores. Six cube samples were taken from Cores 3R and 4R and treated with AF demagnetization up to 100 mT or the point at which demagnetization steps produced inconsistent directions. Of these samples, the two from Core 4R were taken with a punch core extruder tool and placed in plastic cubes (J-cubes). The four samples from Core 5R were cut into 2 cm × 2 cm × 2 cm cubes using a rock saw.
In general, these samples yielded poor results. Of the four samples taken from Core 397T-U1584A-5R, two produced erratic demagnetization directions. Other samples gave more-or-less consistent directions for part of the demagnetization, but principal component analysis (PCA) (Kirschvink, 1980) gave high values for the maximum angular deviation, which is a consistency measure (Figure F15). This situation indicates that the characteristic remanent magnetization (ChRM) direction has large uncertainty. For example, Sample 4R-1, 44–46 cm, produced a PCA inclination of 49.6° using five demagnetization steps (20–40 mT) with a maximum angular deviation of 18.6°. Several samples displayed consistent results only up to moderate demagnetization steps of ~35–40 mT and erratic behavior at higher demagnetization steps (Figure F15).
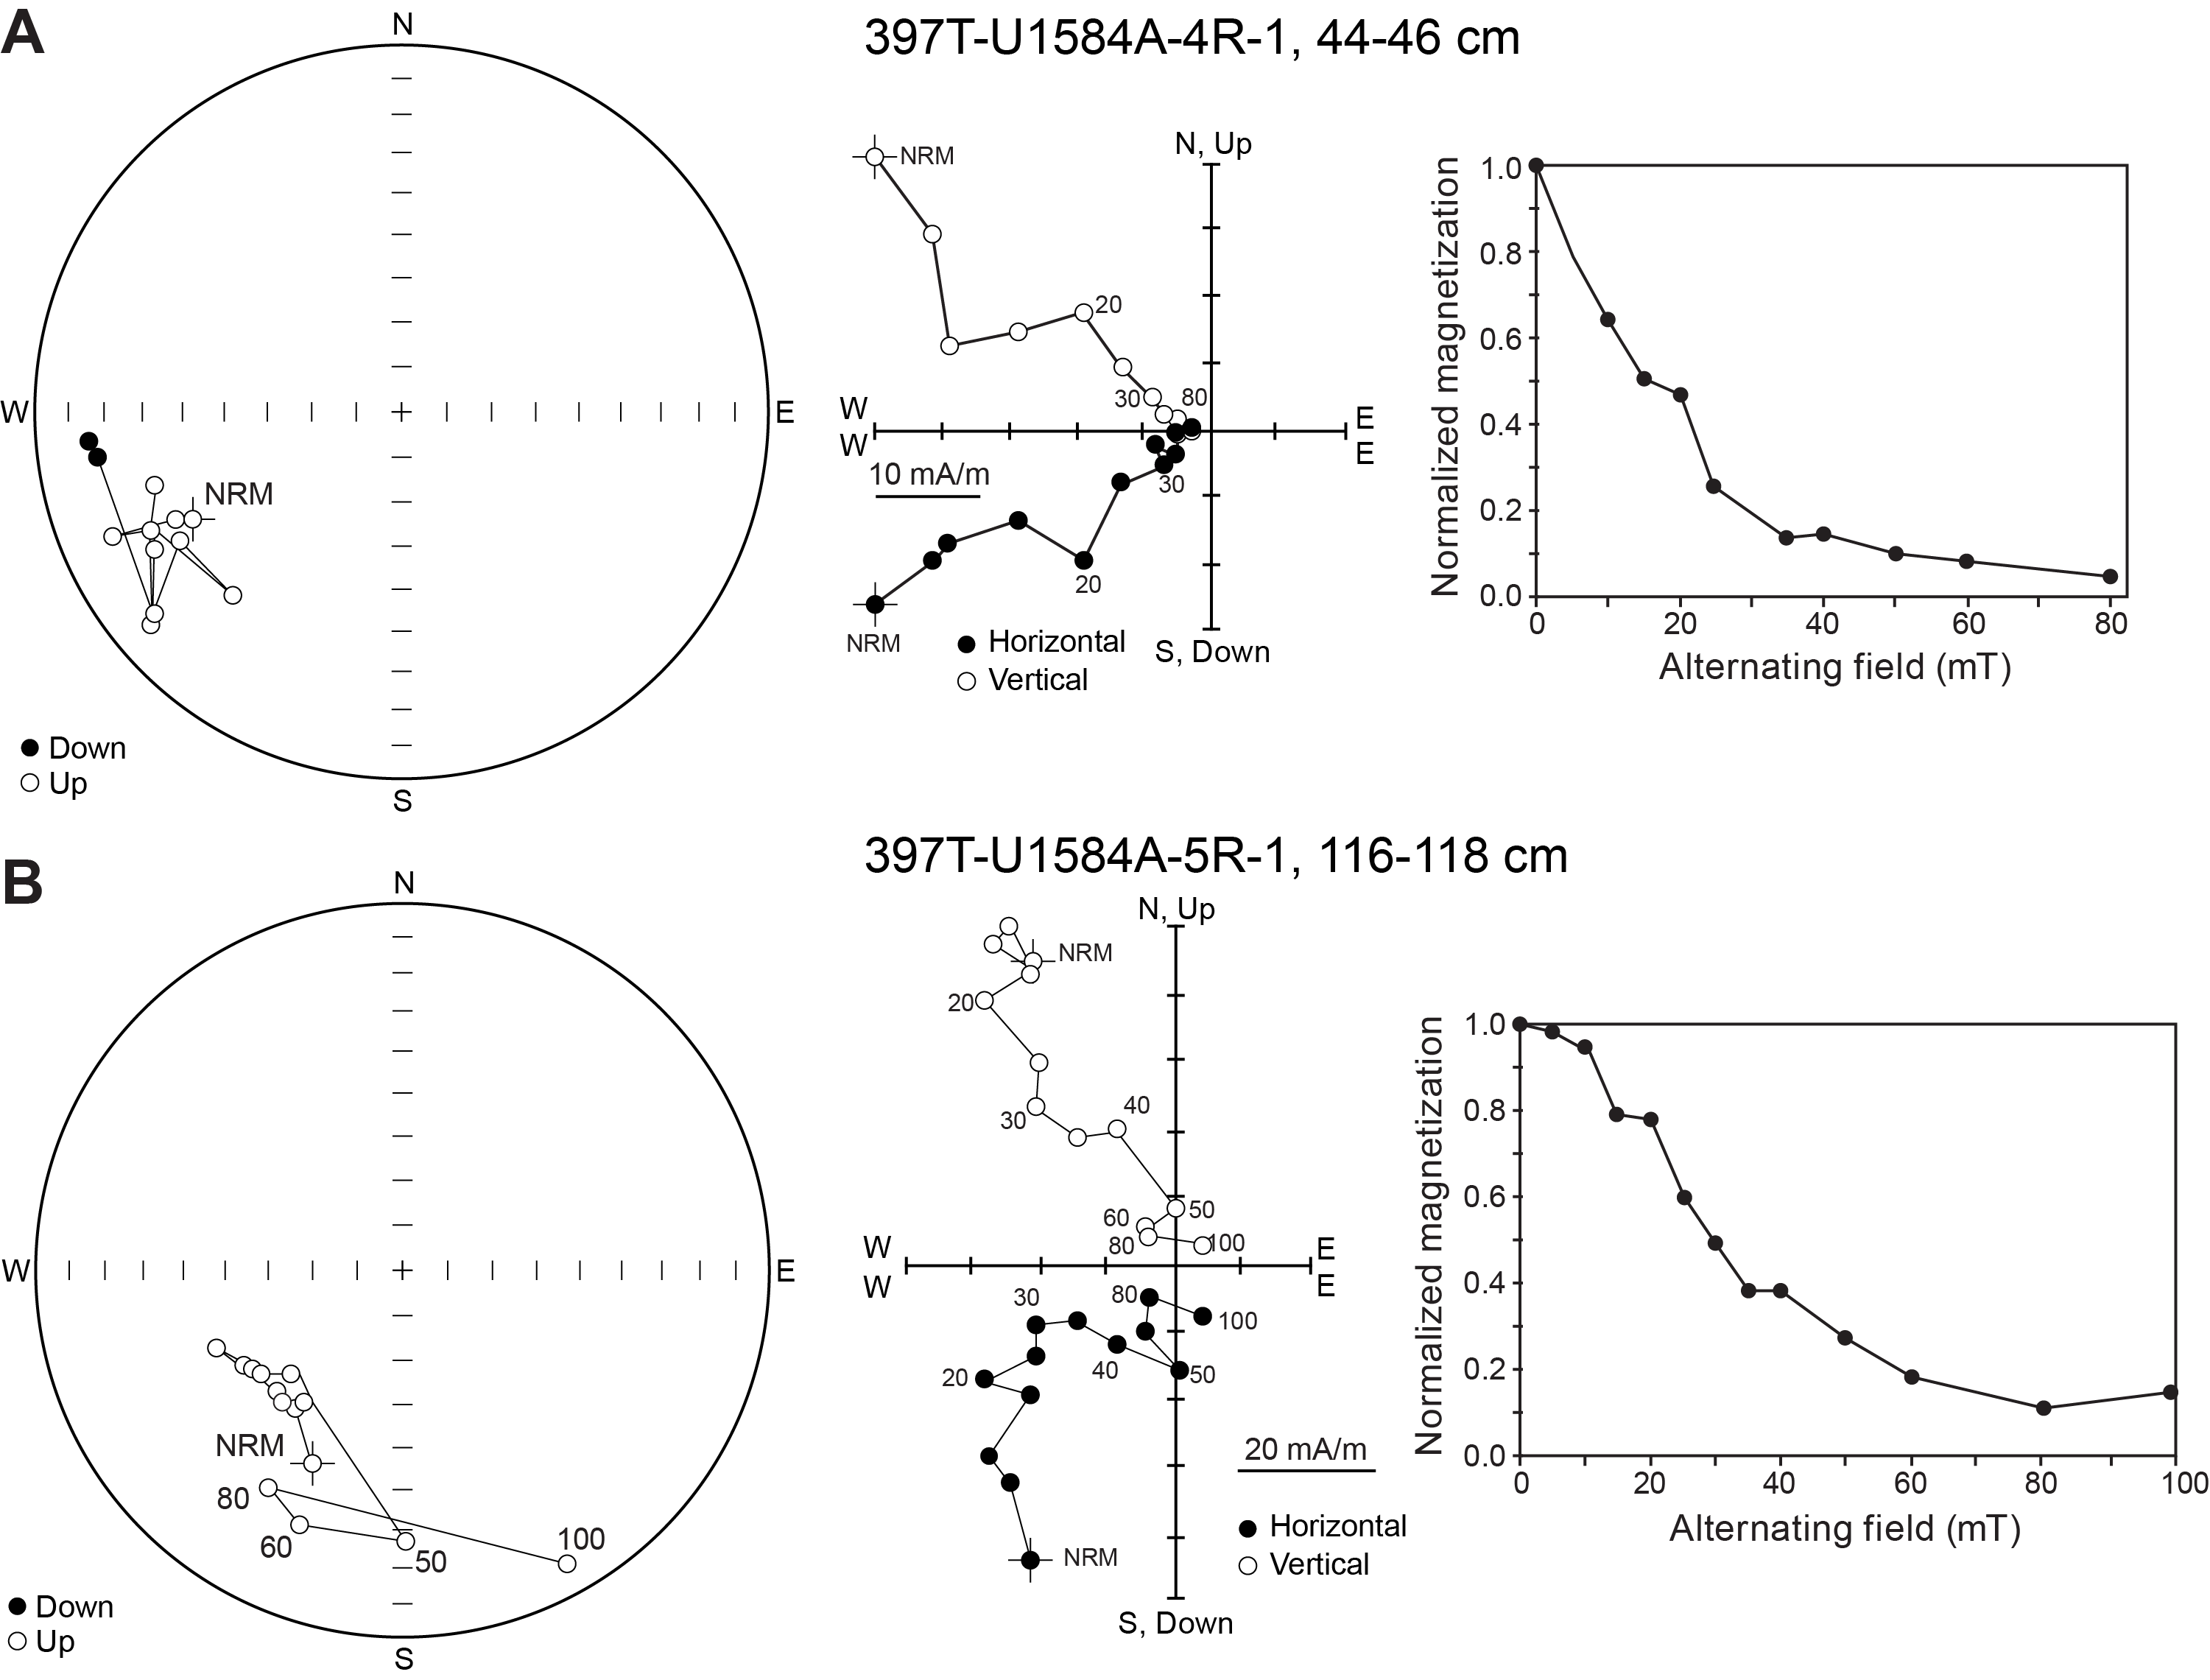
Figure F15. AF demagnetization.
Despite these issues, three of these four samples gave ChRM inclinations that match adjacent SRM measurements (Figure F14). The one that does not (Sample 397T-U1584A-4R-2, 49–51 cm) gave a negative inclination, whereas the SRM measurements are all positive. This is likely a result of sampling using a punch core extruder, which damaged the sample.
Two samples were magnetized in progressively higher applied magnetic fields to examine their isothermal remanent magnetization (IRM) acquisition up to saturation IRM (SIRM). Both samples rapidly acquired magnetization in lower fields and approached saturation before ~300 mT (Figure F16). This behavior is observed for samples whose magnetizations reside within titanomagnetite grains. In contrast, sediments from three Expedition 391 sites (U1576–U1578) displayed a small amount of high-coercivity magnetization, implying hematite content (Sager et al., 2023b; Sager et al., 2023c; Sager et al., 2023d). Site U1584A samples do not indicate this magnetic component.
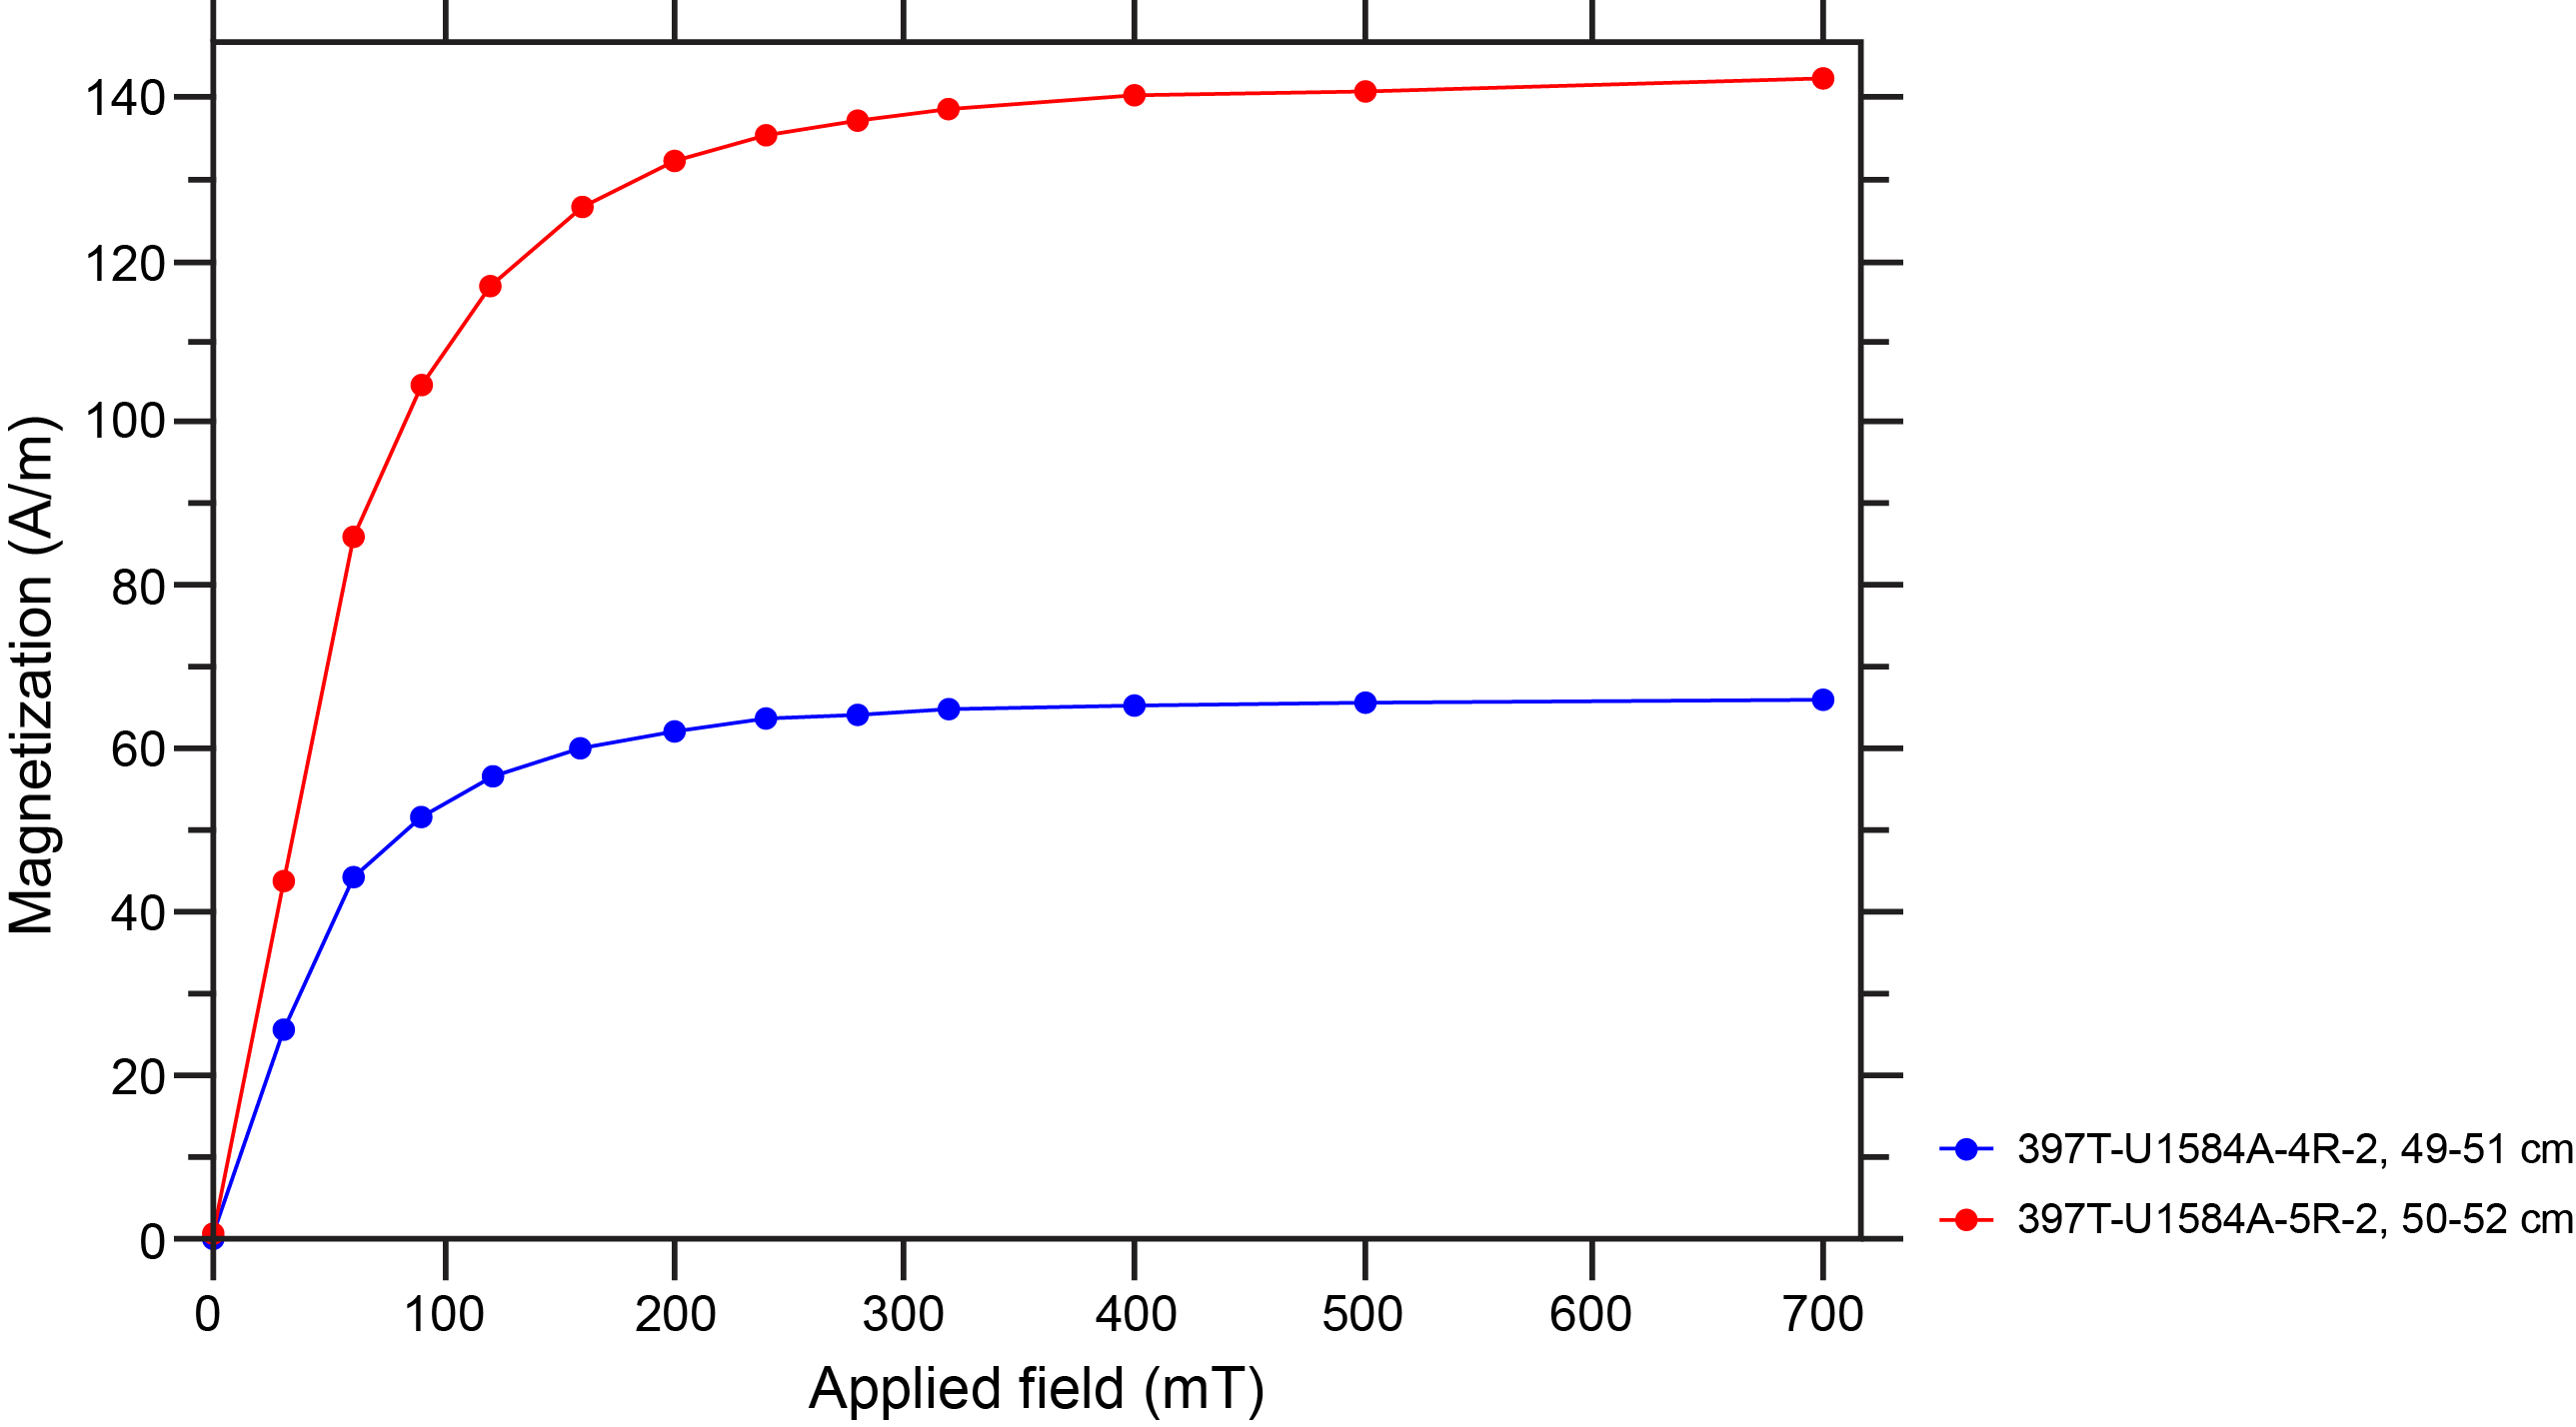
Figure F16. IRM.
7. Sediment geochemistry
7.1. Inorganic carbon, total carbon, and organic carbon
Sediment samples were analyzed to determine the weight percent CaCO3, total carbon (TC), total inorganic carbon, total organic carbon (TOC), and total nitrogen (TN) (Table T3). At Site U1584, seven samples were taken from Cores 397T-U1584A-3R through 5R. In Lithostratigraphic Subunit IA, CaCO3 content is moderate (mean = 55 ± 15.6 wt%). The mean CaCO3 content then decreases to 23.7 ± 3.7 wt% and 22.4 ± 10.3 wt% in Subunits IB and IC, respectively. TOC generally decreases from Subunit IA (0.26 ± 0.1 wt%) to Subunit IC (0.07 ± 0.1 wt%). Therefore, TC contents are nearly identical (within error) to total inorganic carbon. Subunit IA has subtly higher TC (6.5 ± 1.5 wt%) than Subunits IB and IC (3.2 ± 0.5 wt% and 2.8 ± 1.5 wt%, respectively). TN contents are below the instrumental detection limits for all samples.
7.2. Basalt clast geochemistry
Coarse basalt clasts (up to 6 cm) were found in volcaniclastic sediment from Site U1584. Major and select trace element compositions were analyzed using inductively coupled plasma–atomic emission spectroscopy (ICP-AES) on four representative basalt clasts (Table T4). Detailed sample preparation, analytical procedures, standard analyses, calibration, and drift corrections are reported in Geochemistry in the Expedition 391 methods chapter (Sager et al., 2023a). The total sums of the major element oxides in weight percentages acquired using ICP-AES range 96.8–98.8 wt% (Table T4). Major element oxide concentrations determined using ICP-AES were normalized to 100% on a volatile-free basis. The normalized values at Site U1584 are used for an improved comparison between Expedition 391 and 397T sites, together with literature data from previous drill and dredge sites along the submarine Tristan-Gough hotspot track (e.g., Le Maitre, 1962; Weaver et al., 1987; Le Roex et al., 1990; Class and le Roex, 2008; Salters and Sachi-Kocher, 2010; Rohde et al., 2013; Hoernle et al., 2015; Homrighausen et al., 2018, 2019).
Three samples from Site U1584 are basalt and one is basaltic trachyandesite, according to the total alkali versus silica (TAS) classification after Le Bas et al. (1986), and all four samples lie within the alkaline field of MacDonald and Katsura (1964) (Figure F17). Compared to the samples recovered during Expedition 391, the basalt clasts from Site U1584 have a narrow range of SiO2 (45.02–46.40 wt%), TiO2 (2.05–2.54 wt%), and K2O (1.46–1.73 wt%) but a wide range of MgO (2.23–9.50 wt%). The low MgO values are anomalous and do not strongly correlate with other elemental indicators of alteration (e.g., loss on ignition). The clasts span a range of Mg# (22.8–62.4) and show increases in TiO2, Al2O3, and Sr and a decrease in Ni with decreasing Mg# (Figure F18). Though compositionally heterogeneous, these samples from Site U1584 all have higher K2O, Al2O3, Ni, and Sr but generally lower SiO2 and V than the samples from Expedition 391 sites.

Figure F17. Total alkali vs. silica and Ti vs. V.
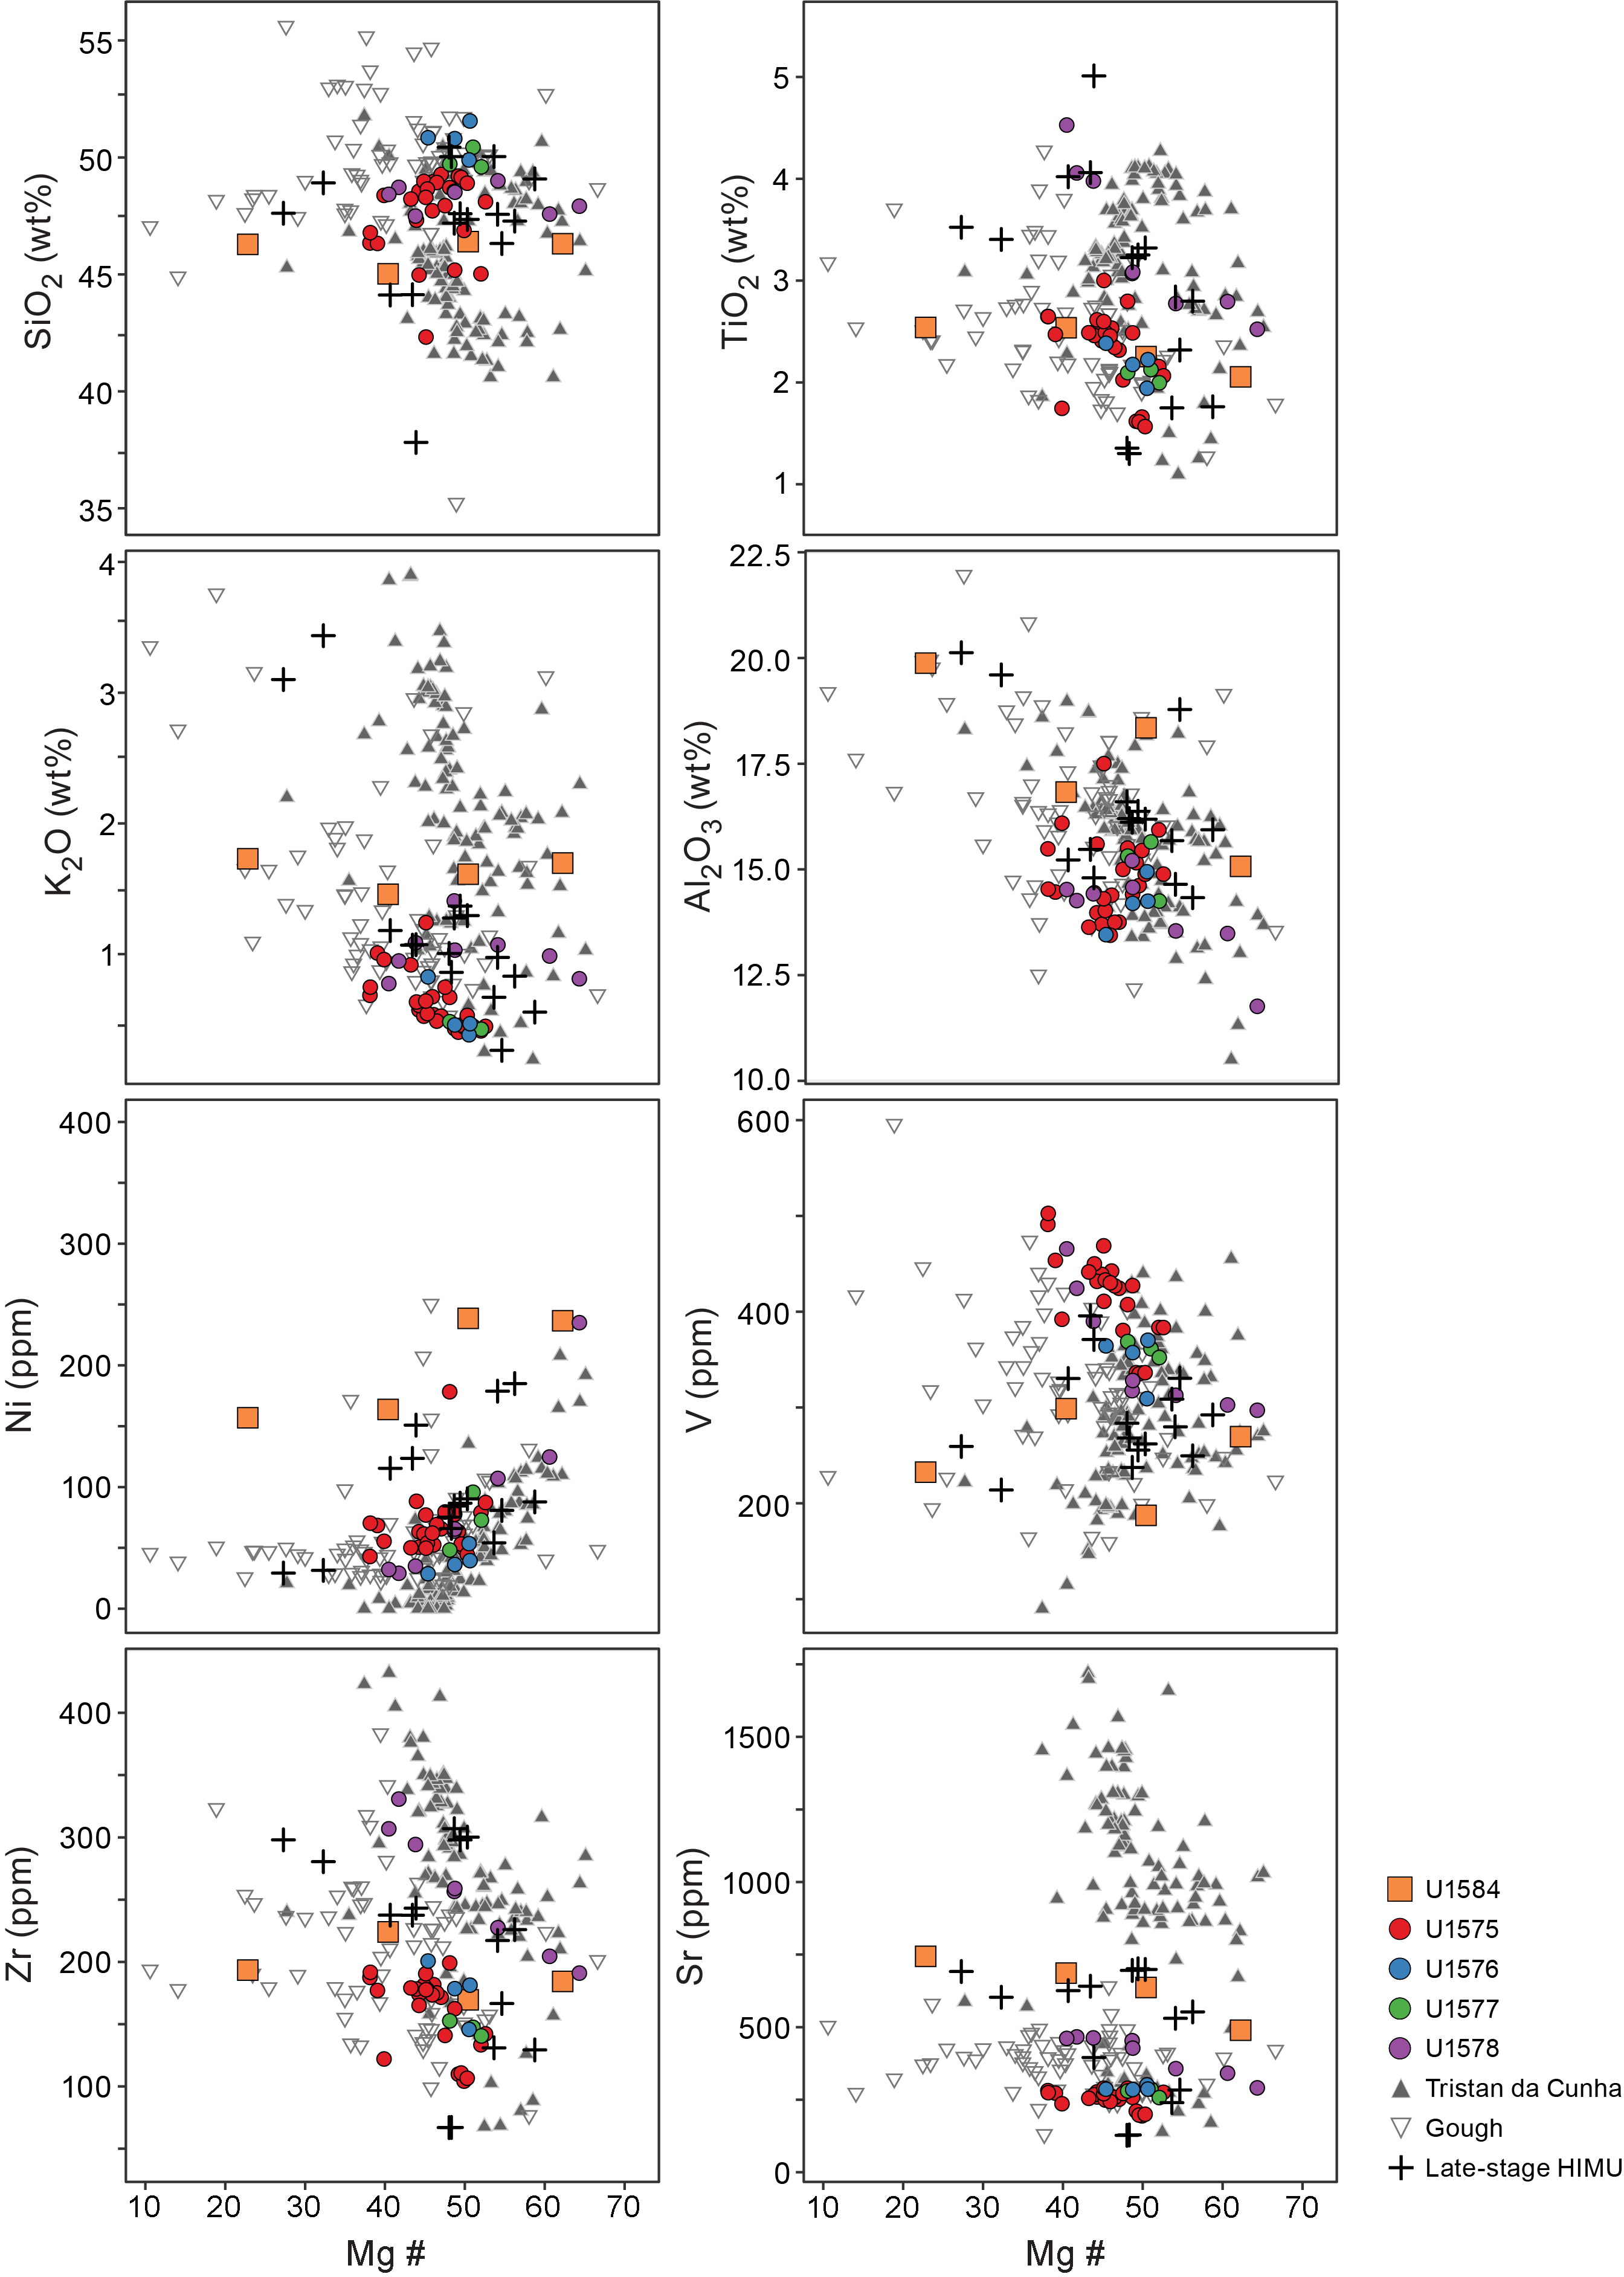
Figure F18. Mg# vs. SiO2, TiO2, K2O, Al2O3, Ni, V, Zr, and Sr.
8. Igneous geochemistry
Drilling did not penetrate basalt flows at Site U1584. Information on some basalt clasts is incorporated in Sediment geochemistry.
9. Physical properties
The physical properties measurements taken on whole-round and split cores during Expedition 397T were fewer than those measured during Expedition 391. Before splitting, the cores were analyzed using the Natural Gamma Radiation Logger (NGRL) and measured for natural gamma radiation (NGR). Next, the cores were put through the Whole-Round Multisensor Logger (WRMSL) to measure magnetic susceptibility (MS) and gamma ray attenuation (GRA) bulk density. Cores were then split, and further measurements were taken on the archive halves. Archive halves were scanned using the Section Half Imaging Logger (SHIL) to collect an image of the core and red-green-blue (RGB) data. Cores were then moved to the Section Half Multisensor Logger (SHMSL) to measure point MS (MSP) and reflectance spectrophotometry and colorimetry every 4–5 cm of the core half. P-wave velocity in the x-direction was measured on section halves using the P-wave caliper (PWC). Moisture and density (MAD) measurements were taken from representative units or at least one per core. Further details of procedures can be found in Physical properties in the Expedition 391 methods chapter (Sager et al., 2023a).
The data from whole-round scanning instruments (MS, GRA, and NGR) are subject to void spaces between the core and the core liner as well as fractures in the core, and the data may not reflect the actual values that would be measured from a discrete sample with another instrument. For example, the whole-round bulk density data using the GRA method on the WRMSL for Subunit IB resulted in a density of 1.52 g/cm3, whereas the discrete sample density using the MAD method produced a density of 1.71 g/cm3. Therefore, the whole-round data should be used as a relative measurement to observe changes throughout the cores collected. The GRA bulk density data can be corrected to better reflect the true density of the core (see Physical properties in the Expedition 391 methods chapter [Sager et al., 2023a]), but for the purpose of tracking lithology changes, the data presented here are uncorrected.
The physical properties measurements were used to assist in defining the lithostratigraphic unit boundaries, but not all the measurements mentioned above tracked with the assigned units. The measurements are shown in Figure F19 and Table T5 with the mean and standard deviation (1σ) based on the units described in Lithostratigraphy. The data were not processed for outliers. Lithostratigraphic Subunit IA was measured only with MSP on the SHMSL and will not be further discussed in this section.
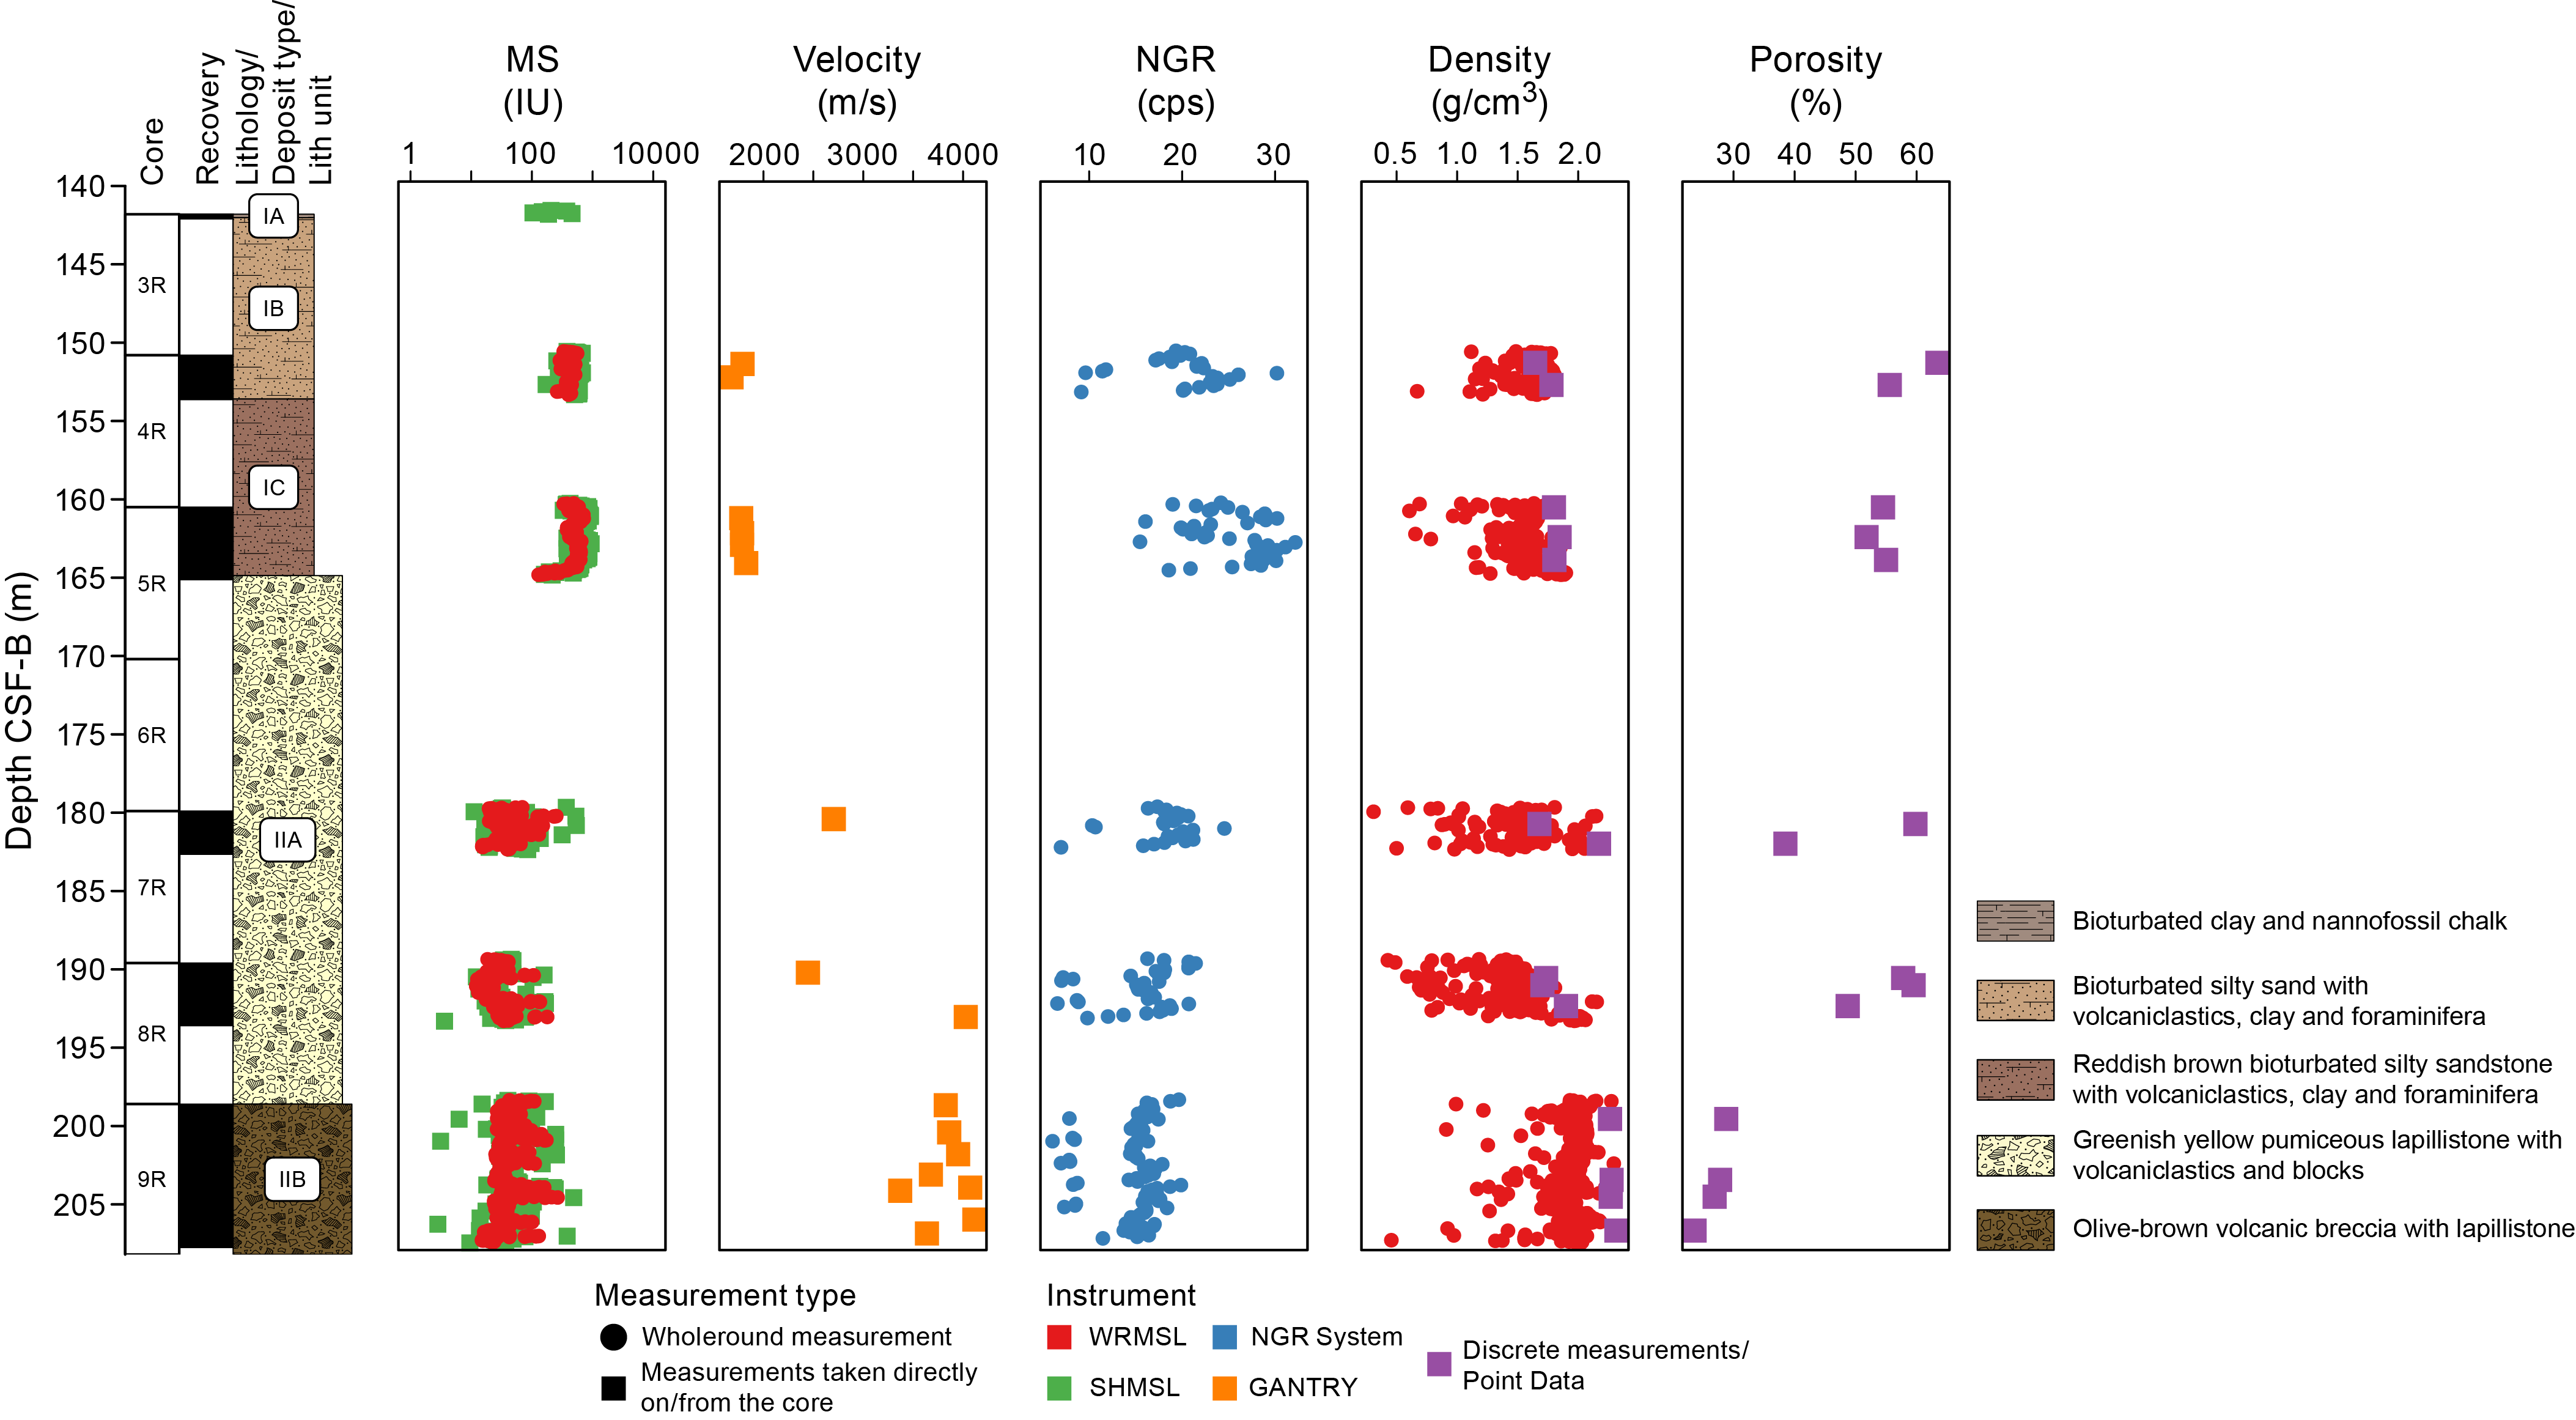
Figure F19. Lithostratigraphy, core recovery, and physical properties.
The physical properties data are divided into two categories: (1) measurements that follow the change in major lithostratigraphic units by following distinct measurable changes that are within 1σ of the previous unit and (2) measurements that display consistent values across major lithologic boundaries. Small-scale variations (e.g., within a single core) are present, but only major changes in the lithology and data gathered are discussed here.
9.1. Properties that follow the lithology
NGR, MS, and MSP increase slightly to their highest relative values from Subunit IB to Subunit IC (~20 to 25 counts/s and ~500 to 700 SI) and then sharply decrease between Units I and II (~25 to 16 counts/s and ~700 to 50 SI) with the transition from clayey/sandy sediment to the light-colored lapillistone. P-wave velocity through the x-axis sharply increased from Unit I to Unit II (~1770 to 3600 m/s). P-wave velocity gradually rises between Subunit IIA and IIB (~3000 to 3800 m/s) with the increase of lithics present in the lapillistone.
9.2. Properties that cross lithologic boundaries
Bulk density (GRA and MAD) measurements stay relatively consistent from Subunit IB to Subunit IIA and sharply increase into Subunit IIB (~1.77 to 2.28 g/cm3). Similar to bulk density measurements, porosity stays consistent from Subunit IB to Subunit IIA but decreases in Subunit IIB (~56 to 27 vol%). The variation in the density and porosity measurements increases toward the bottom of Subunit IIA as it gradually transitions into Subunit IIB.
References
Bartels, T., Krastel, S., and Spiess, V., 2007. Correlation of high-resolution seismic data with ODP Leg 208 borehole measurements. In Kroon, D., Zachos, J.C., and Richter, C. (Eds.), Proceedings of the Ocean Drilling Program, Scientific Results. 208: College Station, TX (Ocean Drilling Program). https://doi.org/10.2973/odp.proc.sr.208.204.2007
Chave, A.D., 1984. Lower Paleocene-Upper Cretaceous magnetostratigraphy, Sites 525, 527, 528, and 529, Deep Sea Drilling Project Leg 74. In Moore, T.C., Jr., Rabinowitz, P.D., et al., Initial Reports of the Deep Sea Drilling Project. 74: Washington, DC (US Government Printing Office), 525–531. https://doi.org/10.2973/dsdp.proc.74.110.1984
Class, C., and le Roex, A.P., 2008. Ce anomalies in Gough Island lavas — trace element characteristics of a recycled sediment component. Earth and Planetary Science Letters, 265(3–4):475–486. https://doi.org/10.1016/j.epsl.2007.10.030
Doubrovine, P.V., Steinberger, B., and Torsvik, T.H., 2012. Absolute plate motions in a reference frame defined by moving hot spots in the Pacific, Atlantic, and Indian oceans. Journal of Geophysical Research: Solid Earth, 117(B9):B09101. https://doi.org/10.1029/2011JB009072
Ernesto, M., Pacca, I.G., Hiodo, F.Y., and Nardy, A.J.R., 1990. Palaeomagnetism of the Mesozoic Serra Geral Formation, southern Brazil. Physics of the Earth and Planetary Interiors, 64(2):153–175.
https://doi.org/10.1016/0031-9201(90)90035-V
Ernesto, M., Raposo, M.I.B., Marques, L.S., Renne, P.R., Diogo, L.A., and de Min, A., 1999. Paleomagnetism, geochemistry and 40Ar/39Ar dating of the north-eastern Paraná Magmatic Province: tectonic implications. Journal of Geodynamics, 28(4):321–340. https://doi.org/10.1016/S0264-3707(99)00013-7
Gibson, S.A., Thompson, R.N., Day, J.A., Humphris, S.E., and Dickin, A.P., 2005. Melt-generation processes associated with the Tristan mantle plume: constraints on the origin of EM-1. Earth and Planetary Science Letters, 237(3–4):744–767. https://doi.org/10.1016/j.epsl.2005.06.015
Gordon, R.G., and Cape, C.D., 1981. Cenozoic latitudinal shift of the Hawaiian hotspot and its implications for true polar wander. Earth and Planetary Science Letters, 55(1):37–47. https://doi.org/10.1016/0012-821X(81)90084-4
Gordon, R.G., Woodworth, D.T., Gaastra, K., and Seidman, L.E., 2019. Paleogene true polar wander, origin of the Hawaiian-Emperor Bend, paleolatitude of Ellesmere Island, and Cenozoic climate change. Geological Society of America Abstracts with Programs, 51(5):59. https://doi.org/10.1130/abs/2019AM-339253
Hoernle, K., Rohde, J., Hauff, F., Garbe-Schönberg, D., Homrighausen, S., Werner, R., and Morgan, J.P., 2015. How and when plume zonation appeared during the 132 Myr evolution of the Tristan Hotspot. Nature Communications, 6(1):7799. https://doi.org/10.1038/ncomms8799
Homrighausen, S., Hoernle, K., Geldmacher, J., Wartho, J.-A., Hauff, F., Portnyagin, M., Werner, R., van den Bogaard, P., and Garbe-Schönberg, D., 2018. Unexpected HIMU-type late-stage volcanism on the Walvis Ridge. Earth and Planetary Science Letters, 492:251–263. https://doi.org/10.1016/j.epsl.2018.03.049
Homrighausen, S., Hoernle, K., Hauff, F., Wartho, J.A., van den Bogaard, P., and Garbe-Schönberg, D., 2019. New age and geochemical data from the Walvis Ridge: the temporal and spatial diversity of South Atlantic intraplate volcanism and its possible origin. Geochimica et Cosmochimica Acta, 245:16–34. https://doi.org/10.1016/j.gca.2018.09.002
Homrighausen, S., Hoernle, K., Zhou, H., Geldmacher, J., Wartho, J.-A., Hauff, F., Werner, R., Jung, S., and Morgan, J.P., 2020. Paired EMI-HIMU hotspots in the South Atlantic—starting plume heads trigger compositionally distinct secondary plumes? Science Advances, 6(28):eaba0282. https://doi.org/10.1126/sciadv.aba0282
Kirschvink, J.L., 1980. The least-squares line and plane and the analysis of palaeomagnetic data. Geophysical Journal International, 62(3):699–718. https://doi.org/10.1111/j.1365-246X.1980.tb02601.x
Koppers, A.A.P., Yamazaki, T., Geldmacher, J., Gee, J.S., Pressling, N., Hoshi, H., Anderson, L., Beier, C., Buchs, D.M., Chen, L.H., Cohen, B.E., Deschamps, M., Dorais, J., Ebuna, D., Ehmann, S., Fitton, J.G., Fulton, P.M., Ganbat, E., Hamelin, C., Hanyu, T., Kalnins, L., Kell, J., Machida, S., Mahoney, J.J., Moriya, K., Nichols, A.R.L., Rausch, S., Sano, S., Sylvan, J.B., and Williams, R., 2012. Limited latitudinal mantle plume motion for the Louisville Hotspot. Nature Geoscience, 5(12):911–917. https://doi.org/10.1038/ngeo1638
Le Bas, M.J., Le Maitre, R. W., Streickeisen, A., Zanettin, B., the IUGS Subcommission on the Systematics of Igneous Rocks, 1986. A chemical classification of volcanic rocks based on the total alkali-silica diagram. Journal of Petrology, 27(3):745–750. https://doi.org/10.1093/petrology/27.3.745
Le Maitre, R.W., 1962. Petrology of volcanic rocks, Gough Island, South Atlantic. Geological Society of America Bulletin, 73(11):1309–1340. https://doi.org/10.1130/0016-7606(1962)73[1309:POVRGI]2.0.CO;2
Le Roex, A.P., Cliff, R.A., and Adair, B.J.I., 1990. Tristan da Cunha, South Atlantic: geochemistry and petrogenesis of a basanite-phonolite lava series. Journal of Petrology, 31(4):779–812. https://doi.org/10.1093/petrology/31.4.779
MacDonald, G.A., and Katsura, T., 1964. Chemical composition of Hawaiian lavas. Journal of Petrology, 5(1):82–133. https://doi.org/10.1093/petrology/5.1.82
Moore, T.C., Jr., Rabinowitz, P.D., Borella, P.E., Boersma, A., and Shackleton, N.J., 1984. Introduction and explanatory notes. In Moore, T.C., Jr., Rabinowitz, P. D., et al., Initial Reports of the Deep Sea Drilling Project. 74: Washington, DC (US Government Printing Office), 3–39. https://doi.org/10.2973/dsdp.proc.74.101.1984
O'Connor, J.M., and le Roex, A.P., 1992. South Atlantic hot spot-plume systems: 1. Distribution of volcanism in time and space. Earth and Planetary Science Letters, 113(3):343–364. https://doi.org/10.1016/0012-821X(92)90138-L
Renne, P.R., Scott, G.R., Glen, J.M.G., and Feinberg, J.M., 2002. Oriented inclusions of magnetite in clinopyroxene: source of stable remanent magnetization in gabbros of the Messum Complex, Namibia. Geochemistry, Geophysics, Geosystems, 3(12):1–11. https://doi.org/10.1029/2002GC000319
Richardson, S.H., Erlank, A.J., Reid, D.L., and Duncan, A.R., 1984. Major and trace element and Nd and Sr isotope geochmistry of basalts from the Deep Sea Drilling Project Leg 74 Walvis Ridge Transect. In Moore, T.C. Jr., Rabinowitz, P.D., et al., Initial Reports of the Deep Sea Drilling Project, 74: Washington , DC (US Government Printing Office). https://doi.org/10.2973/dsdp.proc.74.125.1984
Rohde, J., Hoernle, K., Hauff, F., Werner, R., O'Connor, J., Class, C., Garbe-Schönberg, D., and Jokat, W., 2013. 70 Ma chemical zonation of the Tristan-Gough hotspot track. Geology, 41(3):335–338. https://doi.org/10.1130/G33790.1
Ryan, W.B.F., Carbotte, S.M., Coplan, J.O., O'Hara, S., Melkonian, A., Arko, R., Weissel, R.A., Ferrini, V., Goodwillie, A., Nitsche, F., Bonczkowski, J., and Zemsky, R., 2009. Global multi-resolution topography synthesis. Geochemistry, Geophysics, Geosystems, 10(3):Q03014. https://doi.org/10.1029/2008GC002332
Sager, W., Hoernle, K., Höfig, T.W., Avery, A.J., Bhutani, R., Buchs, D.M., Carvallo, C.A., Class, C., Dai, Y., Dalla Valle, G., Del Gaudio, A.V., Fielding, S., Gaastra, K.M., Han, S., Homrighausen, S., Kubota, Y., Li, C.-F., Nelson, W.R., Petrou, E., Potter, K.E., Pujatti, S., Scholpp, J., Shervais, J.W., Thoram, S., Tikoo-Schantz, S.M., Tshiningayamwe, M., Wang, X.-J., and Widdowson, M., 2023a. Expedition 391 methods. In Sager, W., Hoernle, K., Höfig, T.W., Blum, P., and the Expedition 391 Scientists, Walvis Ridge Hotspot. Proceedings of the International Ocean Discovery Program, 391: College Station, TX (International Ocean Discovery Program). https://doi.org/10.14379/iodp.proc.391.102.2023
Sager, W., Hoernle, K., Höfig, T.W., Avery, A.J., Bhutani, R., Buchs, D.M., Carvallo, C.A., Class, C., Dai, Y., Dalla Valle, G., Del Gaudio, A.V., Fielding, S., Gaastra, K.M., Han, S., Homrighausen, S., Kubota, Y., Li, C.-F., Nelson, W.R., Petrou, E., Potter, K.E., Pujatti, S., Scholpp, J., Shervais, J.W., Thoram, S., Tikoo-Schantz, S.M., Tshiningayamwe, M., Wang, X.-J., and Widdowson, M., 2023b. Site U1576. In Sager, W., Hoernle, K., Höfig, T.W., Blum, P., and the Expedition 391 Scientists, Walvis Ridge Hotspot. Proceedings of the International Ocean Discovery Program, 391: College Station, TX (International Ocean Discovery Program). https://doi.org/10.14379/iodp.proc.391.104.2023
Sager, W., Hoernle, K., Höfig, T.W., Avery, A.J., Bhutani, R., Buchs, D.M., Carvallo, C.A., Class, C., Dai, Y., Dalla Valle, G., Del Gaudio, A.V., Fielding, S., Gaastra, K.M., Han, S., Homrighausen, S., Kubota, Y., Li, C.-F., Nelson, W.R., Petrou, E., Potter, K.E., Pujatti, S., Scholpp, J., Shervais, J.W., Thoram, S., Tikoo-Schantz, S.M., Tshiningayamwe, M., Wang, X.-J., and Widdowson, M., 2023c. Site U1577. In Sager, W., Hoernle, K., Höfig, T.W., Blum, P., and the Expedition 391 Scientists, Walvis Ridge Hotspot. Proceedings of the International Ocean Discovery Program, 391: College Station, TX (International Ocean Discovery Program). https://doi.org/10.14379/iodp.proc.391.105.2023
Sager, W., Hoernle, K., Höfig, T.W., Avery, A.J., Bhutani, R., Buchs, D.M., Carvallo, C.A., Class, C., Dai, Y., Dalla Valle, G., Del Gaudio, A.V., Fielding, S., Gaastra, K.M., Han, S., Homrighausen, S., Kubota, Y., Li, C.-F., Nelson, W.R., Petrou, E., Potter, K.E., Pujatti, S., Scholpp, J., Shervais, J.W., Thoram, S., Tikoo-Schantz, S.M., Tshiningayamwe, M., Wang, X.-J., and Widdowson, M., 2023d. Site U1578. In Sager, W., Hoernle, K., Höfig, T.W., Blum, P., and the Expedition 391 Scientists, Walvis Ridge Hotspot. Proceedings of the International Ocean Discovery Program, 391: College Station, TX (International Ocean Discovery Program). https://doi.org/10.14379/iodp.proc.391.106.2023
Salters, V.J.M., and Sachi-Kocher, A., 2010. An ancient metasomatic source for the Walvis Ridge basalts. Chemical Geology, 273(3–4):151–167. https://doi.org/10.1016/j.chemgeo.2010.02.010
Shervais, J.W., 2022. The petrogenesis of modern and ophiolitic lavas reconsidered: Ti-V and Nb-Th. Geoscience Frontiers, 13(2):101319. https://doi.org/10.1016/j.gsf.2021.101319
Tarduno, J., Bunge, H.-P., Sleep, N., and Hansen, U., 2009. The bent Hawaiian-Emperor hotspot track: inheriting the mantle wind. Science, 324(5923):50–53. https://doi.org/10.1126/science.1161256
Torsvik, T.H., Müller, R.D., Van der Voo, R., Steinberger, B., and Gaina, C., 2008. Global plate motion frames: toward a unified model. Reviews of Geophysics, 46(3):RG3004. https://doi.org/10.1029/2007RG000227
Tozer, B., Sandwell, D.T., Smith, W.H.F., Olson, C., Beale, J.R., and Wessel, P., 2019. Global bathymetry and topography at 15 arc sec: SRTM15+. Earth and Space Science, 6(10):1847–1864. https://doi.org/10.1029/2019EA000658
Van Fossen, M.C., and Kent, D.V., 1992. Paleomagnetism of 122 Ma plutons in New England and the mid-Cretaceous paleomagnetic field in North America: true polar wander or large-scale differential mantle motion? Journal of Geophysical Research: Solid Earth, 97(B13):19651–19661. https://doi.org/10.1029/92JB01466
Verosub, K.L., 1977. Depositional and postdepositional processes in the magnetization of sediments. Reviews of Geophysics, 15(2):129–143. https://doi.org/10.1029/RG015i002p00129
Weaver, B.L., Wood, D.A., Tarney, J., and Joron, J.L., 1987. Geochemistry of ocean island basalts from the South Atlantic: Ascension, Bouvet, St. Helena, Gough and Tristan da Cunha. In Fitton, J.G., and Upton, B.G.J. (Eds.), Alkaline Igneous Rocks. Geological Society Special Publication, 30: 253–267. https://doi.org/10.1144/GSL.SP.1987.030.01.11
Woodworth, D., and Gordon, R.G., 2018. Paleolatitude of the Hawaiian hot spot Since 48 Ma: evidence for a mid-Cenozoic true polar stillstand followed by late Cenozoic true polar wander coincident with Northern Hemisphere glaciation. Geophysical Research Letters, 45(21):11632–11640. https://doi.org/10.1029/2018GL080787
Zheng, L., Gordon, R.G., and Woodworth, D., 2018. Pacific plate apparent polar wander, hot spot fixity, and true polar wander during the formation of the Hawaiian Island and Seamount Chain from an analysis of the skewness of magnetic anomaly 20r (44 Ma). Tectonics, 37(7):2094–2105. https://doi.org/10.1029/2017TC004897