Planke, S., Berndt, C., Alvarez Zarikian, C.A., and the Expedition 396 Scientists
Proceedings of the International Ocean Discovery Program Volume 396
publications.iodp.org
https://doi.org/10.14379/iodp.proc.396.109.2023
Site U15741
![]() S. Planke,
S. Planke,
![]() C. Berndt,
C. Berndt,
![]() C.A. Alvarez Zarikian,
C.A. Alvarez Zarikian,
![]() A. Agarwal,
A. Agarwal,
![]() G.D.M. Andrews,
G.D.M. Andrews,
![]() P. Betlem,
P. Betlem,
![]() J. Bhattacharya,
J. Bhattacharya,
![]() H. Brinkhuis,
H. Brinkhuis,
![]() S. Chatterjee,
S. Chatterjee,
![]() M. Christopoulou,
M. Christopoulou,
![]() V.J. Clementi,
V.J. Clementi,
![]() E.C. Ferré,
E.C. Ferré,
![]() I.Y. Filina,
I.Y. Filina,
![]() J. Frieling,
J. Frieling,
![]() P. Guo,
P. Guo,
![]() D.T. Harper,
D.T. Harper,
![]() M.T. Jones,
M.T. Jones,
![]() S. Lambart,
S. Lambart,
![]() J. Longman,
J. Longman,
![]() J.M. Millett,
J.M. Millett,
![]() G. Mohn,
G. Mohn,
![]() R. Nakaoka,
R. Nakaoka,
![]() R.P. Scherer,
R.P. Scherer,
![]() C. Tegner,
C. Tegner,
![]() N. Varela,
N. Varela,
![]() M. Wang,
M. Wang,
![]() W. Xu,
W. Xu,
![]() S.L. Yager
2
S.L. Yager
2
1 Planke, S., Berndt, C., Alvarez Zarikian, C.A., Agarwal, A., Andrews, G.D.M., Betlem, P., Bhattacharya, J., Brinkhuis, H., Chatterjee, S., Christopoulou, M., Clementi, V.J., Ferré, E.C., Filina, I.Y., Frieling, J., Guo, P., Harper, D.T., Jones, M.T., Lambart, S., Longman, J., Millett, J.M., Mohn, G., Nakaoka, R., Scherer, R.P., Tegner, C., Varela, N., Wang, M., Xu, W., and Yager, S.L., 2023. Site U1574. In Planke, S., Berndt, C., Alvarez Zarikian, C.A., and the Expedition 396 Scientists, Mid-Norwegian Margin Magmatism and Paleoclimate Implications. Proceedings of the International Ocean Discovery Program, 396: College Station, TX (International Ocean Discovery Program). https://doi.org/10.14379/iodp.proc.396.109.2023
2 Expedition 396 Scientists’ affiliations.
1. Background and objectives
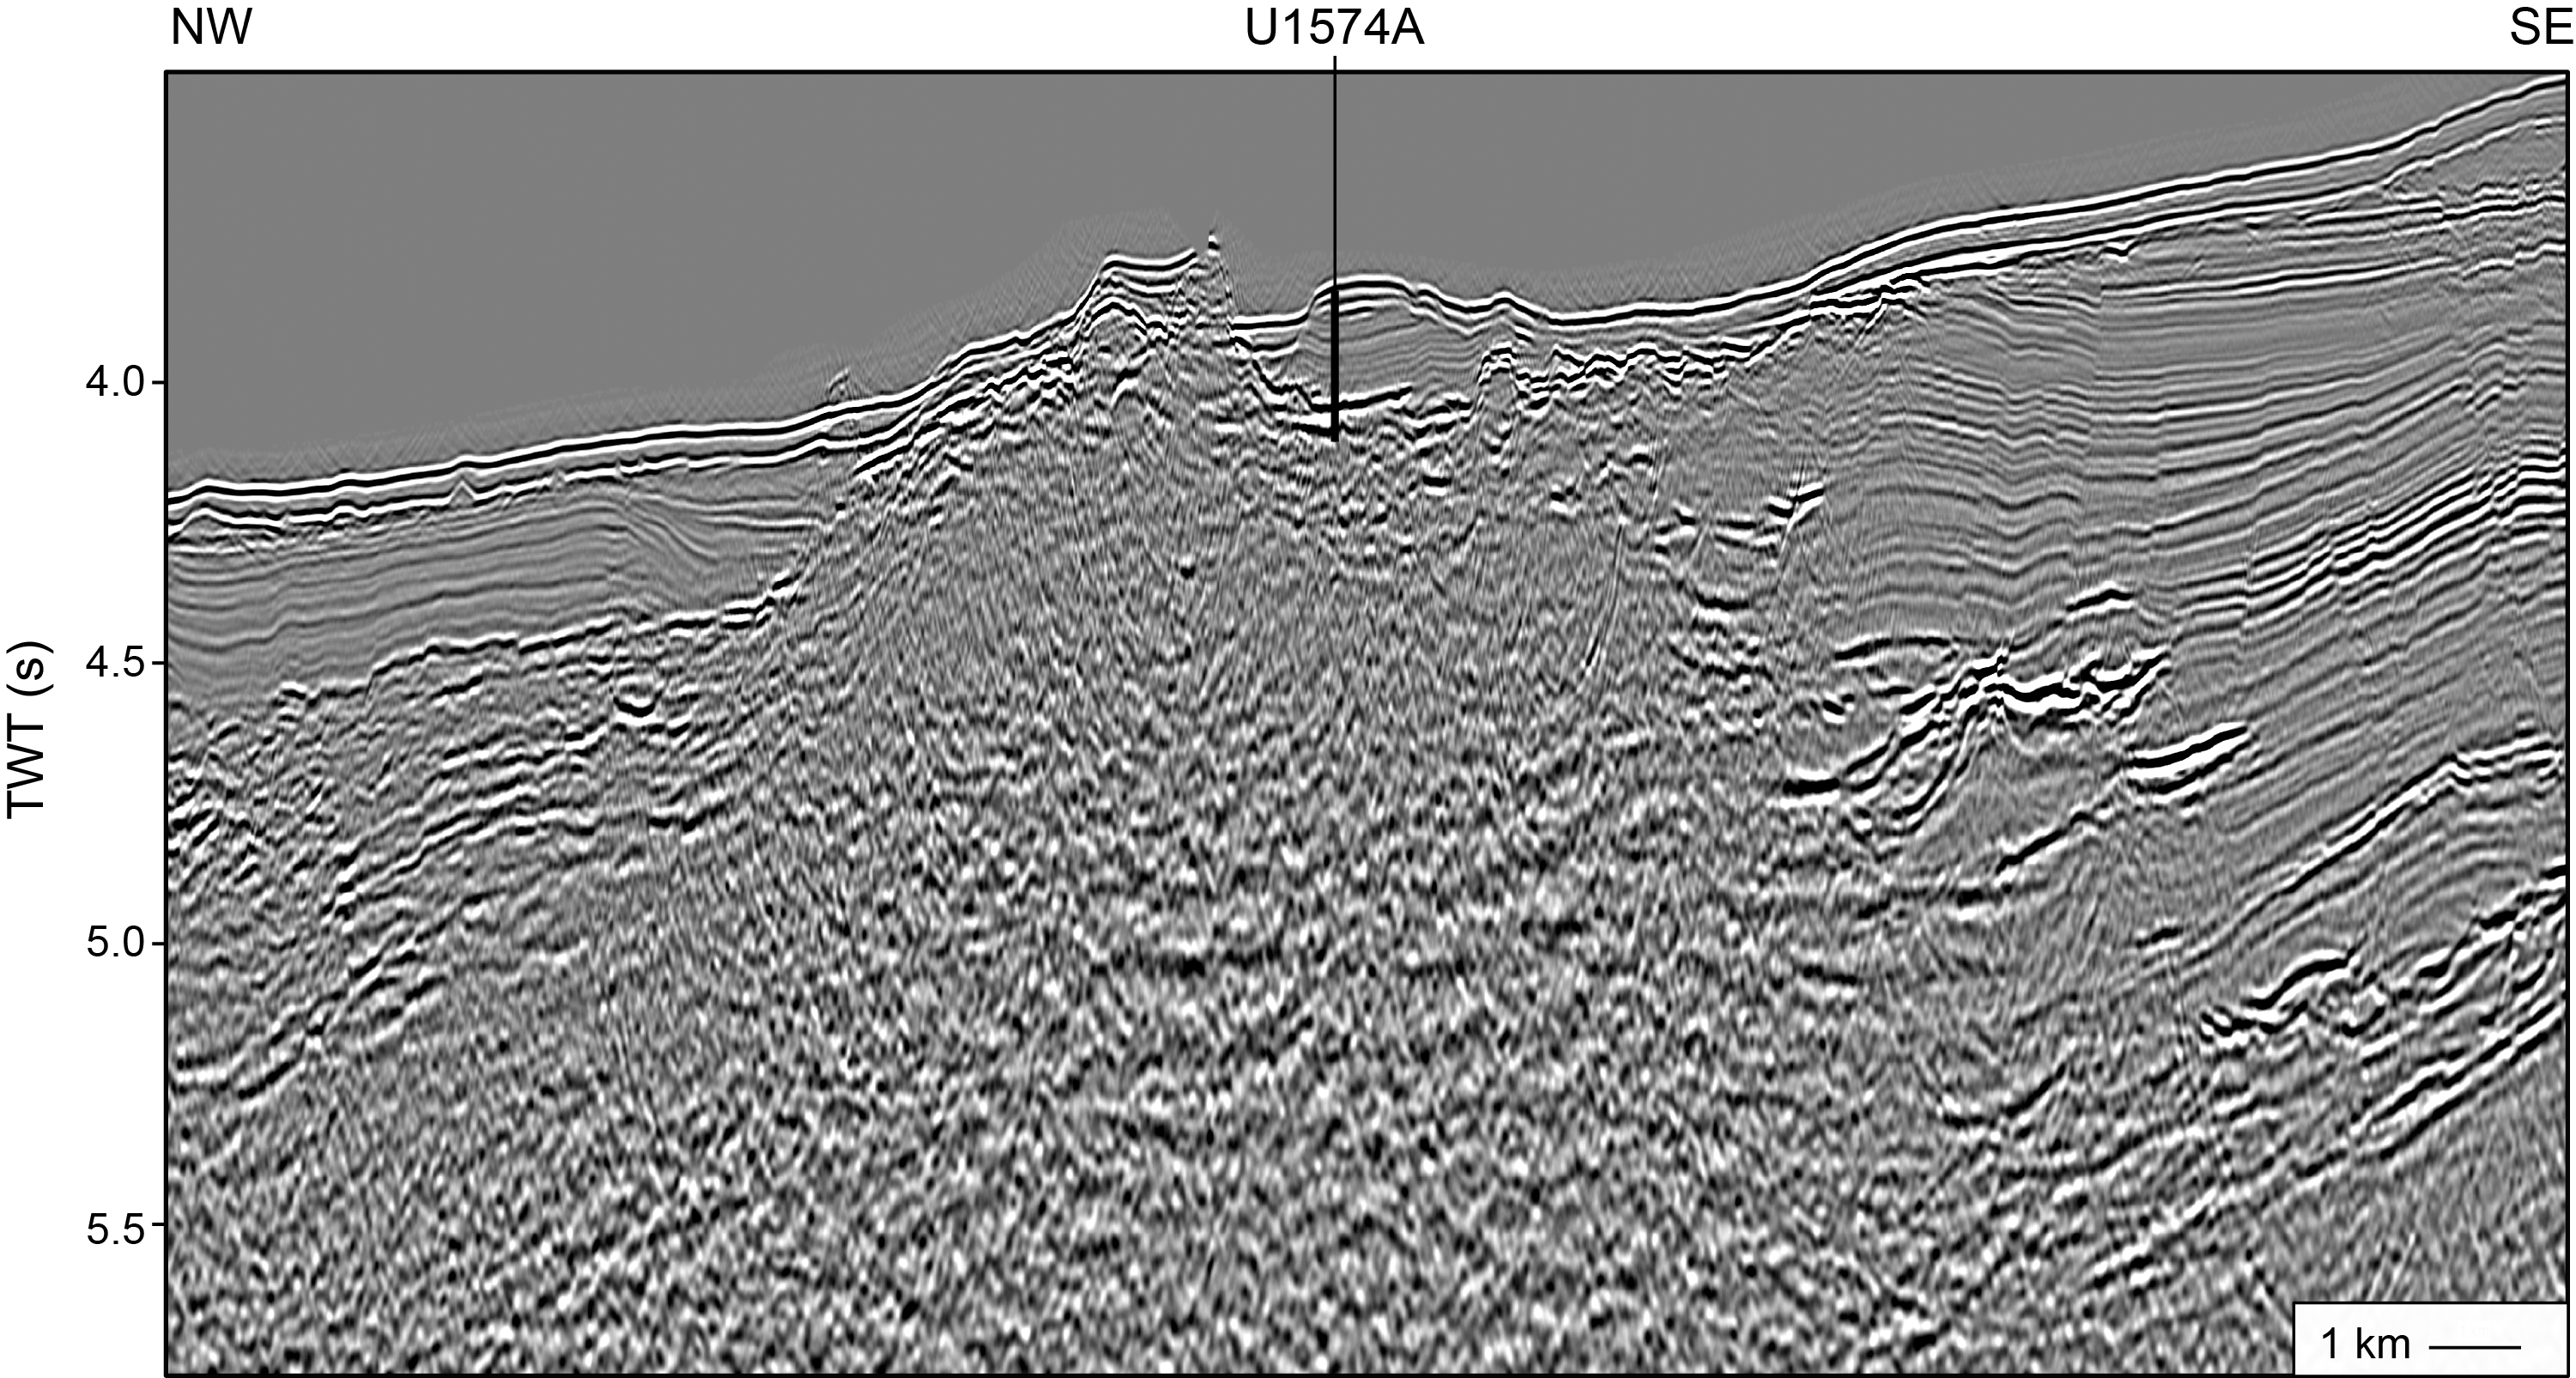
Site U1574 probes the top of an Outer High called Eldhø, which is located on the northern flank of the Vøring Plateau at 2825 m water depth (see Figure F1 in the Sites U1571 and U1572 chapter [Planke et al., 2023c]). Outer Highs are conspicuous volcanic seismic facies units that are located seaward of the Inner Seaward Dipping Reflectors (Inner SDR) facies units (Hopper et al., 1992; Planke et al., 2000; Franke et al., 2019). Although most volcanic seismic facies units are relatively continuous along a rifted margin, Outer Highs have a limited lateral extent of typically 10–20 km (Berndt et al., 2001). They form elongated structures that rise above the top of the adjacent Inner and Outer SDR. Seismically, Outer Highs frequently display a high-amplitude top reflection of normal seismic polarity, chaotic internal reflection patterns, and high-amplitude reflections that extend from the Outer High into adjacent sedimentary sequences that overlie the SDR (Figure F1).
Because Outer Highs are characteristic features of volcanic rifted margins located between Inner and Outer SDR, their presence likely signifies specific geological processes and provides clues to the evolution of volcanic passive margins. The pre-Expedition 396 interpretations of Outer Highs mainly relied on seismic volcanostratigraphic interpretations, field analogs, and geological reasoning. The facies unit was interpreted as dominantly hyaloclastite deposits formed when the eruption fissures were submerged during the initial phase of seafloor spreading. In this situation, eruptions would happen at sea level or in shallow marine conditions and lava would come into direct contact with seawater, leading to phreatomagmatic eruptions. The formation of Surtsey from 1964 to 1968 may serve as a recent analog (Kokelaar, 1983).
The structure targeted at Site U1574 is a typical example of an Outer High (Figure F1). We call this structure Eldhø, meaning “fire mountain” in Scandinavian languages. The name is also inspired by the achievements of Professor Olav Eldholm, who was a pioneer in drilling and defining the concepts of volcanic margins and large igneous provinces (e.g., Eldholm et al., 1989). Eldhø rises more than 1500 m above the adjacent Inner SDR in the southeast and about 650 m above the Outer SDR in the northwest, and there are numerous high-amplitude seismic reflections that transgress into the adjacent sedimentary basins south of the high. Its lateral extent is about 17 km in the dip (northwest–southeast) direction and about 30 km in the along-strike (southwest–northeast) direction. A sedimentary basin with kilometer-thick postbasalt sediment deposits, the Eldhø Basin, is located landward of Eldhø.
The first objective of Site U1574 was to obtain information on the emplacement environment based on observations of the drilled volcanic facies. If Eldhø was indeed emplaced close to sea level, this will validate these aspects of seismic volcanostratigraphy, and their presence may then be used as a marker for vertical movement. The second objective was to constrain the conditions in the melt region, specifically the composition of the mantle before melting and the ambient temperature and pressure conditions in the melt region during the late phase of breakup volcanism based on the geochemical composition and petrology of the encountered rocks. Reaching the first two objectives will allow us to parameterize geodynamic models for excessive breakup volcanism.
Furthermore, Site U1574 was drilled to provide information on the suitability of the breakup basalt sequences and interbedded sediments for permanent geological storage of CO2. If the Outer Highs indeed consist mainly of hyaloclastite deposits as postulated, they should be characterized by high porosity and permeability, which may make them a suitable target for CO2 storage. Finally, we hoped to obtain information on the earliest incursion of deep water into the North Atlantic and the extent of freshwater incursions into the young ocean during the Early to Middle Eocene (Brinkhuis et al., 2006) by coring the overlying sedimentary strata.
2. Operations
2.1. Transit to Site U1574
Because of a severe weather forecast, drilling operations at Site U1573 were terminated earlier than expected, and the ship was set on a south-southwestern course designed to position the vessel in more favorable seas while waiting out the strong weather system moving through the Norwegian Sea. The heaviest weather was experienced on 22 September 2021 while moving into the weather. Seas ranging 10–15 m were experienced during the day. By late afternoon, the winds and seas began to subside. The following morning, the wind had died down and the seas were beginning to flatten out. At 1400 h on 23 September (all times are provided in UTC + 0 h), the vessel turned back toward our next site. The vessel arrived at Site U1574 at 1130 h on 24 September after transiting 345 nmi over 88.5 h evading severe weather and sea conditions. The thrusters and hydrophones were lowered. The vessel shifted from cruise mode to dynamic positioning (DP) mode, and the drill floor was cleared for operations at 1200 h on 24 September, beginning Hole U1574A.
2.2. Site U1574
Site U1574 consists of three holes. The first hole was cored using the rotary core barrel (RCB) system to 260.0 meters below seafloor (mbsf) and then logged with the triple combination (triple combo) and Formation MicroScanner (FMS)-sonic logging tool strings. The original plan for Site U1574 was to core a single hole to 310 mbsf, but the science objectives were achieved by 260 mbsf. After completing Hole U1574A, the Co-Chief Scientists decided to use the remaining expedition time to piston core the sediment section above the basement and to attempt to improve on capturing the sediment/basement interface. The advanced piston corer (APC)/extended core barrel (XCB) system was selected for the second hole at the site. After assembling and lowering the APC/XCB system to the seafloor, the first APC core misfired and penetrated the seafloor at least twice. Hole U1574B was terminated after the poor mudline core at 9.5 mbsf. The vessel was offset 20 m south, and Hole U1574C was piston cored to 169.2 mbsf. We conducted four borehole temperature measurements with the advanced piston corer temperature (APCT-3) tool on Cores 4H (38.0 mbsf), 7H (66.1 mbsf), 10H (94.6 mbsf), and 13H (118.7 mbsf). The Icefield MI-5 core orientation tool was deployed for the first 10 cores. In anticipation of a hard layer based on the material recovered in Hole U1574A, the XCB system was deployed with a polycrystalline diamond compact XCB cutting shoe. Core 20X was cut across the hard layer at 169.2 mbsf, and coring in Hole U1574C was terminated at 1630 h on 1 October 2021 at a final depth of 171.5 mbsf. The last core was on deck at 1655 h. All coring tools were put away. The drill string was pulled back to the surface after clearing the seafloor at 1920 h. The drill collars were laid out to the drill collar racks, and the outer core barrel was disassembled and secured. The drill floor was secured for transit at 0231 h on 2 October, ending Hole U1574C and Site U1574. A total of 182.5 h or 7.6 days were recorded while at Site U1574.
A total of 59 cores were recorded for the site. The RCB system was used exclusively in Hole U1574A to core 260.0 m, and 88.41 m of core was recovered (34%). The APC system was used in both Holes U1574B and U1574C. A total of 20 APC cores were recovered over a 178.7 interval for a total recovery of 183.27 m (103%). The XCB coring system was used for a single core over a 2.3 m interval and recovered 64% of the cored interval (Table T1).
2.2.1. Hole U1574A
At 1200 h, after being cleared for operations by the bridge, the rig crew began assembling the RCB bottom-hole assembly (BHA). The seafloor depth estimated from the ship’s precision depth recorder (PDR) was 2836.4 meters below rig floor (mbrf) (2825.1 meters below sea level [mbsl]). The BHA was lowered to 172.1 mbrf with a new RCB bit before we began to lower the drill pipe, filling it with seawater at 20 pipe stand intervals during the trip to the seafloor. At 2800 mbrf, the top drive and drilling knobbies were installed. The bit was spaced out to spud Hole U1574A. A nonmagnetic core barrel was dropped, and Hole U1574A was spudded at 2325 h on 24 September 2021. The PDR measurement was used for the official seafloor depth. Coring continued with nonmagnetic RCB core barrels from the seafloor with full-length cores through Core 16R to 156.8 mbsf. The science office advised that the basement interface was at approximately 170 mbsf and requested to continue coring with half-length advances thereafter. The basement interface contact was met at 166.5 mbsf. Half-length advance RCB coring continued through Core 32R to 225.8 mbsf. There were several short advances between 195.7 and 206.5 mbsf where the core barrel was pulled because of very slow penetration rates (<1 m/h). At Core 30R we experienced a drilling break, and the penetration rate went from 1 to 29 m/h. This continued from 216.2 to ~233 mbsf. A full advance was taken on Core 33R. The formation finally firmed up again at ~233 mbsf. Core recovery was extremely poor in the weak formation. Half-advance coring resumed and continued through the final core, Core 38R, at 260.0 mbsf. Two mud sweeps were pumped, each 20 bbl, while coring the hole. On 26 September, we briefly paused coring operations because there was a 30 m excursion from the assigned hole position. This offset was quickly controlled and corrected, and the vessel resumed normal operations. As a precaution, an acoustic positioning beacon was launched at 1439 h on 26 September.
The last core on deck from Hole U1574A was recorded at 0100 h on 29 September. At the end of coring, the hole was swept clean of cuttings with a 50 bbl sweep of high-viscosity mud. After circulating the mud through the hole, the rotary shifting tool (RST) was run in on the coring line to release the RCB C-4 coring bit. The bit was released, and the RST was run again to reposition the bit shifting sleeve back to the circulating position in the mechanical bit release (MBR). The RST was pulled back to the surface, and the sinker bars were removed. The hole was displaced with 85 bbl of 10.5 lb/gal mud. The top drive was set back, and the drill string was raised to 104.5 mbsf in preparation for wireline logging. The rig floor personnel and the Schlumberger engineer held a toolbox meeting to review safety issues surrounding the upcoming logging operations, and the rig floor personnel began to assemble the logging tools.
At 0800 h on 29 September, we rigged up the triple combo tool string, consisting of the Magnetic Susceptibility Sonde (MSS), Hostile Environment Litho-Density Sonde (HLDS) (with source), and Hostile Environment Natural Gamma Ray Sonde (HNGS), and deployed it to 213.0 mbsf (logger’s depth). There were hang-ups at 187 and 213 mbsf. The tool string was unable to pass the second hang-up even with repeated attempts. The hole was logged up for a full-length open hole calibration pass. The tool string was run back to bottom at 213.0 mbsf, and the hole was logged up through the drill string to the seafloor. The caliper was closed prior to entering the drill string. The tools were at the surface at 1245 h and rigged down by 1330 h on 29 September.
The second tool string run was the FMS-sonic tool string, which was made up of the FMS, Dipole Sonic Imager (DSI), and HNGS. Starting at 1330 h, this tool string was rigged up, and it was ready to be deployed at 1420 h. It was deployed, and a down log with the FMS calipers closed began at 2825 mbrf and ran to 3090 mbrf (256 mbsf). Natural gamma radiation (NGR) was measured through the drill pipe to identify the seafloor to match the depth results on the first logging run. The FMS-sonic tool string managed to avoid the hang-ups experienced with the triple combo. At total depth, the first upward log was started, and it logged from 256 to 147 mbsf with the FMS calipers open. The tools were run back to the bottom of the hole (now 255.5 mbsf). This time, there were issues getting the tool string back to the bottom. After numerous attempts, it was worked down, and a second upward log was started, the calipers were opened, and the hole was logged to the seafloor. The calipers were closed just prior to entering the drill pipe. Initially there were problems entering the pipe. After several attempts at working the FMS arms open and closed, the entire tool string was pulled inside the drill pipe. As much as 2000 lb of overpull was experienced while trying to recover the tools. The tools were returned to the surface at 2010 h and rigged down by 2130 h on 29 September. While rigging down the FMS, one of the calipers and pads was found to be broken off the tool.
The drilling knobbies were removed from the drill string, and the drill string was recovered on board. The BHA reached the rig floor at 0520 h on 30 September after clearing the seafloor at 2230 h on 29 September. Two stands of drill collars were broken down and laid out to the drill collar racks on the main deck. The outer core barrel components were disassembled, inspected, and laid out. The top half of the MBR cleared the rig floor at 0520 h, ending Hole U1574A. The time spent on this hole was 137.25 h or 5.7 days.
2.2.2. Hole U1574B
Hole U1574B began at 0520 h on 30 September 2021 when the remaining half of the MBR cleared the rotary table from Hole U1574A. While raising the drill pipe, the vessel was relocated 20 m east of Hole U1574A. After the RCB outer core barrel components were laid out, the APC/XCB outer core barrel and BHA, including the nonmagnetic drill collar, were made up and deployed to 136.8 mbrf. The drill pipe was lowered to 2793.0 mbrf while the pipe was filled every 20 stands. The top drive and drilling knobby were picked up, and the bit was spaced out based on the PDR depth and logging depth for Hole U1574A. A shot depth of 2831.0 mbrf was selected. The orientation sinker bars and Icefield MI-5 were installed. A nonmagnetic APC core barrel was run in the hole to the bottom. An attempt was made to pressure up the drill string. This was not successful. Several more attempts were made to fire the core barrel. The hole was spudded at 1530 h. Inspection of the hydraulic piston core indicated that the shear pins had prematurely failed (cause unknown). The mudline core returned 9.72 m of core and was determined to have been disturbed by the misfire. Therefore, Hole U1574B was abandoned, and the vessel was repositioned 20 m south to start another hole. The core was recovered on board and set aside for training purposes. The time spent on Hole U1574B was 10.25 h or 0.4 days.
2.2.3. Hole U1574C
Hole U1574C began at 1530 h on 30 September 2021 after the failed mudline core on Hole U1574B. The shot depth of 2831 mbrf was used again, a nonmagnetic APC core barrel was deployed to the bottom of the hole, and the drill string was pressured up. Hole U1574C was spudded at 1650 h. The mudline core returned 9.91 m of core. The calculated seafloor depth from the APC mudline core was 2831.0 mbrf (2819.6 mbsl). APC coring continued with the Icefield MI-5 still installed from Hole U1574B from the seafloor through Core 396-U1574C-19H to 169.2 mbsf. Successful temperature measurements with the APCT-3 tool were recorded on Cores 4H (38.0 mbsf), 7H (66.1 mbsf), 10H (94.6 mbsf), and 13H (118.7 mbsf). Cores 5H, 12H, 13H, 15H, 18H, and 19H were all recorded as partial strokes. Overpull reached a maximum of 40,000 lb during the coring process. A single hard layer was encountered at ~129 mbsf. After the last (expected) partial stroke of the core barrel, the XCB system was deployed. The final XCB core immediately contacted basement at 169.2 mbsf. After cutting the core for 145 min, time expired for coring. A 2.3 m advance returned a 1.47 m core. The final core, Core 20X, was on deck and laid out at 1655 h on 1 October. The coring systems were secured, the top drive was set back, and the bit was pulled clear of the seafloor at 1920 h. The pipe trip continued to the top of the APC/XCB BHA to 136.8 mbrf. The drill collars were broken down and laid out to the main deck drill collar racks. The outer core barrel components were disassembled, inspected, and secured. The bridge was notified when the rig floor was secured for transit at 0231 h on 2 October, ending Hole U1574C. The time spent on Hole U1574C was 35 h or 1.5 days.
With the drill floor secured, the vessel switched from DP to cruise mode. The thrusters were raised and secured, and we began the 877 nmi sea passage to Reykjavík, Iceland, at 0300 h at a speed of 10.0 kt. The final transit to Reykjavík was completed at 1648 h on 5 October (half a day earlier than originally planned) under fair skies and calm seas with the first line ashore at Berth 10 Skarfabakki Port in Reykjavík ending Expedition 396.
3. Lithostratigraphy
Site U1574 is located on the lower slope of the Vøring Plateau on a structural high called Eldhø. This Outer High was likely formed by subaqueous volcanism during the initial phase of seafloor spreading. The succession of recovered material consists of both sediments and basalts and is divided into five lithostratigraphic units (Table T2). The division of the units is based on changes in lithology, which coincide with changes in physical properties trends. A lithologic summary that includes preliminary ties based on lithostratigraphic unit boundaries at the site is shown in Figure F2. More detailed lithologic columns are provided in Figure F3.
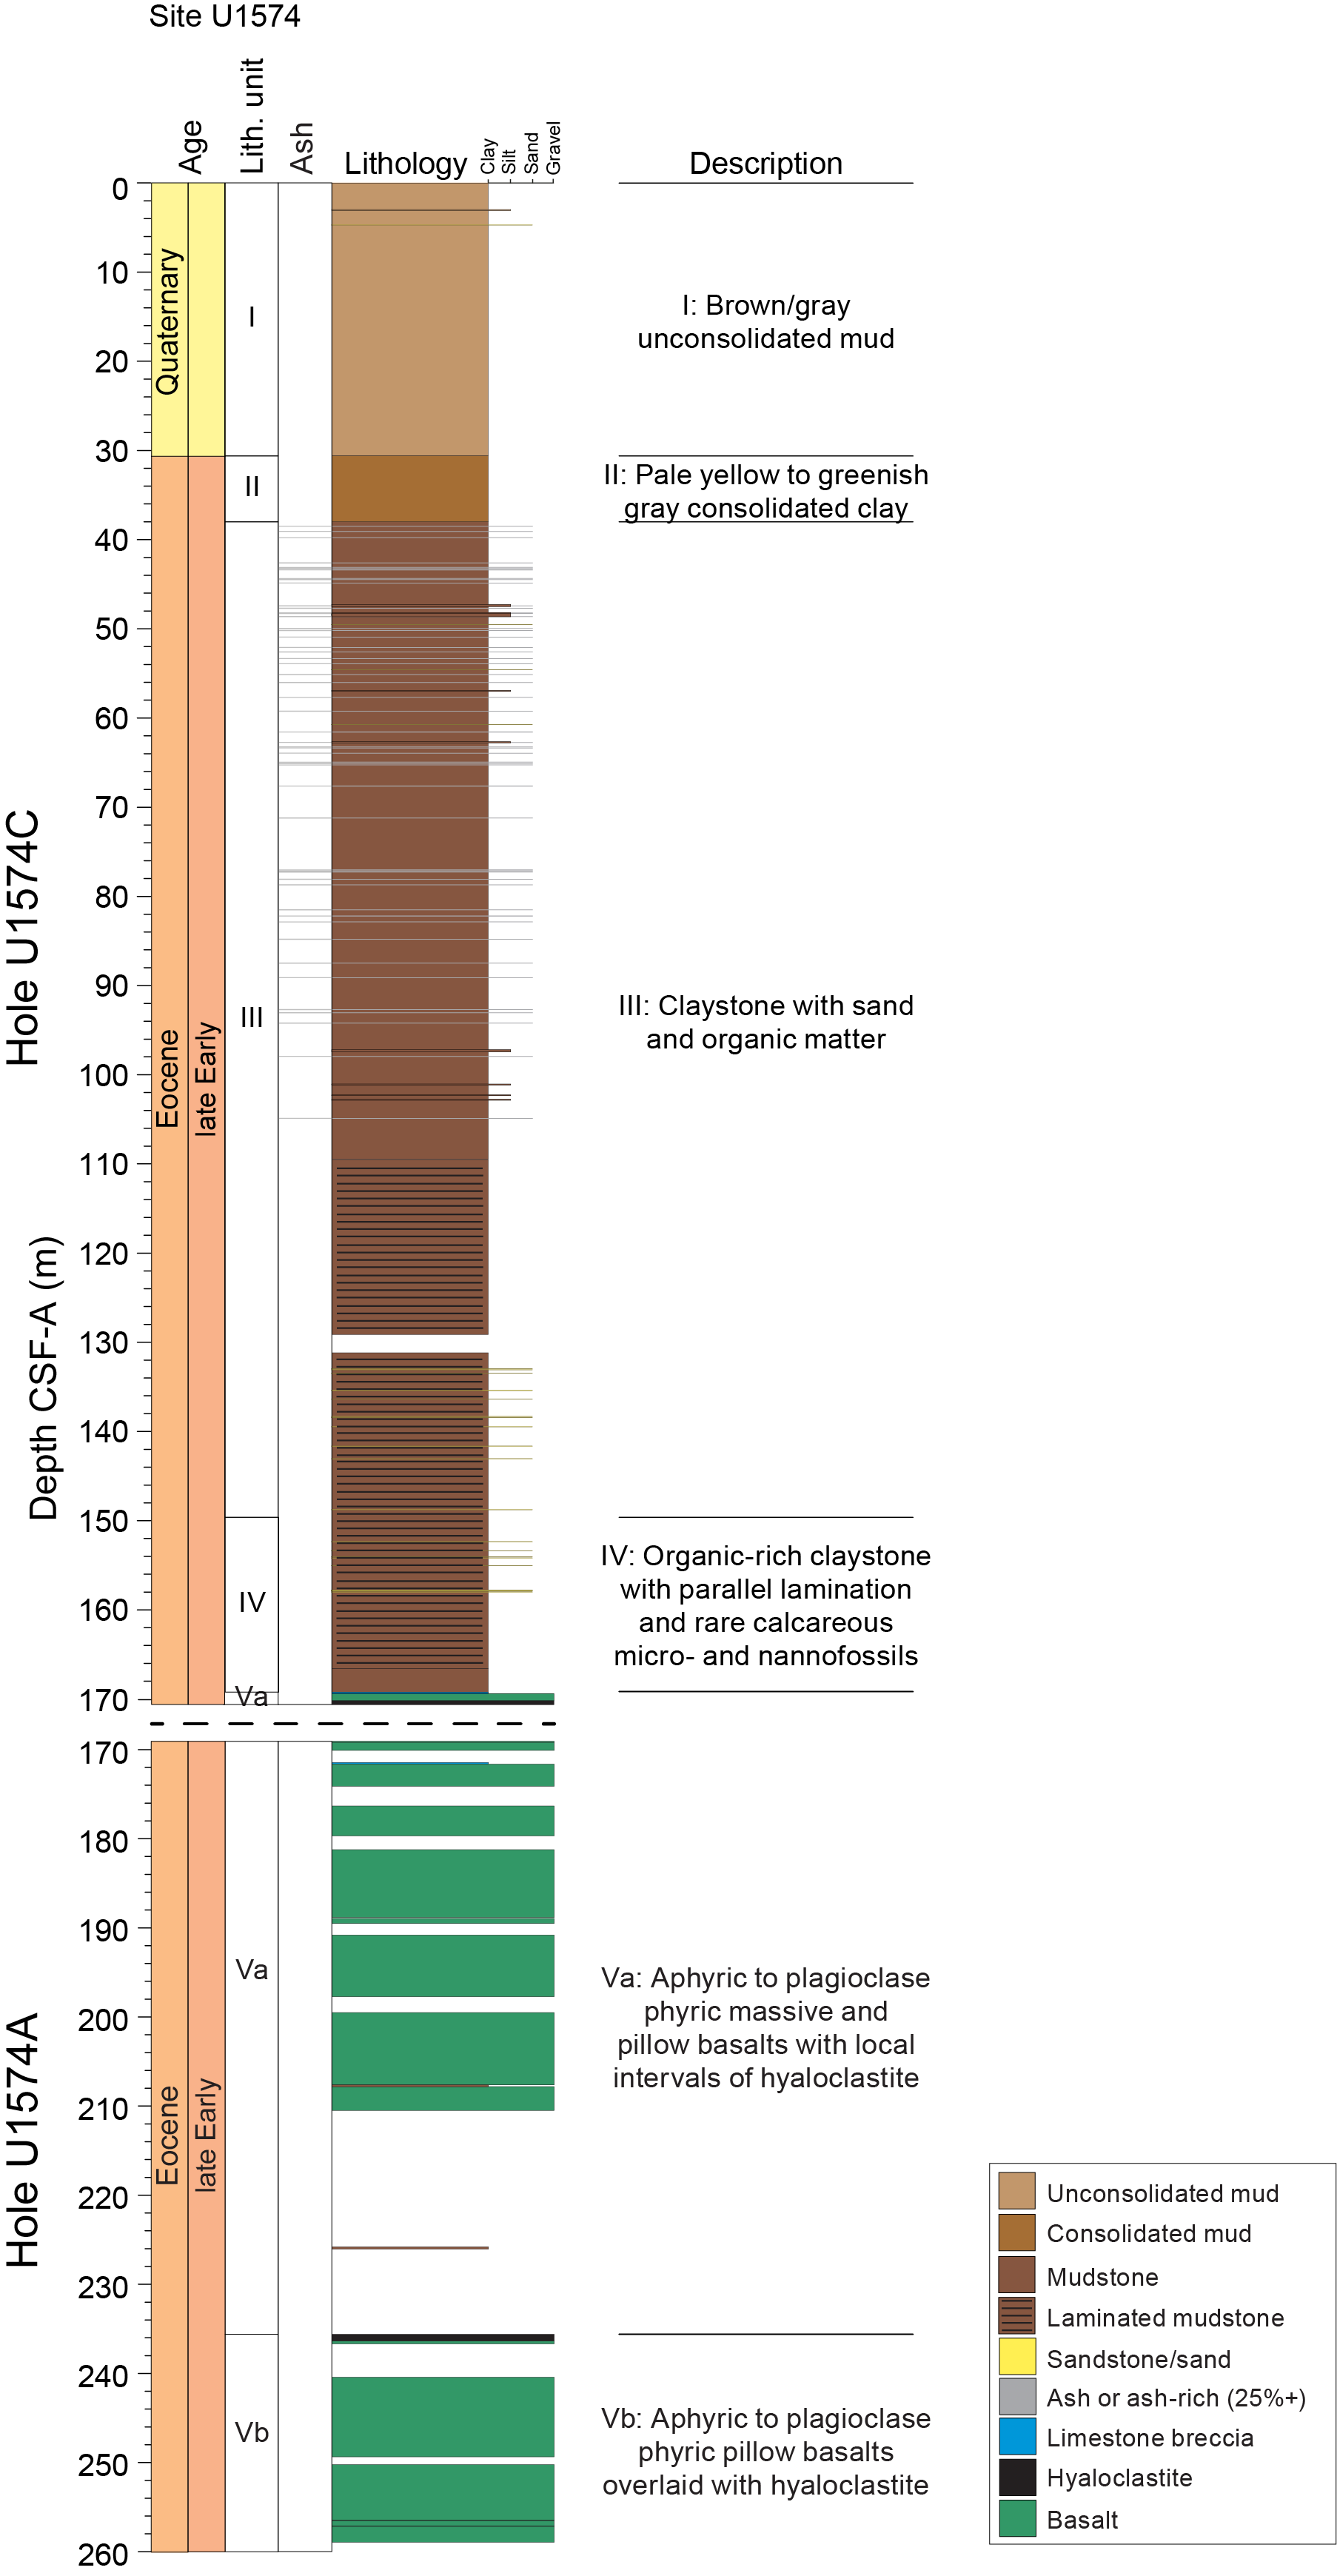
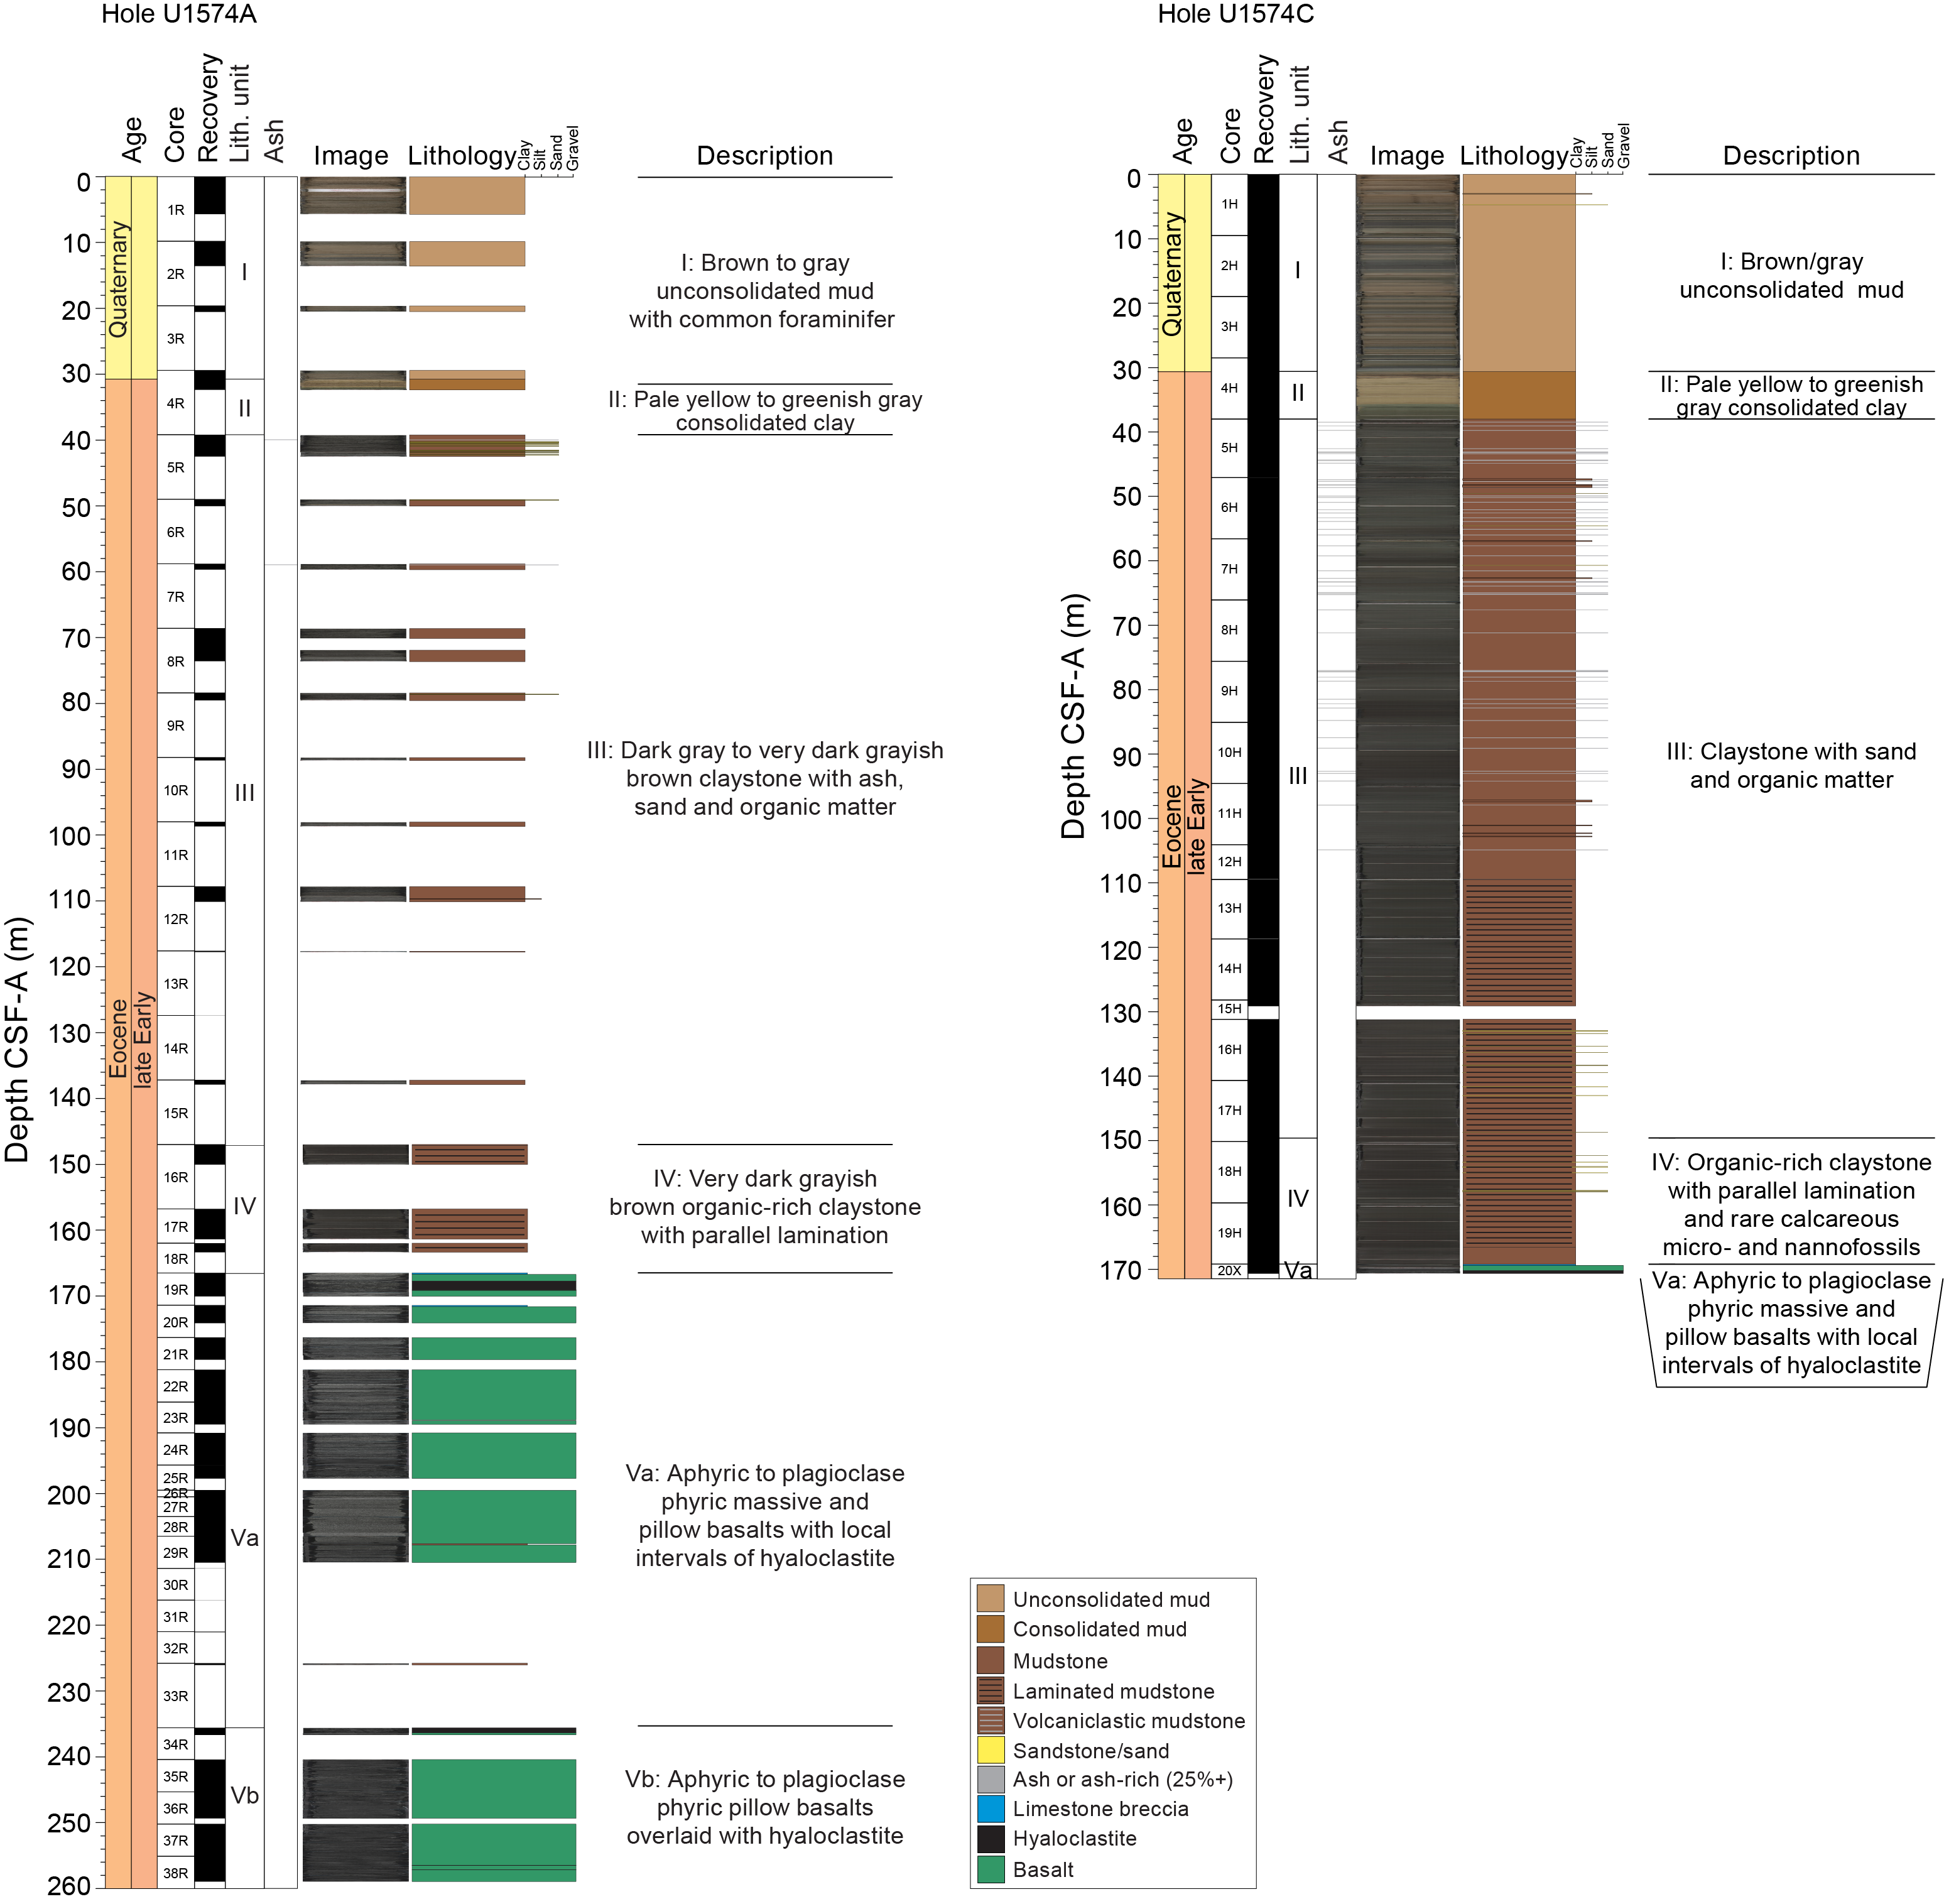
Unit intervals, depths, and descriptions are provided in Table T2. Units I–IV are sedimentary, and Unit V consists of basalt, hyaloclastite, and a small amount of interbasaltic sediments.
The lithology at Site U1574 is as follows:
- Unit I consists of brown and brownish gray unconsolidated mud with intervals of rare pebbles and rare to common foraminifers.
- Unit II consists of pale yellow and grayish green consolidated clay.
- Unit III is very dark gray claystone with rare beds of sandstone and ash and some parallel lamination and bioturbation.
- Unit IV is very dark gray to very dark grayish brown organic rich claystone with thin parallel lamination and rare calcareous micro- and nannofossils.
- Unit V consists of aphyric to plagioclase phyric pillow basalt with localized hyaloclastite and rare interbedded mudstone. Unit V is divided into Subunits Va and Vb based on lithologic and geochemical variations. Subunit Va contains both massive and pillow basalts, and Subunit Vb contains primarily pillow basalt and has a geochemical signature that is distinct from Subunit Va.
The lithostratigraphic highlights of Site U1574 are as follows:
- A late Early Eocene succession (Unit IV) characterized by organic-rich mudstone with thin parallel lamination and well-preserved macrofossils including bivalves and gastropods was recovered.
- Two basaltic sequences (Subunits Va and Vb) consisting of hyaloclastite transitioning to pillow basalts were recovered.
3.1. Lithostratigraphic Unit I
- Intervals: 396-U1574A-1R-1, 0 cm, to 4R-1, 135 cm; 396-U1574C-1R-1, 0 cm, to 4H-2, 62 cm
- Depths: Hole U1574A = 0–30.75 m core depth below seafloor, Method A (CSF-A); Hole U1574C = 0–30.62 m CSF-A
- Age: Quaternary
Lithostratigraphic Unit I consists of brown and brownish gray unconsolidated mud. Intervals with rare to common foraminifers are present throughout, and rare pebbles are observed locally. Pebbles are likely related to ice-rafted debris deposits associated with glacial–interglacial cycles of the Pleistocene because composition is wide ranging (e.g., siltstone and metamorphic basement), suggesting variable provenance.
3.2. Lithostratigraphic Unit II
- Intervals: 396-U1574A-4R-1, 135 cm, to 5R-1, 0 cm; 396-U1574C-4H-2, 62 cm, to 5H-1, 0 cm
- Depths: Hole U1574A = 30.75–39.20 m CSF-A; Hole U1574C = 30.62–38.00 m CSF-A
- Age: latest Early Eocene
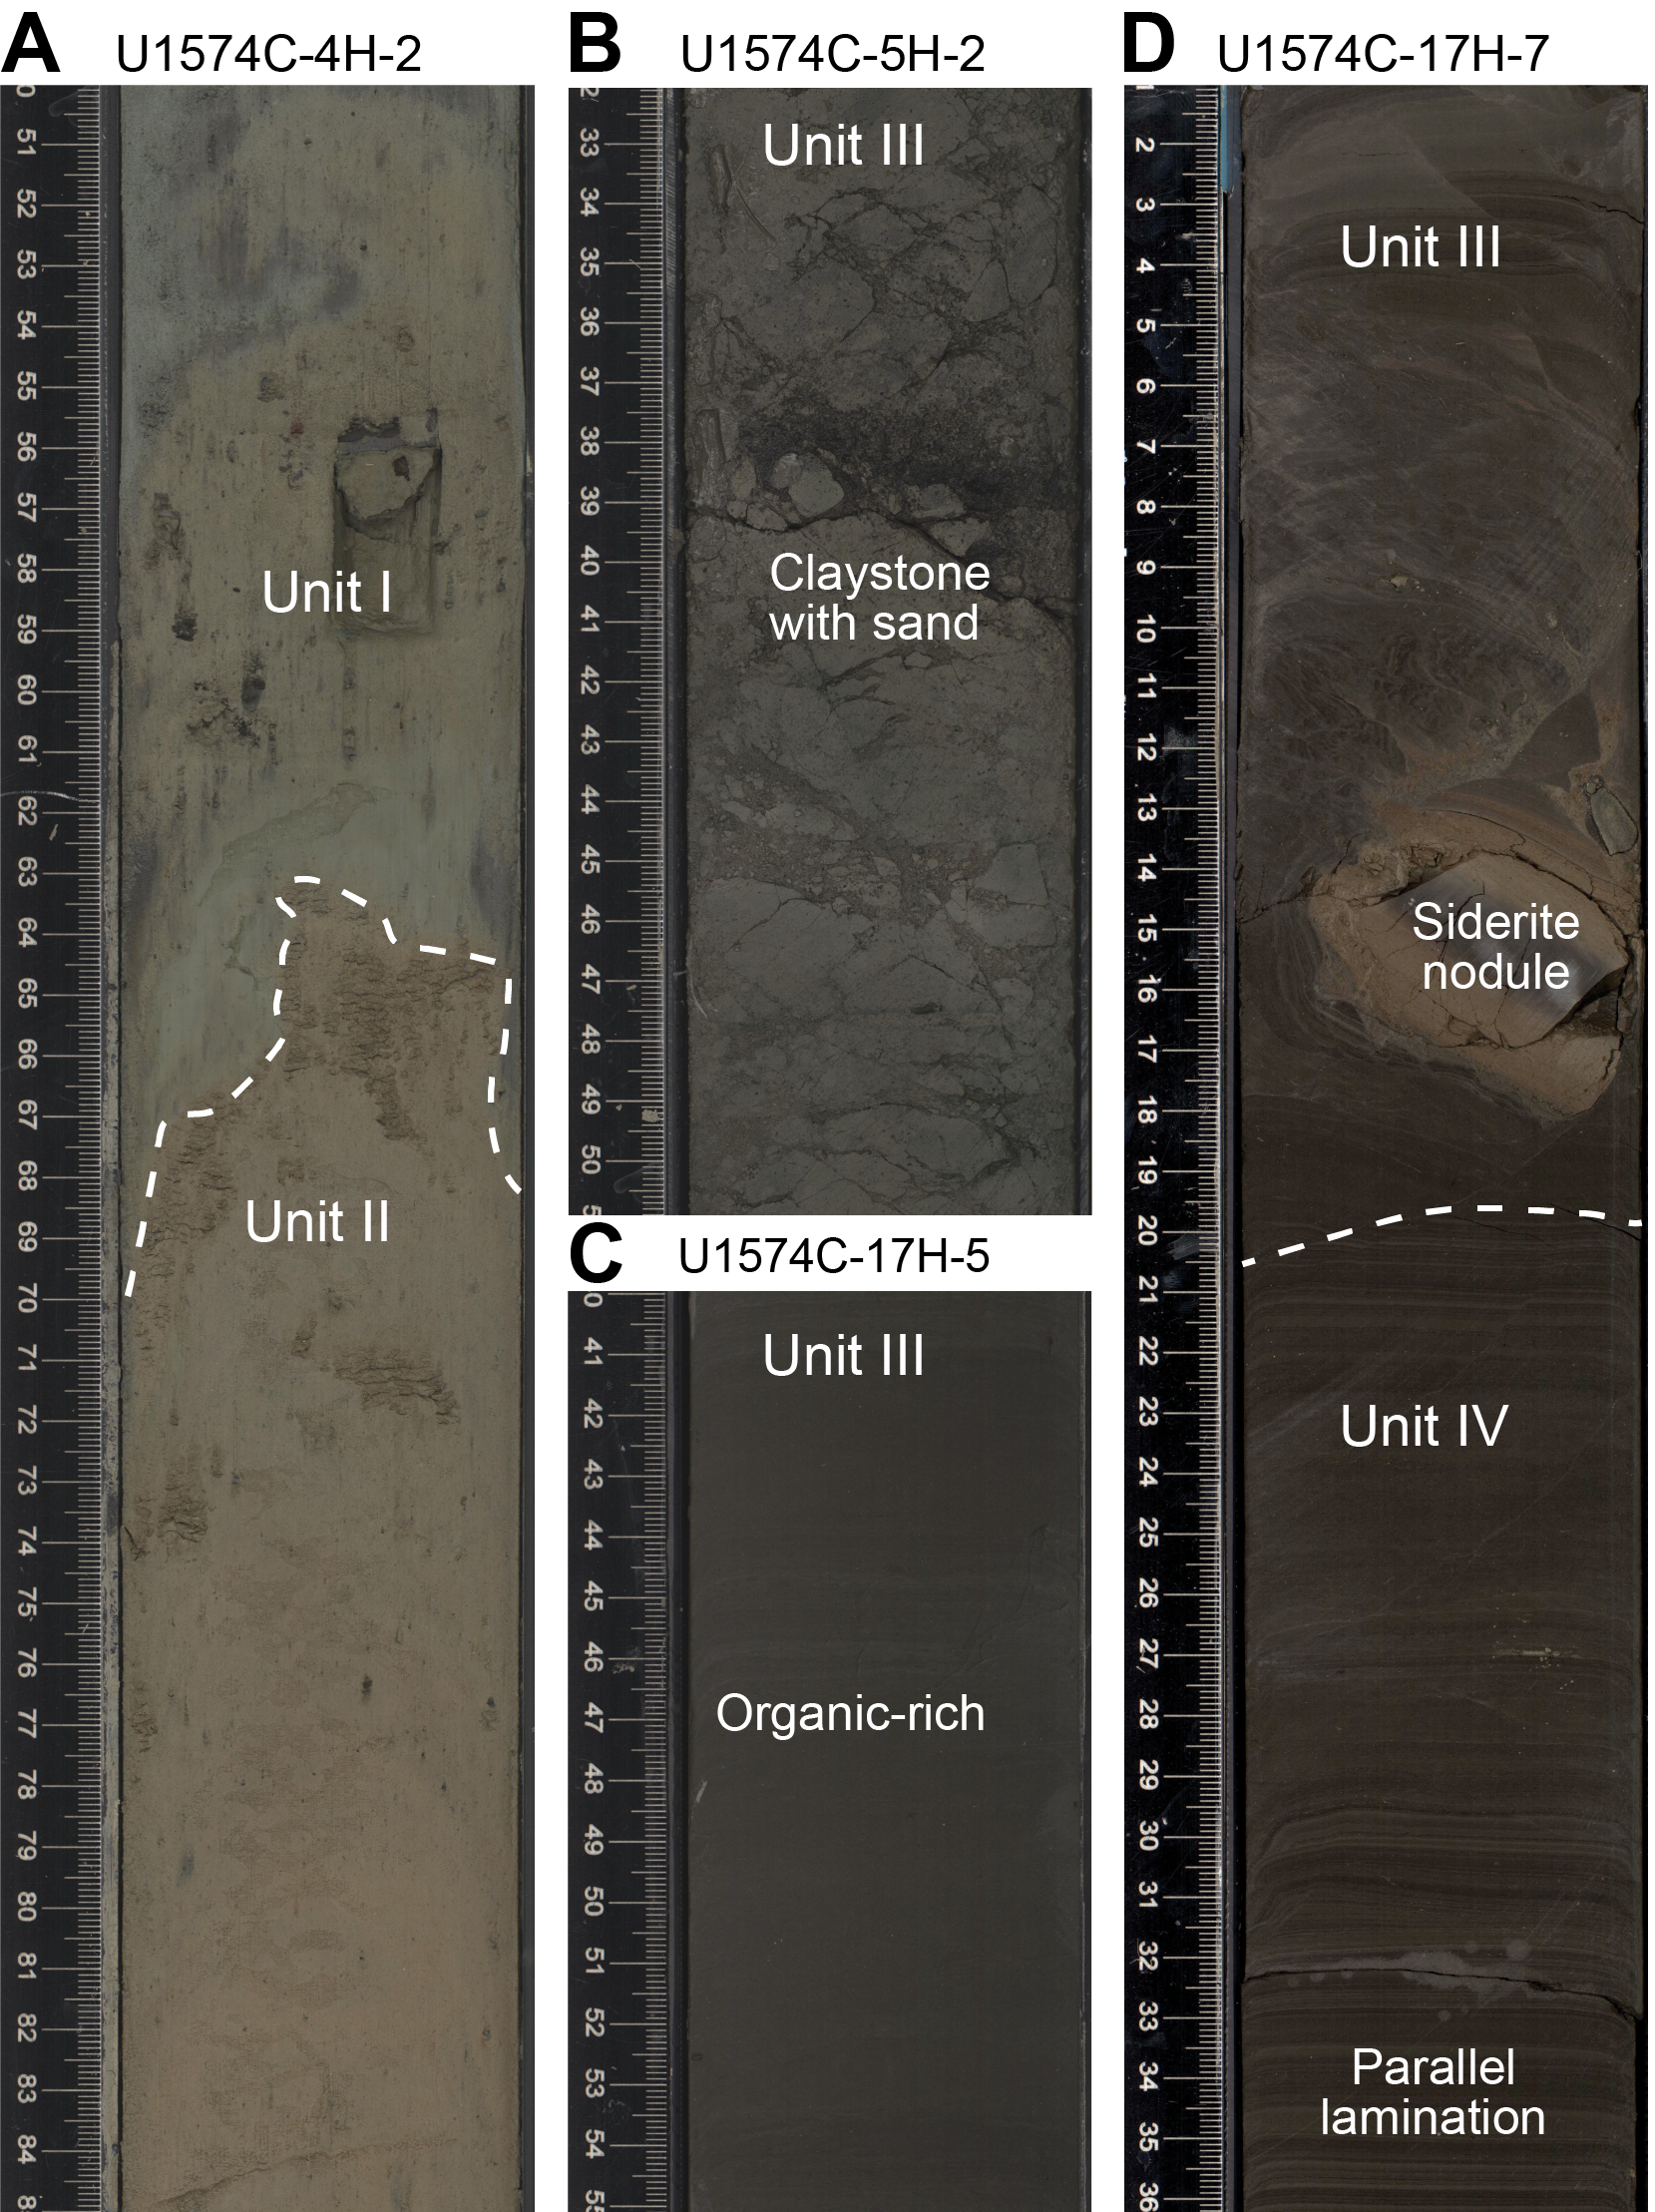
Lithostratigraphic Unit II consists of pale yellow and grayish green consolidated mud. The lithologic transition from Unit I to Unit II is well defined by a distinct change in the consolidation of the mud (Figure F4A). The unit boundary also corresponds to a shift in biostratigraphic observations in which the first Eocene-aged dinocyst zonations are encountered (i.e., latest Early Eocene; see Biostratigraphy).
3.3. Lithostratigraphic Unit III
- Intervals: 396-U1574A-5R-1, 0 cm, to 16R-1, 27 cm; 396-U1574C-5H-1, 0 cm, to 17H-7, 20 cm
- Depths: Hole U1574A = 39.20–147.27 m CSF-A; Hole U1574C = 38.00–149.64 m CSF-A
- Age: latest Early Eocene
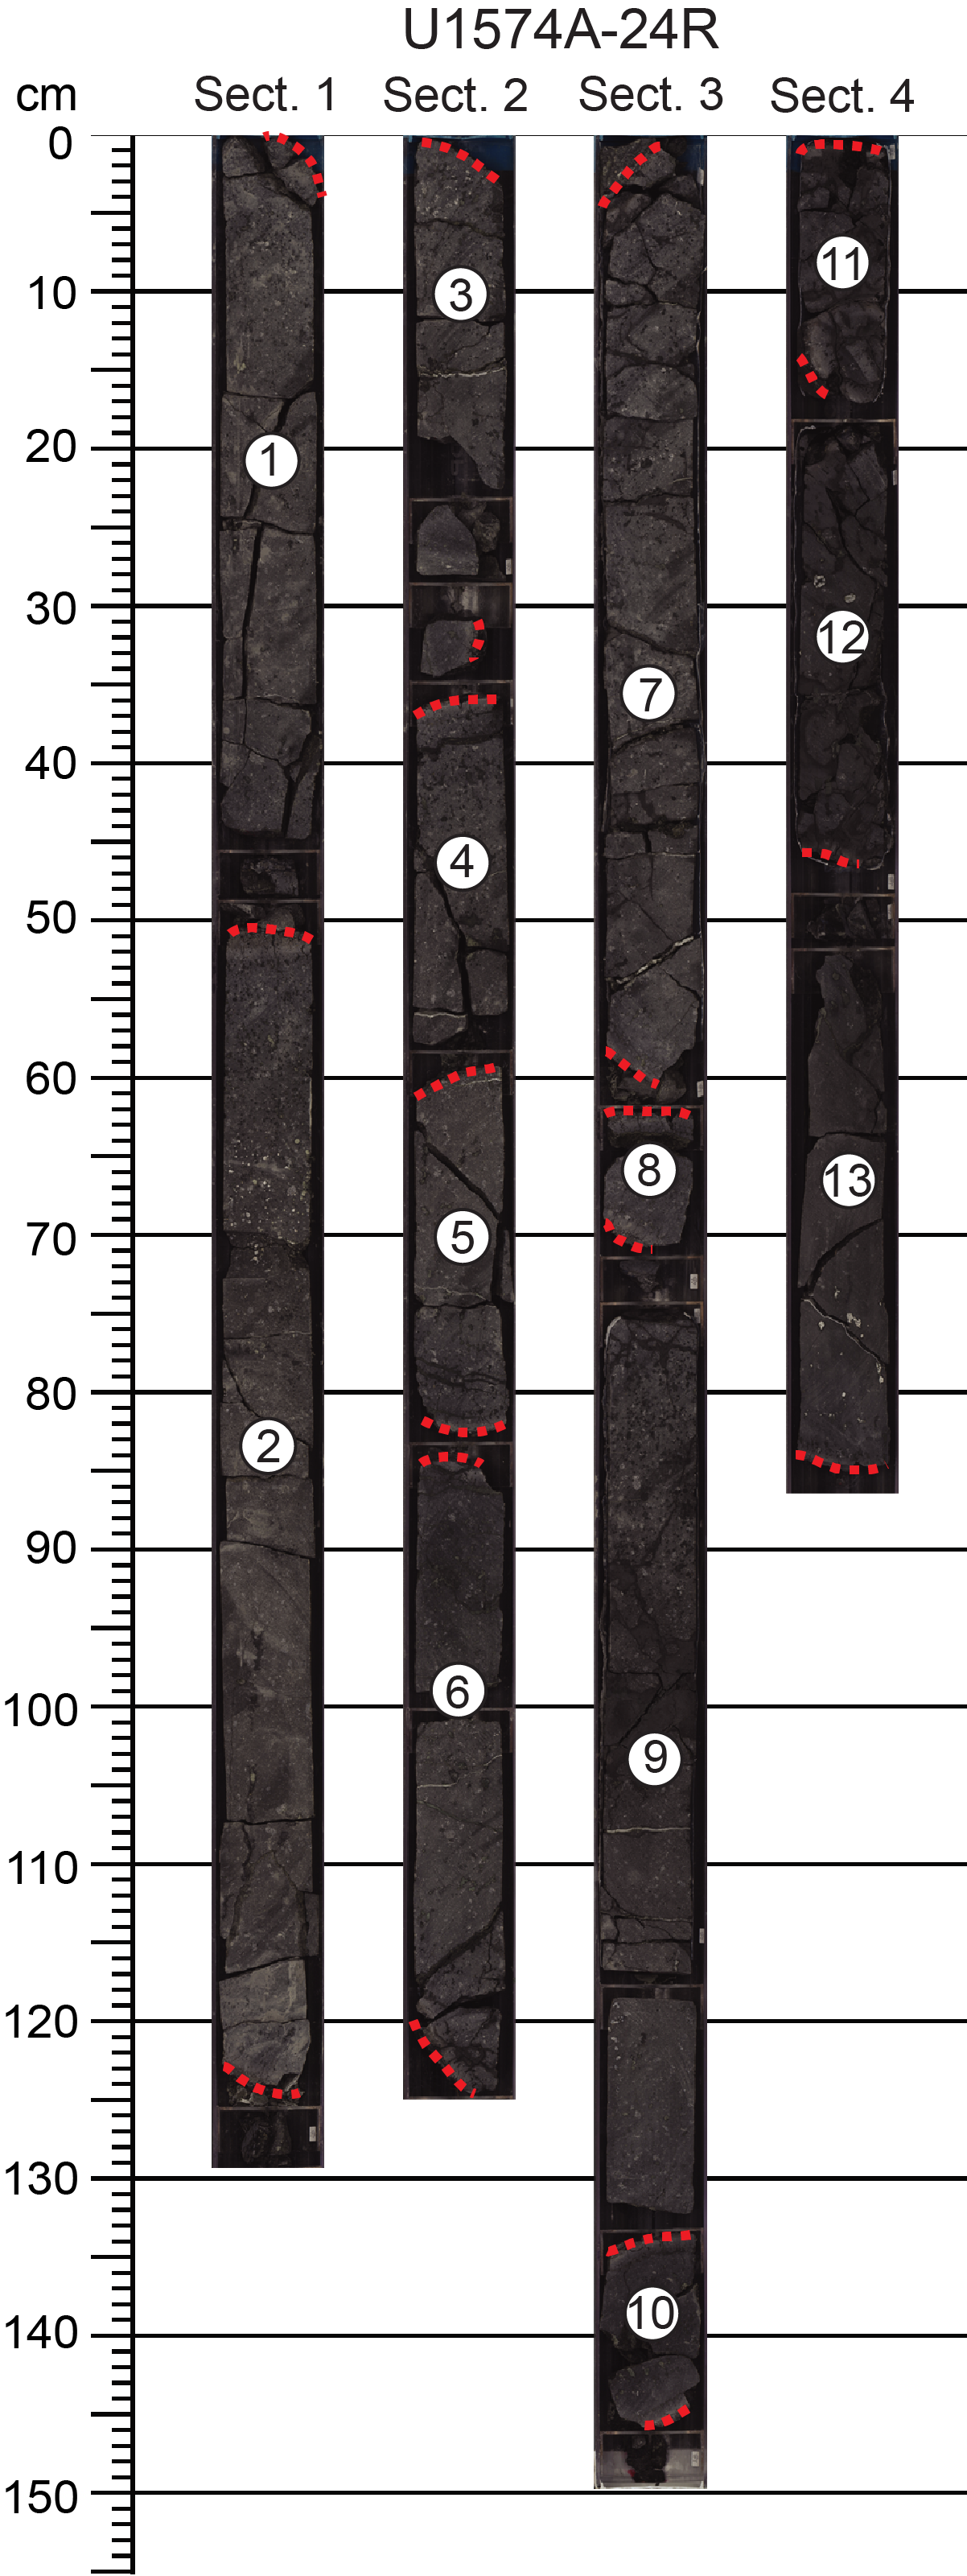
Lithostratigraphic Unit III consists of very dark gray mudstone with rare beds of sandstone and ash. In the uppermost interval, interbedded sandstone is common (Figure F4B) with occurrence decreasing downhole as texture becomes finer grained and organic content increases (Figure F4C). Black, organic-rich mudstone is observed from Core 396-U1574A-9R to the base of the unit in Hole U1574A. This increase in organic content toward the base of the unit is also observed in Hole U1574C. Trace carbonate nodules and thin to medium beds of light gray and grayish brown limestone are recovered toward the base of the unit (i.e., within and below Sections 396-U1574A-12R-1 and 396-U1574C-12H-1). Dewatering structures and authigenic pyrite and siderite (Figure F4D) are also observed in the lowermost interval of the unit. Slight to moderate bioturbation and some intervals of thin parallel lamination are observed throughout the unit.
3.4. Lithostratigraphic Unit IV
- Intervals: 396-U1574A-16R-1, 27 cm, to 19R-1, 6 cm; 396-U1574C-17H-7, 20 cm, to 20X-1, 2 cm
- Depths: Hole U1574A = 147.27–166.56 m CSF-A; Hole U1574C = 149.64–169.22 m CSF-A
- Age: latest Early Eocene
Lithostratigraphic Unit IV is very dark gray to very dark grayish brown organic rich mudstone with thin parallel lamination and authigenic pyrite. Beds of limestone are observed toward the base of this unit, although they are less common compared with Unit III. The transition from Unit III to Unit IV is displayed in Figure F4D, in which a distinct increase in organic content, as observed in smear slide inspection, and strength of preserved laminations is observed. In Unit IV, an increase in microfossils, including foraminifers, is observed macroscopically and confirmed by biostratigraphy (see Biostratigraphy). Other trace macrofossils, including bivalves and gastropods, are observed throughout the unit. Nannofossils are observed in smear slides with abundances increasing downhole within the unit.
3.5. Lithostratigraphic Unit V
- Intervals: 396-U1574A-19R-1, 6 cm, to 38R-3, 95 cm (bottom of hole); 396-U1574C-20X-1, 2 cm, to 20X-CC, 37 cm (bottom of hole)
- Depths: Hole U1574A = 166.56–258.94 m CSF-A; Hole U1574C = 169.22–171.50 m CSF-A
- Age: latest Early Eocene
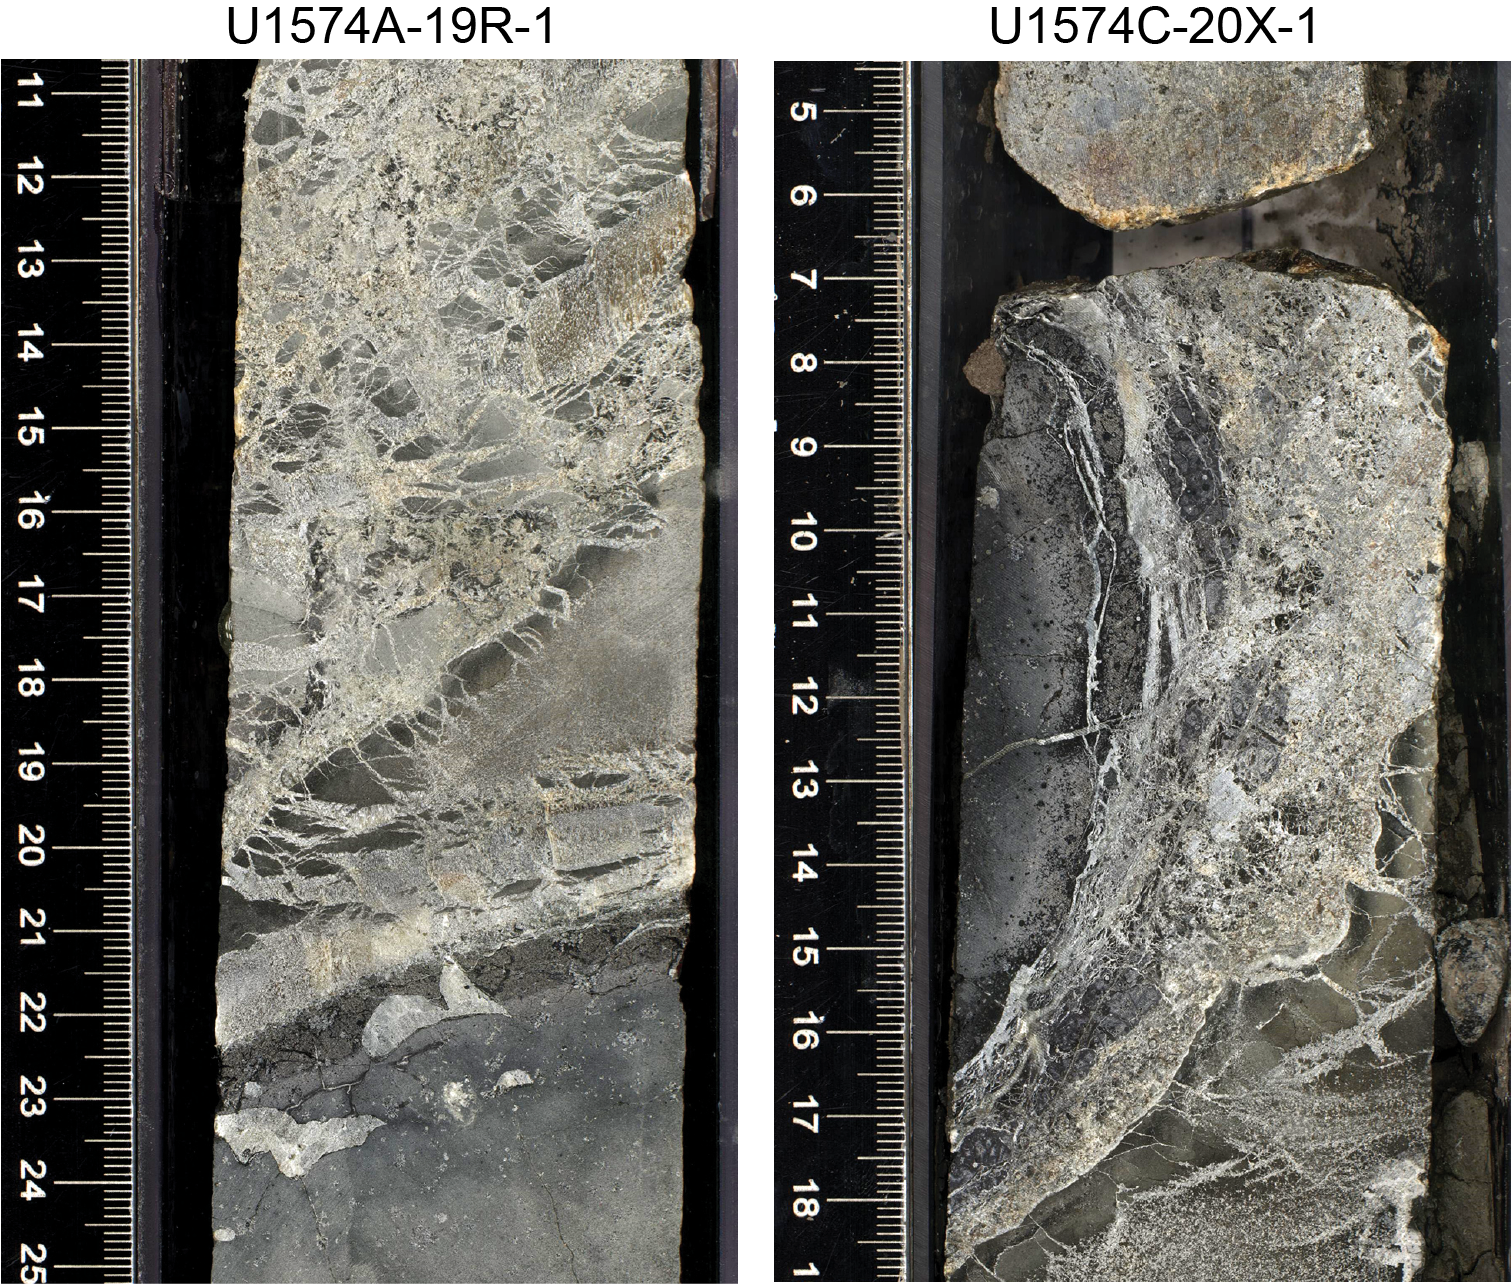
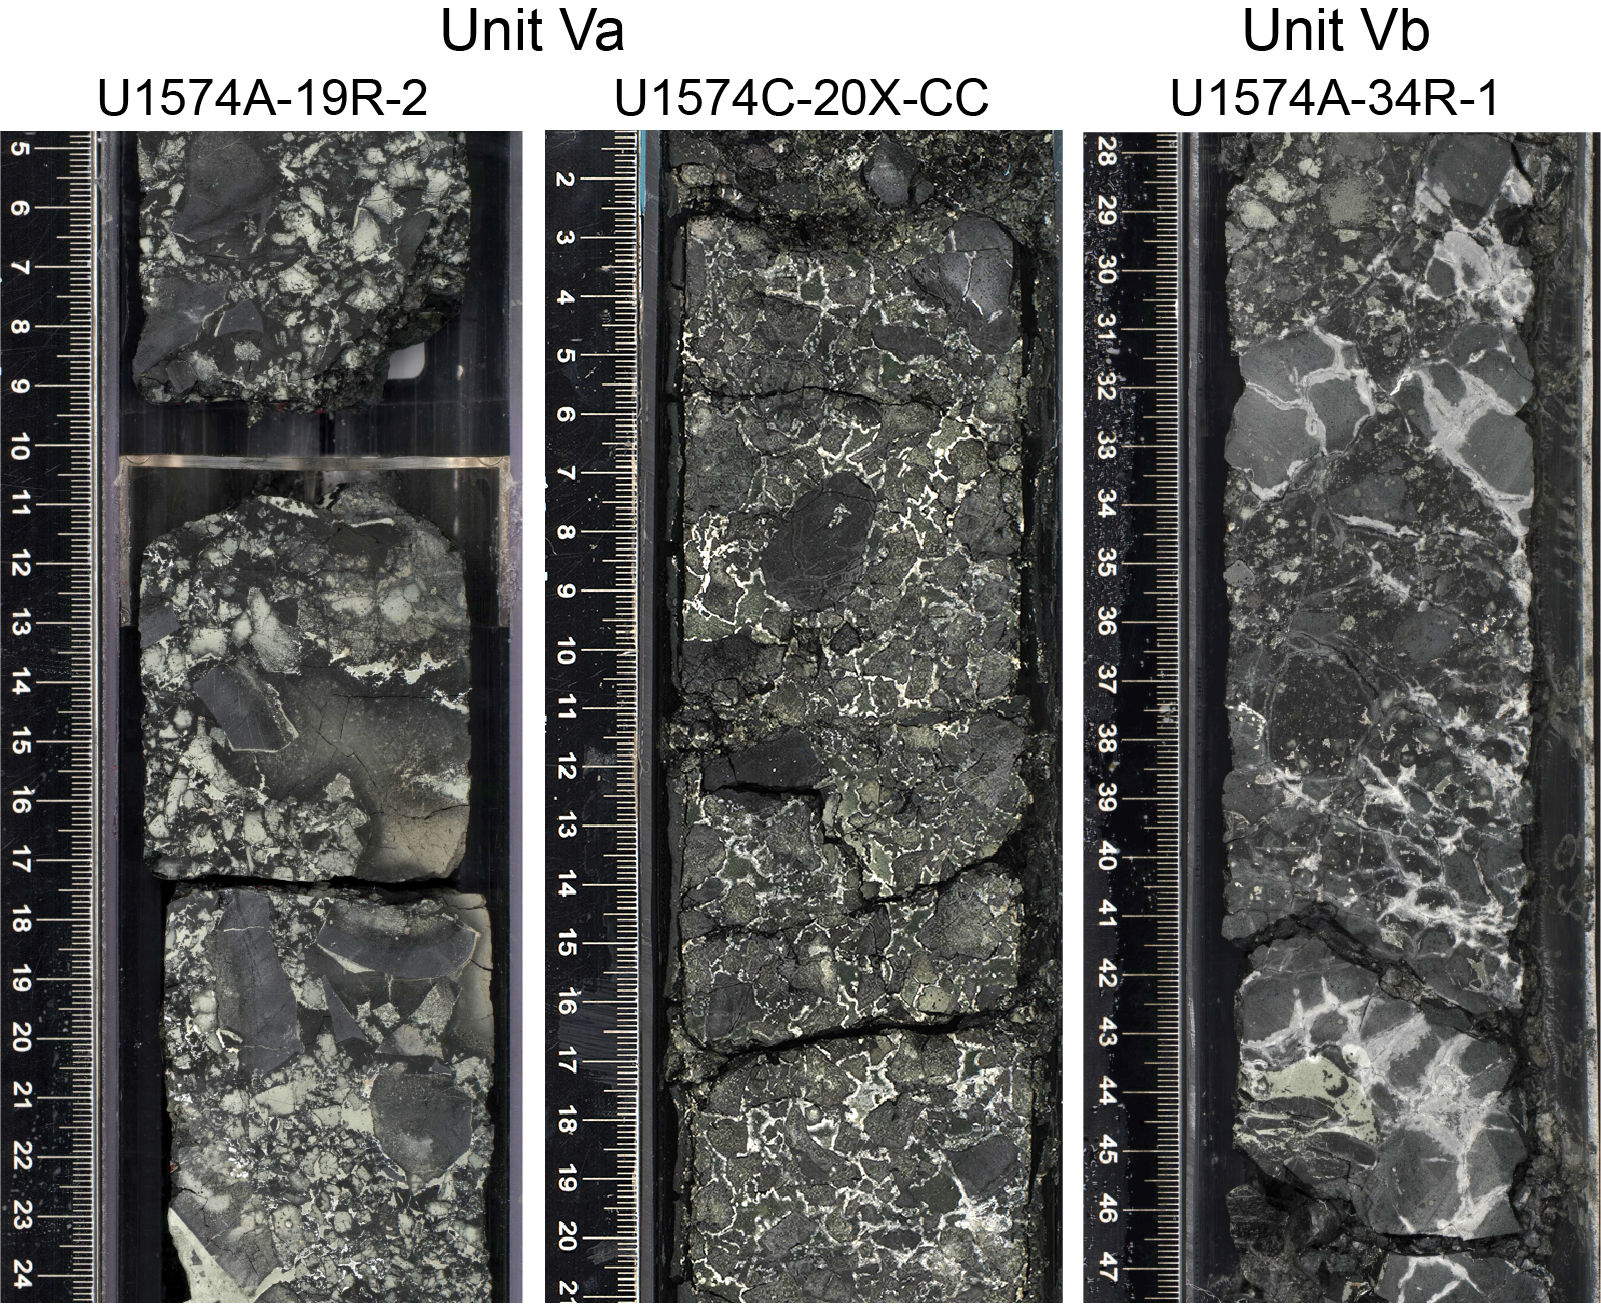
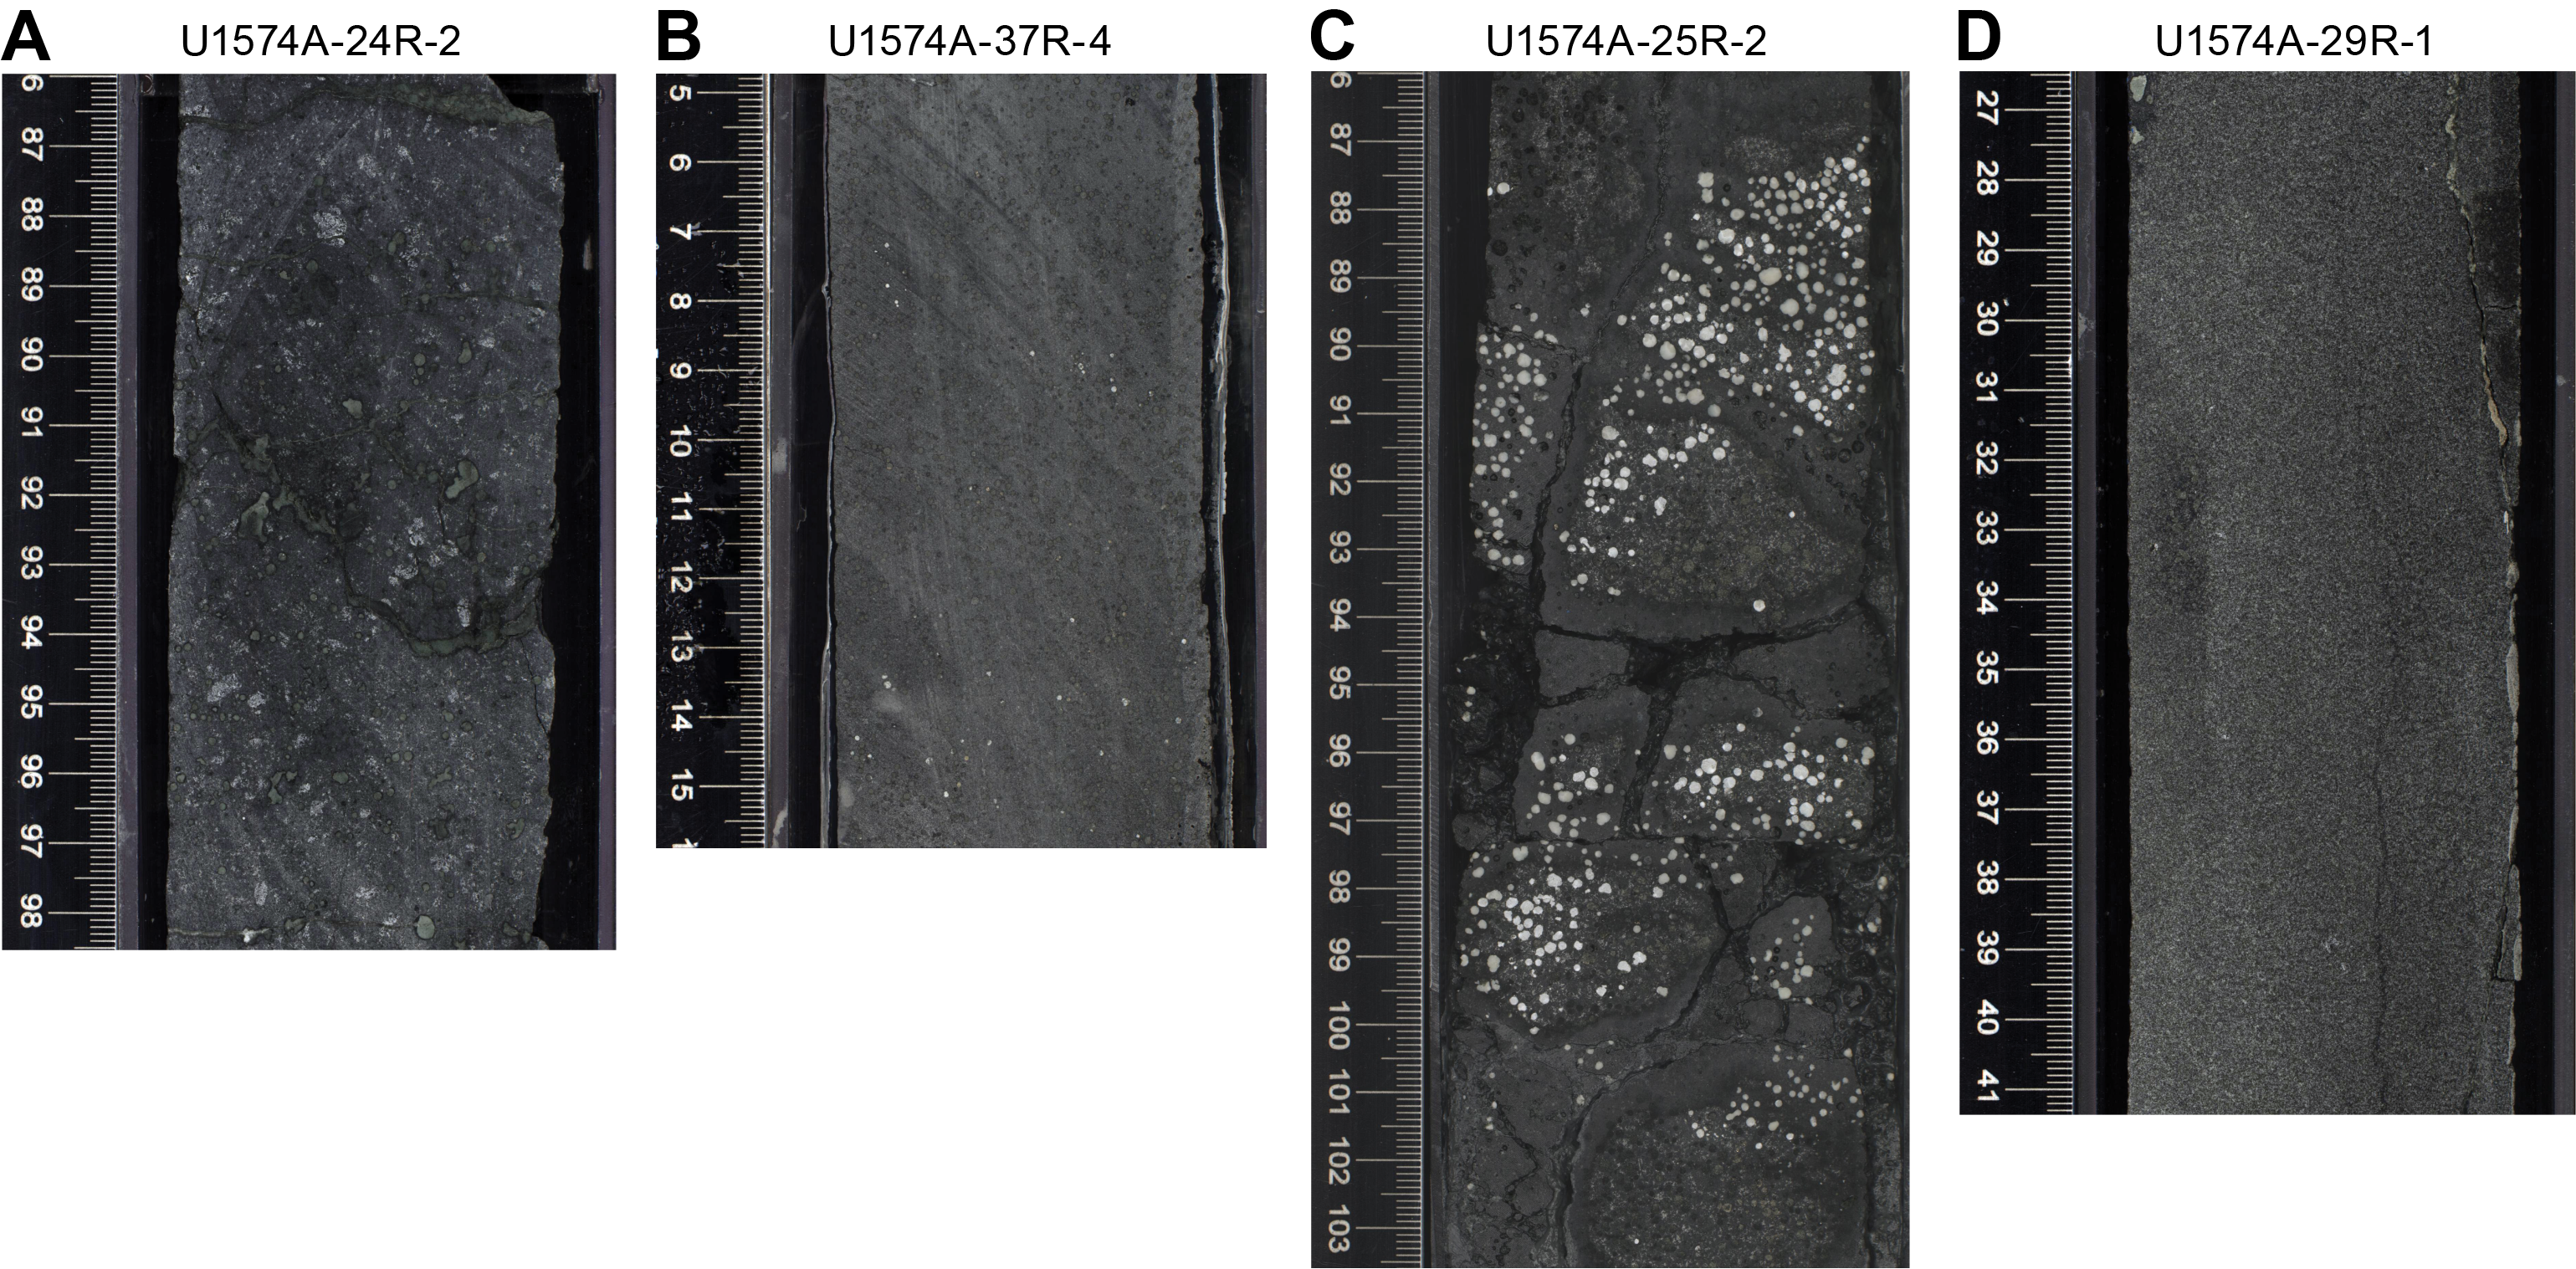
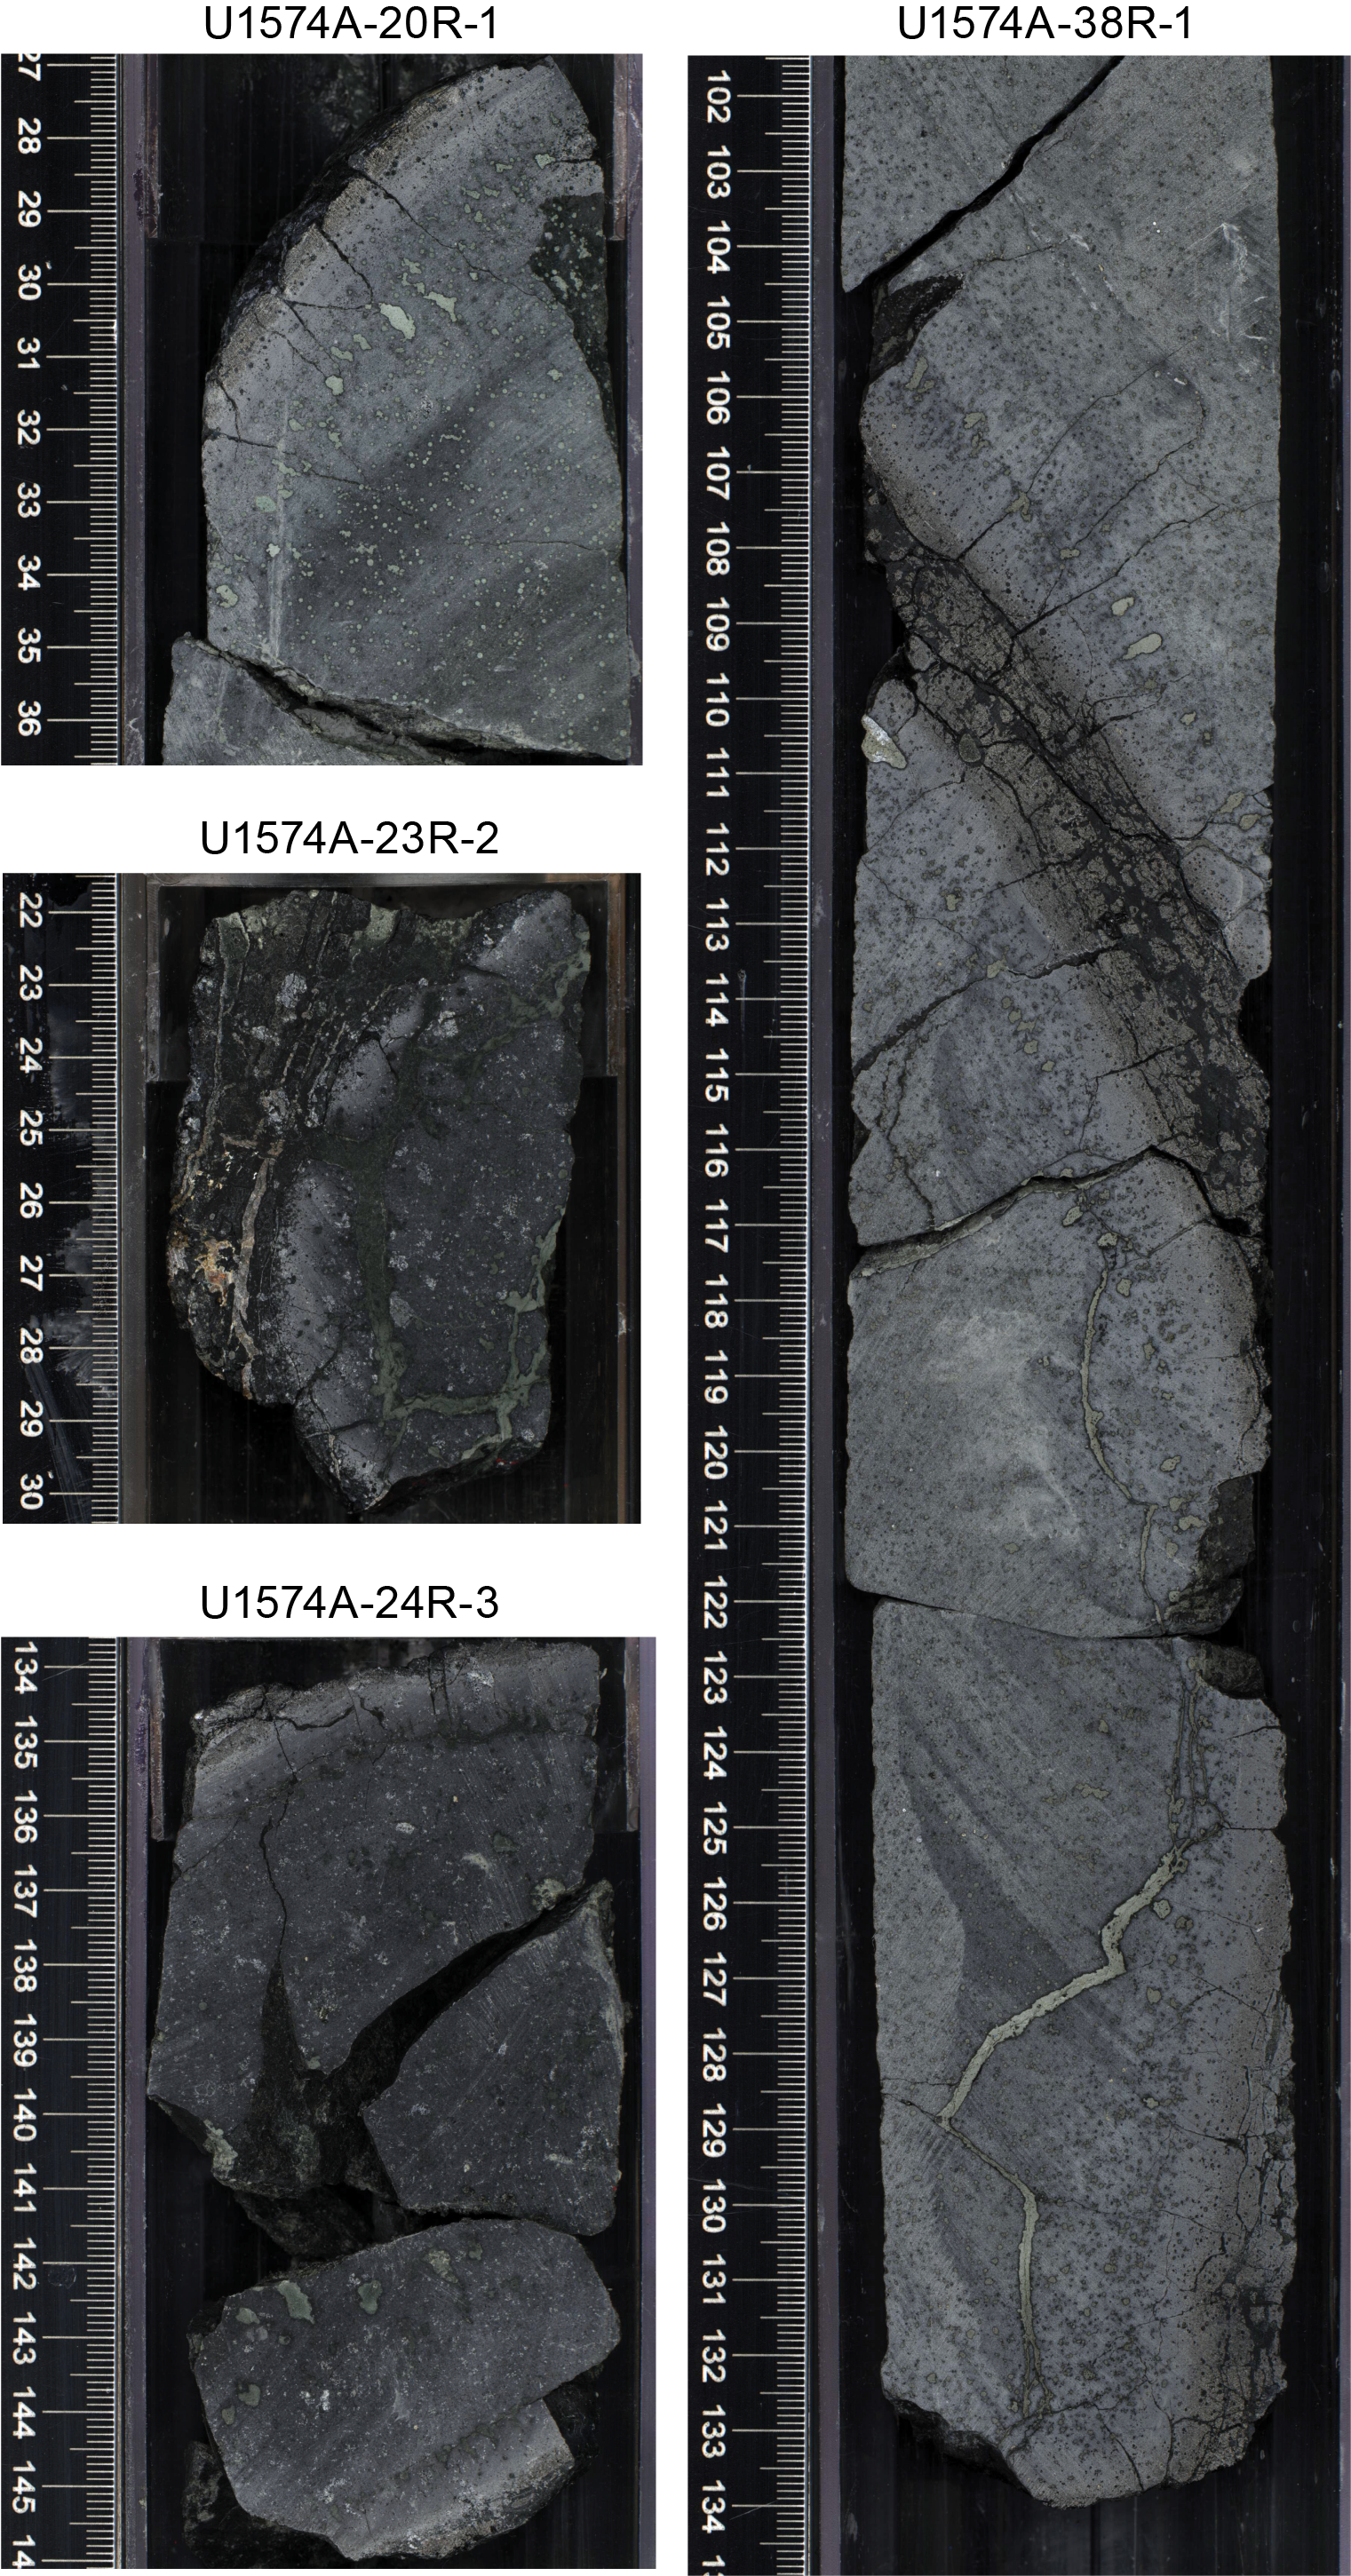
The direct contact between Lithostratigraphic Units IV and V was recovered in Hole U1574C (interval 20X-1, 2 cm). Below the contact in both holes, the top of Lithostratigraphic Unit V is characterized by a breccia with a dense network of carbonate and sulfate veins (Figure F5). The igneous lithologic unit (Lithostratigraphic Unit V) was cored for a total core length of 92.22 m (166.73–258.94 m CSF-A). It is divided into two distinct subunits separated by an interval of no to very poor recovery of sediments (interval 396-U1574A-29R-3, 111 cm, to 34R-1, 0 cm) (Figure F6). In total, 43.75 and 22.92 m were cored for Subunits Va and Vb, respectively. The upper igneous lithologic subunit starts with an interval of hyaloclastite transitioning downward to a succession of pillow basalts and to more massive basalt in Subunit Va (Figure F6).
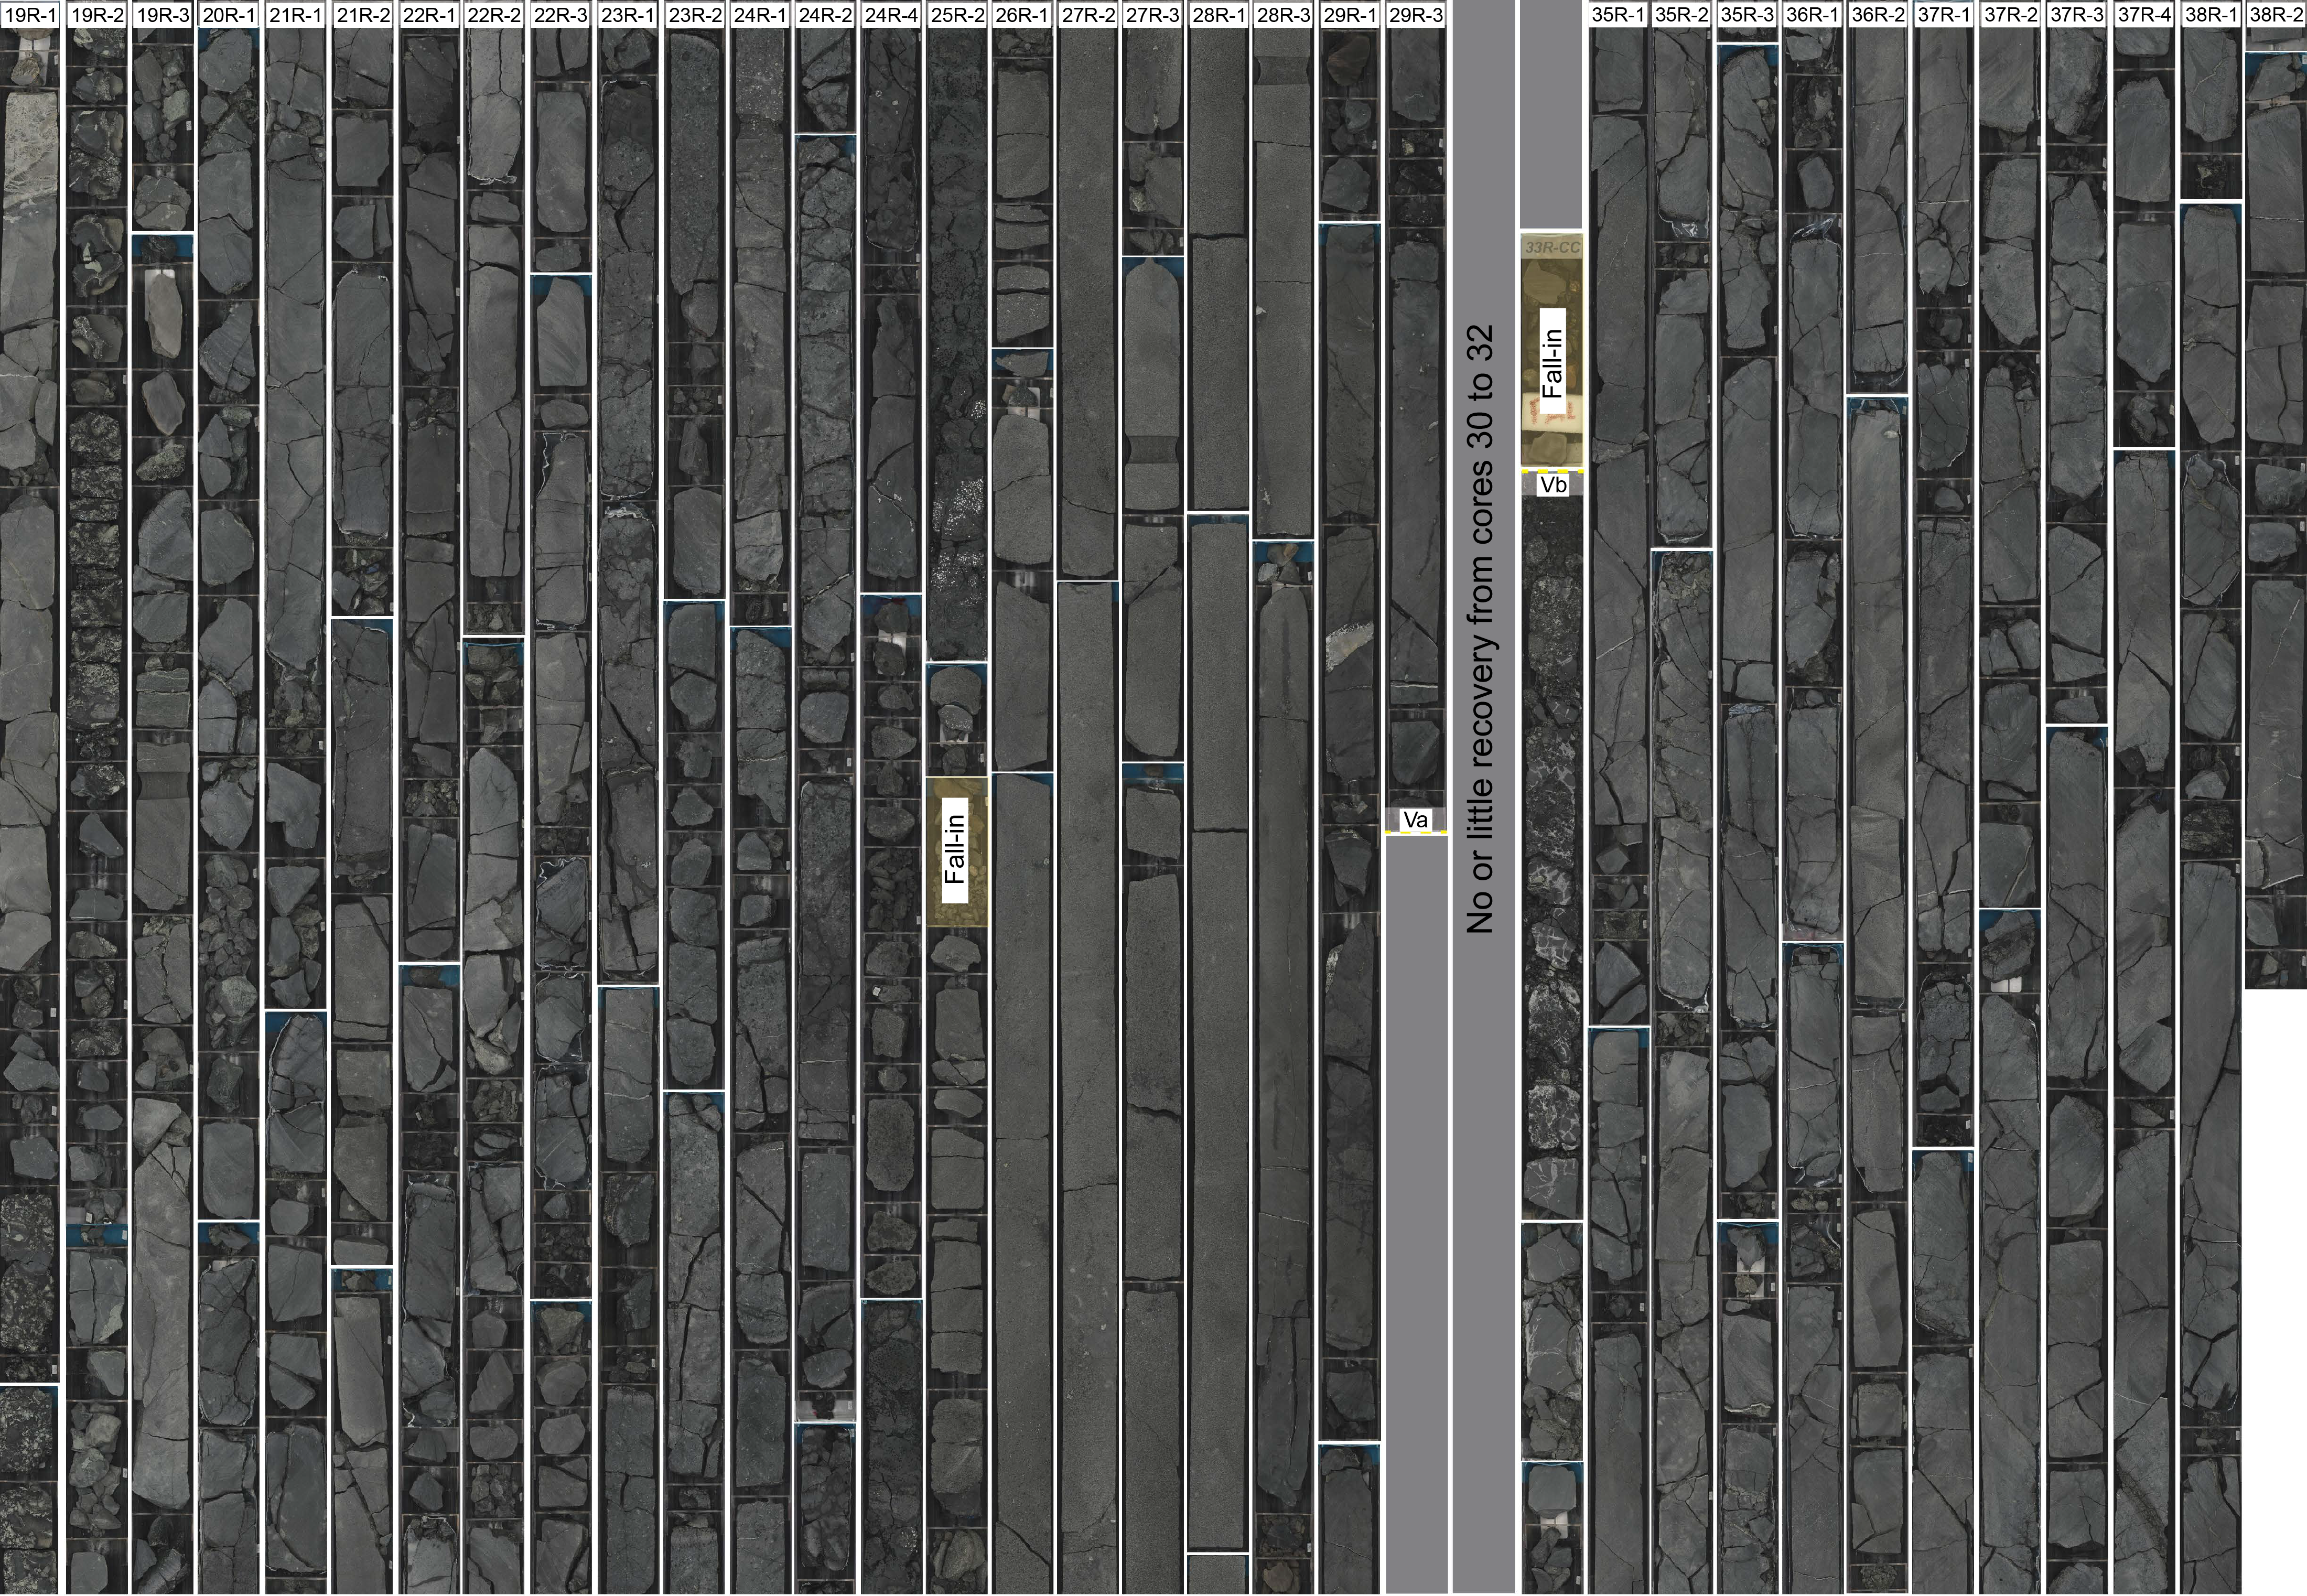
3.5.1. Subunit Va
- Intervals: 396-U1574A-19R-1, 6 cm, to 34R-1, 0 cm; 396-U1574A-20X-1, 2 cm, to 20X-CC, 37 cm (bottom of hole)
- Depths: Hole U1574A = 166.56–235.60 m CSF-A; Hole U1574C = 169.22–171.50 m CSF-A
In Holes U1574A and U1574C, a similar top of Subunit Va is observed: directly below the hydrothermal breccia, a short interval of plagioclase-phyric pillow basalt overlies an interval of hyaloclastite (Figure F7). Below the hyaloclastite in Hole U1574A, in Cores 20R–24R, a succession of dark gray aphyric to plagioclase-phyric pillow basalt is encountered.
In Cores 396-U1574A-24R through 26R, a transition is observed from plagioclase-phyric pillow basalt to highly vesicular aphyric basalt to more massive aphyric basalts. Downcore, the aphyric basalts are associated in some intervals with magma mingling and late segregation structures. Pillow basalts were again observed in the last core of this subunit. Across this subunit, recovered pillow basalts show a typical 50 cm average diameter associated with pillow rims (Figure F8).
3.5.2. Subunit Vb
Subunit Vb is only observed in Hole U1574A. Similar to Subunit Va, a hyaloclastite interval was encountered in the first core (Section 34R-1). The subunit then transitions to aphyric basalt.
Unambiguous, aphyric phaneritic aphanitic pillow basalt is observed in Cores 396-U1574A-35R through 38R. There, glassy margins are well preserved, and locally hyaloclastite intervals are recovered between the pillow basalt. The alteration and veins appear similar to the pillow basalt succession observed in Subunit Va.
3.5.3. Petrology: igneous subunits
3.5.3.1. Macroscopic and microscopic observations
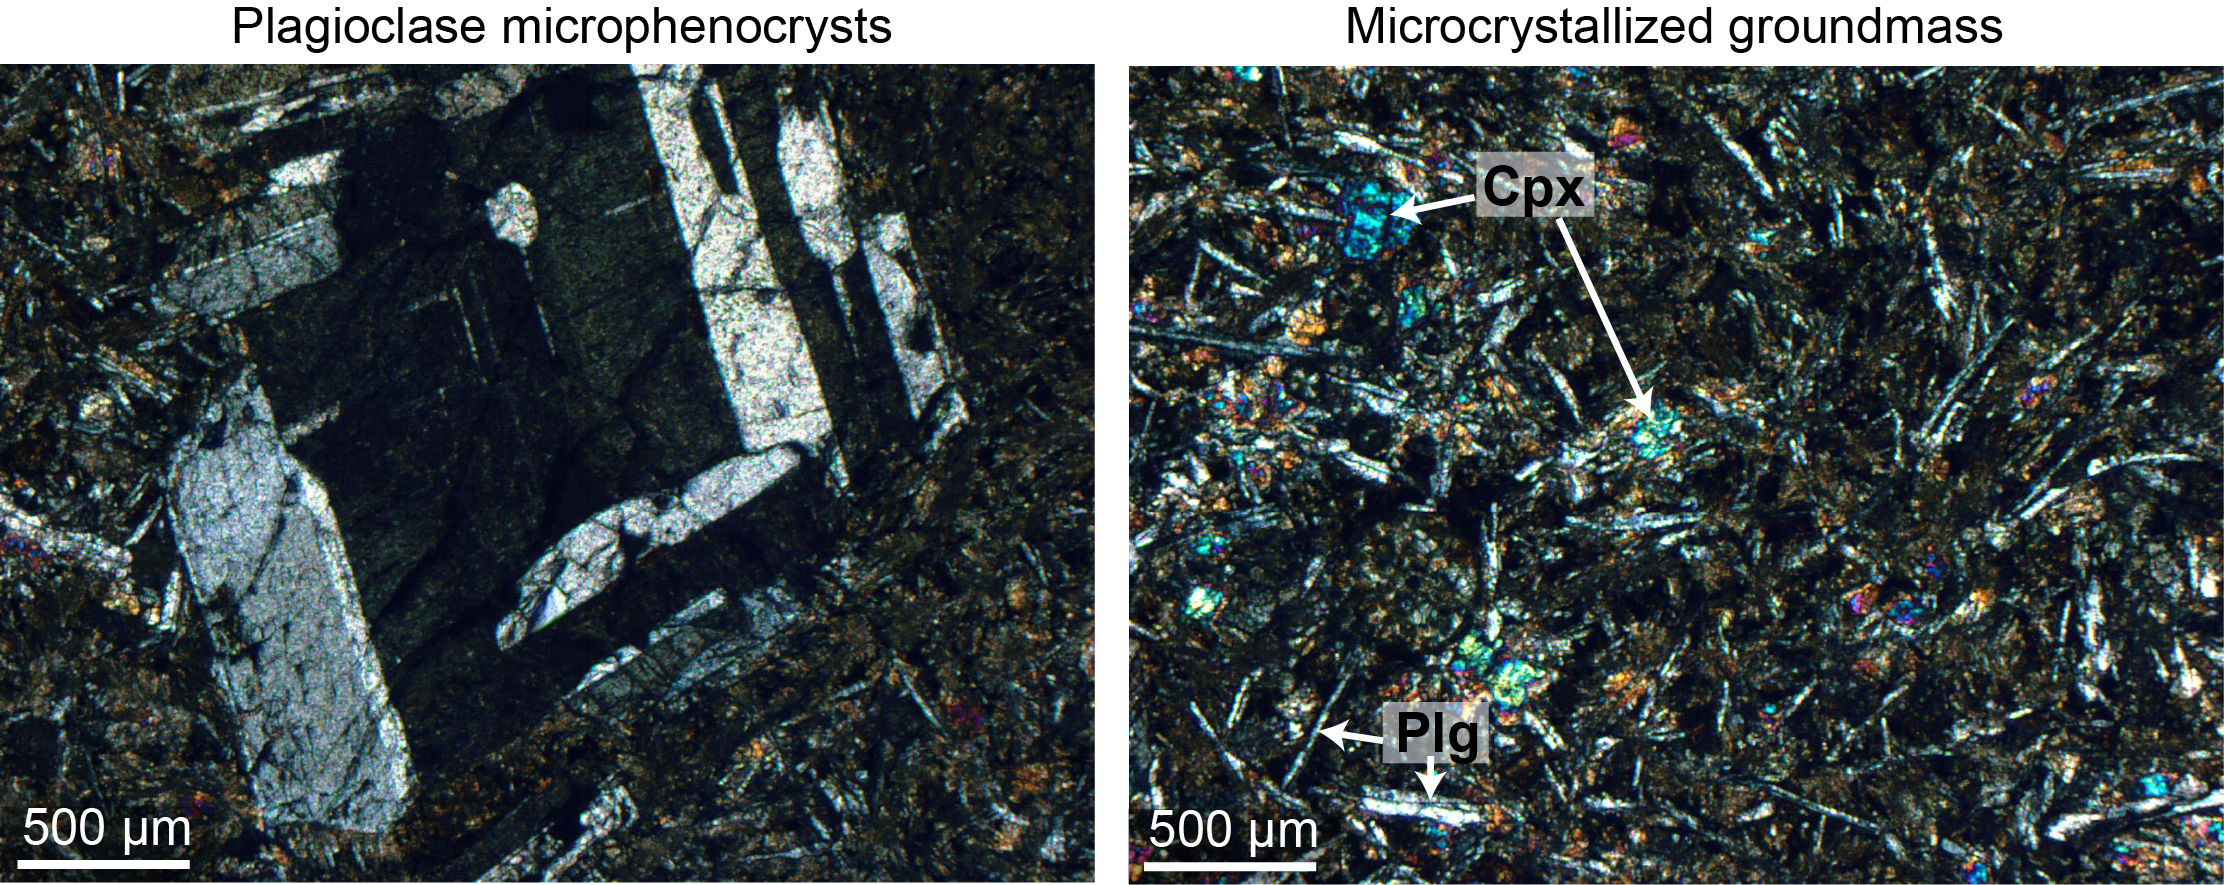
The main basalt facies encountered in Unit V are (1) plagioclase phyric basalt, (2) highly vesicular aphyric aphanitic basalt, (3) sparsely vesicular aphyric aphanitic basalt, and (4) massive aphyric phaneritic basalt (Figure F9). The plagioclase phyric pillow basalt is composed of clusters of plagioclase microphenocrysts in a cryptocrystalline groundmass (Figure F10). Most of the pillow rims are characterized by the following succession from the edge to the center: glassy margin to elongated vesicles (5 mm) transitioning to round vesicles (1 mm). The pillow basalts are moderately to highly vesicular with round vesicles of 1–2 mm filled by clay minerals, zeolite, calcite, and sulfide. Each individual pillow is associated with millimetric wide veins with single to branched morphology (Figure F11).
3.5.3.2. Geochemical observations
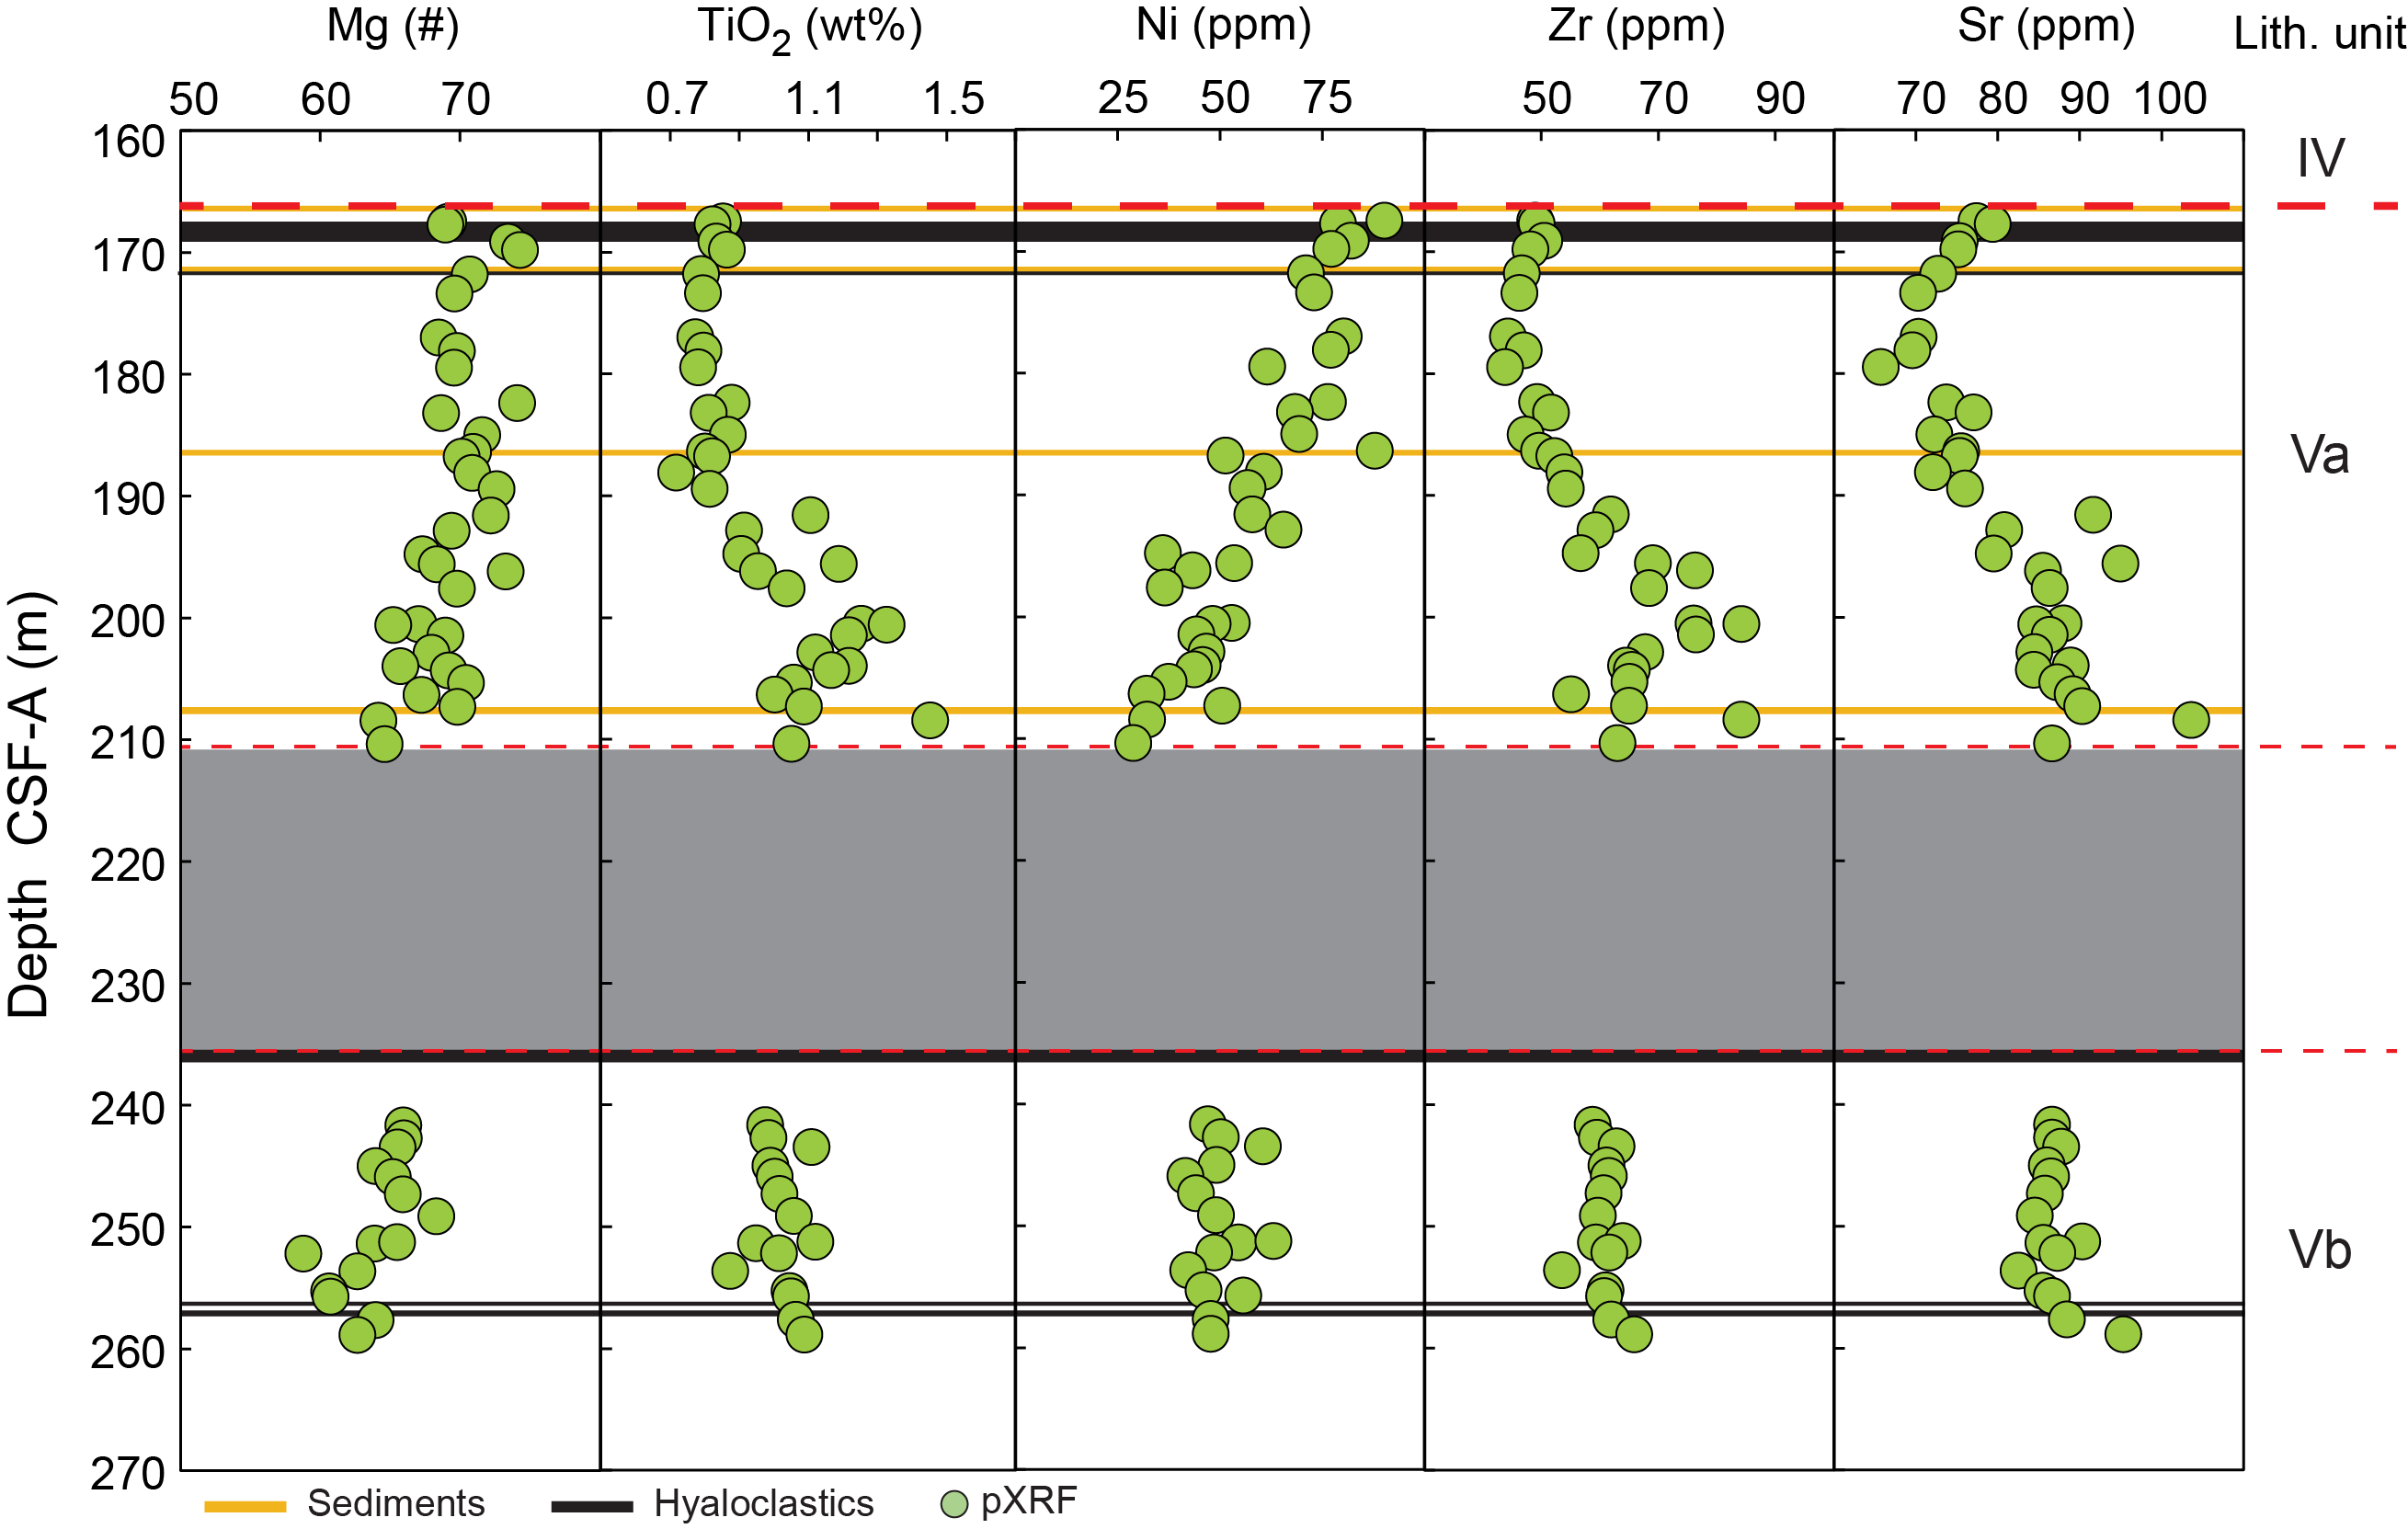
Composition of the basalts in Subunit Va exhibit significant variations with depth (Figure F12). Mg# and Ni content decrease and Zr, Sr, and TiO2 increase downhole, consistent with a continuous supply of the magma chamber during the emplacement of this sequence of pillow lava. The change of emplacement from pillow lava to massive lava flow in Subunit Va coincides with a slight decoupled chemical evolution for TiO2 and Zr content, which may suggest that the replenishment of the magma chamber involved a distinct magma composition. Finally, Subunit Vb presents remarkably uniform composition similar to the composition observed at the base of Subunit Va.
3.5.4. Interbasaltic sediments
Interval 396-U1574A-29R-3, 111 cm, to 34R-1, 0 cm, is characterized by no to poor recovery. Sediments in Section 32R-CC consist of a lithology similar to that of Unit IV. This sequence was entirely used for palynological analysis (see Biostratigraphy) because of the limited recovery. Section 33R-CC also recovered a short interval of sedimentary material characterized by gravels consisting of claystone and carbonate cement.
4. Biostratigraphy
Holes U1574A–U1574C comprise as much as ~170 m of sedimentary strata above igneous rocks. Except for Samples 396-U1574A-1R-CC to 3R-CC, all sedimentary core catcher samples from Hole U1574A were processed for palynology. These samples, including two taken from within igneous facies (Samples 32R-CC and 33R-CC), are assigned a late Early Eocene age (Subzone E3b of Bujak and Mudge, 1994) based on marker dinocyst taxa and broader assemblage characteristics. The overlying Quaternary strata yielded calcareous and siliceous microbiotic remains, but these are largely absent in the late Early Eocene sediments, except for Samples 17R-CC and 18R-CC, which include calcareous remains. Preservation of calcareous debris, including aragonite, is enigmatic and coincides with the observation of rare (micro)spherules. The age obtained from palynology is further supported by age-diagnostic planktonic foraminifer occurrences and pyritized diatoms in Sample 18R-CC. No other holes were sampled. A summary of microfossil abundances at Site U1574 is given in Table T3.
4.1. Siliceous microfossils
Most samples from Site U1574 are devoid of biosilica, except for Samples 396-U1574A-5R-CC and 7R-CC, which contain rare fragments of diatoms and radiolarians. These fragments are often preserved as replacement casts and thus are not possible to identify unequivocally. Rare pyritized diatoms and ebridians occur in laminated organic-rich sediment in Sample 9R-1, 40 cm. Pyritized diatoms consistent with an Early Eocene age occur in Samples 17R-CC and 18R-CC. These pyritized specimens, which are tentatively identified, include Trinacria excavata, Craspedodiscus sp., Grunoviella gemmata, Pyxilla sp., and Porotheca spp.
4.2. Palynology
Except for Samples 396-U1574A-1R-CC to 3R-CC, all sedimentary core catcher samples from Hole U1574A were processed for palynology using the standard hydrofluoric acid (HF) technique (see Biostratigraphy in the Expedition 396 methods chapter [Planke et al., 2023a]). All processed samples are productive, although the uppermost one (Sample 4R-CC) contains only a few palynomorphs (Table T4). All samples, including two taken from between igneous facies (Samples 32R-CC and 33R-CC), are assigned a late Early Eocene age based on marker taxa and broader assemblage characteristics. Only semiquantitative analyses were conducted, given the variable processing quality and high abundance of terrestrial organic matter. Samples from Holes U1574B and U1574C, covering the same succession, were not processed for palynology.
Almost all core catcher samples analyzed yielded the age-diagnostic taxon Eatonicysta ursulae (average first occurrence [FO] = 53.3 Ma; Bijl, 2022), and most also contain another index taxon, Charlesdowniea columna (FO = ~51.4 Ma). Other key species like Membranilarnacia (occasionally referred to as Eatonicysta) glabra and Membranilarnacia compressa occur more sparsely throughout the section and, together with the former, are indicative of Subzone E3b of Bujak and Mudge (1994). This is corroborated by the absence of either younger palynostratigraphic markers (Azolla spp. and Diphyes ficusoides) or older taxa (e.g., Dracodinium politum, Dracodinium simile, Dracodinium solidum, and Dracodinium varielongitudum) that would signal either an older or a younger age (cf. Bujak and Mudge, 1994). Accordingly, the entire section is assigned to a late Early Eocene age identical to the cored sedimentary strata above and below the igneous facies at Site U1573. As in Hole U1573A, M. glabra and M. compressa appear somewhat more frequently near the bottom of the succession (Samples 396-U1574A-18R-CC, 32R-CC, and 33R-CC), hinting at the presence of Subzone E3a of Bujak and Mudge (1994).
4.3. Environmental considerations and other remarks
Samples toward the bottom of the sedimentary succession are progressively more dominated by terrestrial organic matter (phytodebris). Some fragments of cuticles are found, as well as abundant woody fragments. Pollen and spores are rare compared with phytodebris, and marine elements (dinocysts) are even rarer in these lowermost samples. We find remarkably diverse (angiosperm) pollen, and this may warrant further study, for example to compare to localities south and north of the Norwegian Sea (e.g., Eldrett et al., 2014; Sluijs et al., 2009; Willard et al., 2019). In addition, a few freshwater, aquatic palynomorphs are recognized, and we interpret the overall palynofacies to reflect rapid deposition in a distal deltaic setting, under warm and frequent dysoxic to anoxic conditions, given the abundance of pyrite infillings and episodic laminae. Offshore, oceanic dinocysts are very rare and restricted to the upper part of the analyzed succession.
A few samples near the bottom of the sedimentary strata (Samples 396-U1574A-16R-CC to 18R-CC) and between the igneous facies (Samples 32R-CC and 33R-CC) contain specimens of Senegalinium that show a strong morphological resemblance to Senegalinium cf. laevigatum (Barke et al., 2011), which is considered endemic to the Arctic Ocean in the late Early Eocene. Together with the findings in Hole U1573A, this may reflect an influx from higher latitudes.
A few palynomorphs are thermally altered, particularly in the lower part of the succession. Overall, the maturity of the palynomorphs appears to be low, and preservation is generally good. Mature specimens are rare, and no obvious connections can be made to the lithology or depositional environment. Also noteworthy is the occurrence of reworked Upper Cretaceous dinocysts in the lowermost samples from below the last basaltic flow. This mimics the findings at Site U1573.
4.4. Planktonic and benthic foraminifers
The majority of the sedimentary material from Hole U1574A was processed for foraminifers, including the mudline. The mudline sample was stained with rose bengal to note any living organisms during the start of drilling. Core catcher samples from Cores 8R, 10R, and 13R were not sampled. Planktonic foraminifers occur in Samples 1R-CC to 3R-CC and 18R-CC. Planktonic foraminifer abundance in these four samples range from rare to abundant, and preservation ranges from poor to moderate. Samples 11R-CC, 12R-CC, 15R-CC to 17R-CC, and 18R-CC contain benthic foraminifers (Figures F13, F14). Abundances are listed in Table T3.
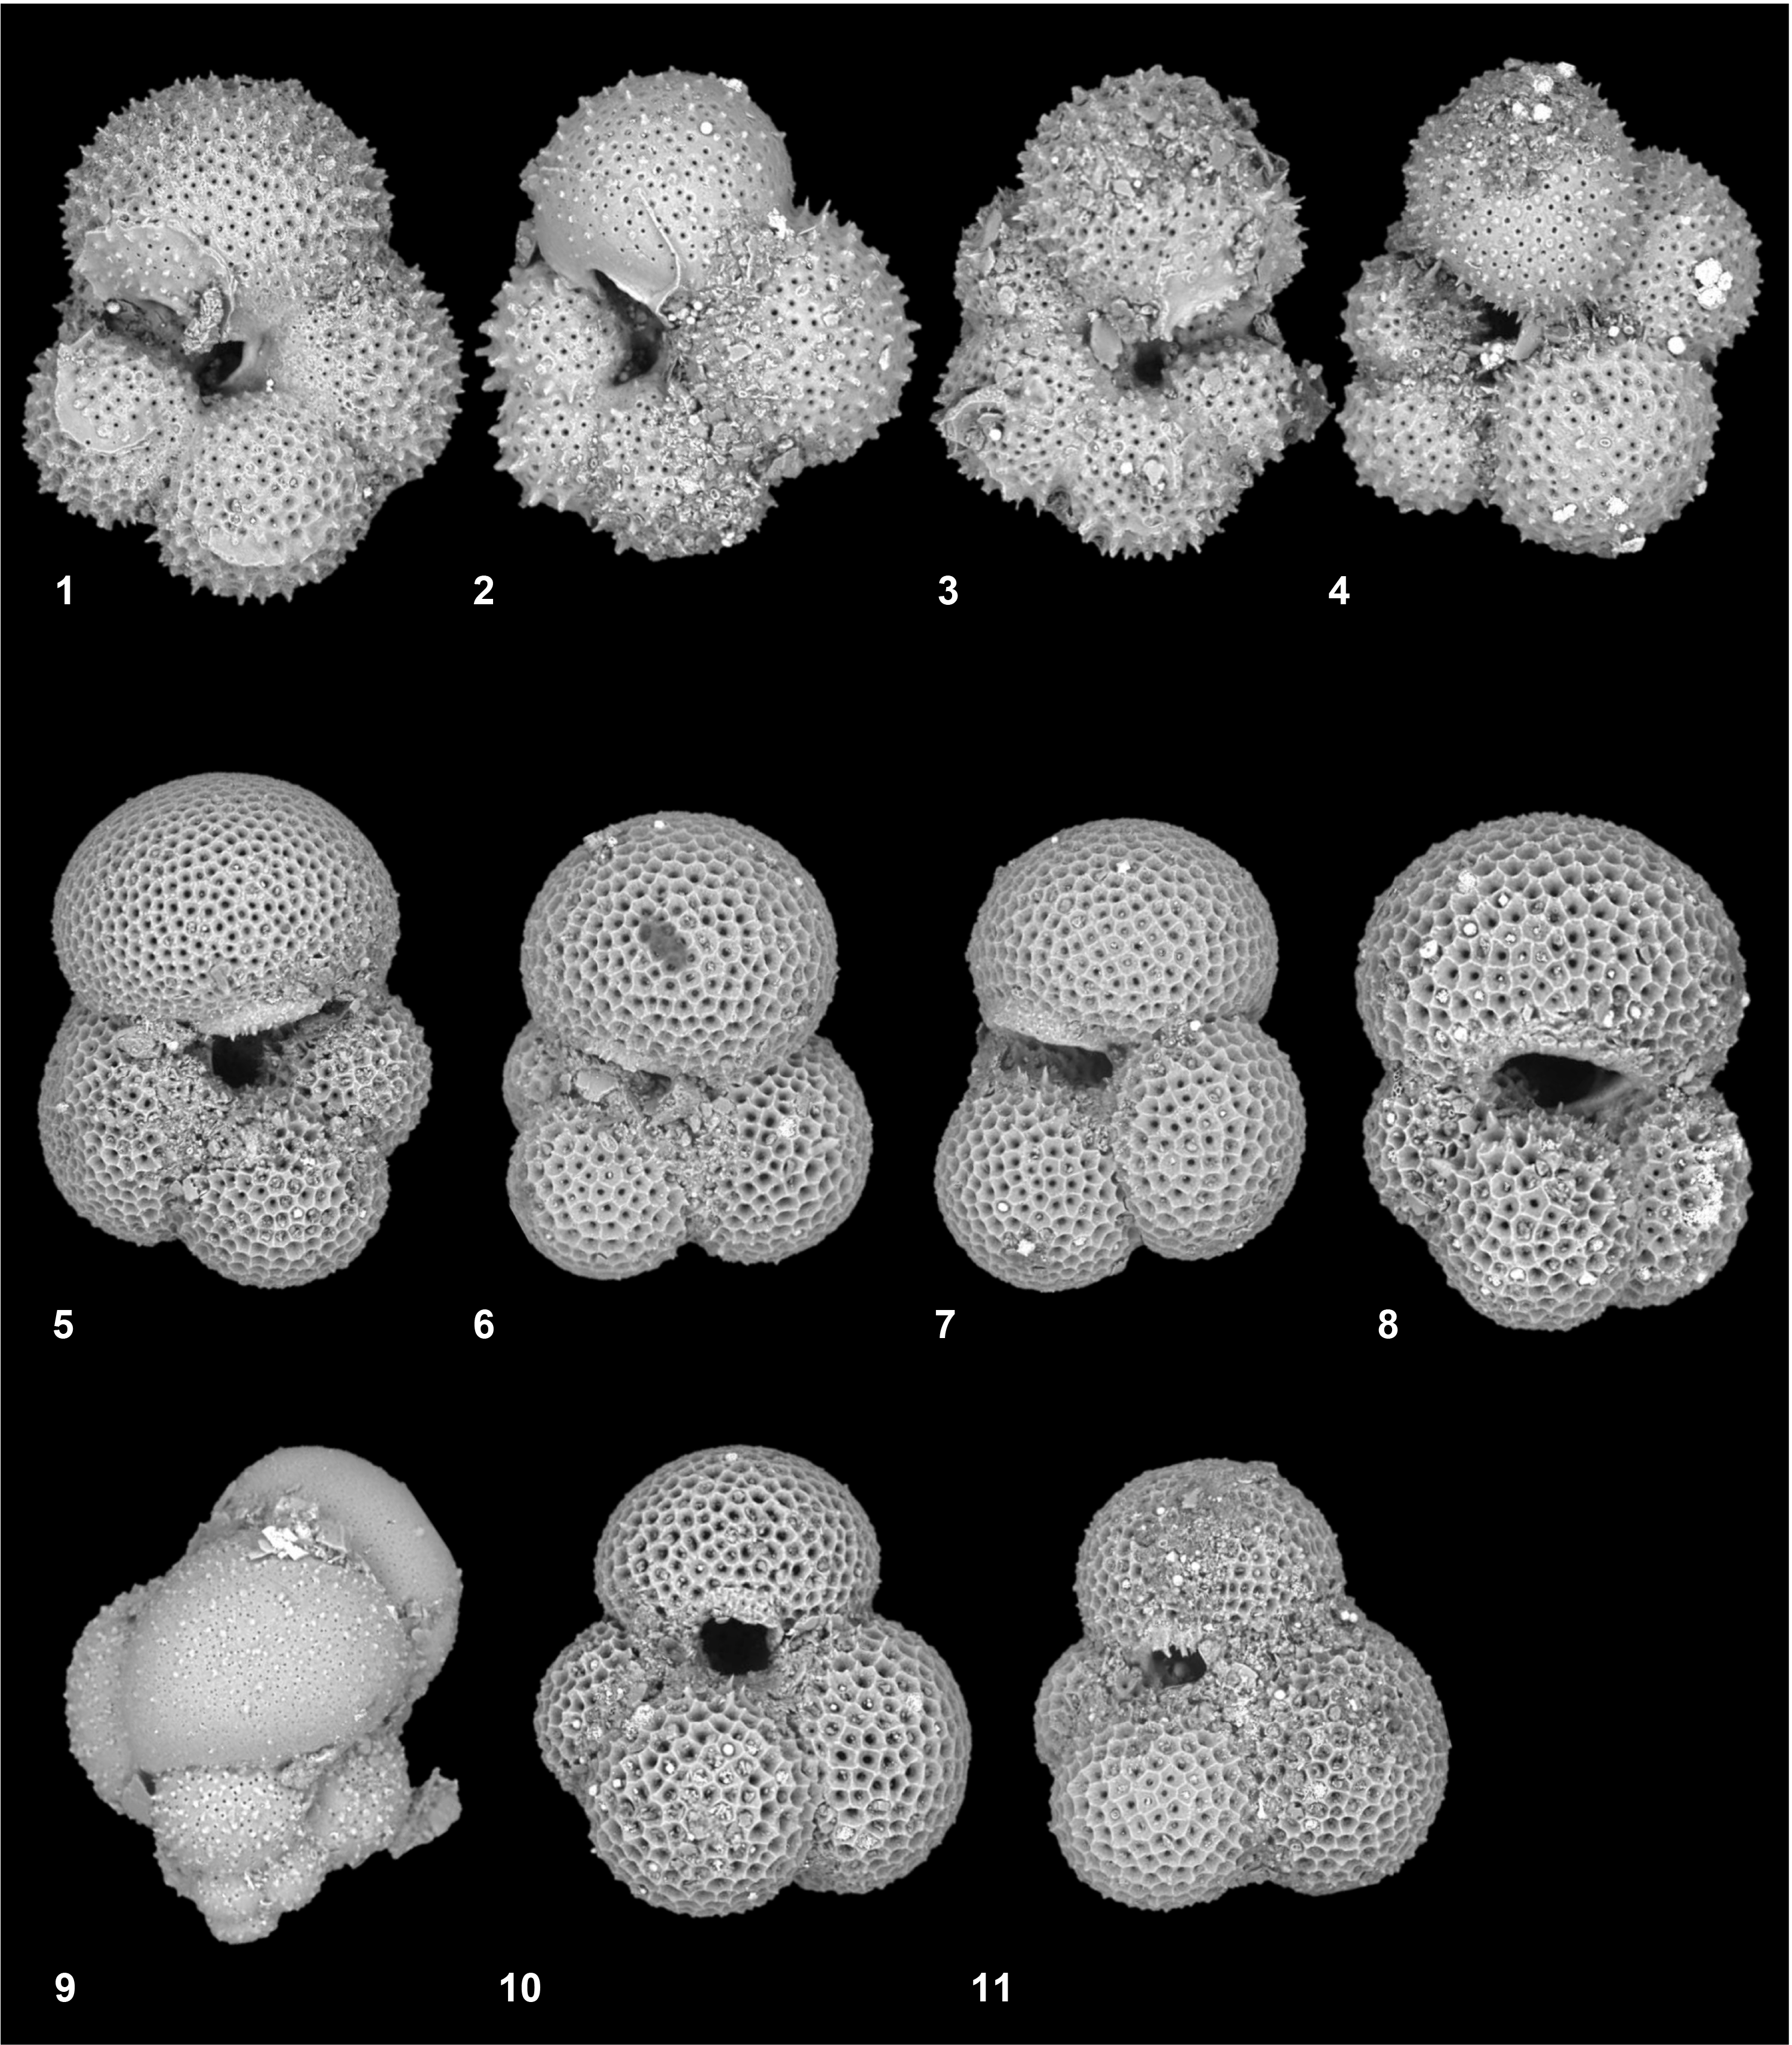
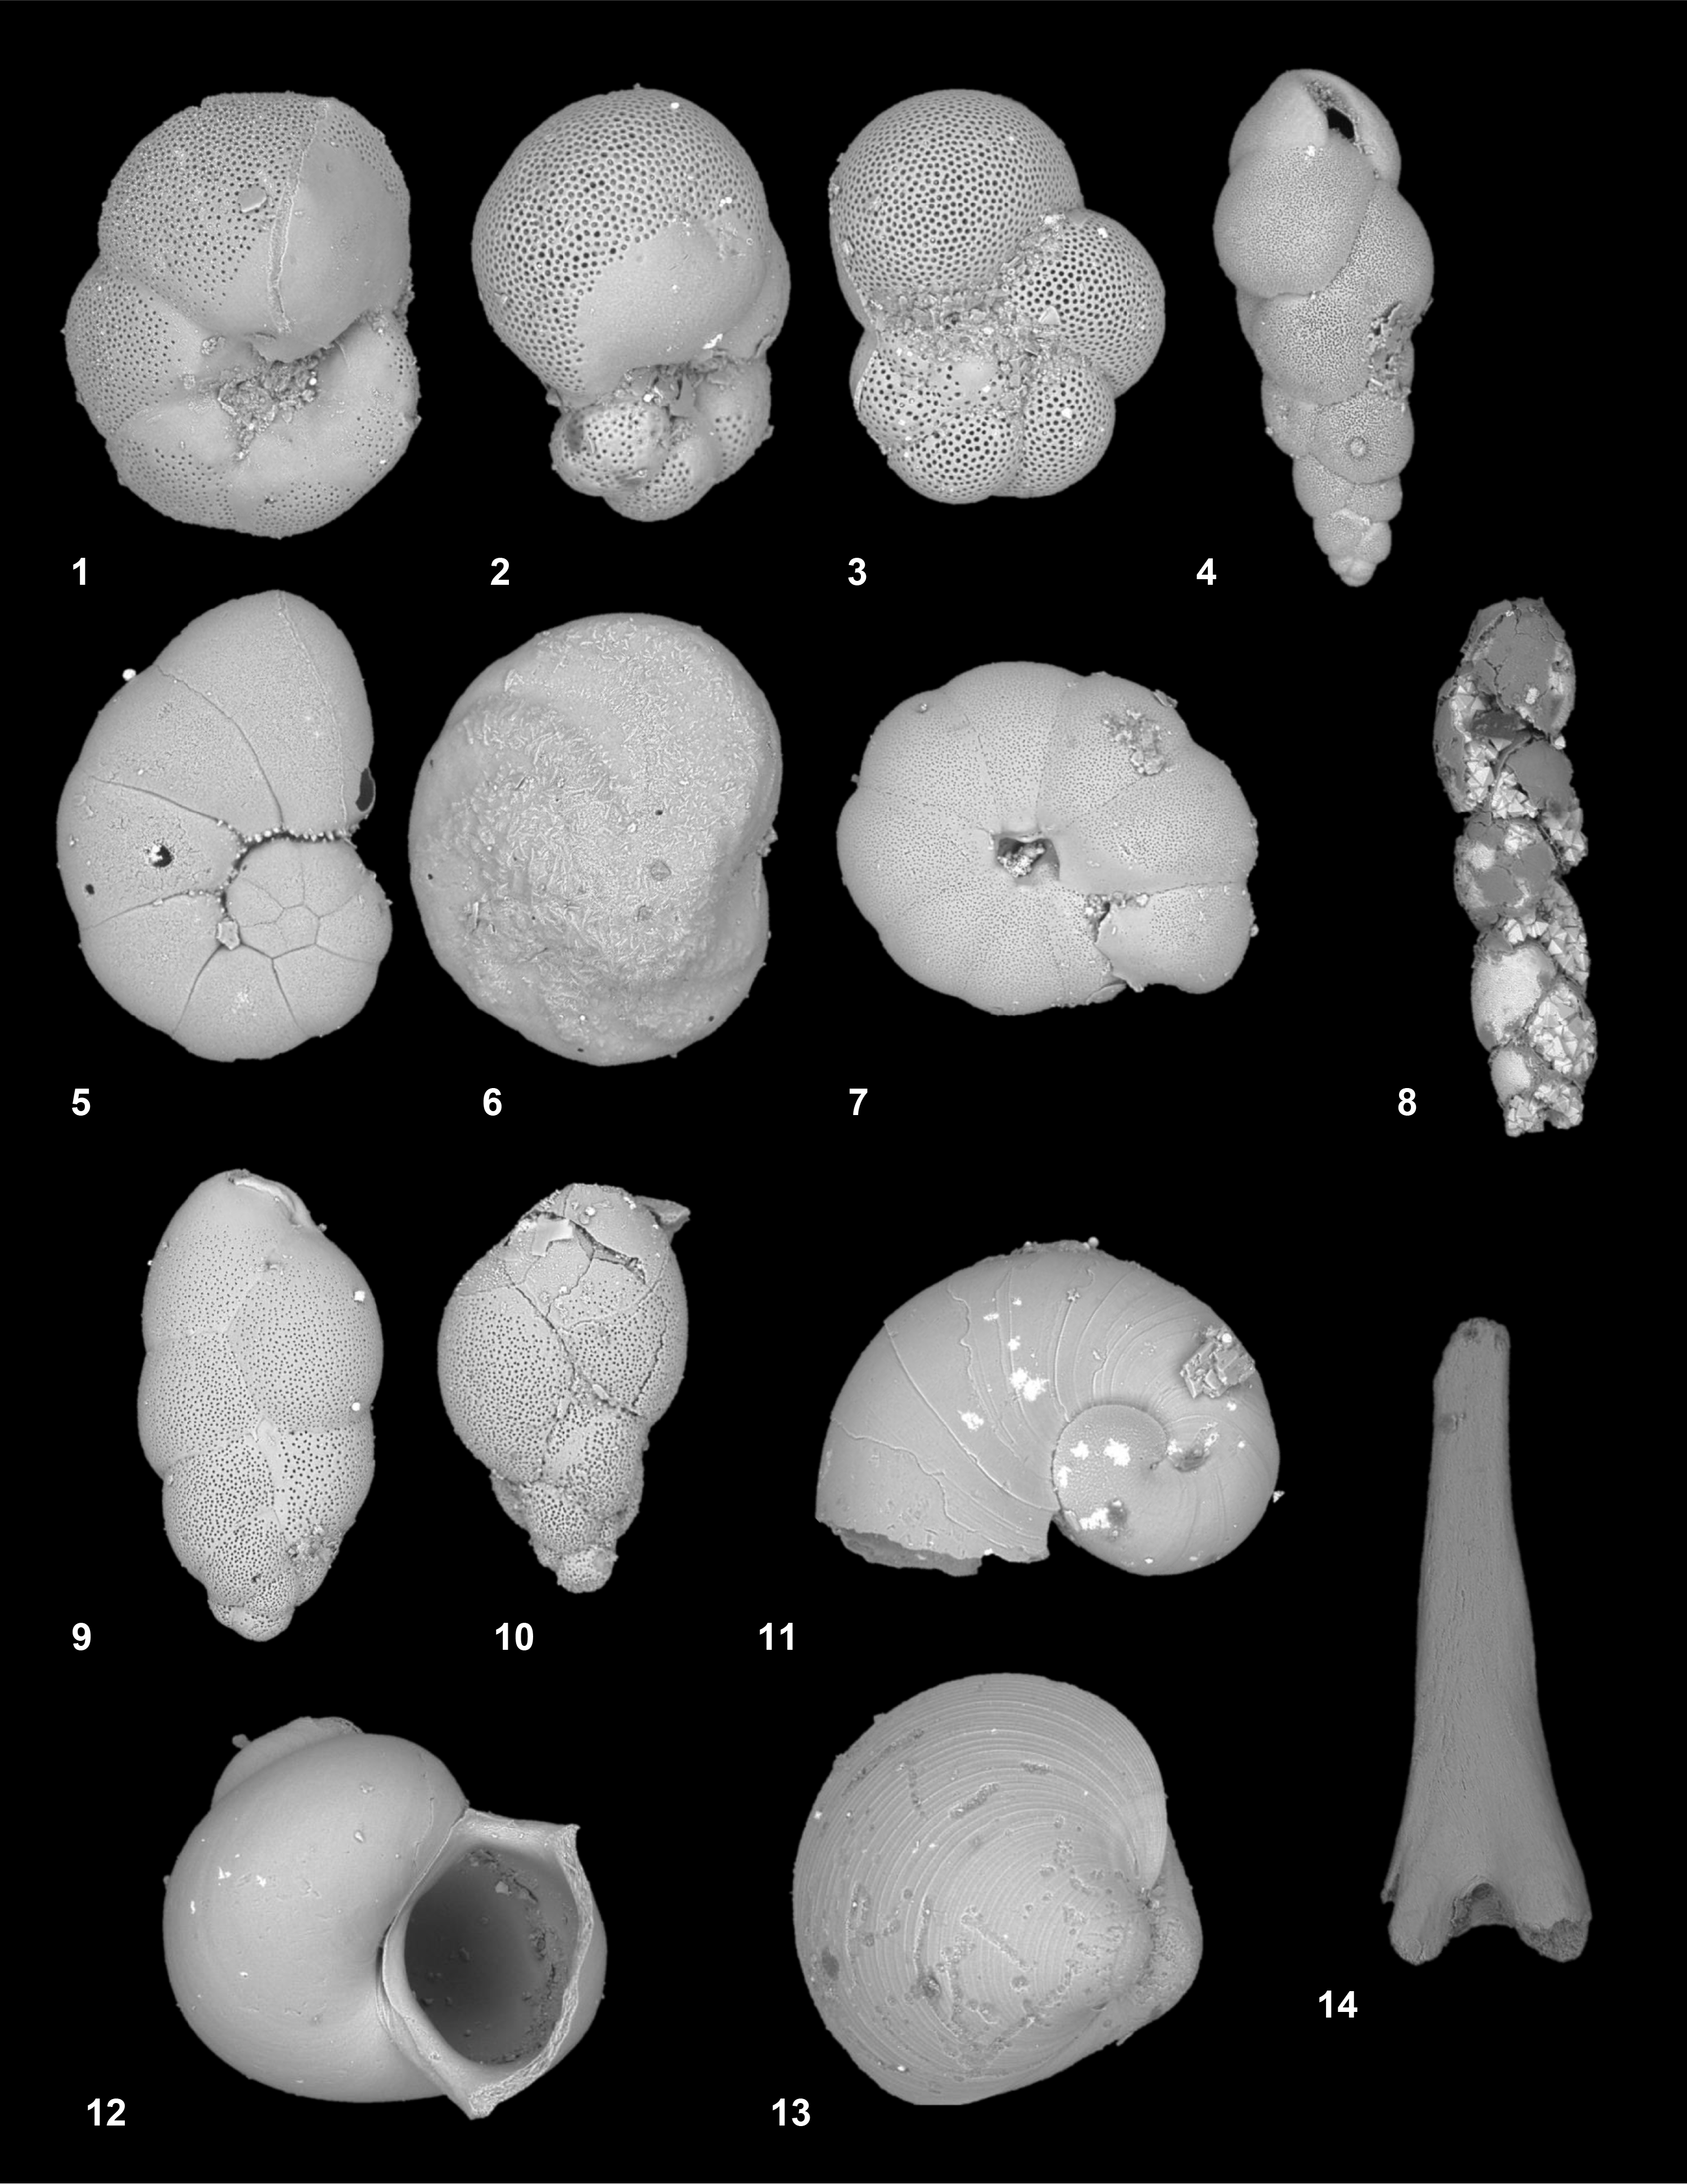
The mudline has abundant siliceous and calcareous microfossils. Neogloboquadrina sp. and Globigerina sp. are the two most dominant planktonic foraminiferal taxa. Sample 396-U1574A-1R-CC has abundant planktonic foraminifers with moderate preservation of the tests. Encrusting of the Neogloboquadrina pachyderma tests are noted, along with minor amounts of broken tests. The dominant taxon in Sample 1R-CC is N. pachyderma (sin.). Less abundant taxa are Globigerina sp., Globigerinita glutinata, Neogloboquadrina atlantica, N. cf. pachyderma, N. pachyderma (dex.), Neogloboquadrina sp., and Turborotalia quinqueloba. Sample 2R-CC is quartz rich with a trace abundance of planktonic foraminifers and poor to moderate preservation of the tests. N. pachyderma (sin.) is identified as the most dominant taxon in this sample. Globigerinita sp., N. atlantica, Neogloboquadrina cf. dutertrei, N. cf. pachyderma, N. pachyderma (dex.), and Neogloboquadrina sp. are less abundant in this sample. Sample 3R-CC has rare planktonic foraminifers, and those present have poor to moderate preservation of the tests. N. pachyderma (sin.) is the dominant taxon in Sample 3R-CC. Other less abundant taxa include N. atlantica, N. cf. dutertrei, N. cf. pachyderma, N. pachyderma (dex.), and Neogloboquadrina sp.
Sample 396-U1574A-18R-CC (Figures F13, F14) has a common overall abundance of planktonic foraminifers with poor preservation. The interior of both the benthic and planktonic forms is typically infilled by pyrite or galena (lead-sulfide). The majority of the apertures are filled in, making identification difficult. Subbotina eocaena and Subbotina sp. are dominant in this sample. Other less abundant taxa include Acarinina cf. medizzai, Globoturborotalita cf. bassriverensis, Subbotina crociapertura, and S. cf. eocaena.
Following the zonal scheme of Spiegler and Jansen (1989), Samples 396-U1574A-1R-CC to 3R-CC are placed in the N. pachyderma (sin.) Zone. Because of the lack of marker taxa in Sample 18R-CC, no assignment can be given at this time. A tentative age of late Early Eocene (possible Subzone E7a?) is suggested, following the zonal scheme of Wade et al. (2011). This concurs with the palynological assignments.
4.5. Calcareous nannofossils
Smear slides prepared for diatom analysis were examined for occurrences of calcareous fossils, notably calcareous nannofossils. Coccoliths and remains of calcareous dinoflagellates were noted in Samples 396-U1574A-16R-CC to 18R-CC and in a particularly high abundance in Sample 18R-CC. This occurrence coincides with other calcareous materials, notably planktonic and benthic foraminifers, microgastropods, microbivalves, and, remarkably, aragonitic pteropods. Smear slides from Hole U1574C show similar occurrences of calcareous nannofossils in Samples 16H-CC to 19H-CC. Smear slides from Section 19H-1 show common calcareous nannofossils. Abundance increases toward the base of the core, where nannofossils account for approximately 5% of the sediment based on visual estimates.
4.6. Ichthyoliths
Fish debris, which includes teeth, bone, and scales, is noted in Samples 396-U1574A-16R-CC to 18R-CC. The abundance is particularly noteworthy in Sample 18R-CC (Figure F15). Ichthyolith material was also noted in Hole U1574C, but time constraints and workload toward the end of the expedition limited analyses mostly to cores from Hole U1574A. A small fish tooth (length = ~1 mm), was extracted from Sample 396-U1574C-8H-5, 3 cm.
4.7. Ostracods and other microfossils
No ostracods were found in Samples 396-U1574A-16H-CC to 19H-CC during examination for planktonic foraminifers. However, Sample 18R-CC also contain gastropods, bivalves, and pteropods (Figure F14).
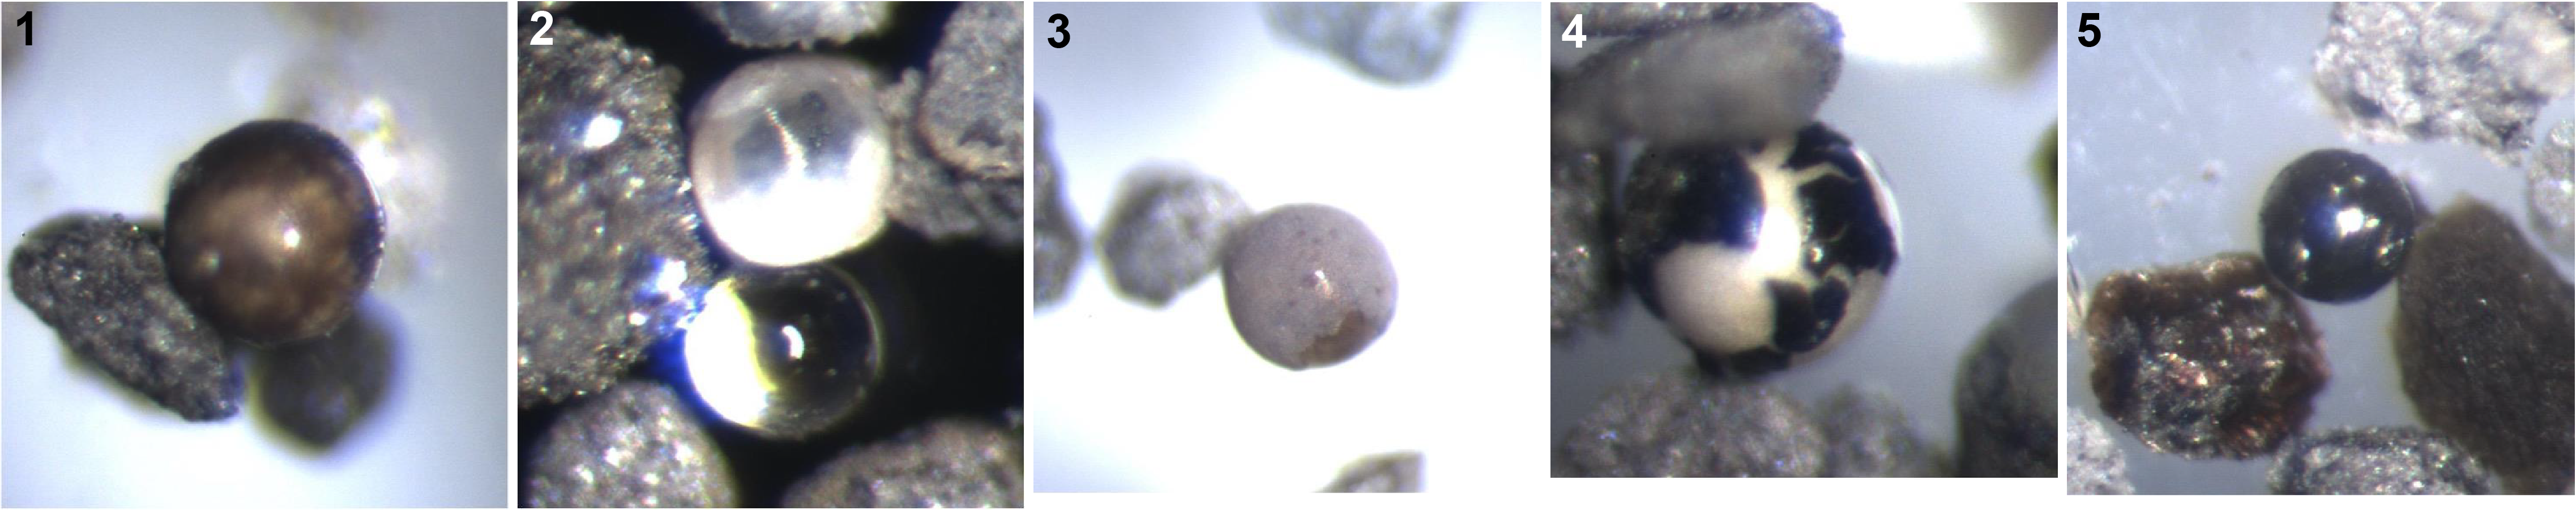
4.8. Microspheres
Also noted in Sample 396-U1574A-18R-CC are (micro)spherules of potential volcanic or impact origin (Figure F15).
4.9. Summary
Holes U1574A–U1574C comprise as much as ~170 m of sedimentary strata overlying igneous facies. Except for Samples 396-U1574A-1R-CC to 3R-CC, all sedimentary core catcher samples from Hole U1574A were processed for palynology. These and two more samples taken from within the igneous facies (Samples 32R-CC and 33R-CC) are assigned a late Early Eocene age, Subzone E3b of Bujak and Mudge (1994), based on marker dinocyst taxa and broader assemblage characteristics. The overlying Quaternary strata yield calcareous and rare biosiliceous fossil remains, but these are largely absent from most of the expanded late Early Eocene strata. A significant exception is the lower ~20 m of sediment overlying the first downhole occurrence of igneous facies (Samples 17R-CC and 18R-CC), which contains calcareous remains, including planktonic and benthic foraminifers and micromolluscs, and has fine preservation of aragonitic pteropods. Benthic foraminifers are mostly mineral filled, and diatoms are replaced by or coated with pyrite microframboids. These samples are tentatively attributed to planktonic foraminifer Zone E7a of Wade et al. (2011), in line with inferences from dinocyst biostratigraphy.
Preliminary paleomagnetism data suggests reverse polarity dominates the entire succession. This applies to both the igneous facies cored in Hole U1574A and the near-continuously recovered overlying sedimentary cover in Hole U1574C. Coupled to the biostratigraphic constraints, we infer the Hole U1574 succession represents an expanded sedimentary/igneous record from within Magnetochron C22r (49.34–50.63 Ma).
5. Paleomagnetism
5.1. Shipboard measurements
Shipboard paleomagnetic investigations combined two complementary approaches (see Paleomagnetism in the Expedition 396 methods chapter [Planke et al., 2023a]): (1) measurement and in-line alternating field (AF) demagnetization of archive-half sections on the pass-through 2G Enterprises superconducting rock magnetometer (SRM) at a 2.5 cm spacing and (2) measurement and AF demagnetization of oriented discrete samples on the AGICO spinner magnetometer (JR-6A). These discrete samples were measured for anisotropy of magnetic susceptibility (AMS) using the AGICO KLY 4S Kappabridge.
We used the directional and intensity data of archive halves (measured at 20 mT) to determine magnetic polarity along the core. AF demagnetization steps were 5, 10, 15, and 20 mT for sediments and 2, 4, 6, 8, 10, 15, and 20 mT for crystalline rocks. The variations of magnetic parameters toward the ends of sections and the ends of pieces are a measurement artifact. We use the I20mT/natural remanent magnetization (NRM) ratio as a crude proxy for magnetic coercivity.
The directional and intensity data of 13 discrete samples from Hole U1574A and 15 from Hole U1574C were used to validate the polarities inferred from section measurements. Directional data were analyzed using Zijderveld diagrams (Zijderveld, 2013). The characteristic remanent magnetization (ChRM) direction(s) were determined using the Remasoft 3.0 software (Chadima and Hrouda, 2006).
5.2. Demagnetization behavior
Lithostratigraphic Unit I is made up of brown/gray unconsolidated mud of Quaternary age. The recovery of this unit in Hole U1574C was far better than in Hole U1574A (Figure F16). The dominantly normal magnetic polarity is interwoven with five short-lived reversal events in the lower part of the unit between Sections 396-U1574C-3H-3 (22 m CSF-A) and 4H-2 (30.6 m CSF-A). Unit I has a low average intensity of magnetization (Hole U1574A = 0.020 A/m; Hole U1574C = 0.046 A/m). The median coercivity in Hole U1574C is 5.72 (Figure F17). This high median coercivity may be due to the occurrence of high-coercivity minerals such as goethite. The only discrete sample measured from this unit (3H-6, 38–40 cm) presents unstable demagnetization behavior.
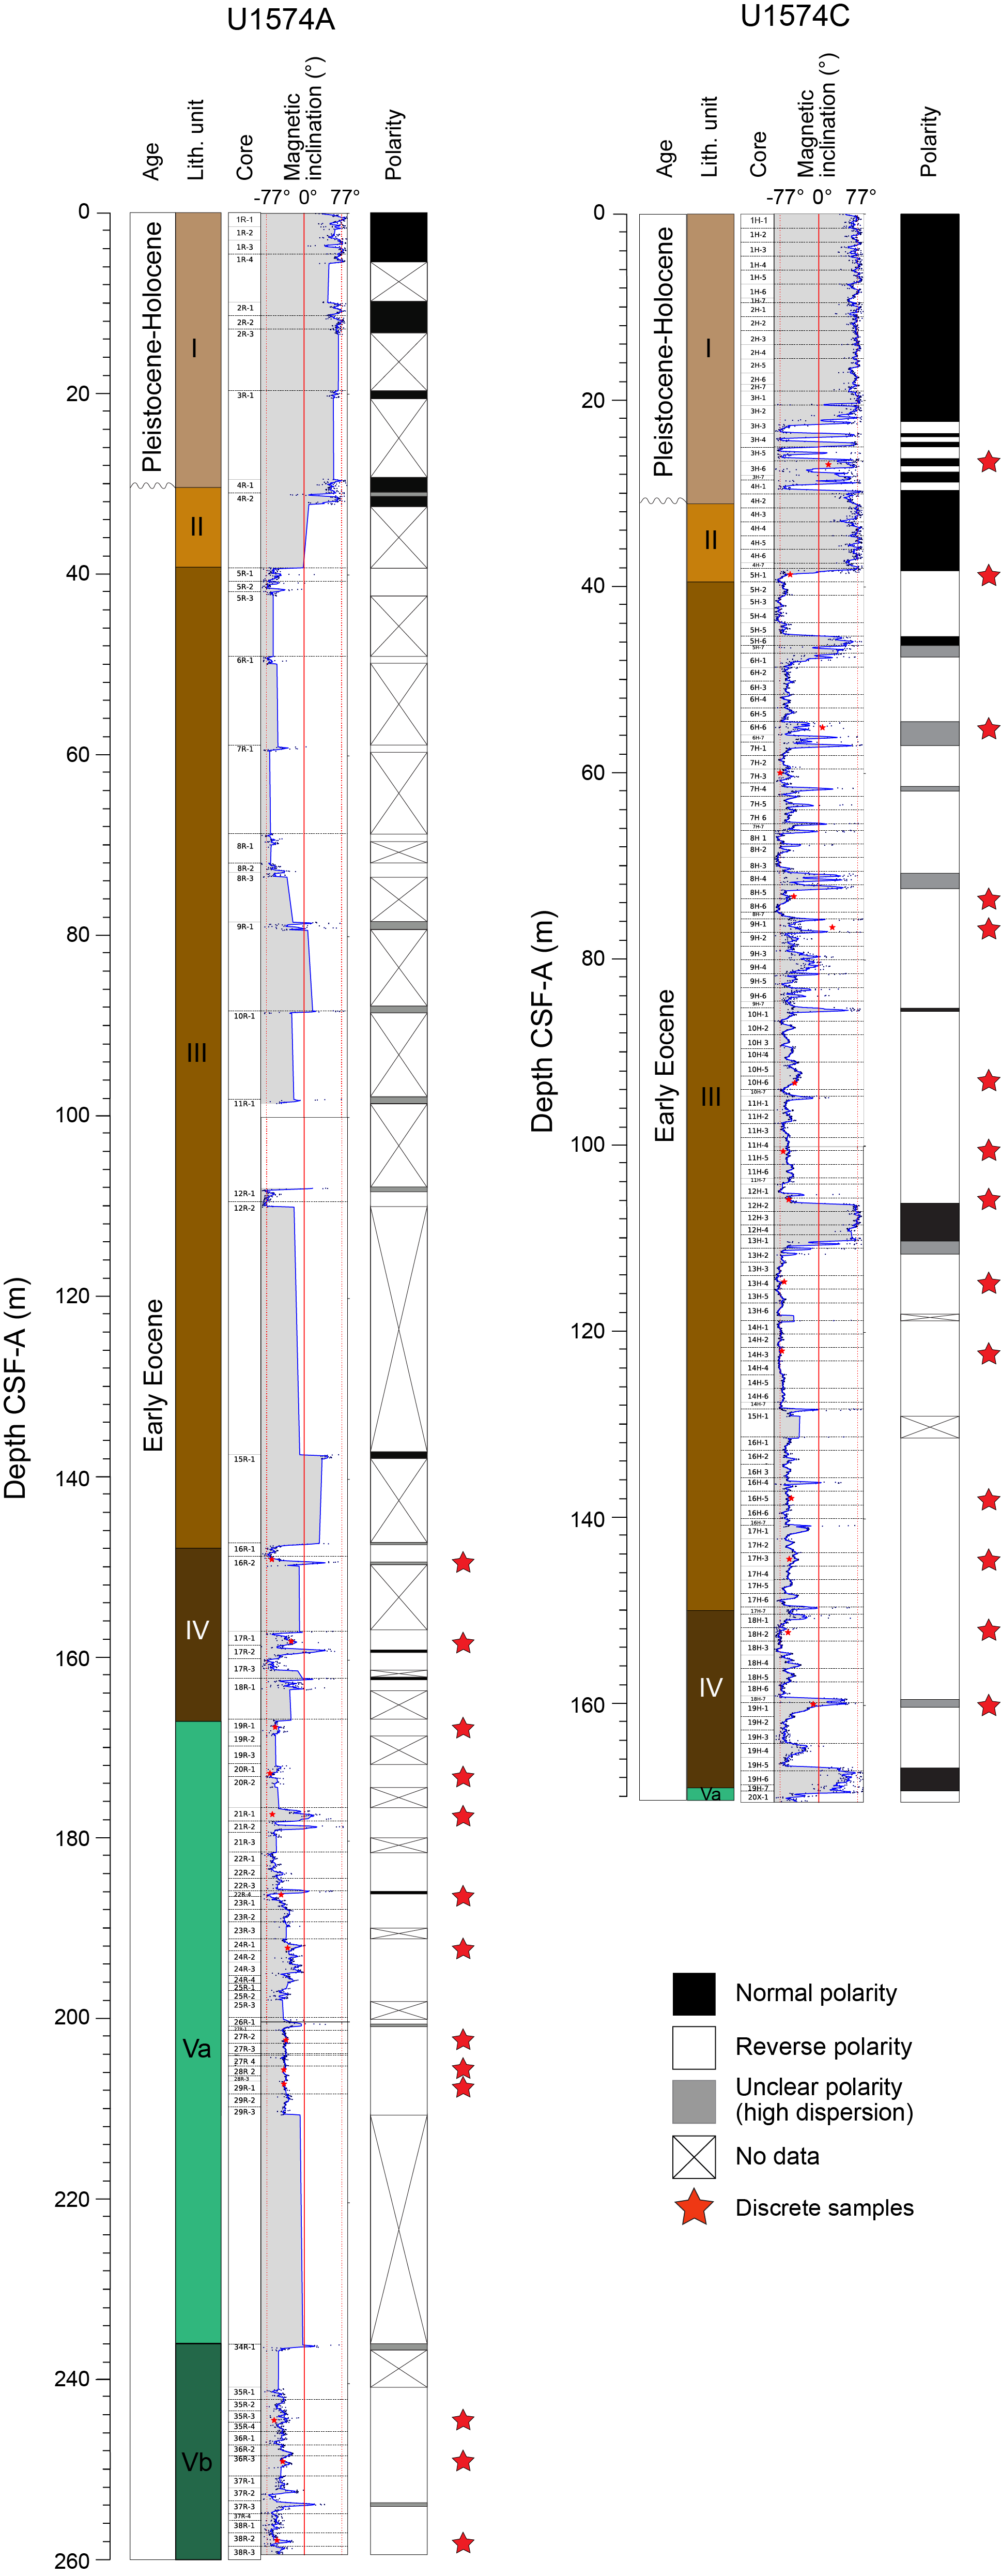
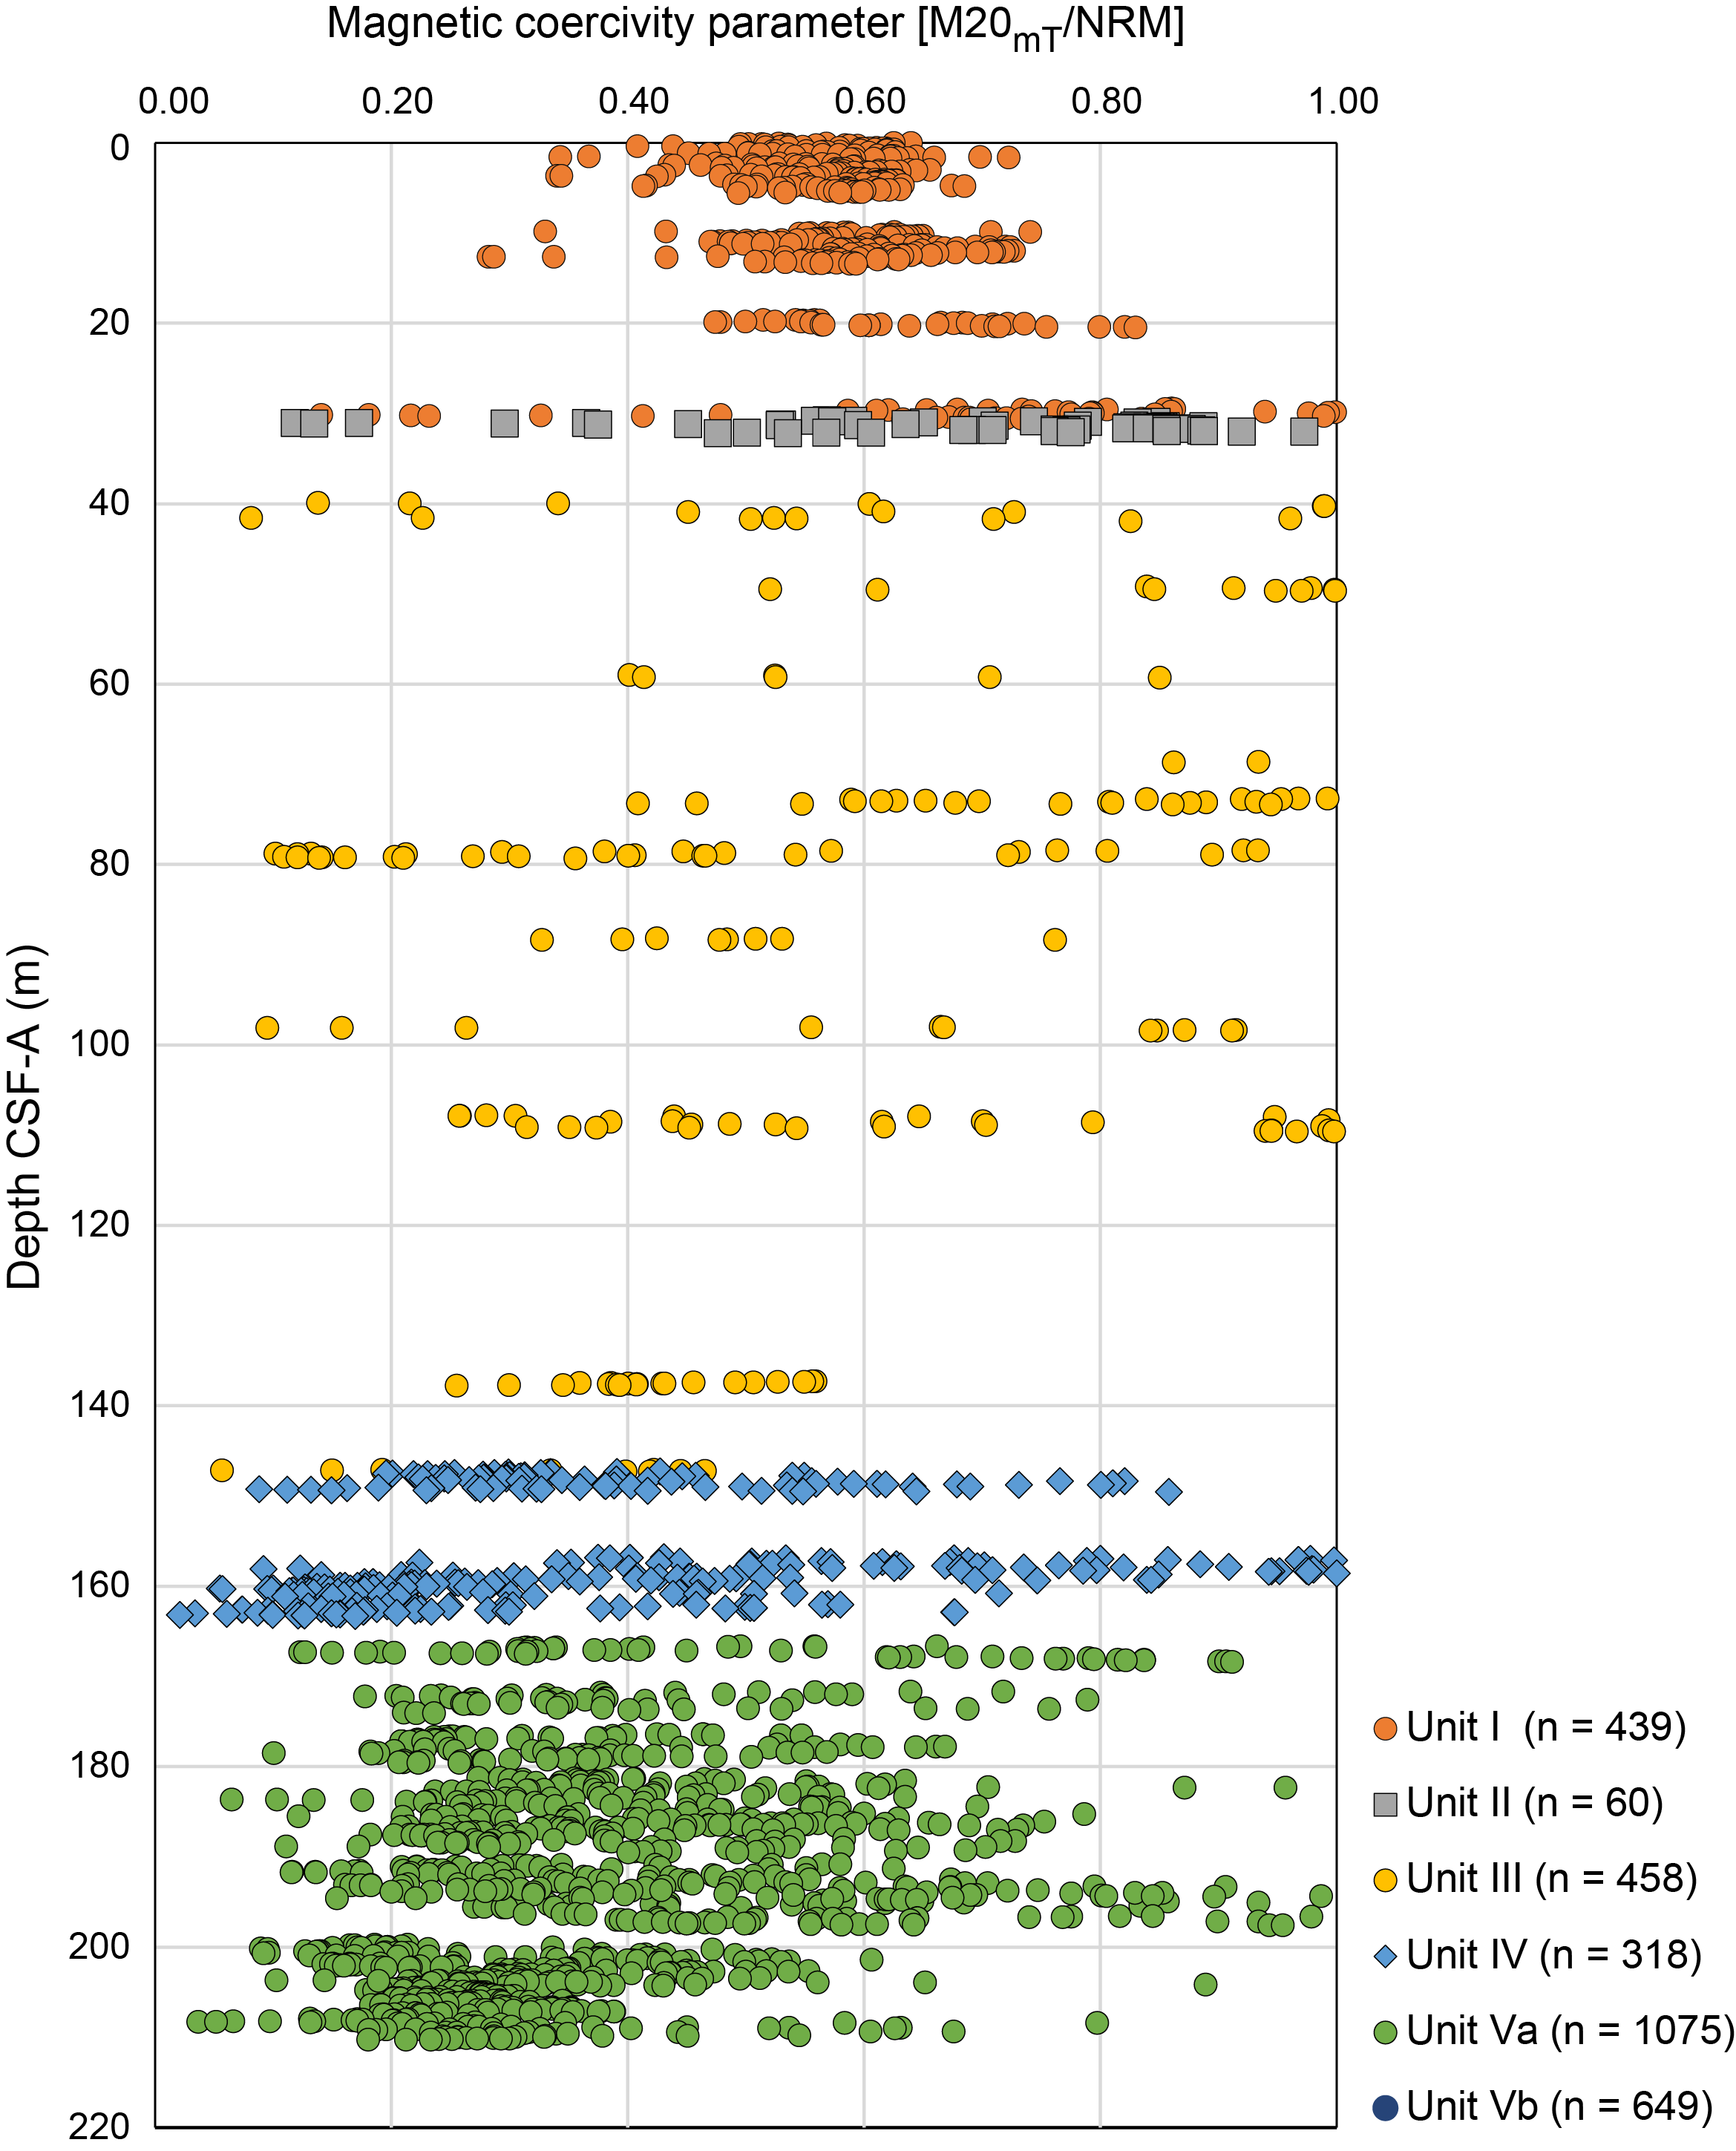
Lithostratigraphic Unit II is made up of pale yellow to greenish gray consolidated clay of Early Eocene age. Recovery of the unit was poor in Hole U1574A (32%). In Hole U1574C, the unit is marked by normal magnetic polarity to Core 5H (38.3 m CSF-A) (Figure F16). The polarity then flips to reverse and remains so to the bottom of the unit. The median coercivity is 6.72, which is higher than in Unit I (Figure F17), indicating intensification of environmental conditions that enhance the growth of high-coercivity minerals like goethite. No discrete samples were measured.
Lithostratigraphic Unit III is characterized by claystone with sand and organic matter of Early Eocene age. The recovery of this unit was excellent in Hole U1574C (102%). The unit is dominated by reverse polarity, with three relatively short-lived normal polarity events in Cores 5H (45.21–46.435 m CSF-A), 10H (85.1–85.5 m CSF-A), and 12H and 13H (106.16–110.225 m CSF-A) (Figure F16). The average intensity of magnetization is 0.076 A/m, and the median coercivity is 2.59. This median coercivity is much lower than in Units I and II, which perhaps indicates a change in environmental conditions that favored growth of lower coercivity minerals, such as magnetite, over higher coercivity minerals such as hematite and goethite. A total of 12 discrete samples from Hole U1574C and none from Hole U1574A were measured. A total of six samples present unstable remanent directions, and the rest have two components of magnetization. The lower coercivity component is removed by 10 mT AF, and the higher coercivity component is removed by 100–120 mT AF demagnetization.
Lithostratigraphic Unit IV comprises organic-rich claystone with parallel lamination and rare calcareous micro- and nannofossils of Early Eocene age. The recovery of this unit was good in Hole U1574C but poor in Hole U1574A. The unit has reverse polarity from the top to Core 19H (166.59 m CSF-A). Polarity then flips and remains normal to the bottom the unit (Figure F16). The average intensity of magnetization is 0.06 A/m, and the median coercivity is 3.10. This is slightly higher than in Unit III but much lower than in Units I and II, indicating continuation of environmental conditions that promoted growth of lower coercivity minerals such as hematite and magnetite. A total of two discrete samples were measured from each hole (U1574A and U1574C). Out of the four samples, only one sample (396-U1574A-17R-1, 111–113 cm) presents stable demagnetization behavior. The magnetic remanence in this sample has low- and a high-coercivity components, which are removed by 10 and 100 mT AF demagnetization, respectively.
Lithostratigraphic Subunit Va contains aphyric to plagioclase phyric massive basalts and pillow basalts with local intervals of hyaloclastite of Early Eocene age. The average intensity of magnetization of this unit in Holes U1574A and U1574C is 3.53 and 0.667 A/m, respectively. The median coercivity of this unit in Hole U1574A is 2.98. However, the recovery of the unit in both Holes U1574A and U1574C was low; therefore, we cannot interpret the intensity of magnetization and the median coercivity (Figure F17). The unit is dominated by reverse polarity. A total of eight discrete samples from Hole U1574A and none from Hole U1574C were measured. Stable remanent magnetization is observed in three of these samples (396-U1574C-27R-2, 108–110 cm; 28R-2, 43–45 cm; and 29R-1, 36–38 cm). There are two remanent magnetization components. The lower coercivity component was removed by 5 mT AF, and the higher coercivity component required 40–60 mT AF to be removed. The lower coercivity component may represent a viscous remanent magnetization, and the higher coercivity component may result from chemical remanent magnetization acquired during or after diagenesis.
Lithostratigraphic Subunit Vb is made up of Early Eocene aphyric to plagioclase phyric pillow basalts overlain with hyaloclastite. This unit was recovered only in Hole U1574A (Figure F16). The sediments of this unit are dominated by reverse polarity. The average intensity of magnetization is 5.72 A/m, and the median coercivity is 2.13. The magnetic remanence of three discrete samples was measured. All three specimens present a remanent magnetization that is removed by 40 mT AF demagnetization. Similar to the stronger component in Subunit Va, this magnetization may represent remanence attained during or after diagenesis.
5.3. Anisotropy of magnetic susceptibility
A single discrete sample (396-U1574C-3H-6, 38–40 cm) from Lithostratigraphic Unit I was measured. It has a bulk susceptibility of 0.079 × 10⁻³ [SI] and a low corrected degree of anisotropy (P′ = 1.019). The magnetic foliation is oblique, with the pole to the fabric (κ3) plunging 48° due 228°, most likely as a result of drilling-related disturbances.
No discrete samples from Lithostratigraphic Unit II were measured for AMS.
Lithostratigraphic Unit III has bulk magnetic susceptibility (MS) ranging 0.63 × 10⁻³ to 1.39 × 10⁻³ [SI]). P′ ranges 1.012–1.083 (median = 1.041). Bulk susceptibility and P′ are higher than in Unit I. However, the median coercivity is lower. These changes in magnetic properties may be attributed to higher contributions from magnetite and hematite, which in turn is an indicator of changes in environmental conditions compared with Unit I. The magnetic fabrics are (sub)horizontal with dip <9° in all but two discrete samples (396-U1574C-6H-6, 65–67 cm, and 9H-1, 90–92 cm).
Lithostratigraphic Unit IV bulk MS ranges 0.066 × 10⁻³ to 0.589 × 10⁻³ [SI], and P′ ranges 1.073–1.114 (median = 1.074). In comparison to Units I and III, bulk MS is lower, possibly because of the lower abundance of high-MS minerals such as magnetite. The magnetic foliation is subhorizontal, dipping less than 5°.
In Lithostratigraphic Subunit Va, bulk MS ranges 21 × 10−3 to 24 × 10−3 [SI]. P′ ranges 1.006–1.015 (median = 1.011). The magnetic foliation is subvertical with a dip angle >87°.
In Lithostratigraphic Subunit Vb, bulk MS ranges 21 × 10−3 to 30 × 10−3 [SI], which is much higher than all previous units at the same site. P′ ranges 1.012–1.016 (median = 1.014). The magnetic foliation is oblique with dips ranging 32°–64°. MS in Subunits Va and Vb is the highest among all the units and is attributed to substantial contributions from magnetite, which is a clear indication of changed environmental conditions compared with Unit IV. The oblique and subvertical magnetic foliations of Subunits Va and Vb are interpreted as drilling-related disturbances.
5.4. Summary
Almost complete recovery of the sedimentary section in Hole U1574B reveals predominately normal magnetic polarity for Lithostratigraphic Units I (Pliocene/Pleistocene) and II (Early Eocene) and mainly reverse polarity for Lithostratigraphic Units III and IV (Early Eocene). The recovered basalts have a reverse magnetic polarity. However, limited recovery does not allow interpretation of magnetization intensity and coercivity variations.
6. Geochemistry
Site U1574 is located on the southern flank of Eldhø. Two holes were sampled at the site: Hole U1574A focused on recovery of the igneous basement, and Hole U1574C focused on high recovery of the postbasalt sediments. A single mudline sample and 8 interstitial water (IW) samples were taken from the sediments in Hole U1574A, and a further 39 were taken from Hole U1574C. Carbonate and carbon-hydrogen-nitrogen-sulfur (CHNS) analysis was completed on all corresponding squeeze cake samples. A total of 18 samples were taken from the underlying basalt lithologies in Hole U1574A for hard rock geochemical analysis. These were analyzed using inductively coupled plasma–atomic emission spectrometry (ICP-AES). A further 49 analyses of basalt were completed using portable X-ray fluorescence (pXRF). A total of 17 samples were taken for routine headspace analysis. A total of 28 samples were analyzed using X-ray diffraction (XRD), of which 5 were prepared for clay analysis and an additional 5 were heated.
6.1. Inorganic geochemistry
Because of their proximity and the similarity in the profiles reconstructed from both holes, we consider data from Holes U1574A and U1574C together. The alkalinity profile displays enrichment in the upper 20 m of the core, reaching 4.1 mM at 13 m CSF-A (Figure F18; Table T5). This is followed by a linear decrease in concentration for the remainder of the sedimentary section, and the lowest alkalinity concentrations (2.25 mM) are present in the sediment layers directly overlying the basalts (140–168 m CSF-A). IW pH is variable and shows no clear trends, and most values are between 7.6 and 7.8 (Figure F18). Ammonium concentrations increase for the uppermost 20 m of the sediment, rising from 0 to 53 µM. Concentrations stay close to ~50 µM to 150 m CSF-A, below which depth there is a steady increase to 105 µM in the last sample above the sediment–basalt transition (168.43 m CSF-A). Phosphate concentrations rise from 5.5 to 8.2 µM from 0 to 32 m CSF-A, followed by a return to values around 6 µM for the remainder of the core. Below 100 m CSF-A, the data show more scatter, and concentrations are between 5 and 6.5 µM (Figure F18).
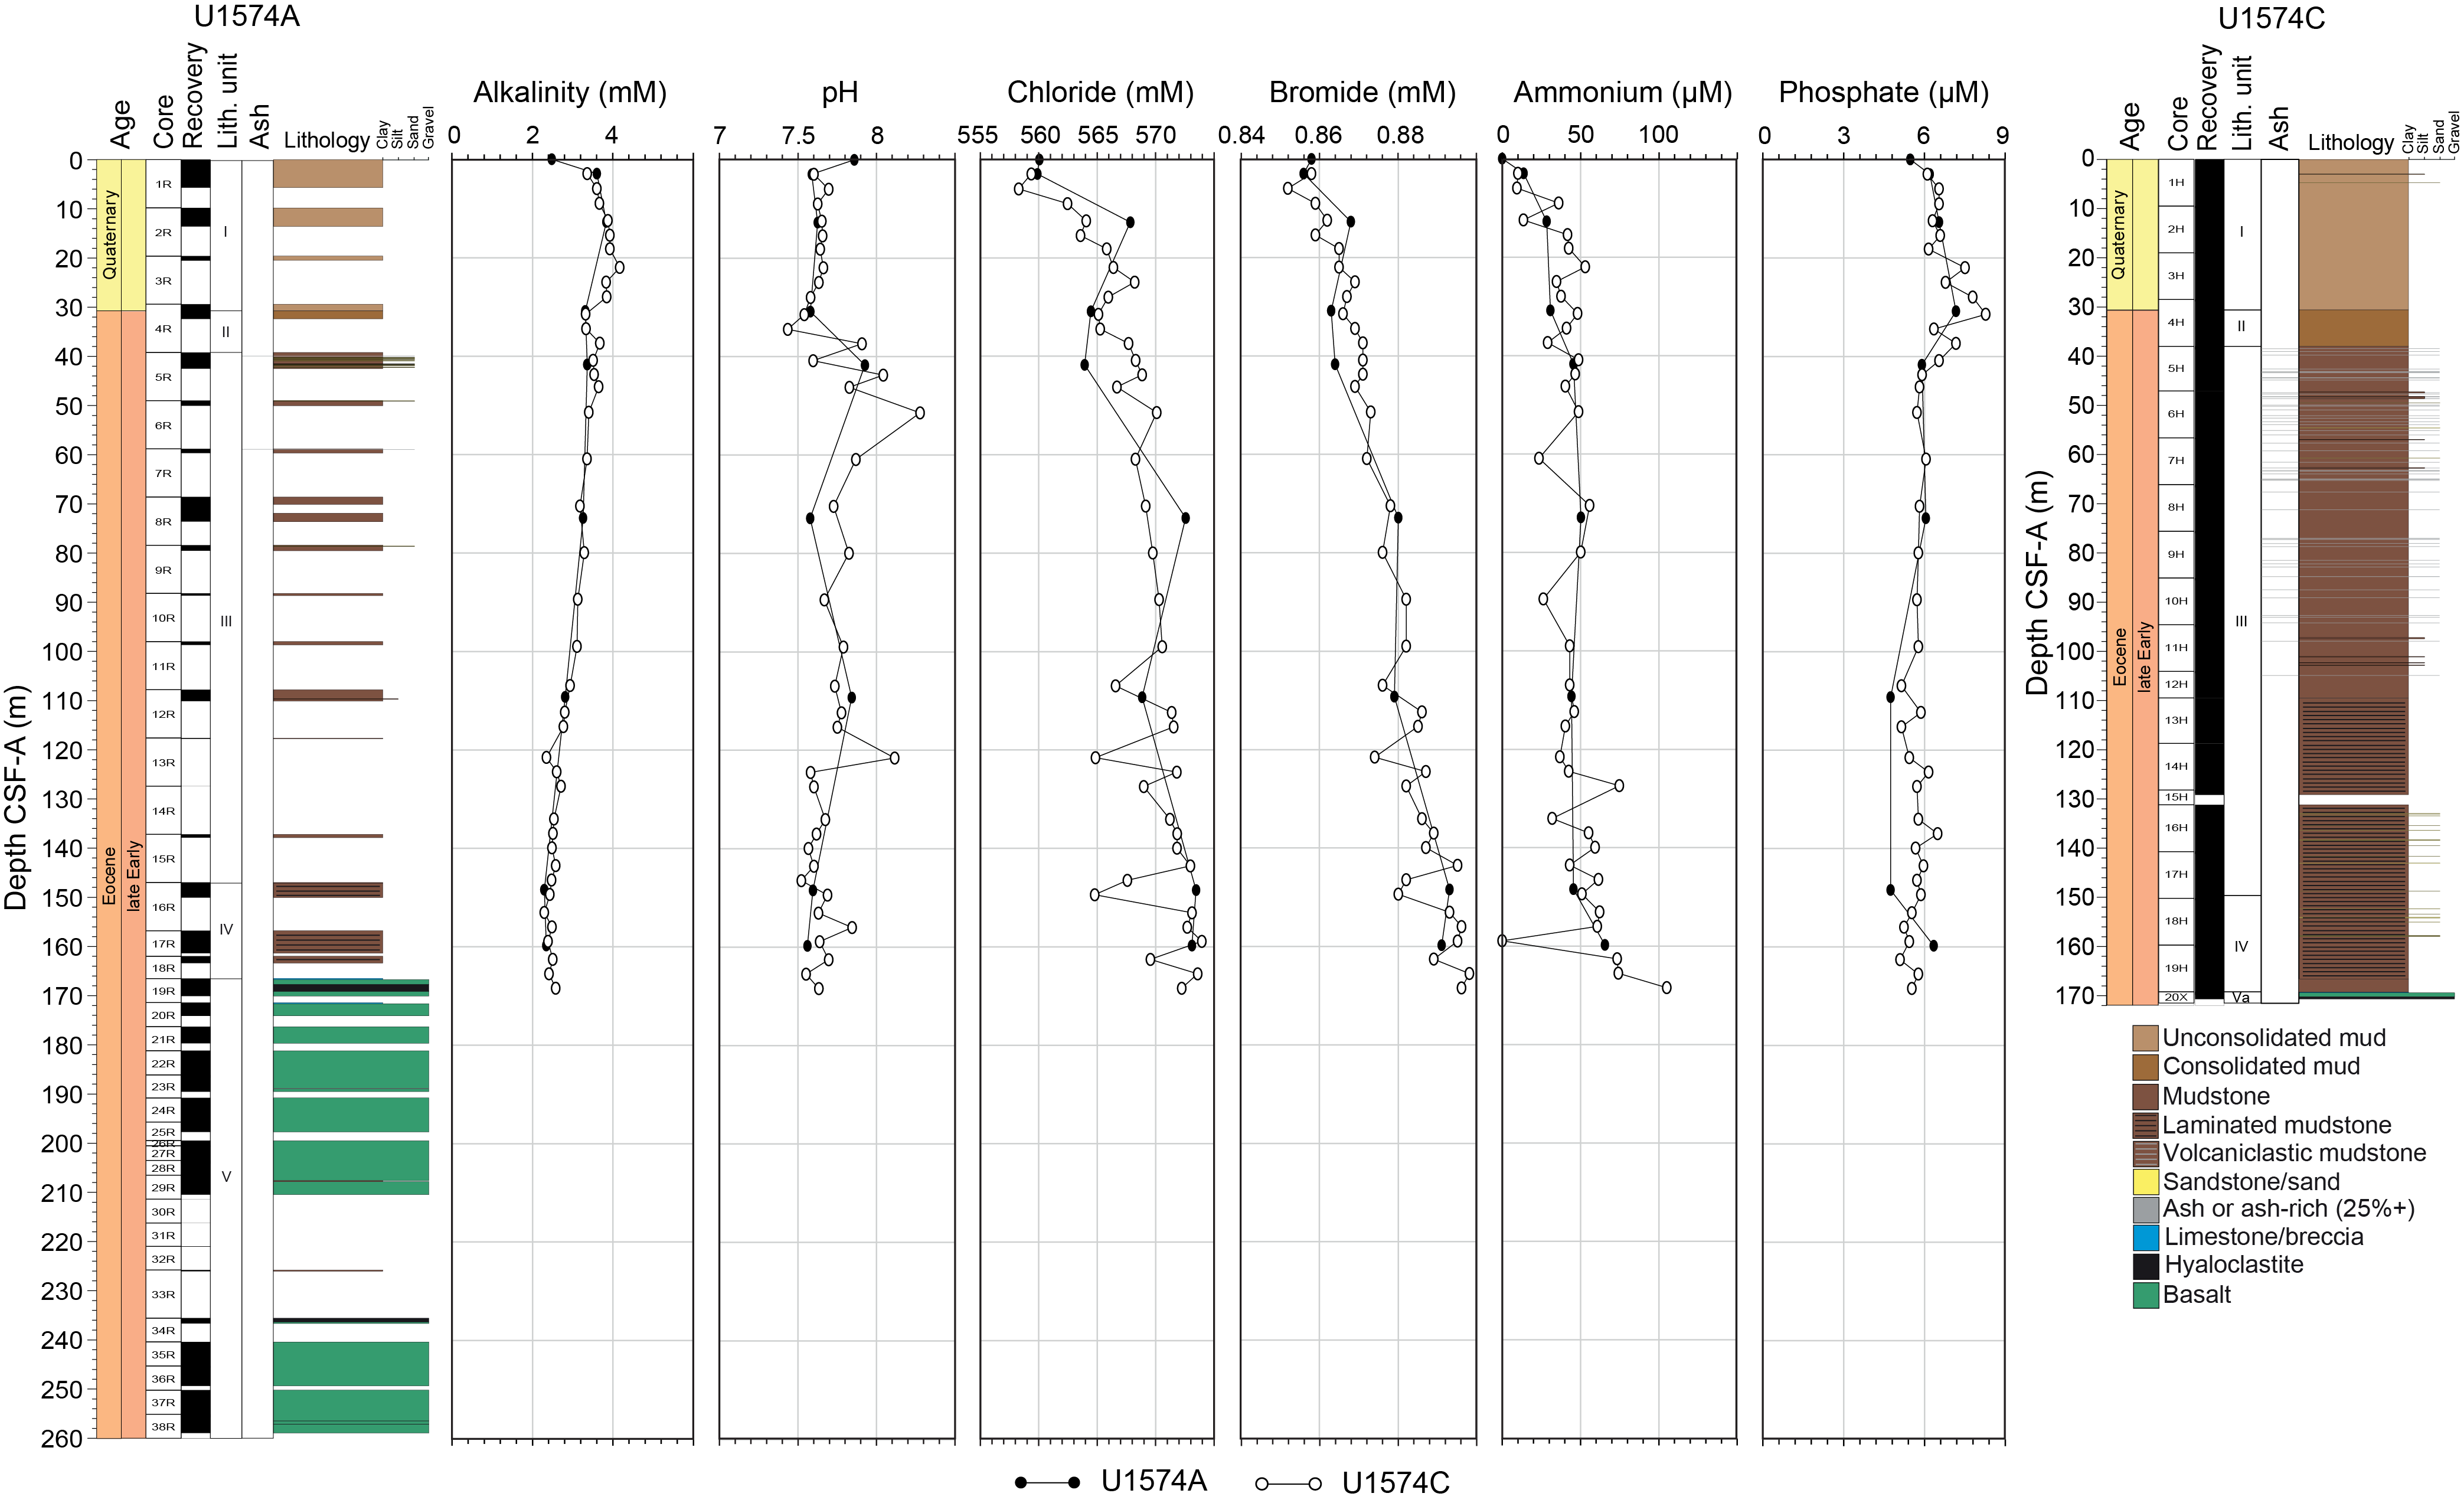
As at other Expedition 396 sites where sediments overlay basalts, the downcore trends of some elements display clear linear increases (Ca and Sr) and others linearly decrease (Mg and S) across the entire sediment package (Figures F19, F20). For Ca, concentrations rise from 11 mM at the surface to 18.3 mM by the lowest sediment. Sr rises from 92 to 123 µM in the same interval (with a little scatter), and Mg drops from 52 to 49 mM (Figure F19). The distribution of these elements is controlled primarily by the alteration of underlying basaltic lithologies and the formation of authigenic clays, a process which absorbs Mg and releases Ca and Sr (Seyfried and Mottl, 1982; Lyons et al., 2000). Chloride and Br concentrations increase downcore from 558 to 574 mM and from 0.85 to 0.89 mM, respectively (Figure F18). In the section between 100 and 160 m CSF-A, a number of samples deviate from these linear trends and show shifts to lower concentration, potentially suggesting pockets of less saline water. The Li profile shows two intervals (0–30 and 120–170 m CSF-A) of very little variation where all values are between 27 and 40 µM. In the remainder of the core, Li content is highly variable, ranging 40–135 µM. Sulfur decreases from surface values of around 29 mM to 25.5 mM at the base of the sediment.
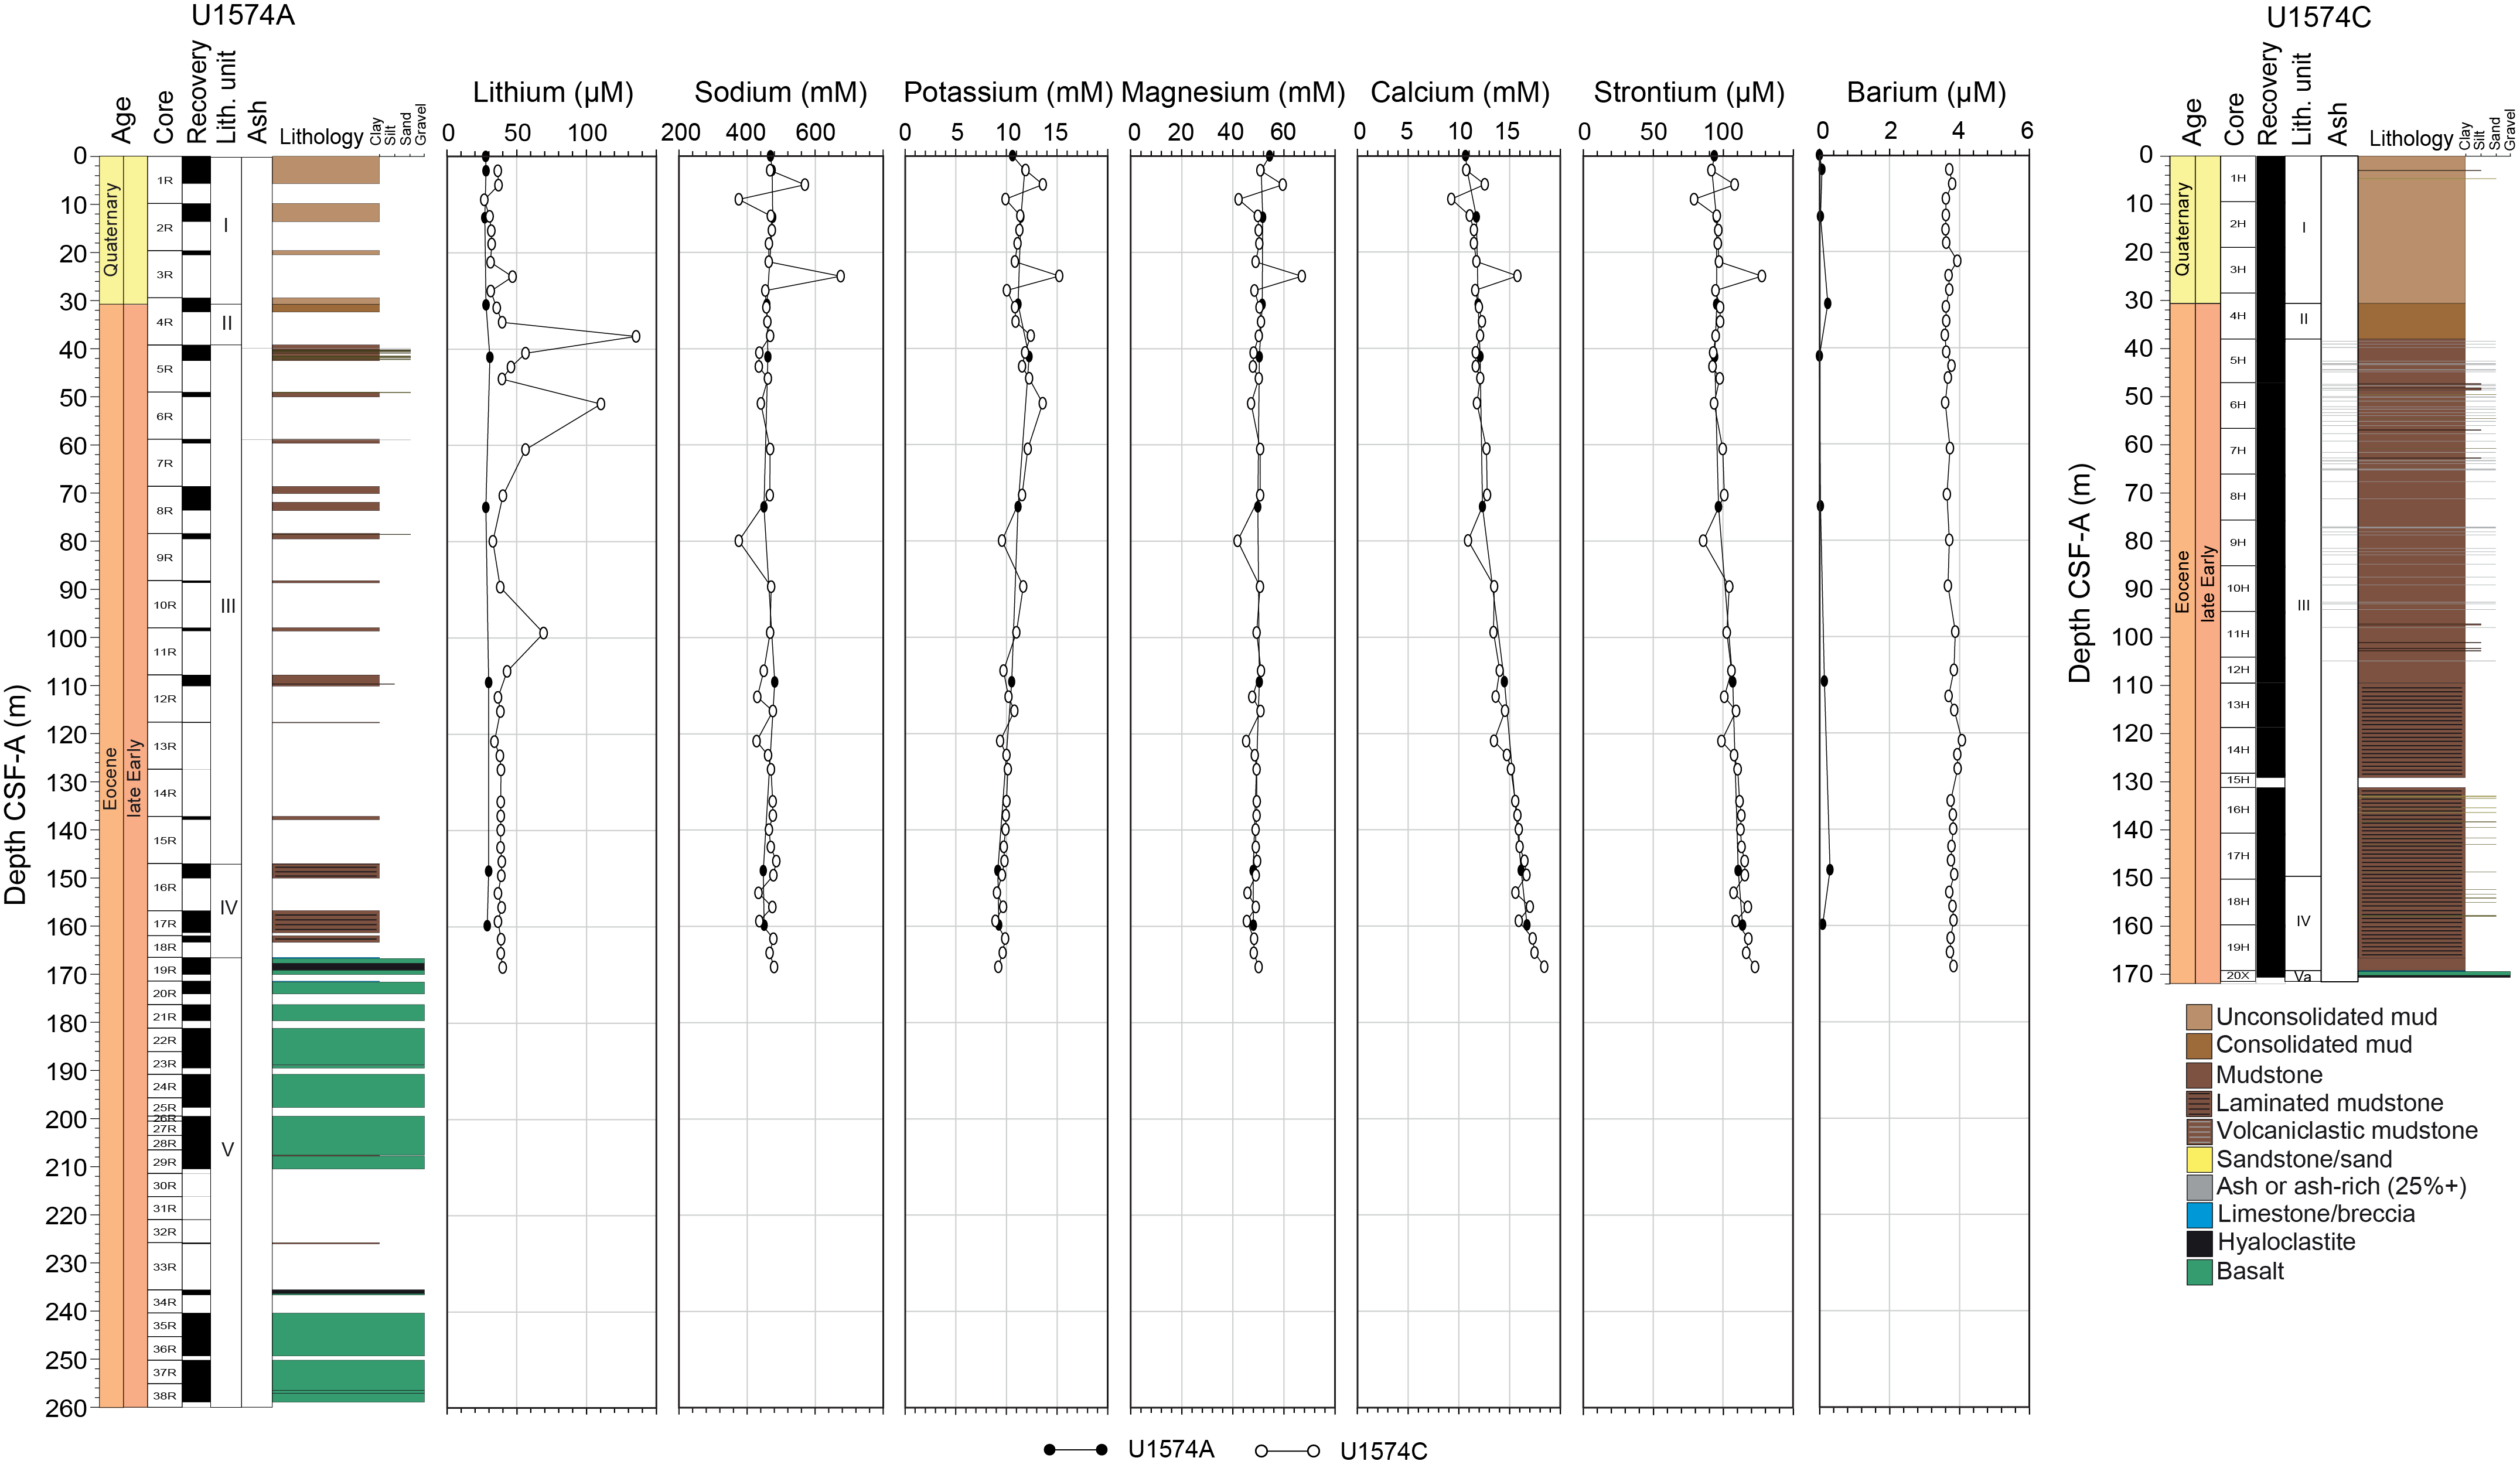
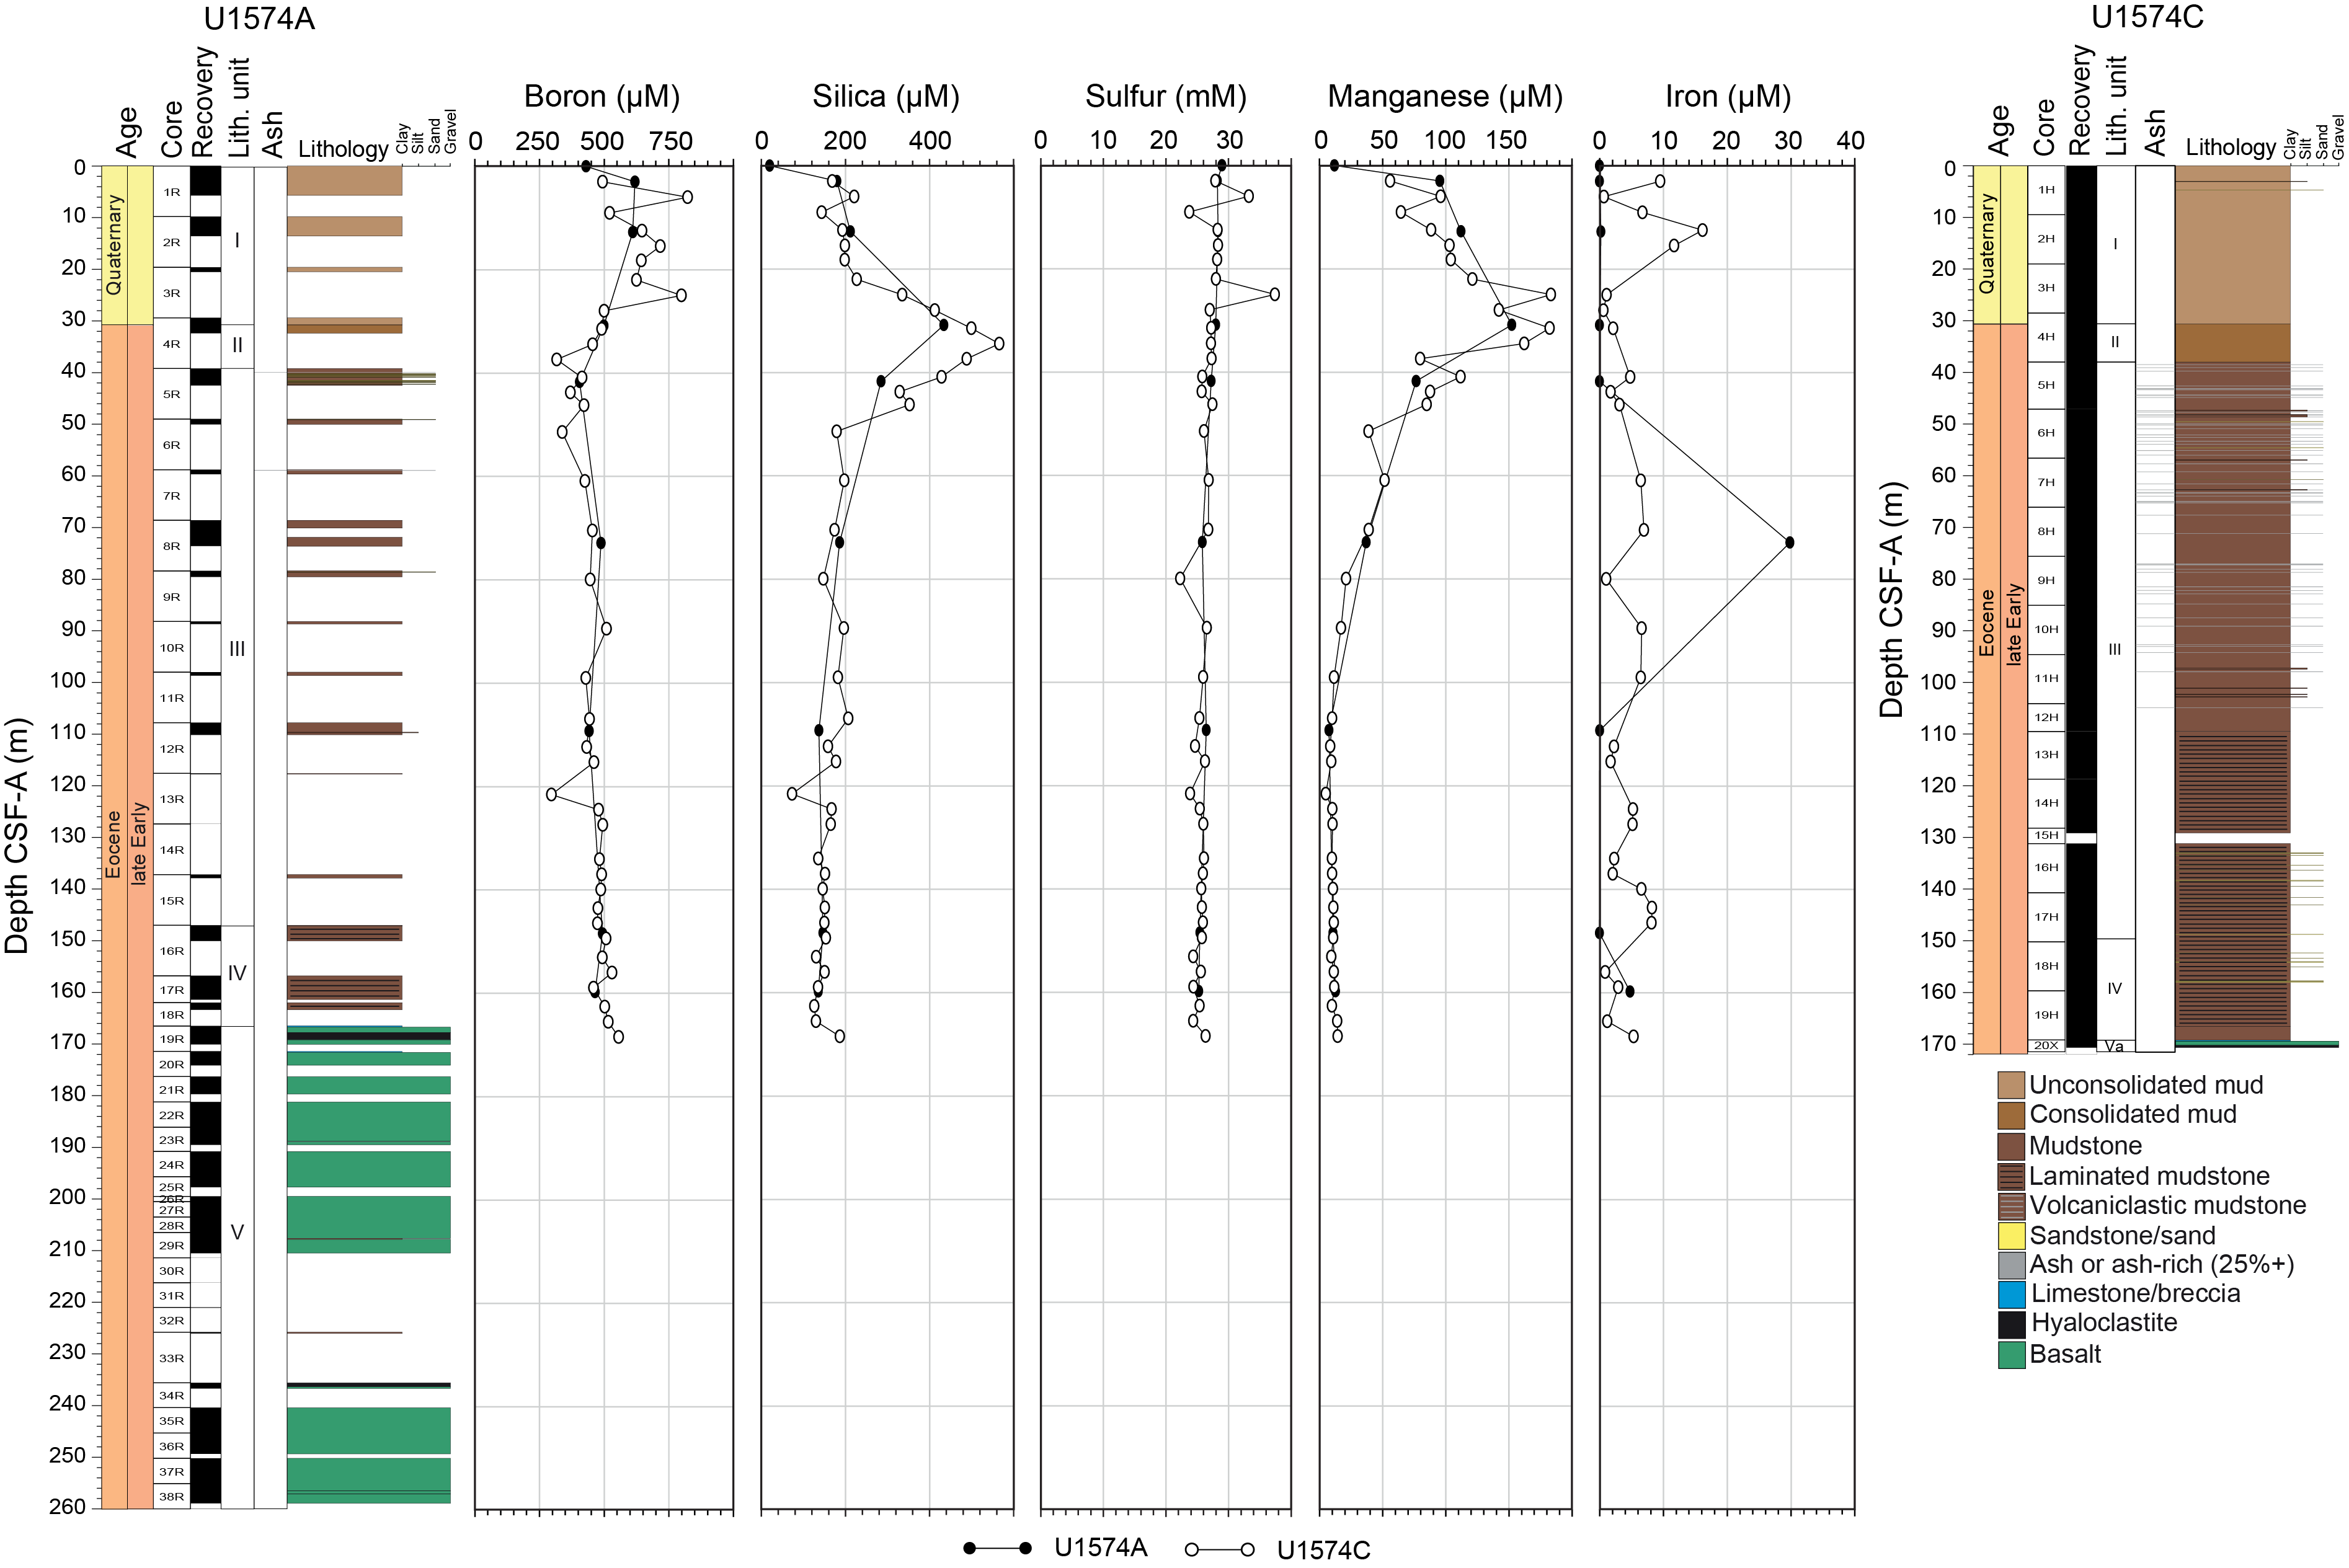
Some elements are enriched in IW from the upper interval of the core before dropping in a similar manner to the alkalinity profile. These include B, which is between 300 and 500 µM for the majority of the core but reaches values above 800 µM for the uppermost 20 m CSF-A (Figure F20). The K profile generally shows concentrations decreasing downcore from 12 mM at the top to 9 mM at the sediment base (Figure F19). There is one interval of K enrichment between 40 and 60 m CSF-A where values are as high as 14.2 mM. Dissolved Si content rises from 200 to 565 µM in the upper 40 m CSF-A, and values decrease to between 150 and 200 µM for the remainder of the core. Sodium content is relatively stable, with concentrations between 400 and 500 mM for the entire core (Figure F19). Iron content is between 0 and 15 µM (or below detection limit) for most of the core but is notably high (29 µM) in the IW sample from 72 m CSF-A in Hole U1574A, suggesting a distinct diagenetic environment. Barium concentrations are stable throughout Hole U1574C, and values are between 3.5 and 4 µM (Figure F19). Barium concentrations poorly correlate between holes, and Hole U1574A shows consistently lower values. This is likely to be an artifact of the concentrations being close to the detection limit and the methodology of the ICP-AES.
6.1.1. Deconvolved natural gamma radiation
Deconvolution of the NGR data yields quantitative estimates of the K, Th, and U content of the samples drilled. The K content of Lithostratigraphic Unit I is between 2 and 3 wt%, and the transition to Unit II is clearly marked by a drop to 1.5 wt% (Figure F21). This is followed by a slow increase in values through Units III and IV, and K reaches an average of 3.5 wt% by the sediment–basalt transition (168 m CSF-A). Within the basaltic unit, K content is much lower (0.2–1 wt%) and exhibits occasional rises linked to interbasaltic sediment layers. U content is relatively invariant, and concentrations are between 1 and 3 ppm in the sediments and <1 ppm in the basalts. Th content follows a similar trend to K content, rising from 6 ppm in the uppermost sediments to 10 ppm at the sediment–basalt transition before dropping below 4 ppm in the basalts (Figure F21).
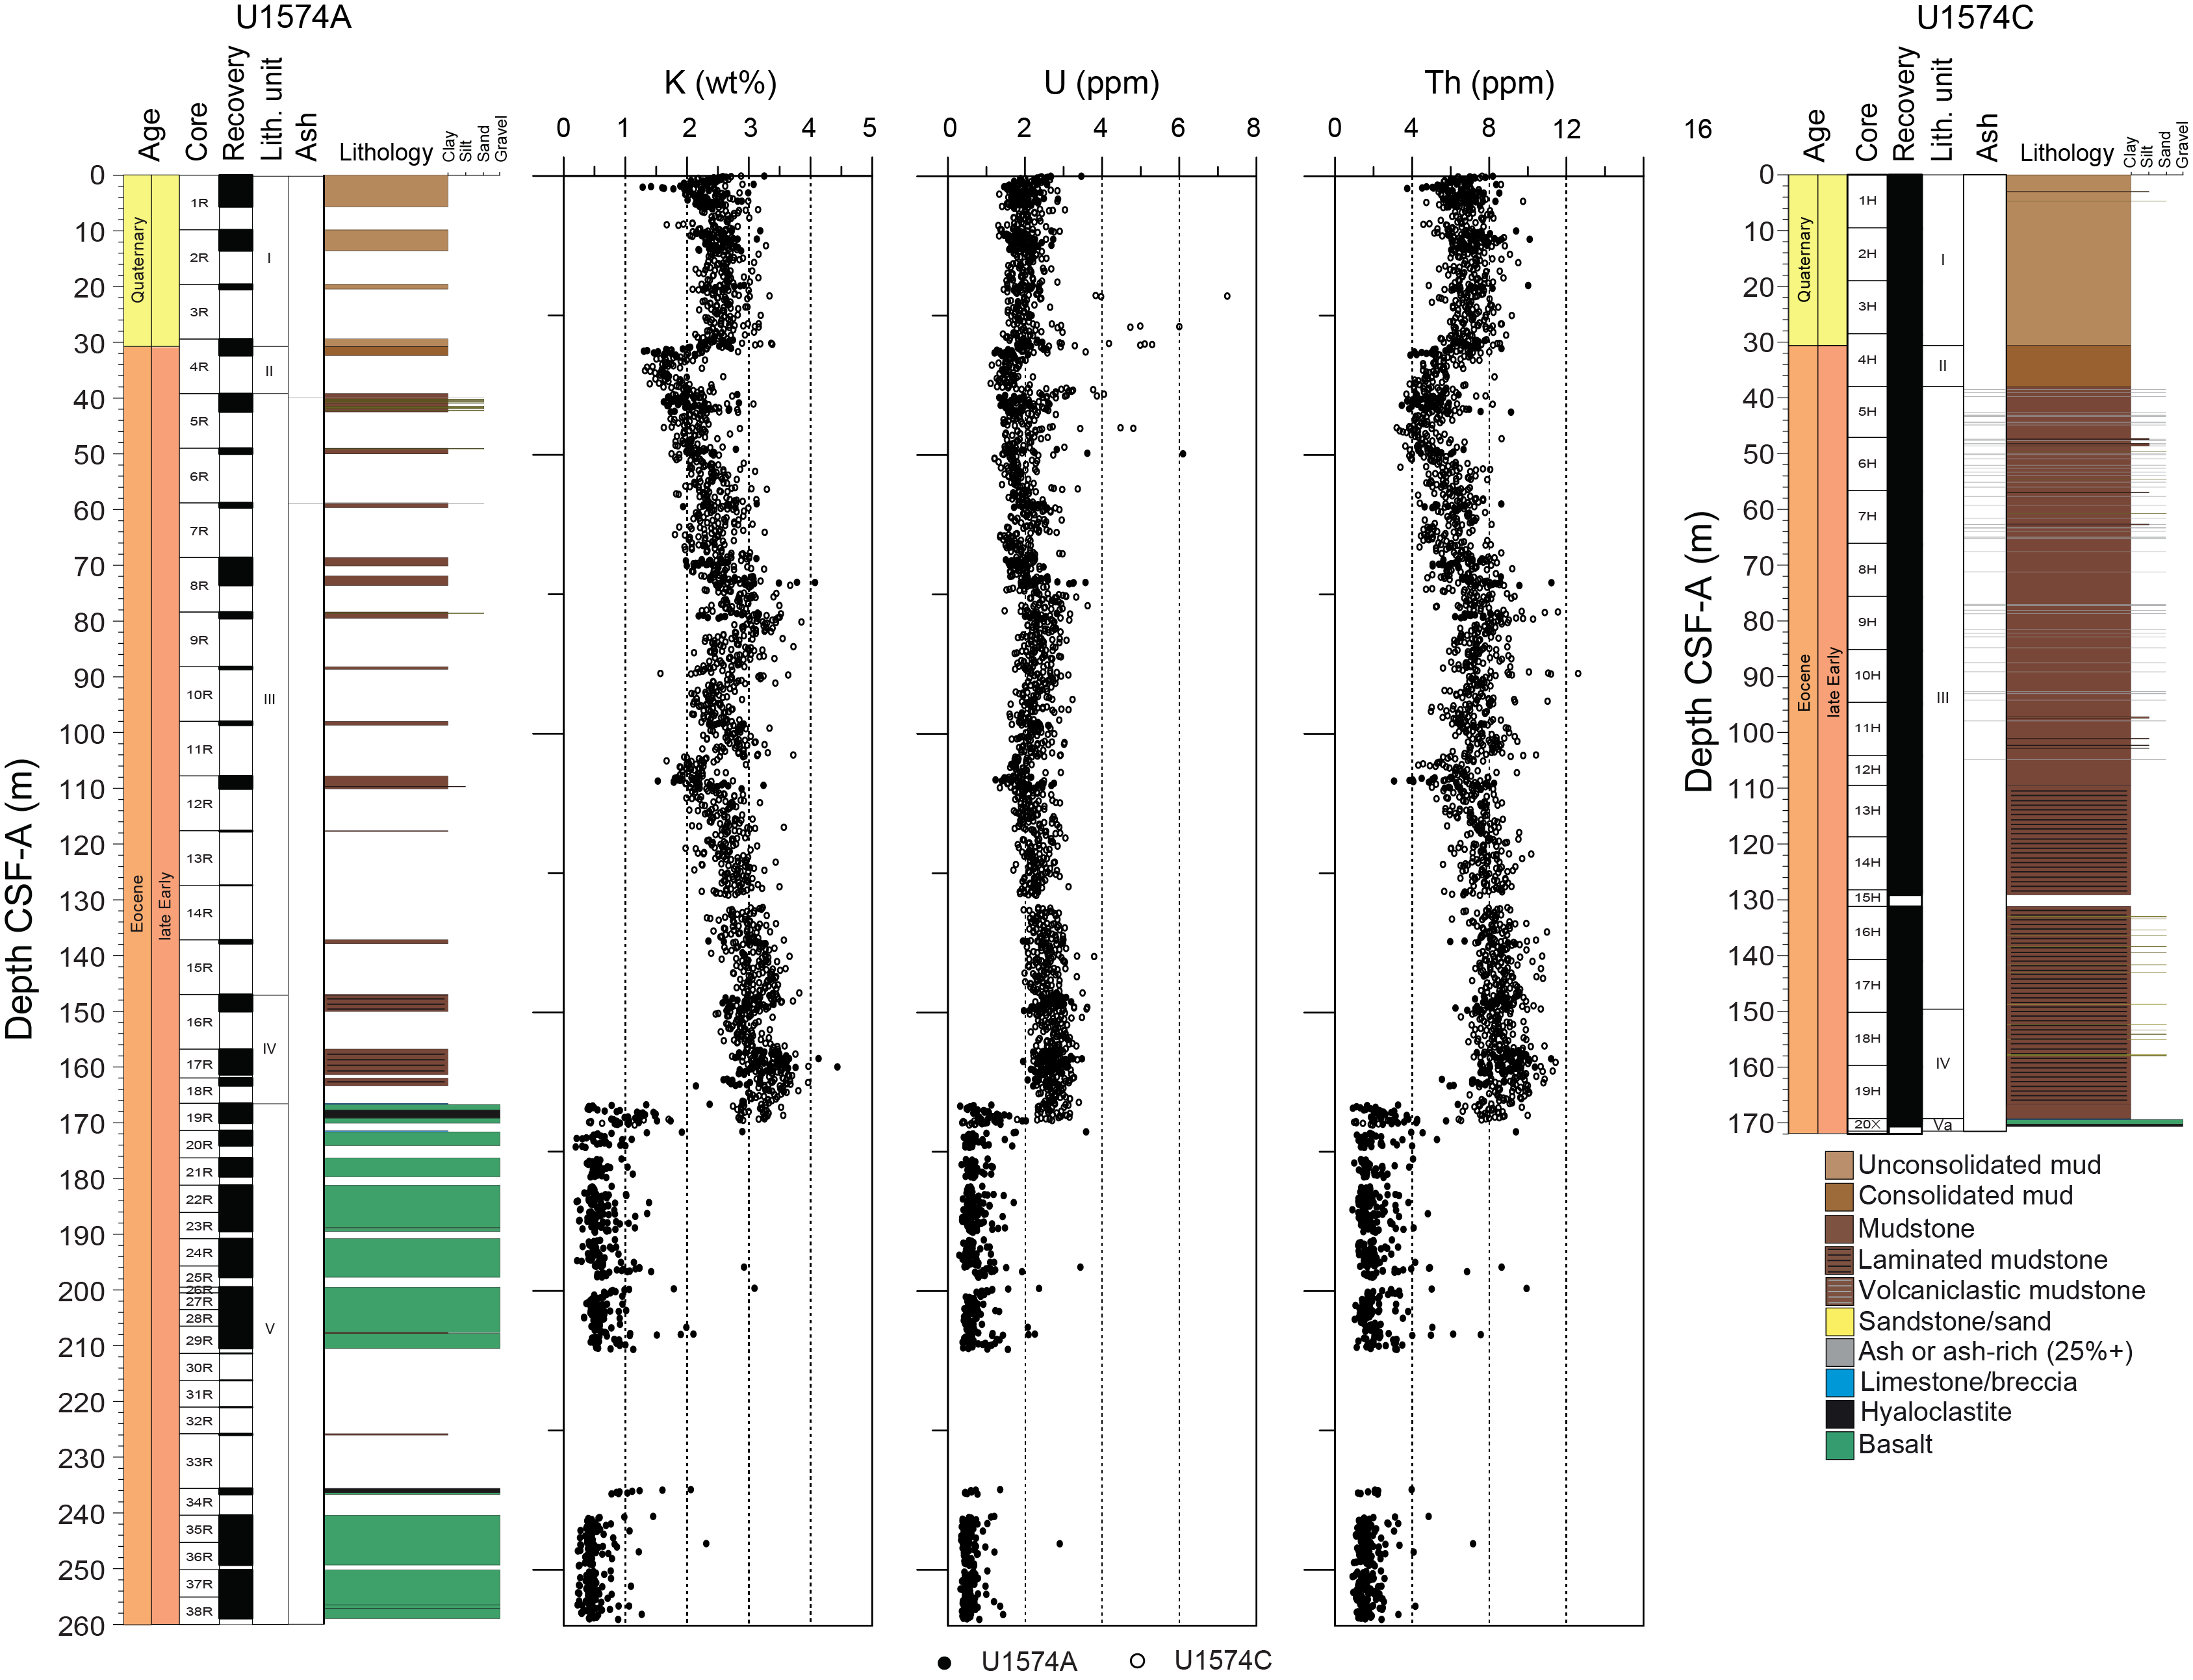
6.1.2. X-ray diffraction
In Unit I, the sediment is dominated by quartz, albite, and clay minerals such as illite. Below this, in Units II and III, quartz remains the dominant phase observed in the XRD scans, but muscovite and occasionally illite and chlorite (as clinochlore) are present. Below Core 396-U1574C-15R, quartz and muscovite are still primary components, but there are greater contributions from illite, chlorite, and montmorillonite. In Unit IV, pyrite is commonly observed. One sample of interbasaltic sediment (from Core 32R) was analyzed and is primarily magnesium calcite (dolomite) with minor calcite.
6.1.3. Hard rock geochemistry
A total of 18 igneous rock samples from different basaltic lava flows in Unit V in Hole U1574A were prepared for major and trace elements using ICP-AES. Loss on ignition (LOI) varied between 1 and 2 wt% in Subunit Va, indicating relatively low levels of alteration. LOI concentrations rose from 3 to 6 wt% at Subunit Vb. The most altered sample is present in Subunit Vb (396-U1574A-37R-4, 113–115 cm); its LOI concentration reached 8.3 wt%. For the first time during Expedition 396, the analyses seem to have been affected by an analytical issue with the ICP-AES. Both silica and Mg# are elevated, suggesting a highly unlikely magma composition. There was no time to rerun shipboard samples, so in the absence of shore-based verification, the data are not used beyond presentation in Table T6. However, because there was good agreement between pXRF and ICP-AES data from previous sites (see Geochemistry in the Expedition 396 methods chapter and Geochemistry in the Site U1573 chapter [Planke et al., 2023a, 2023b]), we present the pXRF data from preliminary results.
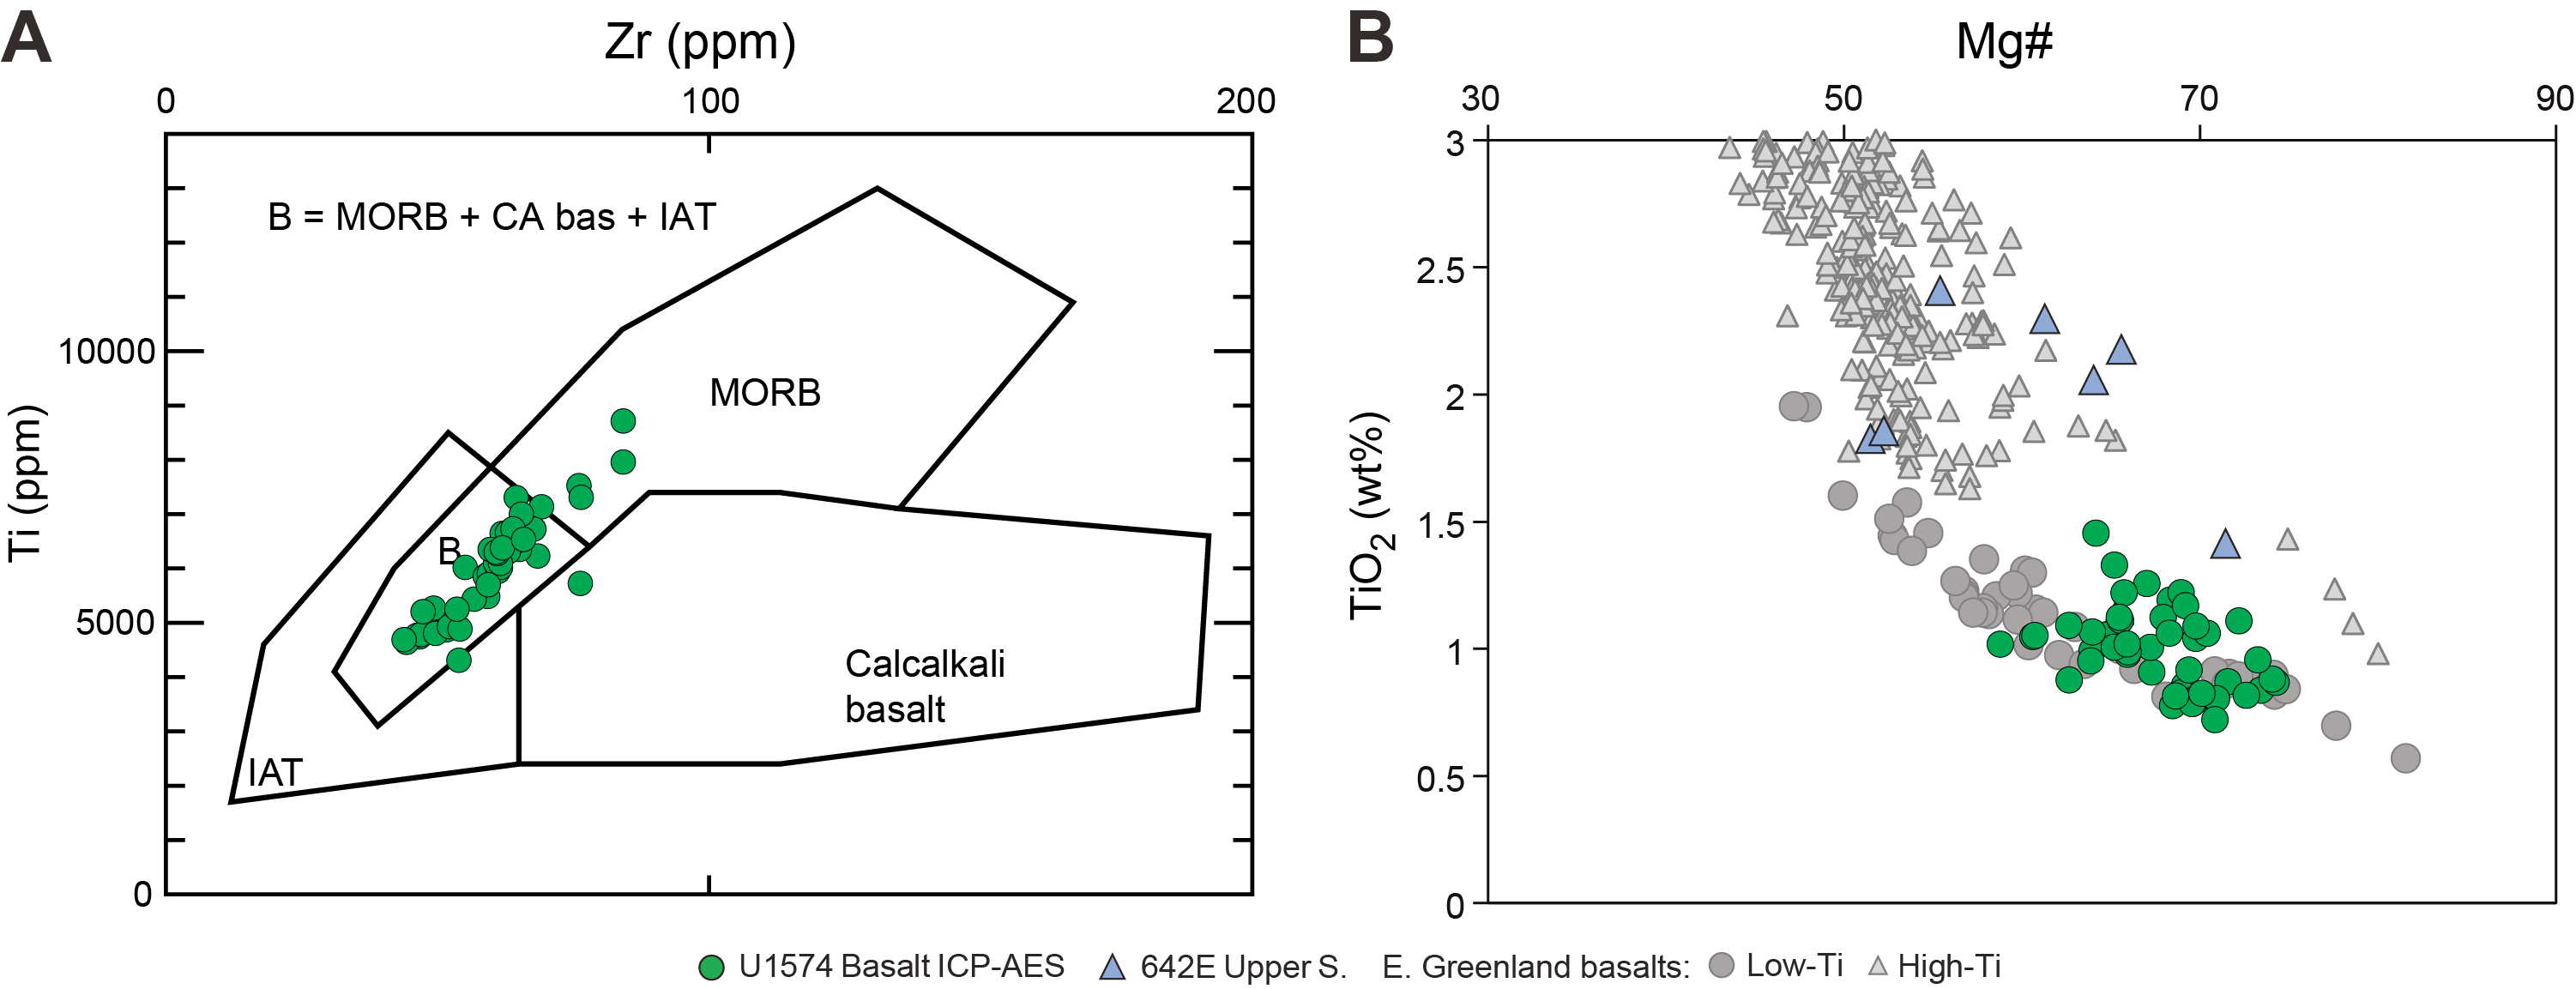
On a Ti versus Zr diagram, four samples plot within the mid-ocean-ridge basalt (MORB) field, one plots within the calc-alkali basalt field, and the rest plot in the region of several overlapping basalt types (Figure F22A). In a TiO2 versus Mg# diagram (Mg# = Mg/[Mg + Fe2+] × 100, assuming FeO/Fe2O3 = 0.85), most of the lithologies have TiO2 below 1.5 wt% and Mg# between 60 and 74 wt% (Figure F22B). When compared with basalts from the upper series in Ocean Drilling Program (ODP) Hole 642E (Meyer et al., 2009), flood basalts from East Greenland (Tegner et al., 1998), and previous sites, all samples overlap with the Greenlandic low-Ti basalts and analyses from Site U1573. The downhole Mg# values in Unit V lavas show a gradual decline from 74 to 60 wt% between 170 and 260 m CSF-A (see Lithostratigraphy; Figure F12). The pXRF of TiO2 shows fairly stable values of ~0.8 wt% from 170 to 190 m CSF-A, a linear increase to ~1.2 wt% by 200 m CSF-A, and then consistent concentrations of ~1.1 wt% to the base of the hole. Zirconium follows a similar trend to TiO2, and Ni decreases from ~90 to ~40 ppm from 170 to 200 m CSF-A. These elements also do not show much variation at the lower part of the hole. The elemental concentrations could reflect upwardly evolving units of magma emplaced as individual events.
6.2. Organic geochemistry
6.2.1. Headspace gas
Of the 17 samples taken for headspace analysis, none contained more than 3 ppmv methane or any other gas elements in detectable quantities. As a result, no samples were taken from Holes U1574B and U1574C.
6.2.2. Carbon, nitrogen, and sulfur
CaCO3 contents show enrichment in the upper 20 m CSF-A of sediment (as high as 15 wt%) that is linked to biogenic carbonate deposition (Figure F23; Table T7). Below this interval, CaCO3 content is below 1.5 wt% to 100 m CSF-A. Between 100 and 168 m CSF-A, CaCO3 content is between 1.5 and 2.5 wt%, and occasional samples show much higher contents (as high as 30 wt%). This enrichment appears linked to authigenic carbonate precipitation as a result of basalt alteration but also to well-preserved nannofossils in this interval. The one analyzed interbasaltic sediment sample is carbonate dominated (69 wt%) and confirmed to be dolomite by XRD analysis.
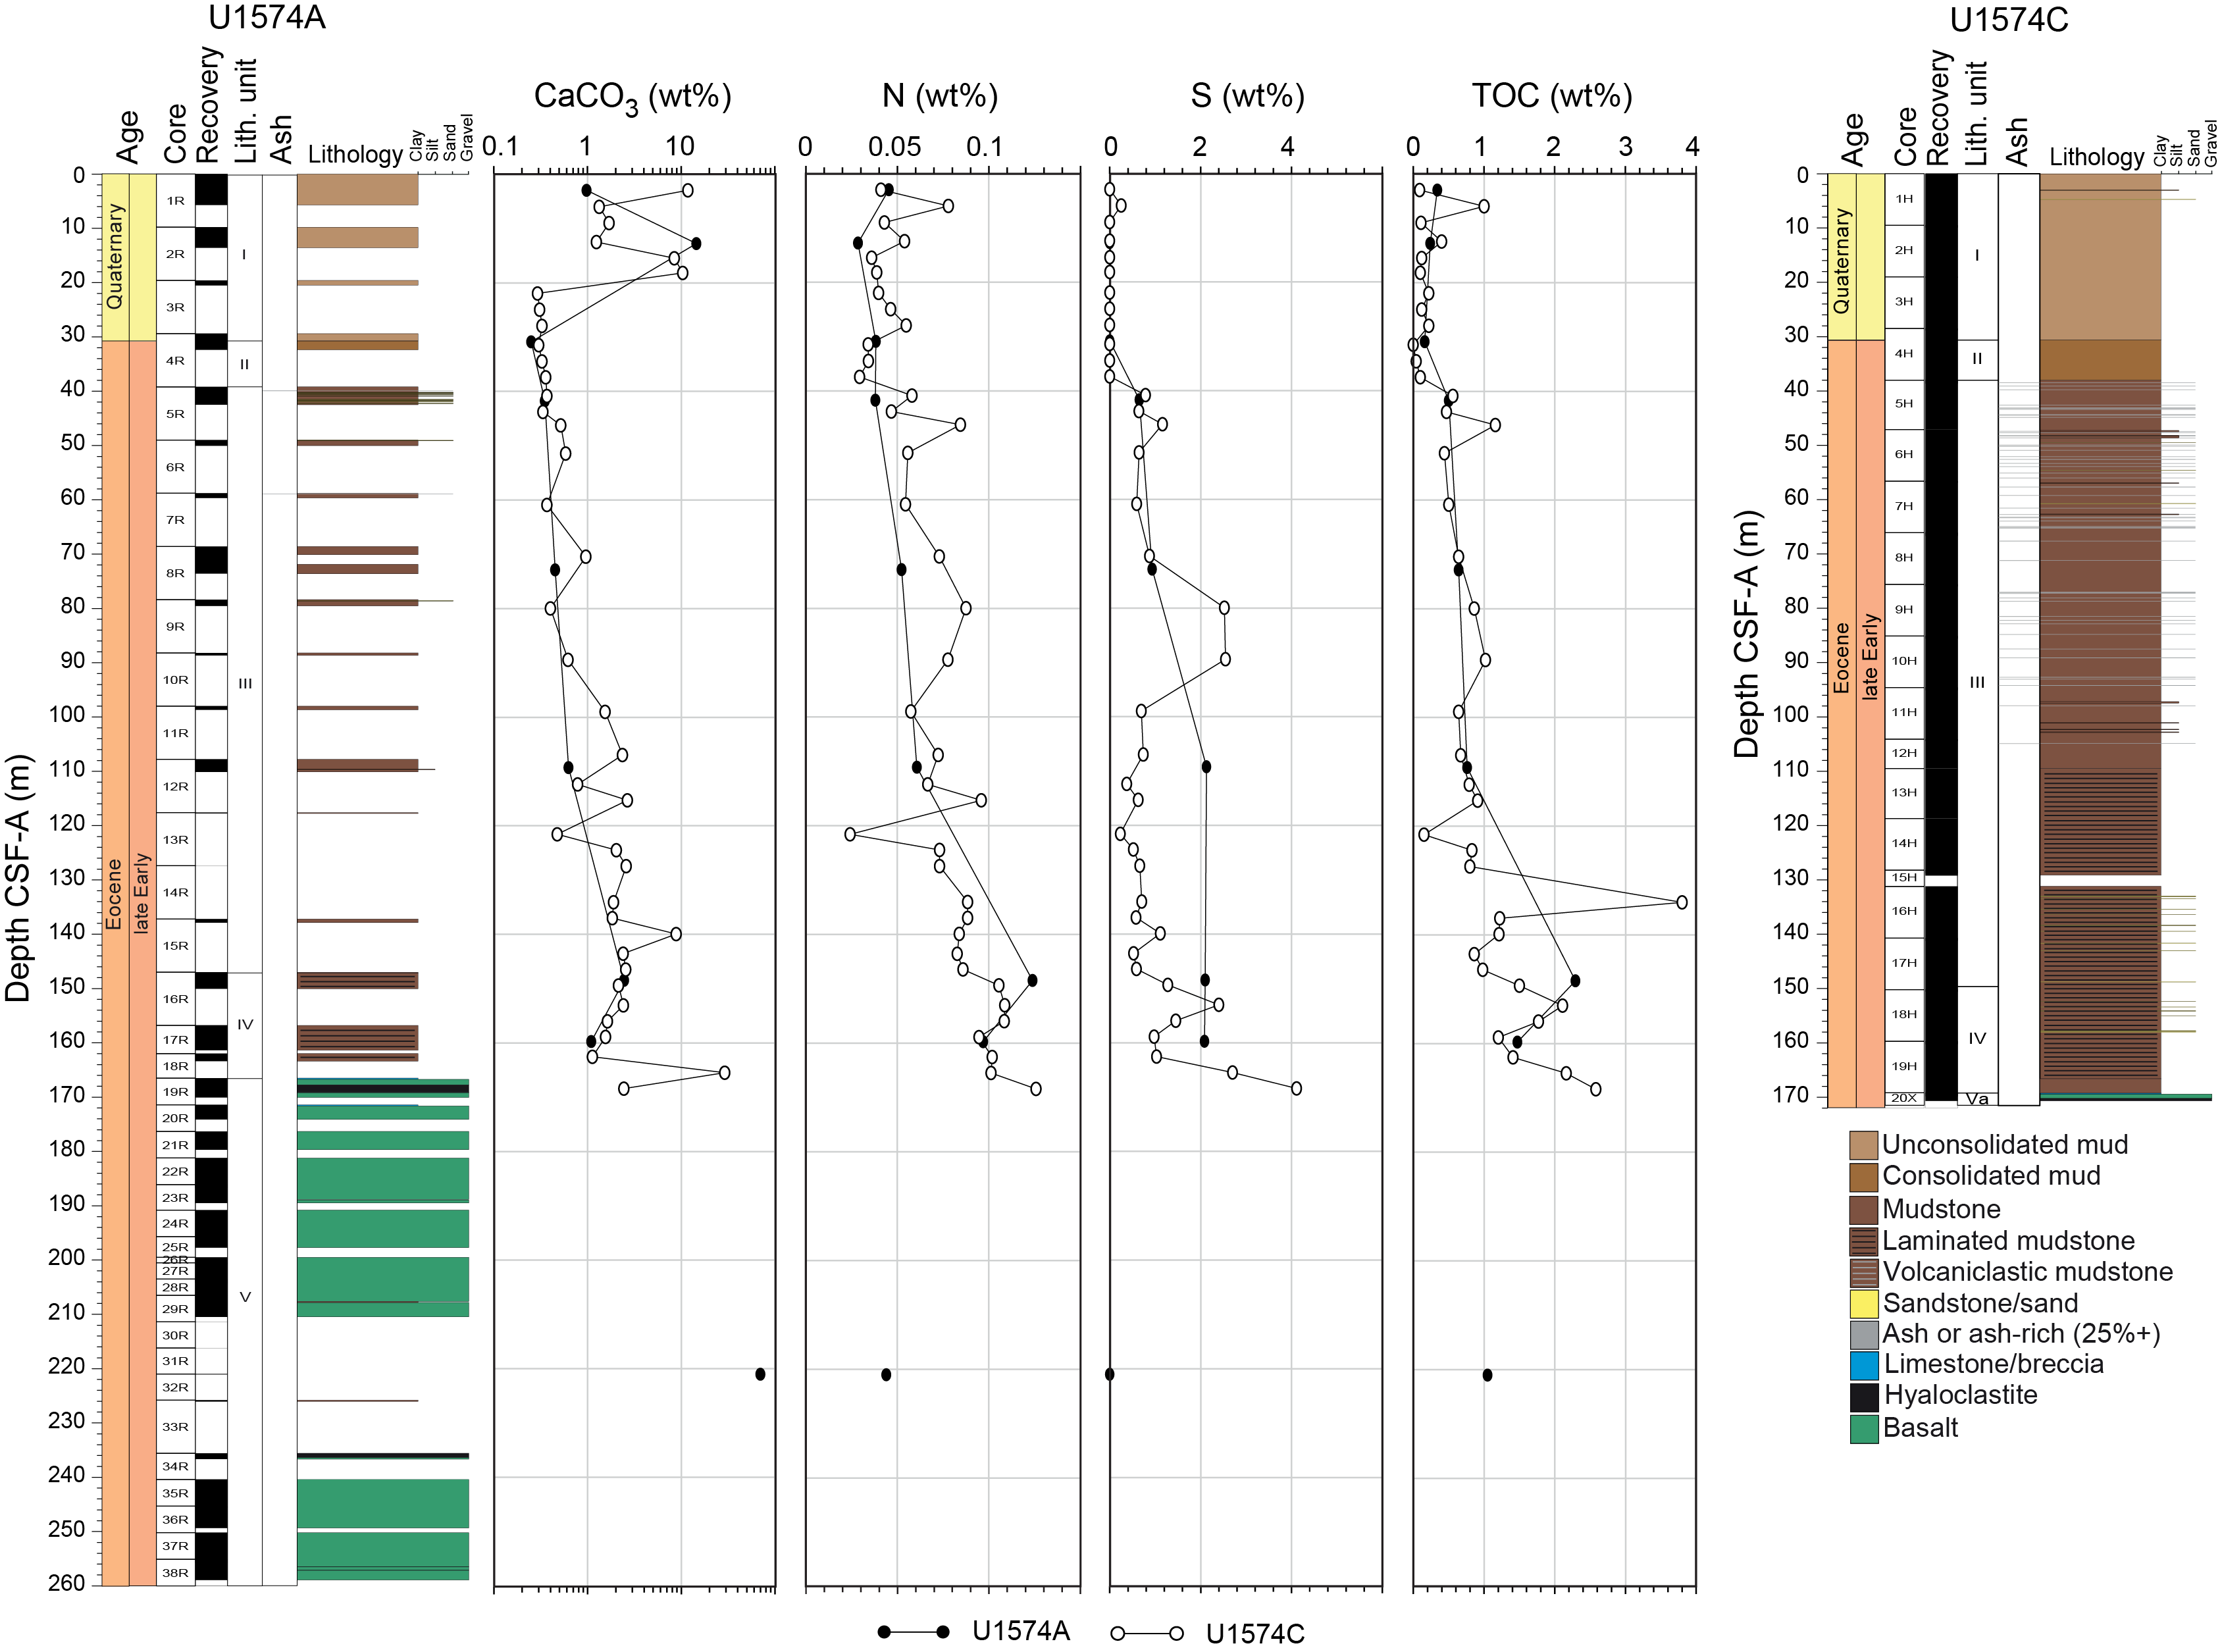
The total organic carbon (TOC) content of the site is characterized by a general increase from concentration below 0.5 wt% in the upper section of the core to as high as 3.7 wt% in the cores directly overlying the basalts (Figure F23). This increase in TOC may be linked to enhanced productivity and/or preservation as a result of the input of volcanic material, both from basalts underlying the base of the sediment package and regular ash input (Jones and Gislason, 2008; Longman et al., 2019). Sulfur content closely follows the TOC profile, with zero sulfur in the upper sediments and sulfur as high as 4 wt% in the lowermost intervals (Figure F22). Total nitrogen (TN) also increases downcore from 0.04 wt% at the surface to 0.12 wt% in the lowest interval. For TOC, sulfur, and TN, the analyzed interbasaltic sediment sample shows lower values than the sediments above the sediment–basalt transition, but this could be due to the high dolomite content.
6.3. Microbiology
Nine samples were taken in Hole U1574C for shore-based microbial community analysis. These were sampled using cutoff syringes and immediately frozen after sampling. A further six samples were taken for Fe reduction experiments in the same manner. These were transferred to glass bottles that were flushed with nitrogen prior to freezing.
6.4. Site summary
Site U1574 consists of three holes; the first (U1574A) targeted the basement, and the third (U1574C) aimed at high recovery of the overlying sediments. The hard rock sampled in Hole U1574A consists of low-Ti basalts. Significant downcore variability of some geochemical parameters (TiO2, Mg#, Ni, and Zr) suggests recovery of multiple flow units. Interbasaltic sediments contain dolomite.
The IW compositions indicate a diagenetic environment dominated by weathering of primary silicate phases and the formation of authigenic clays and carbonate. Calcium and Sr concentrations increase downcore due to their release in the formation of smectite and other clay minerals. The same formation reactions lead to the removal of Mg and K from the IW, resulting in decreasing content downcore. Periodic enrichment of other elements (e.g., Si and B) in the upper 40 m of the core suggest a lithology-controlled elemental composition of the IW.
7. Physical properties
Site U1574 was drilled on the southern flank of Eldhø, an Outer High oceanward of the Vøring Plateau. Hole U1574A was drilled using the RCB system to optimize recovery of hard rocks, and Holes U1574B and U1574C were cored using the APC/XCB system to optimize sedimentary recovery. Hole U1574A penetrated glacial clay and Eocene sediments (Lithostratigraphic Units I–IV; see Lithostratigraphy) overlying hard rock that primarily comprises a succession of pillow lavas, interbasaltic sediments, massive basalt intervals, and hyaloclastites (Unit V). The attempt to spud Hole U1574B was unsuccessful and was ended after the retrieval of only one core (see Operations). Hole U1574C was successfully completed to 171.5 m CSF-A (recovery = 102%), providing almost continuous physical properties measurements of the sedimentary sequences at the site.
The physical properties for cores from Holes U1574A and U1574C are presented below (Figures F24, F25, F26), and data from the single core from Hole U1574B are included in the data summary for all holes in Table T8.
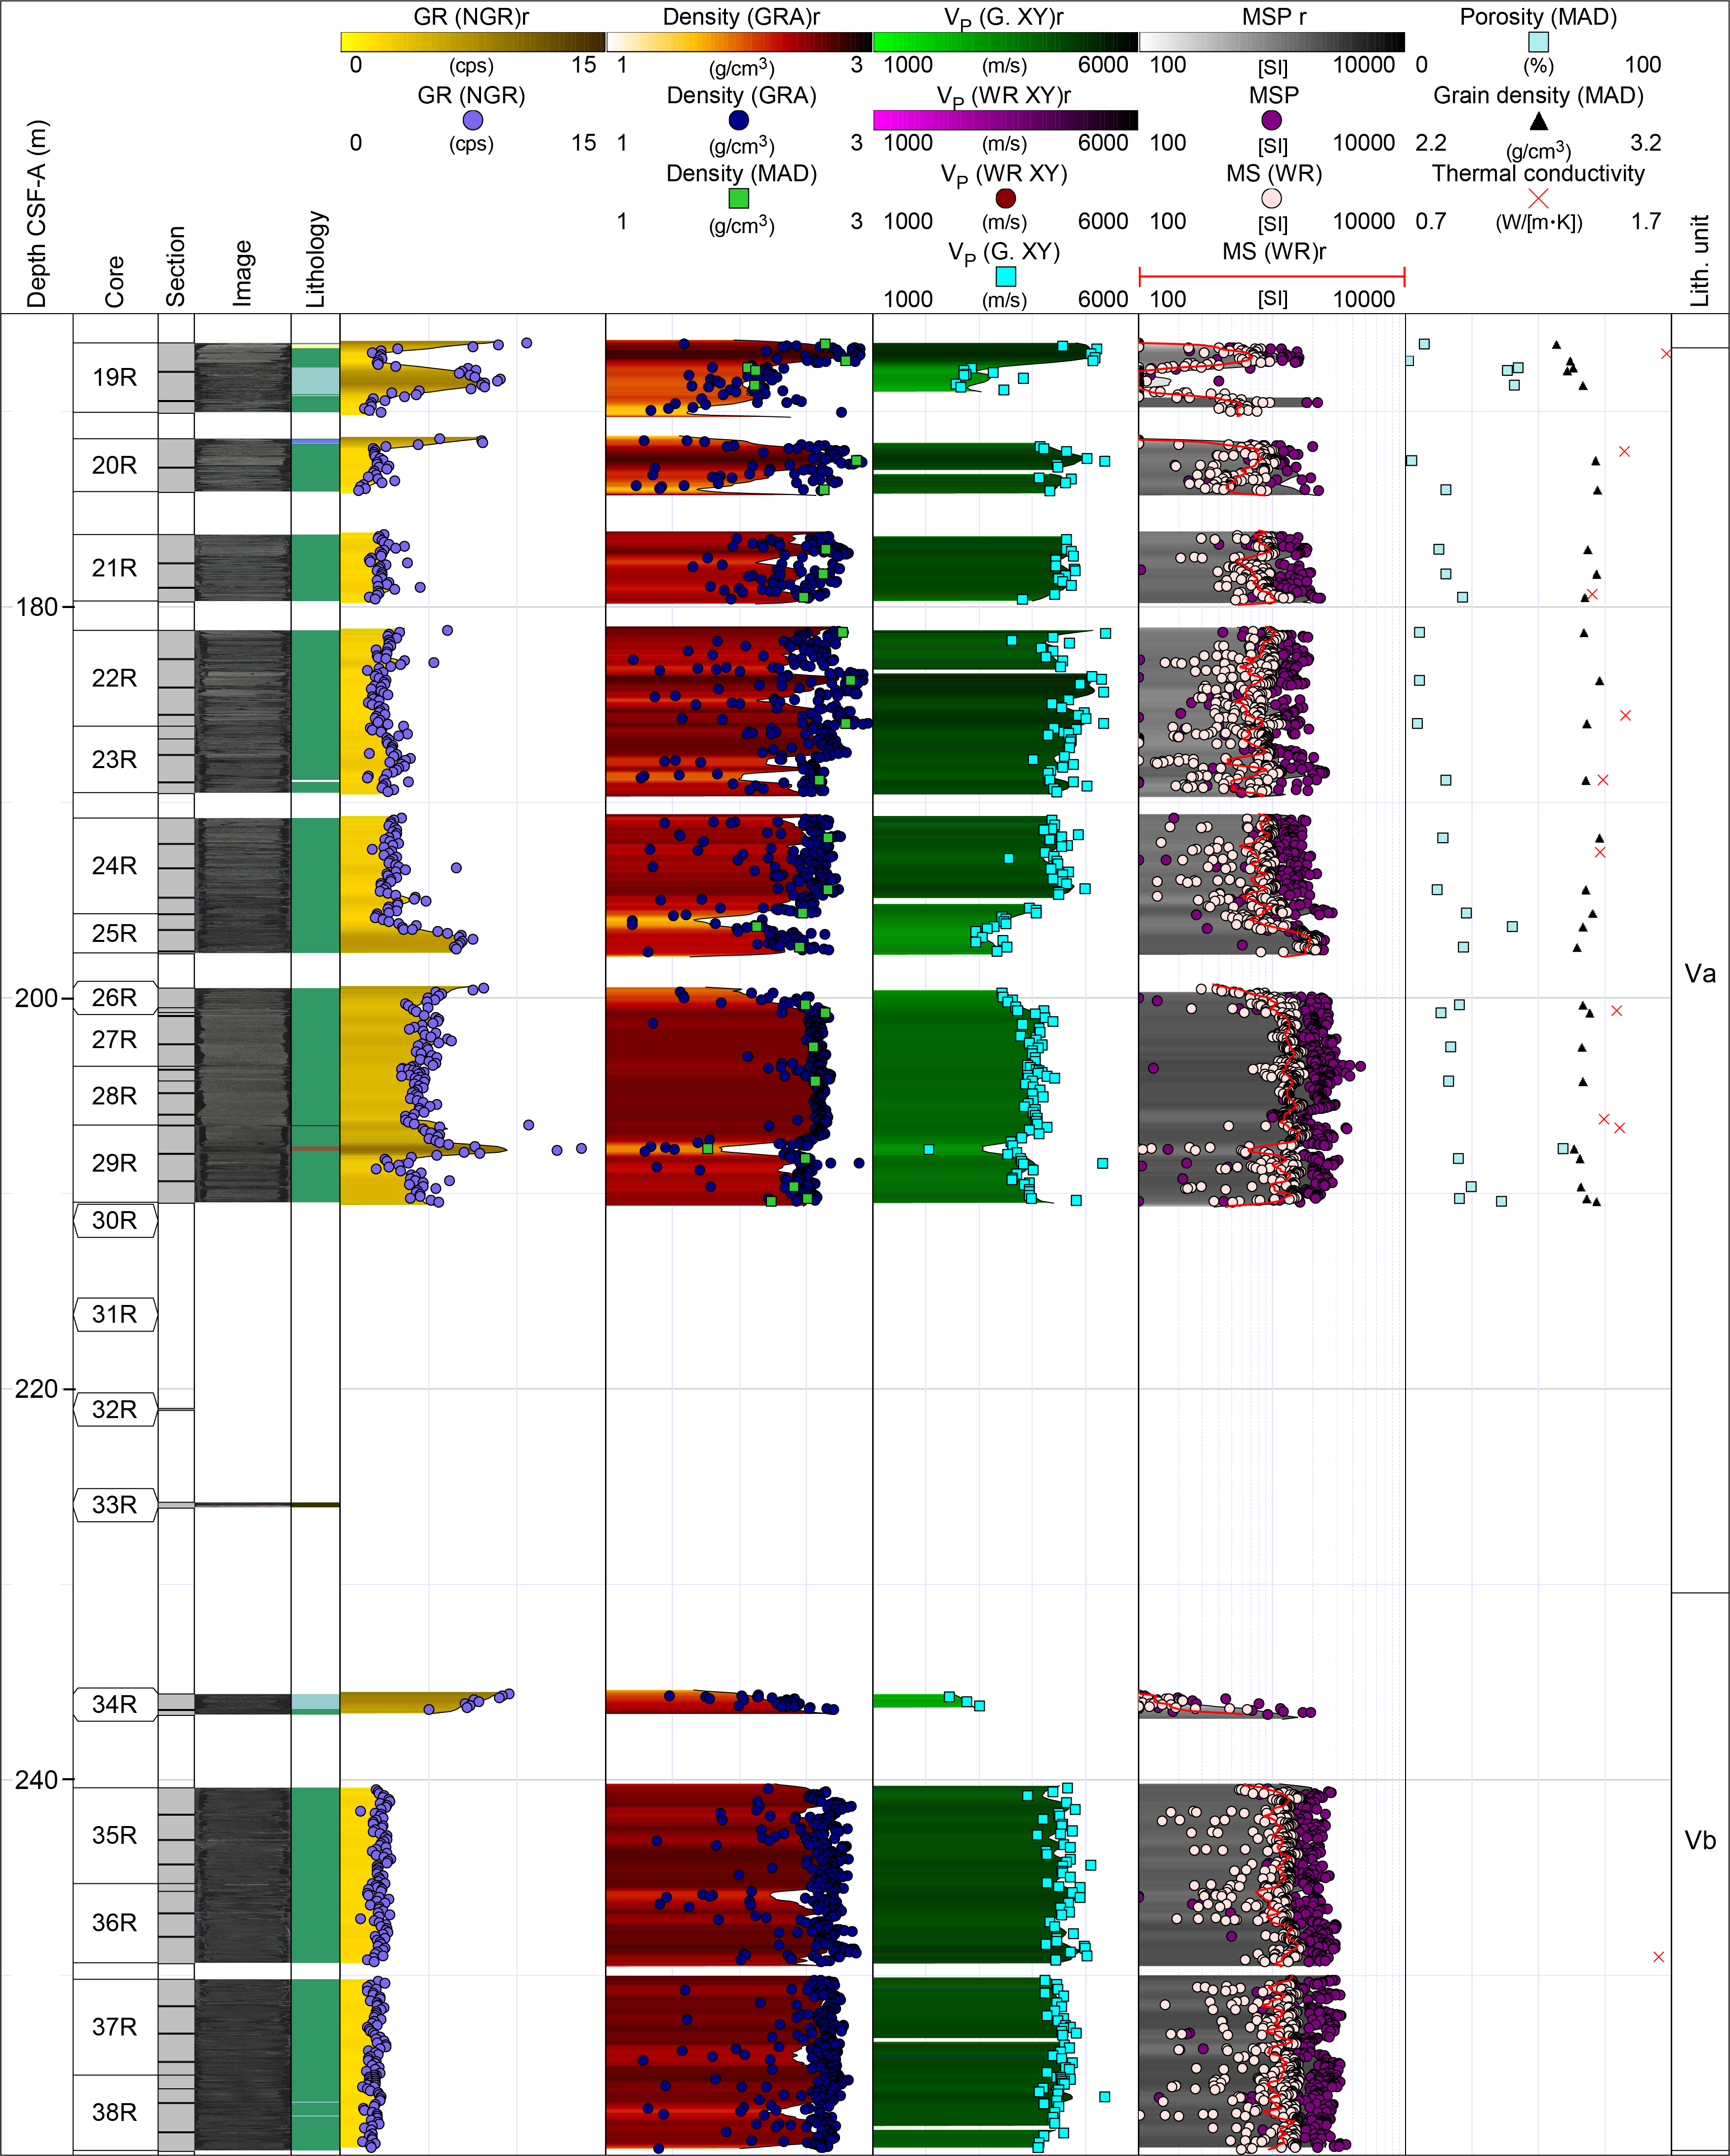
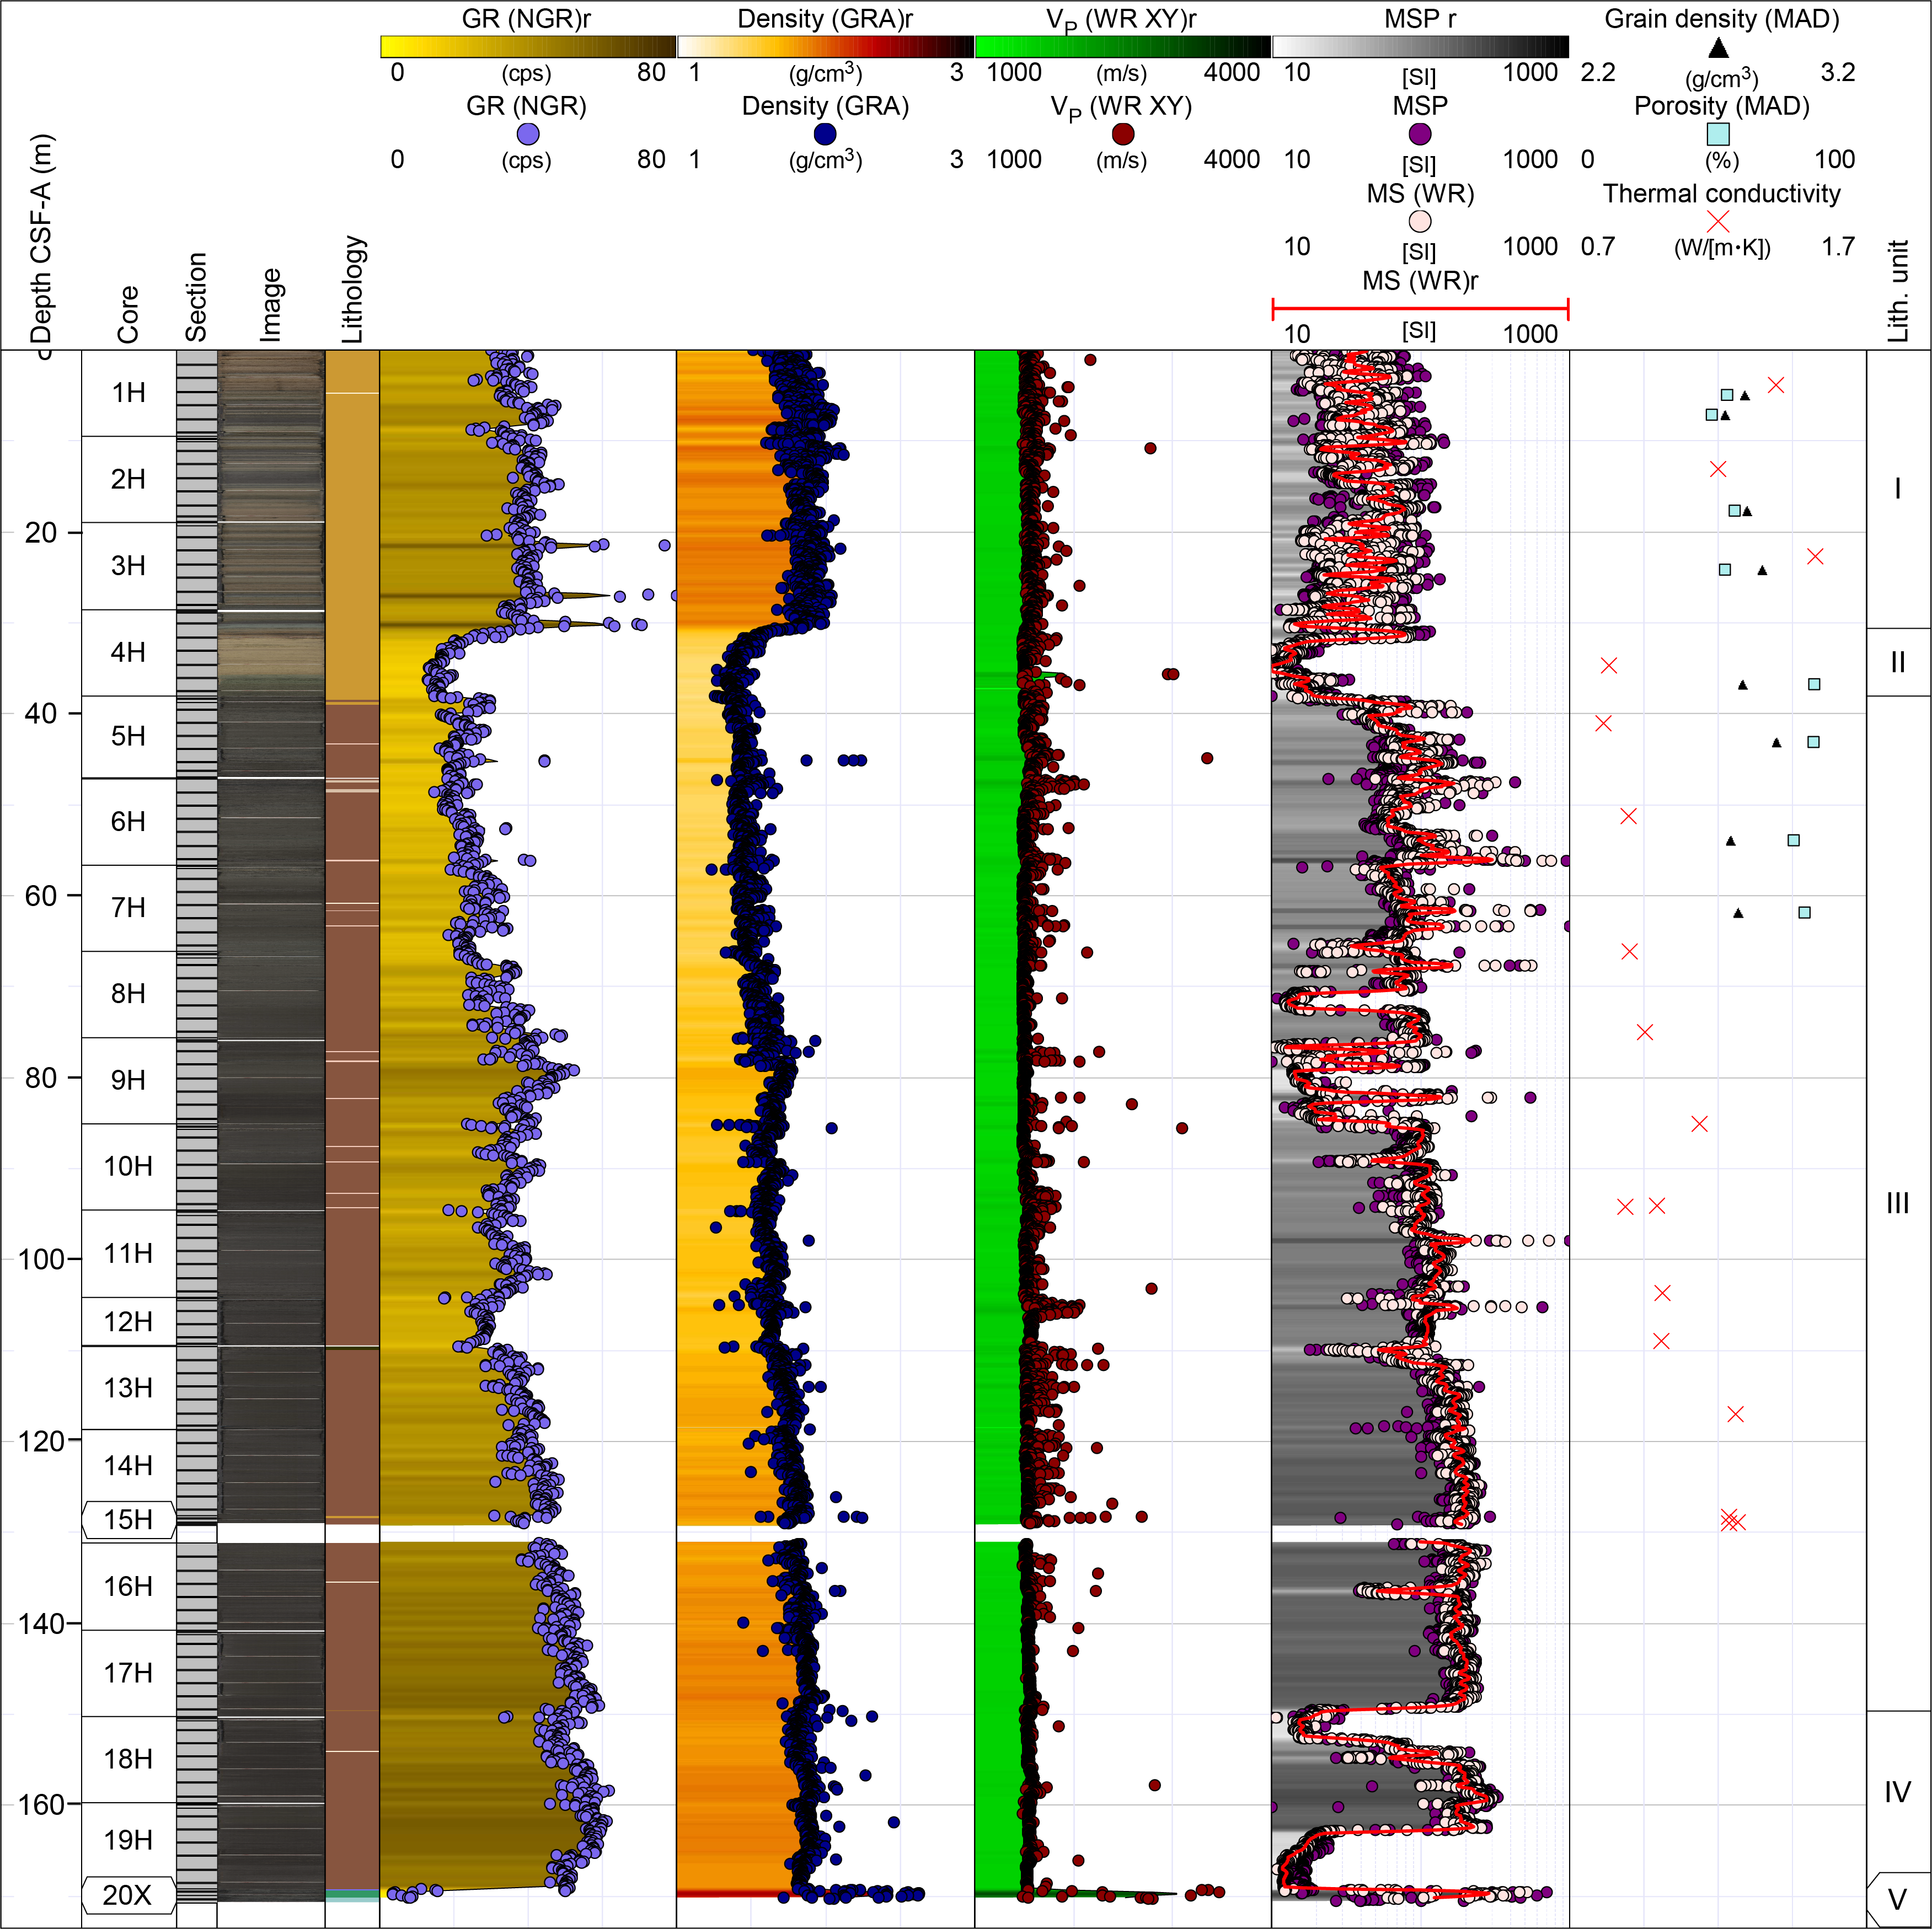
7.1. Data summary and processing
Out of 441 m of penetration from the three holes at Site U1574, 270 m (61%) were recovered, comprising 214 m of sediments of Quaternary and Eocene age and 56 m of basalt and hyaloclastite cores. The recovered rocks and sediments were characterized for their physical properties through a total of 9,874 gamma ray attenuation (GRA) bulk density, 10,115 MS, 7,016 P-wave velocity, and 2,786 NGR whole-round measurements. In addition, 53 thermal conductivity readings were taken on either whole-round (soft sediments) or section-half (hard sediments or basalts) cores, with as many as three readings for each measured interval. These were supplemented by 364 Section Half Measurement Gantry (SHMG) P-wave velocity measurements and 9,485 point MS (MSP) measurements on the section-half cores, followed by analysis of 92 MAD samples and 62 triaxial P-wave velocity measurements on discrete cubic samples.
Standard data reduction and screening procedures (see Physical properties in the Expedition 396 methods chapter [Planke et al., 2023a]) removed 499 GRA bulk density data points (346 within 1.5 cm of a bin liner, 140 with a lower cut off of 1.2 g/cm3, and 13 with relative errors of >20%) and 45 points from the P-wave velocity data sets, including one P-wave velocity data point below a cutoff of 1480 m/s for the Whole-Round Multisensor Logger (WRMSL).
7.2. Hole U1574A
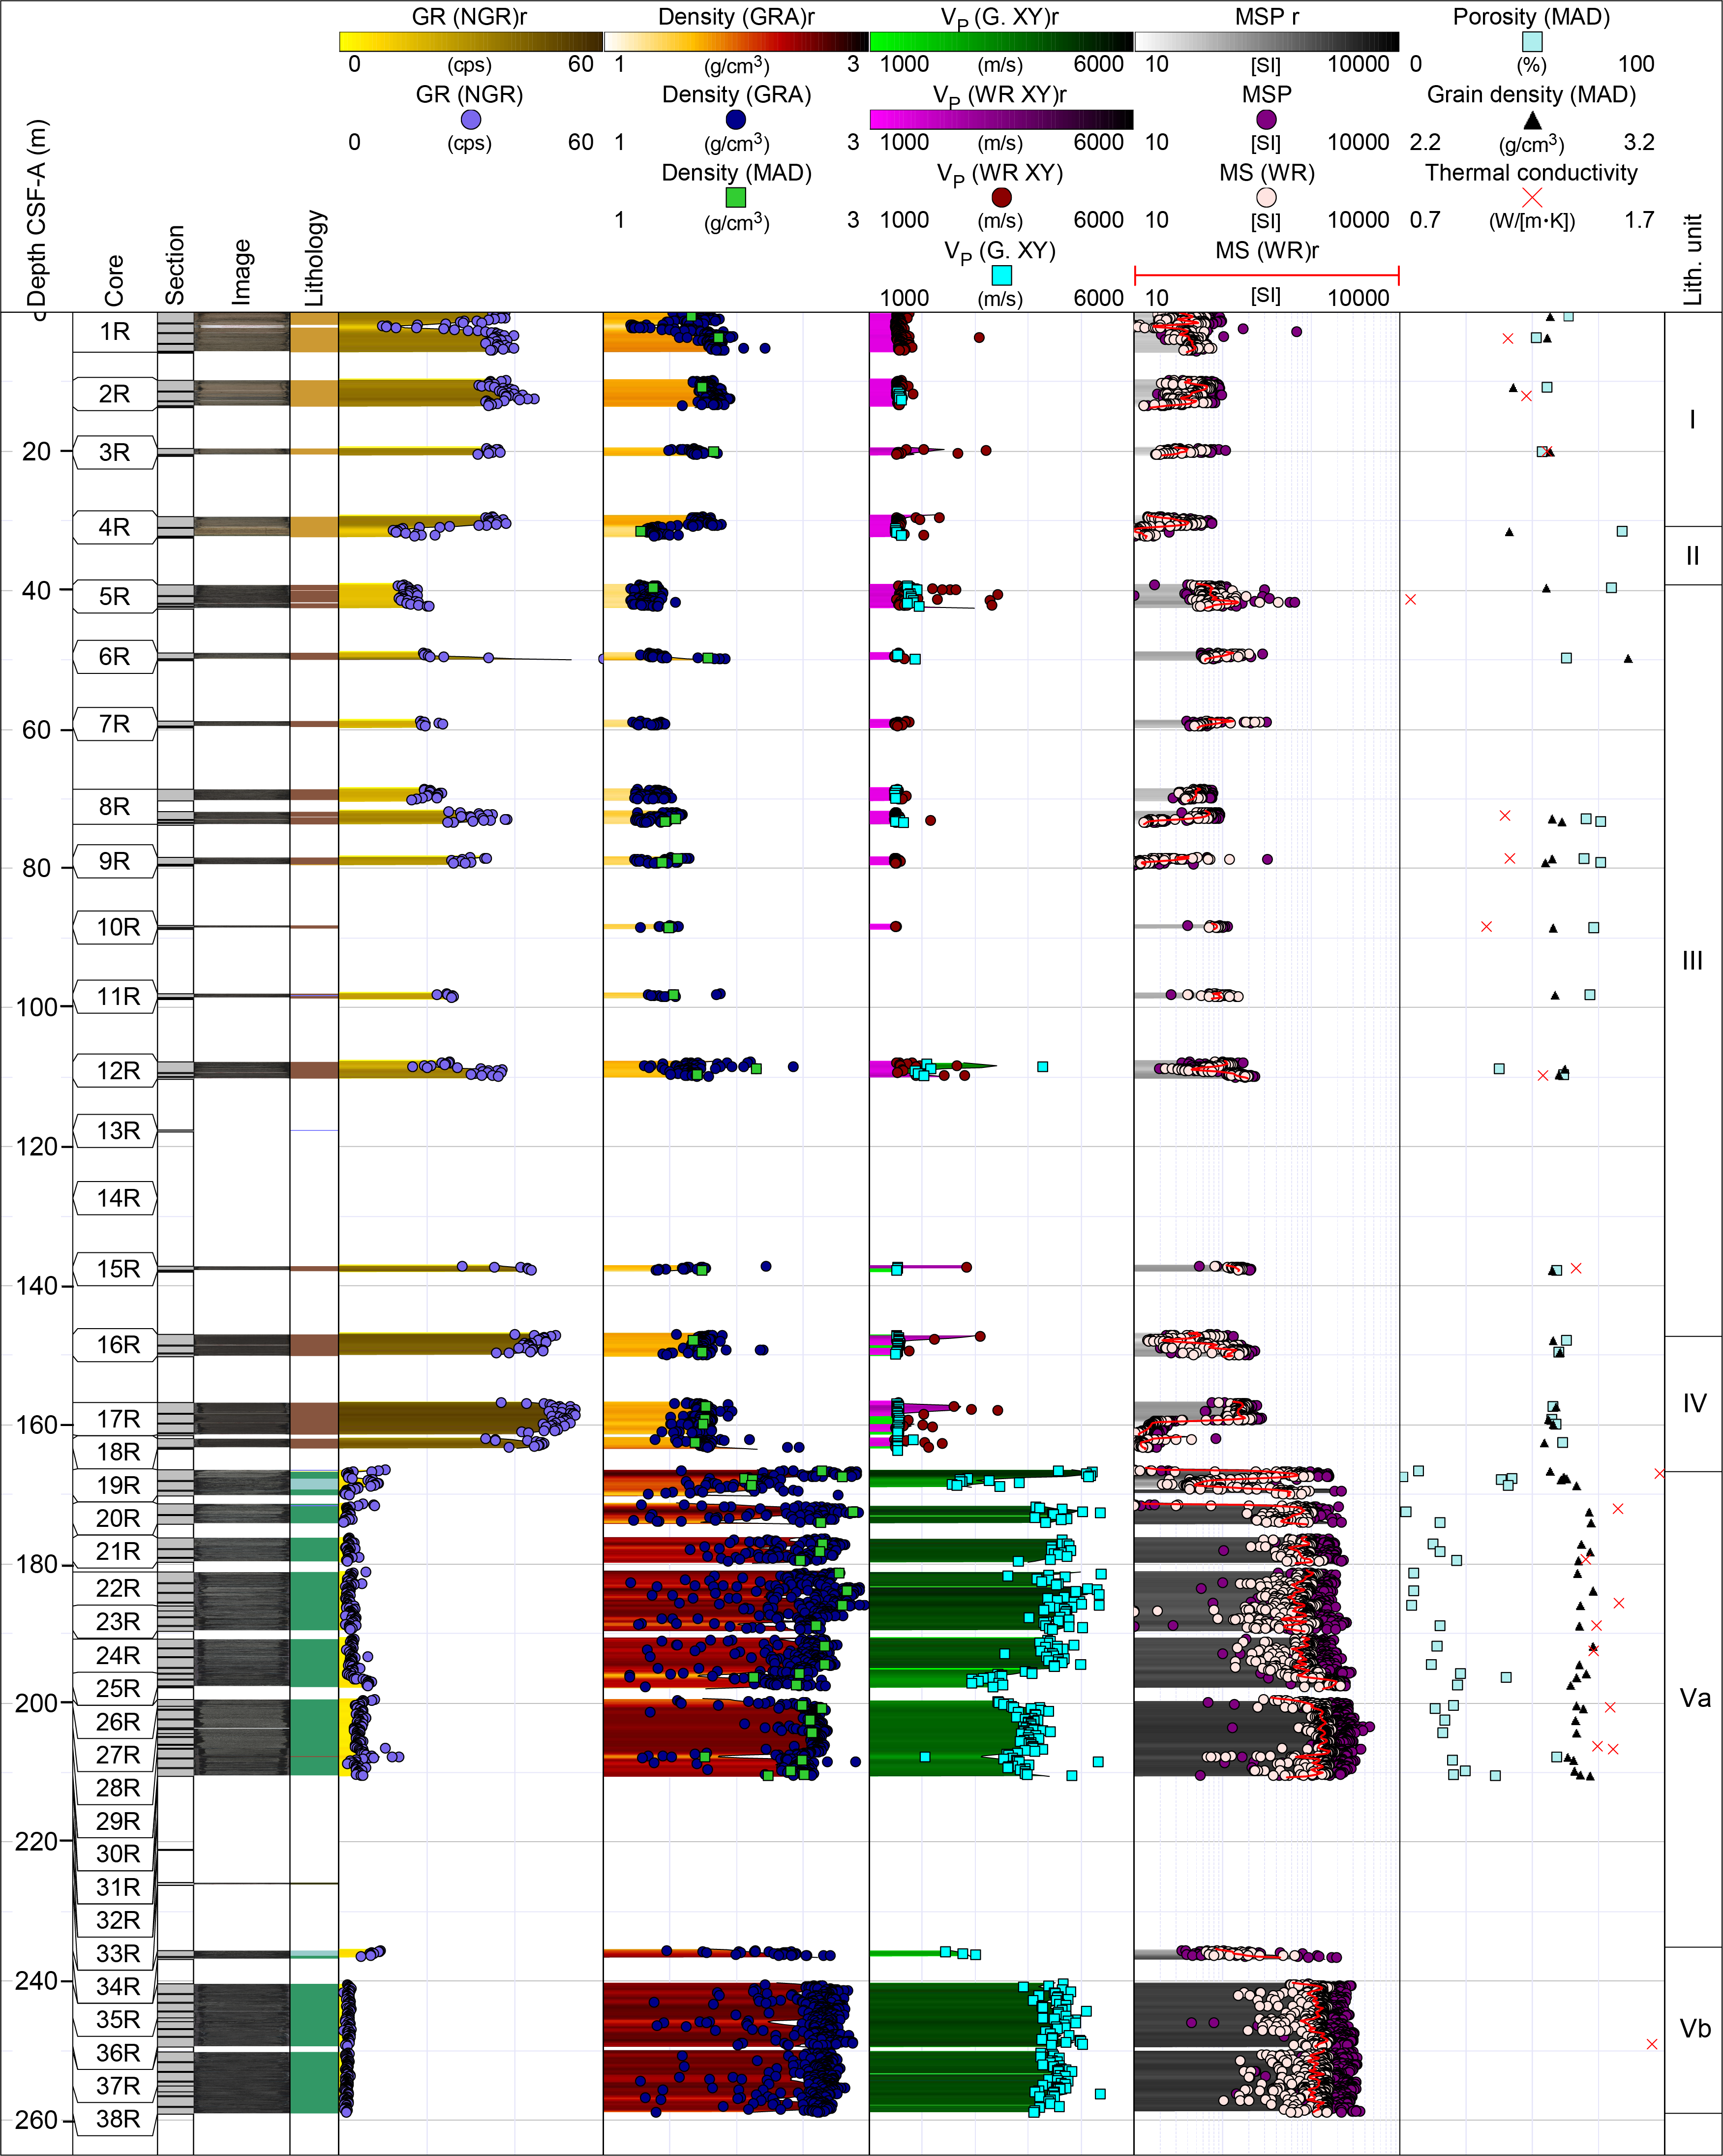
Five distinct lithostratigraphic units were identified in Hole U1574A (Figure F24), four of which span the sedimentary succession above a fifth volcanic hard rock sequence dominated by pillow lavas.
Unit I (0–30.75 m CSF-A) consists primarily of Quaternary brown to gray unconsolidated clays with relatively high mean NGR (34 counts/s) and GRA bulk density (1.75 g/cm3) values. Bulk densities derived from four discrete MAD samples collected from Unit I (mean = 1.77 g/cm3) correlate well with the GRA bulk densities measured using the WRMSL. The mean grain density of the clays from this unit is 2.73 g/cm3, and the average porosity is 56%. The mean WRMSL P-wave velocity is 1584 m/s. MS values are variable (mean = ~45 × 10−5 [SI]), and spikes are as high as ~100 × 10−5 and ~700 × 10−5 [SI] for MSP measurements.
The transition into pale yellow to greenish consolidated clay in Unit II is marked by a decrease in GRA bulk density (to ~1.3 g/cm3), P-wave velocity (to ~1500 m/s), NGR (to ~12 counts/s), and MS (to ~10 × 10−5 [SI]), which reach their respective minima for the sedimentary successions in this unit.
Unit III is composed of Eocene claystone with organic matter and is characterized by a gradual increase in density from ~1.3 g/cm3 at its top (39.2 m CSF-A) to ~1.8 g/cm3 at its base (147.27 m CSF-A). P-wave velocities vary from ~1800 m/s across the upper part of the unit (Core 396-U1574A-5R; 39.2–42.5 m CSF-A) to ~1500 m/s throughout the middle and lower sections and ~1800 m/s for the limestone-rich interval recovered in Core 12R. NGR gradually increases with depth from ~10 to ~50 counts/s throughout Units III and IV and into the transition to Unit V.
Unit IV (147.27–63.36 m CSF-A) is parallel-laminated organic-rich claystone with physical properties forming an extension of the trends described for Unit III. GRA and MAD bulk density (n = 6) averages agree well at 1.75 versus 1.73 g/cm3. Toward the lower end of the unit, MS decreases to ~10 × 10−5 [SI] (mean = ~85 × 10−5 [SI]).
MS increases dramatically into basaltic Unit V, where it remains high except for intervals where interbasaltic sediments and hyaloclastites are present (Figure F25). NGR follows an inverse trend, reaching as high as 15 counts/s for the sediments but otherwise below 5 counts/s for the basalt compositions. A minor baseline shift in NGR of as much as 2 counts/s for the massive flows is seen best by the step up in baseline NGR values in Core 396-U1574A-25R (196 m CSF-A) that marks the transition from the overlying pillow sequence. P-wave velocities and bulk densities feature a similar but inverse response when comparing hyaloclastites with pillow and massive basalts. P-wave velocities are on average ~1000–1500 m/s lower for the hyaloclastite compared with the pillow lavas and massive intervals (4000–5000 m/s; lower end associated with the massive intervals). A total of 47 discrete samples were analyzed for MAD properties, which are in line with GRA bulk densities. Slightly lower values are recorded for Subunit Va, which has MAD bulk densities of 2.50 versus 2.62 g/cm3 in Subunit Vb; these lower values likely result from the higher percentage of sediments and hyaloclastites in the interval. Porosities are low (means = <20%) for both subunits. No data was acquired for the sedimentary interval covered by Cores 13R–15R.
Thermal conductivities were substantially higher for the basaltic intervals (mean = ~1.5 W/[m·K]; n = 11; maxima = 1.68 W/[m·K]) than for the sedimentary successions (mean = ~1.1 W/[m·K]; n = 9).
7.3. Hole U1574B
Hole U1574B only recovered a single core (0–9.72 m CSF-A), for which no discrete measurements were made. WRMSL measurements returned mean GRA bulk density (1.8 g/cm3), MS (44 × 10−5 [SI]), P-wave velocity (1573 m/s), and NGR values (36 counts/s) that are in line with the reported values of the corresponding intervals in Holes U1574A and U1574C. No further analyses were undertaken.
7.4. Hole U1574C
An almost complete sediment succession from seafloor to basement was collected in Hole U1574C (Figure F26), giving important constraints on the physical properties of the postvolcanic sequence at Site U1574, especially because recovery of the overburden in Hole U1574A was poor because of rotary coring.
Unit I (0–30.62 m CSF-A) features a constant NGR response of ~40 counts/s and slightly increasing P-wave velocities and GRA bulk densities throughout the interval, reaching means as high as 1600 m/s and 1.9 g/cm3, respectively. MAD measurements on four discrete samples indicate mean bulk densities of 1.87 g/cm3, in agreement with GRA bulk density averages, and mean porosities of 52%. MS responses are constant and have a standard deviation of 25 around means of ~45 × 10−5 [SI].
The transition into Unit II is characterized by a marked decrease in mean physical properties values, most noticeable in GRA bulk density, NGR, and MS at ~31 m CSF-A. All these properties remain low to the top of Unit III at 38.00 m CSF-A.
The baseline values of the measured physical properties generally increase with depth throughout Unit III, occasionally deviating from the baseline. Notably, three trends can be seen throughout this interval. The upper sections (38 to ~83 m CSF-A) feature an increase in NGR from ~20 to 50 counts/s alongside increased scatter in MS that is likely related to the occurrence of ashes. Increased P-wave velocities as high as 1650 m/s at 38–50 m CSF-A return to a low, constant ~1500 m/s for the remainder of the unit. An increase in the running average GRA bulk density in Core 396-U1574C-9H (1.7 g/cm3) coincides with lows in MS (~20 × 10−5 [SI]) and peaks of NGR (50 counts/s). The transition to the 83–110 m CSF-A interval is marked by a decrease in NGR (mean = 30 counts/s), an increase in P-wave velocity (mean = 1540 m/s), constant GRA bulk density values (mean = 1.6 g/cm3), and decreased MS scatter (mean = 100 × 10−5 [SI]). A local NGR baseline minimum of 20 counts/s and a P-wave velocity peak of 1600 m/s mark the transition into the lowermost sections of Unit III (110–149.64 m CSF-A). The latter are defined by increases in NGR (to ~50 counts/s), GRA bulk densities (to ~1.9 g/cm3), and P-wave velocities (to ~1560 m/s) with depth, whereas MS values remain constant at ~200 × 10−5 [SI]. A total of 13 thermal conductivity measurements taken across the unit indicate a mean thermal conductivity of 1.1 W/(m·K).
The top of Unit IV (149.64–169.22 m CSF-A) corresponds to a local decrease in MS to ~5 × 10⁻⁵ [SI] and smaller decreases in NGR (by 5–10 counts/s), P-wave velocities (by 50 m/s), and GRA bulk densities (by ~0.1 g/cm3) that deviate from the overlying trends. A subsequent decrease of similar extent at ~165 m CSF-A indicates the transition from Unit IV to Unit V, and a hyaloclastite forms part of Subunit Va (169.22–171.5 m CSF-A).
The corrected mean GRA bulk density of 2.53 g/cm3 for Subunit Va corresponds well with Hole U1574A bulk density data. P-wave velocity (~2250 m/s) and MS values (150 × 10−5 [SI]) are lower than in Hole U1574A.
7.5. Lithostratigraphic unit summaries
Unit I has characteristically high bulk densities (mean = 1.82 g/cm3) and NGR values (average = 38 counts/s) and relatively low P-wave velocities (~1575 m/s) and MS values (~45 × 10−5 [SI]). Eight MAD samples collected throughout this unit showed an average bulk density of 1.82 g/cm3, grain density of 2.76 g/cm3, and porosity of 54%. Six thermal conductivity measurements range 1.1–1.5 W/(m·K) (average = 1.3 W/[m·K]).
Unit II P-wave velocities, GRA bulk densities, MSP and MS, and NGR average ~1550 m/s, 1.43 g/cm3, ~21 × 10−5 [SI], and 19 counts/s, respectively. Analysis of two MAD samples resulted in an average porosity of 83%, grain density of 2.70 g/cm3, and bulk density of 1.31 g/cm3, consistent with poorly compacted clay-rich sediments.
A total of 25 discrete MAD sample analyses indicate a mean bulk density of 1.59 g/cm3 for the ~90 m thick Eocene Unit III, which is slightly lower than the mean GRA bulk density of 1.62 g/cm3. Porosities range 37%–82%. The baseline values of the measured physical properties generally increase with depth throughout Unit III, occasionally deviating from the baseline. Notably, three trends can be seen throughout this interval. WRMSL P-wave velocity values average 1560 m/s, which is ~250 m/s slower than the SHMG P-wave velocity values from 30 discrete P-wave caliper (PWC) measurements that have significant spread (standard deviation = 120.5 m/s). MS increases compared with Unit II, averages 100 × 10−5 to 110 × 10−5 [SI], and features increased scattering linked to the occurrence of ash layers.
Reduced MS scatter (mean = ~90 × 10−5 [SI]) is observed for Unit IV. Mean GRA (~1.83 g/cm3) and MAD (~1.73 g/cm3; n = 8) bulk densities correspond well with an associated average porosity of 59%. WRMSL P-wave velocities (mean = 1565 m/s) are within 20 m/s of the mean recorded using the SHMG PWC and are similar to average P-wave velocities found for Unit III. NGR increases slightly compared with the overlying unit and has a constant value around the mean of 51 counts/s.
The massive basalt and pillow basalts from Unit V have significantly higher P-wave velocities, bulk densities (2.4–2.6 g/cm3), and MS values (1000 × 10−5 to 2000 × 10−5 [SI]) than those found for the overlying sedimentary successions. Similar to interbasaltic sediments, the NGR counts, P-wave velocities, and bulk densities measured for the hyaloclastite intervals feature a similar but inverse response to those measured for the pillow and massive basalts because P-wave velocities were on average 1000–1500 m/s lower than the 4000–5000 m/s typically associated with the pillow lavas and massive intervals. Mean P-wave velocities of the massive basalt intervals typically featured on the lower end of this range. The unit has relatively low porosities (15%–20%), although significantly higher porosities are recorded for the interbasaltic heterogeneities.
7.6. Summary
A comprehensive suite of APC/XCB and RCB cores was recovered at Site U1574. The cores comprise both sedimentary cover and the Outer High volcanic rocks, respectively. The sedimentary overburden (total recovery = 102%; Hole U1574C) includes both Quaternary and Eocene sections that are supplemented by a full set of measured physical properties. The high values observed for all properties throughout the uppermost 30 m decrease rapidly into the Eocene section, which is characterized by an increase in bulk density with depth and increased MS scatter that links back to the occurrence of ash layers.
The basement rocks (Cores 396-U1574A-19R through 38R) comprise primarily basaltic pillow lavas, sheet flows, and hyaloclastite with subsidiary interlayered sediments that were retrieved with good recovery (62%) and fully characterized with the physical properties analytical suite. The pillow lava sequence reveals high and consistent densities with low porosity and associated high P-wave velocities with generally limited interpillow hyaloclastite or sediments confirming that the pillow complex is likely in situ and not reworked. Similarly, the presence of high density (~2.6 g/cm3) and velocity (~4500 m/s) massive flow units highlights the presence of in situ higher volume effusive subaqueous volcanism at Eldhø, which will aid in the volcanological and seismic interpretation of the volcano going forward.
8. Downhole measurements
Wireline logging conducted in Hole U1574A penetrated to a total depth of 260.0 m drilling depth below seafloor (DSF).
After coring was completed in Hole U1574A, the borehole was prepared for logging and the drill pipe was pulled back to a logging depth of 104 m DSF. Wireline logging using the triple combo and FMS-sonic logging tool strings was undertaken (Table T9). Each tool string recorded a down pass from just above seafloor with calipers closed followed by a main and repeat pass (repeat pass first, followed by main pass to seafloor with gamma ray [GR] measured through casing). The seafloor was identified by a clear increase in GR measured through the drill pipe on which all logging runs were zeroed. The depth scale for all wireline data is the wireline log matched depth below seafloor (WMSF), whereas the associated core data uses the CSF-A depth scale.
Two obstructions were encountered with the triple combo tool string while logging from the seafloor downward at 187 and 213 m DSF; at the second obstruction, the tool string was unable to pass after multiple attempts. During the upward logging runs, the calipers were closed just before entering the pipe at 121 m WMSF. The FMS-sonic tool string ran into the hole without any major problems and, instead of hanging up where the triple combo got stuck, ran directly to the bottom of the hole, logging down from the seafloor to 256 m DSF. Subsequent to the upward pass from 256 to 147 m DSF, numerous attempts were needed to return the tool string to the bottom of the hole, now at 255.5 m DSF, which indicated that the hole had deteriorated. The main pass logged the hole from bottom to seafloor, with calipers and FMS arms closing at ~147 m WMSF and experiencing an additional obstruction just before entering the casing. Overpull as high as 2000 lb was experienced while trying to recover the tools, and inspection following tool recovery showed one of the calipers and pads had been broken off. The logging summary for Hole U1574A is presented in Table T9.
Data were sent for processing, depth matching, and quality control at Columbia University’s Lamont-Doherty Earth Observatory, and the processed data were returned to the onboard logging team. No depth matching between core and wireline data is presented in this chapter, and comparisons between data sets are therefore only indicative.
In addition to wireline logging, the APCT-3 tool was run in Hole U1574C. It was deployed in the APC cutting shoe and returned four robust temperature values for the formation at 38, 66.1, 94.6, and 118.7 m DSF.
8.1. Logging units
The six logging units defined in Hole U1574A are constrained by a combination of the lithostratigraphy, physical properties, and wireline data (see Lithostratigraphy and Physical properties). Logging units are restricted to broad GR-based inferences above the drill string casing. In the main open hole logged interval in Hole U1574A, the wireline properties reveal several clear transitions that are partly offset from lithostratigraphic units, in part relating to the poor core recovery in the sedimentary sequence that overlies the hard rock volcanic sequence.
Figure F27 summarizes key logging data from the main logged section in Hole U1574A, highlighting the ~150 m of open hole data. The closure of the single arm caliper at ~122 m WMSF affects all data curves collected as part of the triple combo tool string above and should be treated as only indicative of relative changes above this depth. The borehole condition was determined to be generally very bad throughout the sediment sequence above the volcanic transition (Lithostratigraphic Unit V), and both the triple combo and FMS caliper measurements reached saturation over large parts of the logged interval.
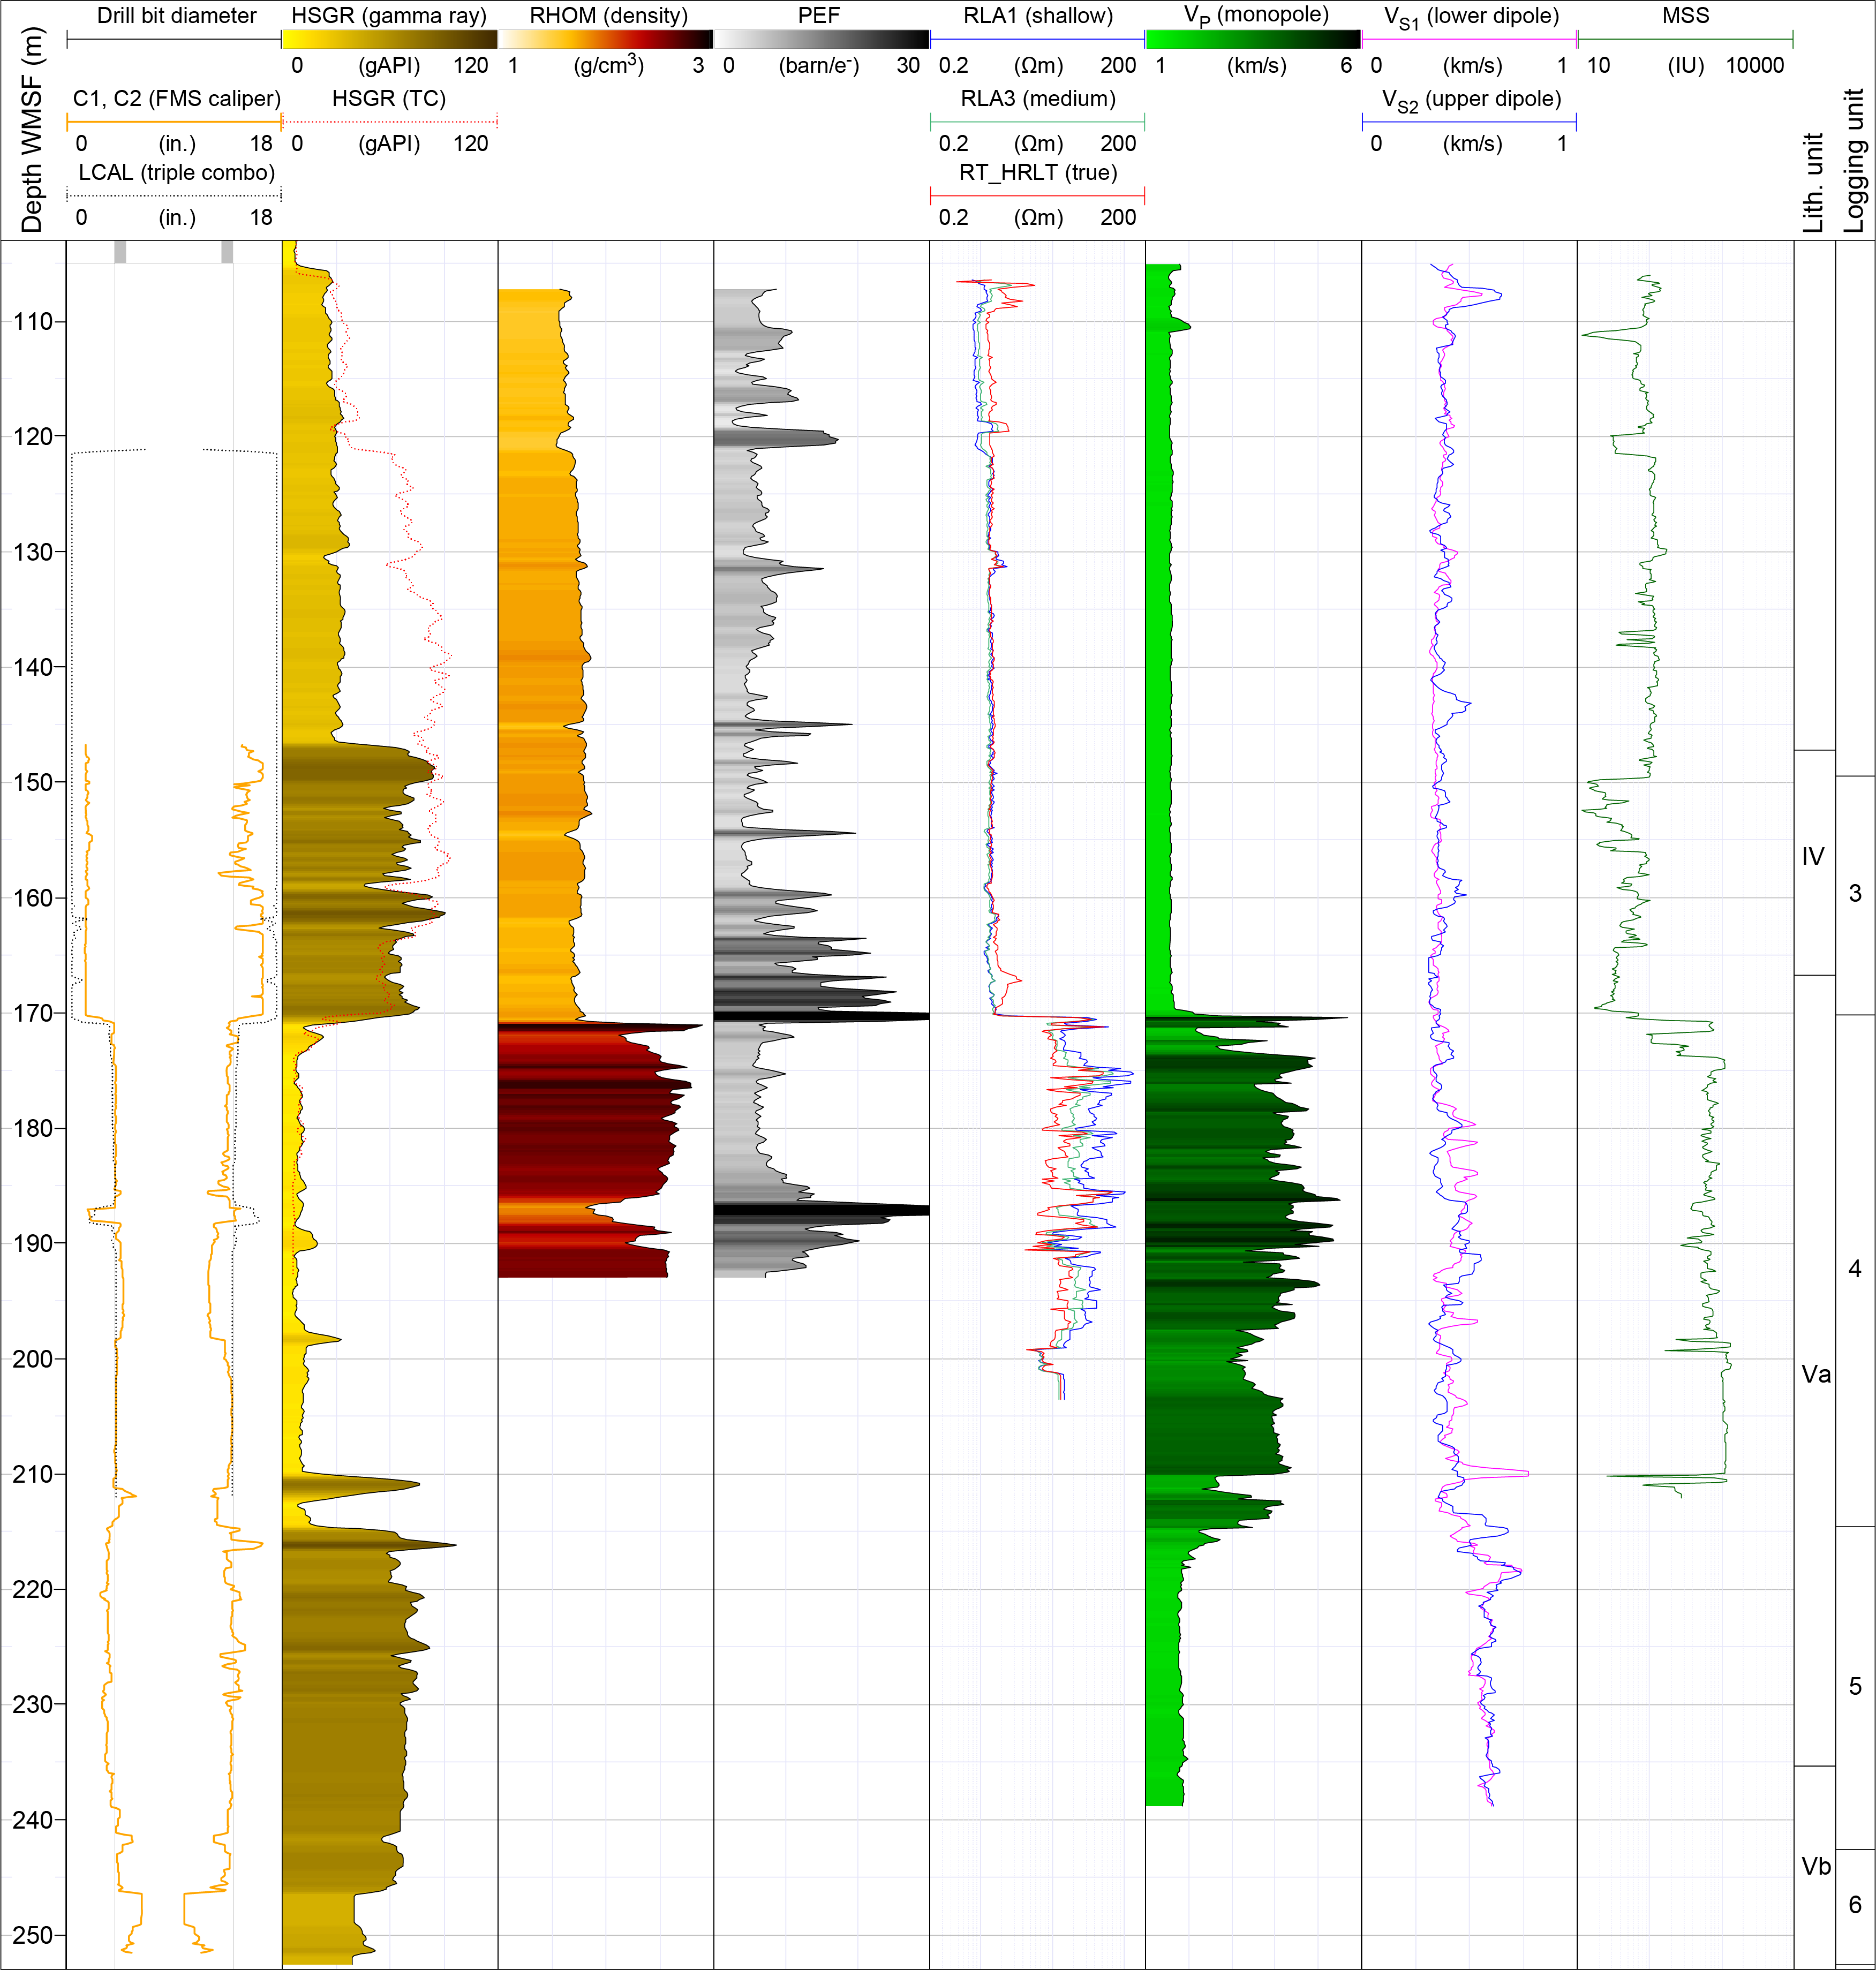
In the logged volcanic sequence, hole conditions vary substantially and reveal changes between logging runs that suggest that the borehole condition deteriorated during logging. A clear tight spot (revealed by the FMS C1 and C2 caliper arms) beginning at ~190 m WMSF reveals a ledge or partial bridge across the borehole where the diameter narrows to substantially (~2 inches) thinner than the drill bit diameter. This likely relates to a slipped hard rock wall section that occurred subsequent to drilling and coincides with the barrier that the triple combo could not pass (Figure F27). Fortunately, the FMS logging tool managed to pass the obstruction and revealed generally good conditions and several narrowing and expanding sections of the borehole, confirming the mixed hole conditions in the pillow lava–dominated sequence, as is common in such sequences (Millett et al., 2016).
8.1.1. Logging Units 1 and 2
Logging Units 1 and 2 comprise fine-grained clay-rich sediments and are constrained by GR data run fully and partially within the pipe, respectively. Unit 1 has GR of ~9 gAPI, which drops to ~5 gAPI in Unit 2 (Figure F28). These values are subdued by at least 20 gAPI due to running within the pipe, as seen at the transition into pipe in Unit 2 at ~105 m WMSF. The closure of the caliper arm in both the triple combo and FMS-sonic logging runs influenced the GR log and other logs in Unit 2. For the interval of Unit 2 collected prior to caliper closure, physical properties are relatively consistent (GR = ~85 gAPI; density = ~1.75 g/cm3; P-wave velocity = ~1.65 km/s; MS = ~100 × 10−5 [SI]) with minor fluctuations. The absolute values of tools requiring good formation connection such as the density tool (HLDS) should be treated as indicative only because of the extremely expanded caliper measurements.
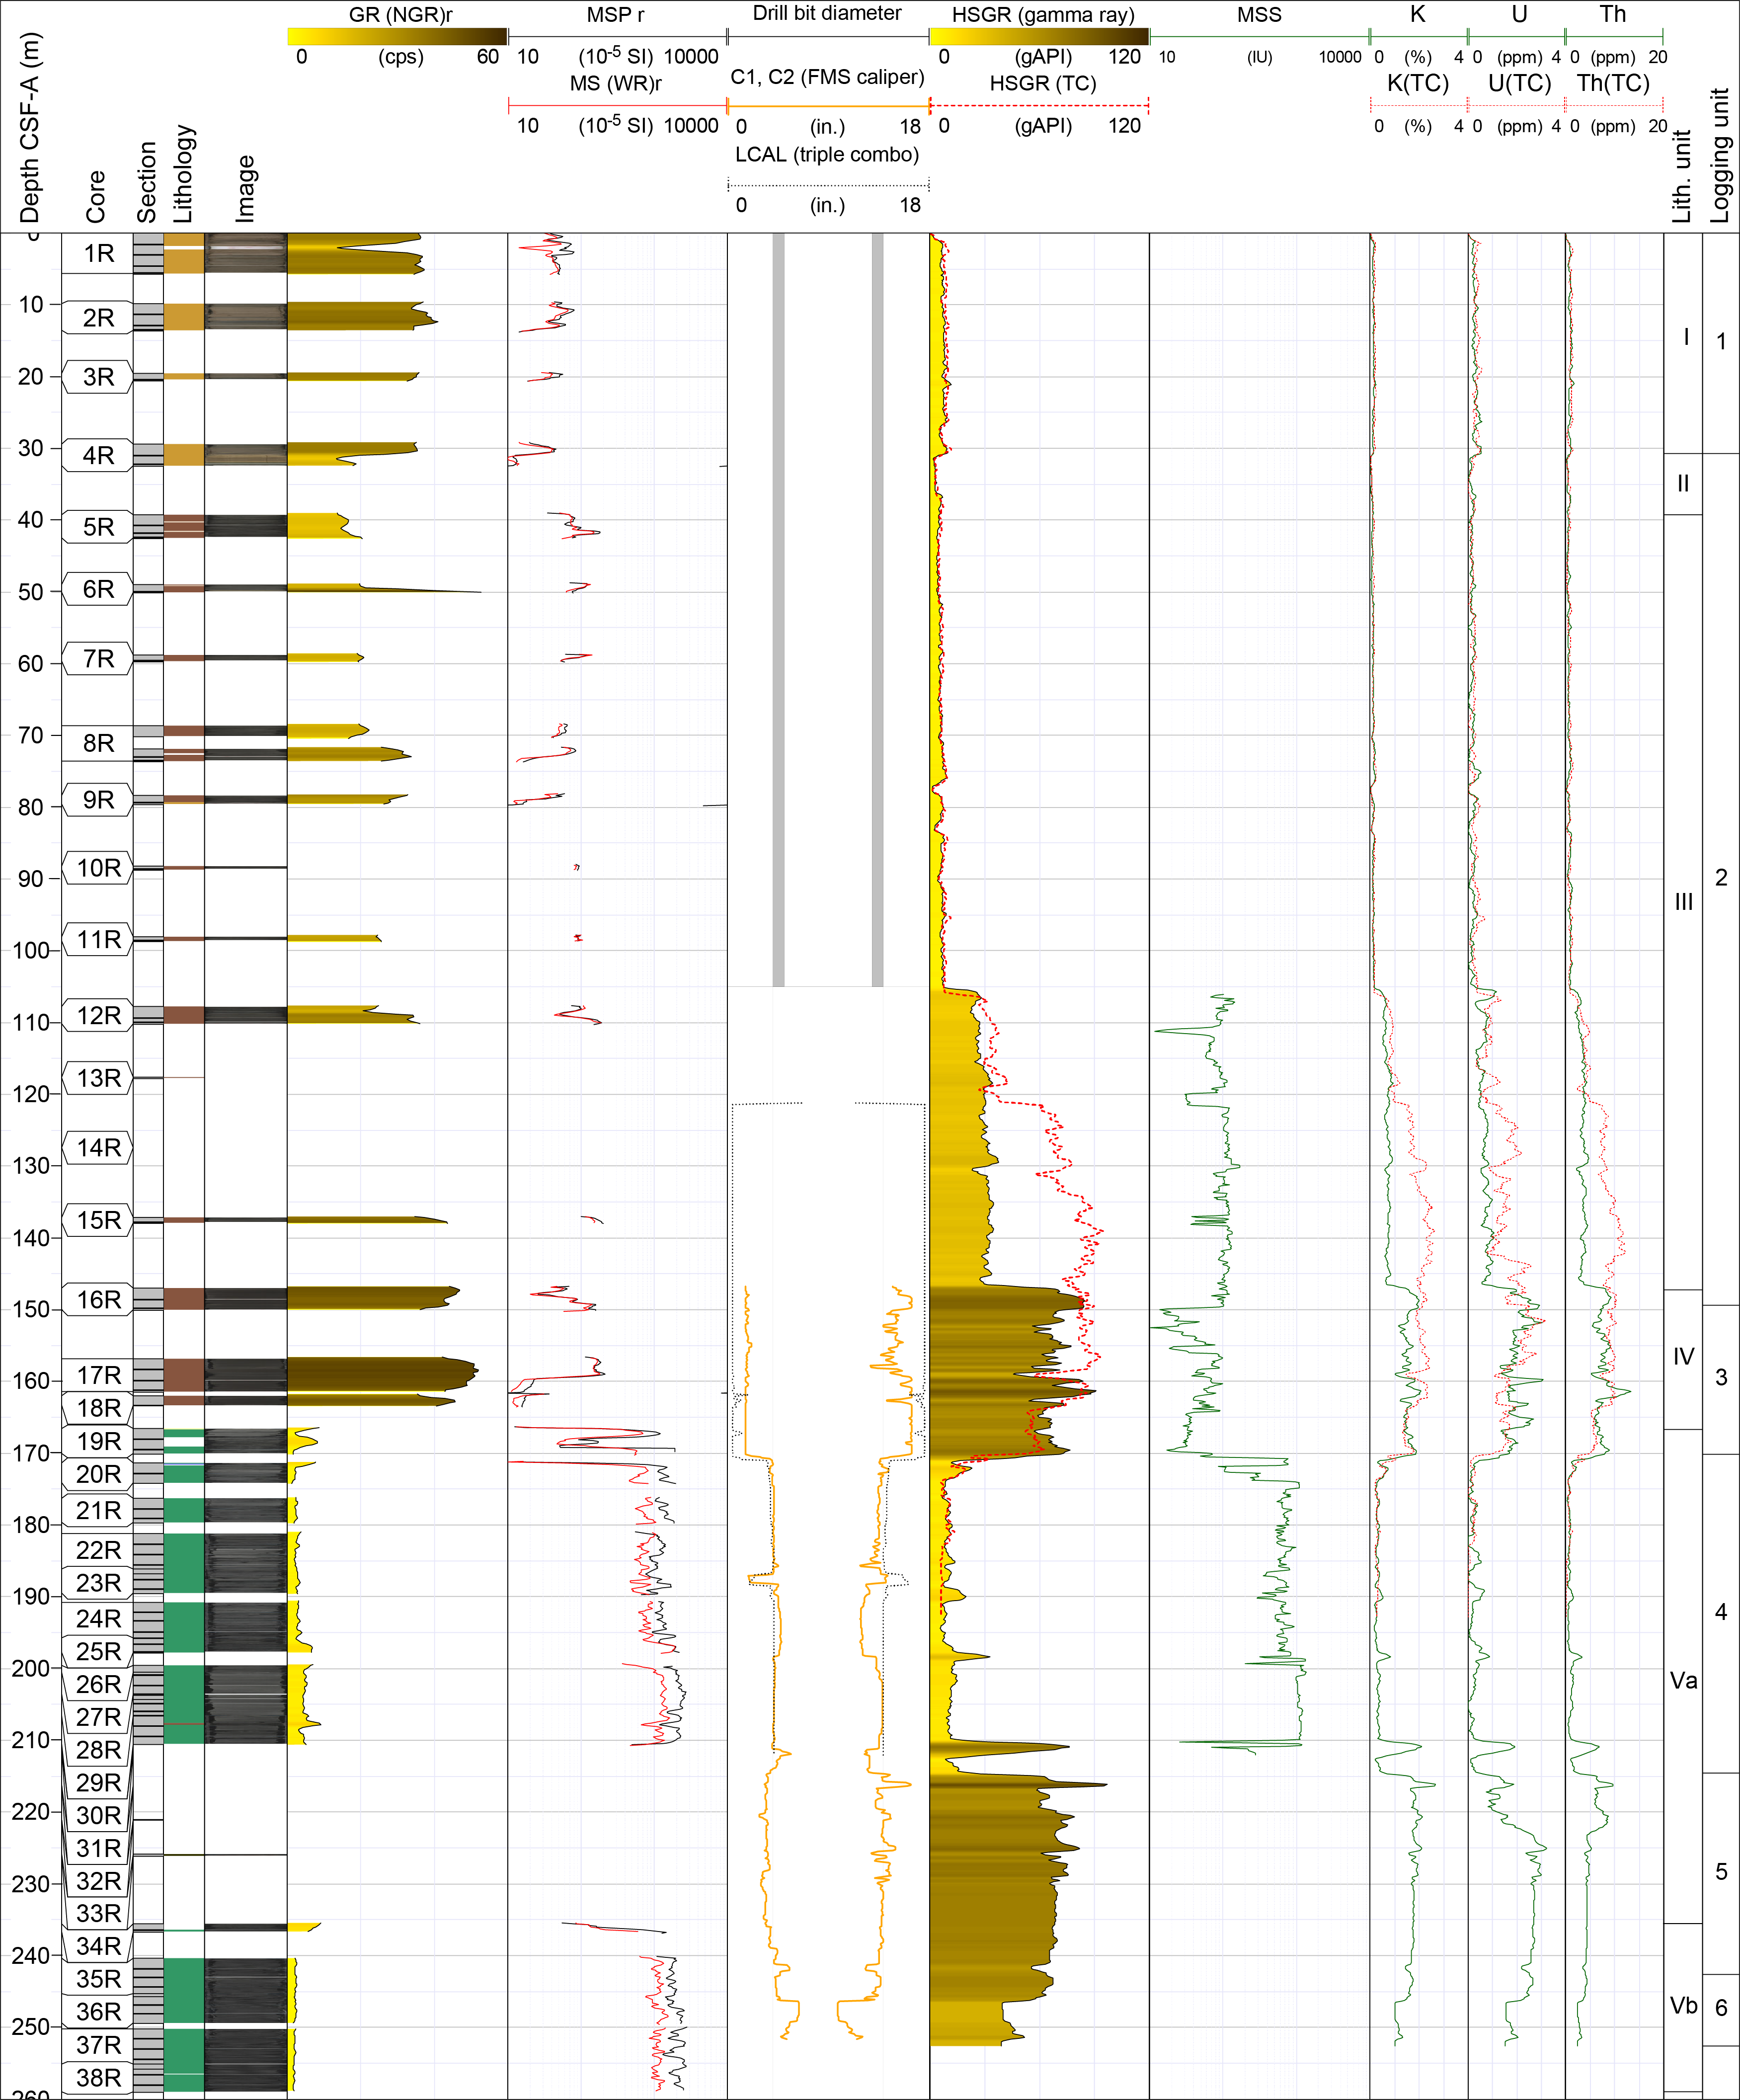
8.1.2. Logging Unit 3
Logging Unit 3 comprises a ~20 m thick interval dominated by clay that is defined by a clear drop in MS from ~100 × 10−5 [SI] in Unit 2 to ~20 × 10−5 [SI]. MS fluctuates between 10 × 10−5 and 100 × 10−5 [SI] for the remainder of the unit. Unit 3 covers an interval dominated by Lithostratigraphic Unit IV and displays extreme caliper washouts that are also visible on the FMS image logs as an increasingly conductive zone toward the sharp transition into Logging Unit 4.
8.1.3. Logging Unit 4
Logging Unit 4 comprises a 45 m thick interval dominated by basaltic pillow lavas and massive basalt with subsidiary hyaloclastite associated with the upper portion of Lithostratigraphic Unit V. The basaltic composition pillow lavas are characterized by elevated density that fluctuates around ~2.6 g/cm3 and fluctuating velocities ranging ~3–5.2 km/s with associated low GR of ~9 gAPI. Three thin (1–2 m) interlayers of lower resistivity and higher GR are present in the basalt-dominated interval at ~190, 198, and 211 m WMSF, and the lowermost layer gives the highest GR signature, peaking as high as ~75 gAPI. These higher GR interlayers are in part associated with reduced resistivity (Figure F29) and are interpreted as interlayers with sedimentary components, potentially variably mixed with hyaloclastite.
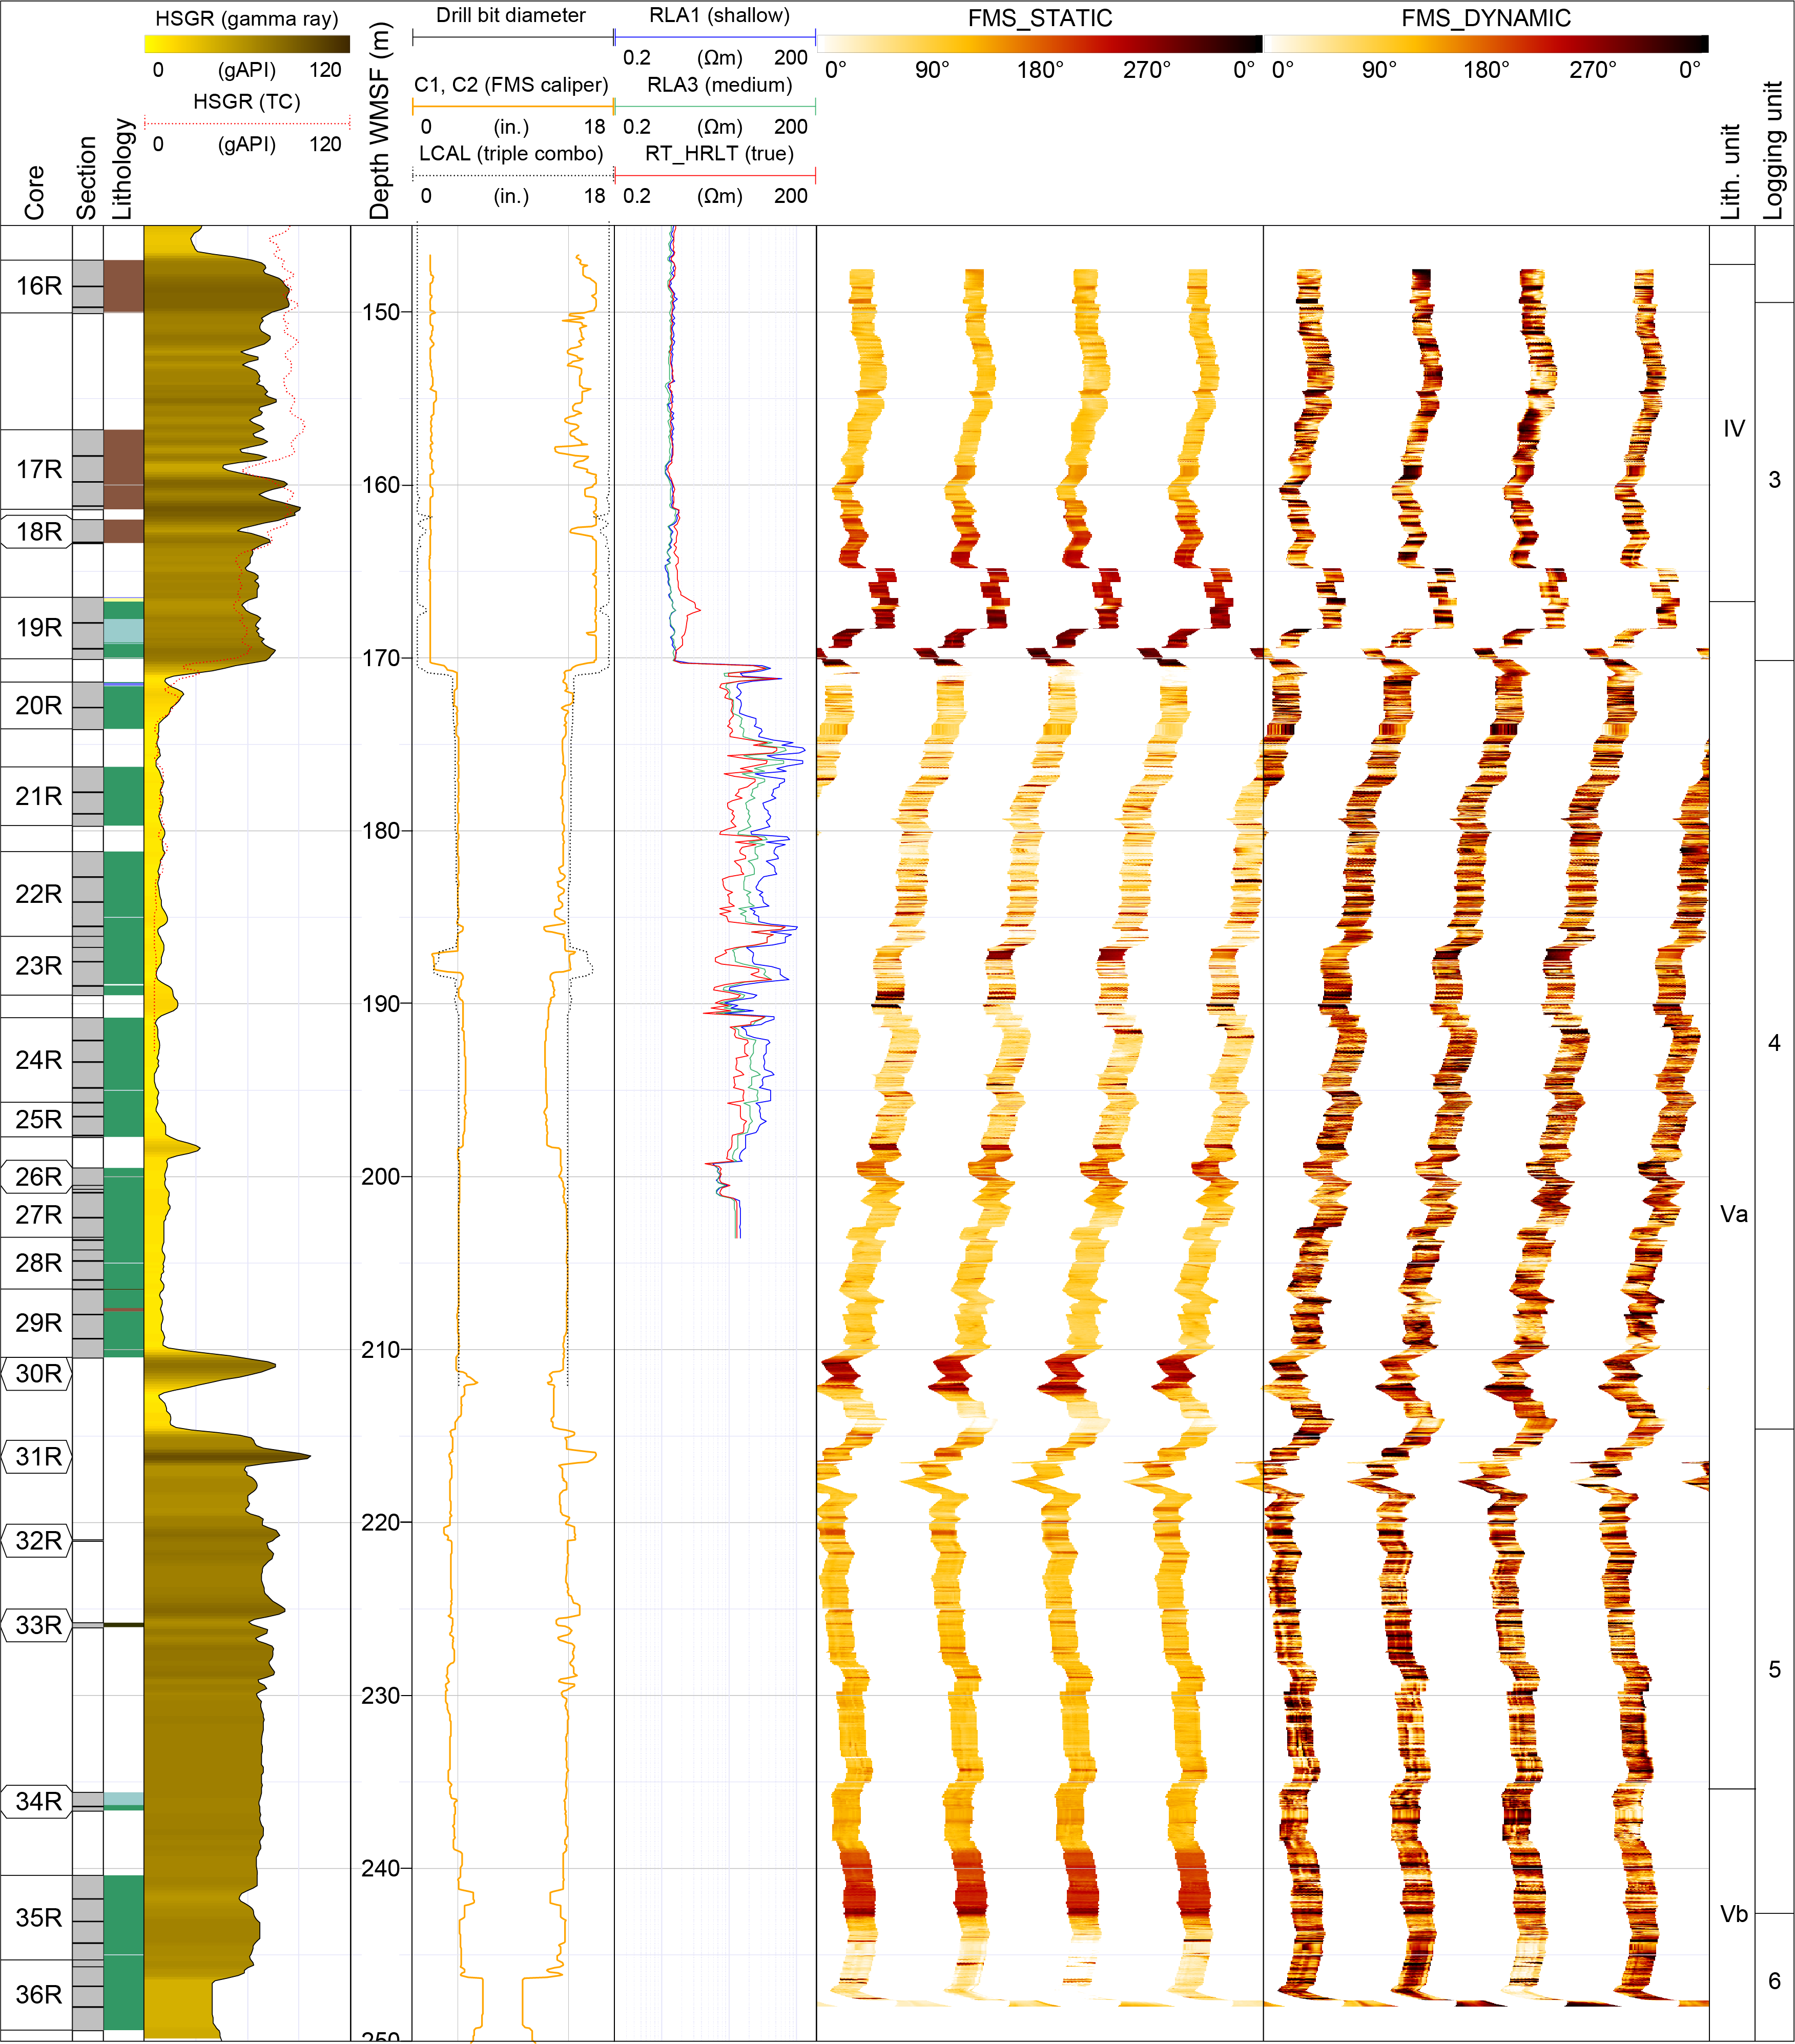
The basaltic sequence is composed of pillow lavas, as confirmed by core observations, and these features are also identified in the FMS image log data (Figure F30). The example reveals a partly mottled high-resistivity background with clearly conductive fractures and curved transitions in conductivity which give pillow-like features. The resolution of the images varies somewhat throughout the sequence, and features such as the clearly imaged pipe vesicles in the core pillows are not resolved, likely because of a combination of limited contrast between vesicle fills (e.g., chlorite) and the background pillow resistivity and/or resolution. The sequence is not fully dominated by pillows, and a more massive flow unit with clearly asymmetrical resistivity and imaging is identified in the lower part of Logging Unit 4 (Figure F31).
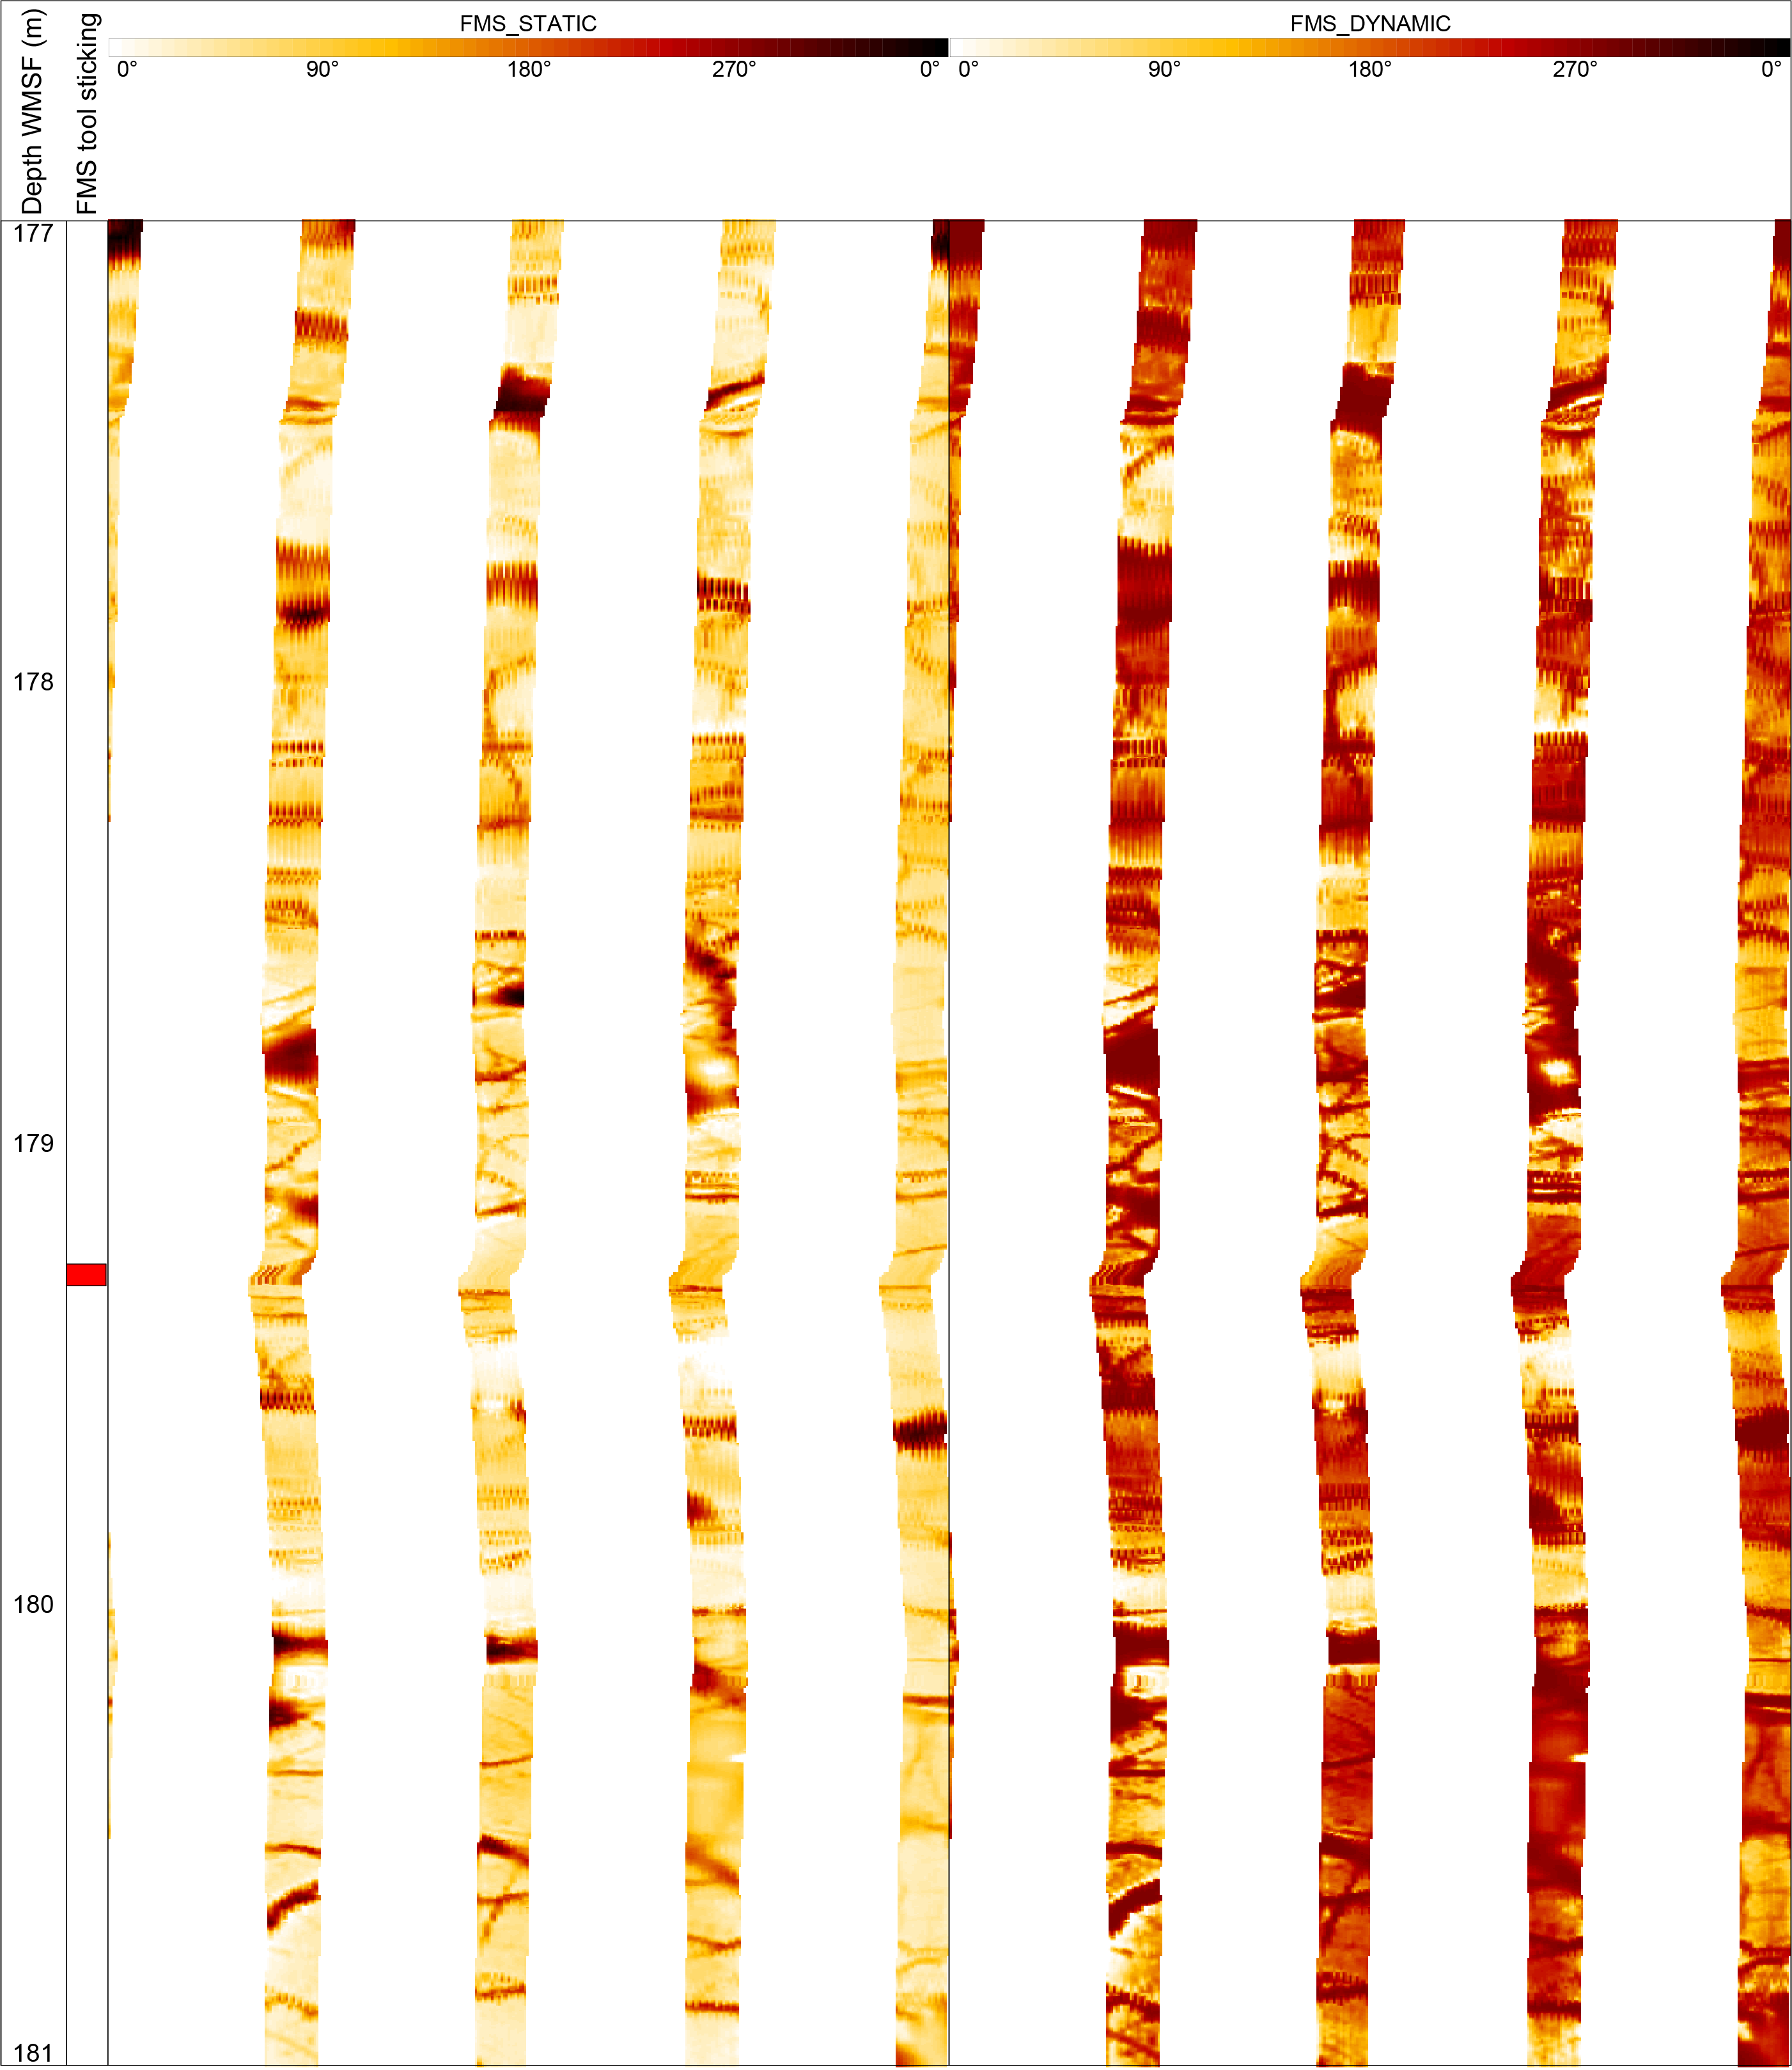
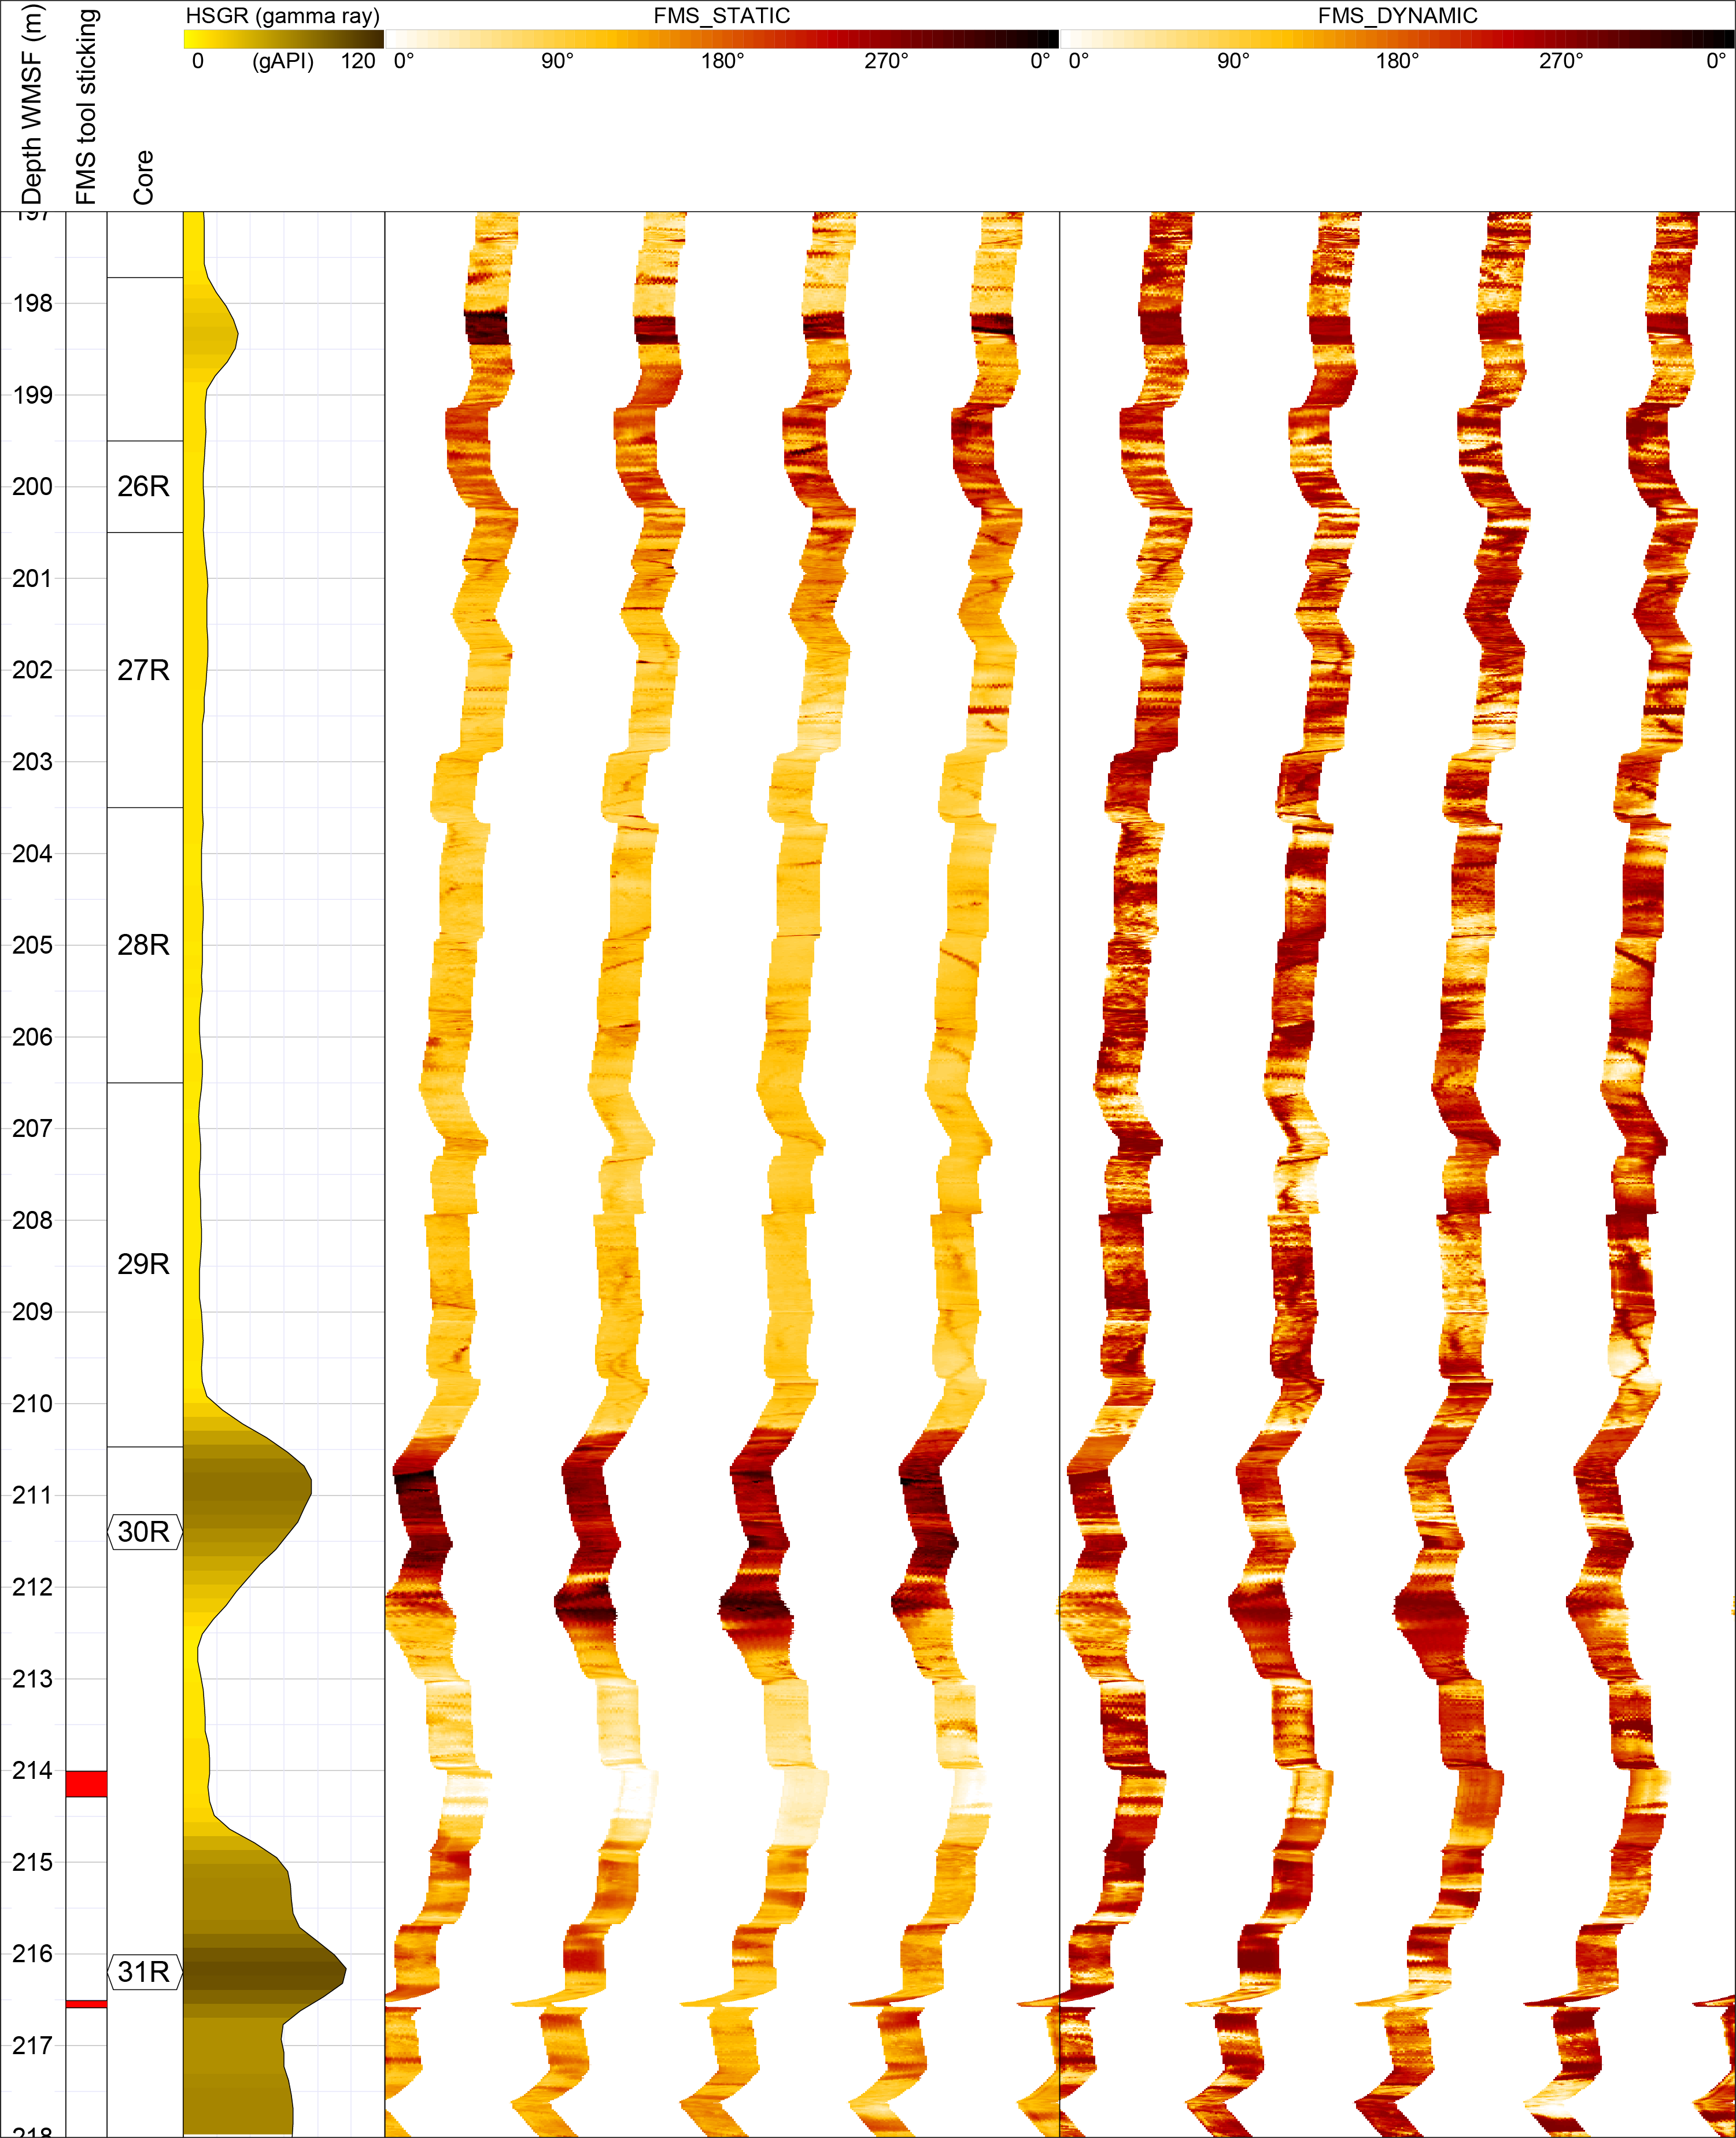
In this example, clear brecciation of resistive clasts in a less resistive background transition down into a more resistive and fractured flow interior. This unit also displays a high-velocity interior (~4 km/s) and a clear asymmetrical transition upward to a lower velocity of ~3 km/s. This asymmetric distribution of wireline properties is typical of lava flows. Section 396-U1574A-25R-2, near the upper transition of this unit, reveals the only example of highly vesicular basalt in the cored interval (Figure F32).
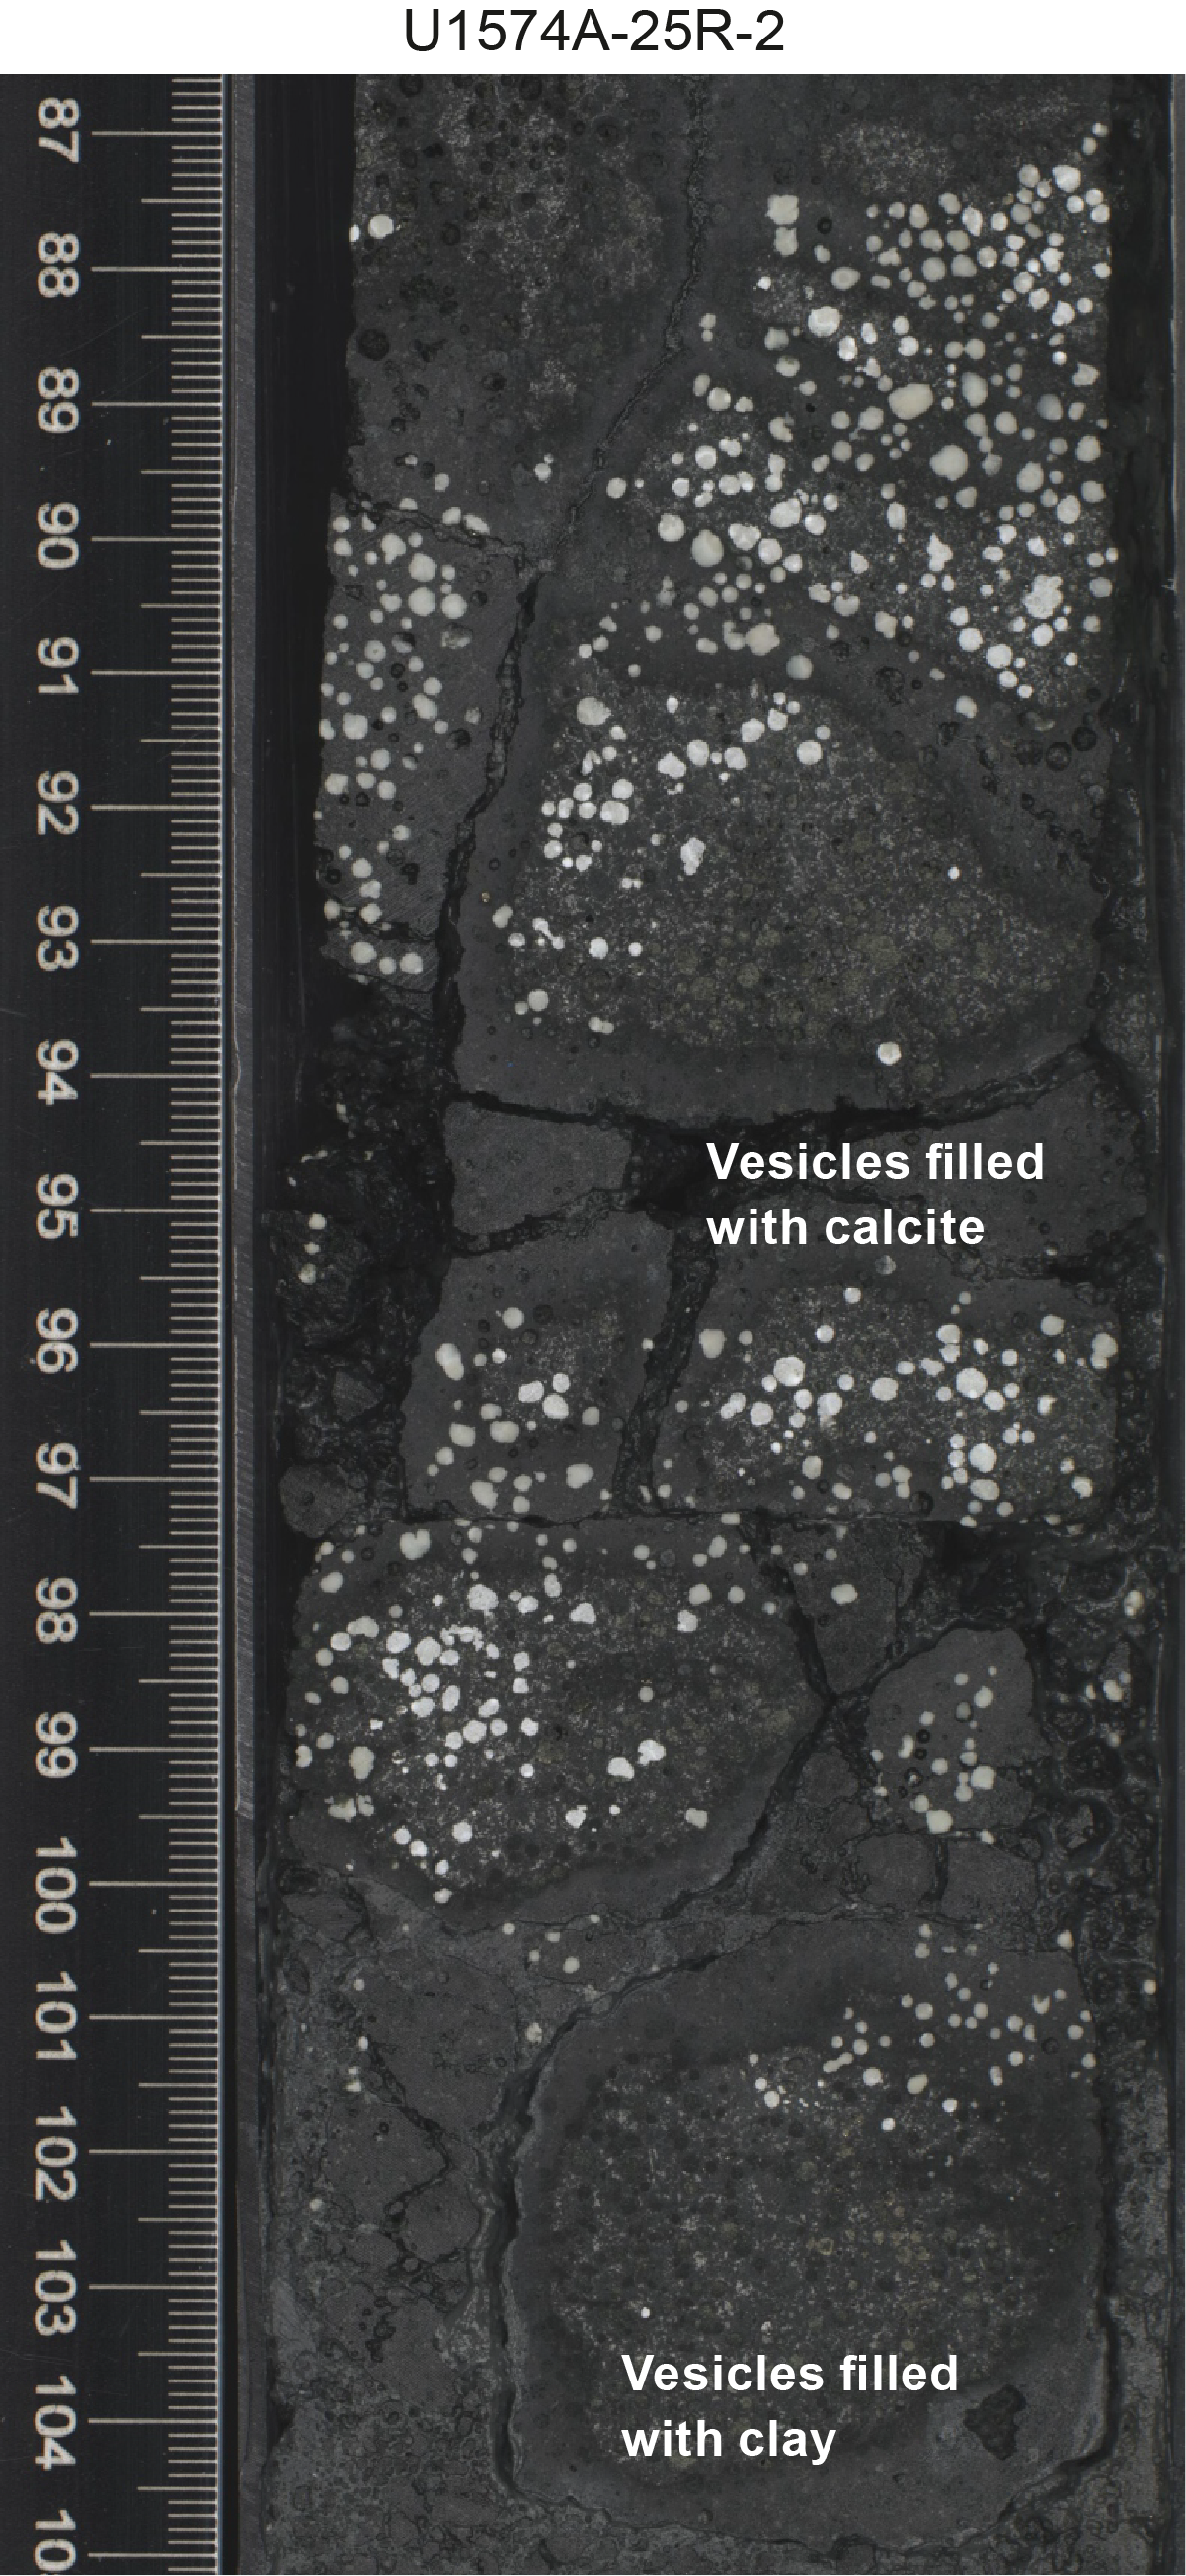
8.1.4. Logging Unit 5
Logging Unit 5 comprises a ~28 m thick, high-GR (~70 gAPI) interval that coincides with a drilling break (rapid bit progression) and was accompanied by very little core recovery. The nature of the unit is therefore largely unconstrained from core information. The FMS caliper measurements of Unit 5 reveal that the hole was in apparently good condition and near–in gauge, which appears partly at odds with the zero recovery and rapid drilling rates. FMS data reveal relatively high resistivity over the interval, similar in magnitude to the overlying pillow complex, and the FMS images show fracturing and traces of features that could be interpreted as pillows but cannot be unambiguously defined (Figure F33). The FMS fabric becomes more mottled and homogeneous lower in the unit, with traces of potential bedding features but no clear transitions in GR. The high-GR readings and rapid drilling are not consistent with basaltic pillow lavas similar to higher in the borehole. However, it should be noted that the limited core NGR data reveals significantly lower NGR than the wireline, potentially hinting at logging data issues in the unstable lower hole interval.
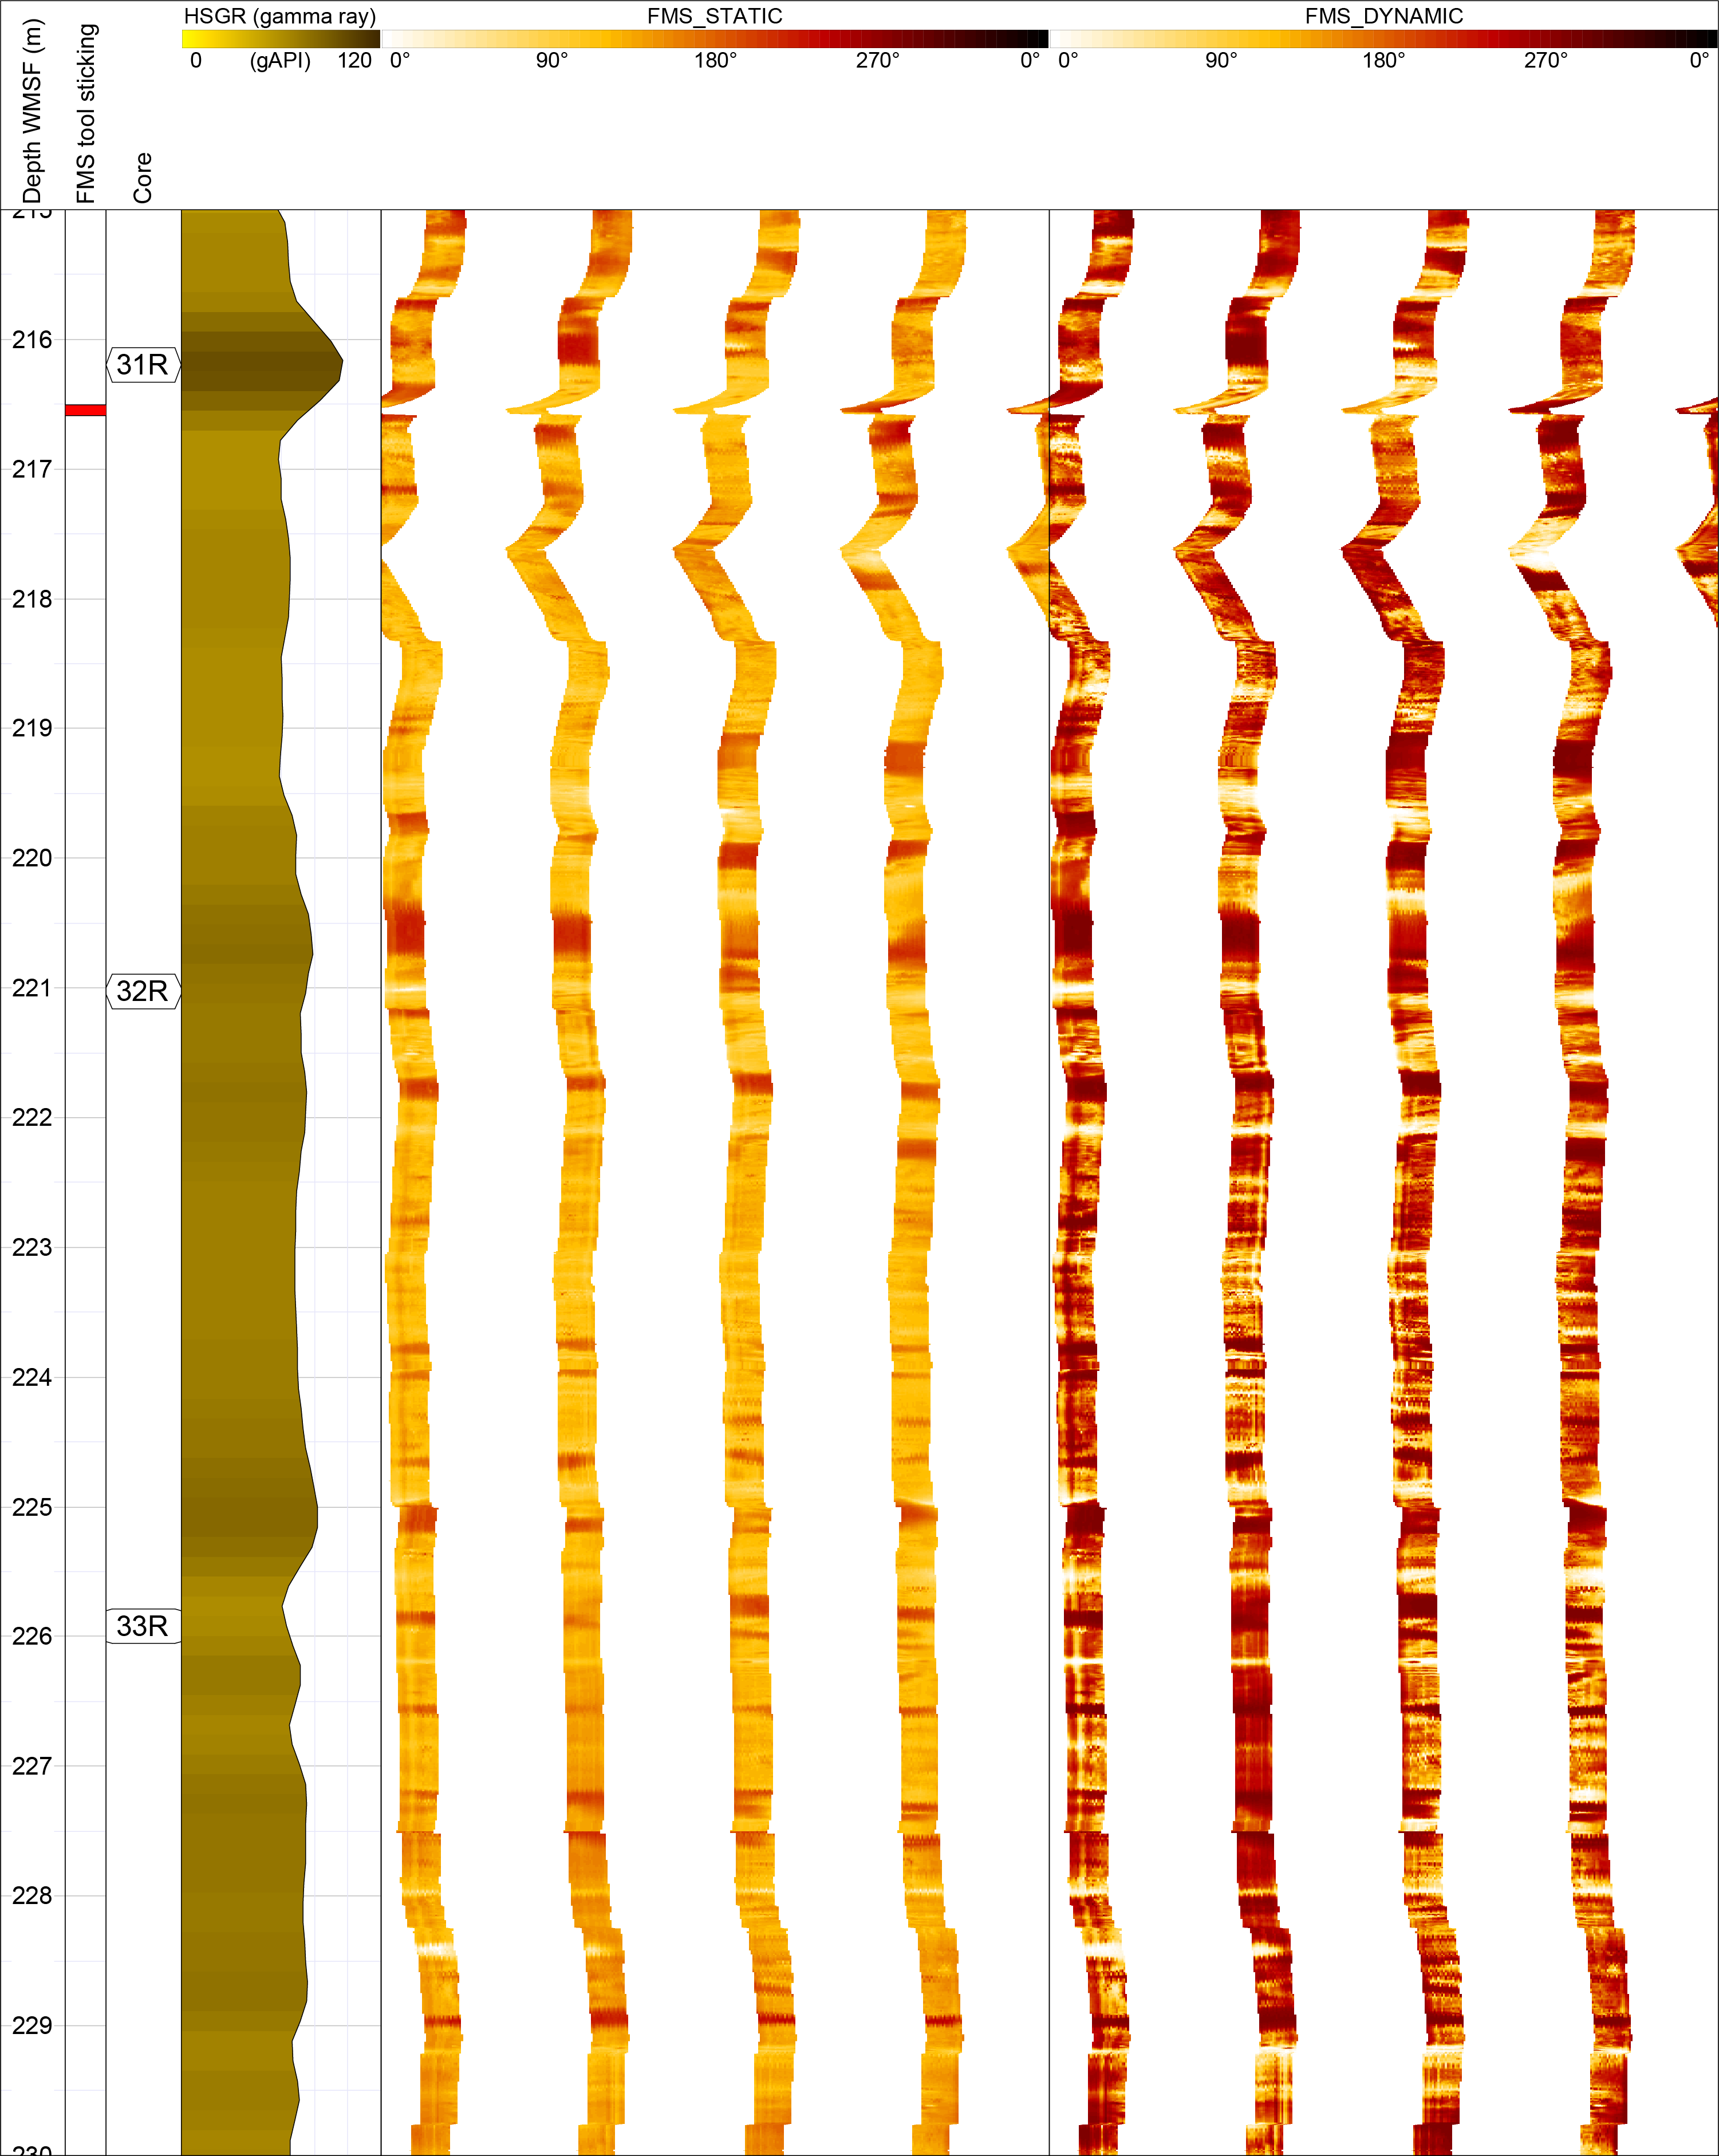
8.1.5. Logging Unit 6
Logging Unit 6 is less covered by wireline logging data, and only GR and FMS data are available for ~10 m. It is included as a separate unit because it coincides with a clear transition from Unit 5 to a more resistive unit with slightly reduced GR (~40 gAPI). Core recovery returned at the beginning of Unit 6, and core information reveals a basaltic pillow lava–dominated sequence with a distinctly different logging character from Unit 5. FMS imaging in Unit 6 reveals a similar lava flow–like distribution of resistivity with evidence for brecciation/alteration at the upper margin (Figure F34). Core evidence in this case documents a pillow-dominated sequence with some interlayered sediments and hyaloclastite below.
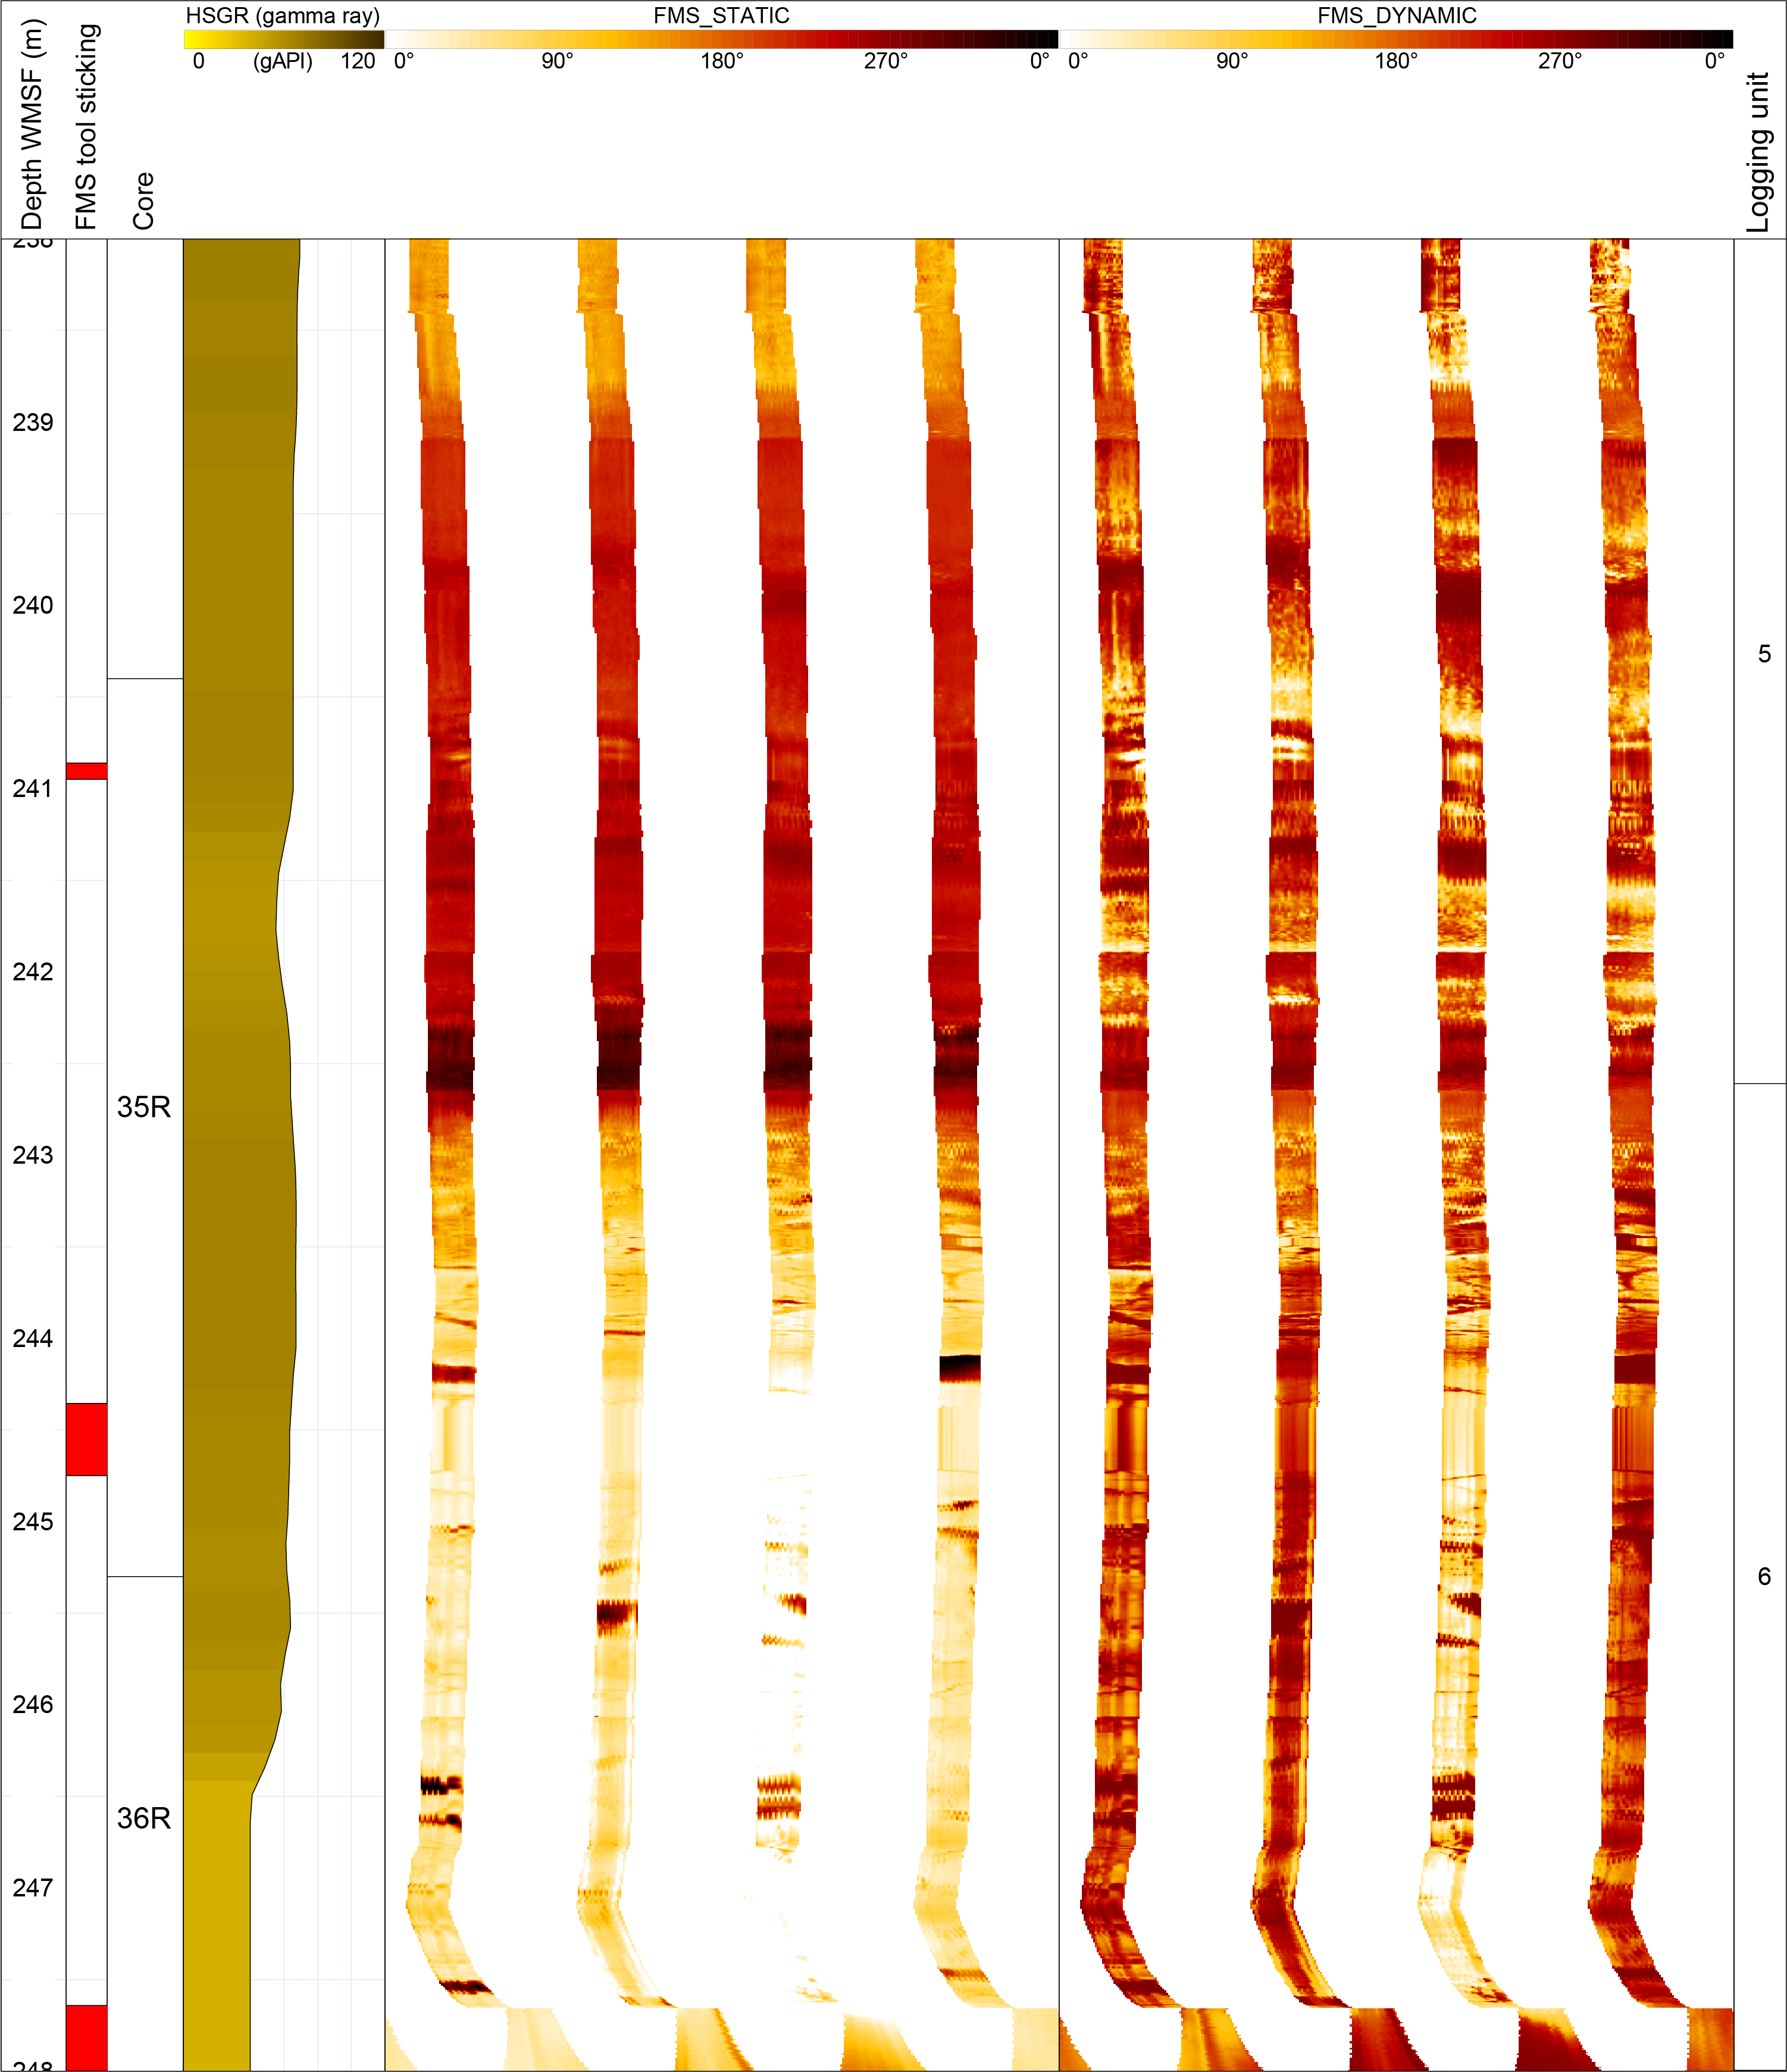
The caliper arms on the FMS tool string show a contraction of the borehole size toward the bottom of the well, which is likely affected by fall-in. The fact that the GR log does not reduce to basaltic values of <10 gAPI in the interval with recovered pillows indicates that the readings at the base of the hole are potentially affected by hole conditions (such as fall-in of high-GR sediments from above).
8.2. Temperature measurements
A preliminary APCT-3 measurement evaluation was carried out aboard ship using the TP-Fit v.3 software (Heesemann, 2008). This involved picking the entry time and two points on the temperature equilibration path to capture the temperature decay after the frictional heating caused by lance entry and the second frictional heat pulse caused by lance retrieval (Figures F35, F36, F37, F38).
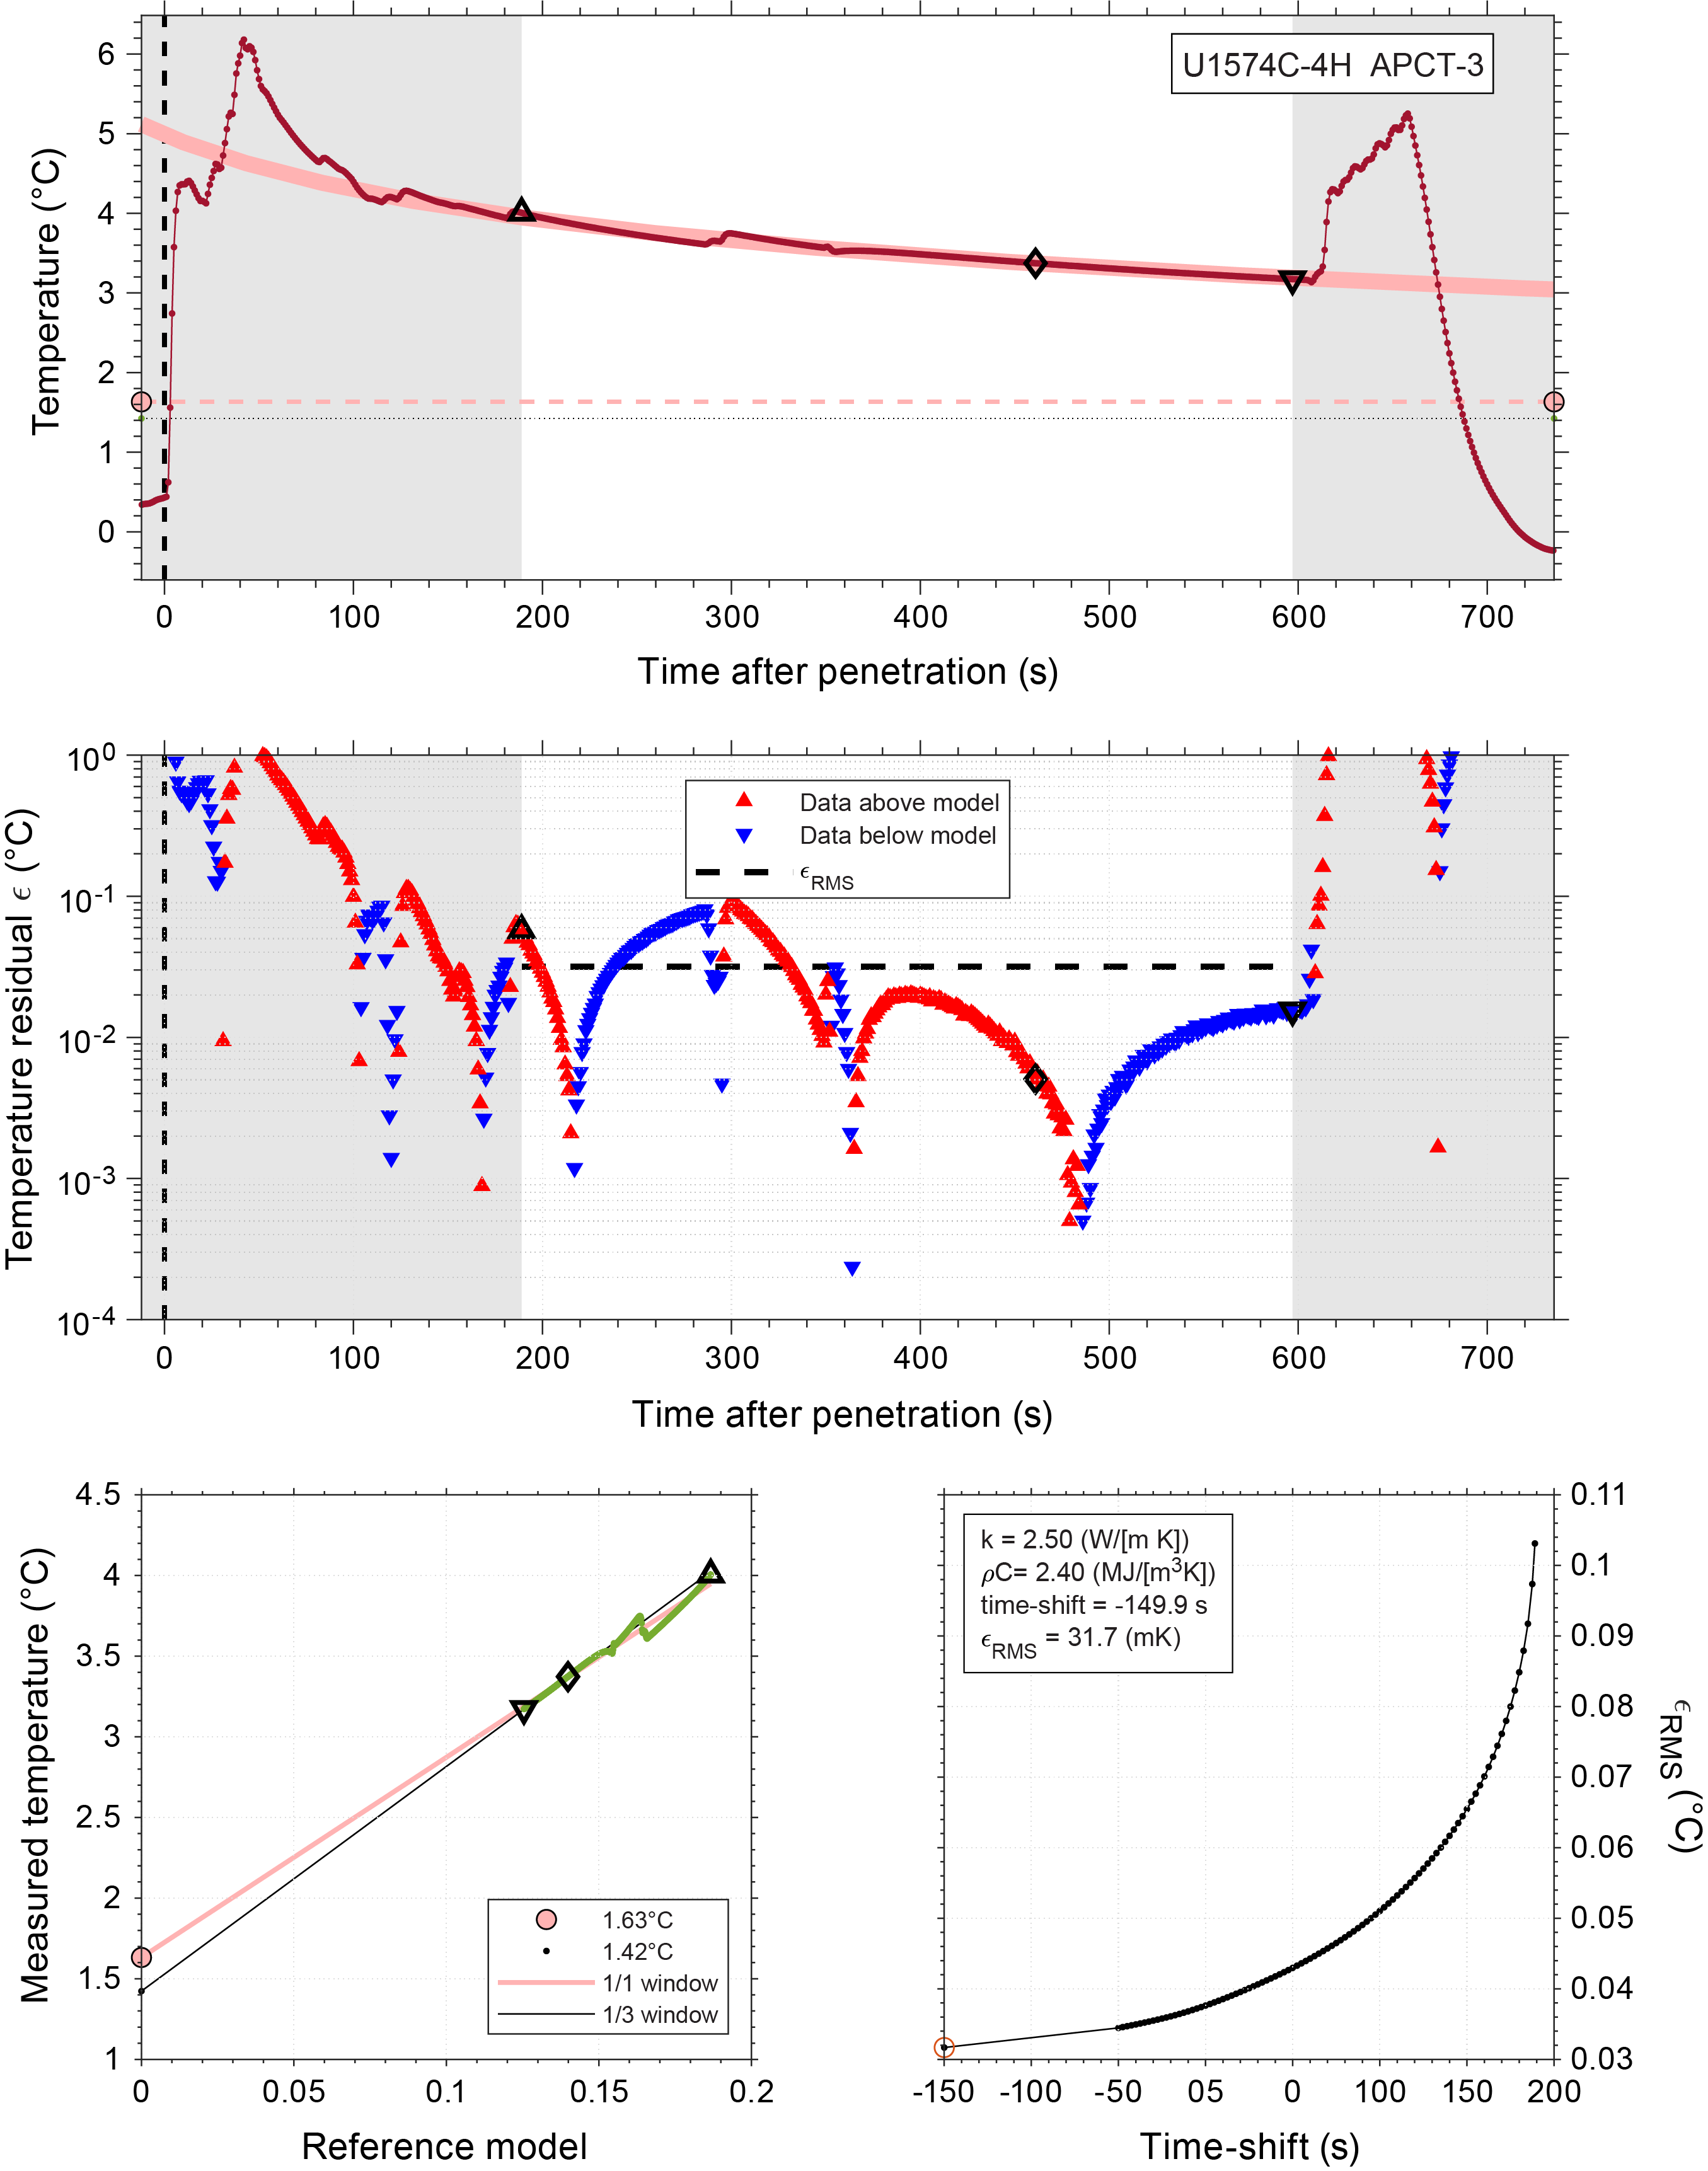
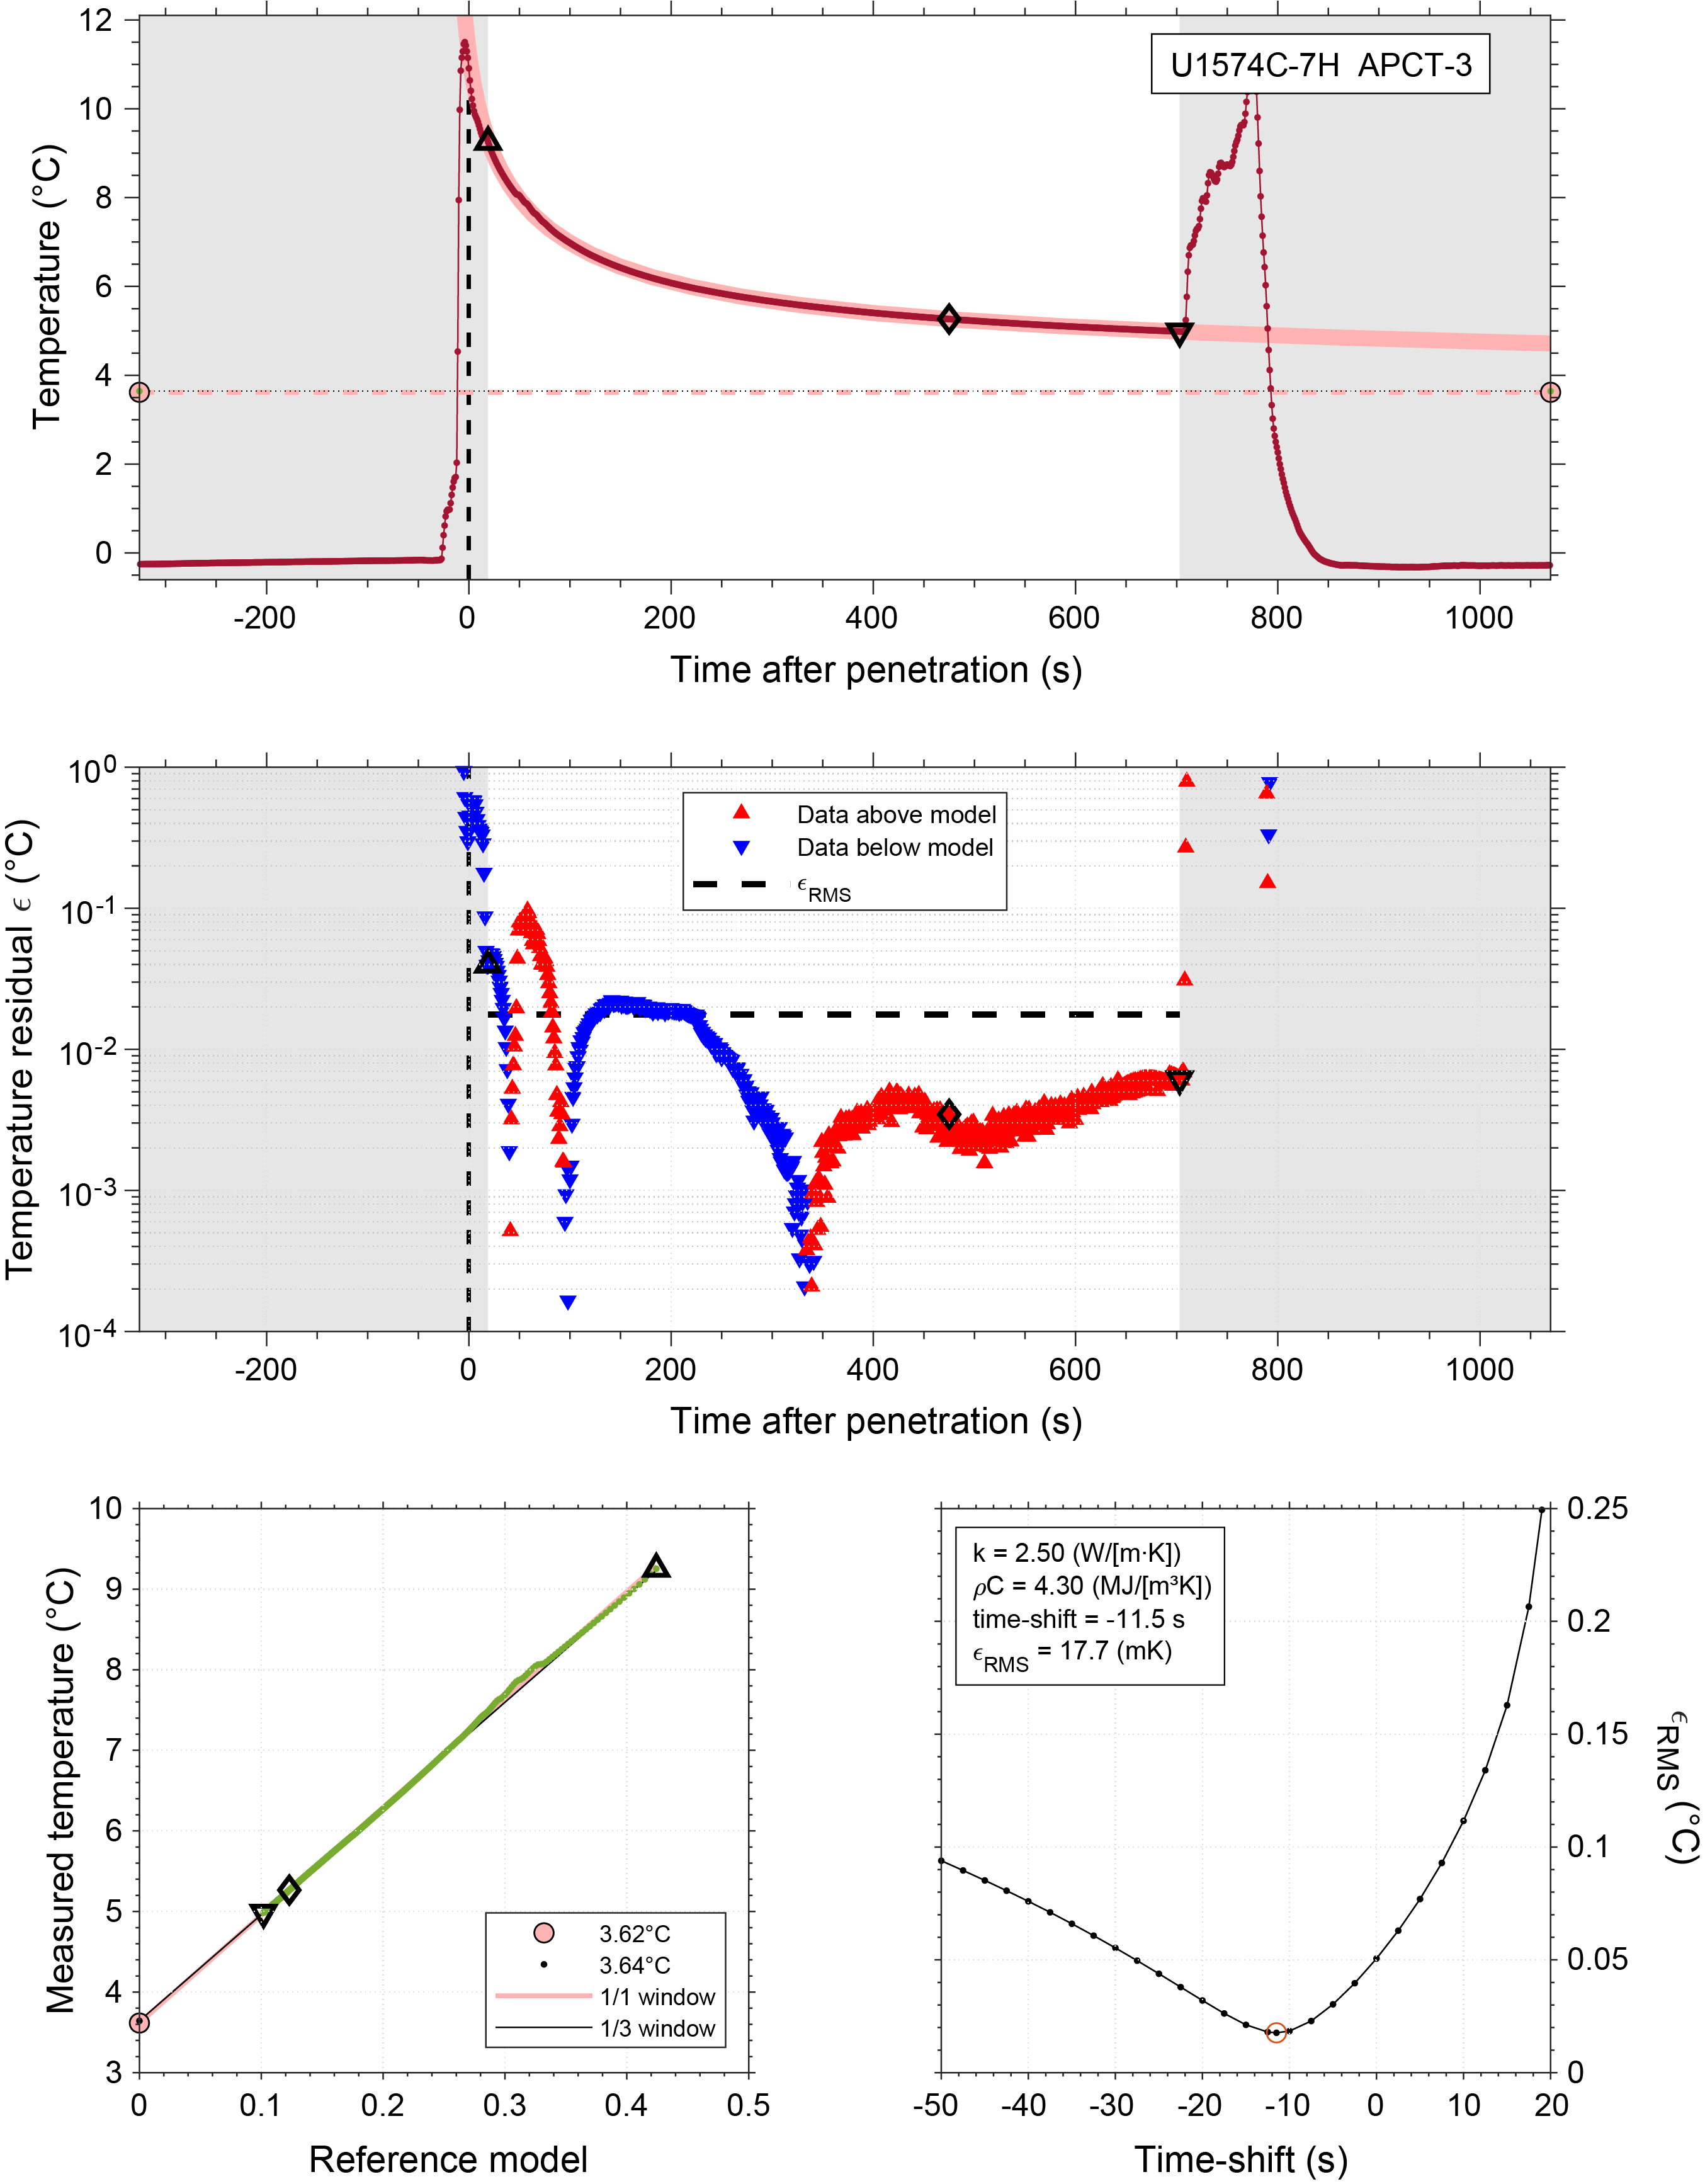
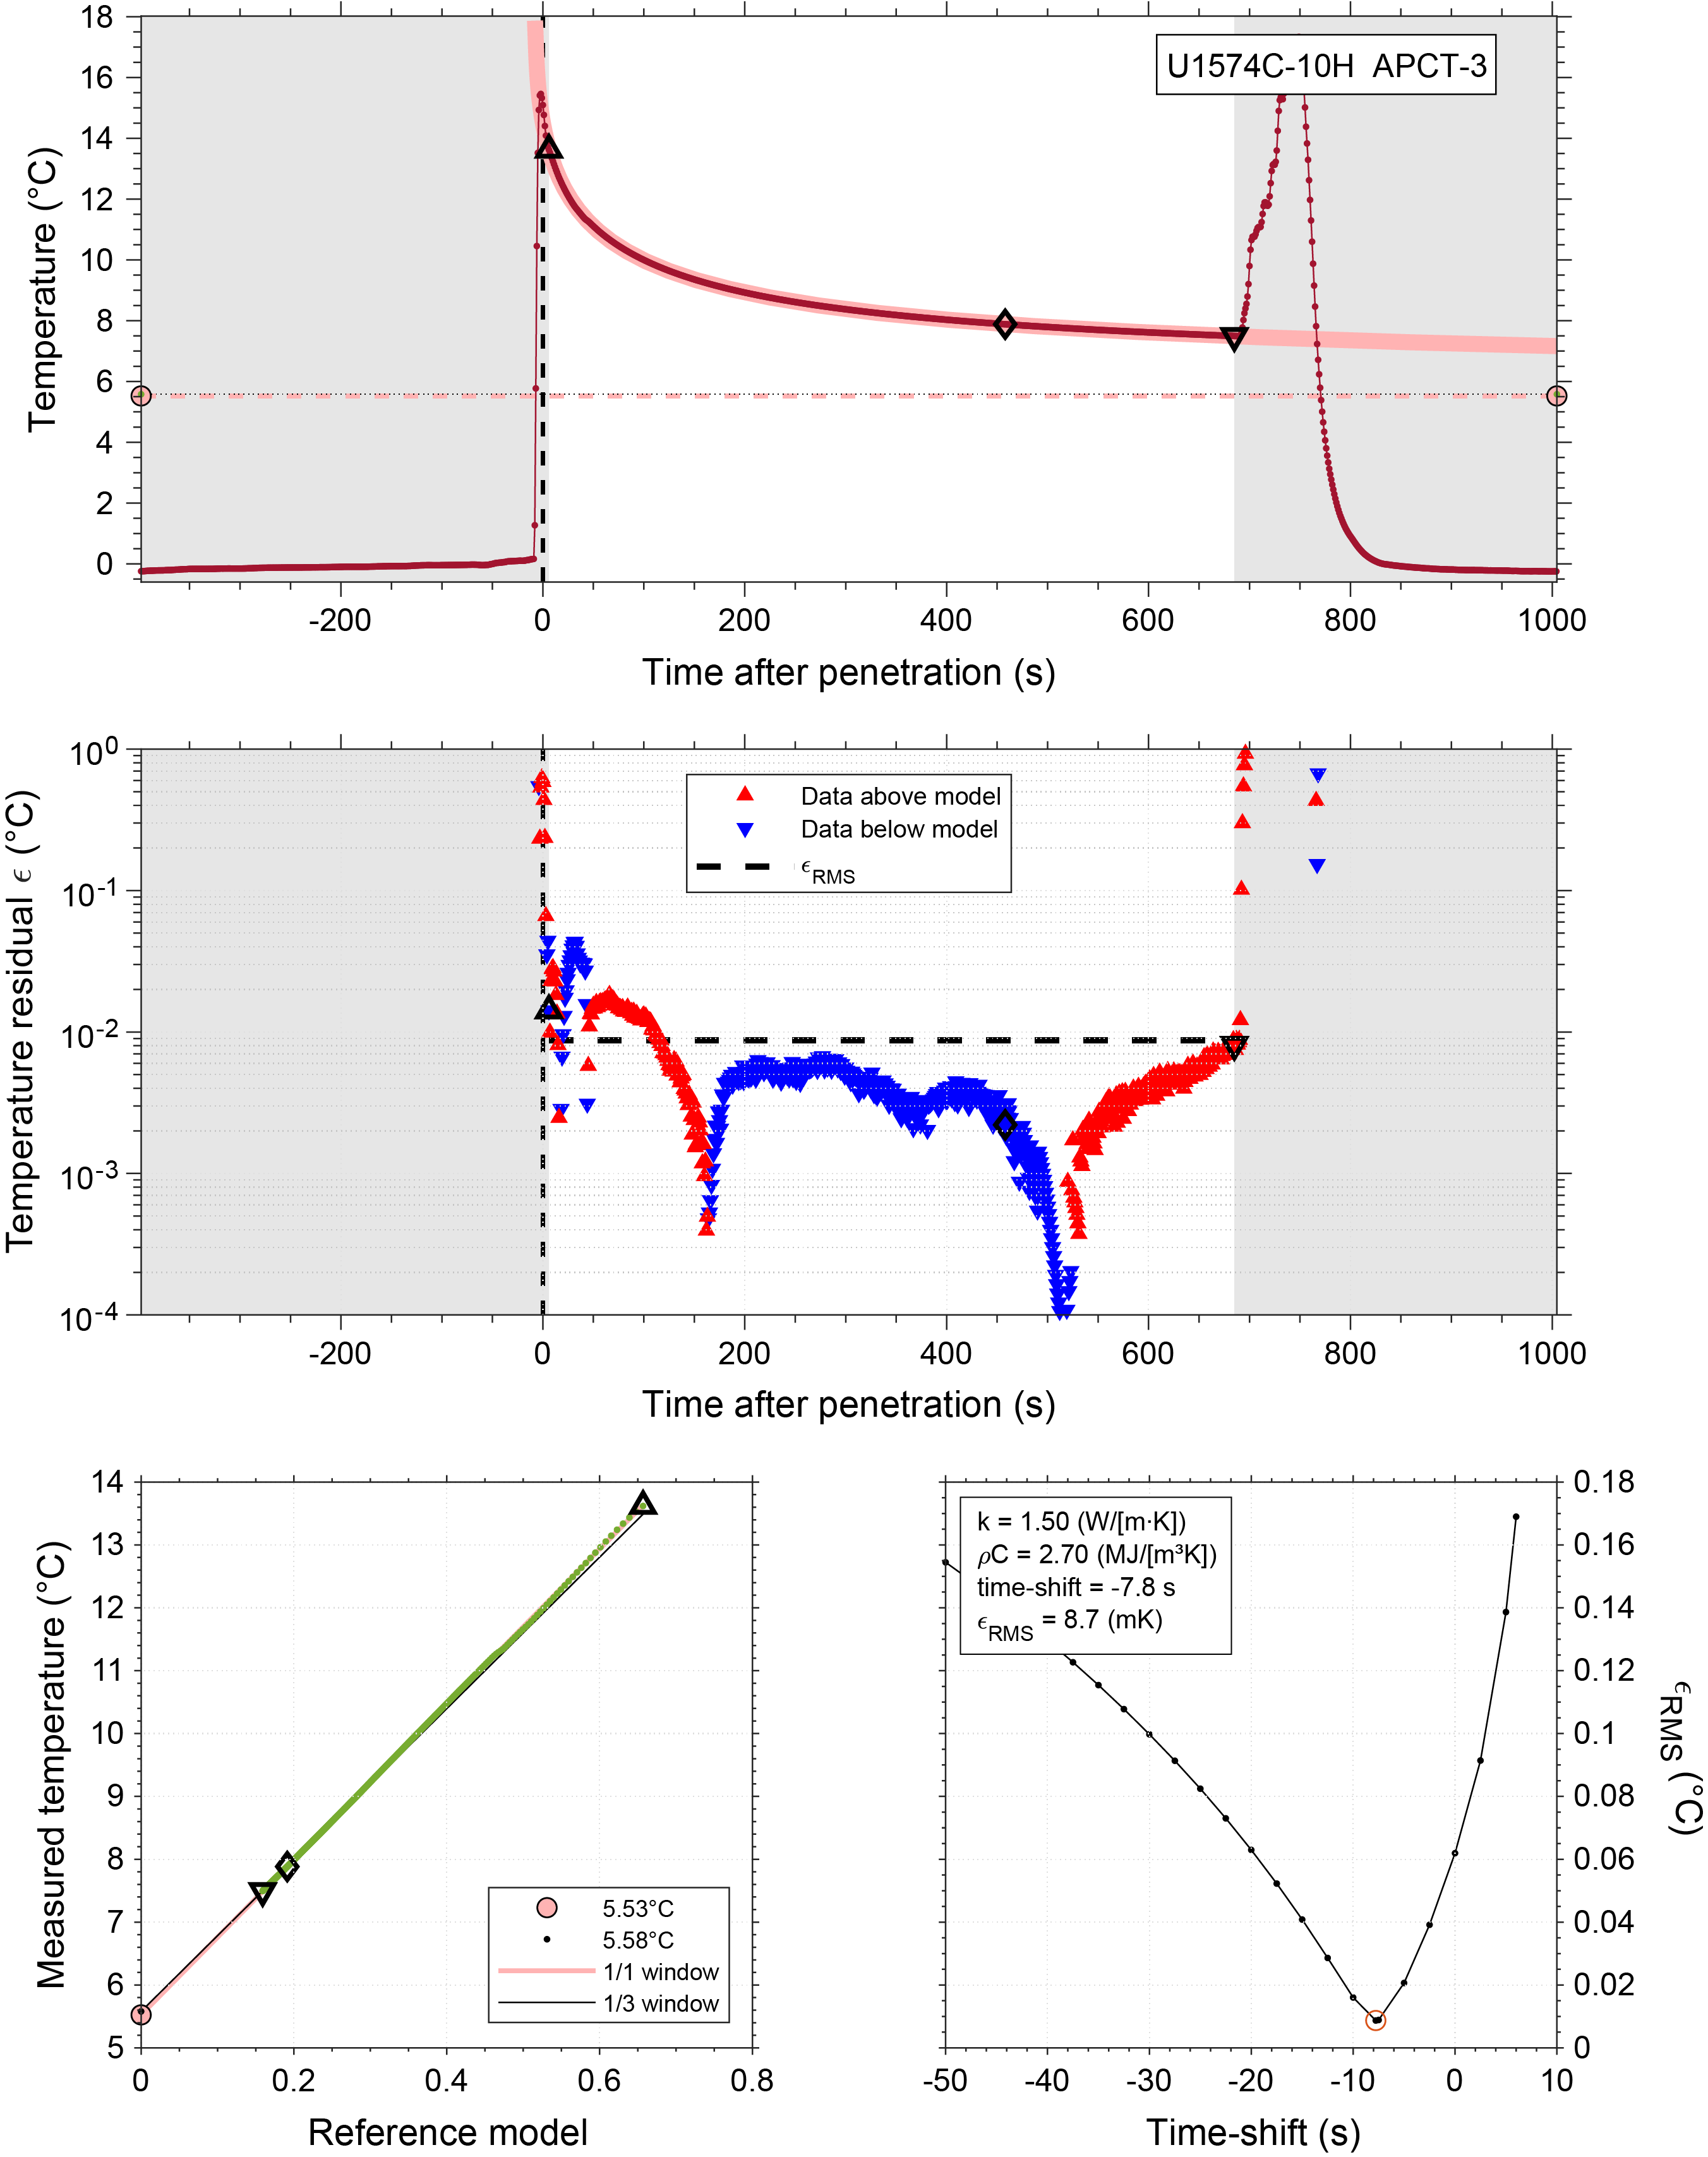
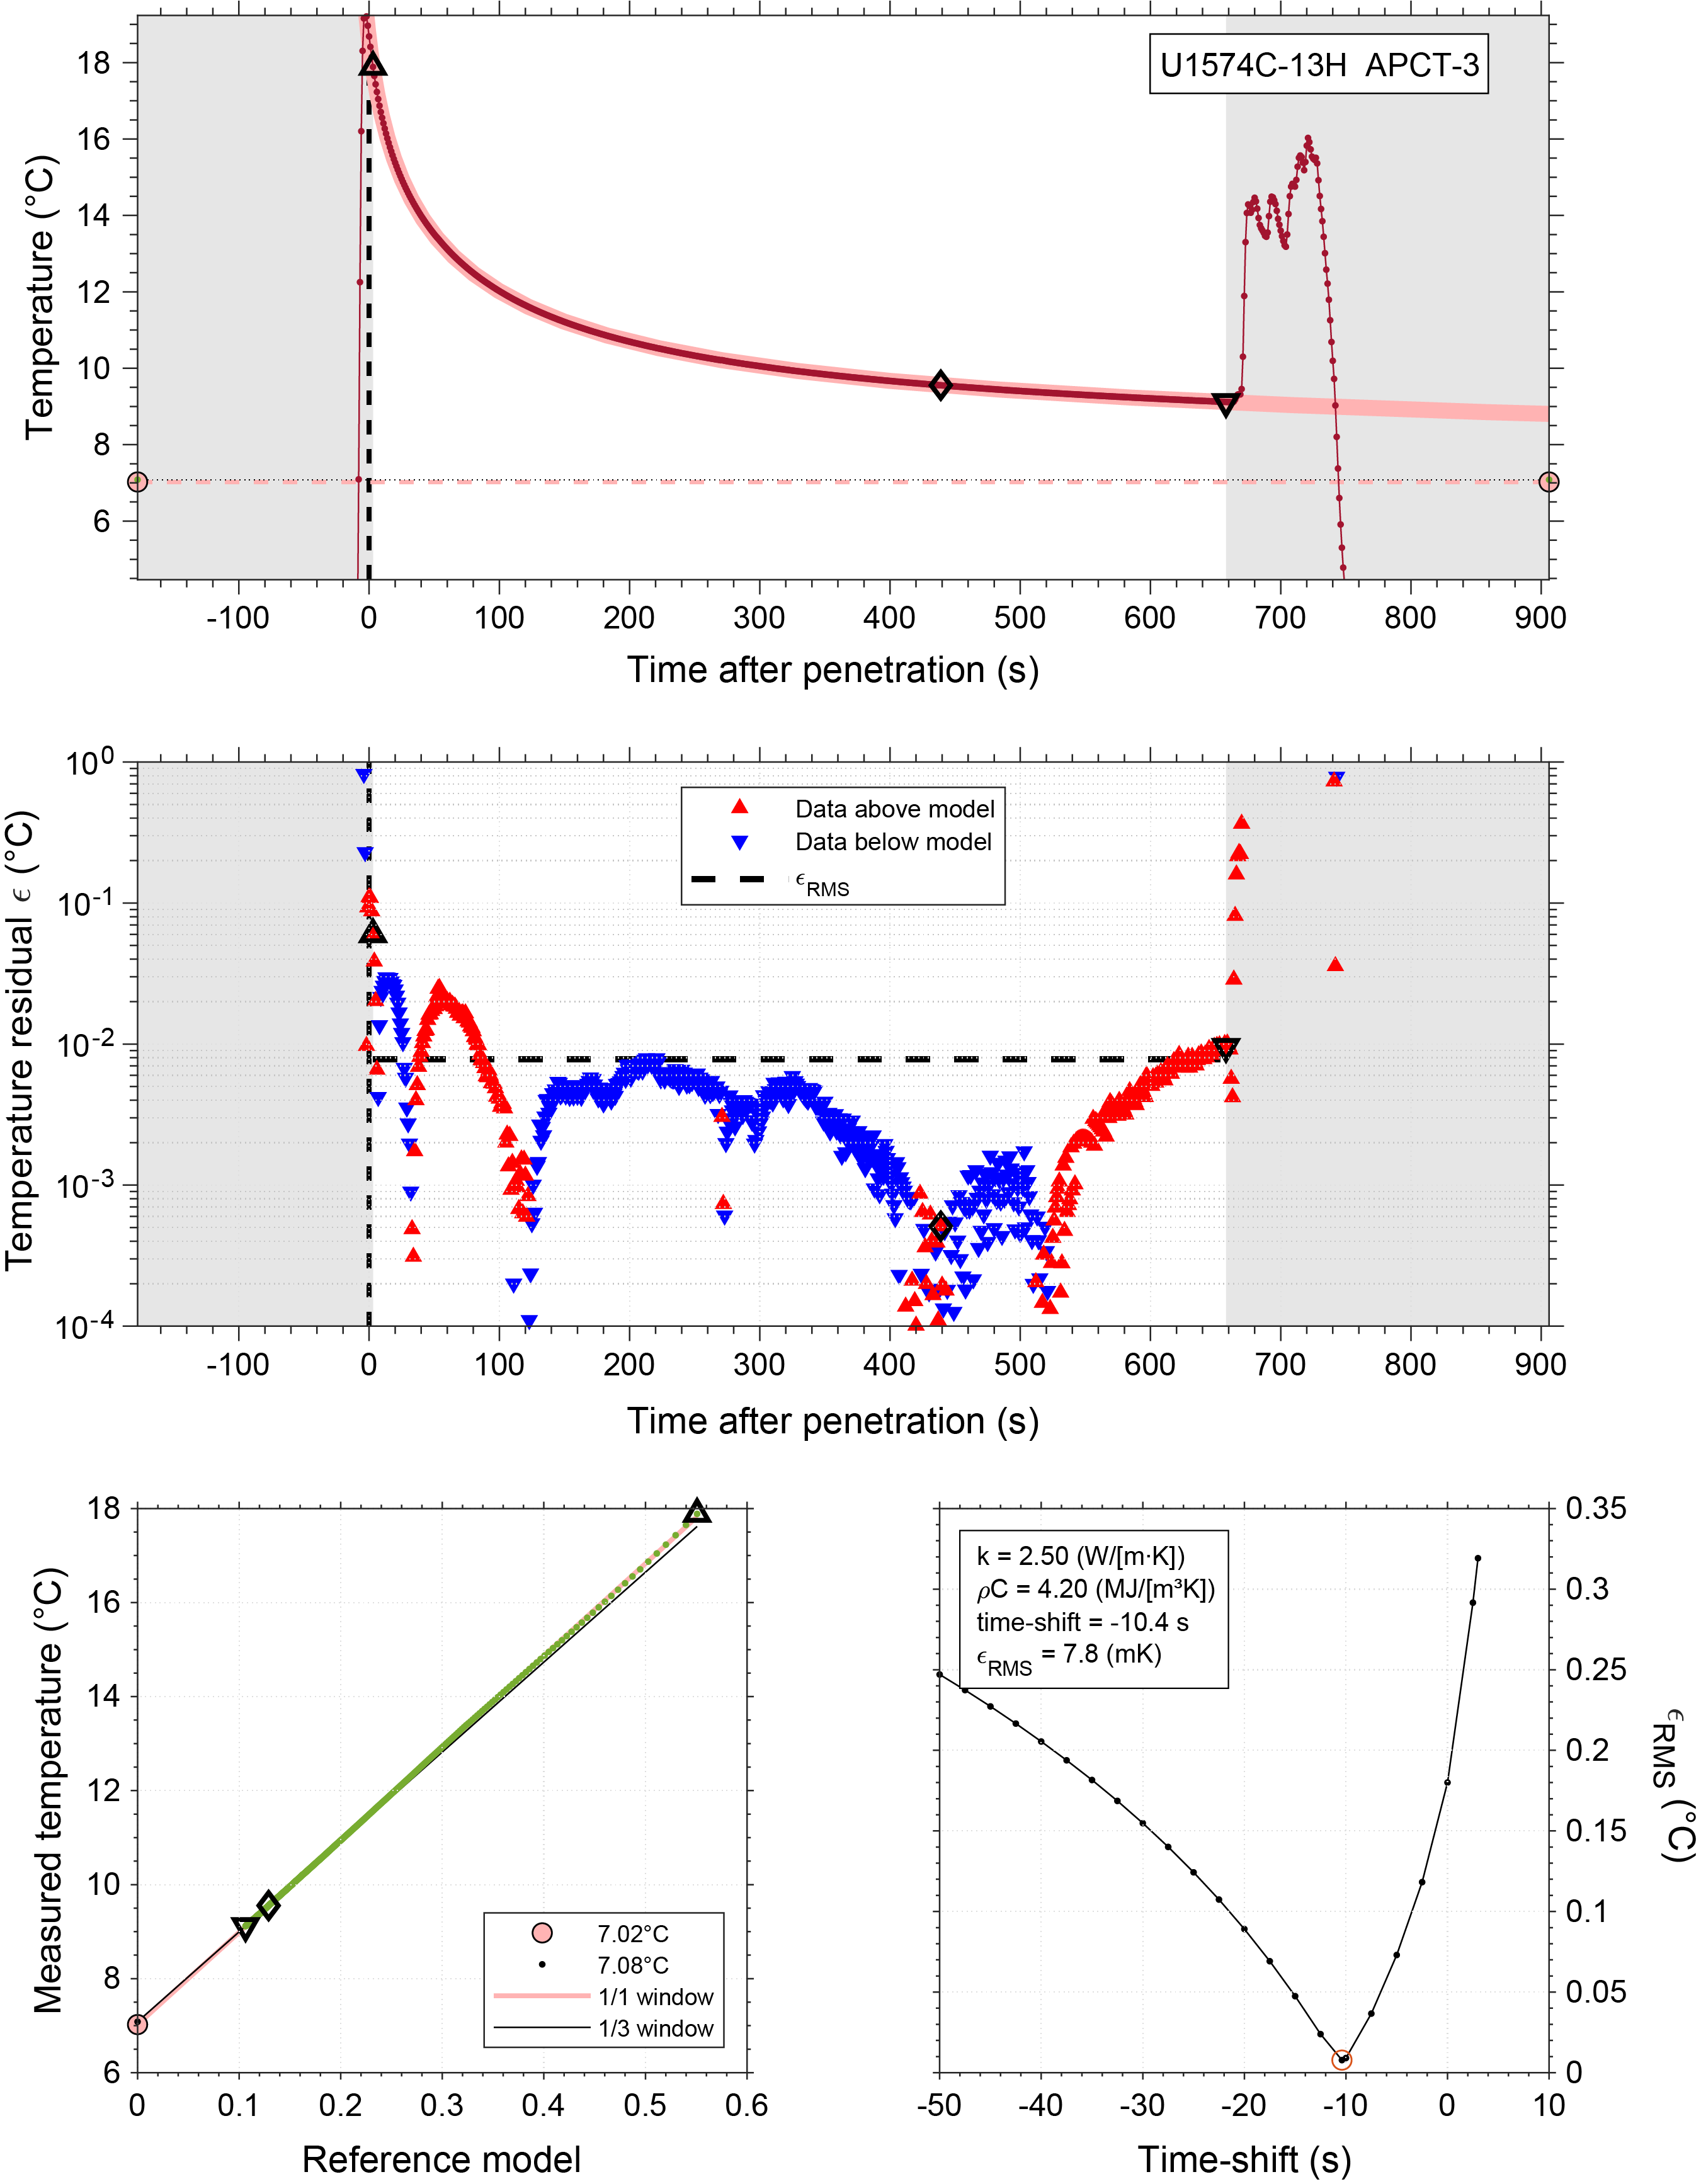
The resulting formation temperatures from Hole U1574C are 1.63° ± 0.032°C at 38.0 m DSF (Section 4H-CC), 3.62° ± 0.018°C at 66.1 m DSF (Section 8H-CC), 5.53° ± 0.0087°C at 94.6 m DSF (Section 10H-CC), and 7.02° ± 0.0078°C at 118.7 m DSF (Section 13H-CC).
These temperatures yield a geothermal gradient of 66.79° ± 0.5°C/km, which is slightly lower than the gradient observed in Hole U1572B. Because the measurement was made on top of a topographic high, the topographic effect is likely a contributing factor to this difference (Kunath et al., 2020).
8.3. Summary
The priority target for Hole U1574A was to characterize the nature of Eldhø, an Outer High on the Vøring Margin. Wireline logging operations achieved important petrophysical and imaging data for the basaltic basement interval. The pillow lavas are characterized by high densities of ~2.6 g/cm3, fluctuating velocities ranging ~3–5.2 km/s, and associated low GR of ~9 gAPI. FMS imaging documents pillow structures and lava flow units with highly vesicular basalt in the upper flow top region. Whether these units were emplaced subaerially or subaqueous like the surrounding pillows is currently unconstrained. Wireline data also show the presence of three thin sediment layers with elevated GR and a much thicker interval of high GR (~70 gAPI) associated with a ~30 m interval with almost no core recovery. This interval was imaged using the FMS, which records a resistive fractured unit with some pillow-like features and sedimentary layering features toward the base.
References
Barke, J., Abels, H.A., Sangiorgi, F., Greenwood, D.R., Sweet, A.R., Donders, T., Reichart, G.-J., Lotter, A.F., and Brinkhuis, H., 2011. Orbitally forced Azolla blooms and middle Eocene Arctic hydrology: clues from palynology. Geology, 39(5):427–430. https://doi.org/10.1130/G31640.1
Berndt, C., Planke, S., Alvestad, E., Tsikalas, F., and Rasmussen, T., 2001. Seismic volcanostratigraphy of the Norwegian Margin: constraints on tectonomagmatic break-up processes. Journal of the Geological Society (London, UK), 158(3):413–426. https://doi.org/10.1144/jgs.158.3.413
Bijl, P.K., 2022. DINOSTRAT: a global database of the stratigraphic and paleolatitudinal distribution of Mesozoic–Cenozoic organic-walled dinoflagellate cysts. Earth System Science Data, 14(2):579–617. https://doi.org/10.5194/essd-14-579-2022
Brinkhuis, H., Schouten, S., Collinson, M.E., Sluijs, A., Sinninghe Damsté, J.S., Dickens, G.R., Huber, M., Cronin, T.M., Onodera, J., Takahashi, K., Bujak, J.P., Stein, R., van der Burgh, J., Eldrett, J.S., Harding, I.C., Lotter, A.F., Sangiorgi, F., van Konijnenburg-van Cittert, H., de Leeuw, J.W., Matthiessen, J., Backman, J., and Moran, K., 2006. Episodic fresh surface waters in the Eocene Arctic Ocean. Nature, 441(7093):606–609. https://doi.org/10.1038/nature04692
Bujak, J., and Mudge, D., 1994. A high-resolution North Sea Eocene dinocyst zonation. Journal of the Geological Society (London, UK), 151(3):449–462. https://doi.org/10.1144/gsjgs.151.3.0449
Chadima, M., and Hrouda, F., 2006. Remasoft 3.0 a user-friendly paleomagnetic data browser and analyzer. Travaux Géophysiques, 27:20–21.
Eldholm, O., Thiede, J., and Taylor, E., 1989. The Norwegian continental margin: tectonic, volcanic, and paleoenvirontmental framework. In Eldholm, O., Thiede, J., Taylor, E., et al., Proceedings of the Ocean Drilling Program, Scientific Results, 104: College Station, TX (Ocean Drilling Program), 5–26. https://doi.org/10.2973/odp.proc.sr.104.110.1989
Eldrett, J.S., Greenwood, D.R., Polling, M., Brinkhuis, H., and Sluijs, A., 2014. A seasonality trigger for carbon injection at the Paleocene–Eocene Thermal Maximum. Climate of the Past, 10(2):759–769.
https://doi.org/10.5194/cp-10-759-2014
Franke, D., Klitzke, P., Barckhausen, U., Berglar, K., Berndt, C., Damm, V., Dannowski, A., Ehrhardt, A., Engels, M., Funck, T., Geissler, W., Schnabel, M., Thorwart, M., and Trinhammer, P., 2019. Polyphase magmatism during the formation of the northern East Greenland continental margin. Tectonics, 38(8):2961–2982. https://doi.org/10.1029/2019TC005552
Heesemann, M., 2008. Advances in the acquisition and processing of subseafloor temperature and pressure data and their interpretation in the context of convergent margin processes [PhD dissertation]. University of Bremen, Bremen, Germany.
Hopper, J.R., Mutter, J.C., Larson, R.L., and Mutter, C.Z., 1992. Magmatism and rift margin evolution: Evidence from northwest Australia. Geology, 20(9):853–857.
https://doi.org/10.1130/0091-7613(1992)020%3C0853:MARMEE%3E2.3.CO;2
Jones, M.T., and Gislason, S.R., 2008. Rapid releases of metal salts and nutrients following the deposition of volcanic ash into aqueous environments. Geochimica et Cosmochimica Acta, 72(15):3661–3680. https://doi.org/10.1016/j.gca.2008.05.030
Kokelaar, B.P., 1983. The mechanism of Surtseyan volcanism. Journal of the Geological Society (London, UK), 140(6):939–944. https://doi.org/10.1144/gsjgs.140.6.0939
Kunath, P., Chi, W.-C., Berndt, C., Chen, L., Liu, C.-S., Kläschen, D., and Muff, S., 2020. A shallow seabed dynamic gas hydrate system off SW Taiwan: results From 3-D seismic, thermal, and fluid migration analyses. Journal of Geophysical Research: Solid Earth, 125(11):e2019JB019245‐T. https://doi.org/10.1029/2019JB019245
Longman, J., Palmer, M.R., Gernon, T.M., and Manners, H.R., 2019. The role of tephra in enhancing organic carbon preservation in marine sediments. Earth-Science Reviews, 192:480–490.
https://doi.org/10.1016/j.earscirev.2019.03.018
Lyons, T.W., Murray, R.W., and Pearson, D.G., 2000. A comparative study of diagenetic pathways in sediments of the Caribbean Sea: highlights from pore-water results. In Leckie, R.M., Sigurdsson, H., Acton, G.D., and Draper, G. (Eds.), Proceedings of the Ocean Drilling Program, Scientific Results, 165: College Station, TX (Ocean Drilling Program). https://doi.org/10.2973/odp.proc.sr.165.020.2000
Meyer, R., Hertogen, J., Pedersen, R.B., Viereck-Götte, L., and Abratis, M., 2009. Interaction of mantle derived melts with crust during the emplacement of the Vøring Plateau, N.E. Atlantic. Marine Geology, 261(1–4):3–16. https://doi.org/10.1016/j.margeo.2009.02.007
Millett, J.M., Wilkins, A.D., Campbell, E., Hole, M.J., Taylor, R.A., Healy, D., Jerram, D.A., Jolley, D.W., Planke, S., Archer, S.G., and Blischke, A., 2016. The geology of offshore drilling through basalt sequences: understanding operational complications to improve efficiency. Marine and Petroleum Geology, 77:1177–1192. https://doi.org/10.1016/j.marpetgeo.2016.08.010
Planke, S., Berndt, C., Alvarez Zarikian, C.A., Agarwal, A., Andrews, G.D.M., Betlem, P., Bhattacharya, J., Brinkhuis, H., Chatterjee, S., Christopoulou, M., Clementi, V.J., Ferré, E.C., Filina, I.Y., Frieling, J., Guo, P., Harper, D.T., Jones, M.T., Lambart, S., Longman, J., Millett, J.M., Mohn, G., Nakaoka, R., Scherer, R.P., Tegner, C., Varela, N., Wang, M., Xu, W., Yager, S.L., 2023a. Expedition 396 methods. In Planke, S., Berndt, C., Alvarez Zarikian, C.A., and the Expedition 396 Scientists, Mid-Norwegian Margin Magmatism and Paleoclimate Implications. Proceedings of the International Ocean Discovery Program, 396: College Station, TX (International Ocean Discovery Program). https://doi.org/10.14379/iodp.proc.396.102.2023
Planke, S., Berndt, C., Alvarez Zarikian, C.A., Agarwal, A., Andrews, G.D.M., Betlem, P., Bhattacharya, J., Brinkhuis, H., Chatterjee, S., Christopoulou, M., Clementi, V.J., Ferré, E.C., Filina, I.Y., Frieling, J., Guo, P., Harper, D.T., Jones, M.T., Lambart, S., Longman, J., Millett, J.M., Mohn, G., Nakaoka, R., Scherer, R.P., Tegner, C., Varela, N., Wang, M., Xu, W., Yager, S.L., 2023b. Site U1573. In Planke, S., Berndt, C., Alvarez Zarikian, C.A., and the Expedition 396 Scientists, Mid-Norwegian Margin Magmatism and Paleoclimate Implications. Proceedings of the International Ocean Discovery Program, 396: College Station, TX (International Ocean Discovery Program). https://doi.org/10.14379/iodp.proc.396.108.2023
Planke, S., Berndt, C., Alvarez Zarikian, C.A., Agarwal, A., Andrews, G.D.M., Betlem, P., Bhattacharya, J., Brinkhuis, H., Chatterjee, S., Christopoulou, M., Clementi, V.J., Ferré, E.C., Filina, I.Y., Frieling, J., Guo, P., Harper, D.T., Jones, M.T., Lambart, S., Longman, J., Millett, J.M., Mohn, G., Nakaoka, R., Scherer, R.P., Tegner, C., Varela, N., Wang, M., Xu, W., Yager, S.L., 2023c. Sites U1571 and U1572. In Planke, S., Berndt, C., Alvarez Zarikian, C.A., and the Expedition 396 Scientists, Mid-Norwegian Margin Magmatism and Paleoclimate Implications. Proceedings of the International Ocean Discovery Program: College Station, TX (International Ocean Discovery Program). https://doi.org/10.14379/iodp.proc.396.107.2023
Planke, S., Symonds, P.A., Alvestad, E., and Skogseid, J., 2000. Seismic volcanostratigraphy of large-volume basaltic extrusive complexes on rifted margins. Journal of Geophysical Research: Solid Earth, 105(B8):19335–19351. https://doi.org/10.1029/1999JB900005
Seyfried, W.E., and Mottl, M.J., 1982. Hydrothermal alteration of basalt by seawater under seawater-dominated conditions. Geochimica et Cosmochimica Acta, 46(6):985–1002. https://doi.org/10.1016/0016-7037(82)90054-0
Sluijs, A., Schouten, S., Donders, T.H., Schoon, P.L., Röhl, U., Reichart, G.-J., Sangiorgi, F., Kim, J.-H., Sinninghe Damsté, J.S., and Brinkhuis, H., 2009. Warm and wet conditions in the Arctic region during Eocene Thermal Maximum 2. Nature Geoscience, 2(11):777–780. https://doi.org/10.1038/ngeo668
Spiegler, D., and Jansen, E., 1989. Planktonic foraminifer biostratigraphy of Norwegian Sea sediments: ODP Leg 104. In Eldholm, O., Thiede, J., Taylor, E., et al., Proceedings of the Ocean Drilling Program, Scientific Results, 104: College Station, TX (Ocean Drilling Program), 681–696. https://doi.org/10.2973/odp.proc.sr.104.157.1989
Tegner, C., Lesher, C.E., Larsen, L.M., and Watt, W.S., 1998. Evidence from the rare-earth-element record of mantle melting for cooling of the Tertiary Iceland plume. Nature, 395(6702):591–594. https://doi.org/10.1038/26956
Wade, B.S., Pearson, P.N., Berggren, W.A., and Pälike, H., 2011. Review and revision of Cenozoic tropical planktonic foraminiferal biostratigraphy and calibration to the geomagnetic polarity and astronomical time scale. Earth-Science Reviews, 104(1–3):111–142. https://doi.org/10.1016/j.earscirev.2010.09.003
Willard, D.A., Donders, T.H., Reichgelt, T., Greenwood, D.R., Sangiorgi, F., Peterse, F., Nierop, K.G.J., Frieling, J., Schouten, S., and Sluijs, A., 2019. Arctic vegetation, temperature, and hydrology during early Eocene transient global warming events. Global and Planetary Change, 178:139–152.
https://doi.org/10.1016/j.gloplacha.2019.04.012
Zijderveld, J.D.A., 2013. A. C. demagnetization of rocks: analysis of results. In Collinson, D.W., Creer, K.M., and Runcorn, S.K. (Eds.), Methods in Paleomagnetism. Developments in Solid Earth Geophysics, 3: New York (Elsevier), 254–286. https://doi.org/10.1016/B978-1-4832-2894-5.50049-5