Lucchi, R.G., St. John, K.E.K., Ronge, T.A., and the Expedition 403 Scientists
Proceedings of the International Ocean Discovery Program Volume 403
publications.iodp.org
https://doi.org/10.14379/iodp.proc.403.106.2026
Sites U1621–U16231
![]() R.G. Lucchi,
R.G. Lucchi,
![]() K.E.K. St. John,
K.E.K. St. John,
![]() T.A. Ronge,
T.A. Ronge,
![]() M.A. Barcena,
M.A. Barcena,
![]() S. De Schepper,
S. De Schepper,
![]() L.C. Duxbury,
L.C. Duxbury,
![]() A.C. Gebhardt,
A.C. Gebhardt,
![]() A. Gonzalez-Lanchas,
A. Gonzalez-Lanchas,
![]() G. Goss,
G. Goss,
![]() N.M. Greco,
N.M. Greco,
![]() J. Gruetzner,
J. Gruetzner,
![]() L. Haygood,
L. Haygood,
![]() K. Husum,
K. Husum,
![]() M. Iizuka,
M. Iizuka,
![]() A.K.I.U. Kapuge,
A.K.I.U. Kapuge,
![]() A.R. Lam,
A.R. Lam,
![]() O. Libman-Roshal,
O. Libman-Roshal,
![]() Y. Liu,
Y. Liu,
![]() L.R. Monito,
L.R. Monito,
![]() B.T. Reilly,
B.T. Reilly,
![]() Y. Rosenthal,
Y. Rosenthal,
![]() Y. Sakai,
Y. Sakai,
![]() A.V. Sijinkumar,
A.V. Sijinkumar,
![]() Y. Suganuma, and
Y. Suganuma, and
![]() Y. Zhong2
Y. Zhong2
1 Lucchi, R.G., St. John, K.E.K., Ronge, T.A., Barcena, M.A., De Schepper, S., Duxbury, L.C., Gebhardt, A.C., Gonzalez-Lanchas, A., Goss, G., Greco, N.M., Gruetzner, J., Haygood, L., Husum, K., Iizuka, M., Kapuge, A.K.I.U., Lam, A.R., Libman-Roshal, O., Liu, Y., Monito, L.R., Reilly, B.T., Rosenthal, Y., Sakai, Y., Sijinkumar, A.V., Suganuma, Y., and Zhong, Y., 2026. Sites U1621–U1623. In Lucchi, R.G., St. John, K.E.K., Ronge, T.A., and the Expedition 403 Scientists, Eastern Fram Strait Paleo-Archive. Proceedings of the International Ocean Discovery Program, 403: College Station, TX (International Ocean Discovery Program). https://doi.org/10.14379/iodp.proc.403.106.2026
2 Expedition 403 Scientists’ affiliations.
1. Background and objectives
The Bellsund drift coring sites are located on a plastered sediment drift that developed along the lower continental slope (1700–1800 m water depth) of the western margin of Svalbard under the influence of the northward-flowing West Spitsbergen Current (WSC) (Rebesco et al., 2013) (Figure F1). The Bellsund drift has built up over millions of years since the opening of the Fram Strait (17–10 Ma) (Jakobsson et al., 2007; Engen et al., 2008; Ehlers and Jokat, 2013), which determined the onset of the contour current circulation system in the area (Eiken and Hinz, 1993; Gebhardt et al., 2014), with development of sediment drifts covering large areas of the European North Atlantic margin, including the Norwegian Sea, Barents Sea, the western margin of Svalbard, and along the eastern side of the Fram Strait (Laberg et al., 2005). Sediment drifts are depocenters developing under persistent bottom currents (Stow et al., 2002; Rebesco, 2014b) that substantially rework the sediments delivered to the marine environment through terrestrial and marine processes. The bottom currents transport sediments, oxygen, and nutrients along the margin, making the environment ideal for biological productivity with sediments rich in carbonate biogenic fraction if postmortem diagenetic conditions allow for their preservation. The Bellsund drift recorded the continental input associated with the expansion and retreat of the paleo-Svalbard–Barents Sea Ice Sheet (SBSIS) during the past glacial and interglacial cycles (glacial debris flows and sediment-laden meltwater plumes) and the variability of the warm WSC through its effect on the marine biological productivity in the water column (Lucchi et al., 2018; Caricchi et al., 2019; Torricella et al., 2022, 2025; Gamboa Sojo et al., 2024). Its location between the Storfjorden Trough Mouth Fan (TMF) to the south and the Bellsund TMF to the north provided some protection from direct glacigenic input from the paleo-SBSIS during the past glaciations while still capturing a record of the ice sheet dynamics.
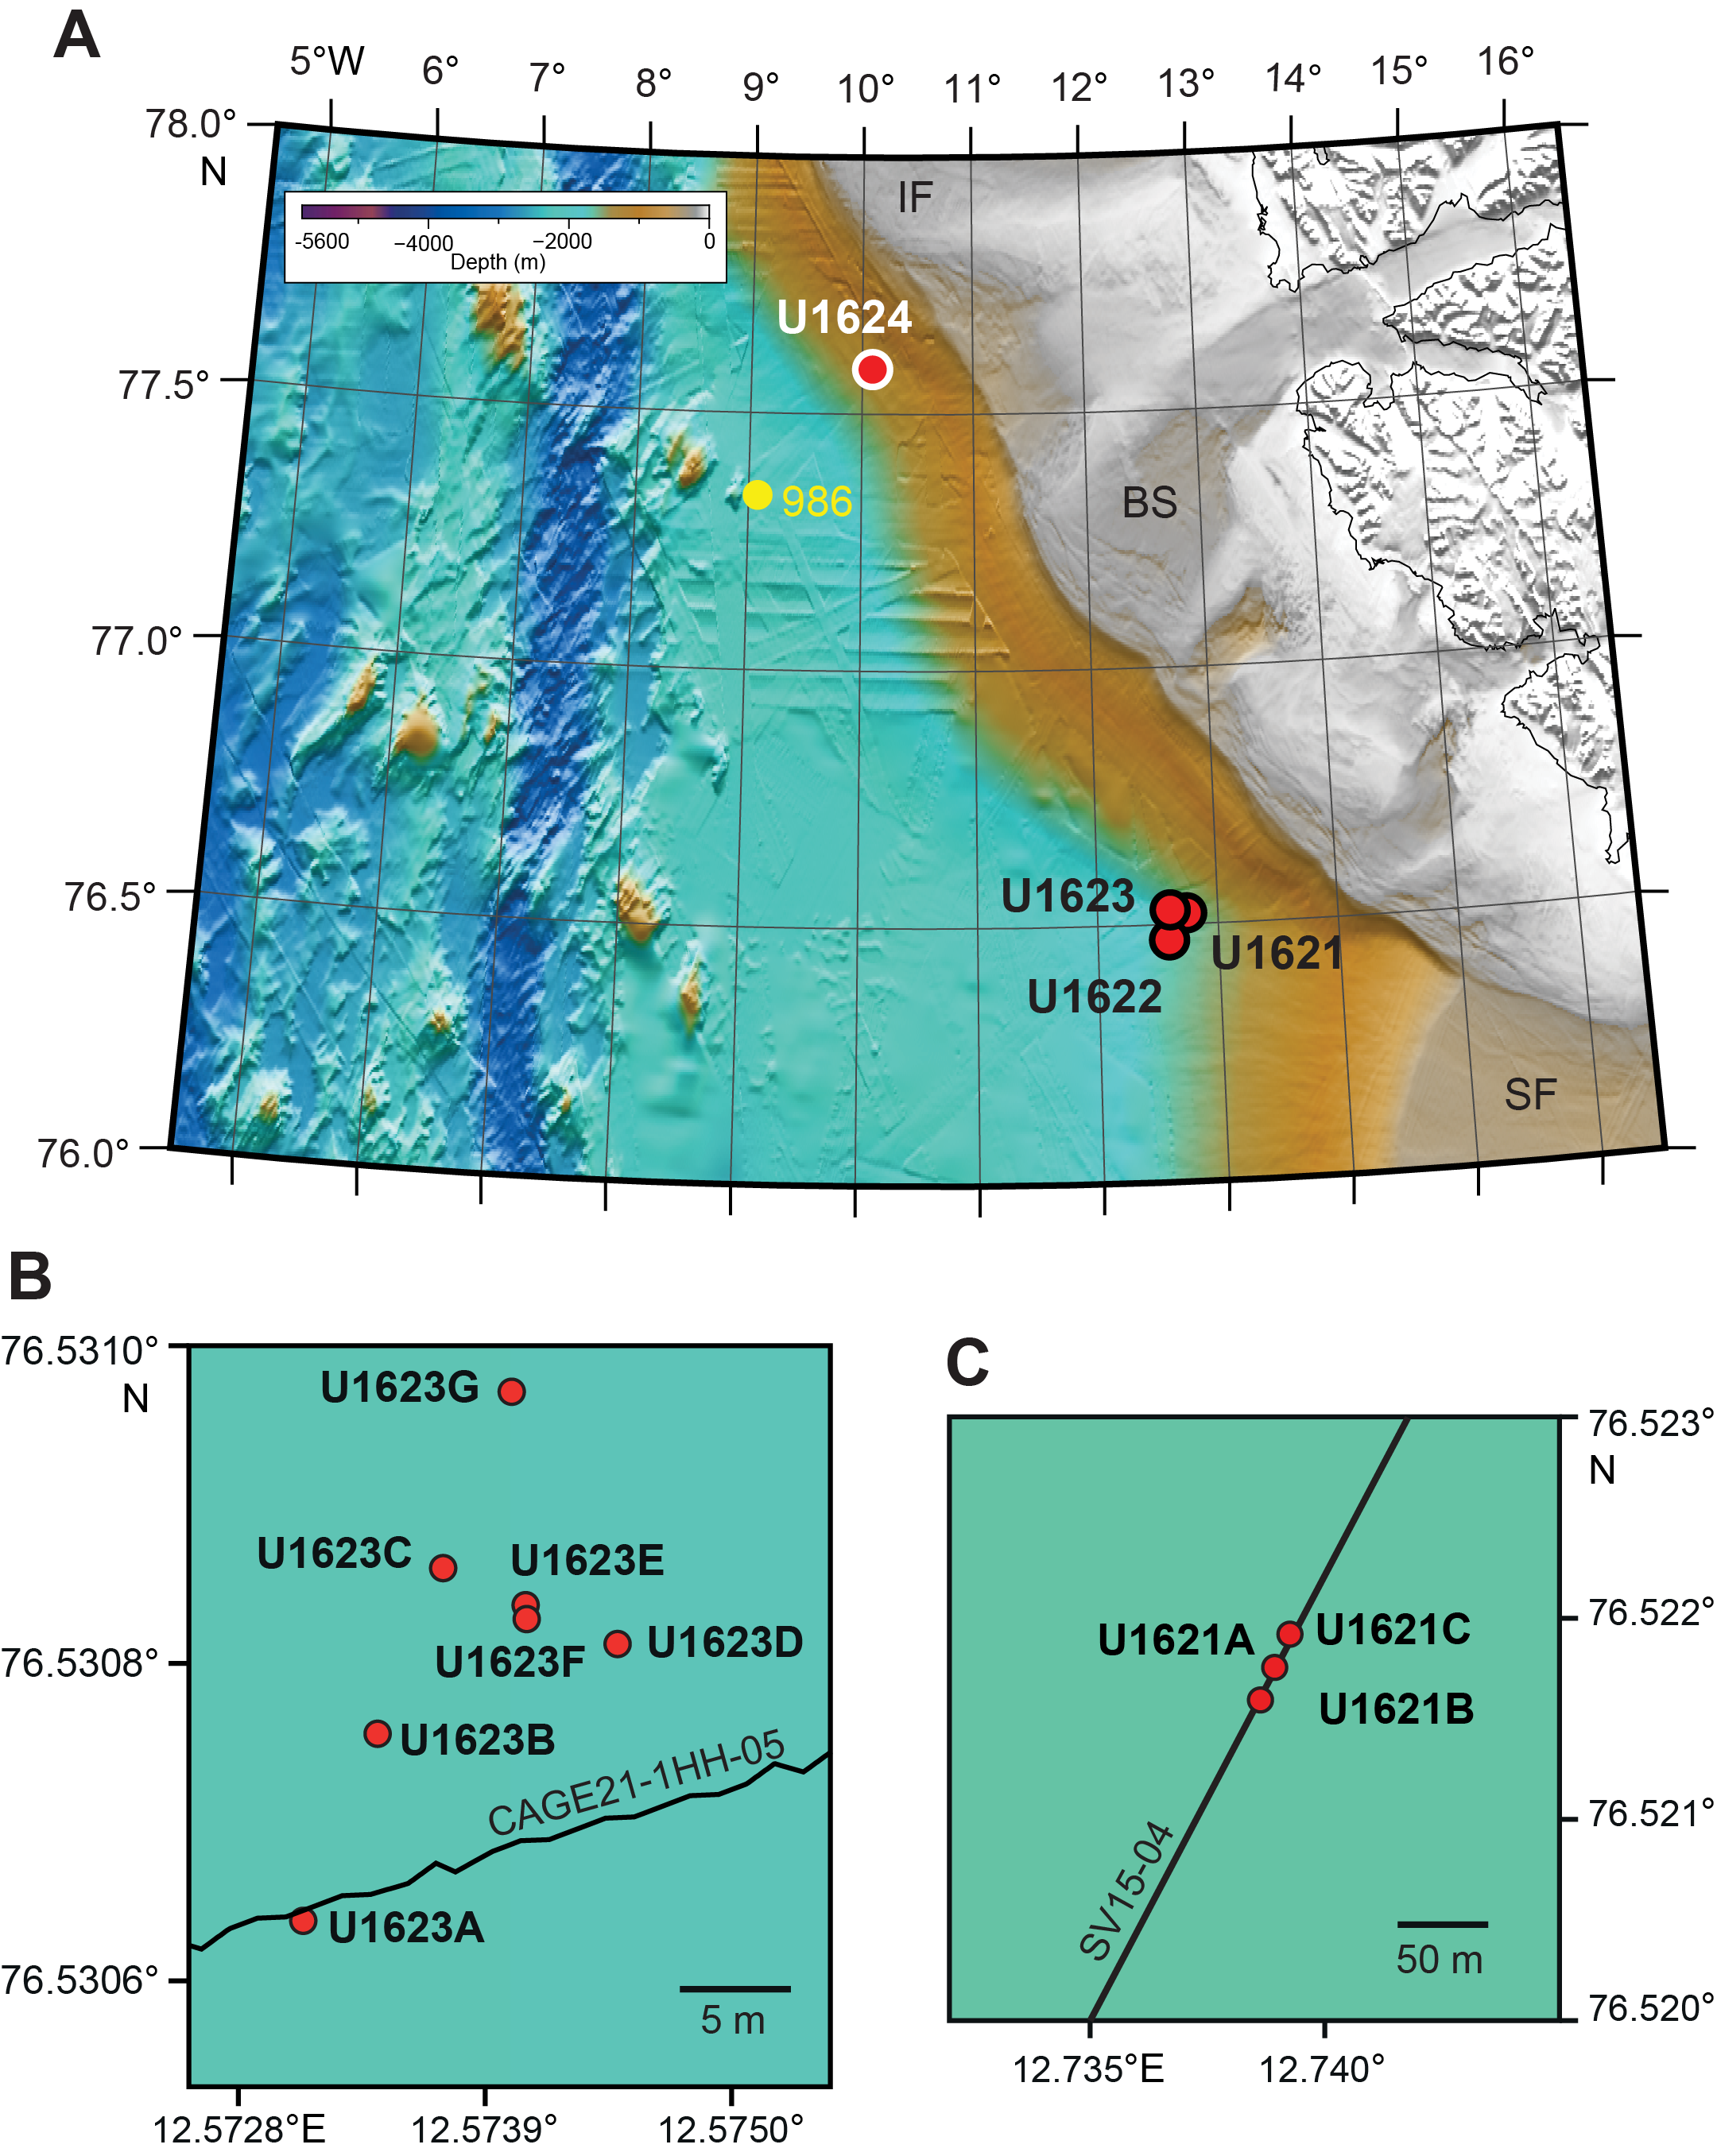
Figure F1. Bathymetric map.
Piston core work in this area demonstrates that the Bellsund drift is an excellent setting to recover continuous, expanded, and datable sedimentary sequences for detailed paleoclimatic and paleoceanographic analyses. The 2014 Eurofleets2-PREPARED project (Lucchi et al., 2014) recovered a long Calypso piston core from the Bellsund drift that contains a continuous, very expanded paleoclimatic record spanning the last 40 ky with up to subcentennial resolution. A robust age model was defined through paleomagnetic and biostratigraphic analyses, the identification of tephras, and radiocarbon dating of the abundant biogenic carbonate fraction (Caricchi et al., 2019, 2020). The sedimentologic analyses indicate the consistent presence of contouritic deposition and the existence of short-lived, abrupt depositional events associated with prominent meltwater events, including the MWP-1A (Lucchi et al., 2013, 2015); the MWP-1A0 (Caricchi et al., 2019), also known as MWP-19ka (Yokoyama et al., 2000, Clark et al., 2004); and Heinrich-like events indicating a highly dynamic paleo-SBSIS during the last 60 ky (Lucchi et al., 2018; Caricchi et al., 2019).
The drill sites on the Bellsund drift (Sites U1621 and U1623) are designed to recover an expanded sedimentary sequence to specifically examine suborbital oscillations of the last 100 ky, the mid-Brunhes event (~400 ka), the mid-Pleistocene transition (~1.2–0.7 Ma), and the primary establishment of shelf edge-glaciation in this area at about 1.3 Ma corresponding to Seismic Reflector R4A (Rebesco et al., 2014a). Site U1621 (Figure F2A) was chosen because seismic profiles indicate a highly expanded sediment record down to Seismic Reflector R3 (~0.75 Ma), with sedimentation rates potentially exceeding 300 m/My. Three holes were drilled at Site U1621 (Figure F1C) down to Seismic Reflector R3 (~225 meters below seafloor [mbsf]) with a maximum penetration depth of 216 mbsf. Because of a discrepancy in coordinate transcription, Site U1622 was drilled into the Storfjorden TMF (~8 km from the intended site) to 46.5 mbsf (Figure F2B). Site U1623 was located ~4.4 km downslope from Site U1621 (Figure F2A) to drill a longer record down to Seismic Reflector R4A (~1.3 Ma; ~347 mbsf). Seven holes were drilled at Site U1623 (Figure F1B) with a maximum drilled depth of 370 mbsf. Water depths at all three sites were between 1636 and 1715 m.
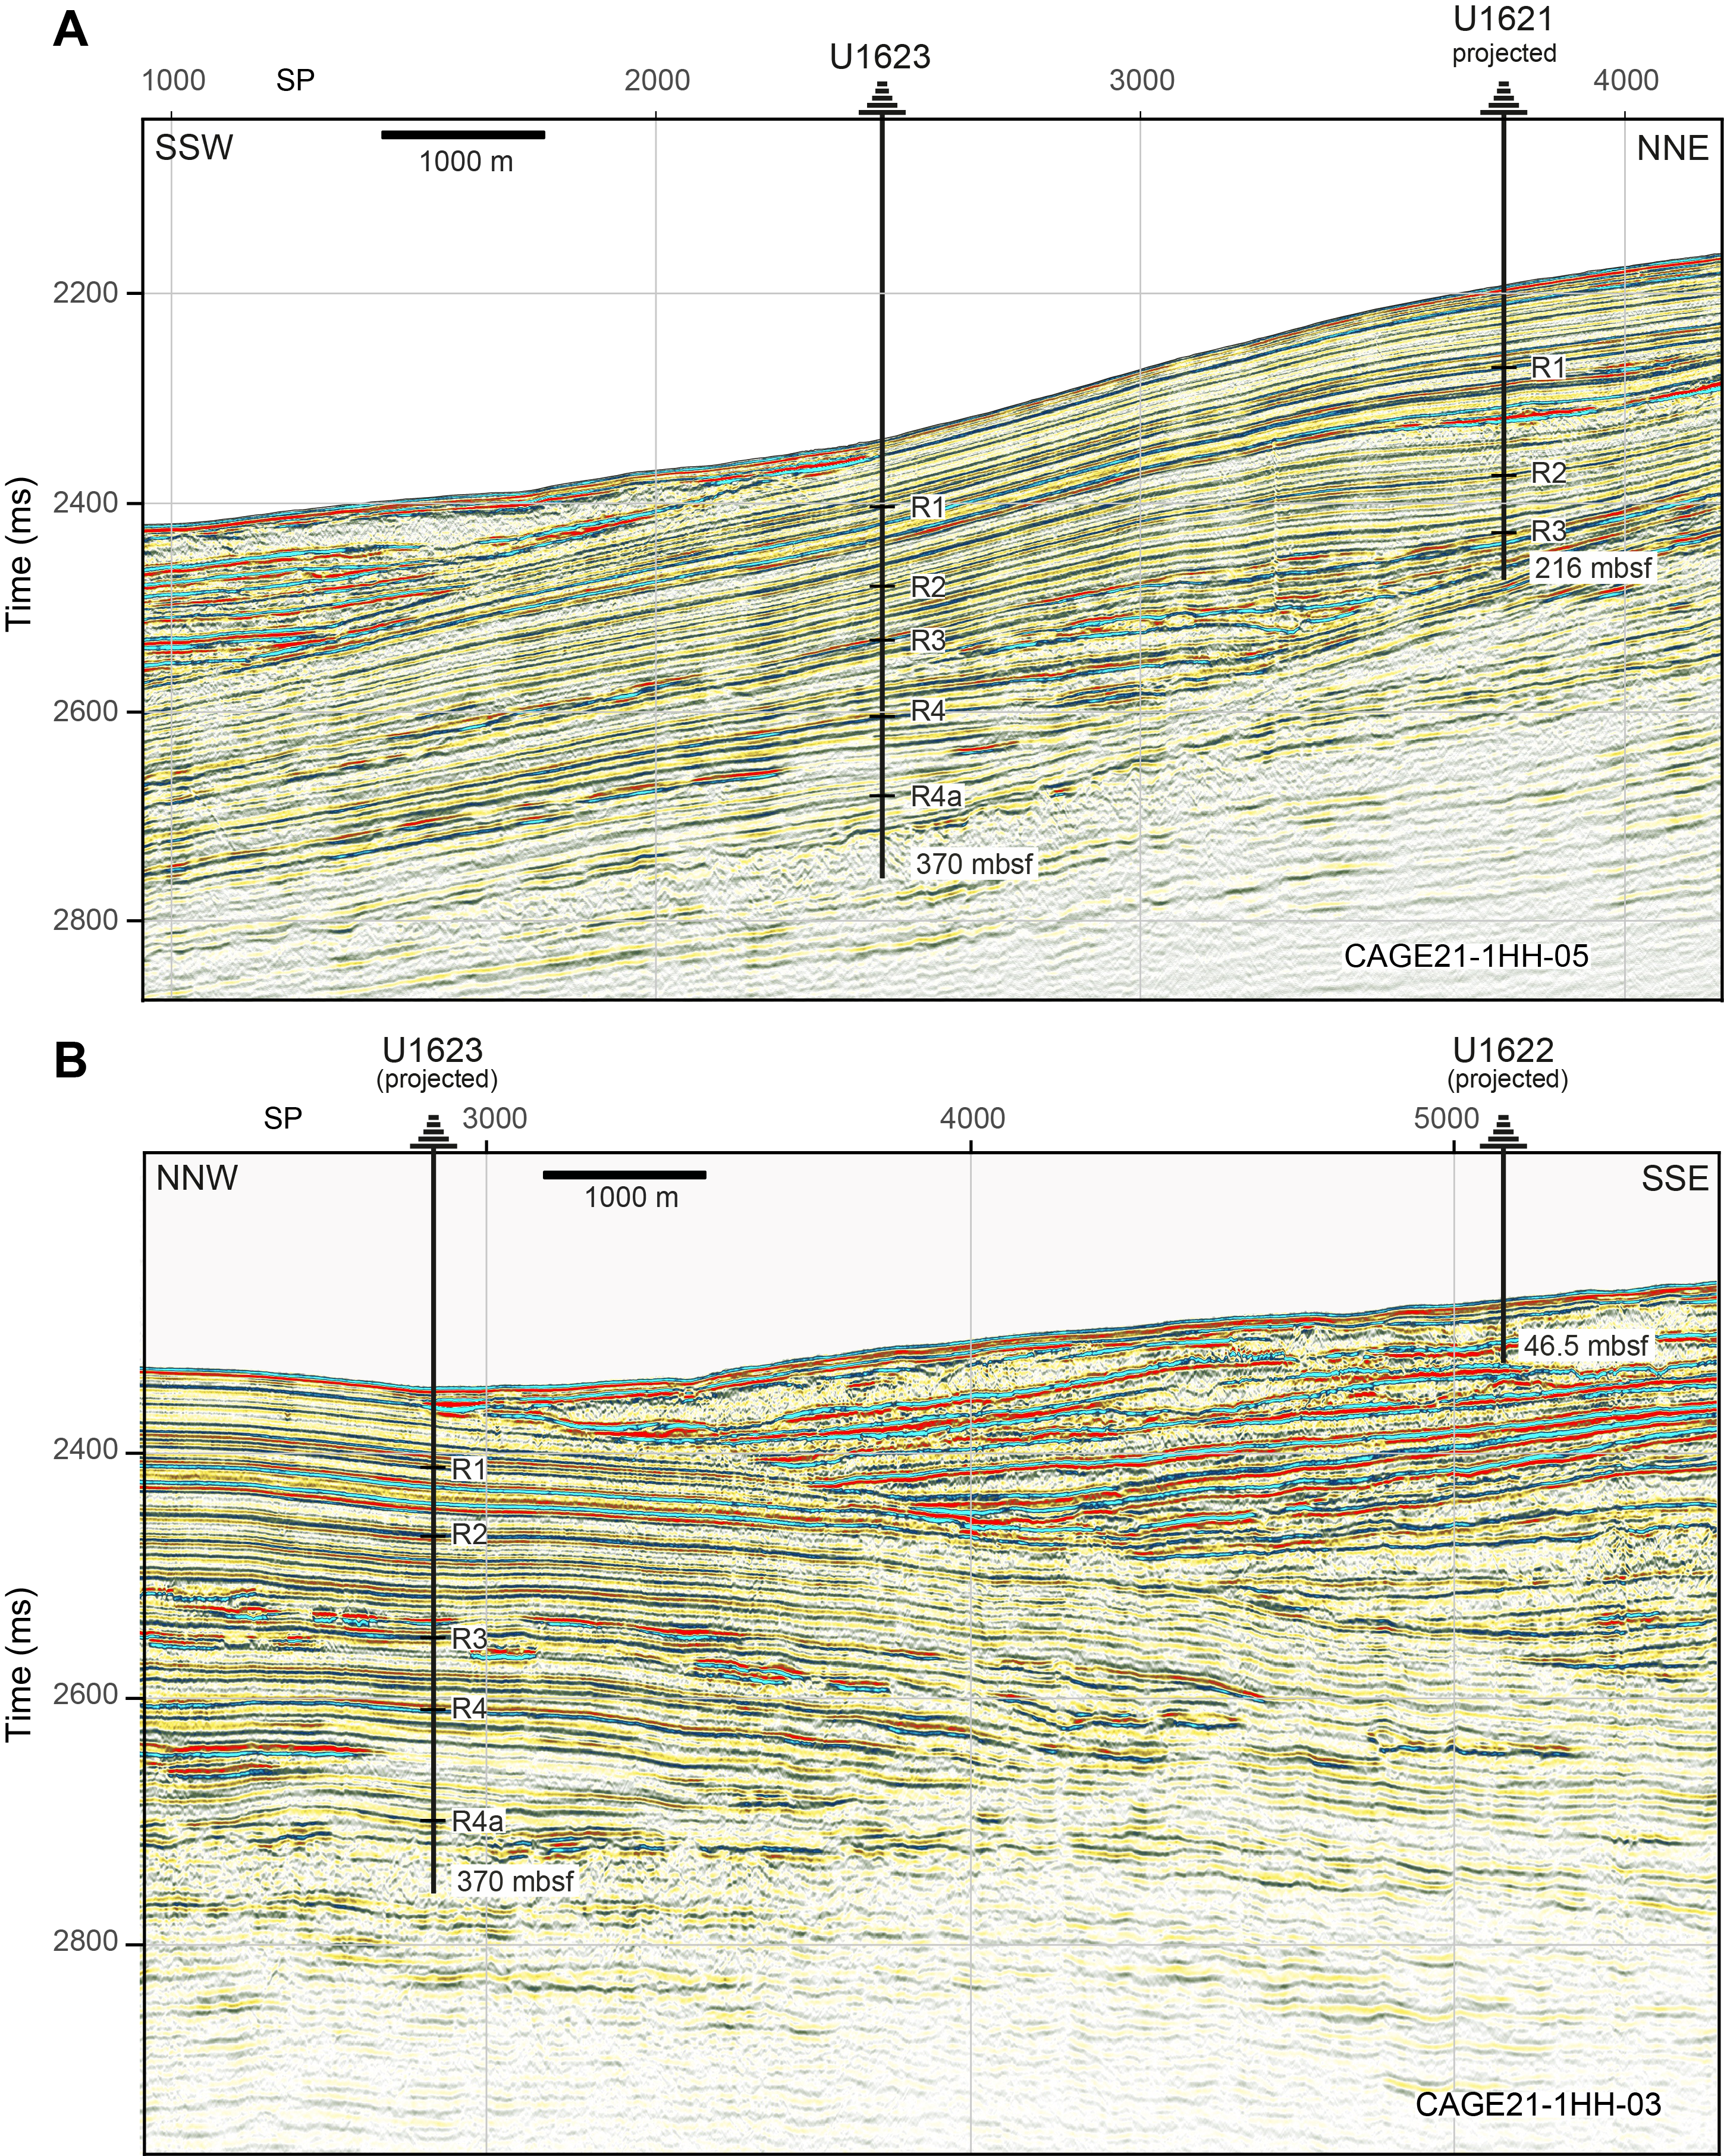
Figure F2. Seismic profile.
The research objectives for these sites include the following:
- Reconstruction of a high-resolution sediment stratigraphy since the onset of Pleistocene shelf-edge glaciation;
- Study of ocean-cryosphere interactions and forcing mechanisms on the paleo–ice sheet dynamics; and
- Investigation of the influence of the WSC variability through time on the ice coverage, climate, and microbial populations and to what extent this is still affecting contemporary geochemical fluxes.
2. Operations
In total, we spent 4.27 days at Site U1621 and penetrated a maximum depth of 216.1 mbsf with a combined penetration of 639.3 m. The cored interval of 517.3 m resulted in a recovered length of 464.62 m. Site U1621 consists of three holes that stretch across a 40 m interval (20 m between holes). Hole U1621A is located on Seismic Line SV15-04, and the other holes were offset at a bearing of 22° along the seismic line. We took 89 cores in total: 45% with the advanced piston corer (APC) system (40 cores), 24% with the half-length APC (HLAPC) system (21 cores), and 31% with the extended core barrel (XCB) system (28 cores).
At Site U1622, we spent 0.54 days in total and penetrated to a maximum depth of 46.5 mbsf. The cored interval of 46.5 m resulted in a recovered length of 46.26 m. Site U1622 consists of only one hole. During coring operations, it was discovered that the coordinates for proposed Site BED-02B (Lucchi et al., 2023) were not the coordinates of the approved shot point for the site. Upon discovery, coring was terminated, the correct coordinates were calculated, and the vessel departed for Site U1623 (proposed Site BED-02B). We took seven cores in total at Site U1622: 86% with the APC system (6 cores) and 14% with the HLAPC system (1 core).
In total, we spent 10.3 days at Site U1623 and penetrated to a maximum depth of 370 mbsf with a combined penetration of 1422.4 m. The cored interval of 1422.4 m resulted in a recovered length of 1314.38 m. Site U1623 consists of seven holes. Hole U1623A is located on Seismic Line CAGE21-1HH-05. Holes U1623B, U1623C, and U1623G stretch along a 60 m long transect from Hole U1623A at a bearing of 22°. Holes U1623C and U1623D are 20 m apart at a bearing of 110°, with Holes U1623E and U1623F in the middle between Holes U1623C and U1623D. Holes U1623B and U1623E did not recover a good mudline; thus, coring was abandoned after one core. It was determined that Hole U1623F sidetracked into an adjacent hole; thus, coring was terminated after Core 22F. We took 205 cores in total: 29% with the APC system (58 cores), 30% with the HLAPC system (62 cores), and 41% with the XCB system (85 cores).
To minimize magnetic overprinting on the cored sediment, nonmagnetic collars and core barrels were used for all APC and HLAPC coring at Sites U1621–U1623. Most holes had intervals where the sediments expanded due to the presence of gas, resulting in recoveries sometimes exceeding 100% as well as intervals of poor recovery due to the presence of clast-rich glacial deposits (Tables T1, T2, T3). To mitigate the impact of expansion and the potential for core disturbance and to release the pressure, holes were drilled into the liner by the drill crew on the rig floor and the technical staff on the core receiving platform. In addition, some XCB cores were advanced by 8 m to allow for gas expansion of the sediments in the liners. Initially, downhole logging was attempted in Hole U1623C with the triple combination (triple combo) and Formation MicroScanner (FMS)-sonic tool strings. However, because an obstruction made it impossible for the logging tools to exit the bottom-hole assembly (BHA), logging was terminated in Hole U1623C. A second downhole logging attempt was successfully completed in Hole U1623D.
To more easily communicate shipboard results, core depth below seafloor, Method A (CSF-A), depths in this chapter are reported as mbsf unless otherwise noted.
2.1. Site U1621
2.1.1. Hole U1621A
The vessel completed the 138.0 nmi transit from Site U1620 in 11.5 h at an average speed of 12.0 kt. Thrusters were down and secure and the vessel in full automatic dynamic positioning (DP) mode at 0743 h local time (UTC + 2 h) on 7 July 2024, beginning operations at Site U1621. Site U1621 was initially planned for two cored holes, both to the approved depth of 397.0 mbsf. Three holes were eventually cored. However, a gravel layer caused coring to be terminated prior to the approved depth in all three holes. An APC/XCB BHA was assembled, and Hole U1621A was spudded at 1320 h. The seafloor depth was calculated to be 1638.6 meters below sea level (mbsl) based on recovery from Core 1H. Coring continued with the APC system to 86.3 mbsf (Cores 1H–10H). Because of gas expansion in the cores, it was decided to switch to the XCB system and use advances of 8.0 m to allow for expansion of the sediments in the liners. The XCB system was used to core from 86.3 to 108.8 mbsf (Cores 11X–14X), and coring was switched back to the APC system due to poor recovery. The APC system was then used to 139.8 mbsf (Cores 15H–18H). Partial strokes were noted on Cores 16H–18H, and a broken liner was noted on Core 17H. Coring was switched to the HLAPC system to advance the hole to 157.1 mbsf (Cores 19F–22F). Partial strokes were recorded on Cores 21F and 22F; therefore, these were advanced by recovery and ended HLAPC coring. Hole U1621A was advanced to its total depth of 215.3 mbsf using the XCB system (Cores 23X–28X). The rate of penetration slowed, and recovery was low for the final two cores. It appeared that the bit had reached a gravel layer. Coring was terminated after Core 28X, and the bit was pulled out of the hole, clearing the seafloor at 1745 h on 8 July and ending Hole U1621A.
A total of 28 cores were taken over a 215.3 m interval with 180.40 m of recovery (84%) (Table T1). The APC system was used for a total of 14 cores over a 117.3 m interval with 124.78 m of recovery (106%). The HLAPC system was used for 4 cores over a 17.3 m interval with 18.06 m of recovery (104%). The XCB system took 10 cores over an 80.7 m interval with 37.56 m of recovery (47%). The advanced piston corer temperature (APCT-3) tool was deployed on Cores 4H, 7H, and 10H. Nonmagnetic core barrels were used on all APC and HLAPC cores.
2.1.2. Hole U1621B
The vessel was offset 20 m at a bearing of 22°, and Hole U1621B was spudded at 2038 h on 8 July 2024. The seafloor depth was calculated to be 1636.5 mbsl based on recovery from Core 1H. Coring continued with the APC and HLAPC systems to 139.9 mbsf (Cores 1H–20F), when the XCB system was used to adjust for correlation purposes on Core 21X for an advance of 2.5 m. The HLAPC system was then deployed for Core 22F, for which a partial stroke was recorded. The XCB system was again used for Cores 23X–33X to advance the hole to its total depth of 216.1 mbsf, where the same gravel layer was encountered and coring was terminated. The bit was pulled out of the hole, clearing the seafloor at 0812 h on 10 July and ending Hole U1621B.
A total of 33 cores were taken over a 216.1 m interval, recovering 203.39 m of sediment (94%) (Table T1). The APC system was deployed for 10 cores over a 92.9 m interval with 98.16 m of recovery (106%); the HLAPC system was deployed for 11 cores over a 51.7 m interval with 55.23 m of recovery (107%); and the XCB system was deployed for 12 cores over a 71.5 m interval, recovering 50.00 m of sediment (70%). Nonmagnetic core barrels were used on all APC cores. Total time spent on Hole U1621B was 38.50 h (1.6 days).
2.1.3. Hole U1621C
The vessel was offset 20 m at 22° from Hole U1621B, and Hole U1621C was spudded at 1012 h on 10 July 2024. The seafloor was calculated to be 1635.9 mbsl based on recovery from Core 1H. The HLAPC system was deployed for Core 2F to support sediment recovery for microbiology sampling in the hole, after which APC coring continued to 147.9 mbsf (Cores 3H–17H), where partial strokes on Cores 16H and 17H signaled APC refusal. The HLAPC system was then redeployed and advanced the hole to 171.4 mbsf. The XCB system was deployed to advance the hole to its total depth of 207.9 mbsf (Cores 23X–28X), where the same gravel layer was encountered and coring was terminated. The bit was pulled out of the hole, clearing the seafloor at 1415 h on 11 July and ending Hole U1621C, and the vessel began a 4.6 nmi DP transit to Site U1622.
A total of 28 cores were taken over a 207.9 m interval, recovering 195.18 m of sediment (94%) (Table T1). The APC system was deployed for 16 cores over a 143.2 m interval with 148.5 m of recovery (104%); the HLAPC system was deployed for 6 cores over a 28.2 m interval with 30.90 m of recovery (110%); and the XCB system was deployed for 6 cores over a 36.5 m interval, recovering 15.83 m of sediment (43%). Nonmagnetic core barrels were used on all APC and HLAPC cores. A total of 30 h (1.3 days) were spent on Hole U1621C.
2.2. Site U1622
2.2.1. Hole U1622A
The vessel made the 4.6 nmi transit from Site U1621 to Site U1622 in DP mode, beginning the transit when the bit cleared the seafloor at Hole U1621C. The bit was pulled to the rig floor during the transit and changed for an APC roller-cone bit. The bit was deployed to depth while in transit and was ready upon arrival. The vessel arrived on site at 0012 h on 12 July 2024. Hole U1622A was spudded at 0244 h on 12 July. The seafloor was calculated to be 1707.5 mbsl based on recovery from Core 1H. APC coring continued to 41.8 mbsf. A gravel layer was encountered almost immediately, causing partial strokes on Cores 4H–6H. The HLAPC system was then deployed for Core 7F to 46.5 mbsf. At this time, it was determined that the coordinates in Lucchi et al. (2023) did not agree with the shotpoint listed as a reference. Calculations were done, and new coordinates were determined. The bit was pulled out of the hole to three stands above seafloor. The bit cleared the seafloor at 1305 h, and the vessel was underway to the coordinates for Site U1623 at 1312 h on 12 July, ending Hole U1622A.
A total of seven cores were taken over a 46.5 m interval, recovering 46.26 m of sediment (99%) (Table T2). The APC system was deployed for six cores over a 41.8 m interval with 41.15 m of recovery (98%), and the HLAPC system was deployed for one core over a 4.7 m interval with 5.11 m of recovery (109%). Nonmagnetic core barrels were used on all APC and HLAPC cores. Total time spent on Hole U1622A was 13.0 h (0.5 days).
2.3. Site U1623
2.3.1. Hole U1623A
The vessel began the 4.4 nmi move from Site U1622 to Site U1623 in DP mode when the bit cleared the seafloor at 1315 h on 12 July 2024 and arrived on location at 1800 h on the same day, making the transit in 4.4 h with an average speed of 0.92 kt.
The bit was lowered to the seafloor, and Hole U1623A was spudded at 1920 h on 12 July. The seafloor depth was calculated to be 1707.5 mbsl based on recovery from Core 1H. Coring continued with the APC system to 58.2 mbsf (Cores 1H–8H). Core 8H was a partial stroke with 0.43 m of recovery, and it was decided to attempt a HLAPC core to determine if the formation had changed or if a stiff layer was encountered. Core 9F was a full stroke, and another APC core was tried for Core 10H. This resulted in a partial stroke, and it was decided to continue to advance the hole using the HLAPC system. The HLAPC system was deployed from 72.1 to 142.6 mbsf (Cores 11F to 25F), where two partial strokes determined HLAPC refusal. The XCB system was then deployed to extend the hole from 146.2 mbsf to a final depth of 369.3 mbsf with Core 51X at 2200 h on 14 July. The bit pulled out of the hole, clearing the seafloor at 0011 h on 5 July and ending Hole U1623A.
A total of 51 cores were taken over a 369.3 m interval, recovering 330.72 m of sediment (90%) (Table T3). The APC system was deployed for 9 cores over a 67.4 m interval with 67.65 m of recovery (100%); the HLAPC system was deployed for 16 cores over a 75.2 m interval with 78.71 m of recovery (105%); and the XCB system was deployed for 51 cores over a 226.7 m interval, recovering 184.36 m of sediment (81%). Nonmagnetic core barrels were used on all APC and HLAPC cores. Total time on Hole U1623A was 54.25 h (2.3 days).
2.3.2. Hole U1623B
The vessel was offset 20 m at a bearing of 22°, and the drill string was flooded with perfluorocarbon tracer (PFT) for microbiology sampling on the hole. Hole U1623B was spudded at 0238 h on 15 July 2024 with Core 1H, recovering 0.05 m of rock and gravel. Hole U1623B was terminated at 0300 h in favor of achieving a better mudline. Total time on Hole U1623B was 2.75 h (0.1 days) (Table T3).
2.3.3. Hole U1623C
The vessel was offset 20 m at a bearing of 22°, and the drill string was flooded with PFT for microbiology sampling on the hole. Hole U1623C was spudded at 0320 h on 15 July 2024. The seafloor was estimated to be 1706.4 mbsl based on recovery from Core 1H. APC coring continued to 79.9 mbsf (Cores 1H–9H). Partial strokes on Cores 8H and 9H signaled APC refusal. The HLAPC system was then deployed to extend the hole to 163.4 mbsf (Cores 10F–28F), and the XCB system was deployed for a 7 m interval (Core 18X) for correlation purposes. Partial strokes on Cores 27F and 28F signaled HLAPC refusal. The XCB system was deployed to extend the hole to its final depth of 369.0 mbsf (Cores 29X–55X) at 0545 h on 17 July. The hole was then prepared for logging by pumping a 70 bbl sweep of sepiolite mud, and the bit was pulled to a logging depth of 65.5 mbsf. The Schlumberger equipment was rigged up, and the triple combo tool string was assembled and deployed. The tool string tagged an obstruction in the drill pipe approximately 80 m prior to exiting the bit. Efforts to pass the obstruction were unsuccessful, and the tool string was pulled to the surface. The top drive was picked up, moving the bit by about 2 m, and connected to the drill pipe, and the driller pressured up the drill string to approximately 1800 psi to clear the obstruction. Once the pressure returned to normal, a deplugger was deployed to verify that the drill string was clear. The bit was again placed at 65.5 mbsf, and the triple combo tool string was again deployed. The tool string encountered an obstruction as it was exiting the bit and was unable to pass. Logging was terminated, and the tool string was recovered and rigged down. The bit was recovered, clearing the seafloor at 1830 h and the rig floor at 2050 h on 17 July. The rig floor was secured for transit, and the vessel switched from DP to cruise mode at 2319 h on 17 July, ending Hole U1623C.
A total of 55 cores were taken over a 369 m interval, recovering 322.38 m of sediment (87%) (Table T3). The APC system was deployed for 9 cores over a 79.9 m interval with 73.68 m of recovery (93%); the HLAPC system was deployed for 18 cores over a 76.5 m interval with 75.90 m of recovery (99%); and the XCB system was deployed for 28 cores over a 212.6 m interval, recovering 172.8 m of sediment (91%). Nonmagnetic core barrels were used on all APC and HLAPC cores. Total time on Hole U1623C was 65.5 h (2.9 days). At this point, coring operations shifted to Site U1624.
2.3.4. Hole U1623D
Following coring operations at Site U1624, the decision was made to return to Site U1623 for additional coring and to reattempt logging at a new hole. The vessel was moved to coordinates that located it 20 m southeast of Hole U1623C, and an APC/XCB BHA was assembled and deployed. Hole U1623D was spudded at 0108 h on 22 July 2024. The seafloor was calculated to be 1715.6 mbsl based on recovery in Core 1H. Coring continued with the APC coring system to 103.9 mbsf (Cores 1H–13H). The HLAPC system was used once in this interval (Core 3F) for correlation purposes. There were partial strokes on Cores 6H, 10H, and 13H. The HLAPC system was then used to extend the hole to 156.4 mbsf (Cores 14F–25F). Partial strokes were recorded on Cores 17F, 23F, and 25F. The XCB coring system was then deployed to extend the hole to the total depth of 370 mbsf at Core 56X. On 23 July, XCB coring was paused for 1.5 h while the core winch depth indicator was repaired; the downtime occurred between Cores 34X and 35X.
After coring was completed on 24 July, the hole was conditioned for logging and the bit was pulled to a logging depth of 98.4 mbsf. The triple combo logging tool string was rigged up and deployed at 1230 h on 24 July. The tools reached 249.8 mbsf and began logging from that point. The triple combo run was completed, and the tools were recovered. The FMS-sonic tool string was rigged up and deployed at 1800 h on 24 July. The first pass of the FMS-sonic string reached 249.8 mbsf, but the second pass was only able to reach 227.8 mbsf before tagging an obstruction. The logging runs were completed, and the tools were recovered at 2200 h. The bit was then pulled out of the hole, clearing the seafloor at 2331 h on 24 July and ending Hole U1623D.
A total of 56 cores were taken over a 370 m interval, recovering 351.06 m of sediment (95%) (Table T3). The APC system was deployed for 12 cores over a 99.2 m interval with 100.62 m of recovery (101%); the HLAPC system was deployed for 13 cores over a 57.2 m interval with 60.94 m of recovery (107%); and the XCB system was deployed for 31 cores over a 213.6 m interval, recovering 189.50 m of sediment (89%). Nonmagnetic core barrels were used on all APC and HLAPC cores. The total time on Hole U1623D was 76.75 h (3.2 days).
2.3.5. Hole U1623E
The vessel was offset 10 m at a bearing of 292° from Hole U1623D, locating it approximately halfway between Holes U1623C and U1623D. Hole U1623E was spudded at 0238 h on 25 July 2024, with Core 1H recovering 9.6 m of core. The seafloor was calculated to be 1707.2 mbsl. However, with a full core barrel, it was decided to abandon the hole in favor of obtaining a better mudline core. The hole was ended at 0300 h on 25 July. Total time on Hole U1623E was 3.50 h (0.1 days) (Table T3).
2.3.6. Hole U1623F
The vessel was offset 1.5 m at a bearing of 180°, and Hole U1623F was spudded at 0323 h. The seafloor depth was calculated to be 1706.8 mbsl based on recovery from Core 1H. APC coring continued to 120.0 mbsf (Cores 1H–13H). There was poor recovery on Cores 11H–13H, and it was decided to use the HLAPC system to advance the hole in an attempt to increase recovery. The HLAPC system was deployed for Cores 14F–22F to 162.3 mbsf. Cores 11H–22F were very unconsolidated, and no weight on bit was required to drill ahead after coring. It was concluded that the bit sidetracked into an adjacent hole. Thus, for most sampling requirements, Cores 11H–22F should be avoided. Coring in Hole U1623F was terminated, and the bit was pulled to the surface, clearing the seafloor at 2105 h on 25 July 2024 and ending Hole U1623F.
A total of 22 cores were taken over a 162.3 m interval, recovering 147.04 m of sediment (86%) (Table T3). The APC system was deployed for 13 cores over a 120 m interval with 103.47 m of recovery (86%), and the HLAPC system was deployed for 9 cores over a 42.3 m interval with 43.57 m of recovery (103%). Nonmagnetic core barrels were used on all APC and HLAPC cores. Total time on Hole U1623F was 18.00 h (0.75 days).
2.3.7. Hole U1623G
It was decided to offset 20 m at a bearing of 22° from Hole U1623C. The vessel was in position at 2130 h on 25 July 2024, and Hole U1623G was spudded at 2245 h. The seafloor depth was calculated to be 1704.9 mbsl based on recovery from Core 1H. APC coring continued to 113.9 mbsf (Cores 1H–13H). Partial strokes were recorded on Cores 8H, 10H, and 13H. The HLAPC system was deployed to the total depth of 142.1 mbsf (Cores 14F–19F). Under the applause of all JOIDES Resolution Science Operator (JRSO) staff and scientists, the final core of Expedition 403 and the last core of JOIDES Resolution under JRSO was on deck at 1220 h. The bit was pulled to the surface, clearing the seafloor at 1500 h and the rig floor at 2015 h. The rig floor was secured for transit, and the vessel switched from DP to cruise mode at 2036 h, ending Hole U1623G and Site U1623.
A total of 19 cores were taken over a 142.1 m interval, recovering 153.50 m of sediment (108%) (Table T3). The APC system was deployed for 13 cores over a 113.9 m interval with 123.16 m of recovery (108%), and the HLAPC system was deployed for 6 cores over a 28.2 m interval with 30.34 m of recovery (108%). Nonmagnetic core barrels were used on all APC and HLAPC cores. Total time on Hole U1623G was 23.50 h (1.0 days).
3. Lithostratigraphy
This lithostratigraphic summary characterizes Sites U1621–U1623, which are located with a distance between sites of 8.6 km (Sites U1621 and U1622), 8.2 km (Sites U1622 and U1623), and 4.4 km (Sites U1621 and U1623). Sites U1621 and U1623 were drilled into the same drift body along Seismic Lines SV15-04 and CAGE21-1HH-05, respectively, and at different relative distances to the adjacent Storfjorden TMF characterized by frequent occurrence of mass transport deposits (MTDs) (Figure F2). Site U1622 was located slightly off Seismic Line CAGE21-1HH-03 (Figure F2B) and penetrated a thick sequence of MTDs of the northwestern fringes of the Storfjorden TMF. The sediments recovered at all three sites yielded comparable lithologies. Because the chapter outlines the lithologies of three different sites, common and discriminating features are discussed here prior to characterizing the units and subunits.
The recovered sequence at Site U1621 consists of 89 cores in a total of three holes with 639.3 m of sediment cored and 578.97 m recovered. At Site U1622, only one hole was drilled, and seven cores with a total cored length of 46.5 m and recovered length of 46.26 m were retrieved. The sequence at Site U1623 consists of 205 cores from a total of seven holes, with a total cored length of 1422.4 m and a recovery of 1314.38 m. In Hole U1623B, only 0.05 m of sediment was retrieved in the first core for the mudline, which was considered insufficient for continued coring, whereas Hole U1623E recovered 9.63 m in the first core over 9.6 m of core length, which did not allow for identification of the mudline. Hence, Hole U1623E was abandoned, and another mudline detection was performed on the adjacent Hole U1623F.
Sediments throughout all Sites U1621–U1623 holes are mainly siliciclastic, primarily composed of (dark) gray to greenish gray silty clay (Figure F3A, F3B), with coarser intervals containing reddish gray to dark reddish gray sandy mud (Figure F3C). The lithologies contain varying amounts of detrital clasts < 2 cm, and some single large clasts > 2 cm were identified from visual core descriptions and X-radiographs (Figure F4A, F4B). Clast abundance ranges from none to dispersed (<1% of the split core surface) to common (1%–5%) to abundant (5%–30%). When clast abundance is between 1% and 30% and clasts > 2 cm are observed on the split core surface, the lithology is designated as a diamicton (Figure F4C). Small intervals of diamicton (<2 m thickness) were observed in different cores and sites, with a major change to thicker diamictic layers below ~170–190 mbsf at Site U1621 and below ~300 mbsf at Site U1623.
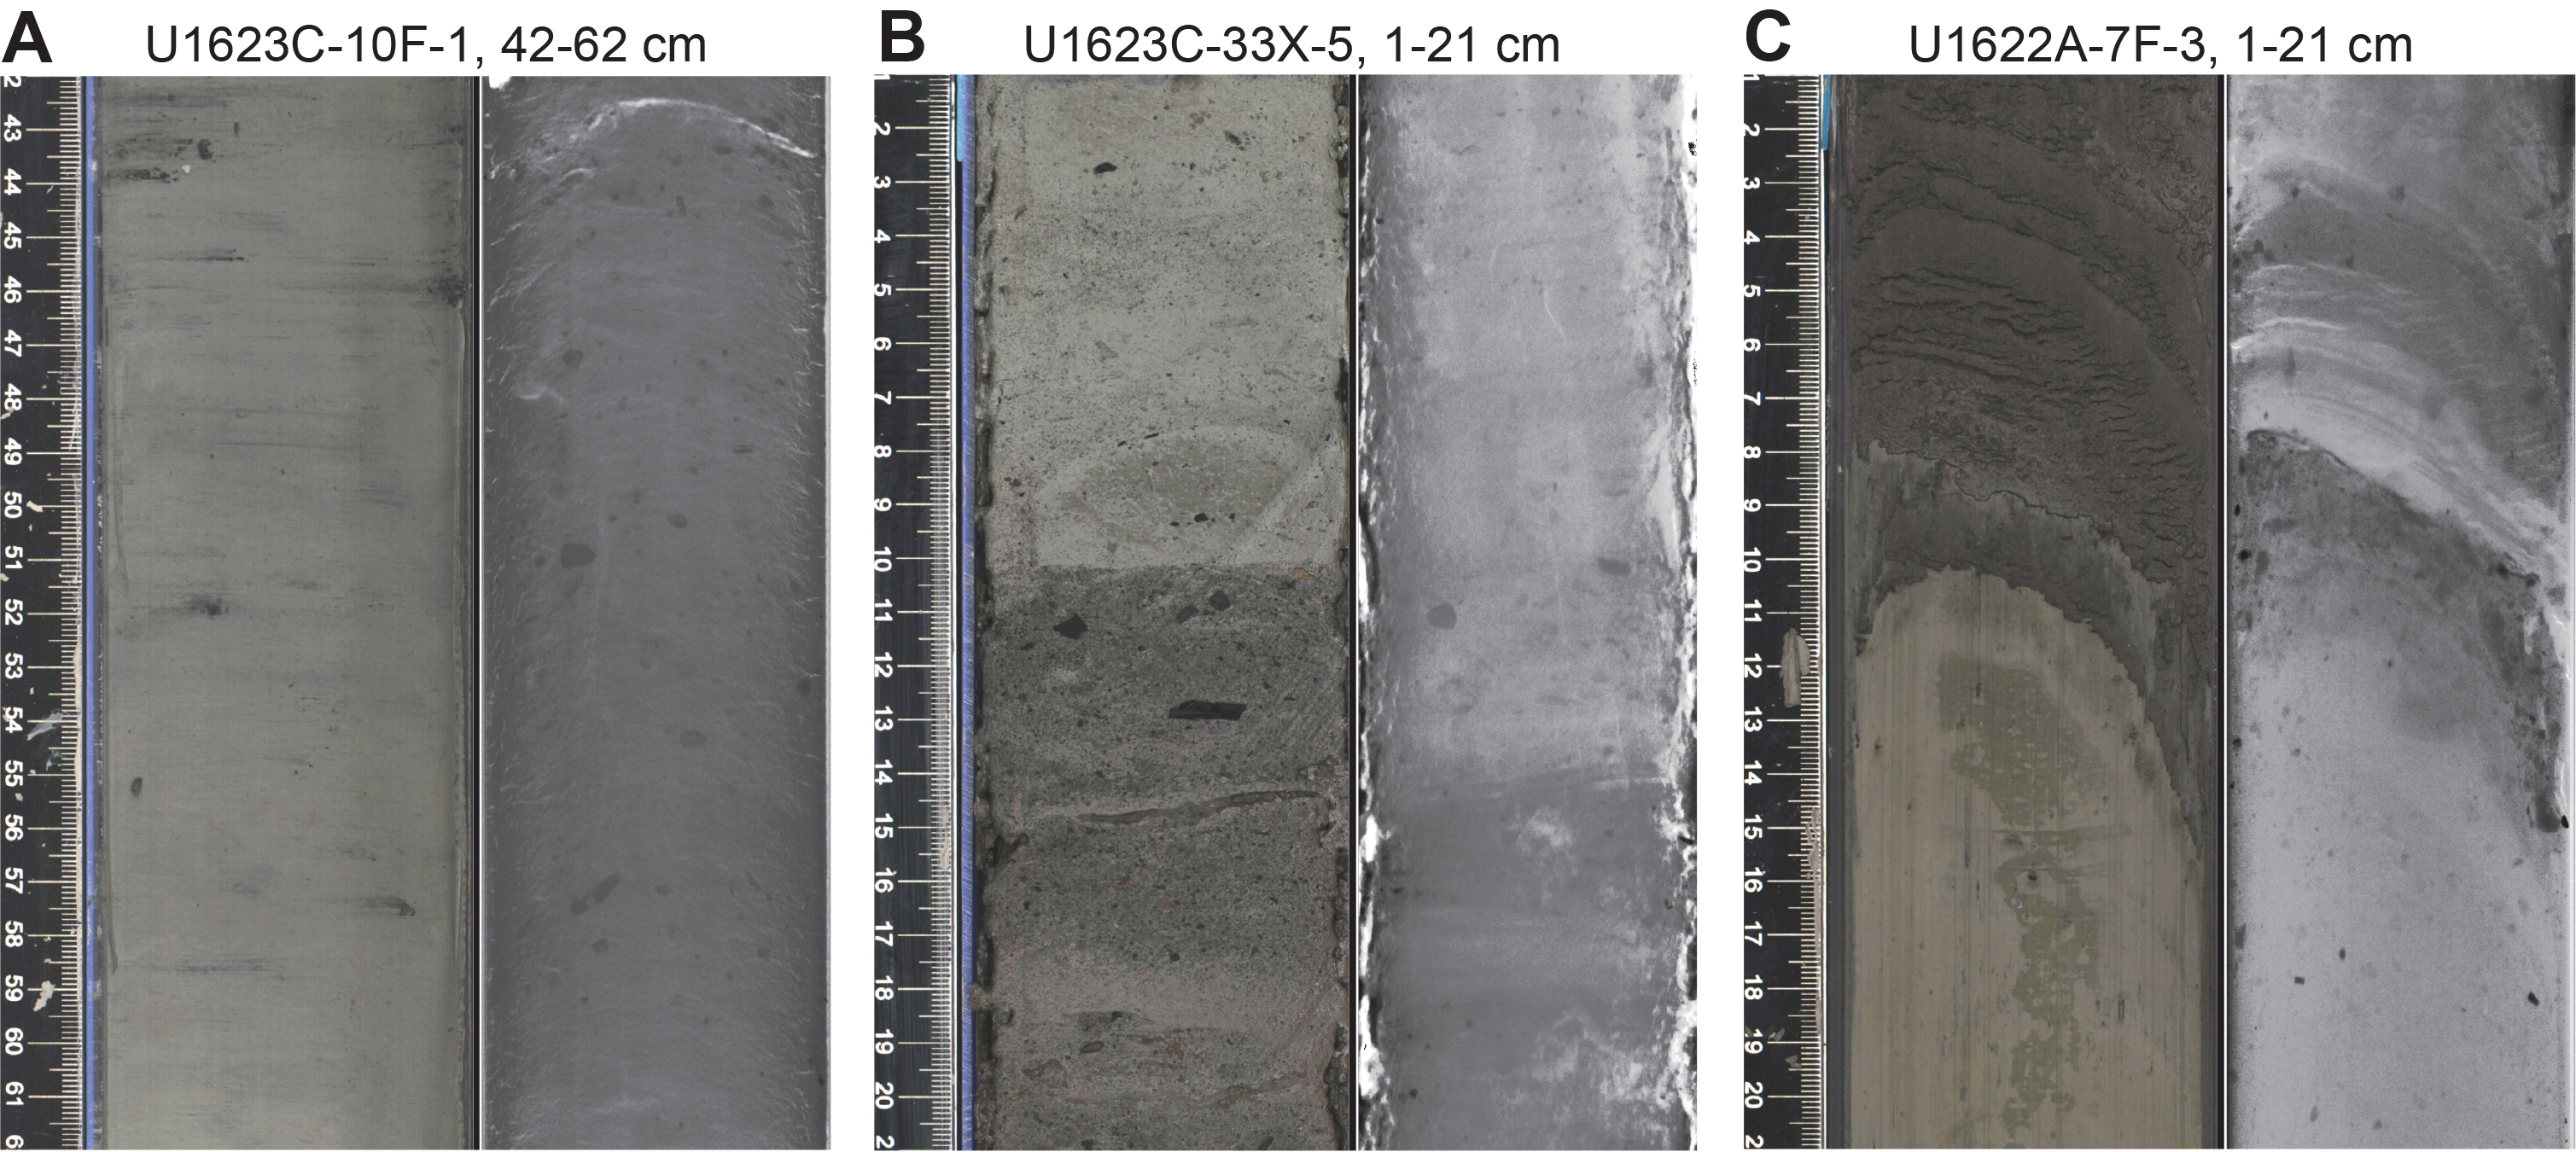
Figure F3. Lithologic boundaries.
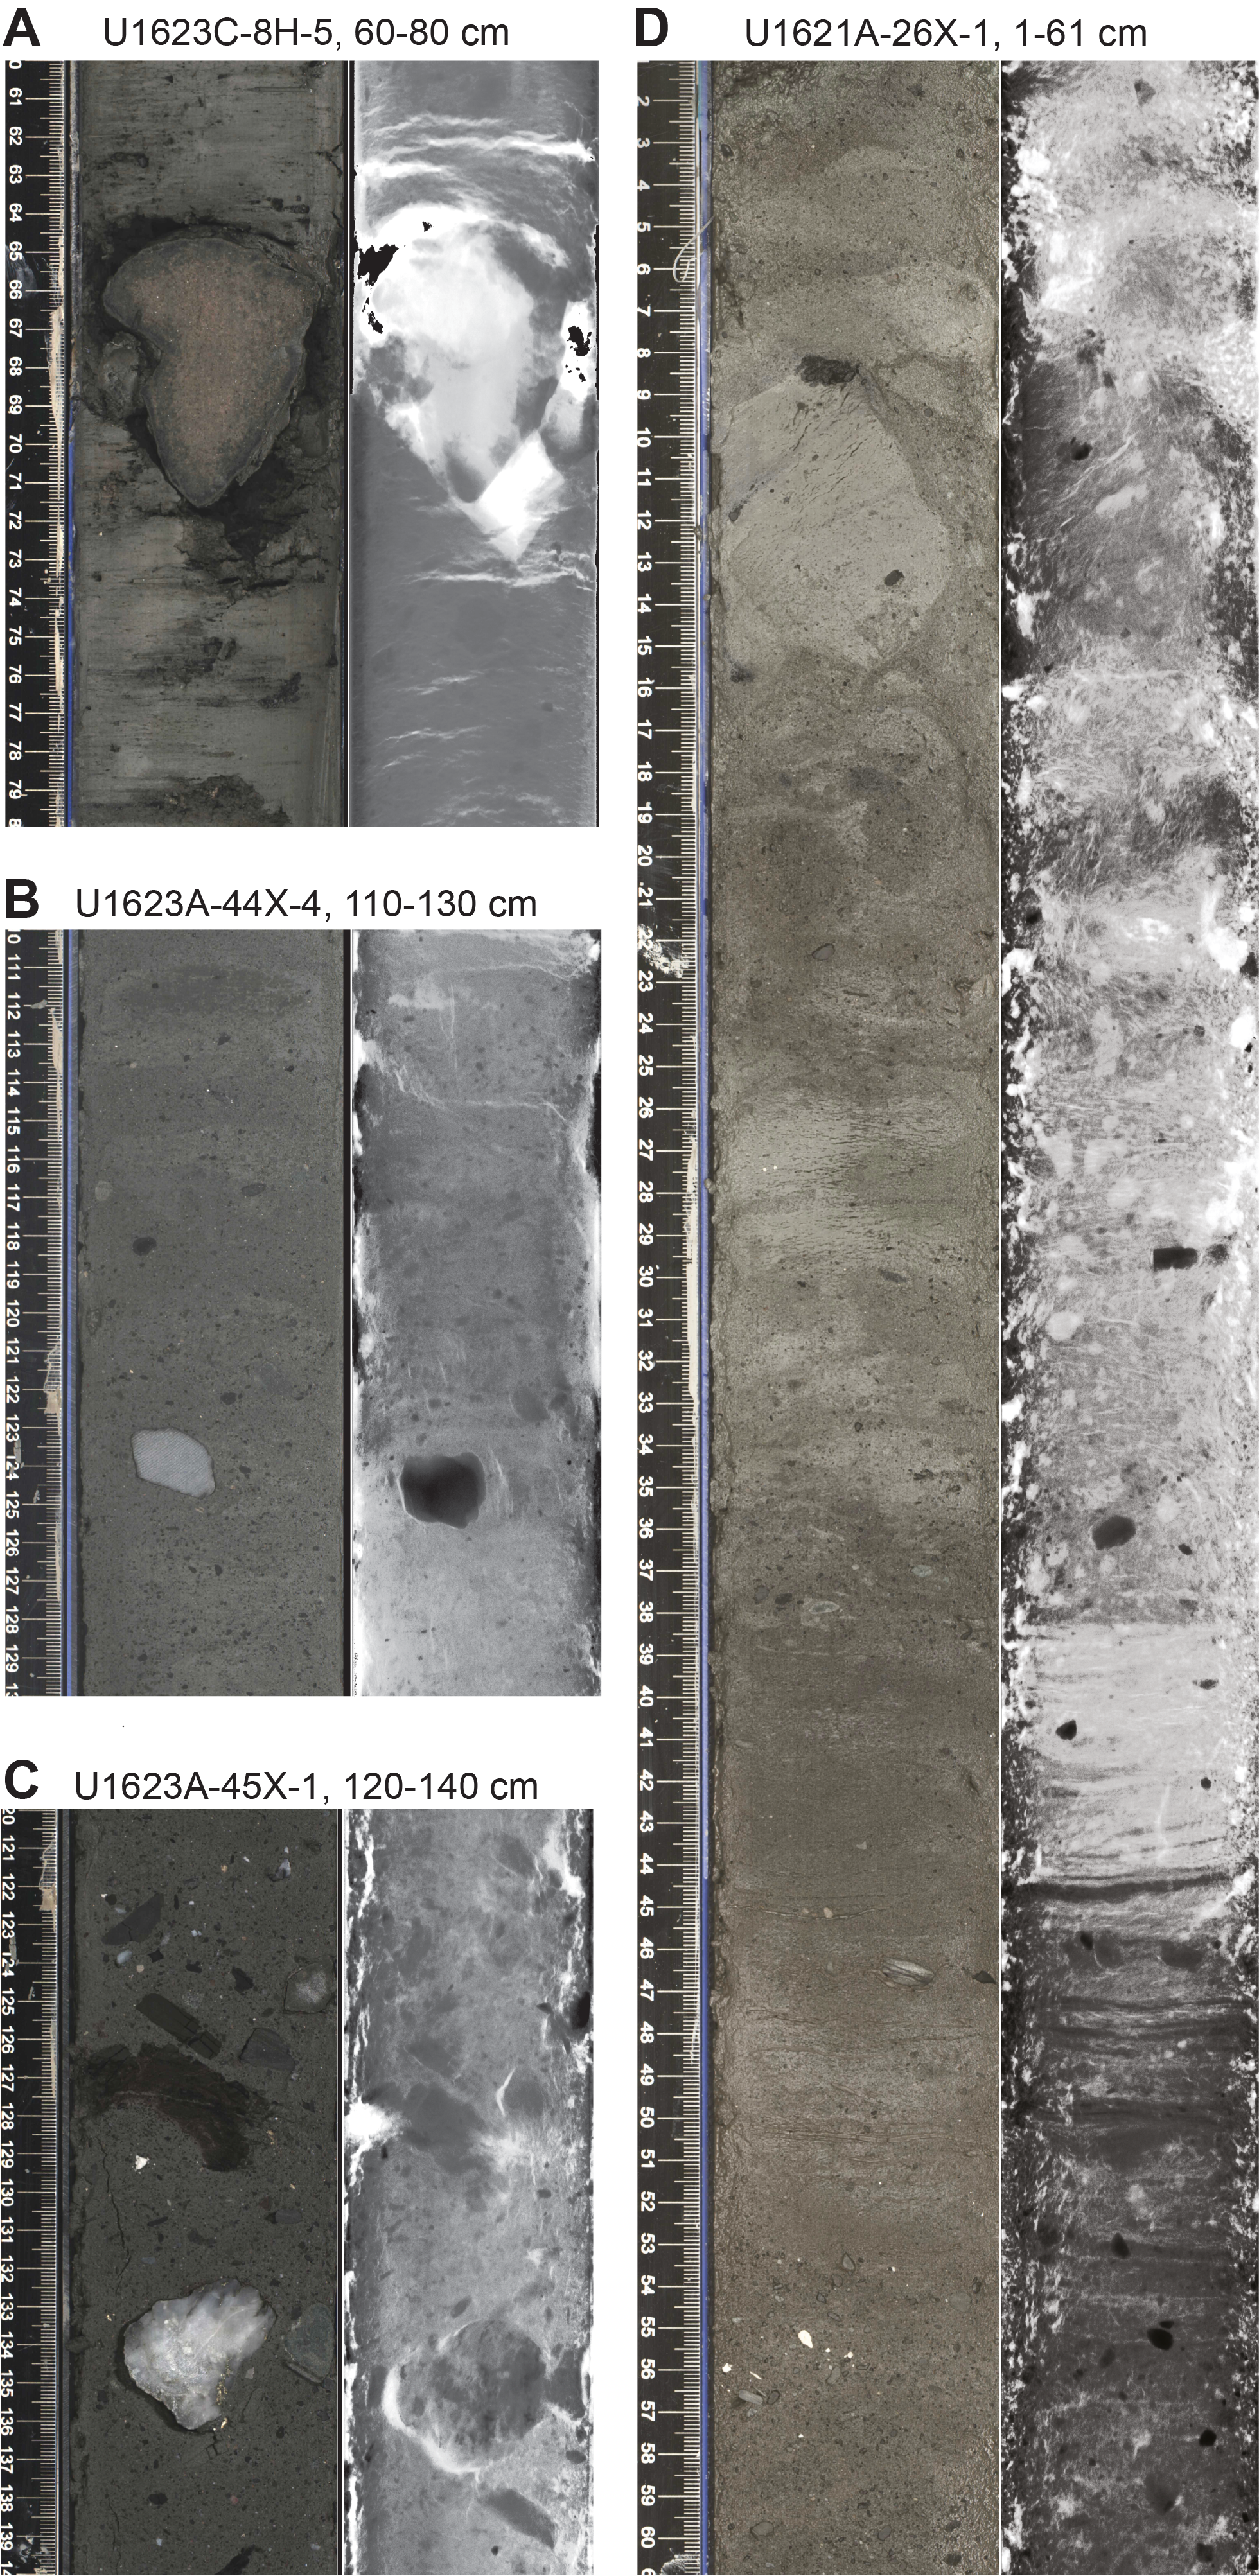
Figure F4. Clast distribution and diamicton.
The uppermost ~190 m of Sites U1621 and U1623 are characterized by the occurrence of sand patches (<5 mm) of predominantly white color (10YR 8/1) (Figure F5A). The same depth range also contains intervals of interbedded layers of mostly gray silty clay with white (10YR 8/1) silt that are either thinly (<0.3 cm) or thickly (0.3–1 cm) laminated (Figure F5B).
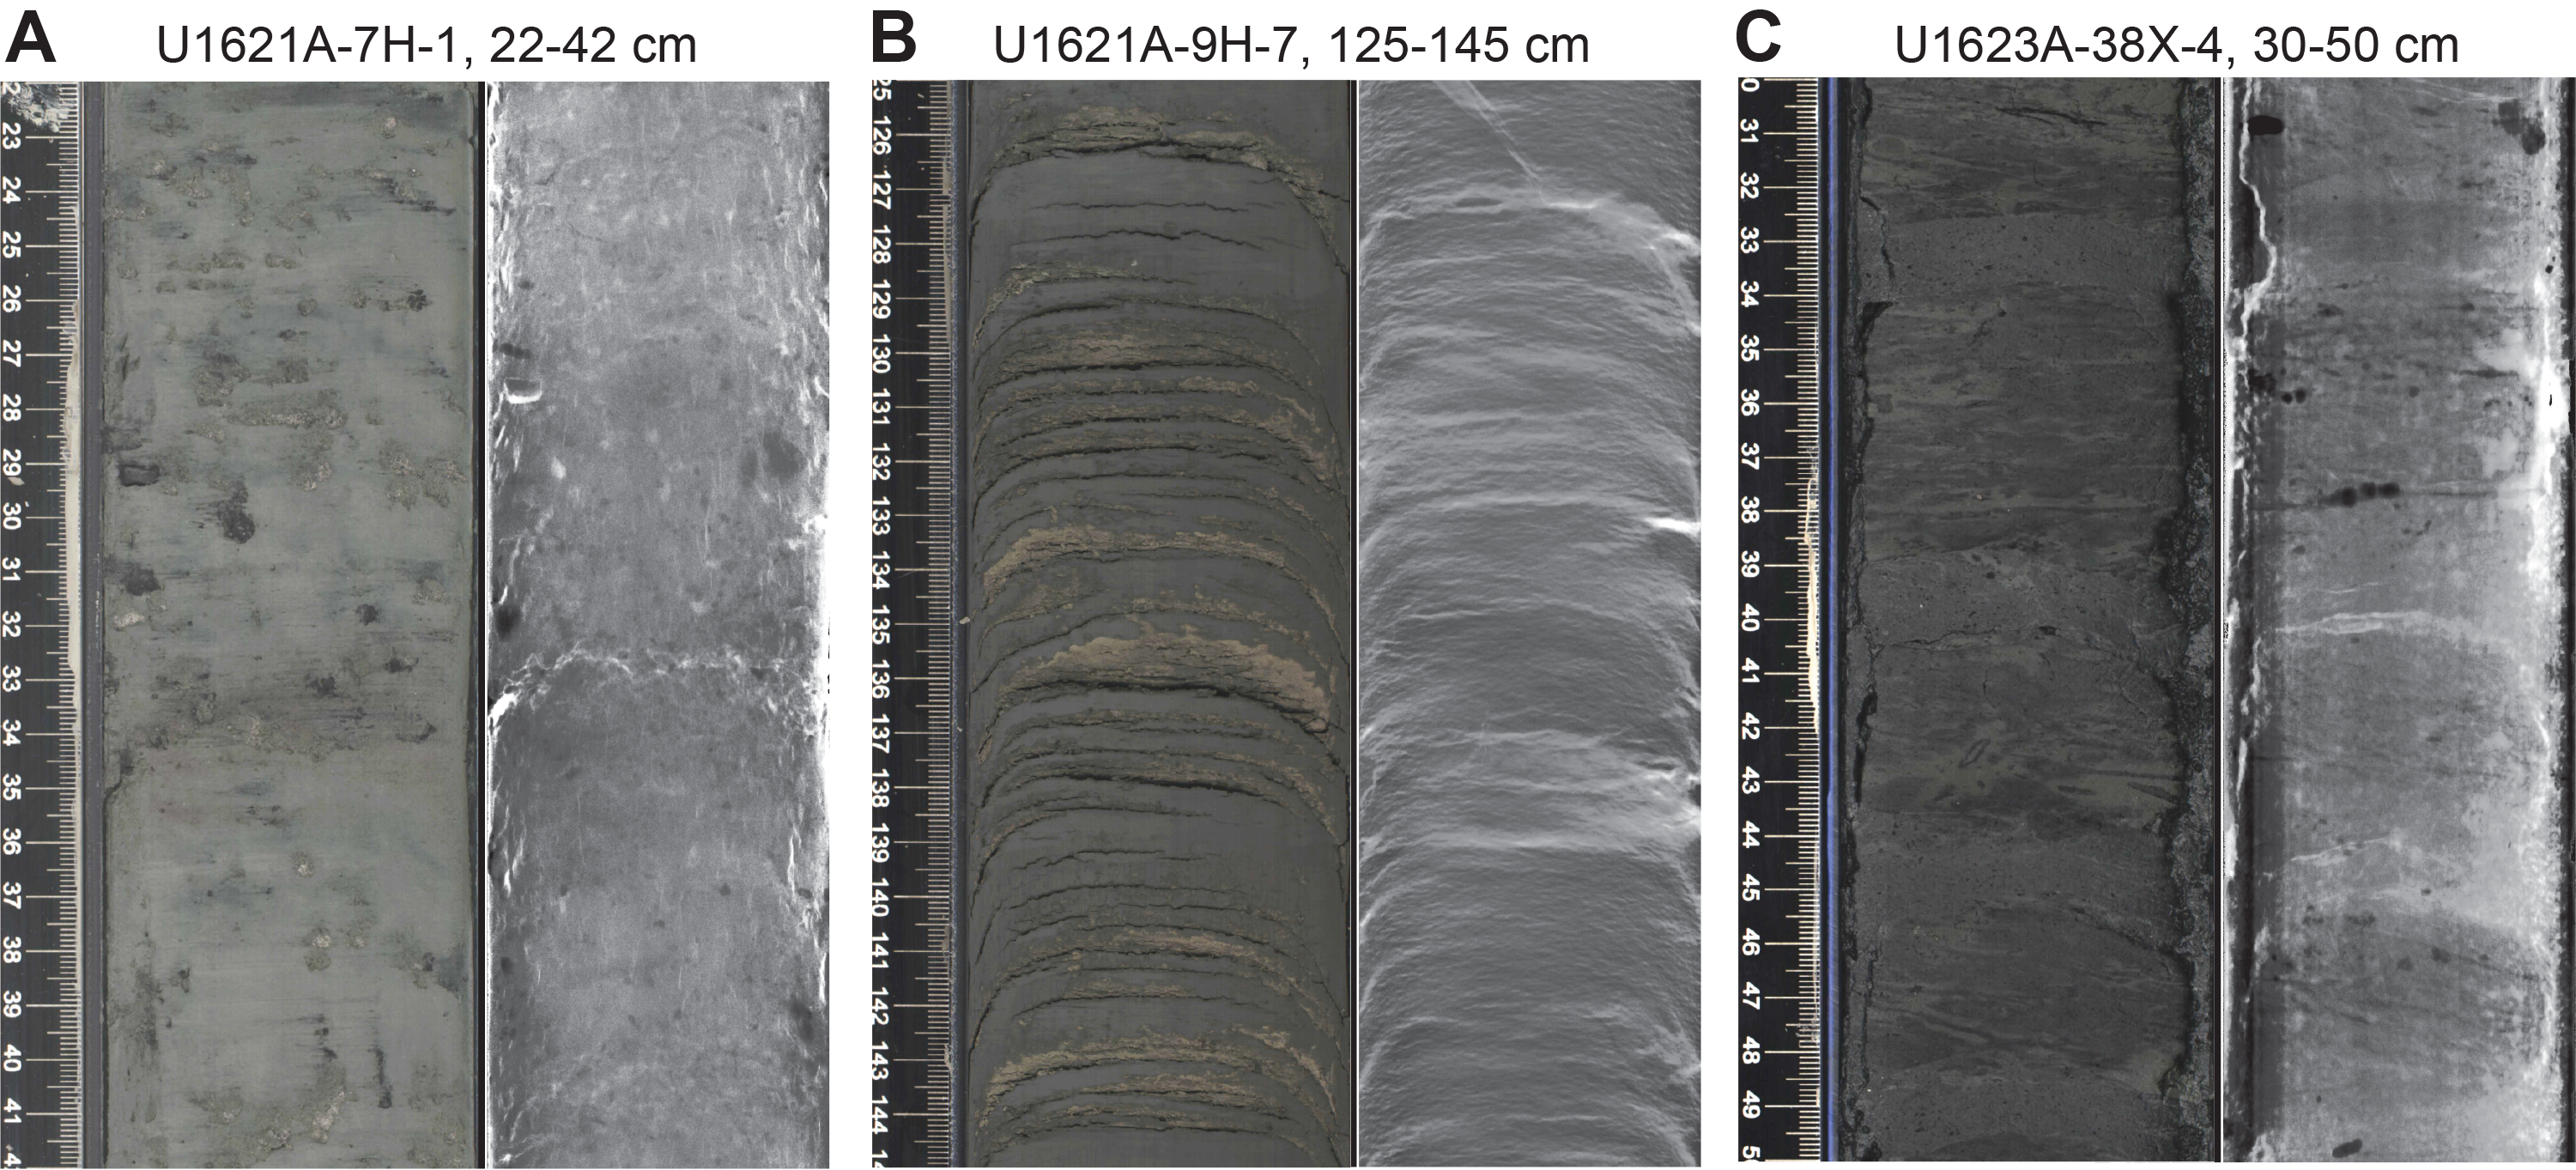
Figure F5. Sedimentary features.
Between ~180 and 270 mbsf at Site U1623, bioturbation is distinctly stronger than above or below that depth range, mostly varying between heavy and complete (Figure F5C). Clasts also vary from absent to abundant.
Below ~270 mbsf at Site U1623, most intervals show no apparent bioturbation or they are slightly to moderately bioturbated. Clast occurrence increases downhole toward ~300 mbsf, where silty clay matrix with abundant clasts transitions into diamicton for a thickness of ~40 m. Below ~340 mbsf, silty clays with dispersed to common clasts form the deepest part of the drilled sequence in Holes U1623A and U1623C, whereas in Hole U1623D, diamicton was encountered below ~360 mbsf.
In contrast to Sites U1618–U1620, diagenetic overprint plays only a minor role in the sediments of Sites U1621–U1623. Only small iron sulfide minerals and sparse patches of authigenic carbonates are observed on the split core surface in the deeper part of the stratigraphic sequences.
The degree of core recovery, coring disturbance, and gas expansion differs between sites and varies with depth and type of coring method employed. APC sediment from all holes exhibits slight to moderate coring disturbances, whereas most XCB cores are slightly to moderately disturbed with the finer grained intervals being more affected than intervals with coarser material.
Sedimentary structures are not always visible on the split core surface (i.e., described as structureless), but primary (e.g., lamination) and secondary (e.g., iron sulfide minerals) structures are often observed in the X-radiographs. The sedimentologic characteristics of Site U1621 (Holes U1621A–U1621C) are summarized in Figures F6, F7, and F8; Site U1622 (Hole U1622A) in Figure F9; and Site U1623 (Holes U1623A, U1623C, U1623D, U1623F, and U1623G) in Figures F10, F11, F12, F13, and F14. These figures include information on core recovery; lithology as inferred from observations of the split core surfaces, X-radiographs, and smear slides; clast abundance; occurrence of sand patches and interbedded silty clay/silt layers; laminations; bioturbation; and drilling disturbance. Summary lithologic information for each hole is plotted along with select physical properties data, including magnetic susceptibility (MS), natural gamma radiation (NGR), gamma ray attenuation (GRA) density, and sediment color reflectance (CIELAB L*, a*, and b*).
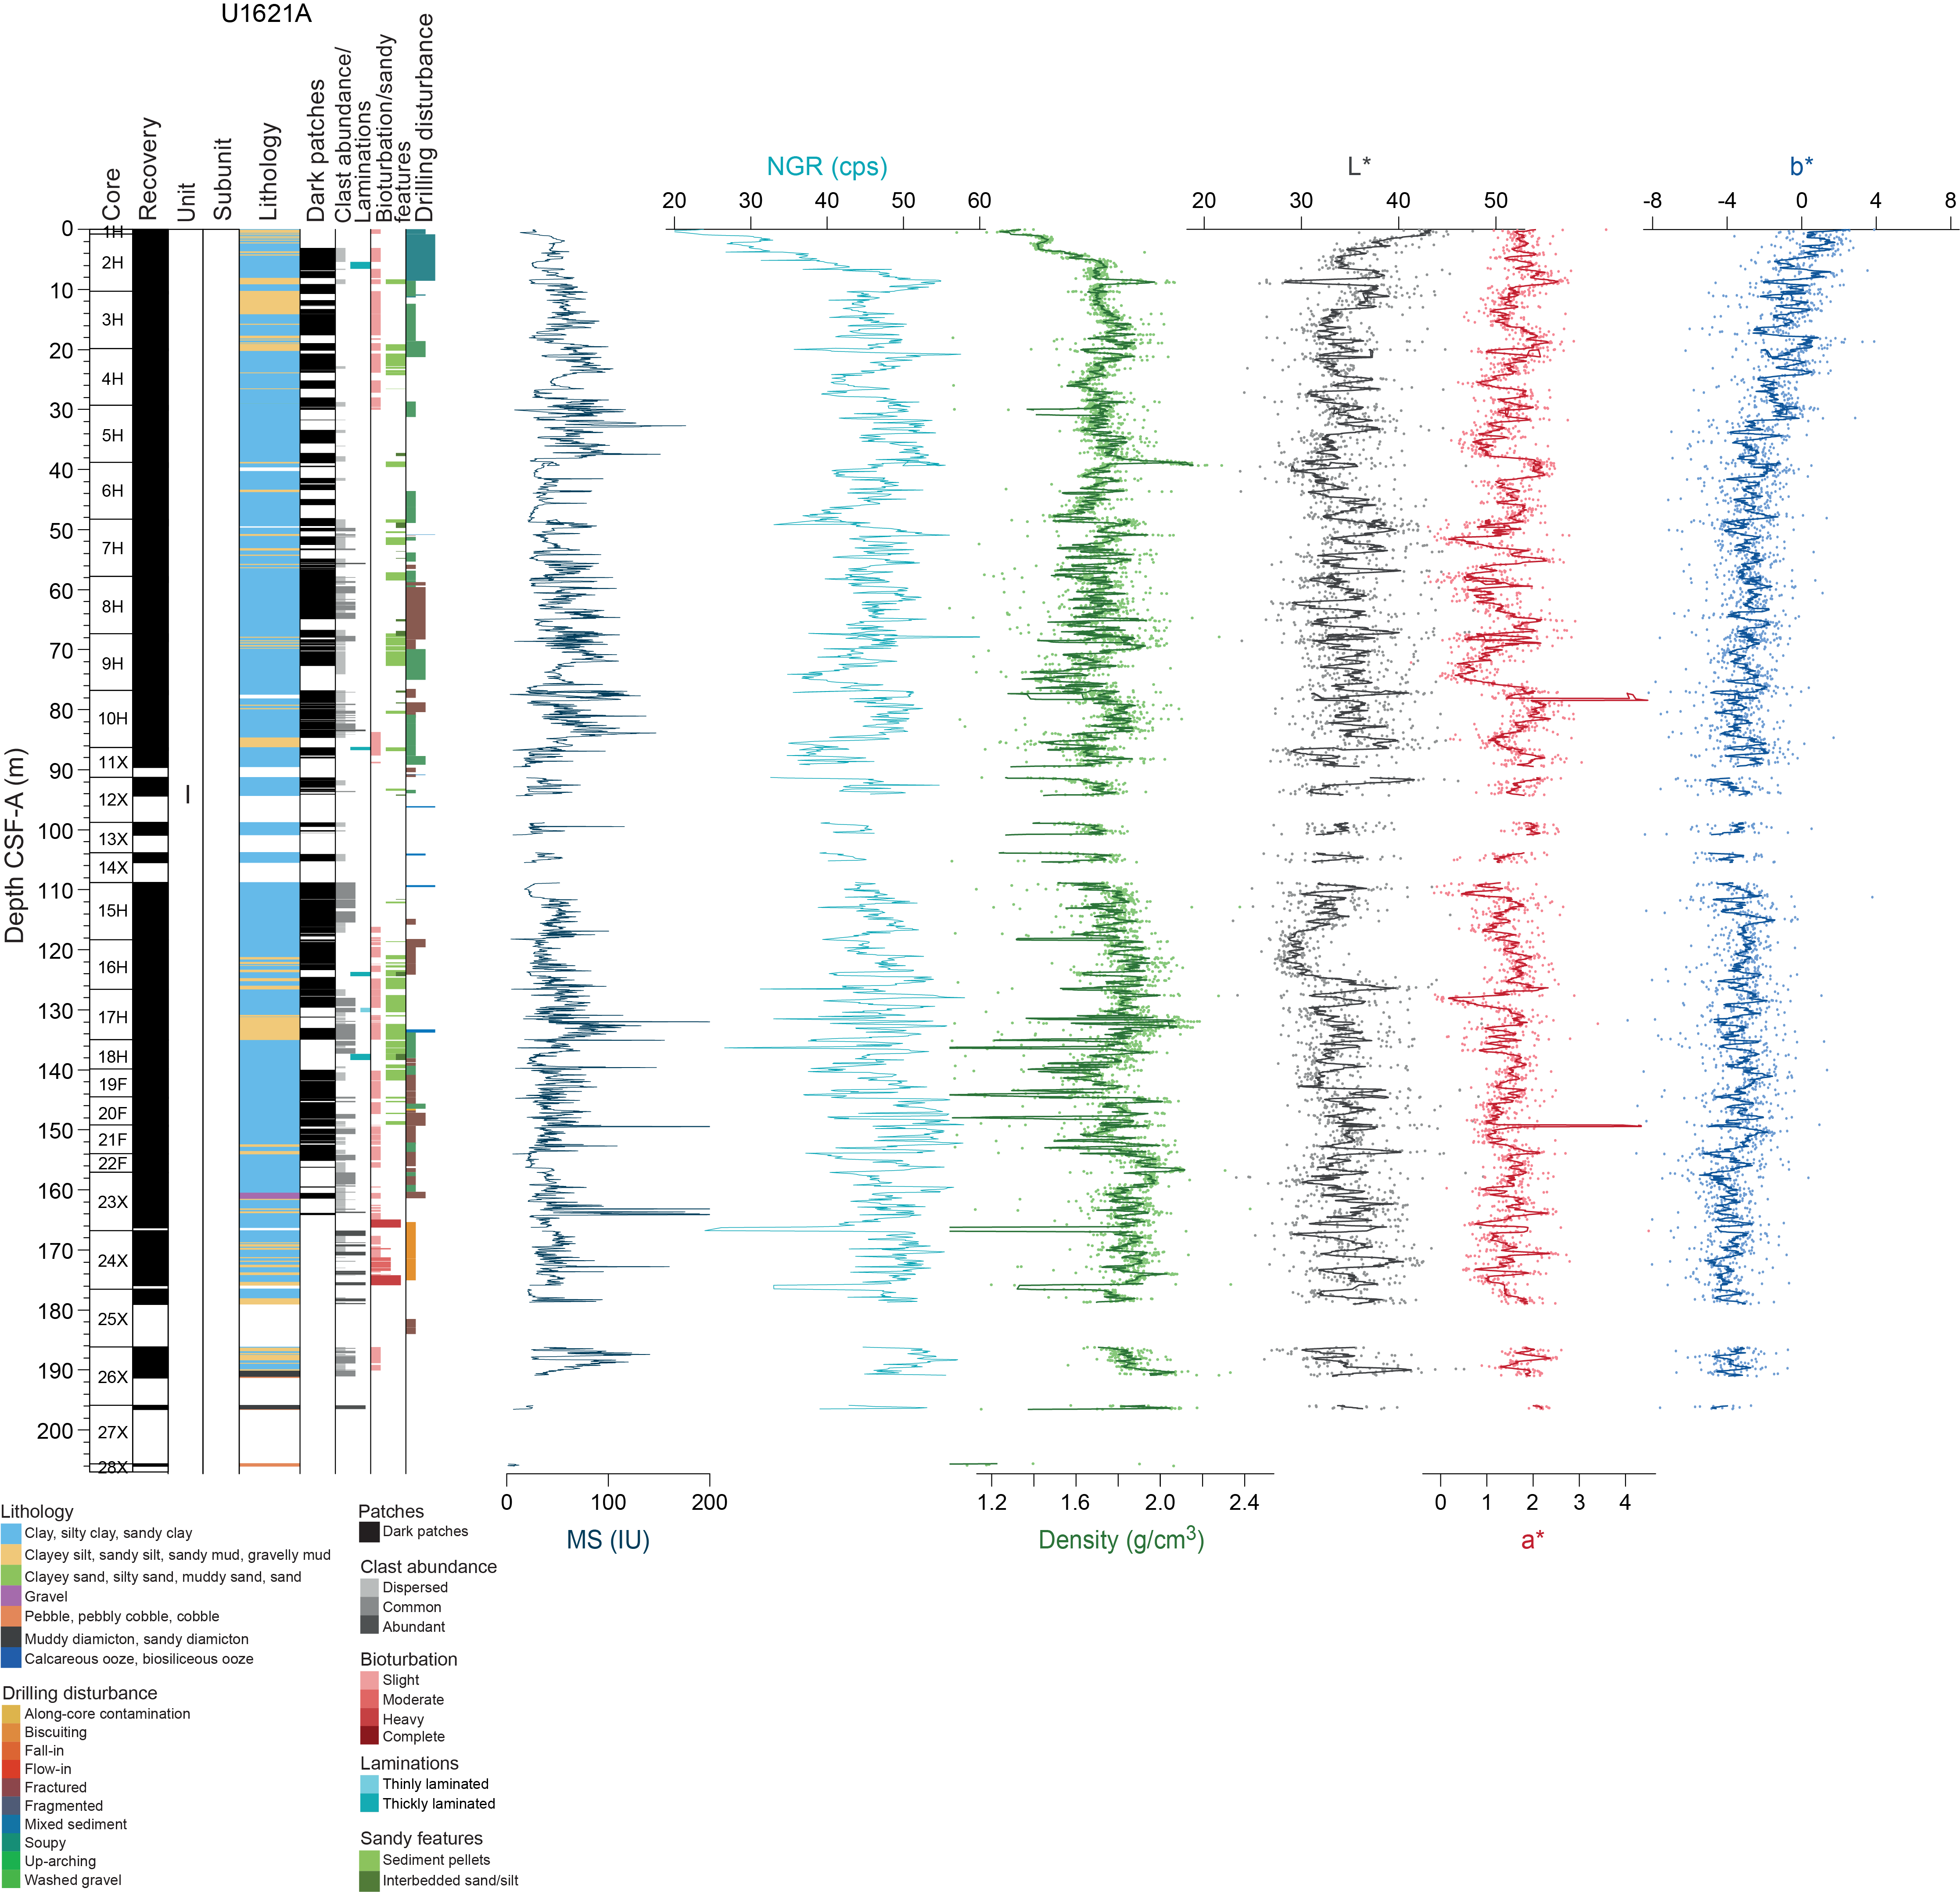
Figure F6. Physical properties, Hole U1621A.
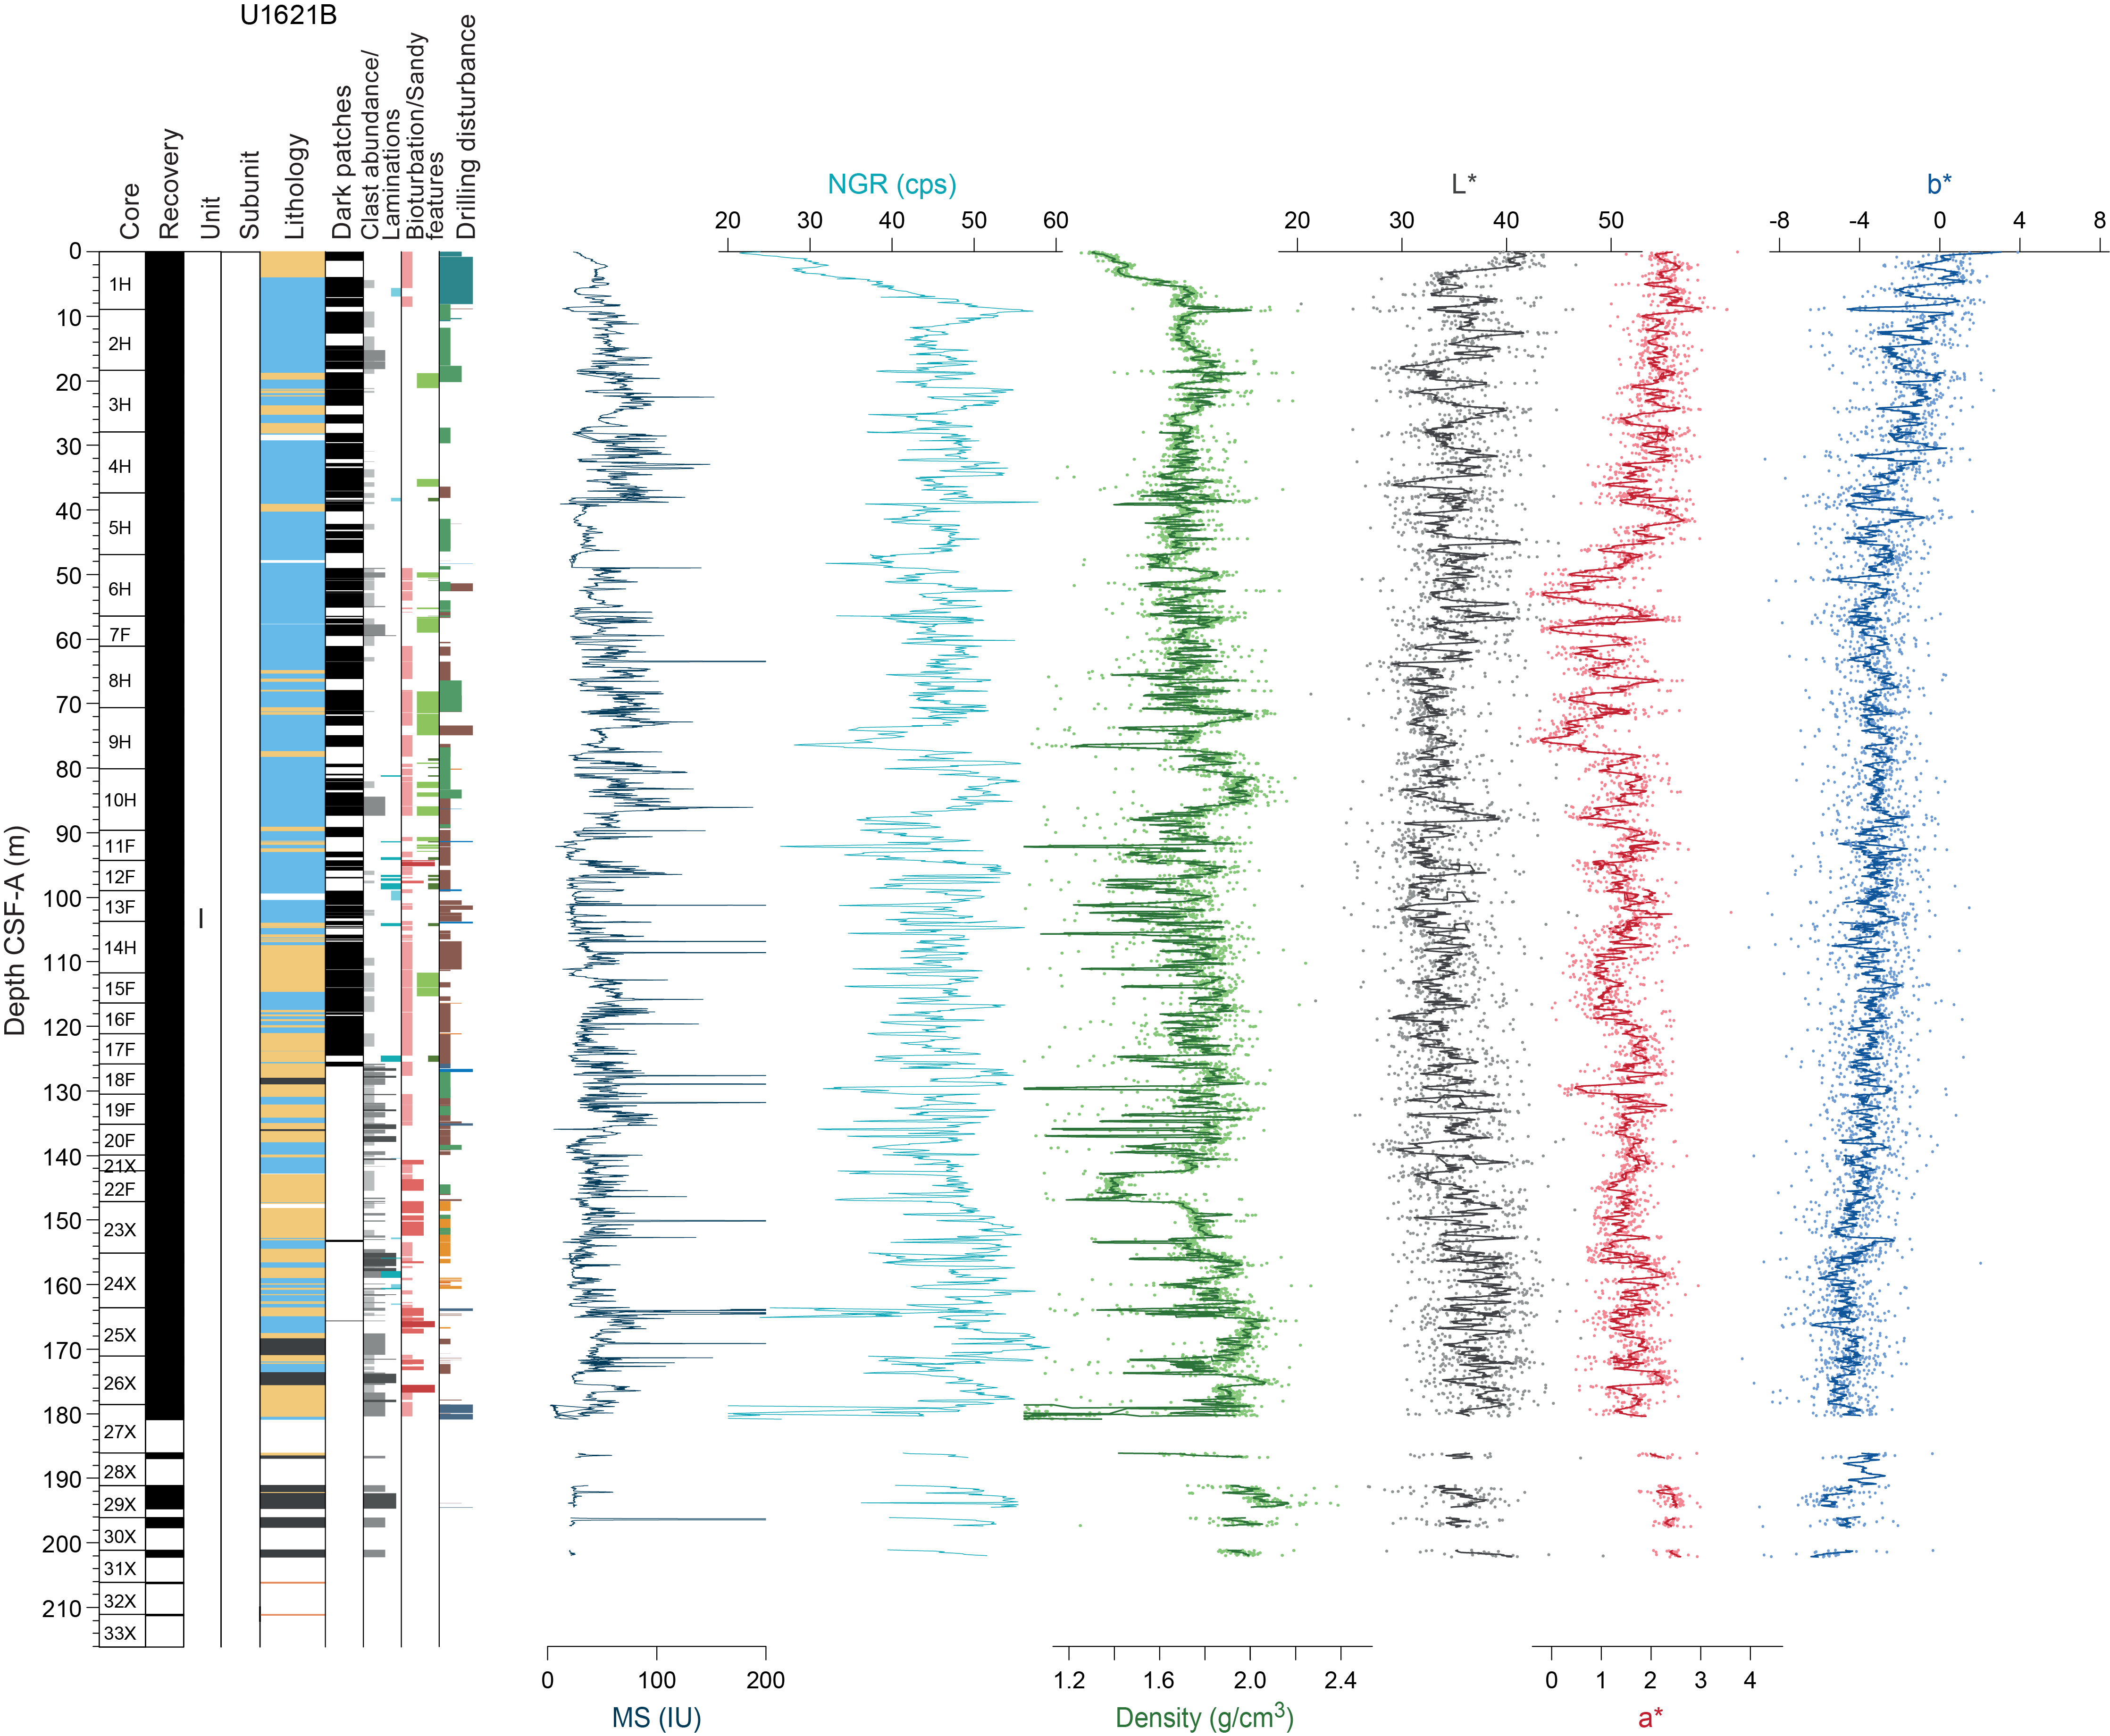
Figure F7. Physical properties, Hole U1621B.
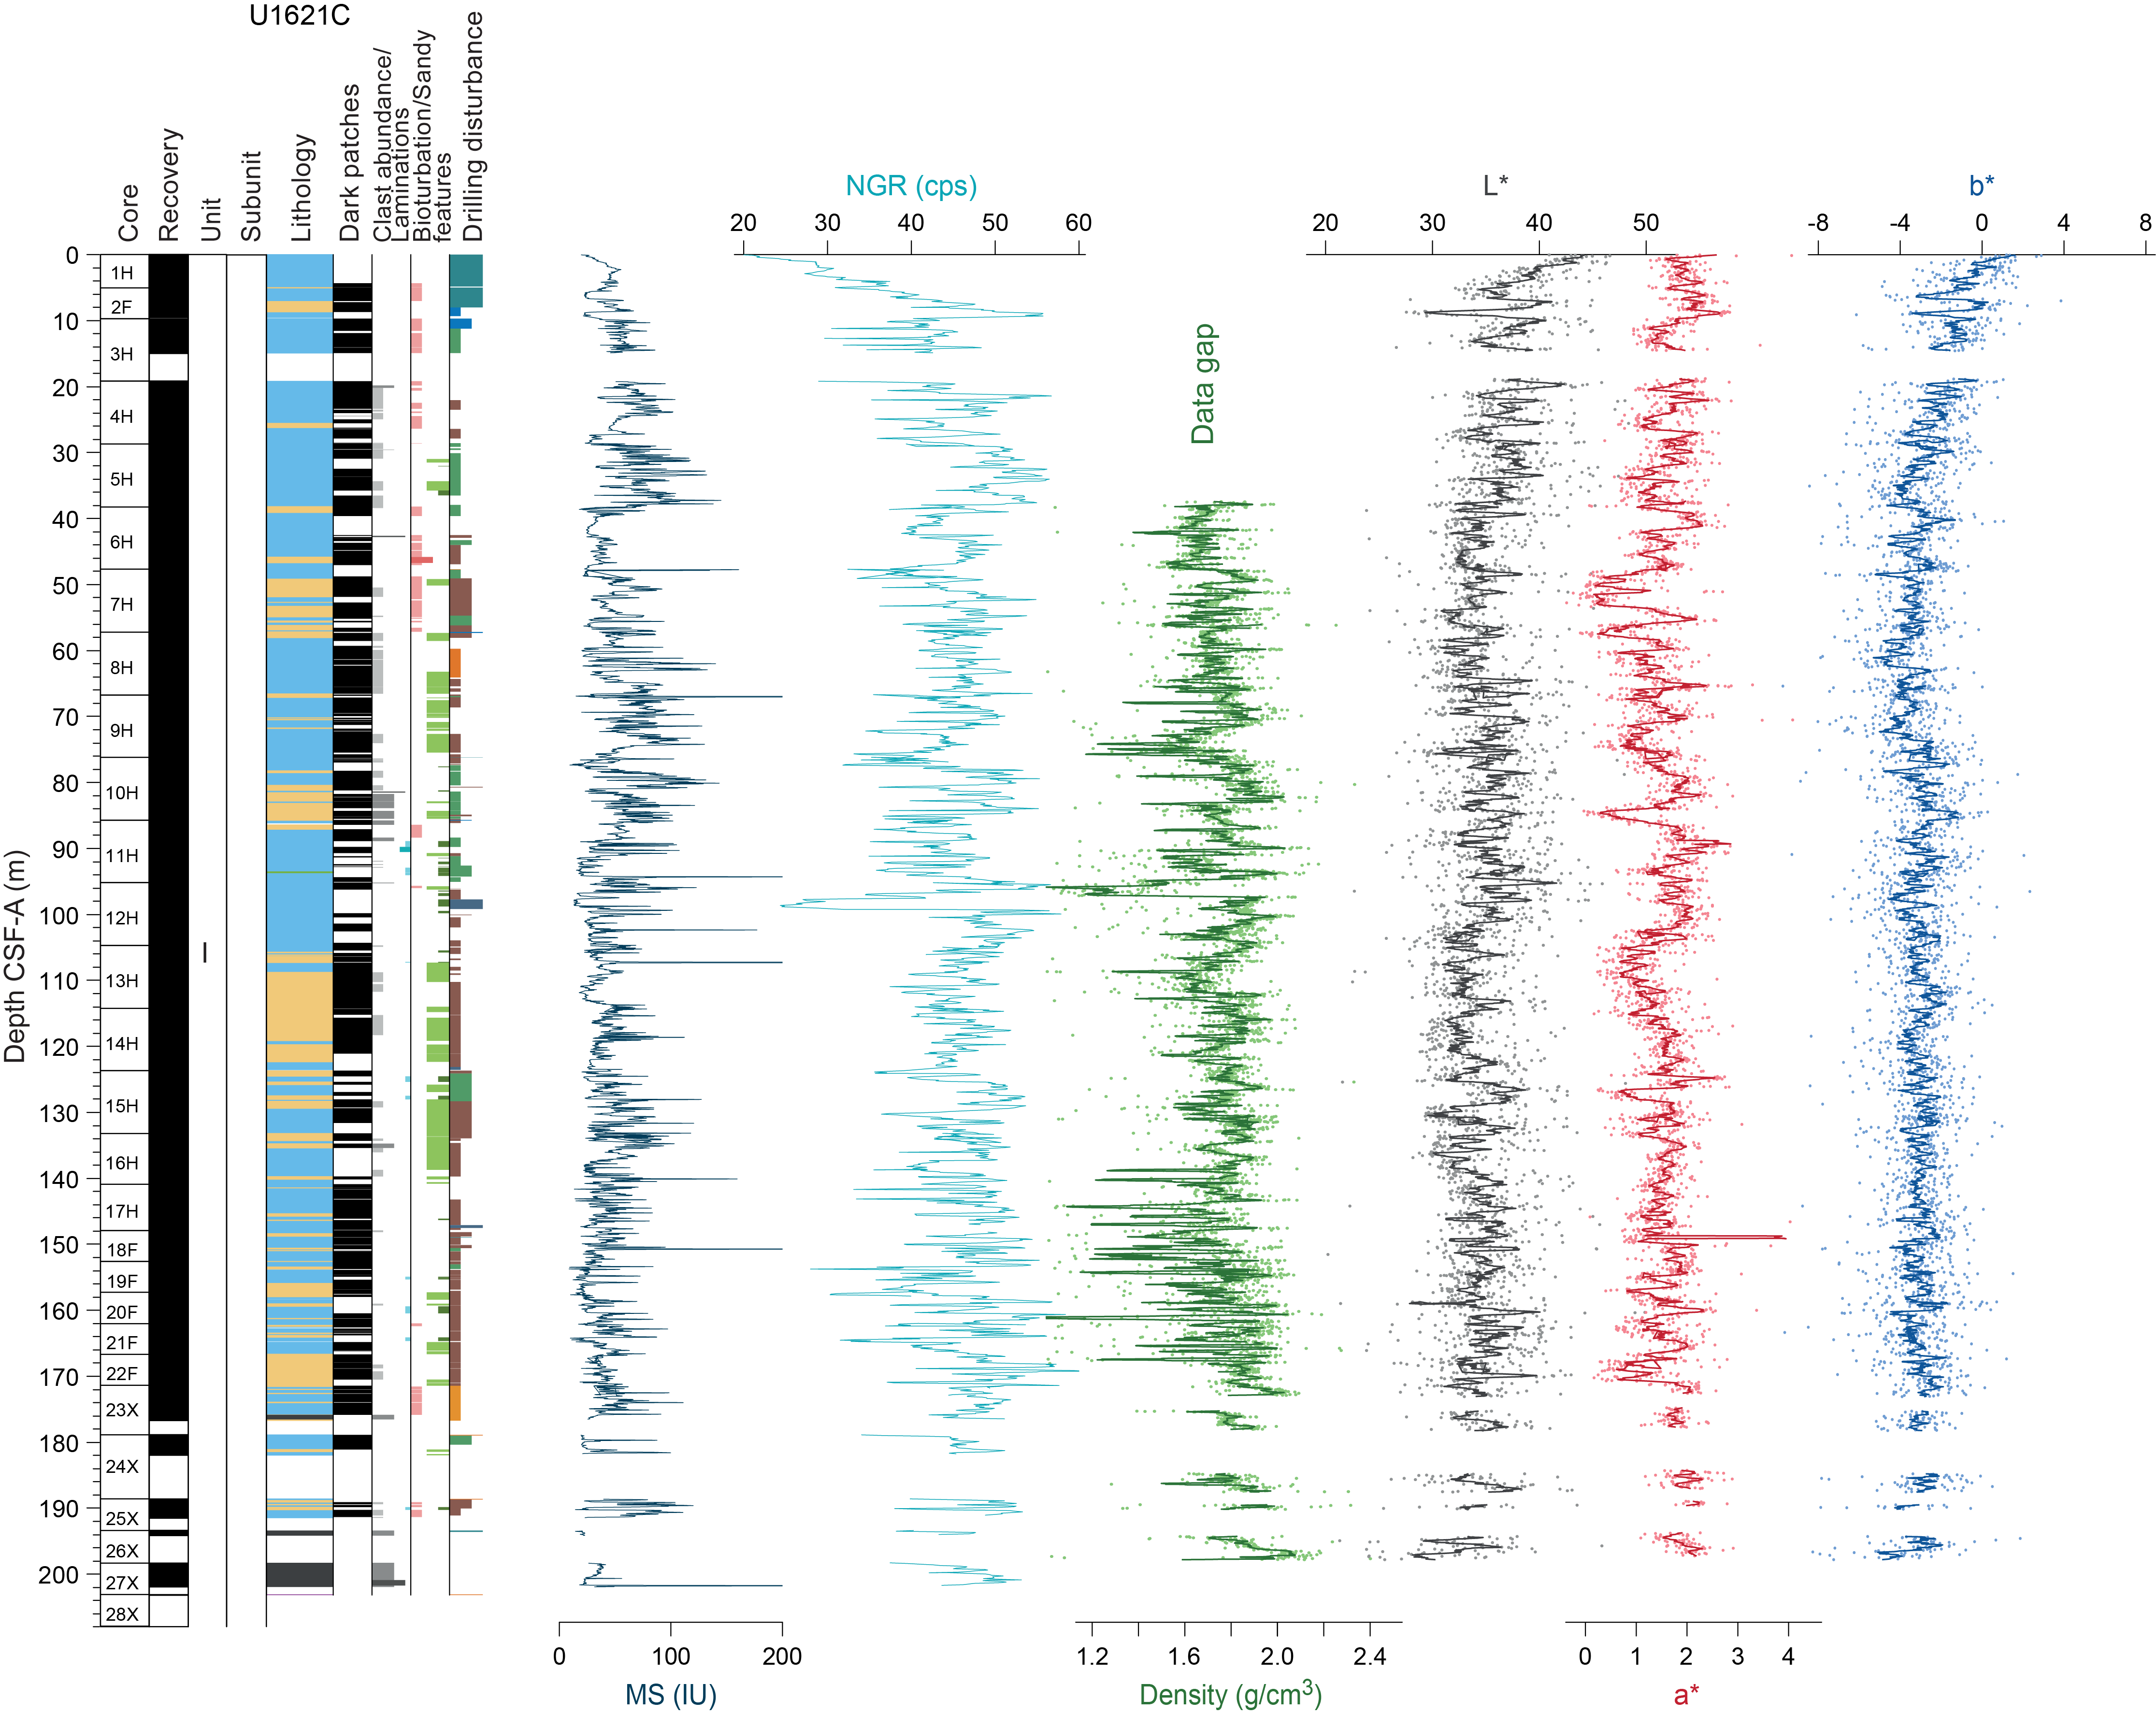
Figure F8. Physical properties, Hole U1621C.
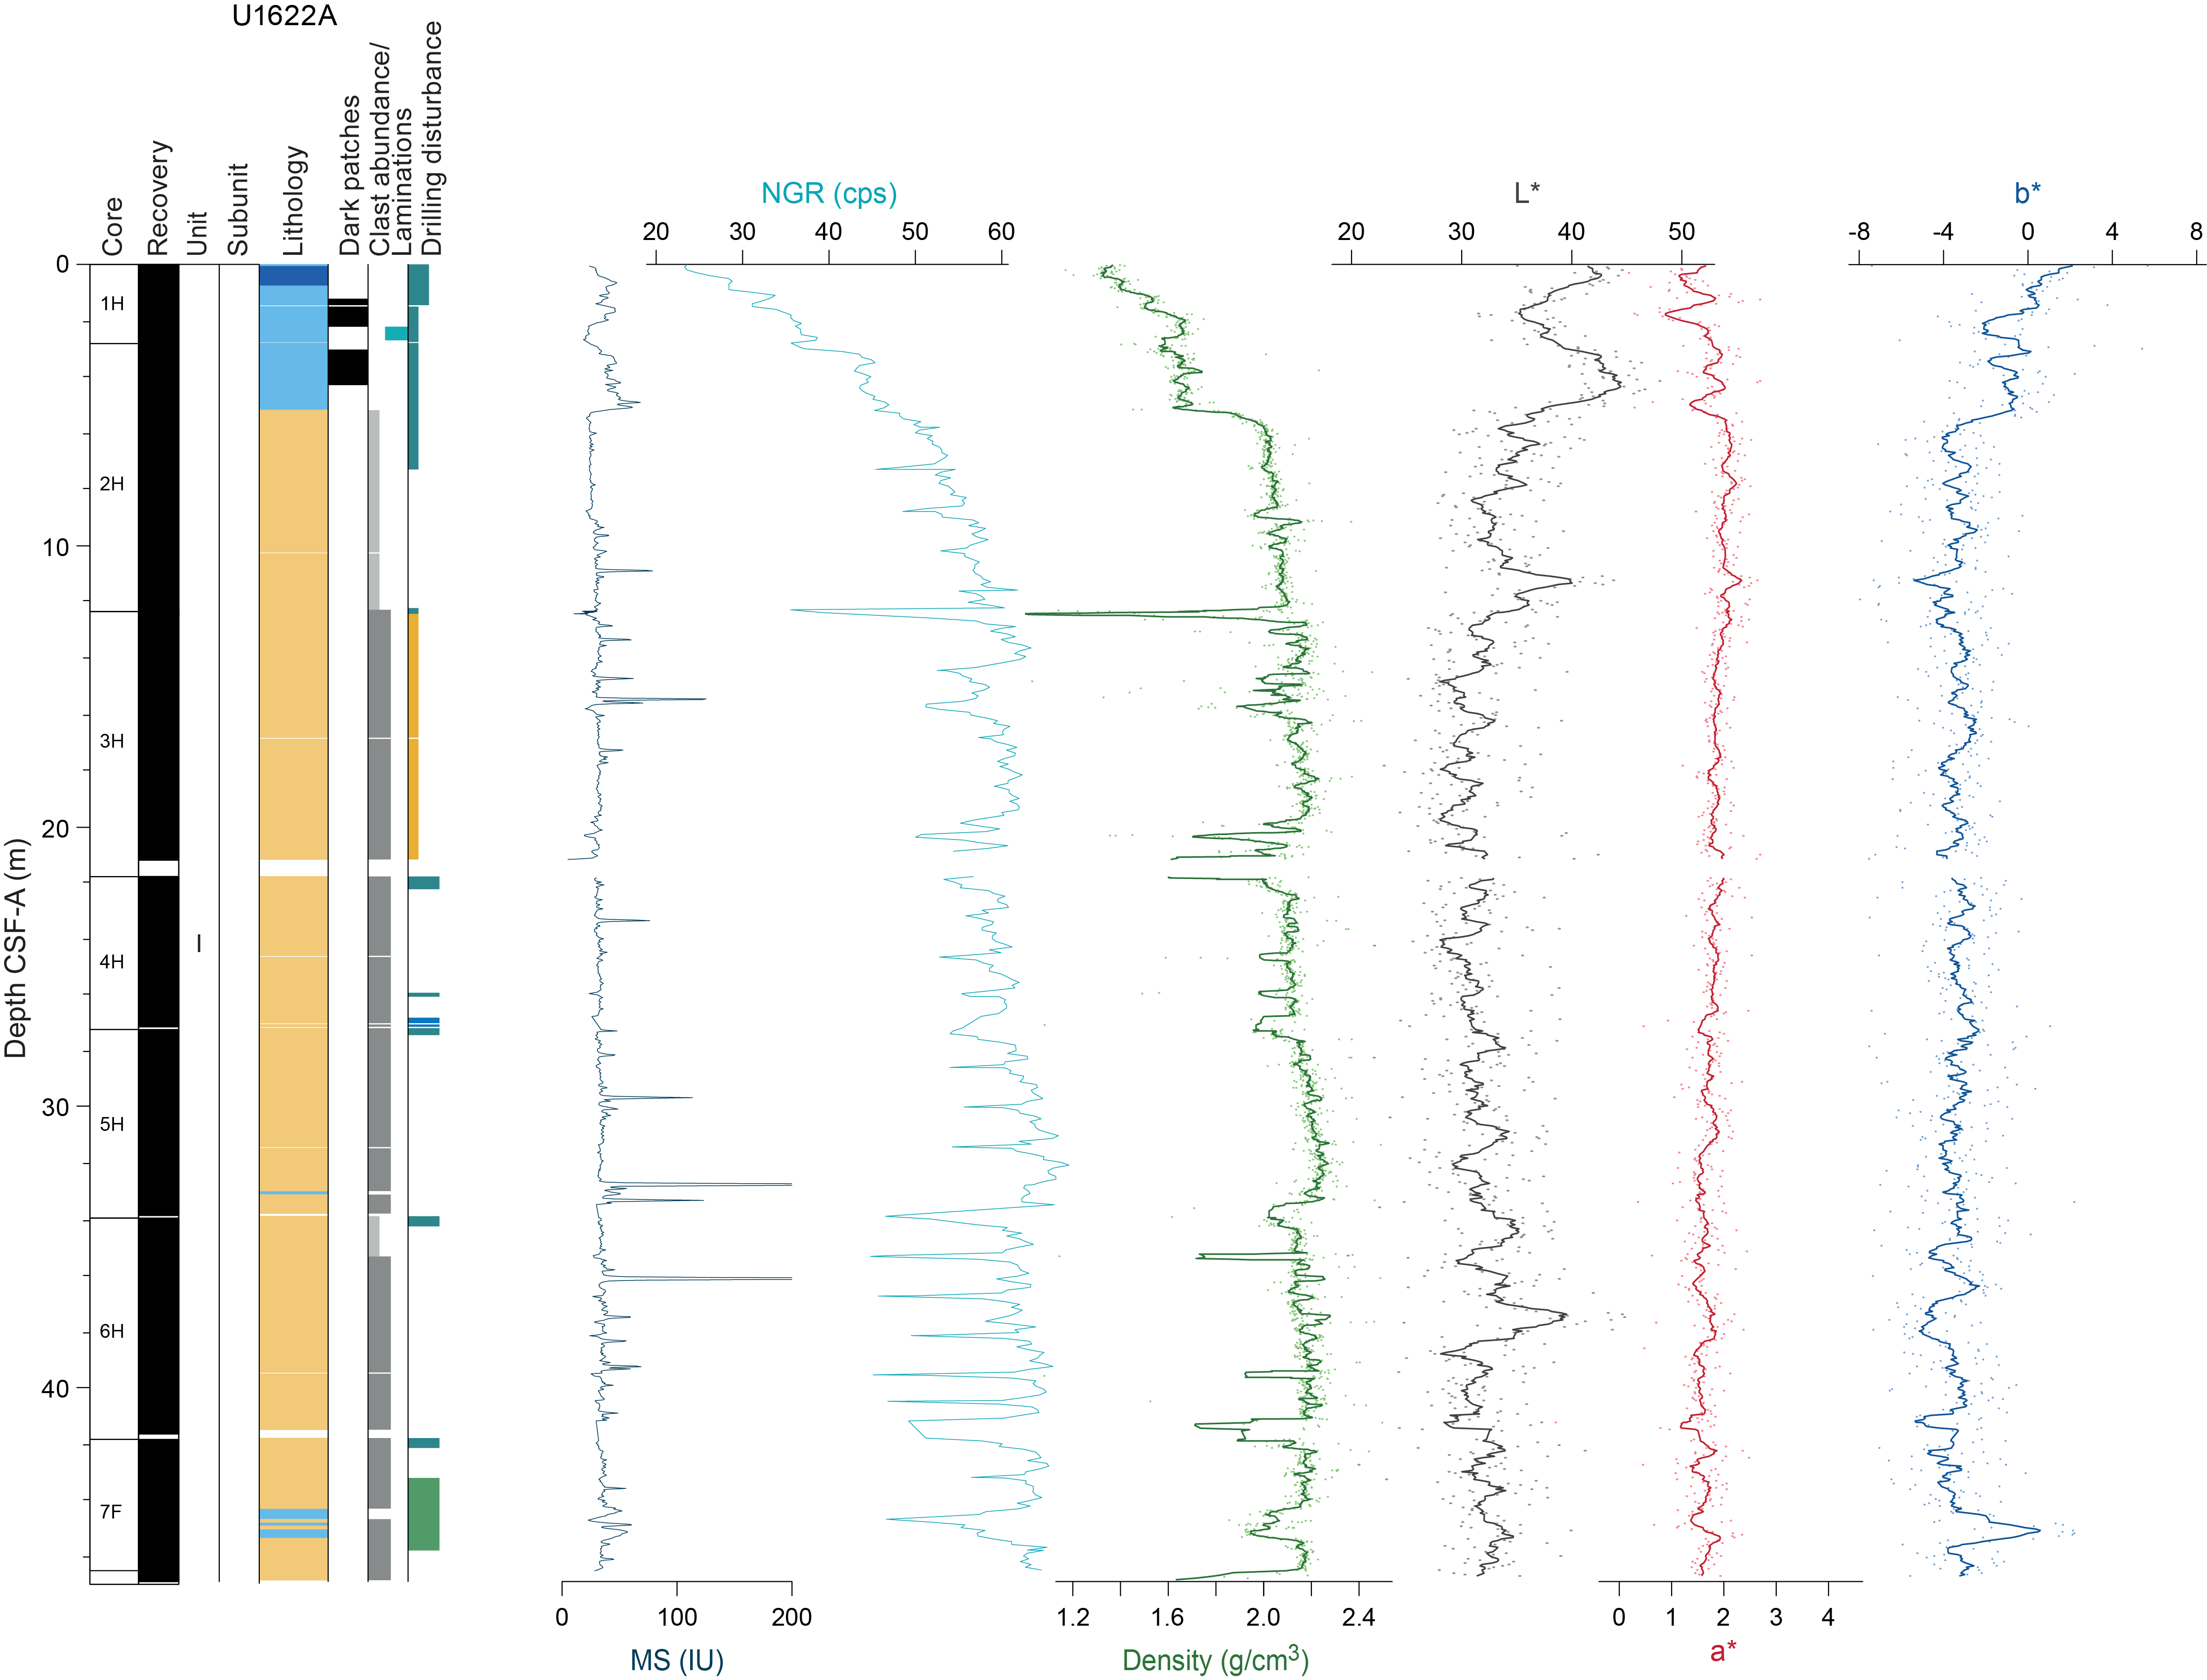
Figure F9. Physical properties, Hole U1622A.
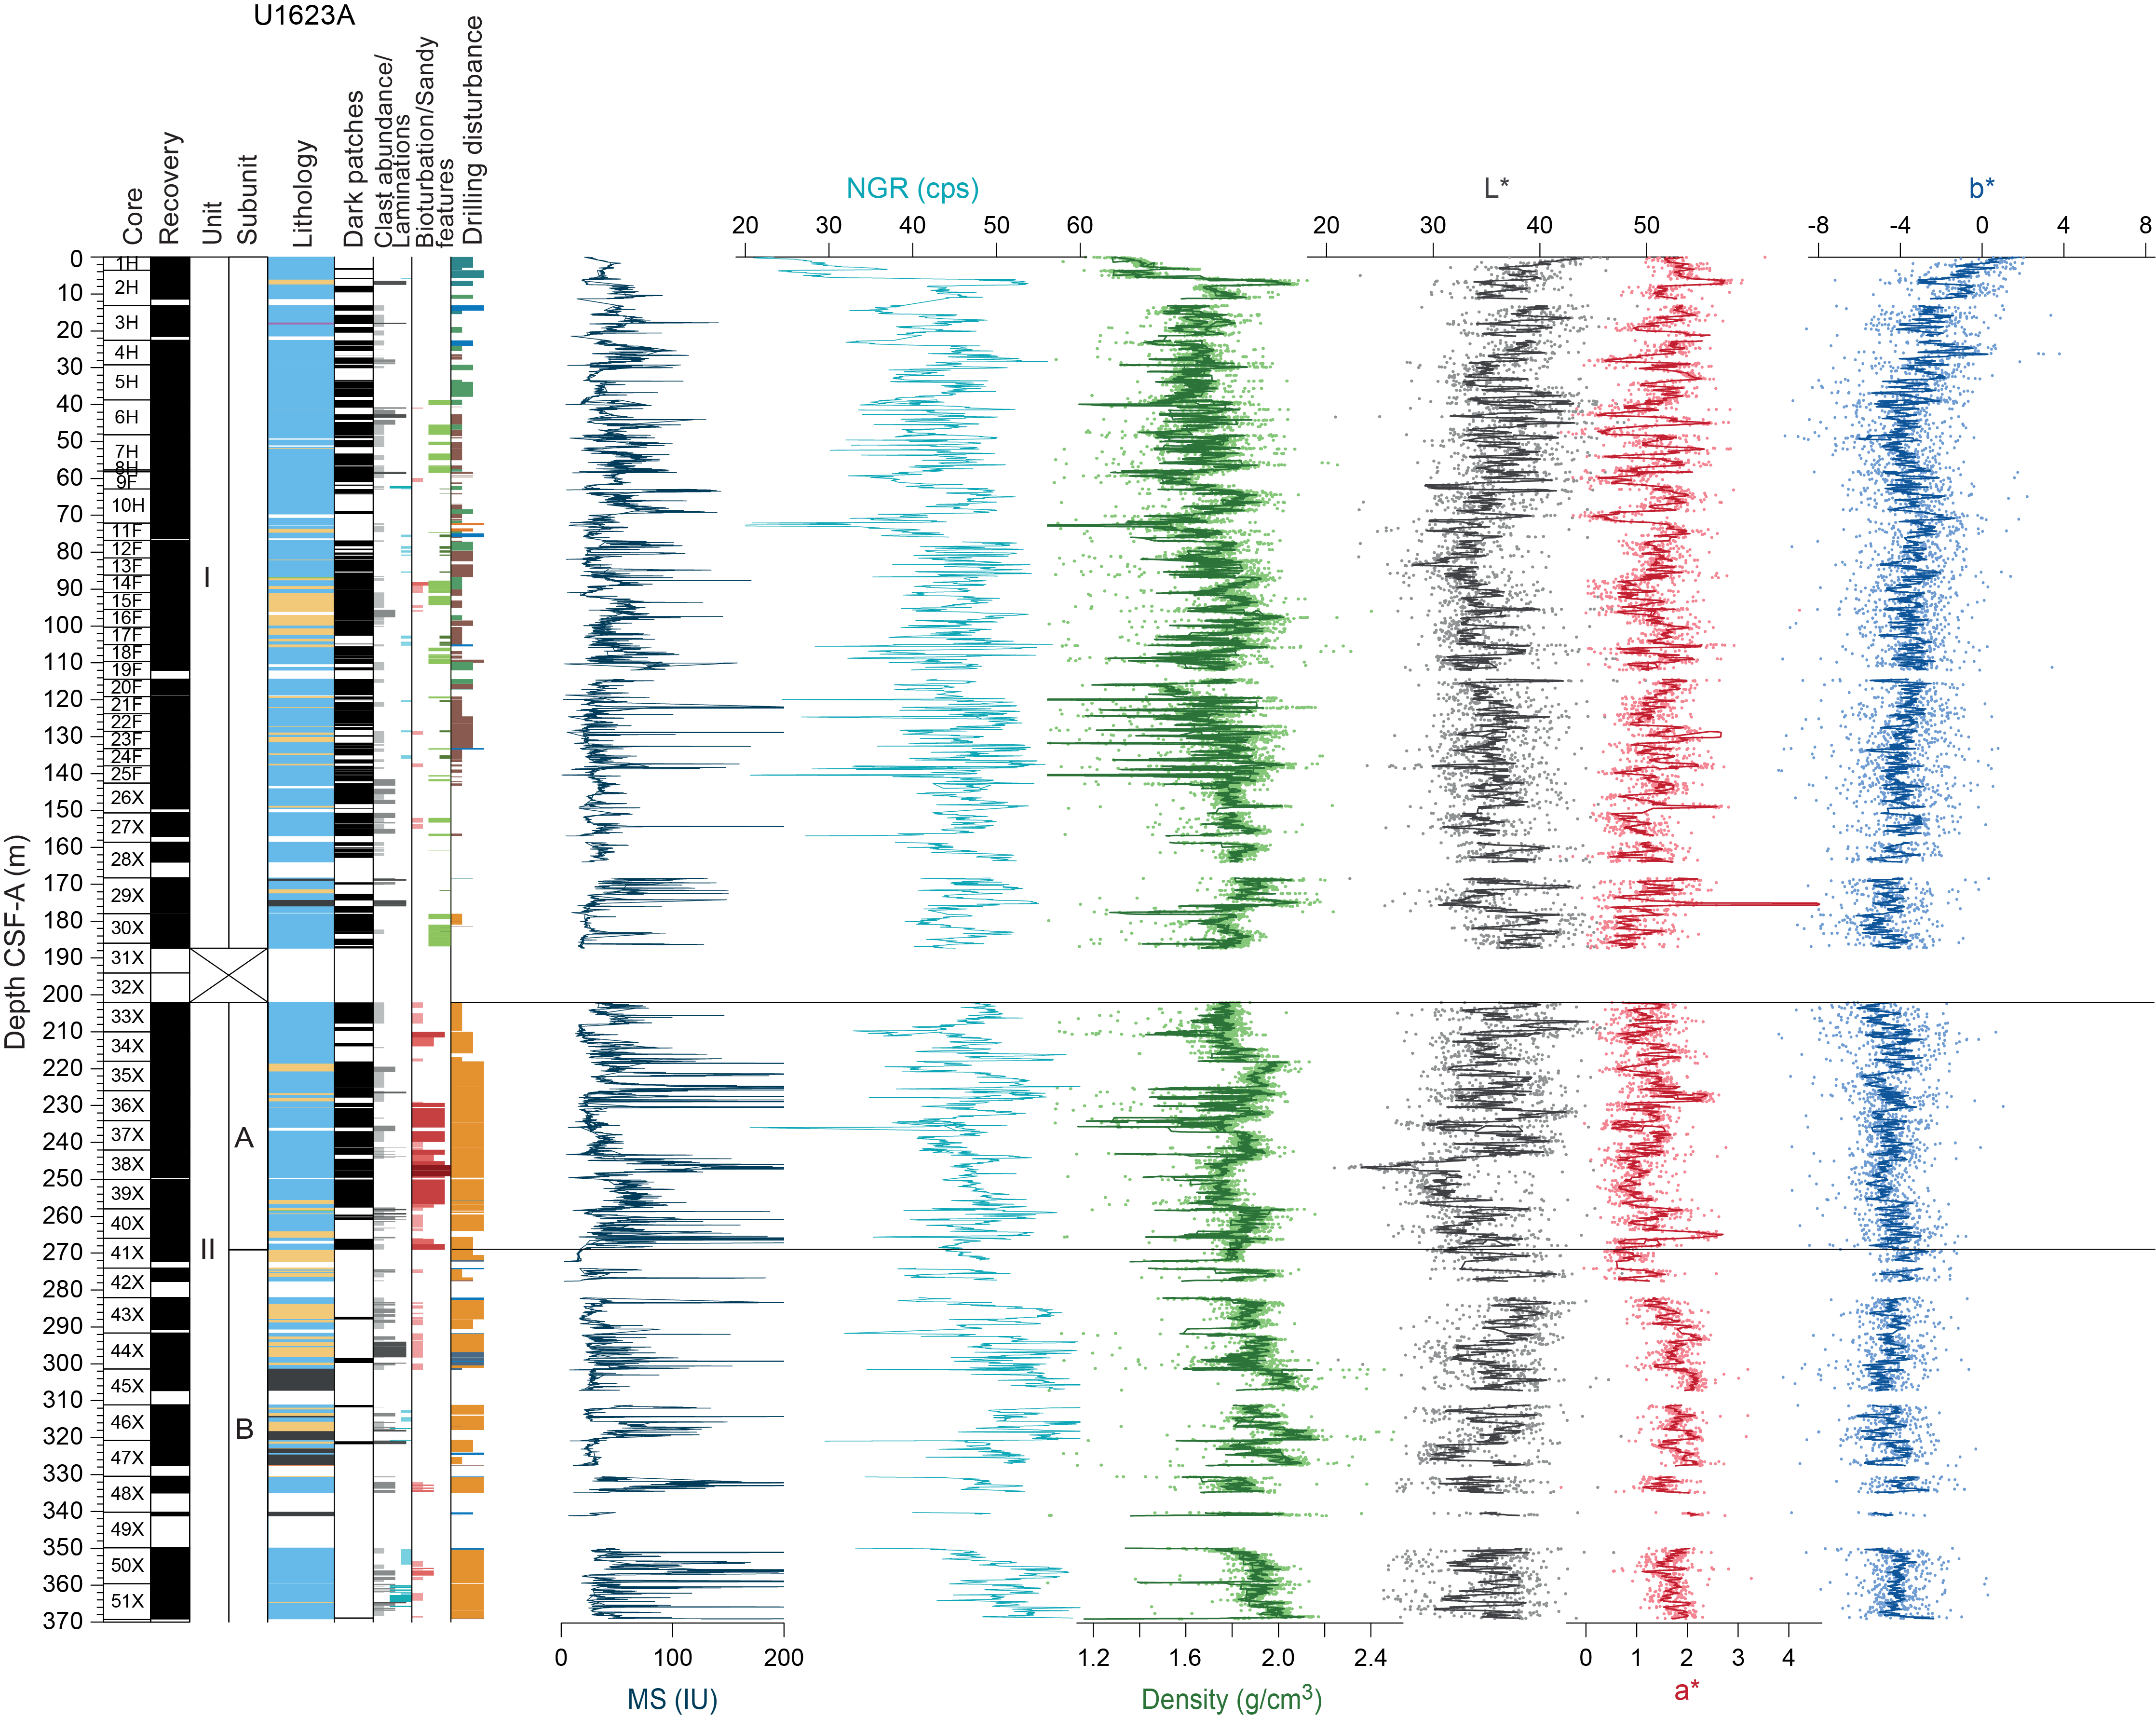
Figure F10. Physical properties, Hole U1623A.
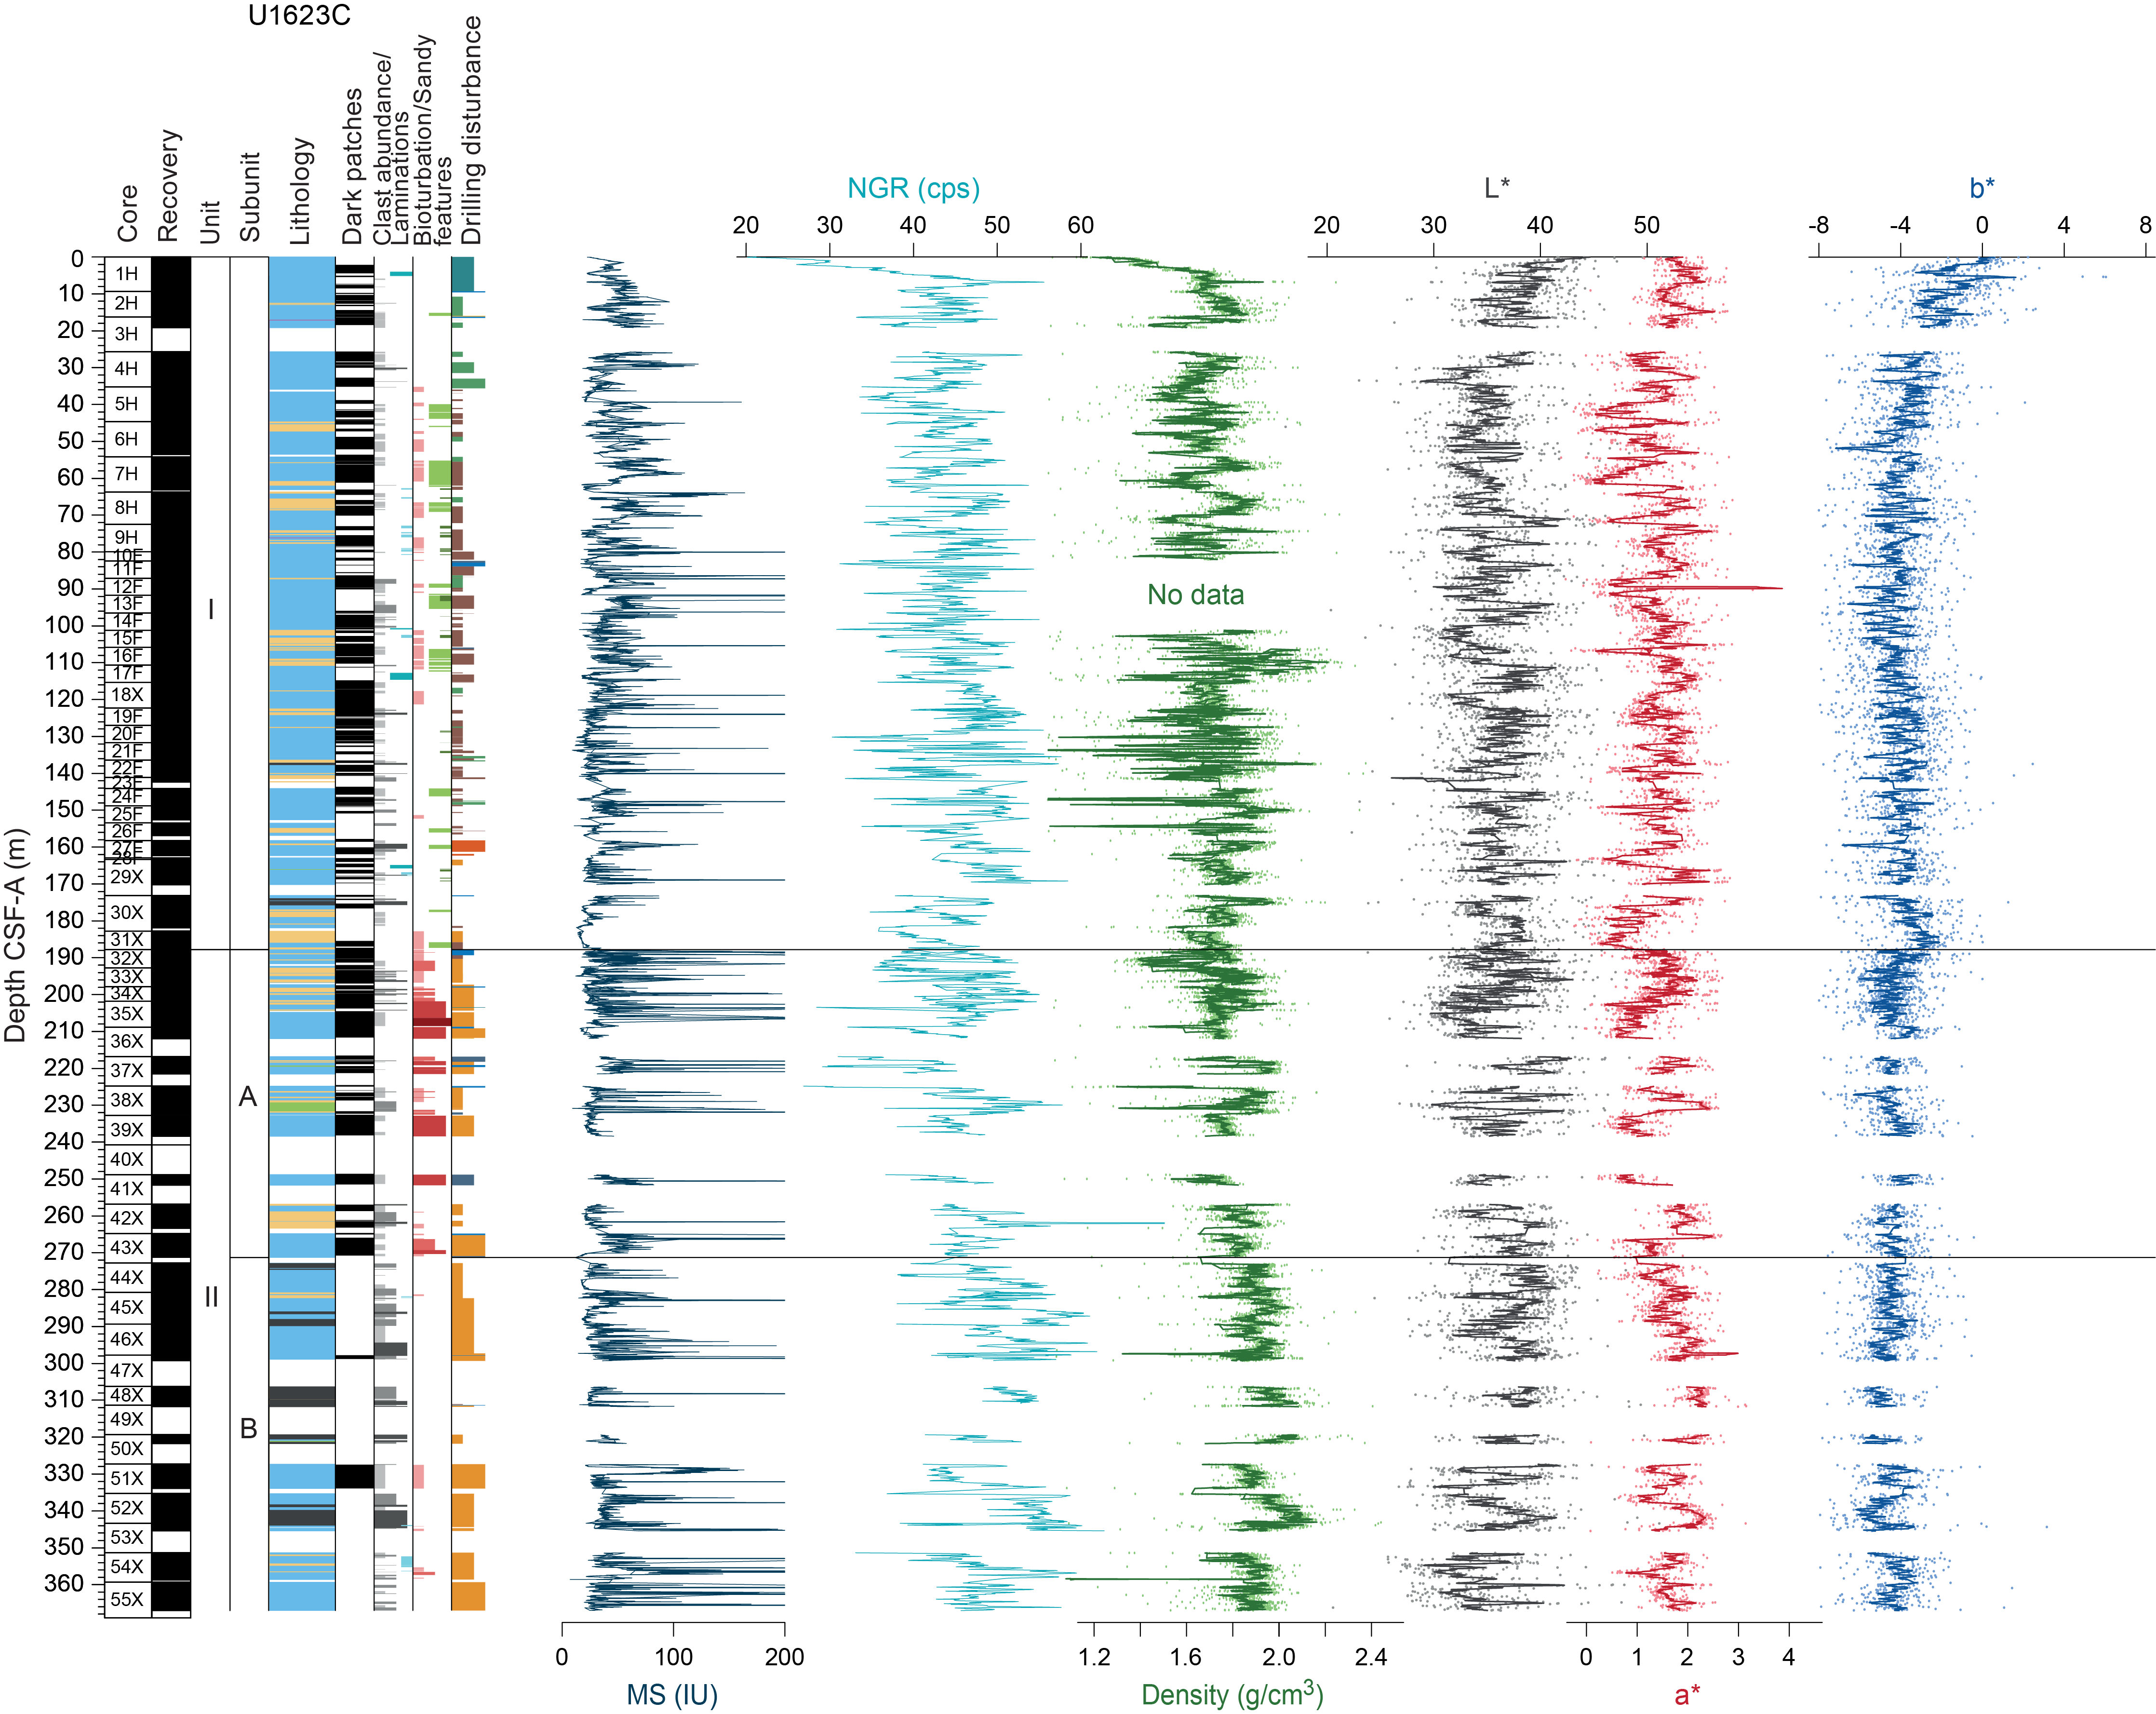
Figure F11. Physical properties, Hole U1623C.
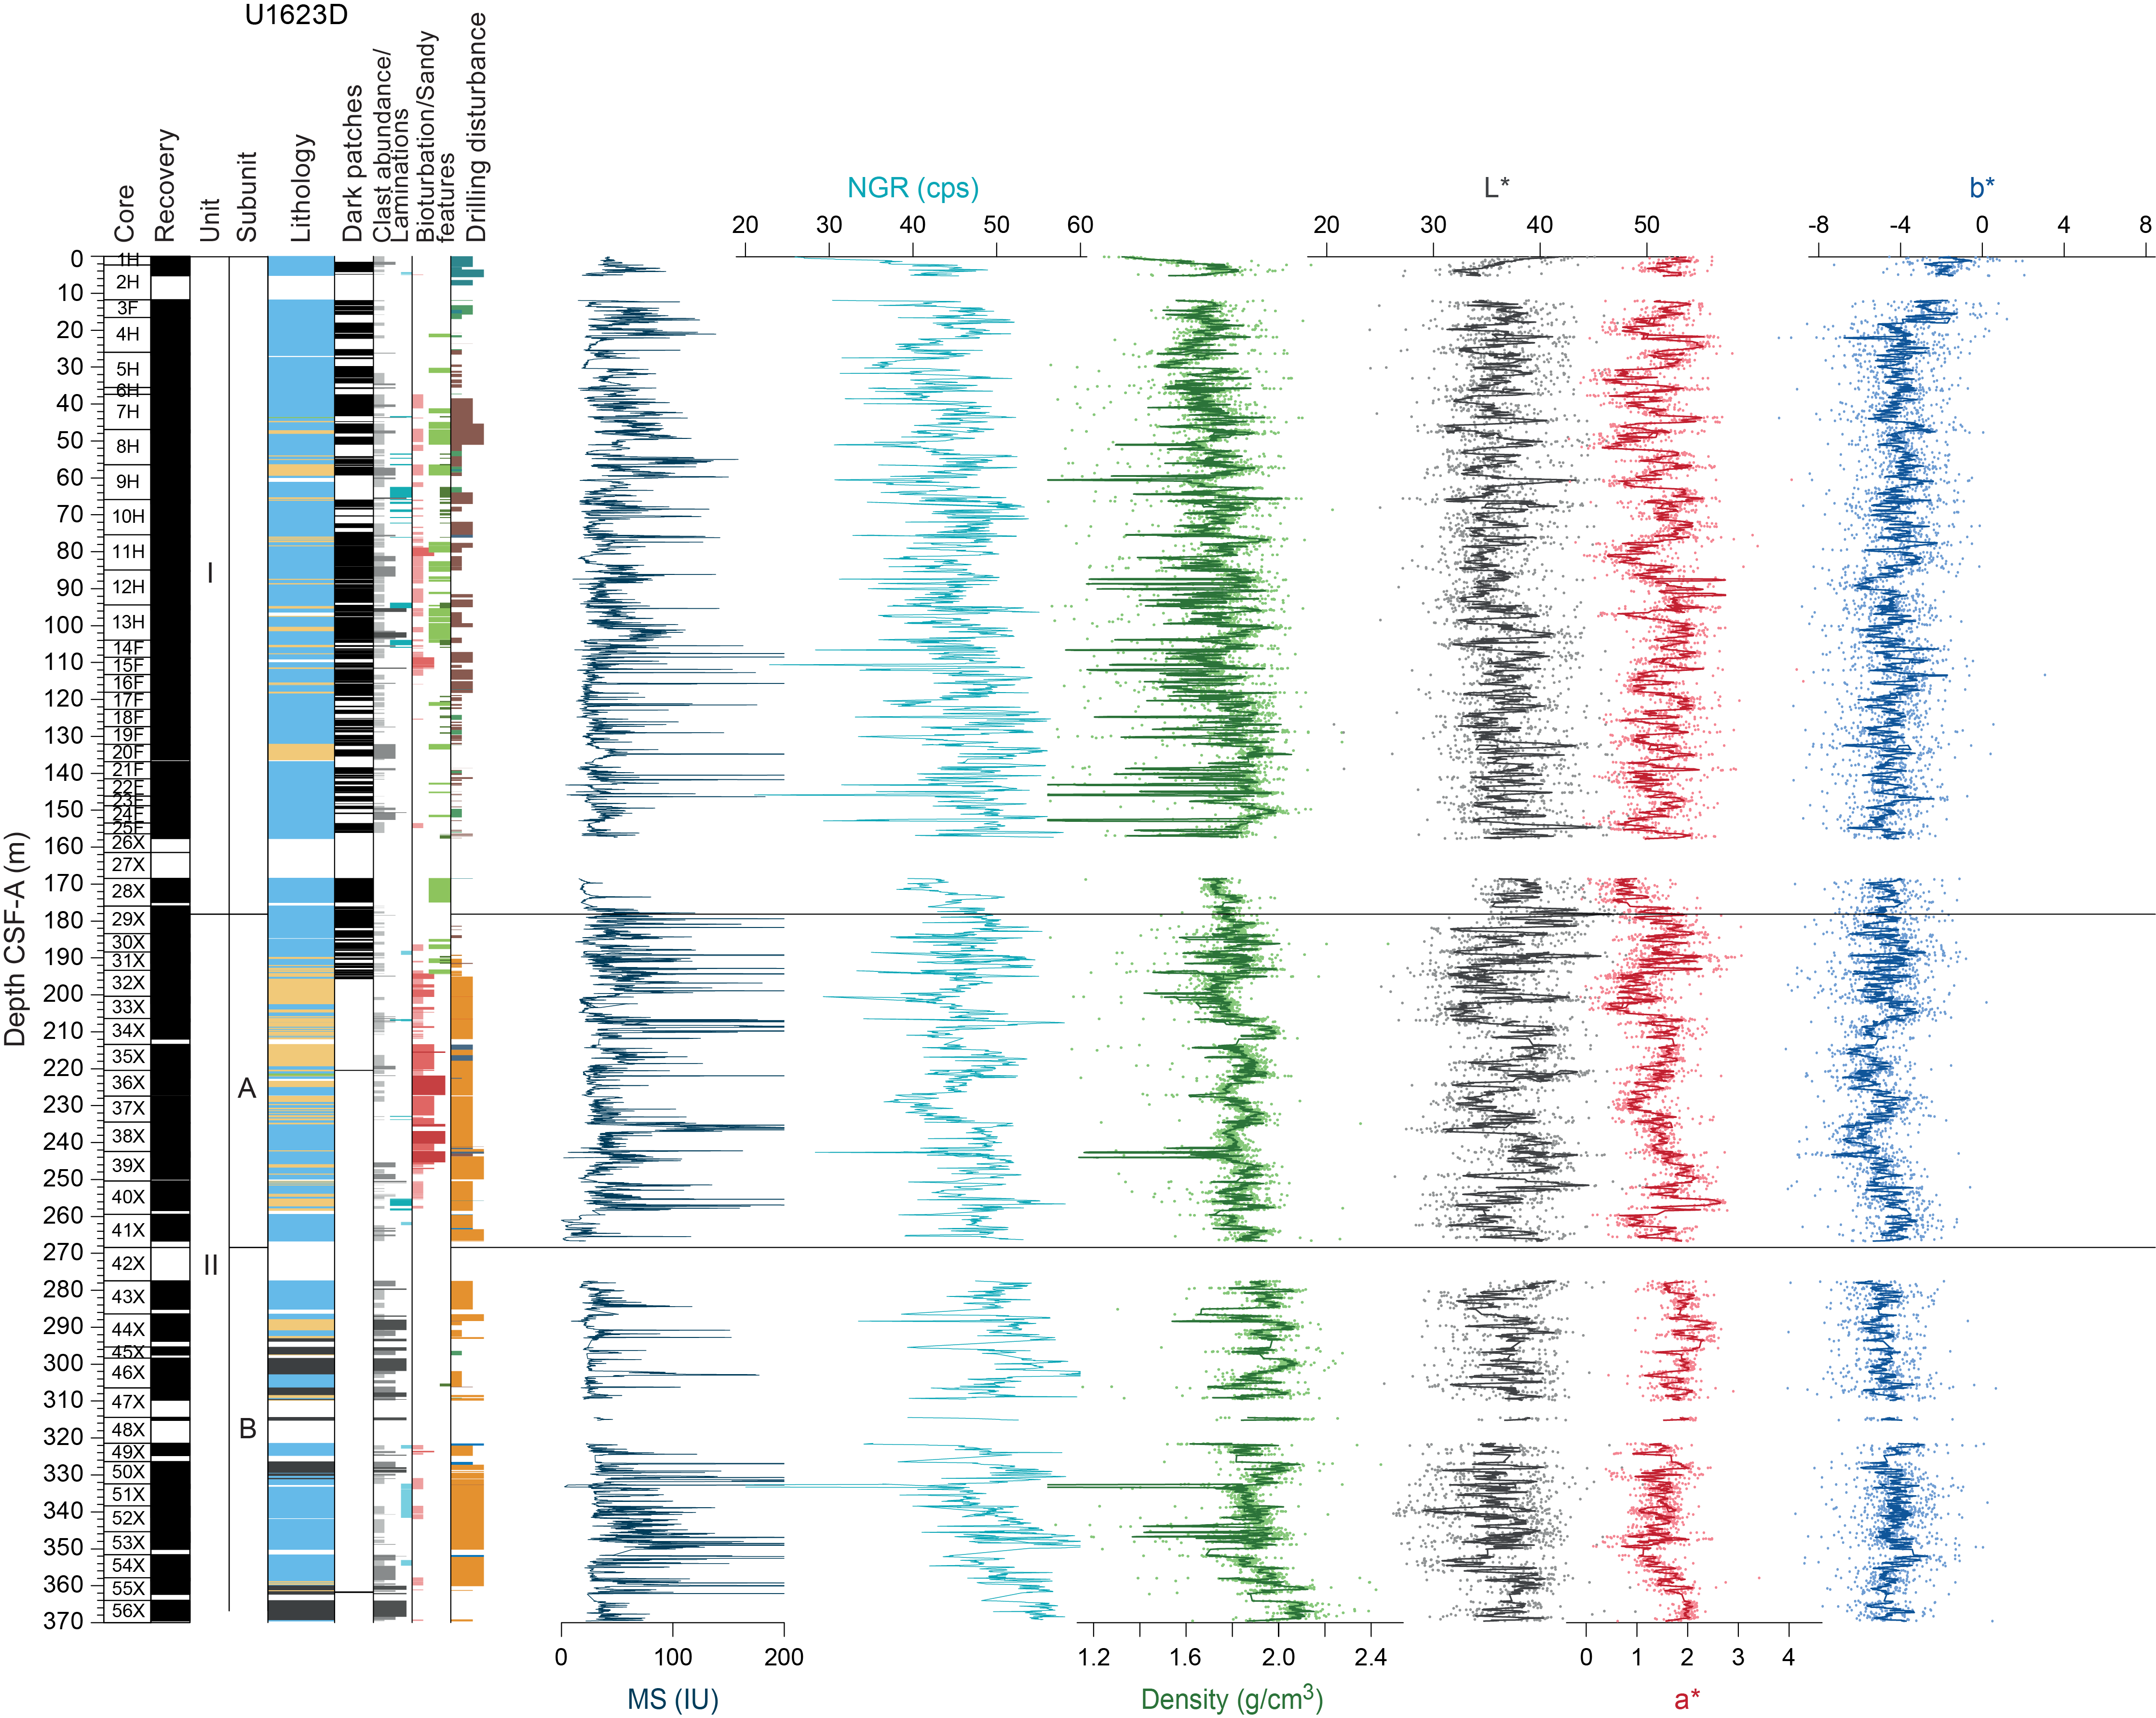
Figure F12. Physical properties, Hole U1623D.
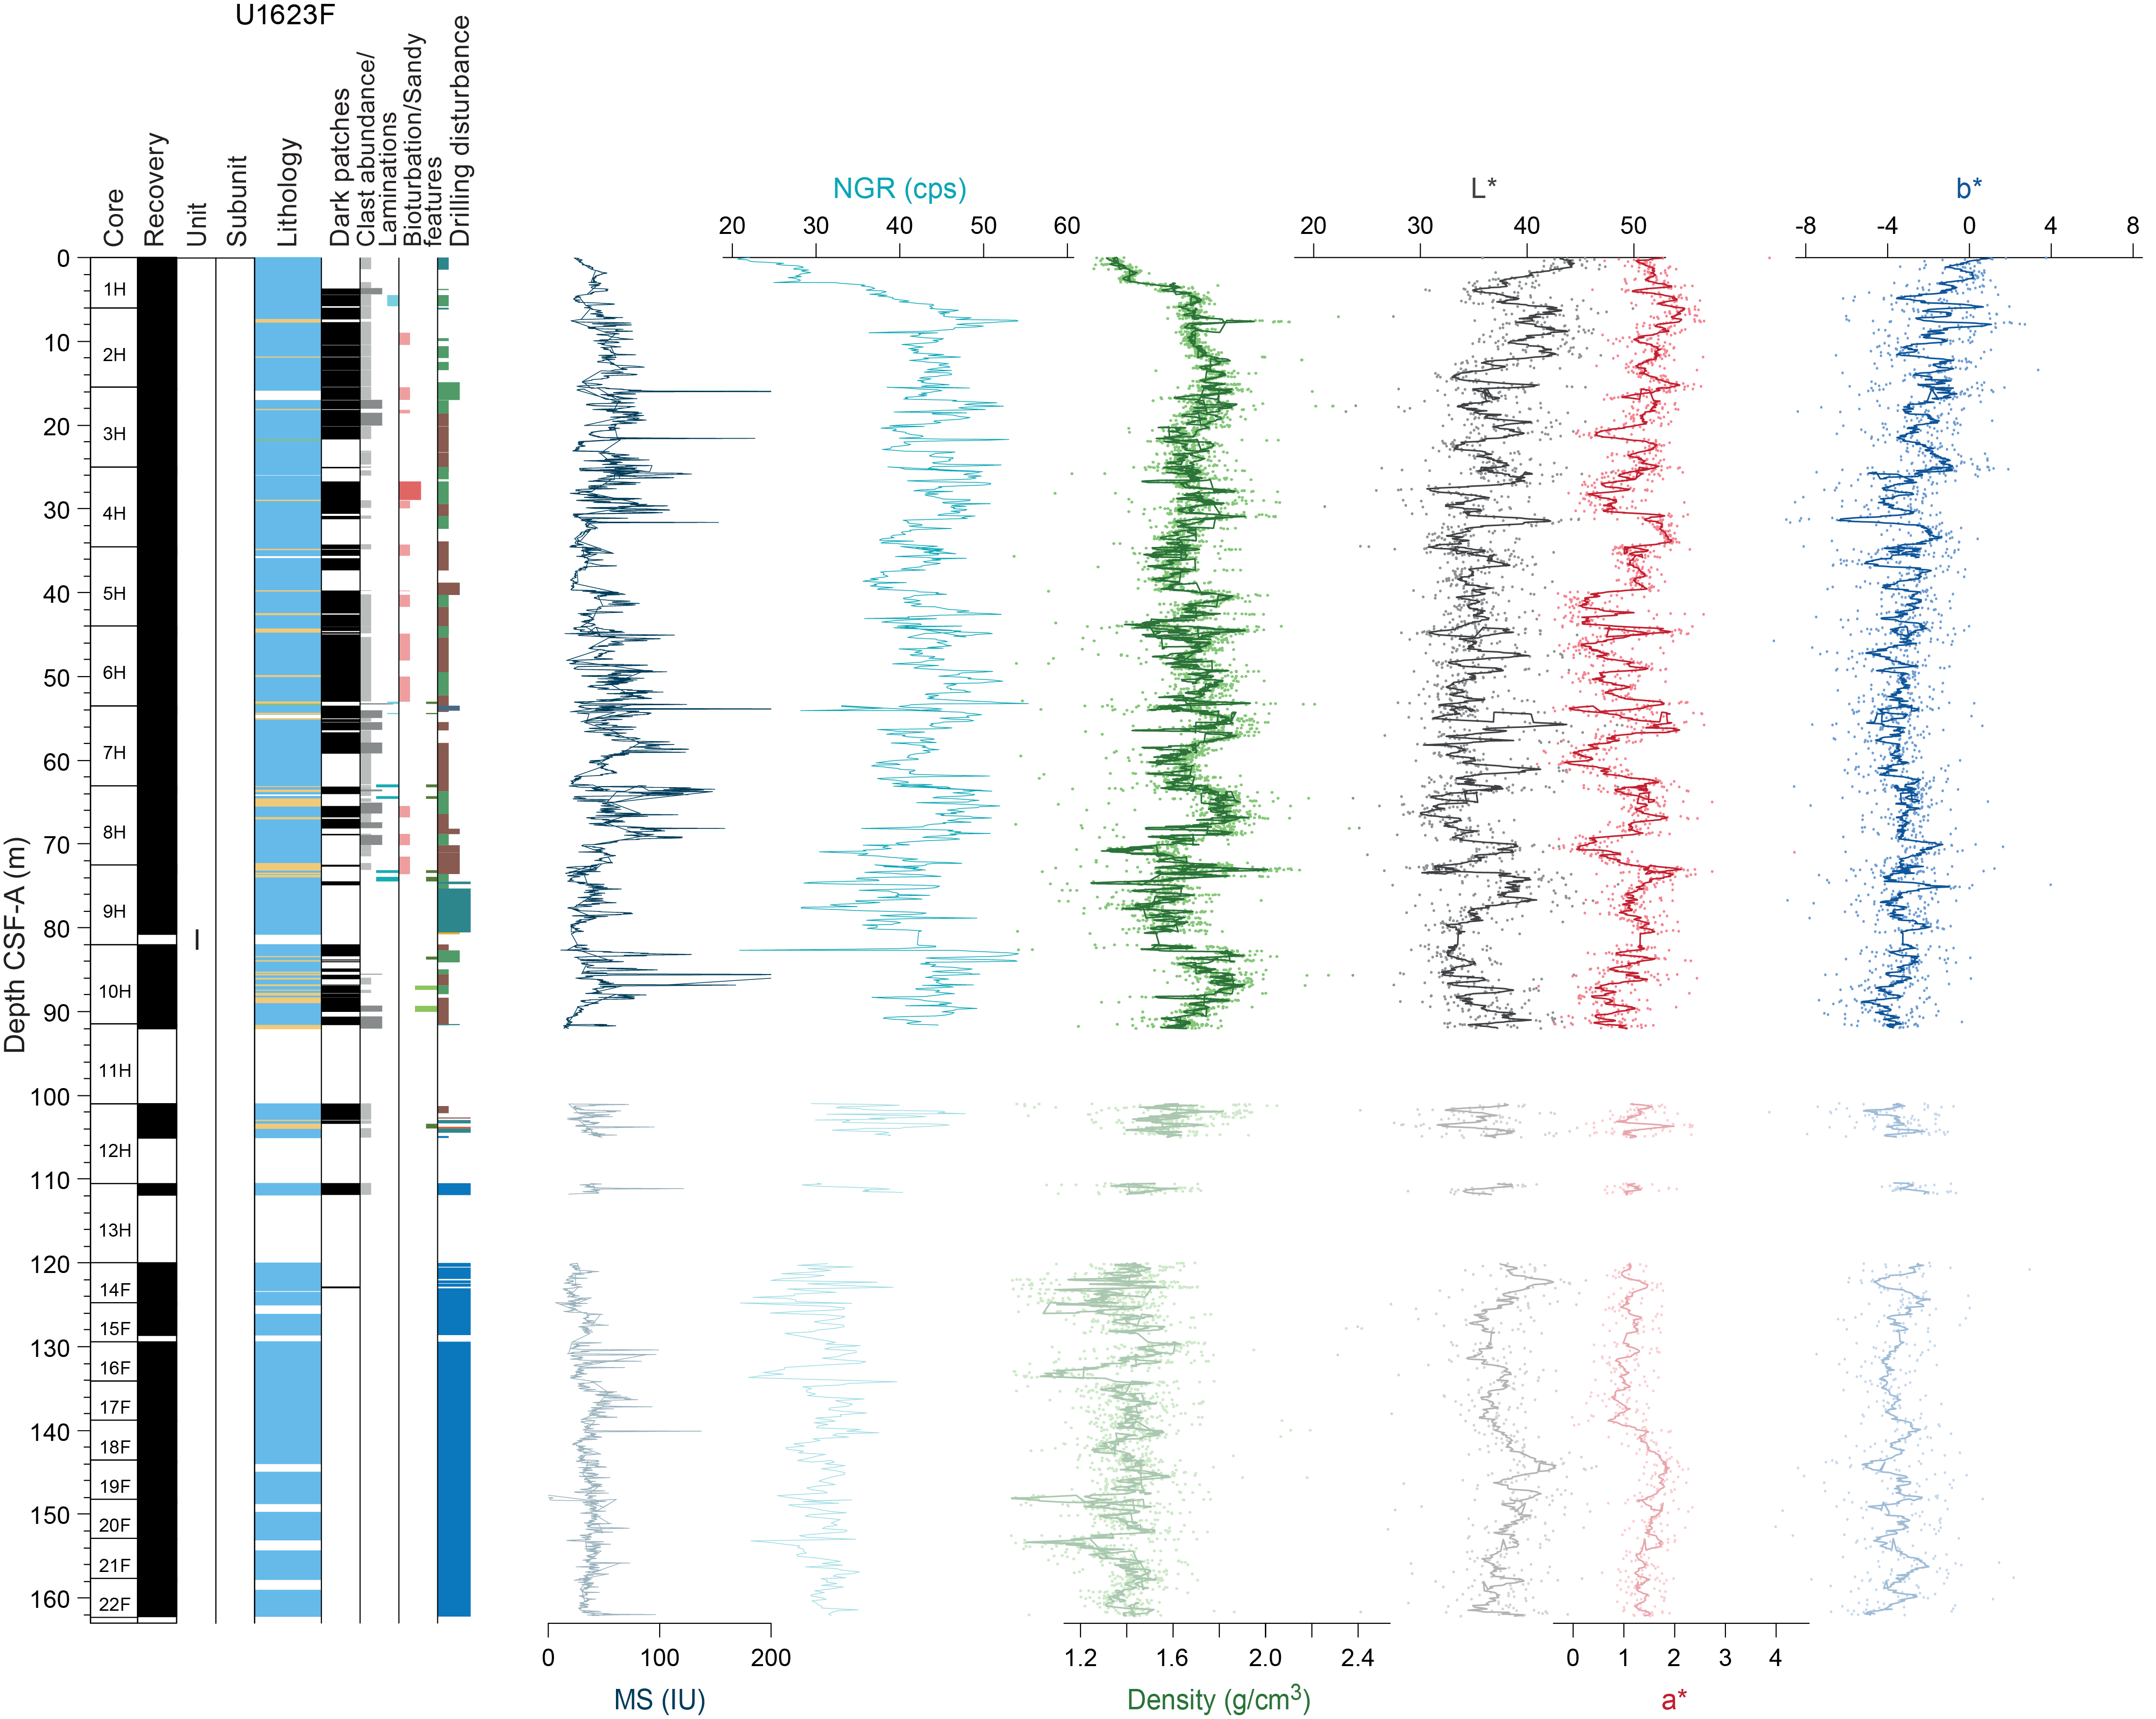
Figure F13. Physical properties, Hole U1623F.
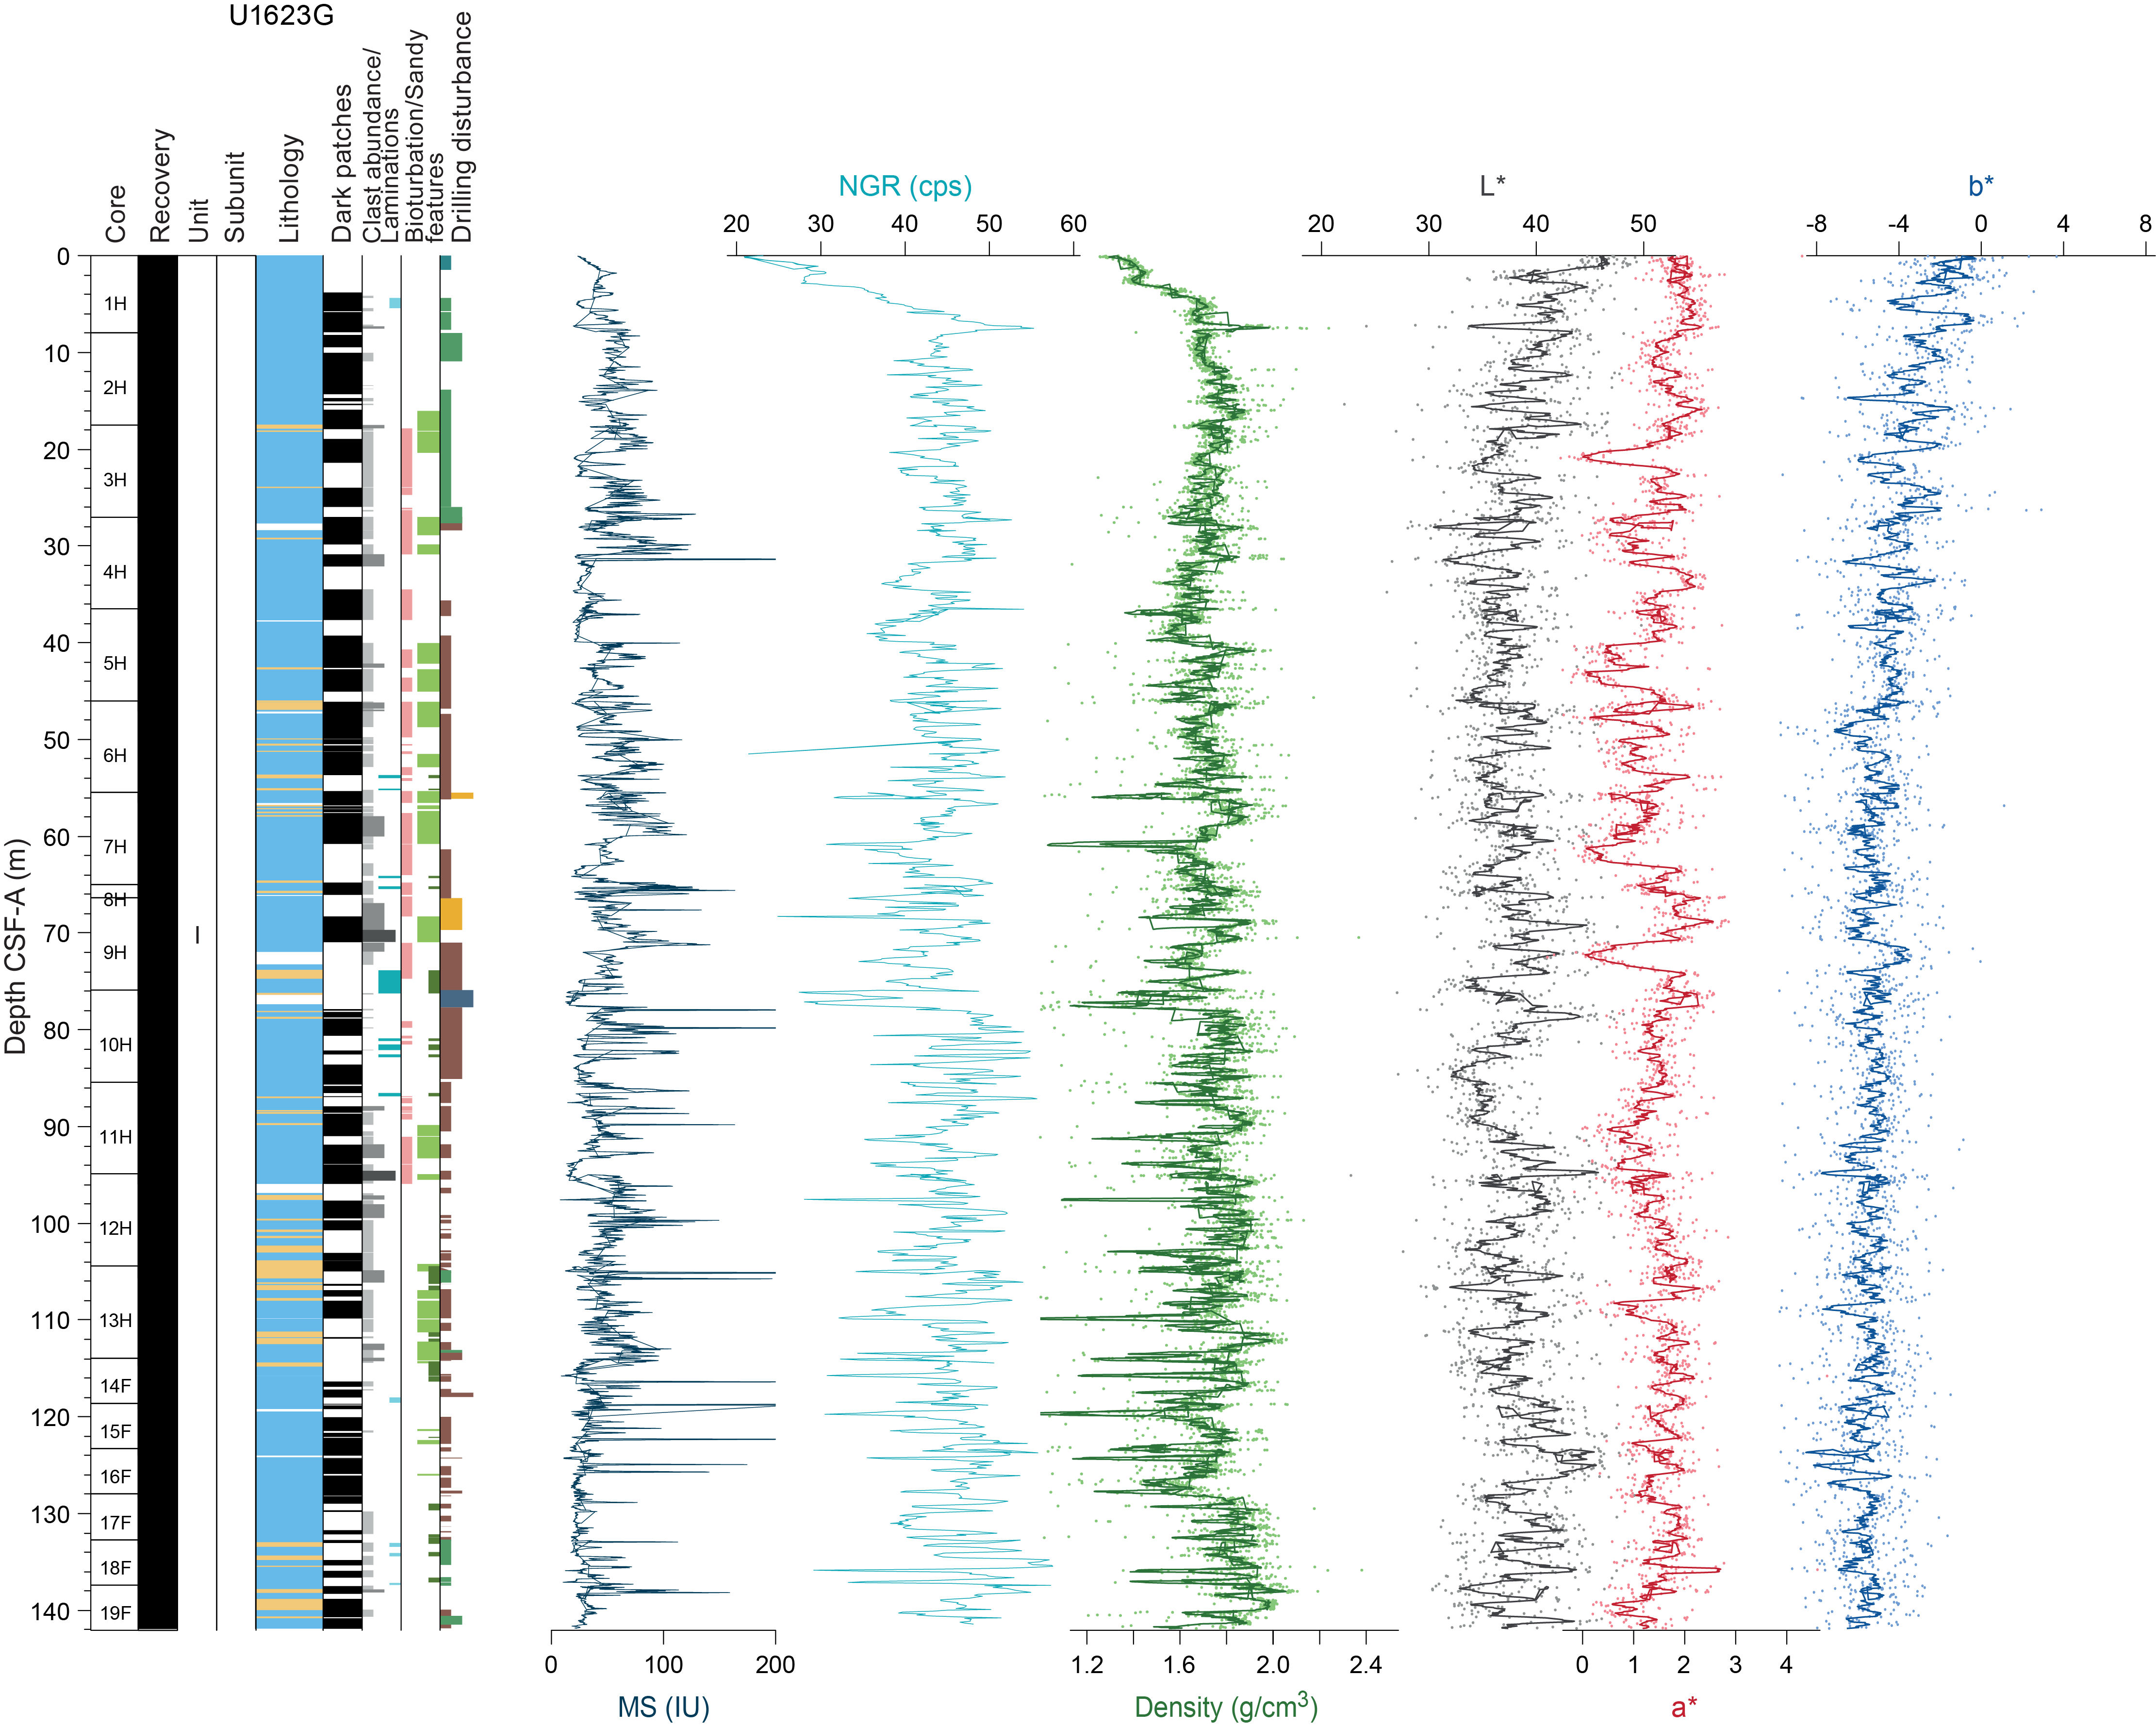
Figure F14. Physical properties, Hole U1623G.
Based on the lithologic characteristics, sediments recovered from Sites U1621–U1623 are divided into two primary lithostratigraphic units and additional subunits (Figures F15, F16; Table T4). Hole U1623A was chosen as the primary site for subdivision, except between ~186 and 202 mbsf where there was poor core recovery; for this depth interval, Hole U1623C was used as the primary source for lithologic information.
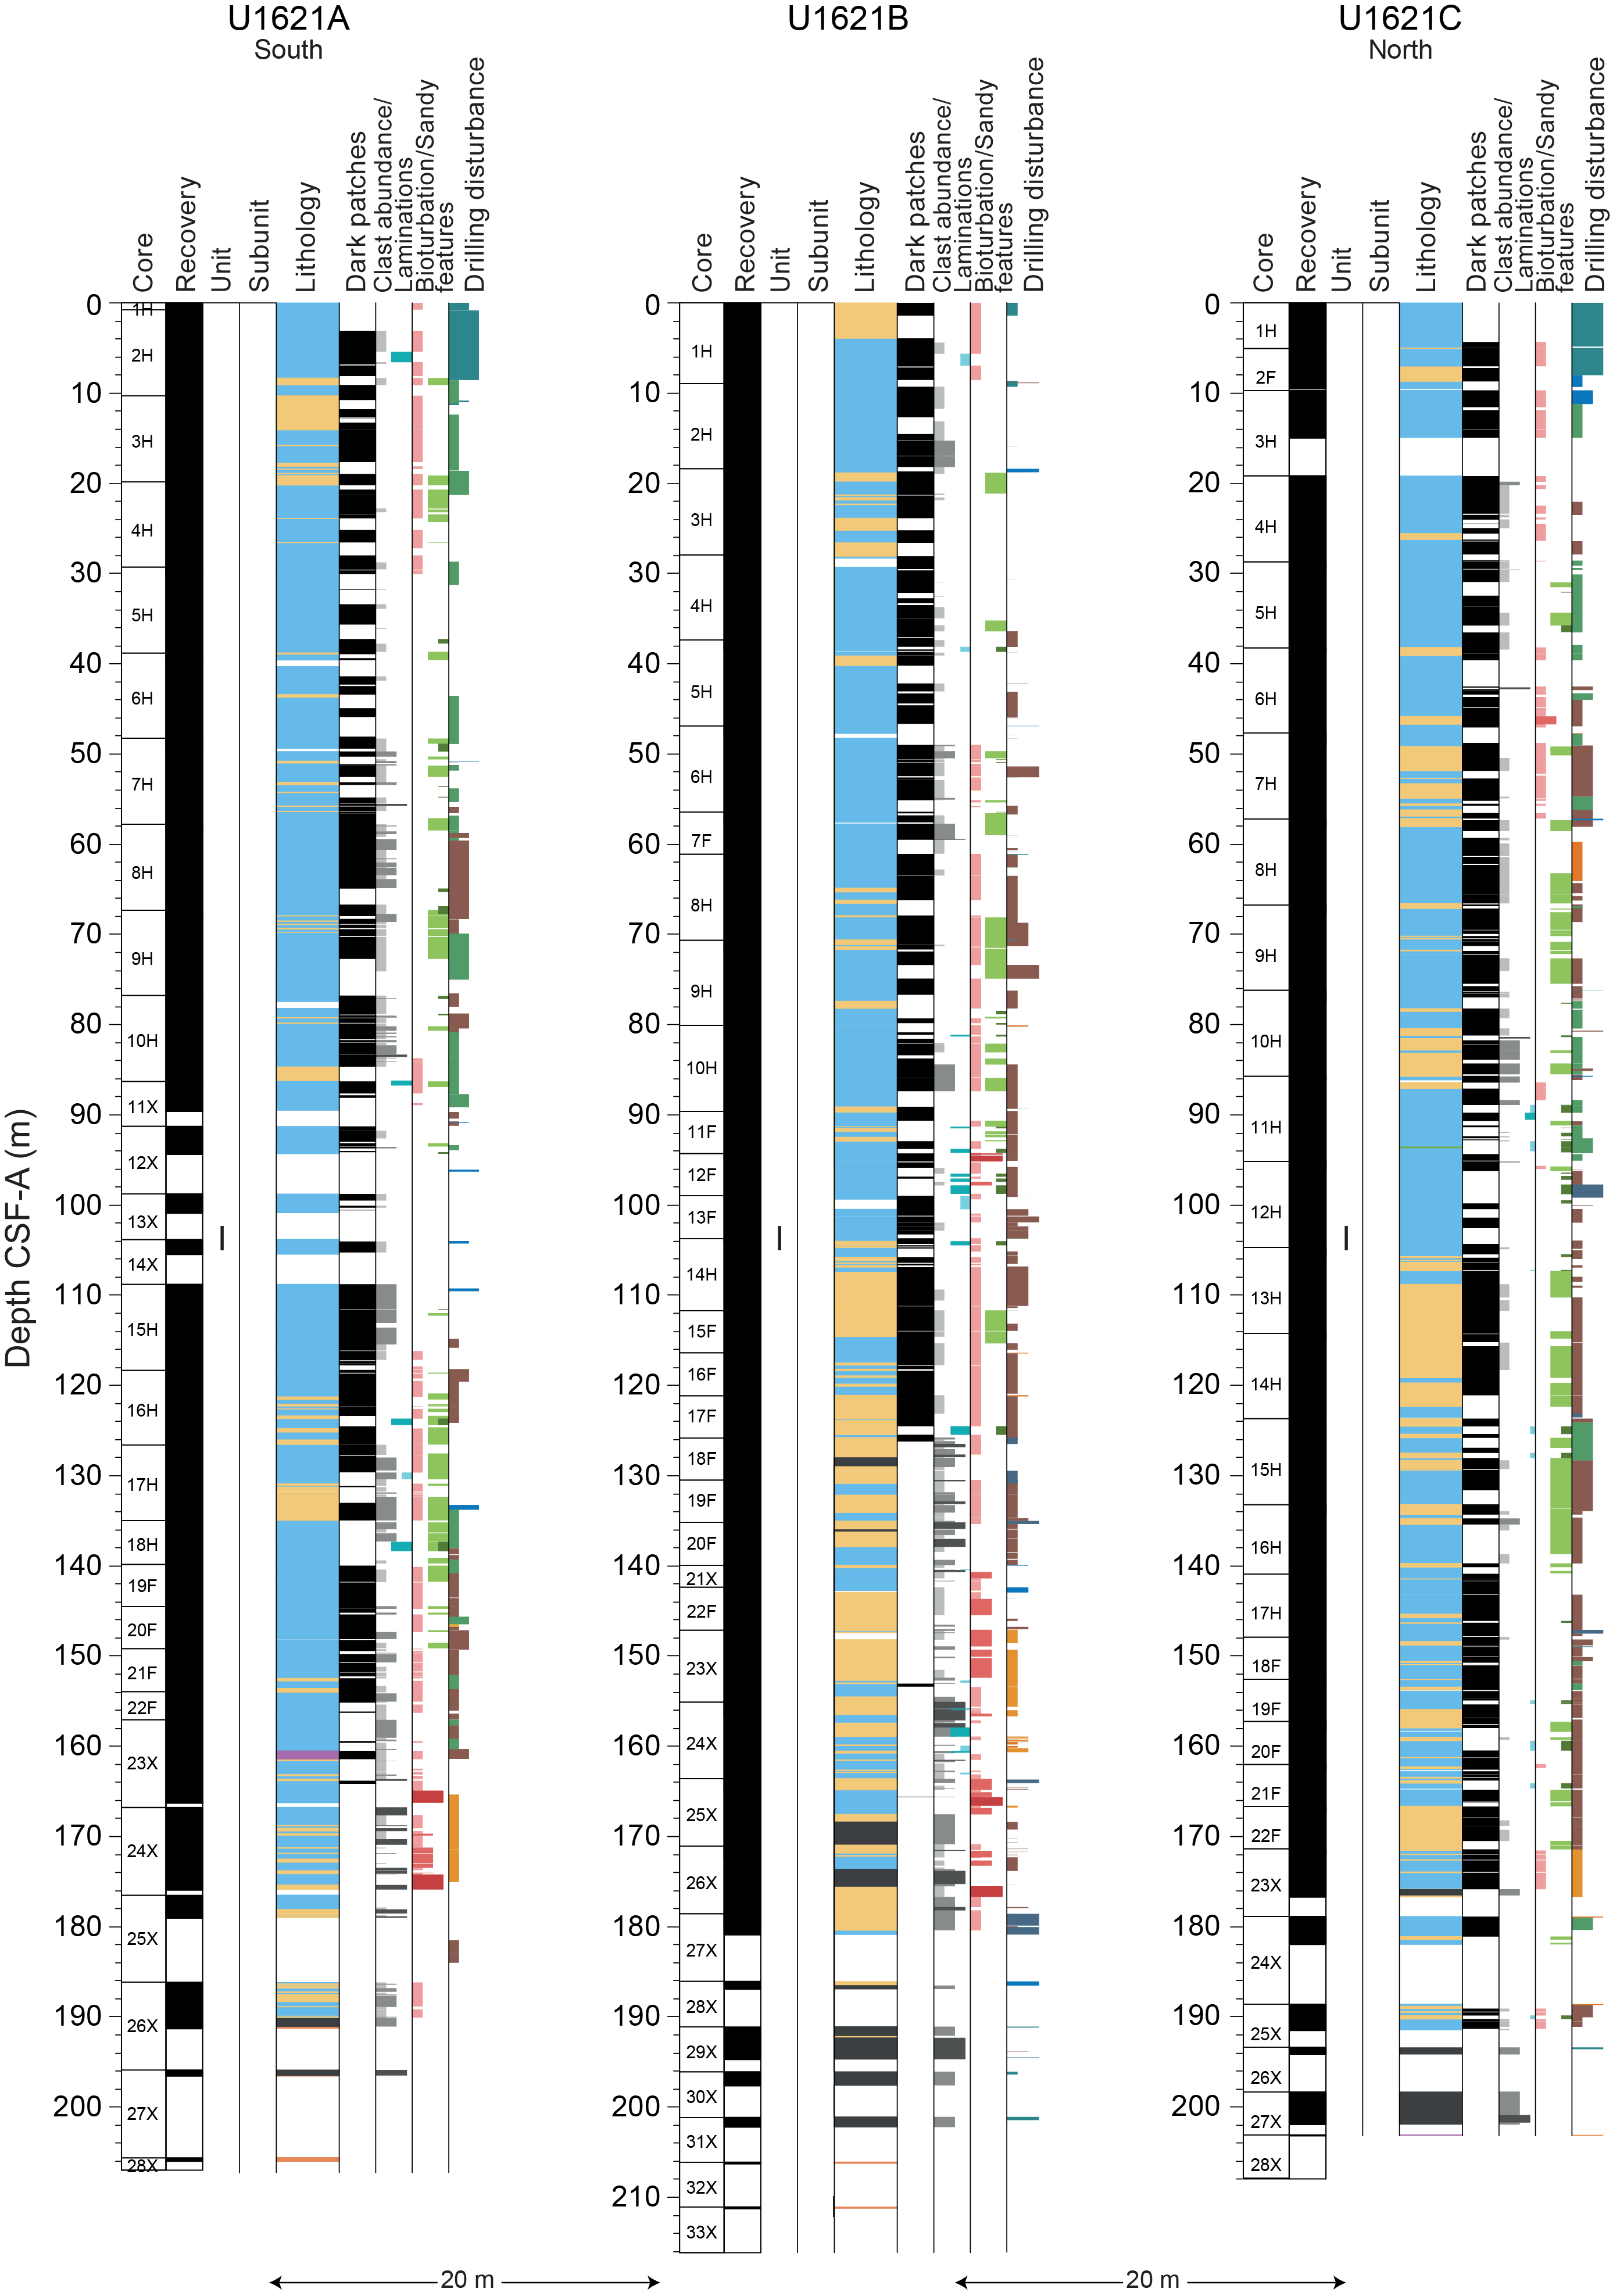
Figure F15. Lithostratigraphic correlation, Holes U1621A–U1621C.
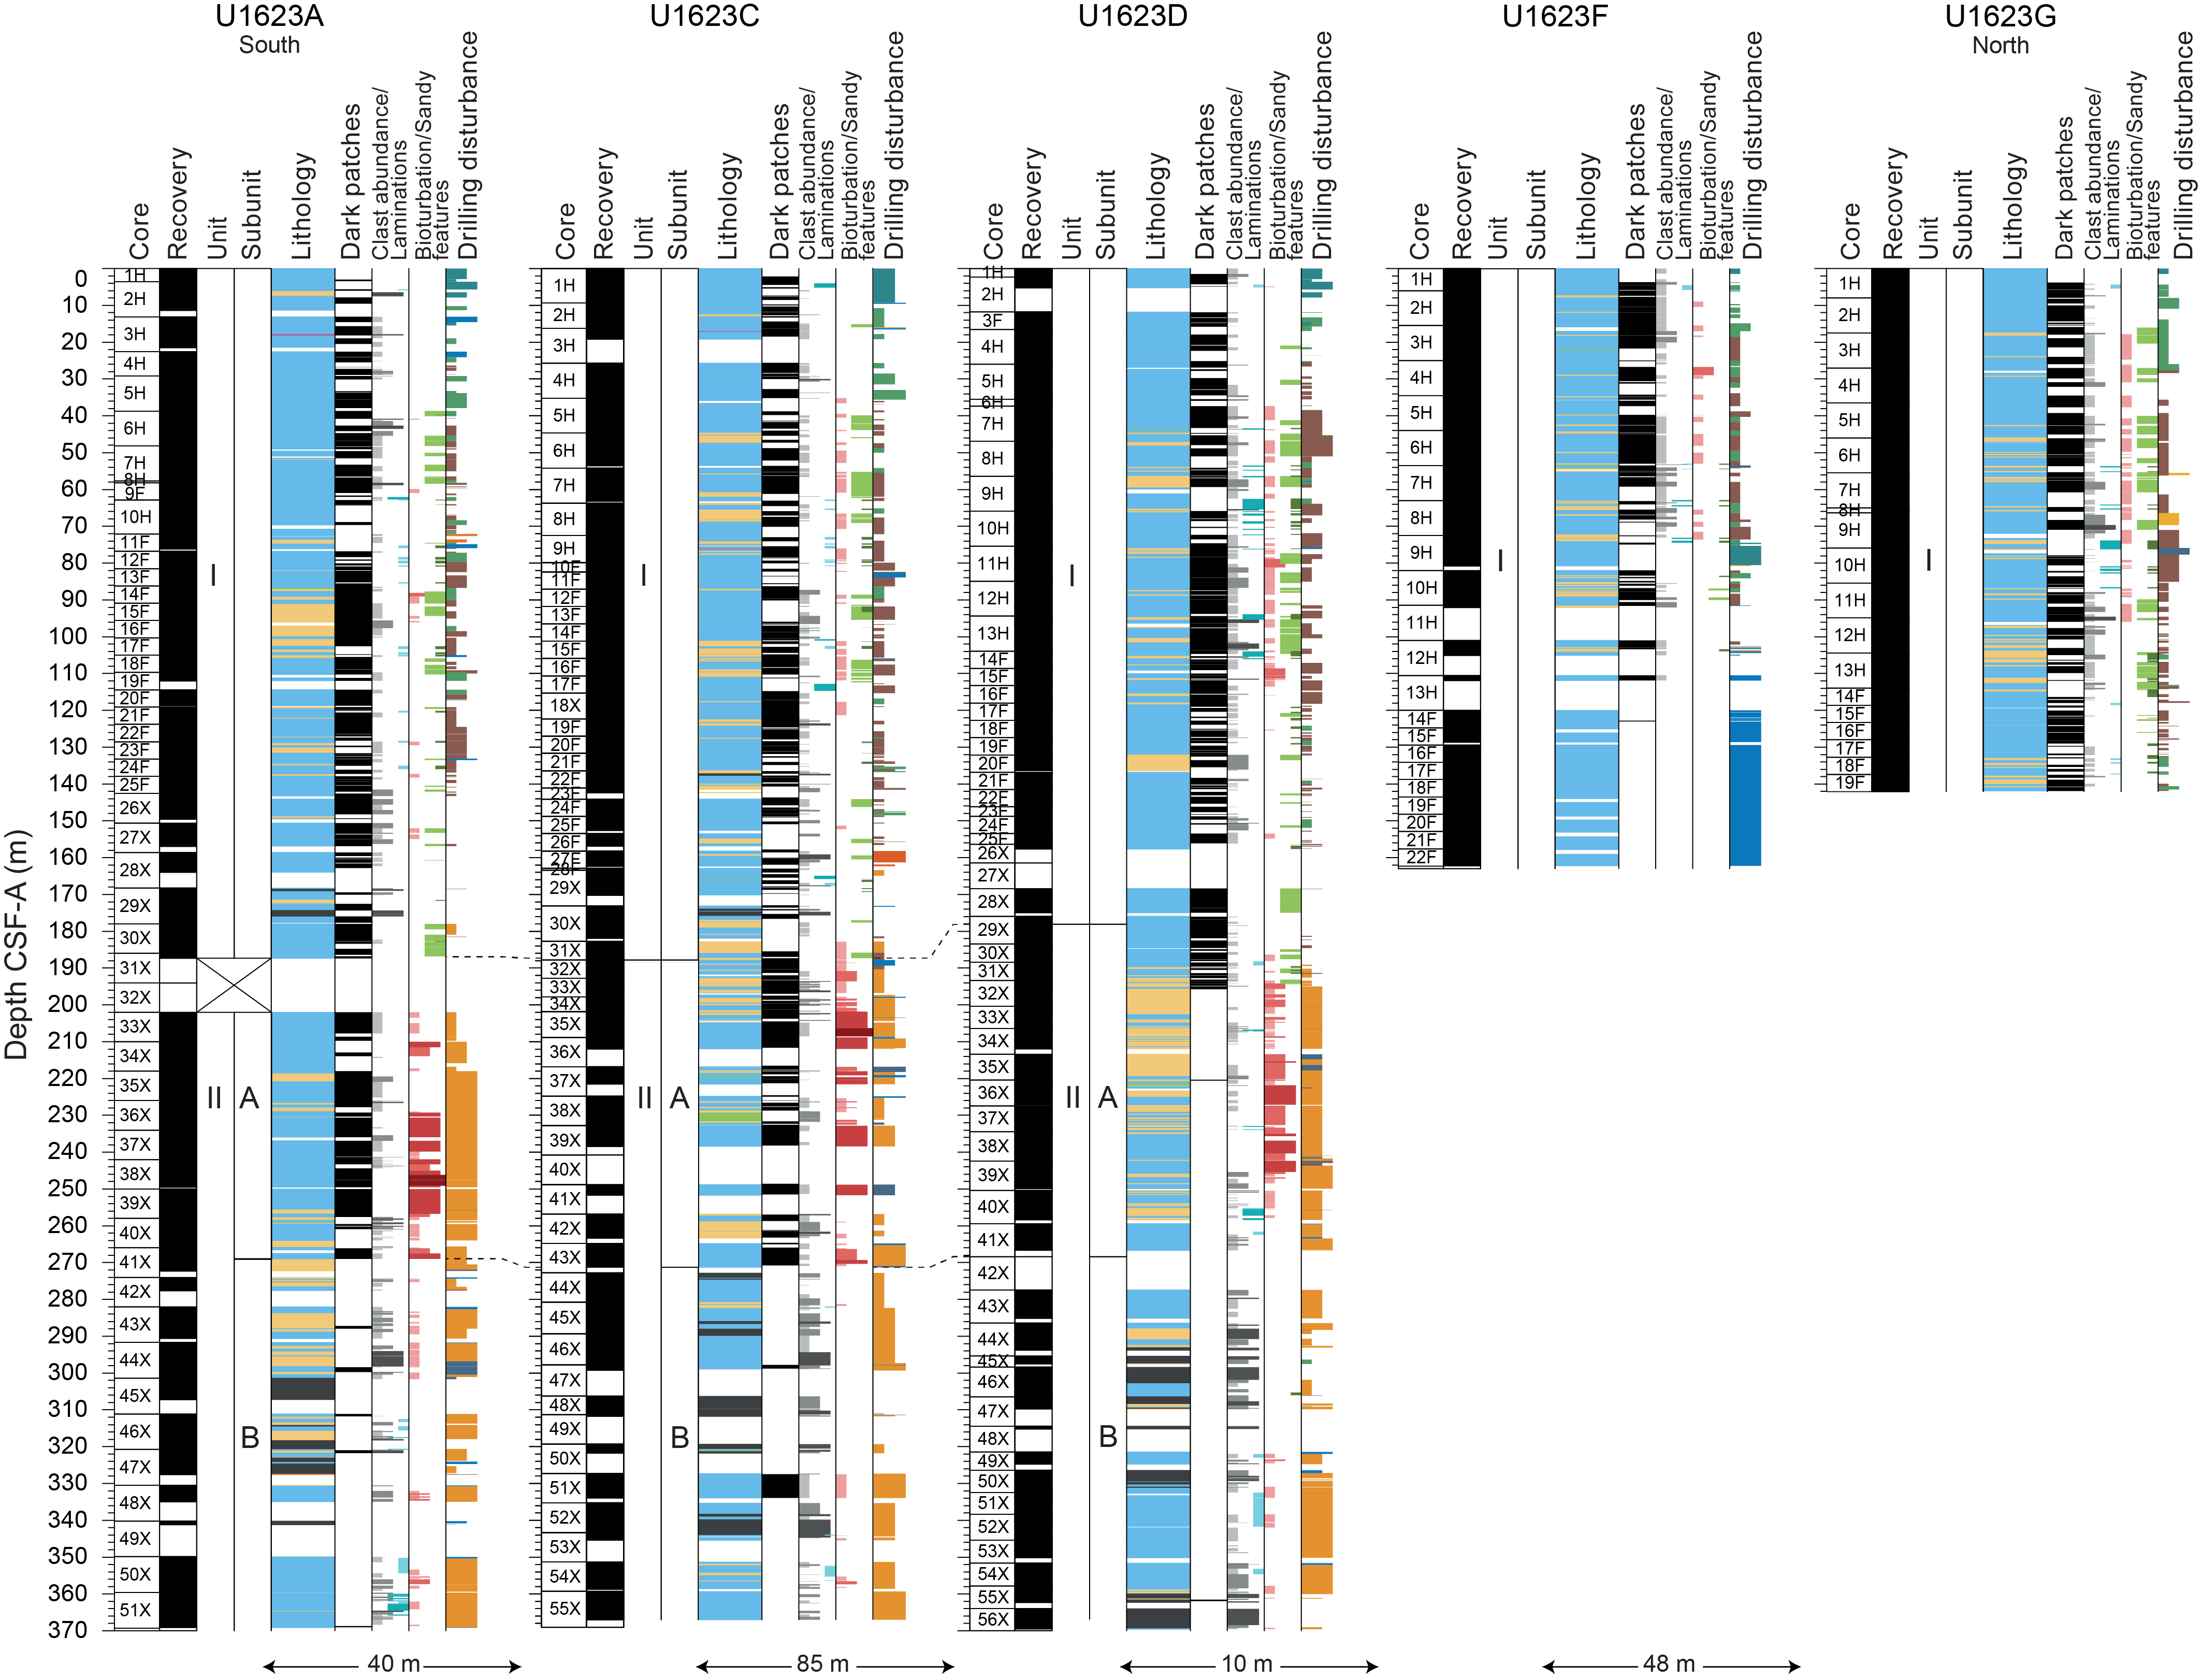
Figure F16. Lithostratigraphic correlation, Holes U1623A, U1623C, U1623D, U1623F, and U1623G.
Lithostratigraphic Unit I is dominantly composed of soft to firm (dark) gray to greenish gray silty clay with abundant slightly coarser intervals of (dark) reddish gray sandy mud and some diamicton intervals occurring near the unit base (Figures F12, F13). Sand patches (e.g., sediment pellets) and interbedded silty clay and silt layers are characteristic for this unit and are not observed below. Clast content ranges from dispersed to abundant. The unit exhibits variable mineralogy, with some intervals having higher percentages of biogenic material (both calcareous and biosiliceous) and slight to moderate bioturbation that varies largely between different holes and sites. Physical properties (MS, NGR, density, and CIELAB a*) show some cyclic fluctuations between lower and higher values.
Lithostratigraphic Unit II is characterized by a high degree of bioturbation in its upper part that is observed in dark greenish gray to black sediments, whereas its lower part contains increasing amounts of sandy mud that transition into diamicton. Physical properties are variable but without the cyclicity seen in Unit I. Unit II is divided into two subunits (IIA and IIB) with the boundary between the two subunits identified where a significant change in degree of bioturbation from heavy to complete (IIA) to slight (IIB) is encountered.
3.1. Lithostratigraphic unit descriptions
3.1.1. Unit I
- Intervals: 403-U1621A-1H-1 to the bottom of the hole; 403-U1621B-1H-1 to the bottom of the hole; 403-U1621C-1H-1 to the bottom of the hole; 403-U1622A-1H-1 to the bottom of the hole; 403-U1623A-1H-1 through 30X; 403-U1623C-1H-1 through 31X; 403-U1623D-1H-1 to 29X-2, 74 cm; 403-U1623F-1H-1 to the bottom of the hole; 403-U1623G-1H-1 to the bottom of the hole
- Depths: Hole U1621A = 0–206.06 mbsf; Hole U1621B = 0–211.24 mbsf; Hole U1621C = 0–203.19 mbsf; Hole U1622A = 0–46.91 mbsf; Hole U1623A = 0–187.35 mbsf; Hole U1623C = 0–191.63 mbsf; Hole U1623D = 0–178.13 mbsf; Hole U1623F = 0–162.20 mbsf; Hole U1623G = 0–141.86 mbsf
- Age: Holocene to Pleistocene
Sediments of Lithostratigraphic Unit I are predominantly dark gray (5Y 4/1) to gray (5Y 5/1) to greenish gray (10Y 5/1) silty clays with coarser intervals of (dark) reddish gray sandy mud (10R 4/1 to 10R 5/1) (Figures F15, F16, F17). Lithification increases with depth, transitioning from soft to firm in Hole U1621A (139.8 mbsf), Hole U1621B (99.0 mbsf), Hole U1621C (57.2 mbsf), Hole U1623A (82.08 mbsf), Hole U1623C (82.88 mbsf), Hole U1623D (75.40 mbsf), and Hole U1623G (85.79 mbsf).
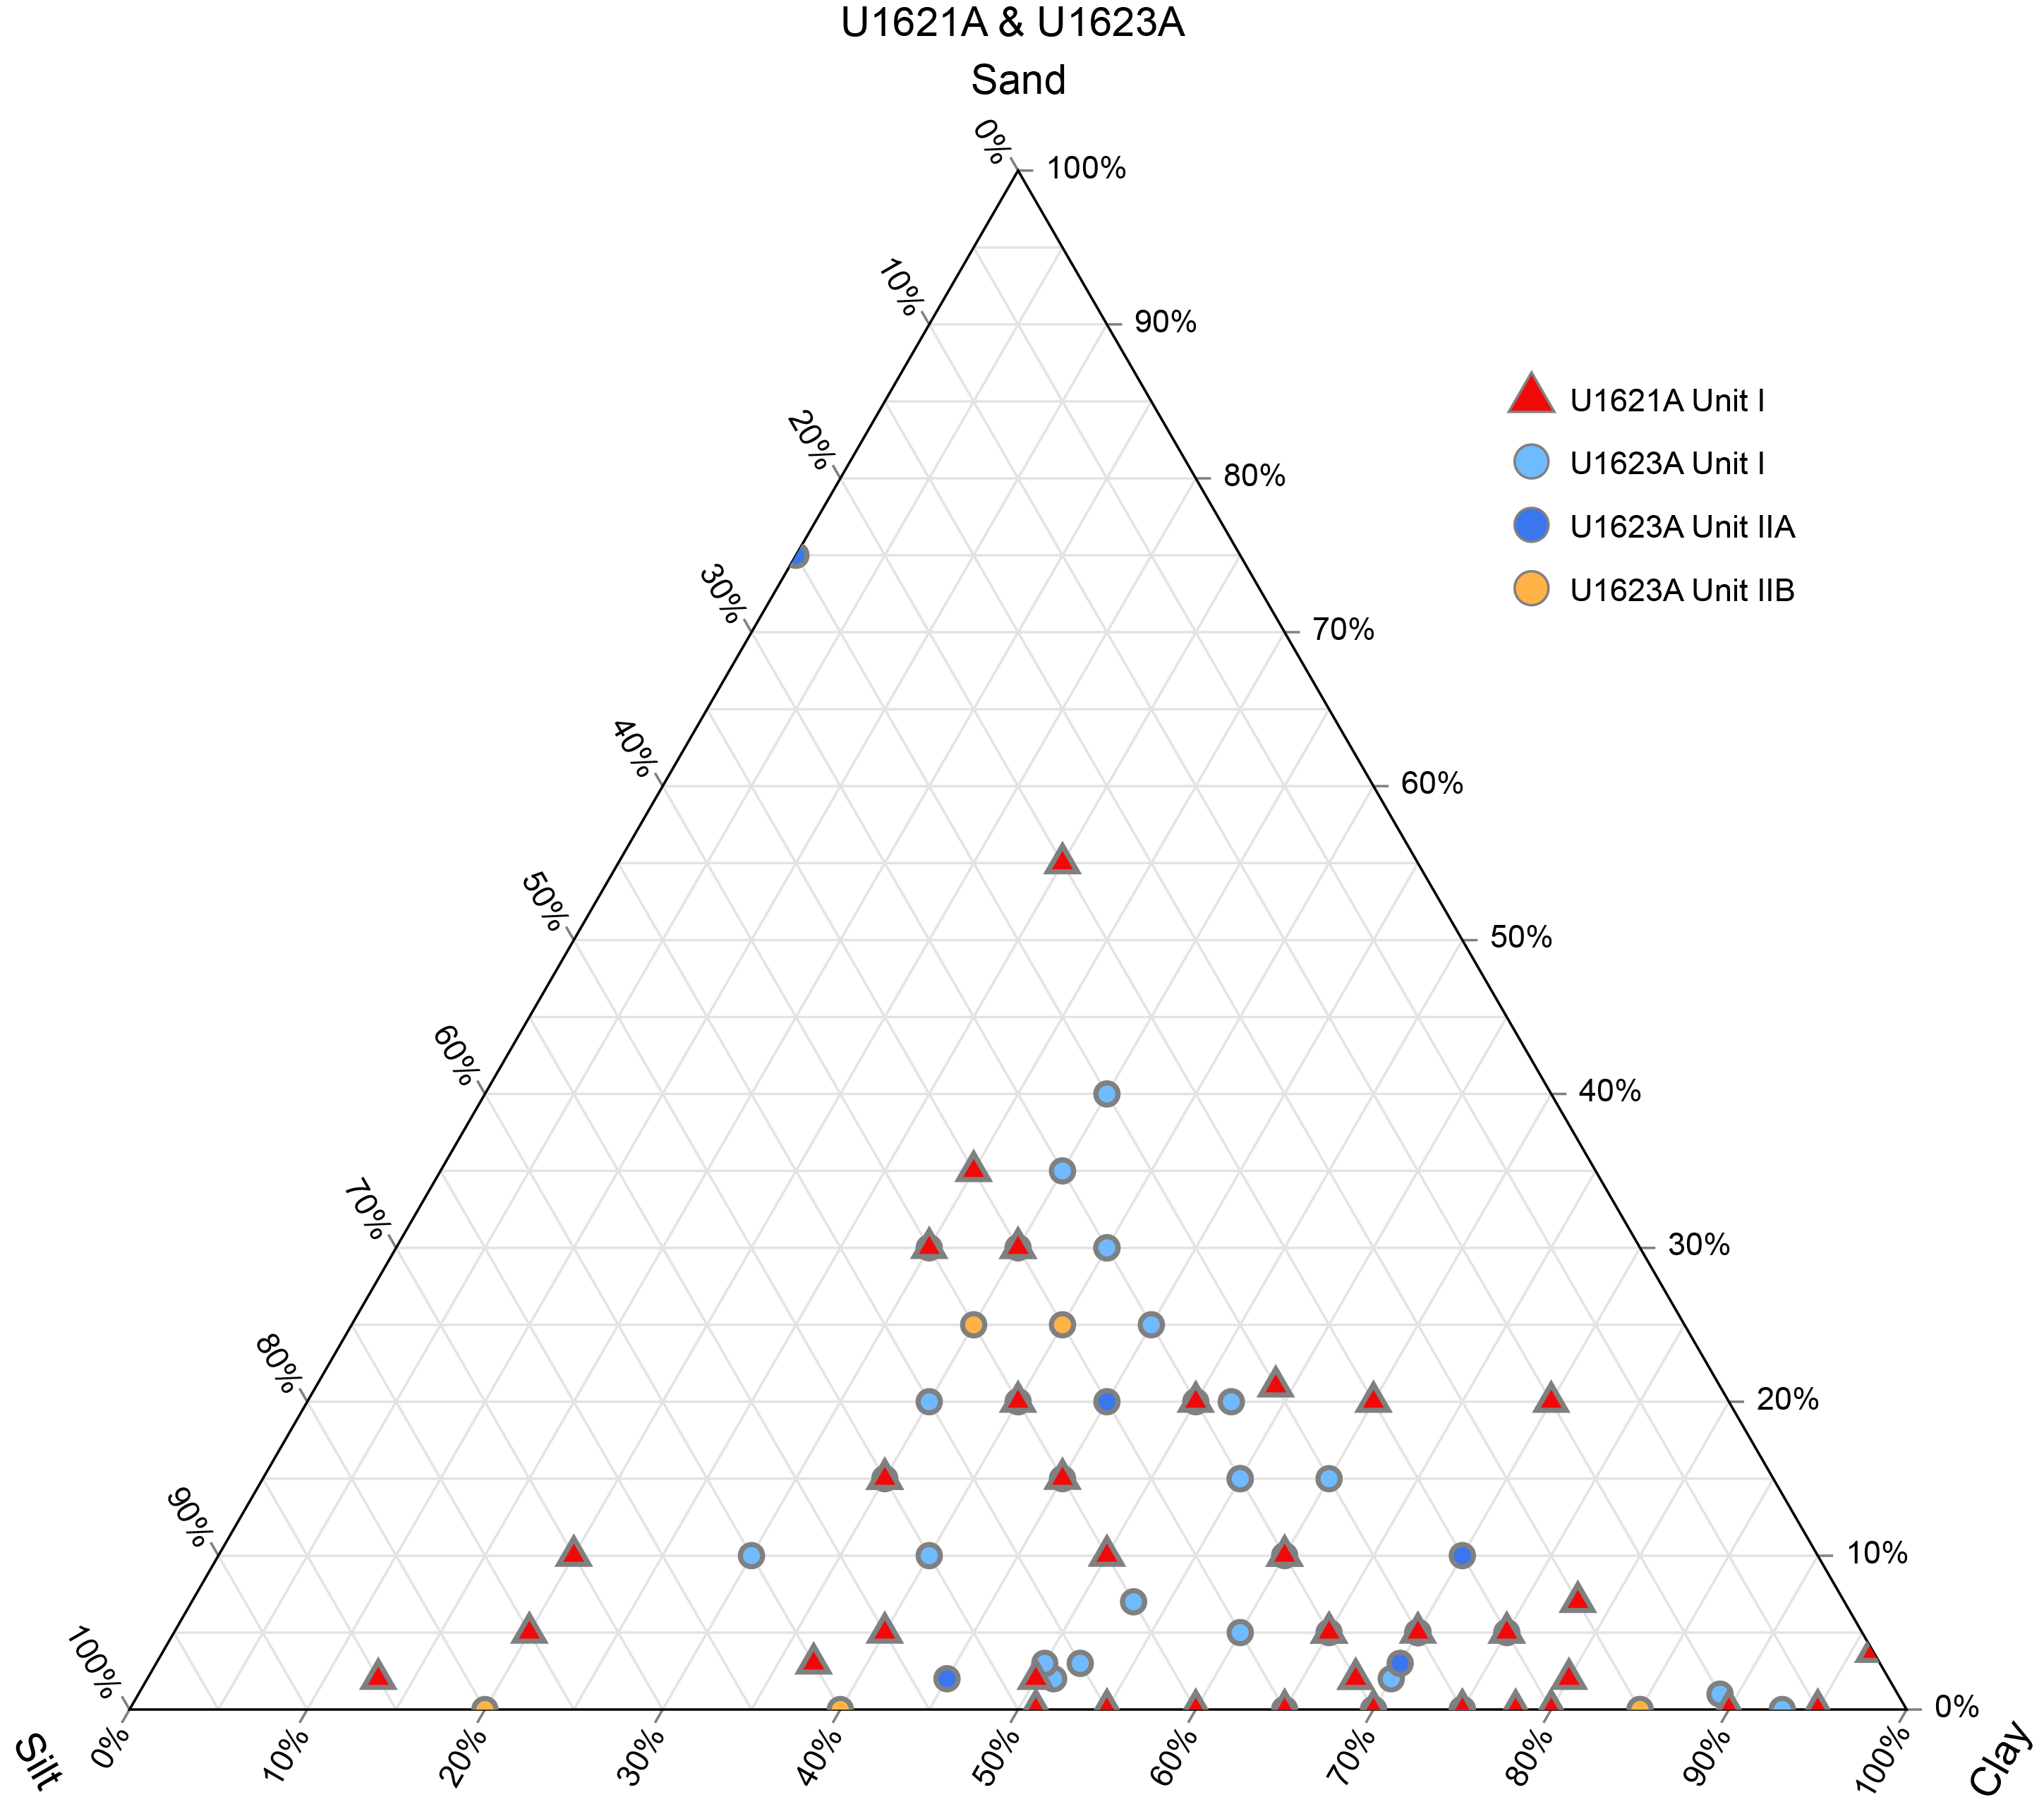
Figure F17. Sand, silt, and clay percentages.
This unit is characterized by the presence of gravel-sized dispersed to abundant clasts progressively increasing in abundance downhole (Figures F15, F16). At Site U1621, sandy mud with clasts transitions to sandy diamicton at ~190 mbsf. In Hole U1621B, the transition between sandy mud and diamicton occurs also in another four intervals 17–248 cm thick located below ~130 mbsf. Sand patches (<5 mm) and intervals of intercalated silty clay with white silt (<0.3–1 cm) are a dominant feature of Unit I. Clast-rich intervals are generally (but not always) associated with high and fluctuating values of MS, whereas intervals with stable, low values of MS are mostly fine grained with few or no clasts. In Hole U1622A, the uppermost 5.19 m are characterized by silty clay with dark patches; in addition, a nannofossil ooze occurs at ~0.2 mbsf, and the interval 5.19–46.91 mbsf contains mostly very dark gray sandy mud with common clasts. Based on visual observations of the split core surface and examination of X-radiographs, Unit I is generally slightly to moderately bioturbated but also contains large intervals in which no bioturbation is detected; bioturbation is not consistent between holes, and some intervals are thinly to thickly laminated.
The most common minerals observed in smear slides are clay minerals and quartz. Rock fragments, micas, and dense minerals occur in varying amounts throughout. Glauconite (1%–5%) and opaque minerals (1%–15%), including iron sulfide minerals, are observed discontinuously throughout the sections (Figures F18, F19). Iron sulfide minerals are also sporadically observed on the surface throughout Unit I. Some minor intervals were found to contain high amounts of biogenic components, which indicate a diatom ooze in Core 403-U1623A-7H-3 (51.237 mbsf) and two layers of nannofossil oozes in Cores 10H-6 (70.51 mbsf) and 403-U1622A-1H-1 (0.2 mbsf).
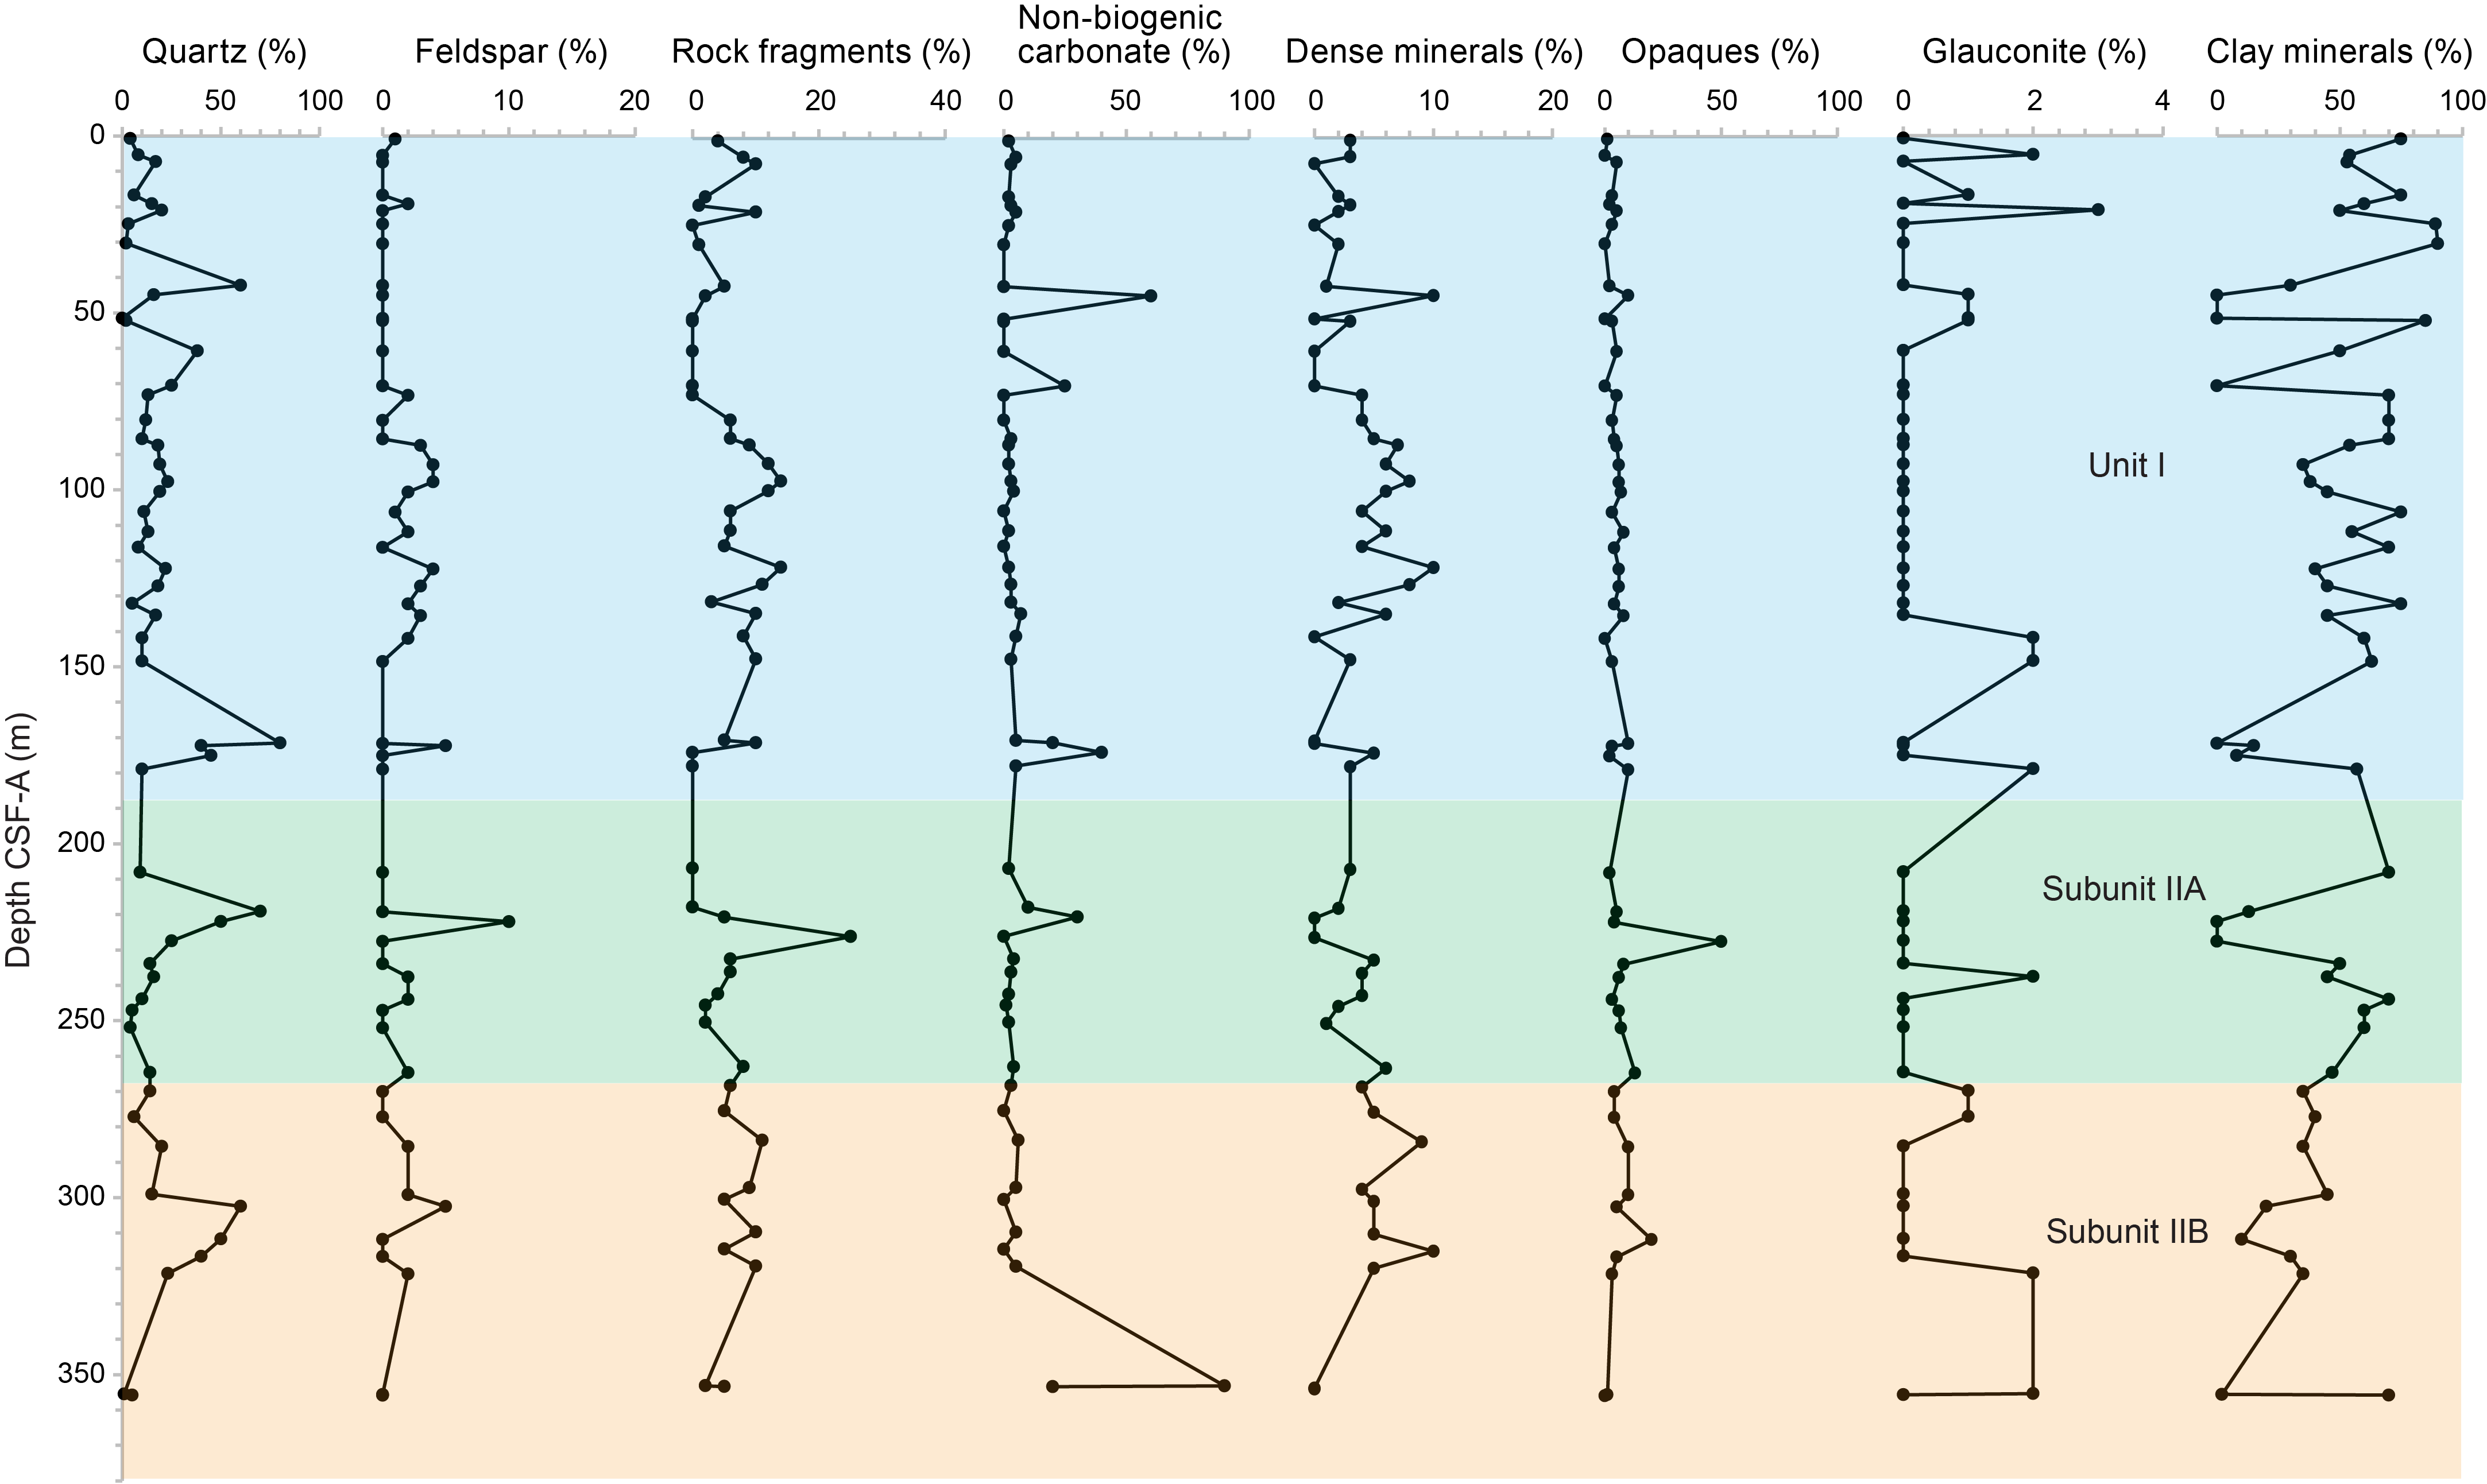
Figure F18. Downhole mineralogy, Hole U1623A.
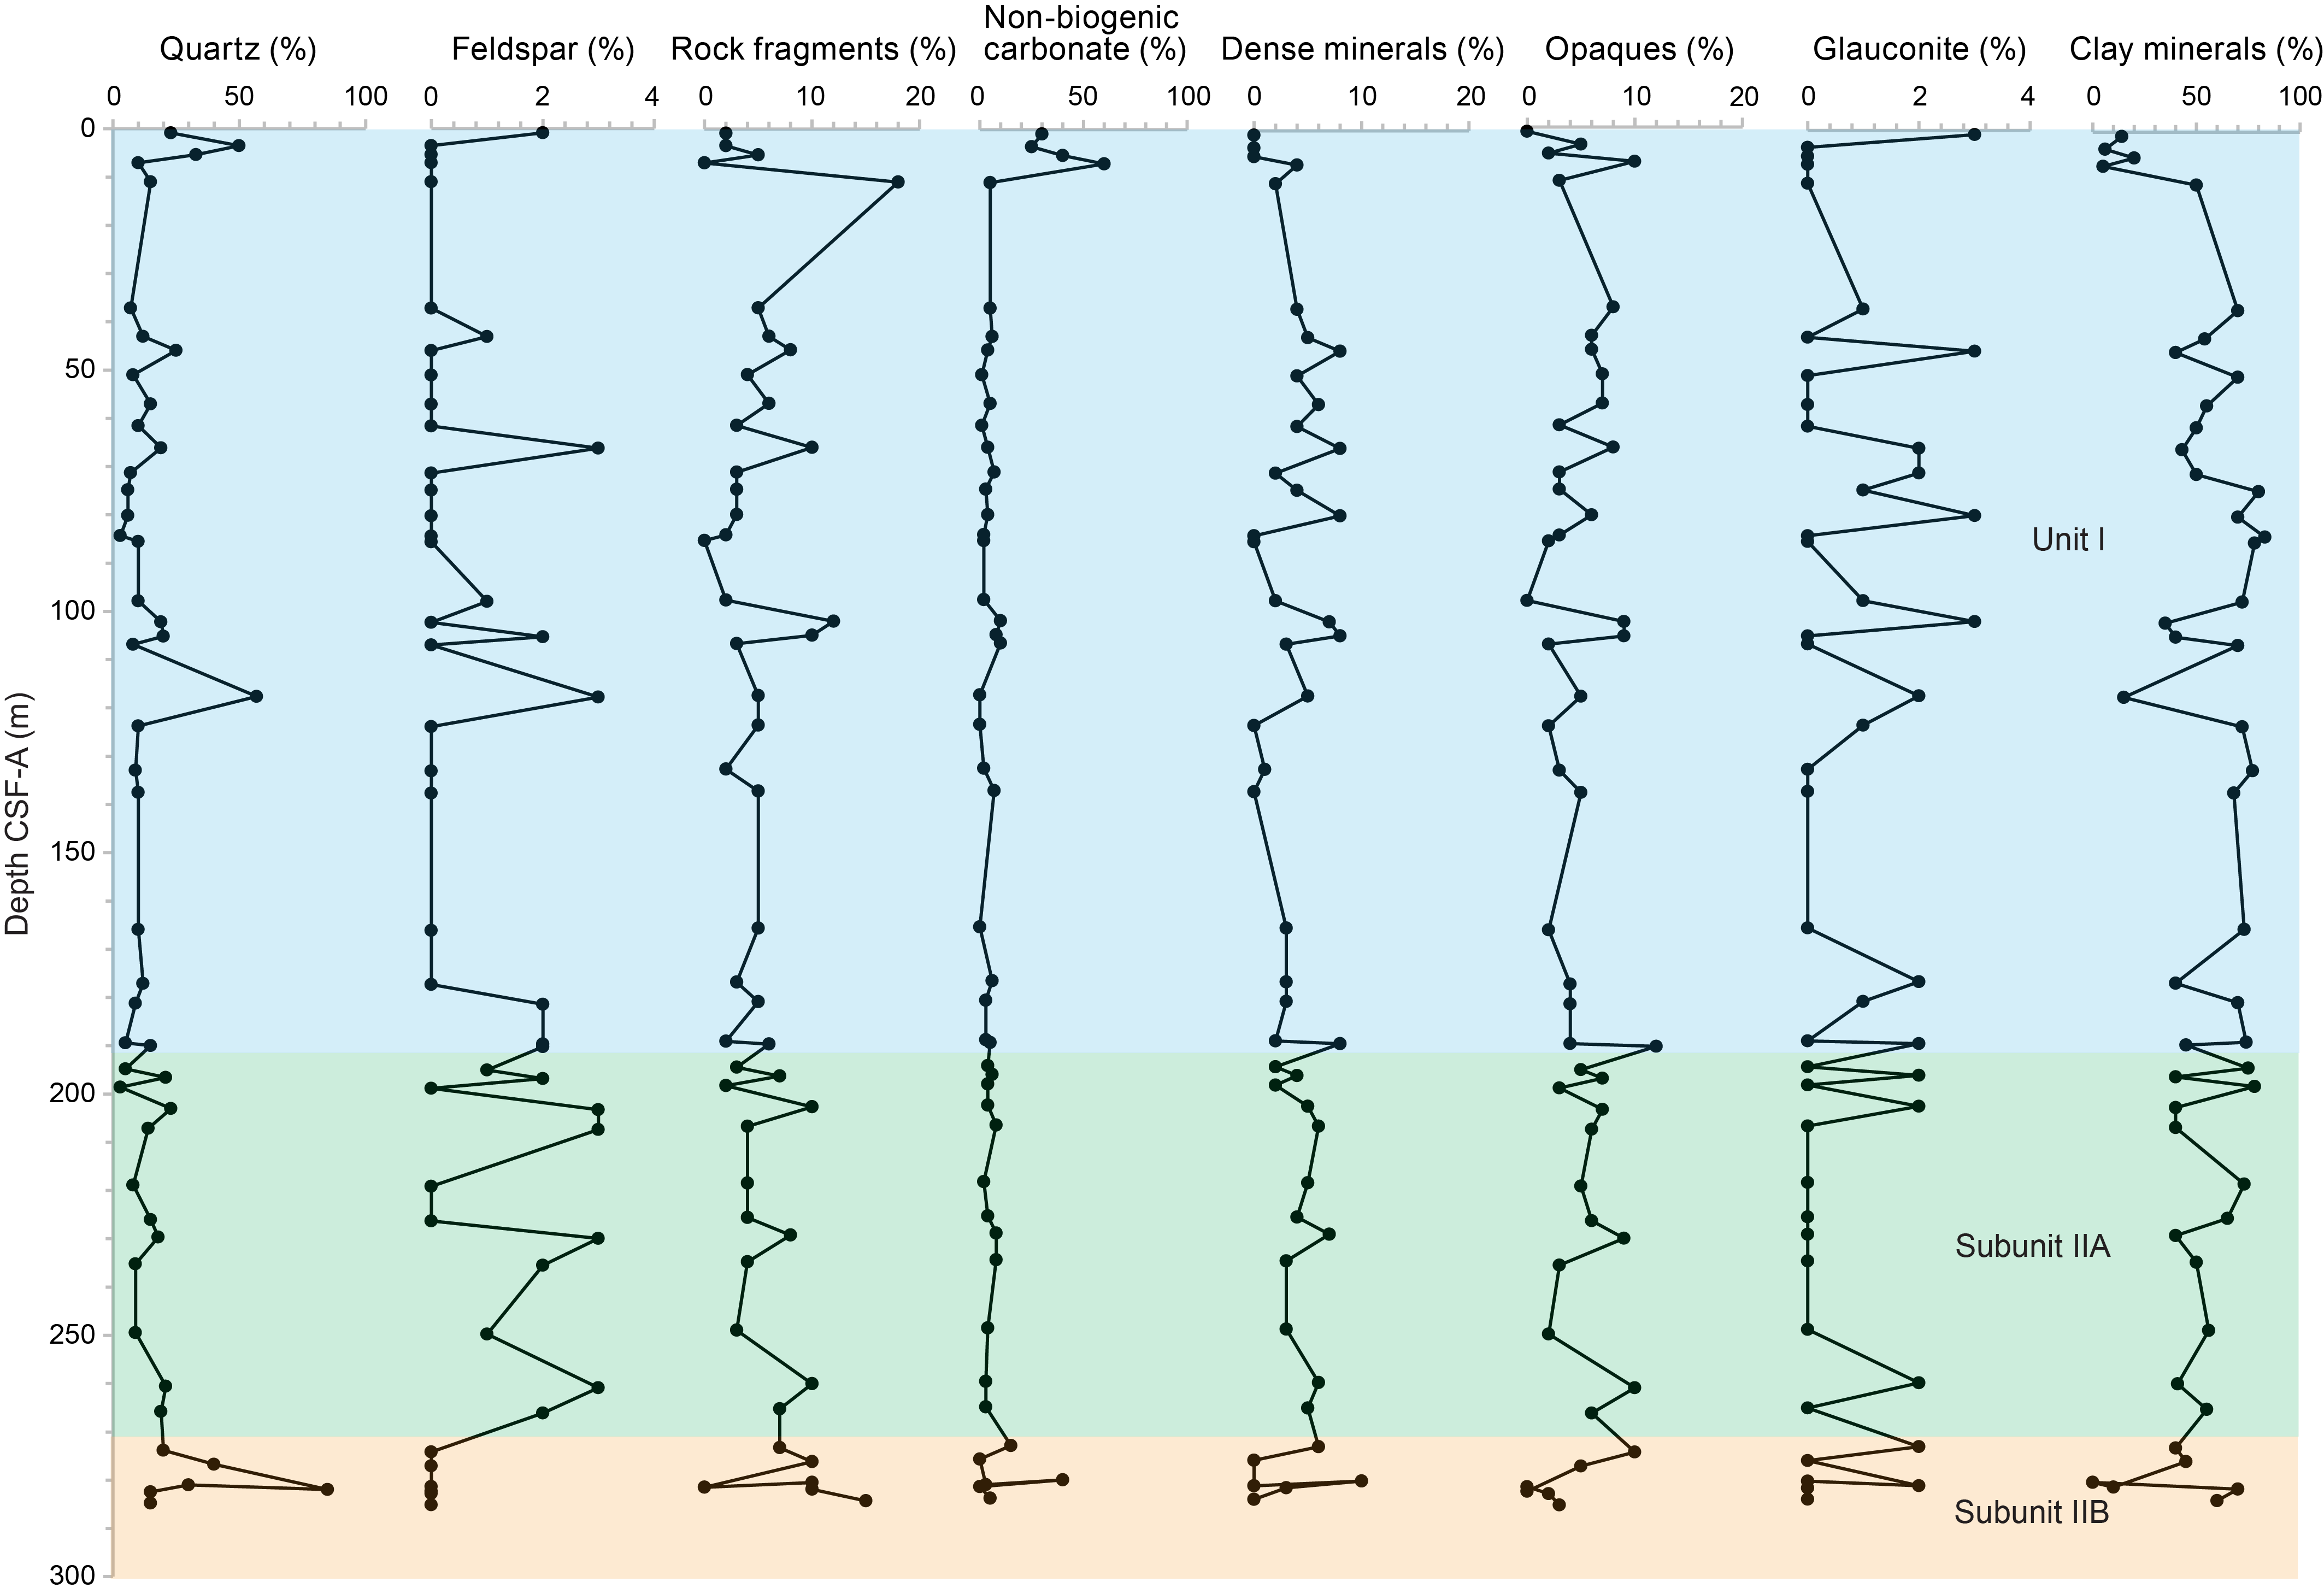
Figure F19. Downhole mineralogy, Hole U1623C.
Sand patches are observed in Holes U1621A, U1621B, and U1621C, to 149.16, 125.49, and 190.27 mbsf, respectively, as well as Holes U1623A (186.81 mbsf), U1623C (187.29 mbsf), U1623D (194.40 mbsf), U1623F (90.04 mbsf), and U1623G (126.04 mbsf). Distinct intervals of interbedded silty clay and silt layers occur in the same depth range of the sand patches in Holes U1623A, U1623C, and U1623D but not in Holes U1623F and U1623G, which recovered a shallower stratigraphic record.
Diamicton intervals were described in the lowermost parts of Unit I at Site U1621, downhole of 190.19, 128.03, and 175.87 mbsf in Holes U1621A, U1621B, and U1621C, respectively, and at Site U1623, downhole of 168.58 and 137.21 mbsf in Holes U1623A and U1623C, respectively. Sharp boundaries divide diamicton intervals from the underlying finer grained sediments. The loose gravel and cobble described at the bottom of all holes at Site U1621 are most likely matrix-depleted diamicton that was washed away during drilling.
MS in Unit I is mostly in the range of 0–100 IU (Figures F6, F7, F8, F10, F11, F12, F13, F14). The downhole MS curve is characterized by the repeated occurrence of short intervals (as long as 4 m) of stable low values alternating with longer intervals (as long as 10 m) with higher, fluctuating values of MS, mostly corresponding to higher amounts of clasts. Similar near-cyclic changes can also be observed in NGR and density data (Figures F6, F7, F8, F10, F11) as well as in CIELAB a*. CIELAB b* is generally slightly bluish (i.e., slightly negative values) except for the uppermost ~5 m.
3.1.2. Unit II
- Intervals: 403-U1623A-30X to the bottom of the hole; 403-U1623C-31X to the bottom of the hole; 403-U1623D-29X-2, 74 cm, to the bottom of the hole
- Depths: Hole U1623A = 187.35–369.15 mbsf; Hole U1623C = 191.63–366.97 mbsf; Hole U1623D = 178.13–369.54 mbsf
- Age: Pleistocene
Similar to Lithostratigraphic Unit I, sediments of Unit II are predominantly dark gray (5Y 4/1) to gray (5Y 5/1) to greenish gray (10Y 5/1) silty clay with coarser intervals of (dark) reddish gray sandy mud (10R 4/1 to 10R 5/1) (Figures F15, F16, F17) and occasional intervals of diamicton. Unit II is divided into Subunits IIA and IIB based on the distinct occurrence of heavy bioturbation in Subunit IIA. The predominantly firm sediments transition to hard at 349.9 mbsf in Hole U1623A.
The pattern of MS in Unit II differs from Unit I in that the intervals with low MS values are longer but the peaks are slightly more pronounced (Figures F10, F11, F12, F13, F14).
3.1.2.1. Subunit IIA
- Intervals: 403-U1623A-30X through 41X-2; 403-U1623C- 31X through 43X; 403-U1623D-29X-2, 74 cm, through 41X
- Depths: Hole U1623A = 187.35–268.98 mbsf; Hole U1623C = 191.63–271.24 mbsf; Hole U1623D = 178.13–266.61 mbsf
Lithostratigraphic Subunit IIA is characterized by heavily bioturbated sediments, mostly visible from the split core surface, whereas the bioturbation is imperceivable in the X-radiographs (Figure F5C). The sediments appear generally dark in color and are described as dark greenish gray (5GY 4/) to black (N 1/); this is also reflected in lower CIELAB L* values. Clast occurrence in this interval ranges from dispersed to abundant with an associated decrease in bioturbation and absence of laminations.
3.1.2.2. Subunit IIB
- Intervals: base of 403-U1623A-41X-2 to the bottom of the hole; base of 403-U1623C-43X to the bottom of the hole; base of 403-U1623D-41X to the bottom of the hole
- Depths: Hole U1623A = 268.98–369.15 mbsf; Hole U1623C = 271.24–366.97 mbsf; Hole U1623D = 266.61–369.54 mbsf
Lithostratigraphic Subunit IIB is generally characterized by a lower degree of bioturbation and the occurrence of some thinly or thickly laminated intervals. Clasts occur in higher amounts than in Subunit IIA and increase in size downhole; the sediments were hence classified either as matrix (mostly silty clay or sandy mud) with common to abundant clasts or as a diamicton if clasts are >2 cm. These intervals are characterized by slightly higher density values. CIELAB a* shows a distinct downcore increase from values ~1 to ~2 at ~270 mbsf (i.e., slightly more reddish sediments).
3.2. X-ray diffraction
X-ray diffraction (XRD) analyses were used to characterize the relative abundances of clay mineral kaolinite, illite, smectite, and chlorite in Holes U1621A and U1623A (Figures F20, F21). The relative abundance of kaolinite ranges 6%–50% (standard deviation [SD] = 9) in Hole U1621A and 7%–34% (SD = 6.21) in Hole U1623A with no significant variation within Lithostratigraphic Unit I, whereas a gradual downhole increase in kaolinite is observed for Unit II. Illite varies from 22% to 69% (SD = 12) in Hole U1621A and 22.2% to 68% (SD = 11) in Hole U1623A, showing a gradual downhole decrease throughout the units. Smectite shows a gradual downhole increase in relative abundance throughout the units, varying from 0% to 33% (SD = 7) in Hole U1621A and 0% to 27% (SD = 7) in Hole U1623A. Chlorite exhibits a gradually increasing trend downhole throughout the units, varying from 11% to 37% (SD = 8) in Hole U1621A and 7.12% to 45% (SD = 10) in Hole U1623A.
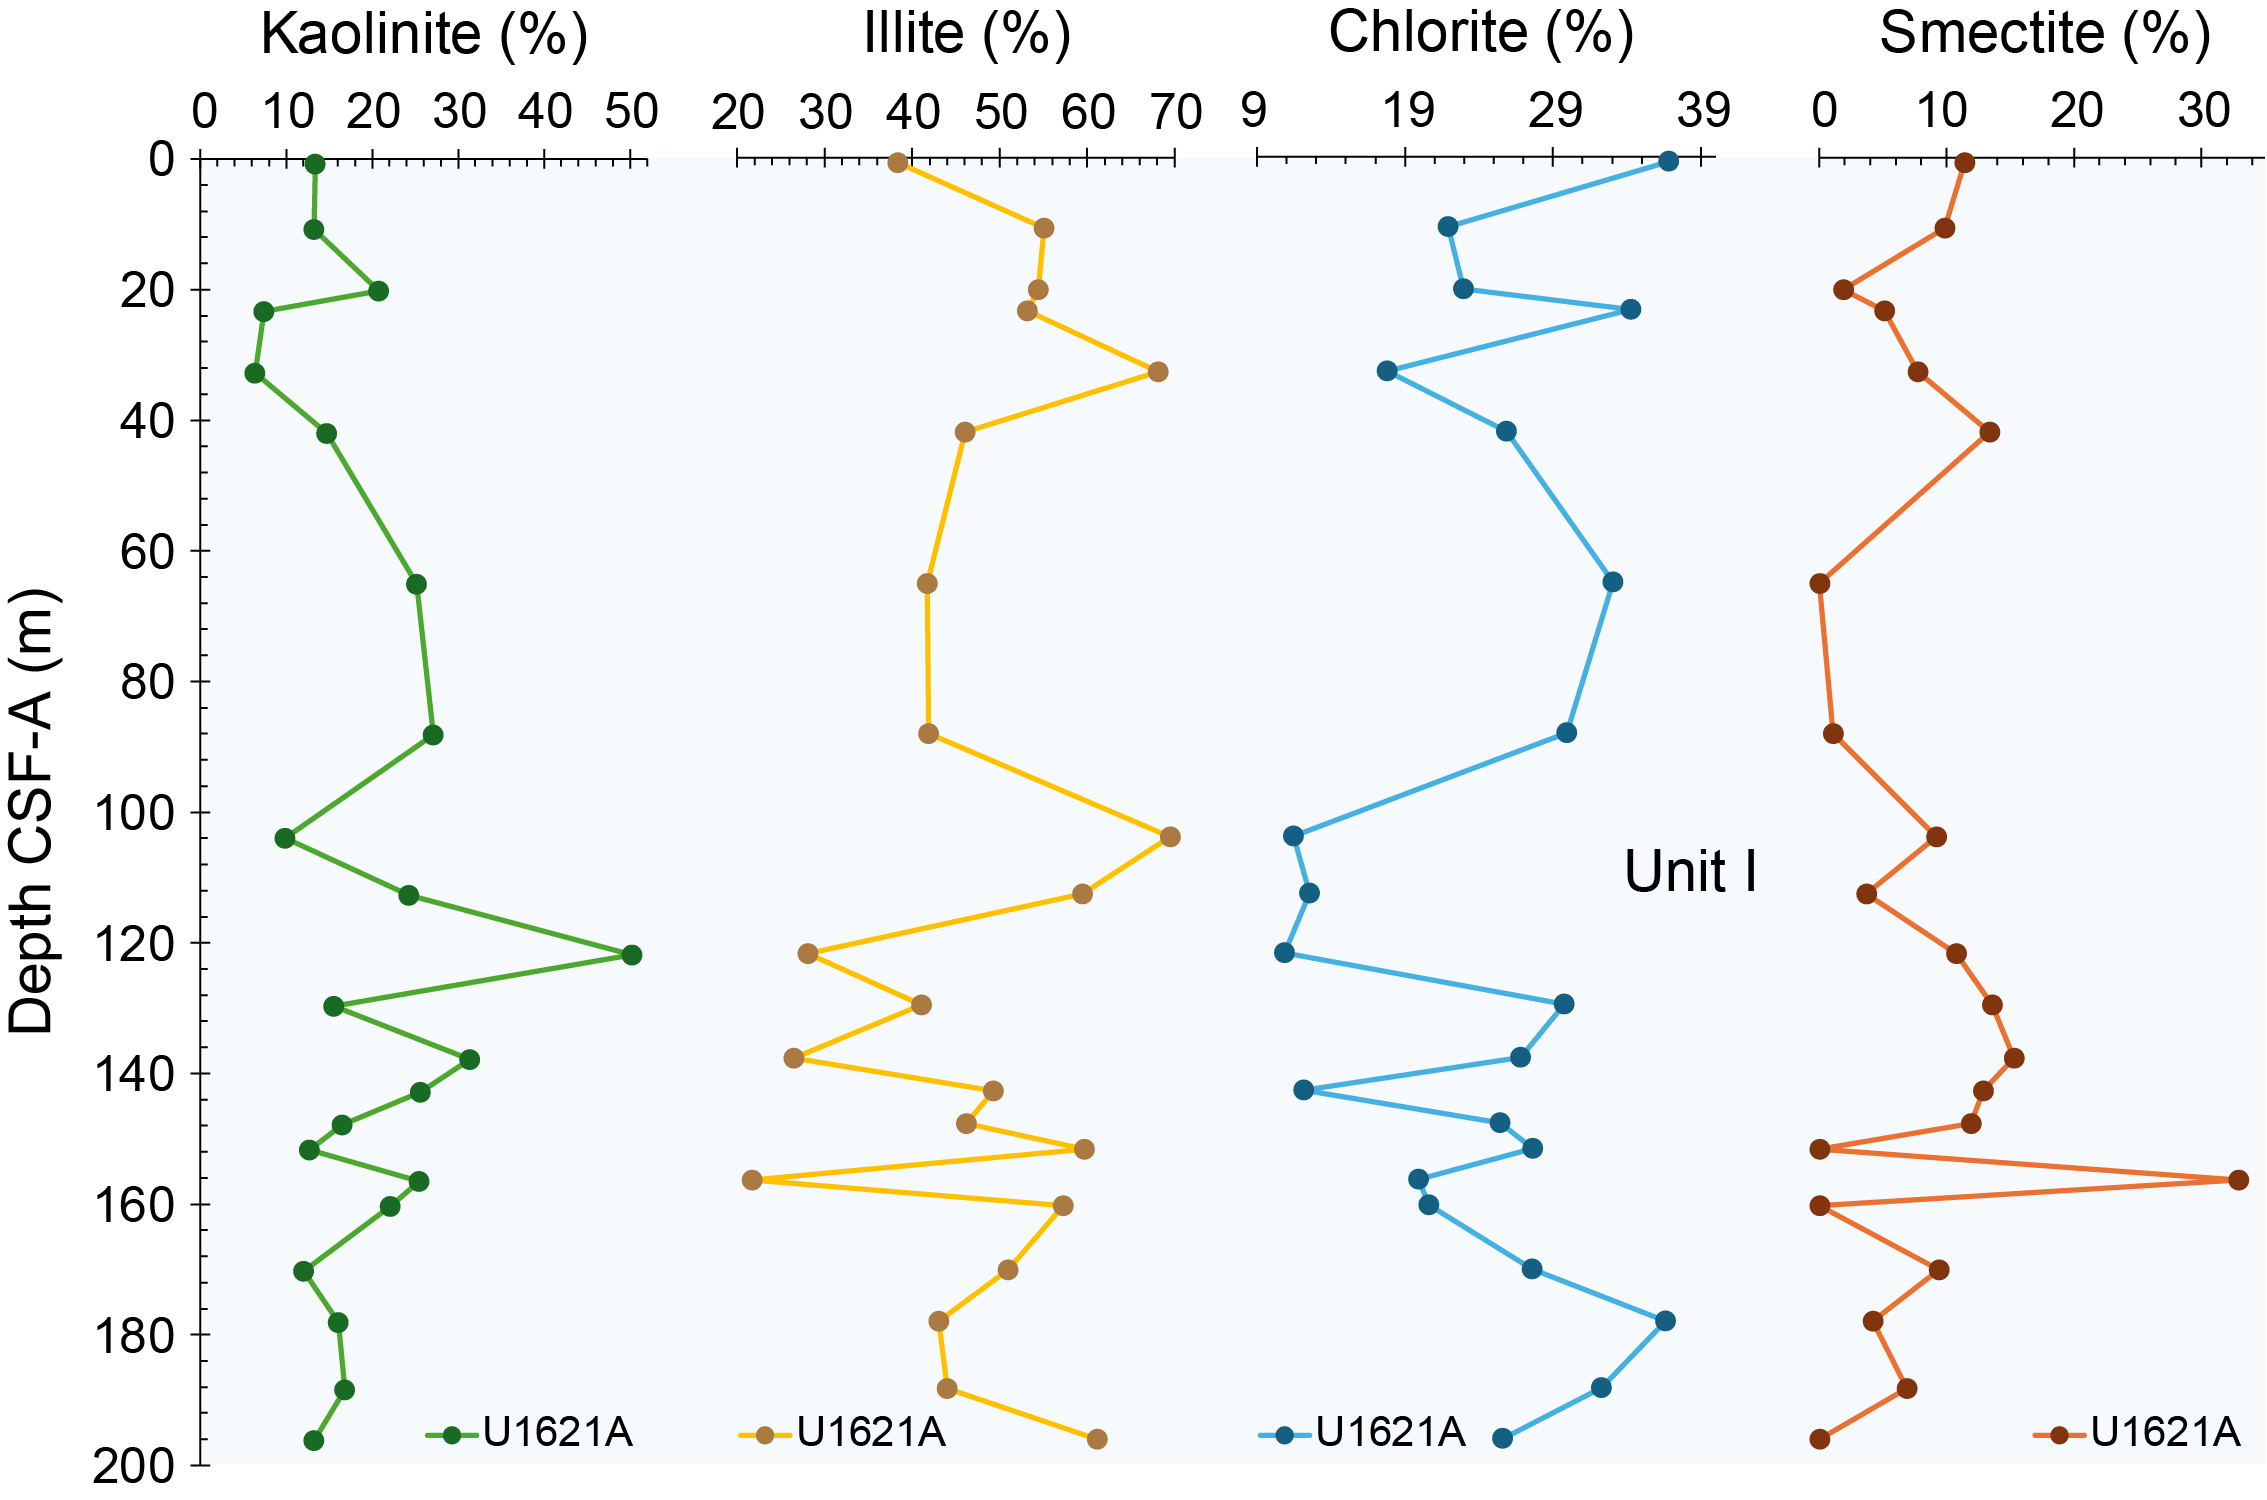
Figure F20. Clay analysis, Hole U1621A.
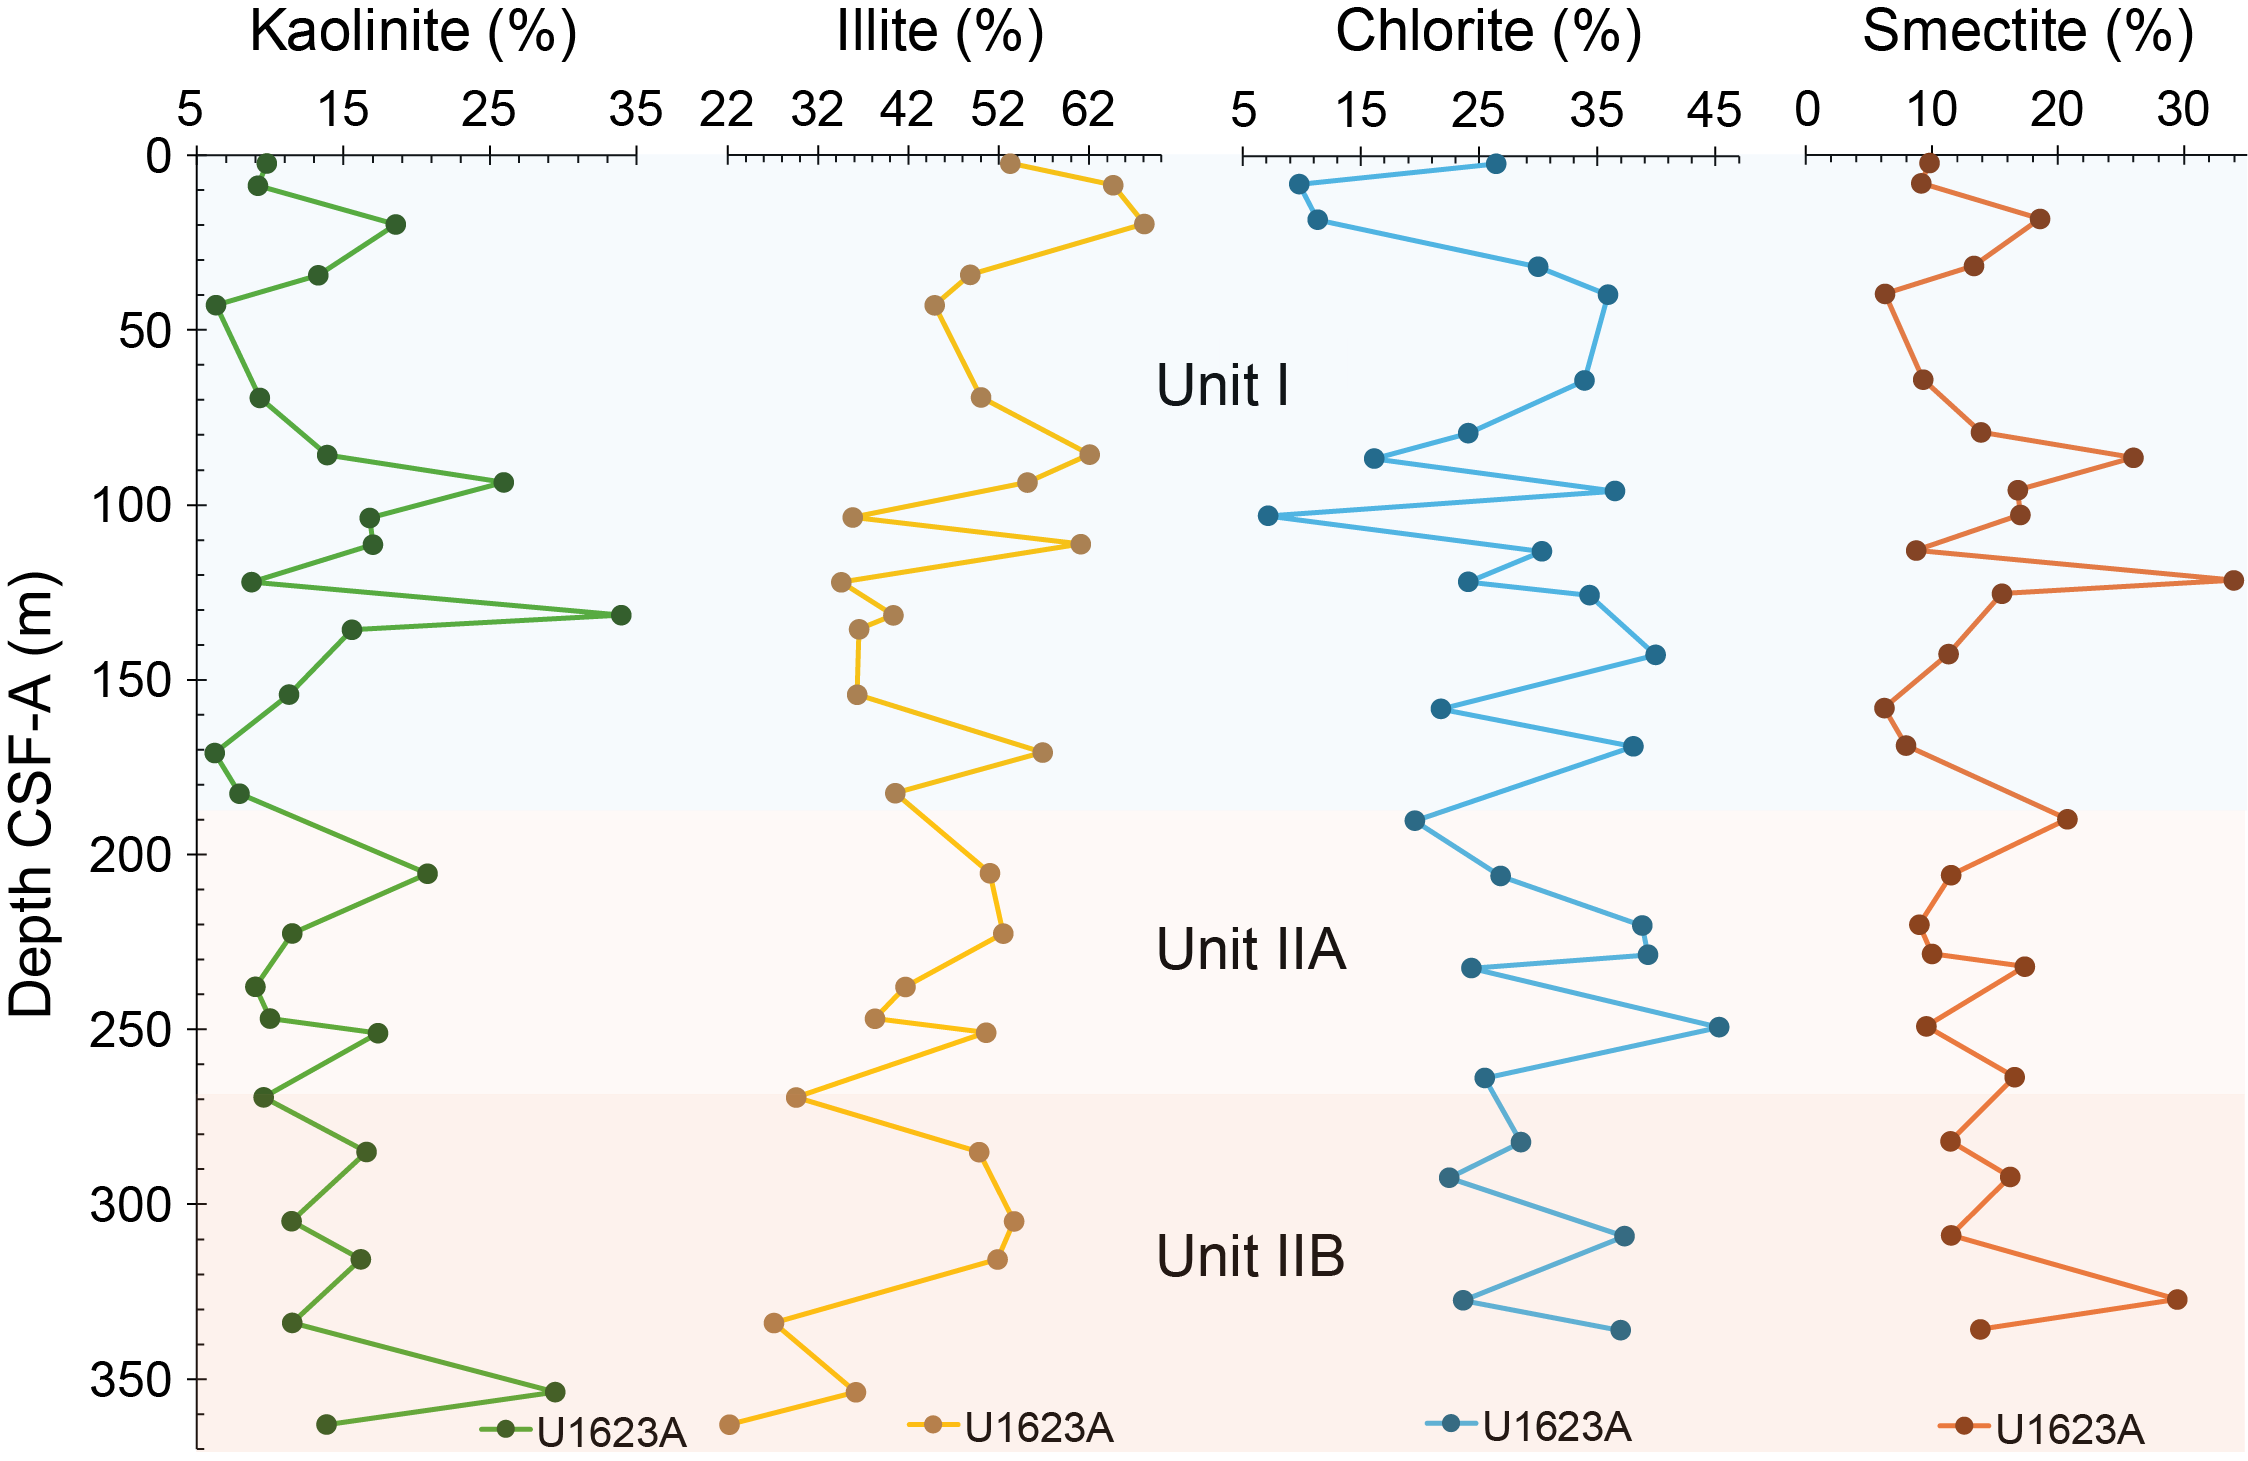
Figure F21. Clay analysis, Hole U1623A.
Additionally, bulk XRD analysis of select powdered samples confirms that quartz comprises the primary composition of the representative lithologies at given depths (Table T5).
3.3. Preliminary interpretation
The sediments of Lithostratigraphic Unit II are characterized by changes between silty clay without clasts, clast-bearing silty clays, sandy muds with variable amounts of clasts, and diamictons. Physical properties data exhibit cyclicity with relatively long periods, most likely related to glacial–interglacial cycles during the mid-Pleistocene. The lowermost interval (Subunit IIB) is slightly more reddish than the overlying younger sequence, which might point to a change in provenance starting at the Subunit IIB/IIA boundary. One of the delivery areas for sediments of Subunit IIB might be the Barents Sea area, which was subaerial before ~1 Ma when it became a shallow sea (Butt et al., 2002). The presence of diamictons suggests an early glacial influence and a proximal location of an ice sheet or glacier to the drilled site.
The high-bioturbation interval encountered in Subunit IIA coincides with the Jaramillo Subchron (i.e., between Marine Isotope Stages [MISs] 19 and 31), possibly indicating more favorable (warmth and nutrient) conditions during this interval. The base of Unit I contains a glacial diamicton at the approximate depth of Seismic Reflector R3 (0.75 Ma). The presence of this diamicton on the slope is evidence of shelf edge glaciation. It could possibly be associated with a large MIS 20 ice sheet that was also described from north of Svalbard where ice was grounded to ~82°N on the Yermak Plateau (Gebhardt et al., 2011). Unit I at Sites U1621 and U1623 displays uphole changes from clast-bearing silty clays and reddish gray sandy muds and from minor diamictons to homogeneous silty clay without clasts accompanied by changes in MS, NGR, density, and CIELAB a*. These changes most likely represent changes in terrestrial delivery of sediments as MTDs (glacial debris flows) or meltwater plumes, with variable influence in bottom current (WSC) strength (i.e., glacial–interglacial cycles on orbital timescales). The cyclicity of physical properties data, however, is different from Unit II with shorter periodicity, which most likely points at a different style of the glacial–interglacial pattern starting around the mid-Pleistocene transition. Unlike Unit II, sand patches are encountered throughout Unit I sediments. In earlier publications regarding the Norwegian and Greenland seas, similar sand patches were named sediment pellets and interpreted as ice-rafted debris (IRD) (Goldschmidt et al., 1992). Whether the sediment pellet IRD at the Bellsund sites were iceberg or sea ice transported is to be determined.
Site U1622 was drilled ~8 km from Sites U1621 and U1623 at a water depth of 1705 m. Its uppermost ~5 m contain silty clays without clasts but include a nannofossil-rich uppermost layer. The entire sequence below ~5 m consists of sandy mud with mostly common clasts. This site most likely recovered a post–last glacial sequence overlaying a thick (>40 m) glaciogenic debrite that is part of the Storfjorden TMF.
4. Biostratigraphy and paleoenvironment
Biostratigraphic and paleoenvironmental characterization of Sites U1621–U1623 was conducted with the analysis of calcareous nannofossils, dinoflagellate cysts (dinocysts), diatoms, and planktonic foraminifers. For calcareous nannofossils and diatoms, all core catchers from Hole A at Sites U1621–U1623 were studied, as well as the deepest core catcher in Hole U1623D, which is located at an absolute CSF-A depth below Hole A. Additional samples were selected for smear slide analyses from the working halves of Holes U1621A–U1621C, U1622A, U1623A, and U1623C. Planktonic foraminifers were studied in all core catchers from Holes U1621A and U1623A, in addition to the uppermost five core catcher samples from Hole U1622A. Additional samples from targeted levels, based on lithologic and physical properties, as well as the shipboard biostratigraphic evidence from other micropaleontological groups, were analyzed for foraminifers and dinocysts in Holes U1621A and U1623A. Dinocysts were analyzed at targeted levels, based on the same evidence as described, in Holes U1621A, U1623A, and U1623C. Additional dinocyst analysis was carried out to identify mid-Pleistocene biostratigraphic events using selected core catcher samples from Hole U1623A. Site U1622 was not investigated for dinocysts (Figures F22, F23, F24, F25, F26). Calcareous nannofossils are generally present at Sites U1621–U1623 but regularly alternate with barren intervals in the record. The studied sites are almost barren of diatoms, except for some intervals with high abundances. Planktonic foraminifers are found continuously in the upper part of Holes U1621A and U1623A (Figures F22, F27), partially downhole, and then completely disappear in the lowermost part of both sites. Compared to calcareous nannofossils, planktonic foraminifers disappear higher in the holes and earlier at both sites. Most of the studied samples have abundant dinocysts, but a few are barren (Figures F22, F23, F24, F25, F26). Combined biostratigraphic information from all groups, together with paleomagnetic data, indicates a Late/Middle Pleistocene age for the sediments recovered at Sites U1621 and U1622 and mid-Pleistocene age for Site U1623 (Figures F25, F27, F28, F29, F30; Tables T6, T7, T8). All microfossil groups together indicate a surface Arctic–polar paleoenvironment under the influence of Atlantic waters and (seasonal) sea ice conditions.
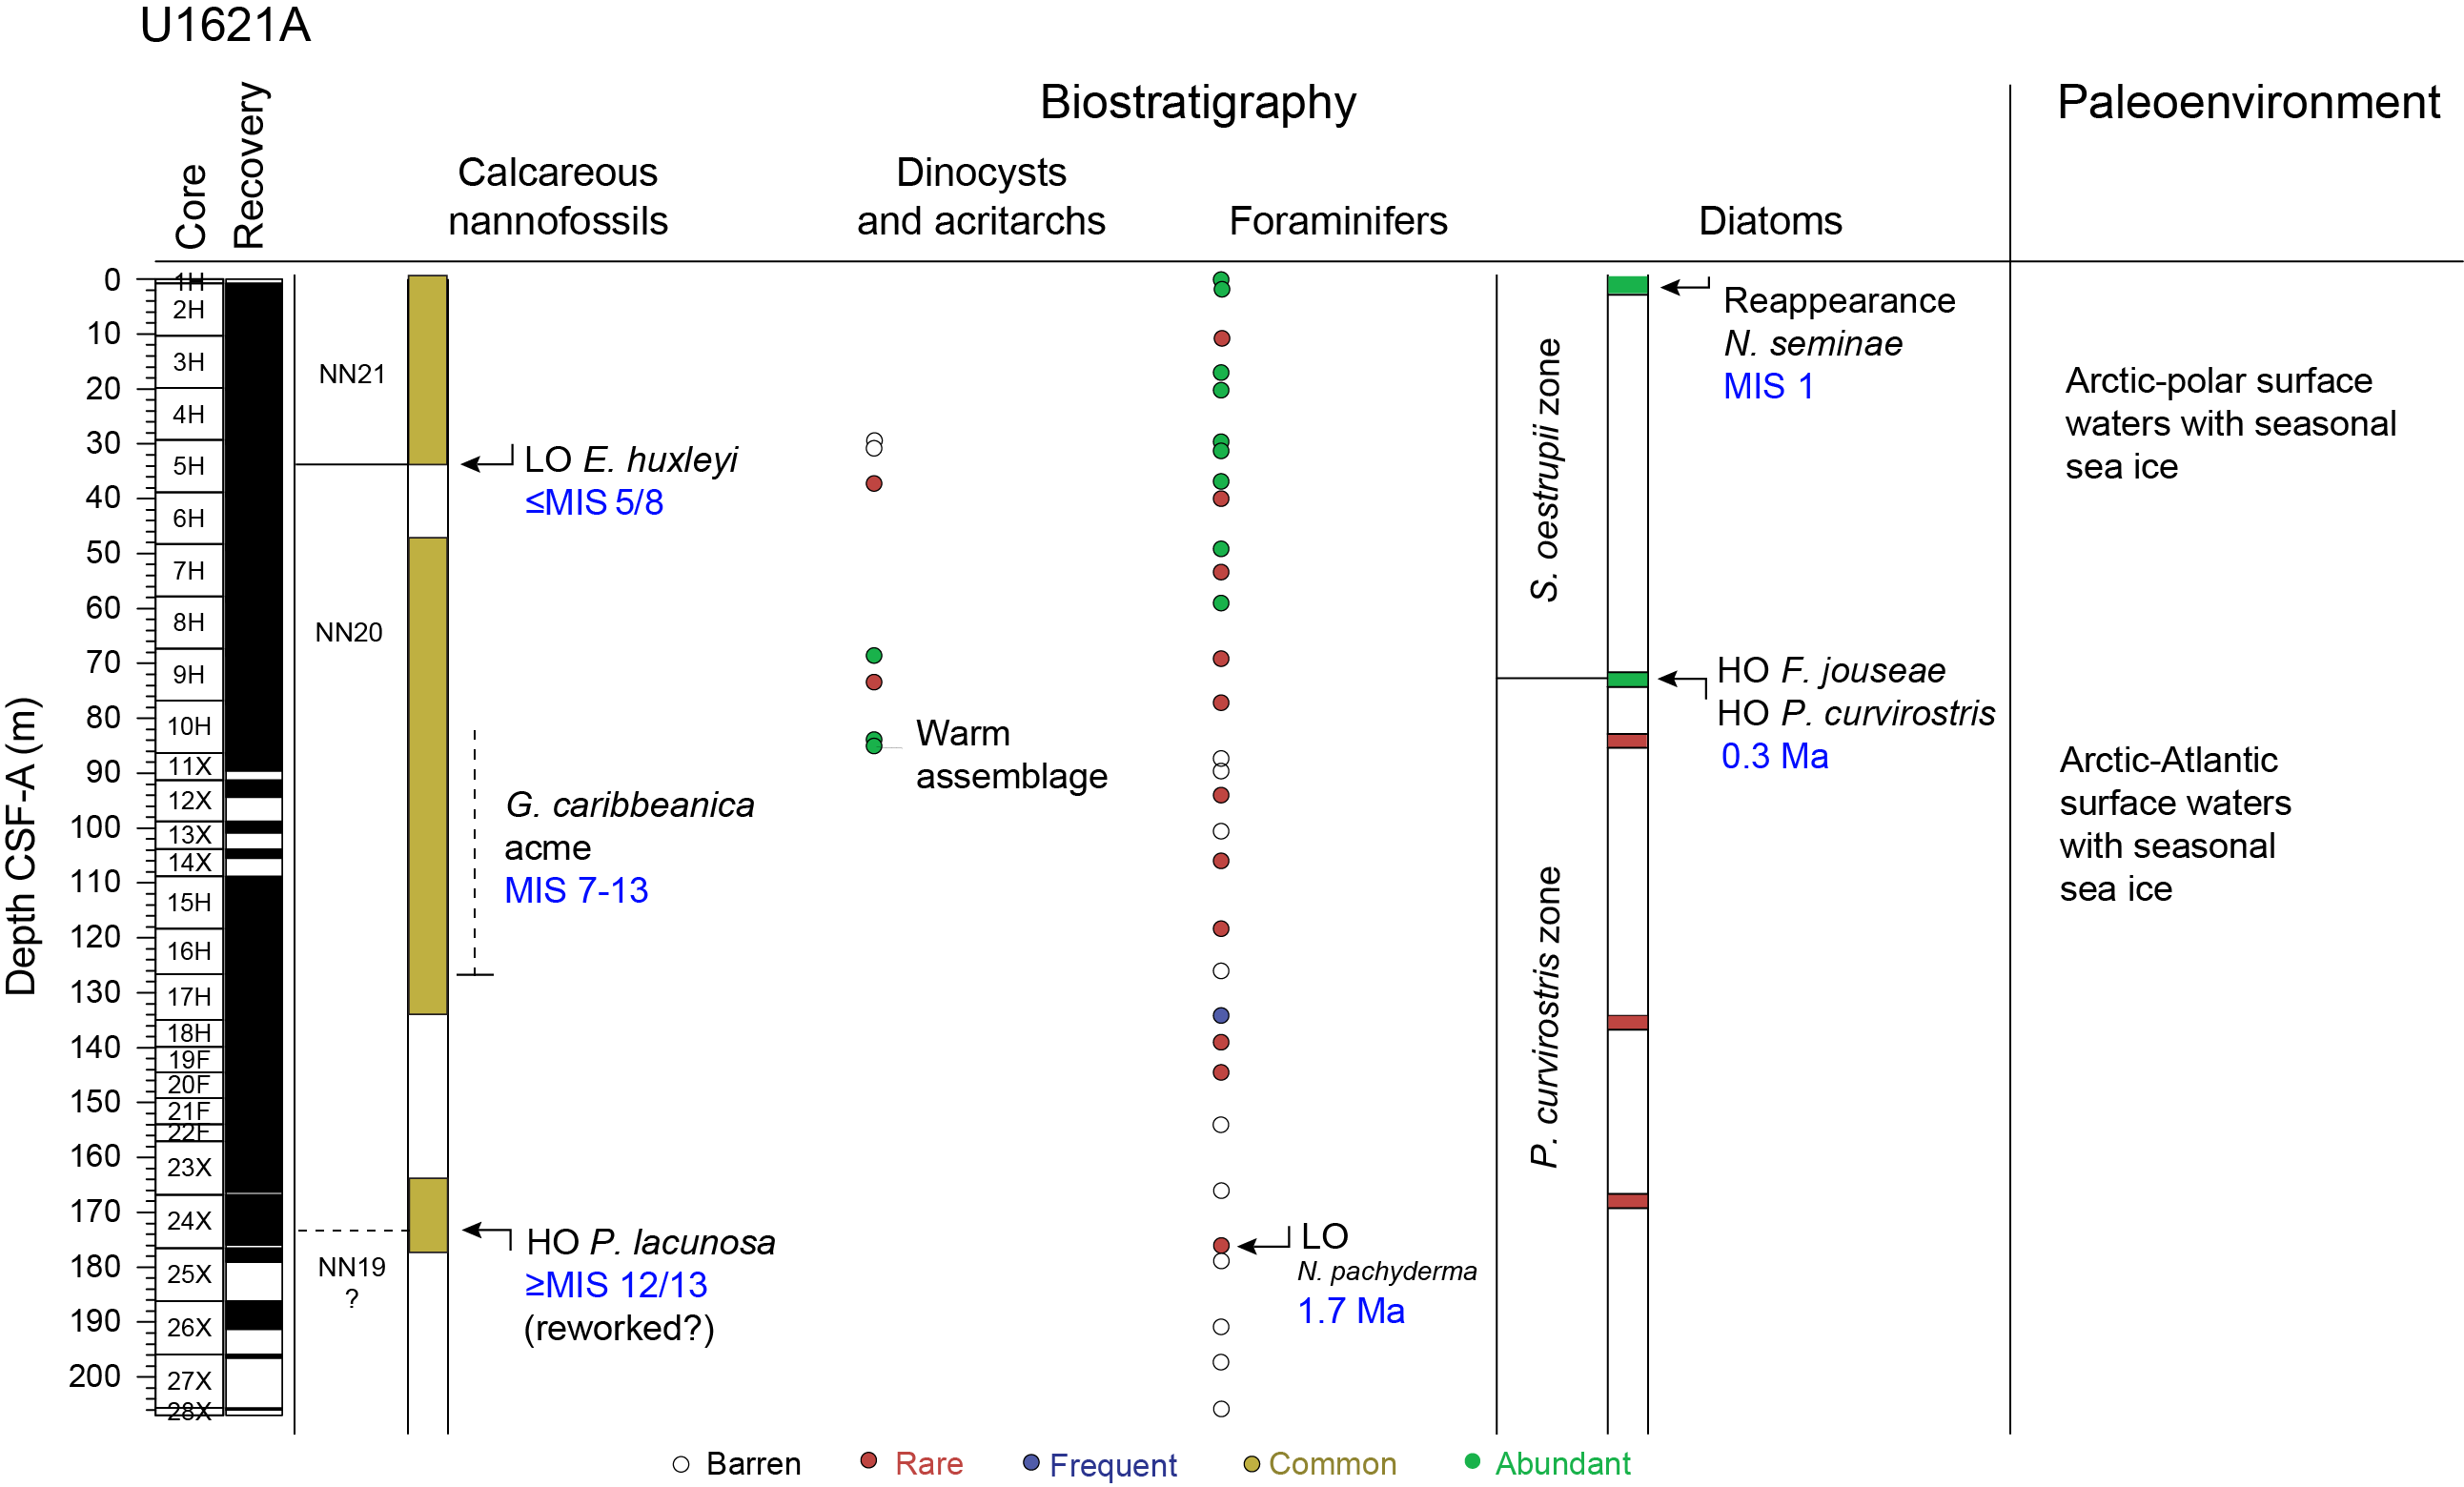
Figure F22. Biostratigraphy and paleoenvironment, Hole U1621A.
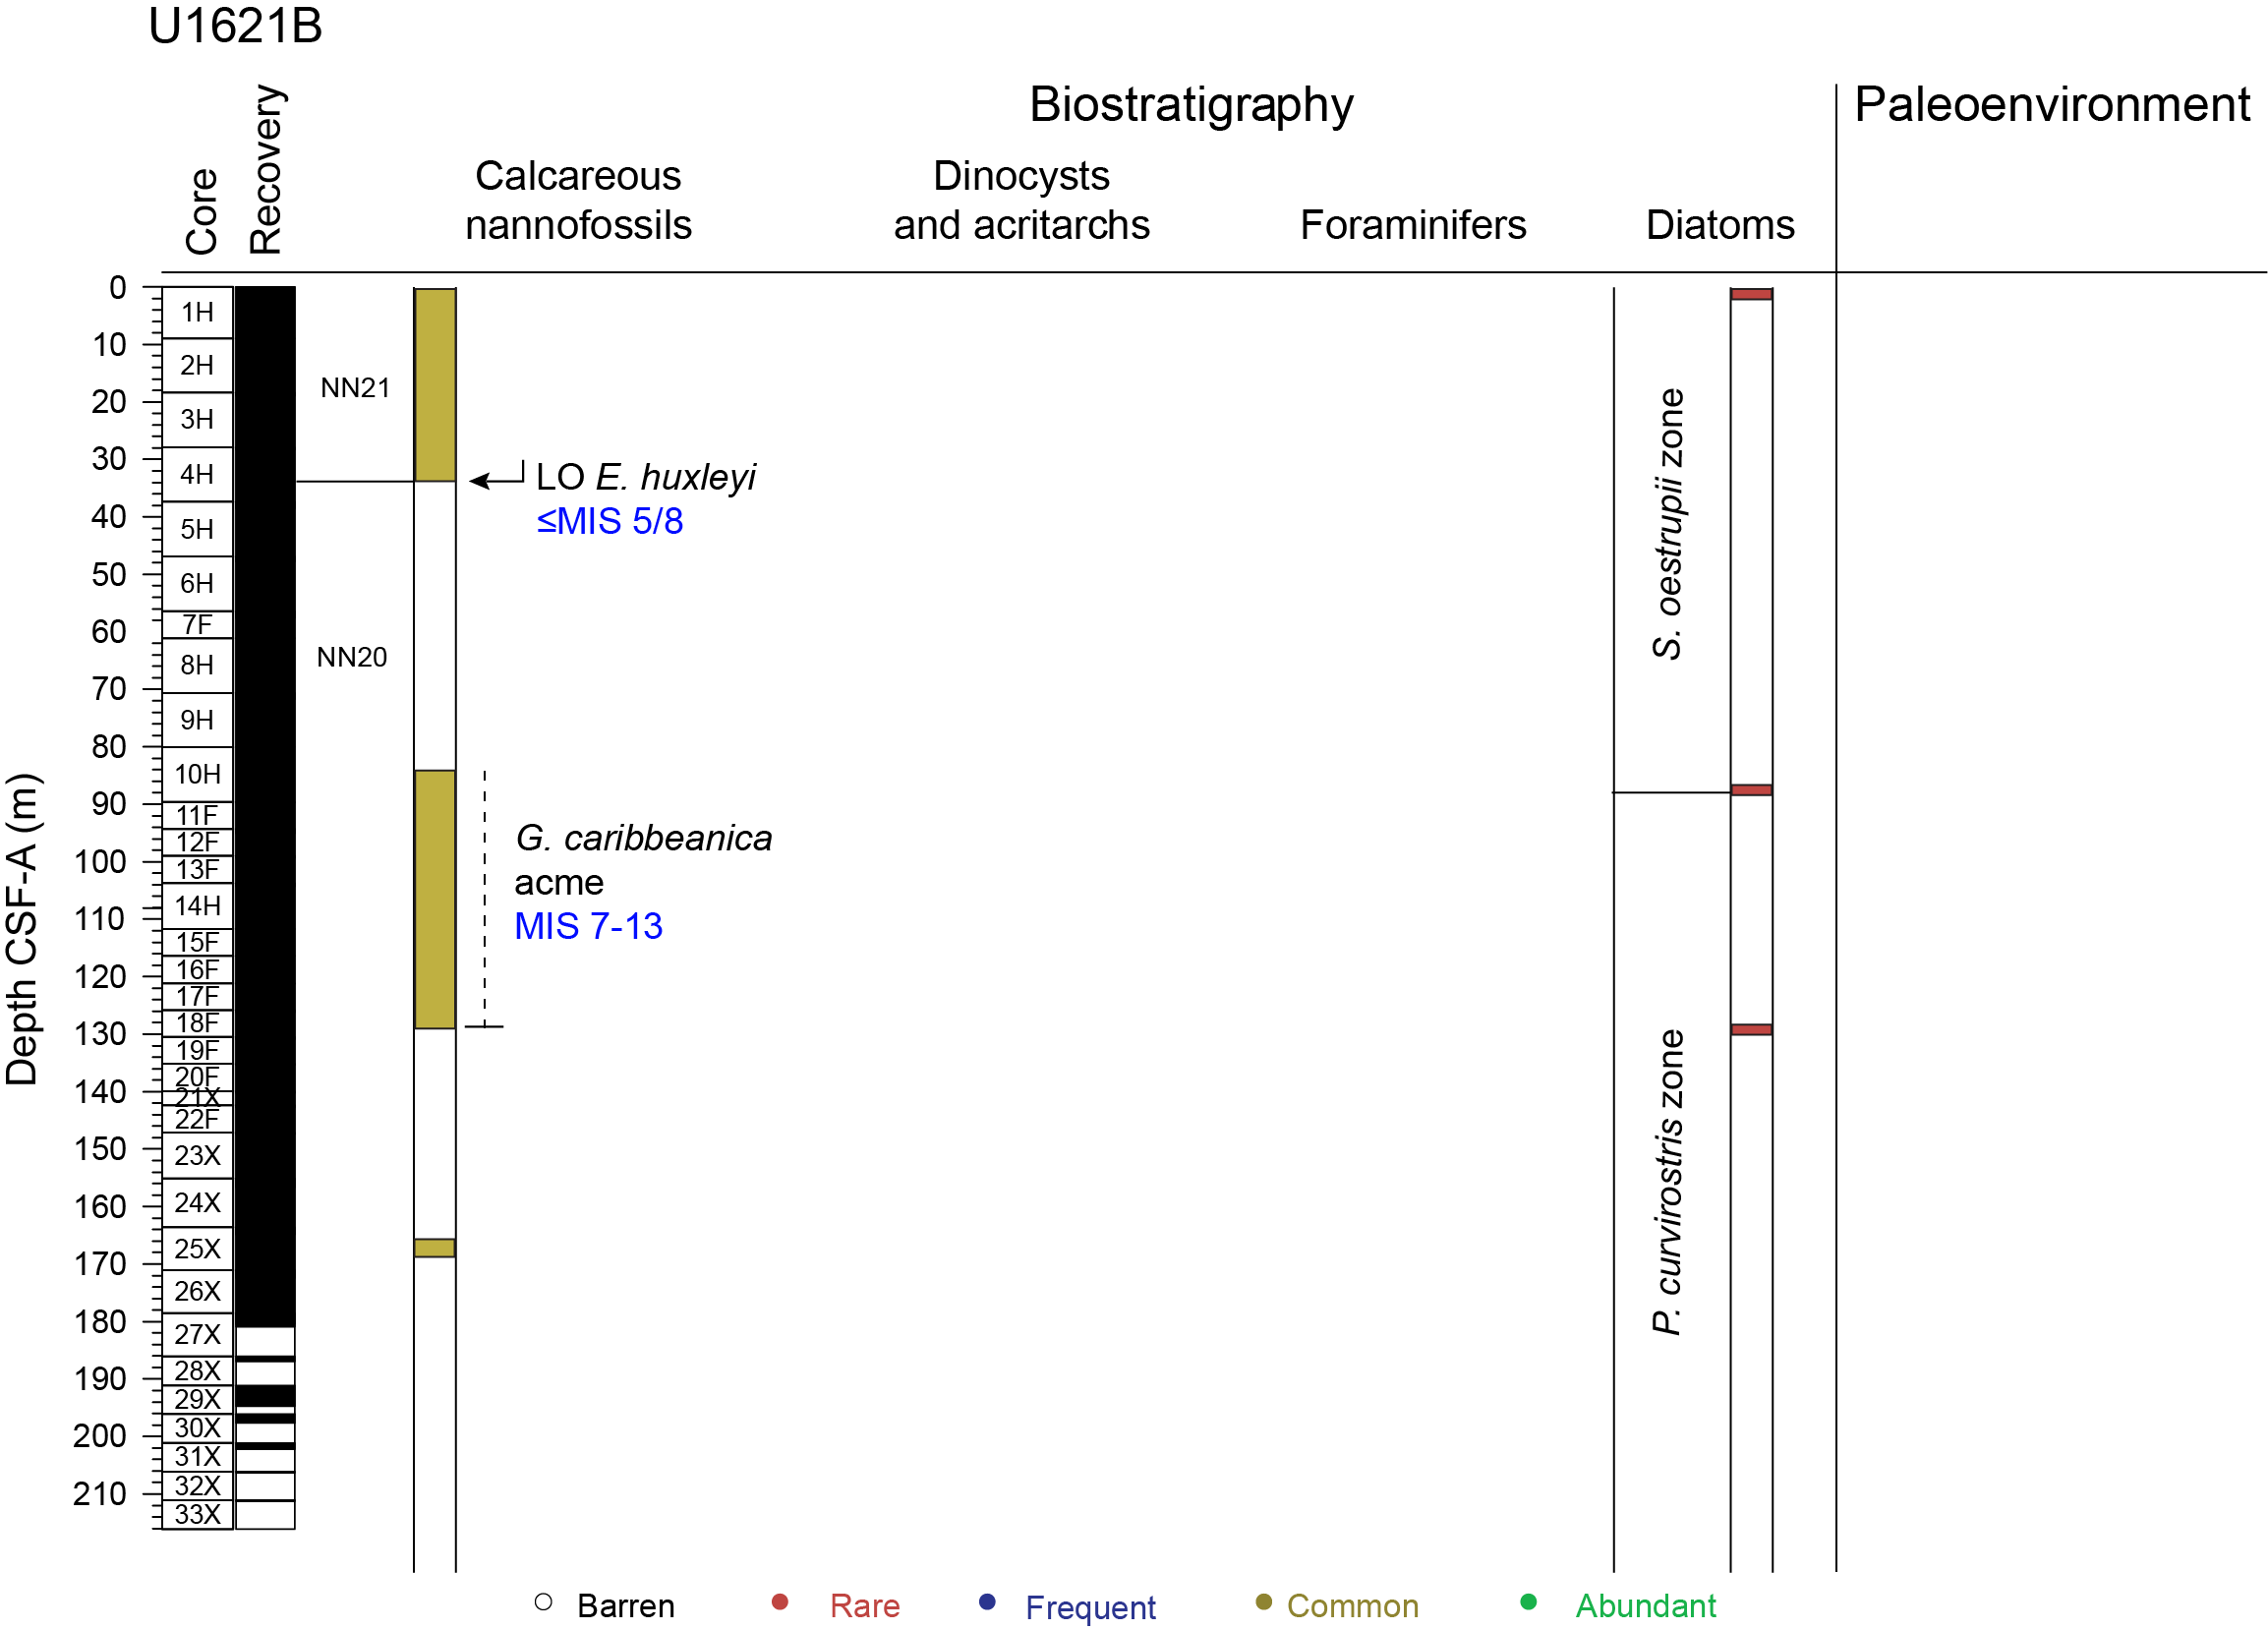
Figure F23. Biostratigraphy and paleoenvironment, Hole U1621B.
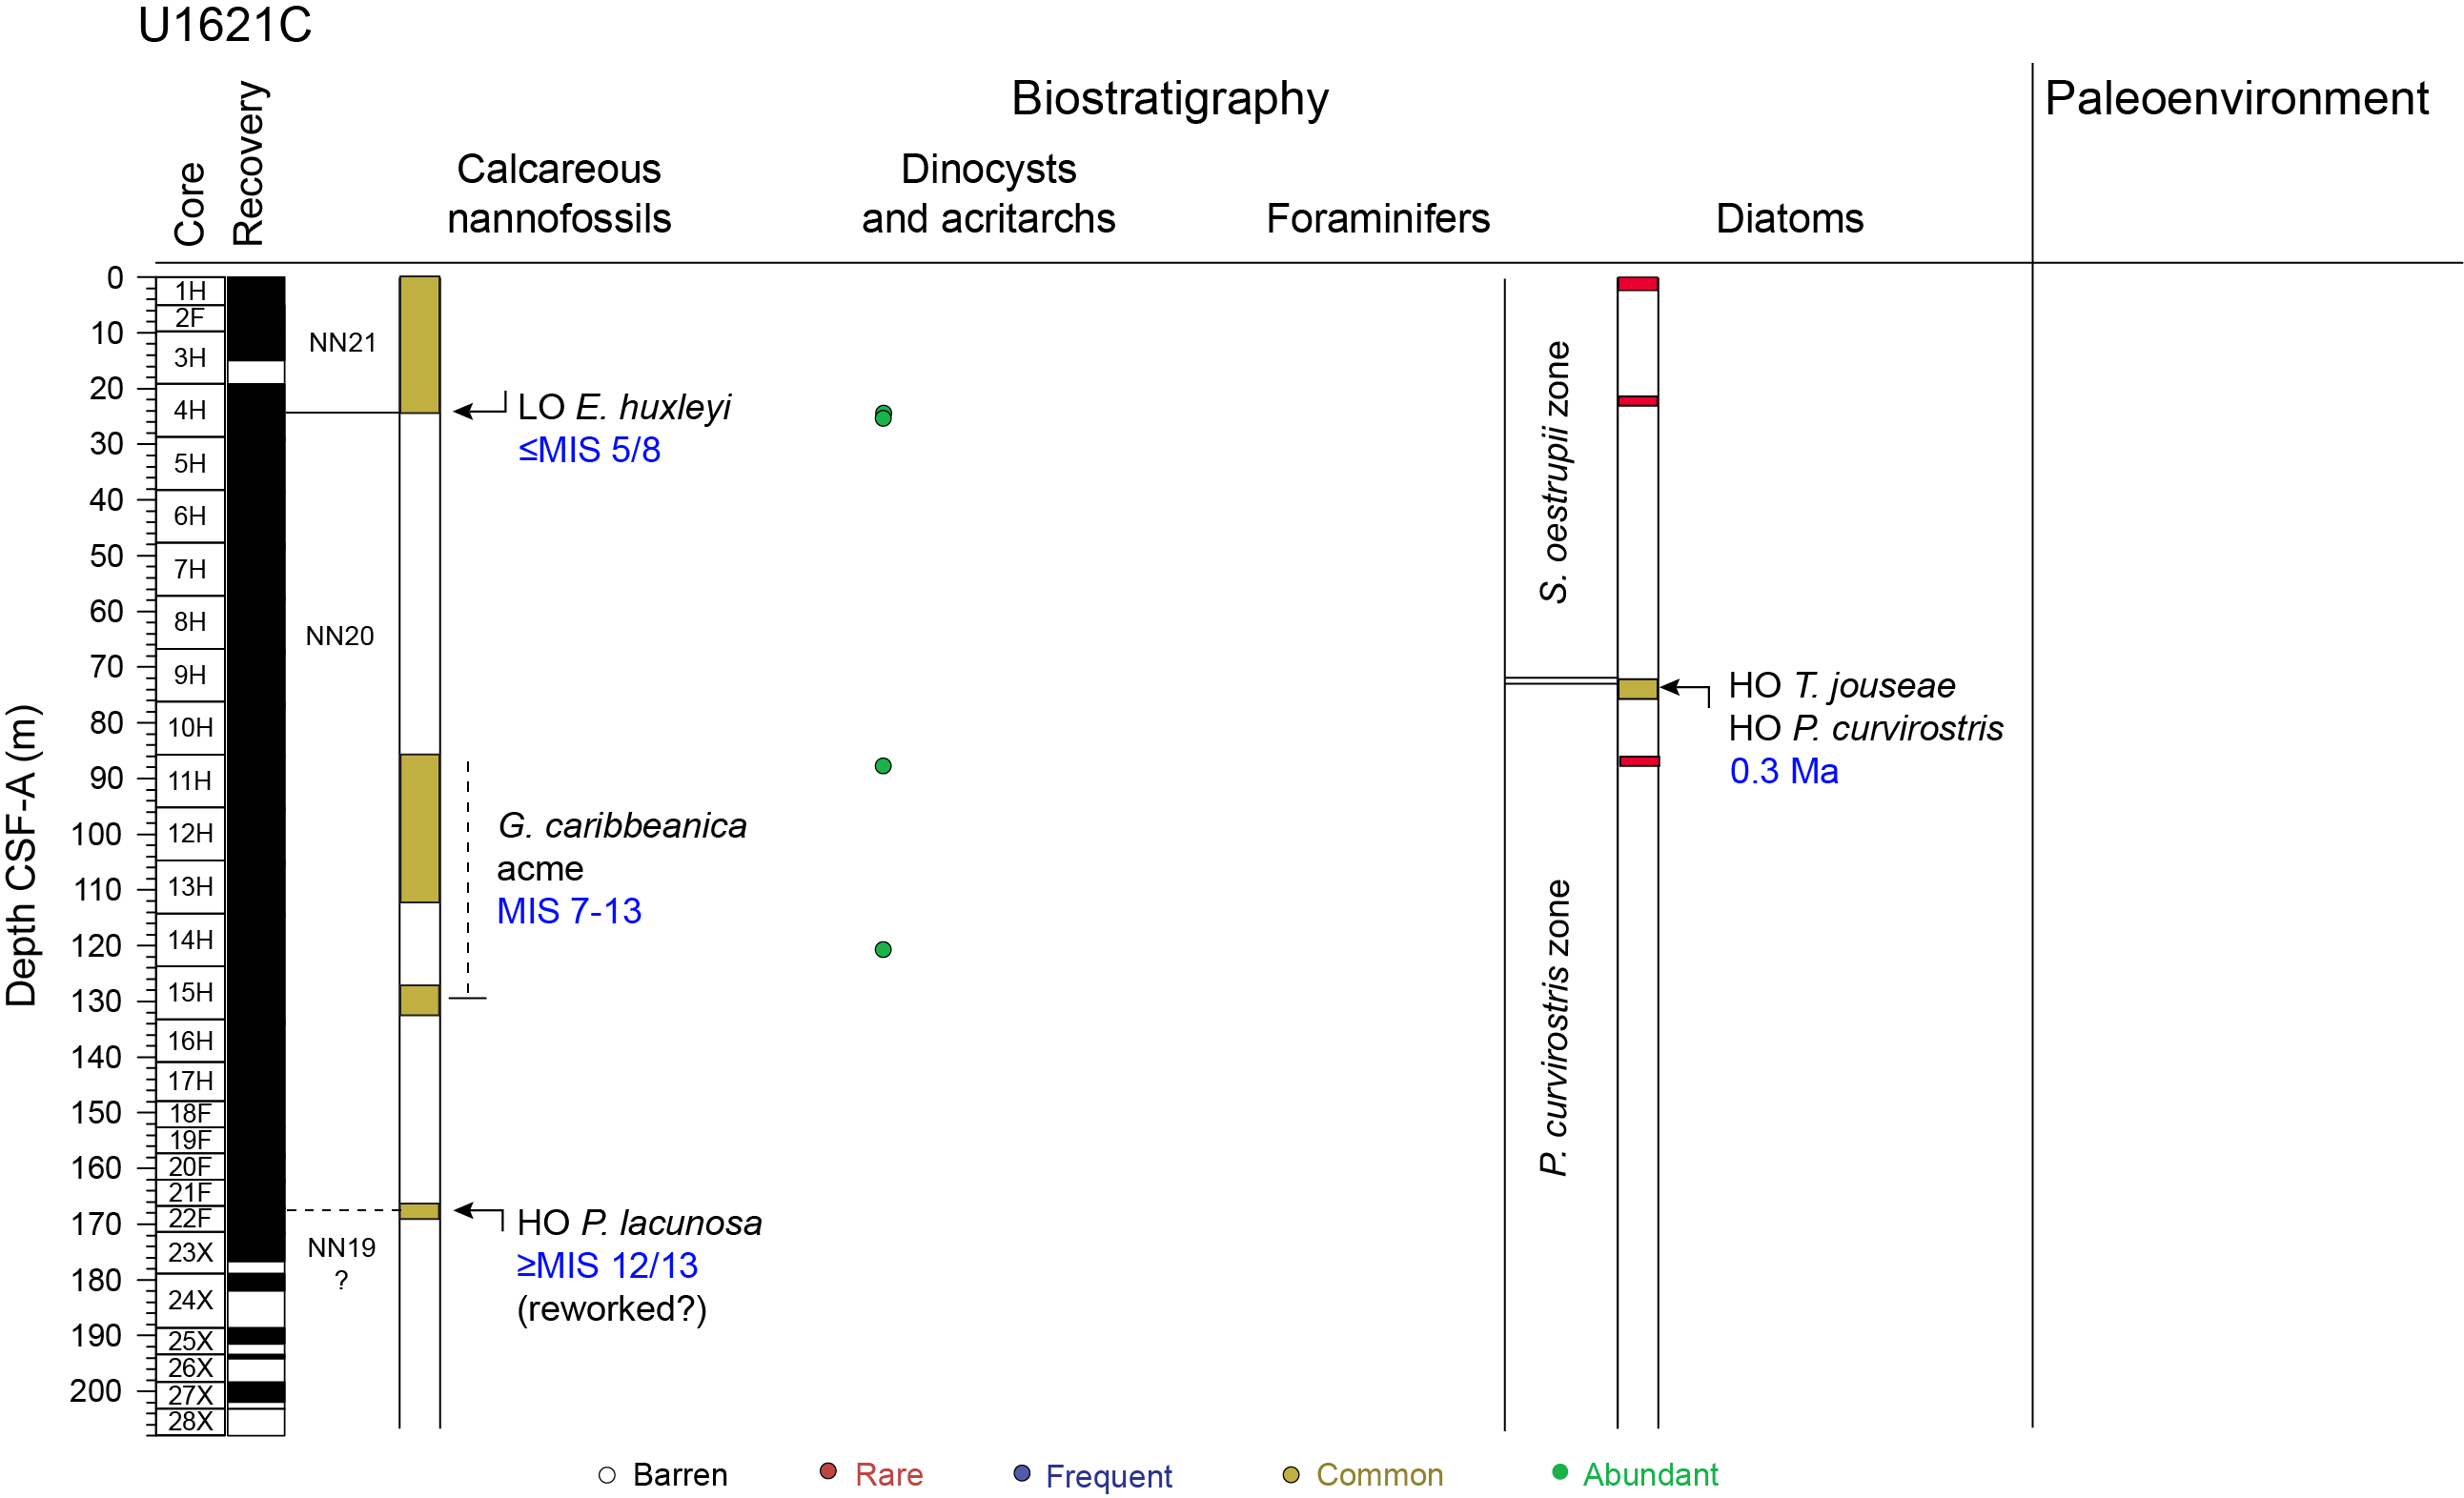
Figure F24. Biostratigraphy and paleoenvironment, Hole U1621C.
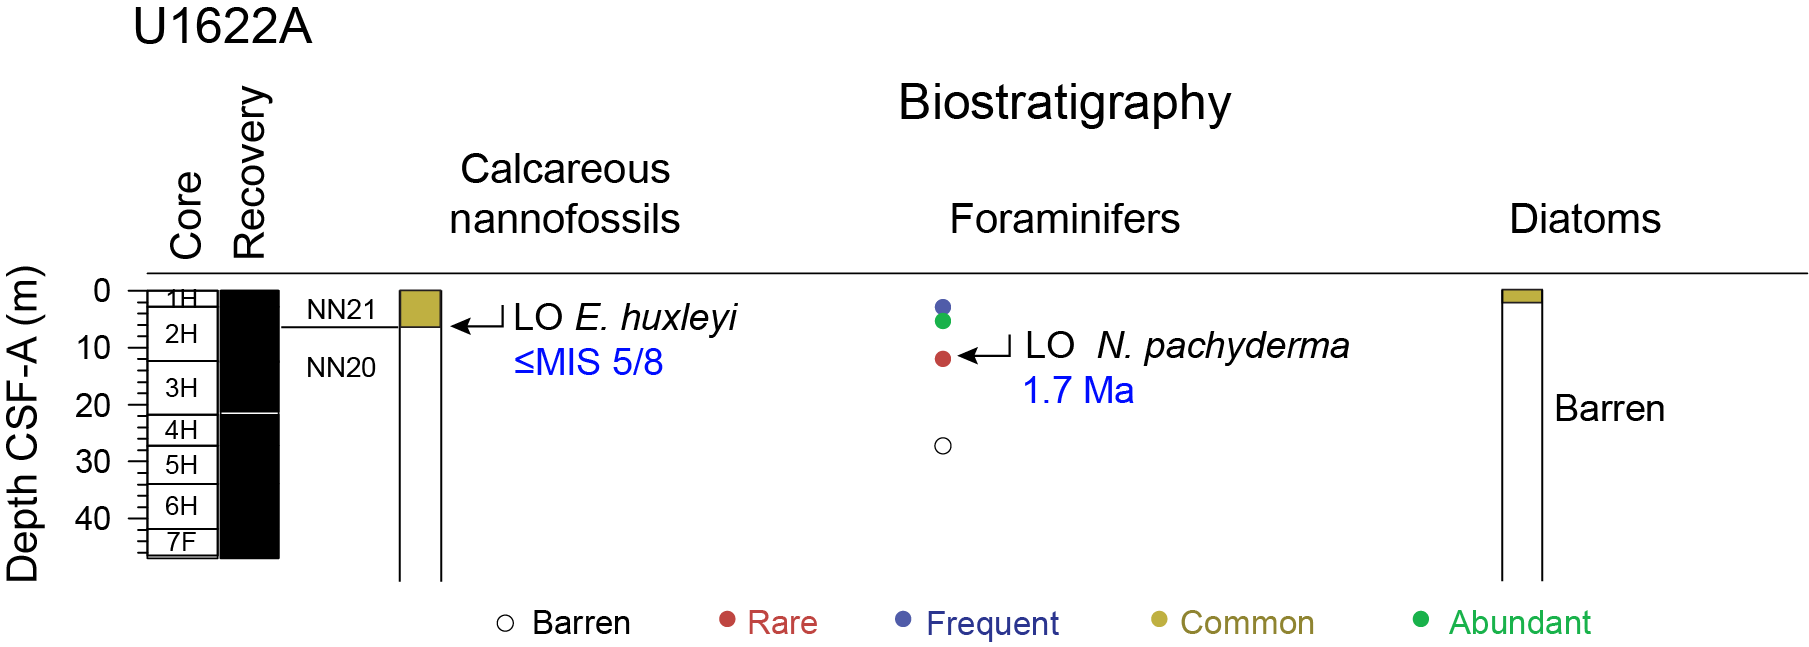
Figure F25. Biostratigraphic summary, Site U1622.
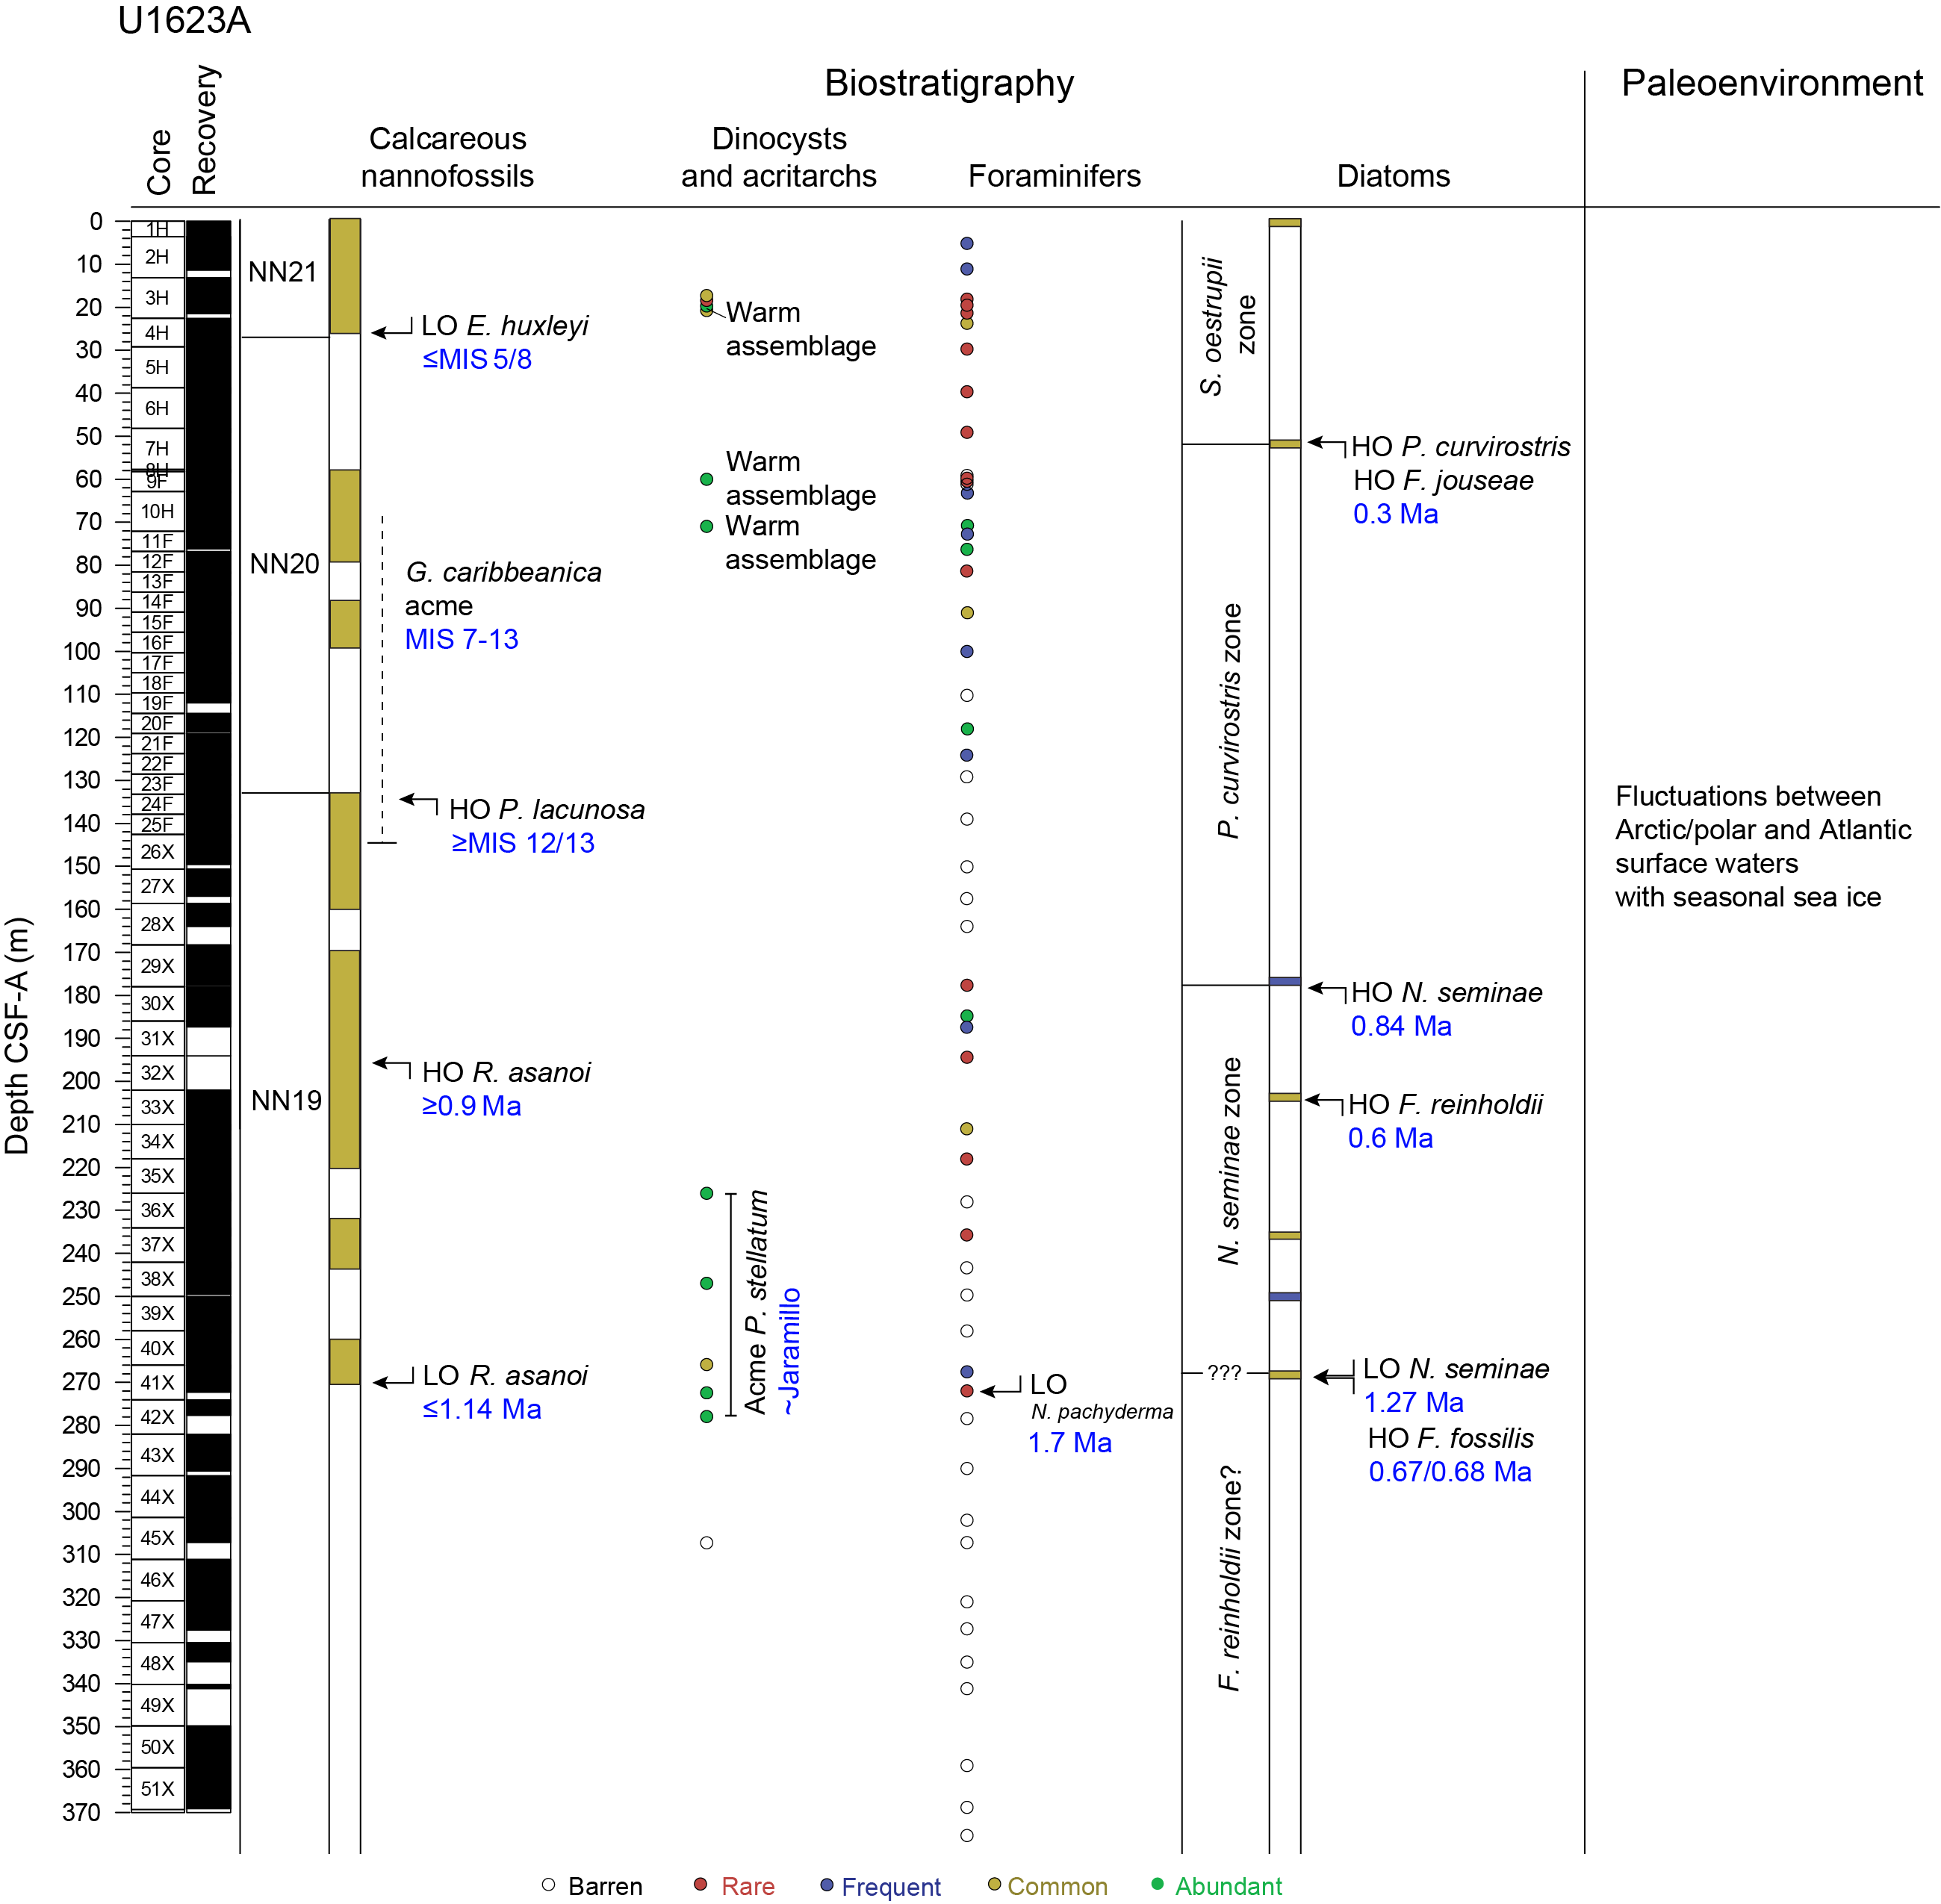
Figure F26. Biostratigraphy and paleoenvironment, Hole U1623A.
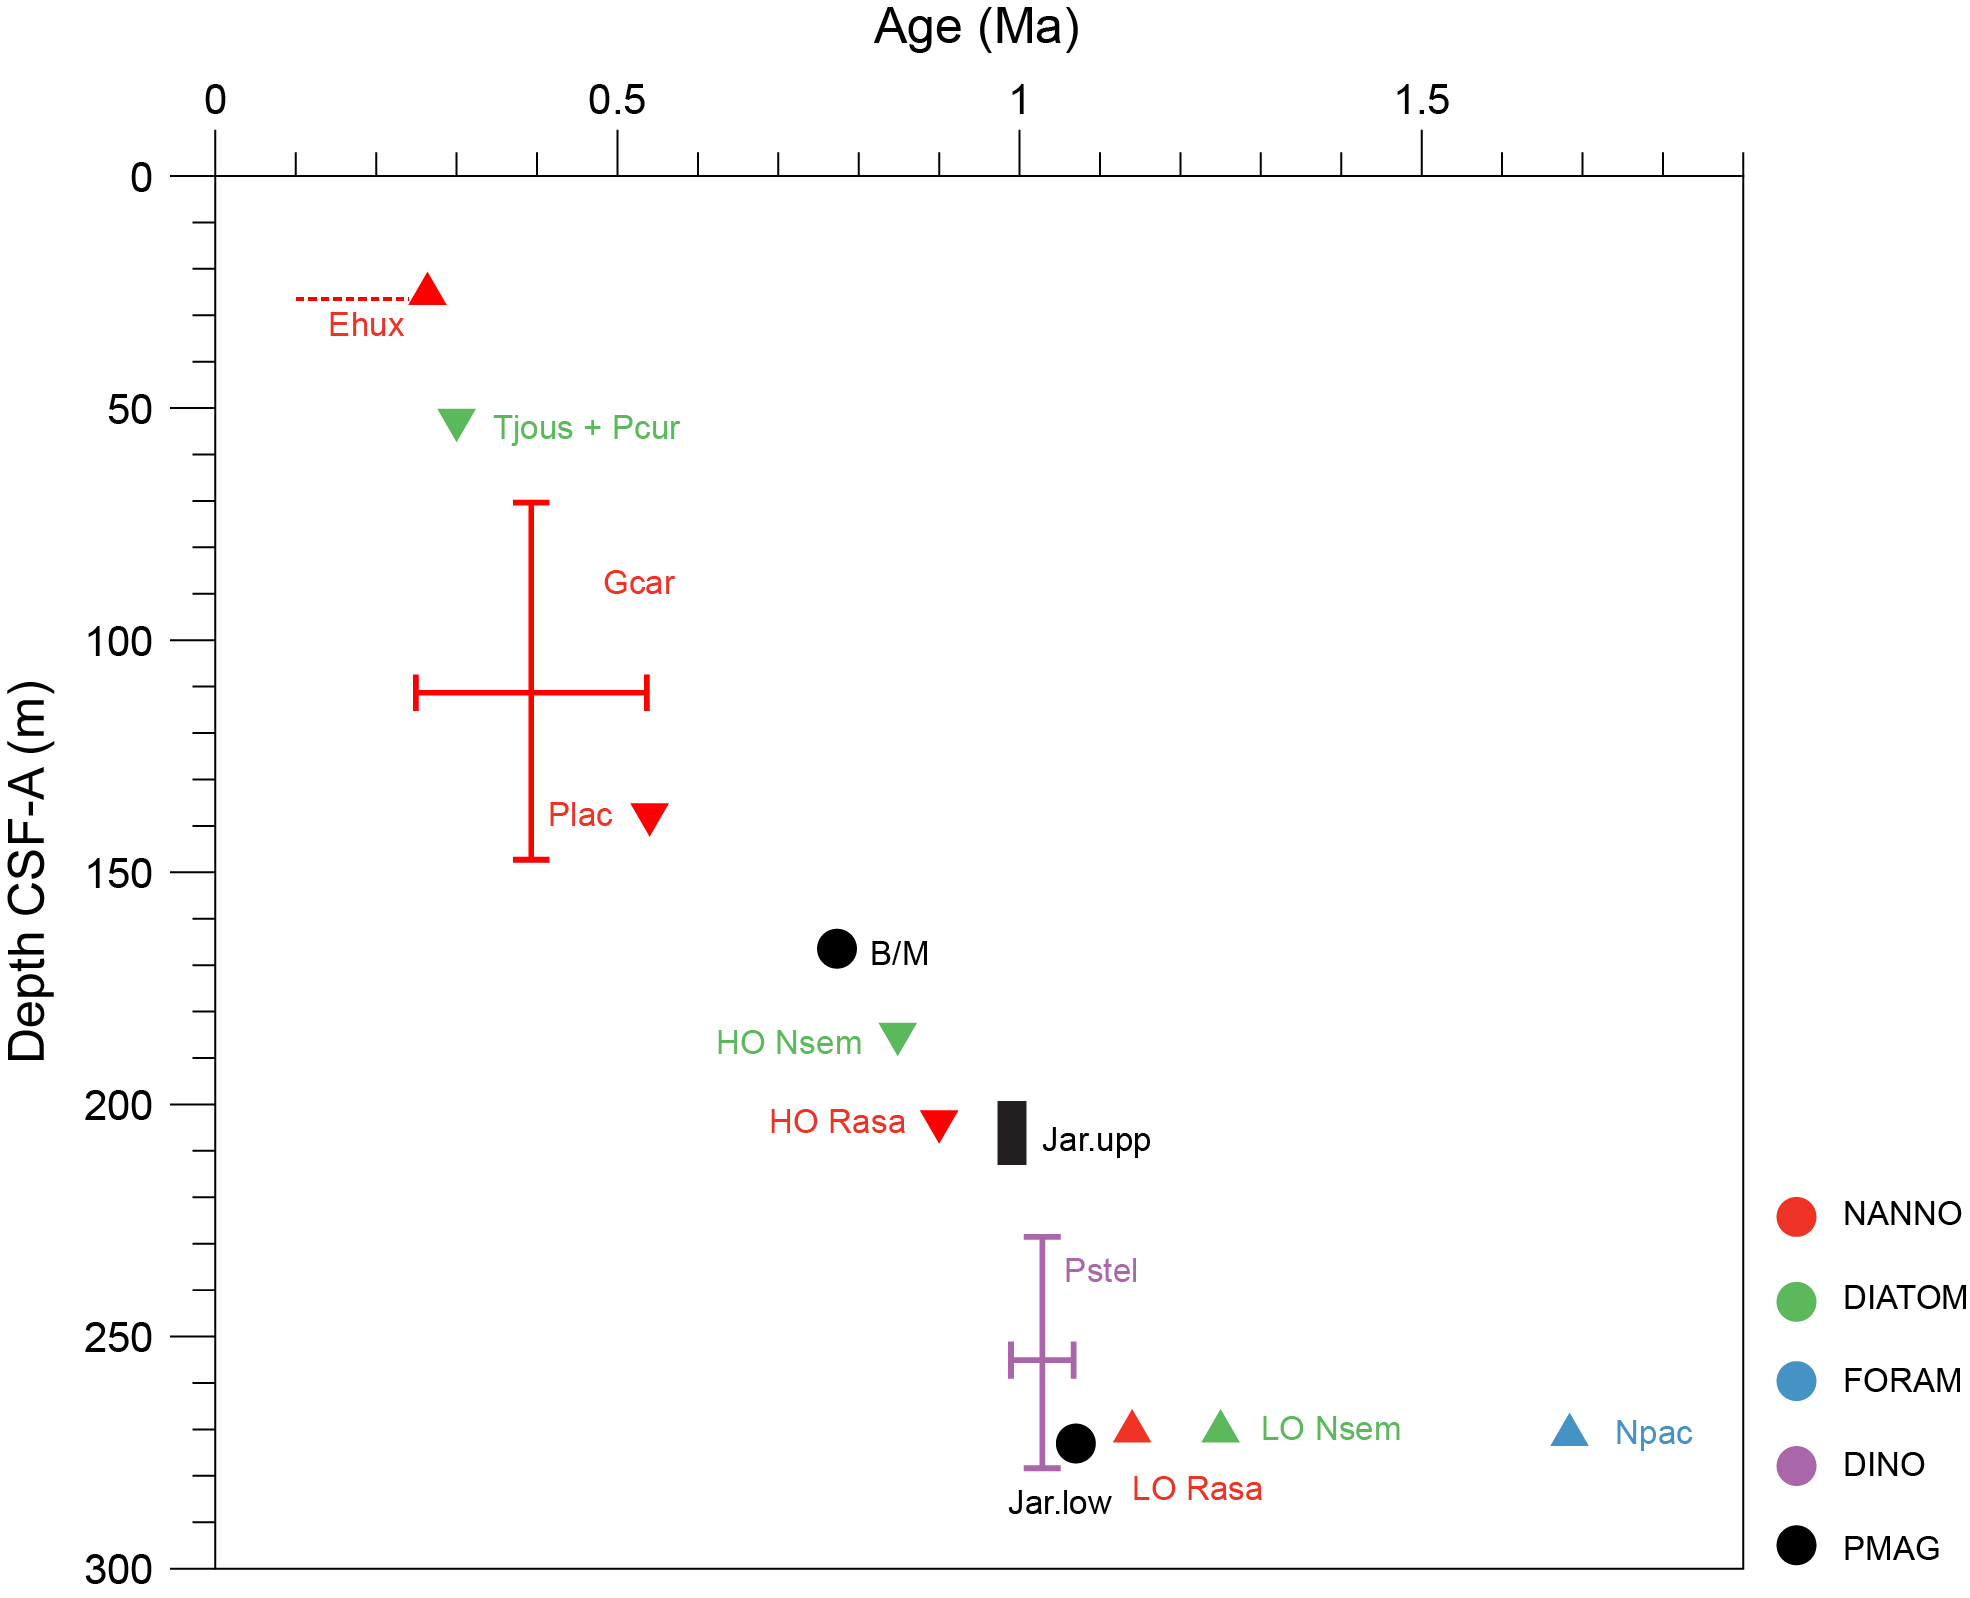
Figure F27. Age-depth model, Site U1623.
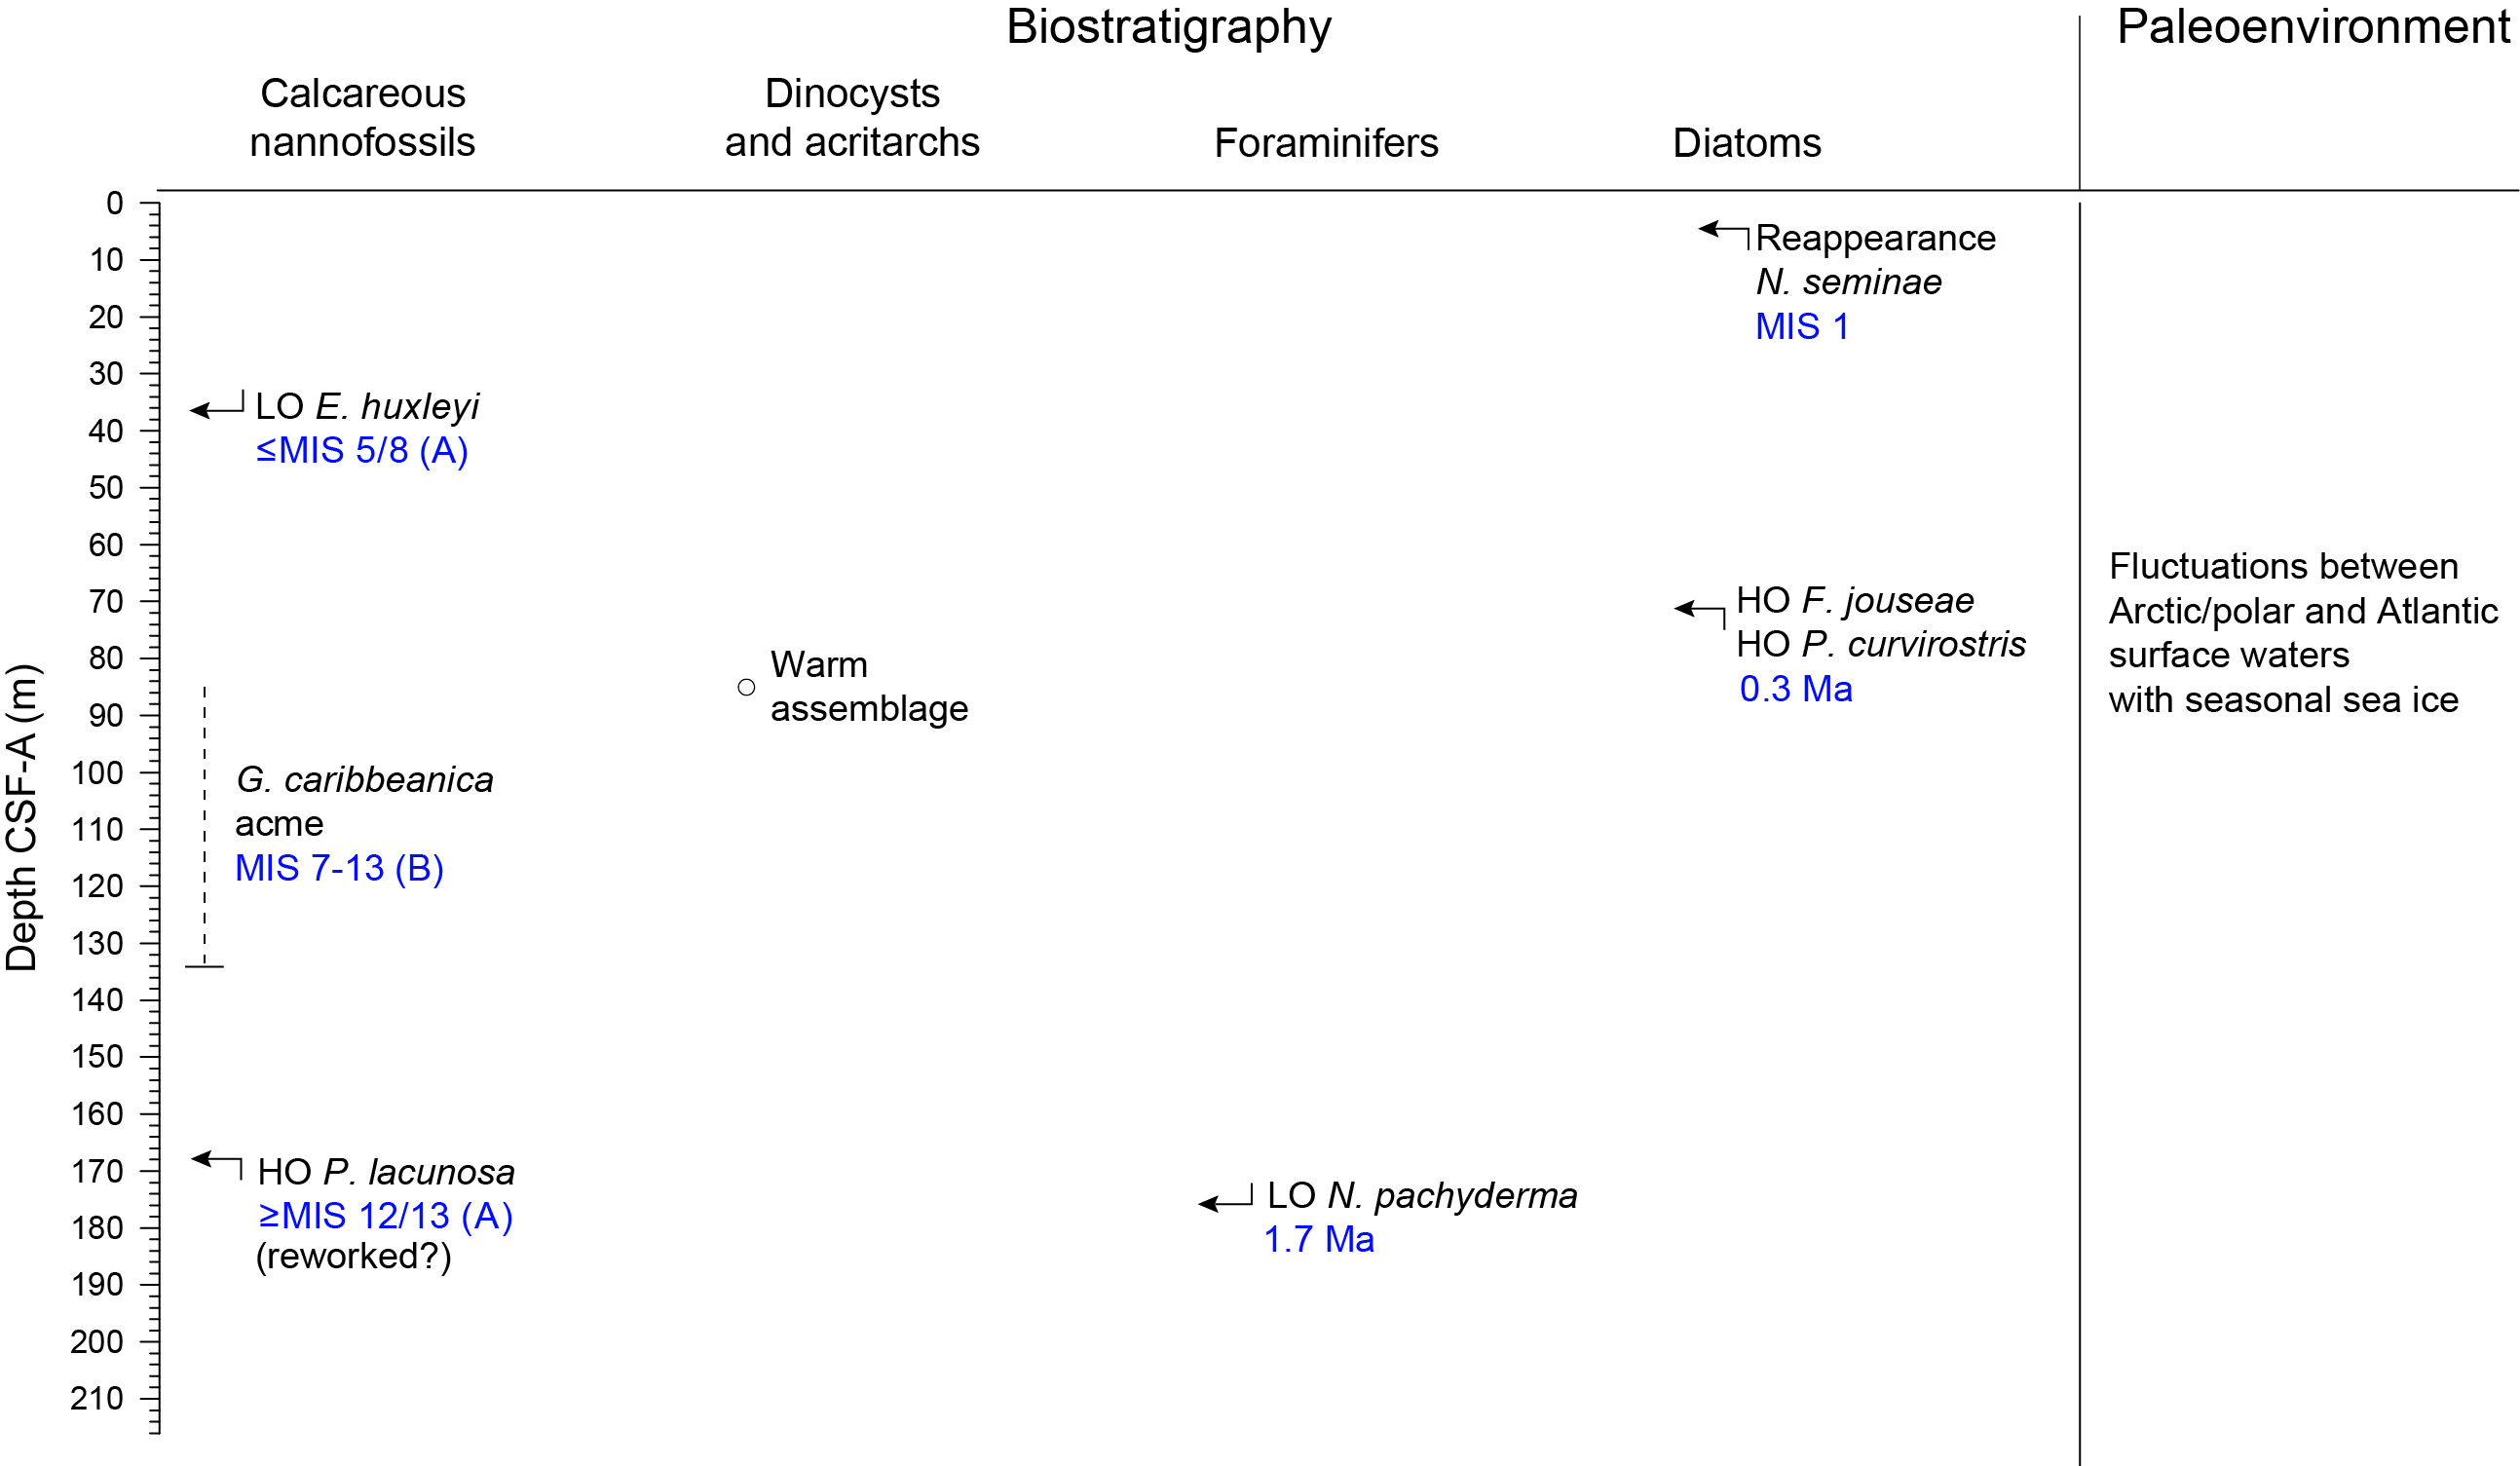
Figure F28. Biostratigraphic summary, Site U1621.
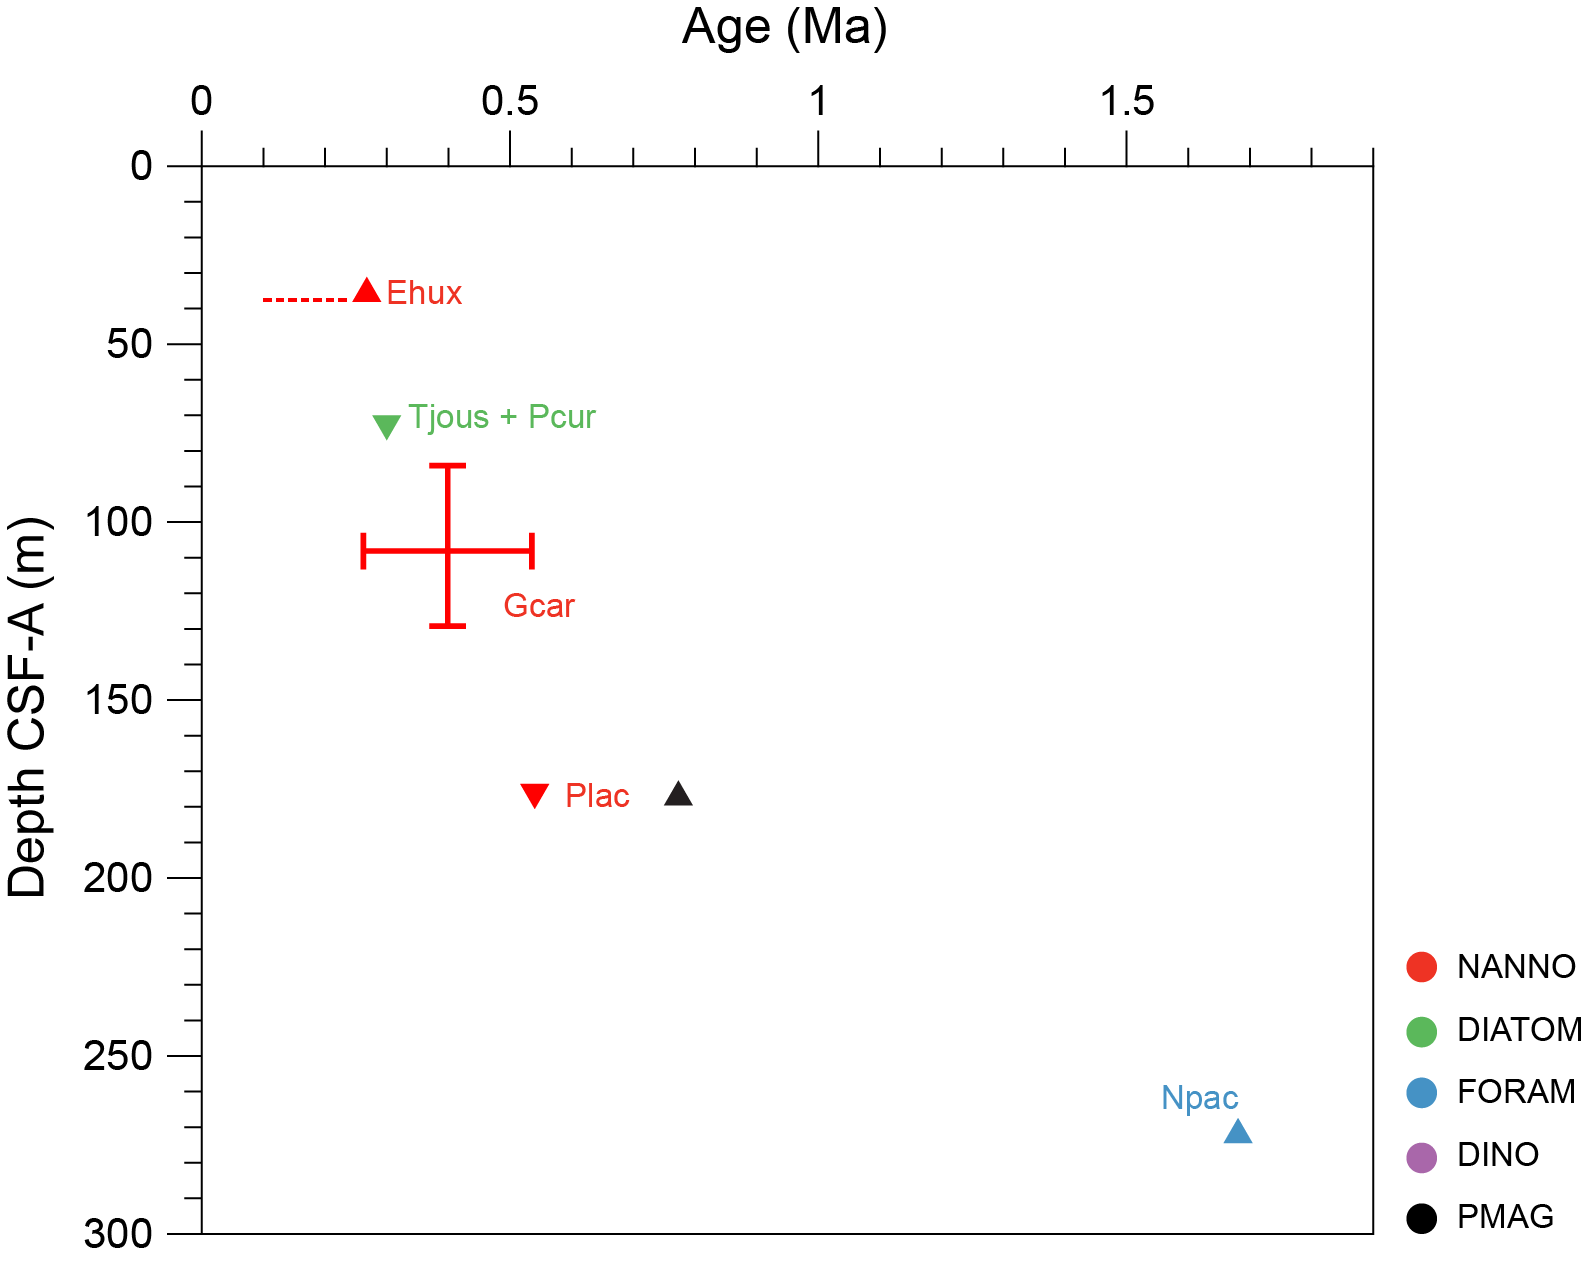
Figure F29. Age-depth model, Site U1621.
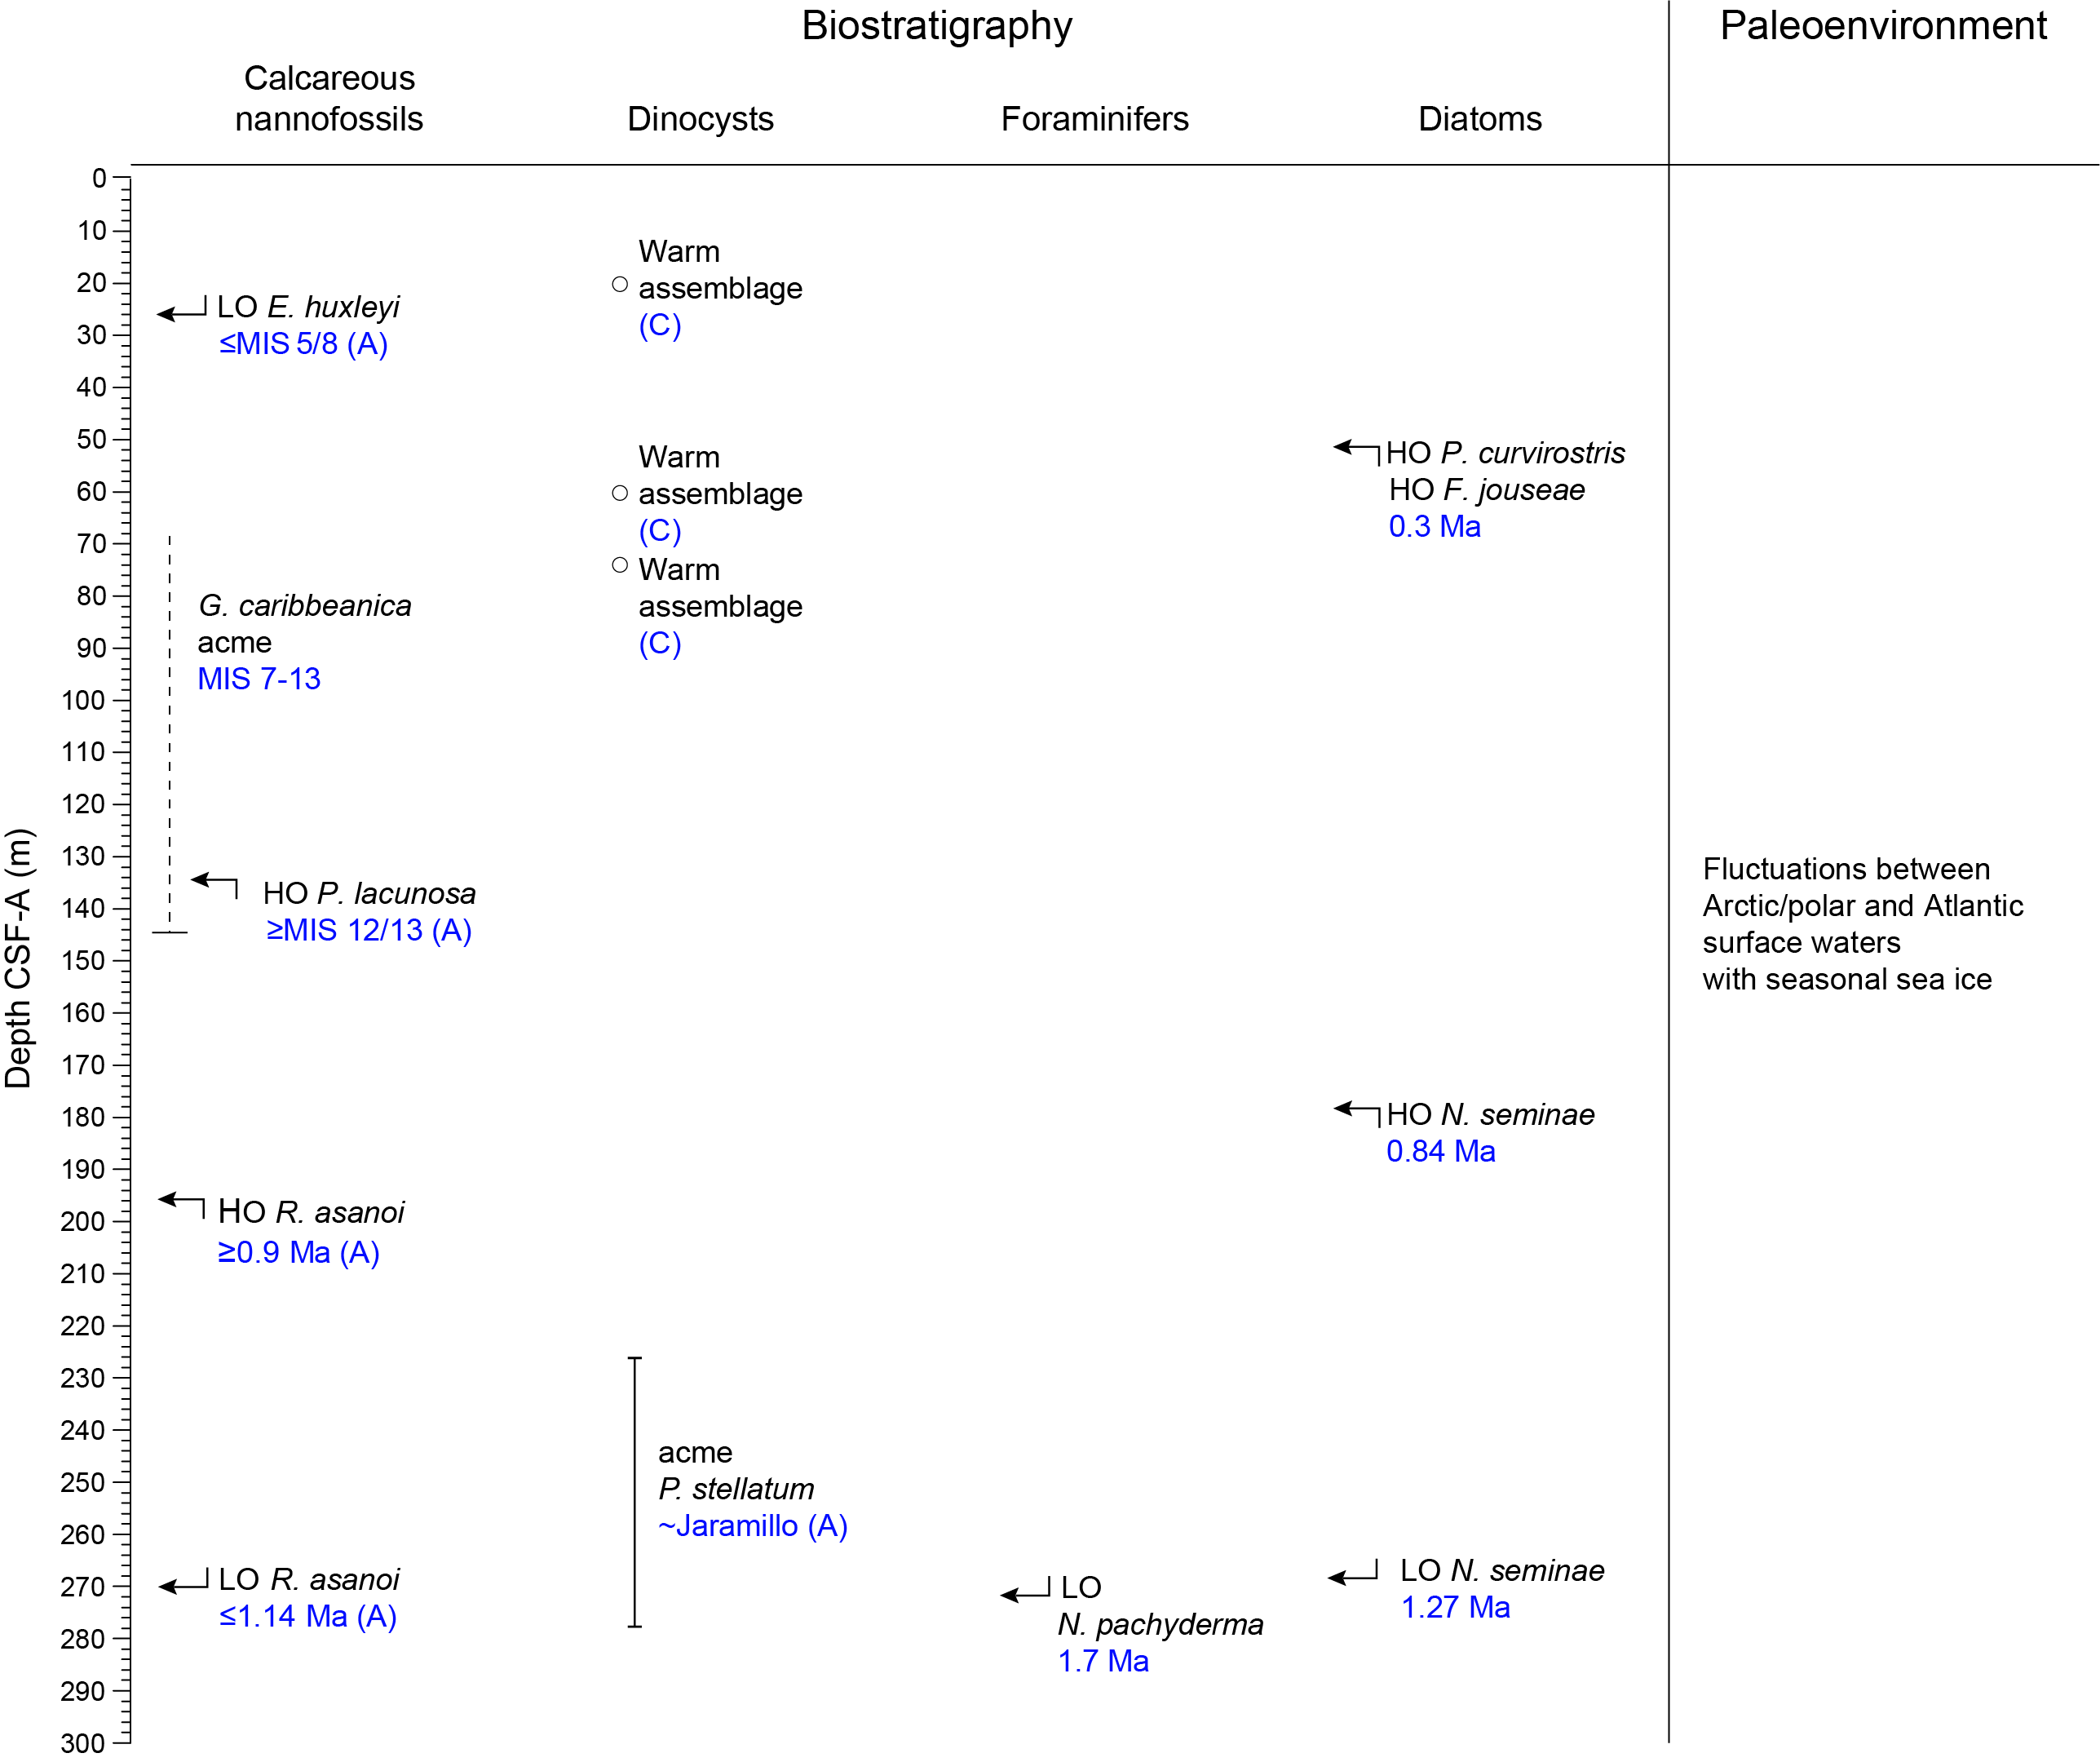
Figure F30. Biostratigraphic summary, Site U1623.
4.1. Calcareous nannofossils
The analysis of calcareous nannofossils at Sites U1621–U1623 is based on the examination of 26 core catchers from Hole U1621A (Figure F22), 7 from Hole U1622A (Figure F25), and 51 from Hole U1623A (Figure F26). In addition, 140 levels were selected from split core sections (working halves) from Site U1621 (Holes U1621A–U1621C), 7 from Hole U1622A, and 163 from Site U1623 (Holes U1623A and U1623C) for smear slide preparation and calcareous nannofossil analysis (Figures F22, F23, F24, F25, F26). The strategy for sample selection from the working halves followed the dominant patterns in sediment color and physical properties (i.e., changes in MS and/or NGR).
The representation of calcareous nannofossils in sediments from Site U1621 is generally constant, with a few exceptions. In the uppermost ~25 m of the three holes, the concentration of specimens in samples ranges between abundant and common (Figures F22, F23, F24). The abundances of calcareous nannofossils decrease toward the lowermost sections. Alternance of barren or almost barren intervals becomes a prominent feature below ~30 mbsf in the three holes (Figures F22, F23, F24). Overall, when the calcareous nannofossils are present below ~30 mbsf, the abundance is frequent to common. Additionally, there are few levels with an abundant concentration of calcareous nannofossils (Figures F22, F23, F24). Calcareous nannofossils are abundant to common in the uppermost 2.98 m of Hole U1622A and barren toward the bottom of the hole (Figure F25). At Site U1623, calcareous nannofossil specimens are generally present with some intermittent barren intervals in Hole U1623A. A more continued barren interval is registered at this site from 272.25 mbsf toward the end of the section (Figures F26, F30). The concentration of specimens in samples generally ranges between frequent and common, in addition to some few levels recording an abundant representation of nannofossils (Figure F26).
Calcareous nannofossil assemblages at Sites U1621–U1623 show low diversity. A total of 10 groups/taxa compose the studied assemblages, including Emiliania huxleyi, small Gephyrocapsa, Gephyrocapsa caribbeanica, medium Gephyrocapsa, Pseudoemiliania lacunosa, Reticulofenestra asanoi < 6 µm and R. asanoi > 6 µm, Coccolithus pelagicus, Calcidiscus leptoporus, and Helicosphaera carteri (Figures F25, F28, F30). The state of preservation is good to moderate. Reworked nannofossils from older stratigraphic levels are intermittently present in the sequences, with an abundance that ranges from frequent to common.
Two calibrated events were identified in the three holes at Site U1621, one in Hole U1622A, and four in Hole U1623A (Figures F25, F28, F30). The determination of these calibrated events is complemented with the identification of acme events and age ranges extracted from the presence of additional species in the studied assemblages. Calcareous nannofossil information suggests a Late Pleistocene age for Sites U1621 and U1622 (Figures F25, F28) and a Middle to Late Pleistocene age for Site U1623 (Figure F30).
The lowest occurrence (LO) of E. huxleyi is observed in Holes U1621A–U1621C (Samples 403-U1621A-5H-6, 53 cm, 403-U1621B-4H-6, 31 cm, and 403-U1621C-4H-5, 37 cm) (Figures F22, F23, F24, F28); in Hole U1622A (Sample 2H-1, 18 cm) (Figure F25); and in Hole U1623A (Sample 4H-4, 54 cm) (Figures F26, F30). According to the global calibration for this event, the 280 ka boundary, at MIS 8, can be identified (Thierstein et al., 1977). Because the regional biostratigraphic characterization of this species for Arctic sediments (Razmjooei et al., 2023) places its LO up to MIS 5 (130 ka), a younger age ranging up to this boundary could be established for the uppermost section of Sites U1621–U1623. Following the zonation by Martini (1971), this boundary determines the transition between Zones NN21 and NN20 and the correspondence to Zone NN21 of Martini (1971) for the uppermost sections from Holes U1621A (37.49 mbsf), U1621B (35.27 mbsf), U1621C (25.34 mbsf), U1622A (2.98 mbsf), and U1623A (27.48 mbsf) (Figures F22, F26, F30).
The acme event of G. caribbeanica is identified between 83.89 and 132.43 mbsf in Holes U1621A–U1621C (Figures F22, F23, F24, F28) and between 69.77 and 146.14 mbsf in Hole U1623A (Figures F26, F30). The observation of this acme episode determines an age interval spanning between MISs 7 and 13 (191–524 ka) for the indicated depth interval (Flores et al., 2012; González-Lanchas et al., 2023; Razmjooei et al., 2023). The highest occurrence (HO) of P. lacunosa is recorded in Samples 403-U1621A-24X-CC, 175.90 cm, and 403-U1621C-22F-80, 171.32 cm (Figures F22, F23, F28). However, a high abundance of reworked specimens from various older stratigraphic intervals, including Cretaceous, Miocene/Pliocene, and also the Early to Middle Pleistocene (i.e., R. asanoi) hampers the complete discrimination of P. lacunosa specimens as in situ or reworked at the indicated levels, obscuring the assignation of the calibrated 430/524 ka boundary (Thierstein et al., 1977; Backman et al., 2012; Razmjooei et al., 2023) and the identification of the Zone NN20–NN21 transition (Martini, 1971). As such, the lowermost sequence in Holes U1621A–U1621C is placed in Zone NN20 (Figure F28). At Site U1623, the HO of P. lacunosa is recorded at 138.72 mbsf (Sample 24F-CC, 54 cm) in Hole U1623A. According to the global calibration (Thierstein et al., 1977; Backman et al., 2012) and regional revision of this event (Razmjooei et al., 2023), the 440/524 ka boundary, within MISs 12/13, could be identified at 138.72 mbsf in Hole U1623A. This depth marks the transition between Zones NN20 and NN19 by Martini (1971) (Figure F25).
The HO and LO of R. asanoi > 6 µm is registered for Hole U1623A in Samples 33X-2, 59 cm, and 41X-3, 107 cm, respectively (Figures F25, F27). Following the global calibration and determinations about the occurrence of this taxa (Wei, 1993; Raffi, 2002; Bown, 1998), an age range spanning between 0.9 and 1.14 Ma could be assigned to the interval constrained by the presence of this species, between 204.05 and 270.05 mbsf (Figures F25, F27). Following this determination, this part of the section is identified to correspond to Zone NN19 by Martini (1971). The lowest core catcher in Hole U1623D (Sample 56X CC) is located at 369.2 mbsf, below the maximum depth drilled in Hole U1623A. The species R. asanoi was not identified in this sample, possibly determining an age older than the 1.14 Ma boundary. Specimens belonging to large Gephyrocapsa were identified in this sample, indicating an age that could span between 1.25 and 1.6 Ma, according to the calibration by Raffi et al. (2006). Further examination at a higher resolution in Hole U1623D is required to accurately determine this tentative lowermost boundary.
4.2. Diatoms and silicoflagellates
The study of diatoms at Sites U1621–U1623 is based on the examination of 26 core catchers from Site U1621 (Figures F22, F23, F24), 7 from Site U1622 (Figure F25), and 44 from Site U1623 (Figure F26). Additionally, 295 samples selected from split core sections were considered: 143 from Site U1621 (Holes U1621A–U1621C) (Figures F22, F23, F24), 7 from Site U1622 (Figure F25), and 163 from Site U1623 (Holes U1623A, U1623C, and U1623D) (Figure F26). The analyses reveal that most of the samples from all sites are almost barren of diatoms, except in the uppermost sections and particular levels at Sites U1621 and U1623 (Figures F22, F23, F24, F26, F30).
In the uppermost parts of Sites U1621–U1623, the diatom record displays a diverse and well-preserved diatom assemblage. Abundance varies from frequent to abundant, and the preservation ranges between moderate and good. The most abundant species belong to the genus Chaetoceros in resting spore stage (RS). This species is common in nutrient-rich waters but, due to its degree of silicification, is also resistant to dissolution (Barron et al., 2016). Moreover, the assemblage includes species Bacteriosira bathyomphala, Fragilariopsis oceanica, Fragilariopsis cylindrus, Fragilariopsis regina-jahniae, or Thalassiosira nordenskioeldii, which have a preference for seasonal sea ice; species such as Thalassiosira antarctica var. borealis, Actinocyclus curvatulus, Coscinodiscus radiatus, Rhizosolenia hebetata f. hebetata, and Shionodiscus trifultus, which are related to Arctic–subpolar waters (Oksman et al., 2019); and a third group of species related to north-flowing Atlantic water within the North Atlantic and Norwegian Atlantic currents, such as Coscinodiscus marginatus, Shionodiscus oestrupii, and Thalassionema nitzschioides var. nitzschioides (Oksman et al., 2019) (Figures F22, F23, F24, F25, F26). The presence of Neodenticula seminae was only observed at Site U1623 (Samples 403-U1623A-1H-1, 1 cm, and 1H-2, 67 cm; 0.01–2.14 mbsf), documenting the reentrance of the species in the region at the onset and during MIS 1 (Reid et al., 2007; Miettinen et al., 2013; Matul and Kazarina, 2020) (Figure F26).
The silicoflagellate species Stephanocha speculum is also recorded in the uppermost part of Hole U1621A (Samples 1H-1, 1 cm, and 1H-1, 5 cm) and indicates the presence of cooler and nutrient-rich waters (Rigual-Hernández et al., 2010) (Figure F22).
A second interval with a well-preserved diatom assemblage, with rare to abundant diatom abundance, is similarly observed at Sites U1621 and U1623. At Site U1621, this interval is located between 73.49 and 73.89 mbsf in Hole U1621A (Samples 9H-5, 77 cm, 9H-5, 99 cm, and 9H-5, 117 cm) and between 74.62 and 76.27 mbsf in Hole U1621C (Samples 9H-7, 56 cm, 9H-7, 102 cm, and 10H-1, 7 cm) (Figures F22, F24). In Hole U1621B, only fragments of Proboscia curvirostris were found in Sample 10H-6, 89 cm (88.27 mbsf) (Figure F23). At Site U1623, this interval is recognized in Hole U1623A at 51.5 mbsf (Sample 7H-3, 55 cm). Assemblages are composed of abundant C. marginatus, A. curvatulus, and Thalassiothrix longissima, in addition to less abundant B. bathyomphala, F. cylindrus, F. oceanica, Paralia sulcata, S. trifultus, T. nordenskioeldii, T. nitzschioides var. nitzschioides, and Chaetoceros. This fossil assemblage is similar to modern assemblages in the region (Oksman et al., 2019).
The calibrated events HO of P. curvirostris and the HO of Thalassiosira jouseae were identified in the upper part of the interval described above at Sites U1621 and U1623. Koç et al. (1999) described both events to be synchronous between the middle and high latitudes of the North Atlantic, the North Pacific, and the Nordic Seas, with a calibrated age of 0.3 Ma, at MIS 9. Following the aforementioned study, this observation indicates an age older than 0.3 Ma for the top of the interval and the identification of the base of the S. oestrupii Zone, as well as the top of the P. curvirostris Zone, at 73.49 mbsf in Hole U1621A and 51.5 mbsf in Hole U1623A (Figures F22, F23, F24).
A third interval with diatom content is recorded at Site U1623 between 58 and 61.5 mbsf in Samples 403-U1623A-8H-CC, 15 cm, 8H-CC, 30 cm, 8H-CC, 9F-1, 25 cm, 9F-2, 38 cm, 9F-2, 68 cm, and 9F-3, 55 cm (Figures F26, F30). The species P. curvirostris and T. jouseae are identified, constraining this interval within the P. curvirostris Zone. The diatom assemblage at this part of the sequence contains North Atlantic–Norwegian surface waters–related taxa, such as C. marginatus, S. oestrupii, and T. nitzschioides var. nitzschioides, indicating interglacial conditions (Oksman et al., 2019).
The HO of P. curvirostris (0.3 Ma) defines the top of the P. curvirostris Zone (Koç and Flower, 1998), whereas the base is defined for the HO of N. seminae (0.84–0.85 Ma). In this study, the HO of N. seminae was observed in Hole U1623A in Sample 30X-CC (187.32 mbsf), allowing the identification of the base of the P. curvirostris Zone at this site (187.32 mbsf; Figure F26). The species Fragilariopsis reinholdii and Fragilariopsis fossilis are scarce along this hole, probably due to poor preservation. The HO of both species was identified at 208.1 and 270.1 mbsf. According to Koç et al. (1999), the HO of F. reinholdii is located within MIS 15, with an estimated age of 0.6 Ma, and the HO of F. fossilis at around 0.675/0.687 Ma at the end of MIS 17. However, the scarcity of our record along the sequence does not allow the identification of these boundaries in Hole U1623A.
The N. seminae Zone is defined by the HO of N. seminae at the top and the LO of N. seminae at the base, between 1.25 and 1.26 Ma (Koç et al., 1999). This biozone was identified by the recognition of these events in Hole U1623A (Figure F26). Within this zone, as well as toward the base of the P. curvirostris Zone, five intervals with a good to moderately preserved diatom assemblage were observed (Figure F26). The first interval extends from 176.33 to 187.32 mbsf in Samples 403-U1623A-29X-7, 96 cm, and 30X-CC. The second interval was observed between 204.05 and 211.225 mbsf in Samples 33X-2, 59 cm, and 33X-CC. A third interval of shorter extent was observed from 235.925 to 236.57 mbsf in Samples 36X-CC to 37X-2, 117 cm. The fourth interval extends from 249.51 to 253.45 mbsf in Samples 36X-CC to 37X-2, 117 cm. The fifth interval was recognized between 268.06 and 272.275 mbsf in Samples 41X-2, 57 cm, to 41X-CC (Figure F26). The LO of N. seminae was recorded at 270.05 mbsf (Core 41X). All samples analyzed are barren of diatoms below this level, obscuring the determination of this LO event.
The remaining flora accompanying the marker species is mostly composed of the species S. oestrupii, T. nitzschioides var. nitzschioides, C. marginatus, and Hemidiscus cuneiformis. These species are related to Atlantic waters of Norwegian–North Atlantic origin (Barron et al., 2016; Miettinen, 2018; Oksman et al., 2019). Complementary, the species B. bathyomphala or T. antarctica var borealis, S. trifultus, and R. hebetata f. hebetata were observed in samples. These species constitute an Arctic water assemblage with seasonal sea ice influence (Barron et al., 2016; Miettinen, 2018; Oksman et al., 2019) (Figure F30).
Holes U1623C and U1623D were targeted to find preserved diatoms during supposed interglacial periods. The HO of P. curvirostris was recorded in Sample 403-U1623C-36X-2, 65 cm, and indicates an age older than 0.3 Ma. Aside from this observation, most of the analyzed samples in these holes are barren of diatoms, except Samples 12F-2, 75 cm (89.32 mbsf), 36X-1, 121 cm (210.01 mbsf), and 36X-2, 65 cm (210.95 mbsf), where traces to rare entire diatoms were observed.
Except in the uppermost part of Hole U1621A, silicoflagellates are absent across the three sites.
4.3. Dinoflagellate cysts and acritarchs
Sites U1621 and U1623 were expected to recover sediments from the Late Pleistocene, a time interval that has no clear dinocyst biostratigraphic markers. Here, however, interglacial stages can be detected using ecostratigraphy, specifically using elevated dinocyst concentrations and/or the peak abundance of index species (e.g., Matthiessen et al., 2018). Concentration maxima are usually associated with interglacials (e.g., Matthiessen and Knies, 2001; Van Nieuwenhove et al., 2011). Unfortunately, concentrations could not be calculated with the nonacid preparation technique we used. Interglacials are often characterized by a high abundance of cysts of Protoceratium reticulatum, but this is an opportunistic species that can also be occasionally abundant during glacials (e.g., Matthiessen et al., 2018).
Dinocysts were analyzed in a total of 28 samples from Holes U1621A (7), U1621C (4), U1623A (13), and U1623C (4) (Figures F22, F24, F28, F30). A targeted sampling strategy was used to identify interglacial intervals, based on lithologic and physical properties, together with evidence from the study of other microfossil groups. Core catchers were analyzed in Hole U1623A to identify mid-Pleistocene biostratigraphic events (e.g., around the Jaramillo Subchron) because that drill hole went deeper than the holes at Site U1621.
Most samples contain abundant dinocysts. Samples 403-U1621A-4H-CC and 5H-2 and Core 50X are barren. A total of 22 different dinocyst taxa were recorded. Assemblages are low in diversity (1–14 taxa per sample), and most have good to excellent preservation. The number of cysts per sample is rather high, suggesting the nonacid preparation method works rather well in the Pleistocene of this region. Acritarchs were not encountered. Occasionally, the freshwater algae Pediastrum was recognized in Hole U1623A. Remains of terrestrial material are common in almost all the studied samples. Reworked terrestrial palynomorphs occur in most samples and are always more abundant than reworked dinocysts and acritarchs.
The dinocyst assemblages from Sites U1621 and U1623 are dominated by round brown cysts (RBCs), Brigantedinium, and P. reticulatum. Frequently encountered taxa are Bitectatodinium tepikiense, Nematosphaeropsis labyrinthus, and Spiniferites (Spiniferites mirabilis and Spiniferites spp.). Islandinium brevispinosum is dominant in Sample 403-U1623A-3H-5, 50–51 cm. Cysts of Protoperidinium stellatum are abundant in the lower part of Hole U1623A, around the Jaramillo Subchron.
Establishing an ecostratigraphy that identifies Pleistocene interglacials requires high-resolution sampling (Matthiessen et al., 2018). This was not possible during Expedition 403 due to time constraints. Initially, most investigated samples indicated nutrient-rich environments and cool, arctic water conditions with (seasonal) sea ice cover. Those samples were dominated by heterotrophic taxa like Brigantedinium and RBCs, as well as I. brevispinosa (Sample 403-U1623A-3H-6, 25–26 cm). After fine-tuning the targeted sampling strategy, using lithologic and physical properties, and biostratigraphic evidences from other microfossil groups, it was observed that several investigated samples record a warm, interglacial assemblage characterized by the abundant to dominant P. reticulatum (e.g., Samples 403-U1621A-10H-7, 44–45 cm, 403-U1621C-11H-2, 80–90 cm, 403-U1623A-3H-5, 50–51 cm, 9F-2, 68–69 cm, and 42X-CC) and/or S. mirabilis (e.g., Samples 403-U1621A-10H-7, 44–45 cm, 403-U1621C-4H-5, 55–65 cm, and 403-U1623A-10H-6, 90–91 cm). In Hole U1623C, a succession of a sea ice–covered environment was documented (Sample 3H-6, 25–26 cm), followed by an Atlantic water–dominated environment (Sample 3H-5, 50–51 cm) and a cool–temperate environment (Sample 3H-4, 45–46 cm) as the most abundant species changed from I. brevispinosum to P. reticulatum and finally B. tepikiense. This sequence may correspond to MIS 5 (de Vernal et al., 2020). Warm conditions with Atlantic water influence identified deeper in the record likely correspond to the MIS 7–11 interglacials (e.g., Samples 403-U1621A-10H-7, 44–45 cm, 403-U1621C-11H-2, 80–90 cm, and 403-U1623A-10H-6, 90–91 cm) and possibly to MIS 29–37 (Samples 42X-CC and 45X-CC). Further analyses on high (millennial-scale) resolution will be required to identify each MIS.
In Samples 403-U1623A-35X-CC, 38X-4, 52–53 cm, 41X-CC, and 42X-CC, P. stellatum was recorded. This species is present in higher abundance in Sections 38X-4 and 42X-CC. Comparable to its record at Sites U1618–U1620 and Ocean Drilling Program (ODP) Hole 911A (Matthiessen and Brenner, 1996), it also occurs here around the Jaramillo Subchron paleomagnetic boundary, further confirming its potential as a good regional biostratigraphic marker. In Hole U1623A, it appears to be present during the entire Jaramillo Subchron, but the uppermost occurrence may range higher than Section 35X-CC.
4.4. Foraminifers
All core catcher samples from Holes U1621A (25) and U1623A (39) were analyzed for planktonic foraminifers. Some additional samples (12) from the split core sections (working halves) were also analyzed to help identify targeted interglacial periods at these holes. Additional samples from split core sections (working halves) from Hole U1623C (3) were selected for this purpose.
Planktonic foraminifers are continuously present in the upper part of Holes U1621A and U1623A. Barren intervals are encountered downcore at both sites, becoming increasingly frequent toward the bottom of the holes (Figures F22, F27). Observations show that the tests are highly abraded, encrusted, and/or dissolved. There are none or very few fragments. Neogloboquadrina pachyderma is present in all samples with a foraminiferal content, placing Holes U1621A and U1623A within the Pleistocene (Weaver and Clement, 1986). N. pachyderma strongly dominates all samples, and Globigerinita bulloides was also observed in most of the samples, but with rare occurrences. Turborotalita quinqueloba is also present in some samples.
The observed fauna assemblage is common for Arctic regions, indicating an influence of Arctic–polar surface water masses and seasonal sea ice (e.g., Husum and Hald, 2012; Schiebel and Hemleben, 2017). Additional samples were taken from Hole U1621A in the working halves of Cores 3H–7H, between 18.7 and 53.4 mbsf, to identify potential interglacial conditions (Figure F22). All samples are dominated by N. pachyderma with the presence of G. bulloides and T. quinqueloba, but one sample at 37.5 mbsf (Sample 5H-6, 52–54 cm) shows increased and frequent abundance of T. quinqueloba. T. quinqueloba is found mainly within warmer Atlantic water masses in this region and is highly abundant at oceanographic fronts (e.g., Husum and Hald, 2012). However, its current abundance is not high enough to resemble fully interglacial conditions (e.g., Pados and Spielhagen, 2014; Chauhan et al., 2014). Similar additional sampling at assumed interglacial periods were also carried out from Hole U1623A in Cores 3H (18.7–20.8 mbsf), 9F (60.2–63.1 mbsf), 10H (70.6 mbsf), and 30X (186.4 mbsf) (Figure F27). All samples are also dominated by N. pachyderma with presence of G. bulloides and T. quinqueloba, but nothing seemed to indicate the warmer water masses. It must be mentioned that T. quinqueloba is a relatively small species that may be underrepresented in the current >125 μm size fraction (e.g., Carstens and Wefer, 1992; Bauch, 1994; Husum and Hald, 2012).
Four core catcher samples from Hole U1622A were prepared and analyzed with regard to planktonic foraminifers before the site was ended. Only the two uppermost samples (1H-CC and 2H-CC) contain foraminifers, ranging from frequent to rare. The dominant species is N. pachyderma. A few specimens of G. bulloides and T. quinqueloba were also observed. Preservation is relatively poor with tests showing a high degree of abrasion and/or dissolution. Sample 2H-CC also contains some few benthic foraminifers. Overall, both faunas seemed to have been reworked. The remaining two core catcher samples (3H-CC and 4H-CC) are barren.
5. Paleomagnetism
Paleomagnetic investigation at Sites U1621–U1623 focused on measurements of the natural remanent magnetization (NRM) before and after alternating field (AF) demagnetization of archive-half sections and vertically oriented discrete cube samples. All archive-half sections were measured except some that had significant visible coring disturbance and the core catchers. APC and HLAPC archive-half sections were measured before and after 10 and 15 mT peak AF demagnetization, except Cores 403-U1623C-1H (all sections) and 2H (Sections 1–3), which were accidentally demagnetized to 30 mT peak AF. Because XCB cores do not use nonmagnetic core barrels and are more susceptible to the viscous isothermal remanent magnetization (VIRM) drill string overprint (Richter et al., 2007), XCB archive-half sections required higher AF demagnetization steps to remove this overprint and were measured before and after 15 and 30 mT peak AF demagnetization. Several XCB cores were measured with the APC core protocol by mistake, including all sections of Cores 403-U1621B-21X, 23X, 24X, and 403-U1621C-23X through 27X, and only experienced peak AF demagnetization of 15 mT.
Although not as common as at previous sites drilled during Expedition 403 (see Paleomagnetism in the Site U1618 chapter [Lucchi et al., 2026b], Paleomagnetism in the Site U1619 chapter [St. John et al., 2026a], and Paleomagnetism in the Site U1620 chapter [St. John et al., 2026b]), some archive-half sections from Sites U1621 and U1623 with high MS (above ~750 IU) had NRM intensities that were too strong to be measured on the superconducting rock magnetometer (SRM) and caused flux jumps (Bowles, 2009) even when the track speed was slowed by 10×, thus compromising our ability to collect quality data in these intervals. However, at Sites U1621 and U1623, the problem was only observed in XCB-cored intervals, and the 30 mT peak AF demagnetization step was typically great enough to reduce the magnetization to levels that could be measured without causing flux jumps.
The archive section half data were supplemented by the study of discrete cube samples for which we could be more selective with the sampling interval, subject to more detailed AF demagnetization of the NRM, and study the rock magnetic properties of the sediment. In Hole U1623A, noisy archive-half data suggested the potential for reverse and normal polarity intervals in XCB cores recovered below around 160 mbsf; however, this noise could largely be attributed to coring disturbance, limiting our ability to confidently identify polarity zones and boundaries. Based on previous success with discrete cube samples at Site U1620 for defining polarity intervals in shallower XCB cores below the depths of APC refusal but above where sediments become more consolidated and have better XCB recovery (see Paleomagnetism in the Site U1620 chapter [St. John et al., 2026b]), we sampled this interval from Cores 403-U1623A-27X through 43X at higher resolution (~1 sample per section when possible), targeting larger intact biscuits and intervals of lower MS. Lower MS intervals were targeted to avoid potential iron sulfide nodules that have been commonly observed at deeper depths (greater than ~100–200 mbsf) in the region (see Paleomagnetism in the Site U1618 chapter [Lucchi et al., 2026b], Paleomagnetism in the Site U1619 chapter [St. John et al., 2026a], and Paleomagnetism in the Site U1620 chapter [St. John et al., 2026b]; c.f. ODP Leg 151 results [Shipboard Scientific Party, 1995]). This strategy likely imposes a bias toward the magnetic properties of these lower MS in our shipboard results, and future work should consider this limitation. The NRMs of the oriented discrete cube samples were stepwise demagnetized before and after 0, 5*, 10, 15, 20, 25, 30, 35, 40, 45, and 50* mT peak AF using the SRM and in-line AF demagnetization system (* = the 5 and 50 mT steps were not used for Hole U1623A samples to keep up with core flow). These measurements were supplemented by measurements of the MS and anhysteretic remanent magnetization (ARM). ARMs of APC/HLAPC-cored and some XCB-cored sections were measured before and after 0, 15, 20, 25, 30, 40 peak AF demagnetization to allow for comparison between NRM and ARM coercivity. ARMs of the remaining XCB-cored sections were measured before and after 30 mT peak AF demagnetization.
An additional sample was taken from Section 403-U1623D-55X-2 where we observed an authigenic nodule that was associated with high MS (>1500 IU). The sample was unoriented, but it was removed as an intact piece and mounted in a paleomagnetic cube. Bulk MS, frequency-dependent MS, ARM, and isothermal remanent magnetizations (IRMs) were measured to compare this nodule to previous nodules that were studied in detail at Sites U1618 and U1619.
5.1. Sediment magnetic properties
Sites U1621–U1623 have magnetic properties that likely represent contributions from detrital and authigenic sources with some similarity, but also major differences, to previous sites drilled during Expedition 403 (see Paleomagnetism in the Site U1618 chapter [Lucchi et al., 2026b], Paleomagnetism in the Site U1619 chapter [St. John et al., 2026a], and Paleomagnetism in the Site U1620 chapter [St. John et al., 2026b]). Based on MS and ARM data, Sites U1621 and U1623 can broadly be classified into three magnetic zones with similar depth ranges (Figure F31). Magnetic Zone 1 (Hole U1621A = 0–38 mbsf; Hole U1623A = 0–25 mbsf) is characterized by higher and variable ARM intensities, low ARM coercivity (tracked by the ratio of the ARM after 30 mT peak AF demagnetization and the initial ARM [ARM30mT/ARM]), and high ARM/MS ratios. Magnetic Zone 2 (Hole U1621A = 38–100 mbsf; Hole U1623A = 25–90 mbsf) has similar lower ARM coercivities but also lower ARM intensity. Data from Hole U1622A, which only recovered material in the uppermost 50 m, are similar to those in these two magnetic zones, but they do not show a clear transition between the two. Some of the variability observed in these units may be related to sampling specific lithology and could be explored further with additional higher resolution sampling. Magnetic Zone 3 (Hole U1621A = below 100 mbsf; Hole U1623A = below 90 mbsf) is defined by higher and more variable ARM coercivities. In Hole U1623A, we divide this interval into two subzones (Magnetic Zones 3a and 3b) because Whole-Round Multisensor Logger (WRMSL) MS values from 90 to 212 mbsf are similar to those observed in Magnetic Zones 1 and 2, whereas below 212 mbsf there are frequent peaks in the WRMSL MS greater than 500 IU (see Figure F45). Hole U1621A did not reach similar depths and does not have MS peaks of this magnitude.
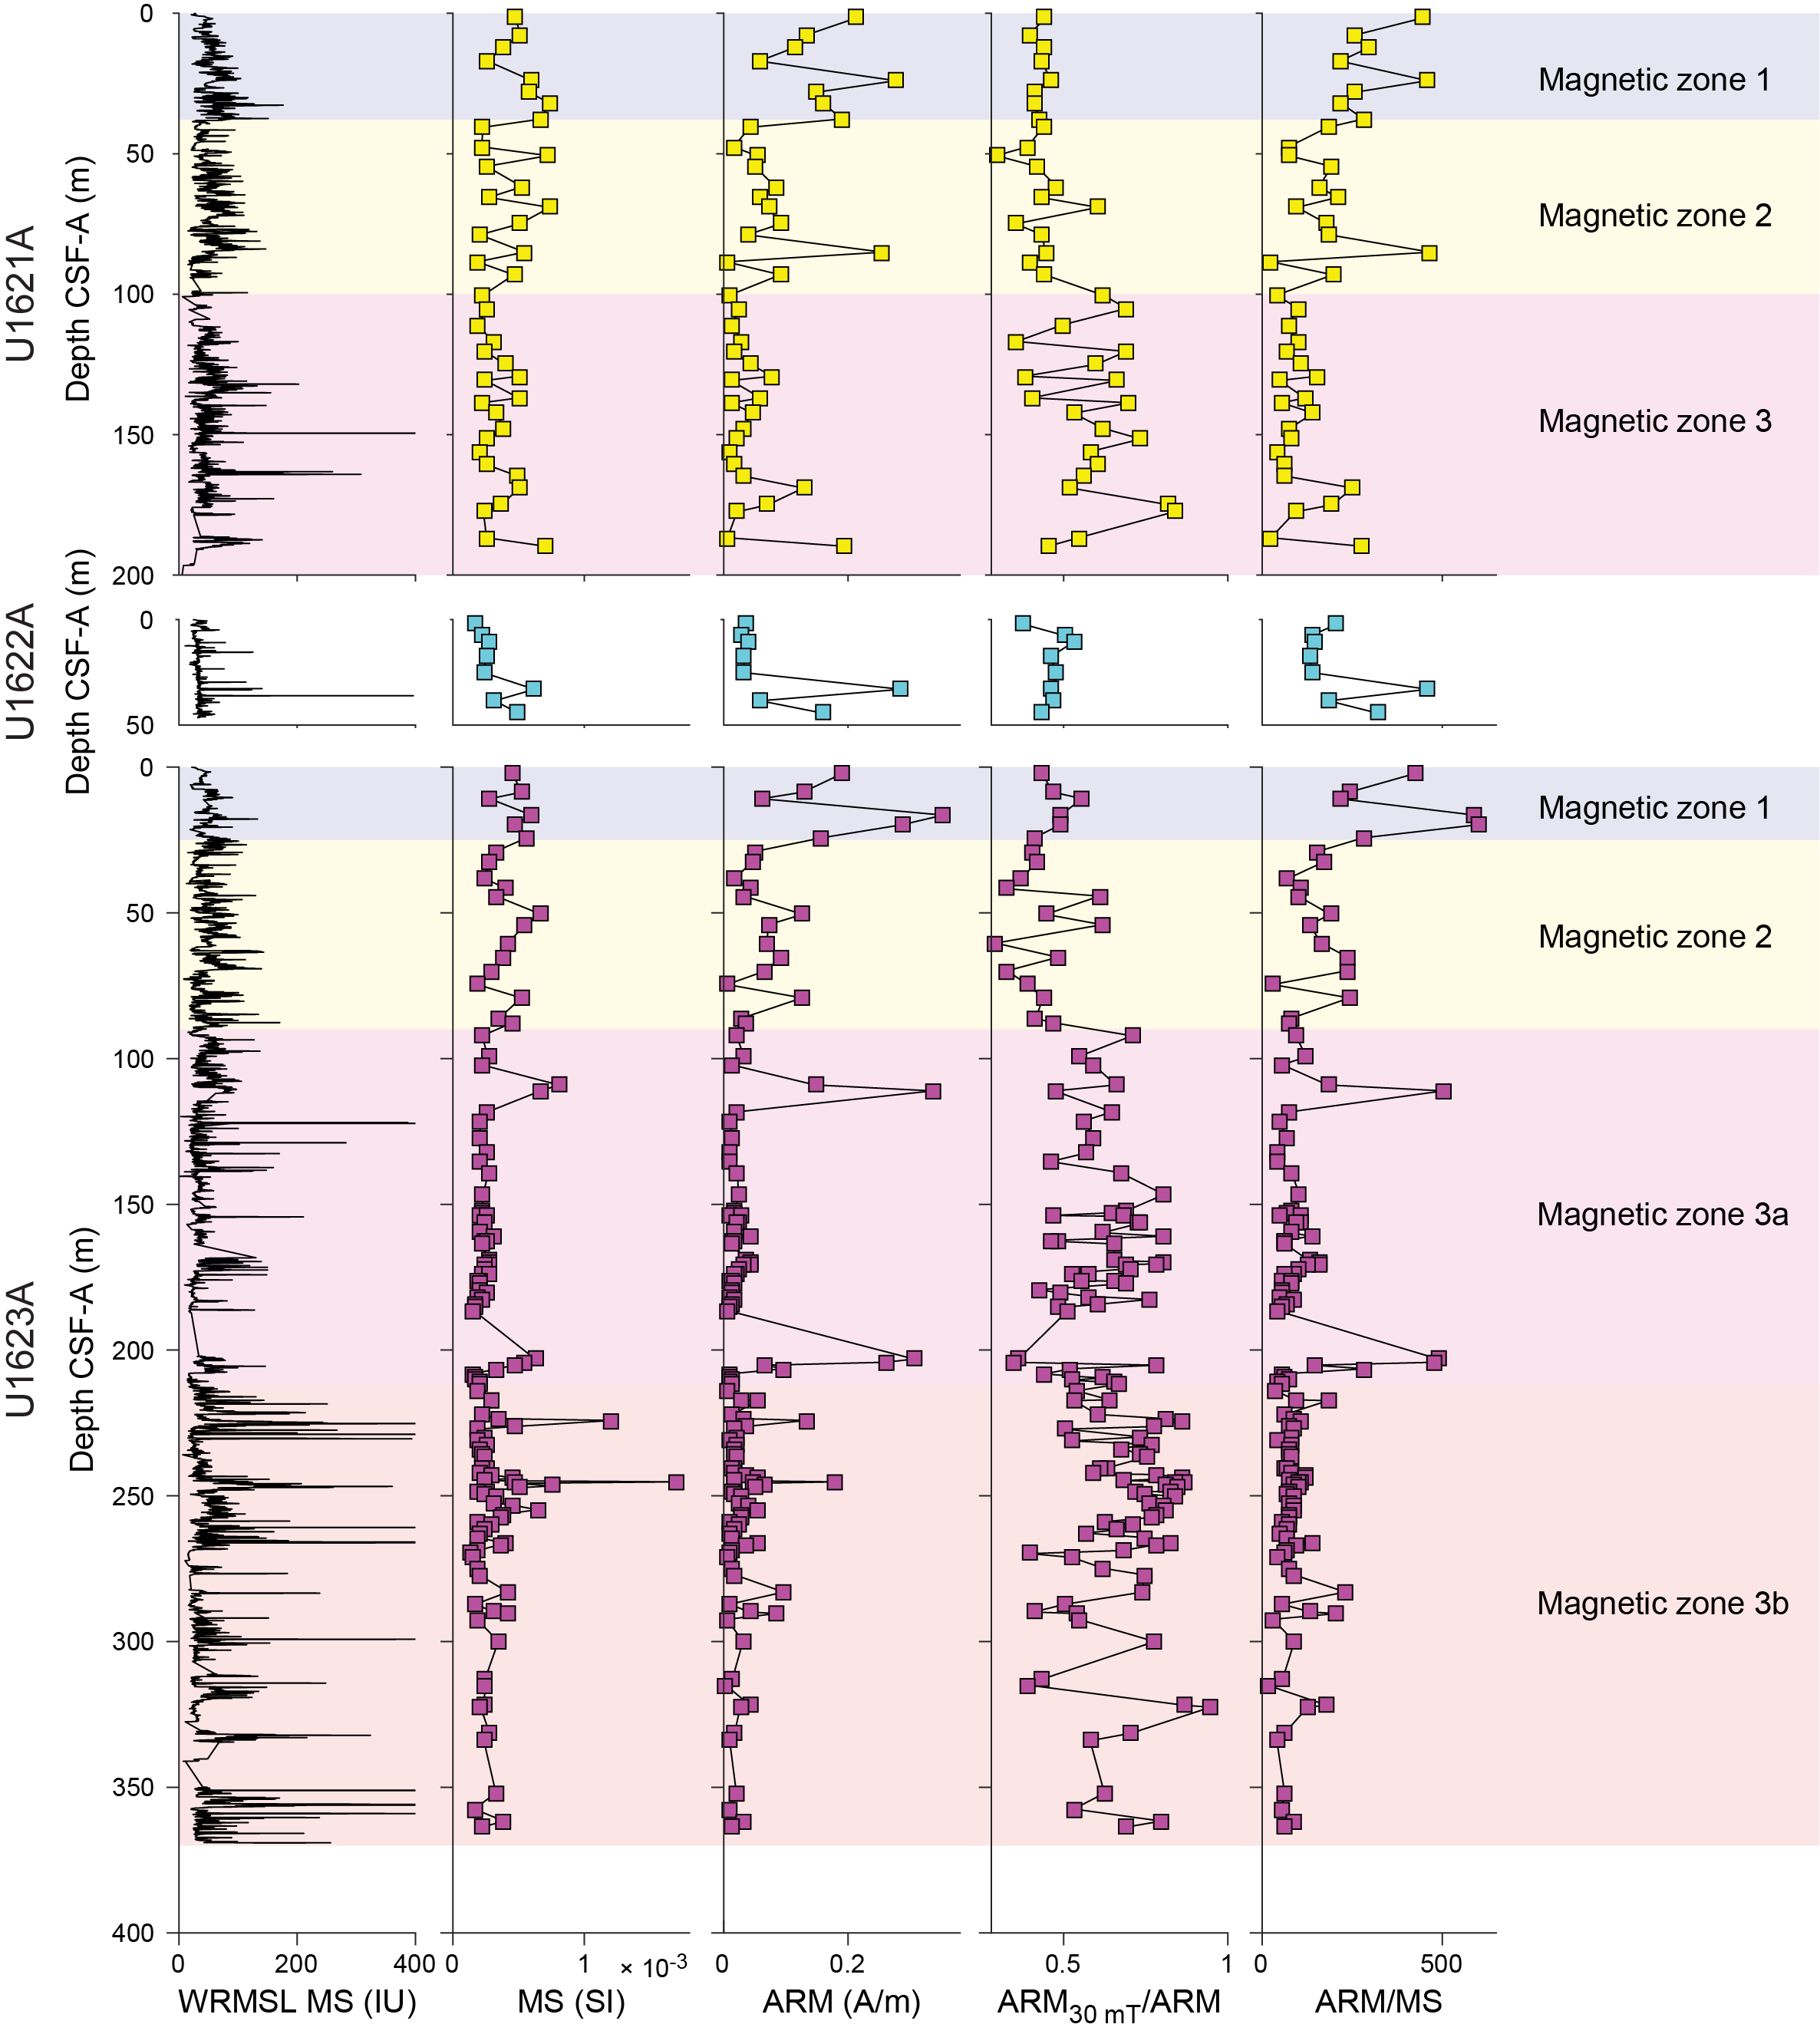
Figure F31. Downhole variations in magnetic properties.
Comparison of the magnetic properties of Sites U1621–U1623 to previous sites drilled during Expedition 403 shows a clear pattern in MS and ARM variability for the region (Figure F32). Plotting MS versus ARM and MS versus ARM30mT/ARM indicates at least three potential contributors to the magnetic mineral assemblages recovered. Samples closest to the surface often plot with a range from low to moderate MS, less than 1 × 10⁻³ SI (equivalent to less than ~150 IU measured on the WRMSL) (Thomas et al., 2003), and lower ARM coercivity with ARM30mT/ARM less than 0.6. We assume that these values are representative of the detrital magnetic mineral assemblage or a magnetic mineral assemblage that is minimally altered by early diagenesis. Sites U1621 and U1623 are unique compared to previously drilled Expedition 403 sites because this magnetic signature persists to fairly deep depths of 100 and 90 mbsf, respectively (Figure F32) (c.f. Paleomagnetism in the Site U1618 chapter [Lucchi et al., 2026b], Paleomagnetism in the Site U1619 chapter [St. John et al., 2026a], and Paleomagnetism in the Site U1620 chapter [St. John et al., 2026b]). Although some sediments below 100 and 90 mbsf at each site have similar magnetic properties to this upper unit, sediments below this depth often have higher and more variable ARM coercivities that are generally associated with MS less than 0.5 × 10⁻³ SI (equivalent to greater than ~75 IU measured on the WRMSL) (Thomas et al., 2003). A few higher MS samples at these depths, greater than 0.5 × 10⁻³ SI, have very high ARM30mT/ARM ratios between 0.8 and 0.9. These ratios are higher than observed in most bulk sediment samples at Sites U1618–U1620, which have an ARM30mT/ARM mode around 0.75 (Figure F32). Although this high MS and high ARM coercivity magnetic signature is only seen in a few samples from Site U1623, this may reflect a bias toward avoiding sampling MS peaks below 212 mbsf (Figure F31). In previous work, similar high-MS assemblages are also associated with high ratios of the saturation isothermal remanent magnetization (SIRM) to MS and instability at temperatures above 300°C (see Paleomagnetism in the Site U1619 chapter [St. John et al., 2026a]; Shipboard Scientific Party, 1995). The high MS and high ARM coercivity (ARM30mT/ARM > ~0.6) signature is consistent with the near-pure greigite nodules sampled at Sites U1618 and U1619 (Table T9) and likely reflects deep-forming authigenic greigite. This compilation of magnetic properties also shows a signature for a mineral with high ARM coercivity (ARM30mT/ARM up to ~0.95) and low MS (<0.5 × 10⁻³ SI) that is more common below 100 and 90 mbsf in Holes U1621A and U1623A, respectively. The exact mineral with this signature is not currently known. Future work can provide a more complete understanding of the magnetic mineral assemblages at Sites U1621–U1623 and their implications for the fidelity of the paleomagnetic signal with additional high field magnetic, thermal magnetic, scanning electron microscope/energy dispersive spectrometry (SEM/EDS), and XRD analyses.
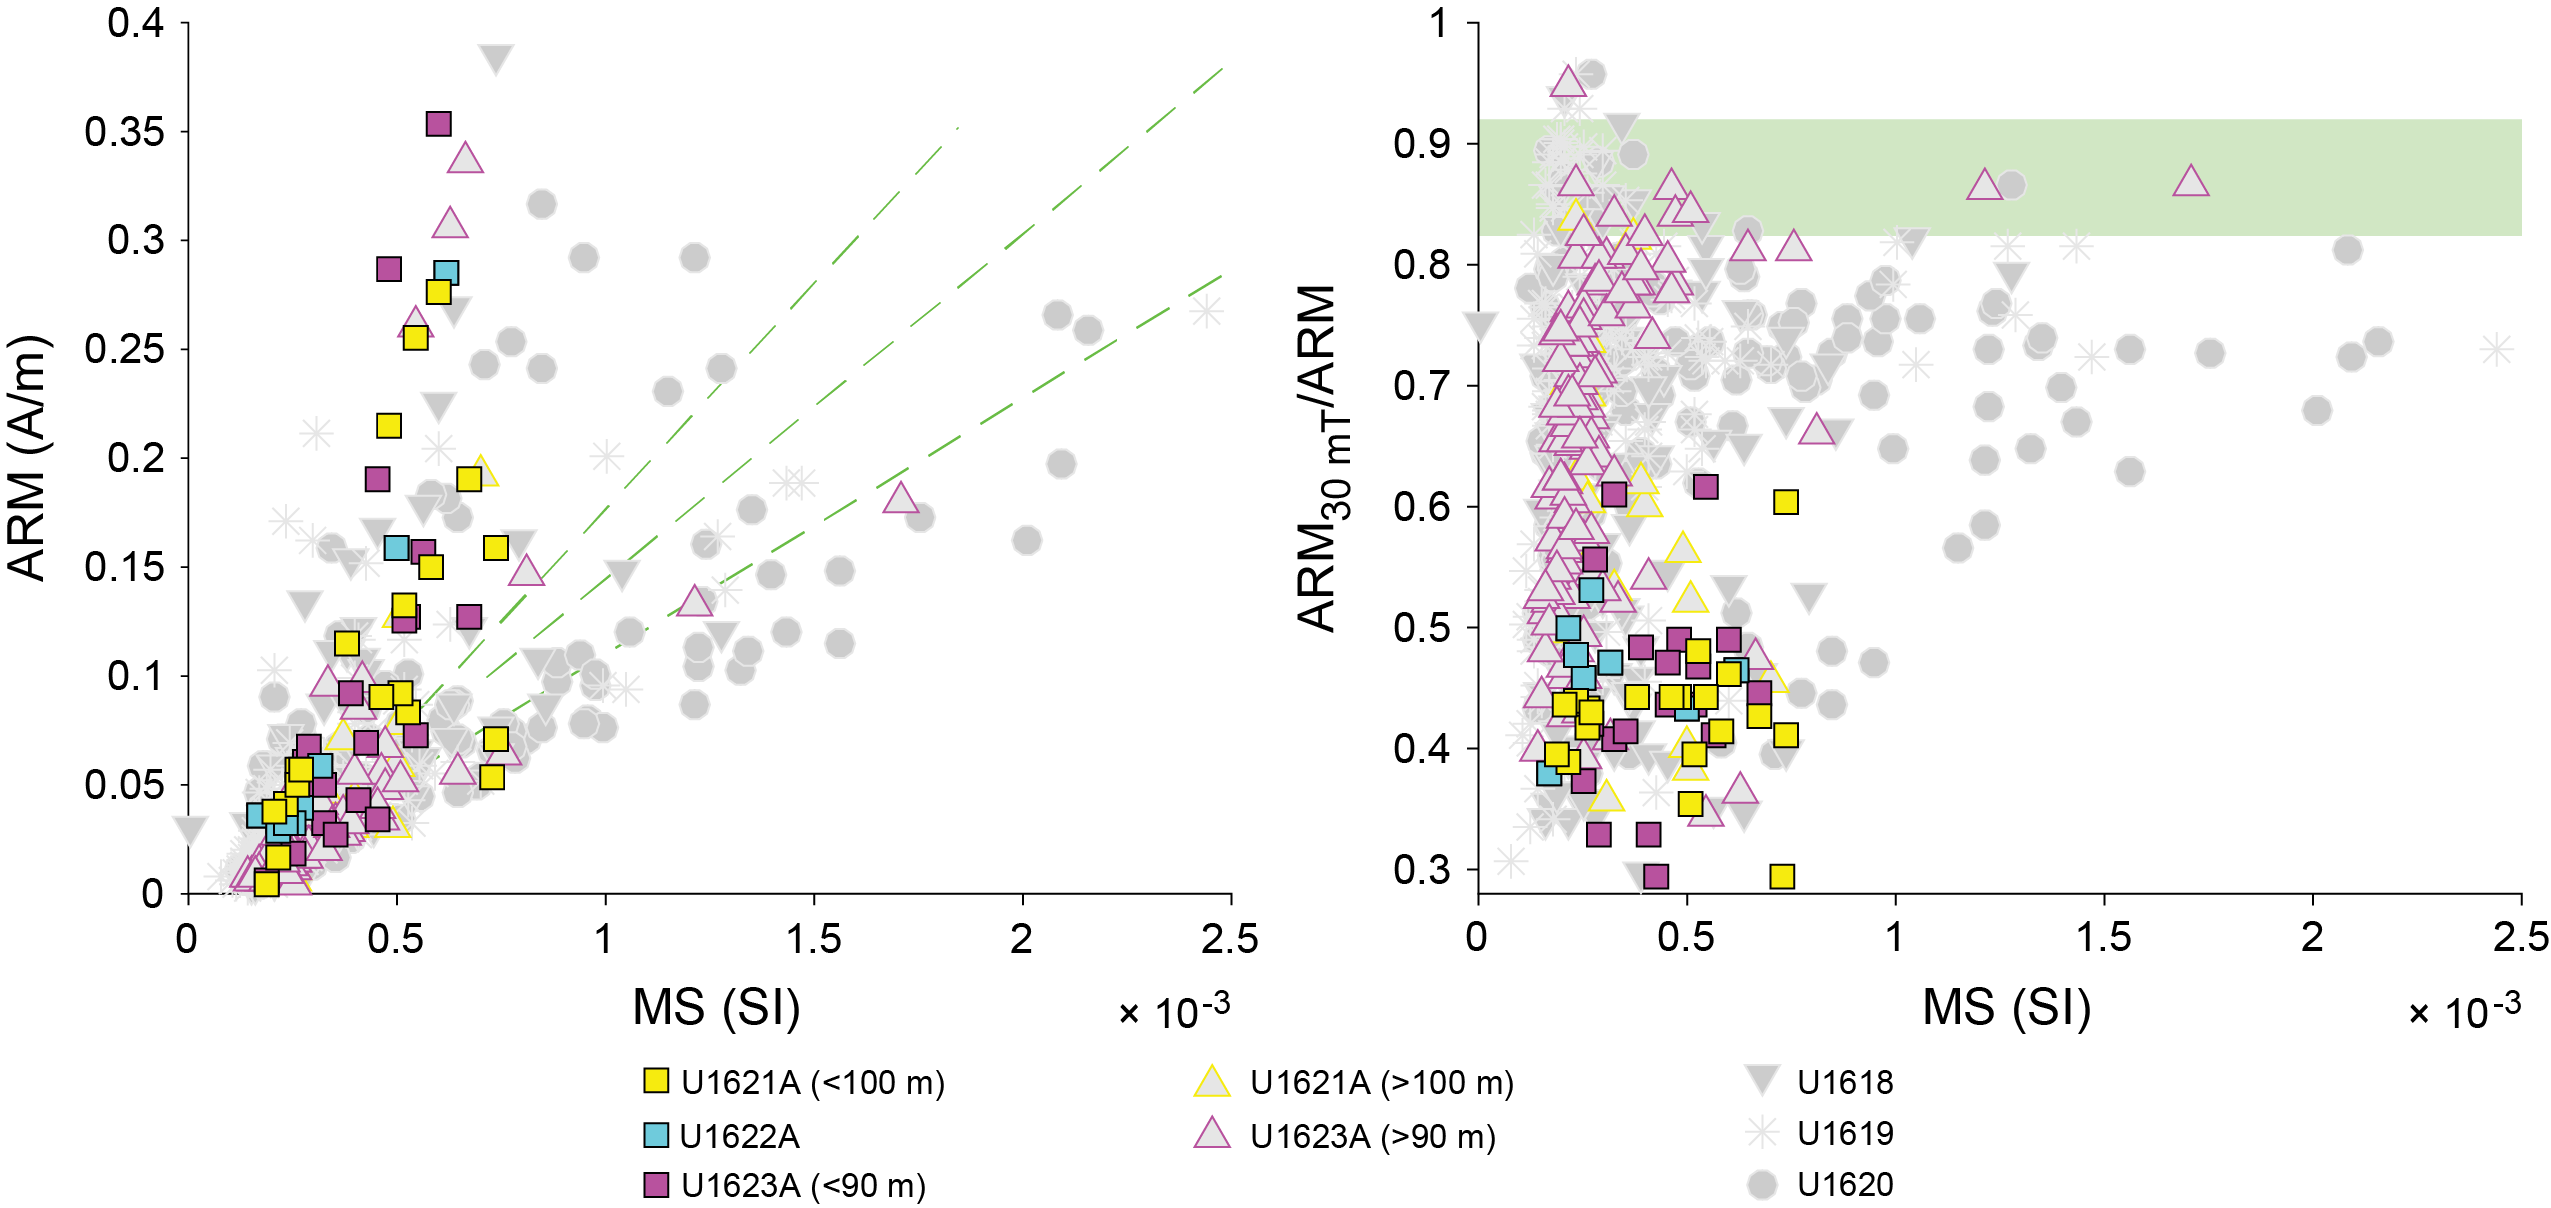
Figure F32. MS and ARM.
The authigenic nodule sampled in Section 403-U1623D-55X-2 had similar high MS values to those studied previously during Expedition 403, but it was horizontal and appeared to be oriented within the bedding plane, unlike nodules from previous sites that were more spherical and did not seem to have any relationship with the bedding plane (Figure F33). Also, whereas XRD analysis of nodules studied from Sites U1618 and U1619 indicates that greigite was the dominant mineral (92% and 100%, respectively), XRD analysis of this nodule indicates that the sample was primarily siderite (90%) and greigite was not detected in the bulk XRD analysis (yellow square in Figure F33B; Table T9). A second sample taken (red square) was primarily quartz. Siderite was also detected in a smaller proportion in the nodule studied in Core 403-U1618B-25X, which potentially indicates a greigite formation pathway from the alteration of siderite (e.g., Roberts and Weaver, 2005). Differences in the magnetic properties of this sample compared to previously studied nodules include lower MS values, ARM intensity, and IRM intensity; higher frequency-dependent MS; lower ARM and IRM coercivity; and a higher ratio of ARM to MS. Similarities include having an S-ratio (ratio of a backfield 300 mT IRM to the 1000 mT IRM; Stober and Thompson, 1979) of 1 and a similar magnitude of the ratio of the SIRM (IRM imparted with a 1000 mT pulse field) to MS (Table T9). Although not identified in XRD analysis, these magnetic properties are consistent with sedimentary greigite (Peters and Thompson, 1998; Roberts et al., 2011; Horng, 2018), likely indicating that greigite is present but in about one order of magnitude lower concentrations as suggested by the difference in concentration-dependent magnetic parameters. Future work can make more quantitative estimates of greigite concentration through mass-normalized magnetic measurements versus the estimated sample volumes used on the ship during the expedition.
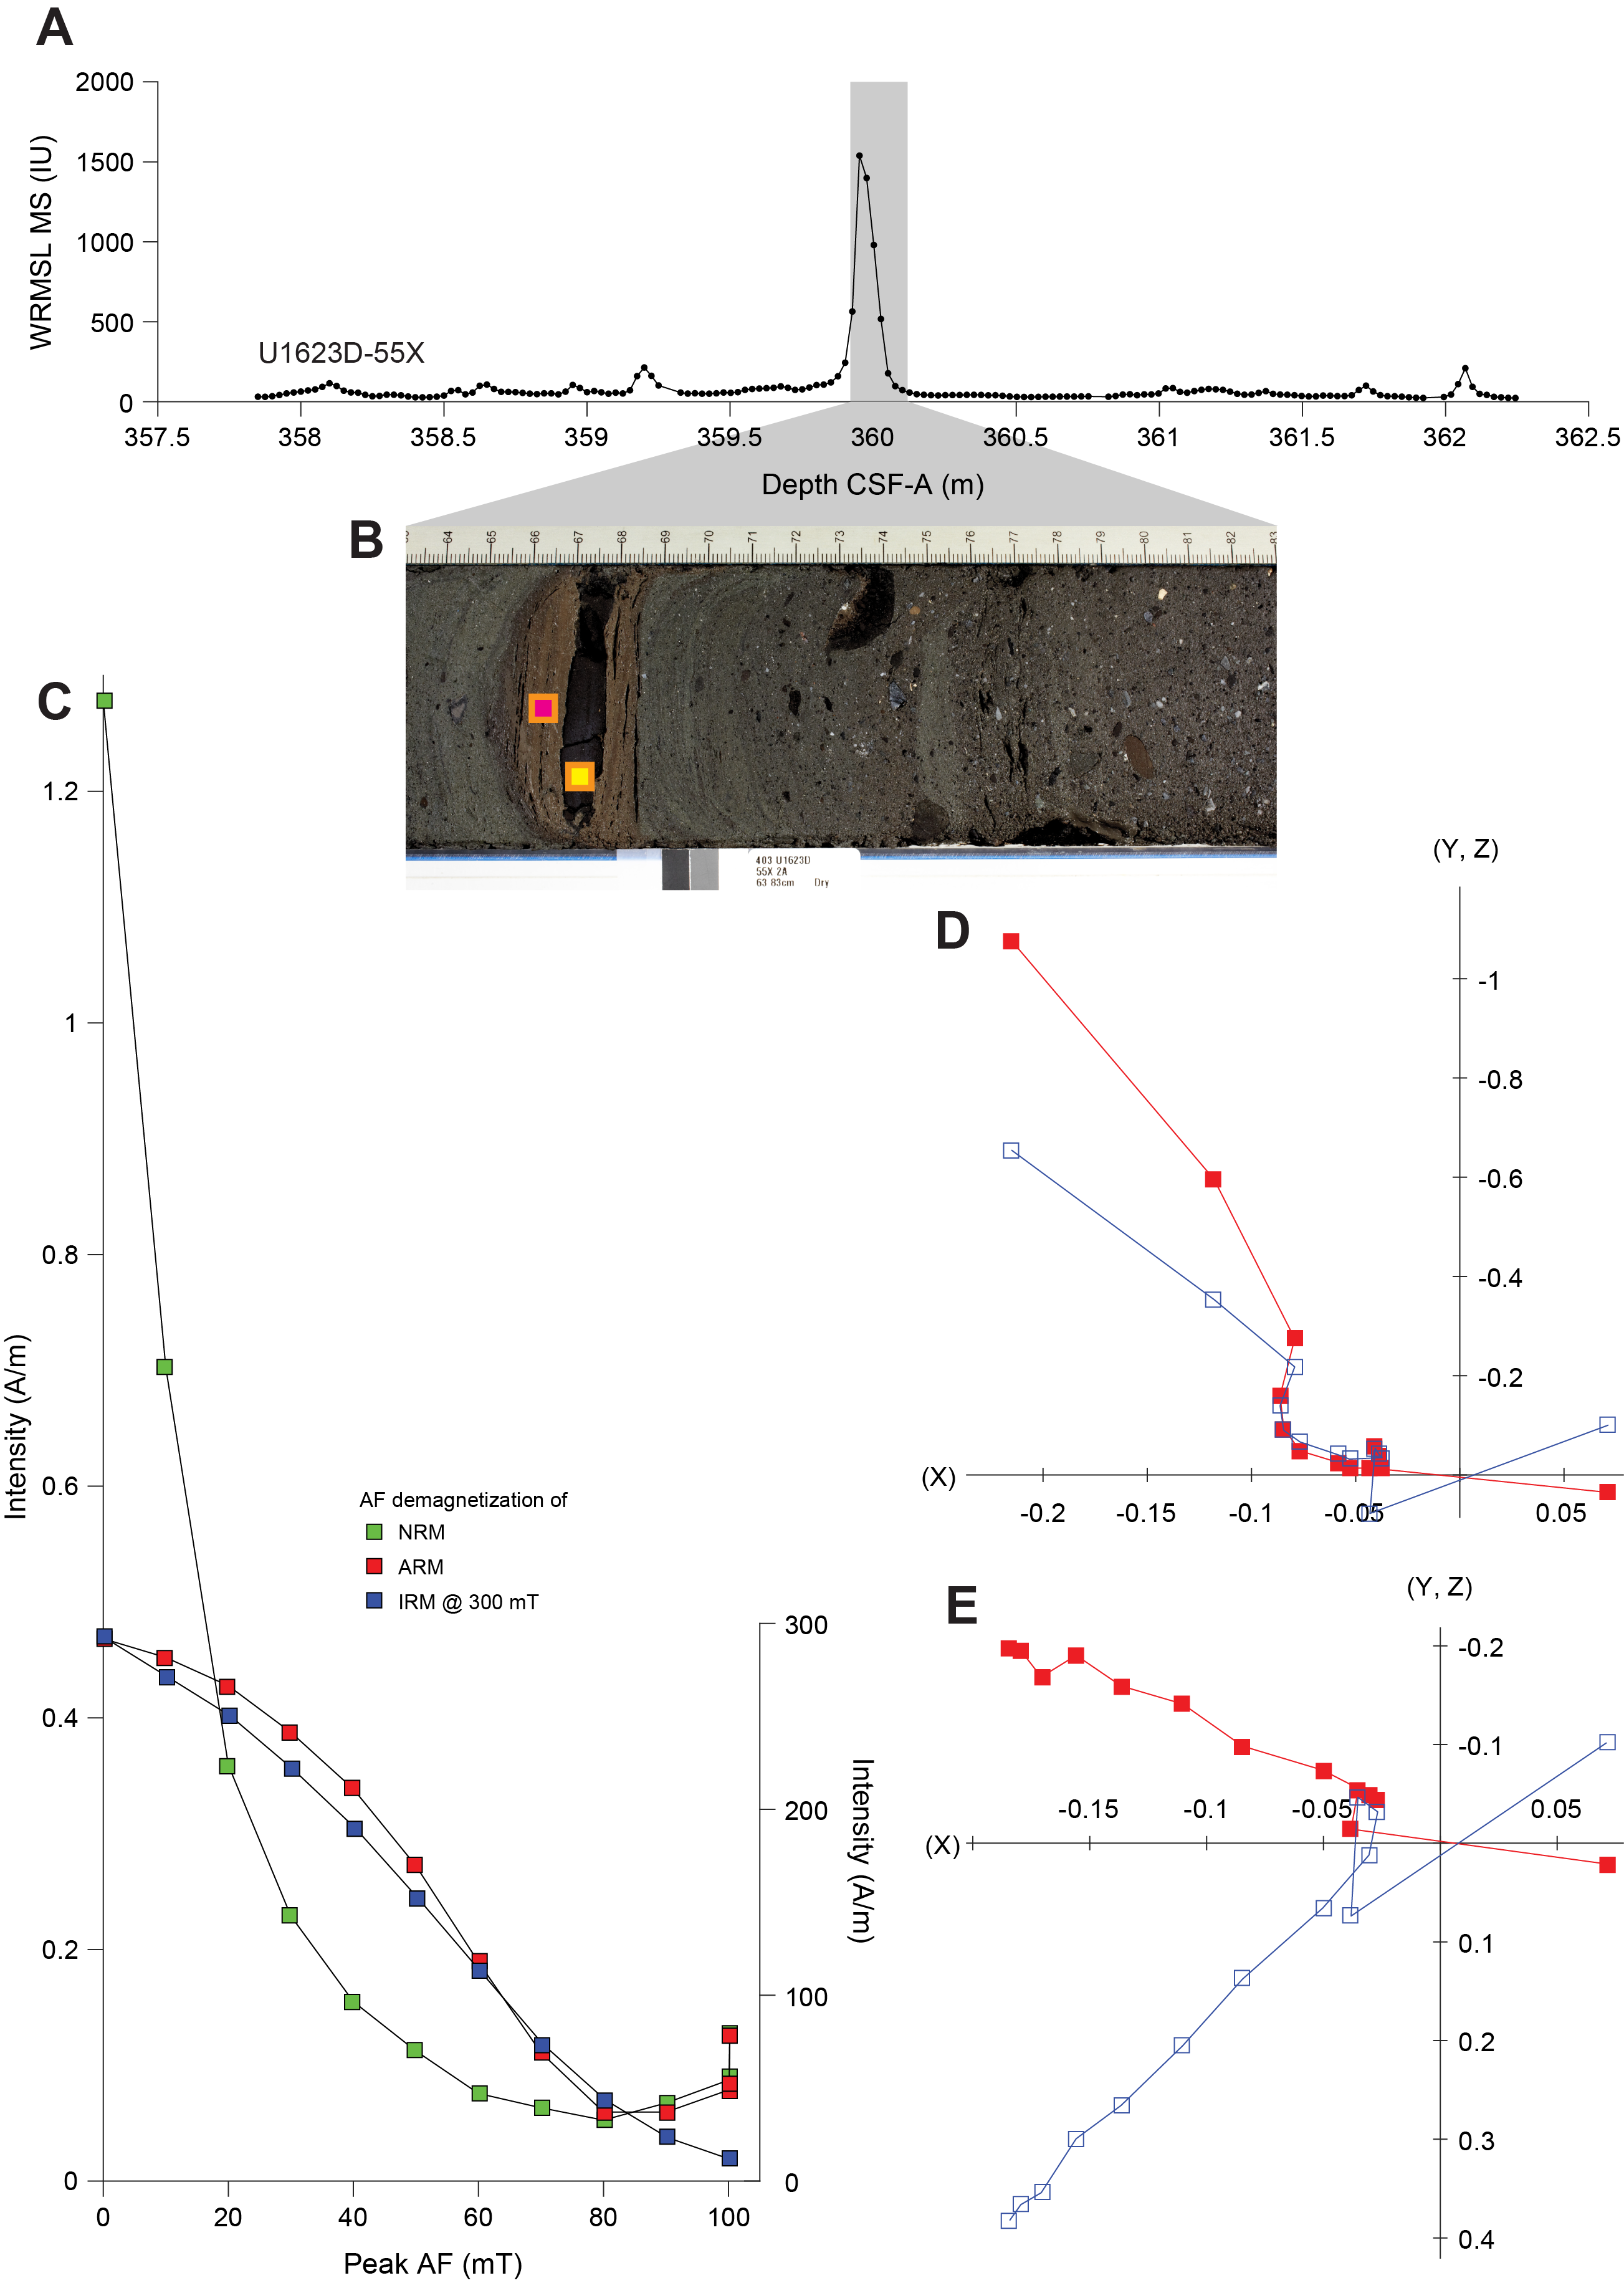
Figure F33. Magnetic data for an authigenic nodule.
Because the nodule was mounted as an intact piece, we also studied the NRM of the nodule during AF demagnetization. The NRM was much easier to demagnetize than the ARM or IRM, with a median destructive field of 11.8 mT compared to 54.6 and 51.6 mT for the ARM and IRM, respectively (Figure F33C). This can likely be explained in part by a weak VIRM imparted by the drill string. However, the demagnetization behavior is complex with at least three components, including a drill string VIRM influence from 0 to 20 mT, perpendicular components that have coercivities that overlap through at least the 30–50 mT range, and a gyroremanent magnetization (GRM) that is acquired above 80 mT (Figure F33D). Further study of these components may provide insight to the formation timescales of this nodule. Like the sample studied at Site U1619, a GRM was also observed during AF demagnetization of the ARM (Figure F33E).
5.2. Natural remanent magnetization
Of the NRM intensities measured, 95% were between 5.6 × 10⁻³ and 2.2 × 10⁻¹ A/m at Site U1621, 1.5 × 10⁻² and 8.3 × 10⁻² A/m at Site U1622, and 4.5 × 10⁻³ and 4.9 × 10⁻¹ A/m at Site U1623. These 95% ranges decreased after 15 mT peak AF demagnetization in APC/HLAPC cores to between 9.0 × 10⁻⁴ and 6.9 × 10⁻² A/m at Site U1621, 6.0 × 10⁻⁴ and 3.0 × 10⁻² A/m at Site U1622, and 9.0 × 10⁻⁴ and 8.0 × 10⁻² A/m at Site U1623. For XCB-cored intervals and after 30 mT peak AF demagnetization, 95% of the remaining NRM intensities ranged between 1.2 × 10⁻³ and 6.6 × 10⁻² A/m for Site U1621 and 4.0 × 10⁻⁴ and 9.7 × 10⁻² A/m for Site U1623.
APC/HLAPC-cored intervals after 15 mT peak AF demagnetization at Sites U1621 and U1623 show a strong unimodal distribution with a peak at values near what are expected inclinations for a geocentric axial dipole (GAD) at these latitudes (83.2°) (Figure F34). This distribution has less variance at Site U1621 than Site U1623. APC-cored intervals at Site U1622 have a much broader distribution with mode at 68°, about 10° shallower than at Sites U1621 and U1623. XCB-cored intervals after 30 mT peak AF demagnetization show much broader distributions, with values mostly positive at Site U1621 and values spanning from steep negative to steep positive at Site U1623. The differences in the spread of these distributions are most likely related to coring disturbance. For APC-cored sections, our visual observation was that Site U1621 generally had the least amount of coring disturbance, whereas Site U1622 had much more significant coring disturbance. XCB coring disturbance was significant, with more disturbance in lithology with abundant clasts and in the shallower XCB cores taken below APC refusal but above where the formation became consolidated enough to be more suitable for XCB coring. Characteristic remanent magnetization (ChRM) inclinations on discrete cube samples from APC-cored sections display an almost identical distribution to their corresponding archive-half data from all three sites; however, the discrete cube ChRM inclinations from XCB-cored sections display distributions much closer to what might be expected for a GAD than their corresponding archive-half data (Figure F34). Like we observed at Site U1620 (see Paleomagnetism in the Site U1620 chapter [St. John et al., 2026b]), discrete cube samples appear to be a more appropriate method for the study of shallower XCB cores because the more selective sampling approach can focus on only collecting data from intervals with better potential for hosting a reliable magnetization.
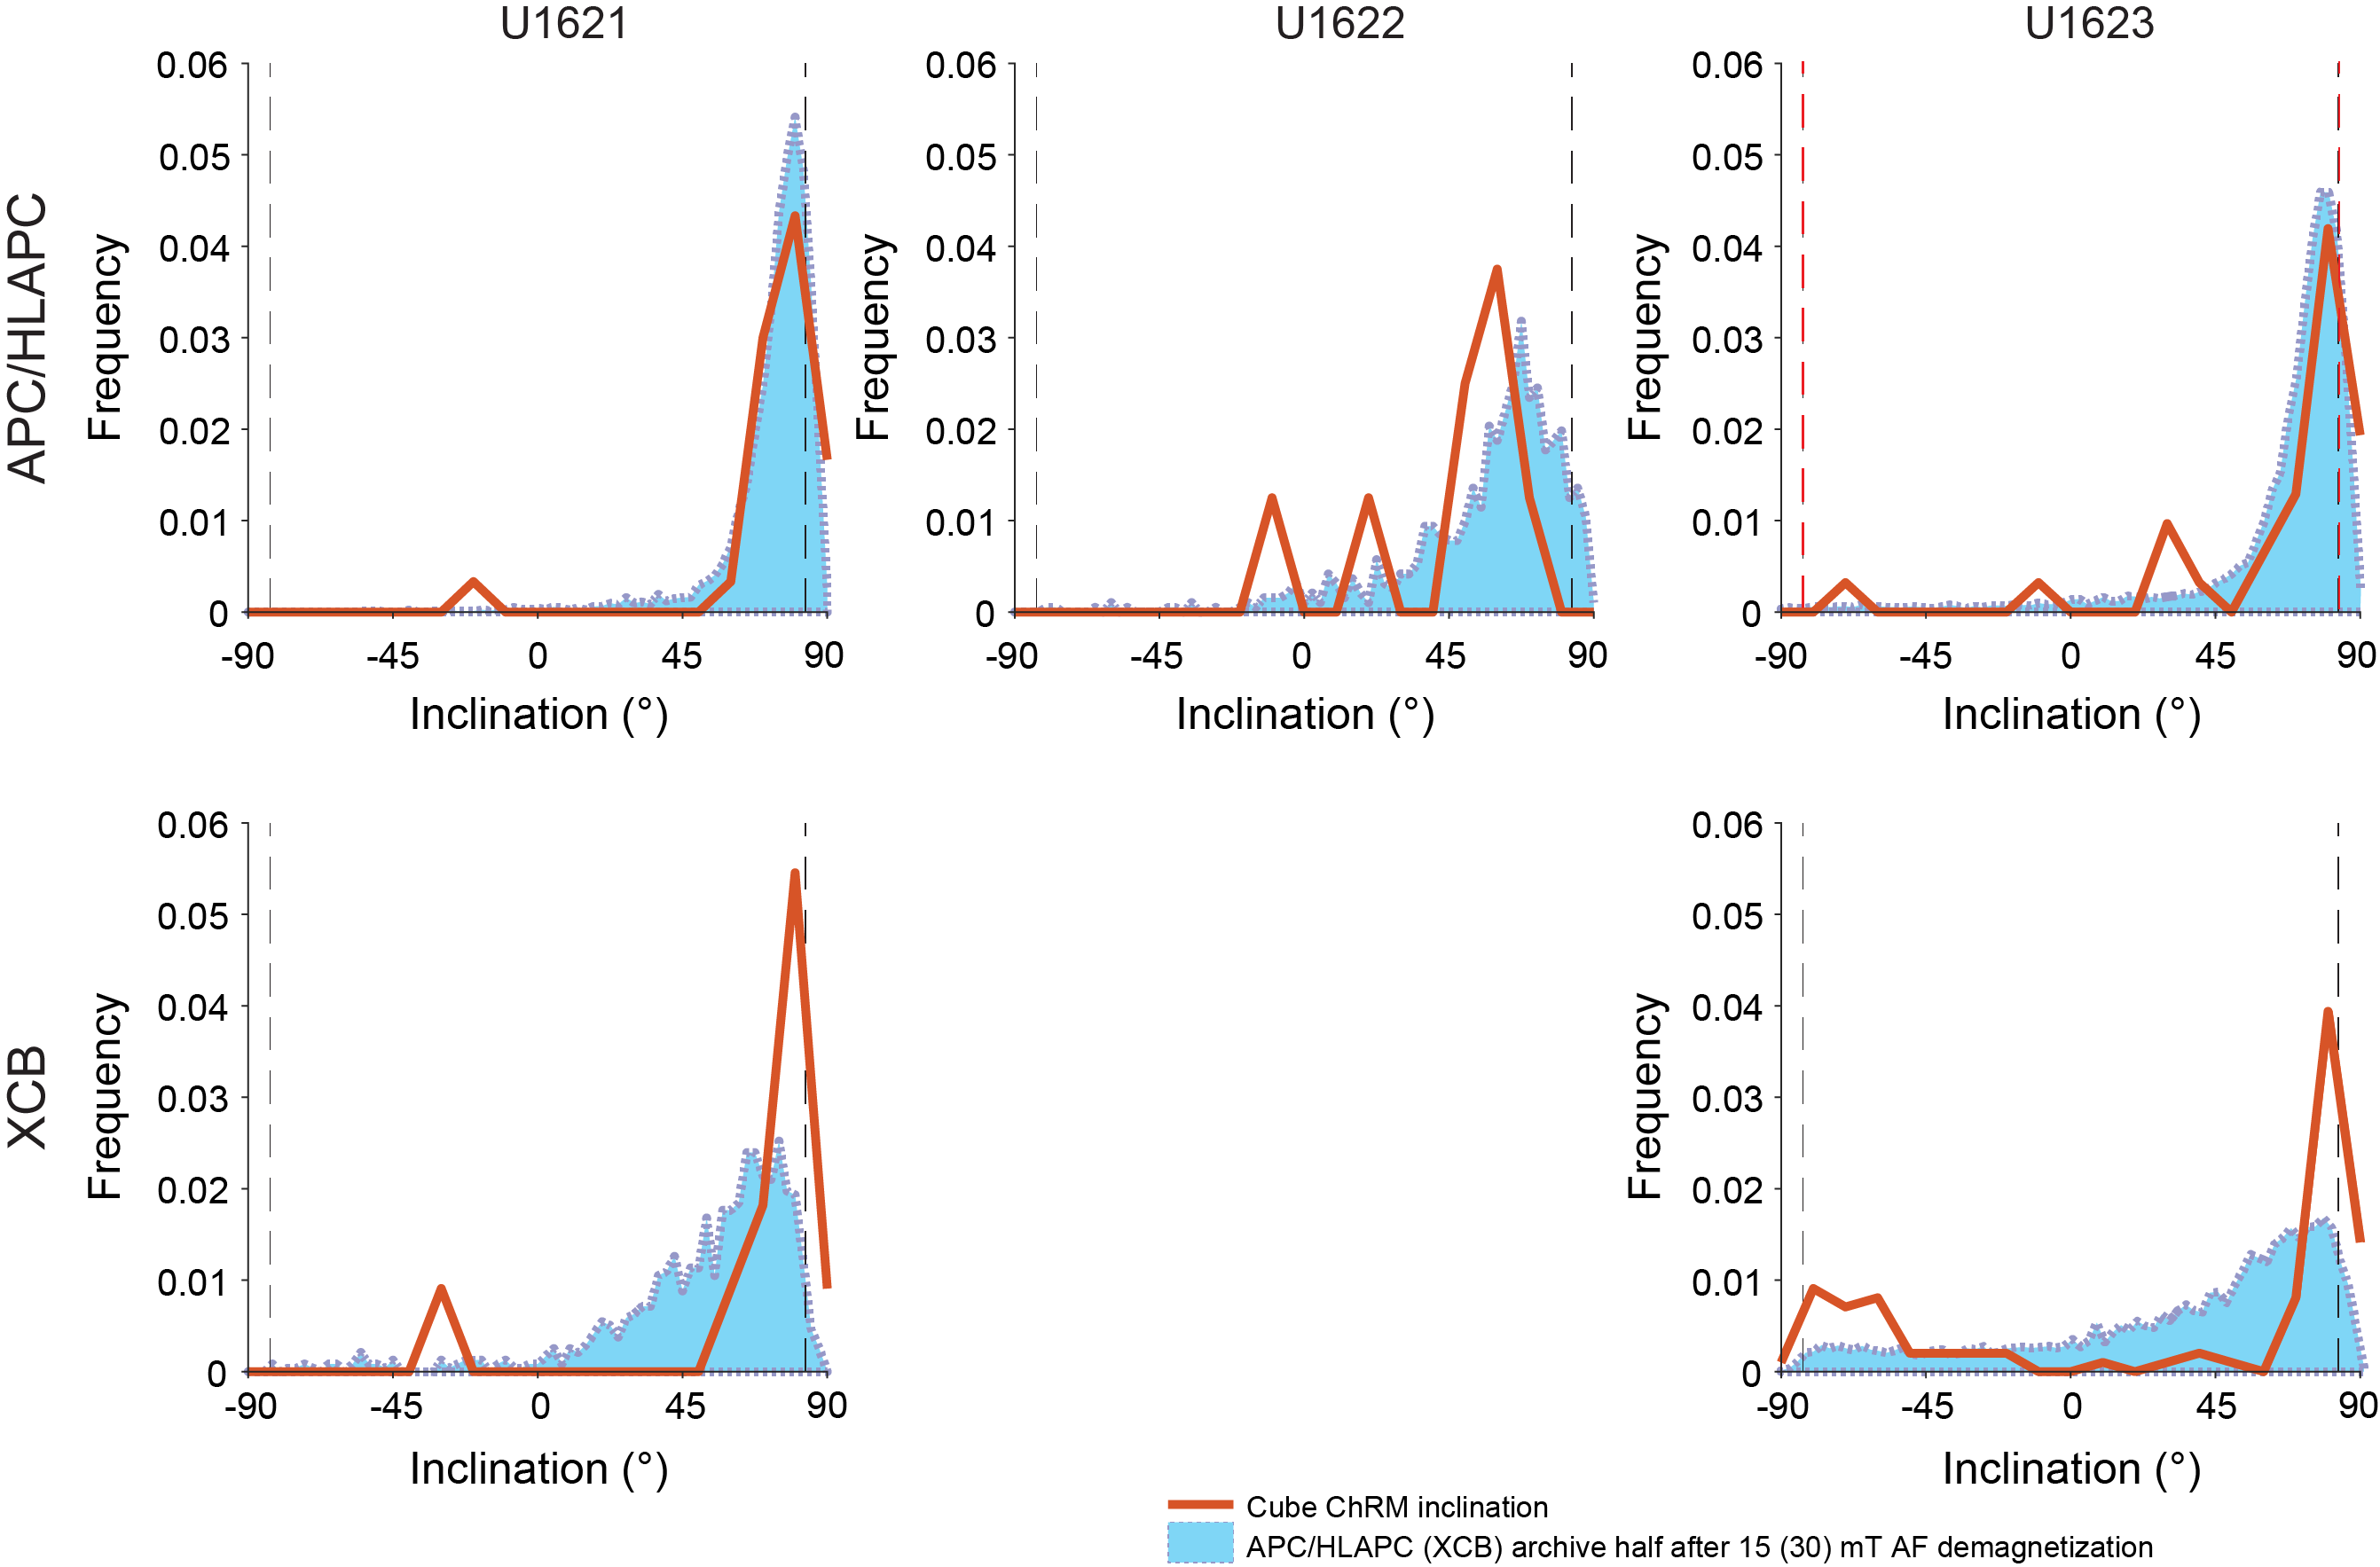
Figure F34. Inclination, Sites U1621–U1623.
Detailed demagnetization of discrete cube samples displayed a range of demagnetization behavior that can in part be assessed using the maximum angular deviation parameter when calculating the ChRM using a principal component analysis (Kirschvink, 1980). We found maximum angular deviation values of less than 20°, which we consider good enough to determine polarity, for 158 of the 179 samples taken from the three sites (88%). ChRMs were best defined at Site U1621, which had a mean maximum angular deviation value of 3.8° and 39 of 41 samples for which a ChRM could be defined. ChRMs were most poorly defined at Site U1622, which has a mean maximum angular deviation value of 15.3°. We could determine a well-defined ChRM for 114 of the 130 samples taken from Site U1623.
5.3. Magnetic stratigraphy
5.3.1. Site U1621 magnetic stratigraphy
Site U1621 sediments generally have well-defined magnetizations and good recovery, with three holes allowing assessment of coring deformation through comparison of reproducibility. For example, a broad interval of anomalously low inclinations around 62 mbsf in Hole U1621C are not reproduced in Holes U1621A and U1621B and can be attributed to coring deformation (Figure F35). Similar anomalous data should be assessed in the same manner. Although the XCB-cored intervals are noisier than the APC-cored intervals, they are generally consistent with normal polarity and are largely in agreement with the steep and positive ChRM inclinations calculated from the discrete cube data (Figure F34). However, the lowest cube sample taken from Hole U1621A has a well-defined shallow ChRM of −32° and a maximum angular deviation value of 3.5° (Figure F35). Because this is only one sample, not consistent with the expected GAD inclination, and the XCB-cored intervals had significant coring disturbance, we cannot make a confident interpretation of this sample but recommend additional sampling below 175 mbsf where possible at Site U1621 to further investigate whether a reverse polarity interval was recovered. The lowest discrete cube sample with steep and positive inclination was taken at 177.47 mbsf in Hole U1621A and has a well-defined ChRM with a maximum angular deviation of 2.0°. Therefore, we can say with high confidence that sediments deposited above 177.47 mbsf were deposited in Chron C1n (Brunhes) and the maximum limiting age for this horizon is 773 ka. Previous work from the Bellsund Drift using Calypso Core GS191-01PC has demonstrated the potential for these sediments to record high-resolution paleosecular variation of the geomagnetic field (Caricchi et al., 2019). The well-resolved magnetizations, magnetic mineral assemblages, and success in coring multiple holes with limited coring disturbance indicate great potential for generating a longer high-resolution paleomagnetic reconstruction through at least the uppermost 100 m at Site U1621.
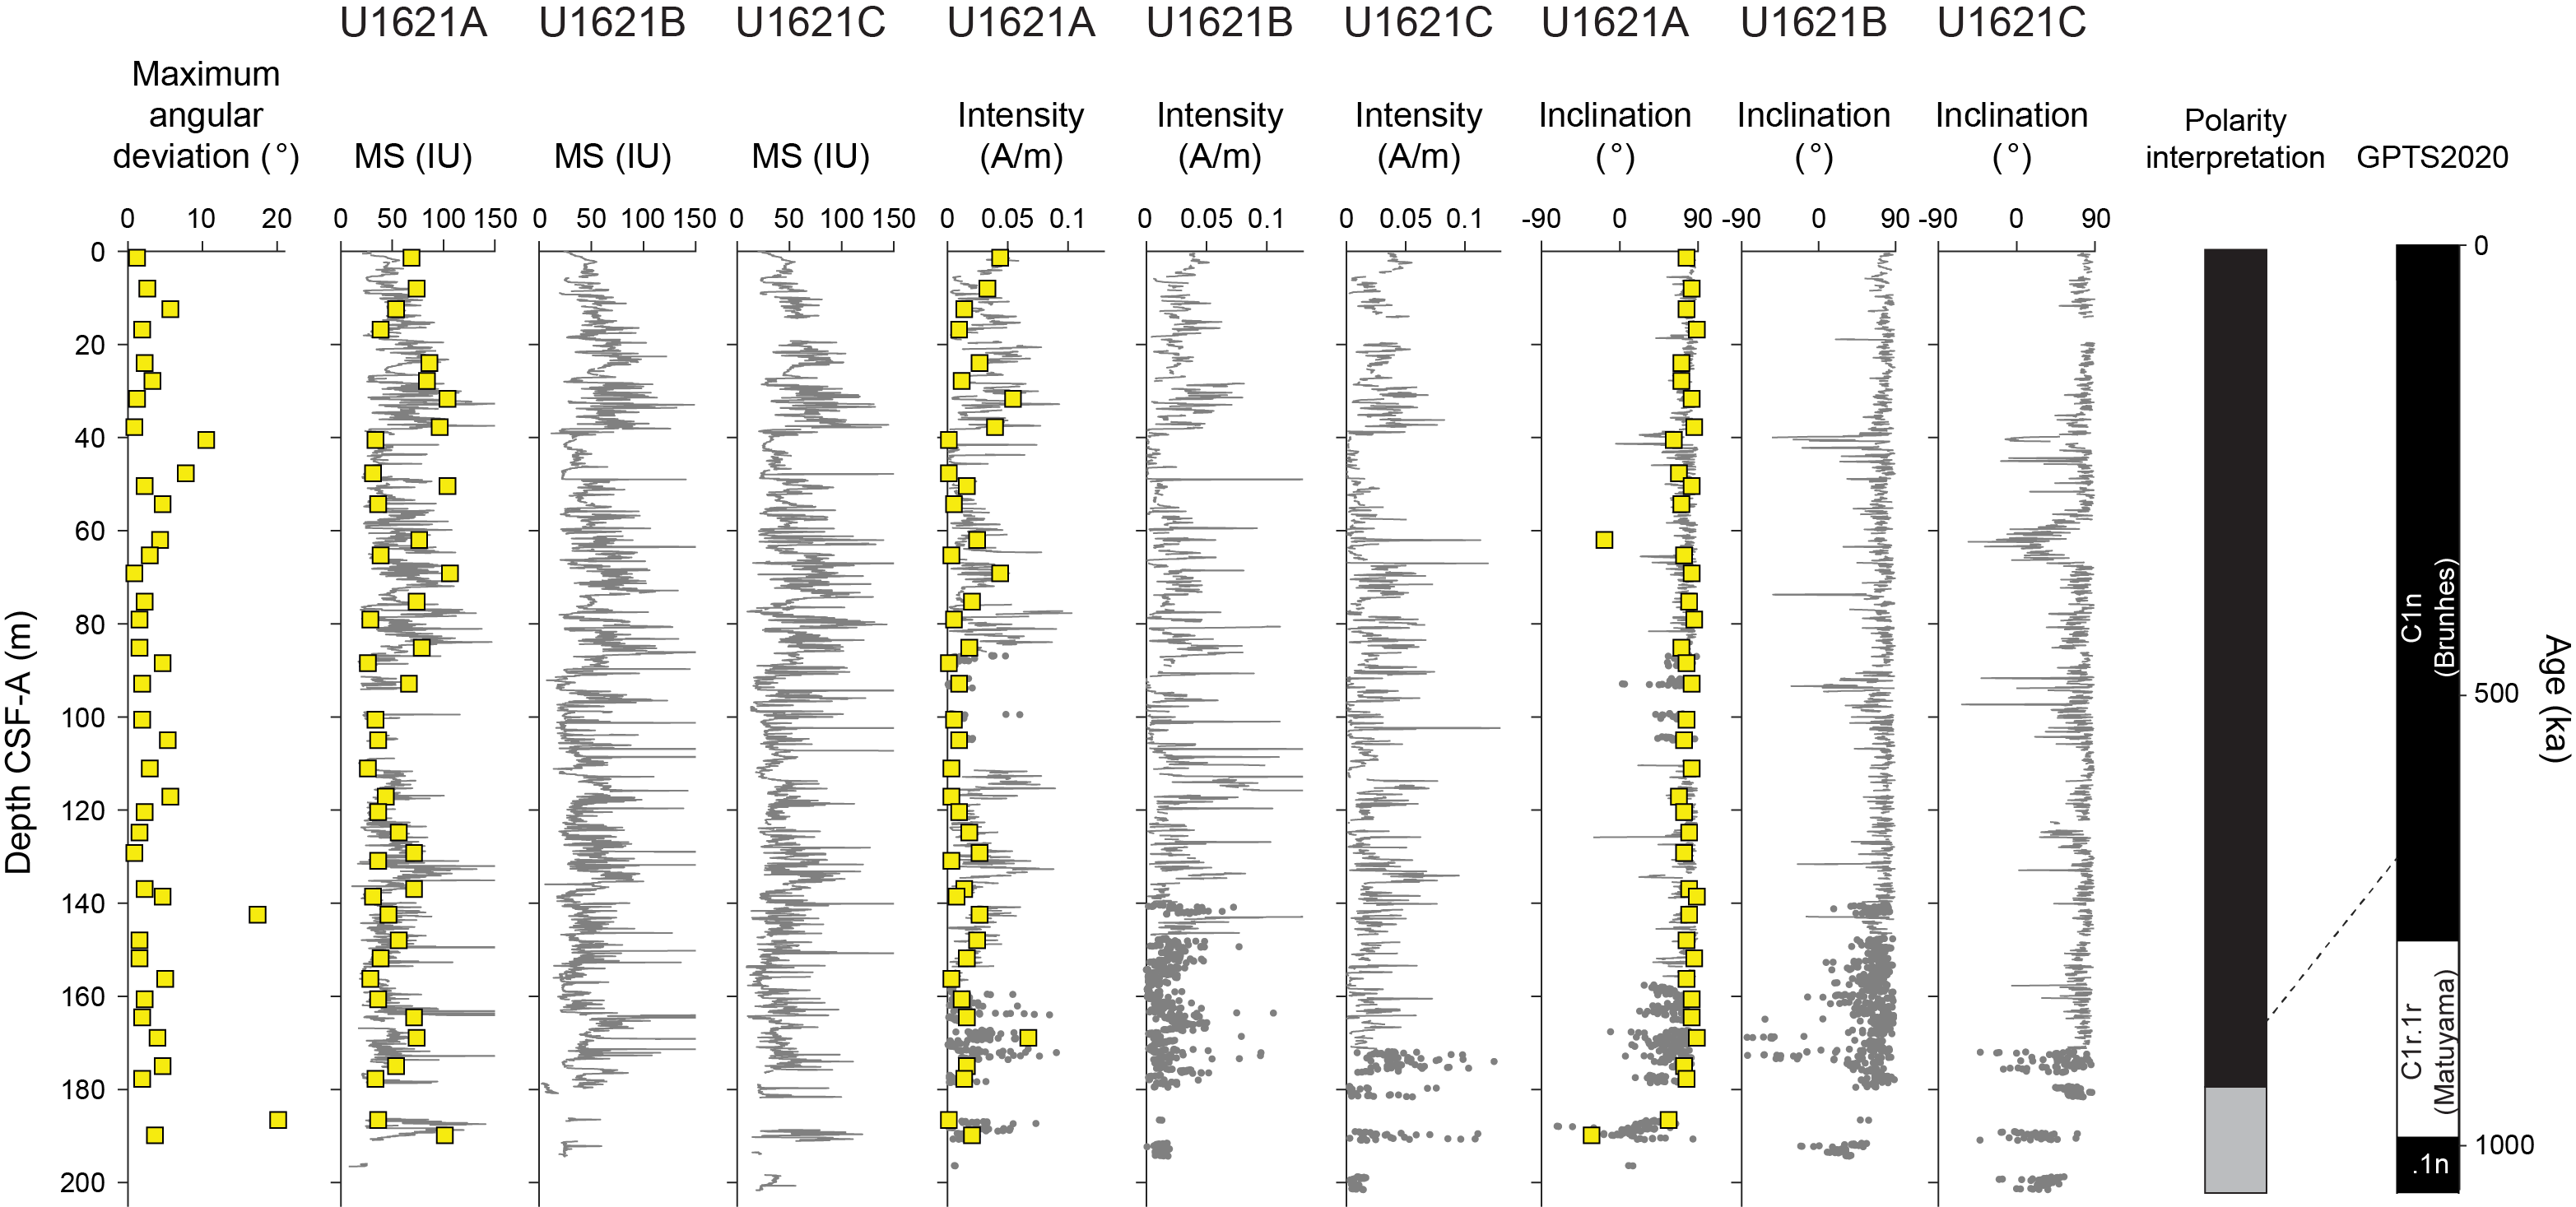
Figure F35. MS and paleomagnetic data, Site U1621.
5.3.2. Site U1622 magnetic stratigraphy
Many of the cores recovered at Site U1622 below 10 mbsf displayed significant coring disturbance. This disturbance can explain much of the variability in the archive section half data (Figure F36). All cube samples with ChRM inclinations that were well defined enough to determine polarity (nominally, maximum angular deviation values less than 20°) are steep and positive. Therefore, we interpret that all sediments recovered from Site U1622 were deposited in Chron C1n (Brunhes) and must be younger than 773 ka.
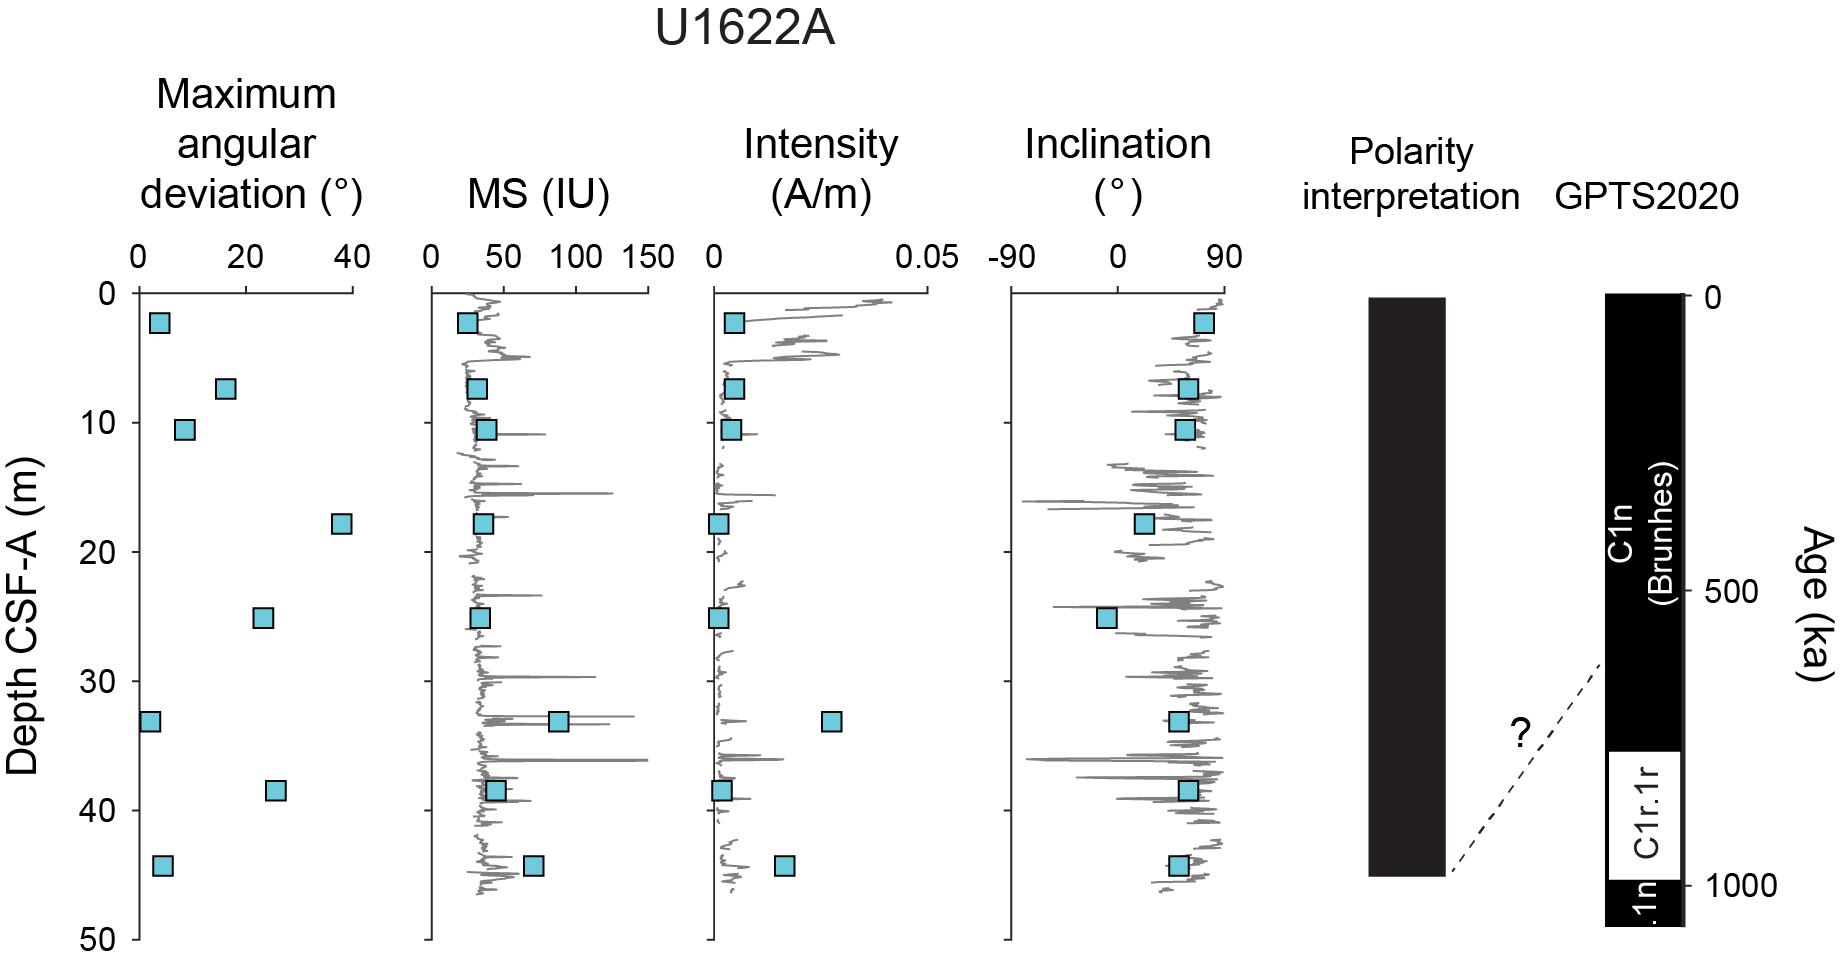
Figure F36. MS and paleomagnetic data, Hole U1622A.
5.3.3. Site U1623 magnetic stratigraphy
Site U1623 has a mix of well-defined magnetizations and poorly defined magnetizations, with clusters of higher maximum angular deviation values, indicating poorly defined ChRMs, common between 165 and 220 and below 285 mbsf (Figure F37). Much of the variability in the archive section half and some cube data can be attributed to coring deformation and is not reproducible between holes; thus, anomalous inclinations should be interpreted with caution (Figure F38). High-MS intervals and magnetic properties consistent with greigite below 90 mbsf are similar to observations made previously during Expedition 403 and ODP Leg 151, and they may indicate the paleomagnetic signal has additional complications from late-forming chemical remanent magnetizations. Future work can assess and refine this initial shipboard interpretation with additional sampling, tests for reproducibility between holes, and assessment of the magnetic mineral assemblages.
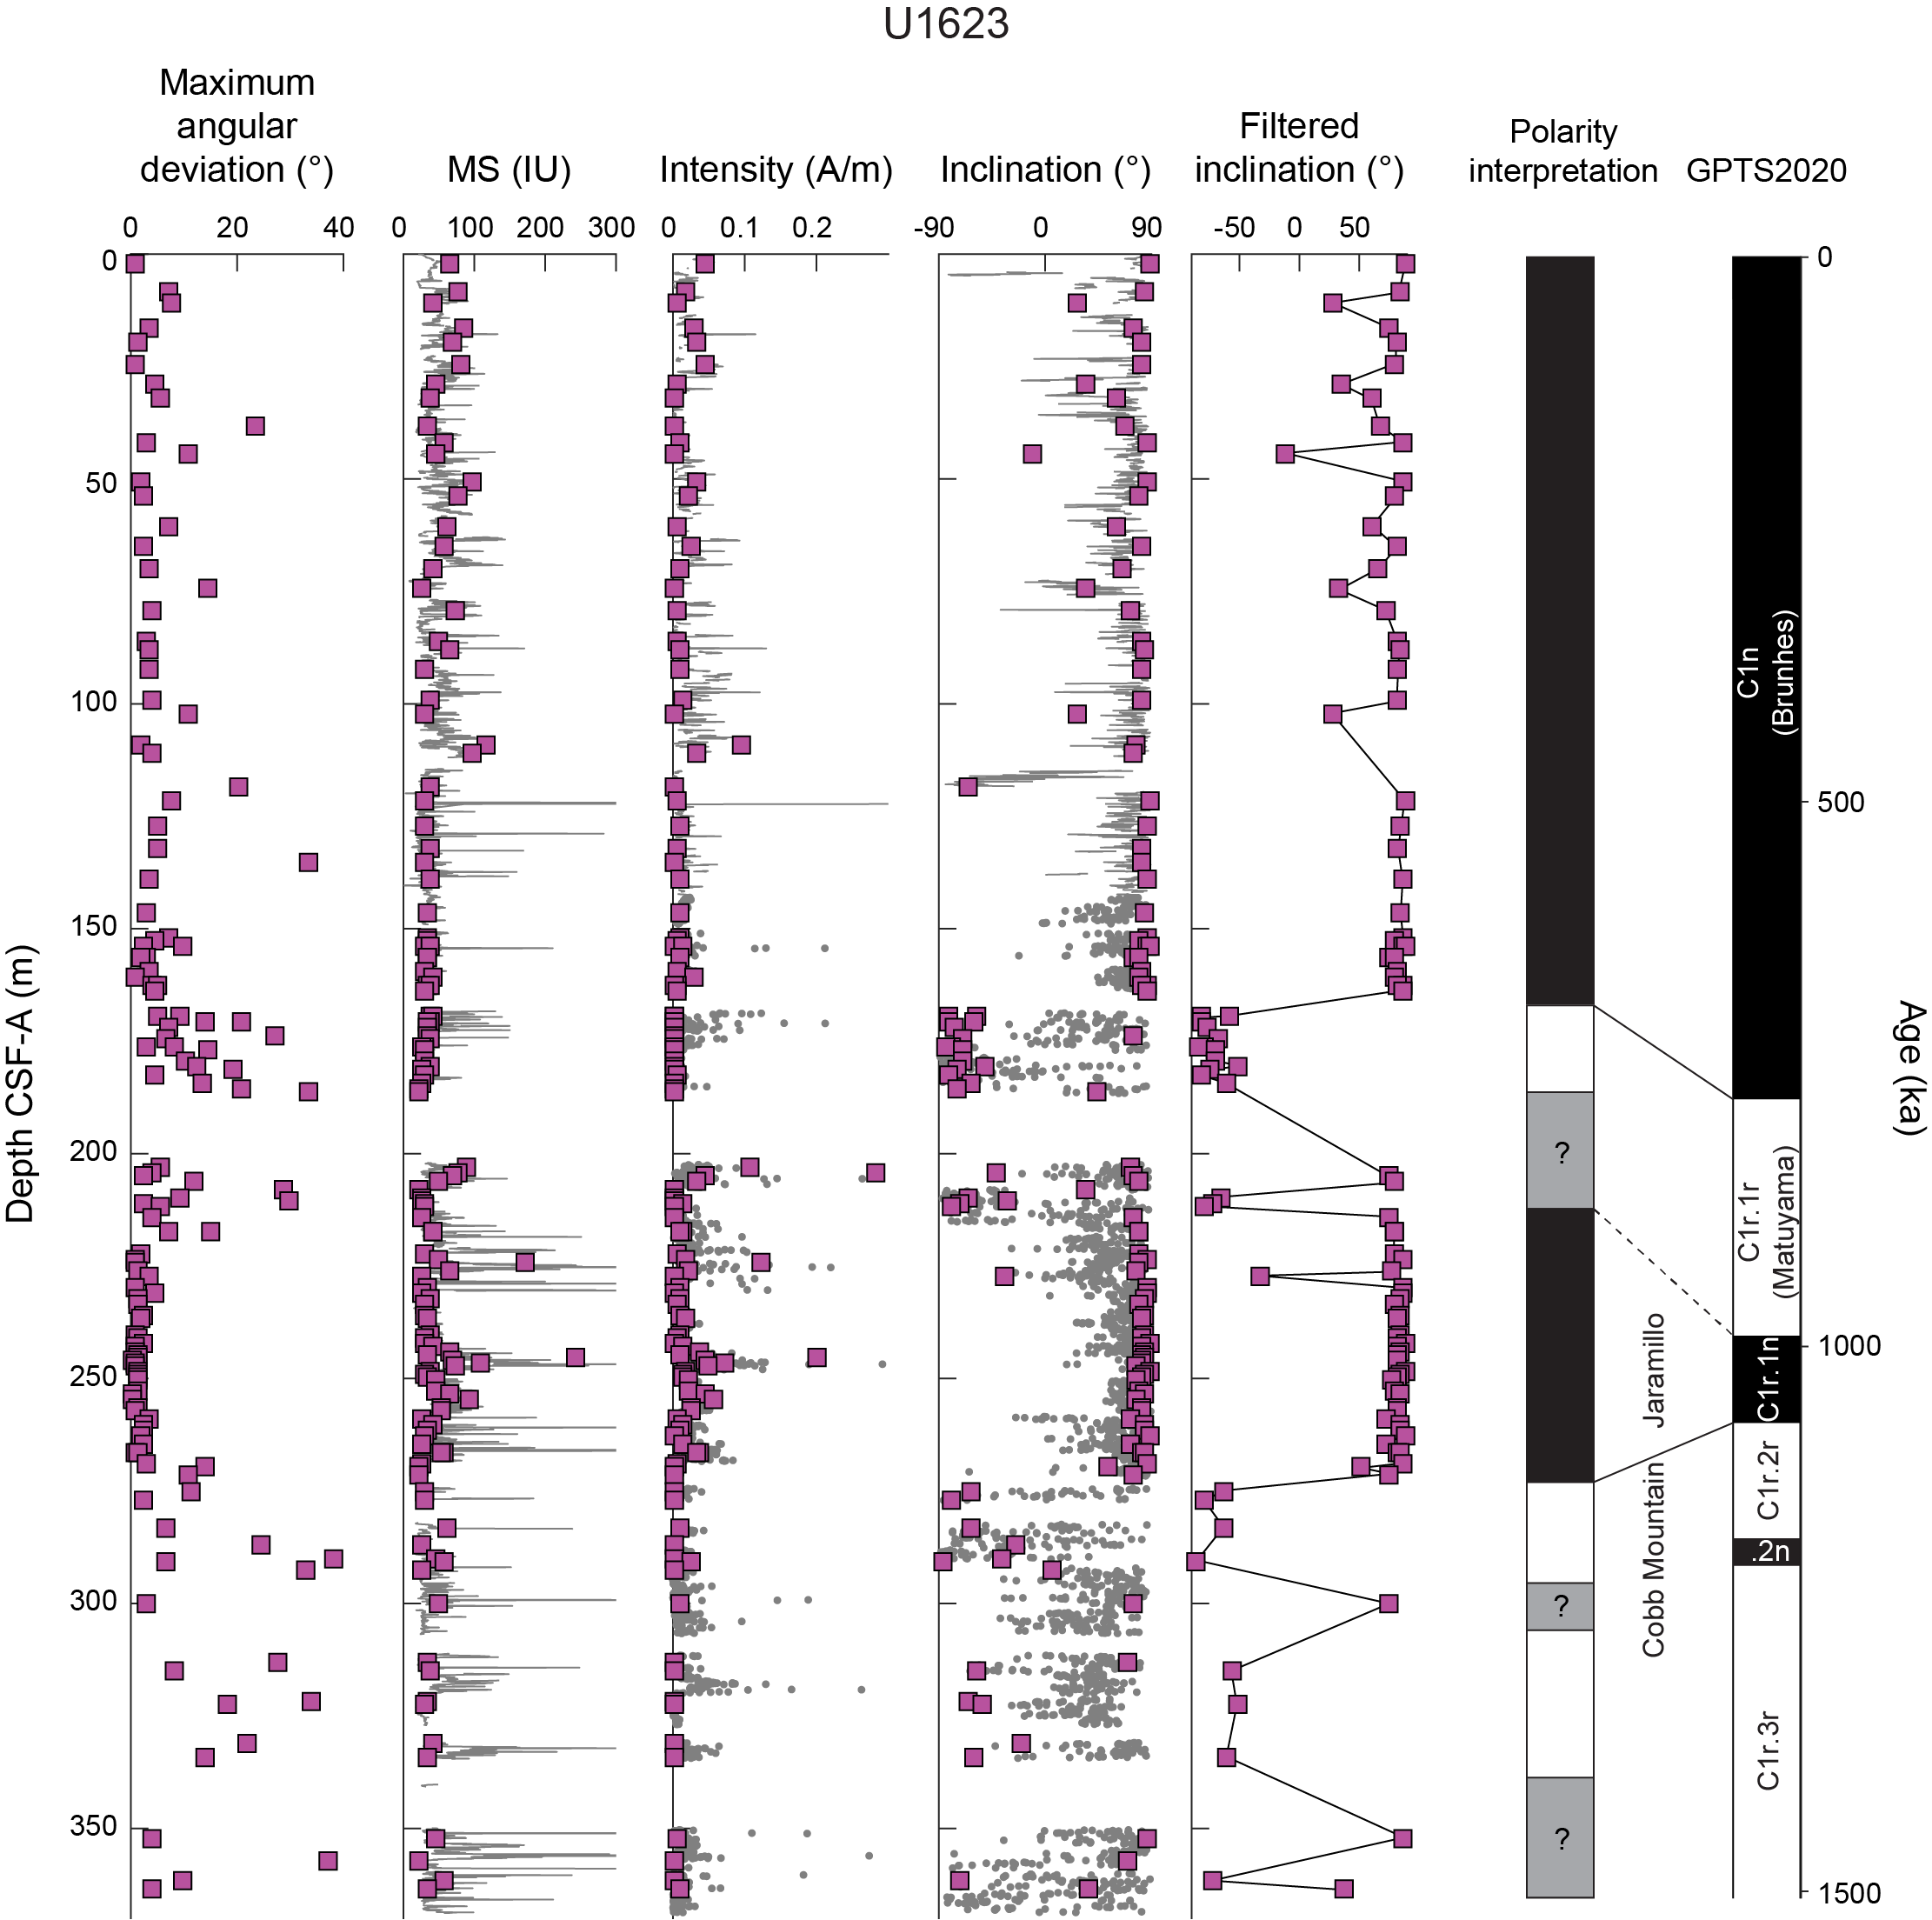
Figure F37. MS and paleomagnetic data, Hole U1623A.
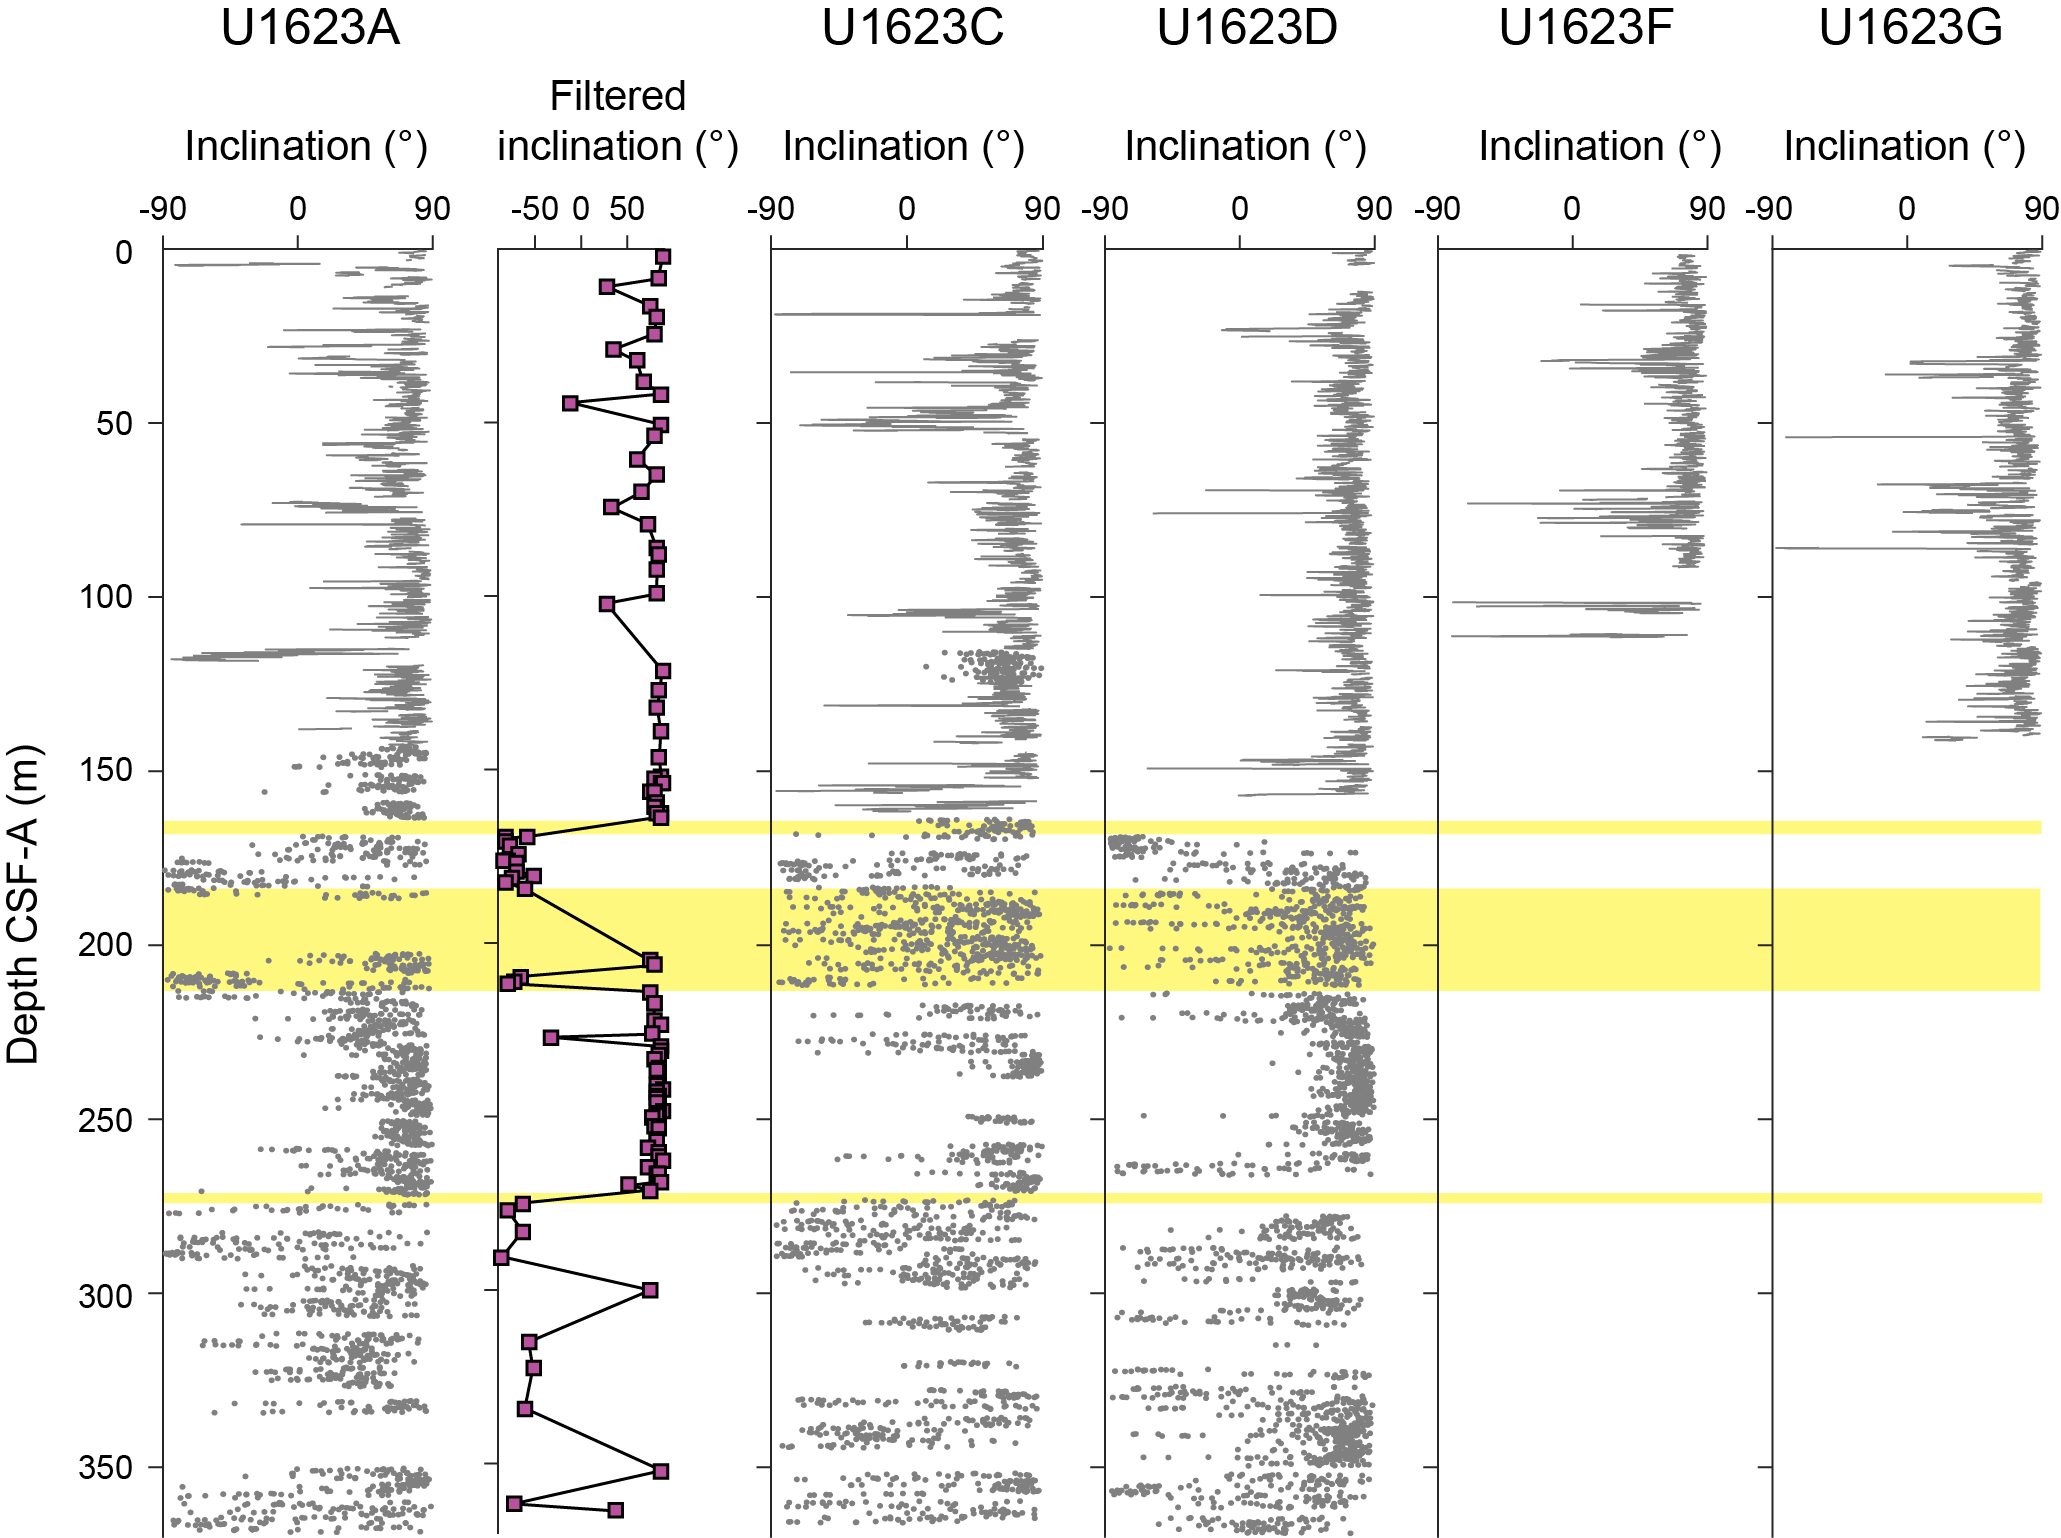
Figure F38. Inclination, Holes U1623A, U1623C, U1623D, U1623F, and U1623G.
Similar to previous observations during Expedition 403, targeted discrete cube samples help to resolve some of the ambiguity in XCB cores taken from shallower depths, below the depths of APC refusal but above where the formation becomes consolidated enough to be more suitable for the XCB method. At Site U1623, this was clearly seen in Core 403-U1623A-29X (168.3–177.7 mbsf), where archive-half data could be interpreted as having normal polarity but the discrete cube samples show stable reverse polarity (Figures F37, F38). Accordingly, we base our interpretation on the discrete cube data in Hole U1623A, which could be tested through additional sampling of Holes U1623C and U1623D. We use the same filtering criteria that we used at Site U1620 (see Paleomagnetism in the Site U1620 chapter [St. John et al., 2026b]) in the Site U1623 Magnetic Zone 3 (below 90 mbsf), only interpreting ChRM inclinations that are sufficiently defined to determine polarity (maximum angular deviation values less than 20°) and excluding samples with high MS (greater than 5 × 10⁻⁴ SI).
In this framework, we observe a downhole transition from normal to reverse polarity between Cores 403-U1623A-28X and 29X, bracketed by discrete cube samples at 163.59 and 169.33 mbsf (midpoint = 166.46 mbsf) (Figure F37). We interpret this to be the base of Chron C1n (Brunhes; 773 ka). Below that, we observe the first normal polarity below a zone of no recovery within Core 33X in samples at 205.20 and 206.43 mbsf. However, below this we find a cluster of reverse polarity inclination near the base of Core 33X and top of Core 34X, with the first sample defining the top of an extended interval of normal polarity in Core 34X at 214.00 mbsf. Based on these observations, a conservative estimate for the top of Subchron C1r.1n (Jaramillo; 990 ka) would be between Cores 30X and 33X, defined by samples at 184.29 and 214.00 mbsf; however, we suspect that the normal polarity samples in Core 33X may be an artifact of the XCB coring process, in which case the position of this boundary may be within Core 34X, defined by samples at 211.70 and 214.00 mbsf. This uncertainty could be tested through additional sampling of Holes U1623C and U1623D with data transferred to the core composite depth below seafloor, Method A (CCSF-A), scale because recovery through this interval was much better (Figure F38). A thick and very well defined normal polarity interval extends from 214.00 to 271.16 mbsf in Core 403-U1623A-41X. The transition to reverse polarity below this, interpreted to be the base of Chron C1r.1n (Jaramillo; 1070 ka), likely occurs near the base of Core 41X, top of Core 42X, or in the interval of no recovery between these two cores and is defined by a normal polarity sample at 271.16 m and reverse polarity sample at 274.91 mbsf (midpoint = 273.04 mbsf). Below this boundary, the data are more difficult to interpret, with many of the cores described as strongly disturbed. However, the majority of samples in this interval have reverse polarity, and we think it is likely that the base of recovery at Site U1623 is between 1070 and 1775 ka, younger than Subchron C2n (Olduvai).
This interpretation implies that long-term accumulation rates at Site U1623 average to around 21.5 cm/ky for the last 1 My to Seismic Reflector R4 and around 75 cm/ky during the short Subchron C1r.1n (Jaramillo), between 990 and 1070 ka (Figure F39; Table T10). Like Site U1621, sediments at Site U1623 have great potential for reconstructing high-resolution paleomagnetic secular variation of the geomagnetic field for at least the uppermost 90 m, with careful consideration for intervals where coring deformation is minimal.
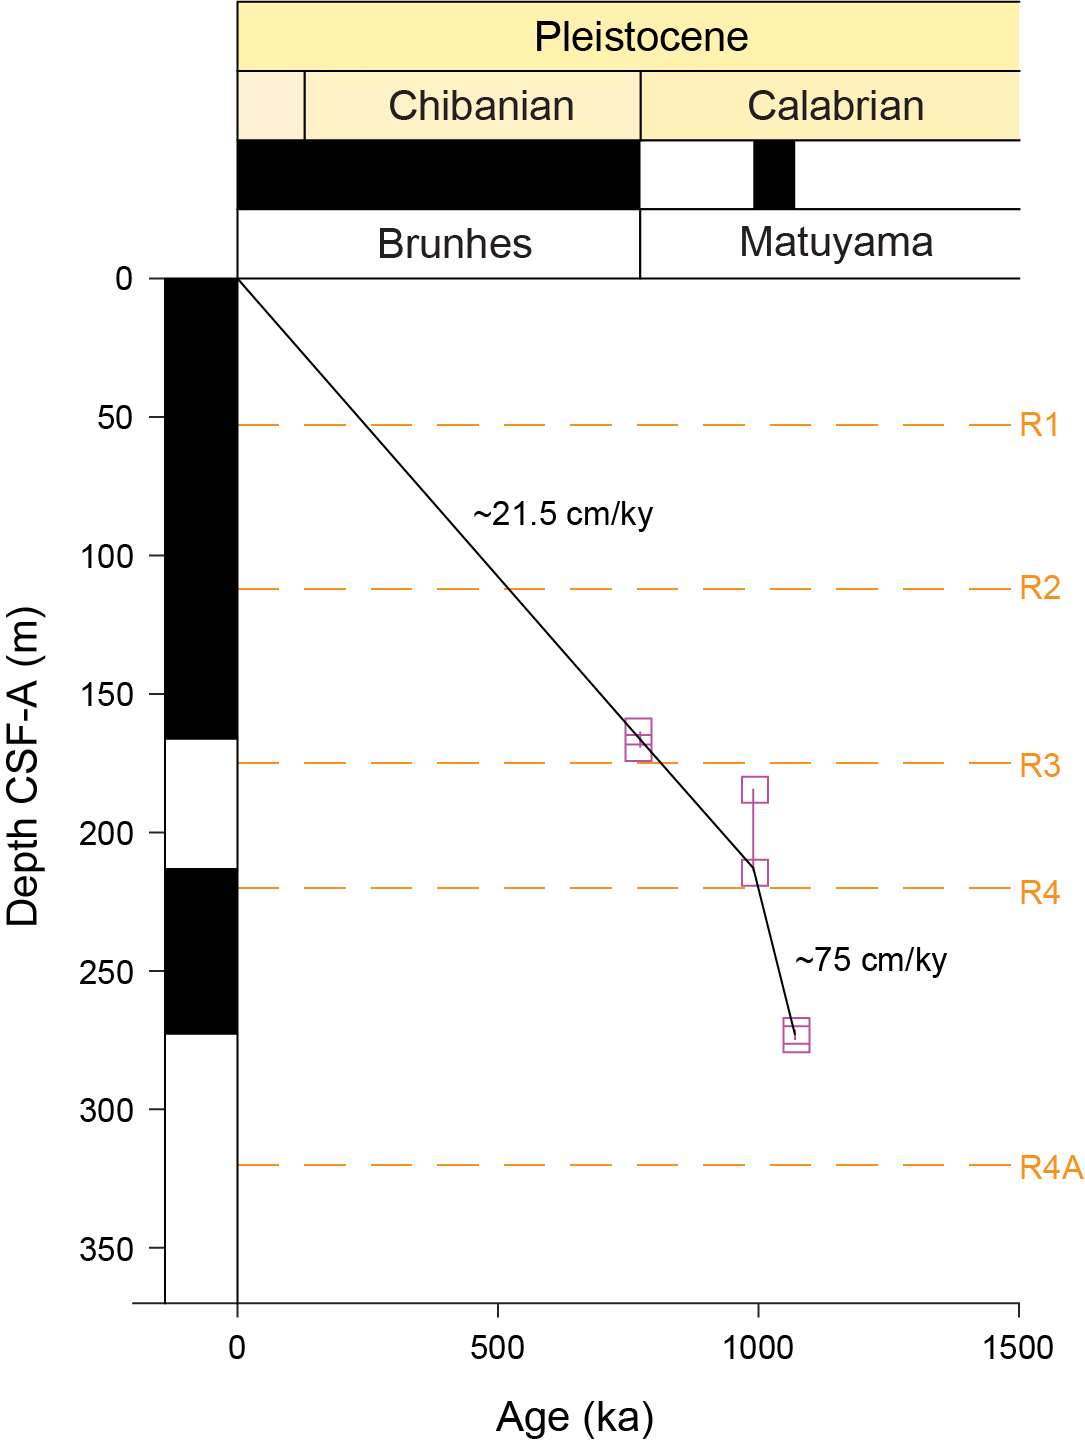
Figure F39. Age-depth plot with implied long-term accumulation rates.
6. Physical properties
The physical properties measured shipboard for Sites U1621–U1623 included nondestructive whole-round measurements using the Special Task Multisensor Logger (STMSL), WRMSL, and Natural Gamma Radiation Logger (NGRL), as well as thermal conductivity and discrete P-wave velocity measurements on working-half sections after cores were split. GRA bulk density and MS were measured on the STMSL immediately after recovery and on the WRMSL after thermally equilibrating for a minimum of 4 h. Cores 403-U1621C-1H through 5H and 403-U1623C-11F through 14F were excluded from WRMSL GRA bulk density measurements due to their selection for sedimentary ancient DNA (sedaDNA) sampling and the need to avoid exposure to the radioactive cesium source. Physical property data from the STMSL were used for initial hole-to-hole stratigraphic correlation and splicing (see Stratigraphic correlation) to aid in near-real-time drilling and sampling (e.g., biostratigraphic smear slides and sedaDNA sampling) decisions, but they are not further evaluated and reported here. Further use of STMSL data is discouraged because WRMSL and Section Half Multisensor Logger (SHMSL) data, collected after allowing for thermal equilibration, are available in the Laboratory Information Management System (LIMS) database. Aside from two whole-round samples (403-U1623C-14F-CC, 20–30 cm, and 54X-CC, 28–38 cm) that were sampled for anelastic strain recovery (ASR) analysis, P-wave velocity was measured on the WRMSL for all core sections. Results from whole-round scans are compiled in Figures F40, F41, and F42. Holes U1623B (<1 m recovery), U1623E (<10 m recovery), and U1623F (which potentially penetrated a previous Site U1623 hole; see Operations) data are available in the LIMS database but are not discussed here.
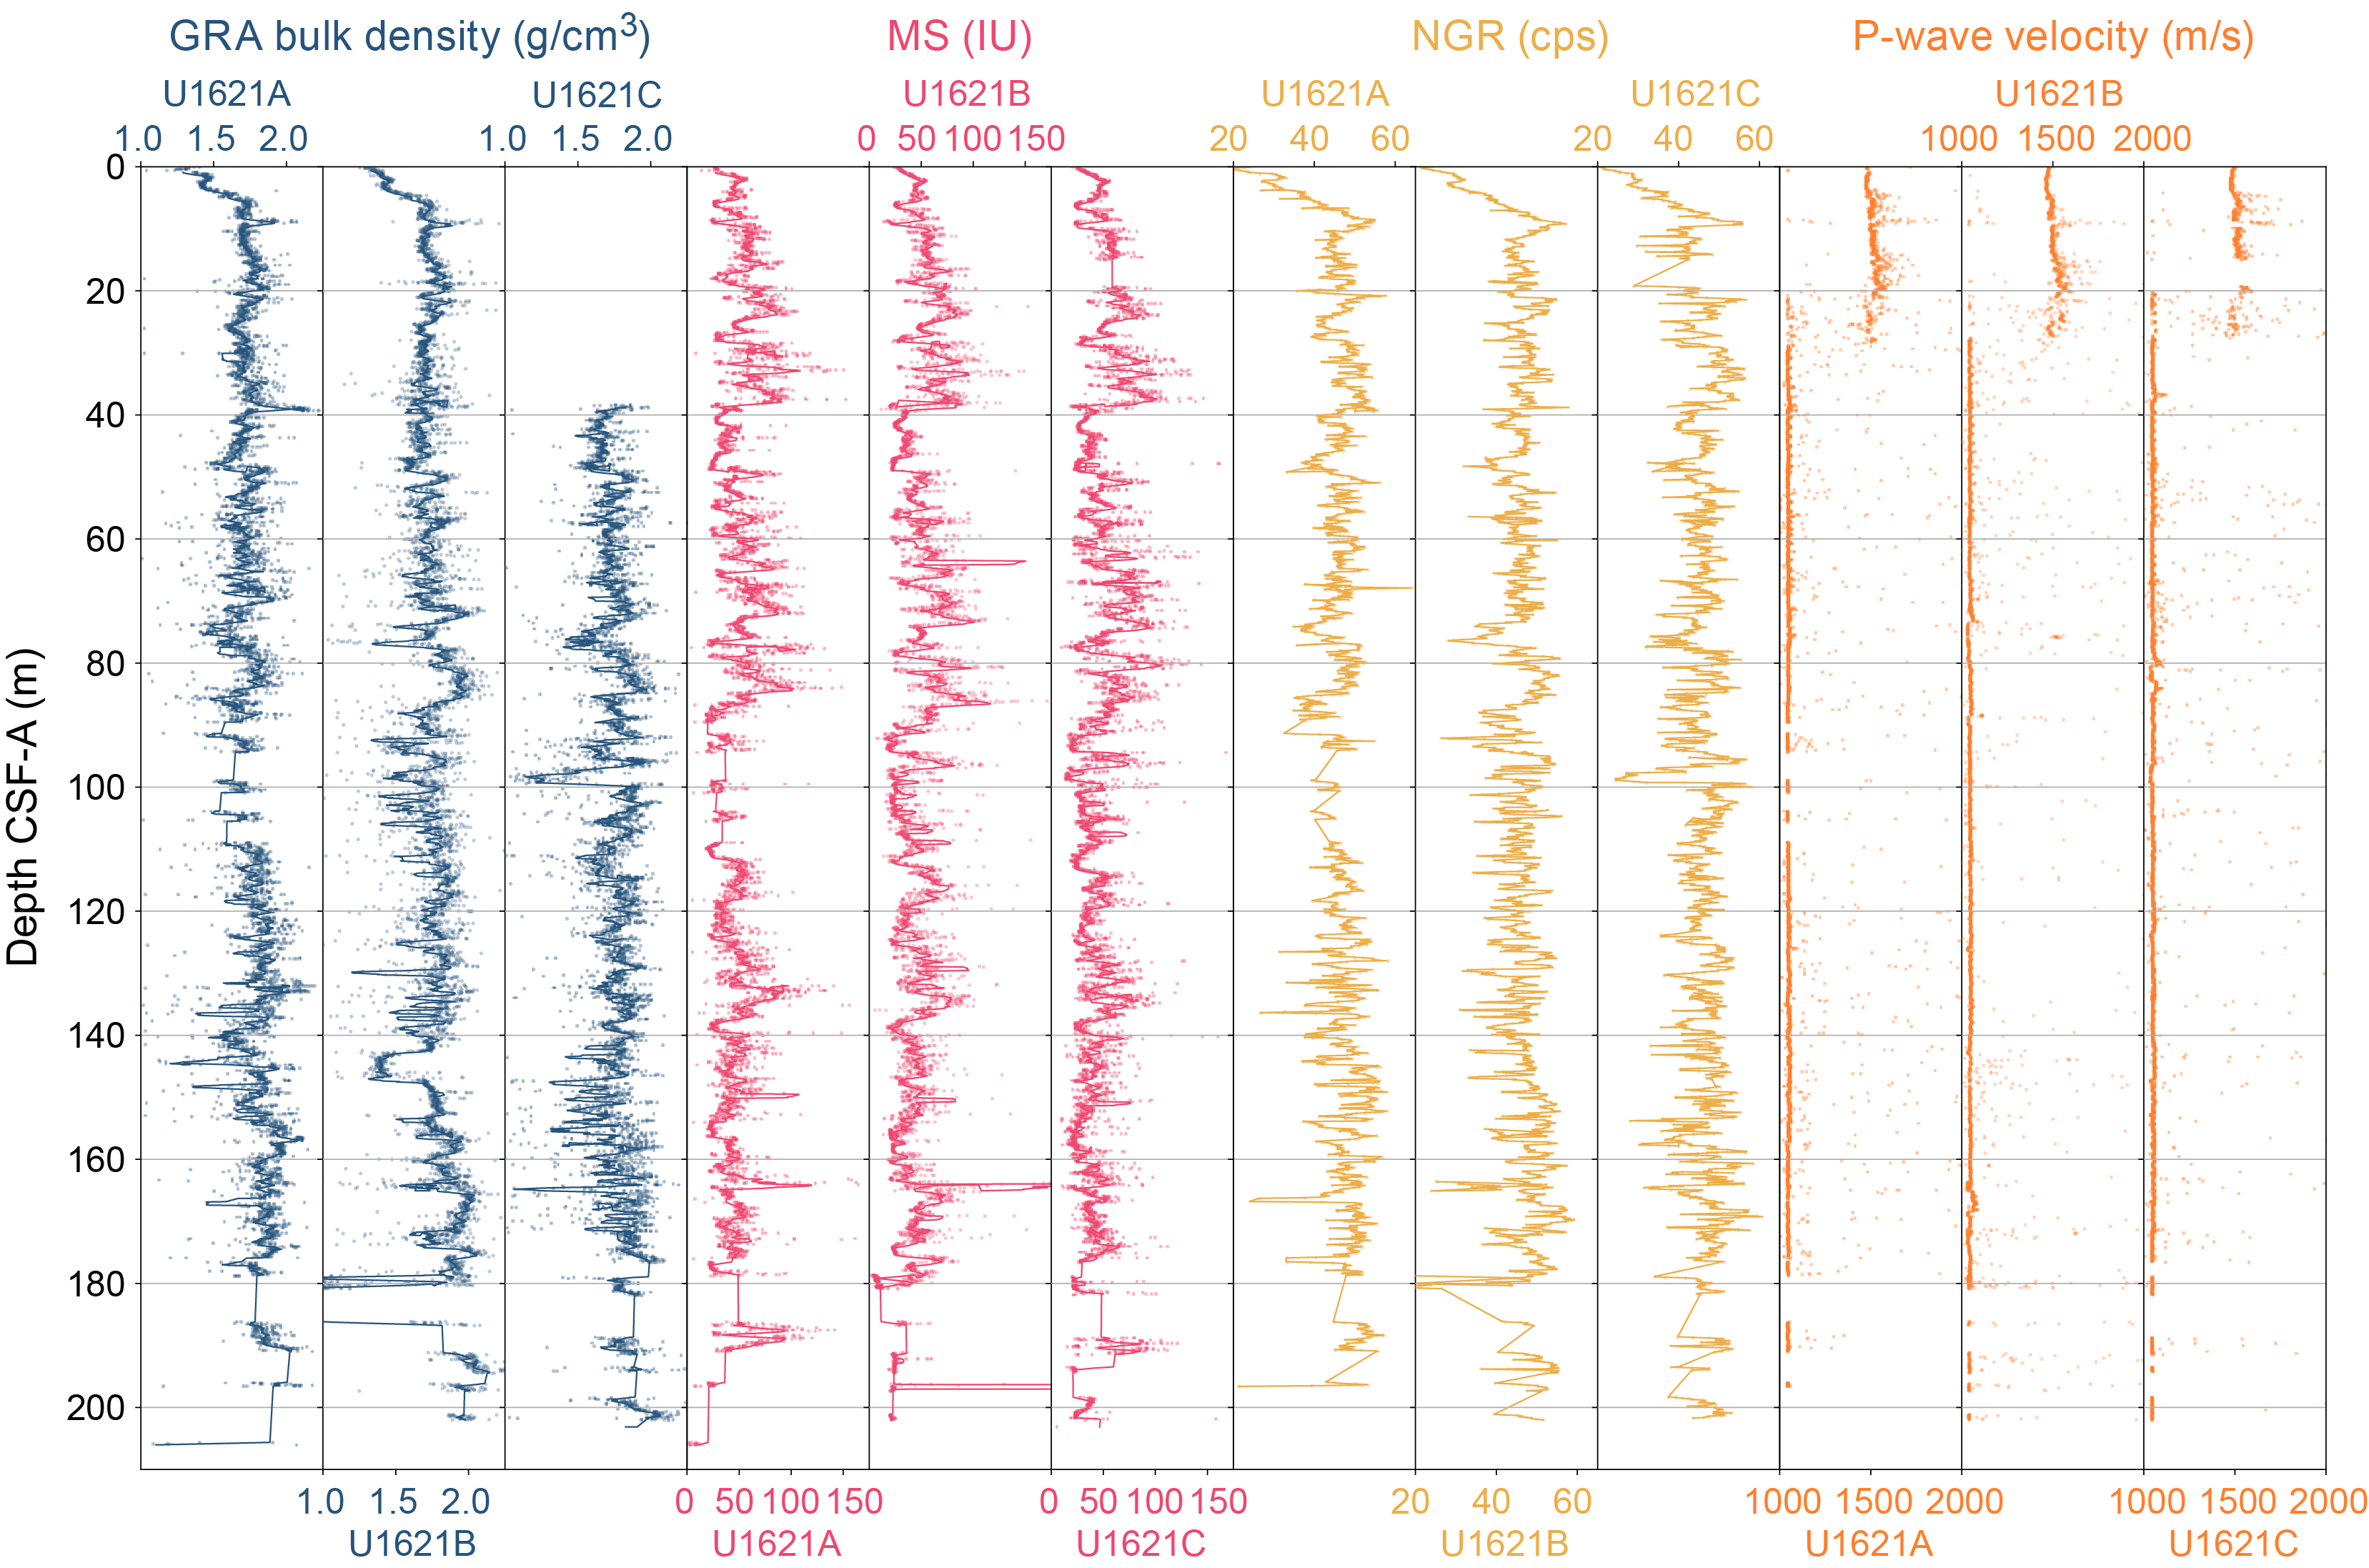
Figure F40. Physical properties, Site U1621.
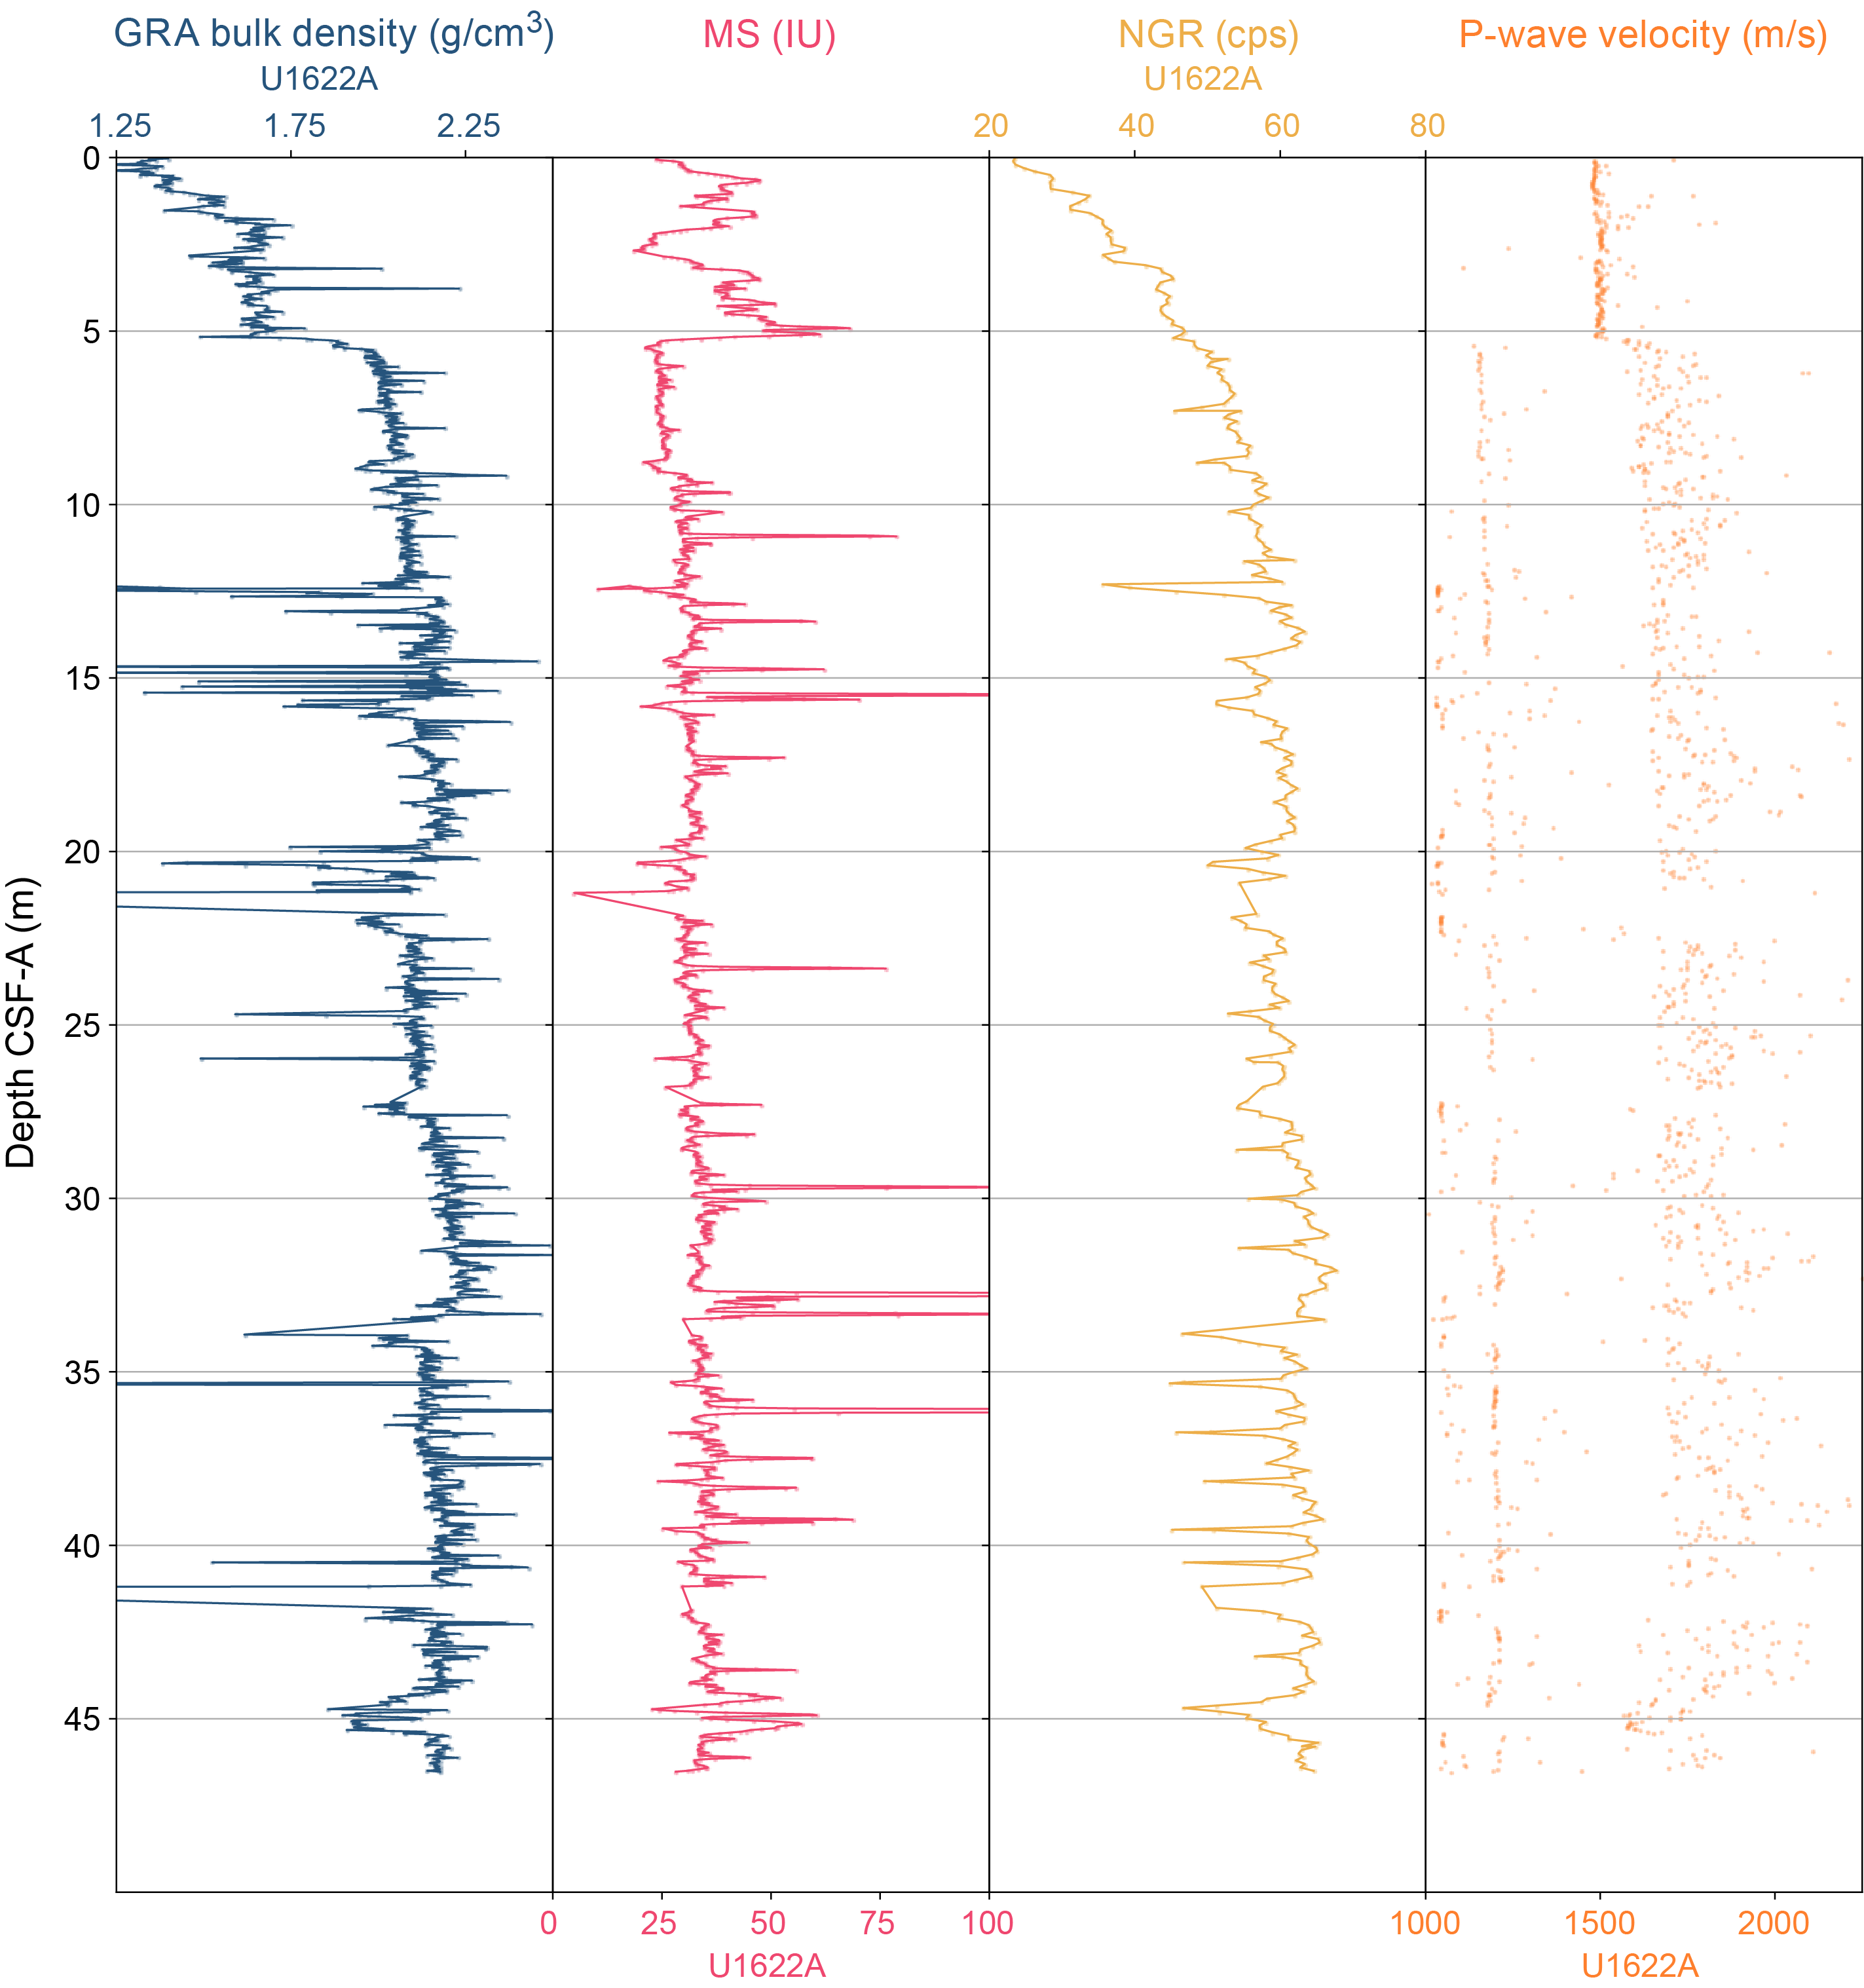
Figure F41. Physical properties, Site U1622.
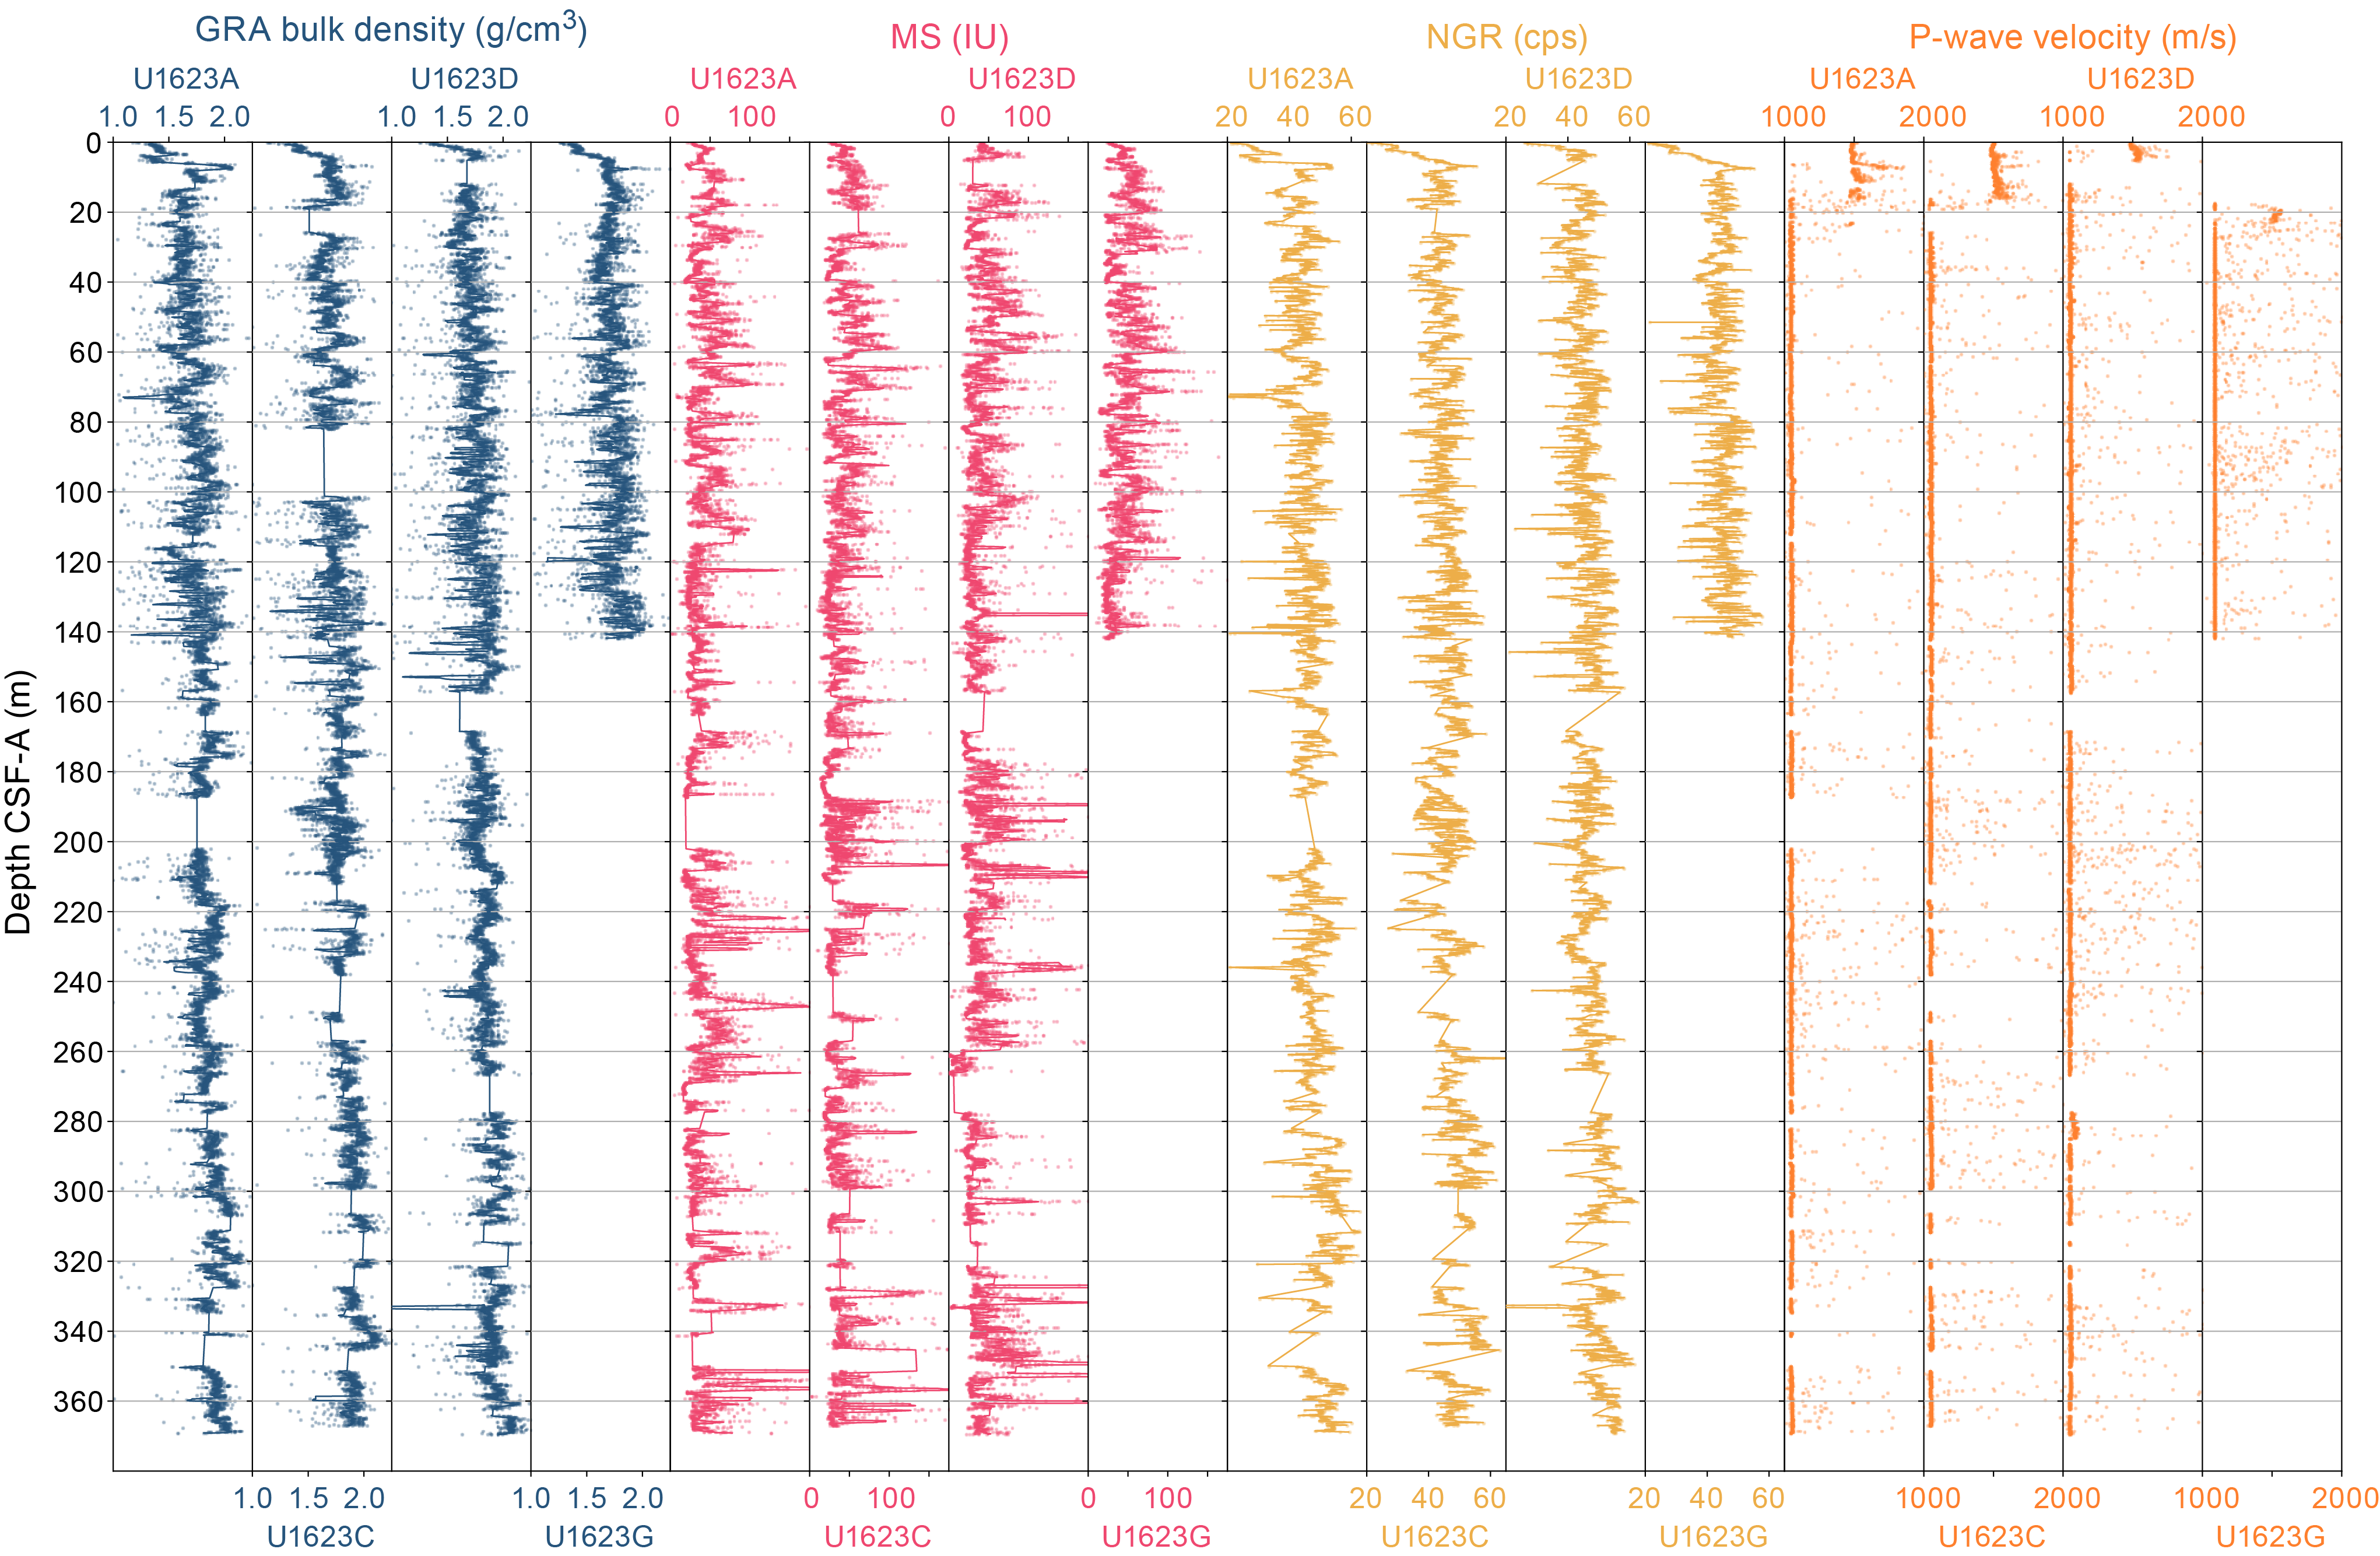
Figure F42. Physical properties, Holes U1623A, U1623C, U1623D, and U1623G.
Discrete P-wave measurements were made with the Section Half Measurement Gantry (SHMG) on one section from Cores 403-U1621A-2H through 5H, 403-U1622A-1H and 2H, and 403-U1623A-1H and 4H. Below these intervals, SHMG measurements ceased due to poor data quality. Thermal conductivity measurements were made using a puck probe on the split face of working-half sections from all Hole U1621A and U1623A cores. Site U1622 thermal conductivity measurements were made on Cores 1H and 2H; below these cores, measurements were not possible due to the unsuitability of sediments (i.e., very coarse, clast-rich). Whole-round physical property data were used for hole-to-hole stratigraphic correlation and splicing (see Stratigraphic correlation).
Working-half sections of cores from Holes U1621A, U1622A, and U1623A were sampled for moisture and density (MAD) analyses. Intervals with minimal coring disturbances were targeted. All archive halves were measured with the SHMSL for point MS (MSP) and color reflectance and X-ray scanned using the X-Ray Linescan Logger (XSCAN) (see Lithostratigraphy). Note that at Site U1621 we encountered complications with several cores (403-U1621B-9H, 22F, 25X, 26X, and 403-U1621C-12H) that were stuck in the core barrel while on the drill floor and required application of heat to be extracted (see Operations). Core 403-U1622A-3H also required heat for extraction from the core barrel. This process could have an impact on the physical properties (e.g., altering magnetic minerals) and should be considered when viewing data from these intervals.
6.1. Magnetic susceptibility
MS was measured both on whole-round sections using a pass-through loop sensor on the WRMSL track and on split archive-half sections using an MSP sensor on the SHMSL track. WRMSL measurements were made at 2.5 cm increments, and SHMSL resolution was 5 cm. WRMSL and SHMSL MS measurements yielded similar values and downhole variability for Sites U1621–U1623 (Figures F43, F44, F45).
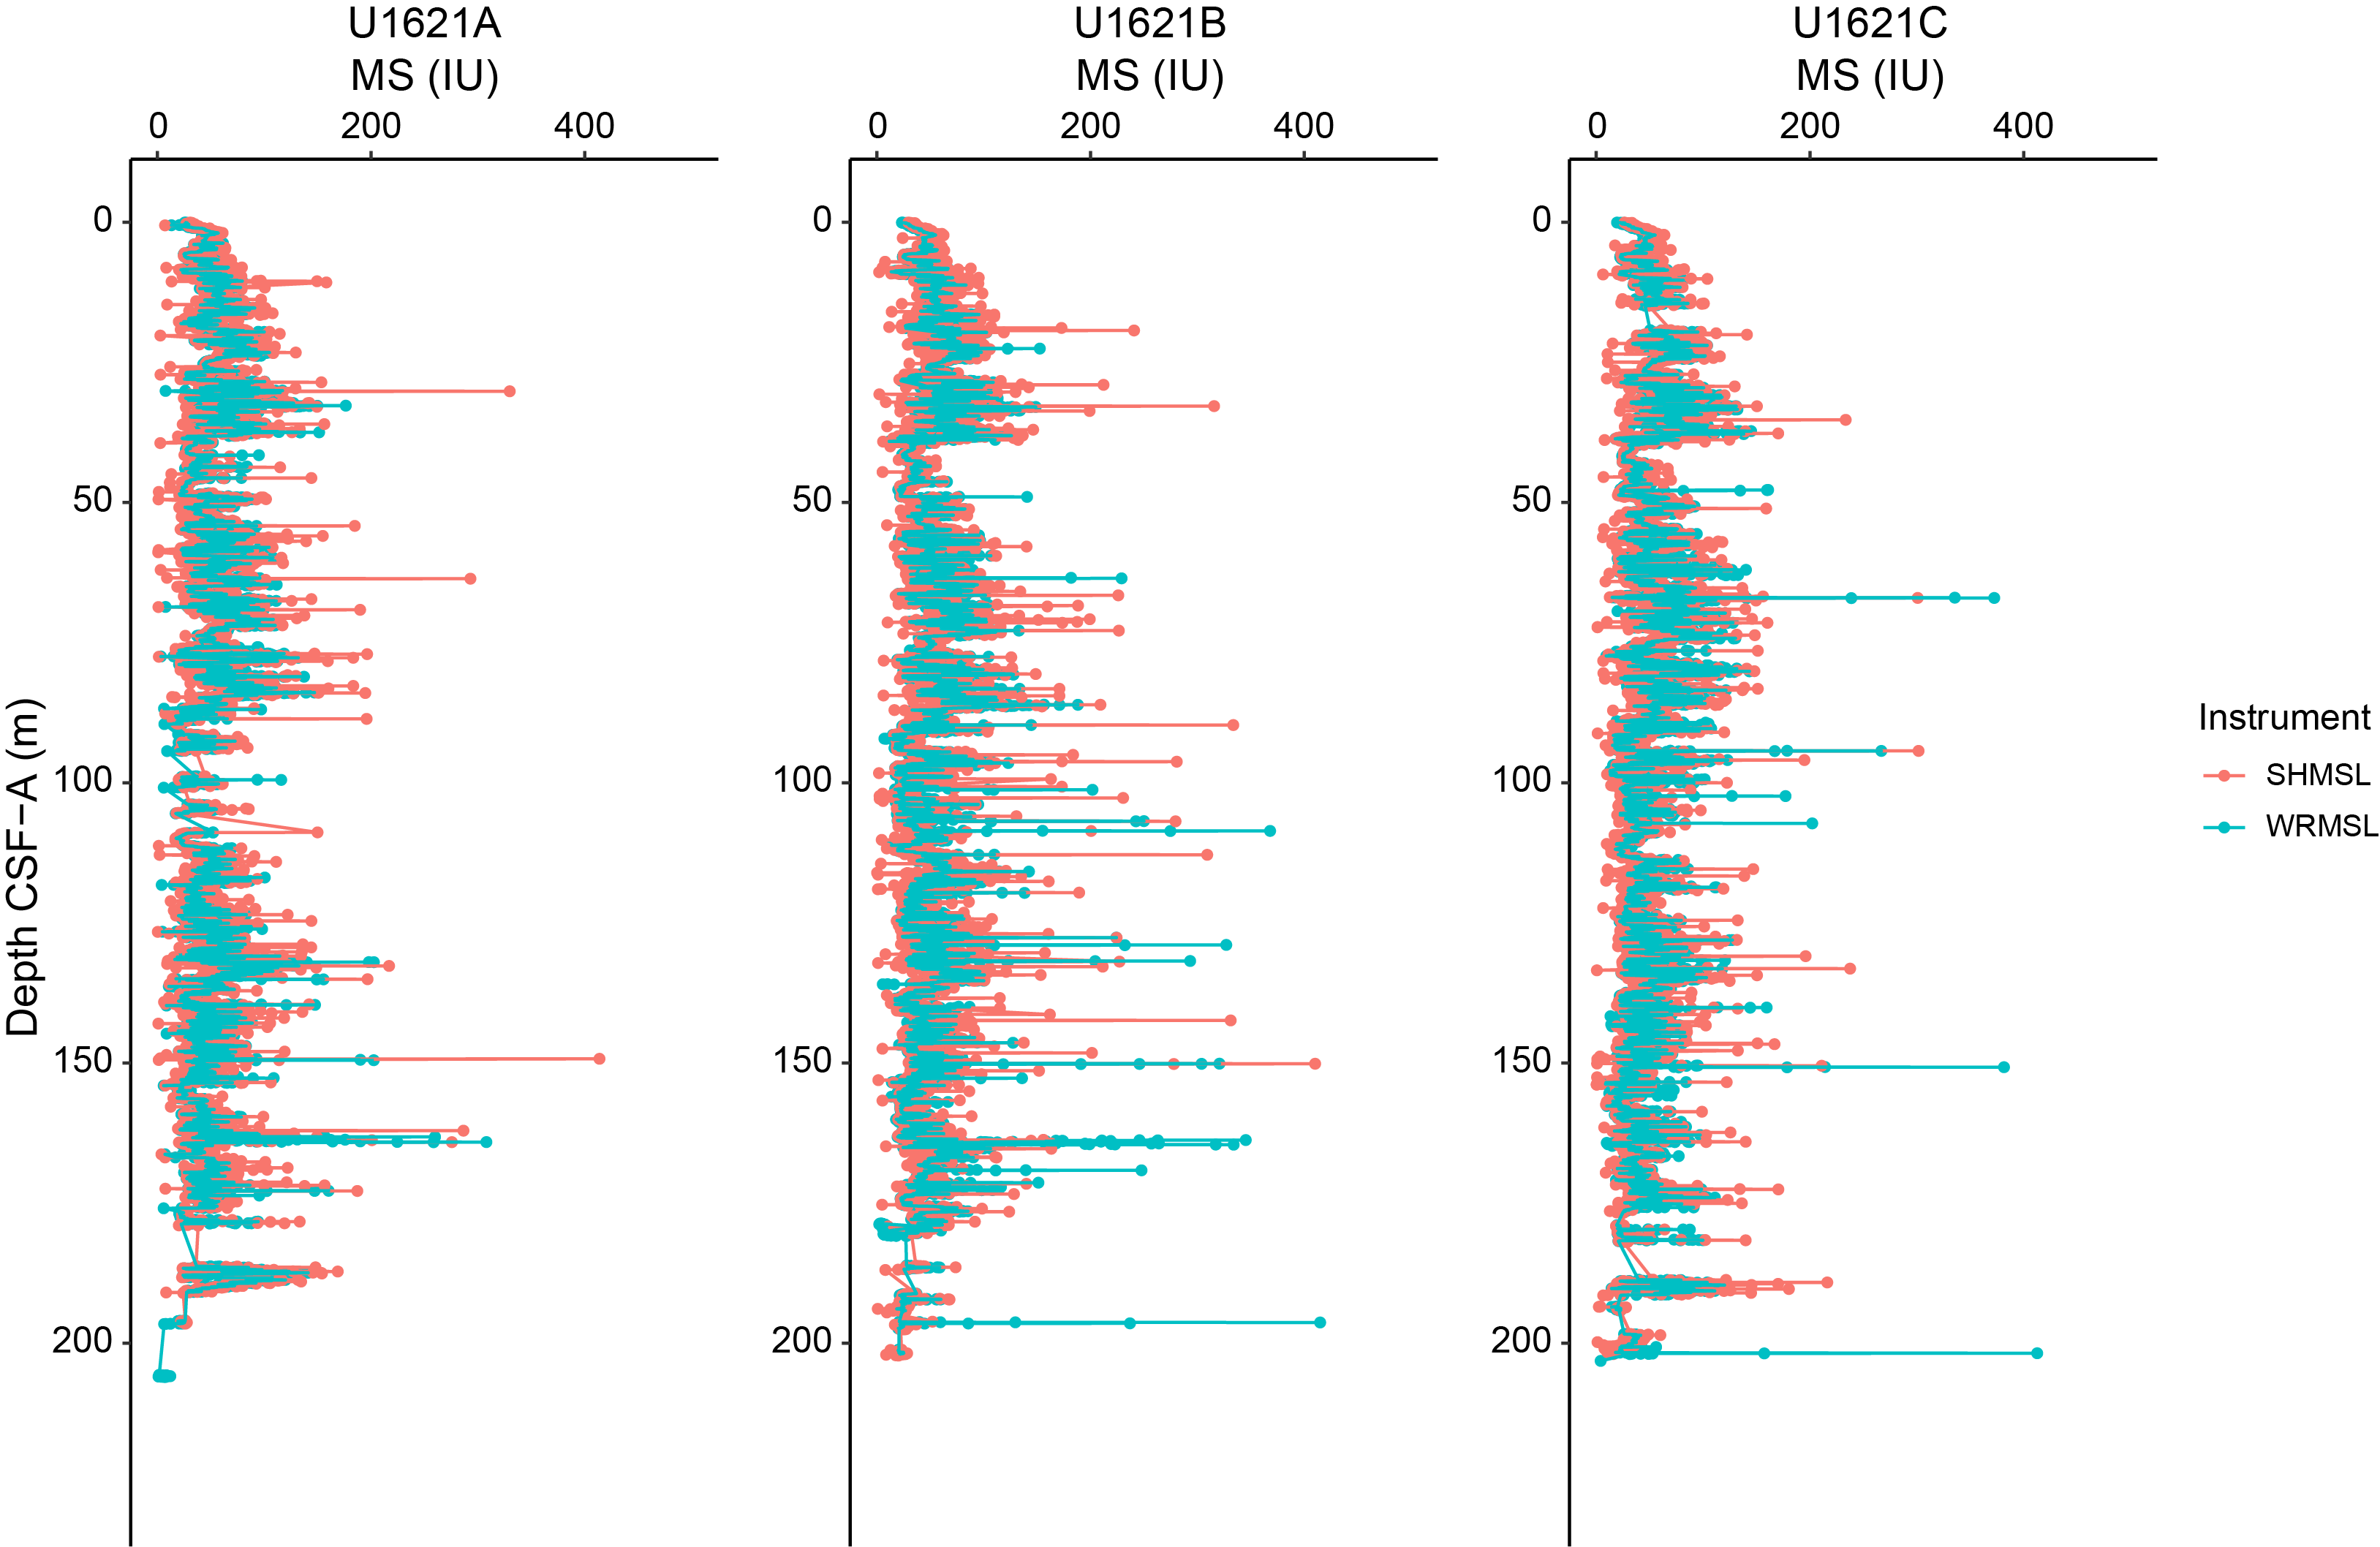
Figure F43. MS, Site U1621.
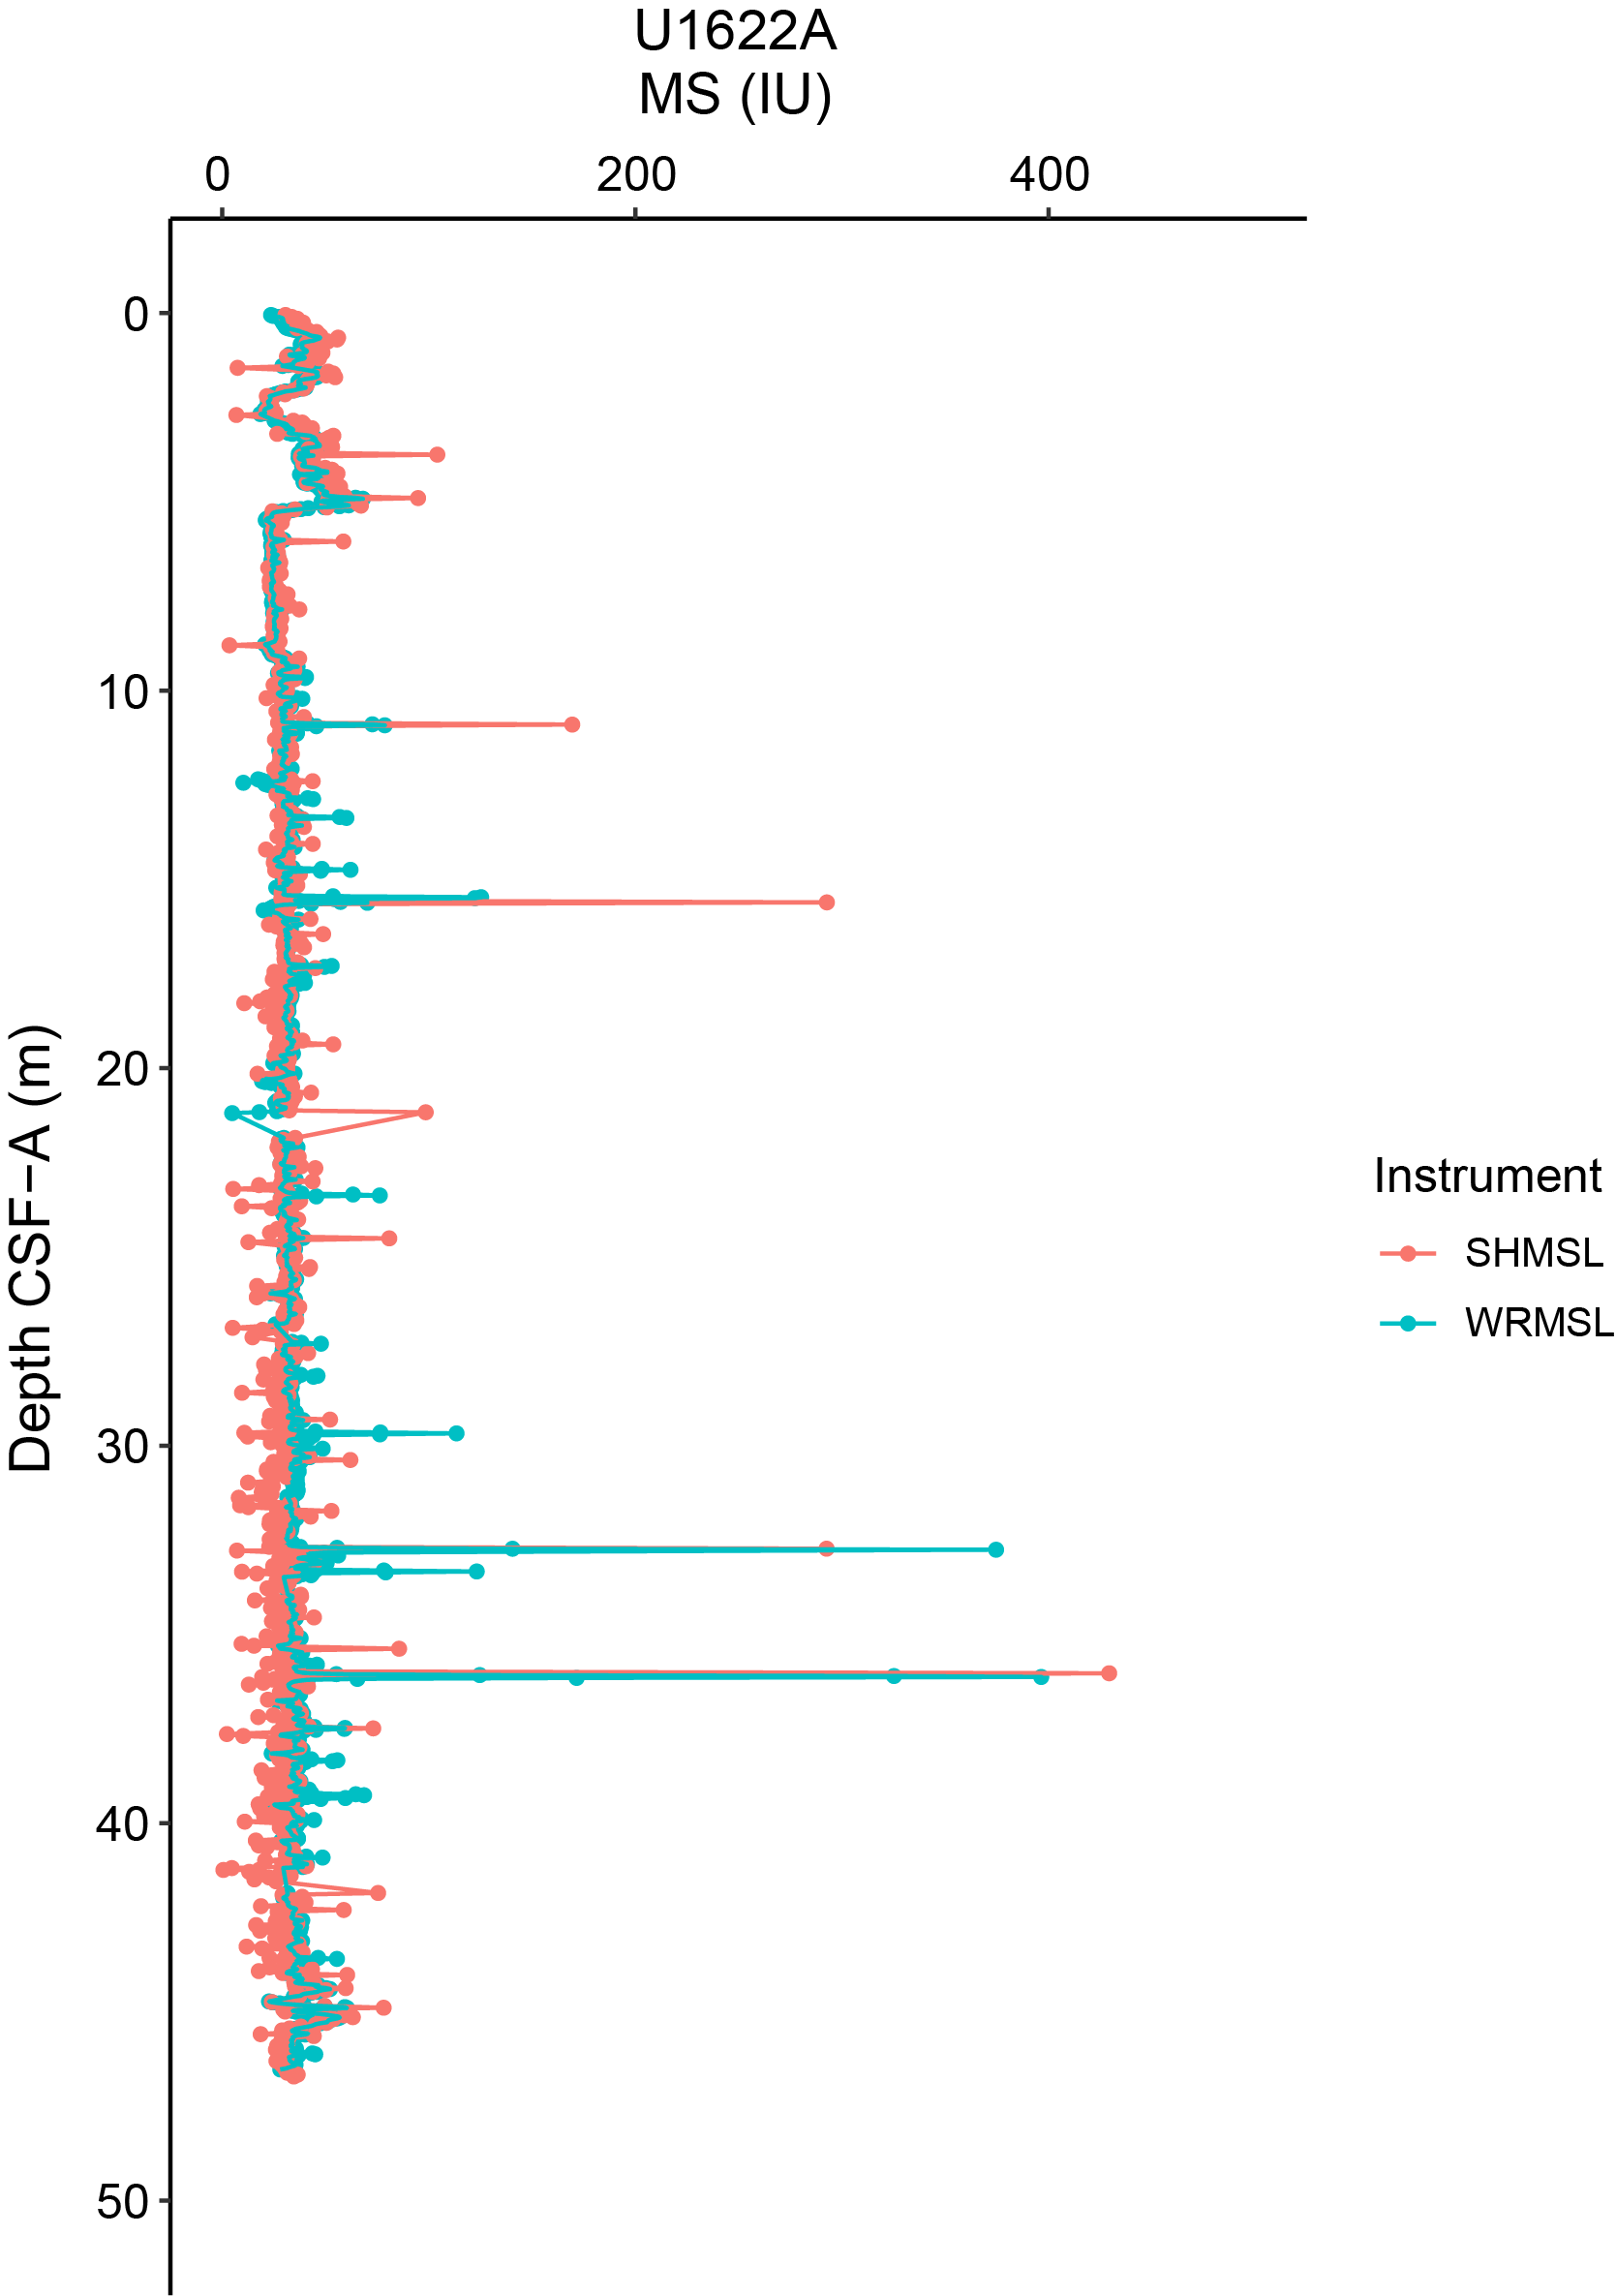
Figure F44. MS, Site U1622.
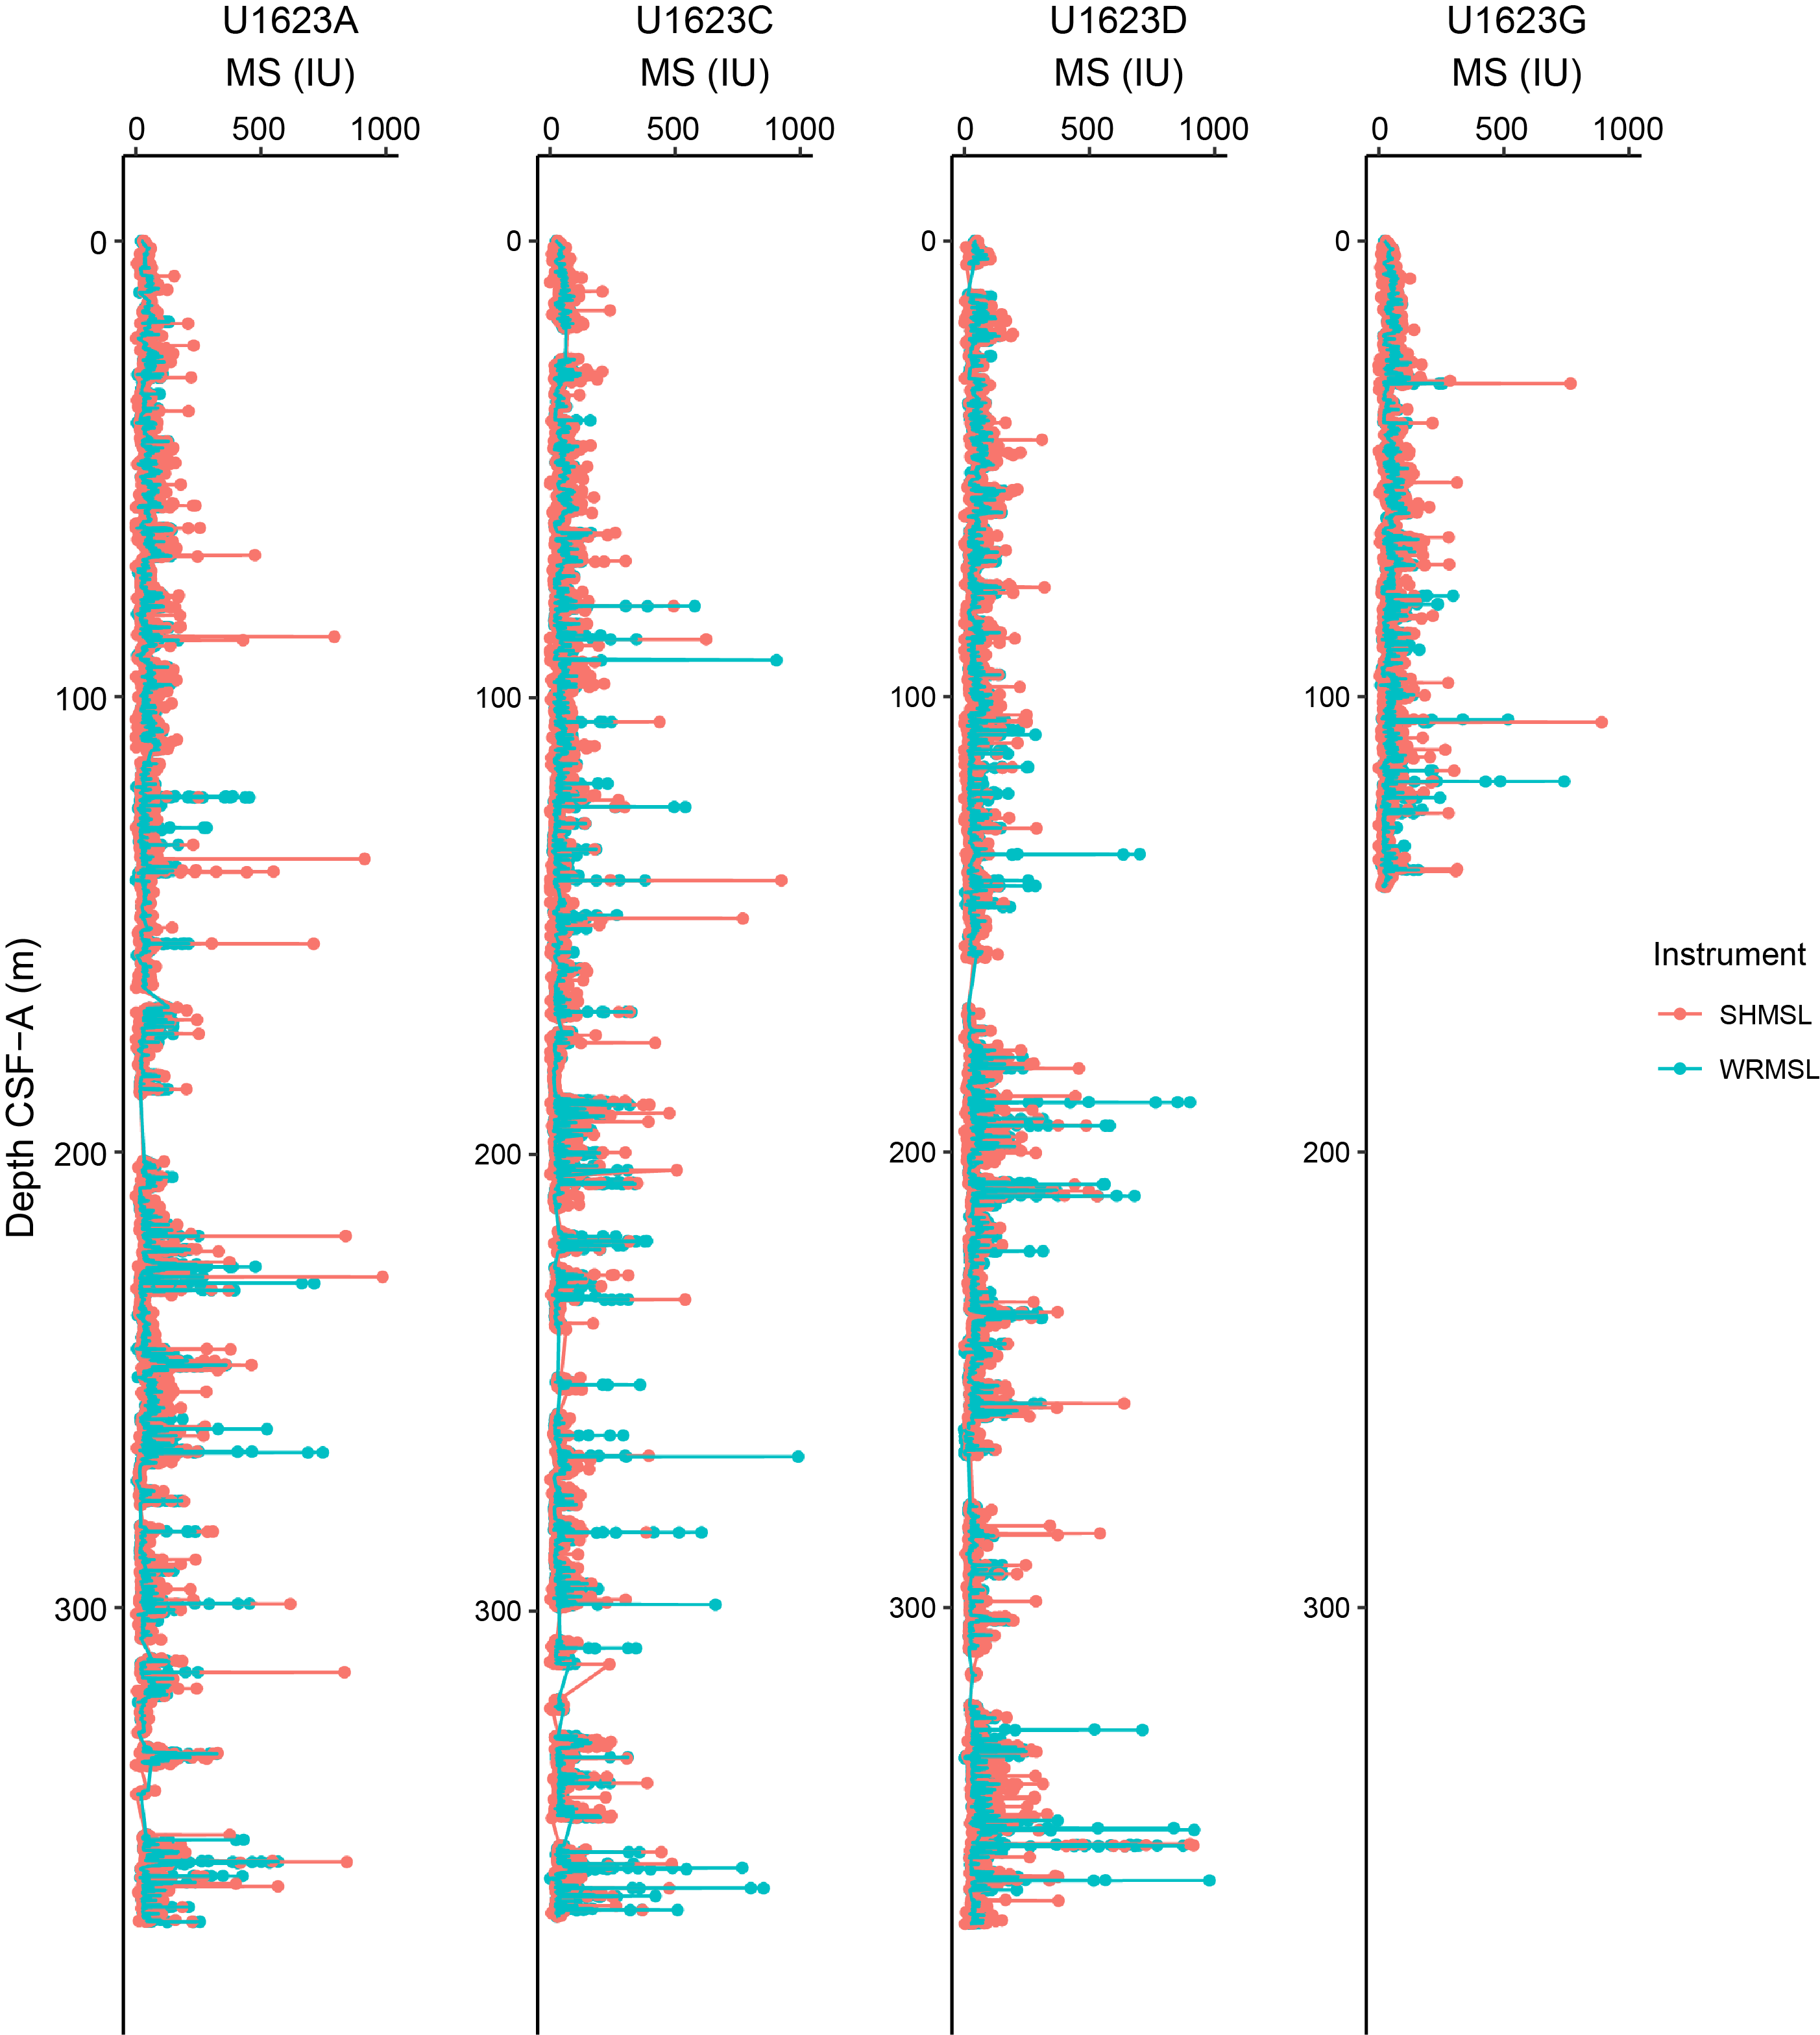
Figure F45. MS, Holes U1623A, U1623C, U1623D, and U1623G.
At Site U1621, excluding outliers related to gaps or disturbances, MS values range 1.02–978.14 IU for whole-round sections and 0.23–2130 IU for archive-half sections (see Physical properties in the Expedition 403 methods chapter [Lucchi et al., 2026a] for details on instrument units). High MS values driven by greigite nodules observed at previous sites (see Physical properties in the Site U1618 chapter [Lucchi et al., 2026b], Physical properties in the Site U1619 chapter [St. John et al., 2026a], and Physical properties in the Site U1620 chapter [St. John et al., 2026b]) are present at Site U1621 but are less pervasive. Nodules observed on the split core surfaces of Site U1621 are typically smaller (millimeter scale) compared to previous sites (centimeter scale), and the associated MS peaks have lower values. Excluding outliers from cores that required heat application for extraction from the core barrel (see Operations), the average MS values were 51.67 IU for the WRMSL and 50.44 IU for the SHMSL. In the uppermost ~40 m of the record, Site U1621 MS values co-vary with NGR (Figure F46). Between ~40 and ~150 mbsf, the Site U1621 MS–NGR relationship has two trends: one with a positive linear correlation and another where the relationship is not linear. Below ~150 mbsf to the bottom of the Site U1621 record, horizons with low MS and low NGR may be associated with layers of detrital carbonates (see Lithostratigraphy). The Site U1621 MS–GRA bulk density relationship has the same two trends: one with a positive linear correlation and another where the relationship is not linear (Figure F46).
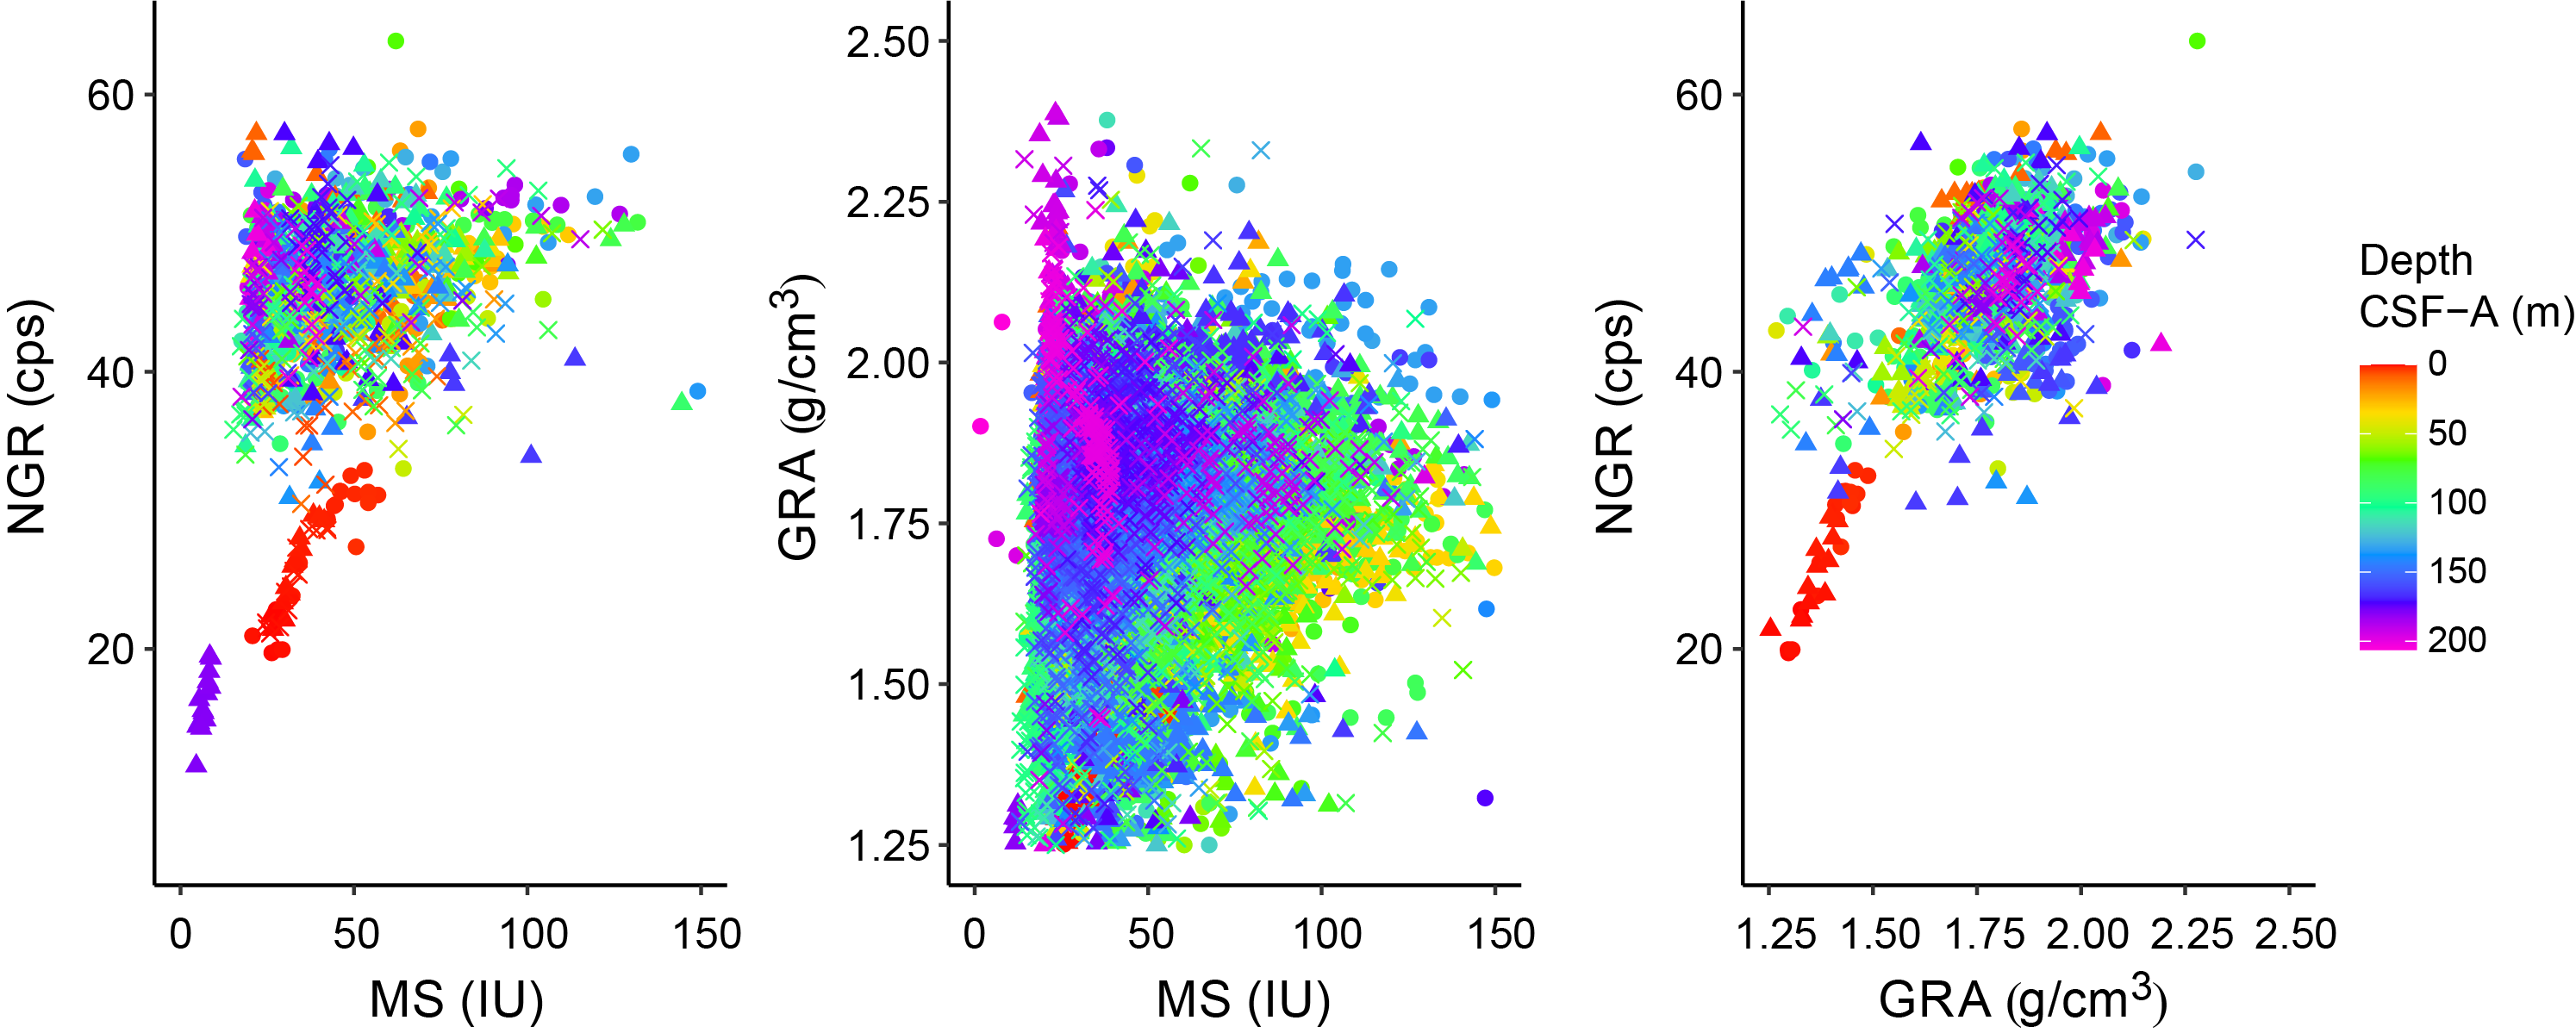
Figure F46. NGR, GRA bulk density, and MS, Site U1621.
Site U1622 WRMSL-derived MS values range ~0–396.48 IU (average = 34.72 IU), and SHMSL-derived MS values range ~0–429.38 IU (average = 32.69 IU). Site U1622 average MS values are lower than the averages for Sites U1621 and U1623. This is consistent with a noted absence of greigite at Site U1622 (see Lithostratigraphy). Because Site U1622 recovered material that is above the depth at which greigite concretions were found at other Bellsund drift sites, MS highs at Site U1622 are likely indicative of clasts transported by debris flow or other gravity mass movement of sediments (see Lithostratigraphy) and are not associated with an authigenic overprint. Crossplots of MS relationship with other physical properties show two distinct clusters, one at ~0–5 mbsf and another from ~5 mbsf to the base of the hole (Figure F47). The clustering is due to stepwise changes in NGR and GRA bulk density at depth, whereas MS values remain consistently low.
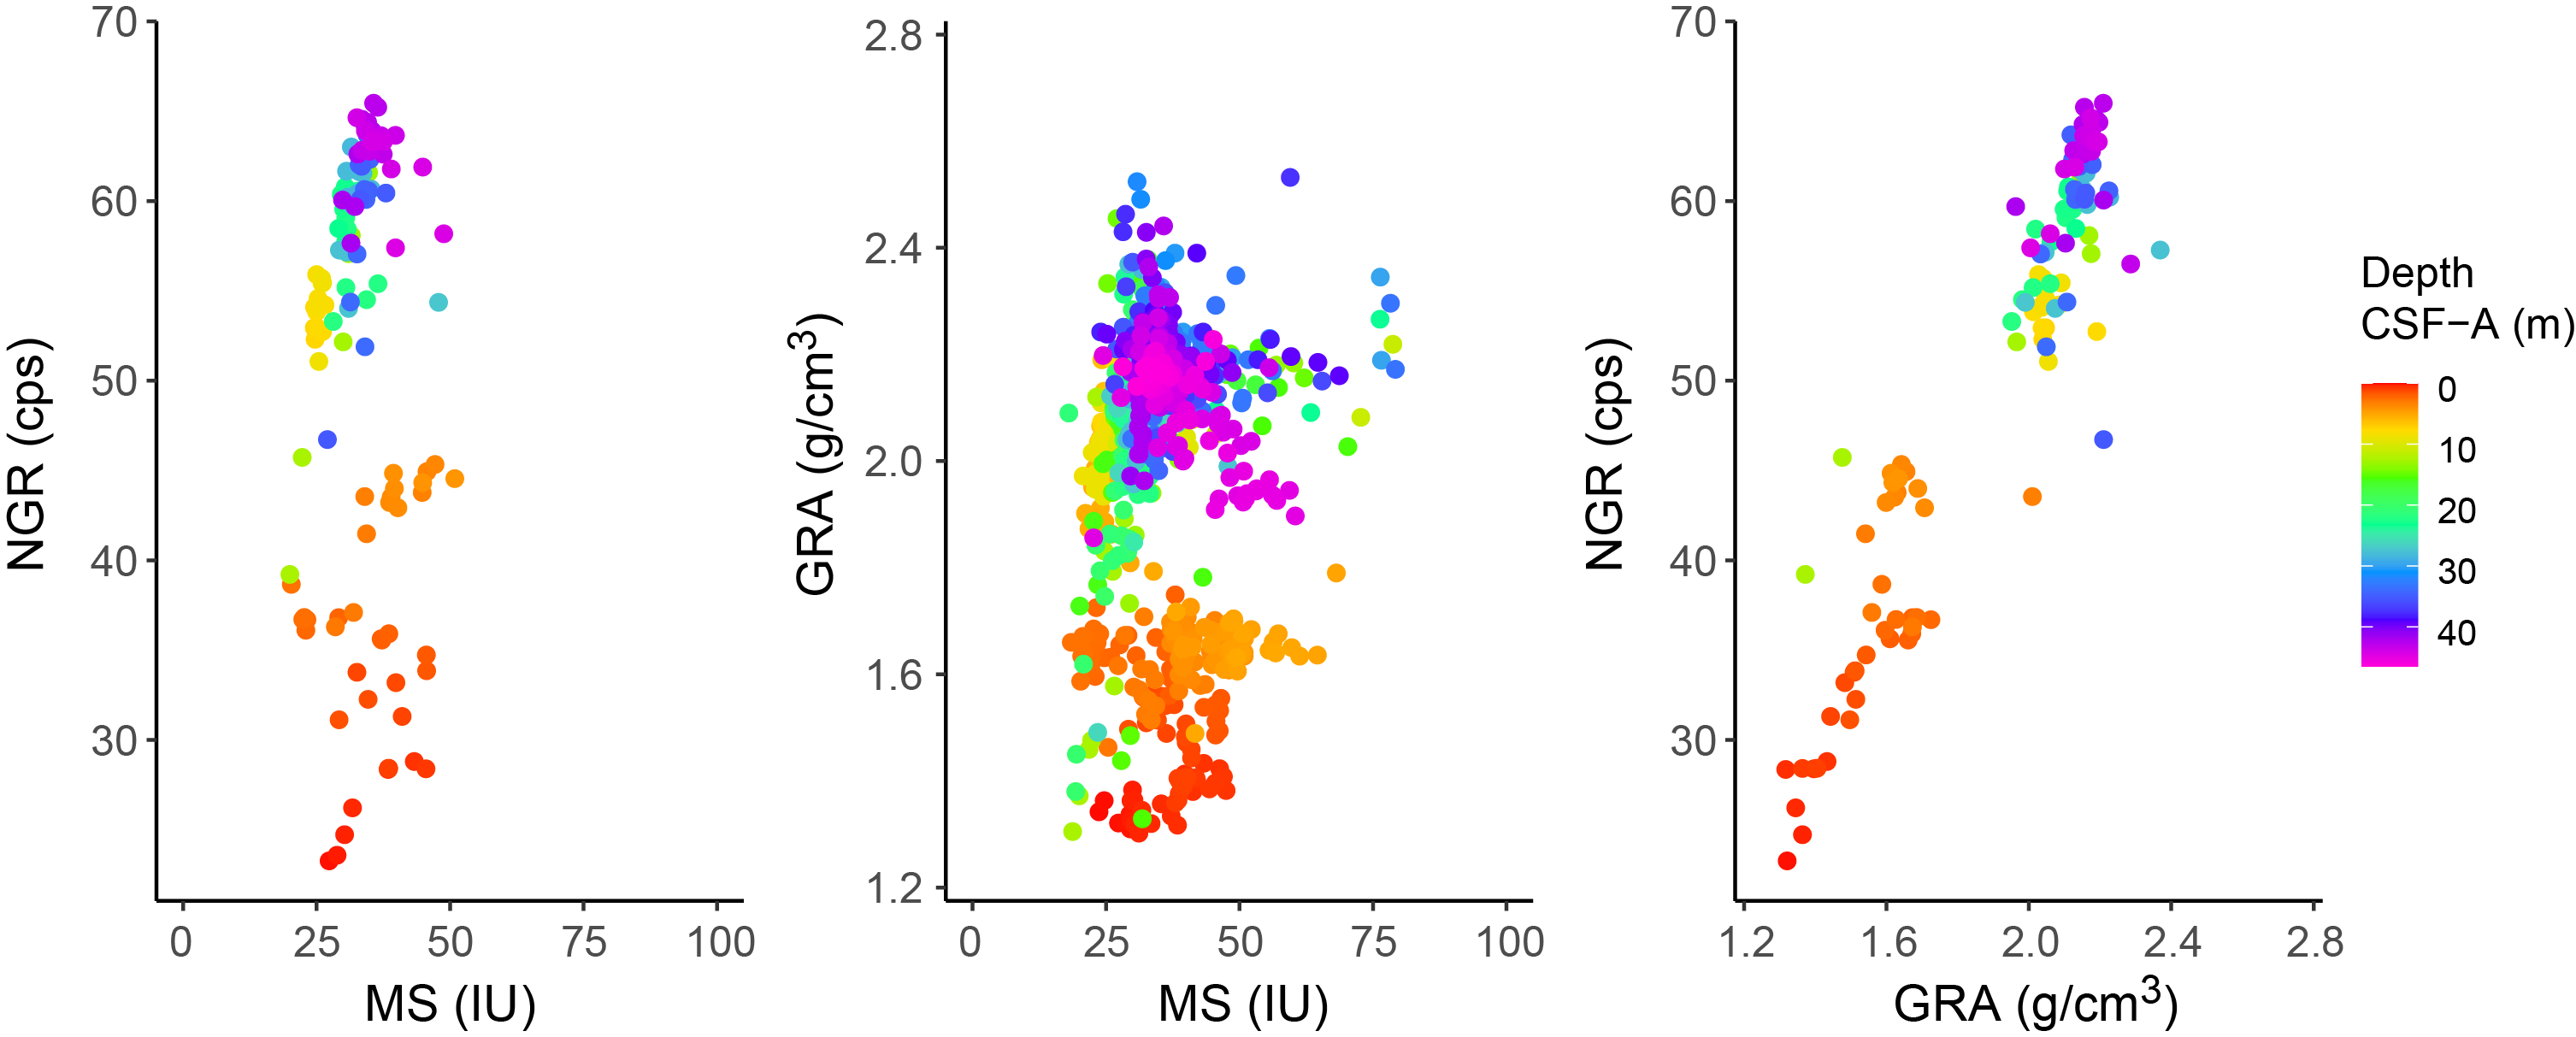
Figure F47. NGR, GRA bulk density, and MS, Site U1622.
Site U1623 WRMSL-derived MS values reach maximums of 18,455.49 IU (average = 46.22 IU) for Hole U1623A, 991.89 IU (average = 44.85 IU) for Hole U1623C, 15,061.61 IU (average = 50.44 IU) for Hole U1623D, and 742.25 IU (average = 47.33 IU) for Hole U1623G. Site U1623 SHMSL-derived MS values reach maximums of 3655.18 IU (average = 44.85 IU) for Hole U1623A, 991.89 IU (average = 48.13 IU) for Hole U1623C, 4065.75 IU (average = 51.32 IU) for Hole U1623D, and 3610.11 IU (average = 49.72 IU) for Hole U1623G. Both WRMSL and SHMSL data display higher MS values in deeper holes. The outsized peaks in MS that are associated with greigite formation at depth are higher magnitude in Site U1623 than in Site U1621 but lower magnitude than the outsized peaks observed in Expedition 403 northern Sites U1618–U1620 (see Physical properties in the Site U1618 chapter [Lucchi et al., 2026b], Physical properties in the Site U1619 chapter [St. John et al., 2026a], and Physical properties in the Site U1620 chapter [St. John et al., 2026b]). Site U1623 MS co-varies with NGR at ~0–40 mbsf. Below ~40 mbsf, the relationship of MS to NGR exhibits two trends: one trend is a positive linear correlation and another is not linear (Figure F48).
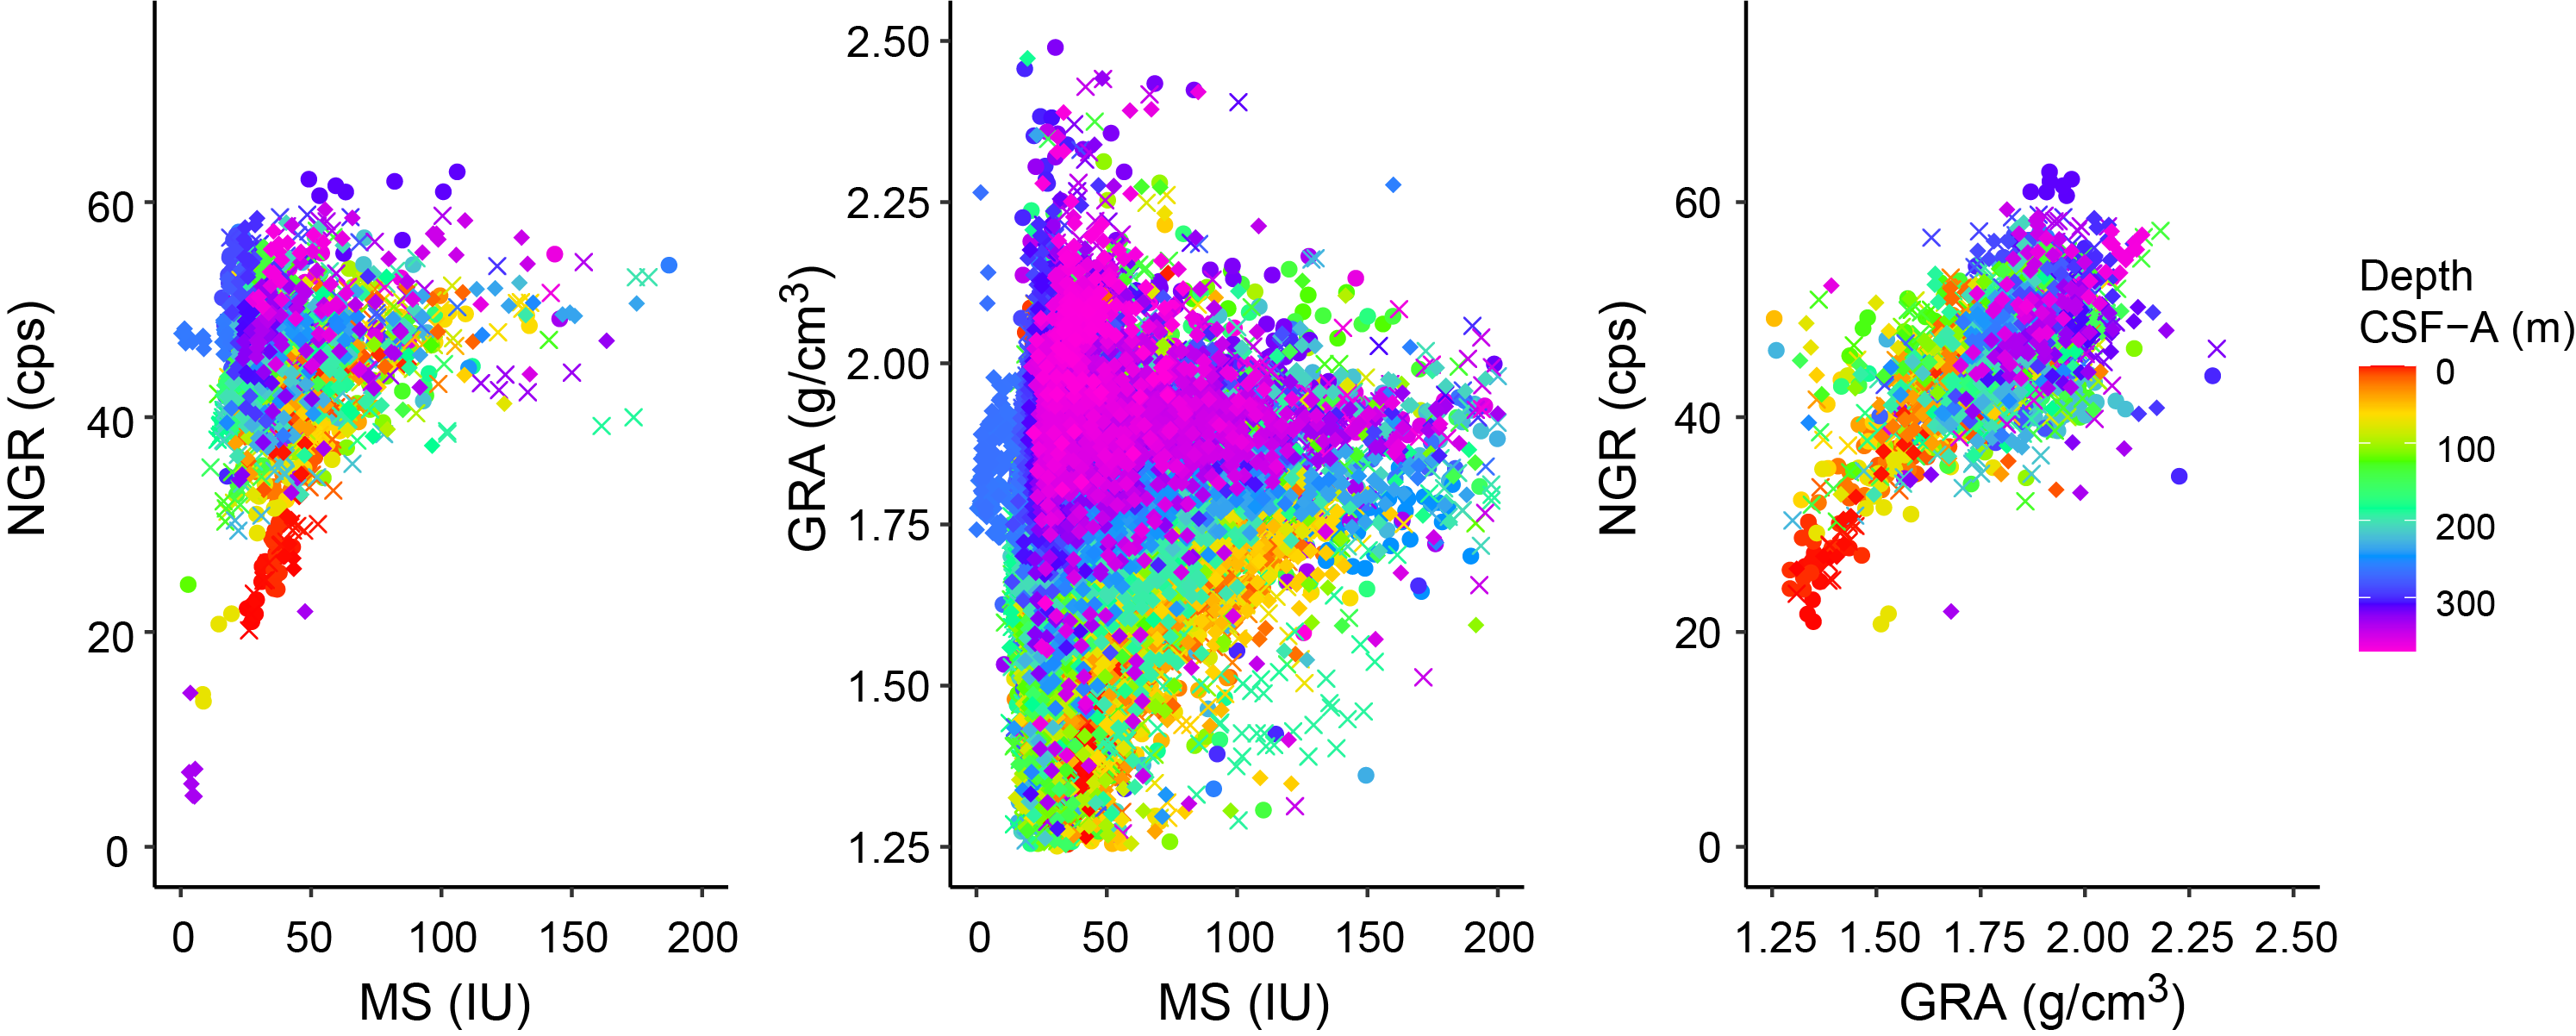
Figure F48. NGR, GRA bulk density, and MS, Holes U1623A, U1623C, and U1623D.
6.2. Gamma ray attenuation bulk density
Except for the cores that were sampled for sedaDNA, every whole-round section was measured at 2.5 cm intervals using the WRMSL GRA sensor. Excluding outliers related to voids or coring disturbances, GRA bulk density values at Sites U1621–U1623 range ~1.2 to ~2.7 g/cm3. A rapid increase from ~1.2–1.3 to ~1.7 g/cm3 occurs from the seafloor to ~10 mbsf at Sites U1621 and U1623 and to ~2.5 mbsf at Site U1622. The overall GRA bulk density trend toward higher values with increasing depth in the few meters below seafloor is consistent with sediment compaction at depth or the occurrence of consolidated gravity mass deposits (e.g., Site U1622).
At Site U1621, below ~10 mbsf, GRA bulk density values are relatively stable with a mode of ~1.7–1.8 g/cm3. A broad interval of higher GRA bulk density, also reflected in higher NGR values, occurs between ~77 and 87 mbsf. The interval of low GRA bulk density in Hole U1621B between ~145 and 150 mbsf is the result of coring disturbance due to difficulties in extracting Core 403-U1621B-22F from the core barrel. Around ~180 mbsf, we encountered a rocky, dense contact that likely corresponds to Reflector R3 (Lucchi et al., 2023). Below ~180 mbsf, core recovery was lower and had some gaps for Holes U1621A–U1621C, suggesting that in these deeper sections GRA bulk density values do not represent the original sediment fabric or compaction. We suggest looking at the MAD data for bulk density values when working with core data and samples below ~180 mbsf. Overall, GRA bulk density shows a positive linear correlation with NGR, which is strongest in the uppermost ~10 m (Figure F46).
Hole U1622A GRA bulk density follows a typical trend of an increase from ~1.25 to ~1.75 g/cm3 in the interval 0 to ~5 mbsf. However, it is then followed by a sharp increase to nearly 2.25 g/cm3. Below ~5 mbsf, bulk density values remain high with an average of 2.05 g/cm3, in contrast to other Bellsund drift sites (U1621 and U1623), which have density averages of ~1.7–1.8 g/cm3. High bulk density at Site U1622 persists from ~5 mbsf to the bottom of the hole at 46.52 mbsf and is also confirmed by the MAD measurements described below. High density is consistent with the coarse gravel observed in split cores (see Lithostratigraphy) and is likely associated with a debris flow, or another gravity mass movement event, possibly linked to a former position of the ice edge. GRA bulk density co-varies with NGR, but it has no correlation with MS, which remains relatively low at this site (Figure F47). Biplots of GRA bulk density with MS and with NGR both have two well-defined clusters, one below and one above ~5 mbsf (Figure F47), which is consistent with a sharp transition observed in downcore plots.
At Site U1623, the GRA bulk density maximum is ~2.57 g/cm3 (average = ~1.76 g/cm3) for Hole U1623A, ~2.76 g/cm3 (average = ~1.77 g/cm3) for Hole U1623C, ~2.84 g/cm3 (average = ~1.78 g/cm3) for Hole U1623D, and ~2.38 g/cm3 (average = ~1.70 g/cm3) for Hole U1623G. A rapid increase in density from 0 to ~10 mbsf is followed by a slower but consistent increasing trend downcore, with highest average GRA bulk densities of 2.01 g/cm3 in the intervals between ~310 and 320 mbsf in Core 403-U1623A-46X and between ~132 and 138 mbsf in Cores 403-U1623D-20F and 21F. The GRA bulk density–MS relationship shows two different trends: one where GRA bulk density and MS co-vary, and another where GRA bulk density increase downcore has no association with MS. GRA bulk density and NGR have a positive linear correlation (Figure F48). GRA bulk density linear relationships with other physical properties potentially indicate climate-driven variability in sediments. The second trend, where GRA lacks coherence with MS, indicates that greigite-induced MS peaks can occur in sediment regardless of its depth or degree of compaction.
6.3. Natural gamma radiation
NGR was measured on all whole-round core sections at 10 cm intervals. At Site U1621, NGR values range ~6 to ~64 counts/s (average = ~46 counts/s). There is a rapid increase from ~24 counts/s at seafloor to ~48–50 counts/s at ~8–10 mbsf, which is likely a result of compaction and decreasing water content. NGR variability appears to be low amplitude and rhythmical, centered around a mode of ~49 counts/s. Generally, NGR mirrors GRA bulk density trends downcore, except below ~140 mbsf in Hole U1621B where similarities are less apparent. This may be due to coring complications around the denser contact discussed above. The crossplot of NGR and MS for Site U1621 shows a population of points in the lower MS–NGR ranges with a positive linear correlation at ~150–200 mbsf (Figure F46). This relationship could be due to nonbiogenic carbonates or due to disturbance affecting both NGR and MS measurements.
Site U1622 NGR ranges ~23.27–67.79 counts/s (average = 56.40 counts/s), which is higher than any other Bellsund drift site. NGR increases from ~20 to ~60 counts/s from seafloor to a sharp change at ~10 mbsf and remains high to ~33 mbsf. From ~33 mbsf to the bottom of Hole U1622A at 46.52 mbsf, NGR shows a larger variability than in other sections. NGR and GRA density values have a positive linear correlation (Figure F47) with high NGR values pointing to decreased porosity and high GRA values pointing to increased compaction in gravity mass movement deposits recovered in Cores 403-U1622A-2H through 6H.
Site U1623 NGR values range 13.55–62.82 counts/s (average = 46.20 counts/s) for Hole U1623A, 20.15–98.75 counts/s (average = 45.80 counts/s) for Hole U1623C, ~5–62.52 counts/s (average = 46.58 counts/s) for Hole U1623D, and 20.90–57.42 counts/s (average = 43.92 counts/s) for Hole U1623G. Site U1623 NGR maxima are among the highest encountered during Expedition 403, whereas NGR averages are similar to or lower than other sites/holes in the Bellsund drift. This is consistent with an increase in units with high clay content and/or compaction (marked by upper NGR ranges) within the coarser, sandy units (marked by lower NGR averages) (see Lithostratigraphy). There is an overall increase of NGR downcore, which occurs in parallel with GRA bulk density. The NGR–MS relationship shows two trends: one where NGR and MS co-vary and another where the higher NGR component can be associated with either low or high MS values (Figure F48). Similar to Site U1621, at Site U1623 the NGR–MS crossplot shows a small population in the lower left corner with low MS and NGR values.
6.4. P-wave velocity
Whole-round sections were measured for compressional P-wave velocity on the WRMSL at a resolution of 2.5 cm for all core sections at Sites U1621–U1623. At Site U1621, there is an initial increase in P-wave velocities from ~1480 m/s at the seafloor to ranging ~1500–1650 m/s below ~5 mbsf. However, below ~25 mbsf, the signal becomes dominated by noise with values outside of the range expected for marine sediments and reaching outlier values greater than 10,000 m/s. The use of these data below 25 mbsf for interpretation is discouraged.
P-wave velocity data from Site U1622 may be more within the expected range for marine sediments, but they still cluster around 1000 m/s, which we interpret as noise. The sharp transition noted at 5 mbsf in other physical property data is present in the P-wave velocity data for Site U1622; excluding values around 1000–1200 m/s, values range ~1700–1900 m/s.
From the seafloor to ~17–20 mbsf at Site U1623, P-wave velocity values are generally between ~1400 and 1700 m/s, but below ~17–20 mbsf we also observed noisy data and occasional extreme outliers.
Discrete P-wave velocity measurements were made using the SHMG for the upper cores of Holes U1621A, U1622A, and U1623A. We selected intervals that excluded excessive coring disturbances, voids, cracks, or large clasts (see Physical properties in the Expedition 403 methods chapter [Lucchi et al., 2026a]). For Hole U1621A, one section per core was measured for Cores 2H–5H. Because of noise in the signal, P-wave velocity waveforms were manually selected. P-wave velocity values are ~1456 m/s at 1.74 mbsf and ~1417 m/s at ~30 mbsf. Below ~25–30 mbsf, however, P-wave measurements on the SHMG were abandoned due to increasing noise and eventual lack of a detectable signal. We encountered similar issues at Sites U1622 and U1623, with signal depletion below ~20 mbsf at Site U1623 and no reliable signal in Cores 403-U1622A-1H or 2H. Above ~20 mbsf at Site U1623, values range from 1472 m/s in Section 403-U1623A-1H-2 to 1482 m/s in Section 3H-5.
We suspect the coarseness of these sediments and decreasing water content with depth, making sediments more brittle and subject to cracking, contribute to the signal depletion. Poor contact between the sediments and core liner may also contribute to signal depletion below ~20 mbsf.
6.5. Moisture and density
MAD analyses were conducted using discrete samples from the working section halves of split cores (see Physical properties in the Expedition 403 methods chapter [Lucchi et al., 2026a]). Bulk density, porosity, water content, and void ratio were calculated for 42 samples from Hole U1621A, 6 samples from Hole U1622A, and 126 samples from Hole U1623A.
For Hole U1621A, MAD bulk density increases sharply downcore from ~1.3 g/cm3 at the sediment surface to ~1.6–1.7 g/cm3 at ~8–10 mbsf, corresponding to sharply decreasing porosity and water content from 83% to 56% and from 64% to 34%–38%, respectively (Figure F49). From 10 mbsf to the bottom of Hole U1621A, the average MAD bulk density is 1.9 g/cm3. Between 150 and 155 mbsf, there is a step increase from 1.7–1.8 to 1.9–2.1 g/cm3, and MAD bulk density values remain high to the base of the hole. Water content, void ratio, and porosity co-vary downcore and are anticorrelated with MAD bulk density. After an initial sharp decrease from the seafloor to ~10 mbsf, water content generally decreases downcore from ~34% to 17% and porosity decreases from ~55% to ~35%. These parameters also exhibit a shift to lower values at around ~150 mbsf at the boundary of the higher density layer. Overall, MAD bulk density values correspond well to GRA bulk density trends downcore, although whole-round measurements may be skewed to lower values (Figure F50). Hole U1621A MAD average bulk density is higher than at previous Expedition 403 Sites U1618–U1620 (see Physical properties in the Site U1618 chapter [Lucchi et al., 2026b], Physical properties in the Site U1619 chapter [St. John et al., 2026a], and Physical properties in the Site U1620 chapter [St. John et al., 2026b]).
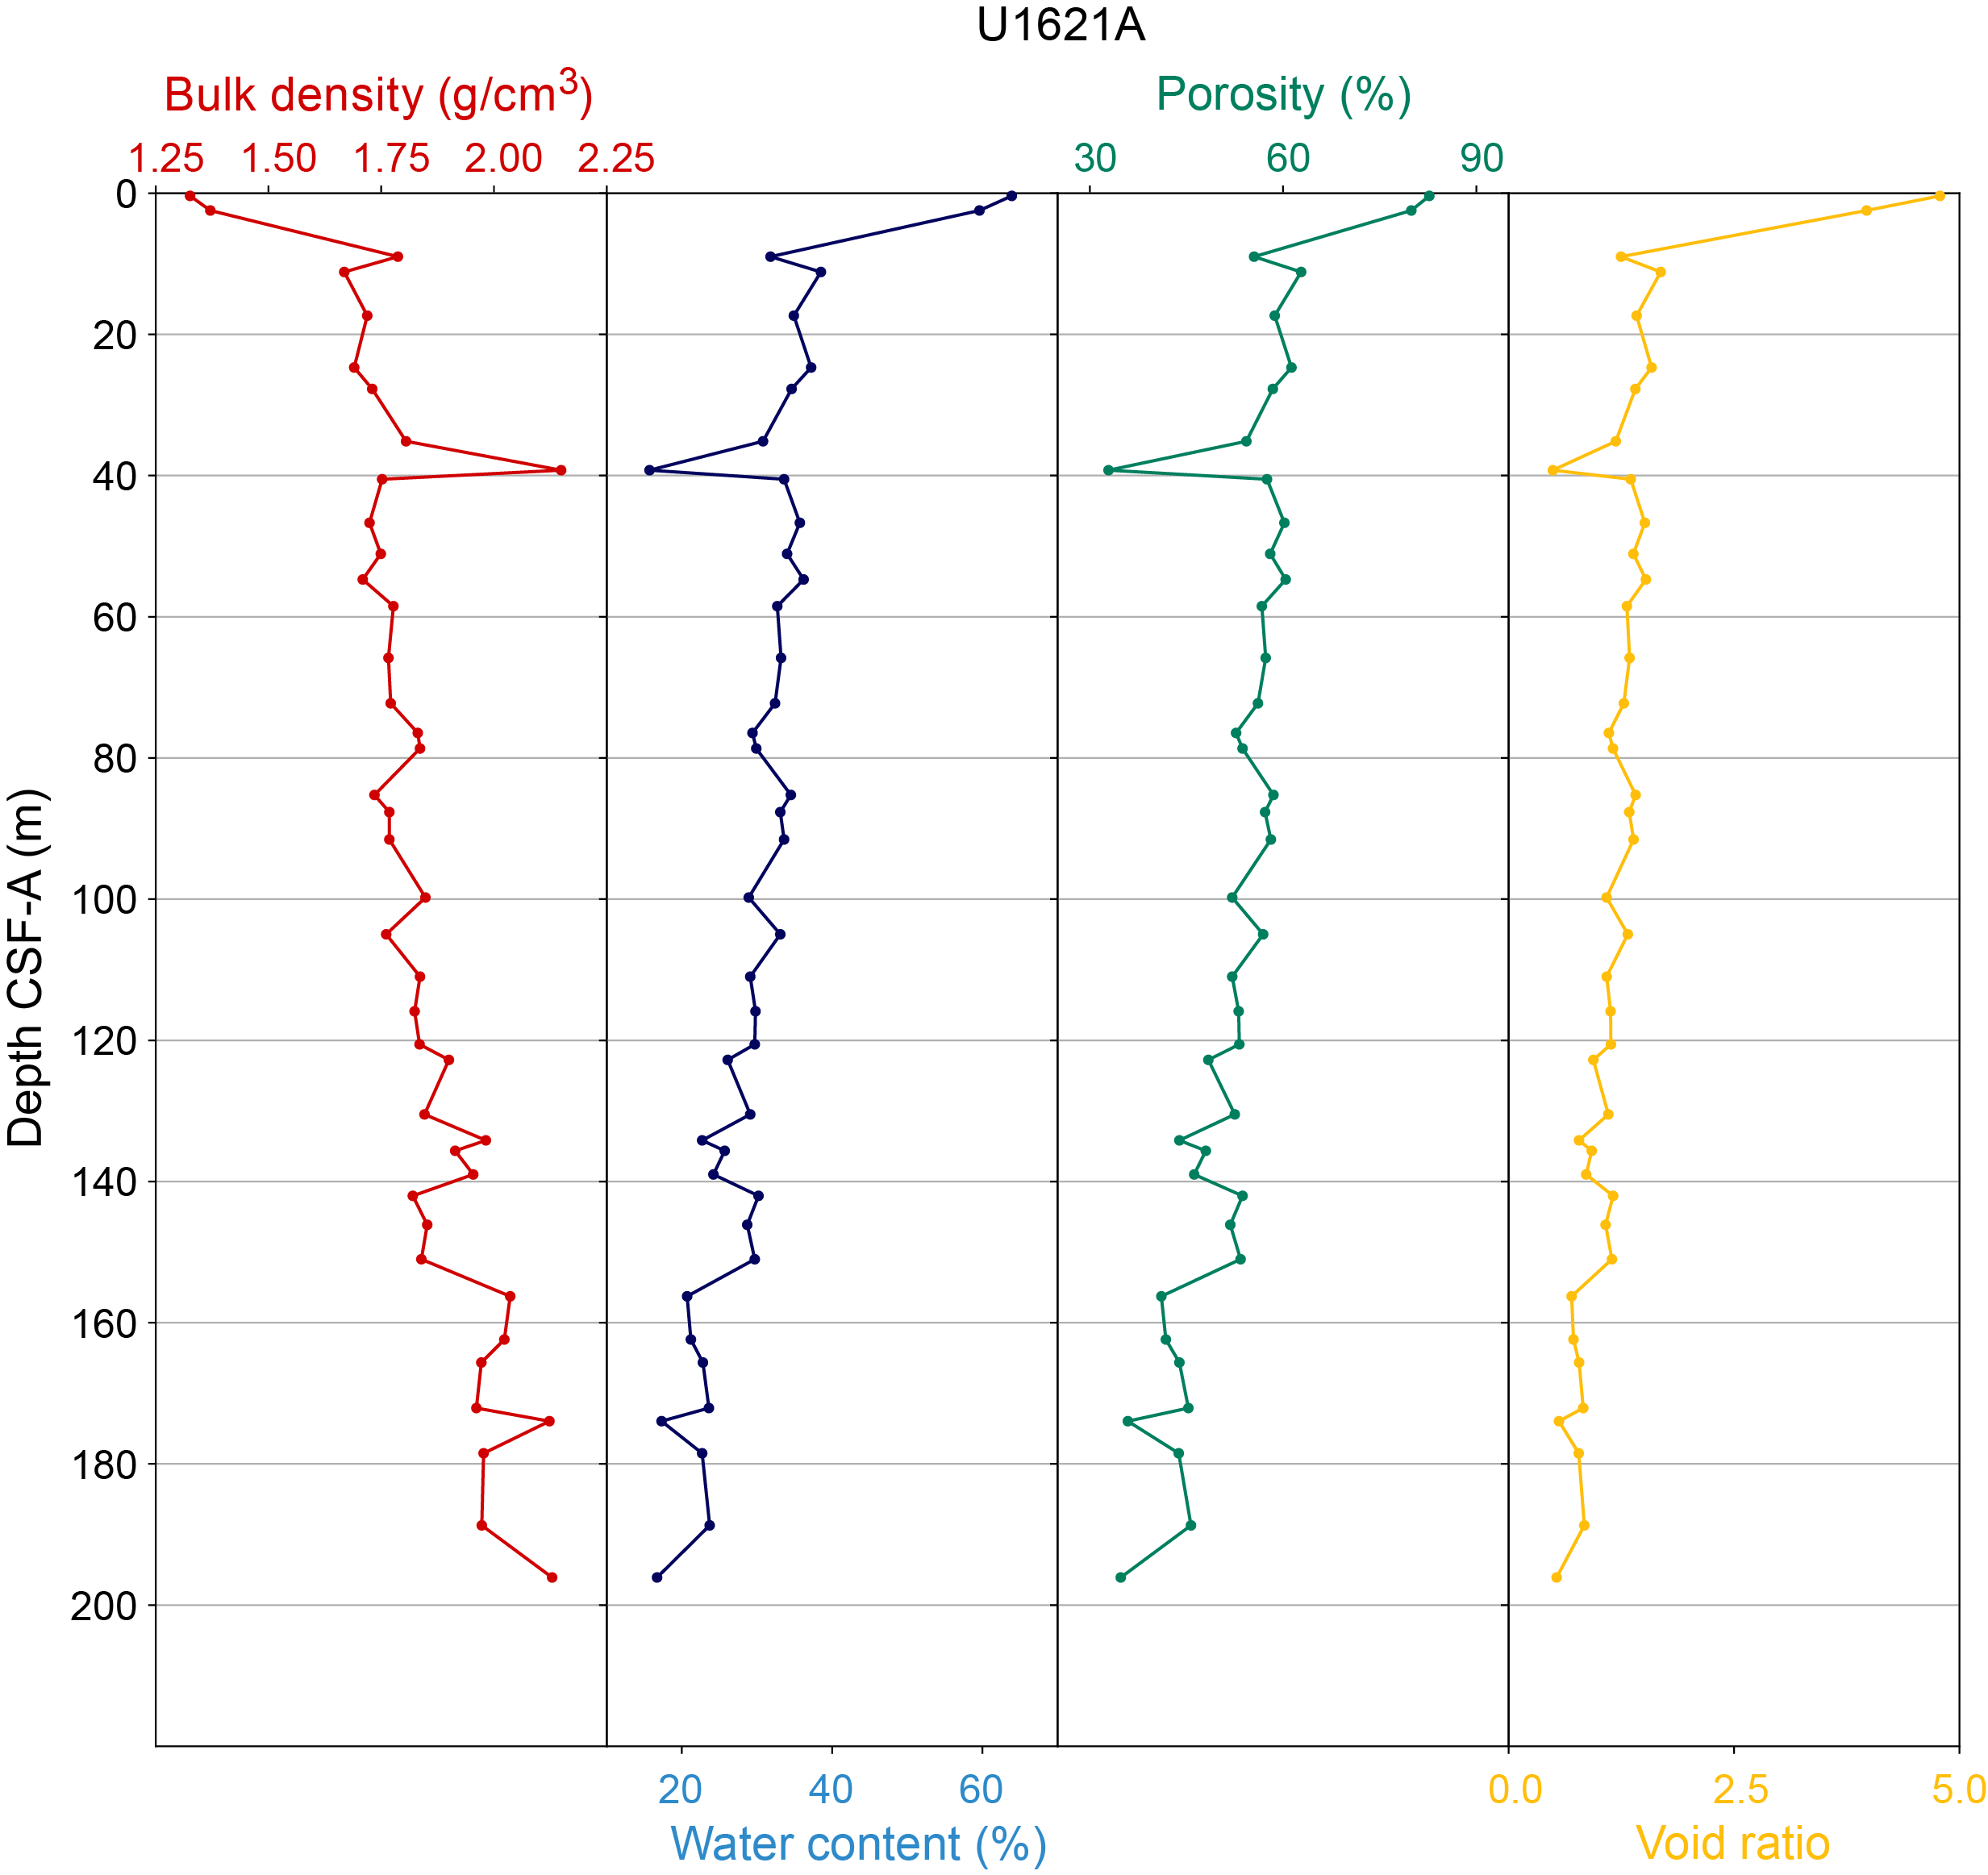
Figure F49. MAD parameters, Hole U1621A.
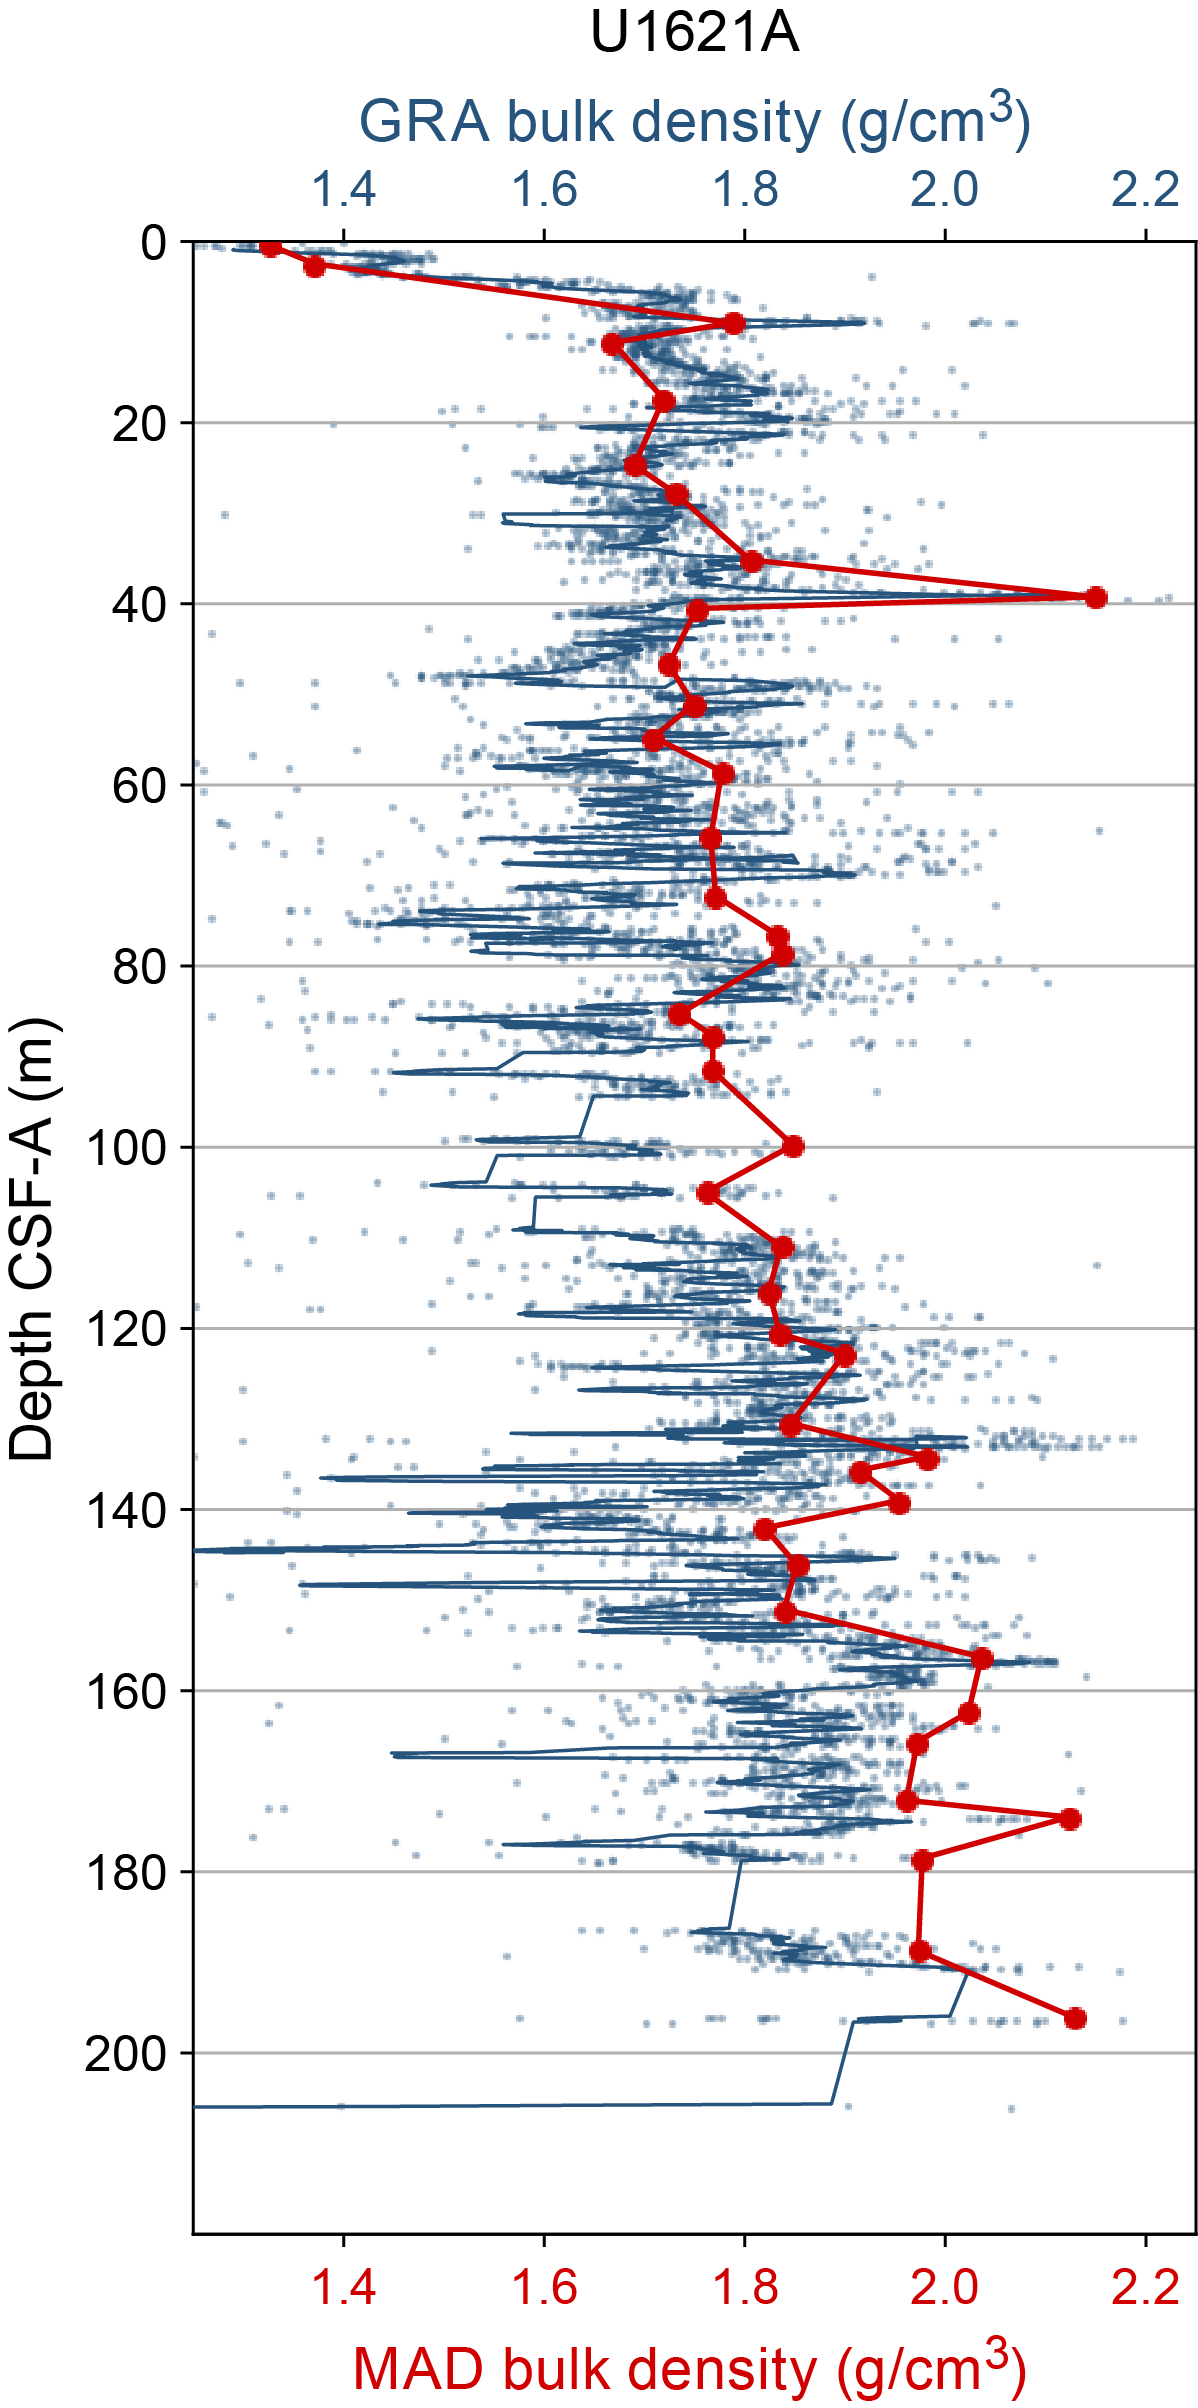
Figure F50. GRA bulk density and MAD, Hole U1621A.
For Hole U1622A, a sharp contrast in MAD parameters at ~5 mbsf corresponds to the sharp increase observed in whole-round data. Above 5 mbsf, MAD bulk density is ~1.5–1.6 g/cm3, water content is ~40%–42%, porosity is ~64%–65%, and the void ratio is ~1.8–1.9. Across the boundary at 5 mbsf, MAD bulk density increases to 2.0–2.1 g/cm3, whereas water content, porosity, and the void ratio sharply decrease to ~15%–17%, 33%–36%, and 0.5–0.7, respectively (Figure F51). Bulk density data from discrete samples are slightly lower than GRA bulk density data from whole-round measurements, especially at ~18 and 28 mbsf (Figure F52). Sediments below 5 mbsf became very clast-rich, and we suspect the abundance of dense rocks may influence values for MAD parameters.
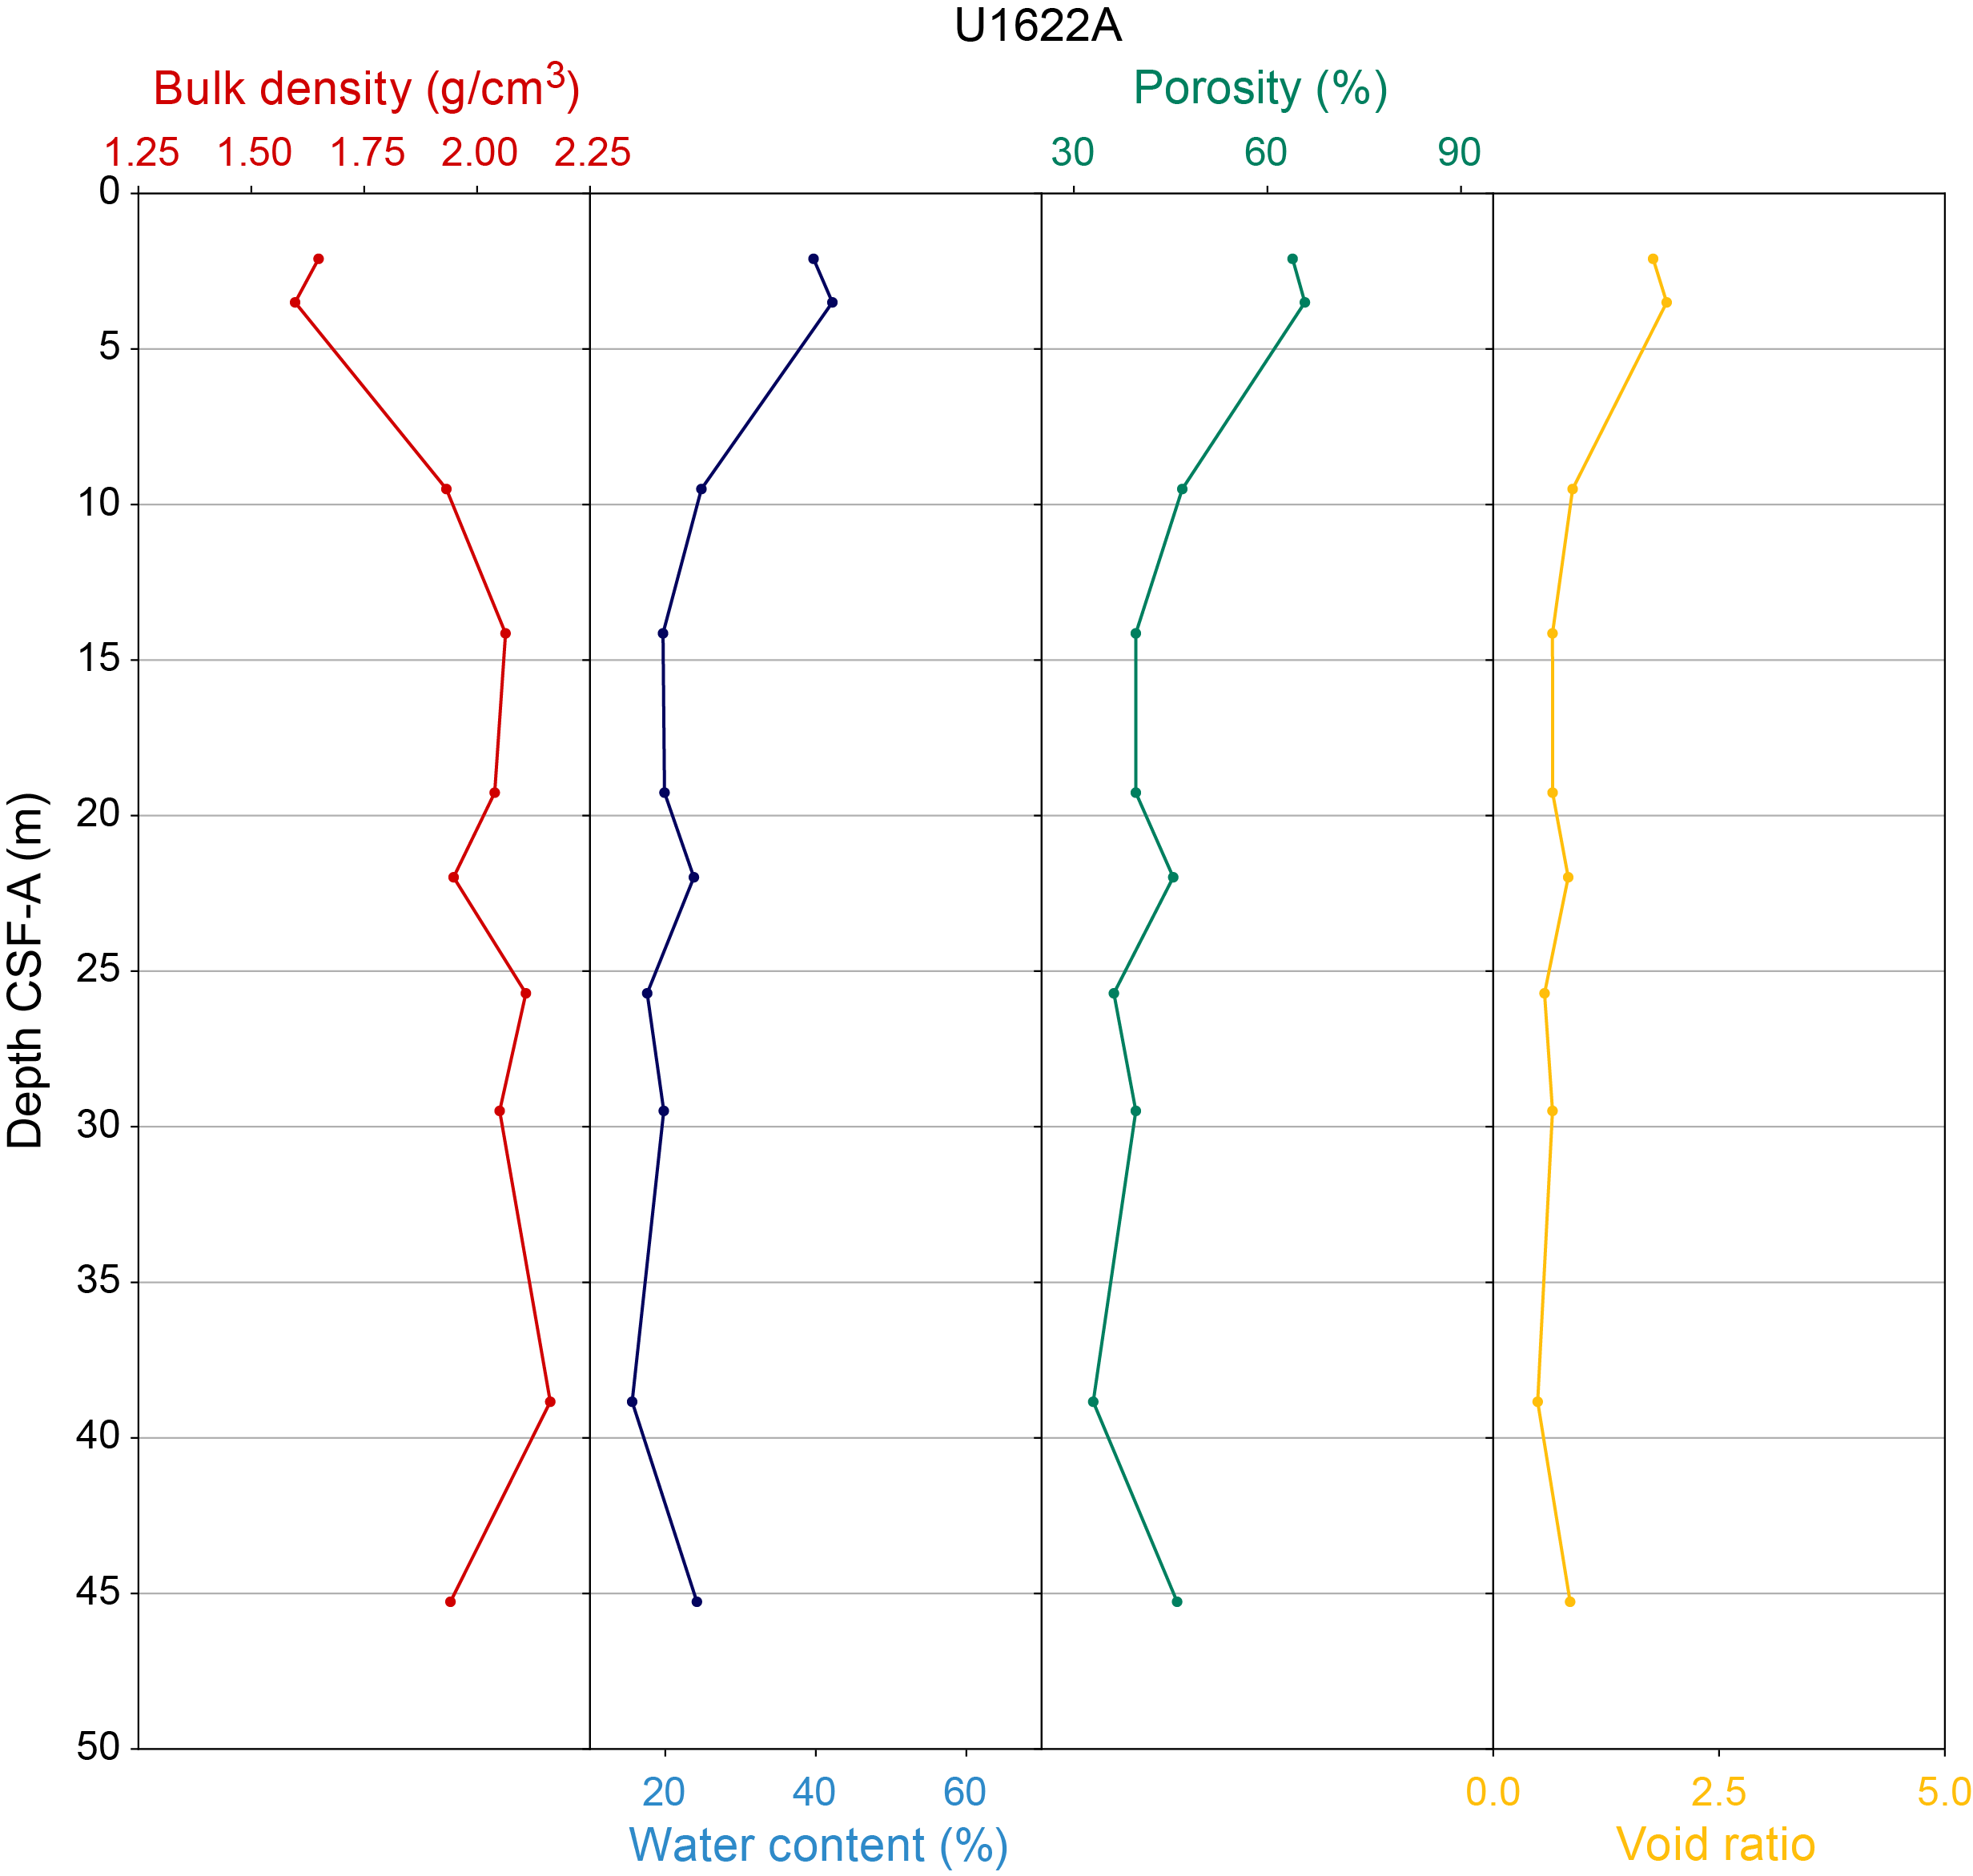
Figure F51. MAD parameters, Hole U1622A.
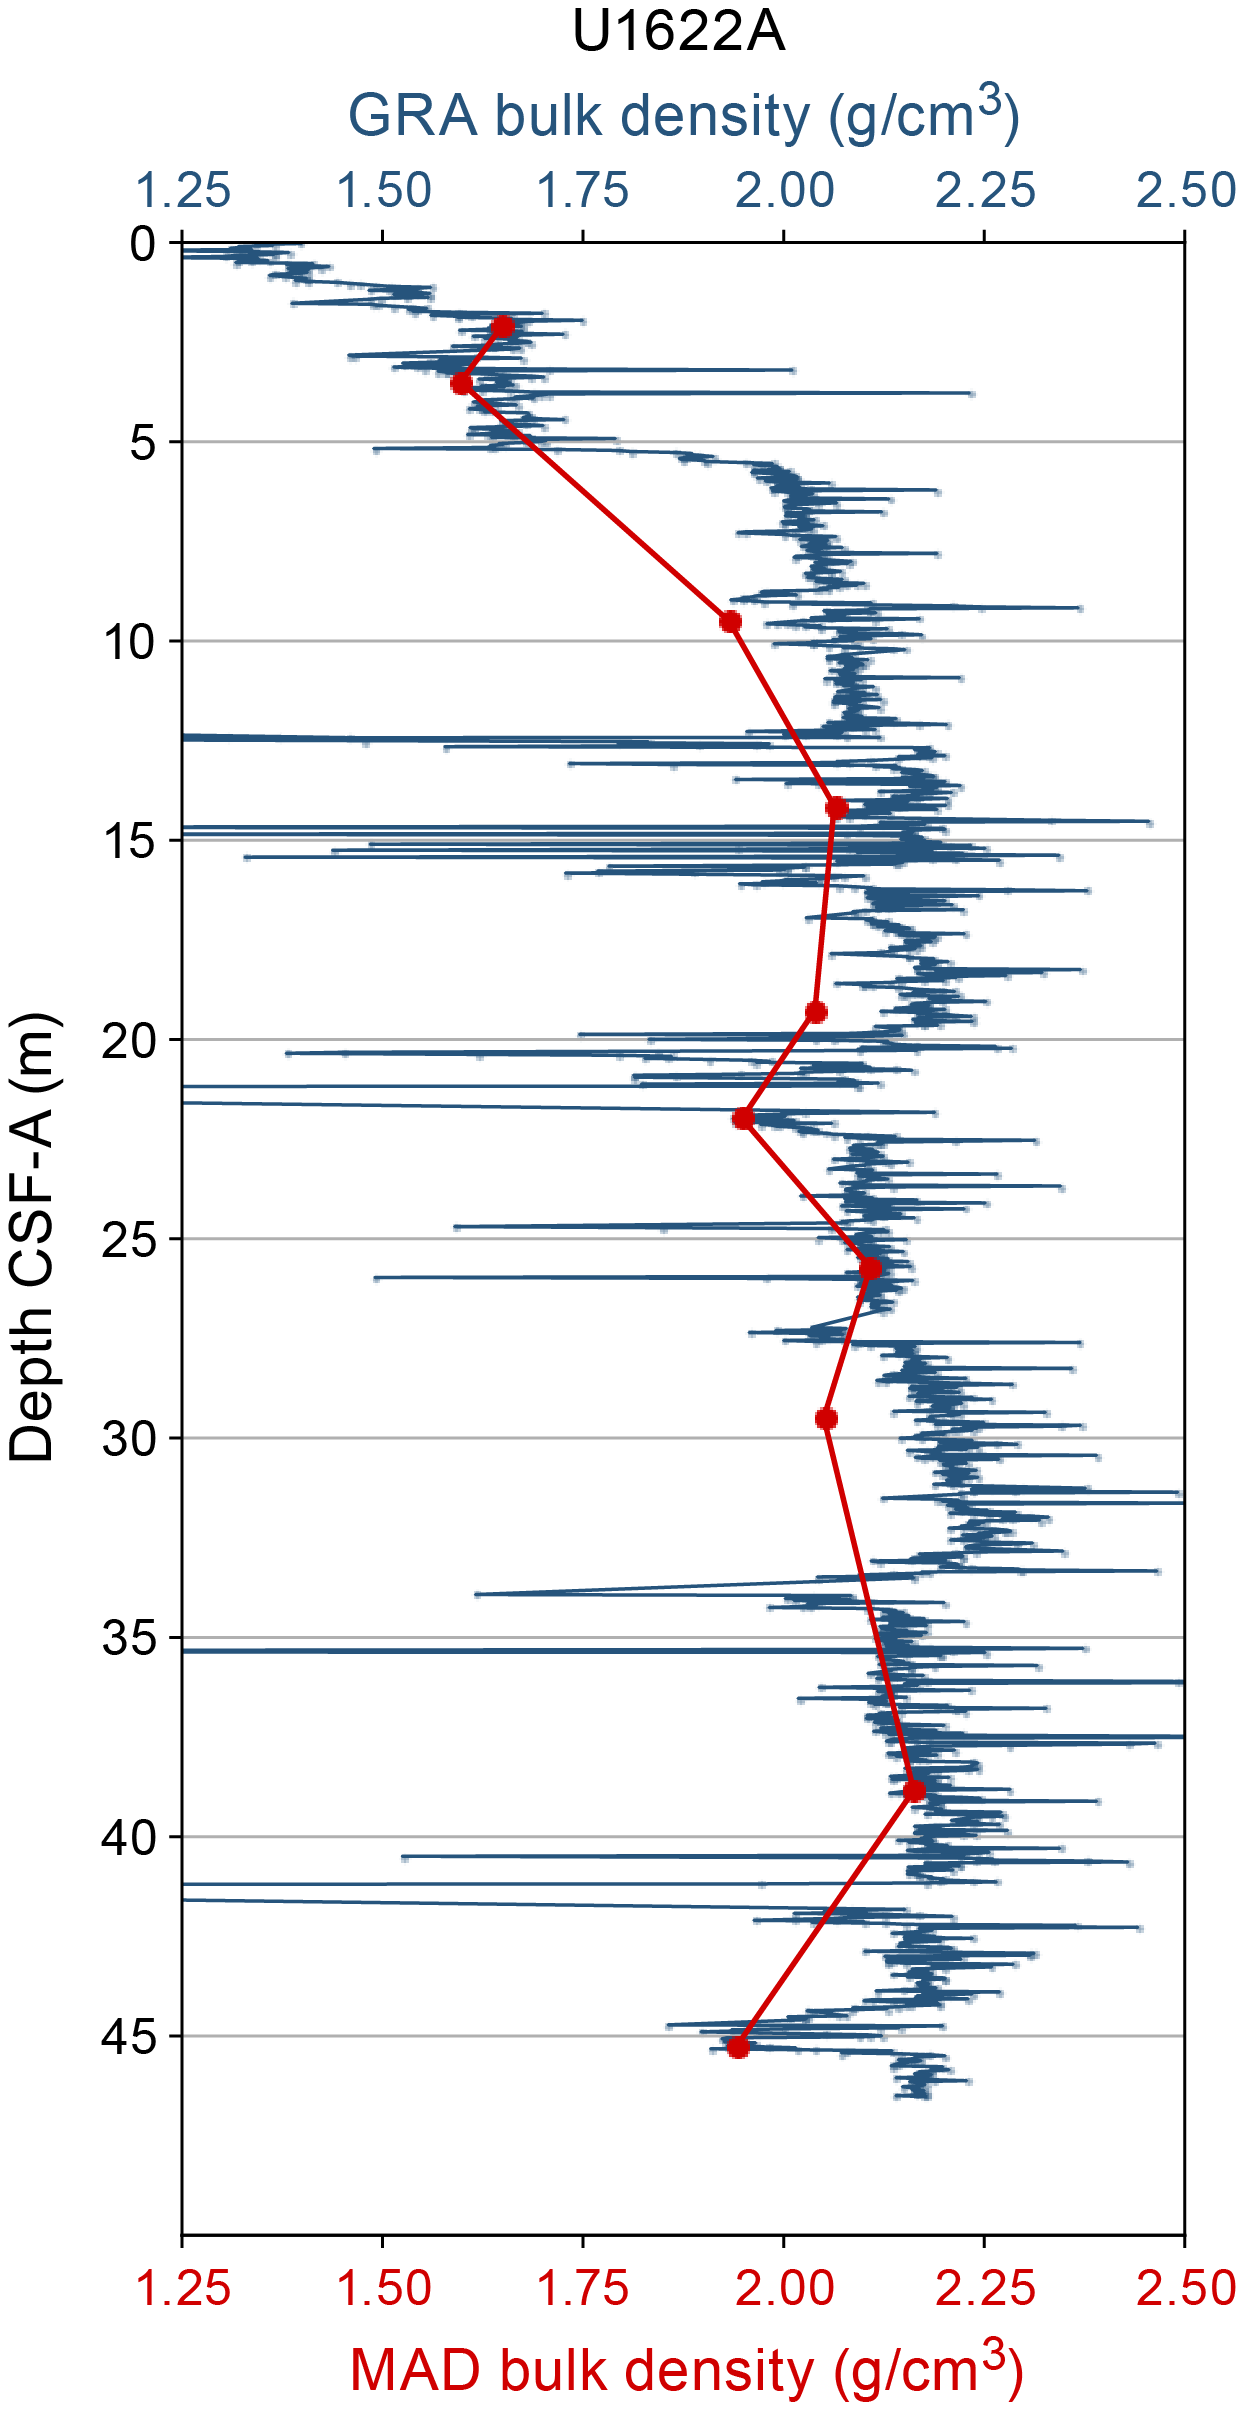
Figure F52. GRA bulk density and MAD, Hole U1622A.
For Hole U1623A, the typical compaction signal observed from the seafloor to ~10 mbsf is somewhat obscured by a high MAD bulk density value of 1.9 g/cm3 at ~6–7 mbsf. At the seafloor, MAD bulk density is ~1.4 g/cm3, and below the high-density interval at ~6–7 mbsf, values are ~1.6 g/cm3. Below ~7 mbsf, Hole U1623A MAD bulk densities vary from 1.6 to 2.0 g/cm3 (average = ~1.8 g/cm3). MAD-derived water content, porosity, and void ratio are all anticorrelated with MAD bulk density (Figure F53). MAD-derived density values gradually increase with depth. Compared to Site U1621, Site U1623 MAD bulk density data show a more obvious gradual downcore increase. We observe slight step changes to higher densities at ~80 and ~215 mbsf as well as intervals that reflect broad lows and highs identified in whole-round measurements. For example, between ~95 and 135 mbsf, the slightly lower MAD bulk density data of ~1.8 g/cm3 are between higher density intervals of ~1.9–2.0 g/cm3. Furthermore, between ~145 and 180 mbsf, slightly higher values of ~1.88 g/cm3 are bound by lower values of ~1.82 g/cm3. These correspond to broad intervals of variability in density observed in the GRA bulk density data. Although GRA bulk density data may be slightly skewed to lower values compared to MAD bulk density data, we see good agreement between the overall trends in density from whole-round and discrete sample measurements (Figure F54).
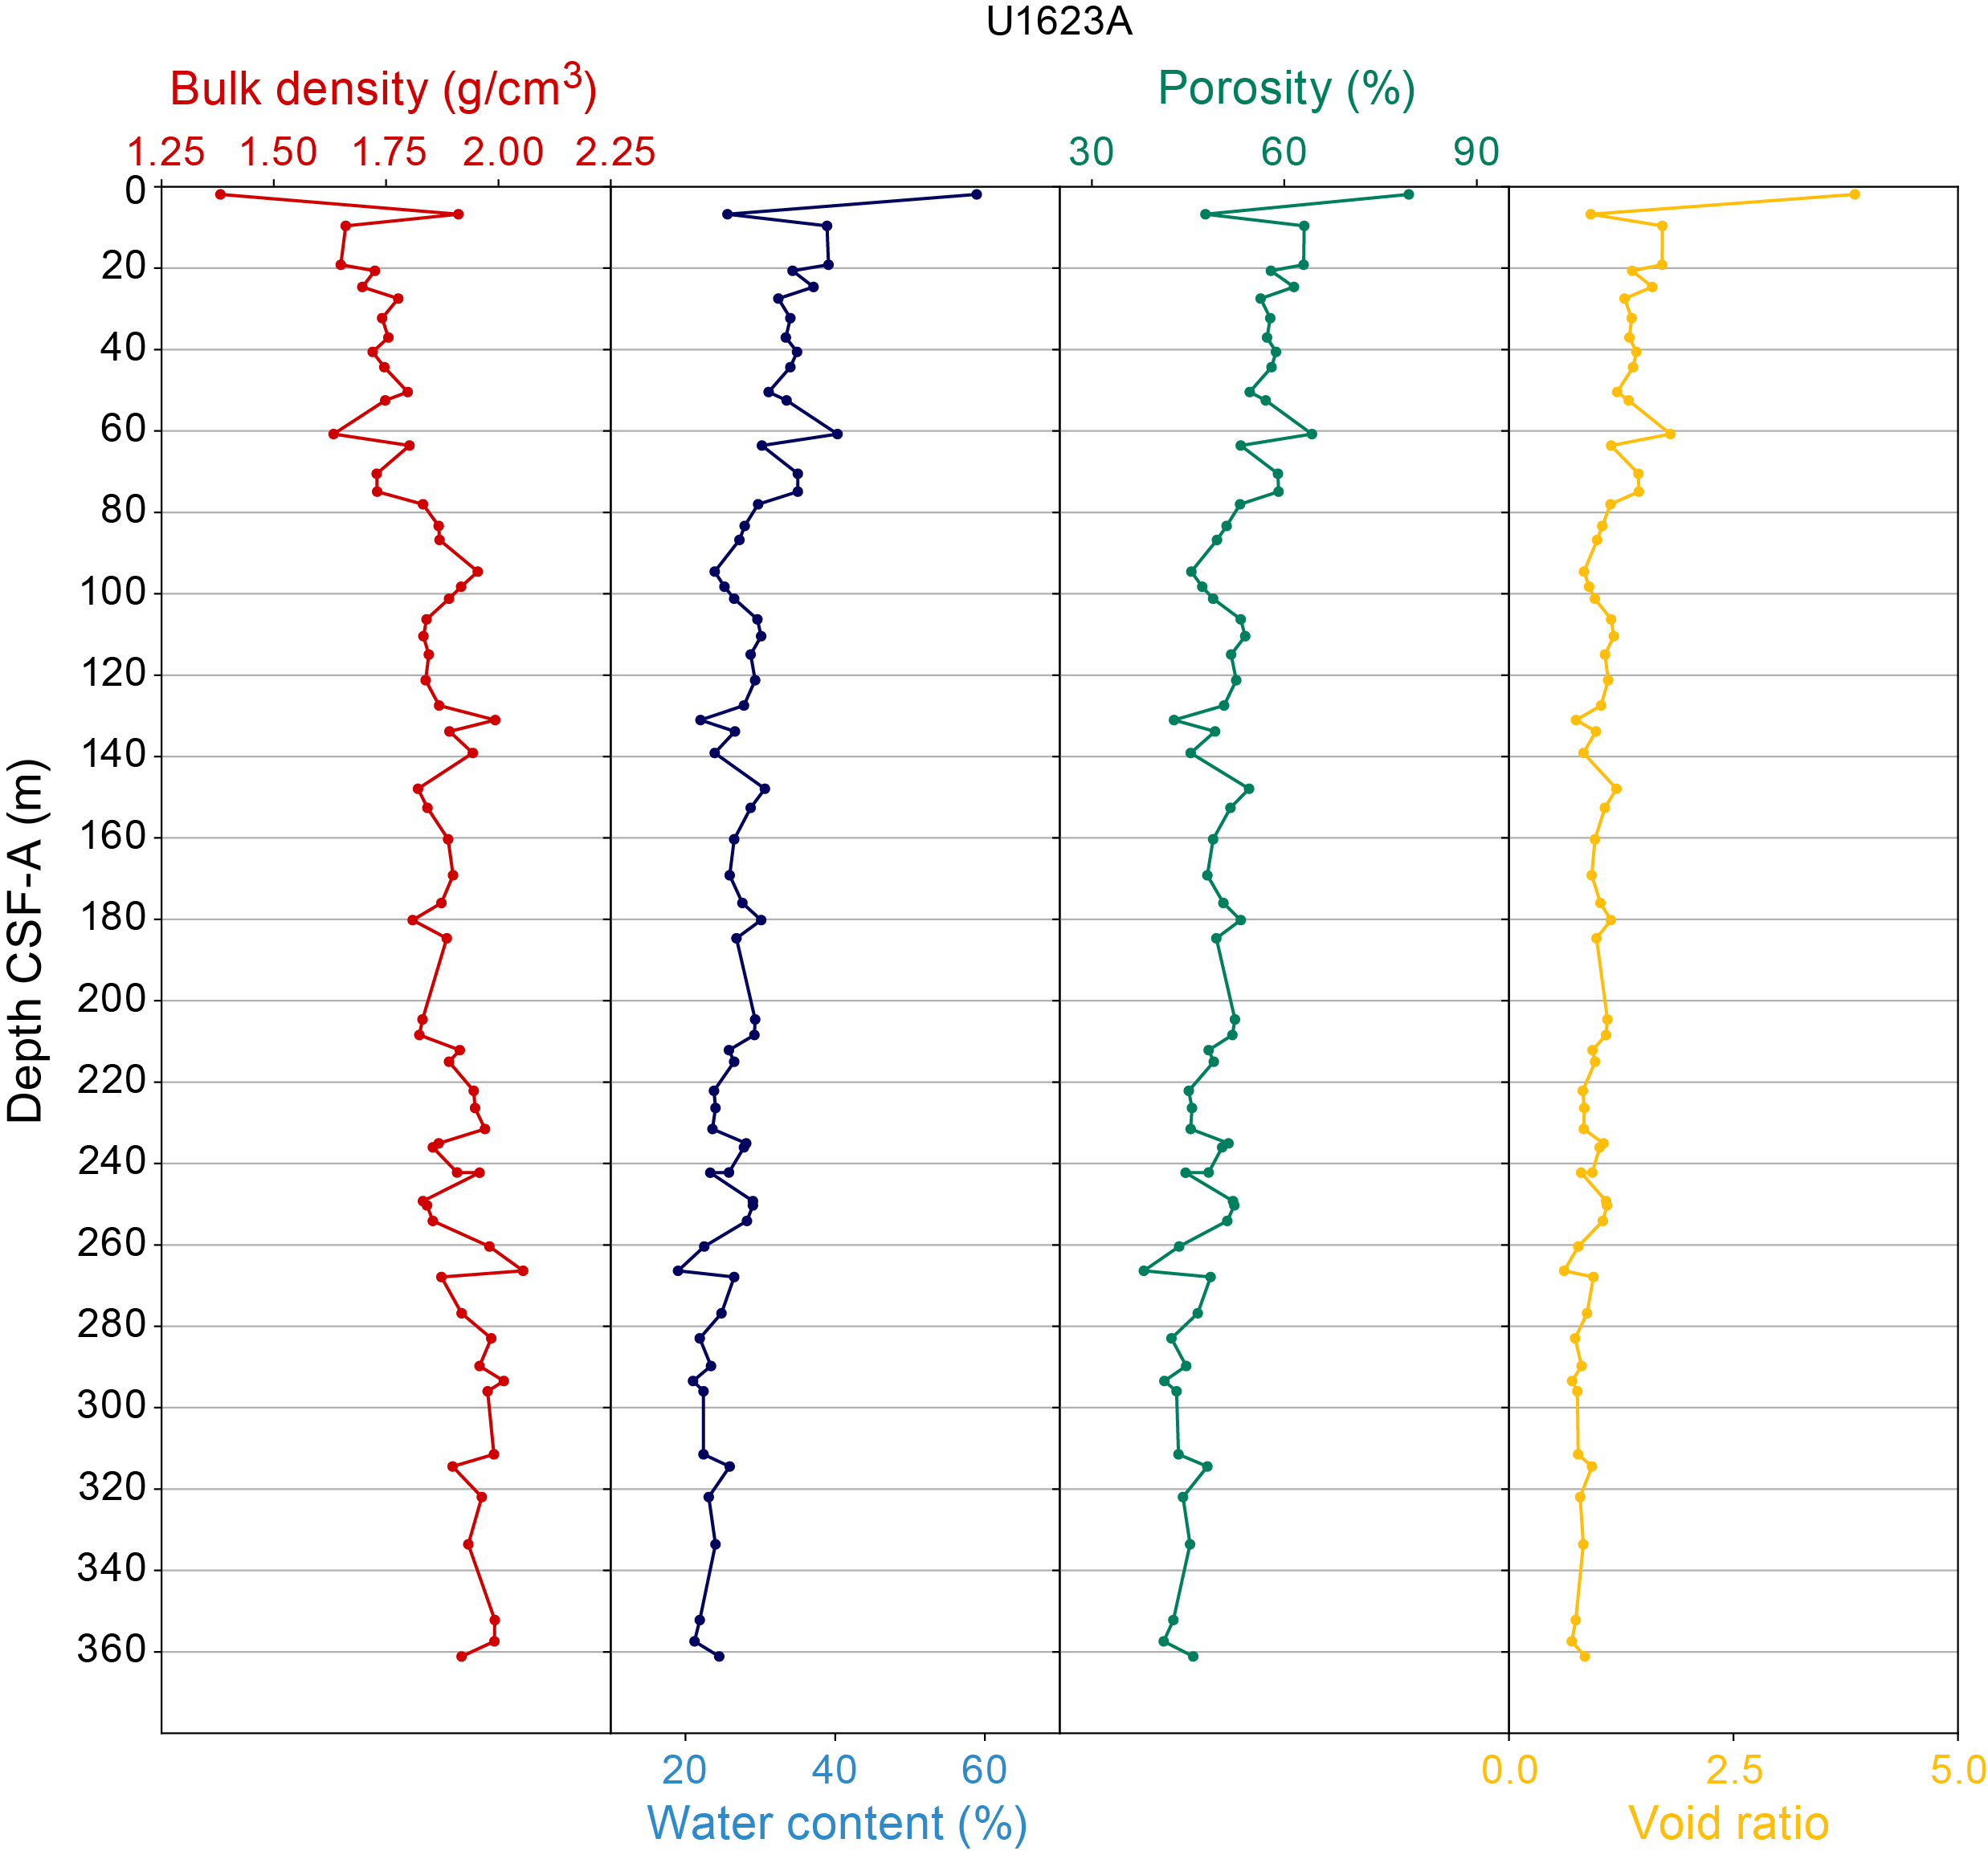
Figure F53. MAD parameters, Hole U1623A.
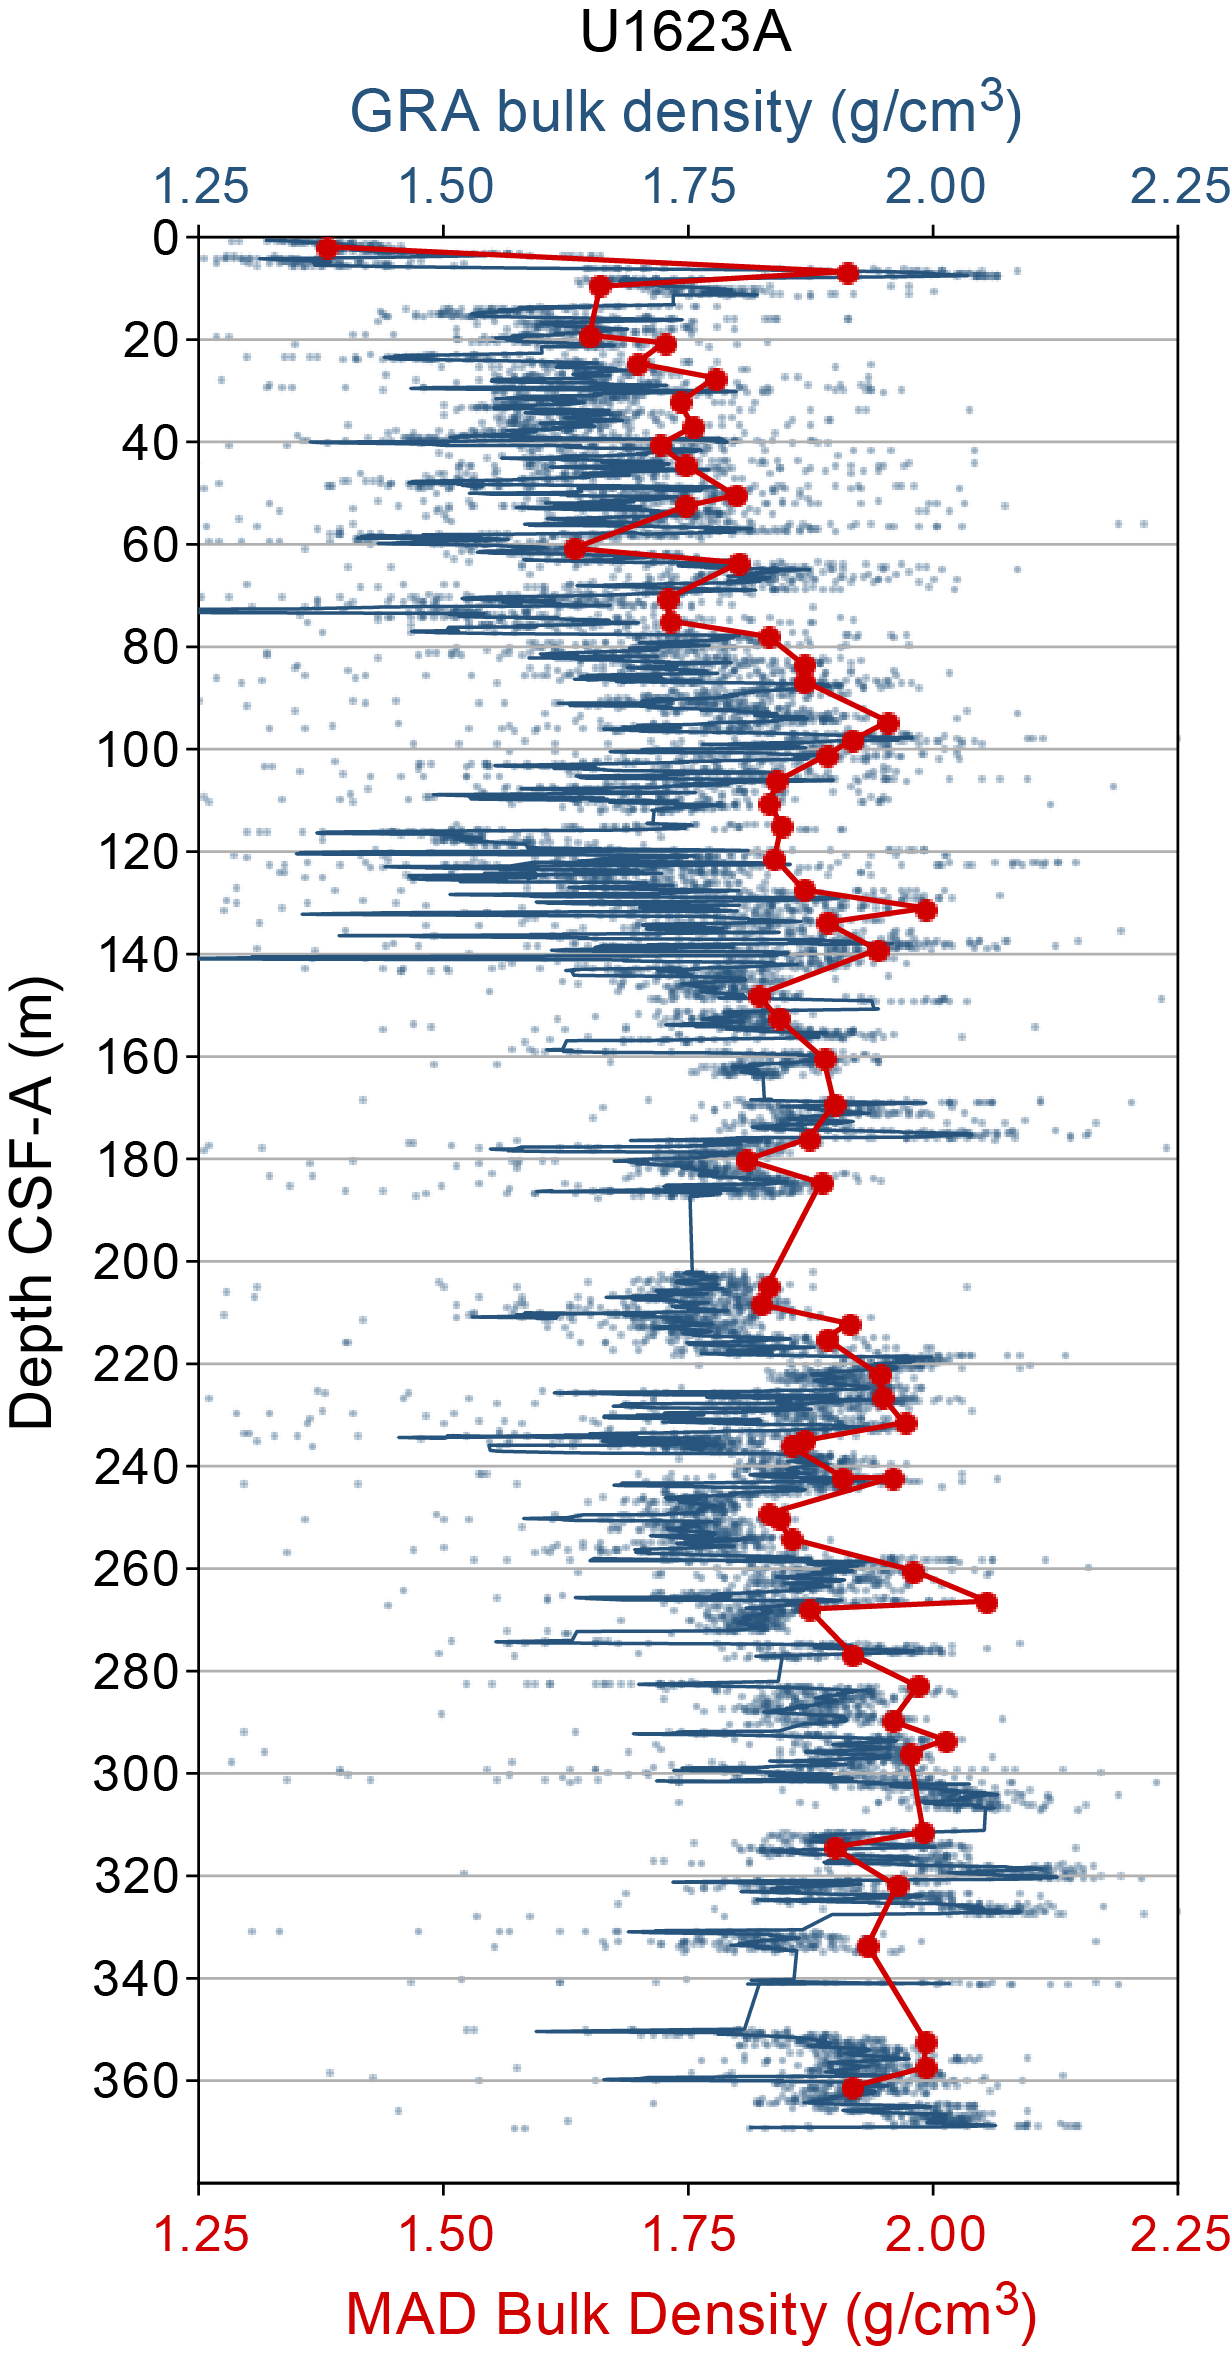
Figure F54. GRA bulk density and MAD, Hole U1623A.
6.6. Thermal conductivity
To calculate heat flow and interpolate temperature data, thermal conductivity measurements were made using the TK04 system for Holes U1621A and U1623A. Sediments from Site U1622 were very clast-rich, and a flat, even surface in an undisturbed interval was difficult to identify. Therefore, measurements were abandoned below Core 403-U1622A-2H. For Sites U1621 and U1623, we measured thermal conductivity for one working section half every 10 mbsf for Cores 403-U1621A-2H through 26X and Cores U1623A-1H through 51X. A puck contact probe was placed on the split face of working section halves. Homogeneous intervals lacking large clasts, voids, cracks, and sediment disturbances were targeted. Three measurements were made on the same interval, but we encountered a few failed measurements from the TK04 meter. Some cores did not have suitable intervals for thermal conductivity, especially in XCB cores, which often had small biscuiting, large clasts, and cracks on the surface of split core halves. Therefore, thermal conductivity results were not possible for all cores and may be responsible for some of the scatter in measurements downcore.
Thermal conductivity values at Site U1621 increase with depth from ~1.1 W/(m·K) at the seafloor to ~1.3 W/(m·K) at ~600 mbsf, likely corresponding to a downcore increase in dry bulk density and a decrease in porosity due to compaction (Figure F55). This gradient is more gradual than at Expedition 403 northern sites (see Physical properties in the Site U1618 chapter [Lucchi et al., 2026b], Physical properties in the Site U1619 chapter [St. John et al., 2026a], and Physical properties in the Site U1620 chapter [St. John et al., 2026b]). This may be due to shallower holes drilled at Sites U1621 and U1623 (~220 and ~350 mbsf compared to over 600 mbsf) or to compositional differences that will be explored postexpedition. Results from thermal conductivity taken from split cores agree with the temperature gradient obtained during downhole logging (see Downhole logging).
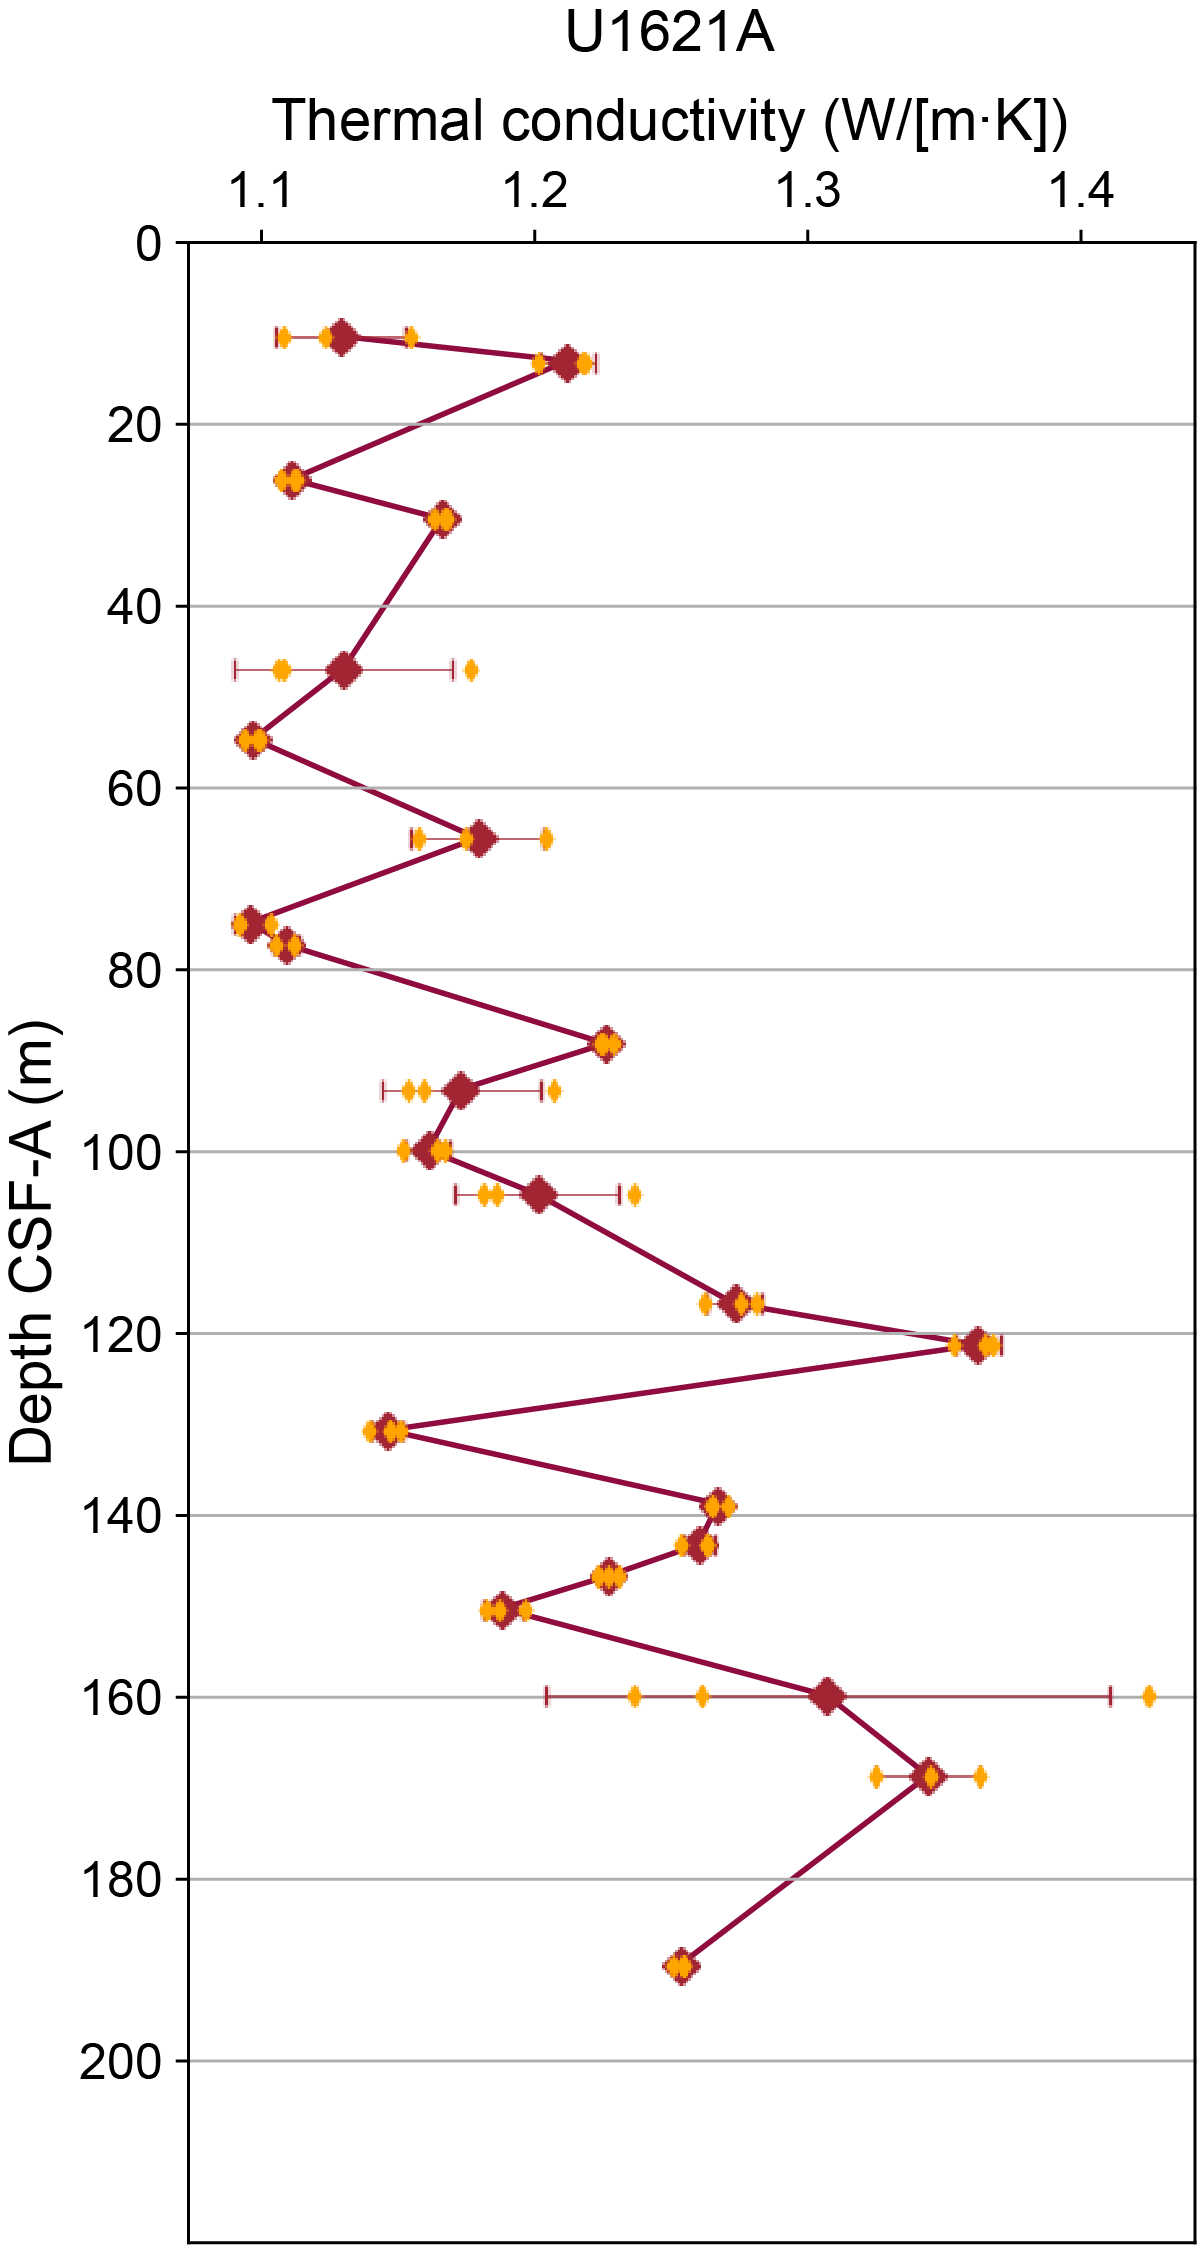
Figure F55. Thermal conductivity, Hole U1621A.
For Hole U1623A, the thermal gradient increases from ~1.0 W/(m·K) at the seafloor to 1.4 W/(m·K) at the base of the hole (Figure F56). There is an interval of higher average thermal conductivity values (~1.5–1.6 W/[m·K]) at ~150–215 mbsf. This depth range corresponds to the interval between Reflectors R2 and R3 discussed by Lucchi et al. (2023), and therefore may represent a unit with distinct properties driving thermal conductivity. However, recovery in this interval at Hole U1623A was less successful, and measured thermal conductivity values may be related to coring disturbances.
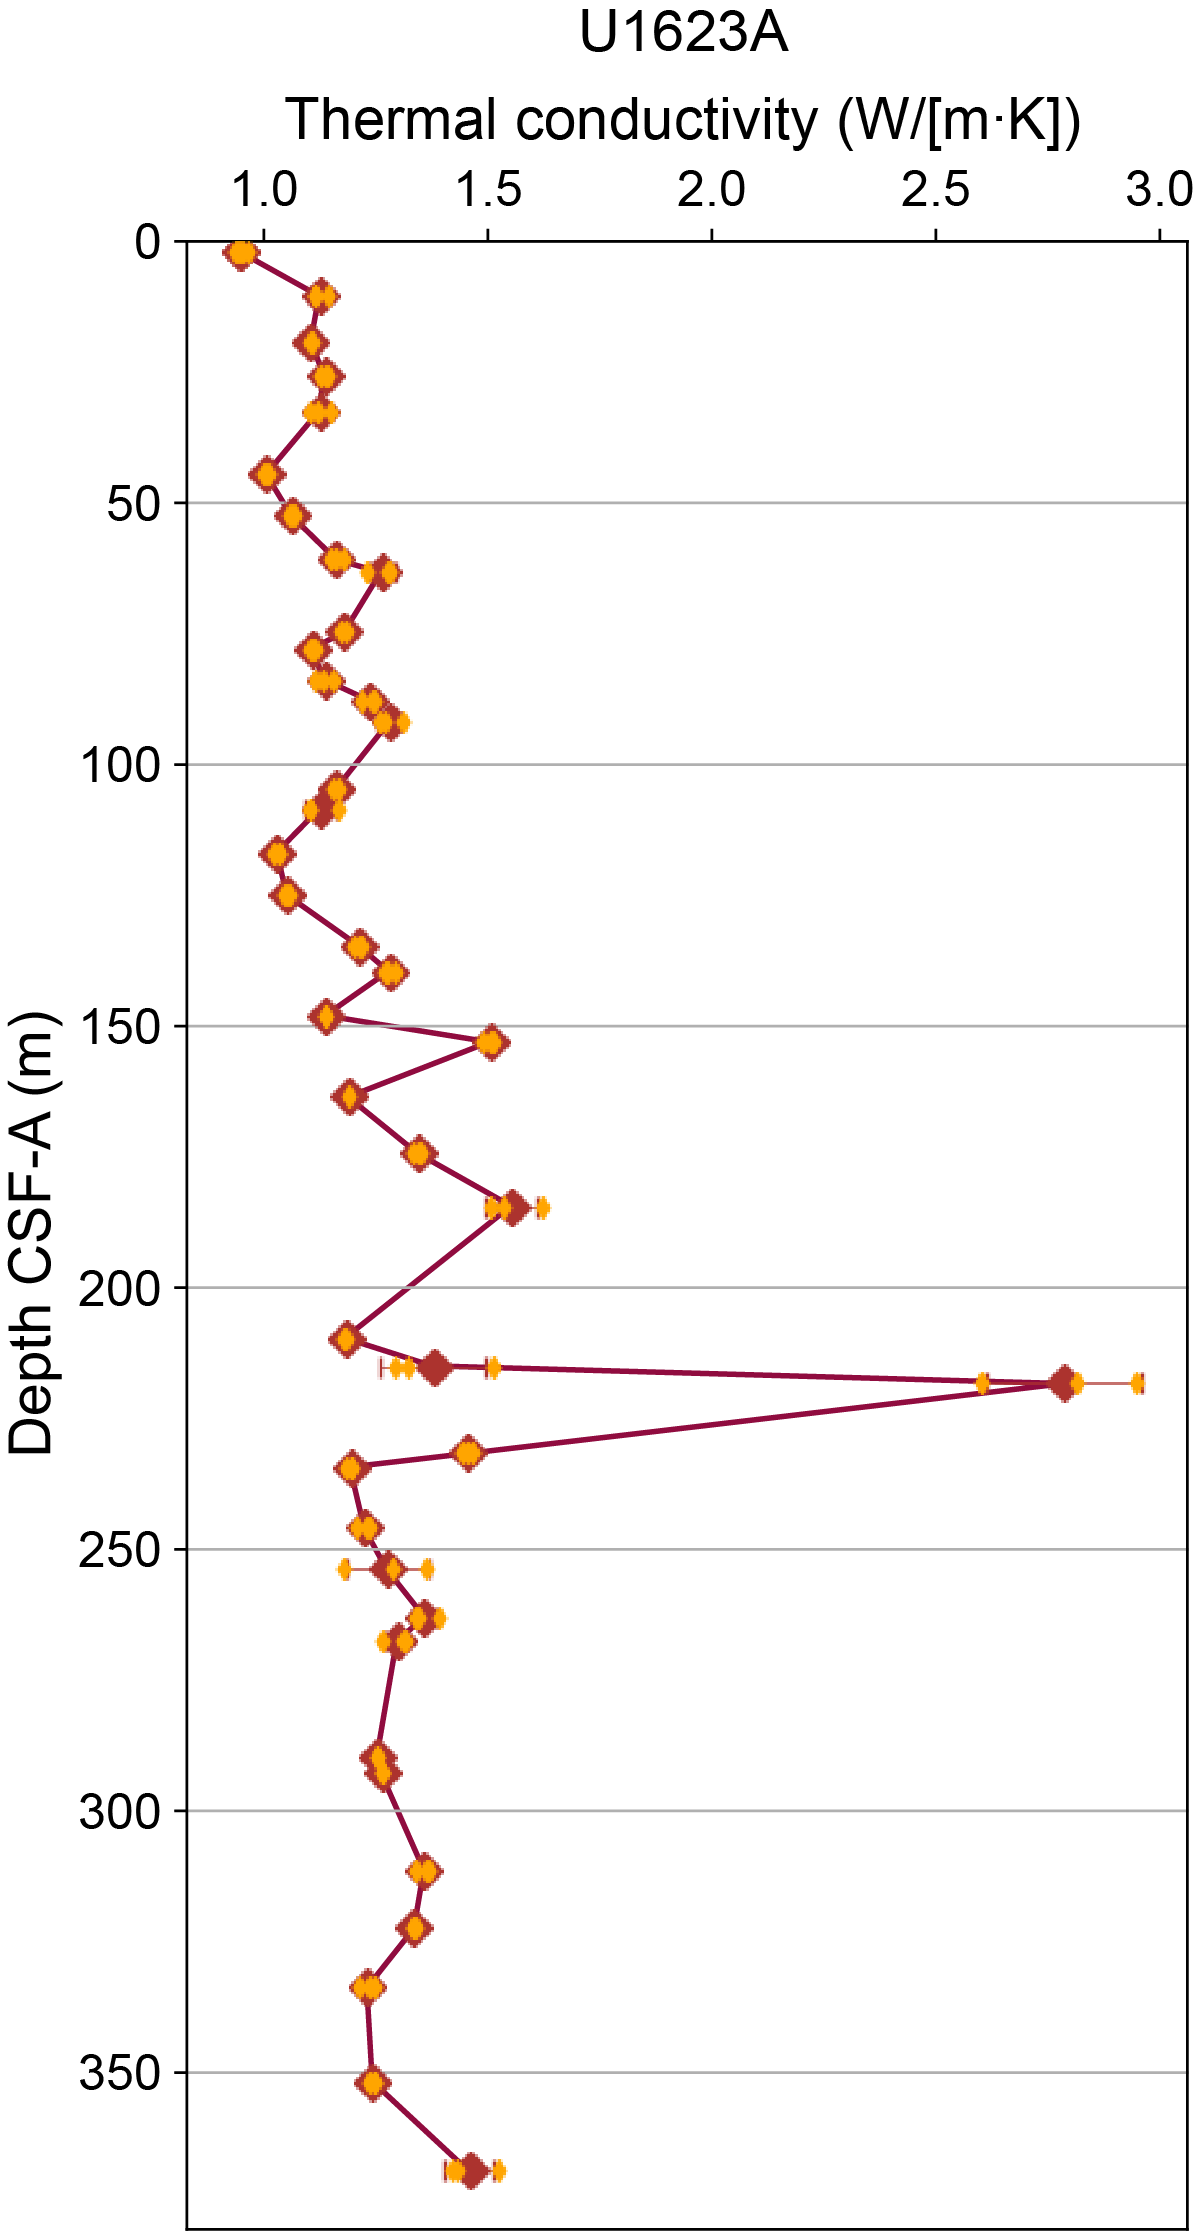
Figure F56. Thermal conductivity, Hole U1623A.
6.7. Anelastic strain recovery
ASR experiments were conducted using two whole-round samples, each 10 or 11 cm length, selected from the bottom of Sections 403-U1623C-14F-CC and 54X-CC. After STMSL scanning, the whole-round core samples were pushed out of core liners. To attach 16 strain gauges, soft materials (i.e., drilling mud) surrounding the core samples were removed and the surfaces were flattened with a spatula and/or sandpaper. Gauges were glued onto the surfaces, and the samples were wrapped with plastic bags and put into a thermostatic water bath. All strain gauges were then electrically connected to a data logger to collect 3D strain recovery. All sample preparation procedures were completed within 3–3.5 h after core recovery from the subseafloor. Average strain values of 11 ASR measurements were collected every 10 min from each of the 18 strain gauges. Temperatures and dummy channel data were also measured to make sure that the water temperature was stable and that the data logger was operating correctly. Gauges remained connected to the samples to monitor strain value for ~6 to 14 days to fully record the recovery. Preliminary results show that after temperature equilibrium, strain released logarithmically, but some strain gauges showed shrinking (Figures F57, F58, F59). Inversion analysis will be conducted postexpedition to convert the raw strain data set to 3D strain that will be combined with azimuths of core samples by paleomagnetism to determine actual principal stress azimuths.
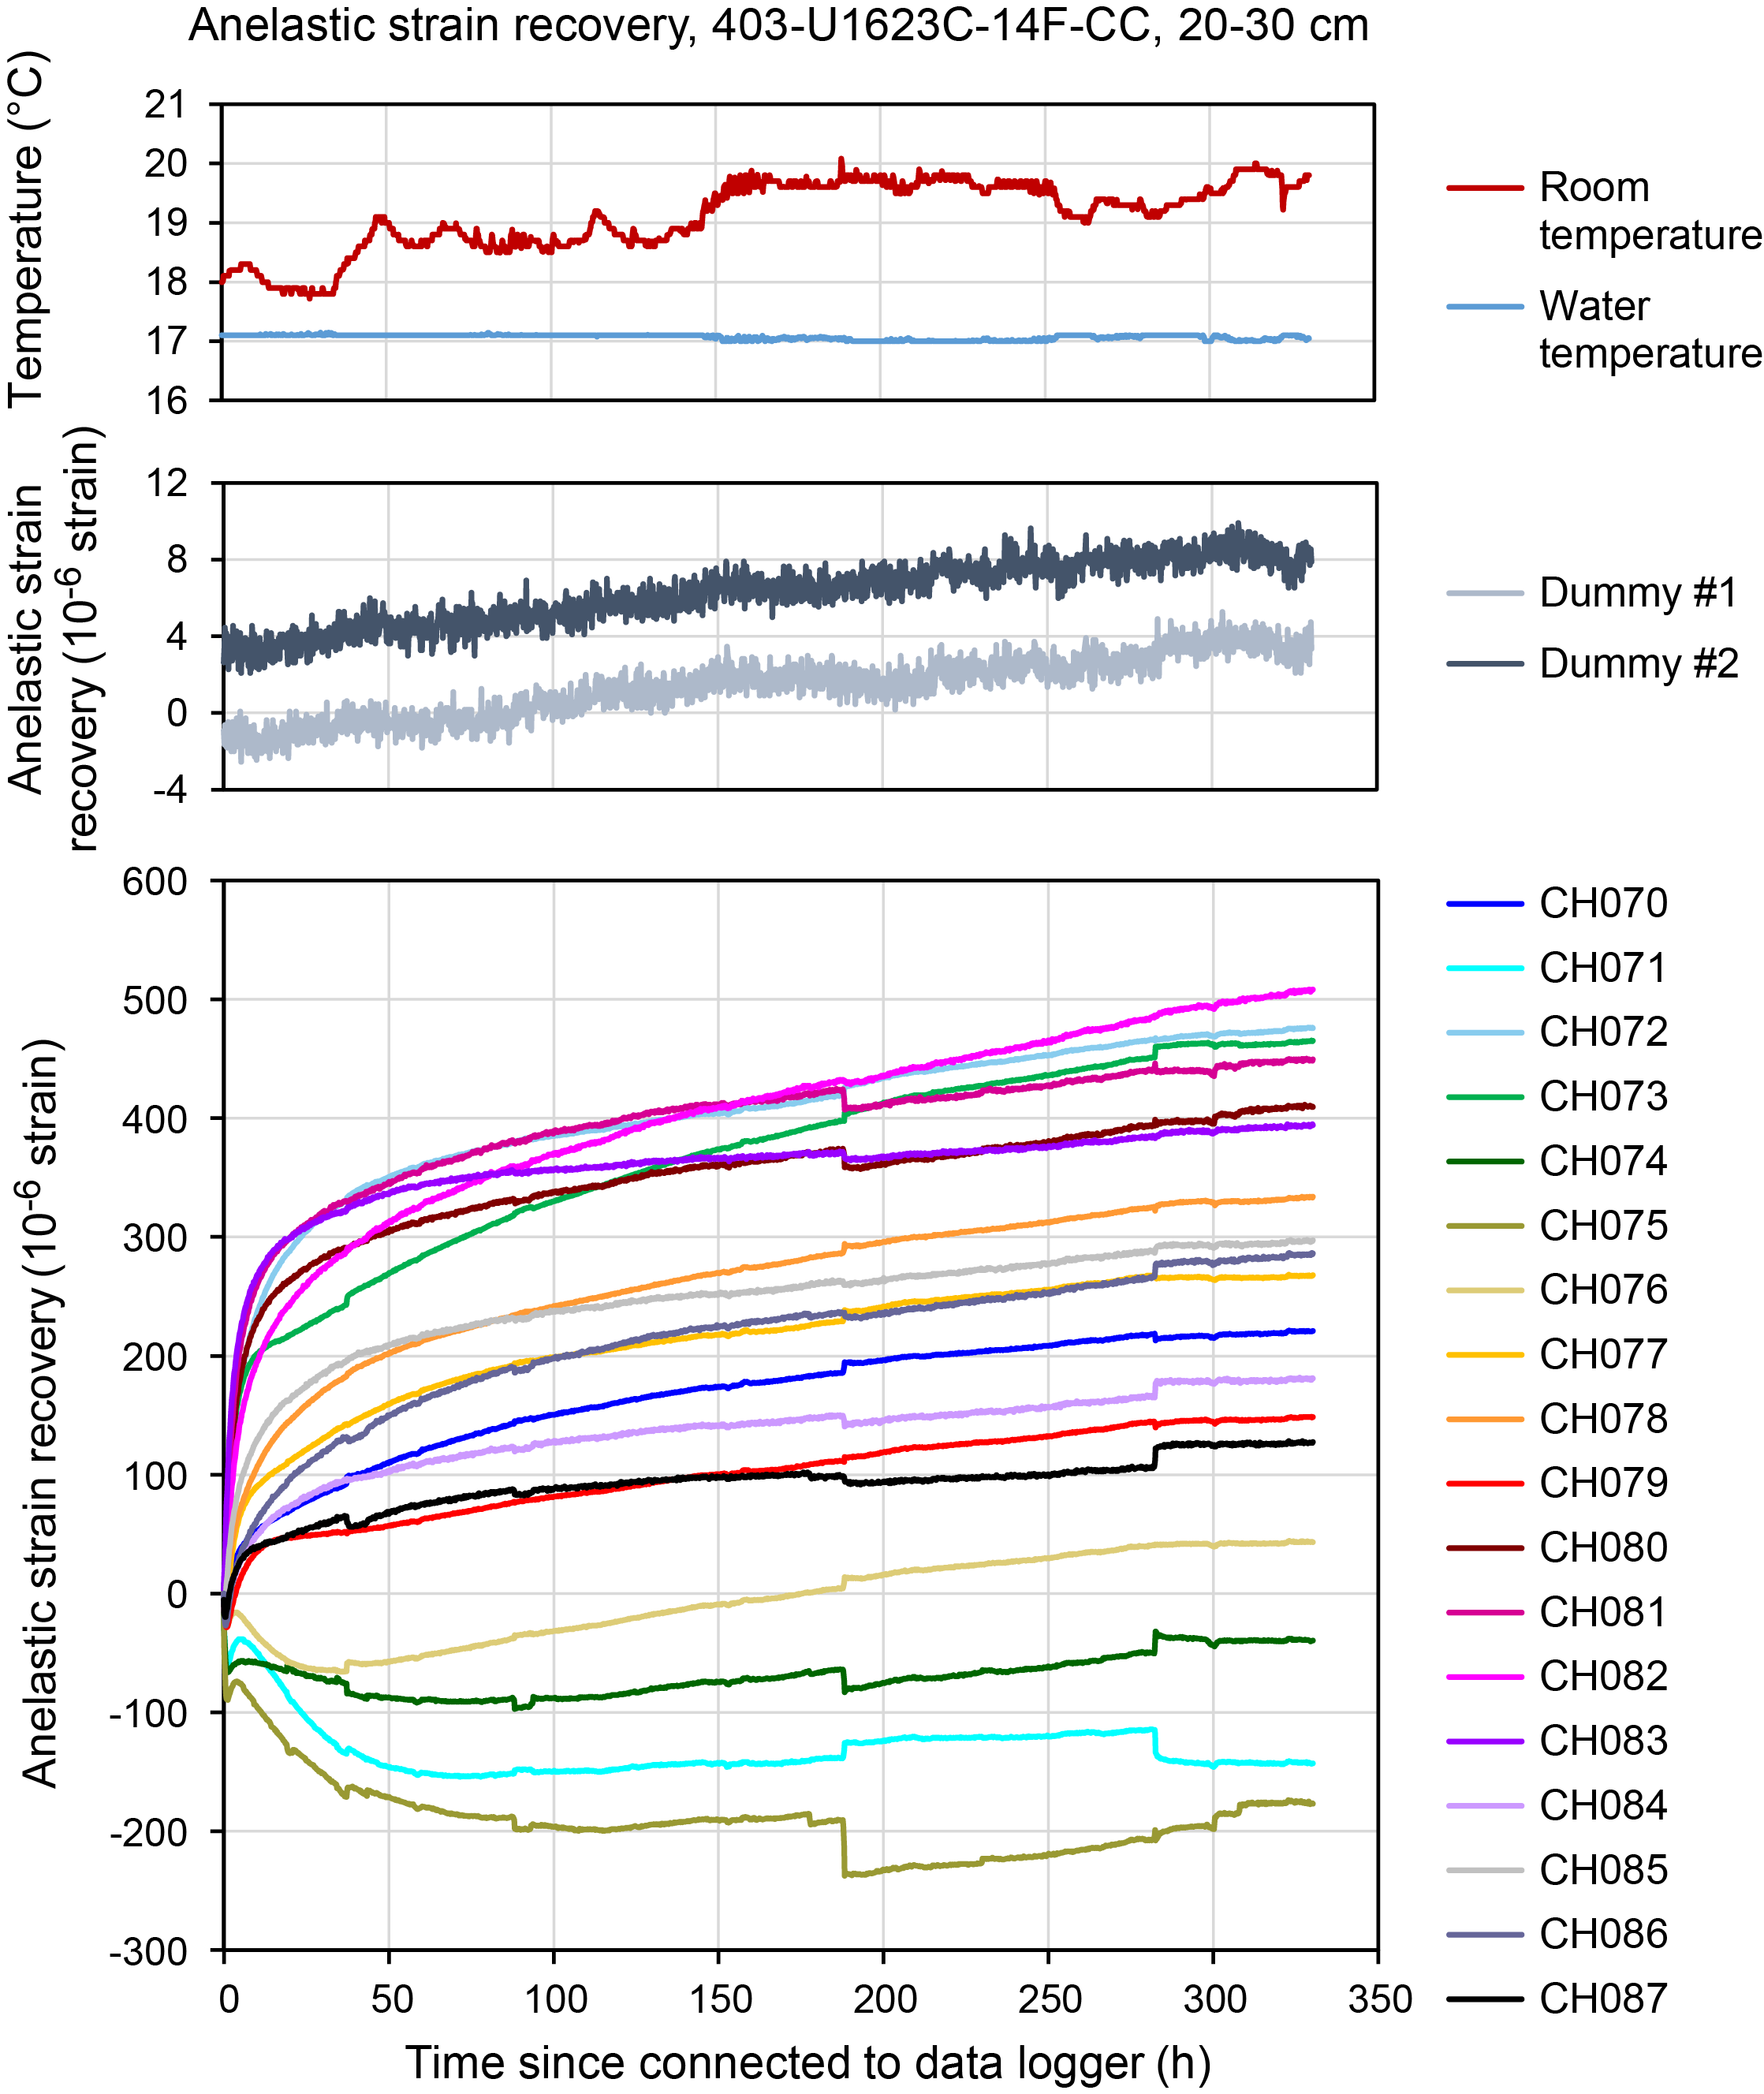
Figure F57. ASR initial results, Sample 403-U1623C-14F-CC, 20–30 cm.
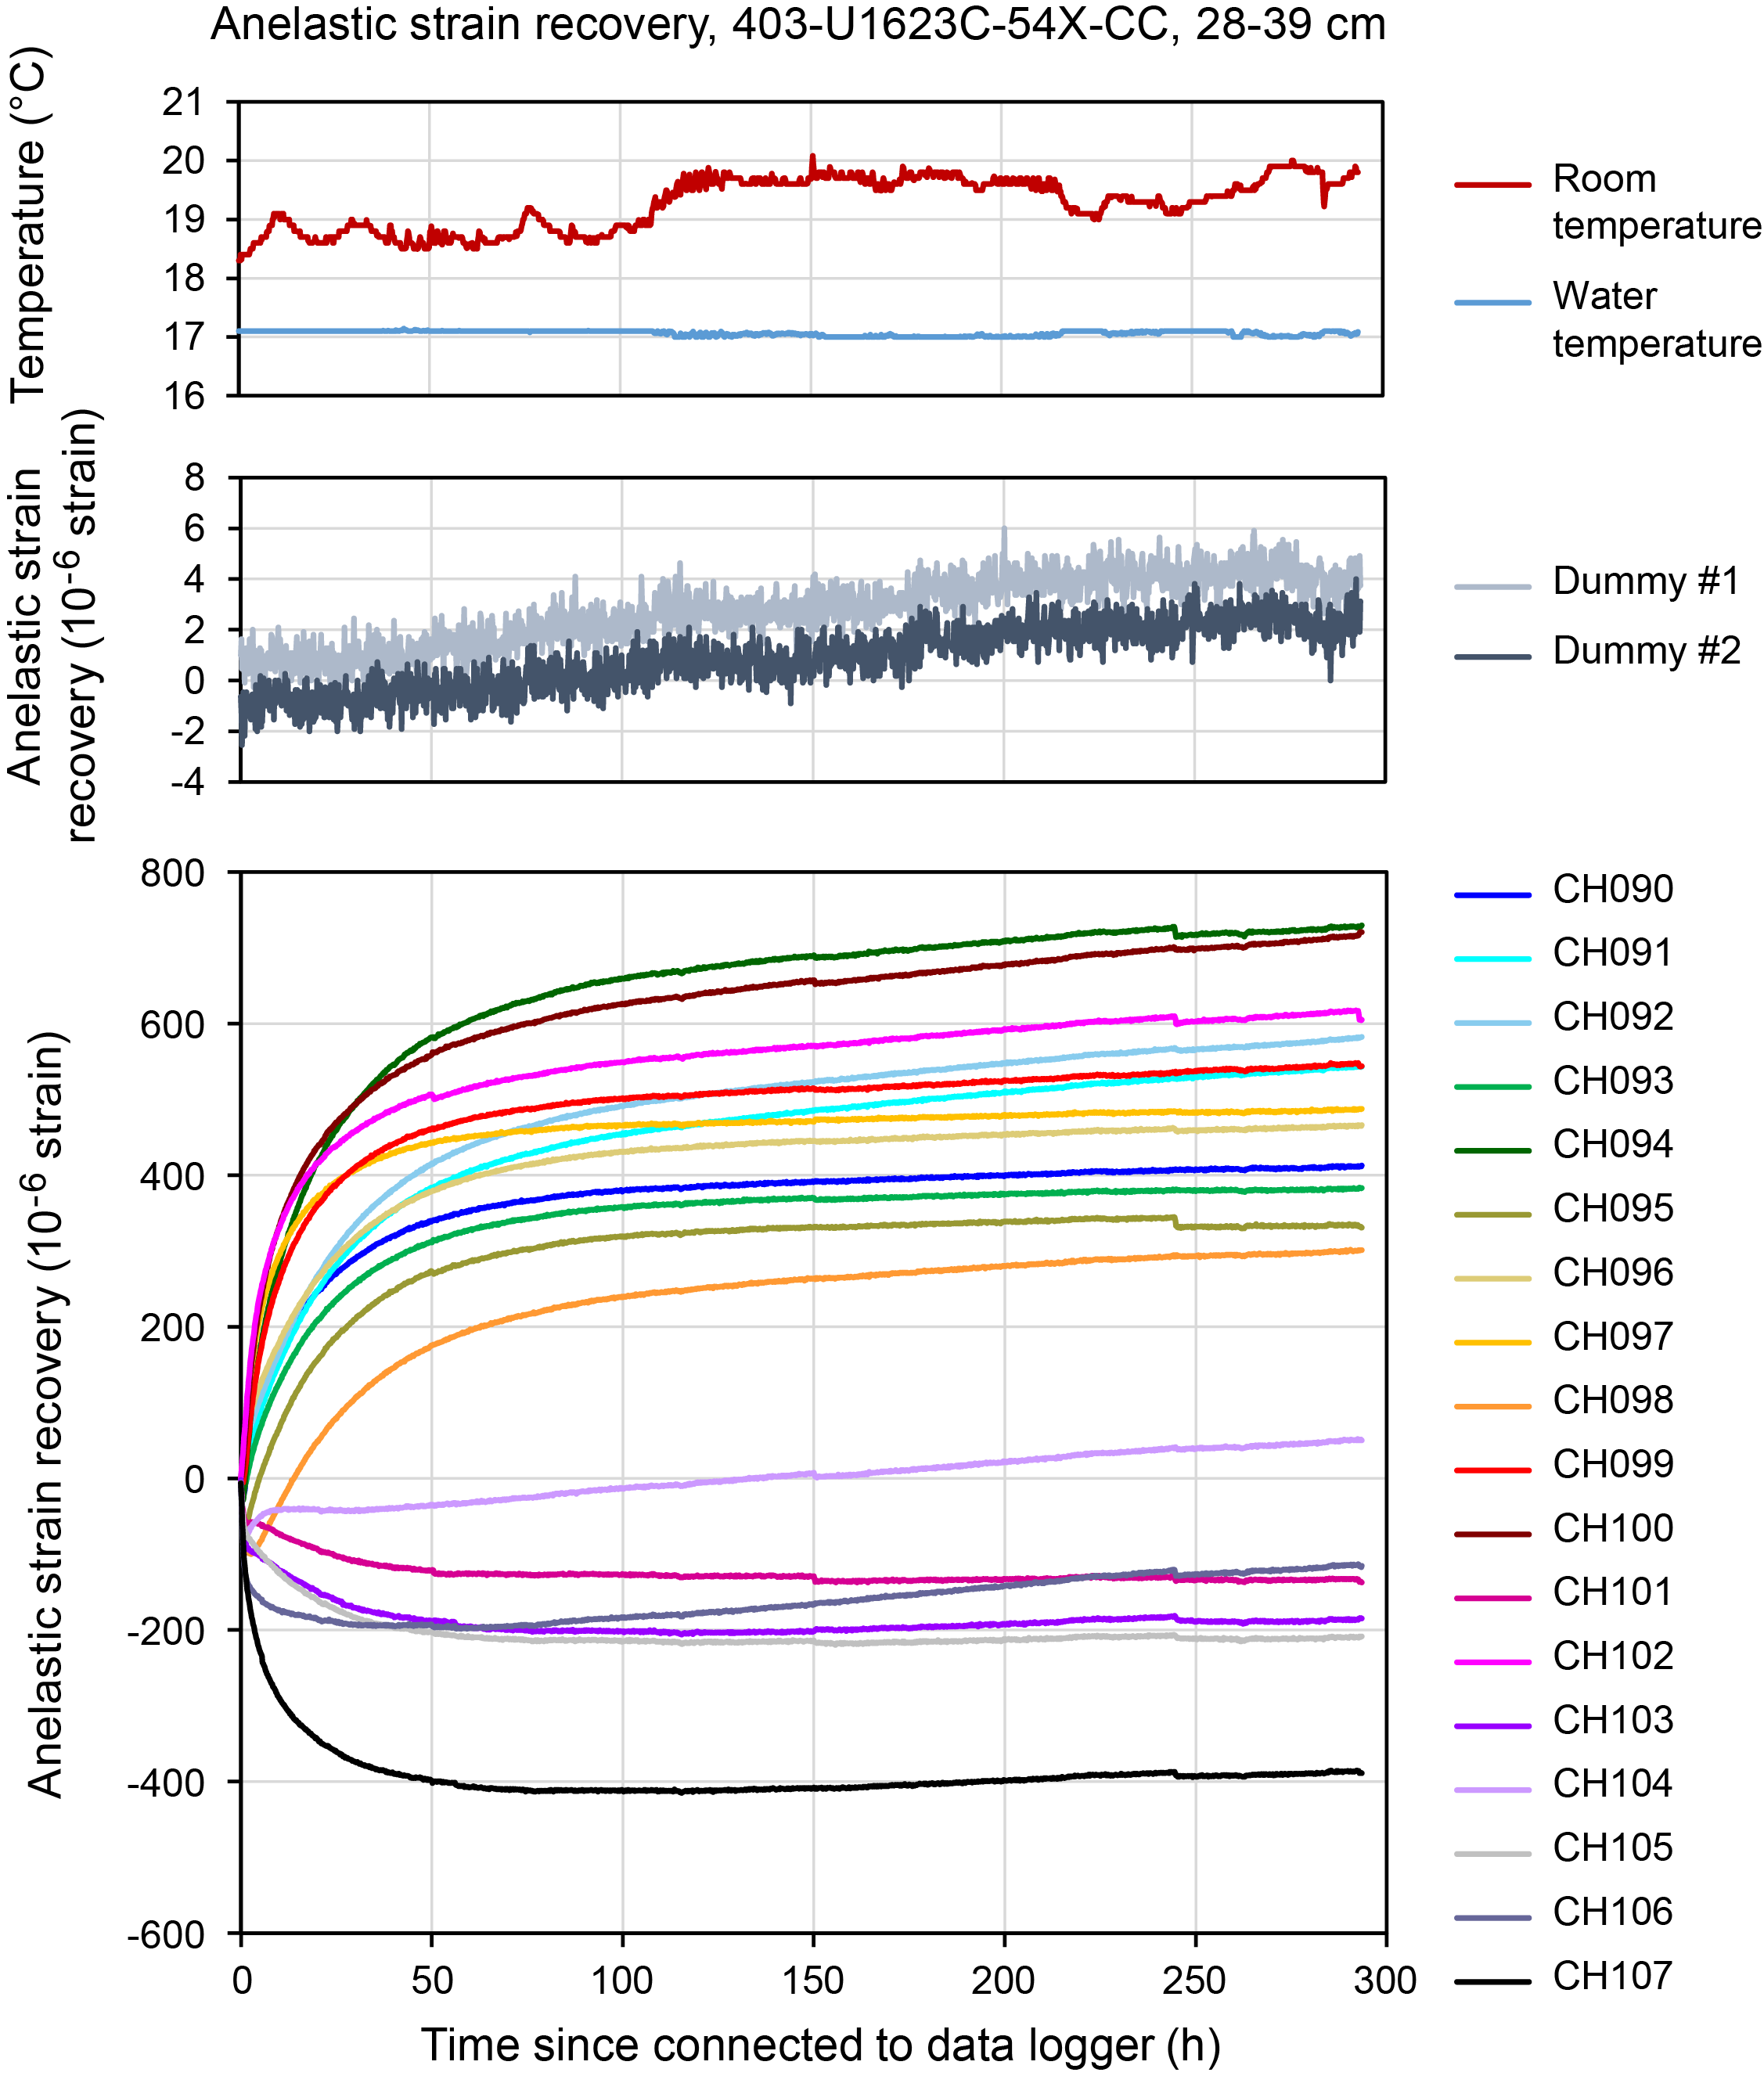
Figure F58. ASR initial results, Sample 403-U1623C-54X-CC, 28–39 cm.
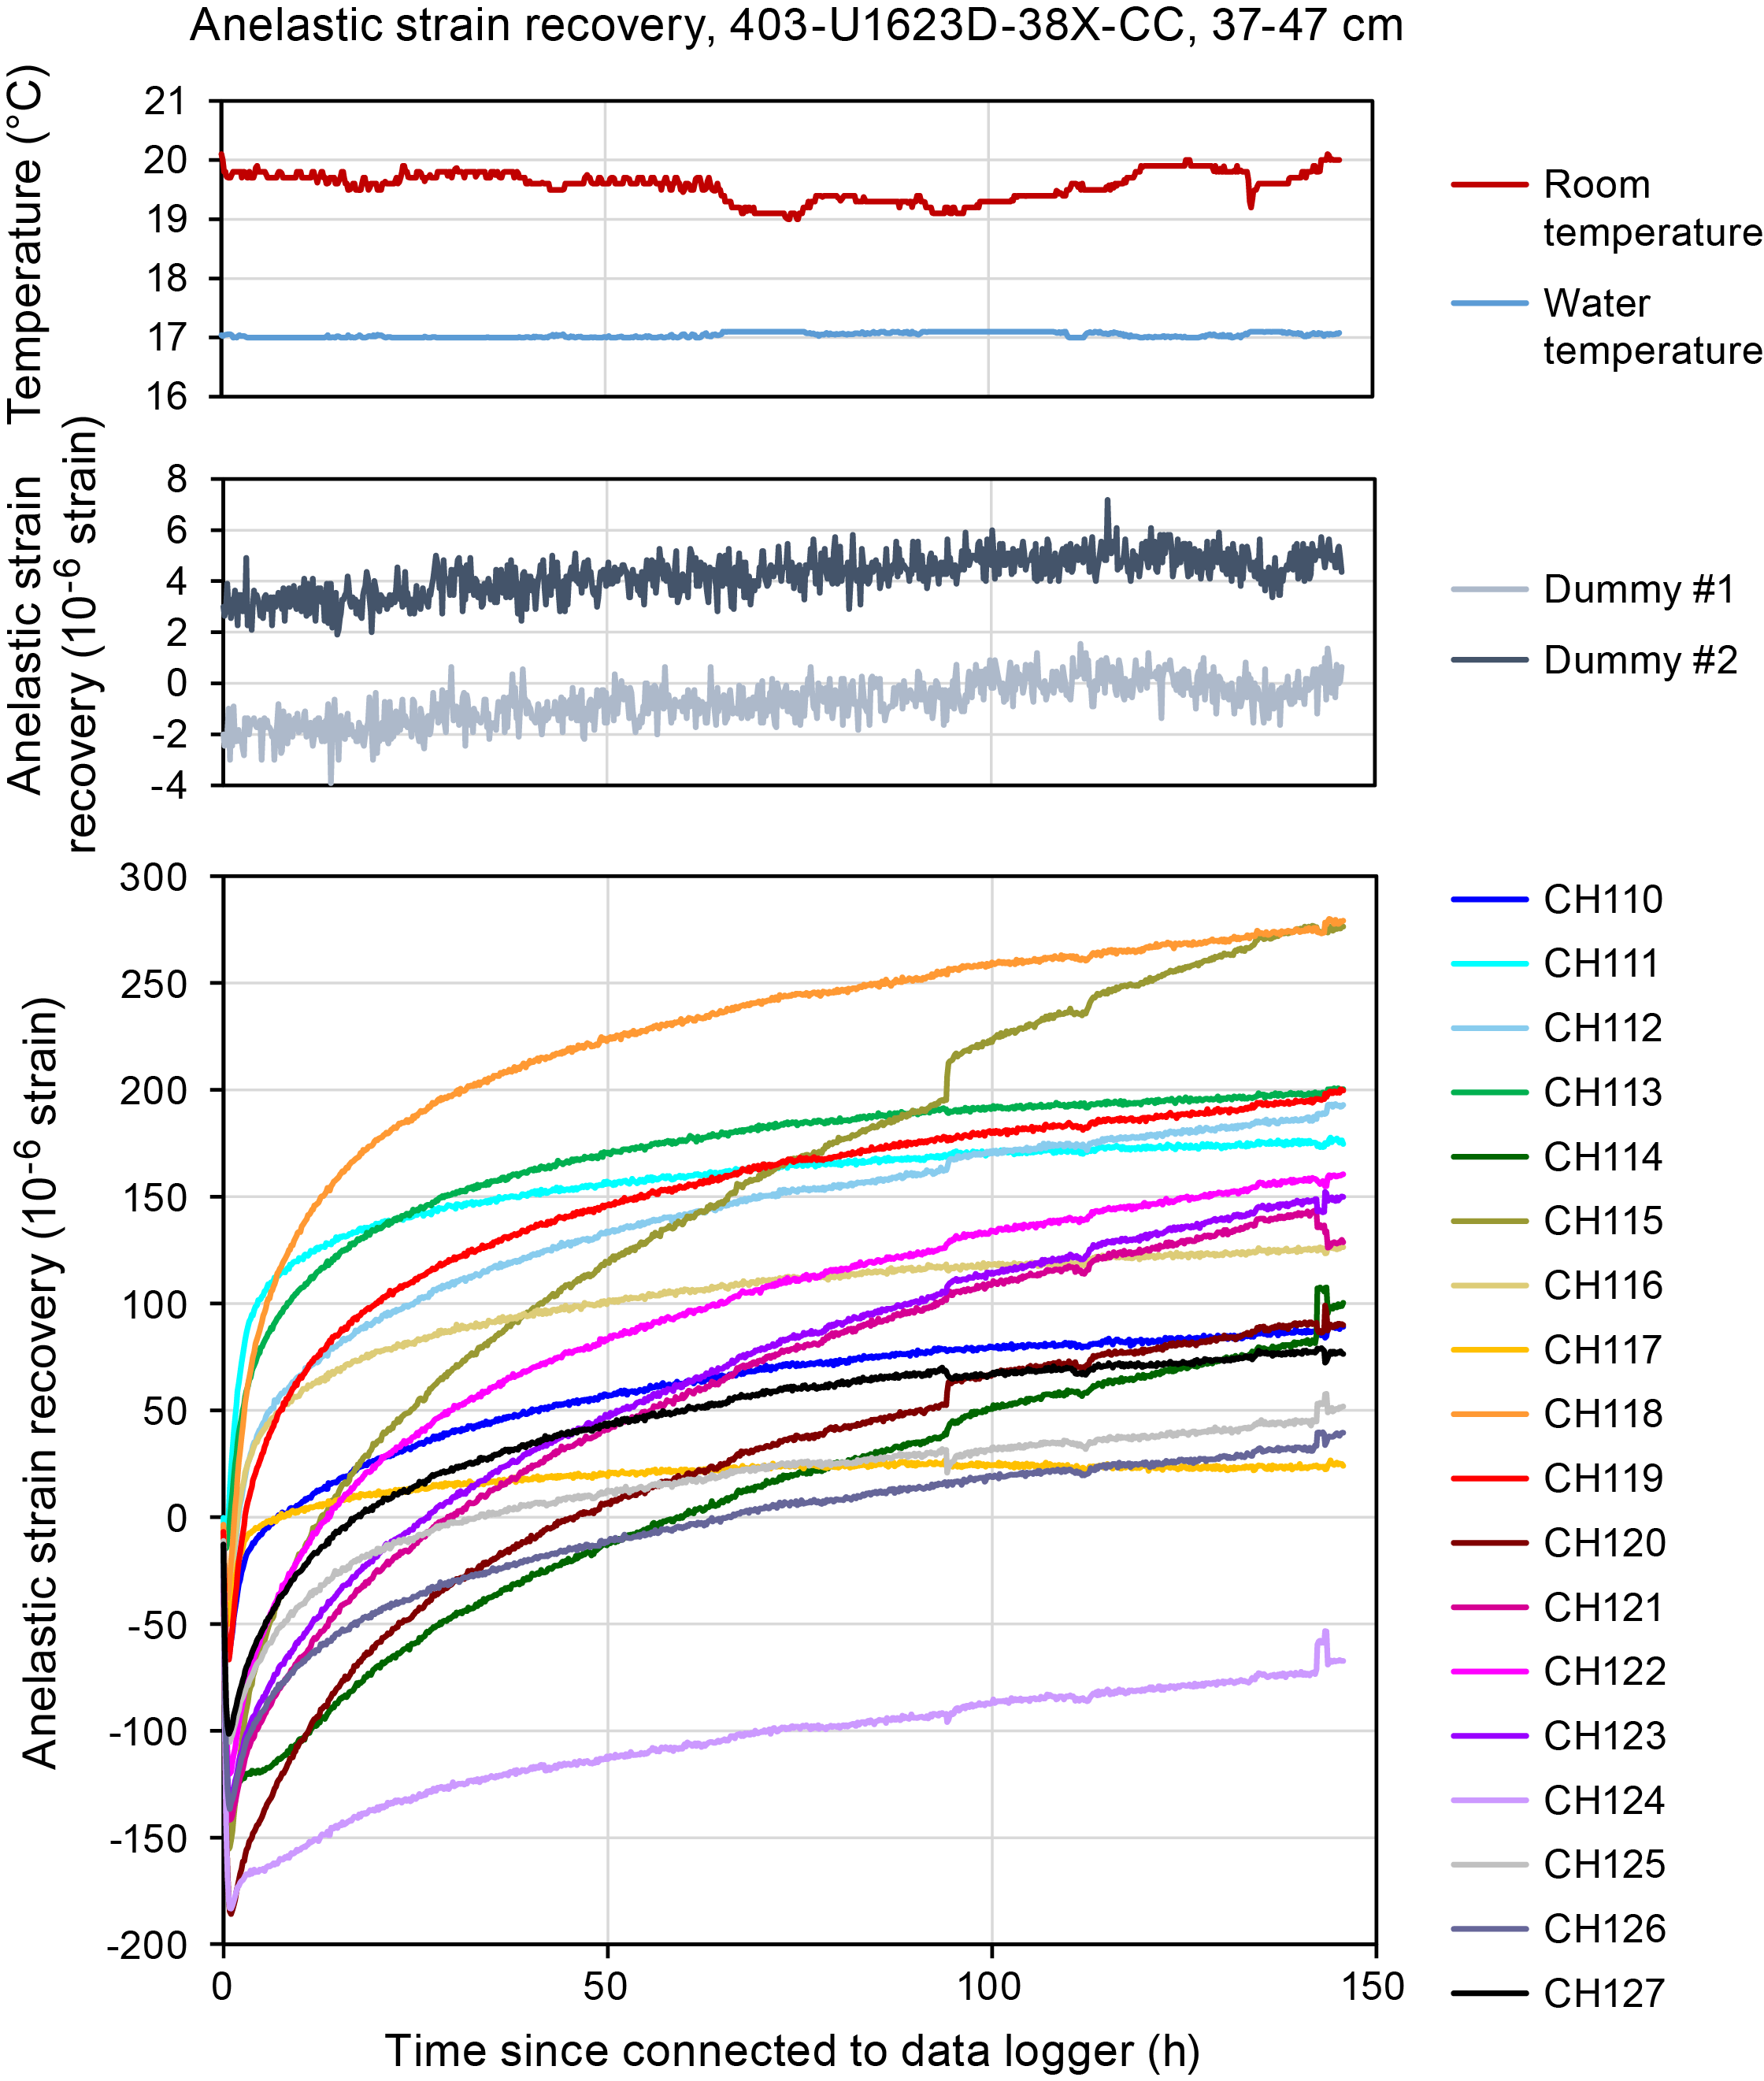
Figure F59. ASR initial results, Sample 403-U1623D-38X-CC, 37–47 cm.
One headspace gas sample was taken at the top of Section 403-U1623D-39X-5 to test the methane degassing rate (see Geochemistry in the Expedition 403 methods chapter [Lucchi et al., 2026a]) under room temperature conditions and to calibrate the ASR results. Degassing rate decreases rapidly and remains low over the course of several days, providing a semiquantitative check on the degassing rate during the ASR measurements (Figure F60).
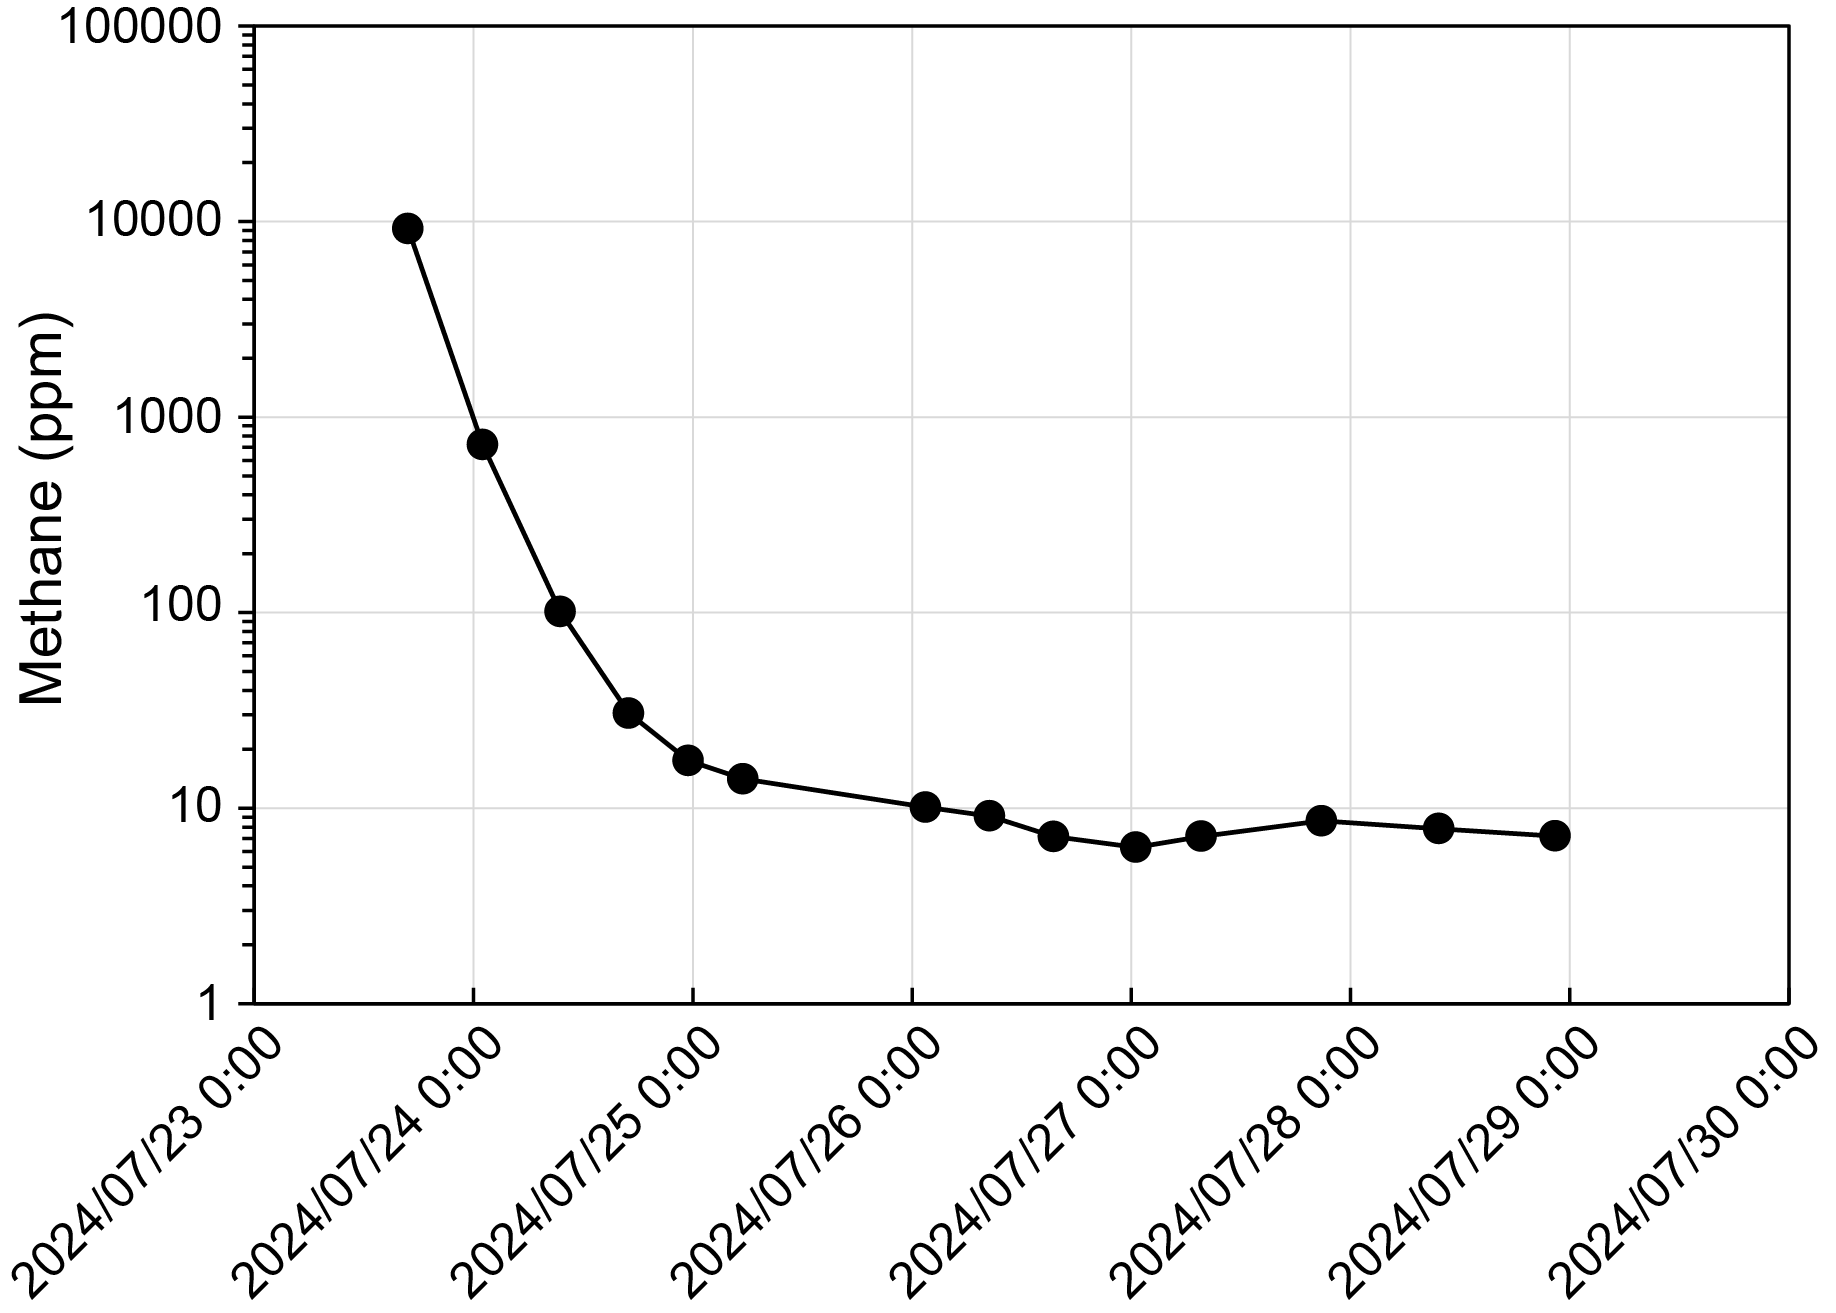
Figure F60. Gas chromatography.
6.8. Physical properties summary
There is generally good correspondence between data collected at high resolution on the MS loop sensor and data collected at low resolution on the MS point sensor, with the MS point measurements picking up additional peaks in MS that were missed during the averaging in WRMSL measurements. Although some intervals of GRA bulk density are slightly lower than MAD sample density, there is good correspondence between data from high- and low-resolution measurements. Because of issues discussed above, P-wave velocity data are not considered reliable, and there is no detectable signal in either discrete or logger data below ~20–30 mbsf at Sites U1621 and U1623. Thermal conductivity data generally increase with depth (see Downhole logging).
Physical properties MS, NGR, and GRA bulk density for Sites U1621–U1623 are synthesized in violin plots (Figure F61). Site U1622 is different from the other Bellsund drift sites, with lower MS and higher NGR and GRA bulk density compared to Sites U1621 and U1623. Site U1622 NGR and GRA bulk density each have two modes: one with low values corresponding to the uppermost ~5 m and another larger mode of high values corresponding to the lower part of the record, likely associated with a buried debris flow or other mass movement of material coming from Svalbard.
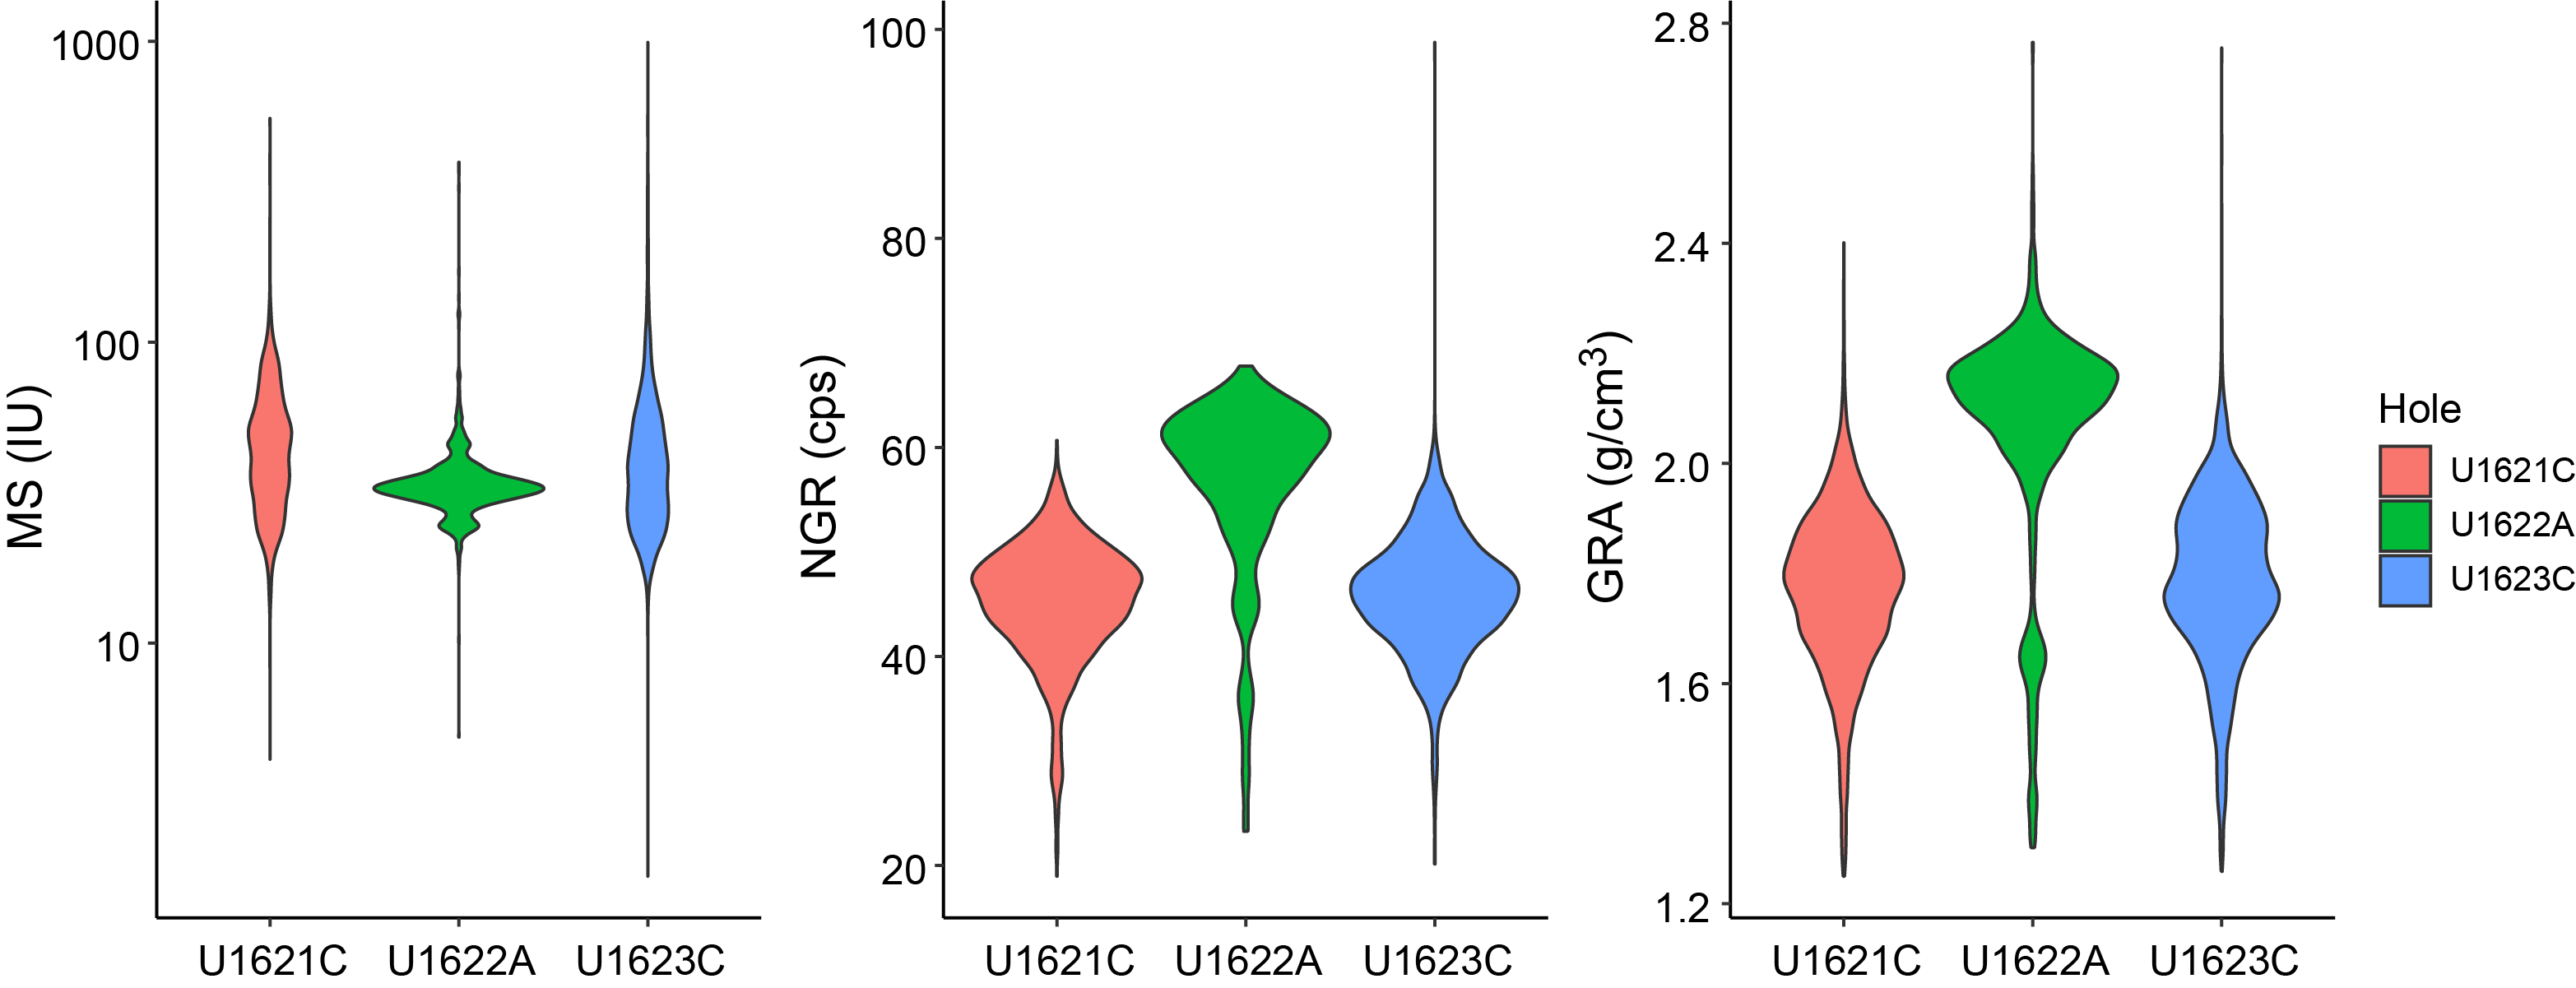
Figure F61. Physical property associations with preliminary lithostratigraphic units/subunits.
Site U1621 and U1623 physical properties show fairly cyclic variability downcore, often co-varying and oscillating between highs and lows. Site U1621 data appear more stable, with lower amplitude variability compared to Site U1623. Site U1623 also has a more obvious downcore trend of increasing GRA bulk density, MS, and NGR with depth. In MS–NGR crossplots, a population in the lower left region of the plot for Sites U1621 and U1623 at similar depths likely corresponds to similar coarse-grained (low NGR), detrital carbonate (low MS) horizons. We observe higher overall NGR values at Site U1623 compared to Site U1621 (Figure F60), which may be associated with higher clay content farther from the shelf edge.
Compared to northern sites of Expedition 403 (see Physical properties in the Site U1618 chapter [Lucchi et al., 2026b], Physical properties in the Site U1619 chapter [St. John et al., 2026a], and Physical properties in the Site U1620 chapter [St. John et al., 2026b]), Site U1621 and U1623 MS is less dominated by secondary alteration, and there are more apparent similarities between MS and other physical properties (e.g., NGR). However, greigite still drives a population of MS peaks and can be identified in MS–NGR and MS–GRA bulk density crossplots for Sites U1621 and U1623. For both sites, two trends are present in crossplots: (1) a linear component that may be associated with lithologic changes driven by changes in climate states and (2) a nonlinear relationship that may be associated with postdepositional alteration of magnetic minerals and formation of authigenic greigite.
Overall, physical properties at Sites U1621 and U1623 appear to be influenced by oceanographic changes, glaciogenic deposition, and postdepositional processes. Site U1622 appears to capture a very dense, coarse, clast-rich deposit that may represent a buried debris flow, possibly of glaciogenic origin. Further studies onshore are necessary to interpret the relationship between physical properties measured on board, depositional lithofacies, and postdepositional alteration.
7. Stratigraphic correlation
Correlations between holes for Sites U1621 and U1623 were accomplished using Correlator software (version 4.5.4). For each splice, tie points were established based on STMSL MS. No correlation was required for Site U1622, which comprises a single 40 m hole.
7.1. Site U1621
For Site U1621, we constructed a single spliced interval from 0 to 188.18 m (top of Core 403-U1621B-26X) core composite depth below seafloor (CCSF) based on correlations among the three holes (U1621A–U1621C) (Figure F62; Table T11). Cores below 188.18 m CCSF (top of Core 403-U1621B-26X) have very poor recovery due to abundant dropstones and partial washout during the drilling process. Therefore, we cannot put them in a correct stratigraphic context, and we left them floating in the record as positioned by coring advance (Table T12). Although we relied on MS data in building this splice, we note that the NGR and L* reflectance data sets may be more useful in comparison with climate records (Figure F63).
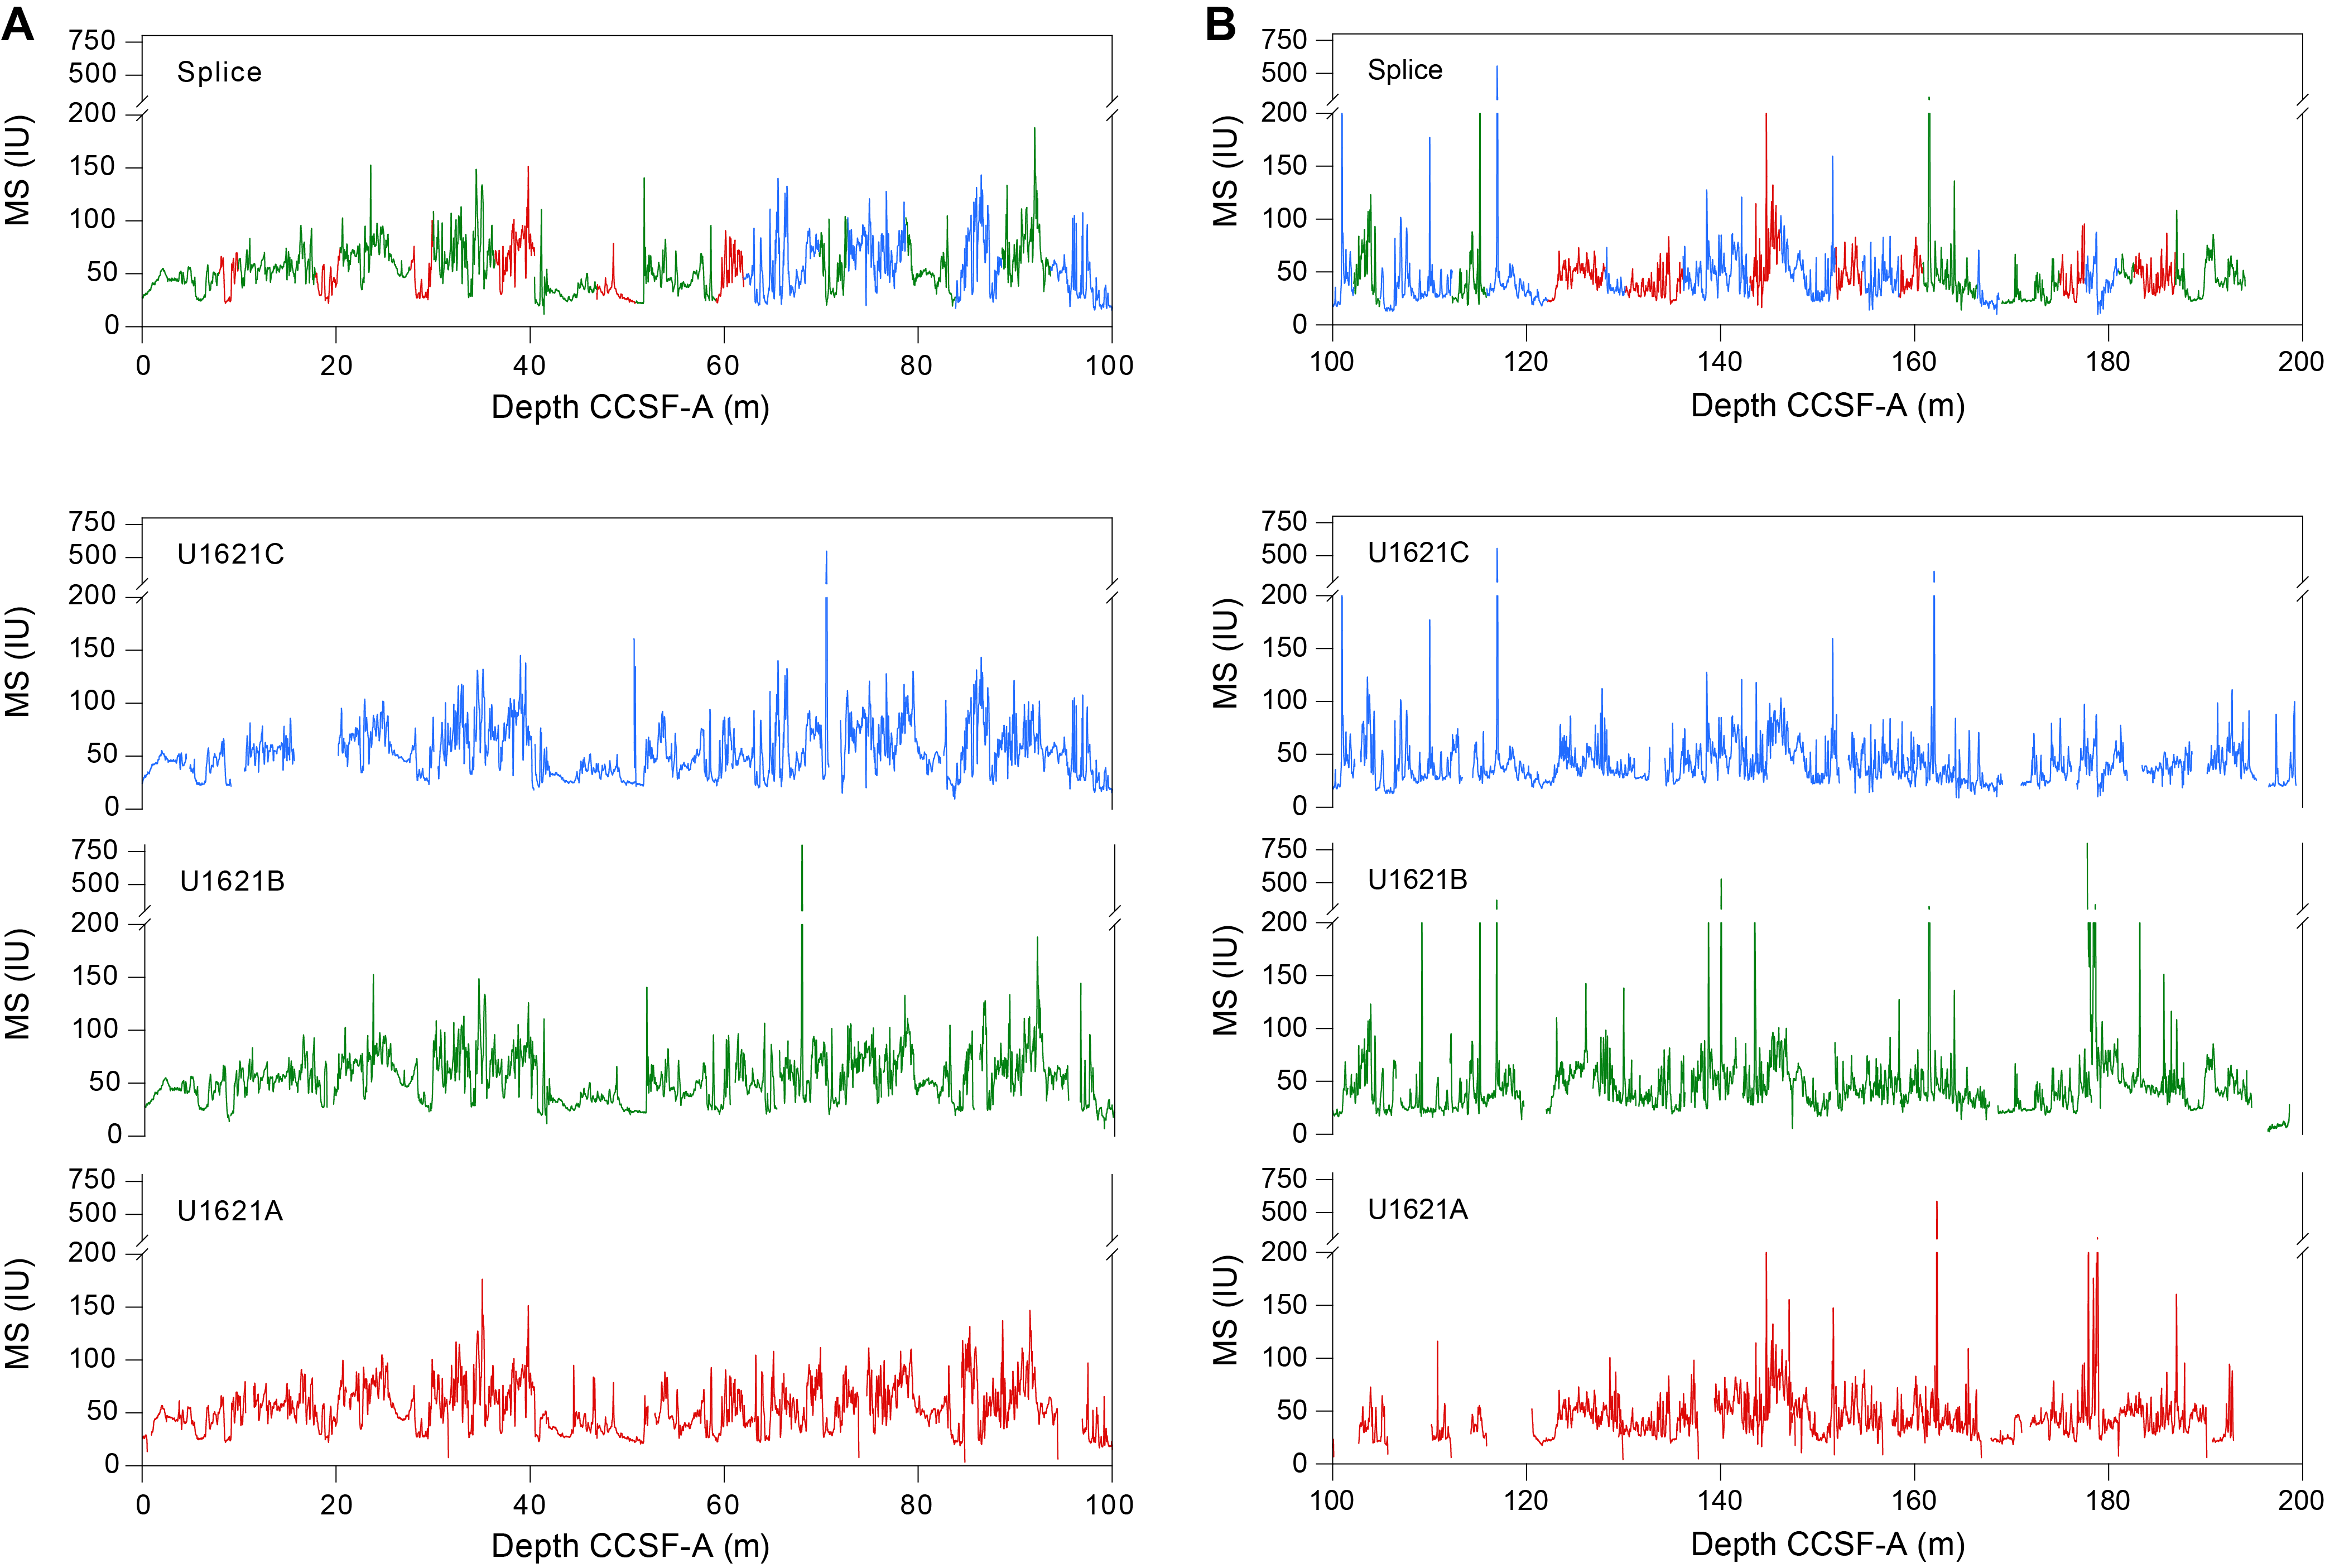
Figure F62. MS data.
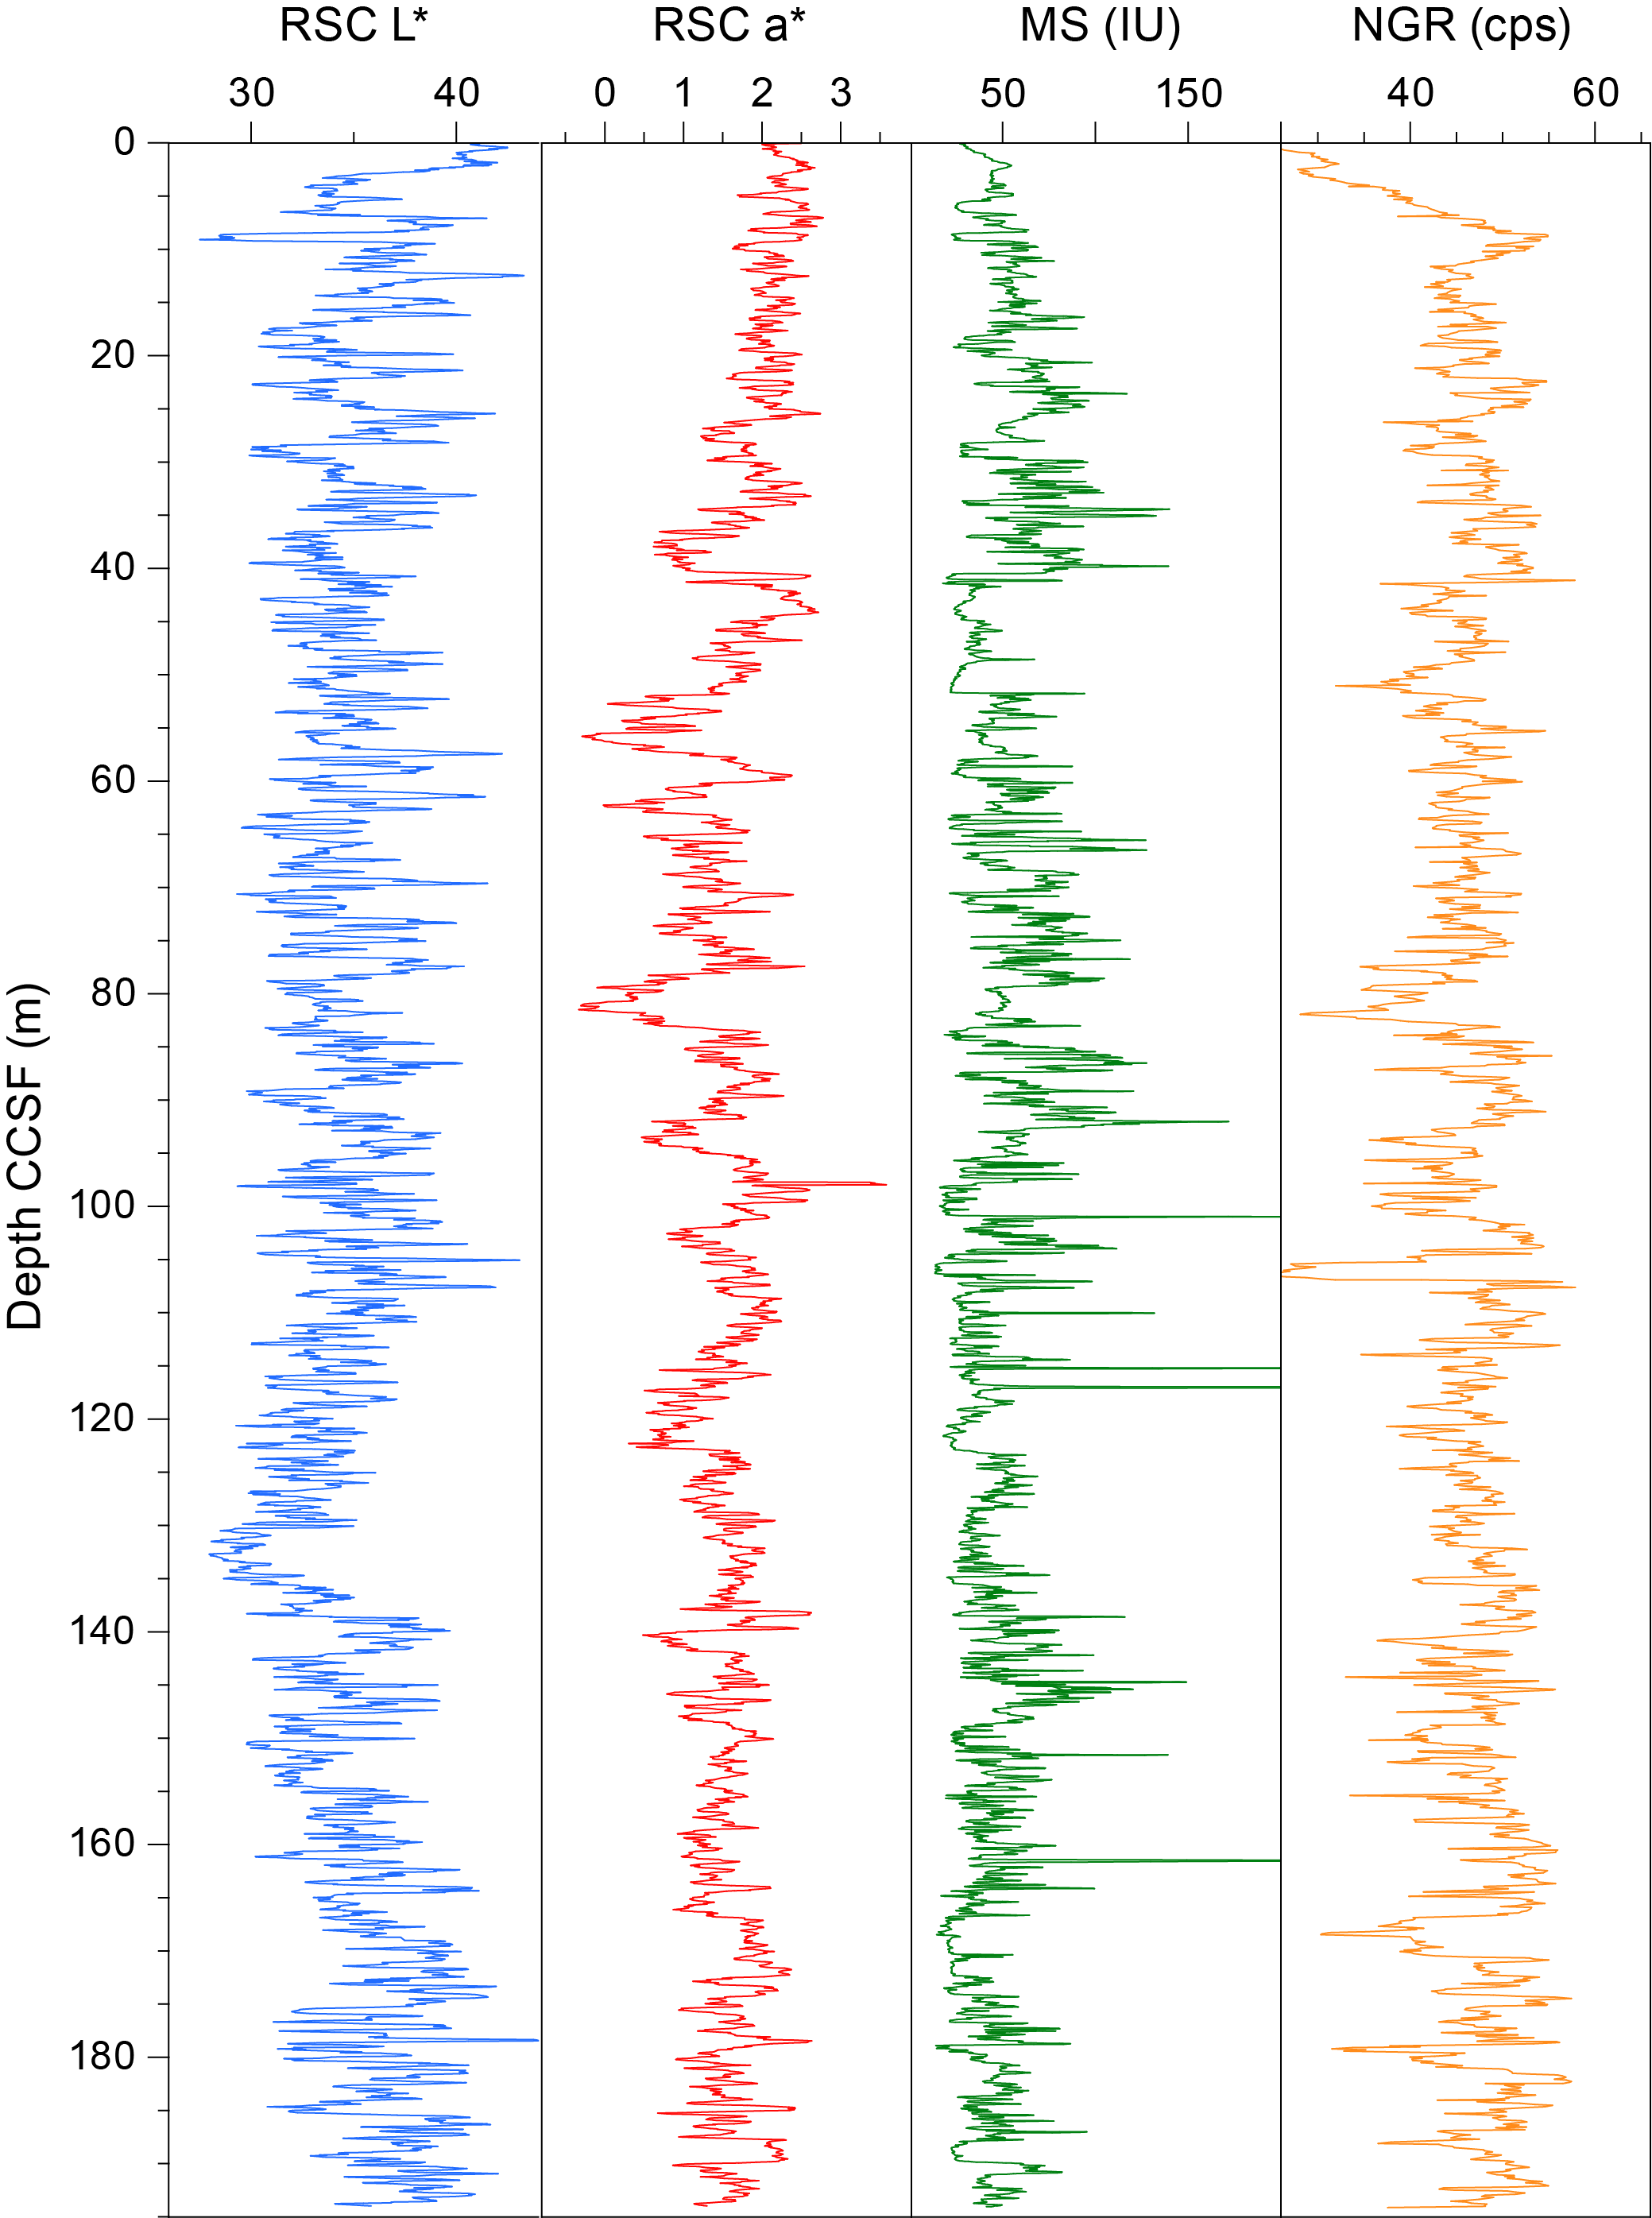
Figure F63. Reflectance spectroscopy and colorimetry (RSC) L* and a*, MS, and NGR.
The CCSF scale is anchored to the mudline of Core 403-U1621B-1H, which is assigned the depth of 0 m CCSF. From this anchor, we worked downhole using Correlator to establish a composite stratigraphy on a core-by-core basis. The match between holes is relatively well constrained within the spliced intervals, with no obvious gaps throughout the spliced interval. Between 0 and ~190 m CCSF, the splice is secured, except for a few tentative tie points (Figure F62). Between 195.42 m CCSF (bottom of Core 26X) and 202.201 m CCSF (Core 31X), we had poor recovery because dropstones jammed the core catcher and the sediment was washed away. We do not include these cores in the vertical plots (Figure F63). The last cores in each hole (403-U1621A-28X, 403-U1621B-32X and 33X, and 403-U1621C-28X) appear in the affine table, but they only contain recovered rocks at the bottom and no sediment.
In the construction of the splice, we started by using cores from Hole U1621B as the backbone, but we alternated among the holes to generate the best splice. There is one gap and two uncertain tie points that were difficult to correlate between holes, and postcruise work will be required to verify some of the tentative tie points used to construct the splice. The gap is between Cores 403-U1621C-16H and 403-U1621A-19F, and the two uncertain tie points are at Cores 403-U1621C-11H to 403-U1621B-12F and 403-U1621C-19F to 403-U1621B-24X. The splice ends at the bottom of Core 403-U1621B-26X.
The offset between the core depth below seafloor (CSF) and CCSF depth scales is nearly linear throughout (Figure F64A). A close inspection of the cumulative offset as a function of depth (mbsf) (Figure F64B) shows that in the upper section (0 to ~60 mbsf), cores from all three holes consistently show minimal growth factor because of low expansion associated with the release of overburden combined with methane gas expansion. The growth factors below ~60 mbsf are a little higher due to gas expansion, leading to growth rates of ~9% that are consistent between the three holes.
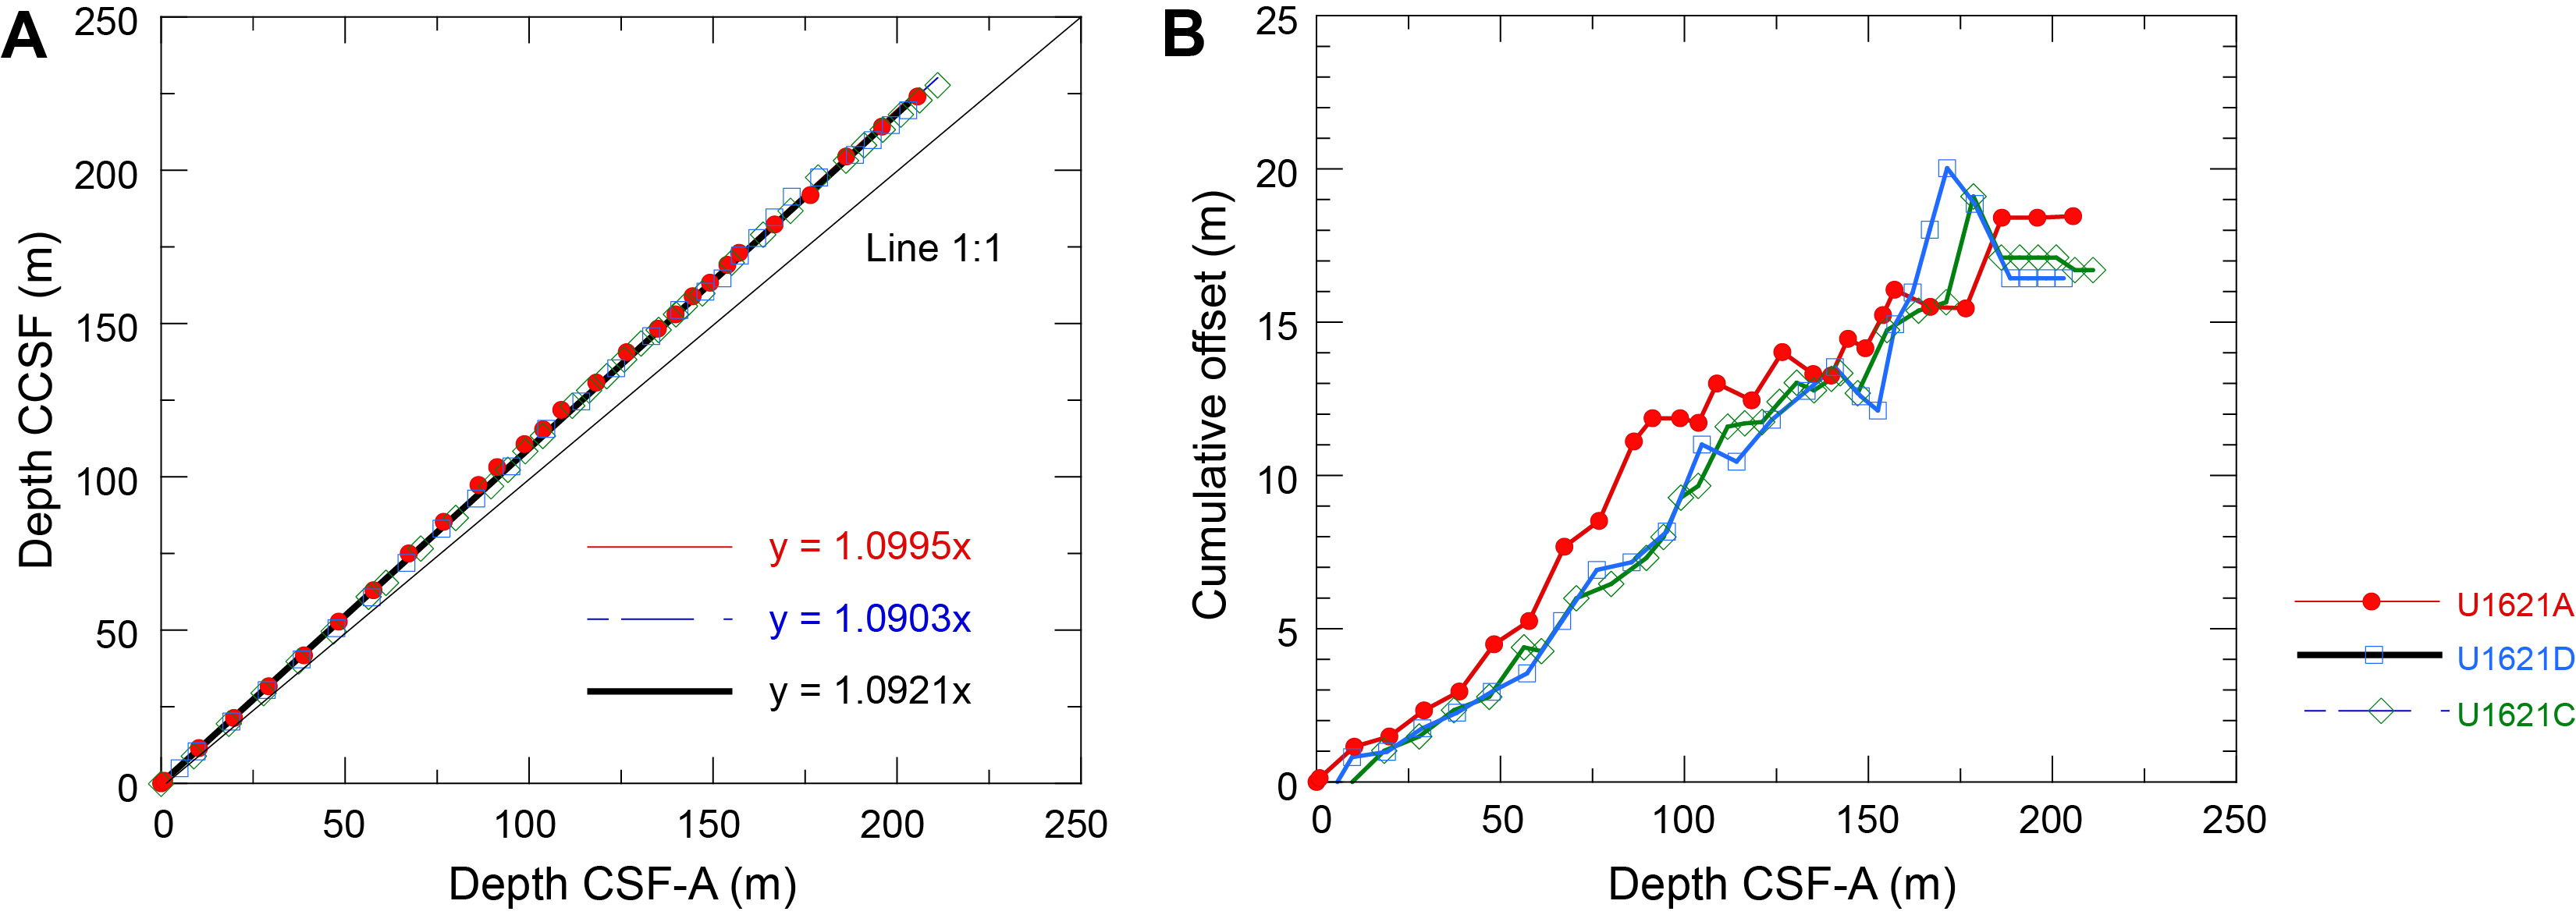
Figure F64. Depth scale offset, Site U1621.
In summary, the splice for Site U1621 is relatively secured for the interval 0–188.18 m CCSF, although some tie points will need to be verified. Calculation of mass accumulation rates based on the CCSF scale should account for the expansion by dividing apparent depth intervals by the appropriate growth factor.
7.2. Site U1622
Only one hole was occupied at Site U1622, and therefore no correlation was applied. The seven cores recovered at this site extend from the surface (0–41.8 mbsf) and were positioned in stratigraphic order relative to their advance and curated length when recovery was greater than 100% (Table T13). This resulted in a curated length of 46.9 m CCSF (Figure F65; Table T14).
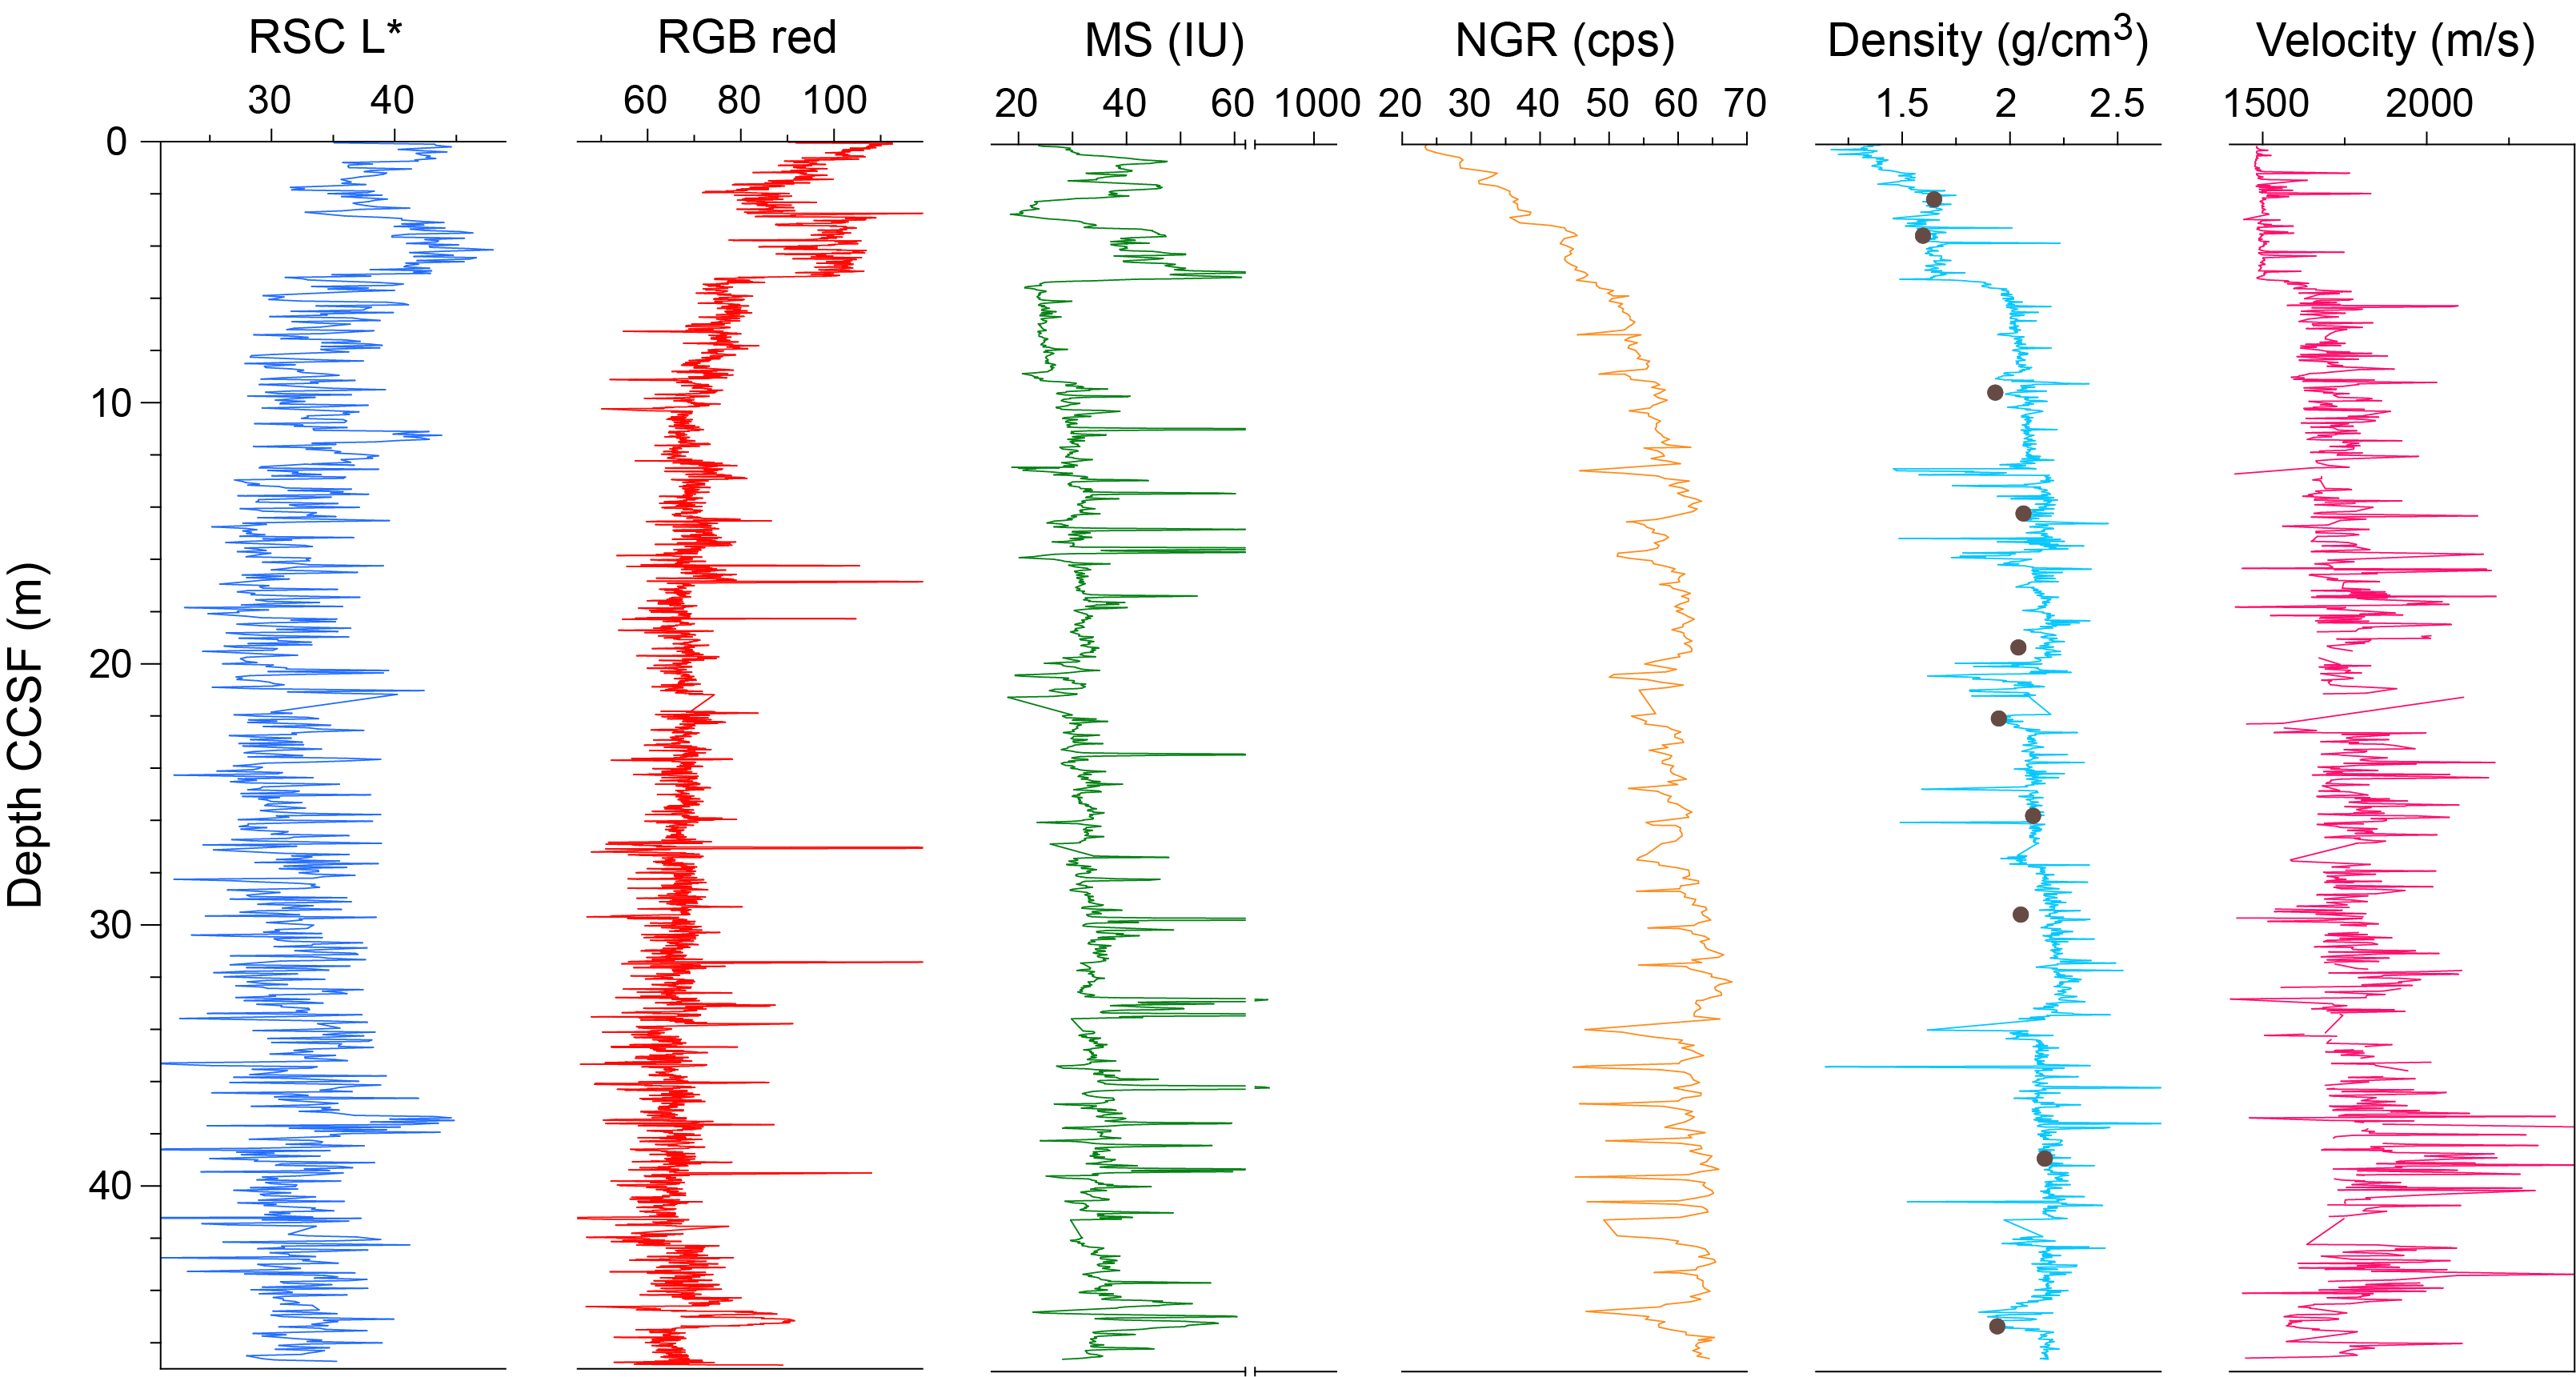
Figure F65. Reflectance spectroscopy and colorimetry (RSC) L*, red-green-blue (RGB) red, MS, NGR, density, and velocity.
7.3. Site U1623
Seven holes with variable depths were cored at Site U1623, allowing us to generate a primary and an alternate splice (Tables T15, T16).
7.3.1. Primary splice
The primary splice comprises the interval from 0 to 404.18 m CCSF (top of Core 403-U1623D-56X) based on correlations between Holes U1623A, U1623C, and U1623D, except for the top 3 m (CCSF) where we used the first core of Hole U1623F (Figure F66; Table T17). We also used Core 403-U1623F-3H to cover the core gap between Cores 403-U1623A-3H and 4H. Below 175 m CCSF (top of Core 403-U1621C-29X), we had poor recovery due to abundant dropstones, and sediments were partially washed out during the XCB drilling process. Nonetheless, with the three first holes, we were able to generate a complete splice for the entire record (Table T15). Although we relied on MS data in building this splice, we note that the NGR data sets may be more useful for comparison with climate records (Figure F67).
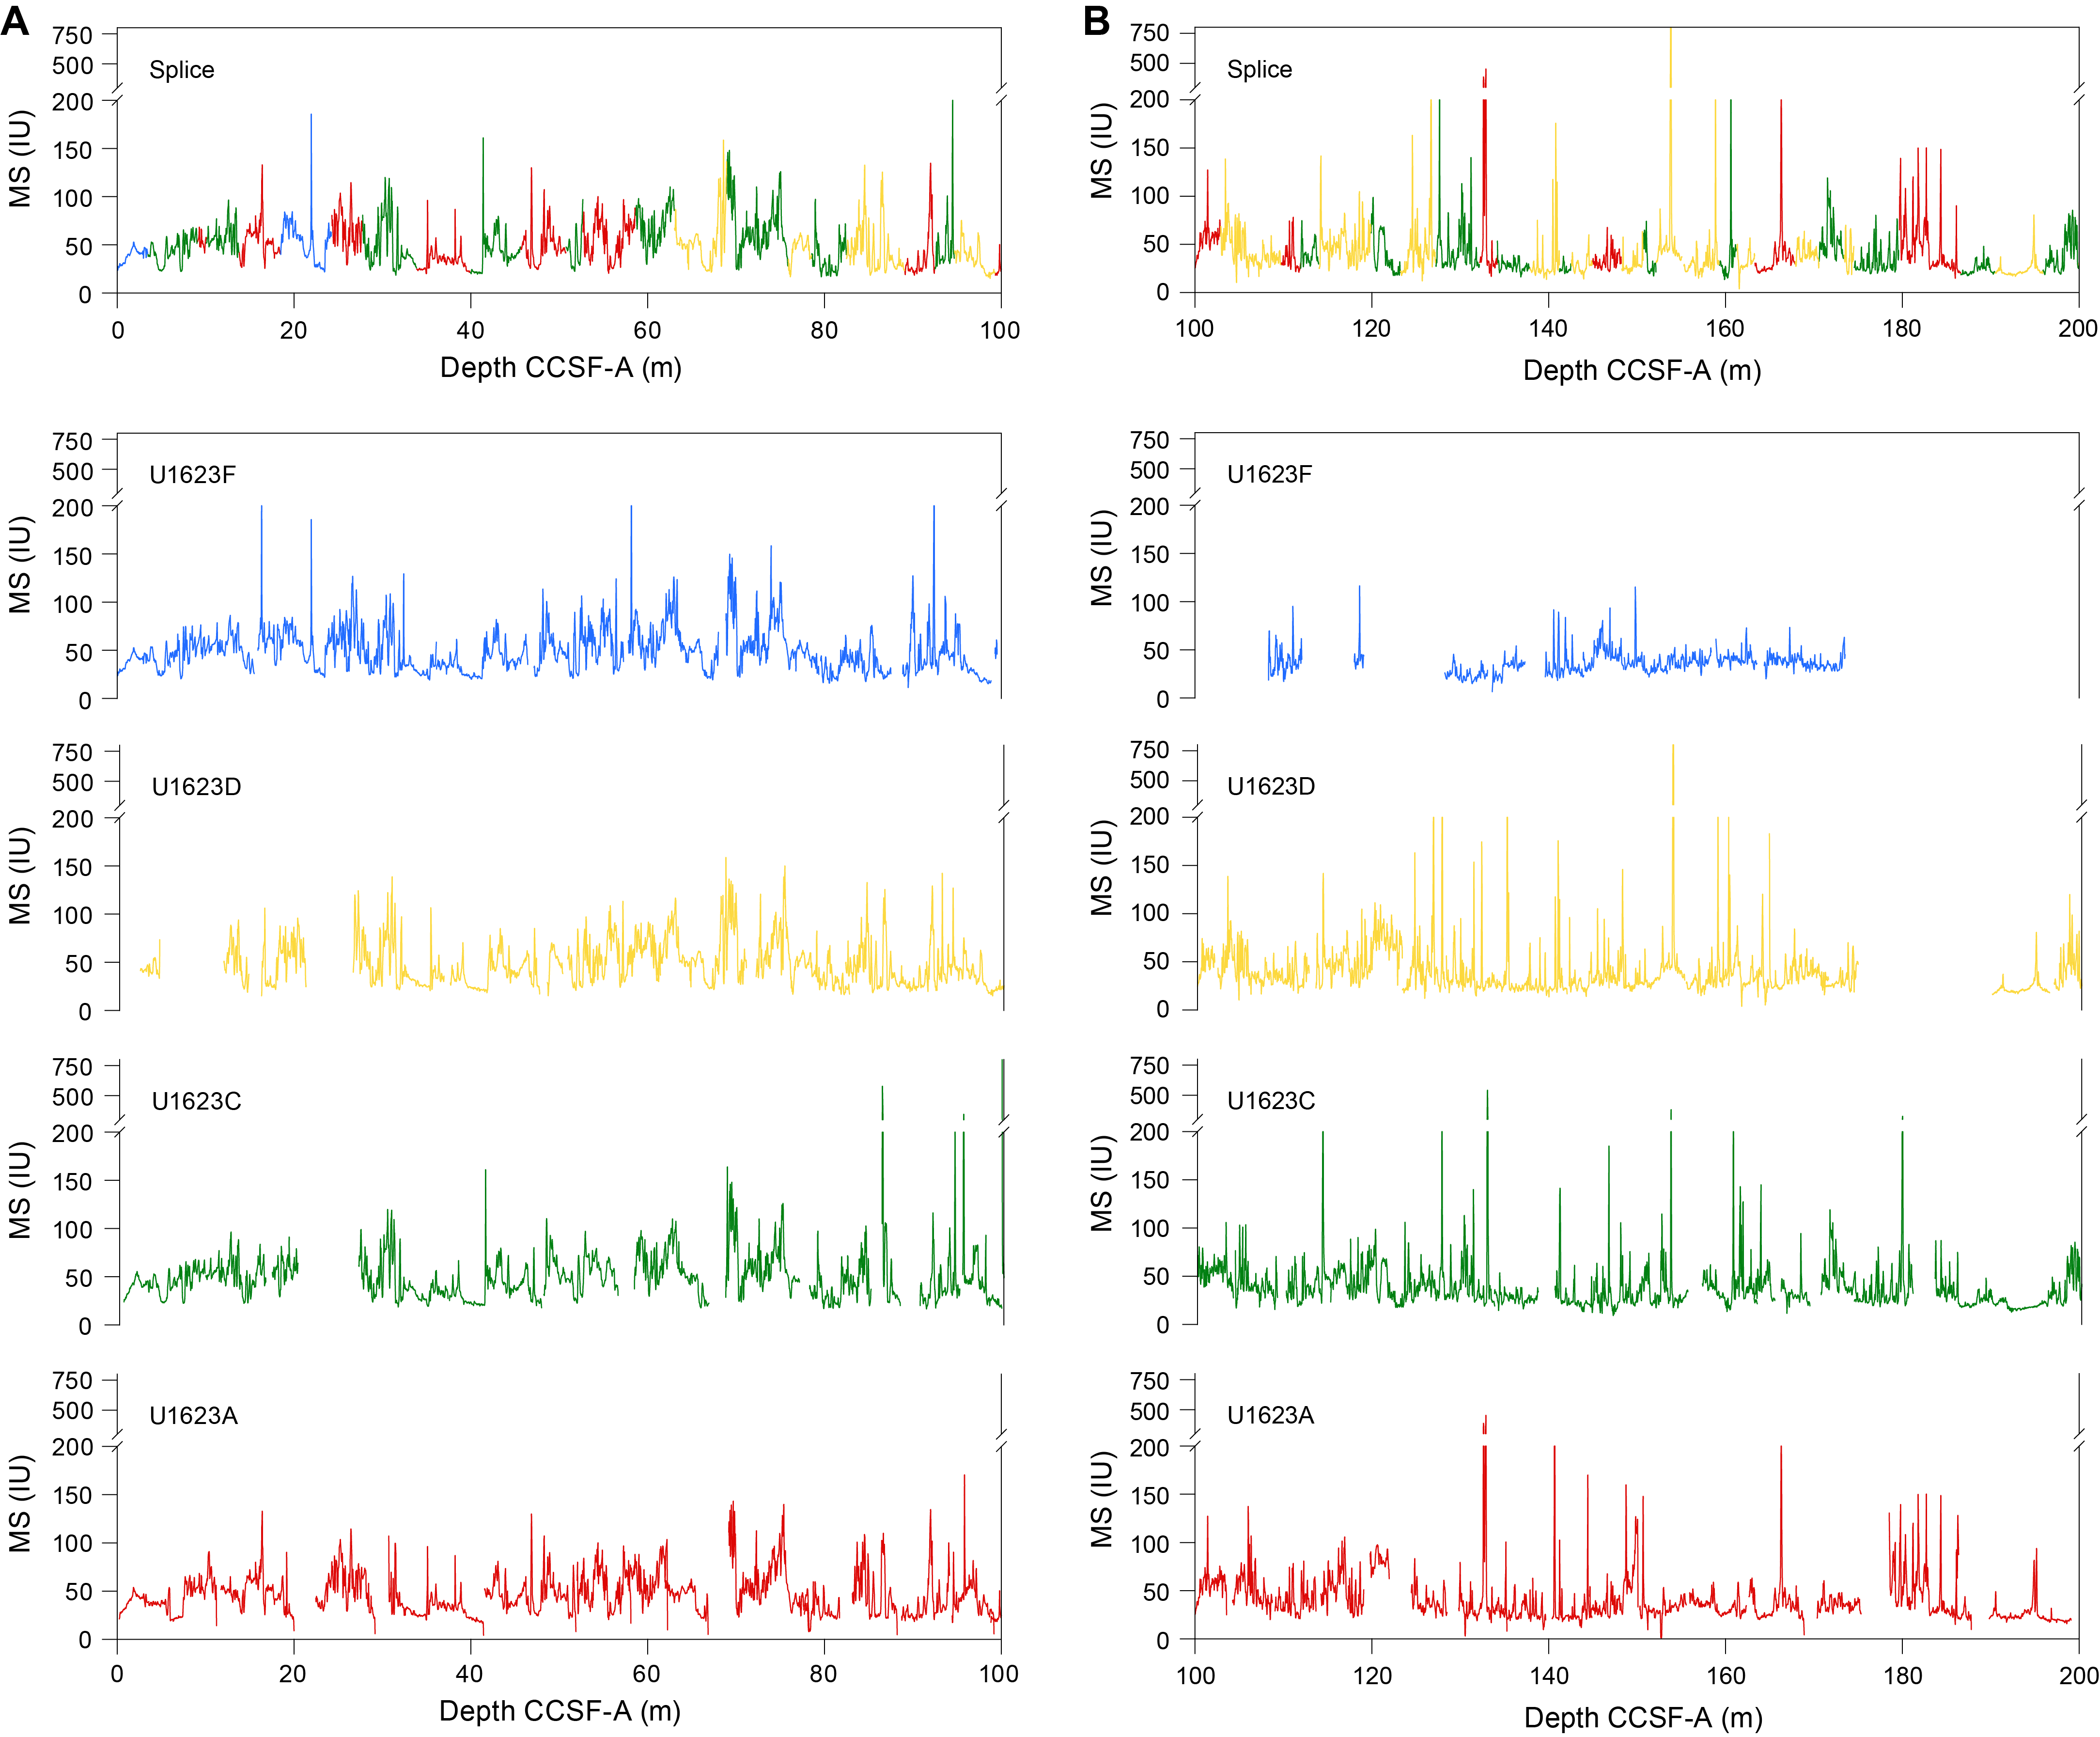
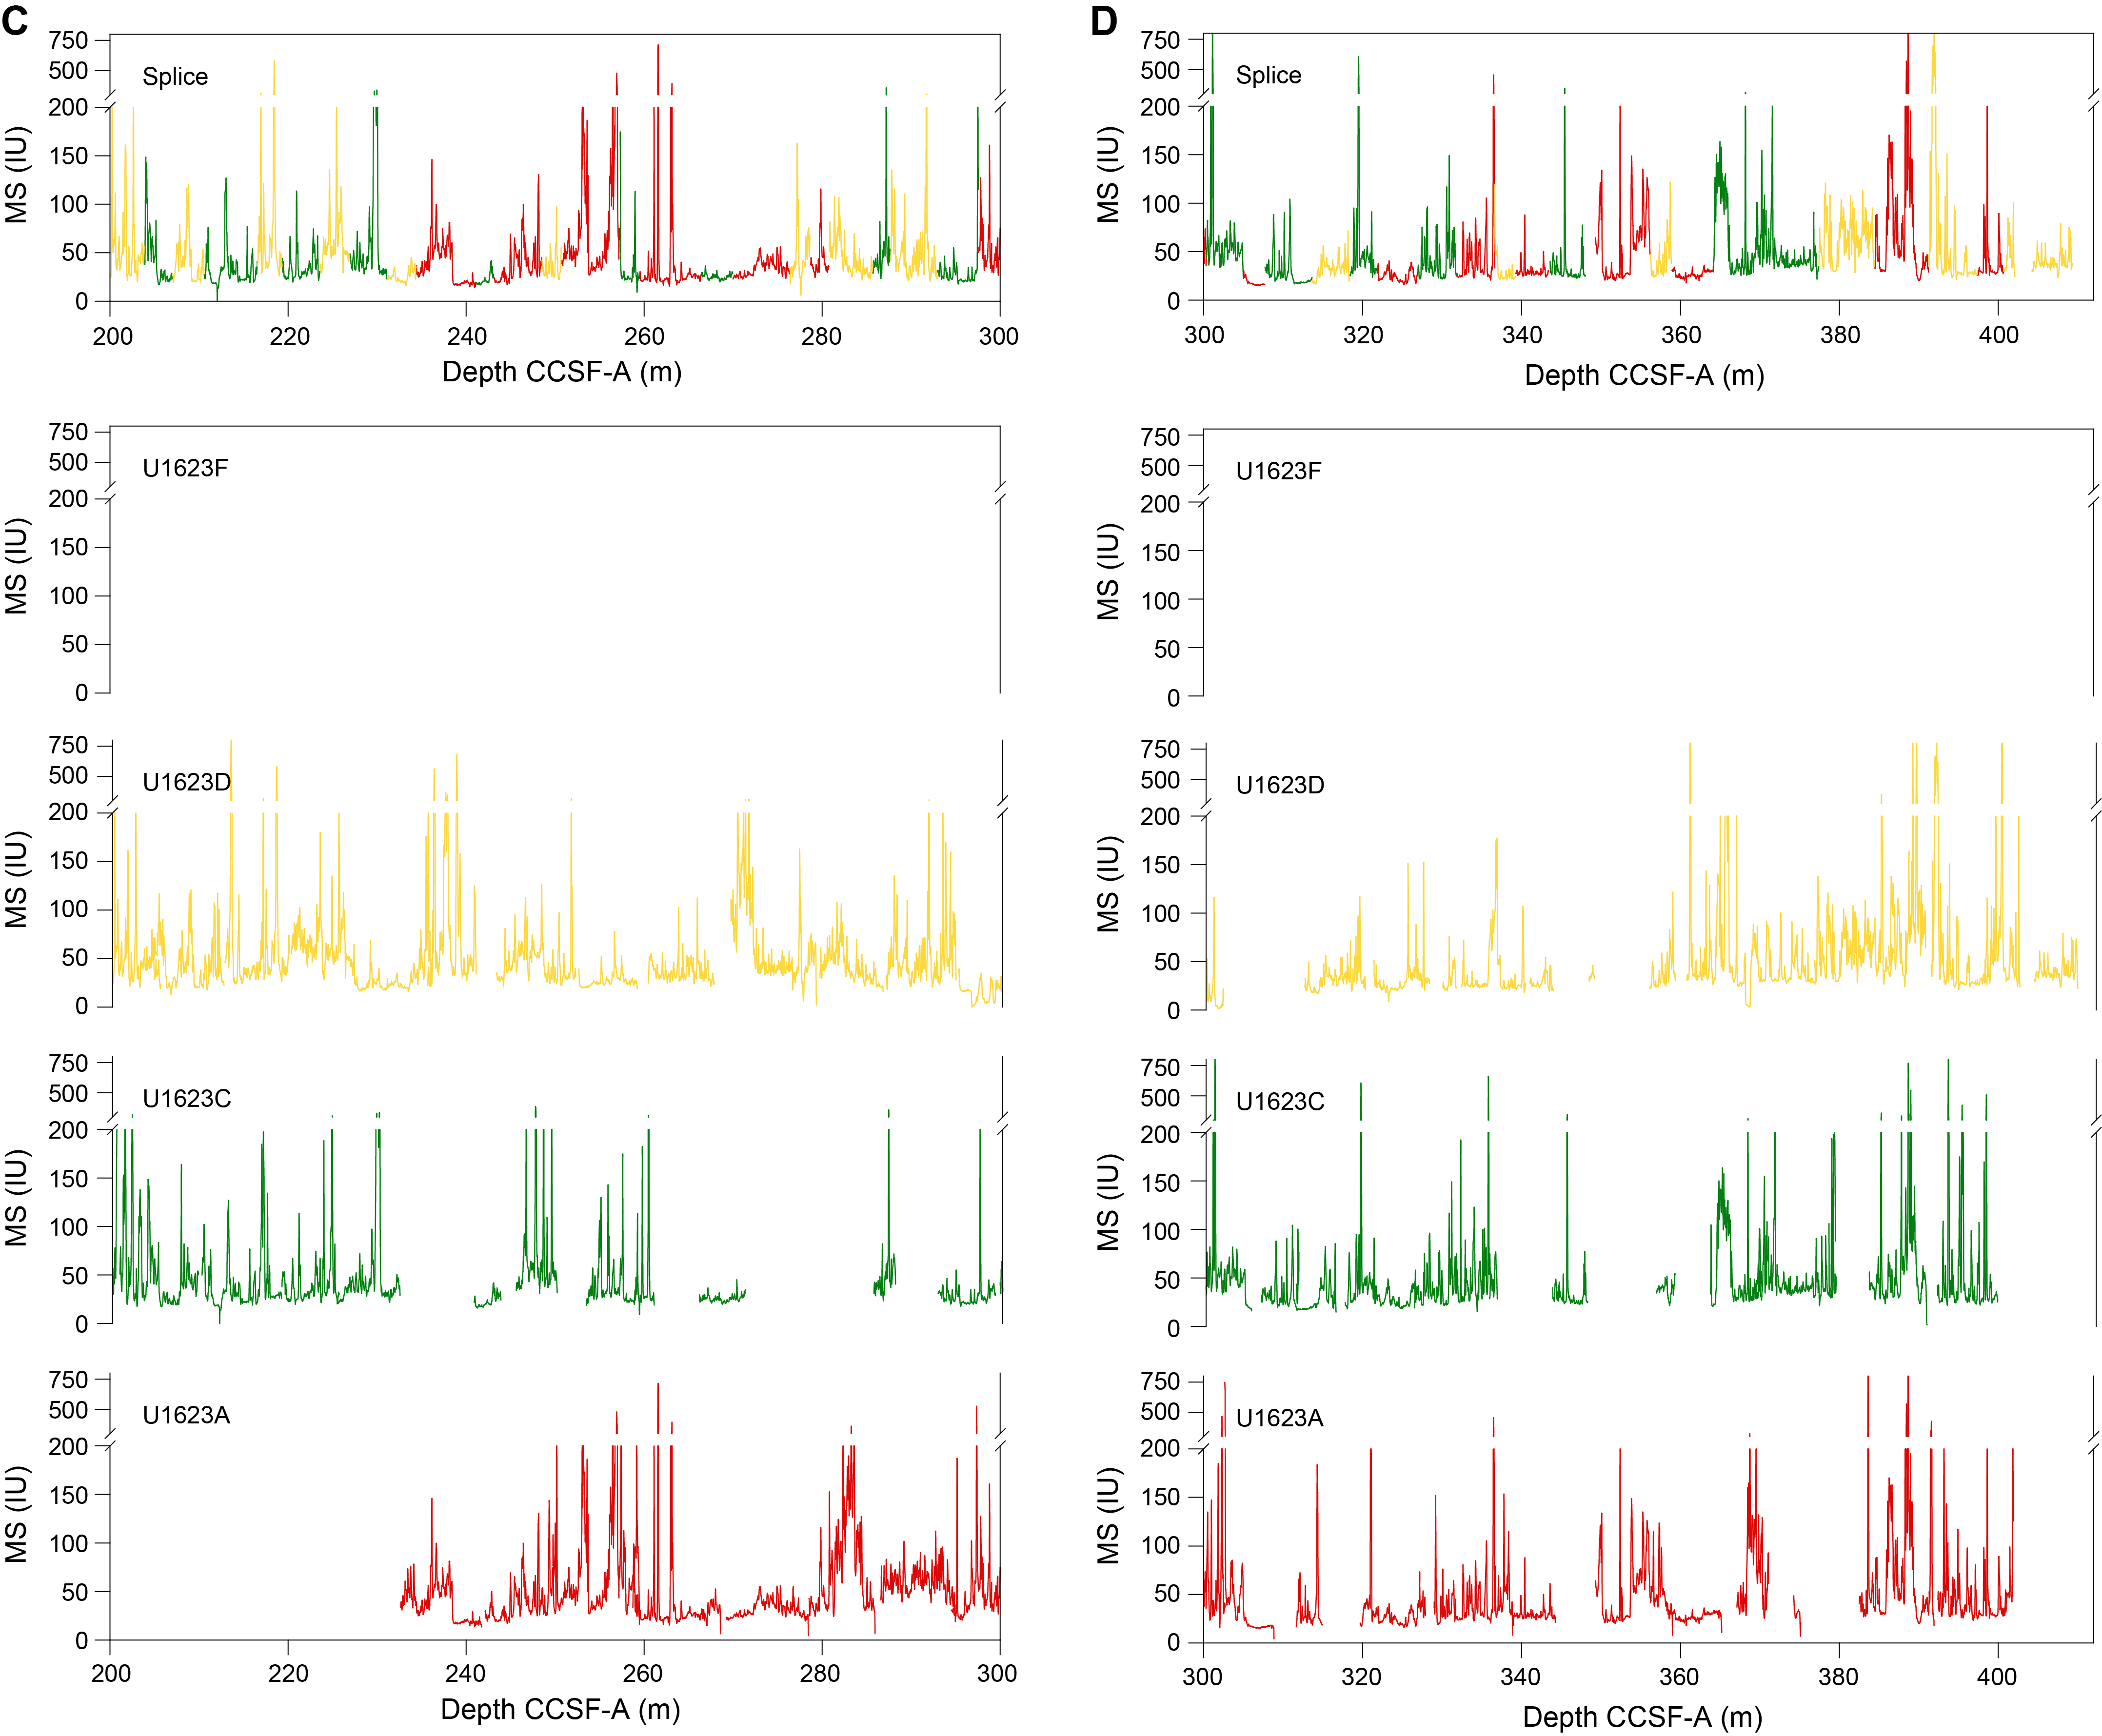
Figure F66. Primary splice showing MS data.
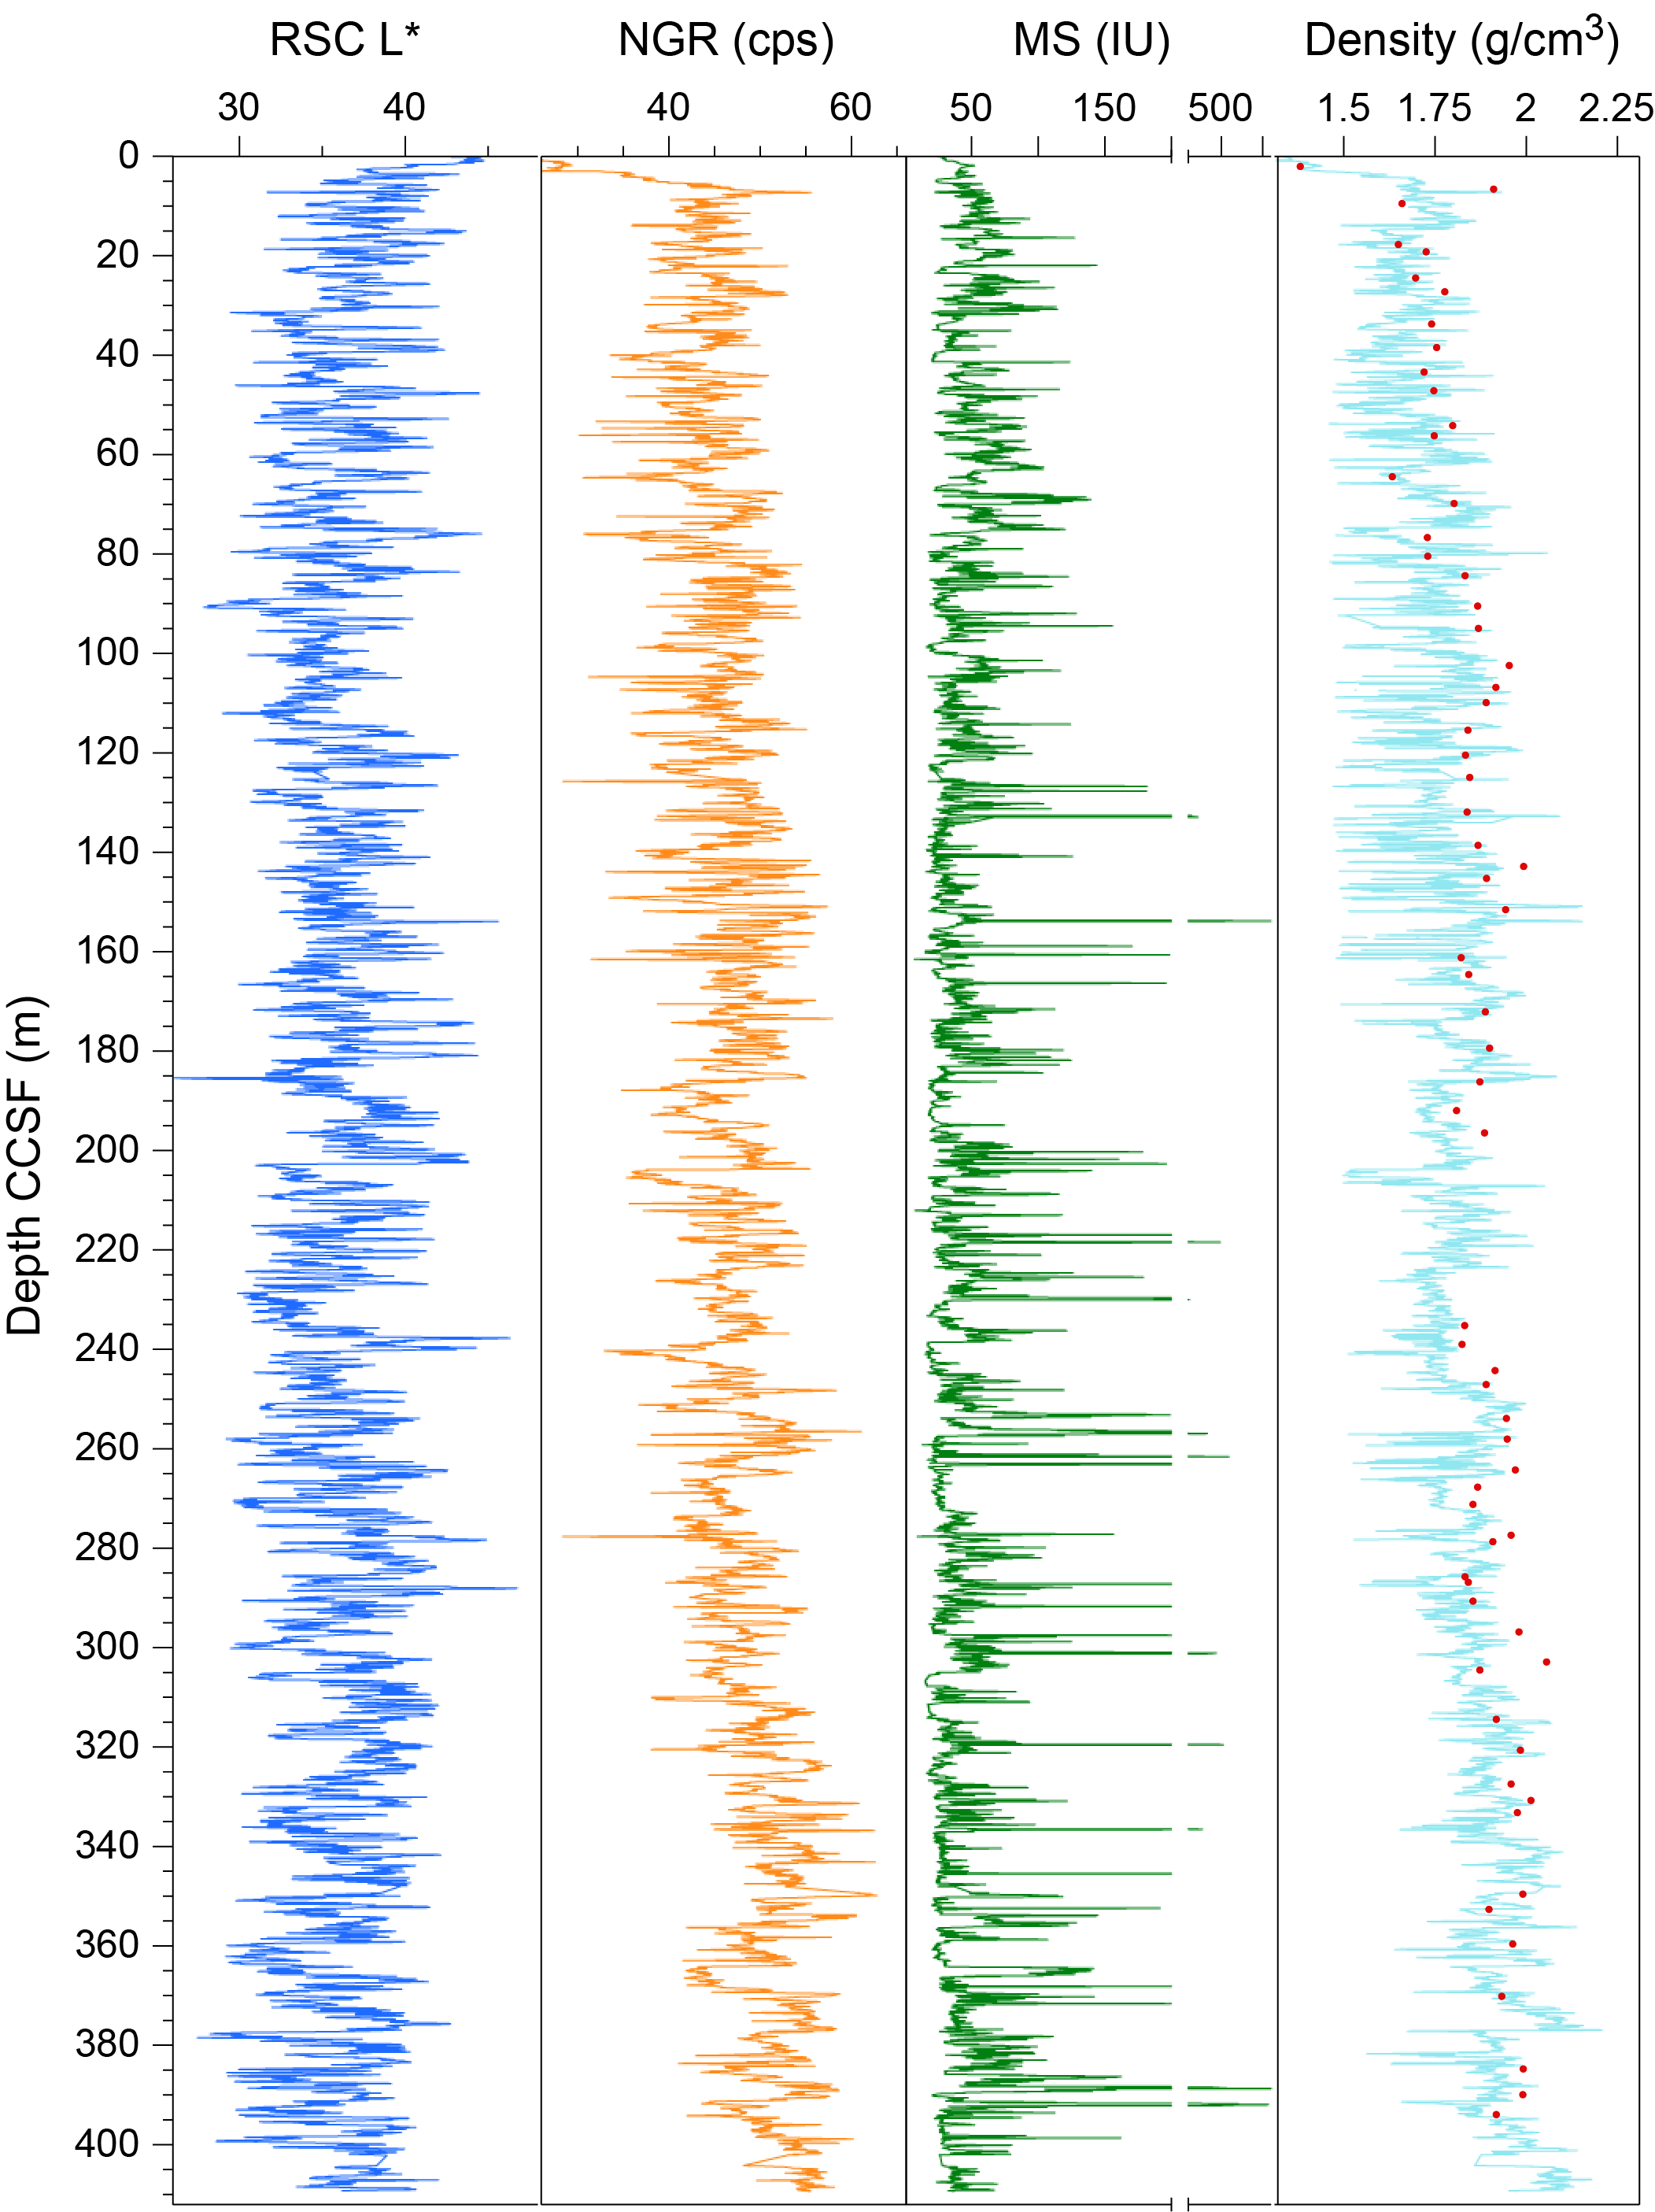
Figure F67. Reflectance spectroscopy and colorimetry (RSC) L*, NGR, MS, and density.
For the primary splice, the CCSF scale is anchored to the mudline of Core 403-U1623F-1H, which is assigned the depth of 0 m CCSF. We chose this core because it seems to have the best mudline recovery, but we note that Cores 403-U1623A-1H, 403-U1623C-1H, and 403-U1623G-1H have equally good mudlines. From this anchor (Core 403-U1623F-1H), we worked downhole using Correlator to establish a composite stratigraphy on a core-by-core basis. The match between holes is relatively well constrained within the spliced intervals, and there is only one obvious gap throughout the spliced interval. Except for a few intervals, the splice is secured throughout (Figure F66). The last core of the splice (403-U1623D-56X) was appended based on the growth factor.
In the construction of the splice, we alternated mostly between Holes U1623A, U1623C, and U1623D to generate the best splice. There is one gap and several uncertain tie points that were difficult to correlate between the holes, and postcruise work will be required to verify some of the tentative tie points used to construct the splice. The gap is between Cores 403-U1623C-48X and 403-U1623A-46X. The uncertain tie points include Cores 403-U1623F-3H to 403-U1623A-4H, 403-U1623A-15F to 403-U1623D-12H, 403-U1623C-20F to 403-U1623D-18F, 403-U1623D-24F to 403-U1623C-27F, 403-U1623C-27F to 403-U1623D-25F, 403-U1623D-25F to 403-U1623C-29X, 403-U1623A-41X to 403-U1623C-44X, 403-U1623D-46X to 403-U1623A-45X, 403-U1623D-49X to 403-U1623A-47X, and 403-U1623A-50X to 403-U1623D-54X. The splice ends at the bottom of Core 403-U1623B-56X.
7.3.2. Alternate splice
For the alternate splice, we constructed a single spliced interval from 0 to 174.5 m CCSF (top of Core 403-U1623A-28F) based on correlations primarily between Holes U1623F and U1623G, with additional sections from Holes U1623A, U1623C, and U1623D in the interval from 73.7 to 174.5 m CCSF (Figure F68). Using cores that were not included in the primary splice, we could generate a complete splice for the 0–174.5 m CCSF interval. The splice is secured between 0 and 145.1 m CCSF (top of Core 403-U1623C-21F). We extended the alternate splice by appending cores between 145.1 and 174.5 m CCSF (bottom of Core 403-U1623A-28X) based on the growth rate. Below 174.5 m CCSF, the primary splice should be used.
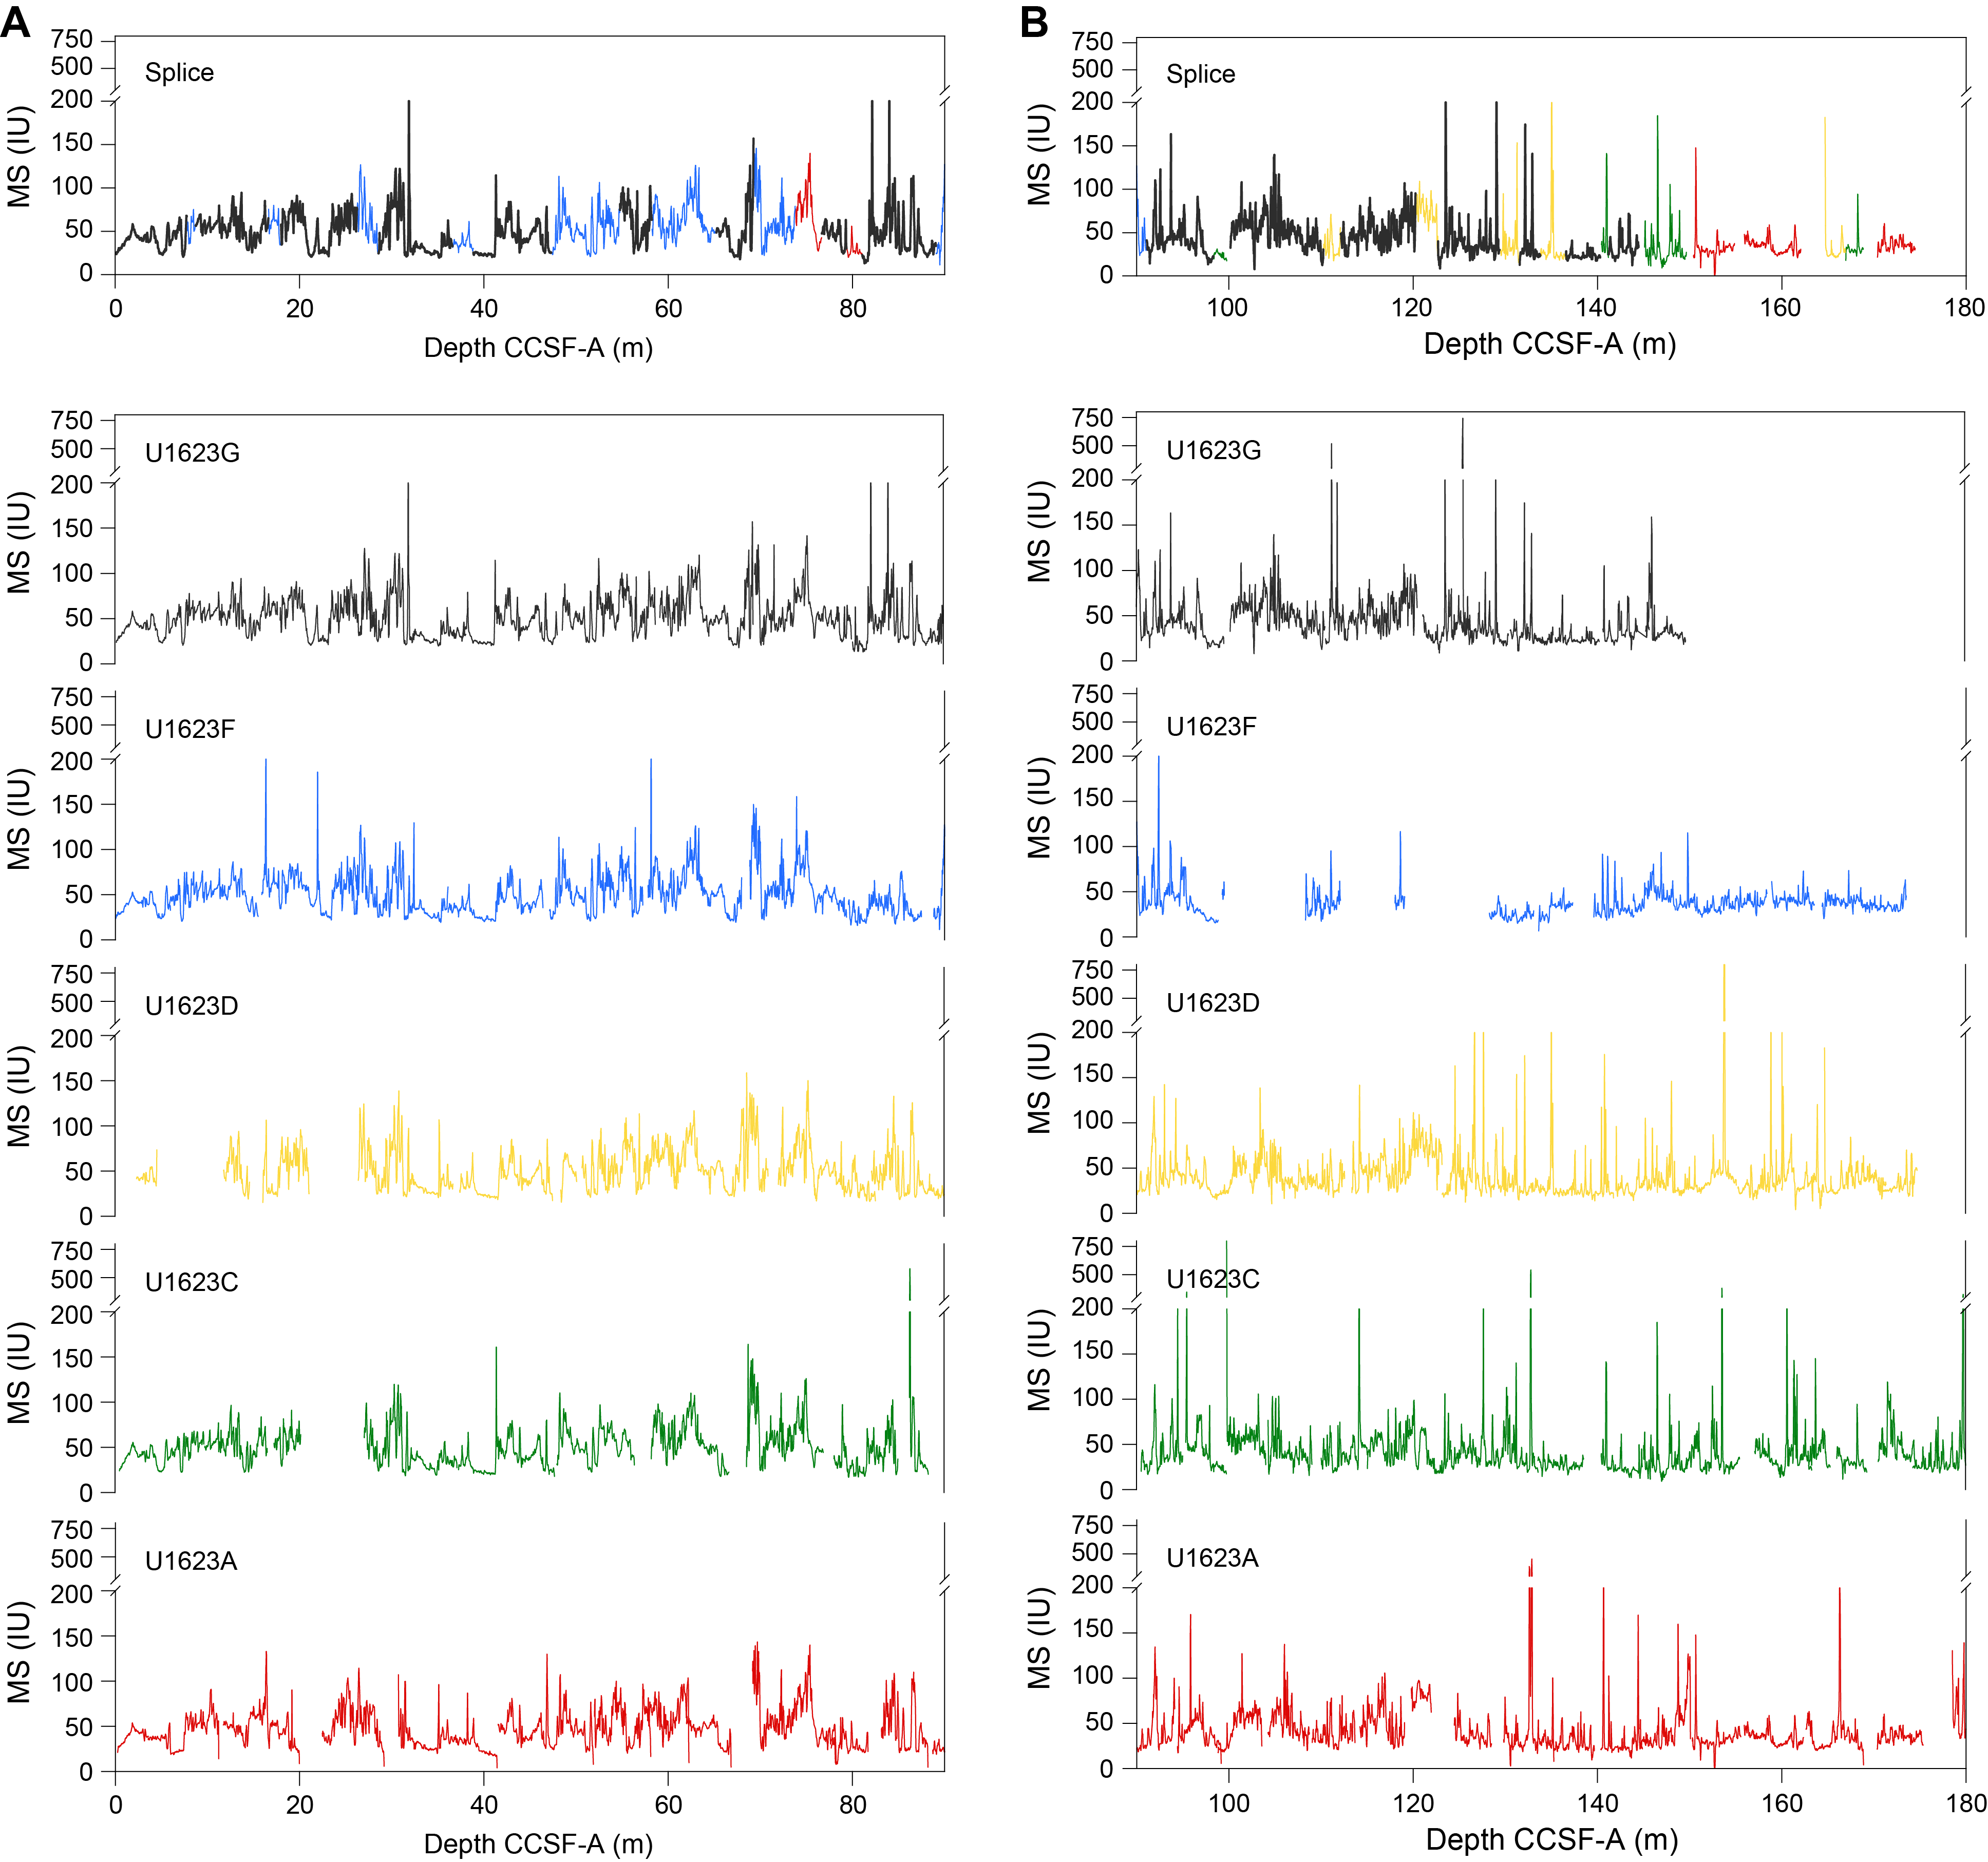
Figure F68. Alternate splice showing MS data.
For the alternate splice, the CCSF scale is anchored to the mudline of Core 403-U1623G-1H, which is assigned the depth of 0 m CCSF. From this anchor, we worked downhole using Correlator to establish a composite stratigraphy on a core-by-core basis. The match between holes is relatively well constrained within the spliced interval, with one obvious gap throughout the spliced interval. Except for a few intervals, the splice is secured throughout (Figure F68).
In the construction of the splice, we used Hole U1623G as the backbone of the splice. Between 0 and ~90 m CCSF, we alternated mostly between Holes U1623G and U1623F to generate the best splice. Below 90 m CCSF, cores from Hole U1623F below Core 10H could not be used because of coring disturbances, and we alternated between cores from Holes U1623G, U1623A, and U1623D. There are two gaps and two uncertain tie points that were difficult to correlate between holes, and postcruise work will be required to verify some of the tentative tie points used to construct the splice. The gaps are between Cores 403-U1623C-12F and 403-U1623G-12H and Cores 403-U1623G-17F and 403-U1623C-20F. The uncertain tie points include Cores 403-U1623G-10H to 403-U1623F-10H and 403-U1623G-18F to 403-U1623C-21F. Below Core 403-U1623C-21F, we appended five more cores. The splice ends at the bottom of Core 403-U1623A-28X.
The offset between the CSF and CCSF depth scales is nearly linear throughout (Figure F69A). The growth factors below ~60 mbsf are affected by gas expansion, leading to growth rates of ~9% that are consistent among the three holes. A close inspection of the cumulative offset as a function of depth (mbsf) (Figure F69B) shows, however, significant differences among some of the holes. Specifically, the mudline of Hole U1623D was deeper than the expected water depth, resulting in an offset from all the other holes, possibly because we cored into a small local surface depression. Except for the offset, the cores show similar expansion rates to other holes. In Hole U1623F, we only consider the first 10 cores. Below these, it is suspected that the pipe was deflected into a previous hole, as indicated by the low GRA bulk density, and we do not consider the deeper sections to represent the sedimentary record (see Operations). Excluding these parts, the cores show similar growth rates, relatively low (~1.06) in the 0–140 mbsf interval and then increasing to ~1.10–1.12 between ~150 and 250 mbsf.
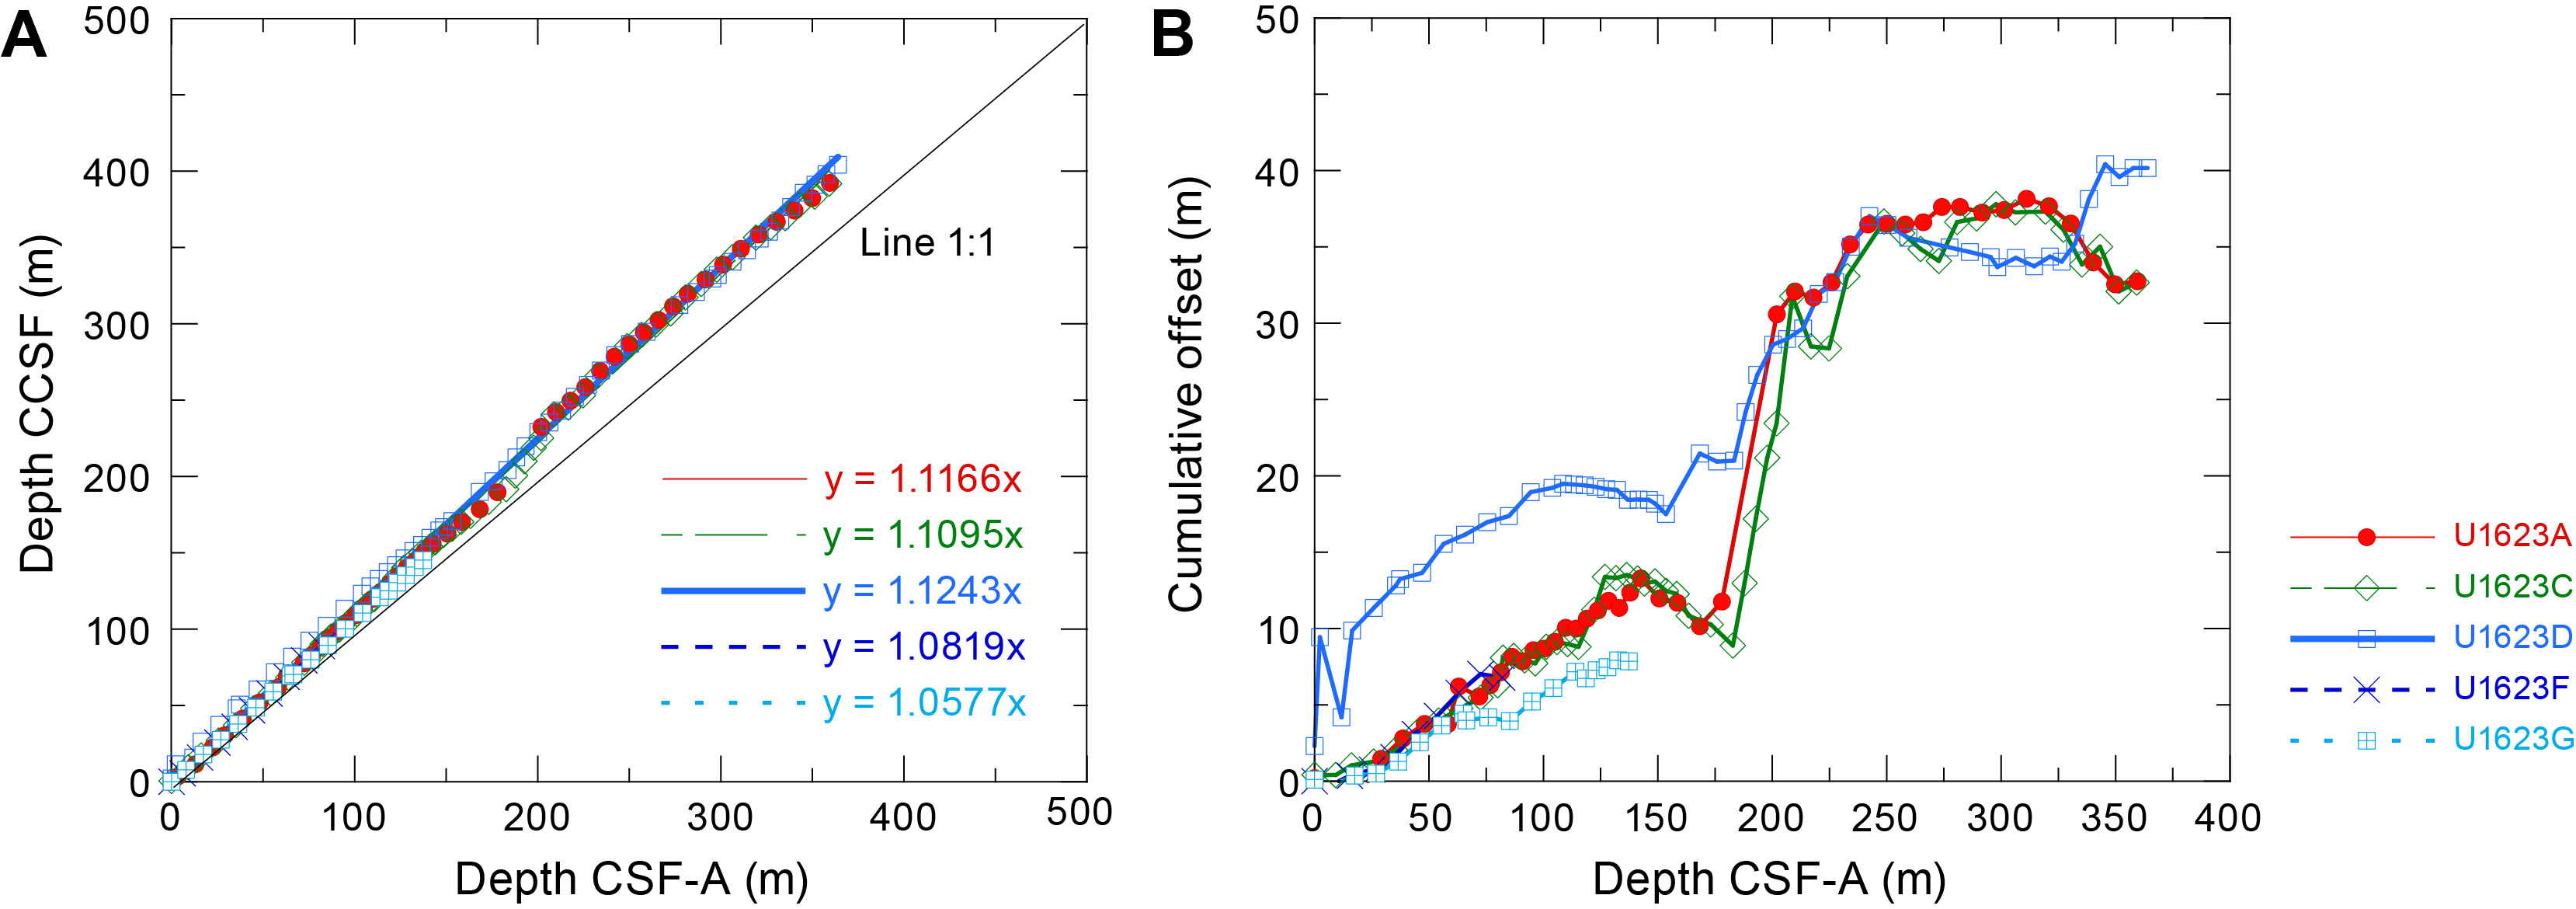
Figure F69. Depth scale offset, Site U1623.
In summary, we generated two splices in Site U1623, a primary splice from 0 to 404.18 m CCSF and an alternate splice from 0 to 174.5 m CCSF. Both are relatively secured for the spliced intervals, with minimal gaps, although some tie points will need to be verified by onshore X-ray fluorescence scanning. We recommend that initial studies focus on the primary splice. Calculation of mass accumulation rates based on the CCSF scale should account for the expansion by dividing apparent depth intervals by the appropriate growth factor.
8. Geochemistry
Samples for interstitial water (IW) chemistry, bulk sediment geochemistry, and headspace gas were analyzed at Sites U1621–U1623. The main findings from IW analyses suggest diagenetic alteration of minerals and organic matter, except at Site U1622, which shows low organic matter diagenesis and an expanded iron (Fe) reduction zone. The calcium carbonate (CaCO3) and total organic carbon (TOC)/total nitrogen (TN) (C/N) ratios change with lithology, with higher values in Lithostratigraphic Unit I and lower values in Unit II. The CaCO3 contents fluctuate with apparent cyclic patterns at Sites U1621 and U1623 in Unit I. Methane concentration sharply increased from near-zero concentrations just below the sediment/water interface, peaking at 46 and 38 m at Sites U1621 and U1623, respectively. At Site U1622, methane concentrations were lower than at other sites, suggesting the presence of sulfate at depth, which inhibits biological methanogenesis, possibly explaining the deeper occurrence of the sulfate–methane transition zone (SMTZ).
The IW geochemistry and bulk sediment geochemistry are reflective of changes in sedimentary source material, likely related to the changing dynamics of glacial activity, as well as diagenetic reactions occurring within the sediment column.
8.1. Interstitial water chemistry
A total of 20 IW samples from Site U1621, 7 from Site U1622, 39 from Hole U1623A, and 8 from Hole U1623F were squeezed from 5 or 10 cm whole-round samples, where typical samples yielded 10 cm3 of water for subsequent analysis. Analyses of inorganic geochemistry parameters (Table T18) were completed on each sample following analytical procedures (see Geochemistry in the Expedition 403 methods chapter [Lucchi et al., 2026a]). The geochemical profiles of all three sites suggest dissolution and alteration of mineral phases. Additionally, an expanded Fe reduction zone is observed at Site U1622, whereas Fe reduction is noticeable above and below the SMTZ at Sites U1621 and U1623.
8.1.1. pH, chloride, sodium, and salinity
The pH measured at all three sites shows little variability (Table T18). The geochemistry profiles of chloride (Cl), sodium (Na), and salinity are shown in Figure F70. The geochemical parameters of pH, Cl, Na, and salinity are discussed below.
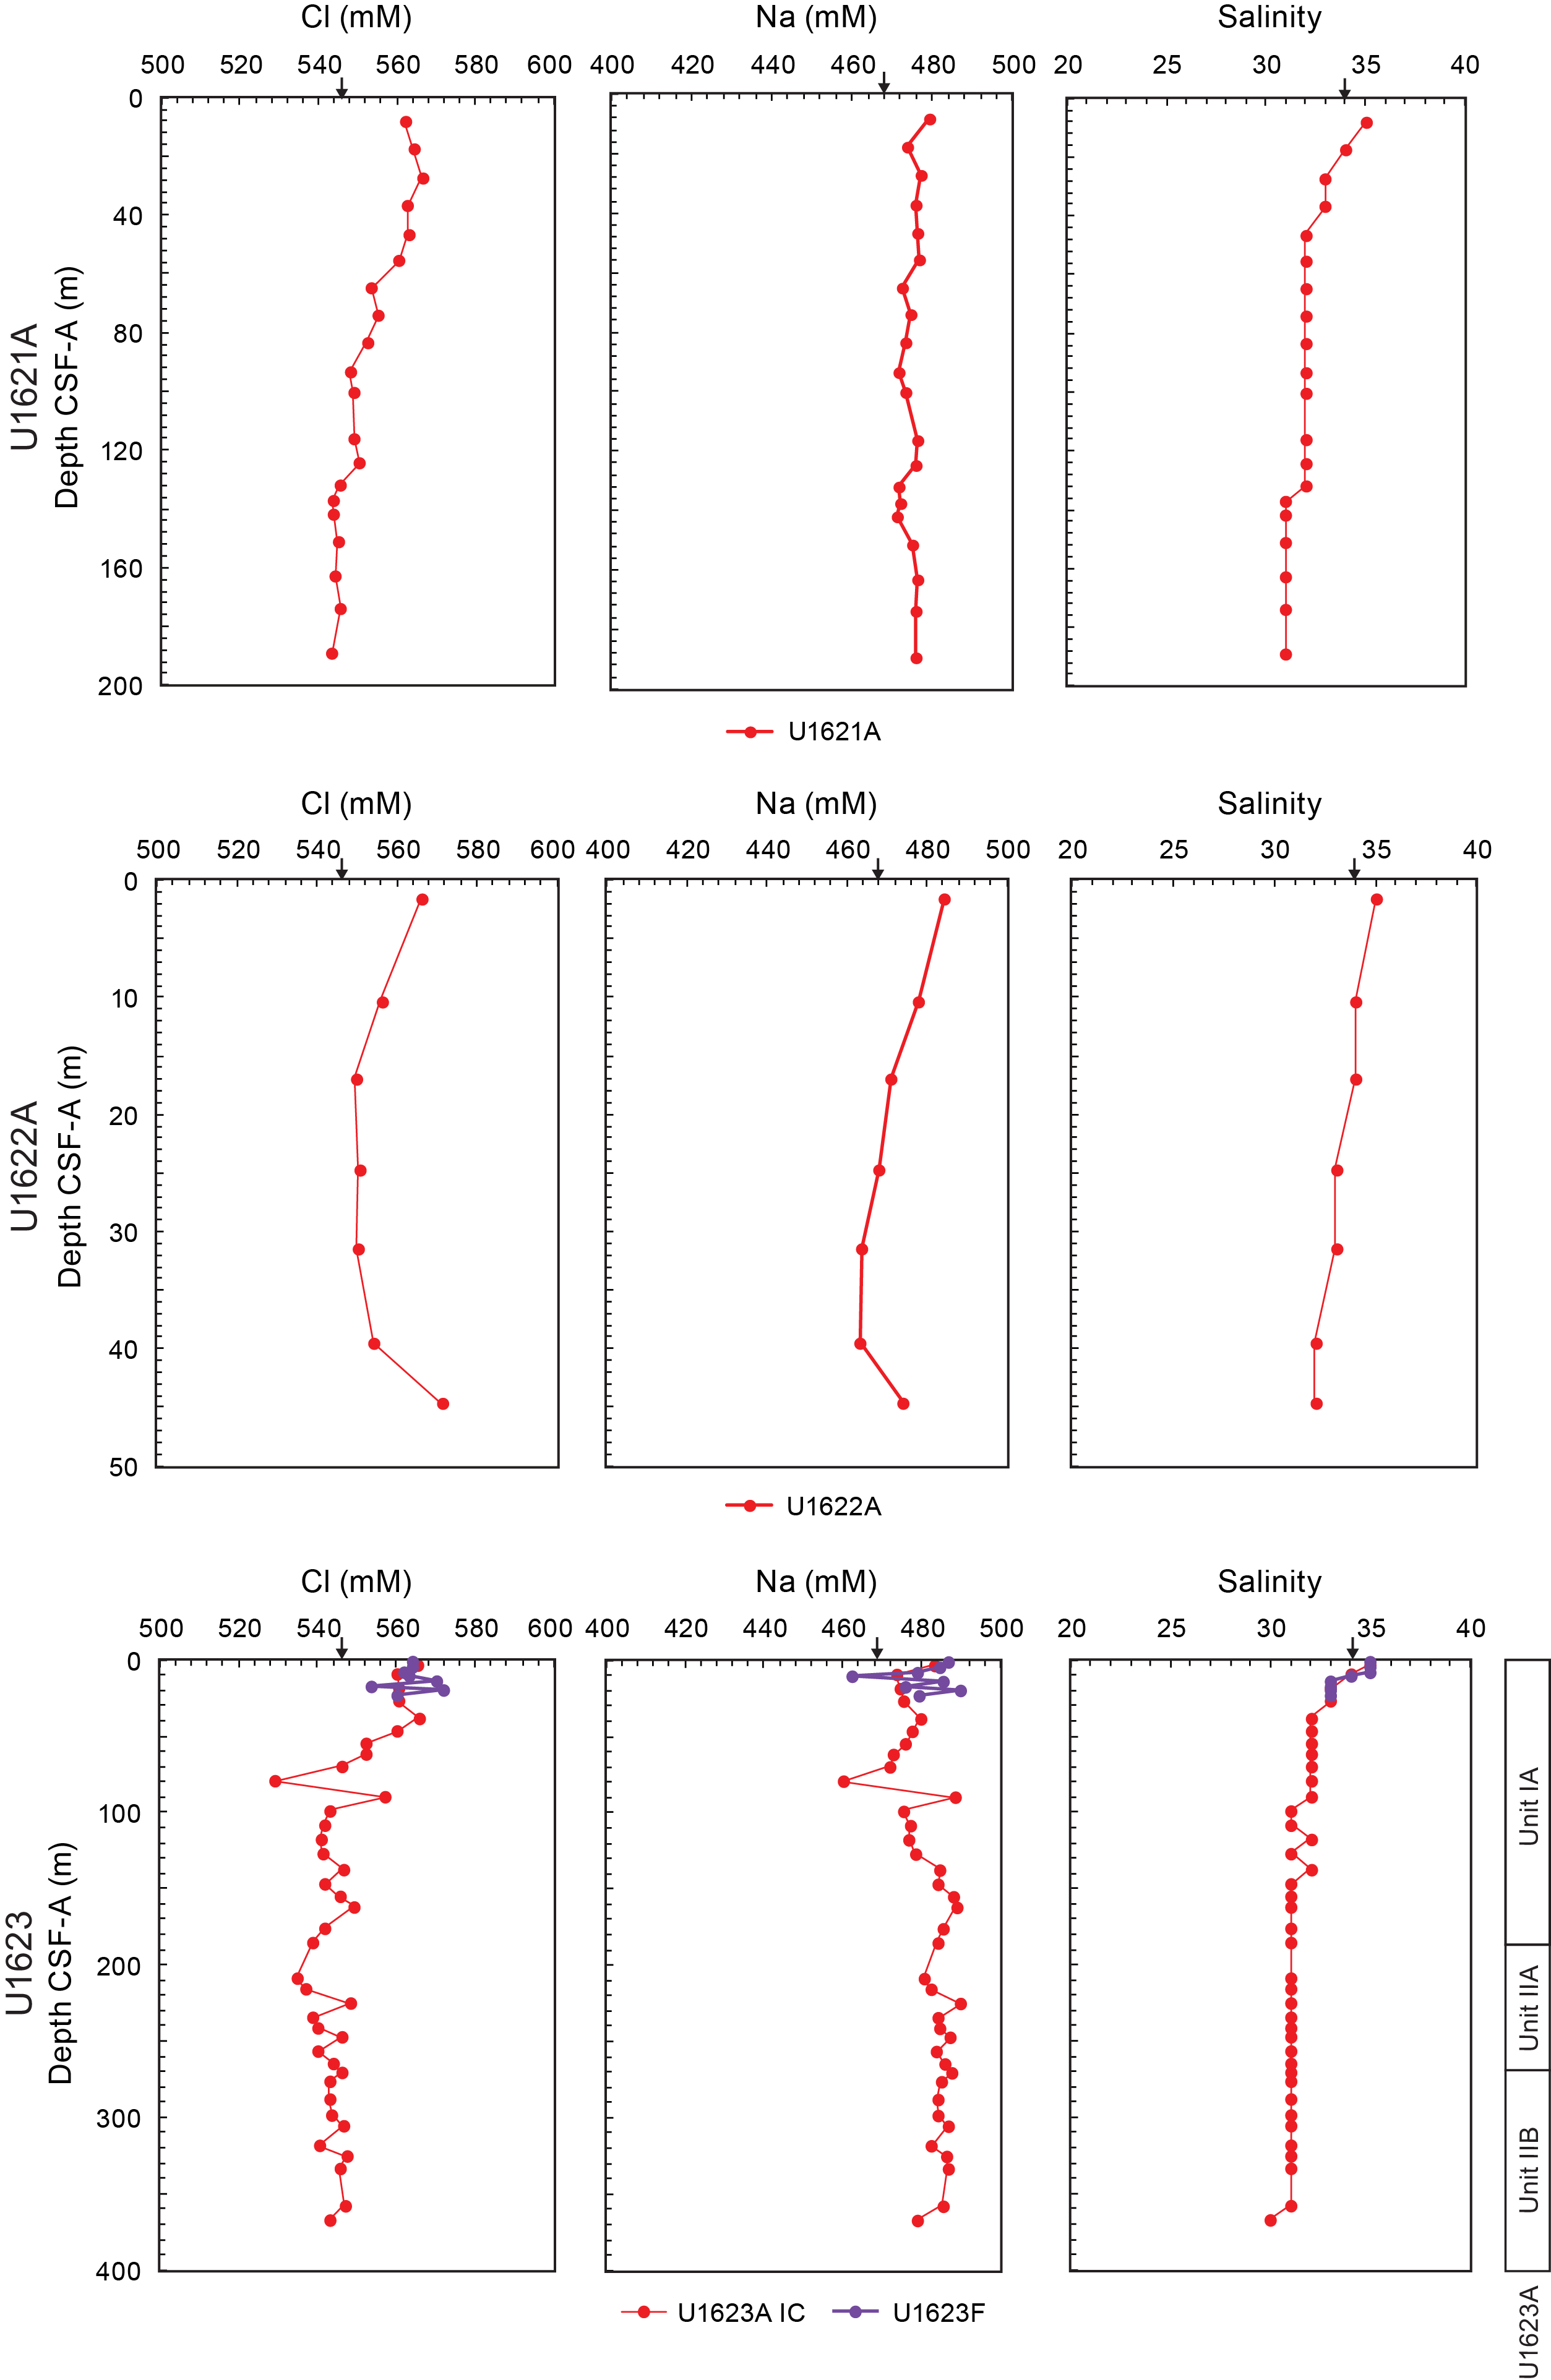
Figure F70. IW chloride, sodium, and salinity.
8.1.1.1. Site U1621
The pH measured at Site U1621 is fairly consistent, with values primarily between 7.8 and 7.9; the exceptions are pH values of 7.6 (8.11 mbsf) and 8.01 (74.13 mbsf). The geochemistry profiles of Cl, Na, and salinity at Site U1621 show an overall decreasing trend with depth. Chloride concentrations decrease from ~562 mM at 8.11 mbsf to ~543 mM at 189.13 mbsf. The Na concentration measured by ion chromatography (IC) is mostly constant throughout the sediment column with minor variations, remaining at ~471–479 mM, which is slightly above the average seawater value of 468 mM (Bruland and Lohan, 2006). Although there is variability between measured inductively coupled plasma (ICP) spectroscopy and IC Na concentrations, the mean concentration is very similar. Salinity decreases with depth from ~35 at 8.11 mbsf to ~31 at 189.13 mbsf. The general decrease of Cl, Na, and salinity (Figure F70) suggests there may be slight freshening of the IWs at Site U1621.
8.1.1.2. Site U1622
Similar to Site U1621, the measured pH values at Site U1622 are fairly consistent, ranging between 7.5 and 7.7. The concentrations of Cl and Na at Site U1622 remain close to and slightly above average seawater values. Chloride ranges ~562 to ~543 mM throughout the sediment column, and Na ranges ~479 to ~471 mM. Similar to Site U1621, the measured Na concentrations measured by IC are less variable, although the mean concentration is very similar between IC and ICP measurements. The salinity profile slightly decreases with depth from ~35 at 8.11 mbsf to ~31 at 189.13 mbsf.
8.1.1.3. Site U1623
The pH measured at Site U1623 is also similar to Site U1621, with most values ranging 7.8–7.9; exceptions are pH values of 7.6 (2.88 mbsf), 8 (107.99 mbsf), and 8.1 (215.8 and 318.28 mbsf). The geochemistry profiles of Cl, Na, and salinity at Site U1623 show slightly different trends. Hole U1623A extends deeper than Hole U1623F (366.89 versus 23.24 mbsf). For Hole U1623A, the Cl concentrations remain between ~565 and ~543 mM, with an observed minima at 79.55 mbsf, where Cl decreases to ~529 mM, which is well below the average seawater value of 546 mM (Bruland and Lohan, 2006). In contrast, the Na profile of Hole U1623A shows an overall release of Na with depth, where Na concentrations remain close to and slightly above the average seawater value of 468 mM (Bruland and Lohan, 2006), except the observed minima at 79.55 mbsf. Hole U1623F Cl and Na concentrations show slight variability with depth to the bottom of the hole (23.24 mbsf). The average Na concentrations for Hole U1623F are slightly different between analytical methods, where concentrations measured by IC are ~10 mM higher relative to concentrations measured by ICP. The salinity profile of Holes U1623A and U1623F are similar in the uppermost 23.24 m. Overall, Hole U1623A shows salinity decreasing from ~35 at 2.88 mbsf to ~30 at 366.89 mbsf.
8.1.2. Sulfate, alkalinity, iron, and manganese
The geochemistry profiles of sulfate, alkalinity, Fe, and manganese (Mn) are shown in Figure F71 and discussed below.
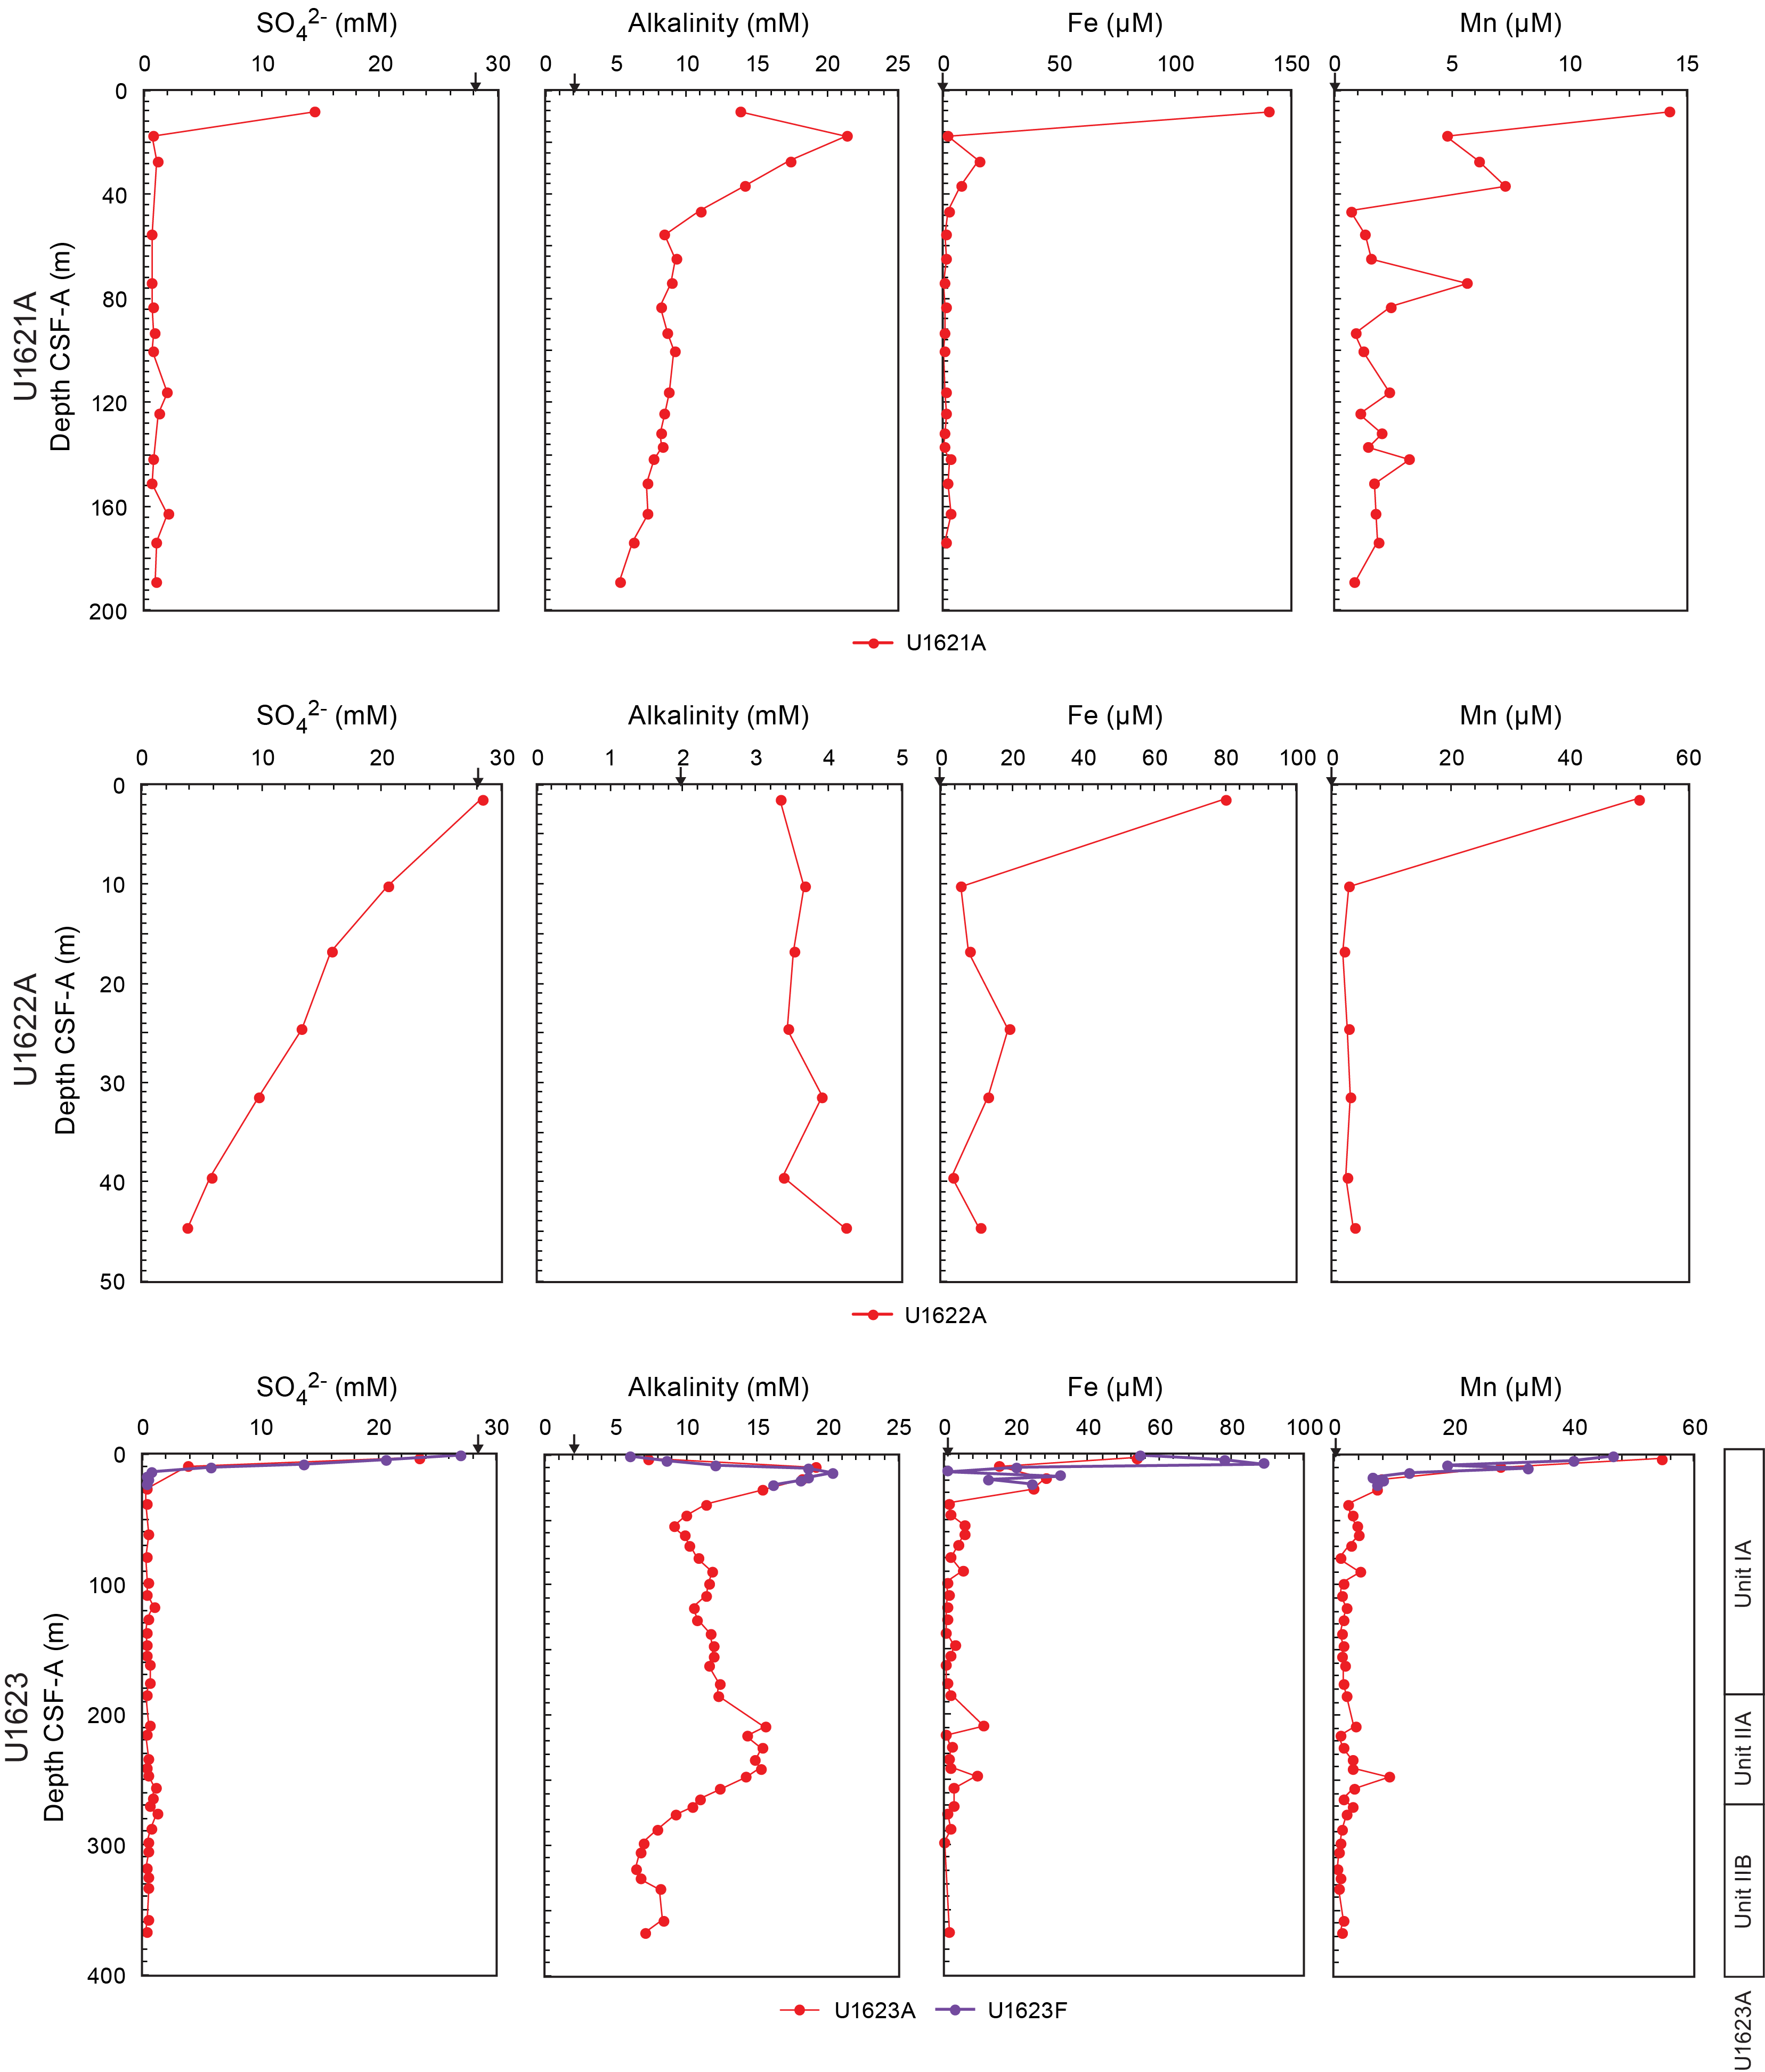
Figure F71. IW sulfate, alkalinity, iron, and manganese.
8.1.2.1. Site U1621
Sulfate at Site U1621 rapidly decreases from ~14 mM at 8.11 mbsf to ~≤1 mM at 17.64 mbsf. Methane is present in the headspace samples (see Headspace gas geochemistry) at 17.64 mbsf, where sulfate depletion occurs. Therefore, the SMTZ is likely located between 8.11 and 17.64 mbsf. Alkalinity concentrations above the SMTZ are likely associated with the degradation of organic matter (see Site U1621 in Phosphate and ammonium). Within the SMTZ, bicarbonate is produced through anaerobic oxidation of methane (AOM), leading to an increase in alkalinity. Below the SMTZ, the alkalinity concentrations decrease, likely due to consumption during authigenic carbonate mineral formation (see Lithostratigraphy) and ongoing microbial methanogenesis (see Site U1621 in Phosphate and ammonium). Iron reduction above the SMTZ may be associated with organic matter remineralization, where Fe concentrations decrease from ~140 to ~1 µM between 8.11 and 17.64 mbsf. The Fe release in the IWs directly below the SMTZ, with Fe increasing to ~15 µM, may be related to the alteration of Fe-bearing minerals. Iron concentrations remain at values ≤ 1 µM below the SMTZ starting at 46.44 mbsf, suggesting Fe is scavenged in diagenetic mineral phases. Release of Mn at the sediment/water interface may result from Mn reduction where Mn decreases from ~14 to ~4 µM from 8.11 to 17.61 mbsf.
8.1.2.2. Site U1622
Sulfate at Site U1622 is present throughout the sediment column, indicating the SMTZ is located deeper than core recovery. The correlation between the sharp increase in methane and the linear decrease of sulfate to ~3 mM at the base of the core (see Headspace gas geochemistry) suggests the SMTZ is likely located between 52 and 55 mbsf, which is slightly deeper than core recovery. The estimated depth of the SMTZ is based on the assumption that sulfate would continue to be consumed at the same rate. A deep SMTZ is expected for Site U1622, given the relatively low methane in the headspace (see Headspace gas geochemistry) and the low rate of organic matter alteration. SMTZ location is dependent on numerous factors, including sedimentation rate, organic matter alteration, methane, and water depth (Egger et al., 2018; Graves et al., 2017; Borowski et al., 1996). Higher TOC contents than measured (see Sedimentary organic geochemistry) are expected with the shallow water depth (≤2000 m) at Site U1622 and thus support low organic matter alteration. The alkalinity concentration is relatively low and close to average seawater values (Bruland and Lohan, 2006), including average values of alkalinity documented near Antarctica (e.g., Scotia Sea) (Bohrmann, 2019). The low alkalinity concentrations reflect low rates of organic carbon diagenesis within the sediments. Consistent with low TOC and sulfate presence in the IWs throughout the sediment column, there is an expanded Fe reduction zone, where Fe is reduced and released in the IWs throughout the sediment column. Manganese reduction is restricted to the uppermost 10.25 m.
8.1.2.3. Site U1623
The SMTZ at Site U1623 is likely located between 10.49 and 13.49 mbsf, given the methane increase and sulfate depletion in Holes U1623A and U1623F. The high-resolution sulfate and methane data of Hole U1623F, above the interval where another hole was penetrated, provide a better constraint on SMTZ location. Similar to Site U1621, the alkalinity concentrations above the SMTZ are likely due to organic matter degradation. Alkalinity increases within the SMTZ in Holes U1623A and U1623F due to AOM, where bicarbonate is produced. Unlike Site U1621, alkalinity in Hole U1623A fluctuates below the SMTZ, which is likely attributed to microbial methanogenesis and the alteration of clay minerals. Iron and Mn reduction above the SMTZ are associated with organic matter remineralization, where Fe decreases from ~53 µM at 2.88 mbsf to ~≤1 µM at 46.75 mbsf and Mn decreases from ~54 to ~≤1 µM at 46.75 mbsf in Hole U1623A. In Hole U1623F, Fe increases from ~54 µM at 1.45 mbsf to ~88 µM at 7.44 mbsf, where Fe is then completely consumed at 13.44 mbsf, coinciding with the start of the SMTZ. Between 17 and 23.24 mbsf, Fe concentrations are variable and show a release into the IWs in Hole U1623F. The Mn concentrations of Hole U1623F follow a similar pattern to Hole U1623A down to 23.24 mbsf. The release of Fe into the IW below the SMTZ, specifically between ~17 and 23 mbsf (Hole U1623F), ~50 and 100 mbsf (Hole U1623A) (Lithostratigraphic Subunit IA), and ~200 and ~250 mbsf (Hole U1623A) (Unit IIA), is likely associated with diagenetic alteration of Fe-bearing minerals within the sediment column.
8.1.3. Calcium, magnesium, strontium, silicon, barium, lithium, potassium, boron, and bromide
The geochemistry profiles of calcium (Ca), magnesium (Mg), strontium (Sr), barium (Ba), and lithium (Li) are shown in Figure F72. Potassium (K) and boron (B) profiles are shown in Figure F73. All geochemistry trends are discussed below.
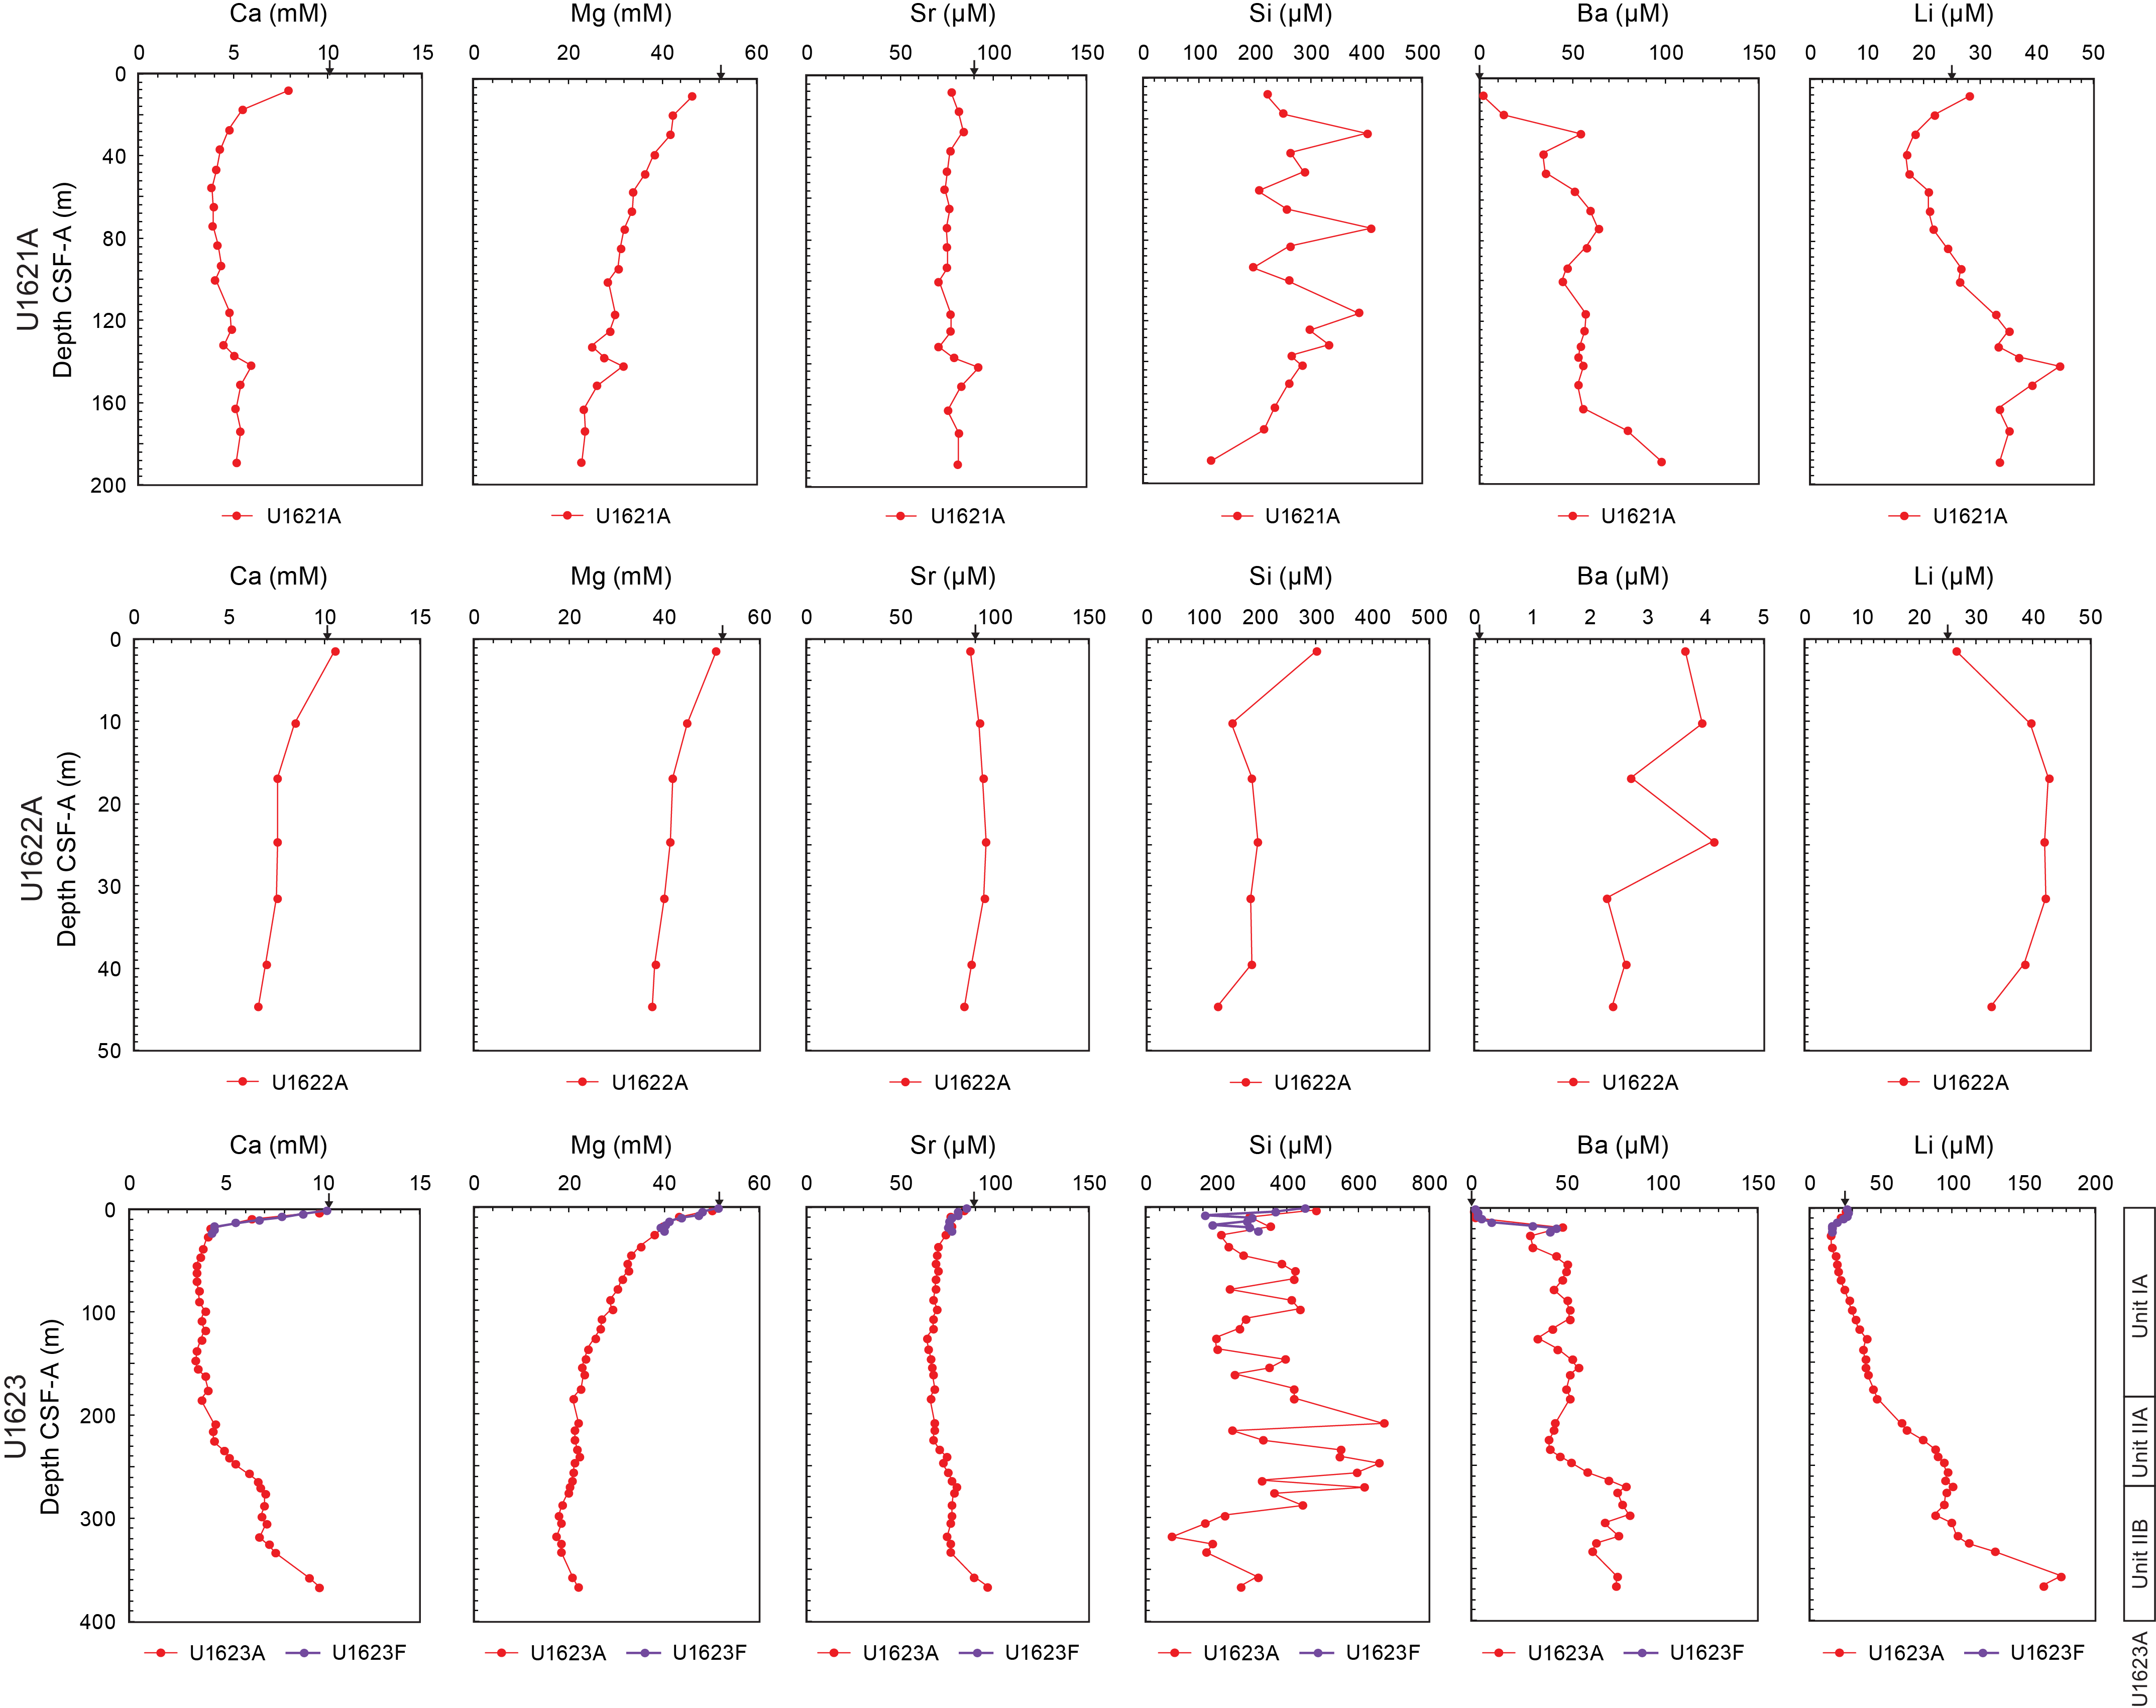
Figure F72. IW calcium, magnesium, strontium, silicon, barium, and lithium.
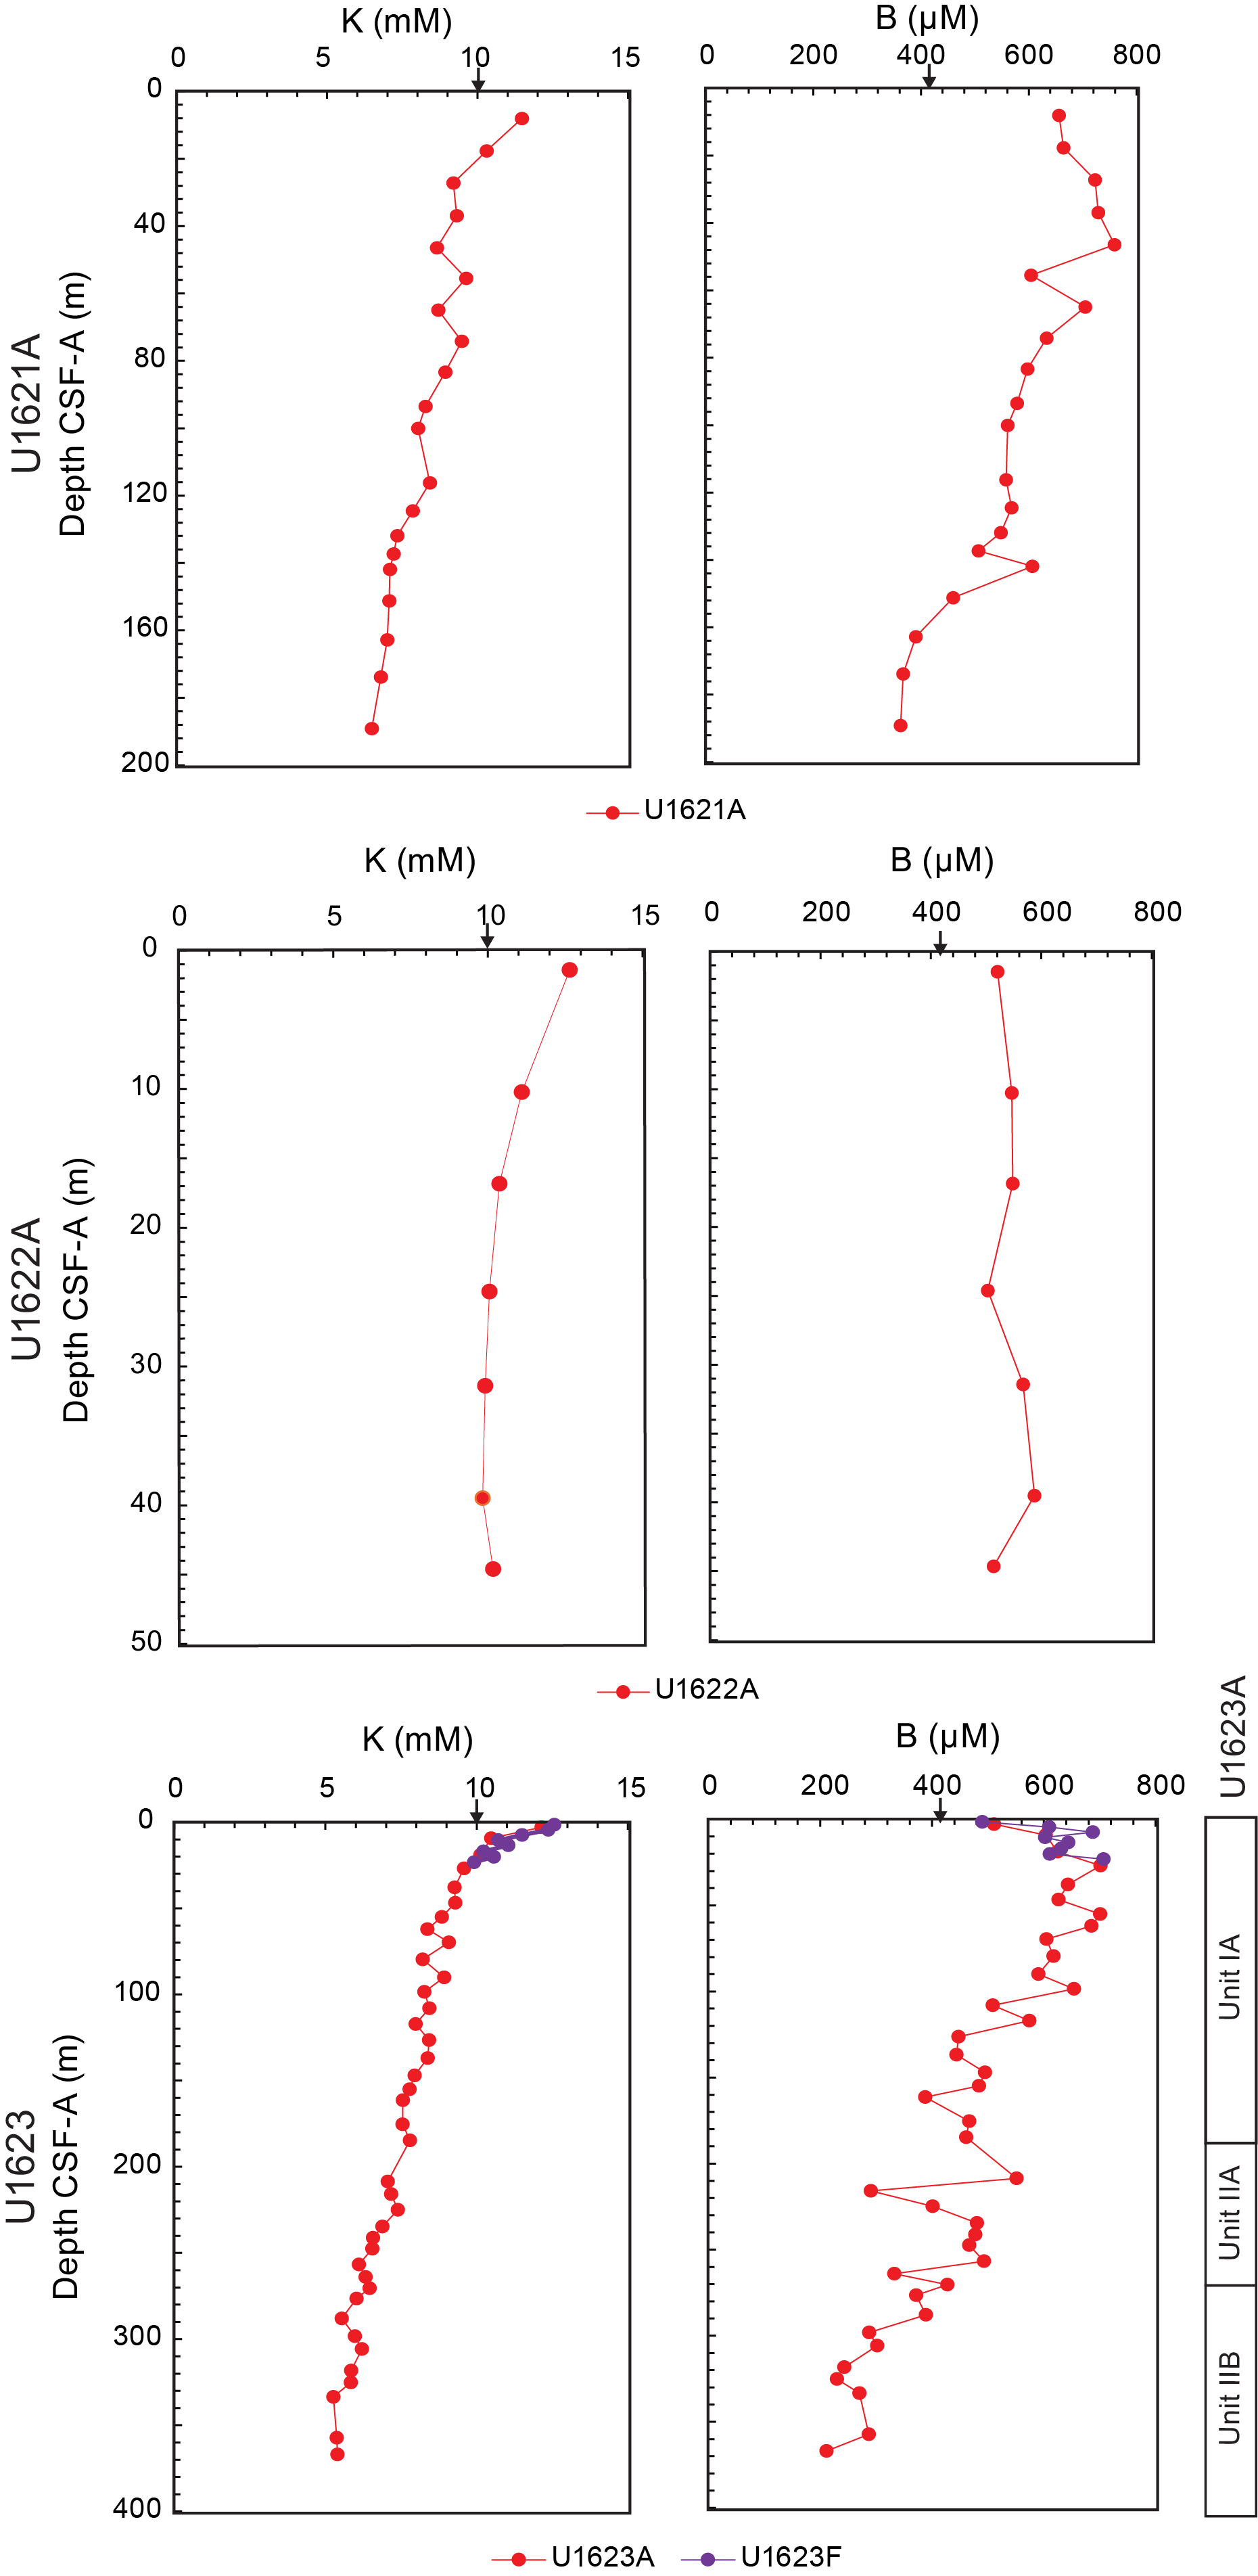
Figure F73. IW potassium and boron.
8.1.3.1. Site U1621
The geochemistry profiles of Ca, Mg, and Sr are indicative of carbonate mineral formation. In general, the Ca concentration in the IWs is below the average seawater value (Bruland and Lohan, 2006). Within the SMTZ, carbonate formation occurs during AOM, resulting in the consumption of Ca and its subsequent decrease in the IWs (Graves et al., 2017). Below the SMTZ to 83.29 mbsf, Ca concentrations decrease. The Ca profile in the uppermost ~30 m can relate to enhanced biogenic carbonate production indicated by the enhanced presence of microfossils in sediments (see Biostratigraphy and paleoenvironment). The biogenic carbonates can then be a further source for authigenic carbonate formation during diagenesis. In the deeper sections of the stratigraphic sequences, IW Ca trends are likely related to authigenic carbonate formation during diagenesis (see Lithostratigraphy). There is a slight release of Ca within the IWs from 83.29 to 189.13 mbsf, which may be related to identified intervals barren of CaCO3 microfossils (see Biostratigraphy and paleoenvironment) and/or diagenetic alteration. The geochemical profile of Mg shows a near-linear decrease with depth, attributed to consumption in carbonates. The Sr concentration remains below the average seawater value of 90 µM (Bruland and Lohan, 2006), except for a release to ~92 µM at 141.82 mbsf. There is a slight increase of Ca and Mg at 141.82 mbsf as well. The release of Ca, Mg, and Sr at the same depth interval may be related to carbonate dissolution. The geochemical profile of Si fluctuates with depth; three main increases were observed at 27.2, 74.13, and 116.15 mbsf. Barium concentrations are indicative of barite formation above the SMTZ, followed by barite dissolution with depth, in response to sulfate-depleted pore waters. Barium concentration varies with depth below the SMTZ, which is likely related to Ba cycling within the sediment column.
The Li geochemistry profile in the IW shows a decrease of Li between 8.11 and ~46.44 mbsf, followed by an increase of Li with depth to a maximum of ~44 µM at 141.82 mbsf, followed by a decrease to ~33 µM at 189.13 mbsf. There may be clay mineral alteration, as reflected in the profiles of K and B, where both K and B linearly decrease with depth. Additionally, the geochemical profile of Br linearly increases with depth from 0.9 to 1.7 mM.
8.1.3.2. Site U1622
The geochemical profiles of Ca, Mg, and Sr suggest formation of Mg-rich carbonates with depth. Calcium and Mg are consumed with depth, whereas Sr concentrations increase with depth. Generally, Sr is consumed to a greater extent in Ca carbonates compared to consumption within Mg-rich carbonates. Similar to Site U1621, Si concentration fluctuates with depth. The Ba concentrations are relatively low and comparable to background values within the instrumentation. The geochemistry profile of Li is similar to that of Sr, but it is inverse to the trend observed of Cl. This trend suggests release of Li and Sr occurring within the sediment column where the scavenging of Cl occurs. The trend of Li and Sr may suggest alteration of clay minerals, which is further reflected in the profiles of K and B, where K decreases with depth and B varies with depth but is consistently higher than average seawater (Bruland and Lohan, 2006). Additionally, the geochemical profile of Br is almost linear, maintaining a concentration of ~0.9–1 mM.
8.1.3.3. Site U1623
The geochemical profile of Ca in Hole U1623A is typical and similar to the Ca profile observed at Site U1621. Intervals of abundant calcareous nannofossils and foraminiferal content were observed at Site U1623 (see Biostratigraphy and paleoenvironment) with alternating barren intervals. A more continuous barren interval starts at 277.25 mbsf. Carbonate formation occurs within the SMTZ associated with AOM, resulting in the consumption of Ca into the sediments (Graves et al., 2017). Calcium then remains at concentrations of ~3–4 mM below the SMTZ to ~230 mbsf. At this depth, Ca starts to slightly increase to ~270 mbsf, where Ca concentrations stabilize around ~6 mM. The Ca increases again between 318.28 and 366.89 mbsf. It is likely Ca IW trends at Site U1623 are driven by similar processes of Site U1621, including biogenic carbonate formation and diagenetic processes forming authigenic carbonates (see Lithostratigraphy); the Sr IW profile supports this interpretation. The Mg concentrations in Hole U1623A decrease with depth from 50 to 21 mM, likely due to consumption within carbonates. Although concentrations of Ca, Mg, and Sr extend between 1.45 and 23.24 mbsf at Hole U1623F, the geochemistry profiles are very similar to Hole U1623A at similar depths.
The Si geochemical profiles of Holes U1623A and U1623F fluctuate with depth, likely due to the alteration of silicates and dissolution of Si-bearing microfossils. A change in Si concentration and fluctuation in Hole U1623A between ~150 and ~200 mbsf correlates to the transition from Lithostratigraphic Subunit IA to Subunit IIA (see Lithostratigraphy). Similar to Site U1621, the Ba concentrations at Site U1623 (Holes U1623A and U1623F) support barite formation above the SMTZ. Hole U1623F does not extend deep enough to observe barite dissolution; however, Hole U1623A extends to 366.89 mbsf, and barite dissolution is observed with depth. Barium concentration varies with depth in Hole U1623A, likely related to the cycling of Ba.
The Li concentration increases with depth in the IWs, from ~25 µM (Hole U1623A) and ~26 µM (Hole U1623F) at the sediment/water interface to 176 and 163 µM at 366.89 mbsf (Hole U1623A) and ~15 µM at 23.24 mbsf (Hole U1623F). Although Hole U1623F does not extend as deep as Hole U1623A, there are likely Li-rich fluids diffusing upward at this site due to the gradual increase of Li with depth in Hole U1623A. These Li-rich fluids are most likely located deeper than core recovery.
The geochemical profiles of K and B in Hole U1623A decrease with depth, suggesting uptake in clay minerals and alteration. Hole U1623F additionally shows K decreases with depth, whereas B increases; however, both profiles follow a similar trend to the upper meters of Hole U1623A. Bromide increases with depth at Site U1623 and does not exceed 2 mM.
8.1.4. Phosphate and ammonium
The geochemistry profiles of ammonium and phosphate are shown in Figure F74 and are discussed below.
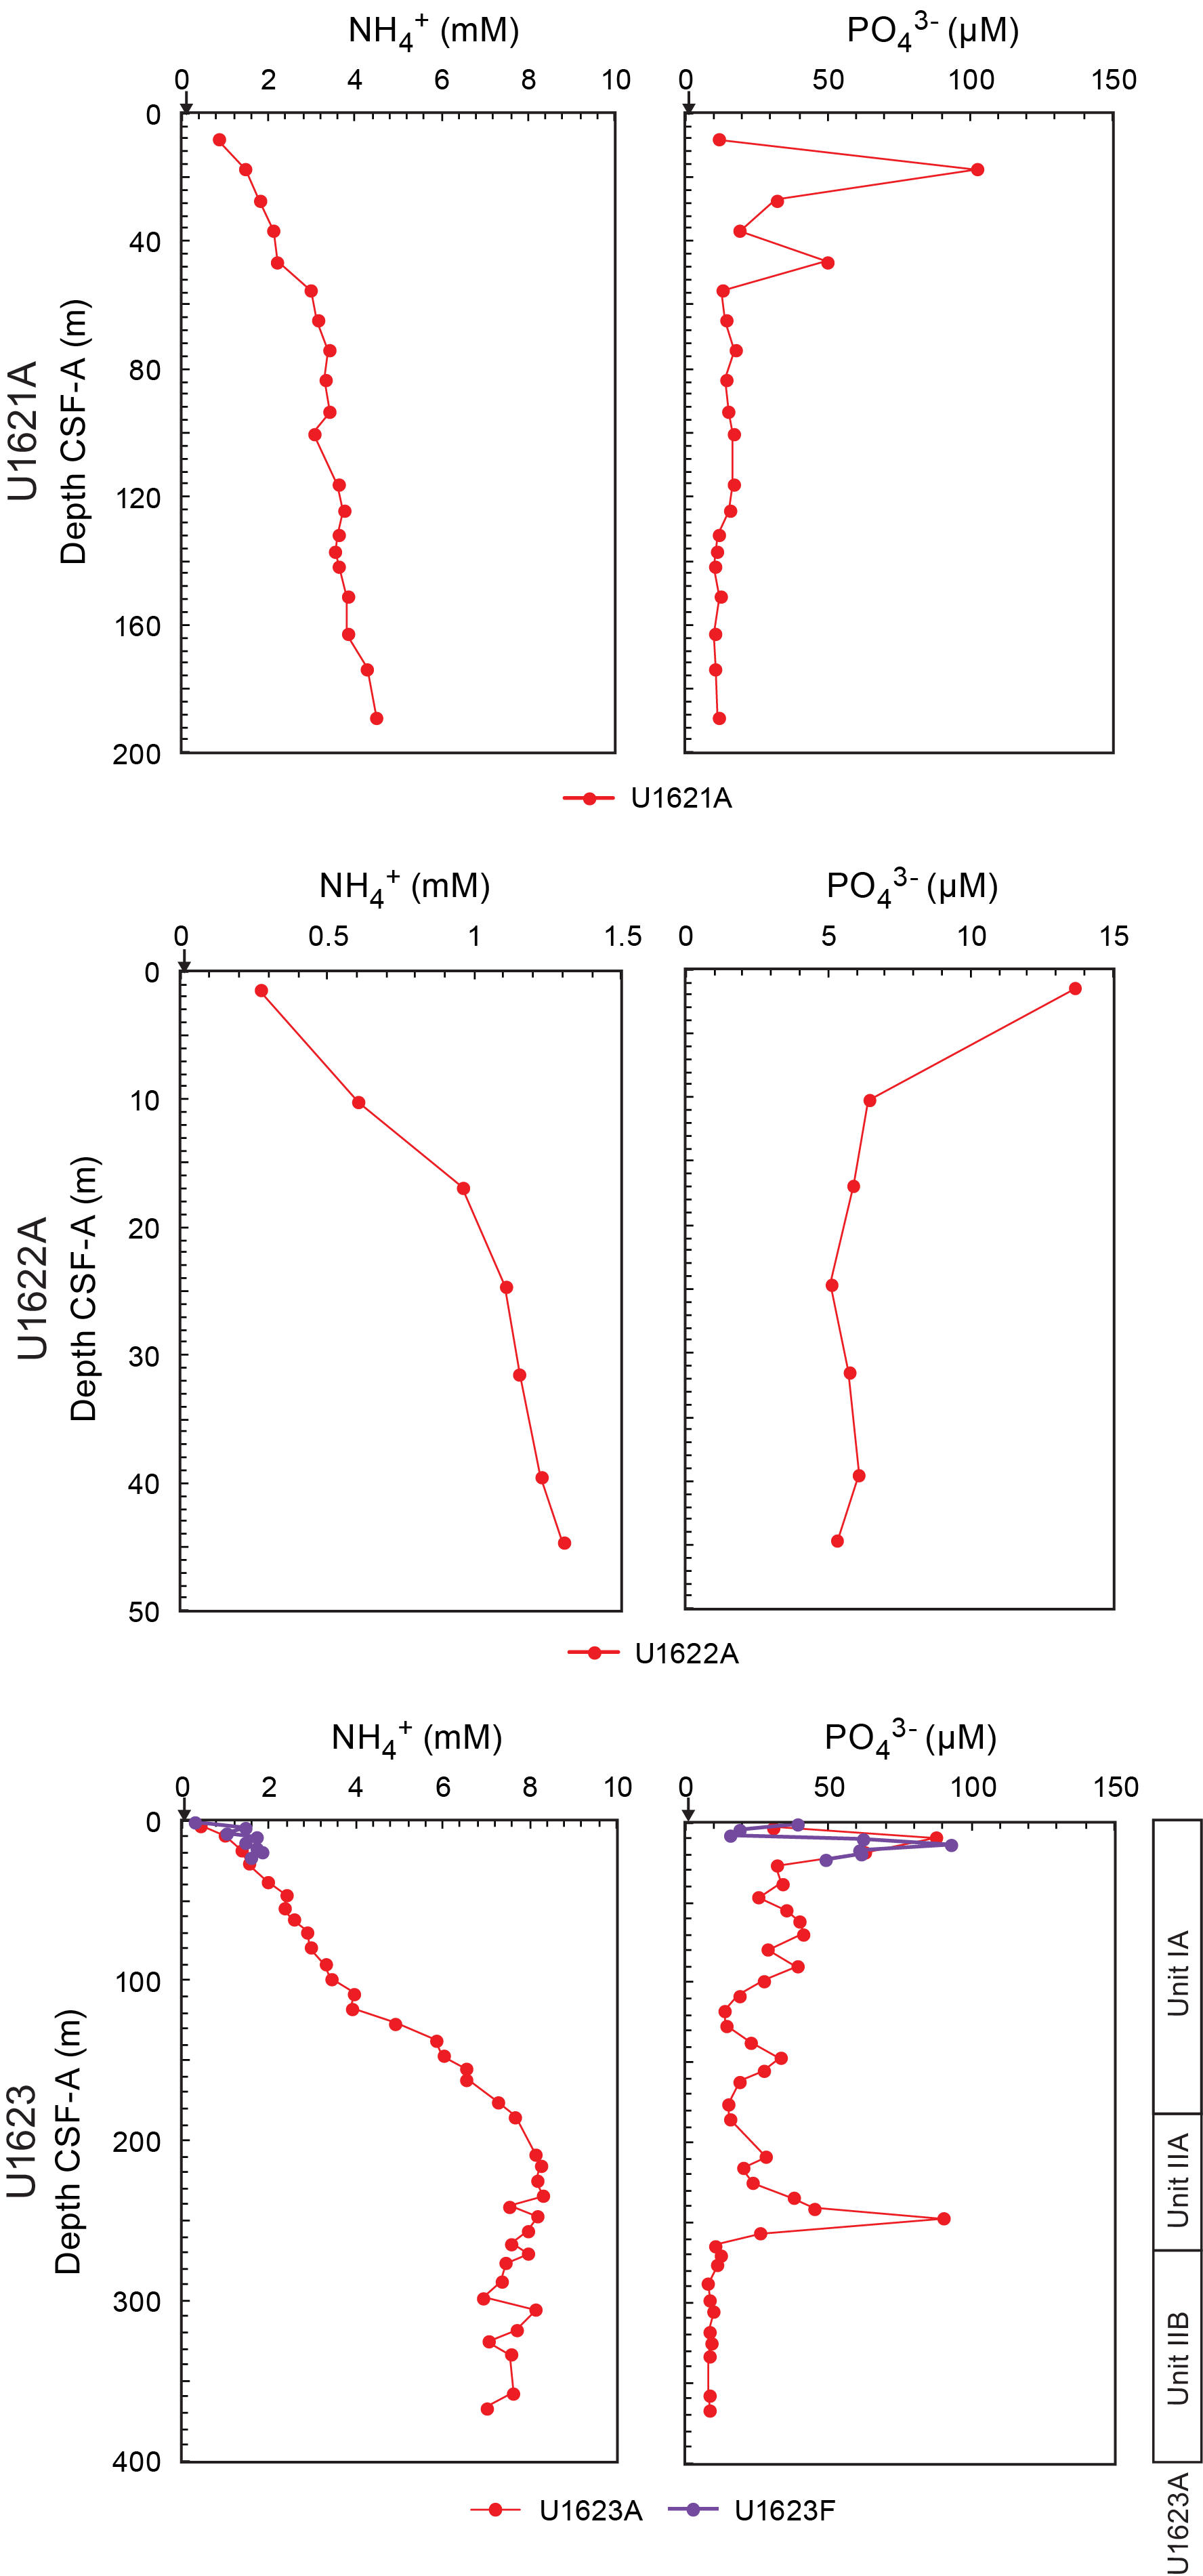
Figure F74. IW ammonium and phosphate.
8.1.4.1. Site U1621
Phosphate concentrations increase from ~11 µM at 8.11 mbsf to ~102 µM at 17.64 mbsf, followed by another increase from ~18 µM at 36.91 mbsf to ~49 µM at 46.44 mbsf, where phosphate concentrations then decrease with depth to ~11 µM at 189.13 mbsf. The increase of phosphate at the sediment/water interface is likely due to organic matter remineralization during early diagenesis (e.g., within the Fe and Mn reduction zone). The increase of phosphate between 36.91 and 46.44 mbsf suggests enhanced organic matter degradation. Ammonium concentrations in the IWs increase from ~1 mM at 8.11 mbsf to ~4 mM at 189.13 mbsf, consistent with organic matter diagenesis.
8.1.4.2. Site U1622
Phosphate concentrations decrease from ~15 µM at the sediment/water interface to ~5 µM at 44.64 mbsf. In the IWs, the overall low background phosphate concentration and relative decreasing trend in values support a context of low organic carbon remineralization occurring throughout the sediment column. The ammonium concentrations never exceed ~1.5 µM in the IWs, which is consistent with low TOC and low organic carbon remineralization; this further supports the observed low alkalinity and expanded Fe reduction zone at this site.
8.1.4.3. Site U1623
Phosphate concentrations for Holes U1623A and U1623F fluctuate with depth, and maxima are observed between ~9 and 10 mbsf (Holes U1623A and U1623F) and at 241.46 mbsf (Hole U1623A). The increase of phosphate between ~9 and 10 mbsf is slightly above the SMTZ and likely results from organic matter remineralization during early diagenesis (e.g., within the Fe and Mn reduction zone). In general, phosphate is higher between 0 and 247.46 mbsf, which coincides with observed Ba trends, a decrease in alkalinity, and low ammonium, in Hole U1623A; this suggests there may be uptake in clay minerals. Ammonium concentrations for Hole U1623A show an increase from ~≤1 mM at 2.88 mbsf to ~7 mM at 366.89 mbsf. For Hole U1623F, ammonium concentrations are slightly variable but never exceed 2 mM between 1.45 and 23.24 mbsf.
8.2. Sedimentary organic geochemistry
The shipboard solid-phase analysis at Sites U1621–U1623 involved measurements of total inorganic carbon (TIC; i.e., CaCO3), TN, total carbon (TC), TOC (calculated as TC − TIC), and total sulfur (TS) (Table T19) using shipboard plastic cylinder sampling (sample type CARB). The sedimentology team identified intervals for CARB samples at Holes U1621A, U1622A, and U1623A, resulting in a total of 75 samples taken. These samples are not systematically spaced, and they include representations of both major and minor lithologies.
The TC content in the sedimentary sequences of Sites U1621 and U1623 fluctuates, with most values exceeding 1 wt% (up to 3.5 wt%). At Site U1622, the values also varied, exceeding 1.5 wt% except for one sample at 44.89 mbsf. The CaCO3 content varies, ranging 2–22 wt% and 0.5–15 wt% at Sites U1621 and U1623, respectively. In Lithostratigraphic Unit I, potentially cyclic fluctuations were observed, whereas in Unit II there was less variation. The higher CaCO3 contents of Sites U1621 and U1623 are possibly derived from biogenic carbonates (e.g., foraminifers and nannofossils) (see Biostratigraphy and paleoenvironment). At Site U1622, the CaCO3 content is relatively lower, ranging 1.5–3.8 wt%.
The TOC contents at Sites U1621 and U1623 vary within a similar range, 0.4–1.5 and 0.5–1.5 wt%, respectively. At Site U1622, the values are higher compared to Sites U1621 and U1623, exceeding 1 wt%, except in one sample at 44.89 mbsf. The TN content fluctuates, ranging 0.04–0.15 wt% at Sites U1621–U1623, with increasing trends observed below 170 mbsf in Hole U1623A. The TS contents at Site U1621 range between 0 and 0.4 wt% and vary with depth. At Sites U1622 and U1623, the TS contents reach higher values compared to Site U1621, with contents of 0–0.7 wt% (Site U1622) and 0–1 wt% (Site U1623).
The ratio of C/N is commonly used to identify the origin of sedimentary organic matter (e.g., Meyers, 1997). Ratios of C/N between 4 and 10 generally indicate marine origin (e.g., marine algae), whereas C/N ratios ≥20 indicate terrestrial origin of organic matter (e.g., Meyers, 1994; Meyers, 1997). The C/N ratio ranges between 8 and 13 at Site U1623, and 9 and 18 at Site U1621. These results suggest that at Site U1623 the organic matter originates primarily from marine production with smaller contributions from terrestrial sources, whereas at Site U1621, there is a larger contribution of organic matter from terrestrial origins that conforms with its slope-proximal location. At Site U1622, C/N decreases with depth, from ~21 (uppermost ~6 m) to 17 (37.82 mbsf), with a drastic C/N decrease to ~8 by 44.89 mbsf. The C/N ratios suggest there is a greater influence of sedimentary organic matter from terrestrial origins at Site U1622 (gravity mass deposits, see Lithostratigraphy). Figure F75 illustrates the downcore profiles of TC, CaCO3, TOC, TN, and C/N at Sites U1621–U1623. Figure F76 shows the TS profile at Sites U1621–U1623.
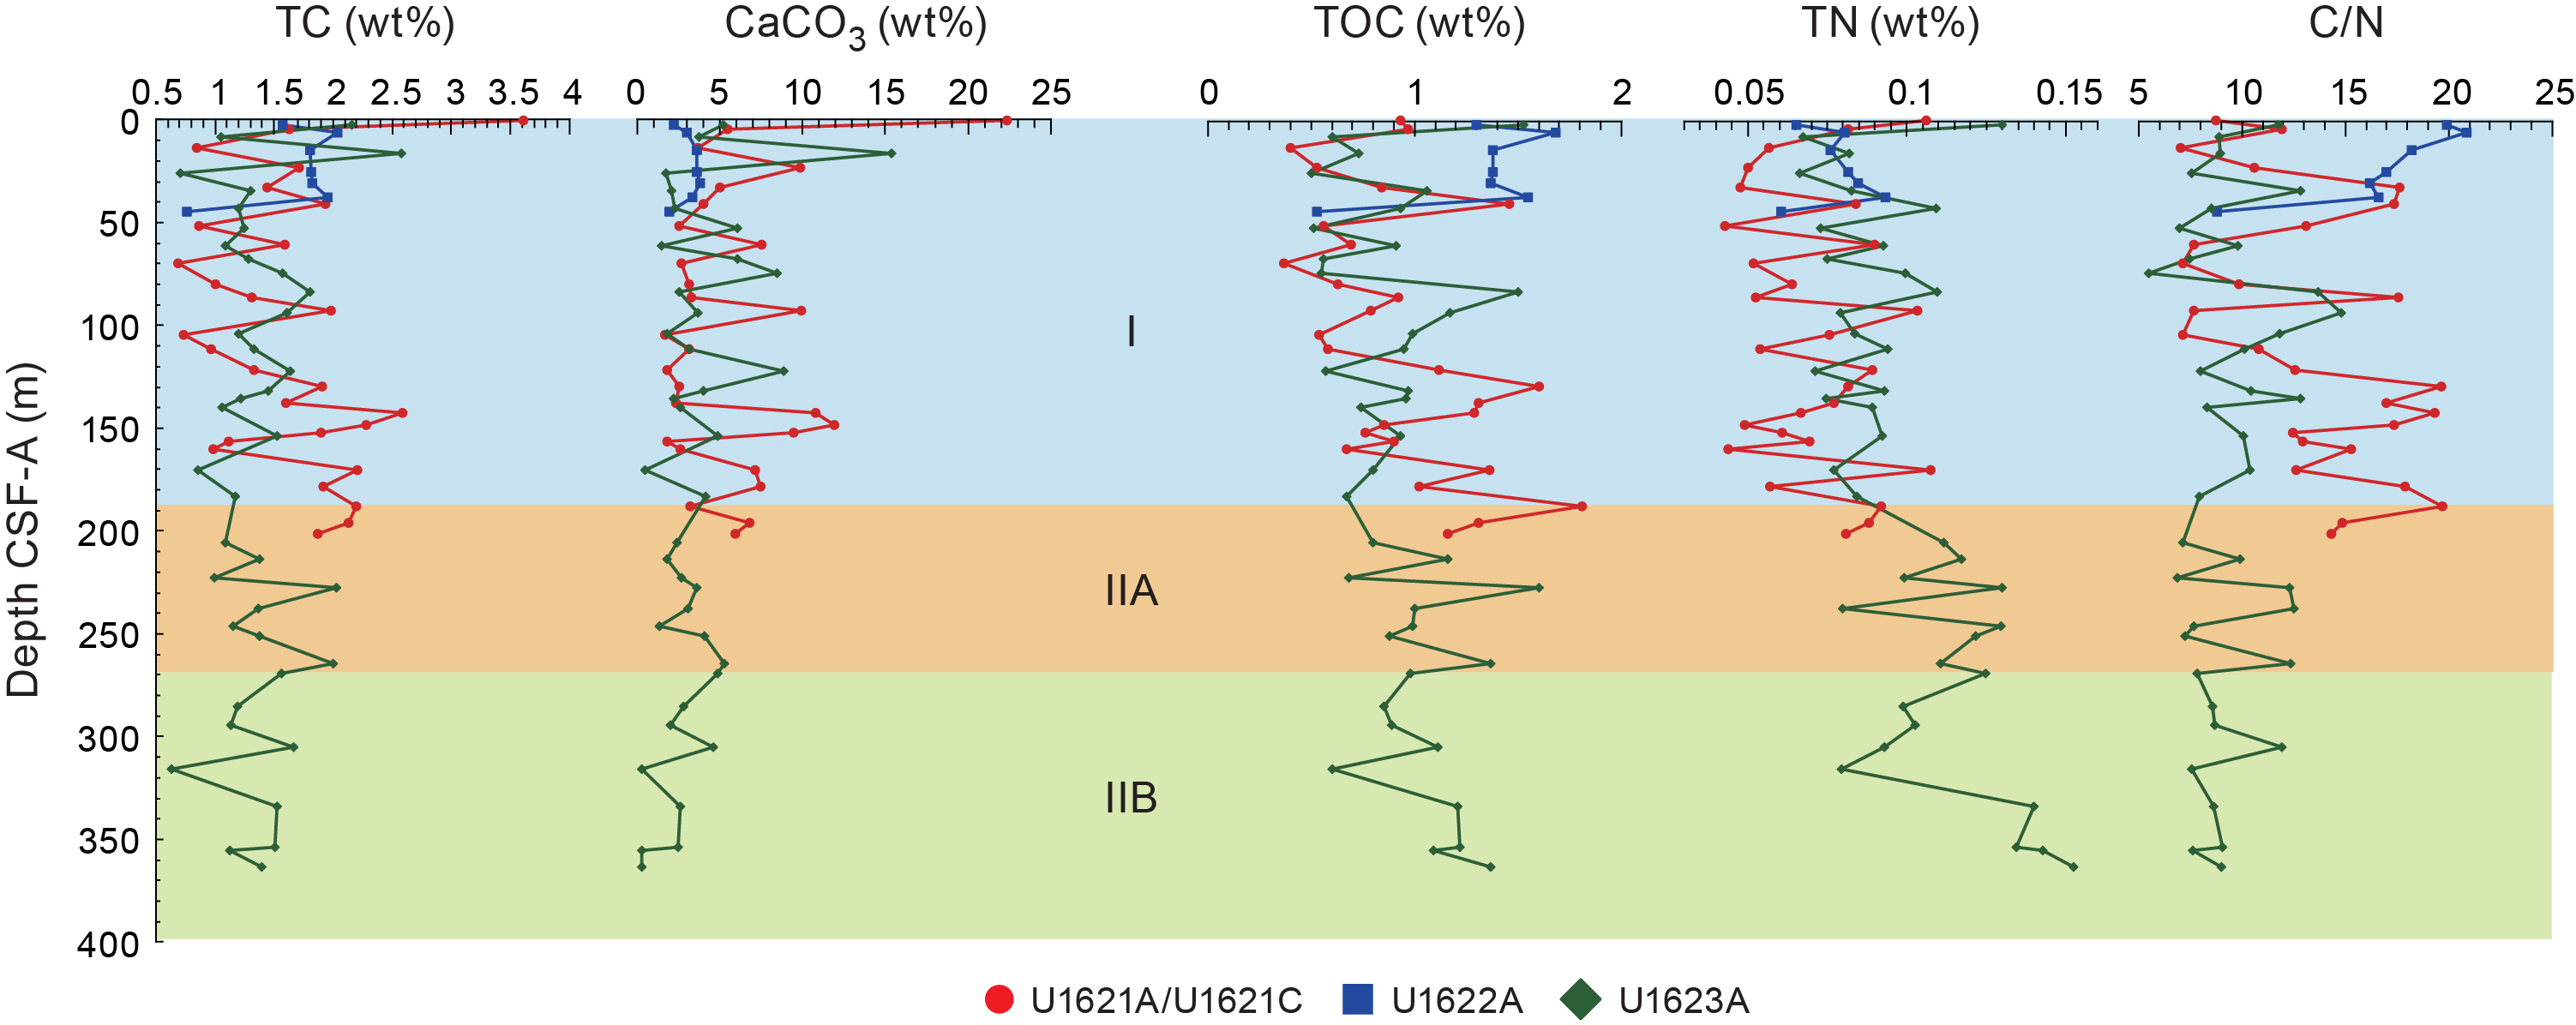
Figure F75. Bulk sediment contents of TC, CaCO3, TOC, TN, and C/N ratio.
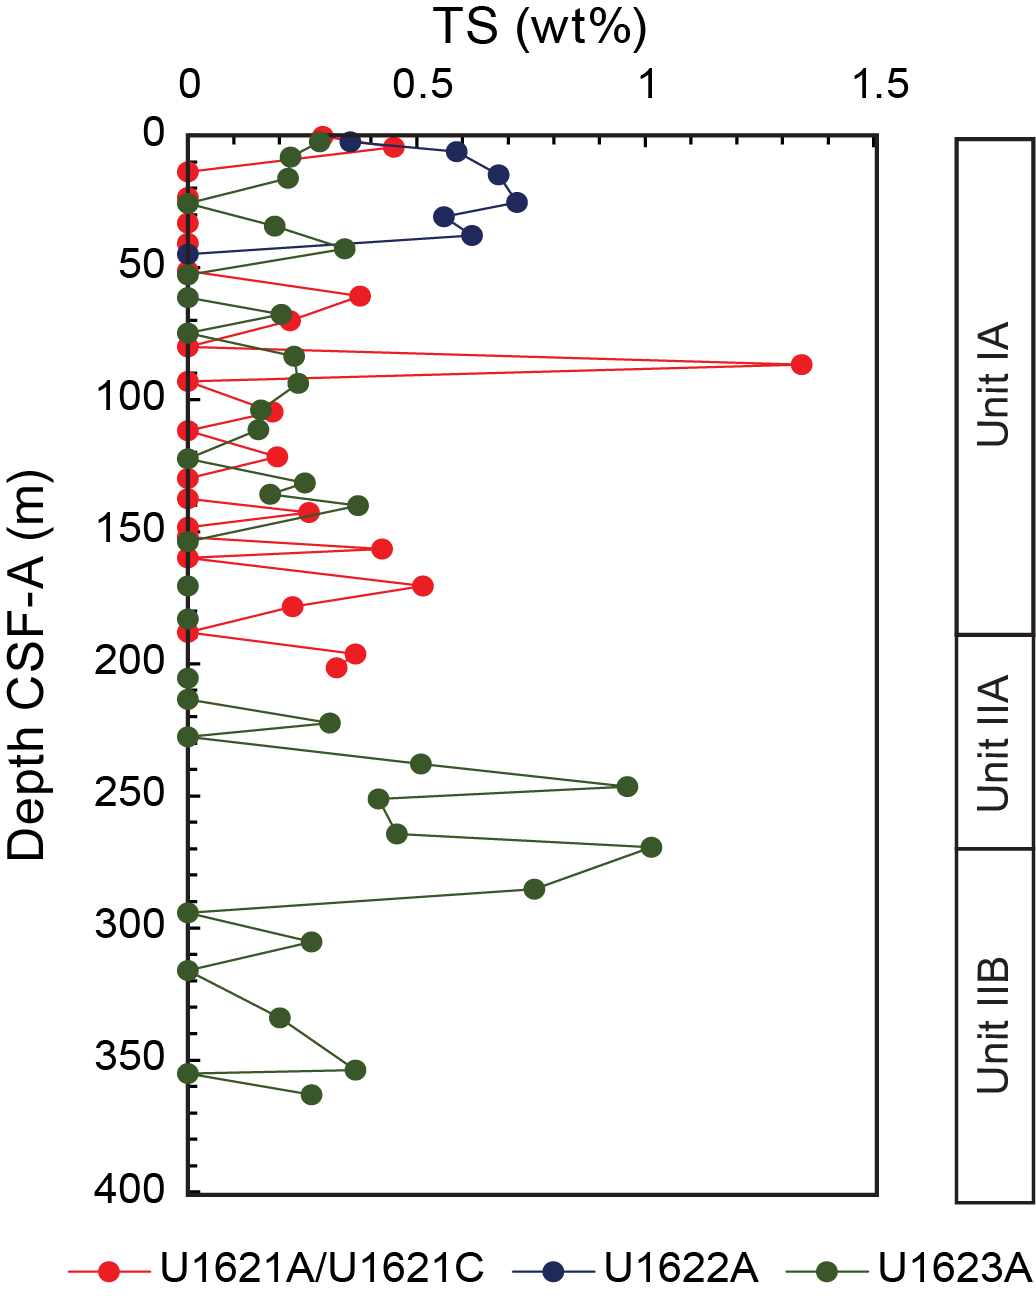
Figure F76. Bulk sediment contents of TS.
8.3. Headspace gas geochemistry
8.3.1. Sites U1621 and U1623
Headspace hydrocarbons (Table T20) were measured at Sites U1621 and U1623, as is standard shipboard safety protocol. A total of 26 samples were taken from Hole U1621A, 46 samples from Hole U1623A, and 8 samples from the uppermost ~25 m of Hole U1623F. Additionally, two void gas samples (VACs) were taken from Sections 403-U1621A-23X-6 and 403-U1621B-15F-2. As observed at other sites, VACs yielded concentrations of methane and ethane more than an order of magnitude larger than the headspace samples. Overall, C1/C2 ratios from gas geochemistry at this site stayed well within safe operational limits (Figure F77), and our results seem to reflect a simpler sediment hydrocarbon gas system than at previous sites.
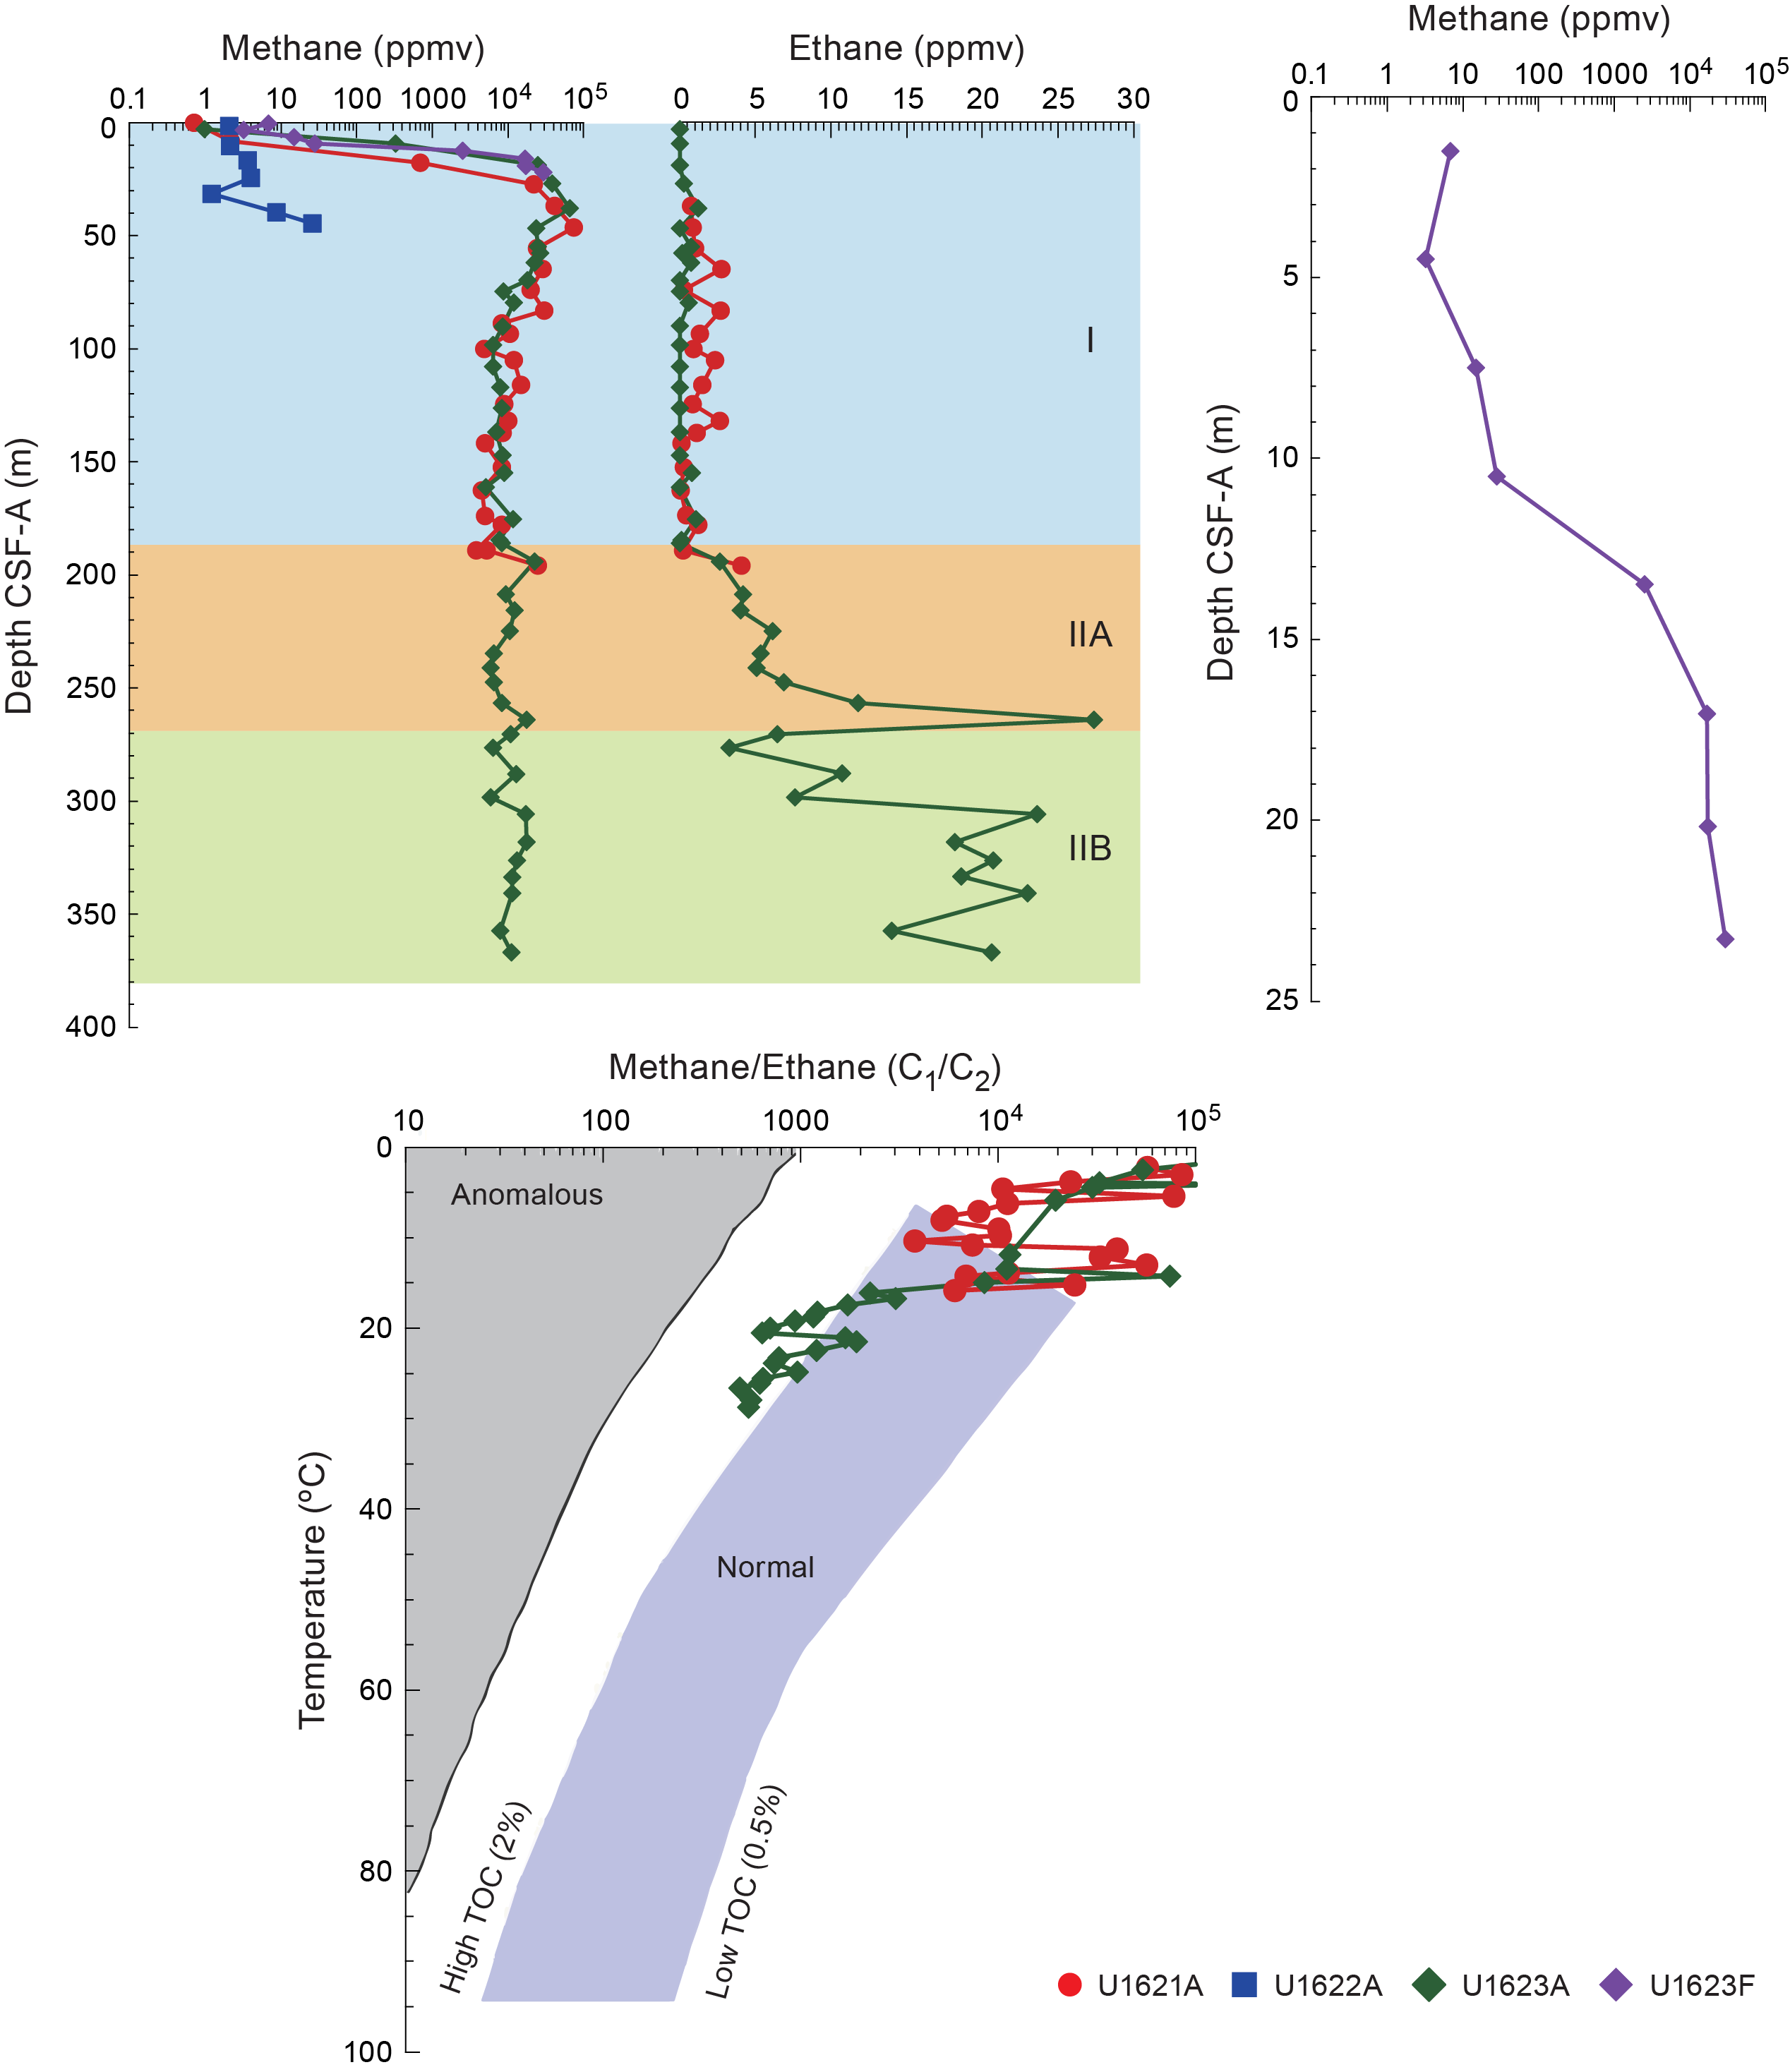
Figure F77. Methane, ethane, and methane/ethane ratios.
Methane concentrations showed good correspondence between Sites U1621 and U1623 (Figure F77). Methane sharply increased from near-zero concentrations just below the sediment/water interface to peaks of ~74,000 and ~66,000 ppmv at ~46 and ~38 mbsf at Sites U1621 and U1623, respectively. The increase in methane downcore corresponds to sulfate depletion in the IW, consistent with an increase in biological methanogenesis immediately below the SMTZ (see Interstitial water chemistry). The methane concentrations support the observed shallow SMTZ at Sites U1623 and U1621. After the peak, methane concentrations decreased and then stabilized at around ~10,000 ppmv at both sites. Additionally, high-resolution analysis was conducted on the upper three cores of Hole U1623F, specifically on 2 or 3 samples per core. The results showed that, although low-resolution analysis indicated a sharp increase in methane occurred somewhere between 9.26 and 18.98 mbsf, high-resolution analysis narrowed the transition zone to between 10.49 and 13.49 mbsf. These high-resolution records will be helpful in detailed studies of changes at the SMTZ during postcruise research.
Ethane was also detected in the sediments at Sites U1621 and U1623 in concentrations between 0 and 27 ppm, with reasonable correspondence between the sites (Figure F77). We found no significant occurrences of hydrocarbons heavier than ethane, except for trace amounts of propane (C3) below ~175 mbsf at Site U1623. Ethane was generally low (<3 ppmv) throughout the uppermost ~190 m at Sites U1621 and U1623, with higher concentrations and variability observed downcore (~3–27 ppmv). The increase of ethane with sediment temperature and age and the lack of other heavier hydrocarbons is consistent with production from the early diagenesis of organic matter (Claypool and Kvenvolden, 1983). Ethane concentrations appeared to zone according to sediment lithology (see Lithostratigraphy). In Unit I, ethane was generally low, and the boundary for Unit IIA marks the transition into higher and more variable ethane concentration. Thus, it may be possible that lithology is exerting some control on the production of ethane from the breakdown of organic matter at Sites U1621 and U1623. Additionally, the trace amounts of ethane between 0 and 190 mbsf combined with relatively higher methane/ethane ratios suggest there is a microbial source of hydrocarbons at Sites U1621 and U1623.
8.3.2. Site U1622
At Site U1622, routine headspace analysis was performed on each core for Hole U1622A, with a total of seven samples analyzed. Only methane was detected at this site and in lower concentrations than other sites, with a minimum of ~1 ppmv at ~31 mbsf and a maximum of ~26 ppmv at ~45 mbsf. This suggests the absence of biotic methane-producing processes in the uppermost ~45 m of sediment recovered at this site, suggesting we did not yet reach the SMTZ, unlike at previous sites. The absence of high concentrations of methane in the sediment corroborates the observation that sulfate penetrates to depth at this site, thus inhibiting biological methanogenesis. The deeper SMTZ could relate to the rapid emplacement of debris flows (see Lithostratigraphy and Physical properties) burying the microbial communities in the upper layers of the sediment profile and an incomplete recolonization process in the overlying material as a result. The relatively low rates of organic carbon diagenesis (see Interstitial water chemistry), combined with low methane and relatively higher sedimentation rate, result in the observed deep SMTZ.
9. Microbiology
9.1. Sites U1621 and U1623
Microbiology sampling at Sites U1621 and U1623 was guided by preliminary shipboard chronologies and lithologic interpretations (see Paleomagnetism, Biostratigraphy and paleoenvironment, and Lithostratigraphy). We focused on capturing sedaDNA records of very warm interglacials, including marine isotopic stages (MISs) 5e, 11, and 31, and during the last 30 ky containing the record of the paleo-Svalbard–Barents Sea Ice Sheet (SBSIS) advance and retreat during the Late Weichselian glaciation (MIS 2) and the post-Last Glacial Maximum to present warming period.
A sedaDNA sample was taken at the mudline of Hole U1621A, and samples on split cores were taken from Hole U1621C for a total of 62 sampled horizons (total of 122 samples). At Site U1623, sampling of split cores was performed on Hole U1623C, with a total of 30 horizons sampled (total of 60 samples) (Table T21).
To evaluate possible drill fluid contamination in the sedaDNA samples, 105 perfluorodecalin (PFD) tracer controls were analyzed aboard ship (n = 66 at Site U1621; n = 39 at Site U1623). Positive controls of the drill fluid were taken from the top of the core to determine whether the tracer had been correctly dispensed (Table T22), and negative controls of the sediment were taken directly adjacent to the sedaDNA samples to assess whether drill fluid had penetrated the interior of the core (Table T23) (see Microbiology in the Expedition 403 methods chapter [Lucchi et al., 2026a]).
9.1.1. Hole U1621C
In Hole U1621C, we sampled 22 horizons across the uppermost ~9 m from Cores 1H–2F (Figure F78). We chose this interval because the sediment physical properties at Site U1621 showed strong correlation to the western Svalbard MS stack for the last ~24,000 y (Jessen et al., 2010). This sedaDNA record is therefore positioned to track how polar marine ecosystems responded to the effects of paleo-SBSIS variability on the ocean.
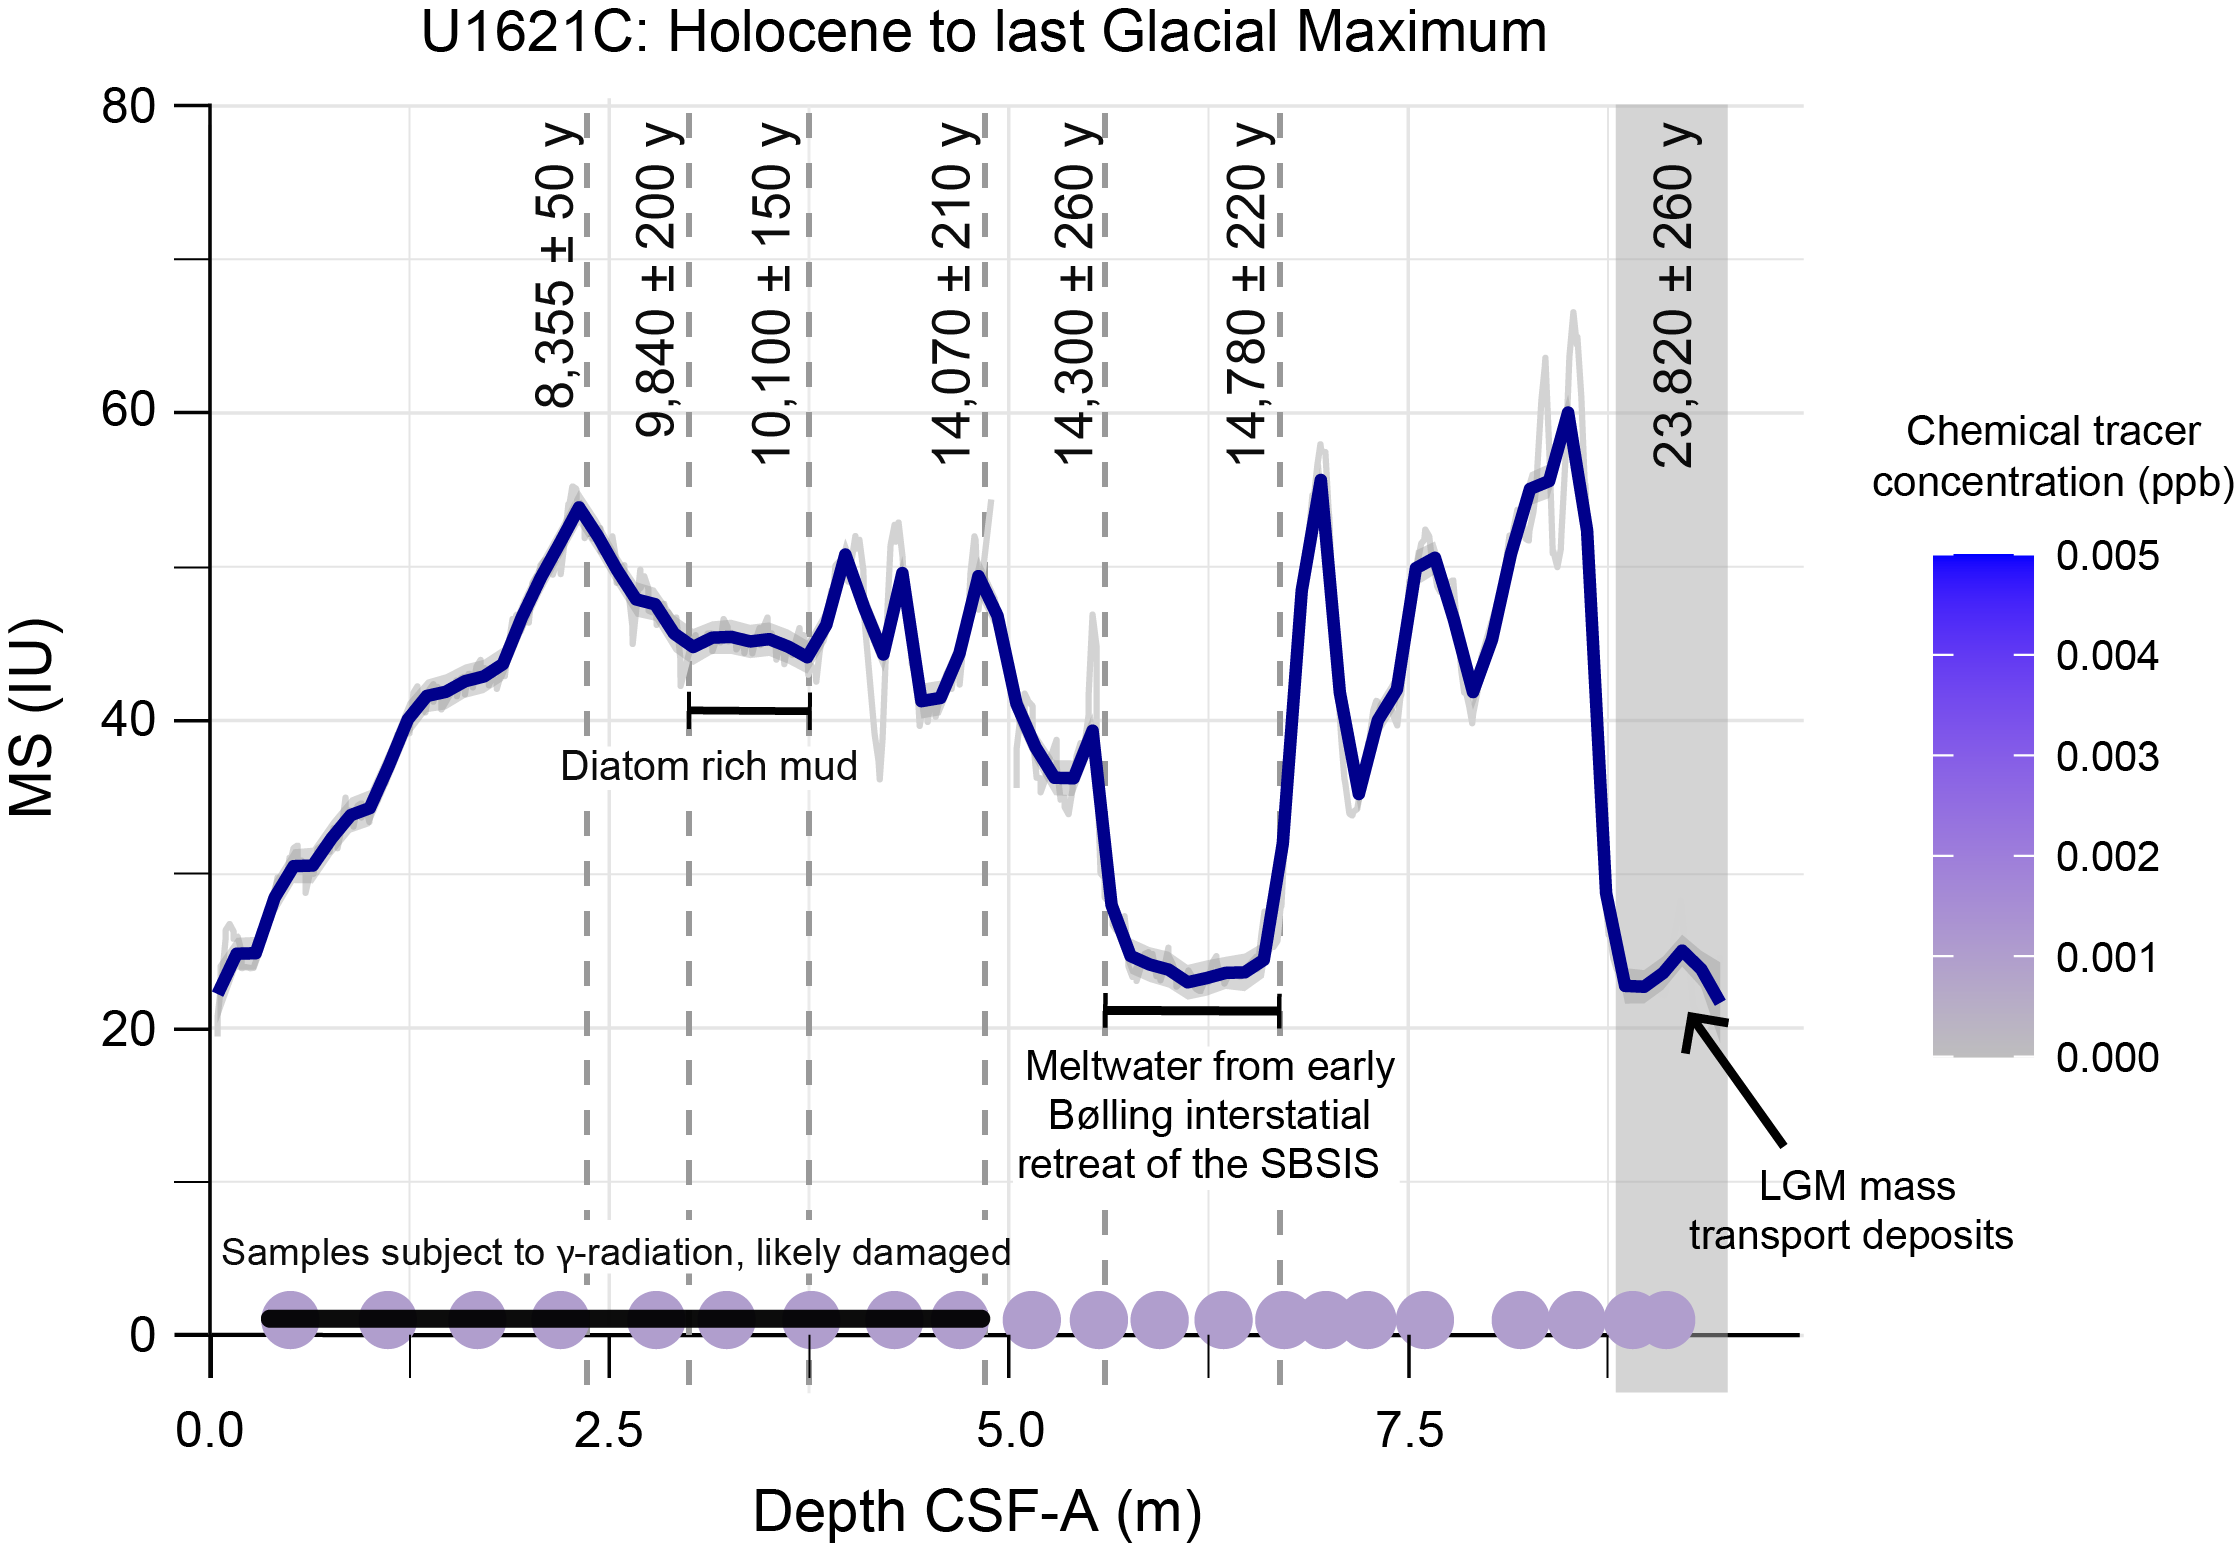
Figure F78. SedaDNA sampling targeting Holocene to LGM sediments.
Core 403-U1621C-1H was scanned for GRA bulk density using a radioactive source. Previous unpublished results have shown this type of radiation to destroy sedaDNA (Armbrecht, pers. comm., 2024). Despite this knowledge, we attempted to avoid the center of the irradiated core, assuming this was where the highest irradiation would have occurred. Samples for DNA were offset slightly from the center, with the tracer taken in the middle.
The chemical tracer was added to the drill fluid, but a positive control of the drill fluid was not collected on the core receiving platform (i.e., catwalk) for Core 403-U1621C-1H. The tracer was not detected in the positive control for Core 2F. As a result, negative tracer analysis of this interval cannot be used to track drill fluid contamination. No tracer was detected in any of the negative controls for this interval. A control of the drill fluid was collected that will be analyzed for sedaDNA. Taxa detected in the drill fluid will be treated as contamination and can be bioinformatically subtracted from the sedaDNA sample community assemblages.
Given the importance of marine microorganisms in global biogeochemical cycles and the uncertainty around projections of the Arctic as a net source or sink of greenhouse gases (Lannuzel et al., 2020), understanding the response of polar marine ecosystems to very warm interglacials in the past is critical to constrain their response to future climate change and the feedbacks these changes would trigger. In Hole U1621C, we sampled 40 horizons from ~19 to 33 mbsf in Cores 4H and 5H, an interval that likely covers the later part of MISs 6 and 5 (Figure F79). The interval was chosen based on MS and NGR patterns, nannofossil and dinocyst biostratigraphy, and lithology. Chemical tracer controls for Cores 4H and 5H revealed correct dispersal of PFD into the drill fluid and no penetration of the drill fluid to the center of the core where the sedaDNA was sampled.
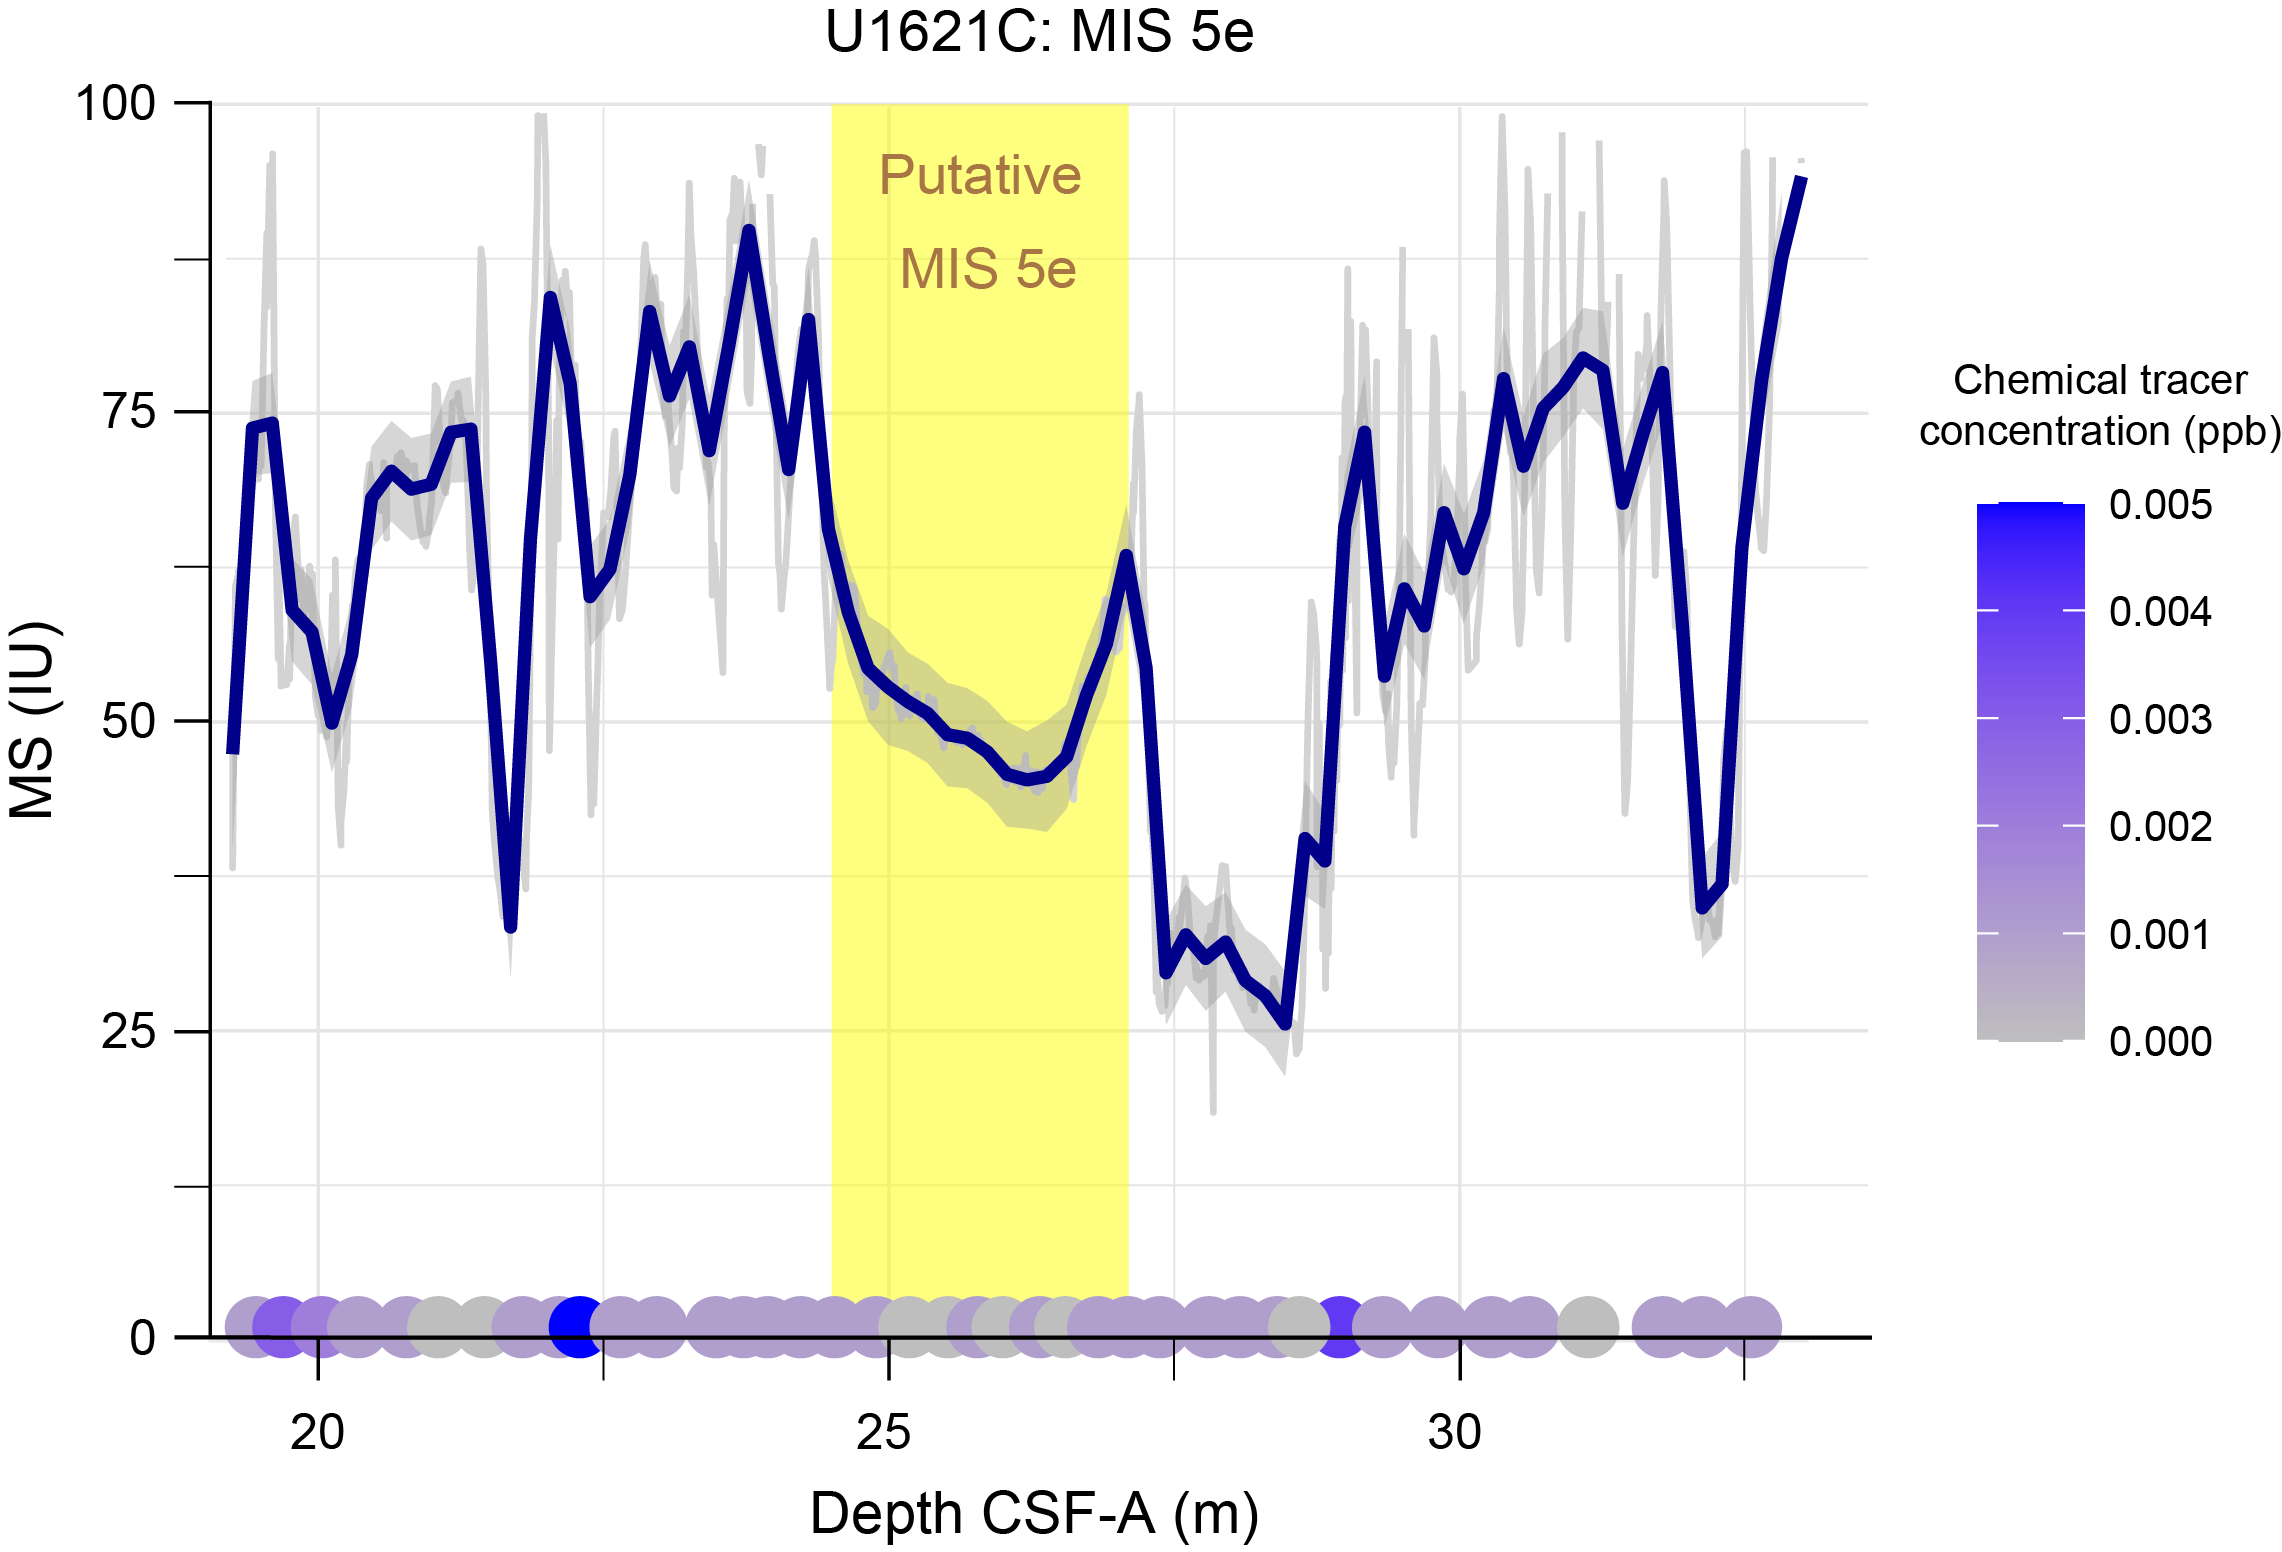
Figure F79. SedaDNA sampling targeting MIS 5.
9.1.2. Hole U1623C
In Hole U1623C, we attempted to sample an interglacial older than MIS 5e. Integration of several lines of chronological evidence (paleomagnetism, lithology, and biostratigraphy) indicated several warm intervals in the Brunhes Chron older than MIS 5e in Hole U1623C. We targeted one warm interval and sampled 30 horizons from ~84 to 101 mbsf in Cores 11F–14F (Figure F80).
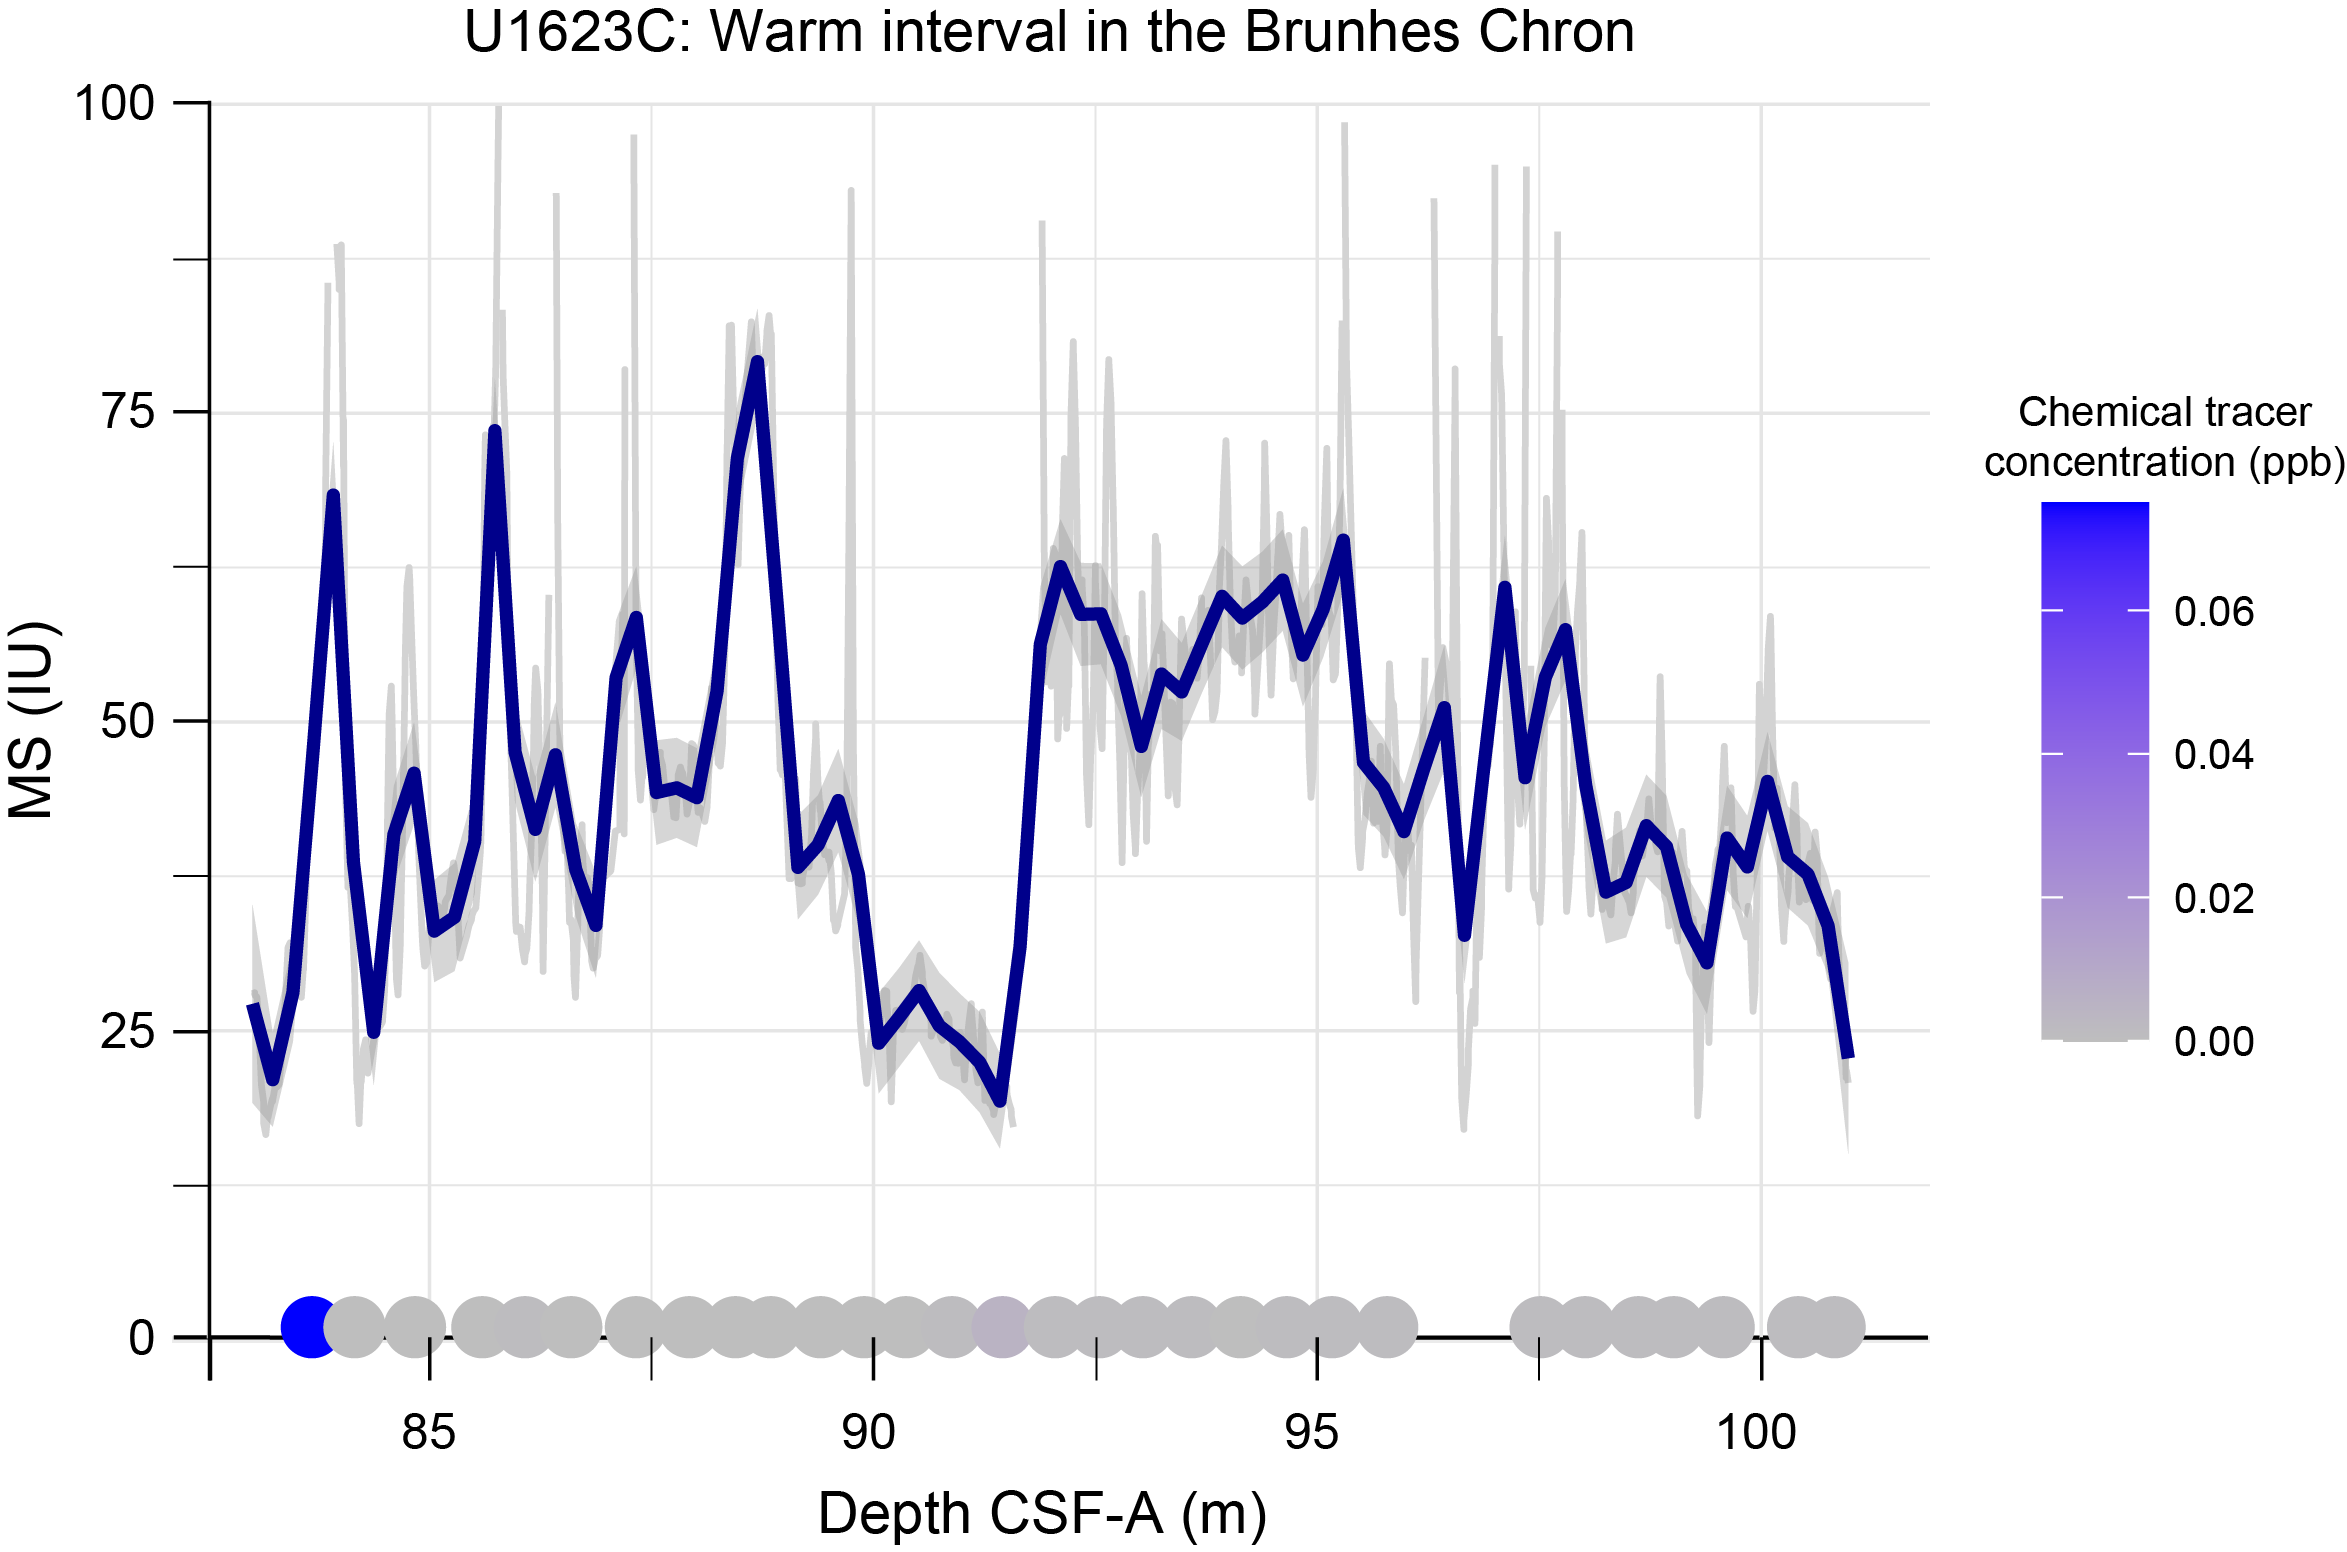
Figure F80. SedaDNA sampling targeting a Brunhes Chron interglacial.
All positive controls indicated the presence of the tracer in the drill fluid, and all but one negative control indicated the drill fluid had not penetrated to the center of the core where the sedaDNA sample was taken.
10. Downhole measurements
10.1. Formation temperature
During APC coring in Holes U1621A and U1623A, in situ formation temperature was measured every third core (403-U1621A-4H, 7H, 10H, 403-U1623A-4H, 7H, 10H, and 13H) using the APCT-3 tool. For Hole U1622A, in situ temperature measurements were performed once for Core 7F. Temperature increased almost linearly with depth, and the slope of linear regression provides a typical geothermal gradient (85.6° and 80.1°C/km for Holes U1621A and U1623A, respectively) for oceanic sediments compared with the statistical data set (Kolawole and Evenick, 2023) (Figure F81). For Holes U1621A and U1623A, the heat flow in the sediments and the temperature at the seafloor were calculated from the formation temperature measurements and the measured thermal conductivity in Cores 403-U1621A-1H through 6H and 403-U1623A-1H through 14F, respectively (see Physical properties). Assuming a linear relationship between thermal conductivity and depth, the heat flow in the sediments and the temperature at the seafloor are approximately 98.5 mW/m2 and −0.813°C, respectively, for Hole U1621A and 90.5 mW/m2 and −0.726°C, respectively, for Hole U1623A.
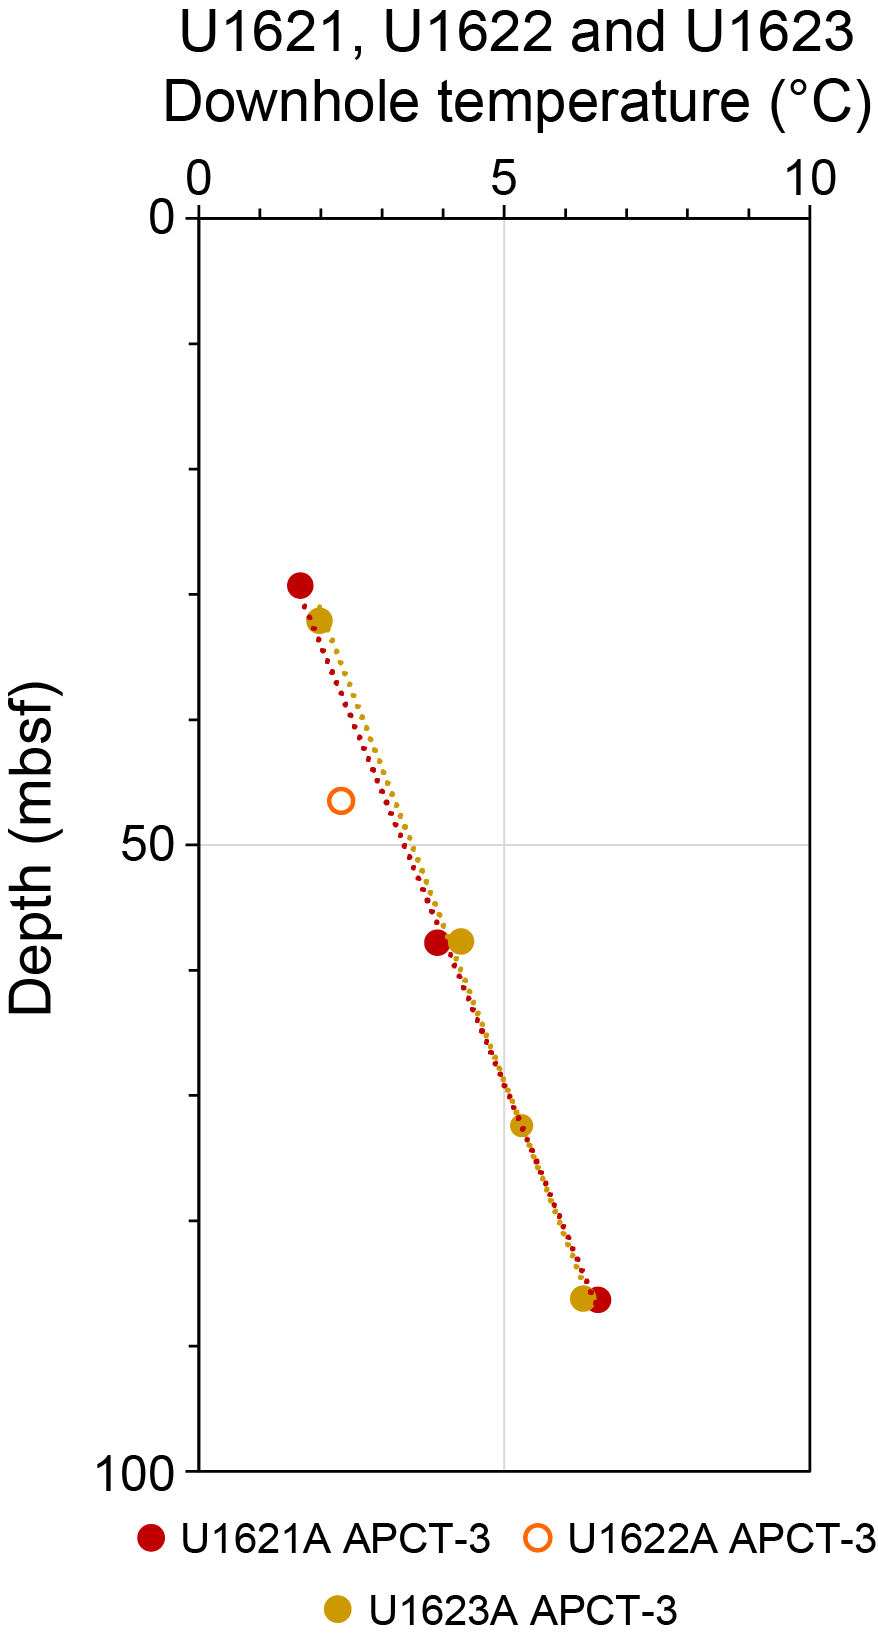
Figure F81. Formation temperature.
10.2. Downhole logging
Planned downhole logging runs in Hole U1623C using the triple combo and FMS-sonic strings were canceled. After the BHA was set at 65.5 m wireline log matched depth below seafloor (WMSF), while lowering the triple combo tool string, the Schlumberger engineer encountered an obstruction at ~7 m WMSF that the tools were unable to pass. The tool was then pulled up, and the mud pumps were run at 1800 psi, clearing the obstruction. Following a deplugger, the triple combo tool string was run down the pipe again, this time unable to pass the bit, which rendered downhole logging in Hole U1623C impossible.
A new attempt of downhole logging was run in Hole U1623D using the triple combo and FMS-sonic strings to obtain multiple in situ property measurements. Logging operations for these tools are illustrated in Figure F82. After the BHA was set at 104 m WMSF, the string was first lowered to 260.5 m WMSF for downlog while the caliper closed. A downlog of the Hostile Environment Litho-Density Sonde (HLDS) was not obtained. Subsequently, the tool string was pulled up for the first uplog from 260.0 to 142.7 m WMSF. To increase data recovery, the strings were lowered again to 257.6 m WMSF and pulled up to 0 m WMSF for the second uplog. After the triple combo, the FMS-sonic string was lowered to 258.9 m WMSF. For the first image uplog, the FMS-sonic string was pulled up from 259.2 to 143.5 m WMSF. To increase data recovery, the tools were lowered again to 238.2 m WMSF and pulled up to 0 m WMSF for the second image uplog. The average peak-to-peak heave was estimated at 1 m. The heave compensator was utilized during the logging operation.
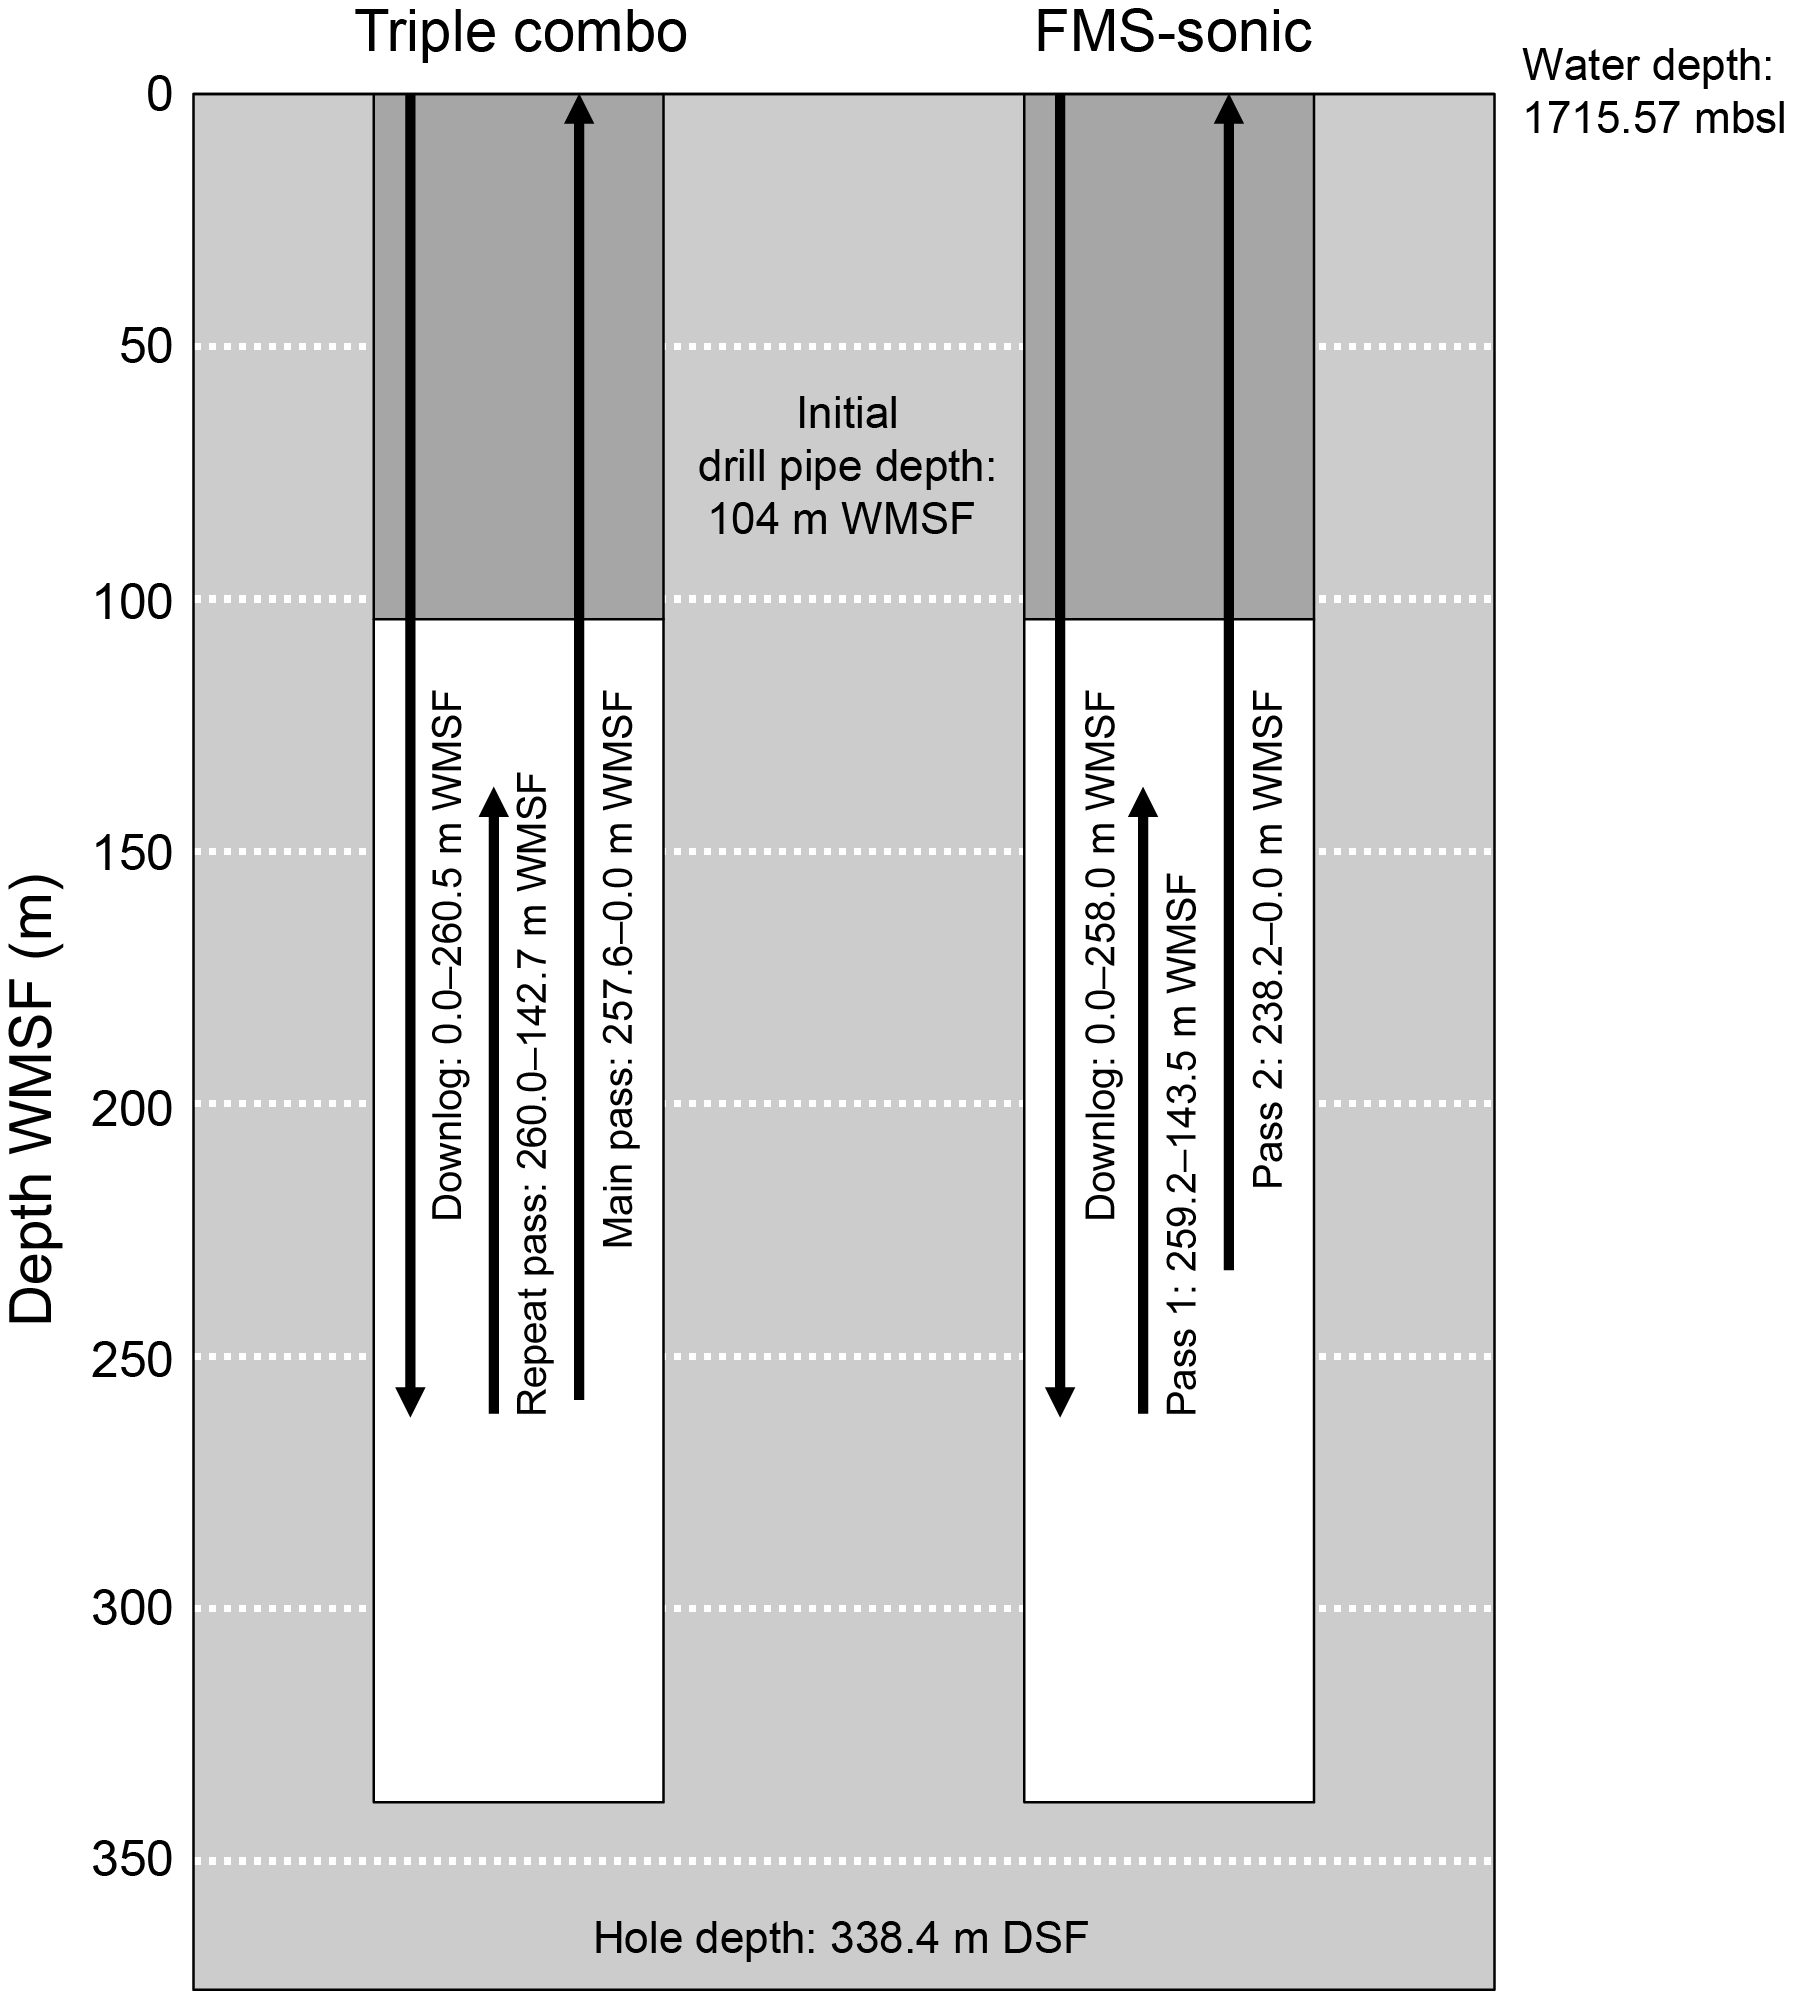
Figure F82. Downhole operations.
Logging data were sent for processing to the Lamont-Doherty Earth Observatory (LDEO; Columbia University, USA) (Figure F83; Table T24). The data provide important information for core-log integration to understand the actual depth and thickness of each lithostratigraphic unit because some cores at this site suffered from gas expansion.
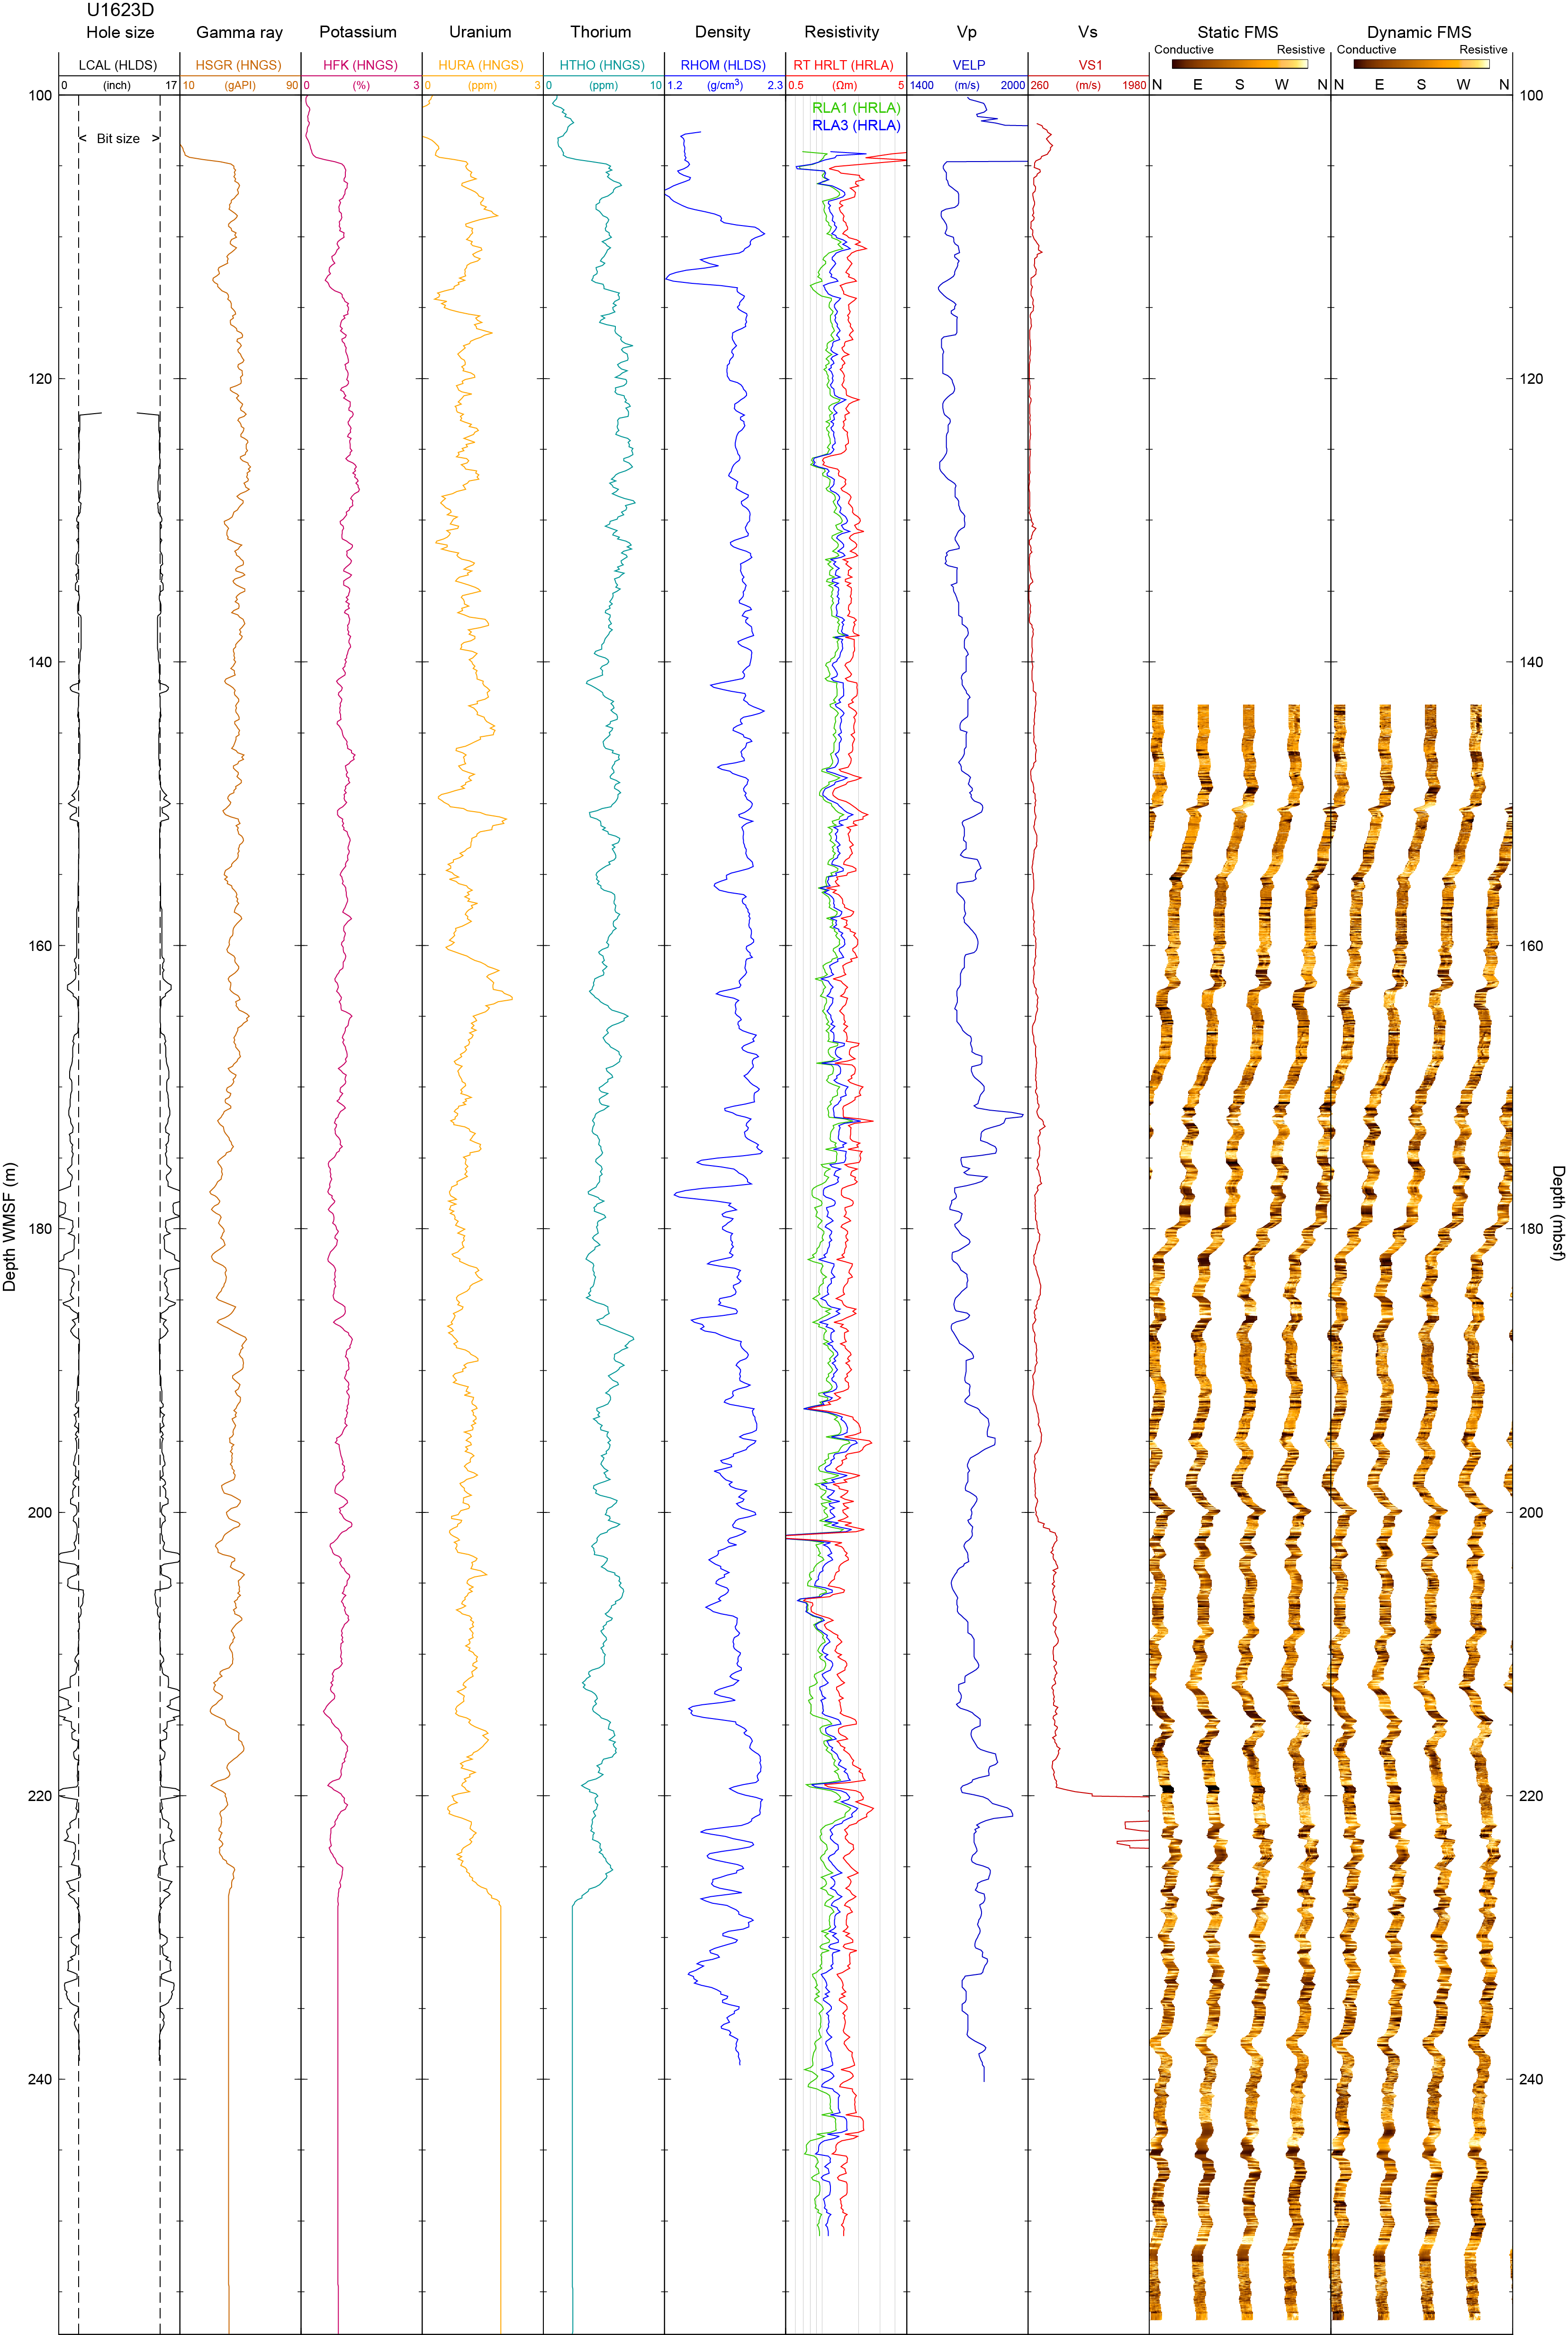
Figure F83. Downhole logging data.
10.2.1. Triple combination
The triple combo tool string acquired density, natural gamma ray, and electrical resistivity. For several depth levels, however, the data should be interpreted with caution because the irregularly enlarged borehole affects eccentralization and/or good contact of tools onto the borehole wall (Figure F83). Because of some technical issues, the Accelerator Porosity Sonde (APS) was not deployed, and the Magnetic Susceptibility Sonde (MSS) was deployed but could not acquire valid MS data from Hole U1623D.
Logging data were collected for variations in the borehole diameter, which were measured using the caliper on the HLDS during each uplog. Based on these caliper measurements, the borehole diameter was enlarged at several depth levels indicating that a lot of washouts occurred while drilling mud circulated in Hole U1623D. Given the characteristics of sondes and methodologies, borehole diameter variation may affect logging of other physical properties.
Natural gamma ray and density showed almost the same trends as the shipboard scanning data. HLDS density log measurements from 105.1 to 239.0 m WMSF (below the drill pipe) are on average 1.84 g/cm3 and do not show a significant downhole trend. Although a lot of anomalies due to bad contact of the HLDS probe with an enlarged borehole wall were observed, otherwise absolute values of the HLDS density measurements were very similar to densities derived from discrete MAD measurements. HLDS logging showed cyclic density changes, but the variability was much smaller than for the GRA bulk density in shallower intervals (105 to ~160 m WMSF), probably due to frequent gas expansion of cores. Mean density values of HLDS logging and GRA density are similar (Figure F84A).
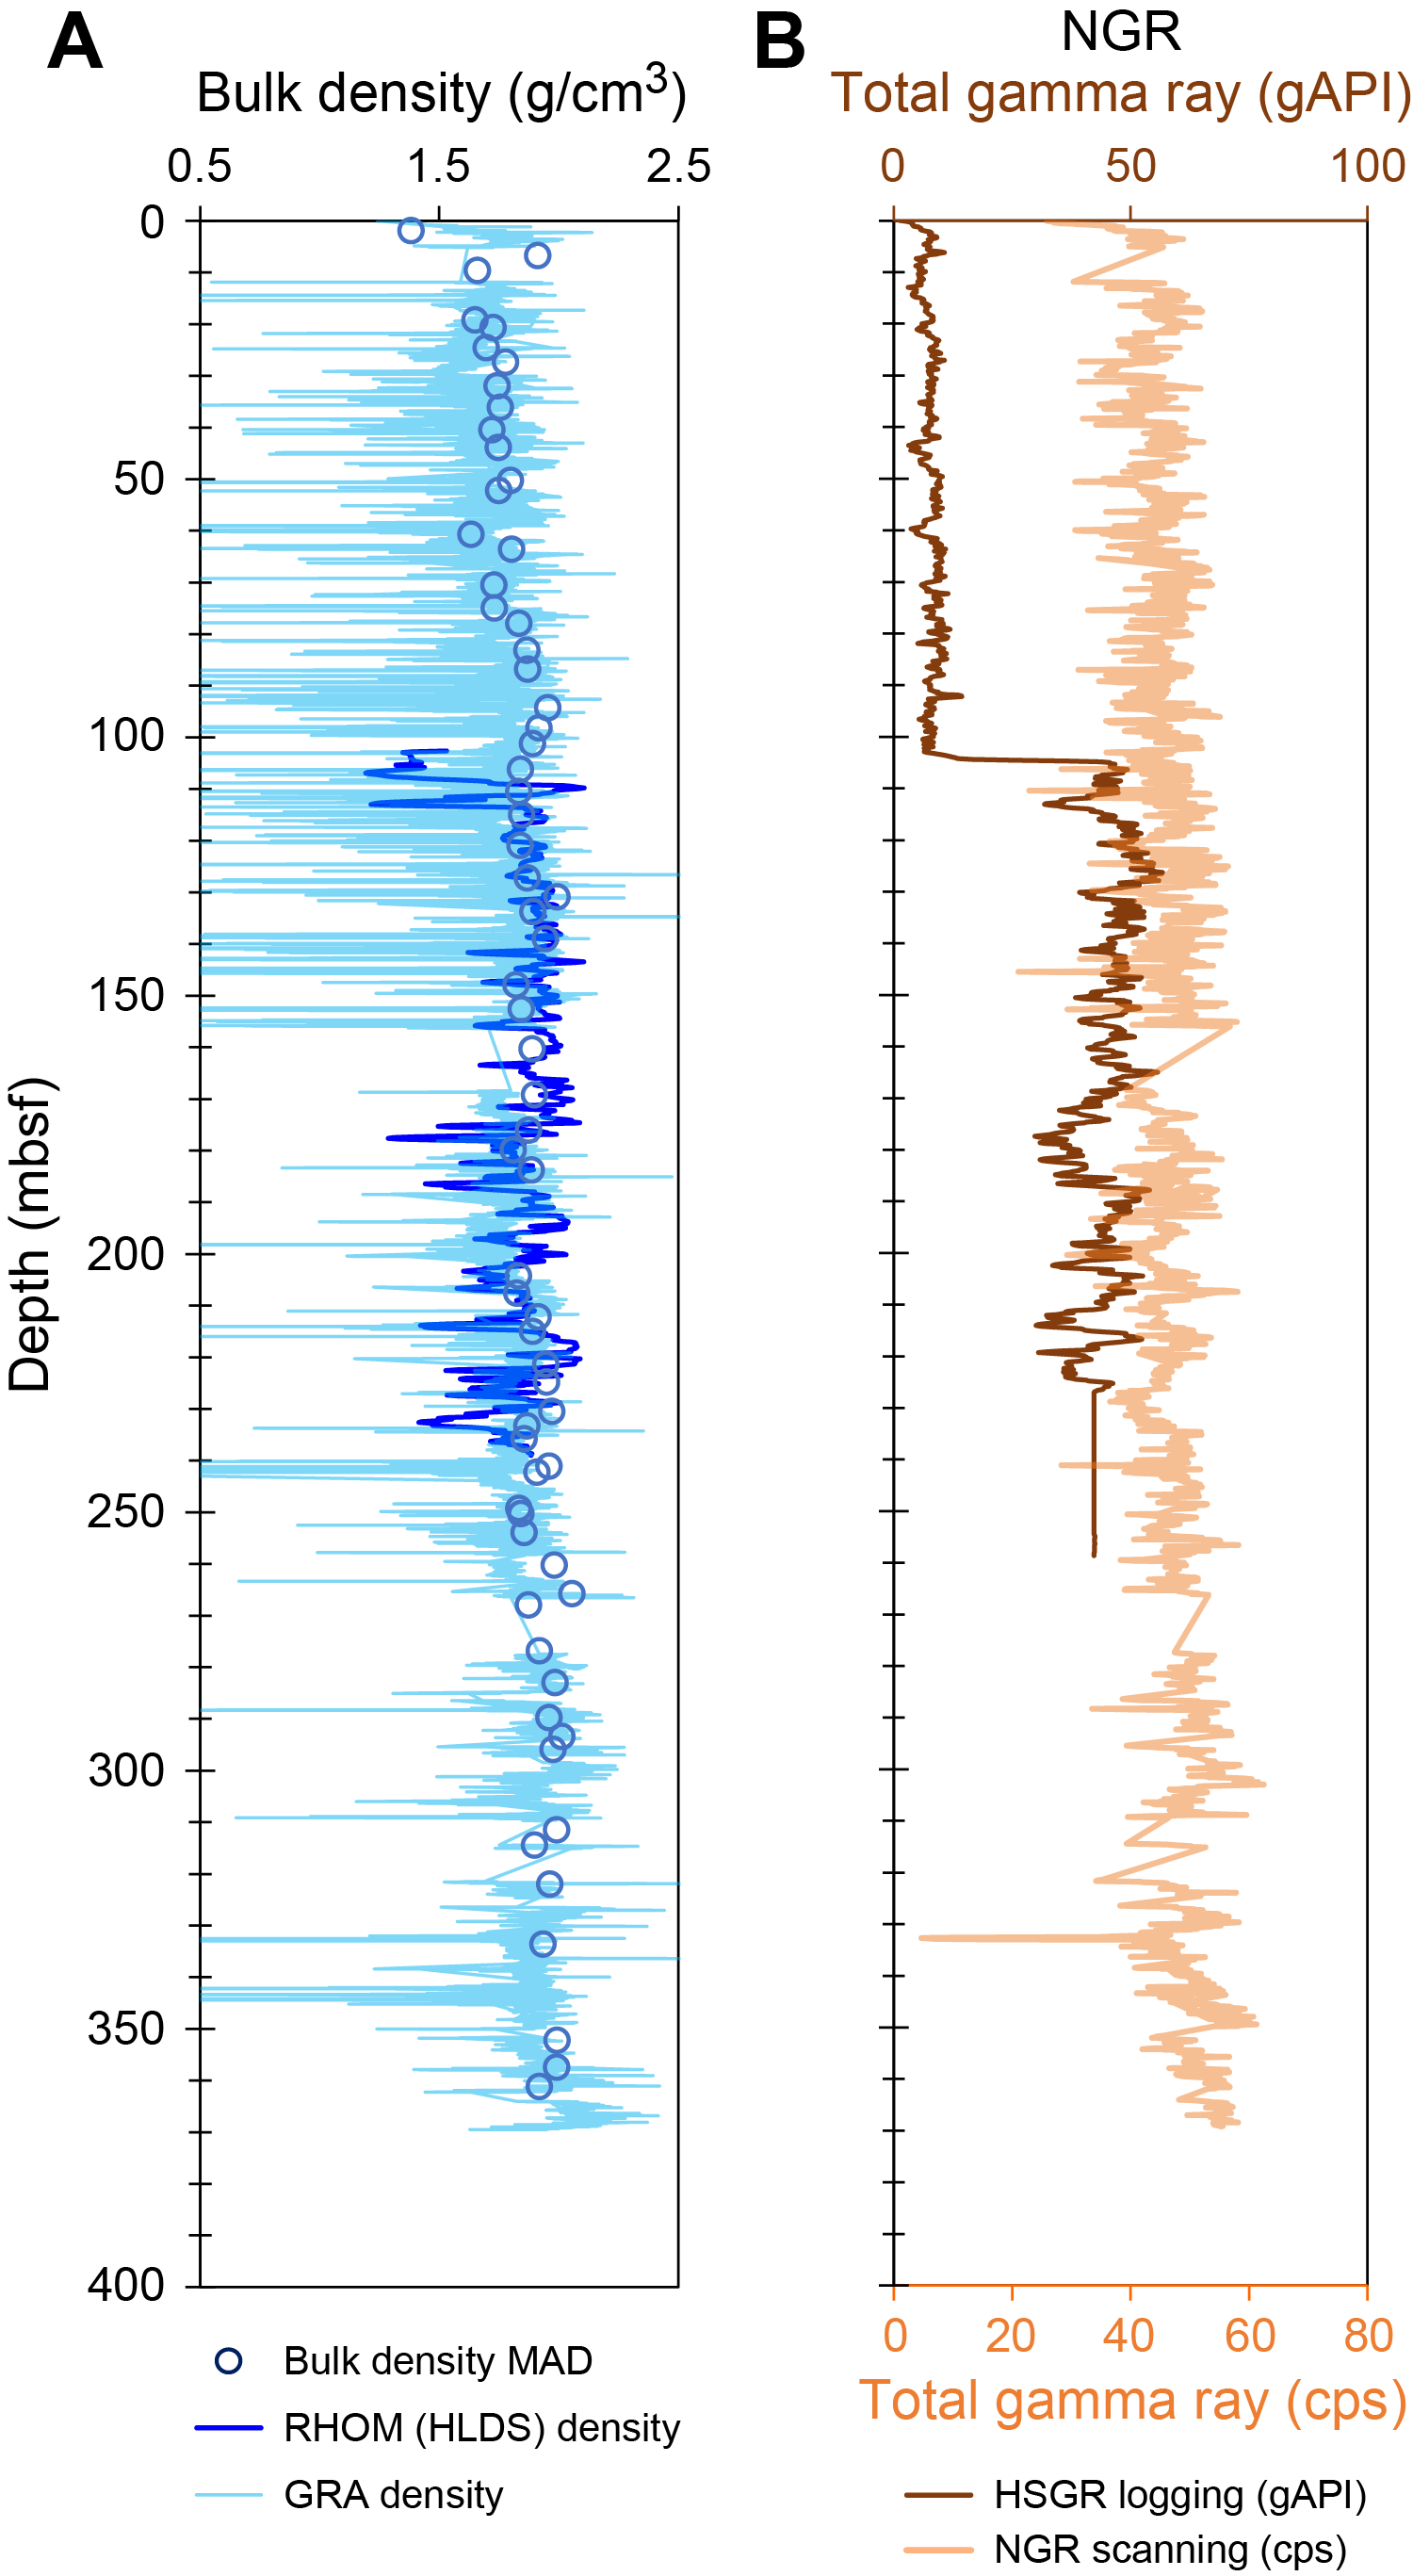
Figure F84. Core-log comparison.
Downhole natural gamma ray was reported as total spectral gamma ray (HSGR) data, potassium (K), uranium (U), and thorium (Th) contents. Each K, U, and Th component was derived from the spectrum of total natural gamma ray counts and 256-window spectroscopy. For the total natural gamma ray measurements not influenced by the drill pipe (105.0–258.6 m WMSF), the average value is 44.1 American Petroleum Institute gamma radiation units (gAPI). Cyclic amplitude fluctuations around this value were observed. The amplitude of these cyclic variations is lower in the lower part (below ~165 m WMSF) of the measurements. An interval of lower HSGR values that occurs around 170–195 m WMSF is due to an extremely enlarged borehole, which results in fewer gamma rays detected in the HNGS tool. Uranium and thorium showed similar trend and fluctuation to HSGR, whereas potassium indicated relatively lower amplitudes. The HSGR data showed great similarity to natural gamma ray measured on cores with the natural gamma ray logger (Figure F84B), indicating that core and log depth scales can be readily correlated. The differences of the depth scales can be assumed to be less than 1 m. Absolute values of the HSGR in the uppermost 105 m are much lower because measurements were made through the drill pipe.
For electrical resistivity, laterologging using the High-Resolution Laterolog Array (HRLA) tool recorded multiple logs depending on the travel paths of electrical current. True resistivity (HRLT) ranged 1–2 Ω·m along the most depth. Around 126, 192, 201, 207, and 219 m WMSF, rapid decrease of resistivity was observed (Figure F83). Because the electrical resistivity of the formation is highly dependent on water content, unless lithology changes, the resistivity lows suggest the presence of large pore spaces and high-water content.
10.2.2. FMS-sonic
The FMS-sonic string successfully logged natural gamma ray, acoustic velocity, and borehole resistivity images (Figure F83).
Logging data were collected for variations in the borehole diameter by calipers on the FMS during each uplog. The results indicate that a lot of washouts occurred, which is the same as the HLDS caliper showed.
The reprocessed P-wave velocity data were provided (Figure F83). The reprocessed data show increasing values with depth. The calculated linear trend was ~1.05 m/s below the drill pipe. The trend is overlain by cyclic changes that mimic changes seen in the density. Maximum velocities below the drill pipe of 1977 m/s were measured at ~171.9 m WMSF.
Due to the capacity of the FMS calipers, borehole resistivity images have 25% recovery of all around the borehole walls at every depth. The images indicate several vertical lines of low resistivity that suggest drilling-induced tensile fractures resulted from higher compressional stress than compressional strength of the formation. However, those lines were not apparently symmetric, and thus we are not confident on their relation with the natural compressional stress.
References
Backman, J., Raffi, I., Rio, D., Fornaciari, E., and Pälike, H., 2012. Biozonation and biochronology of Miocene through Pleistocene calcareous nannofossils from low and middle latitudes. Newsletters on Stratigraphy, 45(3):221–244. https://doi.org/10.1127/0078-0421/2012/0022
Banerjee, S.K., King, J., and Marvin, J., 1981. A rapid method for magnetic granulometry with applications to environmental studies. Geophysical Research Letters, 8(4):333–336. https://doi.org/10.1029/GL008i004p00333
Barron, J.A., Bukry, D., Addison, J.A., and Ager, T.A., 2016. Holocene evolution of diatom and silicoflagellate paleoceanography in Slocum Arm, a fjord in southeastern Alaska. Marine Micropaleontology, 126:1–18. https://doi.org/10.1016/j.marmicro.2016.05.002
Bauch, H.A., 1994. Significance of variability in Turborotalita quinqueloba (Natland) test size and abundance for paleoceanographic interpretations in the Norwegian-Greenland Sea. Marine Geology, 121(1):129–141. https://doi.org/10.1016/0025-3227(94)90162-7
Bohrmann, G., 2019. The Expedition PS119 of the Research Vessel POLARSTERN to the Eastern Scotia Sea in 2019. Reports on Polar and Marine Research, 736:236. https://doi.org/10.2312/BzPM_0736_2019
Borowski, W.S., Paull, C.K., and Ussler, W., III, 1996. Marine pore-water sulfate profiles indicate in situ methane flux from underlying gas hydrate. Geology, 24(7):655–658. https://doi.org/10.1130/0091-7613(1996)024<0655:MPWSPI>2.3.CO;2
Bowles, J., 2009. Cover article: SQUID Attack! IRM Quarterly, 19(1). https://doi.org/11299/171314
Bown, P.R., 1998. Calcareous Nannofossil Biostratigraphy: Dordrect, Netherlands (Kluwer Academic Publishing).
Bruland, K.W., and Lohan, M.C., 2006. Controls of trace metals in seawater. In Elderfield, H., Treatise on Geochemistry (Volume 6): the Oceans and Marine Geochemistry. Amsterdam (Elsevier), 23–47. https://doi.org/10.1016/B0-08-043751-6/06105-3
Butt, F.A., Drange, H., Elverhøi, A., Otterå, O.H., and Solheim, A., 2002. Modelling Late Cenozoic isostatic elevation changes in the Barents Sea and their implications for oceanic and climatic regimes: preliminary results. Quaternary Science Reviews, 21(14–15):1643–1660. https://doi.org/10.1016/S0277-3791(02)00018-5
Caricchi, C., Lucchi, R.G., Sagnotti, L., Macrì, P., Di Roberto, A., Del Carlo, P., Husum, K., Laberg, J.S., and Morigi, C., 2019. A high-resolution geomagnetic relative paleointensity record from the Arctic Ocean deep-water gateway deposits during the last 60 kyr. Geochemistry, Geophysics, Geosystems, 20(5):2355–2377. https://doi.org/10.1029/2018GC007955
Caricchi, C., Sagnotti, L., Campuzano, S.A., Lucchi, R.G., Macrì, P., Rebesco, M., and Camerlenghi, A., 2020. A refined age calibrated paleosecular variation and relative paleointensity stack for the NW Barents Sea: implication for geomagnetic field behavior during the Holocene. Quaternary Science Reviews, 229:106133. https://doi.org/10.1016/j.quascirev.2019.106133
Carstens, J., and Wefer, G., 1992. Recent distribution of planktonic foraminifera in the Nansen Basin, Arctic Ocean. Deep Sea Research Part A. Oceanographic Research Papers, 39(2, Part 1):S507–S524. https://doi.org/10.1016/S0198-0149(06)80018-X
Chauhan, T., Rasmussen, T.L., Noormets, R., Jakobsson, M., and Hogan, K.A., 2014. Glacial history and paleoceanography of the southern Yermak Plateau since 132 ka BP. Quaternary Science Reviews, 92:155–169. https://doi.org/10.1016/j.quascirev.2013.10.023
Clark, P.U., McCabe, A.M., Mix, A.C., and Weaver, A.J., 2004. Rapid rise of sea level 19,000 years ago and its global implications. Science, 304(5674):1141–1144. https://doi.org/10.1126/science.1094449
Claypool, G.E., and Kvenvolden, K.A., 1983. Methane and other hydrocarbon gases in marine sediment. Annual Review of Earth and Planetary Sciences, 11(1):299–327. https://doi.org/10.1146/annurev.ea.11.050183.001503
de Vernal, A., Radi, T., Zaragosi, S., Van Nieuwenhove, N., Rochon, A., Allan, E., De Schepper, S., Eynaud, F., Head, M.J., Limoges, A., Londeix, L., Marret, F., Matthiessen, J., Penaud, A., Pospelova, V., Price, A., and Richerol, T., 2020. Distribution of common modern dinoflagellate cyst taxa in surface sediments of the Northern Hemisphere in relation to environmental parameters: The new n=1968 database. Marine Micropaleontology, 159:101796. https://doi.org/10.1016/j.marmicro.2019.101796
Egger, M., Riedinger, N., Mogollón, J.M., and Jørgensen, B.B., 2018. Global diffusive fluxes of methane in marine sediments. Nature Geoscience, 11(6):421–425. https://doi.org/10.1038/s41561-018-0122-8
Ehlers, B.-M., and Jokat, W., 2013. Paleo-bathymetry of the northern North Atlantic and consequences for the opening of the Fram Strait. Marine Geophysical Research, 34(1):25–43. https://doi.org/10.1007/s11001-013-9165-9
Eiken, O., and Hinz, K., 1993. Contourites in the Fram Strait. Sedimentary Geology, 82(1–4):15–32. https://doi.org/10.1016/0037-0738(93)90110-Q
Engen, Ø., Faleide, J.I., and Dyreng, T.K., 2008. Opening of the Fram Strait gateway: a review of plate tectonic constraints. Tectonophysics, 450(1–4):51–69. https://doi.org/10.1016/j.tecto.2008.01.002
Flores, J.A., Filippelli, G.M., Sierro, F.J., and Latimer, J.C., 2012. The “White Ocean” Hypothesis: A Late Pleistocene Southern Ocean Governed by Coccolithophores and Driven by Phosphorus. Frontiers in Microbiology, 3. https://doi.org/10.3389/fmicb.2012.00233
Gamboa Sojo, V.M., Morigi, C., Langone, L., and Lucchi, R.G., 2024. Deciphering paleoceanographic shifts inferred from the foraminiferal record of the western Svalbard Slope (Bellsund Drift) over the past century. Journal of Marine Science and Engineering, 12(4):559. https://doi.org/10.3390/jmse12040559
Gebhardt, A.C., Geissler, W.H., Matthiessen, J., and Jokat, W., 2014. Changes in current patterns in the Fram Strait at the Pliocene/Pleistocene boundary. Quaternary Science Reviews, 92:179–189. https://doi.org/10.1016/j.quascirev.2013.07.015
Gebhardt, A.C., Jokat, W., Niessen, F., Matthiessen, J., Geissler, W.H., and Schenke, H.W., 2011. Ice sheet grounding and iceberg plow marks on the northern and central Yermak Plateau revealed by geophysical data. Quaternary Science Reviews, 30(13):1726–1738. https://doi.org/10.1016/j.quascirev.2011.03.016
Goldschmidt, P.M., Pfirman, S.L., Wollenburg, I., and Henrich, R., 1992. Origin of sediment pellets from the Arctic seafloor: sea ice or icebergs? Deep Sea Research Part A. Oceanographic Research Papers, 39(2, Part 1):S539–S565. https://doi.org/10.1016/S0198-0149(06)80020-8
González-Lanchas, A., Rickaby, R.E.M., Sierro, F.J., Rigual-Hernández, A.S., Alonso-García, M., and Flores, J.A., 2023. Globally enhanced calcification across the coccolithophore Gephyrocapsa complex during the mid-Brunhes interval. Quaternary Science Reviews, 321:108375. https://doi.org/10.1016/j.quascirev.2023.108375
Gradstein, F.M., Ogg, J.G., Schmitz, M.D., and Ogg, G.M. (Eds.), 2020. Geologic Time Scale 2020: Amsterdam (Elsevier BV). https://doi.org/10.1016/C2020-1-02369-3
Graves, C.A., James, R.H., Sapart, C.J., Stott, A.W., Wright, I.C., Berndt, C., Westbrook, G.K., and Connelly, D.P., 2017. Methane in shallow subsurface sediments at the landward limit of the gas hydrate stability zone offshore western Svalbard. Geochimica et Cosmochimica Acta, 198:419–438. https://doi.org/10.1016/j.gca.2016.11.015
Horng, C.-S., 2018. Unusual Magnetic Properties of Sedimentary Pyrrhotite in Methane Seepage Sediments: Comparison With Metamorphic Pyrrhotite and Sedimentary Greigite. Journal of Geophysical Research: Solid Earth, 123(6):4601–4617. https://doi.org/10.1002/2017JB015262
Husum, K., and Hald, M., 2012. Arctic planktic foraminiferal assemblages: Implications for subsurface temperature reconstructions. Marine Micropaleontology, 96-97:38–47. https://doi.org/10.1016/j.marmicro.2012.07.001
Jakobsson, M., Backman, J., Rudels, B., Nycander, J., Frank, M., Mayer, L., Jokat, W., Sangiorgi, F., O’Regan, M., Brinkhuis, H., King, J., and Moran, K., 2007. The Early Miocene onset of ventilated circulation regime in the Arctic Ocean. Nature, 447(7147):986–990. https://doi.org/10.1038/nature05924
Jessen, S.P., Rasmussen, T.L., Nielsen, T., and Solheim, A., 2010. A new late Weichselian and Holocene marine chronology for the western Svalbard slope 30,000–0 cal years BP. Quaternary Science Reviews, 29(9–10):1301–1312. https://doi.org/10.1016/j.quascirev.2010.02.020
Kirschvink, J.L., 1980. The least-squares line and plane and the analysis of palaeomagnetic data. Geophysical Journal International, 62(3):699–718. https://doi.org/10.1111/j.1365-246X.1980.tb02601.x
Koc, N., and Flower, B.P., 1998. High-resolution Pleistocene diatom biostratigraphy and paleoceanography of Site 919 from the Irminger Basin. In Saunders, A.D., Larsen, H.C., and Wise, S.W., Jr. (Eds.), Proceedings of the Ocean Drilling Program, Scientific Results, 152: College Station, TX (Ocean Drilling Program), 209–219. https://doi.org/10.2973/odp.proc.sr.152.218.1998
Koç, N., Hodell, D.A., Kleiven, H.F., and Labeyrie, L., 1999. High-resolution Pleistocene diatom biostratigraphy of Site 983 and correlations with isotope stratigraphy. In Raymo, M.E., Jansen, E., Blum, P., and Herbert, T.D. (Eds.), Proceedings of the Ocean Drilling Program, Scientific Results, 162: College Station, TX (Ocean Drilling Program), 51–62. https://doi.org/10.2973/odp.proc.sr.162.035.1999
Kolawole, F., and Evenick, J.C., 2023. Global distribution of geothermal gradients in sedimentary basins. Geoscience Frontiers, 14(6):101685. https://doi.org/10.1016/j.gsf.2023.101685
Laberg, J.S., Stoker, M.S., Dahlgren, K.I.T., Haas, H.d., Haflidason, H., Hjelstuen, B.O., Nielsen, T., Shannon, P.M., Vorren, T.O., van Weering, T.C.E., and Ceramicola, S., 2005. Cenozoic alongslope processes and sedimentation on the NW European Atlantic margin. Marine and Petroleum Geology, 22(9–10):1069–1088. https://doi.org/10.1016/j.marpetgeo.2005.01.008
Lannuzel, D., Tedesco, L., van Leeuwe, M., Campbell, K., Flores, H., Delille, B., Miller, L., Stefels, J., Assmy, P., Bowman, J., Brown, K., Castellani, G., Chierici, M., Crabeck, O., Damm, E., Else, B., Fransson, A., Fripiat, F., Geilfus, N.-X., Jacques, C., Jones, E., Kaartokallio, H., Kotovitch, M., Meiners, K., Moreau, S., Nomura, D., Peeken, I., Rintala, J.-M., Steiner, N., Tison, J.-L., Vancoppenolle, M., Van der Linden, F., Vichi, M., and Wongpan, P., 2020. The future of Arctic sea-ice biogeochemistry and ice-associated ecosystems. Nature Climate Change, 10(11):983–992. https://doi.org/10.1038/s41558-020-00940-4
Lucchi, R.G., Camerlenghi, A., Rebesco, M., Colmenero-Hidalgo, E., Sierro, F.J., Sagnotti, L., Urgeles, R., Melis, R., Morigi, C., Bárcena, M.A., Giorgetti, G., Villa, G., Persico, D., Flores, J.A., Rigual-Hernández, A.S., Pedrosa, M.T., Macri, P., and Caburlotto, A., 2013. Postglacial sedimentary processes on the Storfjorden and Kveithola trough mouth fans: significance of extreme glacimarine sedimentation. Global and Planetary Change, 111:309–326. https://doi.org/10.1016/j.gloplacha.2013.10.008
Lucchi, R., Kovacevic, V., Aliani, S., Caburlotto, A., Celussi, M., Corgnati, L., Cosoli, S., Ersdal, E.A., Fredriksson, S., Goszczko, I., Husum, K., G, I., Laberg, J., Łącka, M., Langone, L., P, M., K, M., Morigi, C., Realdon, G., and Tirelli, V., 2014. Present and past flow regime. On contourite drifts west of Spitsbergen. EUROFLEETS-2 Cruise Summary Report R/V G.O. Sars, Cruise No. 191. https://doi.org/10.13140/2.1.1975.3769
Lucchi, R.G., Morigi, C., Sverre Laberg, J., Husum, K., Gamboa Sojo, V., Musco, M.E., Caricchi, C., Caffau, M., Sagnotti, L., Macrì, P., Princivalle, F., Giorgetti, G., Caburlotto, A., and Rebesco, M., 2018. The climatic significance of laminated sediments from turbid meltwaters on the NW Barents Sea continental margin (Arctic). Geophysical Research Abstracts, 20:EGU2018–3115. https://meetingorganizer.copernicus.org/EGU2018/EGU2018-3115.pdf
Lucchi, R.G., Sagnotti, L., Camerlenghi, A., Macrì, P., Rebesco, M., Pedrosa, M.T., and Giorgetti, G., 2015. Marine sedimentary record of Meltwater Pulse 1a along the NW Barents Sea continental margin. arktos, 1(1):7. https://doi.org/10.1007/s41063-015-0008-6
Lucchi, R.G., St. John, K., and Ronge, T.A., 2023. Expedition 403 Scientific Prospectus: Eastern Fram Strait Paleo-Archive (FRAME). International Ocean Discovery Program. https://doi.org/10.14379/iodp.sp.403.2023
Lucchi, R.G., St. John, K.E.K., Ronge, T.A., Barcena, M.A., De Schepper, S., Duxbury, L.C., Gebhardt, A.C., Gonzalez-Lanchas, A., Goss, G., Greco, N.M., Gruetzner, J., Haygood, L., Husum, K., Iizuka, M., Kapuge, A.K.I.U., Lam, A.R., Libman-Roshal, O., Liu, Y., Monito, L.R., Reilly, B.T., Rosenthal, Y., Sakai, Y., Sijinkumar, A.V., Suganuma, Y., and Zhong, Y., 2026a. Expedition 403 methods. In Lucchi, R.G., St. John, K.E.K., Ronge, T.A., and the Expedition 403 Scientists, Eastern Fram Strait Paleo-Archive. Proceedings of the International Ocean Discovery Program, 403: College Station, TX (International Ocean Discovery Program). https://doi.org/10.14379/iodp.proc.403.102.2026
Lucchi, R.G., St. John, K.E.K., Ronge, T.A., Barcena, M.A., De Schepper, S., Duxbury, L.C., Gebhardt, A.C., Gonzalez-Lanchas, A., Goss, G., Greco, N.M., Gruetzner, J., Haygood, L., Husum, K., Iizuka, M., Kapuge, A.K.I.U., Lam, A.R., Libman-Roshal, O., Liu, Y., Monito, L.R., Reilly, B.T., Rosenthal, Y., Sakai, Y., Sijinkumar, A.V., Suganuma, Y., and Zhong, Y., 2026b. Site U1618. In Lucchi, R.G., St. John, K.E.K., Ronge, T.A., and the Expedition 403 Scientists, Eastern Fram Strait Paleo-Archive. Proceedings of the International Ocean Discovery Program, 403: College Station, TX (International Ocean Discovery Program). https://doi.org/10.14379/iodp.proc.403.103.2026
Martini, E., 1971. Standard Tertiary and Quaternary calcareous nannoplankton zonation. Proceedings of the Second Planktonic Conference, Roma, 1970:739–785.
Matthiessen, J., and Brenner, W., 1996. Dinoflagellate cyst ecostratigraphy of Pliocene-Pleistocene sediments from the Yermak Plateau (Arctic Ocean, Hole 911A). In Thiede, J., Myhre, A.M., Firth, J.V., Johnson, G.L., and Ruddiman, W.F. (Eds.), Proceedings of the Ocean Drilling Program, Scientific Results, 151: 243–253. https://doi.org/10.2973/odp.proc.sr.151.109.1996
Matthiessen, J., and Knies, J., 2001. Dinoflagellate cyst evidence for warm interglacial conditions at the northern Barents Sea margin during marine oxygen isotope stage 5. Journal of Quaternary Science, 16(7):727–737. https://doi.org/10.1002/jqs.656
Matthiessen, J., Schreck, M., De Schepper, S., Zorzi, C., and de Vernal, A., 2018. Quaternary dinoflagellate cysts in the Arctic Ocean: potential and limitations for stratigraphy and paleoenvironmental reconstructions. Quaternary Science Reviews, 192:1–26. https://doi.org/10.1016/j.quascirev.2017.12.020
Matul, A., and Kazarina, G.K., 2020. The North Pacific Diatom Species Neodenticula seminae in the Modern and Holocene Sediments of the North Atlantic and Arctic. Geosciences, 10(5). https://doi.org/10.3390/geosciences10050173
Meyers, P.A., 1994. Preservation of elemental and isotopic source identification of sedimentary organic matter. Chemical Geology, 114(3–4):289–302. https://doi.org/10.1016/0009-2541(94)90059-0
Meyers, P.A., 1997. Organic geochemical proxies of paleoceanographic, paleolimnologic, and paleoclimatic processes. Organic Geochemistry, 27(5–6):213–250. https://doi.org/10.1016/S0146-6380(97)00049-1
Miettinen, A., 2018. Diatoms in Arctic regions: Potential tools to decipher environmental changes. Polar Science, 18:220–226. https://doi.org/10.1016/j.polar.2018.04.001
Miettinen, A., Koç, N., and Husum, K., 2013. Appearance of the Pacific diatom Neodenticula seminae in the northern Nordic Seas — An indication of changes in Arctic sea ice and ocean circulation. Marine Micropaleontology, 99:2–7. https://doi.org/10.1016/j.marmicro.2012.06.002
Oksman, M., Juggins, S., Miettinen, A., Witkowski, A., and Weckström, K., 2019. The biogeography and ecology of common diatom species in the northern North Atlantic, and their implications for paleoceanographic reconstructions. Marine Micropaleontology, 148:1–28. https://doi.org/10.1016/j.marmicro.2019.02.002
Pados, T., and Spielhagen, R.F., 2014. Species distribution and depth habitat of recent planktic foraminifera in Fram Strait, Arctic Ocean. Polar Research, 33. https://doi.org/10.3402/polar.v33.22483
Peters, C., and Thompson, R., 1998. Magnetic identification of selected natural iron oxides and sulphides. Journal of Magnetism and Magnetic Materials, 183(3):365–374. https://doi.org/10.1016/S0304-8853(97)01097-4
Raffi, I., 2002. Revision of the Early-Middle Pleistocene calcareous nannofossil biochronology (1.75–0.85 Ma). Marine Micropaleontology, 45(1):25–55. https://doi.org/10.1016/S0377-8398(01)00044-5
Raffi, I., Backman, J., Fornaciari, E., Pälike, H., Rio, D., Lourens, L., and Hilgen, F., 2006. A review of calcareous nannofossil astrobiochronology encompassing the past 25 million years. Quaternary Science Reviews, 25(23):3113–3137. https://doi.org/10.1016/j.quascirev.2006.07.007
Razmjooei, M.J., Henderiks, J., Coxall, H.K., Baumann, K.-H., Vermassen, F., Jakobsson, M., Niessen, F., and O'Regan, M., 2023. Revision of the Quaternary calcareous nannofossil biochronology of Arctic Ocean sediments. Quaternary Science Reviews, 321:108382. https://doi.org/10.1016/j.quascirev.2023.108382
Rebesco, M., Hernández-Molina, F.J., Van Rooij, D., and Wåhlin, A., 2014a. Contourites and associated sediments controlled by deep-water circulation processes: state-of-the-art and future considerations. Marine Geology, 352:111–154. https://doi.org/10.1016/j.margeo.2014.03.011
Rebesco, M., Laberg, J.S., Pedrosa, M.T., Camerlenghi, A., Lucchi, R.G., Zgur, F., and Wardell, N., 2014b. Onset and growth of Trough-Mouth Fans on the North-Western Barents Sea margin – implications for the evolution of the Barents Sea/Svalbard Ice Sheet. Quaternary Science Reviews, 92:227–234. https://doi.org/10.1016/j.quascirev.2013.08.015
Rebesco, M., Wåhlin, A., Laberg, J.S., Schauer, U., Beszczynska-Möller, A., Lucchi, R.G., Noormets, R., Accettella, D., Zarayskaya, Y., and Diviacco, P., 2013. Quaternary contourite drifts of the Western Spitsbergen margin. Deep Sea Research, Part I: Oceanographic Research Papers, 79:156–168. https://doi.org/10.1016/j.dsr.2013.05.013
Reid, P.C., Johns, D.G., Edwards, M., Starr, M., Poulin, M., and Snoeijs, P., 2007. A biological consequence of reducing Arctic ice cover: arrival of the Pacific diatom Neodenticula seminae in the North Atlantic for the first time in 800,000 years. Global Change Biology, 13(9):1910–1921. https://doi.org/10.1111/j.1365-2486.2007.01413.x
Richter, C., Acton, G., Endris, C., and Radsted, M., 2007. Technical Note 34: Handbook for shipboard paleomagnetists. Ocean Drilling Program. https://doi.org/10.2973/odp.tn.34.2007
Rigual-Hernández, A.S., Bárcena, M.A., Sierro, F.J., Flores, J.A., Hernández-Almeida, I., Sanchez-Vidal, A., Palanques, A., and Heussner, S., 2010. Seasonal to interannual variability and geographic distribution of the silicoflagellate fluxes in the Western Mediterranean. Marine Micropaleontology, 77(1):46–57. https://doi.org/10.1016/j.marmicro.2010.07.003
Roberts, A.P., Chang, L., Rowan, C.J., Horng, C.-S., and Florindo, F., 2011. Magnetic properties of sedimentary greigite (Fe3S4): an update. Reviews of Geophysics, 49(1):RG1002. https://doi.org/10.1029/2010RG000336
Roberts, A.P., and Weaver, R., 2005. Multiple mechanisms of remagnetization involving sedimentary greigite (Fe3S4). Earth and Planetary Science Letters, 231(3):263–277. https://doi.org/10.1016/j.epsl.2004.11.024
Schiebel, R., and Hemleben, C., 2017. Planktic Foraminifers in the Modern Ocean: Berlin (Springer). https://doi.org/10.1007/978-3-662-50297-6
Shipboard Scientific Party, 1995. Site 910. In Myhre, A.M., Thiede, J., Firth, J.V., et al., Proceedings of the Ocean Drilling Program, Initial Reports, 151: College Station, TX (Ocean Drilling Program), 221–270. https://doi.org/10.2973/odp.proc.ir.151.108.1995
St. John, K.E.K., Lucchi, R.G., Ronge, T.A., Barcena, M.A., De Schepper, S., Duxbury, L.C., Gebhardt, A.C., Gonzalez-Lanchas, A., Goss, G., Greco, N.M., Gruetzner, J., Haygood, L., Husum, K., Iizuka, M., Kapuge, A.K.I.U., Lam, A.R., Libman-Roshal, O., Liu, Y., Monito, L.R., Reilly, B.T., Rosenthal, Y., Sakai, Y., Sijinkumar, A.V., Suganuma, Y., and Zhong, Y., 2026a. Site U1619. In Lucchi, R.G., St. John, K.E.K., Ronge, T.A., and the Expedition 403 Scientists, Eastern Fram Strait Paleo-Archive. Proceedings of the International Ocean Discovery Program, 403: College Station, TX (International Ocean Discovery Program). https://doi.org/10.14379/iodp.proc.403.104.2026
St. John, K.E.K., Lucchi, R.G., Ronge, T.A., Barcena, M.A., De Schepper, S., Duxbury, L.C., Gebhardt, A.C., Gonzalez-Lanchas, A., Goss, G., Greco, N.M., Gruetzner, J., Haygood, L., Husum, K., Iizuka, M., Kapuge, A.K.I.U., Lam, A.R., Libman-Roshal, O., Liu, Y., Monito, L.R., Reilly, B.T., Rosenthal, Y., Sakai, Y., Sijinkumar, A.V., Suganuma, Y., and Zhong, Y., 2026b. Site U1620. In Lucchi, R.G., St. John, K.E.K., Ronge, T.A., and the Expedition 403 Scientists, Eastern Fram Strait Paleo-Archive. Proceedings of the International Ocean Discovery Program, 403: College Station, TX (International Ocean Discovery Program). https://doi.org/10.14379/iodp.proc.403.105.2026
Stober, J.C., and Thompson, R., 1979. An investigation into the source of magnetic minerals in some Finnish lake sediments. Earth and Planetary Science Letters, 45(2):464–474. https://doi.org/10.1016/0012-821X(79)90145-6
Stow, D.A.V., Kahler, G., and Reeder, M., 2002. Fossil contourites: type example from an Oligocene palaeoslope system, Cyprus. In Stow, D.A.V., Pudsey, C.J., Howe, J.A., Faugères, J.-C., and Viana, A.R. (Eds.), Deep-Water Contourite Systems: Modern Drifts and Ancient Series, Seismic and Sedimentary Characteristics. Geological Society, London, Memoirs, 22: 443–455. https://doi.org/10.1144/GSL.MEM.2002.022.01.31
Thierstein, H.R., Geitzenauer, K.R., Molfino, B., and Shackleton, N.J., 1977. Global synchroneity of late Quaternary coccolith datum levels validation by oxygen isotopes. Geology, 5(7):400–404. https://doi.org/10.1130/0091-7613(1977)5<400:GSOLQC>2.0.CO;2
Thomas, R.G., Guyodo, Y., and Channell, J.E.T., 2003. U channel track for susceptibility measurements. Geochemistry, Geophysics, Geosystems, 4(6):1050. https://doi.org/10.1029/2002GC000454
Torricella, F., Gamboa Sojo, V.M., Gariboldi, K., Douss, N., Musco, M.E., Caricchi, C., Lucchi, R.G., Carbonara, K., and Morigi, C., 2022. Multiproxy investigation of the last 2,000 years BP marine paleoenvironmental record along the western Spitsbergen margin. Arctic, Antarctic, and Alpine Research, 54(1):562–583. https://doi.org/10.1080/15230430.2022.2123859
Torricella, F., Morigi, C., Gamboa-Sojo, V., Carbonara, K., Bronzo, L., and Lucchi, R.G., 2025. Paleoceanographic changes along the western Spitsbergen margin, evidence from planktic microfossil during the last 10 kyr BP. Palaeogeography, Palaeoclimatology, Palaeoecology, 670:112940. https://doi.org/10.1016/j.palaeo.2025.112940
Van Nieuwenhove, N., Bauch, H.A., Eynaud, F., Kandiano, E., Cortijo, E., and Turon, J.-L., 2011. Evidence for delayed poleward expansion of North Atlantic surface waters during the last interglacial (MIS 5e). Quaternary Science Reviews, 30(7):934–946. https://doi.org/10.1016/j.quascirev.2011.01.013
Weaver, P.P.E., and Clement, B.M., 1986. Synchroneity of Pliocene planktonic foraminiferal datums in the North Atlantic. Marine Micropaleontology, 10(4):295–307. https://doi.org/10.1016/0377-8398(86)90033-2
Wei, W., 1993. Calibration of Upper Pliocene-Lower Pleistocene nannofossil events with oxygen isotope stratigraphy. Paleoceanography and Paleoclimatology, 8(1):85–99. https://doi.org/10.1029/92PA02504
Yokoyama, Y., Lambeck, K., De Deckker, P., Johnston, P., and Fifield, L.K., 2000. Timing of the Last Glacial Maximum from observed sea-level minima. Nature, 406(6797):713–716. https://doi.org/10.1038/35021035
Young, J.R., Bown, P.R., and Lees, J.A., 2024. Nannotax3 website. International Nannoplankton Association. https://www.mikrotax.org/Nannotax3