McNeill, L.C., Dugan, B., Petronotis, K.E., and the Expedition 362 Scientists
Proceedings of the International Ocean Discovery Program Volume 362
publications.iodp.org

https://doi.org/10.14379/iodp.proc.362.205.2021
Data report: electrical resistivity of sediments from Site U1480, IODP Expedition 362, Sumatra subduction zone1
Keywords: International Ocean Discovery Program, IODP, JOIDES Resolution, Expedition 362, Sumatra Subduction Zone, subduction inputs, Indian-Australian plate, Site U1480, Site U1481, electrical resistivity, porosity, Archie’s coefficient, sediment consolidation
MS 362-205: Received 6 August 2020 · Accepted 24 November 2020 · Published 10 March 2021
Abstract
Electrical resistivity of sediments was analyzed using samples recovered during International Ocean Discovery Program (IODP) Expedition 362, during which the input materials of the north Sumatran subduction zone were drilled to investigate the material properties linked to shallow seismogenic slip. Electrical resistivity is a valuable indicator for sediment consolidation, pore/grain structures, and distribution of fluid, which can affect the mechanical properties of the forearc wedge. Sediments were recovered from the seafloor to 1415.35 meters below seafloor (mbsf) at Site U1480 and from 1149.7 to 1500 mbsf at Site U1481. They consist of thick sequences of the Bengal-Nicobar Fan (Lithologic Units I–II) underlain by a thin pelagic/igneous sequence (Units III–V). In this study, electrical resistivity was measured on 35 sediment samples from Site U1480 with an Agilent 4294A component analyzer using the bridge method with a two-terminal circuit. Measured resistivity values range from 0.20 to 7.45 Ωm and generally increase with depth. Sample measurements are consistent with the downhole resistivity logs acquired during Expedition 362. Formation factor was calculated from sediment and seawater resistivities, and Archie’s coefficients (cementation [m] and tortuosity [b]) were examined from the relationship between formation factor and porosity. When plotting the sample resistivity in this study together with resistivity logs and shipboard porosity from Sites U1480 and U1481, a contrast in Archie’s coefficients are inferred between the Bengal-Nicobar Fan and pelagic sediments, where the former (m = 3.4–3.8) is characterized by higher m values compared to the latter (m = 2.2). These coefficients show differences in consolidation trend in the input sediments, providing improved equations to estimate porosity from resistivity logs.
Introduction
The input materials of the North Sumatran subduction zone were drilled during International Ocean Discovery Program (IODP) Expedition 362, which was designed to investigate the material properties and causes for the shallow seismogenic slip and forearc prism structures responsible for the Mw 9.2 earthquake and tsunami that occurred in 2004 (McNeill et al., 2017b) (Figure F1A). Sediment consolidation is one of the important factors that can affect the mechanical properties of the forearc wedge, and it is a focus of this study. Electrical resistivity is a valuable indicator for sediment consolidation, pore/grain structures, and distribution of fluid (e.g., Kozlov et al., 2012; Cai et al., 2017). The consolidation trend of sediments can be illustrated from the correlation between resistivity and porosity, known as Archie’s law (Archie, 1942):
(1)
- F = formation factor,
- Reff = resistivity (Ωm) of fluid-saturated sediment,
- Rf = resistivity (Ωm) of fluid in the sediment,
- ϕ = porosity (ratio) of sediment,
- m = cementation coefficient (Archie’s coefficient; empirical parameter), and
- b = tortuosity coefficient (Archie’s coefficient; empirical parameter).

Figure F1. Regional map, seismic profiles, and shipboard data.
Generally, m ranges from 1.0 to 3.0 for natural rocks (e.g., Cai et al., 2017), representing the slope of the porosity-resistivity curve on a logarithmic scale, where larger m values (larger slope) represent higher resistivity for a given porosity, implying higher consolidation. Previous studies have documented the relationships between m, porosity, and grain geometry (e.g., Mendelson and Cohen, 1982; Daigle and Reece, 2015). For example, Mendelson and Cohen (1982) showed in their numerical model that m increases with increases in the grain aspect ratio, which could be caused by the presence of high–aspect ratio clay mineral grains. It is noted, however, that Archie’s law (Equation E1) is only strictly valid in the limit of zero surface conductivity on the grains (e.g., Revil et al., 1998), and the prefactor b should not take any value except b = 1 because any other value would imply that the resistivity of the porous medium does not approach the water resistivity as porosity reaches 100% (e.g., Glover, 2009). Indeed, b values that are not equal to 1 are typically the result of not considering surface conductivity or the presence of a percolation threshold (Winsauer et al., 1952; Sen et al., 1981; Ghanbarian et al., 2014). Nonetheless, Archie’s law is widely applied in various geophysical observations and is useful and practical for comparing resistivity and porosity, particularly from downhole logs. One of the important applications of Archie’s law is to estimate in situ porosity from resistivity logs.
This paper reports on the data and analysis of electrical resistivity measured on discrete sediment samples from Site U1480 in comparison with downhole resistivity logs and shipboard porosity data from Sites U1480 and U1481 acquired during Expedition 362. To investigate the consolidation trend of the input sediments, the relationship between formation factor, porosity, and Archie’s coefficients were examined.
Study sites
Coring at Site U1480 (3°2.04ʹN, 91°36.35ʹE; 4148 m water depth; ~250 km southwest of the subduction zone) reached 1431.6 meters below seafloor (mbsf), penetrating ~17 m into igneous basement (Figure F1A, F1B) (McNeill et al., 2017c). The full sedimentary succession was recovered from the seafloor to 1415.35 mbsf and consists of predominantly siliciclastic sediments deposited from various sediment gravity flows (Lithologic Units I–II), interpreted to be the Nicobar Fan, underlain by mixed tuffaceous and pelagic sediment (Unit III) and thin intervals of intercalated pelagic and igneous material overlying oceanic crust (Units IV and V) (McNeill et al., 2017c) (Figure F1C). The composition of the Nicobar Fan is similar to the Bengal Fan and is sourced mainly from the Himalayan-derived Ganges-Brahmaputra river system and the Indo-Burman range/West Burma (McNeill et al., 2017a). The sediment section encompasses the Late Cretaceous to recent, marked by an increase in deposition rate of the Nicobar Fan since the late Miocene (McNeill et al., 2017c; McNeill et al., 2017a; Backman et al., 2019). At Site U1481 (2°45.29ʹN, 91°45.58ʹE; 4178 m water depth; 35 km southeast of Site U1480), cores were recovered from 1149 to 1499 mbsf in Hole U1481A, which correlates to Subunits IIC and IIIA at Site U1480.
Porosity values determined from moisture and density analyses at Site U1480 generally increase with depth from ~80% near the seafloor to ~31% at 1320 mbsf (see Physical properties in McNeill et al. [2017c]; Figure F1C). Reported P-wave velocity values gradually increase with depth (~1500–2000 m/s) and show a distinct increase deeper than 1300 mbsf (~2000–5000 m/s) (Figure F1C). Thermal conductivity values are reported to increase slightly with depth from ~1.0 to ~2.3 W/(m·K). Subsets of both higher and lower porosity values and variable P-wave velocity values are observed deeper than ~1300 mbsf, deviating from the overall consolidation trend, likely due to the lithologic heterogeneity and diagenesis (McNeill et al., 2017c; Hüpers et al., 2017; Moreau et al., 2020). The most significant changes are reported at 1305–1361 mbsf, where an increase in both porosity and P-wave velocity occurs (McNeill et al., 2017c). The relationship between P-wave velocity and porosity generally shows a normal consolidation curve for terrigenous sediments, whereas the low-porosity calcareous sediments from Units III and V plot in a slightly different curve (McNeill et al., 2017c).
Electrical resistivity measurement on discrete samples was not conducted during Expedition 362. Downhole resistivity logs were recorded at 742–805 mbsf in Hole U1480G during the expedition and yielded values ranging from 1.27 to 2.53 Ωm (see Downhole measurements in McNeill et al. [2017c]). In Hole U1481A, resistivity logs were acquired at 730–1484 mbsf, and values ranged from 1.06 to 3.62 Ωm, showing a general increase with depth and a sharp decrease in resistivity across the boundary between Subunits IIC and IIIA consistent with the local increase in sample porosity (see Downhole measurements in McNeill et al. [2017d]). For 750–1149 mbsf where no coring occurred in Hole U1481A, McNeill et al. (2017d) estimated the porosity from the resistivity logs, assuming (1) Archie’s parameters (m = 2.2; b = 1) that best fit the shipboard porosity data and (2) Rf computed from temperature and salinity. Their estimated porosity fit well for Unit III but exhibited deviations in Subunit IIC (Figure F2A), indicating a contrast in consolidation trend between the Nicobar Fan and pelagic sediments.
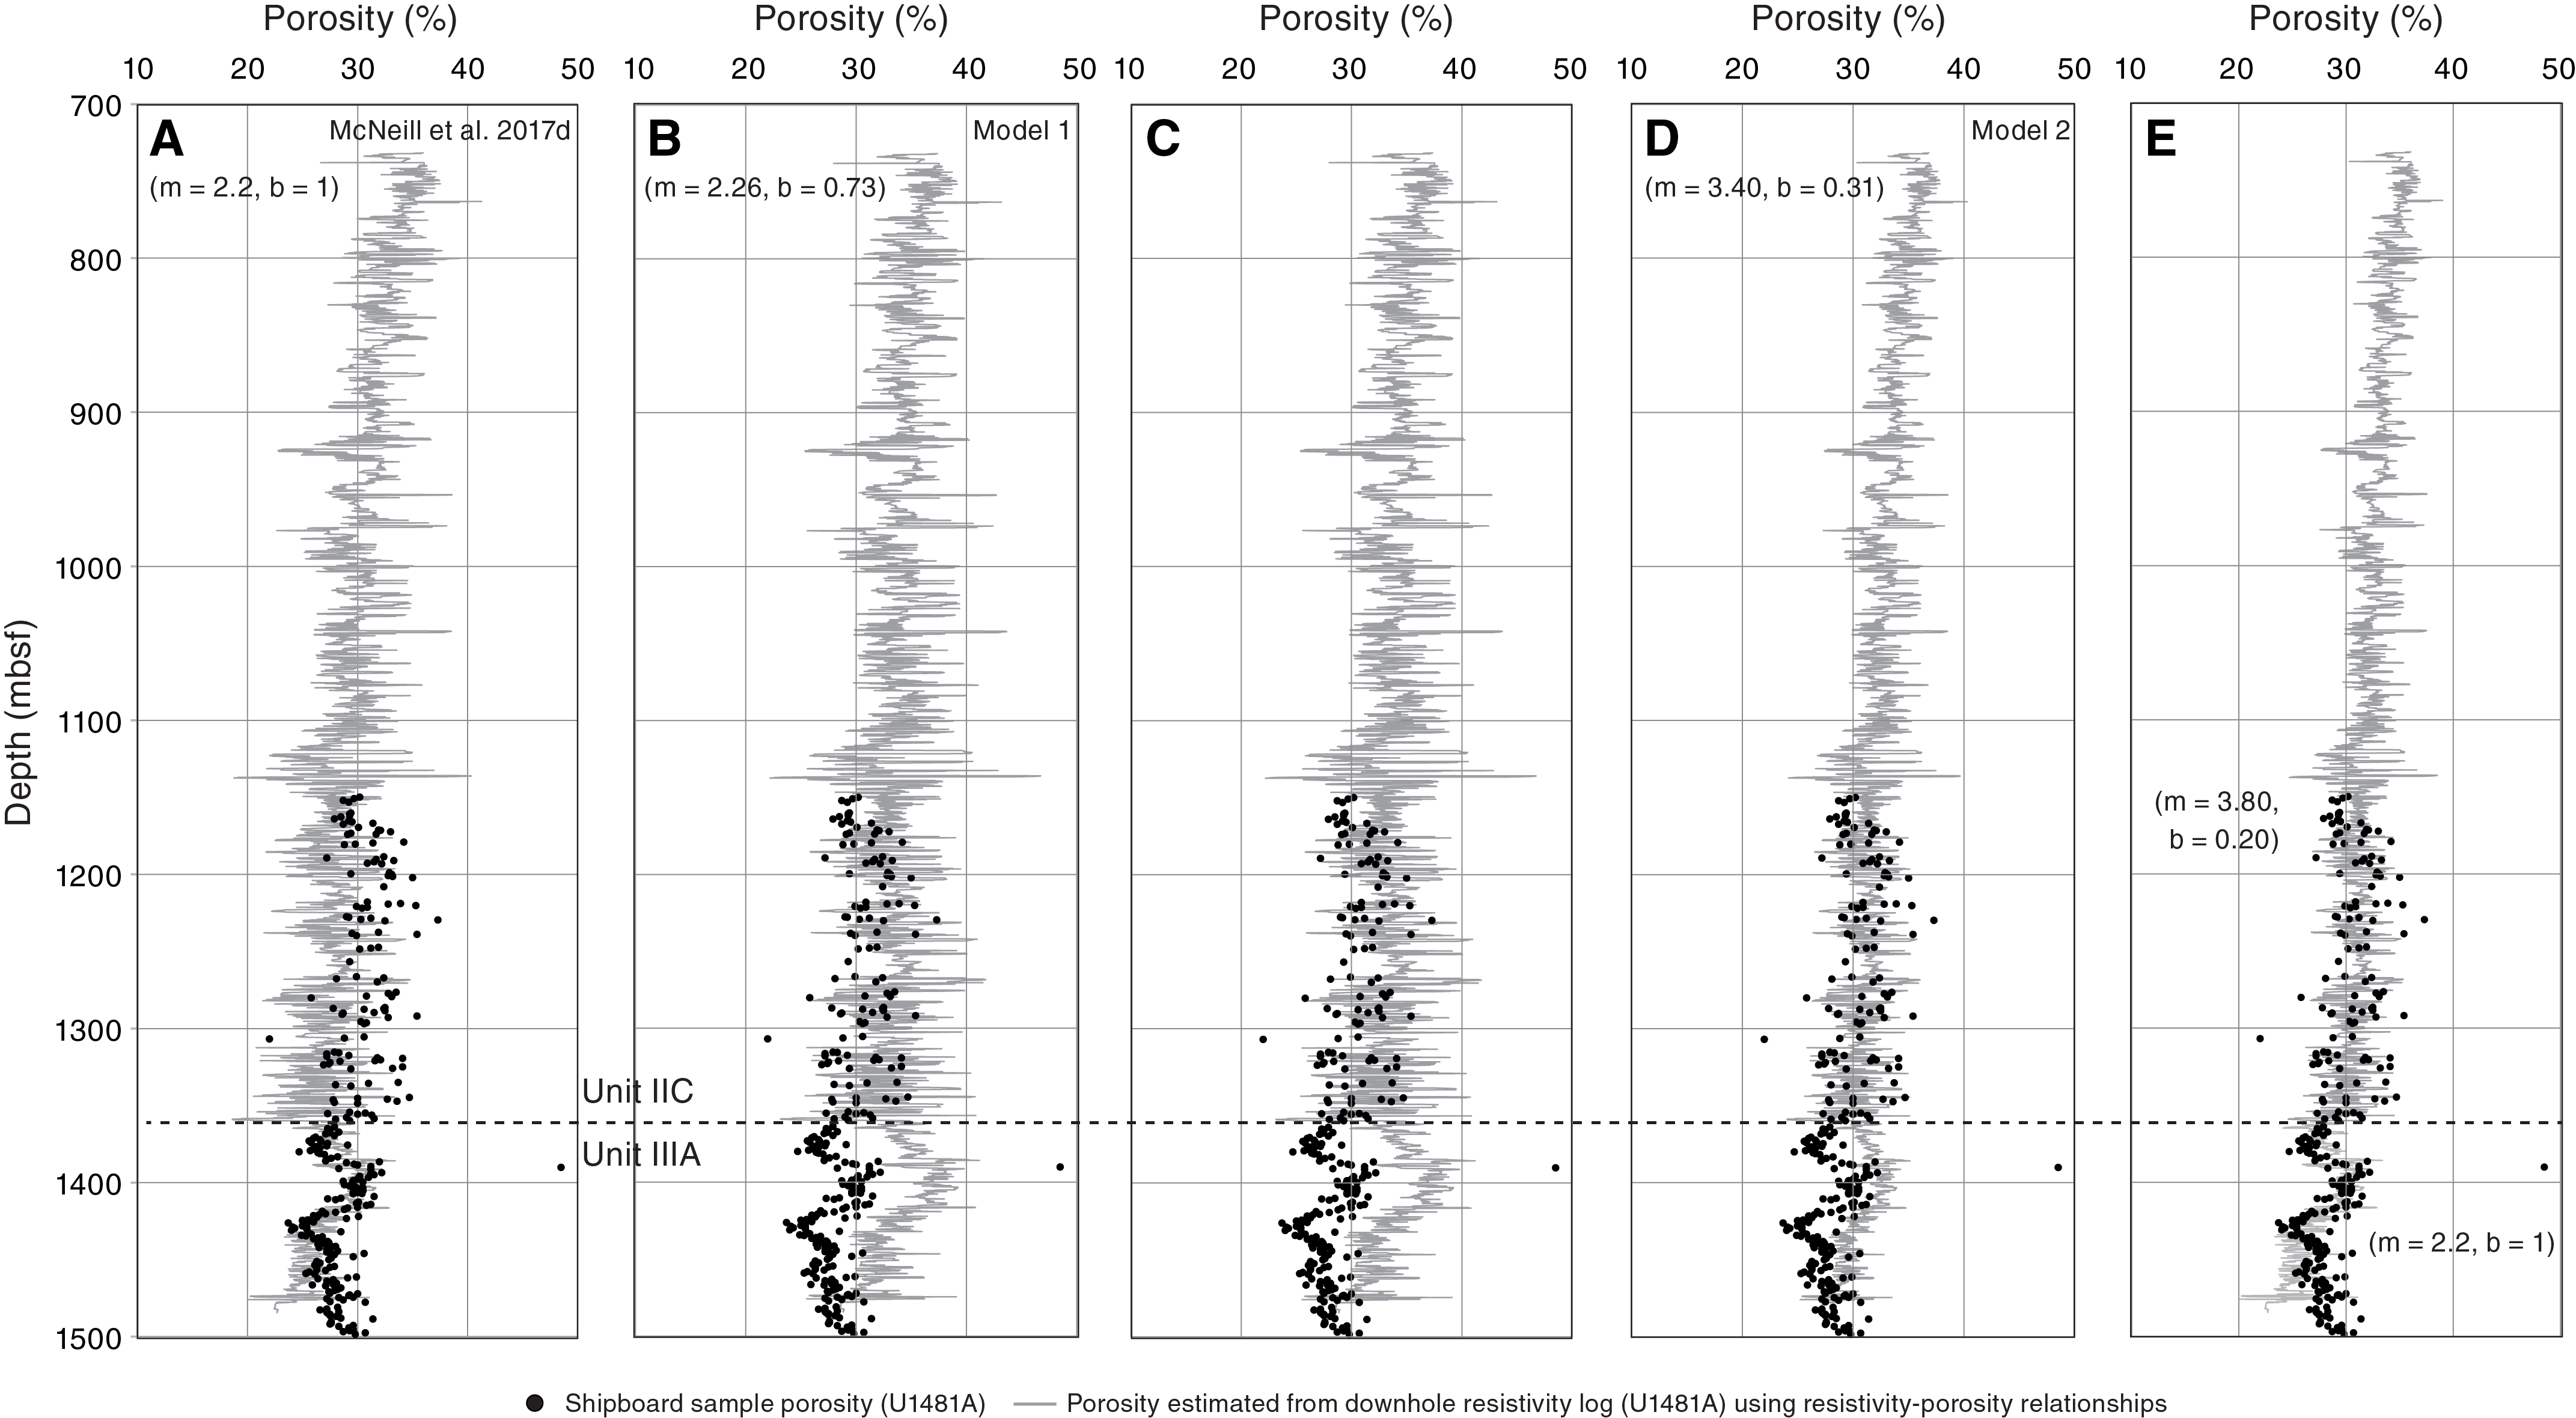
Figure F2. Estimated porosity.
Methods and materials
Electrical resistivity of sediments was measured with an Agilent 4294A component analyzer (Agilent Technologies, USA) equipped at Kochi Core Center, Japan, using the bridge method with a two-terminal circuit (Table T1) (see Expedition 322 Scientists, 2010). A total of 35 discrete sediment samples from Site U1480 were cut parallel to the depth (z-) direction of the borehole, and the horizontal planes (x-y) perpendicular to the z-direction were polished for measurement. Because of limitation of sample remodeling, the samples were cut in a wedge or hexahedral shape of 3–4 cm × 3–4 cm × 1–3 cm instead of in cubes of equal faces. Parafilm was wrapped around the oriented samples to avoid breakage during polishing and seawater saturation. Samples were impregnated with laboratory seawater (35‰ NaCl solution) for more than 10 h for consolidated sediments (Subunits IIB and IIC and Units III and IV) and for 3–4 h for less-consolidated sediments (Unit I and Subunit IIA) using a vacuum pump, depending on sample lithification. Sample mass was measured as the index for the degree of seawater immersion. Samples were carefully examined after saturation, and measurements were excluded for samples that exhibited fractures typically parallel to foliation.
For calibration of the inductance, capacitance, and resistance meters prior to measurement, infinite and zero impedance were applied using a nonconductor rubber tube and metal conductor, respectively. Samples were then placed between two brass electrodes covered with filter papers saturated in seawater and sandwiched between two insulated rubber pads as the outer layer. A 0.3 kg weight was placed on top of the rubber pad to ensure that the electrode and sample were in complete contact. The magnitude (|Zz|) and phase (θz) of the complex impedance were measured at 100 kHz and 1000 mV between opposite sample faces in the z-direction at room temperature (22.5°–25°C). The area of sample faces were measured using Image J software. Electrical resistivity in the z-direction (Rz) was computed from the measured complex impedance and sample dimension defined by face lengths (L):
(2)
where LxLy is the averaged area of upper and lower sample faces and Lz is sample thickness.
Measured resistivity data were plotted with shipboard sample porosity data and downhole resistivity logs acquired during Expedition 362 (see Physical properties and Downhole measurements in McNeill et al. [2017c] and McNeill et al. [2017d]) for comparison. The crossplot between resistivity and porosity (Equation E1) was used to determine m and b and to evaluate the consolidation state of sediments across the lithologic units. In this study, F was first calculated using measured 35‰ NaCl seawater resistivity at room temperature (Rf = 0.225 Ωm), assuming Rf to be constant with depth ("Model 1"). Note that F derived by Model 1 is purely based on a laboratory setting. In the second model, F was calculated by computing Rf as a function of temperature, depth, and salinity, referring to Fofonoff and Millard (1983) and Fofonoff (1985) ("Model 2"), using more realistic parameters. In this model, temperature was assumed to follow a linear gradient of 44°C/km, as constrained by in situ measurements at Site U1480 (see Downhole measurements in McNeill et al. [2017c]), and seawater salinity was assumed to be 35‰ (constant). The two models were compared for the purpose of observing the sensitivity of in situ temperatures and pore fluid composition on F.
Results
Measured resistivity values range from 0.20 to 7.45 Ωm across the lithologic units (Figure F3A; Table T1). Resistivity values yielded 0.52–0.63 Ωm in Unit I, 0.37–1.46 Ωm in Subunit IIA, 0.20–1.75 Ωm in Subunit IIB, 1.69–3.29 Ωm in Subunit IIC, 2.48–2.89 Ωm in Unit III, and 1.36–7.45 Ωm in Unit IV. A general increase in resistivity with depth is observed, and occasional excursions are present. The results of F calculated from two end-member models show fairly similar values above Subunit IIB, whereas the deviation from the two models are enhanced below Subunit IIB, in which Model 2 yields larger F compared to Model 1 at greater depth because of the difference in estimated Rf at depth (Figure F3A–F3C).
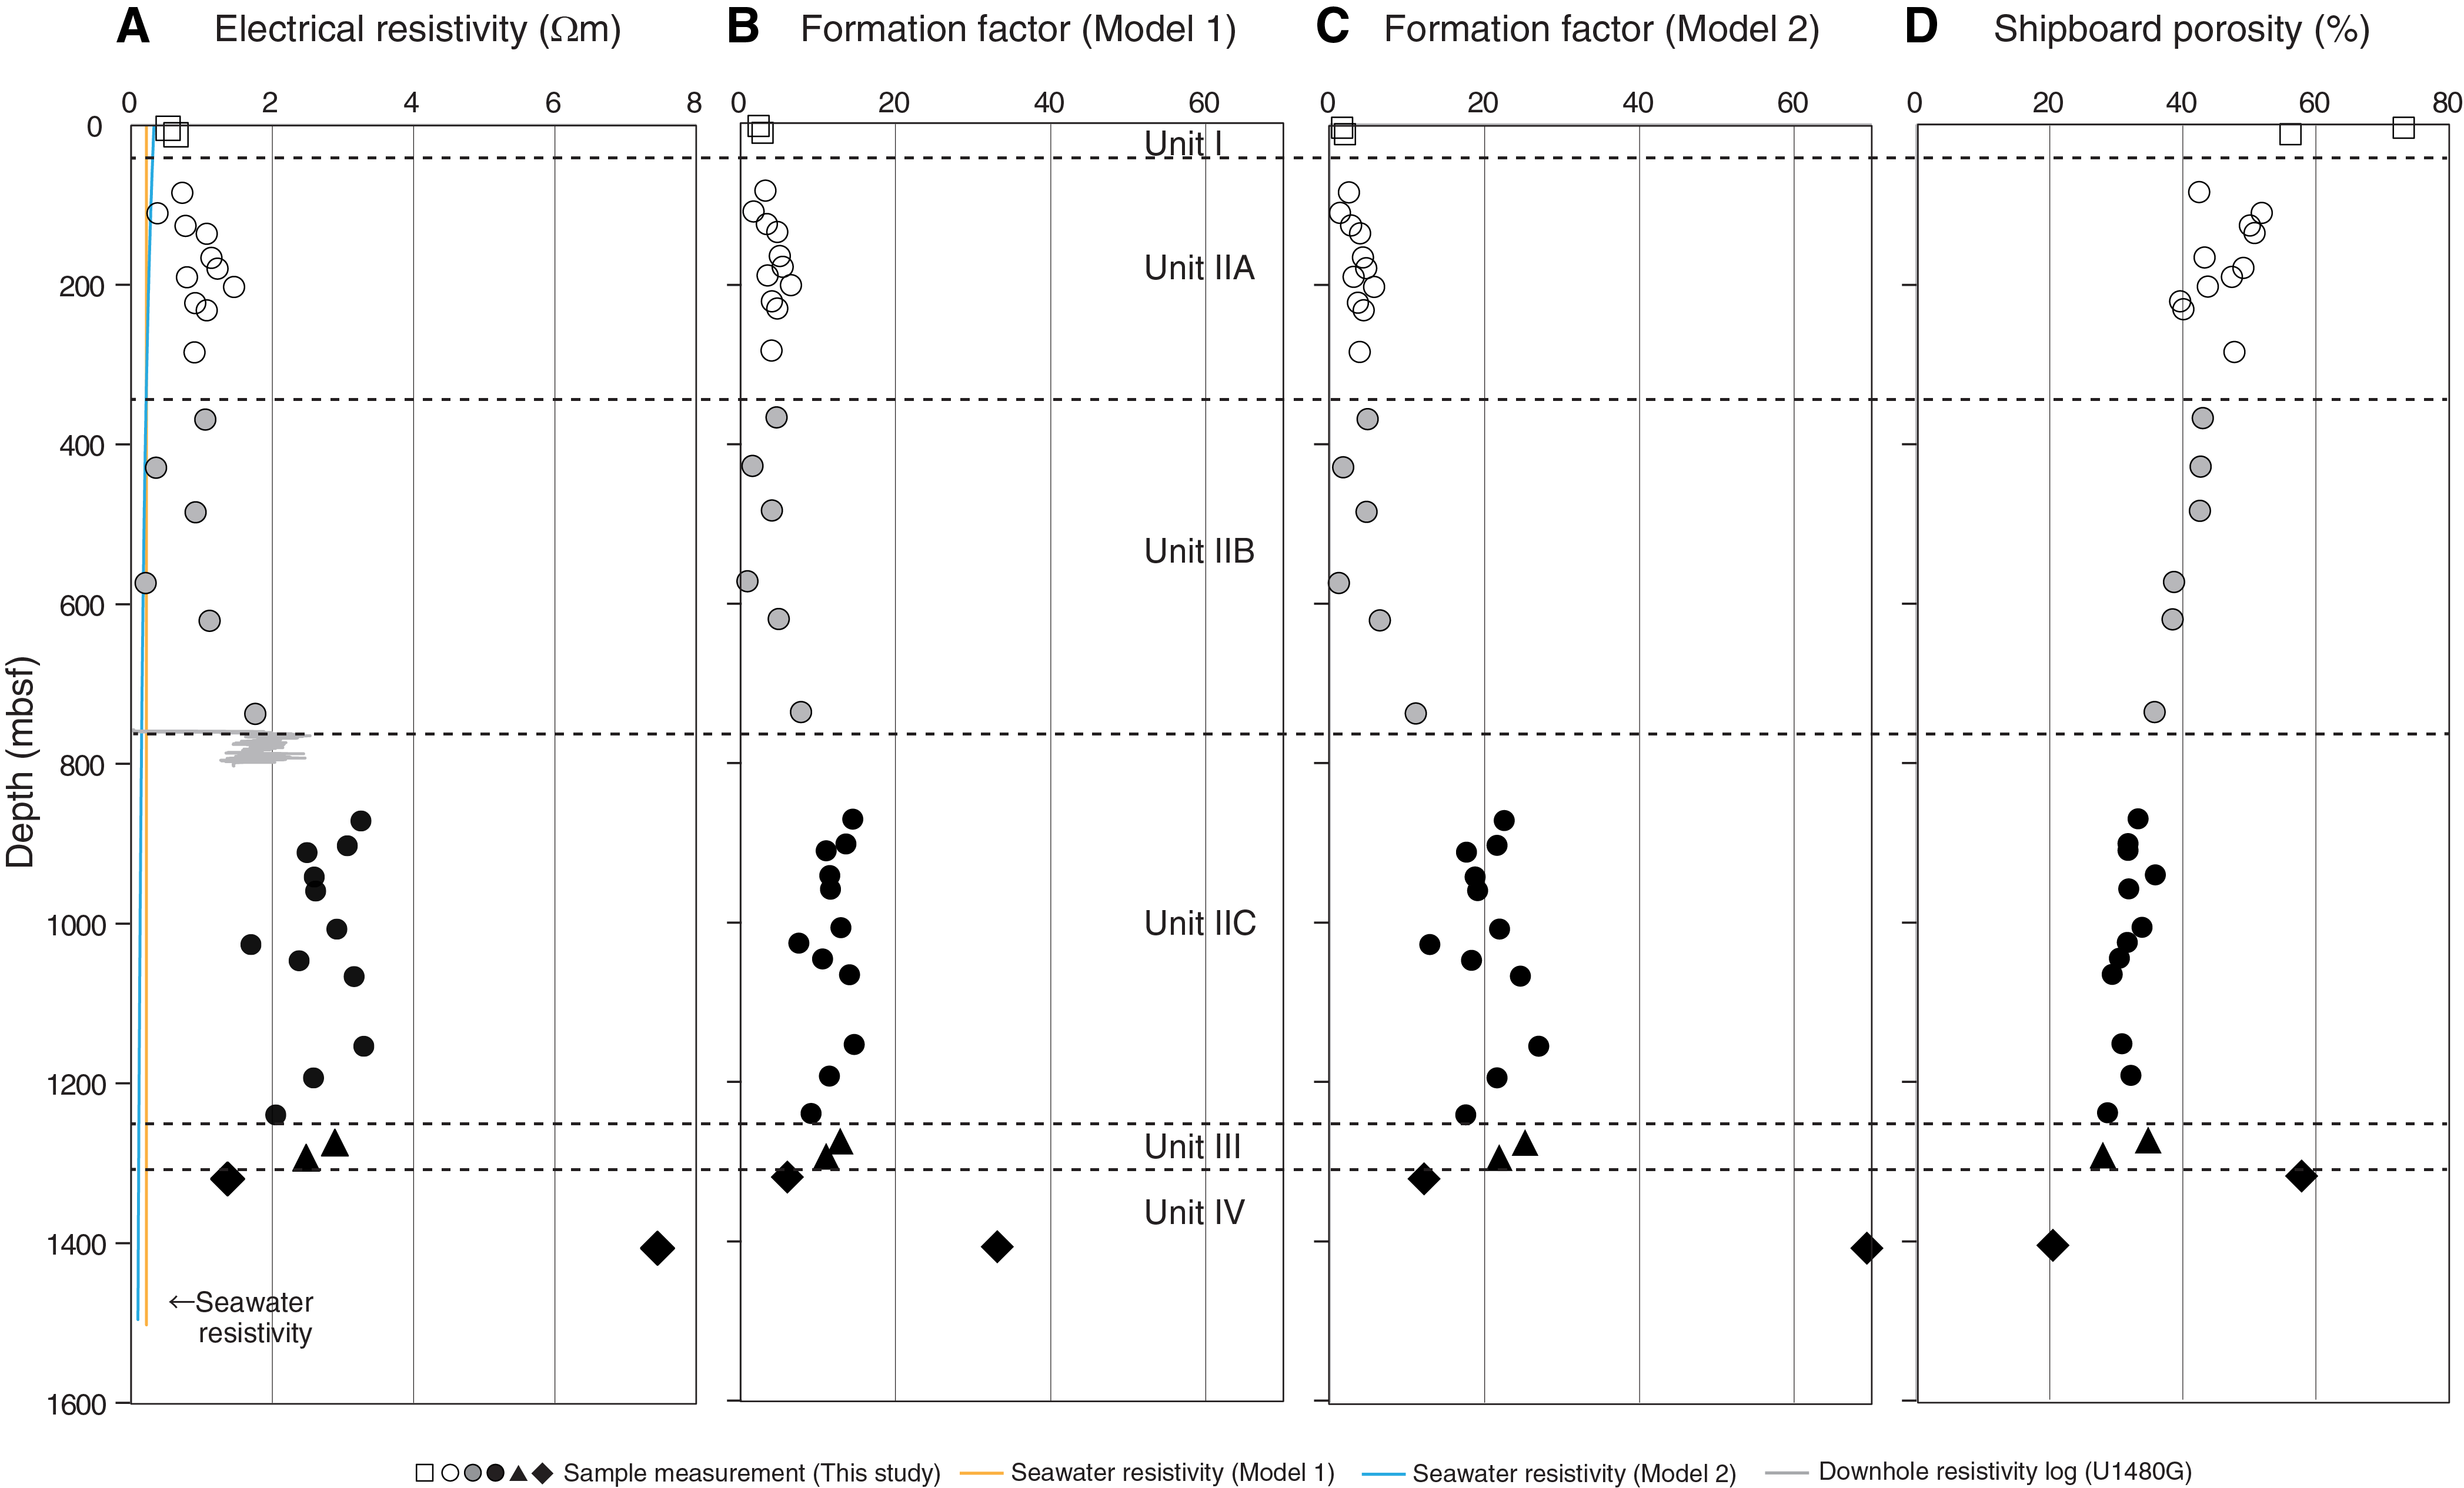
Figure F3. Resistivity data and calculated formation factors.
When comparing with shipboard porosity data from Expedition 362 (see Physical properties in McNeill et al. [2017c]) (Figure F3D), a general inverse relationship between measured resistivity and porosity is observed, reflecting the effect of compaction. The decrease in resistivity (1.36 Ωm) at 1319.52 mbsf coincides with the abrupt increase in porosity (57.9%) in the pelagic sediments, which is a distinct interval observed at 1305–1361 mbsf (McNeill et al., 2017c). Below this interval, a notable increase in resistivity (7.45 Ωm) is observed at 1406.6 mbsf, which is consistent with the decrease in porosity (20.5%).
The crossplot between resistivity and porosity and between formation factor and porosity can be fit with approximate power-law curves across the lithologic units (Figure F4A–F4C). The approximate curve between formation factor and porosity (Archie’s law) for all units is derived as F = 0.73ϕ−2.26 (R2 = 0.56) from Model 1 and F = 0.31ϕ−3.40 (R2 = 0.65) from Model 2, where the Archie’s curve from Model 2 fits the data better than Model 1, with m values of 2.26 and 3.40 for Models 1 and 2, respectively (Figure F4B, F4C). The correlation for Units I–II alone improves with Model 2, where the approximate curve yields F = 0.62ϕ−2.37 (R2 = 0.52) from Model 1 and F = 0.20ϕ−3.80 (R2 = 0.70) from Model 2, with m values of 2.37 and 3.80 for Models 1 and 2, respectively.
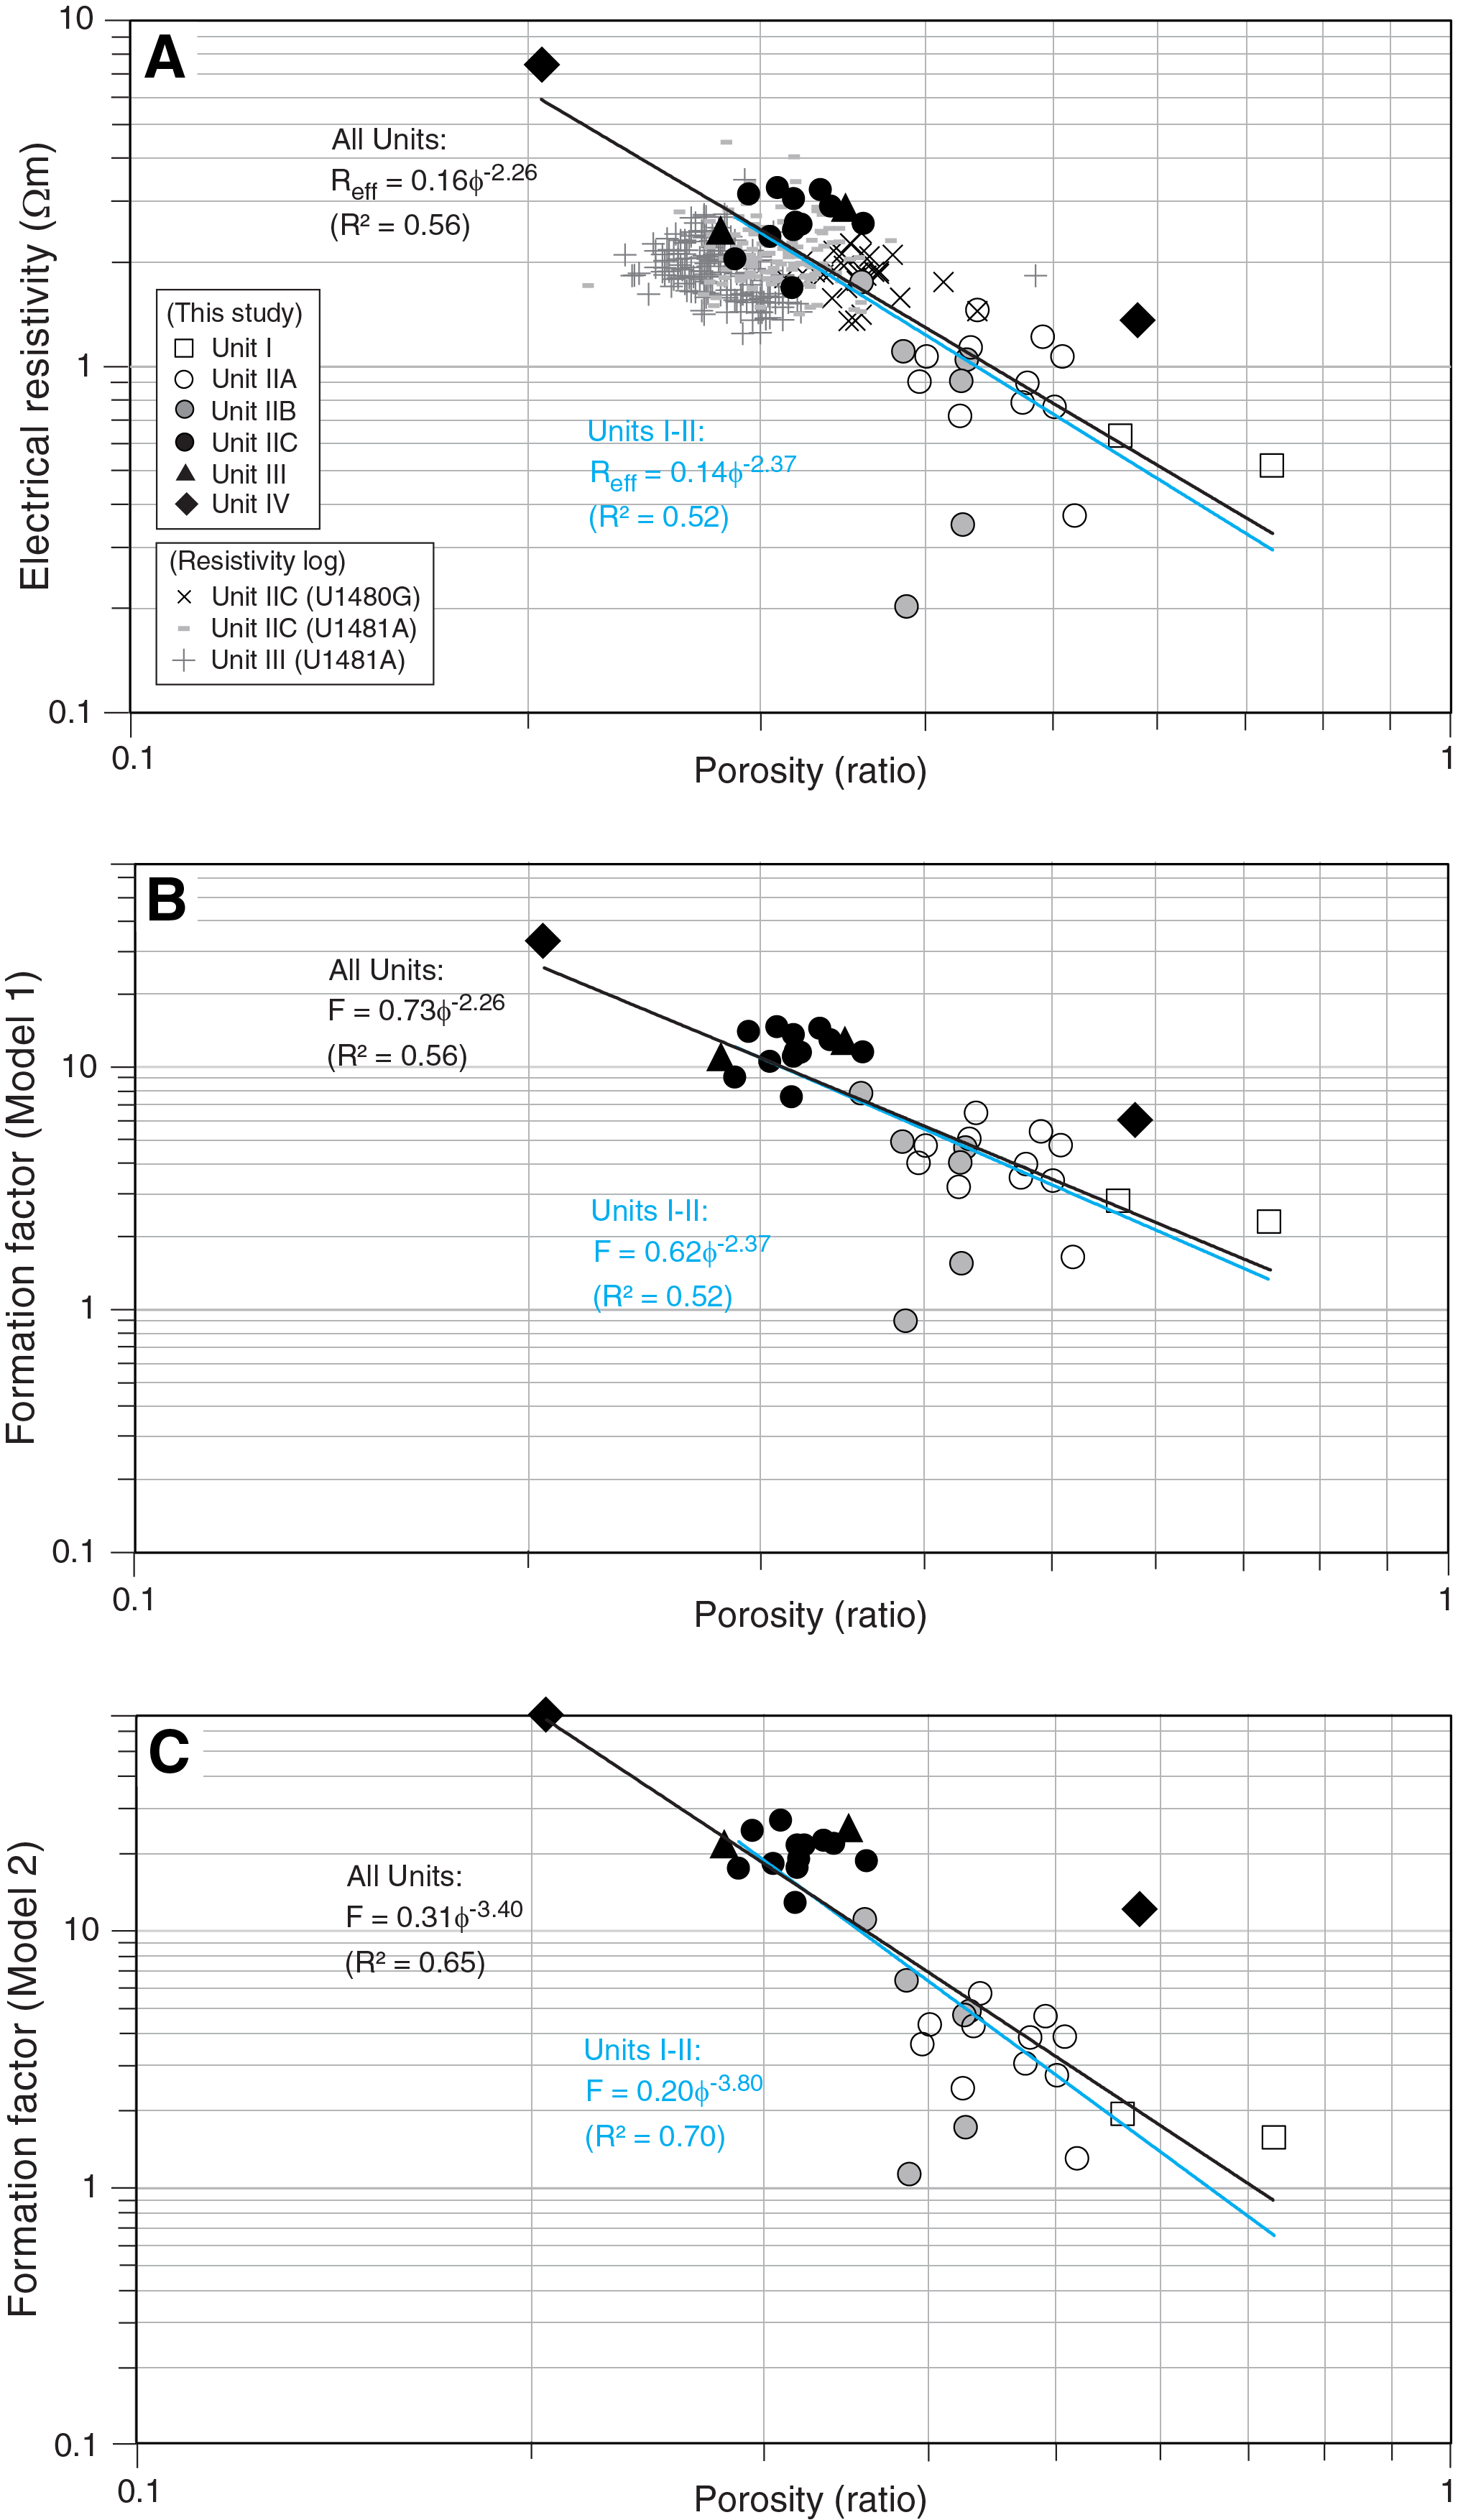
Figure F4. Porosity vs. resistivity and calculated formation factors.
Downhole resistivity logs acquired in Hole U1480G (see Downhole measurements in McNeill et al. [2017c]) are within a consistent range with the sample measurements at the vicinity of the logged depth in the current study (Figure F3A). The resistivity logs can be plotted together on the same resistivity-porosity curve (Figure F4A). Although resistivity measurements were not conducted for samples from Site U1481, resistivity log data from Hole U1481A (see Downhole measurements in McNeill et al. [2017d]) are also comparable with the values measured for Subunit IIC and Unit III in Hole U1480G in this study. The crossplot between resistivity logs and shipboard porosity from Hole U1481A alone do not yield a clear curve because of the limited range of data, but these properties can be plotted with the crossplot in this study (Figure F4A).
Estimation of porosity from resistivity logs for 750–1149 mbsf at Site U1481 was reexamined from the resistivity-porosity relationships derived in this study, in comparison with McNeill et al. (2017d) (Figure F2A). When using the Archie’s coefficients from Model 1 (m = 2.26; b = 0.73), the estimated porosity fits relatively well for Subunit IIC but matches poorly for Unit III (Figure F2B). A similar trend with Model 1 is obtained from the estimation of porosity using the direct approximate curve between resistivity and porosity (Figures F2C, F4A). In contrast, when using Archie’s parameters from Model 2 (m = 3.40; b = 0.31), the correlation improves, especially for Units I and II, but some deviations in Unit III remain (Figure F2D). These observations show that m values of 3.4–3.8 (this study) and 2.2 (McNeill et al., 2017d) best characterize Lithologic Units I–II and Unit III, respectively (Figure F2E), suggesting that Units I–II (Nicobar Fan sediments) exhibit a higher slope in the consolidation curve compared to Unit III (pelagic sediments).
The total clay content is reported to be higher in Unit III (70%–82%) than in Units I–II (27%–64%) (see Sedimentology and Petrology in McNeill et al. [2017c]), suggesting an inverse relationship between m and clay content, which is contrary to the trend modeled by Mendelson and Cohen (1982). Rosenberger et al. (2020) studied the clay composition across the lithologic units and identified 19–33 wt% smectite and 49–59 wt% illite in Units I–II and 73 wt% smectite and 19 wt% illite in Unit III, revealing a higher abundance of illite in Units I–II and higher abundance of smectite in Unit III. Further microscopic study in relation to sediment composition is necessary to investigate the causes for the variation in m.
Acknowledgments
This research used samples and data provided by the International Ocean Discovery Program (IODP). Efforts by the drilling crews, technical team, scientific party, and supporting staff for Expedition 362 are acknowledged. This research was funded by the Japan Drilling Earth Science Consortium (J-DESC) and Japan Agency for Marine-Earth Science and Technology (JAMSTEC) and was performed under the cooperative research program of the Center for Advanced Marine Core Research (CMCR), Kochi University (17A059, 17B059), and the visiting researcher program of JAMSTEC. This research was supported by the Earth Observatory of Singapore, the National Research Foundation Singapore, and the Singapore Ministry of Education under the Research Centres of Excellence initiative. This work comprises Earth Observatory of Singapore (EOS) Contribution 350. The author thanks Dr. Wataru Tanikawa and Dr. Osamu Tadai for their support in the laboratory measurements.
References
Archie, G.E., 1942. The electrical resistivity log as an aid in determining some reservoir characteristics. Transactions of the AIME, 146(1):54–62. https://doi.org/10.2118/942054-G
Backman, J., Chen, W., Kachovich, S., Mitchison, F., Petronotis, K., Yang, T., and Zhao, X., 2019. Data report: revised age models for IODP Sites U1480 and U1481, Expedition 362. In McNeill, L.C., Dugan, B., Petronotis, K.E., and the Expedition 362 Scientists, Sumatra Subduction Zone. Proceedings of the International Ocean Discovery Program, 362: College Station, TX (International Ocean Discovery Program). https://doi.org/10.14379/iodp.proc.362.202.2019
Cai, J., Wei, W., Hu, X., and Wood, D.A., 2017. Electrical conductivity models in saturated porous media: a review. Earth-Science Reviews, 171:419–433. https://doi.org/10.1016/j.earscirev.2017.06.013
Daigle, H., and Reece, J.S., 2015. Permeability of two-component granular materials. Transport in Porous Media, 106:523–544. https://doi.org/10.1007/s11242-014-0412-6
Expedition 322 Scientists, 2010. Methods. In Saito, S., Underwood, M.B., Kubo, Y., and the Expedition 322 Scientists, Proceedings of the Integrated Ocean Drilling Program, 322: Tokyo (Integrated Ocean Drilling Program Management International, Inc.). https://doi.org/10.2204/iodp.proc.322.102.2010
Fofonoff, N.P., 1985. Physical properties of seawater: a new salinity scale and equation of state for seawater. Journal of Geophysical Research: Oceans, 90(C2):3332–3342. https://doi.org/10.1029/JC090iC02p03332
Fofonoff, N.P., and Millard, R.C., Jr., 1983. Algorithms for computation of fundamental properties of seawater. UNESCO Technical Papers in Marine Science, 44:9–18.
Ghanbarian, B., Hunt, A.G., Ewing, R.P., and Skinner, T.E., 2014. Universal scaling of the formation factor in porous media derived by combining percolation and effective medium theories. Geophysical Research Letters, 41(11):3884–3890. https://doi.org/10.1002/2014GL060180
Glover, P., 2009. What is the cementation exponent? A new interpretation. The Leading Edge, 28(1):82–85. https://doi.org/10.1190/1.3064150
Hüpers, A., Torres, M.E., Owari, S., McNeill, L.C., Dugan, B., Henstock, T.J., Milliken, K.L., Petronotis, K.E., Backman, J., Bourlange, S., Chemale, F., Jr., Chen, W., Colson, T.A., Frederik, M.C.G., Guèrin, G., Hamahashi, M., House, B.M., Jeppson, T.N., Kachovich, S., Kenigsberg, A.R., Kuranaga, M., Kutterolf, S., Mitchison, F.L., Mukoyoshi, H., Nair, N., Pickering, K.T., Pouderoux, H.F.A., Shan, Y., Song, I., Vannucchi, P., Vrolijk, P.J., Yang, T., and Zhao, X., 2017. Release of mineral-bound water prior to subduction tied to shallow seismogenic slip off Sumatra. Science, 356(6340):841–844. https://doi.org/10.1126/science.aal3429
Kozlov, B., Schneider, M.H., Montaron, B., Laguës, M., and Tabeling, P., 2012. Archie’s law in microsystems. Transport in Porous Media, 95:1–20. https://doi.org/10.1007/s11242-012-0029-6
McNeill, L., Dugan, B., and Petronotis, K., 2016. Expedition 362 Scientific Prospectus Addendum: the Sumatra subduction zone. International Ocean Discovery Program. https://doi.org/10.14379/iodp.sp.362add.2016
McNeill, L.C., Dugan, B., Backman, J., Pickering, K.T., Pouderoux, H.F.A., Henstock, T.J., Petronotis, K.E., et al., 2017a. Understanding Himalayan erosion and the significance of the Nicobar Fan. Earth and Planetary Science Letters, 475:134–142. https://doi.org/10.1016/j.epsl.2017.07.019
McNeill, L.C., Dugan, B., Petronotis, K.E., Backman, J., Bourlange, S., Chemale, F., Chen, W., Colson, T.A., Frederik, M.C.G., Guèrin, G., Hamahashi, M., Henstock, T., House, B.M., Hüpers, A., Jeppson, T.N., Kachovich, S., Kenigsberg, A.R., Kuranaga, M., Kutterolf, S., Milliken, K.L., Mitchison, F.L., Mukoyoshi, H., Nair, N., Owari, S., Pickering, K.T., Pouderoux, H.F.A., Yehua, S., Song, I., Torres, M.E., Vannucchi, P., Vrolijk, P.J., Yang, T., and Zhao, X., 2017b. Expedition 362 summary. In McNeill, L.C., Dugan, B., Petronotis, K.E., and the Expedition 362 Scientists, Sumatra Subduction Zone. Proceedings of the International Ocean Discovery Program, 362: College Station, TX (International Ocean Discovery Program). https://doi.org/10.14379/iodp.proc.362.101.2017
McNeill, L.C., Dugan, B., Petronotis, K.E., Backman, J., Bourlange, S., Chemale, F., Chen, W., Colson, T.A., Frederik, M.C.G., Guèrin, G., Hamahashi, M., Henstock, T., House, B.M., Hüpers, A., Jeppson, T.N., Kachovich, S., Kenigsberg, A.R., Kuranaga, M., Kutterolf, S., Milliken, K.L., Mitchison, F.L., Mukoyoshi, H., Nair, N., Owari, S., Pickering, K.T., Pouderoux, H.F.A., Yehua, S., Song, I., Torres, M.E., Vannucchi, P., Vrolijk, P.J., Yang, T., and Zhao, X., 2017c. Site U1480. In McNeill, L.C., Dugan, B., Petronotis, K.E., and the Expedition 362 Scientists, Sumatra Subduction Zone. Proceedings of the International Ocean Discovery Program, 362: College Station, TX (International Ocean Discovery Program). https://doi.org/10.14379/iodp.proc.362.103.2017
McNeill, L.C., Dugan, B., Petronotis, K.E., Backman, J., Bourlange, S., Chemale, F., Chen, W., Colson, T.A., Frederik, M.C.G., Guèrin, G., Hamahashi, M., Henstock, T., House, B.M., Hüpers, A., Jeppson, T.N., Kachovich, S., Kenigsberg, A.R., Kuranaga, M., Kutterolf, S., Milliken, K.L., Mitchison, F.L., Mukoyoshi, H., Nair, N., Owari, S., Pickering, K.T., Pouderoux, H.F.A., Yehua, S., Song, I., Torres, M.E., Vannucchi, P., Vrolijk, P.J., Yang, T., and Zhao, X., 2017d. Site U1481. In McNeill, L.C., Dugan, B., Petronotis, K.E., and the Expedition 362 Scientists, Sumatra Subduction Zone. Proceedings of the International Ocean Discovery Program, 362: College Station, TX (International Ocean Discovery Program). https://doi.org/10.14379/iodp.proc.362.104.2017
Mendelson, K.S., and Cohen, M.H., 1982. The effect of grain anisotropy on the electrical properties of sedimentary rocks. Geophysics, 47(2):149–270. https://doi.org/10.1190/1.1441332
Moreau, J., Buls, T., and Thibault, N., 2020. Data report: multiscale visualization of stylolites, deformations in chalk from Subunit IIIB, Site U1480, IODP Expedition 362, Sumatra subduction zone. In McNeill, L.C., Dugan, B., Petronotis, K.E., and the Expedition 362 Scientists, 2017. Sumatra Subduction Zone. Proceedings of the International Ocean Discovery Program, 362: College Station, TX (International Ocean Discovery Program). https://doi.org/10.14379/iodp.proc.362.203.2020
Revil, A., Cathles, L.M., Losh, S., and Nunn, J.A., 1998. Electrical conductivity in shaly sands with geophysical applications. Journal of Geophysical Research: Solid Earth, 103(B10):23925–23936. https://doi.org/10.1029/98JB02125
Rosenberger, K., Underwood, M.B., Vrolijk, P., and Haines, S., 2020. Data report: clay mineral assemblages in hemipelagic sediments entering the Sumatra subduction zone, IODP Sites U1480 and U1481, Expedition 362. In McNeill, L.C., Dugan, B., Petronotis, K.E., and the Expedition 362 Scientists. Sumatra Subduction Zone. Proceedings of the International Ocean Discovery Program, 362: College Station, TX (International Ocean Discovery Program). https://doi.org/10.14379/iodp.proc.362.204.2020
Sen, P.N., Scala, C., and Cohen, M.H., 1981. A self-similar model for sedimentary rocks with application to the dielectric constant of fused glass beads. Geophysics, 46(5):781–795. https://doi.org/10.1190/1.1441215
Shearer, P., and Bürgmann, R., 2010. Lessons learned from the 2004 Sumatra-Andaman megathrust rupture. Annual Review of Earth and Planetary Sciences, 38:103–131. https://doi.org/10.1146/annurev-earth-040809-152537
Winsauer, W.O., Shearin, H.M., Masson, P.H., and Williams, M., 1952. Resistivity of brine-saturated sands in relation to pore geometry. AAPG Bulletin, 36(2):253–277. https://doi.org/10.1306/3D9343F4-16B1-11D7-8645000102C1865D
1 Hamahashi, M., 2021. Data report: electrical resistivity of sediments from Site U1480, IODP Expedition 362, Sumatra subduction zone. In McNeill, L.C., Dugan, B., Petronotis, K.E., and the Expedition 362 Scientists. Sumatra Subduction Zone. Proceedings of the International Ocean Discovery Program, 362: College Station, TX (International Ocean Discovery Program). https://doi.org/10.14379/iodp.proc.362.205.2021
2 Earth Observatory of Singapore, Nanyang Technological University, Singapore.
3 Present affiliation: Kobe University, Ocean-Bottom Exploration Center, Japan. mhamahashi@aquamarine.kobe-u.ac.jp
This work is distributed under the Creative Commons Attribution 4.0 International (CC BY 4.0) license. 