Sun, Z., Jian, Z., Stock, J.M., Larsen, H.C., Klaus, A., Alvarez Zarikian, C.A., and the Expedition 367/368 Scientists
Proceedings of the International Ocean Discovery Program Volume 367/368
publications.iodp.org

https://doi.org/10.14379/iodp.proc.368X.103.2020
Return to Site U1503 1
L.B. Childress, C.A. Alvarez Zarikian, A. Briais, K.A. Dadd, J.-M. Deng, T.W. Höfig, X.-L. Huang, B. Li, J. Lin, C. Liu, Z. Liu, M.F.R. Nirrengarten, D.W. Peate, N. Qiu, S. Satolli, J.M. Stock, Z. Sun, F.M. van der Zwan, R. Xiang, L. Yi, and L. Zhong2
Keywords: International Ocean Discovery Program, IODP, JOIDES Resolution, Expedition 367, Expedition 368, Expedition 368X, South China Sea Rifted Margin, Site U1503, northern South China Sea, rifted margin, continent–ocean transition zone, hyperextension, continental breakup, lithosphere thinning, outer margin high, embryonic ocean
MS 368X-103: Published 23 April 2020
Background and objectives
International Ocean Discovery Program (IODP) Site U1503 is located at 3867.7 meters below sea level (mbsl) (Figures F1, F2) near the top of the basement high named Ridge C. Ridge C is the most seaward ridge of the three margin-parallel ridges (A, B, and C) that characterize the lower continental slope underlain by thin (5–7 km) crust (Figures F3, F4). Ridge C is believed to represent at least partial if not full igneous crust and hence the crustal structure after the completion of continental breakup along this margin segment of the northern South China Sea (SCS).
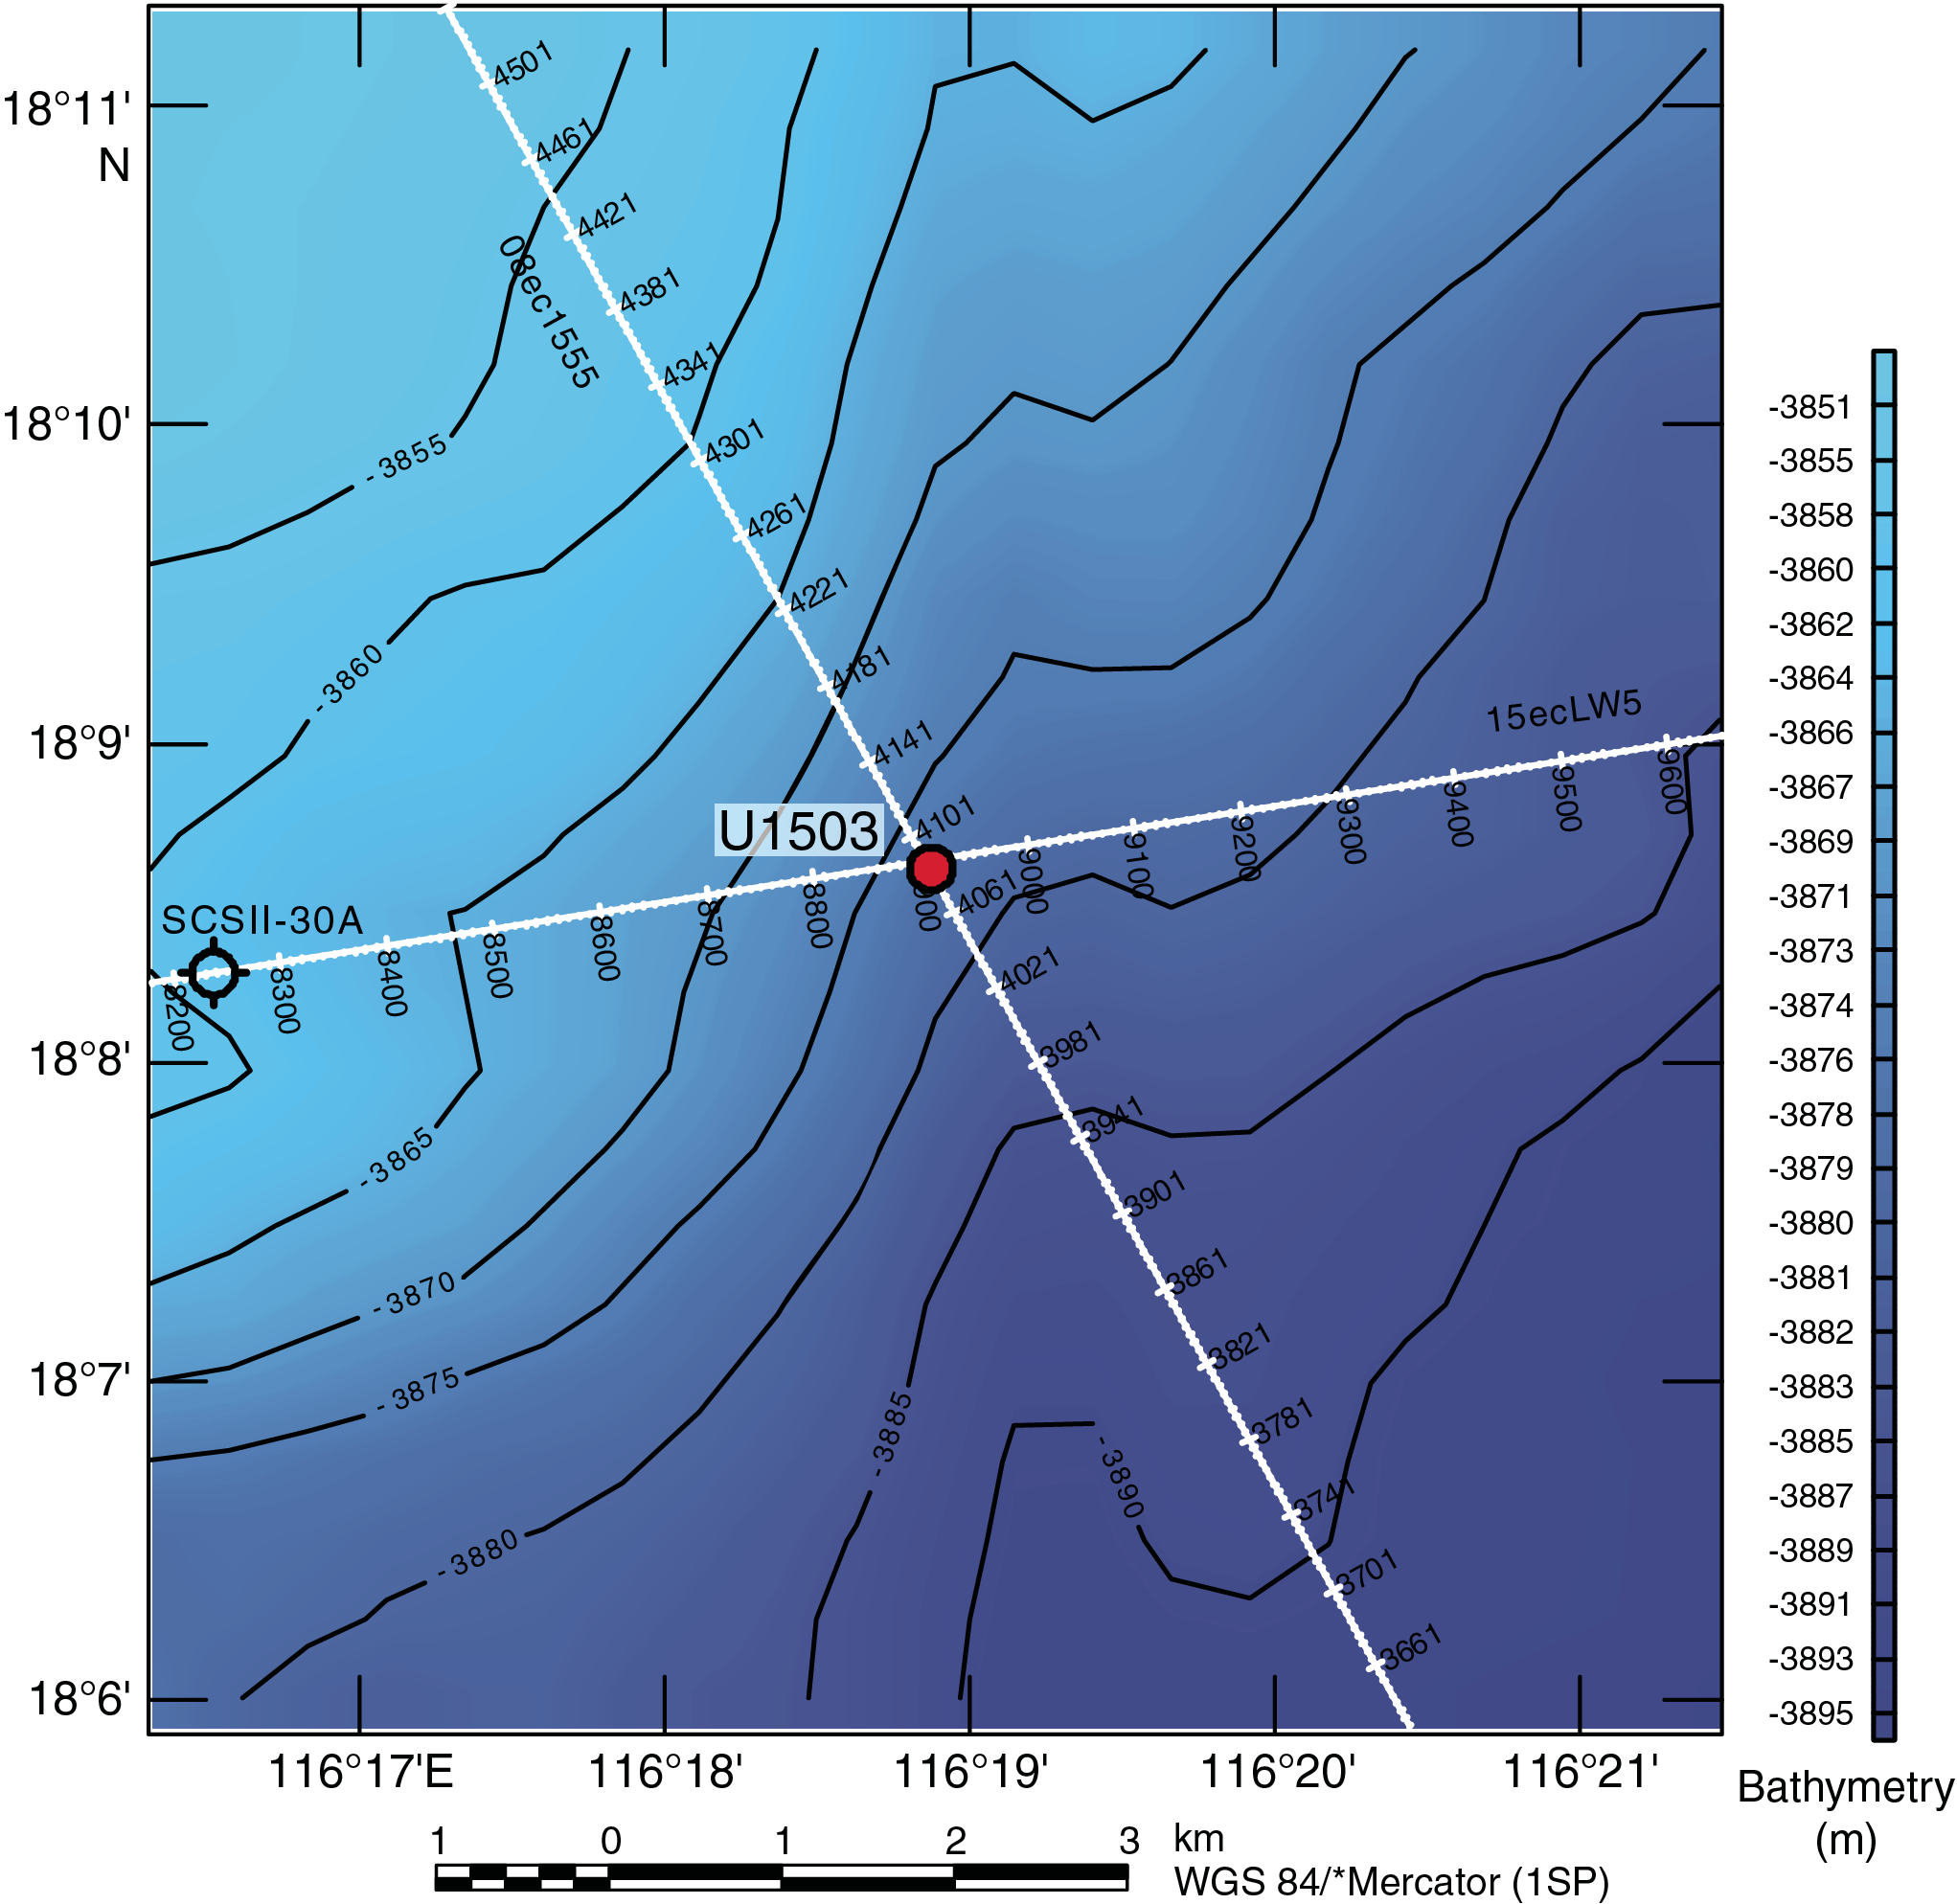
Figure F1. Bathymetry and seismic lines.
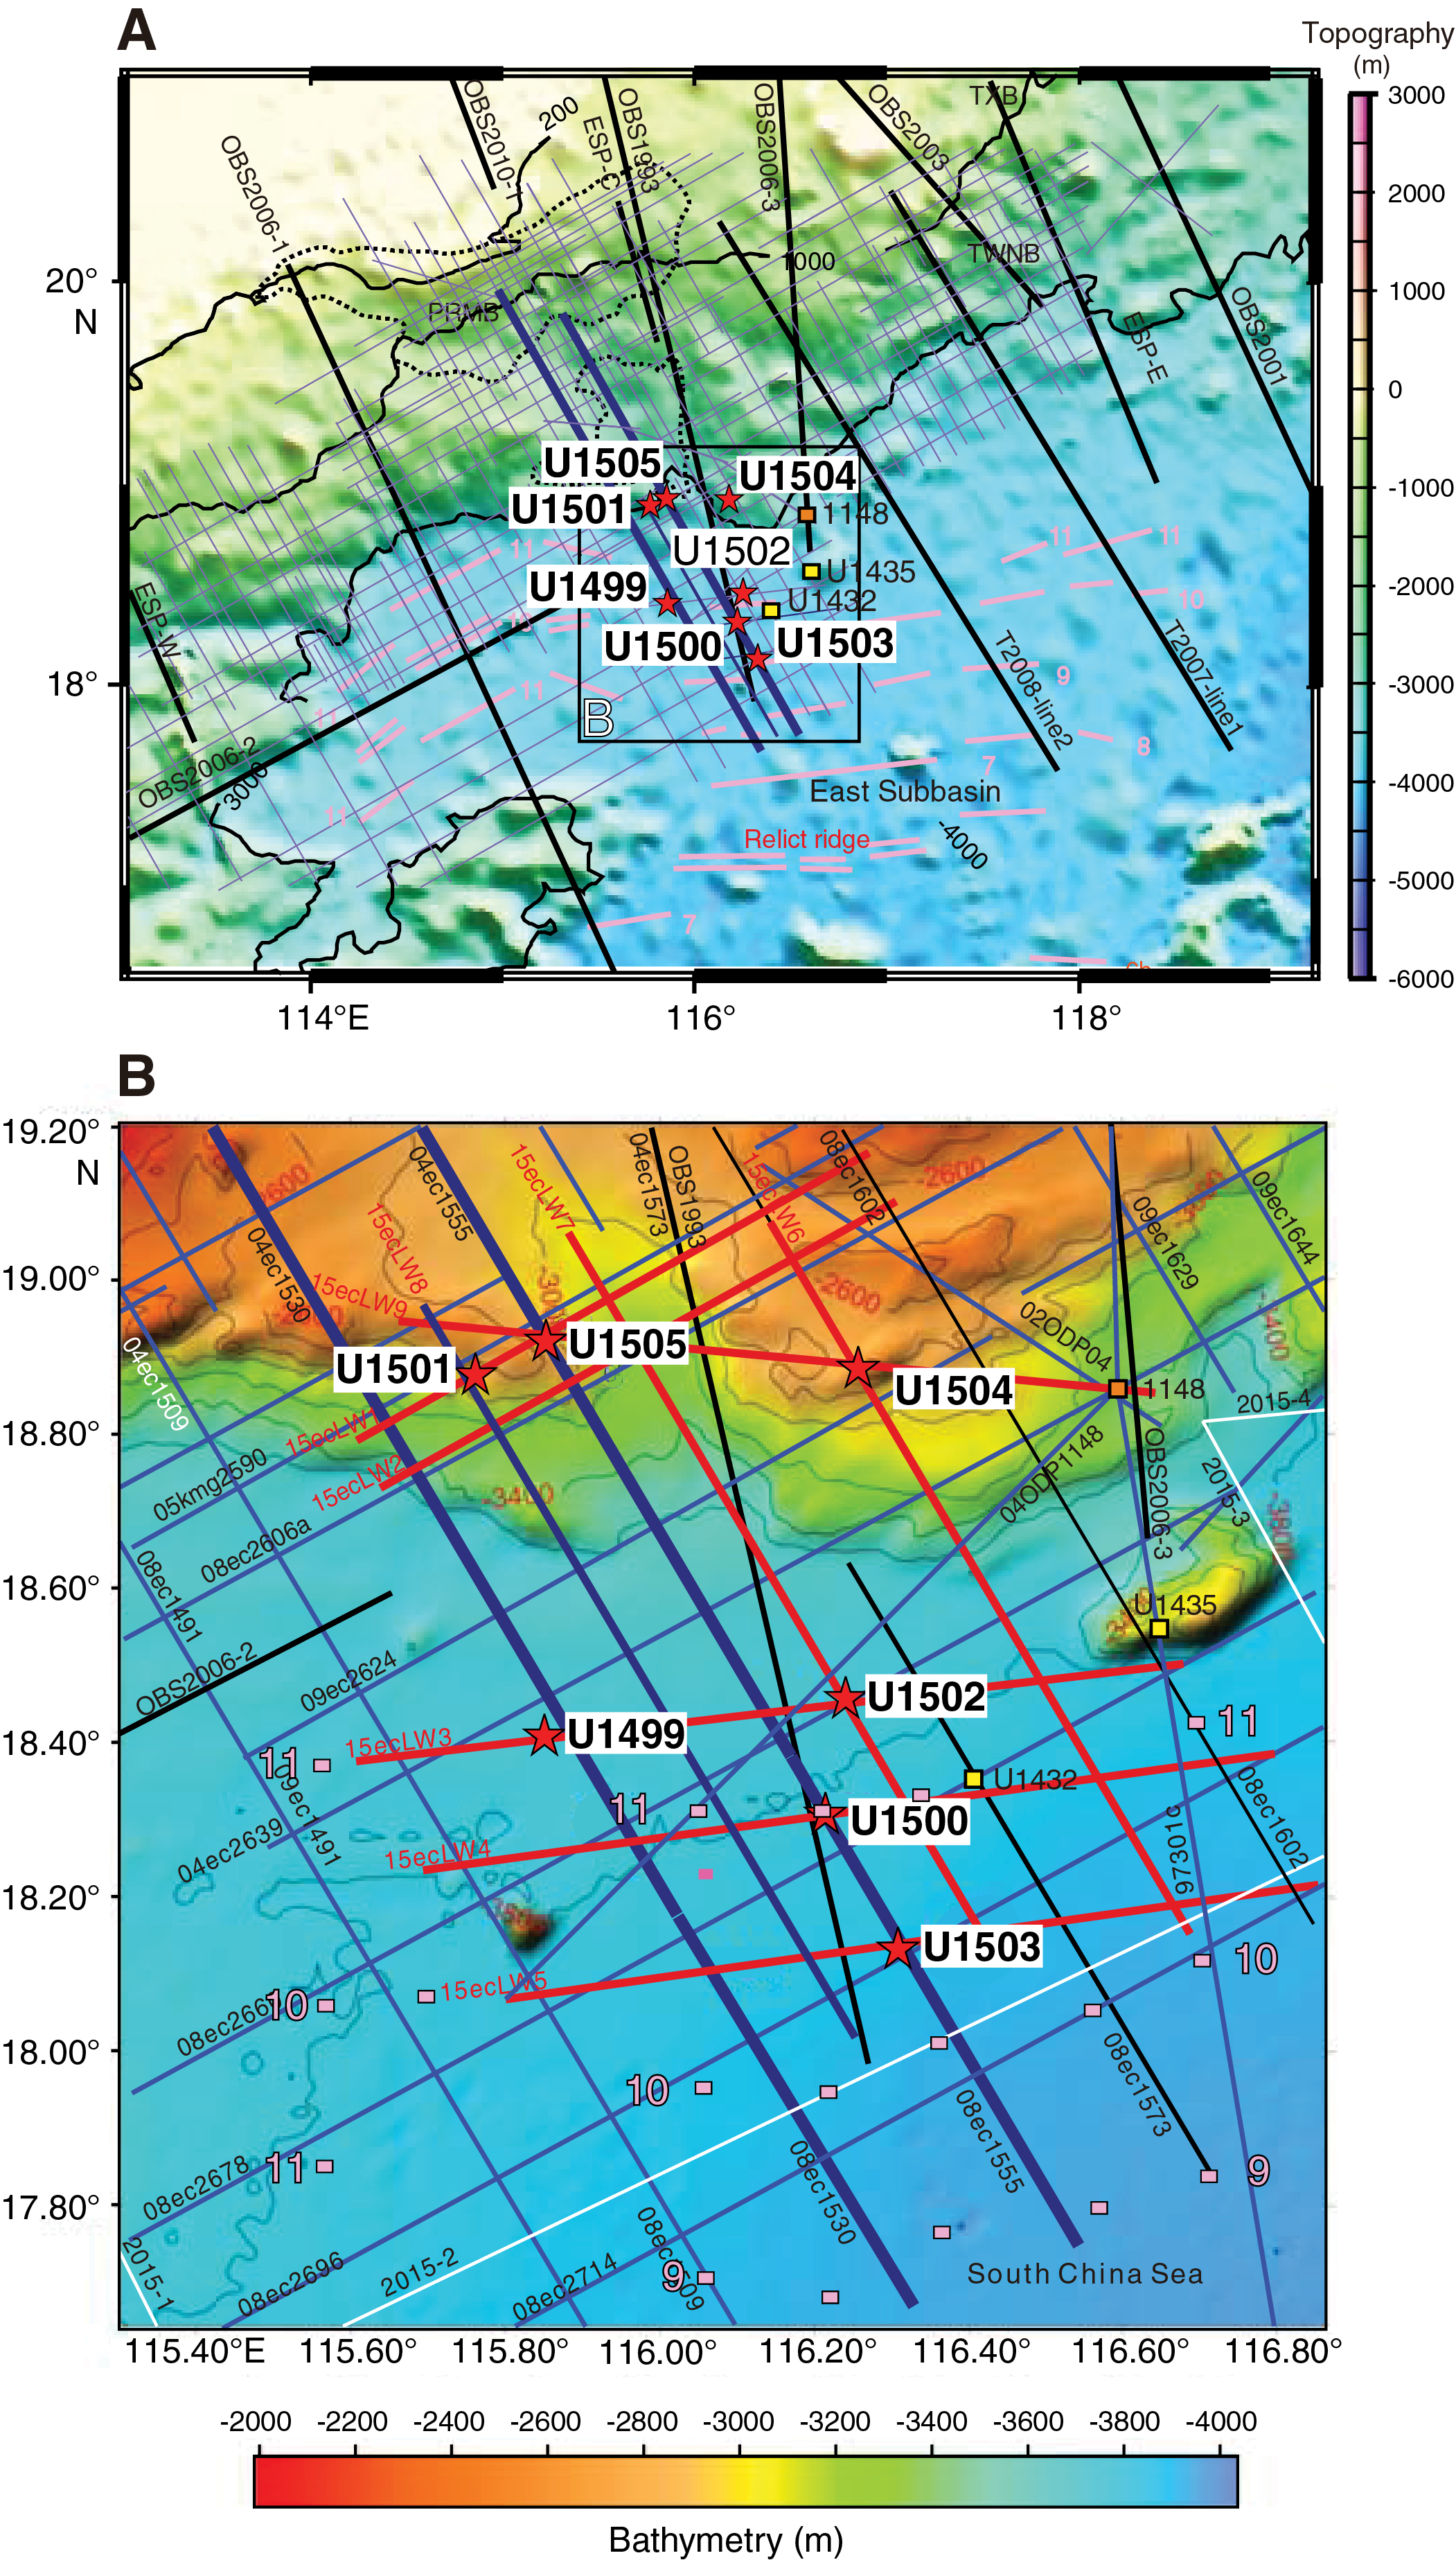
Figure F2. Seismic and ocean-bottom seismometer data.
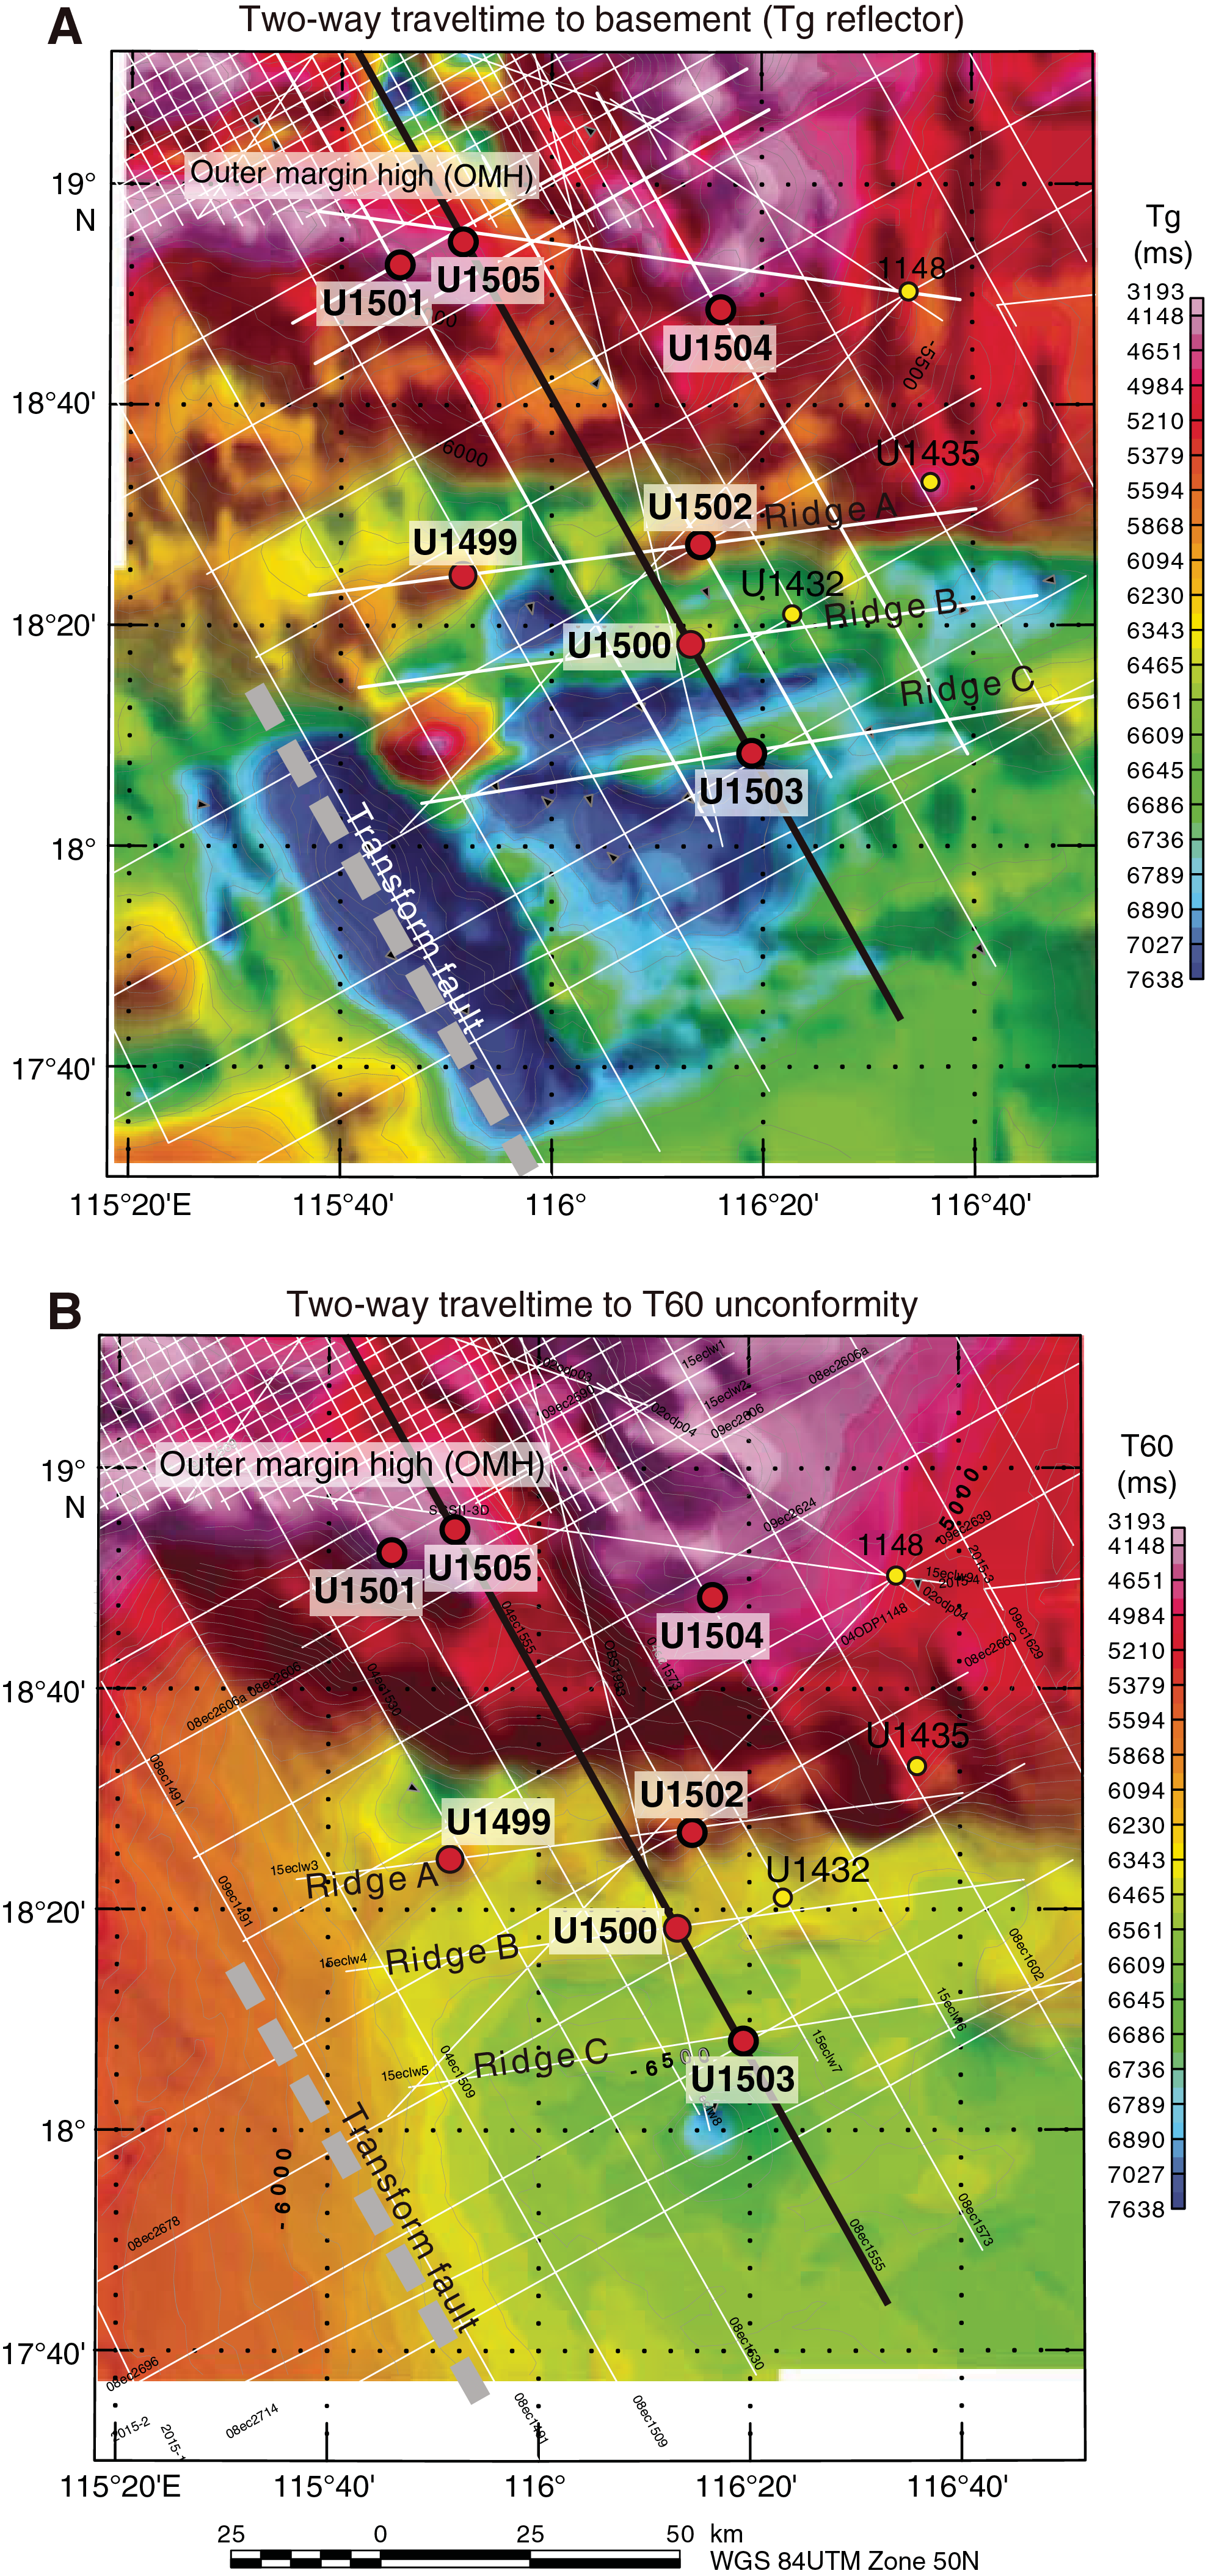
Figure F3. Two-way traveltime to Tg and T60 unconformities.

Figure F4. Deep crustal time-migrated seismic reflection data.
Ridge C is a 50 km long continuous basement ridge that consists of two ridges separated by seaward-dipping normal faults (Figures F4, F5, F6). The offset of the normal faults is as much as ~400 ms two-way traveltime (TWT; ~400–600 m), and faulting was apparently active shortly after formation of igneous crust. Only the oldest of the overlying sediments that fill the half-graben basins seems to be offset by the faults, whereas the younger sediments filling in the majority of the accommodation space generated by normal faulting show a draping (and compaction) structure over the tectonically generated basement relief. Ridge C is very linear and is parallel to Ridge B (see the Site U1500 chapter [Stock et al., 2018]) and to seafloor spreading anomalies south of the ridge (Figure F2).

Figure F5. Seismic Line 08ec1555.
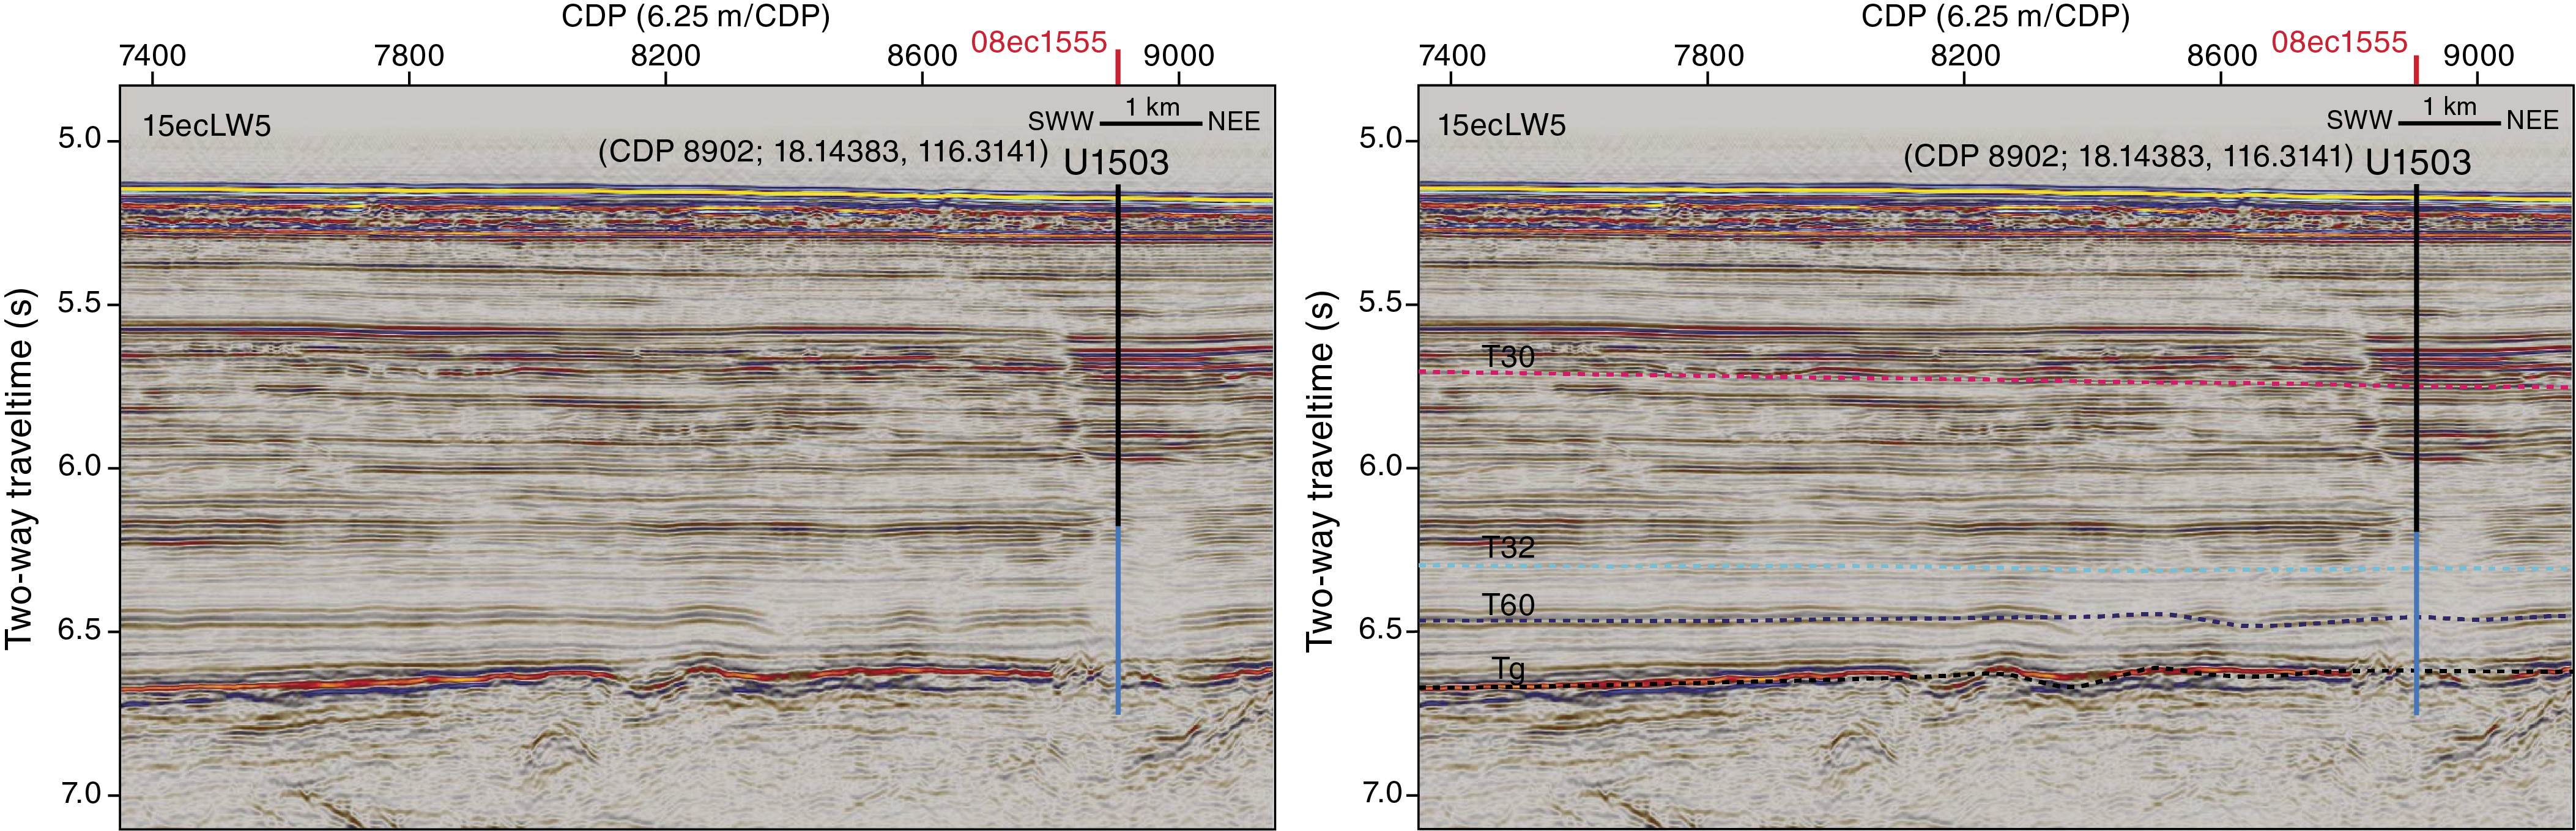
Figure F6. Crossing seismic Line 15ecLW5.
One important objective at Site U1503 was to sample the lowermost ~300 m of sediments on top of the basement to constrain the age and subsidence history of the crust at this location, the timing of normal faulting, and the environment of the early half-graben fill. The most important goal was to sample the igneous stratigraphy to at least 100 m in the underlying basement.
Based on the breakup-related or ocean-spreading basaltic magmatism found at Sites U1502 (Ridge A) and U1500 (Ridge B) (see the Site U1500 chapter and the Site U1502 chapter [Stock et al., 2018; Larsen et al., 2018a), we believe that this rifted margin, unlike magma-starved Iberia-type margins, experienced significant igneous activity during breakup and that extended continental lithosphere within the continent–ocean transition (COT), if present at all, is now likely to be more or less covered by igneous rocks. By implication, the reading of the terminal stages of lithospheric thinning prior to final breakup needs to be gleaned from the detailed composition of the igneous products, such as continental crustal contamination of the magmas, depth and shallowing of mantle melting with time, and mantle source composition including wetness and possible thermal anomalies. The crust at Ridge C is interpreted to represent the oceanic end-member of the transition from breakup magmatism initially modified by an overlying lid of continental lithosphere to accretion of igneous crust unmodified by a preexisting lithosphere. Deep representative sampling of the basaltic rocks at this site therefore forms an important reference frame for the modeling of breakup, and basement penetration must be sufficient to provide a representative sampling of igneous units.
With an estimated 1640 m of sediment overlying the basement target, Site U1503 was a challenging operation. During Expedition 368, following installation of 991.5 m of steel casing in the upper sediments, repeated breakdown of the drawworks' low clutch diaphragm prevented completion of Expedition 368 operations, and Site U1503 was left for possible occupation during a future expedition. Despite this setback to Expedition 368 and the South China Sea Rifted Margin program, Hole U1503A was completed during Expedition 368X, including sampling the lowermost ~300 m of sediment above the basement and more than 100 m of igneous stratigraphy within the basement.
Operations
We conducted operations in one hole at Site U1503 with the primary objective of sampling and logging the lowermost sediments and 100 m into the underlying basement. We successfully penetrated from 995.10 m below the seafloor (below bottom of casing) to the sediment/basalt contact at 1597.84 m and 112.26 m into the underlying basalts. Core recovery in the sedimentary section was highly variable and generally poor (21%). In the basalts, core recovery was variable but relatively high for hard rock coring (43%).
Hole U1503A is located at 18°08.6300′N, 116°18.8456′E in a water depth of 3867.7 m. To achieve the deep objectives of this site, a reentry system and 991.5 m of 10¾ inch casing was installed during Expedition 368 (see the Site U1503 chapter [Larsen et al., 2018b]). We conducted the following operations in Hole U1503A (Table T1):
- Added a secondary free-fall funnel (FFF) with 2.7 m extension into the reentry system previously installed in Hole U1503A,
- Cored the sediment sequence with the rotary core barrel (RCB) system from 991.5 to 1597.84 m (602.74 m cored; recovery = 128.01 m; 21%),
- Cored 112.26 m into the underlying basalt with the RCB system (1597.84–1710.10 mbsf; recovery = 47.91 m; 43%), and
- Logged with the Versatile Seismic Imager (VSI) tool within the casing.
A diagram of the secondary reentry cone and casing in Hole U1503A is shown in Figure F7.
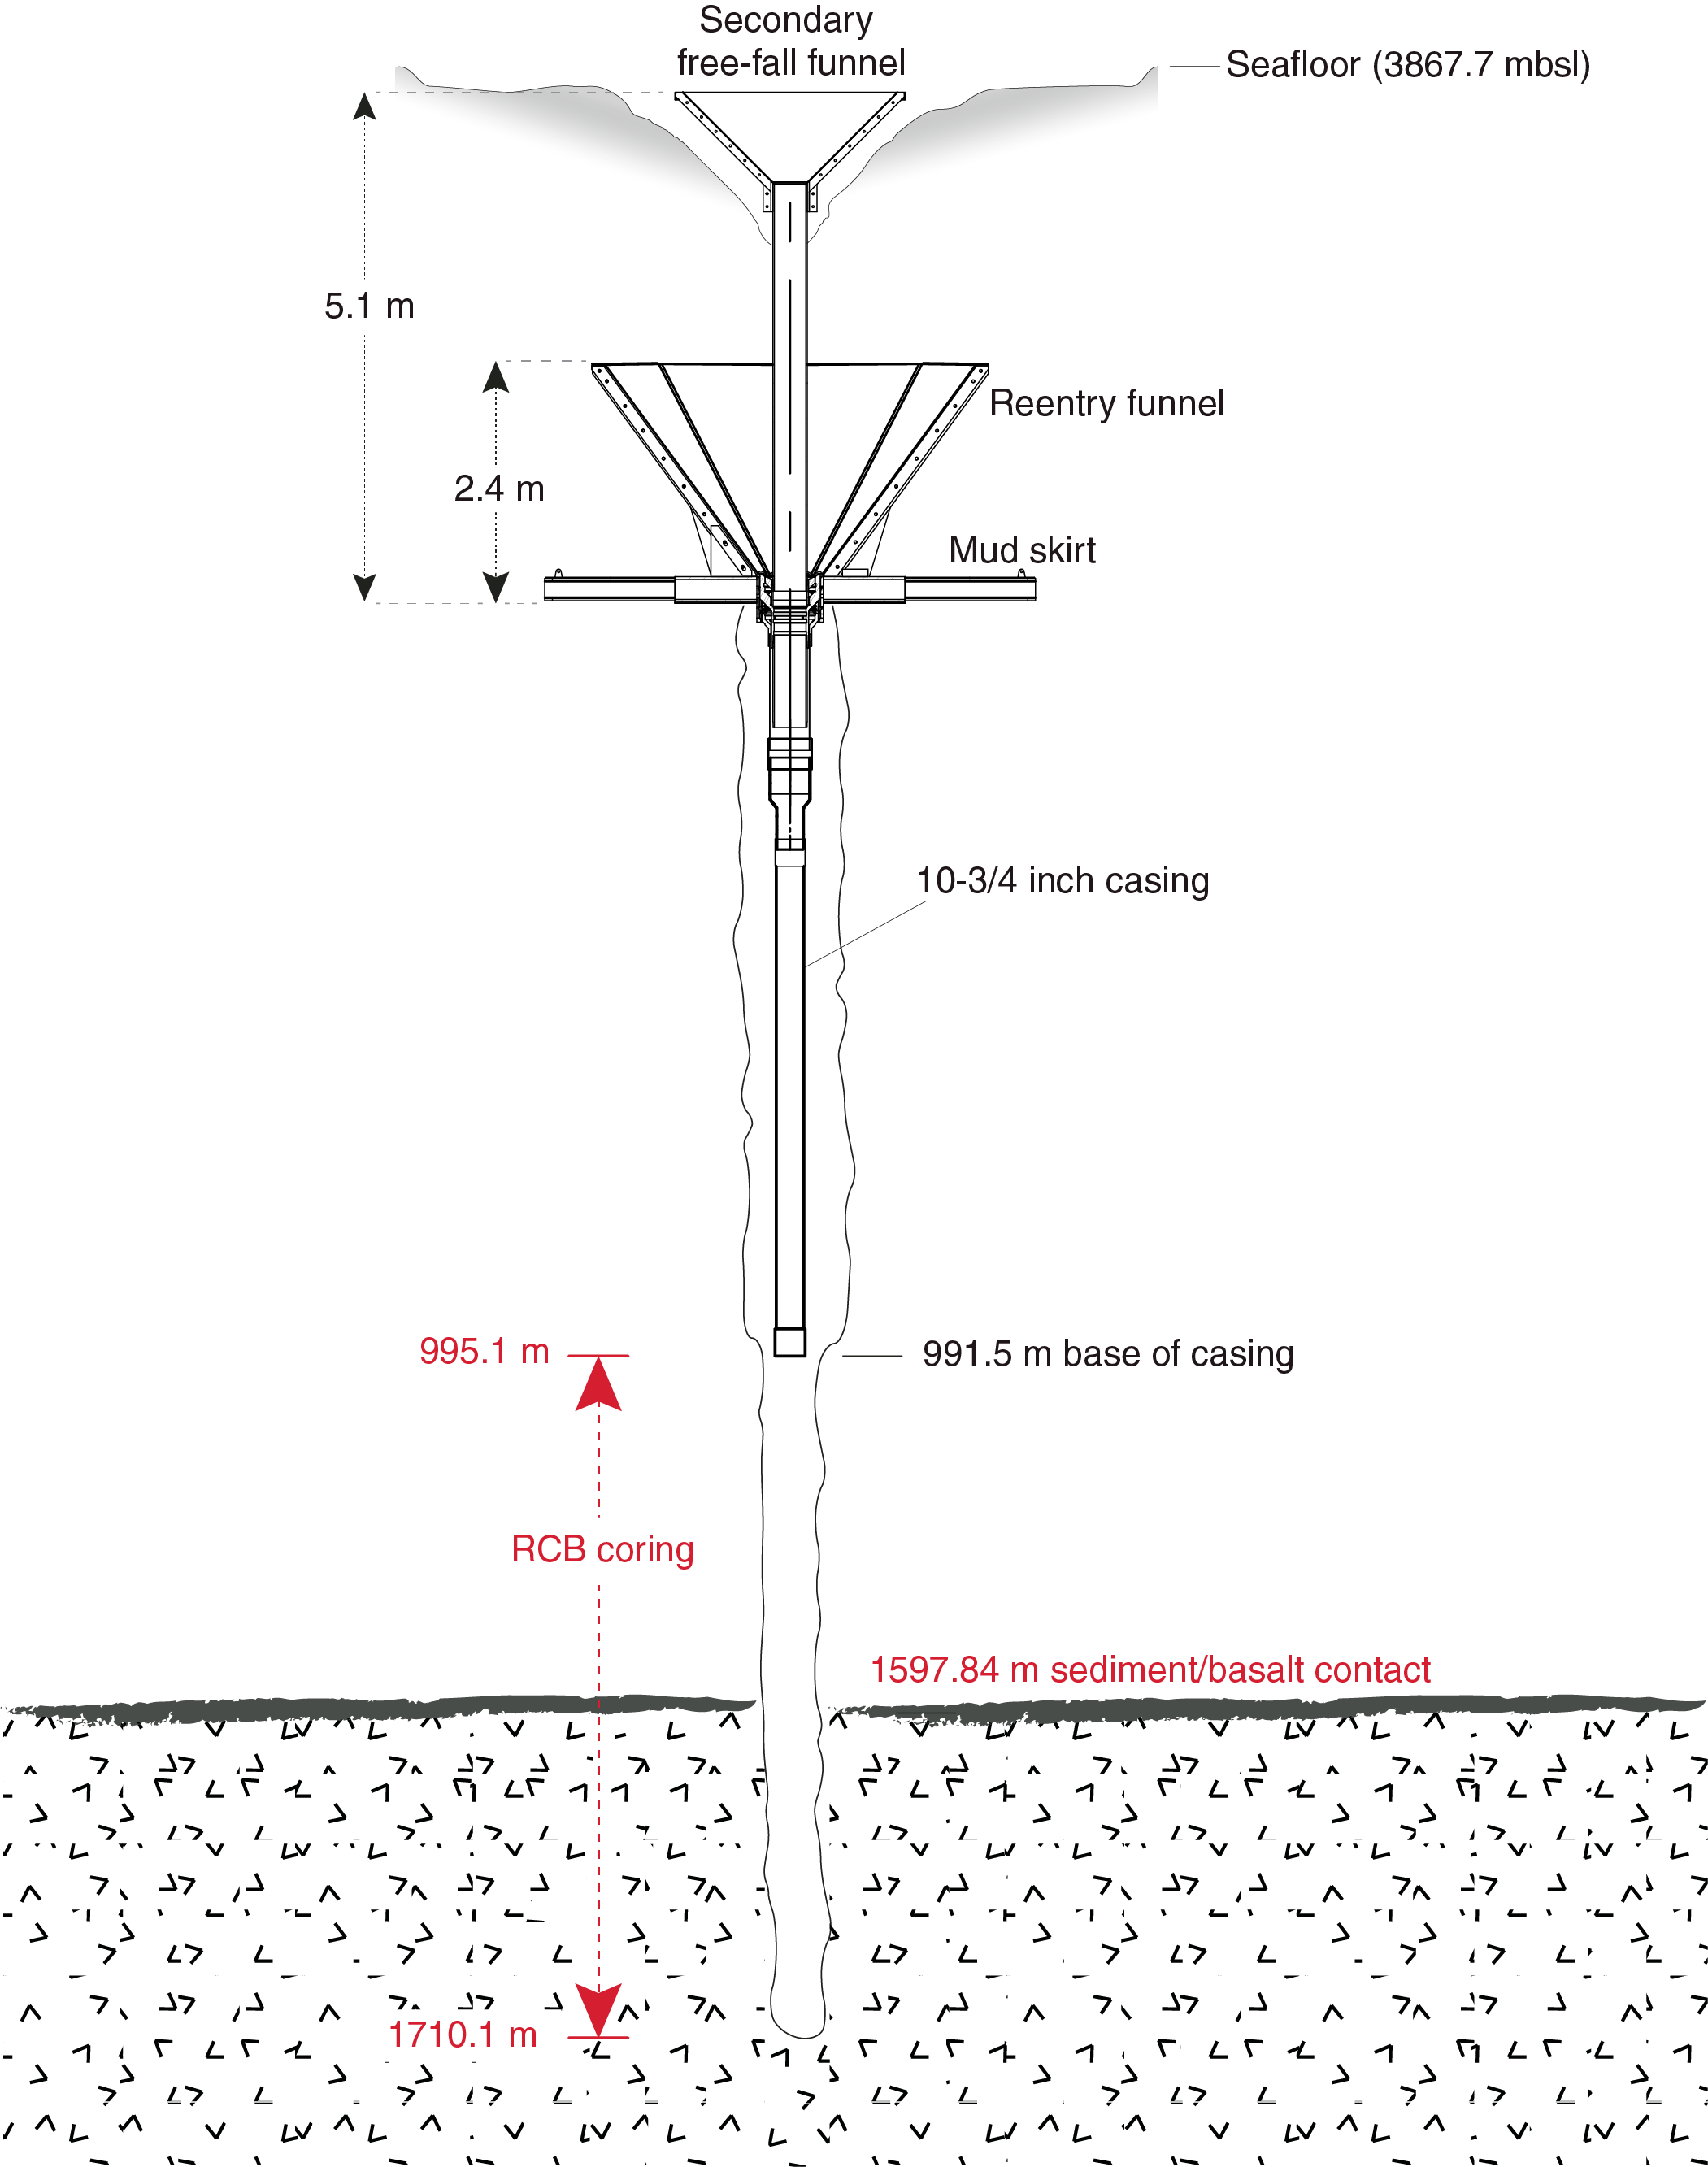
Figure F7. Reentry system and casing.
Hong Kong port call
Expedition 368X began at 0800 h (all times are ship local time [same as Hong Kong]; UTC + 8 h) on 15 November 2018 at the China Merchants Wharf in Hong Kong. The IODP JOIDES Resolution Science Operator (JRSO) technical staff (14 additional), Expedition Project Manager (EPM), and seven of nine scientists boarded the vessel on 15 November. The remainder of the science party boarded on 16 November. The scientists began expedition preparations, which included introductions and an orientation to shipboard computing resources.
On the first day of the port call, we loaded hazardous freight, 155 short tons of potable water, and 404 short tons of drill water, all of which were loaded from a barge on the starboard side of the vessel. On the second day of the port call, 71.9 metric tons of marine gas oil were pumped on board from a barge on the starboard side. The Schlumberger mechanic repaired the Schlumberger active heave wireline compensator hydraulic system with parts that were air freighted to the port call. The system was tested in port after the repairs were completed.
During the two-day port call, a reentry funnel extension was prepared to extend the reentry system in Hole U1503A. Additionally, the outer core barrel was prepared and the RCB core barrels were spaced out. The coring assembly was laid out on the piperacker skate track, ready for a quick deployment on arrival at the site. The passage plan for our expedition was completed, and arrangements were made with the agent and immigration for a departure at 0800 h on 17 November. All port call–generated trash was offloaded to the pier, the pier was cleaned, and all equipment was secured for sailing. During the second day of port call, the science party continued expedition preparations, which included an orientation to life at sea, general safety introductions and tours, and introductions to the laboratories. The EPM gave a presentation about expedition expectations, tasks, and reports. The science party also received shipboard safety introductions by the Captain, First Mate, and Physician.
At 0500 h on 17 November, immigration personnel arrived on board and cleared the personnel and vessel for departure. Shortly before 0800 h, the pilot arrived on board. With assistance from two harbor tugs, Hai Tong and Hai Hoi, the vessel was underway, and the last line was released at 0824 h. The vessel proceeded to the pilot station, and the pilot departed the vessel at 0854 h. While underway, the science party continued training in the laboratories, which included introductions to the handheld portable X-ray fluorescence (pXRF) spectrometer, curation, and description software. The science party also received a lifeboat safety orientation and tours of the bridge and dynamic positioning system. The transit was completed after 24.6 h and ended at the expedition's first and only site, U1503. The average vessel speed was 11.5 kt over 284 nmi. The vessel arrived at Site U1503 at 0900 h on 18 November, and the thrusters were lowered.
Hole U1503A
After arriving at Site U1503 at 0953 h, the vessel shifted to dynamic positioning mode and the drill floor was cleared to begin operations in Hole U1503A. We did not deploy an acoustic positioning beacon, but one was prepared for immediate deployment if required.
The upper guide horn was removed, and a reentry funnel extension was lowered and secured in the moonpool. A four-stand RCB bottom-hole assembly (BHA) was assembled and lowered to 2990.0 meters below rig floor (mbrf). The subsea camera was deployed and run down the drill string while the drill string was deployed to 3874 mbrf. The search for the reentry system was quickly successful. The reentry cone was observed to be slightly below the level of the seafloor and full of debris from the previous drilling in the hole. The vessel was positioned for reentry, and the bit was lowered into the reentry cone at 0014 h on 19 November 2018. After several attempts to reenter the casing, the bit passed into the casing at 0039 h. The subsea camera system was recovered, and a FFF was welded to the top of the reentry funnel extension. The reentry FFF and extension were deployed down the outside of the drill pipe.
The upper guide horn was reinstalled, and the bit was lowered into the 10¾ inch casing. The drill string was filled every 20 stands as the string was lowered toward the bottom of the casing. The driller tagged hard fill inside the casing at 956.0 m. The top drive was picked up, and the driller washed down while pumping with slow rotation to 995.1 m. Total depth was reached at 1600 h on 19 November. A 30 bbl high-viscosity sweep was circulated, and a nonmagnetic core barrel was deployed to begin RCB coring in Hole U1503A. Cores 368X-U1503A-2R through 40R (995.1–1364.9 m) were cored at a rate of just over 100 m per day, and recovery was generally poor (17%). Recovery began to improve in Cores 41R through 51R (1364.9–1470.5 m; 38%), and the penetration rate dropped to <4 m/h.
Coring continued until 0400 h on 26 November and reached a depth of 1528.0 m with Core 368X-U1503A-57R. With 50.8 h on the bit, the hole was circulated clean with a 30 bbl sweep of high-viscosity mud. The bit was raised to 1383 m in the open hole (casing extends to 995.1 m), and 200 bbl of 10.5 lb/gal heavy mud was displaced into the borehole. The heavy mud was used to increase the hydrostatic pressure on a very unstable section of hole. The top drive was set back, and the drill pipe was pulled back to 953.0 m, just above the casing shoe. The upper guide horn was pulled up, and the subsea camera system was deployed.
While running the subsea camera system to just above the seafloor, a slip and cut of the drilling line was performed. The bit was pulled out of the hole at 1247 h and cleared the secondary funnel without issue. The measurement to the top of the cone was confirmed at 3879.7 mbrf. The subsea camera system was pulled back to the surface and secured on board. The remainder of the drill string was recovered, and the bit cleared the rig floor at 2045 h on 26 November. The outer core barrel was disassembled and inspected, and a new C-4 bit was picked up and installed with a mechanical bit release (MBR).
The drill pipe was lowered to 3855 mbrf, and the subsea camera was deployed at 0545 h. Hole U1503A was reentered at 0830 h on 27 November after 30 min of maneuvering. The subsea camera system was pulled back to the surface, and the trip back to bottom continued until the driller encountered a bridge at 1345.0 m. The top drive was picked up, and the driller washed and reamed from 1345.0 m back to bottom at 1528.0 mbsf. After reaching total depth, the hole was circulated clean with high-viscosity mud. A nonmagnetic core barrel was dropped, and coring resumed at 2100 h on 27 November.
Coring with the second bit began with Core 368X-U1503A-58R and continued through Core 75R (1528.0–1633.0 m). Basement was reached at 1597.84 m. After reaching basement, half cores were used to improve recovery. Basement recovery from 1605.0 to 1633.0 m was 33%. With 42.2 h on the bit, the hole was circulated clean with three 50 bbl sweeps of high-viscosity mud. The bit was raised to 1355.7 m in the open hole, and 200 bbl of 10.5 lb/gal heavy mud were displaced into the borehole to increase the hydrostatic pressure on the unstable section of the hole. The top drive was set back, and the drill pipe was recovered, clearing the seafloor at 1050 h on 1 December. After recovering the remaining drill pipe, the bit cleared the rig floor at 1725 h. The outer core barrel was disassembled, cleaned, and inspected, and a new C-7 bit was picked up and installed with an MBR. The drill pipe was lowered to the seafloor, and the subsea camera system was deployed. After 60 min of maneuvering, Hole U1503A was reentered at 0439 h on 2 December, and the subsea camera system was pulled back to the surface.
The trip back to the bottom of Hole U1503A continued to 1375.0 m, where the driller experienced a hard tag of the bit on a bridge. The top drive was picked up, and the driller washed and reamed from 1375.0 m back to the bottom until 1517.0 m, where an electrical problem caused the top drive to stop operating. The problem was resolved, and 1.5 h later we began washing back to total depth. A wash core barrel was deployed at 1615 m, and washing and reaming continued. Total depth (1633.0 m) was reached, and the hole was circulated clean with 40 bbl of high-viscosity mud. The wash barrel was retrieved by wireline, and a nonmagnetic core barrel was dropped. Coring began again at 2100 h on 2 December.
Basement coring with the third bit began with Core 368X-U1503A-76R at 1633.0 m and continued through Core 77R to 1657.3 m before high torque and excessive overpull were experienced and the driller was forced to work the drill string back to 1566.0 m to regain good circulation and rotation. The core barrel that had been dropped for Core 78R was retrieved, and the driller washed and reamed back to bottom (1657.3 m). A 40 bbl mud sweep was pumped down the drill string and circulated out to the seafloor. A core barrel was dropped, and half-coring began at 1657.3 m and continued through Core 88R to a final total depth of 1710.1 m. All cores after Core 85R were full cores. High-viscosity mud sweeps were pumped frequently to help improve the hole conditions. The last core on deck was recorded at 0625 h on 5 December.
The hole was circulated clean, and we began pulling back with the top drive installed. High torque and overpull were observed while pulling back and reaming to ~1600.0 m. Backreaming continued to 1383.0 m while we continued to experience high torque and overpull. The hole was displaced with 200 bbl of high-viscosity mud, and the bit was pulled back to 1355.0 m. The top drive was set back, and the drill pipe was pulled back to the casing shoe, occasionally experiencing overpull as the hole collapsed around the drill string. After reaching the casing shoe at 995.1 m, the remainder of the pipe trip to the seafloor was normal. The bit cleared the seafloor at 1450 h and was pulled 12.7 m above the reentry cone. The subsea camera system was installed, and while running the camera system to bottom the drilling line was slipped and 115 ft of line was cut off. The top drive was picked up, and the sinker bars were inserted through the blocks. The rotary shifting tool (RST) was run to the bit and engaged to shift the retaining sleeve that activated the MBR. The subsea video camera recorded the bit release at 1920 h on 5 December. The wireline was pulled back to the surface, and the top drive was racked.
Hole U1503A was reentered at 2155 h on 5 December for the fourth time. The end of pipe (EOP) was set at 71.0 m in preparation for logging. After reentry, the subsea camera system was recovered to the surface at 0000 h on 5 December. A short delay was required to time the VSI experiment for daylight hours. Logging activities began at 0400 h on 6 December. The rig floor had been prepared for logging during the down period needed for seismic work to be done in daylight hours. The tools were rigged up, tested, and lowered into the pipe at 0430 h.
Because the cable on the winch was new, standard cable seasoning/detorquing was conducted by pausing every 500 m as the tools were lowered into the pipe and pulling up a short distance before resuming the run-in hole. Upon reaching 3850.0 mbrf, a downlog was started as a rough depth reference. No other logs existed to tie into, so there was marginal uncertainty about the exact depth at which a gamma ray signal might begin to register, given that the original casing/cone sunk ~5.1 m into the sediment and the cuttings stacked up to almost the top of the secondary cone. Lacking any better reference and prior to shooting any seismic stations, the log depth was adjusted in such a way that the top gamma ray reading occurred at the driller's seafloor depth of 3879 mbrf. The sole logging run for this expedition was with the VSI tool in the cased section of Hole U1503A. Open hole conditions were highly adverse, so no logs were conducted in the open hole portion of this site. The seismic-through-casing job began, as always, with a toolbox talk/safety meeting on the drill floor with the rig crew on duty. It was also noted that high-pressure air would be in use near the fantail for the air guns and that the fantail should therefore be avoided during seismic shooting.
The average heave was estimated to be 0.3 m just prior to logging. The active heave compensator was turned on when the VSI tool reached 3965.0 mbrf and was utilized during each VSI station. The protective species watch began at 0630 h. After an hour of observation, the soft start began. The seismic air gun cluster (2 × 250 inch3 G-guns in a horizontal array) was turned over to the Schlumberger wireline engineer at 0820 h, and the seismic survey began.
The single tool string consisted of the following tools:
The initial shots were taken at 975.9 m with additional stations every 50 m thereafter to 124.9 m. No further stations could be recorded because the pipe was set inside the casing at 71.0 m. All 18 viable stations were successfully shot and recorded. Moderate noise was present in some areas and most of the shots required manual transit time picking, but the overall data quality was quite reasonable and fit for interpretation.
A continuous gamma ray log was recorded from the bottom of the hole up past the seafloor. This log is the sole depth reference for the expedition and was planned and recorded in real time such that the topmost gamma ray activity would correspond with the driller's seafloor, thus tying the station measurements to the coring data as closely as possible under the circumstances. Once the gamma ray log was completed to ~3860 mbrf at 1055 h on 6 December, the tools were pulled out of the hole, were at the surface at 1330 h, and were rigged down by 1400 h, which concluded the logging run.
The drill string was pulled out of the hole to the surface, clearing the seafloor at 1450 h on 6 December. By 2345 h, all rig floor equipment was secured, ending Hole U1503A and Site U1503. The thrusters and hydrophones were raised, and the vessel began the transit to Hong Kong at 0030 h on 7 December. A total of 444.25 h (18.5 days) were recorded for operations in Hole U1503A during Expedition 368X. One downtime incident occurred during the period; an electrical malfunction caused the top drive to shut down for 1.5 h while the problem was repaired. After the 284 nmi transit to Hong Kong, which averaged 9.4 kt, the vessel arrived at the pilot station. The pilot arrived on board at 0654 h, and the first line ashore 0754 h on 8 December ended Expedition 368X.
Lithostratigraphy
Hole U1503A penetrated 602.74 m (995.1–1597.8 m) of unconsolidated to lithified sediments and sedimentary rocks and recovered 128 m. Deeper than 1597.8 m, 112.26 m of the underlying basalts were cored to 1710.1 m and 47.51 m were recovered. We organized the lithostratigraphy into four units (Figure F8). Lithostratigraphic Unit I is composed of interbedded dark brownish gray claystone, silty claystone and clayey siltstone, greenish gray siltstone, dark greenish gray sandstone, dark olive-gray nannofossil-rich claystone, and grayish brown nannofossil chalk. Unit II is composed of dark reddish brown claystone that transitions to a reddish brown clay-rich chalk. Unit III contains greenish gray nannofossil-rich claystone and dark gray claystone, both of which are heavily bioturbated. Unit IV is composed of basalt with occasional gray claystone inclusions. Lithostratigraphic units and subunits were primarily defined by principal lithology and the repetitive assemblages of facies that occur in each unit (see the Expedition 367/368 methods chapter [Sun et al., 2018a]) and were subsequently corroborated using physical property measurements (Figure F9), mineralogical data from X-ray diffraction (XRD; see XRD in Supplementary material [Sun et al., 2018b]) (Figure F10), pXRF (Figure F11), and calcium carbonate contents (Figure F9). Because core recovery was extremely poor across most of the boundaries that separate individual lithostratigraphic units, precise depths can only be inferred.
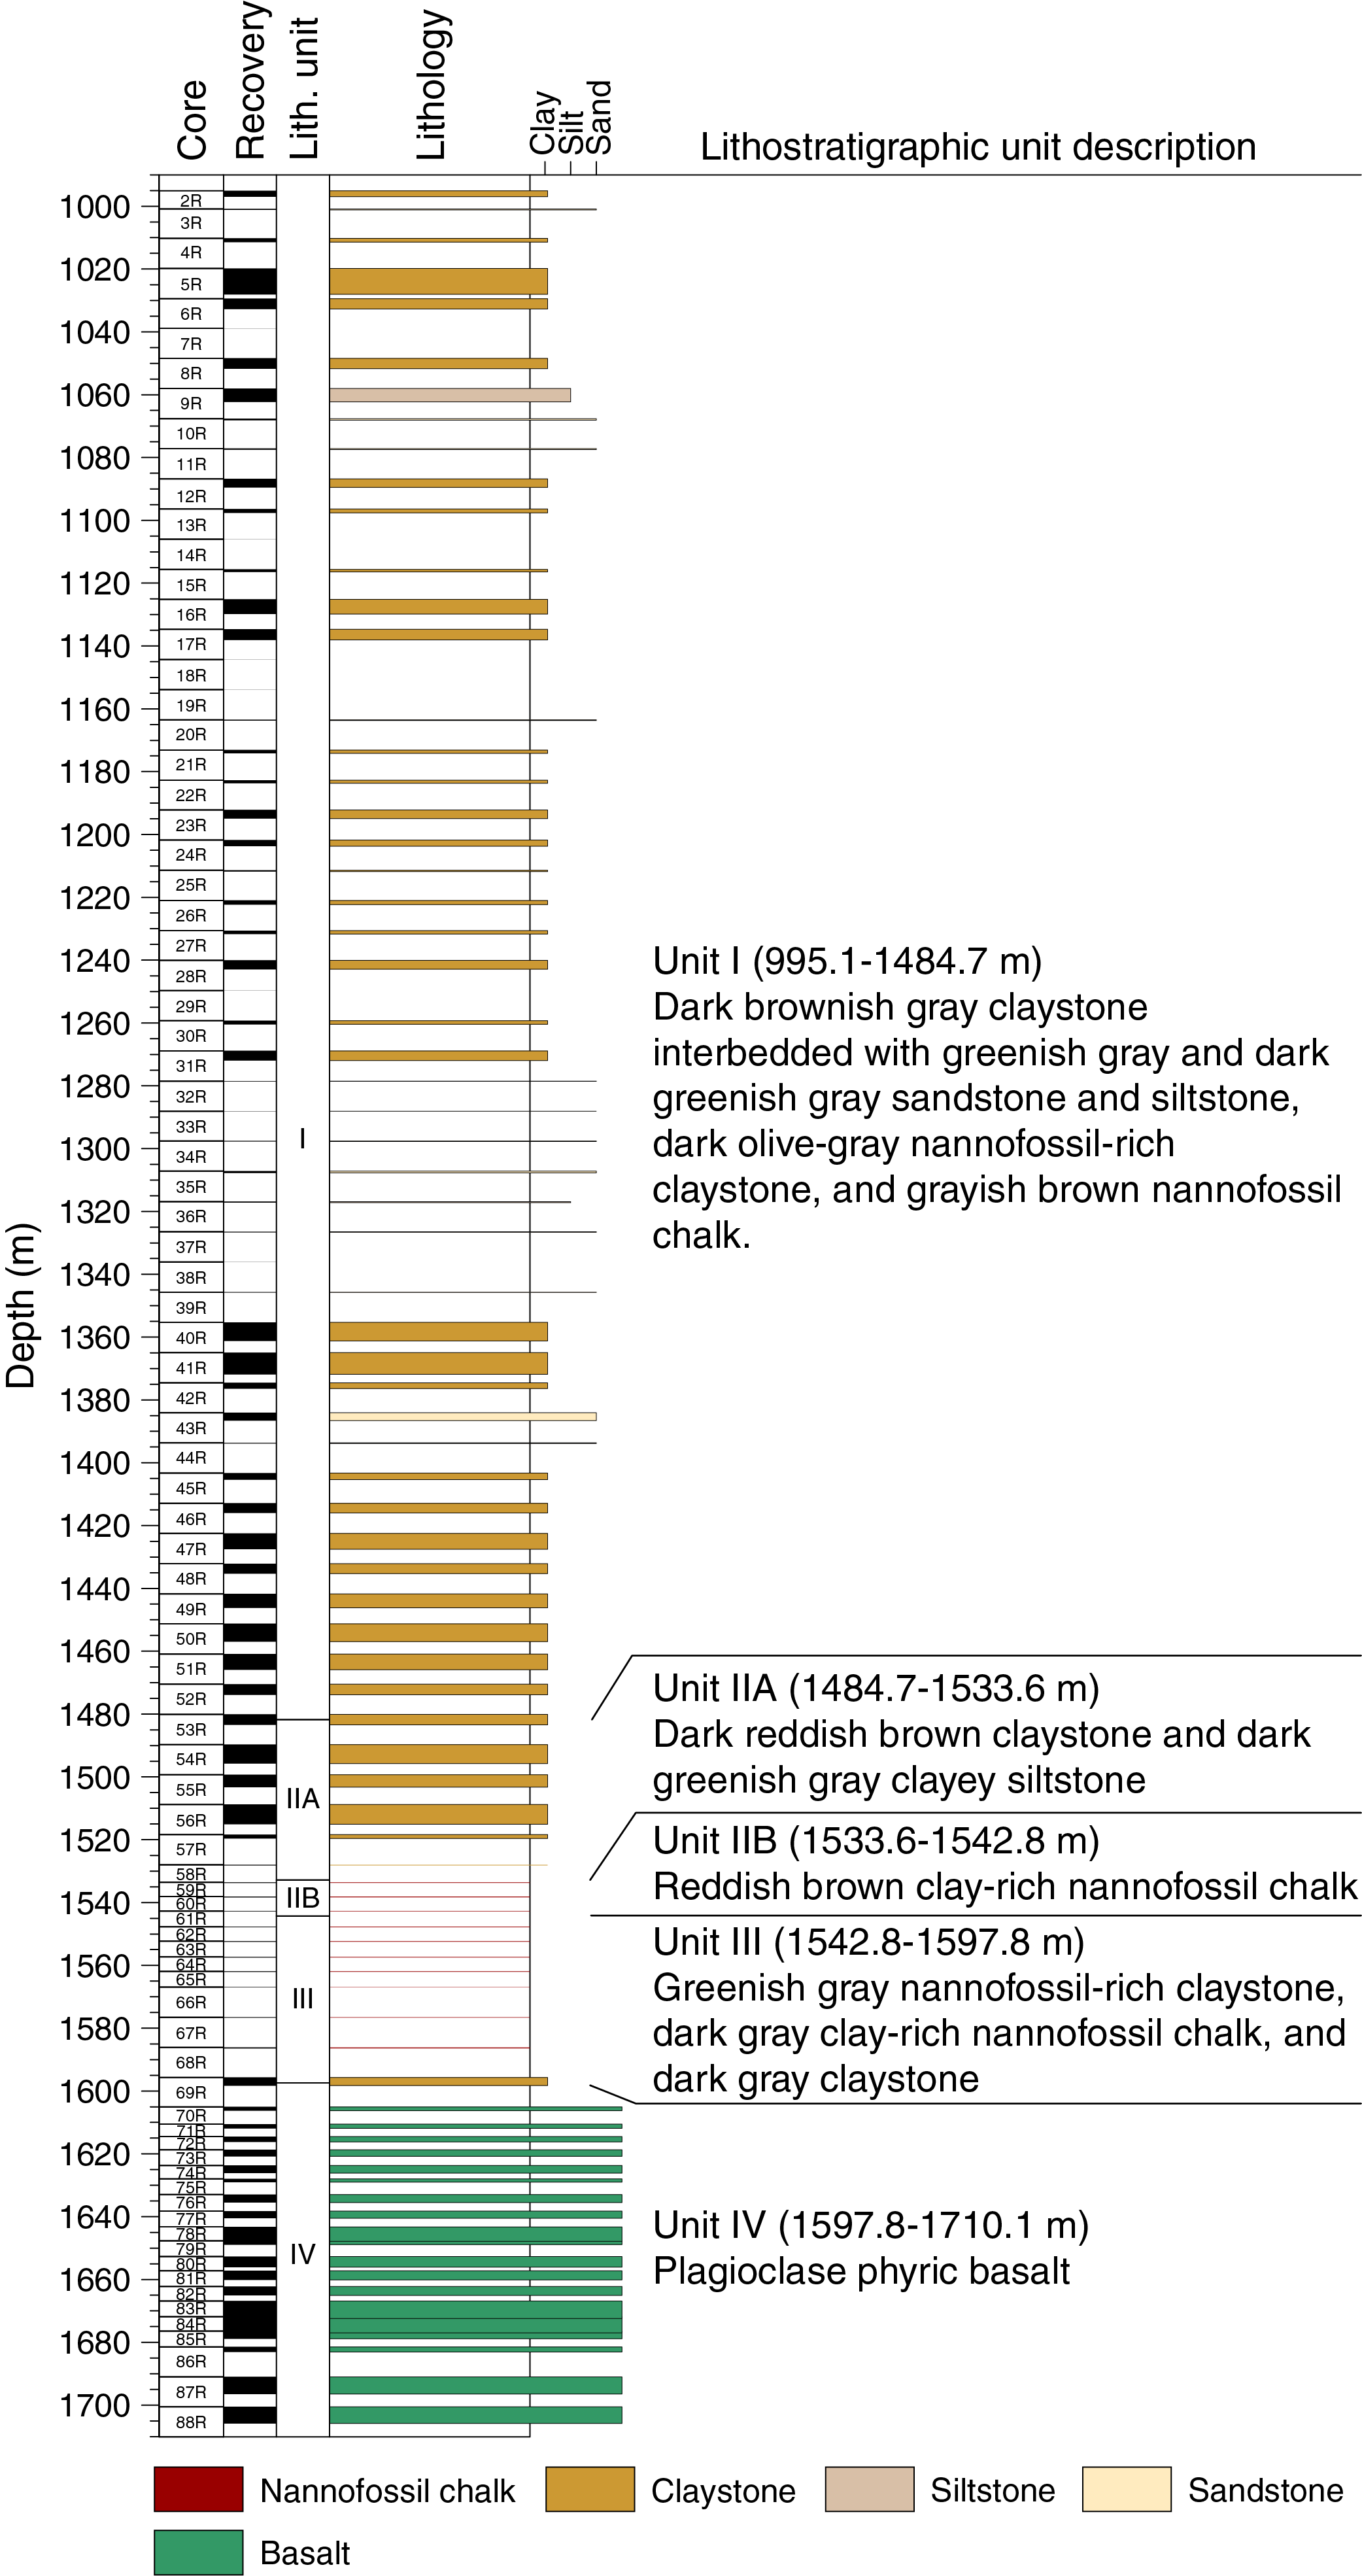
Figure F8. Lithostratigraphic summary.
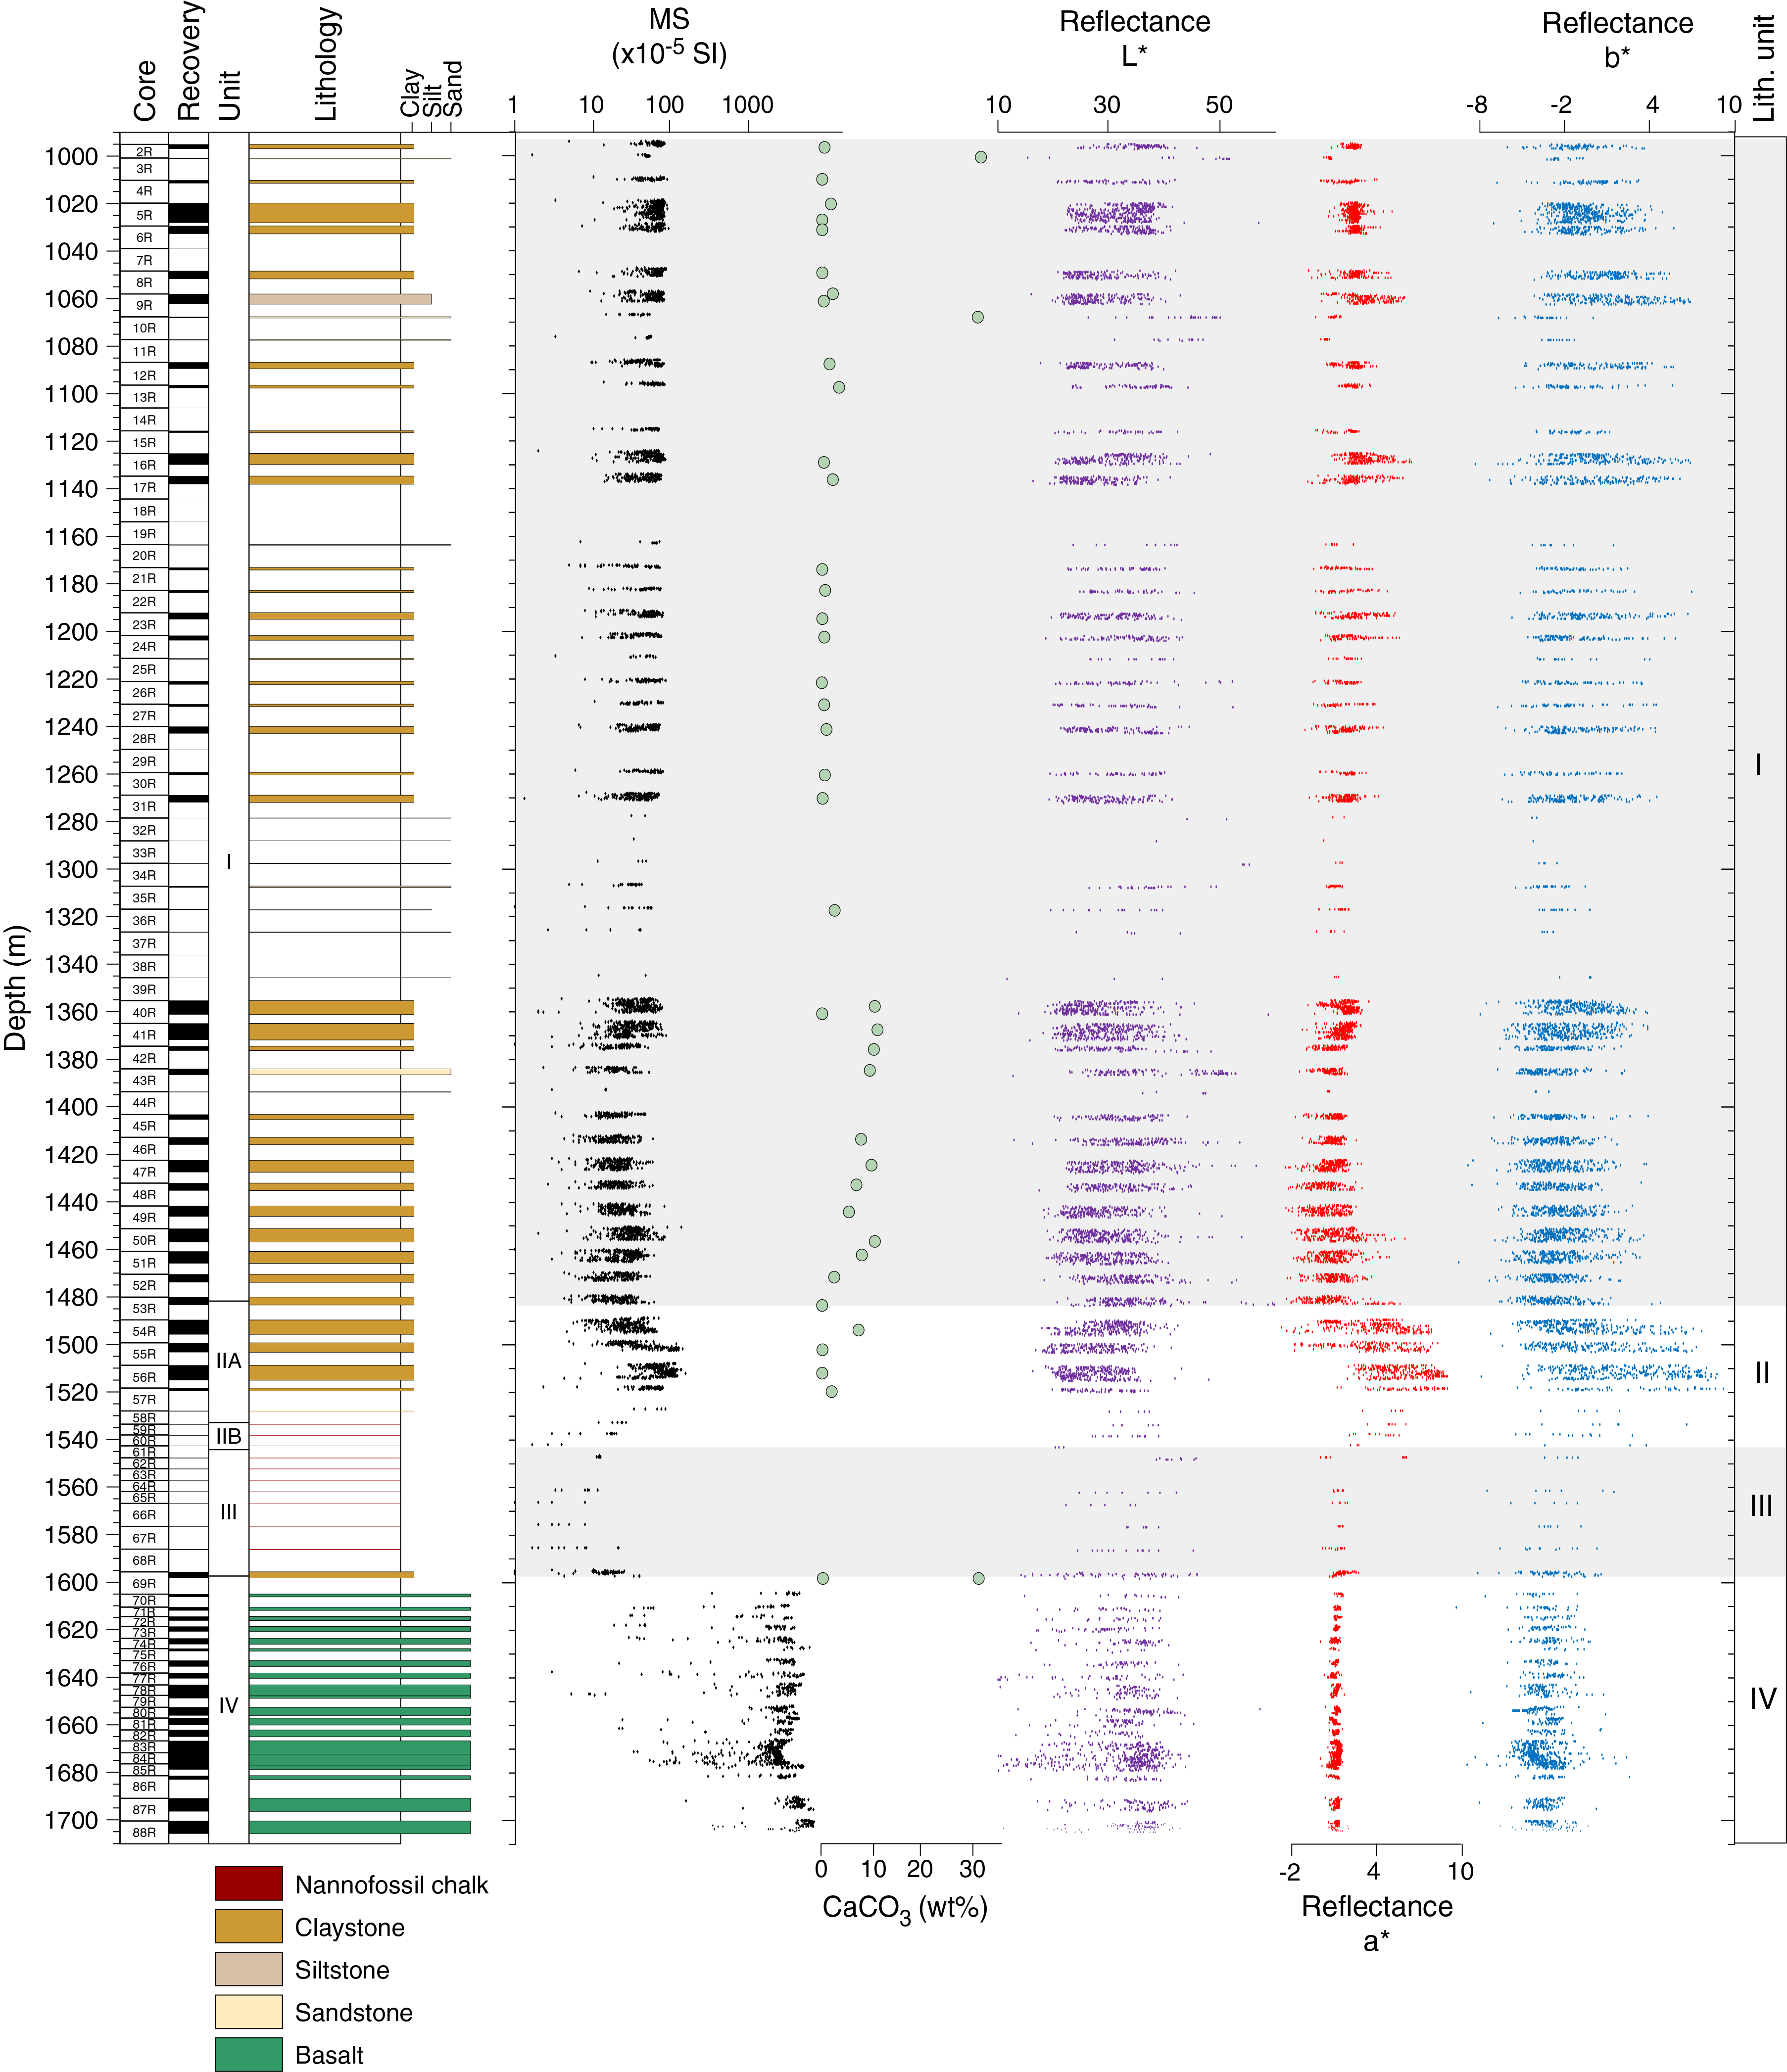
Figure F9. Lithostratigraphic units, physical properties, and carbonate content.

Figure F10. XRD bulk mineralogy.
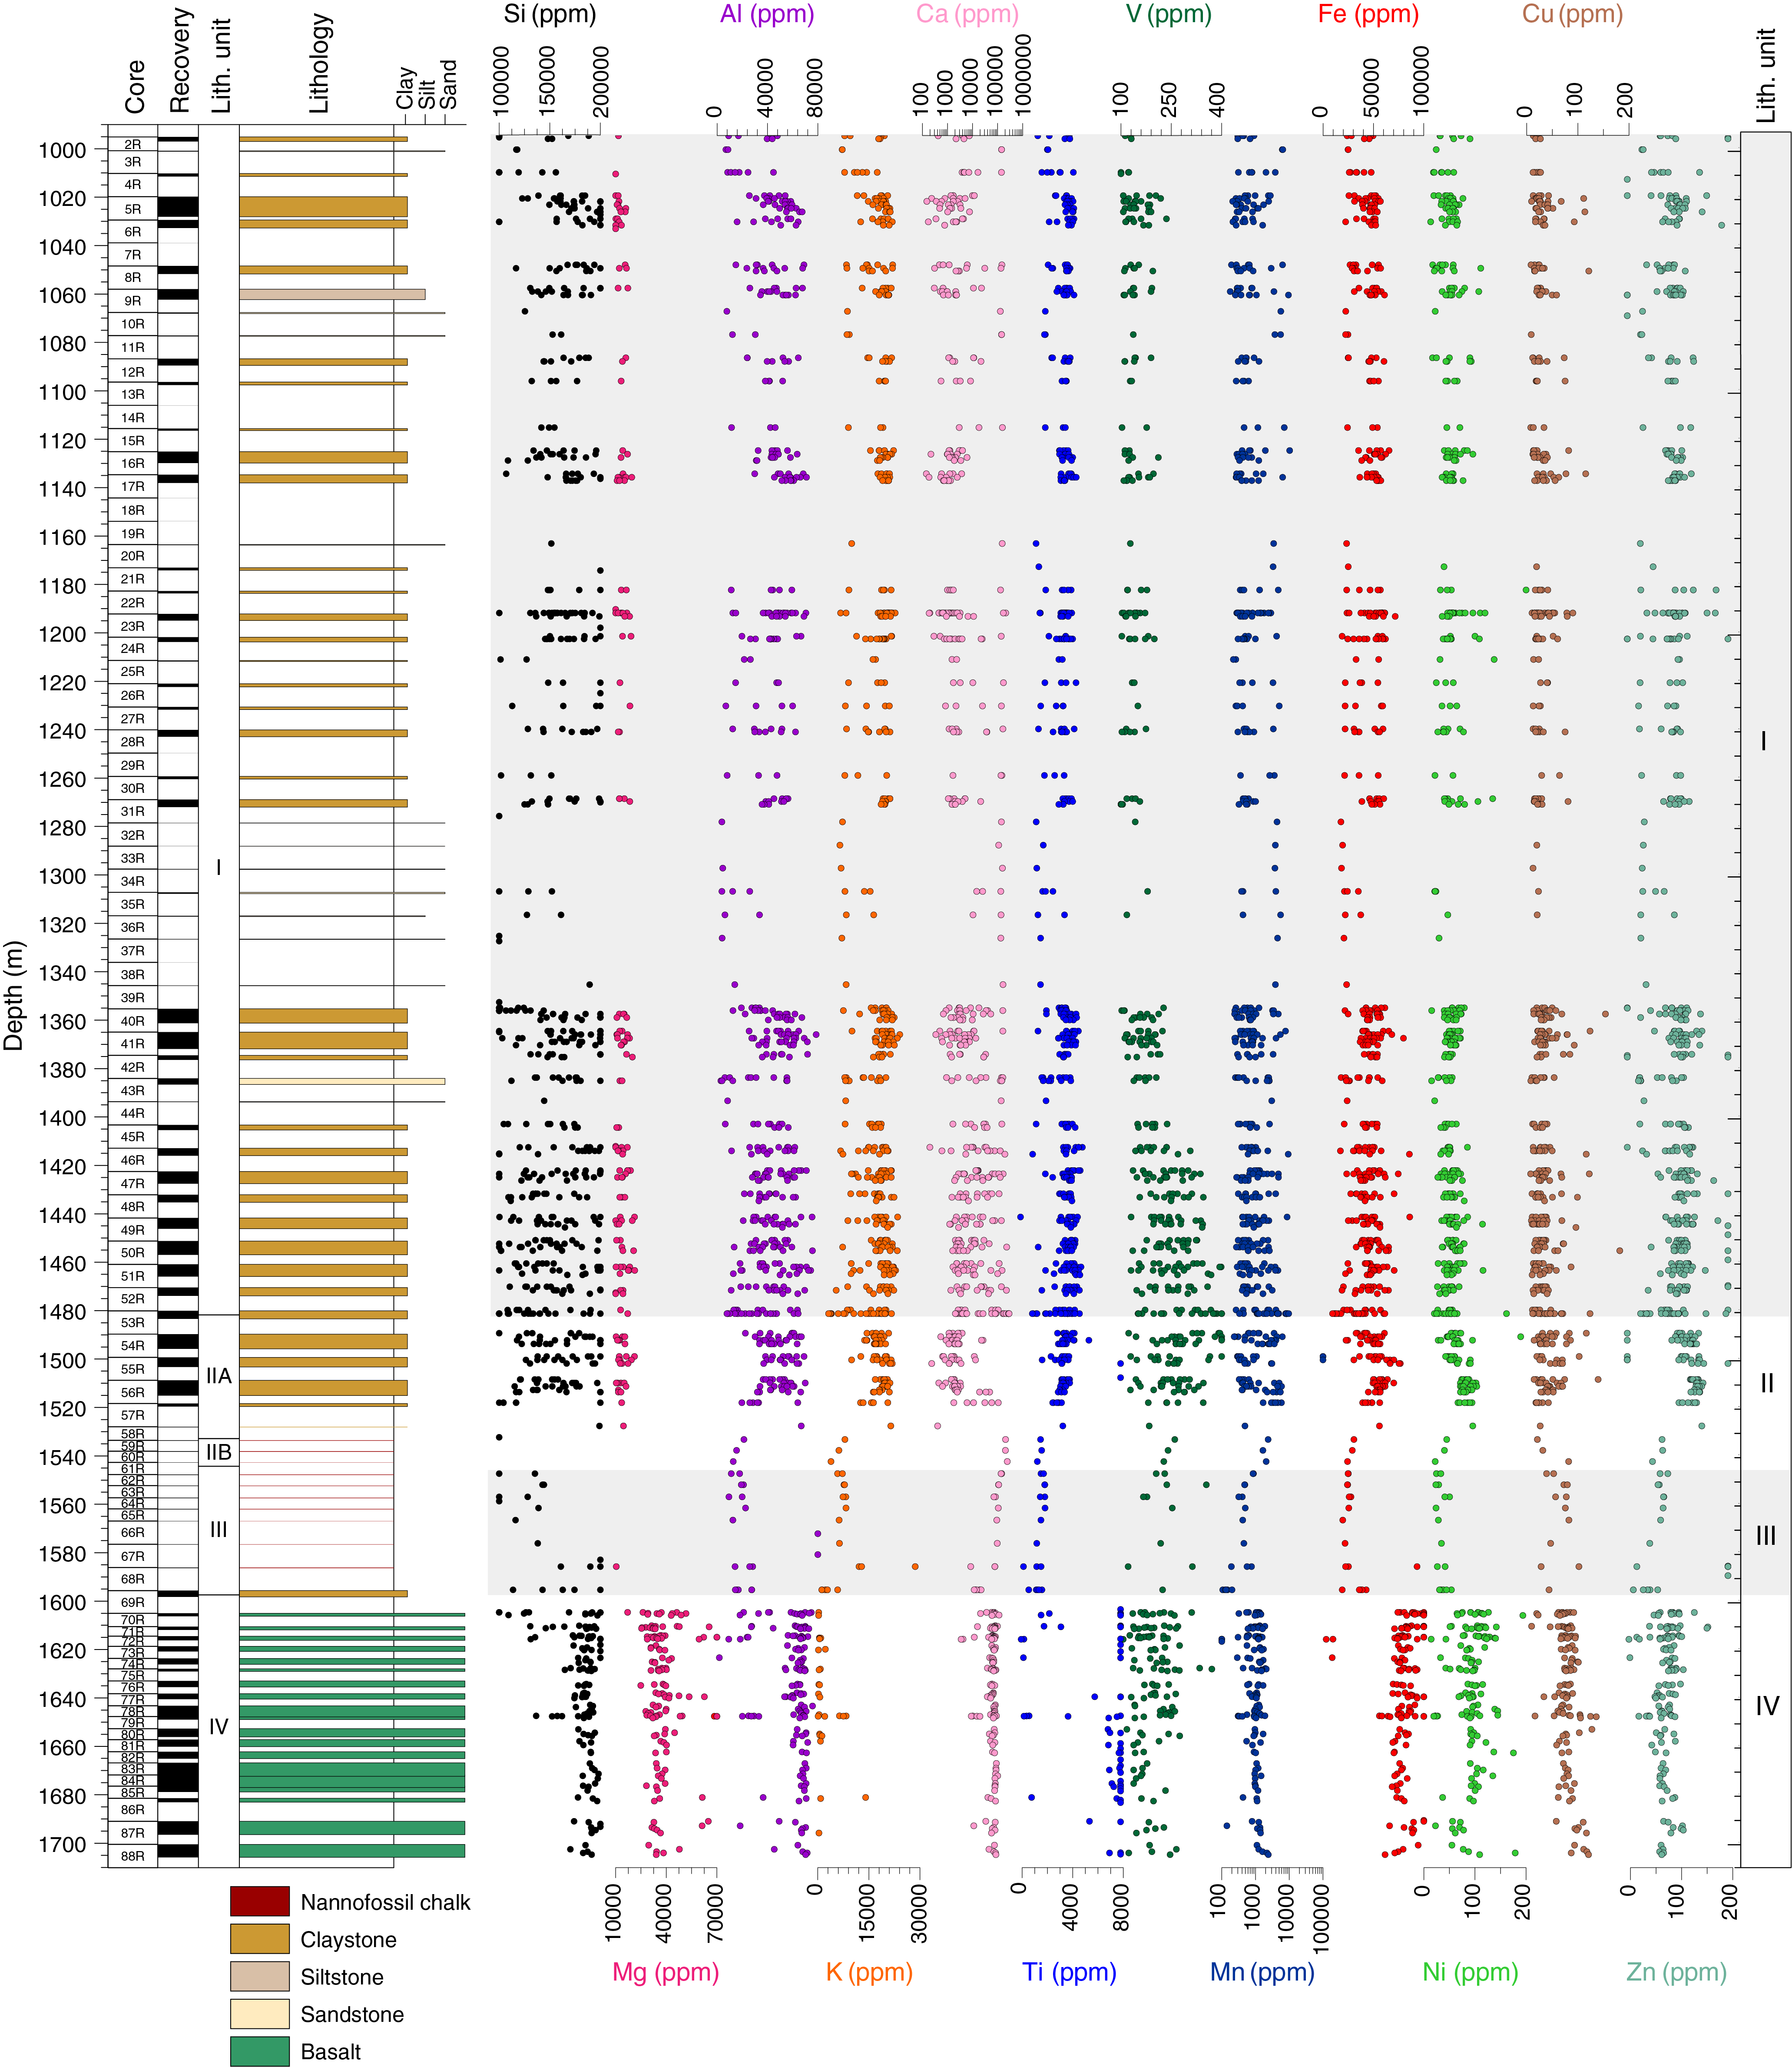
Figure F11. pXRF element abundances.
Unit descriptions
Unit I
- Interval: 368X-U1503A-2R-1, 0 cm, to 53R-2, 113 cm
- Depth: 995.10–1484.74 m (0–991.50 m cased)
- Age: late Miocene–middle Miocene
The relatively low recovery (21%) of lithostratigraphic Unit I is attributed to the presence of thick sand or sandstone layers inferred from the high-amplitude reflectivity of the seismic section. The recovered sediment and sedimentary rock from Unit I is mainly composed of consolidated to lithified claystone, silty claystone, and clayey siltstone interbedded with greenish gray and dark greenish gray sandstone and siltstone layers (Figure F12A). There are dark olive-gray nannofossil-rich claystone and grayish brown nannofossil chalk intervals from Core 368X-U1503A-41R through Section 53R-2. The claystone, silty claystone, and clayey siltstone are moderately to heavily bioturbated (Figure F12C, F12D) and have color variations of dark reddish brown, dark greenish gray, dark gray, and dark grayish brown. Two types of sandstone (Figure F12B) are differentiated based on color, carbonate content, and sedimentary structures. The greenish gray sandstone is well sorted and massive and has relatively higher carbonate content. Thin sections from this lithology (Figure F12I) show subangular quartz and plagioclase in a carbonate cement. The dark greenish gray sandstone contains fining-upward sequences and mudstone intraclasts. Siltstone interval frequency increases downhole, and the intervals contain cross-, parallel, and convolute lamination (Figure F12F, F12G). The lithologies are arranged in repetitive sequences with sandstone or siltstone basal intervals overlain by a gradational sequence from clayey siltstone to silty claystone and claystone. The repetitive fining upward sequences and the presence of tractional sedimentary structures in the coarser material indicate that the much of the sediment of lithostratigraphic Unit I was transported by deep-sea turbiditic flows.

Figure F12. Sedimentary structures.
pXRF data were collected throughout lithostratigraphic Unit I (Figure F11). Dark reddish brown claystone intervals generally have higher Fe content relative to all other lithologies. In intervals with heavier bioturbation, Fe content is usually relatively lower and Ca and Al contents are higher. Greenish gray sandstone usually contains a higher percentage of Ca and Sr, whereas dark greenish gray sandstone has higher Al, Si, and Mg contents and lower Ca content. The bulk mineralogy of Unit I, as measured by XRD, consists mainly of quartz (32.4%–95.3%), plagioclase (1.0%–18.5%), muscovite (0%–27.8%), and clay minerals (including kaolinite, chlorite, and illite; 0%–32.6%) (Figure F10; Table T2). Calcite was not detected by XRD in most samples; however, ten samples contain ~10%–40% calcite. Of those ten samples, eight are located deeper than 1350.0 m. Moreover, carbonate (inferred as calcite) content covaries with lithology; namely, the greenish gray sandstone intervals have higher calcite content than the claystone.
The magnetic susceptibility of lithostratigraphic Unit I ranges from 10 × 10−5 to 158 × 10−5 SI with an average of 41 × 10−5 SI. A decrease in average magnetic susceptibility to 25 × 10−5 SI was observed between Cores 368X-U1503A-41R and 53R. Relatively lower color reflectance a* was also observed in Cores 41R and 53R (Figure F9). Color reflectance L* is greater in sandstone intervals, which is consistent with high carbonate content. The increase in carbonate content, decrease in magnetic susceptibility, and change in color reflectance from Core 41R through the deeper sediments and sedimentary rocks correlate with the increase in nannofossil-rich lithologies.
Unit II
- Interval: 368X-U1503A-53R-2, 113 cm, to 61R-CC, 7 cm
- Depth: 1484.74–1542.77 m
- Age: middle Miocene–late Oligocene
The contact between lithostratigraphic Units I and II is gradational from Core 368X-U1503A-53R through Core 55R with alternating dark reddish brown and greenish gray claystone (Figure F13). The contact is placed where the abundance of siltstone and sandstone in Unit I noticeably decreases and the overall sediment color changes to reddish brown in Unit II. The recovery of this unit is variable (2%–65%; average = 25%). Unit II is divided into two subunits based on carbonate and nannofossil content.
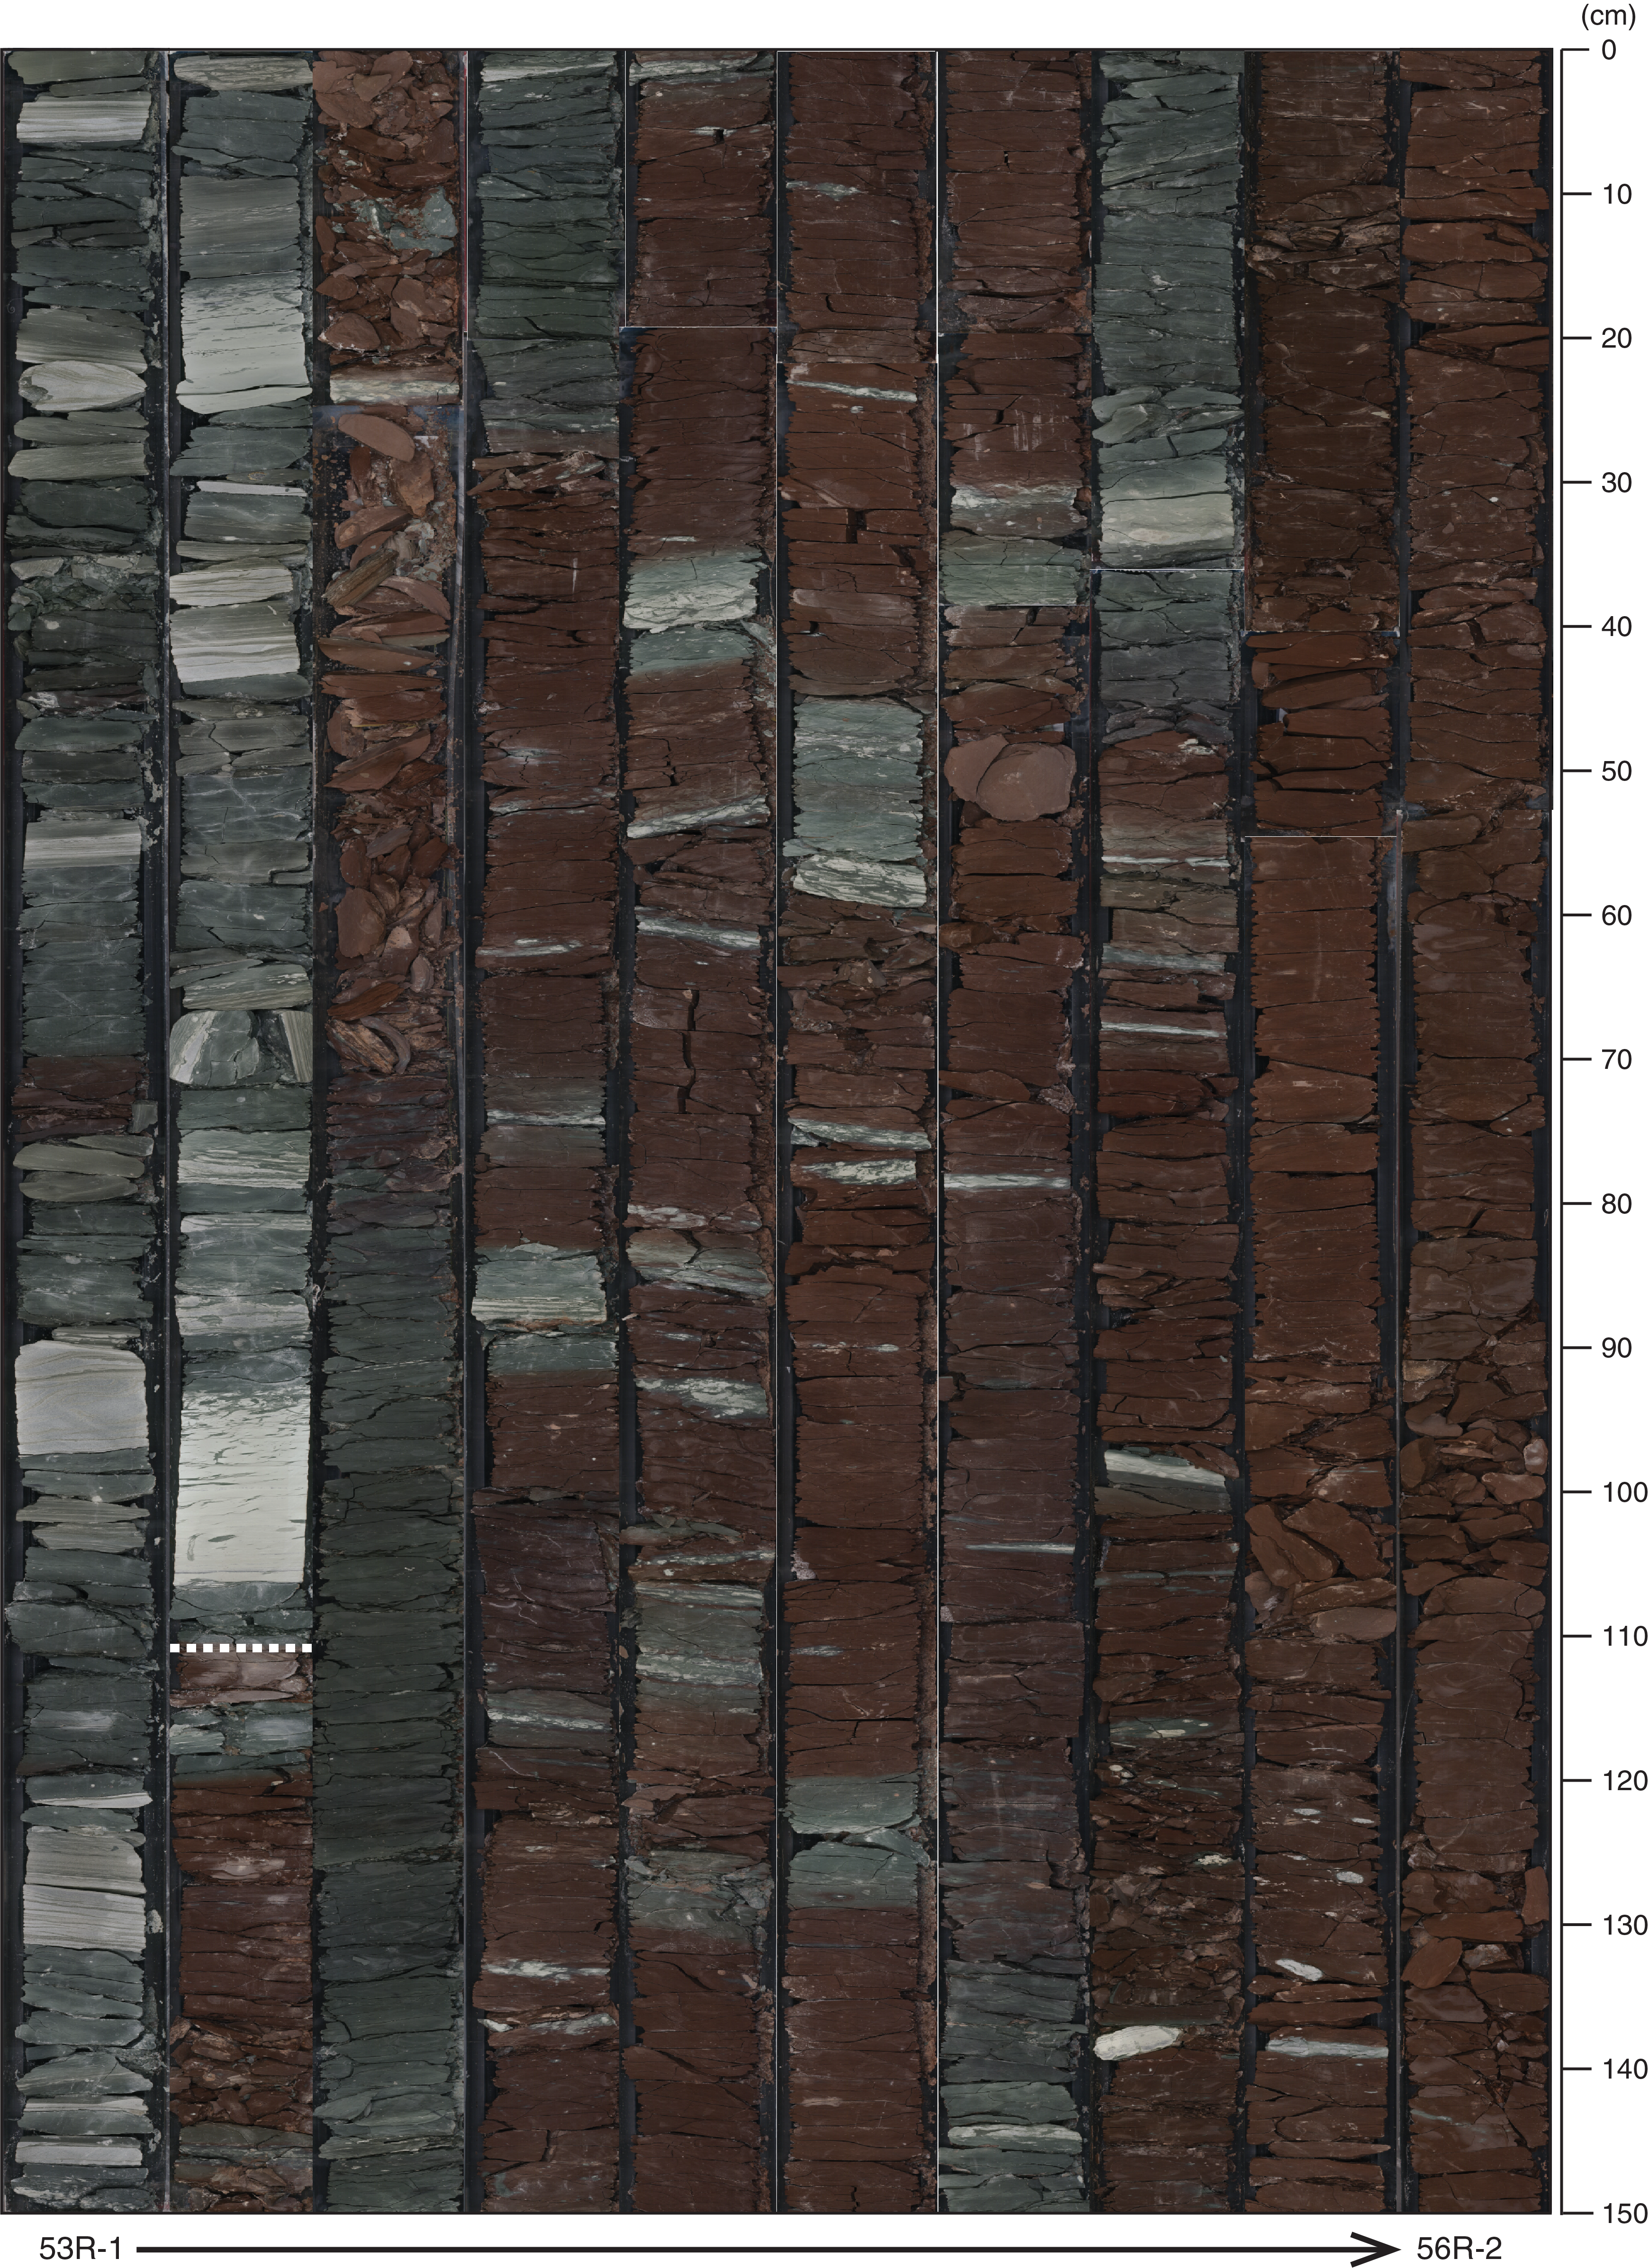
Figure F13. Unit I to II transition.
Subunit IIA
- Interval: 368X-U1503A-53R-2, 113 cm, to 58R-CC, 13 cm
- Depth: 1484.74–1533.60 m
- Age: middle Miocene–early Miocene
Lithostratigraphic Subunit IIA consists of well-consolidated dark reddish brown claystone, silty claystone and clayey siltstone with heavy bioturbation, and slightly inclined dark greenish gray clayey siltstone intervals. Some of the claystone intervals are massive, but there are repeated fining up intervals from clayey siltstone to claystone interpreted to be turbidites. There are greenish halos around foraminifer tests and other fossil fragments. Interval 368X-U1503A-55R-2, 97–99 cm is 2 cm of light greenish gray, highly bioturbated nannofossil chalk.
Element contents in pXRF measurements (Figure F11) in Subunit IIA suggest that carbonate content in the dark reddish brown claystone intervals is generally very low (<1%) but Sr, Fe, Ni, Zn, and Al contents are relatively high. Calcium content is as much as 25% in intervals where burrows are visible. The discrete XRD samples taken from Subunit IIA are composed mainly of quartz (25%–45%), plagioclase (5%–12%), muscovite (15%–30%), and clay minerals. Only one sample (368X-U1503A-54R-3, 53–55 cm) is dominated by carbonate (~20%) with <25% quartz (Figure F10).
Magnetic susceptibility is variable throughout lithostratigraphic Subunit IIA, with lower values at the top of the subunit (0 × 10−5 to 67 × 10−5 SI) and an increase below Core 368X-U1503A-54R (0 × 10−5 to 158 × 10−5 SI) (Figure F9). Higher magnetic susceptibility below Core 368X-U1503A-54R is possibly related to the increased Fe content observed in pXRF measurements (Figure F11). L* reflectance data range from 16 to 47 throughout the subunit, and the highest values are found in the coarser intervals. Color reflectance a* is positive throughout the subunit (average = 4.6), which correlates well with the dominant reddish color.
Subunit IIB
- Interval: 368X-U1503A-58R-CC, 13 cm, to 61R-CC, 7 cm
- Depth: 1533.60–1542.77 m
- Age: early Miocene–late Oligocene
Only 48 cm of reddish brown clay-rich nannofossil chalk was recovered. However, lithostratigraphic Subunit IIB was defined based on physical property data and following the description of Site U1500 (see the Site U1500 chapter [Stock et al., 2018]). Smear slides contain abundant to dominant calcareous nannofossils that correlate with an increase in carbonate content observed in pXRF measurements in Section 368X-U1503A-59R-CC.
Element abundances (pXRF) shift noticeably between Sections 368X-U1503A-58R-CC and 59R-CC. Si, Al, K, Ti, Fe, Ni, and Zn contents decrease by 2–3 times, and Ca, V, Mn, Sr, and Cu increase by 2–5 times (Figure F11). Ca is the primary component of these sediments (as much as 25%). Because of poor recovery, no discrete XRD samples were collected in this subunit.
Magnetic susceptibility is very low throughout the subunit and ranges from 3 × 10⁻⁵ to 27 × 10−5 SI. This low magnetic susceptibility is possibly related to the decrease in Fe content and the increase in carbonate content (Figures F9, F11). L* reflectance is low and ranges between 2 and 5 (average = ~4). Average color reflectance a* is negative (−0.45), and average color reflectance b* is positive (7.2) (Figure F9).
Unit III
- Interval: 368X-U1503A-61R-CC, 7 cm, to 69R-2, 96 cm
- Depth: 1542.77–1597.84 m
- Age: late Oligocene to early Oligocene
Lithostratigraphic Unit III contains heavily bioturbated lithified greenish gray nannofossil-rich claystone, nannofossil-rich claystone with foraminifers, greenish gray claystone, light greenish gray clayey siltstone and siltstone, dark gray nannofossil-rich laminated silty claystone, nannofossil-rich silty claystone with foraminifers, nannofossil-rich silty claystone with pyrite, and clay-rich nannofossil chalk. Recovery in Unit III is extremely low (5%). A greenish black interval, Section 368X-U1503A-68R-CC (TS02; 1586.30–1586.34 m), has a foliation defined by chlorite and abundant sulfide minerals (Figure F14). The alteration and bioturbation make it difficult to interpret how the interval formed. The chlorite might be replacing volcanic ash, or the interval might be a zone of hydrothermal alteration. Core 69R contains nannofossil-rich claystone, nannofossil-rich silty claystone with foraminifers, and clay-rich nannofossil chalk with alternating dark gray and light greenish gray bands dipping ~30°. There are thin, light greenish gray intervals of nannofossil-rich clayey siltstone. All lithologies have heavy bioturbation. In interval 69R-1, 22–26 cm, a set of millimeter-scale normal faults occurs in a finely laminated clayey siltstone.
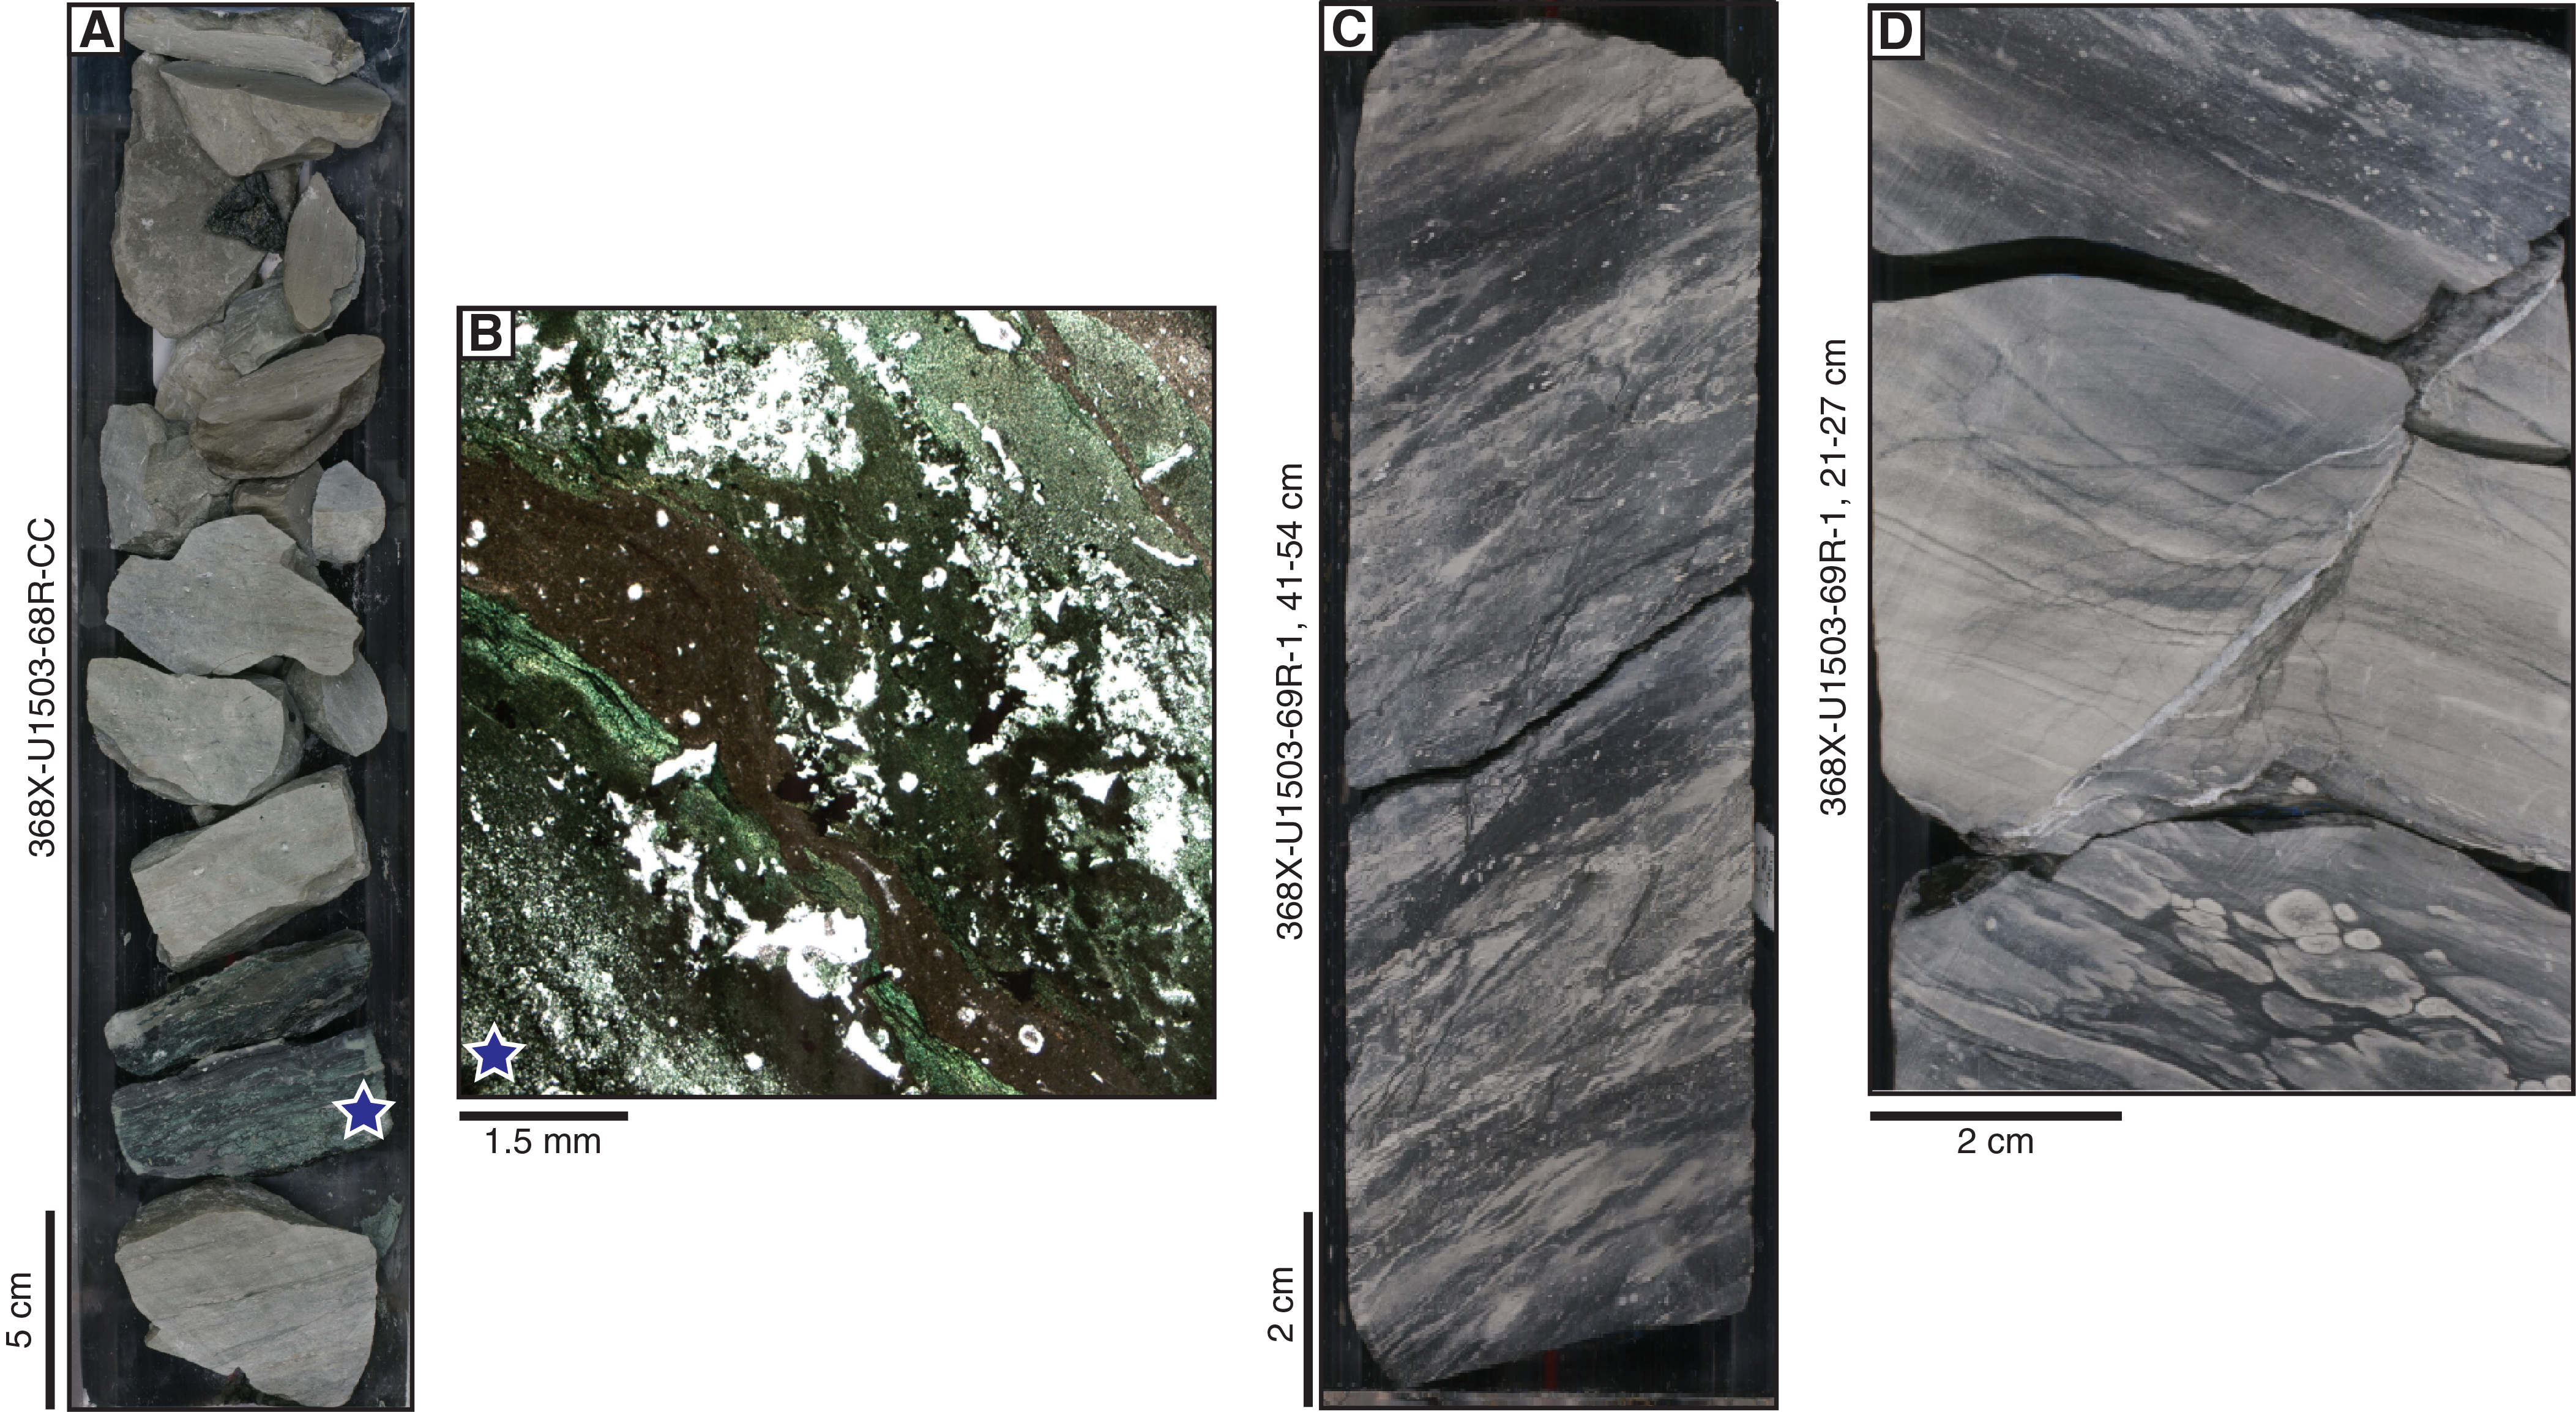
Figure F14. Sedimentary and deformation structures.
Element abundances determined by pXRF are similar in range to those in lithostratigraphic Subunit IIB. Ca, V, Mn, and Cu contents are high, but Si, Al, K, and Fe contents are low. One exception occurs in Sample 68R-CC, 22 cm, where high S, K, Fe, and Rb and low Al, Mg, Ca, Ti, Mn, and Zn were detected, which may correspond to the greenish black interval. XRD measurements were taken in the dark gray claystone and greenish gray claystone of Samples 69R-1, 70–72 cm, and 69R-2, 64–65 cm. The dark gray claystone is composed of 68.8% quartz and 31.2% plagioclase, and the greenish gray claystone is composed of 45.6% quartz, 17.6% K-feldspar, 16.4% calcite, 9.7% muscovite, and minor plagioclase and clay minerals.
L* reflectance ranges from 14 to 45 and averages ~33. Color reflectance a* averages 1.7, and color reflectance b* averages −1.9. Magnetic susceptibility is very low on average (10 × 10−5 SI) and ranges from 0 to 25 × 10−5 SI (Figure F9).
Unit IV
- Interval: 368X-U1503A-69R-2, 96 cm, to 88R-4, 130 cm
- Depth: 1597.84–1710.10 m
- Age: early Oligocene (older than 29–30 Ma)
Unit IV comprises basalt and is further divided into three subunits based on flow morphology and XRF compositional data (see Igneous petrology and structural geology for description of principal composition). The basalt flows are bound with chilled, glassy margins plus occasional chert or claystone intervals (Samples 74R-1, 49–61 cm; 79R-1, 5–23 cm; 81R-1; 114–122 cm; and 81R-2, 87–90 cm). Claystone pieces recovered at the top of some cores are inferred to represent fall-in material.
Igneous petrology and structural geology
In Hole U1503A, basalt was drilled from 1597.84 to 1710.10 m with a total recovered core length of 47.51 m. The basalts are sparsely to moderately plagioclase (± olivine) phyric, nonvesicular to moderately vesicular with mostly subophitic, intergranular or interstitial textures. Lithostratigraphic Unit IV is composed of basalt and corresponds to igneous lithologic Unit 1. Igneous Unit 1 contains 38 hypohyaline to holohyaline chilled margins with altered glass, plus occasional chert, hyaloclastite, or claystone intervals. Igneous Unit 1 is further divided into three subunits (1a, 1b, and 1c) based on flow morphology and XRF compositional data: an upper sequence of pillow and lobate flows (Subunit 1a), a distinct massive flow (Subunit 1b), and a lower sequence of interbedded pillow, lobate, sheet, and massive flows (Subunit 1c). The highly plagioclase-phyric horizons found at Sites U1500 and U1502 (see the Site U1500 chapter and the Site U1502 chapter [Stock et al., 2018; Larsen et al., 2018a]) were not observed in Hole U1503A, where modal phenocryst abundances are <10%. Veins are found throughout the lava flows as single, branched, or networks, in sharp contact with the host basalt, and are predominantly filled with carbonates, chlorite, pyrite, and Fe (hydr)oxides. Alteration of basaltic flows is slight to moderate throughout Unit IV.
Unit description
Igneous Unit 1 (lithostratigraphic Unit IV)
- Interval: 368X-U1503A-69R-2, 96 cm, to 88R-4, 130 cm
- Depth: 1597.84–1710.10 m
- Recovery: 47%
- Lithology: pillow and lobate flows of aphyric to plagioclase(-olivine) phyric basalt, with minor chert and claystone
- Age: early Oligocene (older than 29-30 Ma)
The boundary between the sediment of lithostratigraphic Unit III and the underlying basalt of igneous Unit 1 is at 1597.84 m. Igneous Unit 1 continues through 112.26 m of basement to 1710.1 m at the bottom of Hole U1503A. Unlike at Site U1500 (see the Site U1500 chapter [Stock et al., 2018]), the top of the basement is not well recovered. The sediment/basement contact occurs at the bottom of Section 368X-U1503A-69R-2 and is defined by the separation of claystone and basalt rubble. However, a chilled margin was observed in the basalt rubble. Throughout igneous Unit 1, the recovered basaltic rocks remain mineralogically and texturally very similar (Figure F15D). Unit 1 is primarily composed of aphyric or sparsely to moderately plagioclase (± olivine) phyric basalt that is nonvesicular to moderately vesicular (Figure F15C). Some pieces have an aphanitic or aphyric texture, but most textures were defined as subophitic, intergranular, or interstitial. Unit 1 contains 38 hypohyaline to holohyaline chilled margins with occasionally preserved altered glass (Figure F15A). The distribution of chilled margins is not homogeneous; the density of chilled margins is higher in the shallower cores (down to Core 368X-U1503A-78R) and in Core 87R. The claystones are baked and crosscut by calcite and pyrite veins, indicating that they were emplaced before or during the extrusion of the basaltic melt. Unaltered claystone pieces together with basalt fragments with a lithology different to the bulk of the core were recovered at the top of some cores and are inferred to represent fall-in pieces.

Figure F15. Macroscopic features.
All recovered basalts are grouped as lithostratigraphic Unit IV (see Lithostratigraphy)/igneous Unit 1 due to the lack of any substantial change in mineralogy, texture, composition, or emplacement mechanism. The basalts are separated into three igneous lithologic subunits (1a, 1b, and 1c) based on flow morphology (Figure F16) and high-resolution, qualitative to semiquantitative compositional data obtained from XRF core scanning (Figure F17). Subunit 1a (50.0 m) is composed of ~36 pillow or lobate flows with intermediate to high Zr XRF intensities (Figure F16; Table T3). Subunit 1b represents the first massive flow (7.7 m) and has a comparatively low Zr XRF intensity. The lower part of the volcanic sequence (i.e., Subunit 1c, 42.7 m thick) has alternations of pillow, lobate, sheet, and massive flows with mostly low Zr XRF intensities except for two horizons with high Zr XRF intensities (the base of Section 368X-U1503A-80R-2 to the top of Section 81R-1 and the base of Section 85R-1 to the top of Section 85R-2) that point to higher Zr contents compared to the other lava flow sequences.
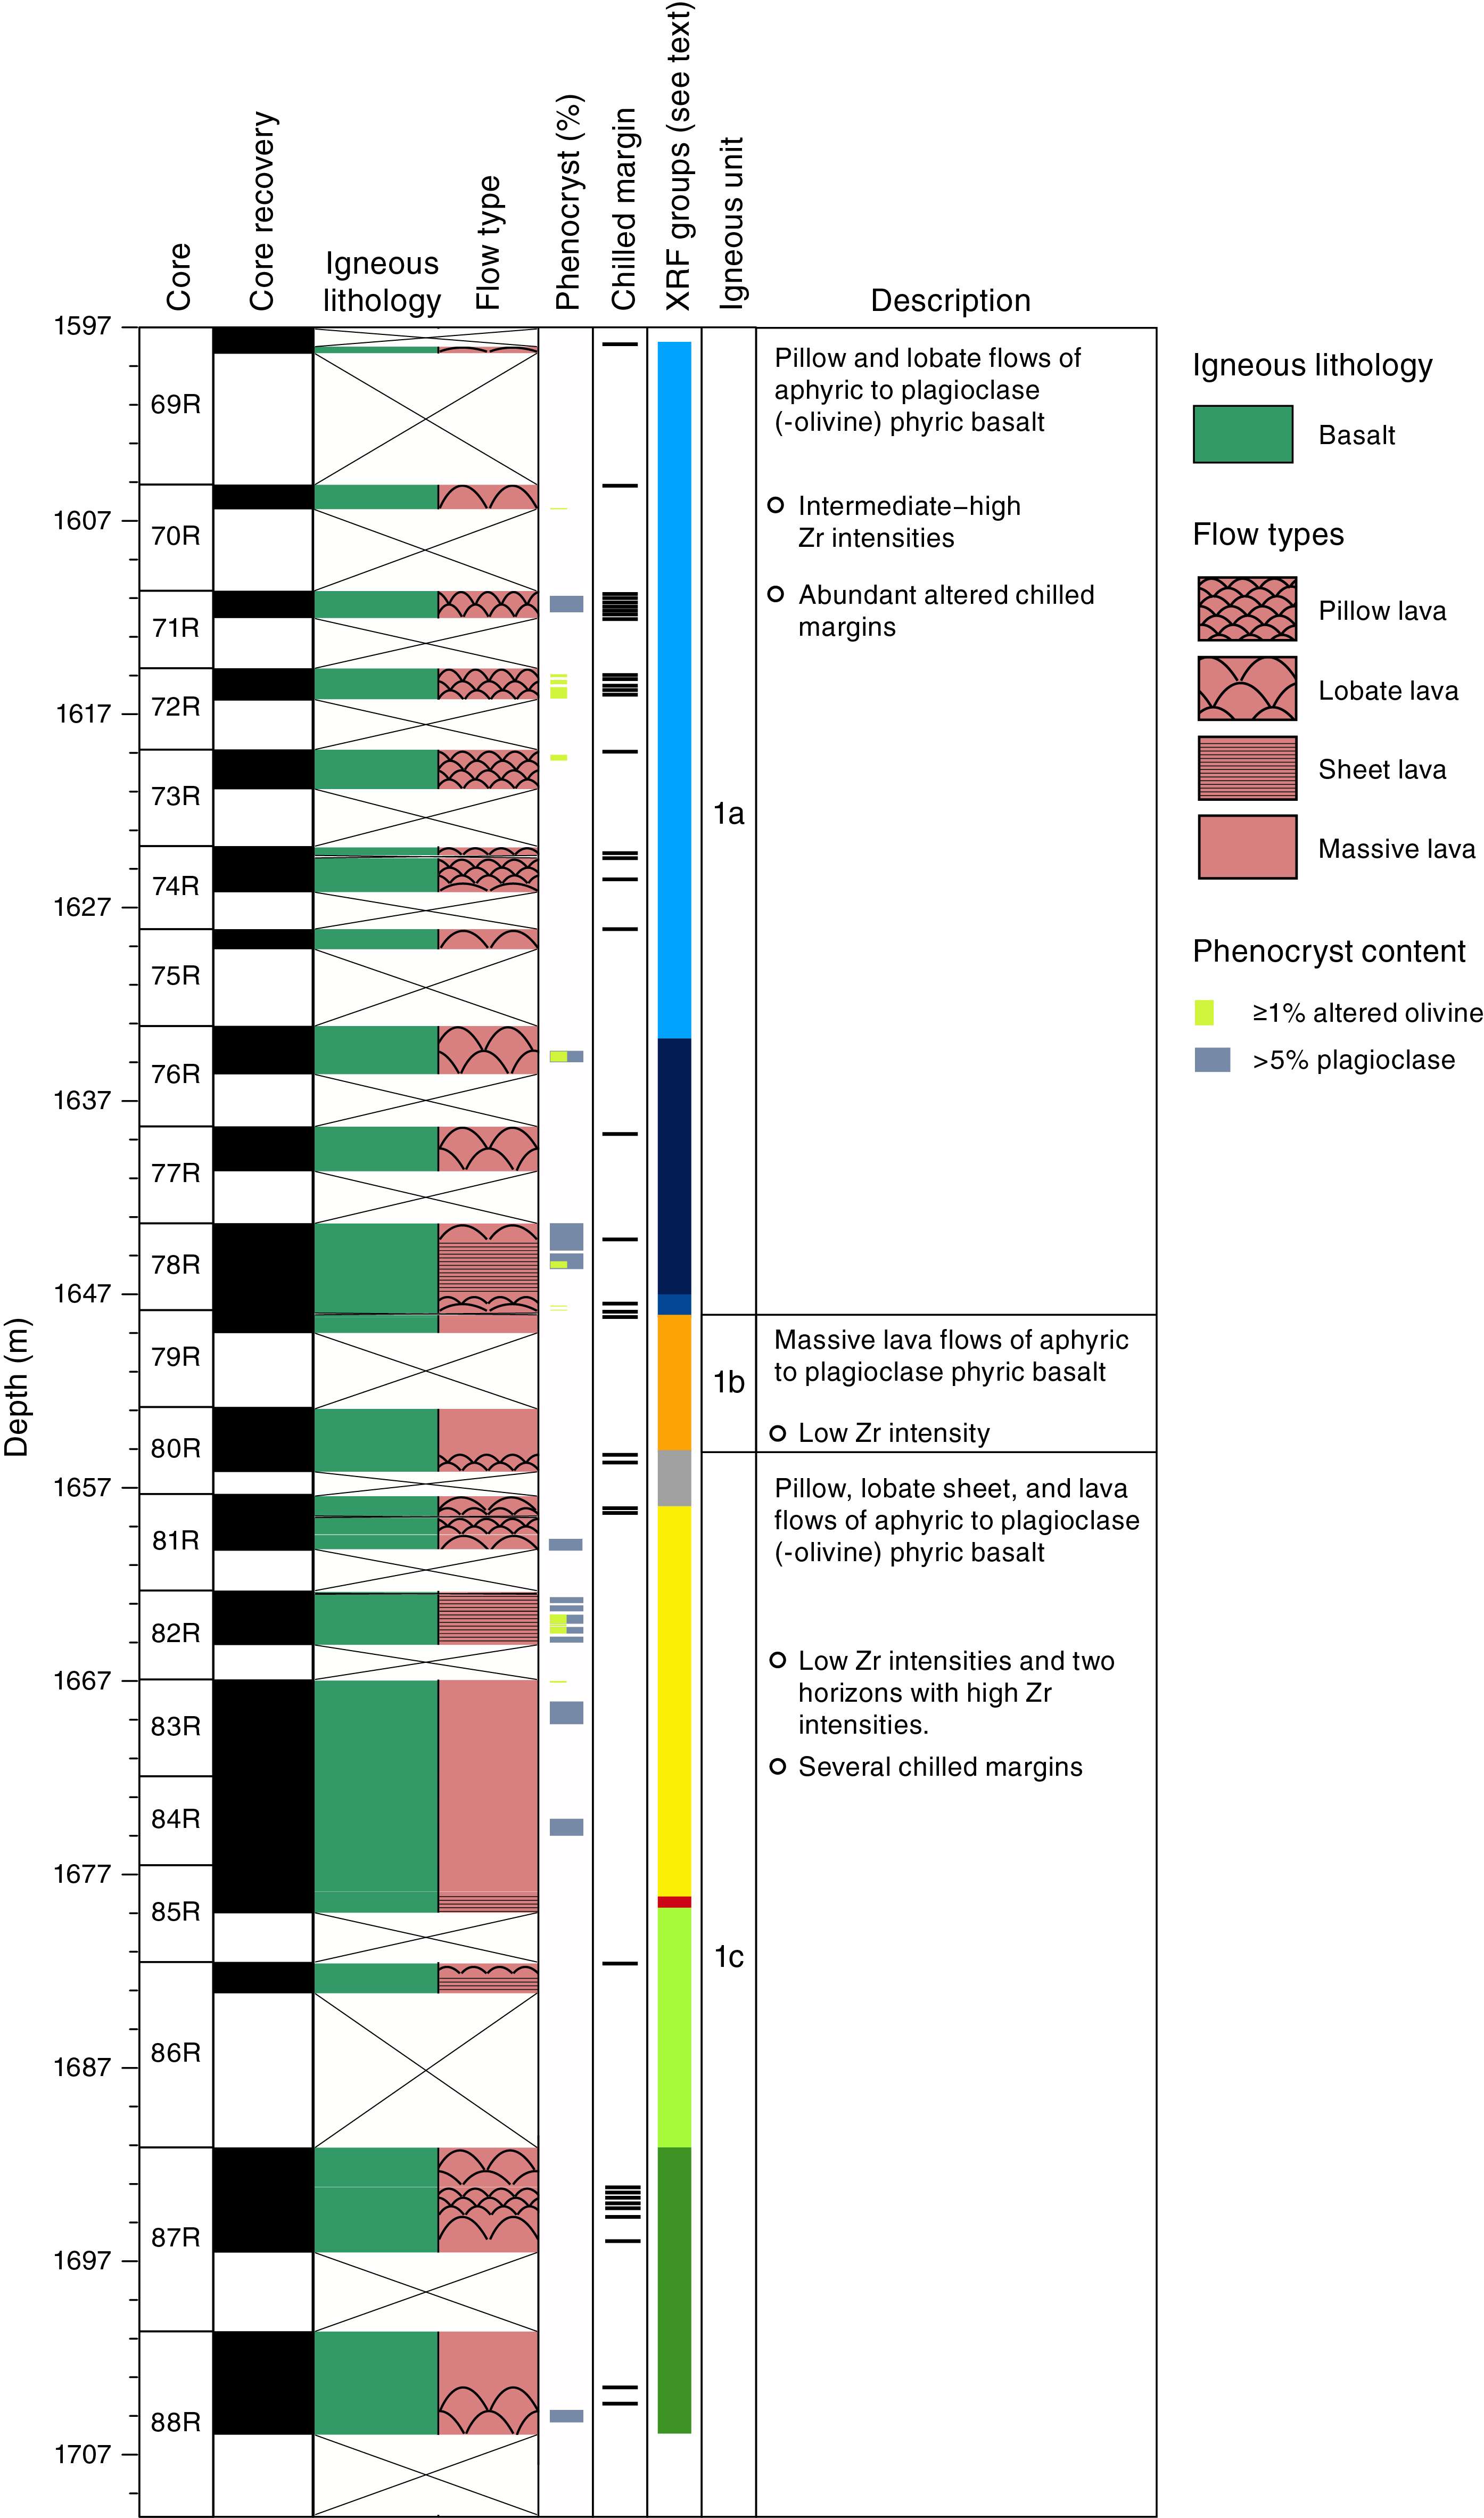
Figure F16. Basalt lithostratigraphic summary.
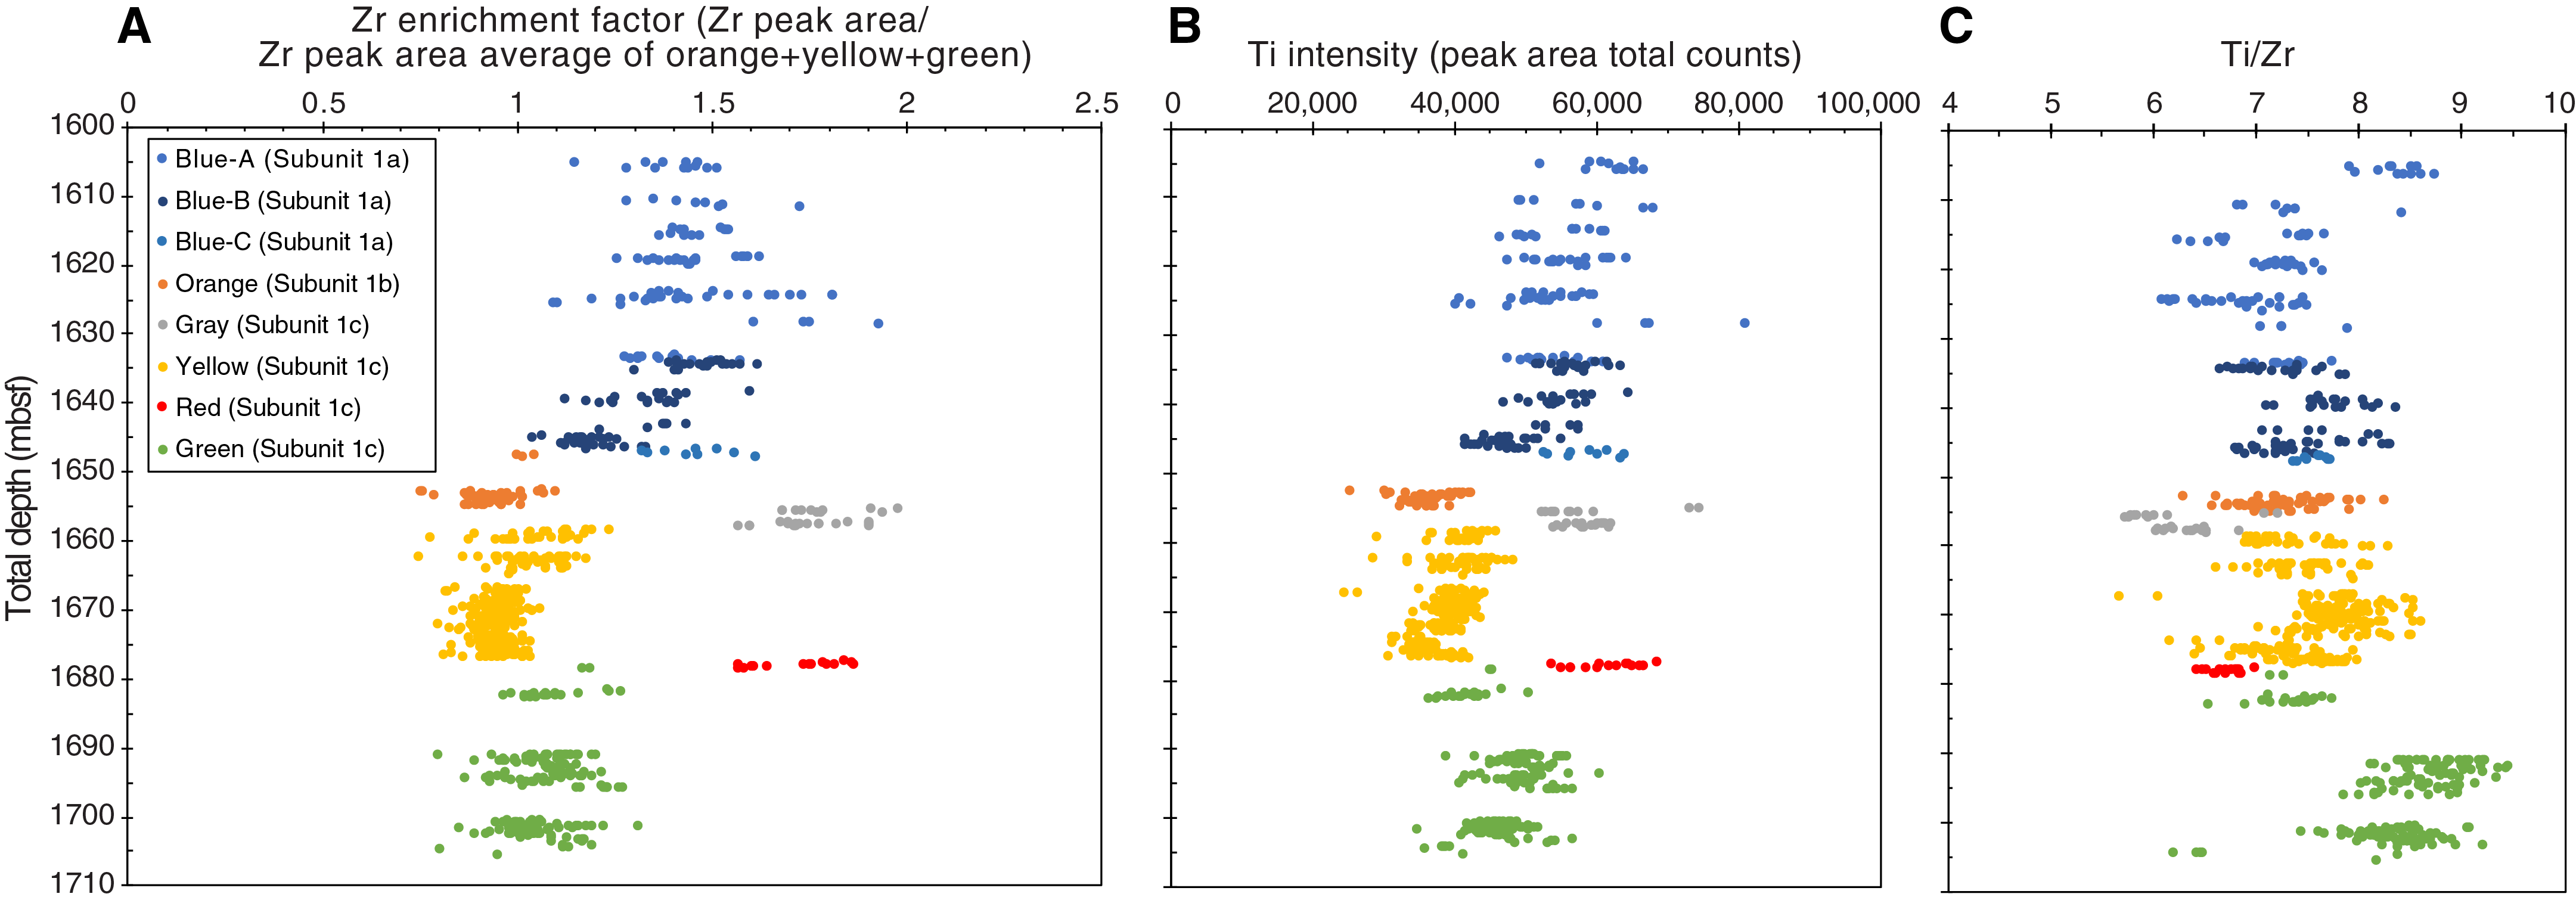
Figure F17. XRF basalt geochemical proxies.
The basalts are very dark gray to greenish gray, suggesting slight to moderate alteration. Euhedral fresh to completely replaced plagioclase phenocrysts were observed throughout the igneous Unit 1 basalts, and altered olivine and traces of altered clinopyroxene intermittently were found as sparse phenocryst phases. At the microscopic scale, the cryptocrystalline, hypocrystalline to fine-grained, porphyritic basalts show well-preserved primary igneous mineral assemblages (plagioclase, clinopyroxene, olivine, and Fe-Ti oxides) and microtextures ([sub]ophitic, aphanitic, intergranular, and interstitial) (Figure F18A–F18C). Elongated prismatic subhedral to euhedral plagioclase is the dominant phenocryst mineral (1%–9%; 0.5–10 mm). Plagioclase glomerocrysts were occasionally observed in thin section. A small quantity of clinopyroxene phenocryst pseudomorphs (<5%) were observed under the microscope, some of which are altered to amphibole, chlorite, and Fe-Ti oxide. Olivine (<5%; 0.1–0.3 mm) remains an occasional phenocryst mineral throughout Unit 1 and is either fresh (Figure F18D) or recognizable by olivine pseudomorphs.
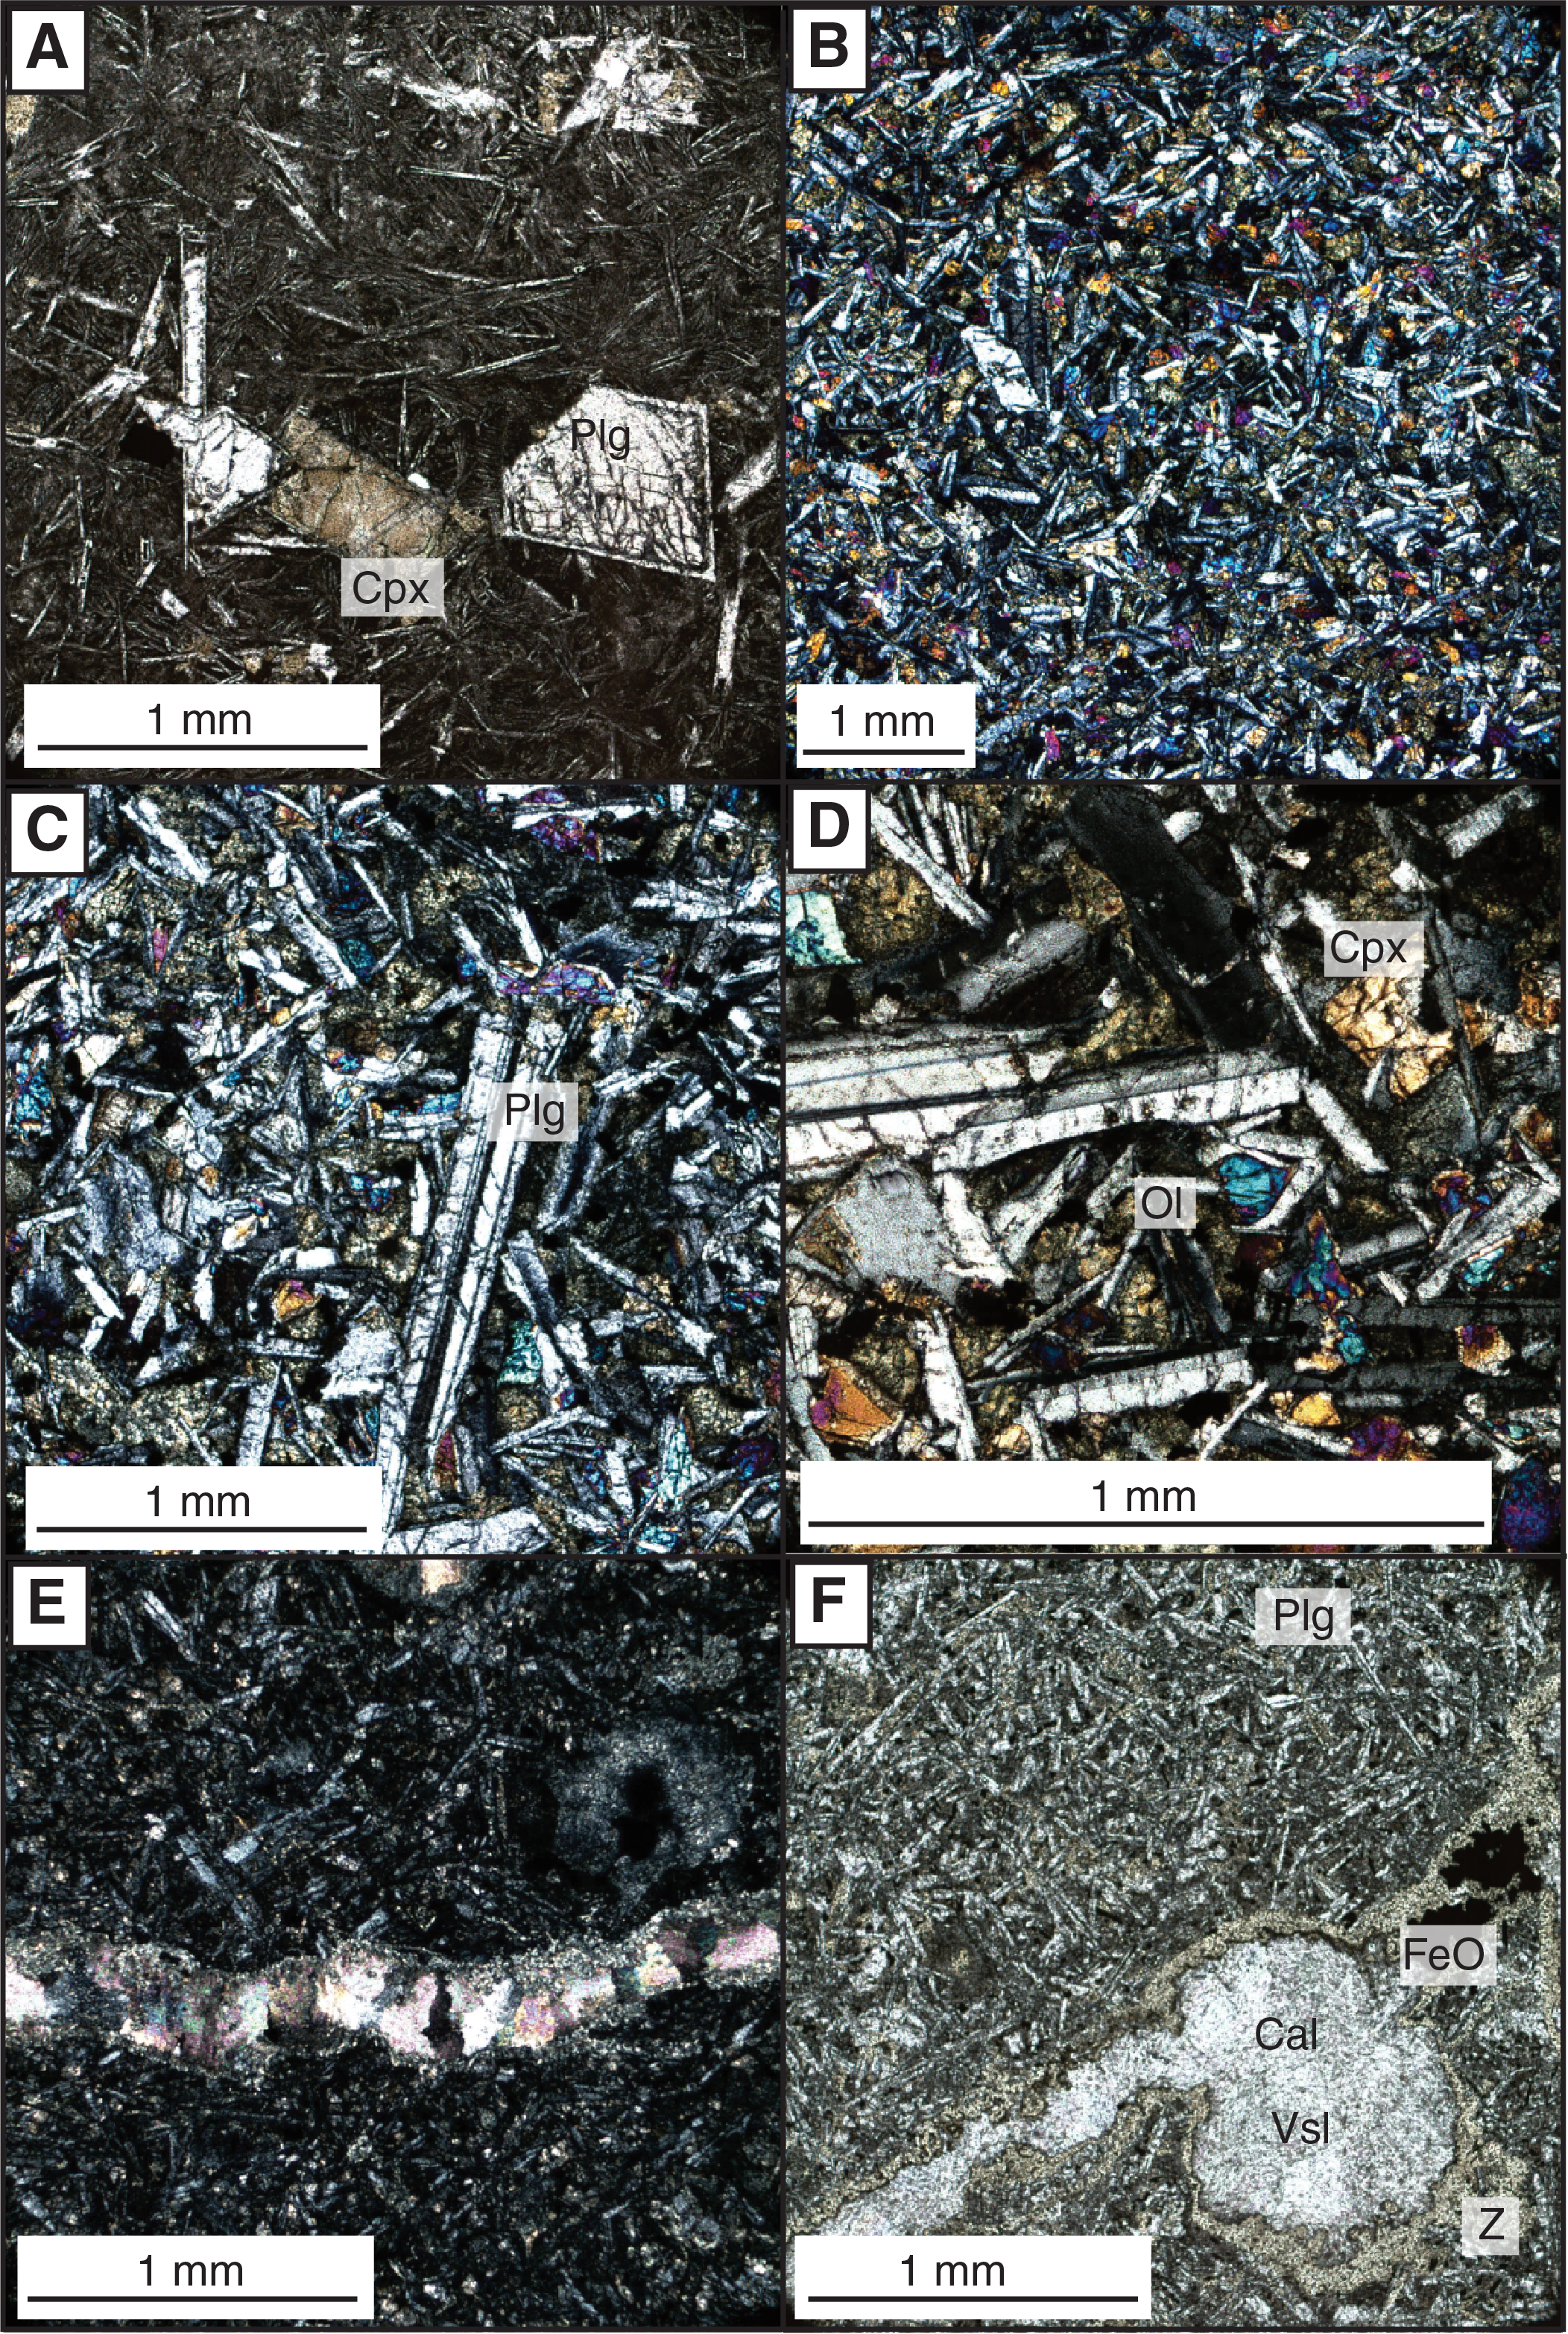
Figure F18. Microscopic features.
The hypocrystalline groundmass is primarily composed of plagioclase, clinopyroxene, glass, and Fe-Ti oxides and occasionally contains olivines that have been completely altered into serpentine. Plagioclase mostly occurs as narrow elongated prismatic or tabular crystals in subophitic relationships with clinopyroxene and altered glass. Clinopyroxene mostly occurs as narrow prismatic crystals within poikilitic texture or as interstitial stubby crystals between plagioclase laths. Clinopyroxene is partially slightly altered to chlorite and amphibole.
Veins and alteration
Veins are found throughout igneous Unit 1 and are predominantly filled with Fe hydr(oxides), carbonates, chlorite, and pyrite, giving them a black, greenish black, greenish white, or white to yellowish color. Veins mostly have a sharp contact with the host basalt and are single, in network, or sporadically branched (Figures F15F, F18E). No preferred orientation or dip of veins can be determined from the whole-round images and structural measurements. Vein texture is often either vuggy with mixed mineralogy or massive. In places, veins have a brecciated appearance with angular basalt clasts surrounded by recrystallized calcite (Figure F15E). Red alteration halos were only observed in the deepest recovered intervals (Cores 368X-U1503A-87R and 88R), which contrasts with the observations at Site U1500, where such halos are ubiquitous (see the Site U1500 chapter [Stock et al., 2018]). Background alteration varies from slight to moderate in intensity throughout Unit 1 with no systematic variation downhole. Vesicles in the flows are generally moderately to highly spherical and rounded and filled with black Fe (hydr)oxides, dark green zeolites, chlorite, and carbonates and occasional pyrite (Figure F18F). The intensity of alteration of the Unit 1 basalts is generally higher than the Site U1500 basalts (see the Site U1500 chapter [Stock et al., 2018]), although nowhere near as high as the Site U1502 basalts (see the Site U1502 chapter [Larsen et al., 2018a]). Preservation of plagioclase phenocrysts varies from fresh to completely altered and pseudomorphed by dark green zeolite or chlorite. Olivine and clinopyroxene phenocrysts are mostly completely altered and replaced by serpentine or iddingsite, and no fresh glass is preserved in chilled margins.
Bulk mineralogy
There are five XRD samples from igneous Unit 1 taken from between 1598.1 and 1656.0 mbsf (see XRD in Supplementary material [Sun et al., 2018b]). The uppermost XRD sample is dominated by plagioclase (58.1%) with a labradorite composition (50%–70% anorthite component) and secondary minerals of mainly smectite and serpentine groups (combined 40%). This reflects the moderate to high alteration with no fresh clinopyroxene present. Samples taken farther downhole reveal less alteration; minerals of the smectite group range from ~17% to 30%. Also, they contain a significant primary clinopyroxene component that has been identified as augite (~24%–32%). The labradorite content ranges from ~47% to 52% in these deeper samples. They also contain subordinate ilmenite (~1%–2%). The XRD data are consistent with a small variation in basaltic modal composition observed visually.
Chemical composition (pXRF and XRF core scanning)
Compositional analyses of igneous Unit 1 basalts, as well as veins and clasts, were made directly on the archive half of the core using the handheld pXRF (see Igneous and metamorphic petrology in the Expedition 367/368 methods chapter [Sun et al., 2018a]). The average pXRF sample spacing was about every 20 cm for the upper cores (368X-U1503A-70R through 80R) and one per core section for the lower cores (81R through 88R). The raw, unprocessed pXRF data can be retrieved as shipboard data from the IODP Laboratory Information Management System (LIMS) database (http://web.iodp.tamu.edu/LORE). The pXRF data for the Hole U1503A basalts show significant variability in incompatible elements:
- TiO2 = 1.2–2.2 wt% (average = 1.6 ± 0.2 wt%).
- Zr = 80–175 ppm (average = 124 ± 21 ppm).
- Sr = 170–290 ppm (average = 233 ± 25 ppm).
These data overlap with compositions measured by pXRF on the Site U1500 basalts (TiO2 = 1.5 ± 0.1 wt%, Zr = 97 ± 10 ppm, and Sr = 161 ± 17 ppm; see the Site U1500 chapter [Stock et al., 2018]) but extend to higher values. Ratios of immobile incompatible elements such as Ti/Zr also show a greater range compared to those for Site U1500 (Ti/Zr = 64–110 versus 84–107).
Systematic downhole compositional variations are clearly shown in the high-resolution XRF core scanning data set that was produced onshore for the Site U1503 basalts (see Igneous and metamorphic petrology in the Expedition 367/368 methods chapter [Sun et al., 2018a]). These data were acquired at a 2 cm spacing and can be retrieved as shipboard data from the LIMS database. Based on measured element intensities (in peak area total counts), the downhole variation of incompatible high field strength elements (e.g., Ti and Zr) reveals six major geochemical groups (Figure F17), each composed of one to several lava flows of different morphological types (Figure F16). These types are distinguished by changes in relative Zr intensities (Figure F17A), Ti peak intensities (Figure F17B), and Ti/Zr (Figure F17C) values that demonstrate varying compositional enrichments among lava sequences and thus suggest melt differentiation trends. The upper part of the recovered basalts (the base of Section 368X-U1503A-69R-2 through the base of Section 78R-4) shows an intermediate Zr enrichment (blue circles in Figure F17; Figure F16) compared to the low-Zr intensities that predominate from Section 79R-1 to the bottom of the hole (Figure F17). Morphologically, the intermediate-Zr group is made up of the igneous lithologic Subunit 1a lobate and pillow flows (50 m thick) that show an overall bottom-to-top increase in Ti intensities. This "blue group," however, also reveals internal Ti variation that leads to distinction of three subgroups (Figure F17B). The uppermost lobate/pillow lava Subunit 1a is underlain by a low-Zr-Ti massive flow (~8 m thick; from Section 79R-1, 25 cm, to Section 80R-2, 114 cm) that constitutes Subunit 1b (orange circles in Figure F17A) and also shows an uphole increase of Ti peak intensities (Figure F17B). Further downhole, two high-Zr-Ti lava flow sequences ("gray group" lobate/pillows from Section 80R-2, 114 cm, to Section 81R-1, 95 cm, and "red group" sheet/pillows from Section 85R-1, 76 cm, to Section 85R-2, 68 cm) are separated by a much thicker low-Zr-Ti flow sequence consisting of massive and sheet flows (~15 m) and capping lobate and pillow pillows (~4 m; yellow circles in Figure F17). The lowermost high-Zr-Ti group (red circles in Figure F17) is underlain by another distinct group of low-Zr-Ti intensities (green circles in Figure F17) represented by interbedded massive/sheet and lobate/pillow flows that were recovered from Section 85R-2, 68 cm, to the bottom of Hole U1503A (~19 m in total). In this "green group," the uppermost sheet/pillow flows (downhole to Section 86R-2, 52 cm) reveal similar Zr but lower Ti intensities compared with the flows below, leading to distinctly lower Ti/Zr values (light green circles in Figure F17C) that are more akin to the "yellow group." Similar to the latter, the lowermost lava flows of Hole U1503A (dark green circles in Figure F17) show an overall increase of Ti intensities from the bottom of the sequence to the top (Figure F17B). Table T3 shows an overview of the intervals and thicknesses of lava sequences and associated flow types that are divided into the XRF data groups.
Interpretation
The minimum age for the igneous lithologic Unit 1 basalts is constrained by microfossil data for the immediately overlying sediments (lithostratigraphic Unit III) in Section 368X-U1503A-69R-2-CC, which provide an age of 29–30 Ma (early Oligocene).
The flow morphologies and presence of chilled margins and pillow-like structures suggest emplacement of the basalts as subaqueous eruptions in approximately 68 individual lava flows. These can be reconciled in distinct chemical groups, forming separate lava flow sequences that internally reveal melt fractionation trends. The basalts show a typical mid-ocean-ridge basalt (MORB) mineralogy dominated by plagioclase phenocrysts and occasional subordinate olivine phenocrysts. The broad compositional similarity to the Site U1500 basalts shown by the XRF data is also consistent with a MORB-like affinity.
Biostratigraphy
Core catcher samples from Hole U1503A were analyzed for calcareous nannofossils and planktonic foraminifers. Additional samples were taken from intervals in the cores when necessary to refine the ages. Calcareous nannofossils are barren or rare in most samples, especially in red clay sediments, but are abundant or common in some turbidite or chalk samples. Varying degrees of overgrowth and broken fragments are common on nannofossils. In most parts of the sediments, planktonic foraminifers are barren and moderate to poorly preserved.
Nine biostratigraphic datums were used to provide an age-depth model for Site U1503 from the early Oligocene to the middle Miocene (Tables T4, T5; Figure F19). The early/late Oligocene boundary was placed tentatively between Cores 368X-U1503A-60R and 65R. The early/middle Miocene boundary was determined to occur between Cores 53R and -54R. Sedimentation rates varied from ~7 mm/ky during the Oligocene and early Miocene to ~60 mm/ky in the middle–late Miocene.

Figure F19. Age-depth plot.
Deepwater agglutinated benthic foraminifers were found in Samples 368X-U1503A-26R-CC to 65R-CC, indicating an abyssal paleoenvironment.
Calcareous nannofossils
Calcareous nannofossil biostratigraphy at Site U1503 is based on analysis of 30 core catcher samples and 26 section-half samples from Hole U1503A (Tables T4, T6). Calcareous nannofossil zonation was based on the scheme of Martini (1971), and the calibrated ages for bioevents are from Gradstein et al. (2012). Calcareous nannofossil abundances vary abruptly in the succession; they are barren or rare in most samples, especially in red clay, and common to abundant in some turbidite or chalk samples. In general, nannofossil preservation and assemblage composition is variably affected by carbonate dissolution and the presence of turbidites. Varying degrees of overgrowth, reworked specimens, and abundant broken fragments on nannofossils are common, especially among the discoasters.
Five nannofossil biostratigraphic datums were recognized from the Oligocene to the middle Miocene sediment sequence (Table T4). The oldest nannofossil event identified is the last appearance datum (LAD) of Sphenolithus pseudoradians, which occurs at 1579.95 m, indicating an age >28.73 Ma for the bottom part of the sedimentary sequence at Site U1503.
Miocene
Three events occur in the Miocene strata in Hole U1503A (Table T4). The LAD of Cyclicargolithus floridanus (11.85 Ma) marks the top of Zone NN6 in Sample 368X-U1503A-4R-1A, 61 cm (1010.81 m), which corresponds to the top of the middle Miocene. The first appearance datum (FAD) of Reticulofenestra pseudoumbilicus (12.83 Ma) occurs in Sample 28R-CC (1242.86 m), which is also in Zone NN6. The FAD of Sphenolithus heteromorphus (17.71 Ma) occurs in Sample 53R-2, 103 cm (1482.64 m), which is at the bottom of Zone NN4, indicating an early Miocene age.
Oligocene
From Section 368X-U1503A-59R-CC through interval 69R-2, 78–96 cm, the early–late Oligocene assemblages composed of Sphenolithus ciperoensis, Sphenolithus predistentus?, Sphenolithus distentus?, Sphenolithus pseudoradians, and Reticulofenestra bisecta (>10 µm) were observed. The LAD of S. distentus (26.84 Ma), which marks the top of Zone NP24, was found in Sample 60R-CC (1538.35 m). The LAD of S. pseudoradians (28.73 Ma) in Zone NP24 was found in Sample 69R-2, 78–96 cm (1597.84 m). S. distentus was found in Sample 69R-2, 78–96 cm, at 1597.84 m. Because the age of the FAD of S. distentus is 30 Ma, the age of the basal sediments in Hole U1503A is younger than 30 Ma.
Planktonic foraminifers
Twenty-seven core catcher samples and three additional samples taken from the working half cores in Hole U1503A were processed for planktonic foraminiferal analyses (Table T7). Two-thirds of the samples were barren of planktonic foraminifers (e.g., Samples 368X-U1503A-2R-CC, 6R-CC, 9R-CC, 13R-CC to 21R-CC, 26R-CC to 40R-CC, 48R-CC to 55R-CC, and 69R-CC). Planktonic foraminifers are well to moderately preserved in the core catcher samples from Cores 5R, 8R, 12R, 23R through 25R, 41R, 47R, 56R, 60R, and 65R.
Four planktonic foraminiferal biostratigraphic datums were recognized in Hole U1503A spanning from the late Oligocene (Zone P21) to the late Miocene (Zone N14) (Table T5). One event was found in the Oligocene strata of Hole U1503A. The LAD of Paragloborotalia opima (26.98 Ma) occurs in Sample 368X-U1503A-65R-CC (1562.06 m) and provides a biostratigraphic control point for the boundary of Zones P21 and P22. The LAD of Paragloborotalia nana (19.3–21.12 Ma) in Sample 56R-CC (1514.94 m) marks the lower part of Zone N5. The FAD of regular Globigerinoides obliquus (11.25 Ma) in Zone N14 was found in Sample 47R-CC (1427.55 m). The LAD of Paragloborotalia mayeri was found in Sample 8R-CC (10.46 Ma; 1051.74 m) and provides a biostratigraphic control point for the boundary of Zones N14 and N15.
The planktonic foraminiferal biostratigraphy for Hole U1503A was established by the above events and the planktonic foraminiferal assemblages at successive depth intervals. The Oligocene–early Miocene planktonic foraminiferal assemblage in Cores 368X-U1503A-56R through 65R is dominated by Catapsydrax dissimilis, P. nana, and Globigerina praebulloides. The middle–late Miocene planktonic foraminiferal assemblage in Cores 8R through 47R is dominated by G. obliquus, Globigerinoides triloba, P. mayeri, Dentoglobigerina altispira, and Orbulina universa, whereas Sphaeroidinellopsis seminulina occurs in Samples 25R-CC, 23R-CC, and 8R-CC.
Benthic foraminifers
In Hole U1503A, neritic benthic foraminifers Ammonia and Florius were observed in some sandstone samples (e.g., 368X-U1503A-8R-CC and 56R-CC), which suggests the influence of downslope transport from shallow water environments. Deepwater agglutinated benthic foraminifers (e.g., Glomospira, Trochamminopsis, Recurvoides, and Ammolagena) are common in Samples 26R-CC to 65R-CC, indicating an abyssal paleoenvironment.
Paleomagnetism
Shipboard measurements
Shipboard paleomagnetic investigations combined two complementary approaches (see the Expedition 367/368 methods chapter and Paleomagnetism in the Expedition 368X methods supplement chapter [Sun et al., 2018a; Childress et al., 2020]): (1) measurement and in-line alternating field (AF) demagnetization of archive-half sections on the pass-through 2G Enterprises superconducting rock magnetometer (SRM) at 2 or 2.5 cm spacing and (2) measurement and AF demagnetization of 62 oriented discrete samples on the AGICO JR-6A spinner magnetometer. In addition, the anisotropy of magnetic susceptibility (AMS) was measured on discrete samples with a KLY 4 Kappabridge (AGICO).
Depending on core recovery and lithology, usually only one discrete sample was collected from each core to perform AF demagnetization. We used the directional and intensity data of archive-half sections (measured at 25 mT for sediments and 15 mT for basalts) to determine magnetic polarity along the core. Directional and intensity data from discrete samples were used to validate the polarities inferred from section measurements. Directional data were analyzed using Zijderveld diagrams (Zijderveld, 1967). The characteristic remanent magnetization (ChRM) direction(s) were calculated using the Remasoft 3.0 software and plotted using the PuffinPlot software (version 1.03; 23 April 2015; Lurcock and Wilson, 2012).
Demagnetization behavior
Sediments
The archive-half sections of sediment Cores 368X-U1503A-2R through 63R (995.1–1552.45 m), excluding cores with <2% recovery (only the core catcher), were measured on the SRM at a 2.5 cm spacing. After measuring the natural remanent magnetization (NRM), the cores were subjected to a stepwise in-line AF demagnetization at 5, 10, 15, 20, and 25 mT. Between Sections 67R-CC and 69R-2 (1576.5–1597.38 m), the same AF demagnetization steps used for basement archive-half sections were applied. Lithostratigraphic Unit II, characterized by reddish claystone, has an average initial intensity of magnetization on the order of 10−2 A/m, which is higher than the average initial intensity of magnetization of the brownish, greenish, and gray sediments of Units I (10−3 A/m) and III (10−4 A/m).
A total of 43 discrete samples were collected from sediment cores (see Lithostratigraphy). Because of the low recovery rate, only four discrete samples were collected in lithostratigraphic Unit II and one discrete sample was collected in Unit III. The samples were AF demagnetized at 2.5, 5, 7.5, 10, 15, 20, 25, 30, 35, 40, 50, 60, 70, and 80 mT steps. Demagnetization axes were inverted at each step of demagnetization to minimize gyroremanent magnetization.
The discrete samples show two components of magnetization (Figure F20). A low-coercivity component of magnetization isolated in 15 of 43 discrete samples in a variable interval generally ranges from NRM (or 2.5 mT) to 7.5 (or 25) mT. This component, which always shows a normal polarity and has a mean inclination of 41.8° ± 10.4°, is interpreted to be a drilling-induced overprint (e.g., Figure F20A, F20E). The ChRM shows two different behaviors and, depending on the presence and range of the low-coercivity one, can be isolated either between 2.5 (or 5) mT and 15 (up to 30 or 40) mT or between 5 mT (or 7.5/30 mT when the low-coercivity component is detected) and to 50 (up to 80) mT. The mean inclination of the ChRM is 26.4° ± 8.0°, which is close to the 25° inclination expected at the latitude of Hole U1503A.
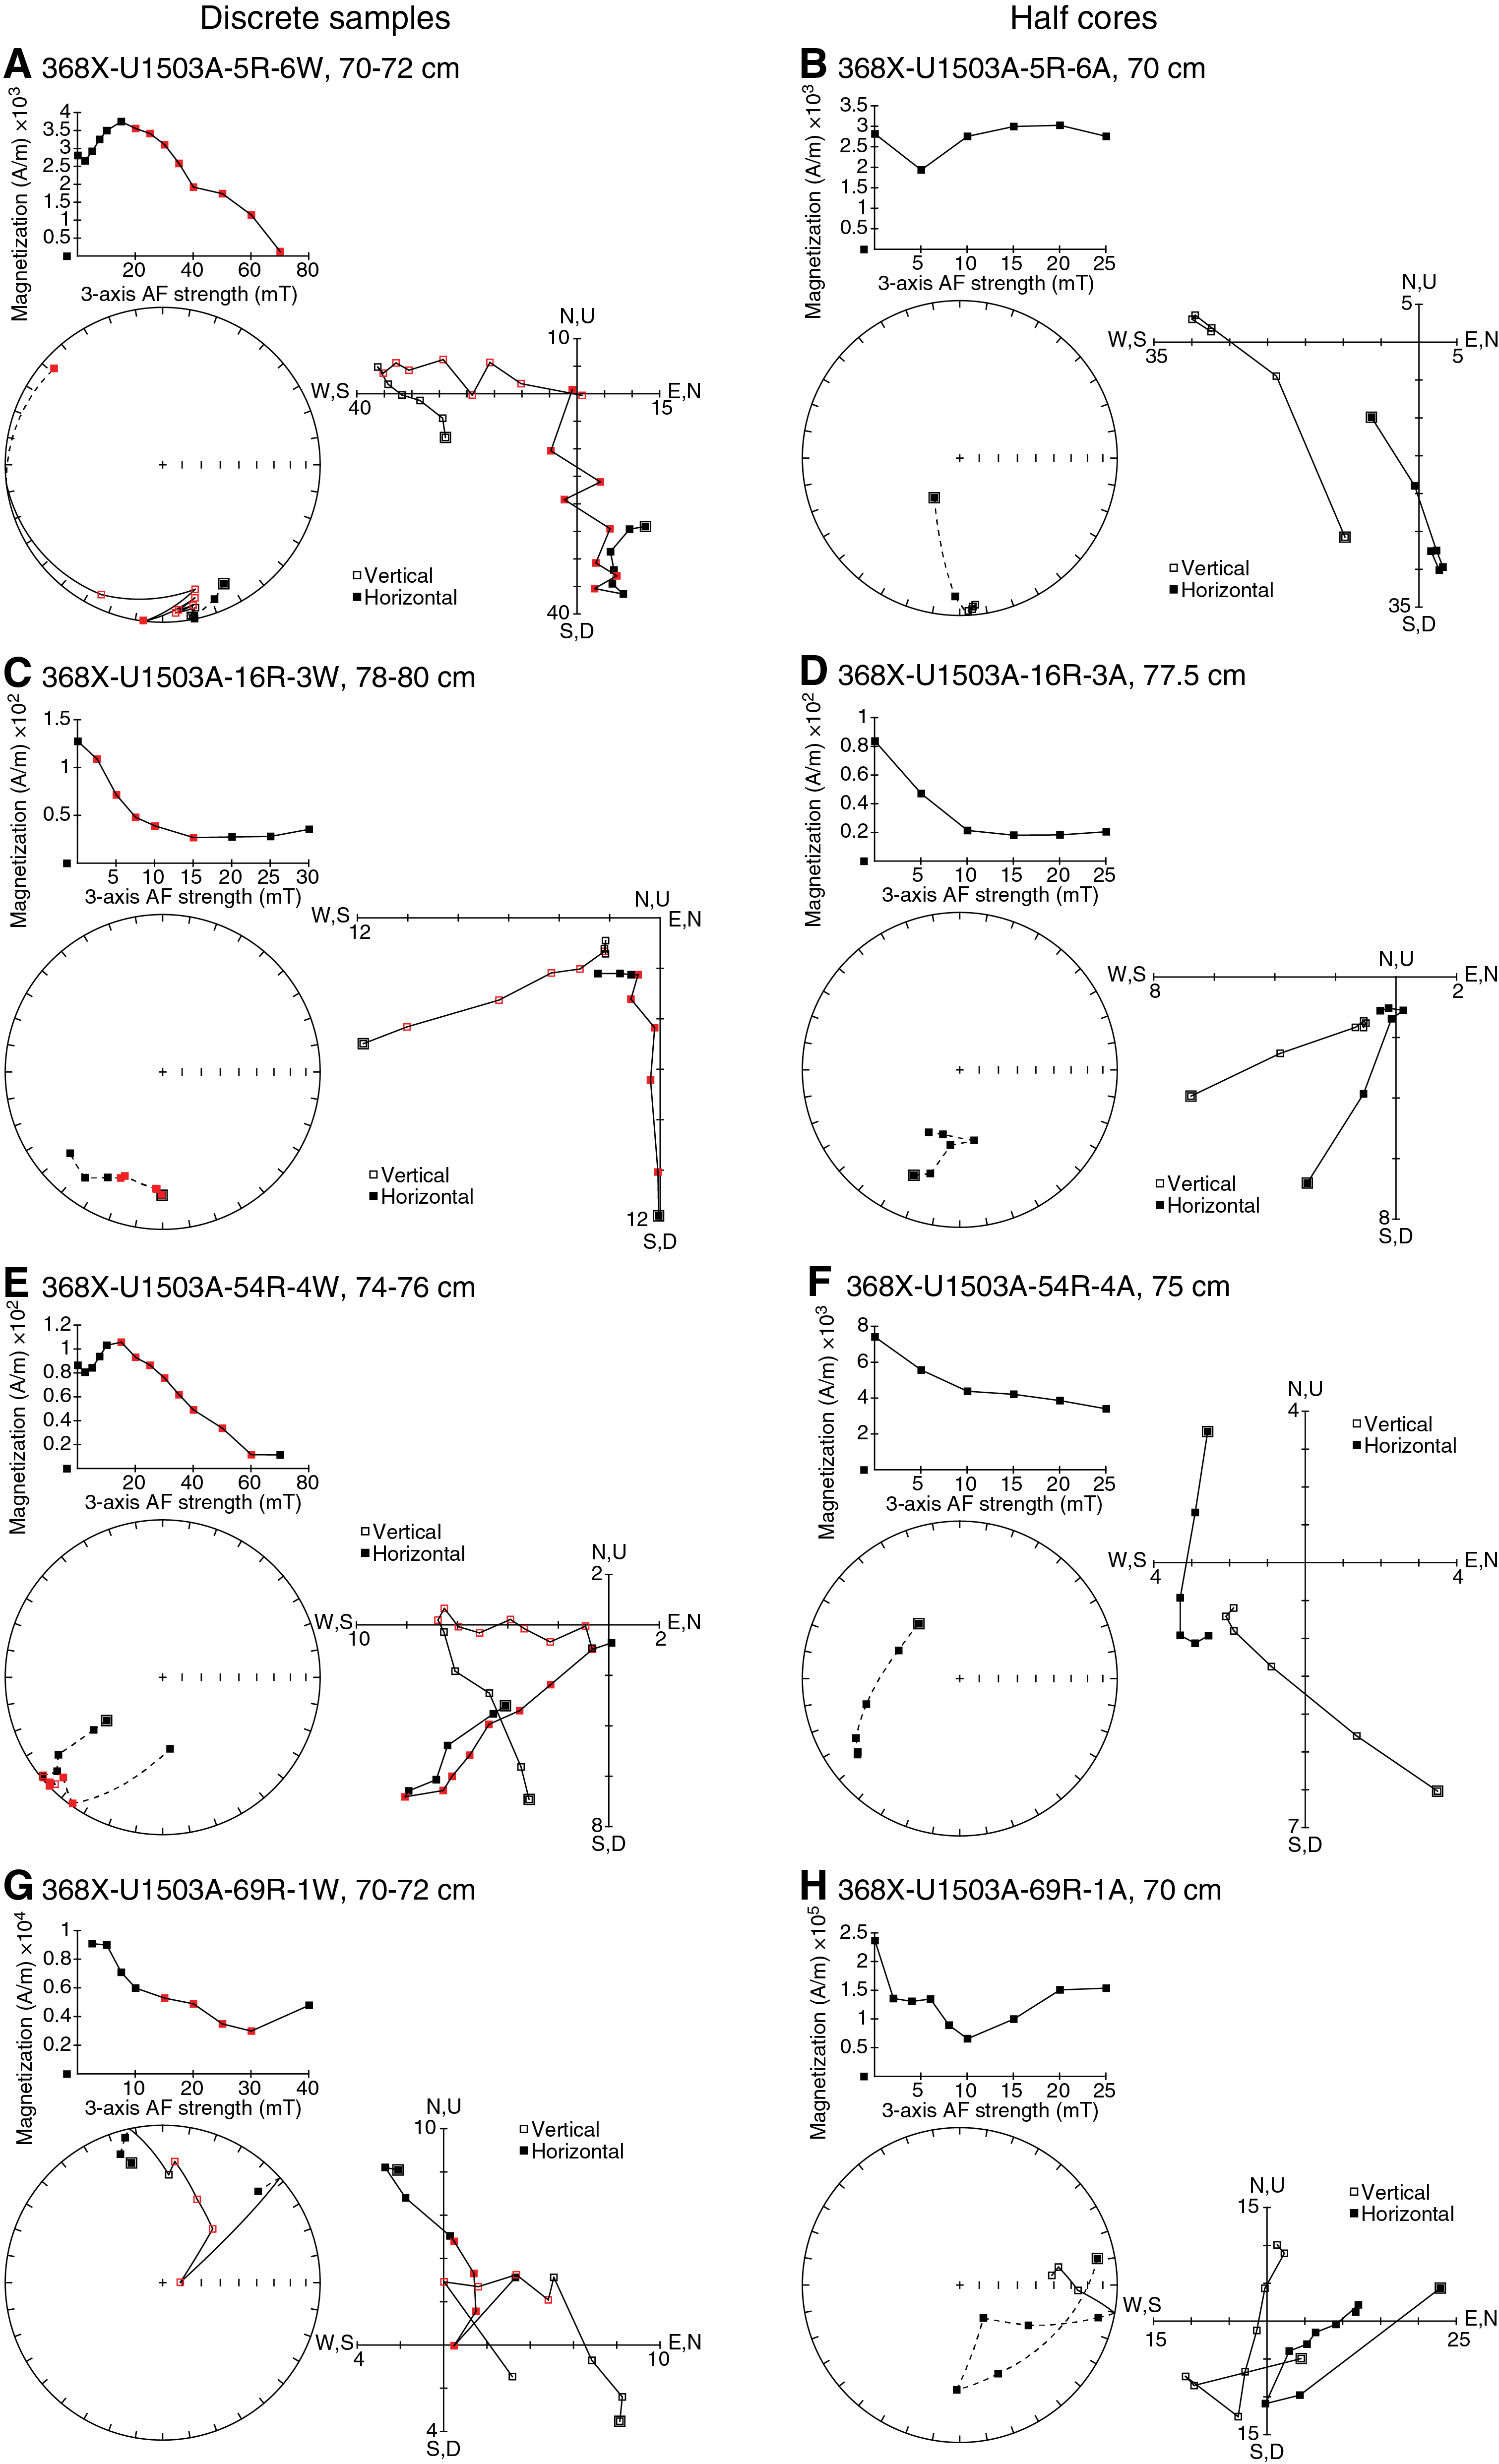
Figure F20. Demagnetization plots for sediment.
Some samples exhibit a coercivity inversion or plateau that suggests the presence of greigite (Figure F20C, F20G) (e.g., Roberts et al., 2011; Horng et al., 1998). However, a complete magnetic mineralogy characterization requires further analysis (e.g., thermal demagnetization, isothermal remanent magnetization acquisition, and variation of susceptibility with temperature).
Typical demagnetization behaviors from the two complementary approaches are shown in Figure F20. AF treatments on discrete samples effectively remove a steeper low-coercivity component induced by the drilling overprint (Figure F20A, F20E). AF treatment on section halves may not be sufficient to isolate a stable ChRM vector (Figure F20B, F20F) because it cannot completely remove the drilling overprint (up to 25 mT). Furthermore, the maximum field strength of in-line AF demagnetization is limited because of the destructive nature of the treatments and our limited ability to measure weak magnetizations in the nonmagnetically shielded shipboard environment. As a consequence, the archive-half sections exhibit a drilling-induced overprint that results in a prevalence of positive directions (unimodal distribution of the magnetization components; Figure F20).
Normal and reversed polarities are documented in the archive-half sections and validated by AF demagnetization of discrete samples (Figure F21). However, the observed inclinations cannot be correlated with a reference geomagnetic polarity timescale because of the extremely low recovery rate. A correlation could be attempted with the addition of paleontological age constraints.
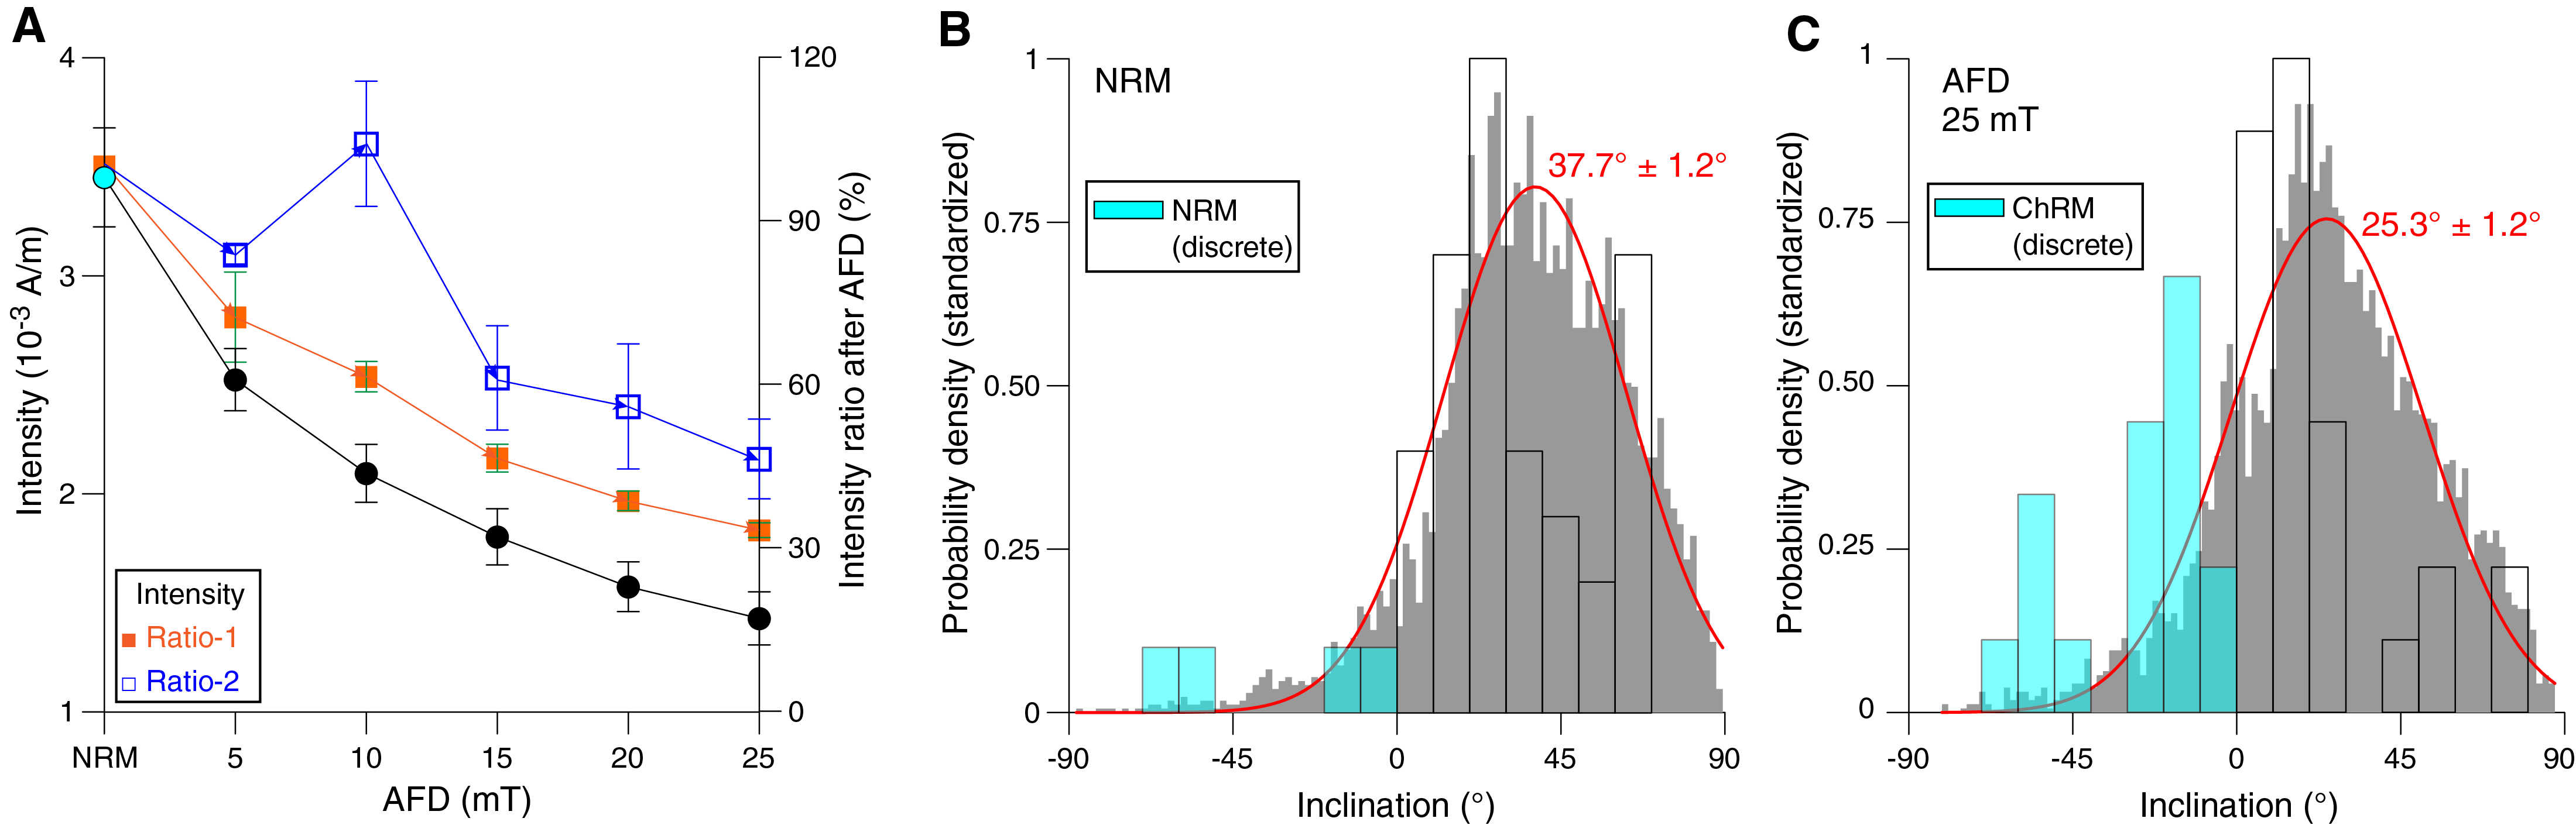
Figure F21. Intensity and inclination changes for sediment.
Basalts
The archive-half sections of basalts from Cores 368X-U1503A-70R through 88R (1605.4–1705.77 m), excluding intervals that were too highly fractured, were measured on the SRM at a 2.0 cm spacing. After measuring the NRM, the cores were subjected to a stepwise in-line AF demagnetization at an incremental rate of 2 mT from 2 to 10 mT and at a rate of 5 mT from 10 to 25 mT. The average initial intensity of magnetization for basalts (lithostratigraphic Unit IV) is on the order of 1 A/m.
A total of 19 basalt discrete samples were measured at room temperature and after AF demagnetization at 2, 4, 6, 8, 10, 15, 20, 25, 30, 35, and 40 mT steps. Both discrete samples and archive-half sections show the presence of a lower coercivity component characterized by different polarities and steepness that is not necessarily associated with drilling overprint. The ChRMs are isolated in two different intervals: (1) between 4 and 15 (or 20) mT or (2) between 6 (or 10) and 35 (or 40) mT. Typical examples of demagnetization behavior are shown in Figure F22.
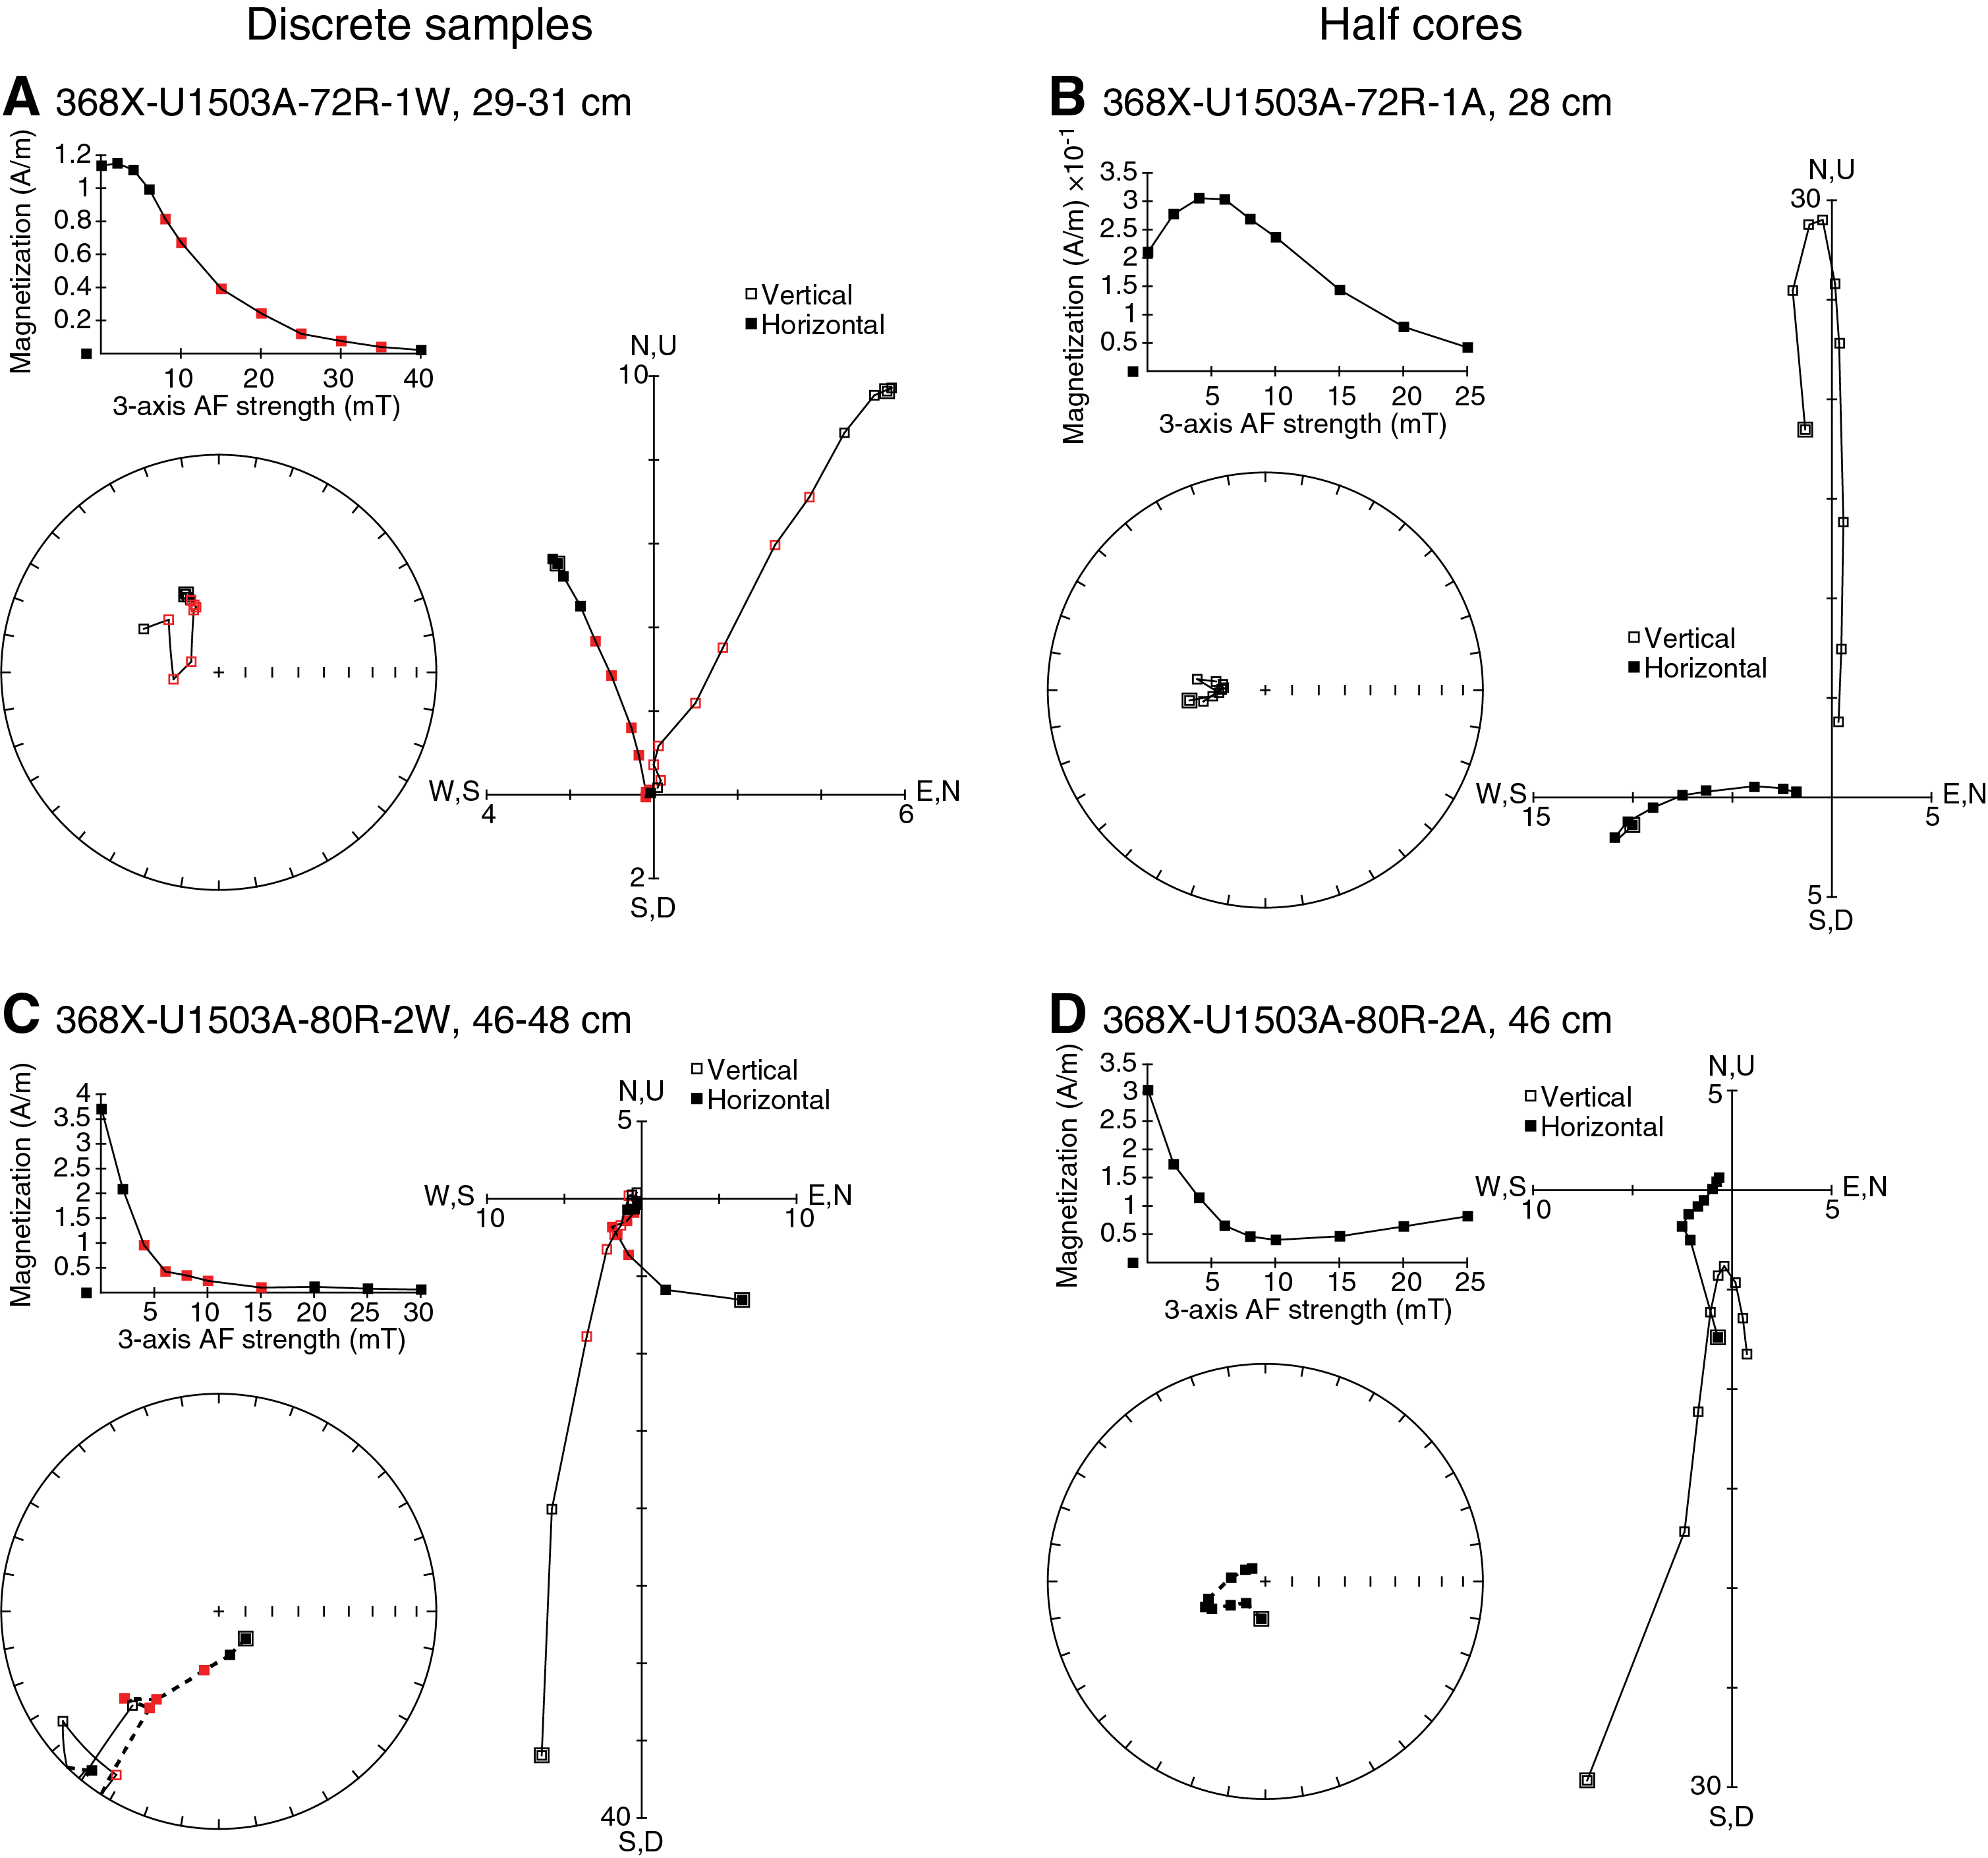
Figure F22. Demagnetization plots for basalt.
Demagnetization data from discrete samples and archive-half sections led to comparable results. Normal and reversed polarities are documented in the basalts from archive-half sections and validated by AF demagnetization of discrete samples (Figure F23). Because the basalts could be completely demagnetized at 20 mT, the demagnetization step at 15 mT is plotted against depth as more representative of their ChRMs (Figure F24).
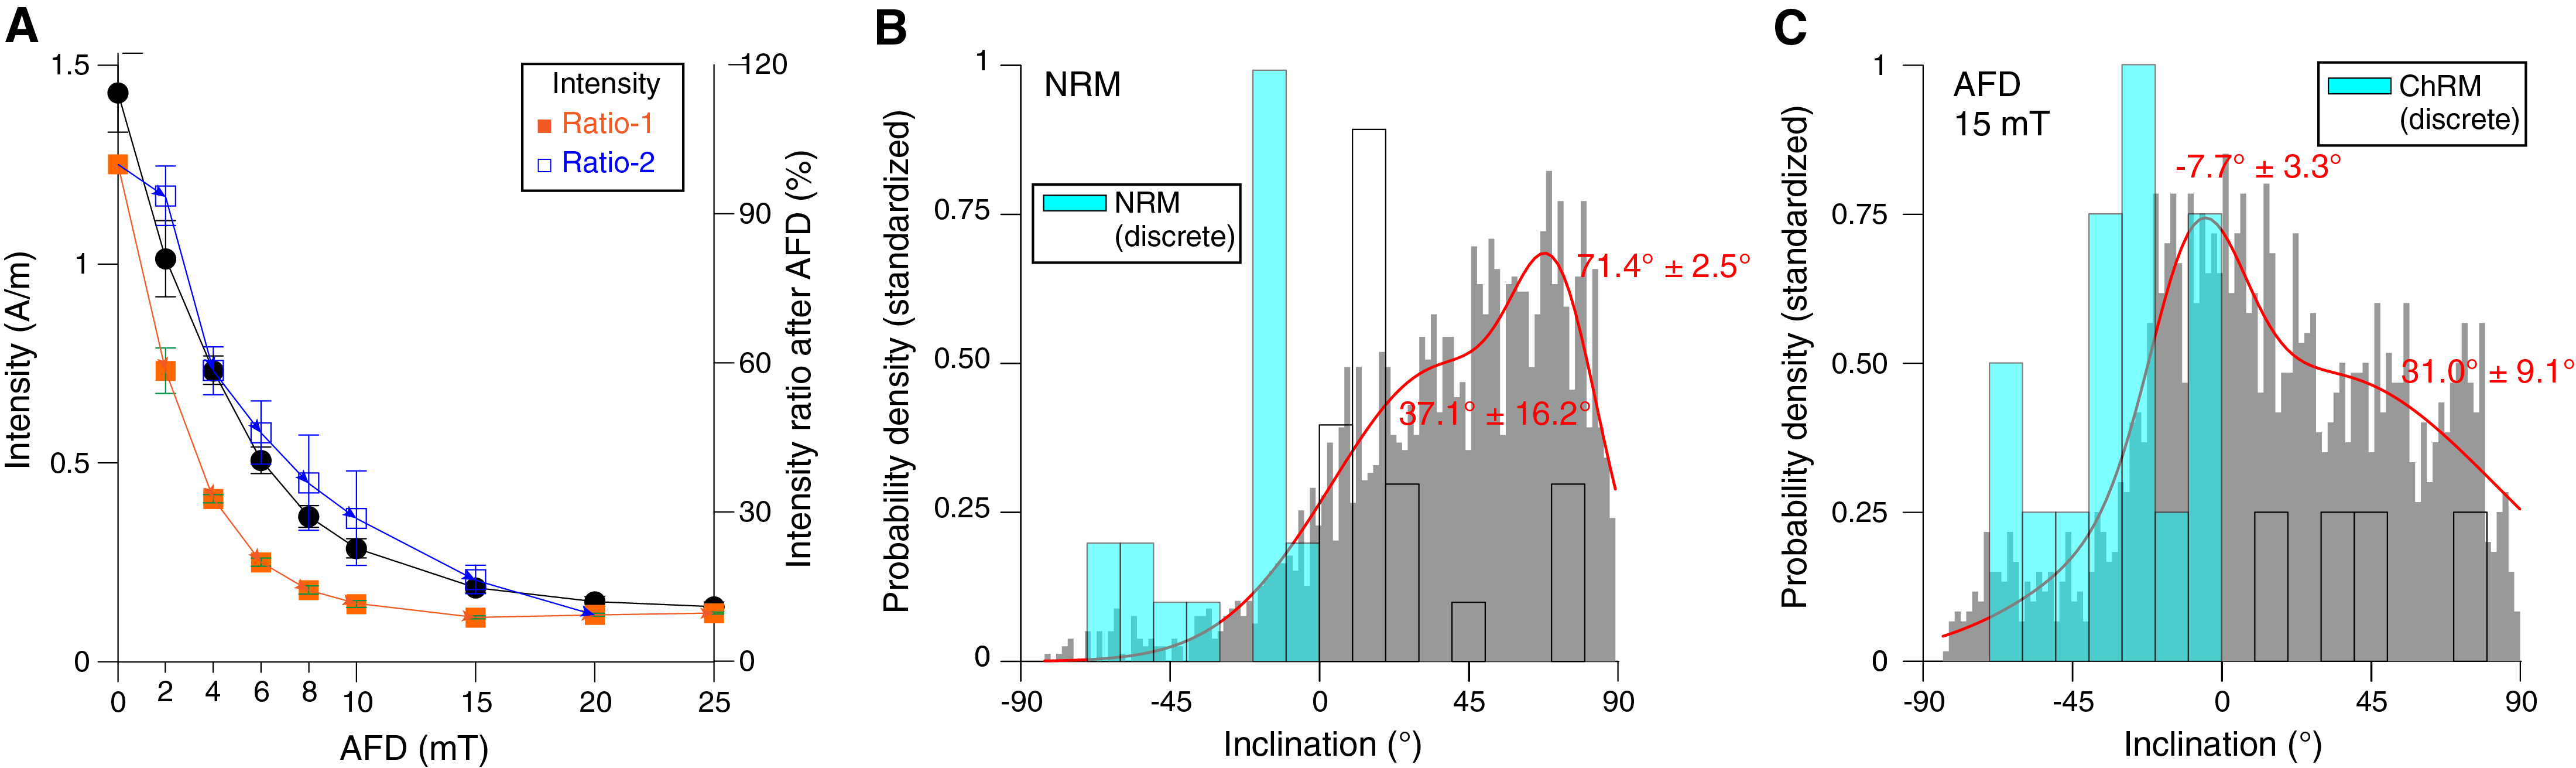
Figure F23. Intensity and inclination changes for basalt.

Figure F24. Paleomagnetic measurements.
Anisotropy of magnetic susceptibility
Sediments
The 43 discrete sediment samples have an average magnetic susceptibility (K) of 486 × 10−6 SI and a maximum value of 1050 × 10−6 SI in lithostratigraphic Unit II and a minimum value of 130 × 10−6 SI in Unit III. The degree of magnetic anisotropy P′ is moderate (~1.12), and the fabric is strongly oblate, as shown by the shape parameter (T) (Figure F25). According to the Fisher distribution of AMS principal axes, this suggests a nearly horizontal planar fabric that is consistent with deposition in a calm pelagic environment with very limited bottom currents. An inclined planar fabric present in Unit II shows a bedding inclined by ~30°, according to structural data (see Lithostratigraphy).

Figure F25. AMS data.
Basalts
The 19 basalt discrete samples show a K of 4.22 x 10⁻² SI and a low P′ (average = 1.09), which is typical of titanomagnetite.
The T indicates mainly a prolate shape of the ellipsoid (Figure F25). Overall, basalts show an intermediate fabric consistent with viscous magmatic flow. However, it is currently not possible to determine the direction of the flow because samples are not fully oriented.
Geochemistry
Headspace gas
At Site U1503, 57 headspace gas samples were analyzed for routine safety monitoring in all sediment cores (995.1–1597.84 m). Two basement samples (1606.25 and 1647.81 m) were also analyzed. Methane content is low (<30 ppmv) in the sediment sections between 995.1 and 1394 m (Table T8). Deeper than 1404 m, methane gradually increases (average = 1249 ppmv) before reaching a maximum of 5066 ppmv at 1596.78 m, which is very near the sediment/basement boundary. In the two basement samples, methane content ranges from 528.60 to 4863.85 ppmv. Methane content in basement material could be abiogenic, resulting from carbon-bearing fluid alteration of basalt at low temperatures.
Bulk sediment geochemistry
Total carbon (TC), total inorganic carbon (TIC), calcium carbonate (CaCO3), total organic carbon (TOC), total nitrogen (TN), and total sulfur (TS) were determined on 43 discrete sediment samples (Table T9; Figure F26). Bulk sediment TC and TN were determined by elemental analysis, and TIC was determined by coulometer (see the Expedition 367/368 methods chapter [Sun et al., 2018a]).
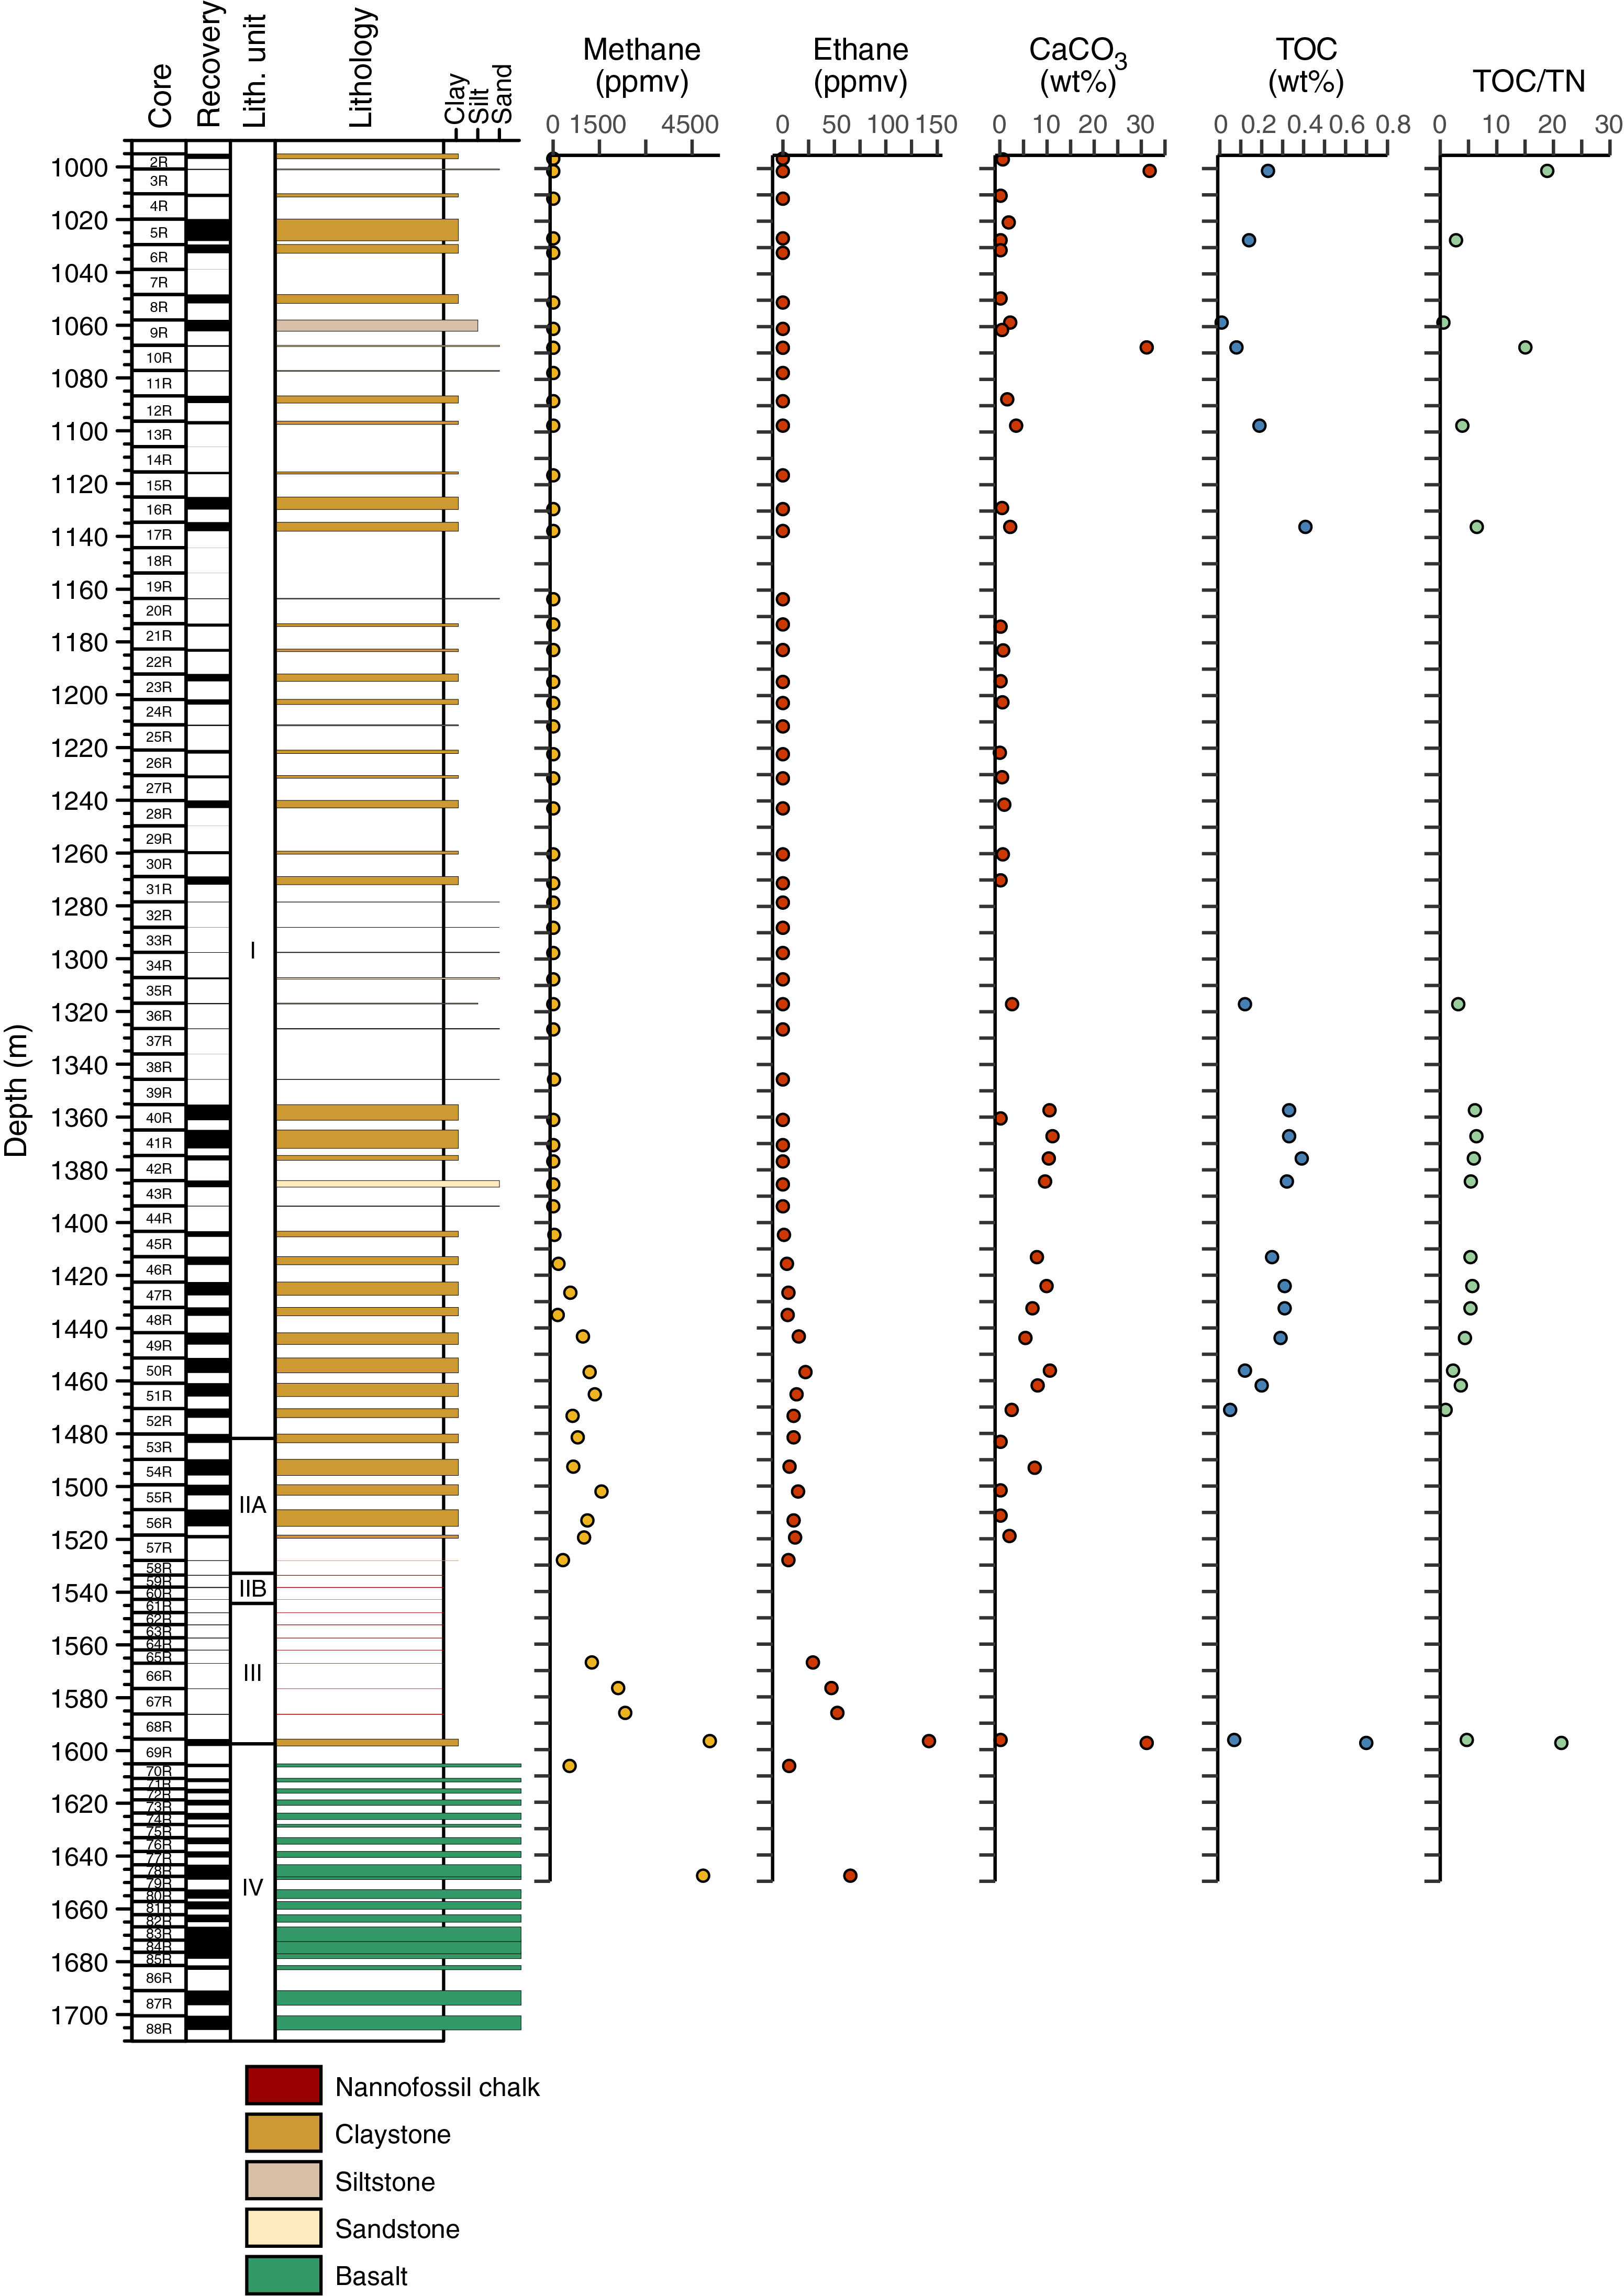
Figure F26. Lithology and geochemical profiles.
TIC contents range from <0.1 to 3.81 wt% (average = 0.61 wt%) in sediments. Calcium carbonate content, assuming inorganic carbon is exclusively present as CaCO3, varies between <0.1 and 31.7 wt% (average = 5.04 wt%). Carbonate content >30 wt% found near the top of the cored sediments (1000.88–1067.9 m) corresponds to sandstones in lithostratigraphic Unit I. Near the sediment/basement interface (1597.52 m), a claystone from Unit III also contains >30 wt% carbonate.
TC content varies between <0.1 and 4.44 wt%. TOC content averages 0.24 wt% but is below detection limit in 23 samples, primarily between 1173.86 and 1270.17 m and between 1483.28 and 1519.04 m (Table T9; Figure F26). Elemental TOC/TN ratios are generally used as a preliminary estimate for the source of organic material. High values (TOC/TN > 12) are typically attributed to a predominantly terrestrial source, and lower values (TOC/TN < 8) are indicative of dominantly marine contributions (Müller and Mathesius, 1999). With three exceptions, TOC/TN ratios range from <1 to 6.4 (average = 4.3) at Site U1503 (Table T9; Figure F26), suggesting that the majority of the organic matter is likely from a marine source. High TOC/TN ratios (15.0–21.3) are at the same depth intervals as the sandstones in lithostratigraphic Unit I and the claystones in Unit III that contain >30% carbonate.
Source rock analysis
Three samples from Site U1503 were analyzed using the source rock analyzer (Table T10). TOC content can be more than double the TOC content calculated for the same sample by coulometer. The temperature at the maximum of the S2 peak (Tmax) is an indicator of rock maturity. Tmax values suggest thermal immaturity (Tmax < 435°C).
Physical properties
We measured physical properties on whole-round cores, working-half sections, and discrete samples. These measurements included gamma ray attenuation (GRA) bulk density, magnetic susceptibility, natural gamma radiation (NGR), P-wave velocity, moisture and density (MAD) and porosity, and thermal conductivity. We used the Whole-Round Multisensor Logger (WRMSL) to measure GRA bulk density and magnetic susceptibility. No P-wave velocity was measured using the WRMSL because of the large gap between the core and core liner produced during RCB coring. NGR was measured on whole-round cores with the Natural Gamma Radiation Logger (NGRL). After the cores were split into section halves, P-wave velocity was measured with the Section Half Measurement Gantry (SHMG) using the X-caliper for measurements through the split cores, and usually at least one measurement was made per section. No velocity measurement was performed with the Y- and Z-bayonets on the SHMG because the sample material was too hard for the bayonets to penetrate without disrupting and introducing cracks. Discrete samples were taken for MAD measurements, including mass measurement with dual balances and volume measurement with a pycnometer. For MAD measurements of hard sediment and basalt, small pieces or cubes were cut from samples of the working-half sections. The resulting MAD values were used to calculate bulk properties (wet bulk density, dry bulk density, sediment grain density, porosity, and void ratio).
For Cores 368X-U1503A-70R through 88R (1605.0–1710.1 m), P-wave measurements were made with the caliper on individual basalt core pieces with a core liner. Discrete samples from these cores were shared between the paleomagnetism and physical properties groups. First, samples were measured for paleomagnetism using AF demagnetization but no heating. Afterward, the samples were measured for P-wave velocity on the SHMG. Samples were then split into two residues, and the bottom residues of the cubes were measured for MAD. We soaked the samples in saltwater for 4 h under a vacuum and then performed MAD measurements (see Physical properties in the Expedition 367/368 methods chapter and Physical properties in the Expedition 368X methods supplement chapter [Sun et al., 2018a; Childress et al., 2020]).
Throughout all cores, thermal conductivity was measured on working-half sections with a puck probe. Good contact results were obtained after smoothing the surface of the rock with sandpaper. For each core, three measurements were conducted, but this number was increased to as many as six measurements when the three measurements were notably different. Before thermal conductivity was measured with a puck in the bath, hard rock samples were placed in a seawater bath for 4 h for Cores 368X-U1503A-70R through 79R (1605.0–1652.7 m) and in a seawater bath under vacuum for 1 h for Cores 80R through 88R (1652.7–1710.1 m).
Data measurements using automatic systems such as the WRMSL, NGRL, and Section Half Multisensor Logger (SHMSL; point magnetic susceptibility) can contain data outliers (e.g., data from voids in the core, unrealistic high/low values, etc.). Artifact magnetic susceptibility data that were clearly due to the presence of broken pieces of metal from the drilling equipment were removed by hand. Because the values in the basalt layers are very different from those in the sediment, we estimated the mean and standard deviation for the two data sets separately (Table T11). The WRMSL measurements on the basalt cores (Section 368X-U1503A-69R-2 to the bottom of the hole; 1597.8–1710.1 m) are very scattered because of voids in the liner between rock pieces. The corresponding standard deviation is relatively high (Table T11).
The variations in physical property values have led us to distinguish intervals defining Physical Property (PP) Units 1–9, each with specific characteristics (Table T12). Lithostratigraphic Unit I includes PP Units 1–5. Subunit IIA includes PP Units 6 and 7. Subunit IIB and Unit III correspond to PP Unit 8. Unit IV corresponds to PP Unit 9.
Natural gamma radiation
In lithostratigraphic Unit I (995.1–1484.7 m), NGR ranges from 30 to 80 counts/s, and there is a significant difference between 60 and 80 counts/s in the claystone and between 30 and 50 counts/s in the sandstone (Figure F27; Tables T11, T12). PP Units 1–5 were defined mostly based on variations in NGR and magnetic susceptibility (Table T12). NGR is 60–80 counts/s in PP Units 1 and 4, 30–50 counts/s in PP Unit 2, 30–80 counts/s in PP Unit 3, and 60–80 counts/s in PP Unit 5. In Unit II (1484.7–1542.8 m), NGR in PP Unit 6 is similar to that in PP Unit 5, and NGR decreases to ~50 counts/s in PP Unit 7. We did not measure NGR in PP Unit 8 because Sections 368X-U1503A-58R-CC through 68R-CC are too short. Basalts in Unit IV have very low NGR, almost entirely <10 counts/s, which is expected for basalt.
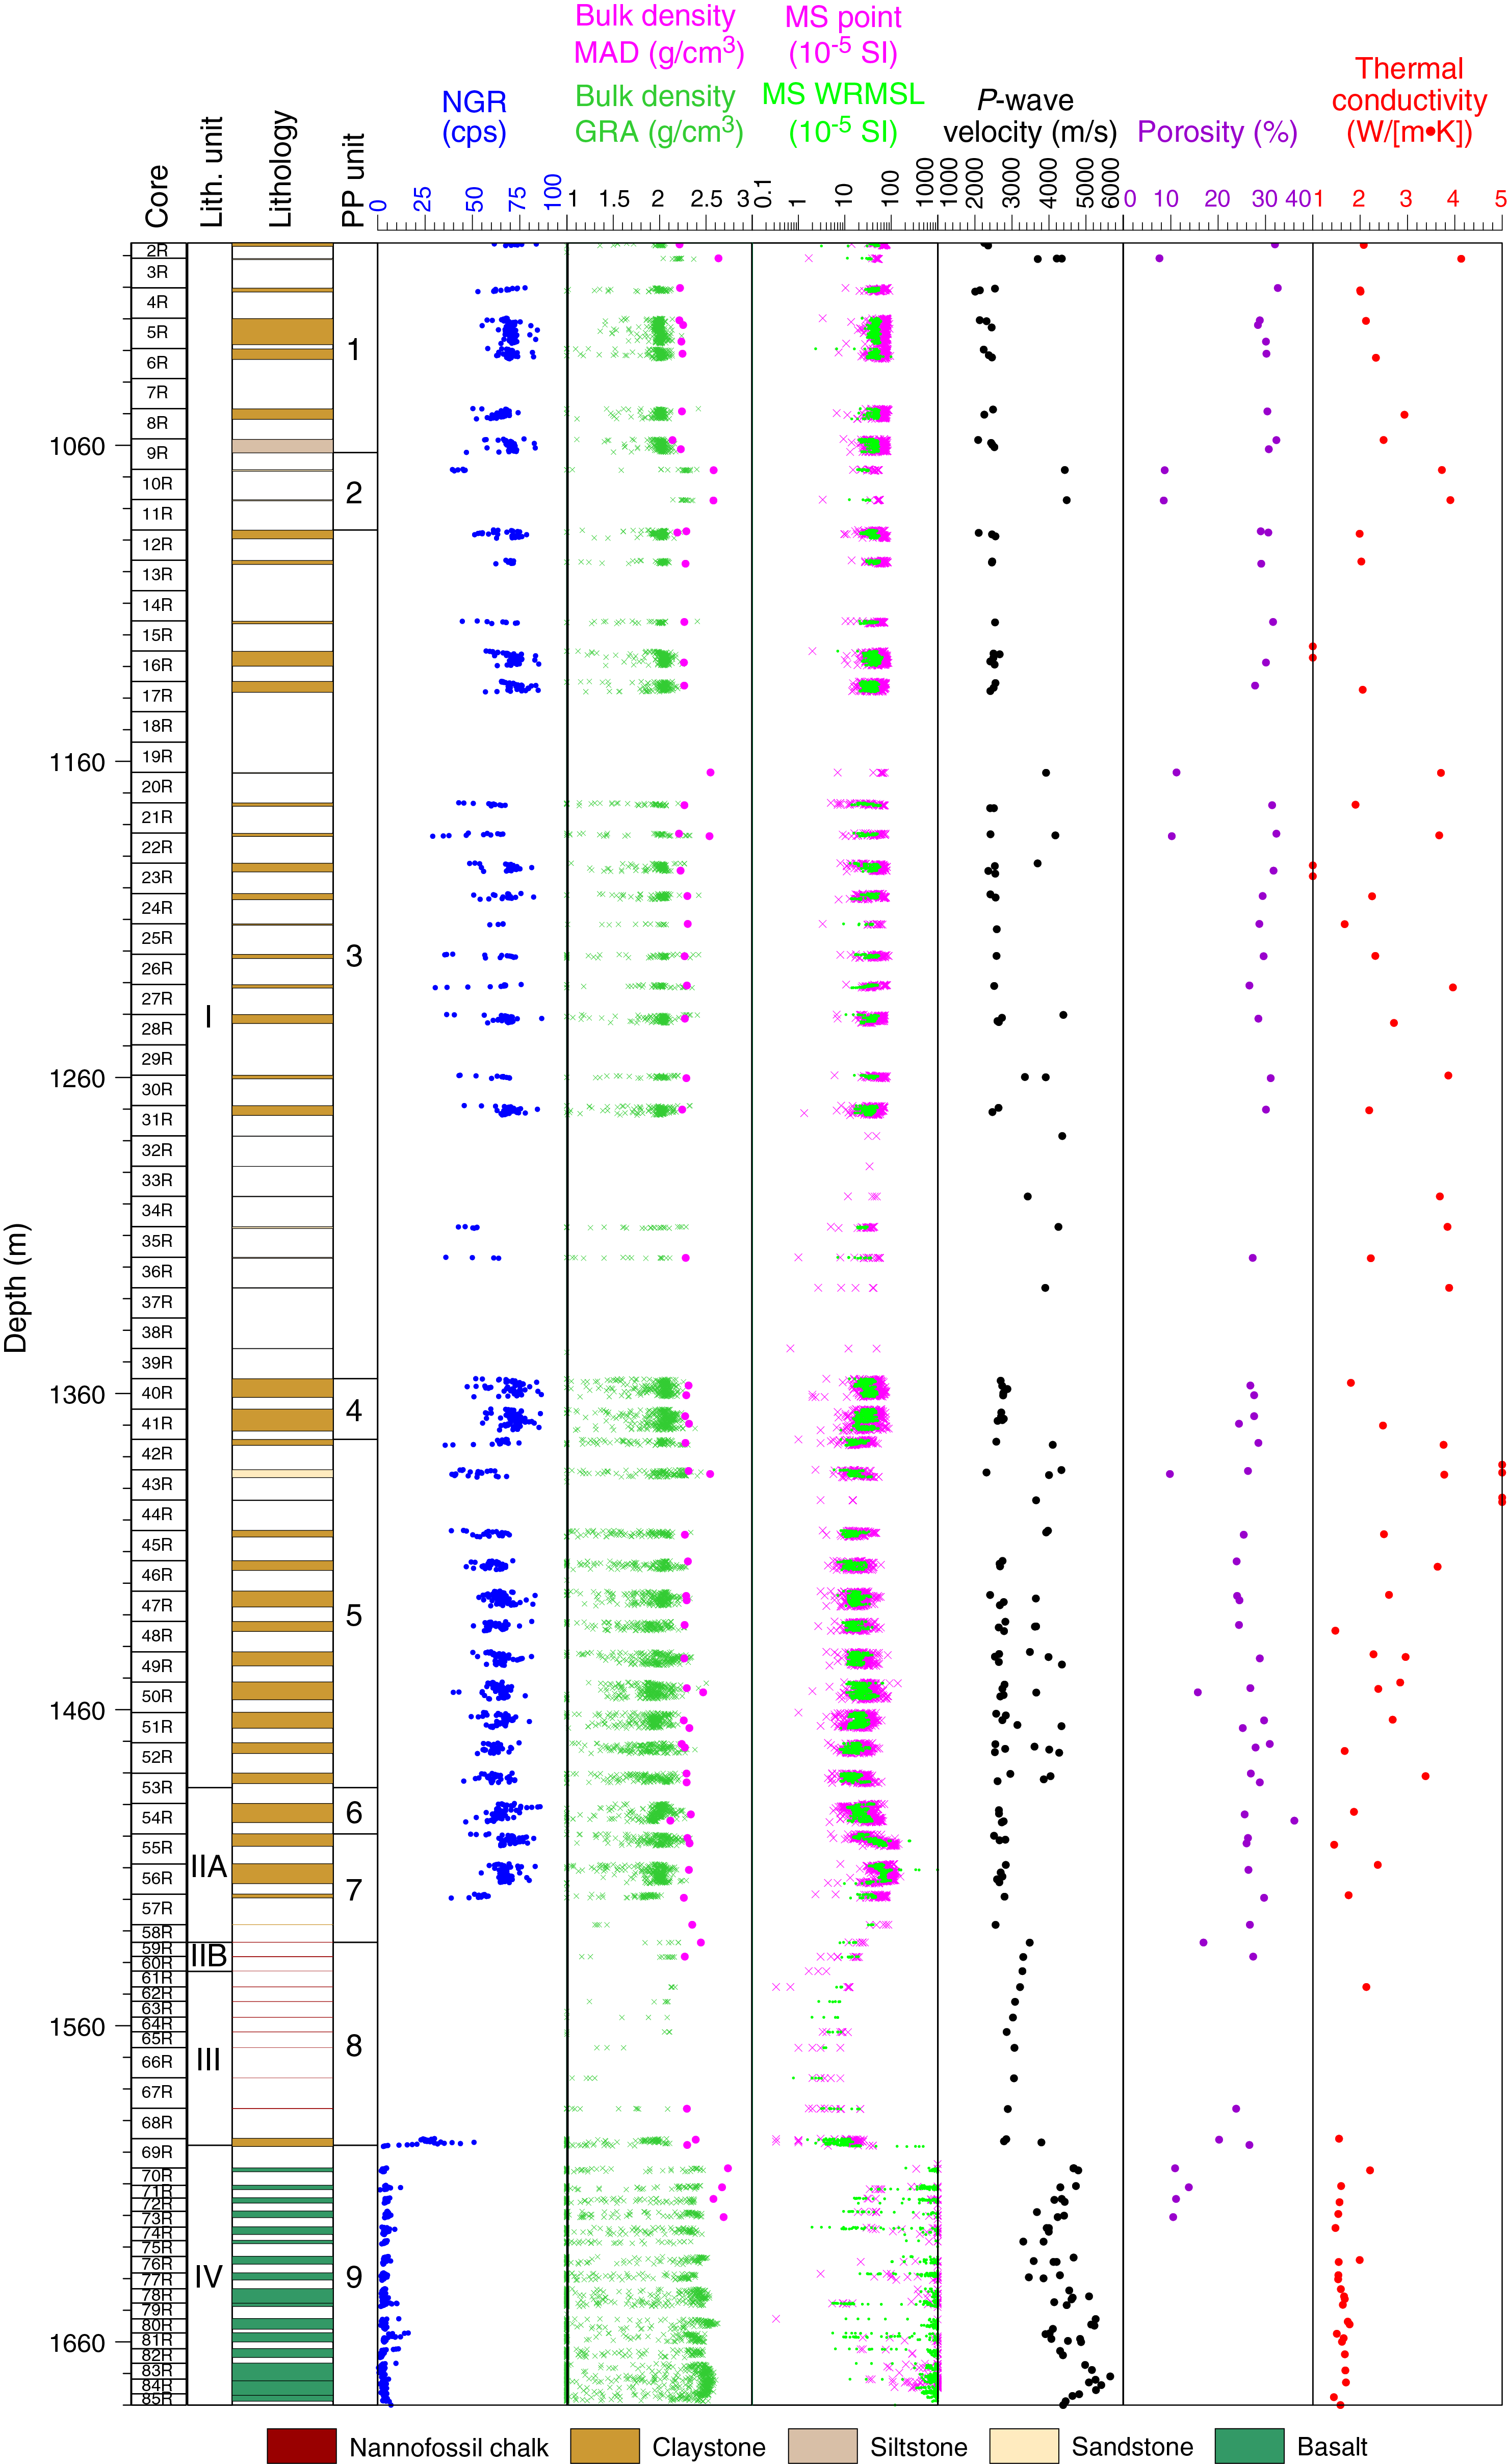
Figure F27. Sediment physical properties.
Magnetic susceptibility
Magnetic susceptibility was measured on the WRMSL (core magnetic susceptibility) and SHMSL (point magnetic susceptibility). Magnetic susceptibility is sensitive to magnetic mineral content and mineralogy of the formation (e.g., Clark and Emerson, 1991). Core magnetic susceptibility and point magnetic susceptibility are in very good agreement throughout the entire cored section (Figure F27). Peaks in magnetic susceptibility near 1501.5 m (Section 368X-U1503A-55R-2) and 1510.7 m (Section 56R-2) are likely artifacts caused by the presence of broken pieces of metal from the drilling equipment. Such artificial anomalies do not appear in the point magnetic susceptibility measurements.
Magnetic susceptibility in lithostratigraphic Unit I (995.1–1484.7 m) is relatively uniform, from 30 × 10−5 to 45 × 10−5 SI, in the claystone in much of PP Units 1, 3, and 4. Magnetic susceptibility is lower, from 15 × 10−5 to 40 × 10−5 SI, in the sandstone in PP Units 2 and 5 (Figure F27). In PP Unit 6 (1484.7–1499.3 m), magnetic susceptibility values are similar to those just above in PP Unit 5. In PP Unit 7 (1499.3–1528.0 m), magnetic susceptibility increases markedly to ~100 × 10−5 SI, corresponding to the red clay of Subunit IIA, and then decreases to ~80 × 10−5 SI in the lower part of Subunit IIA. In Subunit IIB and Unit III (PP Unit 8), magnetic susceptibility decreases from ~25 × 10−5 to <10 × 10−5 SI. In the basalt in Unit IV (PP Unit 9), magnetic susceptibility values are two orders of magnitude higher, increasing to ~1500 × 10−5 to 7000 × 10−5 SI, than those in the sediment units. Magnetic susceptibility values from the basalts are scattered (Figure F28) because of the presence of voids in the measurements and the large size variation of the basalt pieces. Magnetic susceptibility in Cores 368X-U1503A-70R through 86R (1605.0–1683.0 m) is between 1500 × 10−5 and 4000 × 10−5 SI. Magnetic susceptibility increases in Cores 87R and 88R to reach a maximum of ~7000 × 10−5 SI in Section 88R-2 (1701.8–1702.8 m). Magnetic susceptibility then decreases to 1000 × 10−5 to 2000 × 10−5 SI in Sections 88R-3 through 88R-4 (Figure F28).
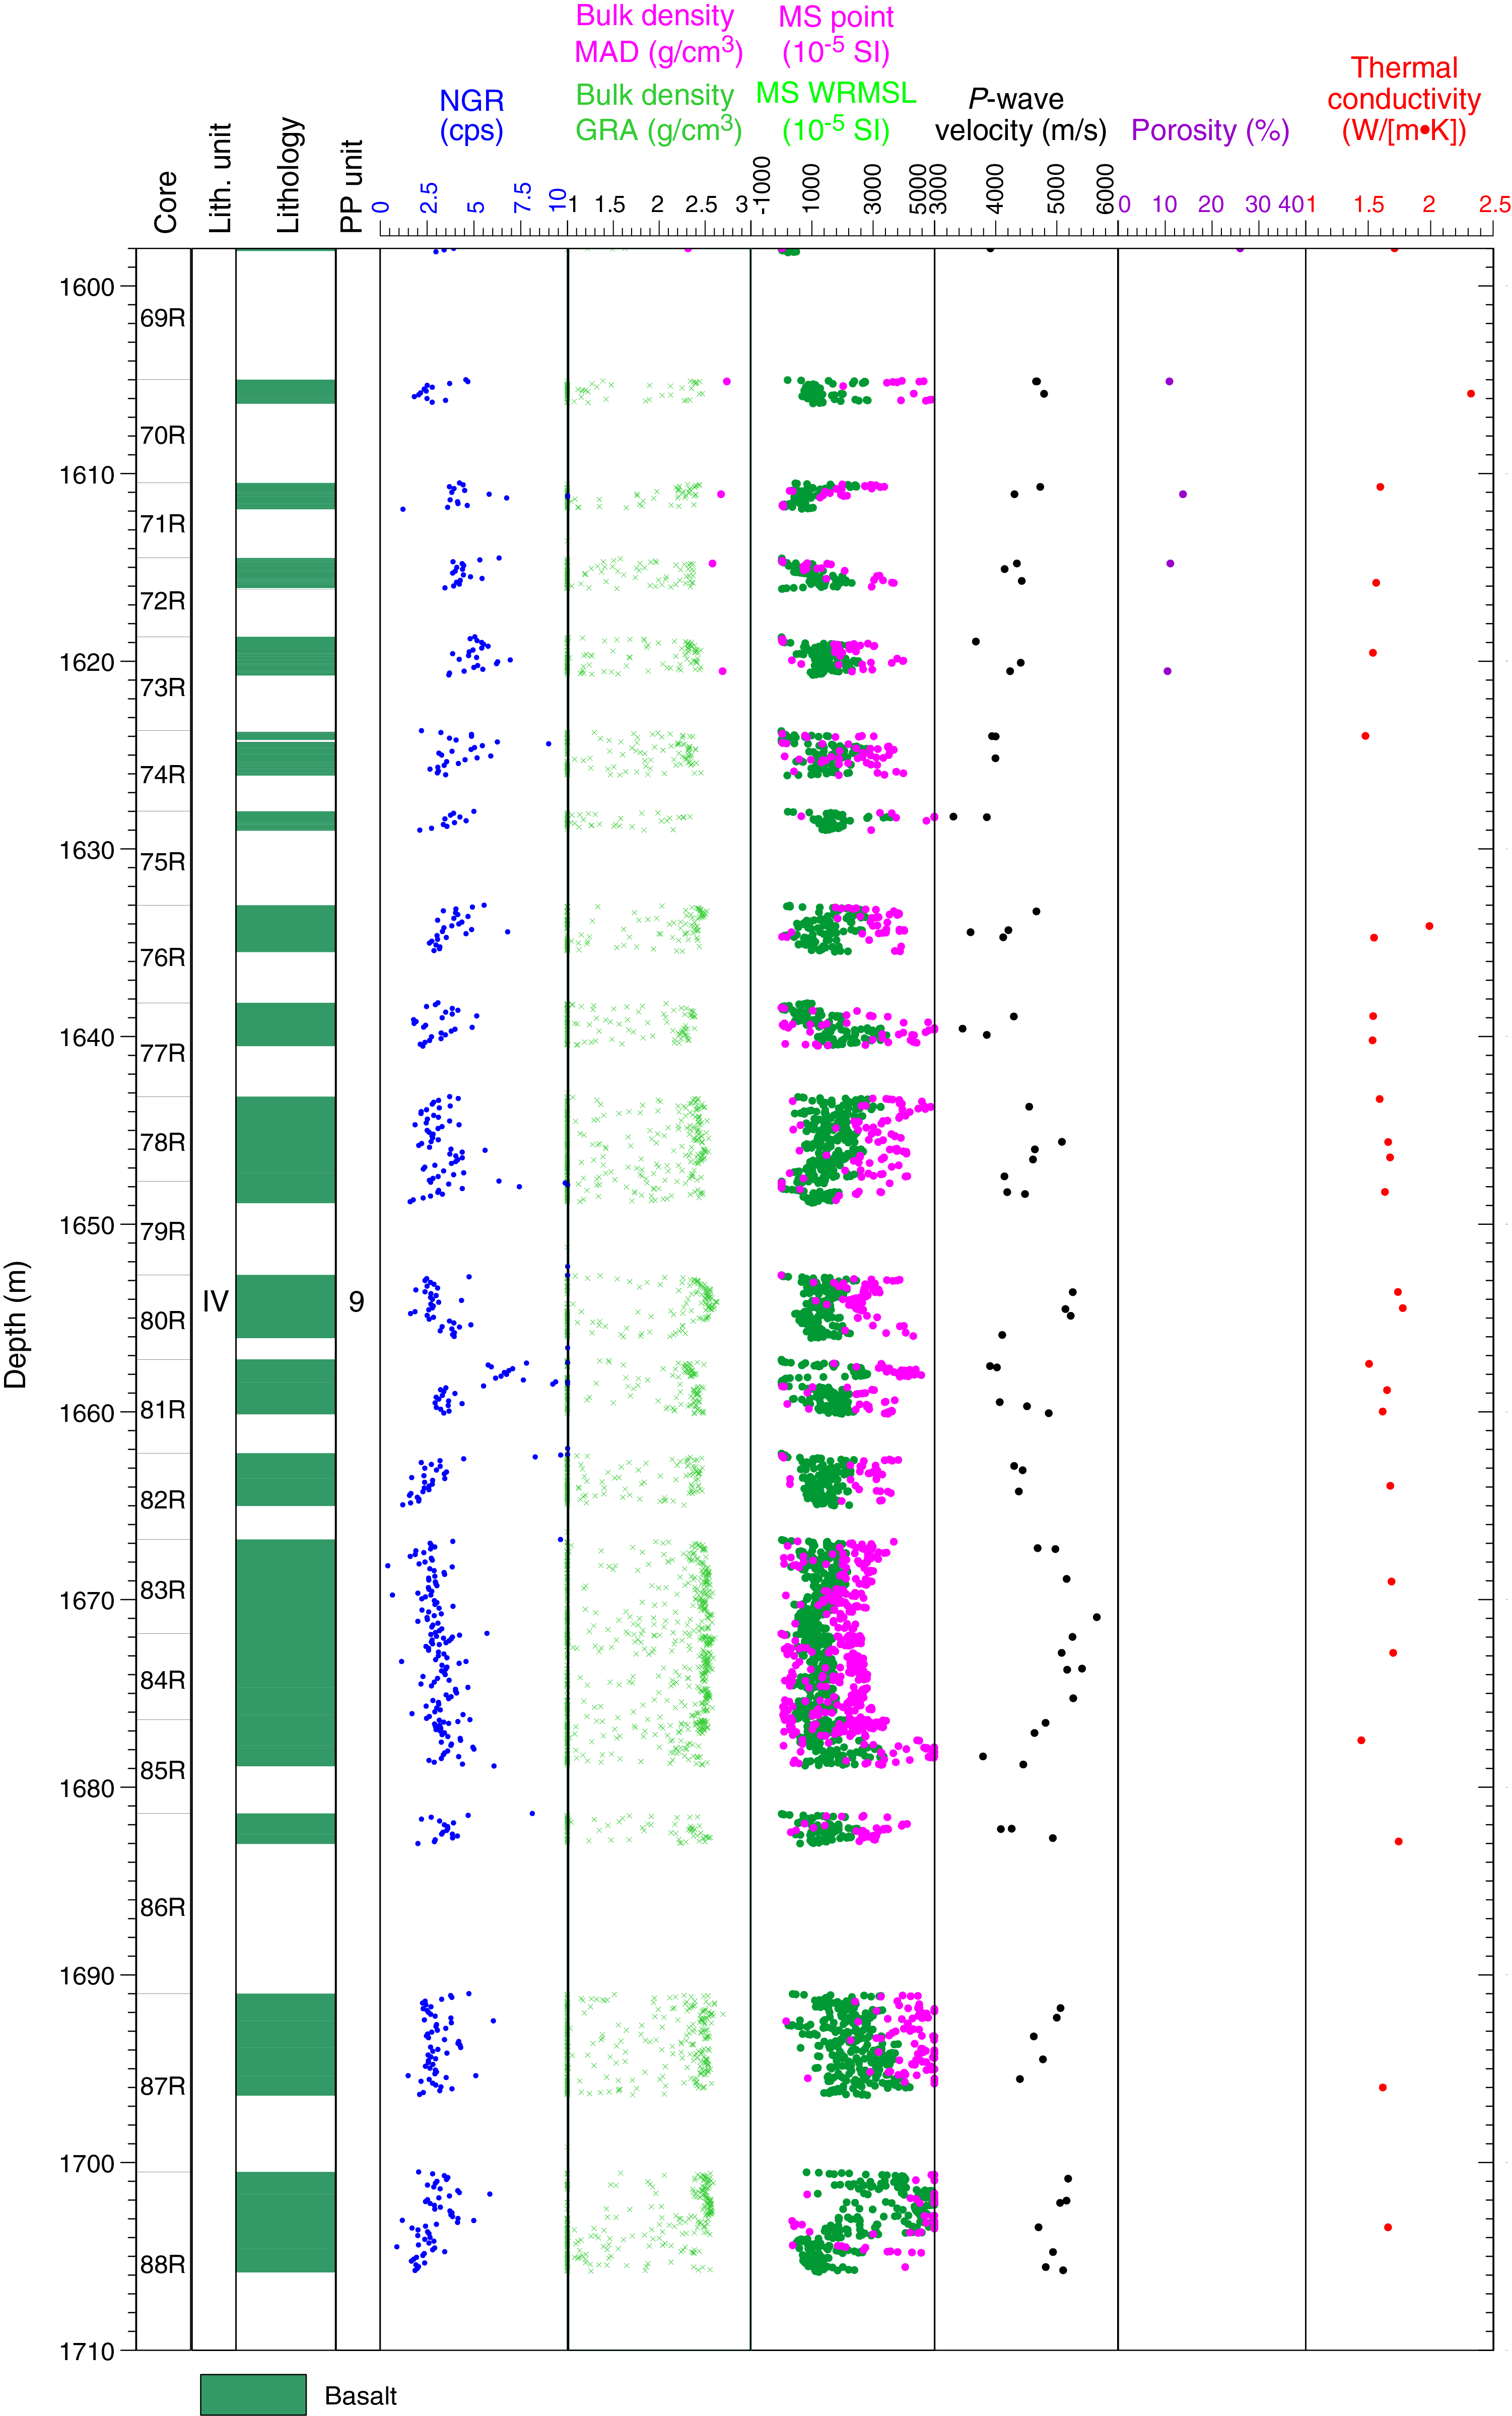
Figure F28. Basalt physical properties.
P-wave velocity
P-wave velocity whole-round measurements were not made on Hole U1503A cores because the contact between the cores and liners was poor for RCB coring. We measured P-wave velocity directly on working-half Sections 368X-U1503A-2R-1 through 88R-4 with the X-caliper. P-wave velocity in claystone and siltstone (2006–2955 m/s) increases by ~0.8 m/s per 1 m depth in PP Units 1–8 (995.1–1597.8 m) (average = 2569.6 m/s) (Figure F27). Several measurements show significantly higher values between 3026 and 4480 m/s that correspond either to measurements in sandstone layers interbedded with claystone in PP Units 3 and 5 or measurements on single samples in the low-recovery cores of PP Units 1–3 and 8 (Figure F27). Notably, P-wave velocity decreases gradually with depth from 3479 m/s at 1533.71 m to 3054 m/s at 1576.62 m in PP Unit 8. In PP Unit 9, P-wave velocity in basalt (3306–5656 m/s; average = 4537 m/s) is much higher than in sediments (Figures F27, F28).
Density and porosity
GRA bulk density was measured automatically every 2 cm by the WRMSL. In addition, MAD measurements on discrete core samples for Sections 368X-U1503A-2R-1 through 69R-2 were made for 1–3 samples per core according to recovery rate except for the low-recovery cores of PP Units 3, 5, and 8 (Figure F27). GRA bulk density (average = ~1.91 g/cm3) from the WRMSL measurements is lower than MAD bulk density (average = ~2.31 g/cm3) because the reduced diameter of the RCB cores did not completely fill the core liner. MAD bulk density measurements for claystone and siltstone in PP Units 1–8 are relatively low at 2.11—2.39 g/cm3 (average = ~2.27 g/cm3) with a relatively high porosity of 20.2%–36.1% (average = ~28.3%) (Figure F27). MAD measurements in sandstone show a relatively high bulk density of 2.45–2.64 g/cm3 (average = ~2.55 g/cm3) and a relatively low porosity of 7.6%–16.9% (average = ~11.08%). For claystone and siltstone in PP Units 1–8, MAD bulk density increases slightly with depth from ~2.21 g/cm3 at 996.46 m to ~2.30 g/cm3 at 1597.72 m (Figure F27). In the basalt in lithostratigraphic Unit IV (PP Unit 9), MAD bulk density is much higher at 2.58–2.84 g/cm3 (average = 2.71 g/cm3) and porosity ranges from 1.7% to 17.6% (average = 10.06%), which is much lower than in the sediment units.
Thermal conductivity
Thermal conductivity was measured on discrete samples from Sections 368X-U1503A-2R-1 through 88R-1. In PP Units 1–8 above the basement, the thermal conductivity for claystone and siltstone is 0.6–2.69 W/(m·K) (average = 2.02 W/[(m·K]), but the thermal conductivity for sandstone is significantly higher at 2.71–5.44 W/(m·K) (average = 3.75 W/[m·K]) (Figure F27). Thermal conductivity in the basalts ranges from 1.45 to 2.32 W/(m·K) (average = 1.66 W/[(m·K]) in PP Unit 9 (Figure F28).
Data interpretation and lithology correlation
Correlation with lithology
Physical property values for the claystone, siltstone, and sandstone in lithostratigraphic Units I and II (995.1–1542.8 m) do not display large contrasts with depth, but the sandstone in these units has higher bulk density and P-wave velocity and lower NGR and magnetic susceptibility than the claystone and siltstone (Figure F27). Deeper layers also exhibit variations that can be correlated to the lithology. For example, the claystone in Subunit IIA (1484.7–1533.6 m) correspond to PP Units 6 and 7 and have a combination of high NGR, high magnetic susceptibility, P-wave velocity <3000 m/s, and low thermal conductivity that is not observed elsewhere in Hole U1503A.
The nannofossil-rich claystone in lithostratigraphic Unit III (1542.8–1597.8 m), which corresponds to PP Unit 8, displays a clear decrease with depth in bulk density, magnetic susceptibility, and P-wave velocity. Such variations, which are opposite to what is expected as a result of lithification or compaction effects, are possibly due to the abundance of nannofossils in the sediment.
The magnetic mineral content of claystones, siltstones, or sandstones and their mineralogy are reflected in magnetic susceptibility measurements, which likely explains the relatively high magnetic susceptibility in the lower part of the brownish claystone in lithostratigraphic Subunit IIA (PP Unit 7).
Lithostratigraphic Unit IV (1597.8–1710.1 m) consists mainly of basalts, which causes major changes in the physical property measurements.
PP Unit 9 basalts
Sections 368X-U1503A-69R-2 through 88R-4 recovered basalts (lithostratigraphic Unit IV). Magnetic susceptibility in the basalts is very high (Figures F27, F28) but shows some variations that might correspond to changes in the nature of the magnetized minerals or the grain size. Compared with the sedimentary rocks above the basement, P-wave velocity in the basalts is quite high. NGR (<10 counts/s) and porosity are quite low, whereas density is much higher than in the sediments. Thermal conductivity in the basalts is slightly lower than in the sediments. High magnetic susceptibility in Cores 87R and 88R (~1691.0–1703.0 m) corresponds to basalts that display more massive textures than those from the other cores and are likely to have distinct magnetized minerals or grain size.
Downhole measurements and seismic correlation
Logging operation and VSI tool
A downhole logging string was run in Hole U1503A (Figure F29). The VSI tool string (Figure F30) was deployed to collect a vertical seismic profile (VSP) of 18 stations starting at 974.9 m with 50 m intervals to 124.9 m. No further stations could be recorded because the pipe was set inside the casing at 71 m. To avoid potentially deteriorated conditions in the open hole, the VSI tool string did not pass into the open hole, and all check shots were conducted inside the casing.
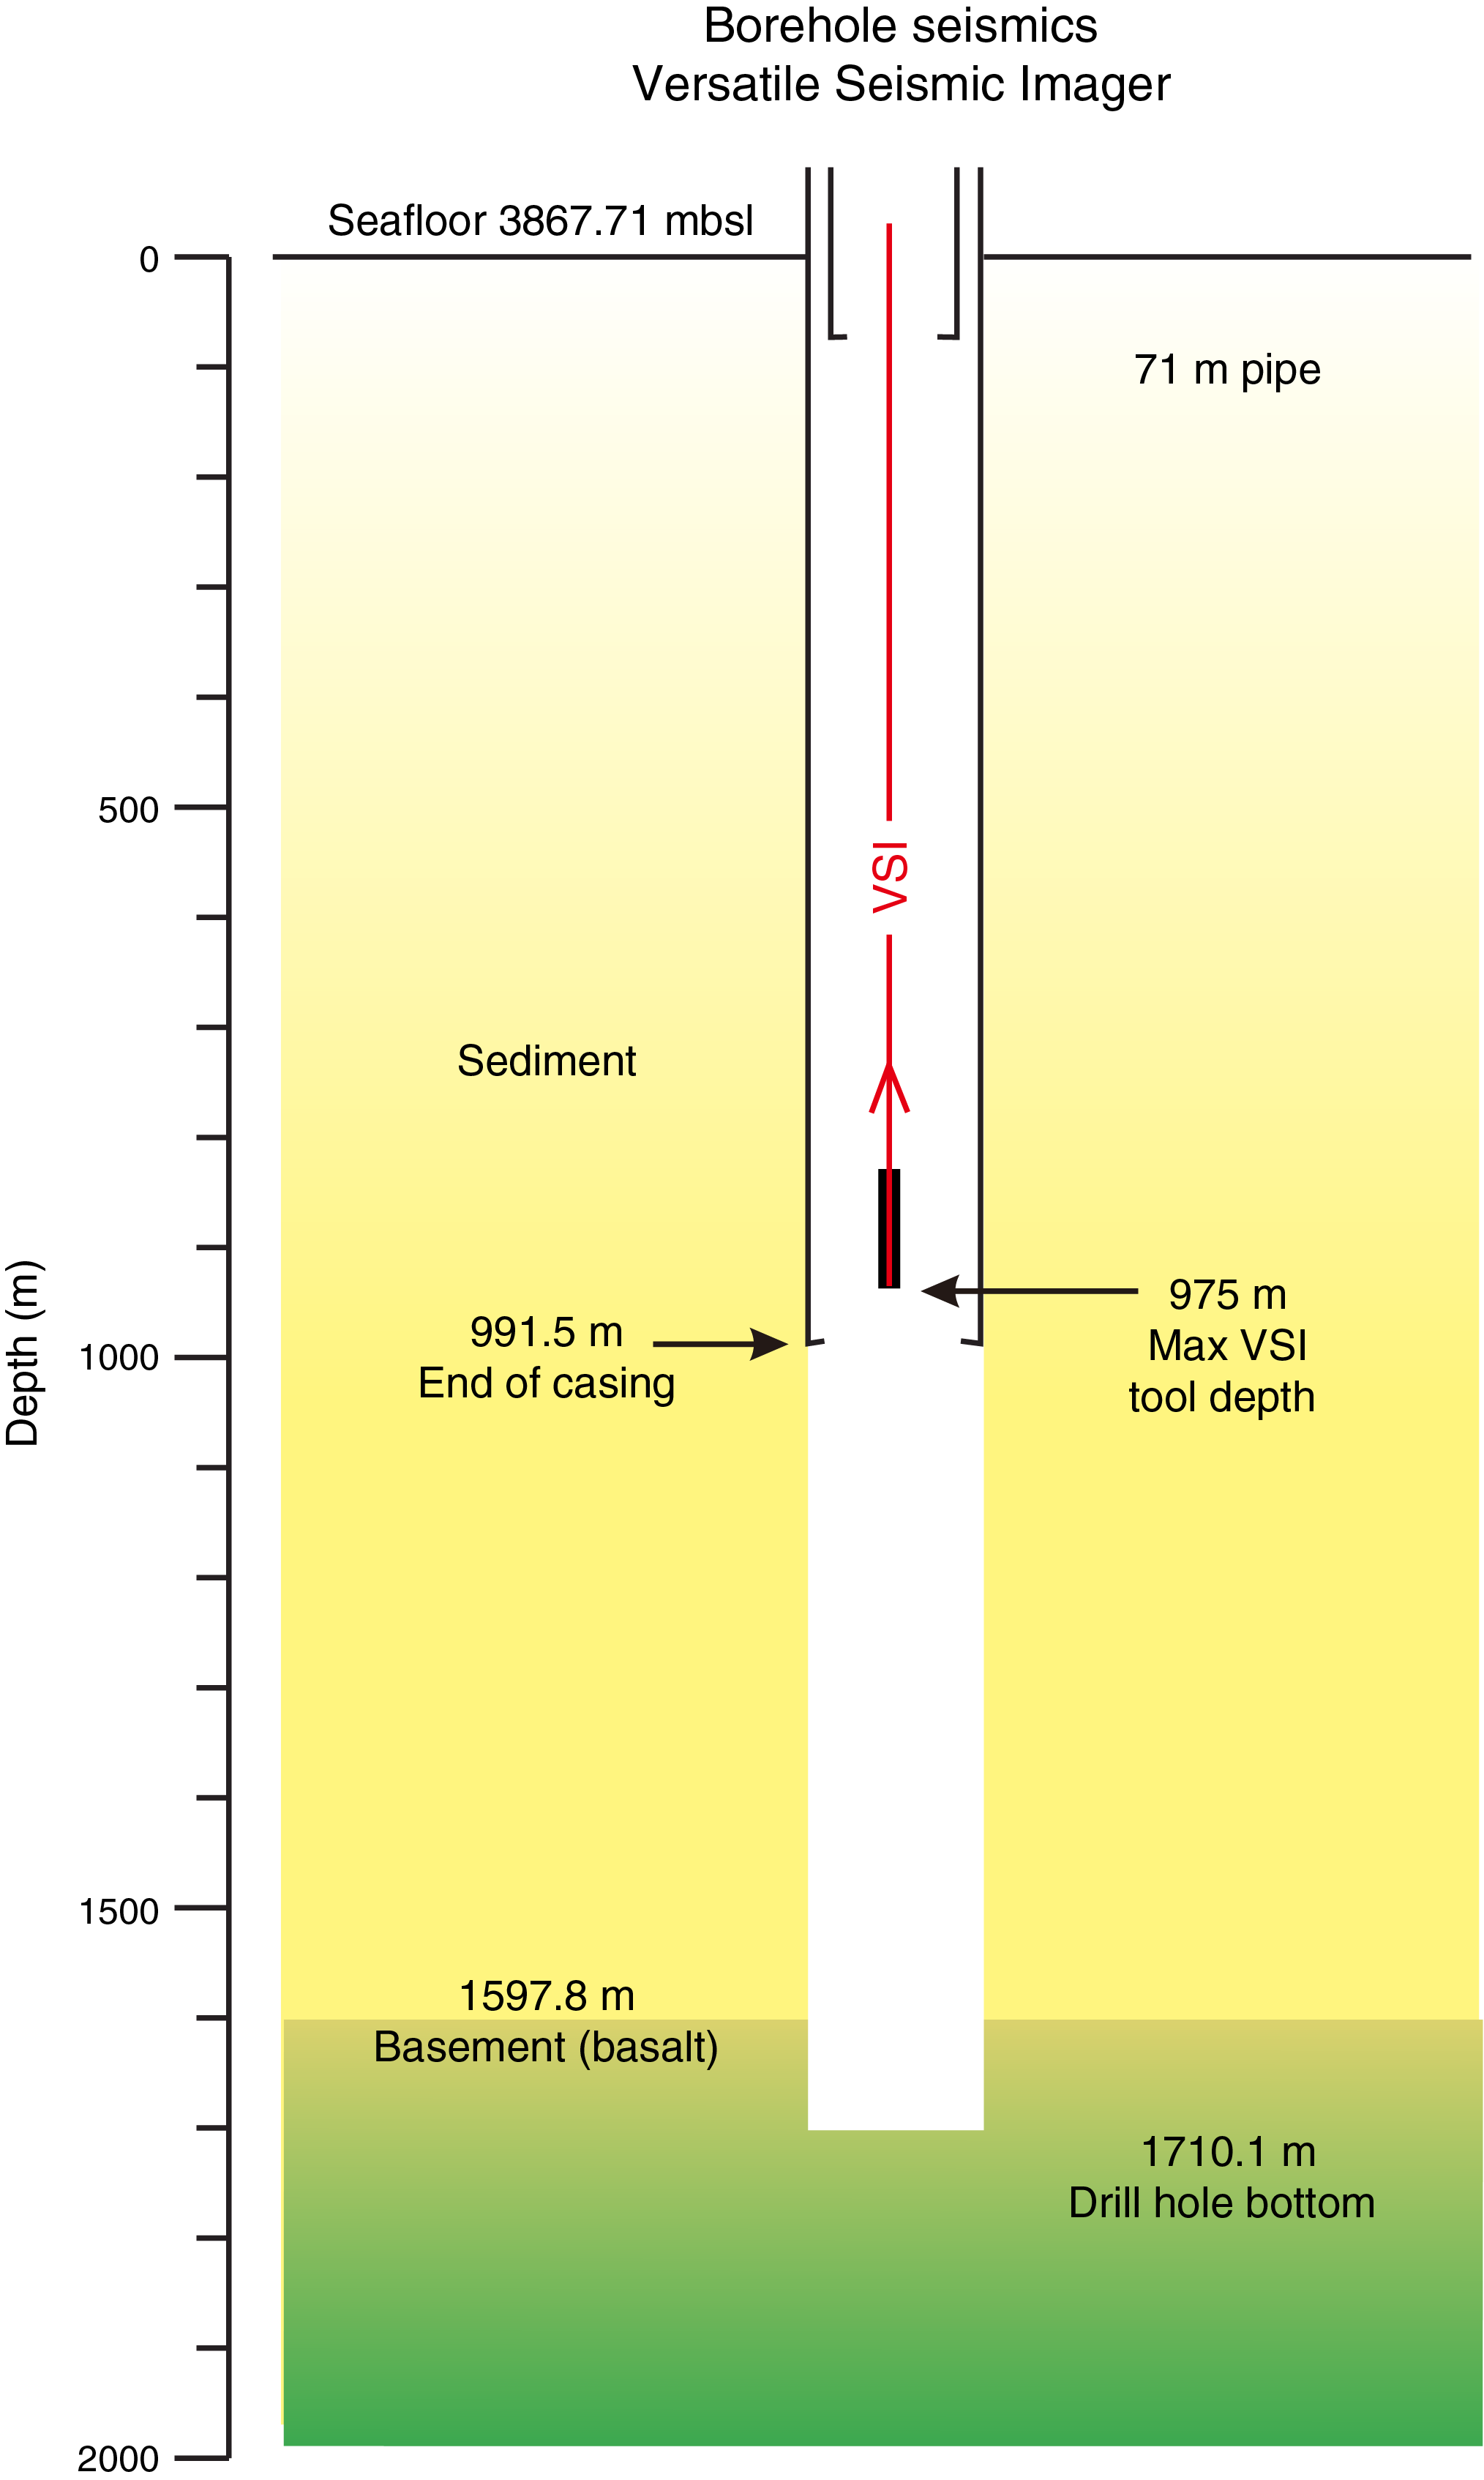
Figure F29. Logging operation summary.
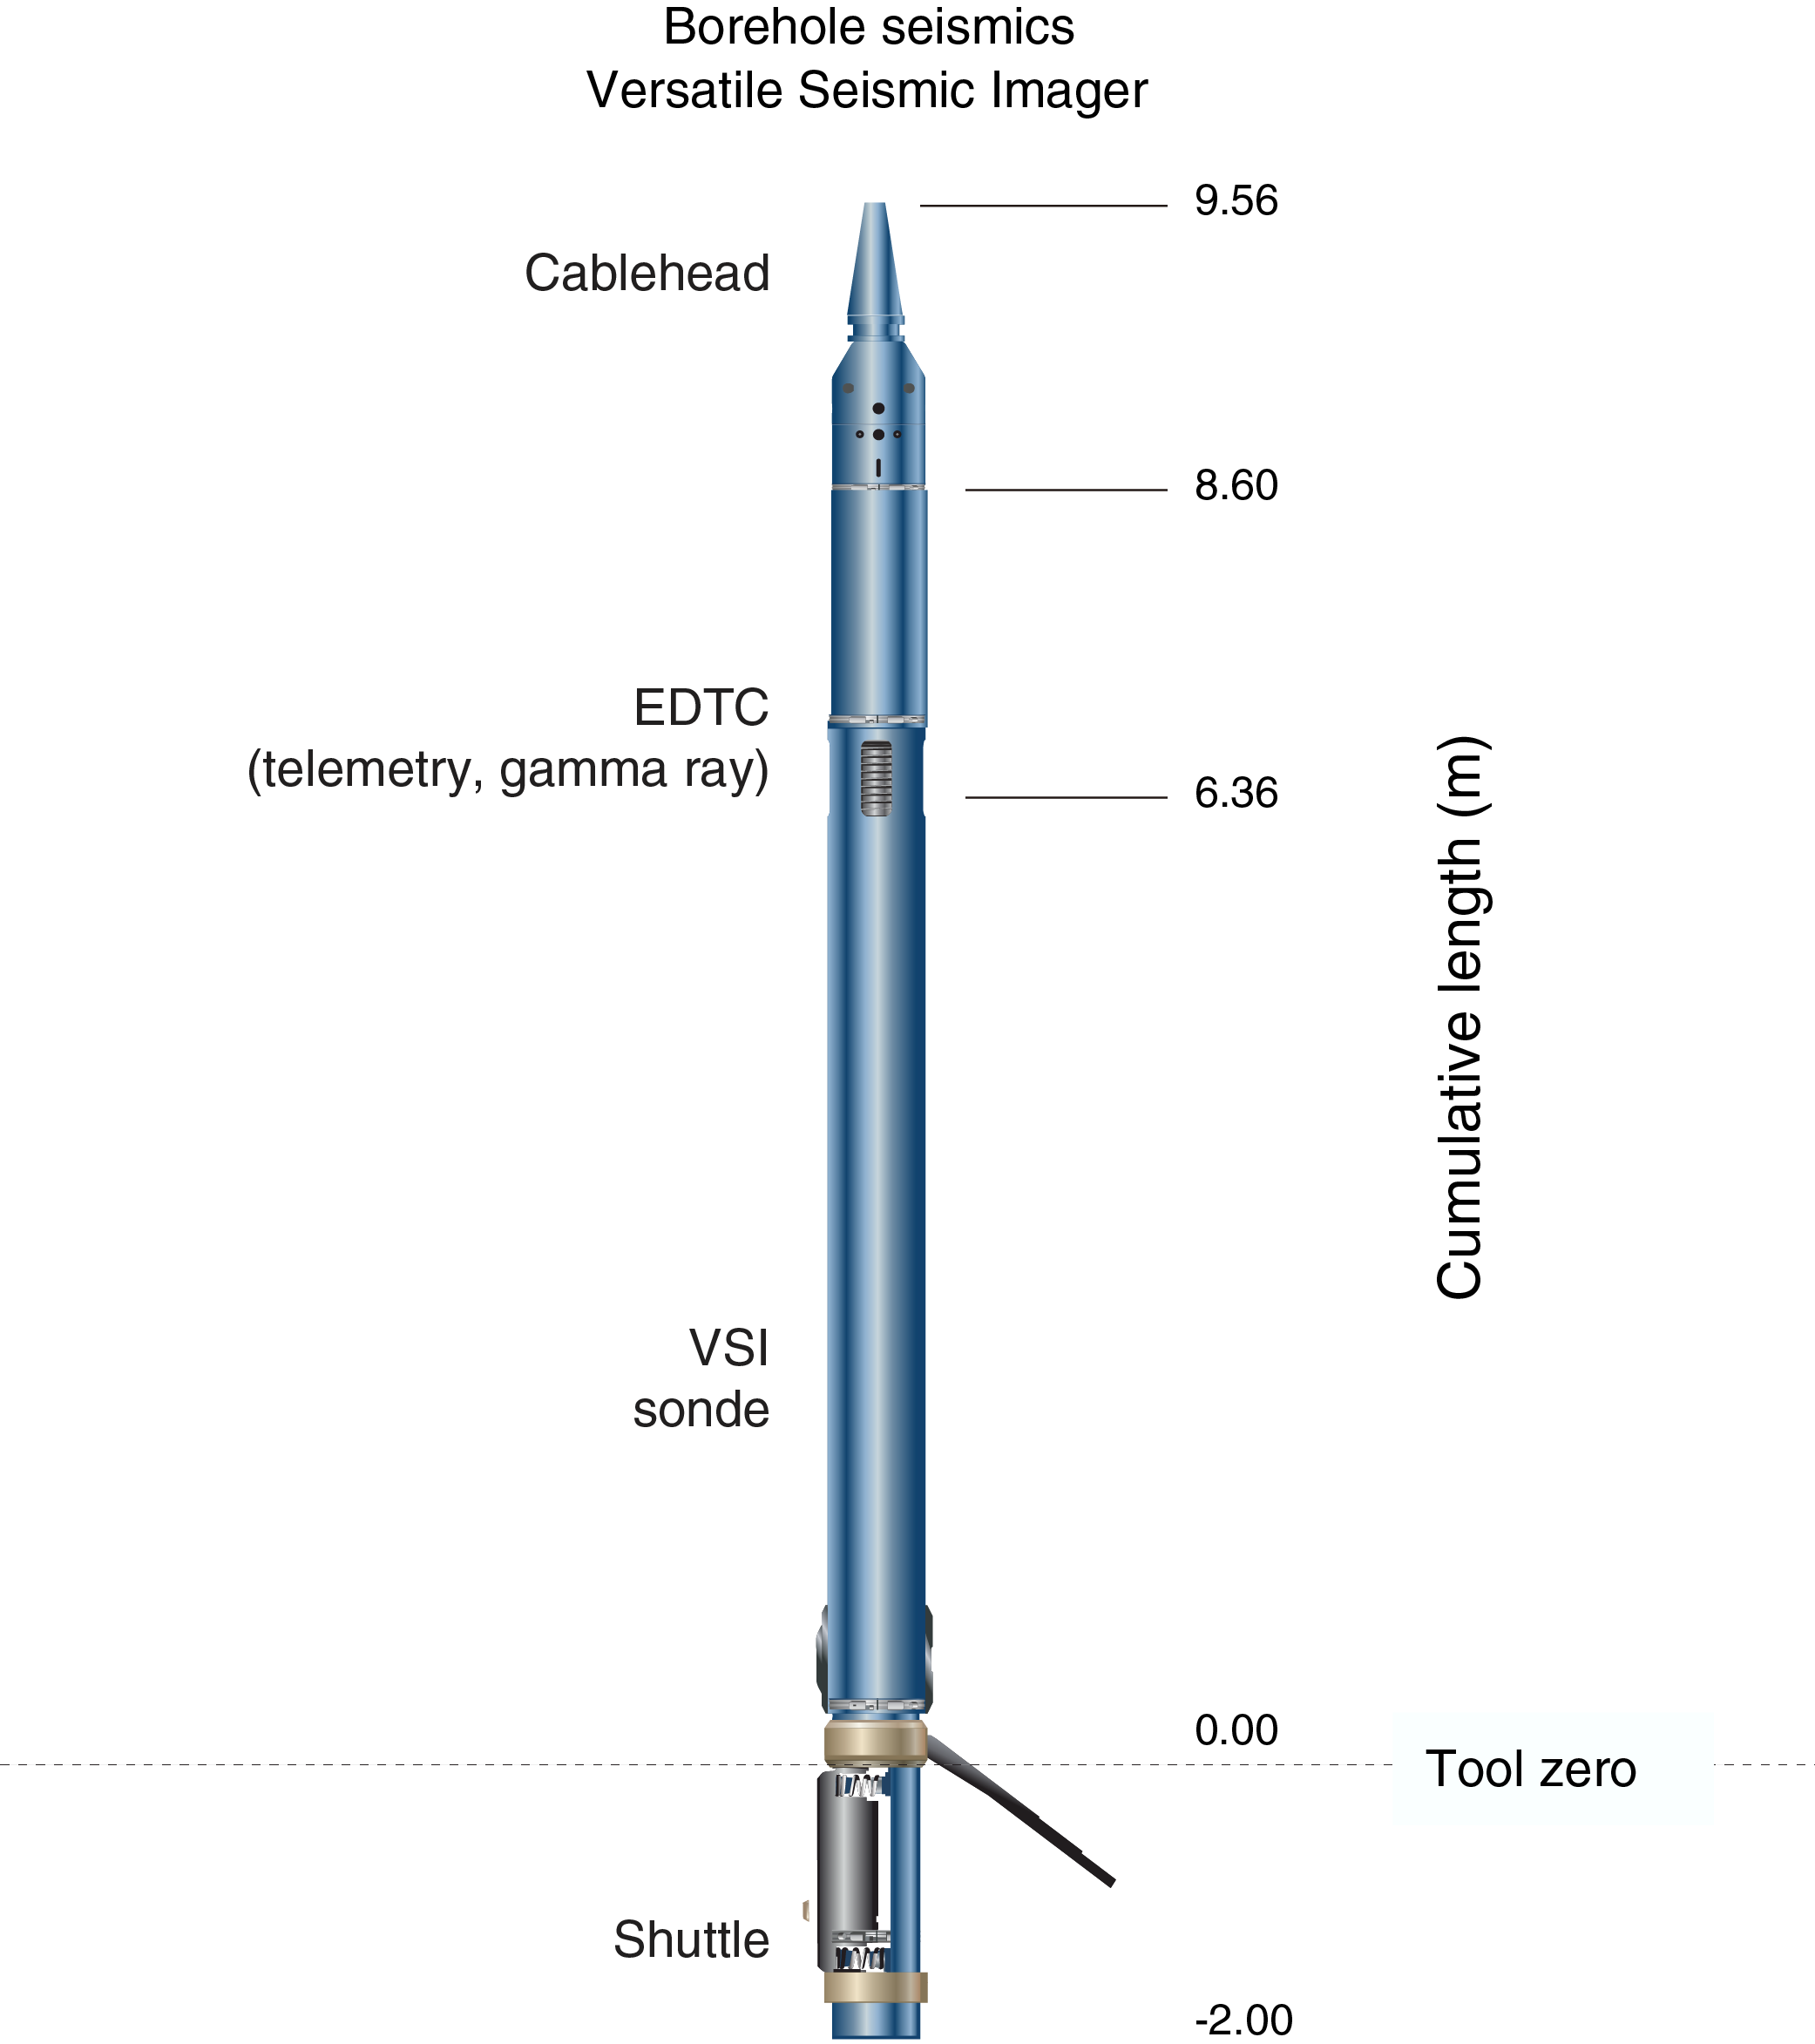
Figure F30. VSI tool string.
Rig-up for the downhole logging run with the VSI tool string started at ~0400 h on 6 December 2018. The tool string was deployed at ~0715 h and reached the bottom of casing (991.5 m) at ~0750 h. A protected species watch was started at 0630 h, and after 1 h of observation a soft ramp-up of the seismic source was performed to a maximum pressure of 2000 psi. No protected species were observed. The seismic source was deployed by the aft port crane at a distance of ~48 m from the moonpool and ~5 m below the sea surface (Figure F31). The seismic source was a cluster of two generator-injector (GI) guns, each with a volume of 250 inch3. An MP-24 hydrophone was deployed at 7 m below the sea surface. The sea condition was calm.
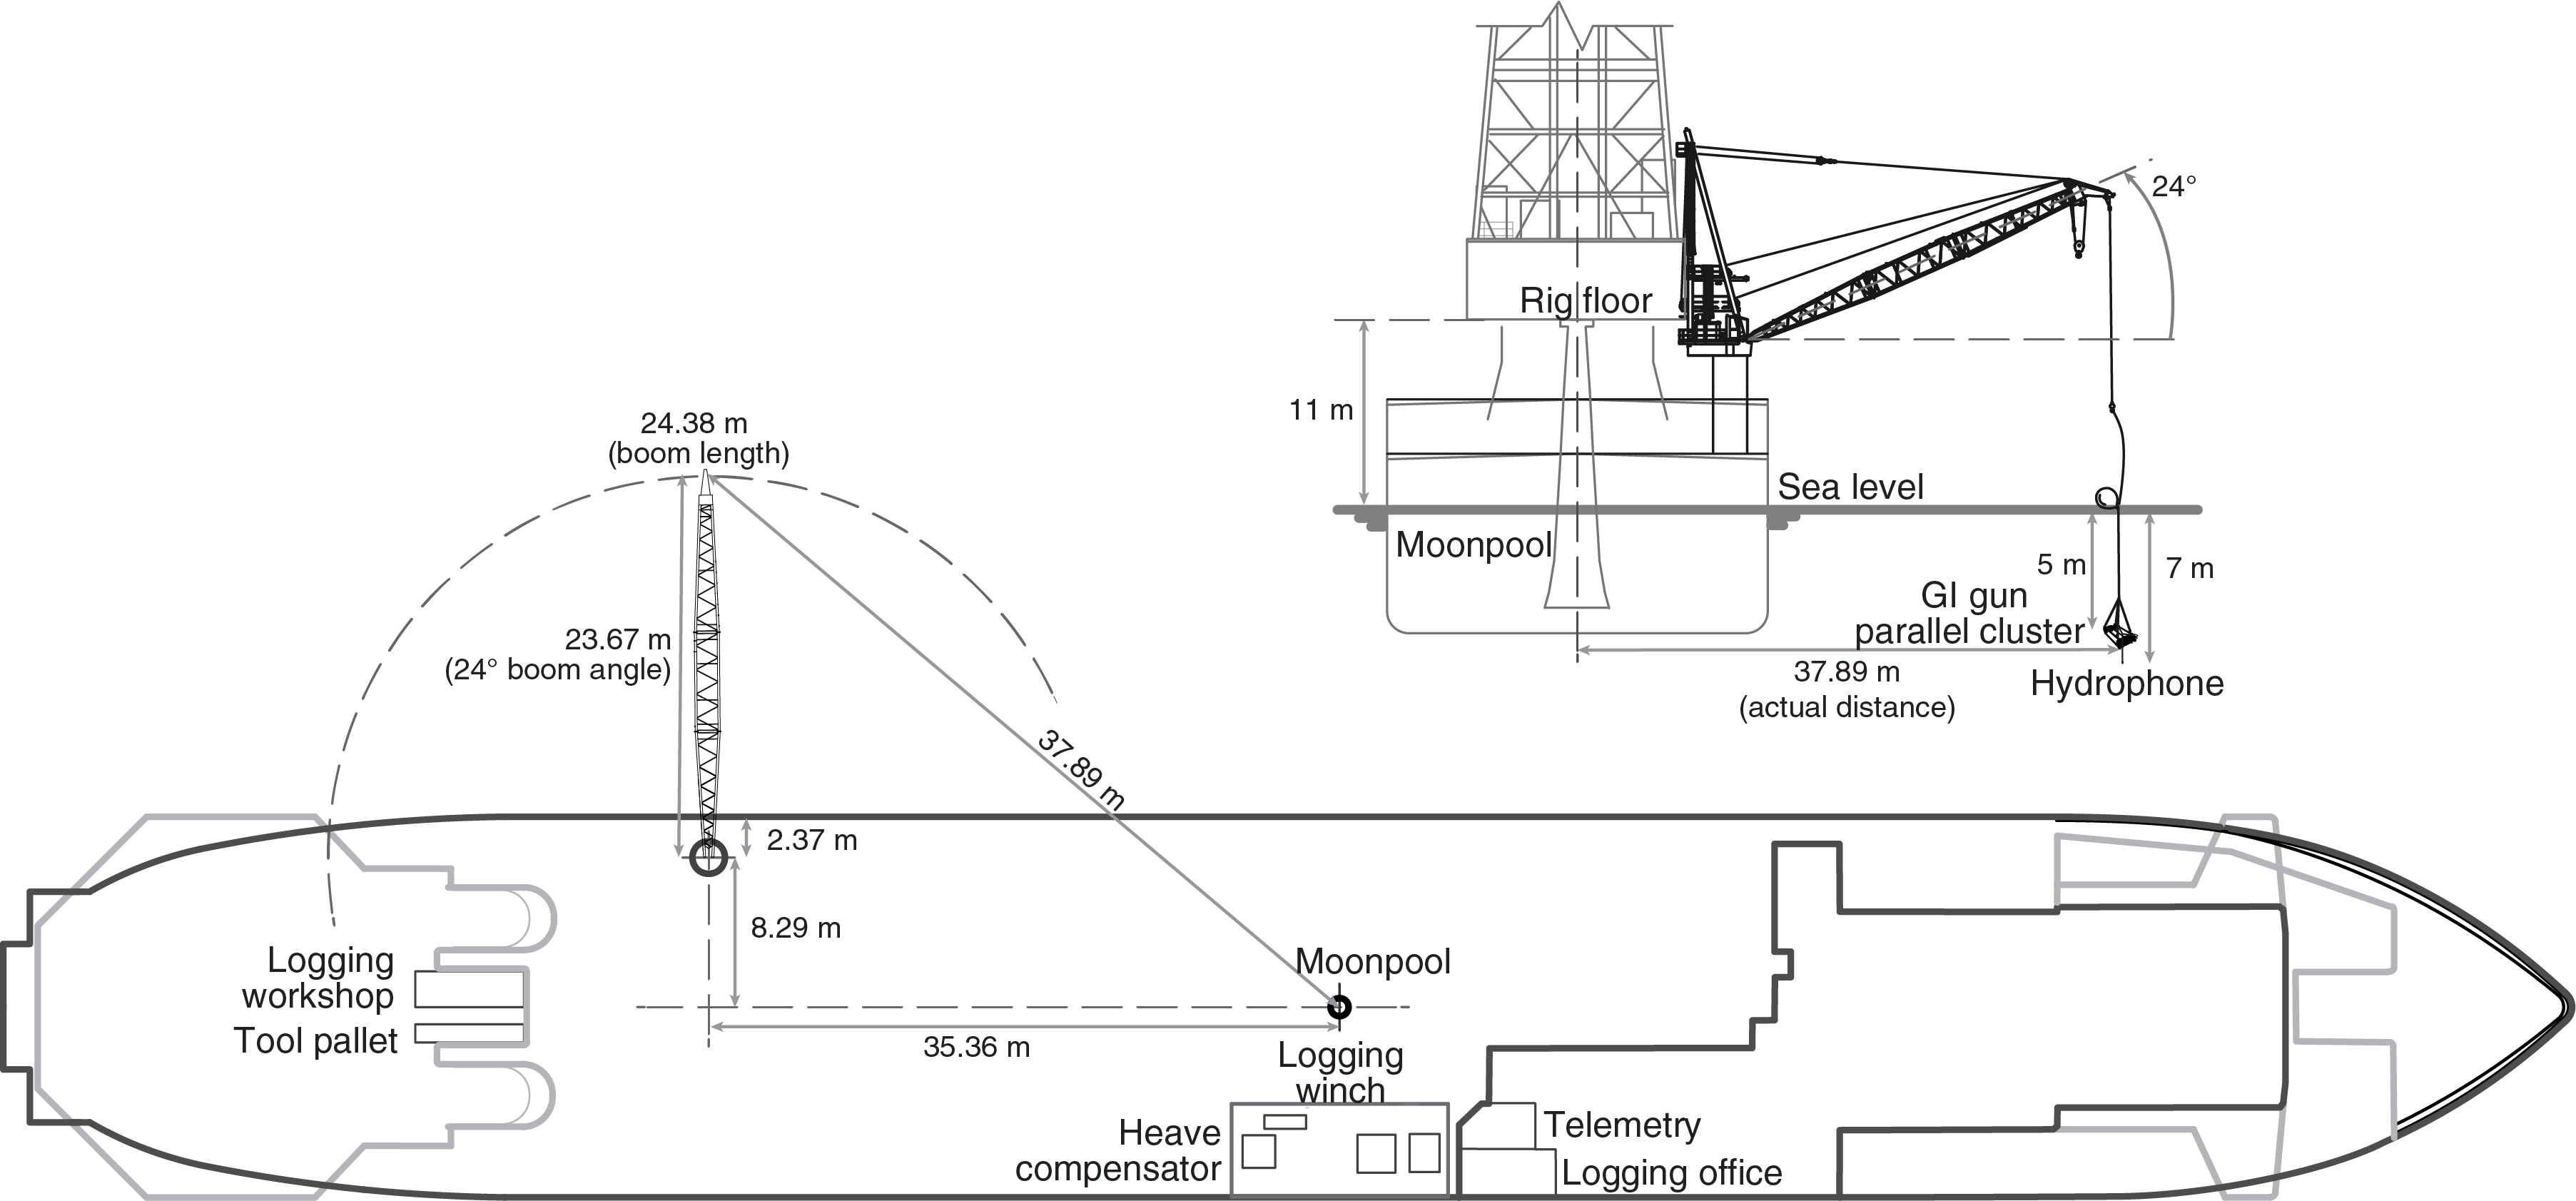
Figure F31. Seismic source deployment scheme.
The VSI tool string was combined with telemetry and gamma ray tools (Figure F30). A downhole recording length of 6000 ms with a sampling rate of 1.0 ms was used. A total of 104 seismic source shots were made during the experiment, from which 63 downhole seismic traces were used and processed to identify waveforms and first arrivals. A continuous gamma ray log was recorded from the bottom of the hole up past the seafloor. That log is the sole depth reference for the expedition and was planned and recorded in real time so that the uppermost gamma ray activity would correspond with the driller's seafloor depth, thus tying the station measurements to the coring data as closely as possible under the circumstances. VSI data collection concluded at 1055 h, and the tools were returned to the surface. See Operations for further details.
Interval velocity
One-way seismic traveltimes were recorded up the hole at 18 VSI stations from 949.9 to 124.9 m (Table T13; Figure F32). Processing, including first arrival picking and stacking, was performed by Schlumberger during Expedition 368X. After the expedition, logging specialists at the Lamont-Doherty Earth Observatory provided corrected traveltimes in SEGY format (Table T13).
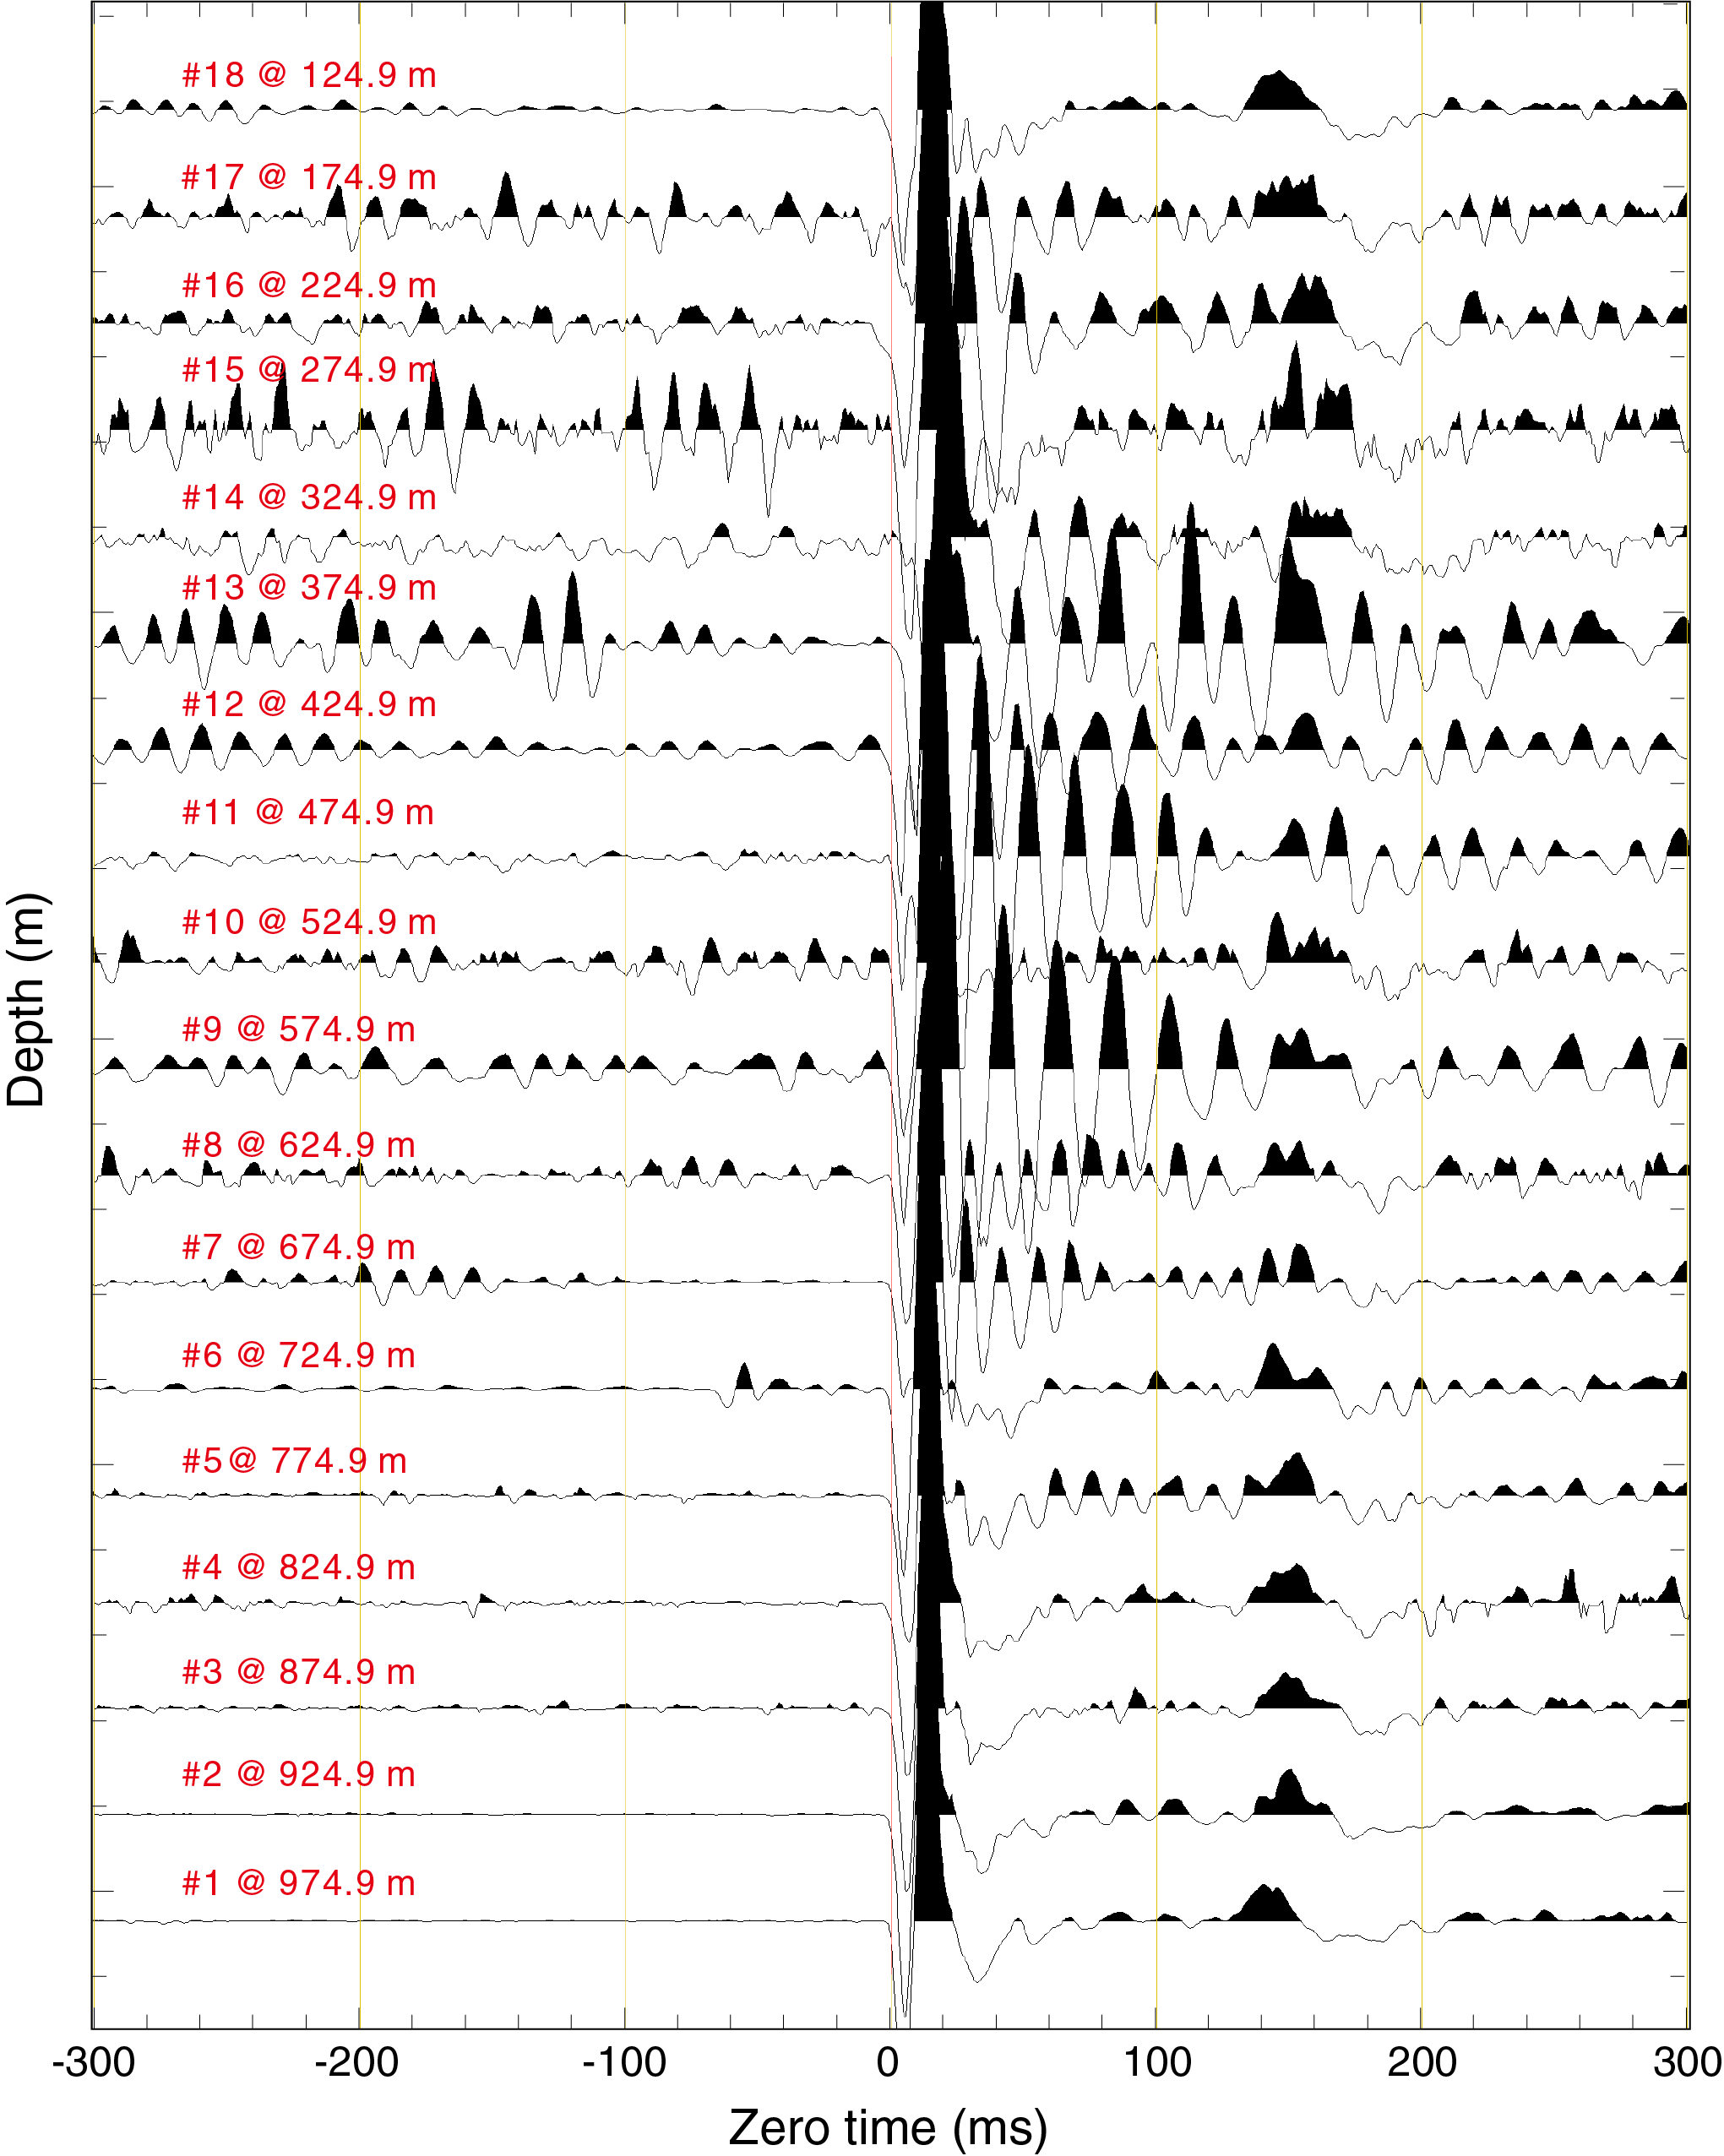
Figure F32. Waveforms and first arrivals.
Based on the recorded traveltimes at the 18 stations, we calculated the interval velocity (Vint) of individual sediment layers at 0–974.9 m (Table T13). Calculated interval velocity is between 1706.5 and 2487.6 m/s and in general increases with depth (Figure F33). For comparison, the average P-wave velocity of discrete core measurements is 2598.7 m/s for a sediment depth of 995.1–1597.8 m.

Figure F33. VSI downhole data.
Correlation to seismic data
The combined VSI and P-wave measurements were used to calculate the velocity-depth relationship for Hole U1503A (Figure F33). The velocity-depth relationship consists of two parts: (1) for 0–974.9 m, we used the interval velocity from the VSI experiment (red solid line in Figure F33), and (2) for 995.1–1710.1 m, the average P-wave velocity of sediment cores were used (red dotted line).
A seismic image near Hole U1503A (without depth correction) is shown in Figure F33. Seismic wave forms in Hole U1503A were extracted from this seismic data set and converted to depth using the composite depth-velocity relationship of Hole U1503A. The most prominent seismic reflectors are shown in the seismic wave forms (circles) and are connected to the same reflectors in the seismic image.
References
Briais, A., Patriat, P., and Tapponnier, P., 1993. Updated interpretation of magnetic anomalies and seafloor spreading stages in the South China Sea: implications for the Tertiary tectonics of Southeast Asia. Journal of Geophysical Research: Solid Earth, 98(B4):6299–6328. https://doi.org/10.1029/92JB02280
Childress, L.B., Alvarez Zarikian, C.A., Briais, A., Dadd, K.A., Deng, J.-M., Höfig, T.W., Huang, X.-L., Li, B., Lin, J., Liu, C., Liu, Z., Nirrengarten, M.F.R., Peate, D.W., Qiu, N., Satolli, S., Stock, J.M., Sun, Z., van der Zwan, F.M., Xiang, R., Yi, L., and Zhong, L., 2020. Expedition 368X methods supplement. In Sun, Z., Jian, Z., Stock, J.M., Larsen, H.C., Klaus, A., Alvarez Zarikian, C.A., and the Expedition 367/368 Scientists, South China Sea Rifted Margin. Proceedings of the International Ocean Discovery Program, 367/368: College Station, TX (International Ocean Discovery Program). https://doi.org/10.14379/iodp.proc.368X.102.2020
Clark, D.A., and Emerson, D.W., 1991. Notes on rock magnetization characteristics in applied geophysical studies. Exploration Geophysics, 22(3):547–555. https://doi.org/10.1071/EG991547
Horng, C.-S., Torii, M., Shea, K.-S., and Kao, S.-J., 1998. Inconsistent magnetic polarities between greigite- and pyrrhotite/magnetite-bearing marine sediments from the Tsailiao-chi section, southwestern Taiwan. Earth and Planetary Science Letters, 164(3–4):467–481. https://doi.org/10.1016/S0012-821X(98)00239-8
Larsen, H.C., Jian, Z., Alvarez Zarikian, C.A., Sun, Z., Stock, J.M., Klaus, A., Boaga, J., Bowden, S.A., Briais, A., Chen, Y., Cukur, D., Dadd, K.A., Ding, W., Dorais, M.J., Ferré, E.C., Ferreira, F., Furusawa, A., Gewecke, A.J., Hinojosa, J.L., Höfig, T.W., Hsiung, K.-H., Huang, B., Huang, E., Huang, X.-L., Jiang, S., Jin, H., Johnson, B.G., Kurzawski, R.M., Lei, C., Li, B., Li, L., Li, Y., Lin, J., Liu, C., Liu, C., Liu, Z., Luna, A., Lupi, C., McCarthy, A.J., Mohn, G., Ningthoujam, L.S., Nirrengarten, M., Osono, N., Peate, D.W., Persaud, P., Qiu, N., Robinson, C.M., Satolli, S., Sauermilch, I., Schindlbeck, J.C., Skinner, S.M., Straub, S.M., Zu, X., Tian, L., van der Zwan, F.M., Wan, S., Wu, H., Xiang, R., Yadav, R., Yi, L., Zhang, C., Zhang, J., Zhang, Y., Zhao, N., Zhong, G., and Zhong, L., 2018a. Site U1502. In Sun, Z., Jian, Z., Stock, J.M., Larsen, H.C., Klaus, A., Alvarez Zarikian, C.A., and the Expedition 367/368 Scientists, South China Sea Rifted Margin. Proceedings of the International Ocean Discovery Program, 367/368: College Station, TX (International Ocean Discovery Program). https://doi.org/10.14379/iodp.proc.367368.106.2018
Larsen, H.C., Jian, Z., Alvarez Zarikian, C.A., Sun, Z., Stock, J.M., Klaus, A., Boaga, J., Bowden, S.A., Briais, A., Chen, Y., Cukur, D., Dadd, K.A., Ding, W., Dorais, M.J., Ferré, E.C., Ferreira, F., Furusawa, A., Gewecke, A.J., Hinojosa, J.L., Höfig, T.W., Hsiung, K.-H., Huang, B., Huang, E., Huang, X.-L., Jiang, S., Jin, H., Johnson, B.G., Kurzawski, R.M., Lei, C., Li, B., Li, L., Li, Y., Lin, J., Liu, C., Liu, C., Liu, Z., Luna, A., Lupi, C., McCarthy, A.J., Mohn, G., Ningthoujam, L.S., Nirrengarten, M., Osono, N., Peate, D.W., Persaud, P., Qiu, N., Robinson, C.M., Satolli, S., Sauermilch, I., Schindlbeck, J.C., Skinner, S.M., Straub, S.M., Su, X., Tian, L., van der Zwan, F.M., Wan, S., Wu, H., Xiang, R., Yadav, R., Yi, L., Zhang, C., Zhang, J., Zhang, Y., Zhao, N., Zhong, G., and Zhong, L., 2018b. Site U1503. In Sun, Z., Jian, Z., Stock, J.M., Larsen, H.C., Klaus, A., Alvarez Zarikian, C.A., and the Expedition 367/368 Scientists, South China Sea Rifted Margin. Proceedings of the International Ocean Discovery Program, 367/368: College Station, TX (International Ocean Discovery Program). https://doi.org/10.14379/iodp.proc.367368.107.2018
Lurcock, P.C., and Wilson, G.S., 2012. PuffinPlot: a versatile, user-friendly program for paleomagnetic analysis. Geochemistry, Geophysics, Geosystems, 13(6):Q06Z45. https://doi.org/10.1029/2012GC004098
Martini, E., 1971. Standard Tertiary and Quaternary calcareous nannoplankton zonation. In Farinacci, A. (Ed.), Proceedings of the Second Planktonic Conference, Roma 1970: Rome (Edizioni Tecnoscienza), 2:739–785.
Müller, A., and Mathesius, U., 1999. The palaeoenvironments of coastal lagoons in the southern Baltic Sea, I. The application of sedimentary Corg/N ratios as source indicators of organic matter. Palaeogeography, Palaeoclimatology, Palaeoecology, 145(1–3):1–16. https://doi.org/10.1016/S0031-0182(98)00094-7
Ogg, J.G., Ogg, G., and Gradstein, F.M., 2016. A Concise Geologic Time Scale 2016: Boston (Elsevier).
Roberts, A.P., Chang, L., Rowan, C.J., Horng, C.-S., and Florindo, F., 2011. Magnetic properties of sedimentary greigite (Fe3S4): an update. Reviews of Geophysics, 49(1):RG1002. https://doi.org/10.1029/2010RG000336
Seton, M., Whittaker, J.M., Wessel, P., Müller, R.D., DeMets, C., Merkouriev, S., Cande, S., Gaina, C., Eagles, G., Granot, R., Stock, J., Wright, N., and Williams, S.E., 2014. Community infrastructure and repository for marine magnetic identifications. Geochemistry, Geophysics, Geosystems, 15(4):1629–1641. https://doi.org/10.1002/2013GC005176
Stock, J.M., Sun, Z., Klaus, A., Larsen, H.C., Jian, Z., Alvarez Zarikian, C.A., Boaga, J., Bowden, S.A., Briais, A., Chen, Y., Cukur, D., Dadd, K.A., Ding, W., Dorais, M.J., Ferré, E.C., Ferreira, F., Furusawa, A., Gewecke, A.J., Hinojosa, J.L., Höfig, T.W., Hsiung, K.-H., Huang, B., Huang, E., Huang, X.-L., Jiang, S., Jin, H., Johnson, B.G., Kurzawski, R.M., Lei, C., Li, B., Li, L., Li, Y., Lin, J., Liu, C., Liu, C., Liu, Z., Luna, A., Lupi, C., McCarthy, A.J., Mohn, G., Ningthoujam, L.S., Nirrengarten, M., Osono, N., Peate, D.W., Persaud, P., Qiu, N., Robinson, C.M., Satolli, S., Sauermilch, I., Schindlbeck, J.C., Skinner, S.M., Straub, S.M., Zu, X., Tian, L., van der Zwan, F.M., Wan, S., Wu, H., Xiang, R., Yadav, R., Yi, L., Zhang, C., Zhang, J., Zhang, Y., Zhao, N., Zhong, G., and Zhong, L., 2018. Site U1500. In Sun, Z., Jian, Z., Stock, J.M., Larsen, H.C., Klaus, A., Alvarez Zarikian, C.A., and the Expedition 367/368 Scientists, South China Sea Rifted Margin. Proceedings of the International Ocean Discovery Program, 367/368: College Station, TX (International Ocean Discovery Program). https://doi.org/10.14379/iodp.proc.367368.104.2018
Sun, Z., Jian, Z., Stock, J.M., Larsen, H.C., Klaus, A., Alvarez Zarikian, C.A., Boaga, J., Bowden, S.A., Briais, A., Chen, Y., Cukur, D., Dadd, K.A., Ding, W., Dorais, M.J., Ferré, E.C., Ferreira, F., Furusawa, A., Gewecke, A.J., Hinojosa, J.L., Höfig, T.W., Hsiung, K.-H., Huang, B., Huang, E., Huang, X.-L., Jiang, S., Jin, H., Johnson, B.G., Kurzawski, R.M., Lei, C., Li, B., Li, L., Li, Y., Lin, J., Liu, C., Liu, C., Liu, Z., Luna, A., Lupi, C., McCarthy, A.J., Mohn, G., Ningthoujam, L.S., Nirrengarten, M., Osono, N., Peate, D.W., Persaud, P., Qiu, N., Robinson, C.M., Satolli, S., Sauermilch, I., Schindlbeck, J.C., Skinner, S.M., Straub, S.M., Zu, X., Tian, L., van der Zwan, F.M., Wan, S., Wu, H., Xiang, R., Yadav, R., Yi, L., Zhang, C., Zhang, J., Zhang, Y., Zhao, N., Zhong, G., and Zhong, L., 2018a. Expedition 367/368 methods. In Sun, Z., Jian, Z., Stock, J.M., Larsen, H.C., Klaus, A., Alvarez Zarikian, C.A., and the Expedition 367/368 Scientists, South China Sea Rifted Margin. Proceedings of the International Ocean Discovery Program, 367/368: College Station, TX (International Ocean Discovery Program). https://doi.org/10.14379/iodp.proc.367368.102.2018
Sun, Z., Jian, Z., Stock, J.M., Larsen, H.C., Klaus, A., Alvarez Zarikian, C.A., and the Expedition 367/368 Scientists, 2018b. Supplementary material, https://doi.org/10.14379/iodp.proc.367368supp.2018. Supplement to Sun, Z., Jian, Z., Stock, J.M., Larsen, H.C., Klaus, A., Alvarez Zarikian, C.A., and the Expedition 367/368 Scientists, South China Sea Rifted Margin. Proceedings of the International Ocean Discovery Program, 367/368: College Station, TX (International Ocean Discovery Program). https://doi.org/10.14379/iodp.proc.367368.2018
Yan, P., Zhou, D., and Liu, Z., 2001. A crustal structure profile across the northern continental margin of the South China Sea. Tectonophysics, 338(1):1–21. https://doi.org/10.1016/S0040-1951(01)00062-2
Zijderveld, J.D.A., 1967. AC demagnetization of rocks: analysis of results. In Collinson, D.W., Creer, K.M., and Runcorn, S.K. (Eds.), Developments in Solid Earth Geophysics (Volume 3): Methods in Palaeomagnetism: Amsterdam (Elsevier), 254–286. https://doi.org/10.1016/B978-1-4832-2894-5.50049-5
1 Childress, L.B., Alvarez Zarikian, C.A., Briais, A., Dadd, K.A., Deng, J.-M., Höfig, T.W., Huang, X.-L., Li, B., Lin, J., Liu, C., Liu, Z., Nirrengarten, M.F.R., Peate, D.W., Qiu, N., Satolli, S., Stock, J.M., Sun, Z., van der Zwan, F.M., Xiang, R., Yi, L., and Zhong, L., 2020. Return to Site U1503. In Sun, Z., Jian, Z., Stock, J.M., Larsen, H.C., Klaus, A., Alvarez Zarikian, C.A., and the Expedition 367/368 Scientists, South China Sea Rifted Margin. Proceedings of the International Ocean Discovery Program, 367/368: College Station, TX (International Ocean Discovery Program). https://doi.org/10.14379/iodp.proc.368X.103.2020
2 Expedition 367/368 Scientists' affiliations.
This work is distributed under the Creative Commons Attribution 4.0 International (CC BY 4.0) license. 